Kaum besser als der Vorgänger: Dell XPS 13 Plus 9320 (2023) mit Core i7-1360P im Test

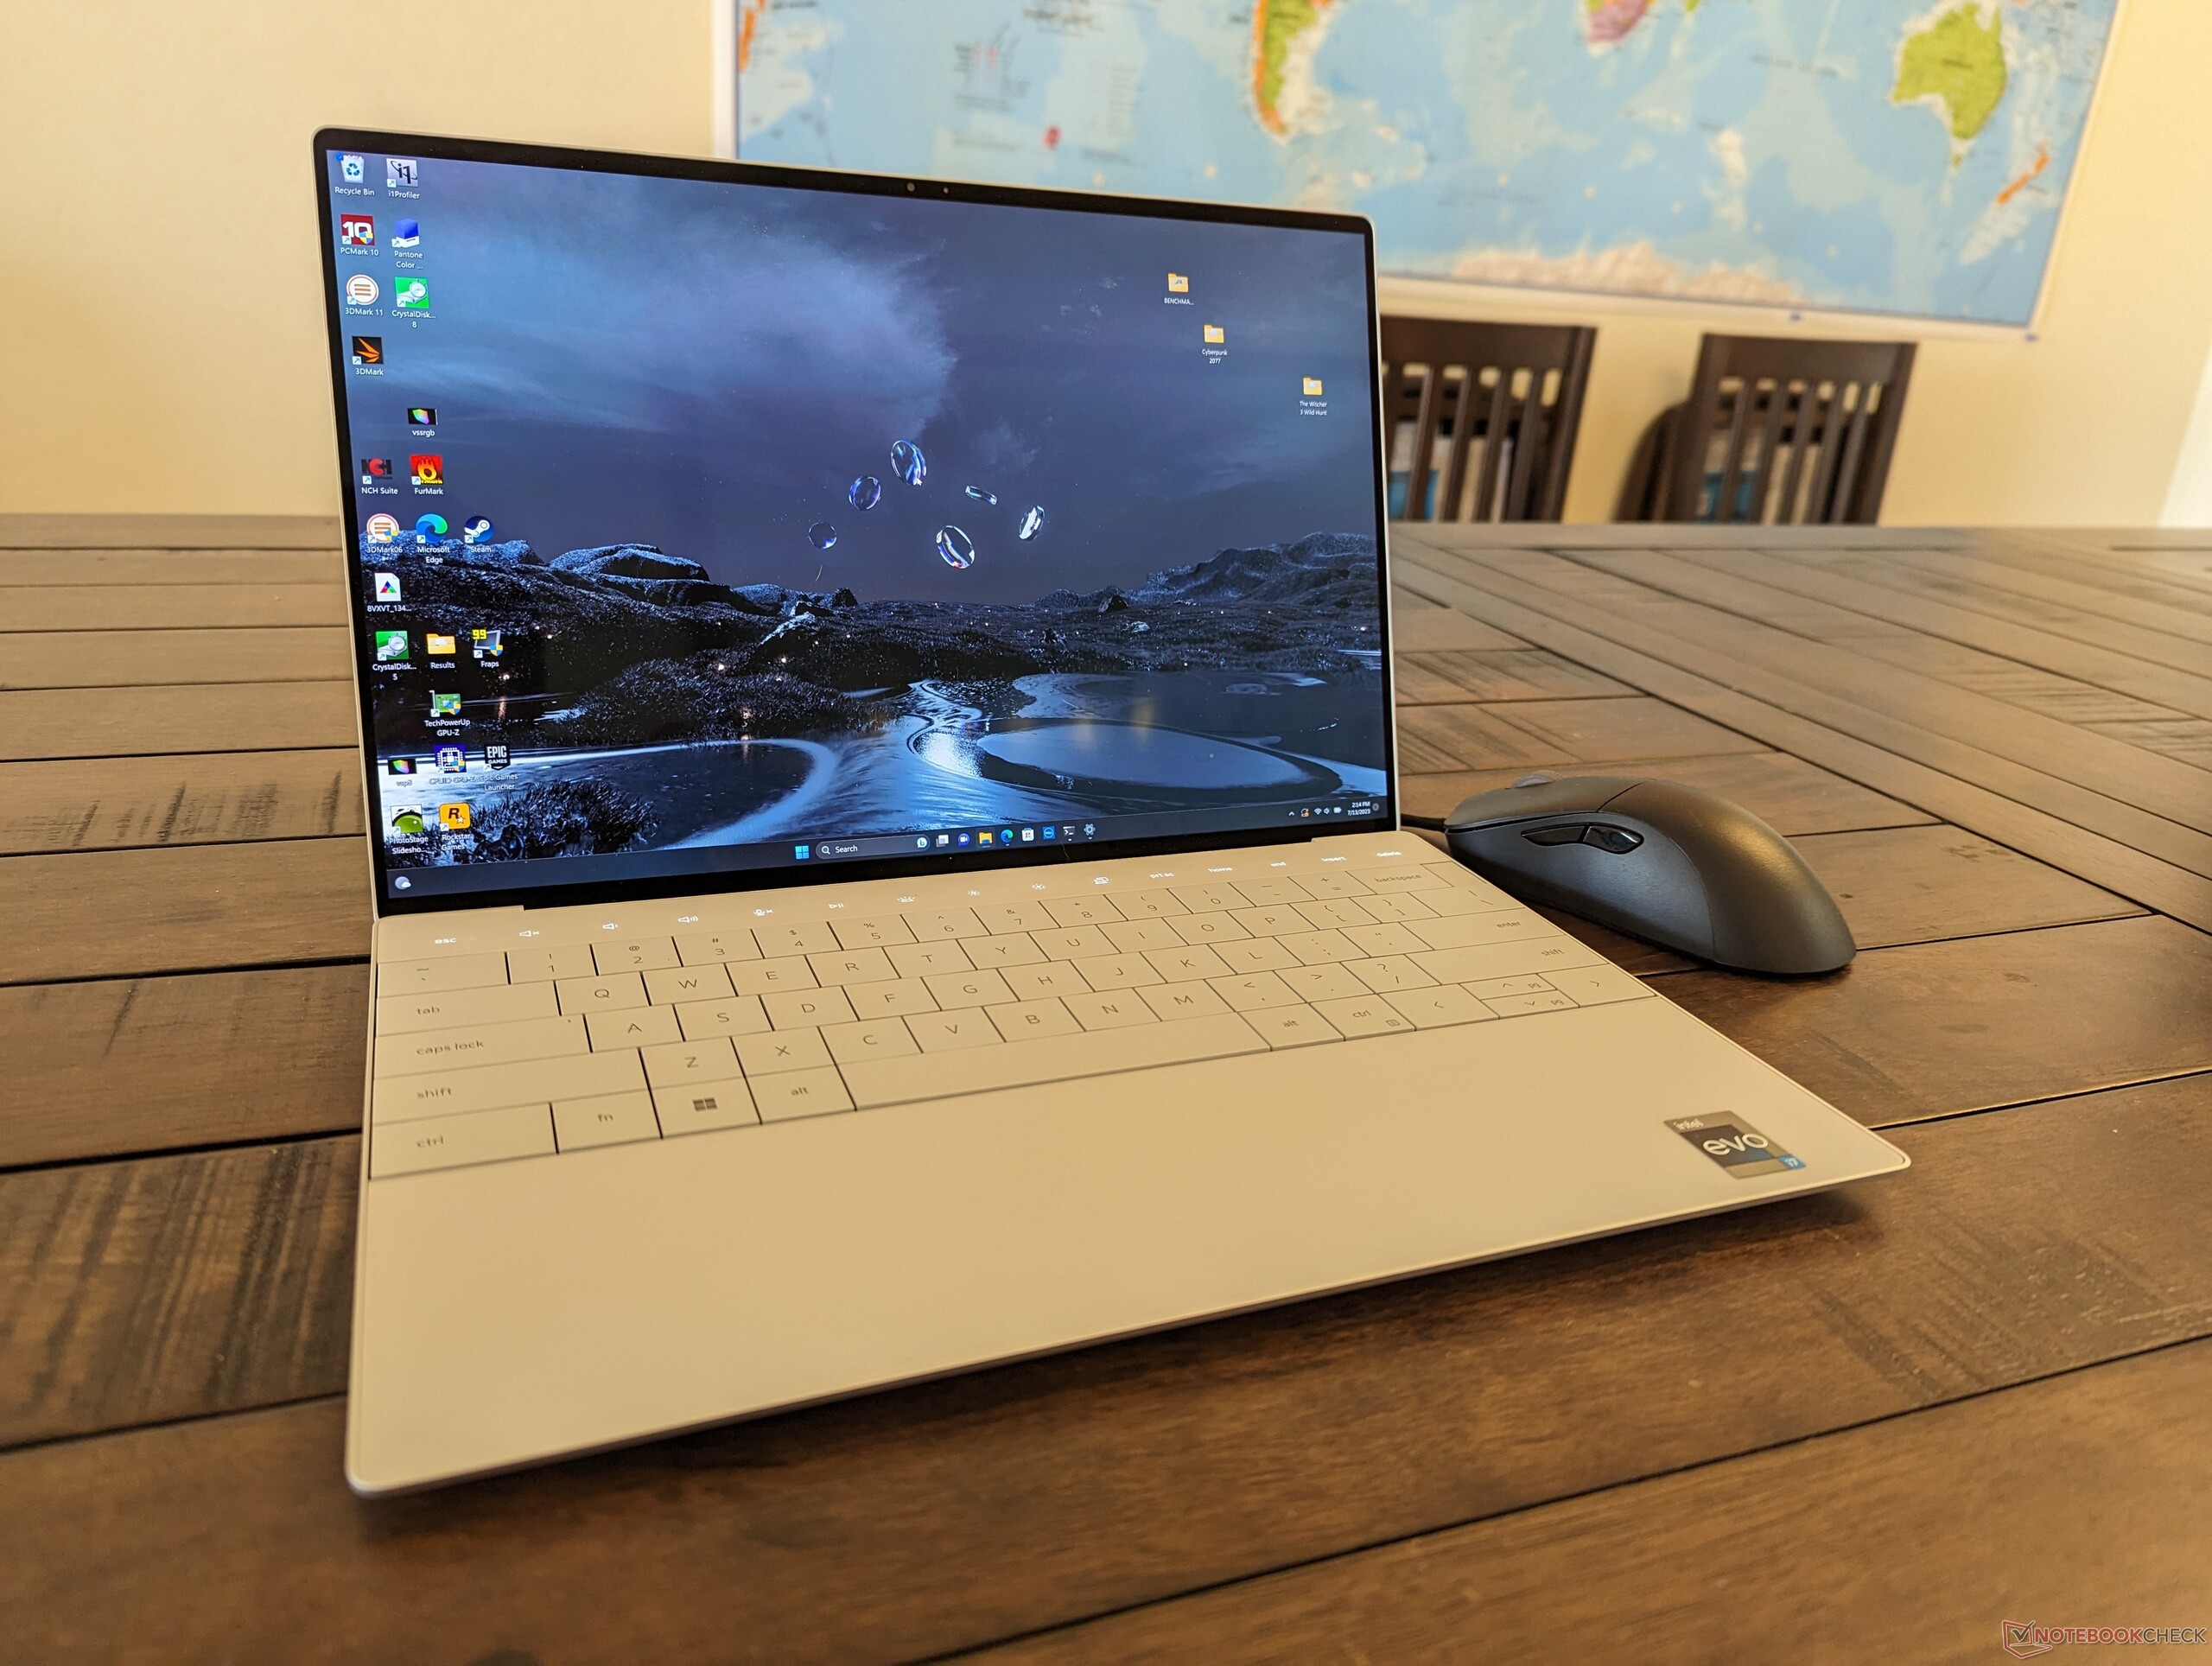
Das XPS 13 Plus 9320 bekommt im Jahr 2023 eine kleine Modellpflege im Vergleich zum Vorgänger von 2022. Das Ultrabook nutzt das gleiche Chassis, bekommt anstelle der alten Alder-Lake-Chips aber neue Raptor-Lake-Prozessoren der 13. Generation spendiert. Äußerlich gibt es ansonsten keine Änderungen, weshalb wir einen Blick in unseren Testbericht zum 2022er Model empfehlen, der weitere Informationen zum Gehäuse und anderen äußerlichen Merkmalen des Notebooks liefert.
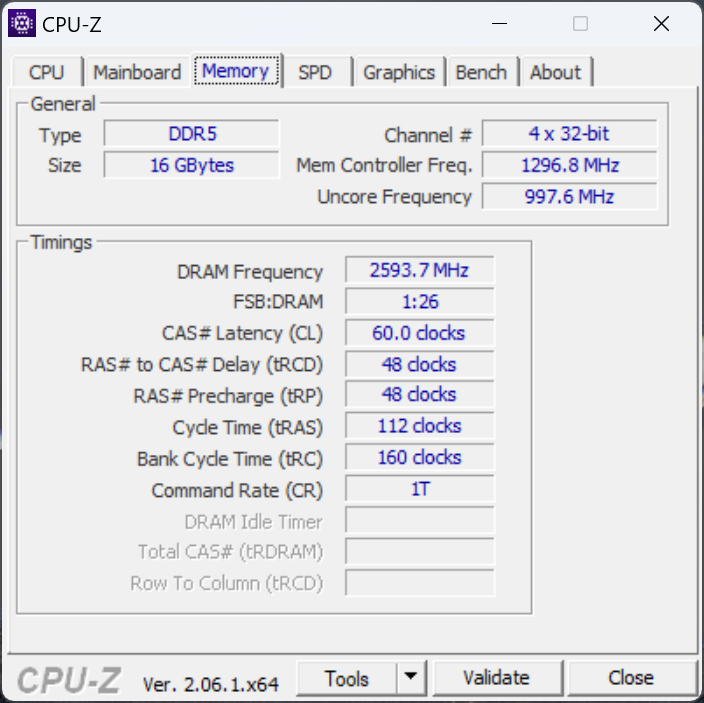
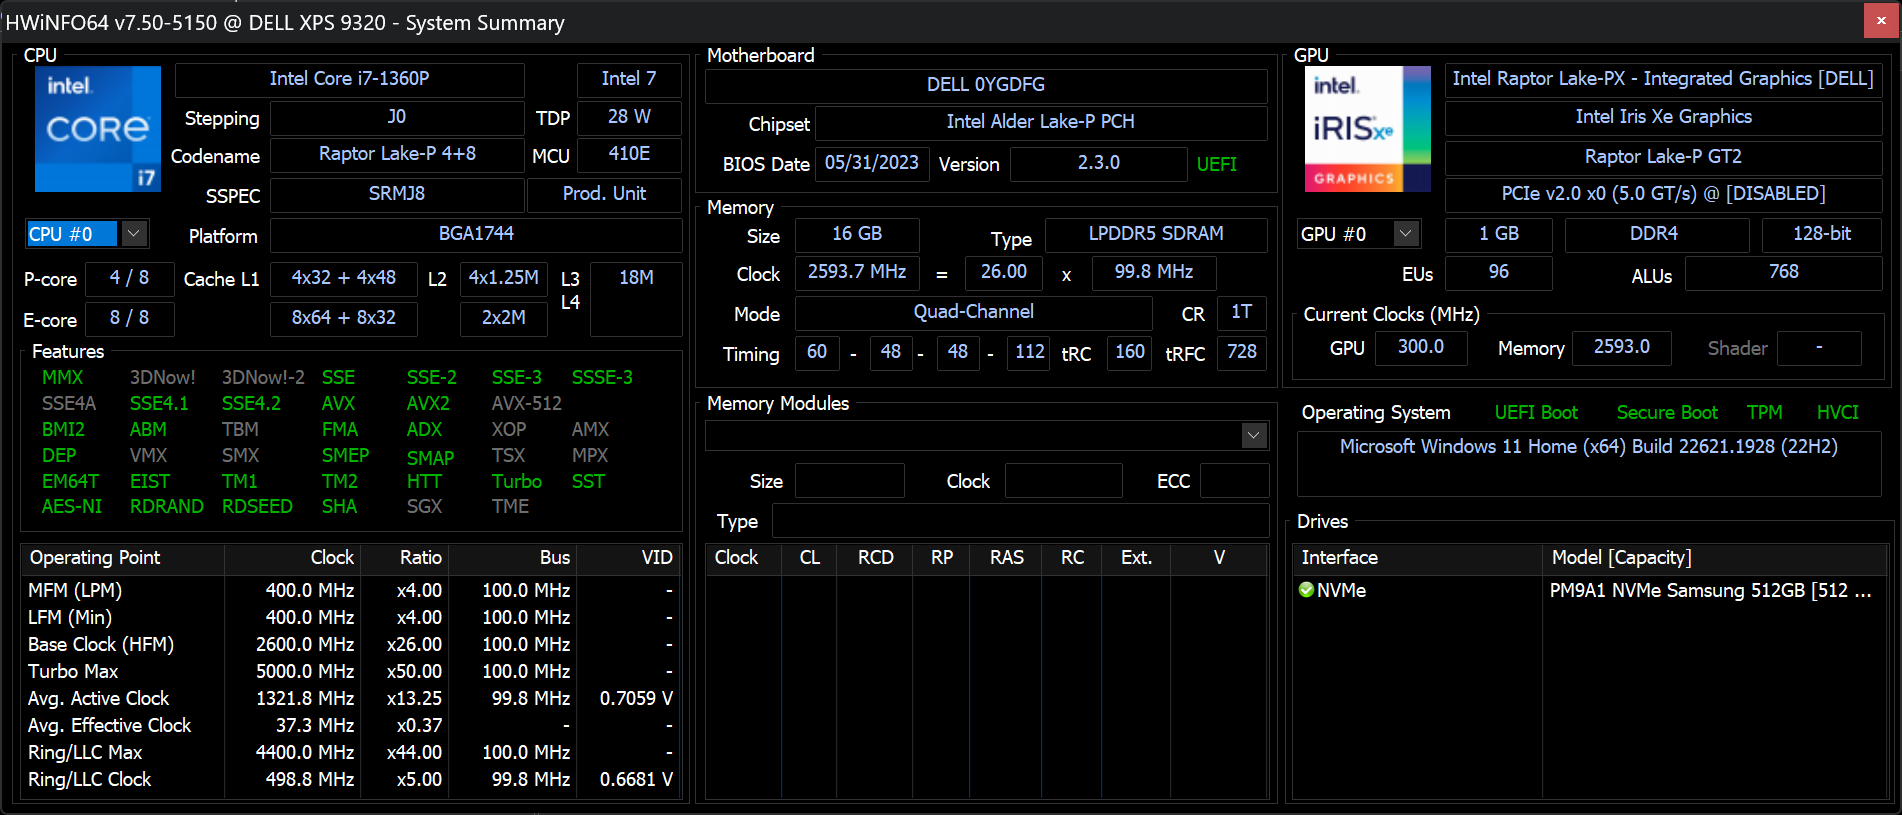
Unsere Mid-Range-Konfiguration ist mit einem 13,4 Zoll großen 3,5K-OLED-Touchscreen und 16GB LPDDDR5-RAM mit 6.000 MHz ausgerüstet. Andere Ausführungen sind mit niedriger auflösenden Panels bestückt, in Deutschland steht neben dem Core i7-1360P Prozessor auch der Core i5-1340P zur Auswahl.
Als Alternativen zum XPS 13 Plus kommen andere Flaggschiff-Subnotebooks im 13-Zoll-Format infrage, wie beispielsweise der Framework Laptop , das HP Spectre x360 13.5 oder das Lenovo ThinkPad X13 G3.
Weitere Dell-Testberichte:
Mögliche Konkurrenten im Vergleich
Bew. | Datum | Modell | Gewicht | Dicke | Größe | Auflösung | Preis ab |
|---|---|---|---|---|---|---|---|
| 87.4 % v7 (old) | 07 / 2023 | Dell XPS 13 Plus 9320 Core i7-1360P i7-1360P, Iris Xe G7 96EUs | 1.3 kg | 15.3 mm | 13.40" | 3456x2160 | |
| 87.3 % v7 (old) | 09 / 2022 | Dell XPS 13 Plus 9320 i7-1280P OLED i7-1280P, Iris Xe G7 96EUs | 1.3 kg | 15.28 mm | 13.40" | 3456x2160 | |
| 85.9 % v7 (old) | 11 / 2019 | Dell XPS 13 7390 Core i7-10710U i7-10710U, UHD Graphics 620 | 1.2 kg | 11.6 mm | 13.30" | 3840x2160 | |
| 86.2 % v7 (old) | 05 / 2023 | Framework Laptop 13.5 13th Gen Intel i7-1370P, Iris Xe G7 96EUs | 1.3 kg | 15.85 mm | 13.50" | 2256x1504 | |
| 89.1 % v7 (old) | 06 / 2023 | Lenovo ThinkPad X13 Yoga G3 21AW003UGE i7-1265U, Iris Xe G7 96EUs | 1.2 kg | 15.9 mm | 13.30" | 2560x1600 | |
| 90.3 % v7 (old) | 08 / 2022 | HP Spectre x360 13.5 14t-ef000 i7-1255U, Iris Xe G7 96EUs | 1.4 kg | 17 mm | 13.50" | 3000x2000 |
Gehäuse
Kommunikation
| Networking | |
| iperf3 transmit AX12 | |
| Dell XPS 13 7390 Core i7-10710U | |
| iperf3 receive AX12 | |
| Dell XPS 13 7390 Core i7-10710U | |
| iperf3 transmit AXE11000 | |
| Dell XPS 13 Plus 9320 Core i7-1360P | |
| Framework Laptop 13.5 13th Gen Intel | |
| Lenovo ThinkPad X13 Yoga G3 21AW003UGE | |
| iperf3 receive AXE11000 | |
| Lenovo ThinkPad X13 Yoga G3 21AW003UGE | |
| Dell XPS 13 Plus 9320 Core i7-1360P | |
| Framework Laptop 13.5 13th Gen Intel | |
| iperf3 transmit AXE11000 6GHz | |
| HP Spectre x360 13.5 14t-ef000 | |
| Framework Laptop 13.5 13th Gen Intel | |
| Dell XPS 13 Plus 9320 Core i7-1360P | |
| iperf3 receive AXE11000 6GHz | |
| Framework Laptop 13.5 13th Gen Intel | |
| Dell XPS 13 Plus 9320 Core i7-1360P | |
| HP Spectre x360 13.5 14t-ef000 | |
Webcam
Die 1-Megapixel-Webcam bleibt unverändert, während andere Konkurrenten wie das HP Spectre bereits auf eine höher auflösende 5-MP-Kamera setzen.


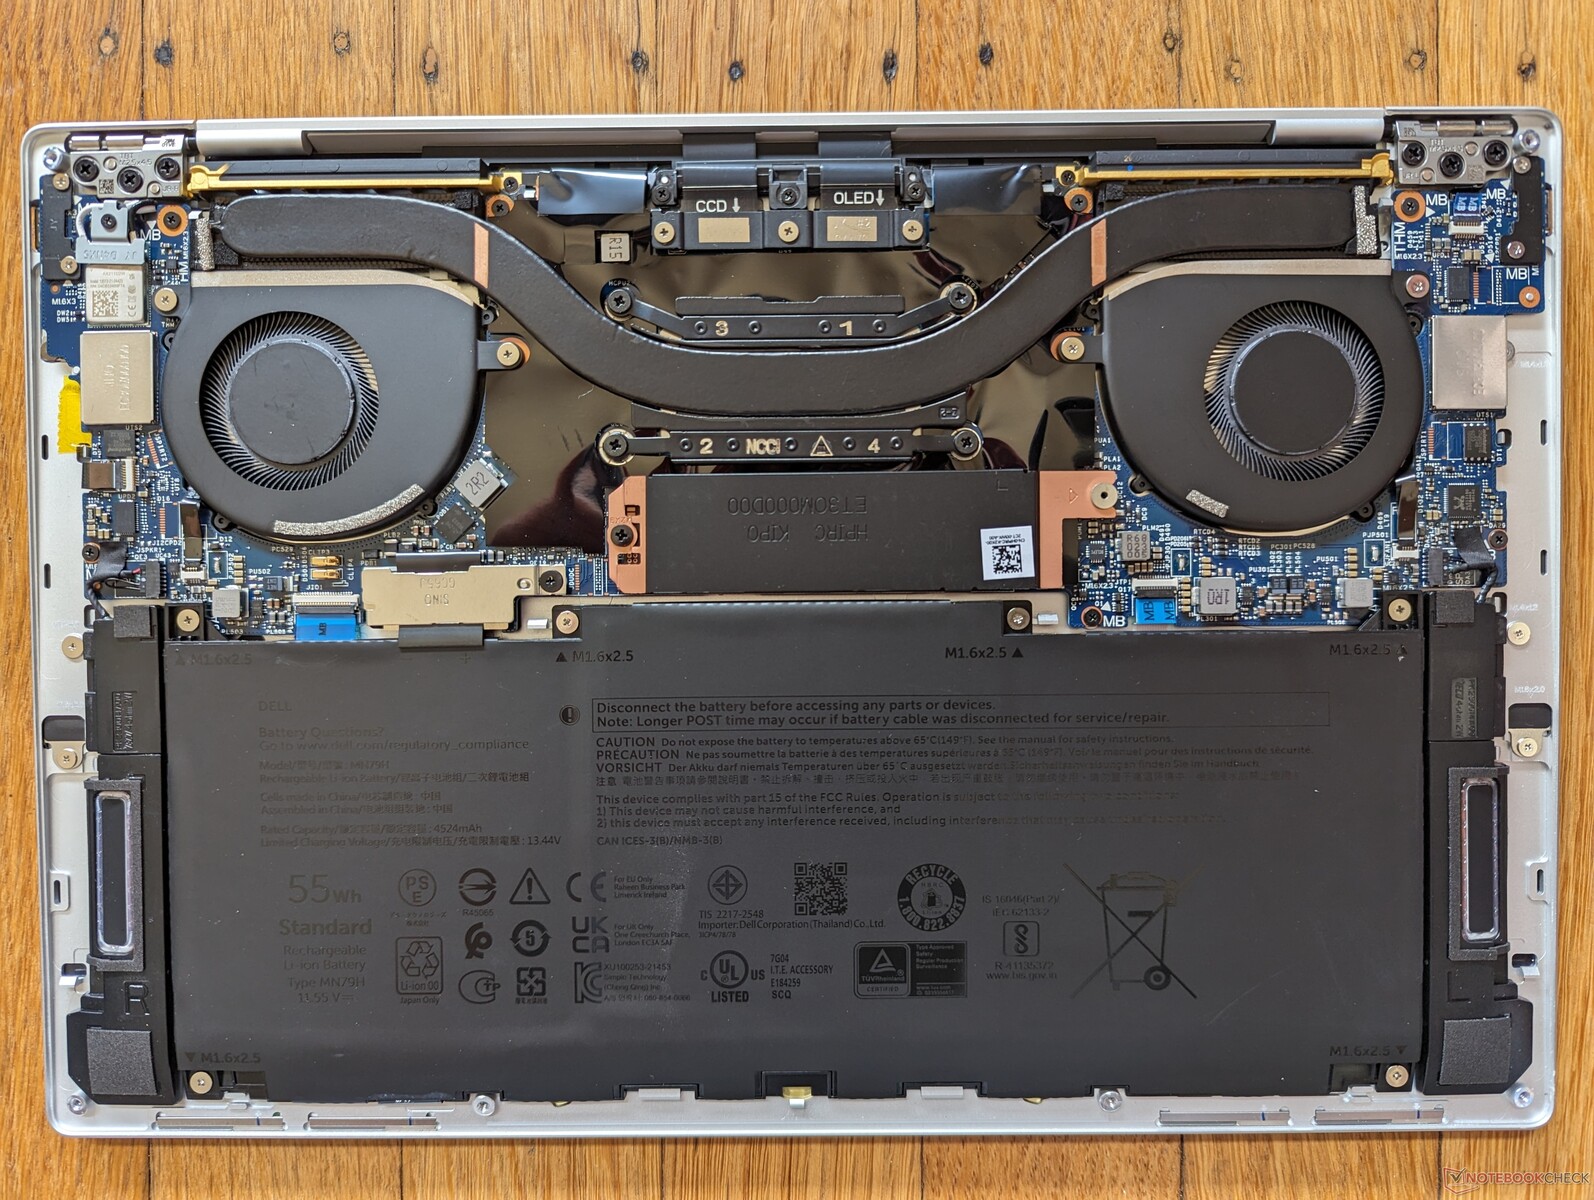
Wartung
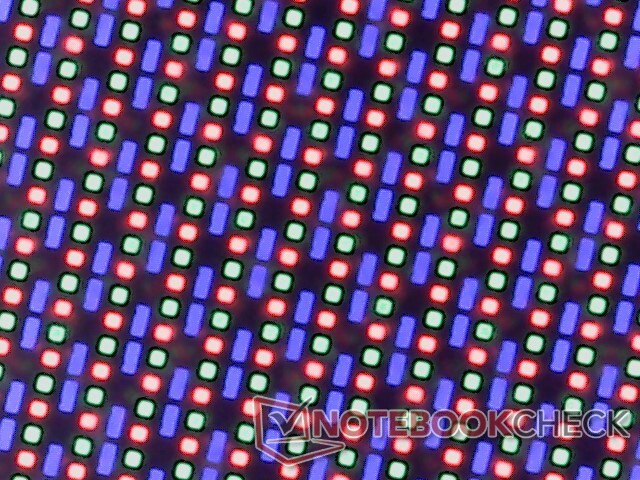
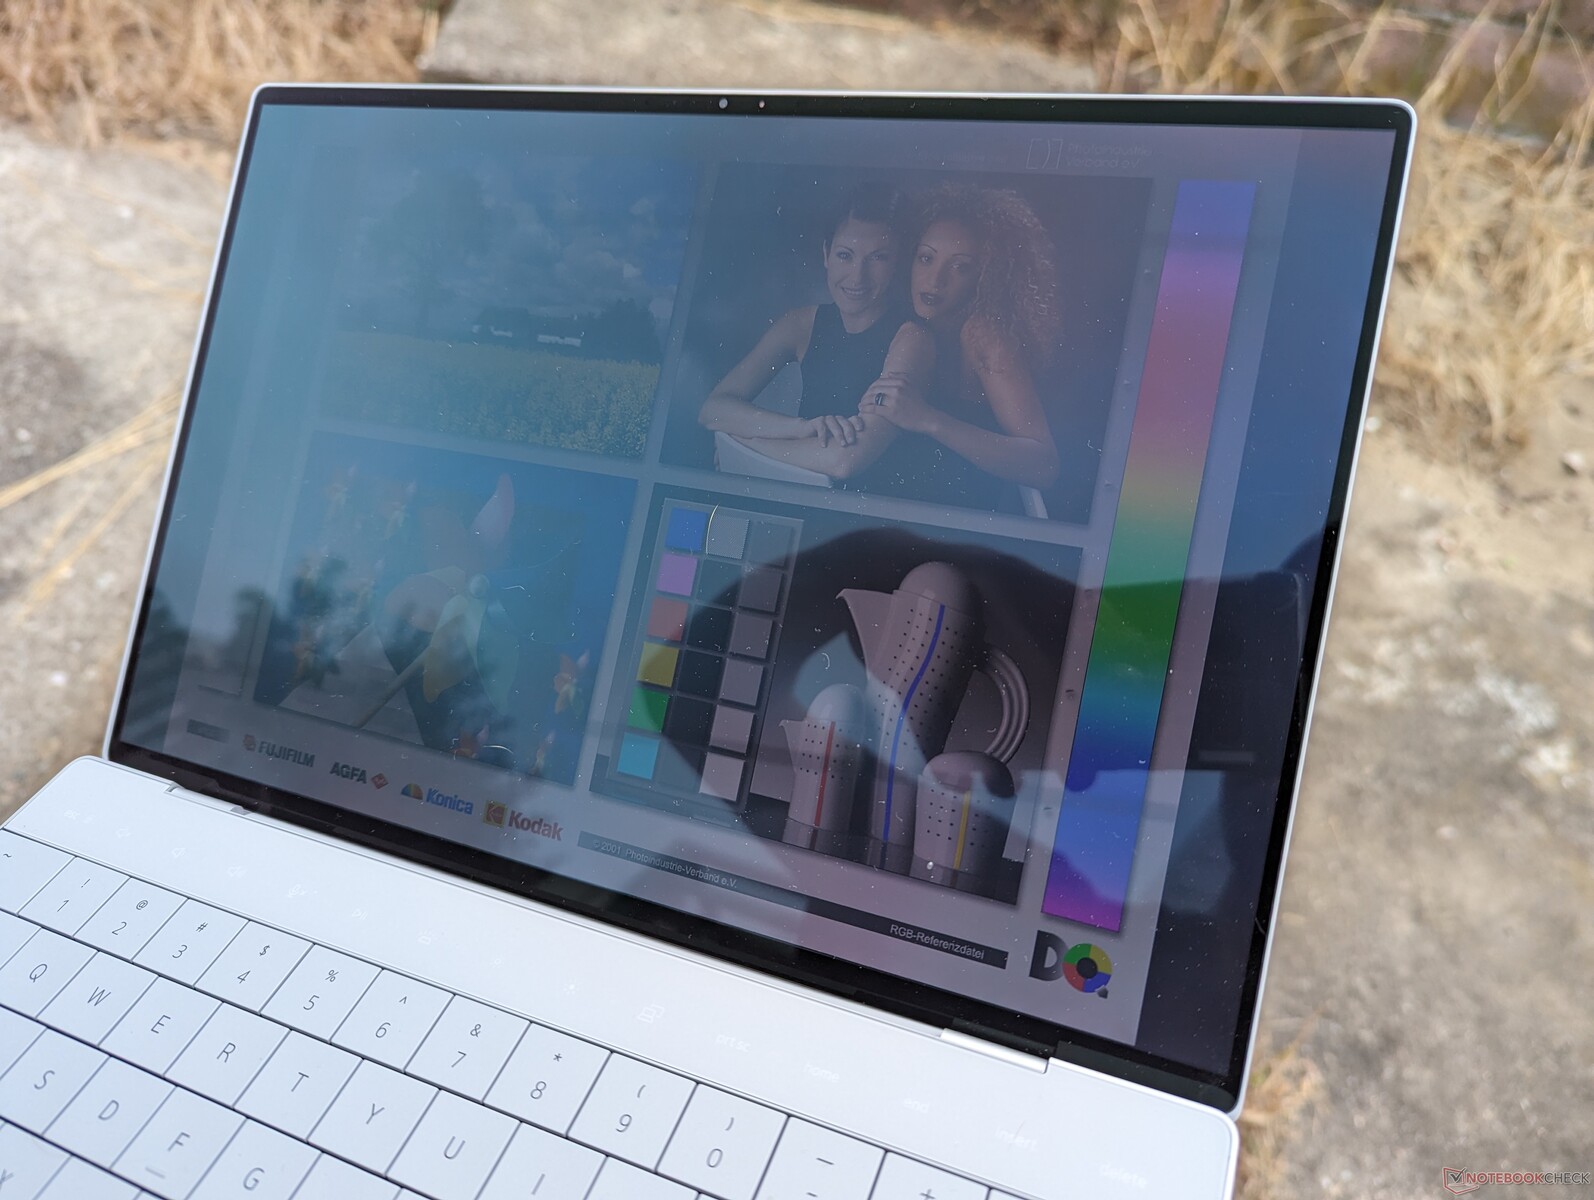
Display
Es stehen die vier folgenden Displays zur Auswahl:
- 1920 x 1200, 60 Hz, IPS, matt, 500 Nits
- 1920 x 1200, 60 Hz, IPS, Touschreen, matt, 500 Nits
- 3456 x 2160, 60 Hz, OLED, Touchscreen, glänzend , 400 Nits
- 3840 x 2400, 60 Hz, IPS, Touchscreen, glänzend, 500 Nits
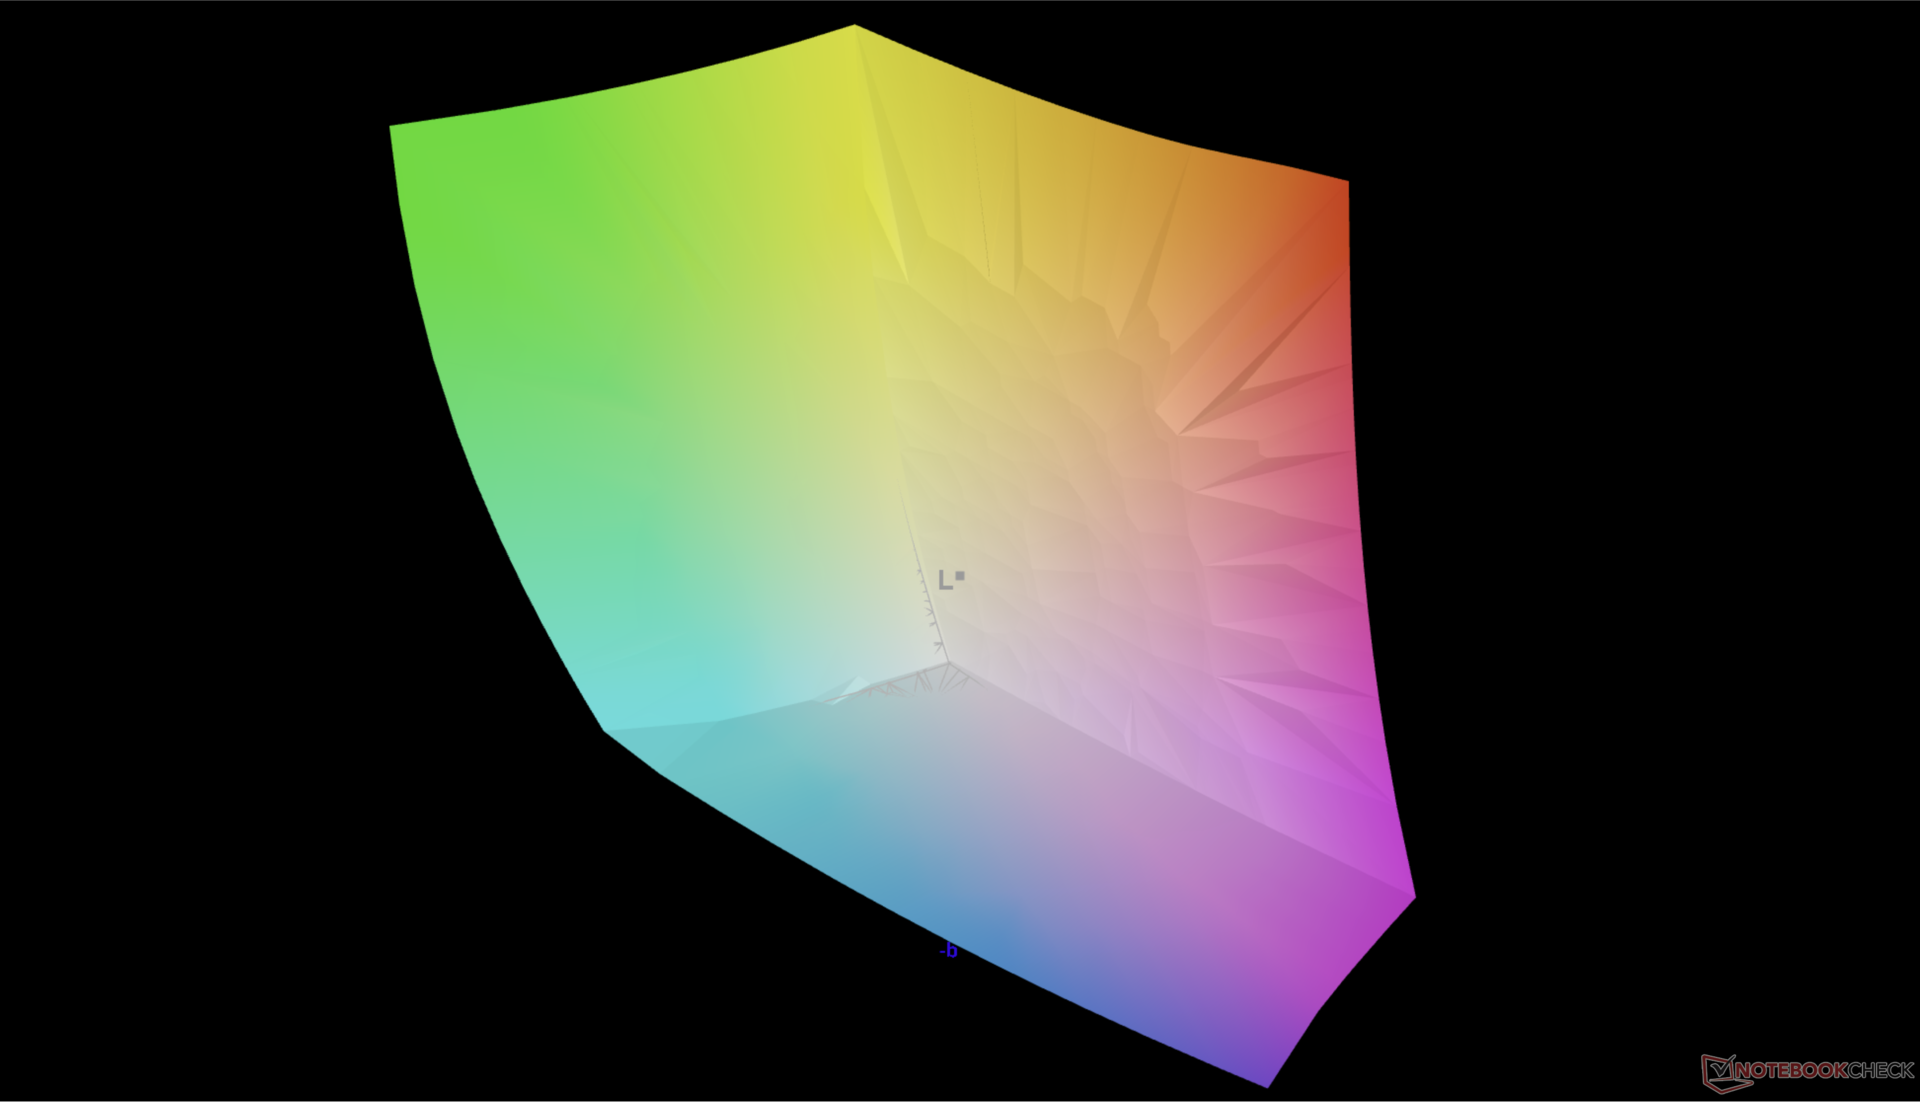
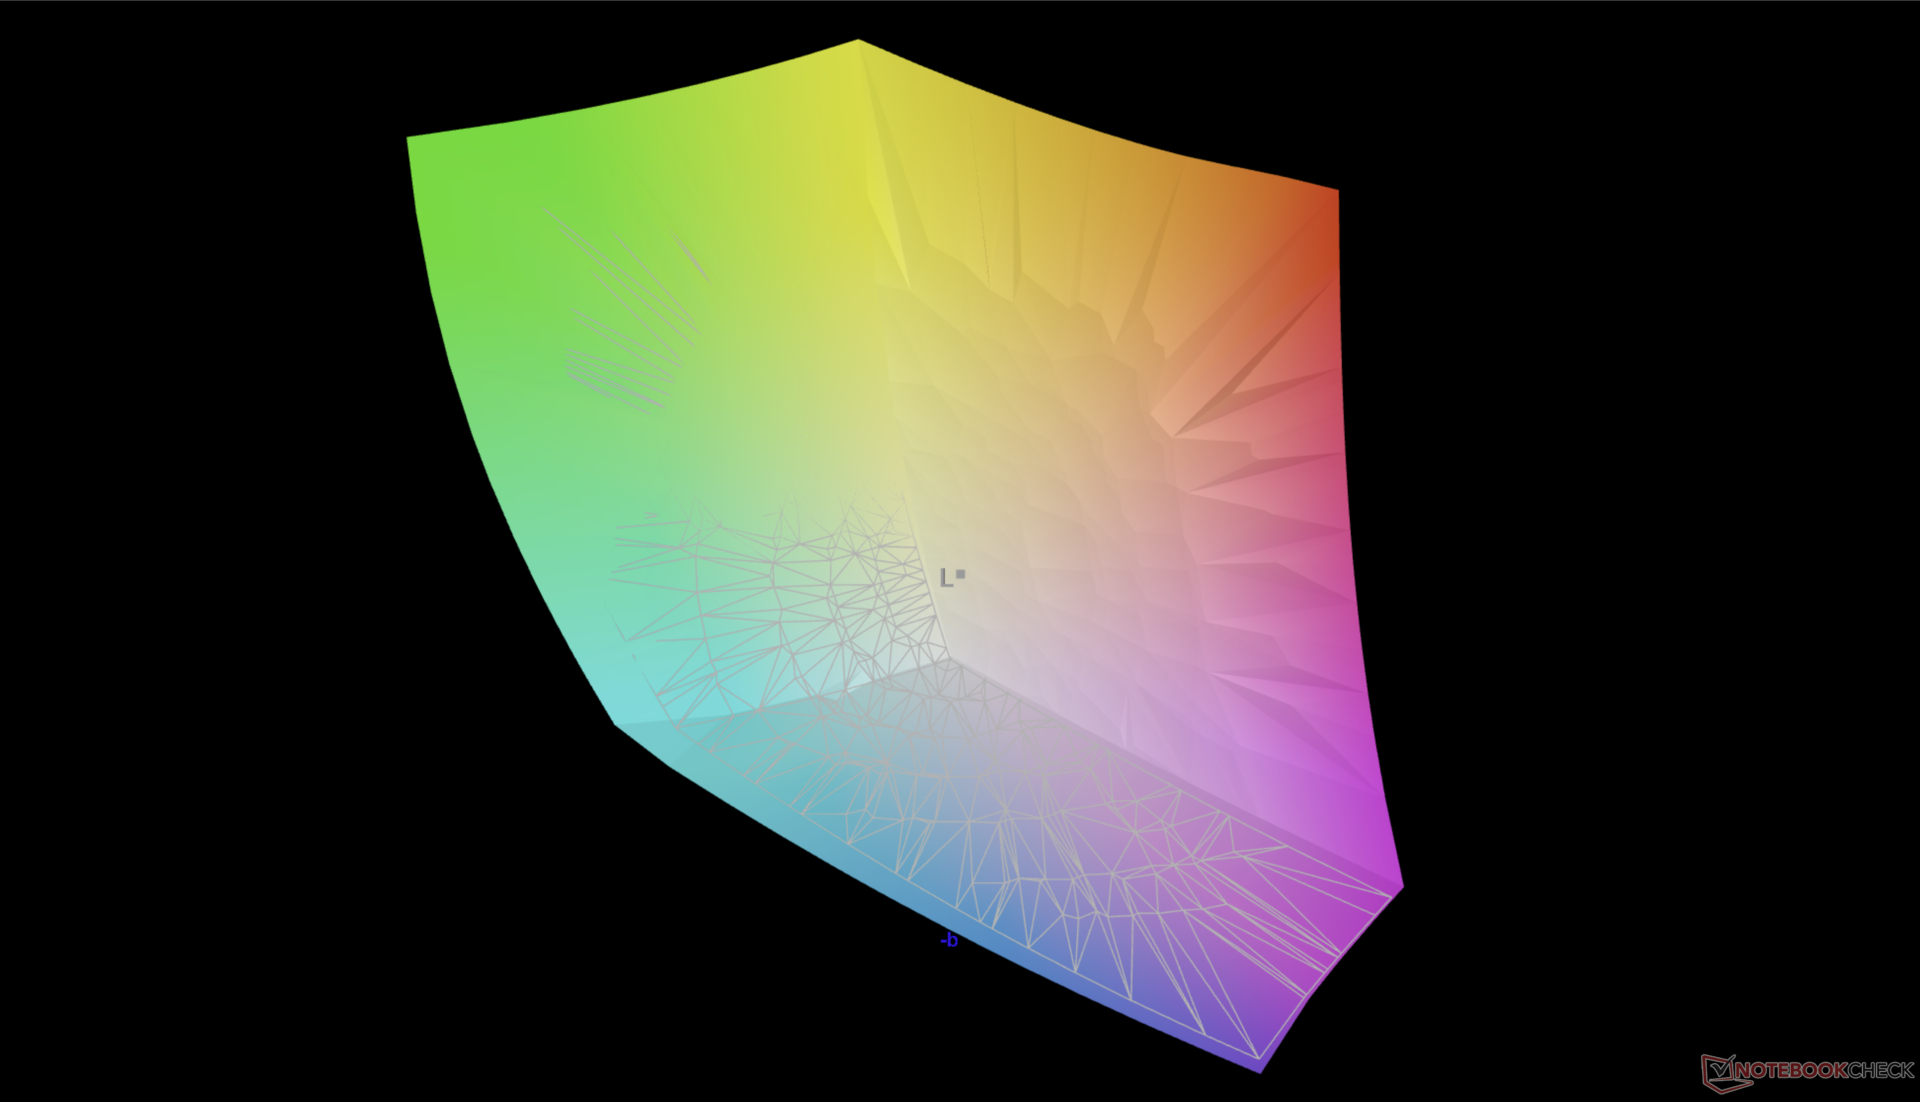
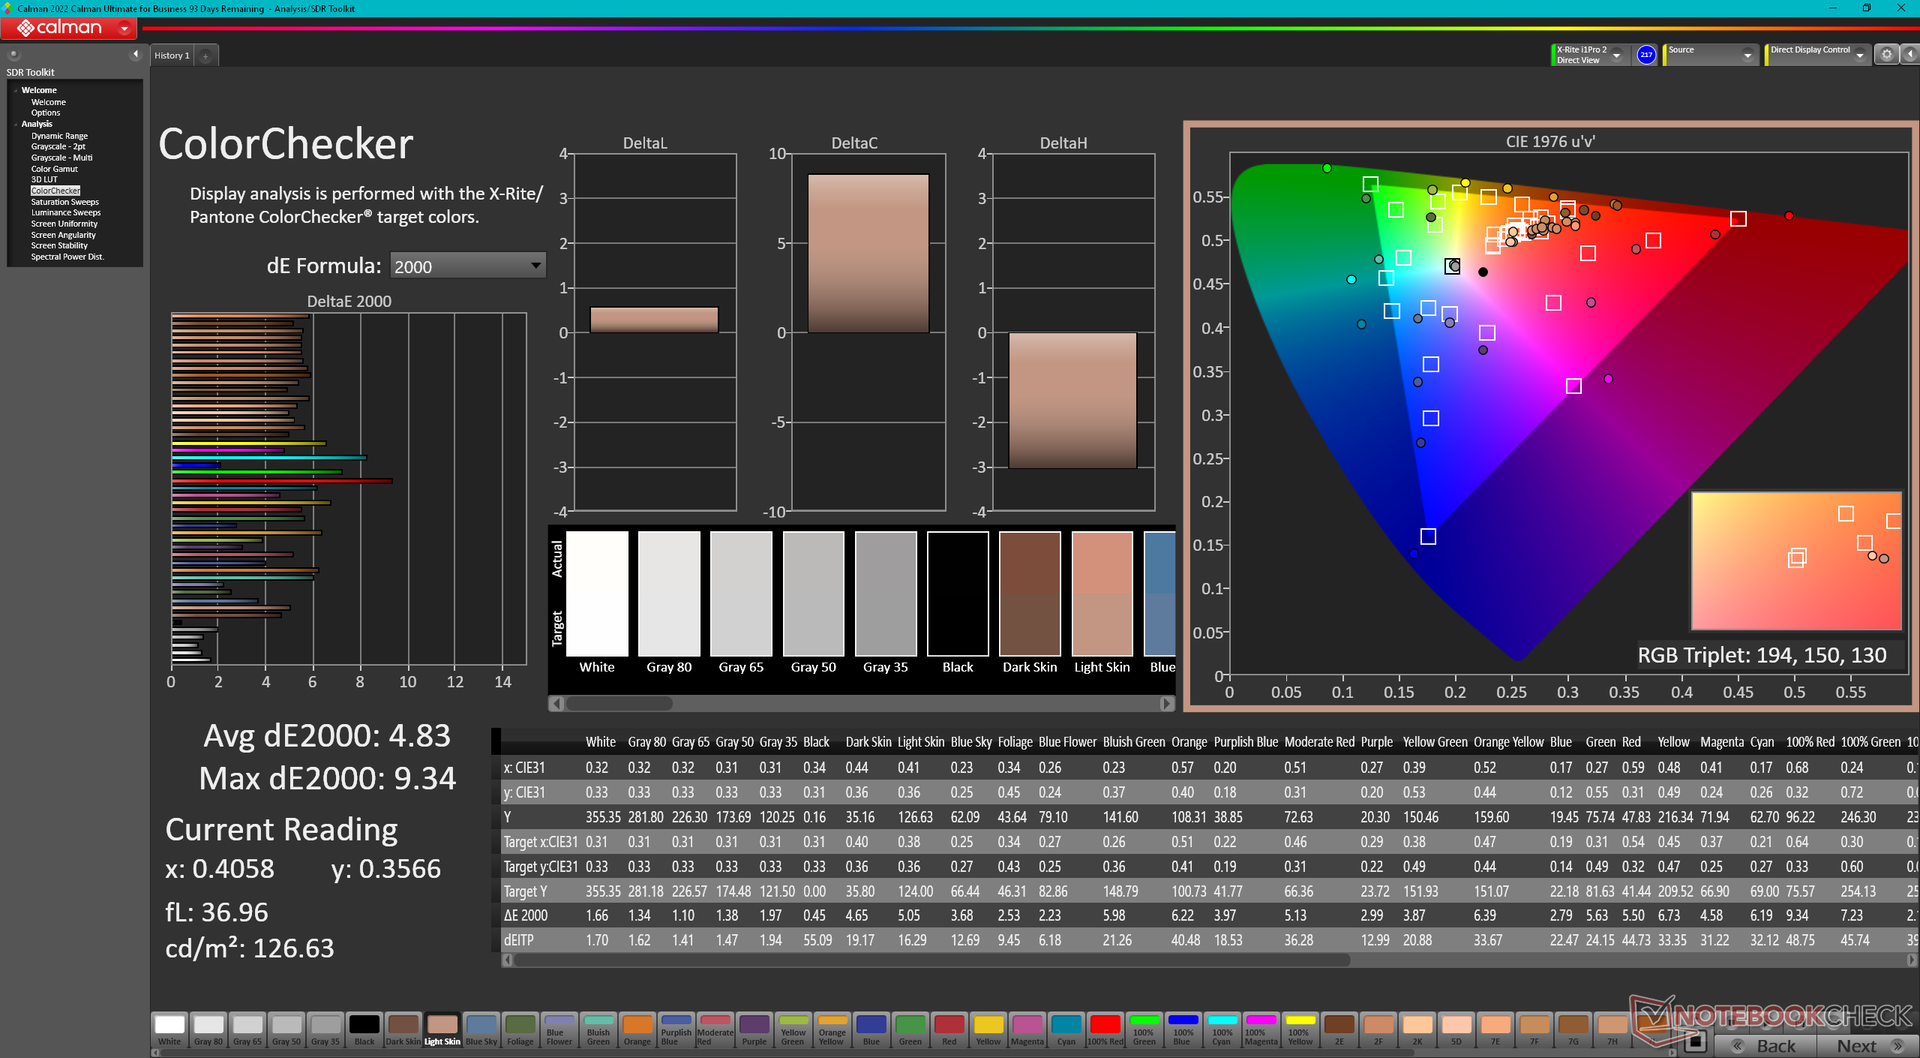
Unsere OLED-Konfiguration kommt mit dem selben Samsung-Panel 134XK04 wie das letztjährige OLED-Modell daher, weshalb die Bildqualität unverändert bleibt. Alle Bildschirme bieten mindestens eine 99 prozentige sRGB-Abdeckung basierend auf unseren vorherigen Erfahrungen mit diesen drei verschiedenen Panels.

| |||||||||||||||||||||||||
Ausleuchtung: 96 %
Helligkeit Akku: 361.7 cd/m²
Kontrast: ∞:1 (Schwarzwert: 0 cd/m²)
ΔE ColorChecker Calman: 4.83 | ∀{0.5-29.43 Ø4.72}
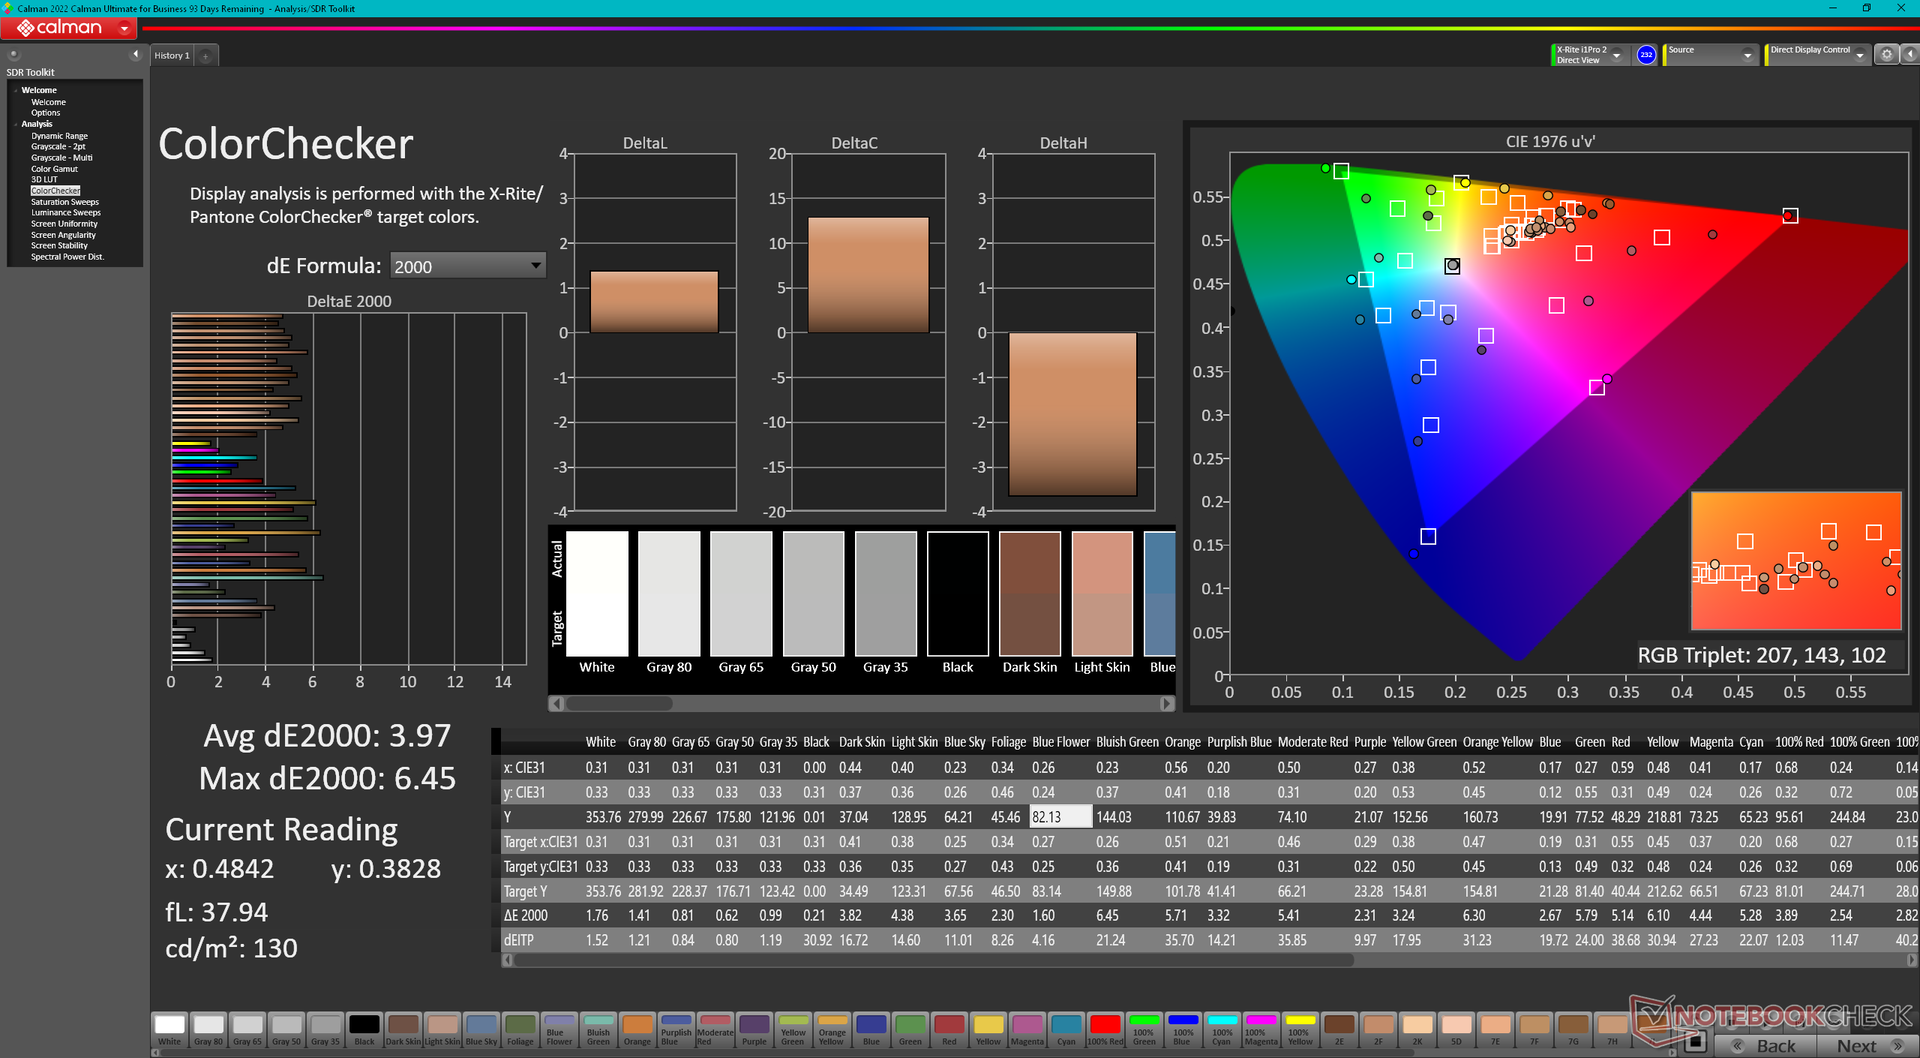
calibrated: 3.97
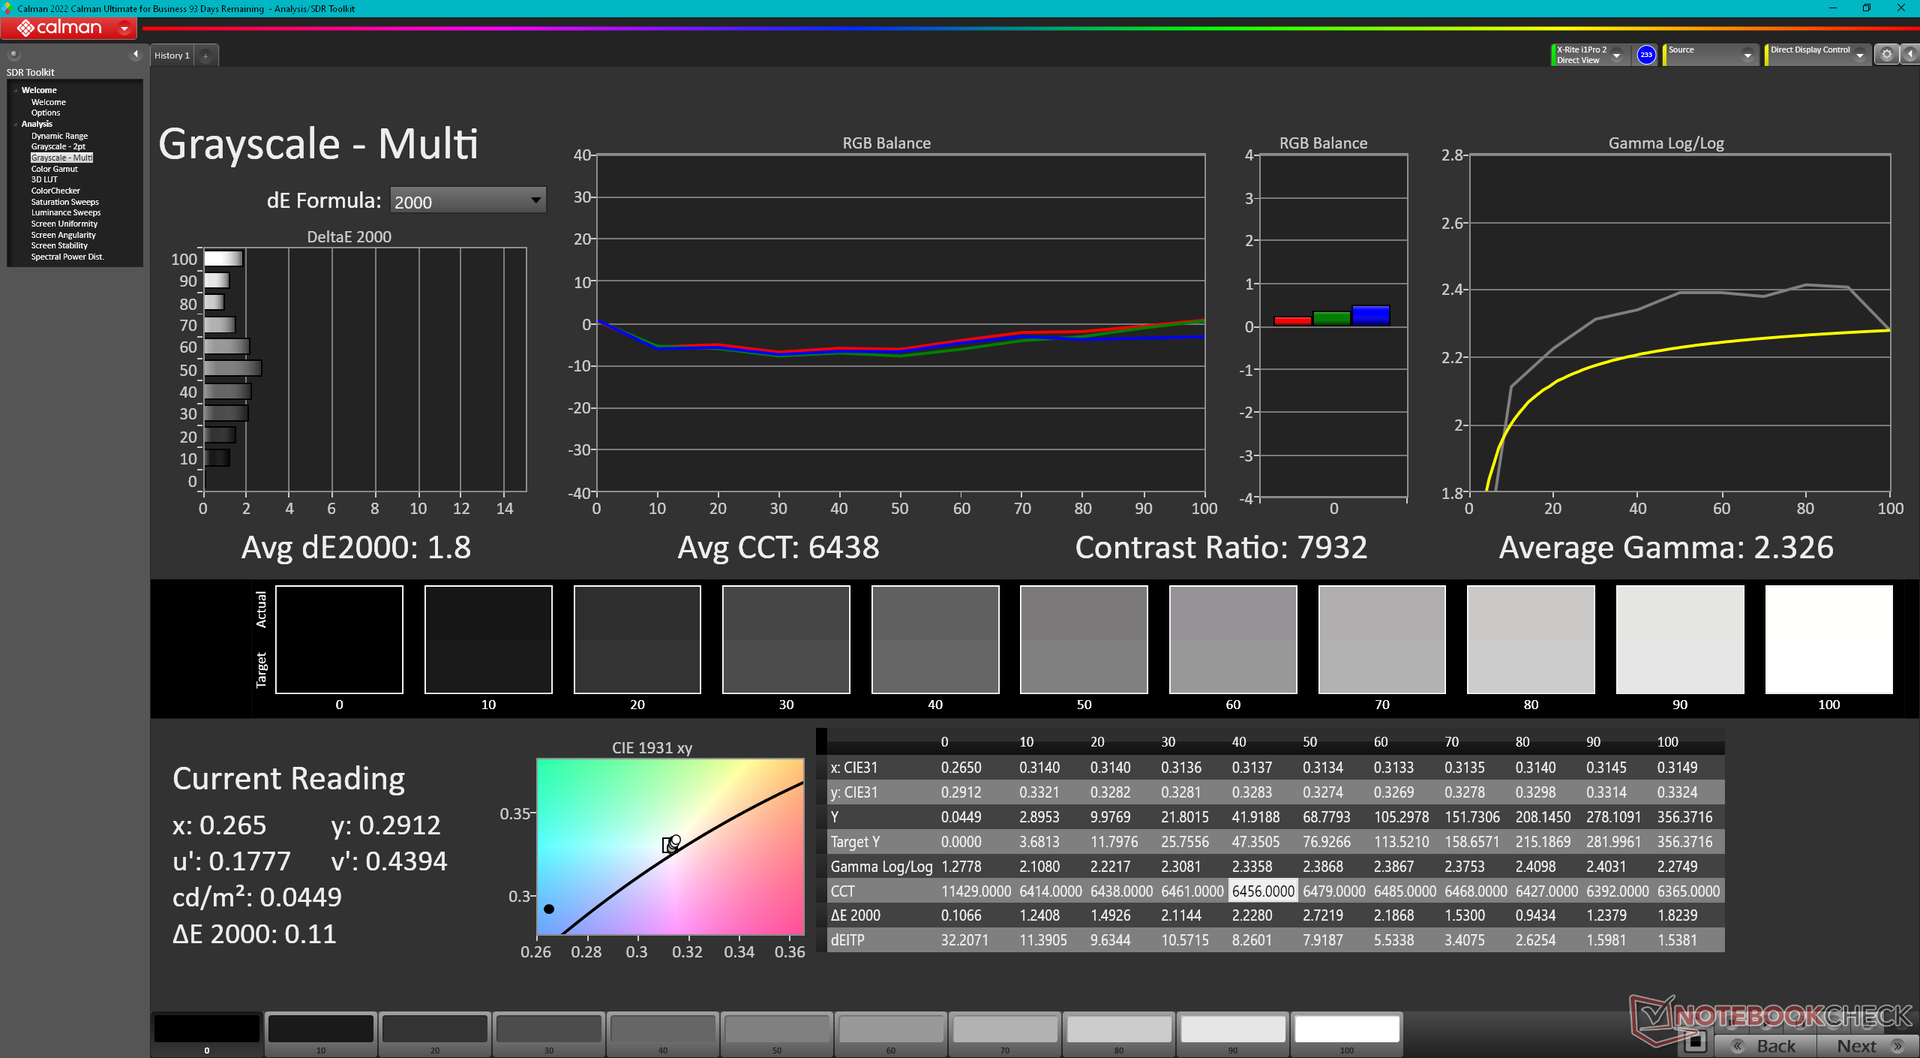
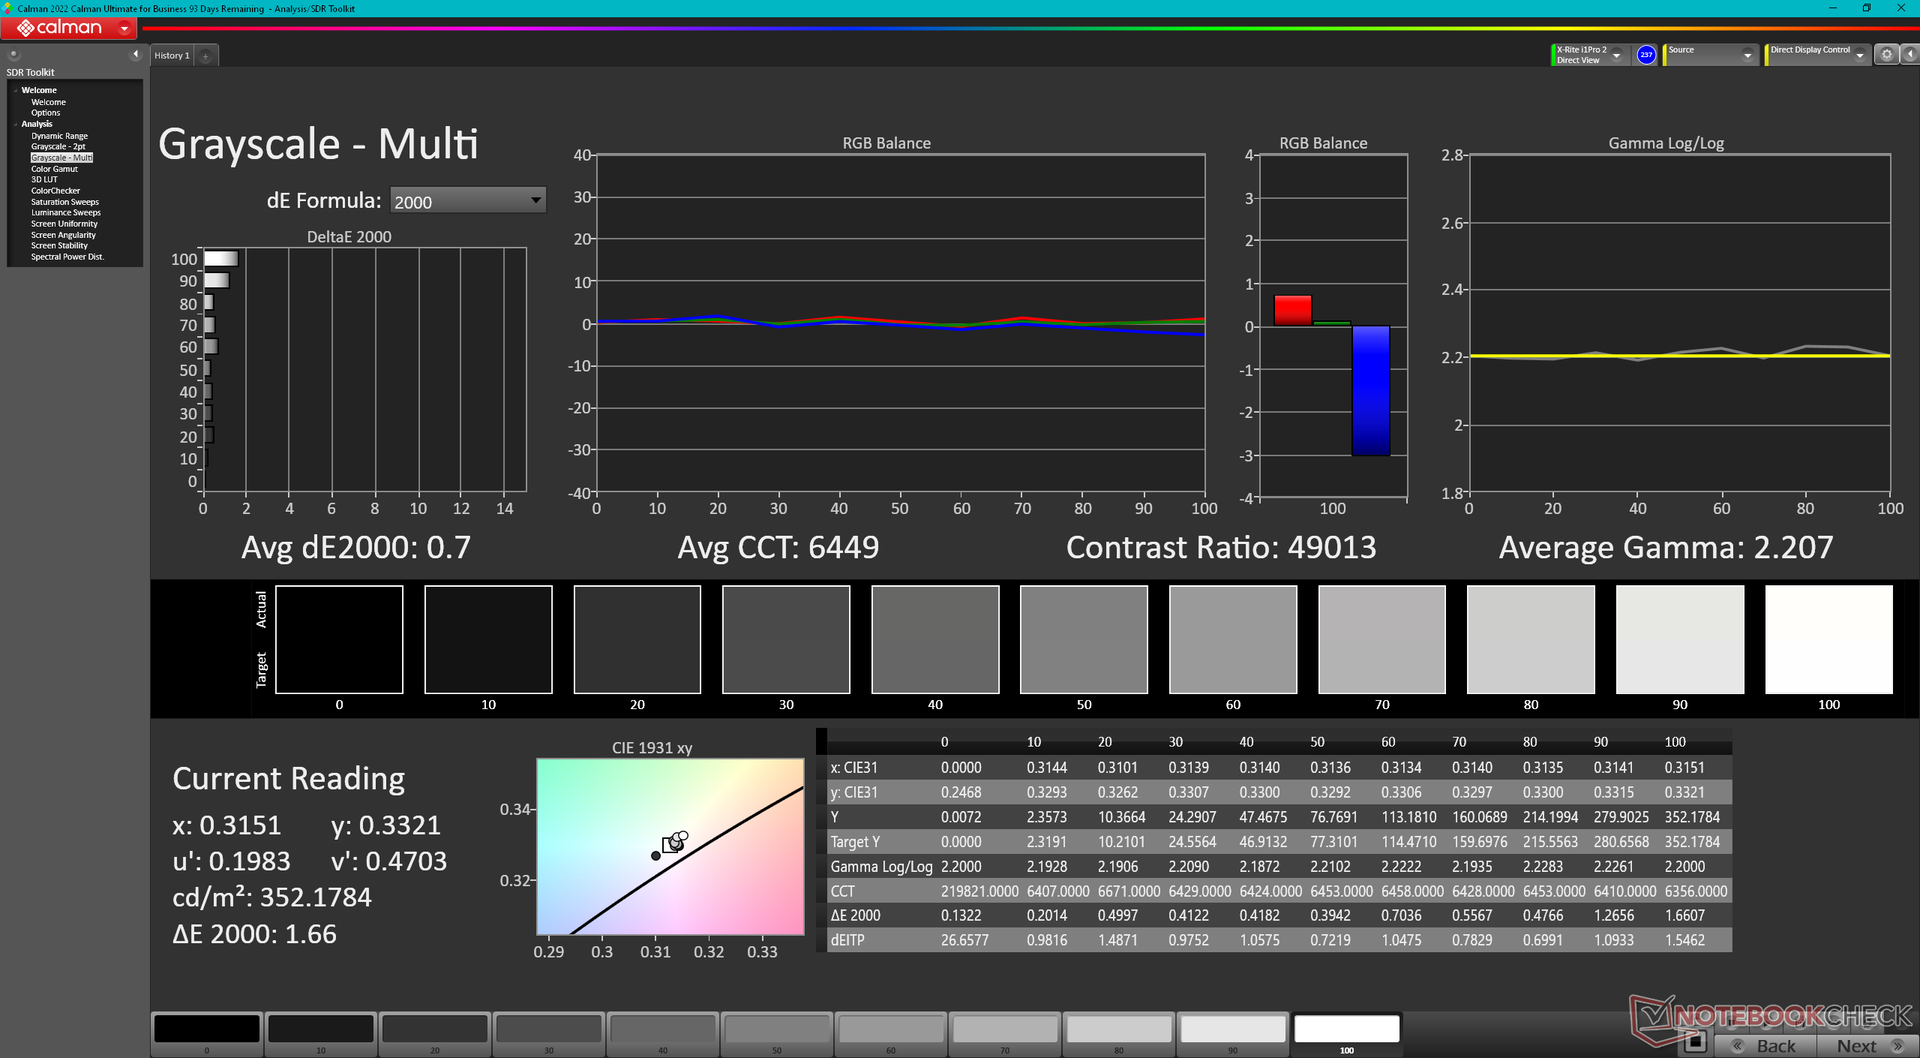
ΔE Greyscale Calman: 1.8 | ∀{0.09-98 Ø4.97}
96.8% AdobeRGB 1998 (Argyll 3D)
100% sRGB (Argyll 3D)
99.7% Display P3 (Argyll 3D)
Gamma: 2.33
CCT: 6438 K
| Dell XPS 13 Plus 9320 Core i7-1360P Samsung 134XK04, OLED, 3456x2160, 13.4" | Dell XPS 13 Plus 9320 i7-1280P OLED Samsung 134XK04, OLED, 3456x2160, 13.4" | Dell XPS 13 7390 Core i7-10710U AU Optronics B133ZAN, Dell P/N: 90NTH, IPS, 3840x2160, 13.3" | Framework Laptop 13.5 13th Gen Intel BOE CQ NE135FBM-N41, IPS, 2256x1504, 13.5" | Lenovo ThinkPad X13 Yoga G3 21AW003UGE LP133WQ1-SPF2, IPS LED, 2560x1600, 13.3" | HP Spectre x360 13.5 14t-ef000 SDC4160, OLED, 3000x2000, 13.5" | |
|---|---|---|---|---|---|---|
| Display | 1% | -25% | -20% | -20% | -2% | |
| Display P3 Coverage (%) | 99.7 | 99.5 0% | 63.4 -36% | 68.9 -31% | 68 -32% | 99.9 0% |
| sRGB Coverage (%) | 100 | 100 0% | 93.7 -6% | 97.5 -2% | 98.6 -1% | 100 0% |
| AdobeRGB 1998 Coverage (%) | 96.8 | 98.4 2% | 64.3 -34% | 71.1 -27% | 69.5 -28% | 90.8 -6% |
| Response Times | -10% | -1891% | -1965% | -1617% | 5% | |
| Response Time Grey 50% / Grey 80% * (ms) | 2.18 ? | 2.6 ? -19% | 51.6 ? -2267% | 54.9 ? -2418% | 45.9 ? -2006% | 1.9 ? 13% |
| Response Time Black / White * (ms) | 2.08 ? | 2.1 ? -1% | 33.6 ? -1515% | 33.5 ? -1511% | 27.6 ? -1227% | 2.16 ? -4% |
| PWM Frequency (Hz) | 238.6 ? | 59.5 | 60.2 ? | |||
| Bildschirm | 14% | -39% | 2% | 23% | 9% | |
| Helligkeit Bildmitte (cd/m²) | 361.7 | 371.8 3% | 408.2 13% | 503 39% | 438 21% | 351.7 -3% |
| Brightness (cd/m²) | 367 | 374 2% | 399 9% | 472 29% | 399 9% | 351 -4% |
| Brightness Distribution (%) | 96 | 98 2% | 89 -7% | 87 -9% | 84 -12% | 87 -9% |
| Schwarzwert * (cd/m²) | 0.39 | 0.36 | 0.29 | |||
| Delta E Colorchecker * | 4.83 | 2.37 51% | 4.6 5% | 3.38 30% | 1.8 63% | 1.78 63% |
| Colorchecker dE 2000 max. * | 9.34 | 6.1 35% | 11.84 -27% | 7.08 24% | 4 57% | 6.14 34% |
| Colorchecker dE 2000 calibrated * | 3.97 | 2.03 49% | 1.21 70% | 0.8 80% | ||
| Delta E Graustufen * | 1.8 | 2 -11% | 7.5 -317% | 4.8 -167% | 2.8 -56% | 2.3 -28% |
| Gamma | 2.33 94% | 2.29 96% | 2.12 104% | 2.13 103% | 2.24 98% | 2.11 104% |
| CCT | 6438 101% | 6261 104% | 7966 82% | 6235 104% | 6785 96% | 6683 97% |
| Kontrast (:1) | 1047 | 1397 | 1510 | |||
| Farbraum (Prozent von AdobeRGB 1998) (%) | 59.5 | |||||
| Color Space (Percent of sRGB) (%) | 93.5 | |||||
| Durchschnitt gesamt (Programm / Settings) | 2% /
6% | -652% /
-344% | -661% /
-331% | -538% /
-261% | 4% /
5% |
* ... kleinere Werte sind besser
Reaktionszeiten (Response Times) des Displays
| ↔ Reaktionszeiten Schwarz zu Weiß | ||
|---|---|---|
| 2.08 ms ... steigend ↗ und fallend ↘ kombiniert | ↗ 0.98 ms steigend | 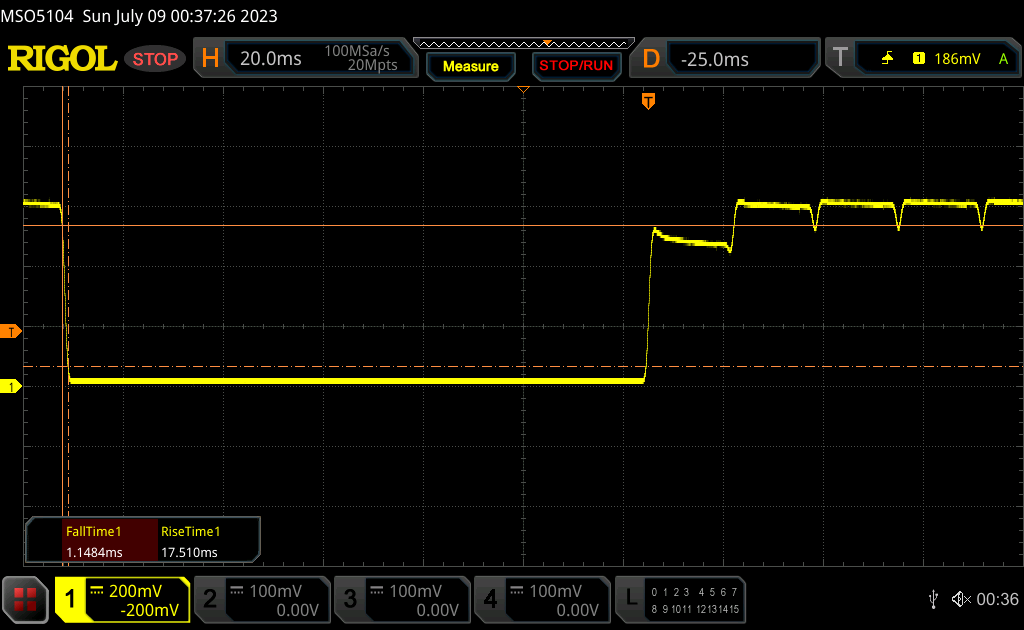 |
| ↘ 1.1 ms fallend | ||
| Die gemessenen Reaktionszeiten sind sehr kurz, wodurch sich der Bildschirm auch für schnelle 3D Spiele eignen sollte. Im Vergleich rangierten die bei uns getesteten Geräte von 0.1 (Minimum) zu 240 (Maximum) ms. » 12 % aller Screens waren schneller als der getestete. Daher sind die gemessenen Reaktionszeiten besser als der Durchschnitt aller vermessenen Geräte (19.8 ms). | ||
| ↔ Reaktionszeiten 50% Grau zu 80% Grau | ||
| 2.18 ms ... steigend ↗ und fallend ↘ kombiniert | ↗ 1.2 ms steigend | 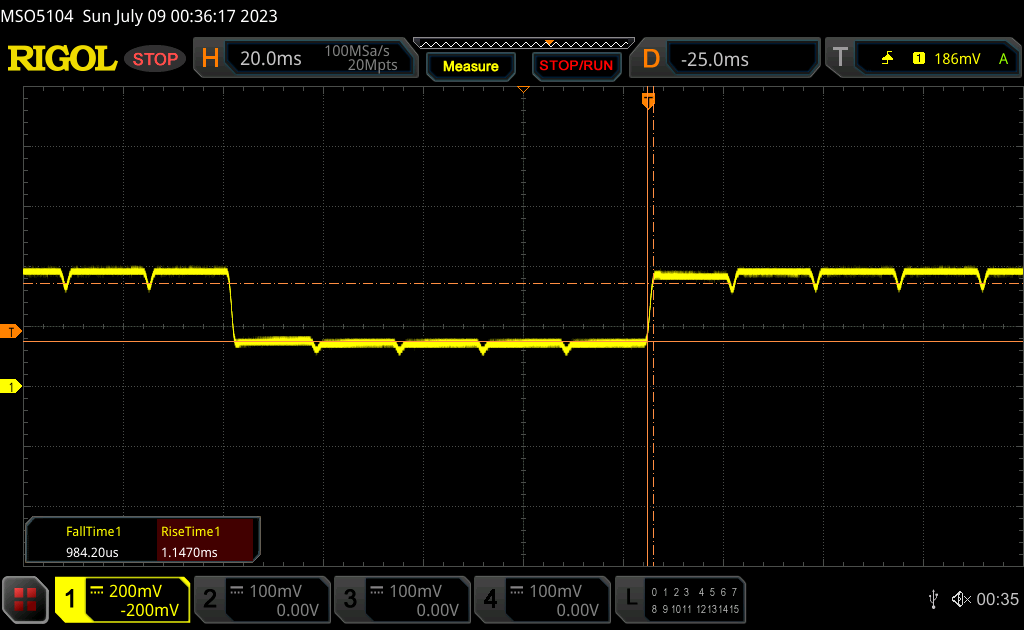 |
| ↘ 0.98 ms fallend | ||
| Die gemessenen Reaktionszeiten sind sehr kurz, wodurch sich der Bildschirm auch für schnelle 3D Spiele eignen sollte. Im Vergleich rangierten die bei uns getesteten Geräte von 0.165 (Minimum) zu 636 (Maximum) ms. » 11 % aller Screens waren schneller als der getestete. Daher sind die gemessenen Reaktionszeiten besser als der Durchschnitt aller vermessenen Geräte (31 ms). | ||
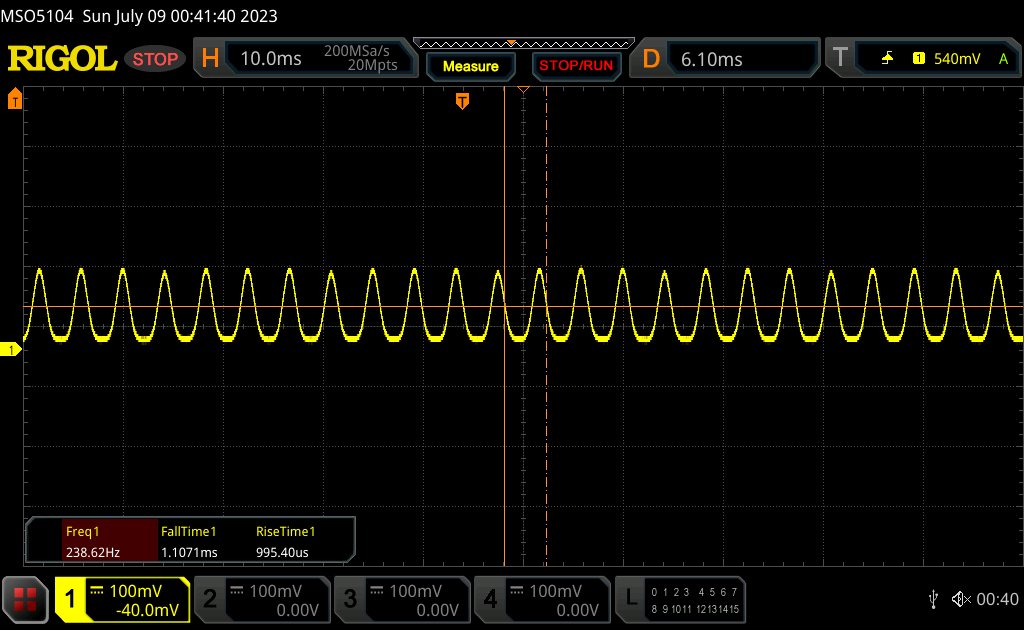
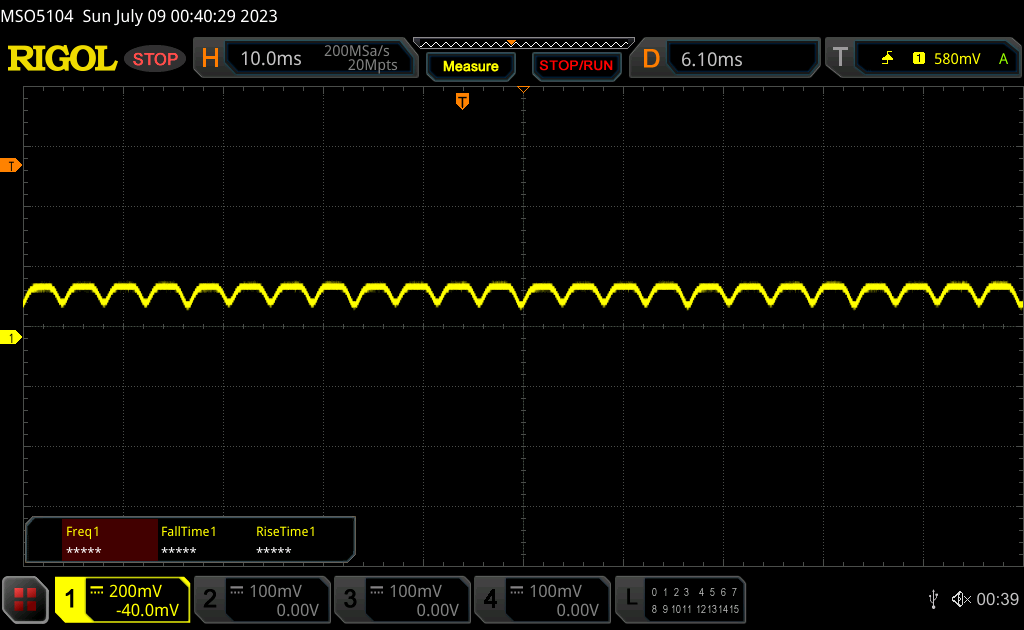
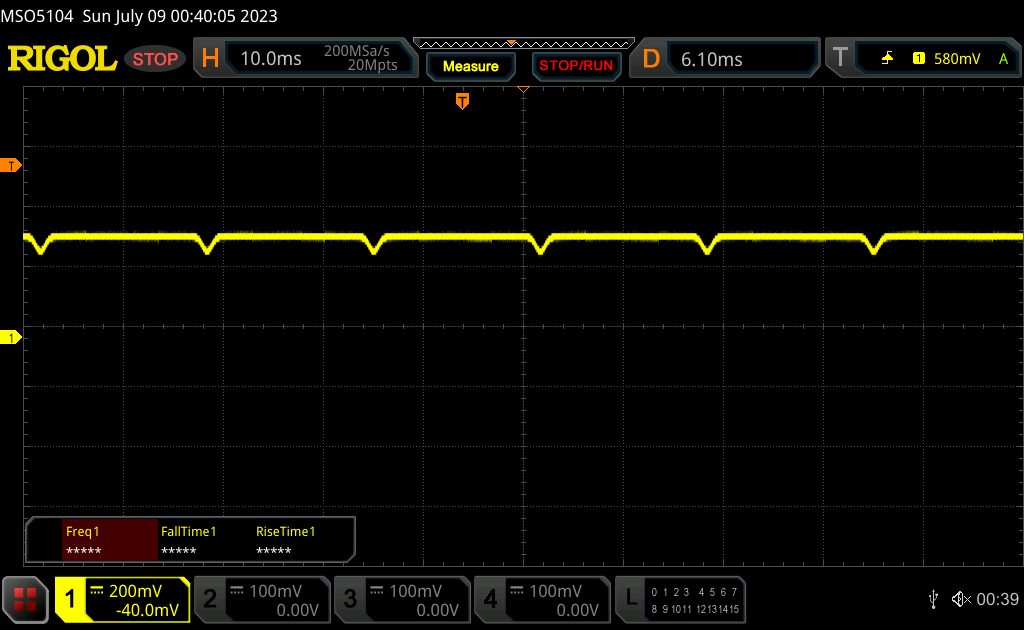
Bildschirm-Flackern / PWM (Pulse-Width Modulation)
| Flackern / PWM festgestellt | 238.6 Hz | ≤ 100 % Helligkeit | 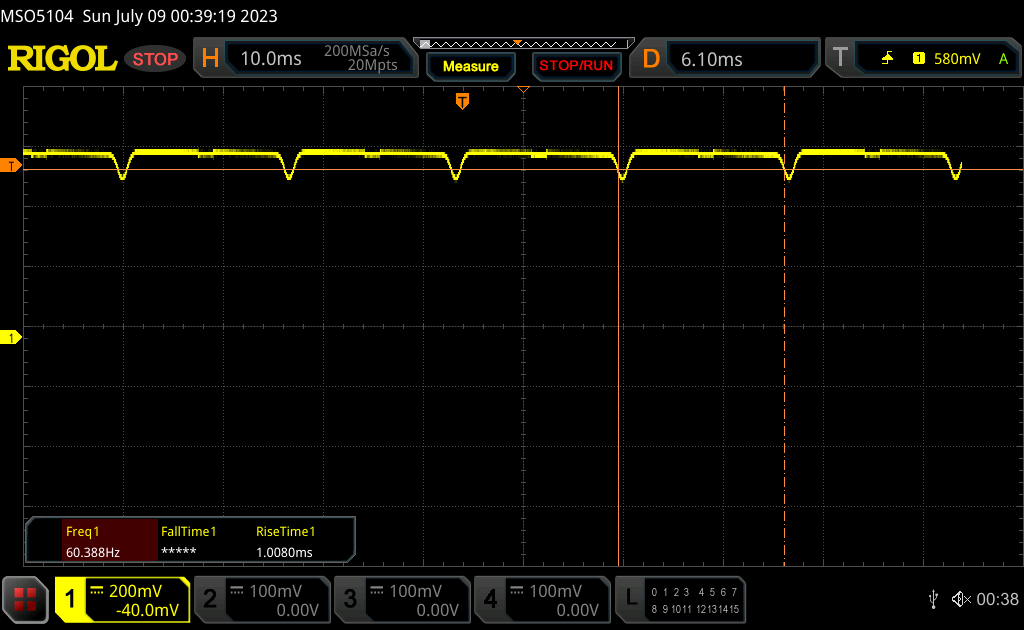 |
Das Display flackert mit 238.6 Hz (im schlimmsten Fall, eventuell durch Pulsweitenmodulation PWM) bei einer eingestellten Helligkeit von 100 % und darunter. Darüber sollte es zu keinem Flackern kommen. Die Frequenz von 238.6 Hz ist relativ gering und daher sollte es bei sensiblen Personen zu Problemen wie Flackern oder Augenbeschwerden führen. Im Vergleich: 52 % aller getesteten Geräte nutzten kein PWM um die Helligkeit zu reduzieren. Wenn PWM eingesetzt wurde, dann bei einer Frequenz von durchschnittlich 7763 (Minimum 5, Maximum 343500) Hz. | |||
PWM-Flackern ist nach wie vor auf den meisten Helligkeitsstufen vorhanden. Bei Helligkeiten zwischen 0 und 52 Prozent haben wir eine Frequenz von 238,6 Hz gemessen, zwischen 53 und 100 Prozent sind es 60Hz. Die alternativen IPS-Bildschirme haben höchstwahrscheinlich kein PWM-Flimmern.


Leistung
Testbedingungen
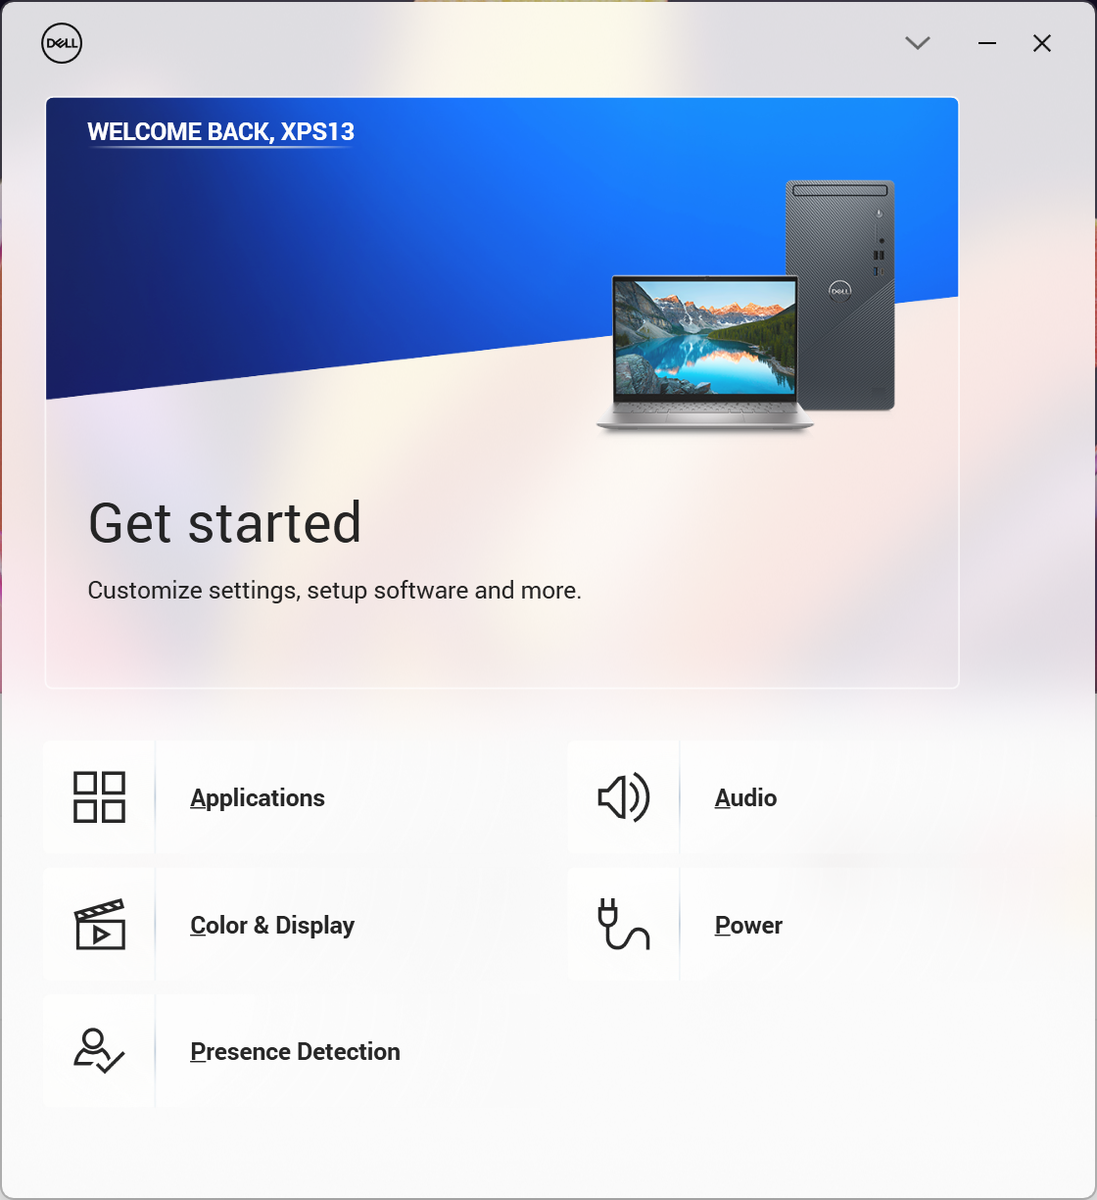
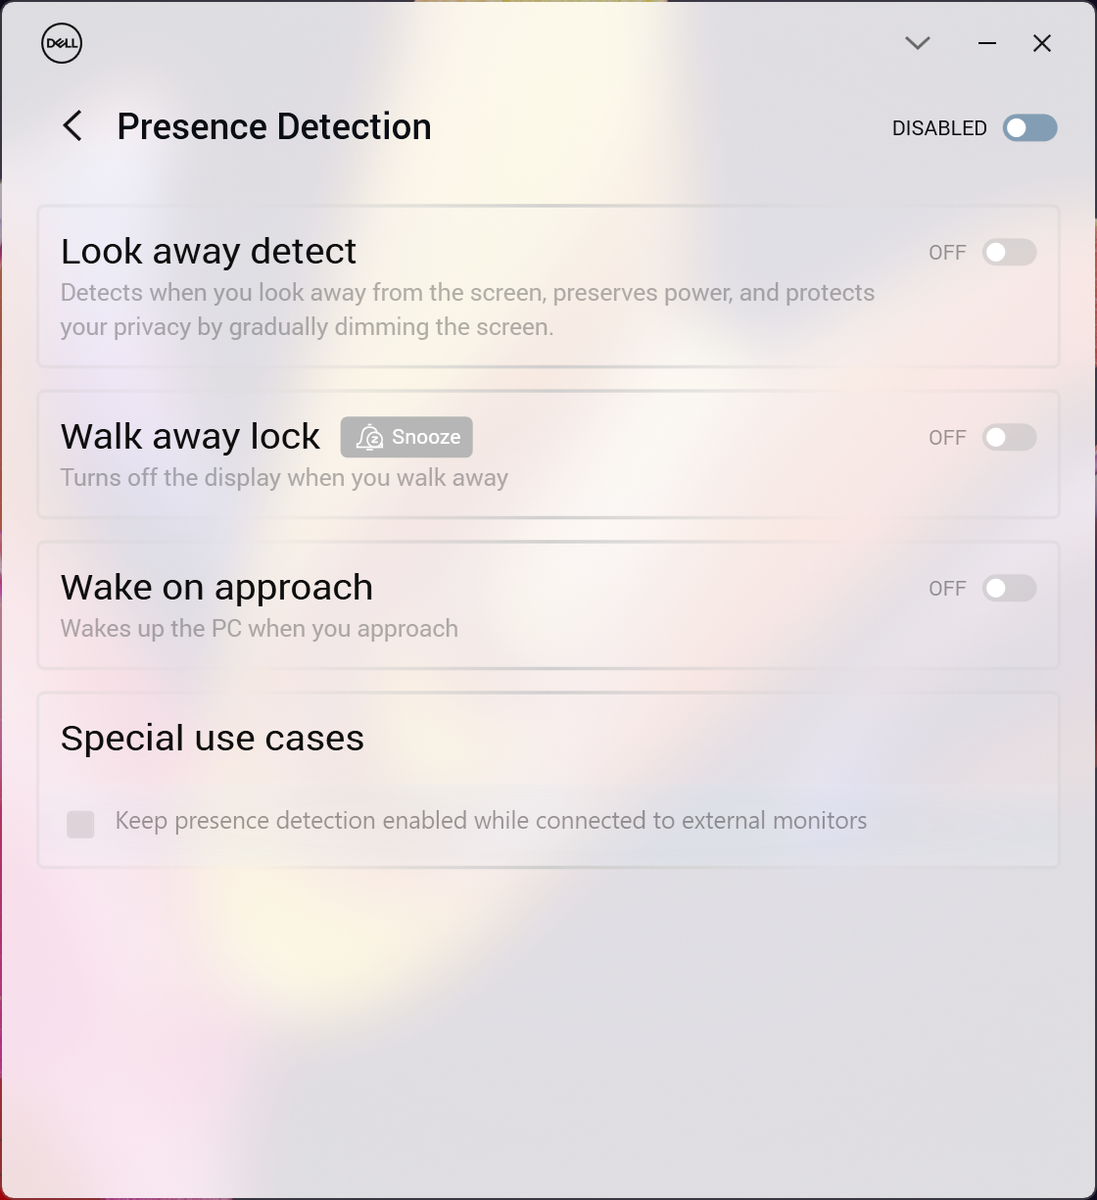
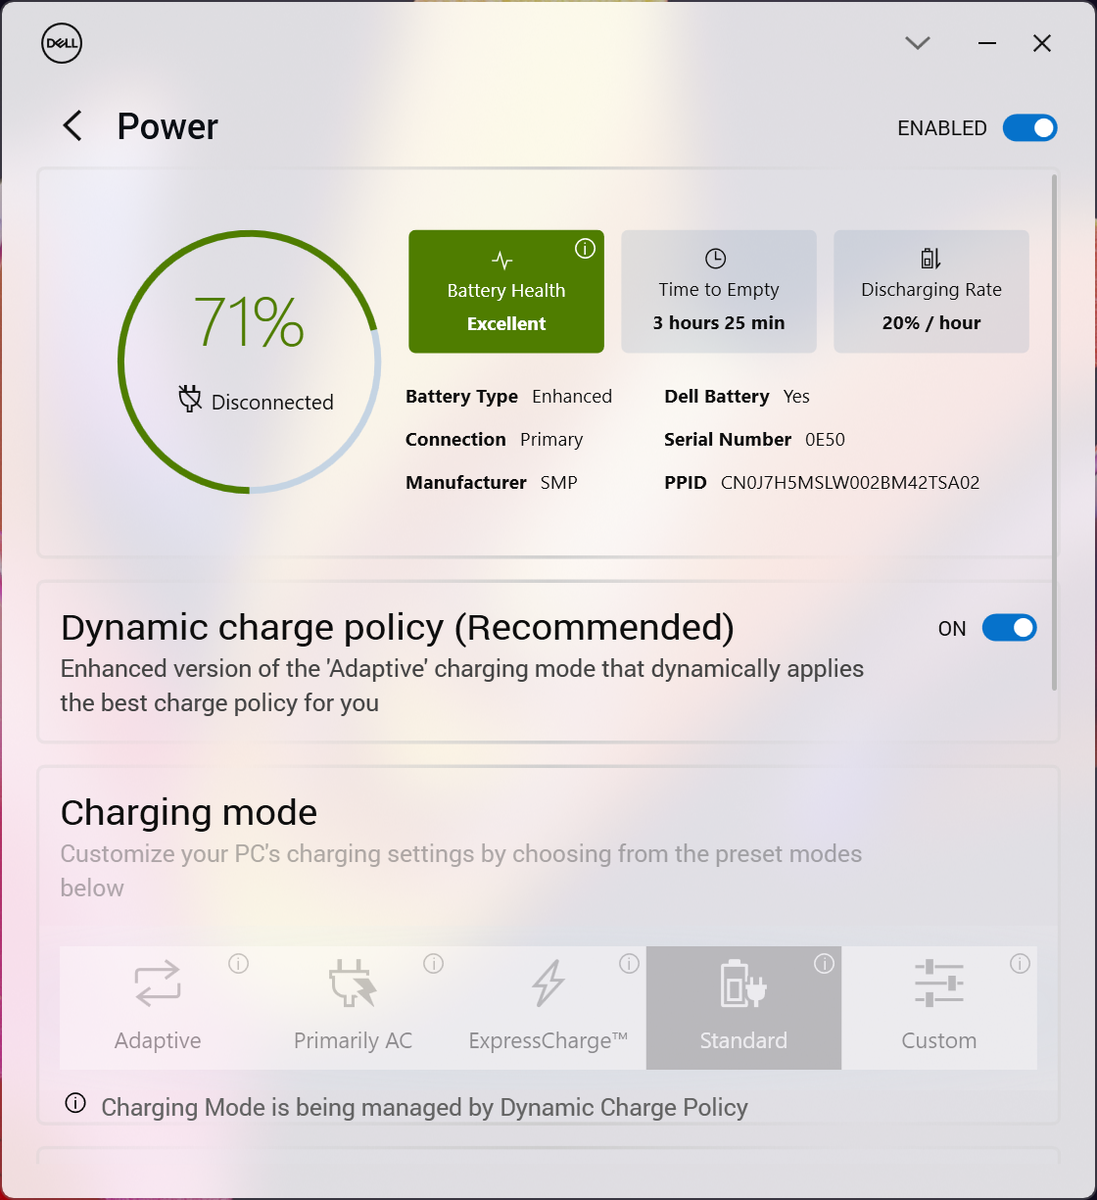
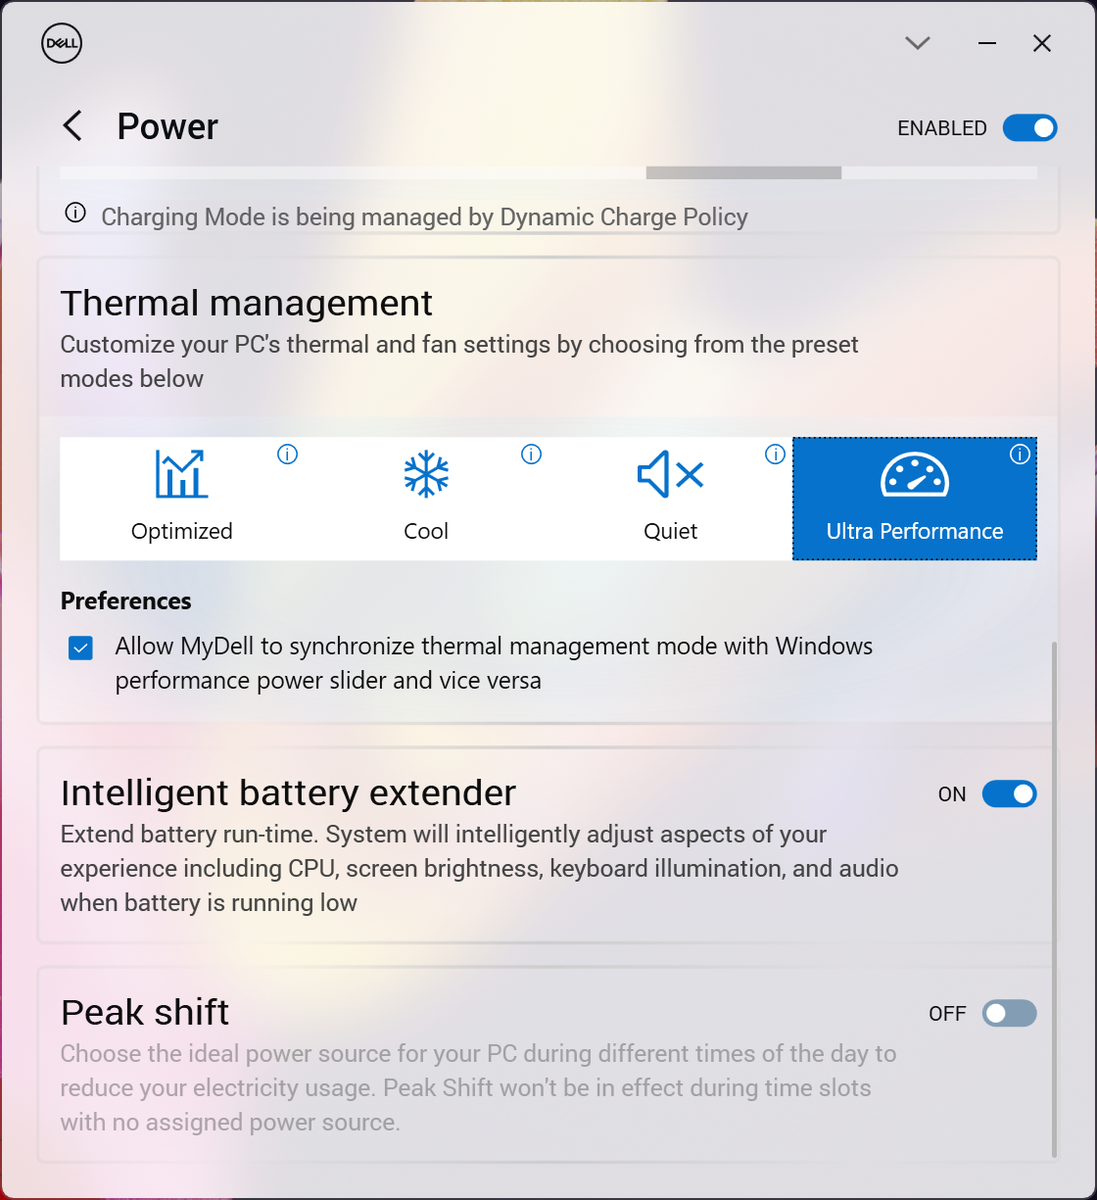
Vor der Durchführung unserer Benchmarks wurde das Notebook in der MyDell-Software in den Höchstleistungsmodus versetzt. "MyDell" ist das XPS-Equivalent zur "Optimizer"-Software, die bei anderen Modellen des Herstellers zum Einsatz kommt. Das Programm bietet aber ähnliche Leistungsmodi und Ladeeinstellungen. Die Energieeinstellungen in der Dell-Software können bequem mit den entsprechenden Windows-Einstellungen synchronisiert werden, was nicht jeder Laptop zu bieten hat.
Prozessor
Die Multi-Thread-Leistung unseres Core i7-1360P der 13. Generation ist fast identisch mit der des Core i7-1280P der 12. Generation aus dem XPS 13 Plus (2022). Sogar das Verhalten des Turbo-Boosts ist gleich, wie die unten eingebundenen Ergebnisse des CineBench R15 Dauertests aufzeigen. Das Lenovo Yoga 9 14IRP G8, das mit dem gleichen Core i7-1360P bestückt ist, liefert in diesem Test im Turbo-Boost über längere Zeit höhere Taktraten.
Während sich bei der Multi-Thread-Performance im Vergleich zum Vorjahr quasi nichts geändert hat, ist die Single-Core-Leistung verglichen mit dem Core i7-1280P um 10 bis 15 Prozent angestiegen. Im Alltagsgebrauch dürfte sich dies aber kaum bemerkbar machen, da die meisten modernen Programme mittlerweile für mehrere Rechenkerne optimiert sind.
Cinebench R15 Dauertest
Cinebench R20: CPU (Multi Core) | CPU (Single Core)
Cinebench R23: Multi Core | Single Core
Cinebench R15: CPU Multi 64Bit | CPU Single 64Bit
Blender: v2.79 BMW27 CPU
7-Zip 18.03: 7z b 4 | 7z b 4 -mmt1
Geekbench 5.5: Multi-Core | Single-Core
HWBOT x265 Benchmark v2.2: 4k Preset
LibreOffice : 20 Documents To PDF
R Benchmark 2.5: Overall mean
* ... kleinere Werte sind besser
AIDA64: FP32 Ray-Trace | FPU Julia | CPU SHA3 | CPU Queen | FPU SinJulia | FPU Mandel | CPU AES | CPU ZLib | FP64 Ray-Trace | CPU PhotoWorxx
| Performance Rating | |
| Framework Laptop 13.5 13th Gen Intel | |
| Dell XPS 13 Plus 9320 i7-1280P OLED | |
| Dell XPS 13 Plus 9320 Core i7-1360P | |
| HP Spectre x360 13.5 14t-ef000 | |
| Lenovo ThinkPad X13 Yoga G3 21AW003UGE | |
| AIDA64 / FP32 Ray-Trace | |
| Framework Laptop 13.5 13th Gen Intel | |
| Dell XPS 13 Plus 9320 i7-1280P OLED | |
| Dell XPS 13 Plus 9320 Core i7-1360P | |
| Lenovo ThinkPad X13 Yoga G3 21AW003UGE | |
| HP Spectre x360 13.5 14t-ef000 | |
| AIDA64 / FPU Julia | |
| Framework Laptop 13.5 13th Gen Intel | |
| Dell XPS 13 Plus 9320 i7-1280P OLED | |
| Dell XPS 13 Plus 9320 Core i7-1360P | |
| Lenovo ThinkPad X13 Yoga G3 21AW003UGE | |
| HP Spectre x360 13.5 14t-ef000 | |
| AIDA64 / CPU SHA3 | |
| Framework Laptop 13.5 13th Gen Intel | |
| Dell XPS 13 Plus 9320 i7-1280P OLED | |
| Dell XPS 13 Plus 9320 Core i7-1360P | |
| Lenovo ThinkPad X13 Yoga G3 21AW003UGE | |
| HP Spectre x360 13.5 14t-ef000 | |
| AIDA64 / CPU Queen | |
| Framework Laptop 13.5 13th Gen Intel | |
| Dell XPS 13 Plus 9320 i7-1280P OLED | |
| Dell XPS 13 Plus 9320 Core i7-1360P | |
| Lenovo ThinkPad X13 Yoga G3 21AW003UGE | |
| HP Spectre x360 13.5 14t-ef000 | |
| AIDA64 / FPU SinJulia | |
| Framework Laptop 13.5 13th Gen Intel | |
| Dell XPS 13 Plus 9320 i7-1280P OLED | |
| Dell XPS 13 Plus 9320 Core i7-1360P | |
| Lenovo ThinkPad X13 Yoga G3 21AW003UGE | |
| HP Spectre x360 13.5 14t-ef000 | |
| AIDA64 / FPU Mandel | |
| Framework Laptop 13.5 13th Gen Intel | |
| Dell XPS 13 Plus 9320 i7-1280P OLED | |
| Dell XPS 13 Plus 9320 Core i7-1360P | |
| Lenovo ThinkPad X13 Yoga G3 21AW003UGE | |
| HP Spectre x360 13.5 14t-ef000 | |
| AIDA64 / CPU AES | |
| Framework Laptop 13.5 13th Gen Intel | |
| HP Spectre x360 13.5 14t-ef000 | |
| Dell XPS 13 Plus 9320 i7-1280P OLED | |
| Dell XPS 13 Plus 9320 Core i7-1360P | |
| Lenovo ThinkPad X13 Yoga G3 21AW003UGE | |
| AIDA64 / CPU ZLib | |
| Framework Laptop 13.5 13th Gen Intel | |
| Dell XPS 13 Plus 9320 Core i7-1360P | |
| Dell XPS 13 Plus 9320 i7-1280P OLED | |
| Lenovo ThinkPad X13 Yoga G3 21AW003UGE | |
| HP Spectre x360 13.5 14t-ef000 | |
| AIDA64 / FP64 Ray-Trace | |
| Framework Laptop 13.5 13th Gen Intel | |
| Dell XPS 13 Plus 9320 i7-1280P OLED | |
| Dell XPS 13 Plus 9320 Core i7-1360P | |
| HP Spectre x360 13.5 14t-ef000 | |
| Lenovo ThinkPad X13 Yoga G3 21AW003UGE | |
| AIDA64 / CPU PhotoWorxx | |
| Dell XPS 13 Plus 9320 Core i7-1360P | |
| Dell XPS 13 Plus 9320 i7-1280P OLED | |
| HP Spectre x360 13.5 14t-ef000 | |
| Lenovo ThinkPad X13 Yoga G3 21AW003UGE | |
| Framework Laptop 13.5 13th Gen Intel | |
Systemleistung
Die PCMark-Ergebnisse sind nur minimal höher als beim XPS 13 Plus vom letzten Jahr, der Vorsprung im einstelligen Prozentbereich ist wahrscheinlich auf den schnelleren RAM und die etwas höhere Single-Core-Leistung zurückzuführen.

CrossMark: Overall | Productivity | Creativity | Responsiveness
| PCMark 10 / Score | |
| Framework Laptop 13.5 13th Gen Intel | |
| Dell XPS 13 Plus 9320 Core i7-1360P | |
| Durchschnittliche Intel Core i7-1360P (5360 - 6998, n=16) | |
| Dell XPS 13 Plus 9320 i7-1280P OLED | |
| HP Spectre x360 13.5 14t-ef000 | |
| Lenovo ThinkPad X13 Yoga G3 21AW003UGE | |
| Dell XPS 13 7390 Core i7-10710U | |
| PCMark 10 / Essentials | |
| Framework Laptop 13.5 13th Gen Intel | |
| HP Spectre x360 13.5 14t-ef000 | |
| Dell XPS 13 Plus 9320 Core i7-1360P | |
| Durchschnittliche Intel Core i7-1360P (9883 - 12059, n=16) | |
| Lenovo ThinkPad X13 Yoga G3 21AW003UGE | |
| Dell XPS 13 Plus 9320 i7-1280P OLED | |
| Dell XPS 13 7390 Core i7-10710U | |
| PCMark 10 / Productivity | |
| Framework Laptop 13.5 13th Gen Intel | |
| Durchschnittliche Intel Core i7-1360P (6572 - 9371, n=16) | |
| HP Spectre x360 13.5 14t-ef000 | |
| Dell XPS 13 Plus 9320 Core i7-1360P | |
| Dell XPS 13 Plus 9320 i7-1280P OLED | |
| Lenovo ThinkPad X13 Yoga G3 21AW003UGE | |
| Dell XPS 13 7390 Core i7-10710U | |
| PCMark 10 / Digital Content Creation | |
| Framework Laptop 13.5 13th Gen Intel | |
| Dell XPS 13 Plus 9320 Core i7-1360P | |
| Durchschnittliche Intel Core i7-1360P (5723 - 9597, n=16) | |
| Dell XPS 13 Plus 9320 i7-1280P OLED | |
| HP Spectre x360 13.5 14t-ef000 | |
| Lenovo ThinkPad X13 Yoga G3 21AW003UGE | |
| Dell XPS 13 7390 Core i7-10710U | |
| CrossMark / Overall | |
| Dell XPS 13 Plus 9320 Core i7-1360P | |
| Dell XPS 13 Plus 9320 i7-1280P OLED | |
| Framework Laptop 13.5 13th Gen Intel | |
| Durchschnittliche Intel Core i7-1360P (1527 - 1891, n=15) | |
| HP Spectre x360 13.5 14t-ef000 | |
| Lenovo ThinkPad X13 Yoga G3 21AW003UGE | |
| CrossMark / Productivity | |
| Framework Laptop 13.5 13th Gen Intel | |
| Dell XPS 13 Plus 9320 Core i7-1360P | |
| Dell XPS 13 Plus 9320 i7-1280P OLED | |
| Durchschnittliche Intel Core i7-1360P (1503 - 1842, n=15) | |
| HP Spectre x360 13.5 14t-ef000 | |
| Lenovo ThinkPad X13 Yoga G3 21AW003UGE | |
| CrossMark / Creativity | |
| Dell XPS 13 Plus 9320 Core i7-1360P | |
| Dell XPS 13 Plus 9320 i7-1280P OLED | |
| Framework Laptop 13.5 13th Gen Intel | |
| Durchschnittliche Intel Core i7-1360P (1558 - 2003, n=15) | |
| HP Spectre x360 13.5 14t-ef000 | |
| Lenovo ThinkPad X13 Yoga G3 21AW003UGE | |
| CrossMark / Responsiveness | |
| Durchschnittliche Intel Core i7-1360P (1311 - 1899, n=15) | |
| Dell XPS 13 Plus 9320 i7-1280P OLED | |
| Dell XPS 13 Plus 9320 Core i7-1360P | |
| Framework Laptop 13.5 13th Gen Intel | |
| HP Spectre x360 13.5 14t-ef000 | |
| Lenovo ThinkPad X13 Yoga G3 21AW003UGE | |
| PCMark 10 Score | 6026 Punkte | |
Hilfe | ||
| AIDA64 / Memory Copy | |
| Dell XPS 13 Plus 9320 Core i7-1360P | |
| Dell XPS 13 Plus 9320 i7-1280P OLED | |
| Durchschnittliche Intel Core i7-1360P (44299 - 72748, n=16) | |
| HP Spectre x360 13.5 14t-ef000 | |
| Lenovo ThinkPad X13 Yoga G3 21AW003UGE | |
| Framework Laptop 13.5 13th Gen Intel | |
| AIDA64 / Memory Read | |
| Dell XPS 13 Plus 9320 i7-1280P OLED | |
| Dell XPS 13 Plus 9320 Core i7-1360P | |
| HP Spectre x360 13.5 14t-ef000 | |
| Durchschnittliche Intel Core i7-1360P (44751 - 68945, n=16) | |
| Lenovo ThinkPad X13 Yoga G3 21AW003UGE | |
| Framework Laptop 13.5 13th Gen Intel | |
| AIDA64 / Memory Write | |
| Dell XPS 13 Plus 9320 Core i7-1360P | |
| Durchschnittliche Intel Core i7-1360P (45887 - 93331, n=16) | |
| HP Spectre x360 13.5 14t-ef000 | |
| Dell XPS 13 Plus 9320 i7-1280P OLED | |
| Framework Laptop 13.5 13th Gen Intel | |
| Lenovo ThinkPad X13 Yoga G3 21AW003UGE | |
| AIDA64 / Memory Latency | |
| Dell XPS 13 Plus 9320 i7-1280P OLED | |
| Lenovo ThinkPad X13 Yoga G3 21AW003UGE | |
| Dell XPS 13 Plus 9320 Core i7-1360P | |
| Durchschnittliche Intel Core i7-1360P (85 - 110.5, n=16) | |
| HP Spectre x360 13.5 14t-ef000 | |
| Framework Laptop 13.5 13th Gen Intel | |
* ... kleinere Werte sind besser
DPC-Latenz
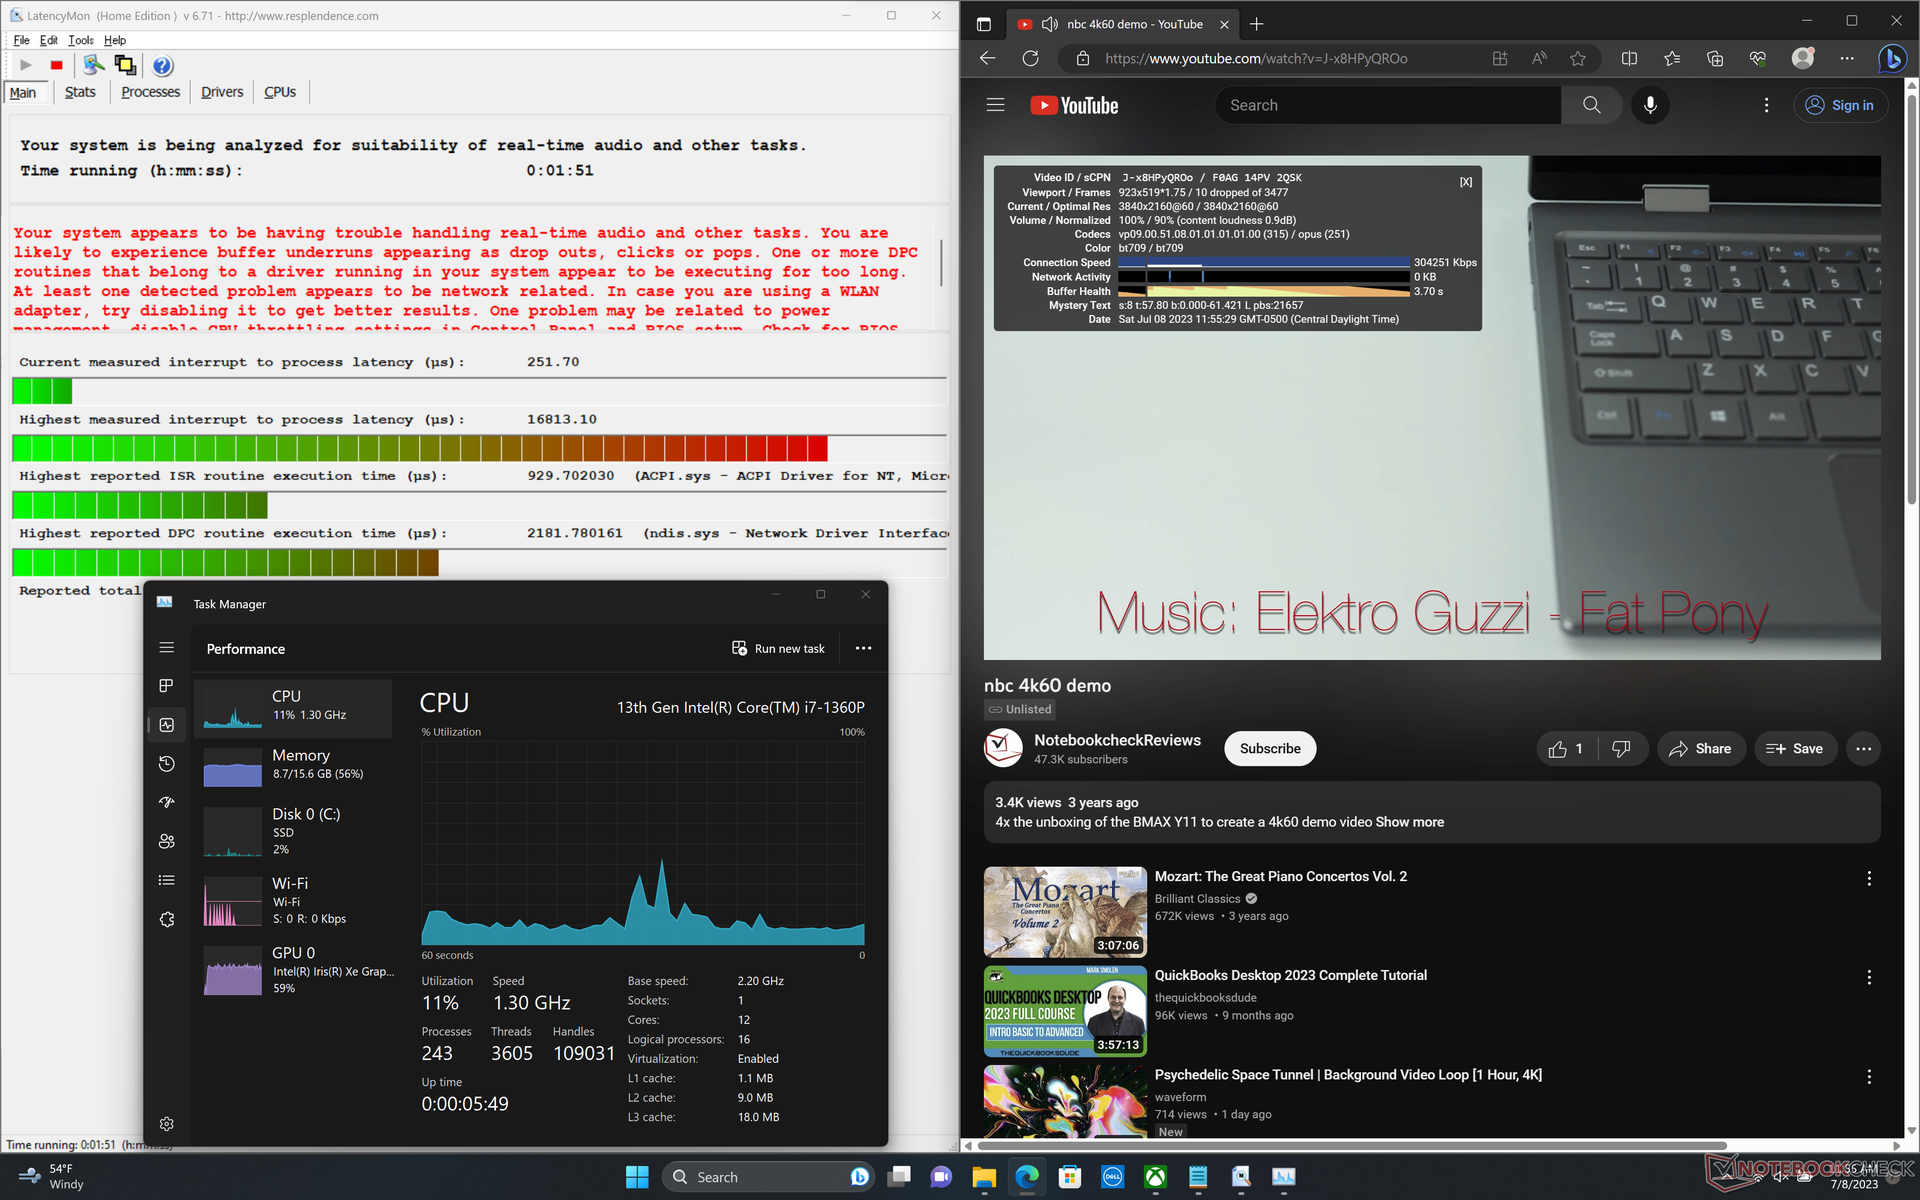
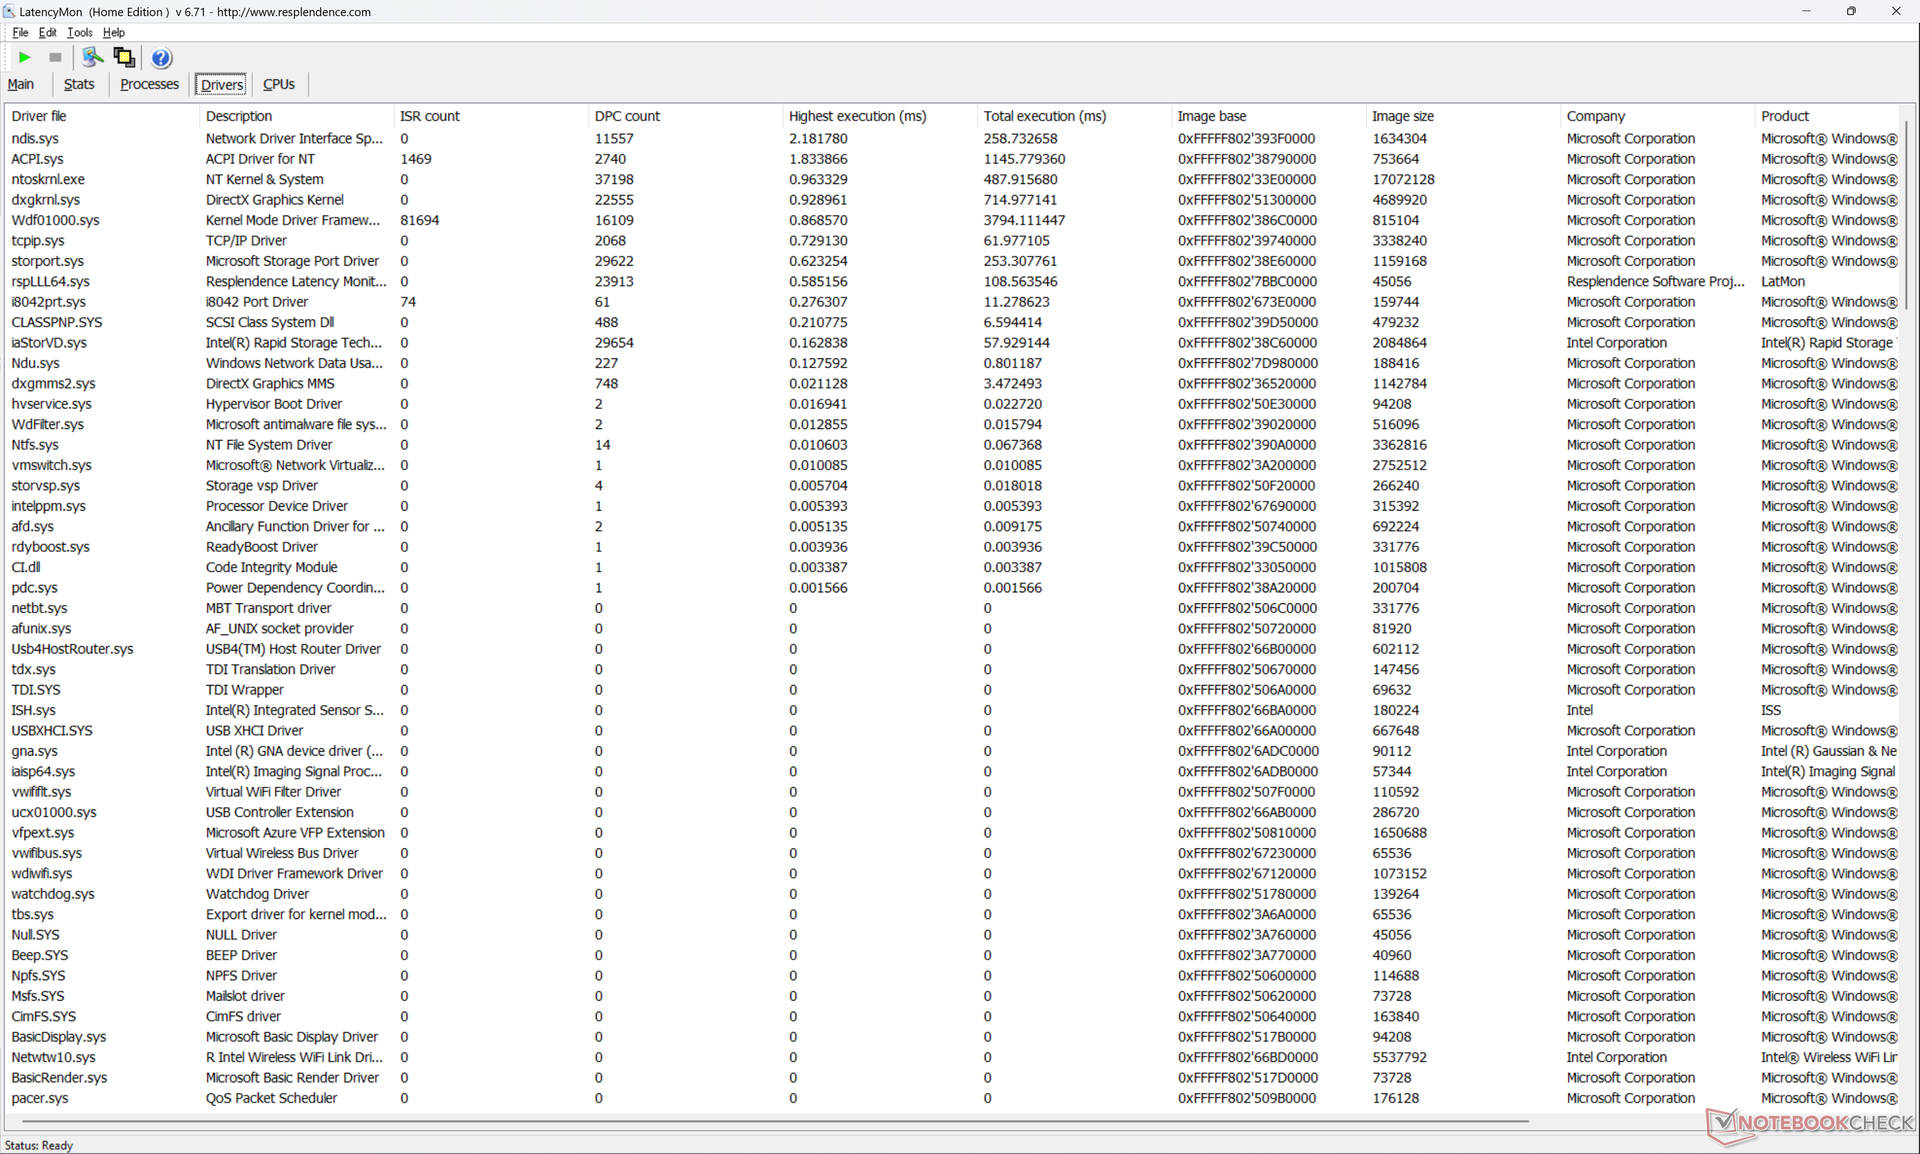
Das Dell XPS 13 hat Latenzprobleme beim Öffnen mehrere Browser-Tabs, auch nach mehreren Durchläufen. 4K-Videos mit 60 Bildern pro Sekunde werden auch nicht korrekt wiedergegeben, in unserem einminütigen Test haben wir 10 übersprungene Frames gezählt. Dabei könnte es sich um einen Bug der 2023er-Modelle handeln, denn bei keinem unserer 2022er Testgeräte sind derartige Probleme aufgetaucht.
| DPC Latencies / LatencyMon - interrupt to process latency (max), Web, Youtube, Prime95 | |
| Dell XPS 13 Plus 9320 Core i7-1360P | |
| Lenovo ThinkPad X13 Yoga G3 21AW003UGE | |
| Dell XPS 13 Plus 9320 i5-1240p | |
| Dell XPS 13 Plus 9320 4K | |
| HP Spectre x360 13.5 14t-ef000 | |
| Dell XPS 13 Plus 9320 i7-1280P OLED | |
| Framework Laptop 13.5 13th Gen Intel | |
* ... kleinere Werte sind besser
Massenspeicher
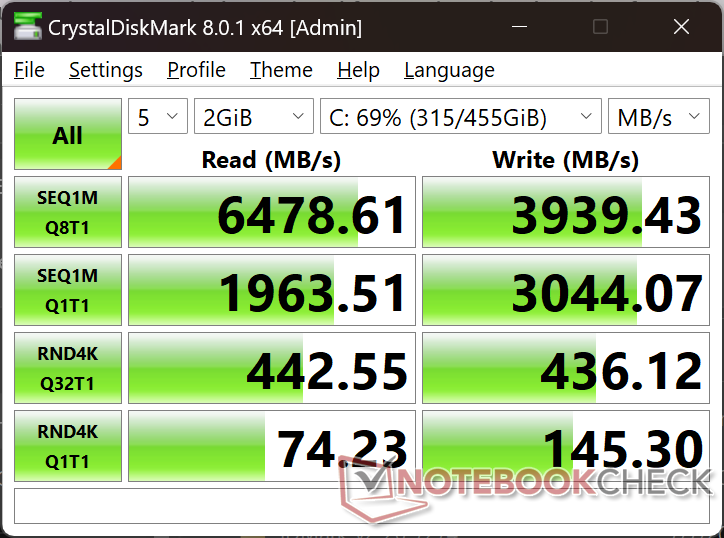
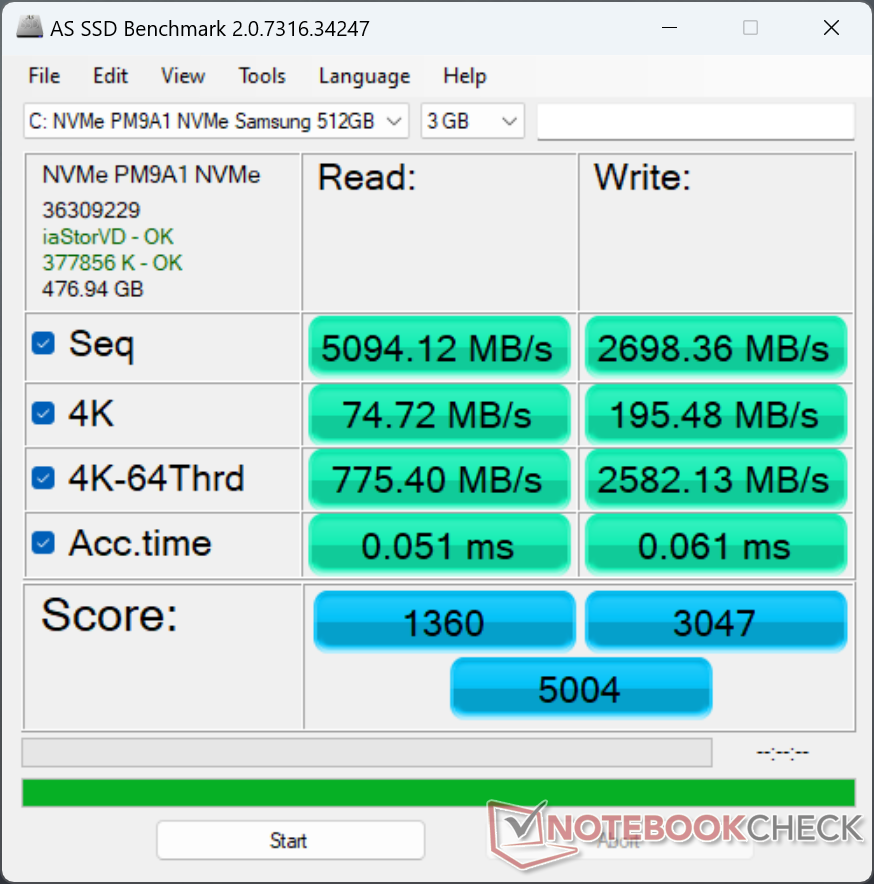
Die SSDs im XPS 13 Plus stammen von Samsung, Micron und Western Digital. In unserem Testgerät ist die Samsung PM9A1 mit sequentiellen PCIe-4.0-Geschwindigkeiten von 7.000 MB/s beim Lesen beziehungsweise 4.000 MB/s beim Schreiben verbaut. Leider wird das Speichermodul beim Stresstest mit DiskSpd auf bis zu 2.000 MB/s gedrosselt, auch wiederholte Testdurchläufe änderten nichts an diesem Ergebnis. Im XPS 13 Plus aus dem Jahr 2022 war die gleiche SSD verbaut, und wurde dort nicht gedrosselt. Die genauen Gründe hierfür sind uns nicht ganz klar, da es bezüglich der SSD-Heatsink offenbar keine Änderungen gegeben hat.

* ... kleinere Werte sind besser
Lesen Dauerleistung: DiskSpd Read Loop, Queue Depth 8
Grafikleistung
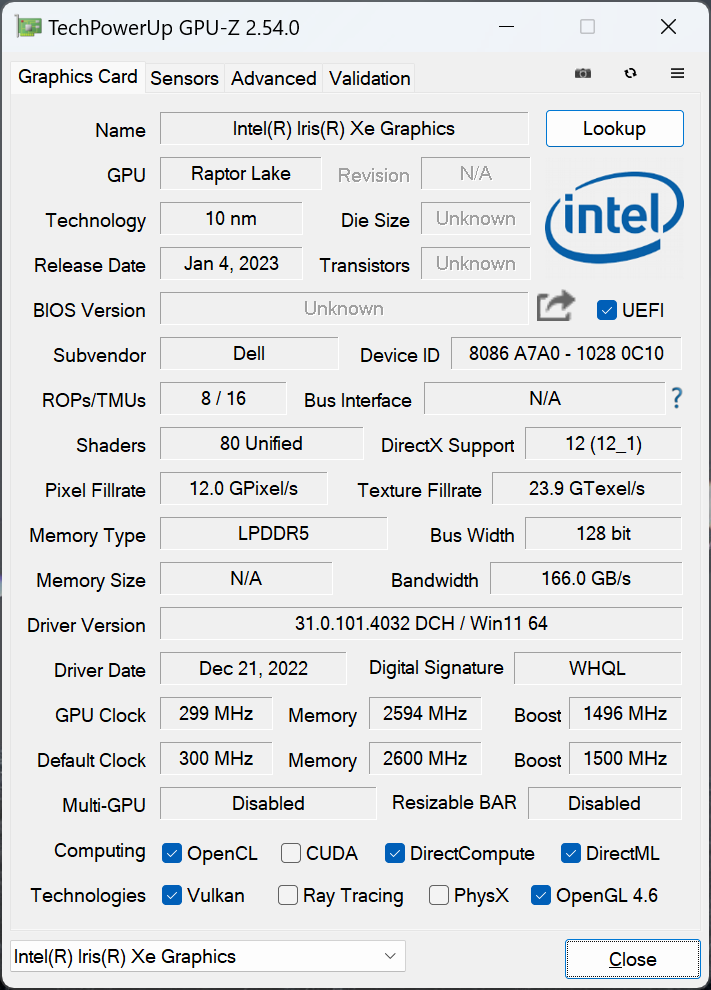
Die Iris Xe mit 96 EUs bleibt trotz ihres gehobenen Alters die schnellste integrierte Grafikeinheit von Intel. Dank des flotteren Arbeitsspeichers ist der Grafikchip dieses Jahr ein wenig performanter als im letzten Jahr, im Vergleich zur konkurrierenden Radeon 680M oder 780M ist die Leistung aber schwach.
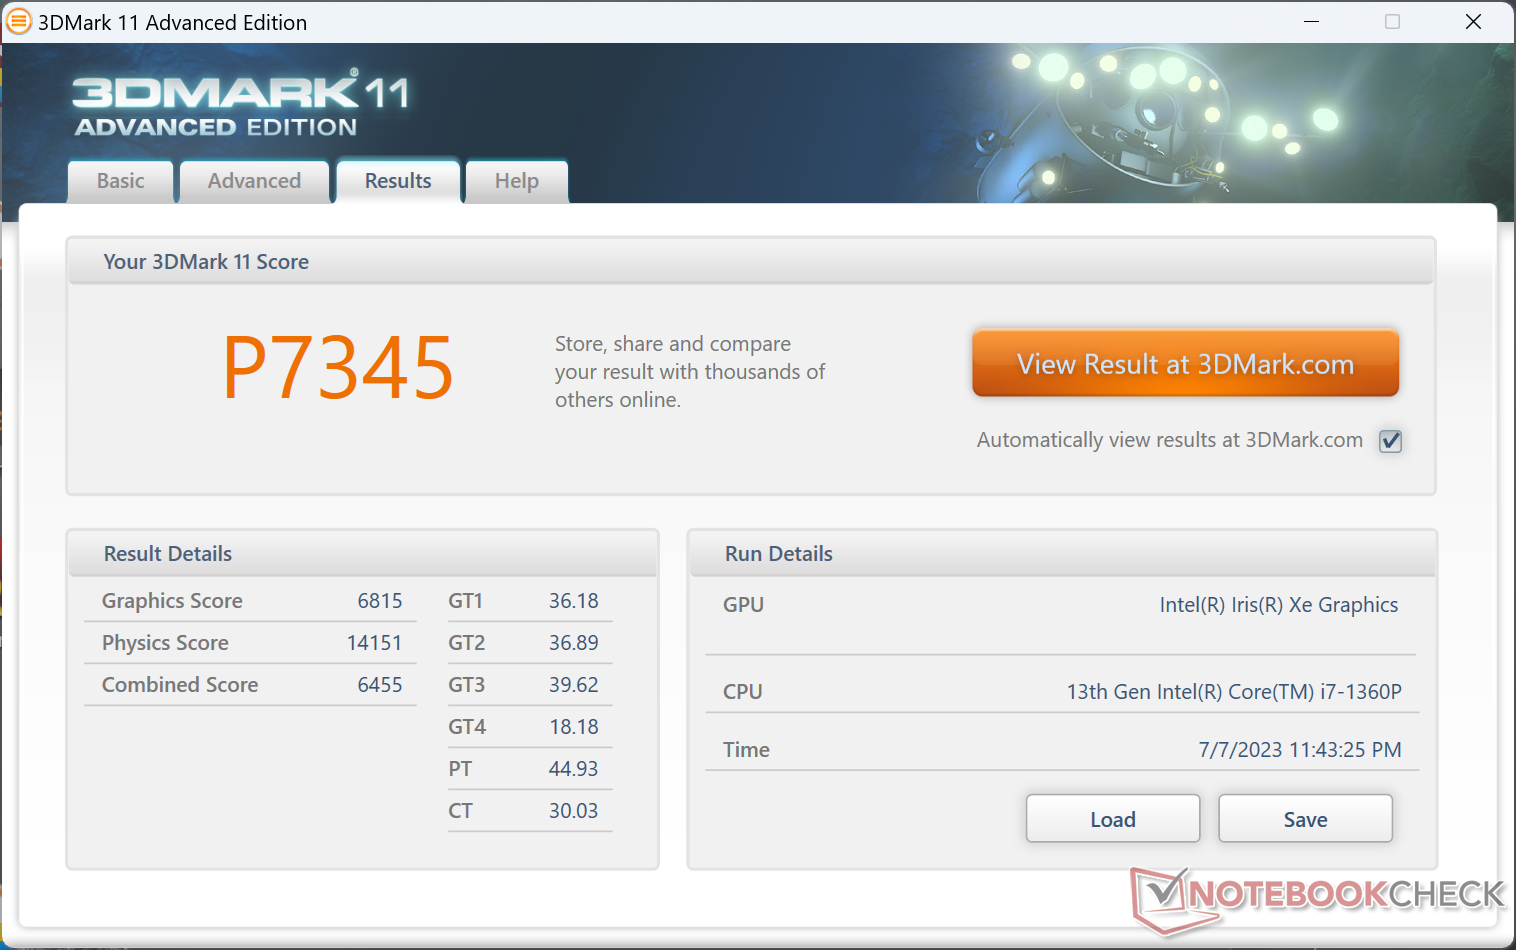

| 3DMark 11 Performance | 7345 Punkte | |
| 3DMark Fire Strike Score | 5514 Punkte | |
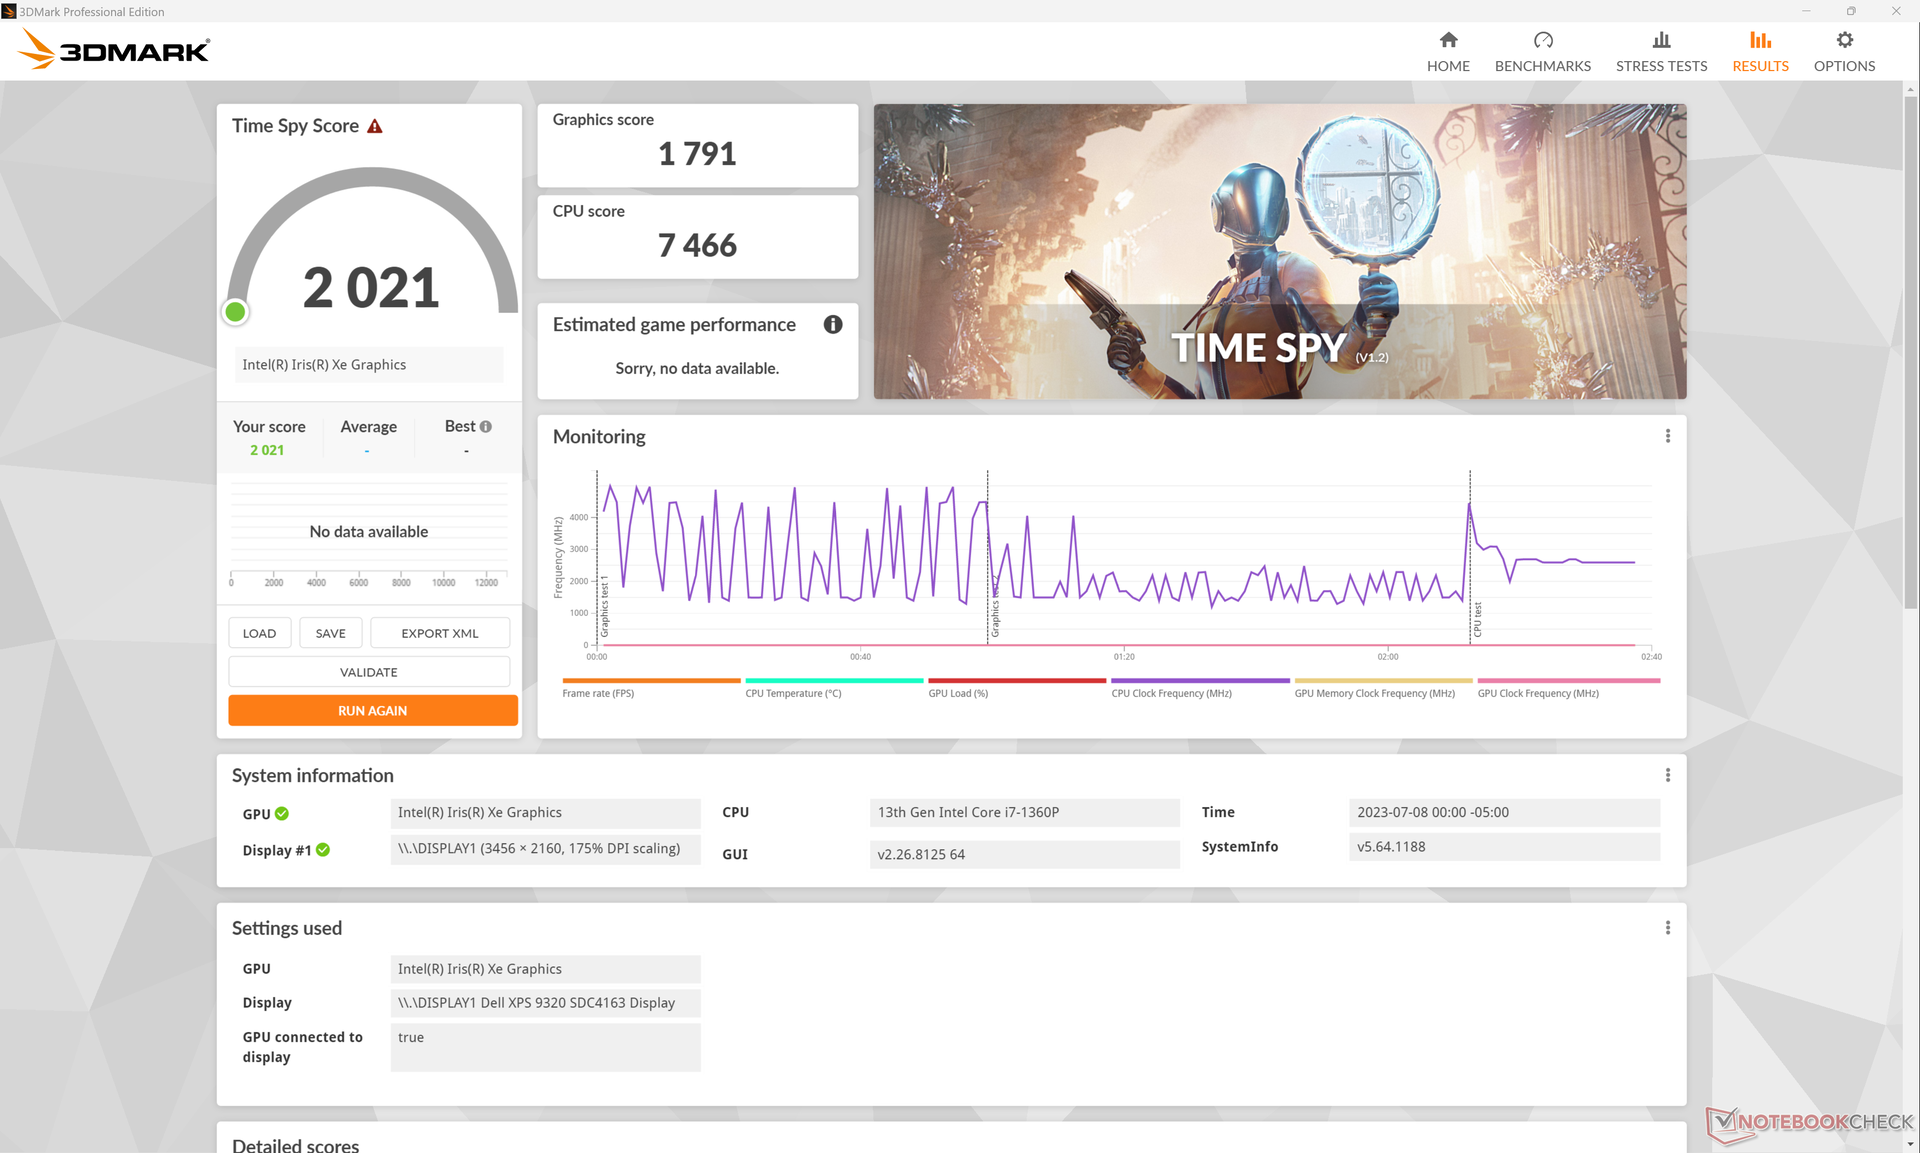
| 3DMark Time Spy Score | 2021 Punkte | |
Hilfe | ||
* ... kleinere Werte sind besser
| Tiny Tina's Wonderlands | |
| 1920x1080 Low Preset (DX12) | |
| Framework Laptop 13.5 13th Gen Intel | |
| Durchschnittliche Intel Iris Xe Graphics G7 96EUs (22.3 - 53, n=32) | |
| Dell XPS 13 Plus 9320 Core i7-1360P | |
| 1920x1080 Medium Preset (DX12) | |
| Framework Laptop 13.5 13th Gen Intel | |
| Dell XPS 13 Plus 9320 Core i7-1360P | |
| Durchschnittliche Intel Iris Xe Graphics G7 96EUs (17 - 40.1, n=30) | |
| 1920x1080 High Preset (DX12) | |
| Framework Laptop 13.5 13th Gen Intel | |
| Dell XPS 13 Plus 9320 Core i7-1360P | |
| Durchschnittliche Intel Iris Xe Graphics G7 96EUs (10.6 - 24.1, n=29) | |
| 1920x1080 Badass Preset (DX12) | |
| Framework Laptop 13.5 13th Gen Intel | |
| Dell XPS 13 Plus 9320 Core i7-1360P | |
| Durchschnittliche Intel Iris Xe Graphics G7 96EUs (8.4 - 18.4, n=26) | |
| 1280x720 Lowest Preset (DX12) | |
| Dell XPS 13 Plus 9320 Core i7-1360P | |
| Durchschnittliche Intel Iris Xe Graphics G7 96EUs (25.9 - 67.3, n=32) | |
Witcher 3 FPS-Diagramm
| min. | mittel | hoch | max. | QHD | |
|---|---|---|---|---|---|
| GTA V (2015) | 130.6 | 105.3 | 26.6 | 11.6 | 7.35 |
| The Witcher 3 (2015) | 86.7 | 56.1 | 33.9 | 15.4 | |
| Dota 2 Reborn (2015) | 125.6 | 97.7 | 68.7 | 61.6 | |
| Final Fantasy XV Benchmark (2018) | 44.5 | 25.2 | 17.5 | ||
| X-Plane 11.11 (2018) | 42.7 | 36.2 | 33.2 | ||
| Strange Brigade (2018) | 93.9 | 43.8 | 35.4 | 27.5 | |
| Cyberpunk 2077 1.6 (2022) | 20.8 | 17.3 | 13.6 | 11 | |
| Tiny Tina's Wonderlands (2022) | 29.6 | 23.7 | 15.2 | 12.2 | |
| F1 22 (2022) | 47.5 | 42.8 | 31.9 | 24.1 |
Emissionen
Systemlautstärke
Obwohl es keine Änderungen am Kühlsystem oder der Lüfterlautstärke gab, konnten wir bei unserem Testgerät ein leichtes Spulenfiepen festellen, als wir das Ohr an die Tastatur gelegt haben. Im Leerlauf, beim Browsen und in Office-Anwendungen sind die Lüfter ansonsten aber kaum hörbar.
Lautstärkediagramm
| Idle |
| 24 / 24 / 24.4 dB(A) |
| Last |
| 37 / 42 dB(A) |
 | ||
30 dB leise 40 dB(A) deutlich hörbar 50 dB(A) störend |
||
min: | ||
| Dell XPS 13 Plus 9320 Core i7-1360P Iris Xe G7 96EUs, i7-1360P, Samsung PM9A1 MZVL2512HCJQ | Dell XPS 13 Plus 9320 i7-1280P OLED Iris Xe G7 96EUs, i7-1280P, WDC PC SN810 512GB | Dell XPS 13 7390 Core i7-10710U UHD Graphics 620, i7-10710U, SK Hynix PC601 NVMe 512 GB | Framework Laptop 13.5 13th Gen Intel Iris Xe G7 96EUs, i7-1370P, WD PC SN740 SDDPNQD-1T00 | Lenovo ThinkPad X13 Yoga G3 21AW003UGE Iris Xe G7 96EUs, i7-1265U, Samsung PM9A1 MZVL2512HCJQ | HP Spectre x360 13.5 14t-ef000 Iris Xe G7 96EUs, i7-1255U, Micron 3400 1TB MTFDKBA1T0TFH | |
|---|---|---|---|---|---|---|
| Geräuschentwicklung | 3% | -12% | -6% | -2% | 7% | |
| aus / Umgebung * (dB) | 23.7 | 23.4 1% | 28 -18% | 23.2 2% | 23.22 2% | 23.5 1% |
| Idle min * (dB) | 24 | 23.4 2% | 28 -17% | 23.2 3% | 23.2 3% | 23.5 2% |
| Idle avg * (dB) | 24 | 23.4 2% | 28 -17% | 23.2 3% | 23.2 3% | 23.5 2% |
| Idle max * (dB) | 24.4 | 23.4 4% | 28 -15% | 23.2 5% | 28.6 -17% | 23.5 4% |
| Last avg * (dB) | 37 | 35 5% | 33.7 9% | 45.3 -22% | 39.8 -8% | 27 27% |
| Witcher 3 ultra * (dB) | 42.1 | 41.6 1% | 47.9 -14% | 41.8 1% | 36.2 14% | |
| Last max * (dB) | 42 | 39.9 5% | 46.5 -11% | 49.2 -17% | 40.6 3% | 42.4 -1% |
* ... kleinere Werte sind besser
Temperatur
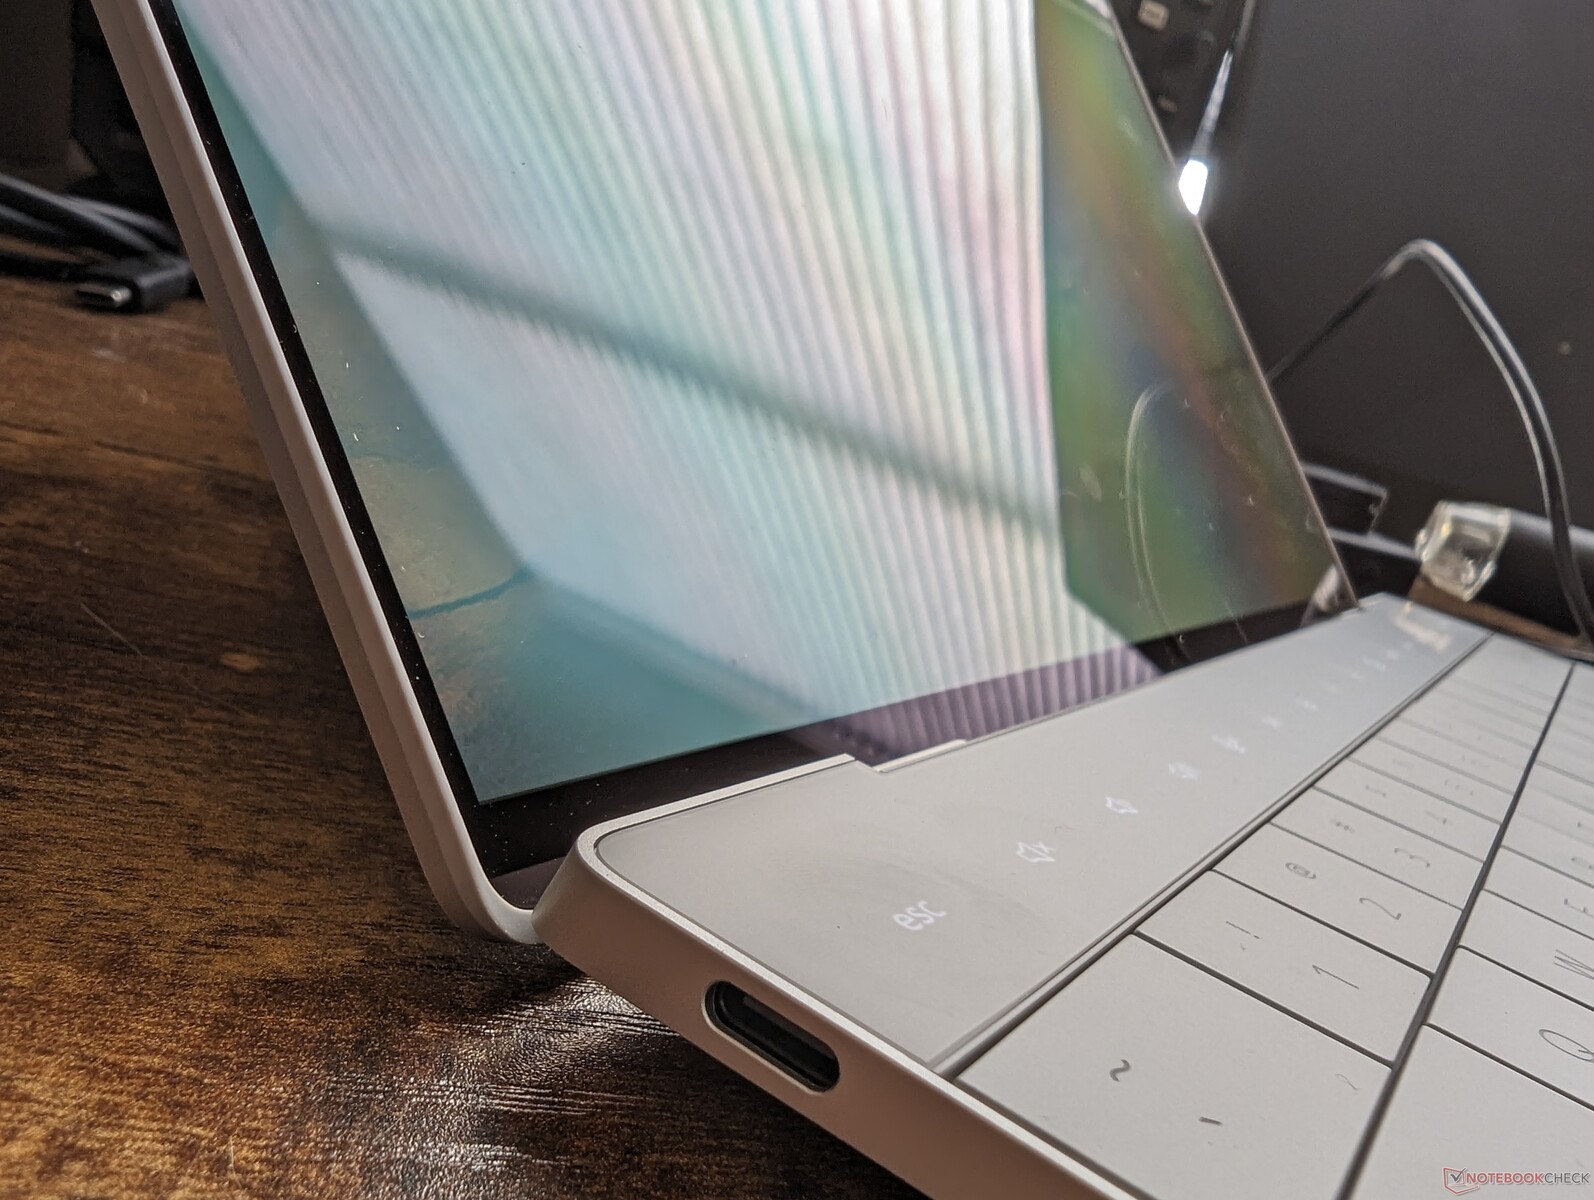
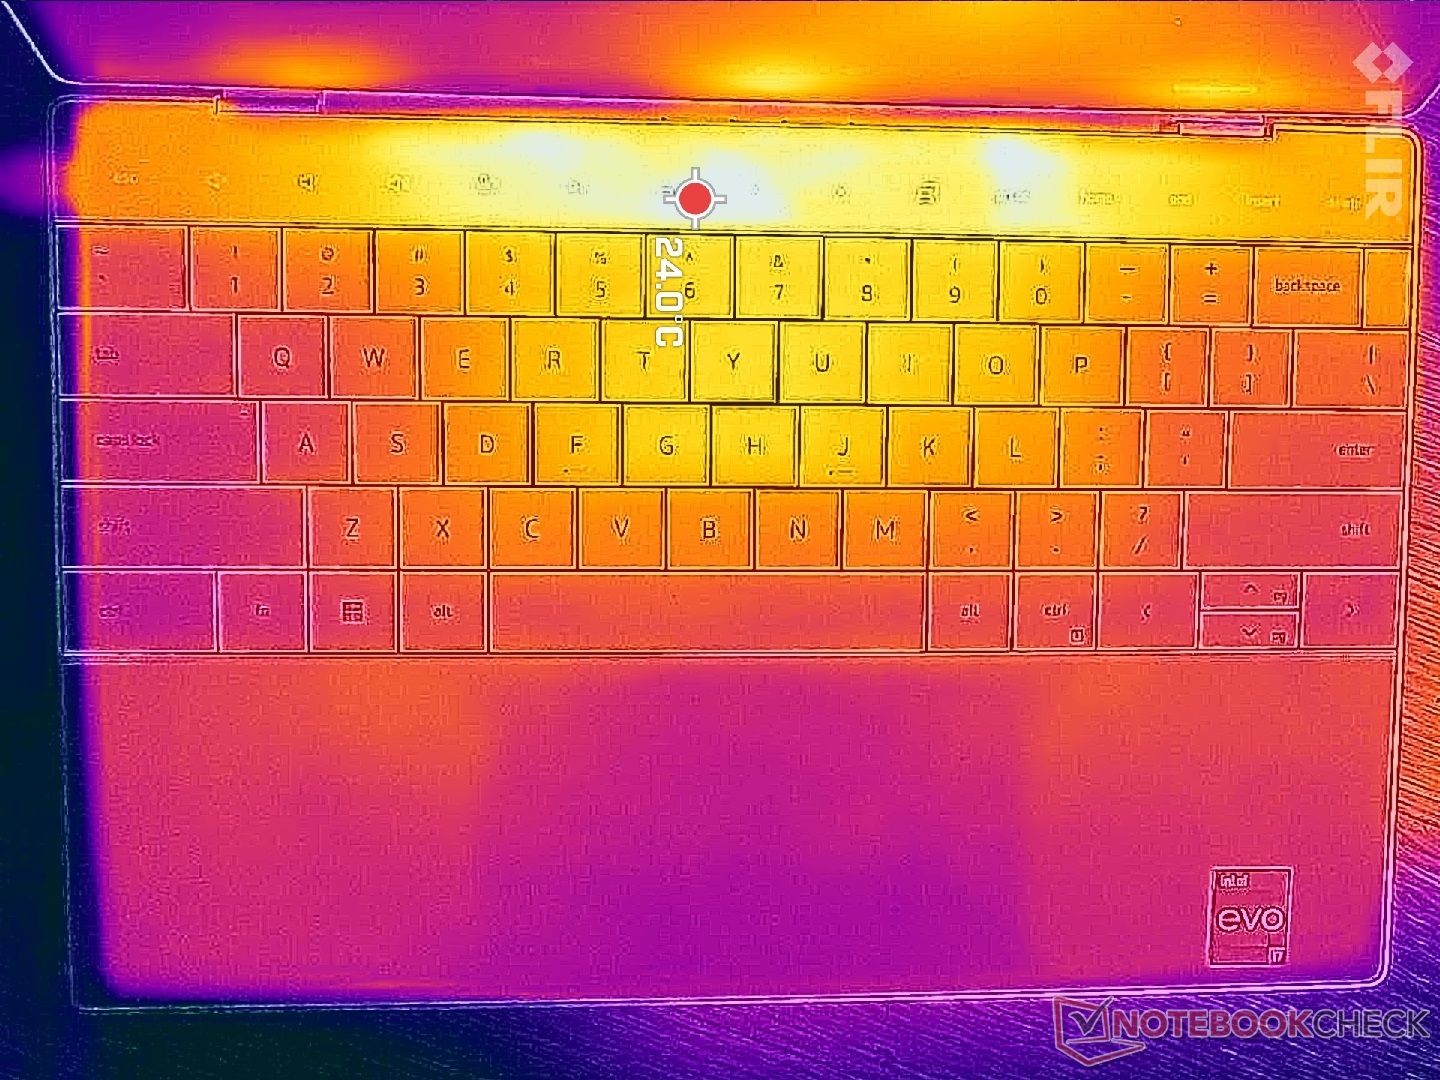
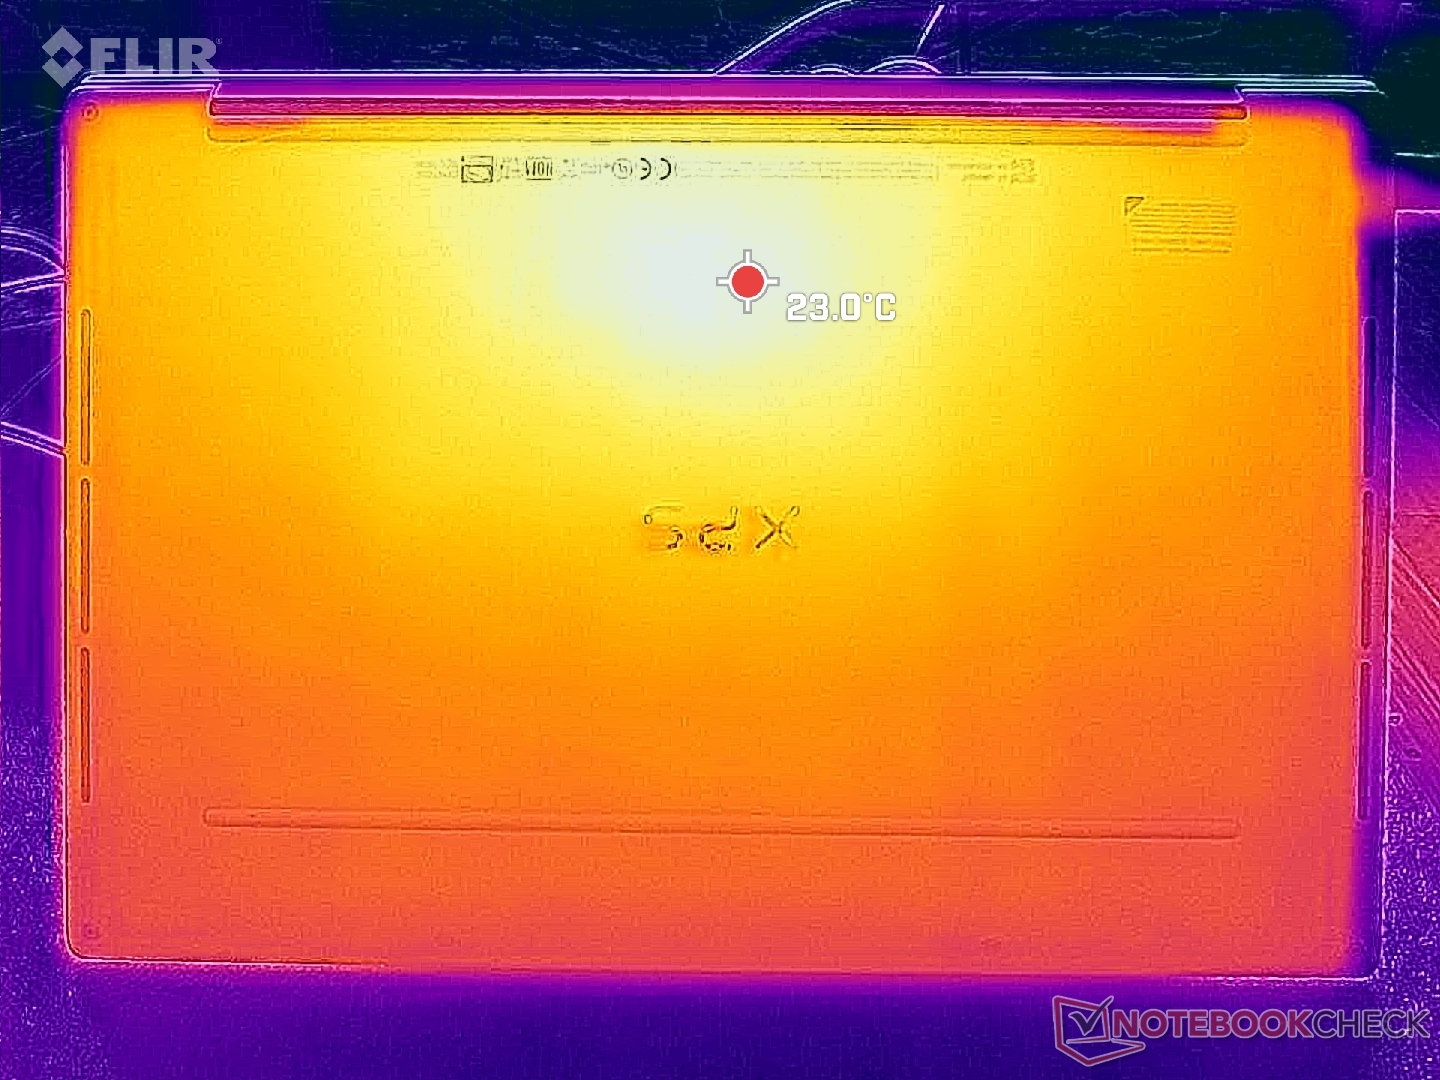
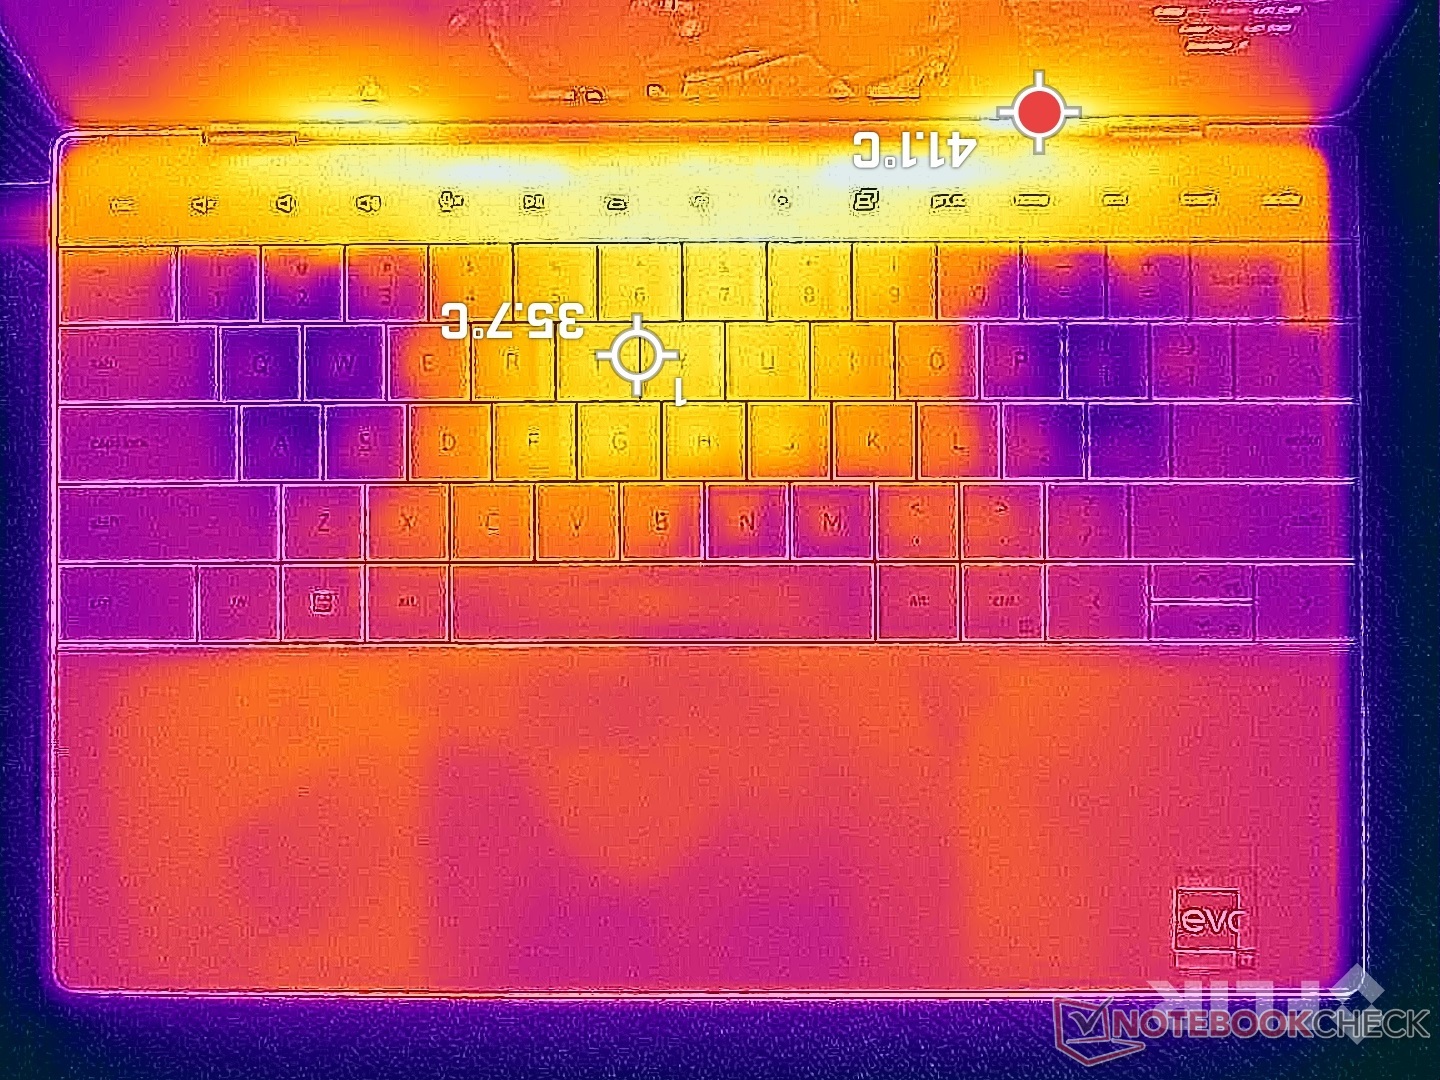
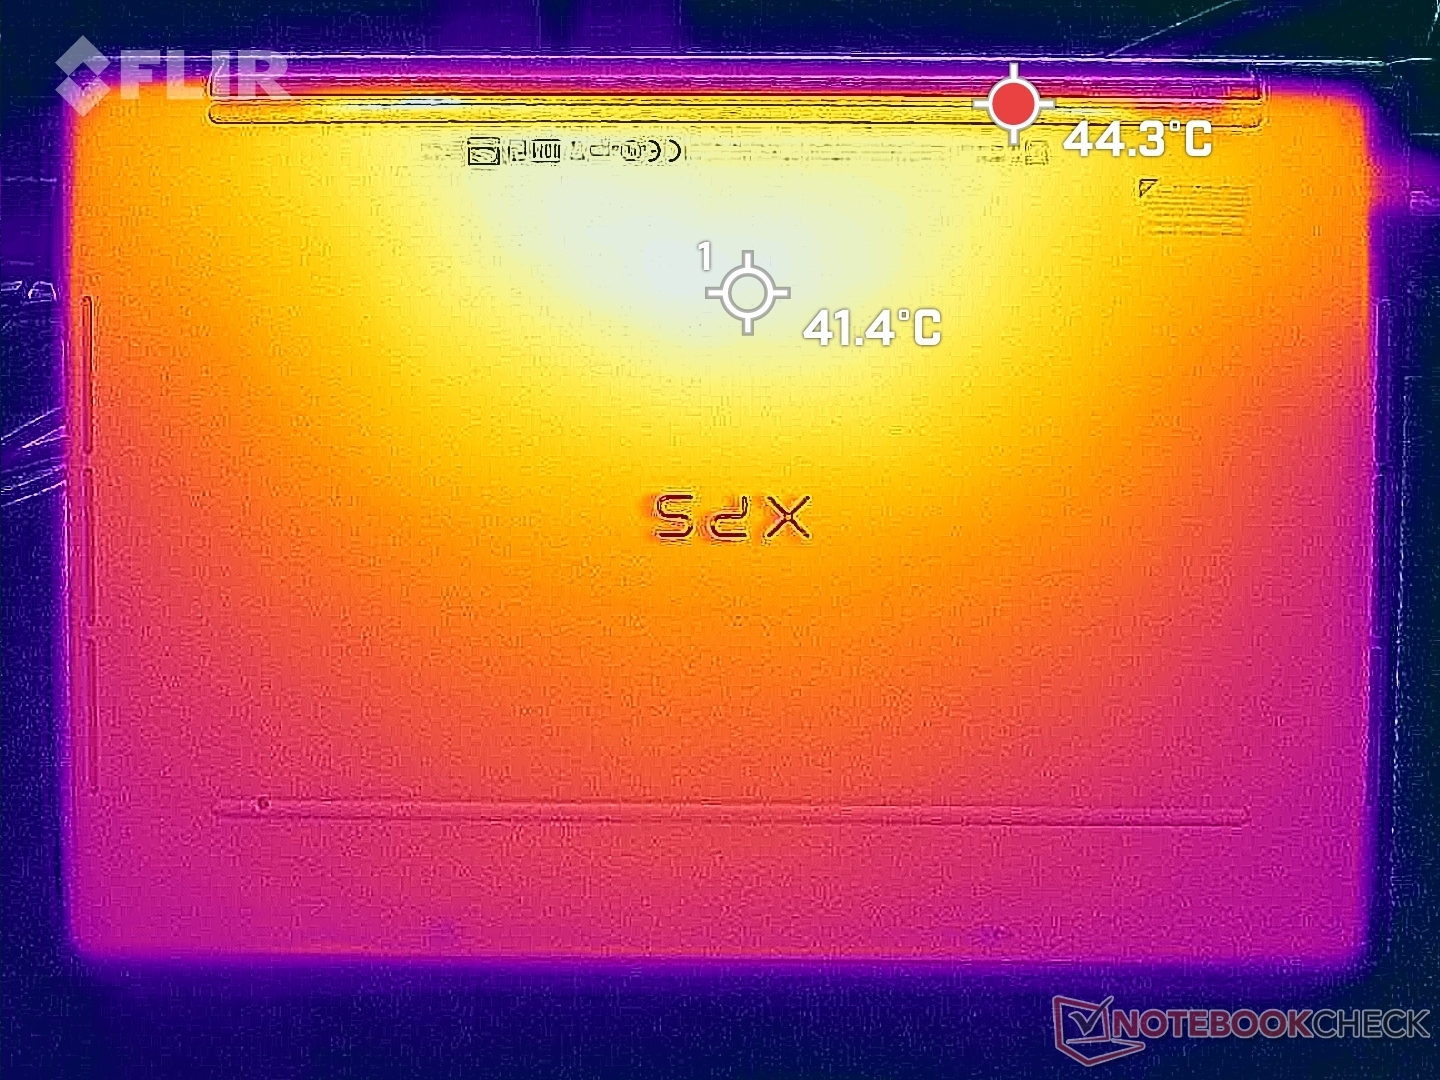
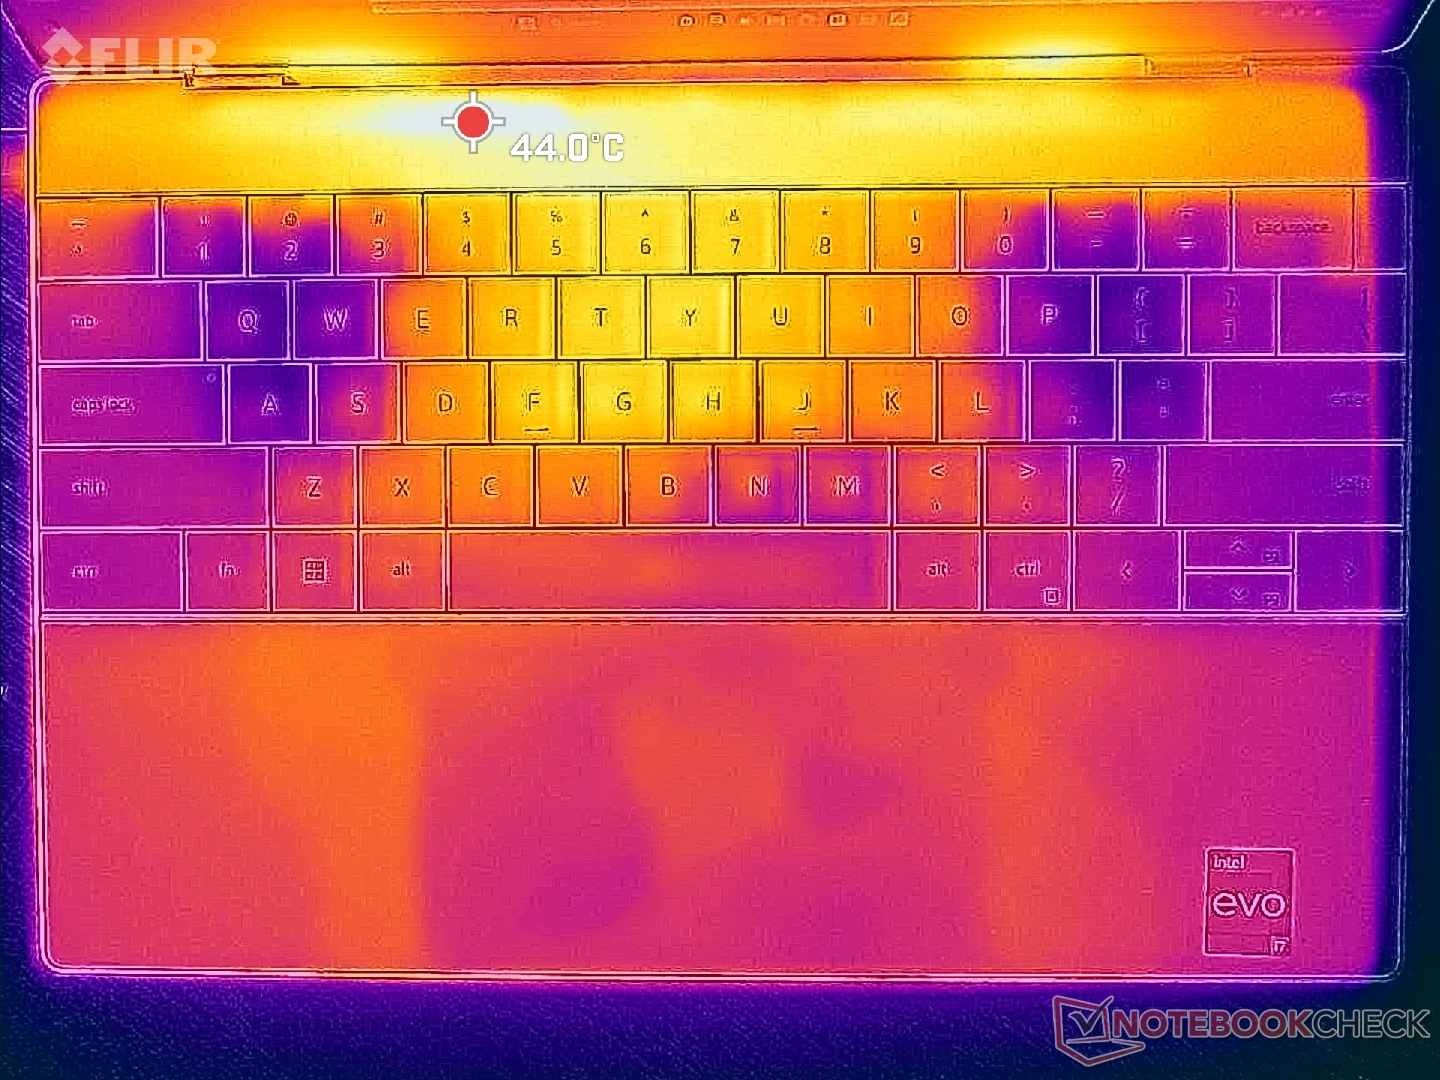
Aufgrund des dünnen Gehäuses und der fehlenden Kühlschlitze an der Bodenplatte können die Oberflächentemperaturen ziemlich warm werden. Hot-Spots erhitzen sich auf bis zu 45 Grad Celsius, beim langsameren HP Dragonfly Folio 13.5 G3 sind es nur 35 Grad.
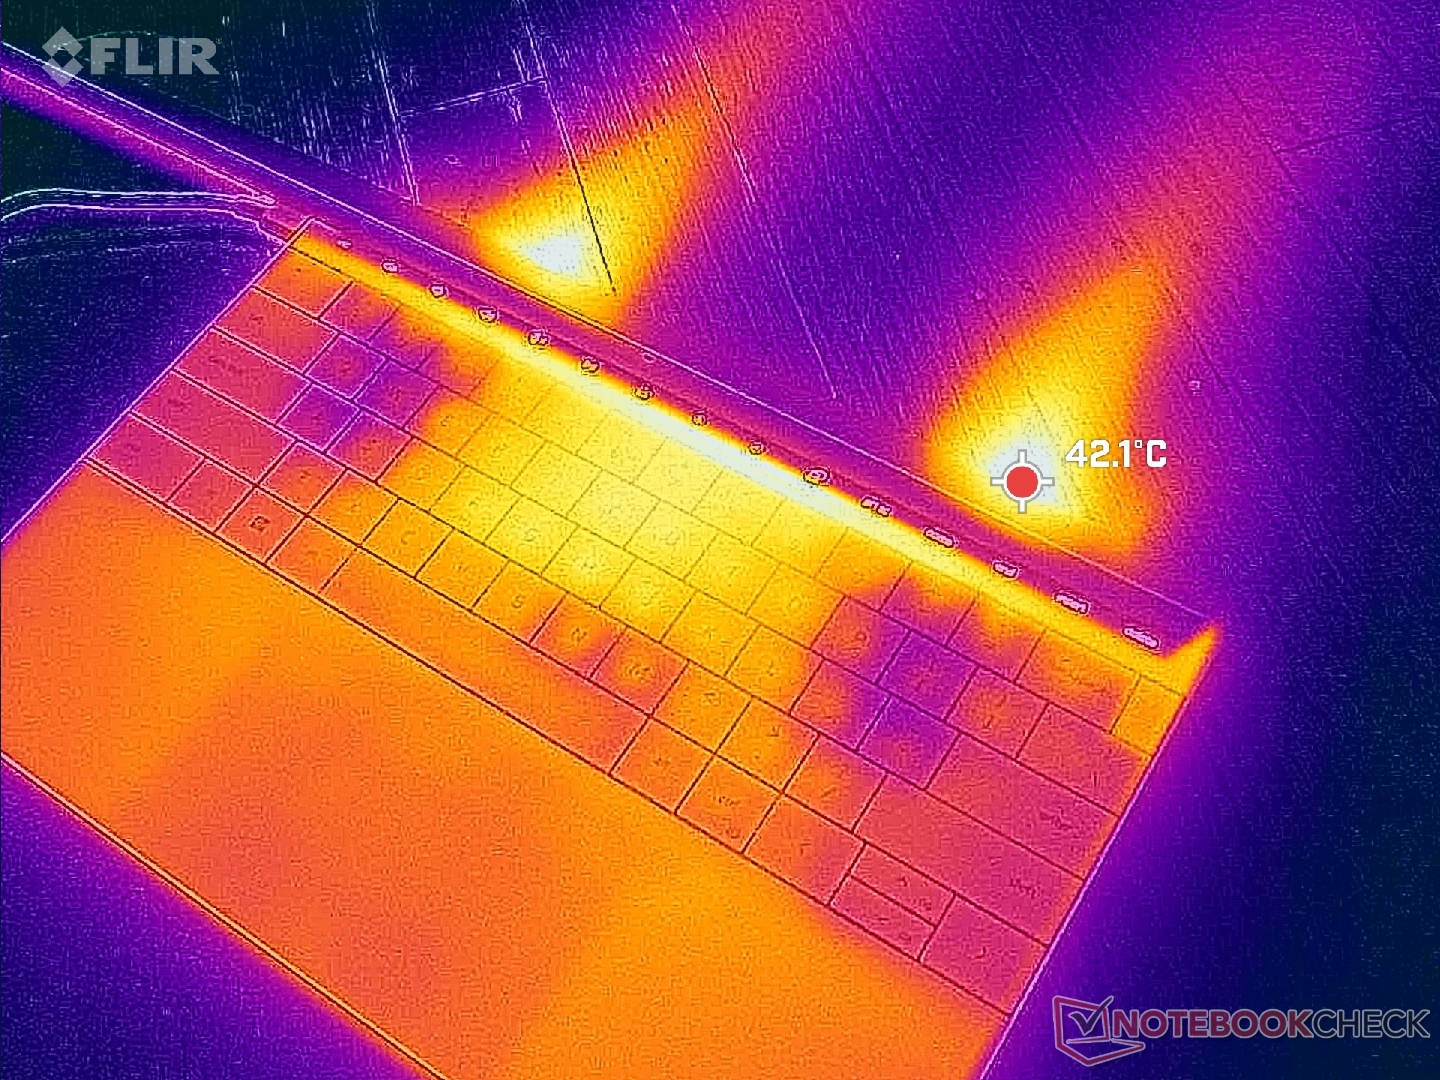

(±) Die maximale Temperatur auf der Oberseite ist 43.8 °C. Im Vergleich liegt der Klassendurchschnitt bei 35.9 °C (von 21.4 bis 59 °C für die Klasse Subnotebook).
(±) Auf der Unterseite messen wir eine maximalen Wert von 44.4 °C (im Vergleich zum Durchschnitt von 39.2 °C).
(+) Ohne Last messen wir eine durchschnittliche Temperatur von 22.4 °C auf der Oberseite. Der Klassendurchschnitt erreicht 30.8 °C.
(±) Beim längeren Spielen von The Witcher 3 erhitzt sich das Gerät durchschnittlich auf 32.9 °C. Der Durchschnitt der Klasse ist derzeit 30.8 °C.
(+) Die Handballen und der Touchpad-Bereich erreichen maximal 32.6 °C und damit die typische Hauttemperatur und fühlen sich daher nicht heiß an.
(-) Die durchschnittliche Handballen-Temperatur anderer getesteter Geräte war 28.2 °C (-4.4 °C).

| Dell XPS 13 Plus 9320 Core i7-1360P Intel Core i7-1360P, Intel Iris Xe Graphics G7 96EUs | Dell XPS 13 Plus 9320 i5-1240p Intel Core i5-1240P, Intel Iris Xe Graphics G7 80EUs | Dell XPS 13 7390 Core i7-10710U Intel Core i7-10710U, Intel UHD Graphics 620 | Framework Laptop 13.5 13th Gen Intel Intel Core i7-1370P, Intel Iris Xe Graphics G7 96EUs | Lenovo ThinkPad X13 Yoga G3 21AW003UGE Intel Core i7-1265U, Intel Iris Xe Graphics G7 96EUs | HP Spectre x360 13.5 14t-ef000 Intel Core i7-1255U, Intel Iris Xe Graphics G7 96EUs | |
|---|---|---|---|---|---|---|
| Hitze | -41% | -13% | 1% | -25% | 14% | |
| Last oben max * (°C) | 43.8 | 47.6 -9% | 44.6 -2% | 38.2 13% | 52.2 -19% | 36.4 17% |
| Last unten max * (°C) | 44.4 | 57 -28% | 49.2 -11% | 41.4 7% | 50.2 -13% | 37 17% |
| Idle oben max * (°C) | 24 | 38.8 -62% | 28.2 -18% | 25.8 -8% | 32 -33% | 20.8 13% |
| Idle unten max * (°C) | 25.2 | 41 -63% | 30.2 -20% | 27.6 -10% | 33.6 -33% | 22.6 10% |
* ... kleinere Werte sind besser
Stresstest
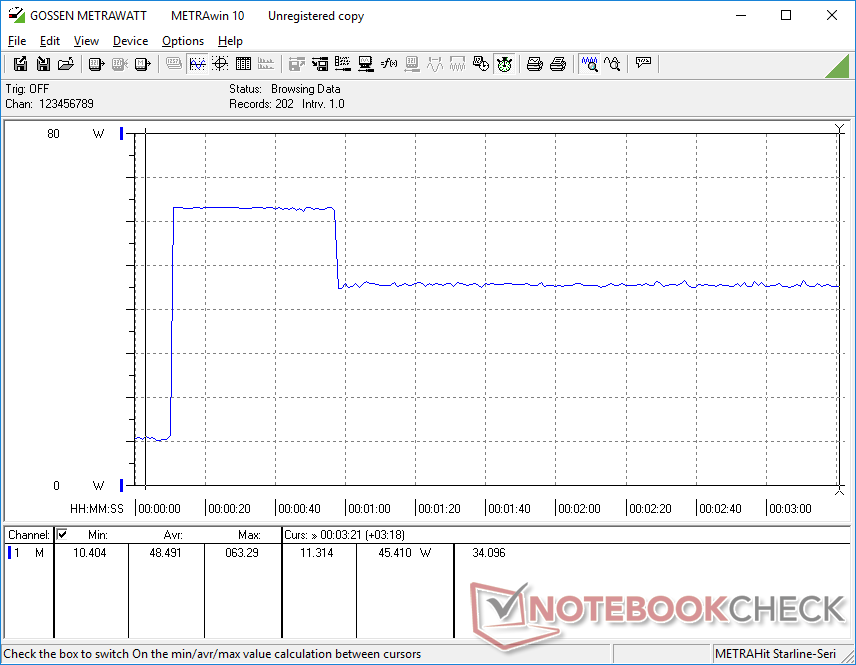
Unter Dauerlast in Prime95 liegen die PL2 und PL1-Limits des Core i7-1360P bei 64 und 34 Watt und damit genauso hoch wie beim Core i7-1280P im letztjährigen XPS 13 Plus. Die Taktrate beträgt in der Spitze 3,6 GHz, danach wird auf 2,3 GHz bei 90 Grad Celsius heruntergetaktet. Die sehr hohen CPU-Temperaturen sind wohl teilweise für die oben thematisierten Oberflächentemperaturen verantwortlich.
Im Akkubetrieb wird die Performance nicht eingeschränkt. Unser 3DMark-11-Benchmark brachte die selben Ergebnisse wie im Netzbetrieb.
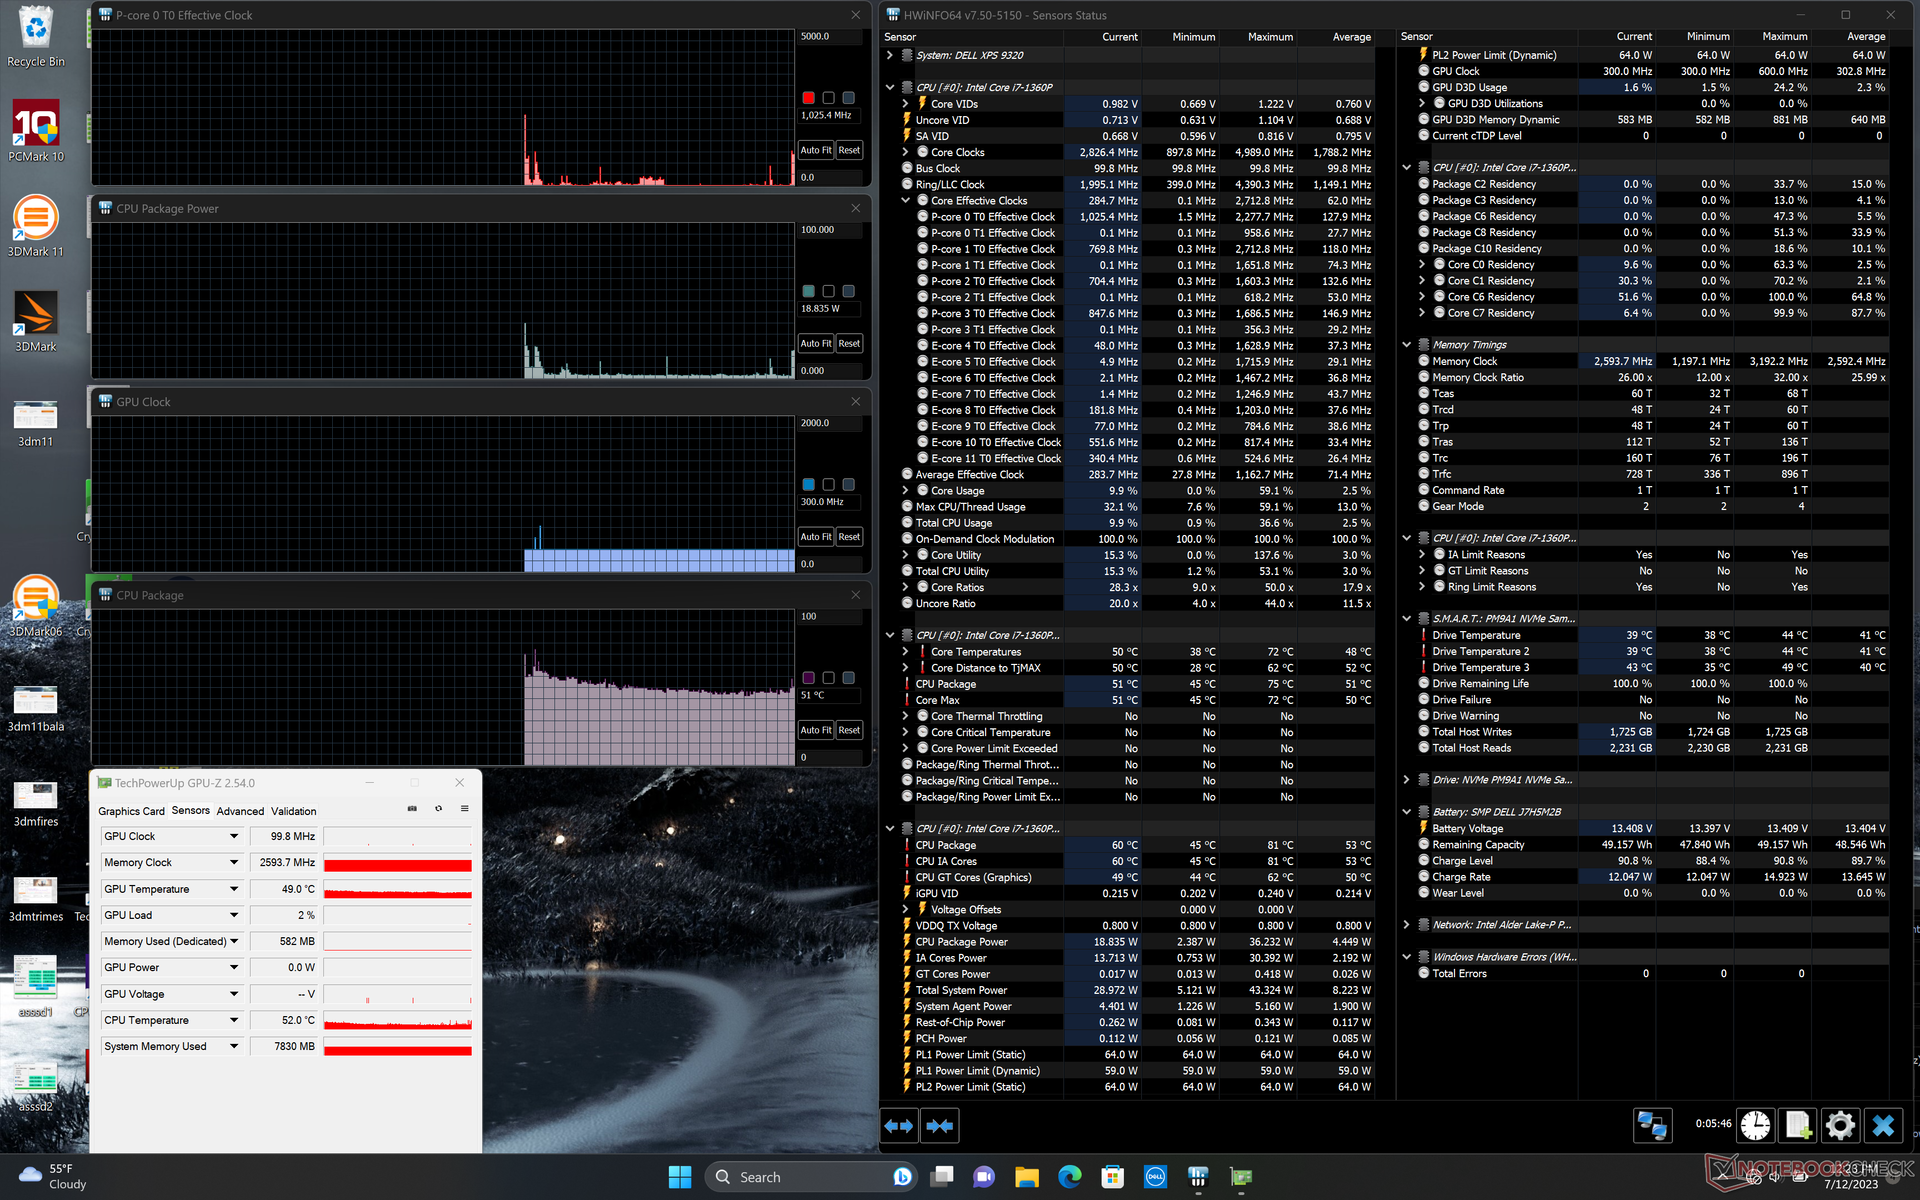
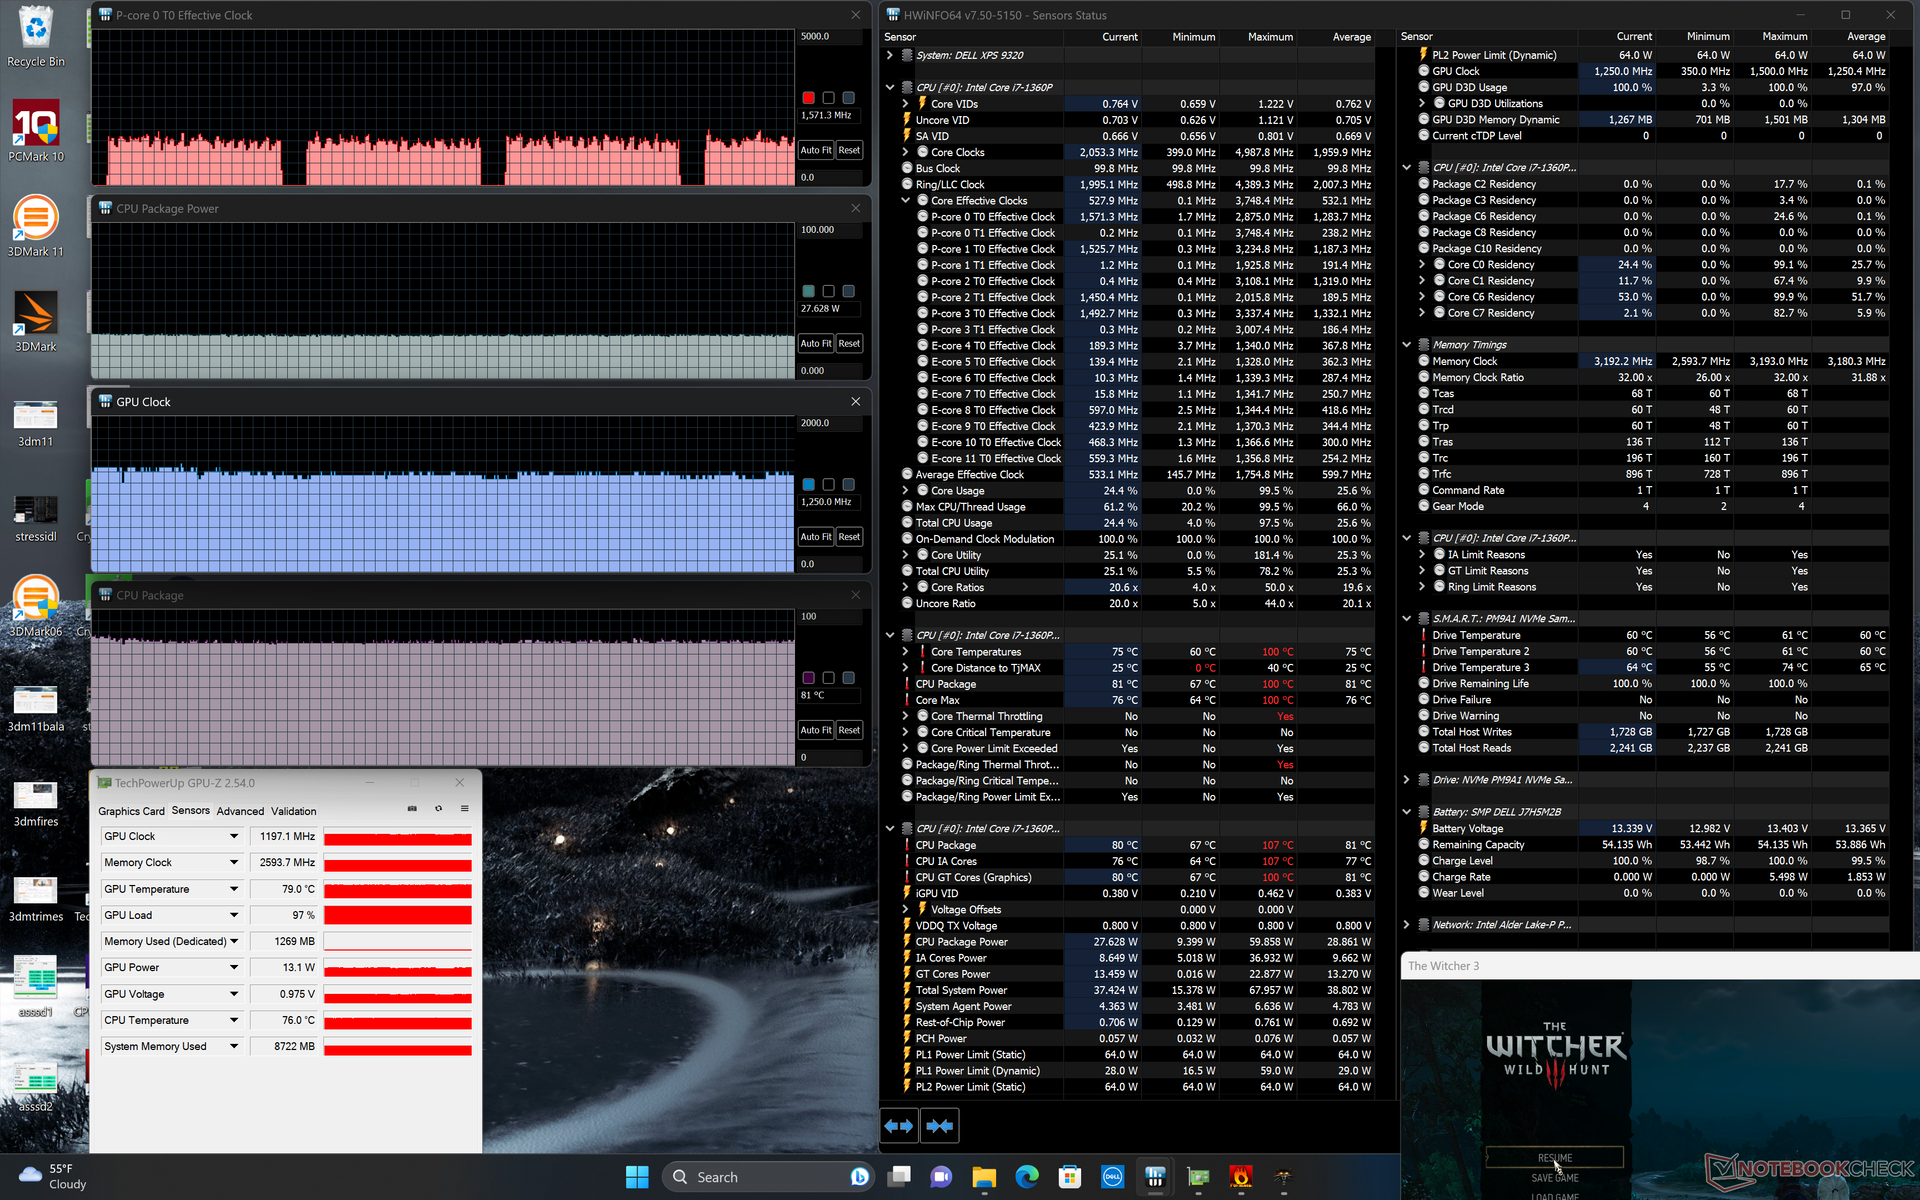
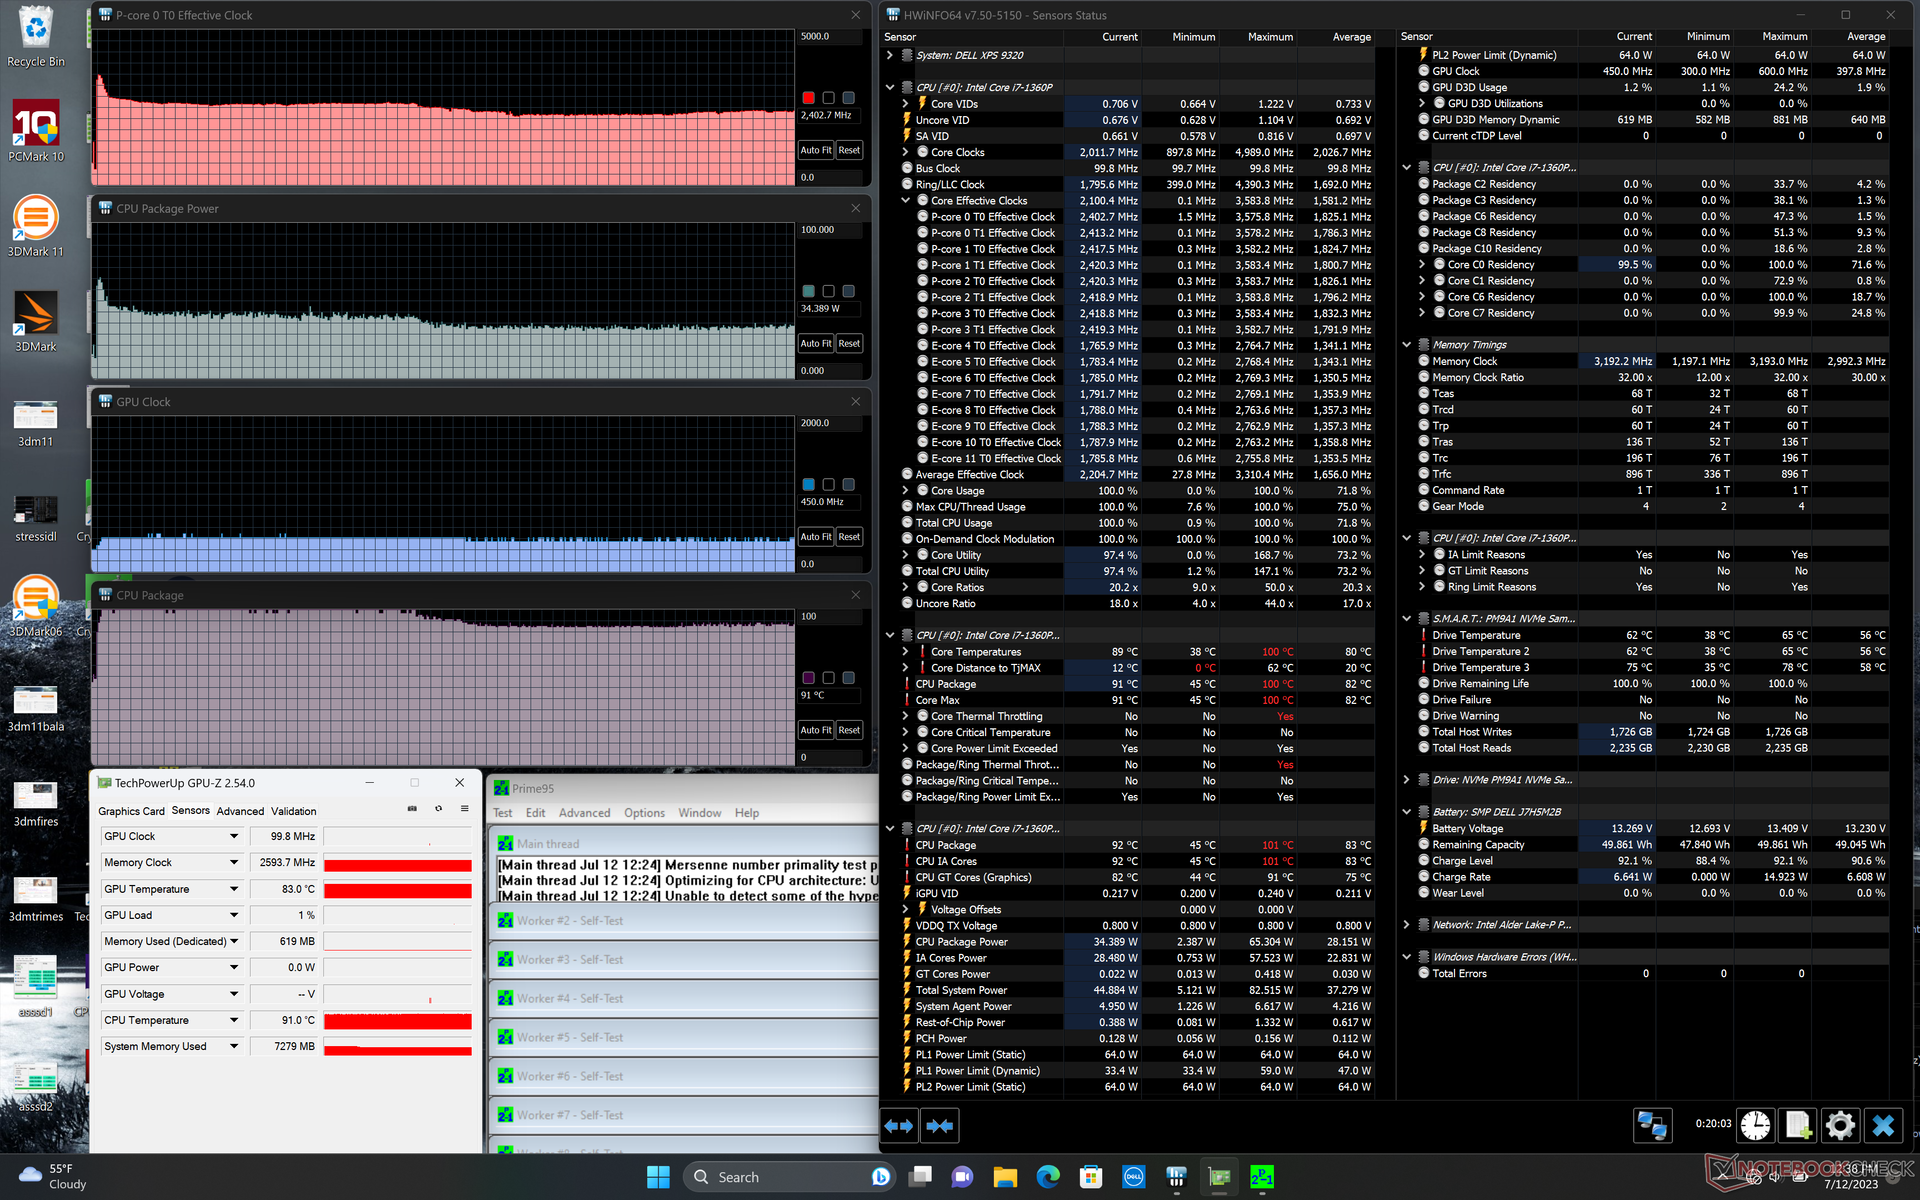
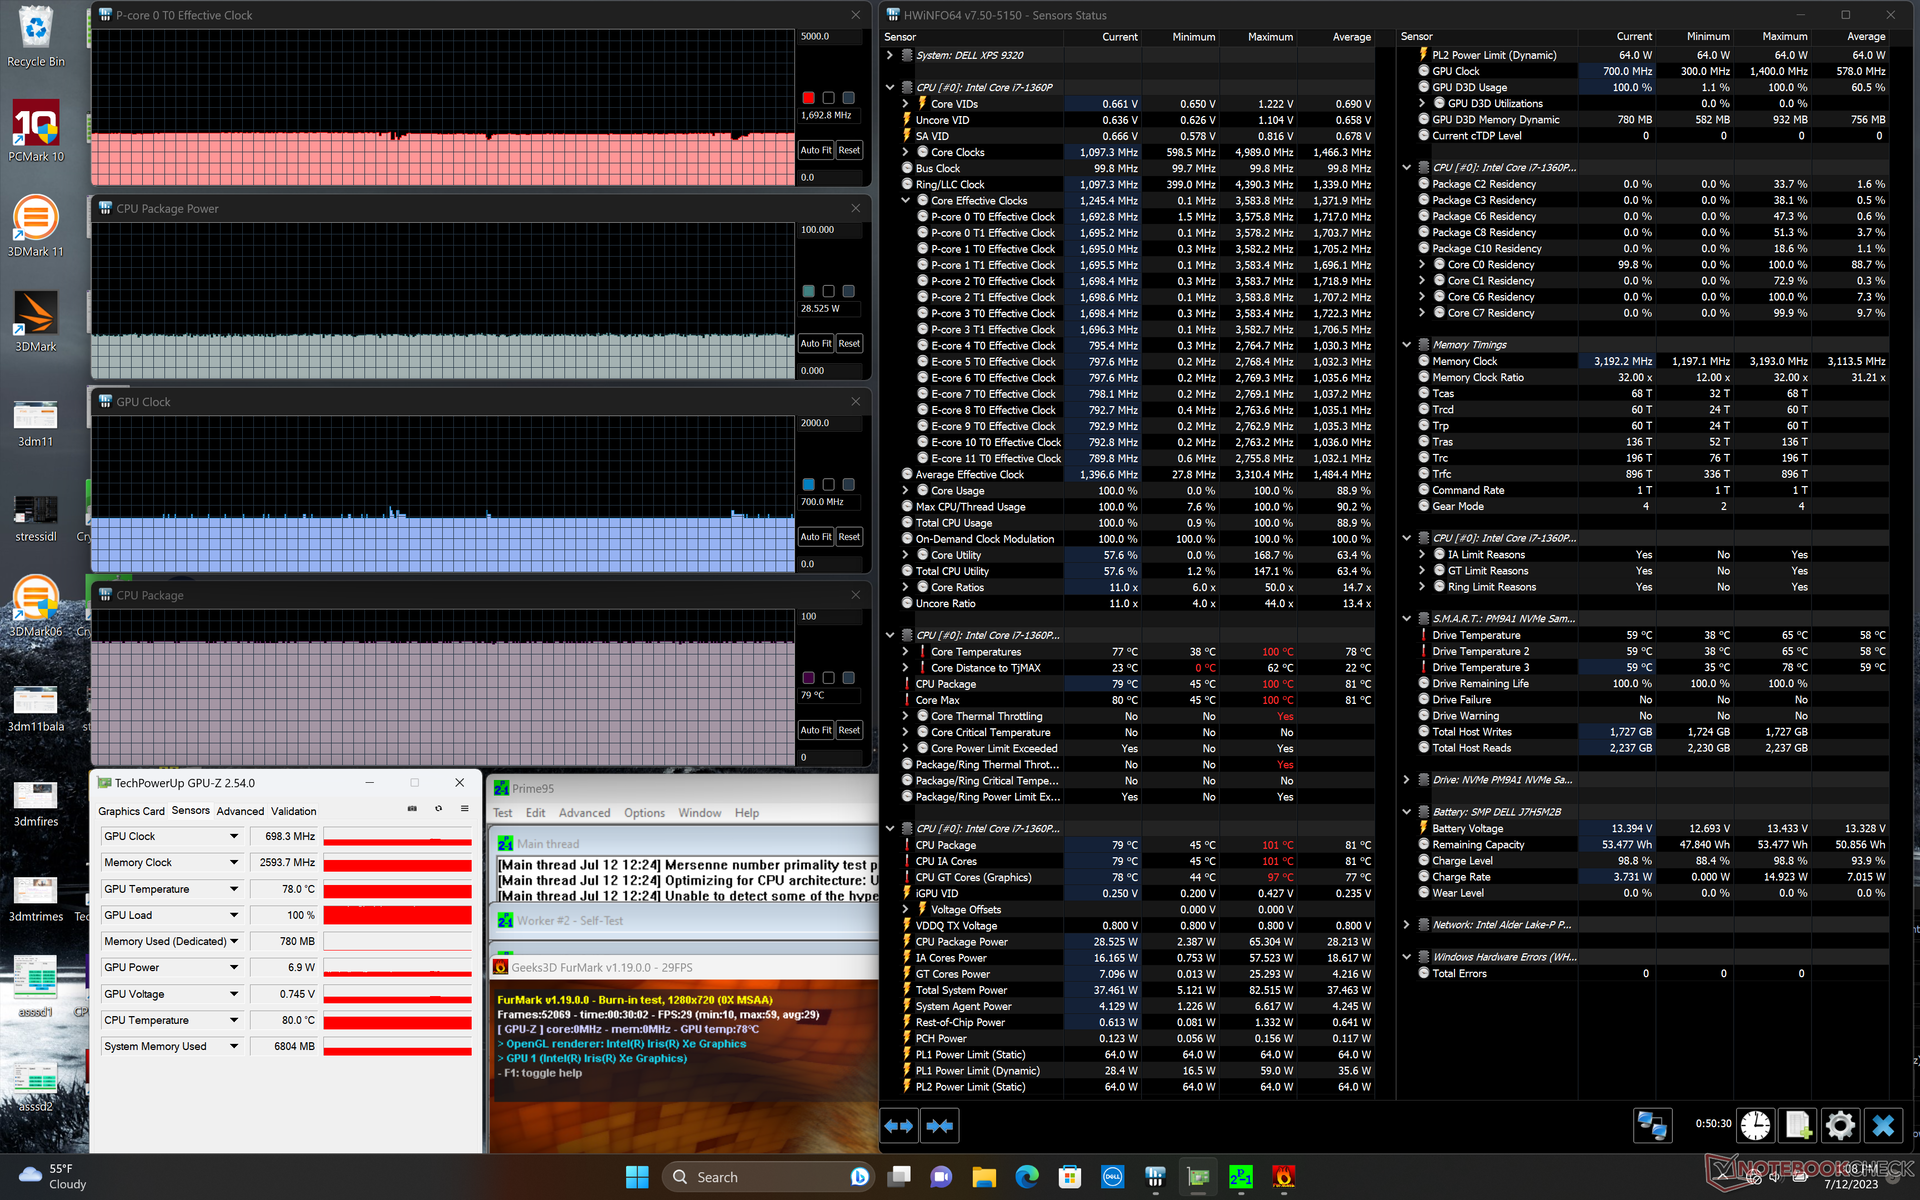
| CPU-Taktrate (GHz) | GPU-Taktrate (MHz) | Durchschnittliche CPU-Temperatur (°C) | |
| System im Leerlauf | -- | -- | 51 |
| Prime95 Stresstest | 2.4 | -- | 91 |
| Prime95 + FurMark Stresstest | 1.7 | 700 | 79 |
| Witcher 3 Stresstest | ~1.6 | 1250 | 81 |
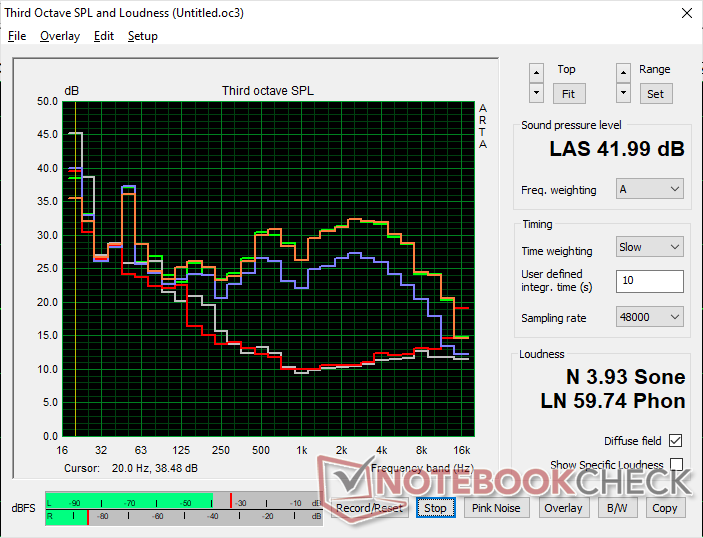
Lautsprecher
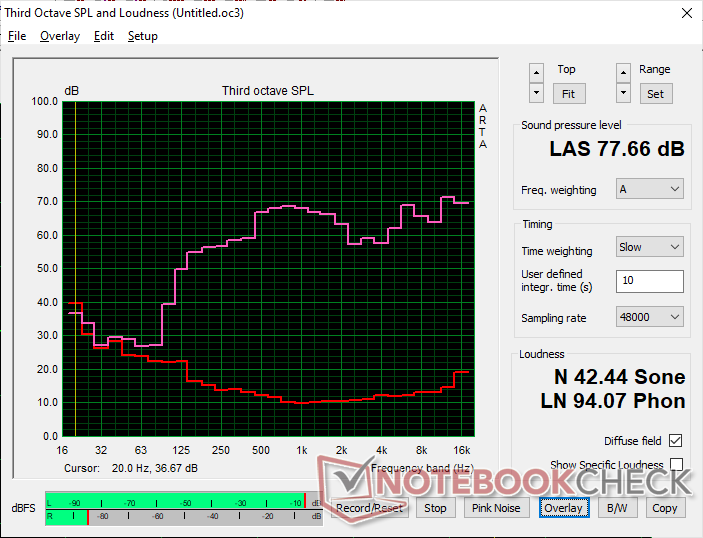
Dell XPS 13 Plus 9320 Core i7-1360P Audio Analyse
(±) | Mittelmäßig laut spielende Lautsprecher (77.7 dB)
Bass 100 - 315 Hz
(±) | abgesenkter Bass - 10.8% geringer als der Median
(±) | durchschnittlich lineare Bass-Wiedergabe (10.2% Delta zum Vorgänger)
Mitteltöne 400 - 2000 Hz
(+) | ausgeglichene Mitten, vom Median nur 3.6% abweichend
(+) | lineare Mitten (3.8% Delta zum Vorgänger)
Hochtöne 2 - 16 kHz
(+) | ausgeglichene Hochtöne, vom Median nur 3.6% abweichend
(±) | durchschnittlich lineare Hochtöne (7.4% Delta zum Vorgänger)
Gesamt im hörbaren Bereich 100 - 16.000 Hz
(+) | hörbarer Bereich ist sehr linear (13.2% Abstand zum Median
Im Vergleich zu allen Geräten derselben Klasse
» 22% aller getesteten Geräte dieser Klasse waren besser, 5% vergleichbar, 74% schlechter
» Das beste Gerät hat einen Delta-Wert von 5%, durchschnittlich ist 18%, das schlechteste Gerät hat 53%
Im Vergleich zu allen Geräten im Test
» 13% aller getesteten Geräte waren besser, 3% vergleichbar, 84% schlechter
» Das beste Gerät hat einen Delta-Wert von 4%, durchschnittlich ist 23%, das schlechteste Gerät hat 134%
Apple MacBook Pro 16 2021 M1 Pro Audio Analyse
(+) | Die Lautsprecher können relativ laut spielen (84.7 dB)
Bass 100 - 315 Hz
(+) | guter Bass - nur 3.8% Abweichung vom Median
(+) | lineare Bass-Wiedergabe (5.2% Delta zum Vorgänger)
Mitteltöne 400 - 2000 Hz
(+) | ausgeglichene Mitten, vom Median nur 1.3% abweichend
(+) | lineare Mitten (2.1% Delta zum Vorgänger)
Hochtöne 2 - 16 kHz
(+) | ausgeglichene Hochtöne, vom Median nur 1.9% abweichend
(+) | sehr lineare Hochtöne (2.7% Delta zum Vorgänger)
Gesamt im hörbaren Bereich 100 - 16.000 Hz
(+) | hörbarer Bereich ist sehr linear (4.6% Abstand zum Median
Im Vergleich zu allen Geräten derselben Klasse
» 0% aller getesteten Geräte dieser Klasse waren besser, 0% vergleichbar, 100% schlechter
» Das beste Gerät hat einen Delta-Wert von 5%, durchschnittlich ist 17%, das schlechteste Gerät hat 45%
Im Vergleich zu allen Geräten im Test
» 0% aller getesteten Geräte waren besser, 0% vergleichbar, 100% schlechter
» Das beste Gerät hat einen Delta-Wert von 4%, durchschnittlich ist 23%, das schlechteste Gerät hat 134%
Energieverwaltung
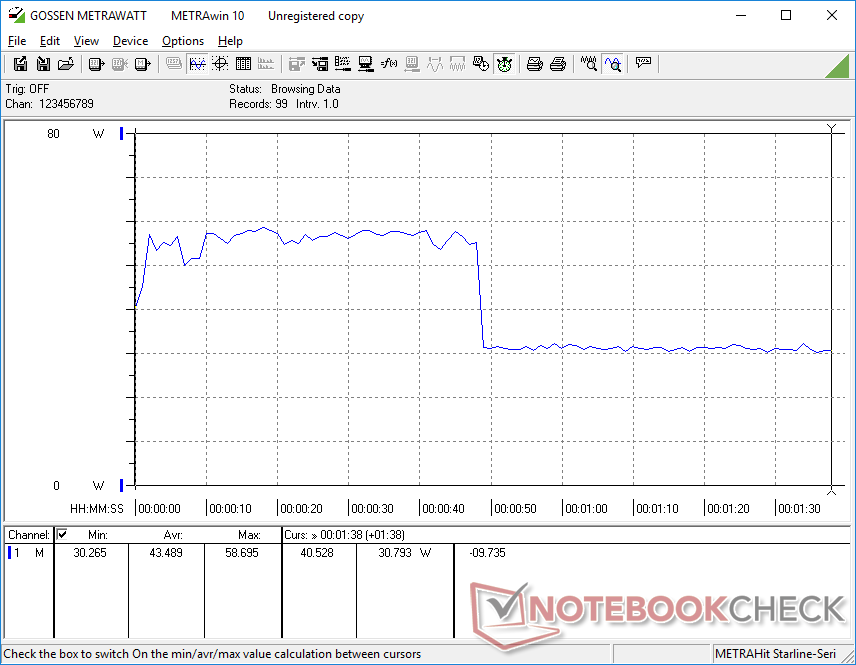
Energieverbrauch
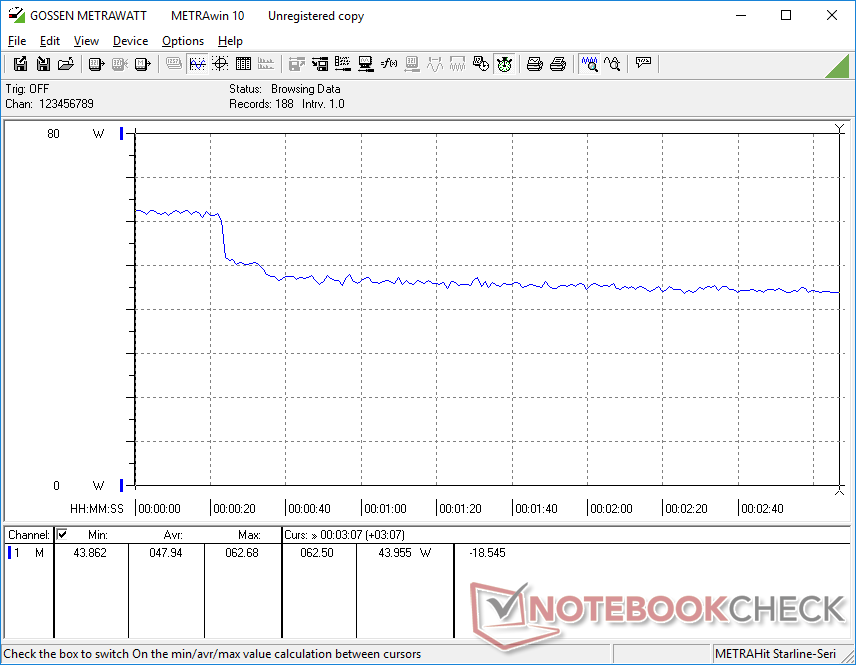
Im Leerlauf liegt der Verbrauch zwischen 6 und 14 Watt, wegen dem stromhungrigen OLED-Display ist diese Spanne also etwas größer als bei den meisten anderen Subnotebooks. Wie wir in einem anderen Artikel bereits erklärt haben, verbrauchen OLED-Panel bei der Darstellung von bestimmten Farben mehr Strom als die farbunabhängigen IPS-Bildschirme.
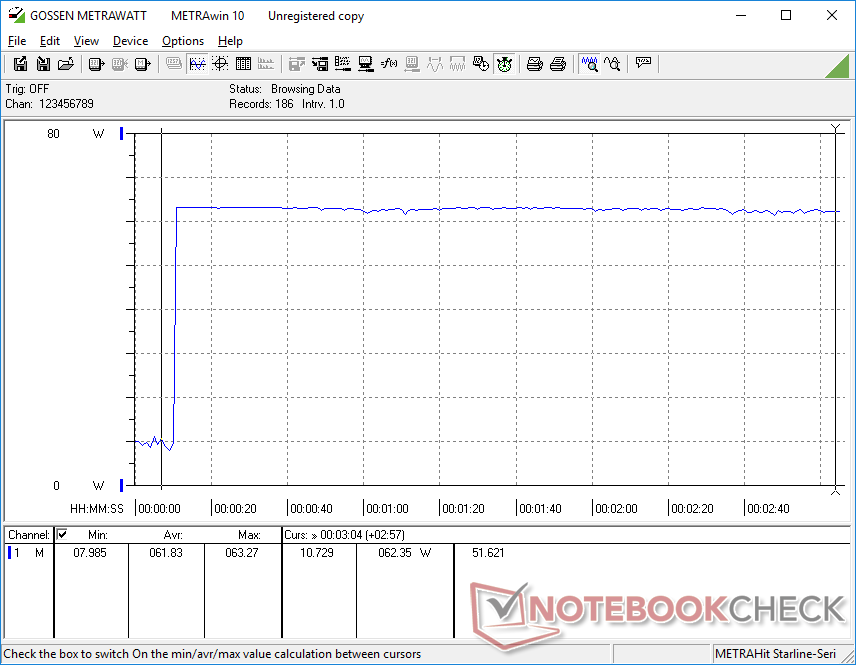
Insgesamt ist der Energieverbrauch trotz des neueren Prozessors ähnlich wie im letzten Jahr. In Prime95 wurden zum Beispiel rund 63 Watt verbraucht, die Leistung pro Watt ist beim Core i7-1360P der 13. Generation also nicht besser als beim Core i7-1280P der 12. Generation.
| Aus / Standby | |
| Idle | |
| Last |
|
Legende:
min: | |
| Dell XPS 13 Plus 9320 Core i7-1360P i7-1360P, Iris Xe G7 96EUs, Samsung PM9A1 MZVL2512HCJQ, OLED, 3456x2160, 13.4" | Dell XPS 13 Plus 9320 i7-1280P OLED i7-1280P, Iris Xe G7 96EUs, WDC PC SN810 512GB, OLED, 3456x2160, 13.4" | Dell XPS 13 7390 Core i7-10710U i7-10710U, UHD Graphics 620, SK Hynix PC601 NVMe 512 GB, IPS, 3840x2160, 13.3" | Framework Laptop 13.5 13th Gen Intel i7-1370P, Iris Xe G7 96EUs, WD PC SN740 SDDPNQD-1T00, IPS, 2256x1504, 13.5" | Lenovo ThinkPad X13 Yoga G3 21AW003UGE i7-1265U, Iris Xe G7 96EUs, Samsung PM9A1 MZVL2512HCJQ, IPS LED, 2560x1600, 13.3" | HP Spectre x360 13.5 14t-ef000 i7-1255U, Iris Xe G7 96EUs, Micron 3400 1TB MTFDKBA1T0TFH, OLED, 3000x2000, 13.5" | |
|---|---|---|---|---|---|---|
| Stromverbrauch | -5% | 16% | 10% | 7% | 16% | |
| Idle min * (Watt) | 6.9 | 6.5 6% | 4.7 32% | 2.9 58% | 4.6 33% | 4 42% |
| Idle avg * (Watt) | 7.4 | 7.8 -5% | 8.3 -12% | 6.3 15% | 7.9 -7% | 4.9 34% |
| Idle max * (Watt) | 13.6 | 13 4% | 9 34% | 9.9 27% | 8.9 35% | 12.5 8% |
| Last avg * (Watt) | 43.5 | 56.6 -30% | 42 3% | 56.2 -29% | 56.1 -29% | 48.1 -11% |
| Witcher 3 ultra * (Watt) | 48 | 49.2 -3% | 56.6 -18% | 40.4 16% | 35.8 25% | |
| Last max * (Watt) | 63.3 | 63 -0% | 49 23% | 60.8 4% | 66.1 -4% | 65.2 -3% |
* ... kleinere Werte sind besser
Energieverbrauch Witcher 3 / Stresstest
Energieverbrauch mit externem Monitor
Akkulaufzeit
Die Laufzeiten sind fast identisch mit denen der Core-i7-1260P-Konfiguration aus dem letzten Jahr und liegen bei rund 7,5 Stunden beim Browsen.
Das Aufladen von 0 auf 100 Prozent dauert mit dem mitgelieferten Netzteil etwas länger als zwei Stunden.
| Dell XPS 13 Plus 9320 Core i7-1360P i7-1360P, Iris Xe G7 96EUs, 55 Wh | Dell XPS 13 Plus 9320 i7-1280P OLED i7-1280P, Iris Xe G7 96EUs, 55 Wh | Dell XPS 13 7390 Core i7-10710U i7-10710U, UHD Graphics 620, 52 Wh | Framework Laptop 13.5 13th Gen Intel i7-1370P, Iris Xe G7 96EUs, 61 Wh | Lenovo ThinkPad X13 Yoga G3 21AW003UGE i7-1265U, Iris Xe G7 96EUs, 52.8 Wh | HP Spectre x360 13.5 14t-ef000 i7-1255U, Iris Xe G7 96EUs, 66 Wh | |
|---|---|---|---|---|---|---|
| Akkulaufzeit | -21% | 15% | 21% | 11% | 10% | |
| WLAN (h) | 7.3 | 5.8 -21% | 8.4 15% | 8.8 21% | 8.1 11% | 8 10% |
| Last (h) | 1.9 | 2.2 | ||||
| Idle (h) | 20.4 |
Pro
Contra
Fazit — Das 2023er-Modell kann bedenkenlos übersprungen werden
Das Design des XPS 13 Plus wurde erst letztes Jahr eingeführt, weshalb die Modellpflege dieses Jahr kaum Neuerungen mit sich bringt. Es wäre auch unrealistisch, bedeutsame interne Änderungen zu erwarten, aber das 2023er-Modell ist aufgrund des kaum schnelleren oder effizienteren Prozessors eher enttäuschend. In Sachen Videowiedergabe und der drosselnden SSD gibt es sogar ein paar Rückschritte, und alle vorherigen Schwachpunkte des ursprünglichen Dell XPS 13 Plus 9320 sind auch im Jahr 2023 noch vorhanden.
Der Core i7-1360P der 13. Generation fühlt sich an wie ein umgetaufter Core i7-1280P aus der 12. Generation. Angehende Käufer sollten vielleicht lieber einen Blick auf das originale XPS 13 Plus 9320 aus dem Jahr 2022 anstelle der neuen 2023er-Version werfen.
Wer die Anschaffung eines XPS 13 Plus 9320 in Erwägung zieht, dem empfehlen wir das günstigere Modell aus dem Jahr 2022, das die praktisch gleiche Leistung wie die neue Version bietet. Käufer können das zusätzliche Geld lieber in handfeste Upgrades wie einen größeren Arbeitsspeicher, eine größere SSD oder ein höher auflösendes Display investieren.
Preis und Verfügbarkeit
Die günstigste Konfiguration des Dell XPS 13 9320 mit Full-HD-Display ist ab 1.239 Euro bestellbar, für die Ausführung mit 4K-Display fallen mindestens 1.639 Euro an.
Dell XPS 13 Plus 9320 Core i7-1360P
- 16.07.2023 v7 (old)
Allen Ngo
Transparenz
Die Auswahl der zu testenden Geräte erfolgt innerhalb der Redaktion. Das vorliegende Testmuster wurde dem Autor vom Hersteller oder einem Shop zu Testzwecken leihweise zur Verfügung gestellt. Eine Einflussnahme des Leihstellers auf den Testbericht gab es nicht, der Hersteller erhielt keine Version des Reviews vor der Veröffentlichung. Es bestand keine Verpflichtung zur Publikation. Als eigenständiges, unabhängiges Unternehmen unterliegt Notebookcheck keiner Diktion von Herstellern, Shops und Verlagen.
So testet Notebookcheck
Pro Jahr werden von Notebookcheck hunderte Laptops und Smartphones unabhängig in von uns standardisierten technischen Verfahren getestet, um eine Vergleichbarkeit aller Testergebnisse zu gewährleisten. Seit rund 20 Jahren entwickeln wir diese Testmethoden kontinuierlich weiter und setzen damit Branchenstandards. In unseren Testlaboren kommt ausschließlich hochwertiges Messequipment in die Hände erfahrener Techniker und Redakteure. Die Tests unterliegen einer mehrstufigen Kontrolle. Unsere komplexe Gesamtbewertung basiert auf hunderten fundierten Messergebnissen und Benchmarks, womit Ihnen Objektivität garantiert ist. Weitere Informationen zu unseren Testmethoden gibt es hier.
Preisvergleich

