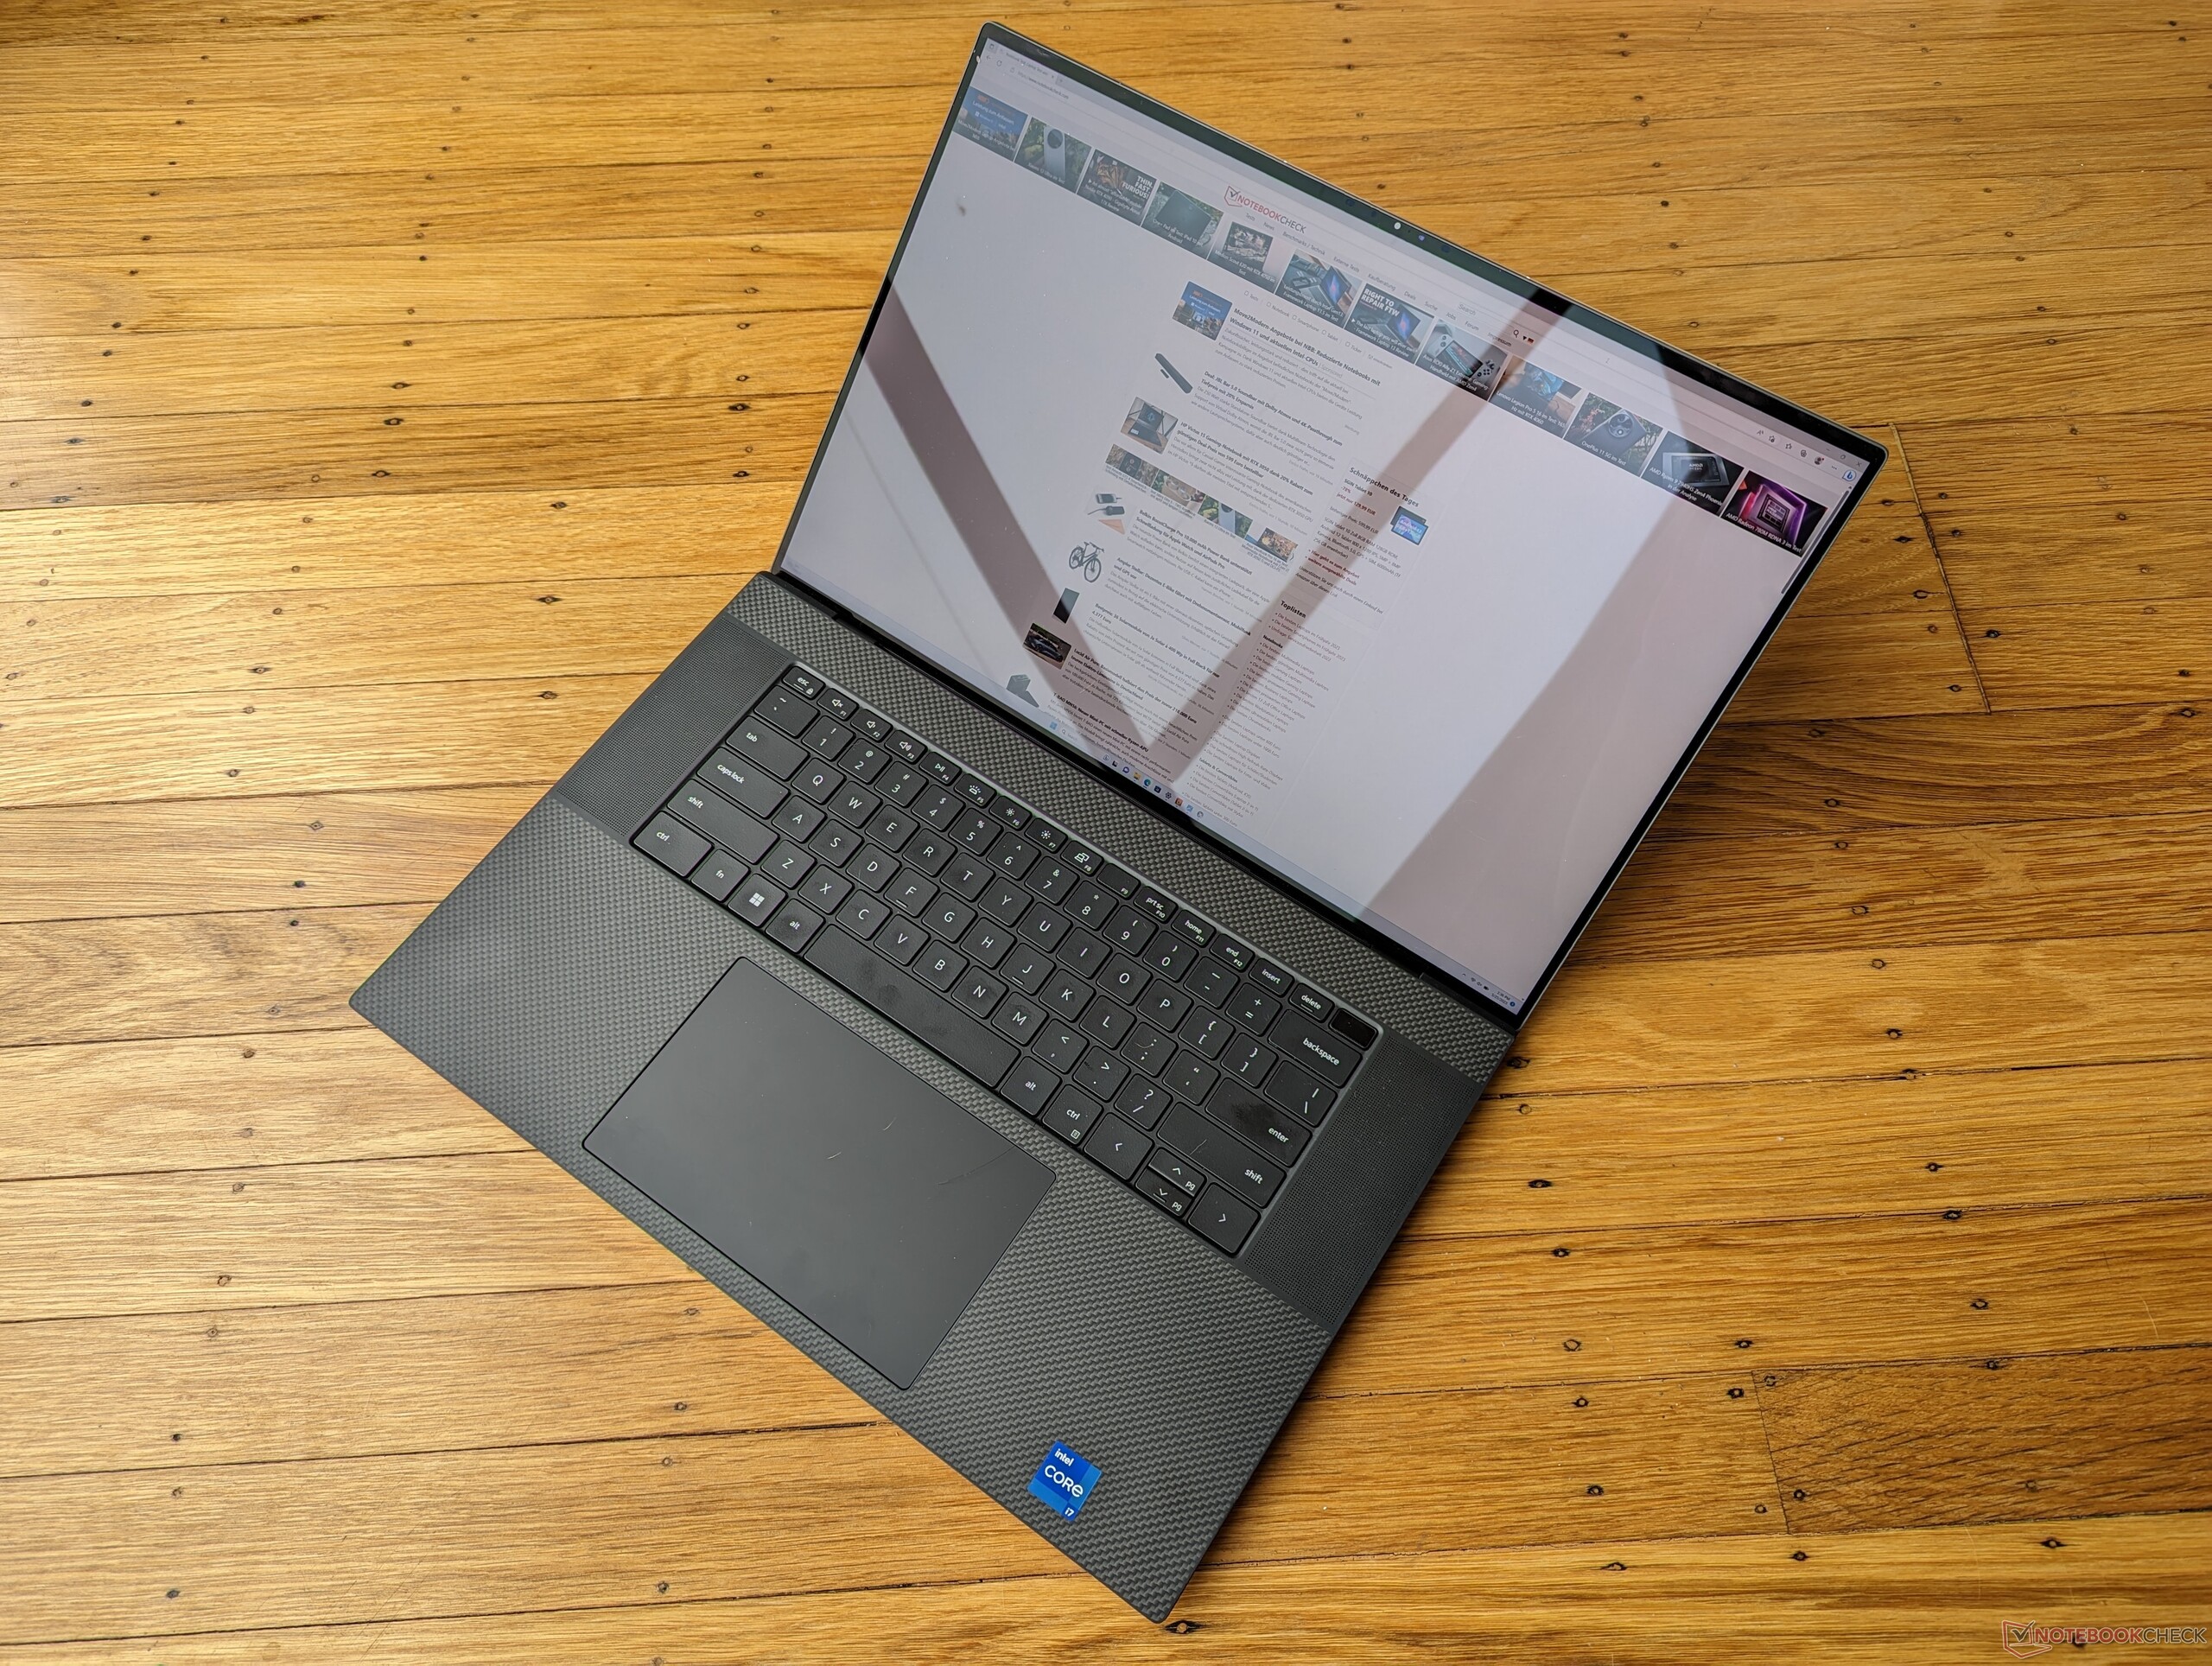
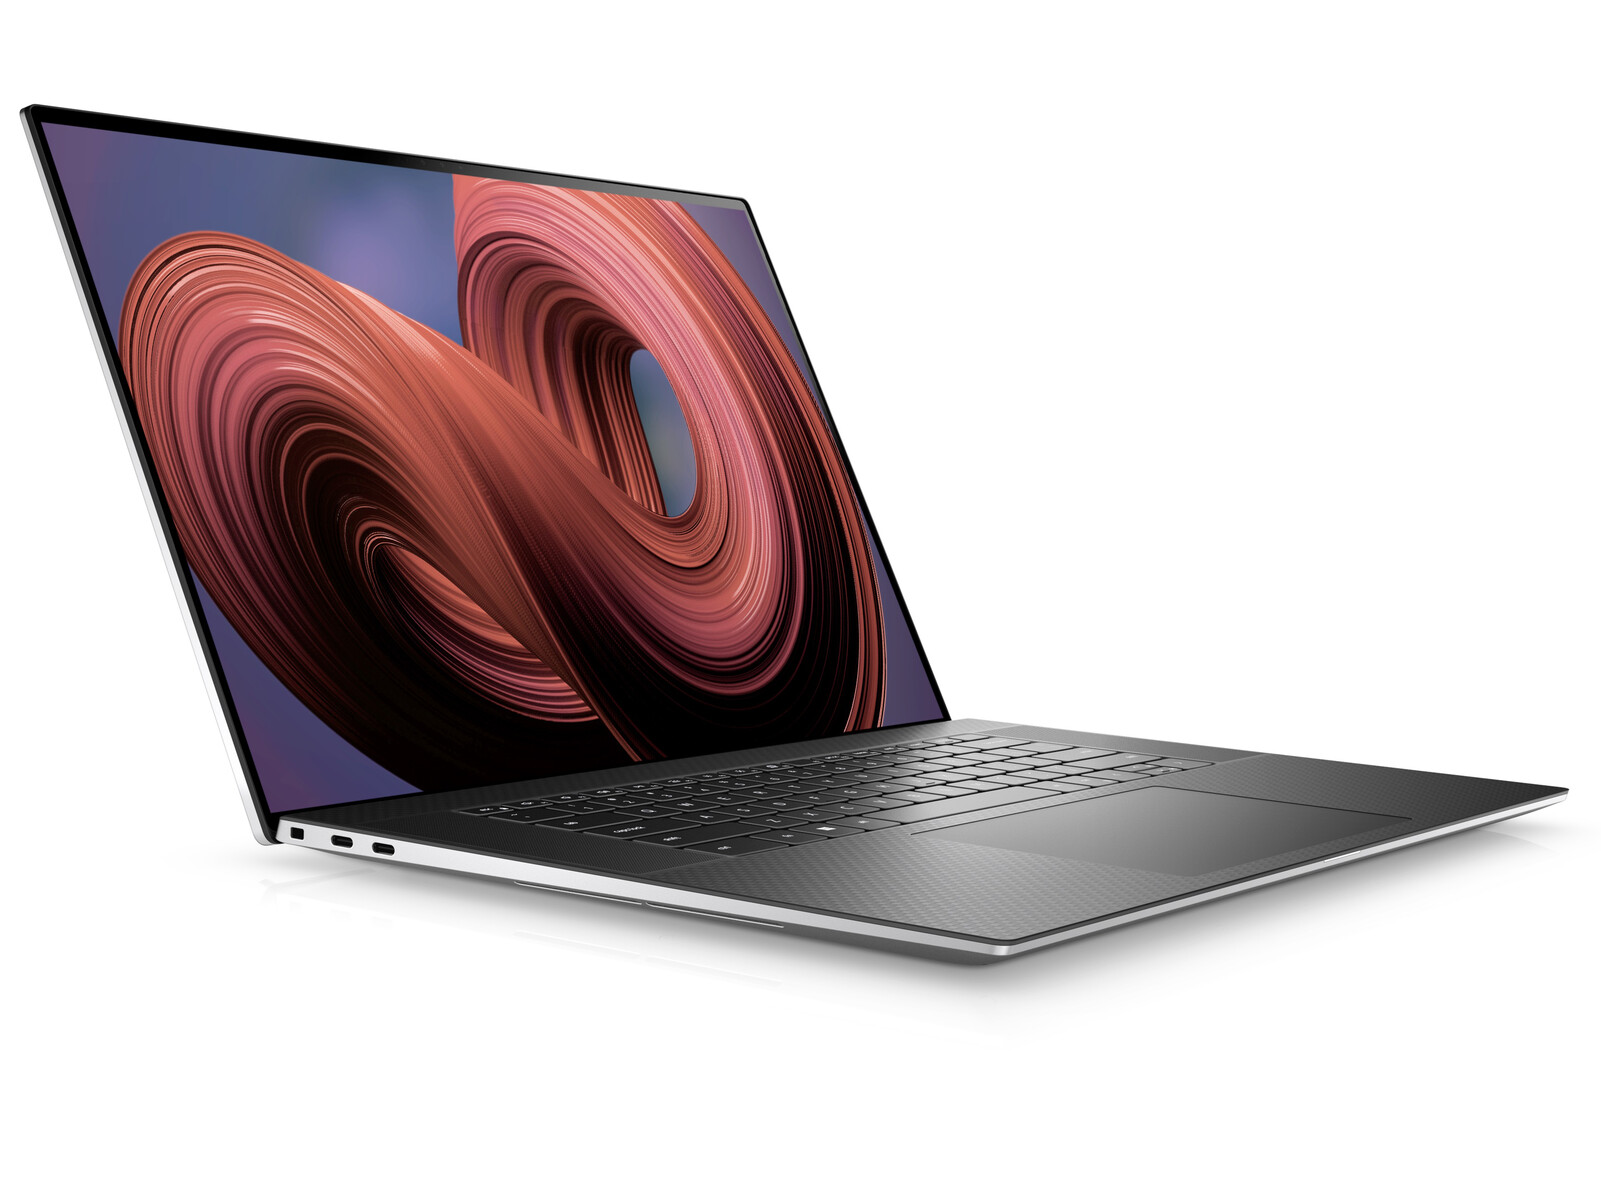
Dell XPS 17 9730 Laptop Test: Multimedia-Monster mit GeForce RTX 4070

Das XPS 17 9730 aus diesem Jahr ist die vierte Ausführung des originalen Designs vom XPS 17 9700 (2020). Es handelt sich um ein internes Update mit einer Intel-Raptor-Lake-H-CPU und einer Nvidia-Ada-Lovelace-GPU, welche die alte Alder-Lake-H-CPU der 12. Generation und die Ampere-Version ersetzen. Abgesehen davon gibt es keine großen Änderungen, weshalb wir den Test des originalen XPS 17 9700 empfehlen. In diesem lässt sich auch mehr zu den physischen Eigenschaften des Laptops nachlesen. Alle zukünftigen Modelle werden sich designtechnisch wahrscheinlich an der XPS 13 Plus Serie orientieren.
Die Konfiguration unseres Testgeräts beinhaltet eine i7-13700H CPU, eine RTX 4070 und einen glänzenden UHD+-2.400p-Touchscreen für ungefähr 3.270 Euro UVP. Andere verfügbare Konfigurationen wären jene mit einer RTX 4050, einer RTX 4060, einer RTX 4080, einer i9-13900H-CPU oder einem matten 1.200p-Display. Interessanterweise erscheinen alle Konfigurationen mit einer dedizierten Grafikkarte, obwohl frühere XPS-17-Modelle die günstigeren und integrierten UHD oder Iris-Xe-Optionen besaßen.
Andere Geräte aus dieser Preisklasse verfügen ebenfalls über einen 17 Zoll Bildschirm, wie das LG Gram 17, das HP Envy 17, das MSI Creator Z17 oder das 16 Zoll Apple MacBook Pro 16.
Weitere Dell Reviews:
Potenzielle Mitstreiter im Vergleich
Bew. | Datum | Modell | Gewicht | Dicke | Größe | Auflösung | Preis ab |
|---|---|---|---|---|---|---|---|
| 90 % v7 (old) | 05 / 2023 | Dell XPS 17 9730 RTX 4070 i7-13700H, GeForce RTX 4070 Laptop GPU | 2.5 kg | 19.5 mm | 17.00" | 3840x2400 | |
| 88.8 % v7 (old) | 06 / 2022 | Dell XPS 17 9720 RTX 3060 i7-12700H, GeForce RTX 3060 Laptop GPU | 2.5 kg | 19.5 mm | 17.00" | 3840x2400 | |
| 86.4 % v7 (old) | 05 / 2023 | LG Gram 17 (2023) i7-1360P, Iris Xe G7 96EUs | 1.4 kg | 17.8 mm | 17.00" | 2560x1600 | |
| 86.3 % v7 (old) | 04 / 2023 | HP Envy 17-cr0079ng i7-1255U, GeForce RTX 2050 Mobile | 2.6 kg | 19.6 mm | 17.30" | 3840x2160 | |
| 83.8 % v7 (old) | 09 / 2022 | MSI Creator Z17 A12UGST-054 i9-12900H, GeForce RTX 3070 Ti Laptop GPU | 2.5 kg | 19 mm | 17.00" | 2560x1600 | |
| 93.7 % v7 (old) | 03 / 2023 | Apple MacBook Pro 16 2023 M2 Max M2 Max, M2 Max 38-Core GPU | 2.2 kg | 16.8 mm | 16.20" | 3456x2234 |
Gehäuse - gleiches Design nun im dritten Jahr
SD-Kartenleser
| SD Card Reader | |
| average JPG Copy Test (av. of 3 runs) | |
| Dell XPS 17 9720 RTX 3060 (Toshiba Exceria Pro SDXC 64 GB UHS-II) | |
| Dell XPS 17 9730 RTX 4070 (Toshiba Exceria Pro SDXC 64 GB UHS-II) | |
| Apple MacBook Pro 16 2023 M2 Max (Angelbird AV Pro V60) | |
| MSI Creator Z17 A12UGST-054 (AV Pro SD microSD 128 GB V60) | |
| HP Envy 17-cr0079ng (AV Pro SD microSD 128 GB V60) | |
| LG Gram 17 (2023) (AV Pro SD microSD 128 GB V60) | |
| maximum AS SSD Seq Read Test (1GB) | |
| Apple MacBook Pro 16 2023 M2 Max (Angelbird AV Pro V60) | |
| Dell XPS 17 9730 RTX 4070 (Toshiba Exceria Pro SDXC 64 GB UHS-II) | |
| Dell XPS 17 9720 RTX 3060 (Toshiba Exceria Pro SDXC 64 GB UHS-II) | |
| LG Gram 17 (2023) (AV Pro SD microSD 128 GB V60) | |
| MSI Creator Z17 A12UGST-054 (AV Pro SD microSD 128 GB V60) | |
| HP Envy 17-cr0079ng (AV Pro SD microSD 128 GB V60) | |
Kommunikation - kein WiFi 6E
Das XPS 15 und das XPS 17 sind weiterhin die einzigen Laptops, die zwar ein WiFi-6E-Modul besitzen, dieses aber trotzdem nicht unterstützen. Dies bedeutet, dass es unmöglich ist, eine Verbindung mit einem 6-GHz-WiFi herzustellen. Das sollte zwar für die meisten Nutzer kein Problem darstellen, es ist aber trotzdem für einen Laptop mit einem Preis von mehr als 3.200 Euro eher enttäuschend.
| Networking | |
| iperf3 transmit AXE11000 | |
| LG Gram 17 (2023) | |
| Dell XPS 17 9720 RTX 3060 | |
| HP Envy 17-cr0079ng | |
| Dell XPS 17 9730 RTX 4070 | |
| iperf3 receive AXE11000 | |
| LG Gram 17 (2023) | |
| HP Envy 17-cr0079ng | |
| Dell XPS 17 9720 RTX 3060 | |
| Dell XPS 17 9730 RTX 4070 | |
| iperf3 transmit AXE11000 6GHz | |
| Apple MacBook Pro 16 2023 M2 Max | |
| LG Gram 17 (2023) | |
| HP Envy 17-cr0079ng | |
| MSI Creator Z17 A12UGST-054 | |
| iperf3 receive AXE11000 6GHz | |
| Apple MacBook Pro 16 2023 M2 Max | |
| MSI Creator Z17 A12UGST-054 | |
| HP Envy 17-cr0079ng | |
| LG Gram 17 (2023) | |
Webcam - nur 720p
Das XPS 15 und das XPS 17 sind wahrscheinlich die einzigen Modelle, die immer noch mit einer 1-MP- oder 720p-Webcam (ohne Kameraverdeckung) ausgeliefert werden. Vergleichbare Firmen wie Lenovo, HP, Asus oder andere verbauen mittlerweile 2-MP- oder sogar 8-MP-Kameras. Dell gibt an, dass der sehr schmale Rand des XPS Designs die Qualität des Sensors limitiert.


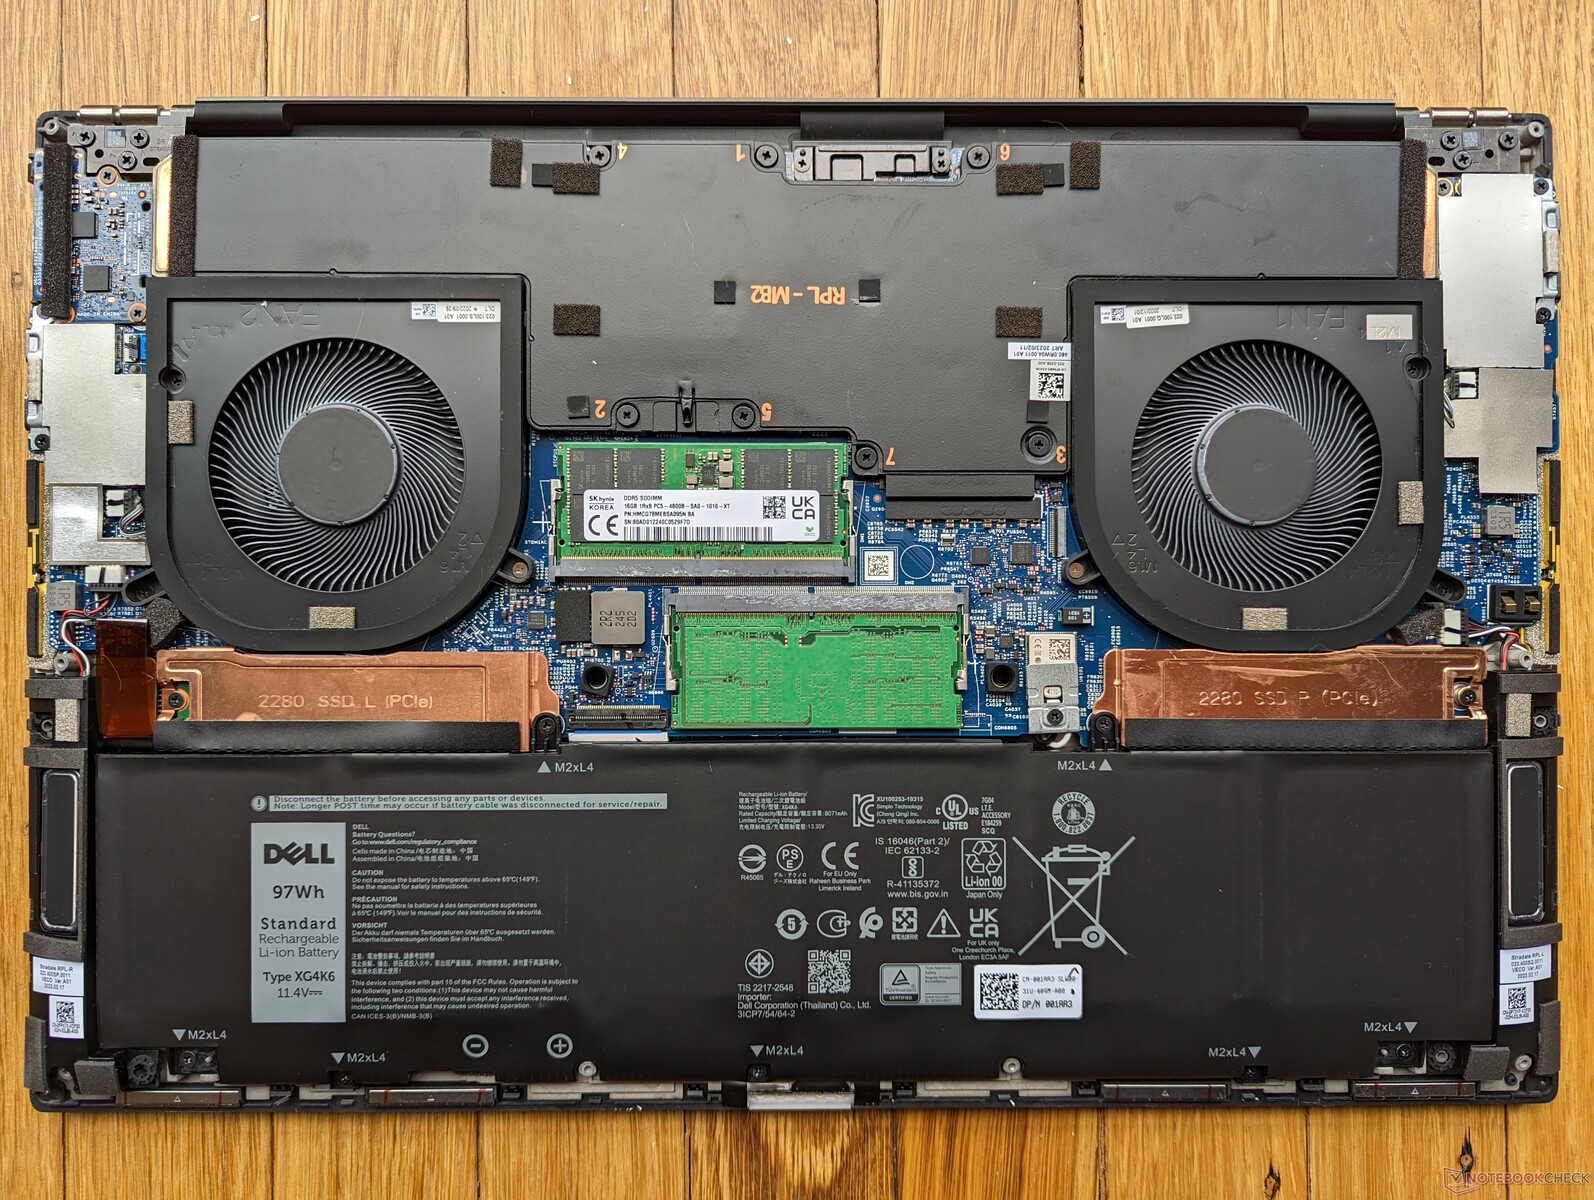
Wartung
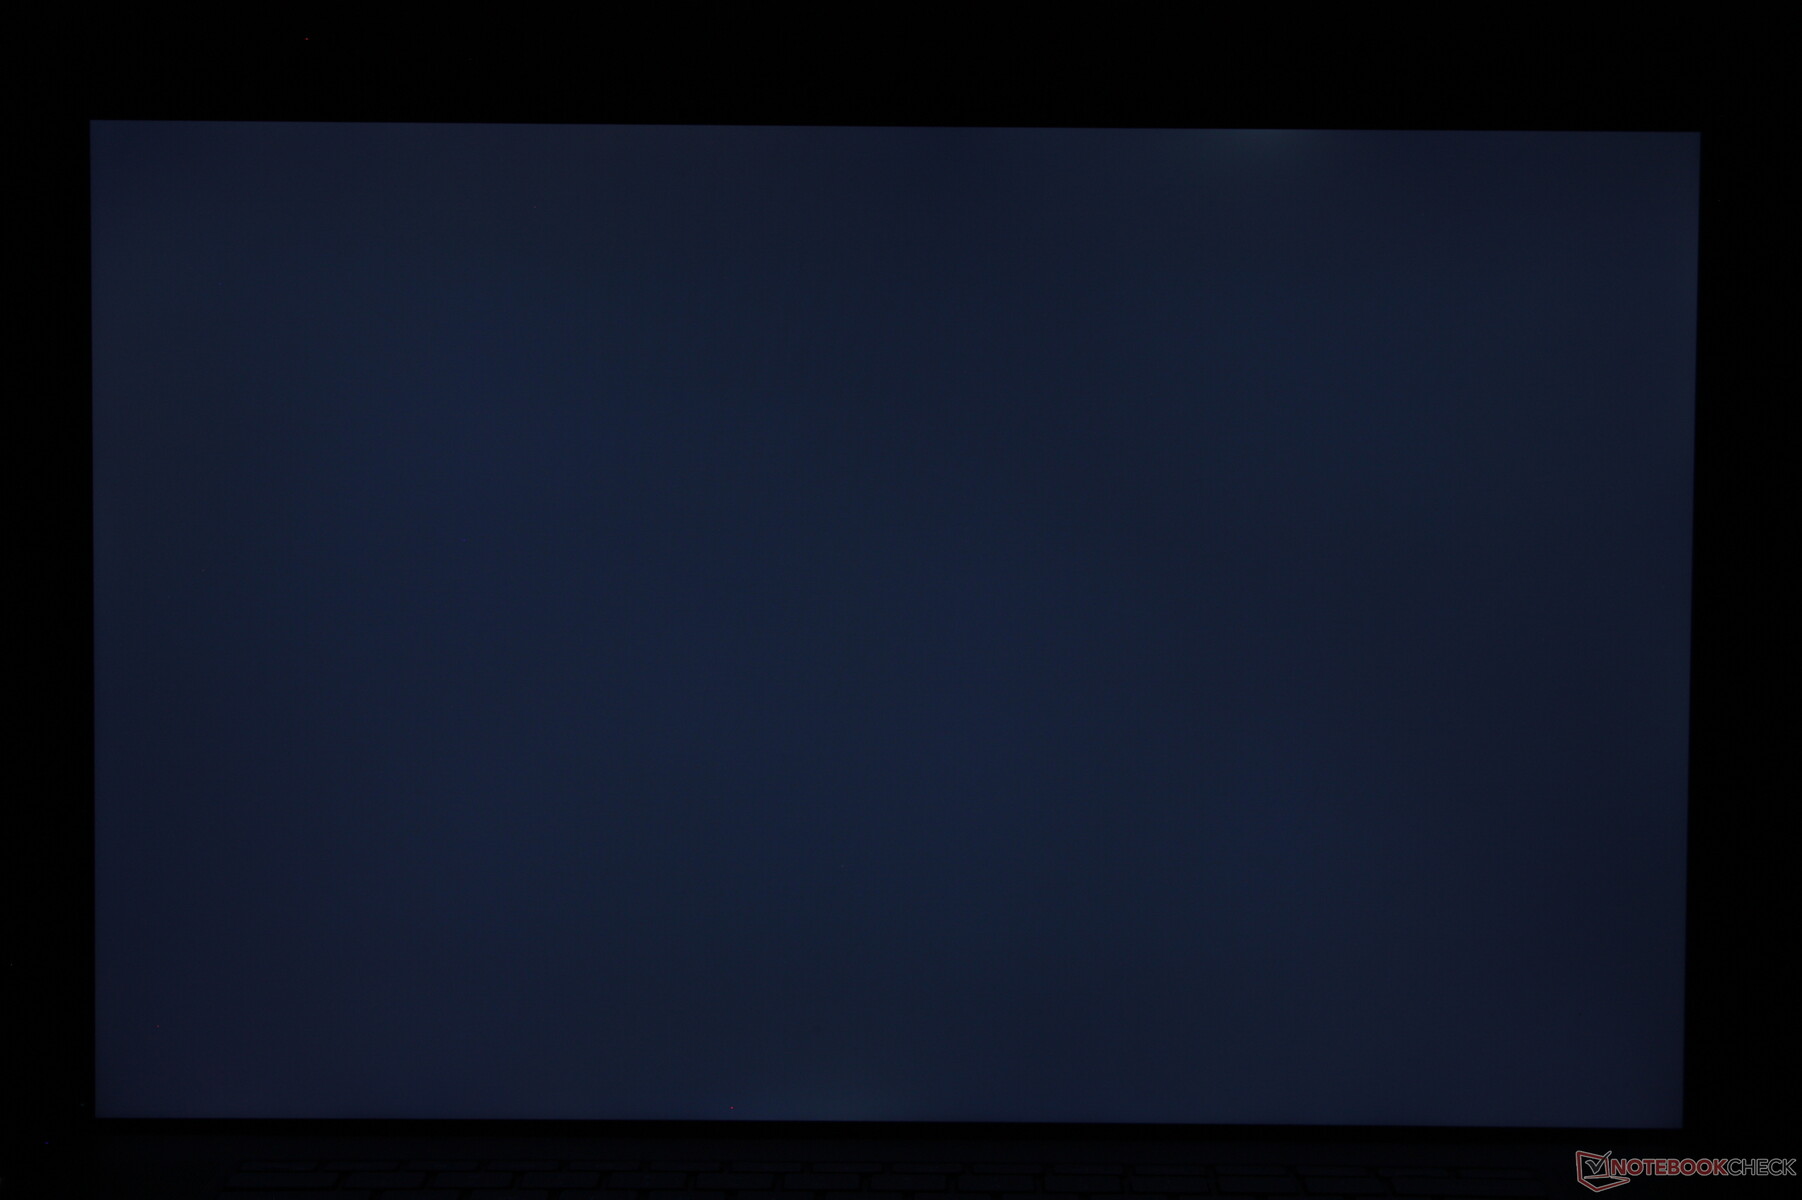
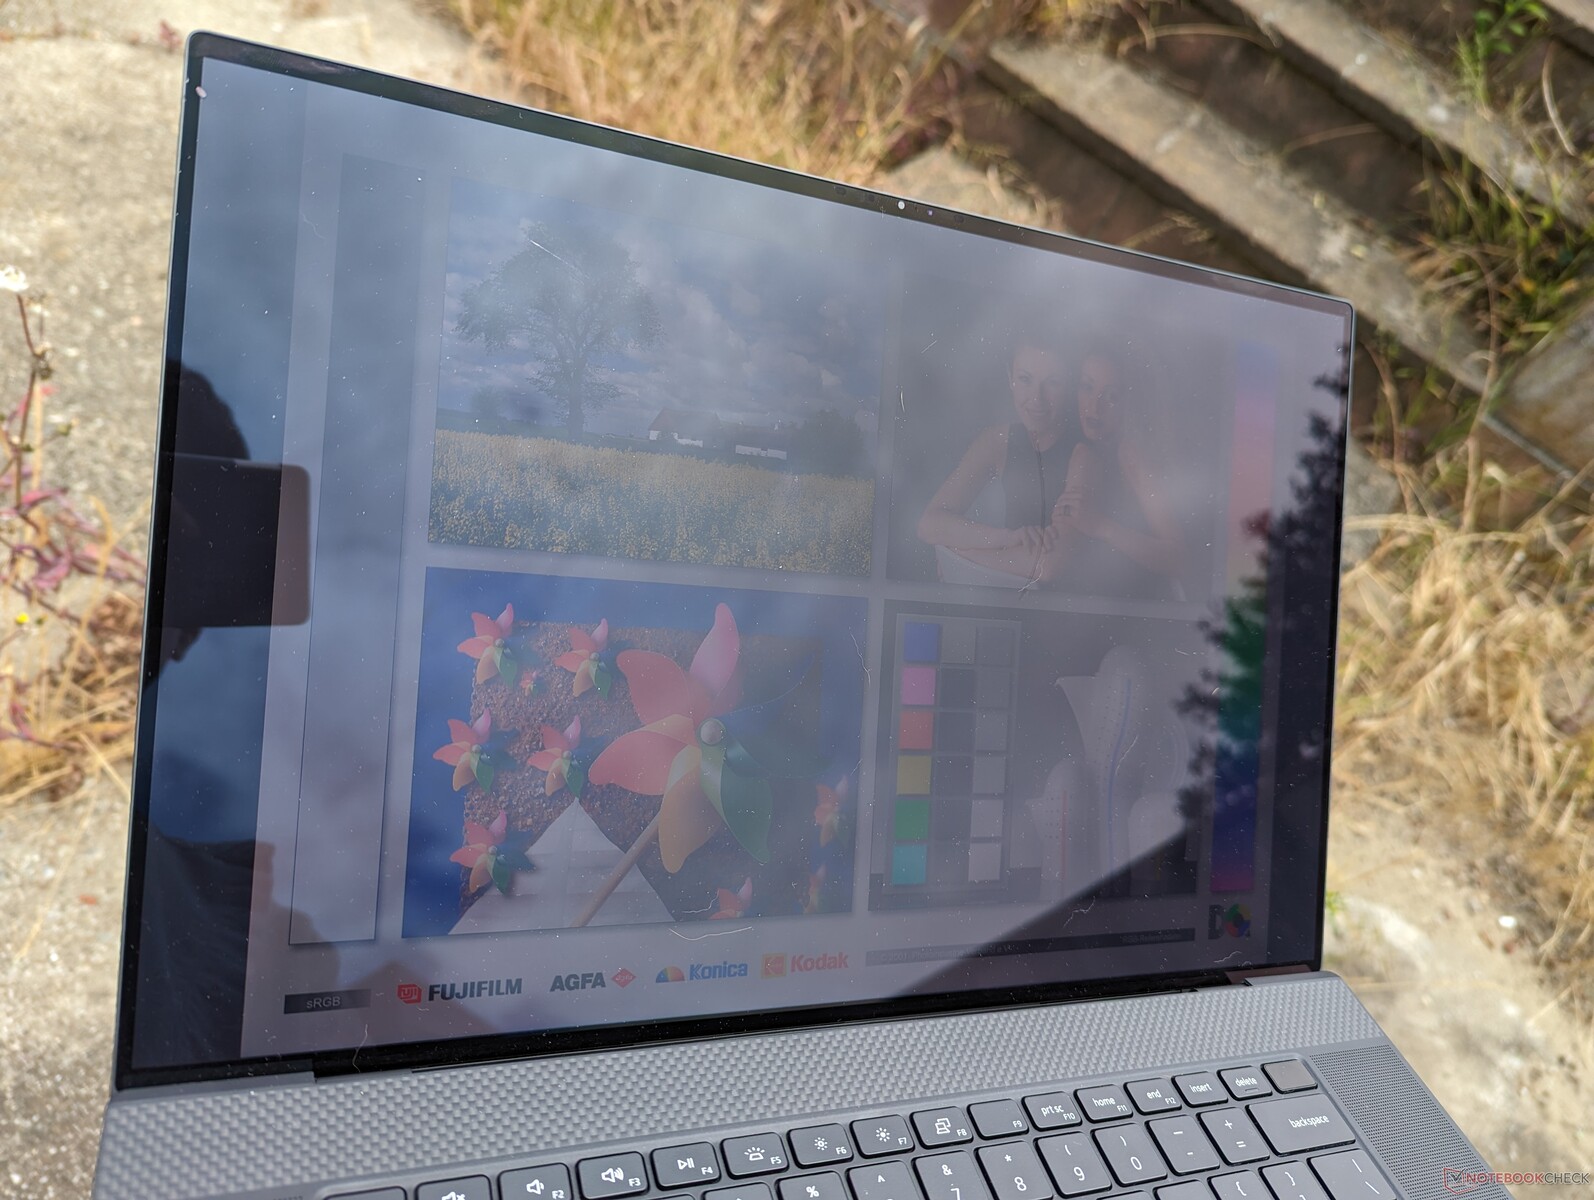
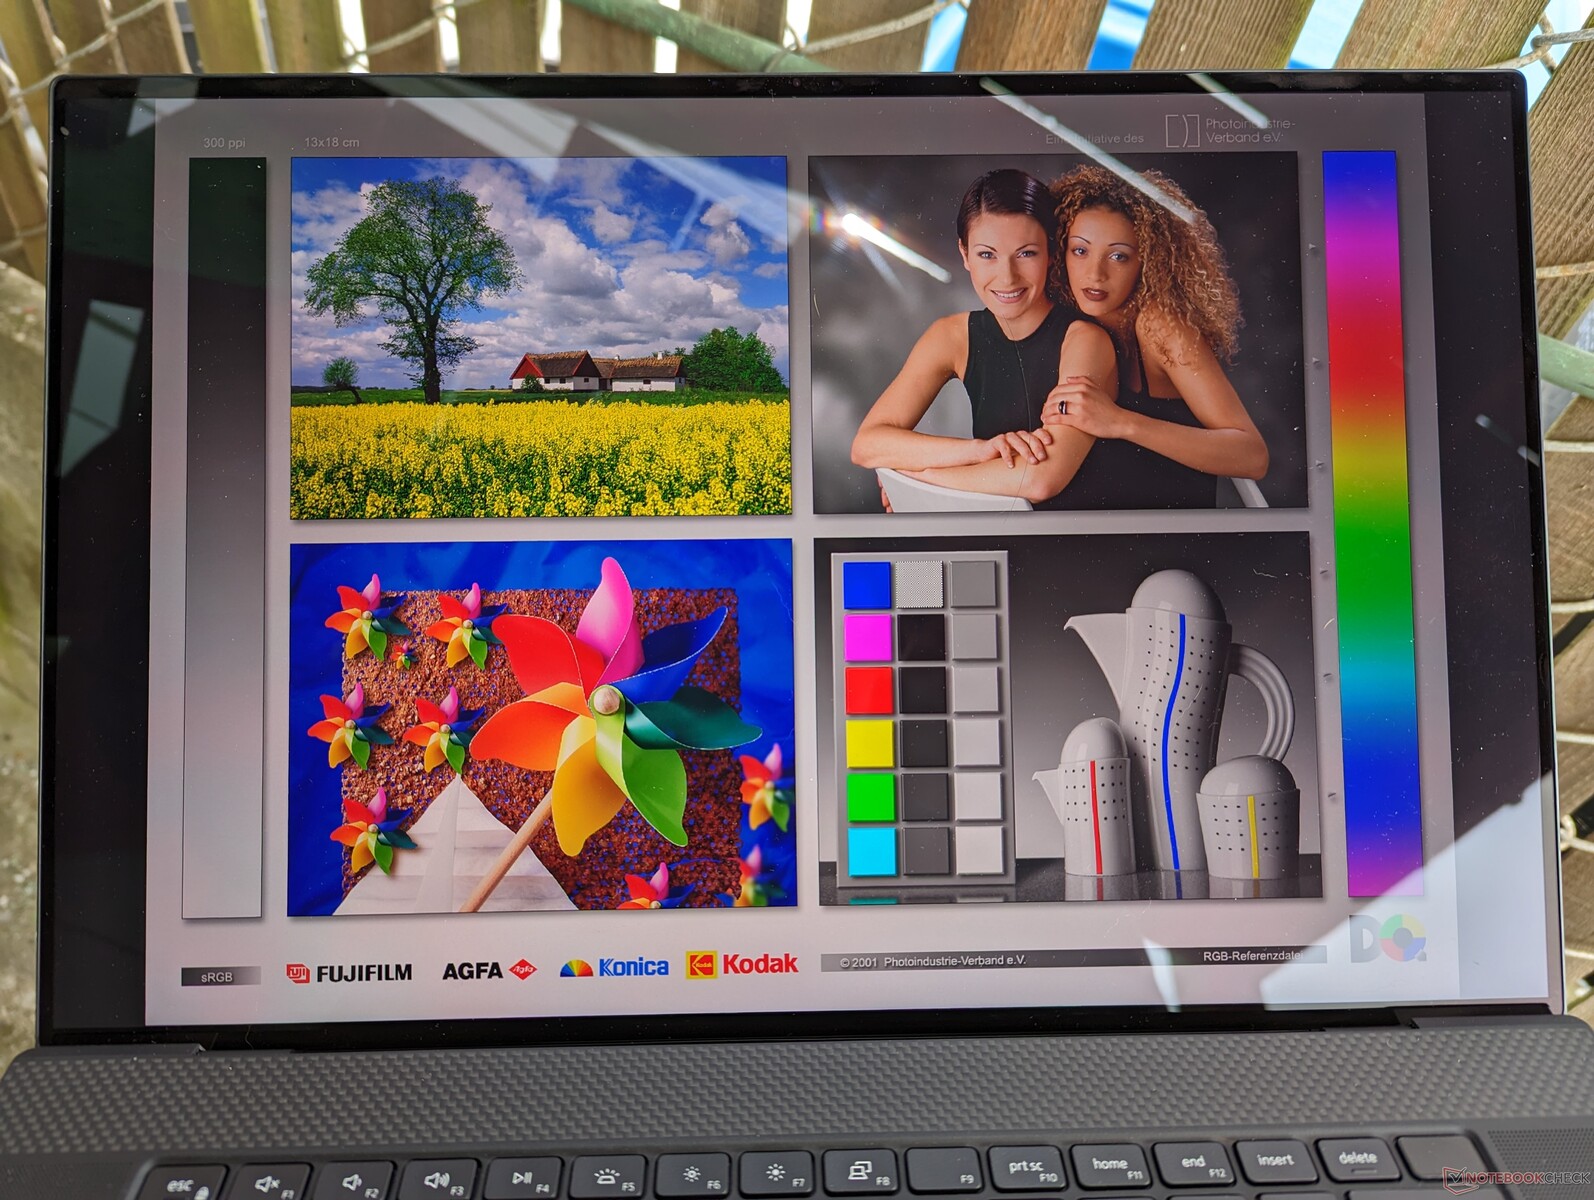
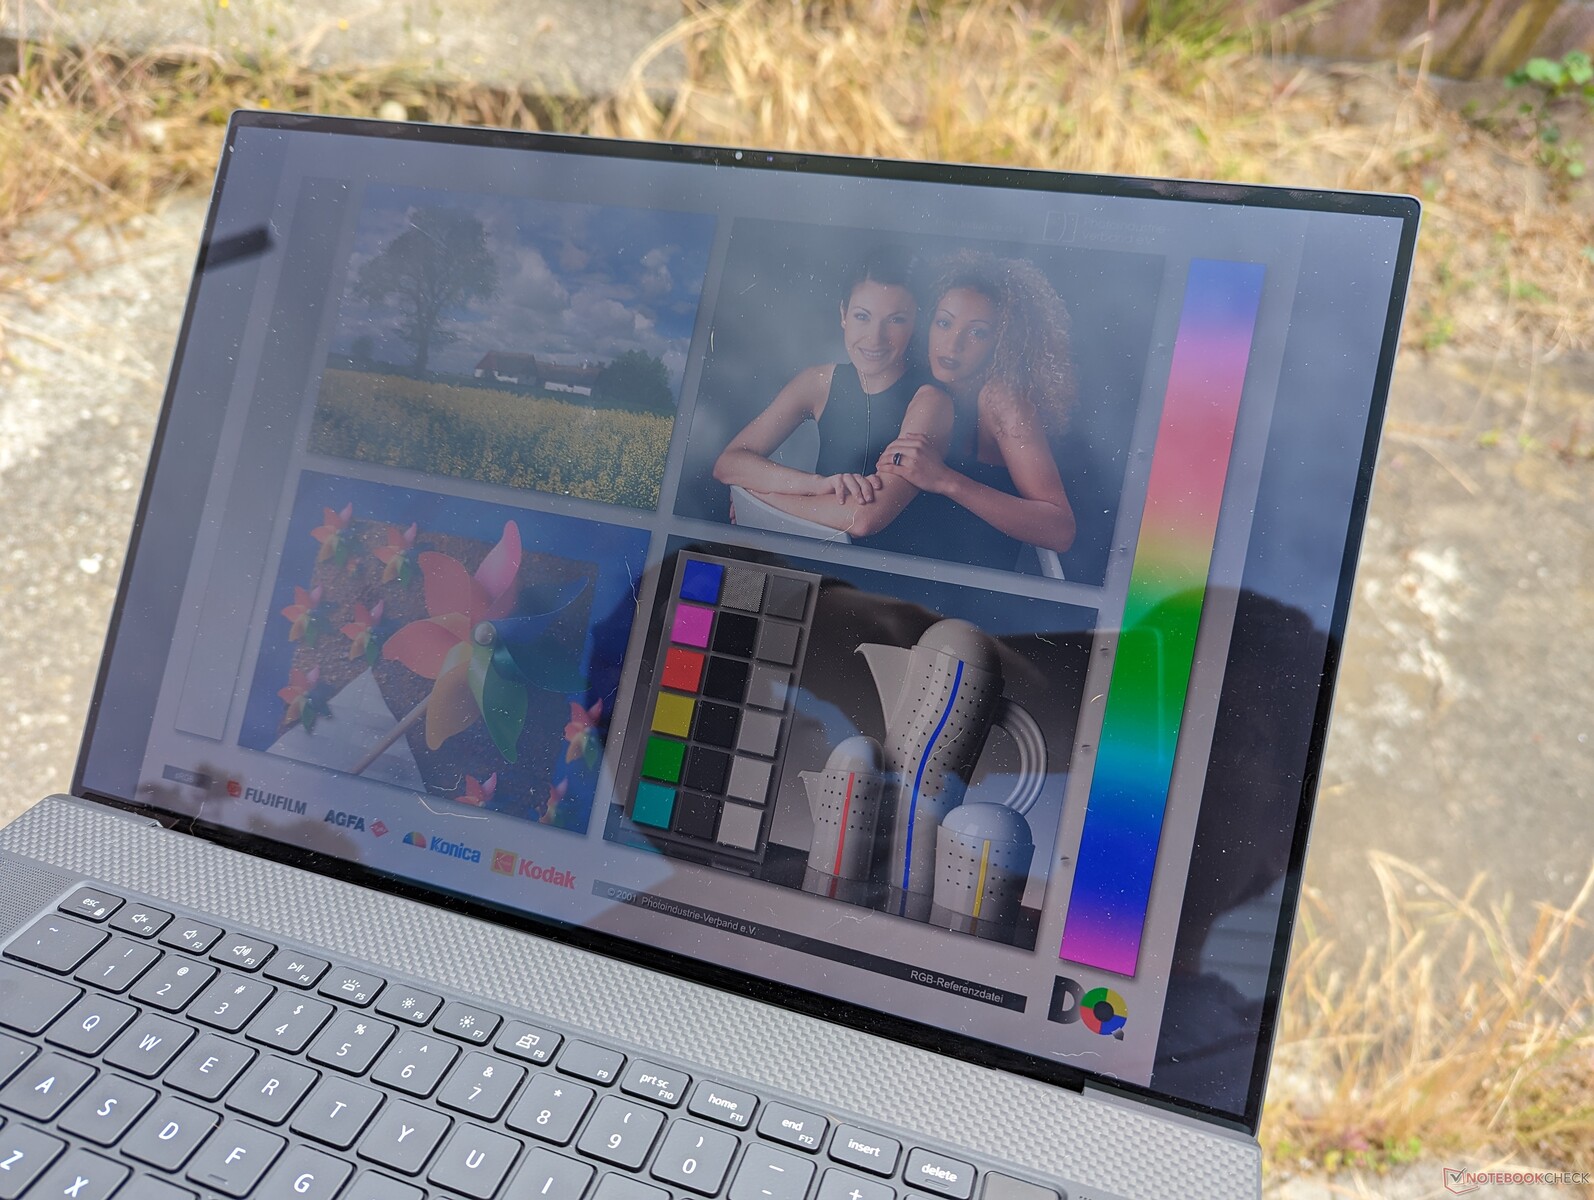
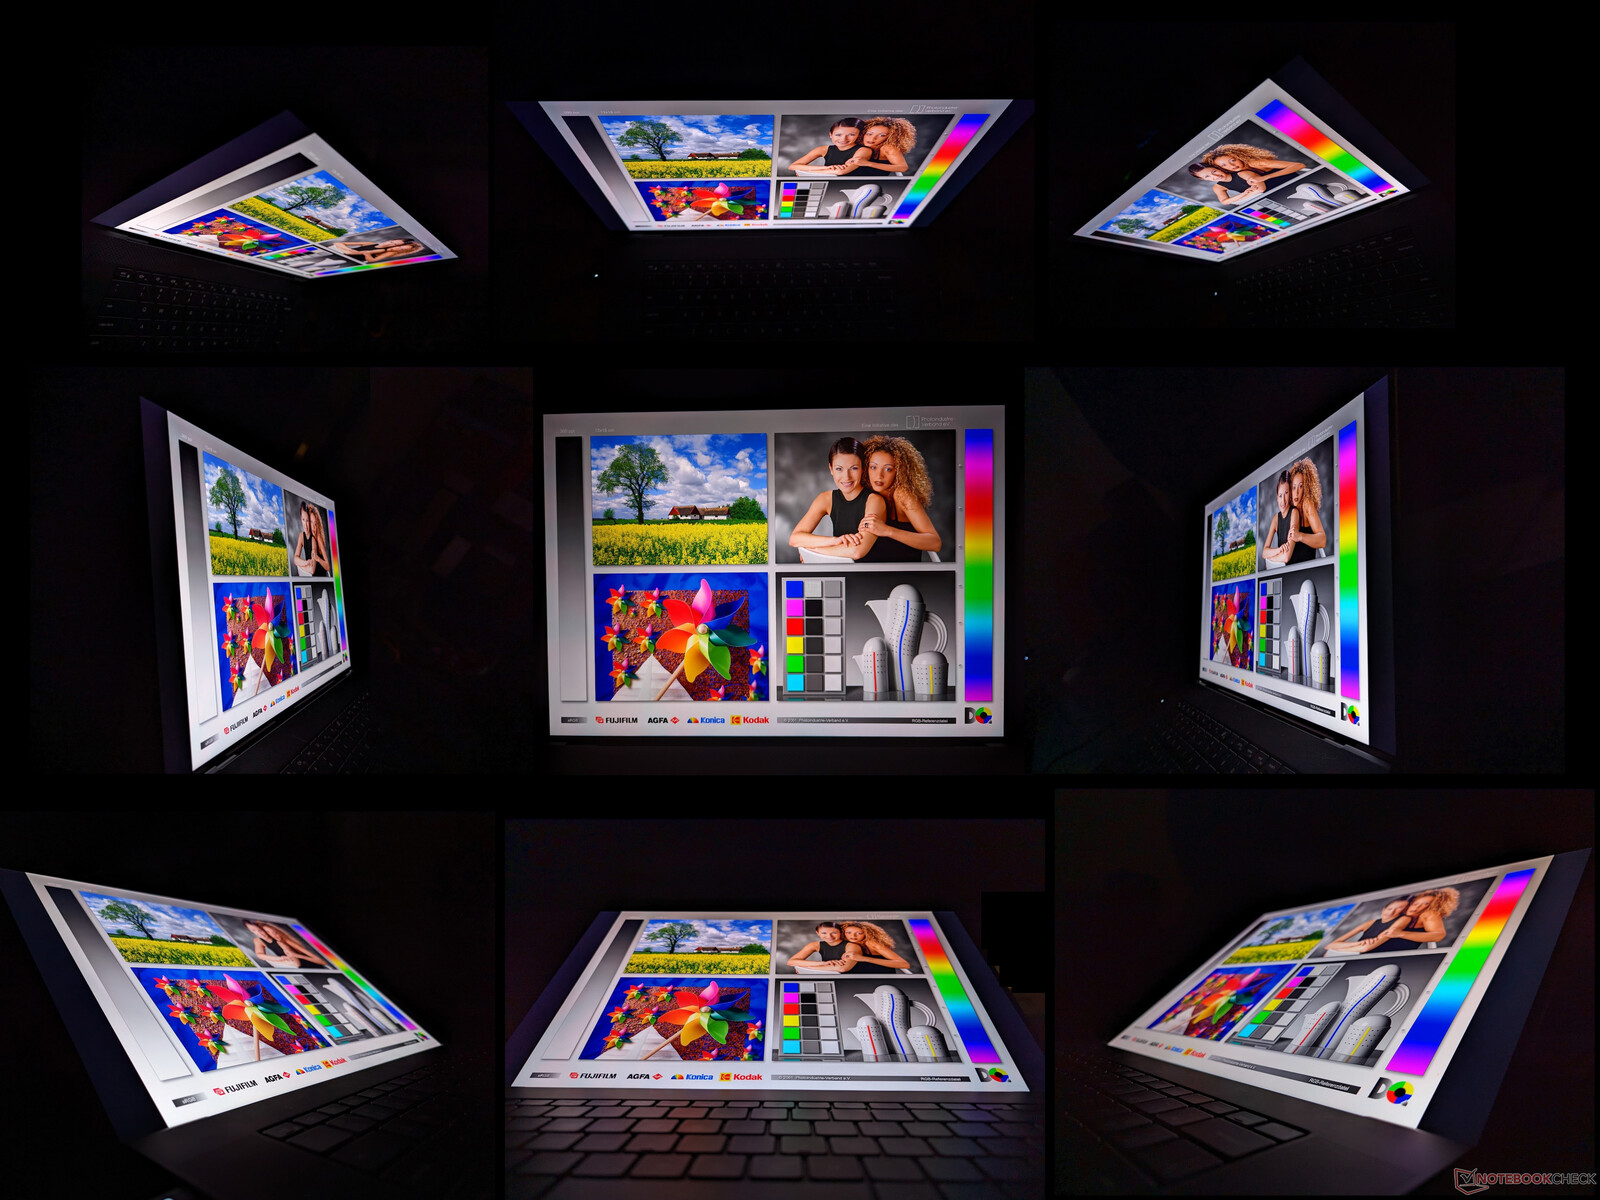
Display — Immer noch gut, aber keine 120 Hz
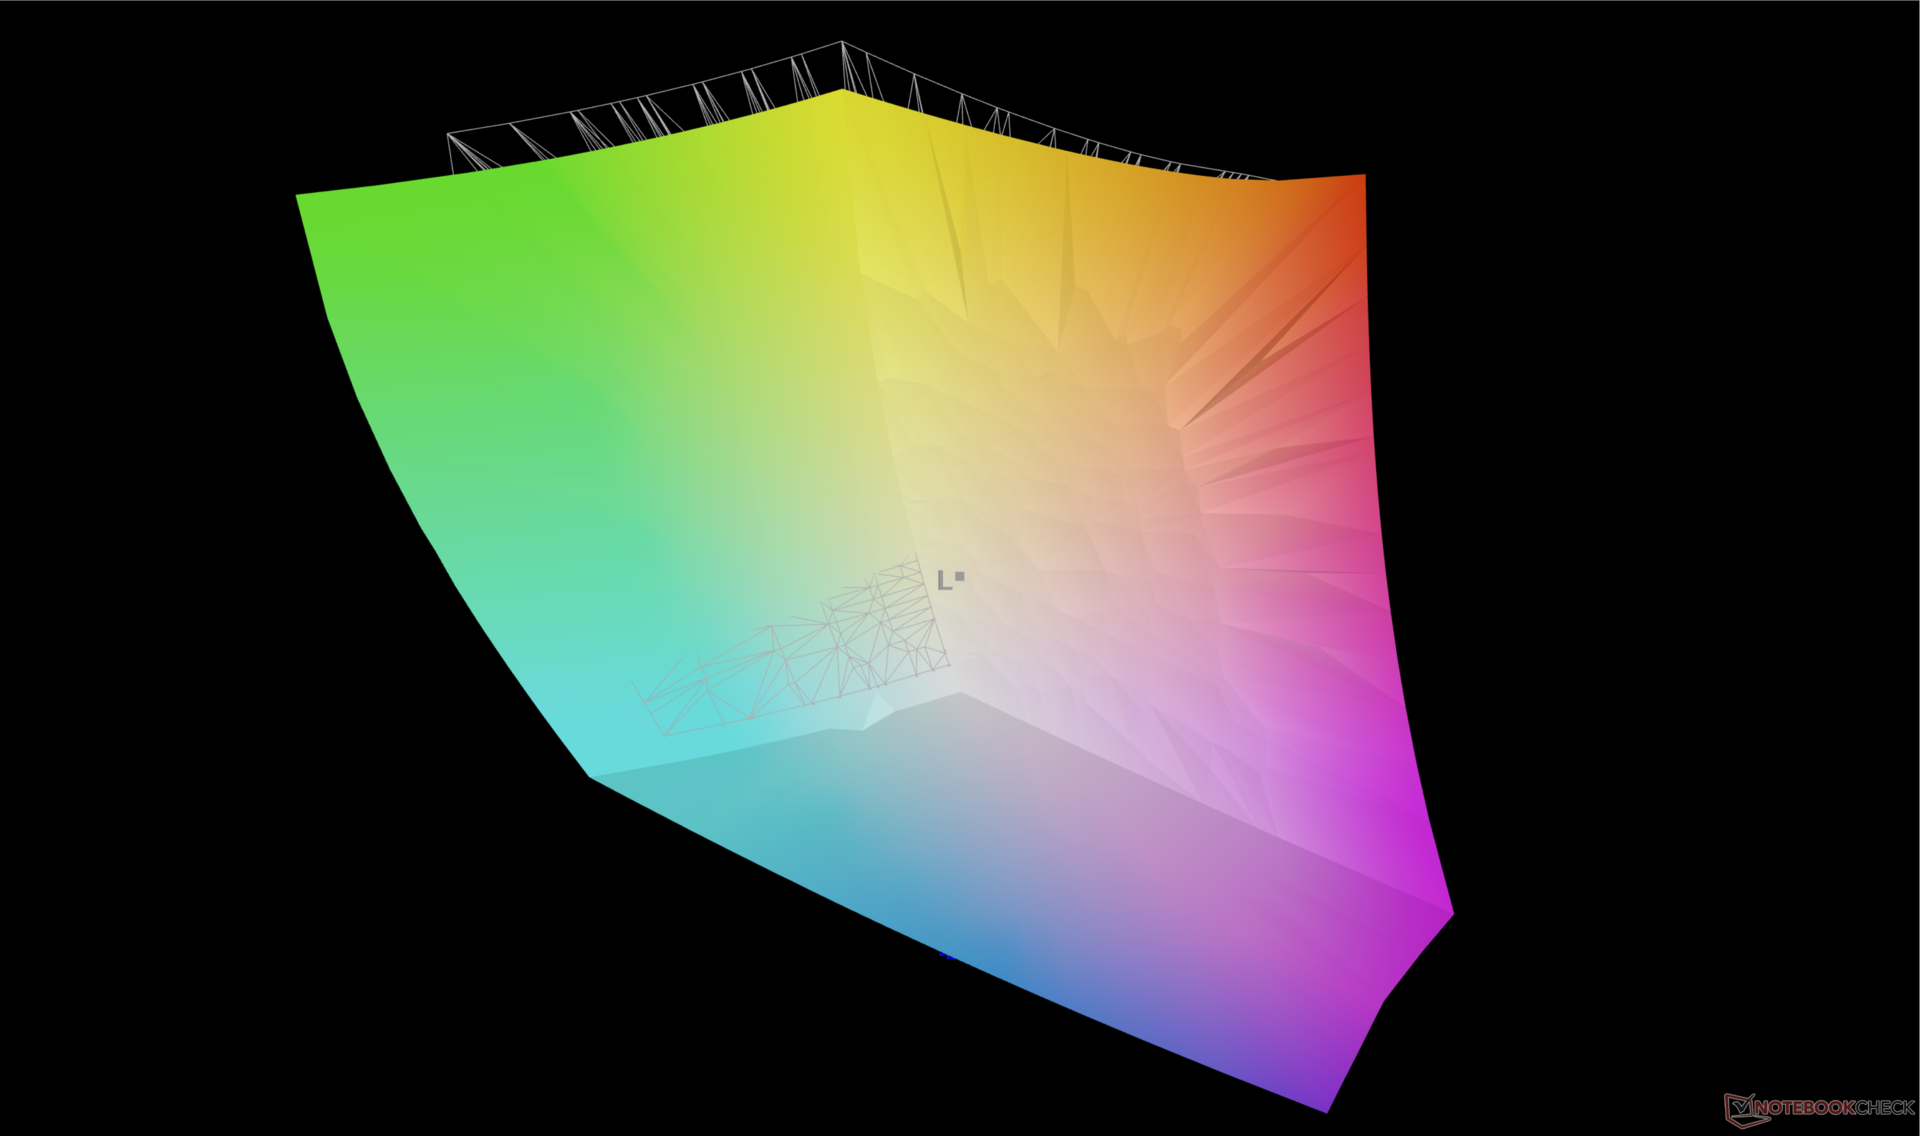
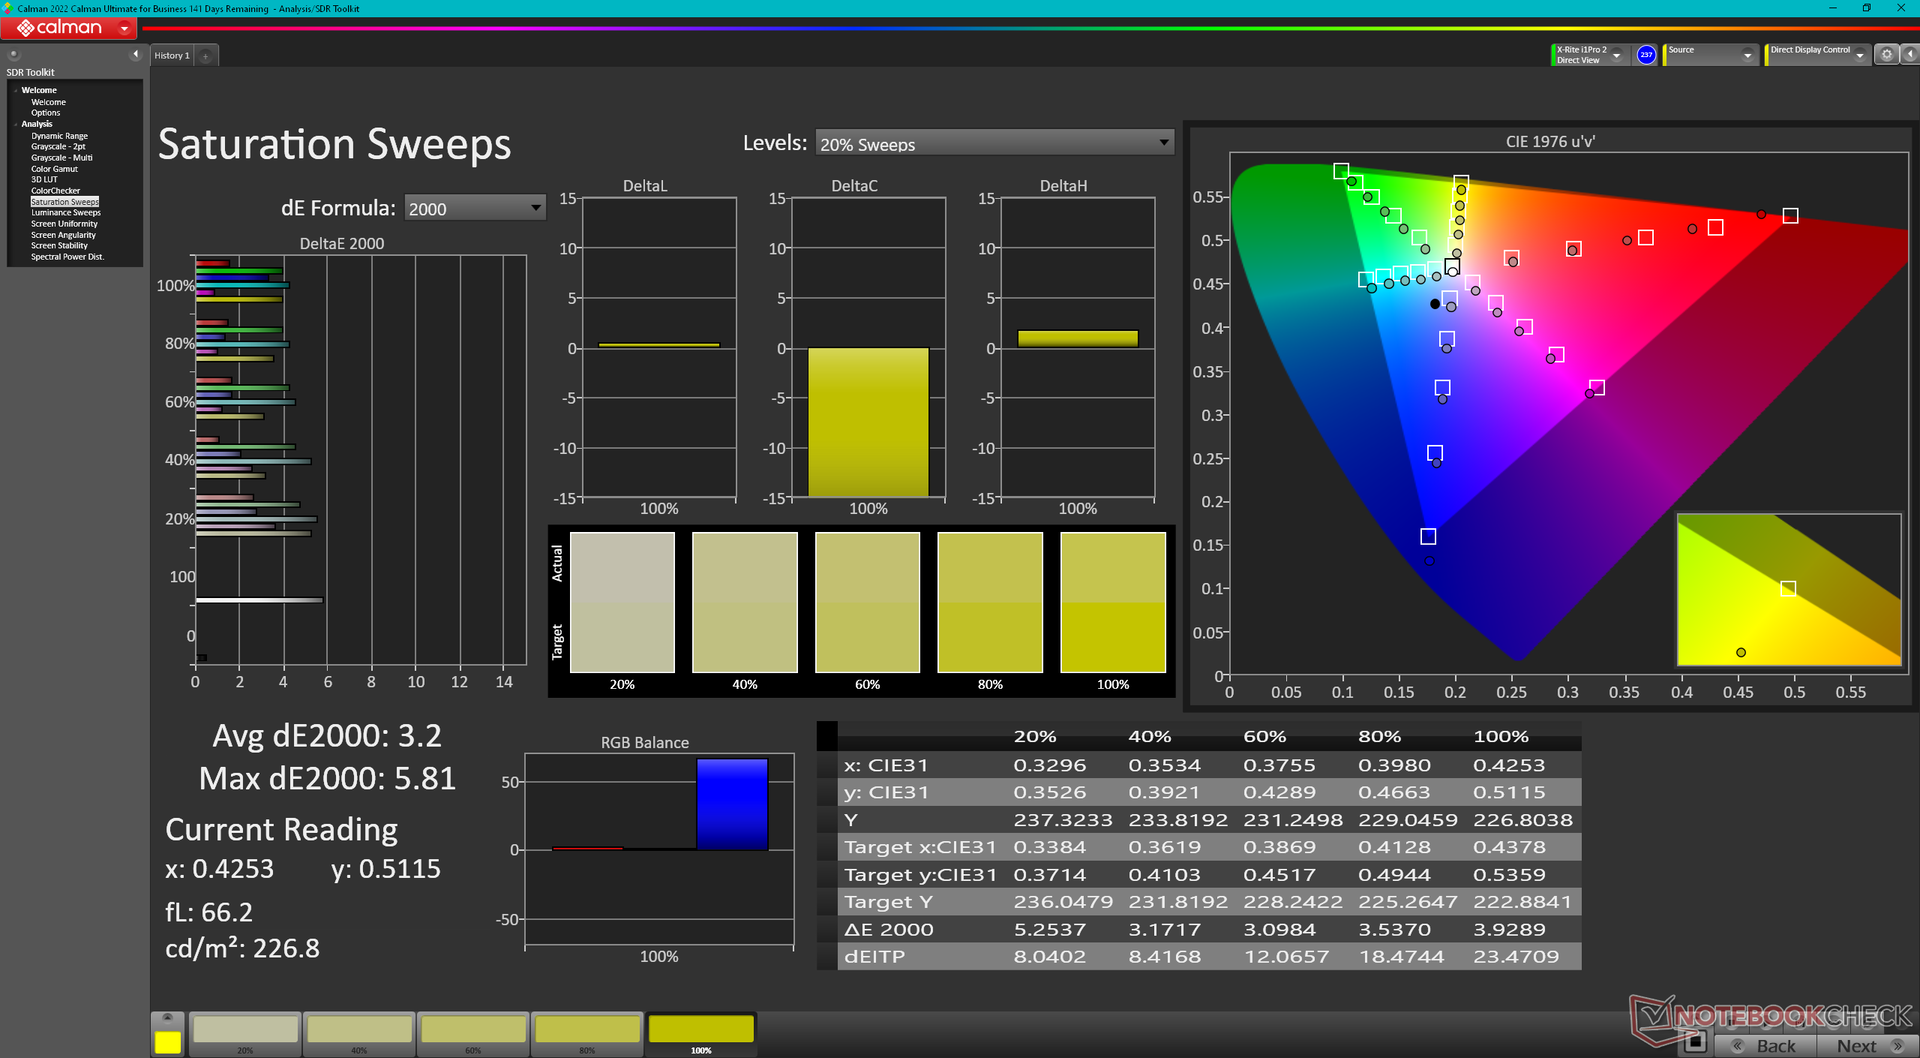
Dell verwendet exakt das gleiche 17-Zoll-Sharp-LQ170R1-IPS-Panel für die XPS-17-Serie seit dem Originalmodell aus dem Jahr 2020. Aus diesem Grund hat sich die Bildqualität auch nie geändert. Deshalb empfehlen wir, unsere Tests zum 9720-, 9710- und 9700-Modell anzusehen, um mehr über das Display zu erfahren. Obwohl die reichen DCI-P3-Farben, eine gute maximale Helligkeit, eine scharfe UHD-Auflösung und ein guter 1.500:1-Kontrast heutzutage immer noch überzeugen können, zeigt sich bei 60 Bildern pro Sekunde langsam das Alter der Technologie. Dies liegt vor allem daran, dass 90-Hz-Displays immer populärer bei Multimedia-Laptops werden, wie beispielsweise beim Asus ZenBook 14 oder dem Lenovo Slim 7i.

| |||||||||||||||||||||||||
Ausleuchtung: 85 %
Helligkeit Akku: 457.4 cd/m²
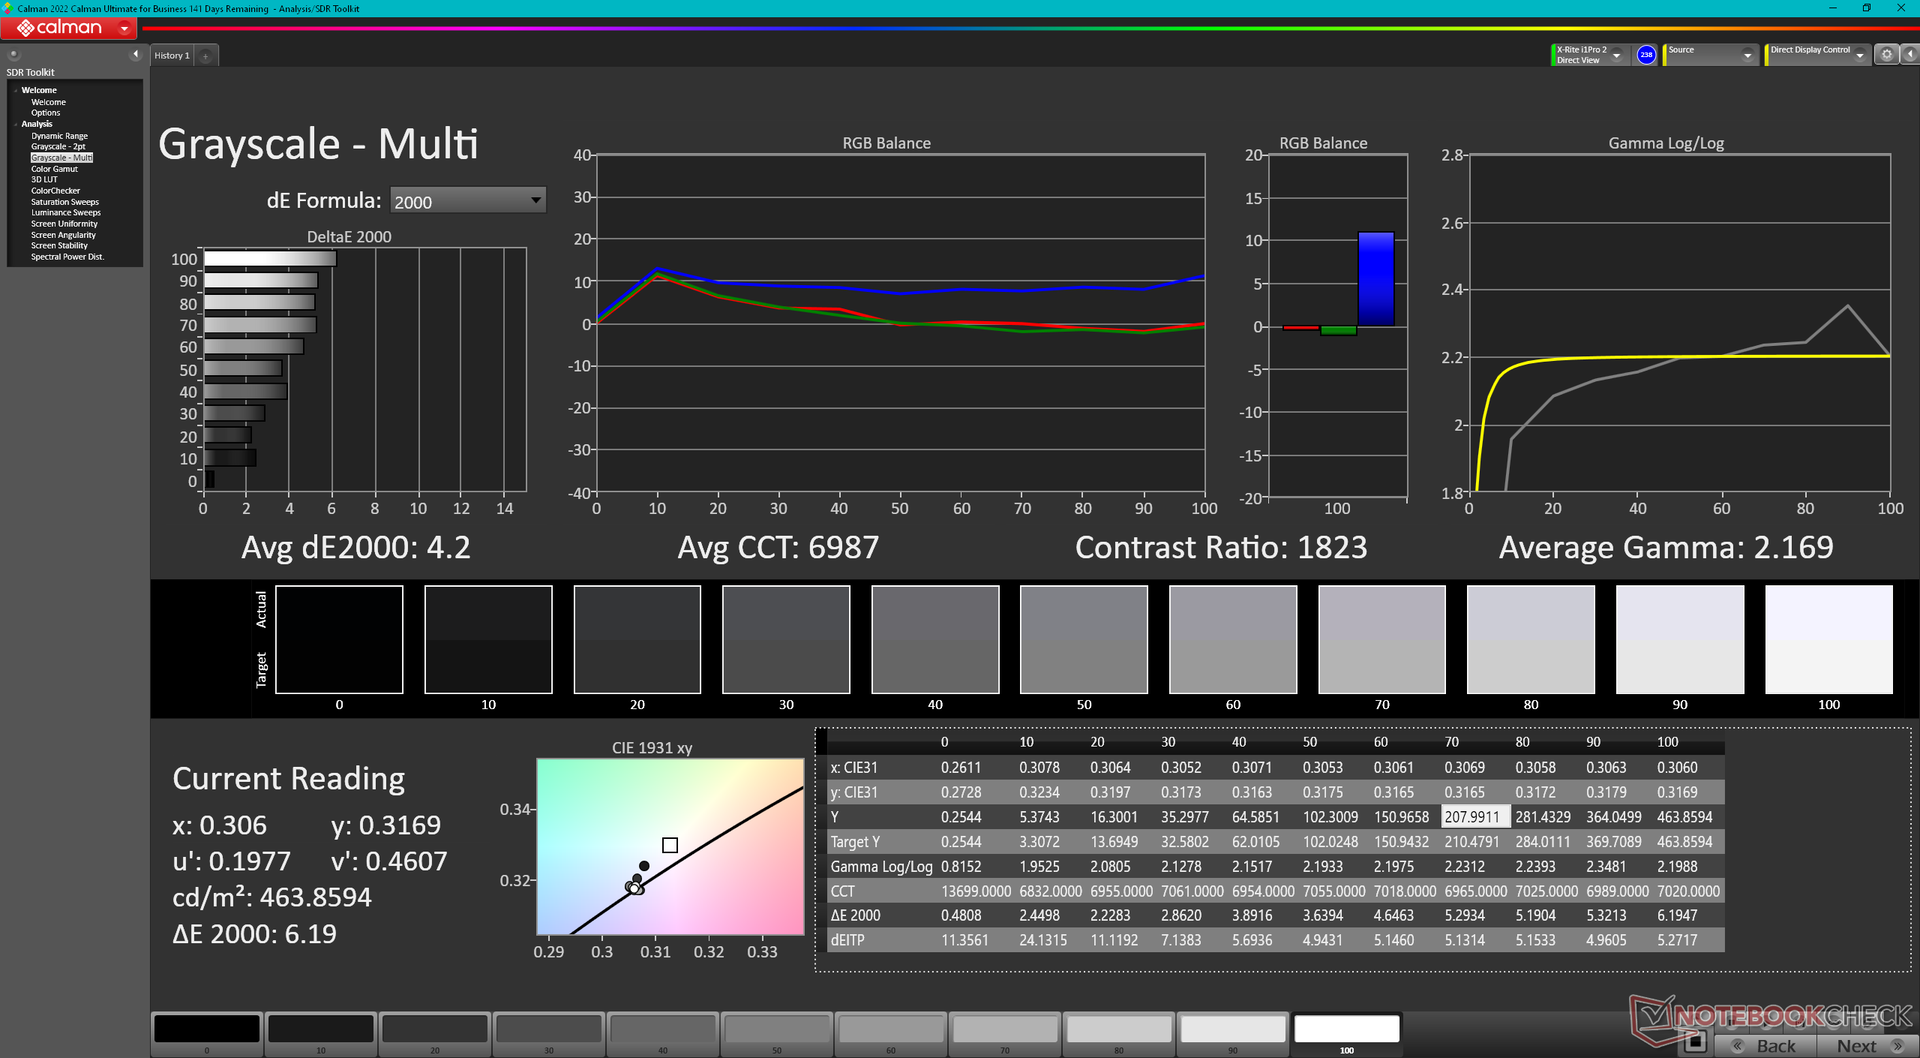
Kontrast: 1475:1 (Schwarzwert: 0.31 cd/m²)
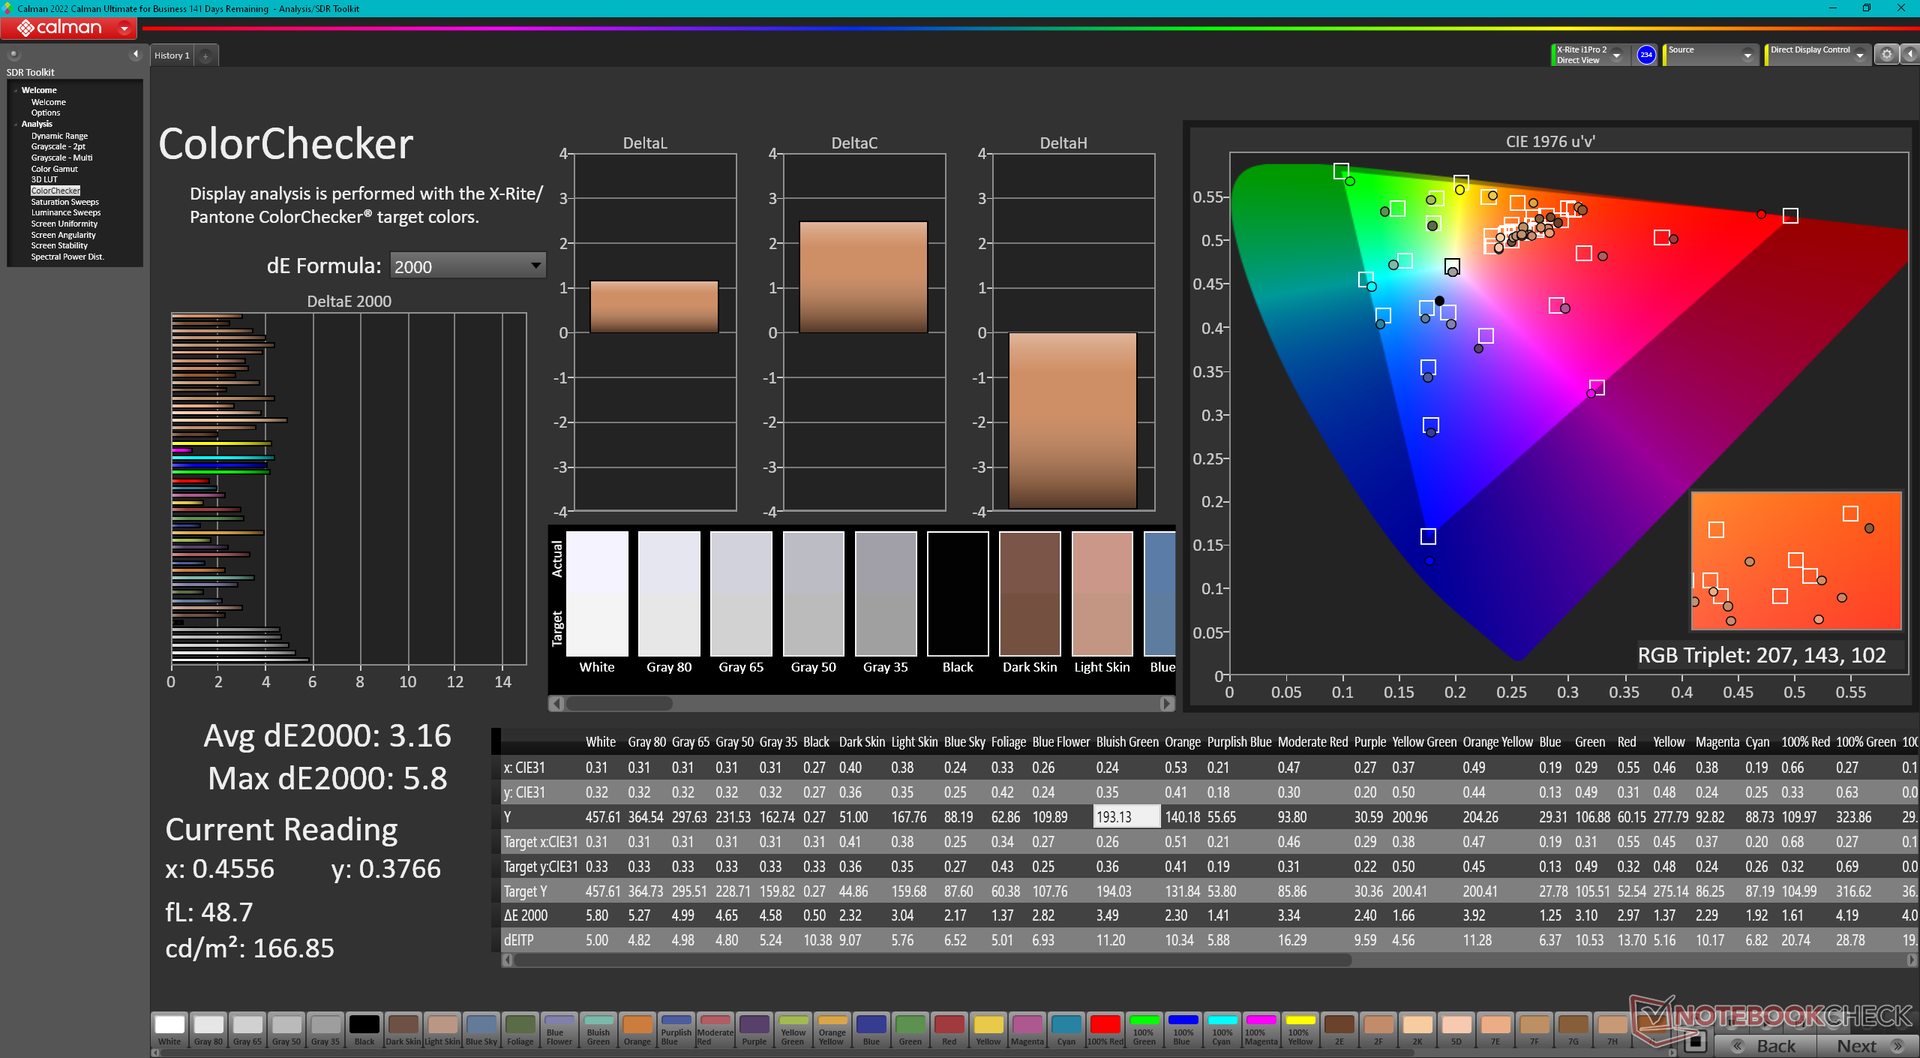
ΔE ColorChecker Calman: 3.16 | ∀{0.5-29.43 Ø4.71}
ΔE Greyscale Calman: 4.2 | ∀{0.09-98 Ø4.96}
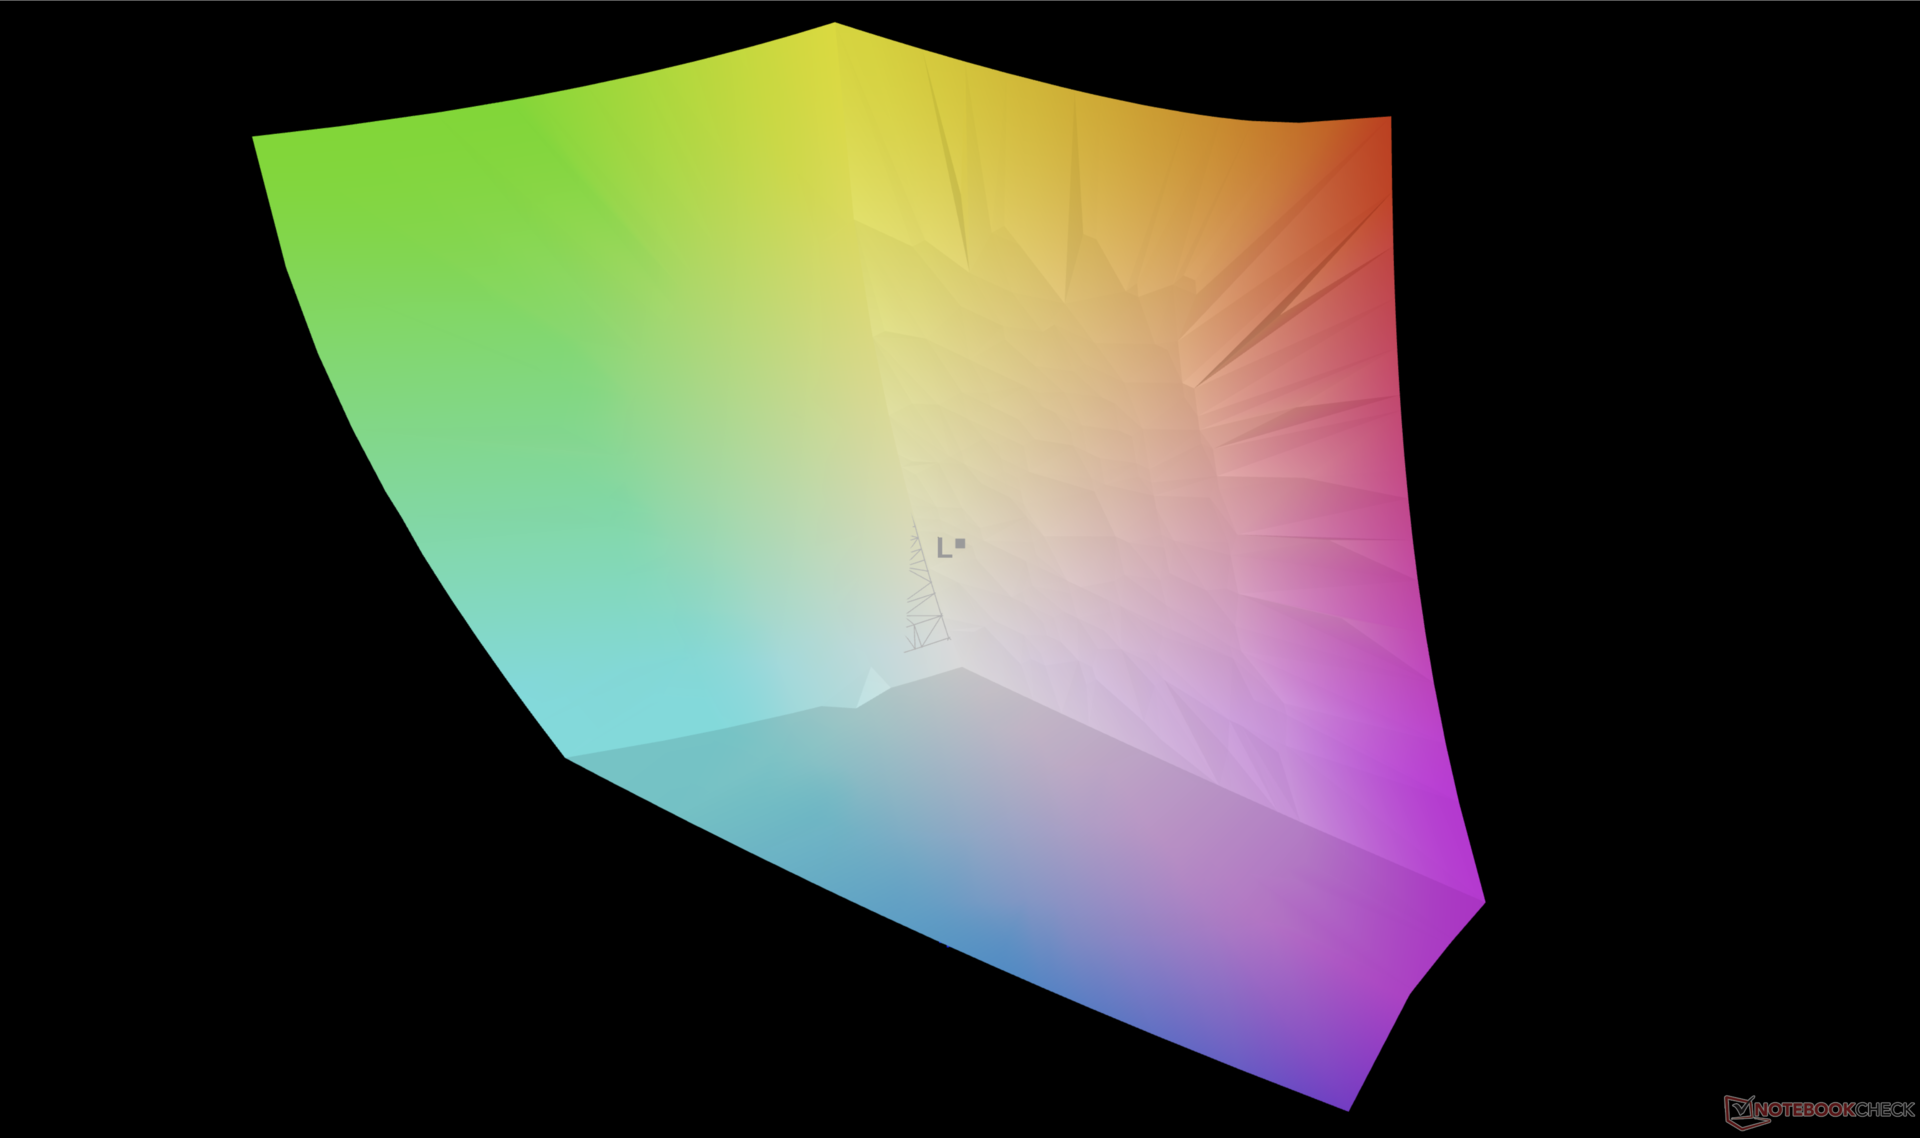
100% AdobeRGB 1998 (Argyll 3D)
100% sRGB (Argyll 3D)
95.2% Display P3 (Argyll 3D)
Gamma: 2.17
CCT: 6987 K
| Dell XPS 17 9730 RTX 4070 10-point capacitive, Sharp LQ170R1, 3840x2400, 17" | Dell XPS 17 9720 RTX 3060 Sharp LQ170R1, IPS, 3840x2400, 17" | LG Gram 17 (2023) LG Display LP170WQ1-SPF2, IPS, 2560x1600, 17" | HP Envy 17-cr0079ng BOE0A66, IPS, 3840x2160, 17.3" | MSI Creator Z17 A12UGST-054 AUO3C9B (B170QAN01.0), IPS, 2560x1600, 17" | Apple MacBook Pro 16 2023 M2 Max Mini-LED, 3456x2234, 16.2" | |
|---|---|---|---|---|---|---|
| Display | -6% | -4% | -3% | -3% | -2% | |
| Display P3 Coverage (%) | 95.2 | 92.9 -2% | 97 2% | 98.31 3% | 98.9 4% | 99 4% |
| sRGB Coverage (%) | 100 | 100 0% | 99.8 0% | 100 0% | 99.9 0% | 100 0% |
| AdobeRGB 1998 Coverage (%) | 100 | 85.3 -15% | 84.9 -15% | 87.03 -13% | 86.4 -14% | 88.5 -11% |
| Response Times | -16% | 80% | 88% | 79% | -70% | |
| Response Time Grey 50% / Grey 80% * (ms) | 42.9 ? | 51.2 ? -19% | 2 ? 95% | 1 98% | 11 ? 74% | 80.5 ? -88% |
| Response Time Black / White * (ms) | 31.3 ? | 35.2 ? -12% | 11 ? 65% | 7 ? 78% | 5 ? 84% | 47.2 ? -51% |
| PWM Frequency (Hz) | 14880 ? | |||||
| Bildschirm | -30% | -6% | 9% | -13% | 4294% | |
| Helligkeit Bildmitte (cd/m²) | 457.4 | 512.7 12% | 405 -11% | 390 -15% | 444 -3% | 504 10% |
| Brightness (cd/m²) | 430 | 463 8% | 363 -16% | 385 -10% | 415 -3% | 487 13% |
| Brightness Distribution (%) | 85 | 85 0% | 82 -4% | 86 1% | 88 4% | 94 11% |
| Schwarzwert * (cd/m²) | 0.31 | 0.32 -3% | 0.225 27% | 0.395 -27% | 0.7 -126% | 0.001 100% |
| Kontrast (:1) | 1475 | 1602 9% | 1800 22% | 987 -33% | 634 -57% | 504000 34069% |
| Delta E Colorchecker * | 3.16 | 5.98 -89% | 3.35 -6% | 1.66 47% | 2.48 22% | 1.5 53% |
| Colorchecker dE 2000 max. * | 5.8 | 12.09 -108% | 7.96 -37% | 2.9 50% | 3.52 39% | 3.3 43% |
| Delta E Graustufen * | 4.2 | 7.2 -71% | 5.28 -26% | 1.83 56% | 3.33 21% | 2.1 50% |
| Gamma | 2.17 101% | 2.54 87% | 2.43 91% | 2.25 98% | 2.33 94% | 2.25 98% |
| CCT | 6987 93% | 6914 94% | 7424 88% | 6727 97% | 6230 104% | 6882 94% |
| Colorchecker dE 2000 calibrated * | 1.34 | 1.16 | 2.91 | |||
| Durchschnitt gesamt (Programm / Settings) | -17% /
-22% | 23% /
7% | 31% /
18% | 21% /
3% | 1407% /
2631% |
* ... kleinere Werte sind besser
Reaktionszeiten (Response Times) des Displays
| ↔ Reaktionszeiten Schwarz zu Weiß | ||
|---|---|---|
| 31.3 ms ... steigend ↗ und fallend ↘ kombiniert | ↗ 16.9 ms steigend | 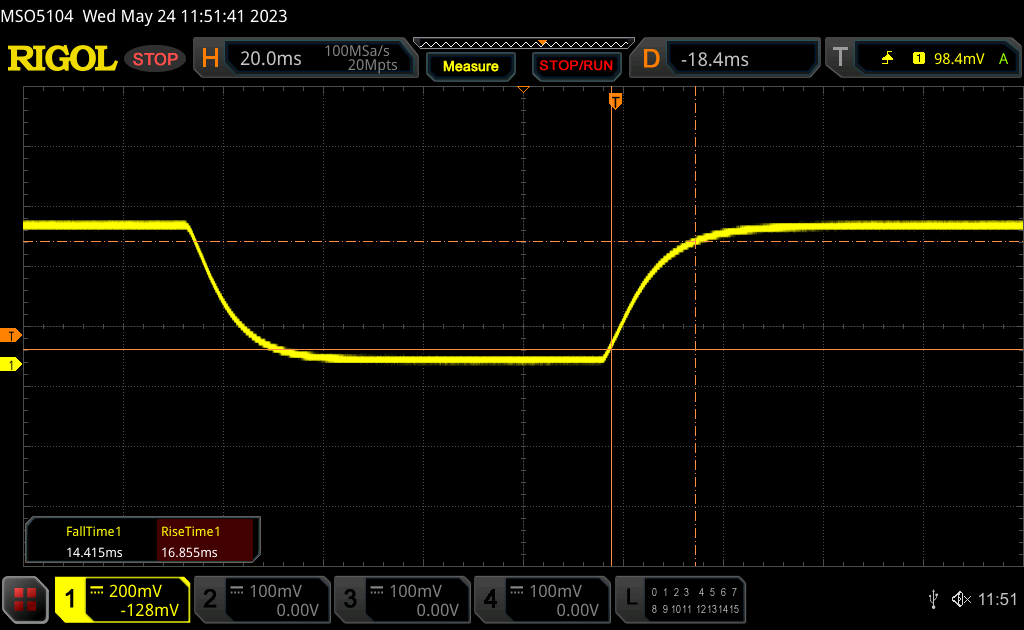 |
| ↘ 14.4 ms fallend | ||
| Die gemessenen Reaktionszeiten sind langsam und dadurch für viele Spieler wahrscheinlich zu langsam. Im Vergleich rangierten die bei uns getesteten Geräte von 0.1 (Minimum) zu 240 (Maximum) ms. » 85 % aller Screens waren schneller als der getestete. Daher sind die gemessenen Reaktionszeiten schlechter als der Durchschnitt aller vermessenen Geräte (19.8 ms). | ||
| ↔ Reaktionszeiten 50% Grau zu 80% Grau | ||
| 42.9 ms ... steigend ↗ und fallend ↘ kombiniert | ↗ 19.9 ms steigend | 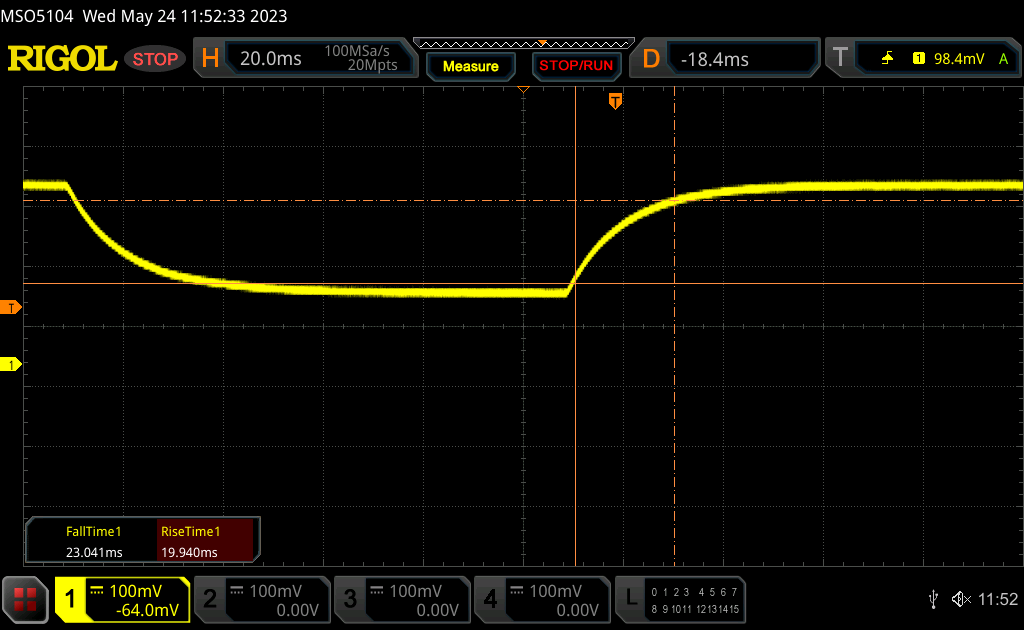 |
| ↘ 23 ms fallend | ||
| Die gemessenen Reaktionszeiten sind langsam und dadurch für viele Spieler wahrscheinlich zu langsam. Im Vergleich rangierten die bei uns getesteten Geräte von 0.165 (Minimum) zu 636 (Maximum) ms. » 71 % aller Screens waren schneller als der getestete. Daher sind die gemessenen Reaktionszeiten schlechter als der Durchschnitt aller vermessenen Geräte (31 ms). | ||
Bildschirm-Flackern / PWM (Pulse-Width Modulation)
| Flackern / PWM nicht festgestellt | 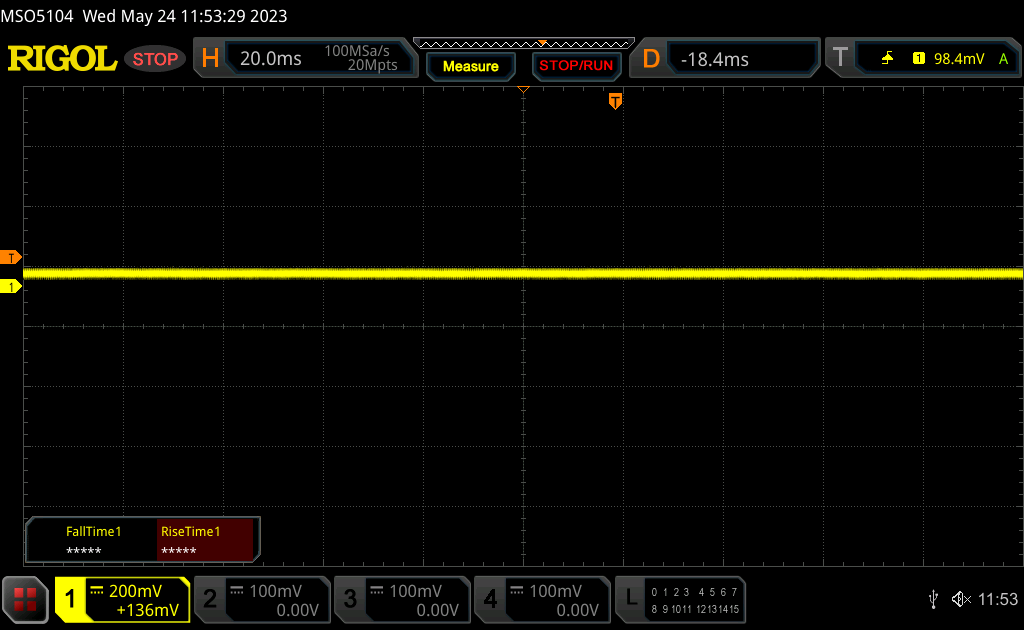 | ||
Im Vergleich: 52 % aller getesteten Geräte nutzten kein PWM um die Helligkeit zu reduzieren. Wenn PWM eingesetzt wurde, dann bei einer Frequenz von durchschnittlich 7754 (Minimum 5, Maximum 343500) Hz. | |||
Performance — Intel in der 13. Generation + Nvidia Ada Lovelace
Testszenario
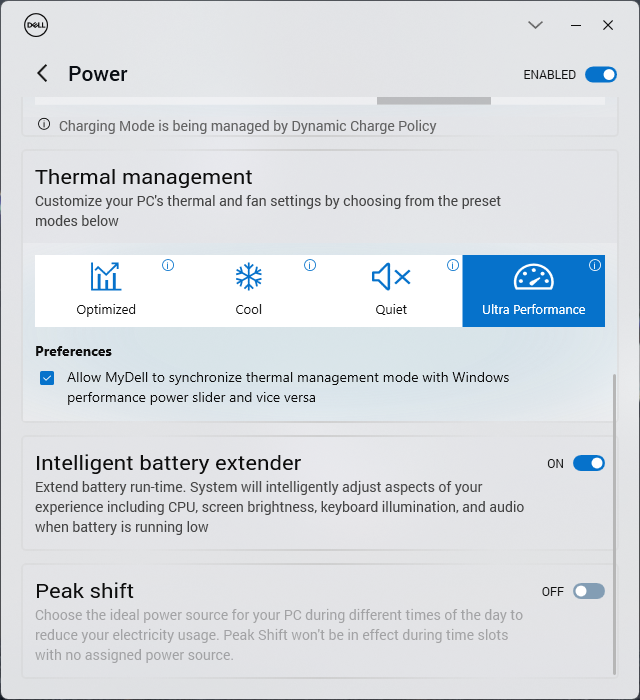
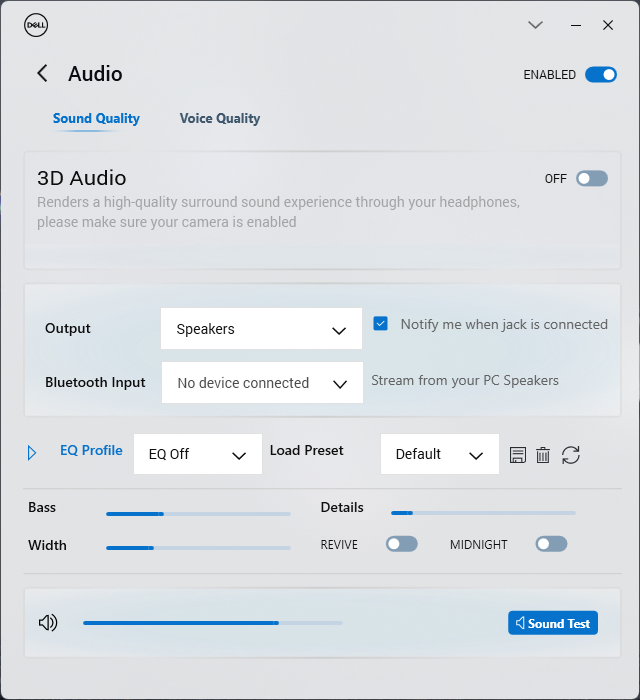
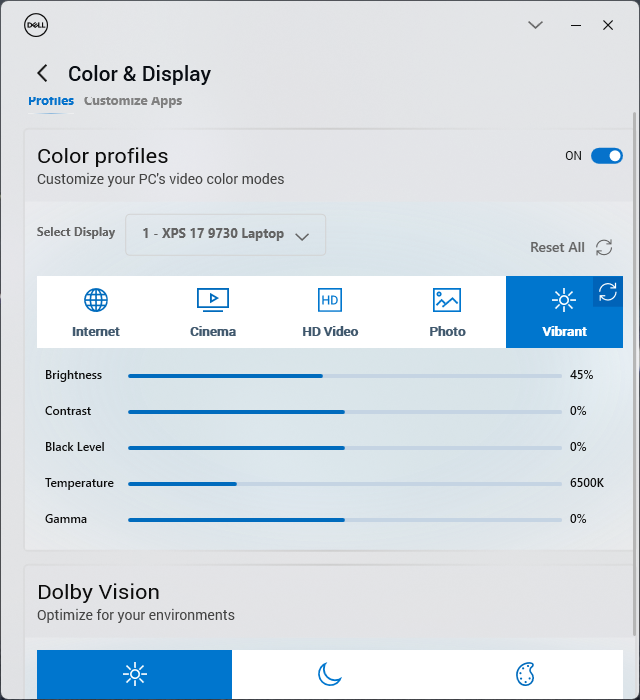
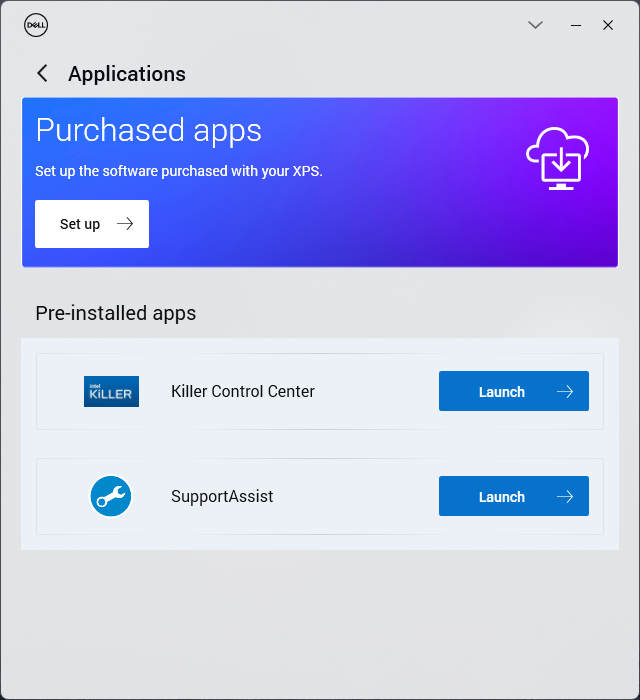
Bevor wir jegliche Benchmarks durchgeführt haben, haben wir auf unserem Gerät den Performance-Modus mithilfe der MyDell App aktiviert. Die Dell Energieeinstellungen sind dabei mit jenen Einstellungen von Windows synchronisiert, was man auf eher wenigen Laptops sieht.
Es wird empfohlen, dass man sich vorab mit MyDell vertraut macht, da es die zentrale Schnittstelle für Audio-, Farb-, Leistungsstellungen und anderen vorinstallierten Apps, wie dem SupportAssist, ist. Dell hat die Benutzeroberfläche von MyDell noch einmal überarbeitet, um sie der Dell Optimierungssoftware anzugleichen, welche ab Werk bei vielen Geräten des Herstellers vorinstalliert ist. Bemängeln lässt sich allerdings, dass das Fenster des Programms ziemlich klein ist und sich auch nicht maximieren lässt.
Optimus ist der Standard für das automatische Schalten zwischen der iGPU und der dGPU. Es gibt keinen Support für Advanced Optimus oder MUX.
Prozessor
Der i7-13700H im XPS 17 liefert sehr gute Ergebnisse in den Benchmarks. Diese sind leicht besser als bei anderen Laptops mit dem gleichen Prozessor, wie beispielsweise das XPS 15 9530. Der Turbo-Boost liefert eine Steigerung von eindrucksvollen 25 Prozent im Vergleich zum i7-12700H im XPS 17 9720 aus dem letzten Jahr.
Es gibt jedoch einen Aspekt, der bedacht werden sollte: Der CPU-Turbo-Boost ist nicht unbegrenzt, wenn CineBench R15 xT in einer Dauerschleife läuft, wie auch die unten stehende Abbildung zeigt. Nach ca. 9 bis 10 Runden sinkt die Leistung um knapp 25 Prozent, was verhältnismäßig viel ist im Vergleich zu anderen Laptops mit einer CPU der H-Serie. Wenn man diese Performance-Minderung betrachtet, ist der i7-13700H fast gleich schnell wie der i7-12700H. Deshalb ist der i7-13700H am schnellsten, wenn viel Rechenleistung in kurzer Zeit benötigt wird, wie beispielsweise beim Starten von Programmen, beim Bearbeiten von Bildern oder beim Encoden von kurzen Videos. Ansonsten arbeitet er nur minimal schneller als der i7-12700H aus dem vergangenen Jahr.
Entscheidet man sich für die i9-13900H-Variante, erhält man bei mehrkernigen Rechenoperationen einen Leistungsboost von ca. 10 bis 20 Prozent. Dies ergab unser Test mit dem MSI Stealth 17 Studio. Bei Rechenoperationen, die nur einen Kern erfordern, ist der i9 gleich schnell, wenn nicht sogar etwas langsamer.
Cinebench R15 Dauerschleife
Cinebench R23: Multi Core | Single Core
Cinebench R20: CPU (Multi Core) | CPU (Single Core)
Cinebench R15: CPU Multi 64Bit | CPU Single 64Bit
Blender: v2.79 BMW27 CPU
7-Zip 18.03: 7z b 4 | 7z b 4 -mmt1
Geekbench 5.5: Multi-Core | Single-Core
HWBOT x265 Benchmark v2.2: 4k Preset
LibreOffice : 20 Documents To PDF
R Benchmark 2.5: Overall mean
* ... kleinere Werte sind besser
AIDA64: FP32 Ray-Trace | FPU Julia | CPU SHA3 | CPU Queen | FPU SinJulia | FPU Mandel | CPU AES | CPU ZLib | FP64 Ray-Trace | CPU PhotoWorxx
| Performance Rating | |
| Dell XPS 17 9730 RTX 4070 | |
| Durchschnittliche Intel Core i7-13700H | |
| MSI Creator Z17 A12UGST-054 | |
| Dell XPS 17 9720 RTX 3060 | |
| LG Gram 17 (2023) | |
| HP Envy 17-cr0079ng | |
| AIDA64 / FP32 Ray-Trace | |
| Dell XPS 17 9730 RTX 4070 | |
| Durchschnittliche Intel Core i7-13700H (4986 - 18908, n=29) | |
| LG Gram 17 (2023) | |
| MSI Creator Z17 A12UGST-054 | |
| HP Envy 17-cr0079ng | |
| Dell XPS 17 9720 RTX 3060 | |
| AIDA64 / FPU Julia | |
| Dell XPS 17 9730 RTX 4070 | |
| Durchschnittliche Intel Core i7-13700H (25360 - 92359, n=29) | |
| HP Envy 17-cr0079ng | |
| LG Gram 17 (2023) | |
| MSI Creator Z17 A12UGST-054 | |
| Dell XPS 17 9720 RTX 3060 | |
| AIDA64 / CPU SHA3 | |
| Dell XPS 17 9730 RTX 4070 | |
| Durchschnittliche Intel Core i7-13700H (1339 - 4224, n=29) | |
| MSI Creator Z17 A12UGST-054 | |
| Dell XPS 17 9720 RTX 3060 | |
| HP Envy 17-cr0079ng | |
| LG Gram 17 (2023) | |
| AIDA64 / CPU Queen | |
| MSI Creator Z17 A12UGST-054 | |
| Dell XPS 17 9720 RTX 3060 | |
| Dell XPS 17 9730 RTX 4070 | |
| Durchschnittliche Intel Core i7-13700H (59324 - 107159, n=29) | |
| LG Gram 17 (2023) | |
| HP Envy 17-cr0079ng | |
| AIDA64 / FPU SinJulia | |
| Dell XPS 17 9730 RTX 4070 | |
| MSI Creator Z17 A12UGST-054 | |
| Dell XPS 17 9720 RTX 3060 | |
| Durchschnittliche Intel Core i7-13700H (4800 - 11050, n=29) | |
| LG Gram 17 (2023) | |
| HP Envy 17-cr0079ng | |
| AIDA64 / FPU Mandel | |
| Dell XPS 17 9730 RTX 4070 | |
| Durchschnittliche Intel Core i7-13700H (12321 - 45118, n=29) | |
| MSI Creator Z17 A12UGST-054 | |
| LG Gram 17 (2023) | |
| Dell XPS 17 9720 RTX 3060 | |
| HP Envy 17-cr0079ng | |
| AIDA64 / CPU AES | |
| MSI Creator Z17 A12UGST-054 | |
| Dell XPS 17 9720 RTX 3060 | |
| Durchschnittliche Intel Core i7-13700H (28769 - 151254, n=29) | |
| Dell XPS 17 9730 RTX 4070 | |
| LG Gram 17 (2023) | |
| HP Envy 17-cr0079ng | |
| AIDA64 / CPU ZLib | |
| Dell XPS 17 9730 RTX 4070 | |
| MSI Creator Z17 A12UGST-054 | |
| Durchschnittliche Intel Core i7-13700H (389 - 1215, n=29) | |
| Dell XPS 17 9720 RTX 3060 | |
| HP Envy 17-cr0079ng | |
| LG Gram 17 (2023) | |
| AIDA64 / FP64 Ray-Trace | |
| Dell XPS 17 9730 RTX 4070 | |
| Durchschnittliche Intel Core i7-13700H (2540 - 10135, n=29) | |
| LG Gram 17 (2023) | |
| MSI Creator Z17 A12UGST-054 | |
| Dell XPS 17 9720 RTX 3060 | |
| HP Envy 17-cr0079ng | |
| AIDA64 / CPU PhotoWorxx | |
| LG Gram 17 (2023) | |
| Dell XPS 17 9730 RTX 4070 | |
| Dell XPS 17 9720 RTX 3060 | |
| Durchschnittliche Intel Core i7-13700H (12872 - 52727, n=29) | |
| MSI Creator Z17 A12UGST-054 | |
| HP Envy 17-cr0079ng | |
System-Performance
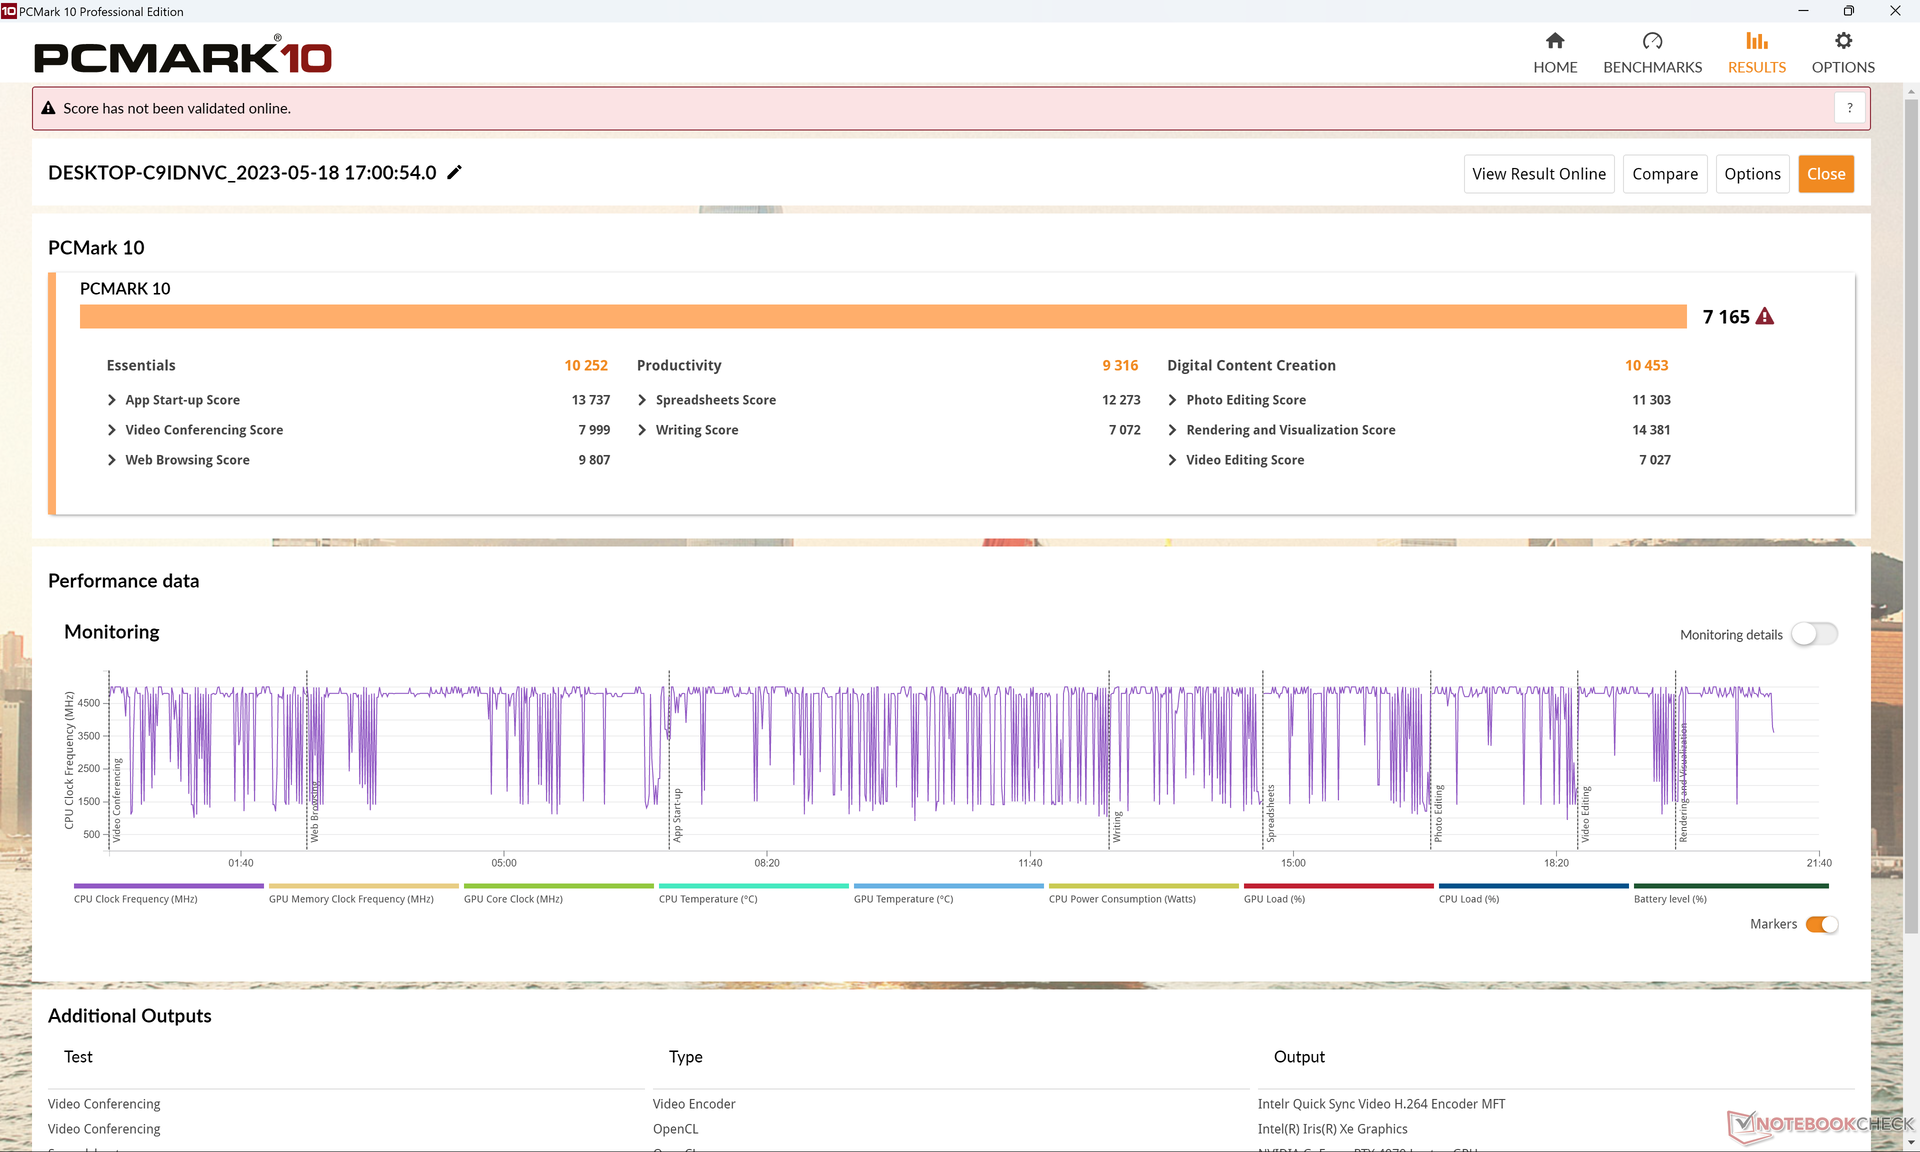
Im PCMark erreicht unser Testgerät fast identische Werte wie das XPS-17-9720-Modell aus dem letzten Jahr, trotz der jährlichen Performance-Verbesserungen. Dies lässt vermuten, dass alltägliche Aufgaben und leichte Office-Tätigkeiten kaum spürbar schneller laufen. Wenn die Nutzung des Laptops hauptsächlich aus Browsen im Internet, Tabellenkalkulation oder Textverarbeitung besteht, wäre eine günstigere Konfiguration des XPS 17 mit der RTX 4050 eher passend als die vorliegende mit der RTX 4070.
CrossMark: Overall | Productivity | Creativity | Responsiveness
| PCMark 10 / Score | |
| Durchschnittliche Intel Core i7-13700H, NVIDIA GeForce RTX 4070 Laptop GPU (7158 - 7956, n=8) | |
| Dell XPS 17 9720 RTX 3060 | |
| Dell XPS 17 9730 RTX 4070 | |
| MSI Creator Z17 A12UGST-054 | |
| HP Envy 17-cr0079ng | |
| LG Gram 17 (2023) | |
| PCMark 10 / Essentials | |
| LG Gram 17 (2023) | |
| Dell XPS 17 9720 RTX 3060 | |
| Durchschnittliche Intel Core i7-13700H, NVIDIA GeForce RTX 4070 Laptop GPU (10252 - 11449, n=8) | |
| HP Envy 17-cr0079ng | |
| MSI Creator Z17 A12UGST-054 | |
| Dell XPS 17 9730 RTX 4070 | |
| PCMark 10 / Productivity | |
| Durchschnittliche Intel Core i7-13700H, NVIDIA GeForce RTX 4070 Laptop GPU (8501 - 10769, n=8) | |
| MSI Creator Z17 A12UGST-054 | |
| Dell XPS 17 9720 RTX 3060 | |
| Dell XPS 17 9730 RTX 4070 | |
| HP Envy 17-cr0079ng | |
| LG Gram 17 (2023) | |
| PCMark 10 / Digital Content Creation | |
| Durchschnittliche Intel Core i7-13700H, NVIDIA GeForce RTX 4070 Laptop GPU (10358 - 12908, n=8) | |
| Dell XPS 17 9730 RTX 4070 | |
| Dell XPS 17 9720 RTX 3060 | |
| MSI Creator Z17 A12UGST-054 | |
| HP Envy 17-cr0079ng | |
| LG Gram 17 (2023) | |
| CrossMark / Overall | |
| MSI Creator Z17 A12UGST-054 | |
| Apple MacBook Pro 16 2023 M2 Max | |
| Durchschnittliche Intel Core i7-13700H, NVIDIA GeForce RTX 4070 Laptop GPU (1768 - 2073, n=6) | |
| Dell XPS 17 9720 RTX 3060 | |
| Dell XPS 17 9730 RTX 4070 | |
| LG Gram 17 (2023) | |
| HP Envy 17-cr0079ng | |
| CrossMark / Productivity | |
| MSI Creator Z17 A12UGST-054 | |
| Durchschnittliche Intel Core i7-13700H, NVIDIA GeForce RTX 4070 Laptop GPU (1645 - 2006, n=6) | |
| Dell XPS 17 9720 RTX 3060 | |
| Dell XPS 17 9730 RTX 4070 | |
| Apple MacBook Pro 16 2023 M2 Max | |
| LG Gram 17 (2023) | |
| HP Envy 17-cr0079ng | |
| CrossMark / Creativity | |
| Apple MacBook Pro 16 2023 M2 Max | |
| MSI Creator Z17 A12UGST-054 | |
| Dell XPS 17 9720 RTX 3060 | |
| Durchschnittliche Intel Core i7-13700H, NVIDIA GeForce RTX 4070 Laptop GPU (1936 - 2137, n=6) | |
| Dell XPS 17 9730 RTX 4070 | |
| LG Gram 17 (2023) | |
| HP Envy 17-cr0079ng | |
| CrossMark / Responsiveness | |
| MSI Creator Z17 A12UGST-054 | |
| Durchschnittliche Intel Core i7-13700H, NVIDIA GeForce RTX 4070 Laptop GPU (1451 - 2202, n=6) | |
| Dell XPS 17 9720 RTX 3060 | |
| Dell XPS 17 9730 RTX 4070 | |
| LG Gram 17 (2023) | |
| Apple MacBook Pro 16 2023 M2 Max | |
| HP Envy 17-cr0079ng | |
| PCMark 10 Score | 7165 Punkte | |
Hilfe | ||
| AIDA64 / Memory Copy | |
| LG Gram 17 (2023) | |
| Dell XPS 17 9730 RTX 4070 | |
| Dell XPS 17 9720 RTX 3060 | |
| MSI Creator Z17 A12UGST-054 | |
| Durchschnittliche Intel Core i7-13700H (24334 - 78081, n=29) | |
| HP Envy 17-cr0079ng | |
| AIDA64 / Memory Read | |
| Dell XPS 17 9730 RTX 4070 | |
| Dell XPS 17 9720 RTX 3060 | |
| MSI Creator Z17 A12UGST-054 | |
| Durchschnittliche Intel Core i7-13700H (23681 - 79656, n=29) | |
| LG Gram 17 (2023) | |
| HP Envy 17-cr0079ng | |
| AIDA64 / Memory Write | |
| LG Gram 17 (2023) | |
| Dell XPS 17 9730 RTX 4070 | |
| Durchschnittliche Intel Core i7-13700H (22986 - 99898, n=29) | |
| MSI Creator Z17 A12UGST-054 | |
| Dell XPS 17 9720 RTX 3060 | |
| HP Envy 17-cr0079ng | |
| AIDA64 / Memory Latency | |
| LG Gram 17 (2023) | |
| MSI Creator Z17 A12UGST-054 | |
| Dell XPS 17 9730 RTX 4070 | |
| Durchschnittliche Intel Core i7-13700H (82.4 - 136.8, n=29) | |
| Dell XPS 17 9720 RTX 3060 | |
| HP Envy 17-cr0079ng | |
* ... kleinere Werte sind besser
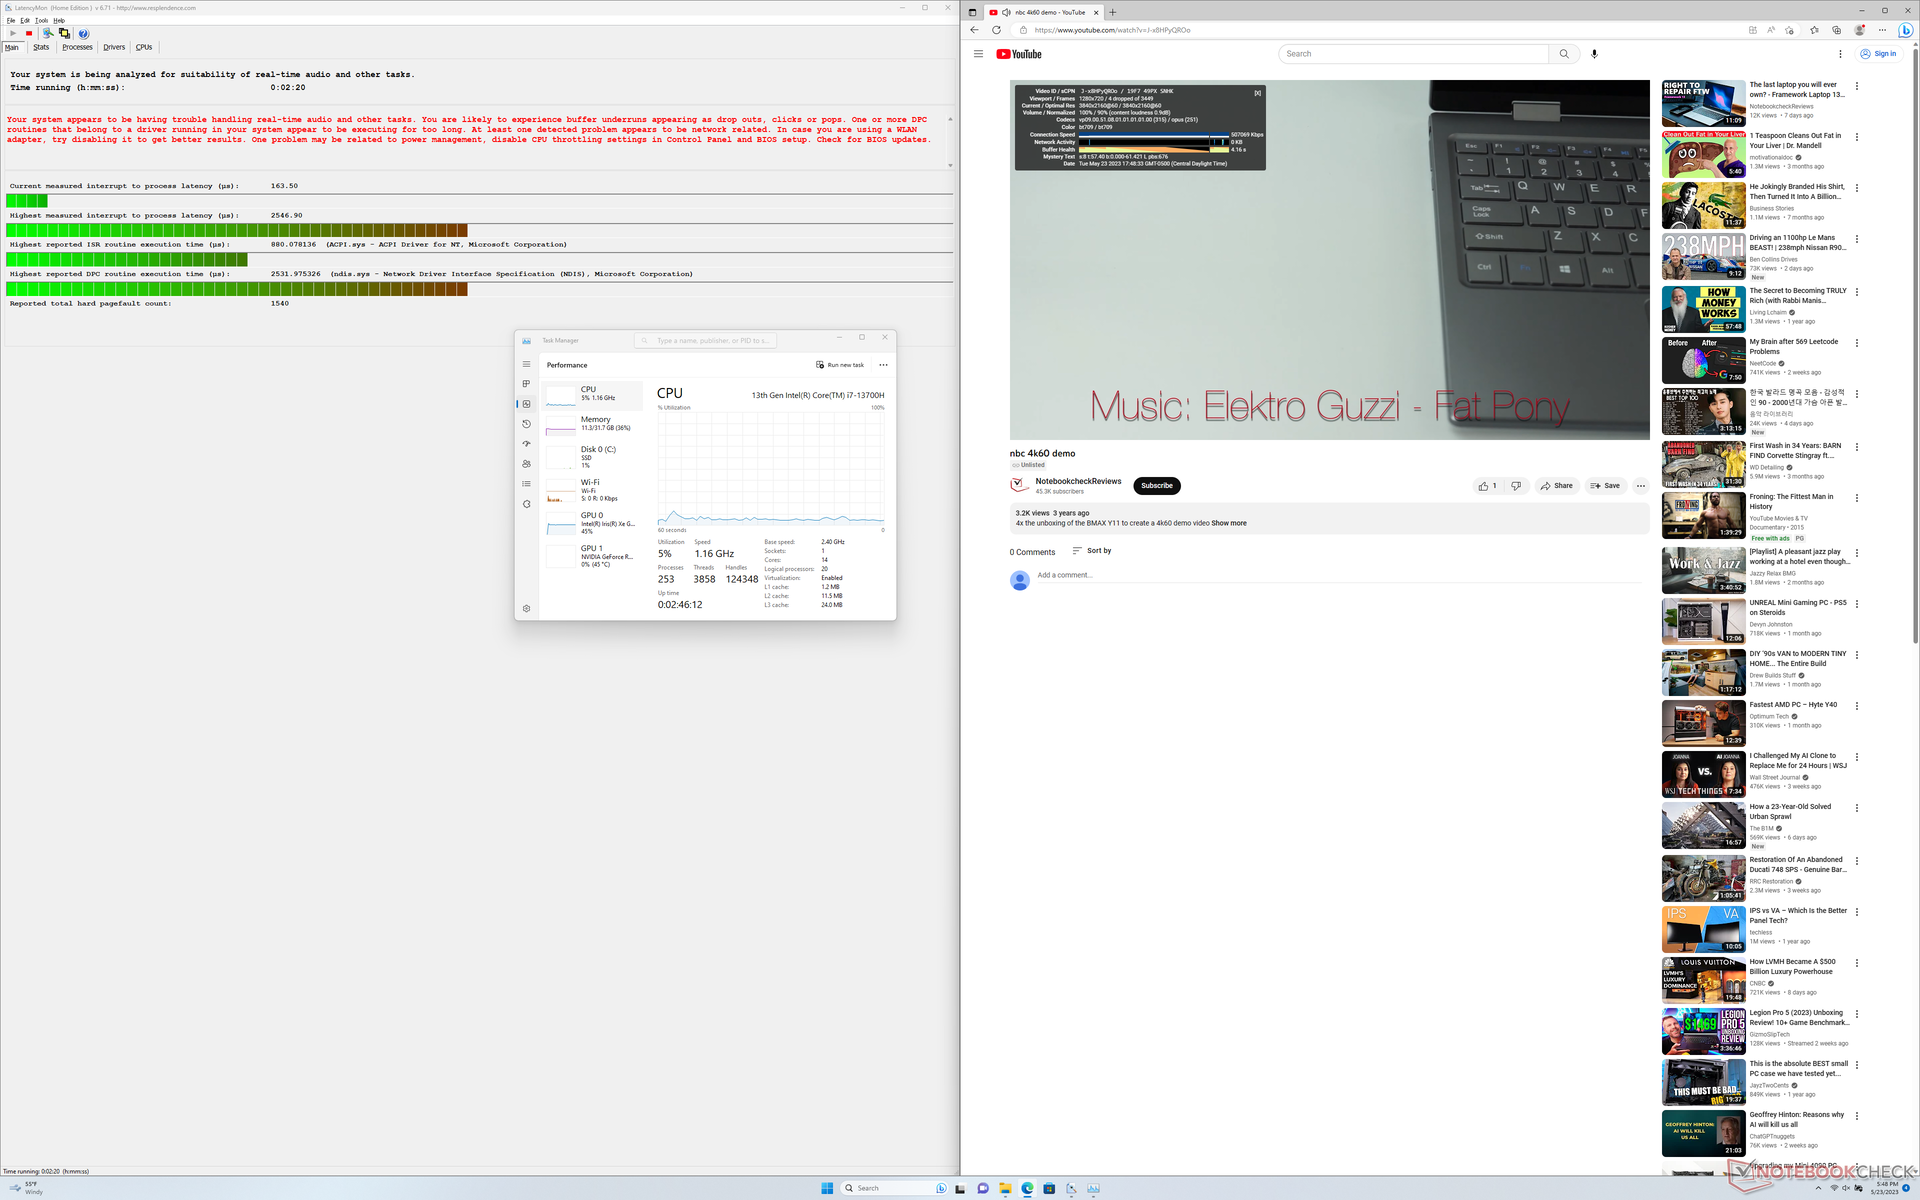
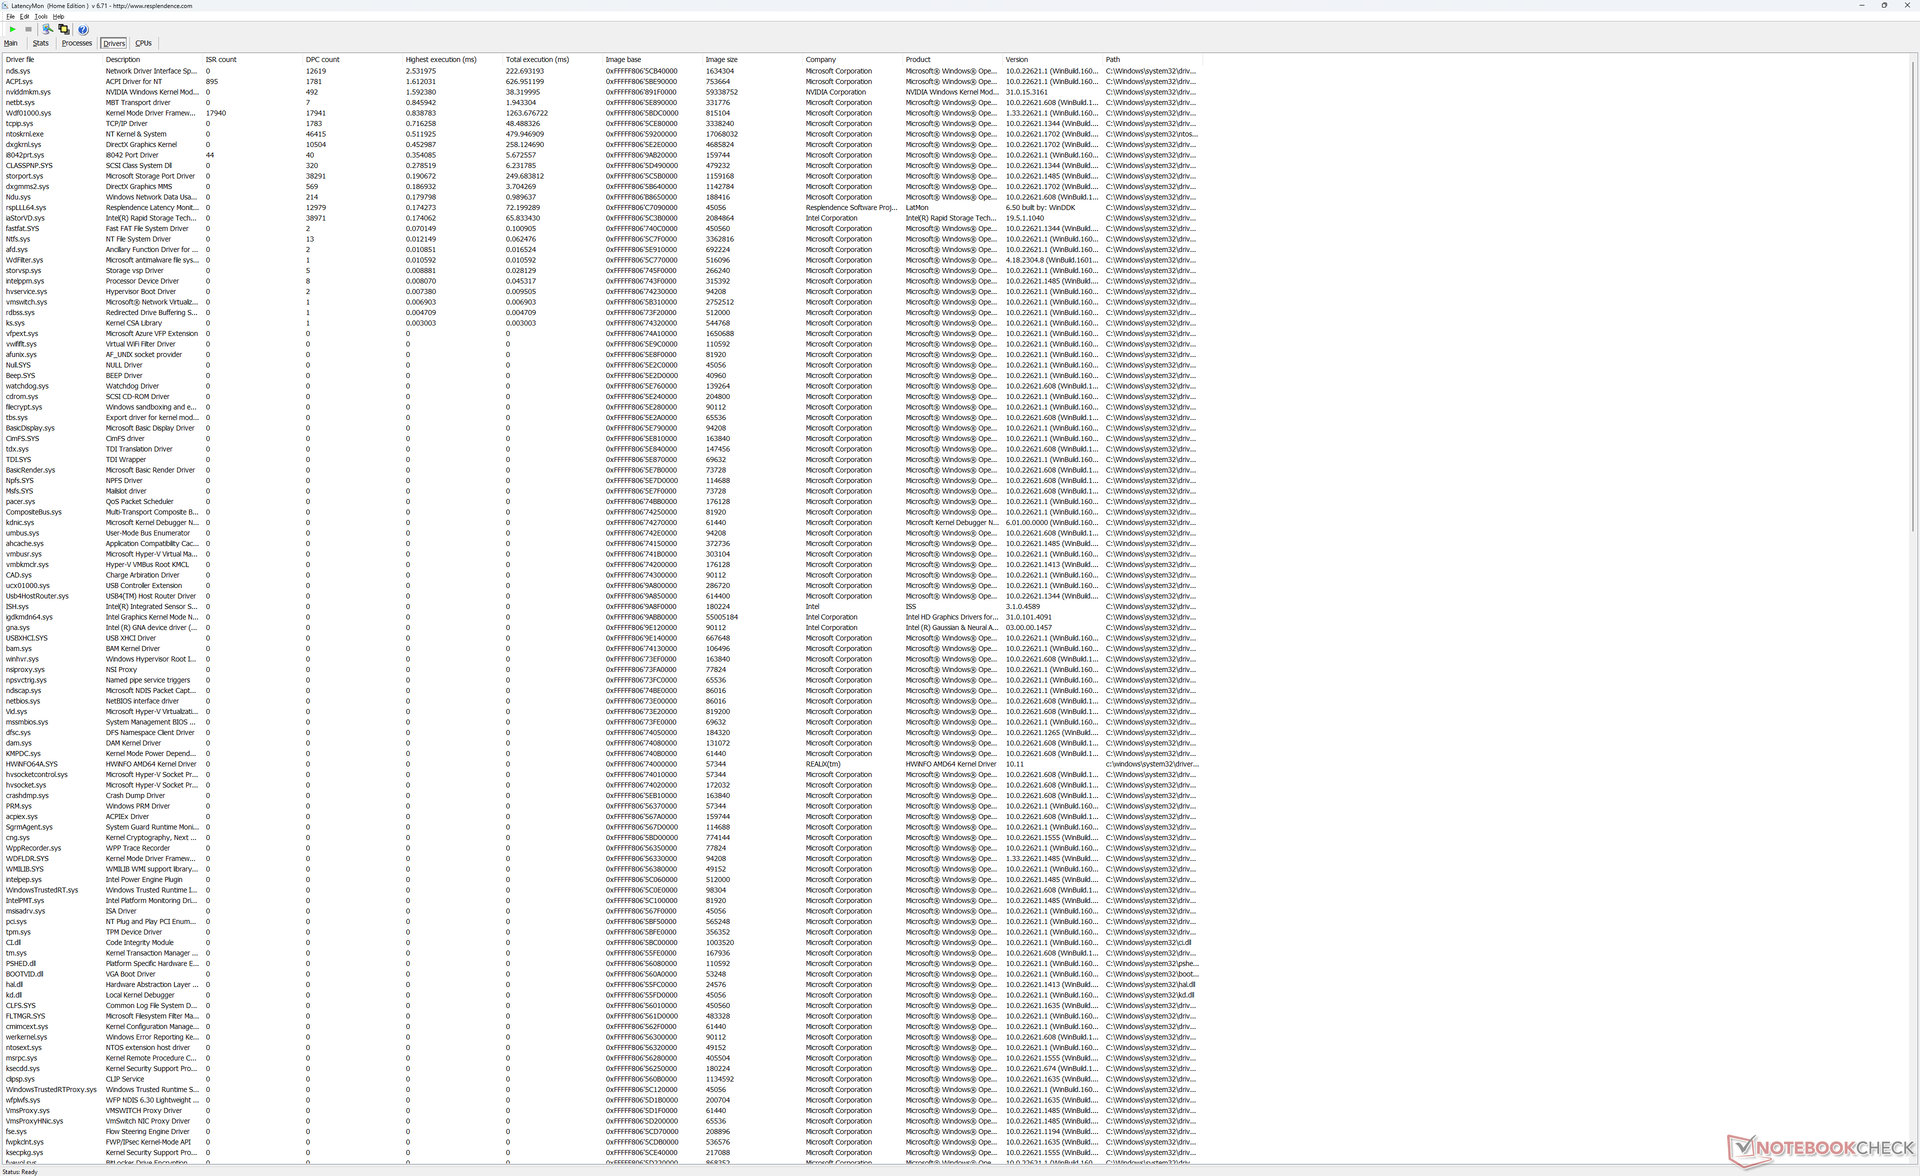
DPC-Latenz
LatencyMon zeigt DPC-Probleme beim Öffnen von mehreren Browser Tabs unserer Website, auch nach mehreren Versuchen. Diese Ergebnisse sind enttäuschend, wenn man bedenkt, dass wir mit dem XPS 15 9530 oder dem XPS 17 9720 aus dem letzten Jahr kaum Probleme hatten.
Beim Abspielen eines 4K-Videos bei 60 fps gibt es keine Mängel, außer am Anfang, wo immer ein Einbruch von knapp vier Bildern bemerkbar war. Interessanterweise passiert dies beim XPS 15 9530 ebenfalls.
| DPC Latencies / LatencyMon - interrupt to process latency (max), Web, Youtube, Prime95 | |
| HP Envy 17-cr0079ng | |
| Dell XPS 17 9730 RTX 4070 | |
| LG Gram 17 (2023) | |
| MSI Creator Z17 A12UGST-054 | |
| Dell XPS 15 9530 RTX 4070 | |
| Dell XPS 17 9720 RTX 3060 | |
* ... kleinere Werte sind besser
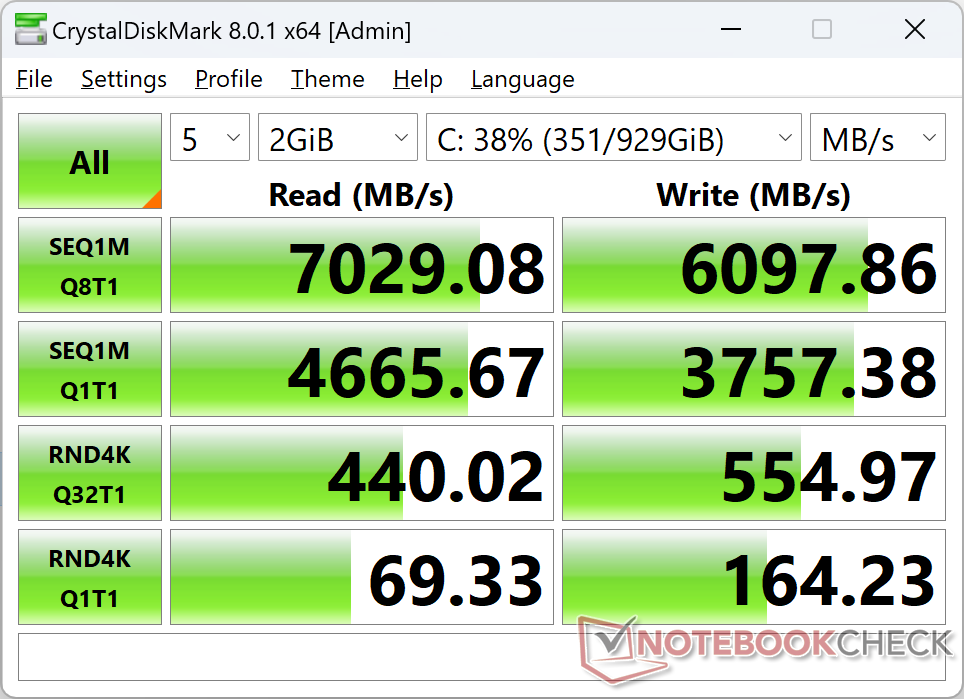
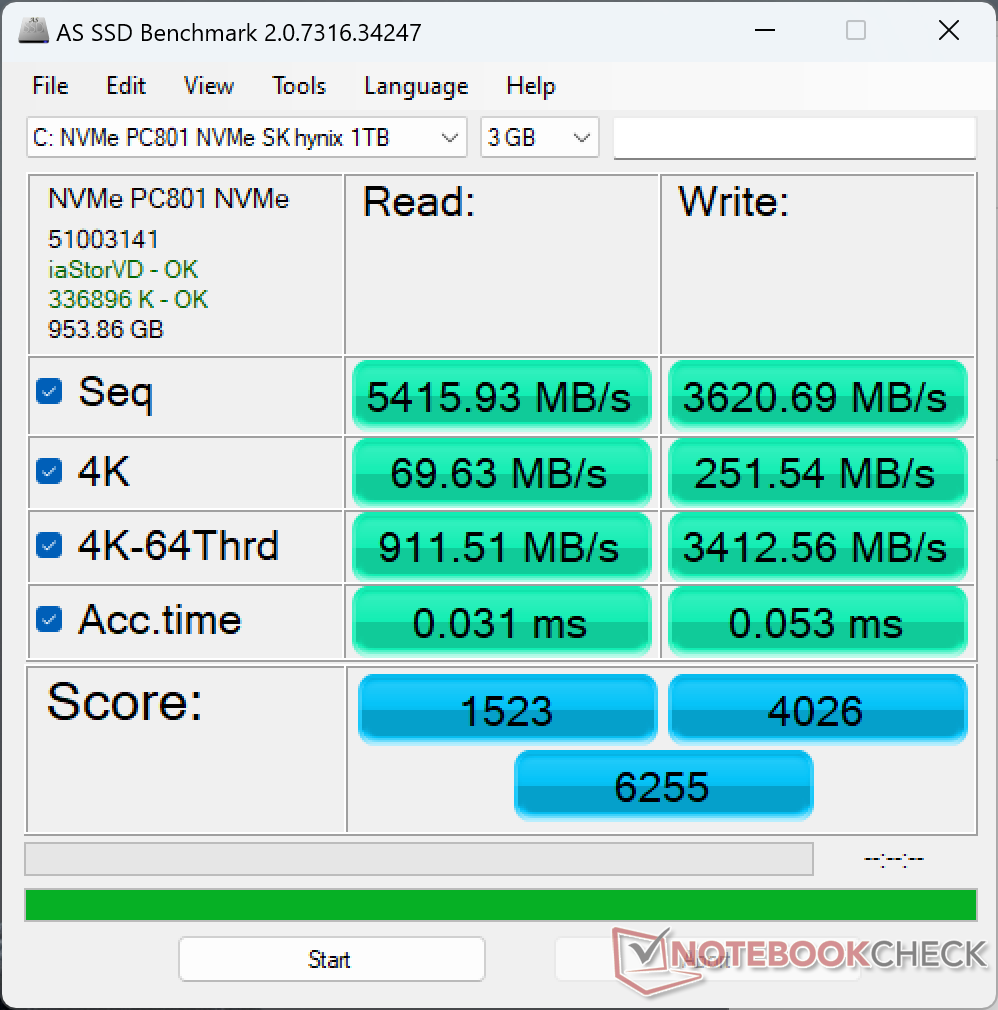
Speicher
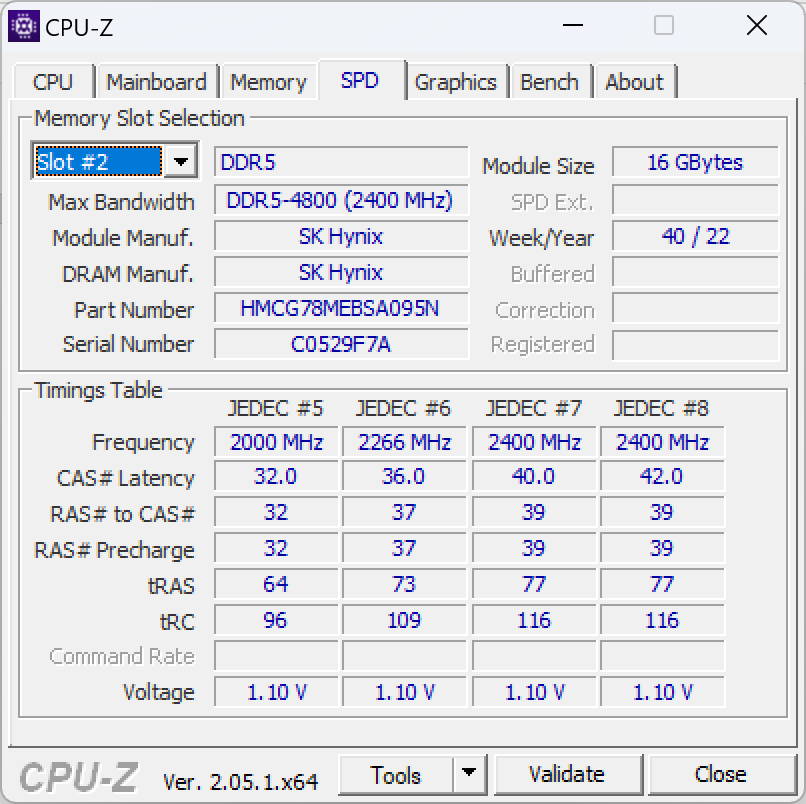
XPS-Geräte werden standardmäßig mit SSDs von Samsung, Micron, Western Digital oder SK Hynix ausgeliefert. In unserem Fall besitzt das Testgerät eine SK Hynix PC801 PCIe4 x4 NVMe SSD. Die Performance kann überzeugen und lässt sich mit einer Samsung PM9A1 vergleichen. Dies zeigt sich vor allem durch stabile Transferraten unter Last.
Optional kann eine zweite M.2-SSD nachgerüstet werden. Dabei besitzt jeder dieser zwei M.2-Slots einen Head Spreader zur Kühlung.

| Drive Performance Rating - Percent | |
| LG Gram 17 (2023) | |
| MSI Creator Z17 A12UGST-054 | |
| Dell XPS 17 9730 RTX 4070 | |
| Dell XPS 17 9720 RTX 3060 | |
| HP Envy 17-cr0079ng | |
* ... kleinere Werte sind besser
Festplattenleistung: DiskSpd Read Loop, Queue Depth 8
GPU-Performance — deutlich schneller als das XPS 15 9530
Die kleinere Version der GeForce RTX 4070 im XPS 17 hat einen maximalen Verbrauch von 60 bis 70 W, während die gleiche GPU im kleineren XPS 15 einen Wert von 40 W ergibt. Der Performance-Boost ist so gut, dass die RTX 4070 im XPS 17 nur ca. 10 bis 15 Prozent hinter anderen Durchschnittsgeräten mit der gleichen GPU liegt. Diese Ergebnisse hätten wir auch beim XPS 15 9530 erwartet.
Im Blender-GPU-Benchmark bekommt sie sogar einen Boost im Vergleich zur gleichen Grafikkarte im XPS 15. Es ist eine Leistungssteigerung von ca. 20 Prozent nötig, um das XPS 17 bei den anderen RTX 4070 Laptops anordnen zu können.
Dell bietet auch eine Version des XPS 17 mit einer RTX 4080 an. Bei dieser erwarten wir jedoch, dass sie im Vergleich zu anderen Laptops mit dieser Grafikeinheit schlecht abschneiden wird, was vor allem an der limitierten 130-W-Stromversorgung via USB-C liegt. Das MSI Stealth 17 Studio beispielsweise bietet ebenfalls eine RTX-4080-Version an, jedoch mit einem deutlich stärkeren 240-W-AC-Adapter.
Die stärkste Variante für das XPS 17 (vor dem XPS 17 9730) war die RTX 3060. Wenn man diese Version mit unserem Testgerät vergleicht, so erhält man mit unserer RTX 4070 knapp 20 bis 30 Prozent mehr Grafik-Performance.
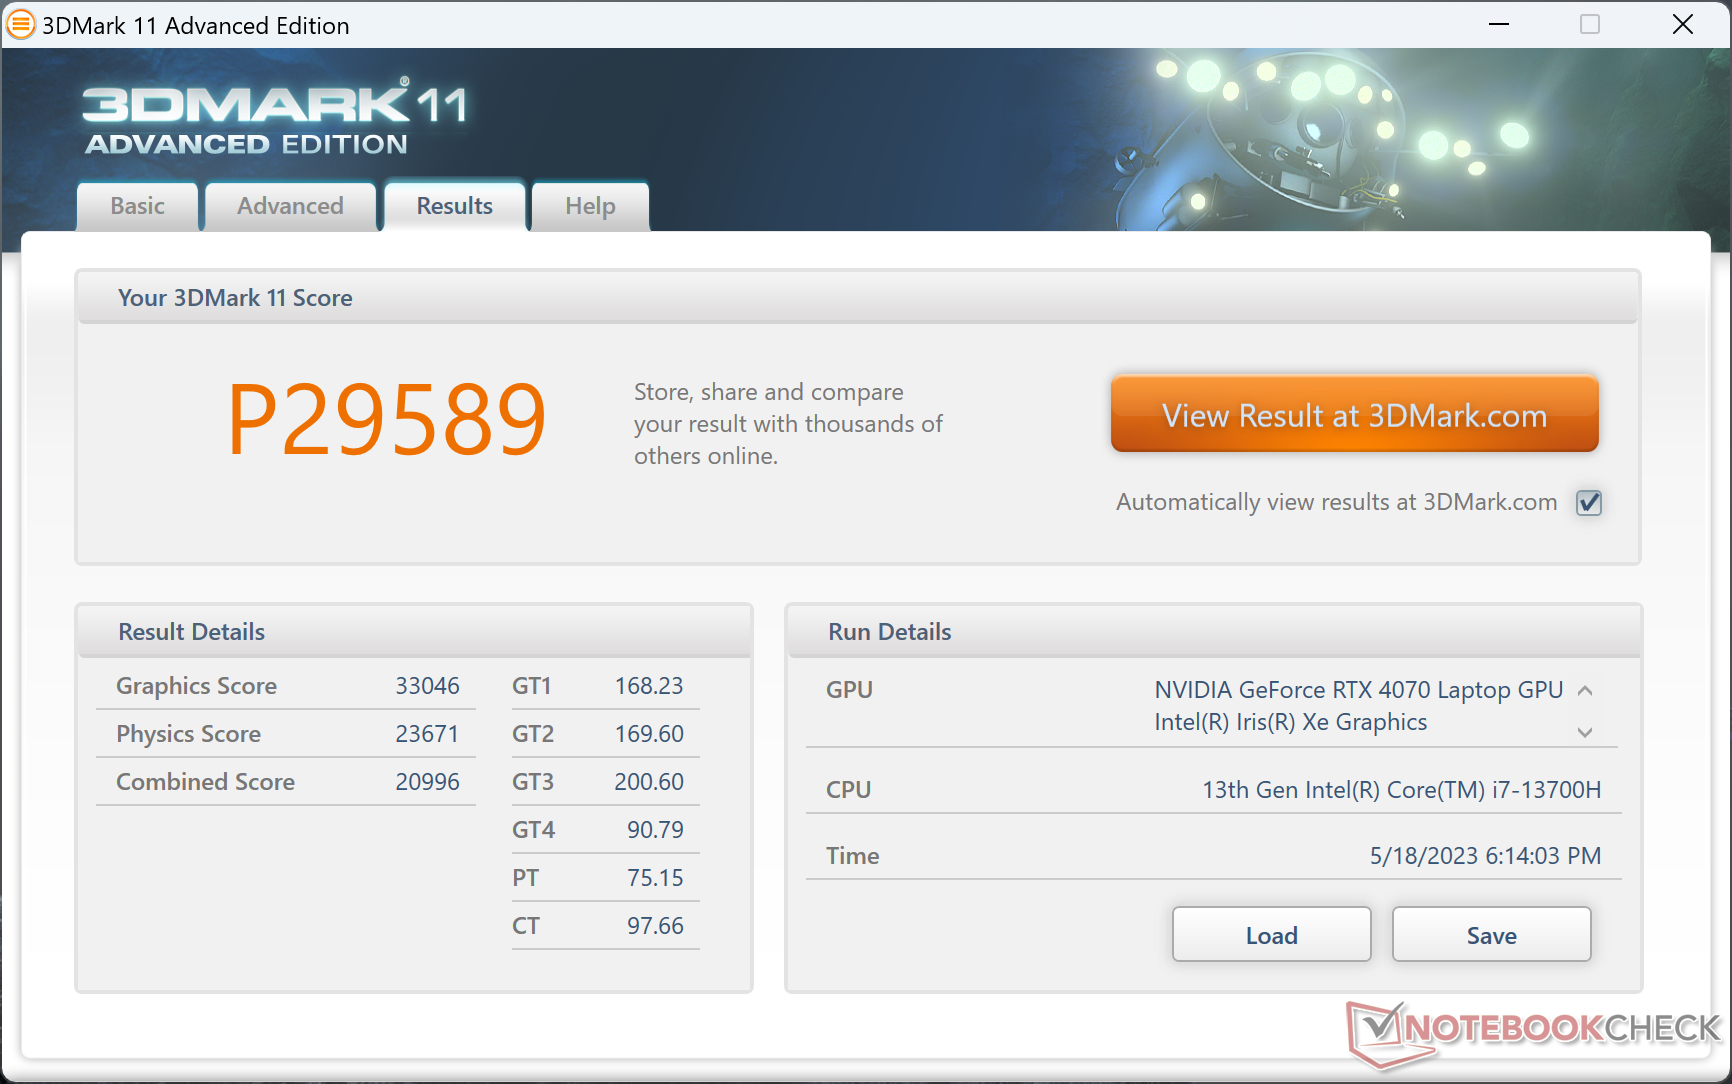
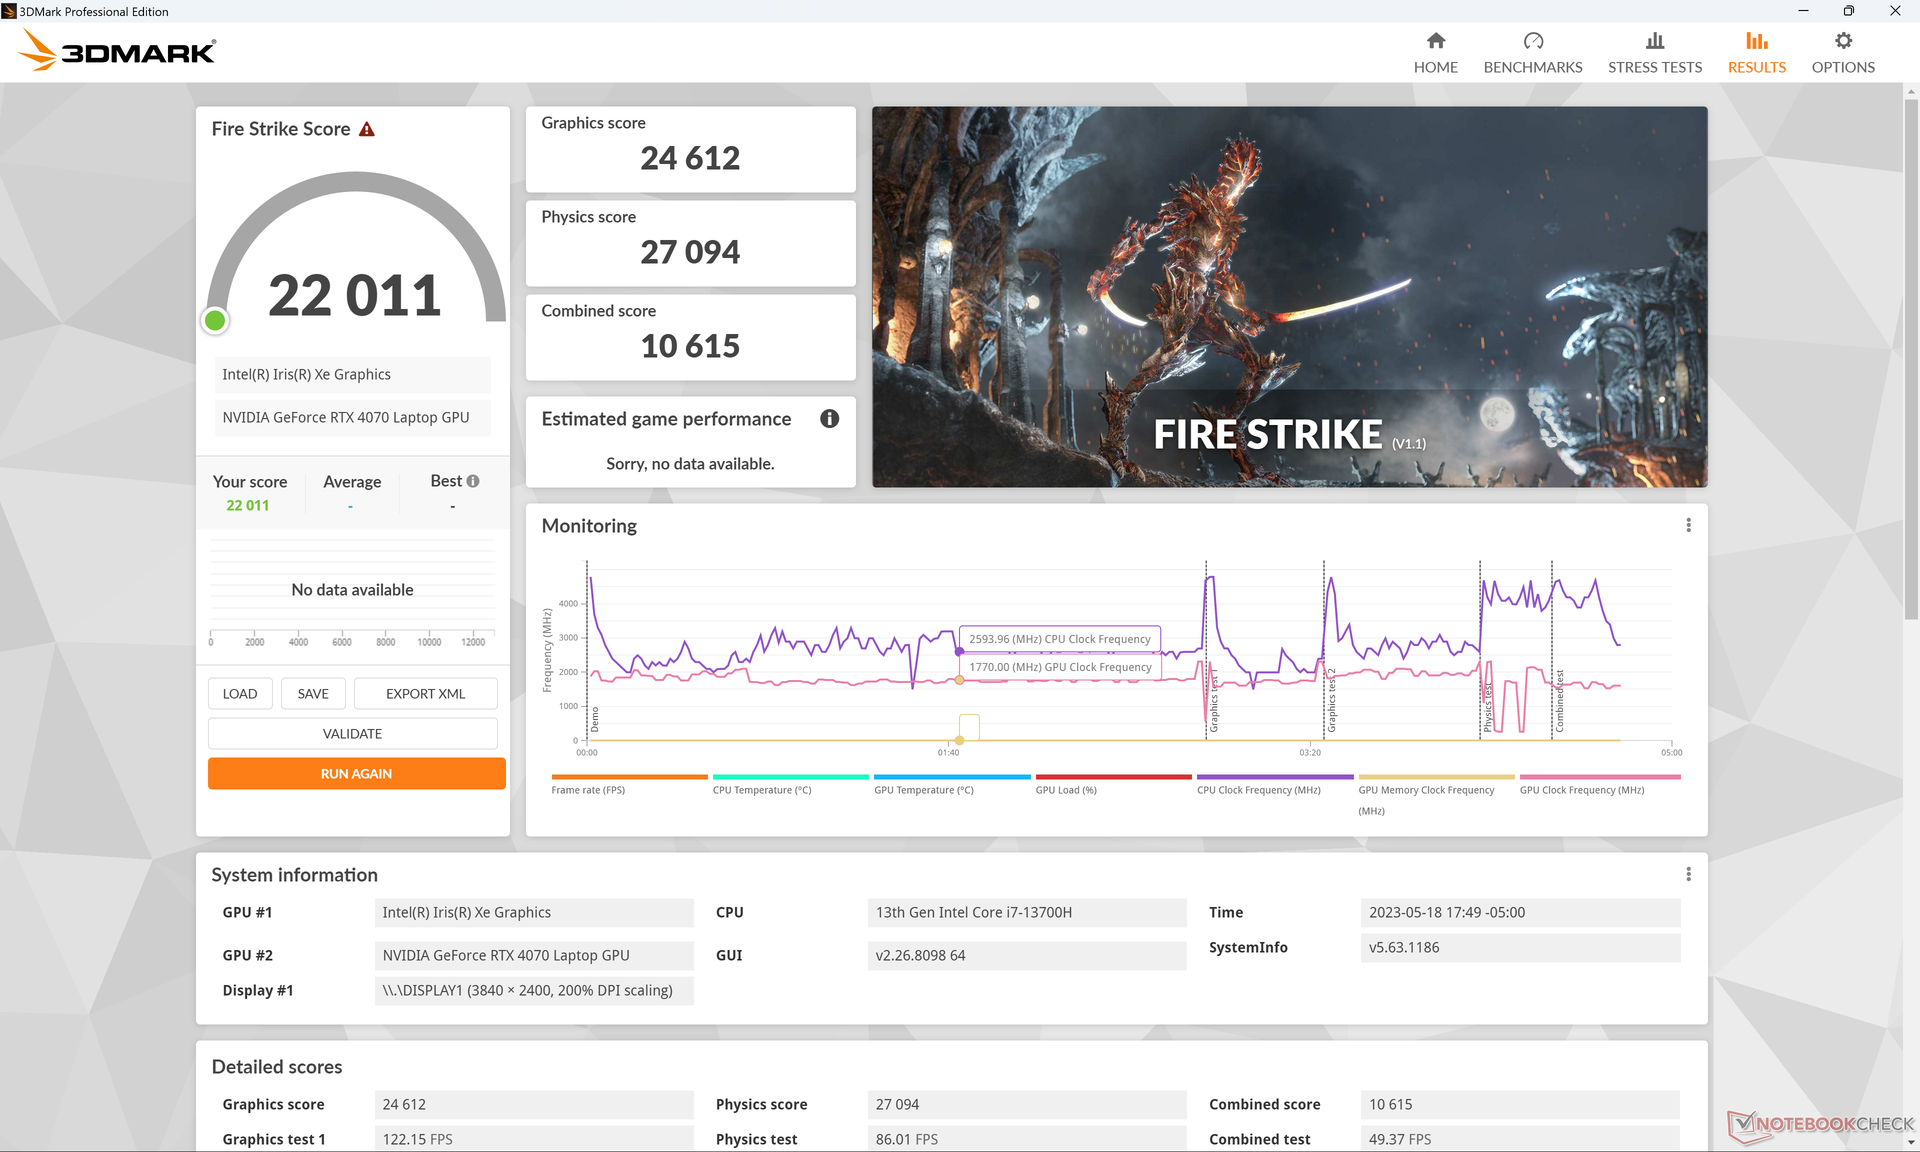
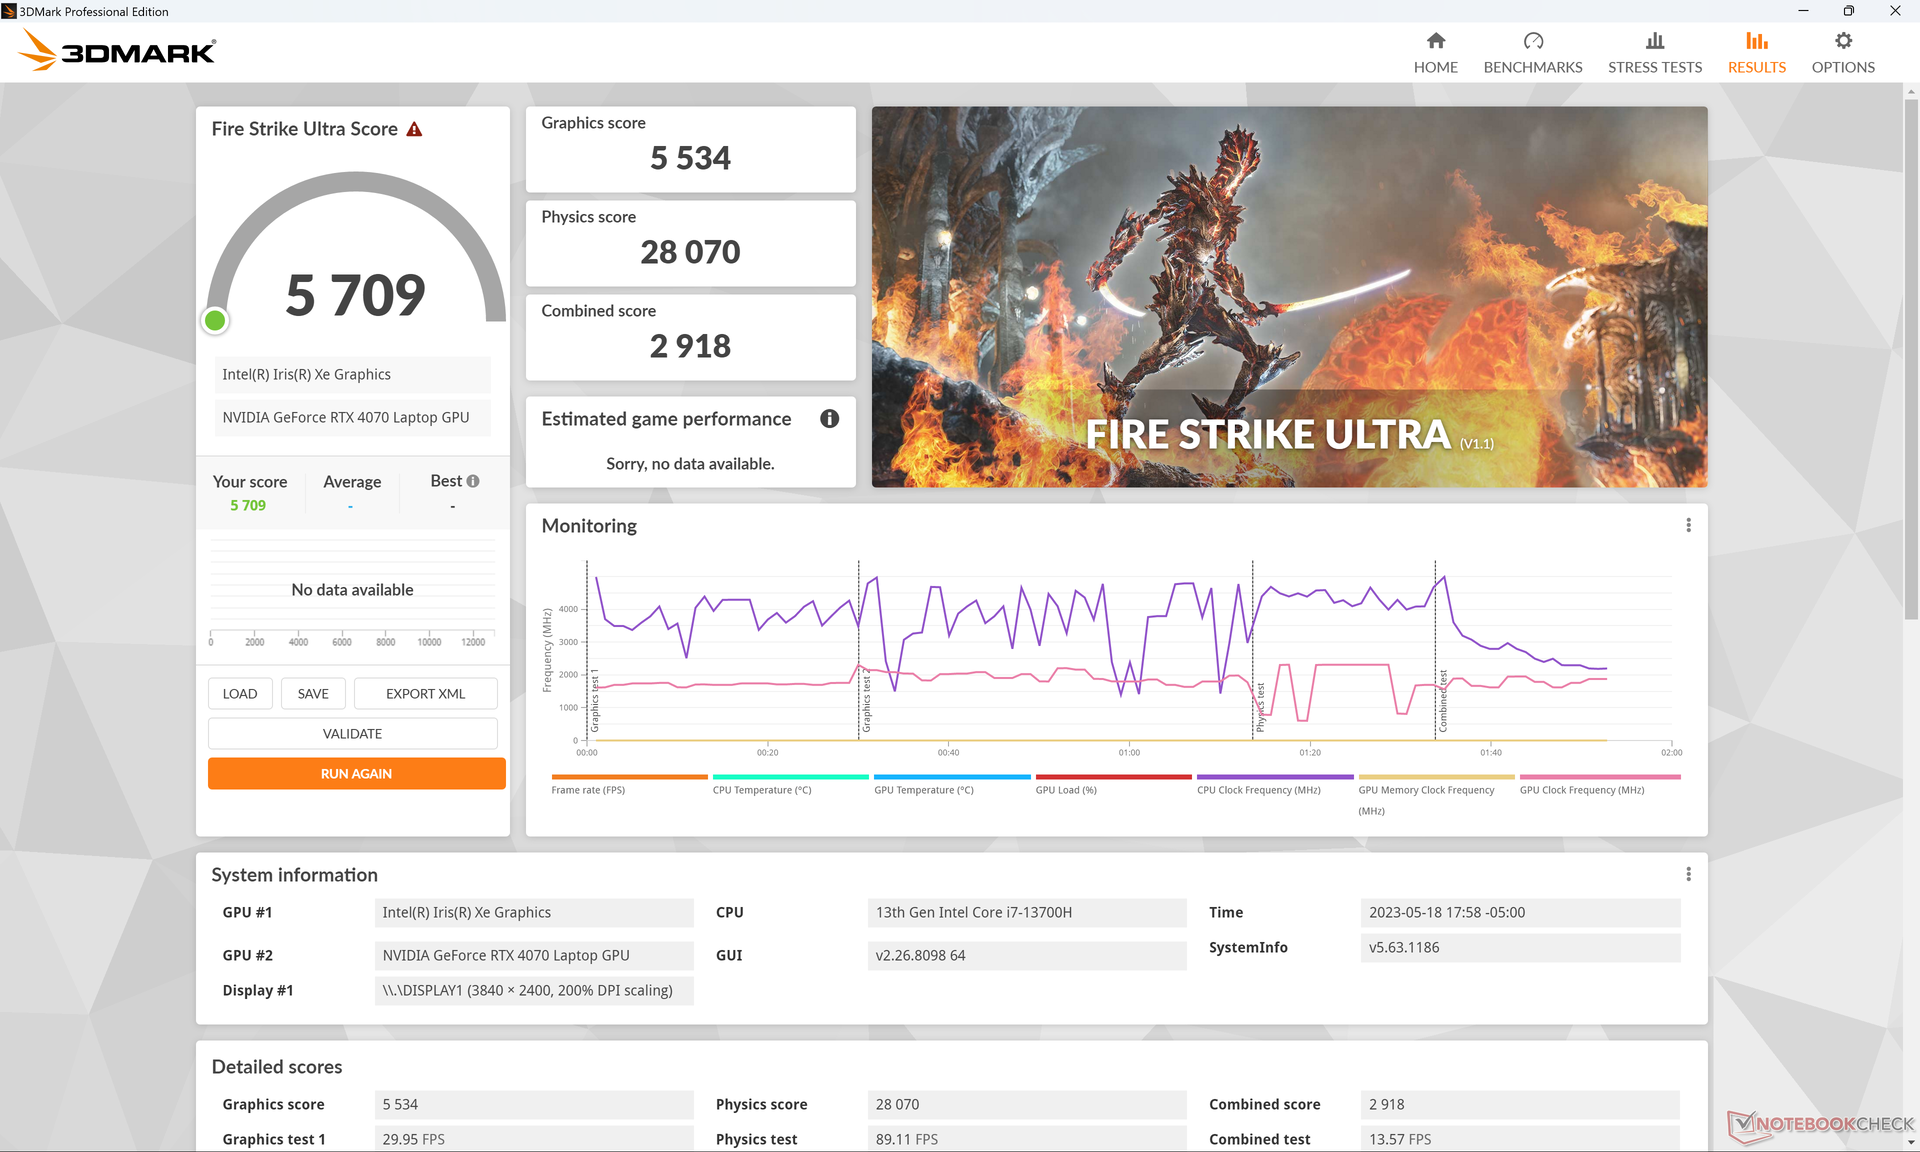
| 3DMark 11 Performance | 29589 Punkte | |
| 3DMark Fire Strike Score | 22011 Punkte | |
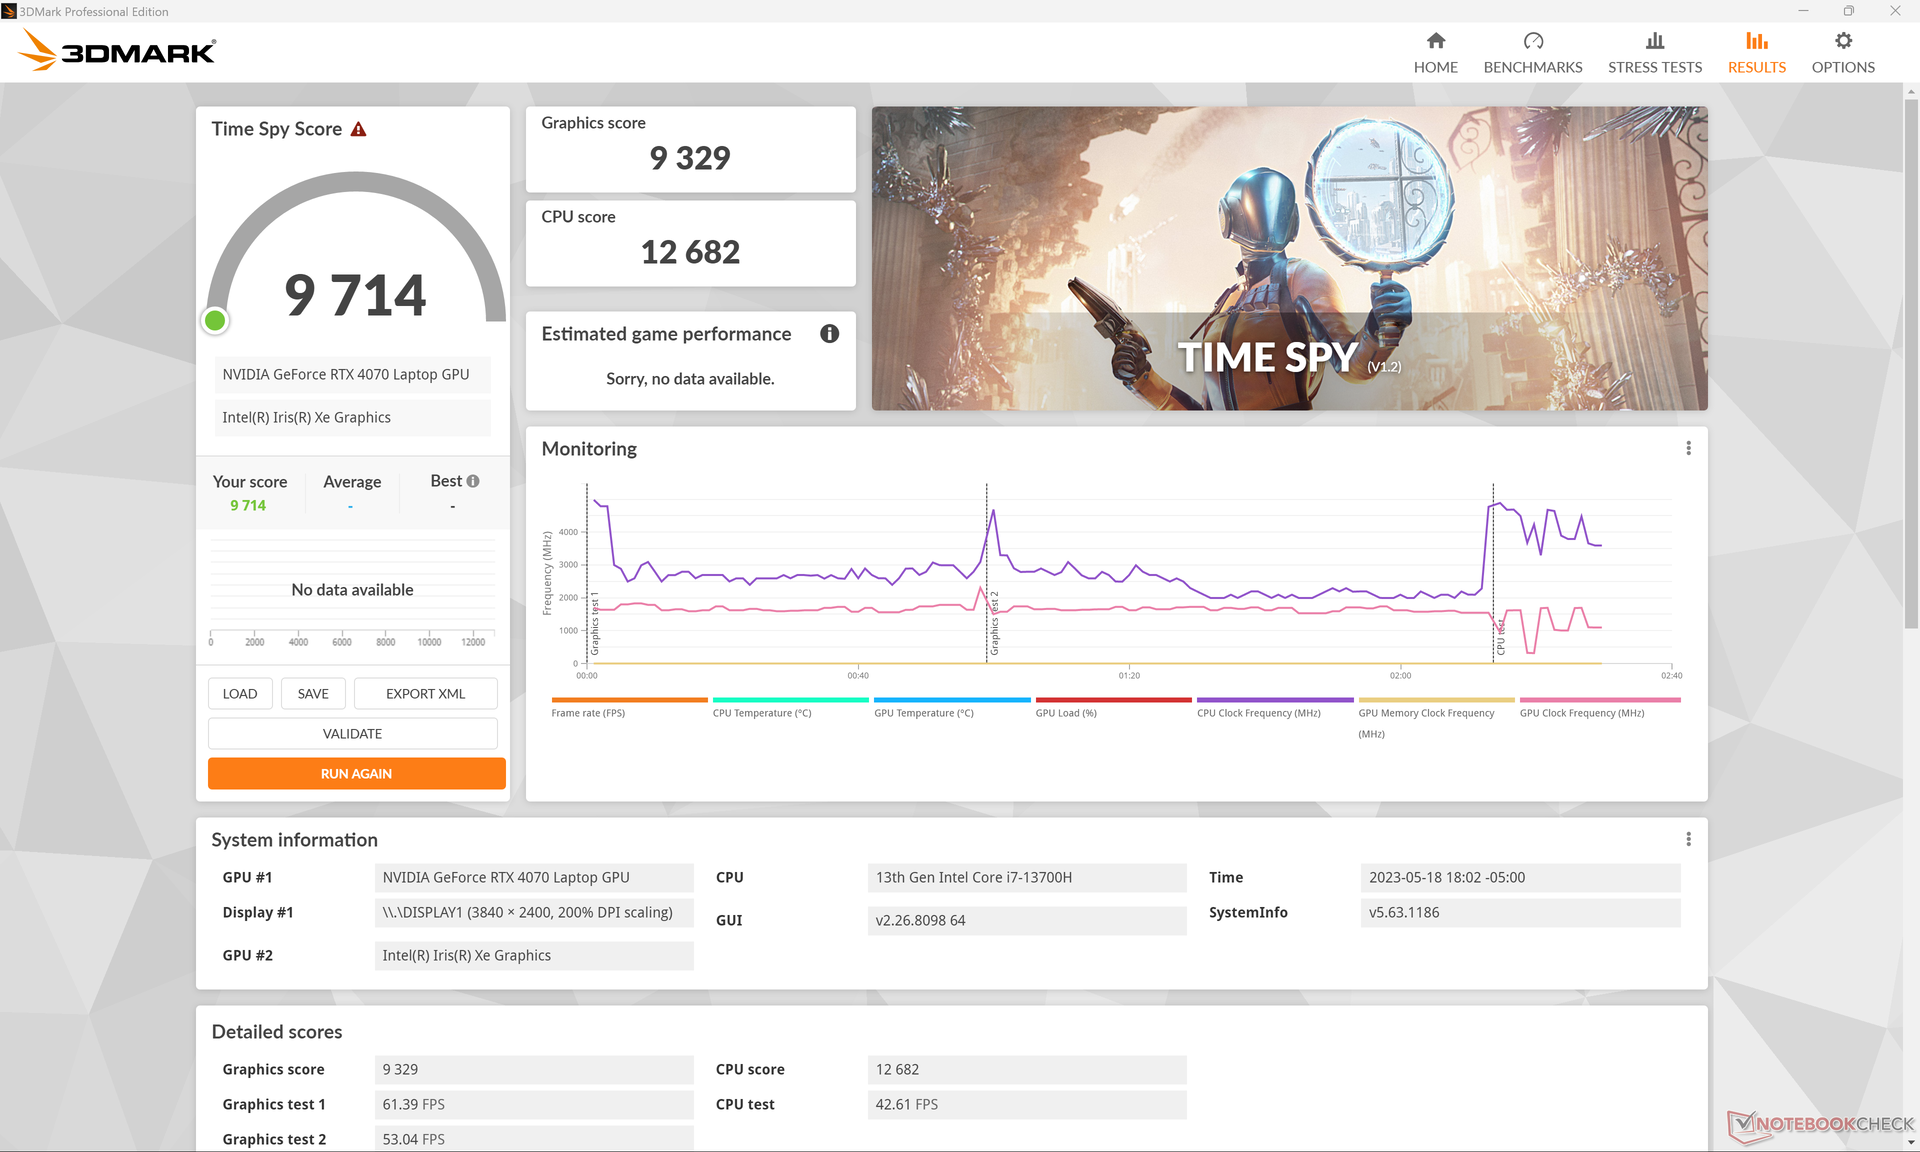
| 3DMark Time Spy Score | 9714 Punkte | |
Hilfe | ||
* ... kleinere Werte sind besser
Gaming Performance
Das Gerät funktioniert einwandfrei als zweiter Gaming-Rechner. Nachdem die 70-W-RTX-4070 nicht so unterversorgt wie das 40-W-Modell im XPS 15 ist, schafft das XPS 17 die neuesten Spiele in QHD-Auflösung und 60 fps auf mittleren bis mittelhohen Einstellungen. 4K-UHD ist zwar in den seltensten Fällen möglich, allerdings lässt sich die GPU gut mit einem externen FHD- oder QHD-Monitor zum Spielen betreiben.
Die einzigen zwei Dinge, die das XPS 17 davon abhalten, ein „richtiger“ Gaming-Laptop zu sein, sind einerseits die relativ langsame Reaktionszeit und andererseits der fehlende G-Sync-Support für das interne Display. Dies führt zu fallenden fps-Raten, Screen Tearing und Ghosting während des Gamings auf dem XPS 17. Natürlich können die meisten dieser Mängel durch einen externen Monitor behoben werden.
| Returnal | |
| 1280x720 Low Preset | |
| Aorus 17X AZF | |
| Durchschnittliche NVIDIA GeForce RTX 4070 Laptop GPU (126 - 150, n=5) | |
| 1920x1080 Low Preset | |
| Aorus 17X AZF | |
| Durchschnittliche NVIDIA GeForce RTX 4070 Laptop GPU (65 - 119, n=11) | |
| Dell XPS 17 9730 RTX 4070 | |
| 1920x1080 Medium Preset | |
| Aorus 17X AZF | |
| Durchschnittliche NVIDIA GeForce RTX 4070 Laptop GPU (69 - 117, n=12) | |
| Dell XPS 17 9730 RTX 4070 | |
| 1920x1080 High Preset | |
| Aorus 17X AZF | |
| Durchschnittliche NVIDIA GeForce RTX 4070 Laptop GPU (64 - 106, n=12) | |
| Dell XPS 17 9730 RTX 4070 | |
| 1920x1080 Epic Preset | |
| Aorus 17X AZF | |
| Durchschnittliche NVIDIA GeForce RTX 4070 Laptop GPU (54 - 90, n=12) | |
| Dell XPS 17 9730 RTX 4070 | |
| 2560x1440 Epic Preset | |
| Aorus 17X AZF | |
| Durchschnittliche NVIDIA GeForce RTX 4070 Laptop GPU (39 - 66, n=12) | |
| Dell XPS 17 9730 RTX 4070 | |
| 3840x2160 Epic Preset | |
| Aorus 17X AZF | |
| Durchschnittliche NVIDIA GeForce RTX 4070 Laptop GPU (21 - 39, n=8) | |
| Dell XPS 17 9730 RTX 4070 | |
| Tiny Tina's Wonderlands | |
| 1920x1080 Low Preset (DX12) | |
| Aorus 17X AZF | |
| Durchschnittliche NVIDIA GeForce RTX 4070 Laptop GPU (98.1 - 283, n=15) | |
| Dell XPS 17 9730 RTX 4070 | |
| 1920x1080 Medium Preset (DX12) | |
| Aorus 17X AZF | |
| Durchschnittliche NVIDIA GeForce RTX 4070 Laptop GPU (92.5 - 231, n=15) | |
| Dell XPS 17 9730 RTX 4070 | |
| 1920x1080 High Preset (DX12) | |
| Aorus 17X AZF | |
| Durchschnittliche NVIDIA GeForce RTX 4070 Laptop GPU (74.3 - 151.4, n=15) | |
| Dell XPS 17 9730 RTX 4070 | |
| 1920x1080 Badass Preset (DX12) | |
| Aorus 17X AZF | |
| Durchschnittliche NVIDIA GeForce RTX 4070 Laptop GPU (58.6 - 115.9, n=18) | |
| Dell XPS 17 9730 RTX 4070 | |
| 2560x1440 Badass Preset (DX12) | |
| Aorus 17X AZF | |
| Durchschnittliche NVIDIA GeForce RTX 4070 Laptop GPU (49.8 - 79.5, n=17) | |
| Dell XPS 17 9730 RTX 4070 | |
| 3840x2160 Badass Preset (DX12) | |
| Aorus 17X AZF | |
| Durchschnittliche NVIDIA GeForce RTX 4070 Laptop GPU (28.3 - 39.7, n=13) | |
| Dell XPS 17 9730 RTX 4070 | |
Witcher 3 FPS Grafik
| min. | mittel | hoch | max. | QHD | 4K | |
|---|---|---|---|---|---|---|
| GTA V (2015) | 186.6 | 182.5 | 167.9 | 102.7 | 75.5 | 76.9 |
| The Witcher 3 (2015) | 415.2 | 297.6 | 181.4 | 96.2 | 59 | |
| Dota 2 Reborn (2015) | 193.5 | 174.5 | 165.9 | 156.9 | 108 | |
| Final Fantasy XV Benchmark (2018) | 174.8 | 128.3 | 94.7 | 69.9 | 38.2 | |
| X-Plane 11.11 (2018) | 154.6 | 133.1 | 106.4 | 90 | ||
| Strange Brigade (2018) | 431 | 238 | 192 | 165.4 | 113.6 | 61.7 |
| Cyberpunk 2077 1.6 (2022) | 102.1 | 99.4 | 85.6 | 71 | 43 | 18.7 |
| Tiny Tina's Wonderlands (2022) | 183.5 | 153.3 | 104.9 | 82.4 | 55.7 | 28.3 |
| F1 22 (2022) | 206 | 196.4 | 158.2 | 60.7 | 39.4 | 18.8 |
| Returnal (2023) | 72 | 71 | 67 | 59 | 41 | 21 |
Emissionen
Lüfterlautsärke — Nur laut, wenn es nötig ist
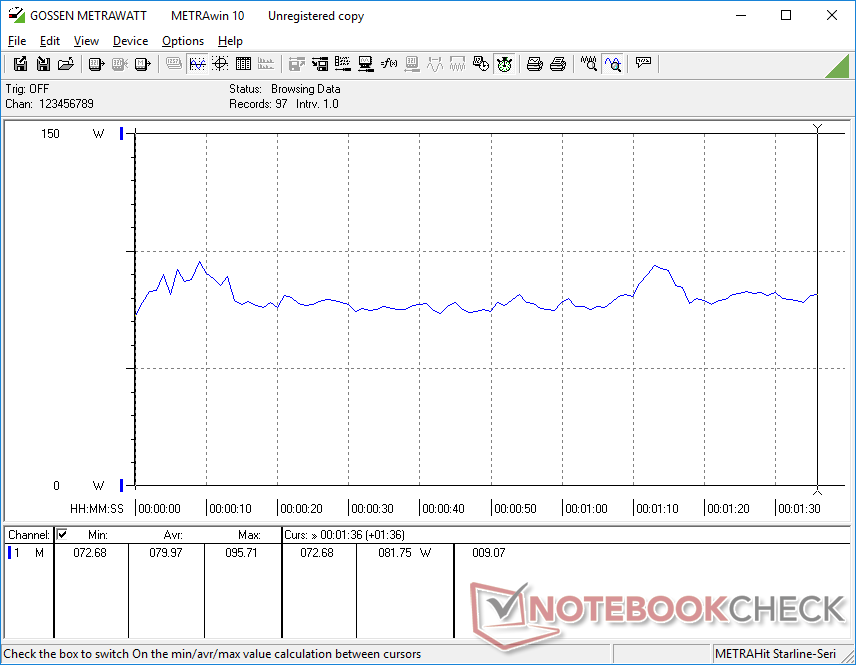
Die Lüfter haben sich nicht wirklich verändert, abgesehen von leichten Verbesserungen der Performance. Das XPS 17 ist während dem Internetsurfen oder dem Streamen von Videos mit 25,6 dB(A) (bei Umgebungsgeräuschen von ca. 22,7 dB(A)) kaum zu hören. Bei viel benötigter Rechenleistung, wie beim Spielen von Spielen, erreicht das Gerät einen Pegel von ca. 50 dB(A), was auch andere Laptops erreichen. Dafür bietet das XPS-Modell auch Gaming-Level-Anpassungen an.
Lautstärkediagramm
| Idle |
| 22.8 / 22.8 / 22.8 dB(A) |
| Last |
| 38.9 / 50.2 dB(A) |
 | ||
30 dB leise 40 dB(A) deutlich hörbar 50 dB(A) störend |
||
min: | ||
| Dell XPS 17 9730 RTX 4070 GeForce RTX 4070 Laptop GPU, i7-13700H, SK hynix PC801 HFS001TEJ9X101N | Dell XPS 17 9720 RTX 3060 GeForce RTX 3060 Laptop GPU, i7-12700H, Samsung PM9A1 MZVL21T0HCLR | LG Gram 17 (2023) Iris Xe G7 96EUs, i7-1360P, Samsung PM9A1 MZVL21T0HCLR | HP Envy 17-cr0079ng GeForce RTX 2050 Mobile, i7-1255U, Samsung PM991a MZVLQ1T0HBLB | MSI Creator Z17 A12UGST-054 GeForce RTX 3070 Ti Laptop GPU, i9-12900H, Micron 3400 1TB MTFDKBA1T0TFH | Apple MacBook Pro 16 2023 M2 Max M2 Max 38-Core GPU, M2 Max, Apple SSD AP2048Z | |
|---|---|---|---|---|---|---|
| Geräuschentwicklung | -4% | -11% | -16% | -28% | 4% | |
| aus / Umgebung * (dB) | 22.7 | 23.8 -5% | 25.2 -11% | 26.5 -17% | 26 -15% | 23.9 -5% |
| Idle min * (dB) | 22.8 | 24.1 -6% | 25.2 -11% | 28.5 -25% | 31.8 -39% | 23.9 -5% |
| Idle avg * (dB) | 22.8 | 24.1 -6% | 25.7 -13% | 28.5 -25% | 31.8 -39% | 23.9 -5% |
| Idle max * (dB) | 22.8 | 24.1 -6% | 29.3 -29% | 29.7 -30% | 31.8 -39% | 23.9 -5% |
| Last avg * (dB) | 38.9 | 43.2 -11% | 44.4 -14% | 39.5 -2% | 53.9 -39% | 36.6 6% |
| Witcher 3 ultra * (dB) | 47.4 | 48 -1% | 53.9 -14% | 35.1 26% | ||
| Last max * (dB) | 50.2 | 48 4% | 45.2 10% | 48 4% | 54.9 -9% | 43.2 14% |
* ... kleinere Werte sind besser
Temperaturen
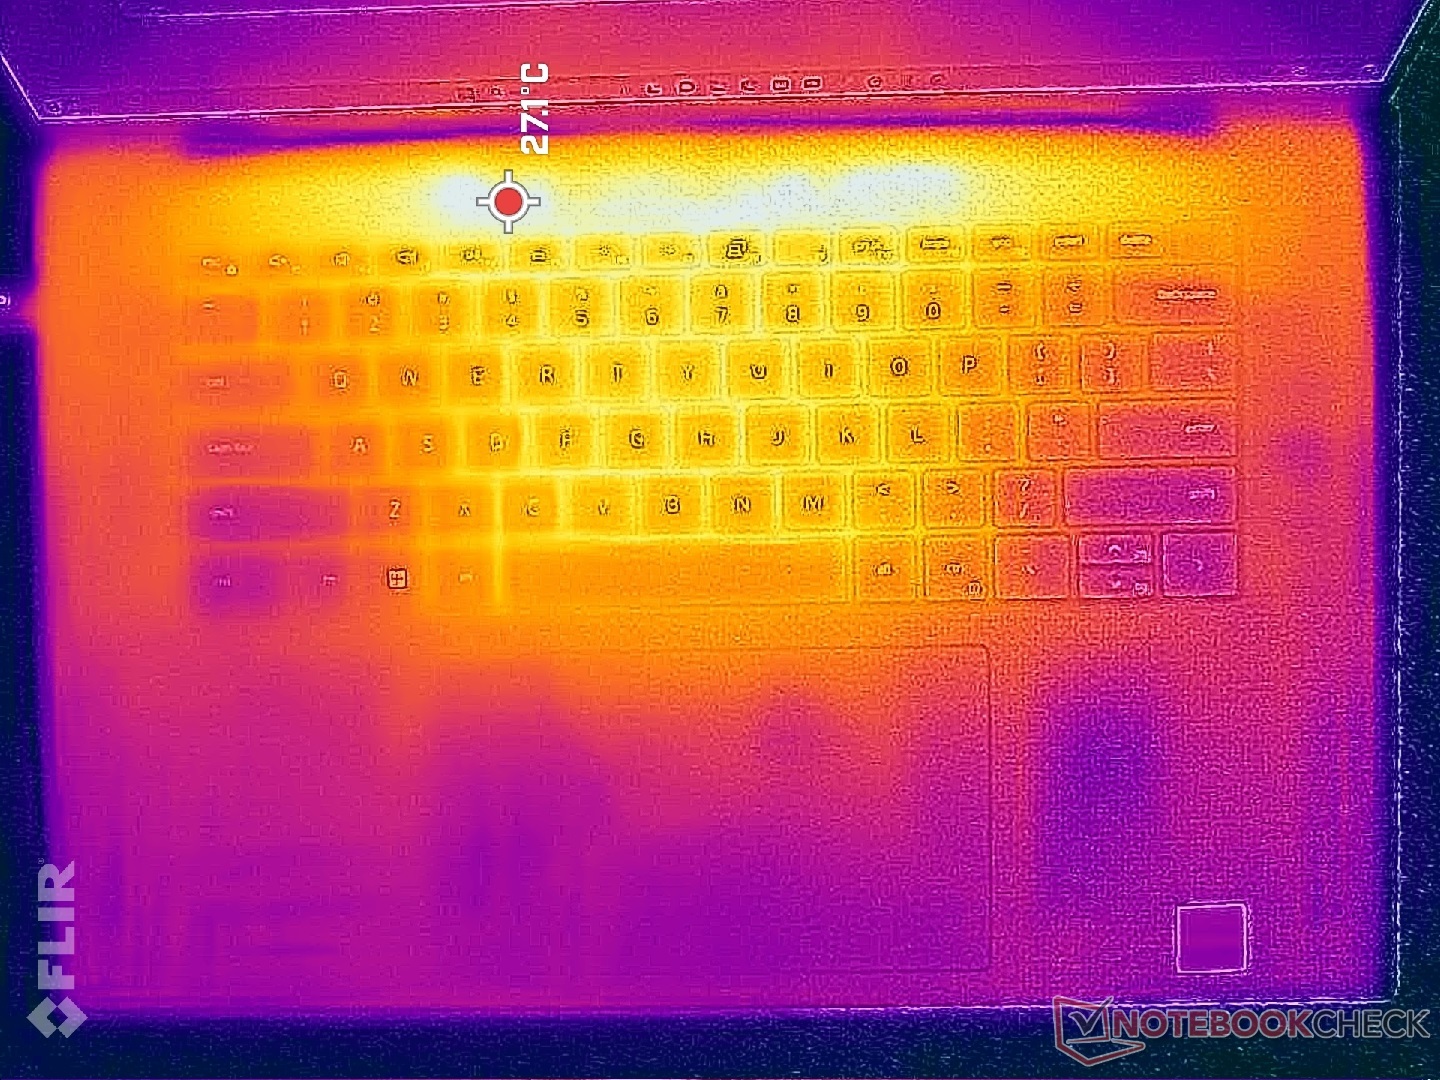
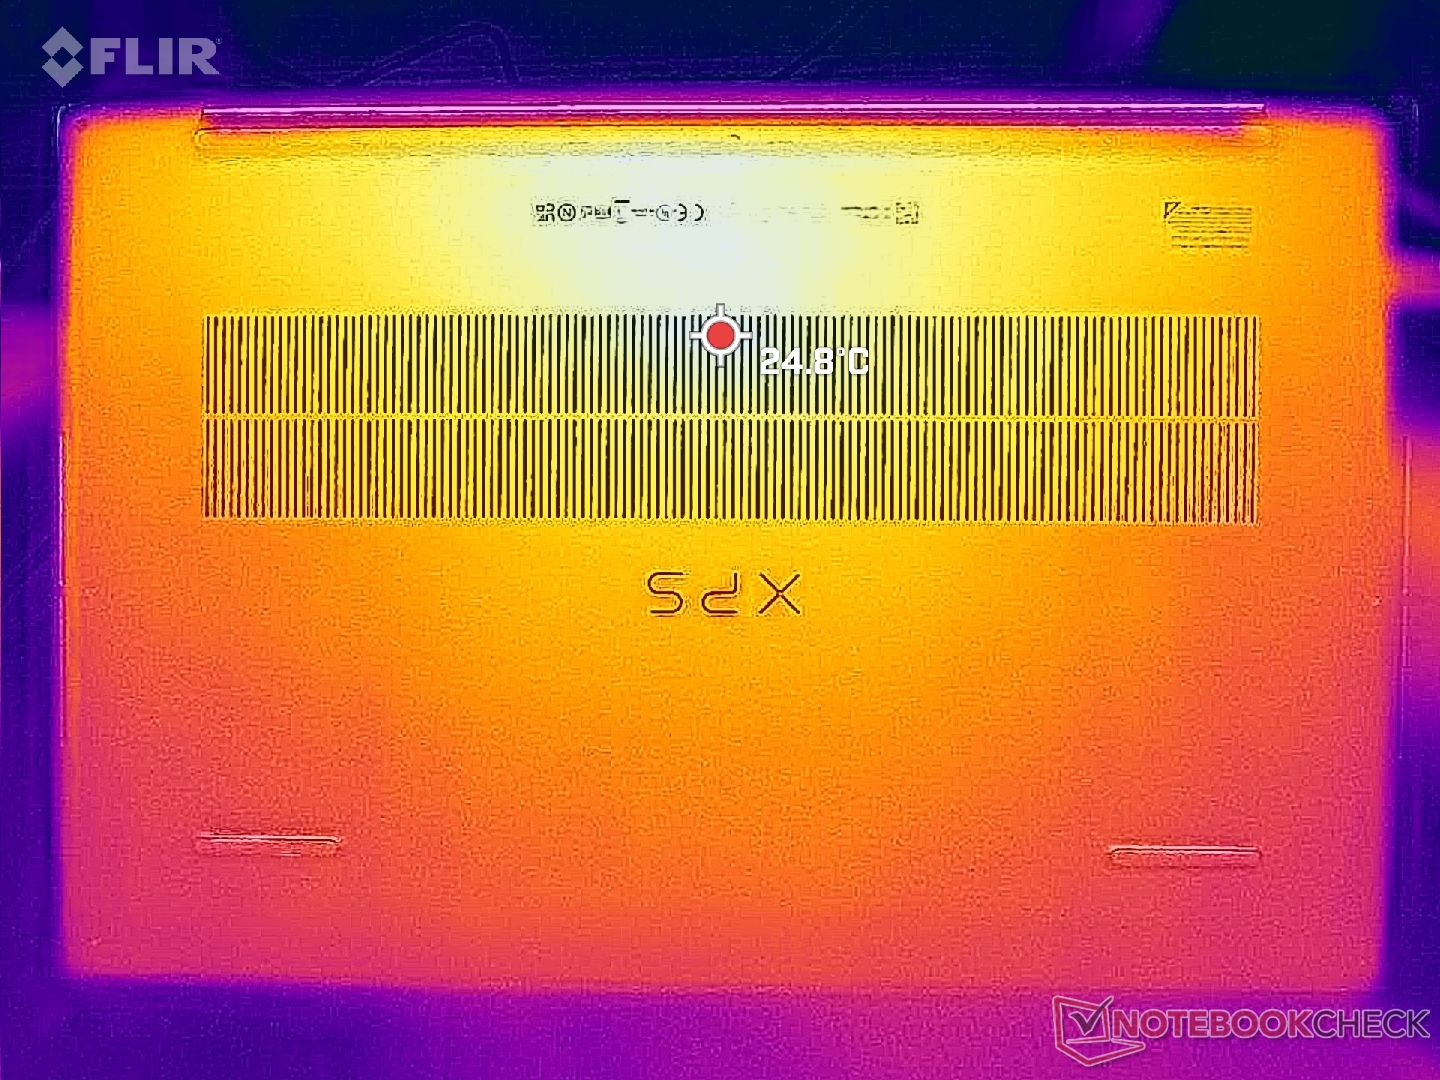
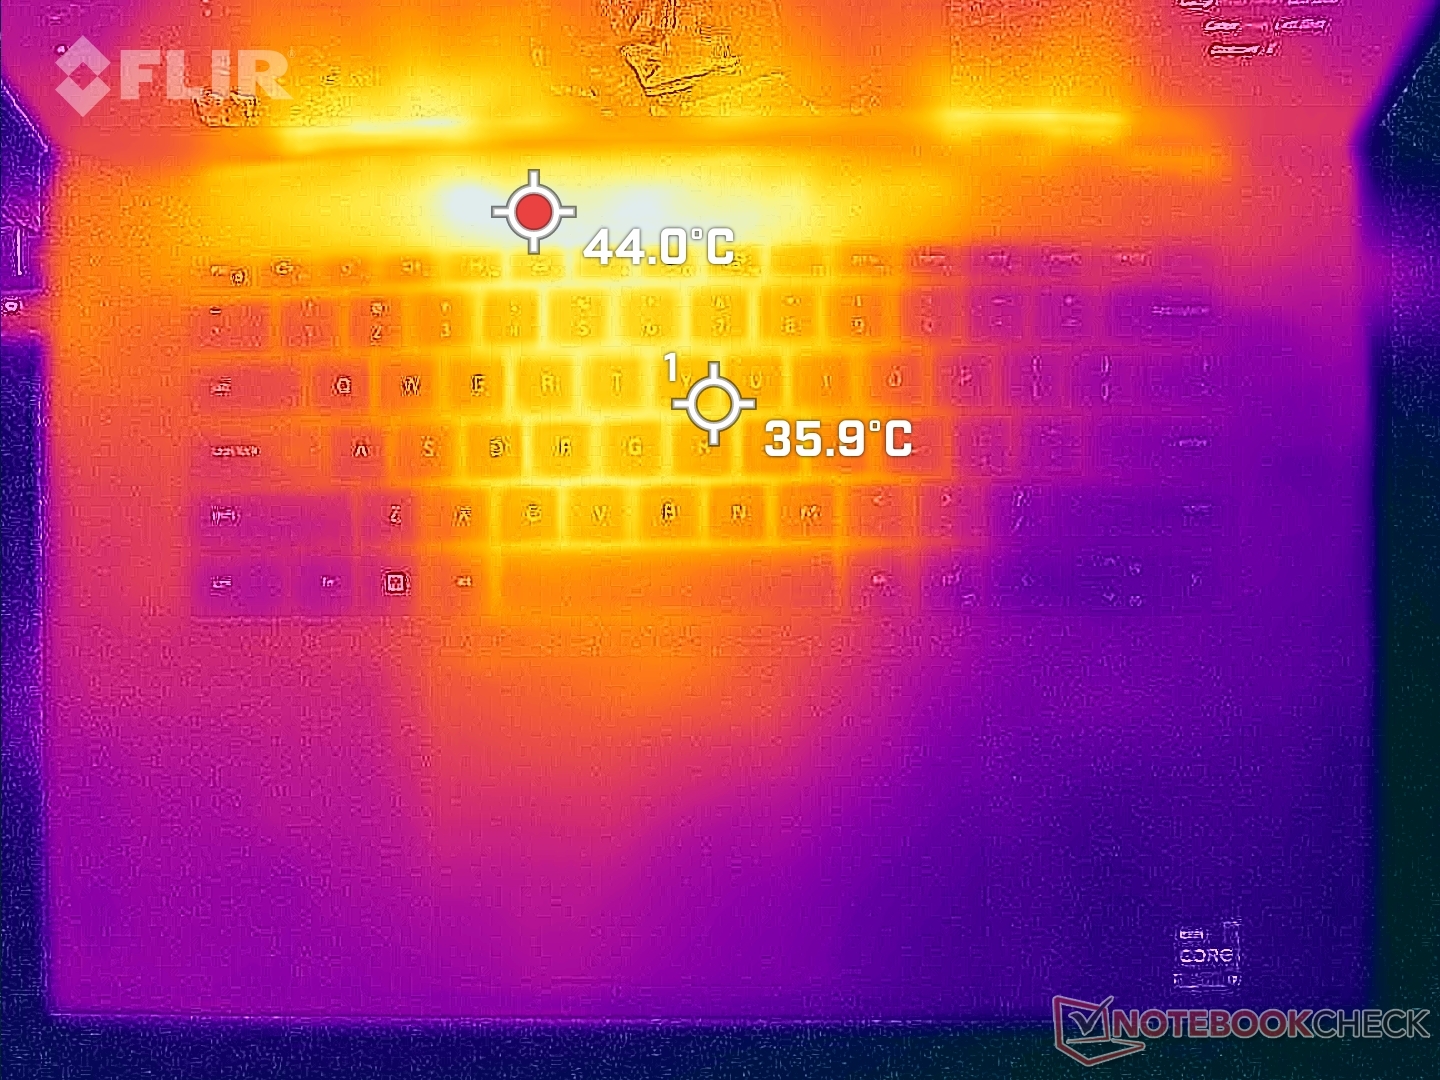
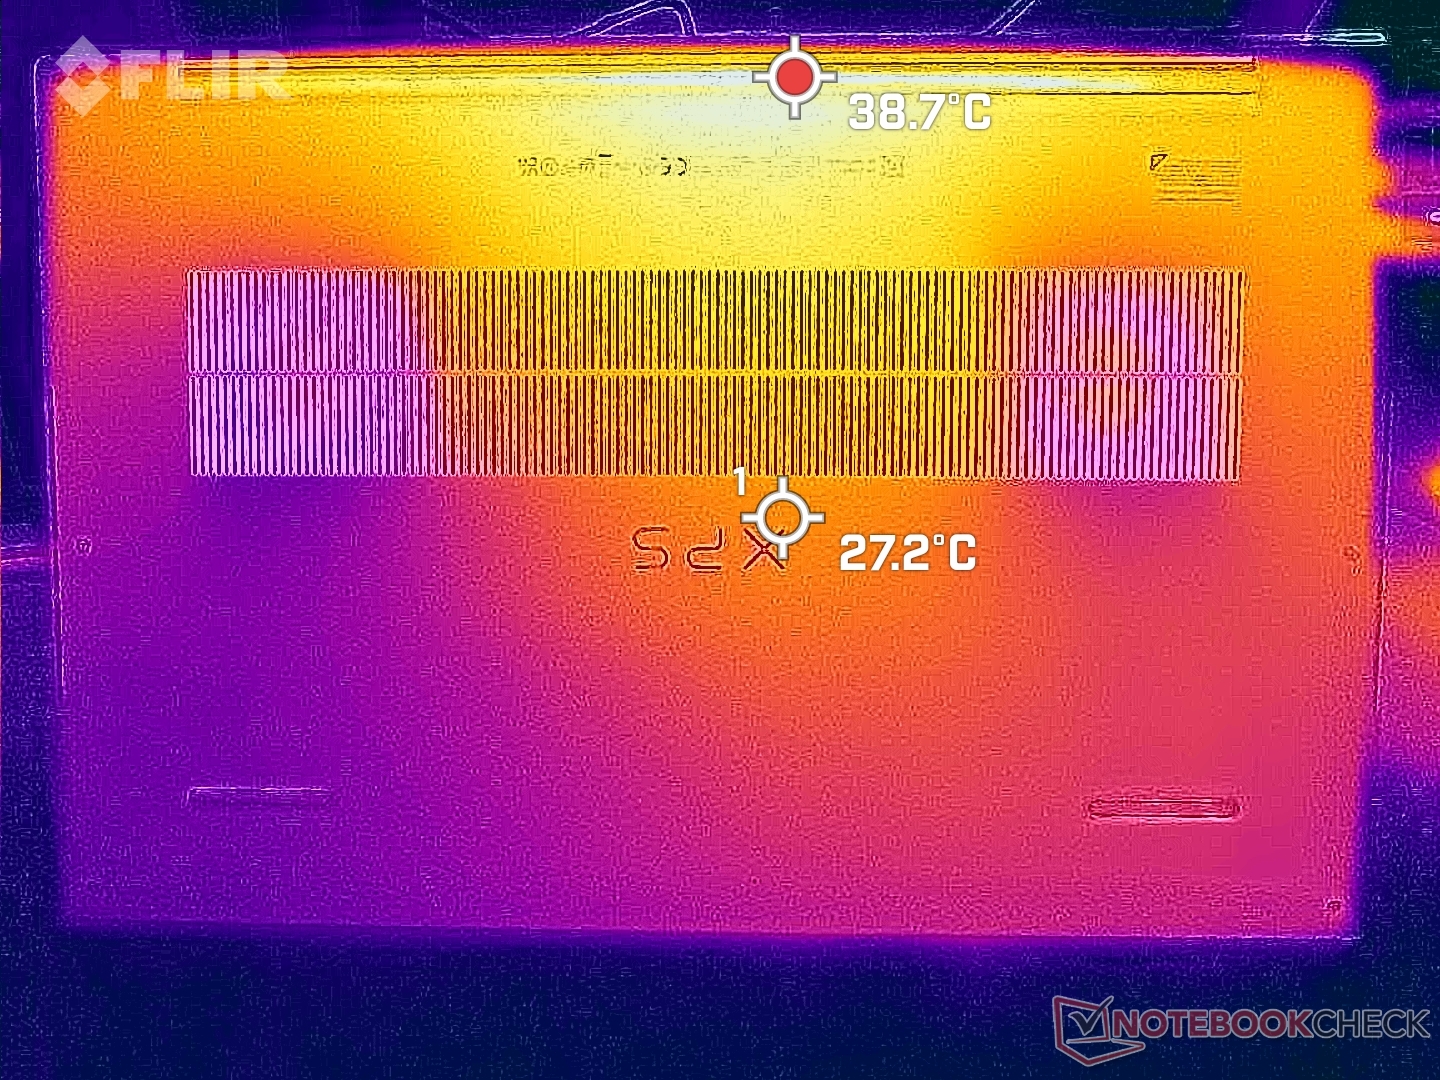
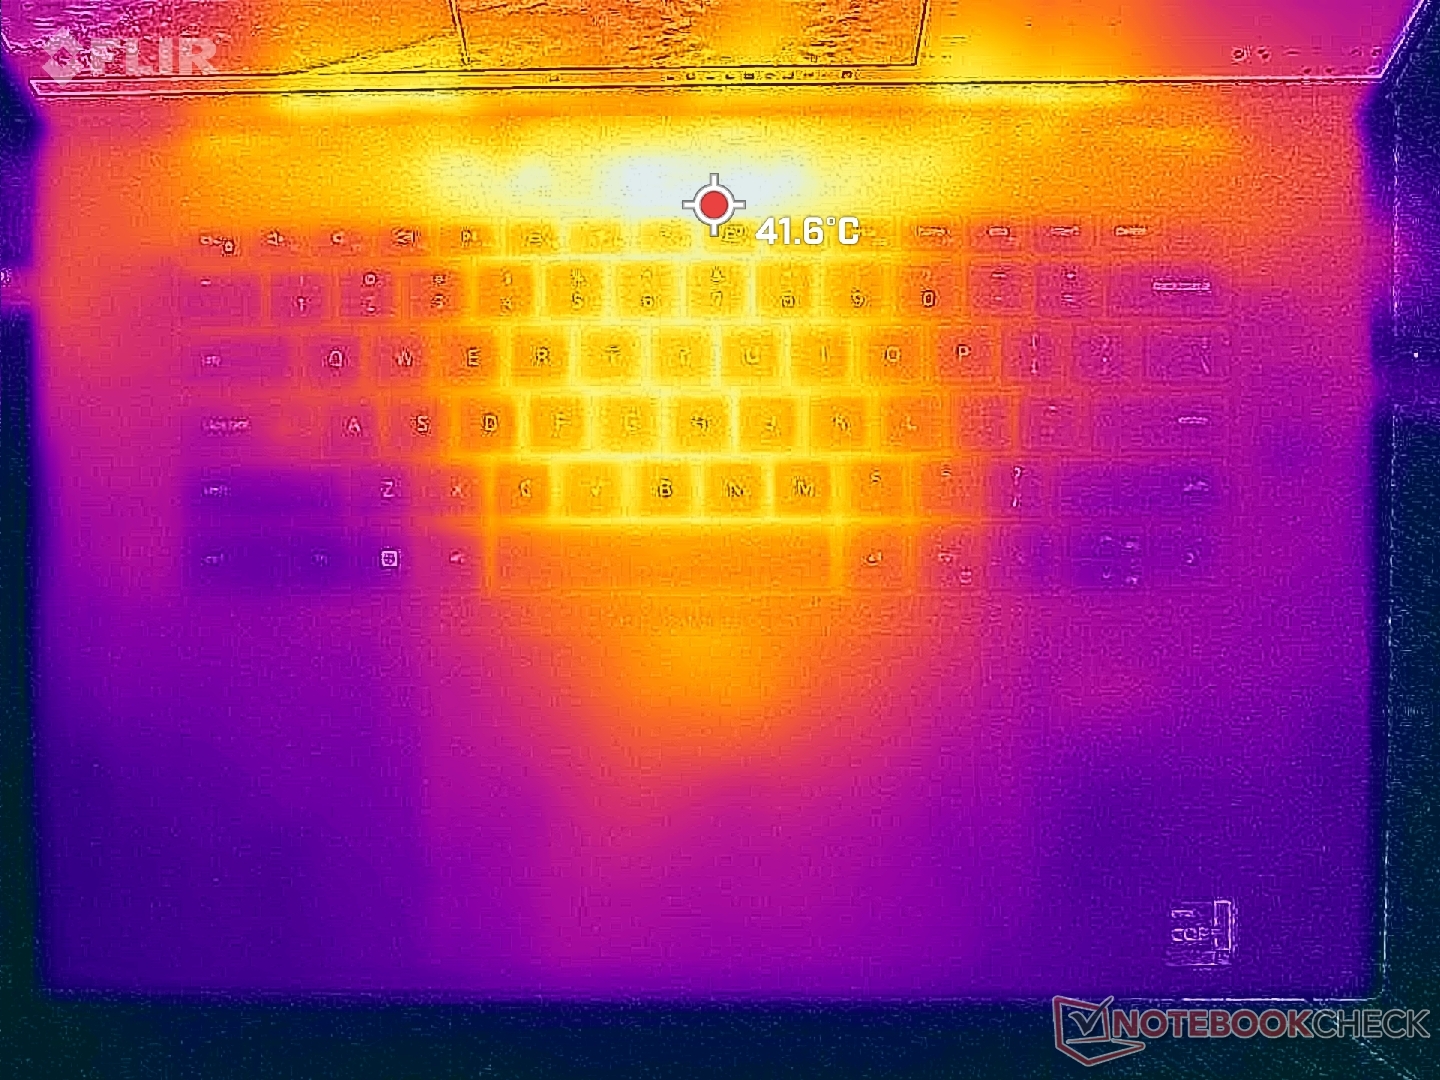
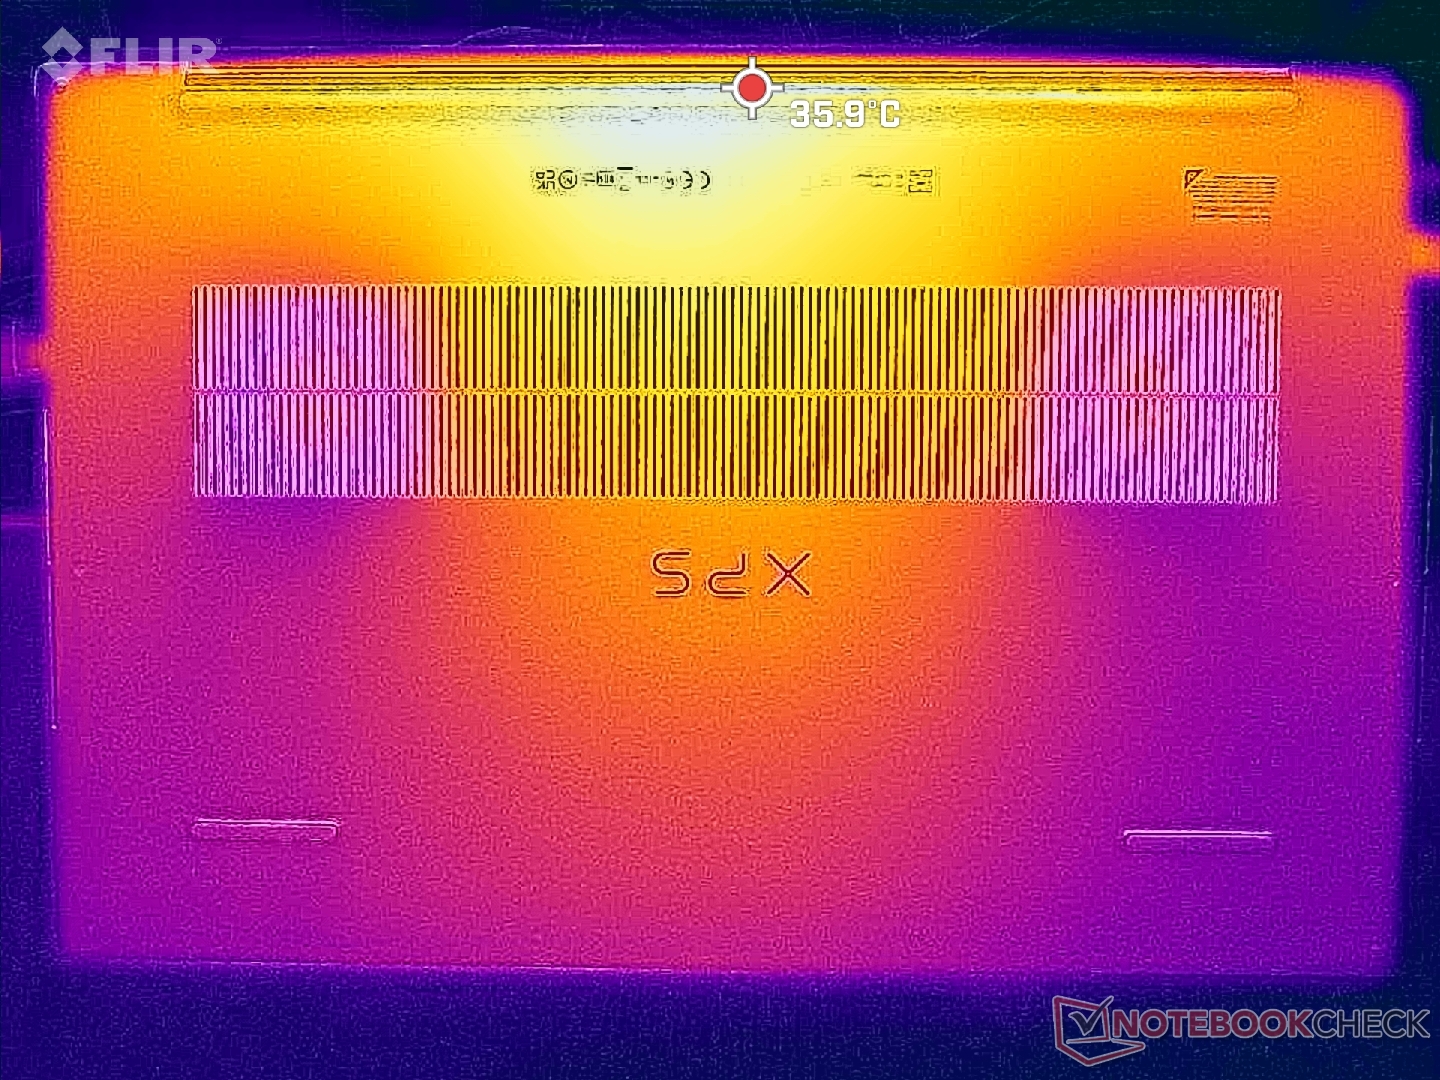
Die Oberflächentemperaturen sind im Vergleich zu anderen Laptops mit einer ähnlichen CPU der H-Serie und GeForce-RTX-GPUs deutlich kühler als erwartet. Das MSI Creator Z17 zum Beispiel besitzt Stellen, die teilweise 60 °C+ erreichen, während das Gerät von Dell unter Volllast nur ca. 43 °C warm wird. Dies lässt sich auf die Vapor-Chamber-Kühlung, auf die thermale Isolierung von Gore und einen niedrigen Stromverbrauch zurückführen.
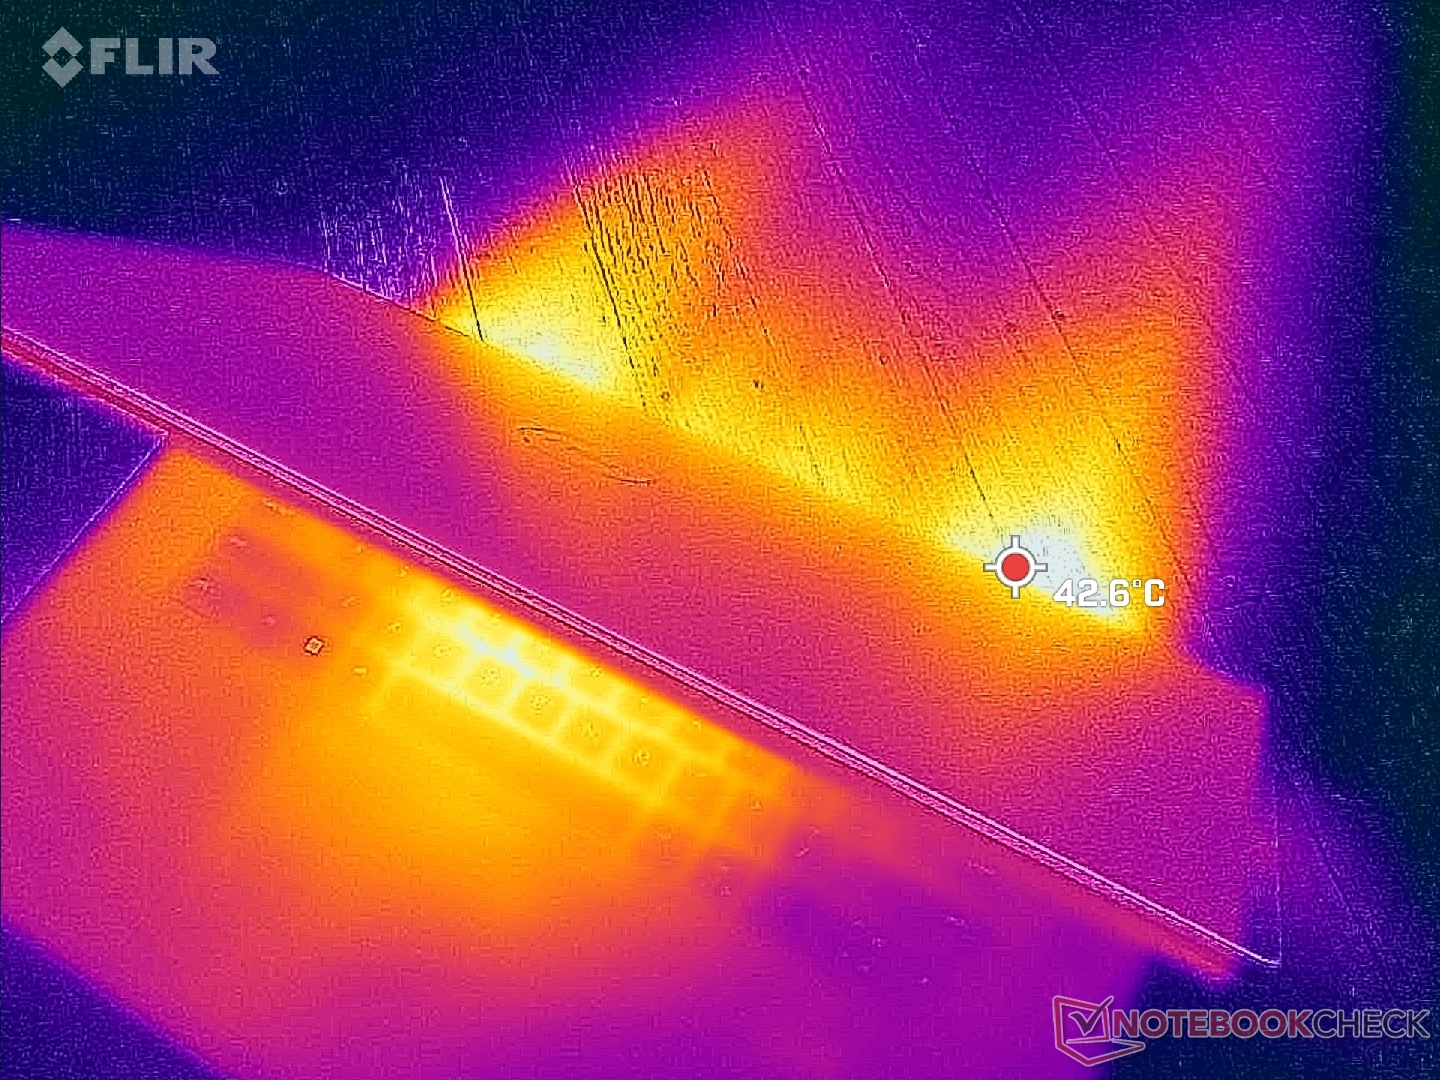
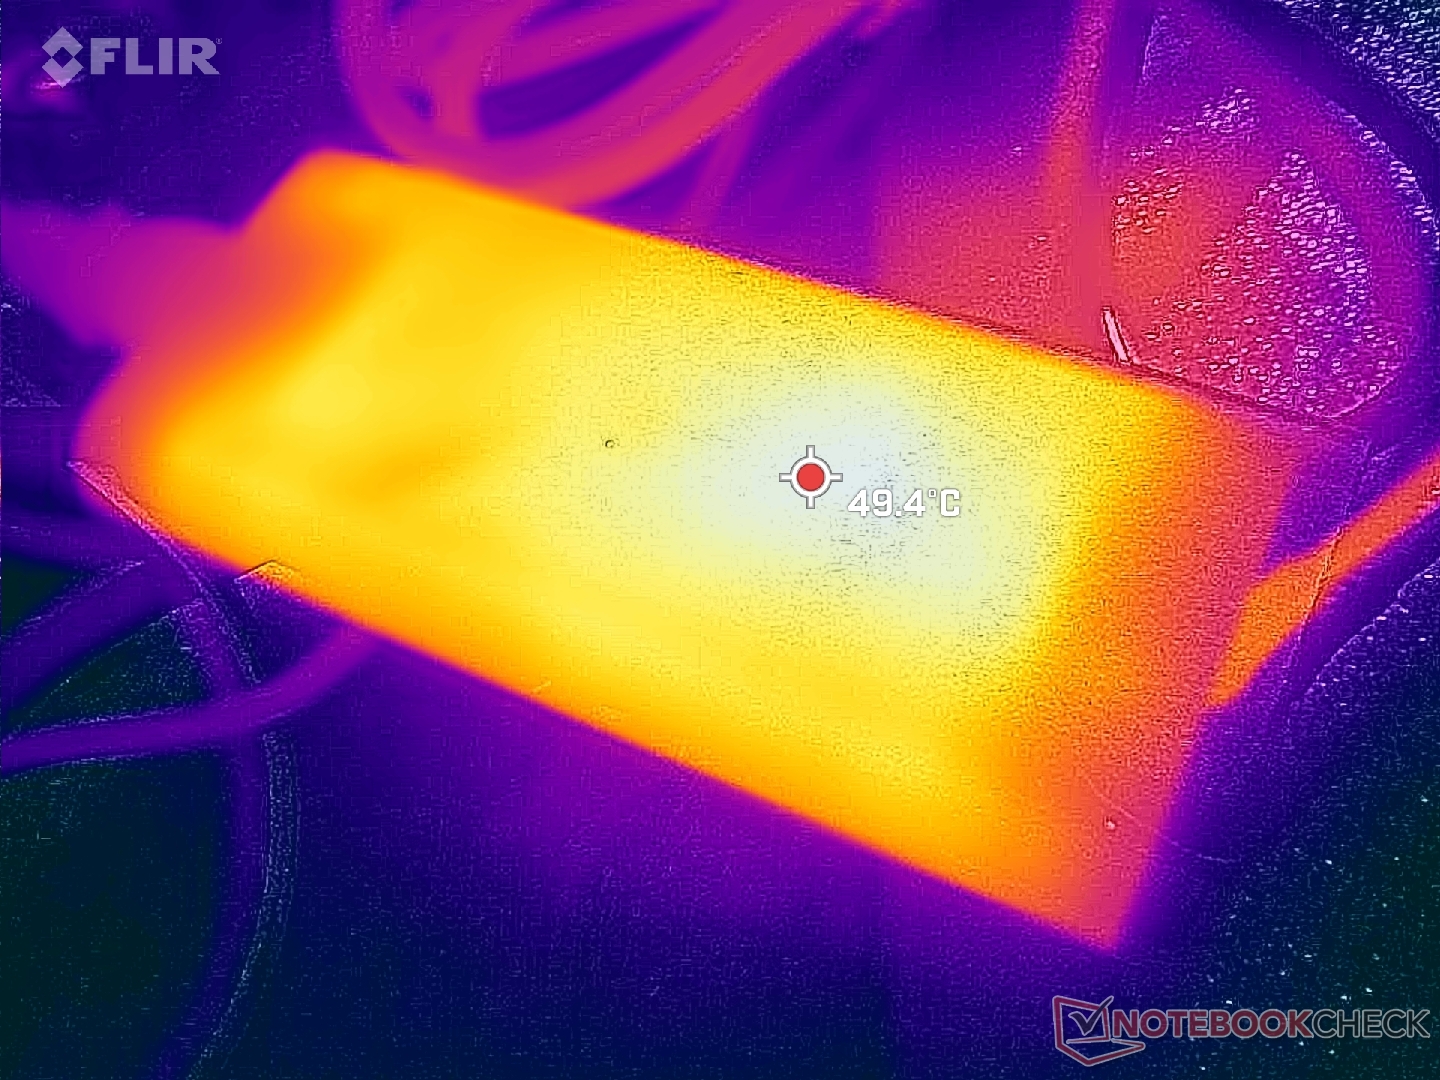
(±) Die maximale Temperatur auf der Oberseite ist 43.2 °C. Im Vergleich liegt der Klassendurchschnitt bei 36.8 °C (von 21 bis 71 °C für die Klasse Multimedia).
(+) Auf der Unterseite messen wir eine maximalen Wert von 31.8 °C (im Vergleich zum Durchschnitt von 39.1 °C).
(+) Ohne Last messen wir eine durchschnittliche Temperatur von 28.2 °C auf der Oberseite. Der Klassendurchschnitt erreicht 31.3 °C.
(±) Beim längeren Spielen von The Witcher 3 erhitzt sich das Gerät durchschnittlich auf 33.7 °C. Der Durchschnitt der Klasse ist derzeit 31.3 °C.
(+) Die Handballen und der Touchpad-Bereich sind mit gemessenen 31 °C kühler als die typische Hauttemperatur und fühlen sich dadurch kühl an.
(-) Die durchschnittliche Handballen-Temperatur anderer getesteter Geräte war 28.7 °C (-2.3 °C).
| Dell XPS 17 9730 RTX 4070 Intel Core i7-13700H, NVIDIA GeForce RTX 4070 Laptop GPU | Dell XPS 17 9720 RTX 3060 Intel Core i7-12700H, NVIDIA GeForce RTX 3060 Laptop GPU | LG Gram 17 (2023) Intel Core i7-1360P, Intel Iris Xe Graphics G7 96EUs | HP Envy 17-cr0079ng Intel Core i7-1255U, NVIDIA GeForce RTX 2050 Mobile | MSI Creator Z17 A12UGST-054 Intel Core i9-12900H, NVIDIA GeForce RTX 3070 Ti Laptop GPU | Apple MacBook Pro 16 2023 M2 Max Apple M2 Max, Apple M2 Max 38-Core GPU | |
|---|---|---|---|---|---|---|
| Hitze | -19% | -7% | -3% | -37% | 5% | |
| Last oben max * (°C) | 43.2 | 51.8 -20% | 43.9 -2% | 47.1 -9% | 63.9 -48% | 44.2 -2% |
| Last unten max * (°C) | 31.8 | 44.2 -39% | 45.5 -43% | 43.8 -38% | 68 -114% | 42.9 -35% |
| Idle oben max * (°C) | 32.8 | 34.8 -6% | 28.4 13% | 25.2 23% | 28.3 14% | 22.4 32% |
| Idle unten max * (°C) | 29.8 | 33.2 -11% | 28.2 5% | 25.9 13% | 30.2 -1% | 22.3 25% |
* ... kleinere Werte sind besser
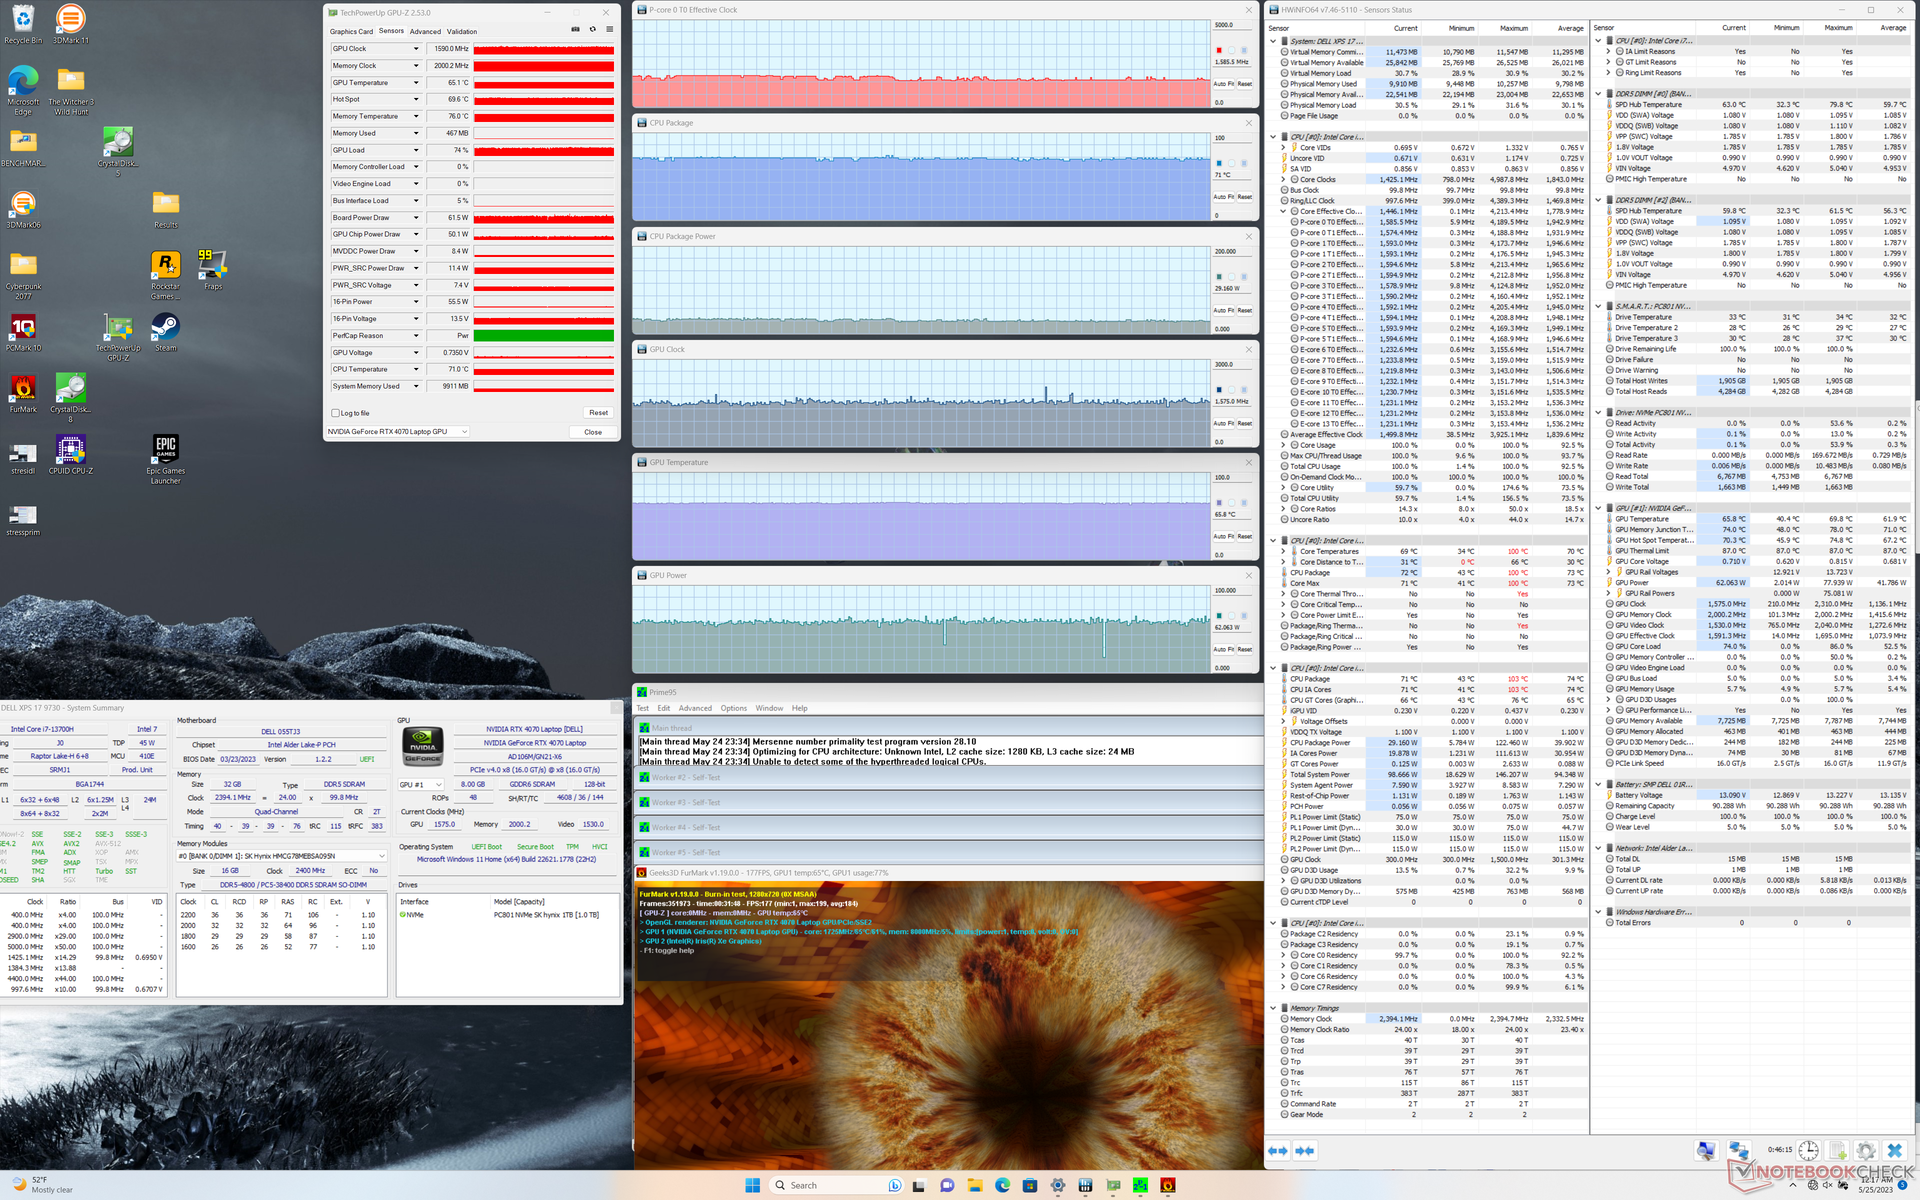
Stresstest
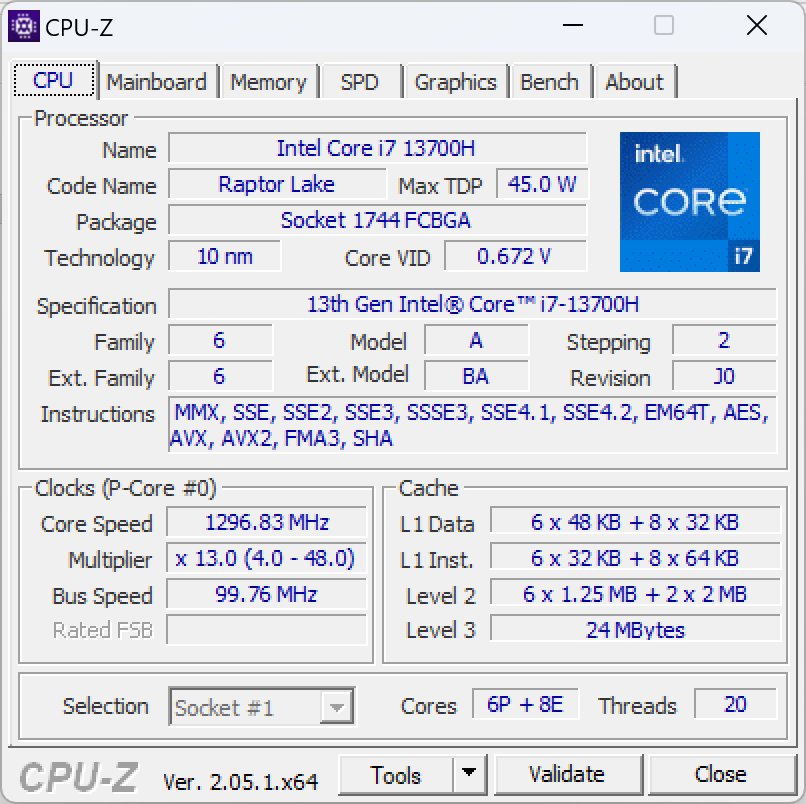
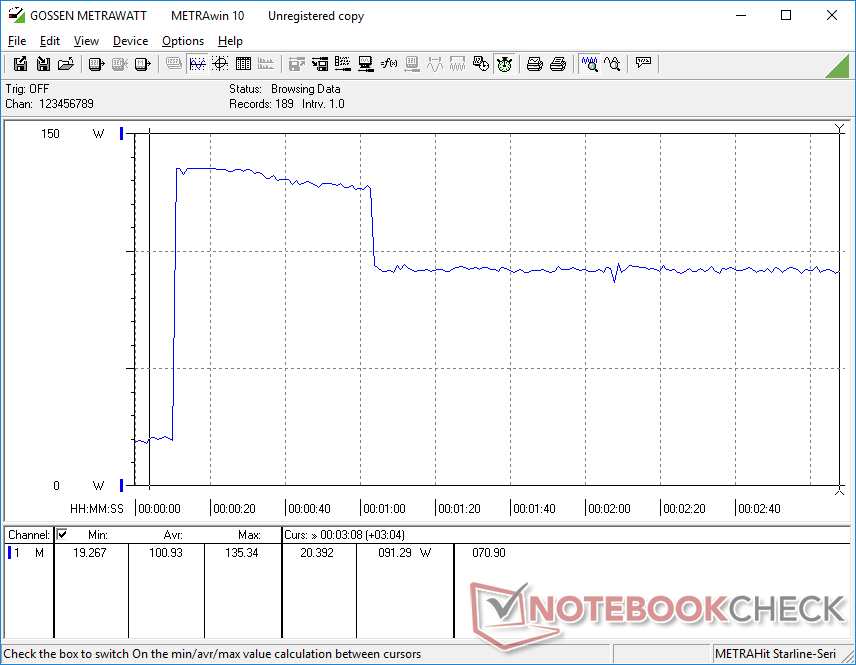
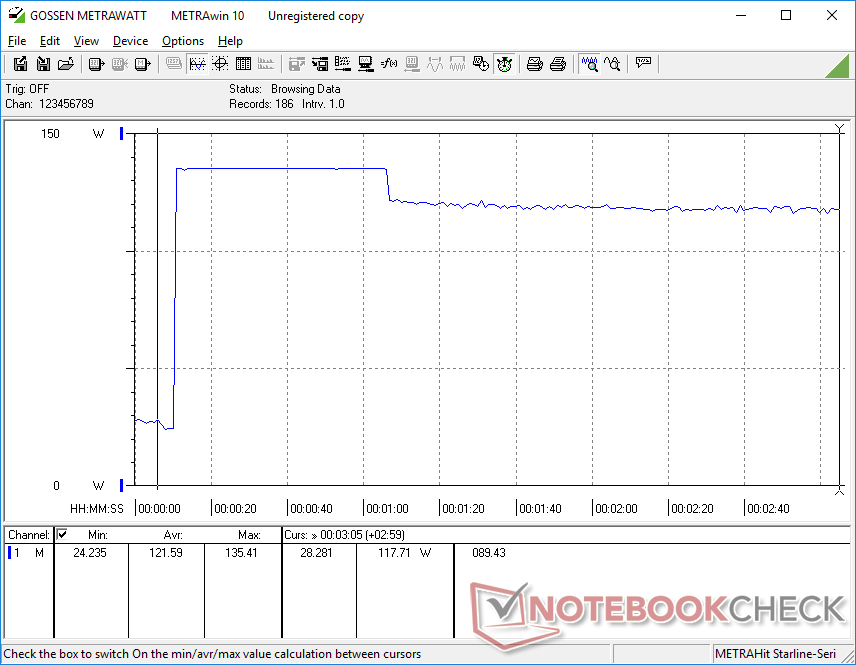
In Prime95 erreicht die CPU Taktraten bis zu 4,1 GHz bei einem Verbrauch von 122 W, jedoch nur für ein paar Sekunden. Anschließend taktet sie auf 3,4 GHz (bei 80 W) und pendelt sich dann nach ein paar Minuten bei 2,6 GHz (bei 55 W) ein. Die erreichten 55 W bei 2,6 GHz sind gleich wie beim XPS 19 9720 aus dem vergangenen Jahr, was die ähnliche Prozessorleistung erklärt. Die Temperatur liegt mit Verwendung des Turbo-Boosts bei hohen 95 bis 100 °C in den ersten Minuten und stabilisiert sich nach einiger Zeit bei 74 °C.
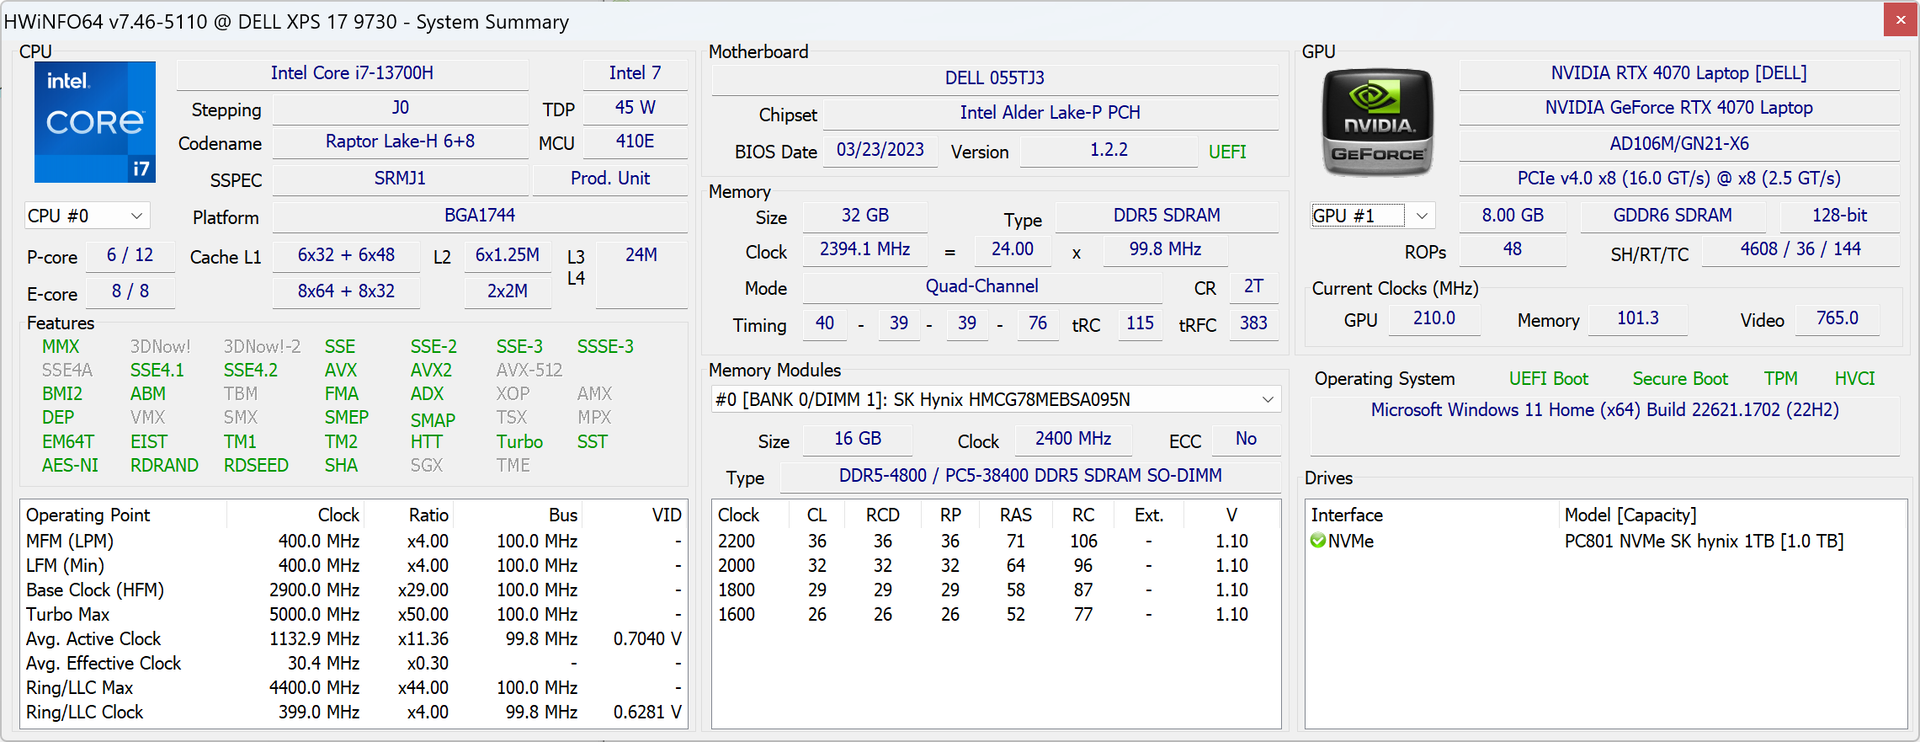
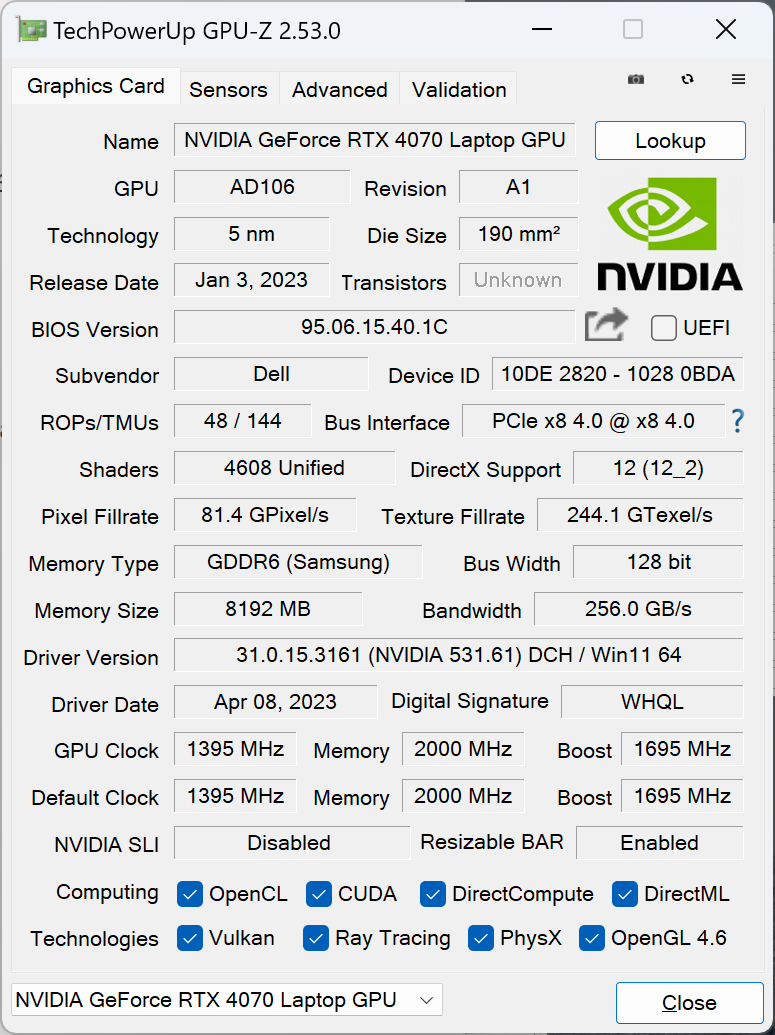
Die GPU taktet bei unserem Witcher-3-Test mit 2.115 MHz und wird 67 °C warm, was ähnlich zur RTX 3060 im XPS 17 9720 ist. Interessanterweise ergibt GPU-Z einen Verbrauch von 52 W, während HWiNFO 70 W angibt, wie auf dem unten stehenden Screenshot zu sehen ist. Trotzdem scheinen beide Werte kaum zu schwanken.
Wird das Gerät mit dem internen Akku betrieben, limitiert dies die Leistung: Der Fire-Strike-Test erreicht 24.847 Punkte beim Physics Test und 21.172 Punkte beim grafischen Teil. Mit dauerhafter Stromversorgung sind es 27.094 bzw. 24.612 Punkte.
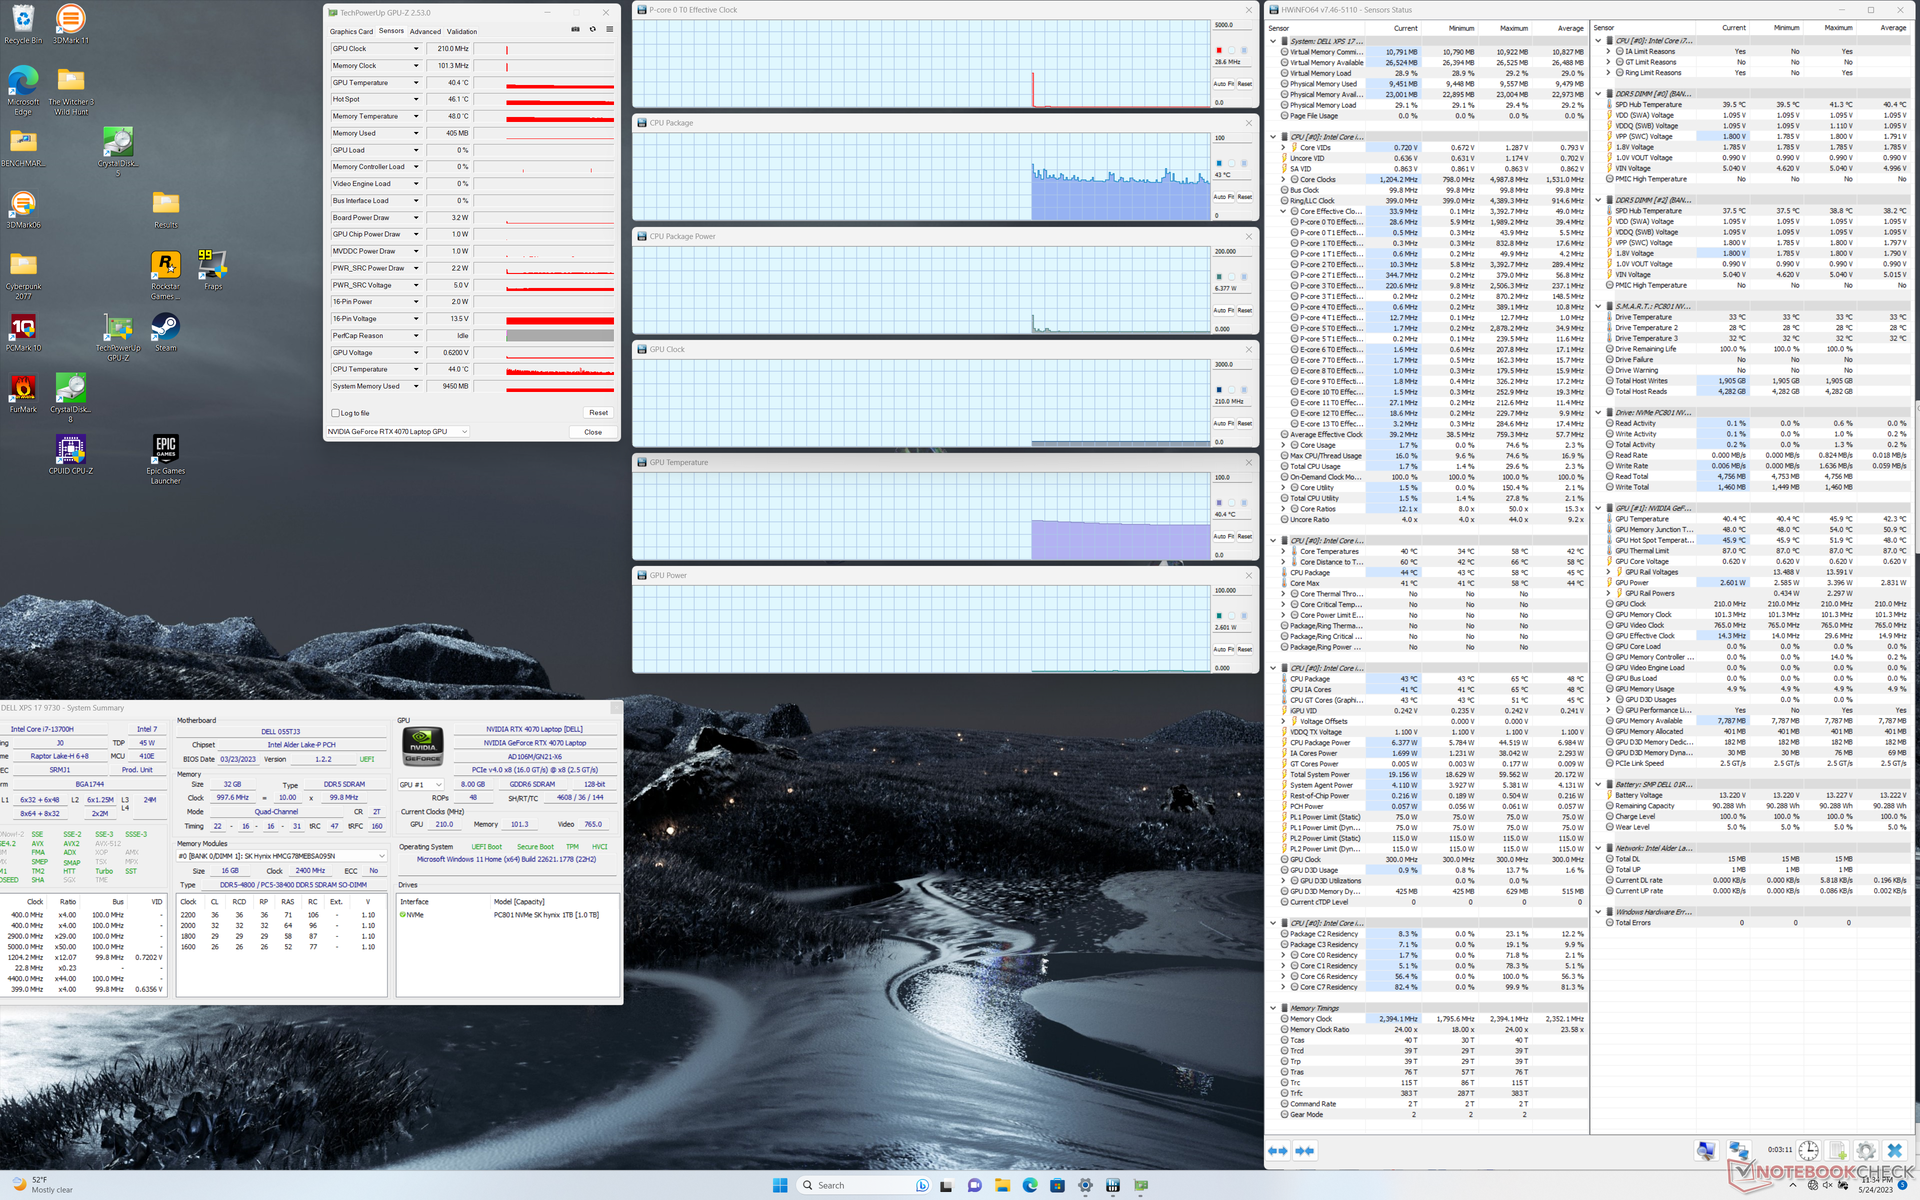
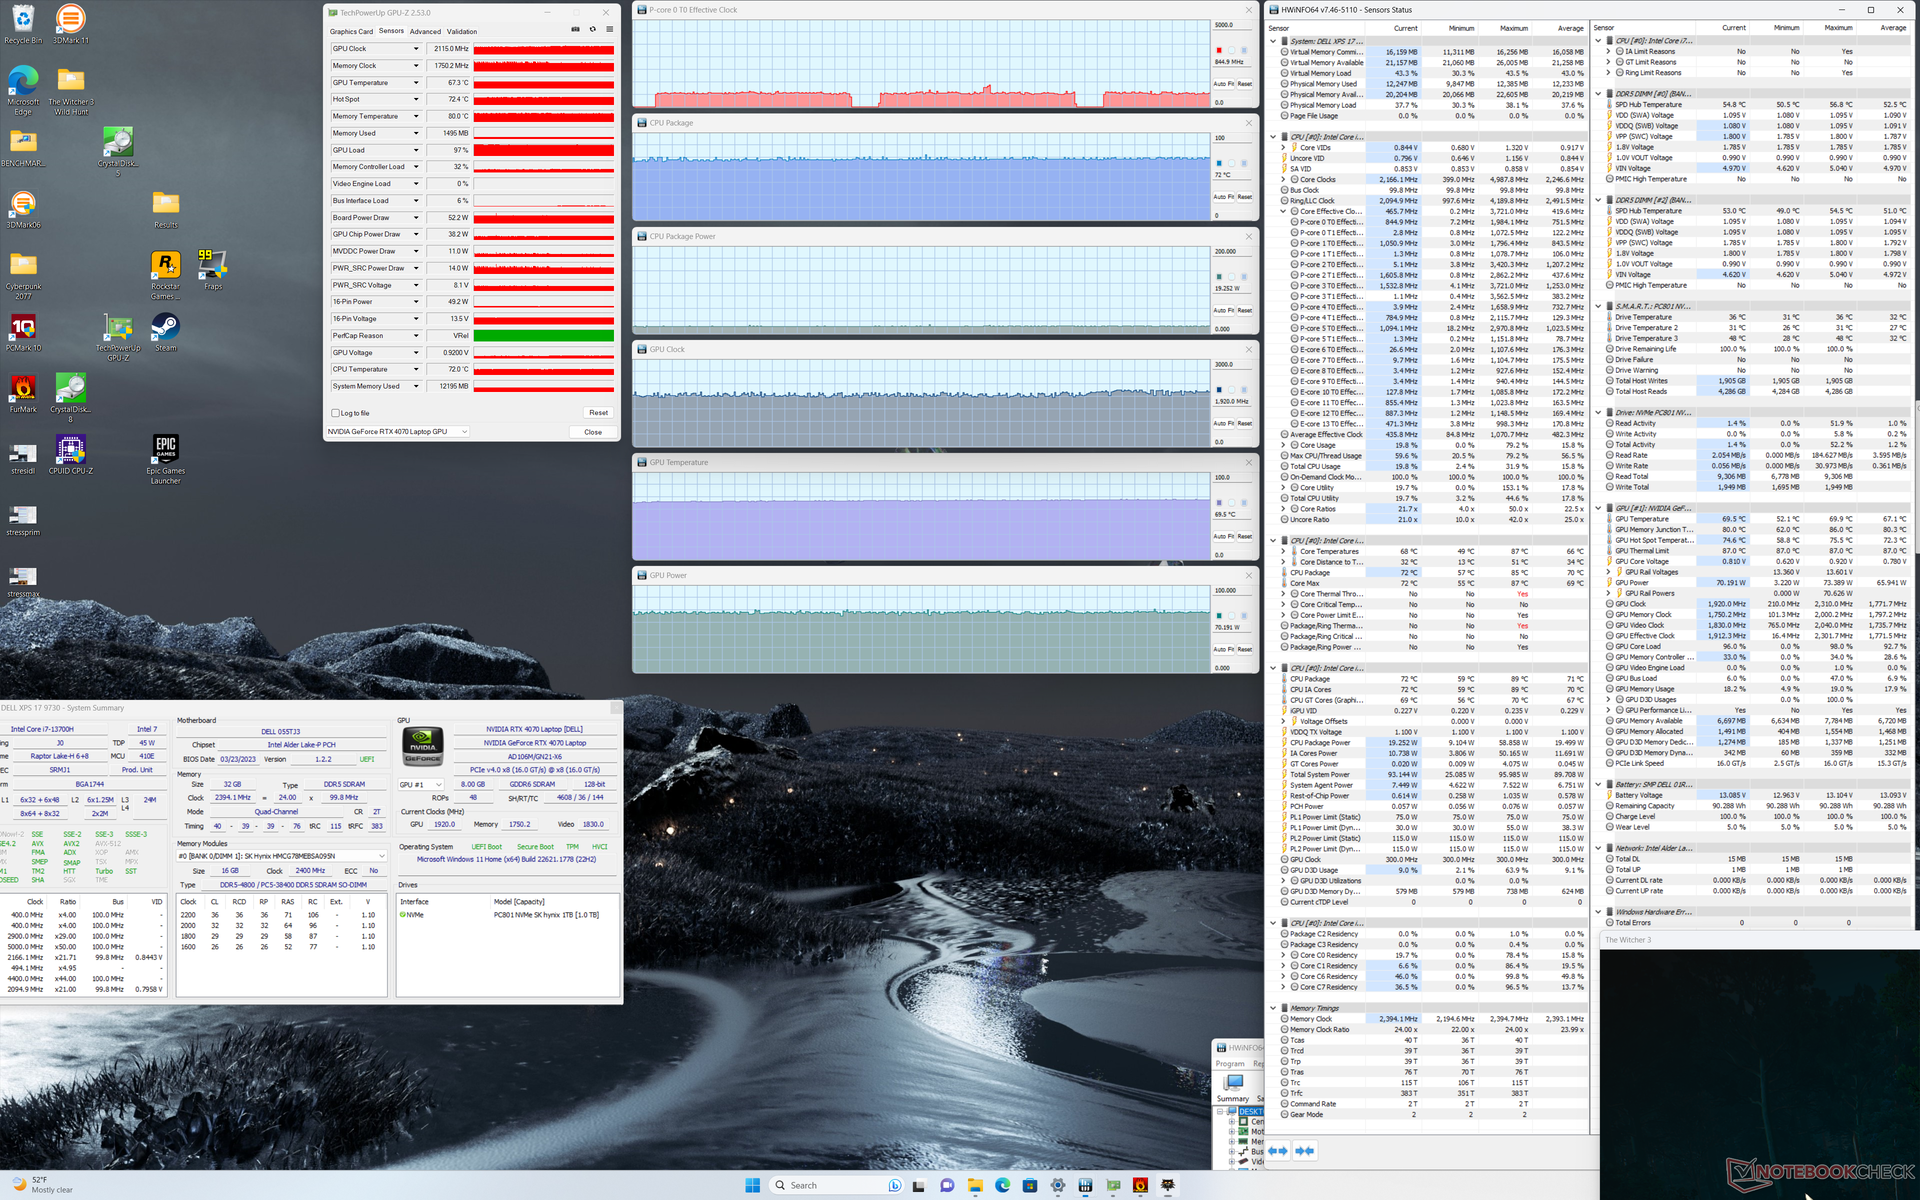
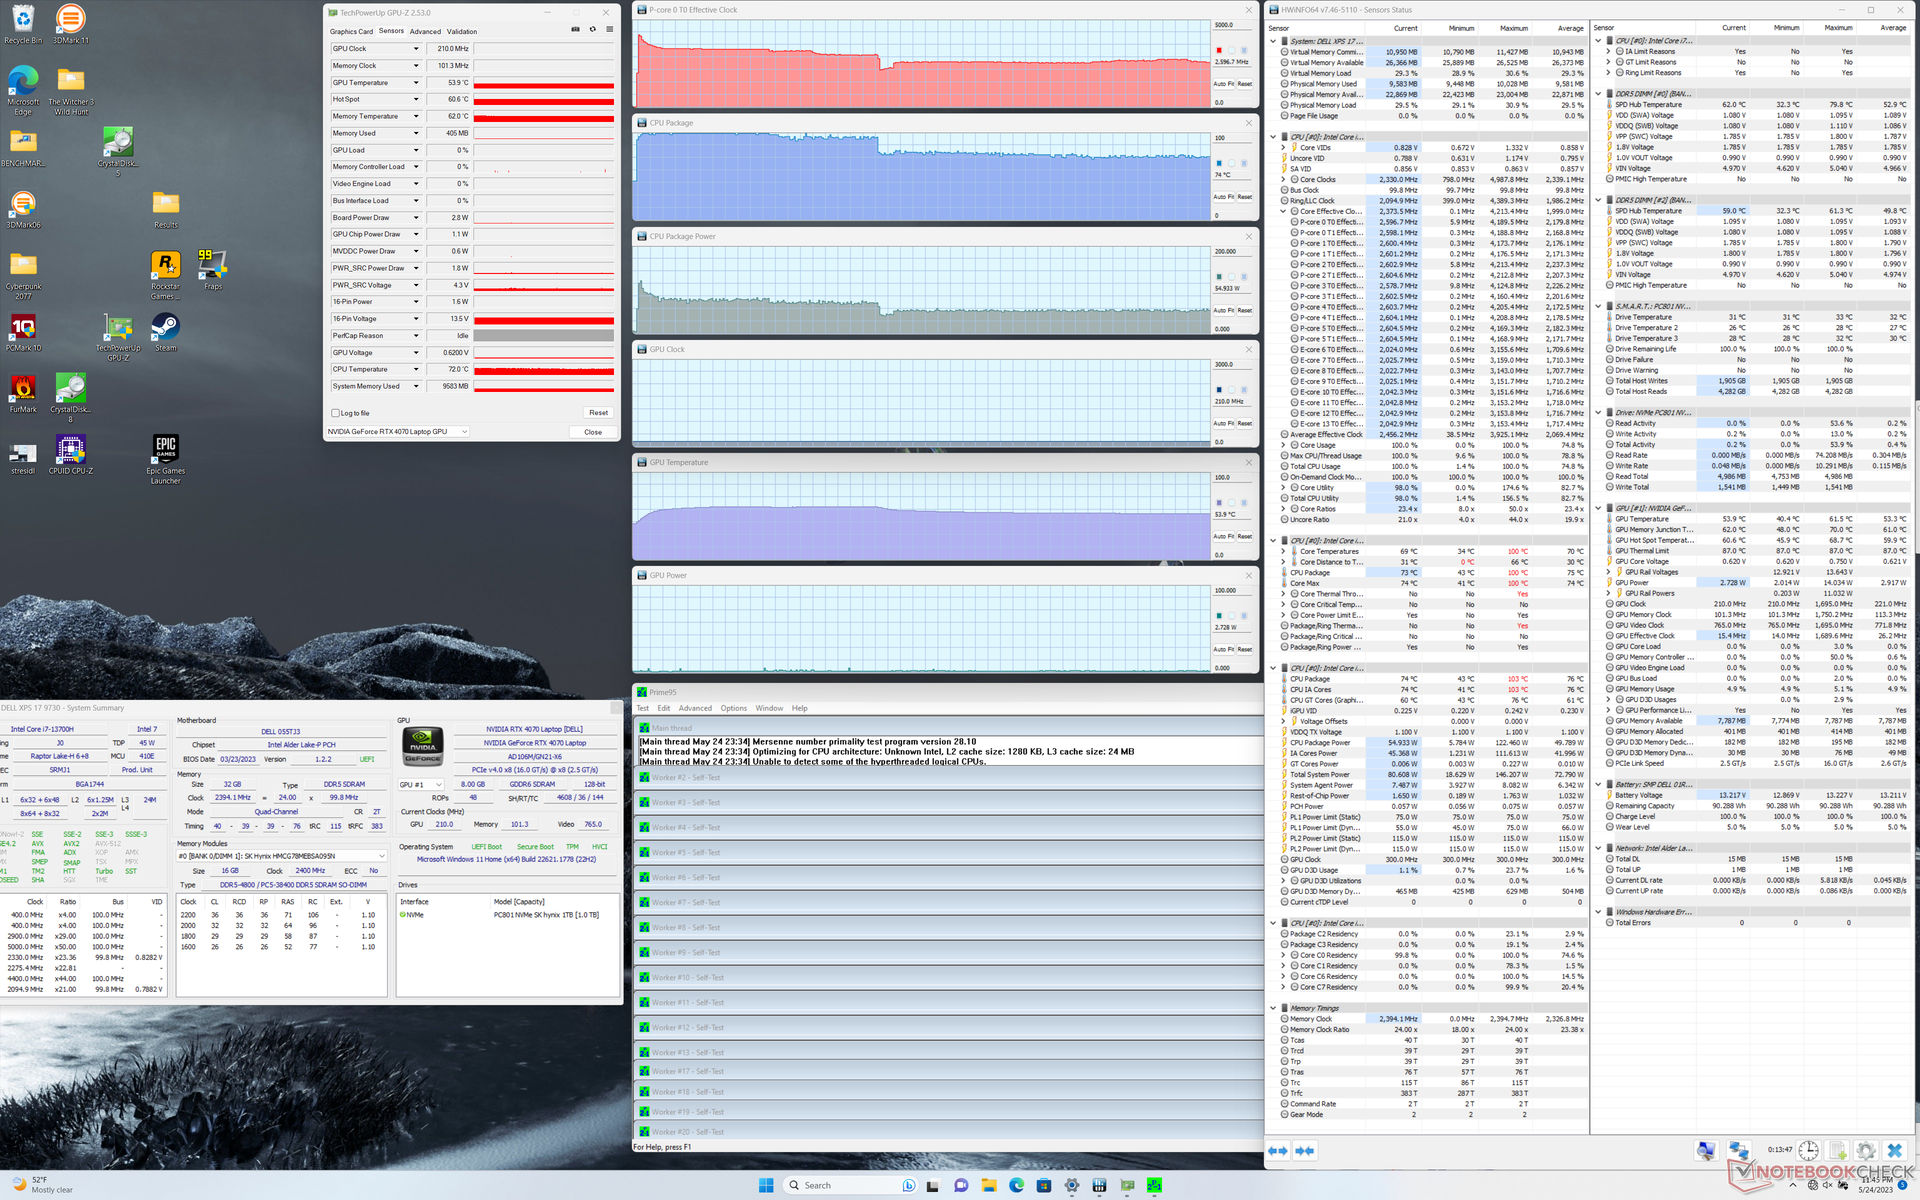
| CPU Clock (GHz) | GPU Clock (MHz) | Average CPU Temperature (°C) | Average GPU Temperature (°C) | |
| System Idle | -- | -- | 43 | 40 |
| Prime95, Stress | 2,6 | -- | 74 | 54 |
| Prime95 + FurMark, Stress | 1,6 | 1.590 | 71 | 65 |
| Witcher 3, Stress | 0,8 | 2.115 | 72 | 67 |
Lautsprecher
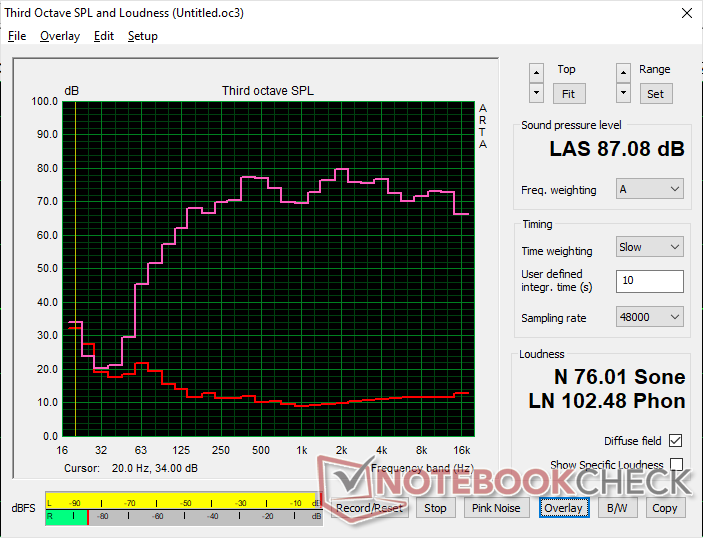
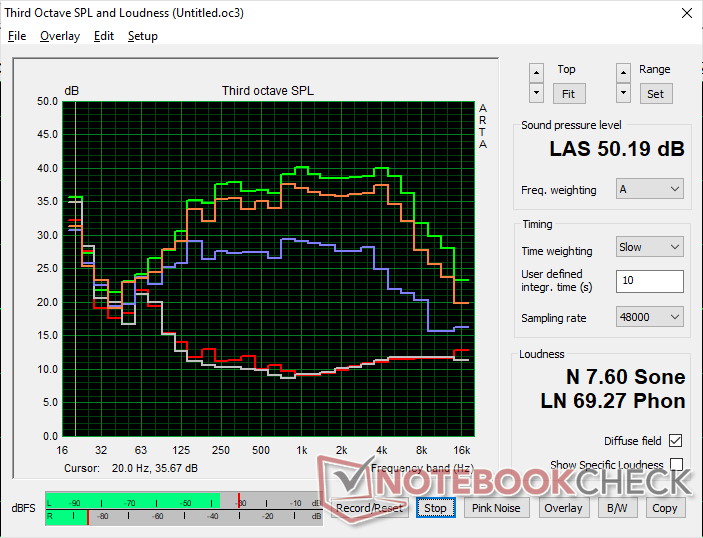
Dell XPS 17 9730 RTX 4070 Audio Analyse
(+) | Die Lautsprecher können relativ laut spielen (87.1 dB)
Bass 100 - 315 Hz
(±) | abgesenkter Bass - 7.2% geringer als der Median
(+) | lineare Bass-Wiedergabe (5.9% Delta zum Vorgänger)
Mitteltöne 400 - 2000 Hz
(+) | ausgeglichene Mitten, vom Median nur 3.3% abweichend
(+) | lineare Mitten (5.1% Delta zum Vorgänger)
Hochtöne 2 - 16 kHz
(+) | ausgeglichene Hochtöne, vom Median nur 1.9% abweichend
(+) | sehr lineare Hochtöne (3.4% Delta zum Vorgänger)
Gesamt im hörbaren Bereich 100 - 16.000 Hz
(+) | hörbarer Bereich ist sehr linear (7% Abstand zum Median
Im Vergleich zu allen Geräten derselben Klasse
» 5% aller getesteten Geräte dieser Klasse waren besser, 1% vergleichbar, 94% schlechter
» Das beste Gerät hat einen Delta-Wert von 5%, durchschnittlich ist 17%, das schlechteste Gerät hat 45%
Im Vergleich zu allen Geräten im Test
» 1% aller getesteten Geräte waren besser, 0% vergleichbar, 99% schlechter
» Das beste Gerät hat einen Delta-Wert von 4%, durchschnittlich ist 23%, das schlechteste Gerät hat 134%
Apple MacBook Pro 16 2021 M1 Pro Audio Analyse
(+) | Die Lautsprecher können relativ laut spielen (84.7 dB)
Bass 100 - 315 Hz
(+) | guter Bass - nur 3.8% Abweichung vom Median
(+) | lineare Bass-Wiedergabe (5.2% Delta zum Vorgänger)
Mitteltöne 400 - 2000 Hz
(+) | ausgeglichene Mitten, vom Median nur 1.3% abweichend
(+) | lineare Mitten (2.1% Delta zum Vorgänger)
Hochtöne 2 - 16 kHz
(+) | ausgeglichene Hochtöne, vom Median nur 1.9% abweichend
(+) | sehr lineare Hochtöne (2.7% Delta zum Vorgänger)
Gesamt im hörbaren Bereich 100 - 16.000 Hz
(+) | hörbarer Bereich ist sehr linear (4.6% Abstand zum Median
Im Vergleich zu allen Geräten derselben Klasse
» 0% aller getesteten Geräte dieser Klasse waren besser, 0% vergleichbar, 100% schlechter
» Das beste Gerät hat einen Delta-Wert von 5%, durchschnittlich ist 17%, das schlechteste Gerät hat 45%
Im Vergleich zu allen Geräten im Test
» 0% aller getesteten Geräte waren besser, 0% vergleichbar, 100% schlechter
» Das beste Gerät hat einen Delta-Wert von 4%, durchschnittlich ist 23%, das schlechteste Gerät hat 134%
Energiemanagement - USB-C macht sich bezahlt
Energieverbrauch - Sind 130 W genug?
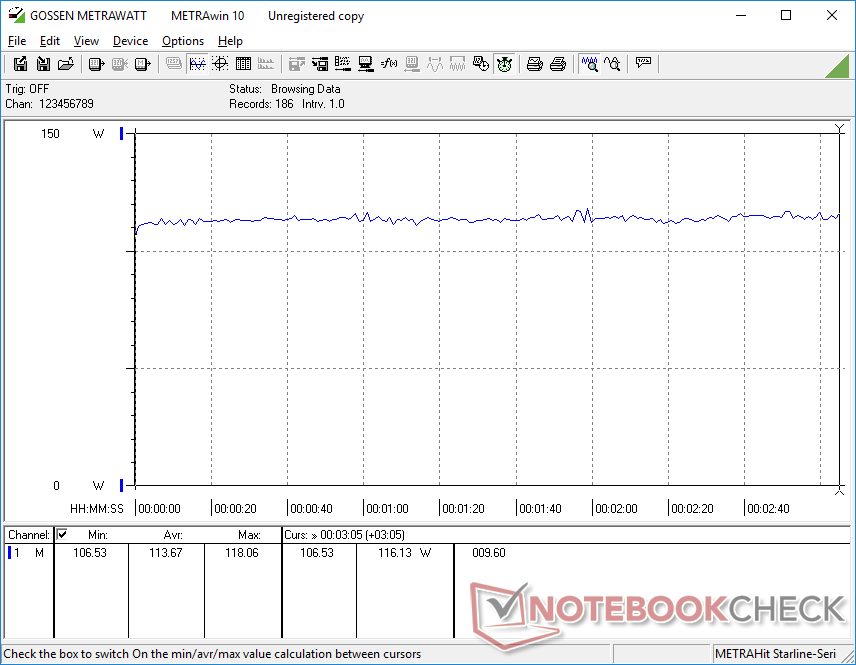
Der Energieverbrauch hat sich seit dem älteren XPS 17 9720 nicht wirklich geändert, da bisher alle XPS-17-Modelle mit dem gleichen 130-W-USB-C-AC-Adapter ausgeliefert werden. Wenn man das Gerät mit anderen Laptops mit CPUs der H-Serie und GPUs der RTX-Serie vergleicht, ist der 130-W-Adapter einer der kleinsten, sowohl physisch als auch von der Stromausgabe. Dabei muss man zu Gunsten der Portabilität auf eine höhere Leistung und schnelles Laden verzichten.
Der höhere Performance-pro-Watt-Wert von Ada Lovelace (im Vergleich zu Ampere) ermöglicht es dem XPS 9730 auch, besser zu performen als noch das Modell aus dem letzten Jahr. Witcher 3 beispielsweise verbraucht ca. 114 W auf dem XPS 17 9720 und dem 9730, obwohl Letzteres fast 30 Prozent mehr Leistung liefert. Der Energieverbrauch der CPU ist auf lange Sicht gesehen ebenfalls stabiler, genauso wie ein längerer und stabilerer Turbo-Boost im Vergleich zum i7-12700H. Es lässt sich also feststellen, dass Dell definitiv die CPU und GPU bestmöglich mit dem vorhandenen Leistungsbudget optimiert hat.
| Aus / Standby | |
| Idle | |
| Last |
|
Legende:
min: | |
| Dell XPS 17 9730 RTX 4070 i7-13700H, GeForce RTX 4070 Laptop GPU, SK hynix PC801 HFS001TEJ9X101N, Sharp LQ170R1, 3840x2400, 17" | Dell XPS 17 9720 RTX 3060 i7-12700H, GeForce RTX 3060 Laptop GPU, Samsung PM9A1 MZVL21T0HCLR, IPS, 3840x2400, 17" | LG Gram 17 (2023) i7-1360P, Iris Xe G7 96EUs, Samsung PM9A1 MZVL21T0HCLR, IPS, 2560x1600, 17" | HP Envy 17-cr0079ng i7-1255U, GeForce RTX 2050 Mobile, Samsung PM991a MZVLQ1T0HBLB, IPS, 3840x2160, 17.3" | MSI Creator Z17 A12UGST-054 i9-12900H, GeForce RTX 3070 Ti Laptop GPU, Micron 3400 1TB MTFDKBA1T0TFH, IPS, 2560x1600, 17" | Apple MacBook Pro 16 2023 M2 Max M2 Max, M2 Max 38-Core GPU, Apple SSD AP2048Z, Mini-LED, 3456x2234, 16.2" | |
|---|---|---|---|---|---|---|
| Stromverbrauch | 6% | 59% | 34% | -79% | 16% | |
| Idle min * (Watt) | 15 | 5.9 61% | 2.2 85% | 5.8 61% | 34.6 -131% | 5.2 65% |
| Idle avg * (Watt) | 23.6 | 15.8 33% | 8.9 62% | 14.3 39% | 43 -82% | 16.5 30% |
| Idle max * (Watt) | 24.3 | 26.7 -10% | 11 55% | 18.4 24% | 44.9 -85% | 16.8 31% |
| Last avg * (Watt) | 80 | 117.4 -47% | 53 34% | 70 12% | 145 -81% | 113 -41% |
| Witcher 3 ultra * (Watt) | 113.7 | 114.8 -1% | 42.5 63% | 69.4 39% | 152.4 -34% | 92 19% |
| Last max * (Watt) | 135.4 | 136.6 -1% | 64 53% | 93 31% | 220 -62% | 145 -7% |
* ... kleinere Werte sind besser
Energieverbrauch Witcher 3 / Stresstest
Energieverbrauch externer Monitor
Akkulaufzeit - Lange Dauer, langsames Laden
Die Akkulaufzeit mit WLAN-Nutzung ist ca. eine Stunde länger als beim XPS 17 9720 aus dem letzten Jahr, was zehn Stunden Internet Browsing ergibt. Somit ist es erfreulich, dass die Akkulaufzeit auch nach den jährlichen Performance-Steigerungen fast immer noch unverändert ist.
Das Laden des komplett leeren Akkus ist mit 2 bis 2,5 Std. relativ langsam, im Vergleich zu 1,5 Std. bei anderen Laptops. Beachtet werden sollte, dass sich diese Zeit bei gewisser Leistung verlängern kann, was an dem limitierten 130-W-AC-Adapter liegt.
Zu erwähnen ist auch noch, dass sich die Batterie im Netzbetrieb nicht langsam entlädt, wenn viel Leistung gefordert wird. Dieses Problem hatte vor allem das Original, das XPS 9700. Ab dem XPS 17 9710 wurde dieses Problem jedoch behoben.
| Dell XPS 17 9730 RTX 4070 i7-13700H, GeForce RTX 4070 Laptop GPU, 97 Wh | Dell XPS 17 9720 RTX 3060 i7-12700H, GeForce RTX 3060 Laptop GPU, 97 Wh | LG Gram 17 (2023) i7-1360P, Iris Xe G7 96EUs, 80 Wh | HP Envy 17-cr0079ng i7-1255U, GeForce RTX 2050 Mobile, 55 Wh | MSI Creator Z17 A12UGST-054 i9-12900H, GeForce RTX 3070 Ti Laptop GPU, 90 Wh | Apple MacBook Pro 16 2023 M2 Max M2 Max, M2 Max 38-Core GPU, 99.6 Wh | |
|---|---|---|---|---|---|---|
| Akkulaufzeit | -11% | 63% | -4% | 28% | 24% | |
| Idle (h) | 19.1 | 25.7 35% | ||||
| WLAN (h) | 10 | 8.7 -13% | 12.8 28% | 4.7 -53% | 5.5 -45% | 14.8 48% |
| Last (h) | 1.1 | 1 -9% | 2.5 127% | 1.6 45% | 2.2 100% | 1.1 0% |
| H.264 (h) | 14.5 | 5.5 | 5.5 | 18.7 |
Pro
Contra
Fazit — Ausgeglichen und optimiert
Man sagt Geräten der ersten Generation oder eines neuen Designs nach, dass man sie nicht kaufen sollte, da es mögliche Probleme geben könnte beziehungsweise Aspekte, die noch optimiert werden müssten. Das Original XPS 17 9700 zum Beispiel hatte Probleme mit der Akkulaufzeit, die Stabilität der Bildwiederholrate war schlecht und der CPU-Turbo-Boost war ebenfalls nicht erfreulich. Nach drei Jahren ständiger Optimierung hat die neueste Generation, das XPS 17 9730, all diese Probleme beheben können, weshalb man dieses nun guten Gewissens empfehlen kann. Der Energieverbrauch ist jetzt kein Thema mehr, die Bildwiederholrate ist stabil und der Turbo-Boost der CPU hält bei bleibender Konstanz länger durch.
Das XPS 17 9730 liefert viel Performance bei wenig Energieverbrauch und ist deutlich besser als das XPS 15 9530. Bei der gleichen Konfiguration (i7 CPU und RTX 4070) übertrifft das XPS 17 seinen kleinen Bruder mit 10 bis 15 bzw. 50 bis 60 Prozent. Außerdem ist der GPU-Boost enorm dank der höheren Taktlimitierung im XPS 17. Sollte man die Qual der Wahl zwischen dem XPS 15 und dem XPS 17 haben, und man legt sehr viel Wert auf Grafik, ist das XPS 17 der klare Gewinner.
Das XPS 17 9730 hat die Performance, die Portabilität, das Display und das Gaming-Potenzial, um die meisten sowohl zu Hause als auch im Büro zufrieden zu stellen. Nichtsdestotrotz hinken manche Aspekte des mittlerweile drei Jahre alten Designs hinterher.
Die Nachteile dieses Modells dürfen aber auch nicht vernachlässigt werden. Für einen Laptop dieser Preisklasse (>3.000 Euro), ist die 1-MP-Frontkamera ohne Verschluss oder der fehlende WiFi-6E-Support beschämend. Das 60-Hz-IPS-Display ist mittlerweile veraltet, während OLED-Displays und Bildschirme mit hohen Bildwiederholraten der Standard werden. Der 130-W-AC-Adapter macht eher den Eindruck, als würde er die XPS-17-Serie vom Schnellladen und höheren Taktlimitierungen abhalten. Es gibt auf jeden Fall genug, was verbessert werden kann, aber die Performance überzeugt auf einem guten Level, wenn man das dünne Design bedenkt.
Preis und Verfügbarkeit
Das XPS 17 9730 ist in zahlreichen Konfigurationen verfügbar, etwa im Dell Online-Shop. Die Preise starten bei rund 3.000 Euro.
Dell XPS 17 9730 RTX 4070
- 27.05.2023 v7 (old)
Allen Ngo
Transparenz
Die Auswahl der zu testenden Geräte erfolgt innerhalb der Redaktion. Das vorliegende Testmuster wurde dem Autor vom Hersteller oder einem Shop zu Testzwecken leihweise zur Verfügung gestellt. Eine Einflussnahme des Leihstellers auf den Testbericht gab es nicht, der Hersteller erhielt keine Version des Reviews vor der Veröffentlichung. Es bestand keine Verpflichtung zur Publikation. Als eigenständiges, unabhängiges Unternehmen unterliegt Notebookcheck keiner Diktion von Herstellern, Shops und Verlagen.
So testet Notebookcheck
Pro Jahr werden von Notebookcheck hunderte Laptops und Smartphones unabhängig in von uns standardisierten technischen Verfahren getestet, um eine Vergleichbarkeit aller Testergebnisse zu gewährleisten. Seit rund 20 Jahren entwickeln wir diese Testmethoden kontinuierlich weiter und setzen damit Branchenstandards. In unseren Testlaboren kommt ausschließlich hochwertiges Messequipment in die Hände erfahrener Techniker und Redakteure. Die Tests unterliegen einer mehrstufigen Kontrolle. Unsere komplexe Gesamtbewertung basiert auf hunderten fundierten Messergebnissen und Benchmarks, womit Ihnen Objektivität garantiert ist. Weitere Informationen zu unseren Testmethoden gibt es hier.
Preisvergleich

