Test Lenovo Legion 5 Pro Gen 7 Laptop: Ryzen 7 6800H oder Ryzen 9 6900HX?
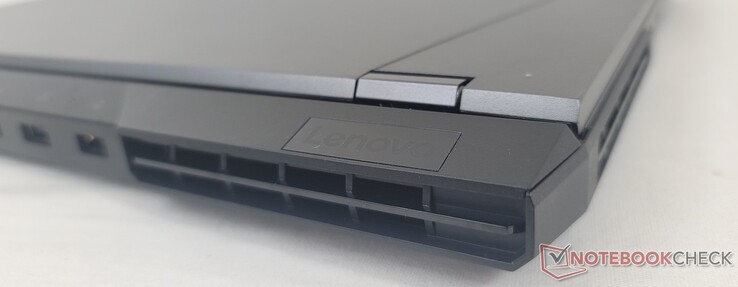
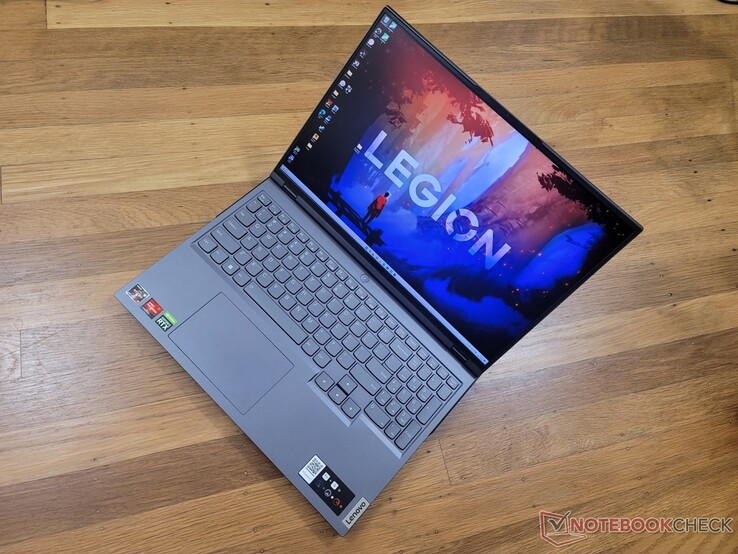
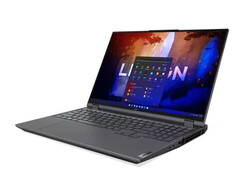
Das Legion 5 Pro Gen. 7 ist ein Gaming-Laptop der gehobenen Mittelklasse, der unter der noch teureren Legion-7-16-Serie angesiedelt ist. Unser heutiges Lenovo-Testgerät konkurriert wie seine direkten Konkurrenten HP Omen 16, Asus ROG Zephyrus M16, Dell G16 und Gigabyte Aero 16 im immer beliebteren 16-Zoll-Segment.
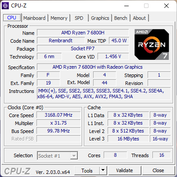
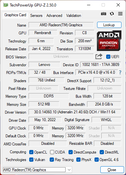
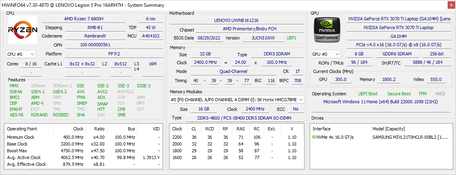
Unsere Konfiguration ist mit dem AMD-Zen-3+-Prozessor Ryzen 7 6800H und einer GeForce RTX 3070 Ti mit einer TGP von 150 W ausgestattet und für ca. 2.360 Euro erhältlich. Andere Modelle mit dem Ryzen 9 6900HX, der RTX 3070, RTX 3060 und der RTX 3050 Ti sind ebenfalls verfügbar, zusätzlich kann bei schwächeren Konfigurationen der statt dem 16:10-IPS-Display mit einer Auflösung von 2.560 x 1.600 Pixeln ein günstigeres 16:10-IPS-Display mit einer Auflösung von 1.920 x 1.200 Pixeln ausgewählt werden. Beide Varianten unterstützen G-Sync.
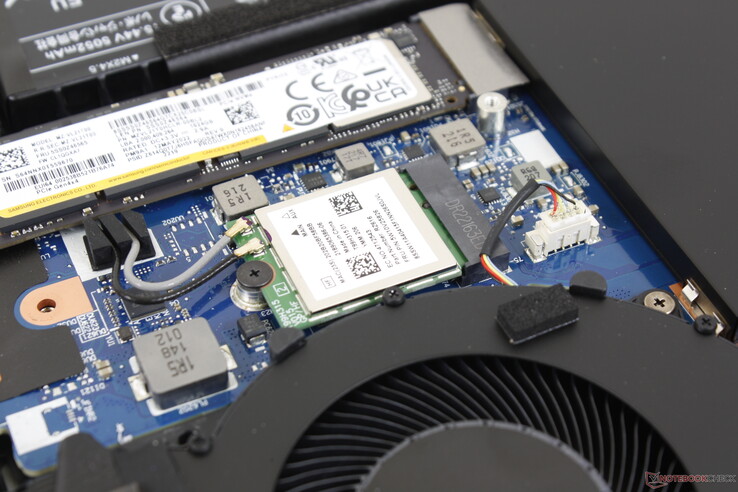
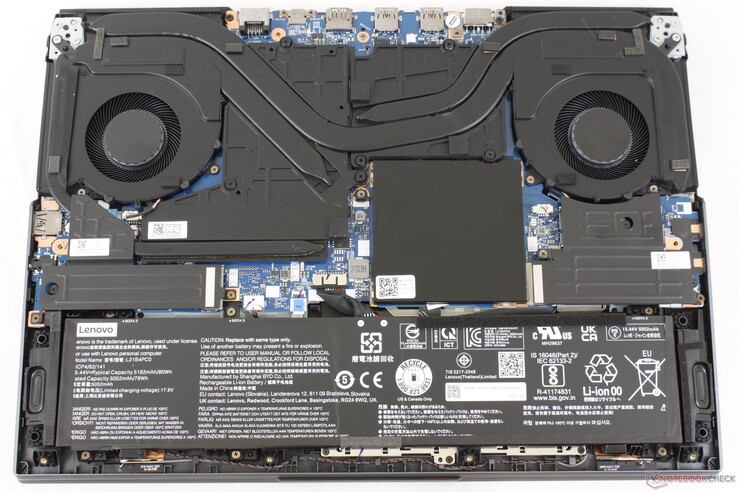
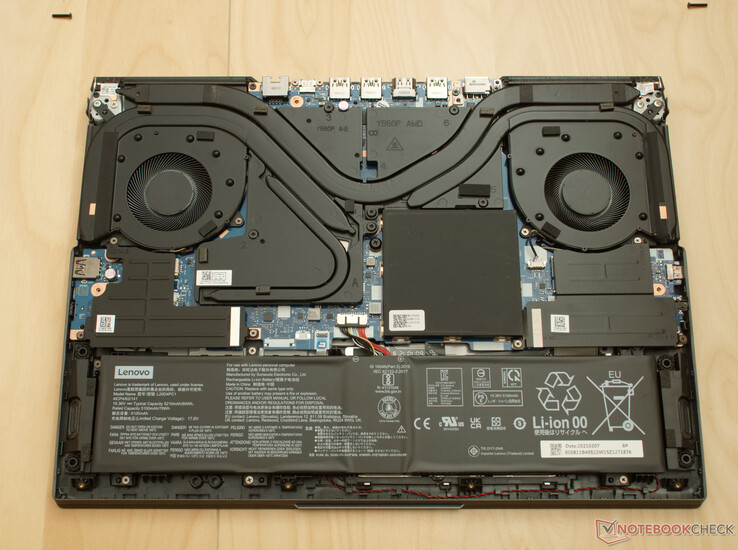
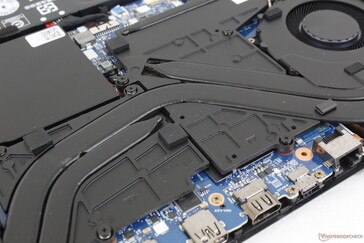
Das Legion 5 Pro Gen. 7 2022 setzt auf das gleiche Gehäusedesign wiie das Modell aus dem Vorjahr, weshalb wir an dieser Stelle für weiitere Informationen zu den physikalischen Eigenschaften des Geräts auf unseren bestehenden Test des 2021er-Modells verweisen. Das ältere Modell nutzt die langsameren Zen-3-CPU Ryzen 7 5800H und eine GeForce RTX 3070 mit einer TGP von 140 W.
Weitere Lenovo-Tests:
Mögliche Kokurrenten im Vergleich
Bew. | Datum | Modell | Gewicht | Dicke | Größe | Auflösung | Preis ab |
|---|---|---|---|---|---|---|---|
| 87.7 % v7 (old) | 10 / 2022 | Lenovo Legion 5 Pro 16ARH7H RTX 3070 Ti R7 6800H, GeForce RTX 3070 Ti Laptop GPU | 2.6 kg | 26.6 mm | 16.00" | 2560x1600 | |
| 86.6 % v7 (old) | 07 / 2022 | Lenovo Legion 5 Pro 16IAH7H i7-12700H, GeForce RTX 3060 Laptop GPU | 2.6 kg | 27 mm | 16.00" | 2560x1600 | |
| 85.6 % v7 (old) | 06 / 2021 | Asus ROG Zephyrus M16 GU603H i9-11900H, GeForce RTX 3070 Laptop GPU | 2 kg | 20 mm | 16.00" | 2560x1600 | |
| 90.8 % v7 (old) | 09 / 2022 | Lenovo Legion 7 16ARHA7 R9 6900HX, Radeon RX 6850M XT | 2.6 kg | 19.4 mm | 16.00" | 2560x1600 | |
| 82.3 % v7 (old) | 05 / 2022 | HP Victus 16-e0145ng R5 5600H, GeForce RTX 3050 Ti Laptop GPU | 2.4 kg | 23.5 mm | 16.10" | 1920x1080 | |
| 86.1 % v7 (old) | 10 / 2022 | Dell G16 7620 i7-12700H, GeForce RTX 3060 Laptop GPU | 2.6 kg | 26.9 mm | 16.00" | 2560x1600 |
Gehäuse — Deckelaußenseite und Bodenschale aus Aluminium
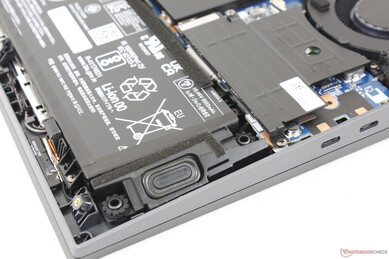
Es gibt eine einfache Methode, das 2022er-Modell des Legion 5 Pro 16 von der 2021er-Versio zu unterscheiden. Durch einen zusätzlichen USB-C-Anschluss auf der linken Seite besitzt das 2022er-Modell statt zwei nämlich insgesamt drei. Zugleich sinkt die Anzahl der USB-A-Anschlüsse von vier auf drei. Davon abgesehen sind die Modelle jedoch optisch identisch.
| Networking | |
| iperf3 transmit AX12 | |
| Asus ROG Zephyrus M16 GU603H | |
| iperf3 receive AX12 | |
| Asus ROG Zephyrus M16 GU603H | |
| iperf3 receive AXE11000 6GHz | |
| Lenovo Legion 5 Pro 16ARH7H RTX 3070 Ti | |
| Lenovo Legion 7 16ARHA7 | |
| iperf3 receive AXE11000 | |
| Dell G16 7620 | |
| HP Victus 16-e0145ng | |
| iperf3 transmit AXE11000 6GHz | |
| Lenovo Legion 7 16ARHA7 | |
| Lenovo Legion 5 Pro 16ARH7H RTX 3070 Ti | |
| iperf3 transmit AXE11000 | |
| Dell G16 7620 | |
| HP Victus 16-e0145ng | |
Webcam
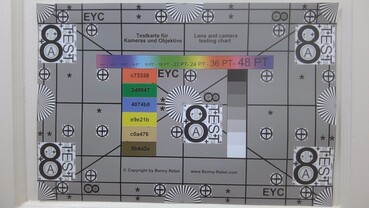
Bei der Webcam setzt Lenovo auf 720p und kein IR.
Garantie und Zubehör
Im Lieferumfang befinden sich abgesehen vom Netzteil und dem üblichen Papierkram keine Extras. Es gilt die übliche, eingeschränkte einjährige Garantie sowie die zweijährige Gewährleistung innerhalb der EU.
Display — Wenige Optionen
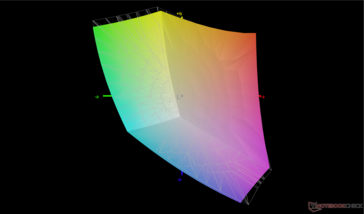
Lenovo nutzt auch beim aktuellen Legion 5 Pro 16 das BOE-IPS-Panel BOE CQ NE160QDM-NY1. Unsere Messungen unten zeigen, dass die Displays mit einer vollständigen sRGB-Abdeckung, schnellen Schwarz-zu-Weiß-Reaktionszeiten, einem Kontrastverhältnis von ~1.000:1 und einer 500-cd/m²-Hintergrundbeleuchtung sehr ähnliche Eigenschaften besitzen.
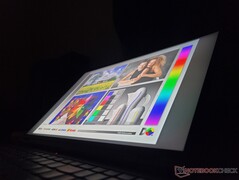
Allerdings leidet unser Testgerät unter moderat bis stark ausgeprägtem Backlight-Bleeding, wie das Bild unten zeigt. Mit einem gewissen Maß an Backlight-Bleeding muss man zwar bei praktisch jedem IPS-Panel rechnen, die hier erreichte Intensität ist jedoch vor allem bei einem Laptop aus der gehobenen Mittelklasse ärgerlich.
| |||||||||||||||||||||||||
Ausleuchtung: 84 %
Helligkeit Akku: 522.8 cd/m²
Kontrast: 1275:1 (Schwarzwert: 0.41 cd/m²)
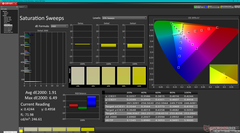
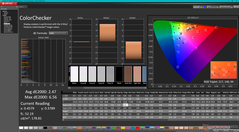
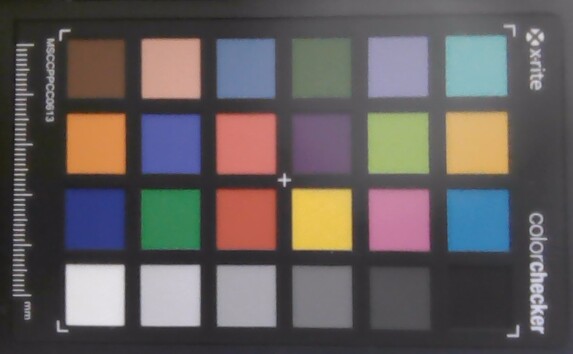
ΔE ColorChecker Calman: 2.47 | ∀{0.5-29.43 Ø4.76}
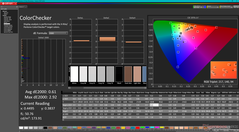
calibrated: 0.61
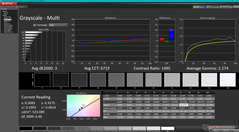
ΔE Greyscale Calman: 3 | ∀{0.09-98 Ø5}
69.5% AdobeRGB 1998 (Argyll 3D)
96.1% sRGB (Argyll 3D)
67.3% Display P3 (Argyll 3D)
Gamma: 2.27
CCT: 6719 K
| Lenovo Legion 5 Pro 16ARH7H RTX 3070 Ti BOE CQ NE160QDM-NY1, IPS, 2560x1600, 16" | Lenovo Legion 5 Pro 16IAH7H BOE CCQ_NE160QDM_NY1, IPS, 2560x1600, 16" | Asus ROG Zephyrus M16 GU603H AU Optronics AUOC199, IPS, 2560x1600, 16" | Lenovo Legion 7 16ARHA7 BOE CQ NE160QDM-NY1, IPS, 2560x1600, 16" | HP Victus 16-e0145ng CMN1609, IPS, 1920x1080, 16.1" | Dell G16 7620 BOE NE16QDM, IPS, 2560x1600, 16" | |
|---|---|---|---|---|---|---|
| Display | 2% | -4% | -37% | 1% | ||
| Display P3 Coverage (%) | 67.3 | 68.53 2% | 63.7 -5% | 41.6 -38% | 68.3 1% | |
| sRGB Coverage (%) | 96.1 | 98.38 2% | 95.3 -1% | 61.9 -36% | 98 2% | |
| AdobeRGB 1998 Coverage (%) | 69.5 | 70.45 1% | 65.7 -5% | 43 -38% | 70.5 1% | |
| Response Times | 25% | 57% | 25% | -90% | 24% | |
| Response Time Grey 50% / Grey 80% * (ms) | 14.4 ? | 14 ? 3% | 4.8 ? 67% | 9.2 ? 36% | 29.6 ? -106% | 8.6 ? 40% |
| Response Time Black / White * (ms) | 11.2 ? | 6 ? 46% | 6 ? 46% | 9.6 ? 14% | 19.4 ? -73% | 10.4 ? 7% |
| PWM Frequency (Hz) | ||||||
| Bildschirm | -7% | -51% | -19% | -127% | -10% | |
| Helligkeit Bildmitte (cd/m²) | 522.8 | 515 -1% | 448 -14% | 478.8 -8% | 257 -51% | 369.4 -29% |
| Brightness (cd/m²) | 503 | 475 -6% | 446 -11% | 477 -5% | 239 -52% | 348 -31% |
| Brightness Distribution (%) | 84 | 85 1% | 86 2% | 90 7% | 88 5% | 83 -1% |
| Schwarzwert * (cd/m²) | 0.41 | 0.45 -10% | 0.48 -17% | 0.43 -5% | 0.25 39% | 0.32 22% |
| Kontrast (:1) | 1275 | 1144 -10% | 933 -27% | 1113 -13% | 1028 -19% | 1154 -9% |
| Delta E Colorchecker * | 2.47 | 2.38 4% | 2.76 -12% | 2.24 9% | 6.91 -180% | 1.78 28% |
| Colorchecker dE 2000 max. * | 6.56 | 4.37 33% | 7.09 -8% | 4.49 32% | 22.27 -239% | 4.41 33% |
| Colorchecker dE 2000 calibrated * | 0.61 | 1.1 -80% | 2.86 -369% | 1.89 -210% | 3.61 -492% | 1.22 -100% |
| Delta E Graustufen * | 3 | 2.71 10% | 3.1 -3% | 2.3 23% | 7.5 -150% | 3.2 -7% |
| Gamma | 2.27 97% | 2.49 88% | 2.153 102% | 2.25 98% | 2.125 104% | 2.2 100% |
| CCT | 6719 97% | 6117 106% | 6826 95% | 6955 93% | 6025 108% | 6750 96% |
| Farbraum (Prozent von AdobeRGB 1998) (%) | 87 | |||||
| Color Space (Percent of sRGB) (%) | 100 | |||||
| Durchschnitt gesamt (Programm / Settings) | 7% /
-0% | 3% /
-31% | 1% /
-9% | -85% /
-102% | 5% /
-3% |
* ... kleinere Werte sind besser
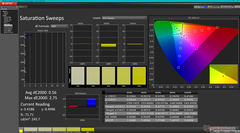
Das Display ist ab Werk kalibriert und weist in unserem Fall durchschnittliche Graustufen- und Farb-DeltaE-Abweichungen von nur 3 bzw. 2,47 auf. Durch eine nachträgliche Kalibrierung mit einem X-Rite-Farbmessgerät konnten wir die DeltaE-Werte auf nur 0,7 bzw. 0,6 senken und damit nochmals deutlich verbessern. Wir empfehlen die Nutzung unseres oben verlinkten ICM-Profils, um die vollständige sRGB-Farbraumabdeckung des Displays bestmöglich nutzen zu können.
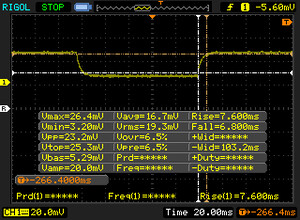
Reaktionszeiten (Response Times) des Displays
| ↔ Reaktionszeiten Schwarz zu Weiß | ||
|---|---|---|
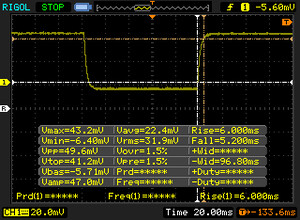
| 11.2 ms ... steigend ↗ und fallend ↘ kombiniert | ↗ 6 ms steigend | |
| ↘ 5.2 ms fallend | ||
| Die gemessenen Reaktionszeiten sind gut, für anspruchsvolle Spieler könnten der Bildschirm jedoch zu langsam sein. Im Vergleich rangierten die bei uns getesteten Geräte von 0.1 (Minimum) zu 240 (Maximum) ms. » 29 % aller Screens waren schneller als der getestete. Daher sind die gemessenen Reaktionszeiten besser als der Durchschnitt aller vermessenen Geräte (20.1 ms). | ||
| ↔ Reaktionszeiten 50% Grau zu 80% Grau | ||
| 14.4 ms ... steigend ↗ und fallend ↘ kombiniert | ↗ 7.6 ms steigend | |
| ↘ 6.8 ms fallend | ||
| Die gemessenen Reaktionszeiten sind gut, für anspruchsvolle Spieler könnten der Bildschirm jedoch zu langsam sein. Im Vergleich rangierten die bei uns getesteten Geräte von 0.165 (Minimum) zu 636 (Maximum) ms. » 27 % aller Screens waren schneller als der getestete. Daher sind die gemessenen Reaktionszeiten besser als der Durchschnitt aller vermessenen Geräte (31.5 ms). | ||
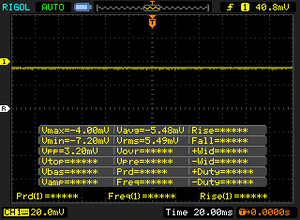
Bildschirm-Flackern / PWM (Pulse-Width Modulation)
| Flackern / PWM nicht festgestellt | |||
Im Vergleich: 53 % aller getesteten Geräte nutzten kein PWM um die Helligkeit zu reduzieren. Wenn PWM eingesetzt wurde, dann bei einer Frequenz von durchschnittlich 8082 (Minimum 5, Maximum 343500) Hz. | |||
Leistung — Nur etwas schneller
Testbedingungen
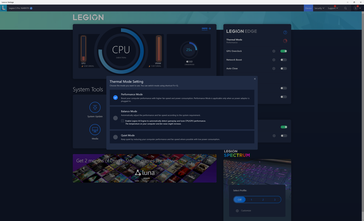
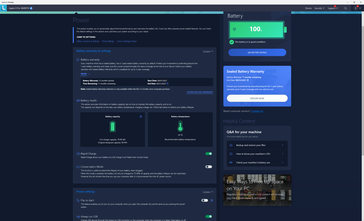
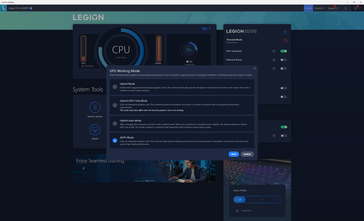
Wir haben sowohl in Windows als auch in der Lenovo-Vantage-Software vor dem Durchführen der folgenden Benchmarks den Leistungsmodus ausgewählt. Außerdem haben wir die GPU-Übertaktungsoption aktiviert und die GPU in den dGPU-Modus versetzt. Wie die folgenden Screenshots zeigen, sollte man sich unbedingt mit der Vantage-Software und ihren verschiedenen Einstellungen vertraut machen.
Prozessor
Basierend auf unserem HP Omen 16 und dem 2021er-Modell des Lenovo Legion 5 Pro 16 liegt die Single- und Multi-Thread-Leistung etwa 10 % bzw. 20 % über der des Ryzen 7 5800H aus der vorherigen Generation. Damit ist der Sprung zwar nicht unbedeutend, der generationsübergreifende Leistungszuwachs ist allerdings lange nicht so hoch wie bei Intels Wechsel von der 11. auf die 12. Generation. So ist der Core i7-12700H beispielsweise um ca. 15 bis 30 % schneller als unser Ryzen 7 6800H.
Wie unsere Vergleichstabellen unten zeigen, sollten potenzielle Käufer bei der Wahl des Ryzen 9 6900HX bestenfalls mit einem minimalen Leistungssprung rechnen. Preisbewusste Käufer sind daher mit dem günstigeren Ryzen 7 6800H vermutlich besser bedient.
Cinebench R15 Multi Dauertest
Cinebench R23: Multi Core | Single Core
Cinebench R15: CPU Multi 64Bit | CPU Single 64Bit
Blender: v2.79 BMW27 CPU
7-Zip 18.03: 7z b 4 | 7z b 4 -mmt1
Geekbench 5.5: Multi-Core | Single-Core
HWBOT x265 Benchmark v2.2: 4k Preset
LibreOffice : 20 Documents To PDF
R Benchmark 2.5: Overall mean
| Cinebench R20 / CPU (Multi Core) | |
| Lenovo Legion 5 Pro 16IAH7H | |
| Alienware x15 R2 P111F | |
| Dell G16 7620 | |
| Lenovo Legion 5 Pro 16ARH7H RTX 3070 Ti | |
| Lenovo Legion 7 16ARHA7 | |
| Gigabyte A5 X1 | |
| Asus ROG Zephyrus M16 GU603H | |
| Durchschnittliche AMD Ryzen 7 6800H (4460 - 5661, n=9) | |
| HP Omen 16-c0077ng | |
| HP Victus 16-e0145ng | |
| Lenovo Legion C7 15IMH05 82EH0030GE | |
| Cinebench R20 / CPU (Single Core) | |
| Alienware x15 R2 P111F | |
| Lenovo Legion 5 Pro 16IAH7H | |
| Dell G16 7620 | |
| Lenovo Legion 7 16ARHA7 | |
| Asus ROG Zephyrus M16 GU603H | |
| Lenovo Legion 5 Pro 16ARH7H RTX 3070 Ti | |
| Durchschnittliche AMD Ryzen 7 6800H (580 - 605, n=9) | |
| Gigabyte A5 X1 | |
| HP Omen 16-c0077ng | |
| HP Victus 16-e0145ng | |
| Lenovo Legion C7 15IMH05 82EH0030GE | |
| Cinebench R23 / Multi Core | |
| Lenovo Legion 5 Pro 16IAH7H | |
| Dell G16 7620 | |
| Alienware x15 R2 P111F | |
| Lenovo Legion 5 Pro 16ARH7H RTX 3070 Ti | |
| Lenovo Legion 7 16ARHA7 | |
| Gigabyte A5 X1 | |
| Durchschnittliche AMD Ryzen 7 6800H (11481 - 14660, n=11) | |
| HP Omen 16-c0077ng | |
| HP Victus 16-e0145ng | |
| Lenovo Legion C7 15IMH05 82EH0030GE | |
| Cinebench R23 / Single Core | |
| Alienware x15 R2 P111F | |
| Lenovo Legion 5 Pro 16IAH7H | |
| Dell G16 7620 | |
| Lenovo Legion 7 16ARHA7 | |
| Lenovo Legion 5 Pro 16ARH7H RTX 3070 Ti | |
| Durchschnittliche AMD Ryzen 7 6800H (1500 - 1552, n=9) | |
| Gigabyte A5 X1 | |
| HP Omen 16-c0077ng | |
| HP Victus 16-e0145ng | |
| Lenovo Legion C7 15IMH05 82EH0030GE | |
| Cinebench R15 / CPU Multi 64Bit | |
| Lenovo Legion 5 Pro 16IAH7H | |
| Alienware x15 R2 P111F | |
| Dell G16 7620 | |
| Lenovo Legion 5 Pro 16ARH7H RTX 3070 Ti | |
| Lenovo Legion 7 16ARHA7 | |
| Asus ROG Zephyrus M16 GU603H | |
| Gigabyte A5 X1 | |
| Durchschnittliche AMD Ryzen 7 6800H (1585 - 2366, n=10) | |
| HP Omen 16-c0077ng | |
| Lenovo Legion C7 15IMH05 82EH0030GE | |
| HP Victus 16-e0145ng | |
| Cinebench R15 / CPU Single 64Bit | |
| Alienware x15 R2 P111F | |
| Lenovo Legion 7 16ARHA7 | |
| Lenovo Legion 5 Pro 16IAH7H | |
| Lenovo Legion 5 Pro 16ARH7H RTX 3070 Ti | |
| Dell G16 7620 | |
| Gigabyte A5 X1 | |
| Asus ROG Zephyrus M16 GU603H | |
| Durchschnittliche AMD Ryzen 7 6800H (182.7 - 250, n=10) | |
| HP Omen 16-c0077ng | |
| HP Victus 16-e0145ng | |
| Lenovo Legion C7 15IMH05 82EH0030GE | |
| Blender / v2.79 BMW27 CPU | |
| Lenovo Legion C7 15IMH05 82EH0030GE | |
| HP Victus 16-e0145ng | |
| HP Omen 16-c0077ng | |
| Asus ROG Zephyrus M16 GU603H | |
| Durchschnittliche AMD Ryzen 7 6800H (213 - 268, n=8) | |
| Gigabyte A5 X1 | |
| Lenovo Legion 7 16ARHA7 | |
| Lenovo Legion 5 Pro 16ARH7H RTX 3070 Ti | |
| Alienware x15 R2 P111F | |
| Dell G16 7620 | |
| Lenovo Legion 5 Pro 16IAH7H | |
| 7-Zip 18.03 / 7z b 4 -mmt1 | |
| Alienware x15 R2 P111F | |
| Lenovo Legion 5 Pro 16ARH7H RTX 3070 Ti | |
| Durchschnittliche AMD Ryzen 7 6800H (5521 - 5803, n=8) | |
| Gigabyte A5 X1 | |
| Lenovo Legion 7 16ARHA7 | |
| Asus ROG Zephyrus M16 GU603H | |
| Lenovo Legion 5 Pro 16IAH7H | |
| HP Omen 16-c0077ng | |
| Lenovo Legion C7 15IMH05 82EH0030GE | |
| HP Victus 16-e0145ng | |
| Dell G16 7620 | |
| Geekbench 5.5 / Multi-Core | |
| Alienware x15 R2 P111F | |
| Lenovo Legion 5 Pro 16IAH7H | |
| Dell G16 7620 | |
| Lenovo Legion 5 Pro 16ARH7H RTX 3070 Ti | |
| Lenovo Legion 7 16ARHA7 | |
| Asus ROG Zephyrus M16 GU603H | |
| Durchschnittliche AMD Ryzen 7 6800H (8898 - 10355, n=10) | |
| Gigabyte A5 X1 | |
| Lenovo Legion C7 15IMH05 82EH0030GE | |
| HP Omen 16-c0077ng | |
| HP Victus 16-e0145ng | |
| Geekbench 5.5 / Single-Core | |
| Alienware x15 R2 P111F | |
| Lenovo Legion 5 Pro 16IAH7H | |
| Dell G16 7620 | |
| Asus ROG Zephyrus M16 GU603H | |
| Lenovo Legion 7 16ARHA7 | |
| Lenovo Legion 5 Pro 16ARH7H RTX 3070 Ti | |
| Durchschnittliche AMD Ryzen 7 6800H (1518 - 1568, n=10) | |
| Gigabyte A5 X1 | |
| HP Victus 16-e0145ng | |
| HP Omen 16-c0077ng | |
| Lenovo Legion C7 15IMH05 82EH0030GE | |
| HWBOT x265 Benchmark v2.2 / 4k Preset | |
| Lenovo Legion 5 Pro 16IAH7H | |
| Alienware x15 R2 P111F | |
| Dell G16 7620 | |
| Lenovo Legion 5 Pro 16ARH7H RTX 3070 Ti | |
| Lenovo Legion 7 16ARHA7 | |
| Gigabyte A5 X1 | |
| Durchschnittliche AMD Ryzen 7 6800H (14.9 - 18.5, n=9) | |
| HP Omen 16-c0077ng | |
| Asus ROG Zephyrus M16 GU603H | |
| HP Victus 16-e0145ng | |
| Lenovo Legion C7 15IMH05 82EH0030GE | |
| LibreOffice / 20 Documents To PDF | |
| HP Omen 16-c0077ng | |
| Gigabyte A5 X1 | |
| HP Victus 16-e0145ng | |
| Lenovo Legion C7 15IMH05 82EH0030GE | |
| Durchschnittliche AMD Ryzen 7 6800H (48.7 - 79.5, n=8) | |
| Lenovo Legion 7 16ARHA7 | |
| Dell G16 7620 | |
| Lenovo Legion 5 Pro 16ARH7H RTX 3070 Ti | |
| Alienware x15 R2 P111F | |
| Asus ROG Zephyrus M16 GU603H | |
| Lenovo Legion 5 Pro 16IAH7H | |
| R Benchmark 2.5 / Overall mean | |
| Lenovo Legion C7 15IMH05 82EH0030GE | |
| Asus ROG Zephyrus M16 GU603H | |
| HP Victus 16-e0145ng | |
| HP Omen 16-c0077ng | |
| Dell G16 7620 | |
| Gigabyte A5 X1 | |
| Durchschnittliche AMD Ryzen 7 6800H (0.4783 - 0.515, n=8) | |
| Lenovo Legion 7 16ARHA7 | |
| Lenovo Legion 5 Pro 16ARH7H RTX 3070 Ti | |
| Lenovo Legion 5 Pro 16IAH7H | |
| Alienware x15 R2 P111F | |
* ... kleinere Werte sind besser
AIDA64: FP32 Ray-Trace | FPU Julia | CPU SHA3 | CPU Queen | FPU SinJulia | FPU Mandel | CPU AES | CPU ZLib | FP64 Ray-Trace | CPU PhotoWorxx
| Performance Rating | |
| Lenovo Legion 7 16ARHA7 | |
| Lenovo Legion 5 Pro 16ARH7H RTX 3070 Ti | |
| Durchschnittliche AMD Ryzen 7 6800H | |
| Dell G16 7620 | |
| Lenovo Legion 5 Pro 16IAH7H | |
| HP Victus 16-e0145ng | |
| Asus ROG Zephyrus M16 GU603H -9! | |
| AIDA64 / FP32 Ray-Trace | |
| Lenovo Legion 7 16ARHA7 | |
| Lenovo Legion 5 Pro 16ARH7H RTX 3070 Ti | |
| Durchschnittliche AMD Ryzen 7 6800H (12876 - 17031, n=8) | |
| Dell G16 7620 | |
| Lenovo Legion 5 Pro 16IAH7H | |
| Lenovo Legion 5 Pro 16IAH7H | |
| HP Victus 16-e0145ng | |
| AIDA64 / FPU Julia | |
| Lenovo Legion 7 16ARHA7 | |
| Lenovo Legion 5 Pro 16ARH7H RTX 3070 Ti | |
| Durchschnittliche AMD Ryzen 7 6800H (82673 - 105987, n=8) | |
| Dell G16 7620 | |
| Lenovo Legion 5 Pro 16IAH7H | |
| Lenovo Legion 5 Pro 16IAH7H | |
| HP Victus 16-e0145ng | |
| AIDA64 / CPU SHA3 | |
| Dell G16 7620 | |
| Lenovo Legion 7 16ARHA7 | |
| Lenovo Legion 5 Pro 16ARH7H RTX 3070 Ti | |
| Lenovo Legion 5 Pro 16IAH7H | |
| Lenovo Legion 5 Pro 16IAH7H | |
| Durchschnittliche AMD Ryzen 7 6800H (2886 - 3634, n=8) | |
| HP Victus 16-e0145ng | |
| AIDA64 / CPU Queen | |
| Lenovo Legion 5 Pro 16ARH7H RTX 3070 Ti | |
| Lenovo Legion 7 16ARHA7 | |
| Dell G16 7620 | |
| Lenovo Legion 5 Pro 16IAH7H | |
| Durchschnittliche AMD Ryzen 7 6800H (75117 - 106322, n=8) | |
| HP Victus 16-e0145ng | |
| AIDA64 / FPU SinJulia | |
| Lenovo Legion 7 16ARHA7 | |
| Lenovo Legion 5 Pro 16ARH7H RTX 3070 Ti | |
| Durchschnittliche AMD Ryzen 7 6800H (11771 - 13120, n=8) | |
| Lenovo Legion 5 Pro 16IAH7H | |
| Lenovo Legion 5 Pro 16IAH7H | |
| Dell G16 7620 | |
| HP Victus 16-e0145ng | |
| AIDA64 / FPU Mandel | |
| Lenovo Legion 7 16ARHA7 | |
| Lenovo Legion 5 Pro 16ARH7H RTX 3070 Ti | |
| Durchschnittliche AMD Ryzen 7 6800H (45287 - 58327, n=8) | |
| HP Victus 16-e0145ng | |
| Lenovo Legion 5 Pro 16IAH7H | |
| Lenovo Legion 5 Pro 16IAH7H | |
| Dell G16 7620 | |
| AIDA64 / CPU AES | |
| Lenovo Legion 7 16ARHA7 | |
| Lenovo Legion 5 Pro 16ARH7H RTX 3070 Ti | |
| Lenovo Legion 5 Pro 16IAH7H | |
| Lenovo Legion 5 Pro 16IAH7H | |
| Durchschnittliche AMD Ryzen 7 6800H (67816 - 137383, n=8) | |
| Dell G16 7620 | |
| HP Victus 16-e0145ng | |
| AIDA64 / CPU ZLib | |
| Lenovo Legion 5 Pro 16IAH7H | |
| Lenovo Legion 5 Pro 16IAH7H | |
| Dell G16 7620 | |
| Lenovo Legion 7 16ARHA7 | |
| Lenovo Legion 5 Pro 16ARH7H RTX 3070 Ti | |
| Durchschnittliche AMD Ryzen 7 6800H (732 - 901, n=8) | |
| HP Victus 16-e0145ng | |
| Asus ROG Zephyrus M16 GU603H | |
| AIDA64 / FP64 Ray-Trace | |
| Lenovo Legion 7 16ARHA7 | |
| Lenovo Legion 5 Pro 16ARH7H RTX 3070 Ti | |
| Durchschnittliche AMD Ryzen 7 6800H (6917 - 8980, n=8) | |
| Dell G16 7620 | |
| Lenovo Legion 5 Pro 16IAH7H | |
| Lenovo Legion 5 Pro 16IAH7H | |
| HP Victus 16-e0145ng | |
| AIDA64 / CPU PhotoWorxx | |
| Dell G16 7620 | |
| Lenovo Legion 5 Pro 16IAH7H | |
| Lenovo Legion 5 Pro 16IAH7H | |
| Lenovo Legion 7 16ARHA7 | |
| Lenovo Legion 5 Pro 16ARH7H RTX 3070 Ti | |
| Durchschnittliche AMD Ryzen 7 6800H (26496 - 30360, n=8) | |
| HP Victus 16-e0145ng | |
Systemleistung
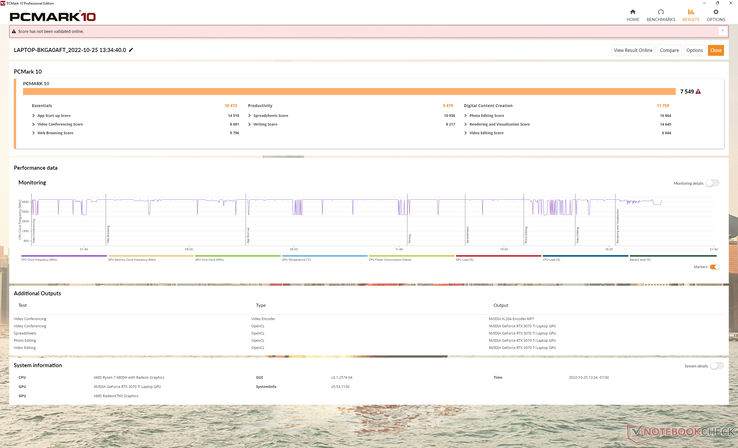
In den PCMark-Benchmarks liegt unser Testgerät innerhalb weniger Prozentpunkte anderer Gaming-Laptops wie zum Beispiel dem Dell G16 7620, obwohl der Ryzen 7 6800H den neuesten Intel-Core-CPUs aus der 12. Generation etwas hinterherhinkt.
CrossMark: Overall | Productivity | Creativity | Responsiveness
| PCMark 10 / Score | |
| Lenovo Legion 5 Pro 16ARH7H RTX 3070 Ti | |
| Lenovo Legion 5 Pro 16IAH7H | |
| Lenovo Legion 7 16ARHA7 | |
| Dell G16 7620 | |
| Durchschnittliche AMD Ryzen 7 6800H, NVIDIA GeForce RTX 3070 Ti Laptop GPU (6783 - 7549, n=2) | |
| Asus ROG Zephyrus M16 GU603H | |
| HP Victus 16-e0145ng | |
| PCMark 10 / Essentials | |
| Lenovo Legion 5 Pro 16IAH7H | |
| Asus ROG Zephyrus M16 GU603H | |
| Lenovo Legion 7 16ARHA7 | |
| Lenovo Legion 5 Pro 16ARH7H RTX 3070 Ti | |
| Durchschnittliche AMD Ryzen 7 6800H, NVIDIA GeForce RTX 3070 Ti Laptop GPU (10343 - 10472, n=2) | |
| Dell G16 7620 | |
| HP Victus 16-e0145ng | |
| PCMark 10 / Productivity | |
| Lenovo Legion 5 Pro 16ARH7H RTX 3070 Ti | |
| Lenovo Legion 5 Pro 16IAH7H | |
| Durchschnittliche AMD Ryzen 7 6800H, NVIDIA GeForce RTX 3070 Ti Laptop GPU (8991 - 9479, n=2) | |
| Asus ROG Zephyrus M16 GU603H | |
| Lenovo Legion 7 16ARHA7 | |
| Dell G16 7620 | |
| HP Victus 16-e0145ng | |
| PCMark 10 / Digital Content Creation | |
| Lenovo Legion 5 Pro 16ARH7H RTX 3070 Ti | |
| Lenovo Legion 7 16ARHA7 | |
| Lenovo Legion 5 Pro 16IAH7H | |
| Dell G16 7620 | |
| Durchschnittliche AMD Ryzen 7 6800H, NVIDIA GeForce RTX 3070 Ti Laptop GPU (9108 - 11759, n=2) | |
| Asus ROG Zephyrus M16 GU603H | |
| HP Victus 16-e0145ng | |
| CrossMark / Overall | |
| Dell G16 7620 | |
| Lenovo Legion 5 Pro 16IAH7H | |
| Lenovo Legion 5 Pro 16ARH7H RTX 3070 Ti | |
| Lenovo Legion 7 16ARHA7 | |
| Durchschnittliche AMD Ryzen 7 6800H, NVIDIA GeForce RTX 3070 Ti Laptop GPU (1522 - 1643, n=2) | |
| CrossMark / Productivity | |
| Lenovo Legion 5 Pro 16IAH7H | |
| Dell G16 7620 | |
| Lenovo Legion 5 Pro 16ARH7H RTX 3070 Ti | |
| Durchschnittliche AMD Ryzen 7 6800H, NVIDIA GeForce RTX 3070 Ti Laptop GPU (1530 - 1600, n=2) | |
| Lenovo Legion 7 16ARHA7 | |
| CrossMark / Creativity | |
| Dell G16 7620 | |
| Lenovo Legion 5 Pro 16IAH7H | |
| Lenovo Legion 7 16ARHA7 | |
| Lenovo Legion 5 Pro 16ARH7H RTX 3070 Ti | |
| Durchschnittliche AMD Ryzen 7 6800H, NVIDIA GeForce RTX 3070 Ti Laptop GPU (1589 - 1746, n=2) | |
| CrossMark / Responsiveness | |
| Lenovo Legion 5 Pro 16IAH7H | |
| Dell G16 7620 | |
| Lenovo Legion 5 Pro 16ARH7H RTX 3070 Ti | |
| Durchschnittliche AMD Ryzen 7 6800H, NVIDIA GeForce RTX 3070 Ti Laptop GPU (1316 - 1481, n=2) | |
| Lenovo Legion 7 16ARHA7 | |
| PCMark 10 Score | 7549 Punkte | |
Hilfe | ||
| AIDA64 / Memory Copy | |
| Lenovo Legion 5 Pro 16IAH7H | |
| Lenovo Legion 5 Pro 16IAH7H | |
| Dell G16 7620 | |
| Lenovo Legion 5 Pro 16ARH7H RTX 3070 Ti | |
| Lenovo Legion 7 16ARHA7 | |
| Durchschnittliche AMD Ryzen 7 6800H (48209 - 51186, n=8) | |
| HP Victus 16-e0145ng | |
| AIDA64 / Memory Read | |
| Dell G16 7620 | |
| Lenovo Legion 5 Pro 16IAH7H | |
| Lenovo Legion 5 Pro 16IAH7H | |
| Lenovo Legion 7 16ARHA7 | |
| Lenovo Legion 5 Pro 16ARH7H RTX 3070 Ti | |
| Durchschnittliche AMD Ryzen 7 6800H (43828 - 51778, n=8) | |
| HP Victus 16-e0145ng | |
| AIDA64 / Memory Write | |
| Lenovo Legion 5 Pro 16IAH7H | |
| Lenovo Legion 5 Pro 16IAH7H | |
| Dell G16 7620 | |
| Lenovo Legion 5 Pro 16ARH7H RTX 3070 Ti | |
| Lenovo Legion 7 16ARHA7 | |
| Durchschnittliche AMD Ryzen 7 6800H (51116 - 55307, n=8) | |
| HP Victus 16-e0145ng | |
| AIDA64 / Memory Latency | |
| Lenovo Legion 5 Pro 16IAH7H | |
| Lenovo Legion 5 Pro 16IAH7H | |
| Dell G16 7620 | |
| Durchschnittliche AMD Ryzen 7 6800H (83.1 - 104.1, n=8) | |
| Lenovo Legion 5 Pro 16ARH7H RTX 3070 Ti | |
| Lenovo Legion 7 16ARHA7 | |
| HP Victus 16-e0145ng | |
| Asus ROG Zephyrus M16 GU603H | |
* ... kleinere Werte sind besser
DPC-Latenzen
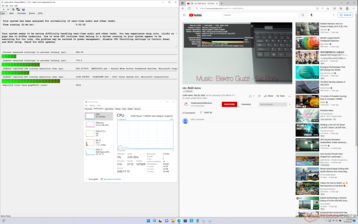
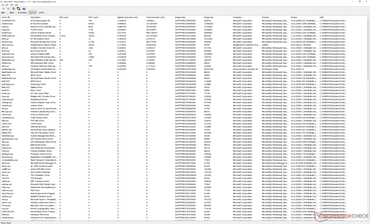
| DPC Latencies / LatencyMon - interrupt to process latency (max), Web, Youtube, Prime95 | |
| Lenovo Legion 7 16ARHA7 | |
| Asus ROG Zephyrus M16 GU603H | |
| Dell G16 7620 | |
| HP Victus 16-e0145ng | |
| Lenovo Legion 5 Pro 16ARH7H RTX 3070 Ti | |
| Lenovo Legion 5 Pro 16IAH7H | |
* ... kleinere Werte sind besser
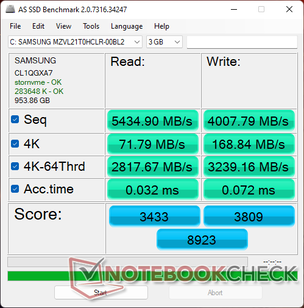
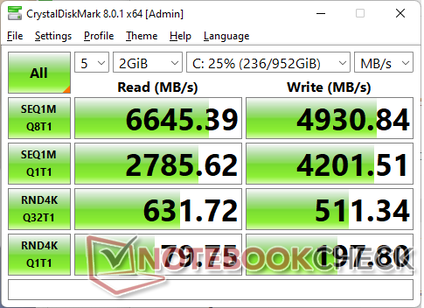
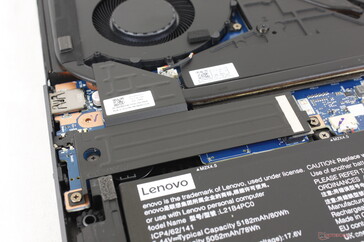
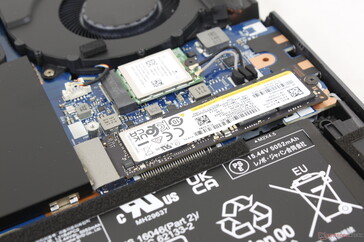
Massenspeicher — Bis zu zwei PCIe4-NVMe-SSDs
| Drive Performance Rating - Percent | |
| Lenovo Legion 5 Pro 16IAH7H | |
| Lenovo Legion 5 Pro 16ARH7H RTX 3070 Ti | |
| Asus ROG Zephyrus M16 GU603H | |
| Dell G16 7620 | |
| Lenovo Legion 7 16ARHA7 | |
| HP Victus 16-e0145ng | |
* ... kleinere Werte sind besser
Laufwerksdrosseln: DiskSpd-Leseschleife, Warteschlangentiefe 8
Grafikkarte — 150-W-Grafik
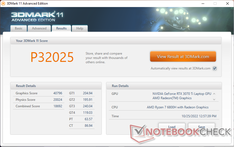
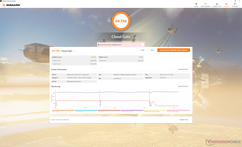
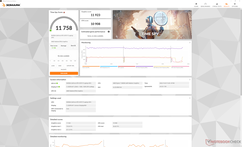
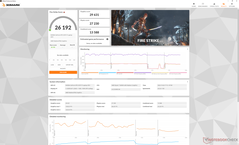
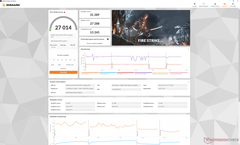
Mit 3DMark-Ergebnissen, die fast 15 % über denen eines durchschnittlichen Laptops aus unserer Datenbank mit der GeForce RTX 3070 Ti liegen, ist die Grafikleistung ausgezeichnet. Tatsächlich positioniert sich unser Testgerät sogar über dem Alienware x15 R2 mit der RTX 3080 Ti.
Die Leistung fällt beim Deaktivieren des Turbo-Modus nur um ungefähr 5 %. Daher muss man daran denken, den Turbo-Modus über Lenovo-Vantage zu aktivieren, wenn man die maximale Leistung aus dem Laptop herauskitzeln möchte.
Die schwächeren RTX-3070- und RTX-3060-Modelle weisen - basierend auf unseren Erfahrungen mit mehreren anderen RTX-3070- bzw. RTX-3060-Laptops - einen Leistungsdefizit von ca. 10 % bzw. 30 % auf.
| 3DMark 11 Performance | 32025 Punkte | |
| 3DMark Cloud Gate Standard Score | 64746 Punkte | |
| 3DMark Fire Strike Score | 27014 Punkte | |
| 3DMark Time Spy Score | 11758 Punkte | |
Hilfe | ||
* ... kleinere Werte sind besser
Witcher 3 FPS Diagramm
| min. | mittel | hoch | max. | QHD | |
|---|---|---|---|---|---|
| GTA V (2015) | 181.5 | 176.5 | 167.6 | 104 | 98.8 |
| The Witcher 3 (2015) | 370.5 | 308.8 | 226 | 117 | |
| Dota 2 Reborn (2015) | 150.4 | 138 | 132.2 | 126.6 | |
| Final Fantasy XV Benchmark (2018) | 187.2 | 156 | 115.6 | 90.4 | |
| X-Plane 11.11 (2018) | 119.6 | 103.6 | 83.9 | ||
| Strange Brigade (2018) | 383 | 298 | 248 | 217 | 160.5 |
| Cyberpunk 2077 1.6 (2022) | 148.9 | 130.2 | 102.1 | 86 | 54.4 |
Emissionen — Recht laut
Geräuschemissionen
Das Verhalten der Lüfter steht eng mit dem gewählten Leistungsprofil in Verbindung. Im Energiesparmodus und bei deaktivierter dGPU bleibt der Laptop mit 23,7 dB(A) bei einem stillen Hintergrund von 23,5 dB(A) leise. Ähnlich wie beim Modell aus dem Vorjahr springt der Geräuschpegel jedoch schon bei etwas Multitasking oder dem Streamen von Videos auf hörbare 32 dB(A).
Im Gaming-Betrieb werden auch bei deaktiviertem Turbo-Modus fast 55 dB(A) erreicht. Daher kann man den Turbo-Modus auch einfach aktivieren, da er den Gaming-Laptop scheinbar weder lauter noch leiser werden lässt. Mit Werten im mittleren 50-dB(A)-Bereicht ist unser Lenovo-Laptop lauter als das HP Victus 16 und das Dell G16 unter ähnlichen Bedingungen.
Lautstärkediagramm
| Idle |
| 23.7 / 31.1 / 32.2 dB(A) |
| Last |
| 38.4 / 54.8 dB(A) |
 | ||
30 dB leise 40 dB(A) deutlich hörbar 50 dB(A) störend |
||
min: | ||
| Lenovo Legion 5 Pro 16ARH7H RTX 3070 Ti GeForce RTX 3070 Ti Laptop GPU, R7 6800H, Samsung PM9A1 MZVL21T0HCLR | Lenovo Legion 5 Pro 16IAH7H GeForce RTX 3060 Laptop GPU, i7-12700H, 2x Samsung PM9A1 MZVL21T0HCLR (RAID 0) | Asus ROG Zephyrus M16 GU603H GeForce RTX 3070 Laptop GPU, i9-11900H, Samsung PM9A1 MZVL22T0HBLB | Lenovo Legion 7 16ARHA7 Radeon RX 6850M XT, R9 6900HX, Samsung PM9A1 MZVL22T0HBLB | HP Victus 16-e0145ng GeForce RTX 3050 Ti Laptop GPU, R5 5600H, Samsung SSD PM981a MZVLB512HBJQ | Dell G16 7620 GeForce RTX 3060 Laptop GPU, i7-12700H, WDC PC SN810 512GB | |
|---|---|---|---|---|---|---|
| Geräuschentwicklung | -8% | -9% | 13% | -2% | 6% | |
| aus / Umgebung * (dB) | 23.5 | 24.6 -5% | 25 -6% | 22.8 3% | 26 -11% | 23.2 1% |
| Idle min * (dB) | 23.7 | 28.7 -21% | 25 -5% | 23 3% | 26 -10% | 28.3 -19% |
| Idle avg * (dB) | 31.1 | 32 -3% | 31 -0% | 23 26% | 28 10% | 28.8 7% |
| Idle max * (dB) | 32.2 | 32 1% | 42 -30% | 23 29% | 34 -6% | 28.9 10% |
| Last avg * (dB) | 38.4 | 45.2 -18% | 48 -25% | 26.8 30% | 44 -15% | 32.4 16% |
| Witcher 3 ultra * (dB) | 54.8 | 52 5% | 54.3 1% | 48 12% | 48.3 12% | |
| Last max * (dB) | 54.8 | 54.4 1% | 56 -2% | 54.2 1% | 53 3% | 48.1 12% |
* ... kleinere Werte sind besser
Temperaturen
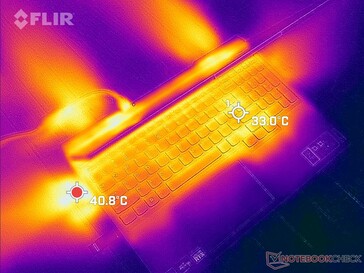
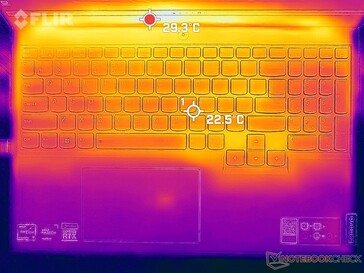
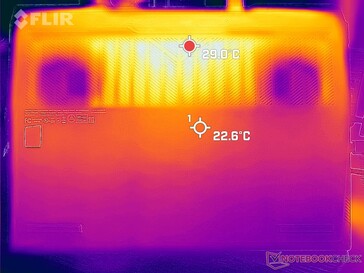
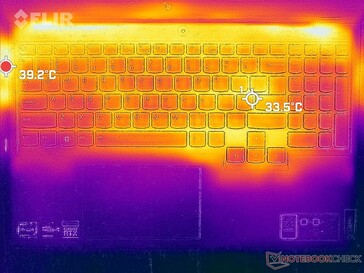
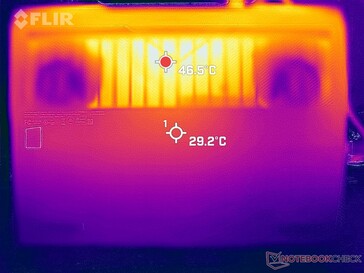
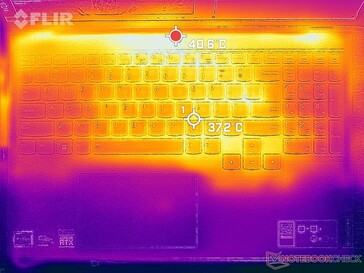
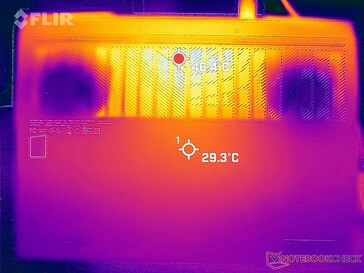
Obwohl sie ähnliche Spitzentemperaturen erreichen, sind die durchschnittlichen Oberflächentemperaturen hier deutlich niedriger als beim Asus ROG Zephyrus M16. So erreichen sowohl das Lenovo- als auch das Asus-Modell stellenweise bis zu 53 °C, die Handballenauflagen und der Tastaturbereich des Lenovo-Systems bleiben jedoch spürbar kühler, was in einer komfortableren Bedienung resultiert.
(±) Die maximale Temperatur auf der Oberseite ist 43.8 °C. Im Vergleich liegt der Klassendurchschnitt bei 40.4 °C (von 21.2 bis 68.8 °C für die Klasse Gaming).
(-) Auf der Unterseite messen wir eine maximalen Wert von 53 °C (im Vergleich zum Durchschnitt von 43.3 °C).
(+) Ohne Last messen wir eine durchschnittliche Temperatur von 27.4 °C auf der Oberseite. Der Klassendurchschnitt erreicht 33.9 °C.
(±) Beim längeren Spielen von The Witcher 3 erhitzt sich das Gerät durchschnittlich auf 33.5 °C. Der Durchschnitt der Klasse ist derzeit 33.9 °C.
(+) Die Handballen und der Touchpad-Bereich sind mit gemessenen 29.4 °C kühler als die typische Hauttemperatur und fühlen sich dadurch kühl an.
(±) Die durchschnittliche Handballen-Temperatur anderer getesteter Geräte war 28.8 °C (-0.6 °C).
| Lenovo Legion 5 Pro 16ARH7H RTX 3070 Ti AMD Ryzen 7 6800H, NVIDIA GeForce RTX 3070 Ti Laptop GPU | Lenovo Legion 5 Pro 16IAH7H Intel Core i7-12700H, NVIDIA GeForce RTX 3060 Laptop GPU | Asus ROG Zephyrus M16 GU603H Intel Core i9-11900H, NVIDIA GeForce RTX 3070 Laptop GPU | Lenovo Legion 7 16ARHA7 AMD Ryzen 9 6900HX, AMD Radeon RX 6850M XT | HP Victus 16-e0145ng AMD Ryzen 5 5600H, NVIDIA GeForce RTX 3050 Ti Laptop GPU | Dell G16 7620 Intel Core i7-12700H, NVIDIA GeForce RTX 3060 Laptop GPU | |
|---|---|---|---|---|---|---|
| Hitze | -7% | -19% | 5% | -12% | 9% | |
| Last oben max * (°C) | 43.8 | 45.8 -5% | 52 -19% | 37.2 15% | 54 -23% | 47.6 -9% |
| Last unten max * (°C) | 53 | 66.3 -25% | 53 -0% | 43 19% | 47 11% | 54 -2% |
| Idle oben max * (°C) | 30 | 30.4 -1% | 38 -27% | 34 -13% | 41 -37% | 23 23% |
| Idle unten max * (°C) | 31.8 | 30.4 4% | 41 -29% | 32.8 -3% | 31 3% | 24.6 23% |
* ... kleinere Werte sind besser
Stresstest
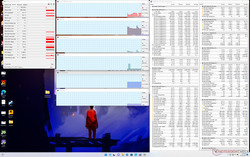
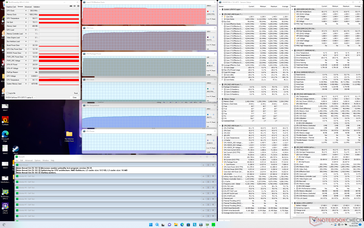
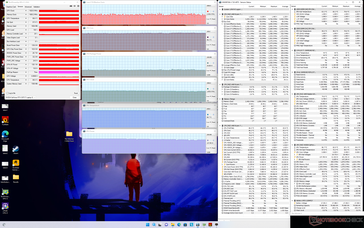
Beim Auslasten der CPU mithilfe von Prime95 springt der Takt auf 4,2 GHz und der Verbrauch auf 90 W. Der Prozessor kann dieses Niveau dauerhaft halten und muss nicht drosseln. Leider sind die Kerntemperaturen mit knapp 95 °C dann sehr hoch und wärmer als bei den meisten anderen Gaming-Laptops.
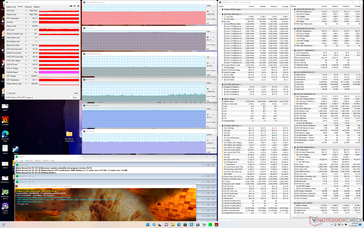
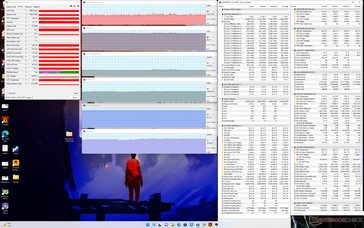
Beim Spielen von Witcher 3 mit aktiviertem Turbo-Modus stabilisiert sich die Nvidia-GPU bei einem Kerntakt von 1.620 MHz, einem Speichertakt von 1.800 MHz und einem Verbrauch von 136 W. Eigenartigerweise sind der Kern- und Speichertakt in einem Test mit deaktiviertem Turbo-Modus zwar niedriger (1.605 MHz, 1.750 MHz), der GPU-Gesamtverbrauch mit 149 W jedoch höher. Es empfiehlt sich aber ohnehin, den Turbo-Modus zu aktivieren, da er die Grafikleistung leicht steigert.
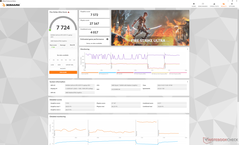
Im Akkumodus ist die Leistung eingeschränkt. Ein Fire-Strike-Durchlauf liefert im Akkumodus Physik- und Grafikpunktzahlen von 20.957 bzw. 13.153 Punkten, während im Netzbetrieb 27.288 bzw. 31.289 Punkte erreicht werden.
| CPU-Takt (GHz) | GPU-Takt (MHz) | Durchschnittliche CPU-Temperatur (°C) | Durchschnittliche GPU-Temperatur (°C) | |
| Leerlauf | -- | -- | 44 | 44 |
| Prime95-Stress | 4,1 | -- | 93 | 59 |
| Prime95-+FurMark-Stress | 3,3 | 1.005 | 89 | 87 |
| Witcher-3-Stress (Turbo-Modus aktiviert) | ~2,3 | 1.620 | 86 | 87 |
| Witcher-3-Stress (Turbo-Modus deaktiviert) | ~2,3 | 1.605 | 85 | 86 |
Lautsprecher
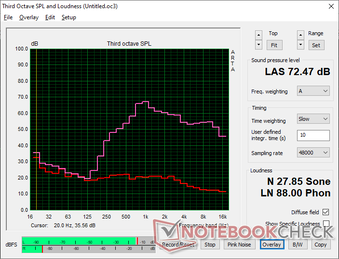
Lenovo Legion 5 Pro 16ARH7H RTX 3070 Ti Audio Analyse
(±) | Mittelmäßig laut spielende Lautsprecher (72.5 dB)
Bass 100 - 315 Hz
(-) | kaum Bass - 22.3% niedriger als der Median
(-) | keine lineare Bass-Wiedergabe (15.4% Delta zum Vorgänger)
Mitteltöne 400 - 2000 Hz
(±) | zu hohe Mitten, vom Median 7.1% abweichend
(±) | Linearität der Mitten ist durchschnittlich (9.5% Delta zum Vorgänger)
Hochtöne 2 - 16 kHz
(+) | ausgeglichene Hochtöne, vom Median nur 1.9% abweichend
(+) | sehr lineare Hochtöne (3.6% Delta zum Vorgänger)
Gesamt im hörbaren Bereich 100 - 16.000 Hz
(-) | hörbarer Bereich ist nur wenig linear (30.3% Abstand zum Median)
Im Vergleich zu allen Geräten derselben Klasse
» 96% aller getesteten Geräte dieser Klasse waren besser, 2% vergleichbar, 3% schlechter
» Das beste Gerät hat einen Delta-Wert von 6%, durchschnittlich ist 18%, das schlechteste Gerät hat 132%
Im Vergleich zu allen Geräten im Test
» 88% aller getesteten Geräte waren besser, 3% vergleichbar, 9% schlechter
» Das beste Gerät hat einen Delta-Wert von 4%, durchschnittlich ist 24%, das schlechteste Gerät hat 134%
Asus ROG Zephyrus M16 GU603H Audio Analyse
(±) | Mittelmäßig laut spielende Lautsprecher (80 dB)
Bass 100 - 315 Hz
(±) | abgesenkter Bass - 7.4% geringer als der Median
(±) | durchschnittlich lineare Bass-Wiedergabe (9.2% Delta zum Vorgänger)
Mitteltöne 400 - 2000 Hz
(±) | zu hohe Mitten, vom Median 5.6% abweichend
(+) | lineare Mitten (4% Delta zum Vorgänger)
Hochtöne 2 - 16 kHz
(+) | ausgeglichene Hochtöne, vom Median nur 2.6% abweichend
(+) | sehr lineare Hochtöne (6.7% Delta zum Vorgänger)
Gesamt im hörbaren Bereich 100 - 16.000 Hz
(+) | hörbarer Bereich ist sehr linear (12.1% Abstand zum Median
Im Vergleich zu allen Geräten derselben Klasse
» 12% aller getesteten Geräte dieser Klasse waren besser, 4% vergleichbar, 84% schlechter
» Das beste Gerät hat einen Delta-Wert von 6%, durchschnittlich ist 18%, das schlechteste Gerät hat 132%
Im Vergleich zu allen Geräten im Test
» 9% aller getesteten Geräte waren besser, 2% vergleichbar, 89% schlechter
» Das beste Gerät hat einen Delta-Wert von 4%, durchschnittlich ist 24%, das schlechteste Gerät hat 134%
Energieverwaltung — Energiehungriges System
Energieaufnahme
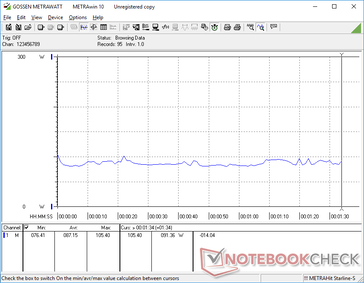
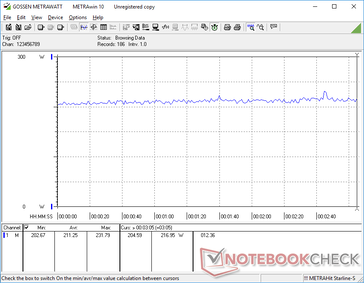
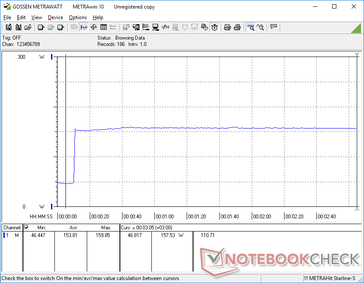
Obwohl der Ryzen 7 6800H um ca. 25 % langsamer als der Core i7-12700H ist, verbraucht er nicht unbedingt auch 25 % weniger Strom. Tatsächlich verbrauchen die AMD- und die Intel-Version des Legion 5 Pro 16 beim Ausführen von Prime95 beide ungefähr 160 W. Auch beim Spielen von Witcher 3 bleibt der Verbrauch der beiden Modelle sehr ähnlich.
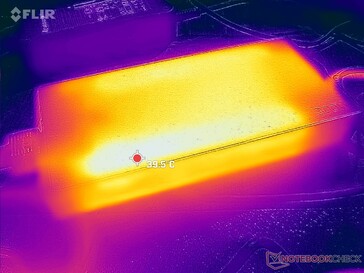
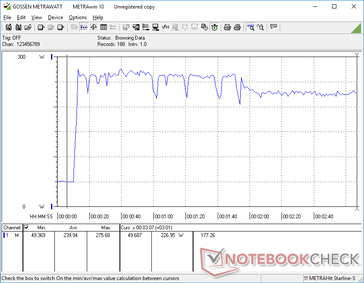
Wir konnten an dem großen (~19,9 x 9,8 x 2,6 cm) 300-W-Netzteil während der gleichzeitigen, maximalen Auslastung von CPU und GPU eine maximale Leistung von 275 W messen. Damit ist das Netzteil in der Lage, den Laptop auch unter Hochlast in einer angemessenen Zeit zu laden.
| Aus / Standby | |
| Idle | |
| Last |
|
Legende:
min: | |
| Lenovo Legion 5 Pro 16ARH7H RTX 3070 Ti R7 6800H, GeForce RTX 3070 Ti Laptop GPU, Samsung PM9A1 MZVL21T0HCLR, IPS, 2560x1600, 16" | Lenovo Legion 5 Pro 16IAH7H i7-12700H, GeForce RTX 3060 Laptop GPU, 2x Samsung PM9A1 MZVL21T0HCLR (RAID 0), IPS, 2560x1600, 16" | Asus ROG Zephyrus M16 GU603H i9-11900H, GeForce RTX 3070 Laptop GPU, Samsung PM9A1 MZVL22T0HBLB, IPS, 2560x1600, 16" | Lenovo Legion 7 16ARHA7 R9 6900HX, Radeon RX 6850M XT, Samsung PM9A1 MZVL22T0HBLB, IPS, 2560x1600, 16" | HP Victus 16-e0145ng R5 5600H, GeForce RTX 3050 Ti Laptop GPU, Samsung SSD PM981a MZVLB512HBJQ, IPS, 1920x1080, 16.1" | Dell G16 7620 i7-12700H, GeForce RTX 3060 Laptop GPU, WDC PC SN810 512GB, IPS, 2560x1600, 16" | |
|---|---|---|---|---|---|---|
| Stromverbrauch | -50% | 2% | -5% | 33% | -4% | |
| Idle min * (Watt) | 9.7 | 22.8 -135% | 11 -13% | 9.9 -2% | 7 28% | 14.4 -48% |
| Idle avg * (Watt) | 14.8 | 26.5 -79% | 20 -35% | 22 -49% | 9 39% | 17.8 -20% |
| Idle max * (Watt) | 45.8 | 41 10% | 30 34% | 23.1 50% | 15 67% | 31.5 31% |
| Last avg * (Watt) | 87.2 | 191 -119% | 111 -27% | 94.4 -8% | 93 -7% | 101.2 -16% |
| Witcher 3 ultra * (Watt) | 209 | 194.7 7% | 156 25% | 249 -19% | 134.5 36% | 176.9 15% |
| Last max * (Watt) | 275.3 | 238 14% | 197 28% | 276 -0% | 185 33% | 242.9 12% |
* ... kleinere Werte sind besser
Verbrauch Witcher 3 / Stresstest
Verbrauch externer Monitor
Akkulaufzeit — Nicht schlecht
Die WLAN-Laufzeit ist im ausbalancierten Modus mit aktiver iGPU um fast eine Stunde länger als bei der Intel-Version des Legion 5 Pro 16. Die höhere Akkulaufzeit ist vermutlich eine Konsequenz der unter niedriger Last effizienteren AMD-CPU, wie der Energieaufnahme-Paragraph oben zeigt. Mit nur knapp 4,5 Stunden ist sie dennoch relativ niedrig, vor allem im Vergleich zu fast 8 Stunden beim Asus ROG Zephyrus M16.
Den leeren Akku vollständig zu laden dauert bei aktivierter Rapid-Charge-Funktion nur knapp eine Stunde. Die meisten anderen Laptops benötigen 1,5 bis 2 Stunden.
| Lenovo Legion 5 Pro 16ARH7H RTX 3070 Ti R7 6800H, GeForce RTX 3070 Ti Laptop GPU, 80 Wh | Lenovo Legion 5 Pro 16IAH7H i7-12700H, GeForce RTX 3060 Laptop GPU, 80 Wh | Asus ROG Zephyrus M16 GU603H i9-11900H, GeForce RTX 3070 Laptop GPU, 90 Wh | Lenovo Legion 7 16ARHA7 R9 6900HX, Radeon RX 6850M XT, 99 Wh | HP Victus 16-e0145ng R5 5600H, GeForce RTX 3050 Ti Laptop GPU, 70 Wh | Dell G16 7620 i7-12700H, GeForce RTX 3060 Laptop GPU, 84 Wh | |
|---|---|---|---|---|---|---|
| Akkulaufzeit | -18% | 75% | 66% | 61% | 14% | |
| WLAN (h) | 4.4 | 3.6 -18% | 7.7 75% | 7.3 66% | 7.1 61% | 5 14% |
| H.264 (h) | 4.1 | |||||
| Witcher 3 ultra (h) | 2.1 | |||||
| Last (h) | 0.6 | 1.6 | 1.8 | 0.7 | ||
| Idle (h) | 13.3 | 4.9 | 7.1 |
Pro
Contra
Fazit — Nur einen Tick schneller
Der Ryzen 7 6800H und die GeForce RTX 3070 Ti mit 150 W sind jeweils um ca. 10 % schneller als der Ryzen 7 5800H bzw. die GeForce RTX 3070 mit 140 W im Legion 5 Pro aus dem letzten Jahr. Daher handelt es sich beim 2022er-Modell um eine iterative Aktualisierung des 2021er-Modells ohne größere externe oder interne Anpassungen.
Besitzer des Lenovo Legion 5 Pro 16 verpassen beim 2022er-Modell nicht viel. Lenovo hebt sich die wirklich bedeutenden Verbesserungen vermutlich für die nächsten ein bis zwei Jahre auf.
Mit ähnlichen Funktionsmerkmalen wie insbesondere dem 165-Hz-Display und einer CPUs aus der H-Serie kommen das Dell G16 und das Asus ROG Zephyrus M16 unserem Legion 5 Pro 16 derzeit am nächsten. Dabei ist das Asus-Modell deutlich kleiner und leichter, erwärmt sich jedoch bei einem gleichen Lüftergeräuschniveau noch stärker. Der Dell-Laptop ist im Betrieb zwar ruhiger, die Kerntemperaturen und die Größe sind jedoch noch höher als bei unserem Lenovo-Testgerät.
Für zukünftige Modelle würden wir uns kühlere Kerntemperaturen und eine übersichtlicher gestaltete Software zur Leistungssteuerung wünschen. In der aktuellen Version von Vantage muss man vier separate Einstellungen einzeln aktivieren (MUX, GPU-Übertaktung, Vantage Performance und den Windows-Hochleistungsmodus), um das gesamte Leistungspotenzial des Laptops nutzen zu können, was beim häufigen Wechseln des Leistungsprofils schnell umständlich wird.
Preis und Verfügbarkeit
Das Lenovo Legion 5 Pro 16 ist mittlerweile bei vielen Händlern wie zum Beispiel Notebooksbilliger.de zu einem Preis von 1.600 bis 2.200 Euro verfügbar. Weitere Modelle findet man direkt in Lenovos Online-Shop. Unsere Konfiguration kostet hier ca. 2.360 Euro.
Lenovo Legion 5 Pro 16ARH7H RTX 3070 Ti
- 29.10.2022 v7 (old)
Allen Ngo


