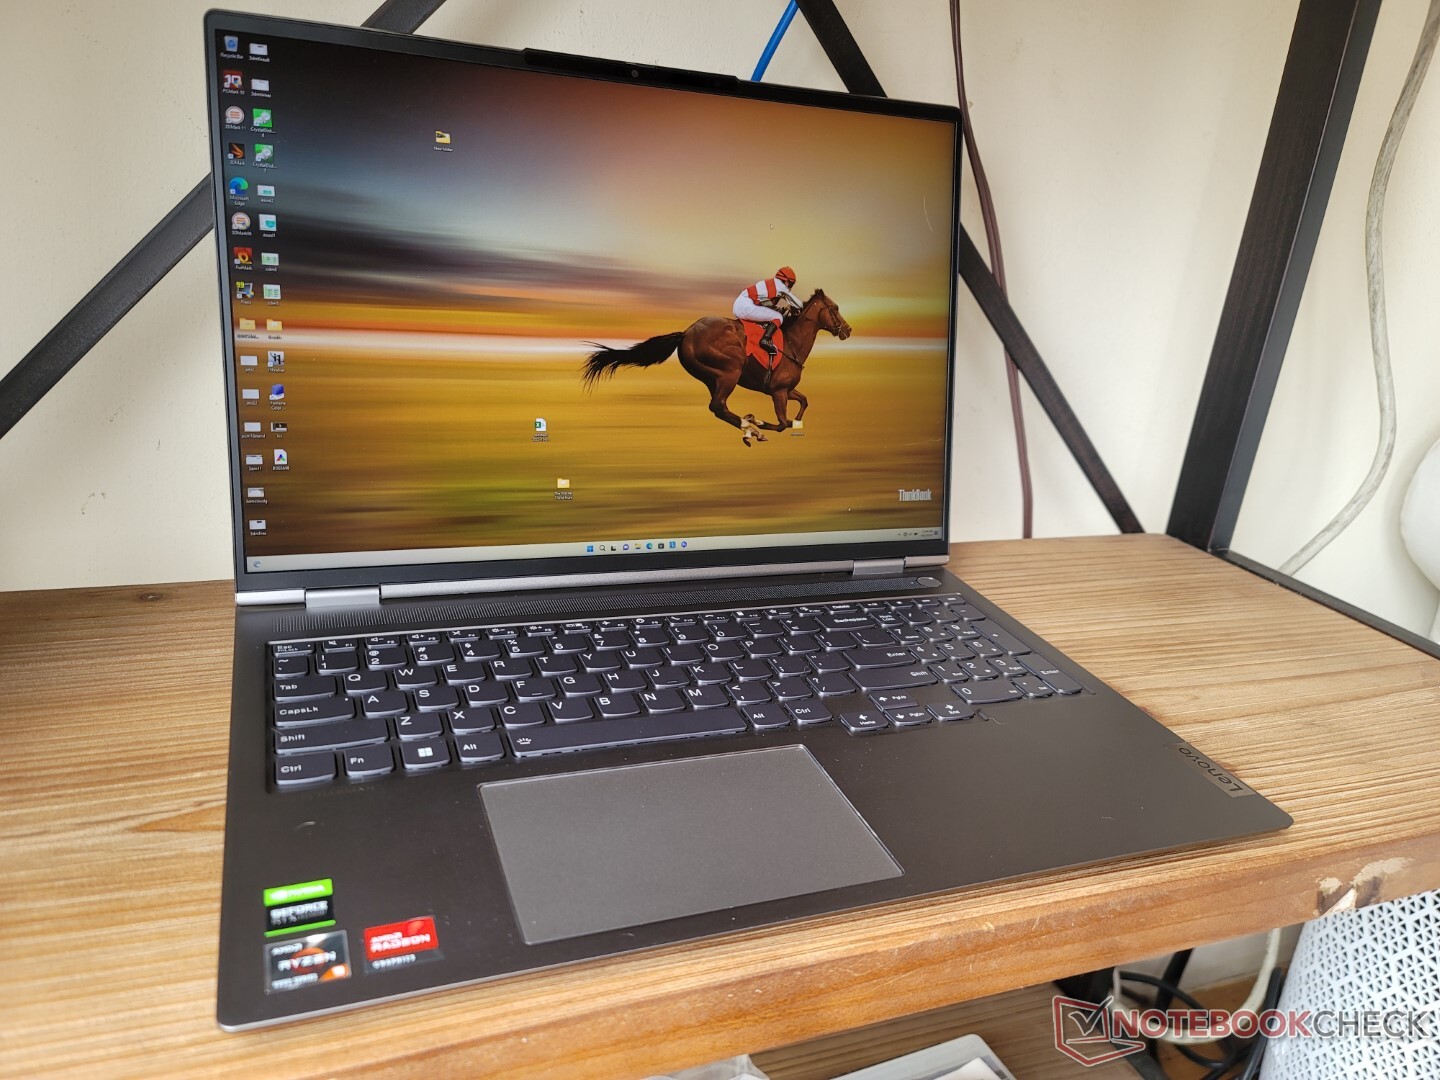
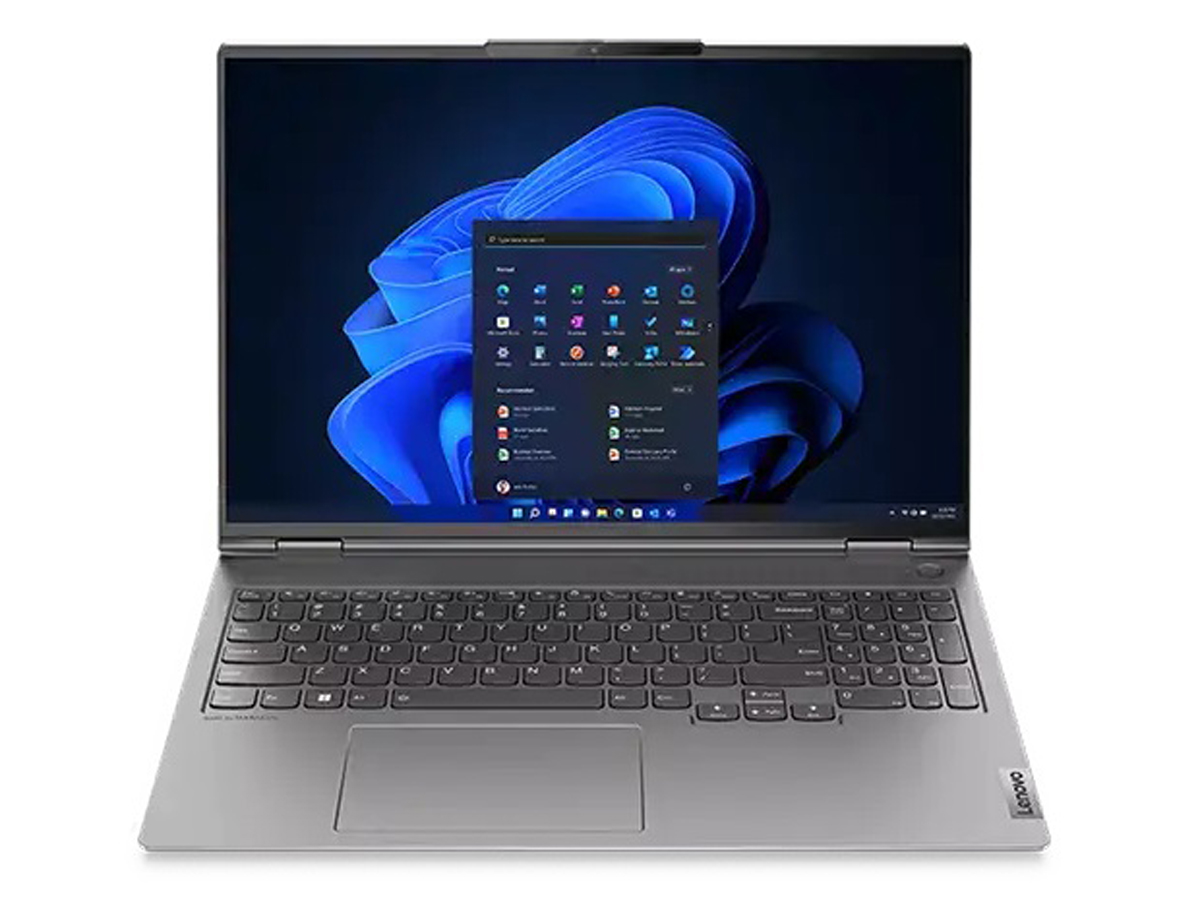
Lenovo ThinkBook 16p Gen 3 ARH im Laptop-Test: Herausforderer für das Dell XPS 15

Das 16-Zoll große ThinkBook 16p Gen 3 tritt die Nachfolge des ThinkBook 16p Gen 2 aus dem letzten Jahr an. Neu ist die AMD-Zen 3+-CPU, welche den Zen-3-Prozessor aus dem 2021er Modell ablöst. Es gibt noch ein paar kleinere Unterschiede, die wir im Test erwähnen, aber optisch ist das 2022er Modell identisch zu seinem 2021er Vorgänger. Daher empfehlen wir den Blick in unseren Tests des ThinkBook 16p Gen 2, um mehr über die äußerlichen Merkmale des Gen 3 zu erfahren.
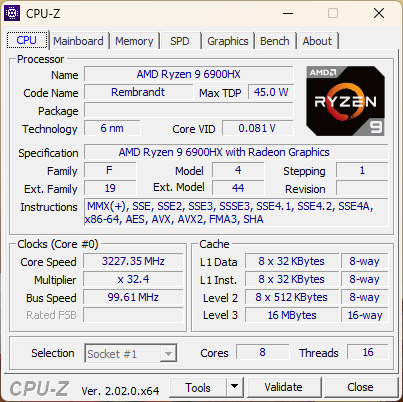
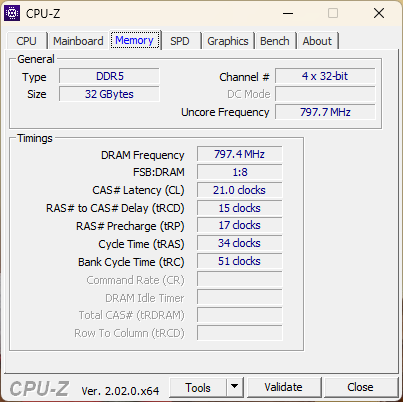
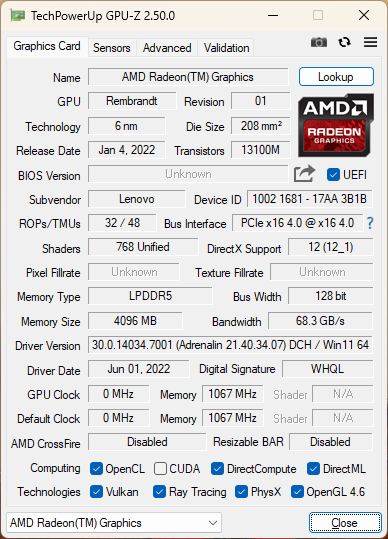
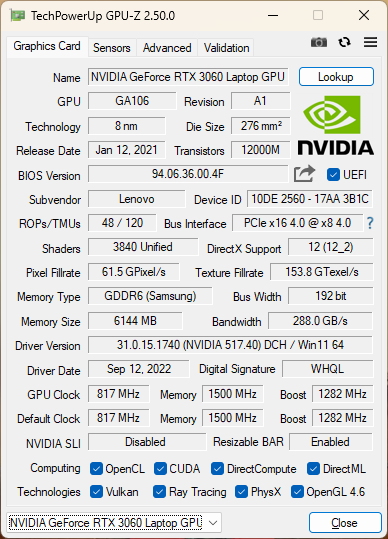
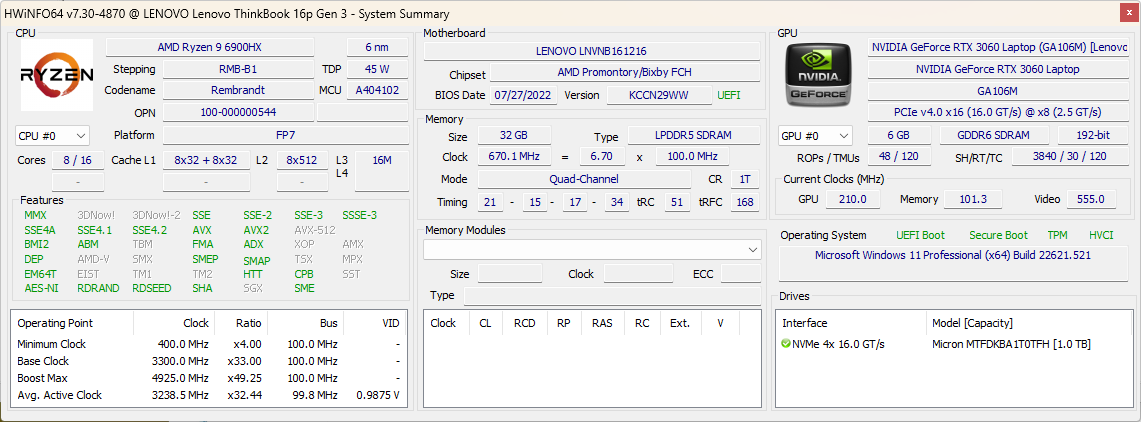
Unsere Testkonfiguration ist mit einem Ryzen 9 6900HX, einer GeForce RTX 3060 mit 90 W, 32 GB LPDDR5-RAM und einem IPS-Display mit 165 Hz und 2.560 x 1.600 Pixel bestückt. In Deutschland ist es erst demnächst verfügbar, es kostet rund $2600 USD (~ 2.675 Euro). Es gibt auch etwas schwächer ausgestattete SKUs mit einem 60-Hz-Display und einem Ryzen 5 6600H oder Ryzen 7 6800H.
Konkurrenz findet sich in anderen High-End-Multimedia- oder Nvidia-Studio-Laptops wie dem HP Envy 16, dem Dell Inspiron 16 Plus 7620, dem Acer Swift X 16 oder dem MSI Creator Z16.
Weitere Lenovo-Tests:
Potential Competitors in Comparison
Bew. | Datum | Modell | Gewicht | Dicke | Größe | Auflösung | Preis ab |
|---|---|---|---|---|---|---|---|
| 87.9 % v7 (old) | 10 / 2022 | Lenovo ThinkBook 16p G3 ARH R9 6900HX, GeForce RTX 3060 Laptop GPU | 2.1 kg | 19.5 mm | 16.00" | 2560x1600 | |
| 86.9 % v7 (old) | 10 / 2022 | HP Envy 16 h0112nr i7-12700H, GeForce RTX 3060 Laptop GPU | 2.3 kg | 19.8 mm | 16.00" | 3840x2400 | |
| 87 % v7 (old) | 09 / 2021 | Lenovo ThinkBook 16p G2 ACH R9 5900HX, GeForce RTX 3060 Laptop GPU | 2 kg | 19.5 mm | 16.00" | 2560x1600 | |
| 85.7 % v7 (old) | 09 / 2022 | Lenovo IdeaPad 5 Pro 16ARH7 R5 6600HS, Radeon 660M | 1.9 kg | 18.4 mm | 16.00" | 2560x1600 | |
| 86.2 % v7 (old) | 07 / 2022 | Acer Swift X SFX16-51G-5388 i5-11320H, GeForce RTX 3050 4GB Laptop GPU | 1.8 kg | 18.9 mm | 16.10" | 1920x1080 | |
| 86.6 % v7 (old) | 07 / 2022 | Lenovo Legion 5 Pro 16IAH7H i7-12700H, GeForce RTX 3060 Laptop GPU | 2.6 kg | 27 mm | 16.00" | 2560x1600 |
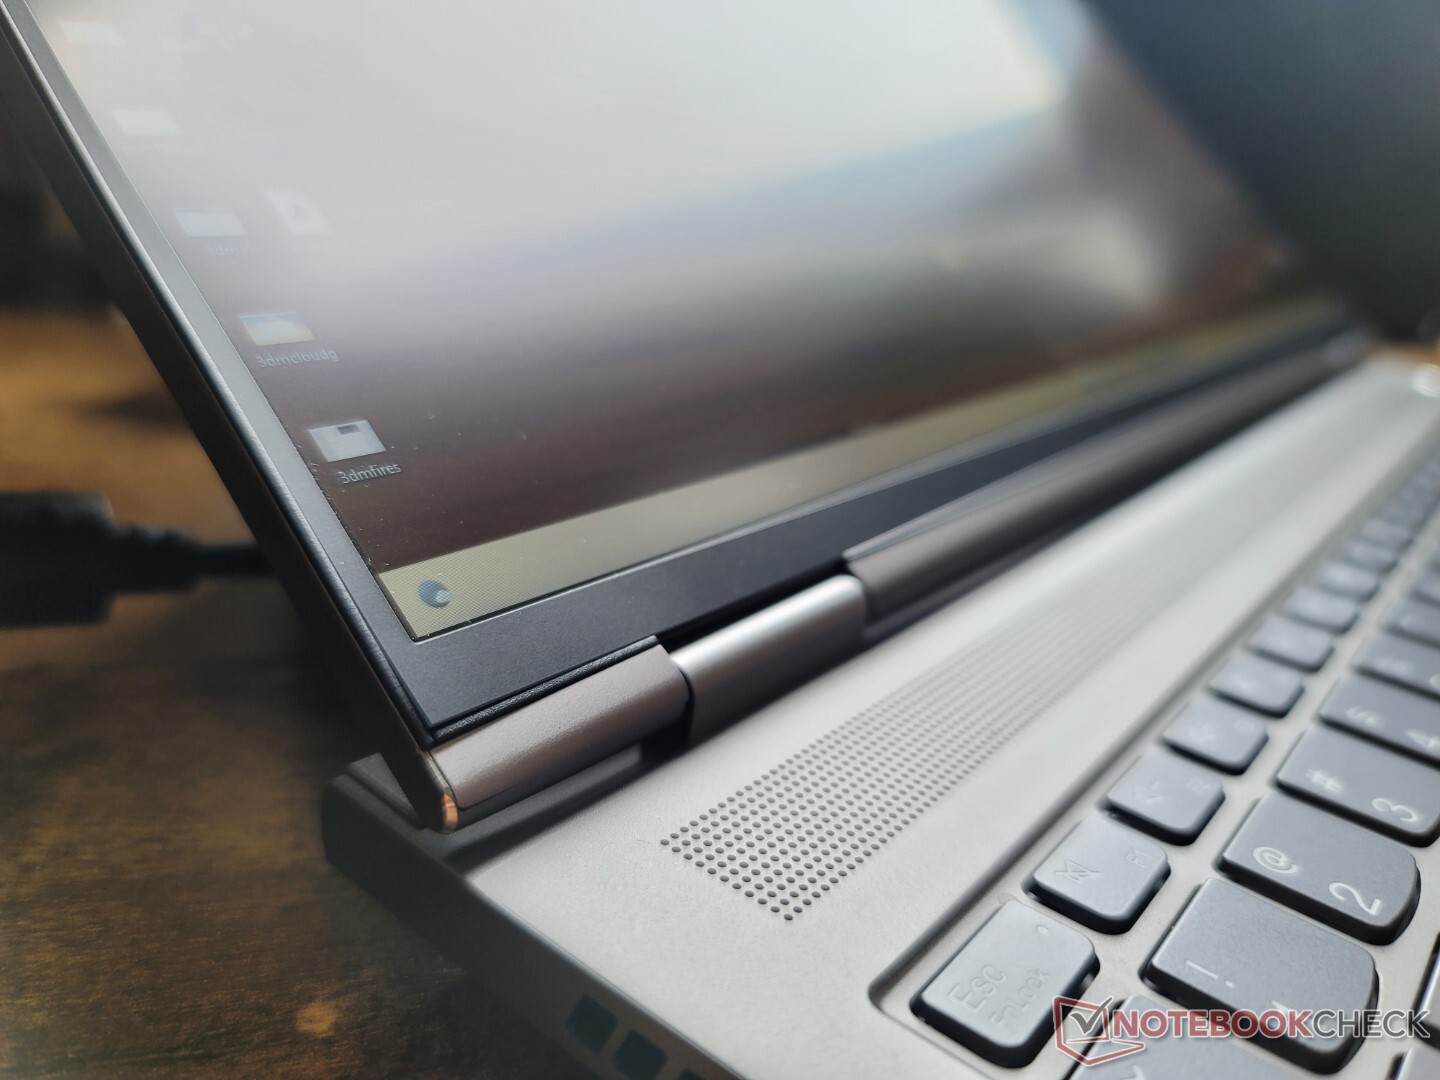
Gehäuse - Nun mit HDMI im ThinkBook 16p Gen 3
Obwohl das Gehäuse optisch quasi identisch zum Vorgänger ist, gibt es einen einfachen Weg das Gen-3-Modell vom Gen-2-Modell zu unterscheiden: Der neue HDMI-Port an der Rückseite. Im Vorgänger gab es schlicht keinen HDMI-Anschluss.

SD Card Reader
| SD Card Reader | |
| average JPG Copy Test (av. of 3 runs) | |
| Lenovo IdeaPad 5 Pro 16ARH7 (AV PRO microSD 128 GB V60) | |
| Lenovo ThinkBook 16p G2 ACH | |
| Lenovo ThinkBook 16p G3 ARH (AV PRO microSD 128 GB V60) | |
| HP Envy 16 h0112nr (AV Pro SD microSD 128 GB V60) | |
| maximum AS SSD Seq Read Test (1GB) | |
| Lenovo ThinkBook 16p G2 ACH | |
| Lenovo ThinkBook 16p G3 ARH (AV PRO microSD 128 GB V60) | |
| HP Envy 16 h0112nr (AV Pro SD microSD 128 GB V60) | |
Kommunikation
| Networking | |
| iperf3 transmit AX12 | |
| Acer Swift X SFX16-51G-5388 | |
| Lenovo ThinkBook 16p G2 ACH | |
| iperf3 receive AX12 | |
| Acer Swift X SFX16-51G-5388 | |
| Lenovo ThinkBook 16p G2 ACH | |
| iperf3 receive AXE11000 6GHz | |
| Lenovo Legion 5 Pro 16IAH7H | |
| HP Envy 16 h0112nr | |
| iperf3 receive AXE11000 | |
| Lenovo ThinkBook 16p G3 ARH | |
| Lenovo IdeaPad 5 Pro 16ARH7 | |
| iperf3 transmit AXE11000 6GHz | |
| Lenovo Legion 5 Pro 16IAH7H | |
| HP Envy 16 h0112nr | |
| iperf3 transmit AXE11000 | |
| Lenovo ThinkBook 16p G3 ARH | |
| Lenovo IdeaPad 5 Pro 16ARH7 | |
Webcam


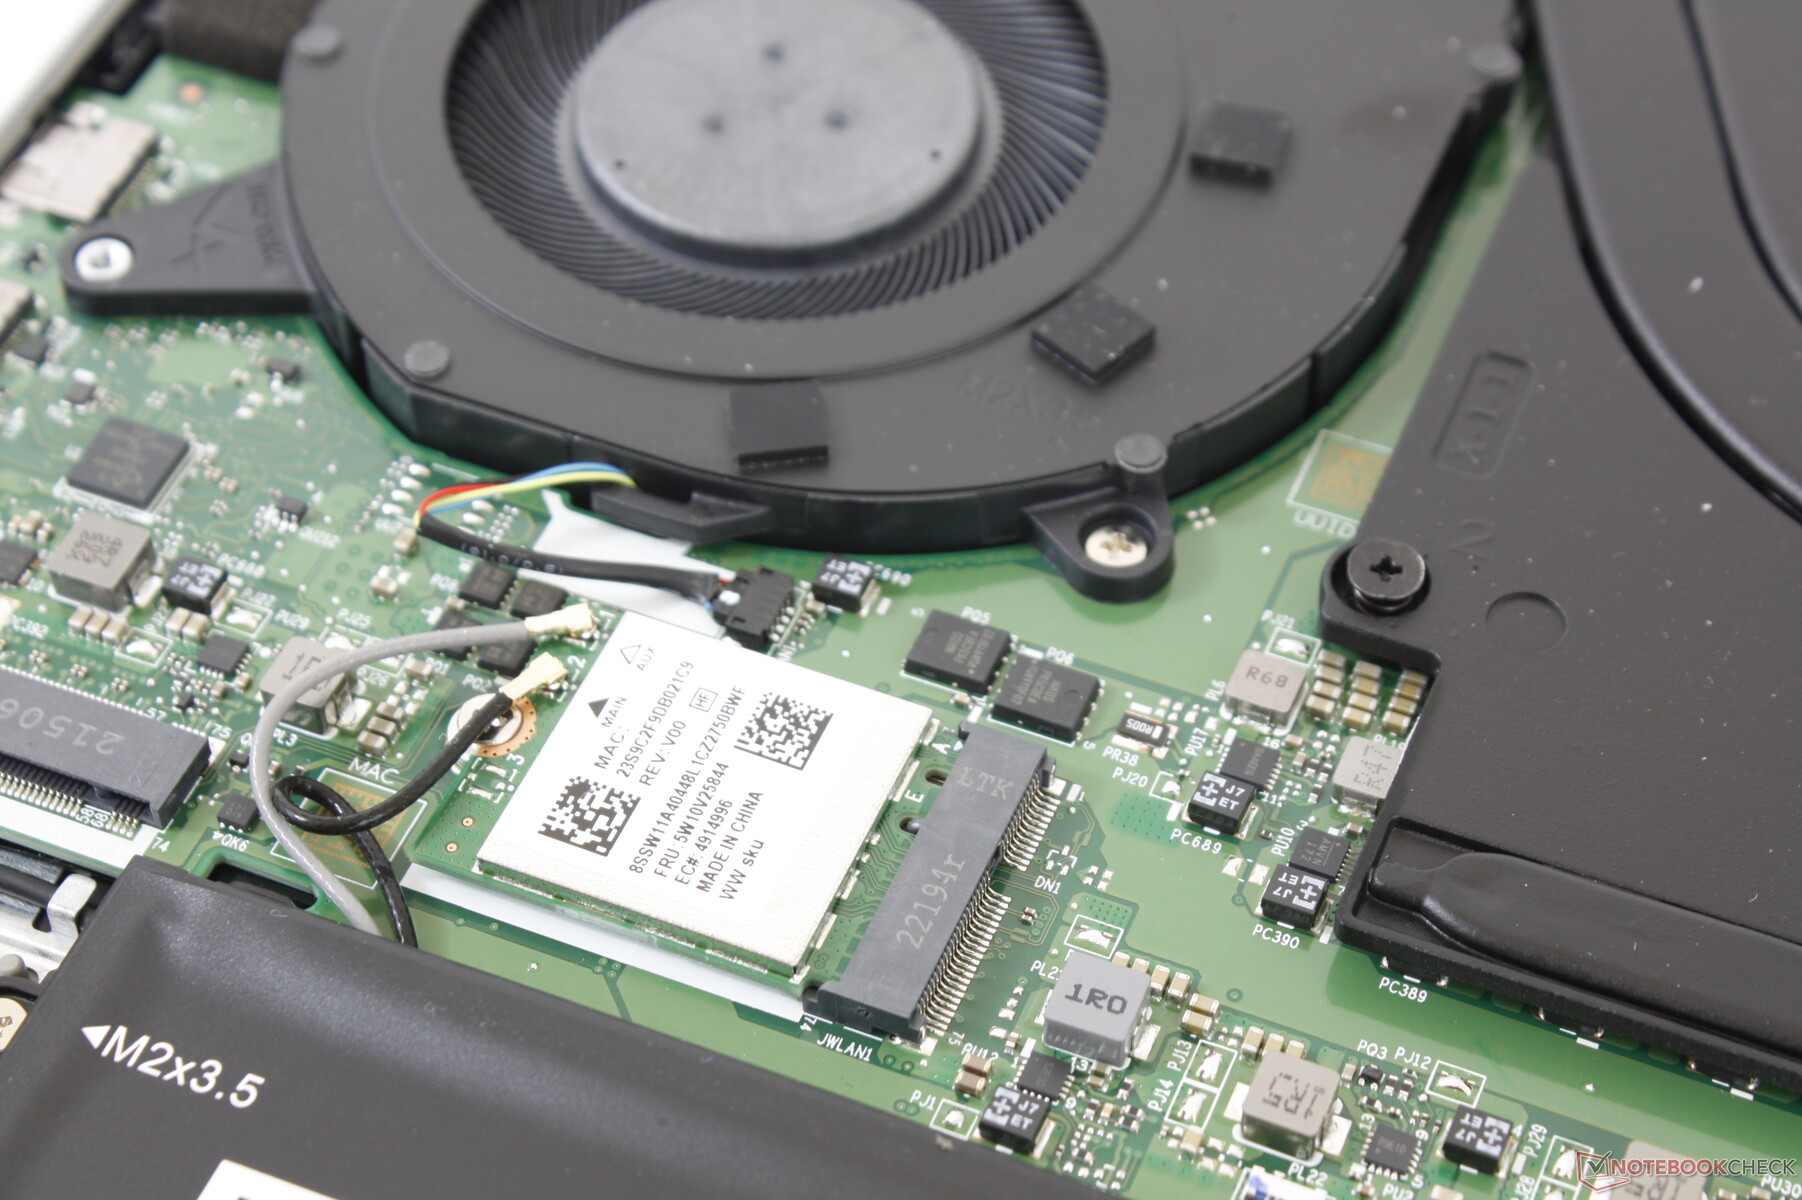
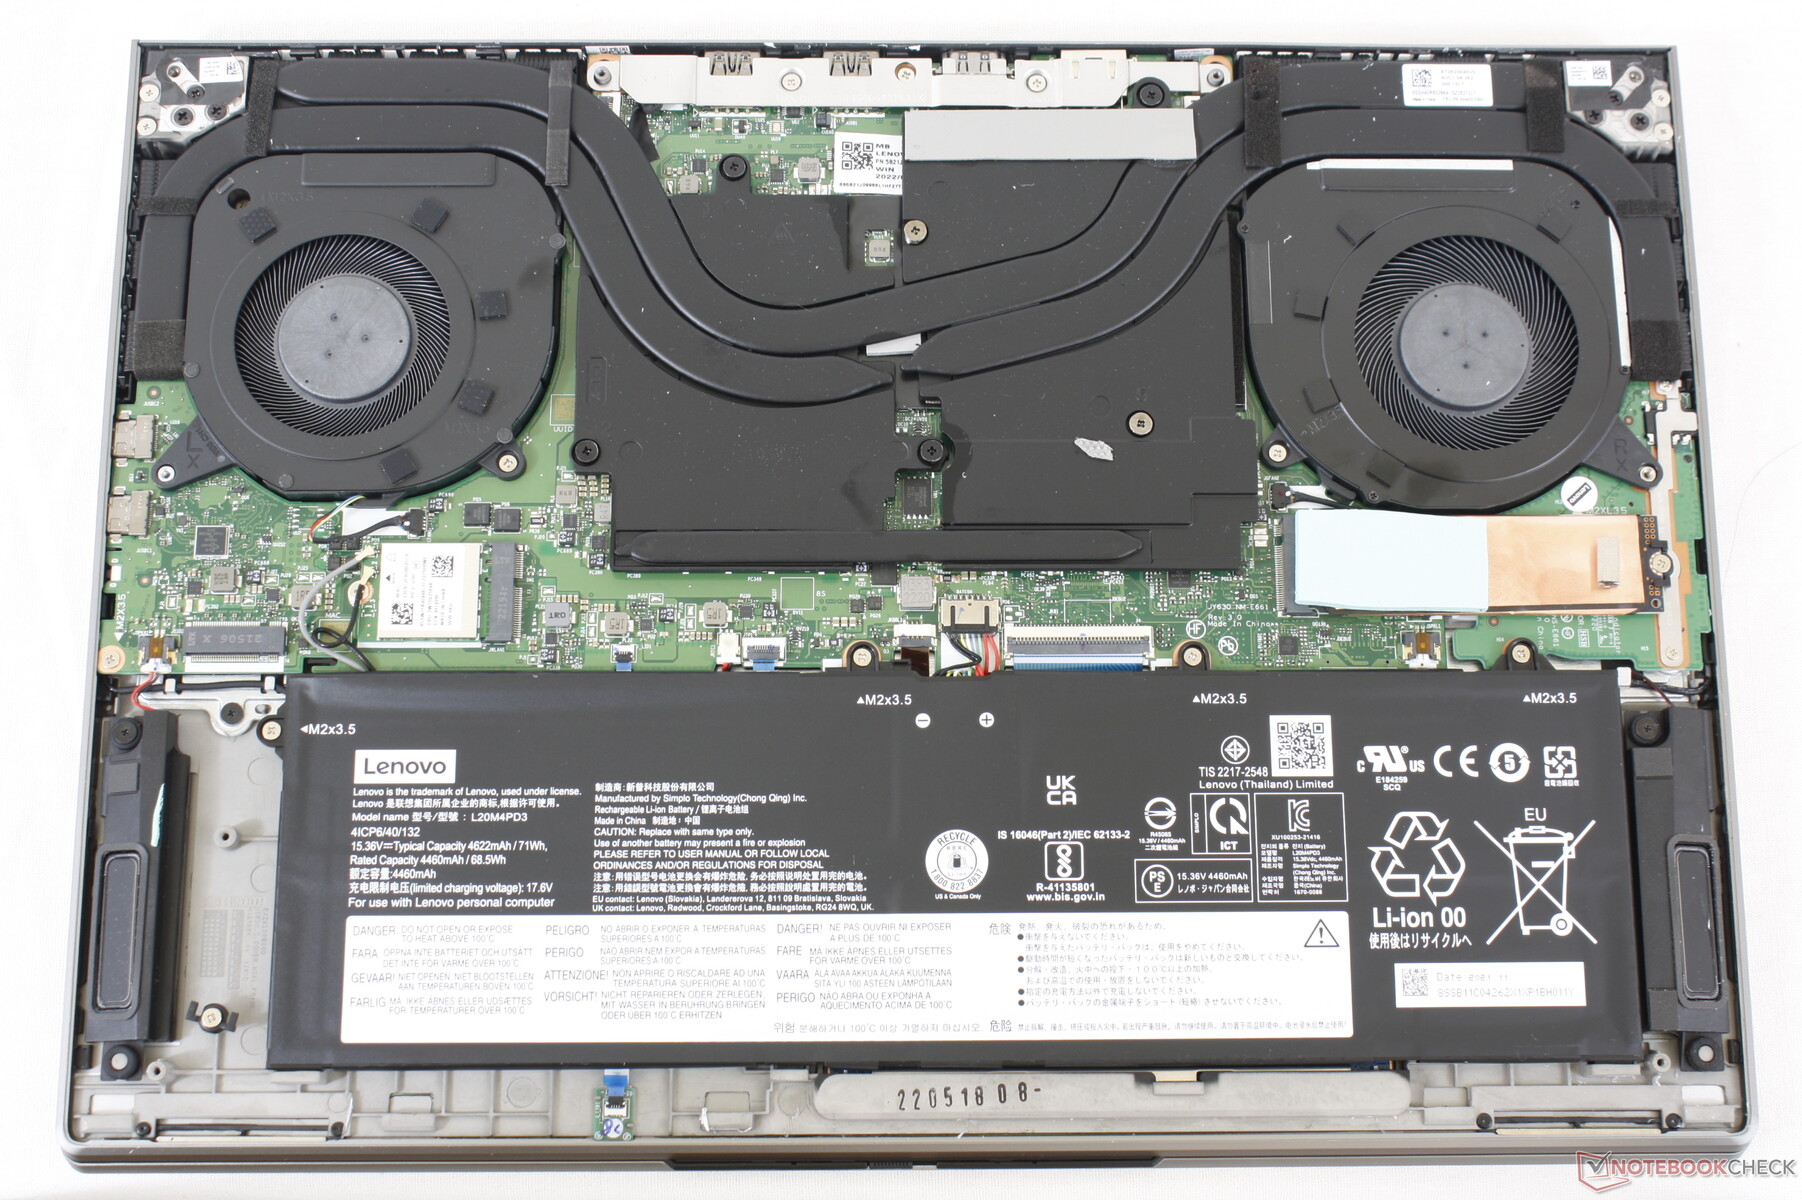
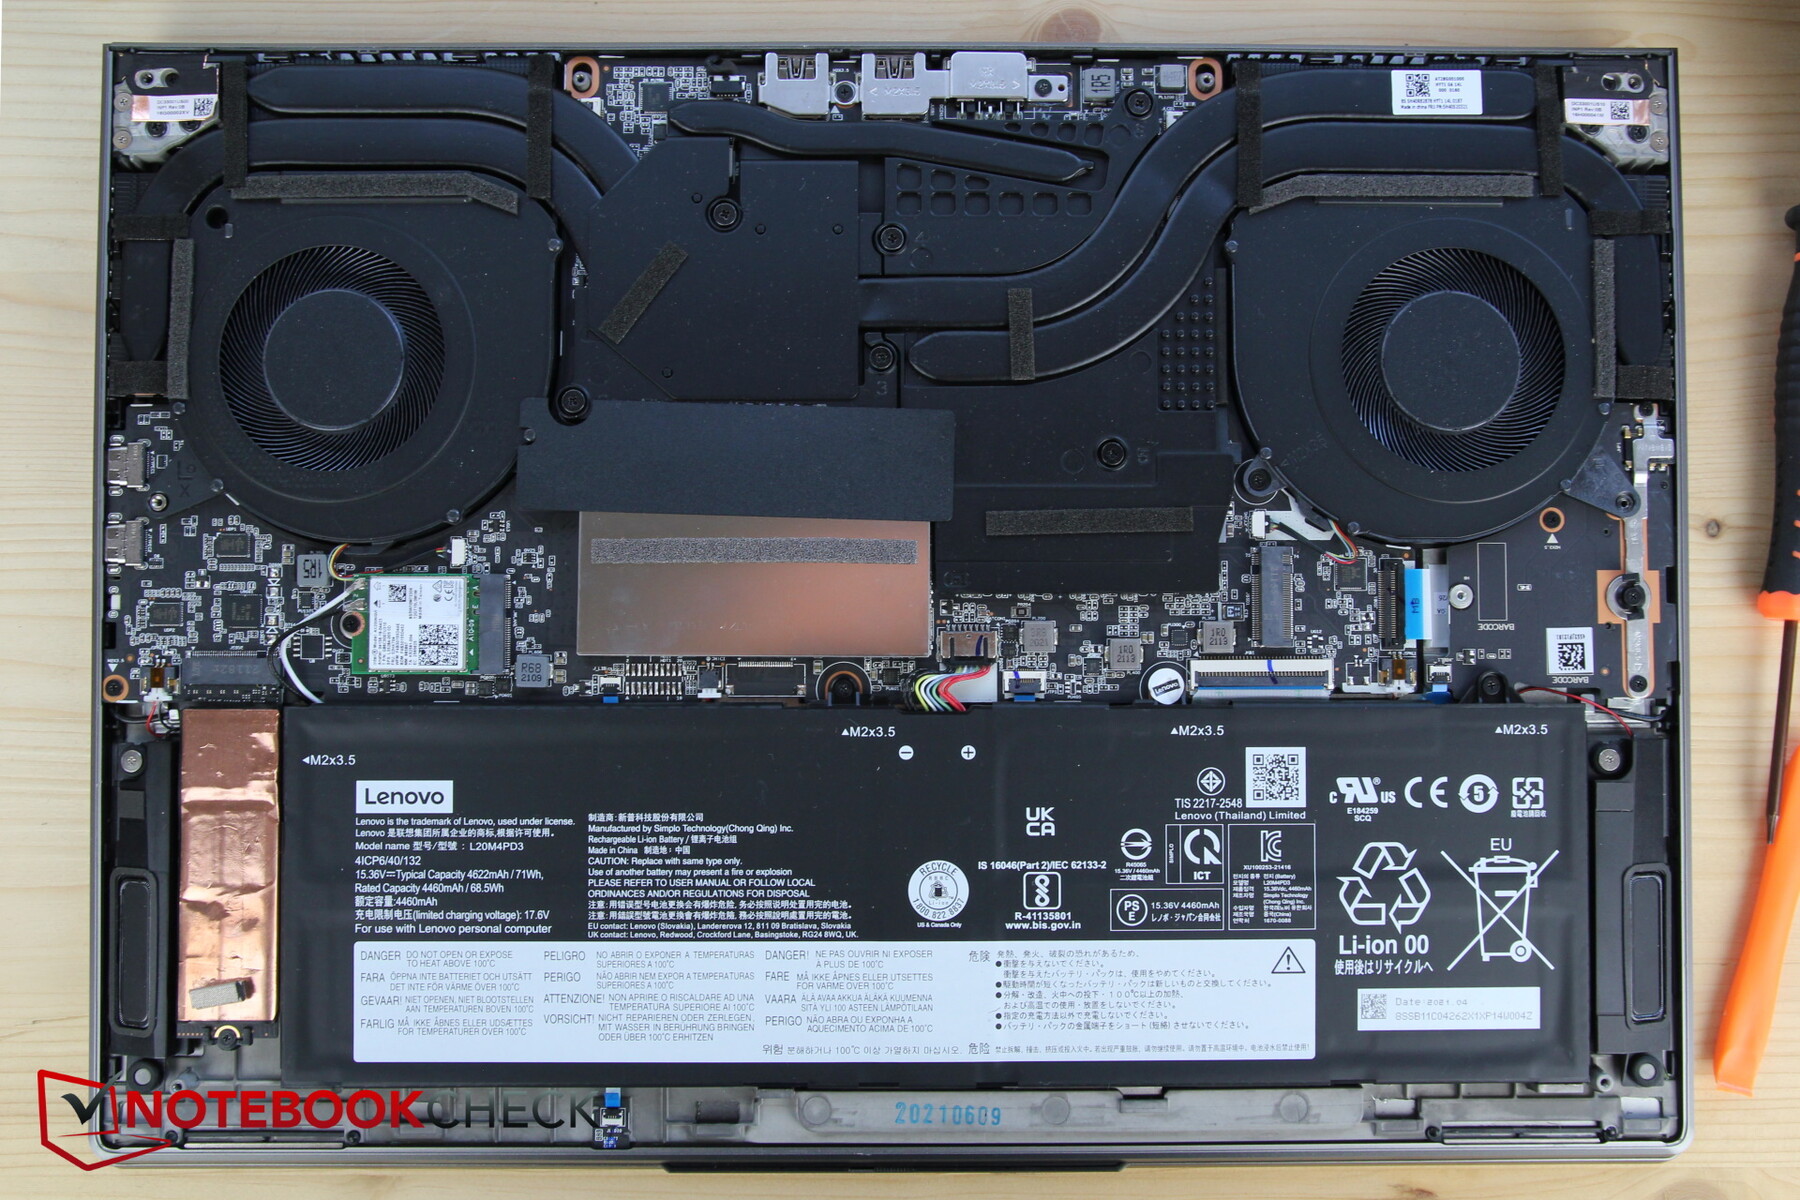
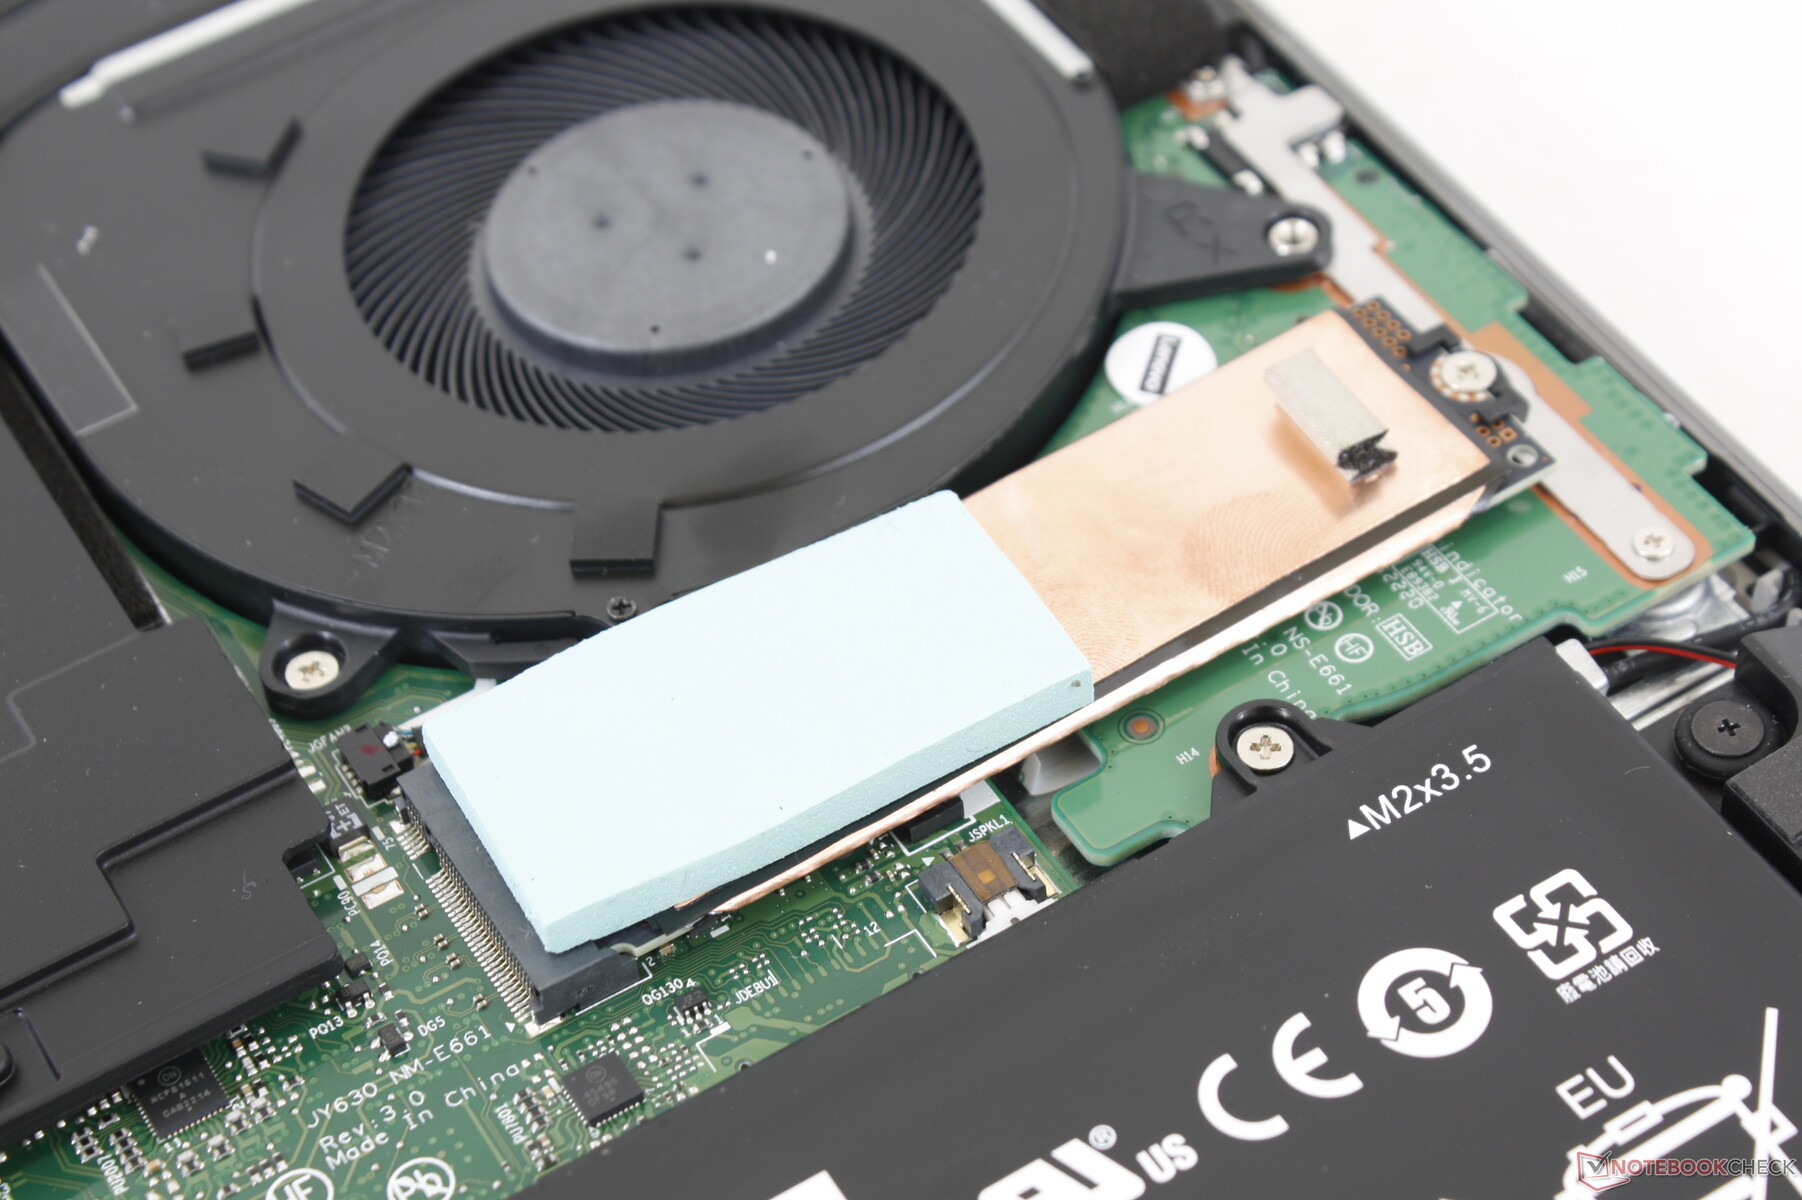
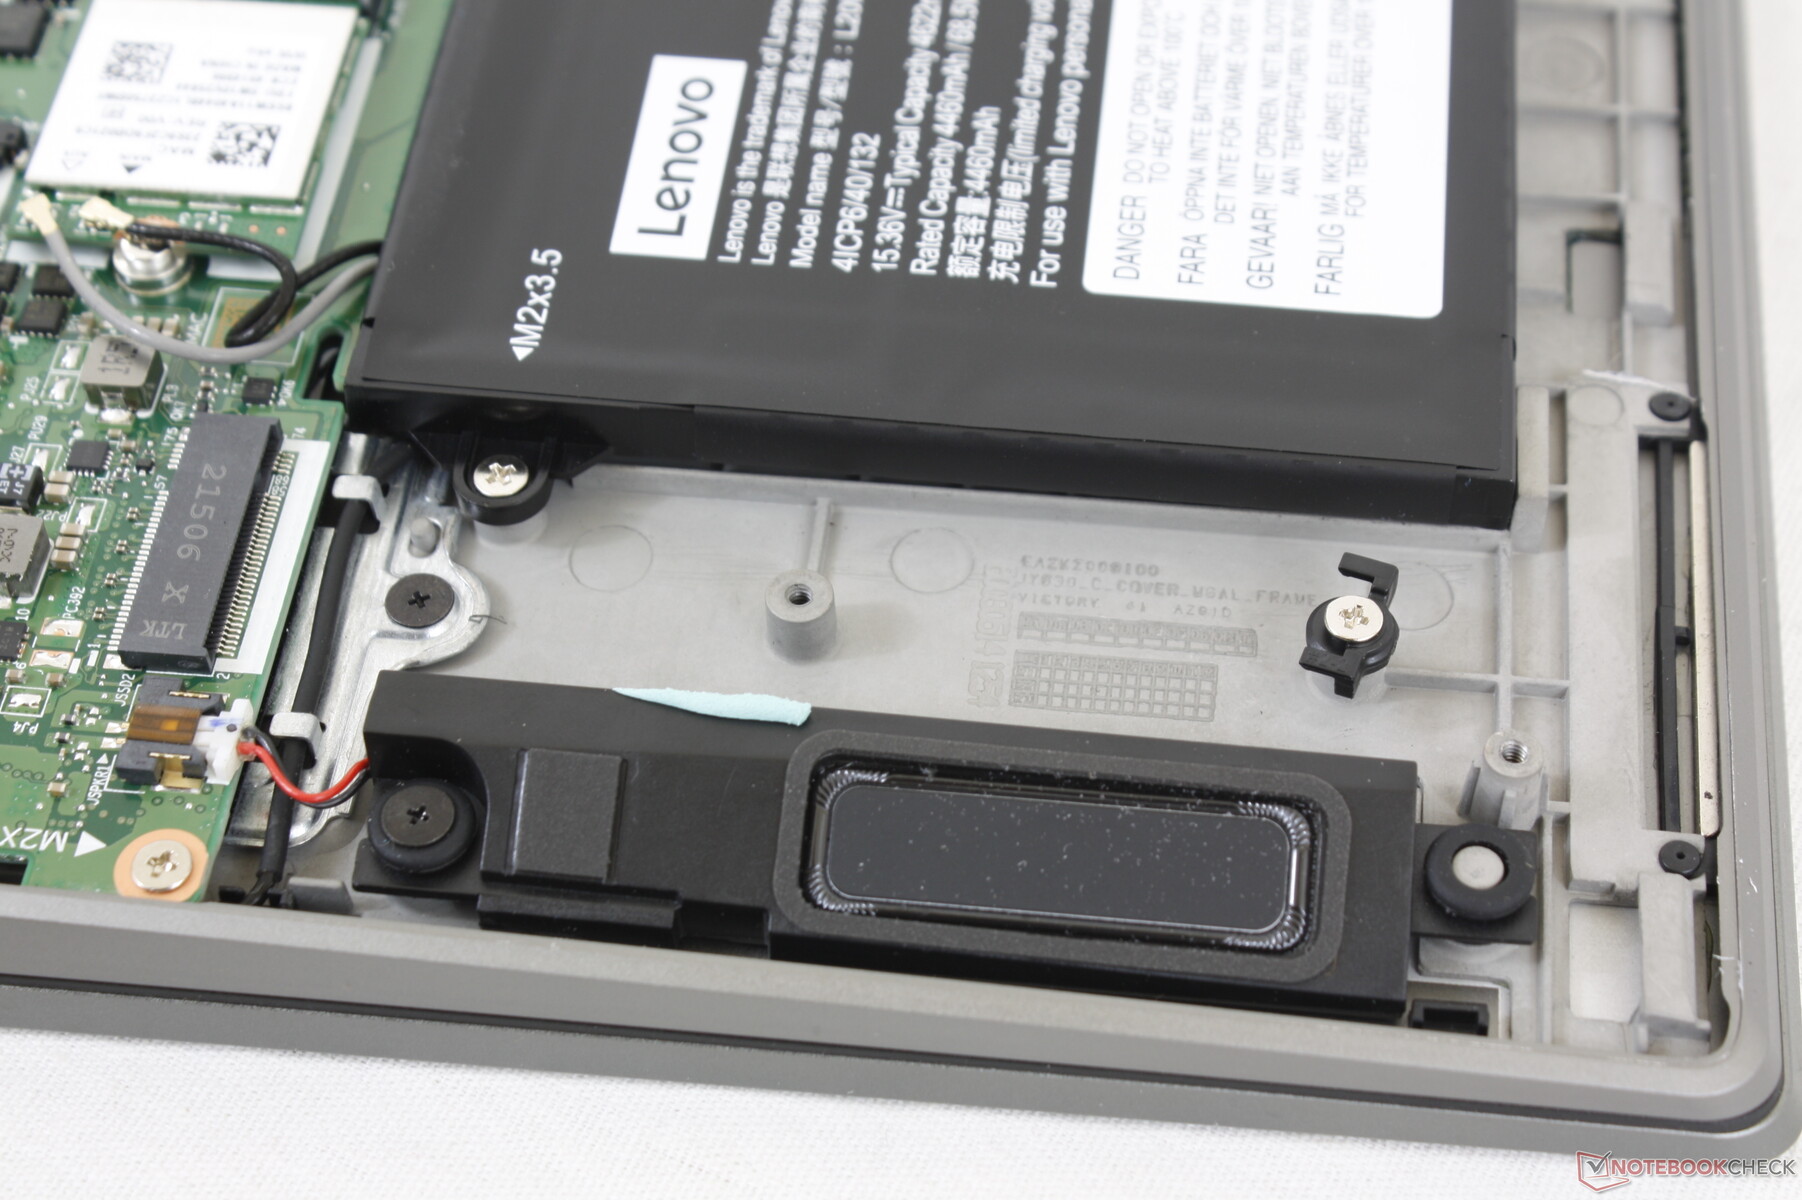
Wartung
Leider verwendete das Gen 3 nun verlöteten RAM, das Gen 2 setzte auf austauschbaren SODIMM-RAM.
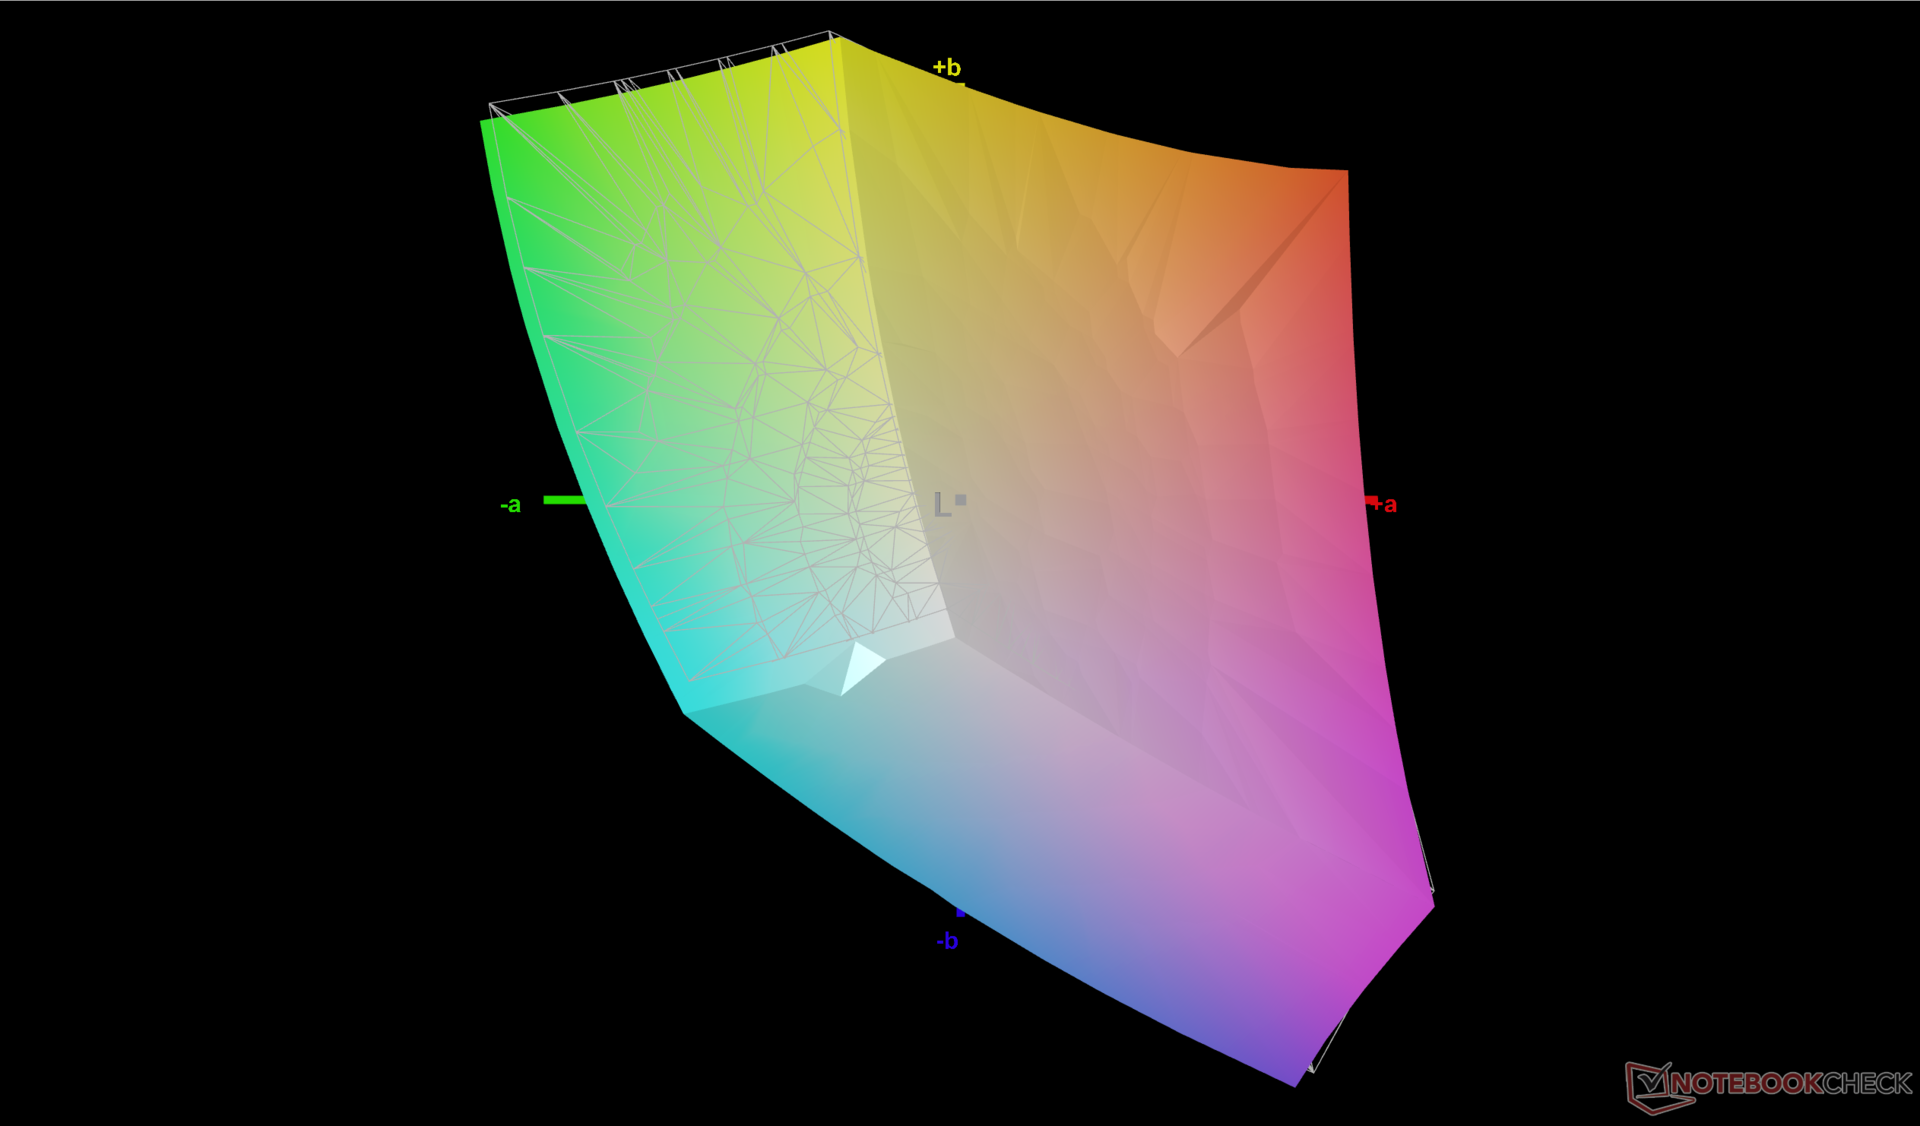
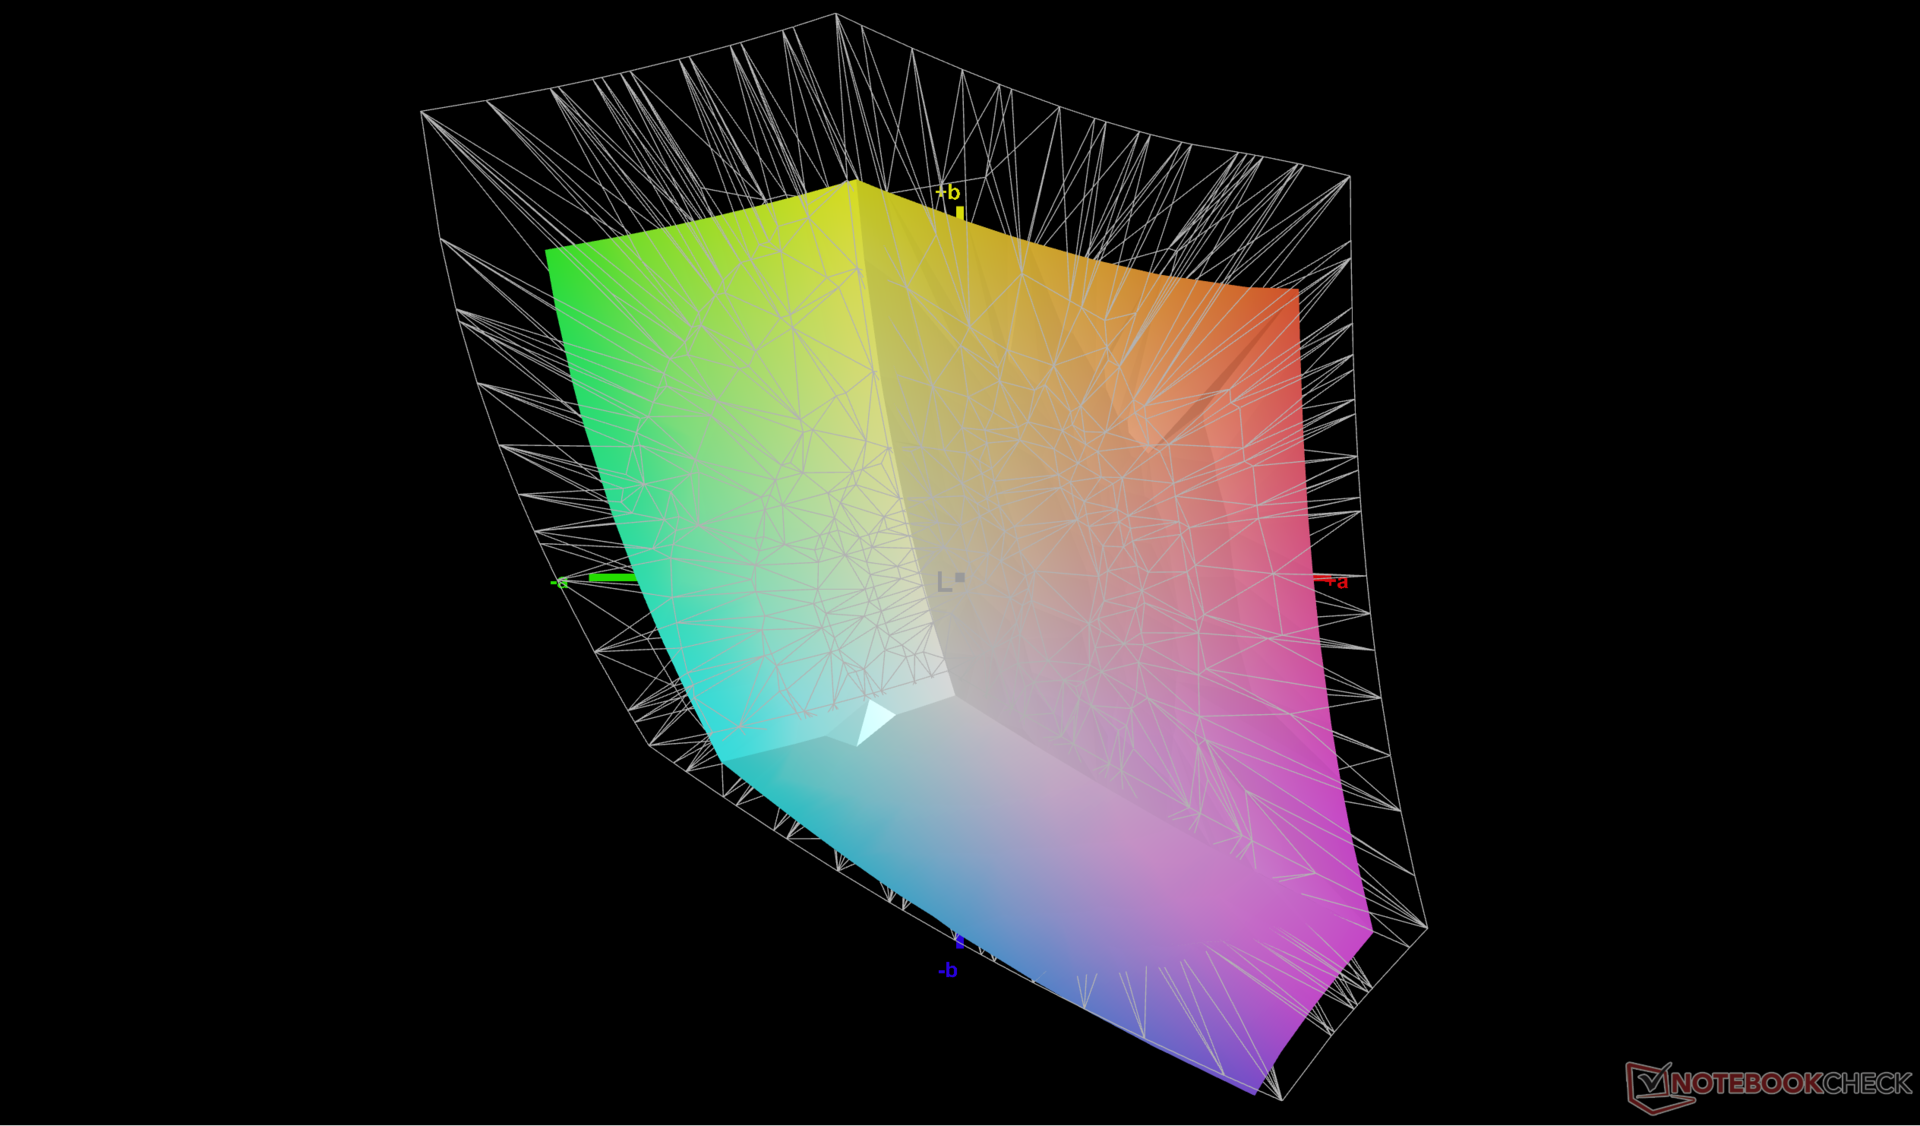
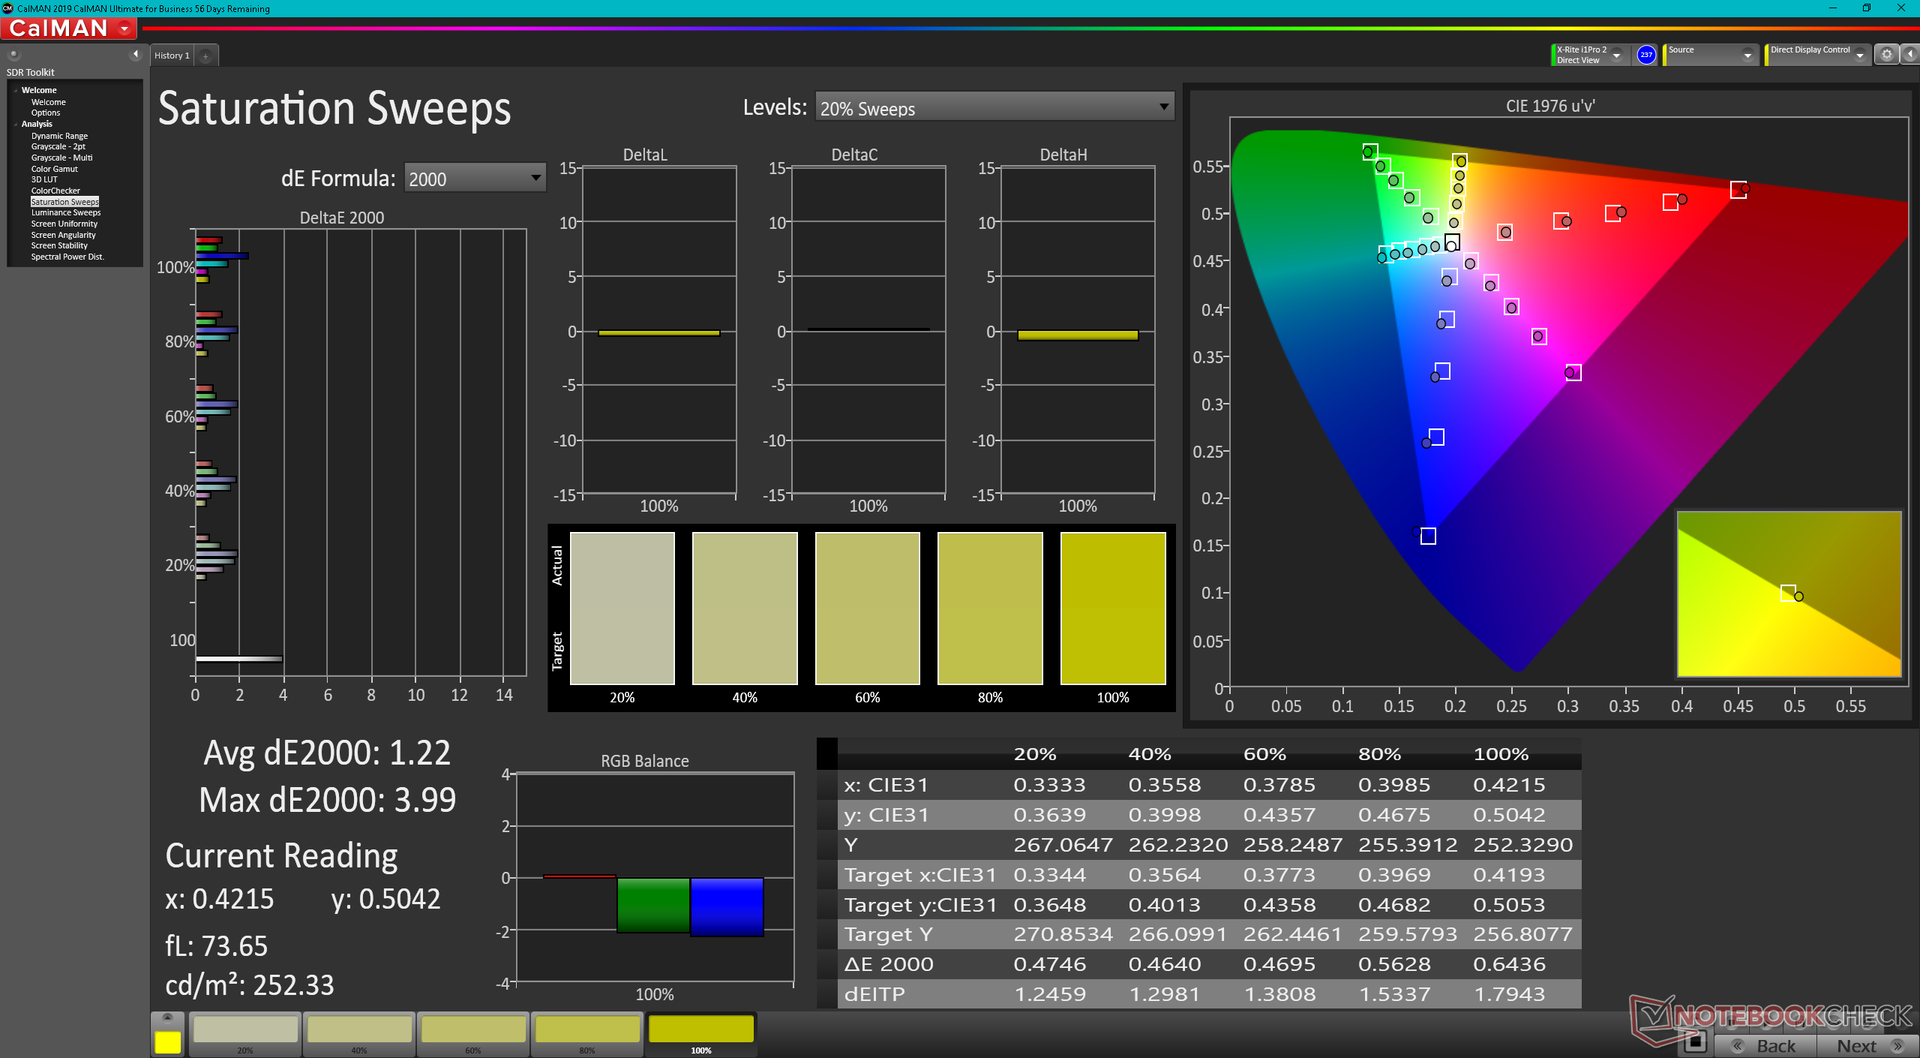
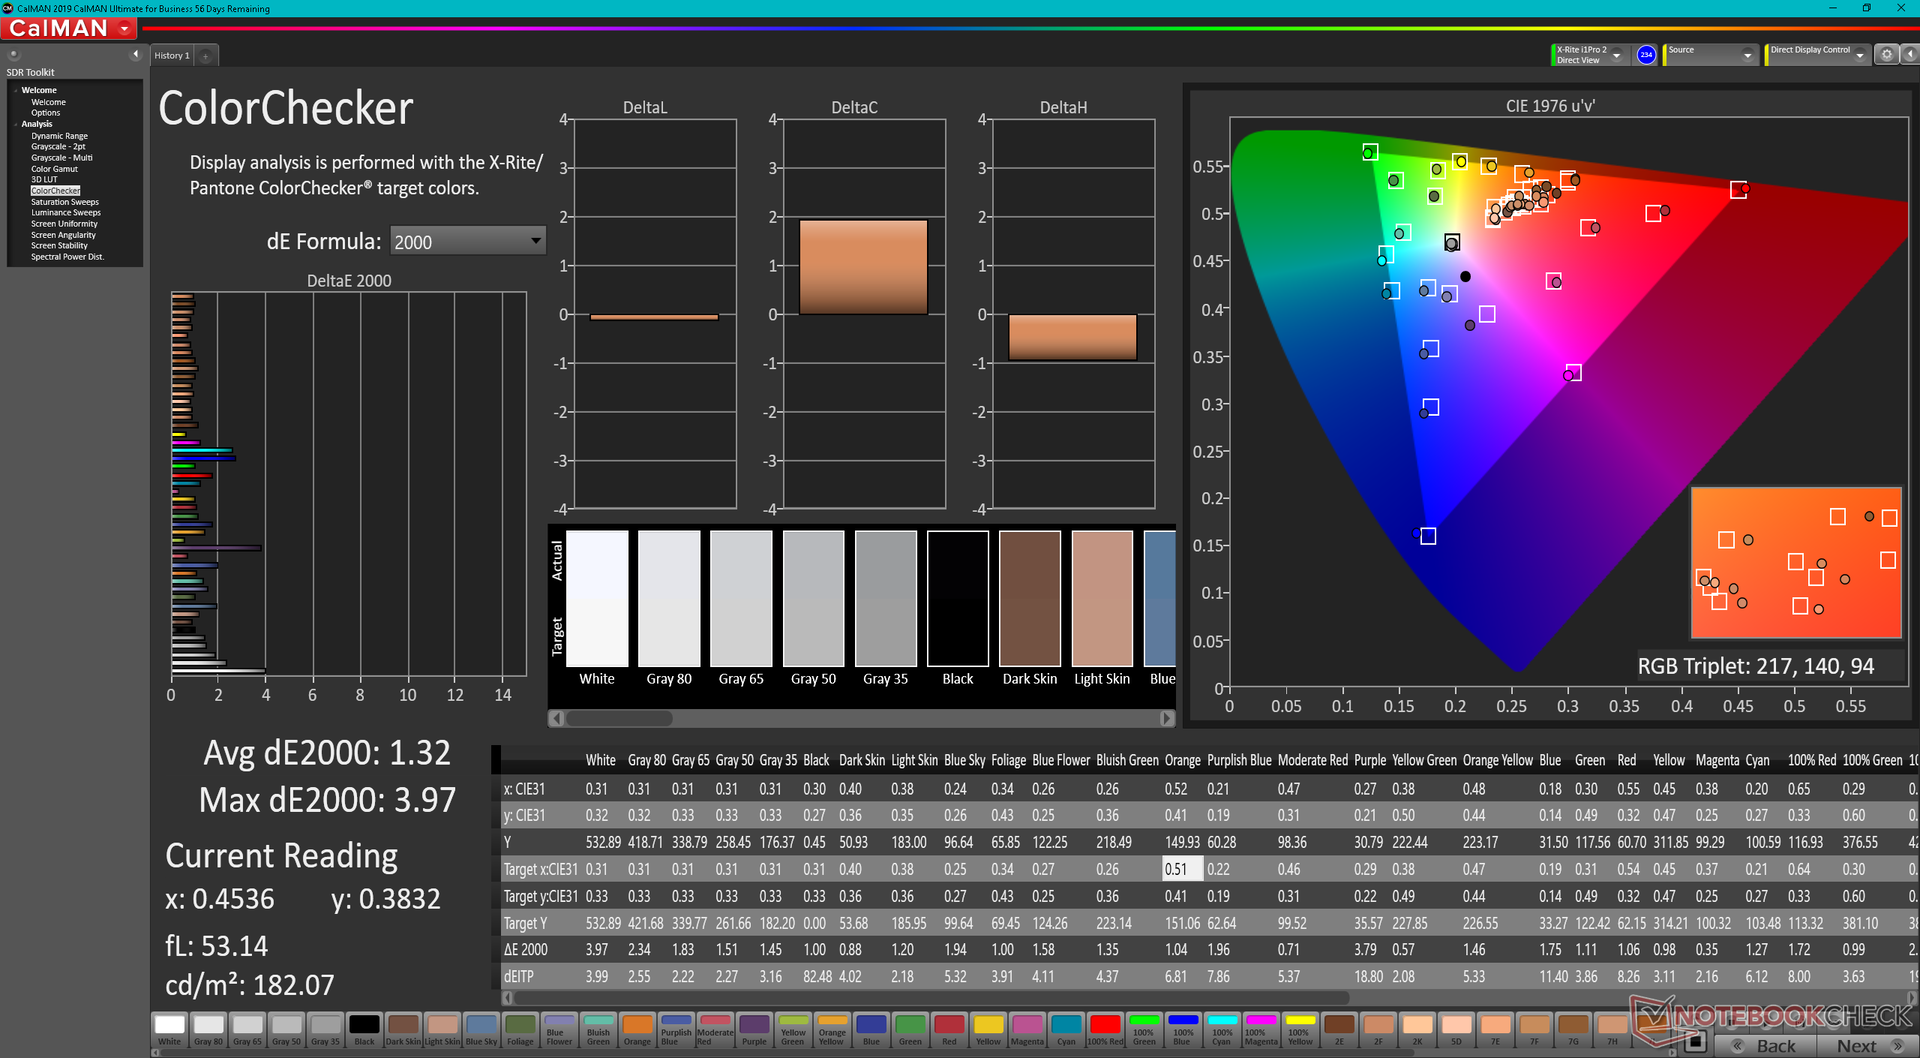
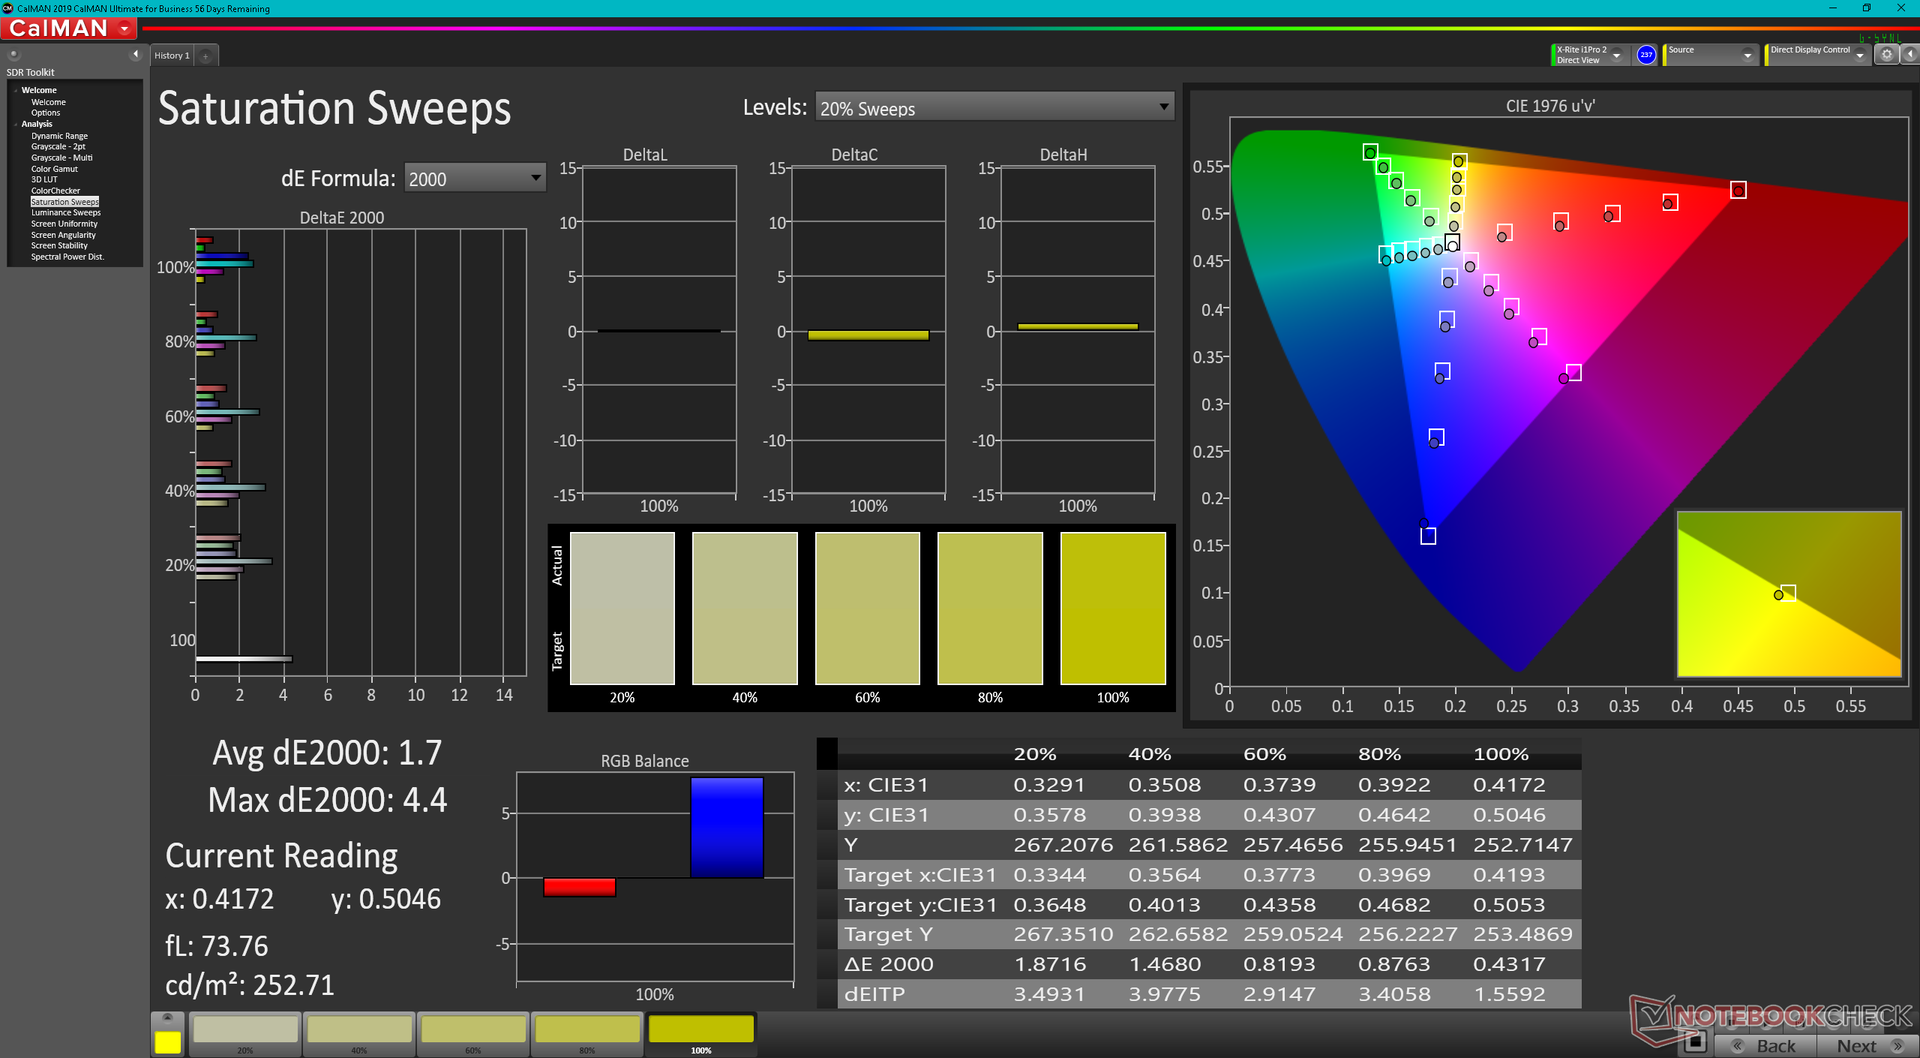
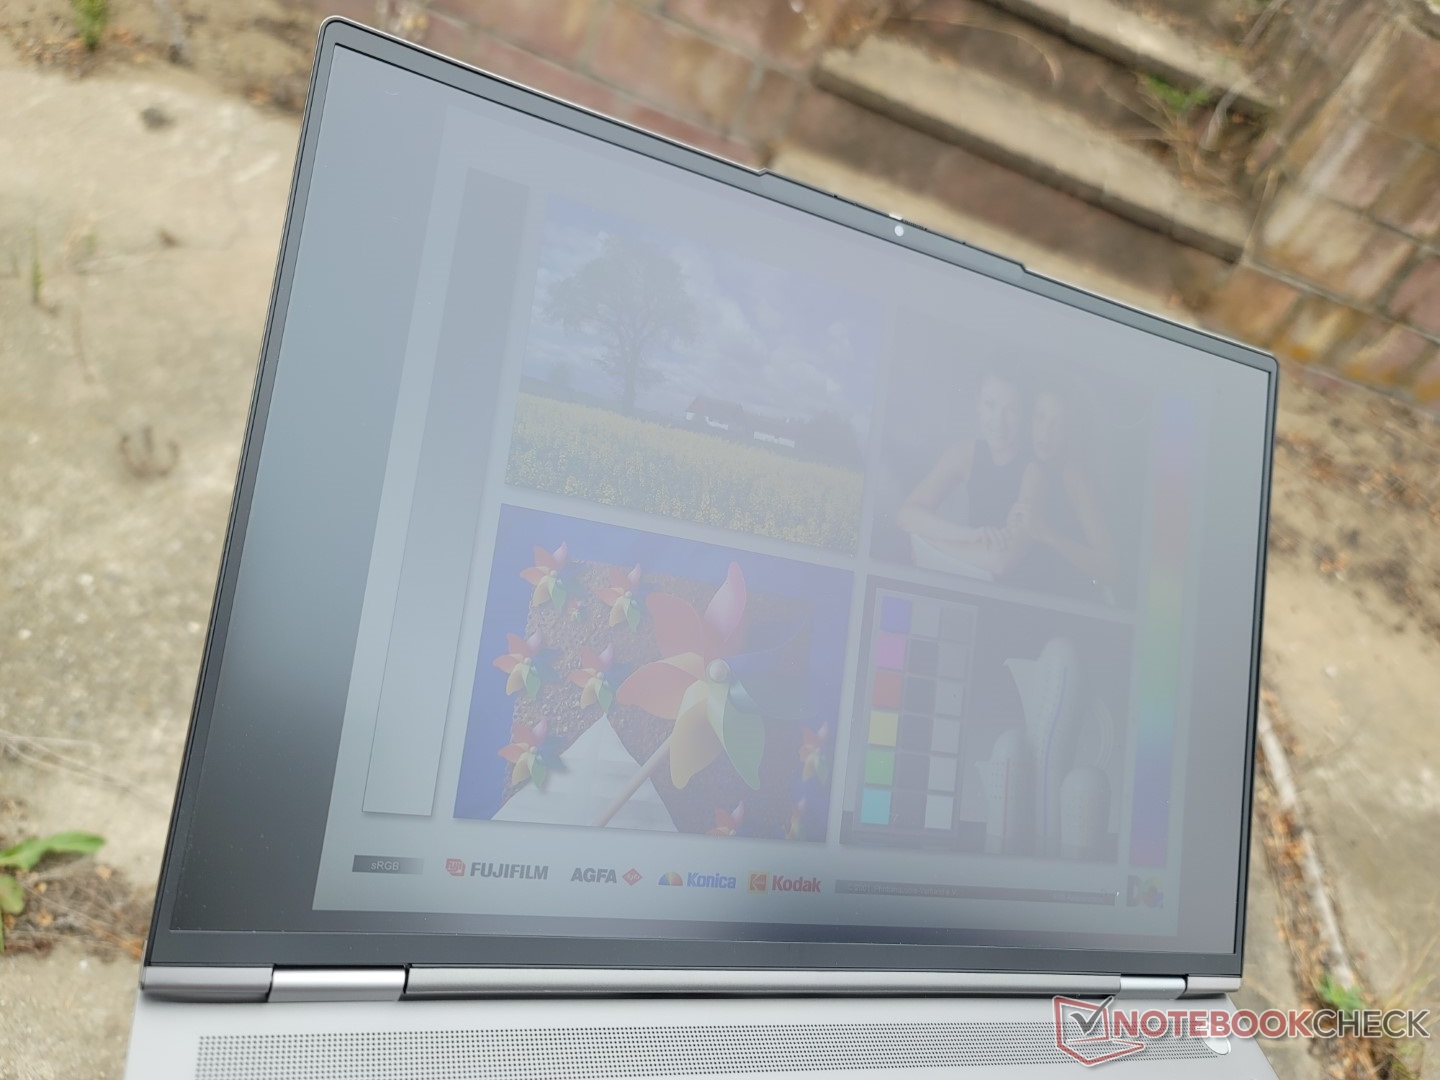
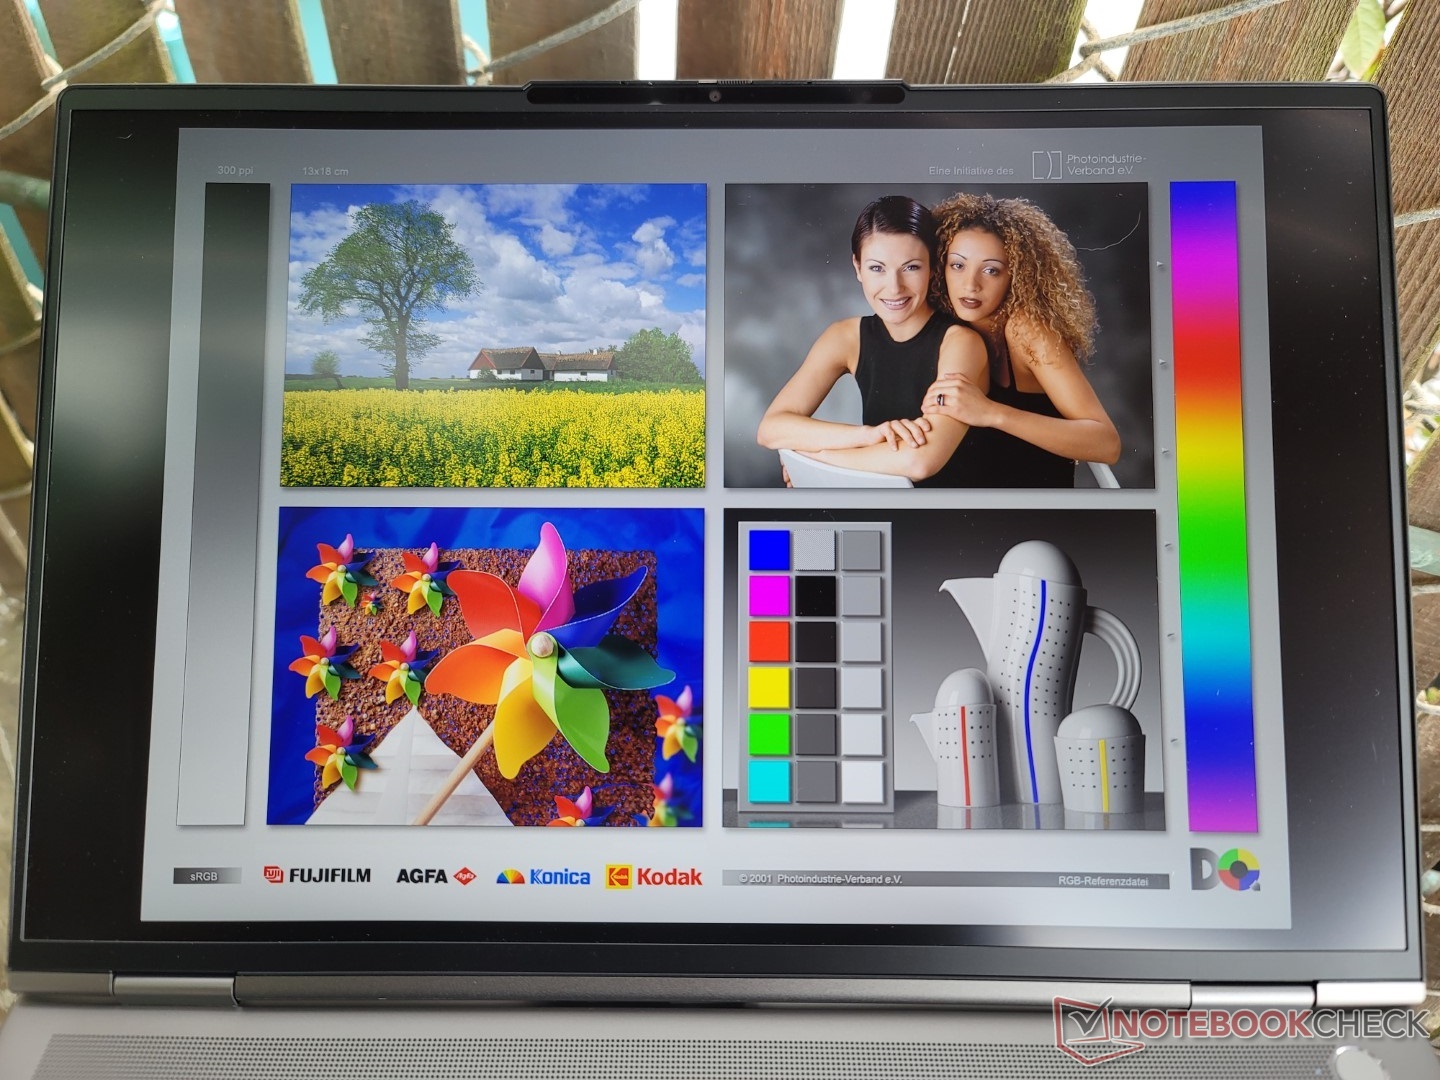
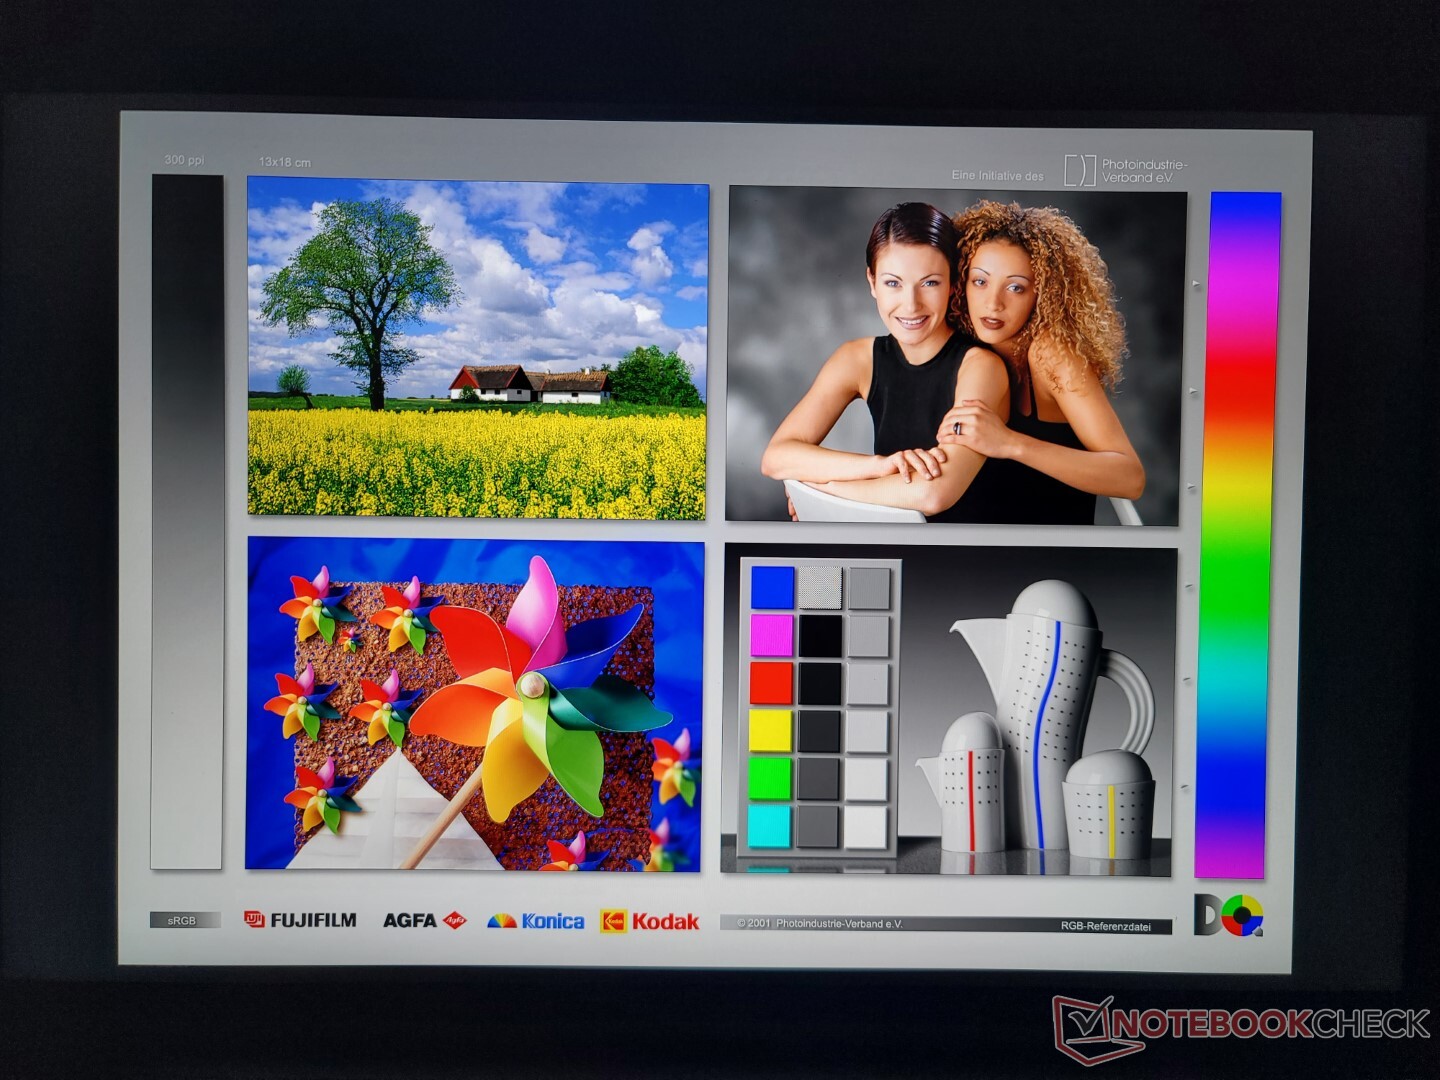
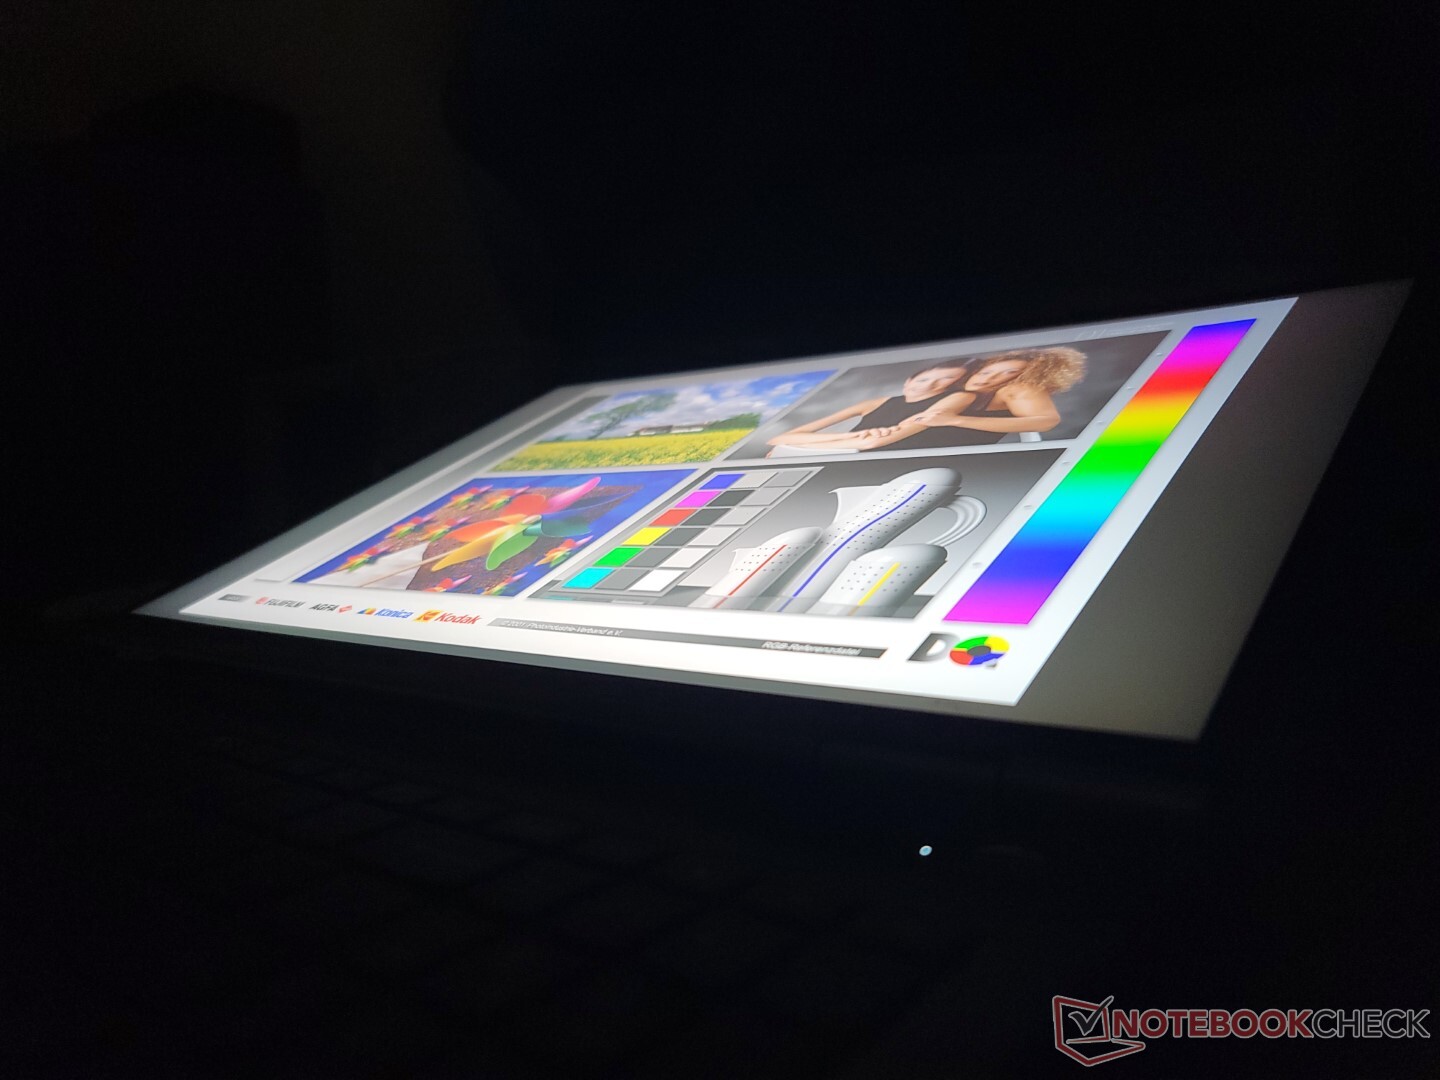
Display - Gen 3 mit 165 Hz, sRGB und 500 Nit
Unser 165-Hz-Display stellt ein Upgrade zum 60-Hz-Panel aus dem Gen-2-Testmodell dar. Es bietet schnellere Reaktionszeiten, eine höhere Helligkeit und die gleiche, vollständige sRGB-Abdeckung. Leider gibt es aktuell keine OLED- oder P3-Displayoptionen.


| |||||||||||||||||||||||||
Ausleuchtung: 94 %
Helligkeit Akku: 532.8 cd/m²
Kontrast: 969:1 (Schwarzwert: 0.55 cd/m²)
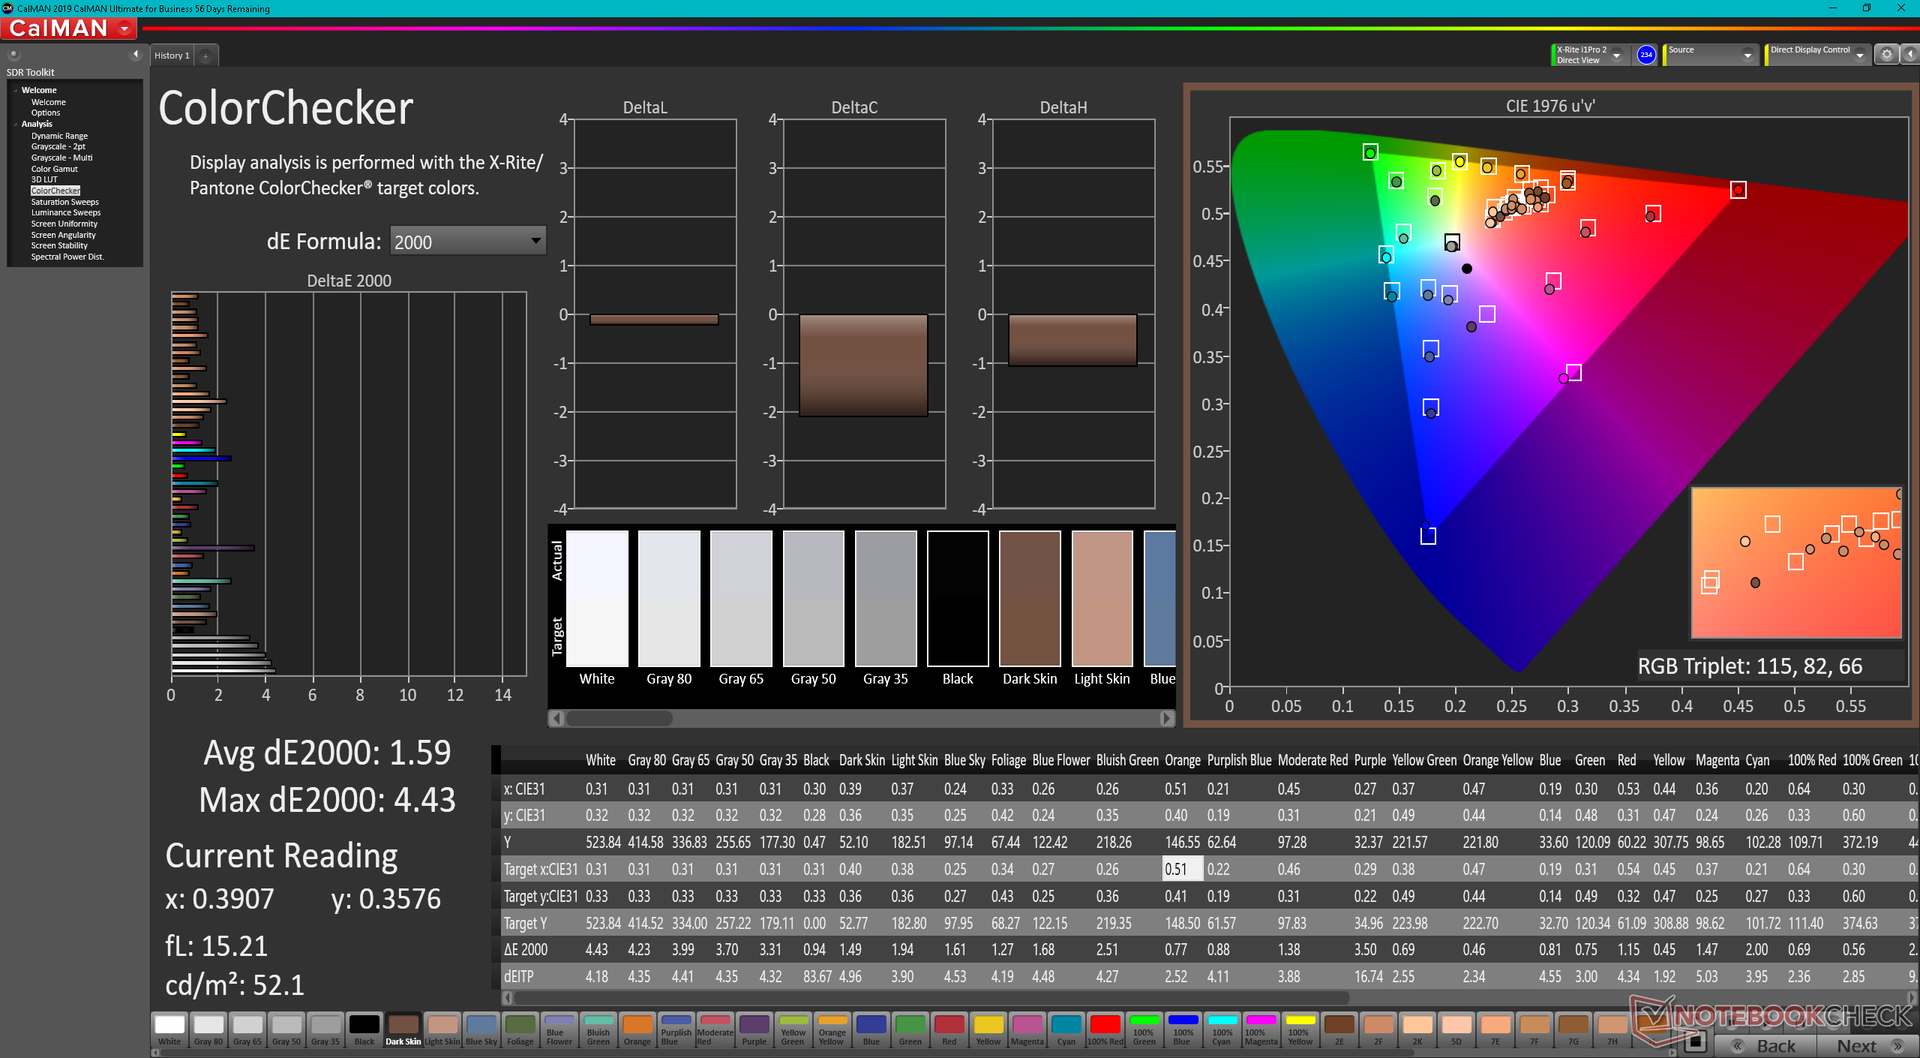
ΔE ColorChecker Calman: 1.32 | ∀{0.5-29.43 Ø4.72}
calibrated: 1.59
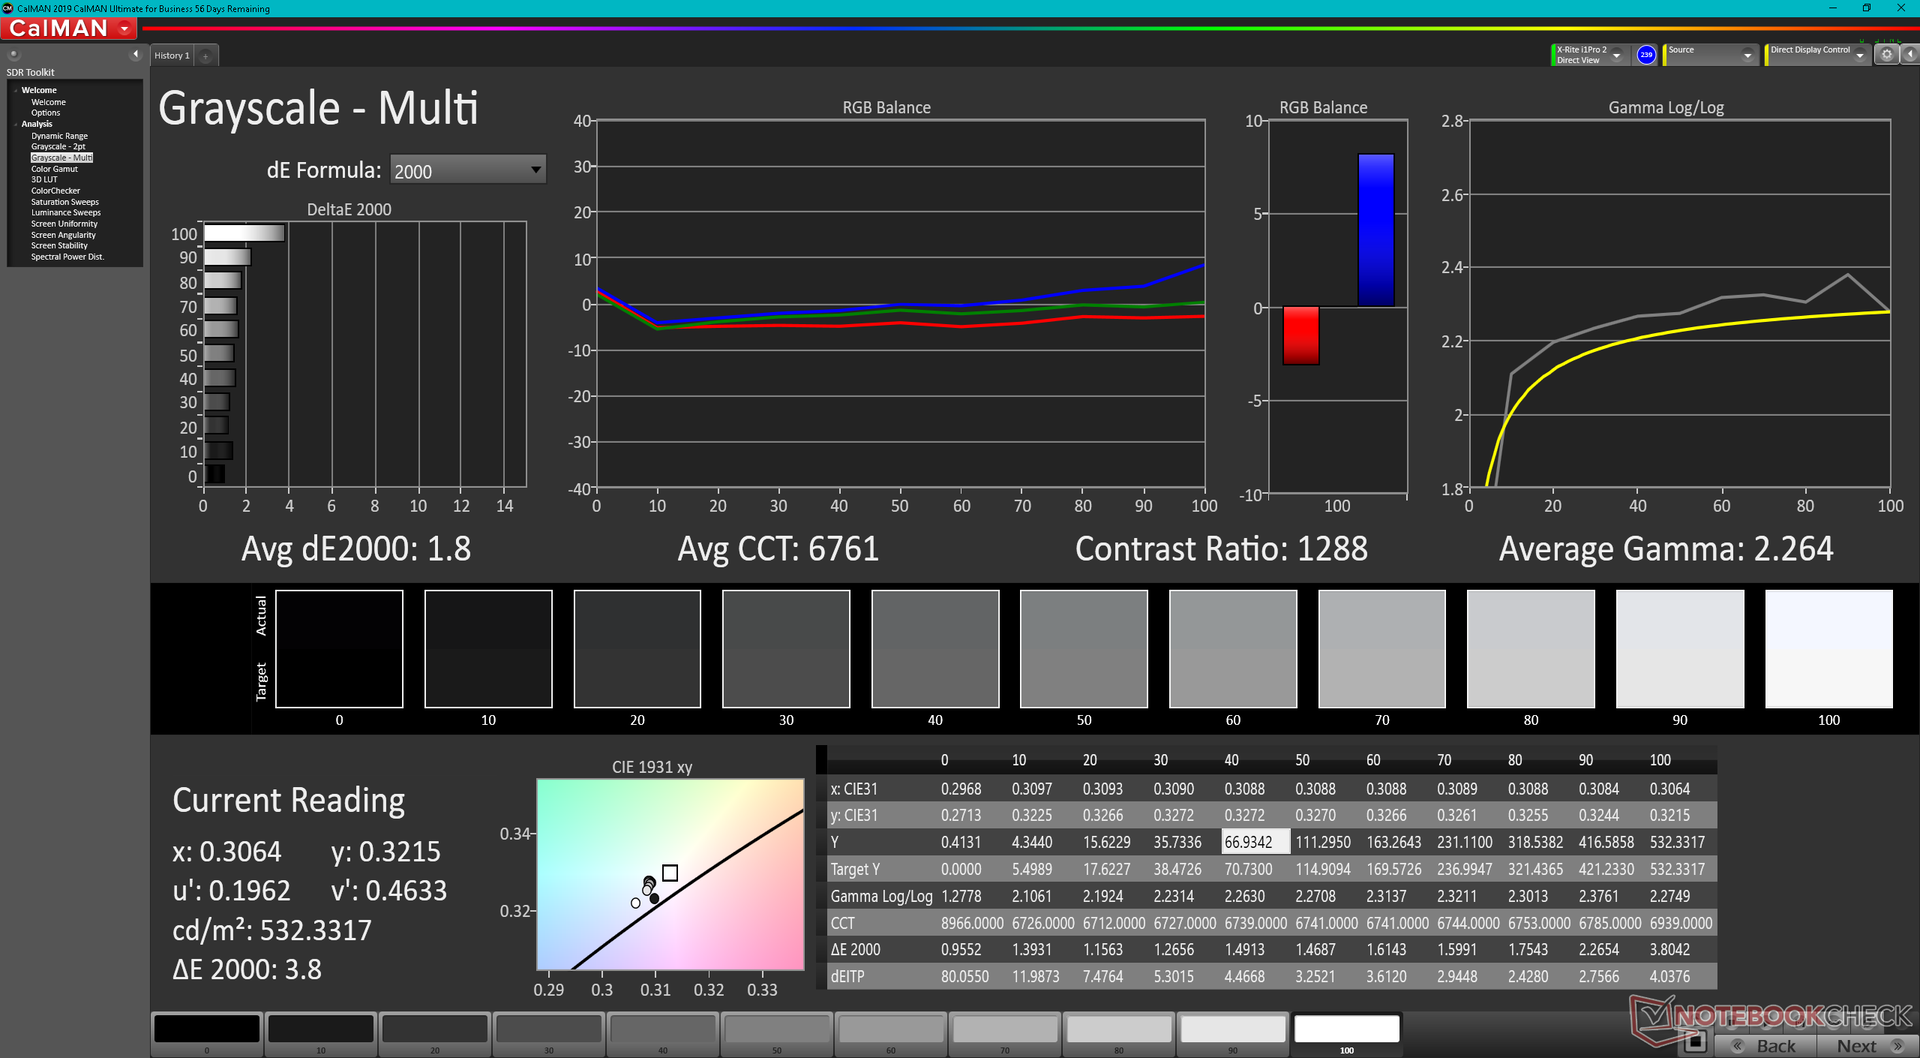
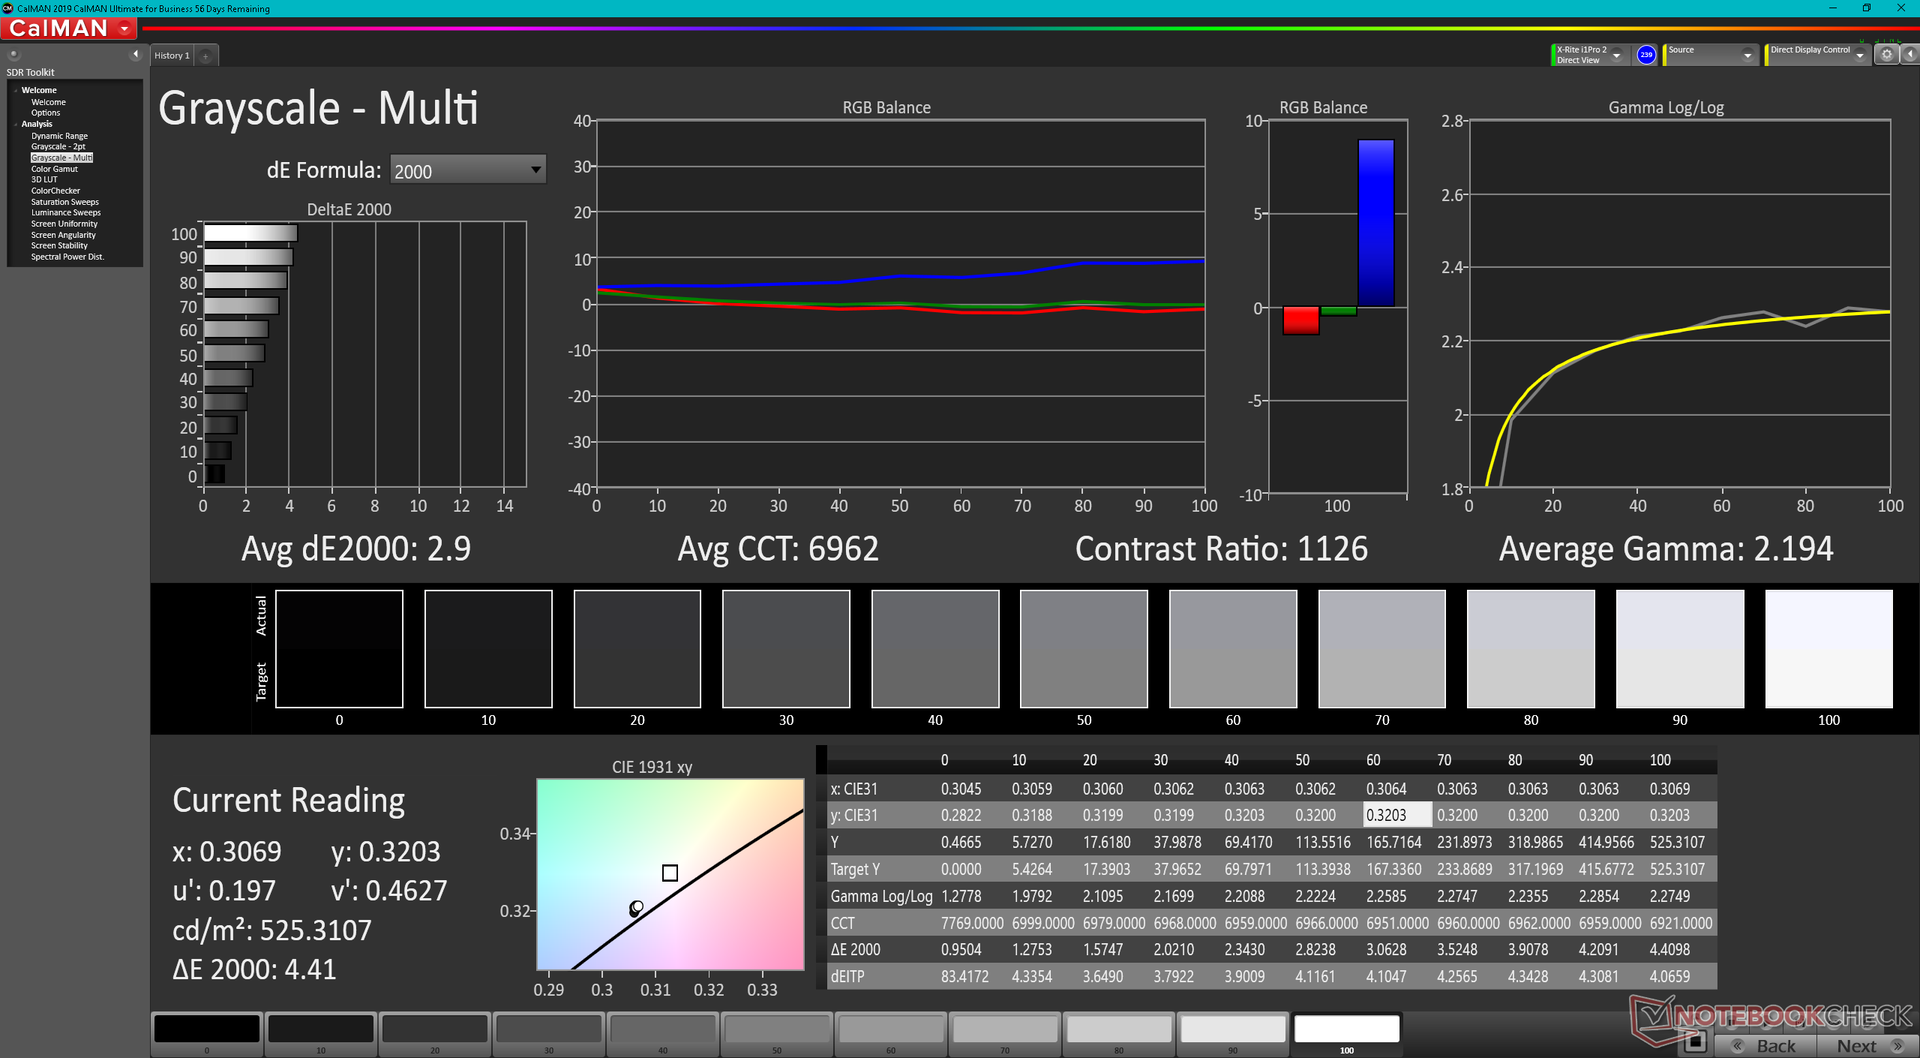
ΔE Greyscale Calman: 1.8 | ∀{0.09-98 Ø4.97}
71.4% AdobeRGB 1998 (Argyll 3D)
98.2% sRGB (Argyll 3D)
69.8% Display P3 (Argyll 3D)
Gamma: 2.64
CCT: 6761 K
| Lenovo ThinkBook 16p G3 ARH BOE CQ NE160QDM-NY1, IPS, 2560x1600, 16" | HP Envy 16 h0112nr Samsung SDC4174, OLED, 3840x2400, 16" | Lenovo ThinkBook 16p G2 ACH Lenovo LEN8A95 (AUO B160QAN02.M), IPS, 2560x1600, 16" | Lenovo IdeaPad 5 Pro 16ARH7 AUO B160QAN02.H, IPS, 2560x1600, 16" | Acer Swift X SFX16-51G-5388 Chi Mei N161HCA-EA3, , 1920x1080, 16.1" | Lenovo Legion 5 Pro 16IAH7H BOE CCQ_NE160QDM_NY1, IPS, 2560x1600, 16" | |
|---|---|---|---|---|---|---|
| Display | 22% | 6% | -4% | -6% | -1% | |
| Display P3 Coverage (%) | 69.8 | 99.3 42% | 76.4 9% | 65 -7% | 65.1 -7% | 68.53 -2% |
| sRGB Coverage (%) | 98.2 | 100 2% | 100 2% | 98 0% | 95.65 -3% | 98.38 0% |
| AdobeRGB 1998 Coverage (%) | 71.4 | 88 23% | 77.4 8% | 67.2 -6% | 66.75 -7% | 70.45 -1% |
| Response Times | 85% | -89% | 24% | -86% | 28% | |
| Response Time Grey 50% / Grey 80% * (ms) | 15.6 ? | 2 ? 87% | 36 -131% | 14.1 ? 10% | 30 ? -92% | 14 ? 10% |
| Response Time Black / White * (ms) | 11.2 ? | 1.9 ? 83% | 16.4 -46% | 7.1 ? 37% | 20 ? -79% | 6 ? 46% |
| PWM Frequency (Hz) | 240.4 ? | |||||
| Bildschirm | -19% | -1% | -11% | 2% | -11% | |
| Helligkeit Bildmitte (cd/m²) | 532.8 | 328.8 -38% | 439 -18% | 415 -22% | 276 -48% | 515 -3% |
| Brightness (cd/m²) | 519 | 332 -36% | 397 -24% | 409 -21% | 264 -49% | 475 -8% |
| Brightness Distribution (%) | 94 | 97 3% | 83 -12% | 91 -3% | 85 -10% | 85 -10% |
| Schwarzwert * (cd/m²) | 0.55 | 0.44 20% | 0.32 42% | 0.16 71% | 0.45 18% | |
| Kontrast (:1) | 969 | 998 3% | 1297 34% | 1725 78% | 1144 18% | |
| Delta E Colorchecker * | 1.32 | 1.53 -16% | 1.68 -27% | 1.92 -45% | 1.8 -36% | 2.38 -80% |
| Colorchecker dE 2000 max. * | 3.97 | 6.04 -52% | 2.36 41% | 5.71 -44% | 3.77 5% | 4.37 -10% |
| Colorchecker dE 2000 calibrated * | 1.59 | 1.57 1% | 0.58 64% | 0.63 60% | 1.1 31% | |
| Delta E Graustufen * | 1.8 | 1.3 28% | 1.64 9% | 3.7 -106% | 2.76 -53% | 2.71 -51% |
| Gamma | 2.64 83% | 2.18 101% | 2.39 92% | 2.272 97% | 2.37 93% | 2.49 88% |
| CCT | 6761 96% | 6362 102% | 6616 98% | 7132 91% | 6564 99% | 6117 106% |
| Durchschnitt gesamt (Programm / Settings) | 29% /
11% | -28% /
-12% | 3% /
-5% | -30% /
-12% | 5% /
-3% |
* ... kleinere Werte sind besser
Das Display ist ab Werk zum sRGB-Standard vorkalibriert. Die durchschnittlichen Graustufen- und Farb-deltaE-Werte betragen nur 1,8 bzw. 1,32, sodass eine Kalibrierung durch den Nutzer entfällt.
Reaktionszeiten (Response Times) des Displays
| ↔ Reaktionszeiten Schwarz zu Weiß | ||
|---|---|---|
| 11.2 ms ... steigend ↗ und fallend ↘ kombiniert | ↗ 6 ms steigend | 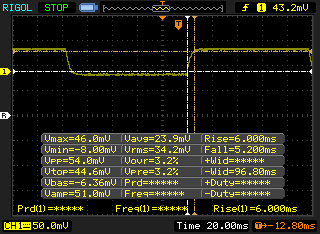 |
| ↘ 5.2 ms fallend | ||
| Die gemessenen Reaktionszeiten sind gut, für anspruchsvolle Spieler könnten der Bildschirm jedoch zu langsam sein. Im Vergleich rangierten die bei uns getesteten Geräte von 0.1 (Minimum) zu 240 (Maximum) ms. » 30 % aller Screens waren schneller als der getestete. Daher sind die gemessenen Reaktionszeiten besser als der Durchschnitt aller vermessenen Geräte (19.8 ms). | ||
| ↔ Reaktionszeiten 50% Grau zu 80% Grau | ||
| 15.6 ms ... steigend ↗ und fallend ↘ kombiniert | ↗ 7.2 ms steigend | 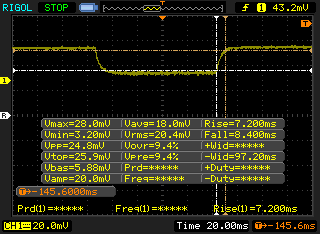 |
| ↘ 8.4 ms fallend | ||
| Die gemessenen Reaktionszeiten sind gut, für anspruchsvolle Spieler könnten der Bildschirm jedoch zu langsam sein. Im Vergleich rangierten die bei uns getesteten Geräte von 0.165 (Minimum) zu 636 (Maximum) ms. » 30 % aller Screens waren schneller als der getestete. Daher sind die gemessenen Reaktionszeiten besser als der Durchschnitt aller vermessenen Geräte (31 ms). | ||
Bildschirm-Flackern / PWM (Pulse-Width Modulation)
| Flackern / PWM nicht festgestellt | 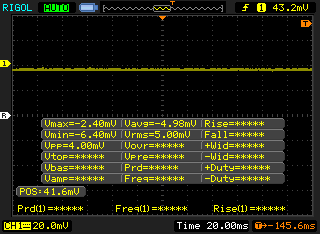 | ||
Im Vergleich: 52 % aller getesteten Geräte nutzten kein PWM um die Helligkeit zu reduzieren. Wenn PWM eingesetzt wurde, dann bei einer Frequenz von durchschnittlich 7769 (Minimum 5, Maximum 343500) Hz. | |||
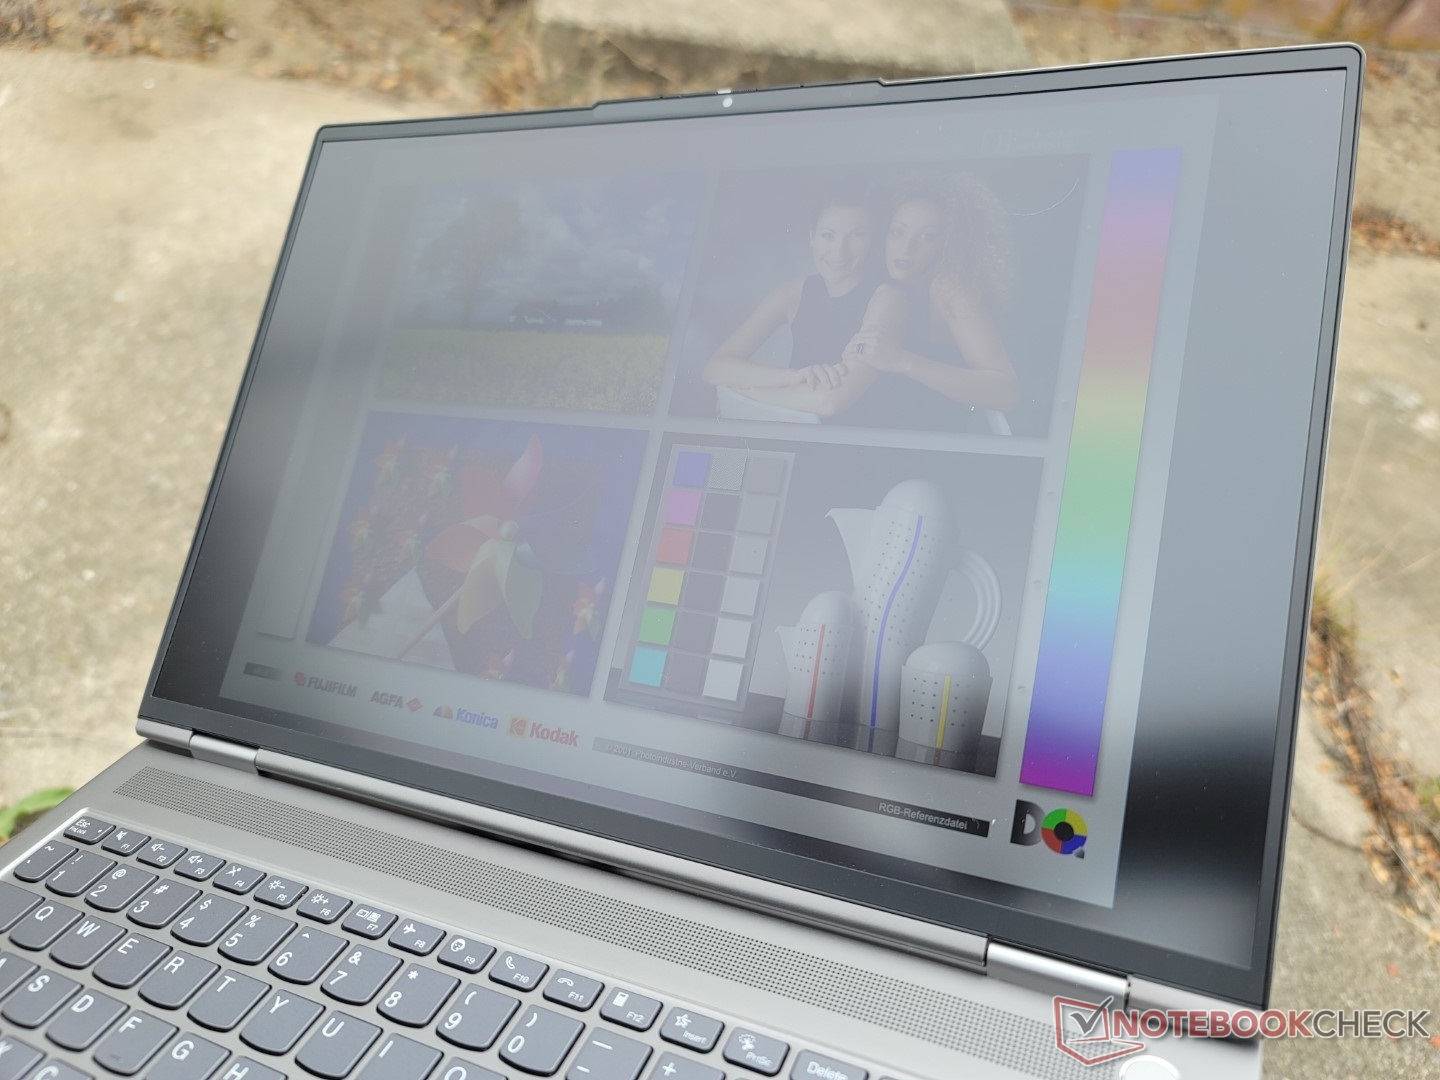
Im Schatten ist die Sichtbarkeit ordentlich. Die matte Oberfläche sowie die recht hellen 500 Nit helfen dabei Spiegelungen deutlich zu reduzieren.

Leistung - Kaum schneller als ThinkBook 16p Gen 2
Testbedingungen
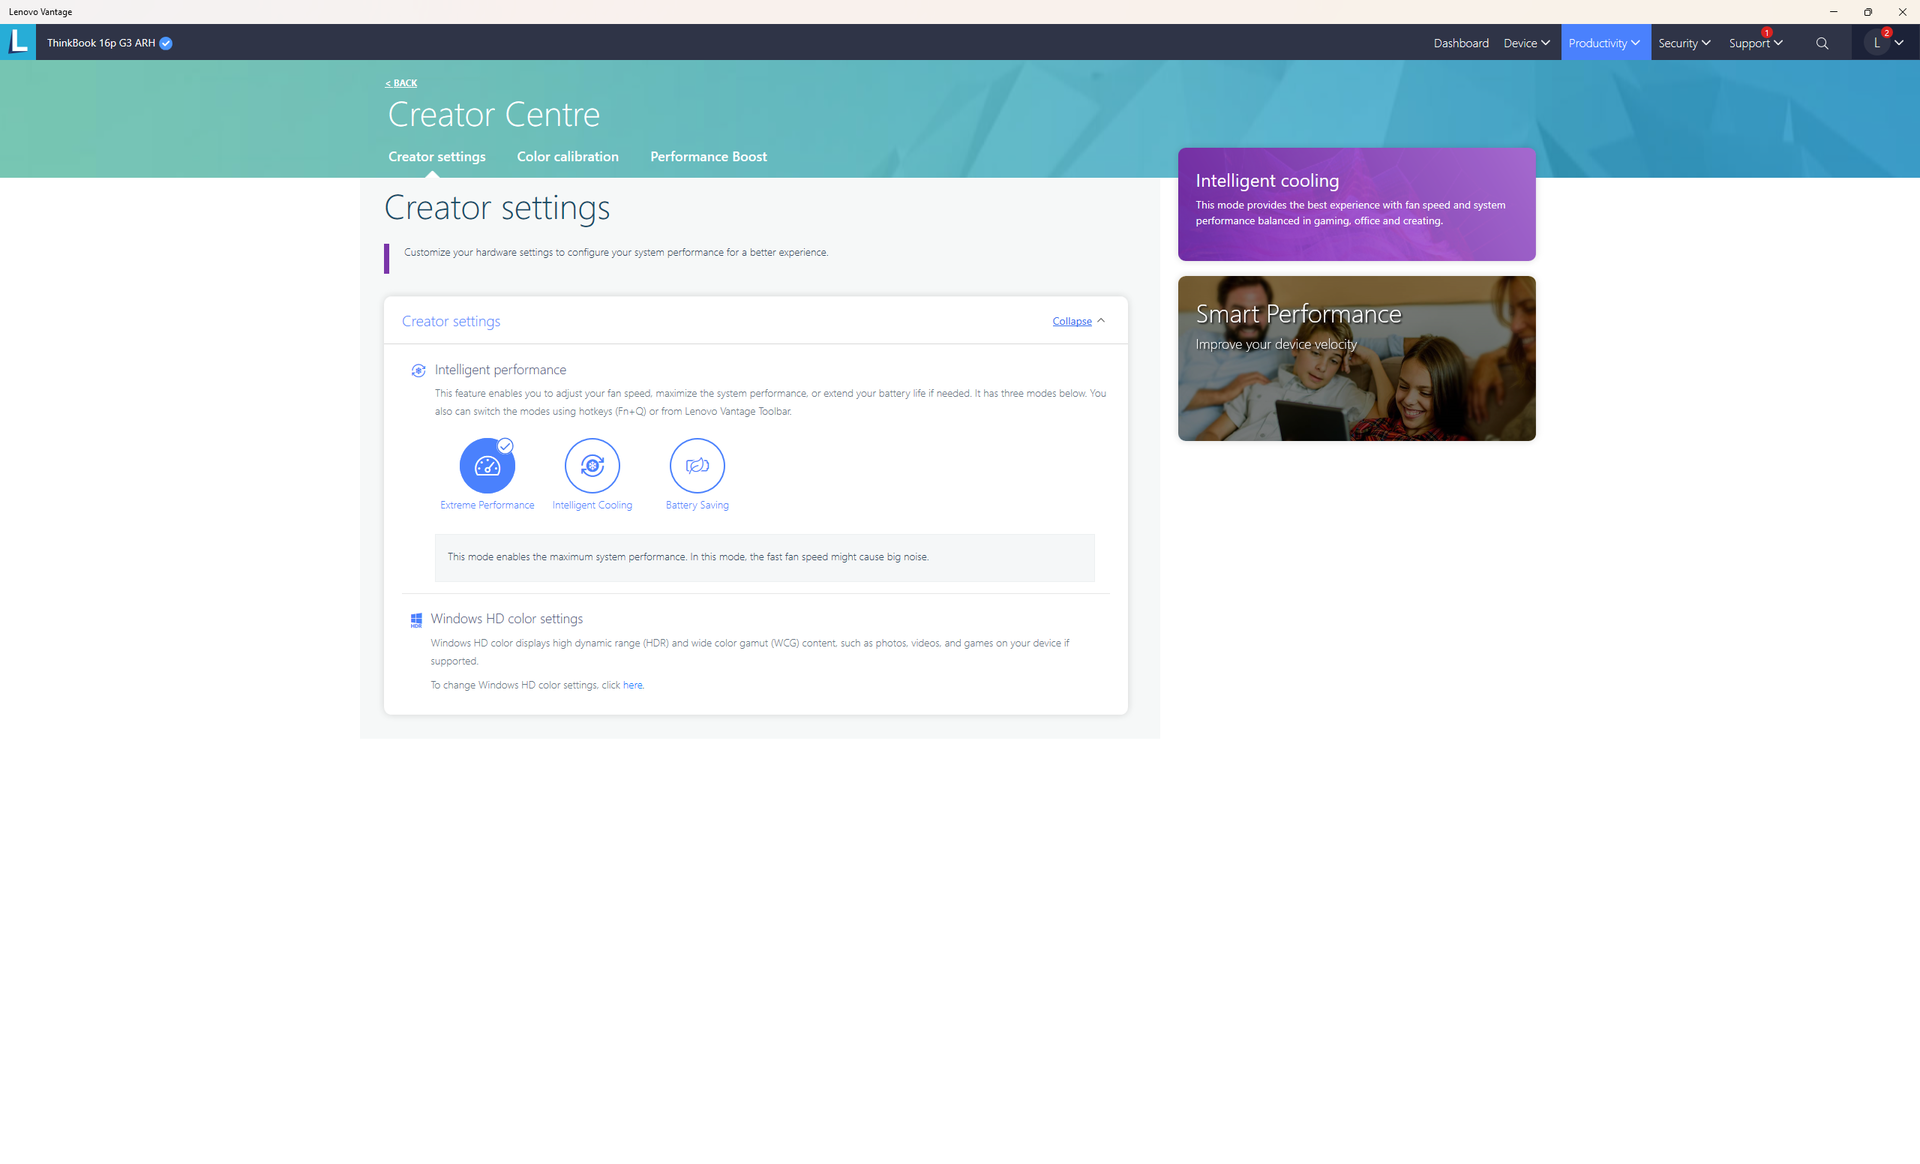
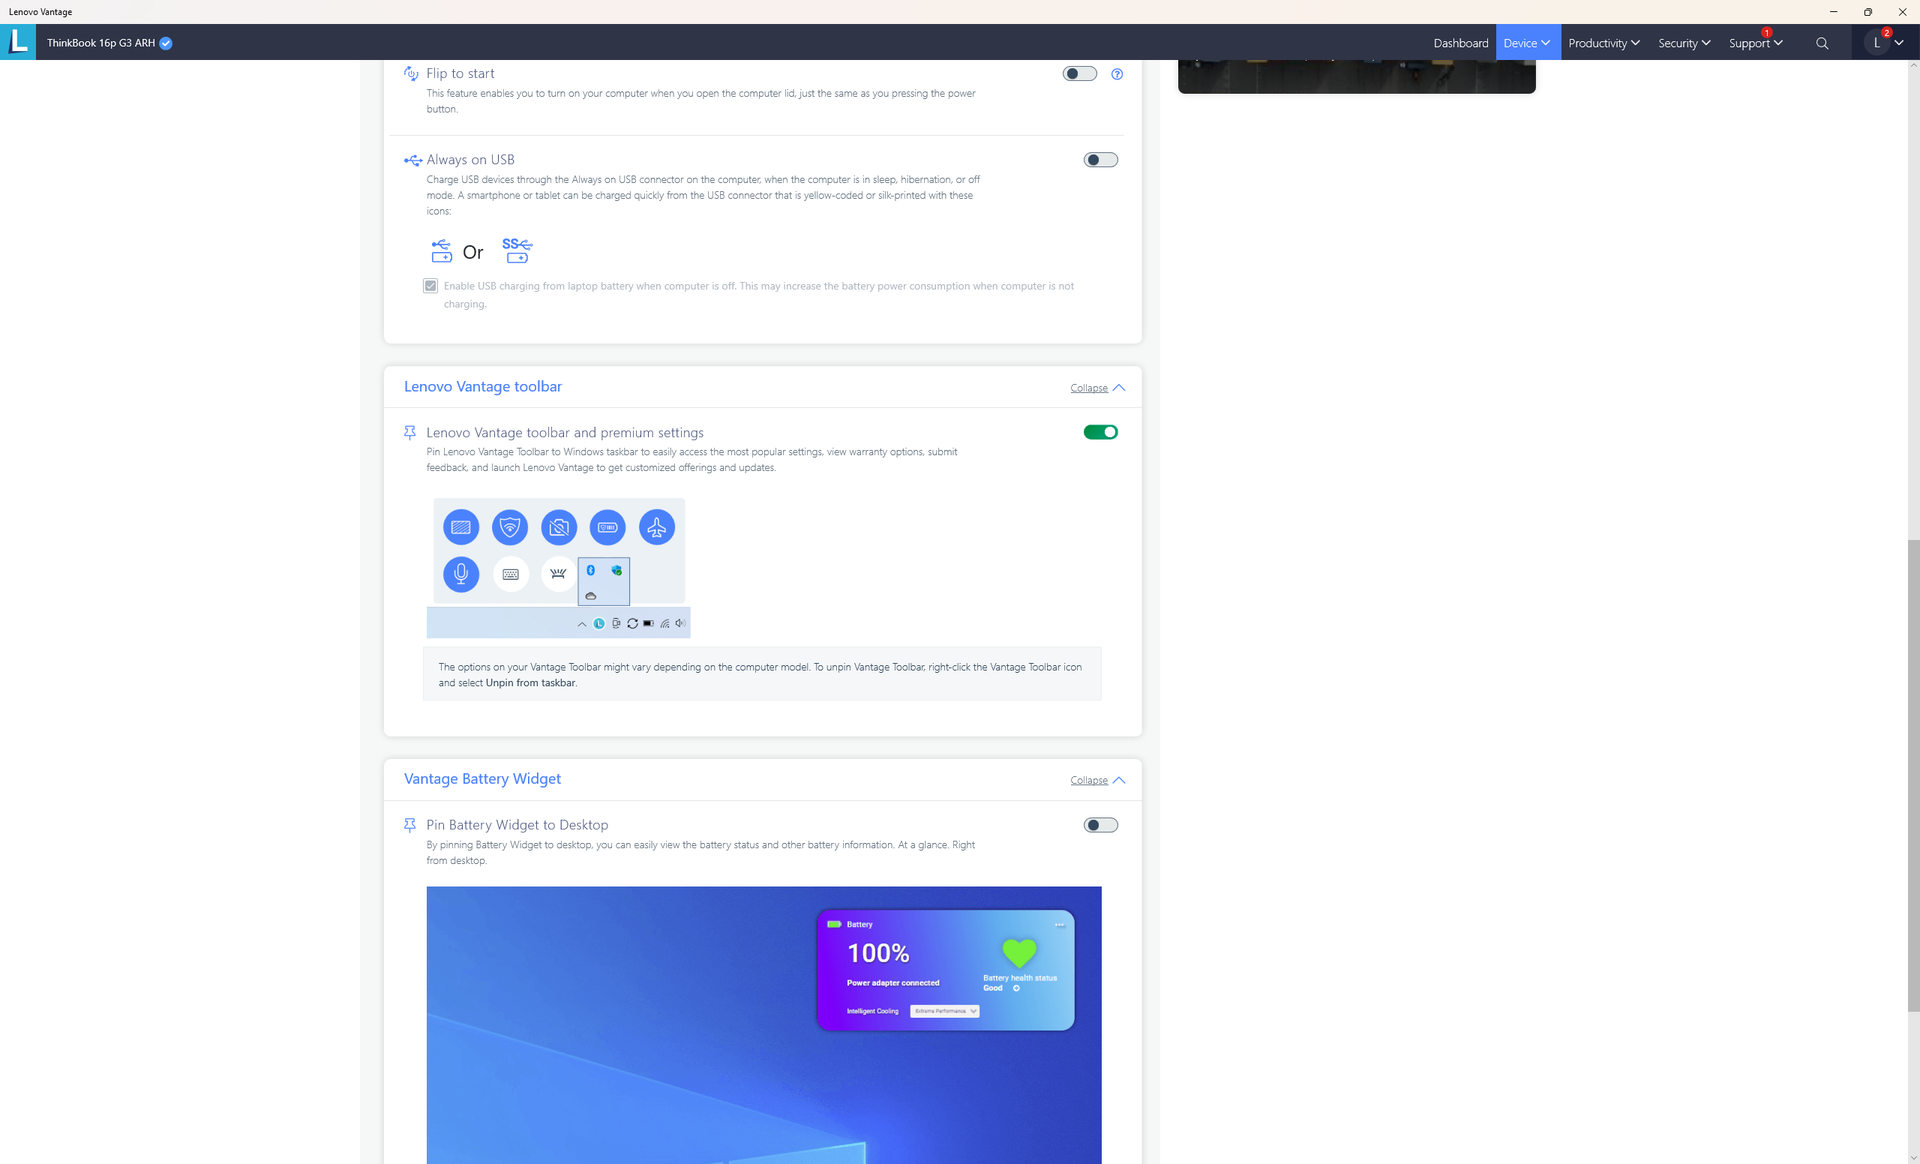
In der Software Lenovo Vantage haben wir das Gerät vor dem Bechmarkparkour in den Modus Extreme Performance versetzt, in Windows haben wir auf Leistung eingestellt. Eine Auseinandersetzung mit Lenovo Vantage wird empfohlen, es stellt quasi das Control Center für Updates und diverse Einstellungen dar, siehe Screenshots.


Prozessor
Die CPU-Leistung hat Licht- und Schattenseiten. Zwar ist der Ryzen 9 6900HX einer der schnellsten mobilen AMD-CPUs, aber die Leistung ist quasi identisch zum Vorgänger Ryzen 9 5900HX. Zusätzlich ist er kaum schneller als der Ryzen 7 6800H. Konfiguriert man stattdessen einen nominell schwächeren Ryzen 5 6600H, so sinkt die Single-Thread-Leistung um 5 Prozent und die Multi-Thread-Leistung um 20 Prozent.
Cinebench R15 Multi Loop
Cinebench R23: Multi Core | Single Core
Cinebench R15: CPU Multi 64Bit | CPU Single 64Bit
Blender: v2.79 BMW27 CPU
7-Zip 18.03: 7z b 4 | 7z b 4 -mmt1
Geekbench 5.5: Multi-Core | Single-Core
HWBOT x265 Benchmark v2.2: 4k Preset
LibreOffice : 20 Documents To PDF
R Benchmark 2.5: Overall mean
| Cinebench R20 / CPU (Multi Core) | |
| Lenovo Legion 5 Pro 16IAH7H | |
| Razer Blade 15 2022 | |
| Lenovo ThinkBook 16p G3 ARH | |
| Durchschnittliche AMD Ryzen 9 6900HX (3742 - 5813, n=19) | |
| Lenovo ThinkBook 16p G2 ACH | |
| HP Envy 16 h0112nr | |
| Asus ROG Zephyrus G14 GA402RJ | |
| Lenovo IdeaPad 5 Pro 16ACH | |
| Lenovo Legion 5 Pro 16 ARH7H-82RG0047GE | |
| Aorus 15P XC | |
| Acer Swift X SFX16-51G-5388 | |
| Cinebench R20 / CPU (Single Core) | |
| Razer Blade 15 2022 | |
| HP Envy 16 h0112nr | |
| Lenovo Legion 5 Pro 16IAH7H | |
| Durchschnittliche AMD Ryzen 9 6900HX (595 - 631, n=19) | |
| Lenovo ThinkBook 16p G3 ARH | |
| Lenovo ThinkBook 16p G2 ACH | |
| Lenovo Legion 5 Pro 16 ARH7H-82RG0047GE | |
| Asus ROG Zephyrus G14 GA402RJ | |
| Acer Swift X SFX16-51G-5388 | |
| Lenovo IdeaPad 5 Pro 16ACH | |
| Aorus 15P XC | |
| Cinebench R23 / Multi Core | |
| Lenovo Legion 5 Pro 16IAH7H | |
| Razer Blade 15 2022 | |
| Lenovo ThinkBook 16p G3 ARH | |
| Durchschnittliche AMD Ryzen 9 6900HX (9709 - 15100, n=19) | |
| Lenovo ThinkBook 16p G2 ACH | |
| HP Envy 16 h0112nr | |
| Asus ROG Zephyrus G14 GA402RJ | |
| Lenovo IdeaPad 5 Pro 16ACH | |
| Lenovo Legion 5 Pro 16 ARH7H-82RG0047GE | |
| Aorus 15P XC | |
| Acer Swift X SFX16-51G-5388 | |
| Cinebench R23 / Single Core | |
| Razer Blade 15 2022 | |
| HP Envy 16 h0112nr | |
| Lenovo Legion 5 Pro 16IAH7H | |
| Durchschnittliche AMD Ryzen 9 6900HX (1516 - 1616, n=19) | |
| Lenovo ThinkBook 16p G3 ARH | |
| Lenovo ThinkBook 16p G2 ACH | |
| Lenovo Legion 5 Pro 16 ARH7H-82RG0047GE | |
| Asus ROG Zephyrus G14 GA402RJ | |
| Lenovo IdeaPad 5 Pro 16ACH | |
| Acer Swift X SFX16-51G-5388 | |
| Aorus 15P XC | |
| Cinebench R15 / CPU Multi 64Bit | |
| Lenovo Legion 5 Pro 16IAH7H | |
| HP Envy 16 h0112nr | |
| Razer Blade 15 2022 | |
| Durchschnittliche AMD Ryzen 9 6900HX (1588 - 2411, n=19) | |
| Lenovo ThinkBook 16p G3 ARH | |
| Lenovo ThinkBook 16p G2 ACH | |
| Asus ROG Zephyrus G14 GA402RJ | |
| Lenovo IdeaPad 5 Pro 16ACH | |
| Lenovo Legion 5 Pro 16 ARH7H-82RG0047GE | |
| Aorus 15P XC | |
| Acer Swift X SFX16-51G-5388 | |
| Cinebench R15 / CPU Single 64Bit | |
| Razer Blade 15 2022 | |
| HP Envy 16 h0112nr | |
| Lenovo Legion 5 Pro 16IAH7H | |
| Durchschnittliche AMD Ryzen 9 6900HX (241 - 261, n=19) | |
| Lenovo ThinkBook 16p G3 ARH | |
| Lenovo ThinkBook 16p G2 ACH | |
| Lenovo Legion 5 Pro 16 ARH7H-82RG0047GE | |
| Asus ROG Zephyrus G14 GA402RJ | |
| Lenovo IdeaPad 5 Pro 16ACH | |
| Acer Swift X SFX16-51G-5388 | |
| Aorus 15P XC | |
| Blender / v2.79 BMW27 CPU | |
| Acer Swift X SFX16-51G-5388 | |
| Aorus 15P XC | |
| Lenovo Legion 5 Pro 16 ARH7H-82RG0047GE | |
| Lenovo IdeaPad 5 Pro 16ACH | |
| Asus ROG Zephyrus G14 GA402RJ | |
| HP Envy 16 h0112nr | |
| Lenovo ThinkBook 16p G3 ARH | |
| Durchschnittliche AMD Ryzen 9 6900HX (212 - 357, n=21) | |
| Lenovo ThinkBook 16p G2 ACH | |
| Razer Blade 15 2022 | |
| Lenovo Legion 5 Pro 16IAH7H | |
| 7-Zip 18.03 / 7z b 4 | |
| Lenovo Legion 5 Pro 16IAH7H | |
| Razer Blade 15 2022 | |
| Durchschnittliche AMD Ryzen 9 6900HX (49526 - 65336, n=20) | |
| Lenovo ThinkBook 16p G2 ACH | |
| Asus ROG Zephyrus G14 GA402RJ | |
| Lenovo ThinkBook 16p G3 ARH | |
| HP Envy 16 h0112nr | |
| Lenovo IdeaPad 5 Pro 16ACH | |
| Lenovo Legion 5 Pro 16 ARH7H-82RG0047GE | |
| Aorus 15P XC | |
| Acer Swift X SFX16-51G-5388 | |
| 7-Zip 18.03 / 7z b 4 -mmt1 | |
| Durchschnittliche AMD Ryzen 9 6900HX (5090 - 6070, n=20) | |
| Lenovo ThinkBook 16p G2 ACH | |
| Razer Blade 15 2022 | |
| HP Envy 16 h0112nr | |
| Lenovo Legion 5 Pro 16 ARH7H-82RG0047GE | |
| Asus ROG Zephyrus G14 GA402RJ | |
| Lenovo Legion 5 Pro 16IAH7H | |
| Lenovo IdeaPad 5 Pro 16ACH | |
| Aorus 15P XC | |
| Lenovo ThinkBook 16p G3 ARH | |
| Acer Swift X SFX16-51G-5388 | |
| Geekbench 5.5 / Multi-Core | |
| Lenovo Legion 5 Pro 16IAH7H | |
| HP Envy 16 h0112nr | |
| Razer Blade 15 2022 | |
| Durchschnittliche AMD Ryzen 9 6900HX (8313 - 10490, n=21) | |
| Lenovo ThinkBook 16p G3 ARH | |
| Asus ROG Zephyrus G14 GA402RJ | |
| Lenovo ThinkBook 16p G2 ACH | |
| Aorus 15P XC | |
| Lenovo Legion 5 Pro 16 ARH7H-82RG0047GE | |
| Lenovo IdeaPad 5 Pro 16ACH | |
| Acer Swift X SFX16-51G-5388 | |
| Geekbench 5.5 / Single-Core | |
| HP Envy 16 h0112nr | |
| Razer Blade 15 2022 | |
| Lenovo Legion 5 Pro 16IAH7H | |
| Durchschnittliche AMD Ryzen 9 6900HX (1523 - 1652, n=21) | |
| Lenovo ThinkBook 16p G3 ARH | |
| Lenovo ThinkBook 16p G2 ACH | |
| Acer Swift X SFX16-51G-5388 | |
| Asus ROG Zephyrus G14 GA402RJ | |
| Lenovo Legion 5 Pro 16 ARH7H-82RG0047GE | |
| Lenovo IdeaPad 5 Pro 16ACH | |
| Aorus 15P XC | |
| HWBOT x265 Benchmark v2.2 / 4k Preset | |
| Lenovo Legion 5 Pro 16IAH7H | |
| Razer Blade 15 2022 | |
| Lenovo ThinkBook 16p G3 ARH | |
| Durchschnittliche AMD Ryzen 9 6900HX (12.6 - 18.7, n=20) | |
| Lenovo ThinkBook 16p G2 ACH | |
| Asus ROG Zephyrus G14 GA402RJ | |
| HP Envy 16 h0112nr | |
| Lenovo Legion 5 Pro 16 ARH7H-82RG0047GE | |
| Lenovo IdeaPad 5 Pro 16ACH | |
| Aorus 15P XC | |
| Acer Swift X SFX16-51G-5388 | |
| LibreOffice / 20 Documents To PDF | |
| Lenovo Legion 5 Pro 16 ARH7H-82RG0047GE | |
| Lenovo ThinkBook 16p G3 ARH | |
| Asus ROG Zephyrus G14 GA402RJ | |
| Lenovo ThinkBook 16p G2 ACH | |
| Aorus 15P XC | |
| Durchschnittliche AMD Ryzen 9 6900HX (44.8 - 81.7, n=20) | |
| Razer Blade 15 2022 | |
| Acer Swift X SFX16-51G-5388 | |
| Lenovo IdeaPad 5 Pro 16ACH | |
| HP Envy 16 h0112nr | |
| Lenovo Legion 5 Pro 16IAH7H | |
| R Benchmark 2.5 / Overall mean | |
| Acer Swift X SFX16-51G-5388 | |
| Aorus 15P XC | |
| Lenovo IdeaPad 5 Pro 16ACH | |
| Asus ROG Zephyrus G14 GA402RJ | |
| Lenovo Legion 5 Pro 16 ARH7H-82RG0047GE | |
| Lenovo ThinkBook 16p G2 ACH | |
| Lenovo ThinkBook 16p G3 ARH | |
| Durchschnittliche AMD Ryzen 9 6900HX (0.4627 - 0.4974, n=20) | |
| Lenovo Legion 5 Pro 16IAH7H | |
| Razer Blade 15 2022 | |
| HP Envy 16 h0112nr | |
* ... kleinere Werte sind besser
AIDA64: FP32 Ray-Trace | FPU Julia | CPU SHA3 | CPU Queen | FPU SinJulia | FPU Mandel | CPU AES | CPU ZLib | FP64 Ray-Trace | CPU PhotoWorxx
| Performance Rating | |
| Durchschnittliche AMD Ryzen 9 6900HX | |
| Lenovo ThinkBook 16p G2 ACH | |
| Lenovo ThinkBook 16p G3 ARH | |
| Lenovo Legion 5 Pro 16IAH7H | |
| HP Envy 16 h0112nr | |
| Lenovo IdeaPad 5 Pro 16ARH7 | |
| Acer Swift X SFX16-51G-5388 | |
| AIDA64 / FP32 Ray-Trace | |
| Lenovo ThinkBook 16p G3 ARH | |
| Lenovo ThinkBook 16p G2 ACH | |
| Durchschnittliche AMD Ryzen 9 6900HX (10950 - 17963, n=20) | |
| Lenovo Legion 5 Pro 16IAH7H | |
| Lenovo Legion 5 Pro 16IAH7H | |
| HP Envy 16 h0112nr | |
| Lenovo IdeaPad 5 Pro 16ARH7 | |
| Acer Swift X SFX16-51G-5388 | |
| AIDA64 / FPU Julia | |
| Lenovo ThinkBook 16p G3 ARH | |
| Lenovo ThinkBook 16p G2 ACH | |
| Durchschnittliche AMD Ryzen 9 6900HX (71414 - 110797, n=20) | |
| Lenovo Legion 5 Pro 16IAH7H | |
| Lenovo Legion 5 Pro 16IAH7H | |
| Lenovo IdeaPad 5 Pro 16ARH7 | |
| HP Envy 16 h0112nr | |
| Acer Swift X SFX16-51G-5388 | |
| AIDA64 / CPU SHA3 | |
| Lenovo Legion 5 Pro 16IAH7H | |
| Lenovo Legion 5 Pro 16IAH7H | |
| Lenovo ThinkBook 16p G2 ACH | |
| Durchschnittliche AMD Ryzen 9 6900HX (2471 - 3804, n=20) | |
| Lenovo ThinkBook 16p G3 ARH | |
| HP Envy 16 h0112nr | |
| Lenovo IdeaPad 5 Pro 16ARH7 | |
| Acer Swift X SFX16-51G-5388 | |
| AIDA64 / CPU Queen | |
| Lenovo ThinkBook 16p G3 ARH | |
| Lenovo ThinkBook 16p G2 ACH | |
| HP Envy 16 h0112nr | |
| Durchschnittliche AMD Ryzen 9 6900HX (84185 - 107544, n=20) | |
| Lenovo Legion 5 Pro 16IAH7H | |
| Lenovo IdeaPad 5 Pro 16ARH7 | |
| Acer Swift X SFX16-51G-5388 | |
| AIDA64 / FPU SinJulia | |
| Lenovo ThinkBook 16p G3 ARH | |
| Durchschnittliche AMD Ryzen 9 6900HX (10970 - 13205, n=20) | |
| Lenovo ThinkBook 16p G2 ACH | |
| Lenovo Legion 5 Pro 16IAH7H | |
| Lenovo Legion 5 Pro 16IAH7H | |
| Lenovo IdeaPad 5 Pro 16ARH7 | |
| HP Envy 16 h0112nr | |
| Acer Swift X SFX16-51G-5388 | |
| AIDA64 / FPU Mandel | |
| Lenovo ThinkBook 16p G3 ARH | |
| Lenovo ThinkBook 16p G2 ACH | |
| Durchschnittliche AMD Ryzen 9 6900HX (39164 - 61370, n=20) | |
| Lenovo IdeaPad 5 Pro 16ARH7 | |
| Lenovo Legion 5 Pro 16IAH7H | |
| Lenovo Legion 5 Pro 16IAH7H | |
| HP Envy 16 h0112nr | |
| Acer Swift X SFX16-51G-5388 | |
| AIDA64 / CPU AES | |
| Lenovo ThinkBook 16p G2 ACH | |
| Lenovo Legion 5 Pro 16IAH7H | |
| Lenovo Legion 5 Pro 16IAH7H | |
| Durchschnittliche AMD Ryzen 9 6900HX (54613 - 142360, n=20) | |
| HP Envy 16 h0112nr | |
| Acer Swift X SFX16-51G-5388 | |
| Lenovo ThinkBook 16p G3 ARH | |
| Lenovo IdeaPad 5 Pro 16ARH7 | |
| AIDA64 / CPU ZLib | |
| Lenovo Legion 5 Pro 16IAH7H | |
| Lenovo Legion 5 Pro 16IAH7H | |
| Lenovo ThinkBook 16p G3 ARH | |
| Lenovo ThinkBook 16p G2 ACH | |
| HP Envy 16 h0112nr | |
| Durchschnittliche AMD Ryzen 9 6900HX (578 - 911, n=20) | |
| Lenovo IdeaPad 5 Pro 16ARH7 | |
| Acer Swift X SFX16-51G-5388 | |
| AIDA64 / FP64 Ray-Trace | |
| Lenovo ThinkBook 16p G3 ARH | |
| Lenovo ThinkBook 16p G2 ACH | |
| Durchschnittliche AMD Ryzen 9 6900HX (5798 - 9540, n=20) | |
| Lenovo Legion 5 Pro 16IAH7H | |
| Lenovo Legion 5 Pro 16IAH7H | |
| HP Envy 16 h0112nr | |
| Lenovo IdeaPad 5 Pro 16ARH7 | |
| Acer Swift X SFX16-51G-5388 | |
| AIDA64 / CPU PhotoWorxx | |
| HP Envy 16 h0112nr | |
| Acer Swift X SFX16-51G-5388 | |
| Lenovo Legion 5 Pro 16IAH7H | |
| Lenovo Legion 5 Pro 16IAH7H | |
| Durchschnittliche AMD Ryzen 9 6900HX (26873 - 30604, n=20) | |
| Lenovo IdeaPad 5 Pro 16ARH7 | |
| Lenovo ThinkBook 16p G3 ARH | |
| Lenovo ThinkBook 16p G2 ACH | |
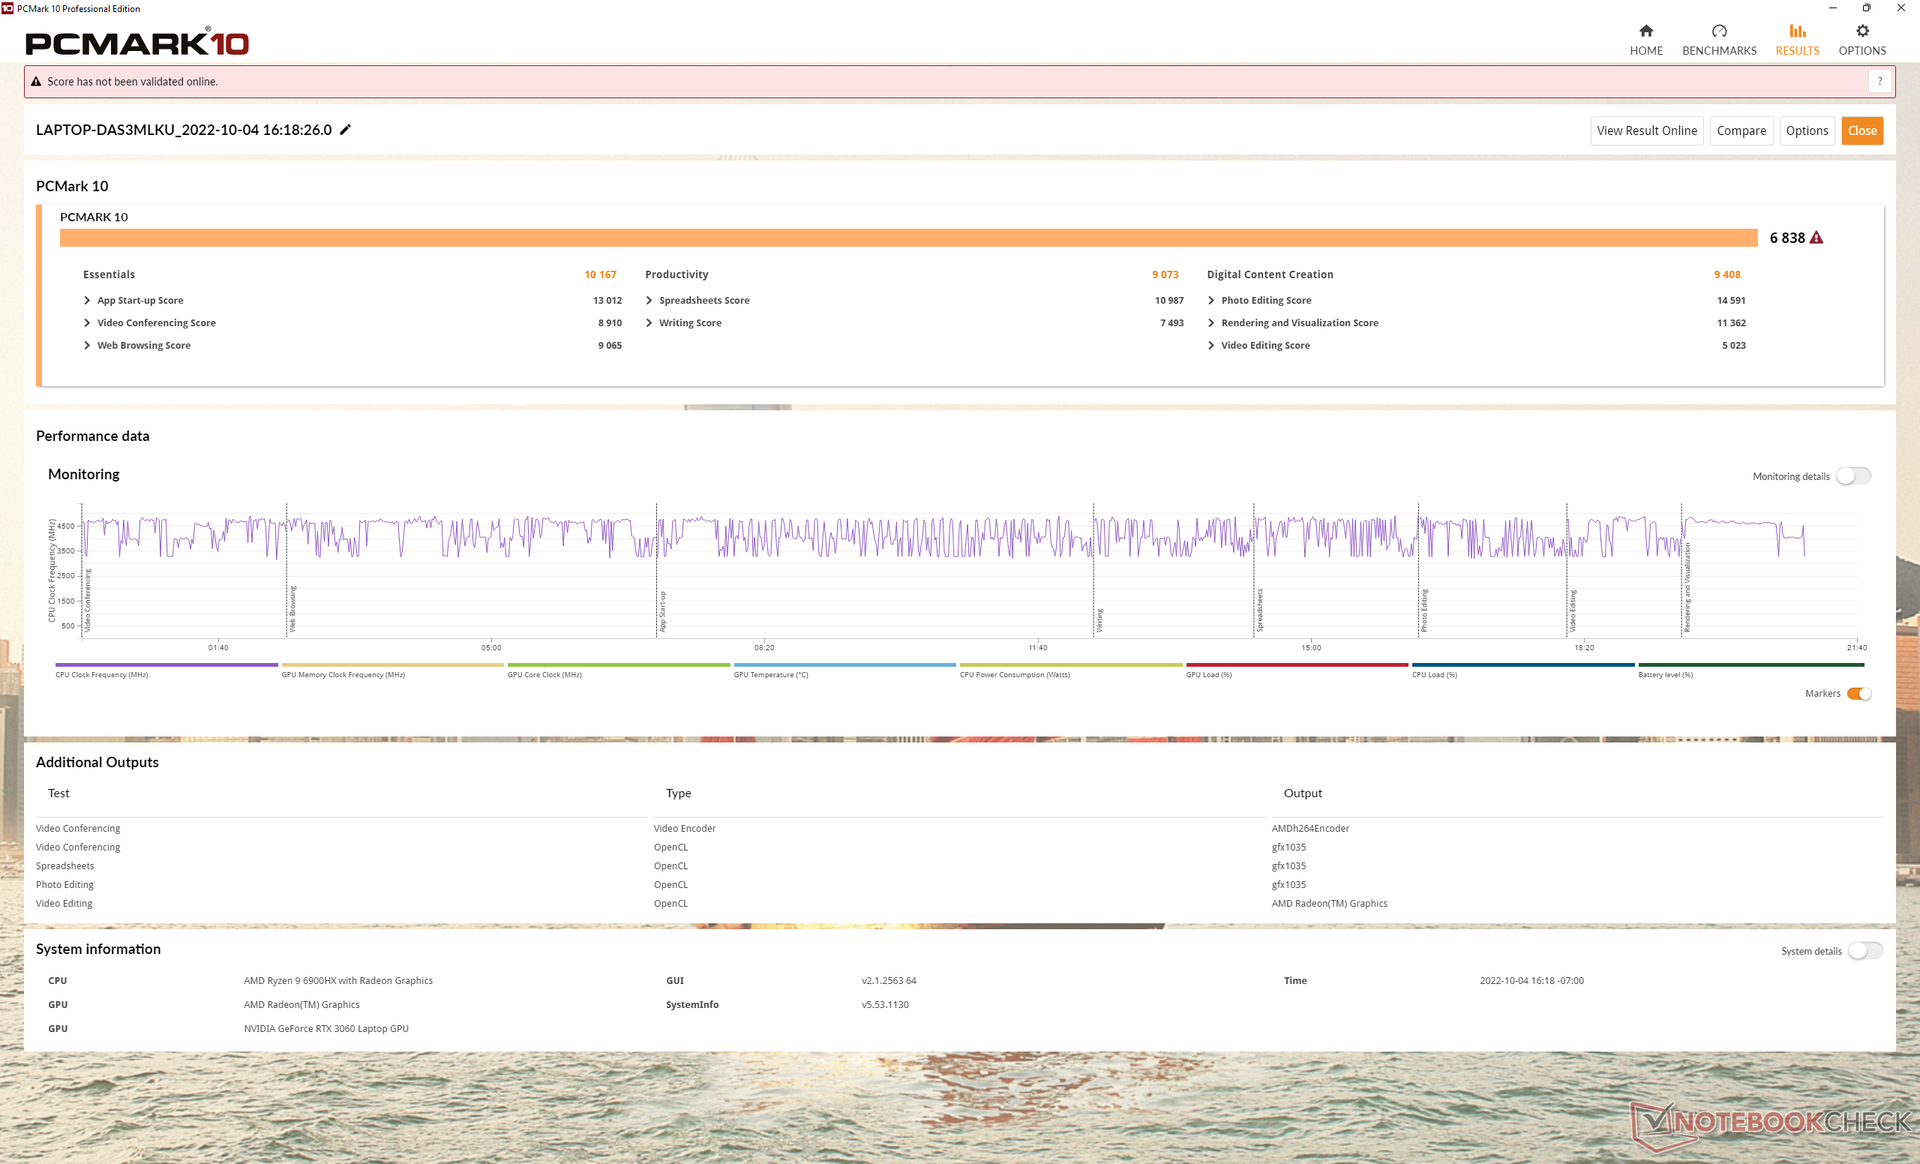
Systemleistung
Im PCMark sind die Ergebnisse nahezu identisch zum ThinkBook 16p Gen 2, da die CPU-Leistung kaum gestiegen ist, wie wir weiter oben erwähnt haben.
CrossMark: Overall | Productivity | Creativity | Responsiveness
| PCMark 10 / Score | |
| HP Envy 16 h0112nr | |
| Lenovo Legion 5 Pro 16IAH7H | |
| Lenovo ThinkBook 16p G3 ARH | |
| Durchschnittliche AMD Ryzen 9 6900HX, NVIDIA GeForce RTX 3060 Laptop GPU (n=1) | |
| Lenovo ThinkBook 16p G2 ACH | |
| Lenovo IdeaPad 5 Pro 16ARH7 | |
| Acer Swift X SFX16-51G-5388 | |
| PCMark 10 / Essentials | |
| HP Envy 16 h0112nr | |
| Lenovo Legion 5 Pro 16IAH7H | |
| Lenovo ThinkBook 16p G2 ACH | |
| Lenovo ThinkBook 16p G3 ARH | |
| Durchschnittliche AMD Ryzen 9 6900HX, NVIDIA GeForce RTX 3060 Laptop GPU (n=1) | |
| Lenovo IdeaPad 5 Pro 16ARH7 | |
| Acer Swift X SFX16-51G-5388 | |
| PCMark 10 / Productivity | |
| Lenovo Legion 5 Pro 16IAH7H | |
| HP Envy 16 h0112nr | |
| Lenovo ThinkBook 16p G2 ACH | |
| Lenovo ThinkBook 16p G3 ARH | |
| Durchschnittliche AMD Ryzen 9 6900HX, NVIDIA GeForce RTX 3060 Laptop GPU (n=1) | |
| Lenovo IdeaPad 5 Pro 16ARH7 | |
| Acer Swift X SFX16-51G-5388 | |
| PCMark 10 / Digital Content Creation | |
| Lenovo Legion 5 Pro 16IAH7H | |
| HP Envy 16 h0112nr | |
| Lenovo ThinkBook 16p G3 ARH | |
| Durchschnittliche AMD Ryzen 9 6900HX, NVIDIA GeForce RTX 3060 Laptop GPU (n=1) | |
| Lenovo ThinkBook 16p G2 ACH | |
| Acer Swift X SFX16-51G-5388 | |
| Lenovo IdeaPad 5 Pro 16ARH7 | |
| CrossMark / Overall | |
| HP Envy 16 h0112nr | |
| Lenovo Legion 5 Pro 16IAH7H | |
| Lenovo ThinkBook 16p G3 ARH | |
| Durchschnittliche AMD Ryzen 9 6900HX, NVIDIA GeForce RTX 3060 Laptop GPU (n=1) | |
| Acer Swift X SFX16-51G-5388 | |
| CrossMark / Productivity | |
| HP Envy 16 h0112nr | |
| Lenovo Legion 5 Pro 16IAH7H | |
| Lenovo ThinkBook 16p G3 ARH | |
| Durchschnittliche AMD Ryzen 9 6900HX, NVIDIA GeForce RTX 3060 Laptop GPU (n=1) | |
| Acer Swift X SFX16-51G-5388 | |
| CrossMark / Creativity | |
| HP Envy 16 h0112nr | |
| Lenovo Legion 5 Pro 16IAH7H | |
| Lenovo ThinkBook 16p G3 ARH | |
| Durchschnittliche AMD Ryzen 9 6900HX, NVIDIA GeForce RTX 3060 Laptop GPU (n=1) | |
| Acer Swift X SFX16-51G-5388 | |
| CrossMark / Responsiveness | |
| Lenovo Legion 5 Pro 16IAH7H | |
| HP Envy 16 h0112nr | |
| Lenovo ThinkBook 16p G3 ARH | |
| Durchschnittliche AMD Ryzen 9 6900HX, NVIDIA GeForce RTX 3060 Laptop GPU (n=1) | |
| Acer Swift X SFX16-51G-5388 | |
| PCMark 10 Score | 6838 Punkte | |
Hilfe | ||
| AIDA64 / Memory Copy | |
| HP Envy 16 h0112nr | |
| Acer Swift X SFX16-51G-5388 | |
| Lenovo Legion 5 Pro 16IAH7H | |
| Lenovo Legion 5 Pro 16IAH7H | |
| Lenovo IdeaPad 5 Pro 16ARH7 | |
| Durchschnittliche AMD Ryzen 9 6900HX (47938 - 53345, n=20) | |
| Lenovo ThinkBook 16p G3 ARH | |
| Lenovo ThinkBook 16p G2 ACH | |
| AIDA64 / Memory Read | |
| HP Envy 16 h0112nr | |
| Lenovo Legion 5 Pro 16IAH7H | |
| Lenovo Legion 5 Pro 16IAH7H | |
| Acer Swift X SFX16-51G-5388 | |
| Durchschnittliche AMD Ryzen 9 6900HX (43892 - 53321, n=20) | |
| Lenovo ThinkBook 16p G2 ACH | |
| Lenovo IdeaPad 5 Pro 16ARH7 | |
| Lenovo ThinkBook 16p G3 ARH | |
| AIDA64 / Memory Write | |
| Lenovo IdeaPad 5 Pro 16ARH7 | |
| Acer Swift X SFX16-51G-5388 | |
| Lenovo Legion 5 Pro 16IAH7H | |
| Lenovo Legion 5 Pro 16IAH7H | |
| HP Envy 16 h0112nr | |
| Durchschnittliche AMD Ryzen 9 6900HX (51085 - 57202, n=20) | |
| Lenovo ThinkBook 16p G3 ARH | |
| Lenovo ThinkBook 16p G2 ACH | |
| AIDA64 / Memory Latency | |
| Lenovo ThinkBook 16p G3 ARH | |
| Lenovo IdeaPad 5 Pro 16ARH7 | |
| Lenovo Legion 5 Pro 16IAH7H | |
| Lenovo Legion 5 Pro 16IAH7H | |
| Acer Swift X SFX16-51G-5388 | |
| HP Envy 16 h0112nr | |
| Durchschnittliche AMD Ryzen 9 6900HX (80.7 - 120.6, n=20) | |
| Lenovo ThinkBook 16p G2 ACH | |
* ... kleinere Werte sind besser
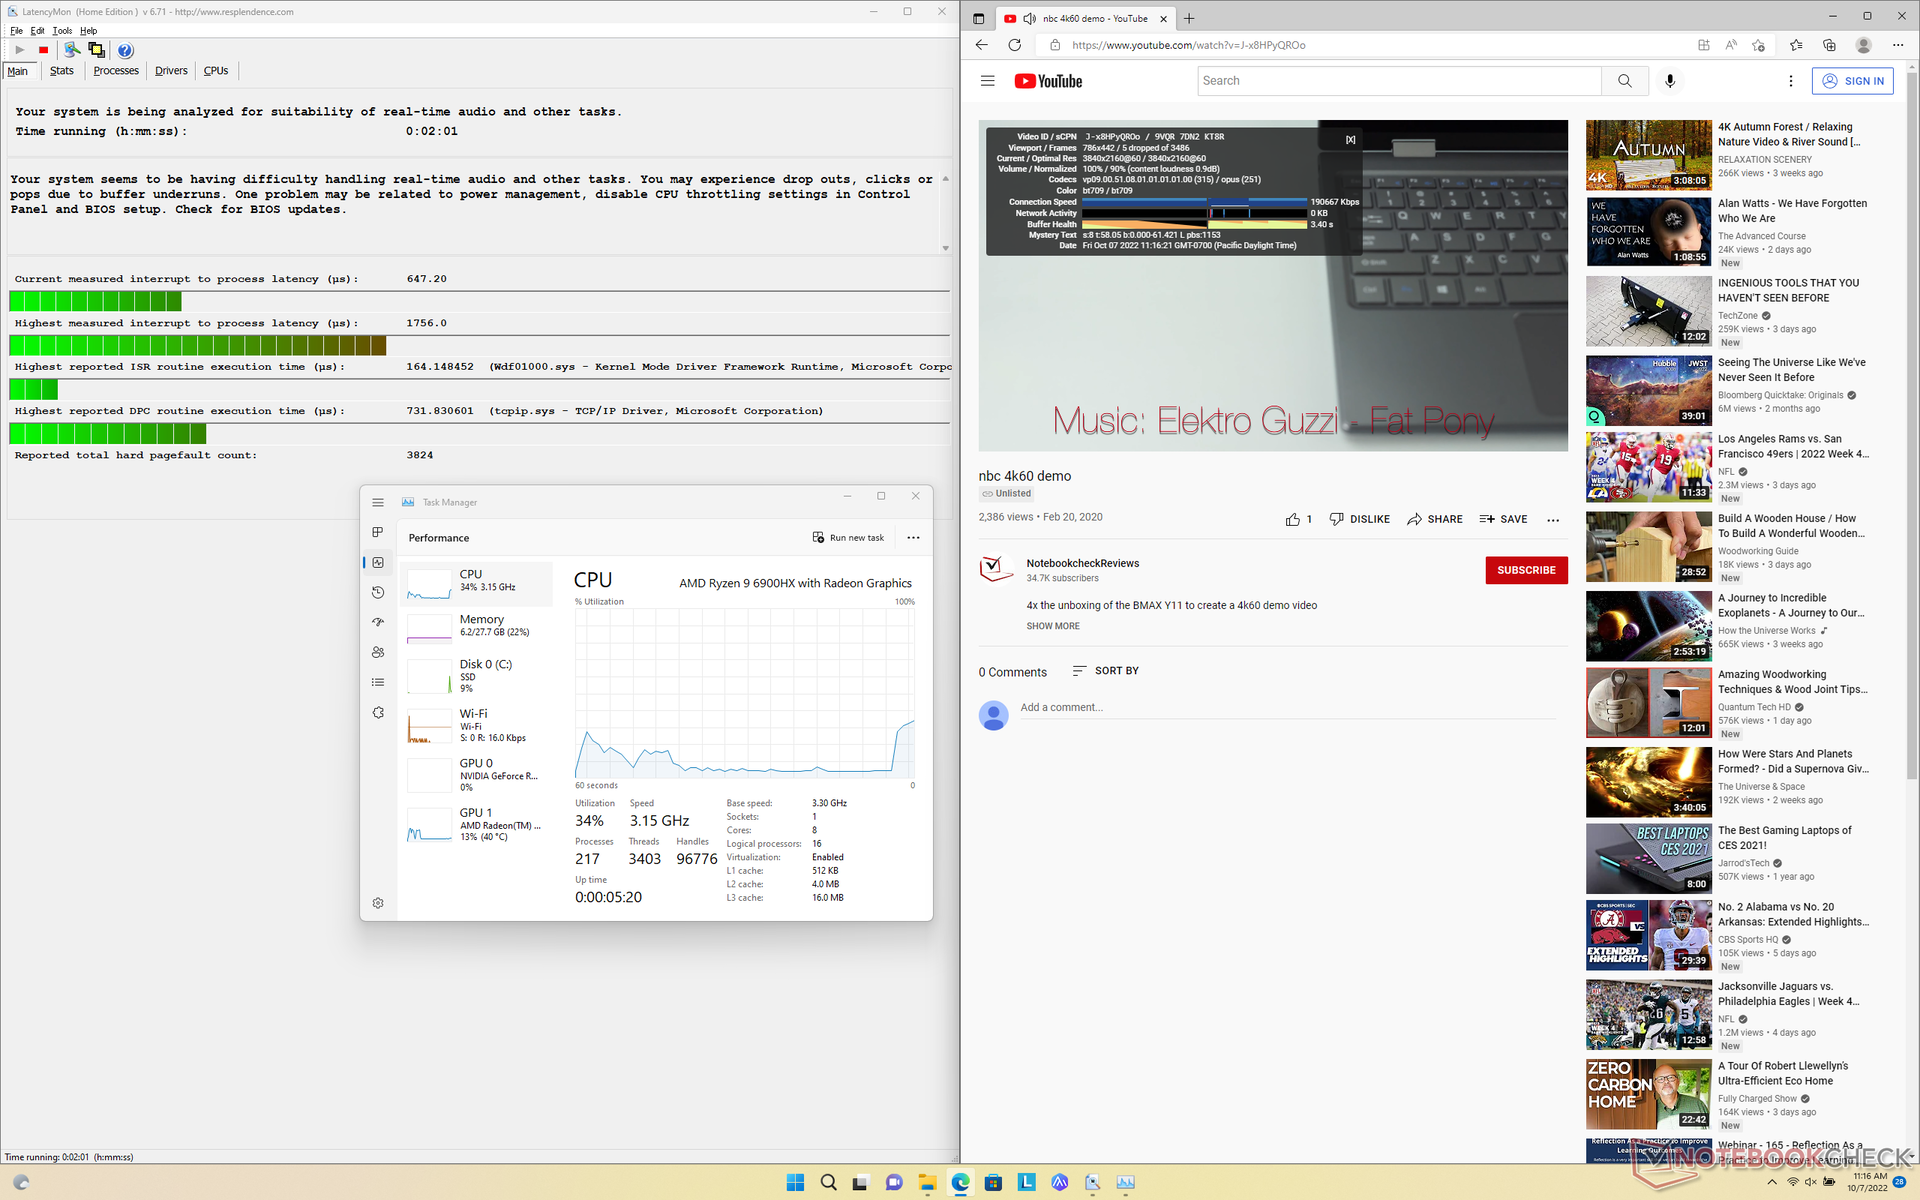
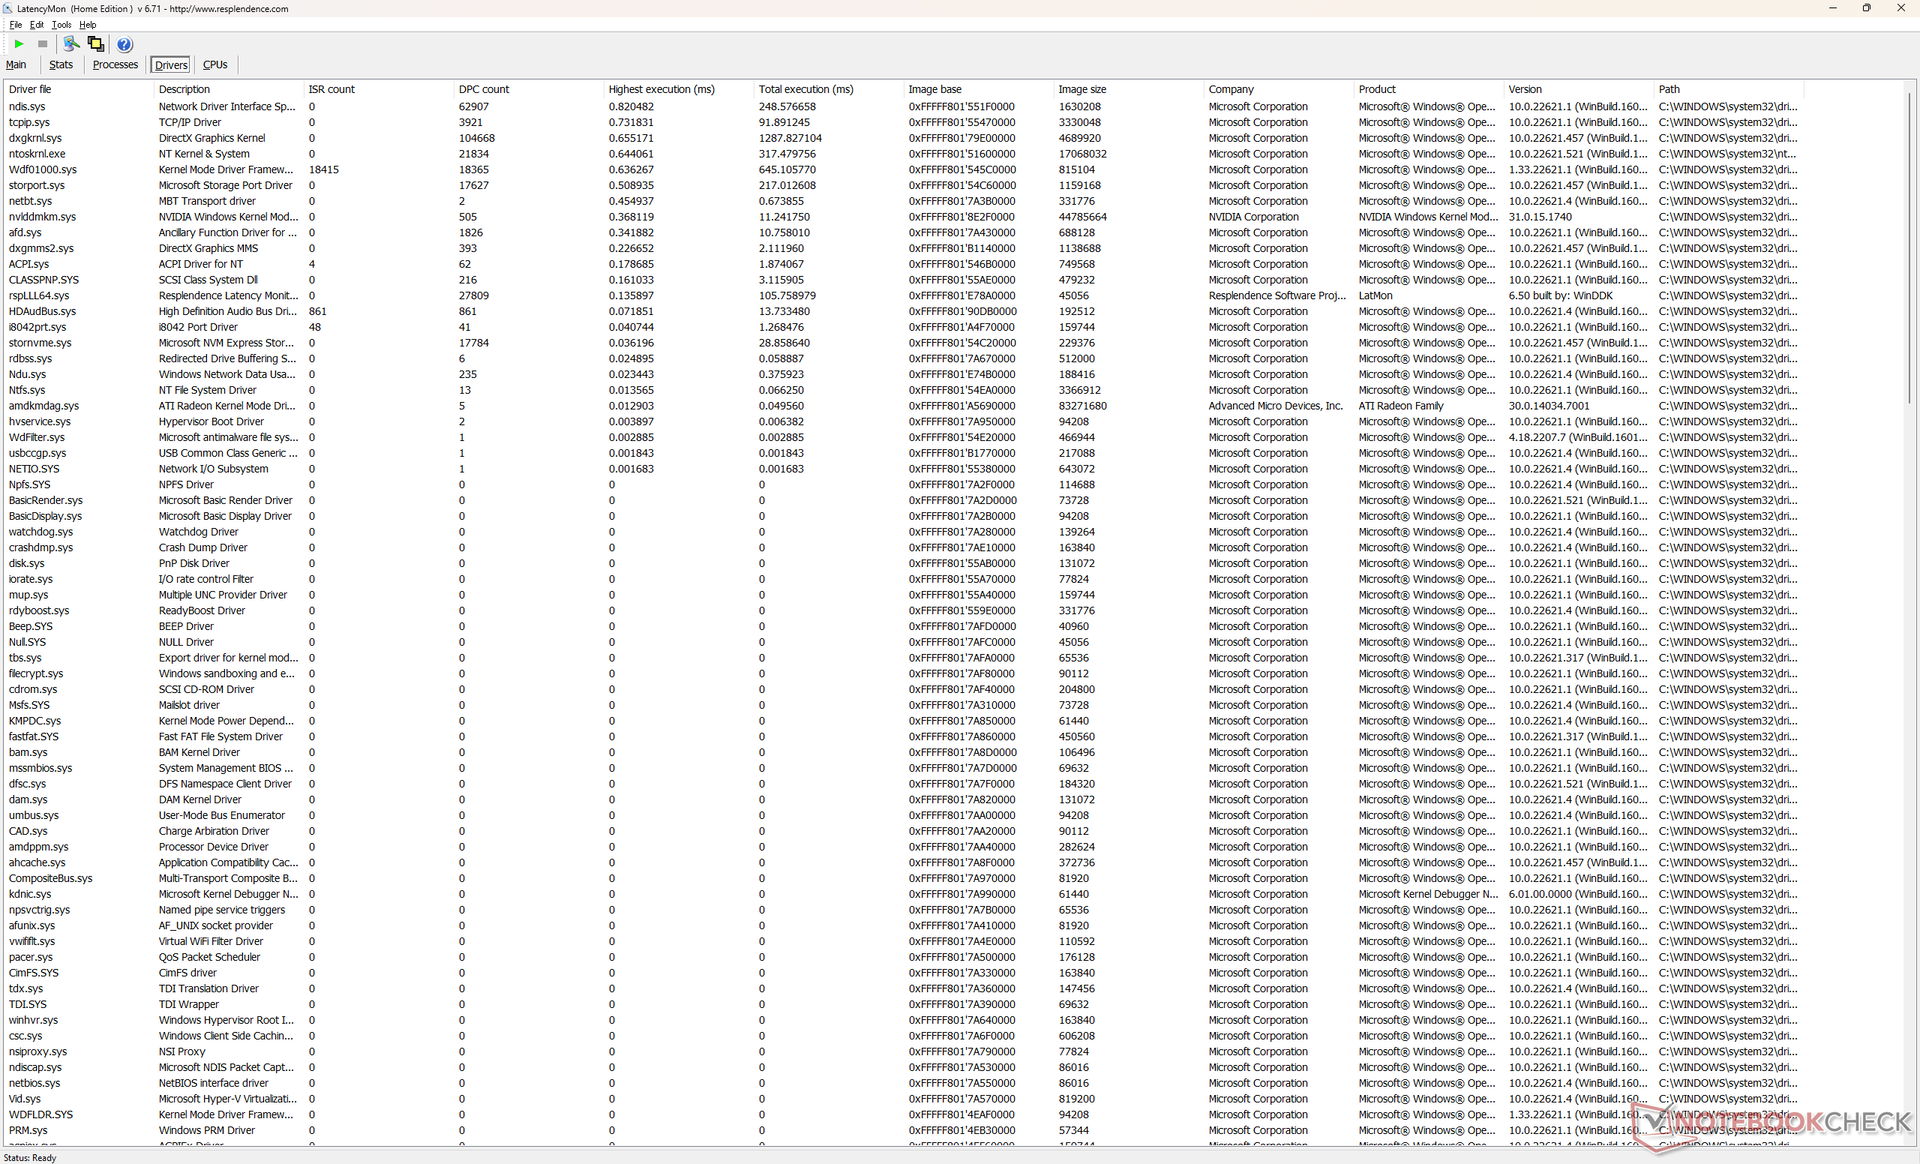
DPC Latency
LatencyMon deckt leichte DPC-Probleme beim Öffnen mehrerer Browsertabs auf unserer Homepage auf. Auch die Wiedergabe unseres 4K/60-fps-YouTubevideos ist mit 5 Dropped Frames leider nicht perfekt.
| DPC Latencies / LatencyMon - interrupt to process latency (max), Web, Youtube, Prime95 | |
| Acer Swift X SFX16-51G-5388 | |
| Lenovo ThinkBook 16p G3 ARH | |
| HP Envy 16 h0112nr | |
| Lenovo IdeaPad 5 Pro 16ARH7 | |
| Lenovo Legion 5 Pro 16IAH7H | |
| Lenovo ThinkBook 16p G2 ACH | |
* ... kleinere Werte sind besser
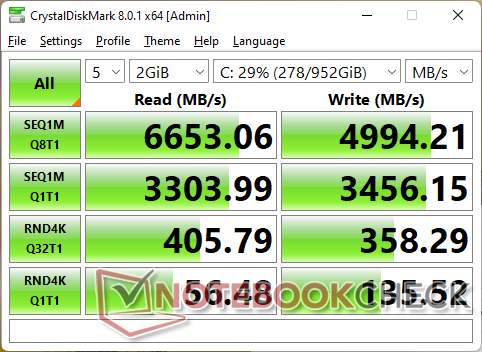
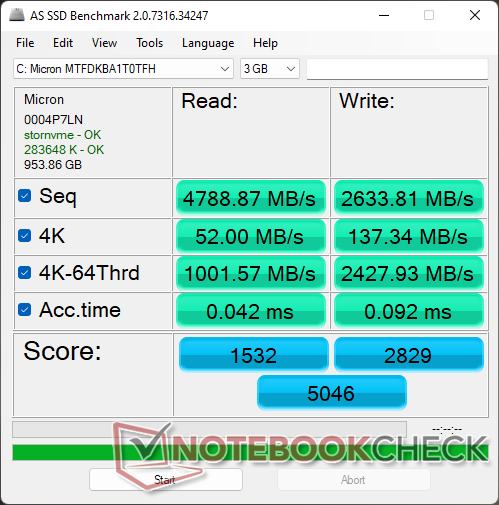
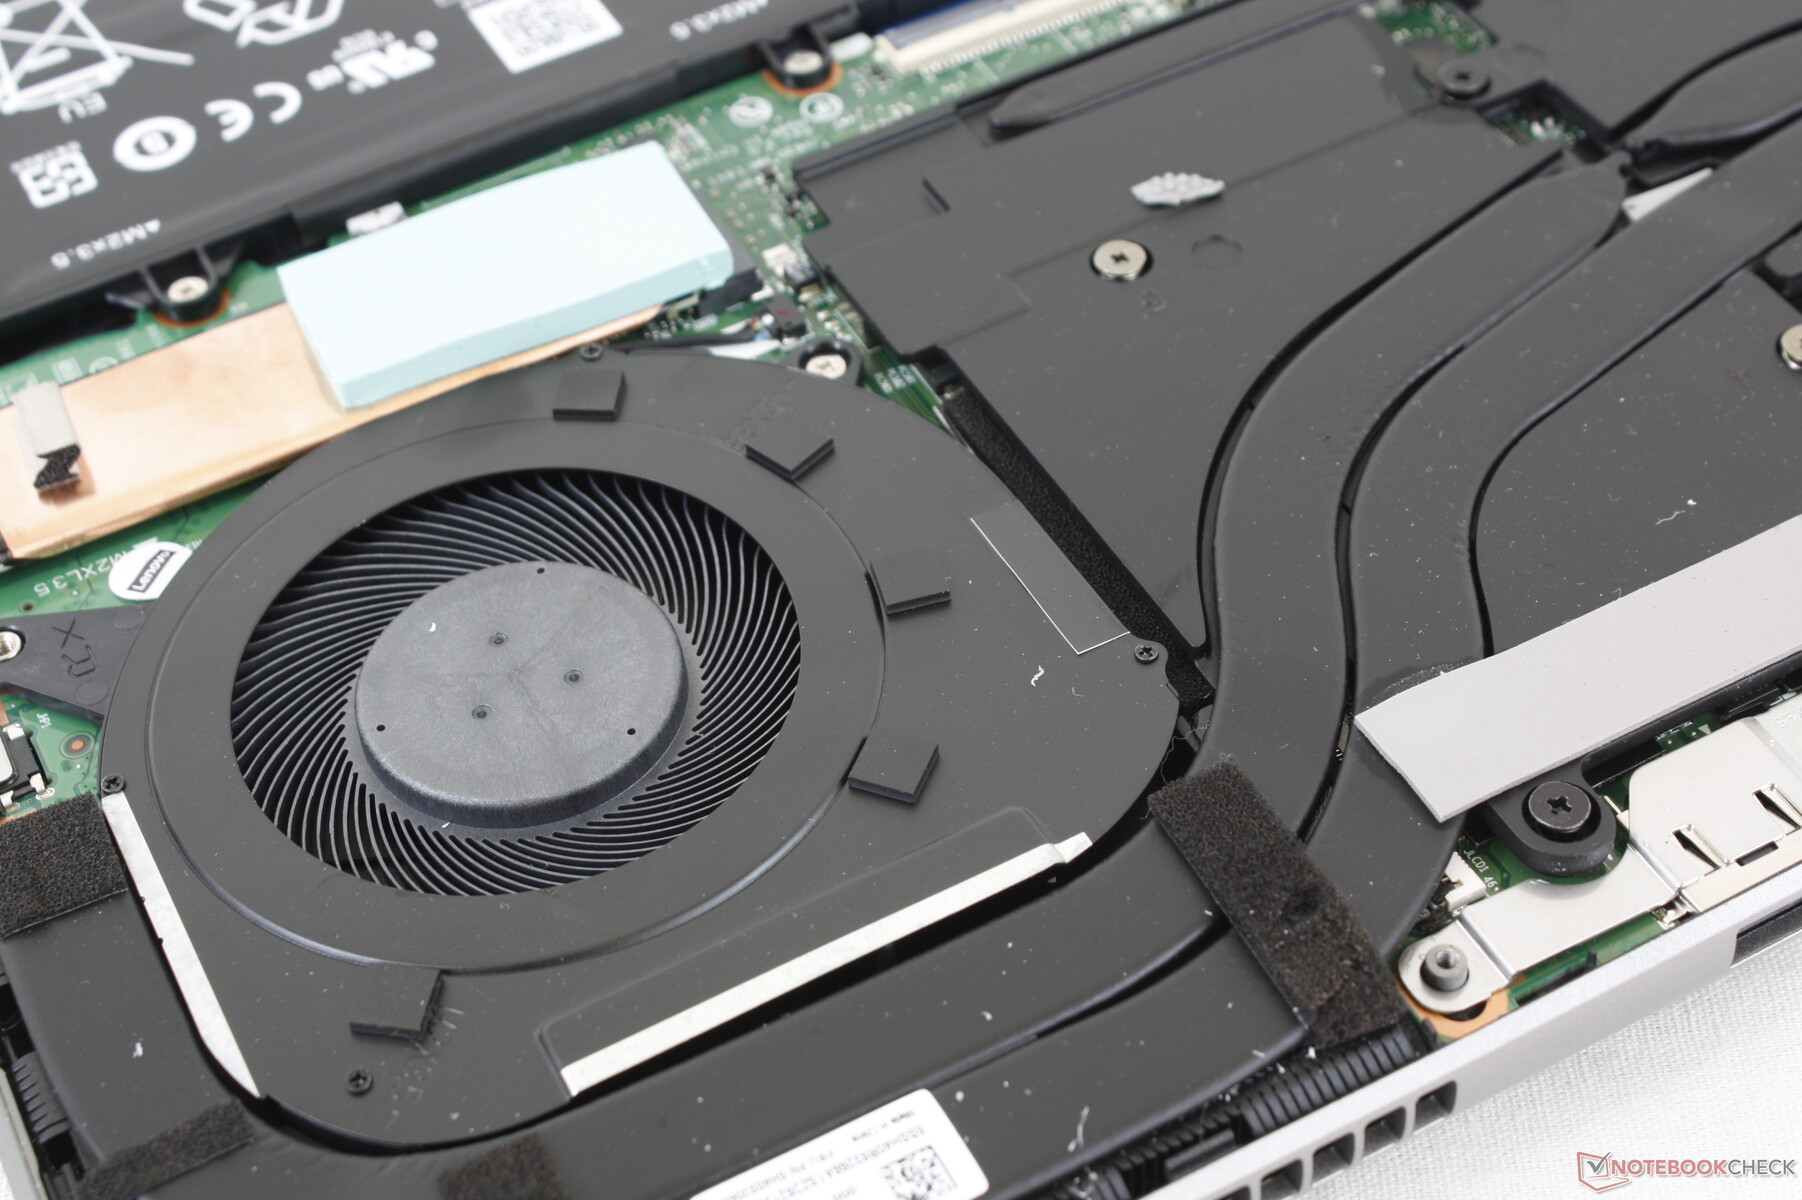
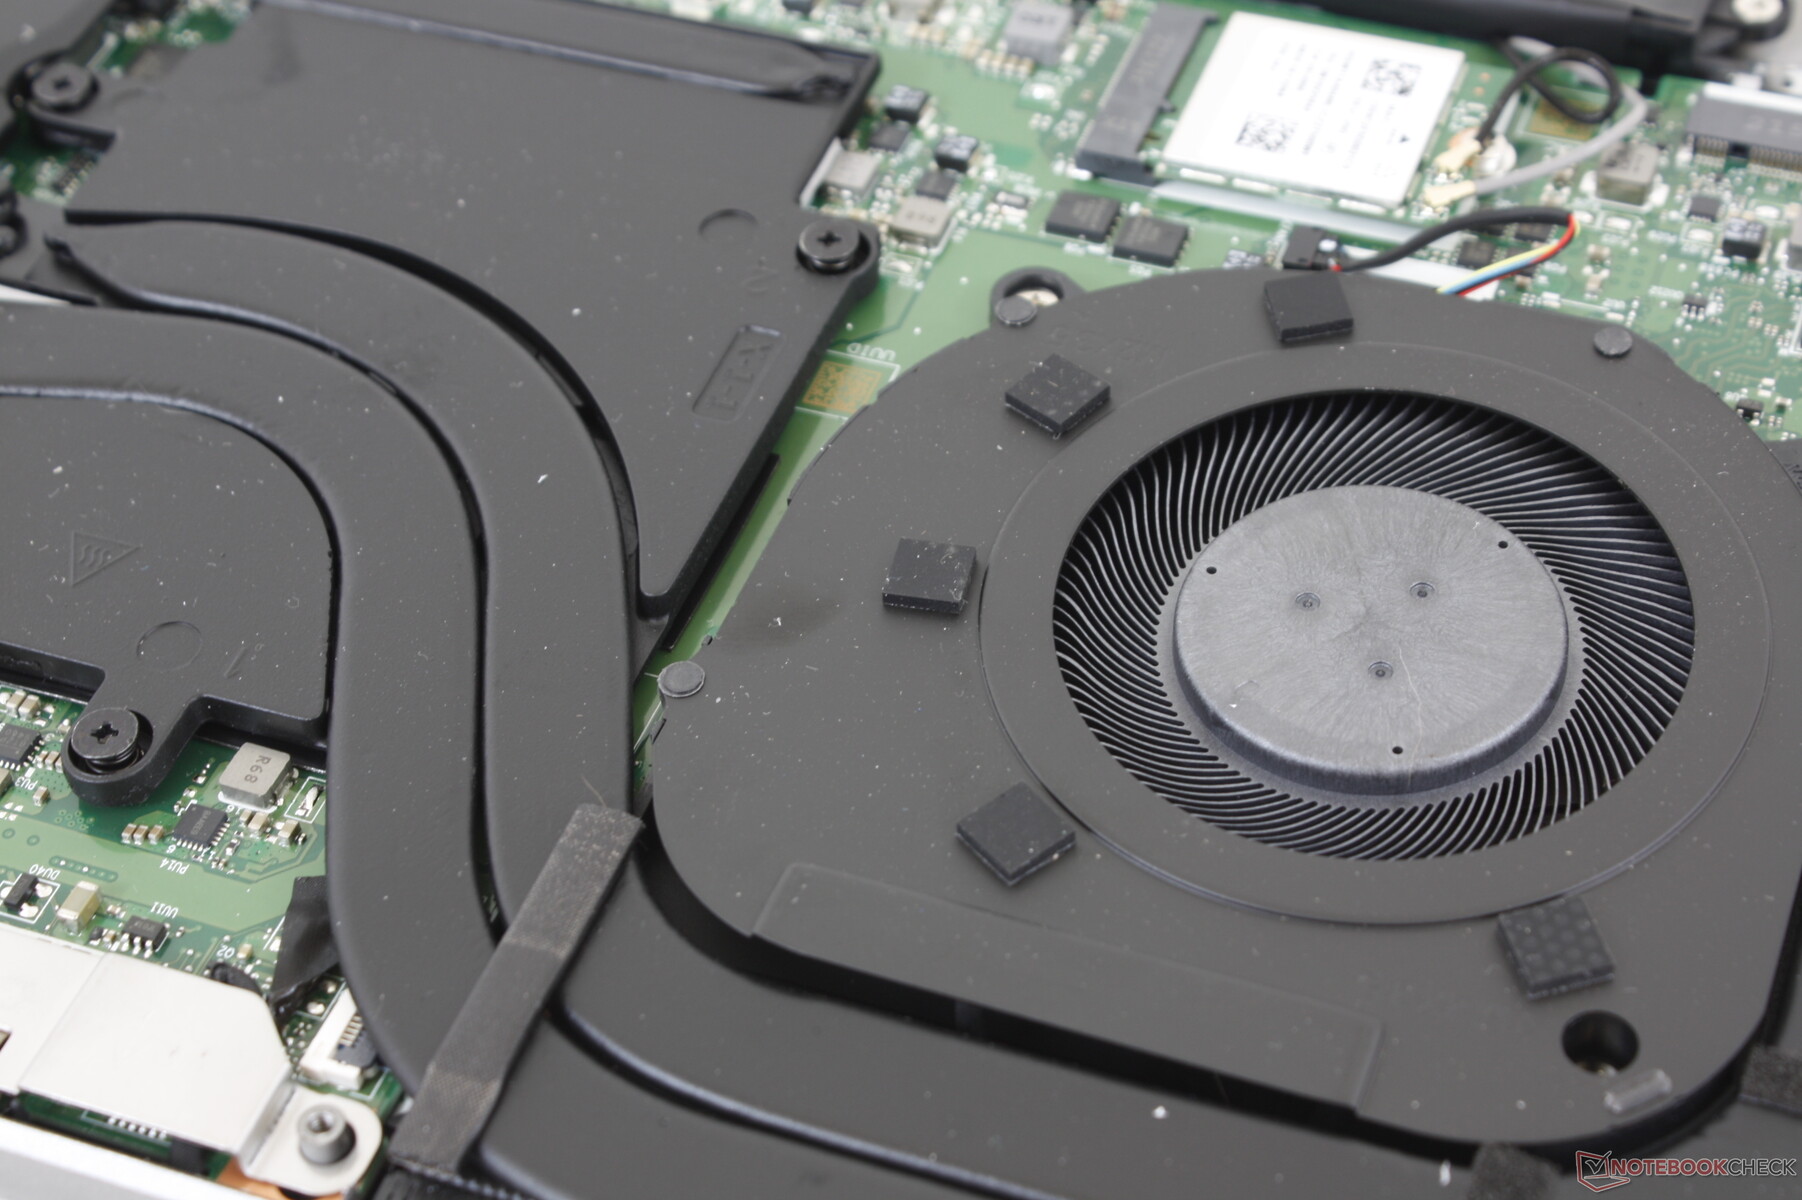
Massenspeicher
Die verbaute PCIe4-x4-SSD verfügt über einen eigenen Heatspreader und einem Kühlpad, was bei der Hitzeableitung sehr hilfreich ist. Daher zeigt unser Laufwerk auch keinerlei Drosselprobleme, wenn DiskSpd als Loop für längere Zeit läuft, siehe unten.

| Drive Performance Rating - Percent | |
| Lenovo Legion 5 Pro 16IAH7H | |
| Lenovo ThinkBook 16p G2 ACH | |
| HP Envy 16 h0112nr | |
| Lenovo ThinkBook 16p G3 ARH | |
| Lenovo IdeaPad 5 Pro 16ARH7 | |
| Acer Swift X SFX16-51G-5388 | |
* ... kleinere Werte sind besser
Disk Throttling: DiskSpd Read Loop, Queue Depth 8
Grafikleistung
Lenovo hebt die TGP der GeForce RTX 3060 von 75 W im Gen 2 auf nun 90 W im ThinkBook 16p Gen 3 an. Dennoch fällt die Leistung bestenfalls 10 Prozent schneller aus.
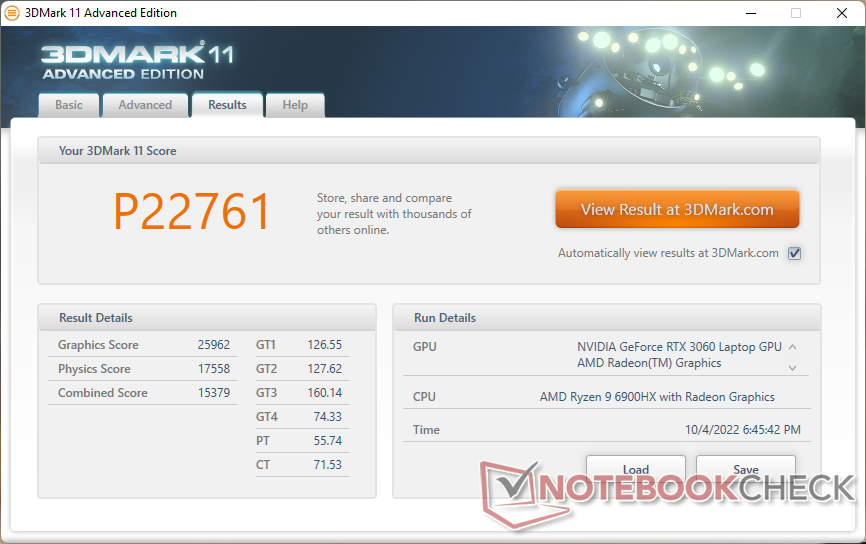
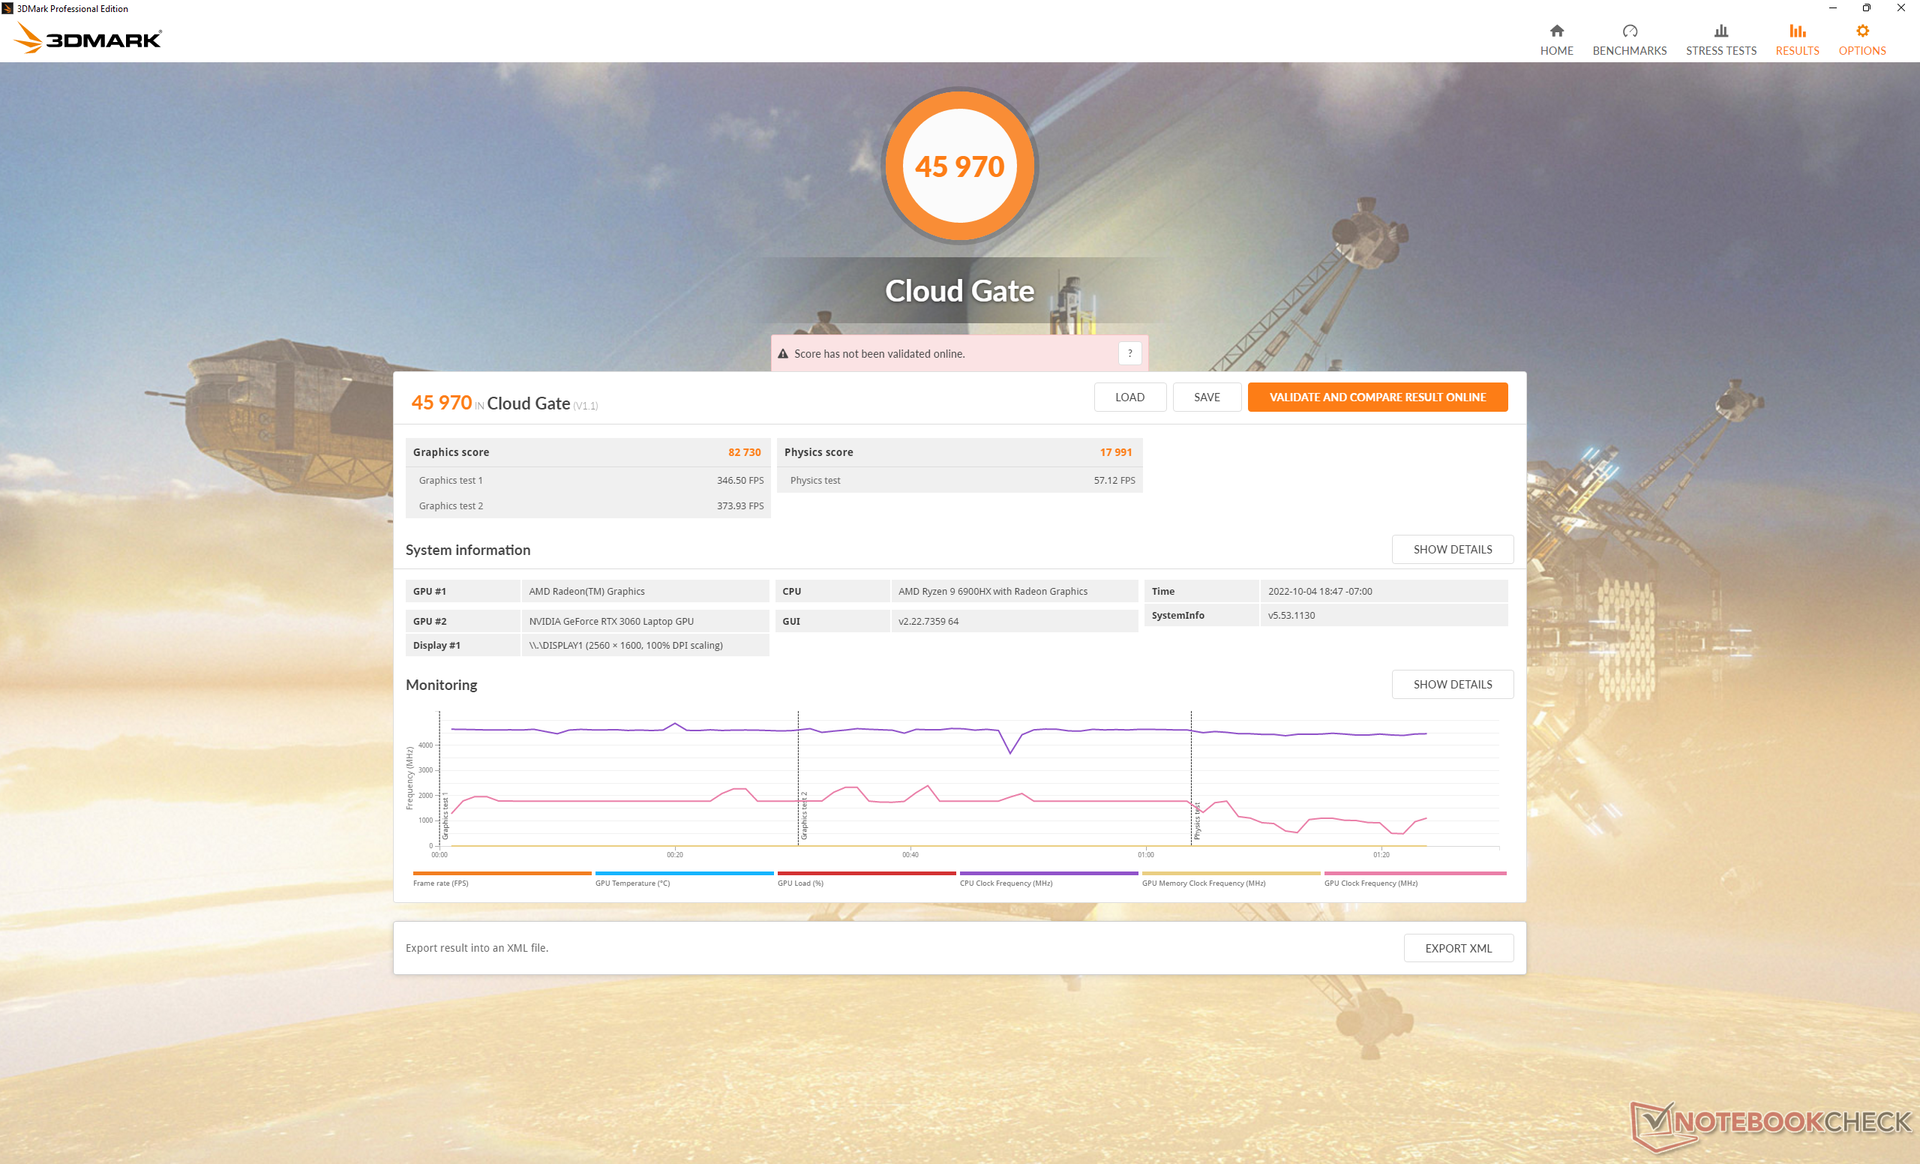
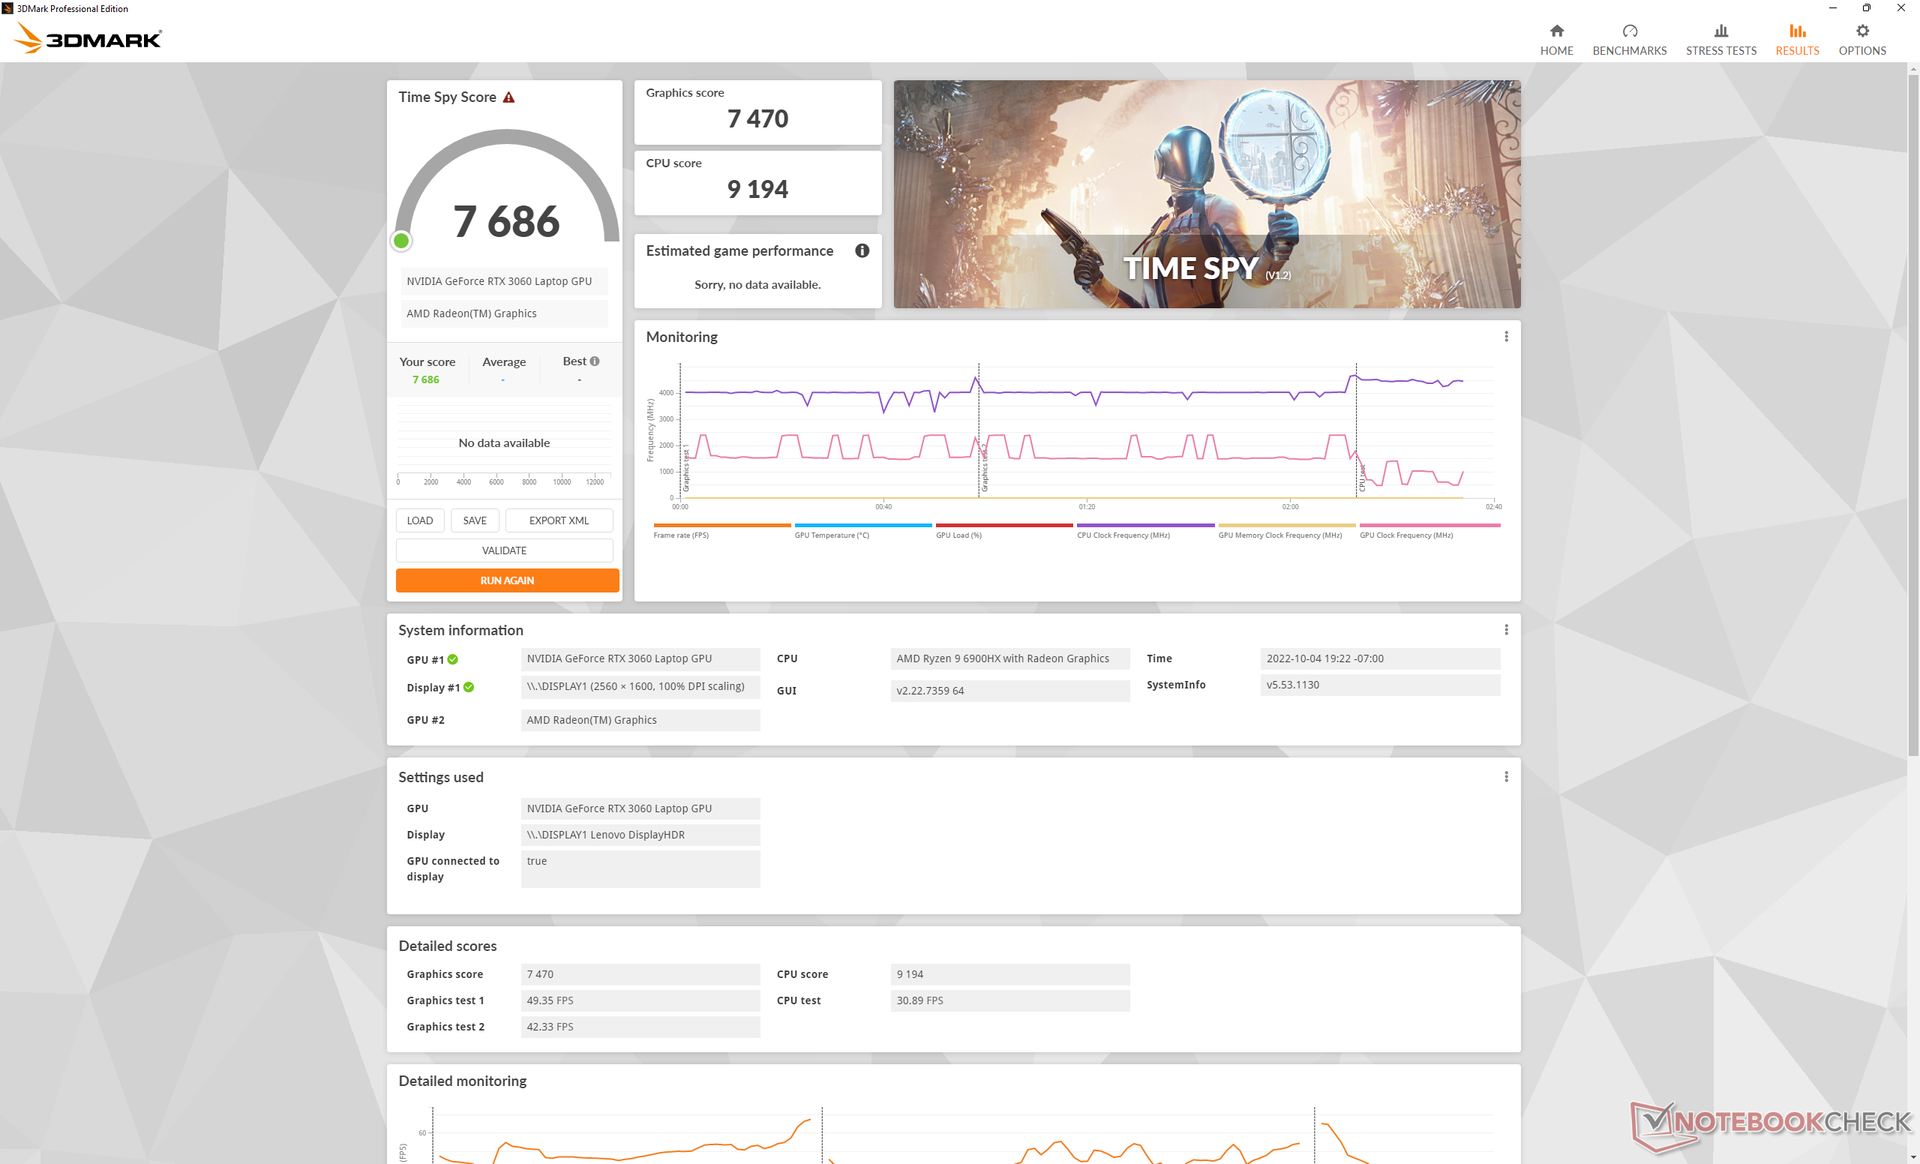
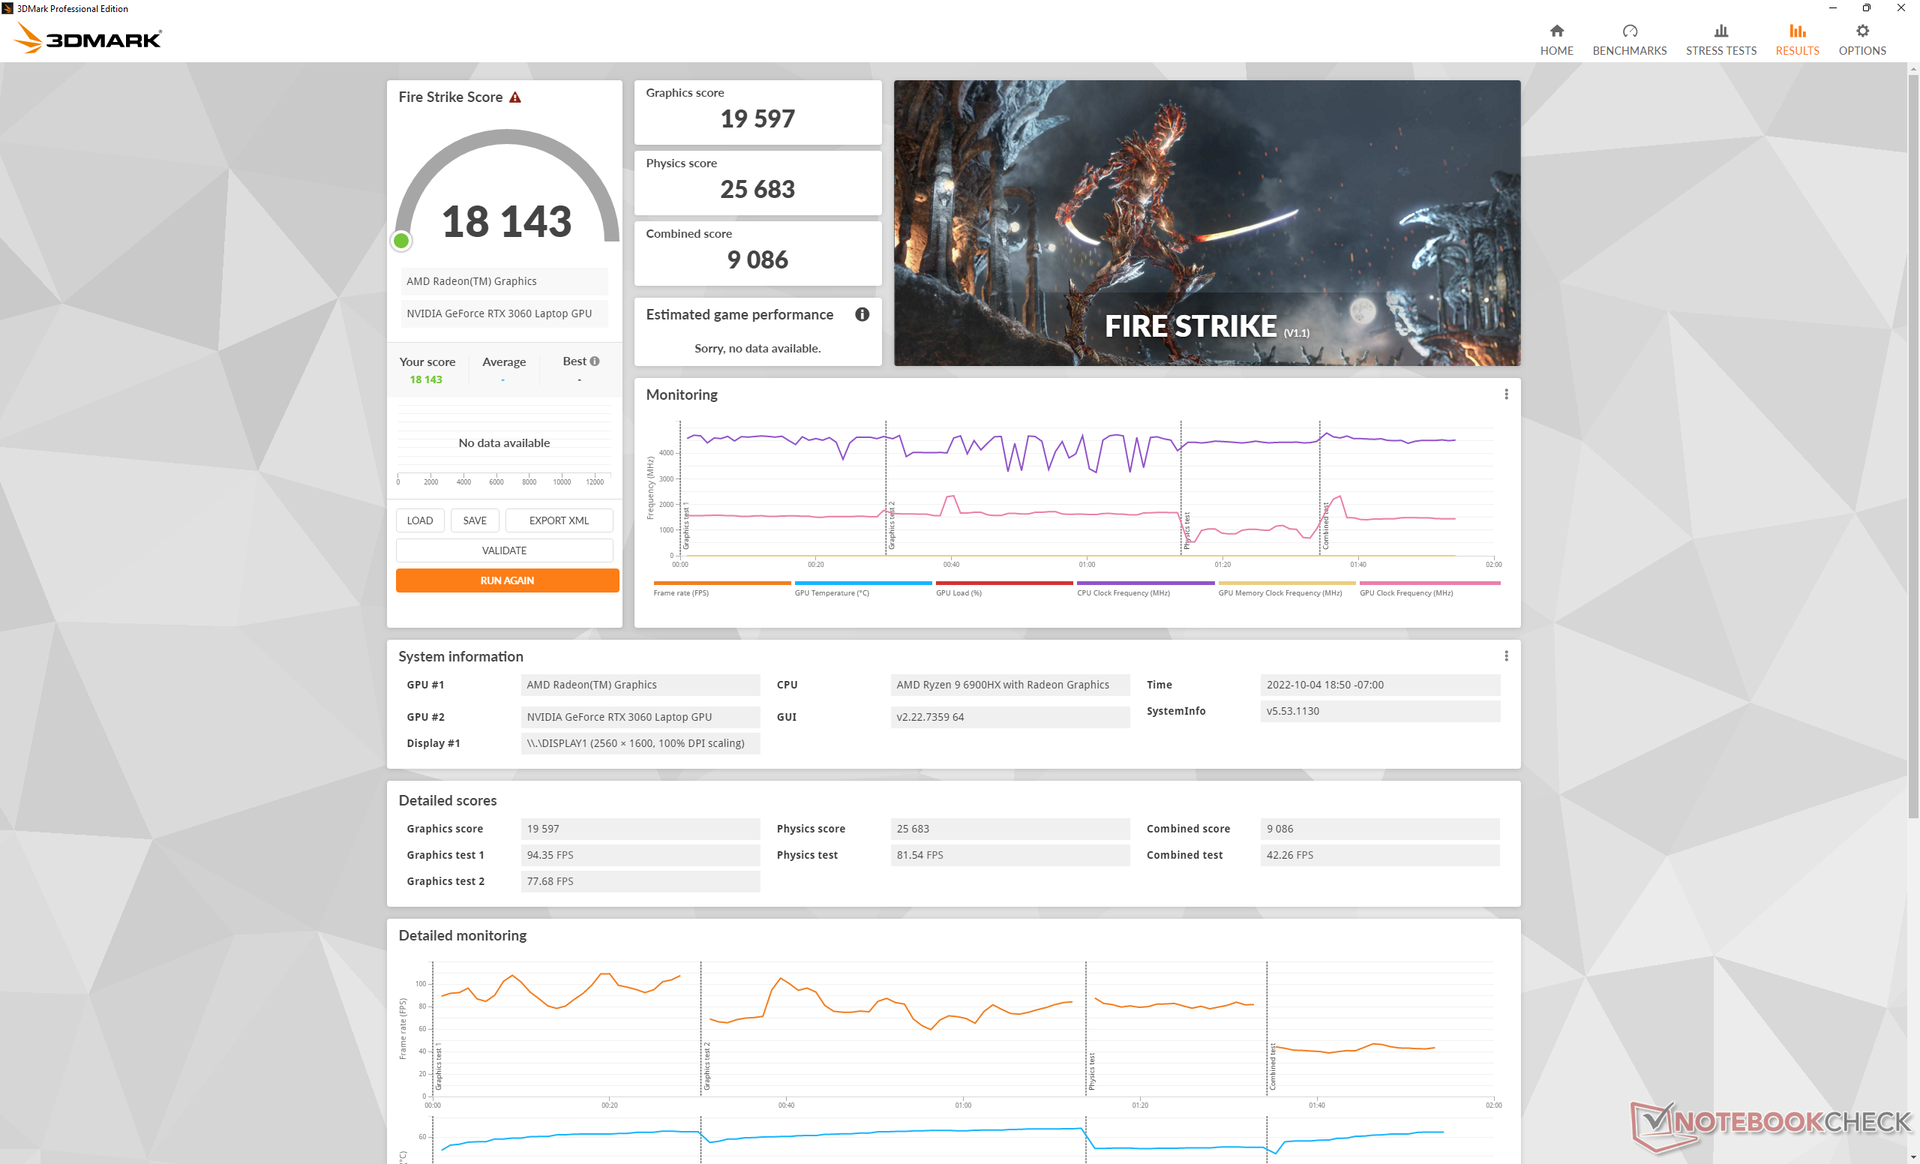
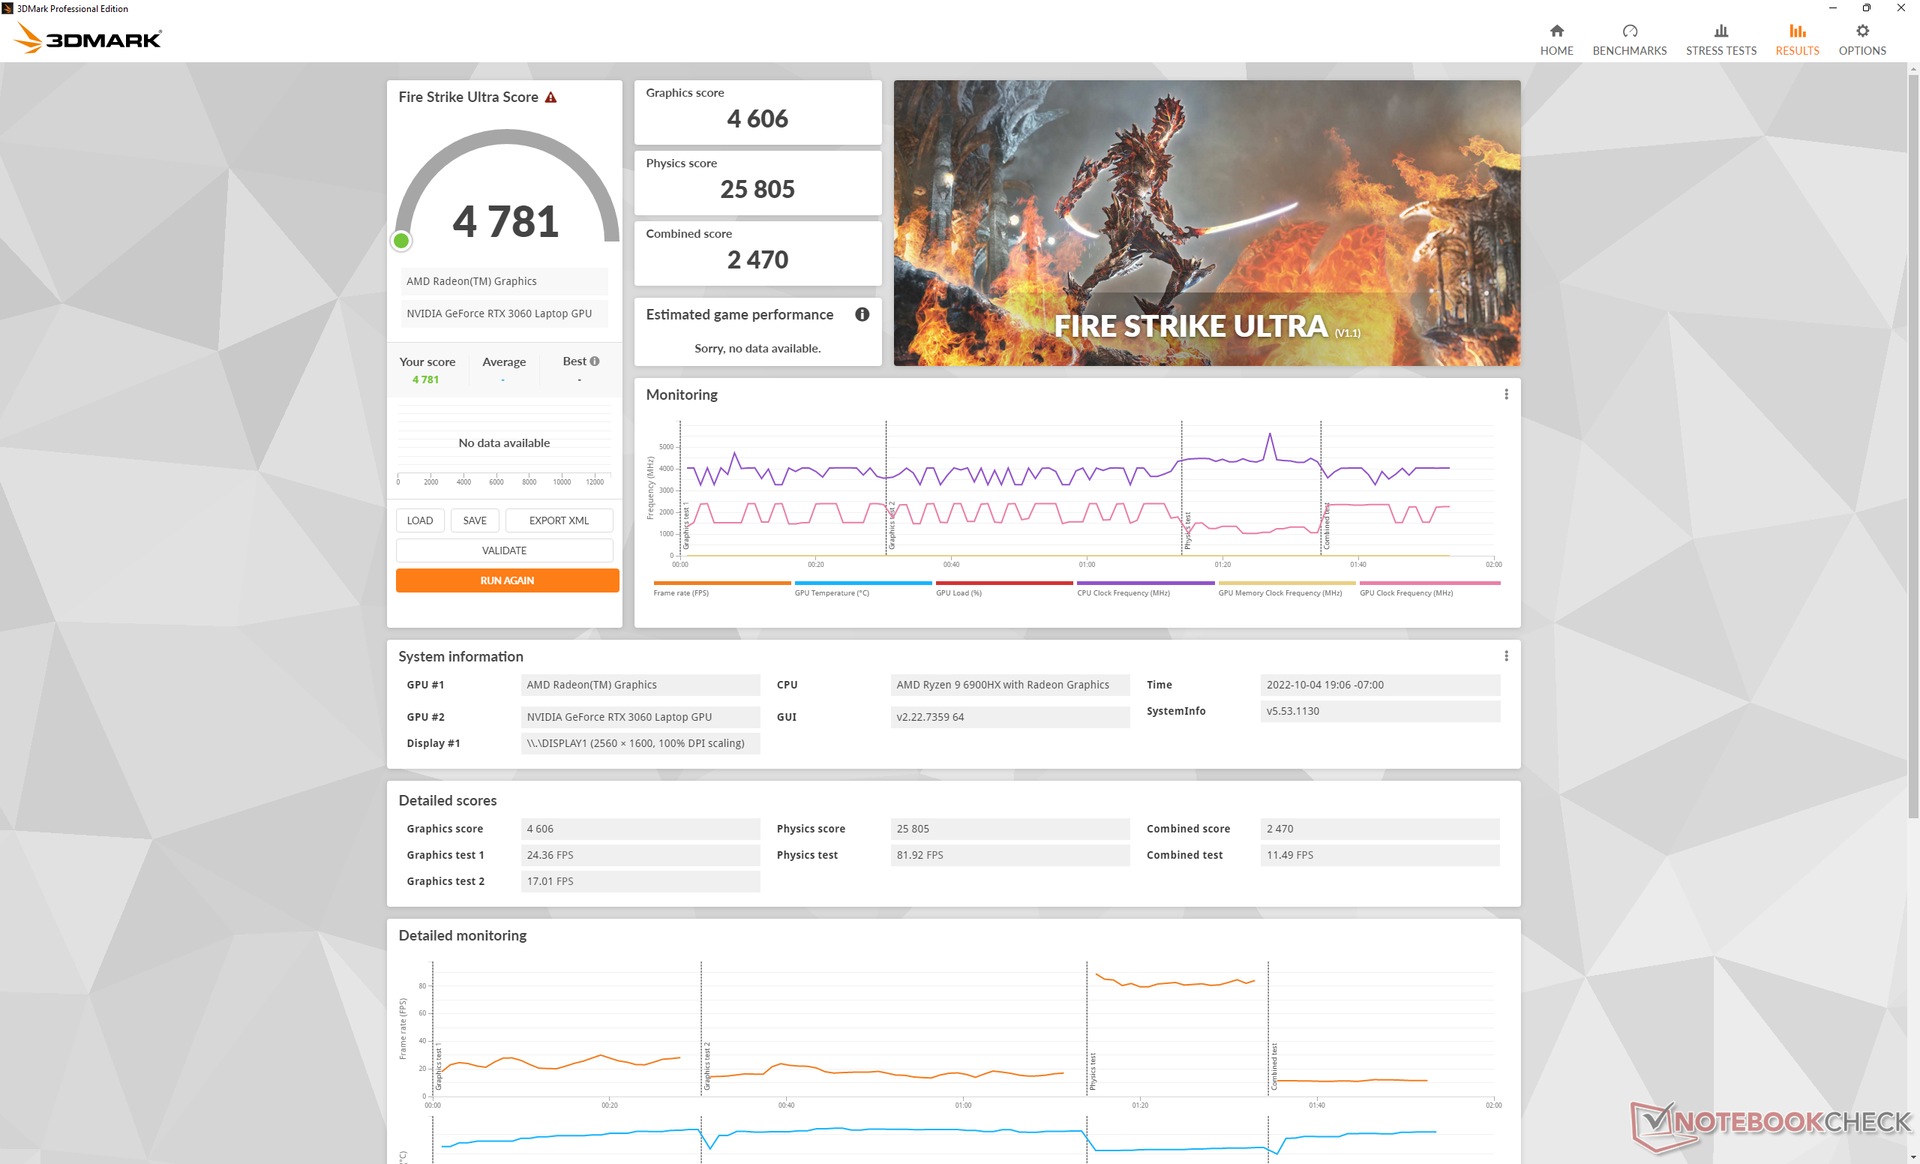
| 3DMark 11 Performance | 22761 Punkte | |
| 3DMark Cloud Gate Standard Score | 45970 Punkte | |
| 3DMark Fire Strike Score | 18143 Punkte | |
| 3DMark Time Spy Score | 7686 Punkte | |
Hilfe | ||
* ... kleinere Werte sind besser
| Cyberpunk 2077 1.6 | |
| 1920x1080 Low Preset | |
| Durchschnittliche NVIDIA GeForce RTX 3060 Laptop GPU (80 - 135.7, n=14) | |
| Lenovo ThinkBook 16p G3 ARH | |
| Lenovo IdeaPad 5 Pro 16ARH7 | |
| 1920x1080 Medium Preset | |
| Durchschnittliche NVIDIA GeForce RTX 3060 Laptop GPU (68 - 118, n=14) | |
| Lenovo ThinkBook 16p G3 ARH | |
| Lenovo IdeaPad 5 Pro 16ARH7 | |
| 1920x1080 High Preset | |
| Durchschnittliche NVIDIA GeForce RTX 3060 Laptop GPU (42.2 - 87.7, n=14) | |
| Lenovo ThinkBook 16p G3 ARH | |
| Lenovo IdeaPad 5 Pro 16ARH7 | |
| 1920x1080 Ultra Preset | |
| Durchschnittliche NVIDIA GeForce RTX 3060 Laptop GPU (40 - 78.8, n=16) | |
| Lenovo ThinkBook 16p G3 ARH | |
| 2560x1440 Ultra Preset | |
| Durchschnittliche NVIDIA GeForce RTX 3060 Laptop GPU (23 - 45.8, n=9) | |
| Lenovo ThinkBook 16p G3 ARH | |
Witcher 3 FPS Chart
| min. | mittel | hoch | max. | QHD | |
|---|---|---|---|---|---|
| GTA V (2015) | 165.4 | 158.9 | 134.6 | 78.5 | 68.8 |
| The Witcher 3 (2015) | 259.5 | 211.4 | 138.5 | 73.4 | |
| Dota 2 Reborn (2015) | 112.5 | 106 | 98.9 | 96.8 | |
| Final Fantasy XV Benchmark (2018) | 141.8 | 104.1 | 78.2 | 58.5 | |
| X-Plane 11.11 (2018) | 90.6 | 81.8 | 64.8 | ||
| Strange Brigade (2018) | 253 | 170.9 | 147.7 | 132.5 | 99.3 |
| Cyberpunk 2077 1.6 (2022) | 100.8 | 87.7 | 67.8 | 56 | 35 |
Emissionen - Relativ ruhiges ThinkBook 16p
Systemlautstärke
Unter hohen Lasten ist die Lüfterlautstärke vergleichbar mit der eines Acer Swift X SFX16, bleibt jedoch ruhiger als ein HP Envy 16. Da die Lüfter selten pulsieren, ergibt sich insgesamt eine recht ruhige Erfahrung beim Surfen, Video Streaming oder bei weniger anspruchsvollen Lasten.
Lautstärkediagramm
| Idle |
| 23.1 / 23.2 / 23.6 dB(A) |
| Last |
| 30.6 / 47.5 dB(A) |
 | ||
30 dB leise 40 dB(A) deutlich hörbar 50 dB(A) störend |
||
min: | ||
| Lenovo ThinkBook 16p G3 ARH GeForce RTX 3060 Laptop GPU, R9 6900HX, Micron 3400 1TB MTFDKBA1T0TFH | HP Envy 16 h0112nr GeForce RTX 3060 Laptop GPU, i7-12700H, Micron 3400 1TB MTFDKBA1T0TFH | Lenovo ThinkBook 16p G2 ACH GeForce RTX 3060 Laptop GPU, R9 5900HX, WDC PC SN730 SDBPNTY-1T00 | Lenovo IdeaPad 5 Pro 16ARH7 Radeon 660M, R5 6600HS, Samsung PM9A1 MZVL2512HCJQ | Acer Swift X SFX16-51G-5388 GeForce RTX 3050 4GB Laptop GPU, i5-11320H, Samsung PM991 MZVLQ512HBLU | Lenovo Legion 5 Pro 16IAH7H GeForce RTX 3060 Laptop GPU, i7-12700H, 2x Samsung PM9A1 MZVL21T0HCLR (RAID 0) | |
|---|---|---|---|---|---|---|
| Geräuschentwicklung | -11% | -2% | -6% | -14% | -28% | |
| aus / Umgebung * (dB) | 22.7 | 22.8 -0% | 23 -1% | 25 -10% | 25.4 -12% | 24.6 -8% |
| Idle min * (dB) | 23.1 | 22.9 1% | 23 -0% | 25 -8% | 25.4 -10% | 28.7 -24% |
| Idle avg * (dB) | 23.2 | 22.9 1% | 23 1% | 26 -12% | 25.4 -9% | 32 -38% |
| Idle max * (dB) | 23.6 | 30.5 -29% | 23 3% | 28 -19% | 27.8 -18% | 32 -36% |
| Last avg * (dB) | 30.6 | 41.4 -35% | 35.66 -17% | 44 -44% | 41 -34% | 45.2 -48% |
| Witcher 3 ultra * (dB) | 47.6 | 51.1 -7% | 48.7 -2% | 35 26% | ||
| Last max * (dB) | 47.5 | 51.4 -8% | 48.13 -1% | 35 26% | 47 1% | 54.4 -15% |
* ... kleinere Werte sind besser
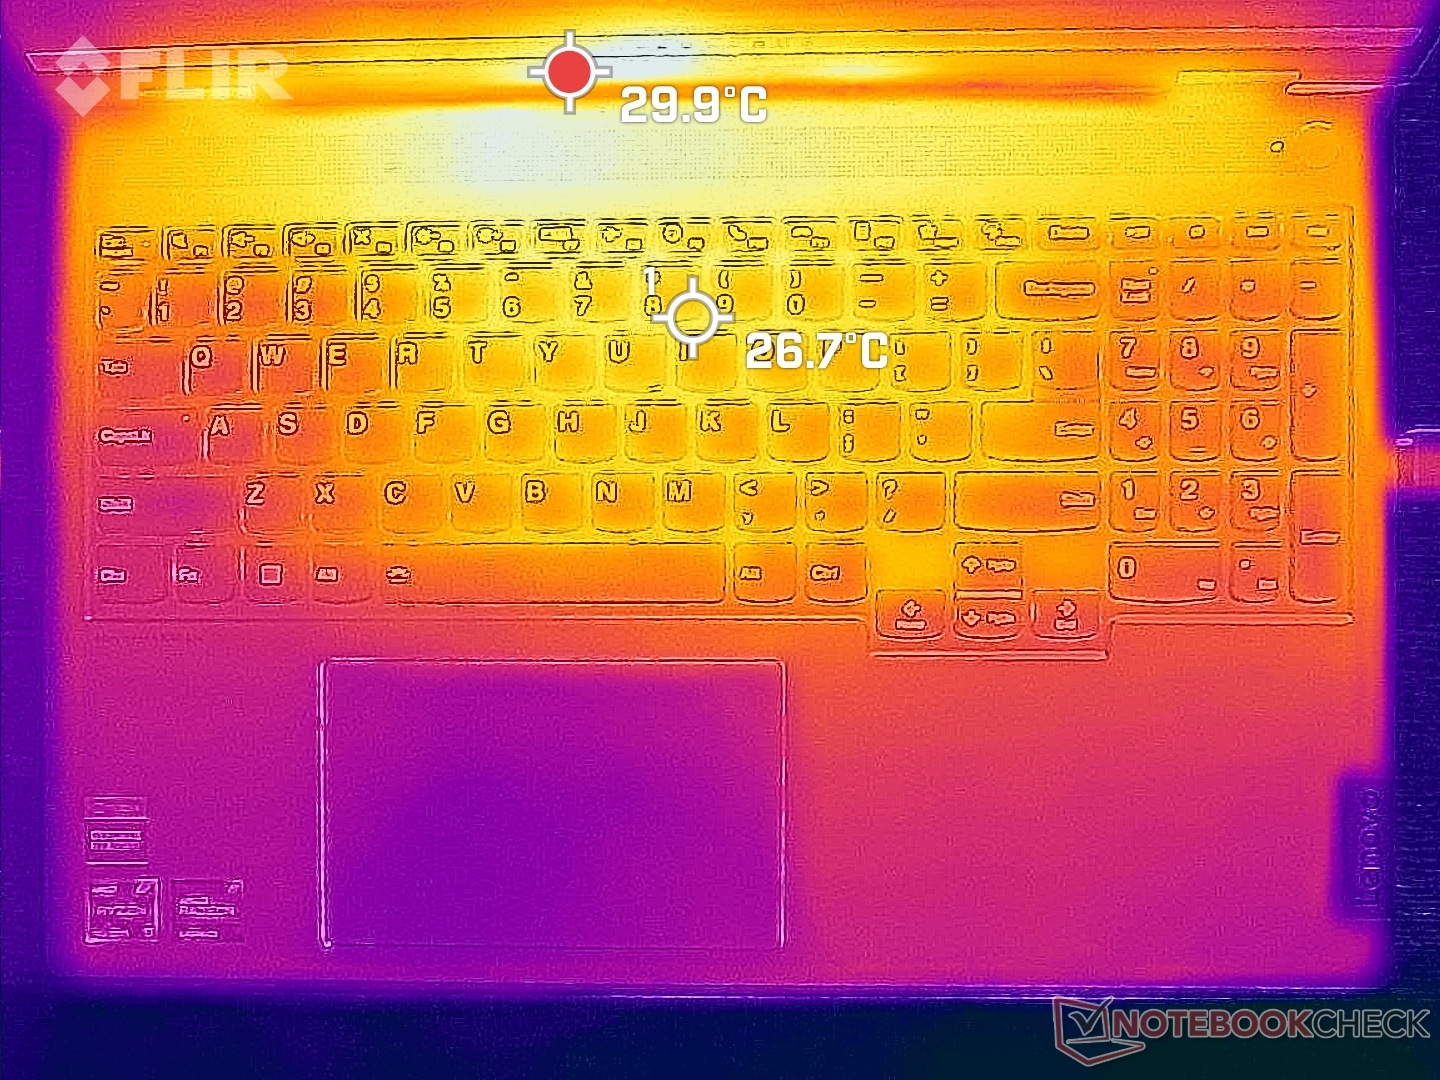
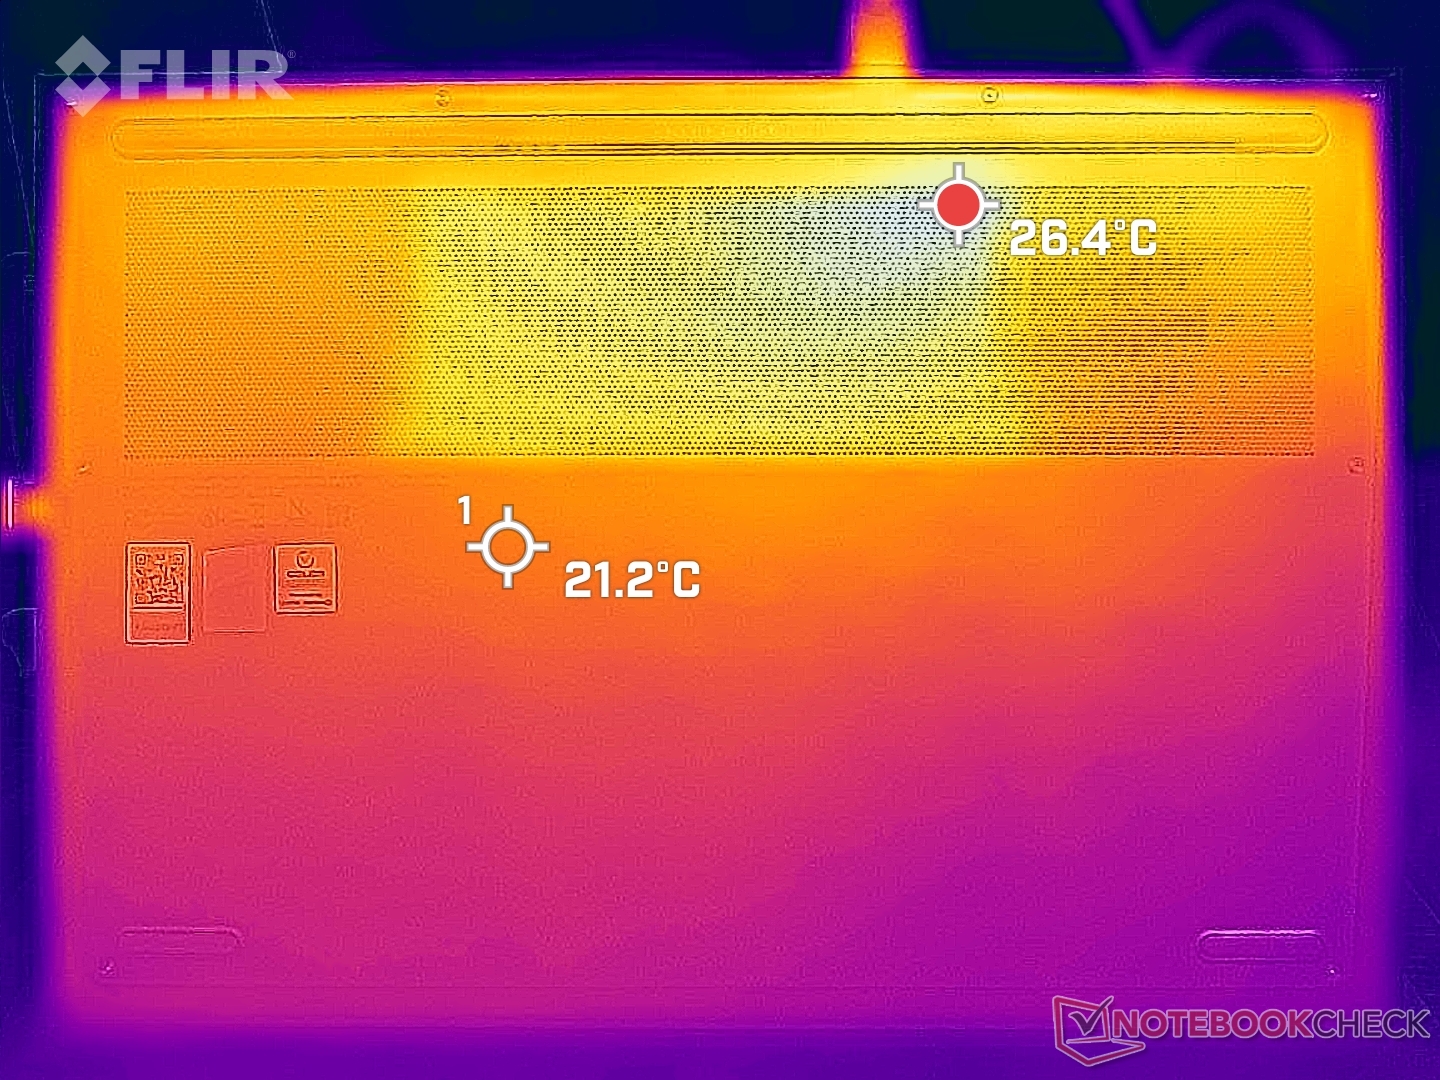
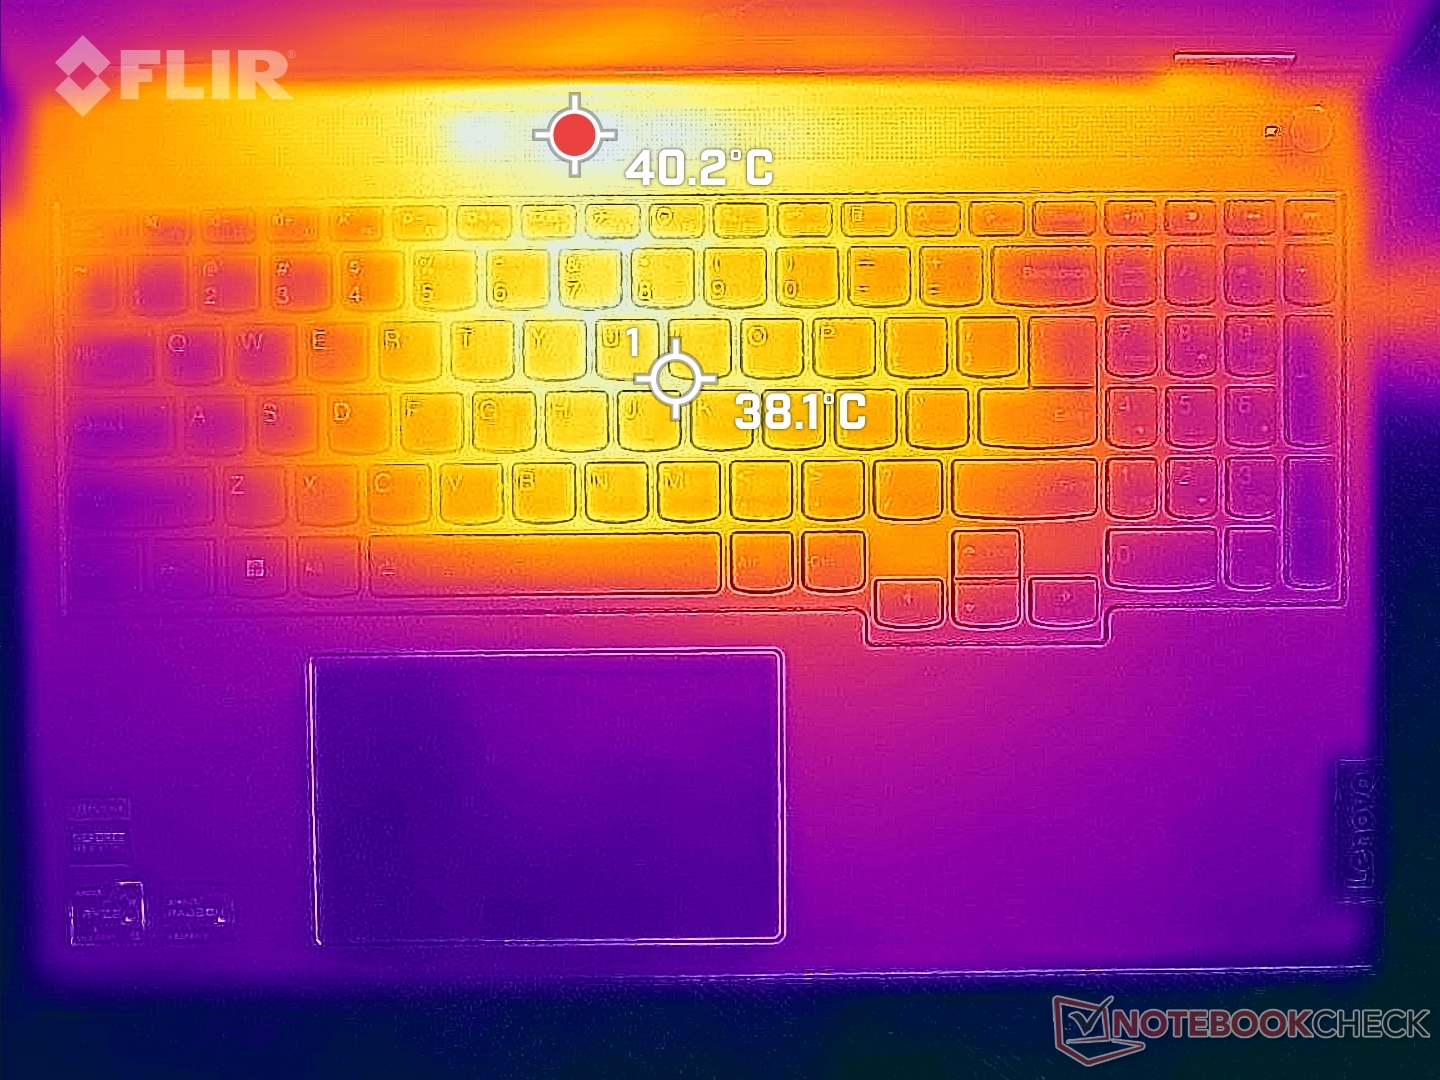
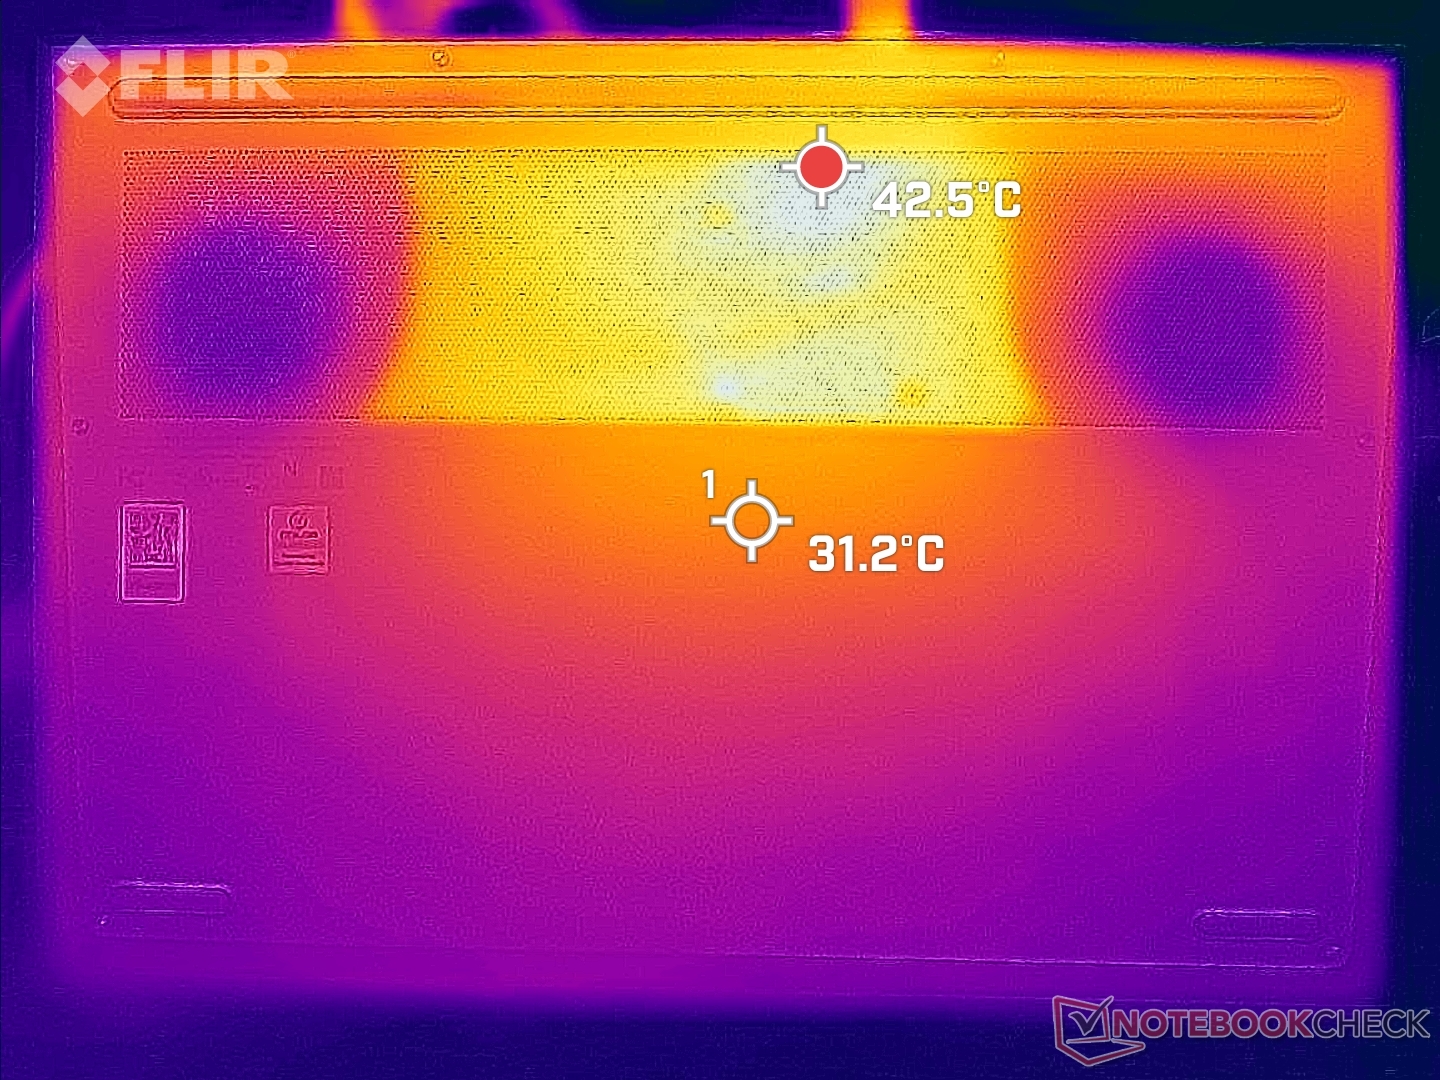
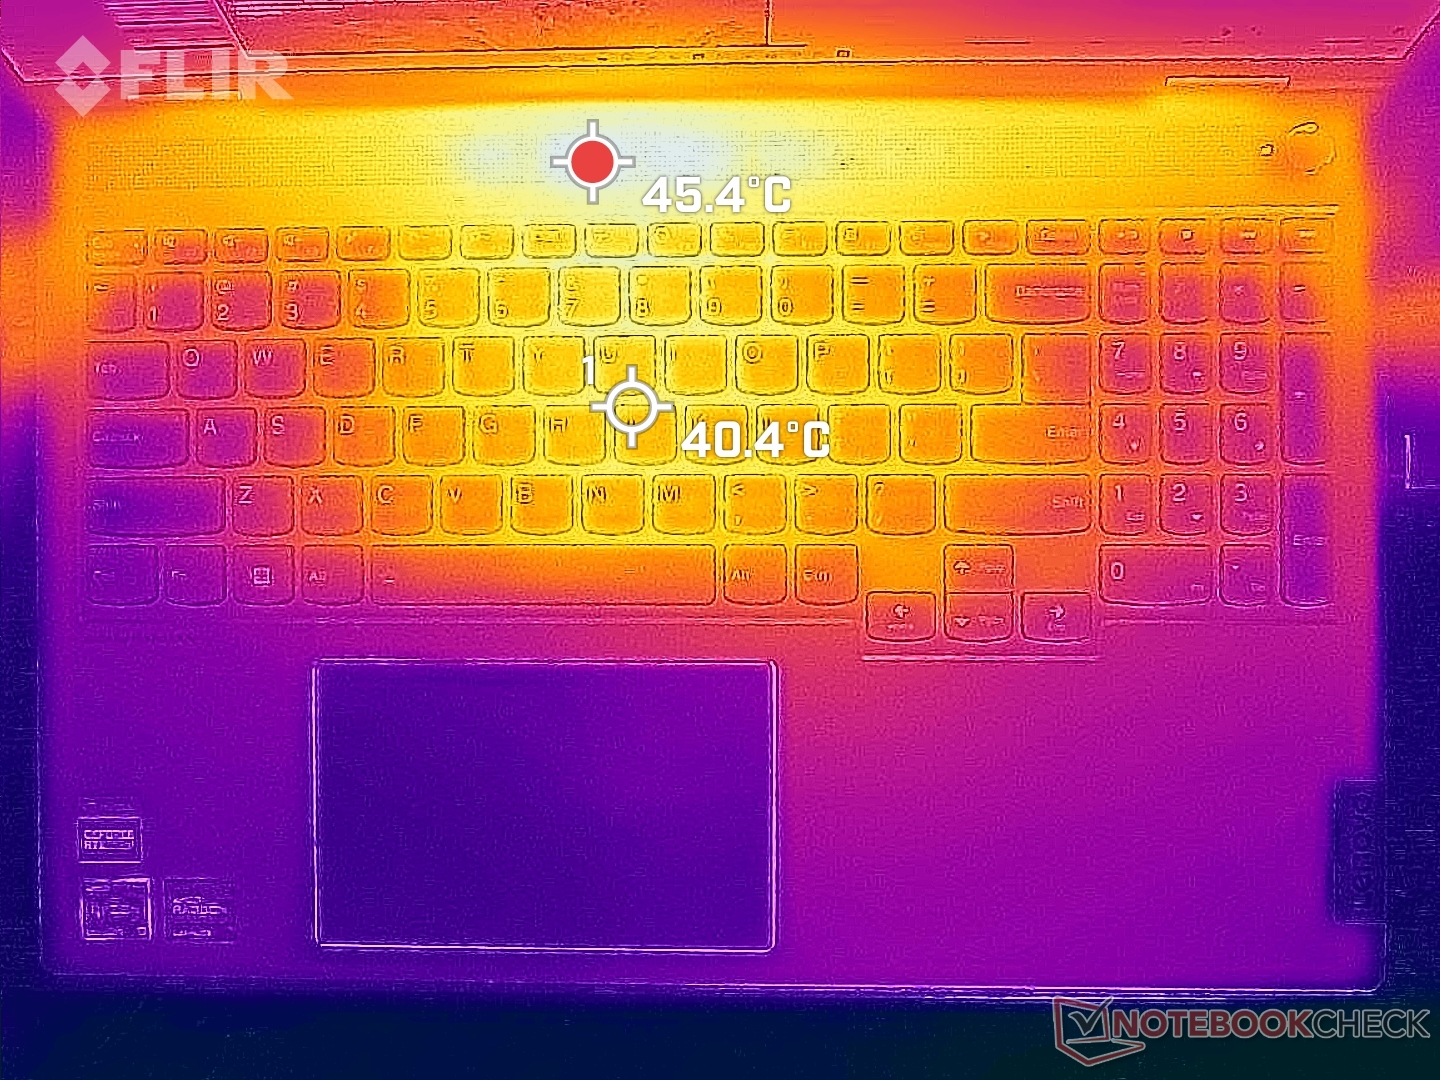
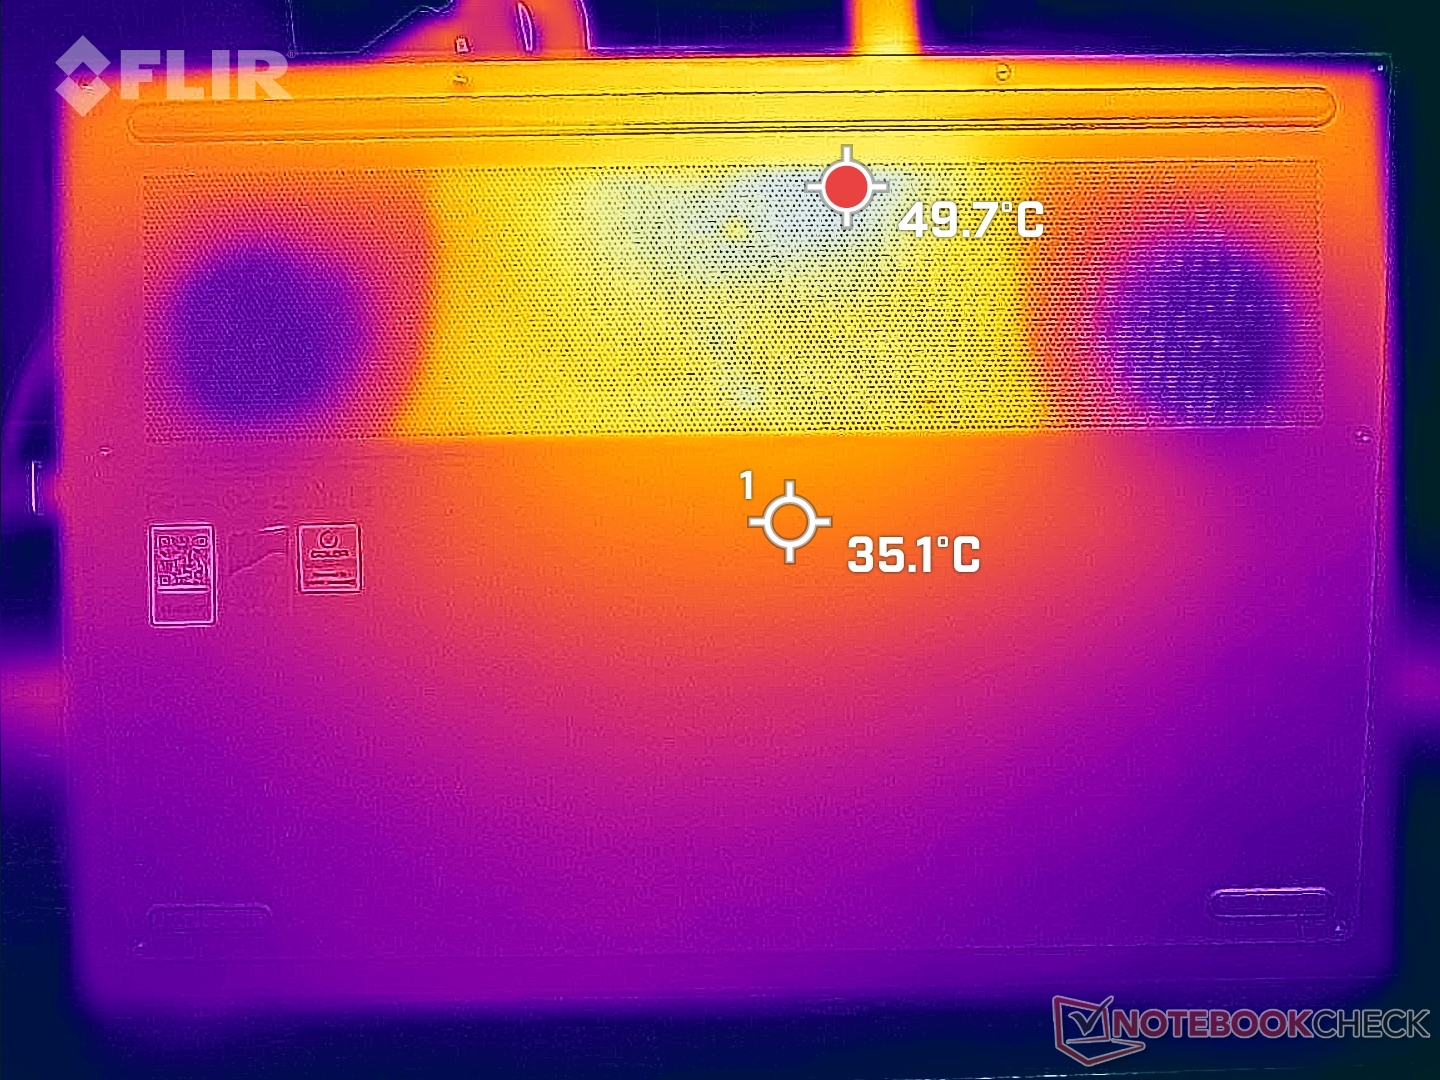
Temperatur
Die Oberflächen können sich an den Hot Spots sowohl oben als unten auf bis zu 50 °C erhitzen, was in etwa dem entspricht, was wir auf dem Gen 2 sowie dem Dell Inspiron 16 Plus gemessen haben.
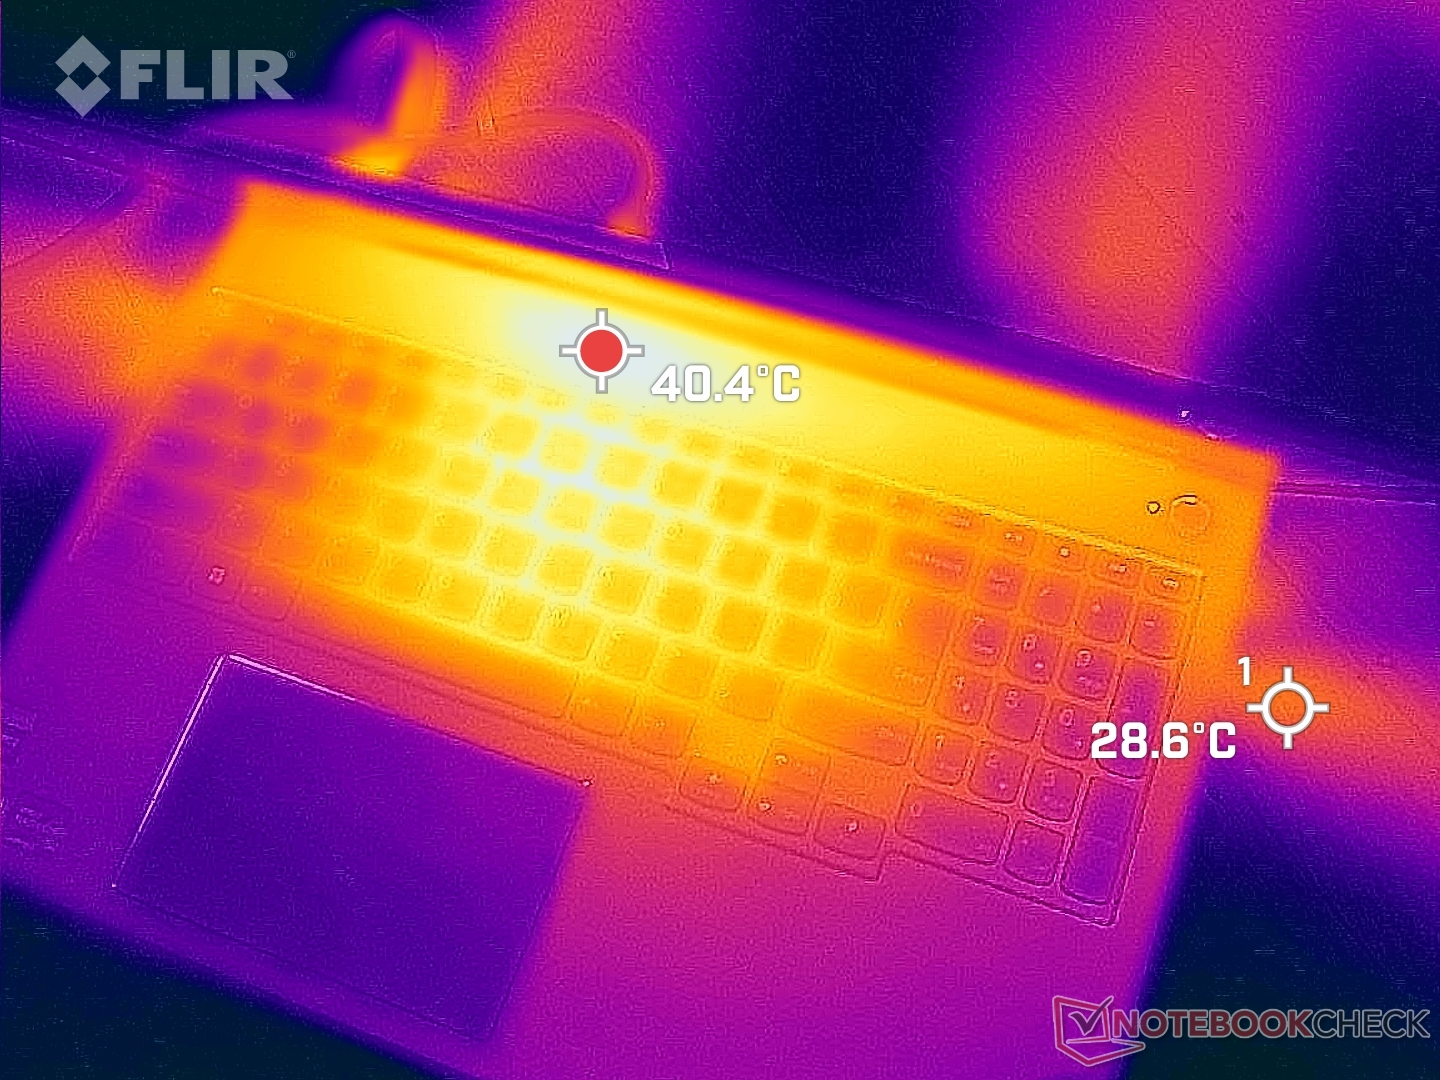
(-) Die maximale Temperatur auf der Oberseite ist 48.2 °C. Im Vergleich liegt der Klassendurchschnitt bei 36.8 °C (von 21 bis 71 °C für die Klasse Multimedia).
(-) Auf der Unterseite messen wir eine maximalen Wert von 49.6 °C (im Vergleich zum Durchschnitt von 39.1 °C).
(+) Ohne Last messen wir eine durchschnittliche Temperatur von 29.3 °C auf der Oberseite. Der Klassendurchschnitt erreicht 31.3 °C.
(±) Beim längeren Spielen von The Witcher 3 erhitzt sich das Gerät durchschnittlich auf 34.3 °C. Der Durchschnitt der Klasse ist derzeit 31.3 °C.
(+) Die Handballen und der Touchpad-Bereich sind mit gemessenen 29.4 °C kühler als die typische Hauttemperatur und fühlen sich dadurch kühl an.
(±) Die durchschnittliche Handballen-Temperatur anderer getesteter Geräte war 28.7 °C (-0.7 °C).
| Lenovo ThinkBook 16p G3 ARH AMD Ryzen 9 6900HX, NVIDIA GeForce RTX 3060 Laptop GPU | HP Envy 16 h0112nr Intel Core i7-12700H, NVIDIA GeForce RTX 3060 Laptop GPU | Lenovo ThinkBook 16p G2 ACH AMD Ryzen 9 5900HX, NVIDIA GeForce RTX 3060 Laptop GPU | Lenovo IdeaPad 5 Pro 16ARH7 AMD Ryzen 5 6600HS, AMD Radeon 660M | Acer Swift X SFX16-51G-5388 Intel Core i5-11320H, NVIDIA GeForce RTX 3050 4GB Laptop GPU | Lenovo Legion 5 Pro 16IAH7H Intel Core i7-12700H, NVIDIA GeForce RTX 3060 Laptop GPU | |
|---|---|---|---|---|---|---|
| Hitze | 4% | 2% | 10% | 1% | -4% | |
| Last oben max * (°C) | 48.2 | 45.2 6% | 50 -4% | 46 5% | 52.4 -9% | 45.8 5% |
| Last unten max * (°C) | 49.6 | 44 11% | 53 -7% | 48 3% | 50 -1% | 66.3 -34% |
| Idle oben max * (°C) | 31.8 | 33.6 -6% | 29 9% | 28 12% | 30.3 5% | 30.4 4% |
| Idle unten max * (°C) | 33.6 | 32.6 3% | 30 11% | 27 20% | 30.4 10% | 30.4 10% |
* ... kleinere Werte sind besser
Stresstest
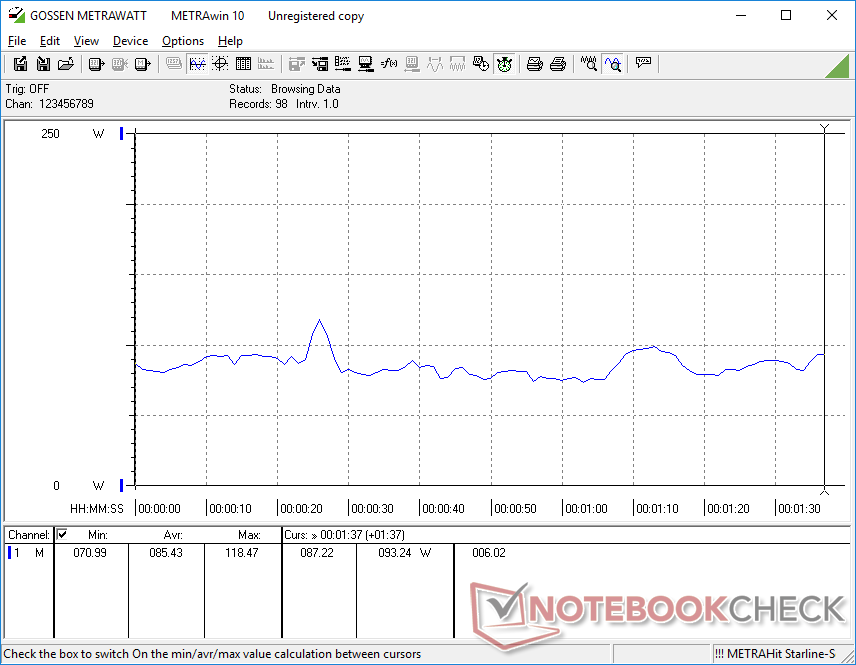
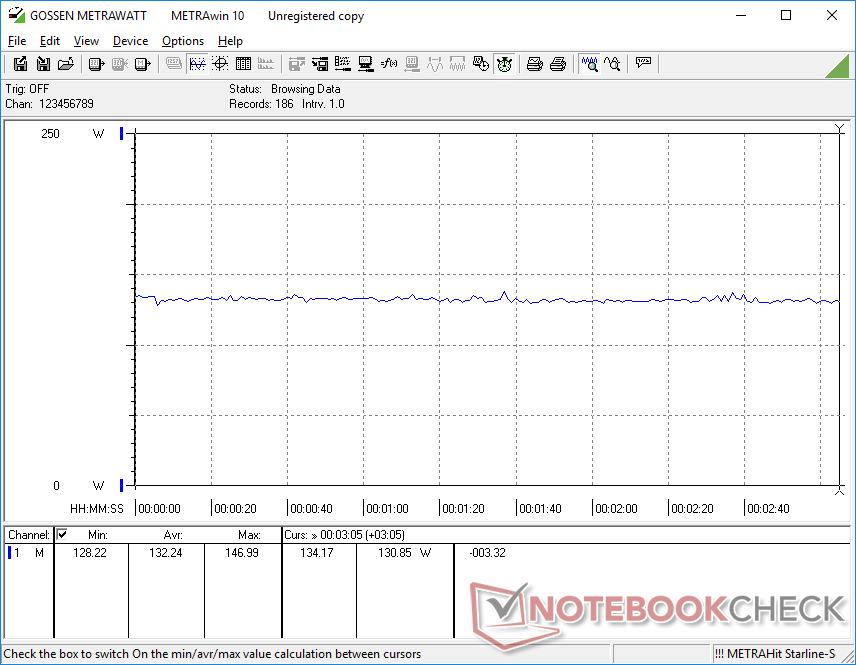
Beim Starten von Prime95 maximieren sich die Taktraten, Temperaturen und Leistungsaufnahme auf 4,1 GHz, 77 °C und 65 W. Der Prozessor stabilisiert sich letztlich bei 3,7 GHz, 82 °C und 54 W. Zum Vergleich: Das dickere Lenovo Legion 7 16ARHA mit dem gleichen Ryzen 9 6900HX stabilisiert sich beim gleichen Prime95-Test auf schnellere 4,2 GHz, 89 °C und 99 W.
GPU-Taktraten, Temperaturen und Leistungsaufnahme stabilisieren sich bei 1.582 MHz, 69 °C und 69 W unter Witcher 3. Selbst im Extreme-Performance-Modus erreichen wir nicht annähernd die vom System eigentlich anvisierten 90 W TGP.
Abseits der Steckdose reduziert sich die Leistung signifikant. Ein erneuter Fire-Strike-Test ermittelt nur noch Physics- und Graphics-Scores von 17.799 und 10.557 Punkten anstelle der 25.683 und 19..597 Punkten am Netzteil.
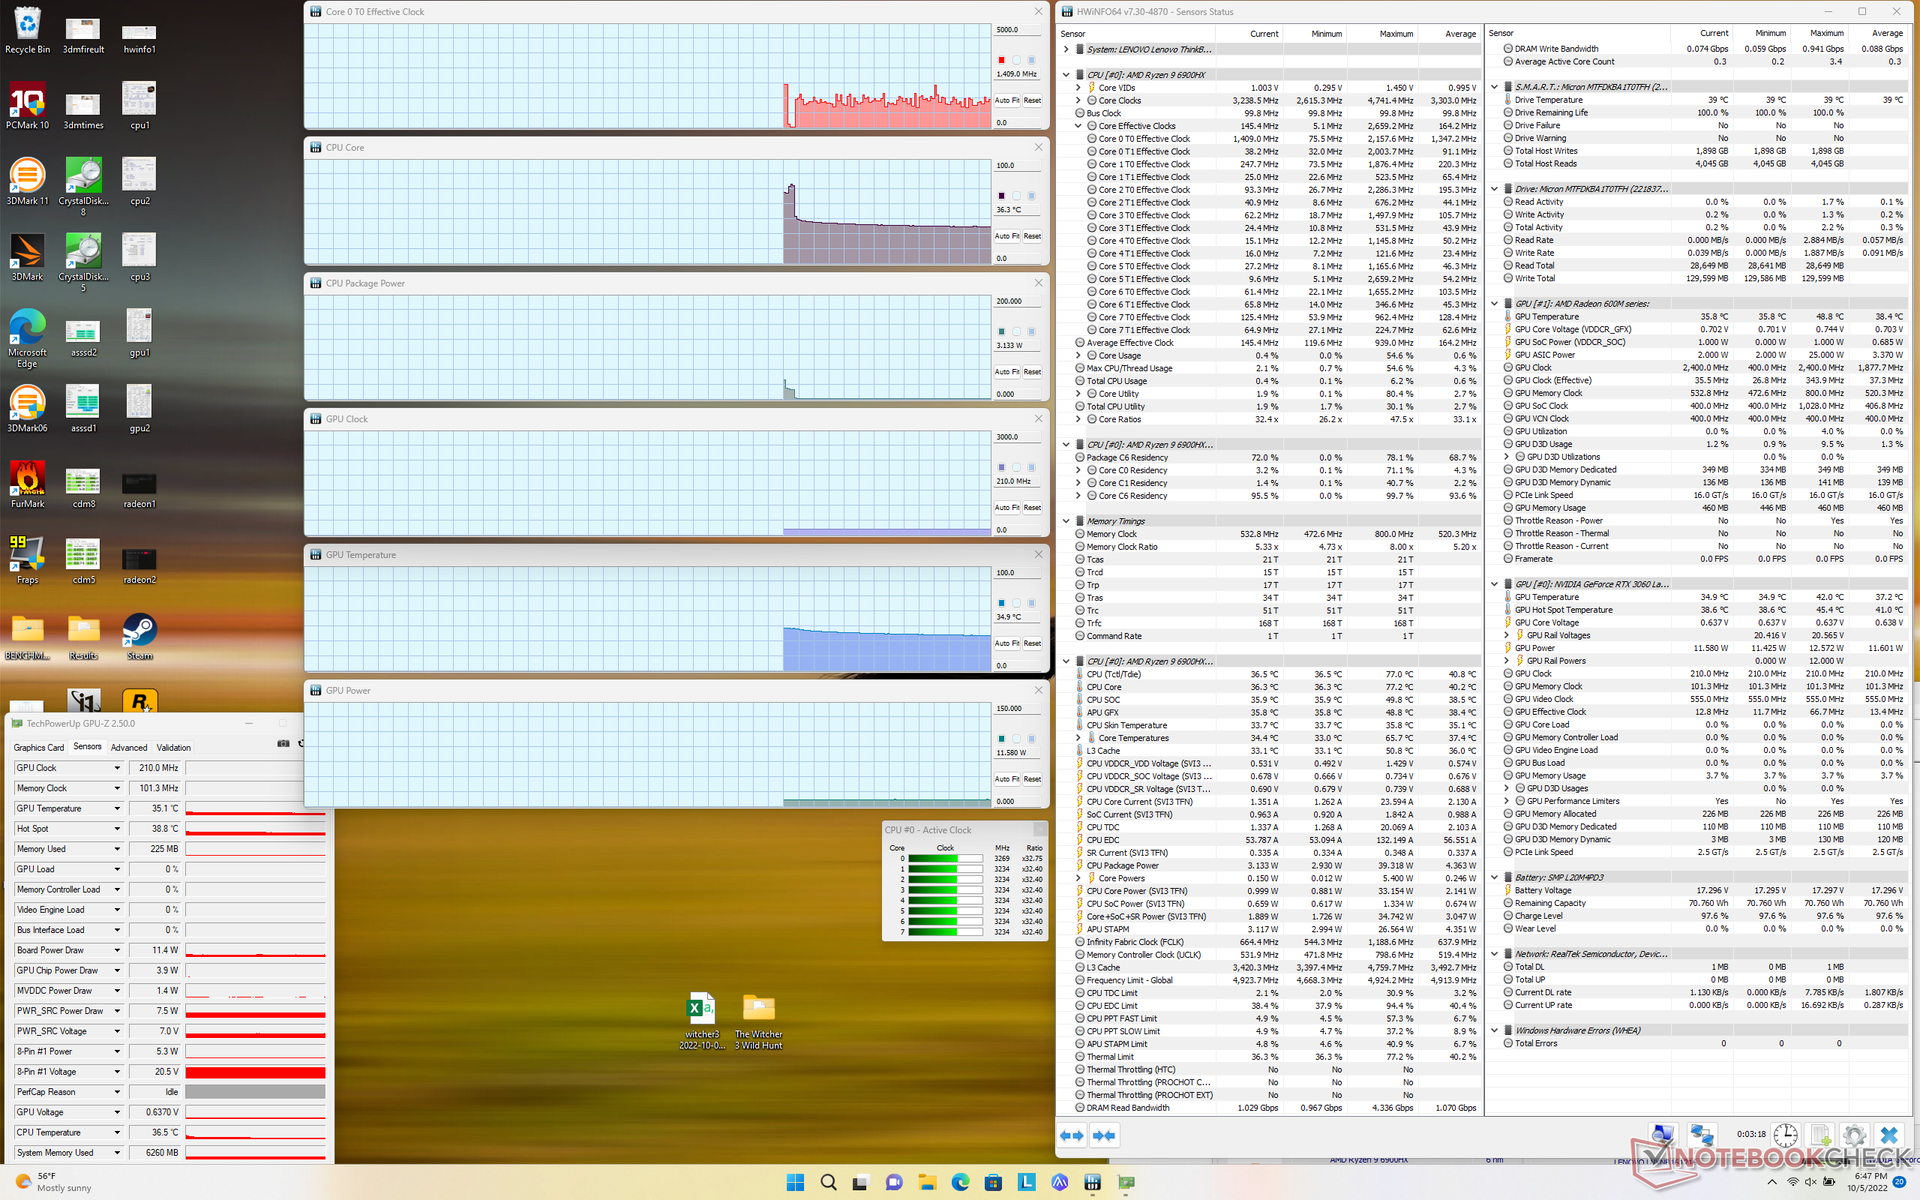
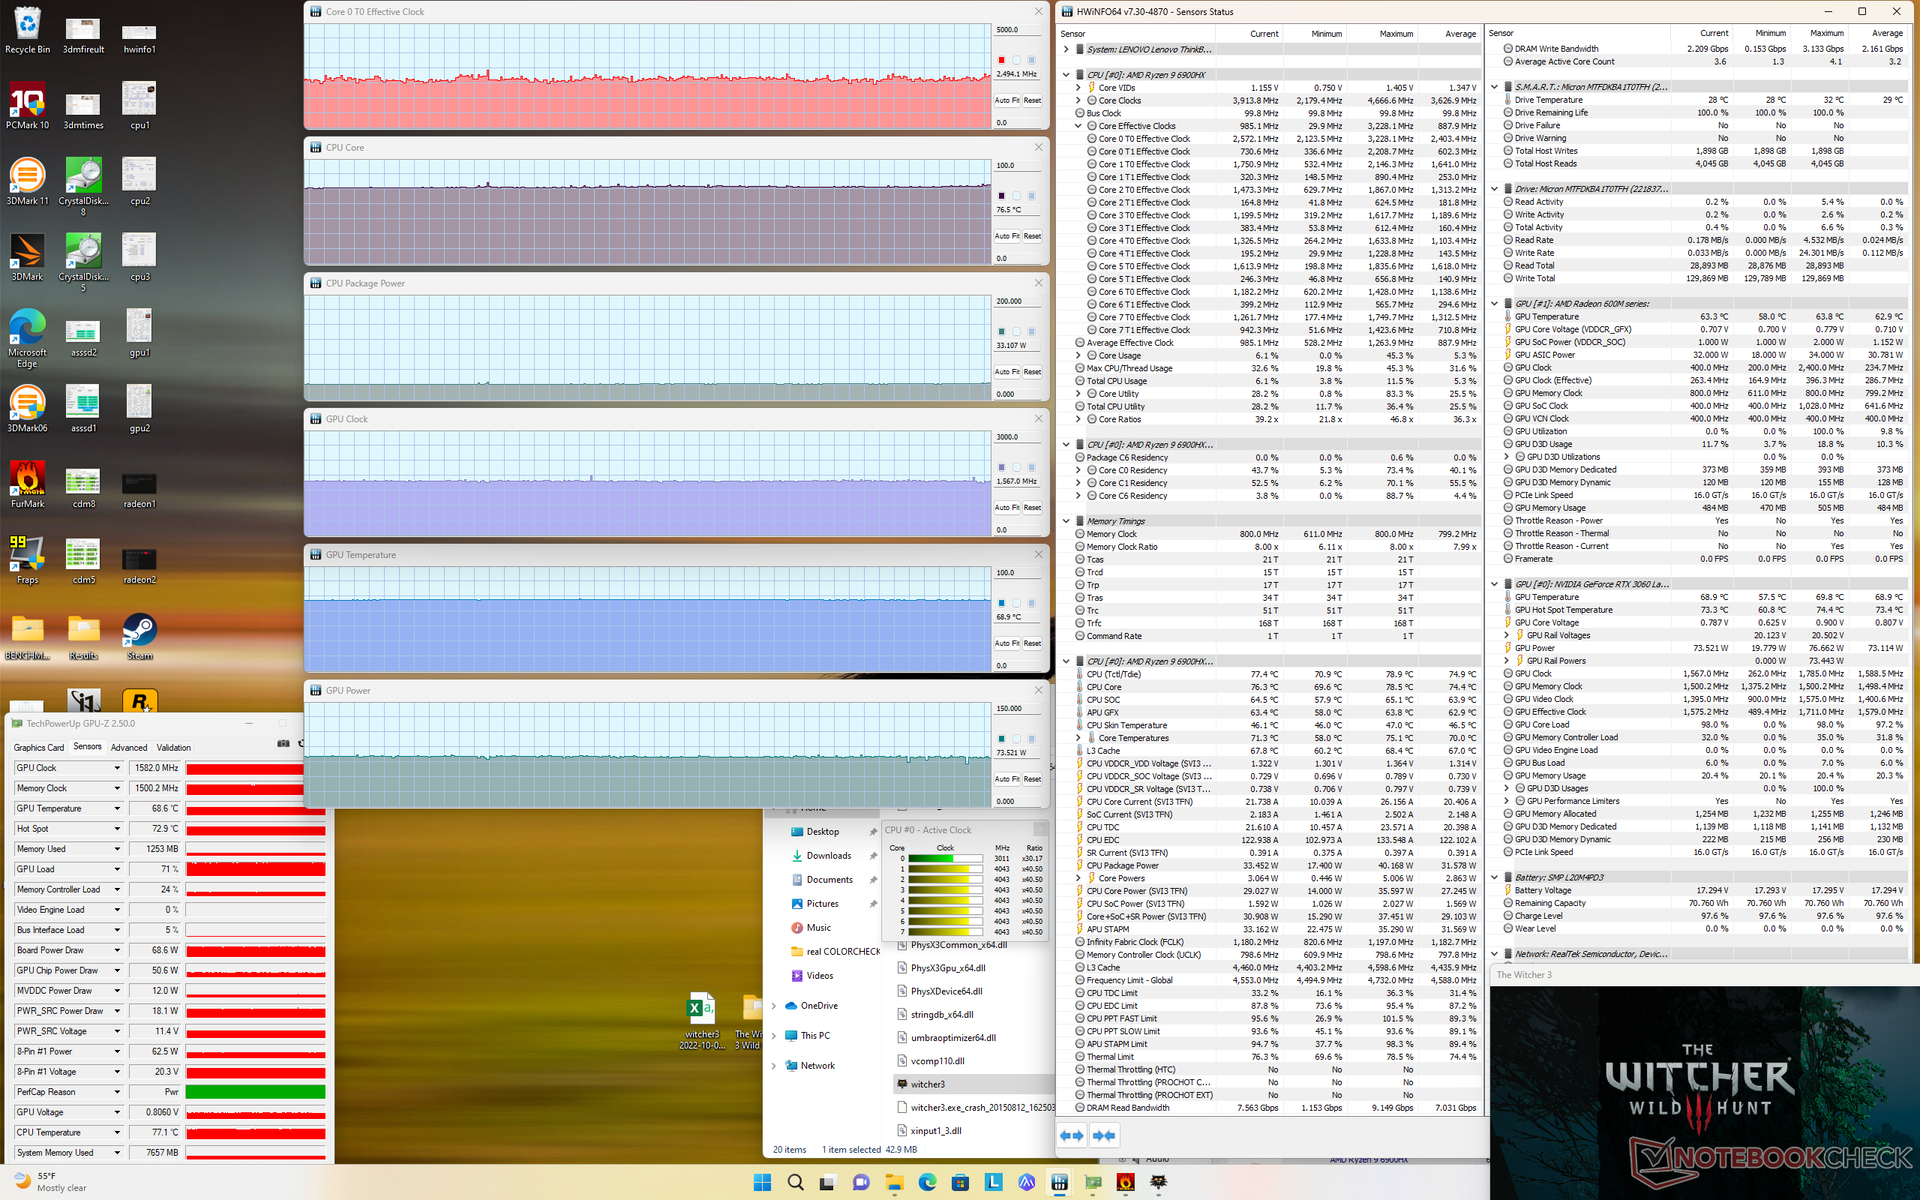
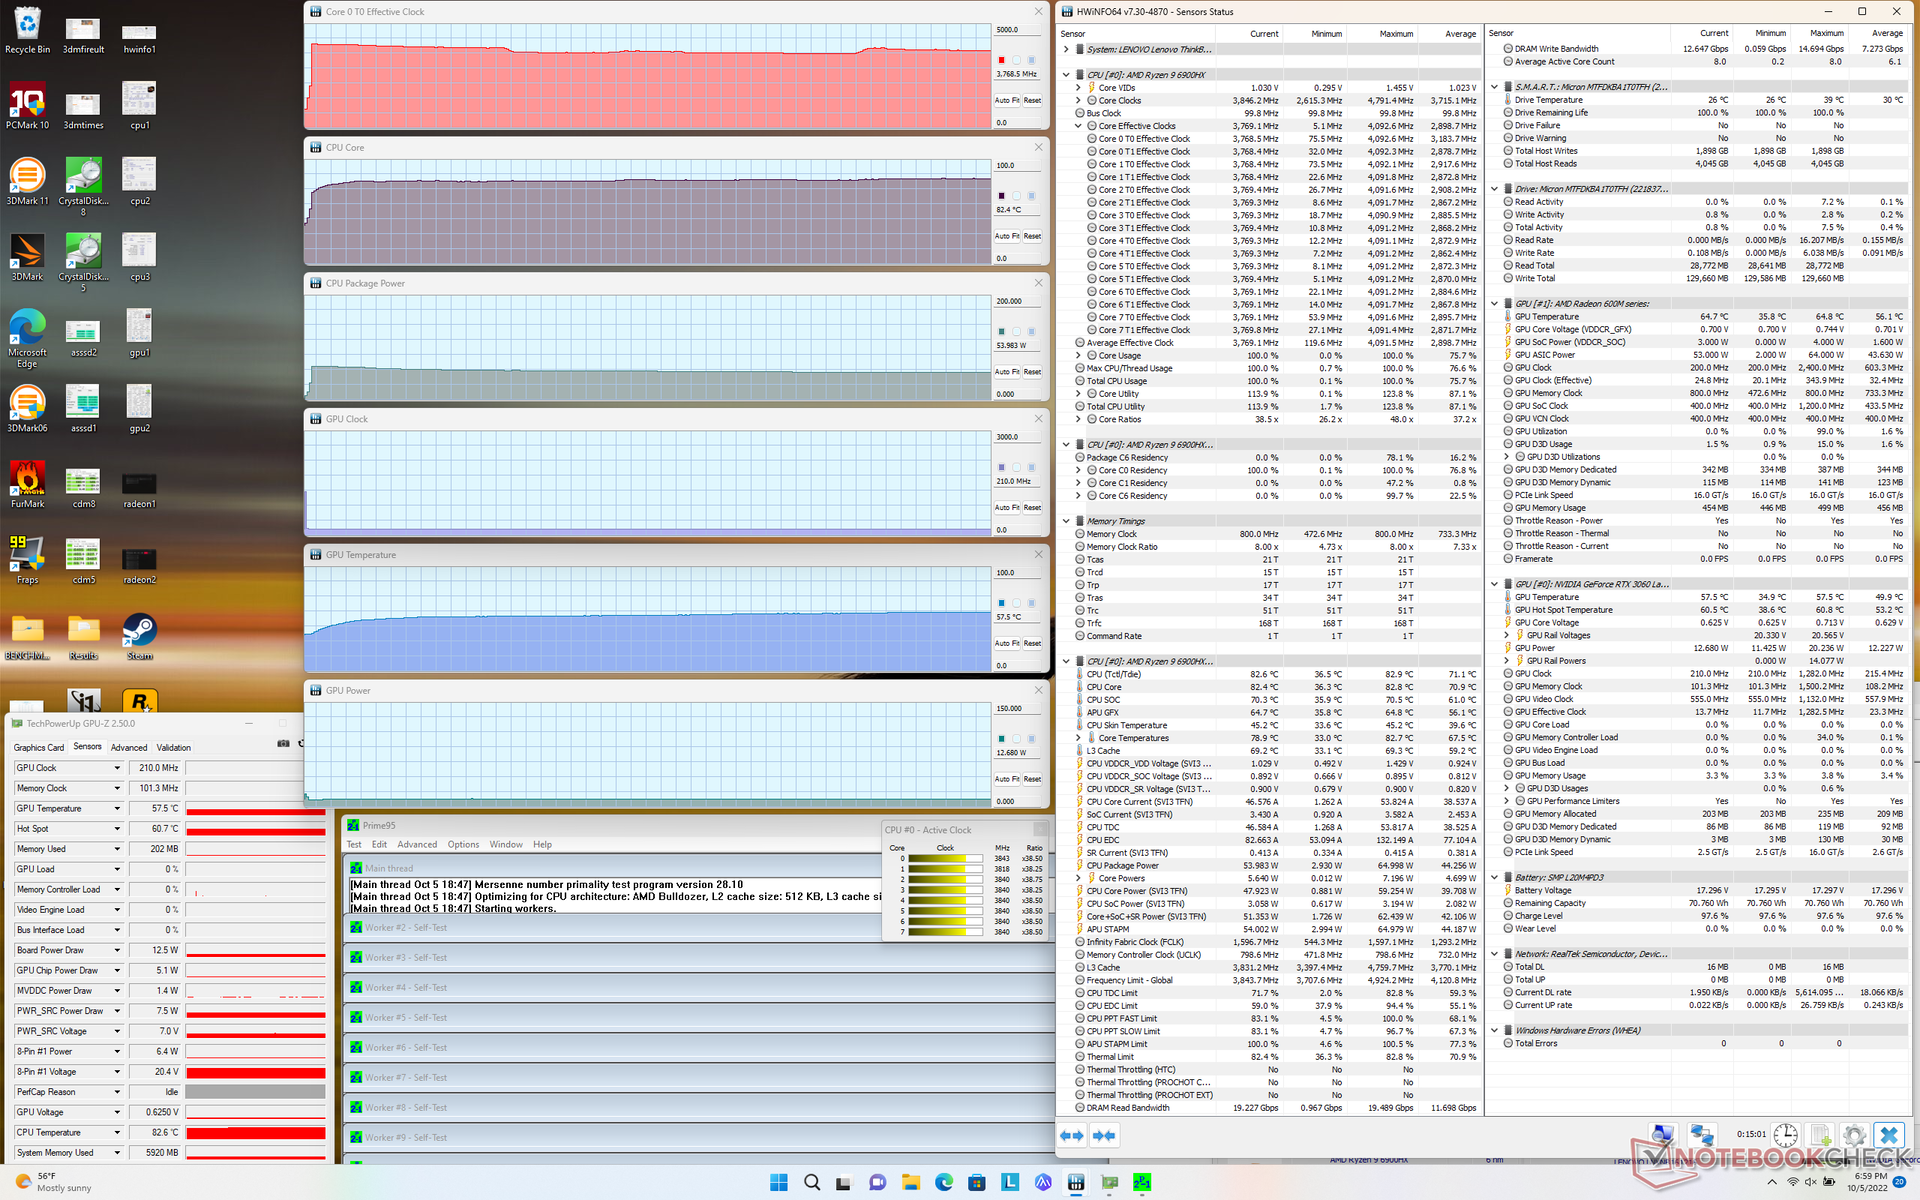
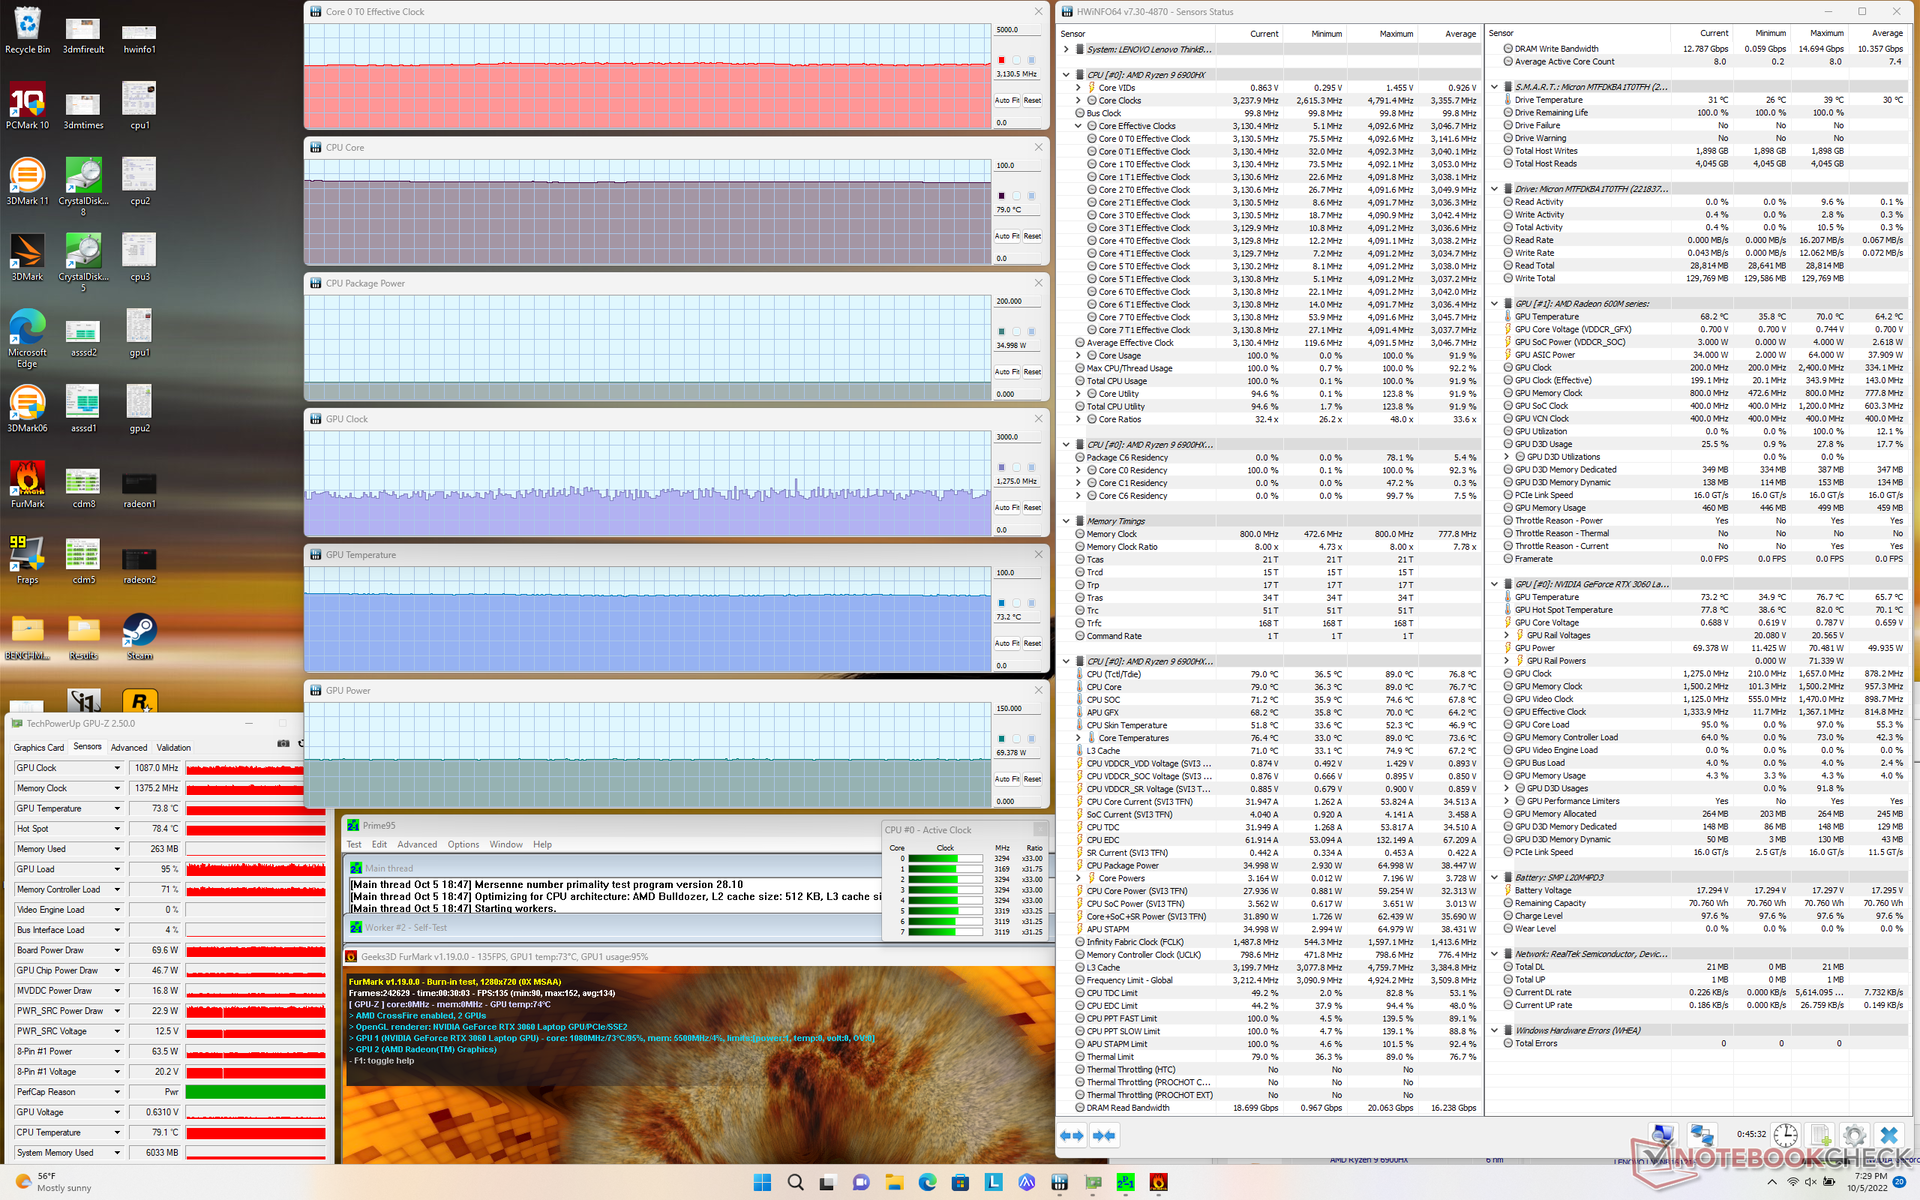
| CPU Clock (GHz) | GPU Clock (MHz) | Average CPU Temperature (°C) | Average GPU Temperature (°C) | |
| System Idle | -- | -- | 36 | 34 |
| Prime95 Stress | 3.7 | -- | 82 | 58 |
| Prime95 + FurMark Stress | 3.1 | ~1275 | 79 | 73 |
| Witcher 3 Stress | ~2.5 | 1582 | 77 | 69 |
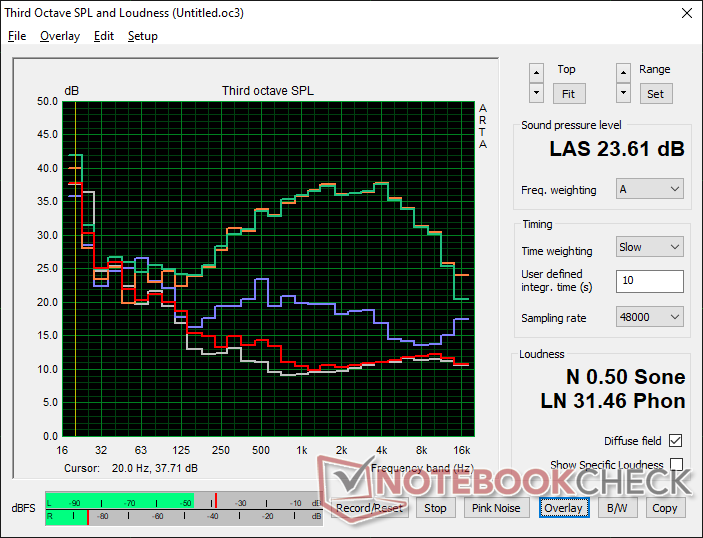
Lautsprecher
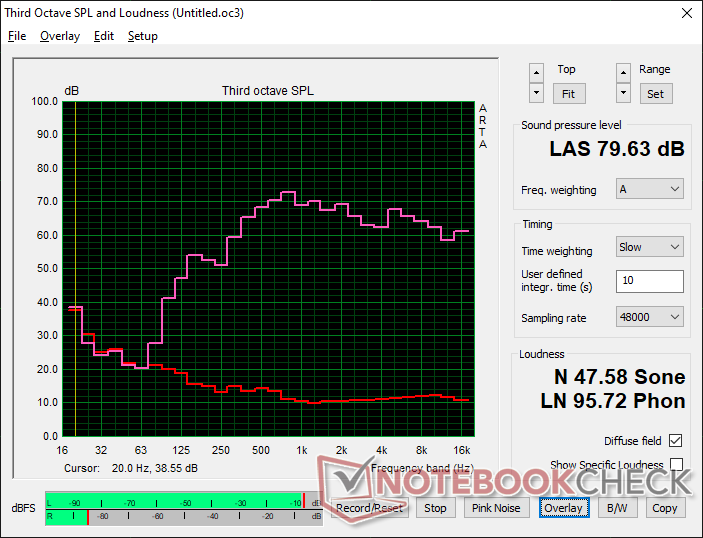
Lenovo ThinkBook 16p G3 ARH Audio Analyse
(±) | Mittelmäßig laut spielende Lautsprecher (79.6 dB)
Bass 100 - 315 Hz
(±) | abgesenkter Bass - 13.4% geringer als der Median
(±) | durchschnittlich lineare Bass-Wiedergabe (11.9% Delta zum Vorgänger)
Mitteltöne 400 - 2000 Hz
(+) | ausgeglichene Mitten, vom Median nur 4.8% abweichend
(+) | lineare Mitten (5.5% Delta zum Vorgänger)
Hochtöne 2 - 16 kHz
(+) | ausgeglichene Hochtöne, vom Median nur 1.6% abweichend
(+) | sehr lineare Hochtöne (4.6% Delta zum Vorgänger)
Gesamt im hörbaren Bereich 100 - 16.000 Hz
(+) | hörbarer Bereich ist sehr linear (13% Abstand zum Median
Im Vergleich zu allen Geräten derselben Klasse
» 26% aller getesteten Geräte dieser Klasse waren besser, 5% vergleichbar, 70% schlechter
» Das beste Gerät hat einen Delta-Wert von 5%, durchschnittlich ist 17%, das schlechteste Gerät hat 45%
Im Vergleich zu allen Geräten im Test
» 13% aller getesteten Geräte waren besser, 2% vergleichbar, 85% schlechter
» Das beste Gerät hat einen Delta-Wert von 4%, durchschnittlich ist 24%, das schlechteste Gerät hat 134%
Apple MacBook Pro 16 2021 M1 Pro Audio Analyse
(+) | Die Lautsprecher können relativ laut spielen (84.7 dB)
Bass 100 - 315 Hz
(+) | guter Bass - nur 3.8% Abweichung vom Median
(+) | lineare Bass-Wiedergabe (5.2% Delta zum Vorgänger)
Mitteltöne 400 - 2000 Hz
(+) | ausgeglichene Mitten, vom Median nur 1.3% abweichend
(+) | lineare Mitten (2.1% Delta zum Vorgänger)
Hochtöne 2 - 16 kHz
(+) | ausgeglichene Hochtöne, vom Median nur 1.9% abweichend
(+) | sehr lineare Hochtöne (2.7% Delta zum Vorgänger)
Gesamt im hörbaren Bereich 100 - 16.000 Hz
(+) | hörbarer Bereich ist sehr linear (4.6% Abstand zum Median
Im Vergleich zu allen Geräten derselben Klasse
» 0% aller getesteten Geräte dieser Klasse waren besser, 0% vergleichbar, 100% schlechter
» Das beste Gerät hat einen Delta-Wert von 5%, durchschnittlich ist 17%, das schlechteste Gerät hat 45%
Im Vergleich zu allen Geräten im Test
» 0% aller getesteten Geräte waren besser, 0% vergleichbar, 100% schlechter
» Das beste Gerät hat einen Delta-Wert von 4%, durchschnittlich ist 24%, das schlechteste Gerät hat 134%
Energiemanagement - Kürzere Akkulaufzeit als der Vorgänger
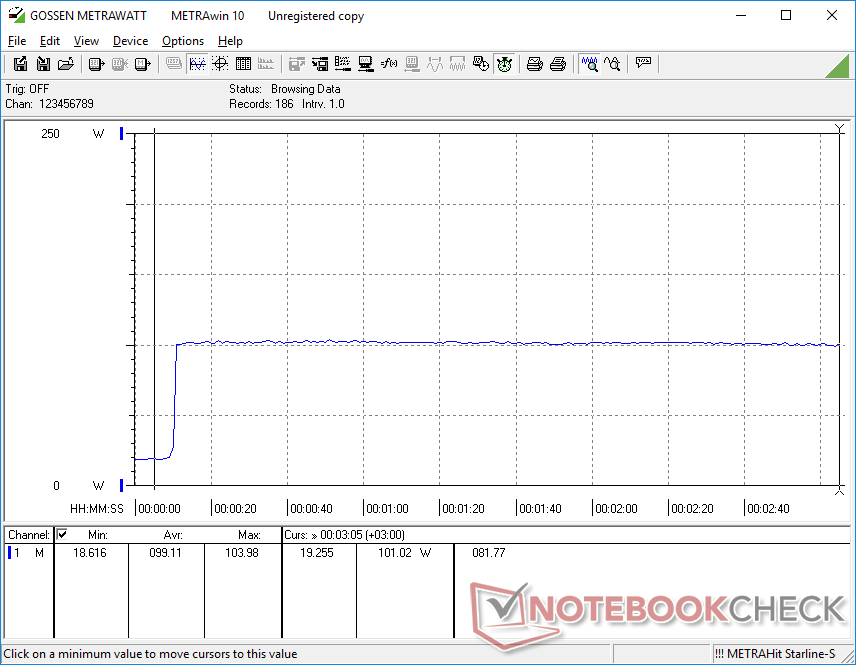
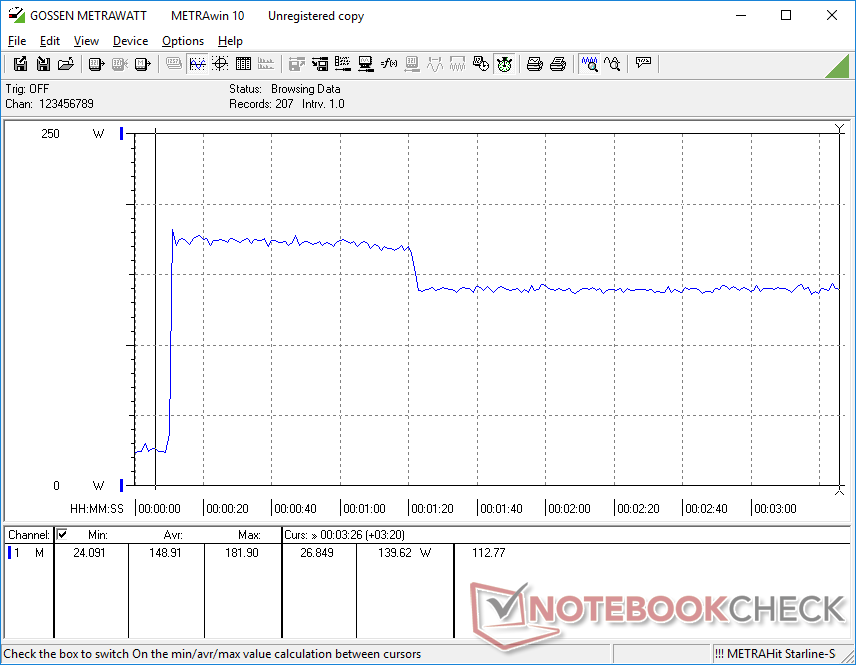
Energieverbrauch
Im Leerlauf verbraucht das System zwischen 10 und 24 W, je nach Leistungsprofil und Displayhelligkeit, das Gen-2-Modell benötigte hier nur zwischen 10 und 19 W. Der allgemeine Verbrauch ist dennoch signifikant niedriger als bei einem Legion 5 Pro 16 mit der gleichen GeForce RTX 3060, aber einem schnelleren Intel Gen12 Core i7.
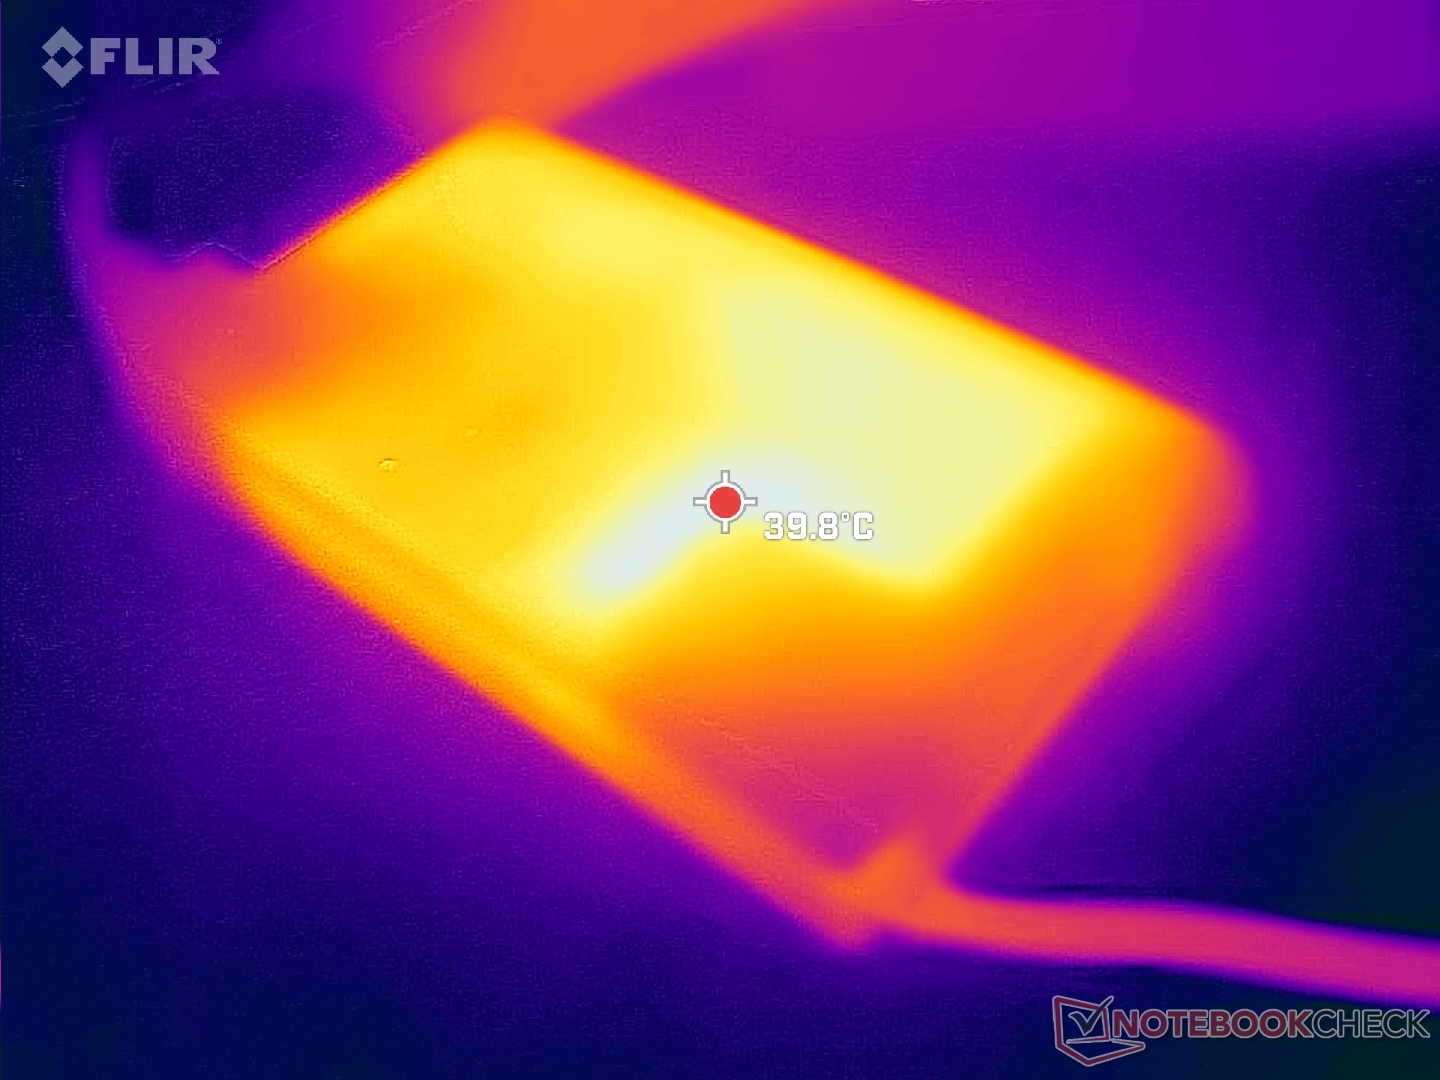
Wir messen ein Maximum von 182 W aus dem mittelgroßen (~16 x 8,8 x 2,8 cm) 230-W-Netzteil wenn sowohl CPU als auch GPU zu jeweils 100 Prozent ausgelastet sind.
| Aus / Standby | |
| Idle | |
| Last |
|
Legende:
min: | |
| Lenovo ThinkBook 16p G3 ARH R9 6900HX, GeForce RTX 3060 Laptop GPU, Micron 3400 1TB MTFDKBA1T0TFH, IPS, 2560x1600, 16" | HP Envy 16 h0112nr i7-12700H, GeForce RTX 3060 Laptop GPU, Micron 3400 1TB MTFDKBA1T0TFH, OLED, 3840x2400, 16" | Lenovo ThinkBook 16p G2 ACH R9 5900HX, GeForce RTX 3060 Laptop GPU, WDC PC SN730 SDBPNTY-1T00, IPS, 2560x1600, 16" | Lenovo IdeaPad 5 Pro 16ARH7 R5 6600HS, Radeon 660M, Samsung PM9A1 MZVL2512HCJQ, IPS, 2560x1600, 16" | Acer Swift X SFX16-51G-5388 i5-11320H, GeForce RTX 3050 4GB Laptop GPU, Samsung PM991 MZVLQ512HBLU, , 1920x1080, 16.1" | Lenovo Legion 5 Pro 16IAH7H i7-12700H, GeForce RTX 3060 Laptop GPU, 2x Samsung PM9A1 MZVL21T0HCLR (RAID 0), IPS, 2560x1600, 16" | |
|---|---|---|---|---|---|---|
| Stromverbrauch | -6% | 4% | 52% | 39% | -77% | |
| Idle min * (Watt) | 10.3 | 10 3% | 13.2 -28% | 4 61% | 7 32% | 22.8 -121% |
| Idle avg * (Watt) | 16 | 10.9 32% | 17 -6% | 7 56% | 10.1 37% | 26.5 -66% |
| Idle max * (Watt) | 24 | 27.8 -16% | 18.6 22% | 13 46% | 15 37% | 41 -71% |
| Last avg * (Watt) | 85.4 | 116.4 -36% | 88.8 -4% | 61 29% | 63.3 26% | 191 -124% |
| Witcher 3 ultra * (Watt) | 132.2 | 133.7 -1% | 123 7% 123 7% | 42.8 68% | 63.3 52% | 194.7 -47% |
| Last max * (Watt) | 181.9 | 209.8 -15% | 132 27% | 88 52% | 94 48% | 238 -31% |
* ... kleinere Werte sind besser
Energieverbrauch Witcher 3 / Stresstest
Energieverbrauch mit externem Monitor
Akkulaufzeit
Die praxisnahen WLAN-Laufzeiten fallen um zwei Stunden kürzer aus als beim Gen-2-Modell, trotz des gleich großen 71-Wh-Akkus. Die höhere Bildwiederholrate (165 Hz vs. 60 Hz) dürfte teilweise dafür verantwortlich sein.
Eine komplette Aufladung von 0 auf 100 Prozent nimmt zwischen 1,5 und 2 Stunden in Anspruch. Leider kann das Gerät nicht über USB-C geladen werden, da Power Delivery (PD) nicht unterstützt wird.
| Lenovo ThinkBook 16p G3 ARH R9 6900HX, GeForce RTX 3060 Laptop GPU, 71 Wh | HP Envy 16 h0112nr i7-12700H, GeForce RTX 3060 Laptop GPU, 83 Wh | Lenovo ThinkBook 16p G2 ACH R9 5900HX, GeForce RTX 3060 Laptop GPU, 71 Wh | Lenovo IdeaPad 5 Pro 16ARH7 R5 6600HS, Radeon 660M, 75 Wh | Acer Swift X SFX16-51G-5388 i5-11320H, GeForce RTX 3050 4GB Laptop GPU, 58.7 Wh | Lenovo Legion 5 Pro 16IAH7H i7-12700H, GeForce RTX 3060 Laptop GPU, 80 Wh | |
|---|---|---|---|---|---|---|
| Akkulaufzeit | 22% | 31% | 51% | 25% | -45% | |
| WLAN (h) | 6.5 | 7.9 22% | 8.5 31% | 9.8 51% | 8.1 25% | 3.6 -45% |
| Idle (h) | 17.8 | |||||
| Last (h) | 1.6 | 2 | 1.5 | 0.6 | ||
| H.264 (h) | 7 | 8.4 | 4.1 | |||
| Spielen (h) | 1.1 | |||||
| Witcher 3 ultra (h) | 2.1 |
Pro
Contra
Fazit — Man sollte lieber den Vorgänger in Betracht ziehen
Anders als beim spürbaren Leistungssprung vom Intel Gen11 zu Gen12, bringt der Sprung von AMD Zen 3 auf Zen 3+ bestenfalls minimale Verbesserungen. Wenn es um eine hohe Prozessorleistung geht, können wir den um nur 5 Prozent schnelleren Ryzen 9 6900HX gegenüber dem Ryzen 9 5900HX im 2021er ThinkBook 16p Gen 2 schwerlich empfehlen.
Alle weiteren Änderungen im 2022er Modell sind hingegen kaum erwähnenswert. Zumindest das 165-Hz-G-Sync-P stellt eine deutliche Verbesserung zum 60-Hz-Panel im Vorgänger dar und sorgt für eine flüssigere Gaming-Erfahrung. Wir wissen auch den neuen HDMI-Port zu schätzen, aber der Umstieg auf verlöteten RAM könnte den einen oder anderen Nutzer verärgern. Wir vermuten mal, dass Lenovo nun den nicht-wechselbaren RAM zugunsten eines größeren Kühlsystems einsetzt, um die schnelleren 90 W für die GPU zu erzielen.
Die Leistungsverbesserungen zum Vorjahr sind zu gering, um sich in den meisten Situationen spürbar auszuwirken. Allerdings hilft das neue und noch beeindruckendere 165-Hz-Display dabei das ThinkBook 16p Gen 3 von den meisten anderen 16-Zoll-Laptops auf dem Markt abzugrenzen.
Nutzer können einiges an Geld sparen indem sie anstelle des Gen 3 einfach die ältere aber optisch identische Gen-2-Version kaufen und dabei annähernd die gleiche Leistung erhalten. Achtung: Lenovo verlangt aktuell einen Aufpreis für das ThinkBook 16p Gen 3, gerade verglichen mit den konkurrierenden Dell Inspiron 16 Plus 7620 und HP Envy 16. Dafür bietet das Lenovo-Modell das 165-Hz-Panel, welches in den erwähnten Dell- oder HP-Alternativen aktuell nicht erhältlich ist.
Preise und Verfügbarkeit
Aktuell wird das ThinkBook 16p Gen 3 in Deutschland noch nicht auf entsprechenden Vergleichsportalen gelistet. Auf der Lenovo-Homepage steht, dass das Modell "demnächst verfügbar" sein wird. Bei einem US-Preis ab $2460 darf mit Europreisen ab 2.600 Euro gerechnet werden.
Lenovo ThinkBook 16p G3 ARH
- 08.10.2022 v7 (old)
Allen Ngo
Preisvergleich

