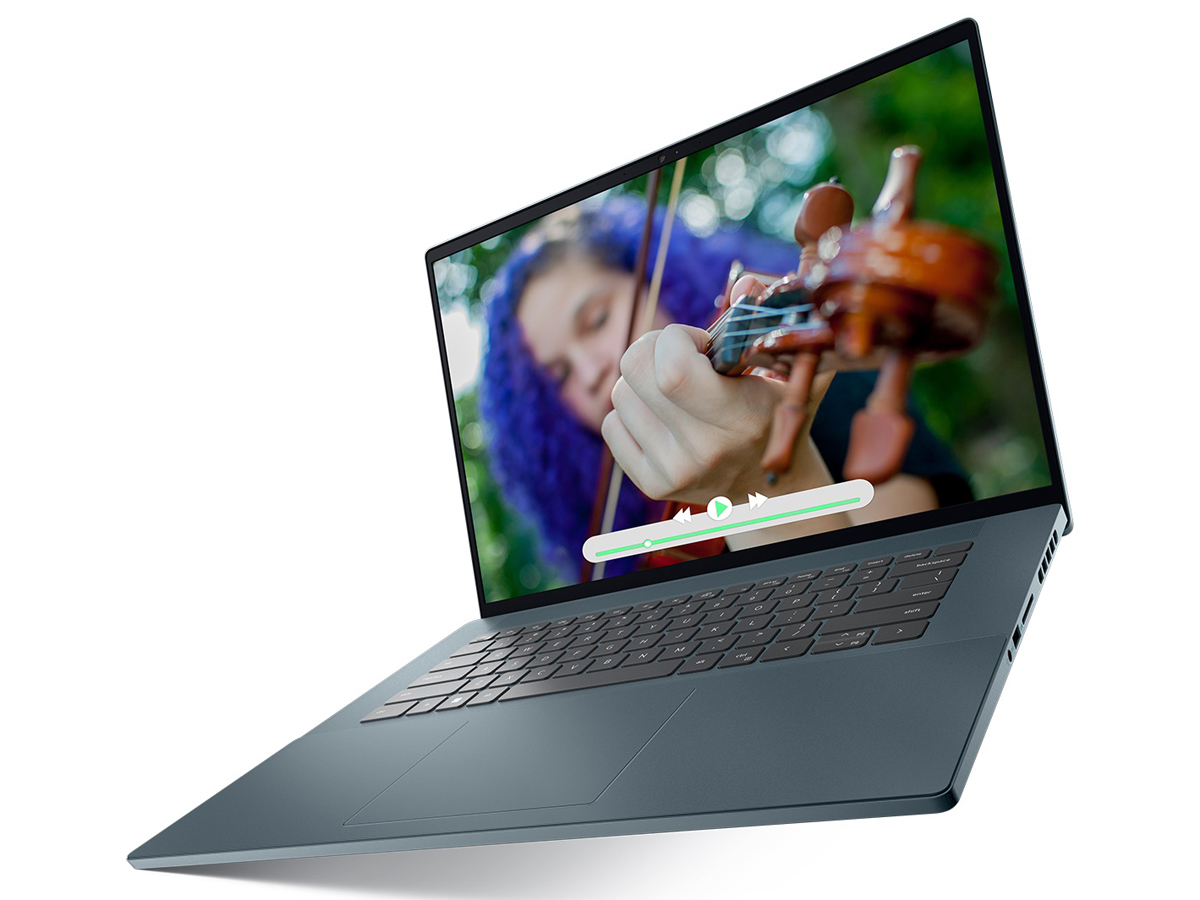
Test Dell Inspiron 16 Plus 7620: Der Alleskönner-Multimedia-Laptop
Das 2022er-Modell Dell Inspiron 16 Plus 7620 ist der direkte Nachfolger des 2021er-Modells Inspiron 16 Plus 7610 und ersetzt die CPUs aus der 11. Generation im Vorgänger durch CPUs aus der 12. Generation und schnellere GeForce-RTX-GPUs. Außerdem hat der Hersteller nach nur einem Jahr das Gehäuse überarbeitet.
Unser Testgerät ist mit der Alder-Lake-H-CPU Core i7-12700H, einer 65-W-GeForce-RTX-3050-Ti und einem 3.072-x-1.280-IPS-Display im 16:10-Format ausgestattet und kostet ca. 1.400 Euro. Andere Modelle mit dem Core i5-12500H, einer 60-W-RTX-3060 und einem 1.920-x-1.200-Touchscreen sind ebenfalls verfügbar. Weiterhin gibt es eine Convertible-Version namens Inspiron 16 Plus 7620 2-in-1.
Zu den direkten Konkurrenten in diesem Bereich zählen andere Multimedia- und Creator-Laptops aus dem Mittelklasse-bis-High-End-Segment wie das Lenovo Yoga 7 16IAP7, Huawei MateBook D 16, Acer Swift X, Asus Vivobook Pro 16X und auch das MSI Creator Z16.
Weitere Dell-Tests:
Mögliche Konkurrenten im Vergleich
Bew. | Datum | Modell | Gewicht | Dicke | Größe | Auflösung | Preis ab |
|---|---|---|---|---|---|---|---|
| 87.4 % v7 (old) | 08 / 2022 | Dell Inspiron 16 Plus 7620 i7-12700H, GeForce RTX 3050 Ti Laptop GPU | 2.1 kg | 18.99 mm | 16.00" | 3072x1920 | |
| 86.7 % v7 (old) | 08 / 2021 | Dell Inspiron 16 Plus 7610 i7-11800H, GeForce RTX 3050 4GB Laptop GPU | 2 kg | 18.99 mm | 16.00" | 3072x1920 | |
| 88.7 % v7 (old) | 08 / 2022 | Lenovo Yoga 7 16IAP7 i7-1260P, Iris Xe G7 96EUs | 2 kg | 19.2 mm | 16.00" | 2560x1600 | |
| 83.6 % v7 (old) | 07 / 2022 | Huawei MateBook D 16 2022 i7-12700H, Iris Xe G7 96EUs | 1.7 kg | 18.4 mm | 16.00" | 1920x1200 | |
| 86.2 % v7 (old) | 07 / 2022 | Acer Swift X SFX16-51G-5388 i5-11320H, GeForce RTX 3050 4GB Laptop GPU | 1.8 kg | 18.9 mm | 16.10" | 1920x1080 | |
v (old) | 10 / 2021 | Asus Vivobook Pro 16X-M7600QE R9 5900HX, GeForce RTX 3050 Ti Laptop GPU | 1.9 kg | 19 mm | 16.10" | 3840x2400 |
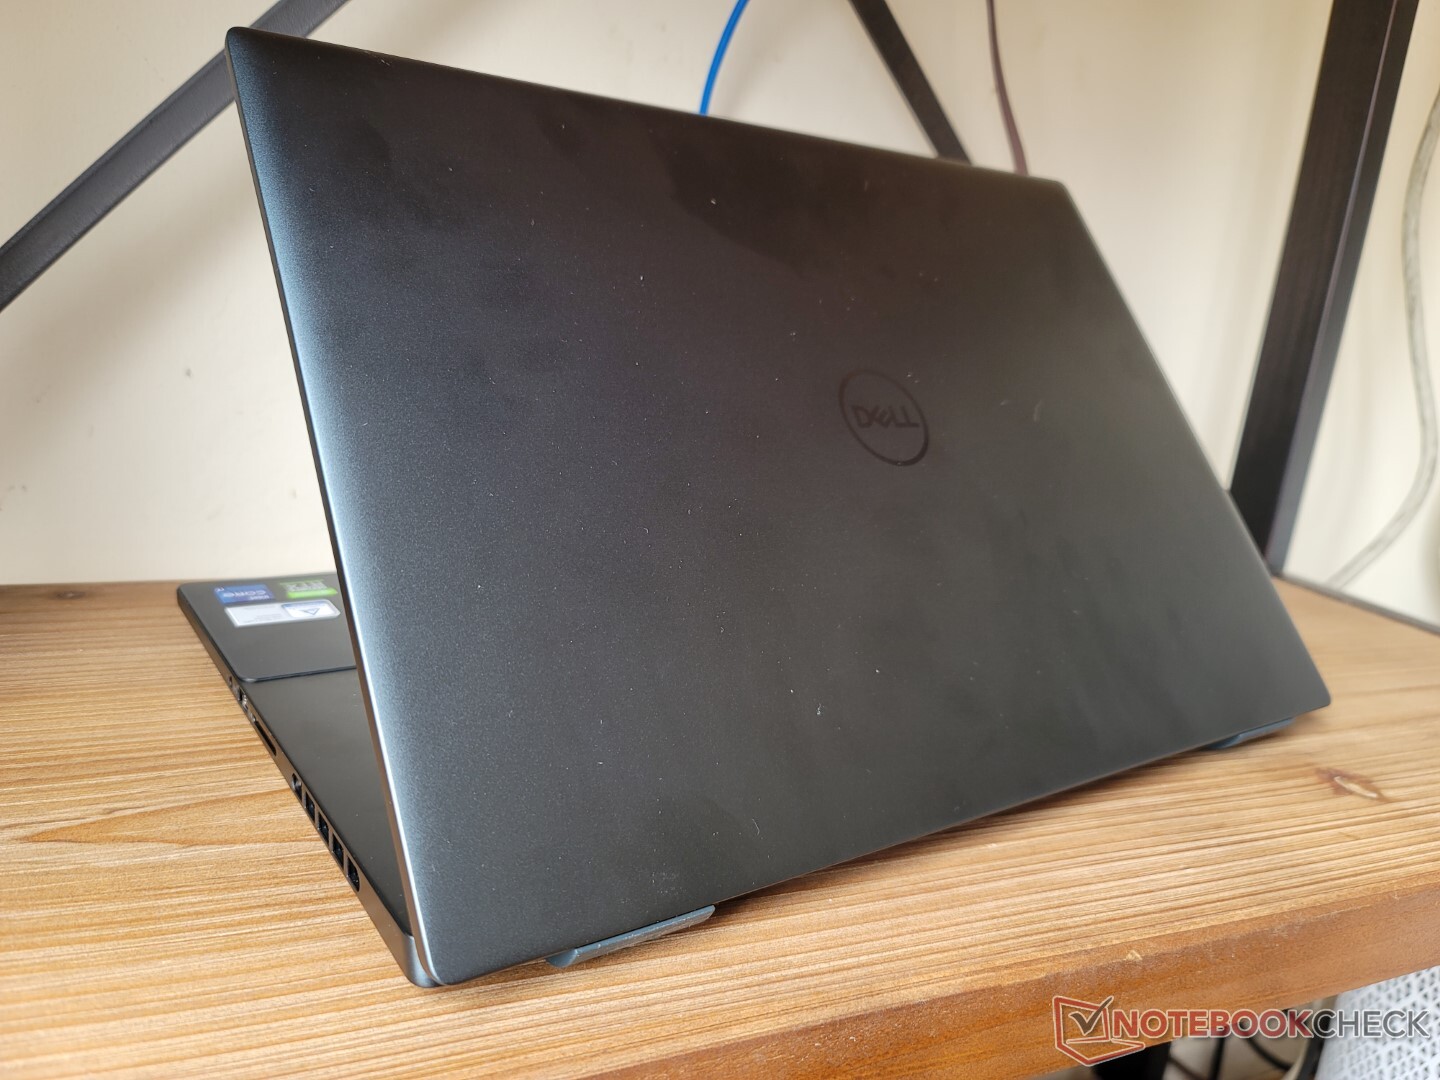
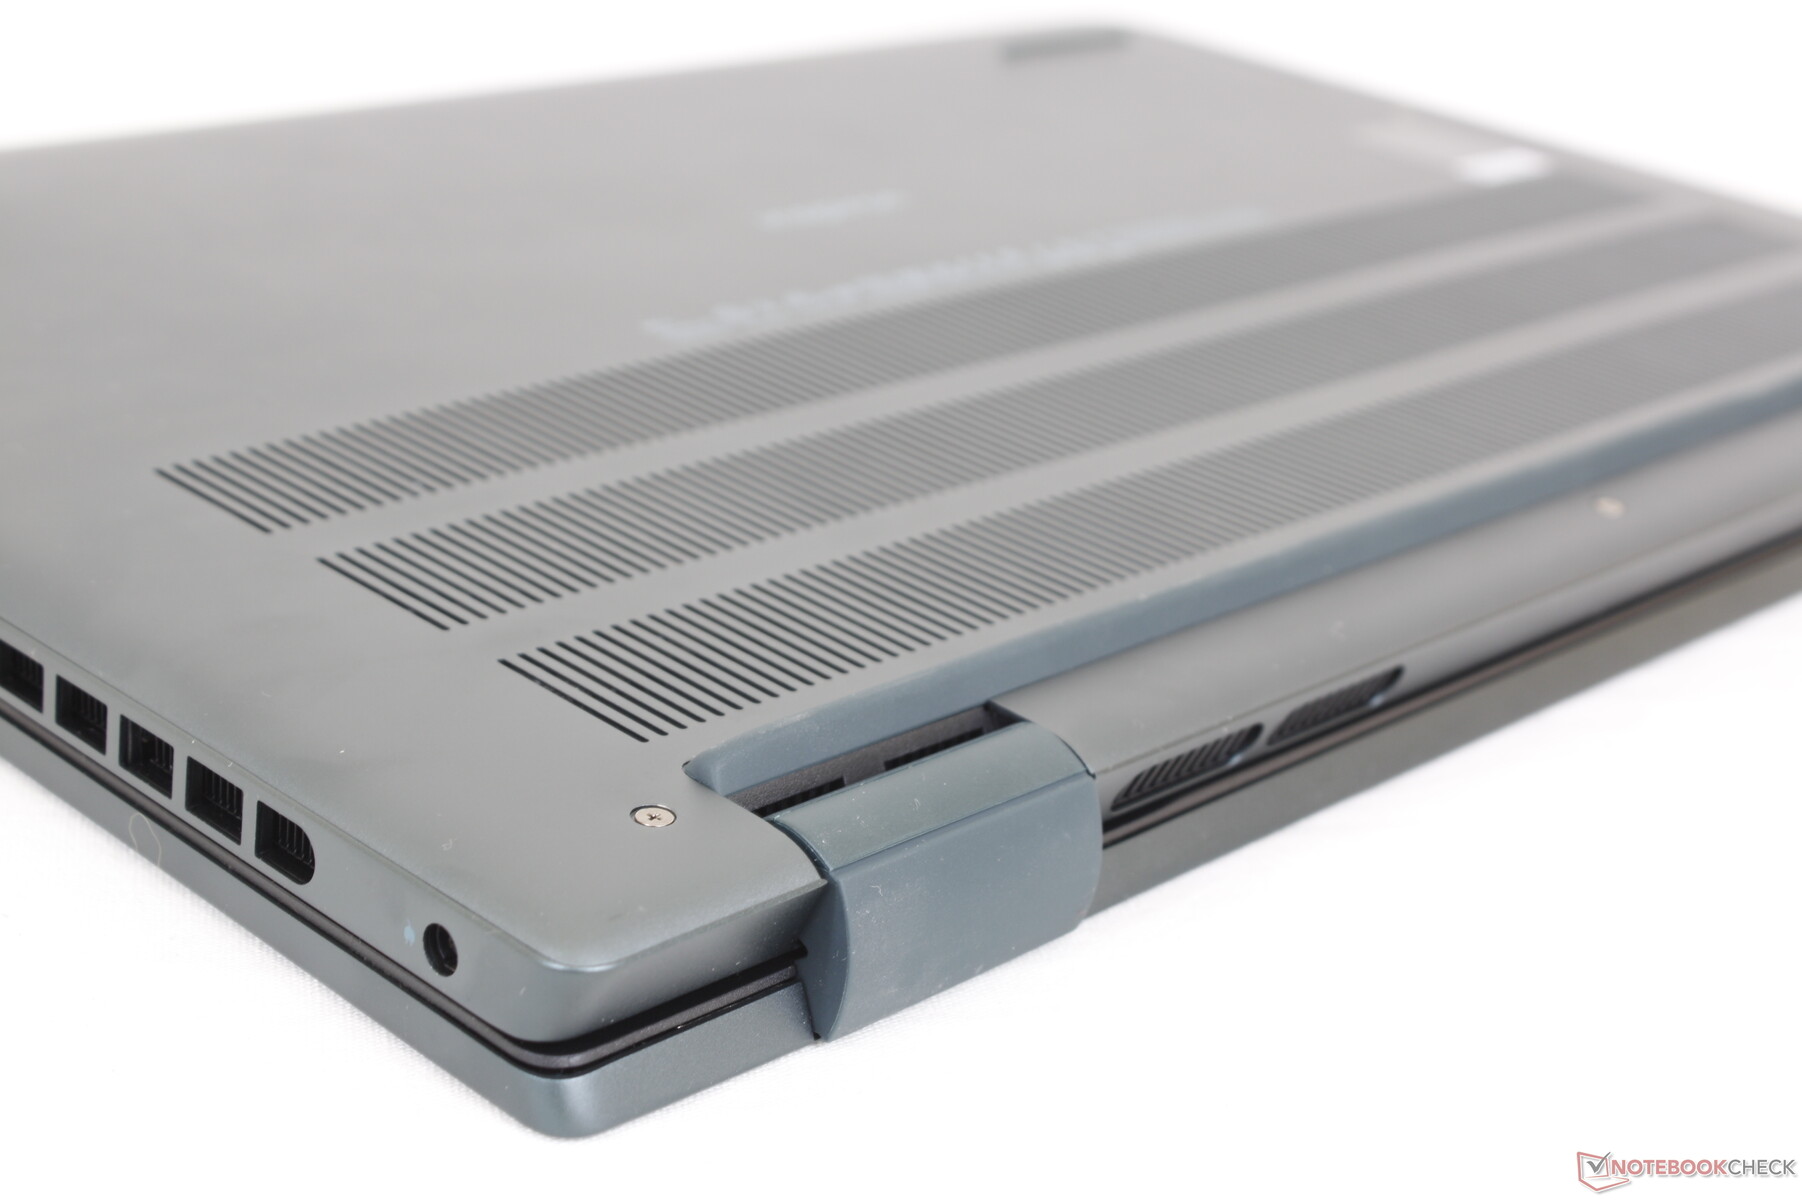
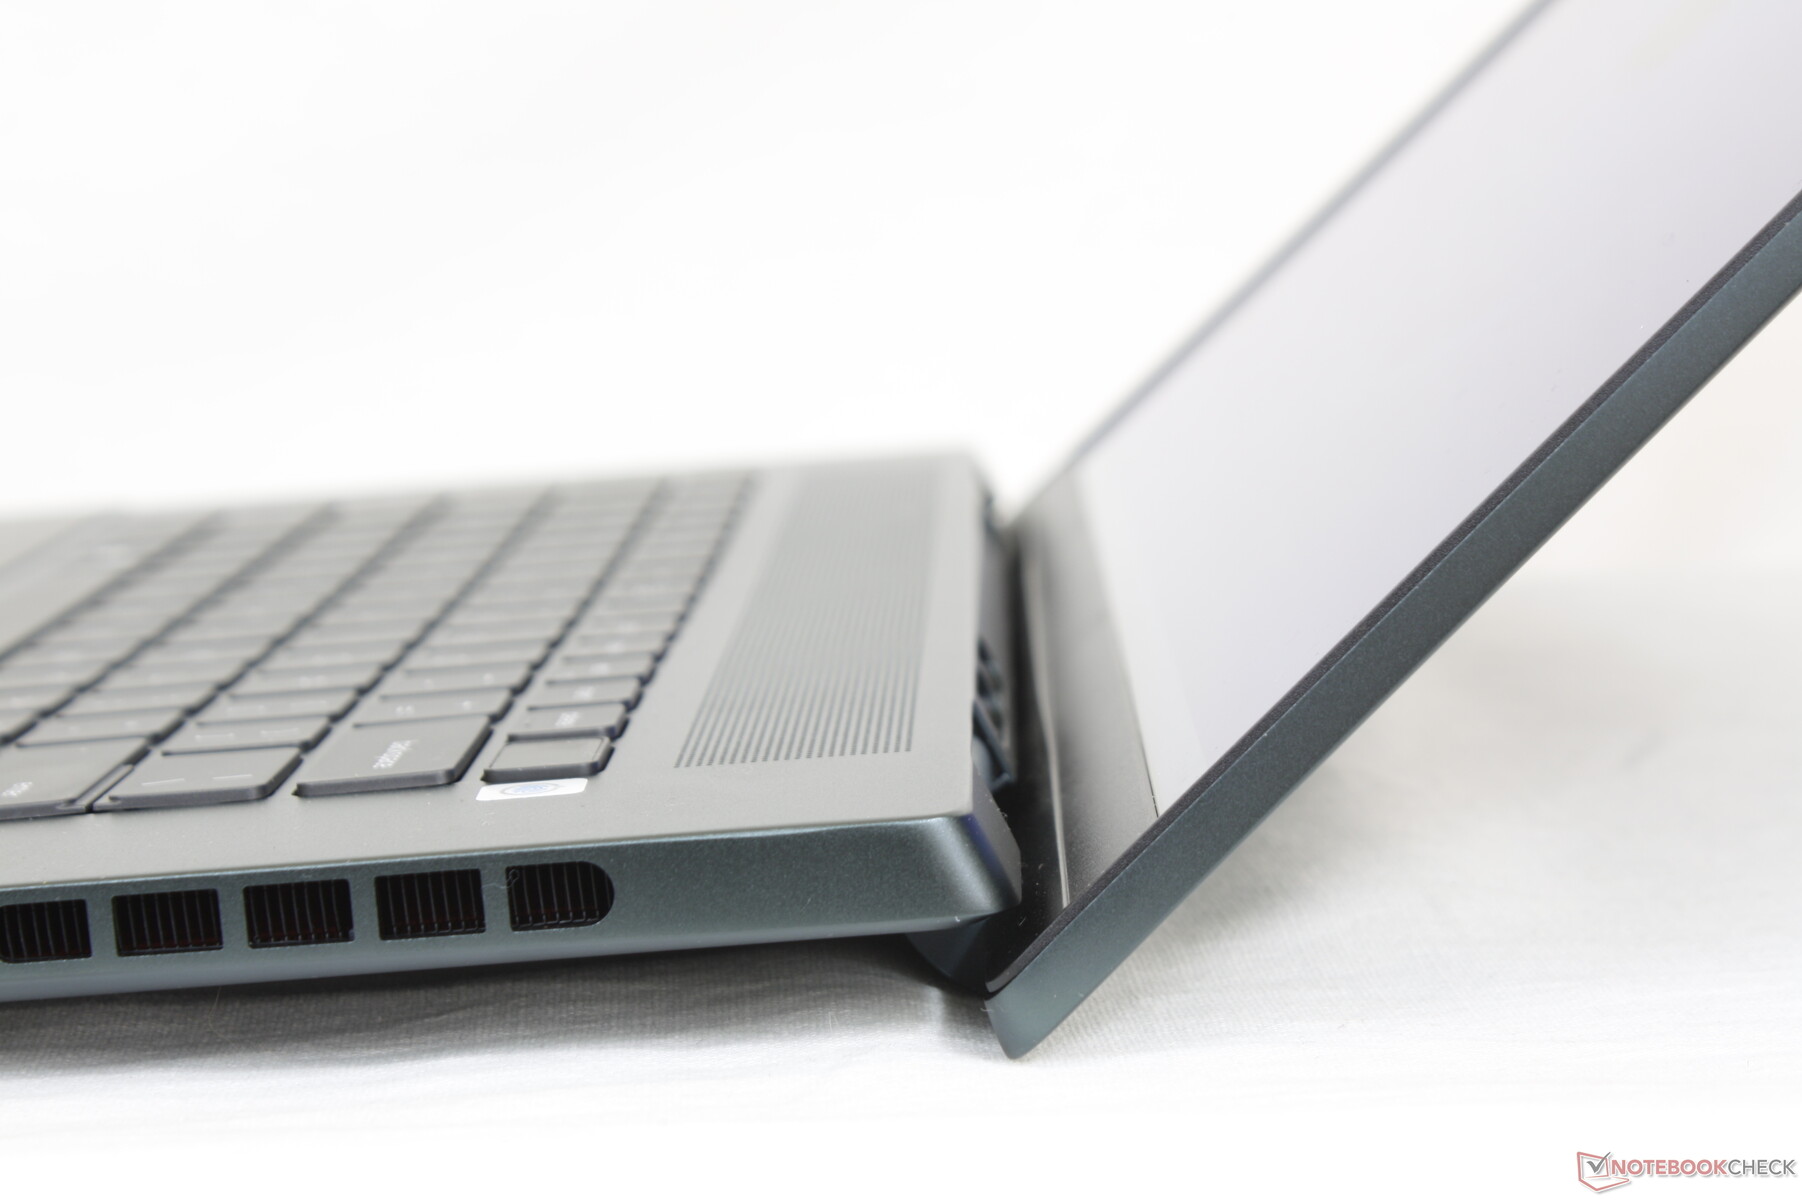
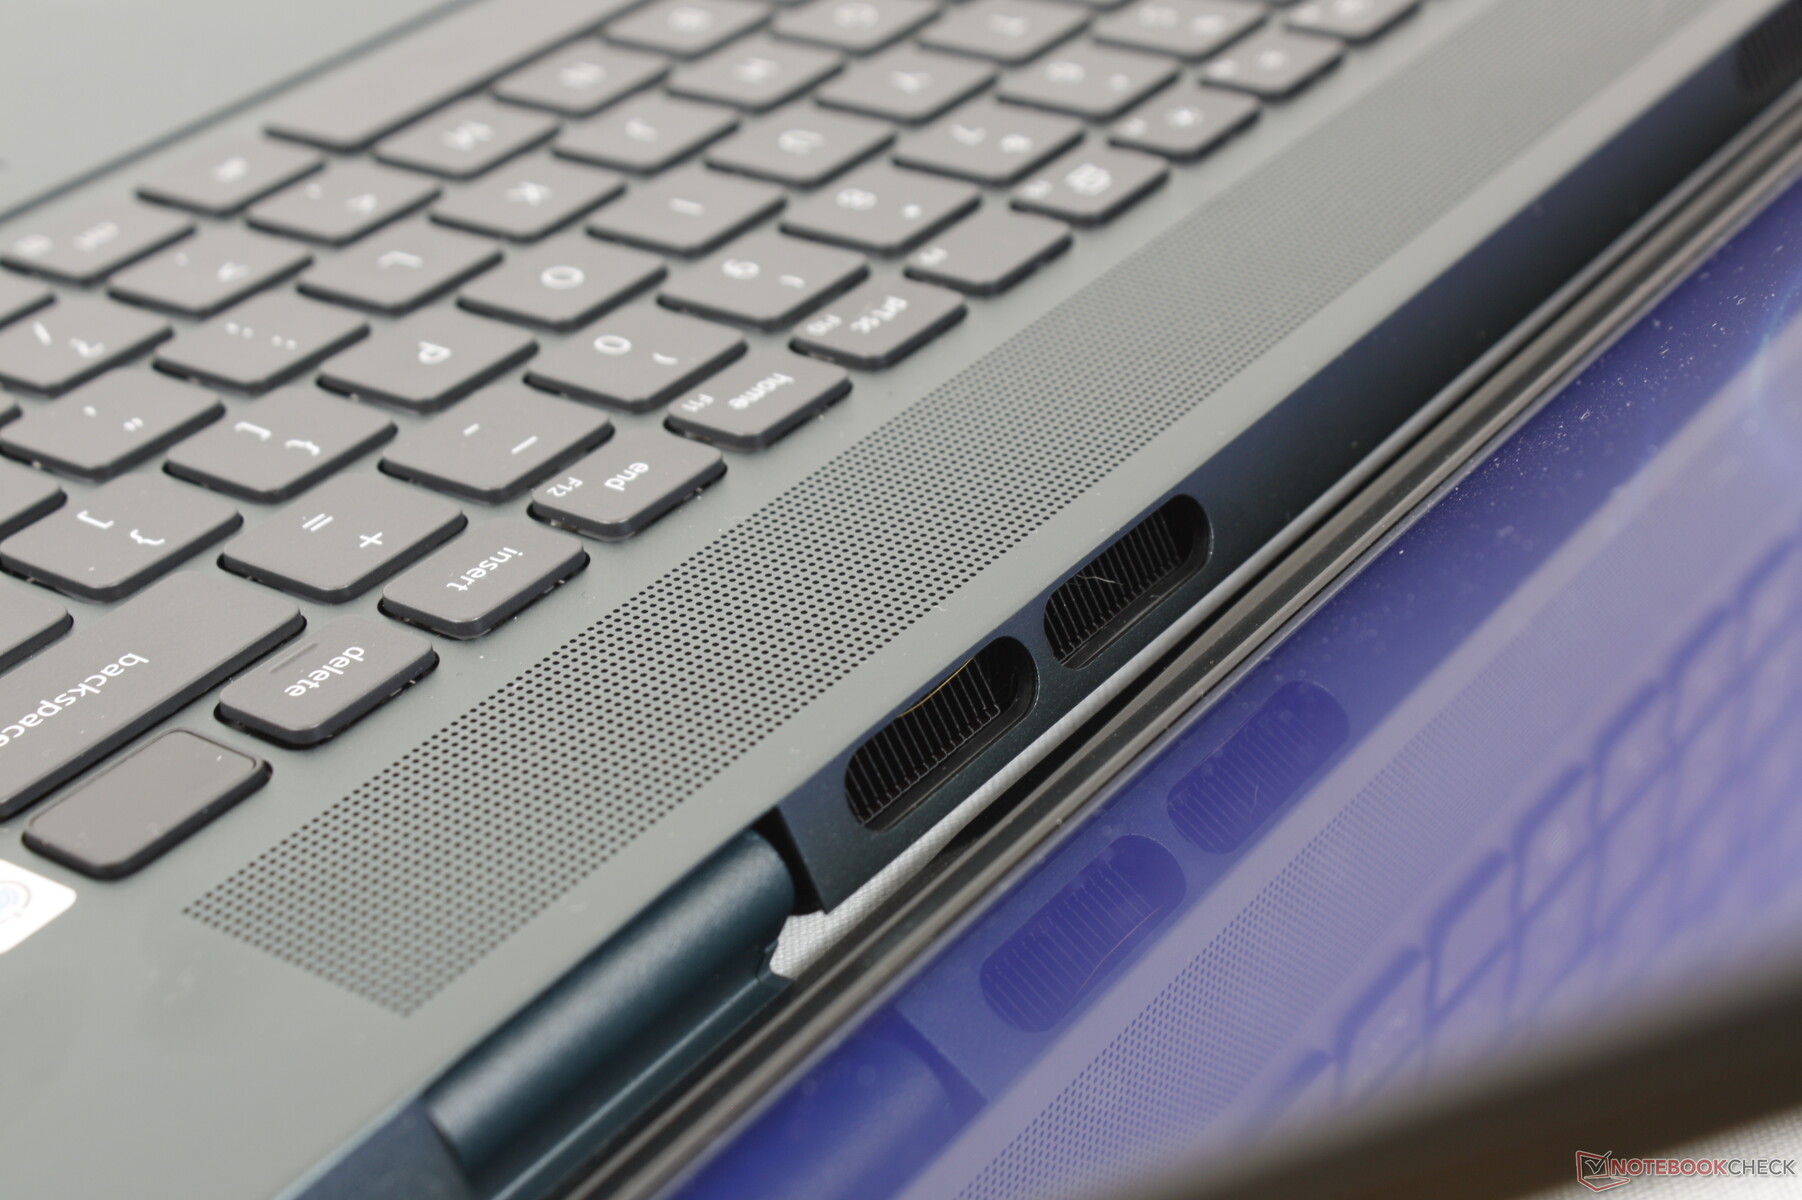
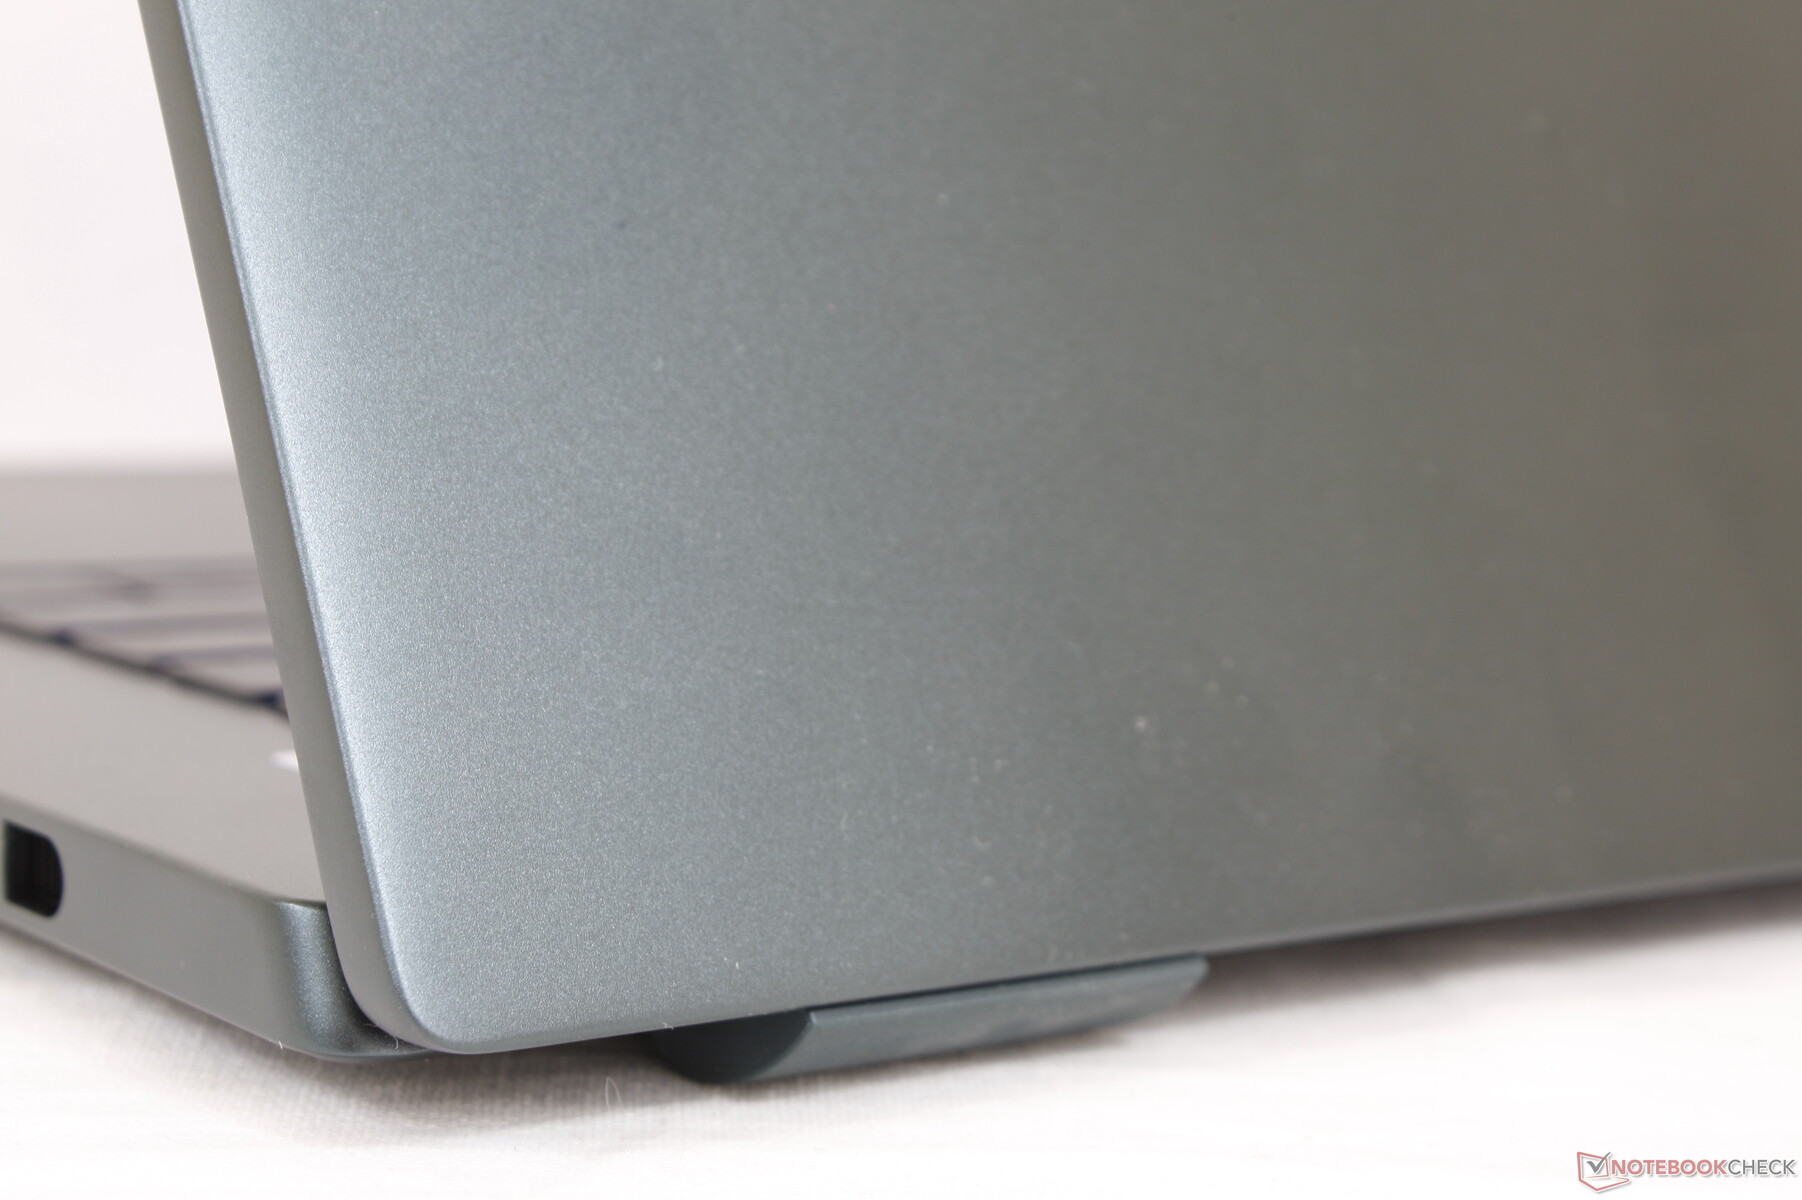
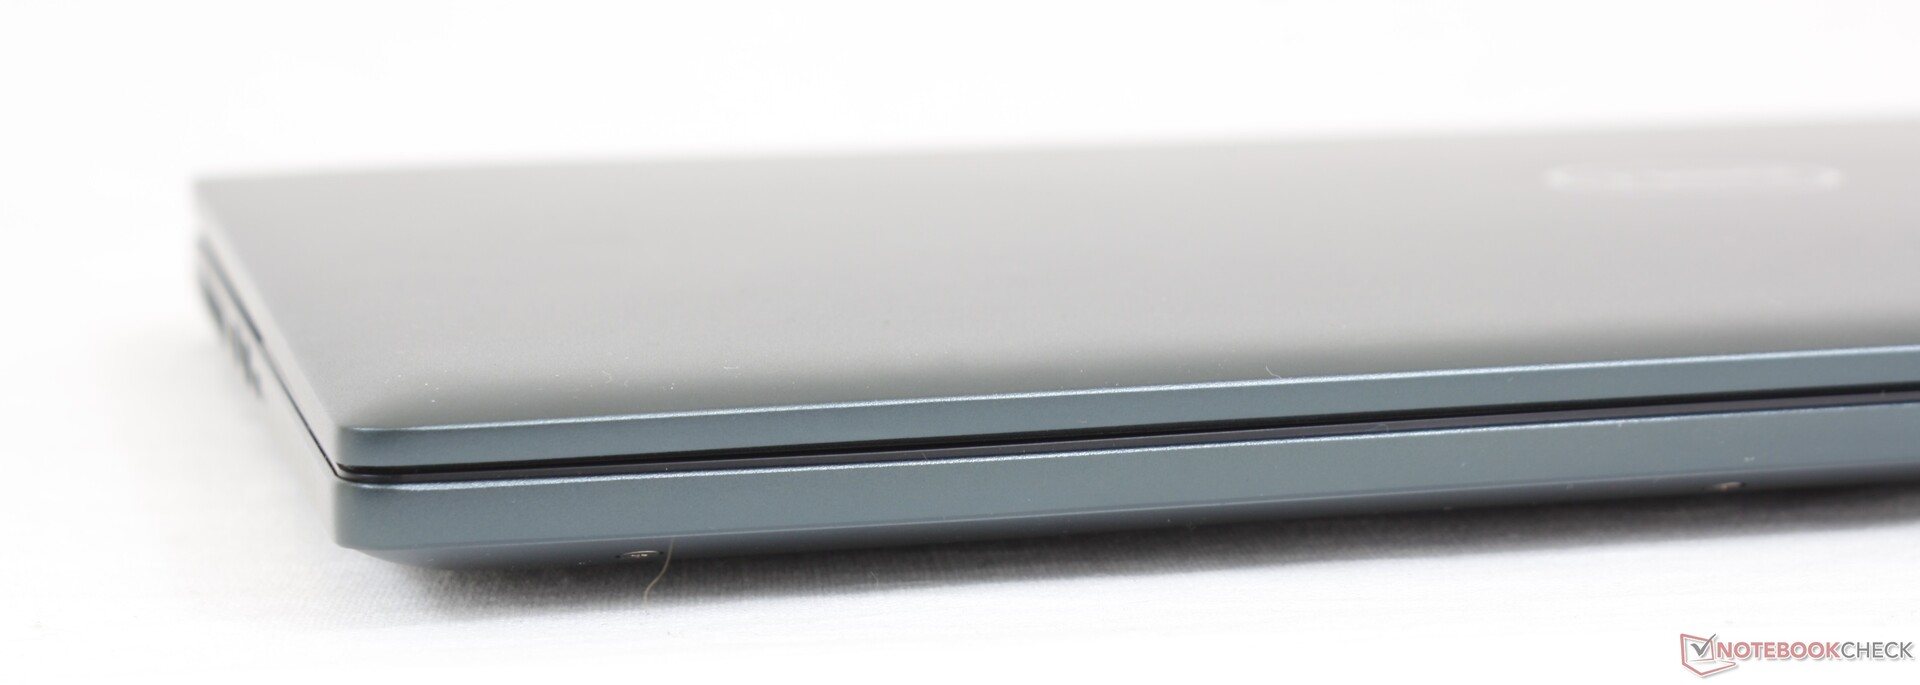
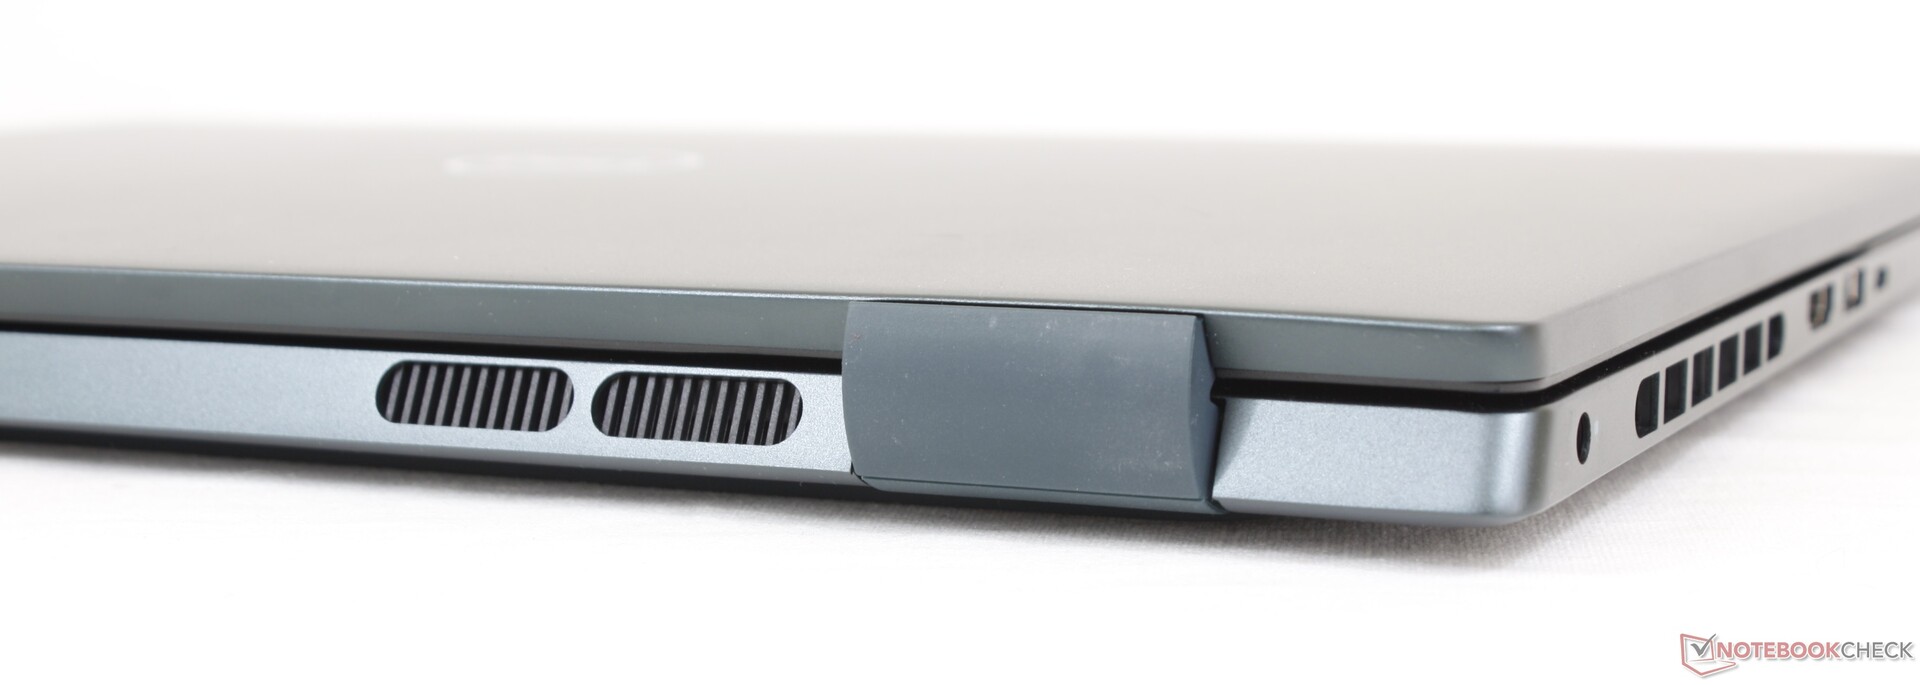
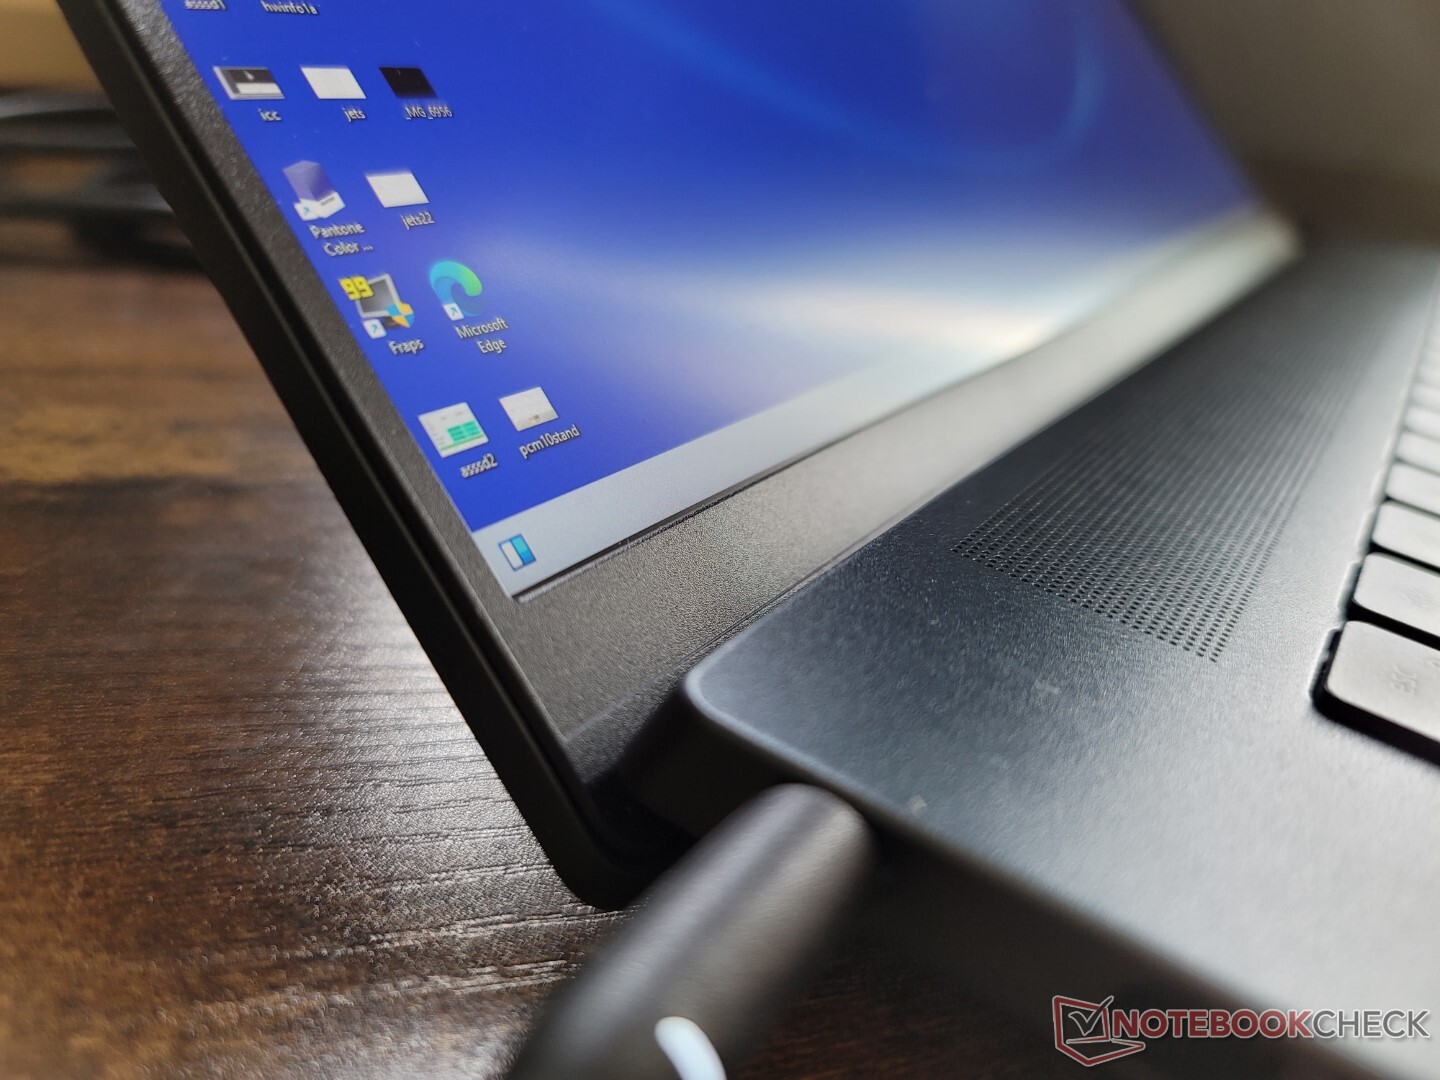
Gehäuse — Dunklere Farbgebung
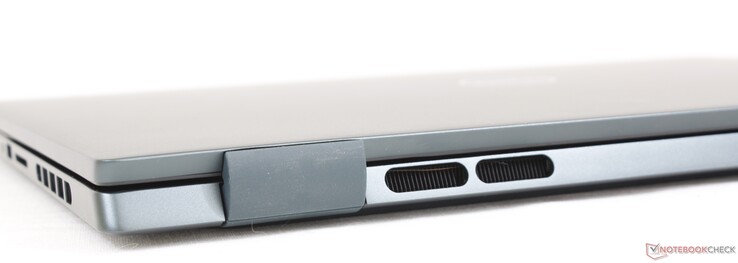
Optisch fallen die Unterschiede zwischen dem 2021er- und dem 2022er-Modell sofort auf. Die Lüftungsschlitze an den Seiten und auf der Rückseite sind jetzt viereckig bzw. oval statt rund. Die verchromten Ecken und Kanten wurden gestrichen, was in einer recht monochromen und schlichteren Ästhetik resultiert.
Die Verarbeitungsqualität ist ungefähr gleich geblieben. Die metallische Basiseinheit und insbesondere der Deckel knarzt etwas mehr als bei einem teureren XPS oder Spectre. Wir hatten gehofft, dass die vielen optischen Anpassungen mit einem stabileren Gehäuse einhergehen, das scheint jedoch nicht der Fall zu sein. In Bezug auf das Design verpasst man, wenn man noch das 2021er-Modell hat, hier nicht viel.
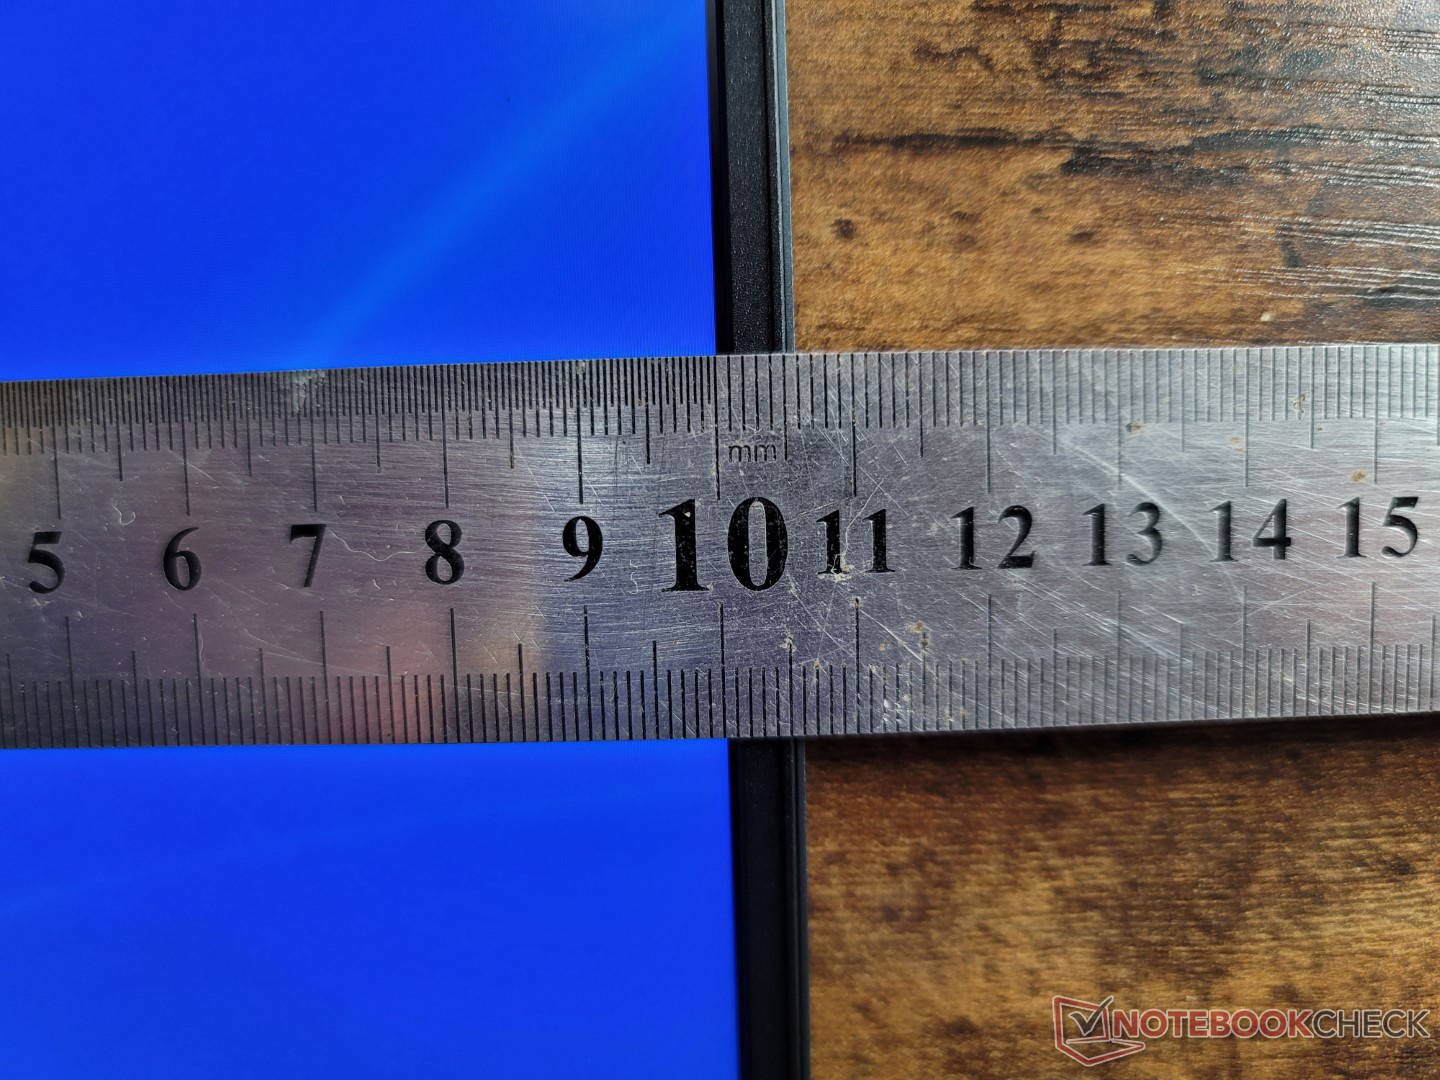
Einer unserer Hauptkritikpunkte zum Inspiron 16 Plus 7610 war das Gewicht, das beim 7620 trotz des erneuerten Designs hoch bleibt. Mit 2 bis 2,1 kg ist der Laptop um mehrere Hundert Gramm schwerer als das 16 Zoll große Acer Swift X bzw. Huawei MateBook D 16. Das neue Design macht das Inspiron auch nicht kleiner, da die Abmessungen tatsächlich etwas größer ausfallen als beim 7610.
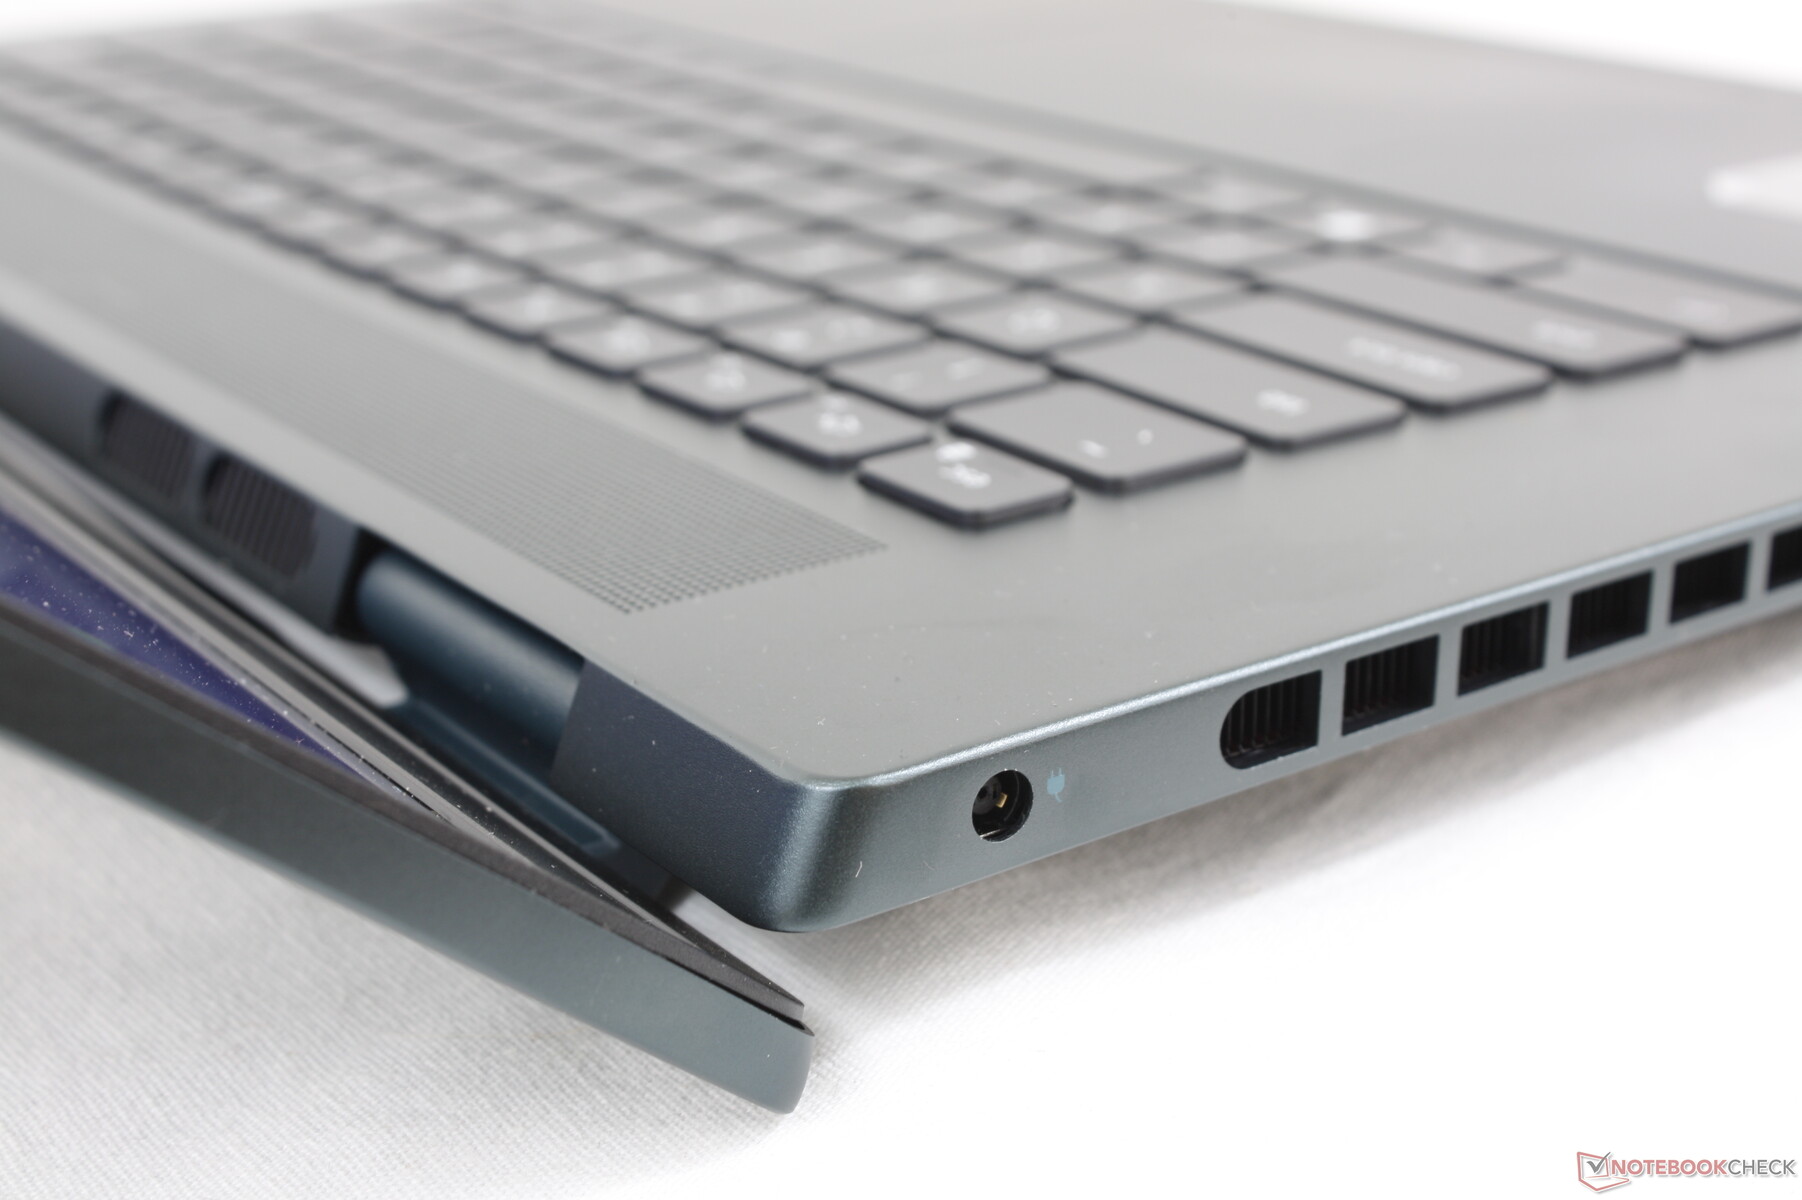
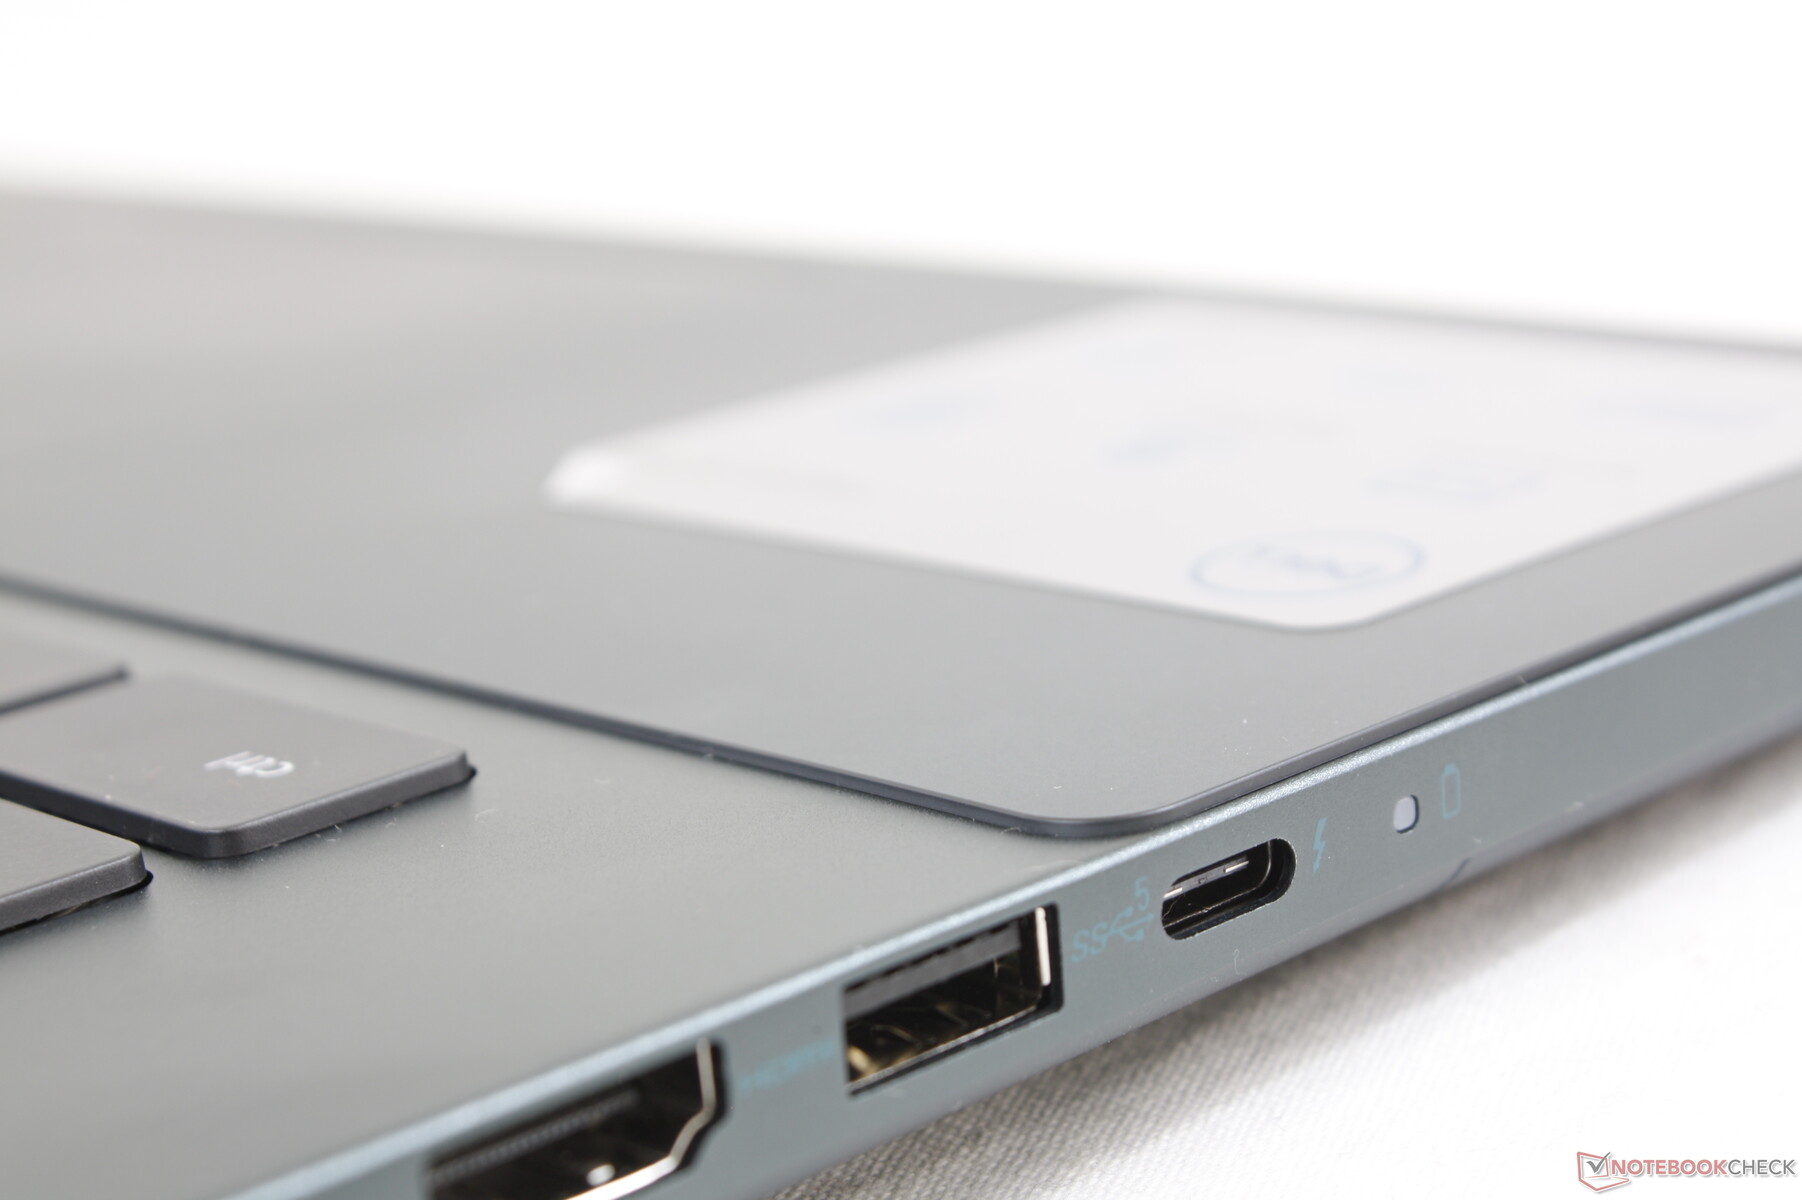
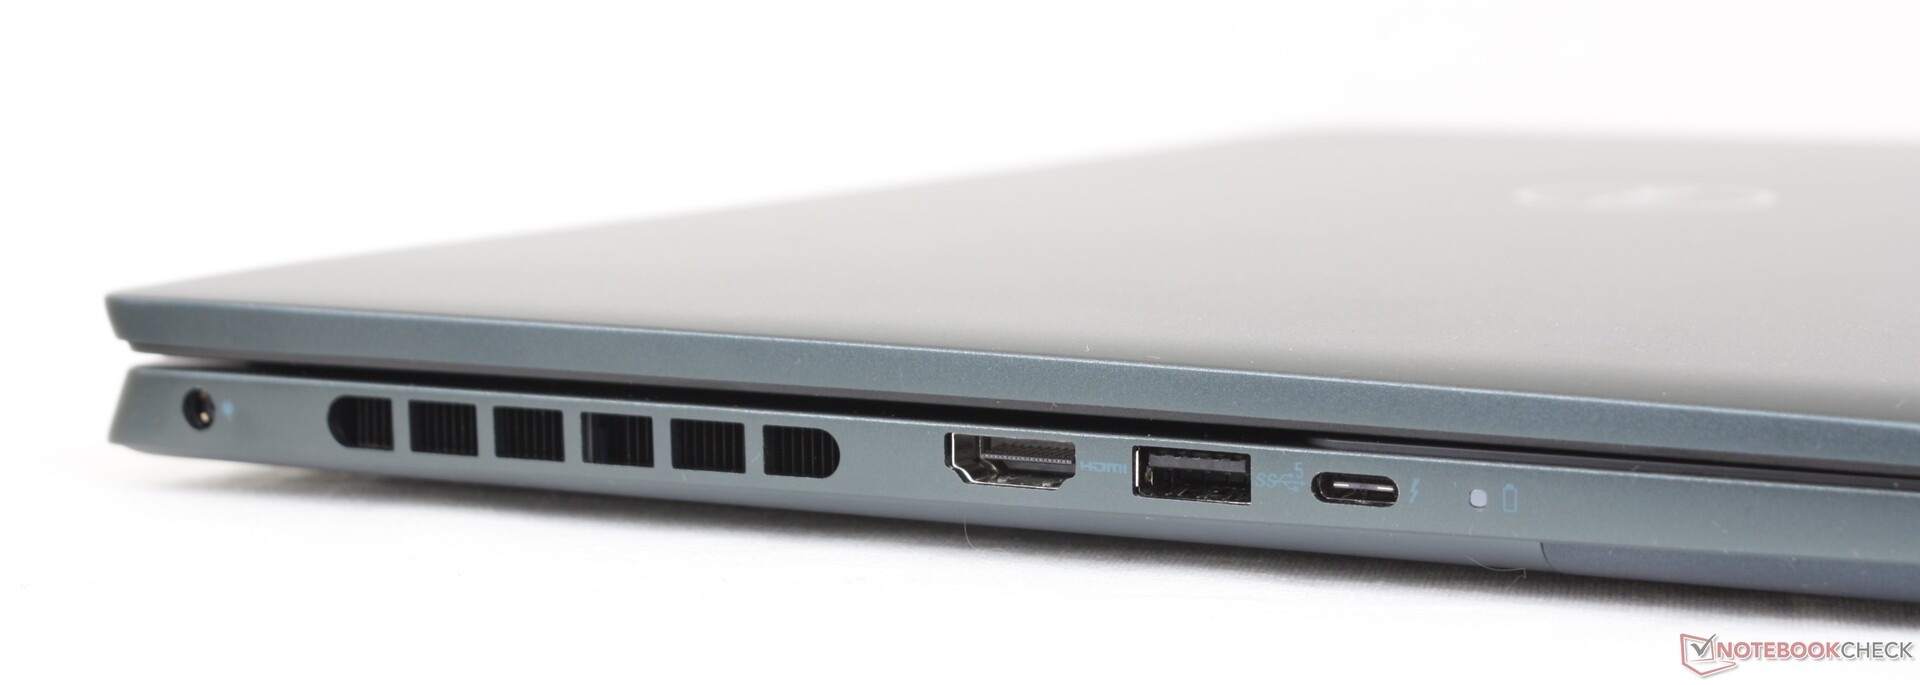
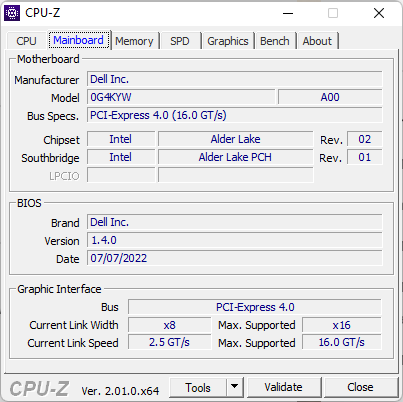
Ausstattung — Thunderbolt 4 an Bord
Trotz der Designänderungen ist das 7620 mit den gleichen Anschlüssen bestückt wie das 7610. In Anbetracht der Größe und des Gewichts des Laptops hätten wir uns über einen zweiten USB-C-Anschluss wie beim Lenovo Yoga 7 16 Gen 7 gefreut.
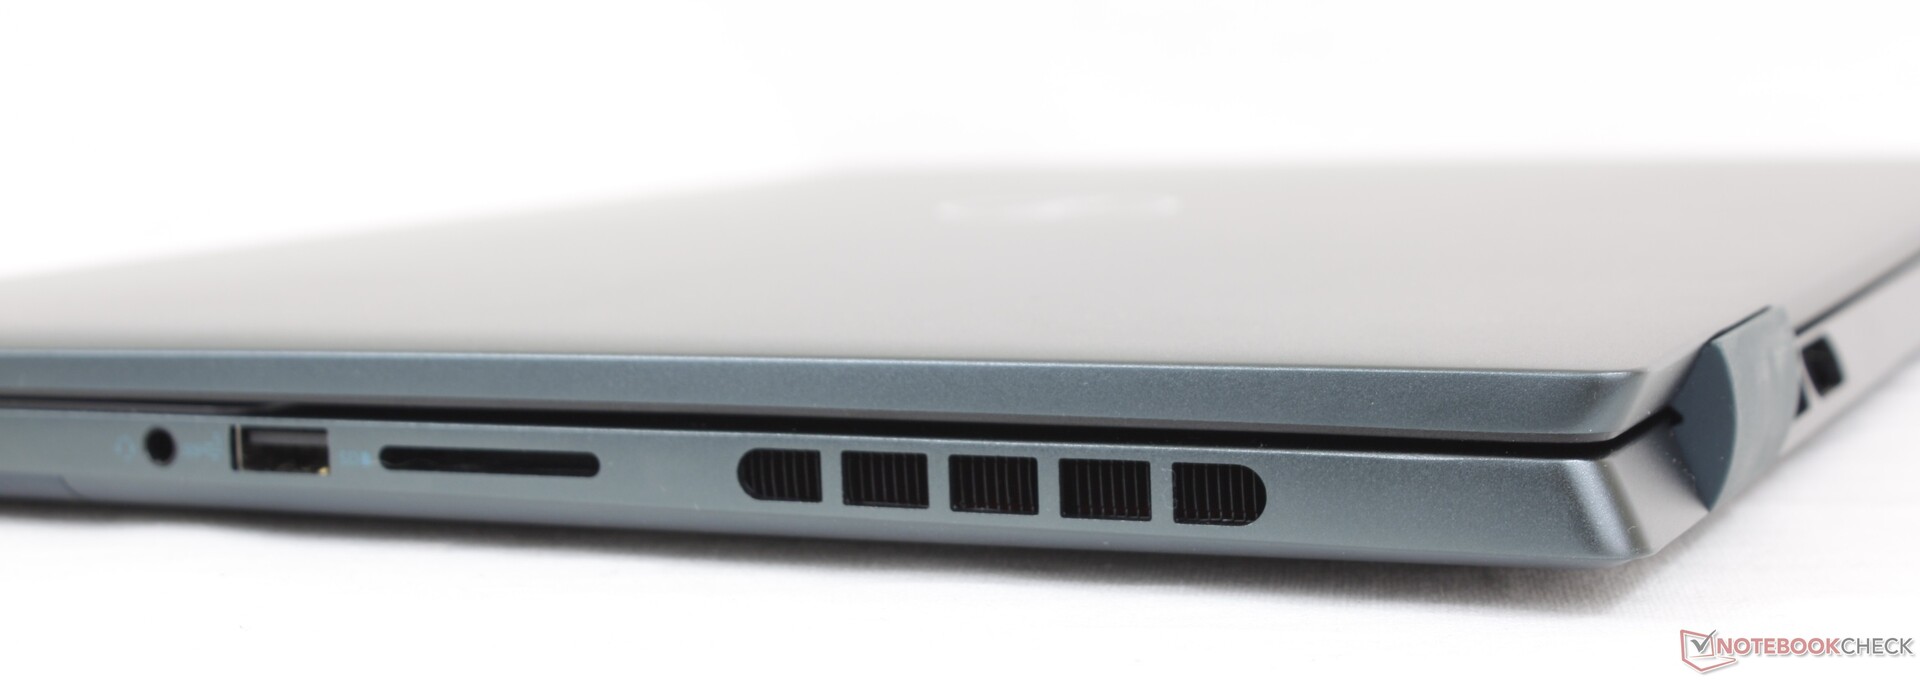
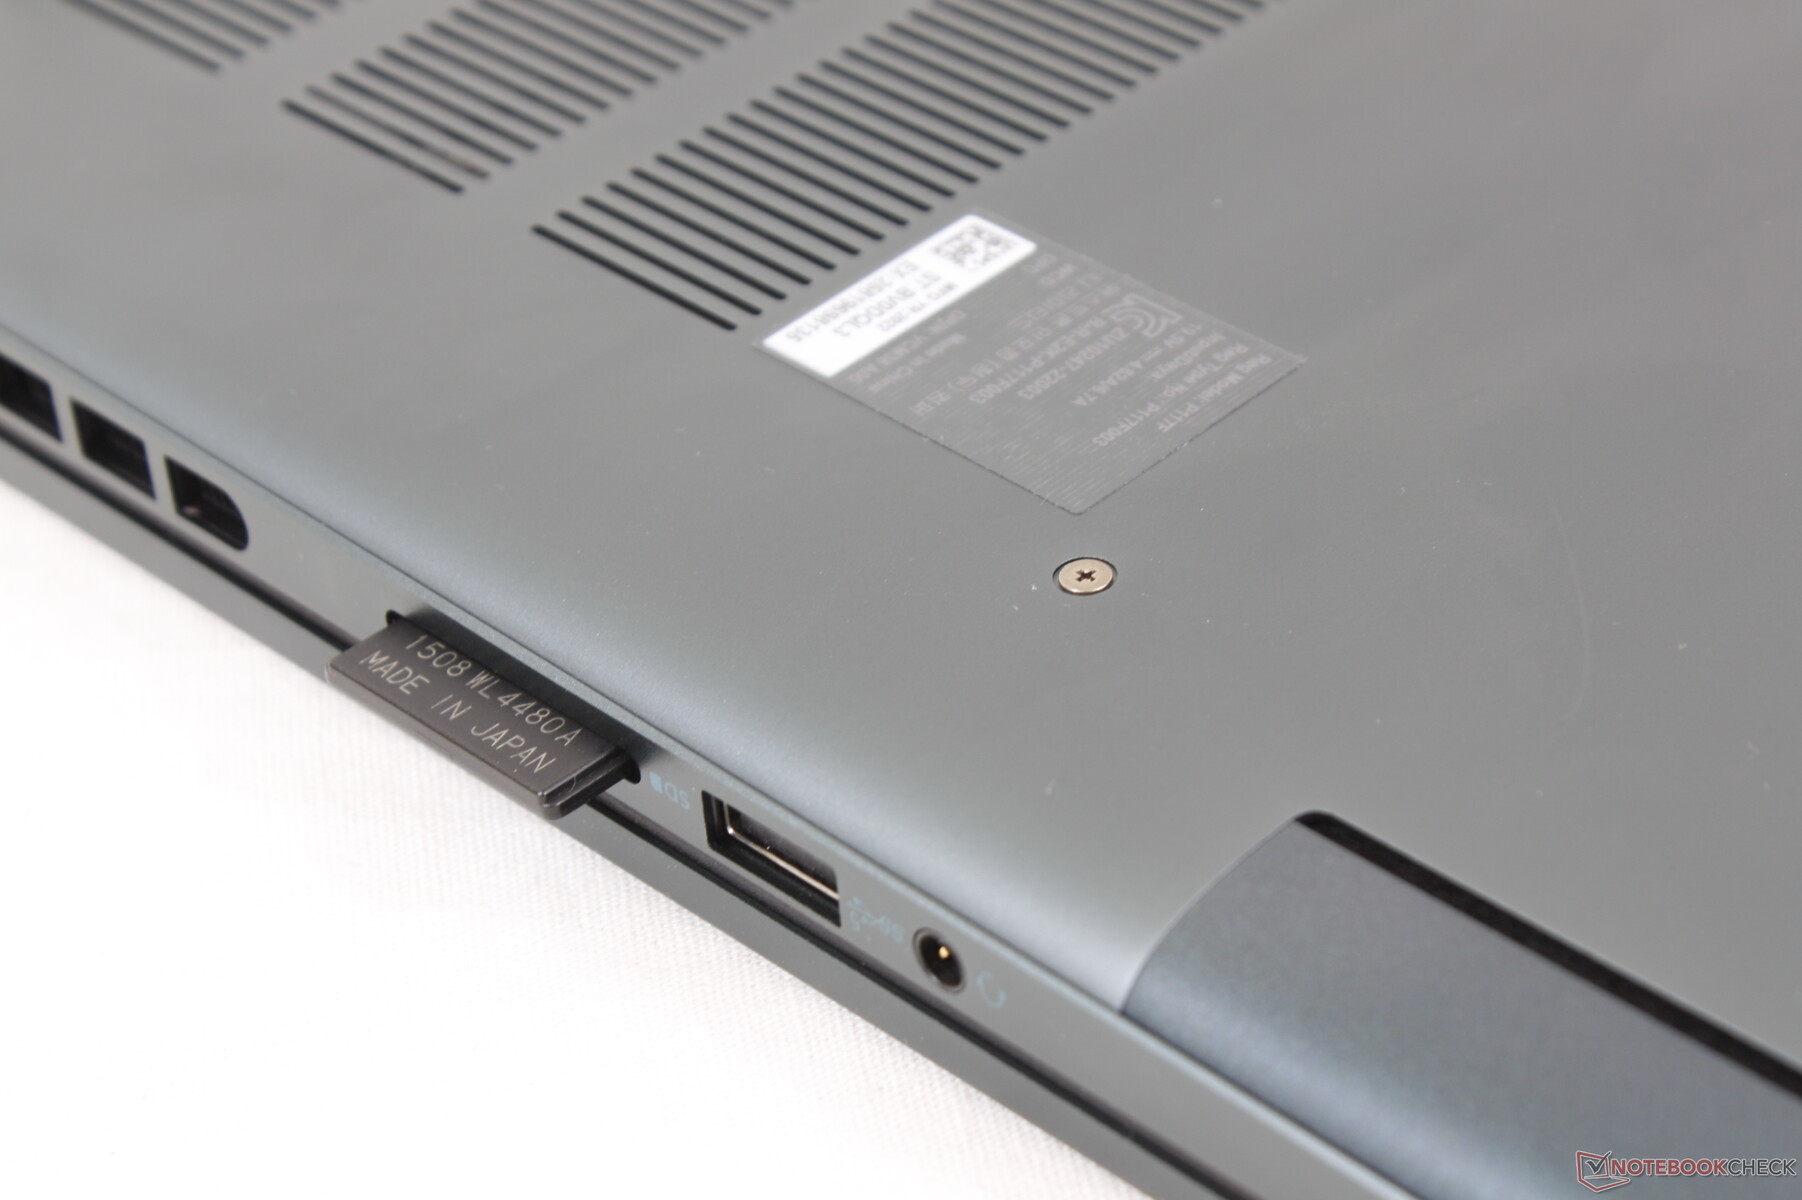
SD-Kartenleser
Die Übertragungsraten des SD-Kartenlesers sind weiterhin sehr langsam. Das zeigt deutlich, dass Nutzer zur teureren XPS-Reihe greifen sollen, um in den Genuss von schnelleren SD-Karten-Transfers zu kommen.
Man sollte beachten, dass das RTX-3060-Modell mit einem micro-SD-Kartenleser statt einem vollwertigen SD-Kartenleser ausgestattet ist.
| SD Card Reader | |
| average JPG Copy Test (av. of 3 runs) | |
| Dell XPS 15 9520 RTX 3050 Ti (Toshiba Exceria Pro SDXC 64 GB UHS-II) | |
| Lenovo Yoga 7 16IAP7 (Toshiba Exceria Pro SDXC 64 GB UHS-II) | |
| Asus Vivobook Pro 16X-M7600QE (AV Pro SD microSD 128 GB V60) | |
| Dell Inspiron 16 Plus 7620 (Toshiba Exceria Pro SDXC 64 GB UHS-II) | |
| Dell Inspiron 16 Plus 7610 (AV PRO microSD 128 GB V60) | |
| maximum AS SSD Seq Read Test (1GB) | |
| Dell XPS 15 9520 RTX 3050 Ti (Toshiba Exceria Pro SDXC 64 GB UHS-II) | |
| Lenovo Yoga 7 16IAP7 (Toshiba Exceria Pro SDXC 64 GB UHS-II) | |
| Asus Vivobook Pro 16X-M7600QE (AV Pro SD microSD 128 GB V60) | |
| Dell Inspiron 16 Plus 7620 (Toshiba Exceria Pro SDXC 64 GB UHS-II) | |
| Dell Inspiron 16 Plus 7610 (AV PRO microSD 128 GB V60) | |
Kommunikation
Das Modell kann entweder mit dem WLAN-6-Modul AX201 oder dem WLAN-6E-Modul AX211 konfiguriert werden. Mit dem AX211 in unserem Testgerät konnten wir ausgezeichnete Empfangsgeschwindigkeiten in unserem 6-GHz-Netzwerk messen, die Sendegeschwindigkeiten schwankten jedoch auch nach mehrfachem Wiederholen des Tests.
| Networking | |
| iperf3 transmit AX12 | |
| Acer Swift X SFX16-51G-5388 | |
| Dell Inspiron 16 Plus 7610 | |
| Asus Vivobook Pro 16X-M7600QE | |
| iperf3 receive AX12 | |
| Acer Swift X SFX16-51G-5388 | |
| Dell Inspiron 16 Plus 7610 | |
| Asus Vivobook Pro 16X-M7600QE | |
| iperf3 receive AXE11000 6GHz | |
| Lenovo Yoga 7 16IAP7 | |
| Dell Inspiron 16 Plus 7620 | |
| iperf3 transmit AXE11000 6GHz | |
| Lenovo Yoga 7 16IAP7 | |
| Dell Inspiron 16 Plus 7620 | |
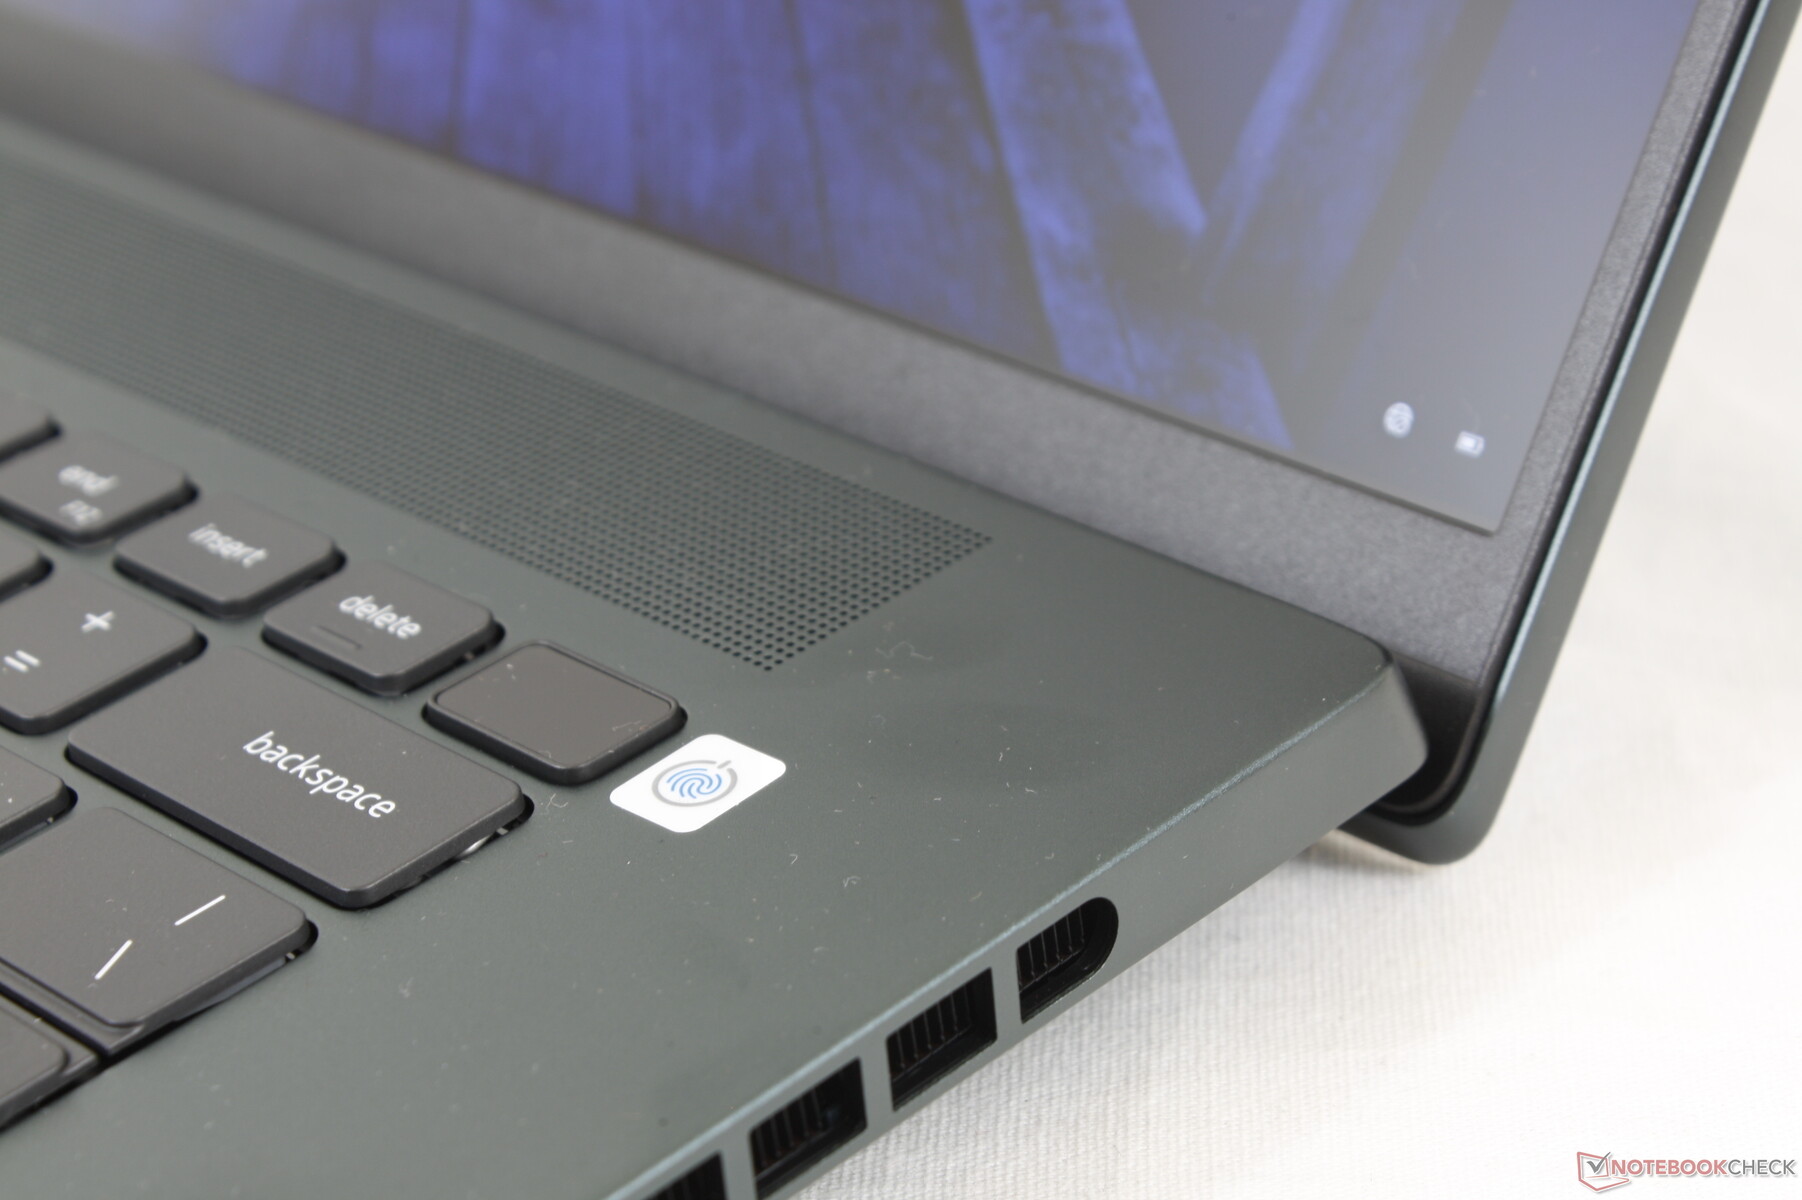
Webcam — 2 MP statt 1 MP
Dell hat die 720p- bzw. 1-MP-Webcam des Inspiron 16 Plus 7610 beim 7620 durch eine schärfere 1080p- bzw. 2-MP-Webcam ersetzt. Windows-Hello-Unterstützung sowie eine physikalische Webcam-Abdeckung sind vorhanden.


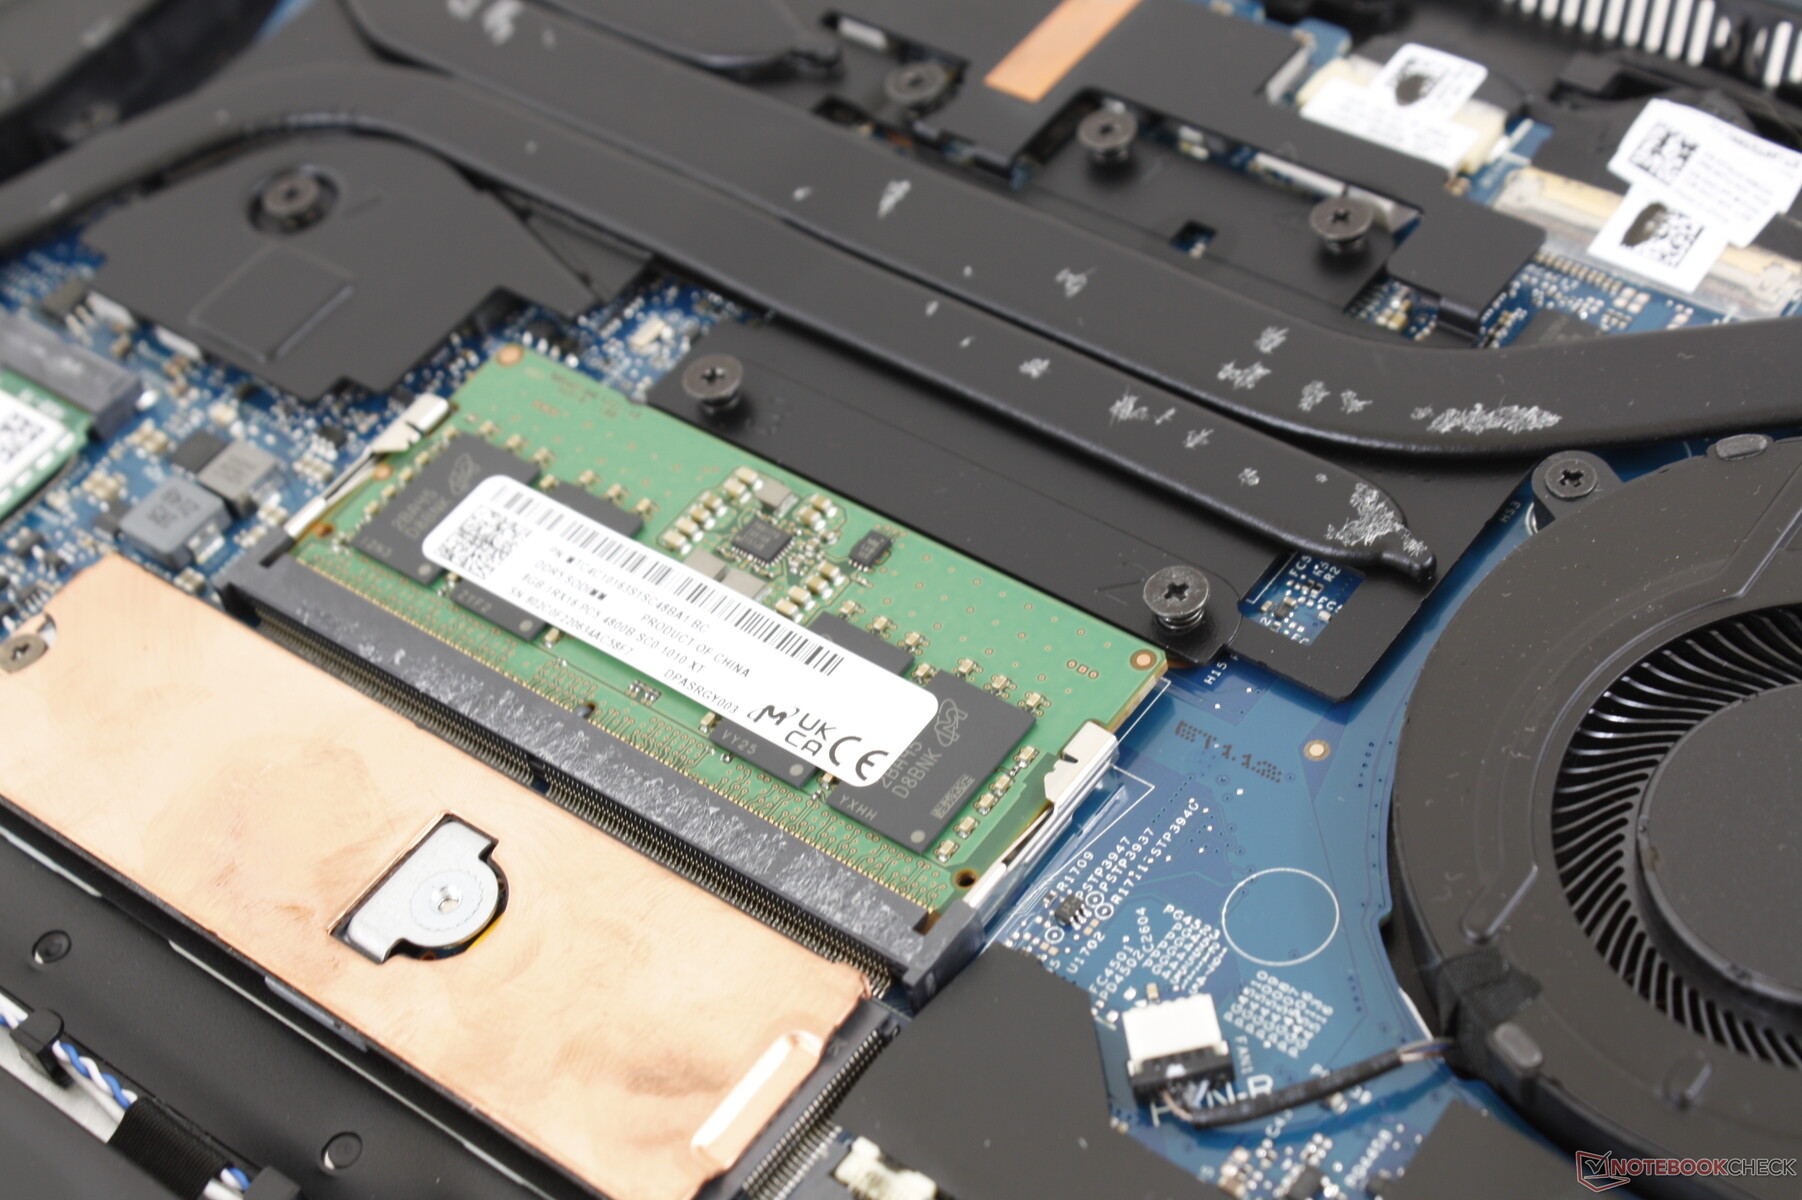
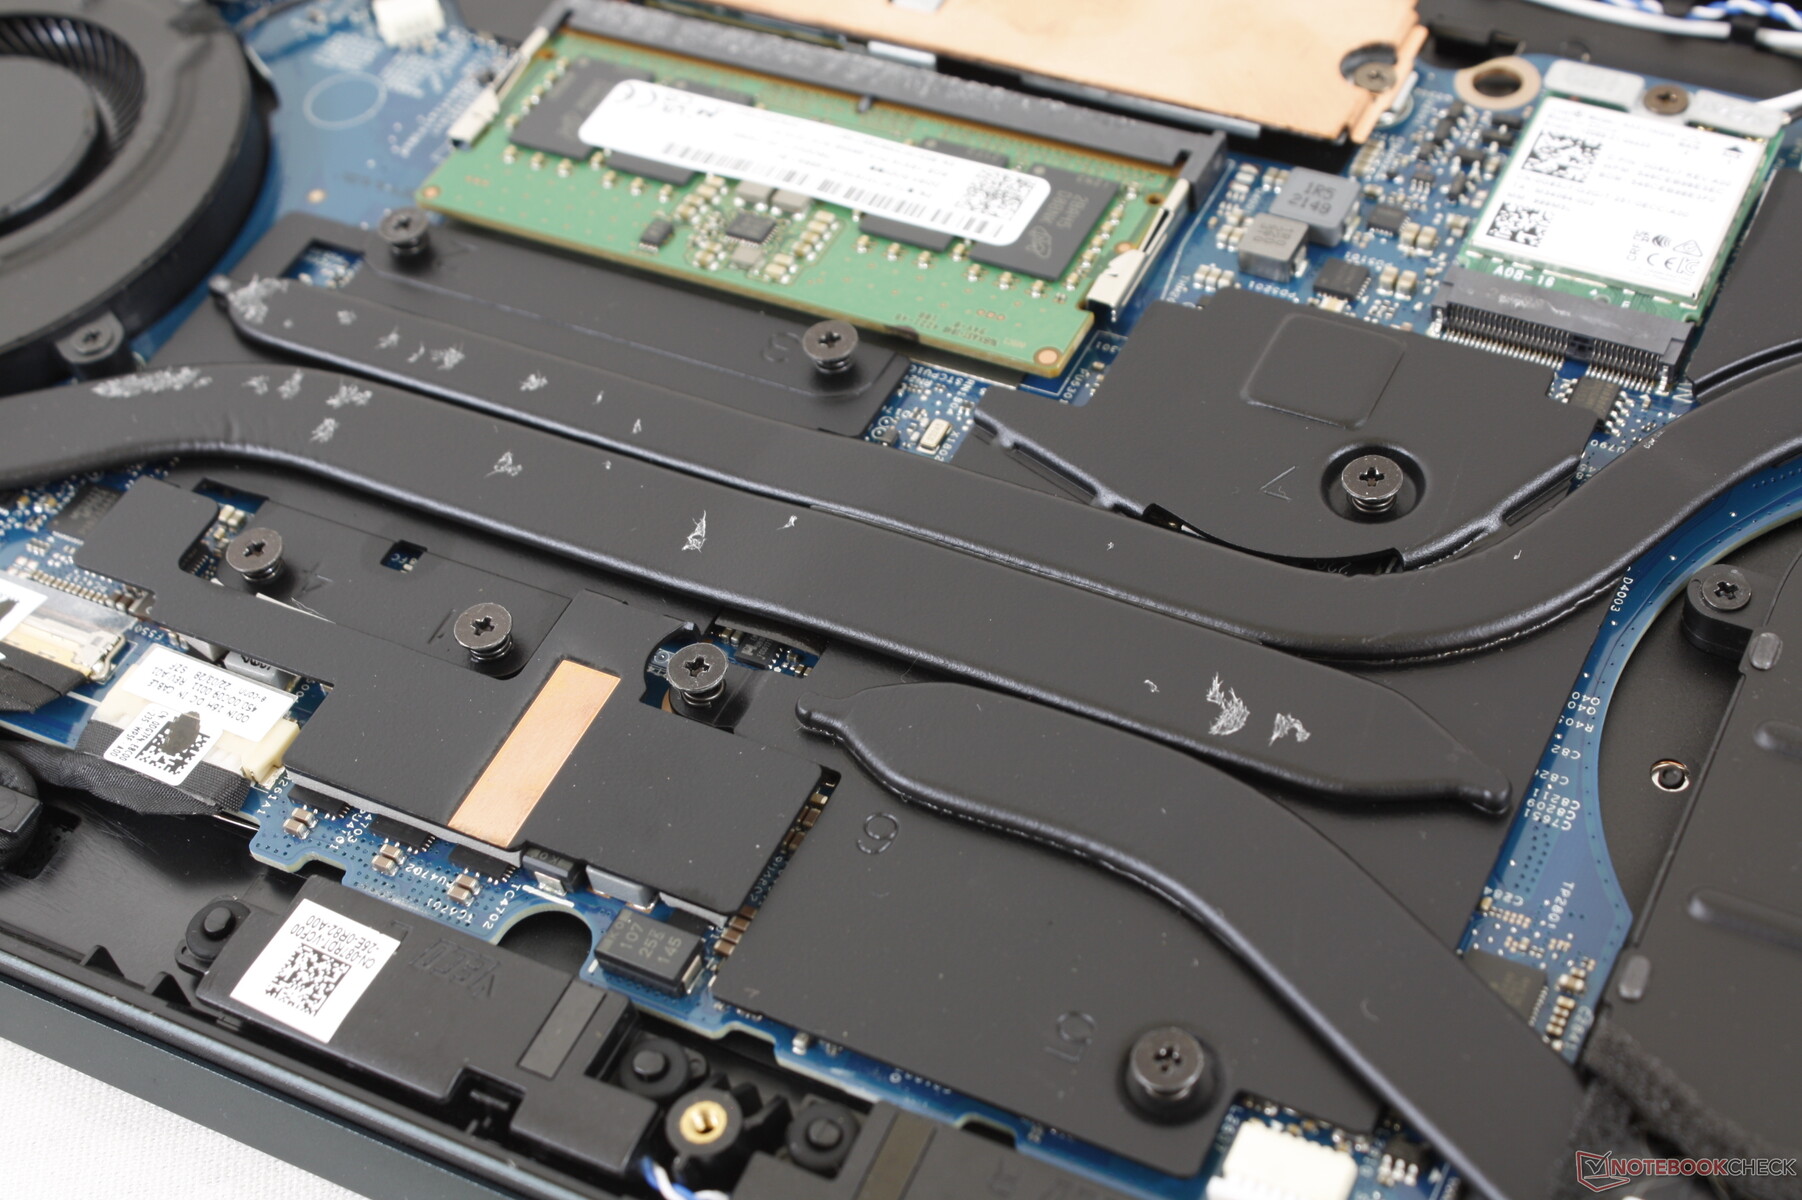
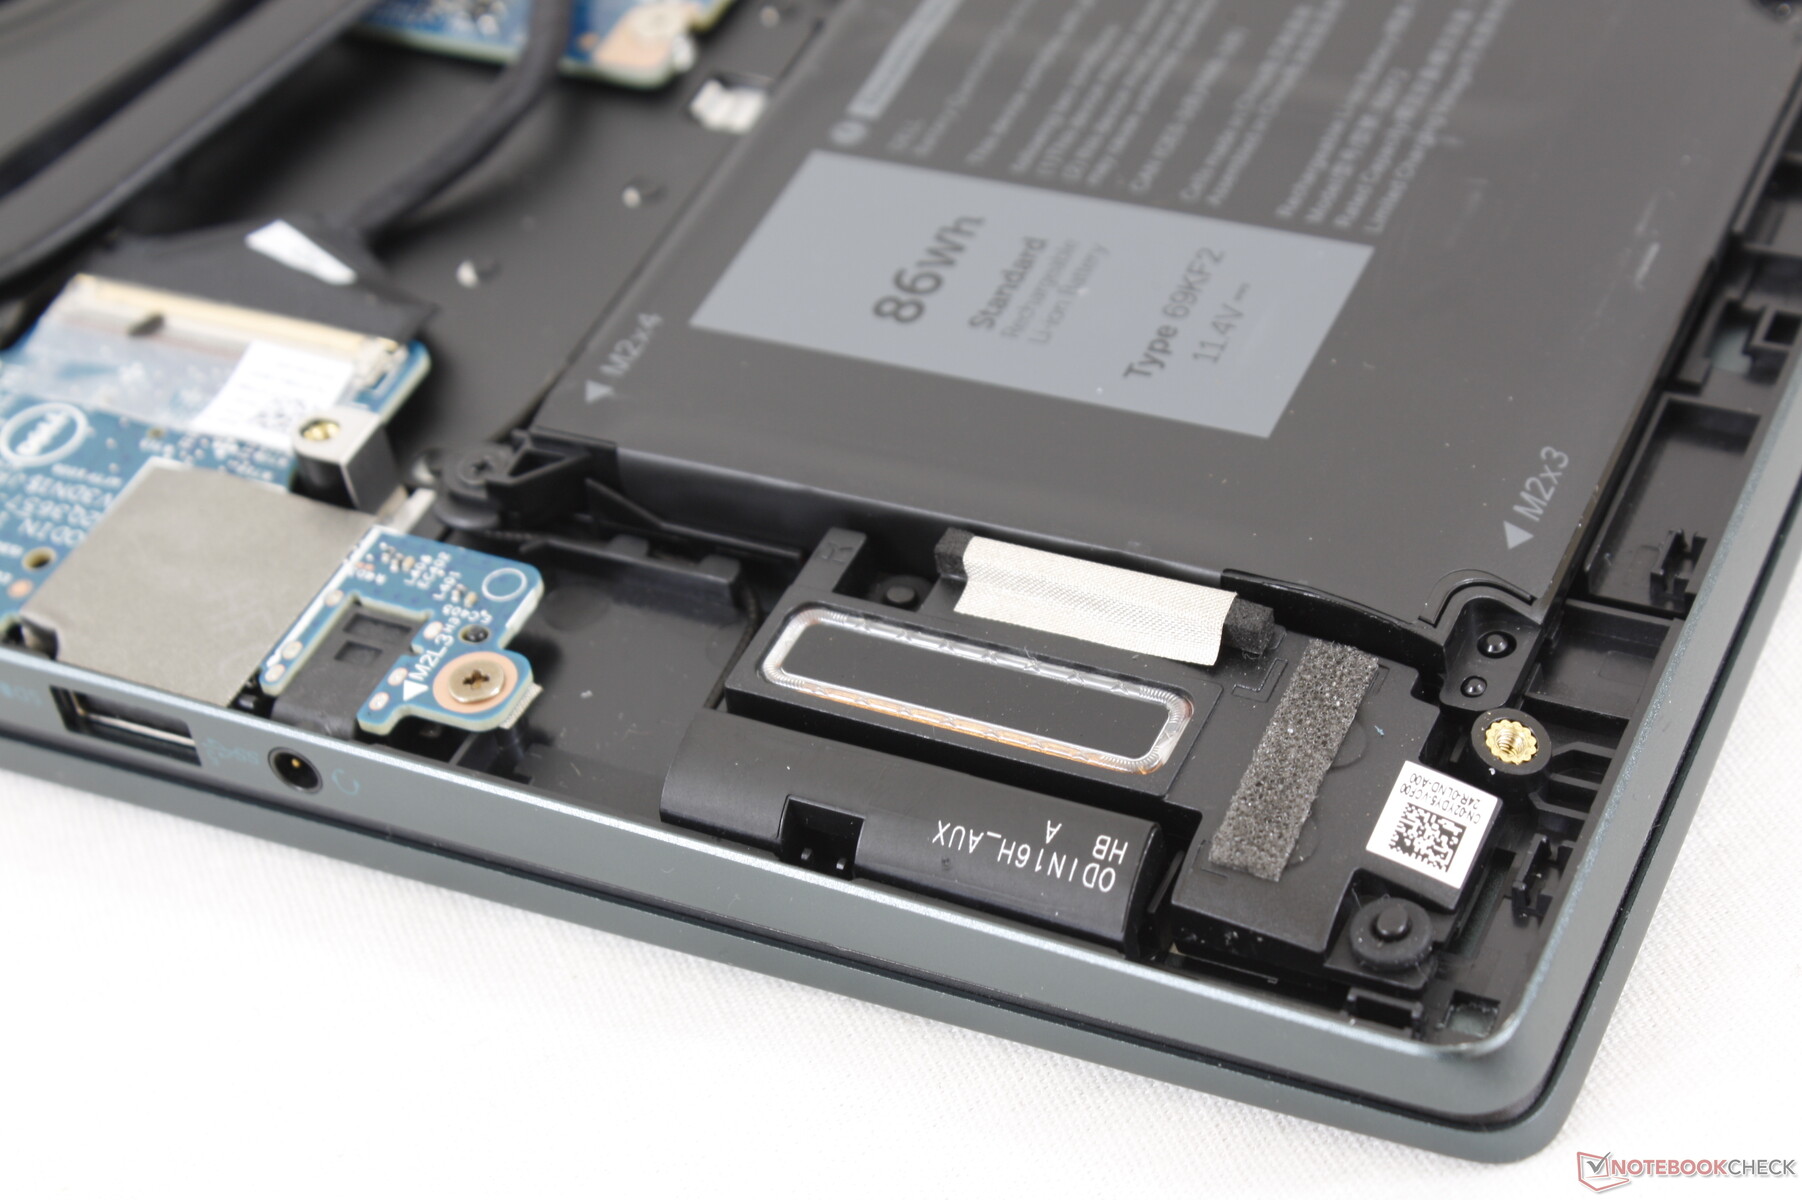
Wartung
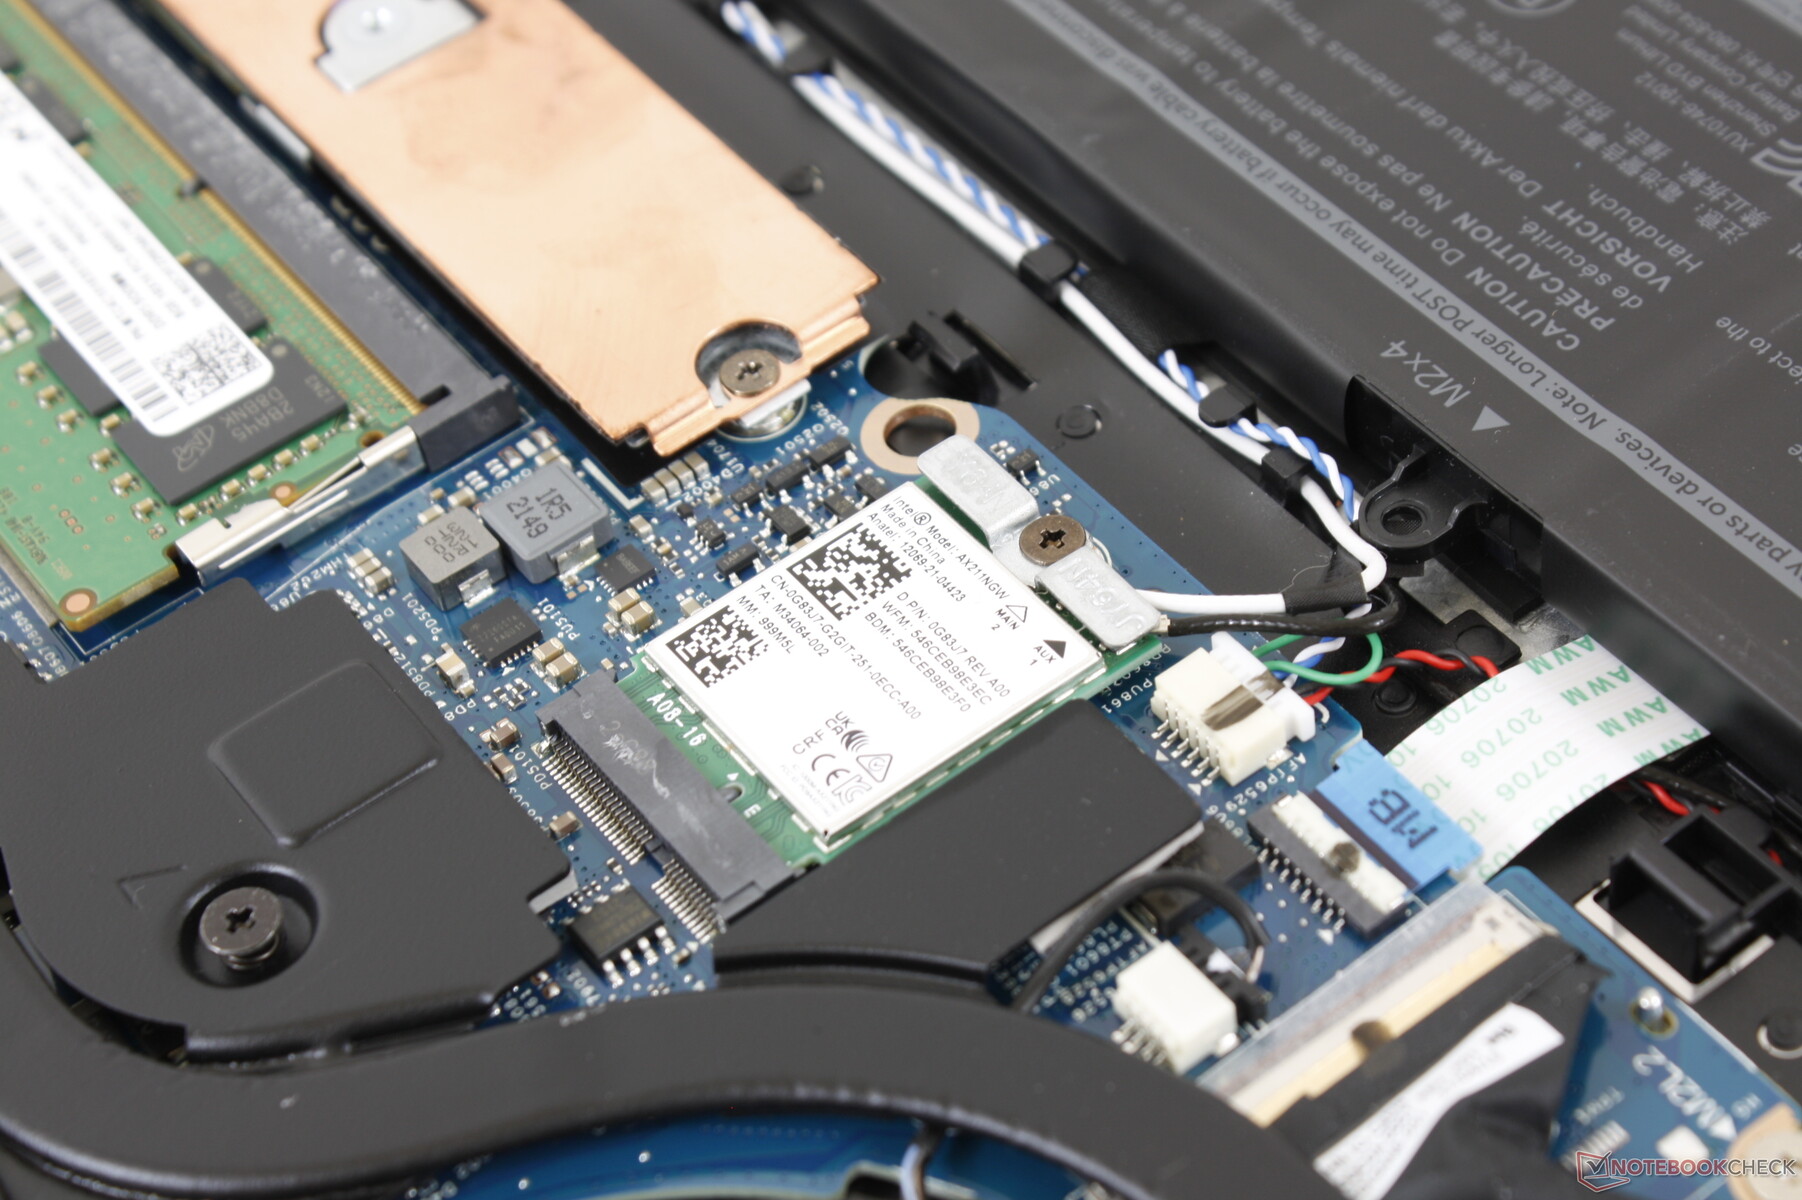
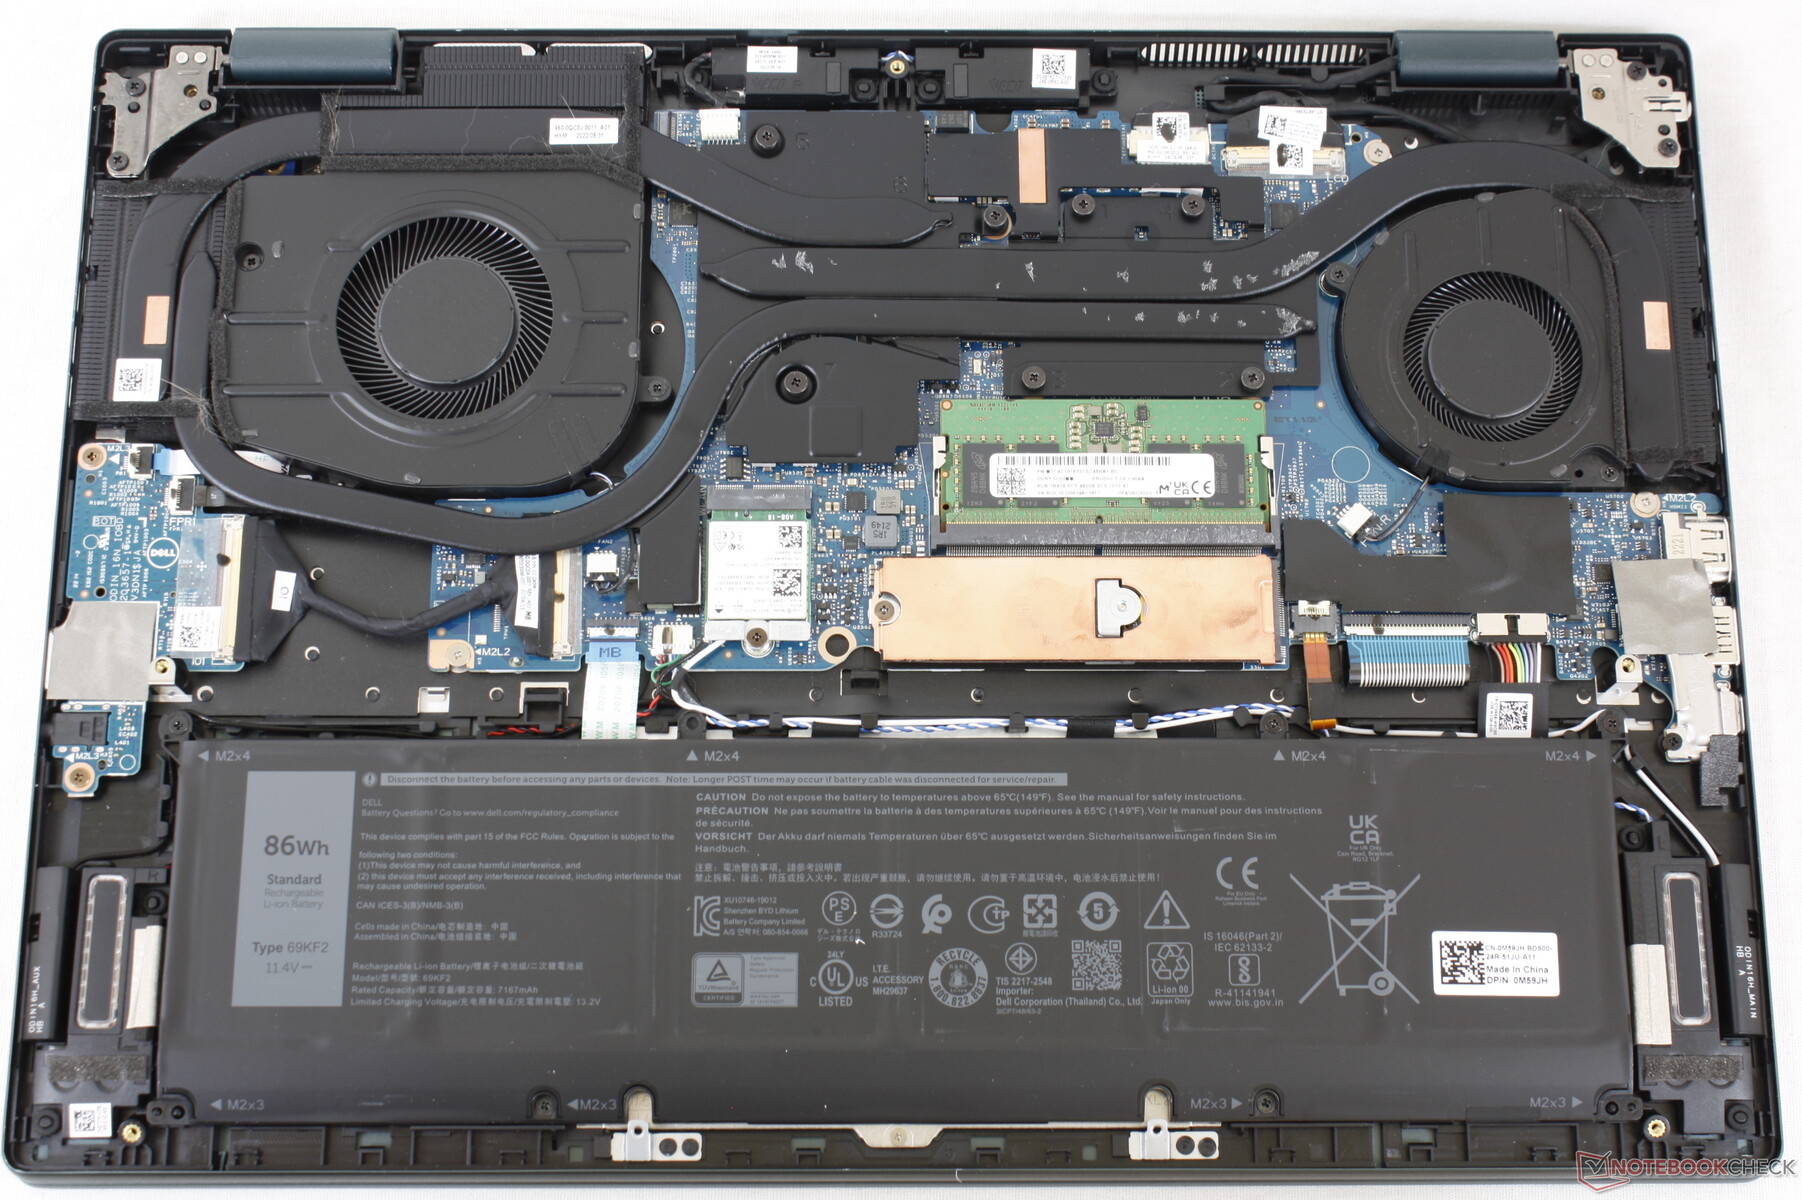
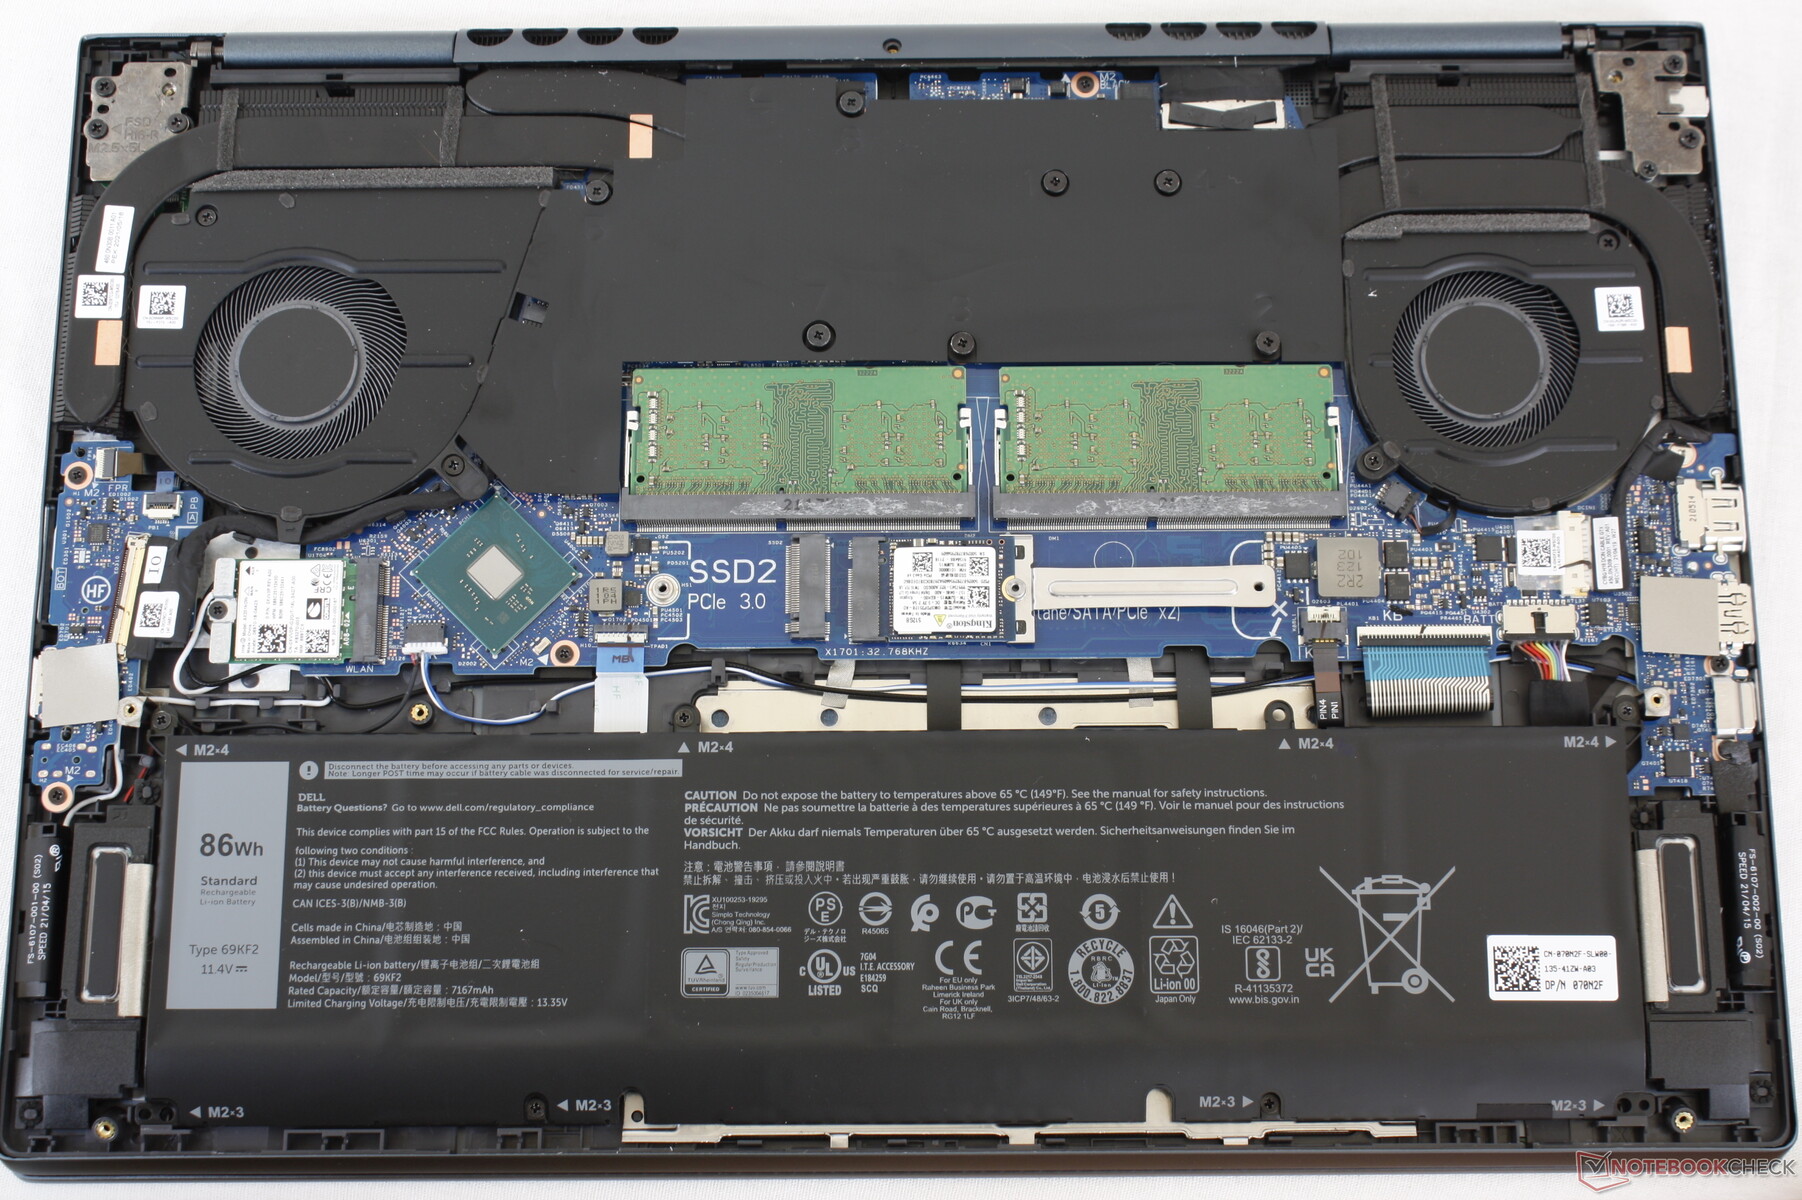
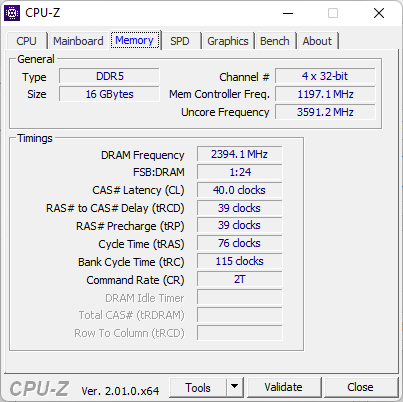
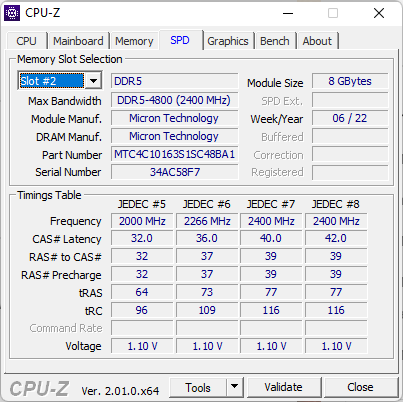
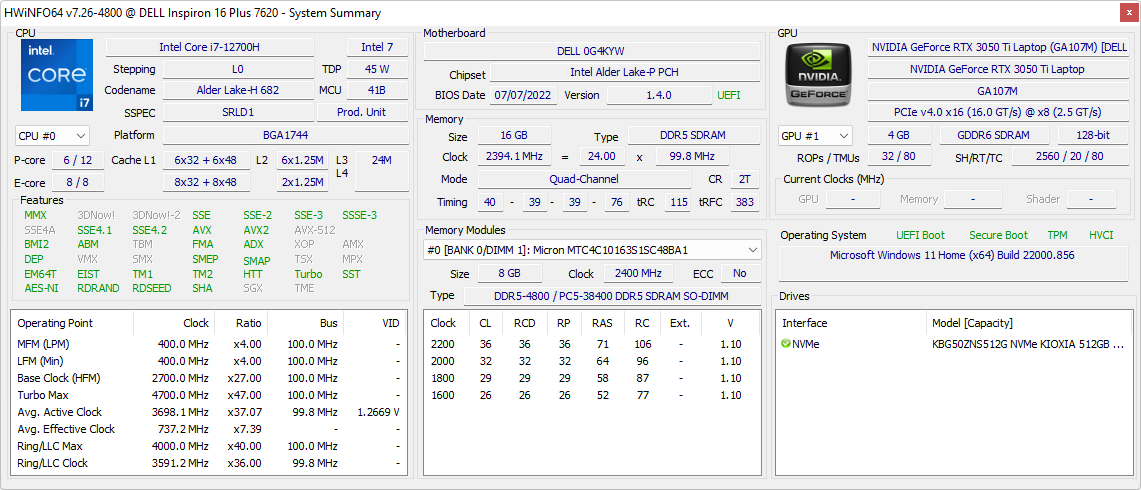
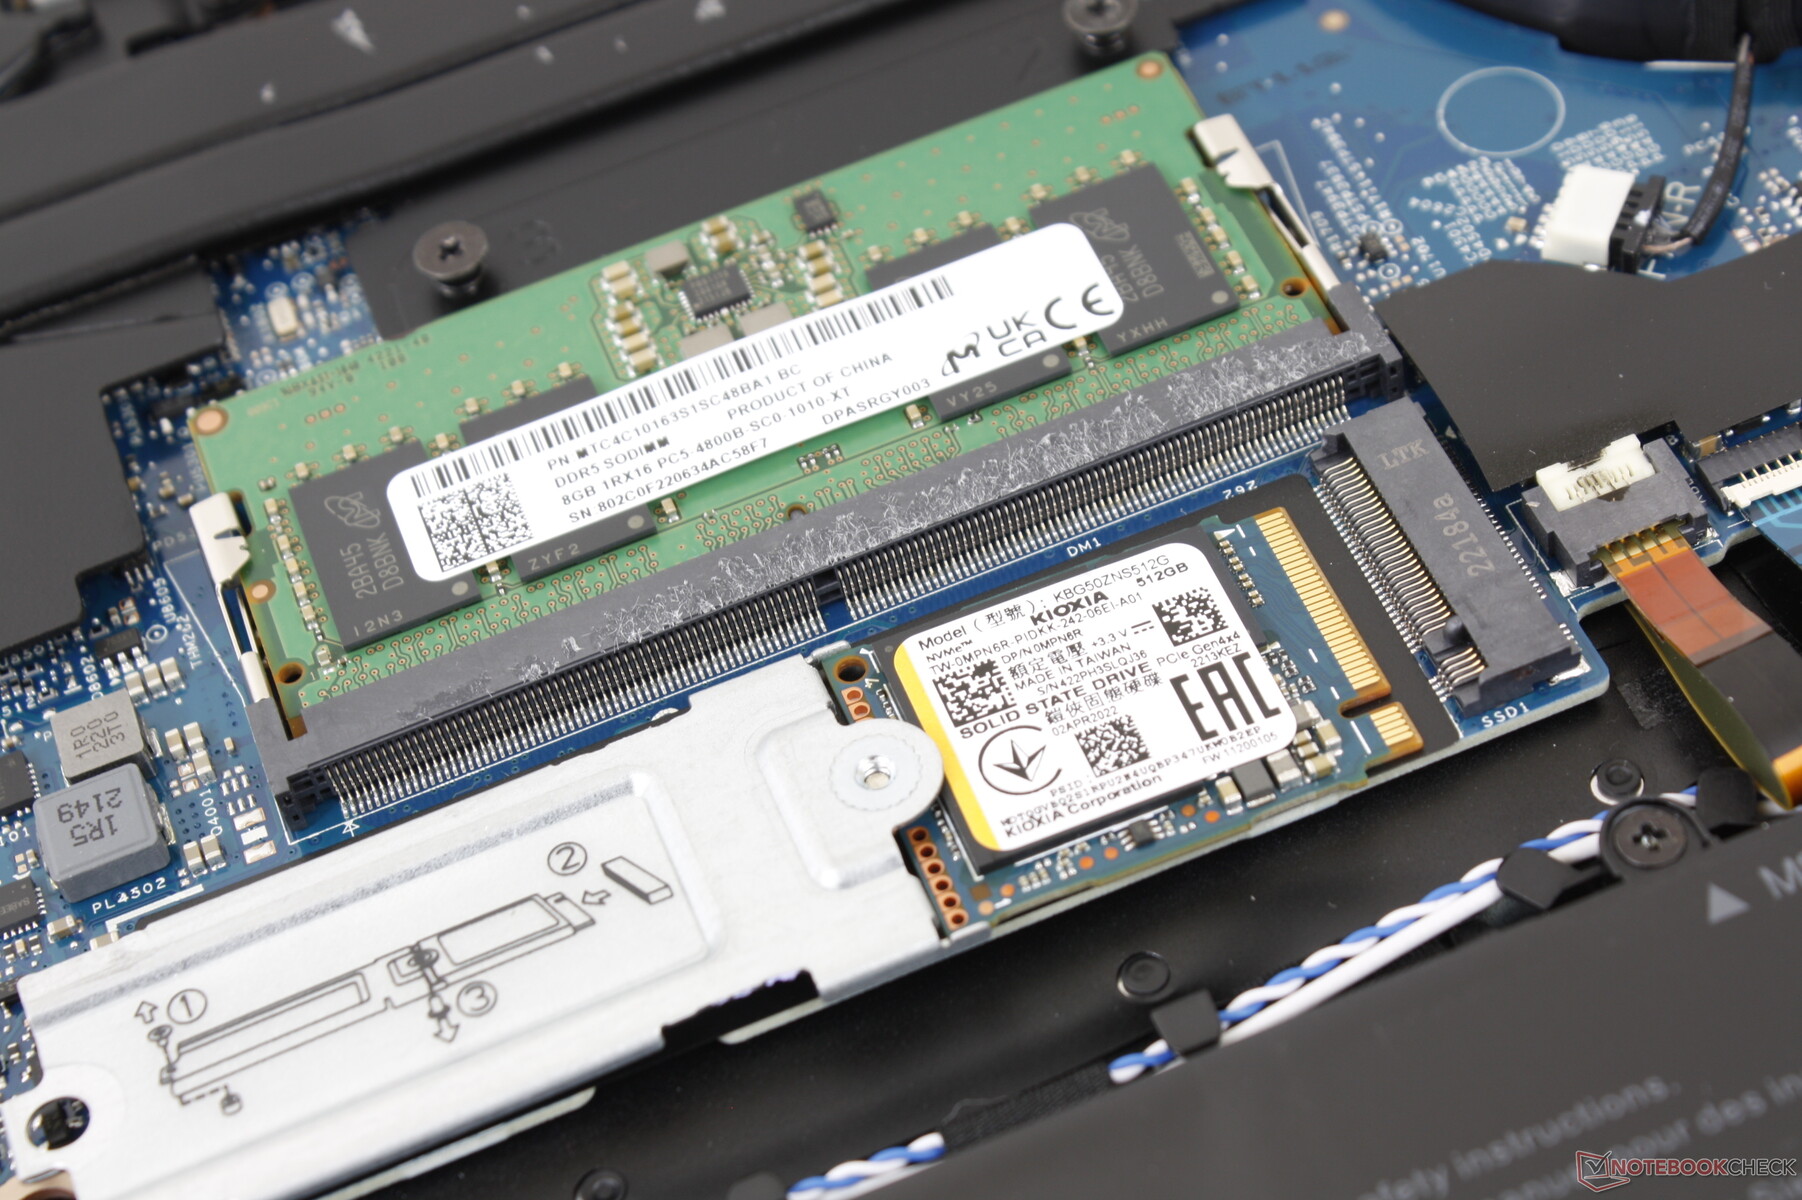
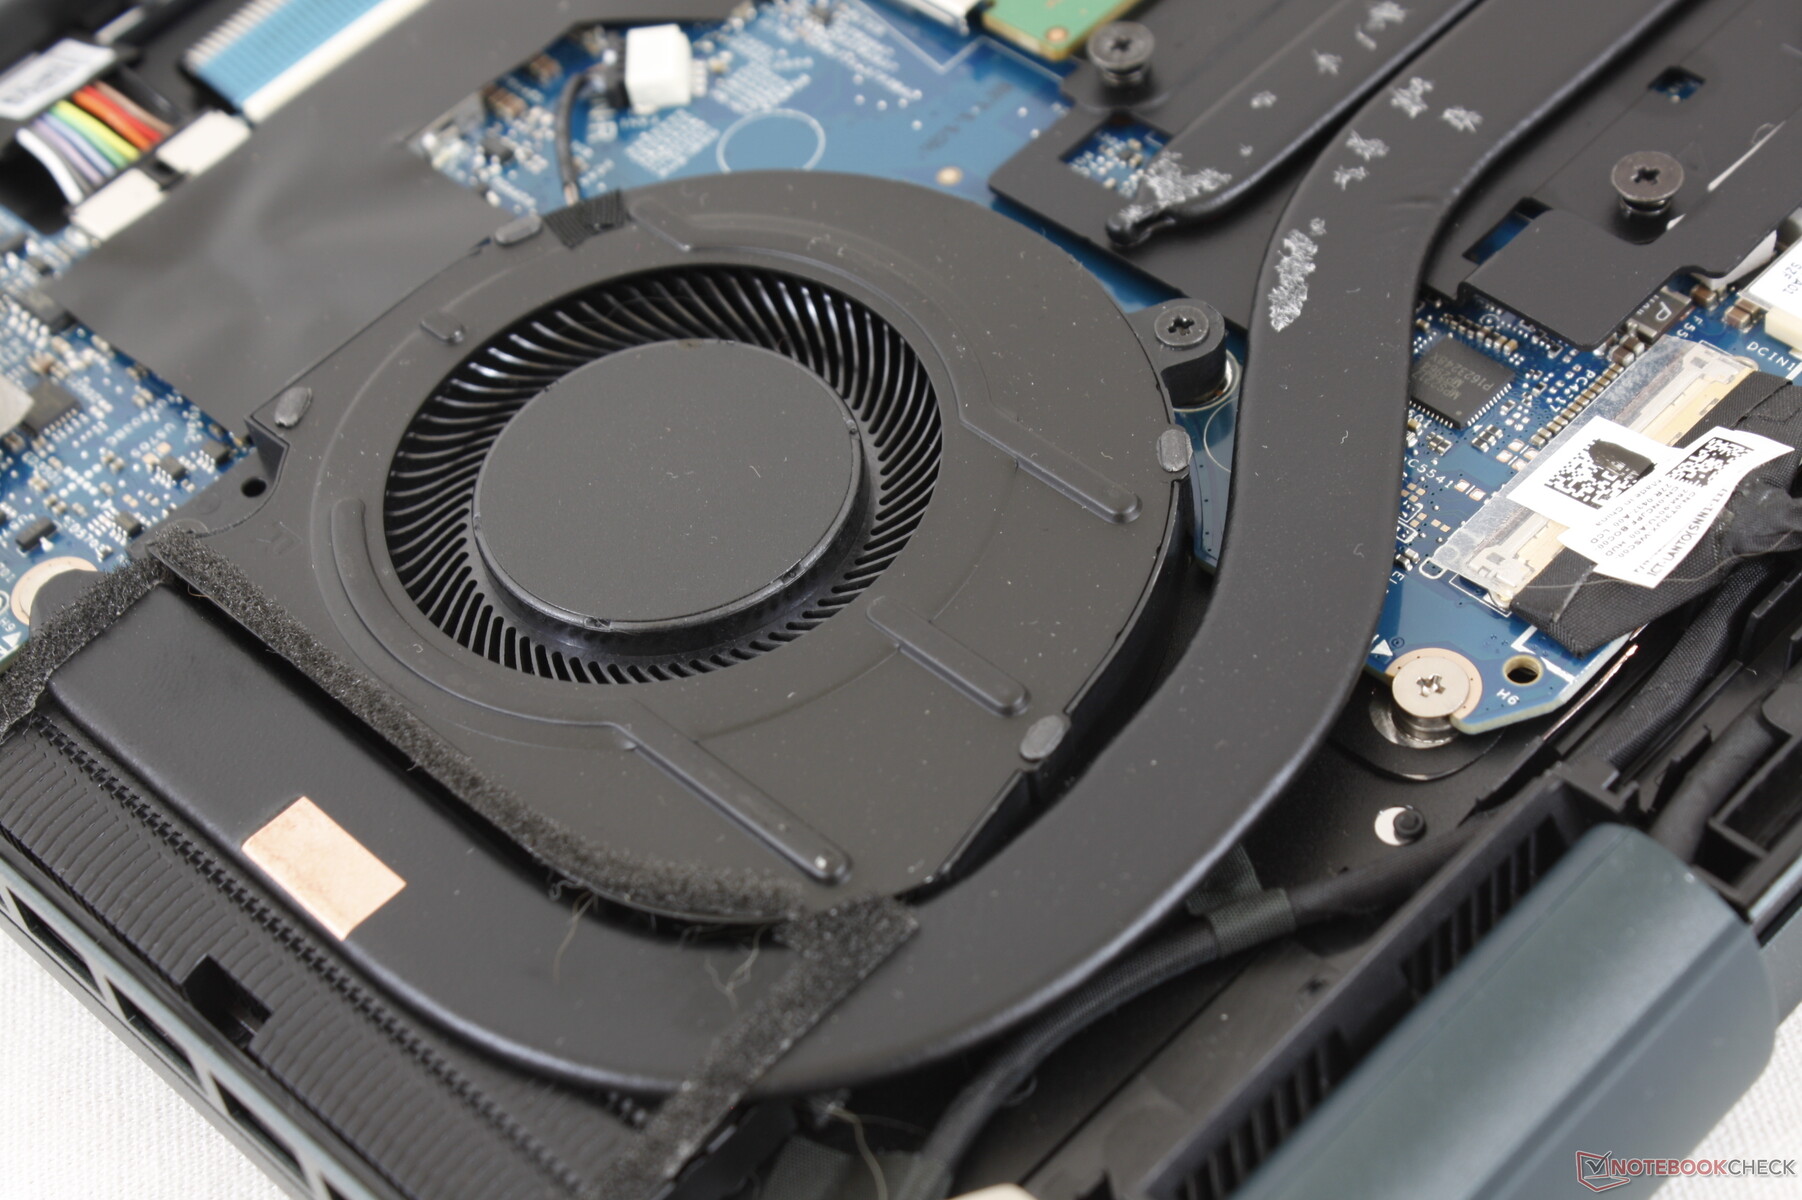
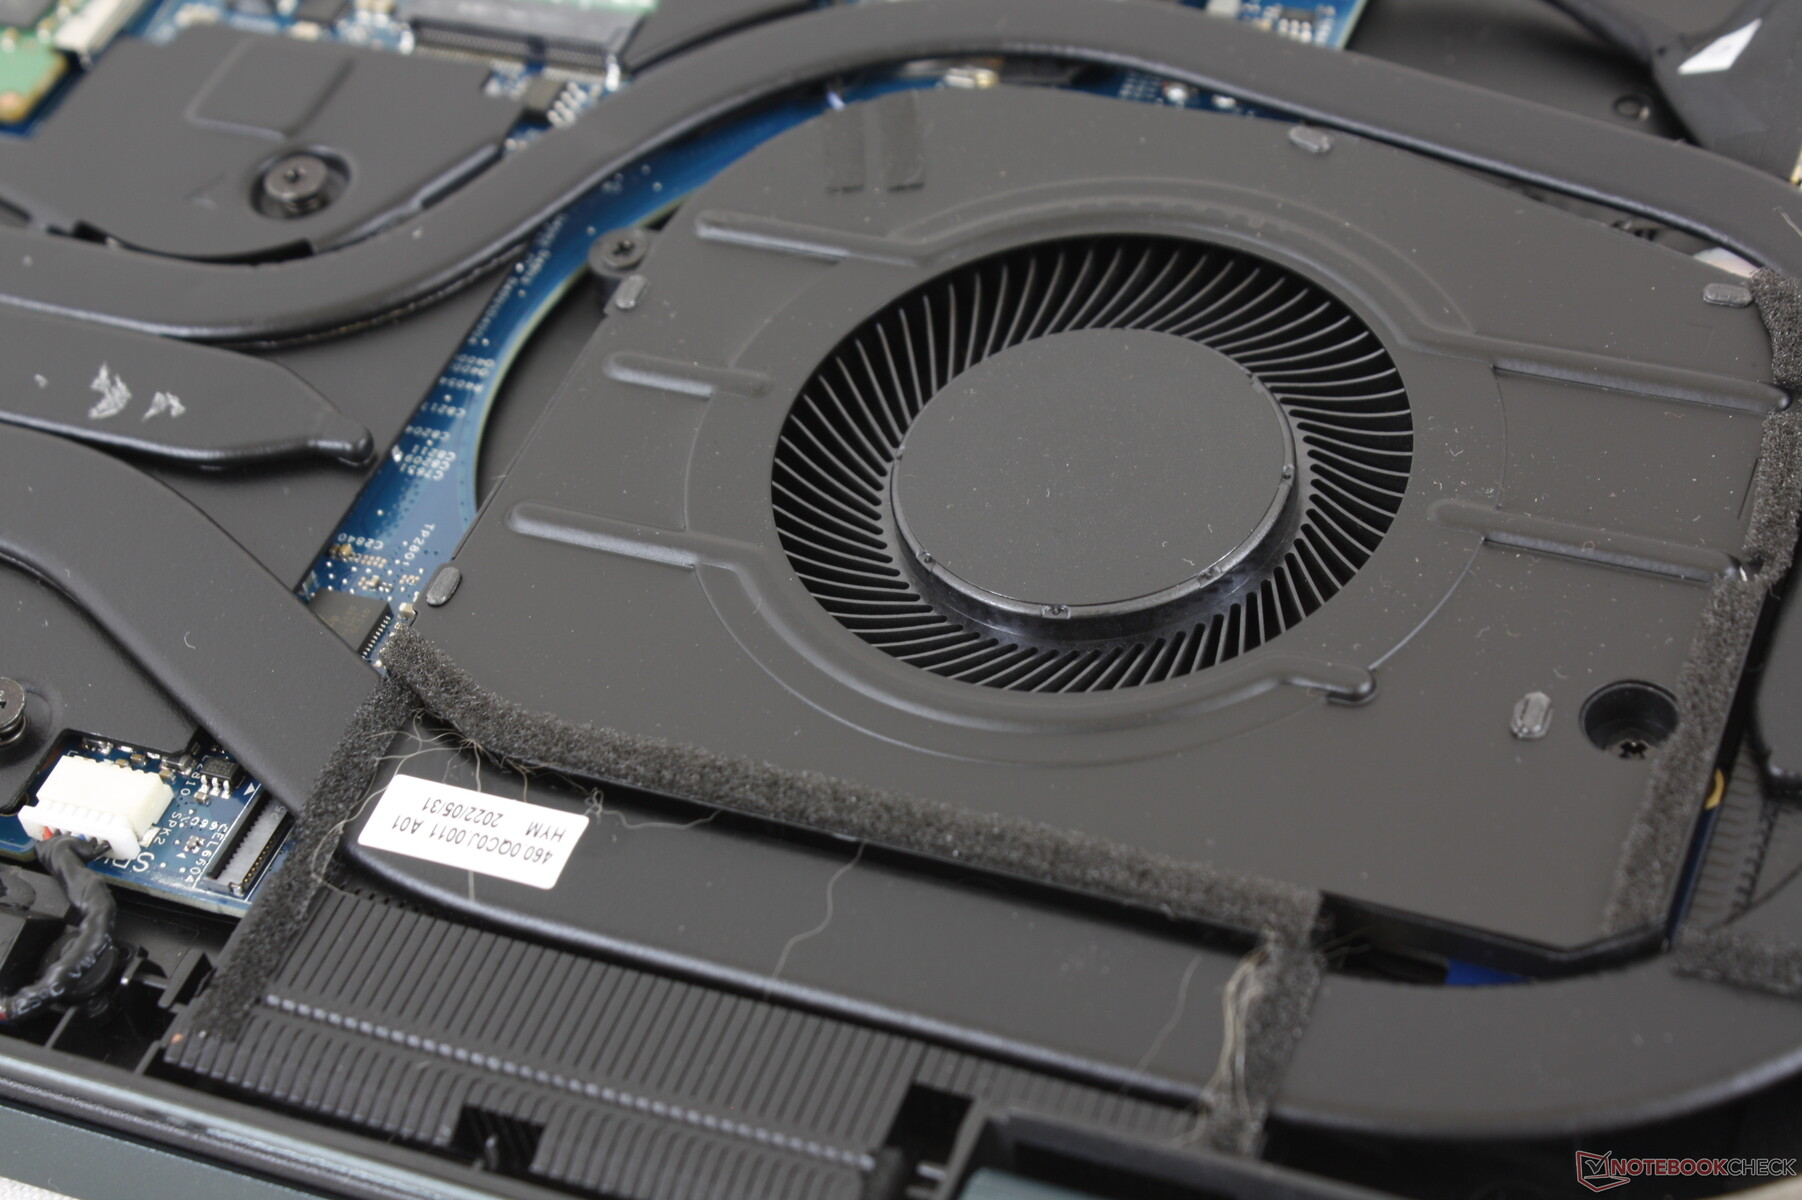
Die Bodenplatte kann mithilfe eines einfachen Kreuzschraubenziehers entfernt werden. Im Inneren trifft man auf eine andere Kühllösung als beim 7610. Den Neuerungen sind ein SODIMM- und ein M.2-SSD-Slot zum Opfer gefallen, wodurch das 7620 nur noch einen SSD- und einen SODIMM-Slot besitzt, wie die Bilder unten zeigen. Eigenartigerweise hat das RTX-3060-Modell zwei SODIMM-Steckplätze.
8 GB RAM sind auf unserer Platine verlötet und erlauben in Kombination mit einem 32-GB-DDR5-RAM-Modul maximal 40 GB Arbeitsspeicher. Da das RTX-3060-Modell keinen verlöteten RAM besitzt und über zwei SODIMM-Steckplätze verfügt, sind hier bis zu 64 GB möglich.
Garantie und Zubehör
Bis auf das Netzteil und den üblichen Papierkram befinden sich keine Extras im Lieferumfang. Es gilt die standardmäßige, einjährige eingeschränkte Garantie.
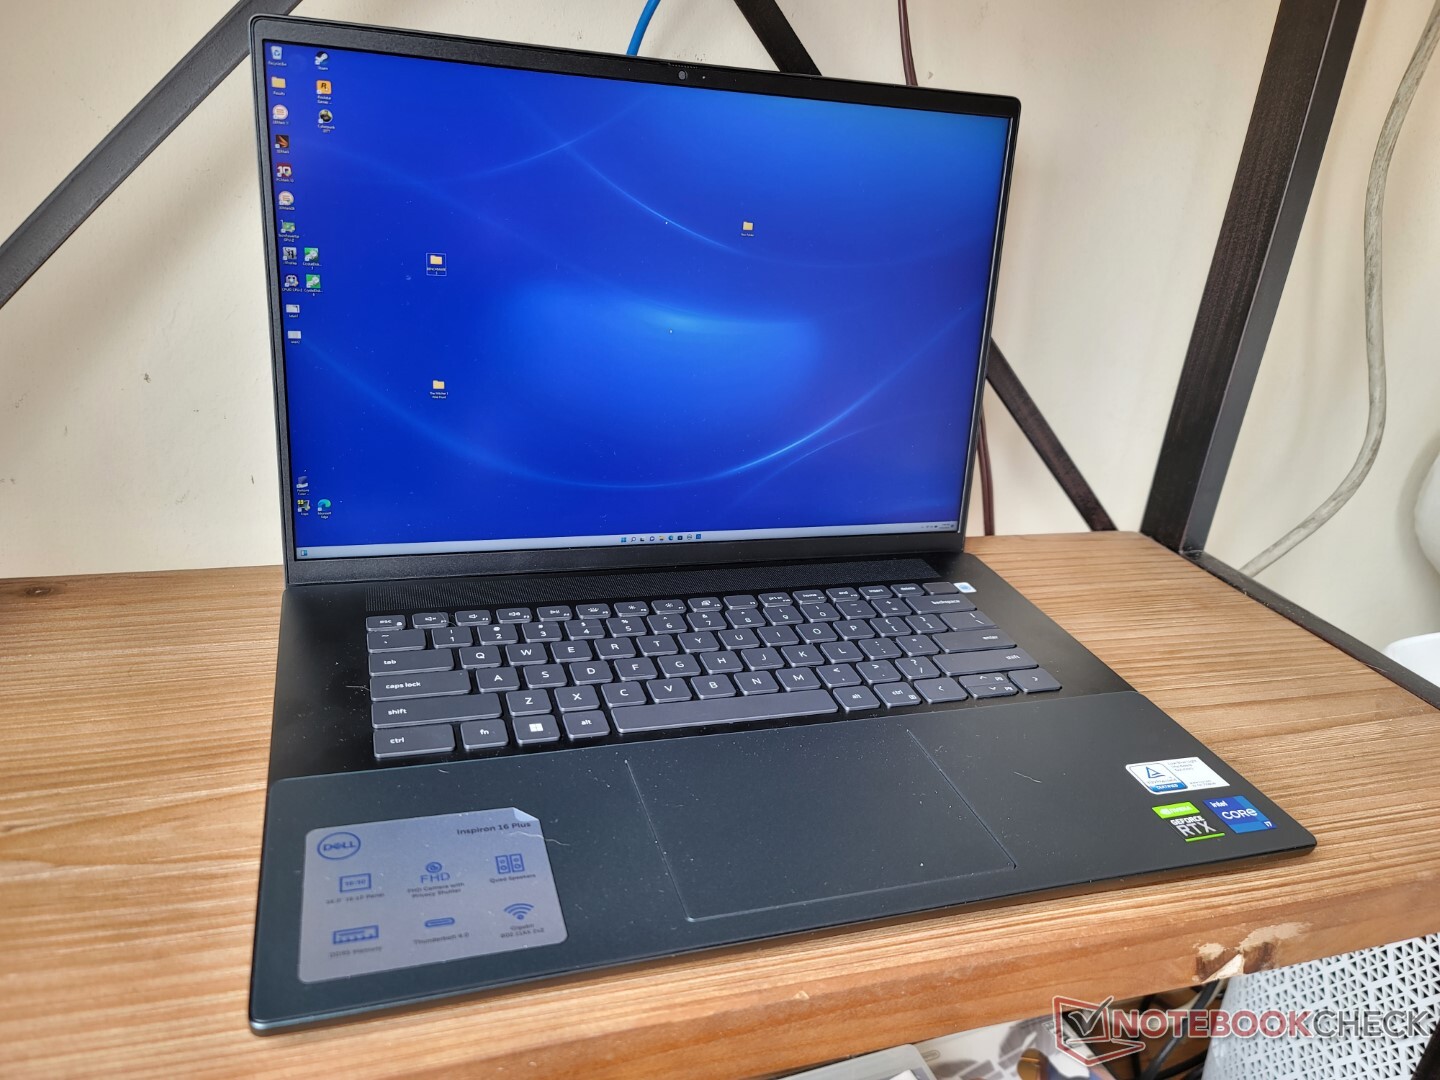
Eingabegeräte — Inspiriert vom Inspiron 16 Plus 7620 2-in-1
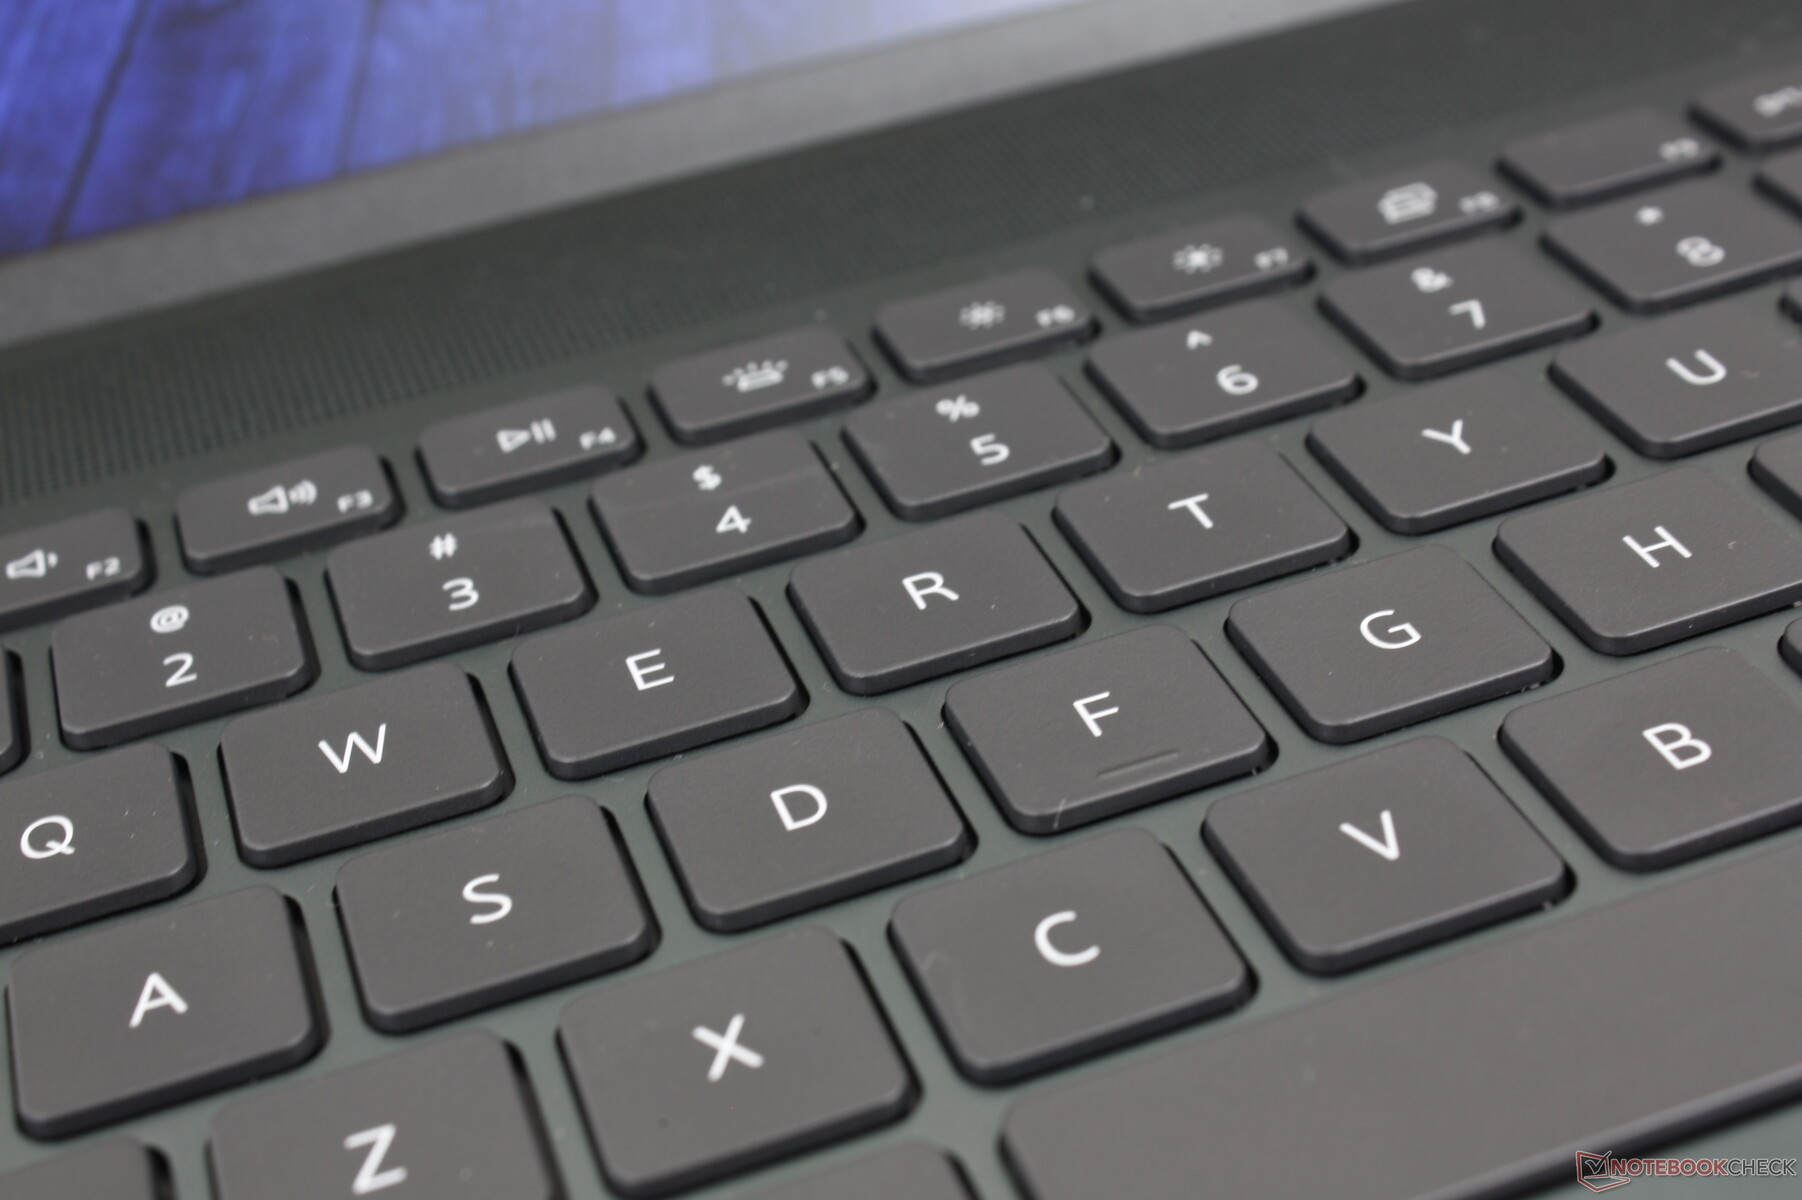
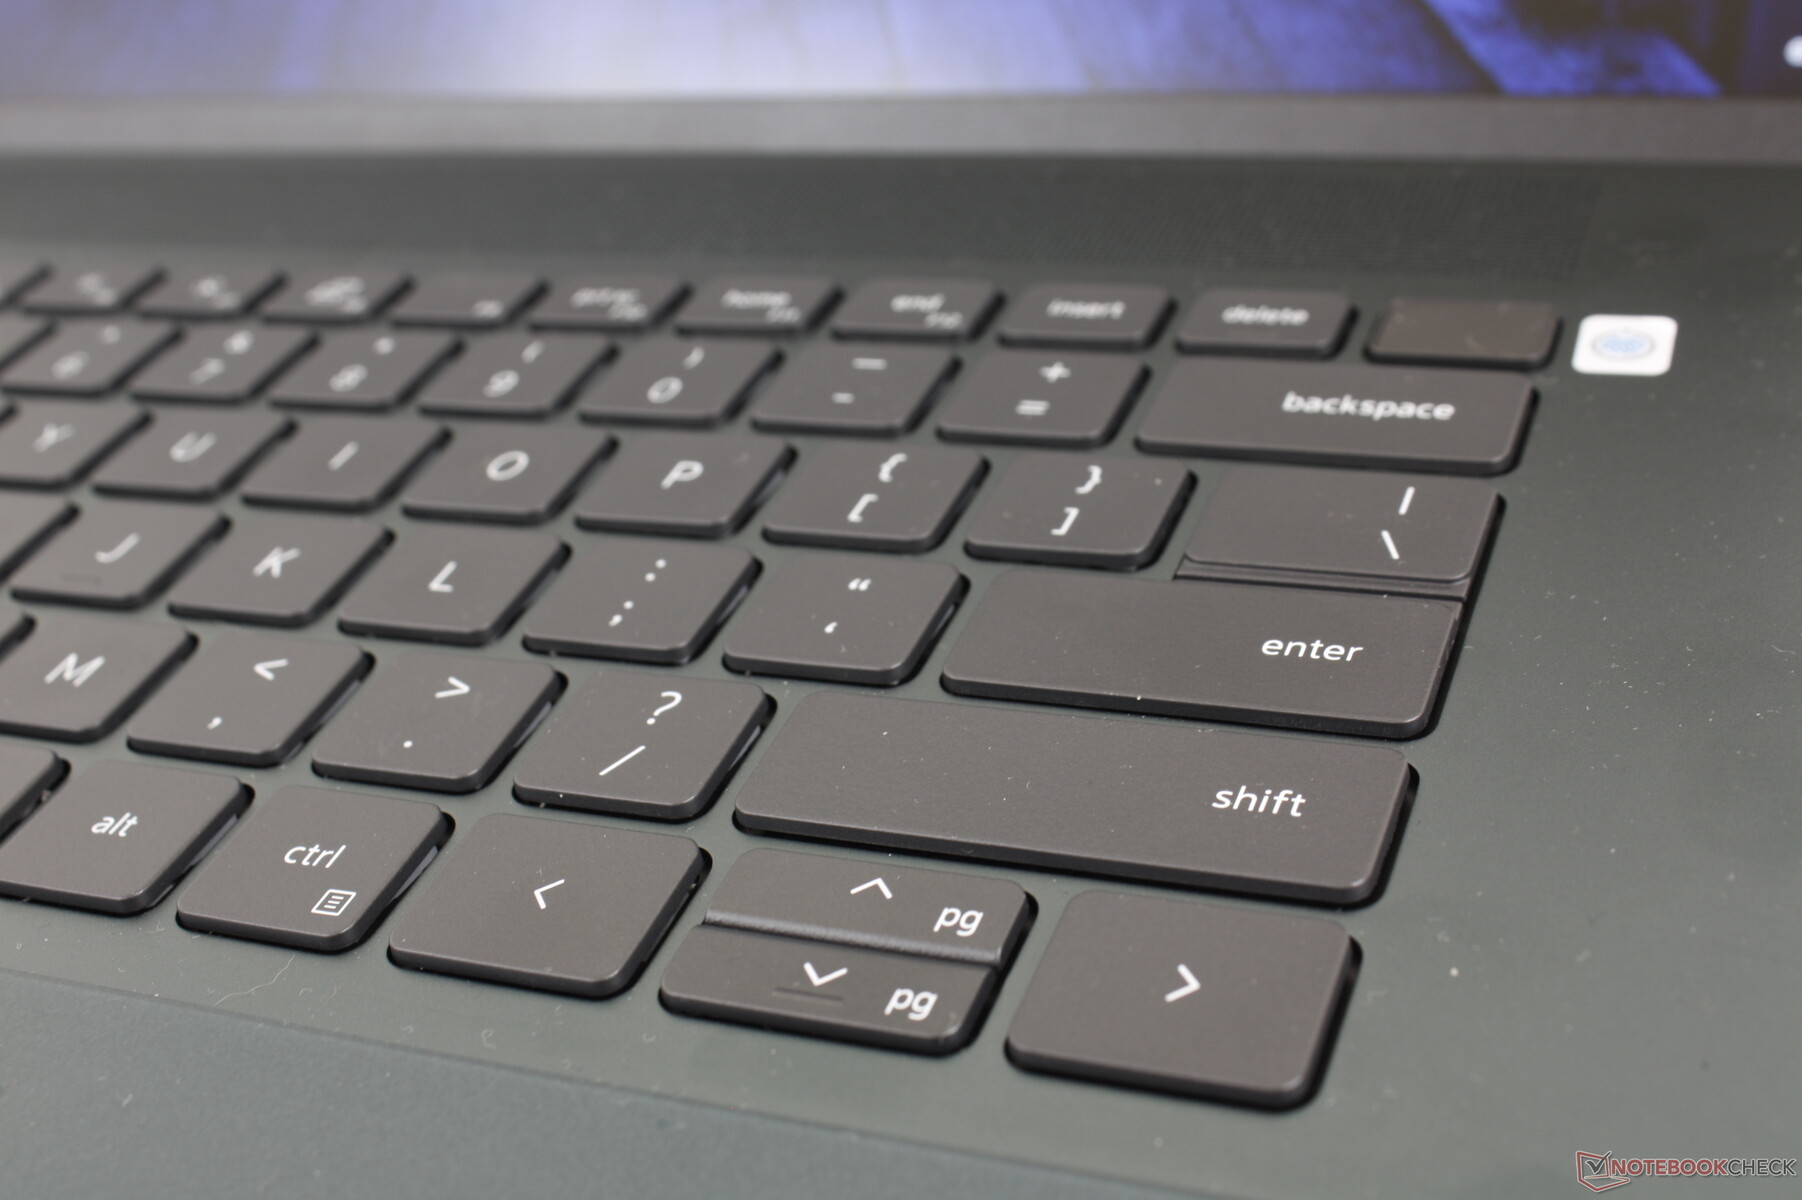
Tastatur
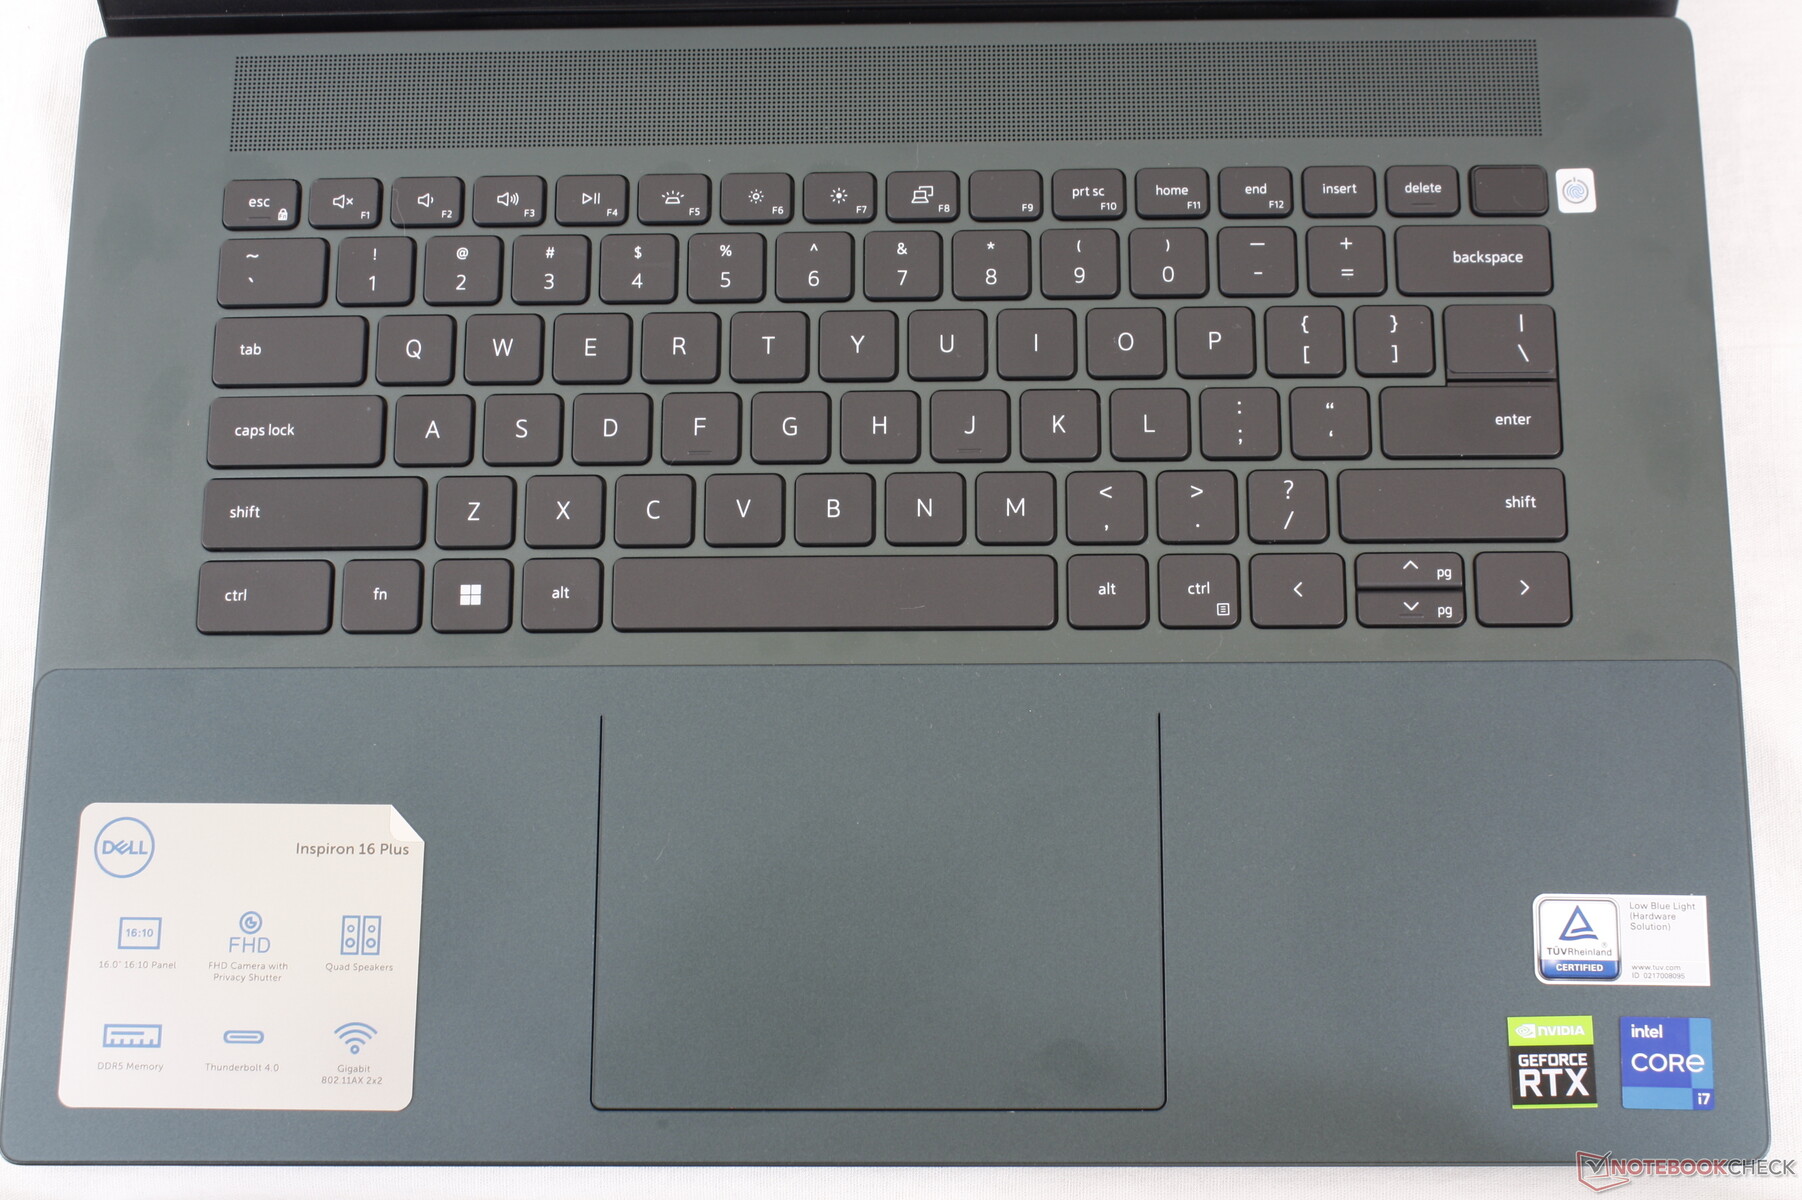
Dell hat den Ziffernblock der Tastatur beim aktuellen Modell gestrichen. Davon abgesehen ist das Tippgefühl ähnlich wie beim Inspiron 16 Plus 7620 2-in-1, da die Tasten immer noch etwas weicher wirken als beim LG Gram 16 und der HP-Spectre-Reihe.
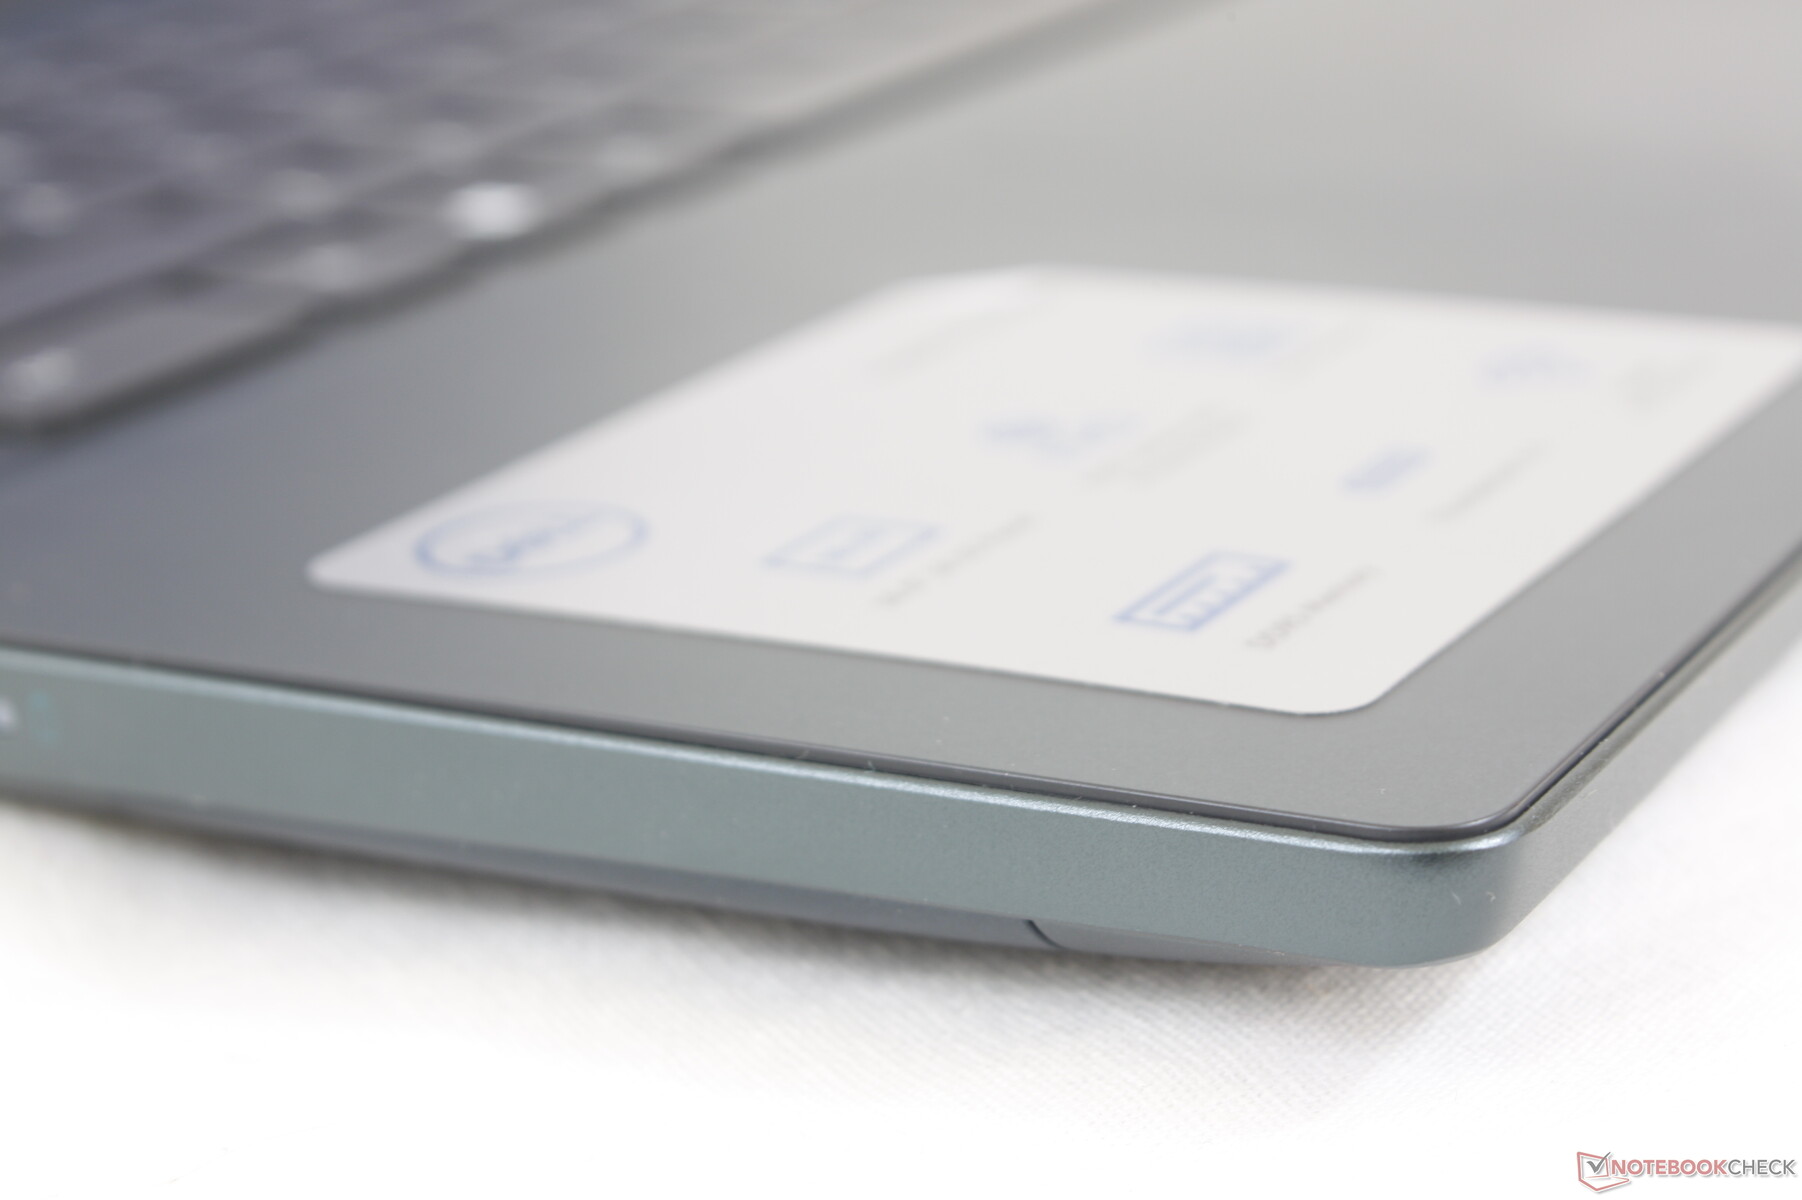
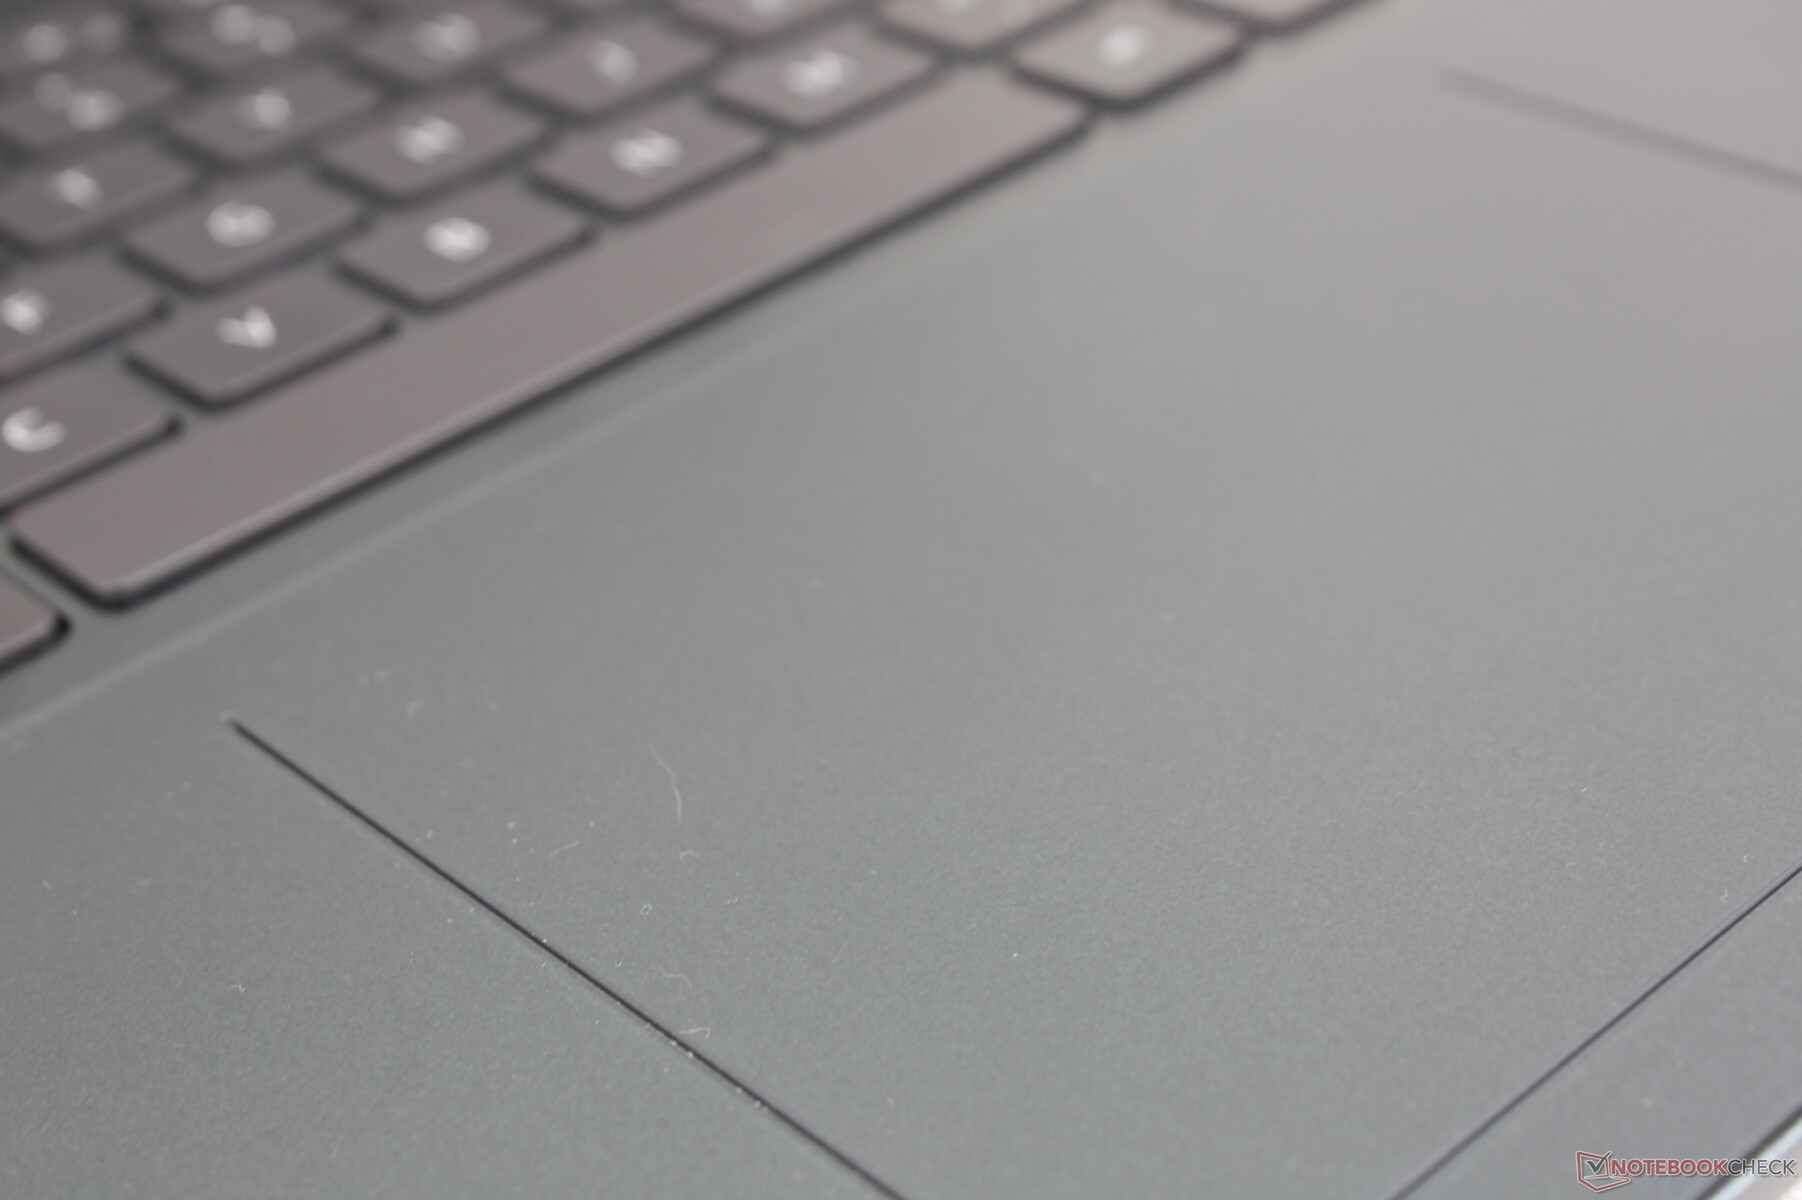
Touchpad
Das ClickPad des 2022er-Modells ist kleiner als das ClickPad des 2021er-Modells (11,5 x 8 cm vs. 13,5 x 9 cm) und damit gleich groß wie beim Inspiron 16 7620 2-in-1. Die neue BO-PET-Oberfläche eignet sich hervorragend für Zeigerbewegungen, da sie gute Gleiteigenschaften aufweist und bei langsamen Zeigerbewegungen leicht haftet, was die Präzision begünstigt. Dennoch sind die Klicks etwas zu weich und schwammig.
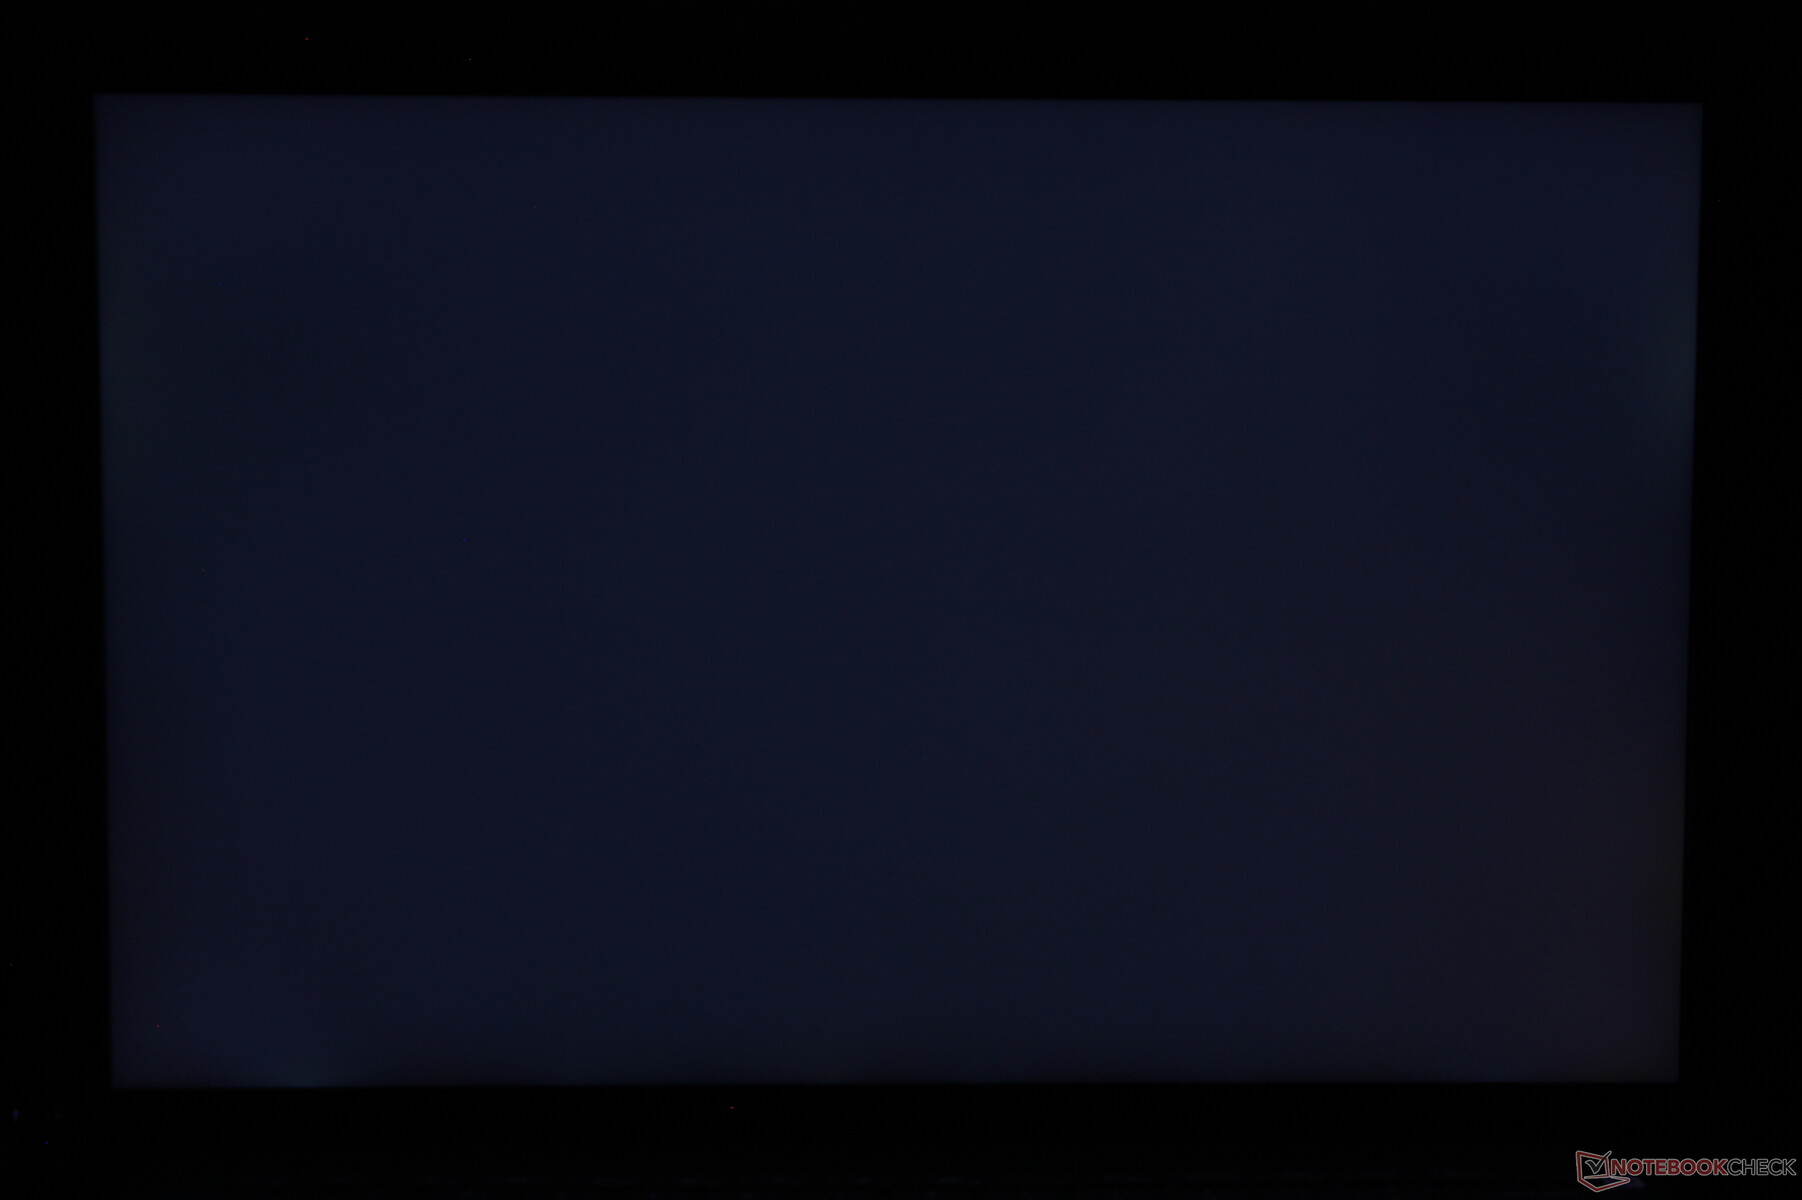
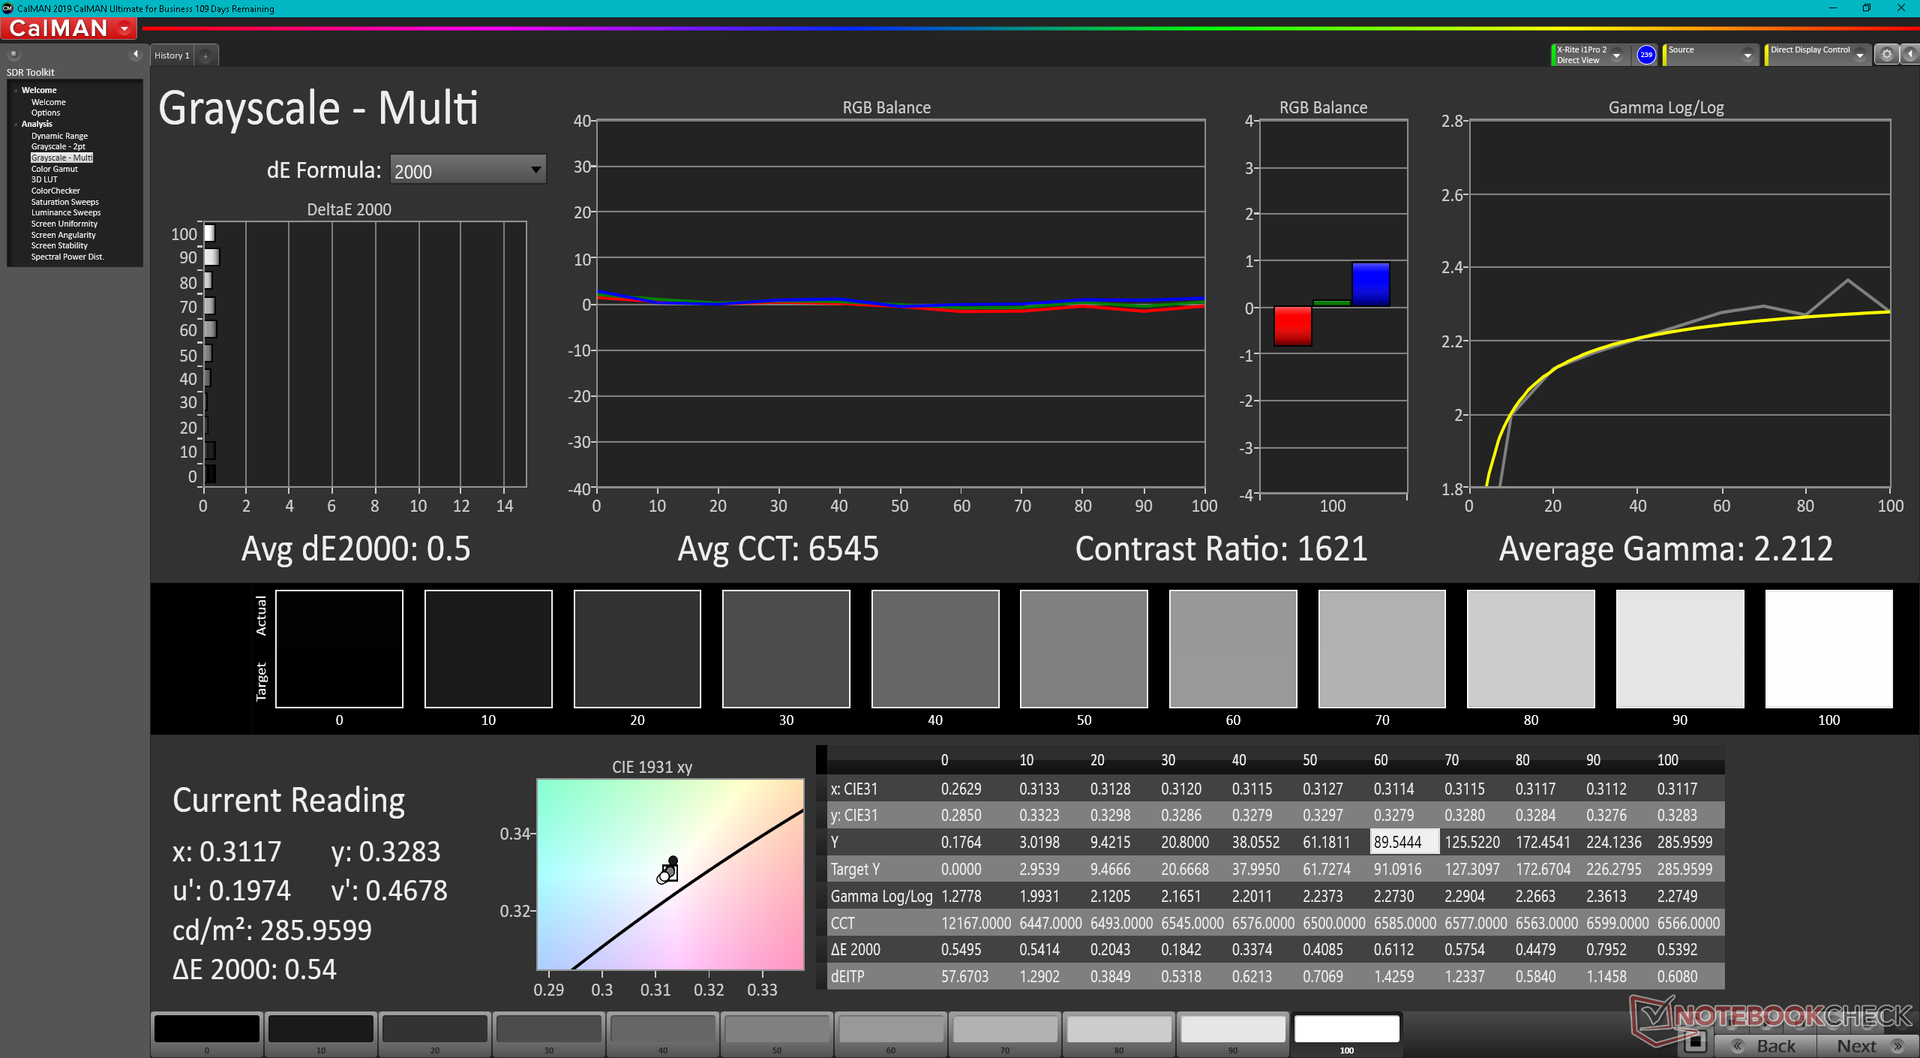
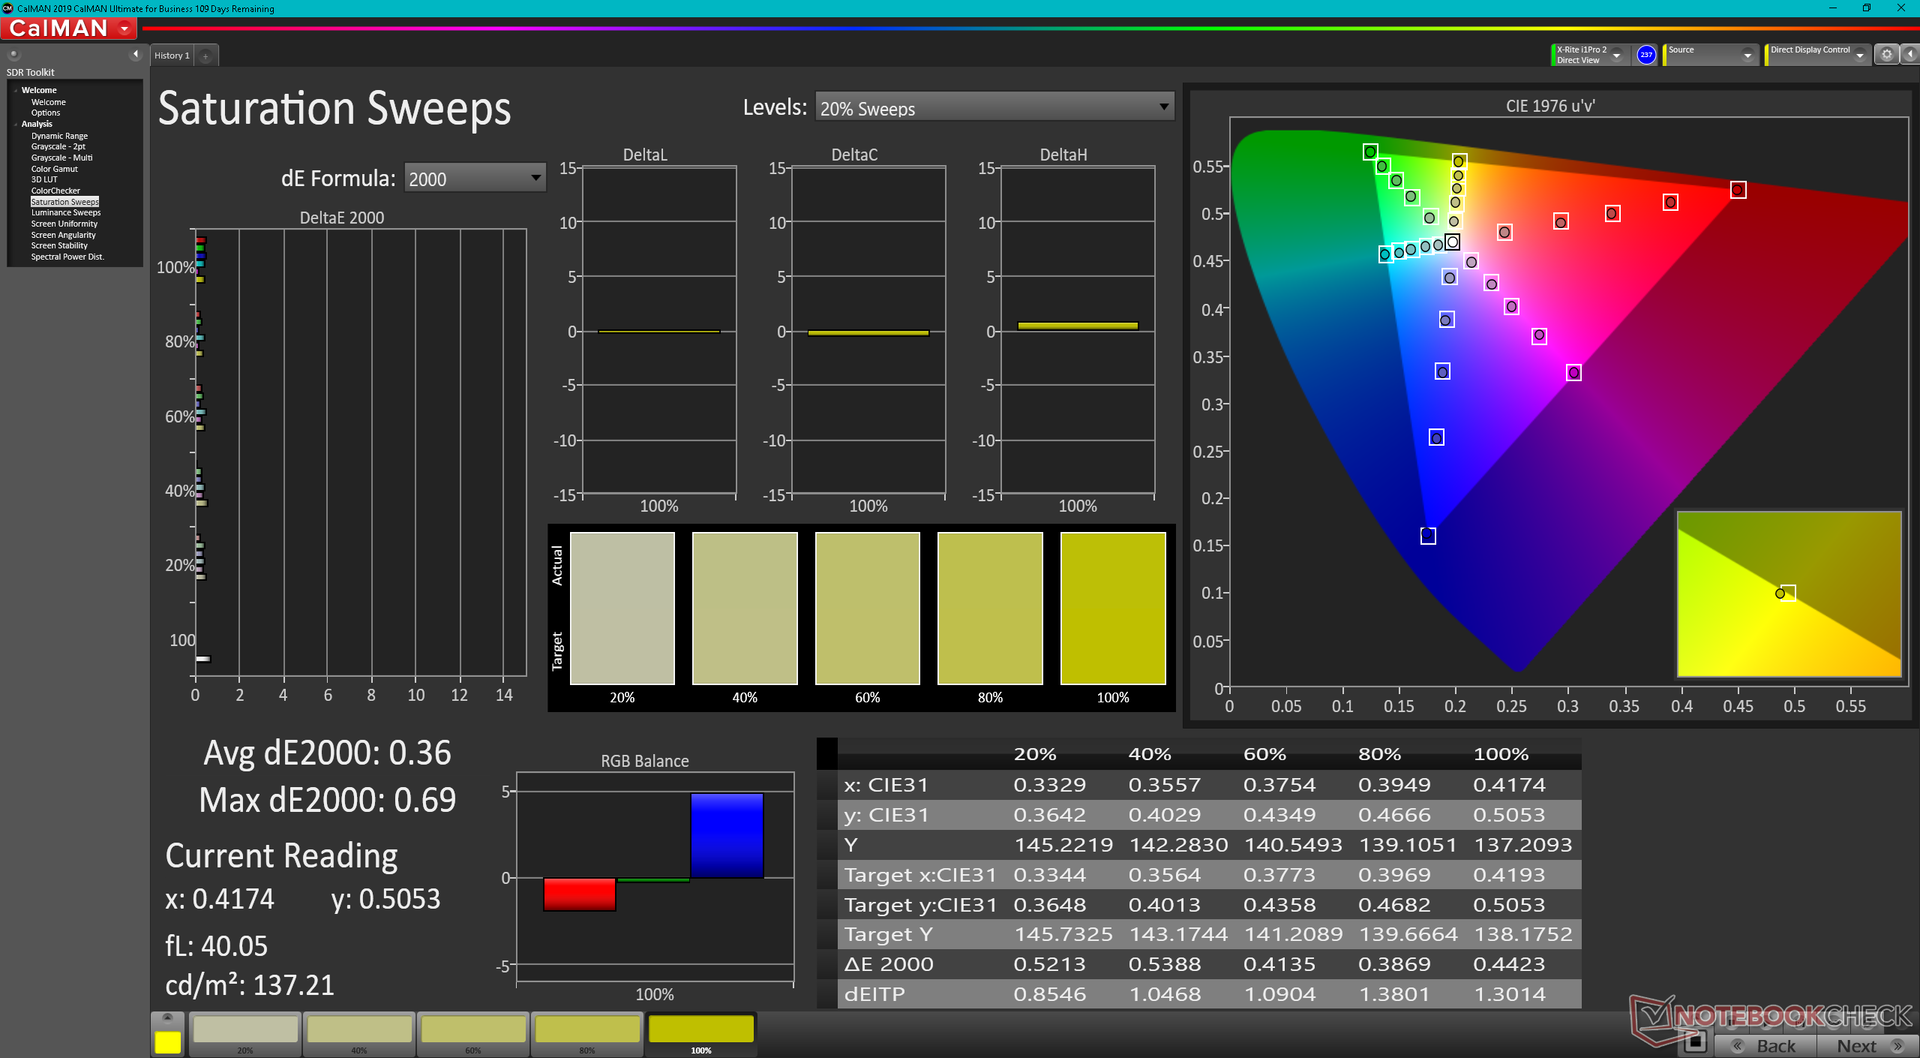
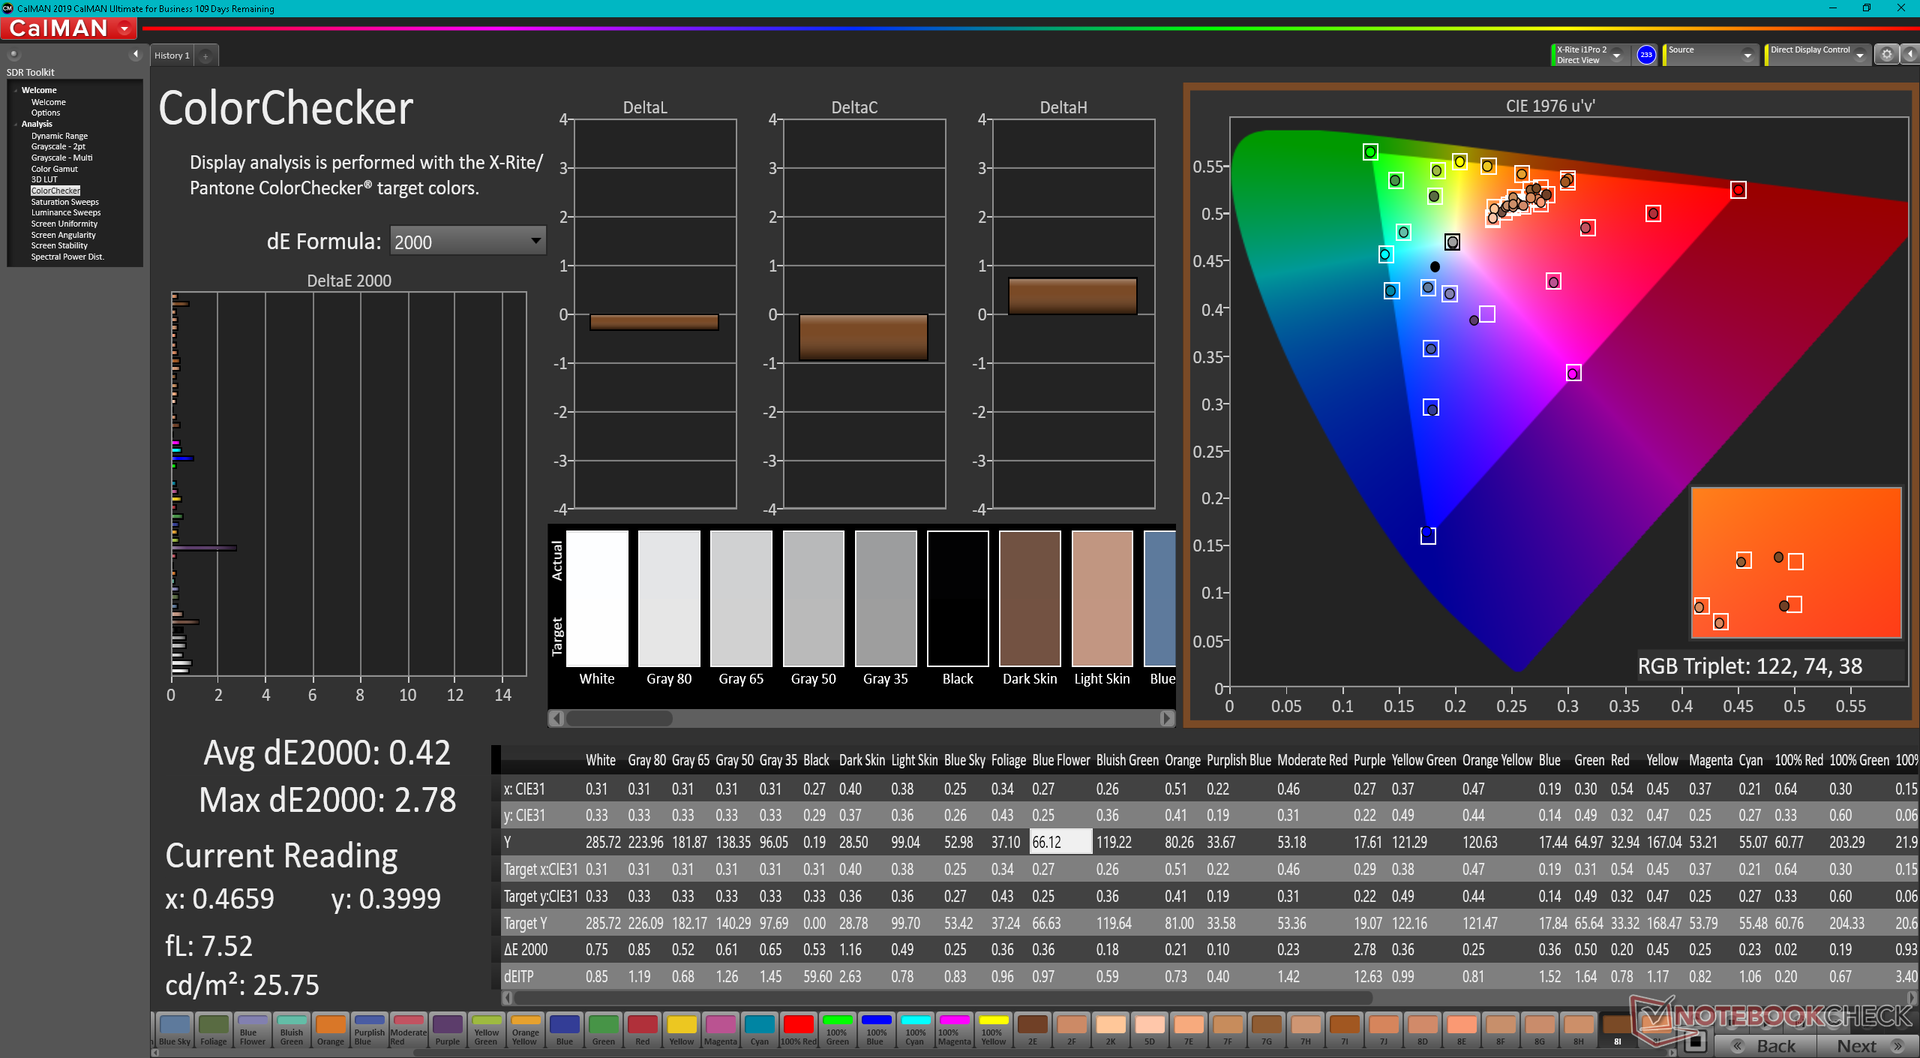
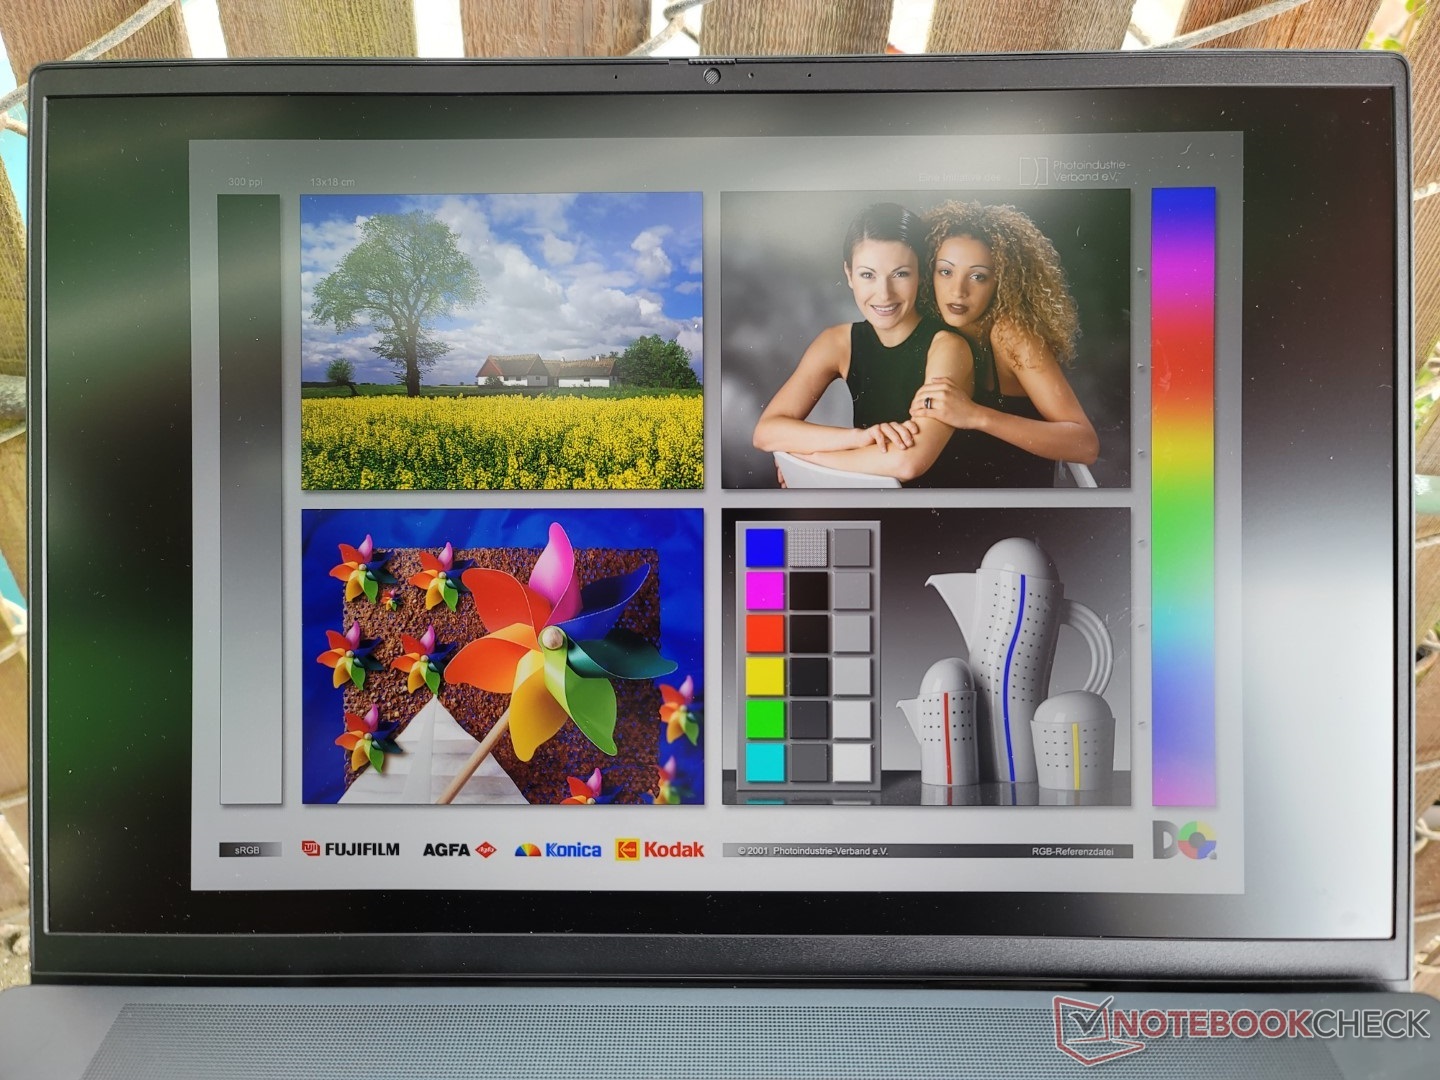
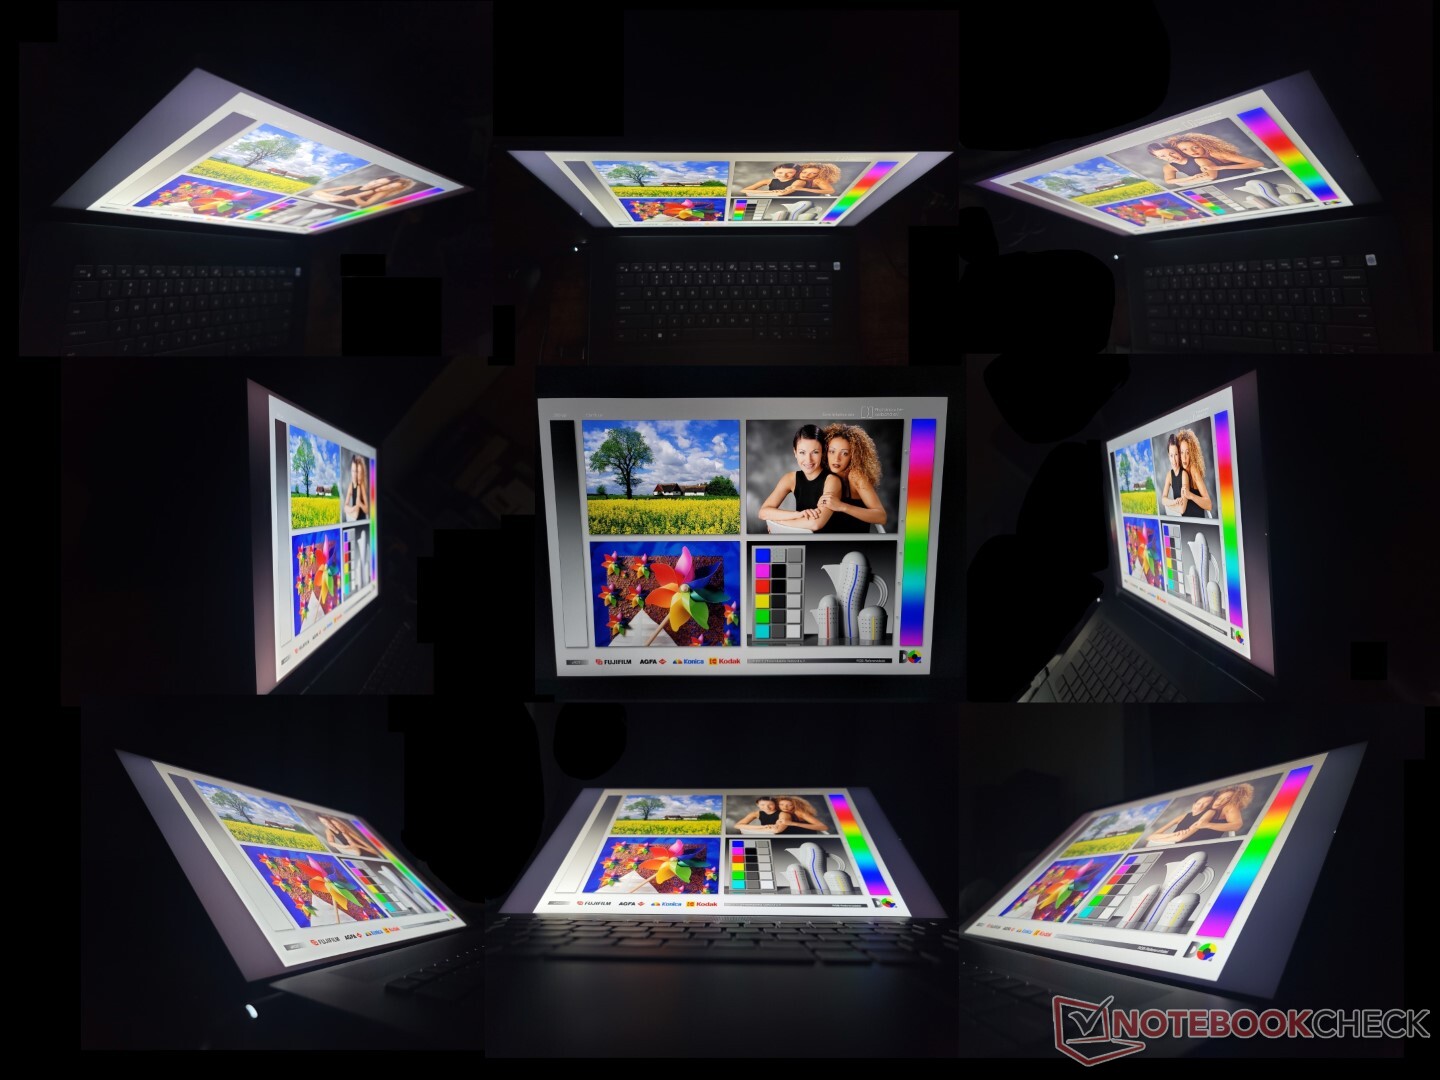
Display — Keine großen Änderungen
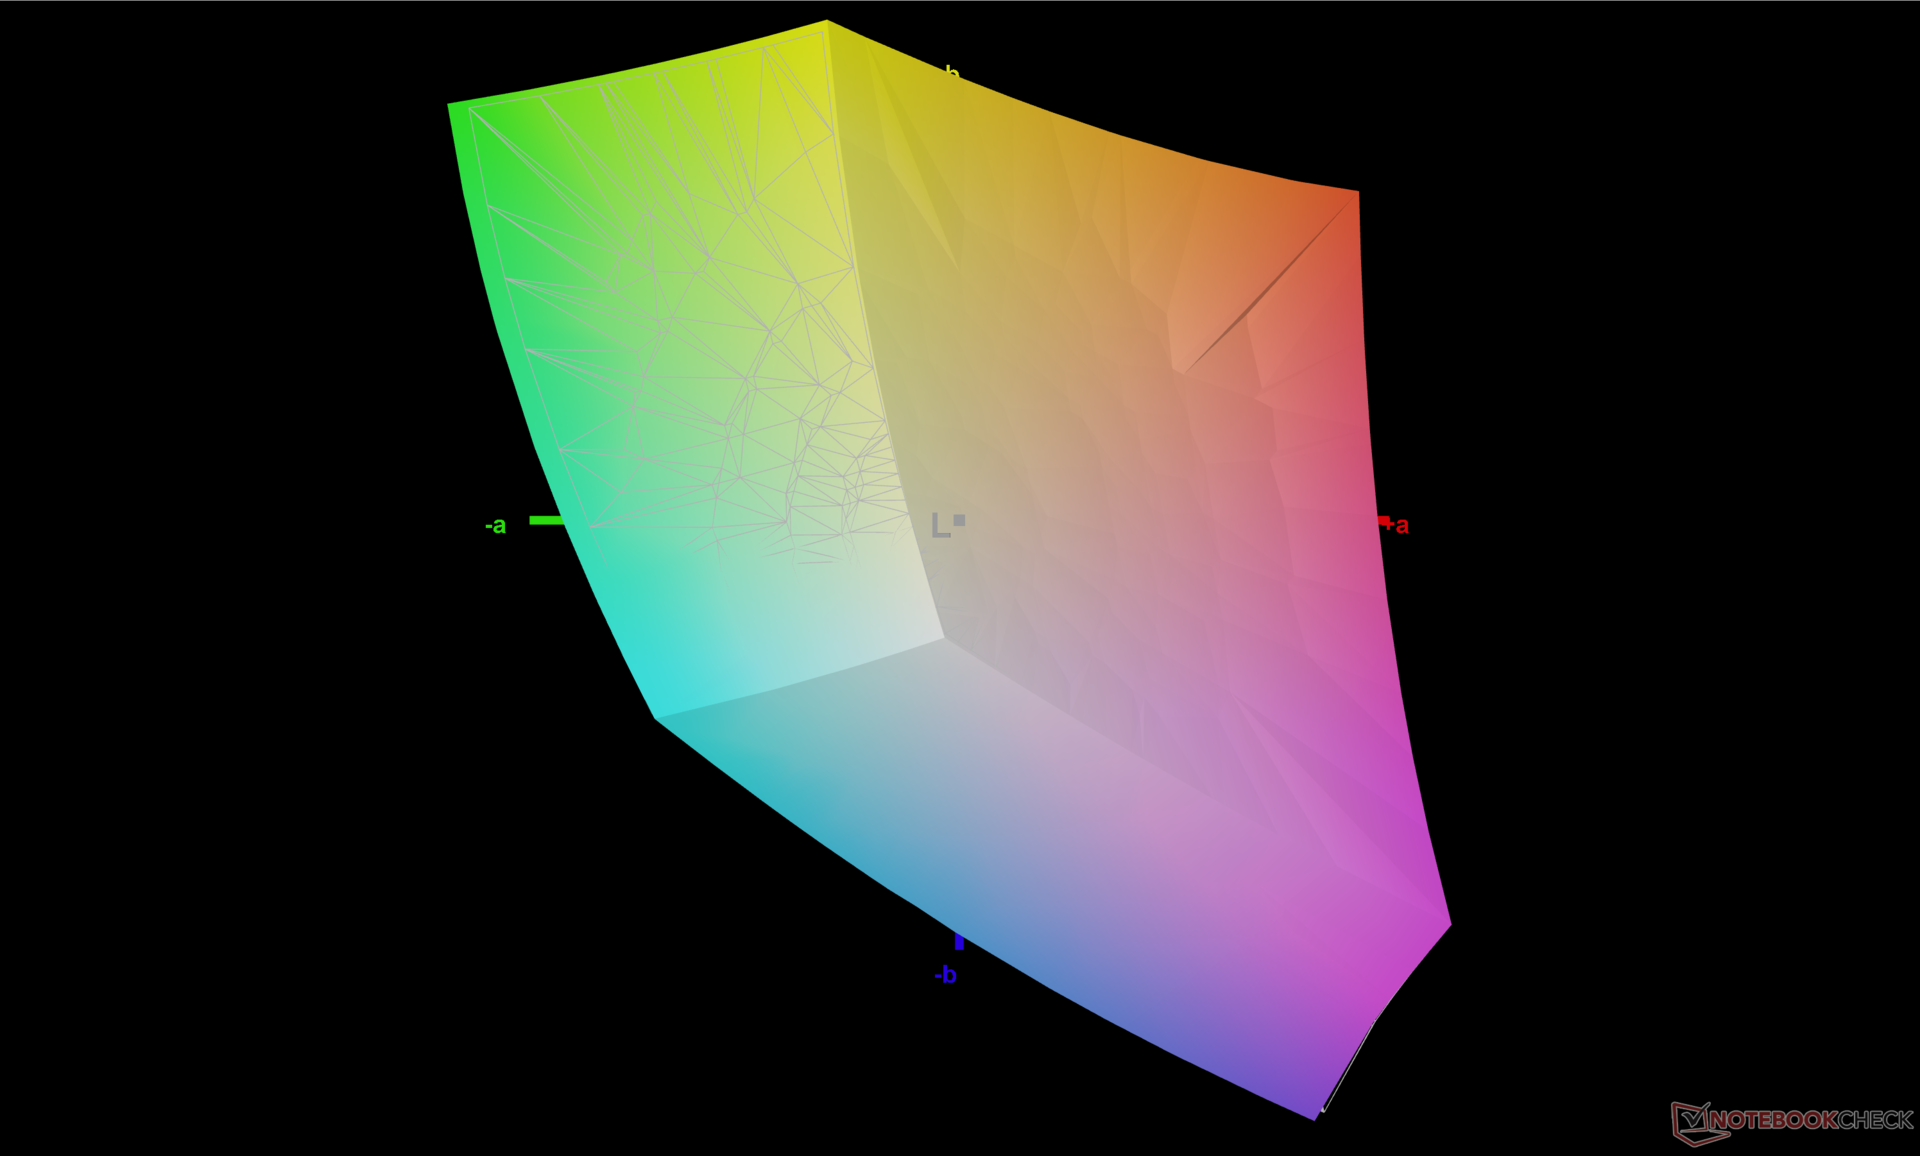
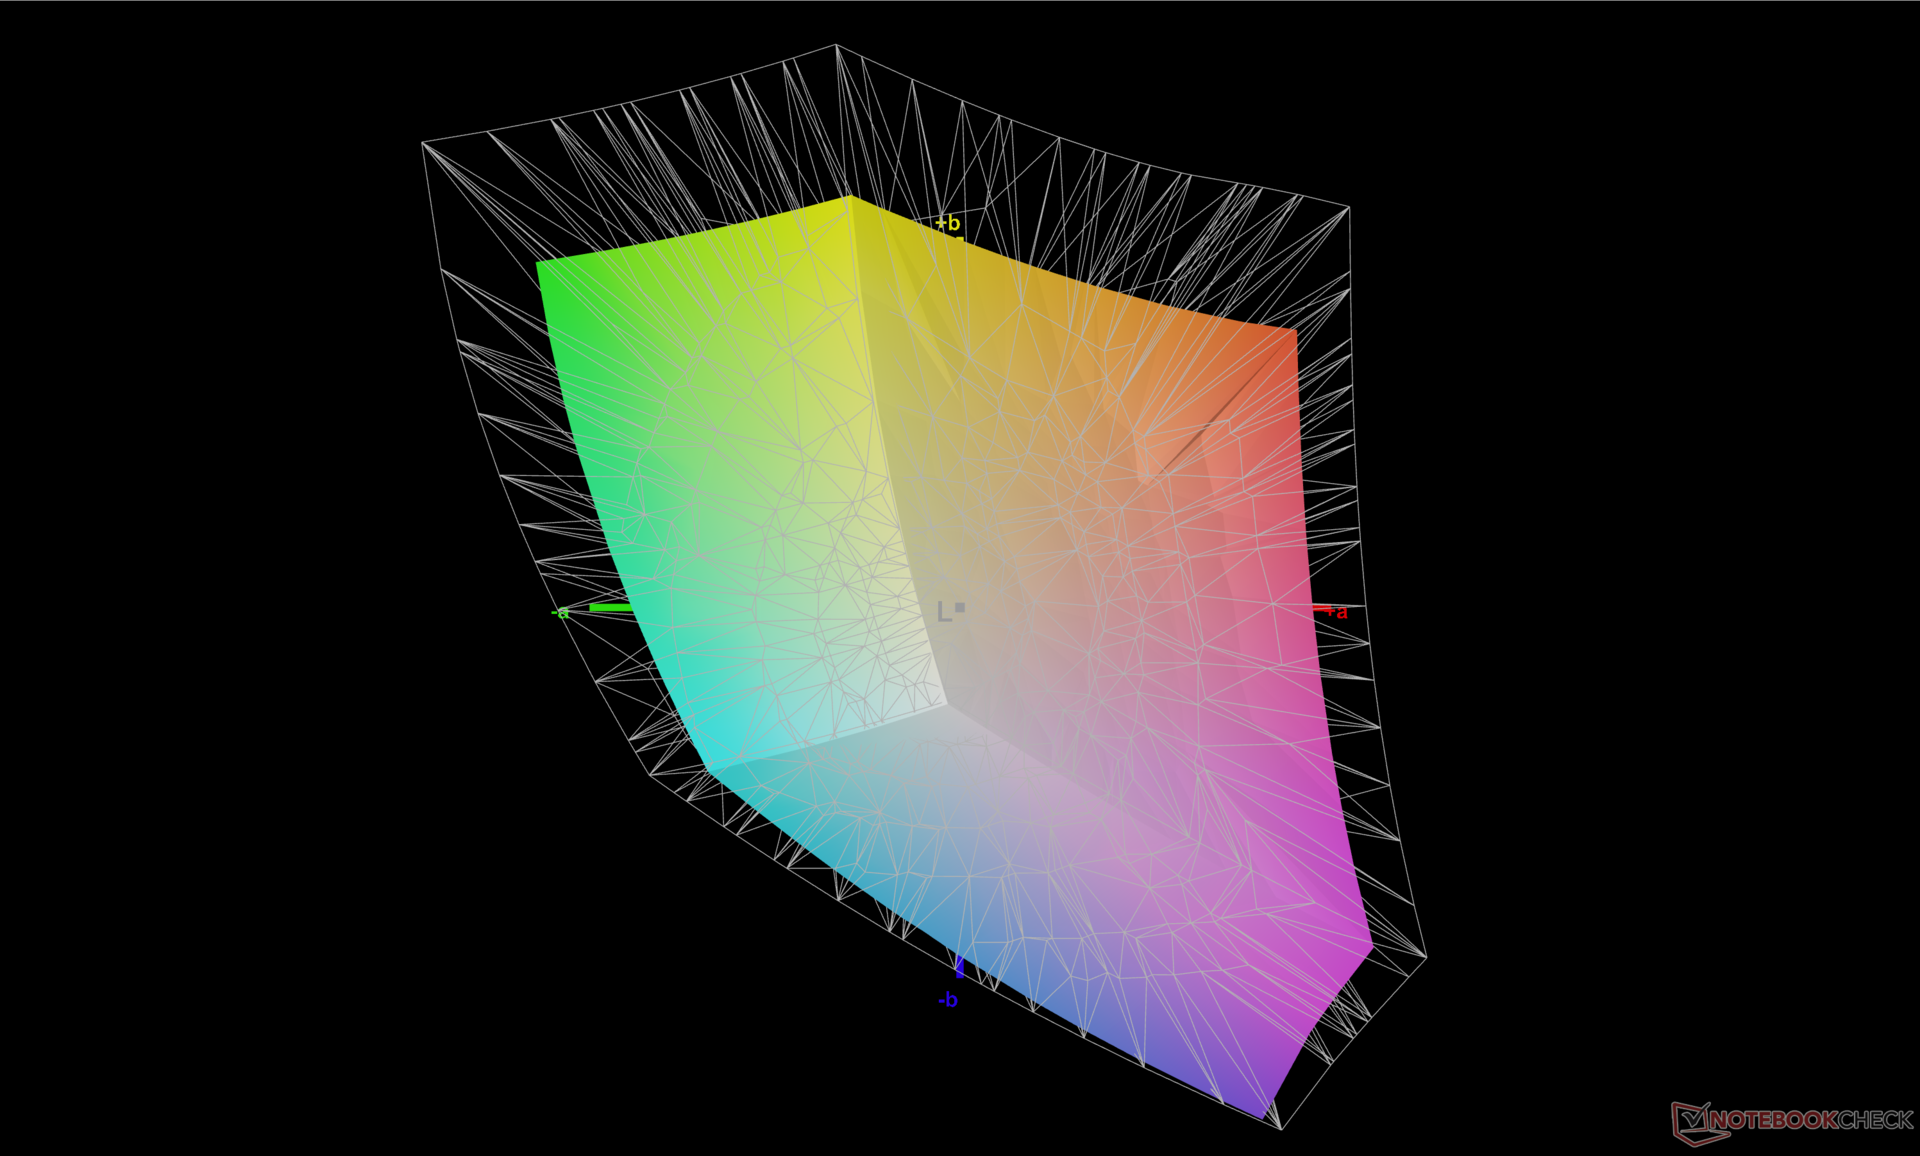
Interessanterweise hat Dell den Panelhersteller gewechselt, sodass statt dem AU-Optronics-Panel des Inspiron 16 Plus 7610 aus dem Vorjahr beim aktuellen Modell ein BOE-Panel zum Einsatz kommt. Die Reaktionszeiten sind zwar etwas schneller und Ghosting dadurch weniger stark ausgeprägt, die meisten anderen Displaycharakteristika wie die vollständige sRGB-Farbraumabdeckung, das ~1.000:1-Kontrastverhältnis und die maximale Helligkeit von ~290 cd/m² bleiben davon jedoch unberührt.
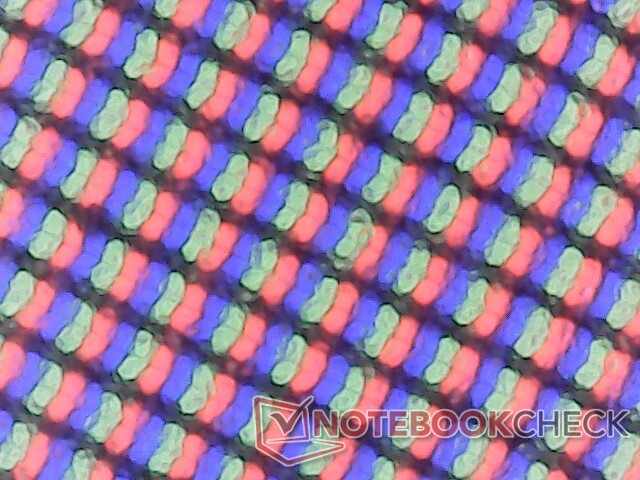
Die Darstellung fällt gut aus, allerdings immer noch bei Weitem nicht so gut wie bei der XPS-Reihe oder dem OLED-Panel des Asus VivoBook Pro 16X. Das Bild wirkt aufgrund der stark matten Schicht leicht körnig und die Farben sind nicht annähernd so lebhaft wie auf einem OLED-Bildschirm. Obwohl die Inspiron-Reihe nicht zur Flaggschiff-Klasse gehört, sind wir etwas enttäuscht, dass es beim Display dieses Jahr gar keine großen Verbesserungen gab.
Drei 300-cd/m²-Displayvarianten stehen zur Auswahl: 3.072 x 1.920 matt, 1.920 x 1.200 matt und 1.920 x 1.200 reflektiv mit Touchscreen. Die folgenden Messungen beziehen sich ausschließlich auf das höherauflösende Panel.
| |||||||||||||||||||||||||
Ausleuchtung: 92 %
Helligkeit Akku: 288.9 cd/m²
Kontrast: 1111:1 (Schwarzwert: 0.26 cd/m²)
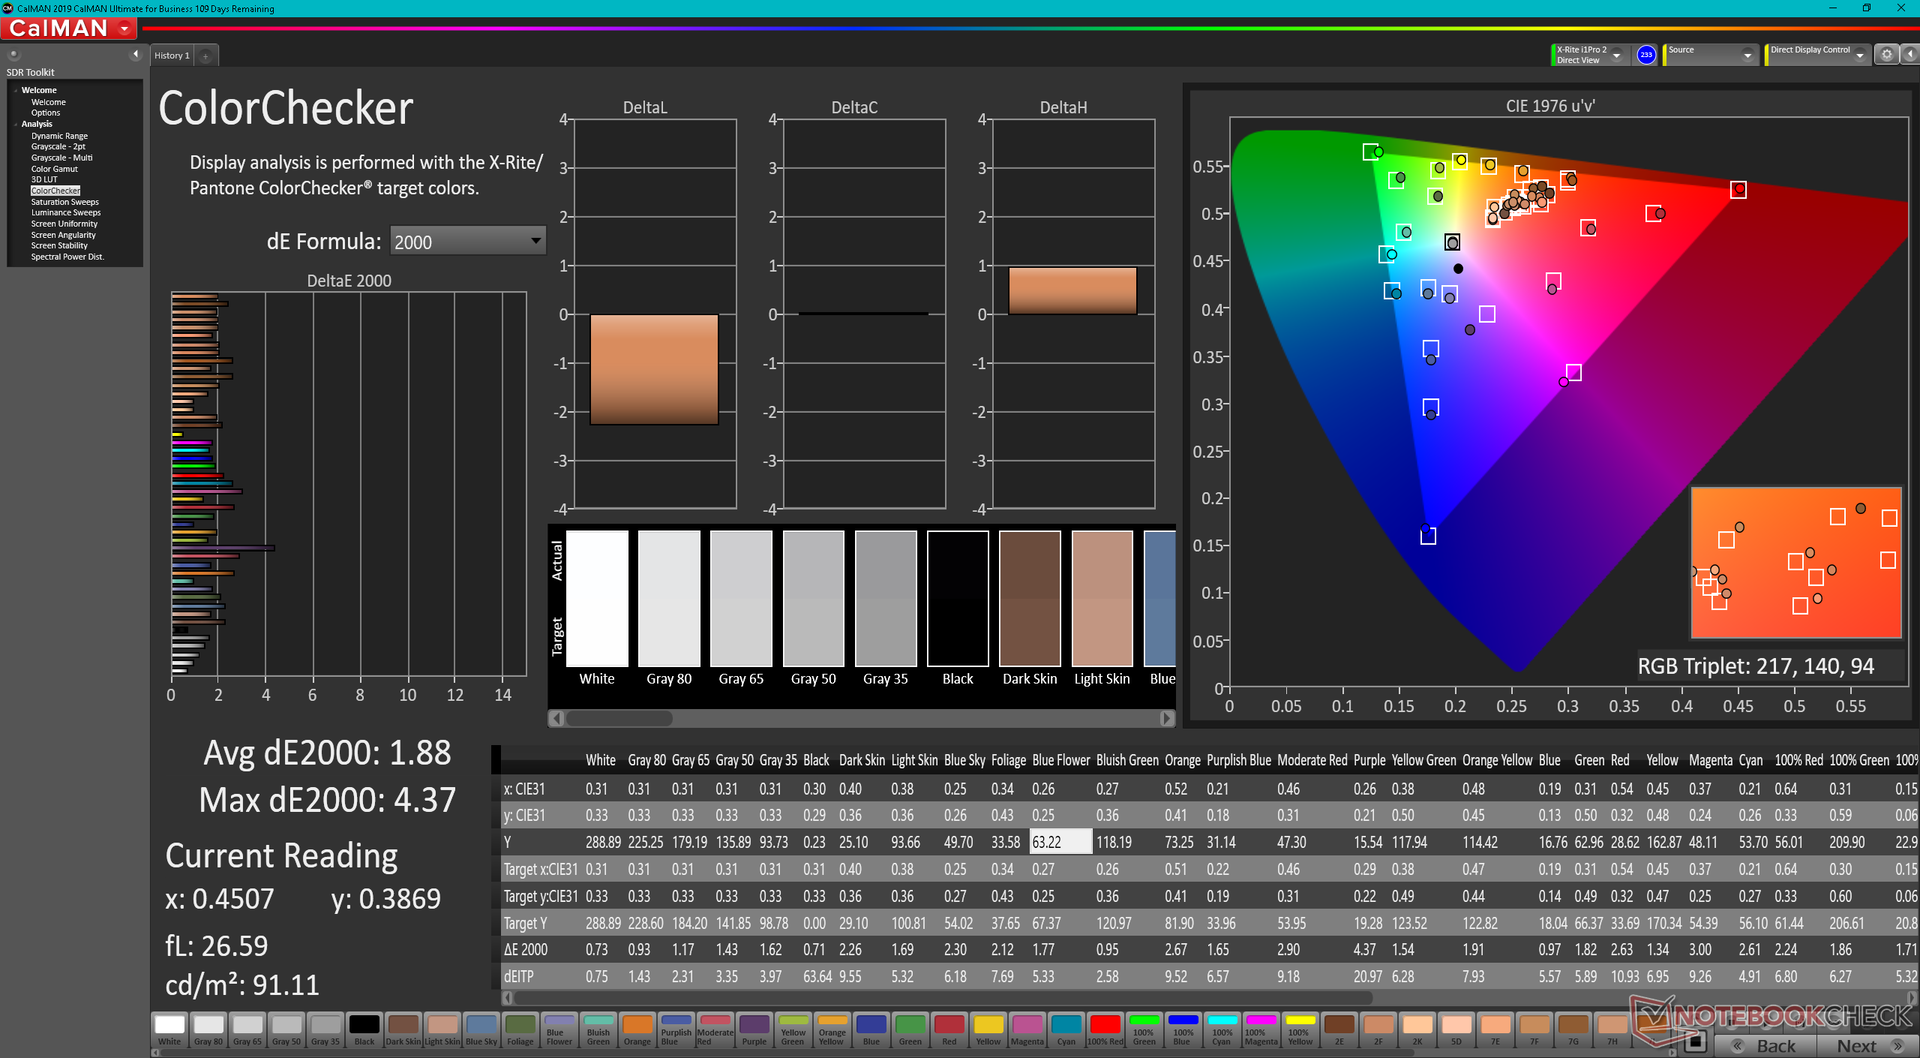
ΔE ColorChecker Calman: 1.88 | ∀{0.5-29.43 Ø4.71}
calibrated: 0.42
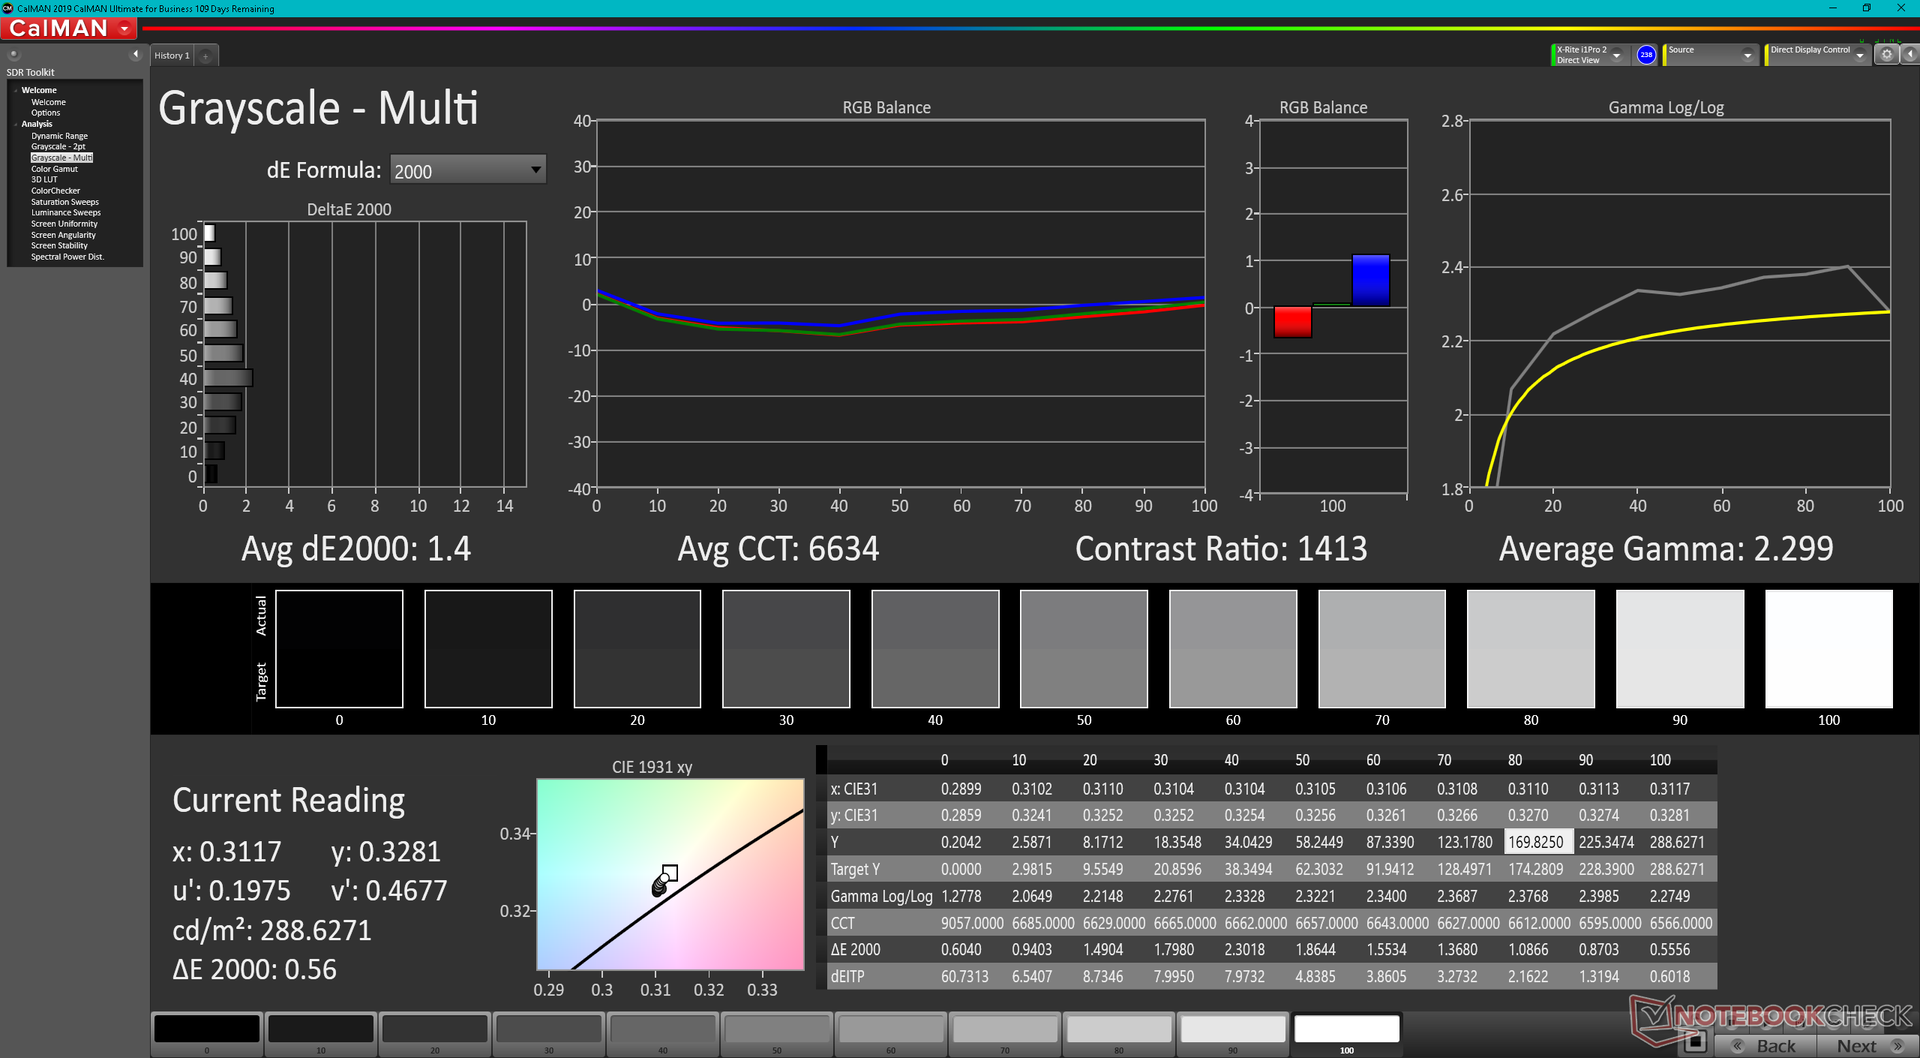
ΔE Greyscale Calman: 1.4 | ∀{0.09-98 Ø4.96}
73.2% AdobeRGB 1998 (Argyll 3D)
99.5% sRGB (Argyll 3D)
70.8% Display P3 (Argyll 3D)
Gamma: 2.3
CCT: 6634 K
| Dell Inspiron 16 Plus 7620 BOE NE16N41, IPS, 3072x1920, 16" | Dell Inspiron 16 Plus 7610 AU Optronics B160QAN, IPS, 3072x1920, 16" | Lenovo Yoga 7 16IAP7 Lenovo LEN160WQXGA, IPS, 2560x1600, 16" | Huawei MateBook D 16 2022 BOE NV160WUM-NH0, IPS, 1920x1200, 16" | Acer Swift X SFX16-51G-5388 Chi Mei N161HCA-EA3, , 1920x1080, 16.1" | Asus Vivobook Pro 16X-M7600QE Samsung ATNA60YV02-0, OLED, 3840x2400, 16.1" | |
|---|---|---|---|---|---|---|
| Display | 3% | -5% | -5% | -7% | 25% | |
| Display P3 Coverage (%) | 70.8 | 74.1 5% | 67 -5% | 66.2 -6% | 65.1 -8% | 99.8 41% |
| sRGB Coverage (%) | 99.5 | 99.4 0% | 95.7 -4% | 96.4 -3% | 95.65 -4% | 100 1% |
| AdobeRGB 1998 Coverage (%) | 73.2 | 75.8 4% | 69.3 -5% | 68.3 -7% | 66.75 -9% | 96.9 32% |
| Response Times | -30% | 8% | 27% | 25% | 94% | |
| Response Time Grey 50% / Grey 80% * (ms) | 38 ? | 49.2 ? -29% | 36 ? 5% | 30.5 ? 20% | 30 ? 21% | 2 ? 95% |
| Response Time Black / White * (ms) | 28 ? | 36.8 ? -31% | 24.8 ? 11% | 18.7 ? 33% | 20 ? 29% | 2 ? 93% |
| PWM Frequency (Hz) | 60 ? | |||||
| Bildschirm | -47% | -13% | -56% | -6% | -35% | |
| Helligkeit Bildmitte (cd/m²) | 288.9 | 296.8 3% | 393.7 36% | 319 10% | 276 -4% | 392 36% |
| Brightness (cd/m²) | 276 | 292 6% | 367 33% | 317 15% | 264 -4% | 396 43% |
| Brightness Distribution (%) | 92 | 87 -5% | 84 -9% | 90 -2% | 85 -8% | 98 7% |
| Schwarzwert * (cd/m²) | 0.26 | 0.21 19% | 0.38 -46% | 0.23 12% | 0.16 38% | |
| Kontrast (:1) | 1111 | 1413 27% | 1036 -7% | 1387 25% | 1725 55% | |
| Delta E Colorchecker * | 1.88 | 2.56 -36% | 1.97 -5% | 3.4 -81% | 1.8 4% | 1.74 7% |
| Colorchecker dE 2000 max. * | 4.37 | 4.76 -9% | 5.46 -25% | 8.1 -85% | 3.77 14% | 3.18 27% |
| Colorchecker dE 2000 calibrated * | 0.42 | 1.86 -343% | 0.62 -48% | 0.8 -90% | 0.63 -50% | 1.85 -340% |
| Delta E Graustufen * | 1.4 | 2.6 -86% | 2.1 -50% | 5.7 -307% | 2.76 -97% | 1.77 -26% |
| Gamma | 2.3 96% | 2.07 106% | 2.1 105% | 2.1 105% | 2.37 93% | 2.22 99% |
| CCT | 6634 98% | 6628 98% | 6461 101% | 7433 87% | 6564 99% | 6483 100% |
| Durchschnitt gesamt (Programm / Settings) | -25% /
-34% | -3% /
-9% | -11% /
-33% | 4% /
-2% | 28% /
1% |
* ... kleinere Werte sind besser
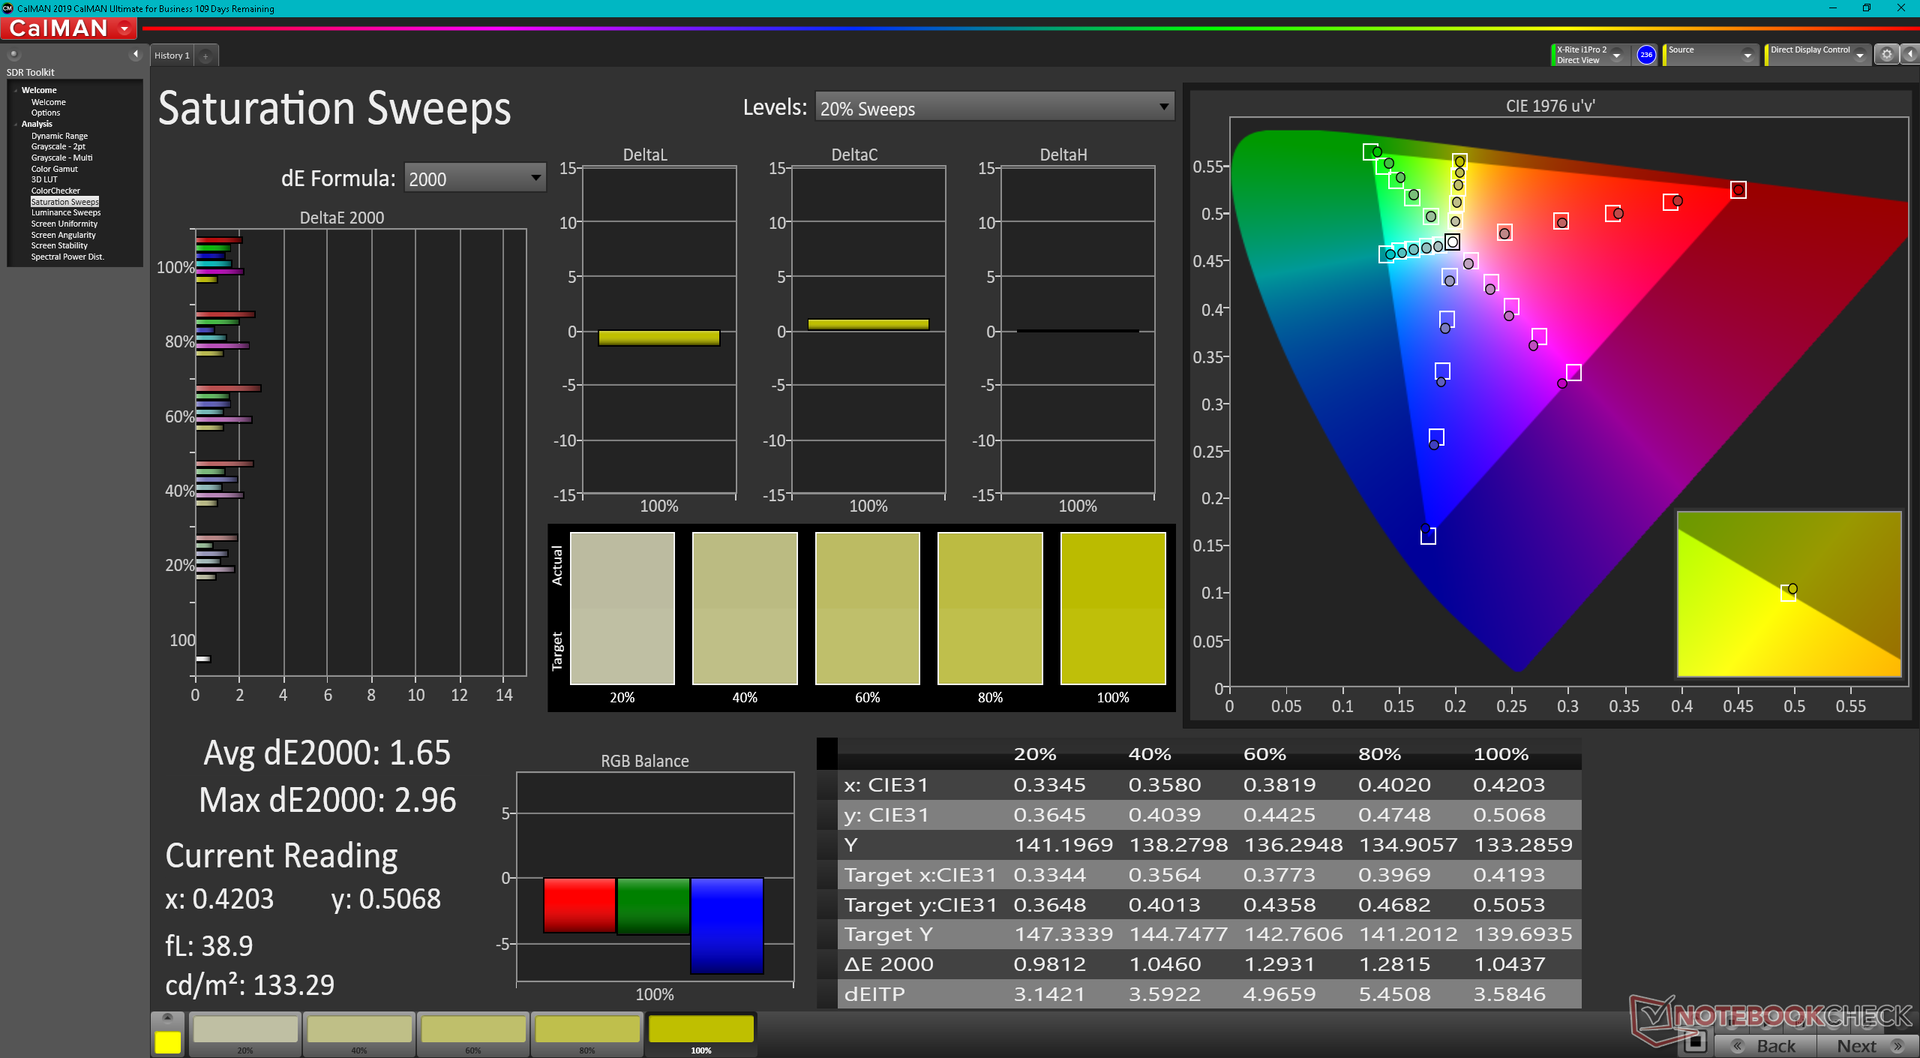
Wie beim 7610 ist die Darstellung des Displays schon ab Werk gut. Die durchschnittlichen Graustufen- und Farb-DeltaE-Werte liegen bei nur 1,4 bzw. 1,88, durch eine nachträgliche Kalibrierung konnten wir sie auf nur 0,5 bzw. 0,42 senken. Damit ist es für Nutzer, die auf eine hohe Farbgenauigkeit bei einem sRGB-Display Wert legen gut geeignet.
Reaktionszeiten (Response Times) des Displays
| ↔ Reaktionszeiten Schwarz zu Weiß | ||
|---|---|---|
| 28 ms ... steigend ↗ und fallend ↘ kombiniert | ↗ 13.2 ms steigend |  |
| ↘ 14.8 ms fallend | ||
| Die gemessenen Reaktionszeiten sind mittelmäßig und dadurch für Spieler eventuell zu langsam. Im Vergleich rangierten die bei uns getesteten Geräte von 0.1 (Minimum) zu 240 (Maximum) ms. » 71 % aller Screens waren schneller als der getestete. Daher sind die gemessenen Reaktionszeiten schlechter als der Durchschnitt aller vermessenen Geräte (19.8 ms). | ||
| ↔ Reaktionszeiten 50% Grau zu 80% Grau | ||
| 38 ms ... steigend ↗ und fallend ↘ kombiniert | ↗ 21.2 ms steigend | 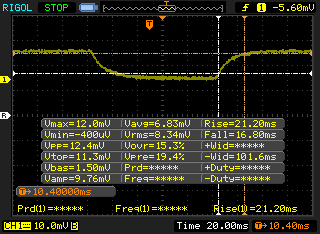 |
| ↘ 16.8 ms fallend | ||
| Die gemessenen Reaktionszeiten sind langsam und dadurch für viele Spieler wahrscheinlich zu langsam. Im Vergleich rangierten die bei uns getesteten Geräte von 0.165 (Minimum) zu 636 (Maximum) ms. » 55 % aller Screens waren schneller als der getestete. Daher sind die gemessenen Reaktionszeiten schlechter als der Durchschnitt aller vermessenen Geräte (31 ms). | ||
Bildschirm-Flackern / PWM (Pulse-Width Modulation)
| Flackern / PWM nicht festgestellt |  | ||
Im Vergleich: 52 % aller getesteten Geräte nutzten kein PWM um die Helligkeit zu reduzieren. Wenn PWM eingesetzt wurde, dann bei einer Frequenz von durchschnittlich 7757 (Minimum 5, Maximum 343500) Hz. | |||
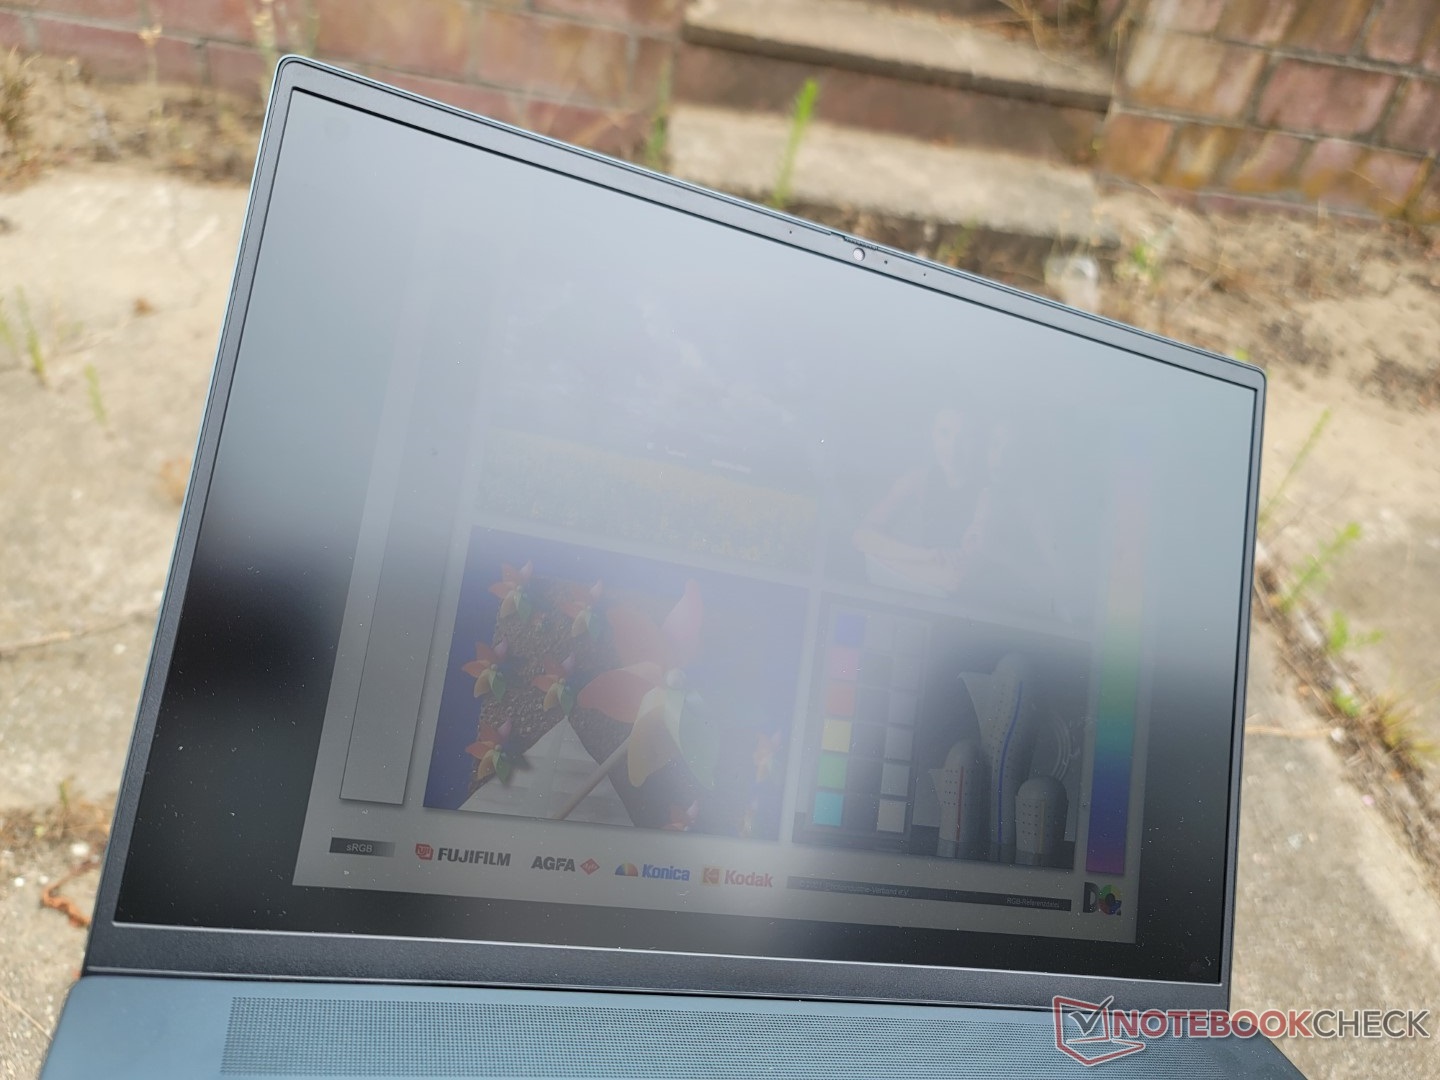
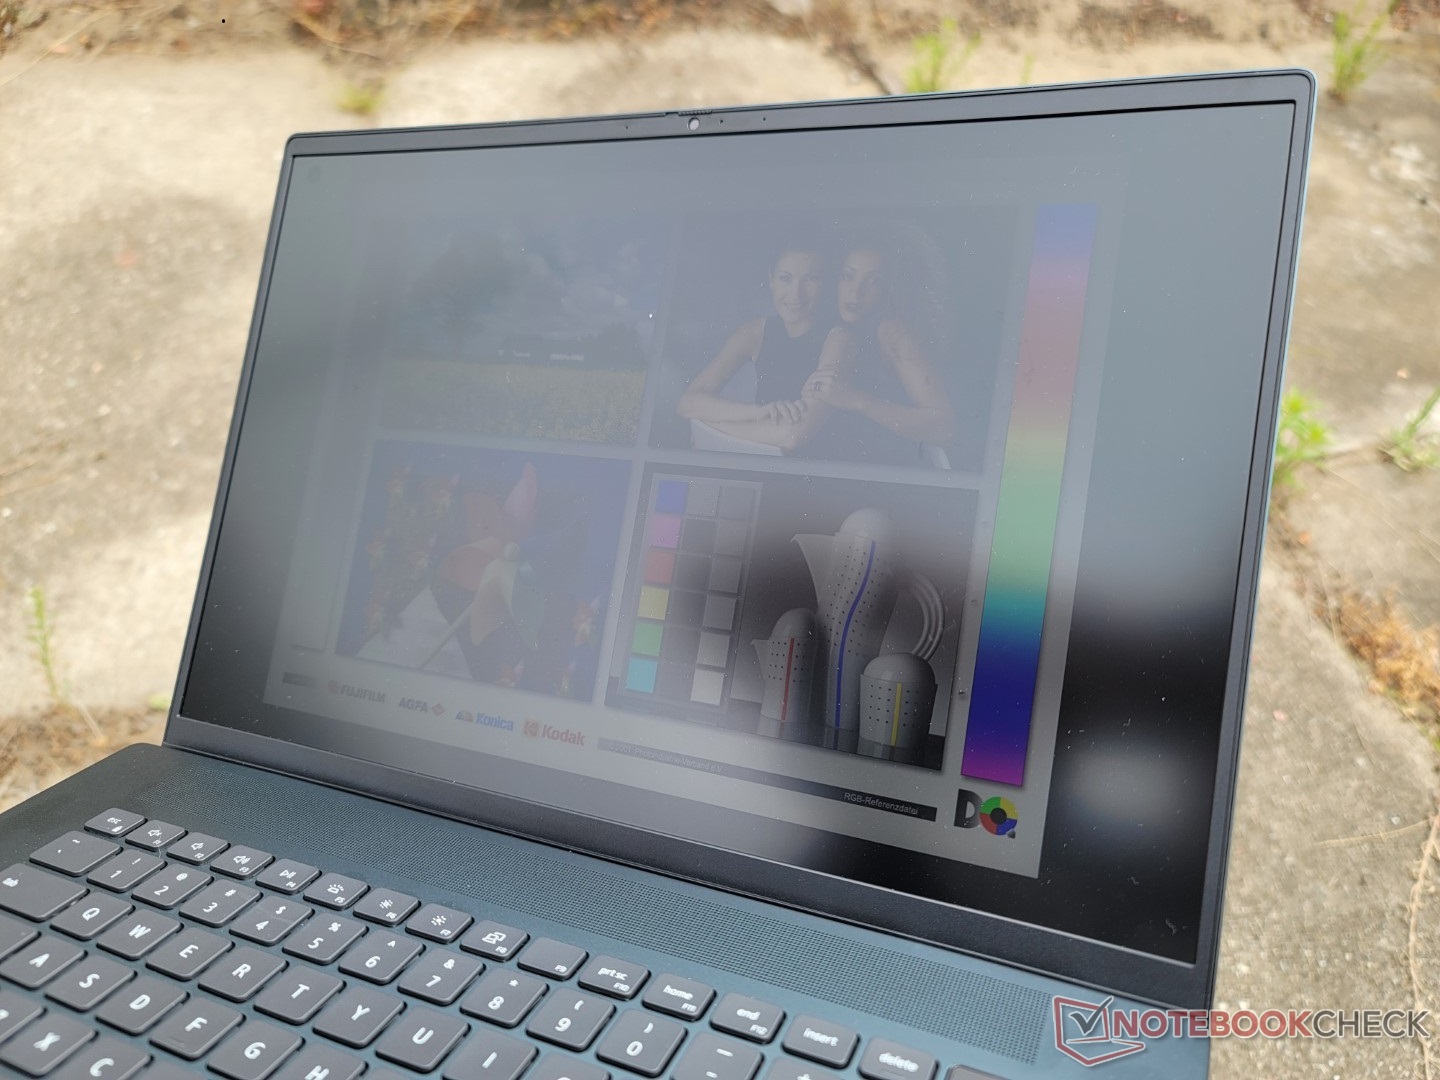
Im Freien ist die Lesbarkeit mit der des Modells aus dem Vorjahr vergleichbar, da sich die maximale Helligkeit nicht geändert hat. Das Lenovo Yoga 7 und das Asus VivoBook Pro 16X haben zwar hellere Displays, leiden jedoch im Freien aufgrund ihrer reflektiven Ansatzes unter stärker ausgeprägten Reflexionen.
Leistung — 12th Gen. mit mehr Leistung und einem höheren Verbrauch

Testbedingungen
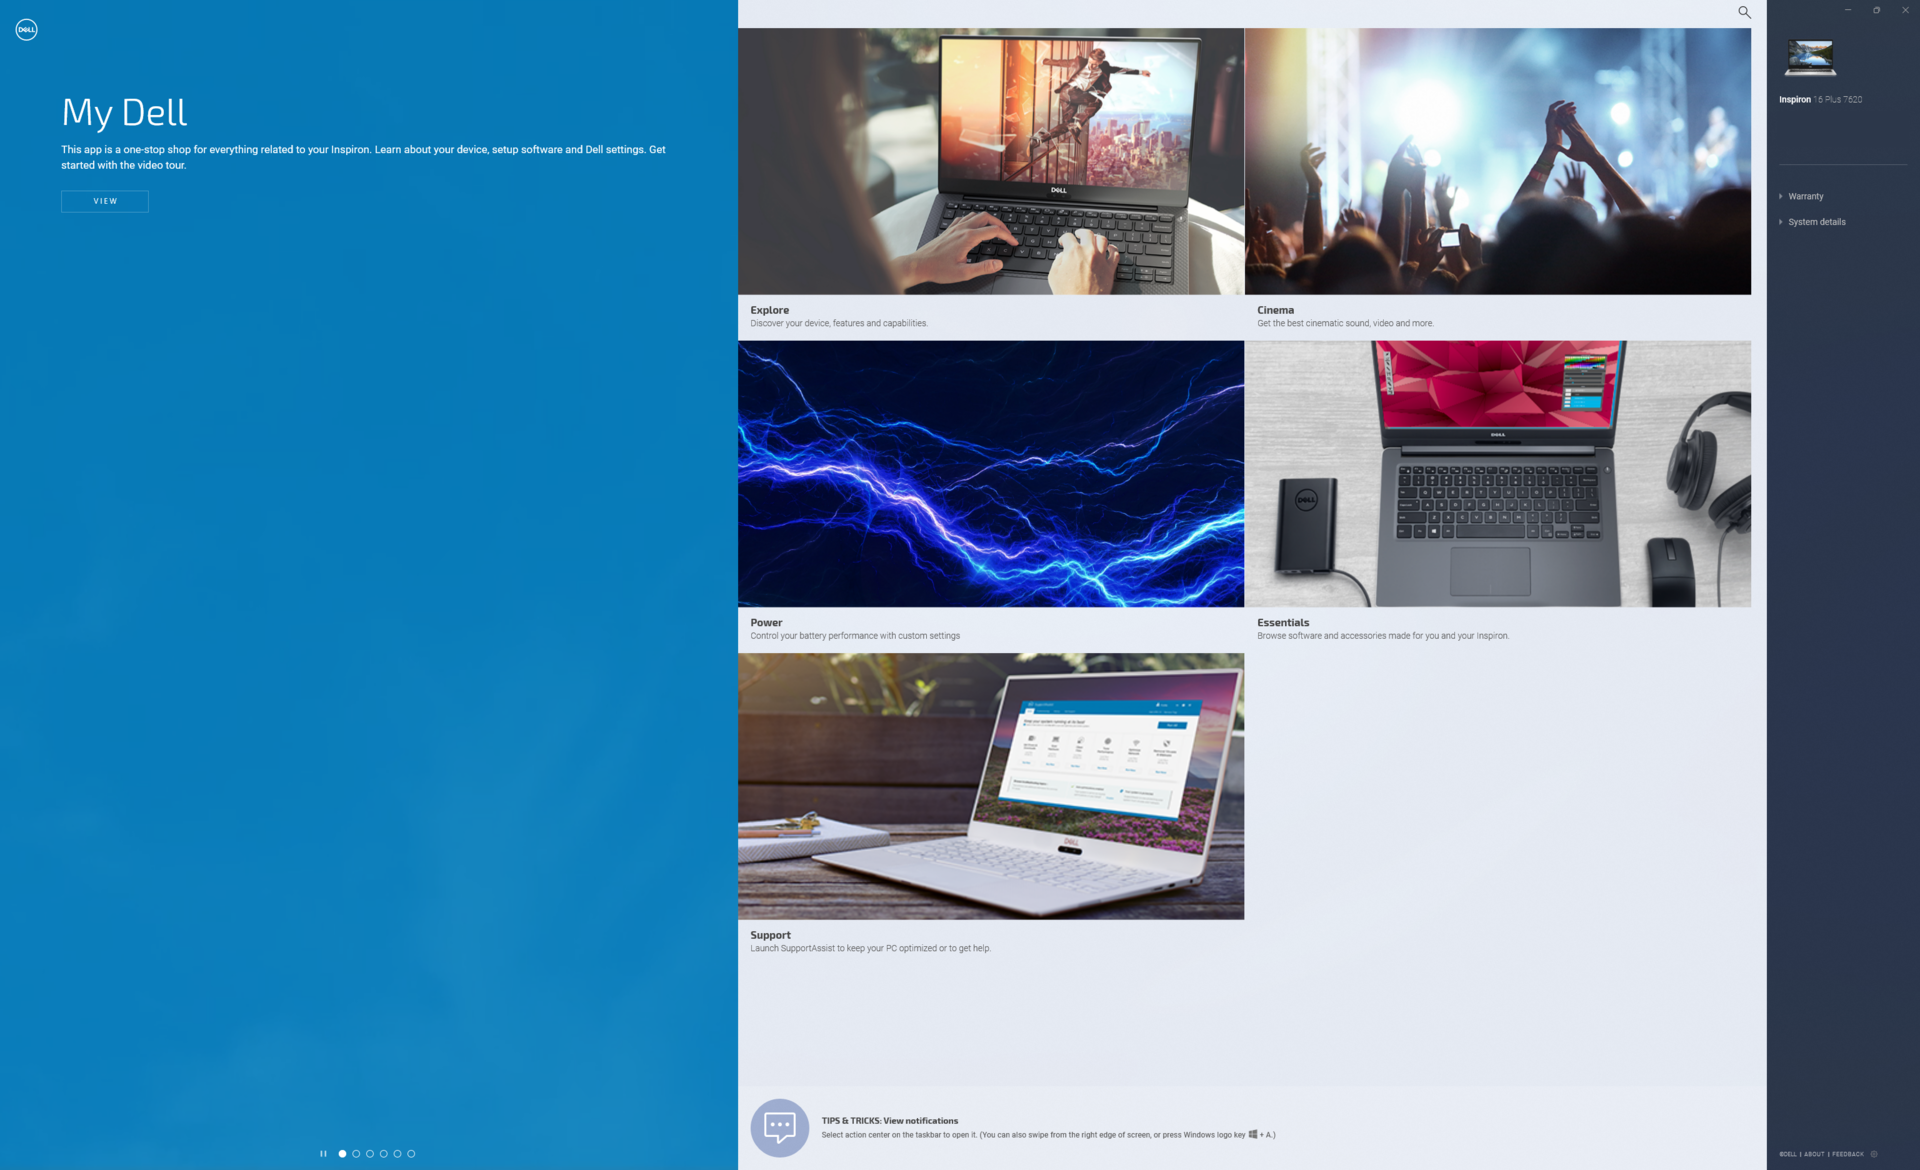
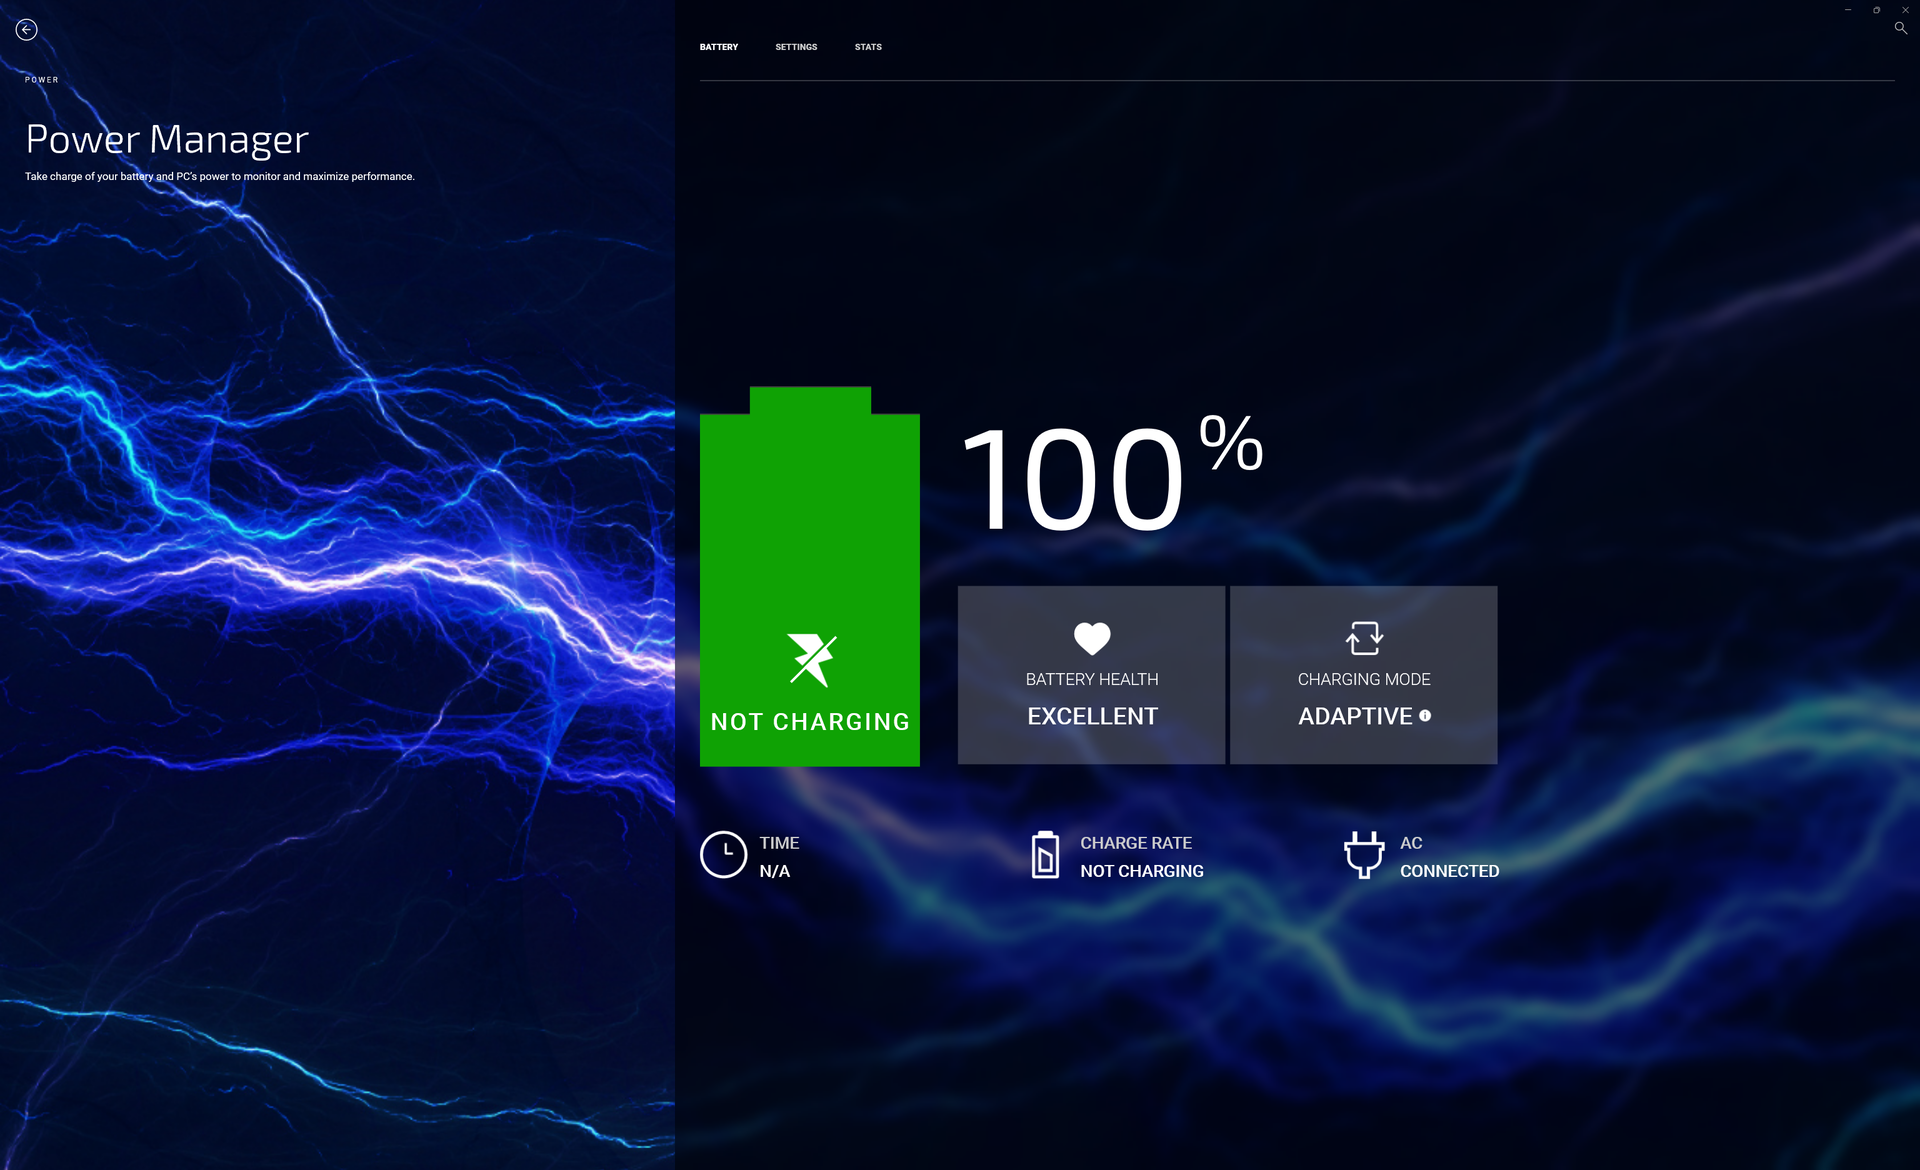
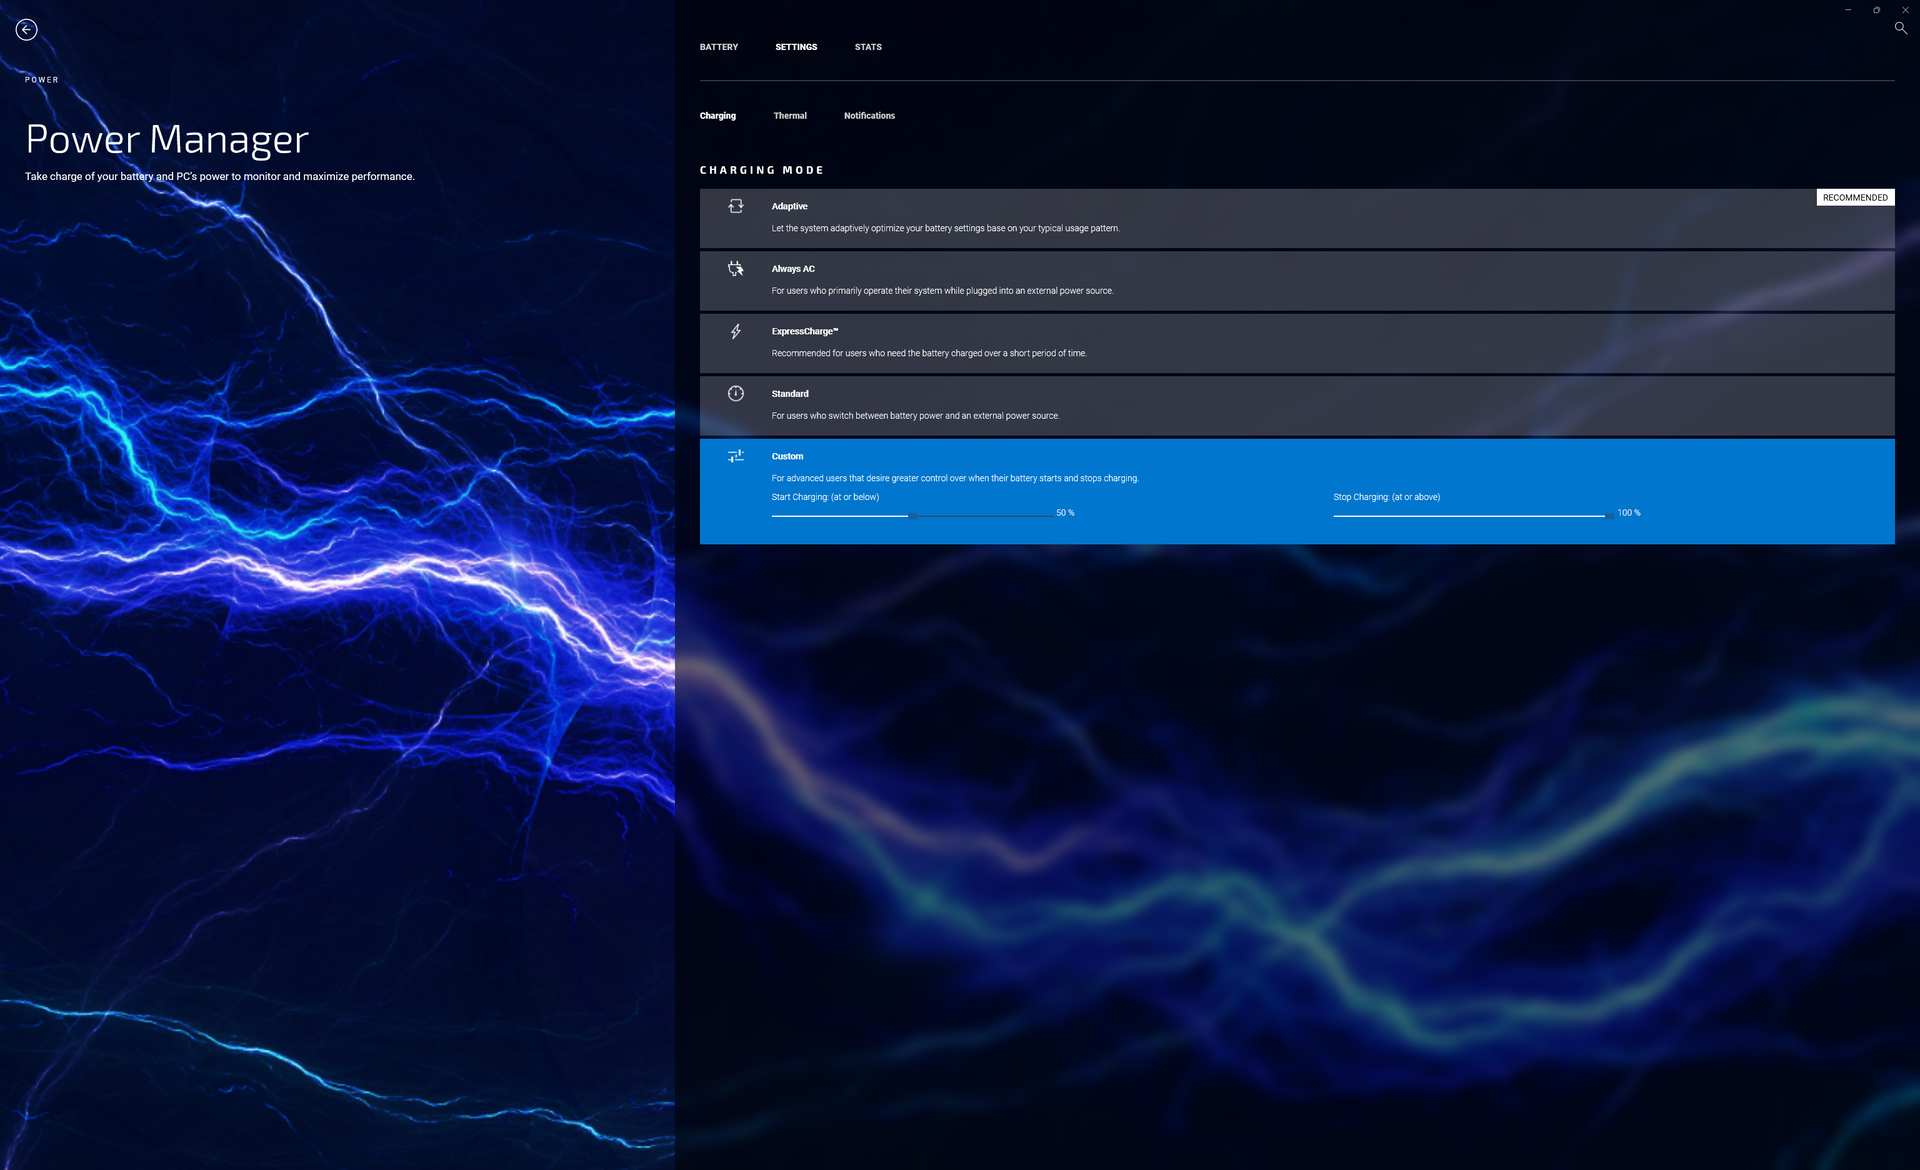
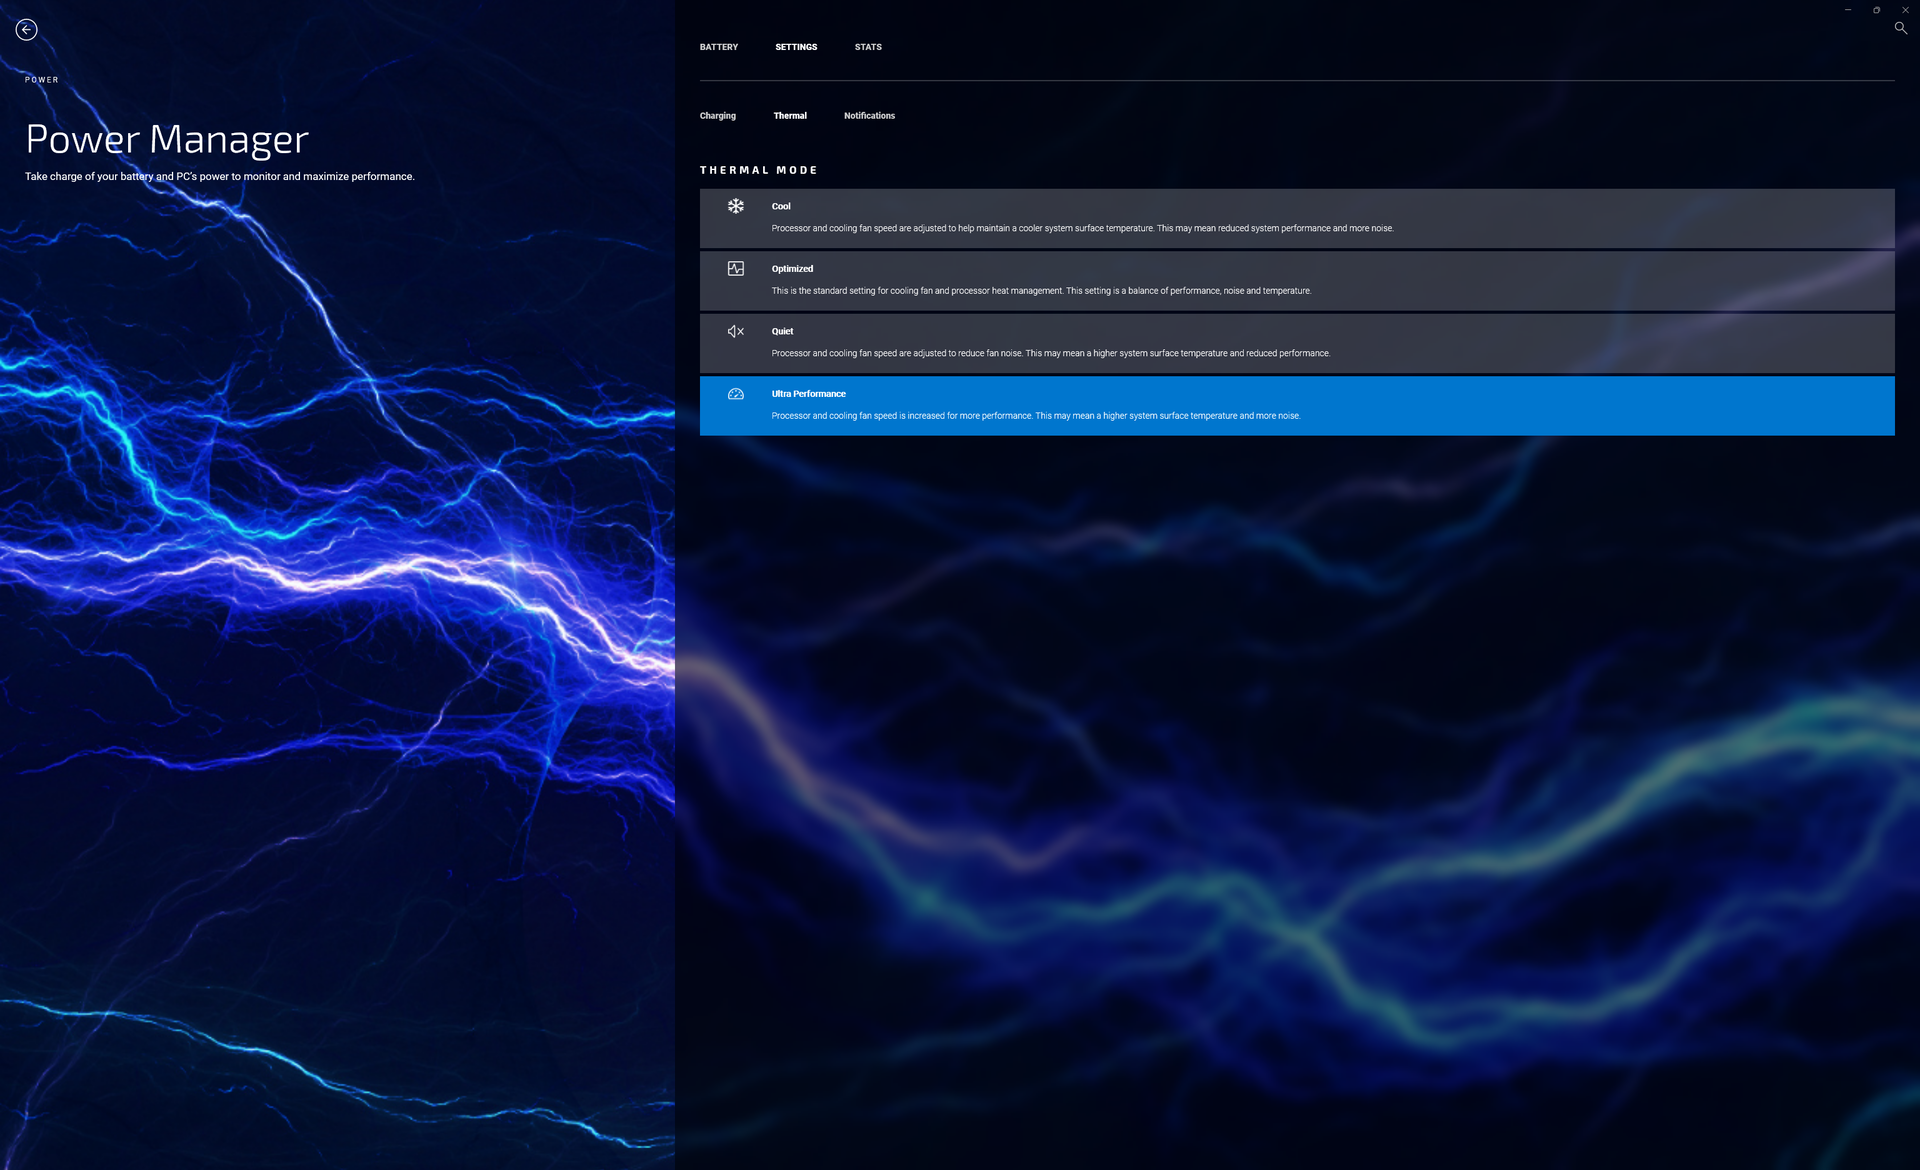
Vor dem Durchführen der folgenden Benchmarks haben wir unser Testgerät über Windows in den Leistungsmodus und über die vorinstallierte MyDell-Software in den Ultrahochleistungsmodus versetzt. Da MyDell die zentrale Anlaufstelle für Garantiefragen, die Produktregistrierung, Akkuladeeinstellungen und Leistungsmodi ist, sollten sich Nutzer mit der Software vertraut machen.
Nvidia Optimus ohne MUX-Optionen kommt standardmäßig zum Einsatz.
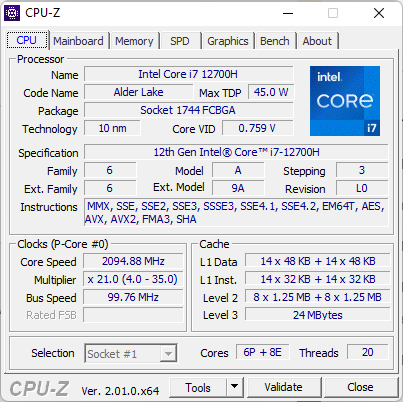
Prozessor
Die reine Multi-Thread-Leistung ist um 30-50 % und damit um einiges höher als beim Core i7-11800H aus der vorherigen Generation. Da die Cinebench-R15-xT-Punktzahl um 18 % fällt, lässt die Dauerleistung jedoch etwas zu Wünschen übrig. Da wir bisher noch keinen Laptop mit dem schwächeren Core i5-12500H getestet haben, können wir derzeit keine Aussage zu dessen Leistung machen.
Dauertest: Cinebench R15 Multi
Cinebench R23: Multi Core | Single Core
Cinebench R15: CPU Multi 64Bit | CPU Single 64Bit
Blender: v2.79 BMW27 CPU
7-Zip 18.03: 7z b 4 | 7z b 4 -mmt1
Geekbench 5.5: Multi-Core | Single-Core
HWBOT x265 Benchmark v2.2: 4k Preset
LibreOffice : 20 Documents To PDF
R Benchmark 2.5: Overall mean
| Cinebench R20 / CPU (Multi Core) | |
| MSI Creator Z16P B12UHST | |
| Gigabyte Aero 16 YE5 | |
| Durchschnittliche Intel Core i7-12700H (1576 - 7407, n=64) | |
| Razer Blade 15 2022 | |
| Dell Inspiron 16 Plus 7620 | |
| Lenovo Yoga 7 16IAP7 | |
| Dell Inspiron 16 Plus 7610-MHJ8F | |
| HP Victus 16-e0145ng | |
| Dell Inspiron 14 7420 2-in-1 | |
| Acer Swift X SFX16-51G-5388 | |
| HP Pavilion Gaming 16-a0242ng | |
| Cinebench R20 / CPU (Single Core) | |
| MSI Creator Z16P B12UHST | |
| Razer Blade 15 2022 | |
| Gigabyte Aero 16 YE5 | |
| Dell Inspiron 14 7420 2-in-1 | |
| Dell Inspiron 16 Plus 7620 | |
| Durchschnittliche Intel Core i7-12700H (300 - 704, n=64) | |
| Lenovo Yoga 7 16IAP7 | |
| Dell Inspiron 16 Plus 7610-MHJ8F | |
| Acer Swift X SFX16-51G-5388 | |
| HP Victus 16-e0145ng | |
| HP Pavilion Gaming 16-a0242ng | |
| Cinebench R23 / Multi Core | |
| MSI Creator Z16P B12UHST | |
| Gigabyte Aero 16 YE5 | |
| Durchschnittliche Intel Core i7-12700H (4032 - 19330, n=64) | |
| Razer Blade 15 2022 | |
| Dell Inspiron 16 Plus 7620 | |
| Dell Inspiron 16 Plus 7610-MHJ8F | |
| Lenovo Yoga 7 16IAP7 | |
| HP Victus 16-e0145ng | |
| Dell Inspiron 14 7420 2-in-1 | |
| Acer Swift X SFX16-51G-5388 | |
| Cinebench R23 / Single Core | |
| Gigabyte Aero 16 YE5 | |
| MSI Creator Z16P B12UHST | |
| Razer Blade 15 2022 | |
| Dell Inspiron 14 7420 2-in-1 | |
| Dell Inspiron 16 Plus 7620 | |
| Durchschnittliche Intel Core i7-12700H (778 - 1826, n=63) | |
| Lenovo Yoga 7 16IAP7 | |
| Dell Inspiron 16 Plus 7610-MHJ8F | |
| HP Victus 16-e0145ng | |
| Acer Swift X SFX16-51G-5388 | |
| Cinebench R15 / CPU Multi 64Bit | |
| MSI Creator Z16P B12UHST | |
| Gigabyte Aero 16 YE5 | |
| Durchschnittliche Intel Core i7-12700H (1379 - 2916, n=70) | |
| Dell Inspiron 16 Plus 7620 | |
| Razer Blade 15 2022 | |
| Dell Inspiron 16 Plus 7610-MHJ8F | |
| Lenovo Yoga 7 16IAP7 | |
| HP Victus 16-e0145ng | |
| Dell Inspiron 14 7420 2-in-1 | |
| Acer Swift X SFX16-51G-5388 | |
| HP Pavilion Gaming 16-a0242ng | |
| Cinebench R15 / CPU Single 64Bit | |
| Gigabyte Aero 16 YE5 | |
| MSI Creator Z16P B12UHST | |
| Razer Blade 15 2022 | |
| Dell Inspiron 16 Plus 7620 | |
| Durchschnittliche Intel Core i7-12700H (113 - 263, n=65) | |
| Dell Inspiron 14 7420 2-in-1 | |
| Lenovo Yoga 7 16IAP7 | |
| Dell Inspiron 16 Plus 7610-MHJ8F | |
| HP Victus 16-e0145ng | |
| Acer Swift X SFX16-51G-5388 | |
| HP Pavilion Gaming 16-a0242ng | |
| Blender / v2.79 BMW27 CPU | |
| HP Pavilion Gaming 16-a0242ng | |
| Acer Swift X SFX16-51G-5388 | |
| Dell Inspiron 14 7420 2-in-1 | |
| Lenovo Yoga 7 16IAP7 | |
| HP Victus 16-e0145ng | |
| Dell Inspiron 16 Plus 7610-MHJ8F | |
| Dell Inspiron 16 Plus 7620 | |
| Razer Blade 15 2022 | |
| Durchschnittliche Intel Core i7-12700H (168 - 732, n=63) | |
| Gigabyte Aero 16 YE5 | |
| MSI Creator Z16P B12UHST | |
| 7-Zip 18.03 / 7z b 4 -mmt1 | |
| Gigabyte Aero 16 YE5 | |
| MSI Creator Z16P B12UHST | |
| Razer Blade 15 2022 | |
| Durchschnittliche Intel Core i7-12700H (2743 - 5972, n=63) | |
| Dell Inspiron 16 Plus 7620 | |
| Dell Inspiron 14 7420 2-in-1 | |
| Lenovo Yoga 7 16IAP7 | |
| HP Victus 16-e0145ng | |
| Dell Inspiron 16 Plus 7610-MHJ8F | |
| HP Pavilion Gaming 16-a0242ng | |
| Acer Swift X SFX16-51G-5388 | |
| HWBOT x265 Benchmark v2.2 / 4k Preset | |
| MSI Creator Z16P B12UHST | |
| Gigabyte Aero 16 YE5 | |
| Razer Blade 15 2022 | |
| Durchschnittliche Intel Core i7-12700H (4.67 - 21.8, n=64) | |
| Dell Inspiron 16 Plus 7620 | |
| HP Victus 16-e0145ng | |
| Lenovo Yoga 7 16IAP7 | |
| Dell Inspiron 16 Plus 7610-MHJ8F | |
| Dell Inspiron 14 7420 2-in-1 | |
| Acer Swift X SFX16-51G-5388 | |
| HP Pavilion Gaming 16-a0242ng | |
| LibreOffice / 20 Documents To PDF | |
| HP Victus 16-e0145ng | |
| HP Pavilion Gaming 16-a0242ng | |
| Razer Blade 15 2022 | |
| Acer Swift X SFX16-51G-5388 | |
| Dell Inspiron 14 7420 2-in-1 | |
| Lenovo Yoga 7 16IAP7 | |
| Dell Inspiron 16 Plus 7620 | |
| Durchschnittliche Intel Core i7-12700H (34.2 - 95.3, n=63) | |
| Dell Inspiron 16 Plus 7610-MHJ8F | |
| Gigabyte Aero 16 YE5 | |
| MSI Creator Z16P B12UHST | |
| R Benchmark 2.5 / Overall mean | |
| HP Pavilion Gaming 16-a0242ng | |
| Acer Swift X SFX16-51G-5388 | |
| Dell Inspiron 16 Plus 7610-MHJ8F | |
| HP Victus 16-e0145ng | |
| Dell Inspiron 16 Plus 7620 | |
| Durchschnittliche Intel Core i7-12700H (0.4441 - 1.052, n=63) | |
| Razer Blade 15 2022 | |
| Dell Inspiron 14 7420 2-in-1 | |
| Lenovo Yoga 7 16IAP7 | |
| MSI Creator Z16P B12UHST | |
| Gigabyte Aero 16 YE5 | |
* ... kleinere Werte sind besser
AIDA64: FP32 Ray-Trace | FPU Julia | CPU SHA3 | CPU Queen | FPU SinJulia | FPU Mandel | CPU AES | CPU ZLib | FP64 Ray-Trace | CPU PhotoWorxx
| Performance Rating | |
| Asus Vivobook Pro 16X-M7600QE | |
| Dell Inspiron 16 Plus 7620 | |
| Durchschnittliche Intel Core i7-12700H | |
| Huawei MateBook D 16 2022 | |
| Lenovo Yoga 7 16IAP7 | |
| Acer Swift X SFX16-51G-5388 | |
| Dell Inspiron 16 Plus 7610 -9! | |
| AIDA64 / FP32 Ray-Trace | |
| Asus Vivobook Pro 16X-M7600QE | |
| Asus Vivobook Pro 16X-M7600QE | |
| Dell Inspiron 16 Plus 7620 | |
| Huawei MateBook D 16 2022 | |
| Durchschnittliche Intel Core i7-12700H (2585 - 17957, n=64) | |
| Lenovo Yoga 7 16IAP7 | |
| Acer Swift X SFX16-51G-5388 | |
| AIDA64 / FPU Julia | |
| Asus Vivobook Pro 16X-M7600QE | |
| Asus Vivobook Pro 16X-M7600QE | |
| Dell Inspiron 16 Plus 7620 | |
| Huawei MateBook D 16 2022 | |
| Durchschnittliche Intel Core i7-12700H (12439 - 90760, n=64) | |
| Lenovo Yoga 7 16IAP7 | |
| Acer Swift X SFX16-51G-5388 | |
| AIDA64 / CPU SHA3 | |
| Asus Vivobook Pro 16X-M7600QE | |
| Asus Vivobook Pro 16X-M7600QE | |
| Durchschnittliche Intel Core i7-12700H (833 - 4242, n=64) | |
| Dell Inspiron 16 Plus 7620 | |
| Huawei MateBook D 16 2022 | |
| Lenovo Yoga 7 16IAP7 | |
| Acer Swift X SFX16-51G-5388 | |
| AIDA64 / CPU Queen | |
| Asus Vivobook Pro 16X-M7600QE | |
| Asus Vivobook Pro 16X-M7600QE | |
| Durchschnittliche Intel Core i7-12700H (57923 - 103202, n=63) | |
| Huawei MateBook D 16 2022 | |
| Dell Inspiron 16 Plus 7620 | |
| Lenovo Yoga 7 16IAP7 | |
| Acer Swift X SFX16-51G-5388 | |
| AIDA64 / FPU SinJulia | |
| Asus Vivobook Pro 16X-M7600QE | |
| Asus Vivobook Pro 16X-M7600QE | |
| Durchschnittliche Intel Core i7-12700H (3249 - 9939, n=64) | |
| Dell Inspiron 16 Plus 7620 | |
| Huawei MateBook D 16 2022 | |
| Lenovo Yoga 7 16IAP7 | |
| Acer Swift X SFX16-51G-5388 | |
| AIDA64 / FPU Mandel | |
| Asus Vivobook Pro 16X-M7600QE | |
| Asus Vivobook Pro 16X-M7600QE | |
| Dell Inspiron 16 Plus 7620 | |
| Durchschnittliche Intel Core i7-12700H (7135 - 44760, n=64) | |
| Huawei MateBook D 16 2022 | |
| Lenovo Yoga 7 16IAP7 | |
| Acer Swift X SFX16-51G-5388 | |
| AIDA64 / CPU AES | |
| Asus Vivobook Pro 16X-M7600QE | |
| Asus Vivobook Pro 16X-M7600QE | |
| Huawei MateBook D 16 2022 | |
| Durchschnittliche Intel Core i7-12700H (31839 - 144360, n=64) | |
| Dell Inspiron 16 Plus 7620 | |
| Acer Swift X SFX16-51G-5388 | |
| Lenovo Yoga 7 16IAP7 | |
| AIDA64 / CPU ZLib | |
| Dell Inspiron 16 Plus 7620 | |
| Durchschnittliche Intel Core i7-12700H (305 - 1171, n=64) | |
| Asus Vivobook Pro 16X-M7600QE | |
| Asus Vivobook Pro 16X-M7600QE | |
| Huawei MateBook D 16 2022 | |
| Lenovo Yoga 7 16IAP7 | |
| Acer Swift X SFX16-51G-5388 | |
| Dell Inspiron 16 Plus 7610 | |
| AIDA64 / FP64 Ray-Trace | |
| Asus Vivobook Pro 16X-M7600QE | |
| Asus Vivobook Pro 16X-M7600QE | |
| Dell Inspiron 16 Plus 7620 | |
| Durchschnittliche Intel Core i7-12700H (1437 - 9692, n=64) | |
| Huawei MateBook D 16 2022 | |
| Lenovo Yoga 7 16IAP7 | |
| Acer Swift X SFX16-51G-5388 | |
| AIDA64 / CPU PhotoWorxx | |
| Lenovo Yoga 7 16IAP7 | |
| Huawei MateBook D 16 2022 | |
| Acer Swift X SFX16-51G-5388 | |
| Dell Inspiron 16 Plus 7620 | |
| Durchschnittliche Intel Core i7-12700H (12863 - 52207, n=64) | |
| Asus Vivobook Pro 16X-M7600QE | |
| Asus Vivobook Pro 16X-M7600QE | |
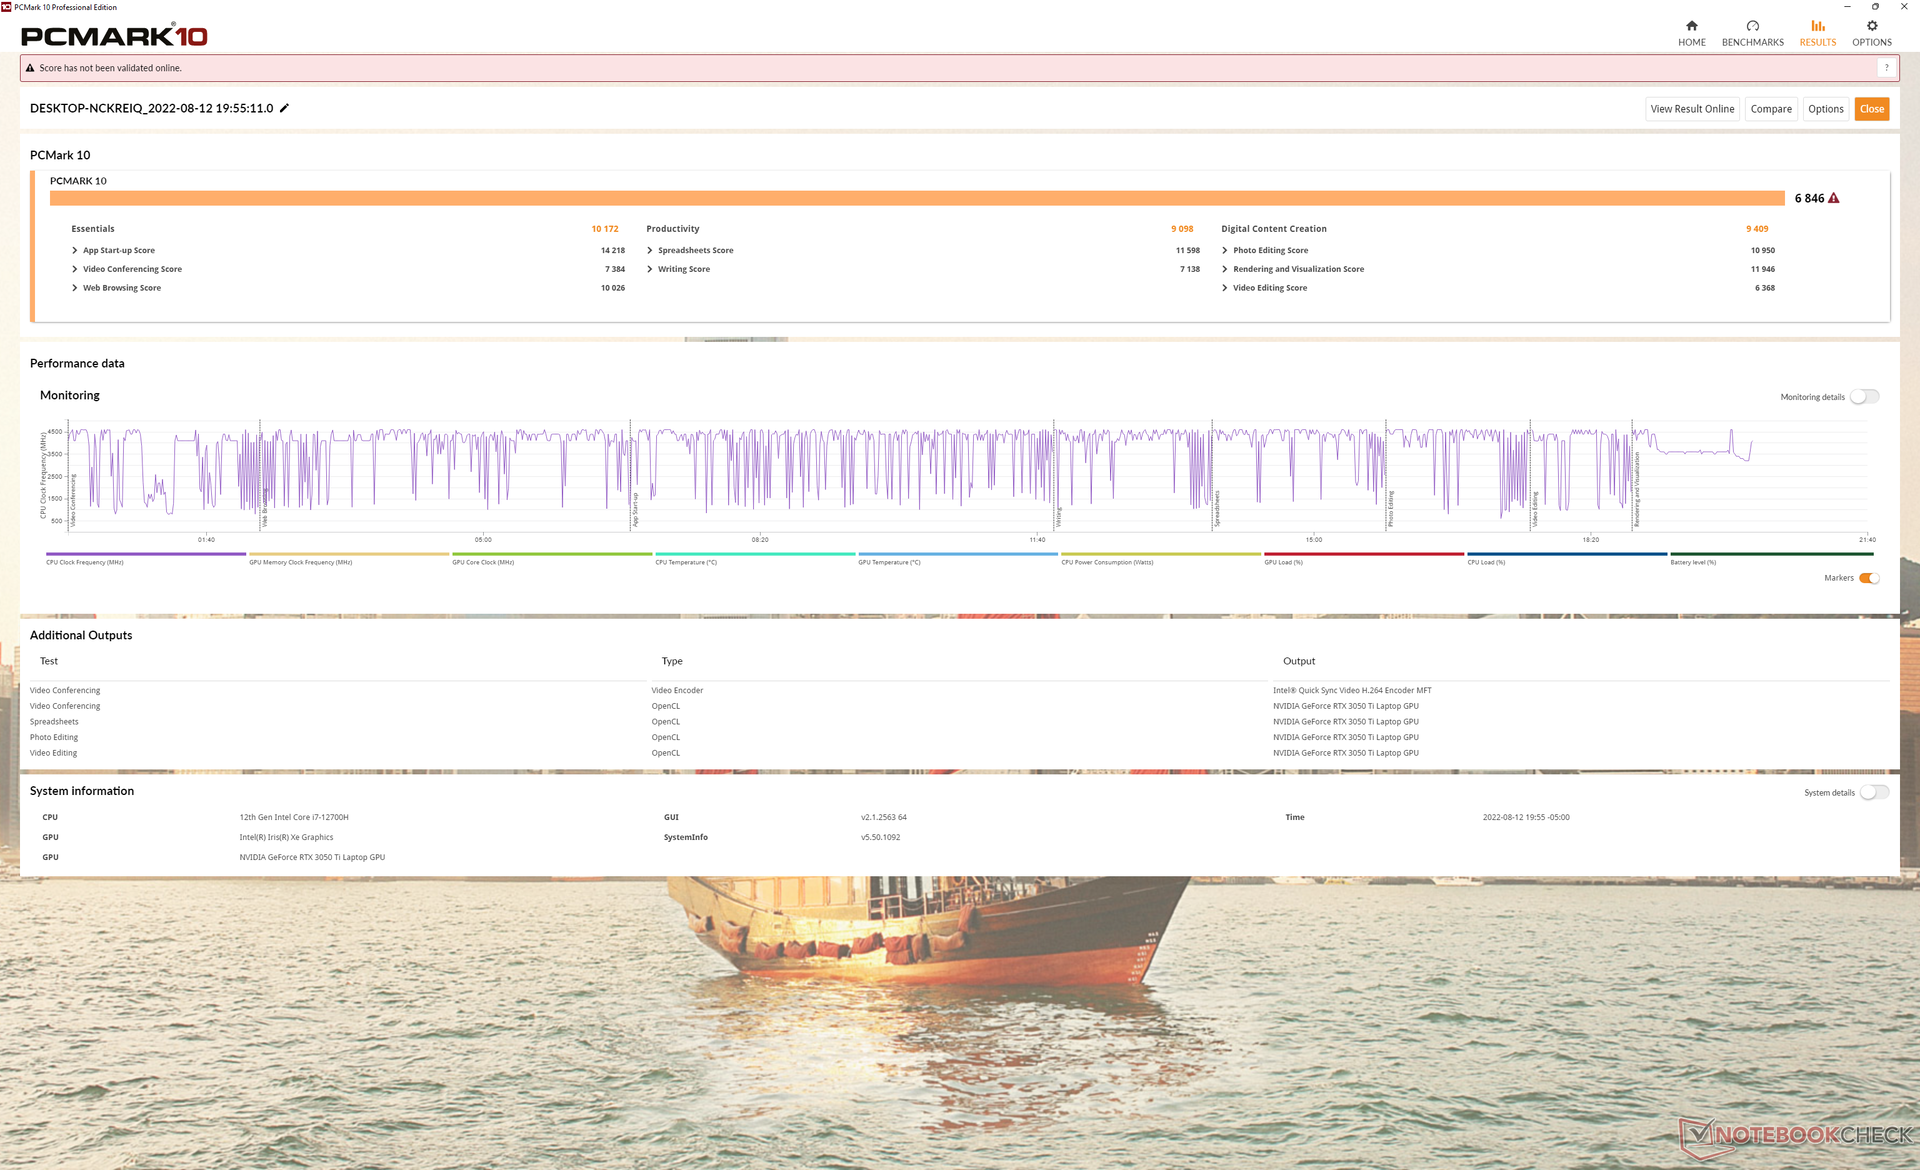
Systemleistung
Die PCMark-10-Testergebnisse fallen konstant höher aus als beim Vorgänger, dem Inspiron 16 Plus 7610, sowie fast allen anderen 16-Zoll-Multimedia-Laptops.
CrossMark: Overall | Productivity | Creativity | Responsiveness
| PCMark 10 / Score | |
| Dell Inspiron 16 Plus 7620 | |
| Durchschnittliche Intel Core i7-12700H, NVIDIA GeForce RTX 3050 Ti Laptop GPU (6623 - 7075, n=5) | |
| Asus Vivobook Pro 16X-M7600QE | |
| Dell Inspiron 16 Plus 7610 | |
| Huawei MateBook D 16 2022 | |
| Lenovo Yoga 7 16IAP7 | |
| Acer Swift X SFX16-51G-5388 | |
| PCMark 10 / Essentials | |
| Huawei MateBook D 16 2022 | |
| Lenovo Yoga 7 16IAP7 | |
| Asus Vivobook Pro 16X-M7600QE | |
| Durchschnittliche Intel Core i7-12700H, NVIDIA GeForce RTX 3050 Ti Laptop GPU (9540 - 10970, n=5) | |
| Dell Inspiron 16 Plus 7620 | |
| Dell Inspiron 16 Plus 7610 | |
| Acer Swift X SFX16-51G-5388 | |
| PCMark 10 / Productivity | |
| Asus Vivobook Pro 16X-M7600QE | |
| Dell Inspiron 16 Plus 7620 | |
| Durchschnittliche Intel Core i7-12700H, NVIDIA GeForce RTX 3050 Ti Laptop GPU (8530 - 9555, n=5) | |
| Acer Swift X SFX16-51G-5388 | |
| Dell Inspiron 16 Plus 7610 | |
| Huawei MateBook D 16 2022 | |
| Lenovo Yoga 7 16IAP7 | |
| PCMark 10 / Digital Content Creation | |
| Dell Inspiron 16 Plus 7620 | |
| Durchschnittliche Intel Core i7-12700H, NVIDIA GeForce RTX 3050 Ti Laptop GPU (8855 - 9542, n=5) | |
| Dell Inspiron 16 Plus 7610 | |
| Asus Vivobook Pro 16X-M7600QE | |
| Lenovo Yoga 7 16IAP7 | |
| Huawei MateBook D 16 2022 | |
| Acer Swift X SFX16-51G-5388 | |
| CrossMark / Overall | |
| Huawei MateBook D 16 2022 | |
| Dell Inspiron 16 Plus 7620 | |
| Durchschnittliche Intel Core i7-12700H, NVIDIA GeForce RTX 3050 Ti Laptop GPU (1654 - 1872, n=5) | |
| Lenovo Yoga 7 16IAP7 | |
| Acer Swift X SFX16-51G-5388 | |
| CrossMark / Productivity | |
| Huawei MateBook D 16 2022 | |
| Durchschnittliche Intel Core i7-12700H, NVIDIA GeForce RTX 3050 Ti Laptop GPU (1595 - 1792, n=5) | |
| Dell Inspiron 16 Plus 7620 | |
| Lenovo Yoga 7 16IAP7 | |
| Acer Swift X SFX16-51G-5388 | |
| CrossMark / Creativity | |
| Huawei MateBook D 16 2022 | |
| Dell Inspiron 16 Plus 7620 | |
| Lenovo Yoga 7 16IAP7 | |
| Durchschnittliche Intel Core i7-12700H, NVIDIA GeForce RTX 3050 Ti Laptop GPU (1699 - 1993, n=5) | |
| Acer Swift X SFX16-51G-5388 | |
| CrossMark / Responsiveness | |
| Huawei MateBook D 16 2022 | |
| Durchschnittliche Intel Core i7-12700H, NVIDIA GeForce RTX 3050 Ti Laptop GPU (1383 - 1768, n=5) | |
| Dell Inspiron 16 Plus 7620 | |
| Lenovo Yoga 7 16IAP7 | |
| Acer Swift X SFX16-51G-5388 | |
| PCMark 10 Score | 6846 Punkte | |
Hilfe | ||
| AIDA64 / Memory Copy | |
| Lenovo Yoga 7 16IAP7 | |
| Huawei MateBook D 16 2022 | |
| Acer Swift X SFX16-51G-5388 | |
| Dell Inspiron 16 Plus 7620 | |
| Durchschnittliche Intel Core i7-12700H (25615 - 80511, n=64) | |
| Asus Vivobook Pro 16X-M7600QE | |
| Asus Vivobook Pro 16X-M7600QE | |
| AIDA64 / Memory Read | |
| Lenovo Yoga 7 16IAP7 | |
| Dell Inspiron 16 Plus 7620 | |
| Durchschnittliche Intel Core i7-12700H (25586 - 79442, n=64) | |
| Huawei MateBook D 16 2022 | |
| Acer Swift X SFX16-51G-5388 | |
| Asus Vivobook Pro 16X-M7600QE | |
| Asus Vivobook Pro 16X-M7600QE | |
| AIDA64 / Memory Write | |
| Acer Swift X SFX16-51G-5388 | |
| Lenovo Yoga 7 16IAP7 | |
| Huawei MateBook D 16 2022 | |
| Dell Inspiron 16 Plus 7620 | |
| Durchschnittliche Intel Core i7-12700H (23679 - 88660, n=64) | |
| Asus Vivobook Pro 16X-M7600QE | |
| Asus Vivobook Pro 16X-M7600QE | |
| AIDA64 / Memory Latency | |
| Acer Swift X SFX16-51G-5388 | |
| Huawei MateBook D 16 2022 | |
| Lenovo Yoga 7 16IAP7 | |
| Dell Inspiron 16 Plus 7620 | |
| Durchschnittliche Intel Core i7-12700H (76.2 - 133.9, n=62) | |
| Asus Vivobook Pro 16X-M7600QE | |
| Asus Vivobook Pro 16X-M7600QE | |
| Dell Inspiron 16 Plus 7610 | |
* ... kleinere Werte sind besser
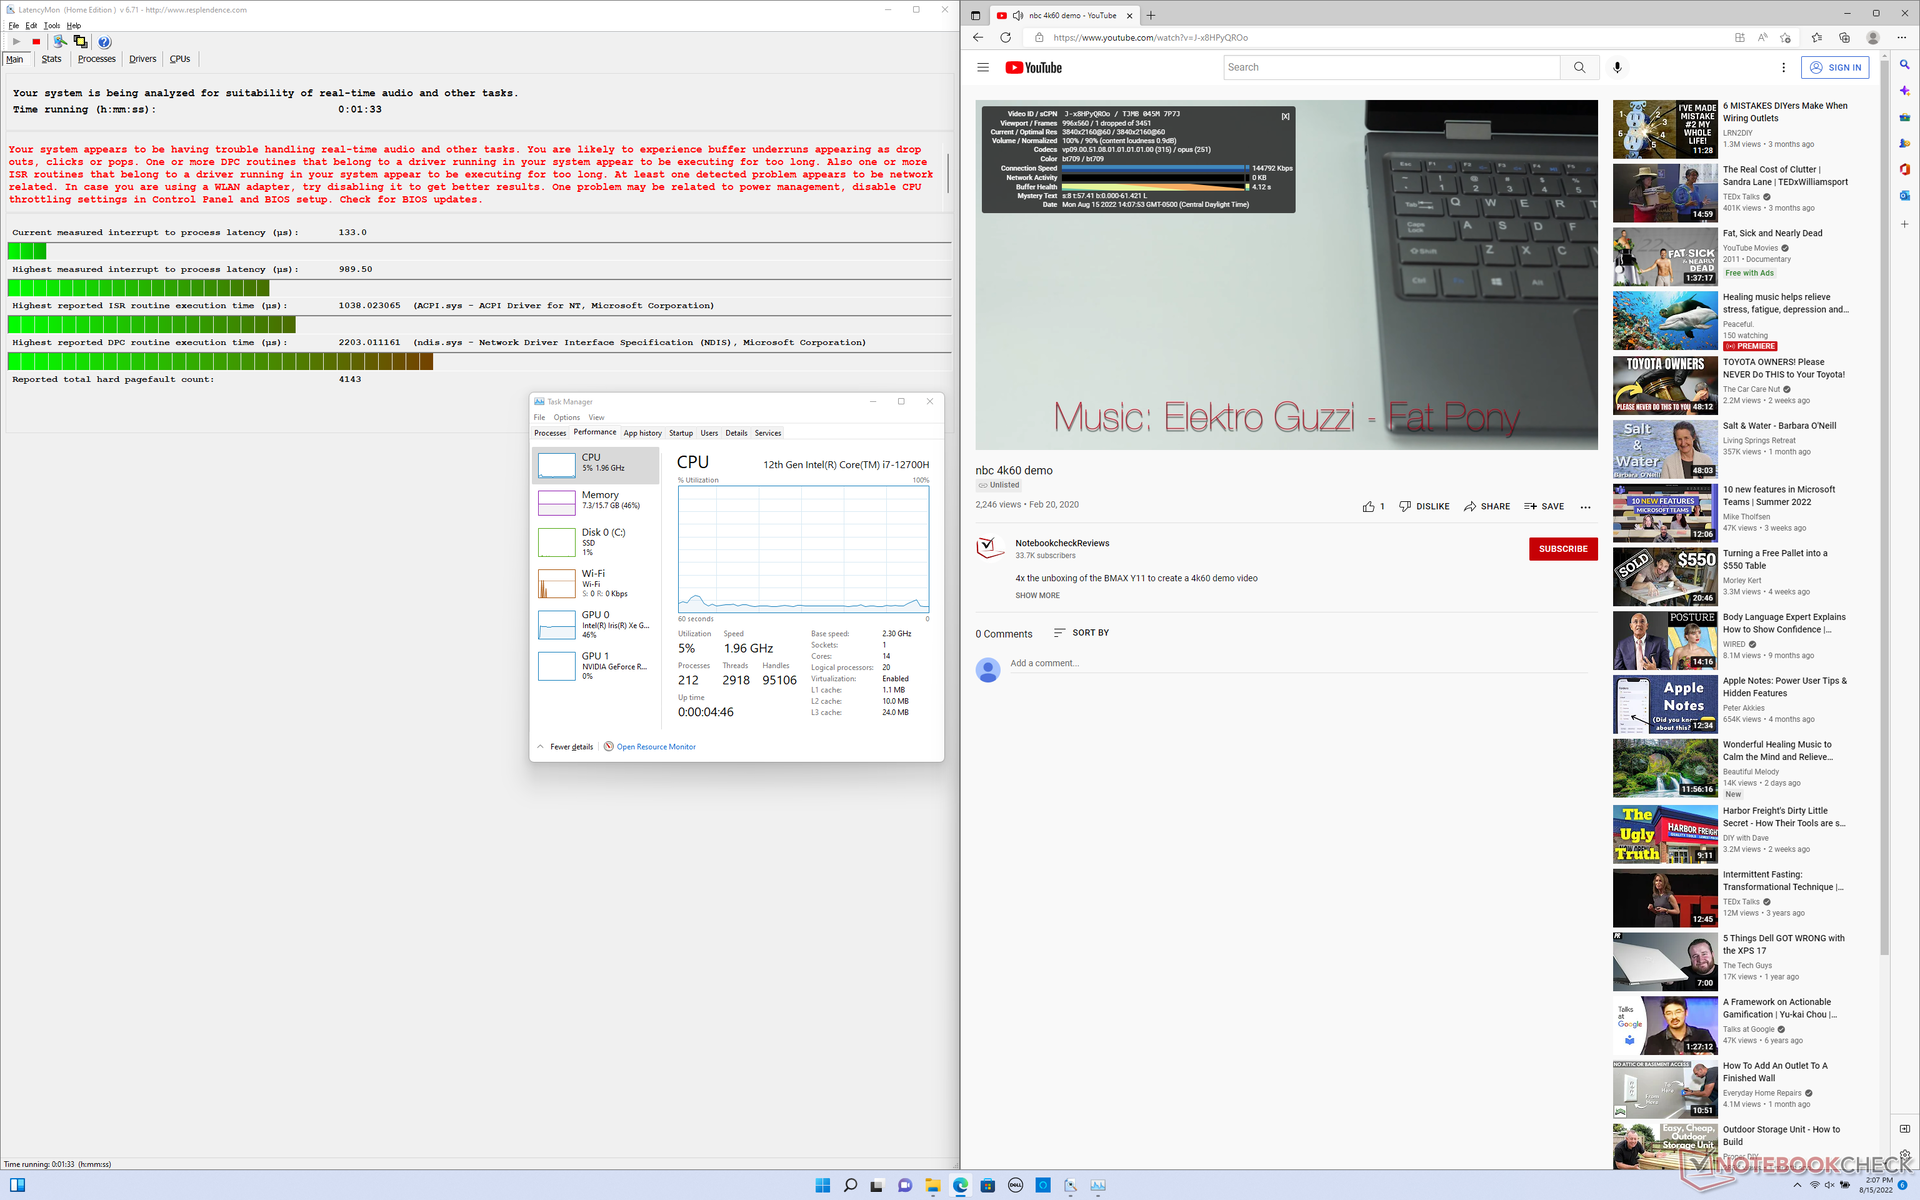
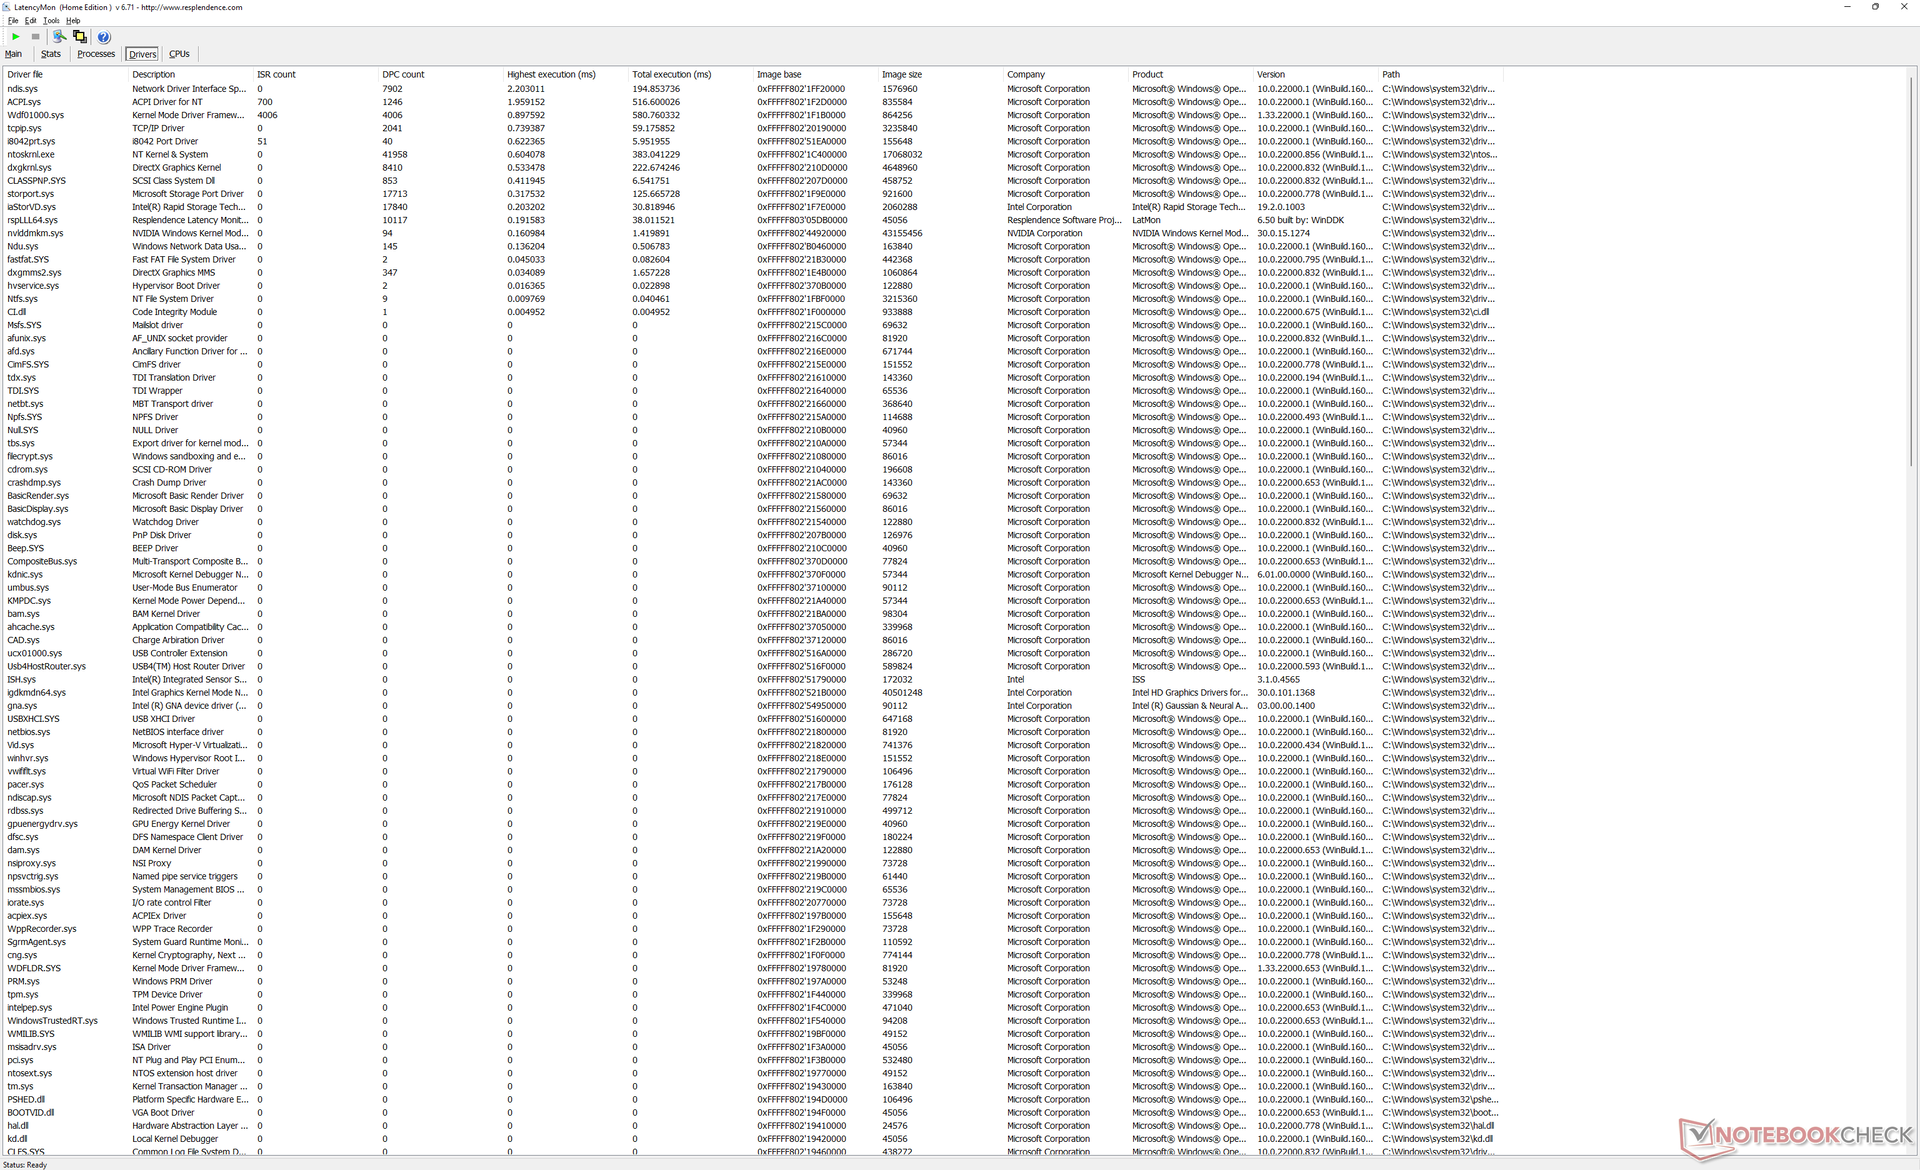
DPC-Latenzen
Beim Öffnen unserer Homepage in mehreren Tabs meldet LatencyMon geringfügig problematische DPC-Latenzen. Die Wiedergabe eines 4K-Videos mit 60 Fps geht flüssig vonstatten und während unseres einminütigen Testvideos ging nur 1 Frame verloren.
| DPC Latencies / LatencyMon - interrupt to process latency (max), Web, Youtube, Prime95 | |
| Acer Swift X SFX16-51G-5388 | |
| Asus Vivobook Pro 16X-M7600QE | |
| Dell Inspiron 16 Plus 7610 | |
| Dell Inspiron 16 Plus 7620 | |
| Huawei MateBook D 16 2022 | |
| Lenovo Yoga 7 16IAP7 | |
* ... kleinere Werte sind besser
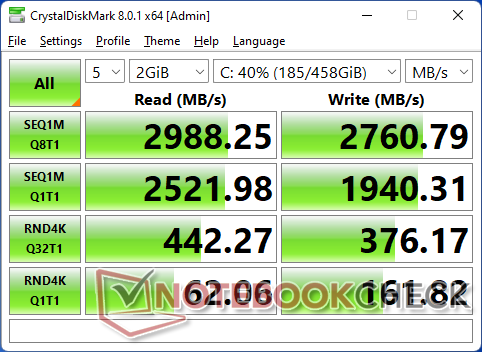
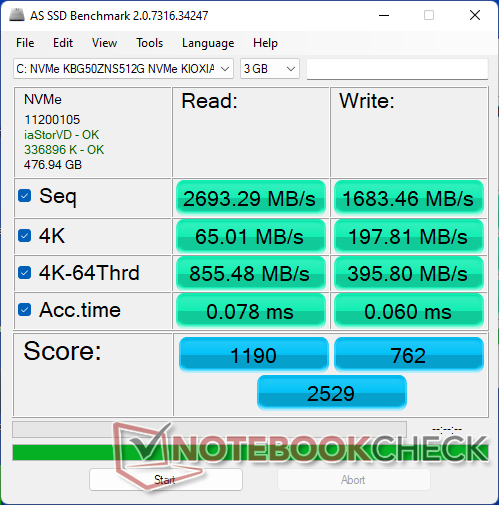
Massenspeicher
Unser Testgerät ist mit einer Mittelklasse-PCIe3-x4-M.2-2242-SSD von Kioxia ausgestattet und erreicht mit dieser sequenzielle Lese- und Schreibraten von jeweils bis zu ~2.700 MB/s. Auf ihr sitzt ein Kupferkühlkörper, welcher bei der Wärmeabfuhr helfen soll. In unserem DiskSpd-Schleifentest war die Leistung des Laufwerks nicht gedrosselt.

| Drive Performance Rating - Percent | |
| Huawei MateBook D 16 2022 | |
| Asus Vivobook Pro 16X-M7600QE | |
| Lenovo Yoga 7 16IAP7 | |
| Dell Inspiron 16 Plus 7620 | |
| Acer Swift X SFX16-51G-5388 | |
| Dell Inspiron 16 Plus 7610 | |
* ... kleinere Werte sind besser
Laufwerksdrosseln: DiskSpd-Leseschleife, Warteschlangentiefe 8
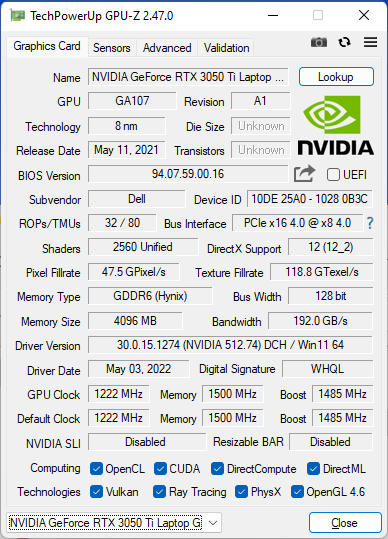
Grafikkarte — Etwas schneller als zuvor
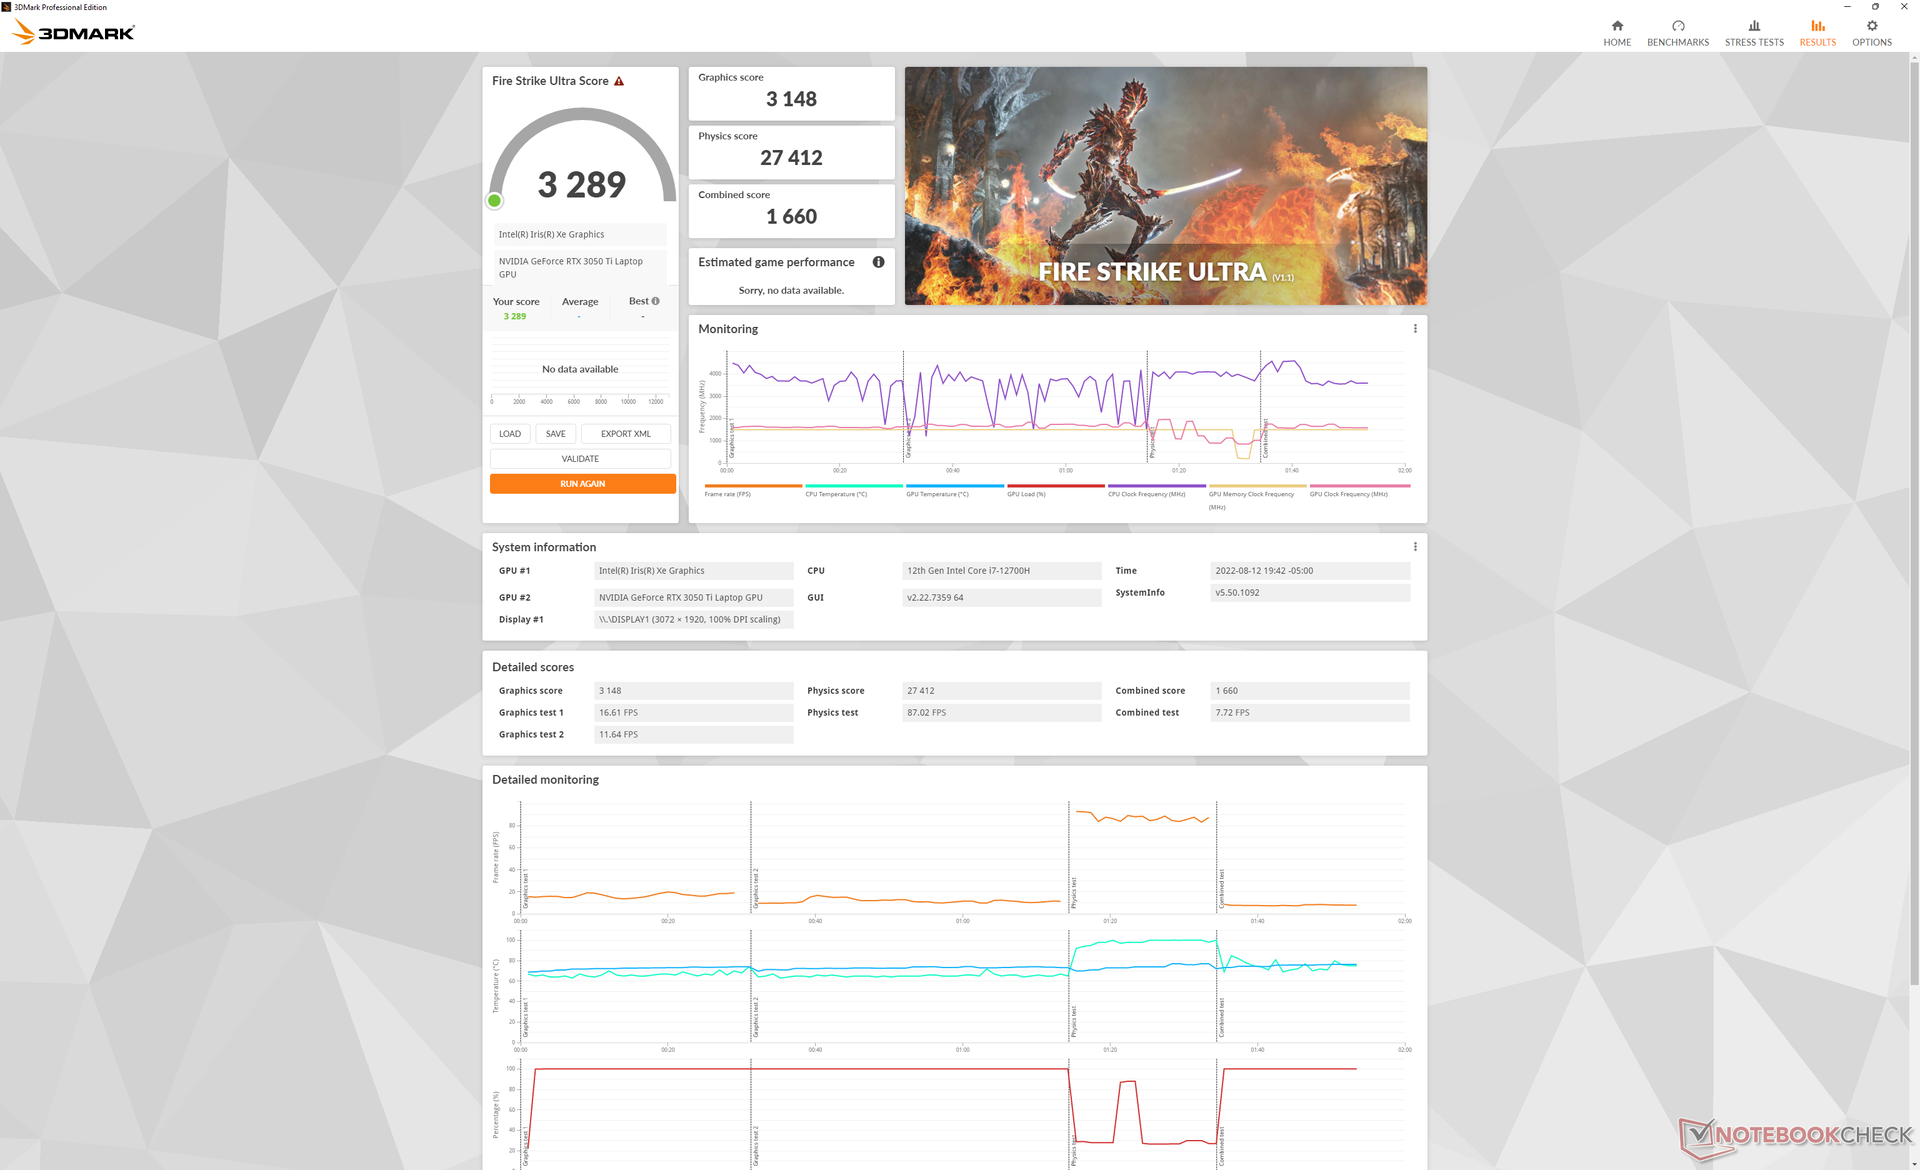
Die Grafikleistung unserer GeForce RTX 3050 Ti ist nur um ca. 10 % höher als bei der RTX 3050 im Modell aus dem Vorjahr. Obwohl die RTX-3050-GPUs tendenziell enttäuschend sind, da sie sogar von der älteren und günstigeren GTX 1660 Ti geschlagen werden, entfaltet die von Dell verbaute Version ihre Leistung zumindest besser als bei den meisten anderen Laptops mit dieser GPU.
Bei der RTX-3060-Konfiguration kann man mit einer um ca. 20 % gesteigerten Grafikleistung rechnen. Diese GPU ist dann jedoch auf eine TGP von 60 W beschränkt und bewegt sich damit am unteren Ende des Spektrums für eine mobile RTX 3060.
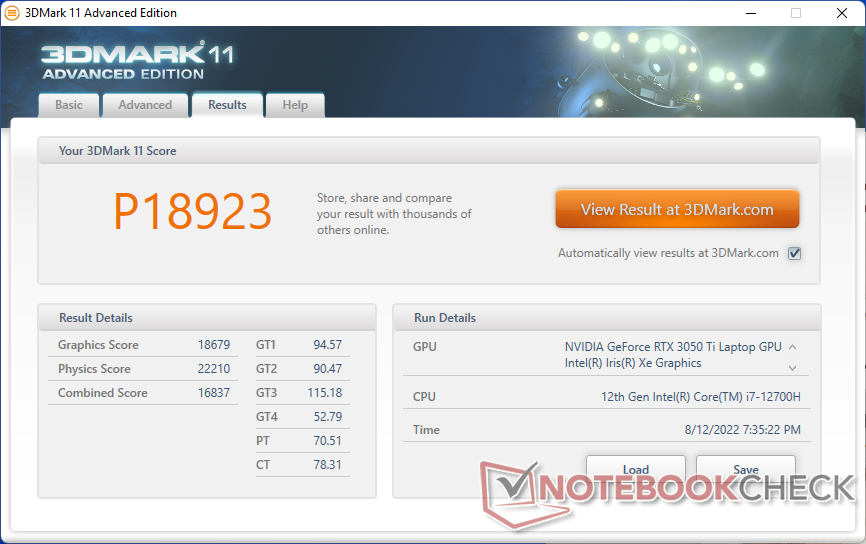
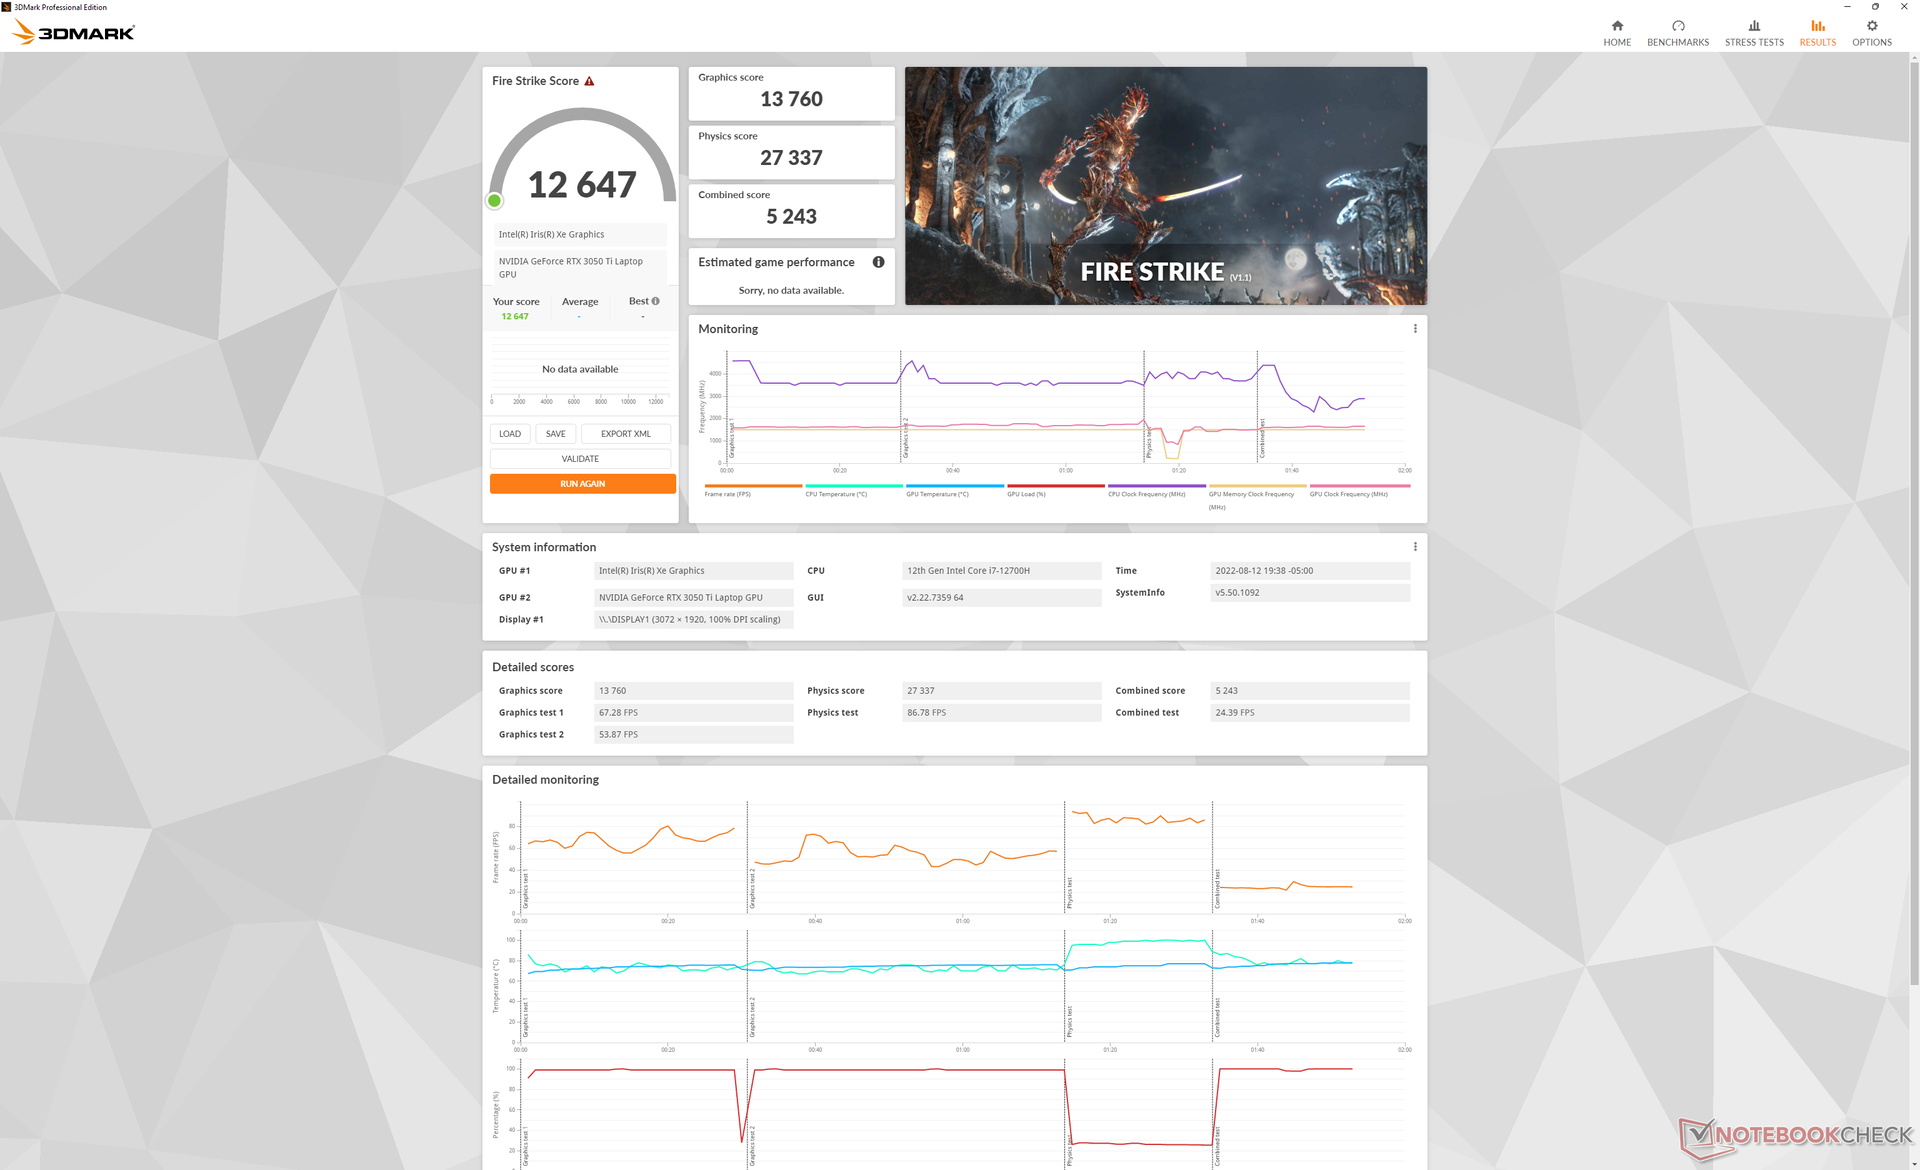
| 3DMark 11 Performance | 18923 Punkte | |
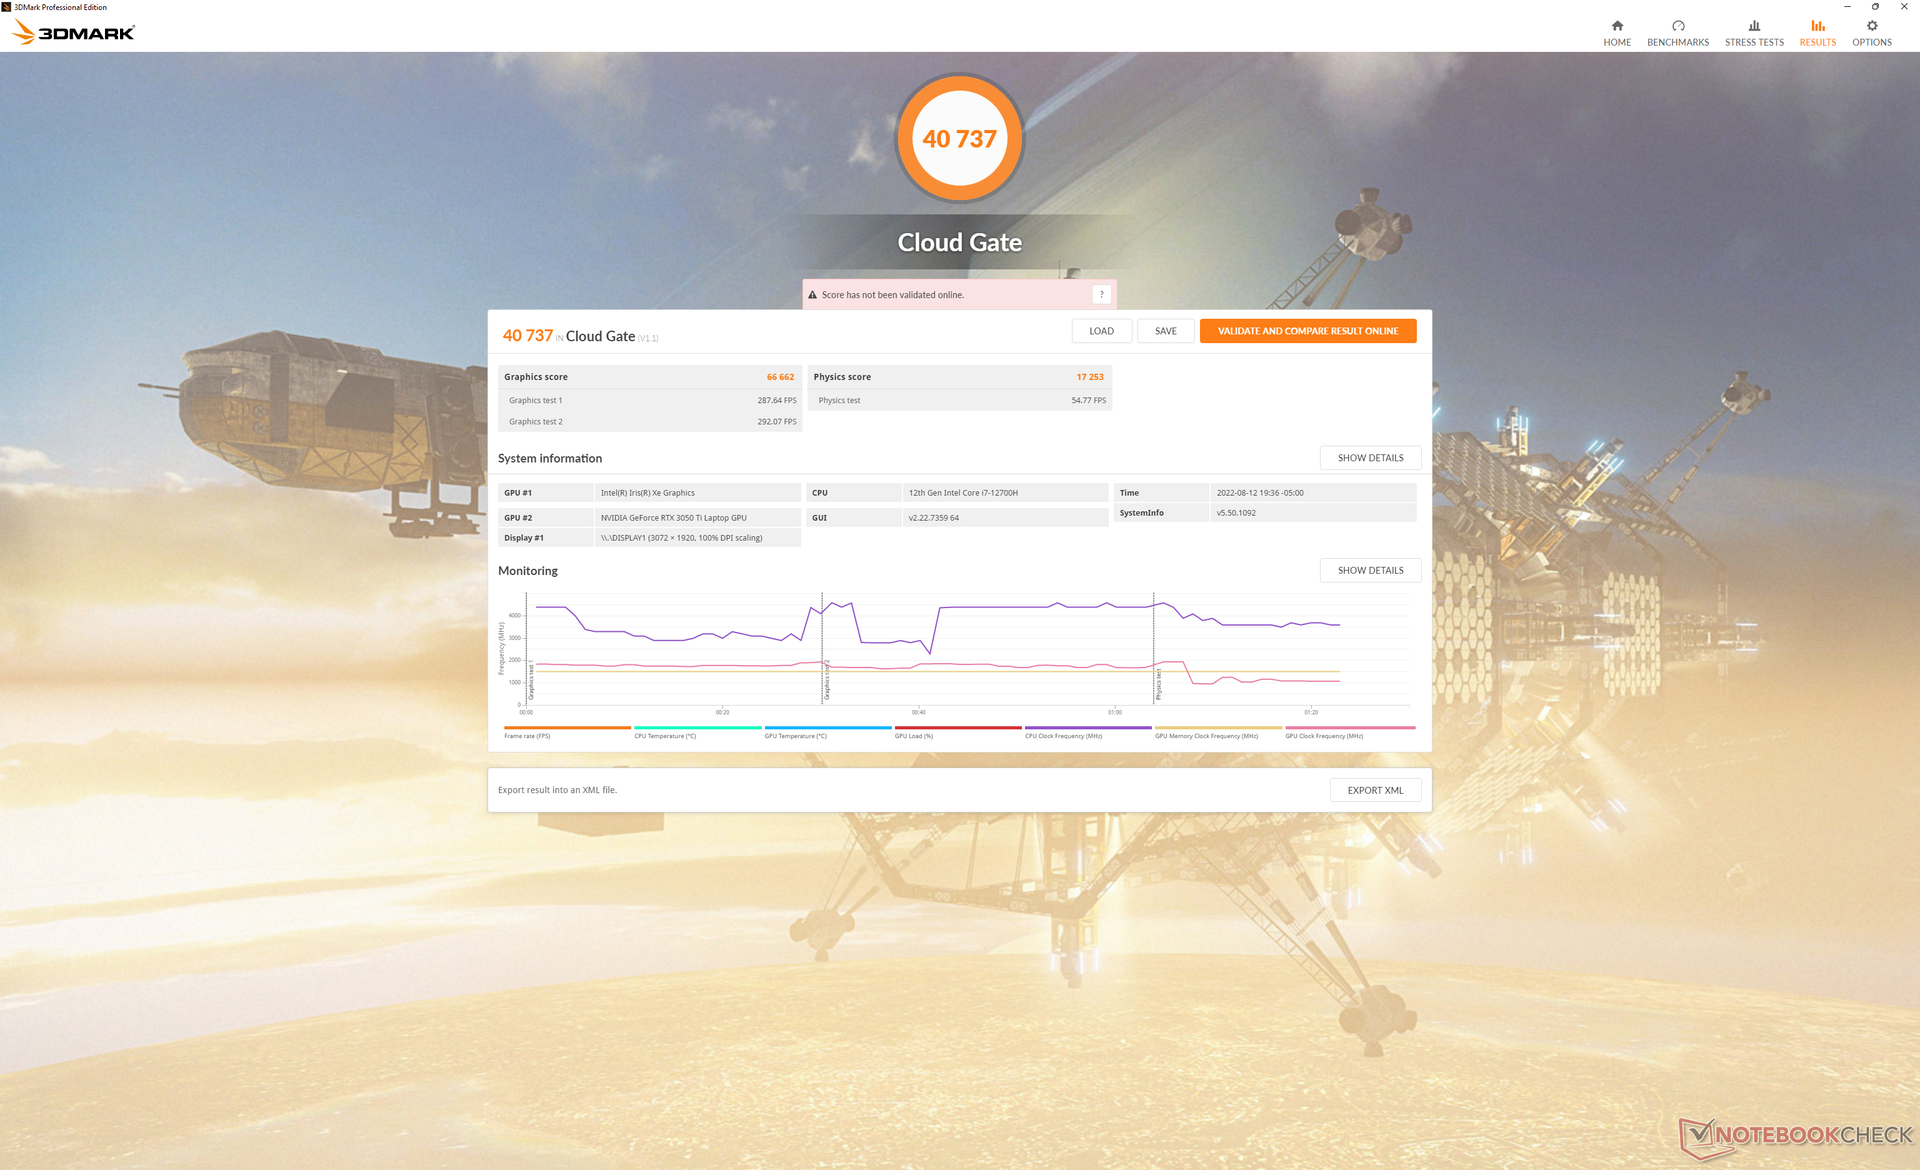
| 3DMark Cloud Gate Standard Score | 40737 Punkte | |
| 3DMark Fire Strike Score | 12647 Punkte | |
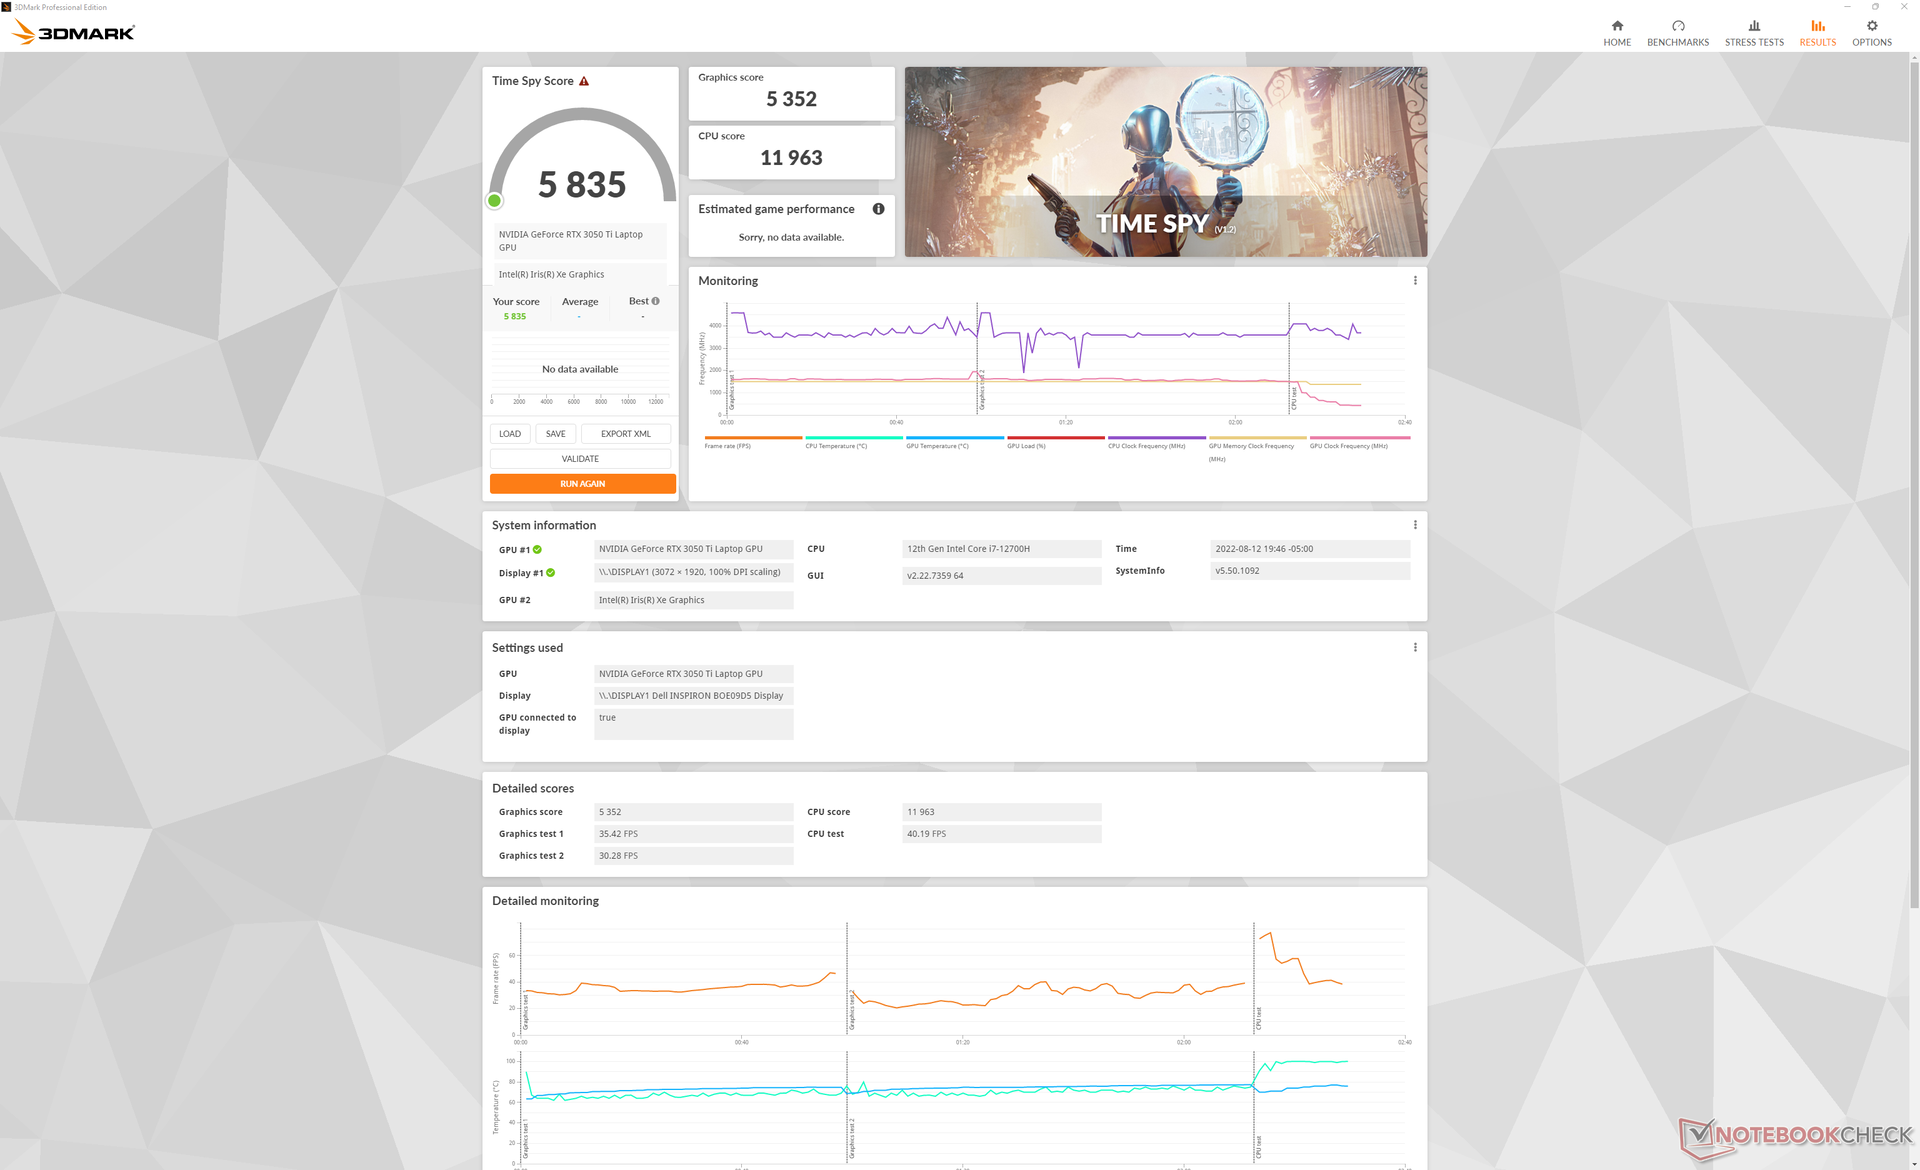
| 3DMark Time Spy Score | 5835 Punkte | |
Hilfe | ||
| Cyberpunk 2077 1.6 | |
| 1920x1080 Low Preset | |
| Dell Inspiron 16 Plus 7620 | |
| Durchschnittliche NVIDIA GeForce RTX 3050 Ti Laptop GPU (48.2 - 81.9, n=9) | |
| Lenovo Yoga 7 16IAP7 | |
| 1920x1080 Medium Preset | |
| Dell Inspiron 16 Plus 7620 | |
| Durchschnittliche NVIDIA GeForce RTX 3050 Ti Laptop GPU (47.4 - 67.4, n=9) | |
| Lenovo Yoga 7 16IAP7 | |
| 1920x1080 High Preset | |
| Dell Inspiron 16 Plus 7620 | |
| Durchschnittliche NVIDIA GeForce RTX 3050 Ti Laptop GPU (39 - 51.5, n=9) | |
| Lenovo Yoga 7 16IAP7 | |
| 1920x1080 Ultra Preset | |
| Durchschnittliche NVIDIA GeForce RTX 3050 Ti Laptop GPU (31 - 50.5, n=9) | |
| Dell Inspiron 16 Plus 7620 | |
| Lenovo Yoga 7 16IAP7 | |
| 2560x1440 Ultra Preset | |
| Dell Inspiron 16 Plus 7620 | |
| Durchschnittliche NVIDIA GeForce RTX 3050 Ti Laptop GPU (20 - 25, n=4) | |
Witcher 3 FPS-Diagramm
| min. | mittel | hoch | max. | QHD | |
|---|---|---|---|---|---|
| GTA V (2015) | 181.7 | 176.1 | 148.7 | 75.4 | 53.4 |
| The Witcher 3 (2015) | 297.3 | 183 | 108.4 | 57 | |
| Dota 2 Reborn (2015) | 171.8 | 157.5 | 148 | 140.7 | |
| Final Fantasy XV Benchmark (2018) | 138.9 | 77.7 | 54.1 | 38.1 | |
| X-Plane 11.11 (2018) | 132.5 | 115.6 | 92.8 | ||
| Strange Brigade (2018) | 307 | 138.3 | 110.2 | 95.2 | 69.1 |
| Cyberpunk 2077 1.6 (2022) | 79.5 | 66.2 | 47.9 | 39.5 | 23.4 |
Emissionen — Es geht auch leiser
Geräuschemissionen
Die Lüfter produzieren ständig Geräusche, da sie auch im Leerlauf auf dem Desktop, wenn keine Programme ausgeführt werden, nie wirklich still stehen. Bestenfalls können wir im Modus "Leise" einen Geräuschpegel von 25,7 dB(A) bei einem stillen Hintergrund von 23,3 dB(A) messen. Außerdem dauert es eine Weile, bis die Lüftergeräusche nach einem Hochlastszenario wie zum Beispiel dem Gaming-Betrieb wieder beruhigen. Nach dem Beenden von The Witcher 3 produzierten die Lüfter noch mehrere Minuten lang Lärm.
Das Lüftergeräuschniveau pendelt sich beim Spielen von The Witcher 3 im Ultrahochleistungsmodus bei 49,2 dB(A) und im ausbalancierten Modus bei 46,1 dB(A) ein und liegt damit über dem des VivoBook Pro 16X, das mit der gleichen RTX 3050 Ti bestückt ist. Der hohe 40-dB(A)-Bereich ist eher unter Hochleistungs-Gaming-Laptops üblich als unter anderen Multimedia-Laptops.
Lautstärkediagramm
| Idle |
| 25.7 / 26.1 / 30.6 dB(A) |
| Last |
| 46.2 / 49.4 dB(A) |
 | ||
30 dB leise 40 dB(A) deutlich hörbar 50 dB(A) störend |
||
min: | ||
| Dell Inspiron 16 Plus 7620 GeForce RTX 3050 Ti Laptop GPU, i7-12700H, Kioxia BG5 KBG50ZNS512G | Dell Inspiron 16 Plus 7610 GeForce RTX 3050 4GB Laptop GPU, i7-11800H, Kingston OM3PDP3512B | Lenovo Yoga 7 16IAP7 Iris Xe G7 96EUs, i7-1260P, Micron 2450 512GB MTFDKCD512TFK | Huawei MateBook D 16 2022 Iris Xe G7 96EUs, i7-12700H, Silicon Motion PCIe-8 SSD | Acer Swift X SFX16-51G-5388 GeForce RTX 3050 4GB Laptop GPU, i5-11320H, Samsung PM991 MZVLQ512HBLU | Asus Vivobook Pro 16X-M7600QE GeForce RTX 3050 Ti Laptop GPU, R9 5900HX, SK Hynix HFM001TD3JX013N | |
|---|---|---|---|---|---|---|
| Geräuschentwicklung | 3% | 14% | 8% | 3% | 1% | |
| aus / Umgebung * (dB) | 23.3 | 24.4 -5% | 23.6 -1% | 24.2 -4% | 25.4 -9% | 26 -12% |
| Idle min * (dB) | 25.7 | 24.4 5% | 23.6 8% | 24.2 6% | 25.4 1% | 27 -5% |
| Idle avg * (dB) | 26.1 | 24.4 7% | 23.6 10% | 25.8 1% | 25.4 3% | 27 -3% |
| Idle max * (dB) | 30.6 | 24.4 20% | 23.6 23% | 30.5 -0% | 27.8 9% | 27.5 10% |
| Last avg * (dB) | 46.2 | 48.3 -5% | 37.7 18% | 39.8 14% | 41 11% | 41.7 10% |
| Witcher 3 ultra * (dB) | 49.2 | 48.9 1% | 40 19% | 39.8 19% | ||
| Last max * (dB) | 49.4 | 48.9 1% | 40.2 19% | 39.8 19% | 47 5% | 45.3 8% |
* ... kleinere Werte sind besser
Temperatur
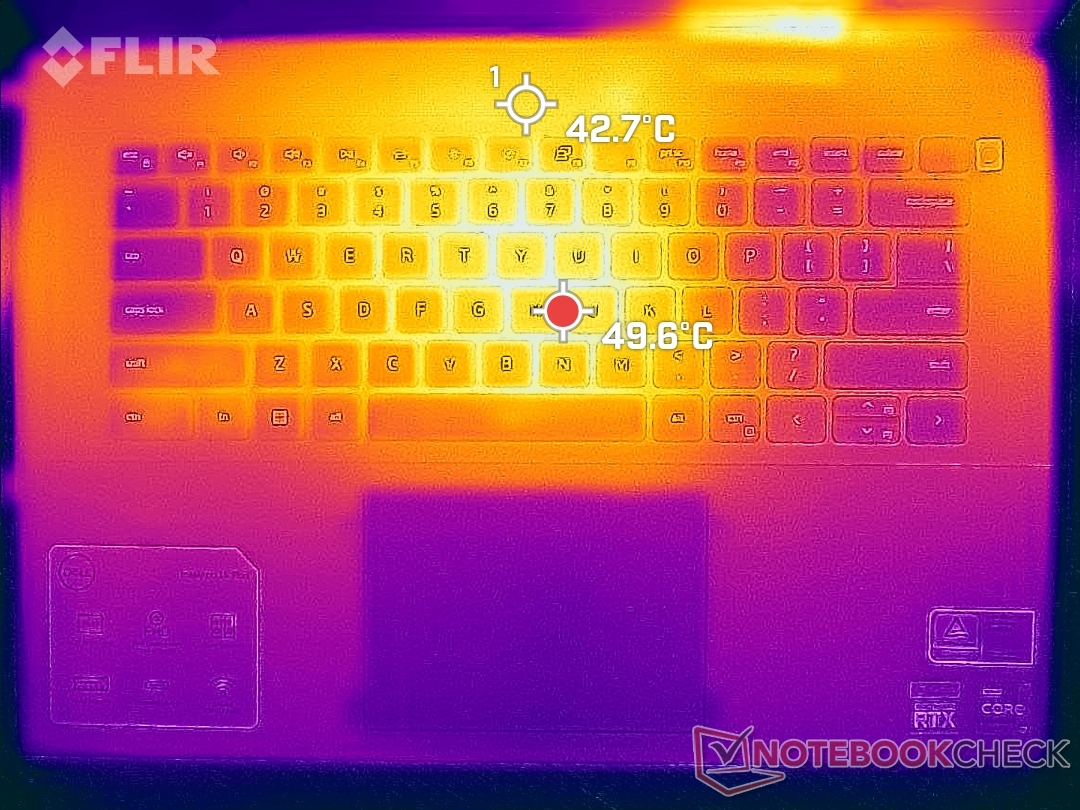
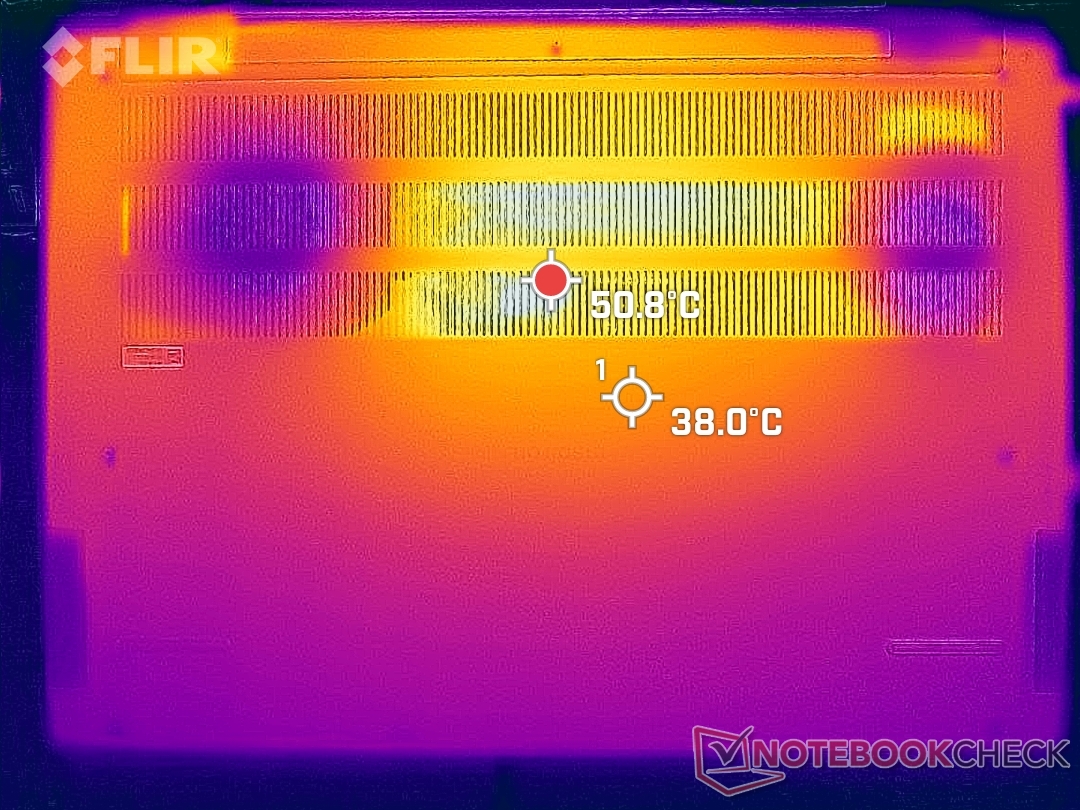
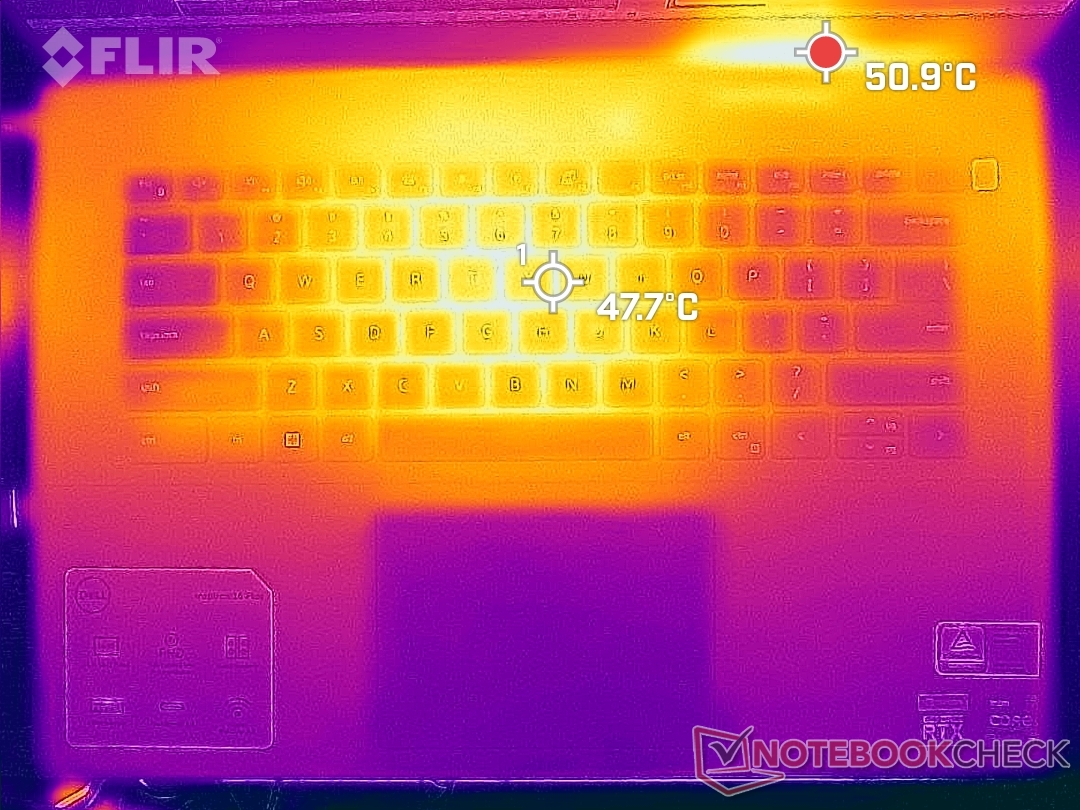
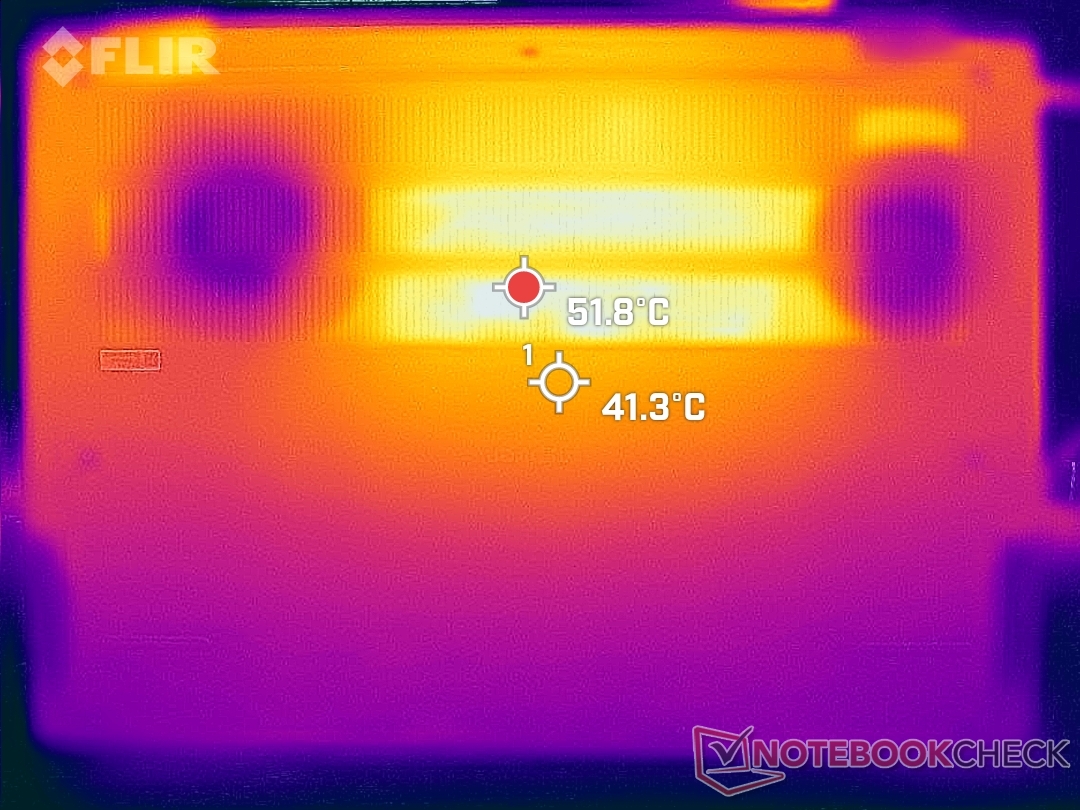
Die wärmsten Stellen konzentrieren sich auf die Tastaturmitte und erreichen unter hoher Last wie im Gaming-Betrieb bis zu 50 °C. Andere 16-Zoll-Laptops wie das Asus Vivobook Pro 16X, Lenovo Yoga 7 und sogar das ältere Inspiron 16 7610 bleiben in ähnlichen Situationen um mehrere Grad kühler. Mit 30 °C statt dem üblichen, mittleren 20-°C-Bereich erwärmen sich auch die Handballenauflagen erstaunlich stark. Alles in allem ist das Inspiron 16 Plus 7620 wohl doch eher ein Tisch-Laptop als ein Oberschenkel-Laptop.
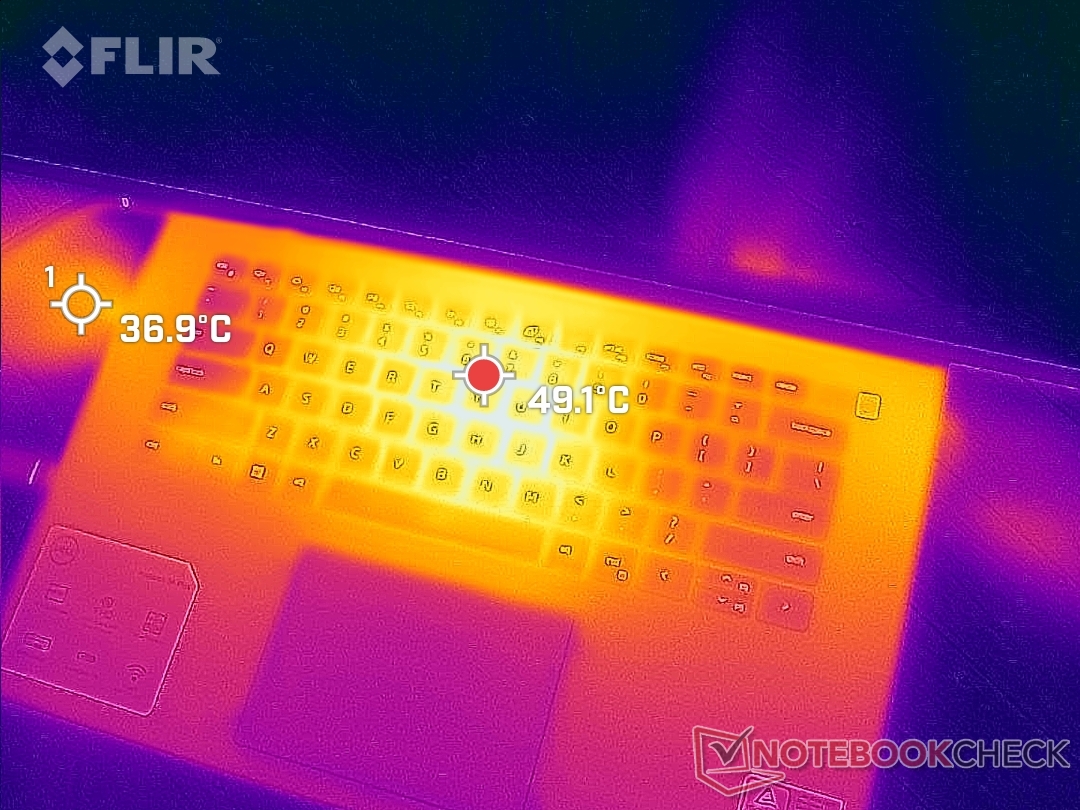
(-) Die maximale Temperatur auf der Oberseite ist 46 °C. Im Vergleich liegt der Klassendurchschnitt bei 36.8 °C (von 21 bis 71 °C für die Klasse Multimedia).
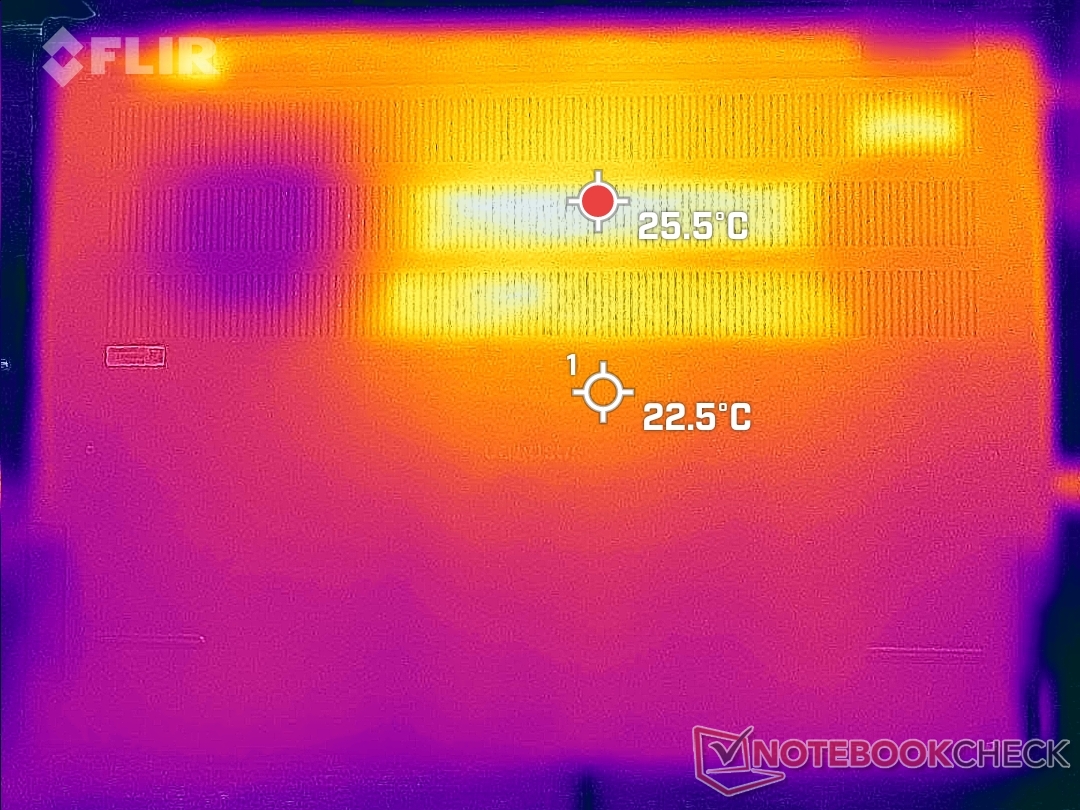
(-) Auf der Unterseite messen wir eine maximalen Wert von 45.8 °C (im Vergleich zum Durchschnitt von 39.1 °C).
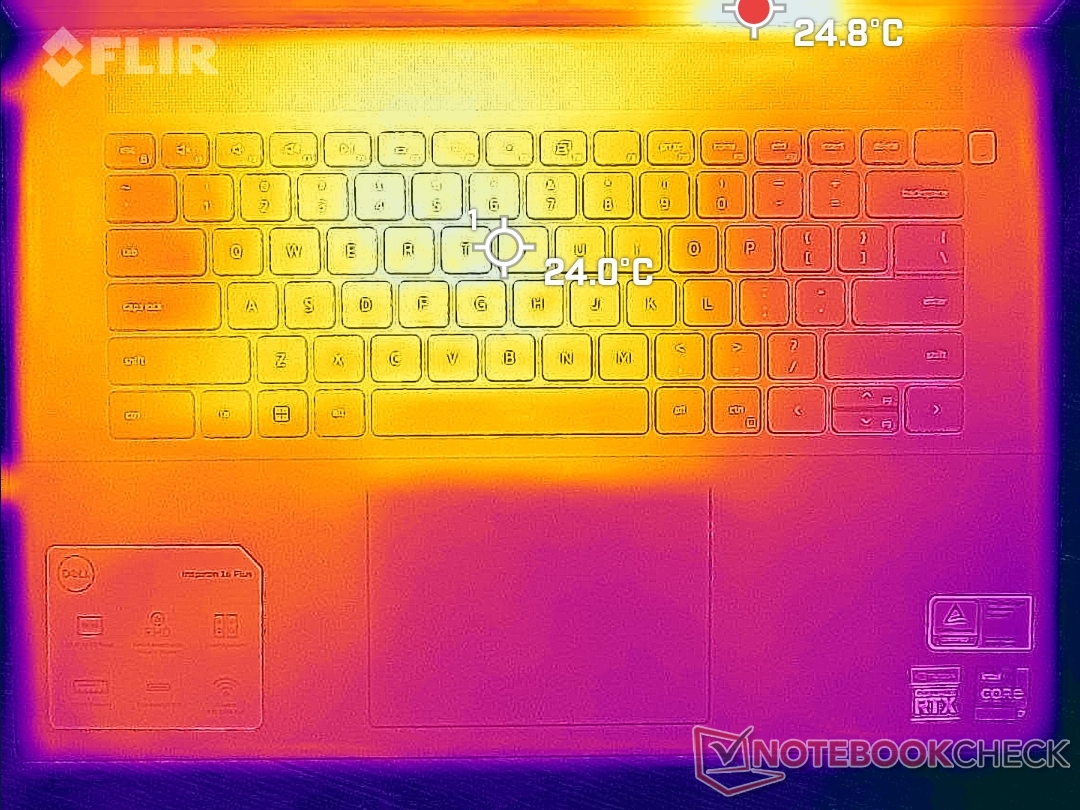
(+) Ohne Last messen wir eine durchschnittliche Temperatur von 26.8 °C auf der Oberseite. Der Klassendurchschnitt erreicht 31.3 °C.
(±) Beim längeren Spielen von The Witcher 3 erhitzt sich das Gerät durchschnittlich auf 36.8 °C. Der Durchschnitt der Klasse ist derzeit 31.3 °C.
(+) Die Handballen und der Touchpad-Bereich sind mit gemessenen 30.6 °C kühler als die typische Hauttemperatur und fühlen sich dadurch kühl an.
(±) Die durchschnittliche Handballen-Temperatur anderer getesteter Geräte war 28.7 °C (-1.9 °C).
| Dell Inspiron 16 Plus 7620 Intel Core i7-12700H, NVIDIA GeForce RTX 3050 Ti Laptop GPU | Dell Inspiron 16 Plus 7610 Intel Core i7-11800H, NVIDIA GeForce RTX 3050 4GB Laptop GPU | Lenovo Yoga 7 16IAP7 Intel Core i7-1260P, Intel Iris Xe Graphics G7 96EUs | Huawei MateBook D 16 2022 Intel Core i7-12700H, Intel Iris Xe Graphics G7 96EUs | Acer Swift X SFX16-51G-5388 Intel Core i5-11320H, NVIDIA GeForce RTX 3050 4GB Laptop GPU | Asus Vivobook Pro 16X-M7600QE AMD Ryzen 9 5900HX, NVIDIA GeForce RTX 3050 Ti Laptop GPU | |
|---|---|---|---|---|---|---|
| Hitze | -12% | 24% | 3% | -6% | 9% | |
| Last oben max * (°C) | 46 | 46.4 -1% | 39 15% | 41.8 9% | 52.4 -14% | 39.4 14% |
| Last unten max * (°C) | 45.8 | 54.8 -20% | 34.2 25% | 47.3 -3% | 50 -9% | 43.6 5% |
| Idle oben max * (°C) | 29.2 | 31.4 -8% | 21.2 27% | 28.3 3% | 30.3 -4% | 27.6 5% |
| Idle unten max * (°C) | 31 | 36.6 -18% | 21.6 30% | 30.2 3% | 30.4 2% | 27.5 11% |
* ... kleinere Werte sind besser
Stresstest
Beim Auslasten der CPU mittels Prime95 arbeitet diese ca. 15 Sekunden lang mit 3,5 GHz und 80 W und erreicht dann eine Kerntemperatur von 90 °C. Darauf fallen die Taktfrequenzen und der Gesamtverbrauch des Chips (Board Power Draw) stetig ab und pendeln sich schließlich bei 2,3 GHz bzw. 50 W ein, um eine kühlere Kerntemperatur von 86 °C zu ermöglichen. Beim 2021er-Modell resultierte dieser Test in etwas niedrigeren Werten von 83 °C bzw. 45 W.
GPU-Takt, -Temperatur und -Chipverbrauch (Board Power Draw) stabilisieren sich beim Spielen von The Witcher 3 bei 1.627 MHz, 85 °C bzw. 64 W, während wir beim Inspiron 16 Plus 7610 Werte von 1.837 MHz, 69 °C bzw. 63 W messen konnten. Daher besteht kein Zweifel daran, dass die Prozessoren des 2022er-Modells heißer werden, um mehr Leistung bereitstellen zu können.
Im Akkumodus ist die Leistung auch im Ultrahochleistungsmodus eingeschränkt. Ein 3DMark-11-Durchlauf liefert im Akkumodus Physik- und Grafikpunktzahlen von 10.252 bzw. 8.609 Punkten, während im Netzbetrieb 22.210 bzw. 18.923 erreicht wurden.
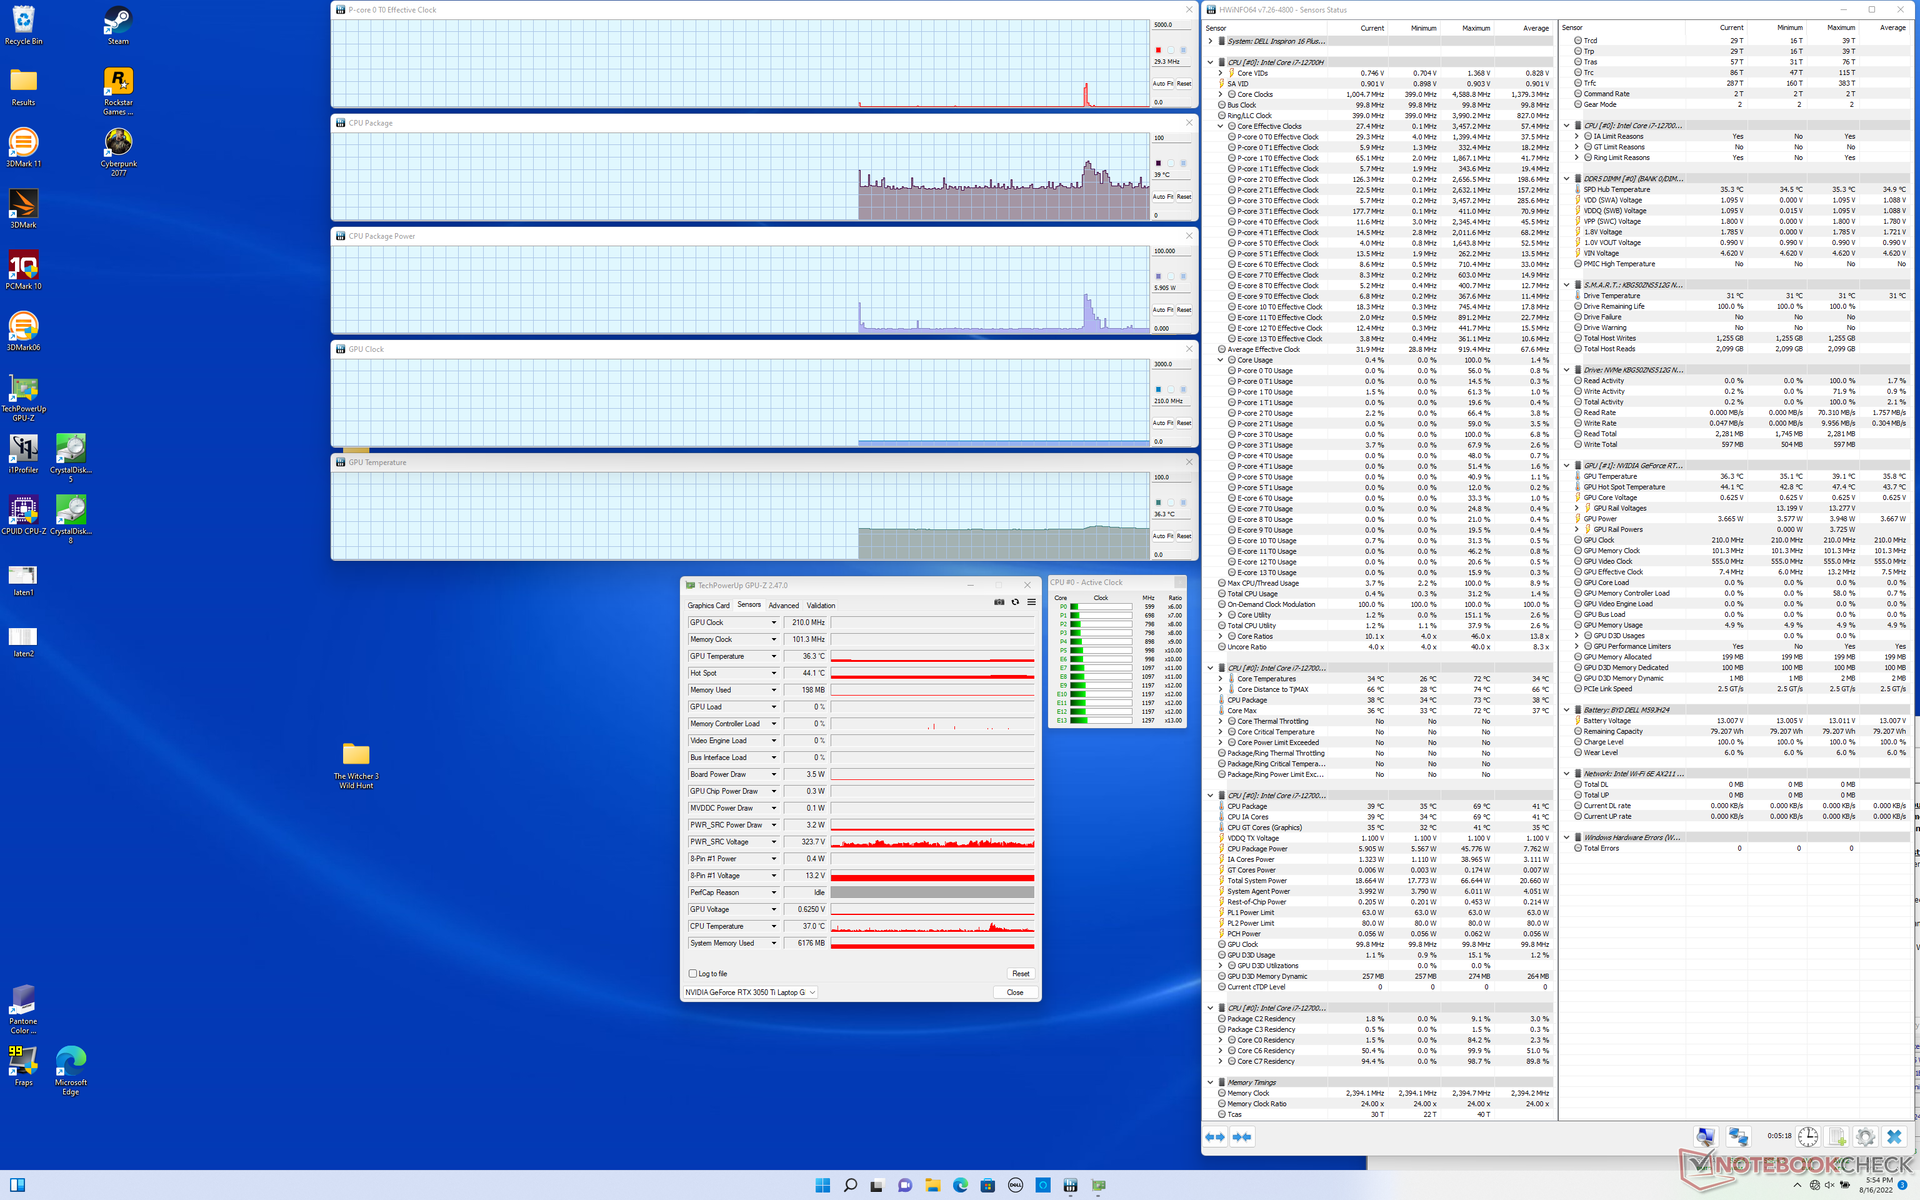
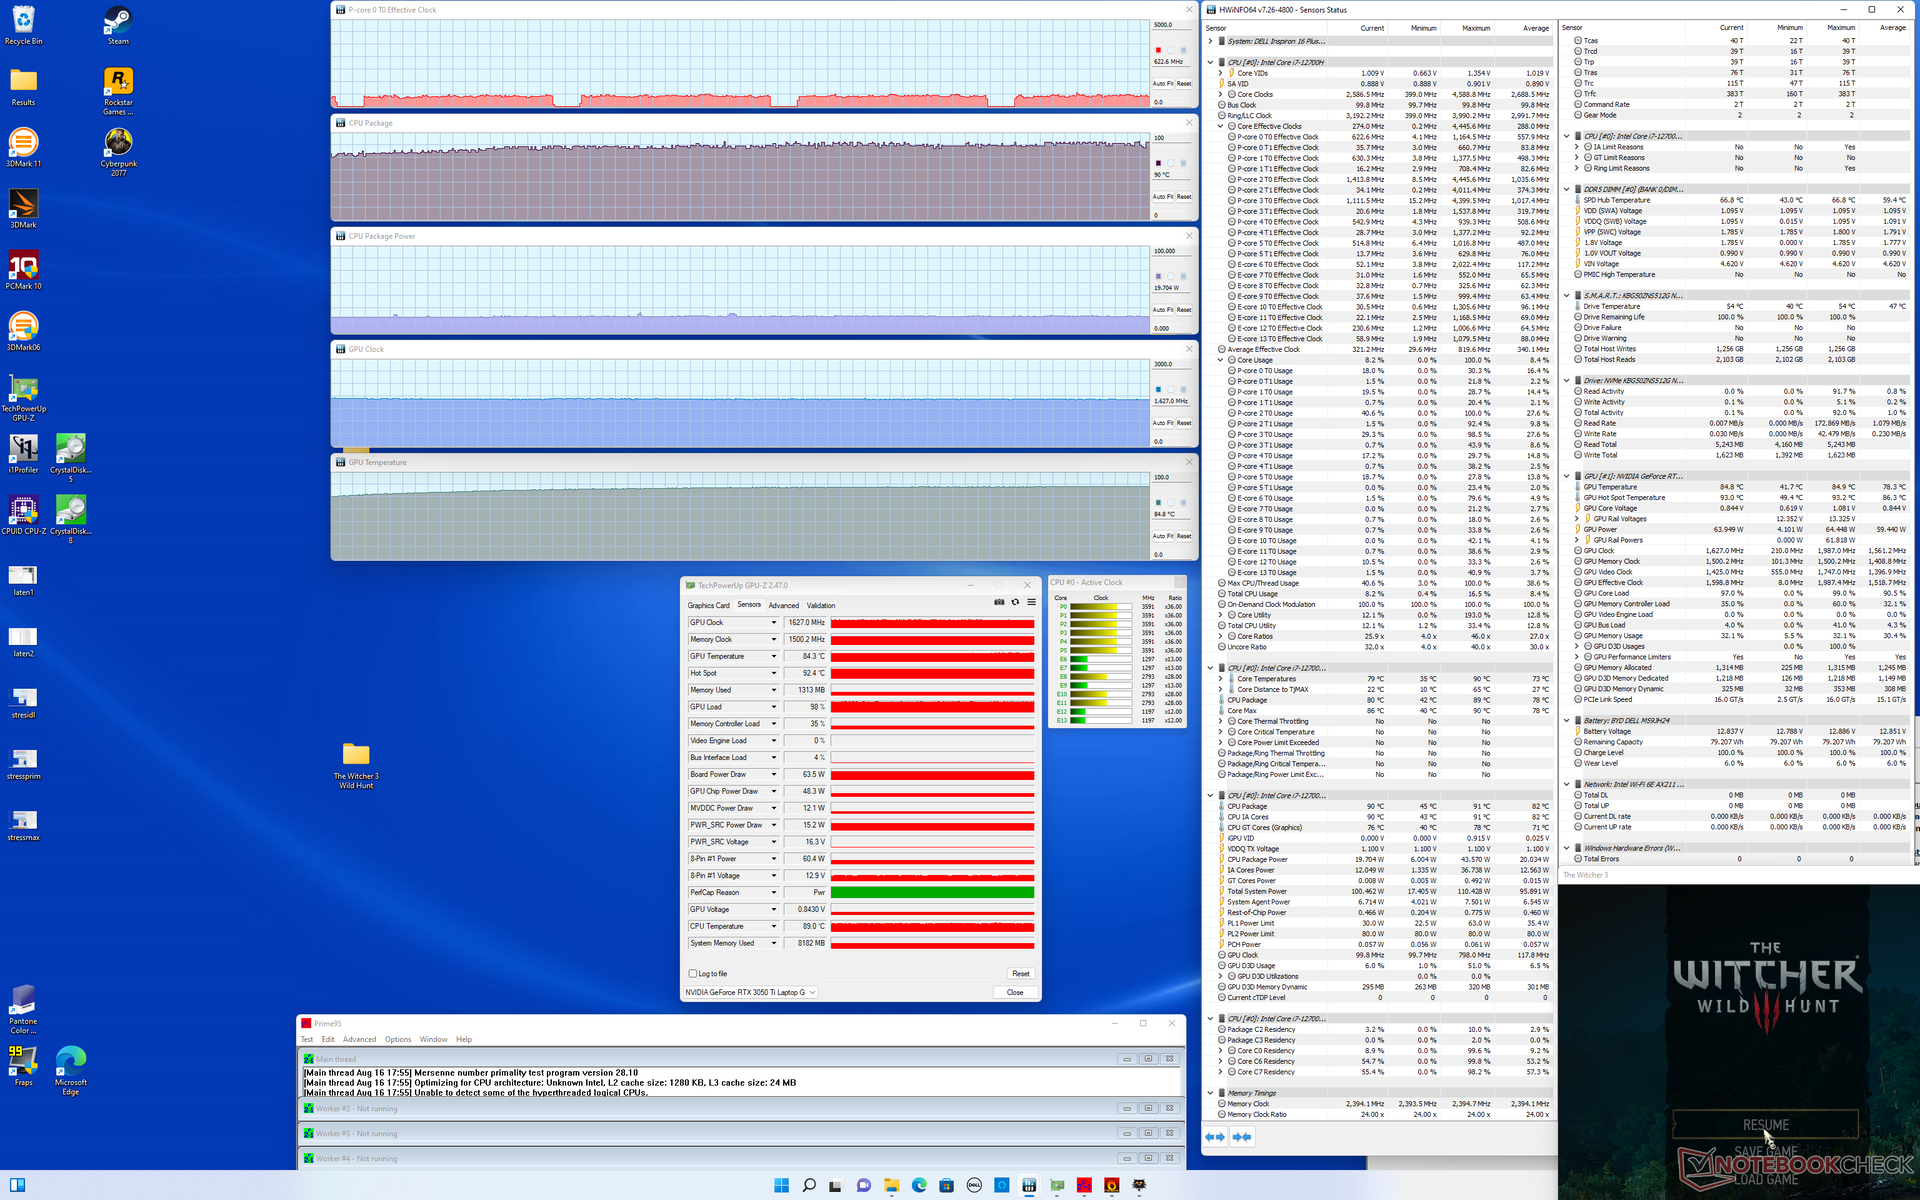
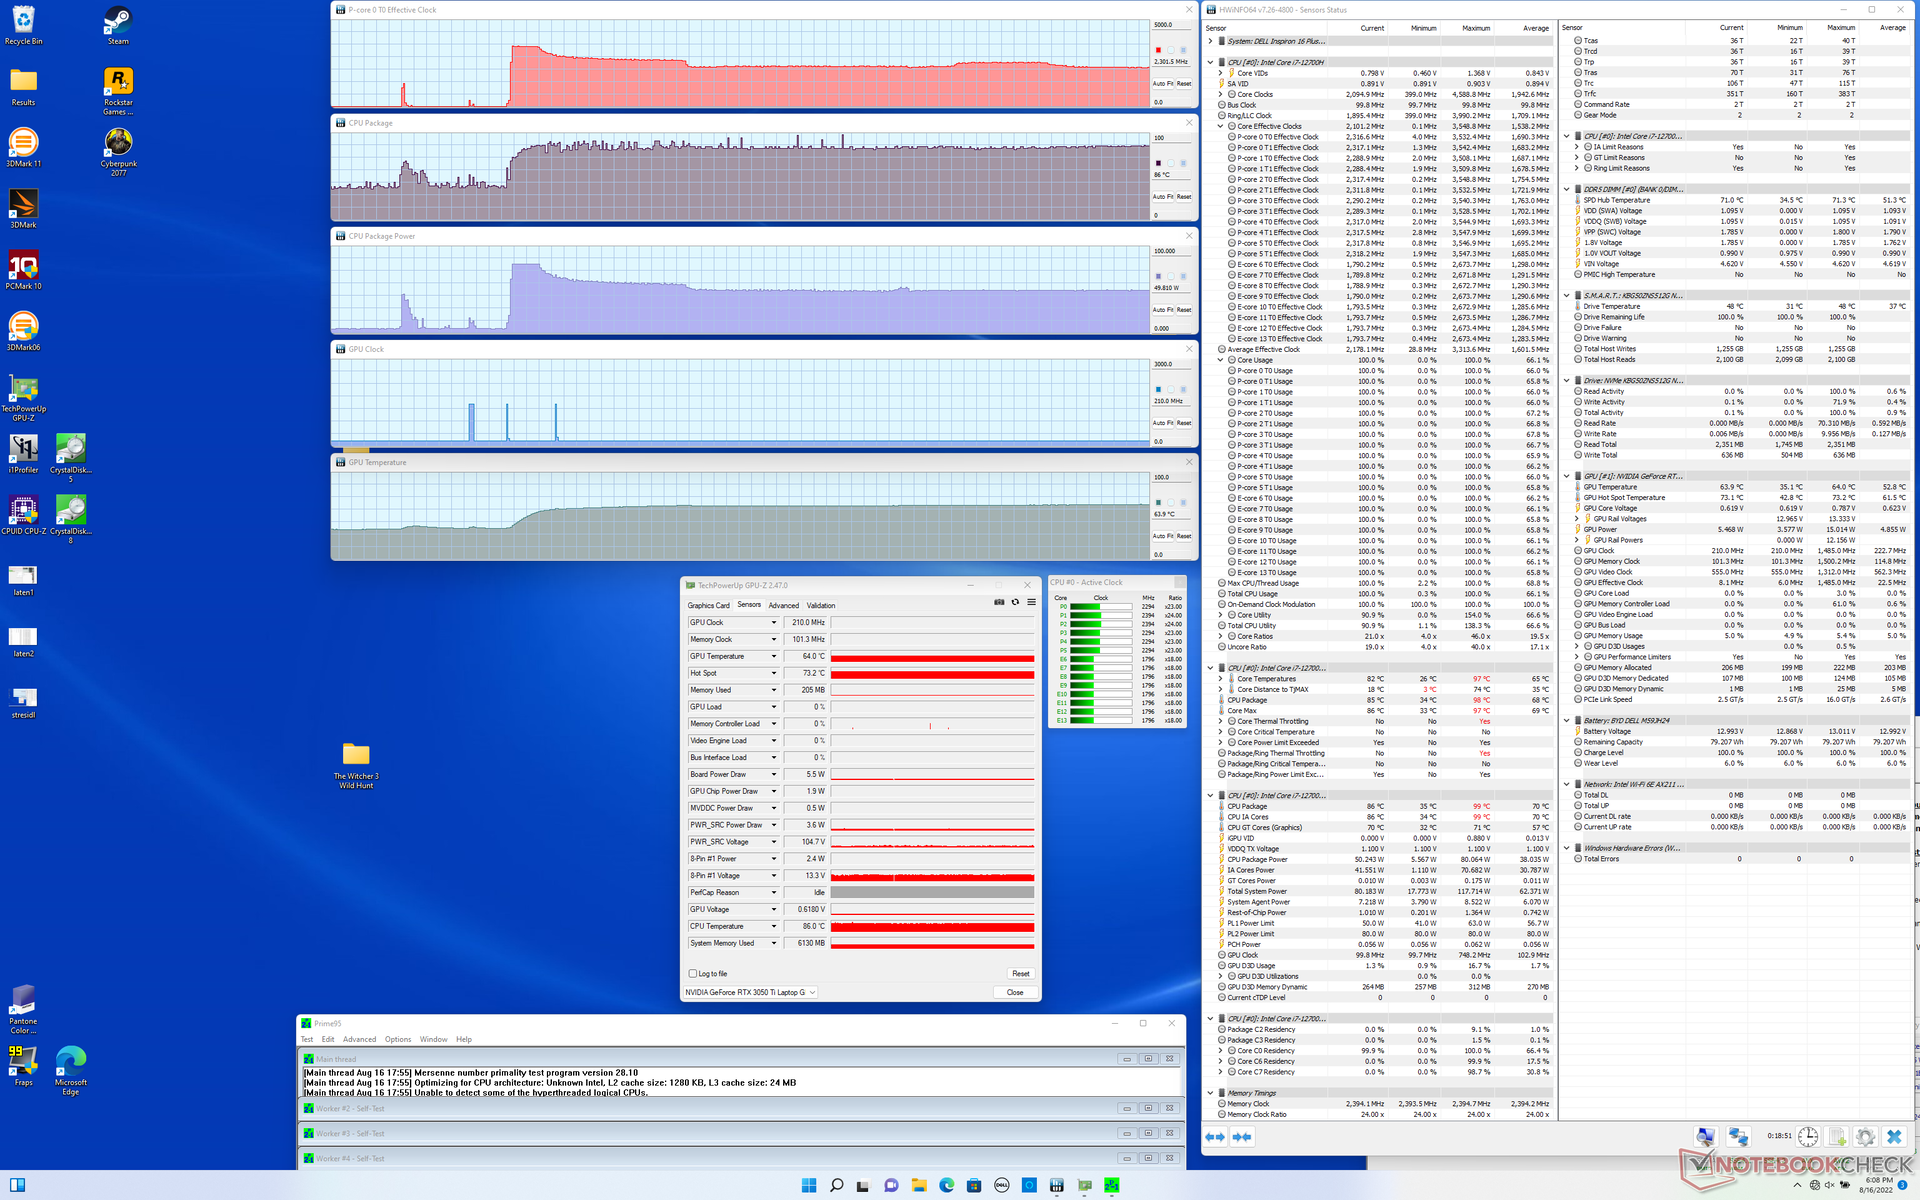
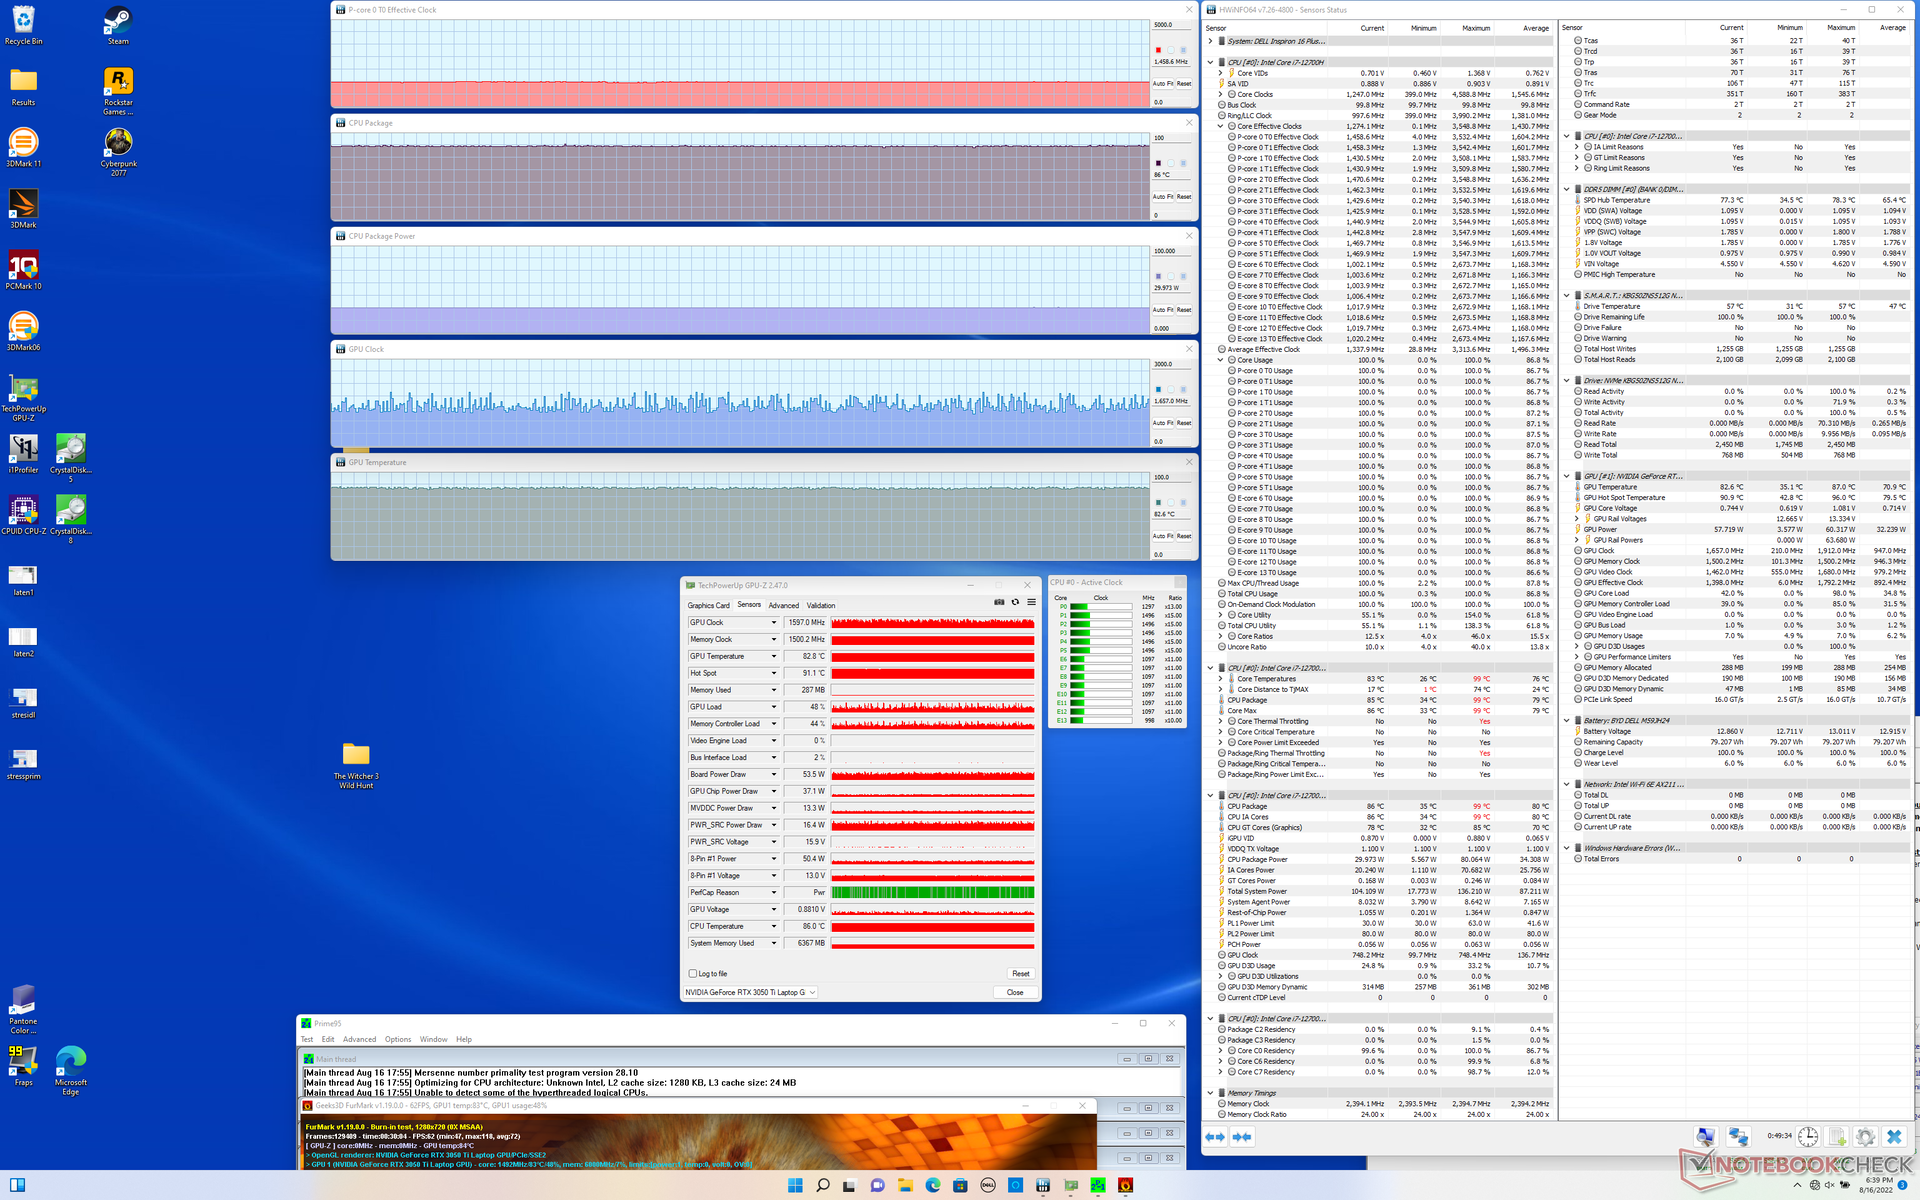
| CPU-Takt (GHz) | GPU-Takt (MHz) | Durchschnittliche CPU-Temperatur (°C) | Durchschnittliche GPU-Temperatur (°C) | |
| Leerlauf | -- | -- | 39 | 36 |
| Prime95-Stress | 2,3 | -- | 86 | 64 |
| Prime95-+FurMark-Stress | 1,5 | ~1.597 | 86 | 83 |
| Witcher-3-Stress | ~0,6 | 1.627 | 90 | 85 |
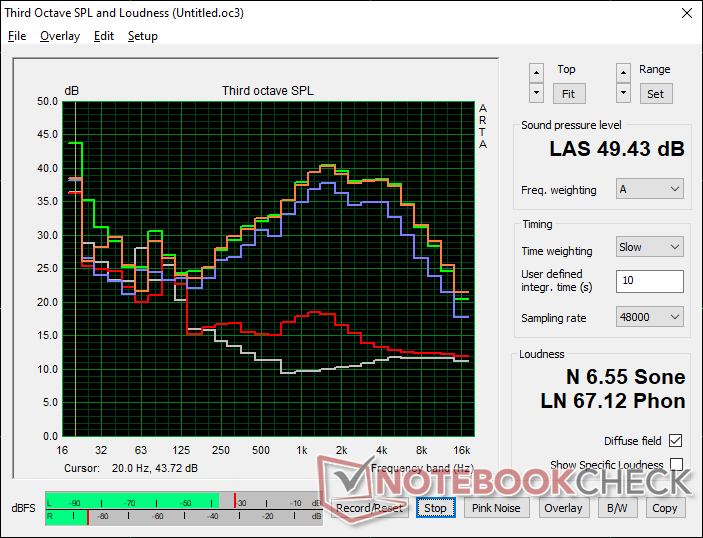
Lautsprecher
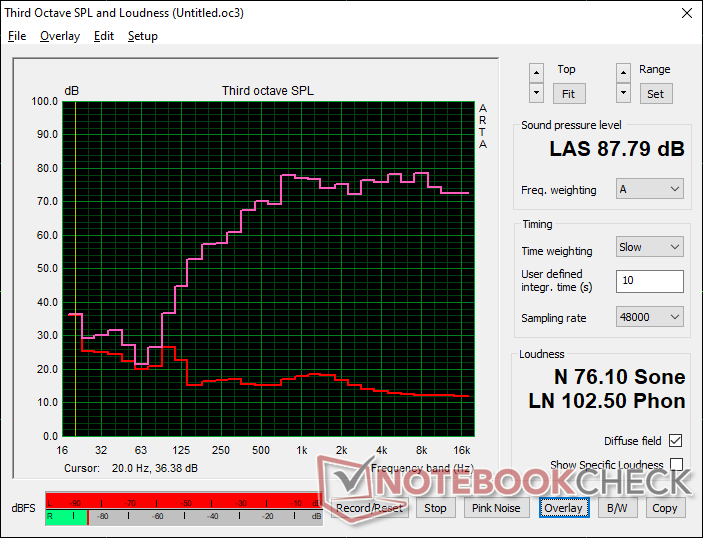
Dell Inspiron 16 Plus 7620 Audio Analyse
(+) | Die Lautsprecher können relativ laut spielen (87.8 dB)
Bass 100 - 315 Hz
(-) | kaum Bass - 22.2% niedriger als der Median
(±) | durchschnittlich lineare Bass-Wiedergabe (9.7% Delta zum Vorgänger)
Mitteltöne 400 - 2000 Hz
(+) | ausgeglichene Mitten, vom Median nur 3.3% abweichend
(+) | lineare Mitten (5.3% Delta zum Vorgänger)
Hochtöne 2 - 16 kHz
(+) | ausgeglichene Hochtöne, vom Median nur 2.5% abweichend
(+) | sehr lineare Hochtöne (4.7% Delta zum Vorgänger)
Gesamt im hörbaren Bereich 100 - 16.000 Hz
(+) | hörbarer Bereich ist sehr linear (13.4% Abstand zum Median
Im Vergleich zu allen Geräten derselben Klasse
» 28% aller getesteten Geräte dieser Klasse waren besser, 5% vergleichbar, 68% schlechter
» Das beste Gerät hat einen Delta-Wert von 5%, durchschnittlich ist 17%, das schlechteste Gerät hat 45%
Im Vergleich zu allen Geräten im Test
» 14% aller getesteten Geräte waren besser, 4% vergleichbar, 82% schlechter
» Das beste Gerät hat einen Delta-Wert von 4%, durchschnittlich ist 23%, das schlechteste Gerät hat 134%
Apple MacBook Pro 16 2021 M1 Pro Audio Analyse
(+) | Die Lautsprecher können relativ laut spielen (84.7 dB)
Bass 100 - 315 Hz
(+) | guter Bass - nur 3.8% Abweichung vom Median
(+) | lineare Bass-Wiedergabe (5.2% Delta zum Vorgänger)
Mitteltöne 400 - 2000 Hz
(+) | ausgeglichene Mitten, vom Median nur 1.3% abweichend
(+) | lineare Mitten (2.1% Delta zum Vorgänger)
Hochtöne 2 - 16 kHz
(+) | ausgeglichene Hochtöne, vom Median nur 1.9% abweichend
(+) | sehr lineare Hochtöne (2.7% Delta zum Vorgänger)
Gesamt im hörbaren Bereich 100 - 16.000 Hz
(+) | hörbarer Bereich ist sehr linear (4.6% Abstand zum Median
Im Vergleich zu allen Geräten derselben Klasse
» 0% aller getesteten Geräte dieser Klasse waren besser, 0% vergleichbar, 100% schlechter
» Das beste Gerät hat einen Delta-Wert von 5%, durchschnittlich ist 17%, das schlechteste Gerät hat 45%
Im Vergleich zu allen Geräten im Test
» 0% aller getesteten Geräte waren besser, 0% vergleichbar, 100% schlechter
» Das beste Gerät hat einen Delta-Wert von 4%, durchschnittlich ist 23%, das schlechteste Gerät hat 134%
Energieverwaltung — CPU mit hohem Stromverbrauch
Energieaufnahme
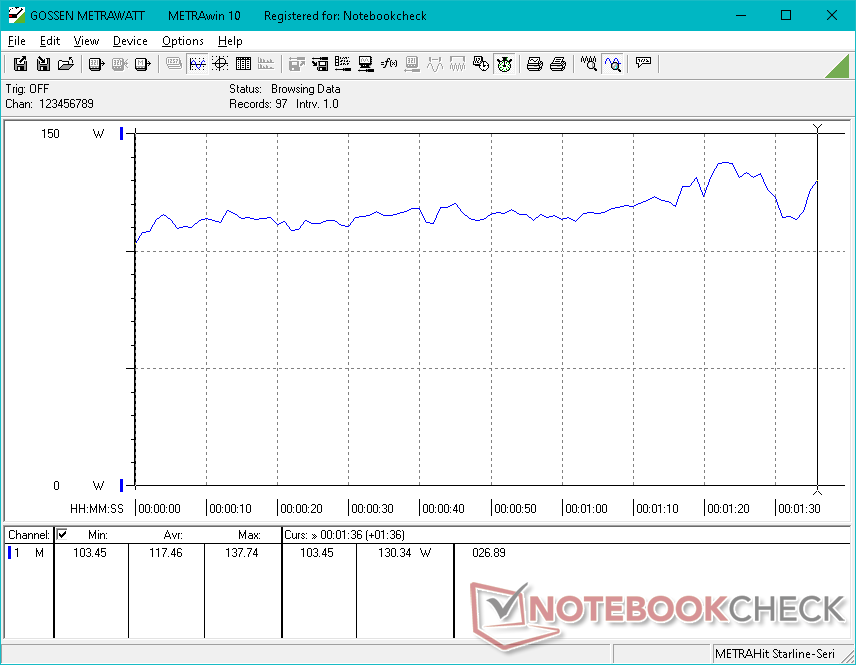
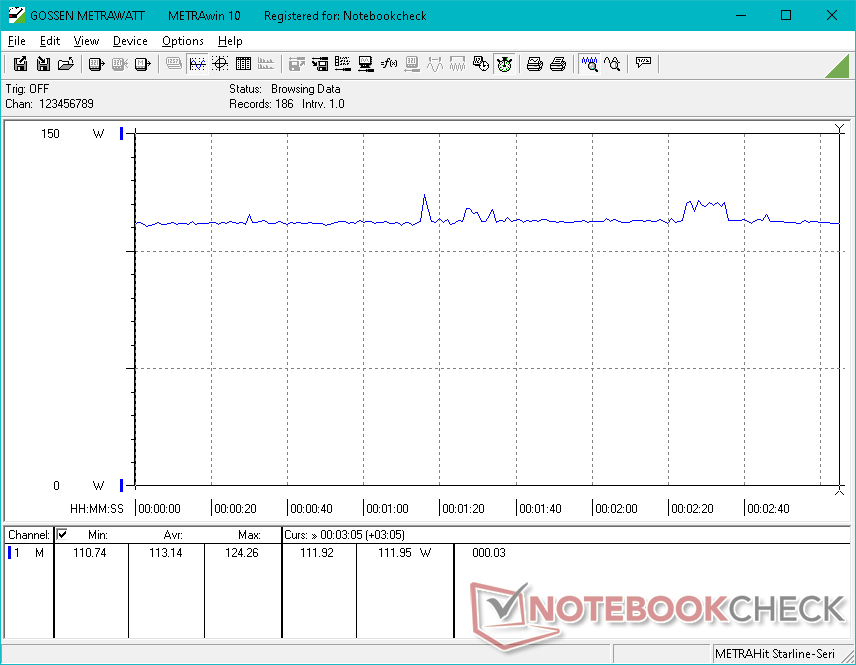
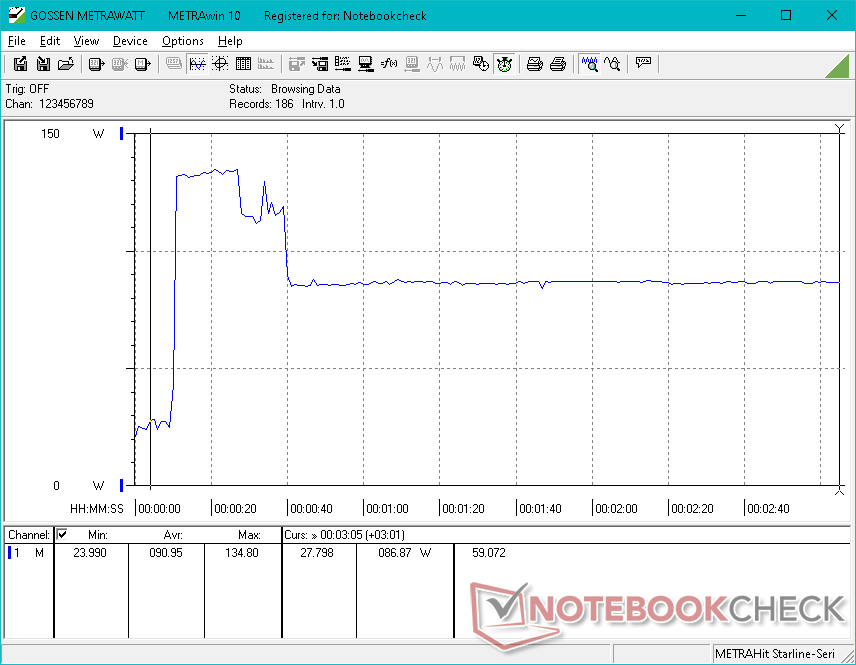
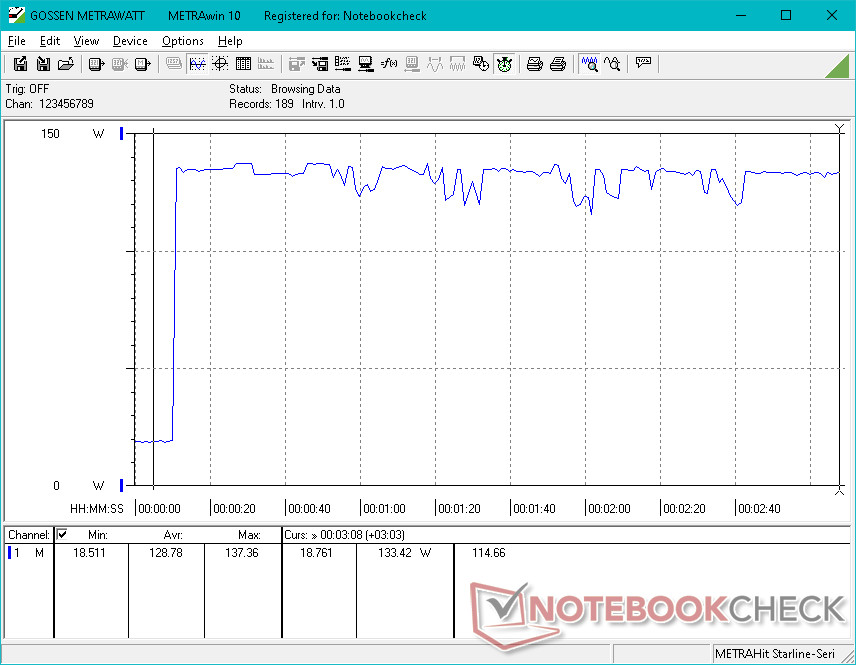
Die Energieaufnahme ist im Leerlauf auf dem Desktop und unter sehr niedriger Last mit der des 2021er-Modells vergleichbar. Unter hoher Last ist das 2022er-Modell jedoch wesentlich weniger genügsam, vor allem, wenn die CPU ausgelastet wird. So steigt der Verbrauch beim Spielen von The Witcher 3 nur um 5 % und beim Ausführen von Prime95 um ganze 72 %. Der erheblich höhere Verbrauch entspricht unseren Beobachtungen zu anderen, bisher von uns getesteten Laptops mit 12.-Gen.-Alder-Lake-CPUs.
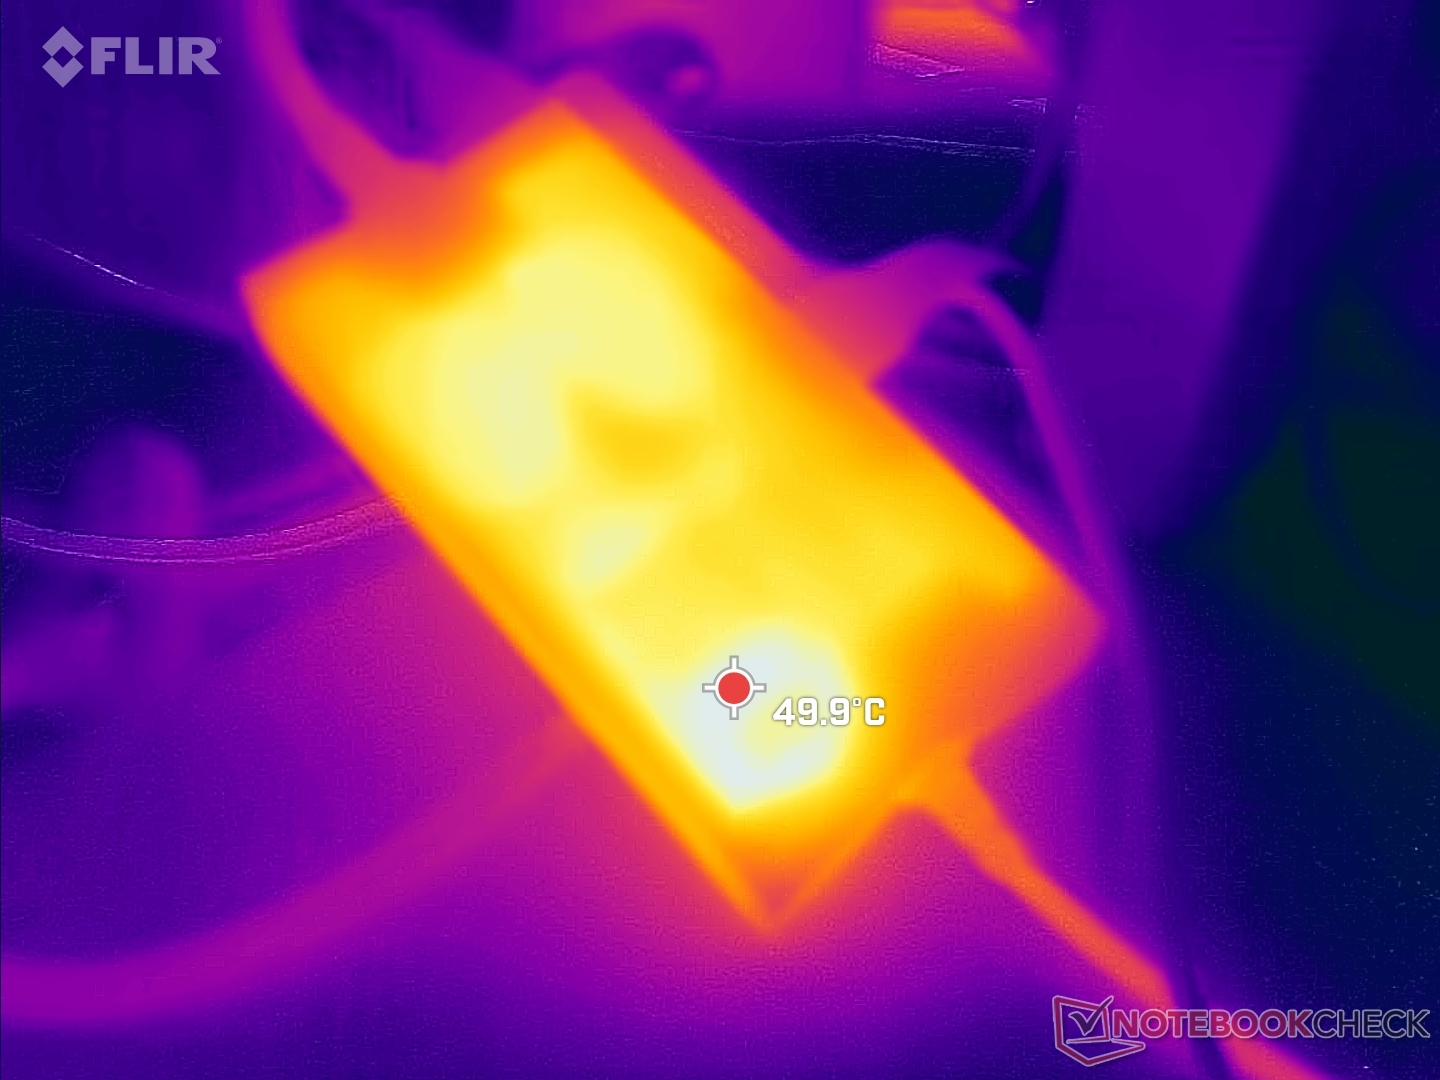
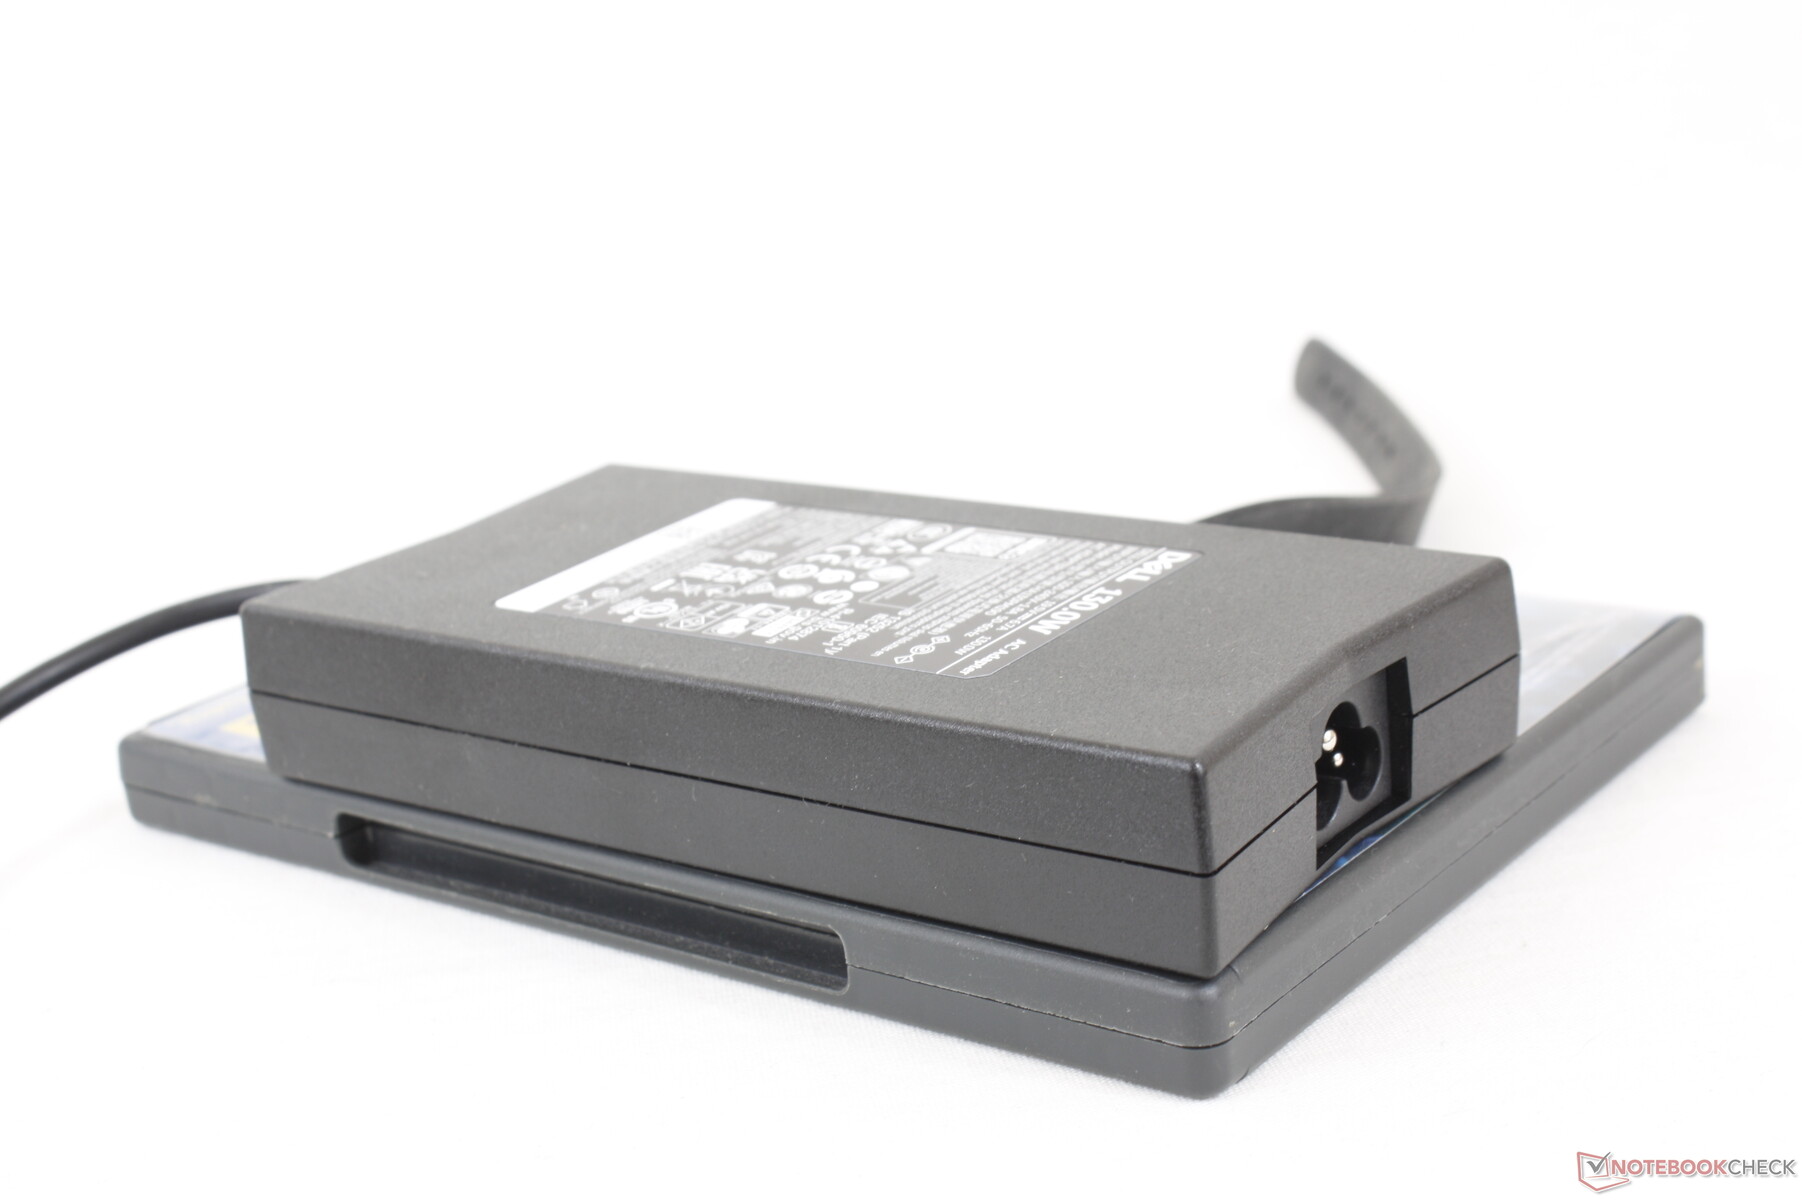
Wir konnten an dem mittelgroßen (~15,3 x 7,5 x 2,6 cm) 130-W-Netzteil einen maximalen Verbrauch von 137 W messen. Trotz der anspruchsvolleren CPU hat Dell keine Änderungen an dem Netzteil oder dessen Leistung vorgenommen.
| Aus / Standby | |
| Idle | |
| Last |
|
Legende:
min: | |
| Dell Inspiron 16 Plus 7620 i7-12700H, GeForce RTX 3050 Ti Laptop GPU, Kioxia BG5 KBG50ZNS512G, IPS, 3072x1920, 16" | Dell Inspiron 16 Plus 7610 i7-11800H, GeForce RTX 3050 4GB Laptop GPU, Kingston OM3PDP3512B, IPS, 3072x1920, 16" | Lenovo Yoga 7 16IAP7 i7-1260P, Iris Xe G7 96EUs, Micron 2450 512GB MTFDKCD512TFK, IPS, 2560x1600, 16" | Huawei MateBook D 16 2022 i7-12700H, Iris Xe G7 96EUs, Silicon Motion PCIe-8 SSD, IPS, 1920x1200, 16" | Acer Swift X SFX16-51G-5388 i5-11320H, GeForce RTX 3050 4GB Laptop GPU, Samsung PM991 MZVLQ512HBLU, , 1920x1080, 16.1" | Asus Vivobook Pro 16X-M7600QE R9 5900HX, GeForce RTX 3050 Ti Laptop GPU, SK Hynix HFM001TD3JX013N, OLED, 3840x2400, 16.1" | |
|---|---|---|---|---|---|---|
| Stromverbrauch | 1% | 35% | 29% | 21% | 1% | |
| Idle min * (Watt) | 6.8 | 7.7 -13% | 6.6 3% | 6.1 10% | 7 -3% | 8.2 -21% |
| Idle avg * (Watt) | 9.6 | 10.7 -11% | 8.3 14% | 10.6 -10% | 10.1 -5% | 16.2 -69% |
| Idle max * (Watt) | 17 | 16.8 1% | 9.8 42% | 11.5 32% | 15 12% | 19.7 -16% |
| Last avg * (Watt) | 117.5 | 100.39 15% | 66 44% | 65.5 44% | 63.3 46% | 65.8 44% |
| Witcher 3 ultra * (Watt) | 113.1 | 108 5% | 52 54% | 61.2 46% | 63.3 44% | 65.6 42% |
| Last max * (Watt) | 137.4 | 129 6% | 67.1 51% | 68.4 50% | 94 32% | 104 24% |
* ... kleinere Werte sind besser
Verbrauch Witcher 3 / Stresstest
Verbrauch externer Monitor
Akkulaufzeit
Da sich die Akkukapazität im Vergleich zu der des Vorgängers nicht geändert hat, sind auch die Laufzeiten ähnlich hoch. Im ausbalancierten Leistungsprofil kann man mit einer praxisnahen WLAN-Laufzeit von 9,5 Stunden rechnen. Eine kleinere 56-Wh-Akkuoption steht bei bestimmten Modellen zur Gewichtsreduktion ebenfalls zur Auswahl.
Den leeren Akku voll zu laden dauert mit dem mitgelieferten Hohlsteckernetzteil ungefähr zwei Stunden. Alternativ kann der Laptop auch über USB-C-Netzteile von Drittanbietern geladen werden.
| Dell Inspiron 16 Plus 7620 i7-12700H, GeForce RTX 3050 Ti Laptop GPU, 86 Wh | Dell Inspiron 16 Plus 7610 i7-11800H, GeForce RTX 3050 4GB Laptop GPU, 86 Wh | Lenovo Yoga 7 16IAP7 i7-1260P, Iris Xe G7 96EUs, 71 Wh | Huawei MateBook D 16 2022 i7-12700H, Iris Xe G7 96EUs, 60 Wh | Acer Swift X SFX16-51G-5388 i5-11320H, GeForce RTX 3050 4GB Laptop GPU, 58.7 Wh | Asus Vivobook Pro 16X-M7600QE R9 5900HX, GeForce RTX 3050 Ti Laptop GPU, 96 Wh | |
|---|---|---|---|---|---|---|
| Akkulaufzeit | 63% | 2% | -26% | 5% | 6% | |
| Idle (h) | 18.6 | 20.5 10% | 12.2 -34% | 20.3 9% | ||
| WLAN (h) | 9.6 | 9.9 3% | 7.9 -18% | 7.1 -26% | 8.1 -16% | 11.3 18% |
| Last (h) | 1.2 | 3.3 175% | 1.9 58% | 1.5 25% | 1.1 -8% | |
| H.264 (h) | 8.4 | |||||
| Spielen (h) | 1.1 |
Pro
Contra
Fazit — Teils Multimedia, Teils Leinwand, Teils Gamer
Der größte Vorteil des Inspiron 16 Plus 7620 ist die Intel-Core-H-CPU aus der 12. Generation, die im Vergleich zum Prozessor des 7610 eine 50 % höhere Multi-Thread-Leistung bietet. Für alle, deren Aufgaben von dem schnelleren Prozessor profitieren, lohnt sich das 7620 möglicherweise mehr als sein Vorgänger.
Die meisten übrigen Änderungen sind eher als neutral bzw. bestenfalls geringfügige Verbesserungen zu betrachten. Die höherauflösende 2-MP-Webcam ist zwar ganz nett, jedoch immer noch weit entfernt von den 5-MP-Webcams eines HP Spectre oder Envy 16. Das überarbeitete Gehäusedesign sieht ebenfalls schick aus, macht den Laptop jedoch nicht leichter, kompakter oder stabiler als den Vorgänger 7610. Darüber hinaus bieten Alternativen wie das Asus VivoBook Pro 16X eine RTX 3050 Ti und ein OLED-Panel, während letzteres bei unserem Dell immer noch nicht zur Auswahl steht. Ein schnelleres Panel wie zum Beispiel das 120-Hz-Panel des HP Envy 16 könnte ebenso eine spannende Konfigurationsmöglichkeit darstellen.
Das Inspiron 16 Plus 7620 ist in Bezug auf die CPU-Leistung um einiges schneller als das 7610. Davon abgesehen bleibt jedoch alles mehr oder weniger beim Alten oder verschlechtert sich sogar, wie man an den höheren Temperaturen und der reduzierten Anzahl an Erweiterungsslots sieht.
Einige andere Revisionen wie der fehlende Ziffernblock, das kleinere ClickPad, der höhere Stromverbrauch unter Last, die höheren Temperaturen und die geringere Zahl an SODIMM- und M.2-SSD-Slots können durchaus Nachteile sein. Damit bleibt das Inspiron zwar ein leistungsfähiges Gesamtpaket, das mit seinen Farben und seiner Leistung für gelegentliche Spiele und das Erstellen digitaler Inhalte geeignet ist, überzeugt jedoch aufgrund gewisser Einschränkungen nicht auf ganzer Linie.
Preis und Verfügbarkeit
Das Inspiron 16 Plus 7620 ist in Dells Online-Shop ab sofort für rund 1.350 Euro verfügbar (Core i7-12700H, GeForce RTX 3050, 3K-Display, 16 GB RAM, 512-GB-SSD).
Dell Inspiron 16 Plus 7620
- 18.08.2022 v7 (old)
Allen Ngo
Preisvergleich

