Fast ein XPS 16: Dell Inspiron 16 Plus 7610 Laptop im Test
Die Inspiron Produktreihe beinhaltet vermutlich Dells zahlreichste und vielfältigste PCs für Privatnutzer. Angefangen bei der günstigen 3000er-Reihe bis zur High-End-7000er-Reihe beinhaltet sie alle Bildschirmgrößen von 13 bis 17 Zoll. Das neue Inspiron 16 zeichnet sich dadurch aus, eines der ersten 16-Zoll-Modelle zu sein, die Funktionen mitbringen, die nicht bereits im April angekündigt wurden.
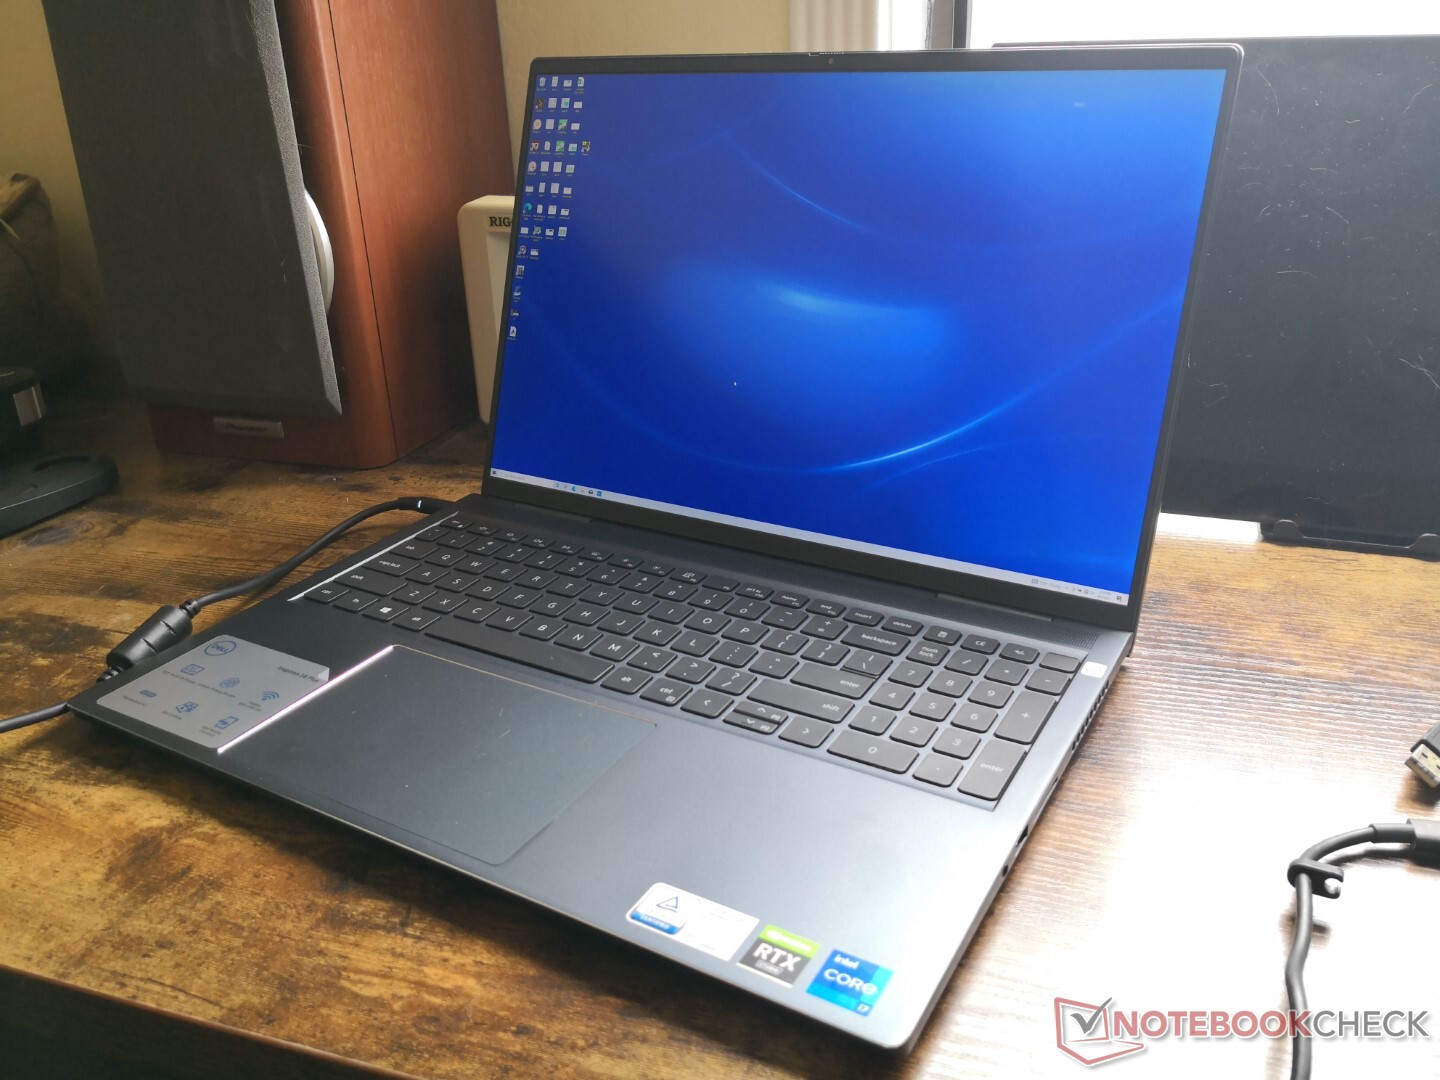
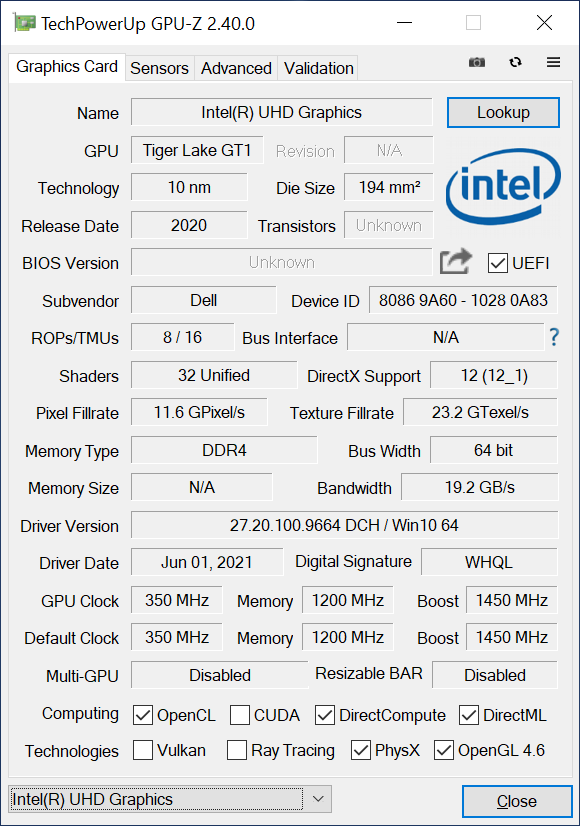
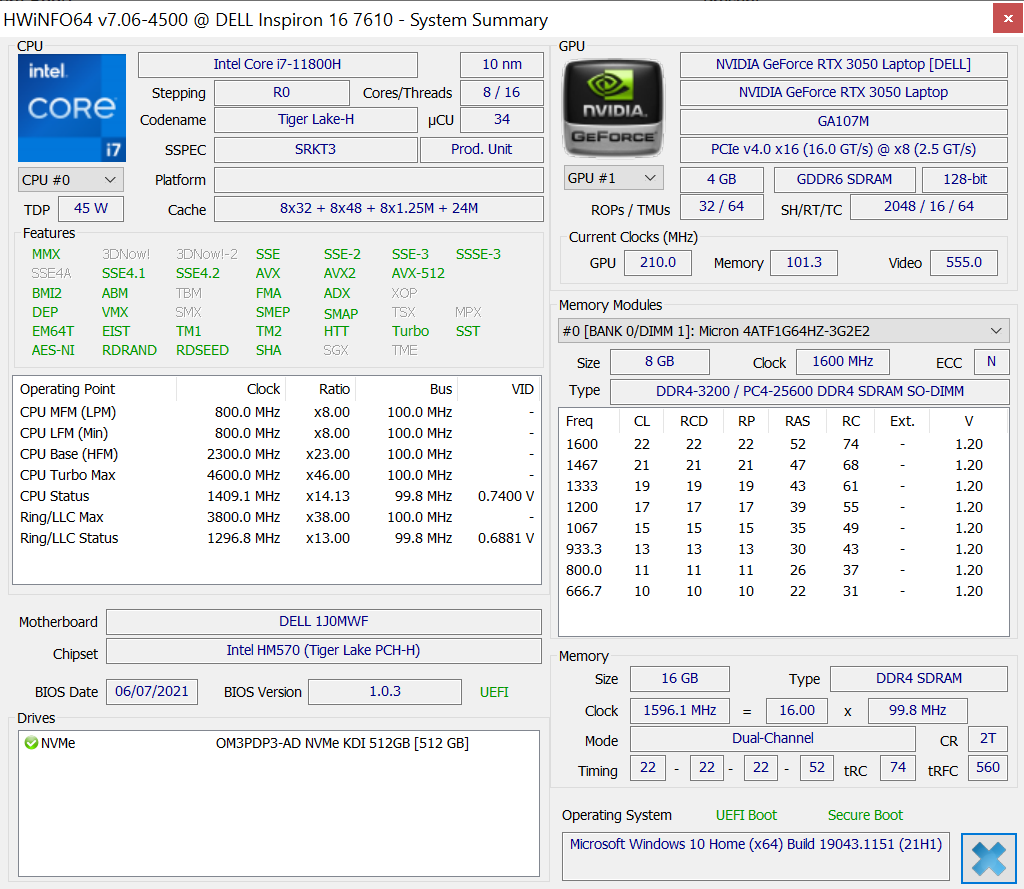
Bei unserem Testgerät handelt es sich um eine relativ leistungsfähige Konfiguration des Inspiron 16 7610, die mit dem Core i7-11800H aus Intels 11. CPU-Generation sowie einer GeForce-RTX-3050-Grafikkarte ausgestattet ist und ca. 1.400 Euro kostet. Alternative Modelle mit dem etwas schwächeren Core i5-11400H und integrierter UHD-Grafik sind ebenfalls verfügbar. Davon hatten wir die ein Inspiron 16 Plus 7610 mit iGPU im Test.
Das 16,0-Zoll-Display mit dem Seitenverhältnis 16:10, nativer 3K-Auflösung und der Farbausführung "Mist Blue" ist jedoch bei allen Konfigurationen fix. Im Gegensatz zu den Gaming-Laptops aus der G-Reihe und den Poweruser-Laptops aus der XPS-Reihe wird unser Testgerät als Nvidia-Studio-Laptop für die digitale Mediengestaltung vermarktet.
Zu den direkten Konkurrenten zählen andere 16-Zoll-Multimedia-Laptops wie das LG Gram 16, das Honor MagicBook Pro und das MacBook Pro 16.
Weitere Dell Tests:
Mögliche Konkurrenten im Vergleich
Bew. | Datum | Modell | Gewicht | Dicke | Größe | Auflösung | Preis ab |
|---|---|---|---|---|---|---|---|
| 86.7 % v7 (old) | 08 / 2021 | Dell Inspiron 16 Plus 7610 i7-11800H, GeForce RTX 3050 4GB Laptop GPU | 2 kg | 18.99 mm | 16.00" | 3072x1920 | |
| 87.4 % v7 (old) | 08 / 2021 | Lenovo Legion 5 Pro 16ACH6H (82JQ001PGE) R7 5800H, GeForce RTX 3070 Laptop GPU | 2.6 kg | 26.85 mm | 16.00" | 2560x1600 | |
| 85.6 % v7 (old) | 06 / 2021 | Asus ROG Zephyrus M16 GU603H i9-11900H, GeForce RTX 3070 Laptop GPU | 2 kg | 20 mm | 16.00" | 2560x1600 | |
| 86.3 % v7 (old) | 06 / 2021 | LG Gram 16 (2021) i7-1165G7, Iris Xe G7 96EUs | 1.2 kg | 16.8 mm | 16.00" | 2560x1600 | |
| 79.9 % v7 (old) | 08 / 2020 | HP Pavilion Gaming 16-a0242ng i5-10300H, GeForce GTX 1650 Ti Mobile | 2.2 kg | 23.5 mm | 16.10" | 1920x1080 | |
| 82.4 % v7 (old) | 01 / 2021 | Dell Inspiron 15 7000 7506 2-in-1 Black Edition i7-1165G7, Xe MAX | 1.9 kg | 17.94 mm | 15.60" | 3840x2160 |
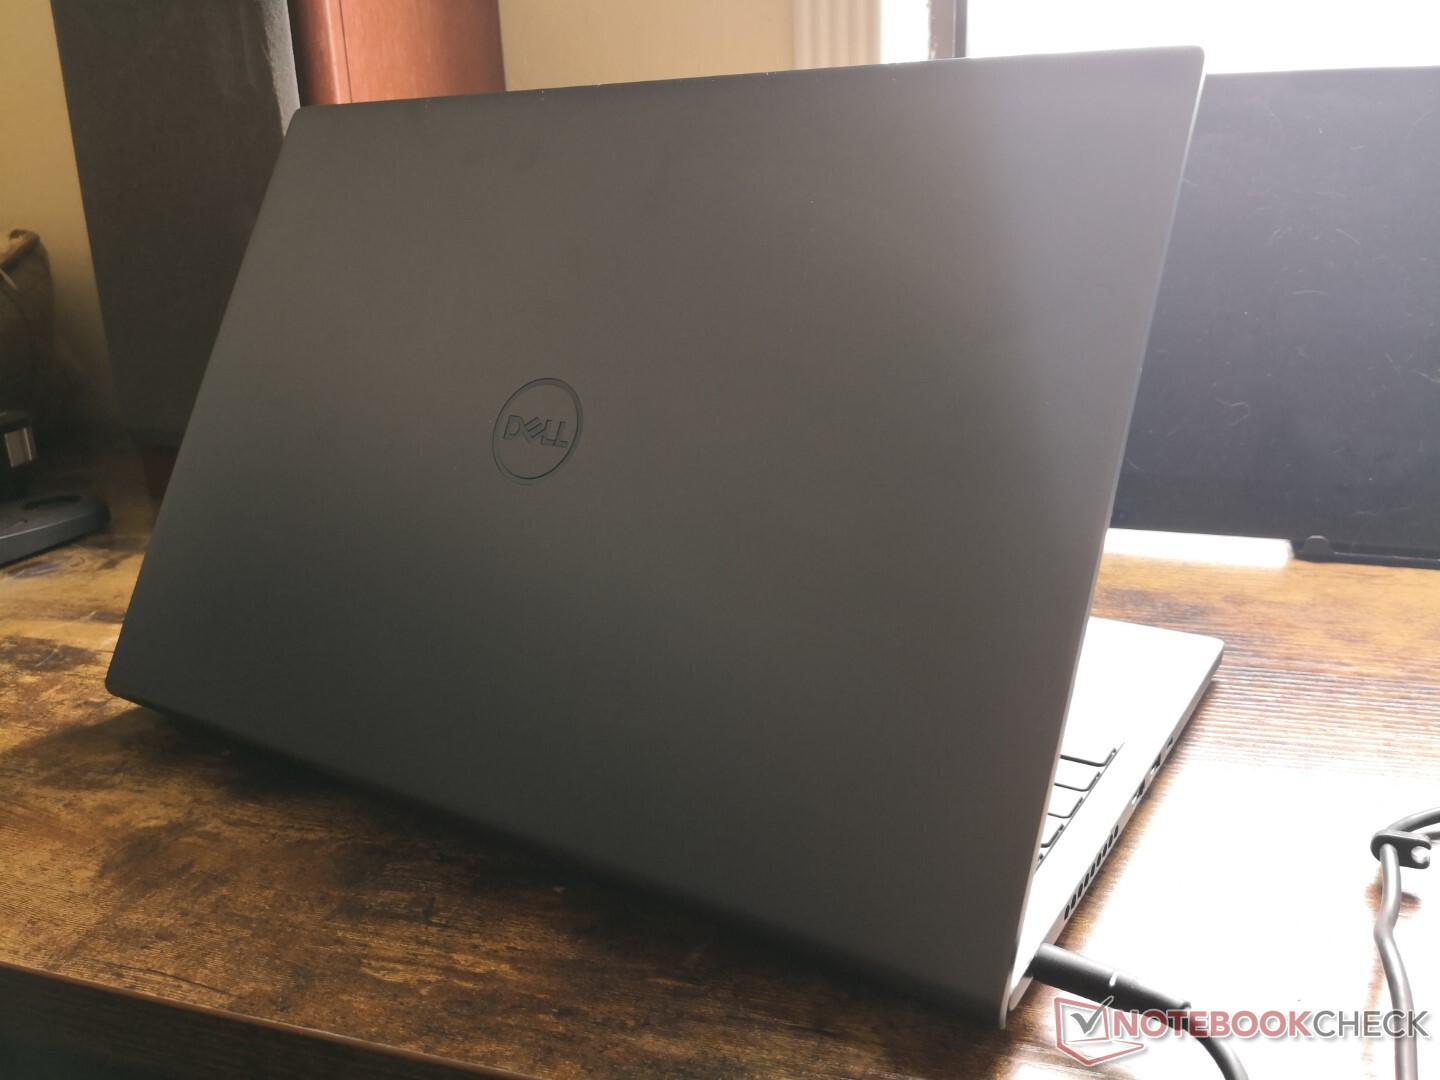
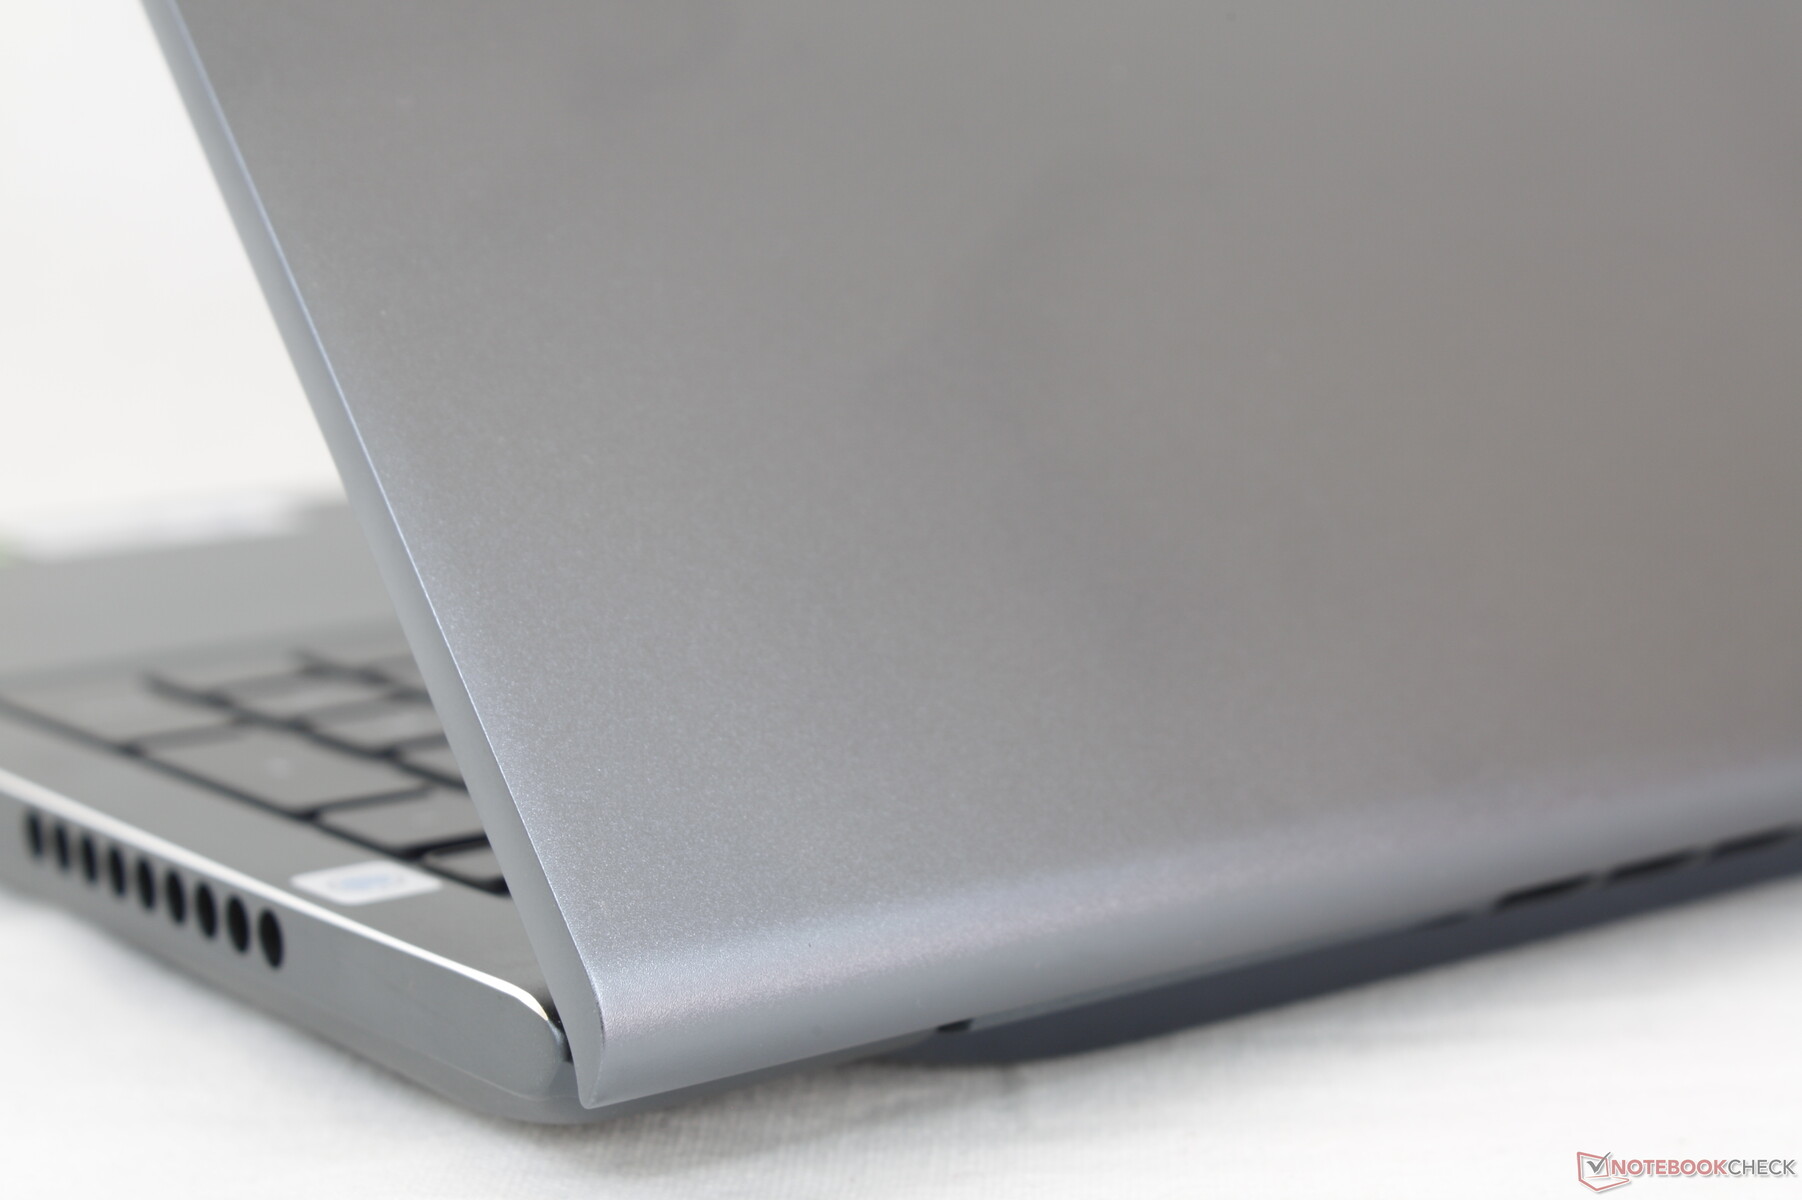
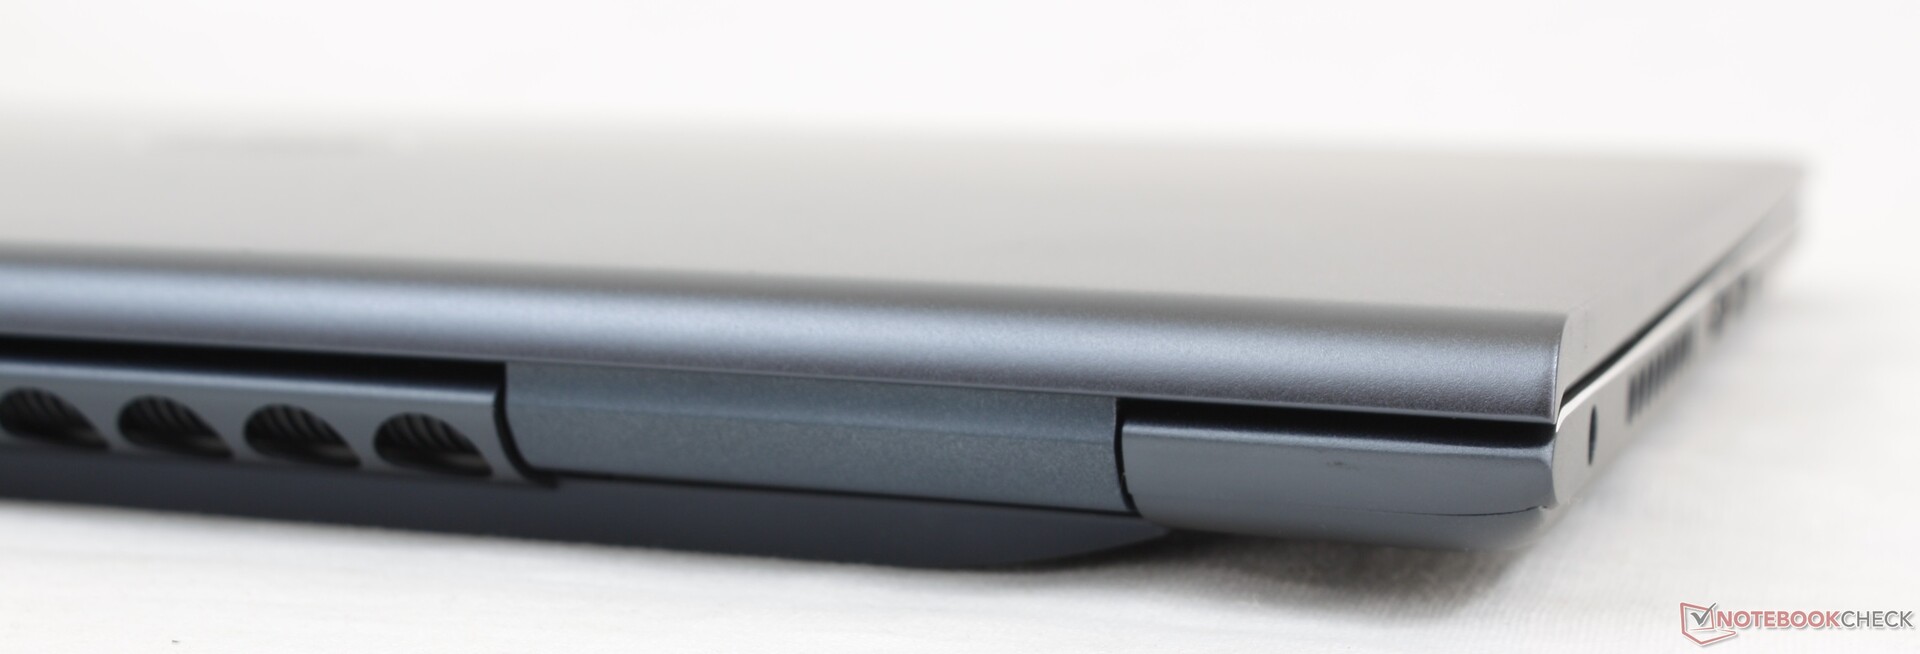
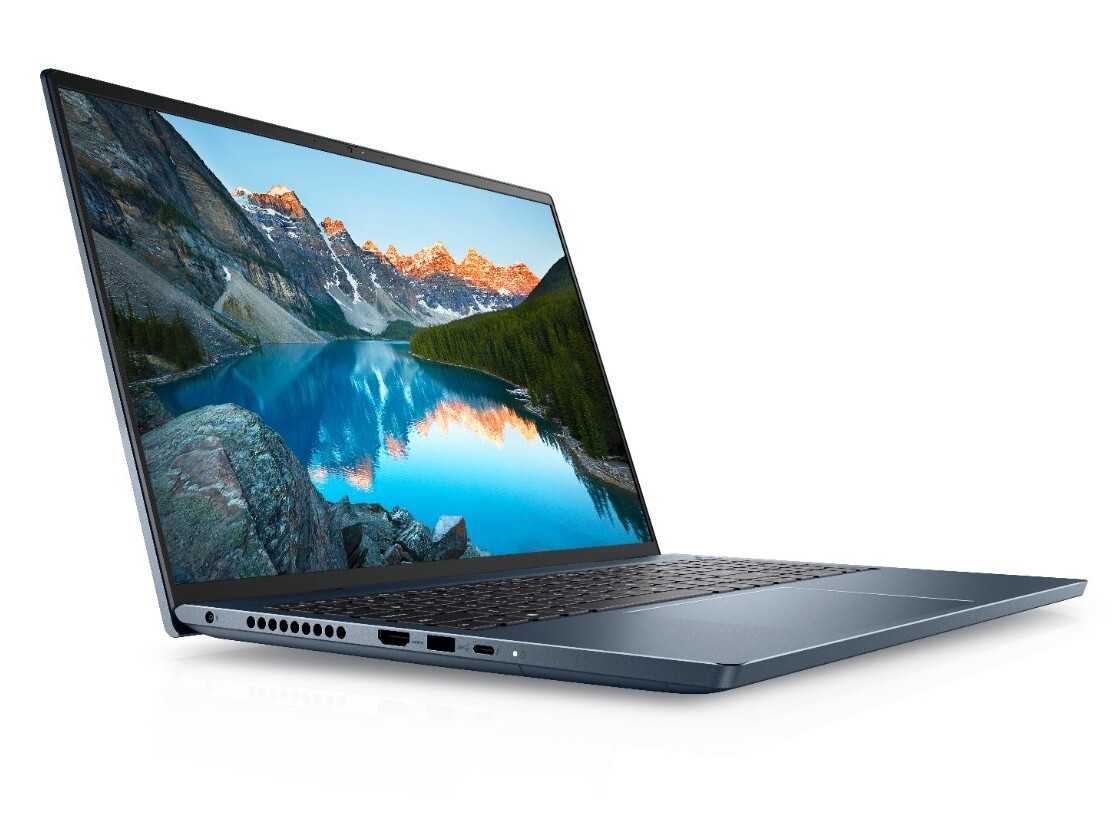
Gehäuse — Schwer und robust
Das Gehäuse scheint mit denen anderer Inspiron-15- oder Inspiron-17-Modelle nicht viel gemeinsam zu haben und stattdessen auf ein neues Design zu setzen. Das aktuelle Inspiron 15 nutzt beispielsweise Scharniere, welche die Basiseinheit zur Belüftung anwinkeln, wodurch es auf auffällige Belüftungsschlitze seitlich und auf der Rückseite verzichten kann. Dagegen besitzt das Inspiron 16 eher klassische Scharniere und sichtbare Belüftungsschlitze rund um das Gerät. Das Gehäuse und der Deckel sind starrer und qualitativ höherwertig als bei allen Inspiron-15-Laptops, die wir bisher getestet haben. Da das Gehäuse auf der Außenseite des Deckels am schwächsten ist, raten wir davon ab, schwere Bücher darauf abzulegen.
Die solide Konstruktion geht auf Kosten des Gewichts, das hier noch höher ist als beim bereits relativ schweren XPS 15. Im Größenvergleich mit anderen 16-Zoll-Modellen kommt das Inspiron 16 dem leistungsfähigeren Asus Zephyrus M16 sehr nahe, womit es etwas kleiner und leichter ist als das Pavilion Gaming 16.
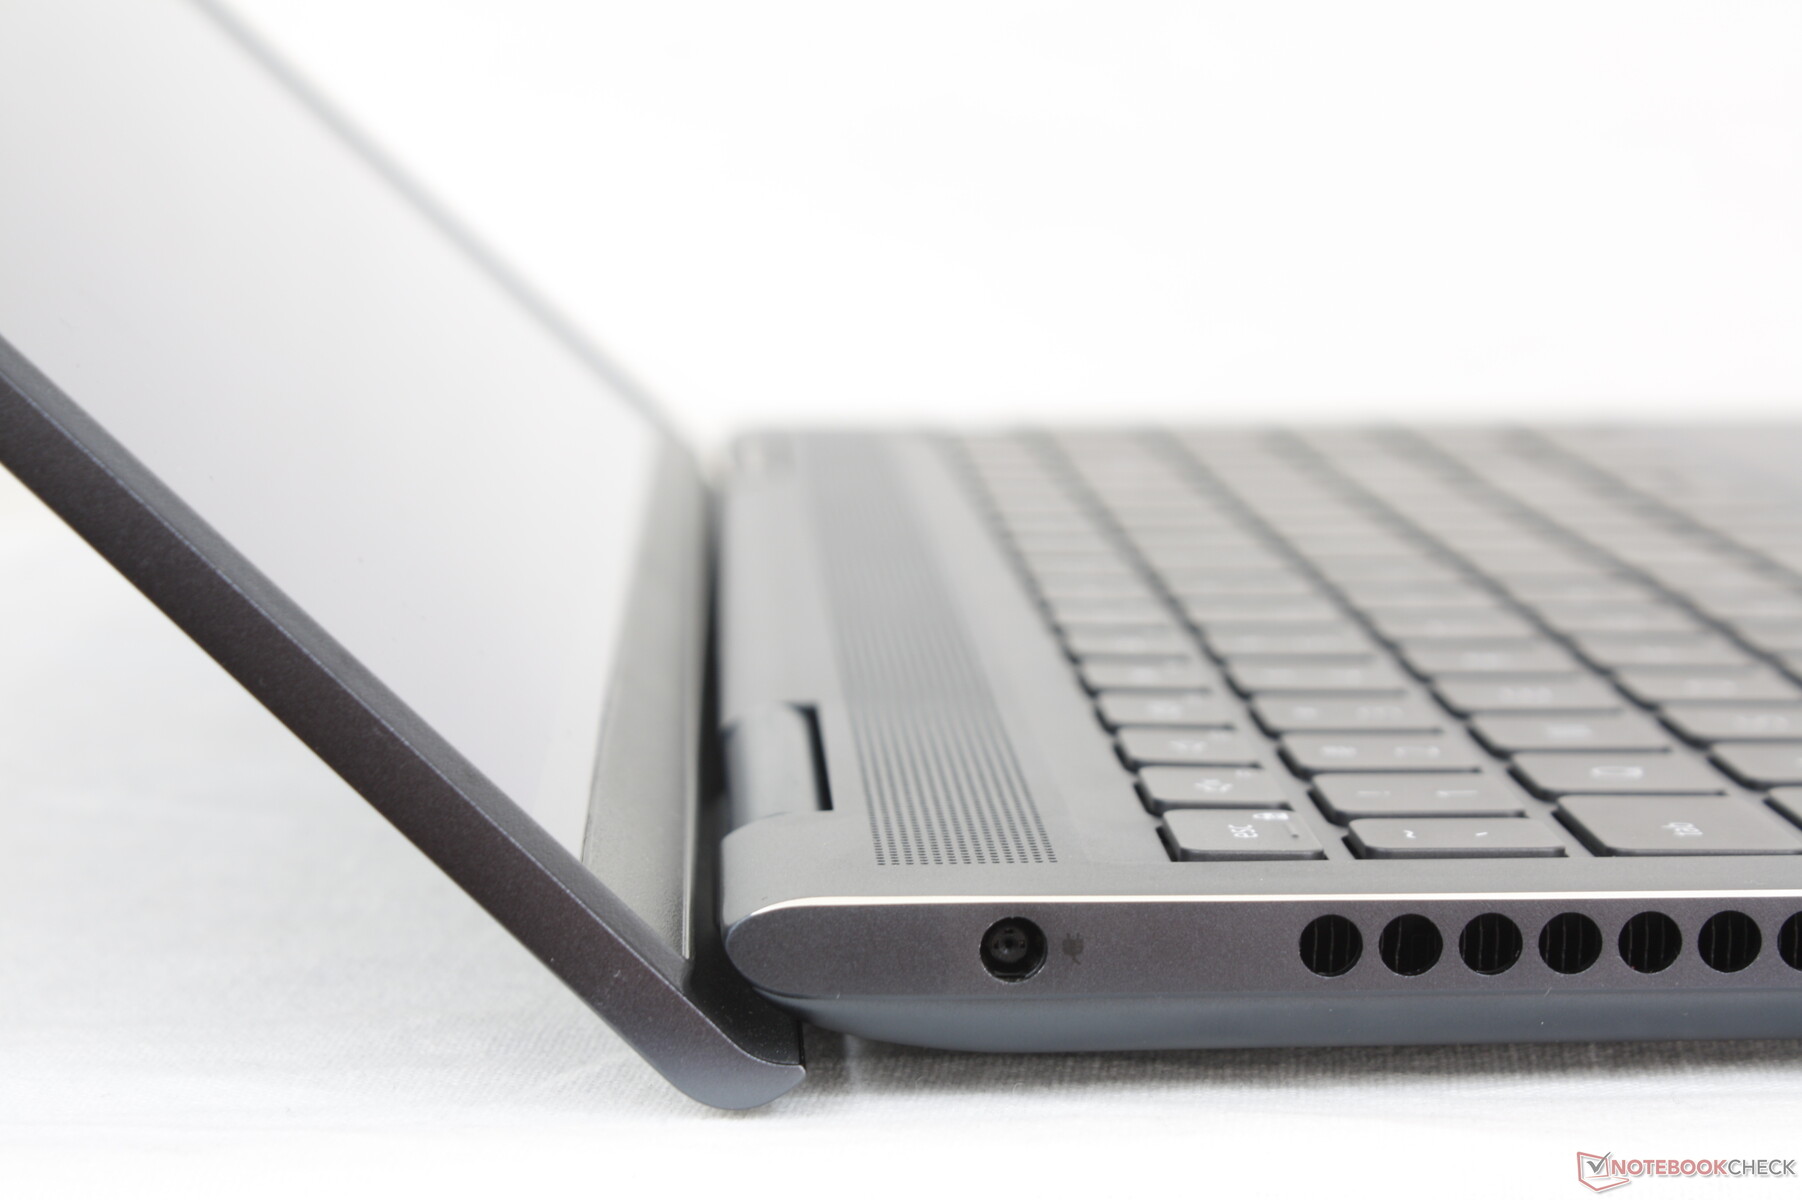
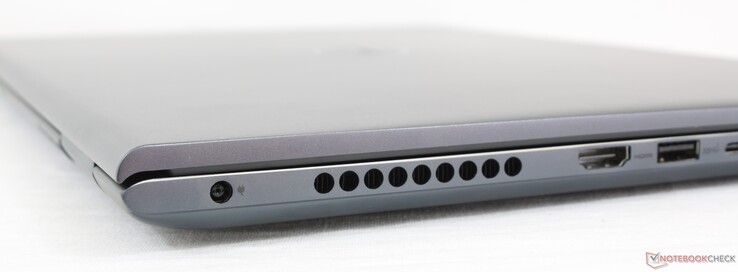
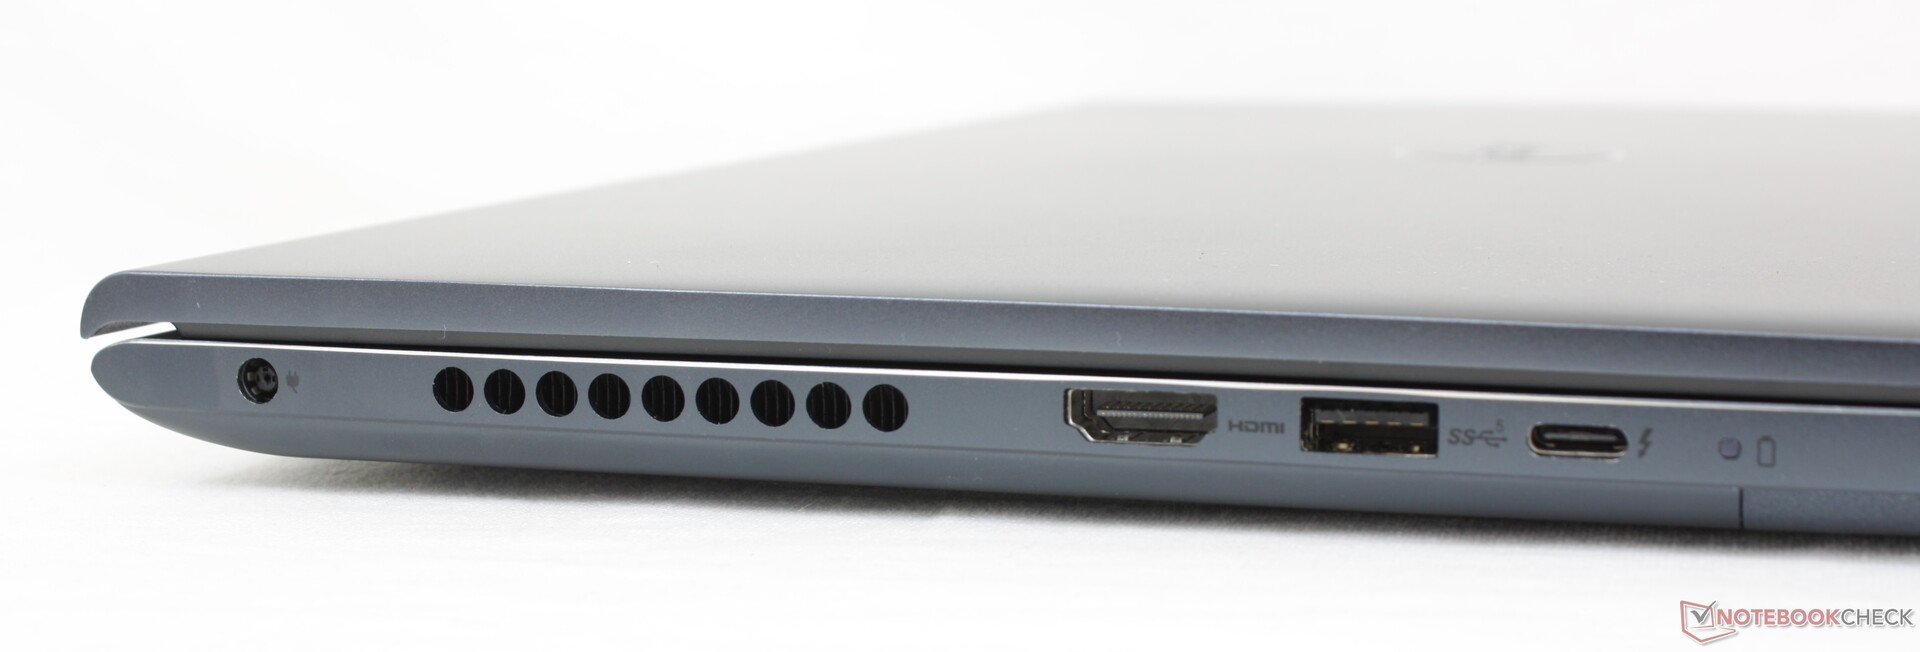
Ausstattung — Von allem etwas
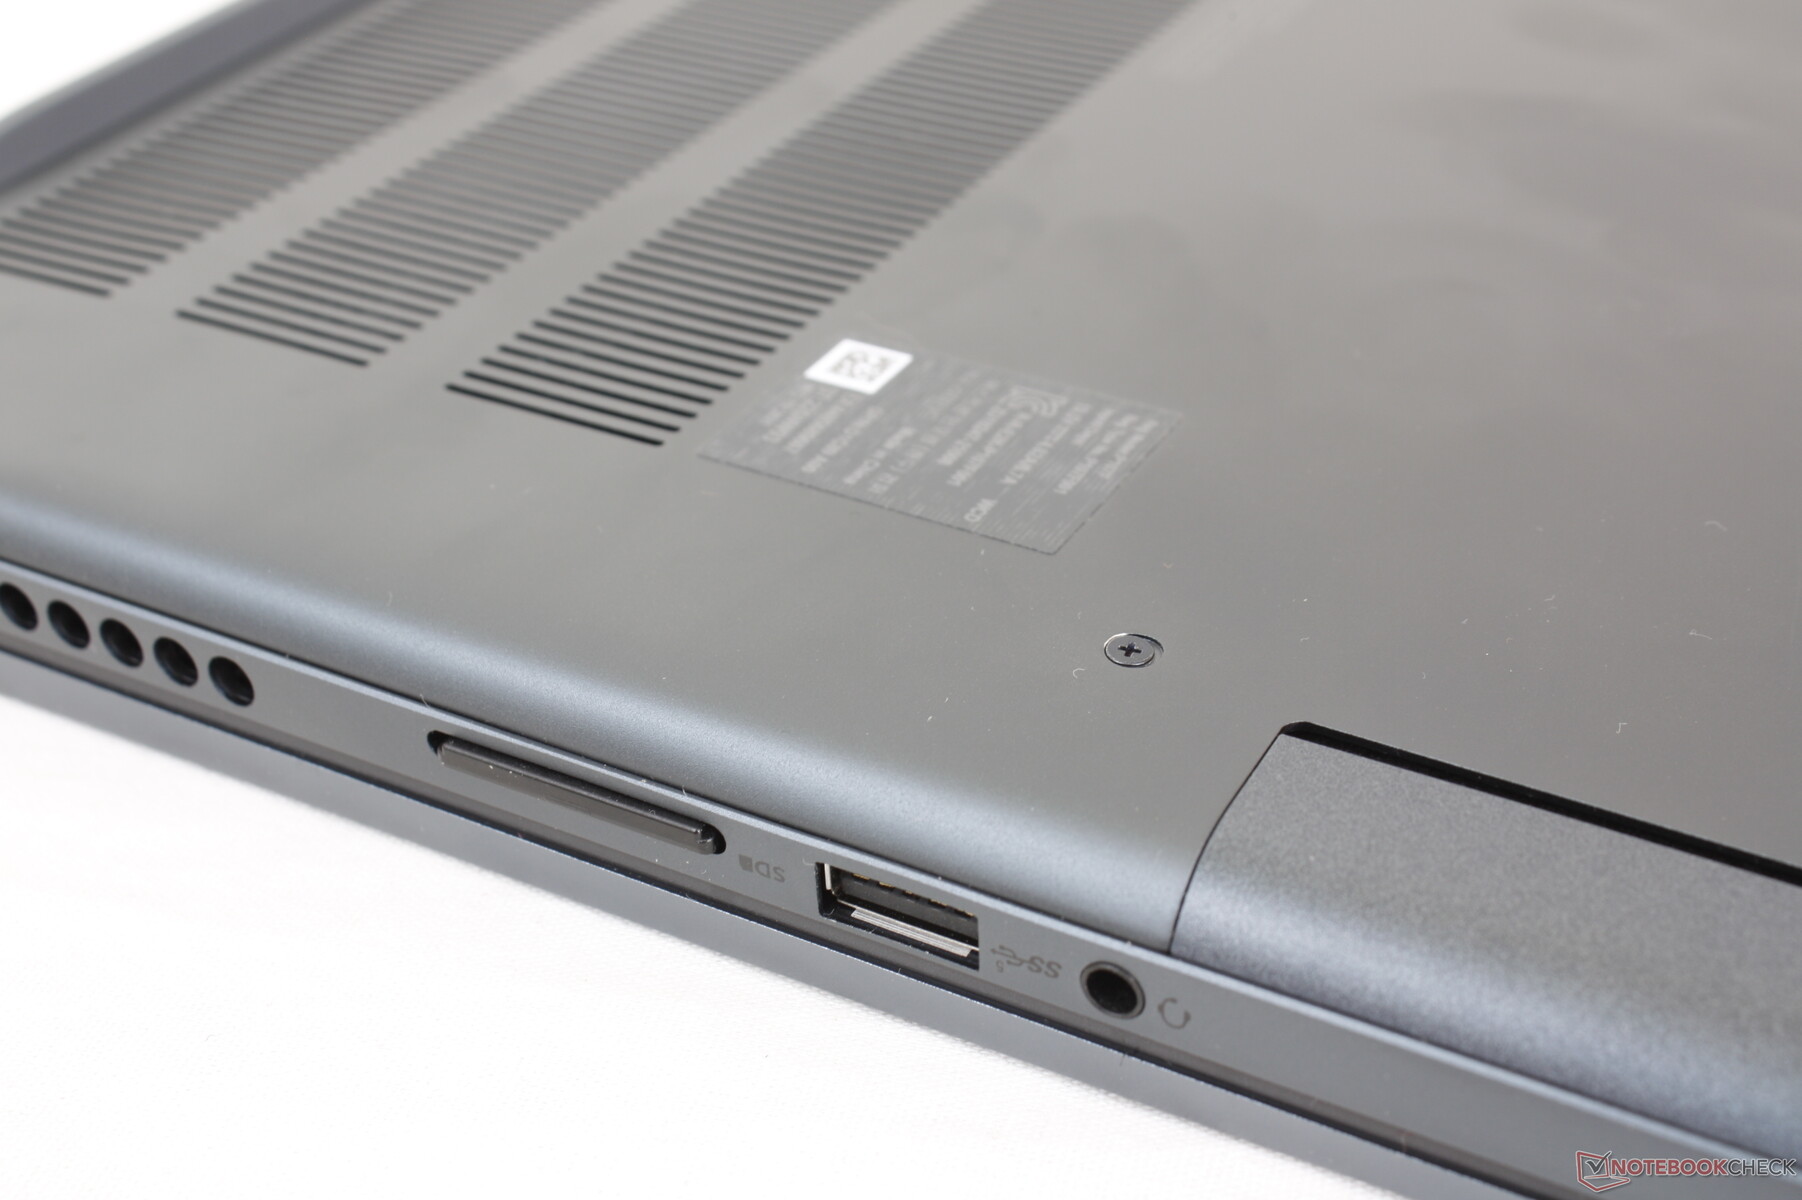
Die Anschlussausstattung ist der des Inspiron 15 7506 2-in-1 sehr ähnlich, es gibt jedoch zwei kleine Unterschiede: Erstens wurde der MicroSD-Kartenleser zu einem vollwertigen SD-Kartenleser, und zweitens weicht das Anschlusslayout aufgrund der neuen Belüftungsschlitze leicht ab. Im Gegensatz zur XPS-Reihe, bei der USB-C-Ports Vorrang haben, sind die Anschlüsse hier gleichmäßiger verteilt.
Erwähnenswert ist an dieser Stelle, dass unsere externe SSD an keinem der beiden USB-A-Ports erkannt wurde. Beim Verbinden des Laufwerks mit einem USB-C-Anschluss gab es hingegen keine Probleme. Wir empfehlen Käufern daher, die USB-A-Ports nach dem Kauf auf mögliche Probleme zu prüfen.

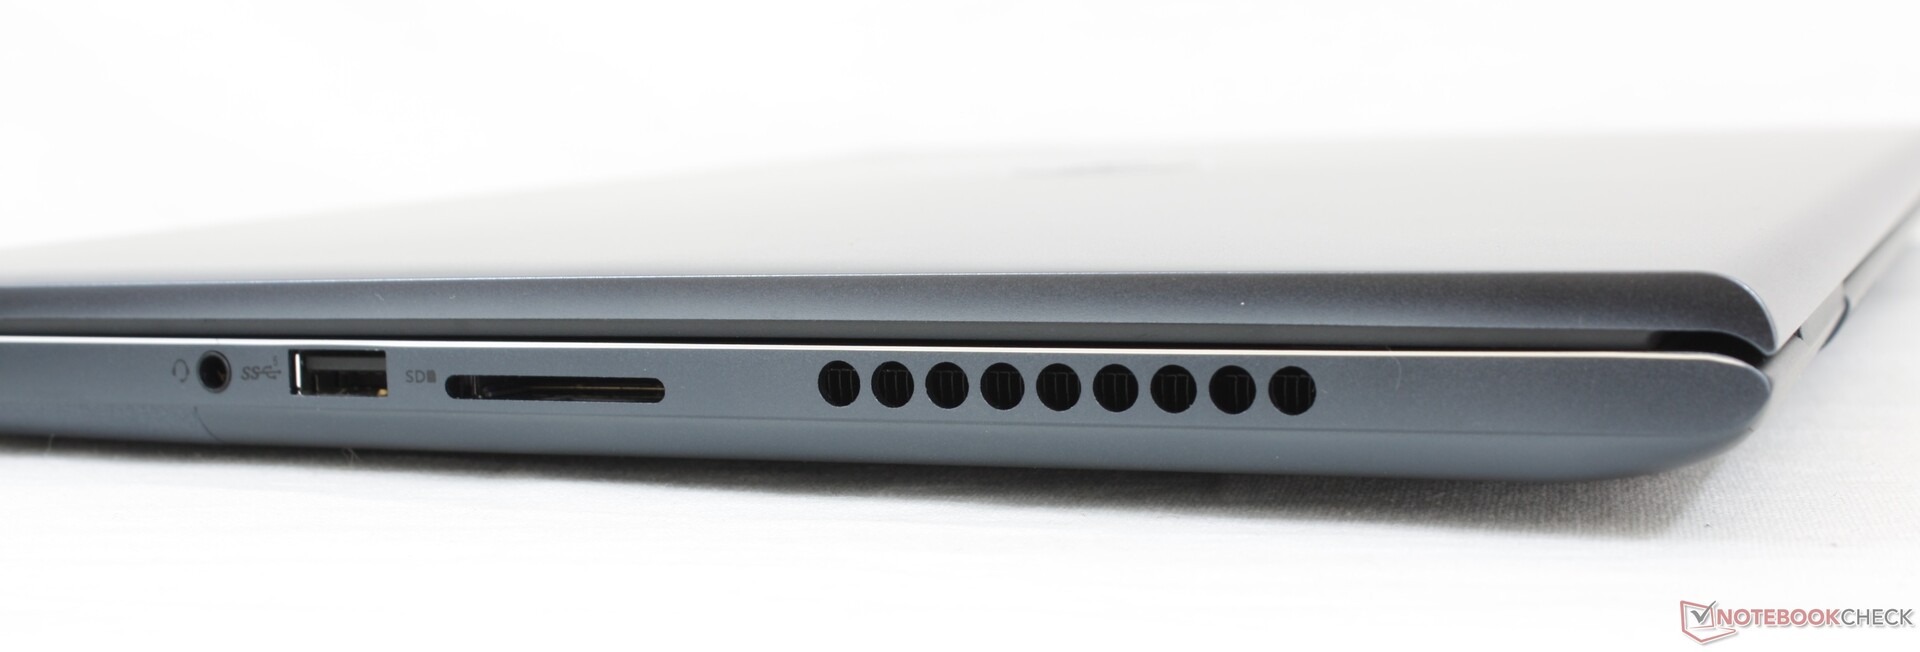
SD-Kartenleser
Die Übertragungsraten des gefederten SD-Kartenlesers sind sehr langsam. 1 GB Bilder von unserer UHS-II-Testkarte auf den Desktop zu übertragen, dauert hier mehr als 50 Sekunden, während das XPS 15 nur 6 Sekunden benötigt.
| SD Card Reader | |
| average JPG Copy Test (av. of 3 runs) | |
| Asus ROG Zephyrus M16 GU603H (AV PRO microSD 128 GB V60) | |
| LG Gram 16 (2021) (Toshiba Exceria Pro M501 microSDXC 64GB) | |
| HP Pavilion Gaming 16-a0242ng (Toshiba Exceria Pro SDXC 64 GB UHS-II) | |
| Dell Inspiron 15 7000 7506 2-in-1 Black Edition (Toshiba Exceria Pro M501 microSDXC 32GB) | |
| Dell Inspiron 16 Plus 7610 (AV PRO microSD 128 GB V60) | |
| maximum AS SSD Seq Read Test (1GB) | |
| Asus ROG Zephyrus M16 GU603H (AV PRO microSD 128 GB V60) | |
| LG Gram 16 (2021) (Toshiba Exceria Pro M501 microSDXC 64GB) | |
| HP Pavilion Gaming 16-a0242ng (Toshiba Exceria Pro SDXC 64 GB UHS-II) | |
| Dell Inspiron 15 7000 7506 2-in-1 Black Edition (Toshiba Exceria Pro M501 microSDXC 32GB) | |
| Dell Inspiron 16 Plus 7610 (AV PRO microSD 128 GB V60) | |
Kommunikation
Intels AX201-Modul ist standardmäßig an Bord und bietet WLAN-6- und Bluetooth-5.1-Konnektivität. Im Test mit unserem Netgear Testrouter RAX200 sind keine Probleme aufgetreten.
Webcam
Die Kamera löst wie bei den meisten Laptops üblich mit 1 MP bzw. 720p auf. Eine manuelle Abdeckung ist zwar vorhanden, IR oder Windows Hello werden jedoch nicht unterstützt.


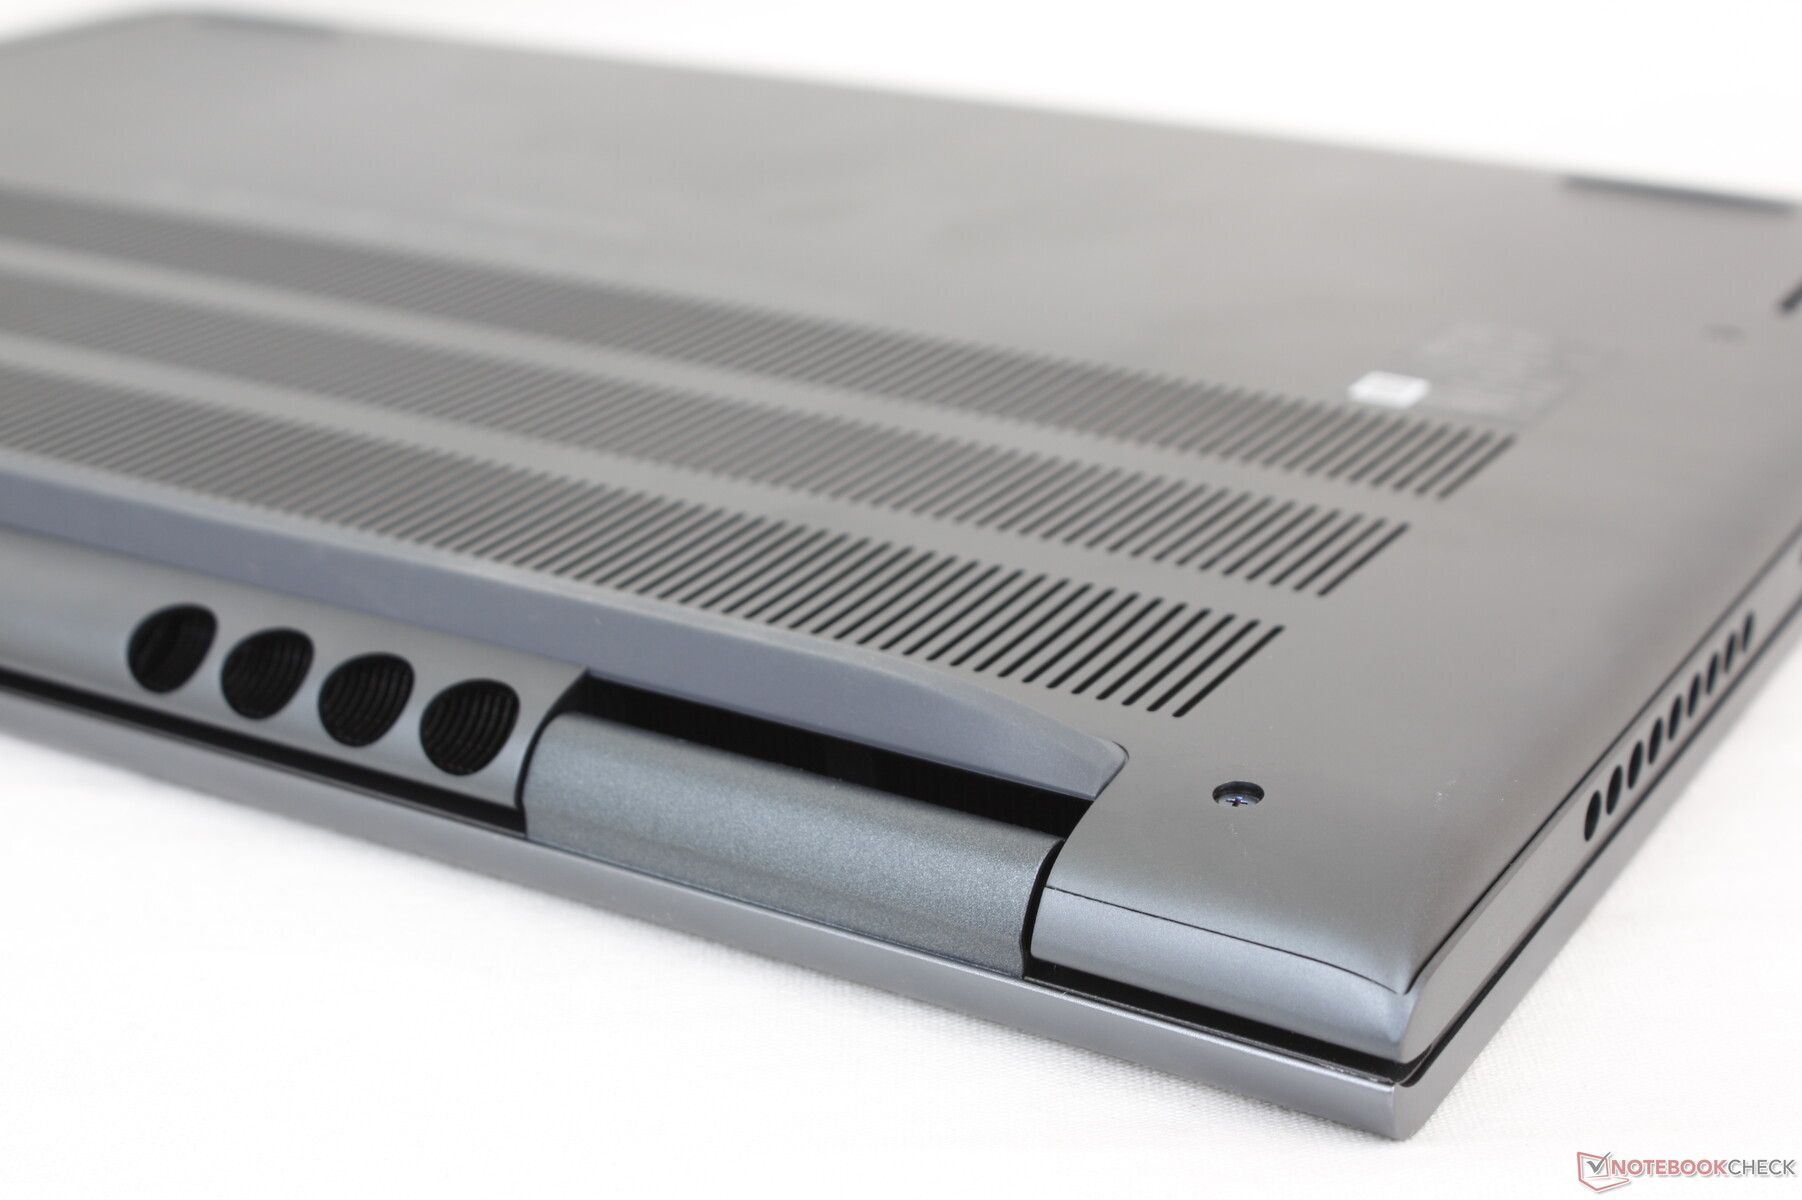
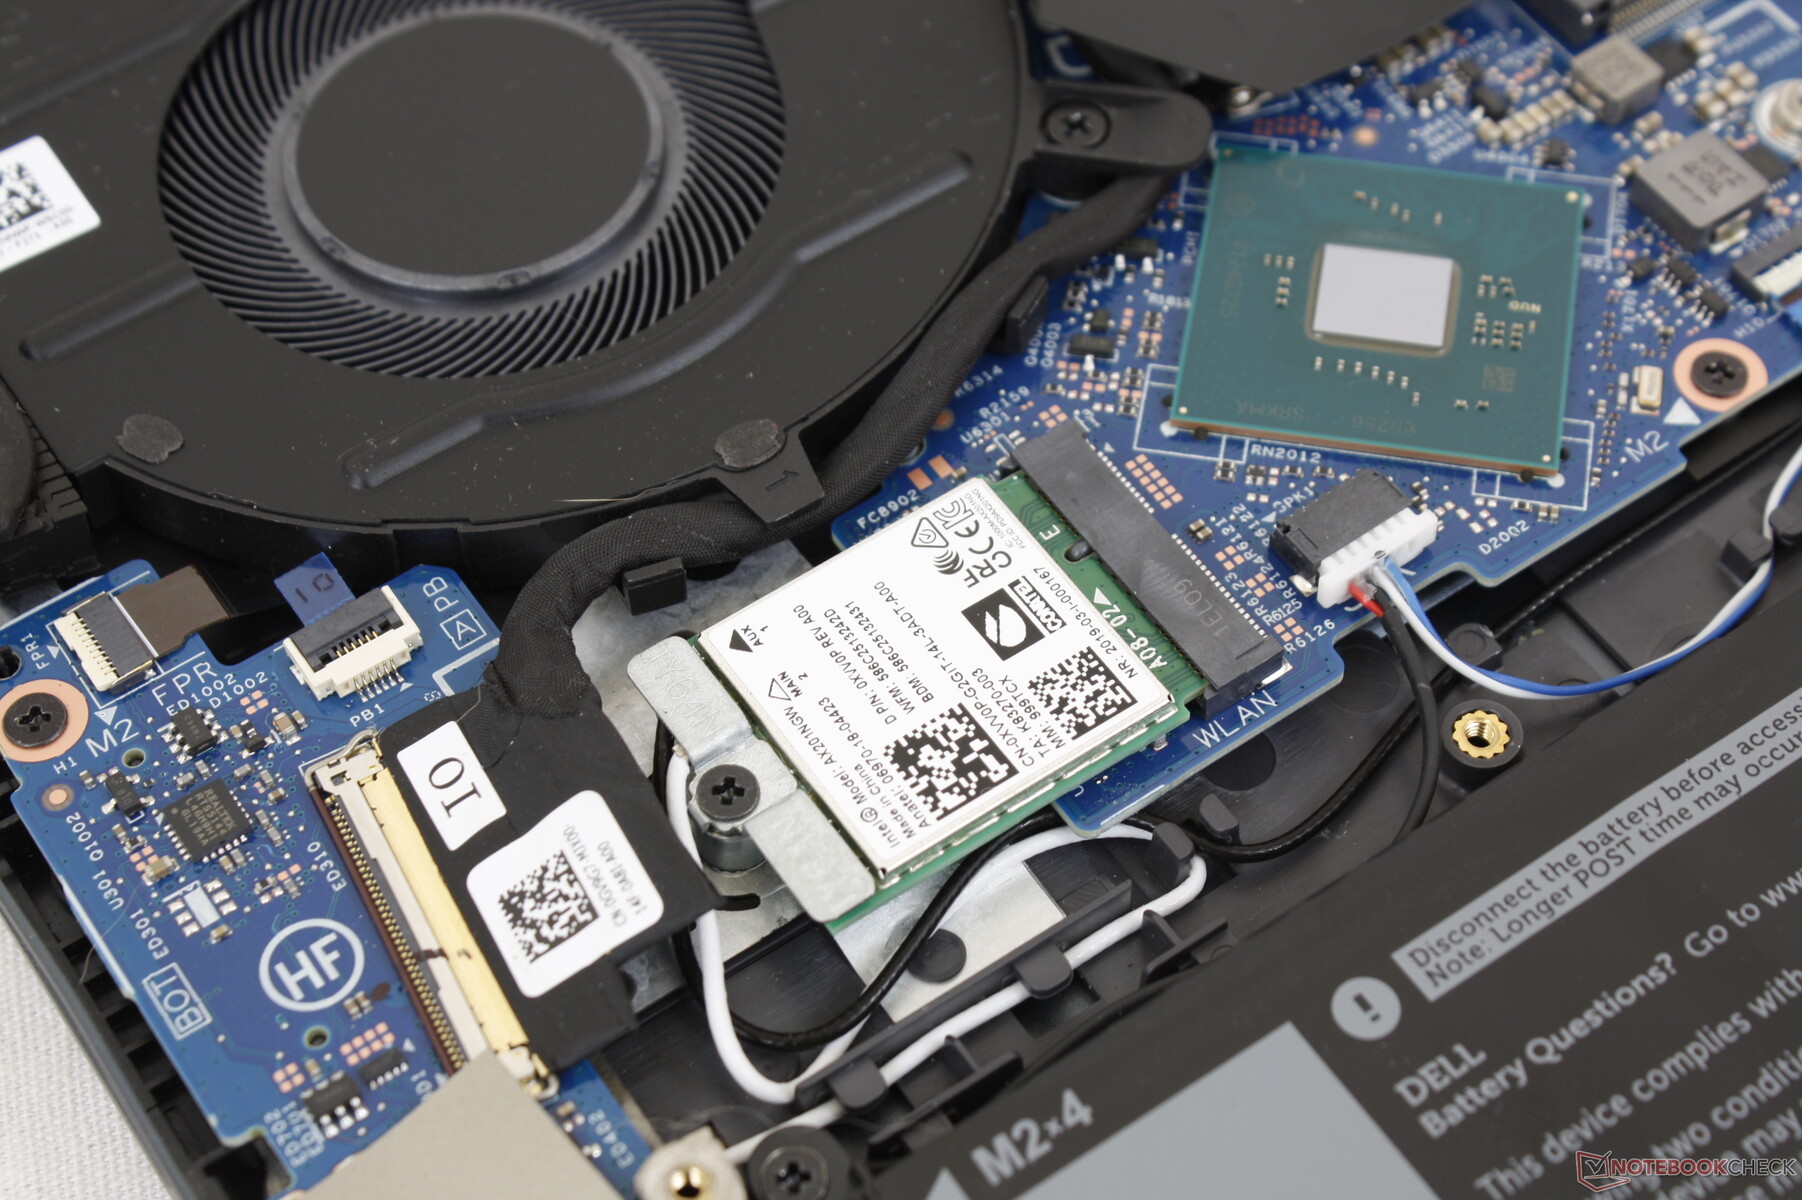
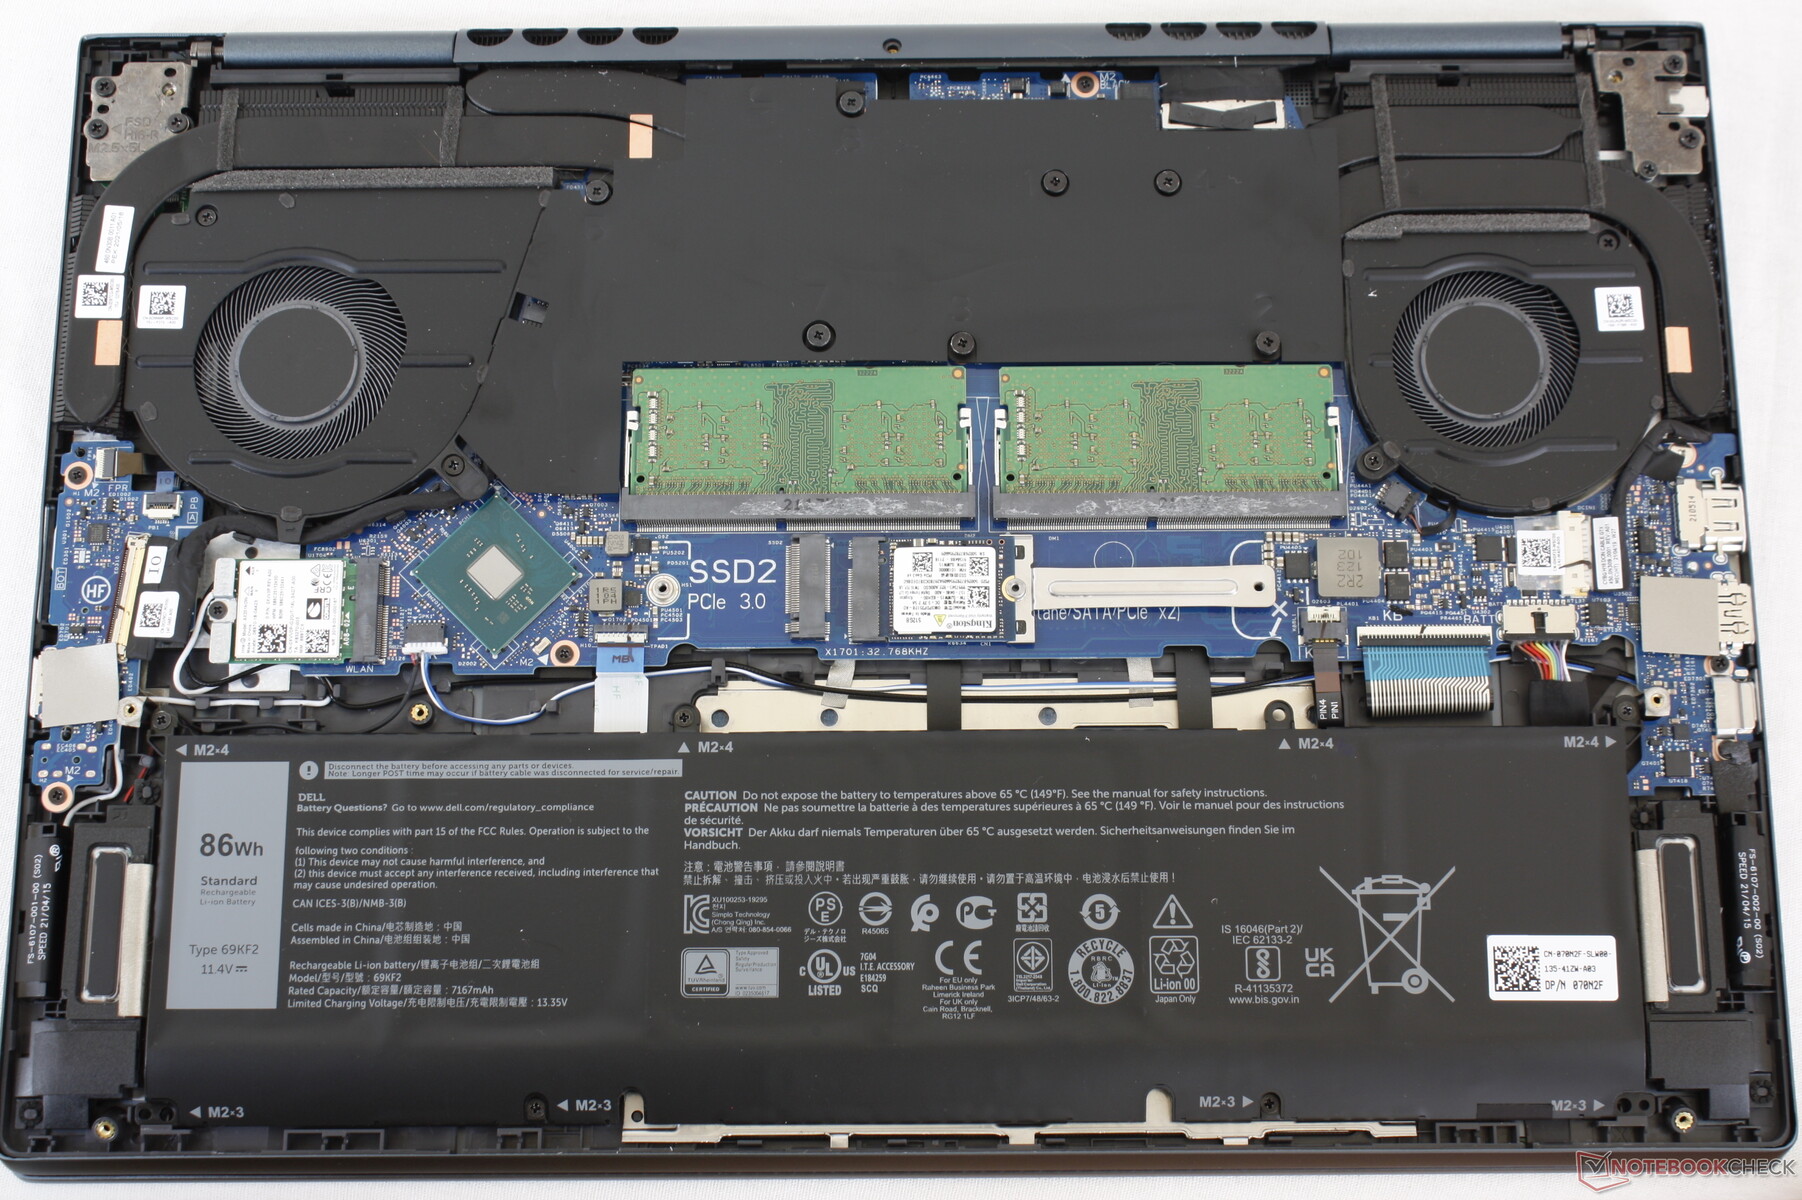
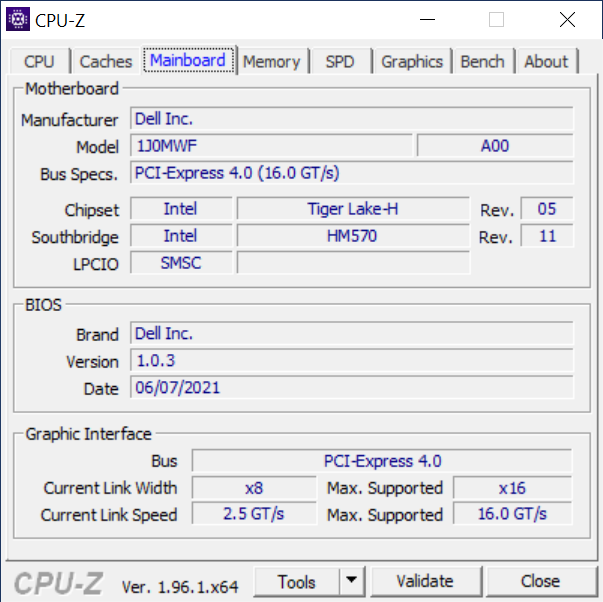
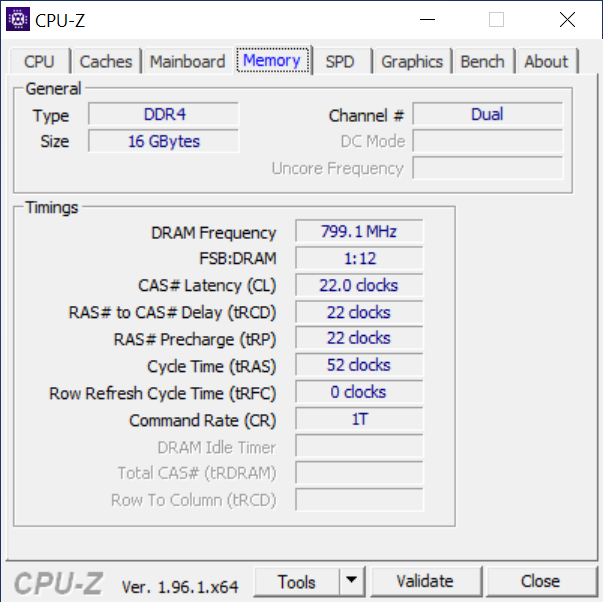
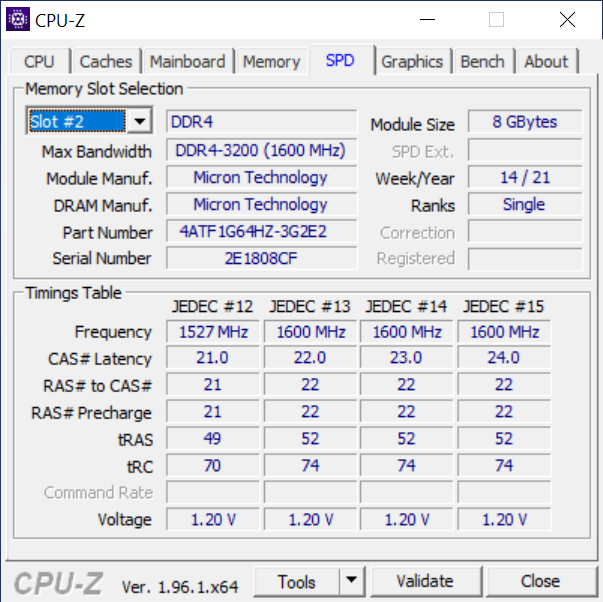
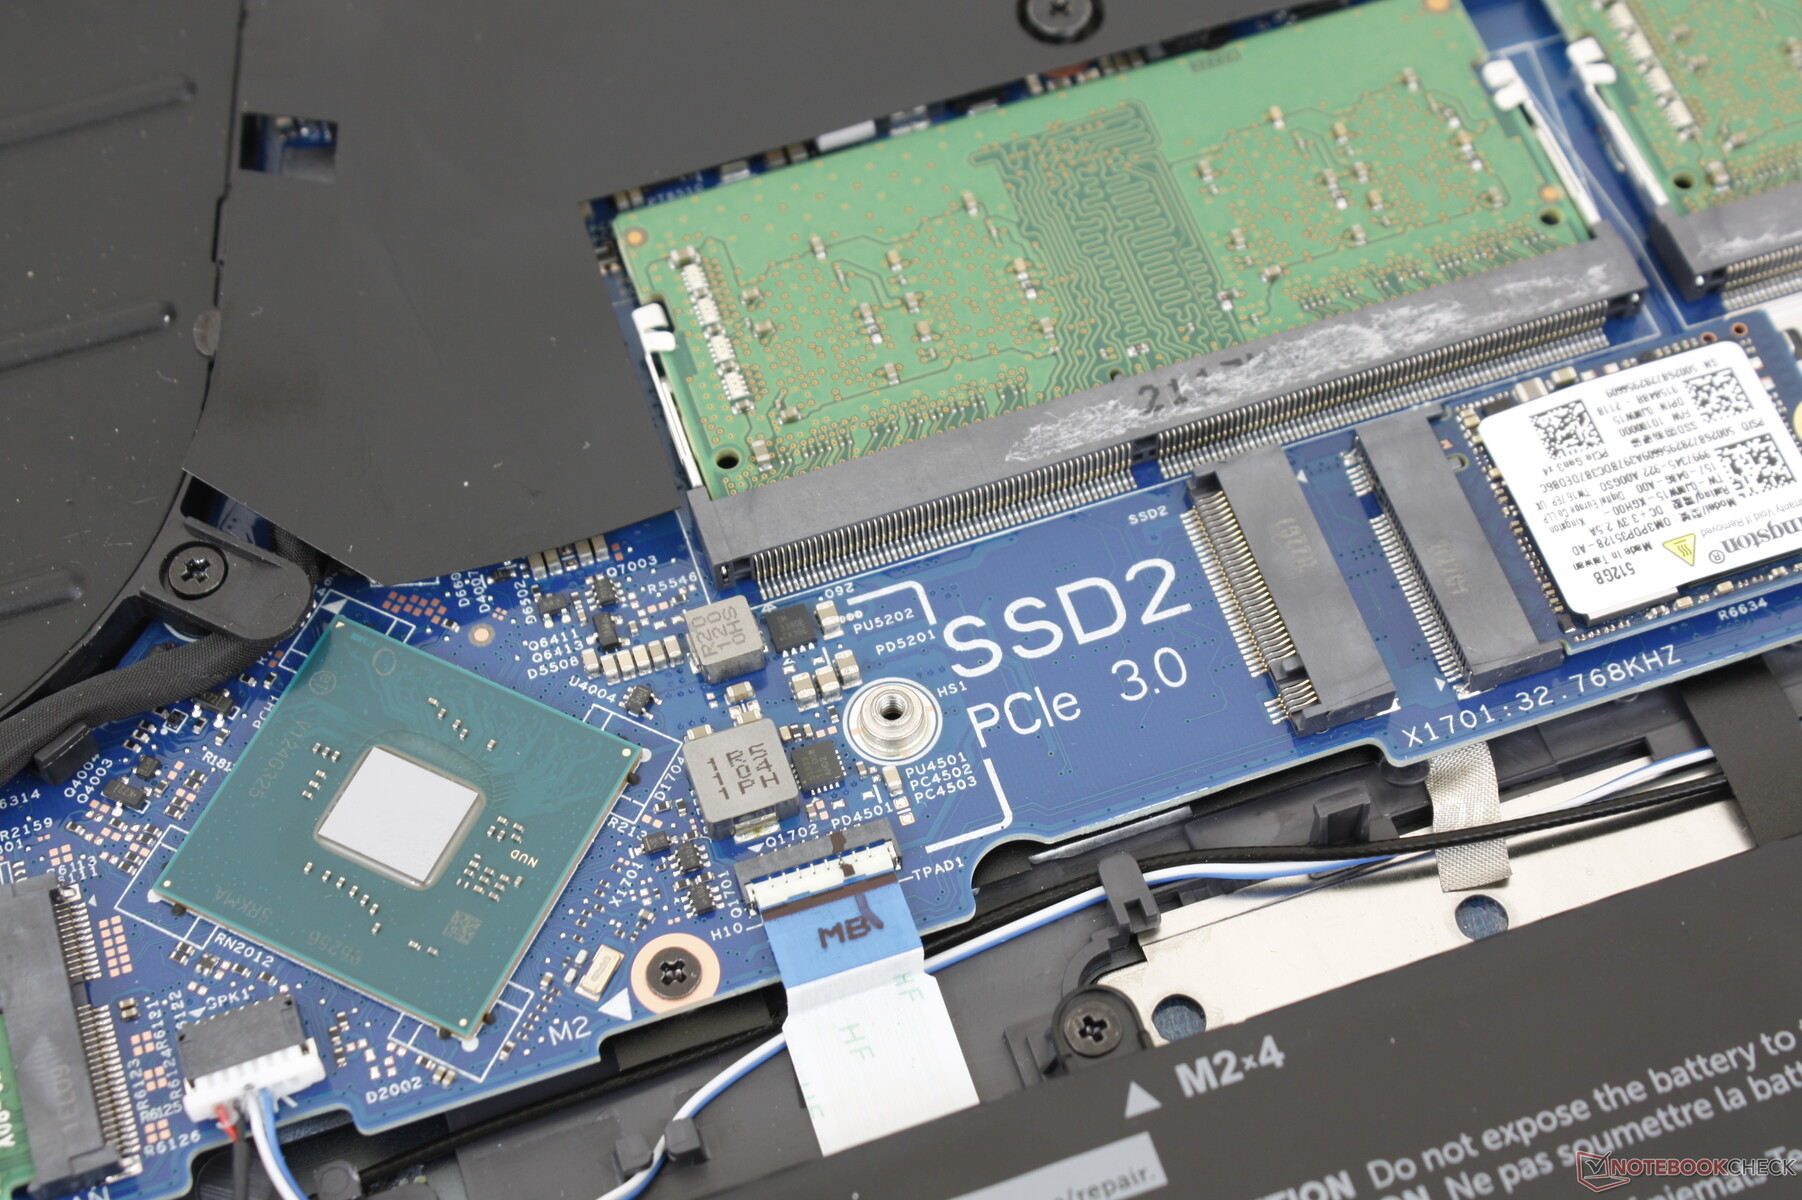
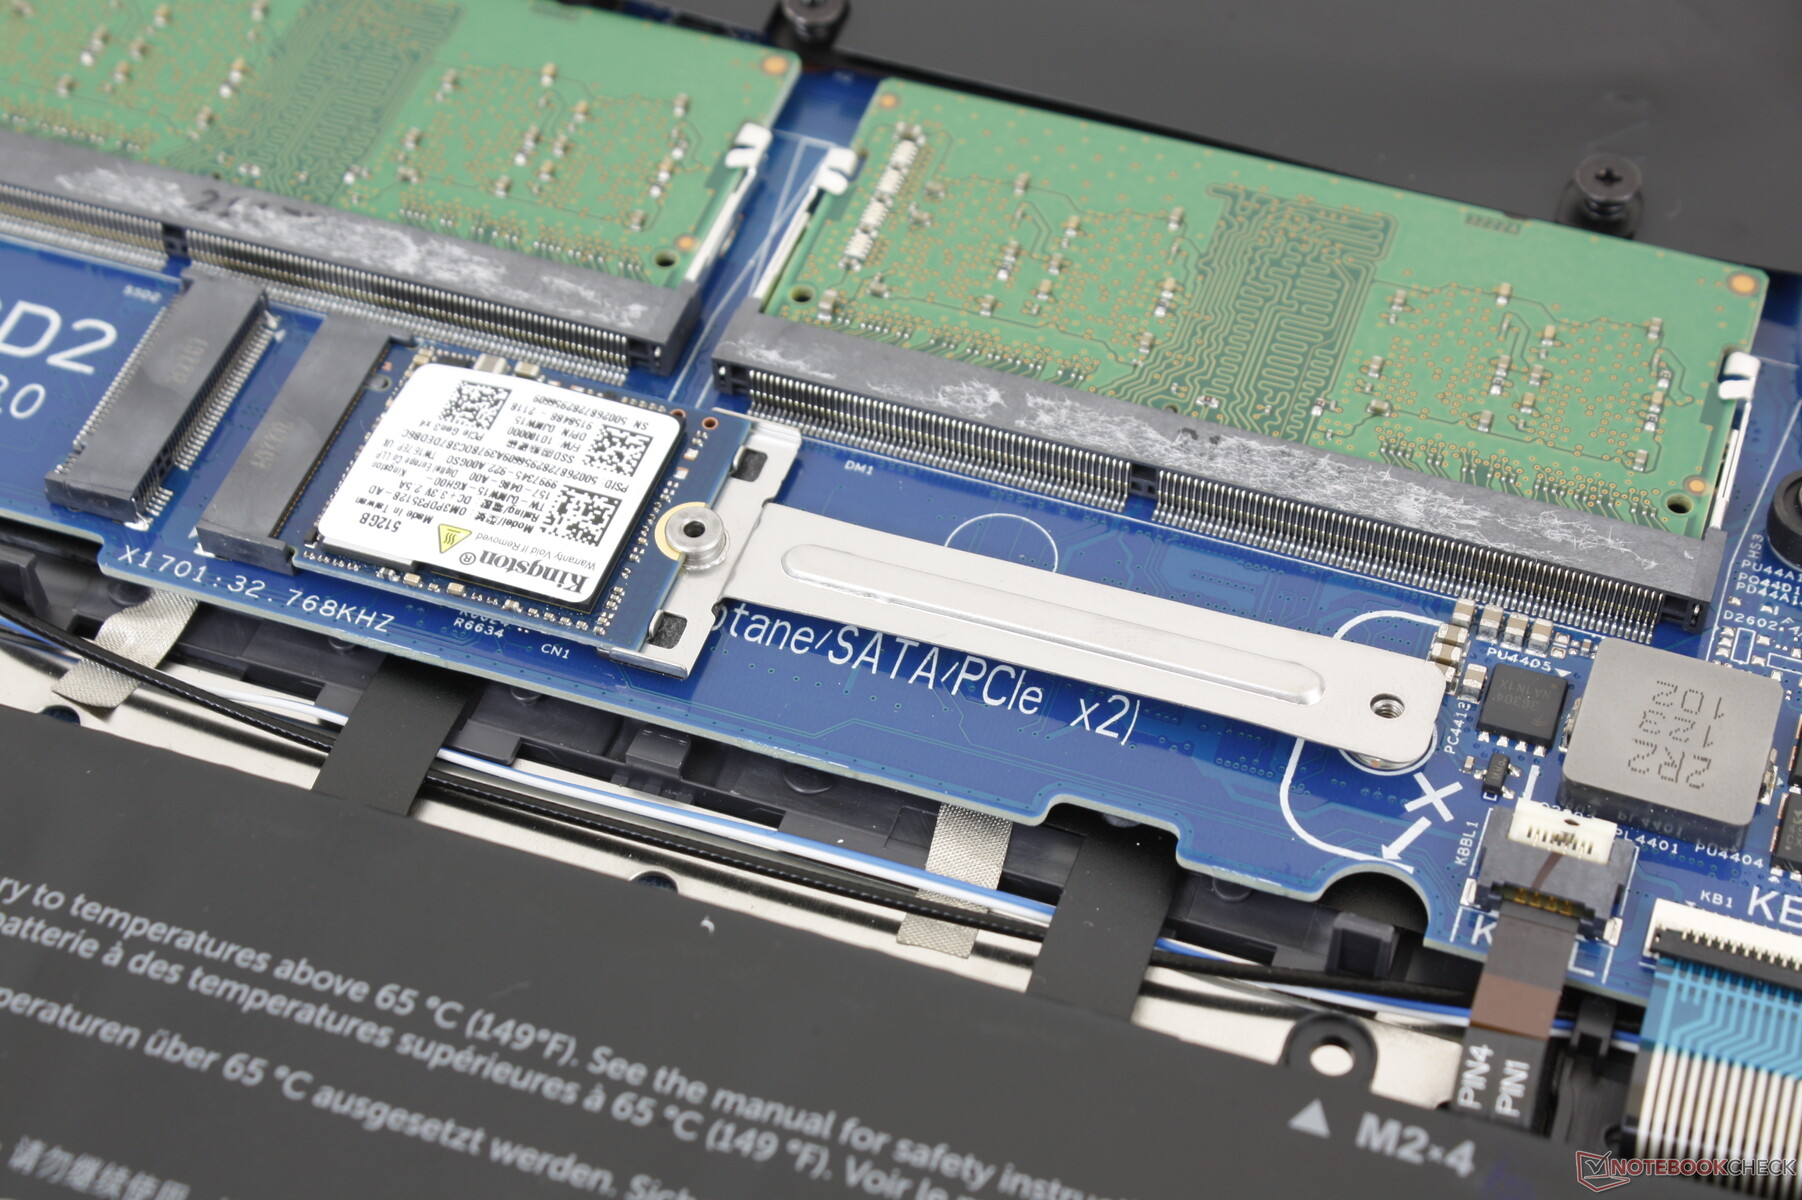
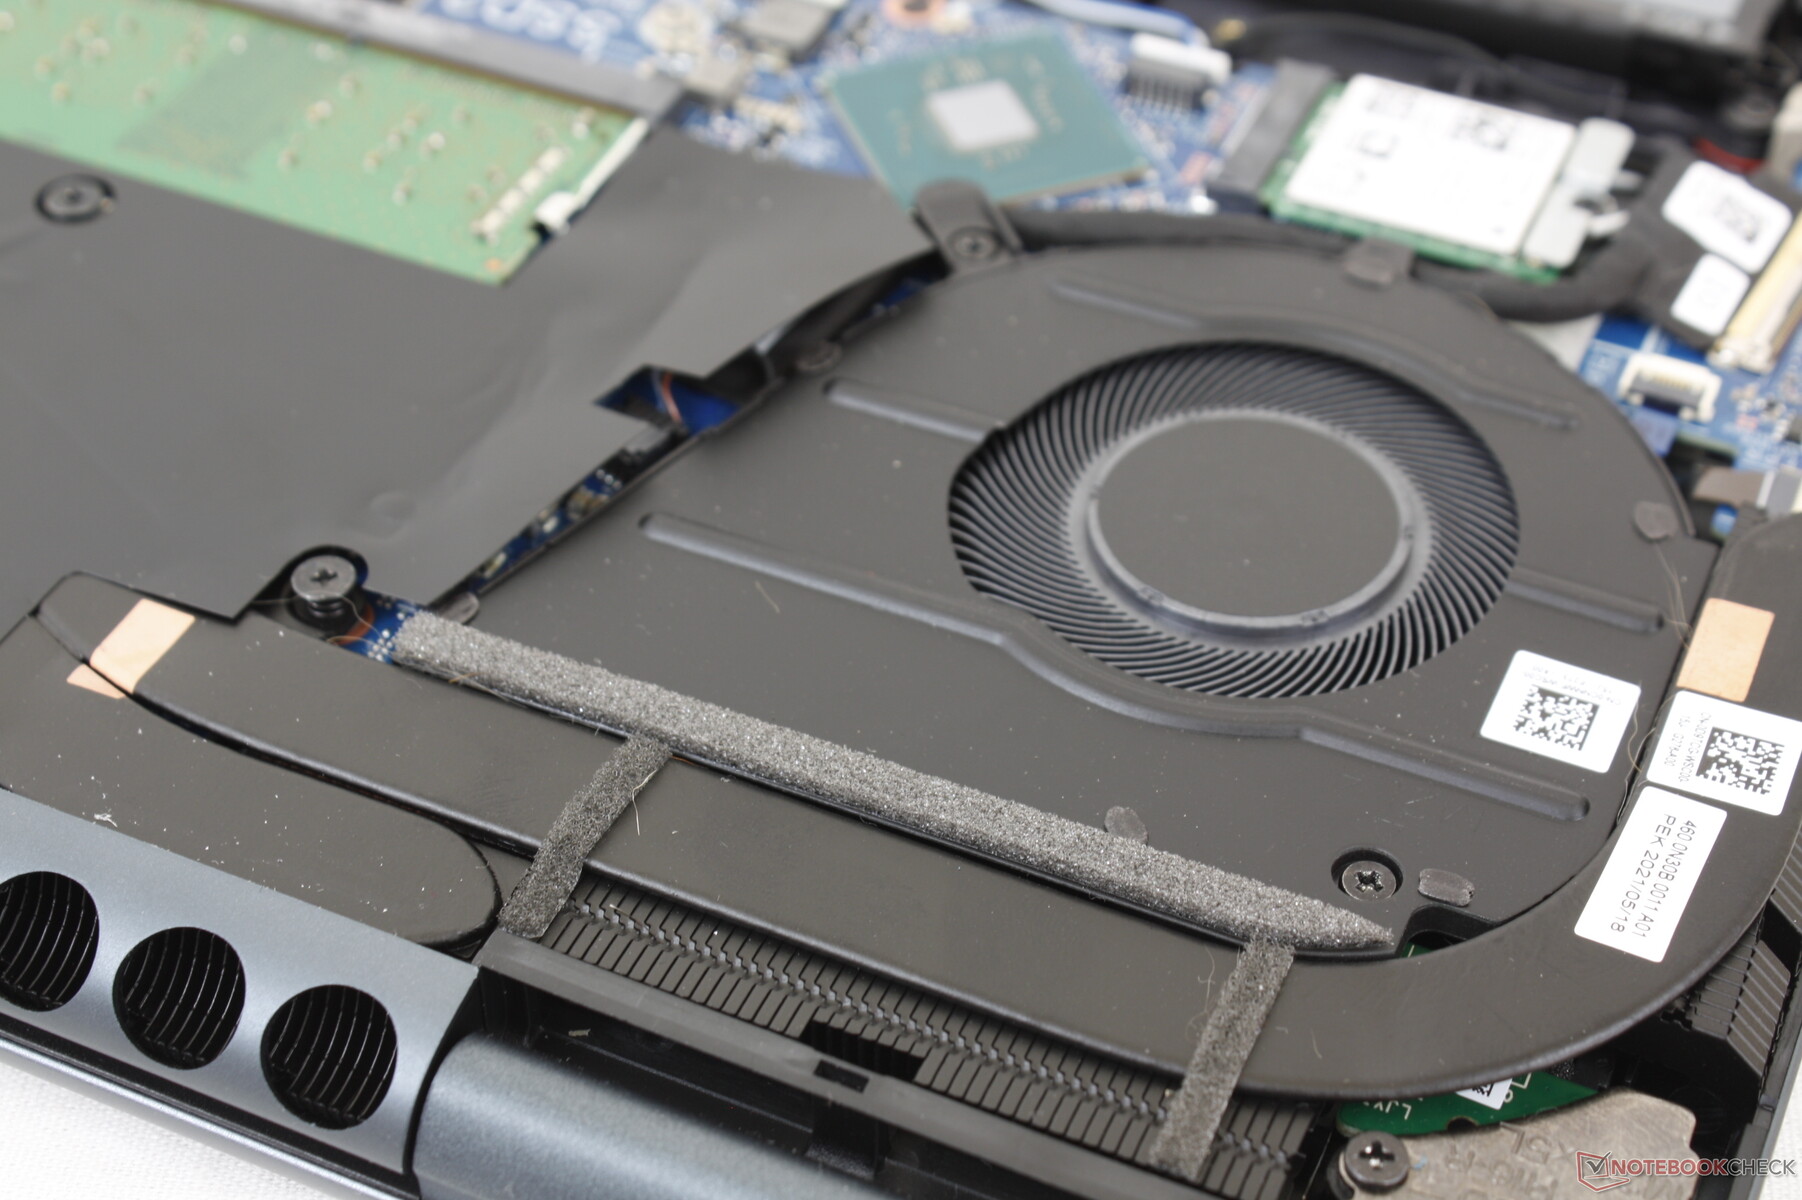
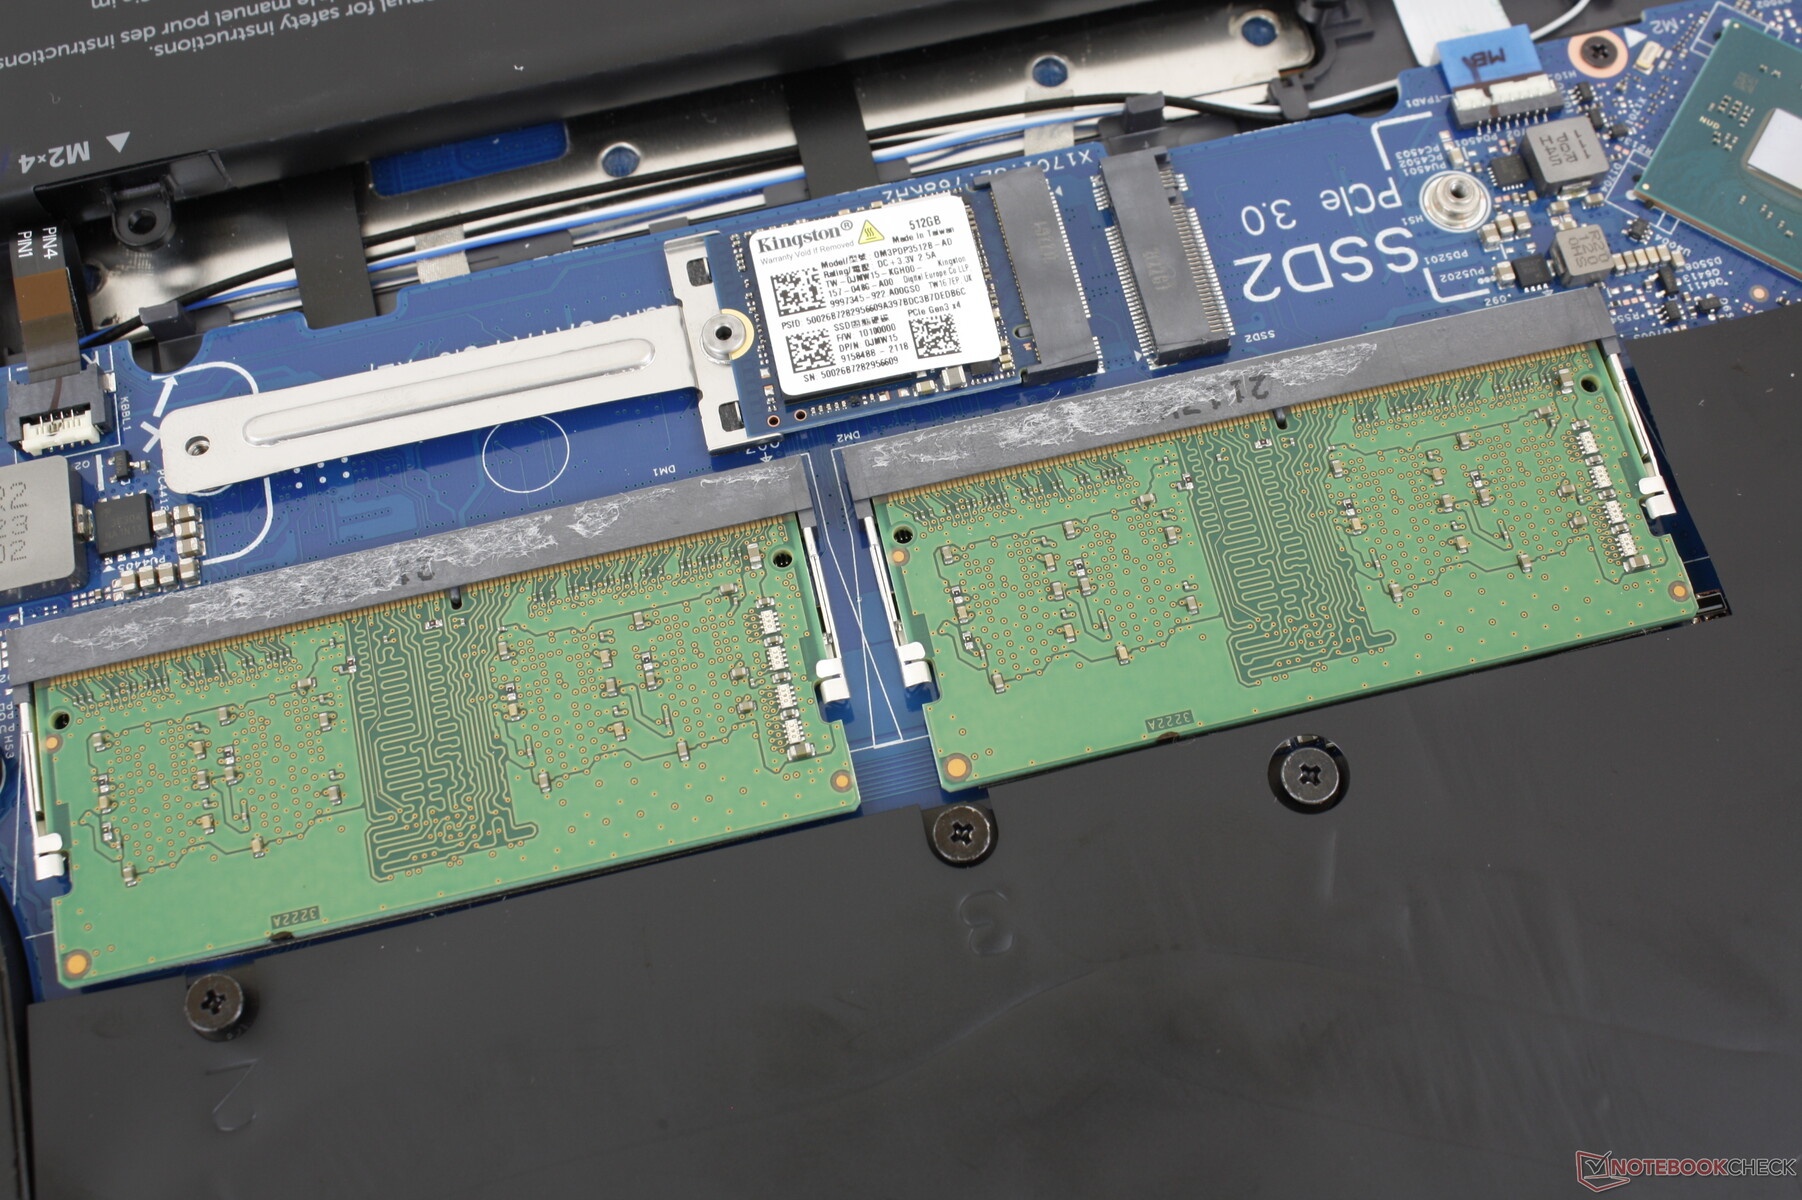
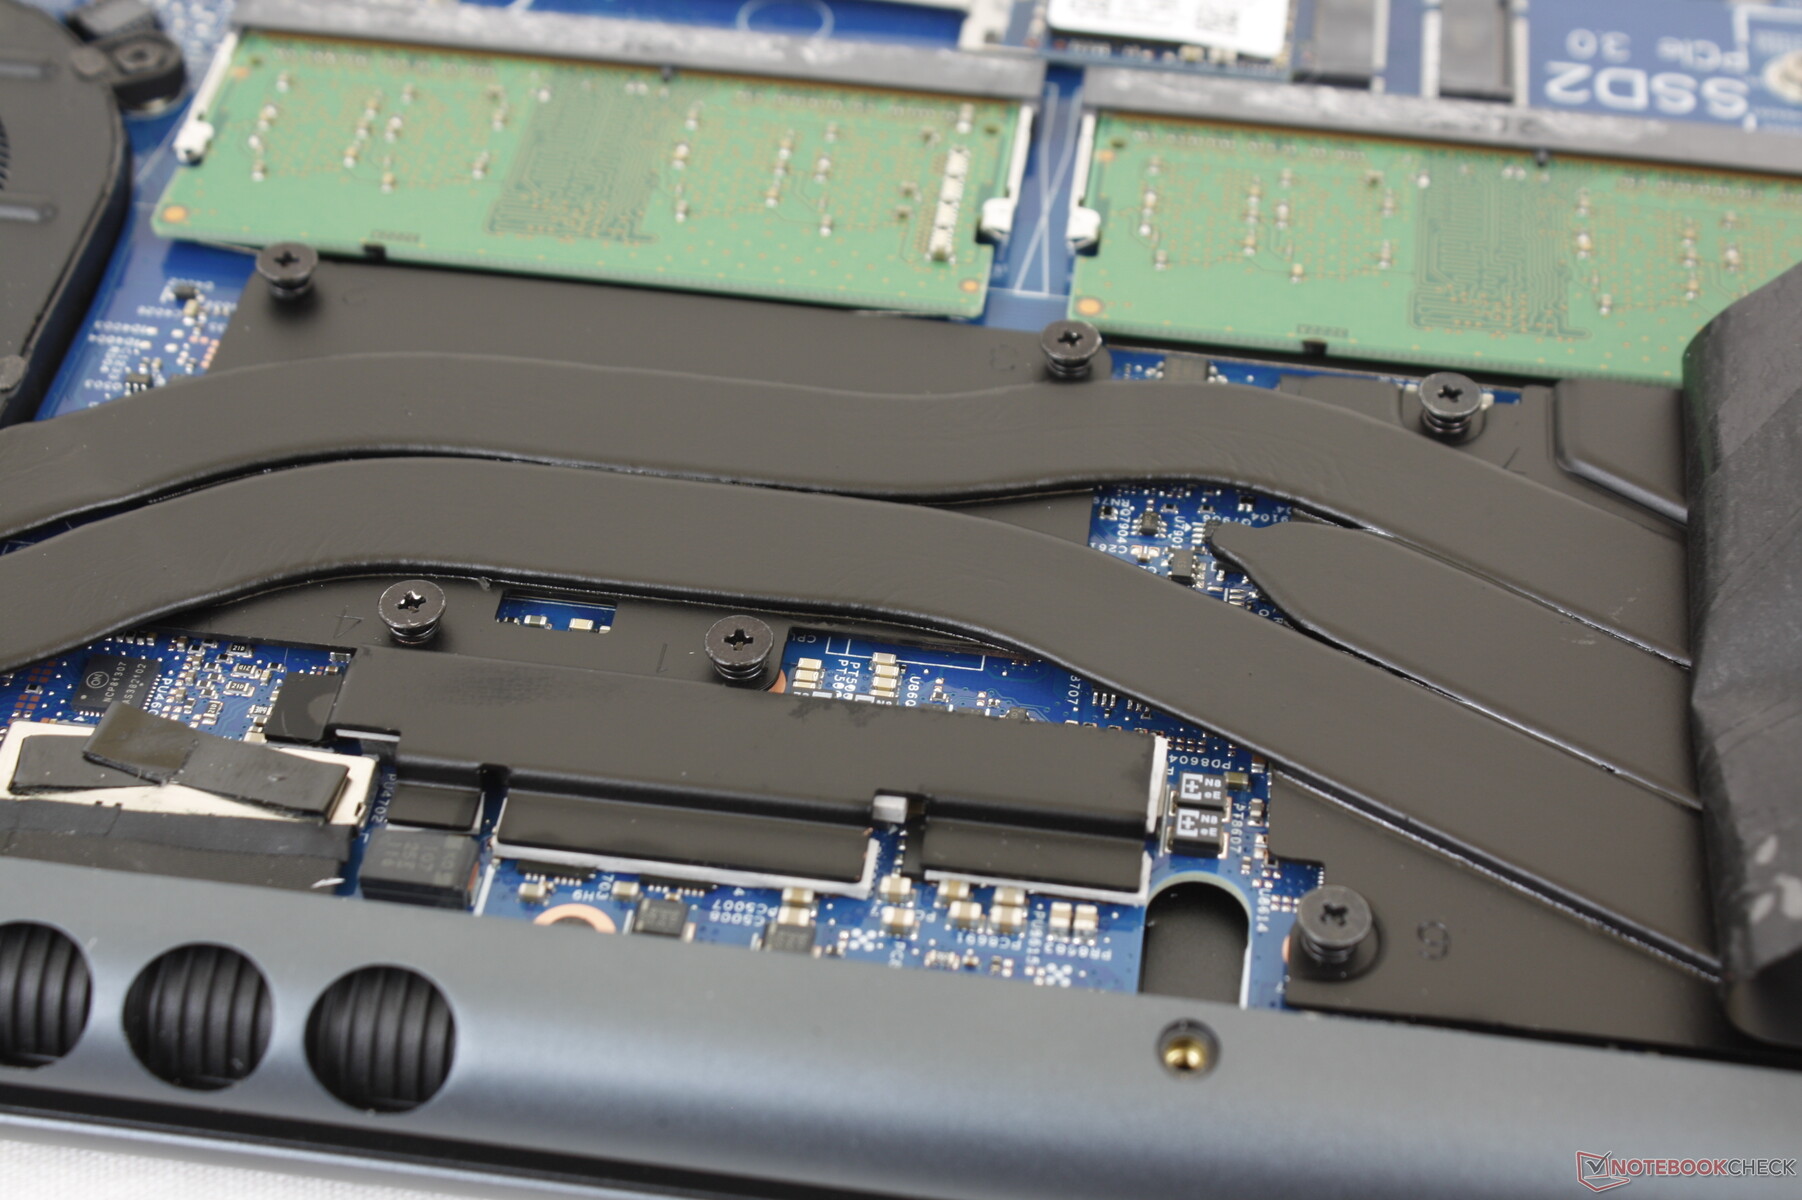
Wartung - Leicht aufrüstbar
Das Entfernen der Bodenplatte erfordert einen Kreuzschraubenzieher, einen Gegenstand mit einer scharfen Kante sowie etwas Geduld und Geschick. Im Inneren hat man direkten Zugriff auf beide SODIMM-Steckplätze, zwei M.2-Speicherplätze und das austauschbare WLAN-Modul.
Garantie und Zubehör
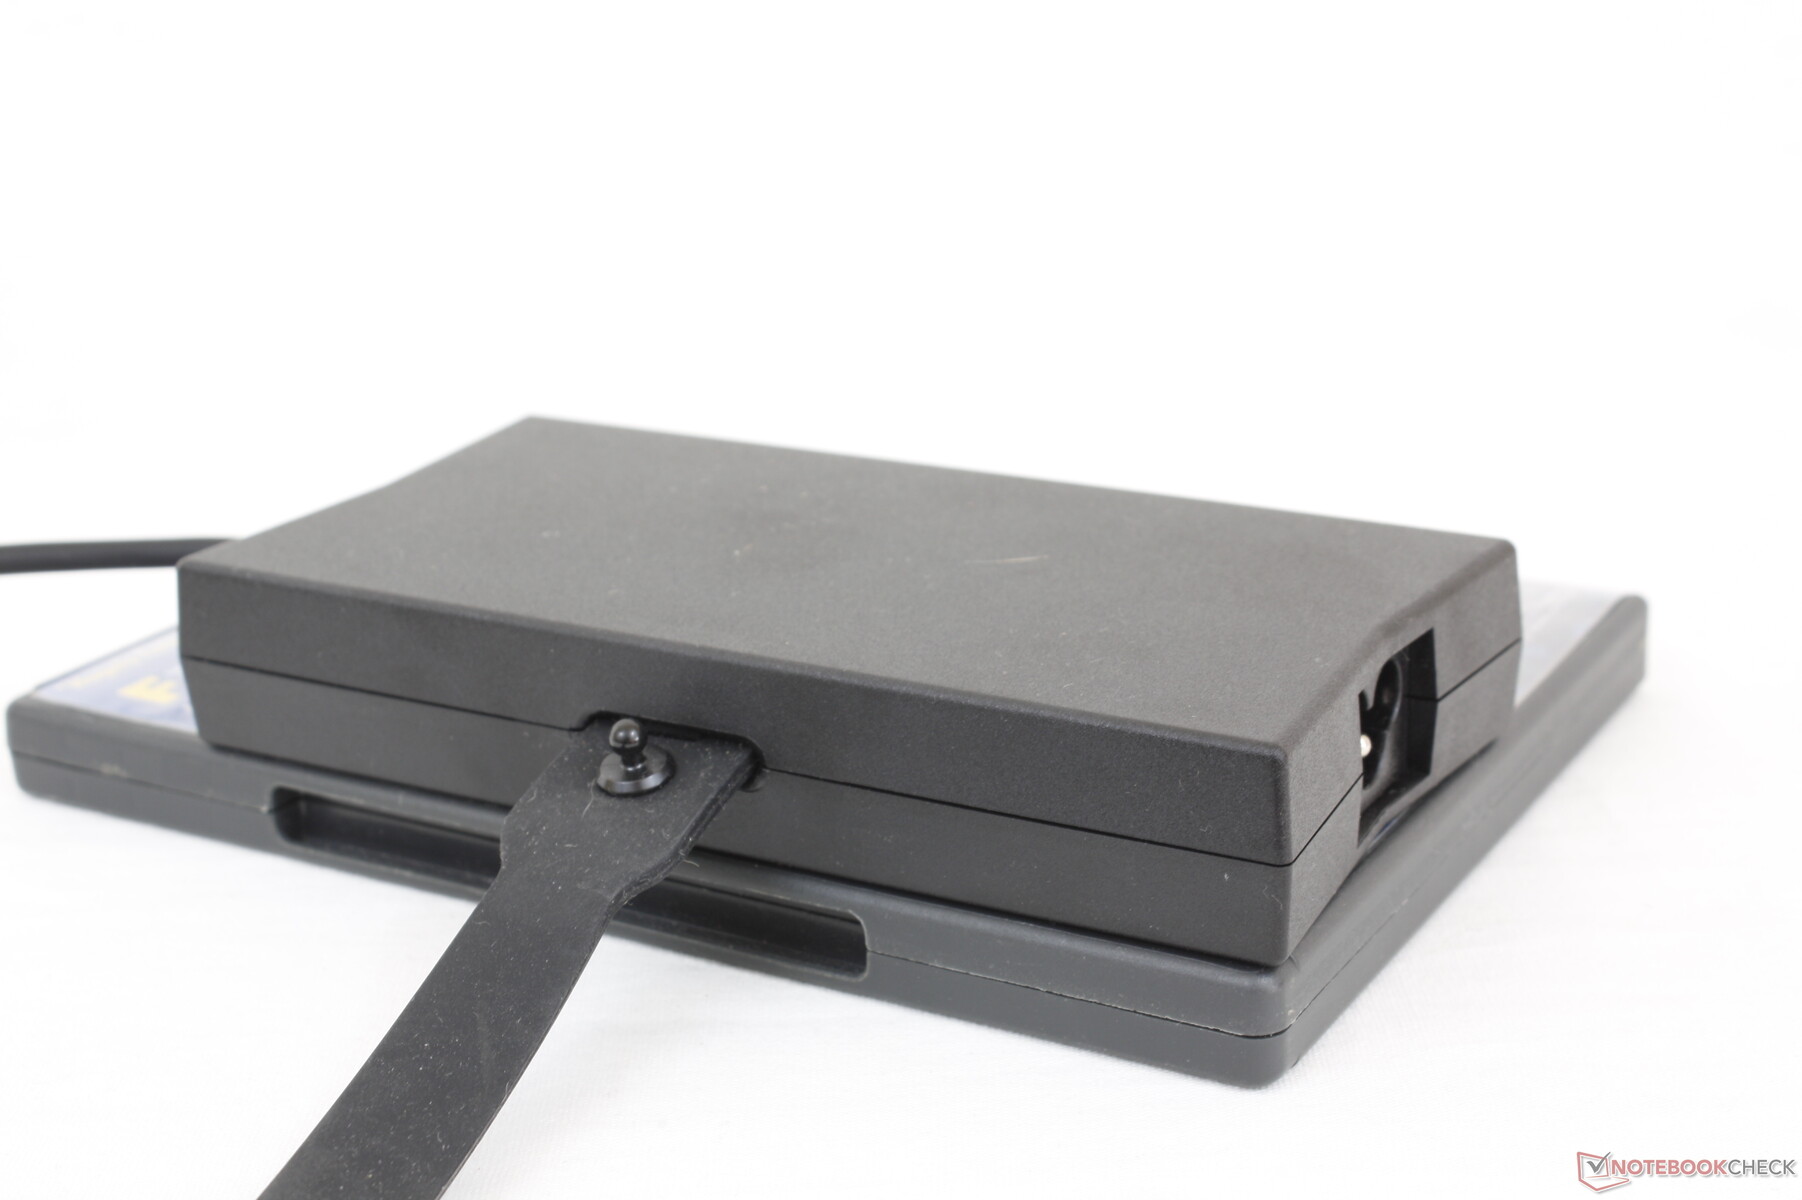
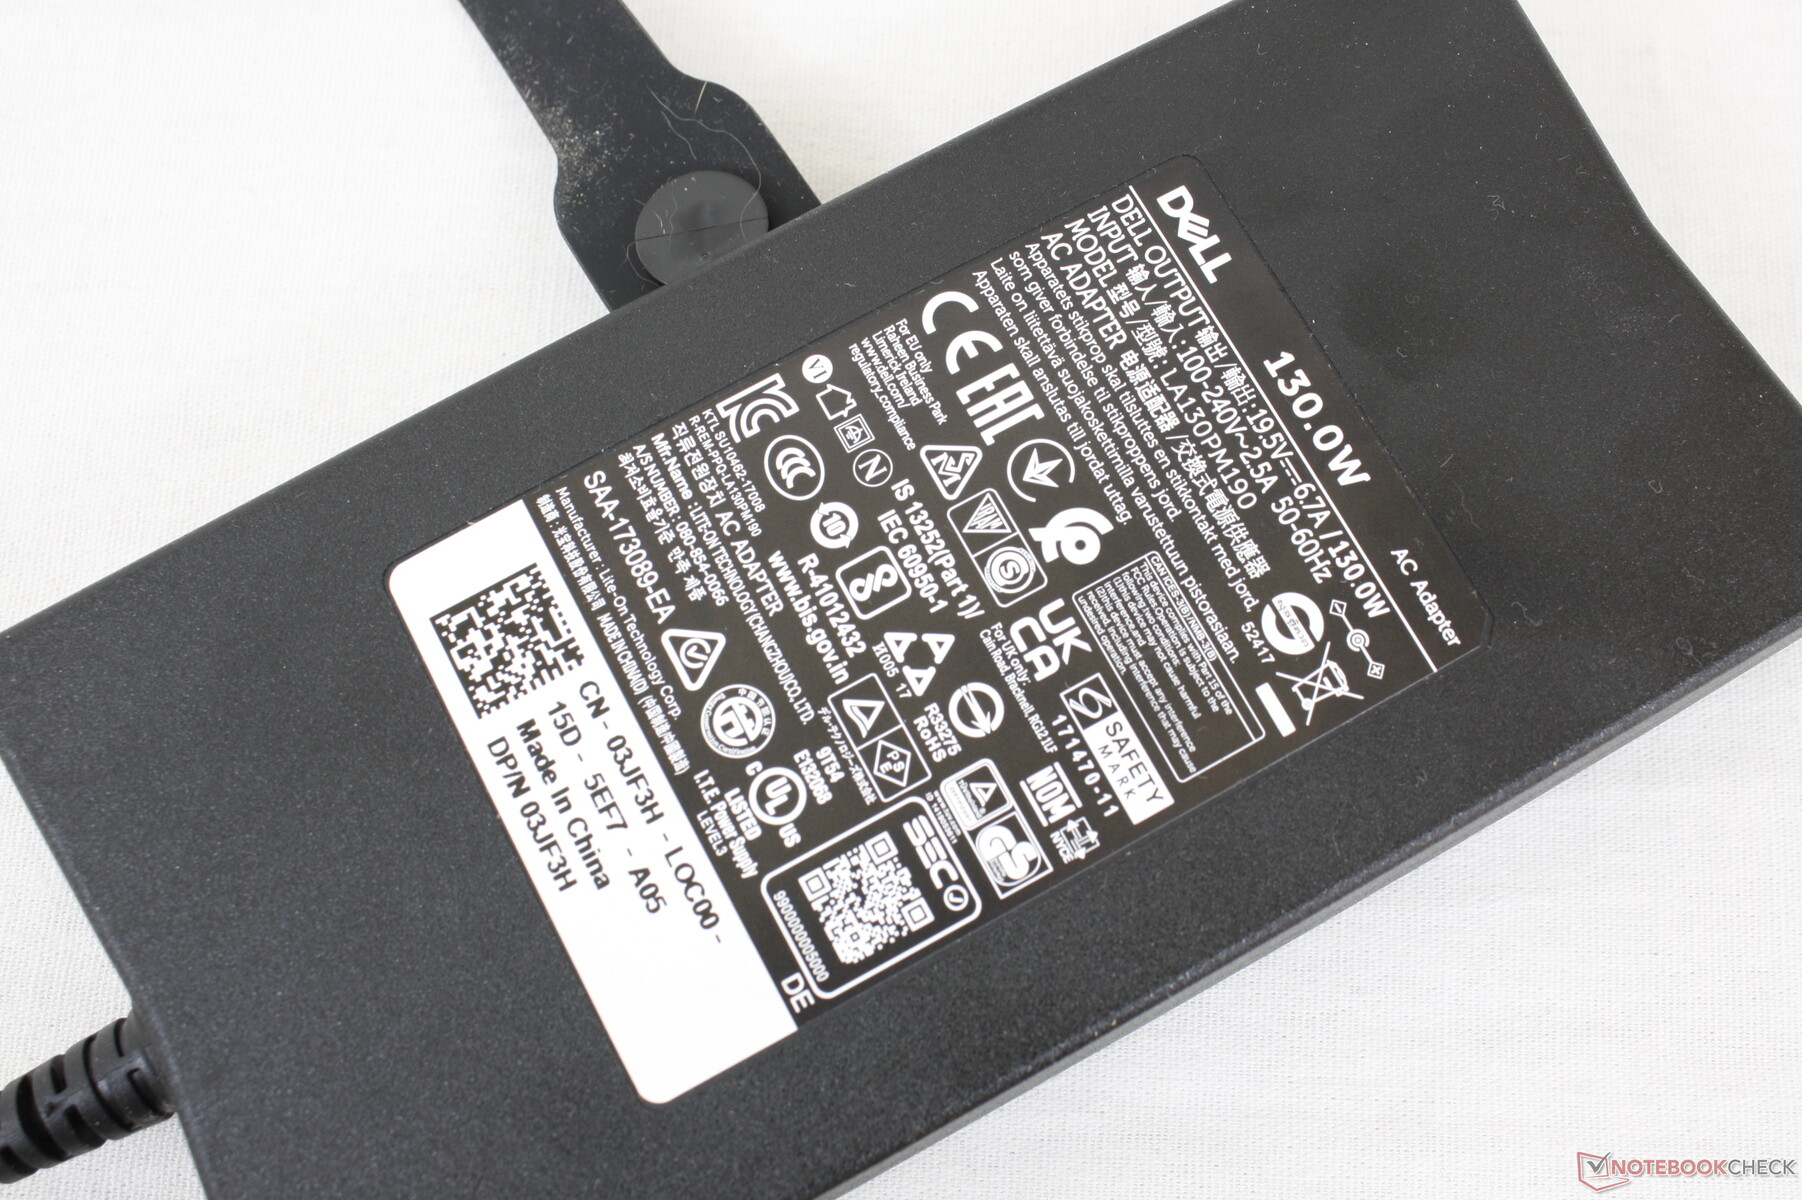
Bis auf das Hohlsteckernetzteil und den Papierkram befinden sich keine Extras im Lieferumfang. Es gilt die standardmäßige, eingeschränkte einjährige Garantie, die beim Kauf direkt von Dell mit verschiedenen Optionen erweitert werden kann.
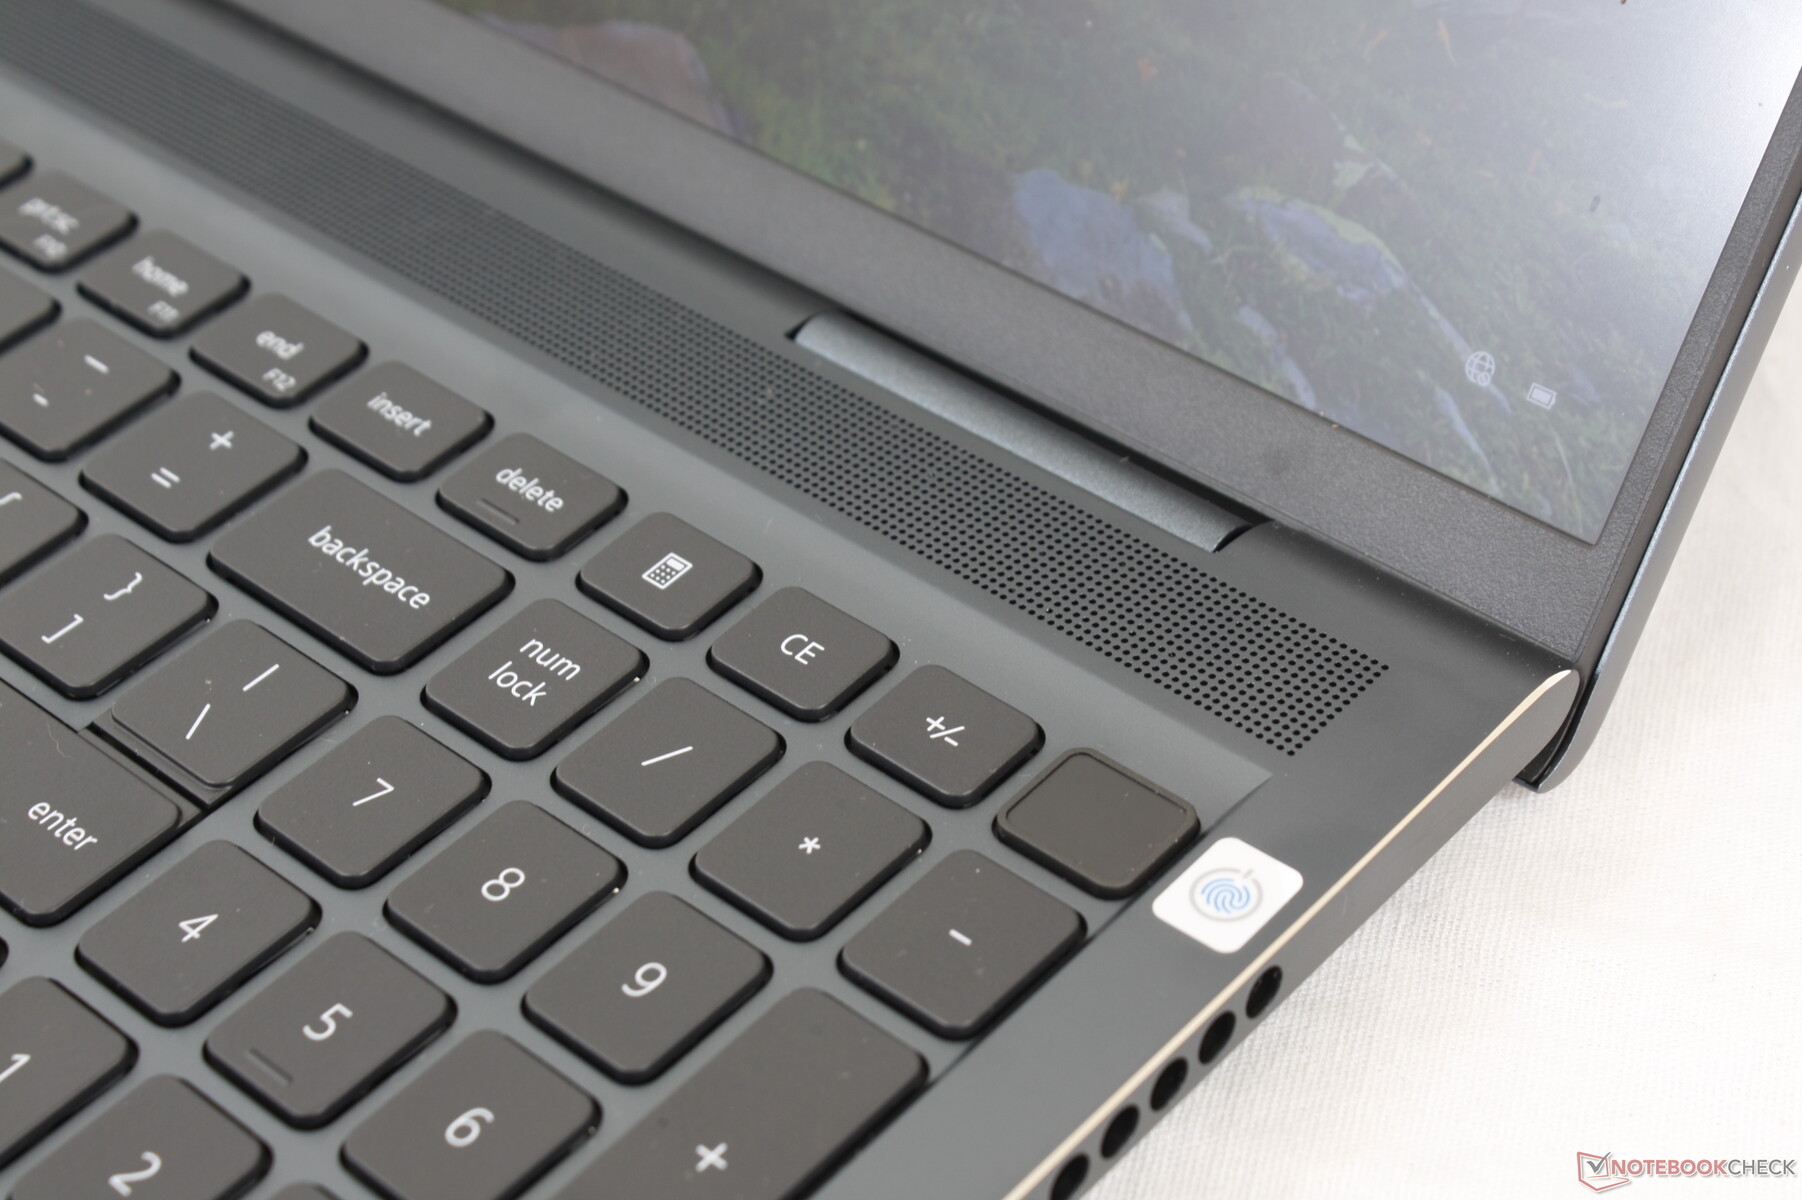
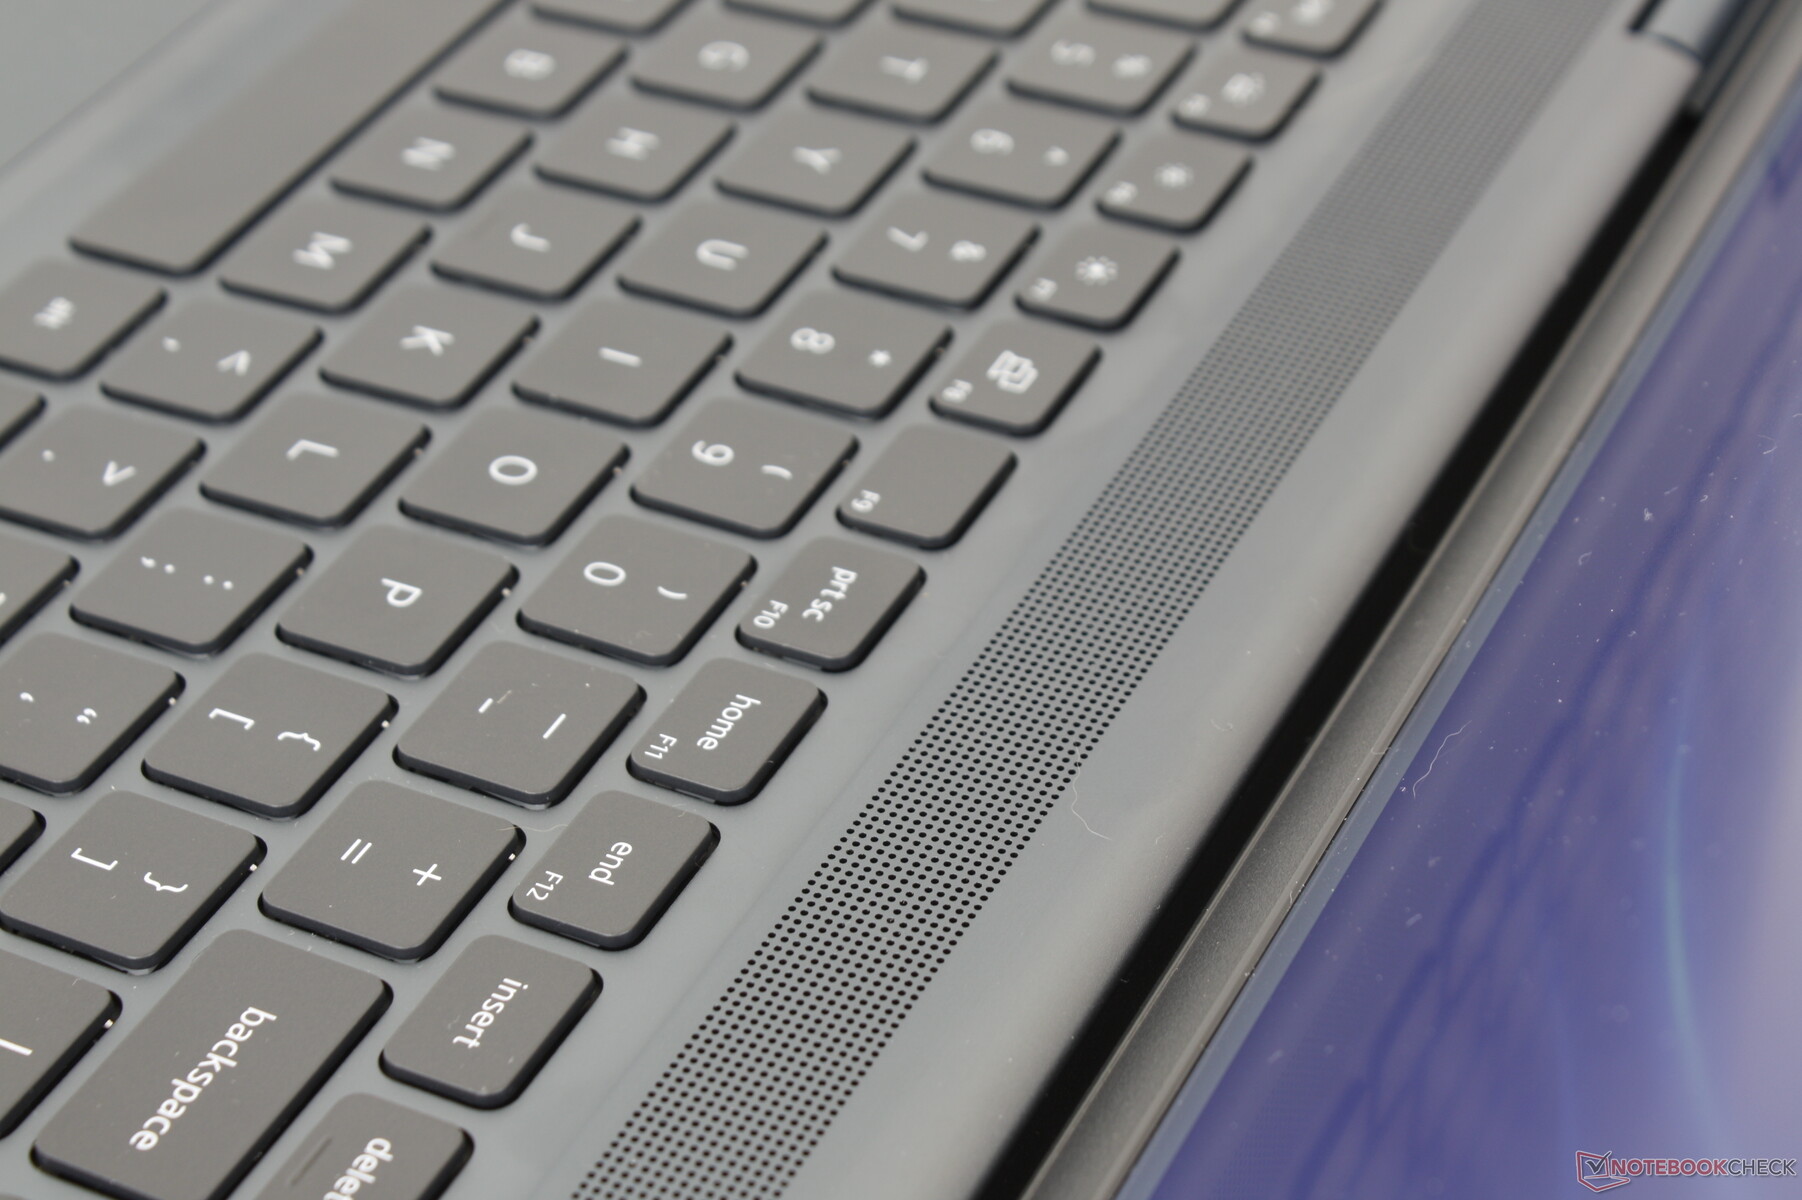
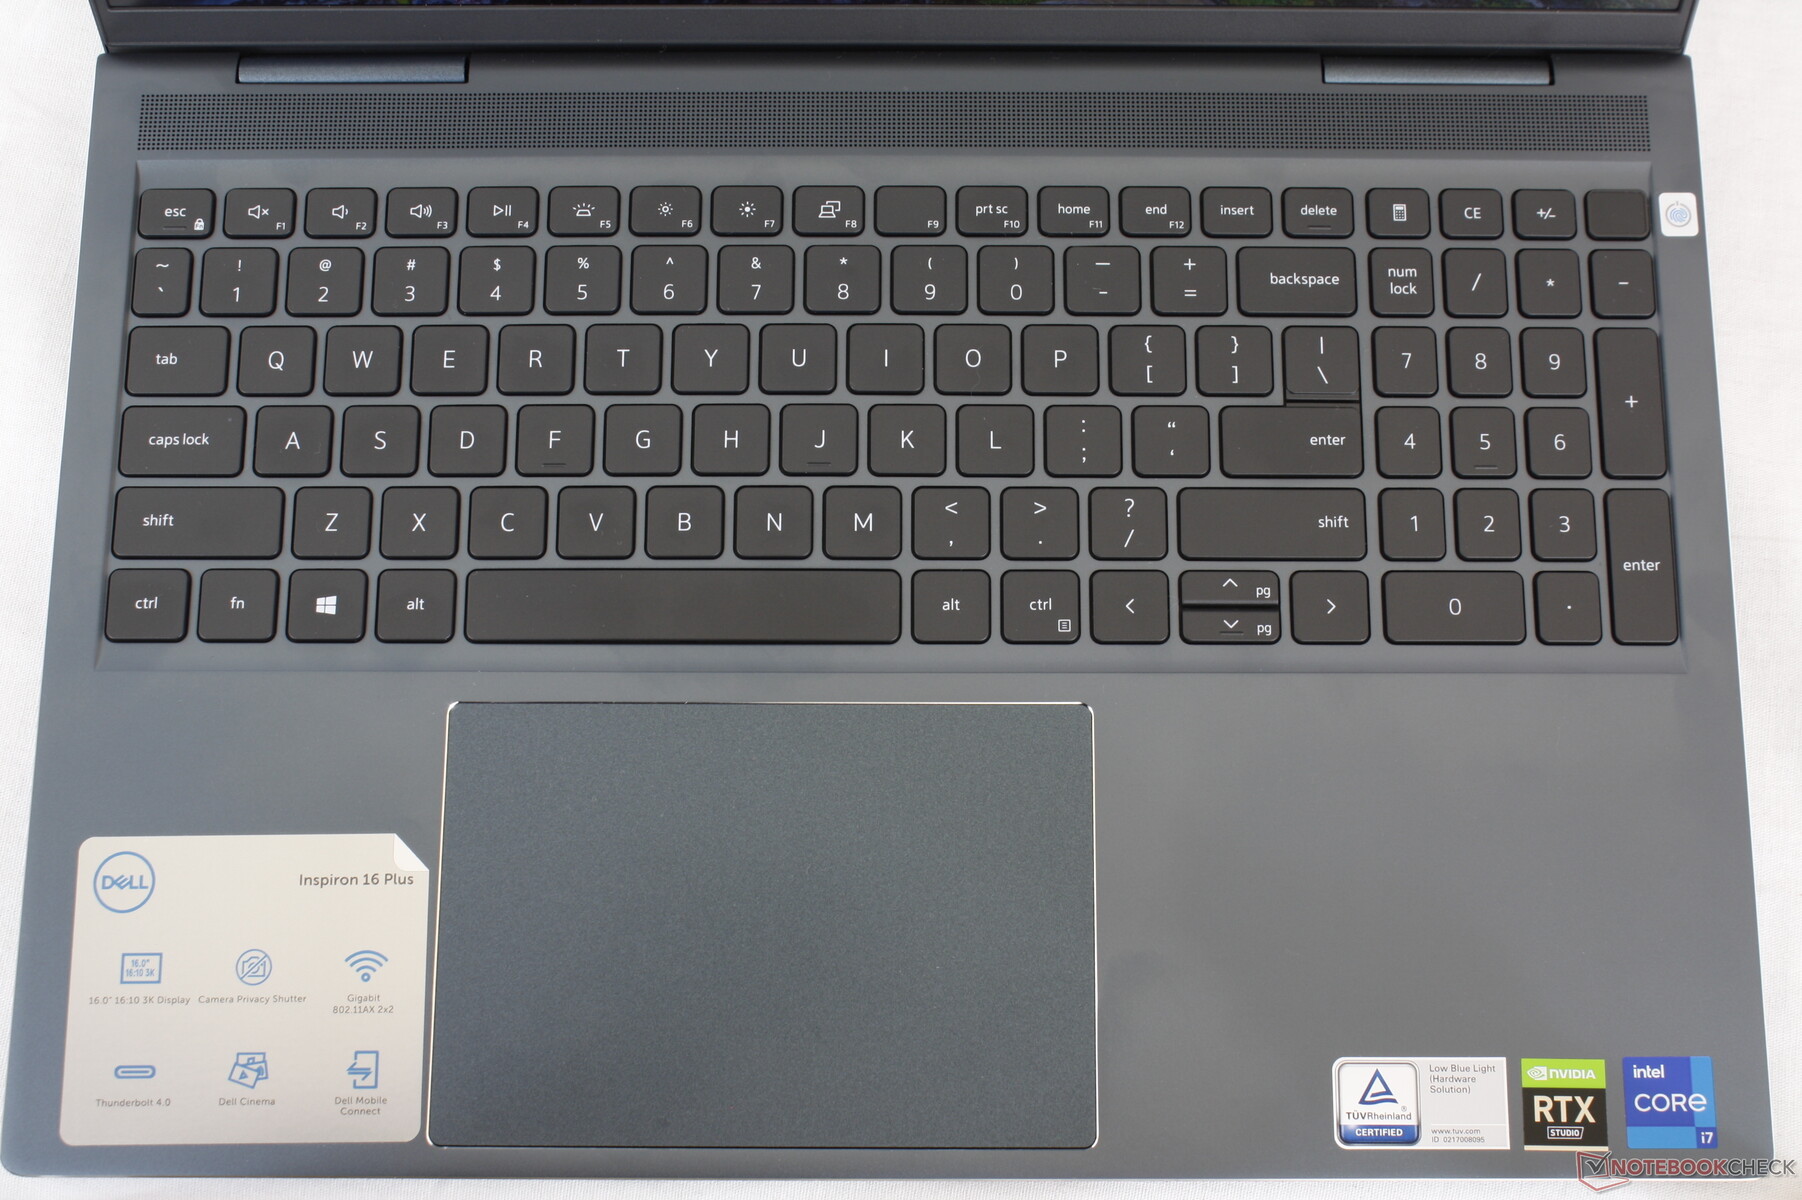
Eingabegeräte — Leise und flache Tasten
Tastatur
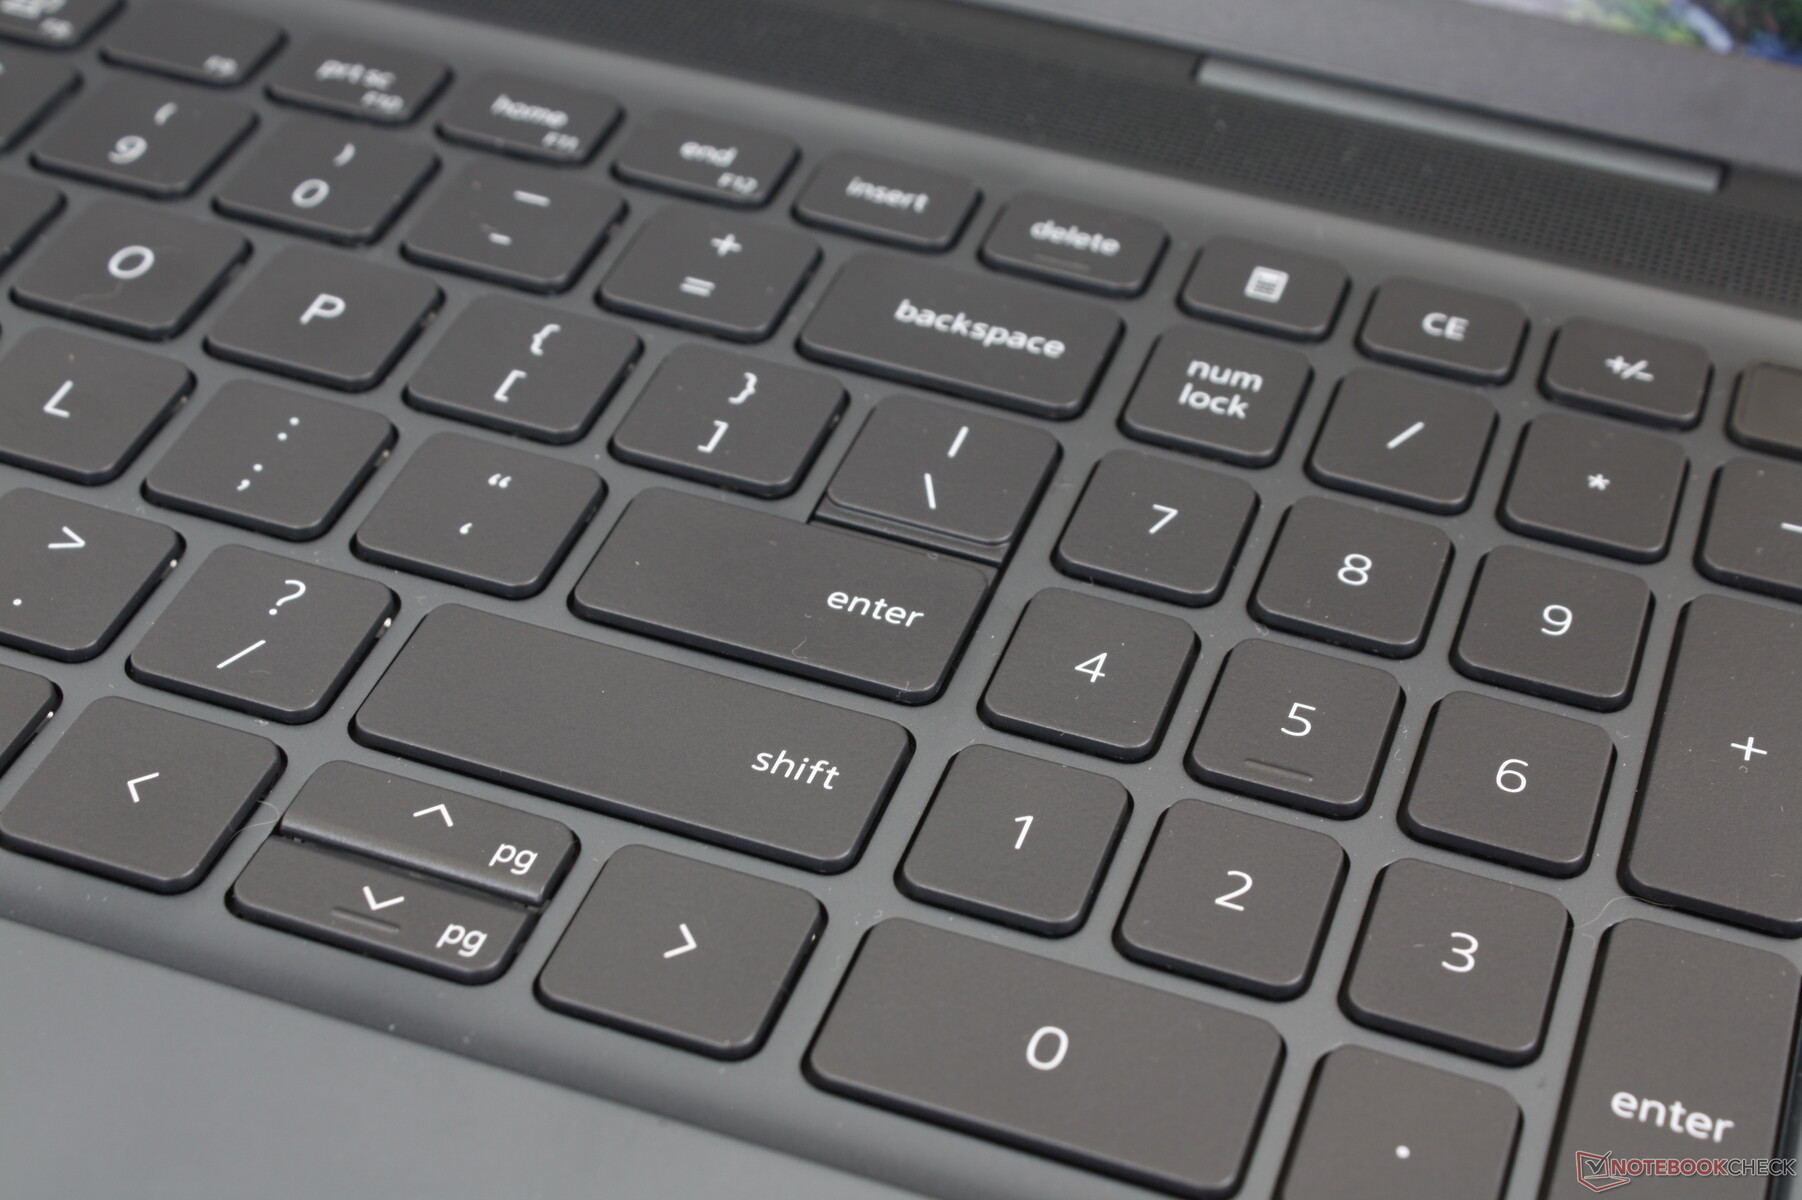
Das Tippgefühl lässt gemischte Gefühle aufkommen. Im Vergleich zur XPS-Reihe ist das Tasten-Feedback zwar knackiger und dadurch besser, allerdings fällt der Tastenhub zu gering aus. Ein größerer Tastenhub wie bei HP-Envy- oder HP-Spectre-Laptops hätte die Tasten des Inspiron aufwerten und von denen eines typischen Ultrabooks abheben können.
Die standardmäßig vorhandene, zweistufige Hintergrundbeleuchtung leuchtet alle Tasten und Symbole mit Ausnahme des Ein-/Ausschalters mit optionalem Fingerabdruckscanner aus. Die Tastenbeleuchtung ist zwar nicht ganz so hell wie die der meisten anderen beleuchteten Tastaturen, für dunkle Umgebungen ist sie jedoch ausreichend.
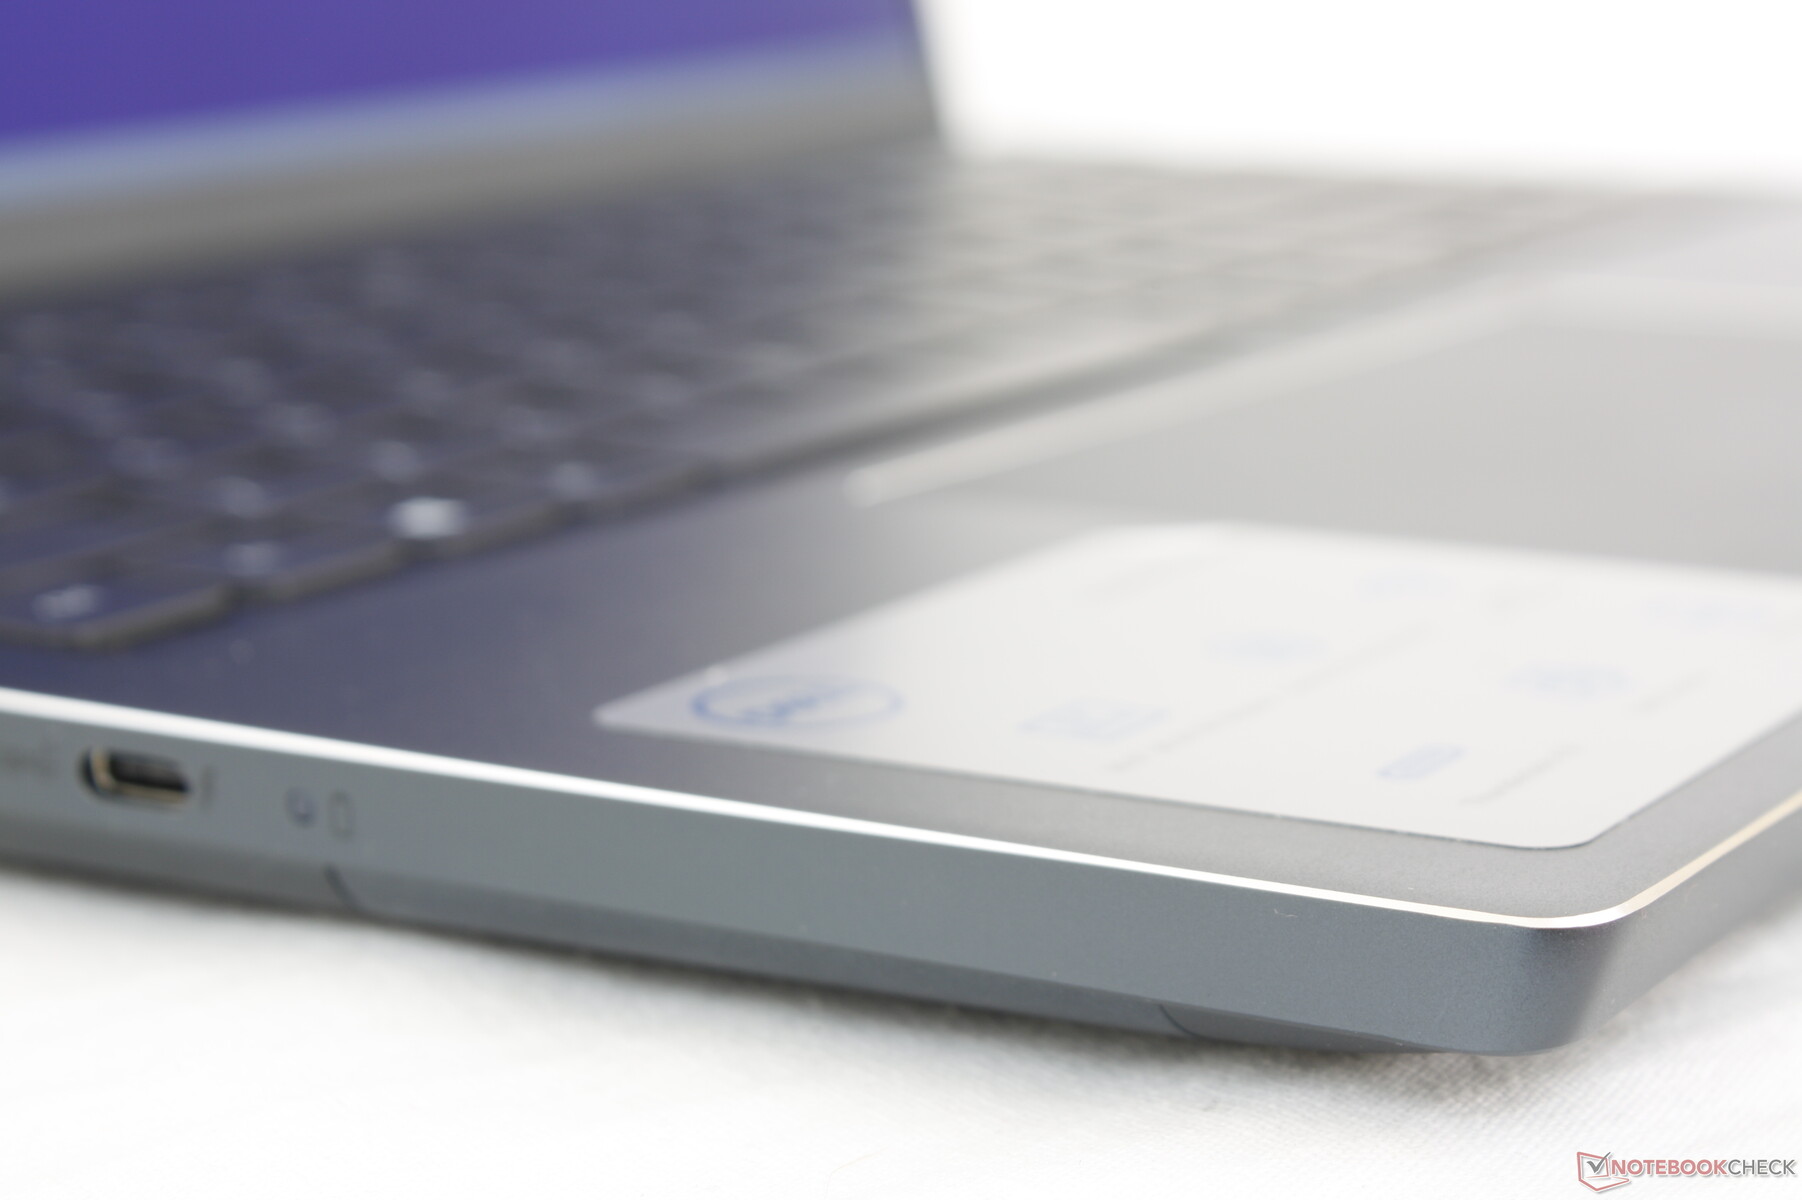
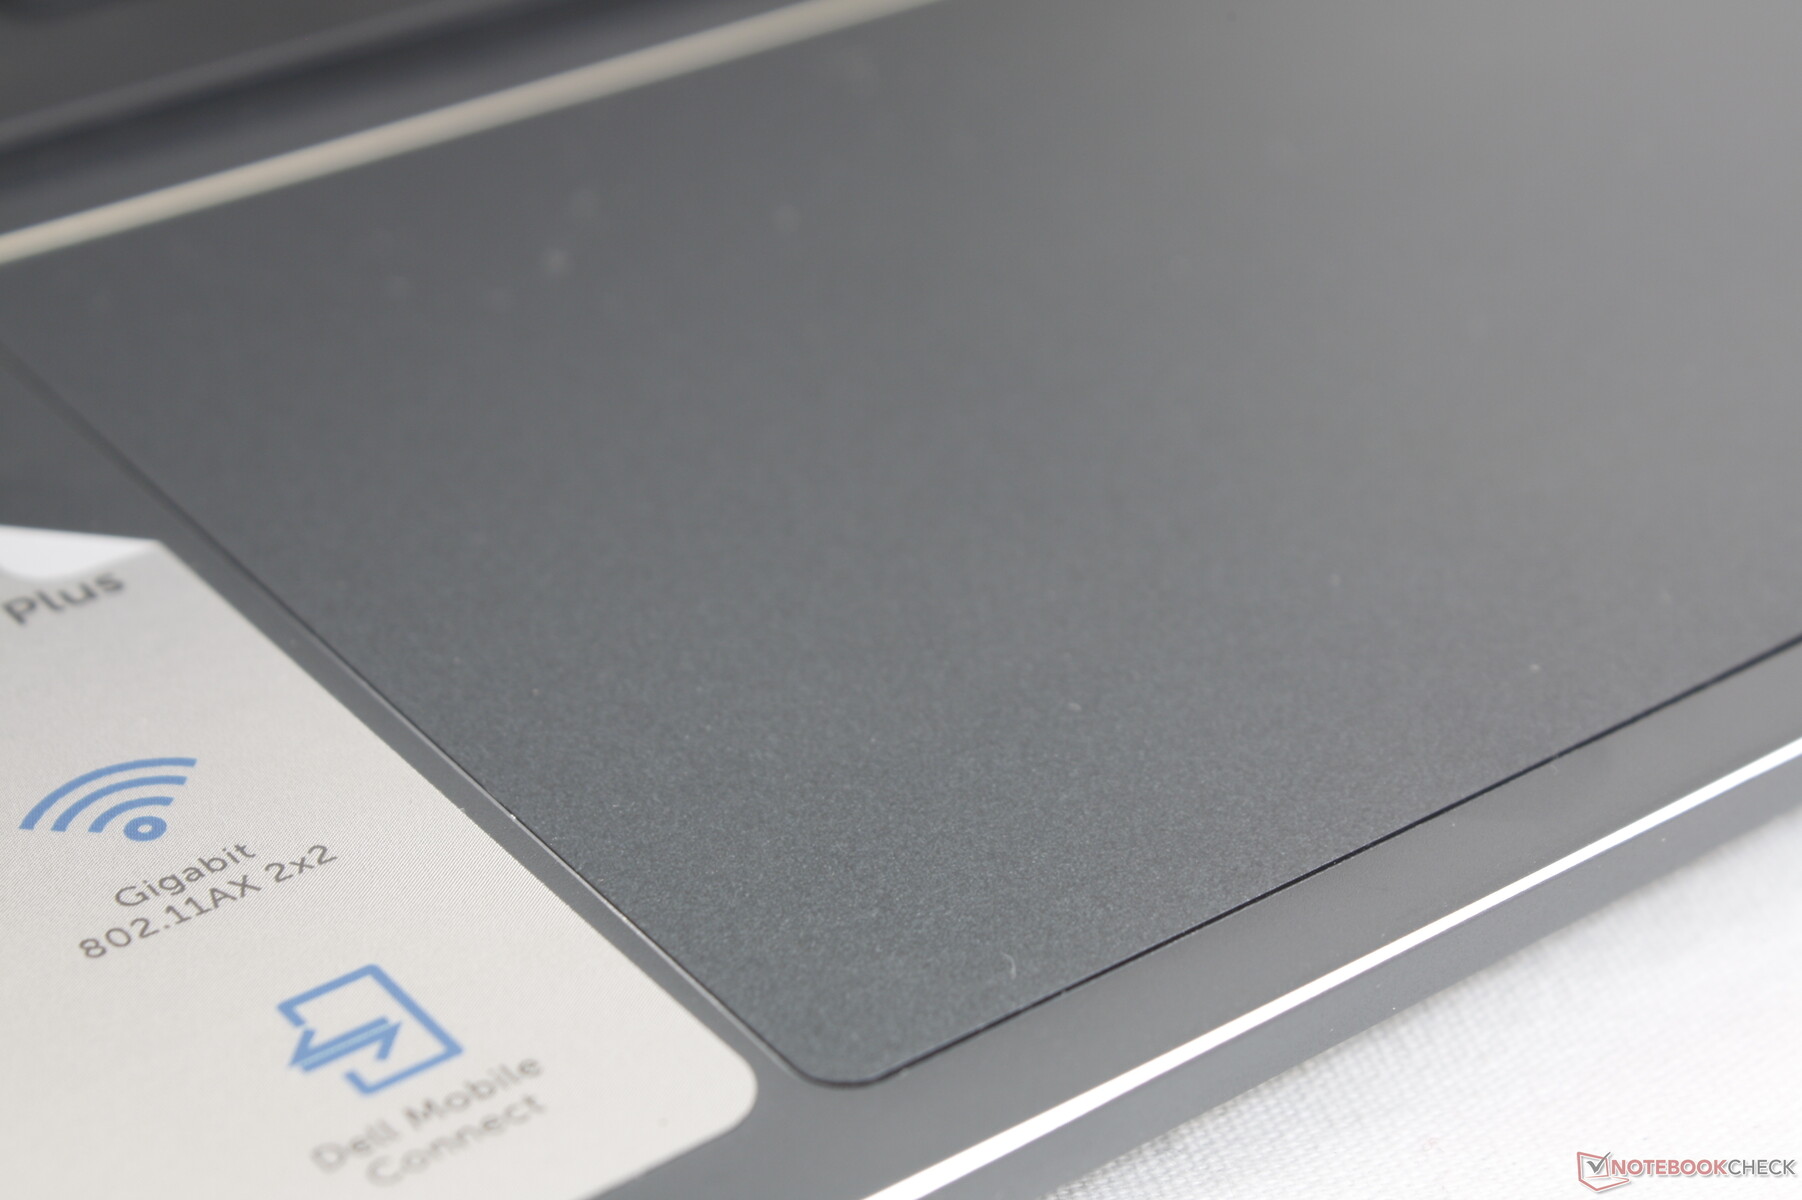
Touchpad
Das ClickPad ist größer als beim älteren Inspiron 15 7506 (13,5 x 9 cm vs. 11,5 x 8 cm), was Multi-Touch-Eingaben vereinfacht. Die Gleiteigenschaften der glatten Oberfläche sind konstant gut, nur bei langsameren Bewegungen haften Finger leicht an der Oberfläche, um präzise Eingaben zu erleichtern. Die Klicks des ClickPads sind bedauerlicherweise schwammig und bieten kein zufriedenstellendes Feedback.

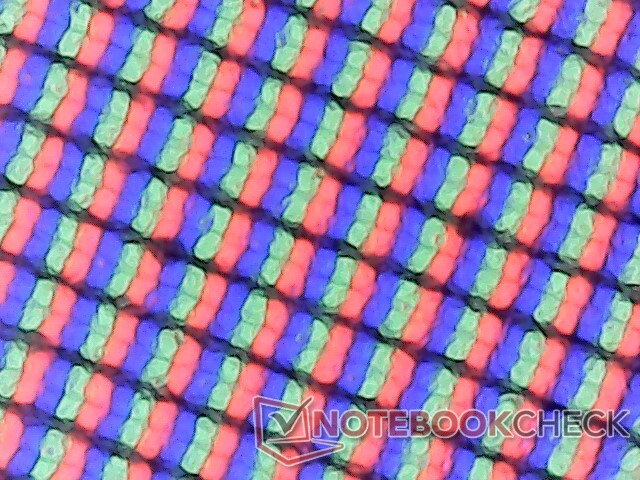
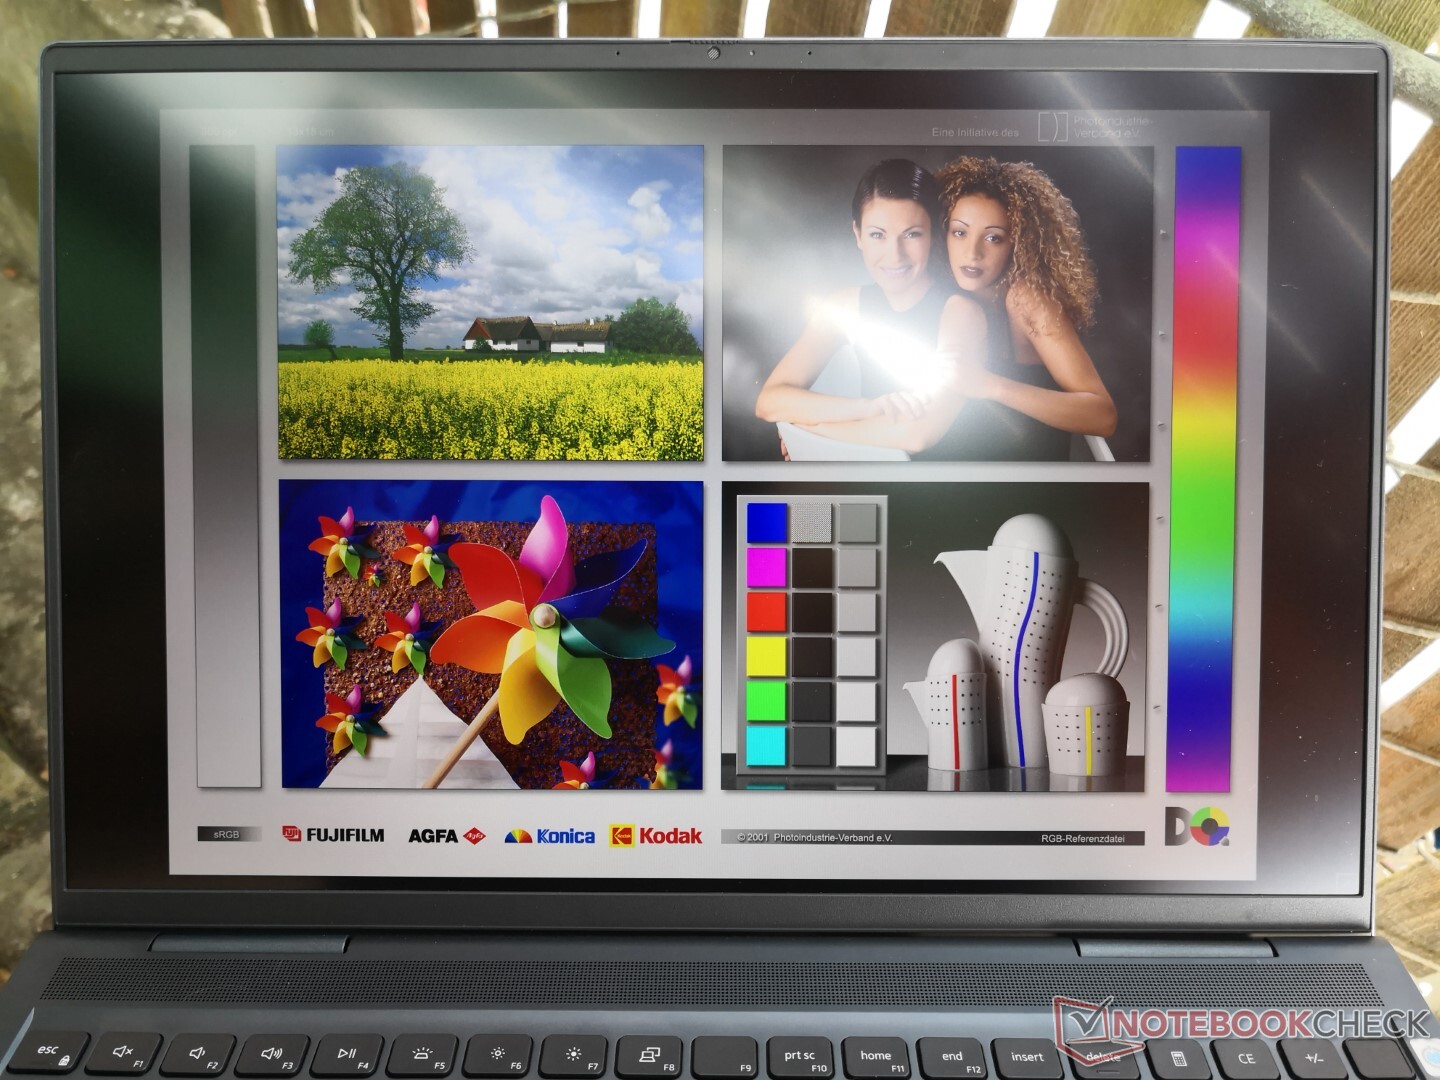
Display — Gute Farben, annehmbare Helligkeit, langsame Reaktionszeiten
Unser Testgerät setzt auf das 3K-IPS-Panel AU Optronics B160QAN, welches zum Zeitpunkt dieses Artikels in keinem anderen Laptop verbaut wird. Die Auflösung ist jedoch mit der des MacBook Pro 16 identisch. Da die DPI fast so hoch wie bei einem 4K-Display ausfällt, sollte man gegebenenfalls die Textskalierung anpassen, um die Lesbarkeit zu verbessern.
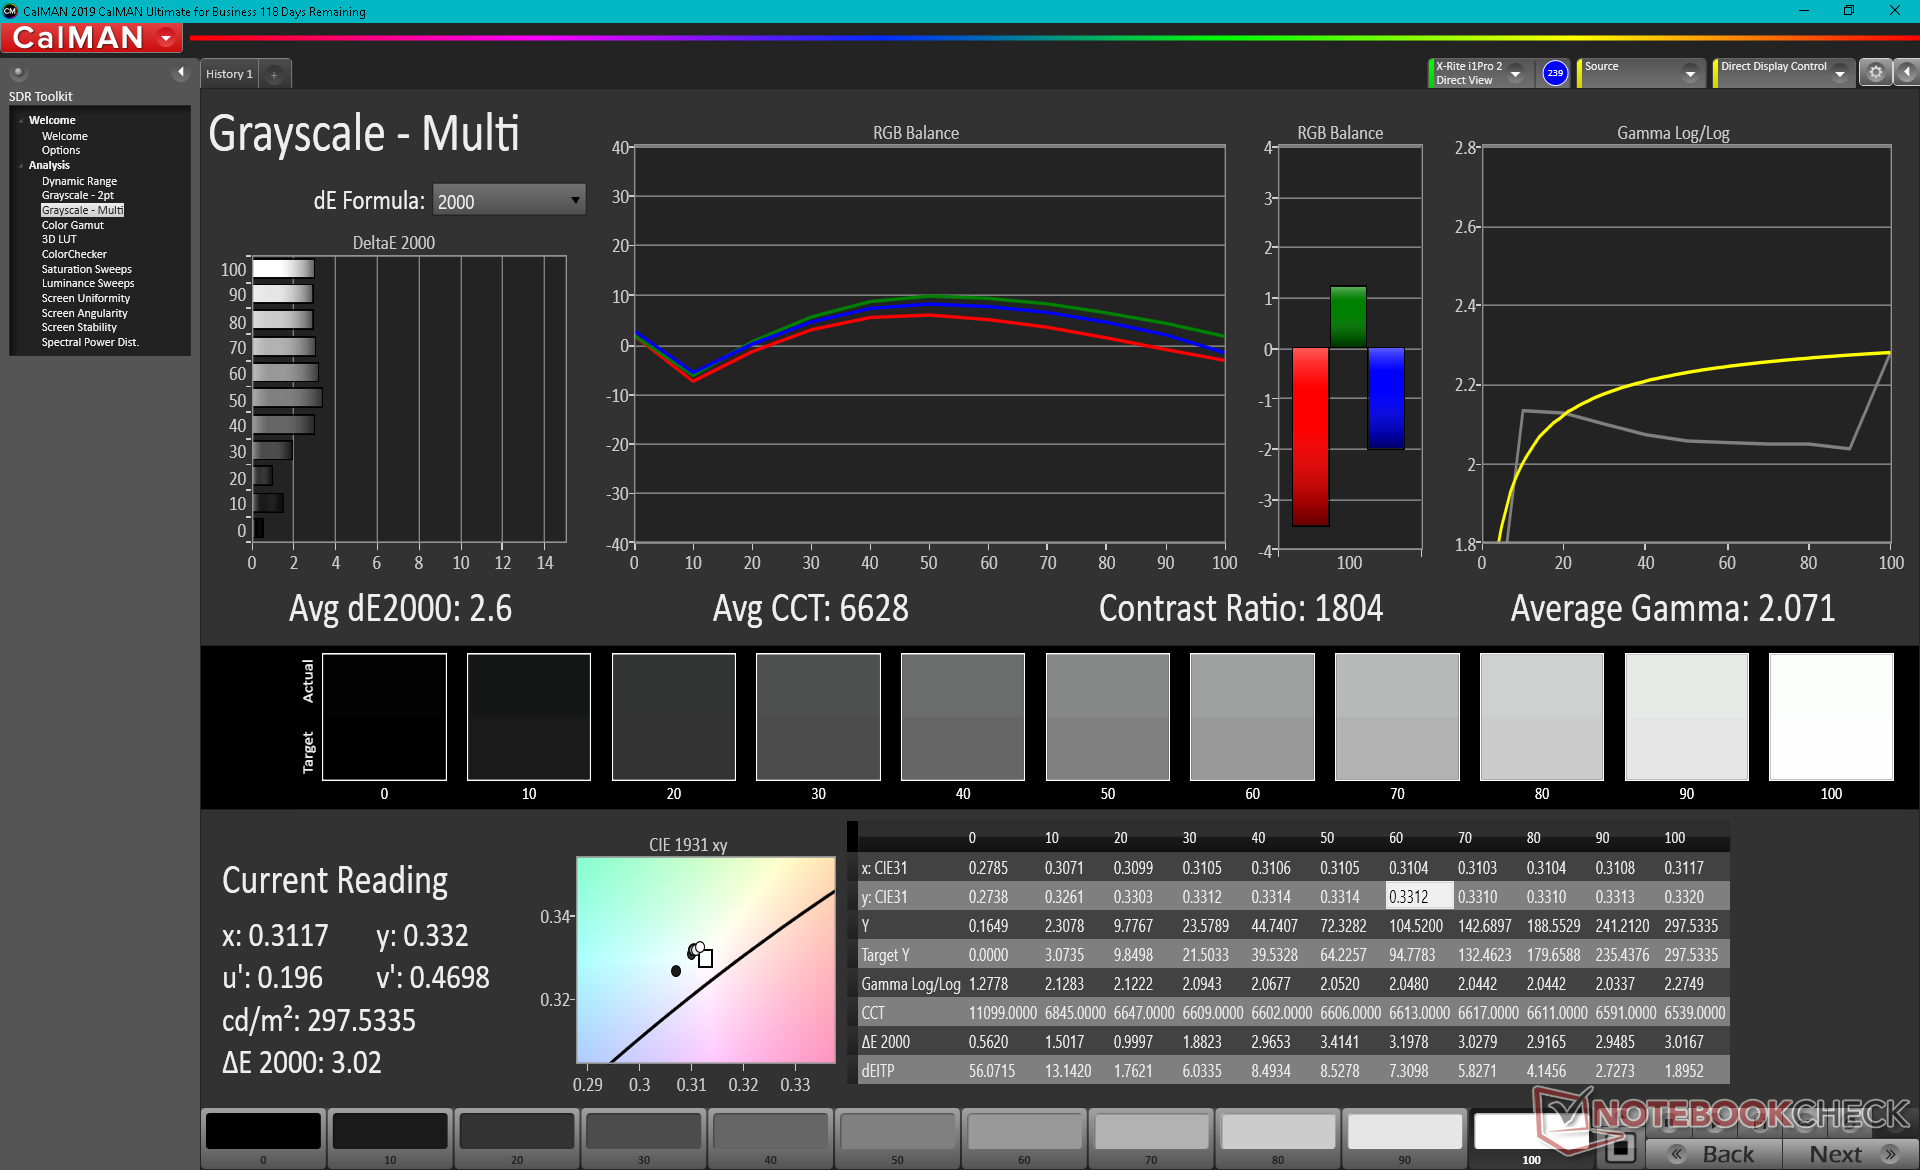
Die Displayqualität ist ausgezeichnet, und das Kontrastverhältnis liegt bei fast 1.500:1. Das Inspiron 16 unterscheidet sich hauptsächlich durch seine langsamen Reaktionszeiten von "reinen" 16-Zoll-Gaming-Laptops wie dem Asus ROG Zephyrus M16, das seinerseits deutlich schnellere Reaktionszeiten bietet.

| |||||||||||||||||||||||||
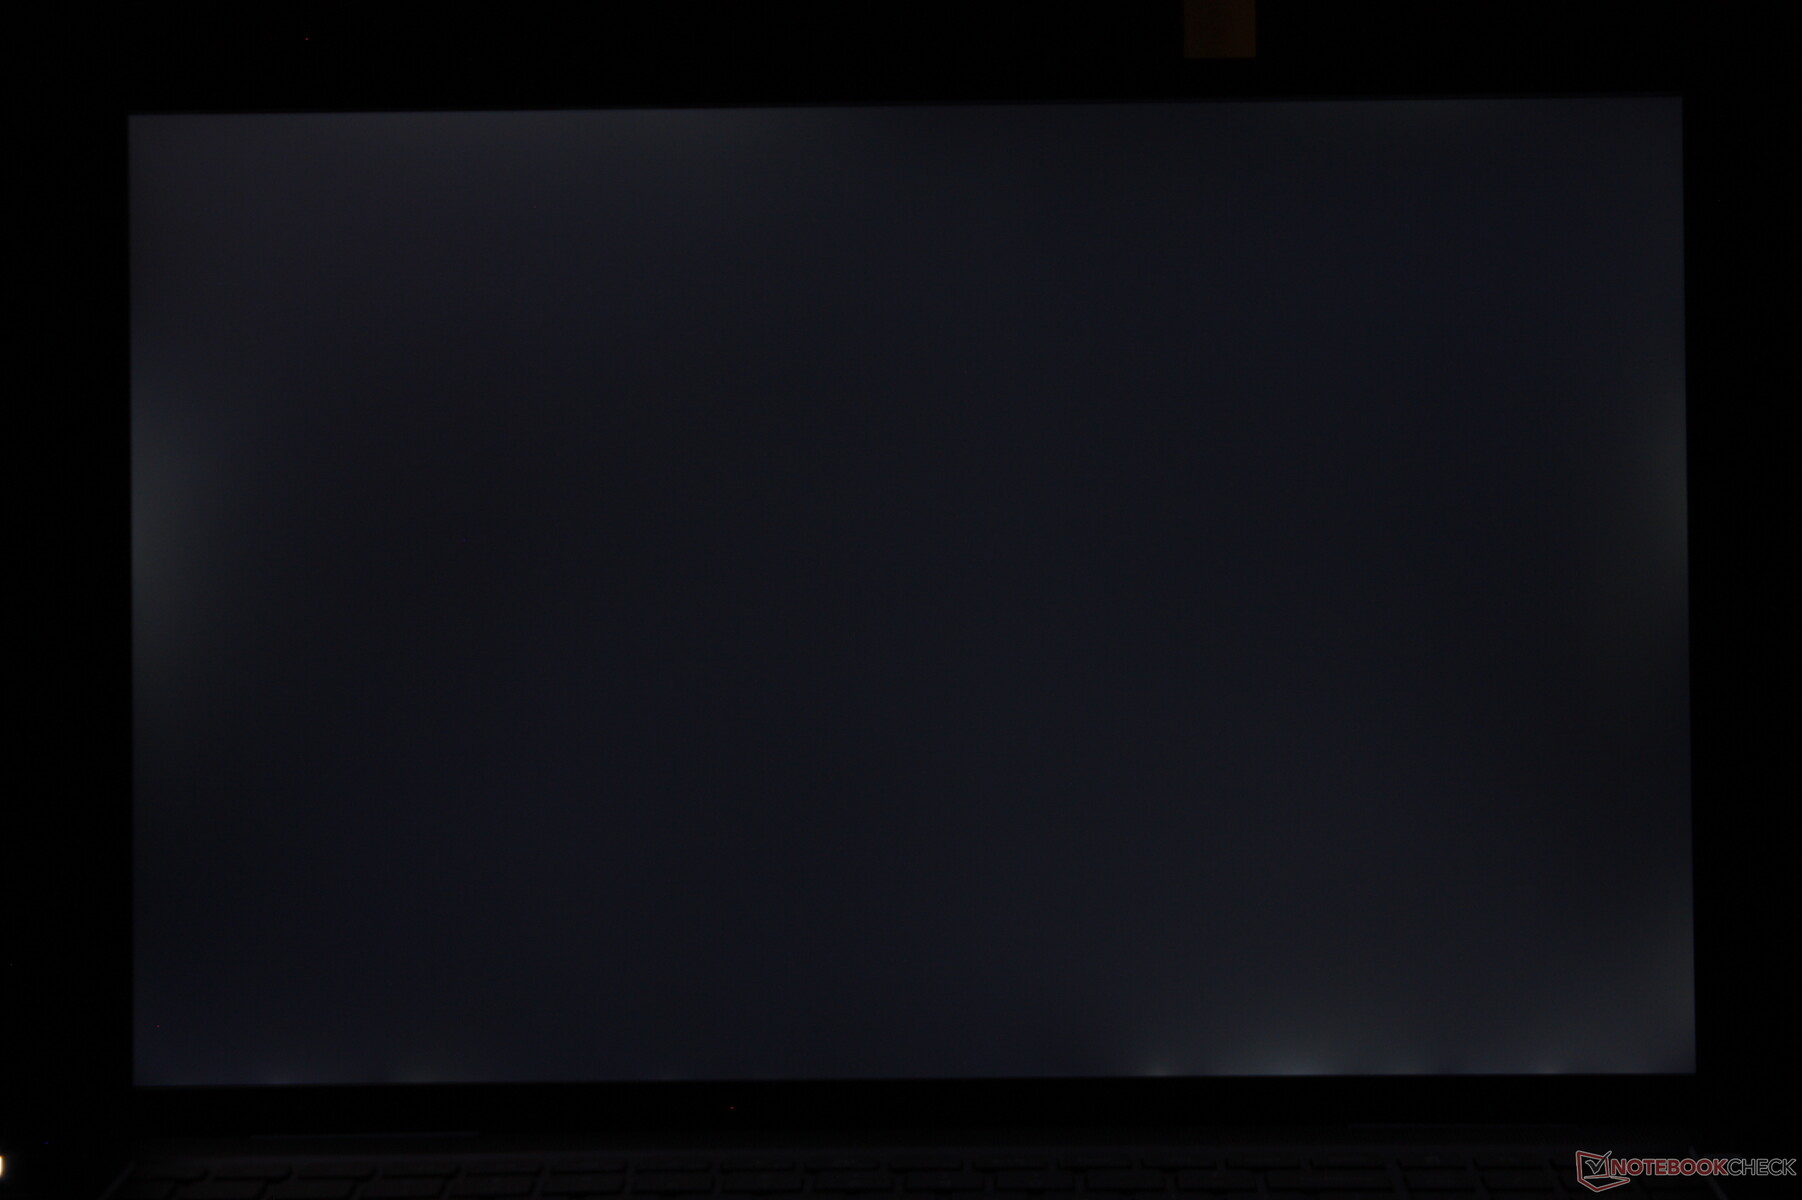
Ausleuchtung: 87 %
Helligkeit Akku: 296.8 cd/m²
Kontrast: 1413:1 (Schwarzwert: 0.21 cd/m²)
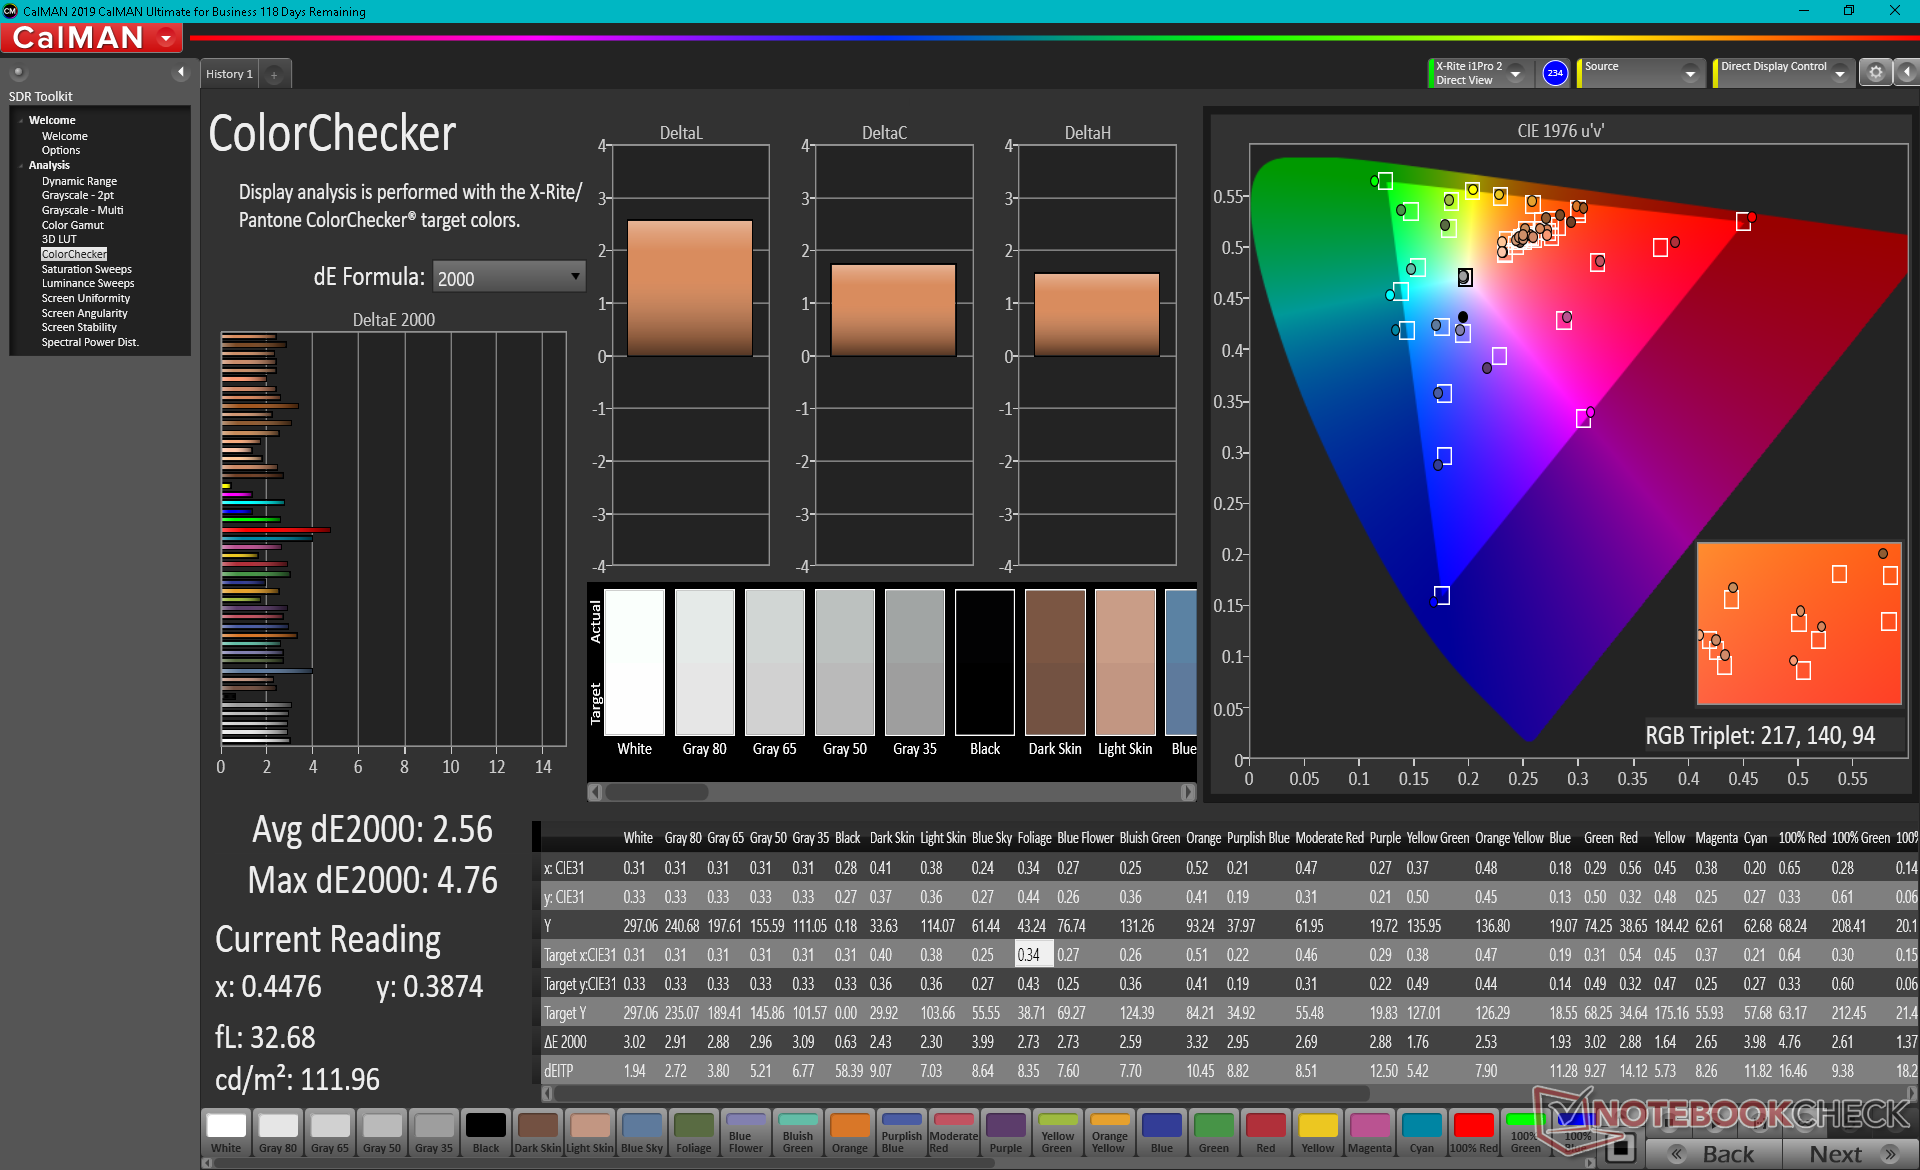
ΔE ColorChecker Calman: 2.56 | ∀{0.5-29.43 Ø4.72}
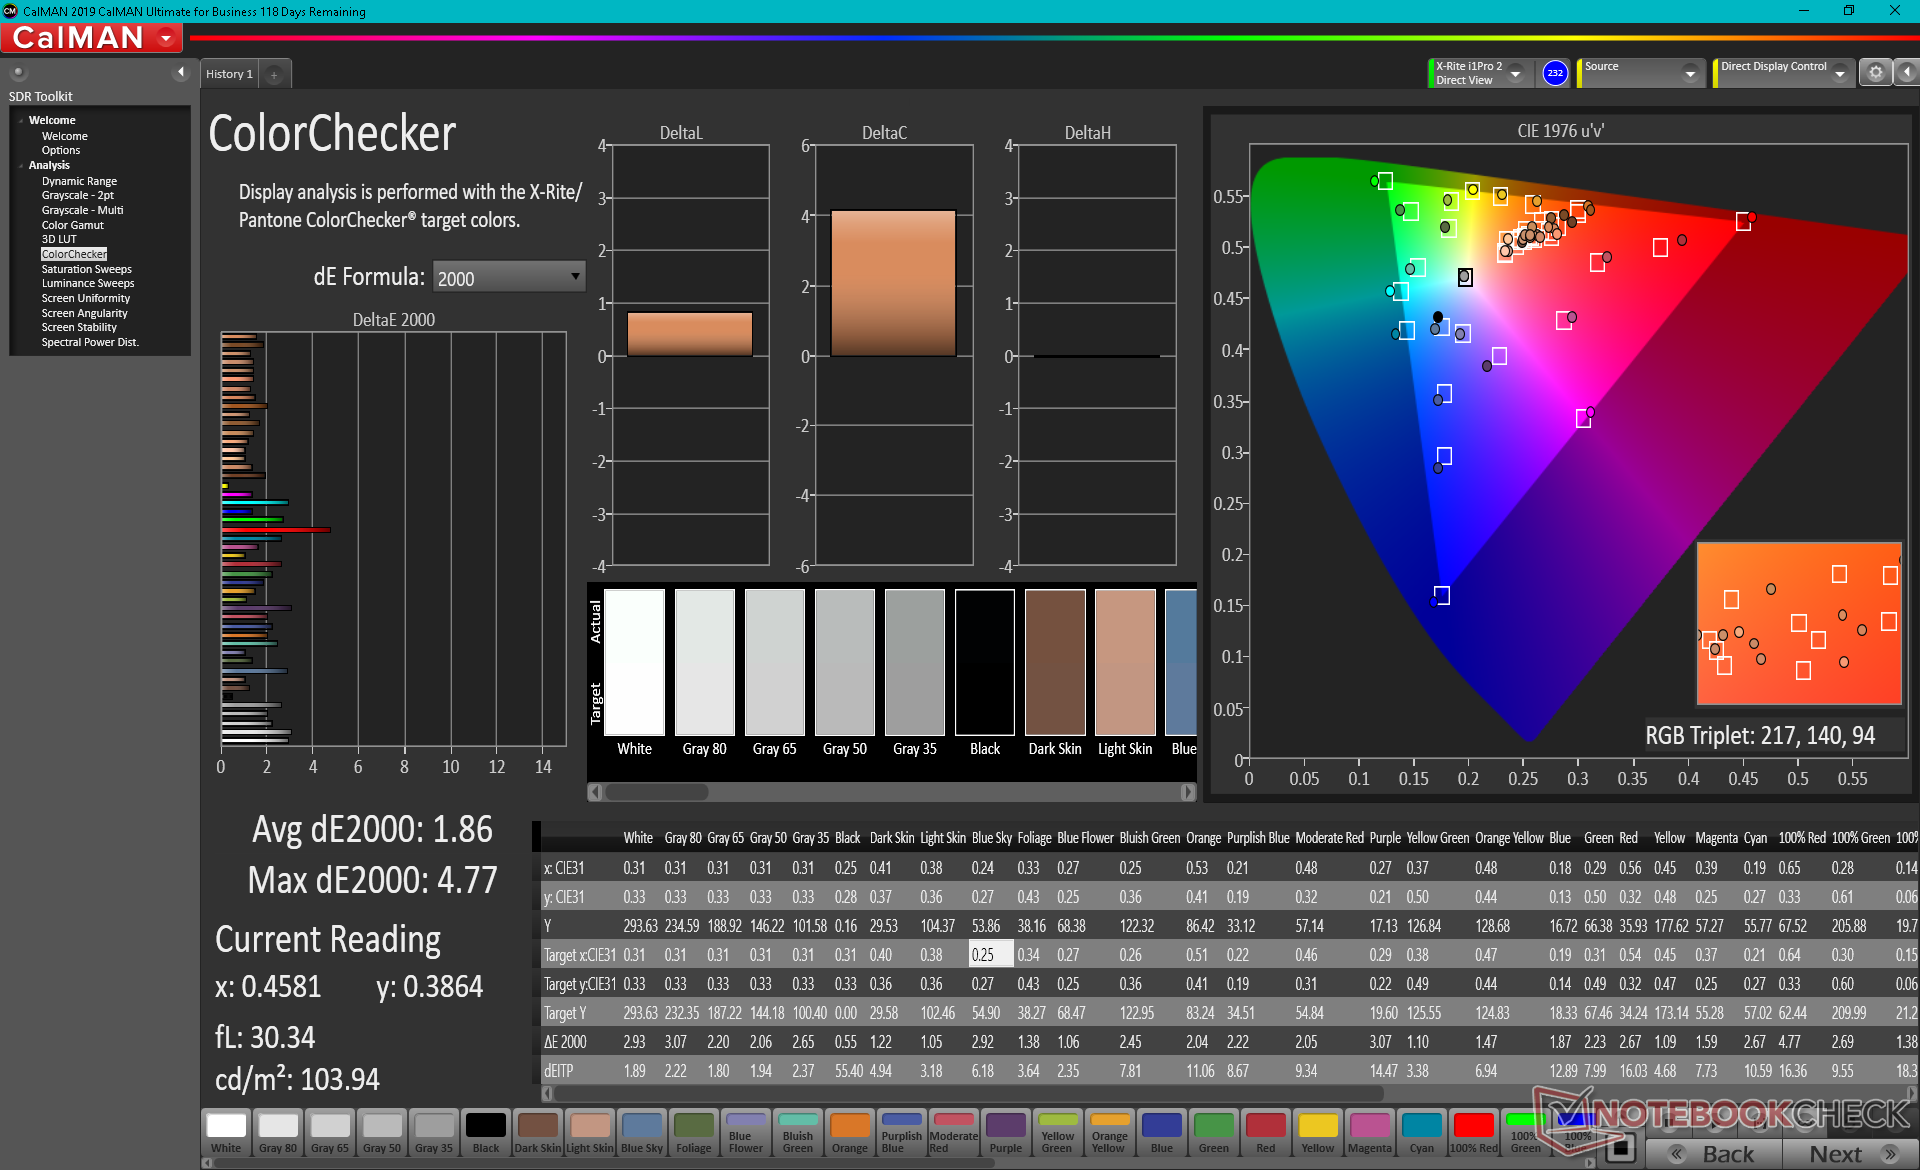
calibrated: 1.86
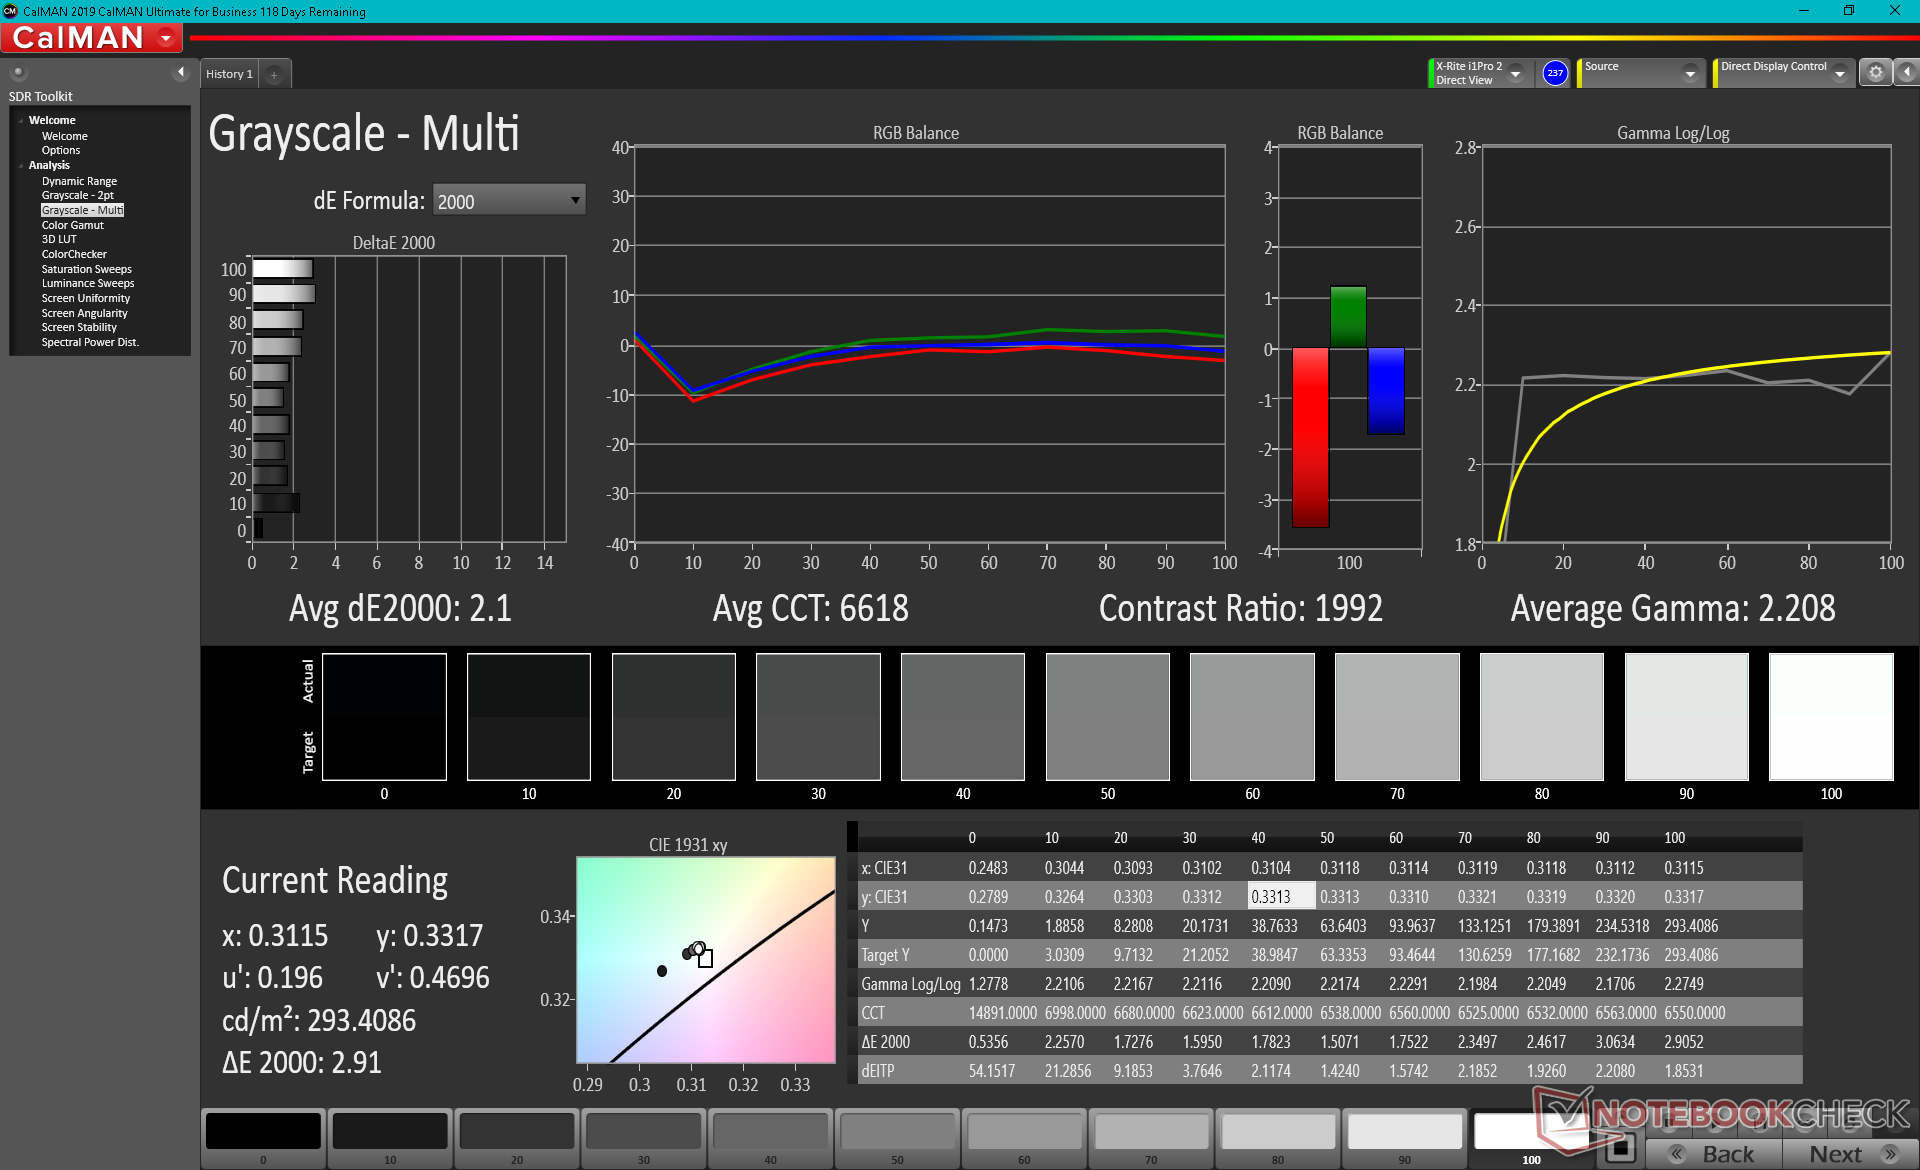
ΔE Greyscale Calman: 2.6 | ∀{0.09-98 Ø4.97}
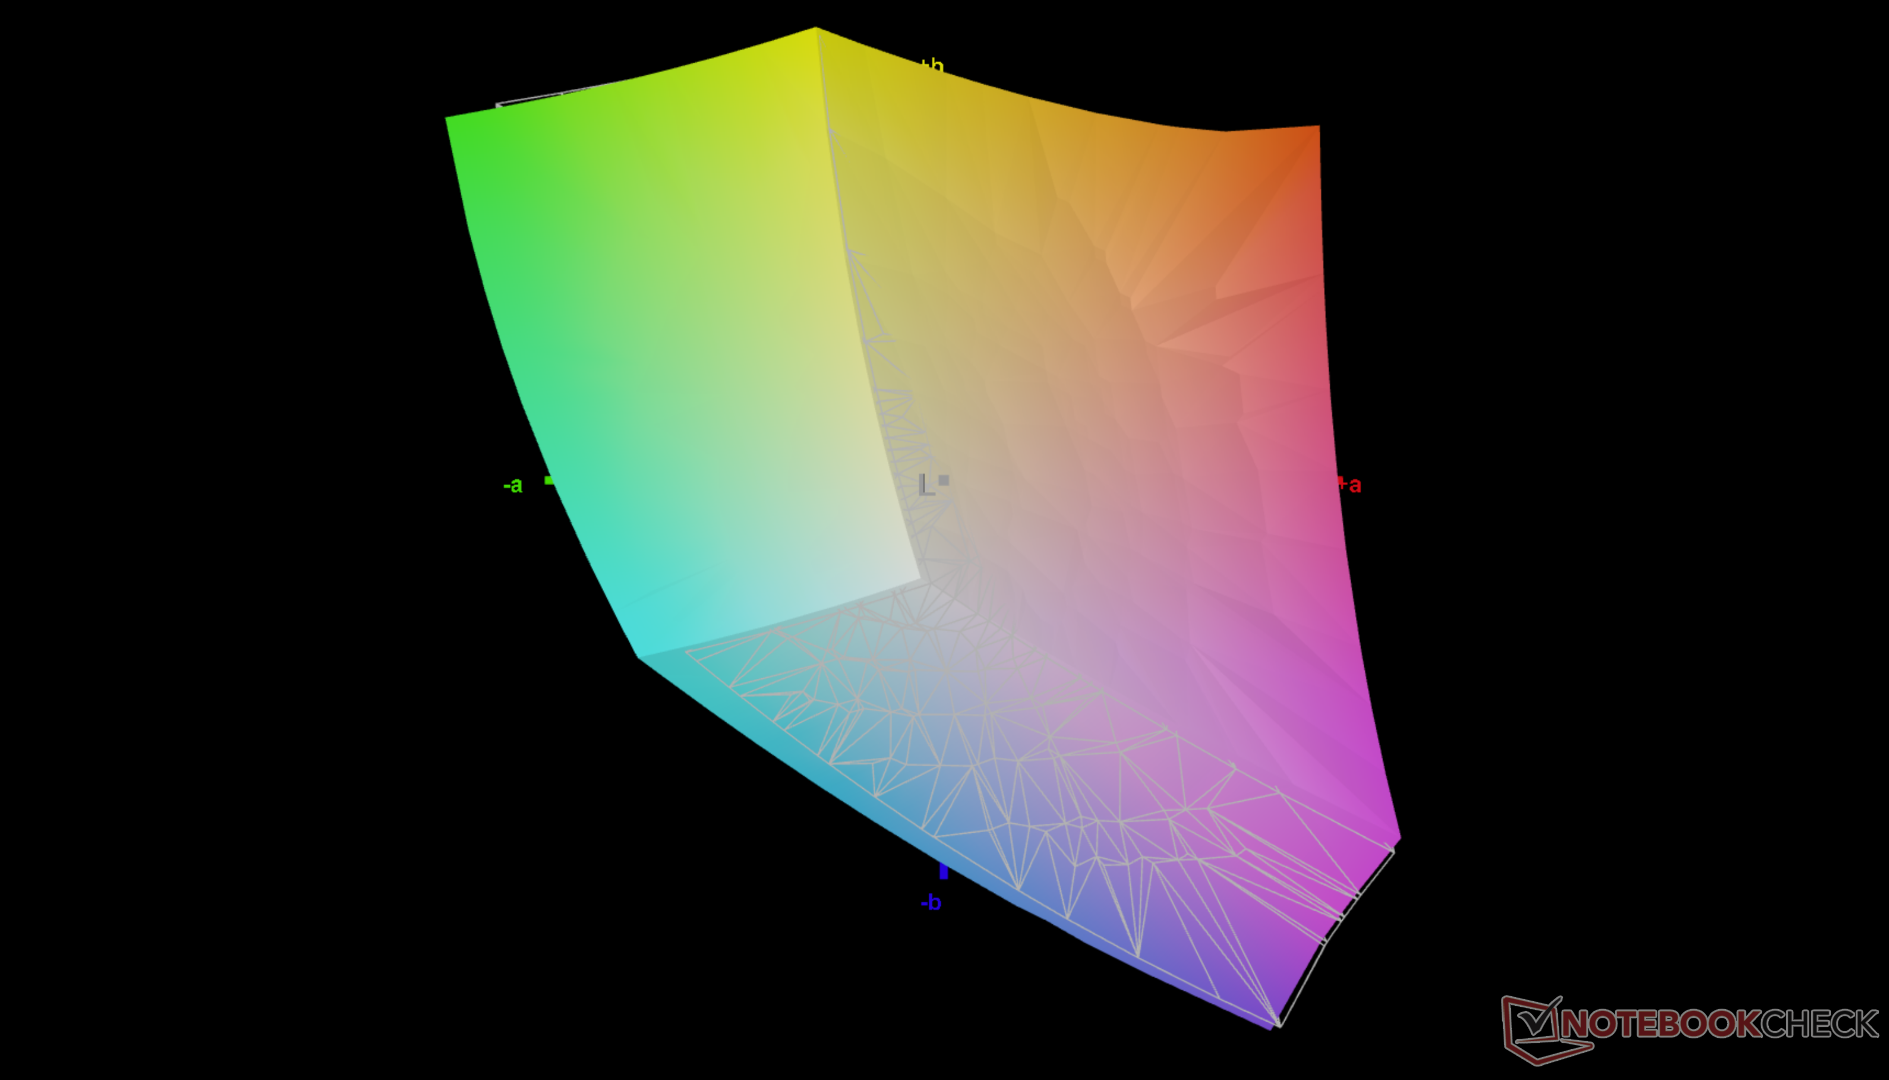
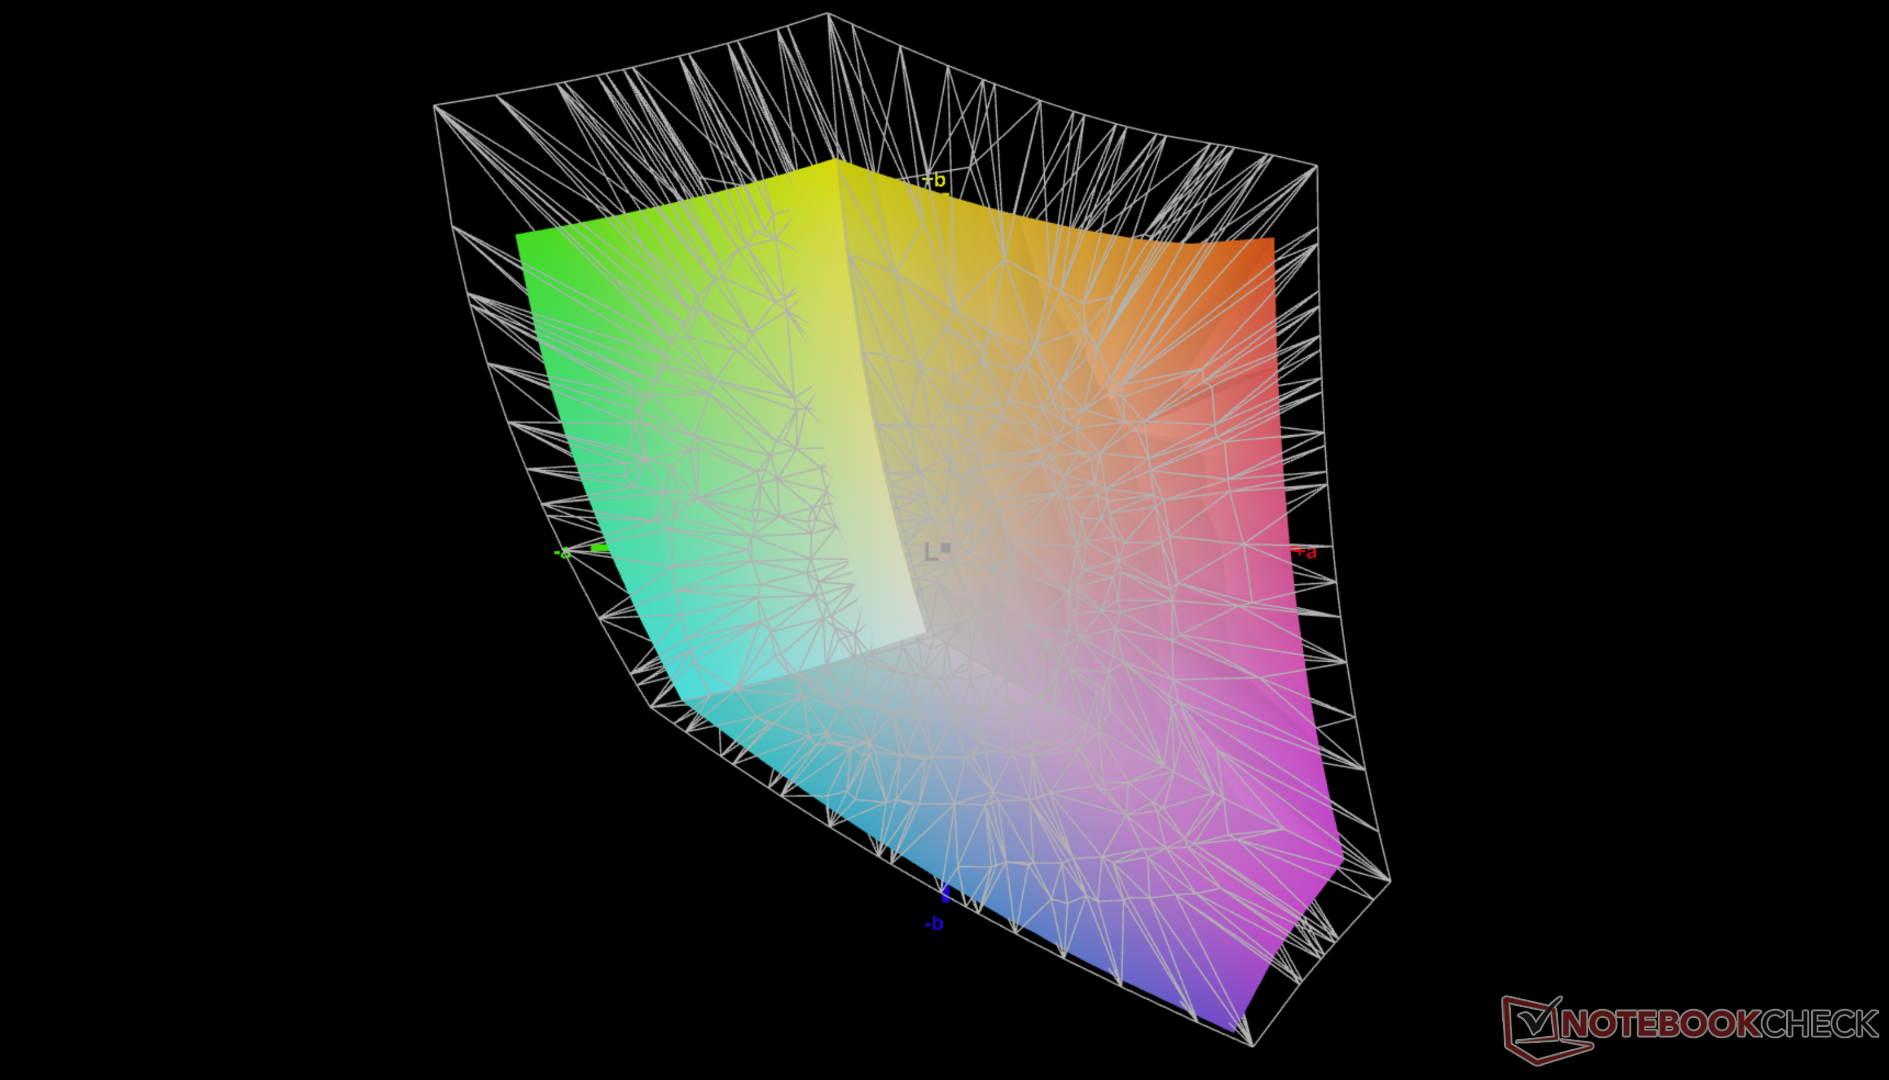
75.8% AdobeRGB 1998 (Argyll 3D)
99.4% sRGB (Argyll 3D)
74.1% Display P3 (Argyll 3D)
Gamma: 2.07
CCT: 6628 K
| Dell Inspiron 16 Plus 7610 AU Optronics B160QAN, IPS, 16", 3072x1920 | Lenovo Legion 5 Pro 16ACH6H (82JQ001PGE) CSOT T3 MNG007DA1-1, IPS, 16", 2560x1600 | Asus ROG Zephyrus M16 GU603H AU Optronics AUOC199, IPS, 16", 2560x1600 | LG Gram 16 (2021) LG Philips LP160WQ1-SPA1, IPS, 16", 2560x1600 | HP Pavilion Gaming 16-a0242ng BOE08F6, IPS, 16.1", 1920x1080 | Dell Inspiron 15 7000 7506 2-in-1 Black Edition AU Optronics B156ZAN, IPS, 15.6", 3840x2160 | |
|---|---|---|---|---|---|---|
| Display | -2% | 13% | -43% | -1% | ||
| Display P3 Coverage (%) | 74.1 | 95.8 29% | 40.42 -45% | 74.3 0% | ||
| sRGB Coverage (%) | 99.4 | 99 0% | 99.8 0% | 60.7 -39% | 99 0% | |
| AdobeRGB 1998 Coverage (%) | 75.8 | 73 -4% | 83.8 11% | 41.77 -45% | 74.6 -2% | |
| Response Times | 84% | 87% | 29% | 15% | -2% | |
| Response Time Grey 50% / Grey 80% * (ms) | 49.2 ? | 9.2 ? 81% | 4.8 ? 90% | 44 ? 11% | 43.2 ? 12% | 55.2 ? -12% |
| Response Time Black / White * (ms) | 36.8 ? | 4.8 87% | 6 ? 84% | 20 ? 46% | 30.4 ? 17% | 34 ? 8% |
| PWM Frequency (Hz) | ||||||
| Bildschirm | 11% | -21% | -45% | -20% | -39% | |
| Helligkeit Bildmitte (cd/m²) | 296.8 | 551 86% | 448 51% | 331 12% | 319 7% | 303.8 2% |
| Brightness (cd/m²) | 292 | 523 79% | 446 53% | 309 6% | 306 5% | 296 1% |
| Brightness Distribution (%) | 87 | 88 1% | 86 -1% | 88 1% | 91 5% | 93 7% |
| Schwarzwert * (cd/m²) | 0.21 | 0.54 -157% | 0.48 -129% | 0.22 -5% | 0.18 14% | 0.24 -14% |
| Kontrast (:1) | 1413 | 1020 -28% | 933 -34% | 1505 7% | 1772 25% | 1266 -10% |
| Delta E Colorchecker * | 2.56 | 1.8 30% | 2.76 -8% | 4.64 -81% | 4 -56% | 4.58 -79% |
| Colorchecker dE 2000 max. * | 4.76 | 2.53 47% | 7.09 -49% | 9.82 -106% | 11.18 -135% | 9.4 -97% |
| Colorchecker dE 2000 calibrated * | 1.86 | 1.66 11% | 2.86 -54% | 3.16 -70% | 3.52 -89% | 2.17 -17% |
| Delta E Graustufen * | 2.6 | 1.85 29% | 3.1 -19% | 6.9 -165% | 1.53 41% | 6.4 -146% |
| Gamma | 2.07 106% | 2.3 96% | 2.153 102% | 2.34 94% | 2.39 92% | 2.3 96% |
| CCT | 6628 98% | 6338 103% | 6826 95% | 7904 82% | 6533 99% | 7414 88% |
| Farbraum (Prozent von AdobeRGB 1998) (%) | 72.81 | 87 | 75.1 | 38 | 66.7 | |
| Color Space (Percent of sRGB) (%) | 99.41 | 100 | 100 | 60 | 99 | |
| Durchschnitt gesamt (Programm / Settings) | 31% /
20% | 33% /
-1% | -1% /
-22% | -16% /
-20% | -14% /
-26% |
* ... kleinere Werte sind besser
Die vollständige sRGB-Farbraumabdeckung sollte die meisten Hobby-Grafiker zufriedenstellen. Dagegen können andere Multimedia-Laptops zum Beispiel innerhalb der ZenBook-Pro-Reihe schon den größeren AdobeRGB- bzw. DCI-P3-Farbraum darstellen.
Unser X-Rite-Farbmessgerät misst Graustufen- und Farb-DeltaE-Werte von nur 2,6 bzw. 2,56, was zeigt, dass das Display ab Werk bereits eine gute Darstellung bietet. Dass diese jedoch noch weiter verbessert werden können, macht unsere nachträgliche Kalibrierung deutlich, mit der wir die DeltaE-Werte auf 2,1 bzw. 1,86 senken konnten.

Reaktionszeiten (Response Times) des Displays
| ↔ Reaktionszeiten Schwarz zu Weiß | ||
|---|---|---|
| 36.8 ms ... steigend ↗ und fallend ↘ kombiniert | ↗ 20.8 ms steigend | 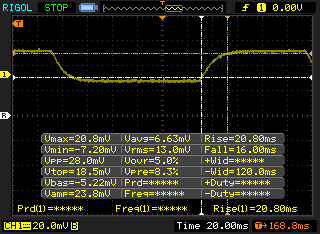 |
| ↘ 16 ms fallend | ||
| Die gemessenen Reaktionszeiten sind langsam und dadurch für viele Spieler wahrscheinlich zu langsam. Im Vergleich rangierten die bei uns getesteten Geräte von 0.1 (Minimum) zu 240 (Maximum) ms. » 95 % aller Screens waren schneller als der getestete. Daher sind die gemessenen Reaktionszeiten schlechter als der Durchschnitt aller vermessenen Geräte (19.8 ms). | ||
| ↔ Reaktionszeiten 50% Grau zu 80% Grau | ||
| 49.2 ms ... steigend ↗ und fallend ↘ kombiniert | ↗ 24.8 ms steigend | 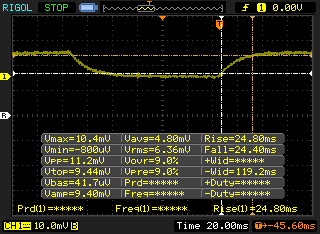 |
| ↘ 24.4 ms fallend | ||
| Die gemessenen Reaktionszeiten sind langsam und dadurch für viele Spieler wahrscheinlich zu langsam. Im Vergleich rangierten die bei uns getesteten Geräte von 0.165 (Minimum) zu 636 (Maximum) ms. » 85 % aller Screens waren schneller als der getestete. Daher sind die gemessenen Reaktionszeiten schlechter als der Durchschnitt aller vermessenen Geräte (31 ms). | ||
Bildschirm-Flackern / PWM (Pulse-Width Modulation)
| Flackern / PWM nicht festgestellt | 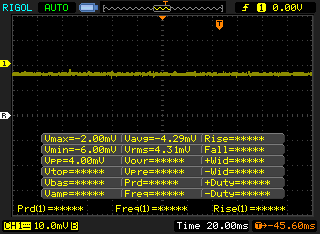 | ||
Im Vergleich: 52 % aller getesteten Geräte nutzten kein PWM um die Helligkeit zu reduzieren. Wenn PWM eingesetzt wurde, dann bei einer Frequenz von durchschnittlich 7772 (Minimum 5, Maximum 343500) Hz. | |||
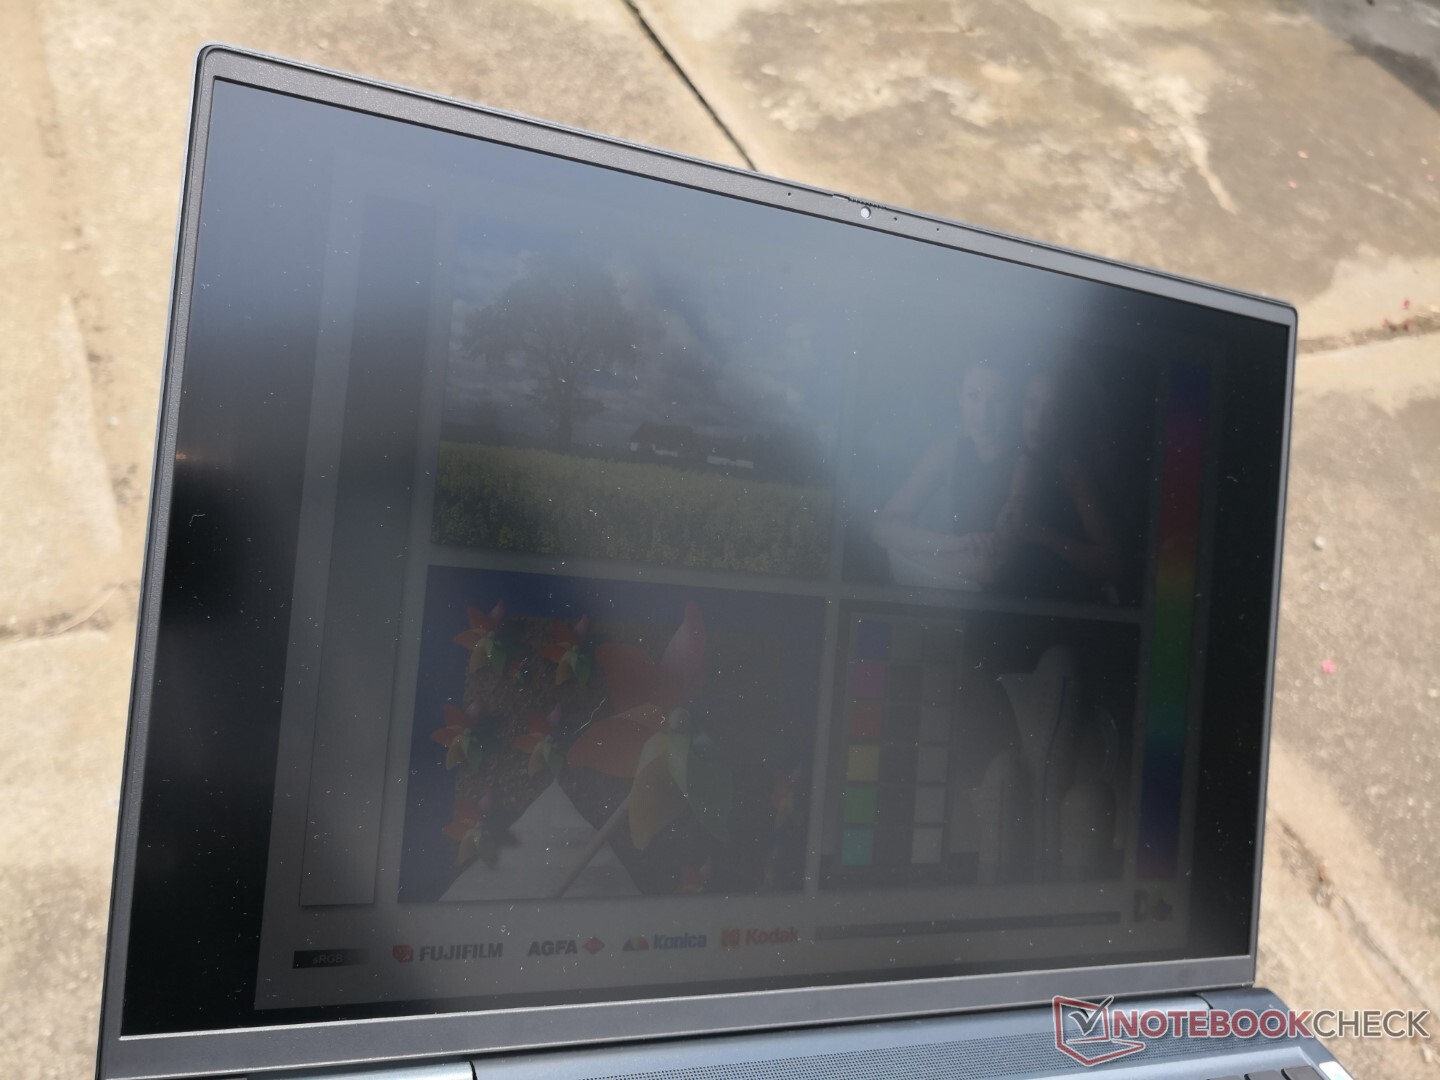
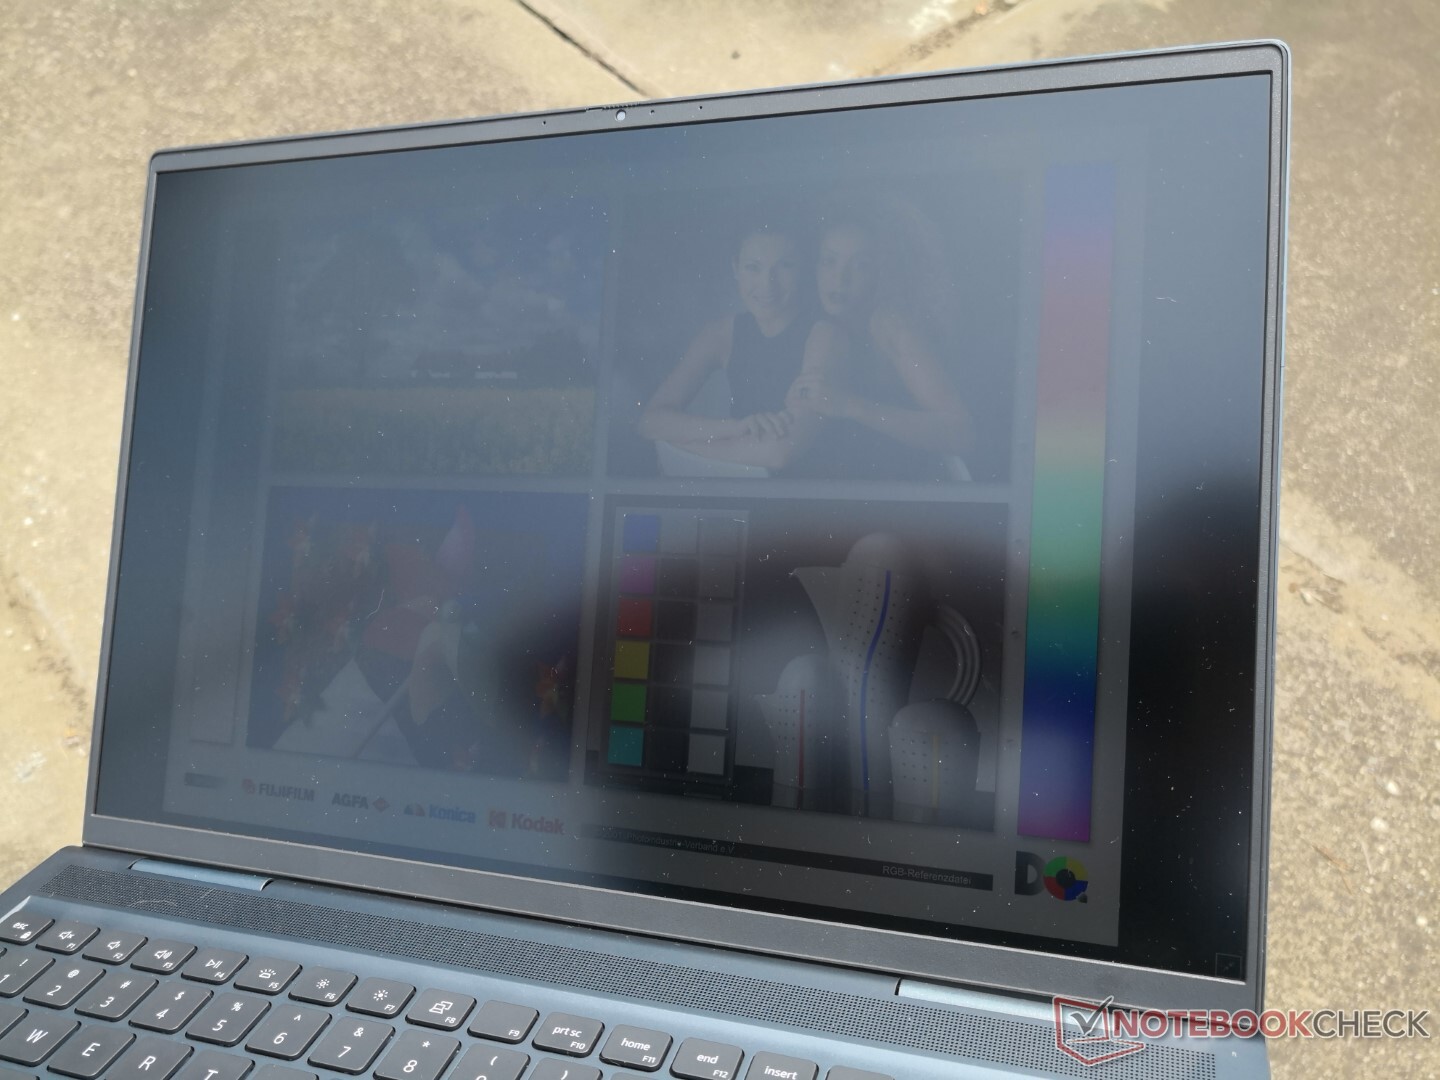
Wie bei vielen 15,6-Zoll-Gaming-Laptops ist die Lesbarkeit im Freien auch hier unterdurchschnittlich, da die meisten Modelle in dieser Kategorie auf eine Helligkeit von nur 300 cd/m2 abzielen. Für eine bessere Lesbarkeit im Freien existieren sichtlich hellere Alternativen in Form des Asus Rog Zephyrus M16, MacBook Pro 16 und des Lenovo Legion 5 Pro.

Leistung — Intel-Core-H-Basis
Standardmäßig kommen Intels Tiger-Lake-H-CPUs und optional eine GeForce RTX 3050 oder eine RTX 3060 zum Einsatz. Das Inspiron 16 ist den XPS-Laptops in dieser Hinsicht sehr ähnlich, da abgesehen vom Core i9 ähnliche CPU- und GPU-Optionen zur Verfügung stehen. Zum Zeitpunkt des Artikels gibt es keine AMD Modelle.
In Konfigurationen mit einer Nvidia GPU werden Resizable Bar und Optimus 1.0 unterstützt.
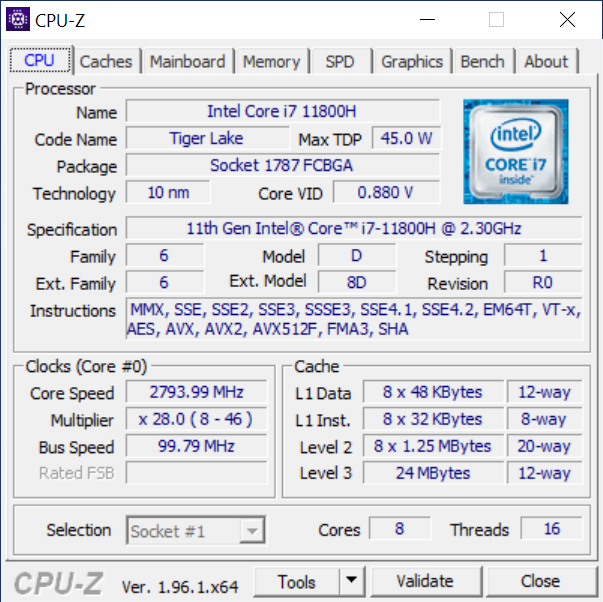
Prozessor
Die CPU-Leistung könnte besser sein, denn die Cinebench-Multi-Thread-Ergebnisse liegen 11 bis 16 % hinter denen eines durchschnittlichen Laptops, der mit dem Core i7-11800H bestückt ist. Dieser Rückstand bedeutet, dass die meisten Laptops, die mit dem AMD Ryzen 7 4800H ausgestattet sind, schneller sind als unser Dell. Letzterer schlägt den Core i7-10870H aus der letzten Generation dennoch um ca. 10 bis 15 %. Die Single-Thread-Leistung ist ausgezeichnet und entspricht unseren Erwartungen.
Mit dem schwächeren Core i5-11400H büßt man gegenüber dem i7-11800H ungefähr 10 bis 20 % an Leistung ein.
Cinebench-R15-Multi-Schleife
Cinebench R23: Multi Core | Single Core
Cinebench R15: CPU Multi 64Bit | CPU Single 64Bit
Blender: v2.79 BMW27 CPU
7-Zip 18.03: 7z b 4 -mmt1 | 7z b 4
Geekbench 5.5: Single-Core | Multi-Core
HWBOT x265 Benchmark v2.2: 4k Preset
LibreOffice : 20 Documents To PDF
R Benchmark 2.5: Overall mean
| Cinebench R20 / CPU (Multi Core) | |
| Asus ROG Zephyrus M16 GU603H | |
| Asus TUF Gaming A15 FA506QR-AZ061T | |
| Durchschnittliche Intel Core i7-11800H (2498 - 5408, n=50) | |
| Schenker XMG Core 15 Ampere | |
| Dell Inspiron 16 Plus 7610 | |
| Gigabyte Aero 15 OLED XC | |
| Asus ProArt StudioBook Pro 15 W500G5T | |
| Razer Blade 15 Advanced Model Early 2021 | |
| Acer Aspire Nitro 5 AN515-55-57GF | |
| Cinebench R20 / CPU (Single Core) | |
| Asus ROG Zephyrus M16 GU603H | |
| Dell Inspiron 16 Plus 7610 | |
| Durchschnittliche Intel Core i7-11800H (520 - 586, n=47) | |
| Asus TUF Gaming A15 FA506QR-AZ061T | |
| Schenker XMG Core 15 Ampere | |
| Gigabyte Aero 15 OLED XC | |
| Razer Blade 15 Advanced Model Early 2021 | |
| Asus ProArt StudioBook Pro 15 W500G5T | |
| Acer Aspire Nitro 5 AN515-55-57GF | |
| Cinebench R23 / Multi Core | |
| Durchschnittliche Intel Core i7-11800H (6508 - 14088, n=48) | |
| Schenker XMG Core 15 Ampere | |
| Dell Inspiron 16 Plus 7610 | |
| Gigabyte Aero 15 OLED XC | |
| Razer Blade 15 Advanced Model Early 2021 | |
| Acer Aspire Nitro 5 AN515-55-57GF | |
| Cinebench R23 / Single Core | |
| Dell Inspiron 16 Plus 7610 | |
| Durchschnittliche Intel Core i7-11800H (1386 - 1522, n=45) | |
| Schenker XMG Core 15 Ampere | |
| Gigabyte Aero 15 OLED XC | |
| Razer Blade 15 Advanced Model Early 2021 | |
| Acer Aspire Nitro 5 AN515-55-57GF | |
| Cinebench R15 / CPU Multi 64Bit | |
| Asus ROG Zephyrus M16 GU603H | |
| Asus TUF Gaming A15 FA506QR-AZ061T | |
| Schenker XMG Core 15 Ampere | |
| Durchschnittliche Intel Core i7-11800H (1342 - 2173, n=50) | |
| Gigabyte Aero 15 OLED XC | |
| Dell Inspiron 16 Plus 7610 | |
| Asus ProArt StudioBook Pro 15 W500G5T | |
| Razer Blade 15 Advanced Model Early 2021 | |
| Acer Aspire Nitro 5 AN515-55-57GF | |
| Cinebench R15 / CPU Single 64Bit | |
| Asus ROG Zephyrus M16 GU603H | |
| Asus TUF Gaming A15 FA506QR-AZ061T | |
| Dell Inspiron 16 Plus 7610 | |
| Durchschnittliche Intel Core i7-11800H (201 - 231, n=46) | |
| Gigabyte Aero 15 OLED XC | |
| Razer Blade 15 Advanced Model Early 2021 | |
| Schenker XMG Core 15 Ampere | |
| Asus ProArt StudioBook Pro 15 W500G5T | |
| Acer Aspire Nitro 5 AN515-55-57GF | |
| Blender / v2.79 BMW27 CPU | |
| Acer Aspire Nitro 5 AN515-55-57GF | |
| Asus ProArt StudioBook Pro 15 W500G5T | |
| Razer Blade 15 Advanced Model Early 2021 | |
| Gigabyte Aero 15 OLED XC | |
| Durchschnittliche Intel Core i7-11800H (217 - 454, n=46) | |
| Dell Inspiron 16 Plus 7610 | |
| Asus TUF Gaming A15 FA506QR-AZ061T | |
| Schenker XMG Core 15 Ampere | |
| Asus ROG Zephyrus M16 GU603H | |
| 7-Zip 18.03 / 7z b 4 -mmt1 | |
| Asus ROG Zephyrus M16 GU603H | |
| Asus TUF Gaming A15 FA506QR-AZ061T | |
| Dell Inspiron 16 Plus 7610 | |
| Durchschnittliche Intel Core i7-11800H (5138 - 5732, n=46) | |
| Razer Blade 15 Advanced Model Early 2021 | |
| Gigabyte Aero 15 OLED XC | |
| Asus ProArt StudioBook Pro 15 W500G5T | |
| Acer Aspire Nitro 5 AN515-55-57GF | |
| Schenker XMG Core 15 Ampere | |
| Geekbench 5.5 / Single-Core | |
| Asus ROG Zephyrus M16 GU603H | |
| Durchschnittliche Intel Core i7-11800H (1429 - 1625, n=40) | |
| Asus TUF Gaming A15 FA506QR-AZ061T | |
| Razer Blade 15 Advanced Model Early 2021 | |
| Gigabyte Aero 15 OLED XC | |
| Asus ProArt StudioBook Pro 15 W500G5T | |
| Schenker XMG Core 15 Ampere | |
| Acer Aspire Nitro 5 AN515-55-57GF | |
| Geekbench 5.5 / Multi-Core | |
| Asus ROG Zephyrus M16 GU603H | |
| Durchschnittliche Intel Core i7-11800H (4655 - 9851, n=40) | |
| Schenker XMG Core 15 Ampere | |
| Gigabyte Aero 15 OLED XC | |
| Asus TUF Gaming A15 FA506QR-AZ061T | |
| Razer Blade 15 Advanced Model Early 2021 | |
| Asus ProArt StudioBook Pro 15 W500G5T | |
| Acer Aspire Nitro 5 AN515-55-57GF | |
| HWBOT x265 Benchmark v2.2 / 4k Preset | |
| Asus ROG Zephyrus M16 GU603H | |
| Durchschnittliche Intel Core i7-11800H (7.38 - 17.4, n=46) | |
| Schenker XMG Core 15 Ampere | |
| Asus TUF Gaming A15 FA506QR-AZ061T | |
| Dell Inspiron 16 Plus 7610 | |
| Gigabyte Aero 15 OLED XC | |
| Razer Blade 15 Advanced Model Early 2021 | |
| Asus ProArt StudioBook Pro 15 W500G5T | |
| Acer Aspire Nitro 5 AN515-55-57GF | |
| LibreOffice / 20 Documents To PDF | |
| Gigabyte Aero 15 OLED XC | |
| Acer Aspire Nitro 5 AN515-55-57GF | |
| Asus ProArt StudioBook Pro 15 W500G5T | |
| Schenker XMG Core 15 Ampere | |
| Razer Blade 15 Advanced Model Early 2021 | |
| Asus TUF Gaming A15 FA506QR-AZ061T | |
| Durchschnittliche Intel Core i7-11800H (38.6 - 59.9, n=45) | |
| Dell Inspiron 16 Plus 7610 | |
| Asus ROG Zephyrus M16 GU603H | |
| R Benchmark 2.5 / Overall mean | |
| Asus ProArt StudioBook Pro 15 W500G5T | |
| Acer Aspire Nitro 5 AN515-55-57GF | |
| Razer Blade 15 Advanced Model Early 2021 | |
| Gigabyte Aero 15 OLED XC | |
| Schenker XMG Core 15 Ampere | |
| Durchschnittliche Intel Core i7-11800H (0.548 - 0.615, n=46) | |
| Dell Inspiron 16 Plus 7610 | |
| Asus ROG Zephyrus M16 GU603H | |
| Asus TUF Gaming A15 FA506QR-AZ061T | |
* ... kleinere Werte sind besser
Systemleistung

Die Ergebnisse der PCMark-10-Benchmarks liegen tendenziell über denen der Laptops, die mit den älteren Core-H-CPUs aus der 10. Generation ausgestattet sind, wie dem Asus ROG Zephyrus M15. Beim Vergleich mit Core-U-basierten Laptops vergrößert sich der Vorsprung nochmals deutlich.
| PCMark 10 / Score | |
| Asus ROG Zephyrus M16 GU603H | |
| Lenovo Legion 5 Pro 16ACH6H (82JQ001PGE) | |
| Dell Inspiron 16 Plus 7610 | |
| Durchschnittliche Intel Core i7-11800H, NVIDIA GeForce RTX 3050 4GB Laptop GPU (n=1) | |
| Dell Inspiron 15 7000 7506 2-in-1 Black Edition | |
| LG Gram 16 (2021) | |
| HP Pavilion Gaming 16-a0242ng | |
| PCMark 10 / Essentials | |
| Asus ROG Zephyrus M16 GU603H | |
| LG Gram 16 (2021) | |
| Dell Inspiron 16 Plus 7610 | |
| Durchschnittliche Intel Core i7-11800H, NVIDIA GeForce RTX 3050 4GB Laptop GPU (n=1) | |
| Dell Inspiron 15 7000 7506 2-in-1 Black Edition | |
| Lenovo Legion 5 Pro 16ACH6H (82JQ001PGE) | |
| HP Pavilion Gaming 16-a0242ng | |
| PCMark 10 / Productivity | |
| Asus ROG Zephyrus M16 GU603H | |
| Lenovo Legion 5 Pro 16ACH6H (82JQ001PGE) | |
| Dell Inspiron 16 Plus 7610 | |
| Durchschnittliche Intel Core i7-11800H, NVIDIA GeForce RTX 3050 4GB Laptop GPU (n=1) | |
| HP Pavilion Gaming 16-a0242ng | |
| LG Gram 16 (2021) | |
| Dell Inspiron 15 7000 7506 2-in-1 Black Edition | |
| PCMark 10 / Digital Content Creation | |
| Asus ROG Zephyrus M16 GU603H | |
| Lenovo Legion 5 Pro 16ACH6H (82JQ001PGE) | |
| Dell Inspiron 16 Plus 7610 | |
| Durchschnittliche Intel Core i7-11800H, NVIDIA GeForce RTX 3050 4GB Laptop GPU (n=1) | |
| Dell Inspiron 15 7000 7506 2-in-1 Black Edition | |
| HP Pavilion Gaming 16-a0242ng | |
| LG Gram 16 (2021) | |
| PCMark 10 Score | 6282 Punkte | |
Hilfe | ||
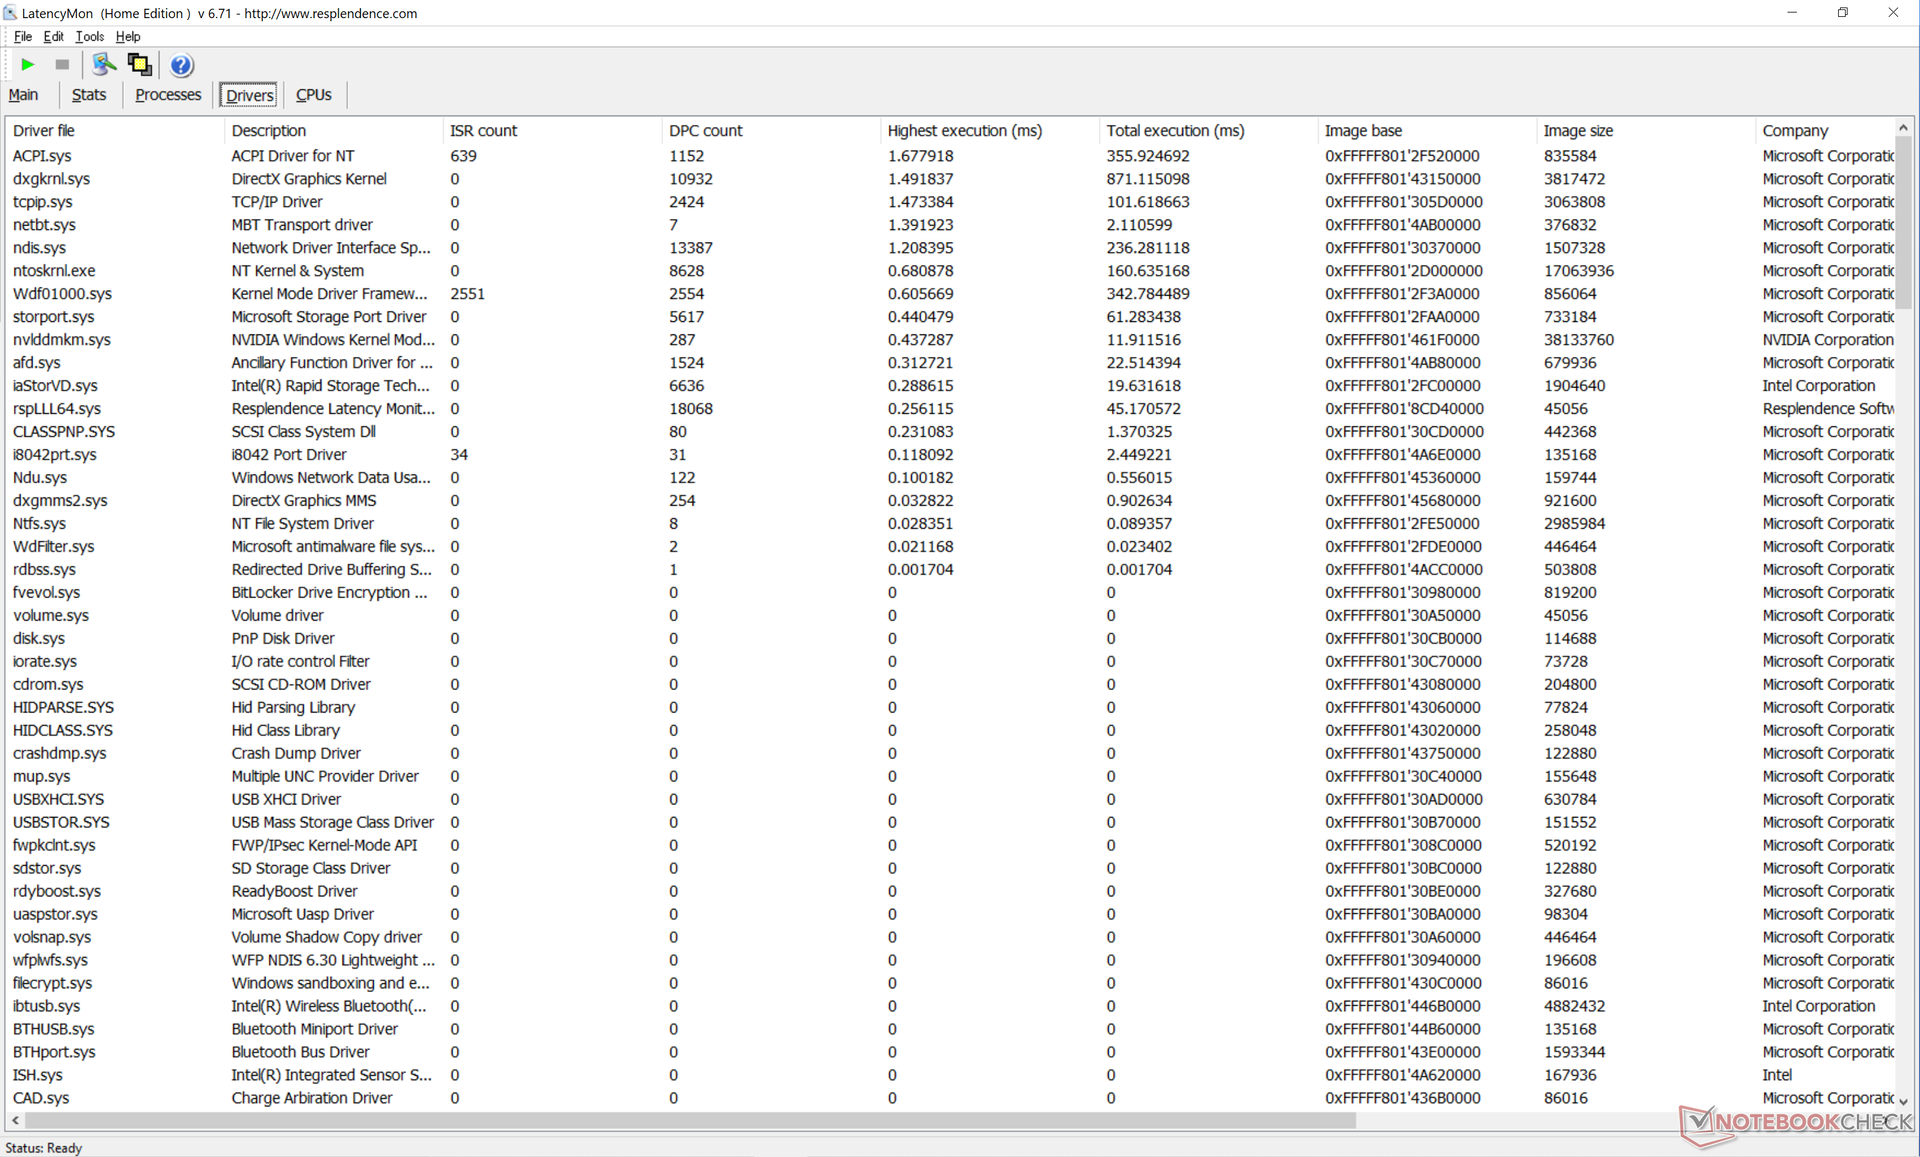
DPC-Latenzen
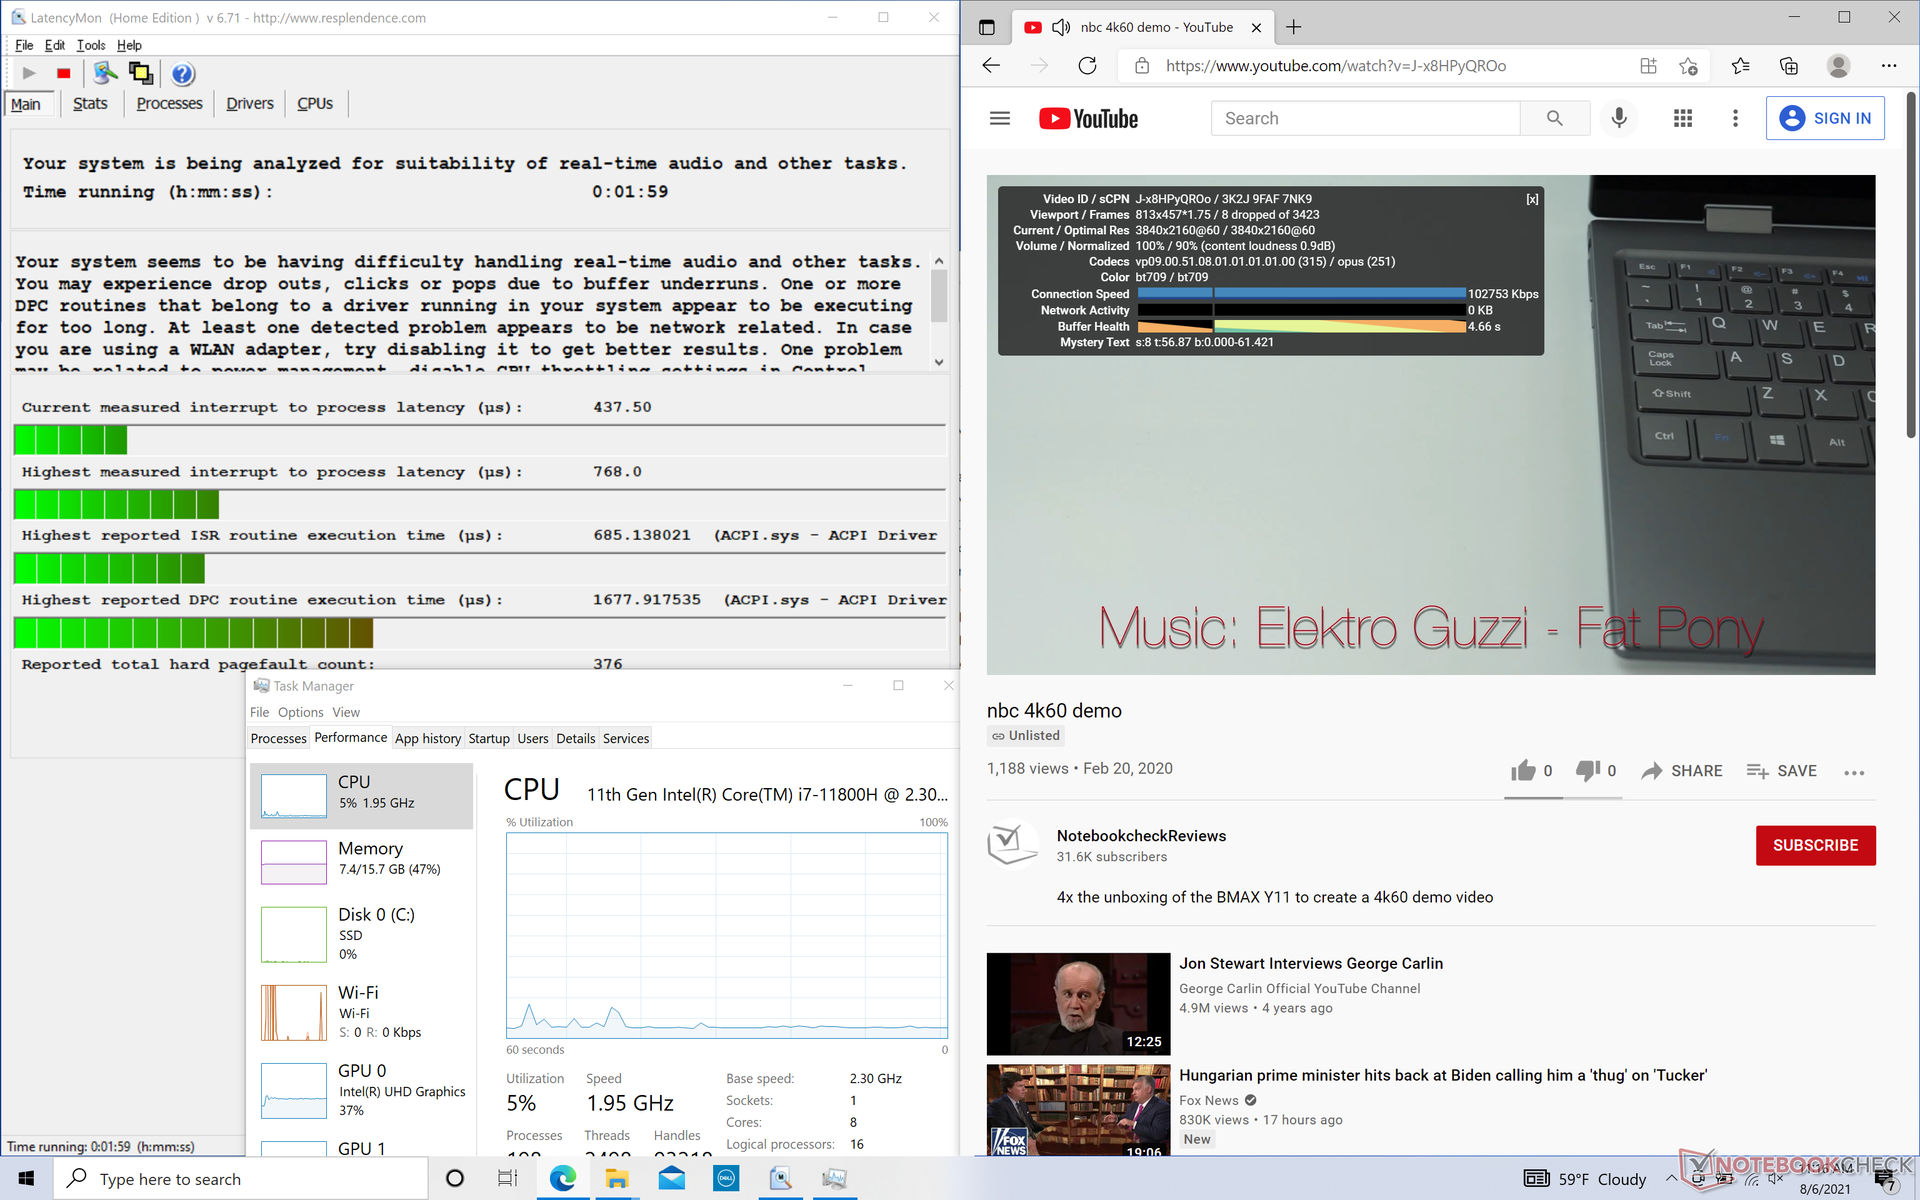
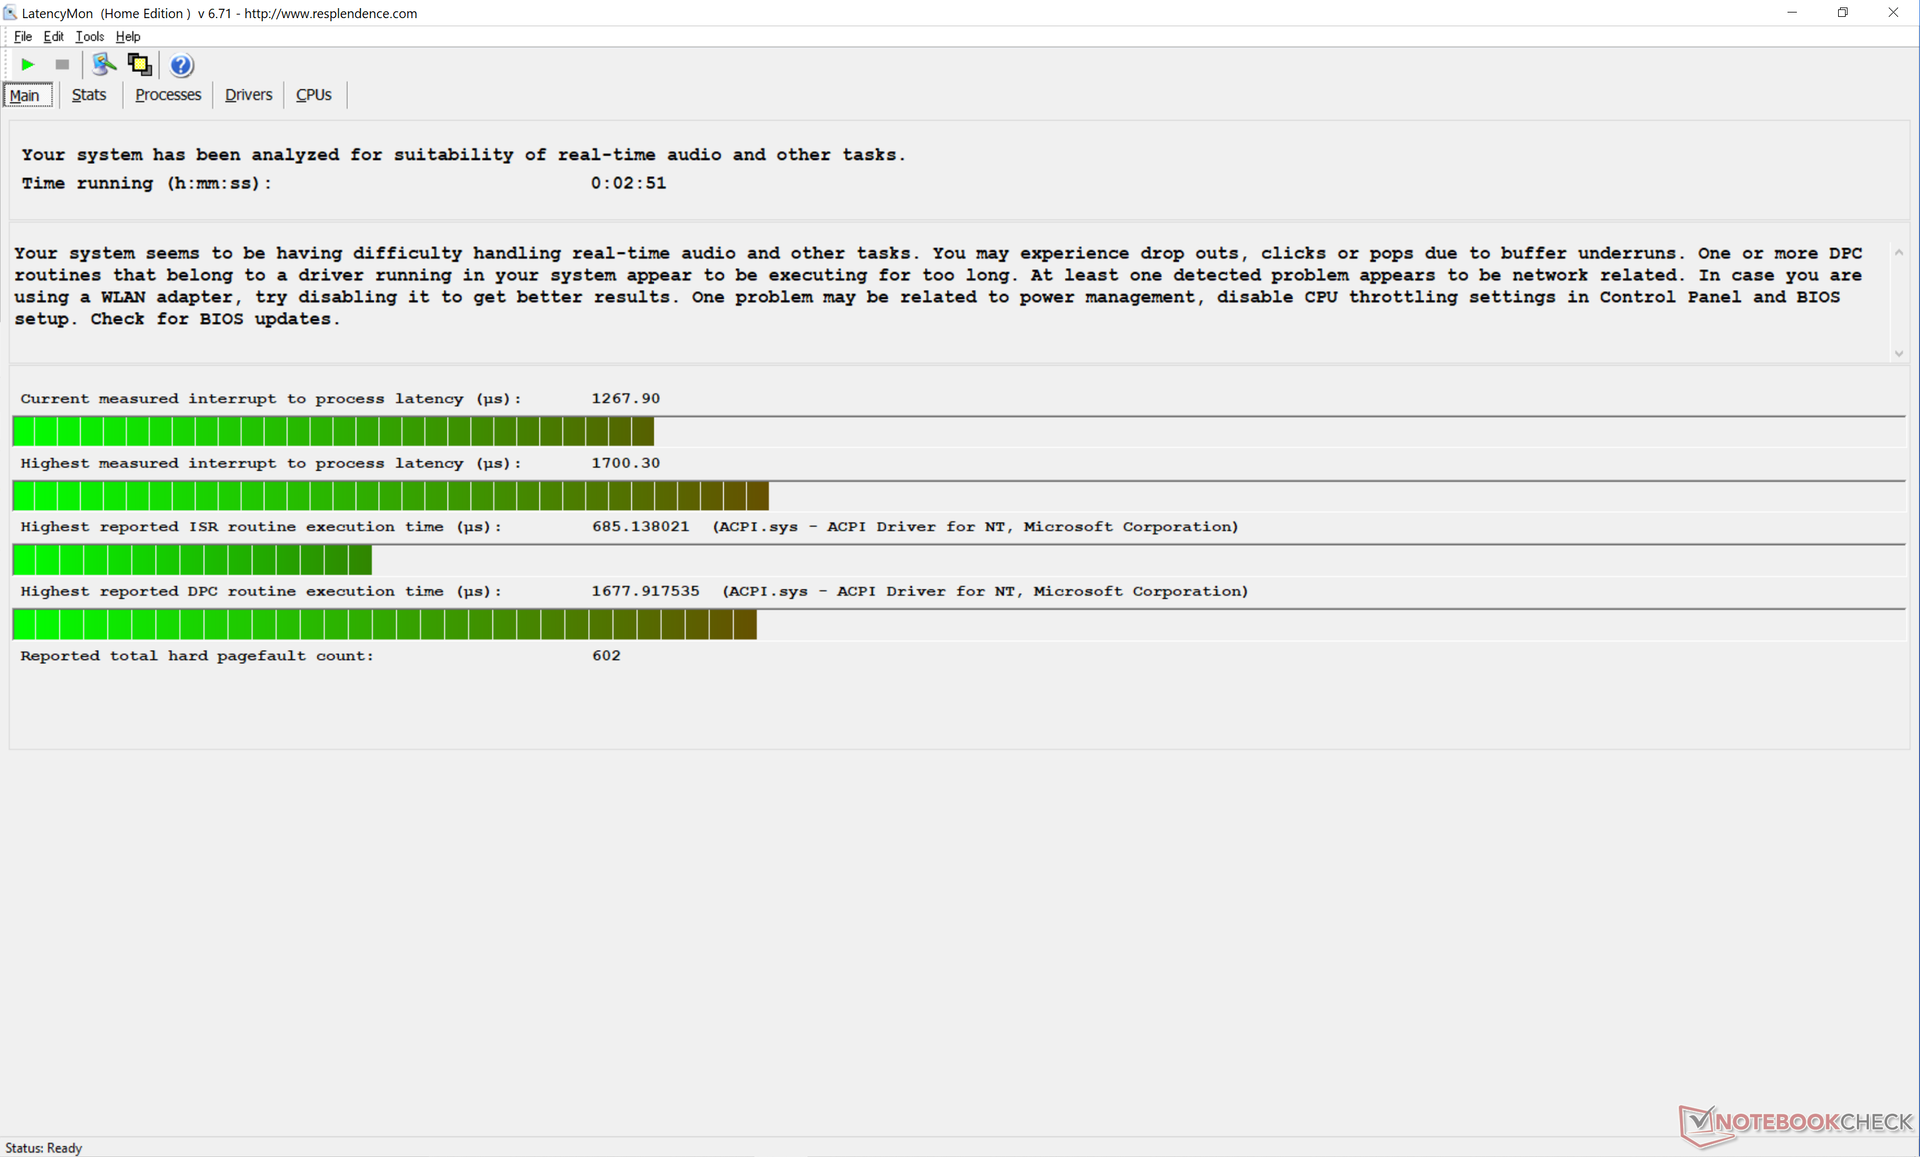
Beim Öffnen unserer Homepage in mehreren Tabs bzw. während der Ausführung von Prime95 meldet LatencyMon problematische DPC-Latenzen. Auch die Wiedergabe eines 4K-Videos verläuft nicht ganz reibungslos, da im Verlauf des 60-sekündigen Videos acht Frames verloren gingen.
| DPC Latencies / LatencyMon - interrupt to process latency (max), Web, Youtube, Prime95 | |
| HP Pavilion Gaming 16-a0242ng | |
| Dell Inspiron 16 Plus 7610 | |
| Lenovo Legion 5 Pro 16ACH6H (82JQ001PGE) | |
| Asus ROG Zephyrus M16 GU603H | |
| LG Gram 16 (2021) | |
| Dell Inspiron 15 7000 7506 2-in-1 Black Edition | |
* ... kleinere Werte sind besser
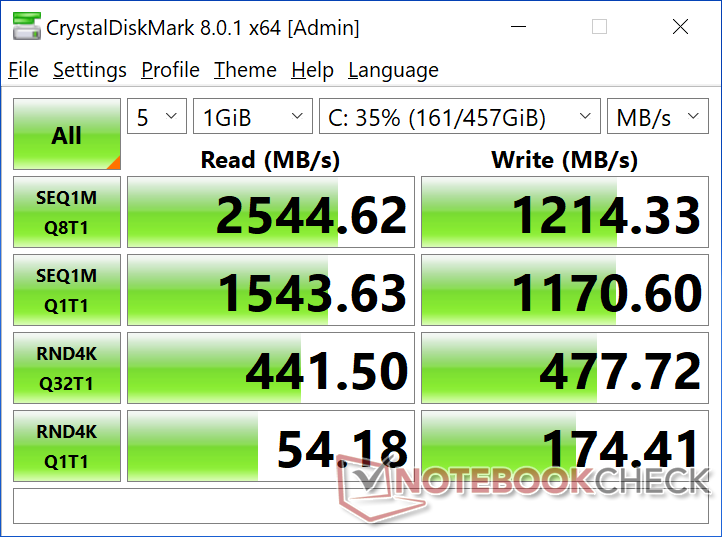
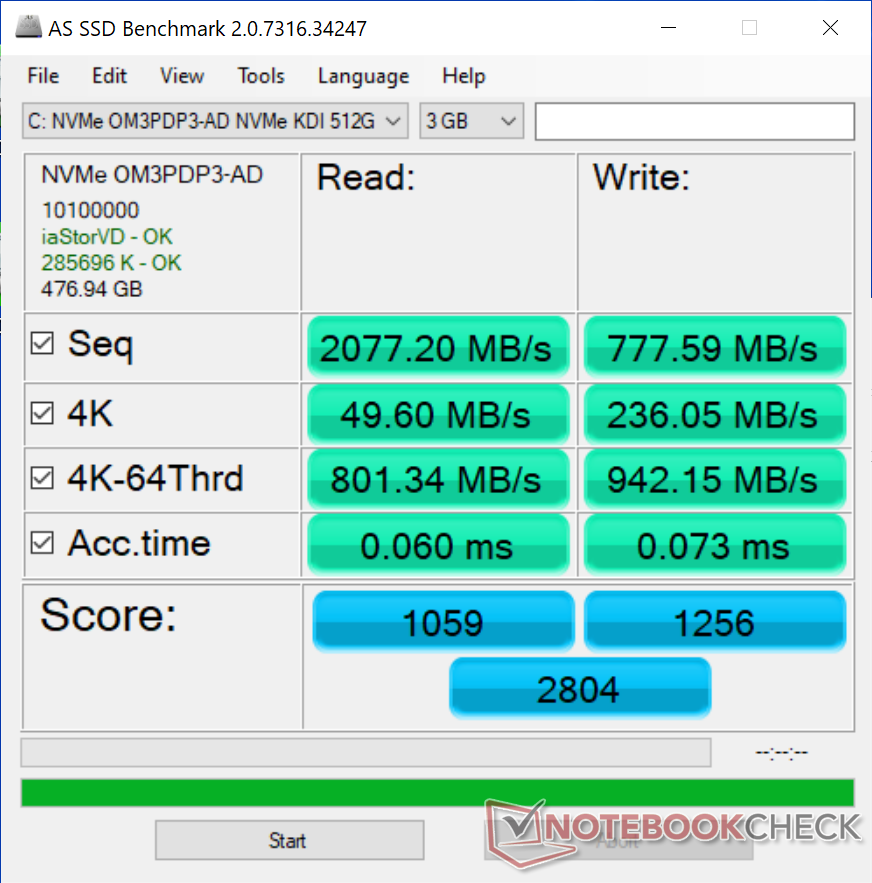
Massenspeicher — Zwei interne Laufwerke
Unser Testgerät ist mit der unüblichen NVMe-SSD Kingston OM3PDP3-AD ausgestattet. Mit bis zur Hälfte der Leistung der Micron 2300 im XPS 15 9510 ist ihre Geschwindigkeit relativ durchschnittlich. Da Dell Laufwerke von mehreren SSD-Herstellern wie unter anderem Samsung, Micron, Western Digital, Toshiba und scheinbar auch Kingston bezieht, ist es schwierig vorauszusagen, mit welchen Laufwerken ein im Handel erhältlicher Inspiron Laptop ausgestattet sein wird.
Es lassen sich bis zu zwei interne Laufwerke einbauen, mindestens eines davon muss jedoch das kleinere 2230-Format besitzen.
| Dell Inspiron 16 Plus 7610 Kingston OM3PDP3512B | Lenovo Legion 5 Pro 16ACH6H (82JQ001PGE) WDC PC SN730 SDBPNTY-1T00 | LG Gram 16 (2021) SK Hynix PC601 1TB HFS001TD9TNG | HP Pavilion Gaming 16-a0242ng Intel SSD 660p SSDPEKNW512G8 | Dell Inspiron 15 7000 7506 2-in-1 Black Edition Micron 2300 1TB MTFDHBA1T0TDV | |
|---|---|---|---|---|---|
| AS SSD | -28% | 57% | -23% | 31% | |
| Seq Read (MB/s) | 2077 | 2695 30% | 2808 35% | 1438 -31% | 1910 -8% |
| Seq Write (MB/s) | 778 | 2384 206% | 2345 201% | 905 16% | 2795 259% |
| 4K Read (MB/s) | 49.6 | 29.75 -40% | 50.2 1% | 50.3 1% | 50.5 2% |
| 4K Write (MB/s) | 236.1 | 52 -78% | 138.6 -41% | 111.7 -53% | 103.8 -56% |
| 4K-64 Read (MB/s) | 801 | 1193 49% | 1584 98% | 324 -60% | 1485 85% |
| 4K-64 Write (MB/s) | 942 | 1107 18% | 1687 79% | 729 -23% | 1820 93% |
| Access Time Read * (ms) | 0.06 | 0.136 -127% | 0.035 42% | 0.105 -75% | 0.056 7% |
| Access Time Write * (ms) | 0.073 | 0.36 -393% | 0.028 62% | 0.047 36% | 0.282 -286% |
| Score Read (Points) | 1059 | 1493 41% | 1915 81% | 518 -51% | 1727 63% |
| Score Write (Points) | 1256 | 1397 11% | 2060 64% | 931 -26% | 2203 75% |
| Score Total (Points) | 2804 | 3636 30% | 4934 76% | 1707 -39% | 4863 73% |
| Copy ISO MB/s (MB/s) | 1028 | 1007 -2% | 1852 80% | 1145 11% | 1892 84% |
| Copy Program MB/s (MB/s) | 794 | 43.11 -95% | 704 -11% | 602 -24% | 649 -18% |
| Copy Game MB/s (MB/s) | 987 | 621 -37% | 1329 35% | 929 -6% | 1558 58% |
| CrystalDiskMark 5.2 / 6 | 13% | 49% | 51% | ||
| Write 4K (MB/s) | 176.8 | 89.9 -49% | 204.2 15% | 111.4 -37% | |
| Read 4K (MB/s) | 52.3 | 30.98 -41% | 47.14 -10% | 53.4 2% | |
| Write Seq (MB/s) | 1170 | 2521 115% | 2598 122% | ||
| Read Seq (MB/s) | 1557 | 1748 12% | 2308 48% | ||
| Write 4K Q32T1 (MB/s) | 471.5 | 371.6 -21% | 669 42% | 644 37% | |
| Read 4K Q32T1 (MB/s) | 437.9 | 470.6 7% | 760 74% | 665 52% | |
| Write Seq Q32T1 (MB/s) | 1214 | 3065 152% | 2513 107% | 3147 159% | |
| Read Seq Q32T1 (MB/s) | 2549 | 3370 32% | 3452 35% | 3242 27% | |
| Write 4K Q8T8 (MB/s) | 1619 | ||||
| Read 4K Q8T8 (MB/s) | 1670 | ||||
| Durchschnitt gesamt (Programm / Settings) | -8% /
-15% | 53% /
54% | -23% /
-23% | 41% /
38% |
* ... kleinere Werte sind besser

Disk Throttling: DiskSpd Read Loop, Queue Depth 8
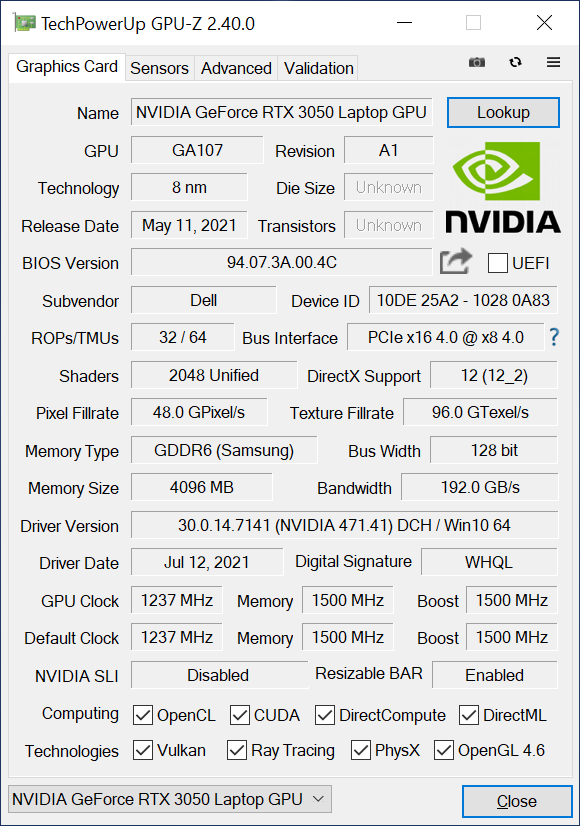
Grafikkarte — Bis zu 65 W TGP
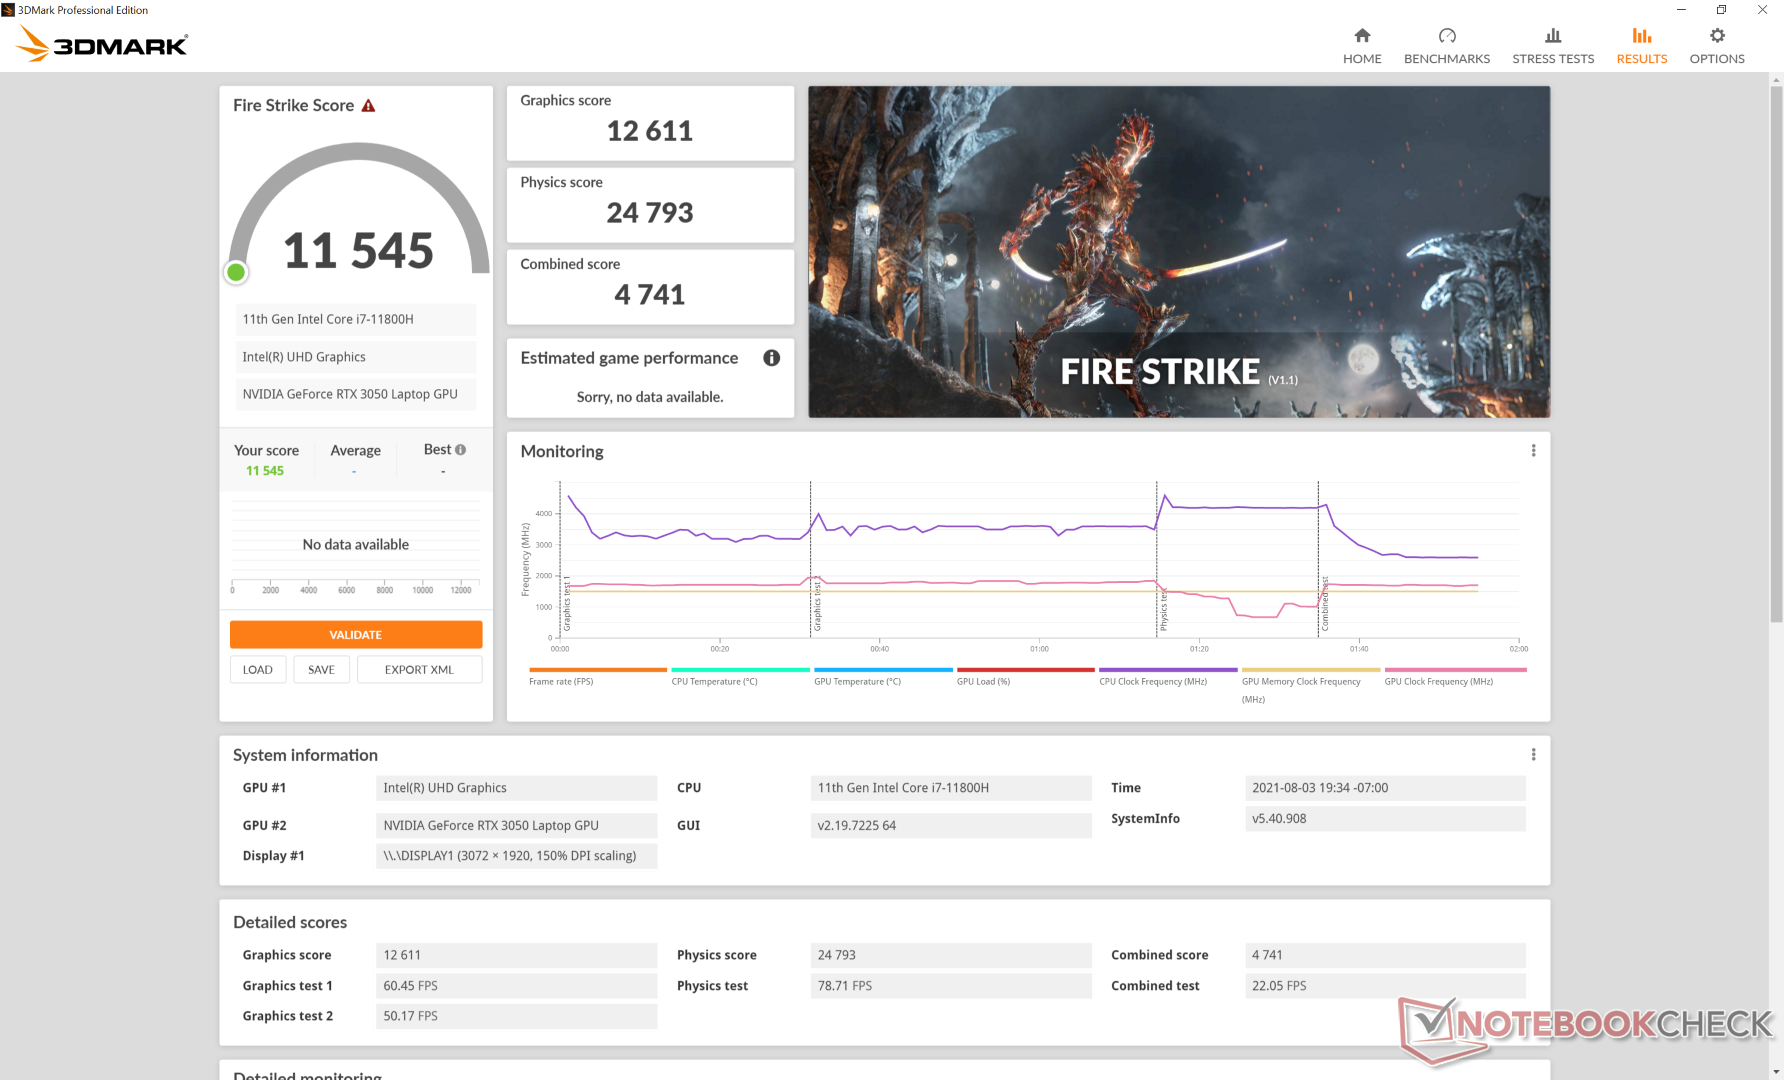
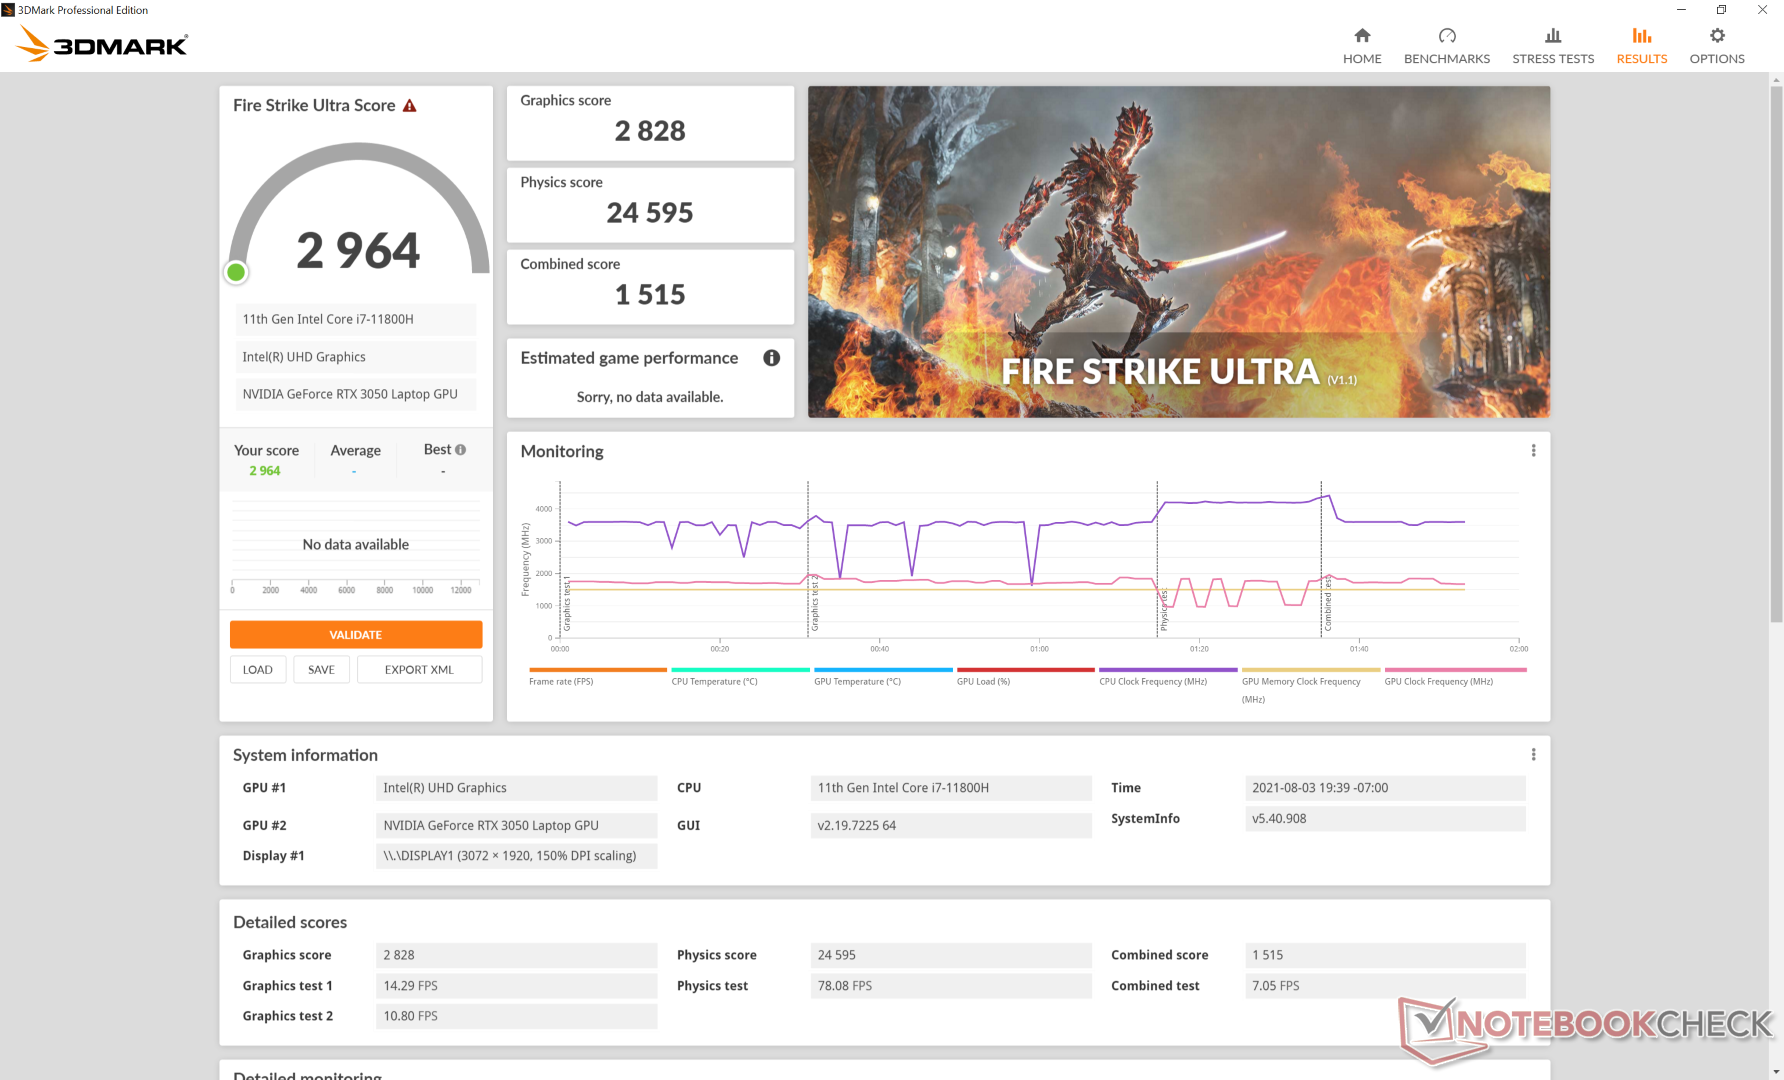
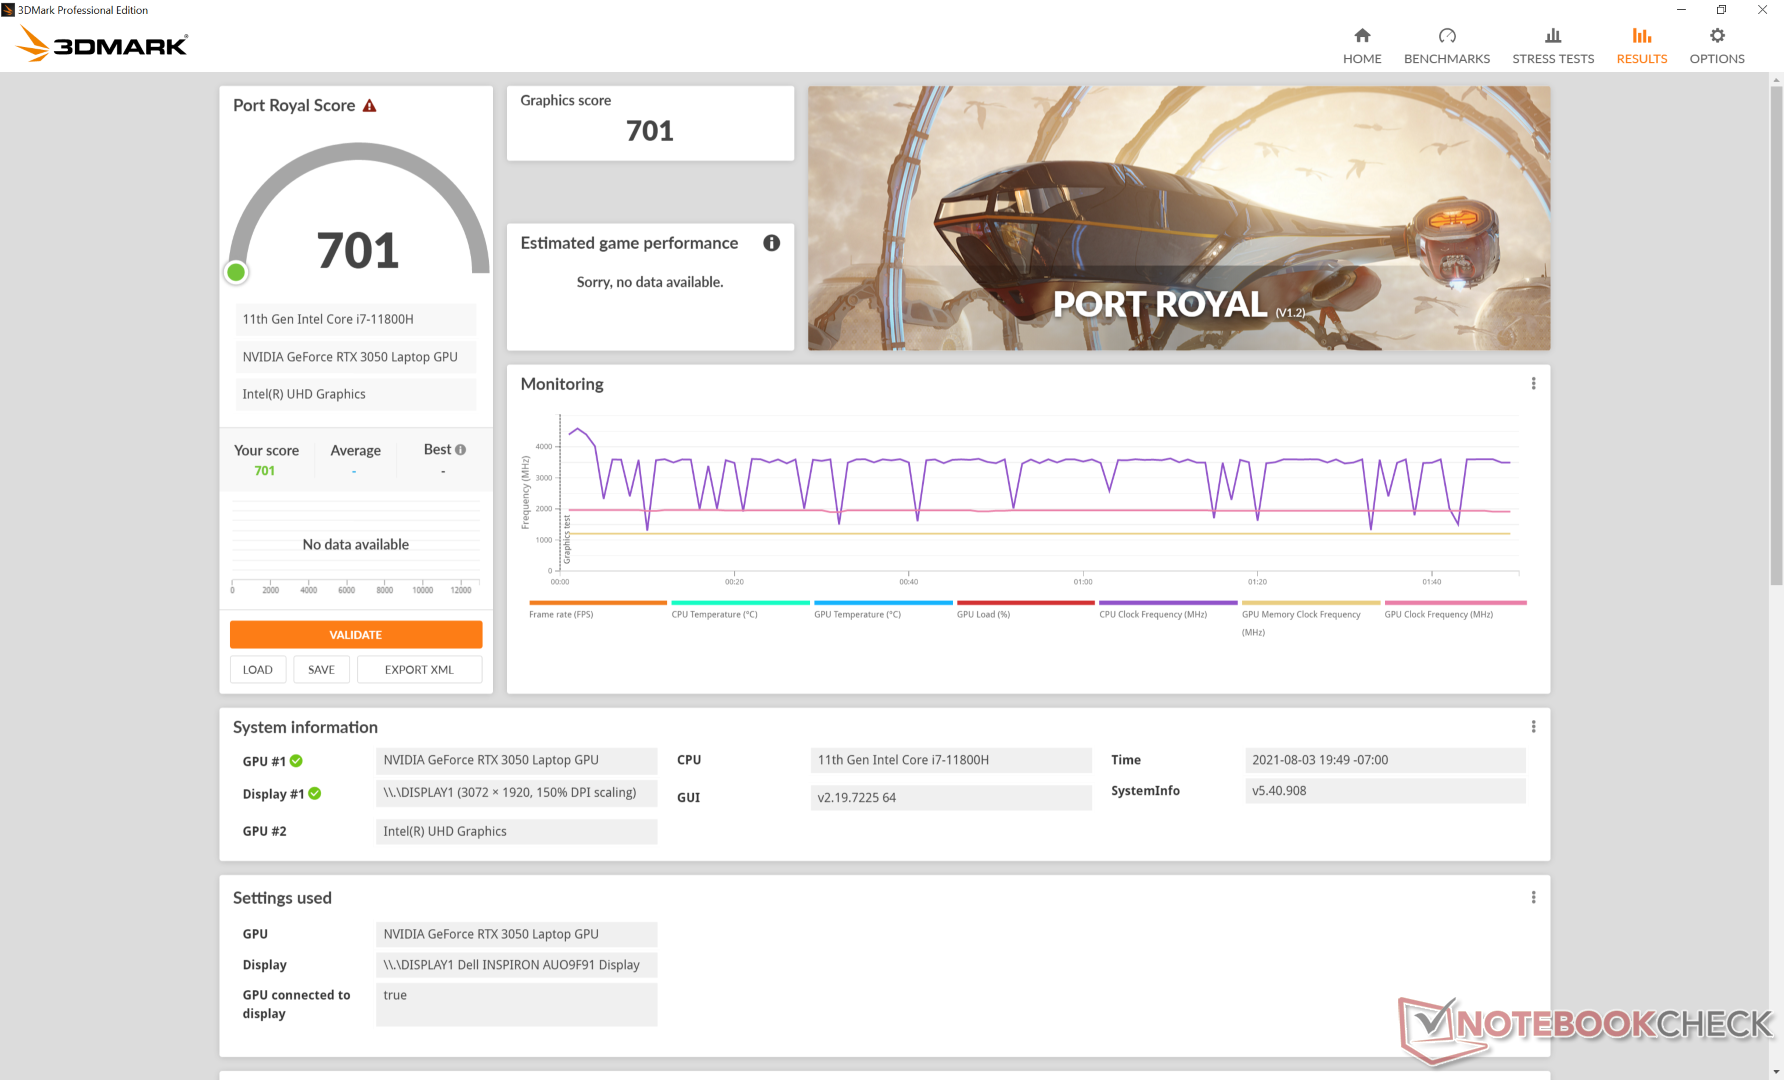
Die Grafikleistung ist etwas enttäuschend. Wir hatten zwar nicht damit gerechnet, der teureren RTX 3060 besonders nahe zu kommen, allerdings ist unsere RTX 3050 meistens nicht einmal schneller als eine GTX 1660 Ti. Mit einer gegenüber der RTX 3060 40 % niedrigeren Leistung ist die Grafikleistung geringer als bei älteren, günstigeren Laptops, die mit einer GTX 1660 Ti oder RTX 2060 ausgerüstet sind.
Außerdem ist unsere 3DMark-Port-Royal-Punktzahl mit nur 701 Punkten ungewöhnlich niedrig. Daran ändert auch ein Update auf die neuesten Treiber- und Benchmark-Versionen nichts. Wir haben Dell kontaktiert, um herauszufinden, ob es sich hierbei um einen Bug handeln könnte.
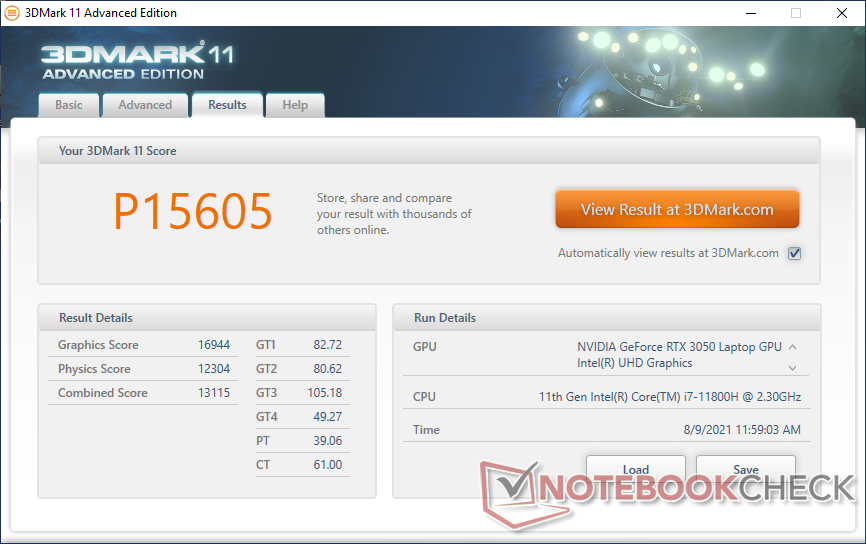
| 3DMark 11 Performance | 15605 Punkte | |
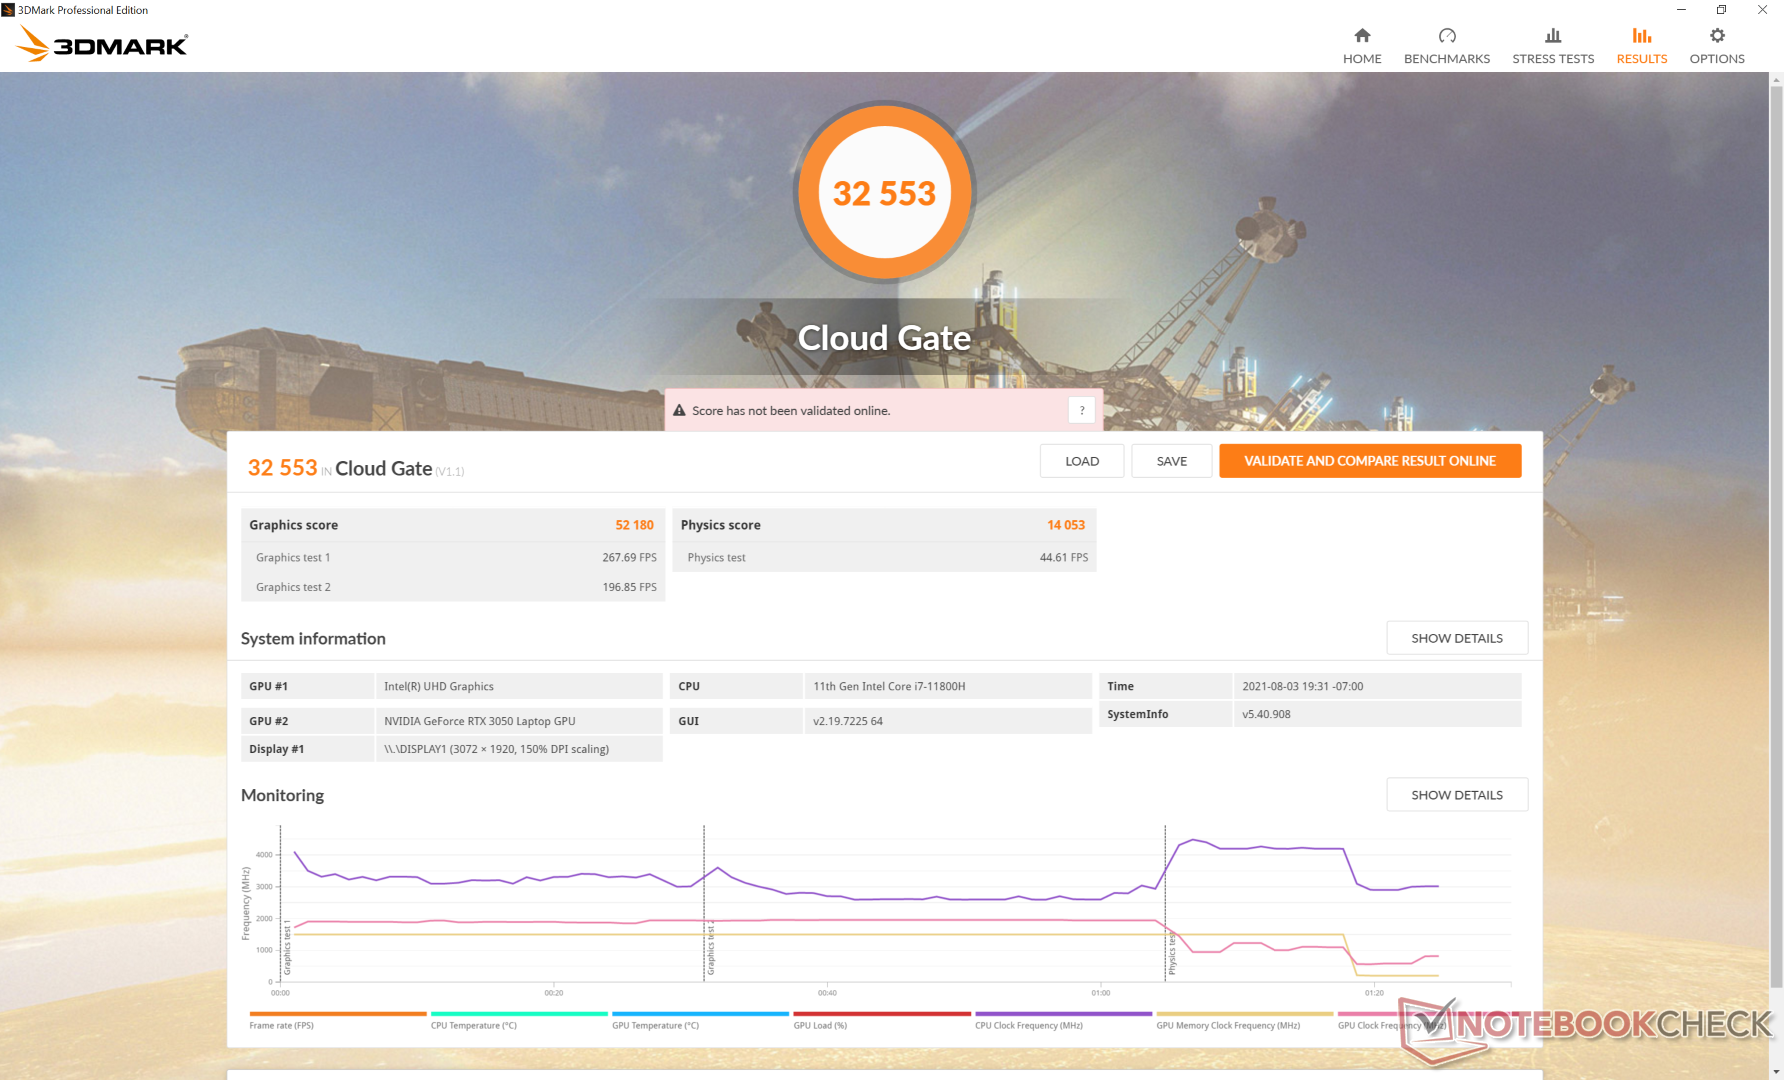
| 3DMark Cloud Gate Standard Score | 32553 Punkte | |
| 3DMark Fire Strike Score | 11545 Punkte | |
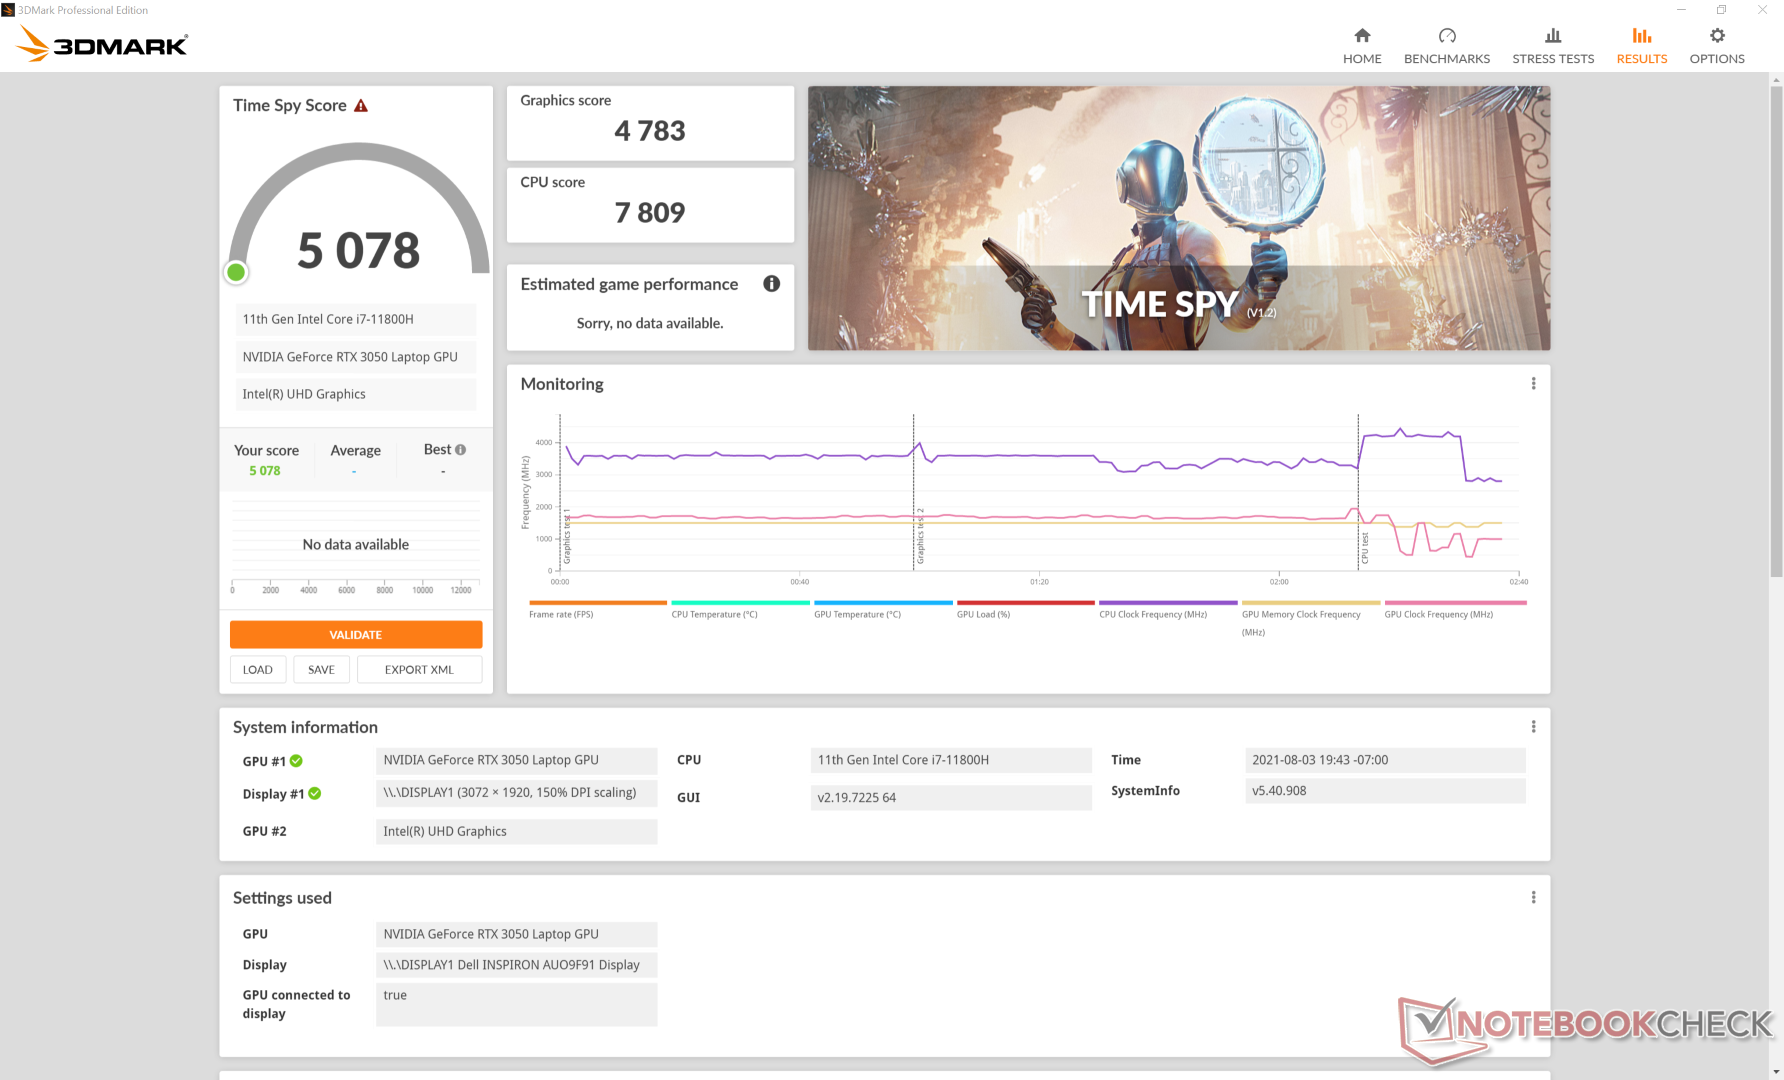
| 3DMark Time Spy Score | 5078 Punkte | |
Hilfe | ||
Gaming-Leistung
Das Inspiron 16 Plus wurde nicht fürs Gaming gebaut, für 1.080p-Einstellungen ist es jedoch durchaus dafür geeignet. Um die langsamen Reaktionszeiten und die sichtbare Schlierenbildung zu umgehen, empfiehlt es sich allerdings, einen externen Monitor anzuschließen.
Witcher-3-FPS-Verlauf
| min. | mittel | hoch | max. | QHD | |
|---|---|---|---|---|---|
| GTA V (2015) | 179 | 174 | 131 | 68.3 | 48.9 |
| The Witcher 3 (2015) | 248.5 | 153.9 | 92.1 | 51.6 | |
| Dota 2 Reborn (2015) | 162 | 142 | 135 | 125 | |
| Final Fantasy XV Benchmark (2018) | 117 | 69.6 | 50.1 | 36.5 | |
| X-Plane 11.11 (2018) | 119 | 101 | 76.2 | ||
| Far Cry 5 (2018) | 138 | 88 | 80 | 74 | 51 |
| Strange Brigade (2018) | 274 | 125 | 101 | 87 | 63.4 |
| Shadow of the Tomb Raider (2018) | 118 | 81 | 71 | 61 | 39 |
| Far Cry New Dawn (2019) | 118 | 83 | 77 | 66 | 52 |
| Metro Exodus (2019) | 123 | 62.2 | 45.8 | 36.5 | 28.6 |
| The Division 2 (2019) | 132 | 77 | 66 | 50 | 32 |
| Borderlands 3 (2019) | 111.7 | 69.2 | 49.4 | 34.9 | 22.5 |
| GRID 2019 (2019) | 181 | 108 | 104 | 43 | 27 |
| Gears Tactics (2020) | 253 | 122 | 81 | 58 | 38 |
| F1 2020 (2020) | 218 | 134 | 113 | 81 | 59 |
| Horizon Zero Dawn (2020) | 99 | 75 | 62 | 56 | 46 |
| Watch Dogs Legion (2020) | 80 | 71 | 60 | 26 | 19 |
| Dirt 5 (2020) | 141 | 66 | 51 | 40 | 34 |
| Assassin´s Creed Valhalla (2020) | 99 | 56 | 36 | 27 | 24 |
| Immortals Fenyx Rising (2020) | 106 | 71 | 57 | 53 | 39 |
| Hitman 3 (2021) | 159.4 | 100.7 | 86.9 | 79.9 | 49.1 |
| F1 2021 (2021) | 186 | 130 | 110 | 52 | 36 |
Emissionen
Geräuschemissionen
Den Lüftern des Inspiron 16 gelingt es, sehr lange still oder zumindest sehr leise zu bleiben. Im 3DMark-06-Benchmark machen sie sich zum Beispiel erst nach 40 Sekunden bemerkbar. Sobald sie ihre Drehzahl stärker erhöhen müssen, wird der Laptop mit fast 50 dB(A) schnell ähnlich laut wie viele Gaming-Laptops.
Unter niedrigerer Last wie zum Beispiel während des Surfens oder der Videowiedergabe erzeugen die Lüfter üblicherweise maximal 33 dB(A) für einen kurzen Zeitraum. Die Lüfter puliseren gelegentlich, aber nur selten.
| Dell Inspiron 16 Plus 7610 GeForce RTX 3050 4GB Laptop GPU, i7-11800H, Kingston OM3PDP3512B | Asus ROG Zephyrus M16 GU603H GeForce RTX 3070 Laptop GPU, i9-11900H, Samsung PM9A1 MZVL22T0HBLB | LG Gram 16 (2021) Iris Xe G7 96EUs, i7-1165G7, SK Hynix PC601 1TB HFS001TD9TNG | HP Pavilion Gaming 16-a0242ng GeForce GTX 1650 Ti Mobile, i5-10300H, Intel SSD 660p SSDPEKNW512G8 | Dell Inspiron 15 7000 7506 2-in-1 Black Edition Xe MAX, i7-1165G7, Micron 2300 1TB MTFDHBA1T0TDV | |
|---|---|---|---|---|---|
| Geräuschentwicklung | -18% | 7% | -16% | -6% | |
| aus / Umgebung * (dB) | 24.4 | 25 -2% | 26 -7% | 25 -2% | 27.3 -12% |
| Idle min * (dB) | 24.4 | 25 -2% | 26 -7% | 25 -2% | 27.3 -12% |
| Idle avg * (dB) | 24.4 | 31 -27% | 26 -7% | 33 -35% | 27.3 -12% |
| Idle max * (dB) | 24.4 | 42 -72% | 26 -7% | 42 -72% | 27.3 -12% |
| Last avg * (dB) | 48.3 | 48 1% | 30.8 36% | 48 1% | 47.4 2% |
| Witcher 3 ultra * (dB) | 48.9 | 52 -6% | 46 6% | 47.4 3% | |
| Last max * (dB) | 48.9 | 56 -15% | 31.1 36% | 54 -10% | 47.5 3% |
* ... kleinere Werte sind besser
Lautstärkediagramm
| Idle |
| 24.4 / 24.4 / 24.4 dB(A) |
| Last |
| 48.3 / 48.9 dB(A) |
 | ||
30 dB leise 40 dB(A) deutlich hörbar 50 dB(A) störend |
||
min: | ||
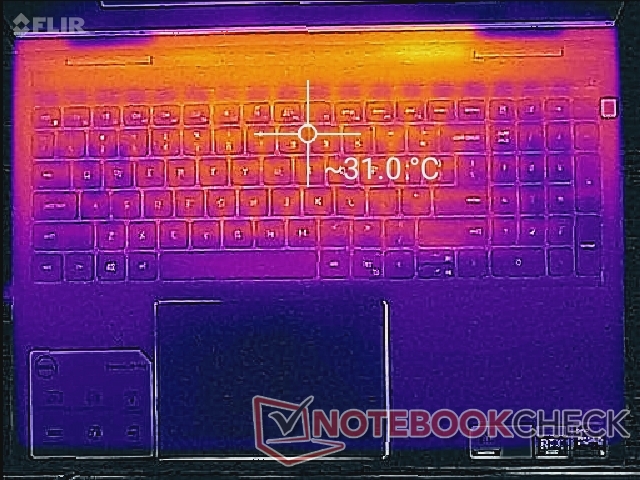
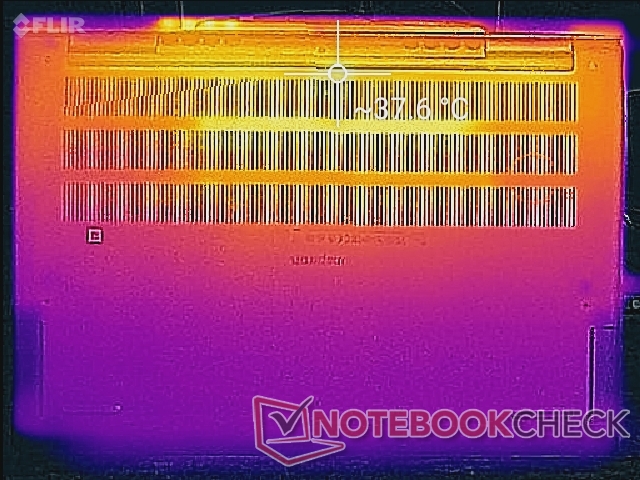
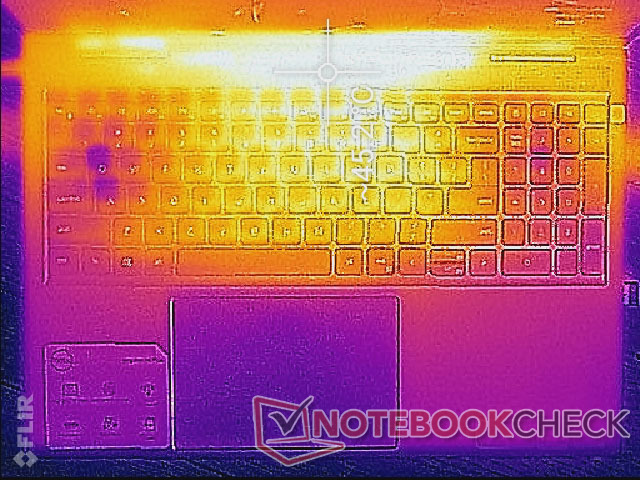
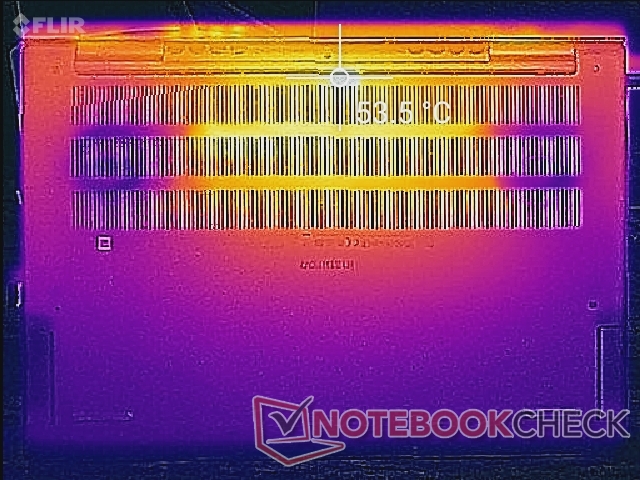
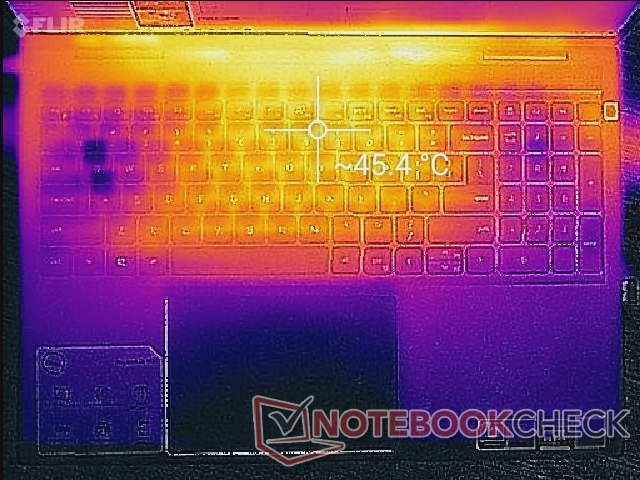
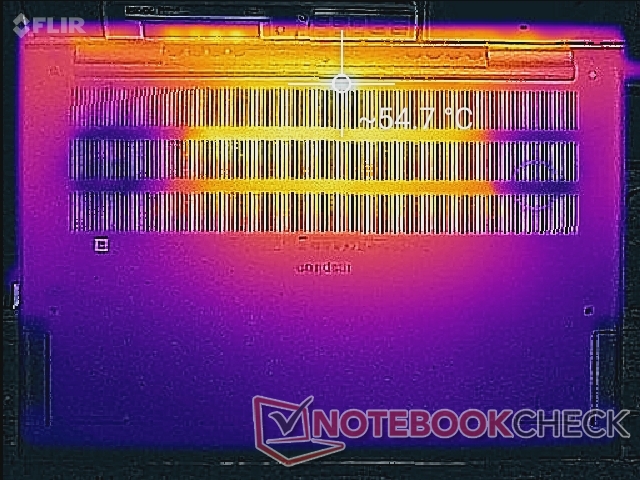
Temperatur — Fast nie warm
Die Oberflächentemperaturen sind auf der wärmeren Seite, was vermutlich auf das oben erwähnte träge Lüfterverhalten zurückzuführen ist. Dadurch können die wärmsten Stellen auf der Ober- und Unterseite im Desktopbetrieb ohne das Ausführen von Programmen beispielsweise 31 bzw. 38 °C erreichen. Im Gaming-Betrieb erreicht die Tastaturmitte bis zu 45 °C und damit eine ähnliche Temperatur wie beim Pavilion Gaming 16. Das Inspiron 16 besitzt mehr und größere Belüftungsschlitze als langsamere Core-U-Laptops wie das LG Gram 16.
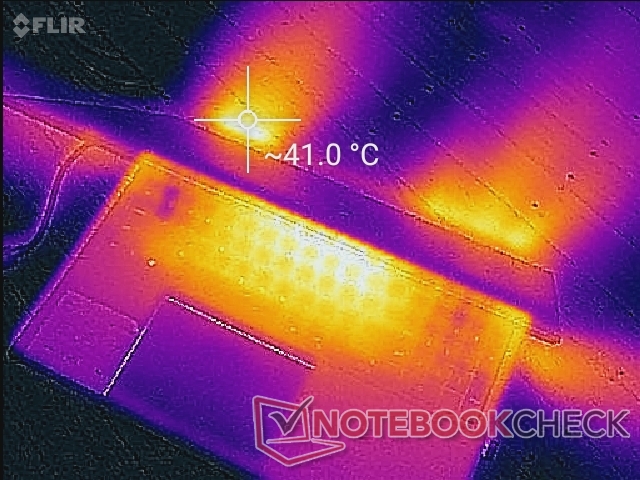
(-) Die maximale Temperatur auf der Oberseite ist 46.4 °C. Im Vergleich liegt der Klassendurchschnitt bei 36.8 °C (von 21 bis 71 °C für die Klasse Multimedia).
(-) Auf der Unterseite messen wir eine maximalen Wert von 54.8 °C (im Vergleich zum Durchschnitt von 39.1 °C).
(+) Ohne Last messen wir eine durchschnittliche Temperatur von 28.3 °C auf der Oberseite. Der Klassendurchschnitt erreicht 31.3 °C.
(±) Beim längeren Spielen von The Witcher 3 erhitzt sich das Gerät durchschnittlich auf 35.4 °C. Der Durchschnitt der Klasse ist derzeit 31.3 °C.
(+) Die Handballen und der Touchpad-Bereich sind mit gemessenen 29 °C kühler als die typische Hauttemperatur und fühlen sich dadurch kühl an.
(±) Die durchschnittliche Handballen-Temperatur anderer getesteter Geräte war 28.7 °C (-0.3 °C).
Stresstest
Unter Prime95-Last steigt die Taktfrequenz für eine bis zwei Sekunden auf 4,1 GHz, wonach sofort eine Kerntemperatur von 100 °C erreicht wird. Die Taktfrequenz fällt dann auf den 2,4-bis-3,2-GHz-Bereich, um eine vernünftigere Temperatur von 83 °C halten zu können.
Beim Spielen von The Witcher 3 zwecks der Simulation einer praktischen Gaming-Last stabilisieren sich CPU und GPU bei 63 bzw. 69 °C, während das dickere, lautere MSI GF65 mit der älteren GTX 1660 Ti hier 61 °C bzw. 72 °C erreicht. Die Leistungsaufnahme unserer GPU (board power draw) stabilisiert sich außerdem bei 49 statt dem theoretischen Maximum von 65 W. Nur beim Ausführen von FurMark liegt sie bei über 60 W.
Im Akkumodus ist die Grafikleistung eingeschränkt. Ein 3DMark-11-Test lieferte im Akkumodus Physik- und Grafikpunktzahlen von 12.832 bzw. 10.938 Punkten, im Netzbetrieb waren es 12.304 bzw. 16.944 Punkte.
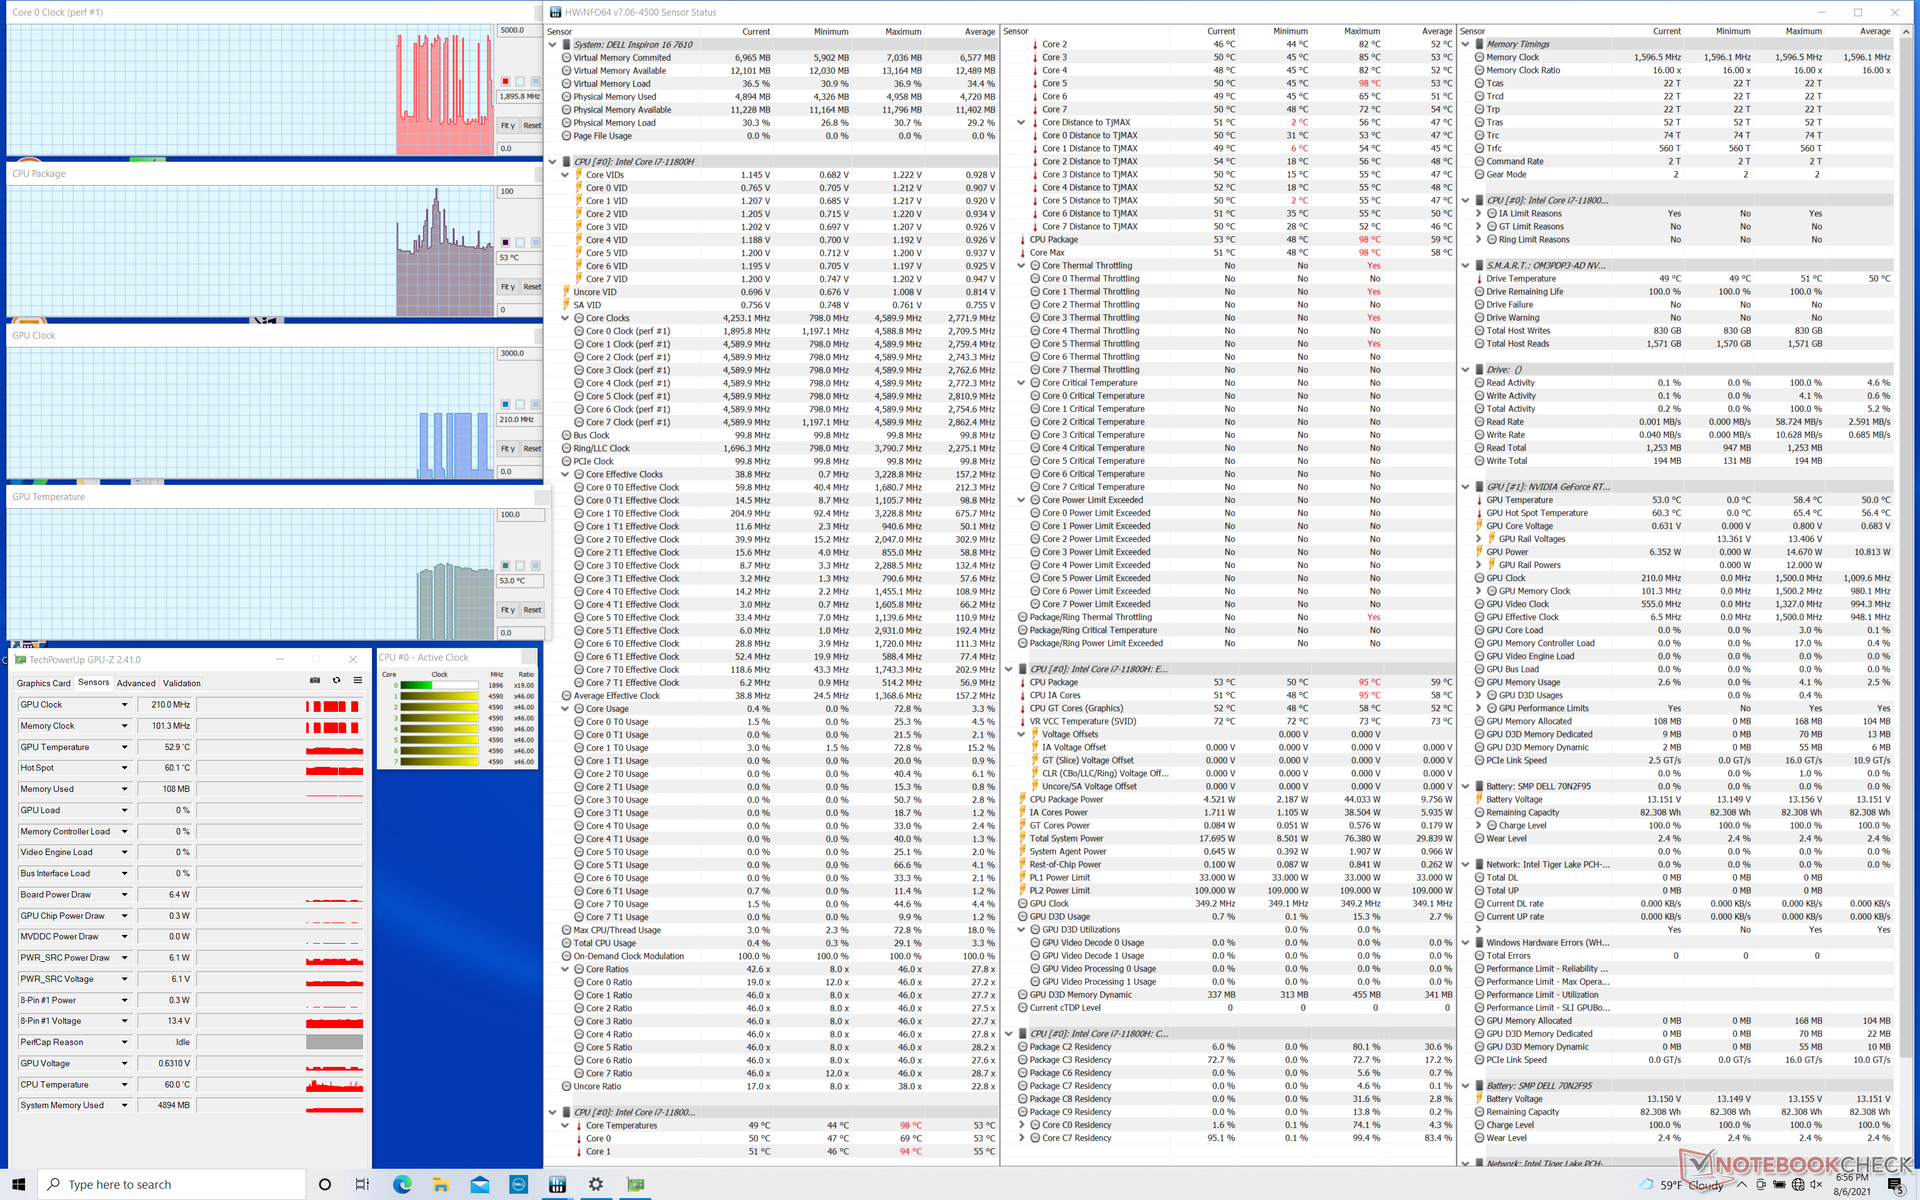
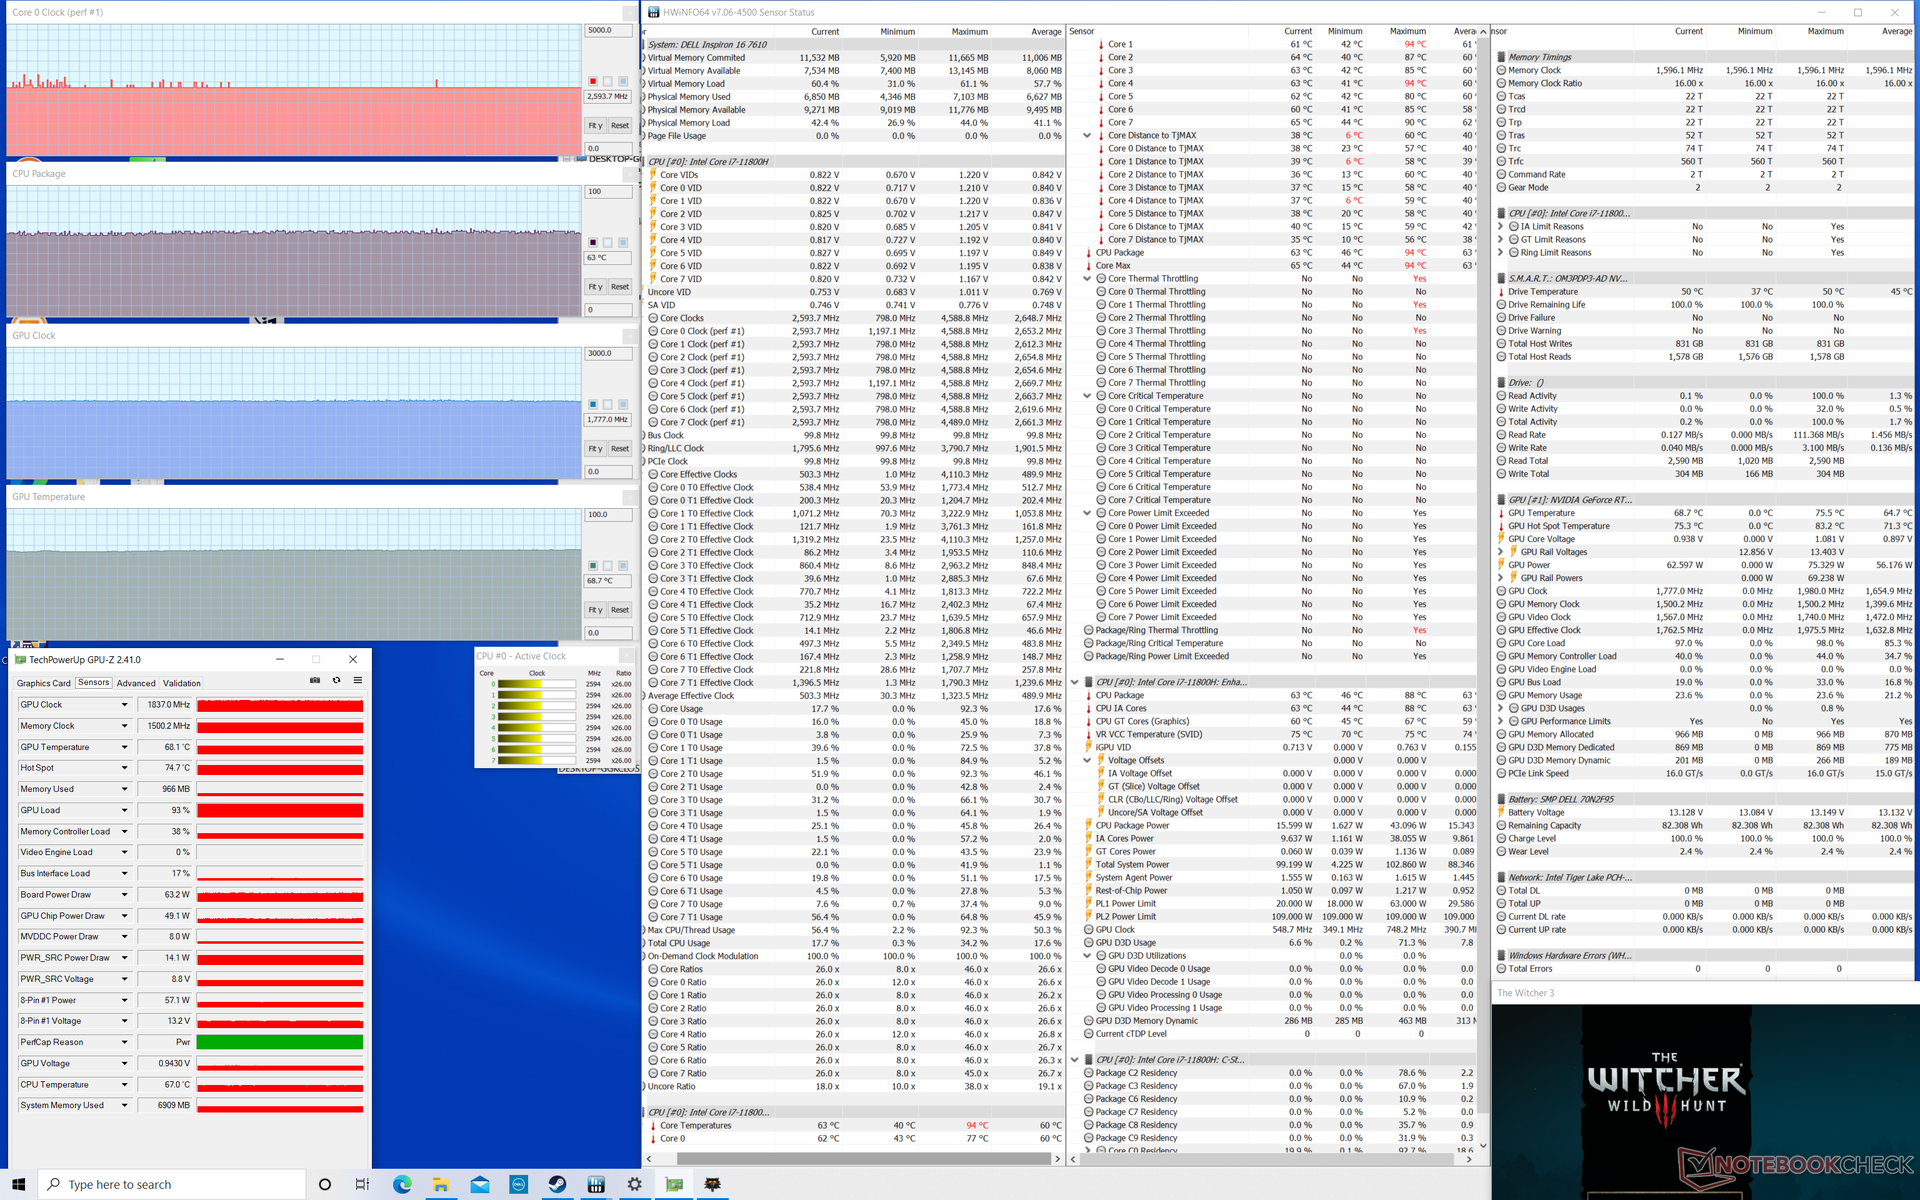
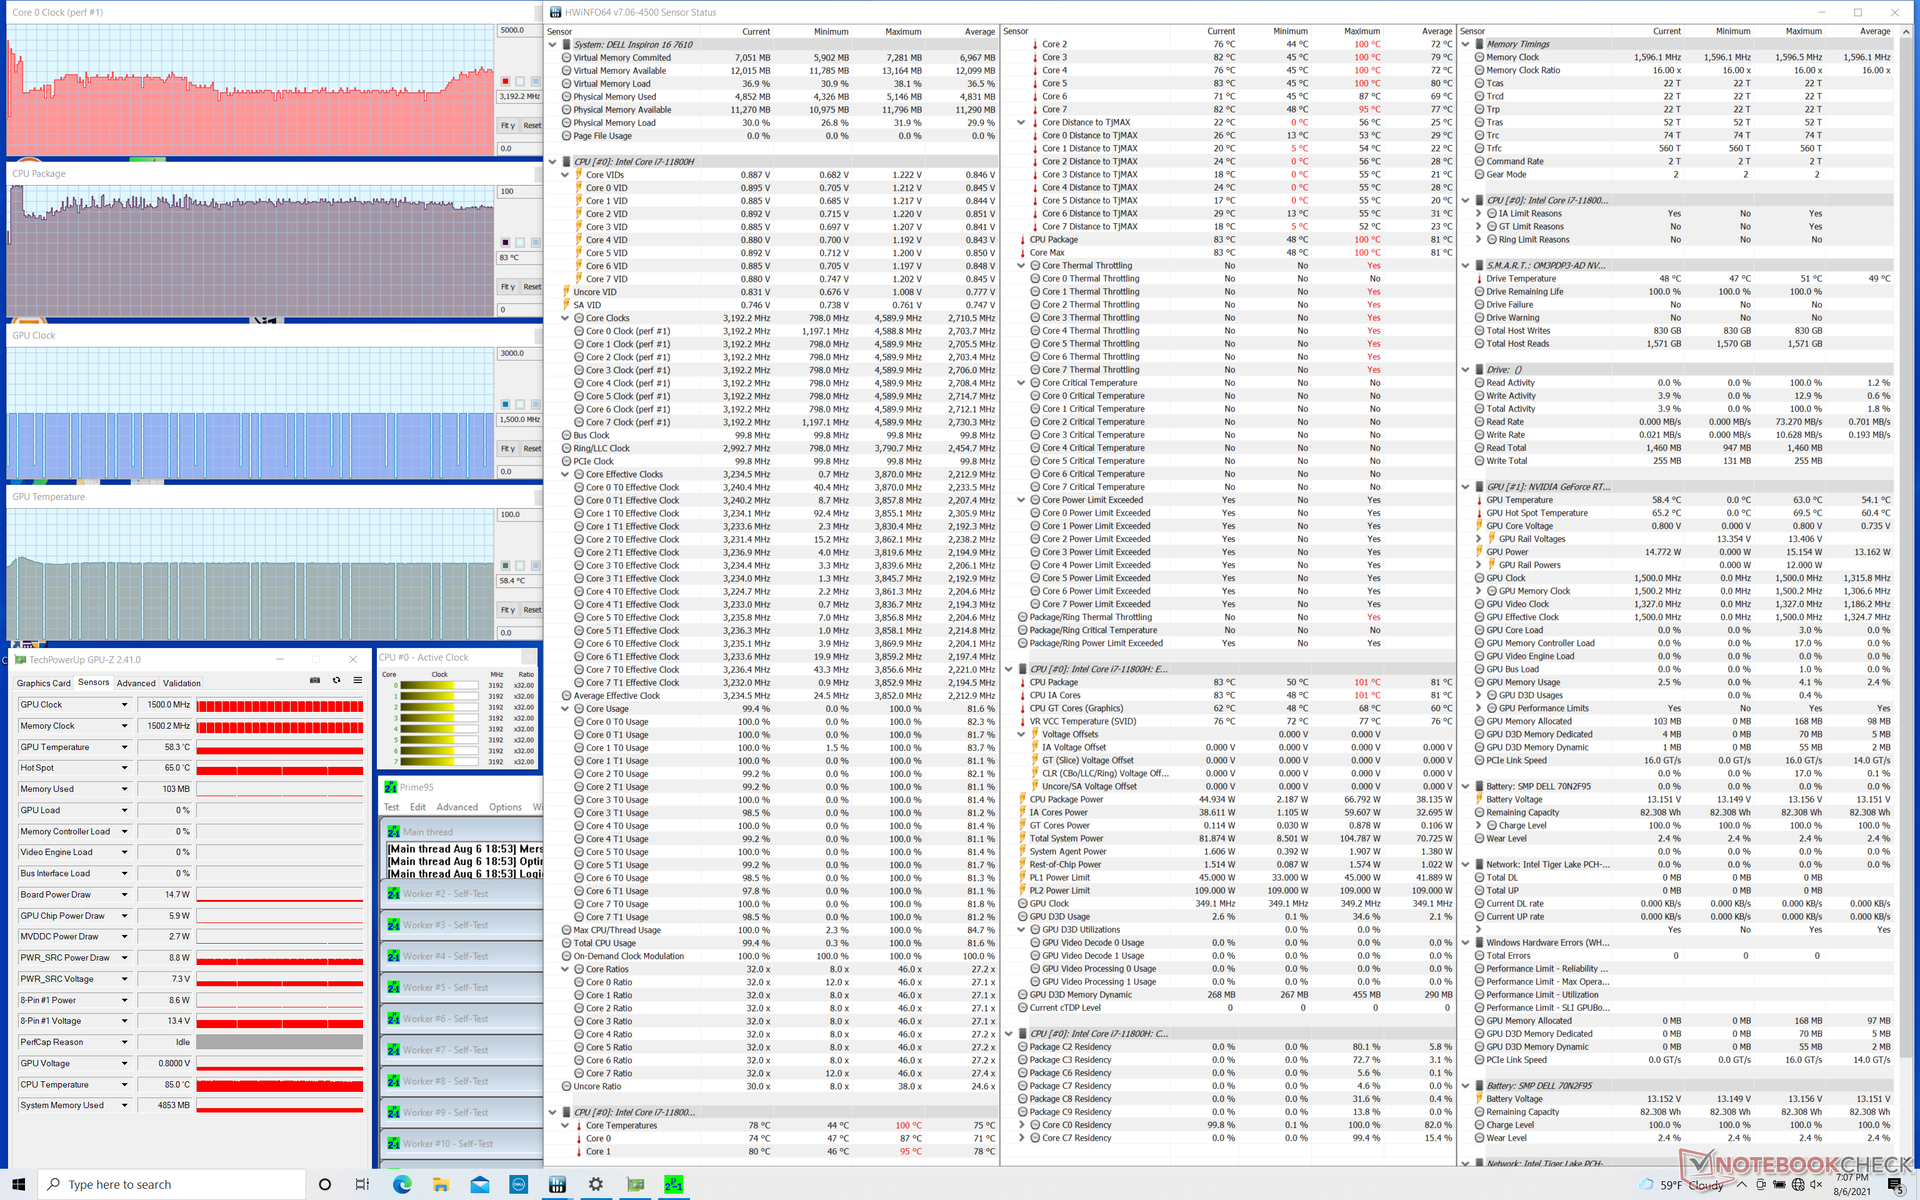
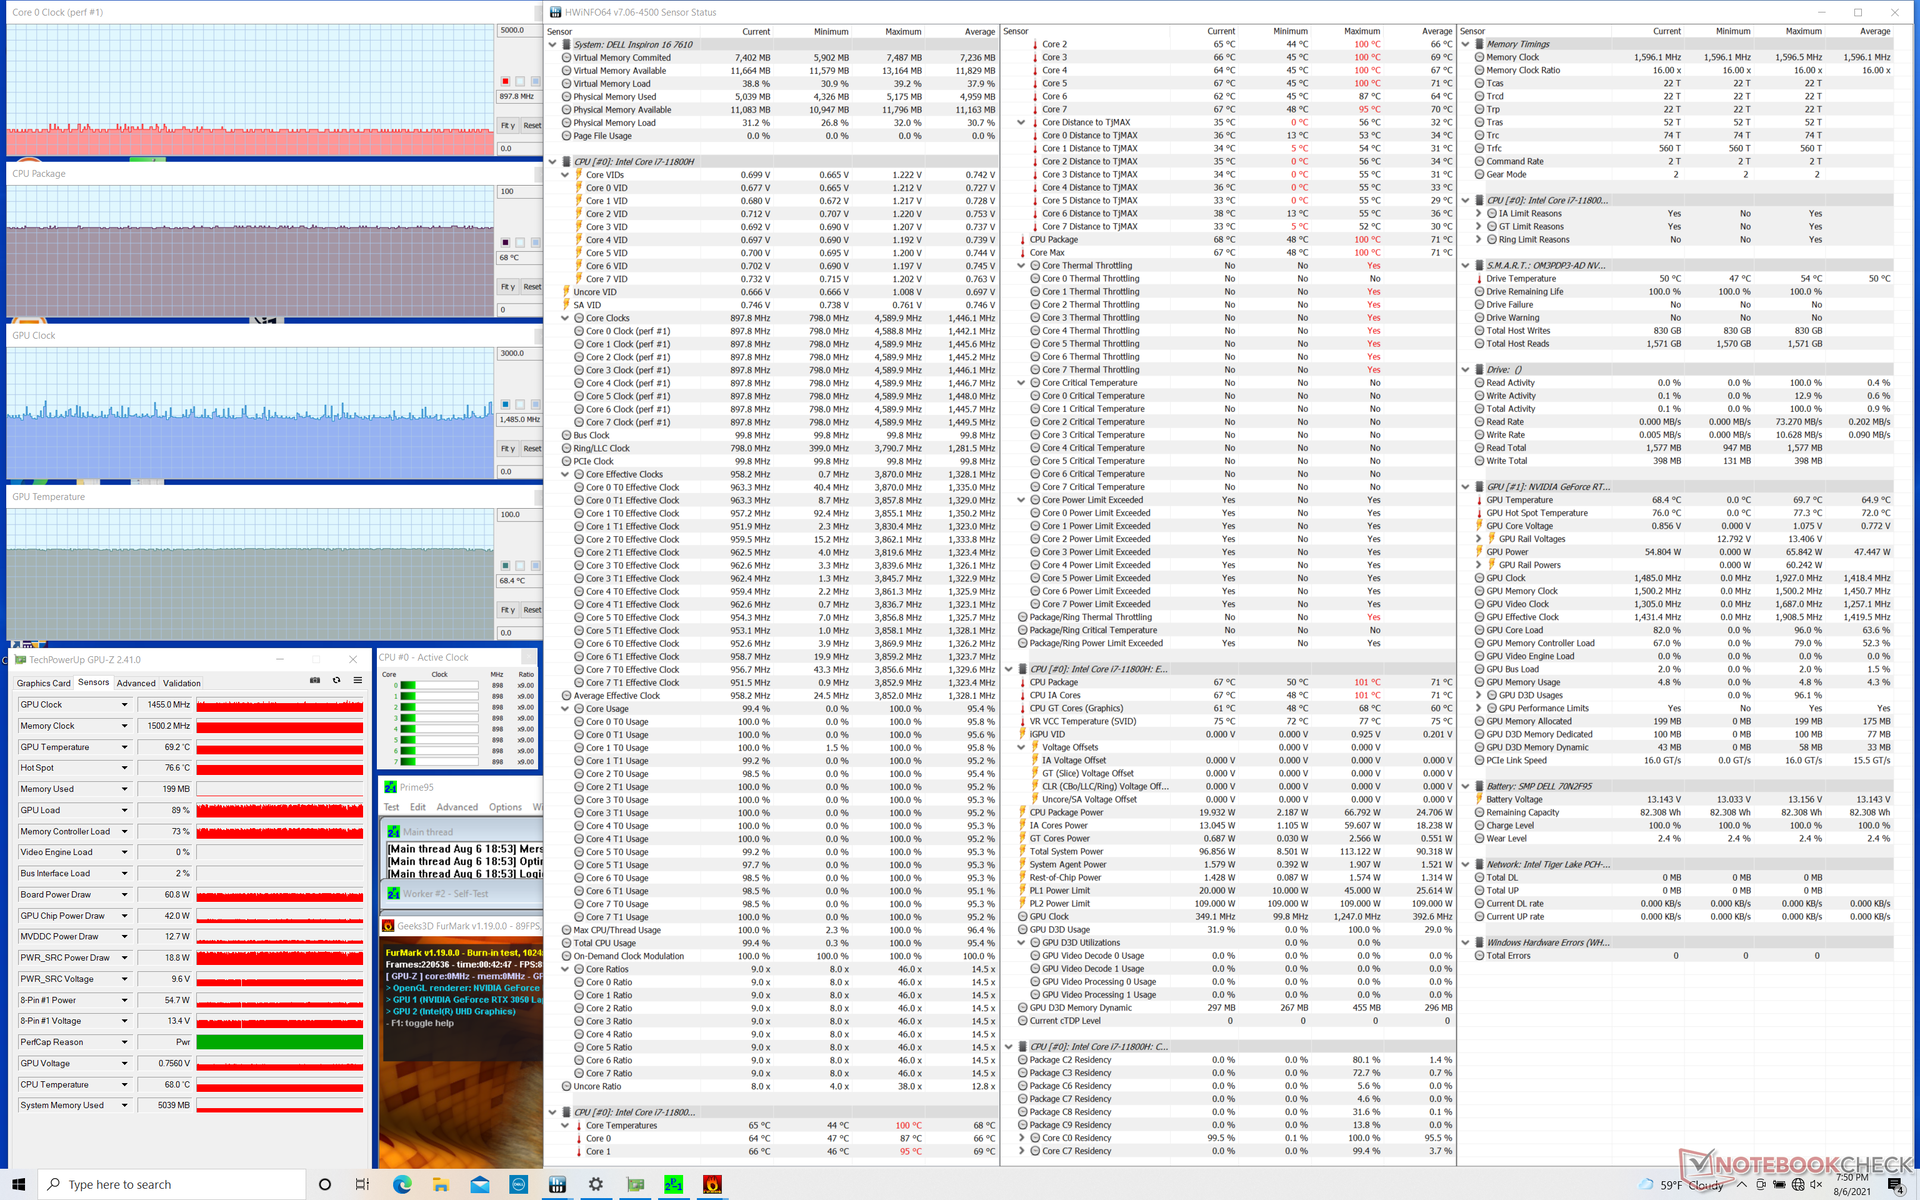
| CPU Clock (GHz) | GPU Clock (MHz) | Average CPU Temperature (°C) | Average GPU Temperature (°C) | |
| System Idle | -- | -- | 53 | 53 |
| Prime95 Stress | 2.4 - 3.2 | -- | 83 | 58 |
| Prime95 + FurMark Stress | 0.9 - 1.0 | 1455 | 68 | 68 |
| Witcher 3 Stress | 2.6 | 1837 | 63 | 69 |
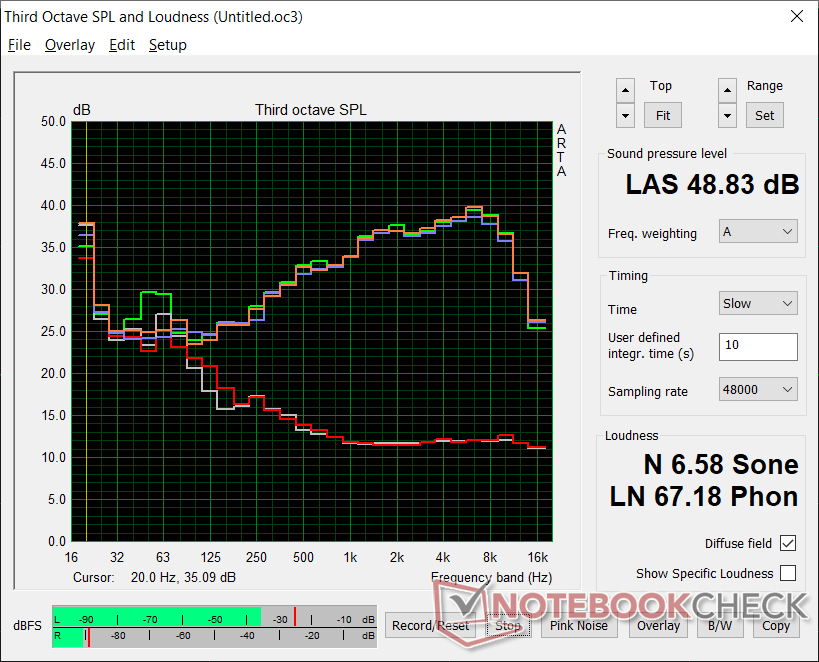
Lautsprecher — Auf der schwächeren Seite
Die Klangqualität der eingebauten Lautsprecher ist nicht gerade überragend. Die maximale Lautstärke geht zwar in Ordnung, die Basswiedergabe kommt jedoch deutlich zu kurz. Unser Pink-Noise-Diagramm zeigt einen Frequenzabfall bei rund 500 Hz und einen Schalldruck von nur 75 dB. Andere Laptops wie das XPG Xenia Xe und das Envy x360 15 bieten tendenziell eine höhere Maximallautstärke bzw. eine bessere Basswiedergabe.


Dell Inspiron 16 Plus 7610 Audio Analyse
(±) | Mittelmäßig laut spielende Lautsprecher (75.3 dB)
Bass 100 - 315 Hz
(±) | abgesenkter Bass - 14.4% geringer als der Median
(±) | durchschnittlich lineare Bass-Wiedergabe (8.4% Delta zum Vorgänger)
Mitteltöne 400 - 2000 Hz
(±) | zu hohe Mitten, vom Median 5.6% abweichend
(±) | Linearität der Mitten ist durchschnittlich (7.9% Delta zum Vorgänger)
Hochtöne 2 - 16 kHz
(+) | ausgeglichene Hochtöne, vom Median nur 3.9% abweichend
(±) | durchschnittlich lineare Hochtöne (7.2% Delta zum Vorgänger)
Gesamt im hörbaren Bereich 100 - 16.000 Hz
(±) | hörbarer Bereich ist durchschnittlich linear (19.3% Abstand zum Median)
Im Vergleich zu allen Geräten derselben Klasse
» 62% aller getesteten Geräte dieser Klasse waren besser, 8% vergleichbar, 30% schlechter
» Das beste Gerät hat einen Delta-Wert von 5%, durchschnittlich ist 17%, das schlechteste Gerät hat 45%
Im Vergleich zu allen Geräten im Test
» 47% aller getesteten Geräte waren besser, 8% vergleichbar, 46% schlechter
» Das beste Gerät hat einen Delta-Wert von 4%, durchschnittlich ist 24%, das schlechteste Gerät hat 134%
Apple MacBook 12 (Early 2016) 1.1 GHz Audio Analyse
(+) | Die Lautsprecher können relativ laut spielen (83.6 dB)
Bass 100 - 315 Hz
(±) | abgesenkter Bass - 11.3% geringer als der Median
(±) | durchschnittlich lineare Bass-Wiedergabe (14.2% Delta zum Vorgänger)
Mitteltöne 400 - 2000 Hz
(+) | ausgeglichene Mitten, vom Median nur 2.4% abweichend
(+) | lineare Mitten (5.5% Delta zum Vorgänger)
Hochtöne 2 - 16 kHz
(+) | ausgeglichene Hochtöne, vom Median nur 2% abweichend
(+) | sehr lineare Hochtöne (4.5% Delta zum Vorgänger)
Gesamt im hörbaren Bereich 100 - 16.000 Hz
(+) | hörbarer Bereich ist sehr linear (10.2% Abstand zum Median
Im Vergleich zu allen Geräten derselben Klasse
» 7% aller getesteten Geräte dieser Klasse waren besser, 2% vergleichbar, 91% schlechter
» Das beste Gerät hat einen Delta-Wert von 5%, durchschnittlich ist 18%, das schlechteste Gerät hat 53%
Im Vergleich zu allen Geräten im Test
» 5% aller getesteten Geräte waren besser, 1% vergleichbar, 94% schlechter
» Das beste Gerät hat einen Delta-Wert von 4%, durchschnittlich ist 24%, das schlechteste Gerät hat 134%
Energieverwaltung
Energieaufnahme
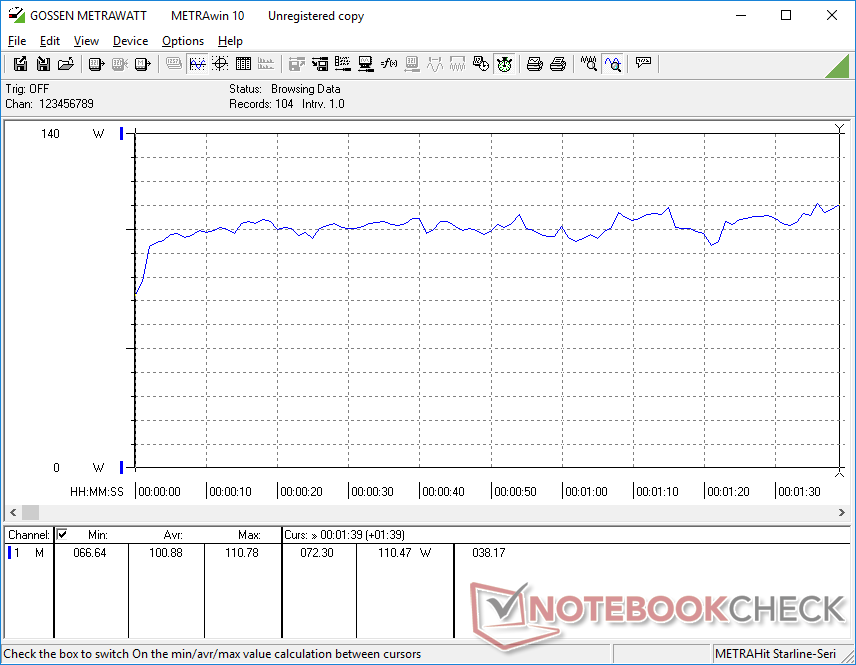
Im Leerlauf auf dem Desktop wird auf der niedrigsten Helligkeitsstufe und im sparsamsten Leistungsprofil mit knapp über 7 W etwas mehr Strom verbrauch als erwartet. In ähnlichen Szenarien verbrauchen das LG Gram 16 und das Pavilion Gaming 16 hingegen nur 3 bis 4 W.
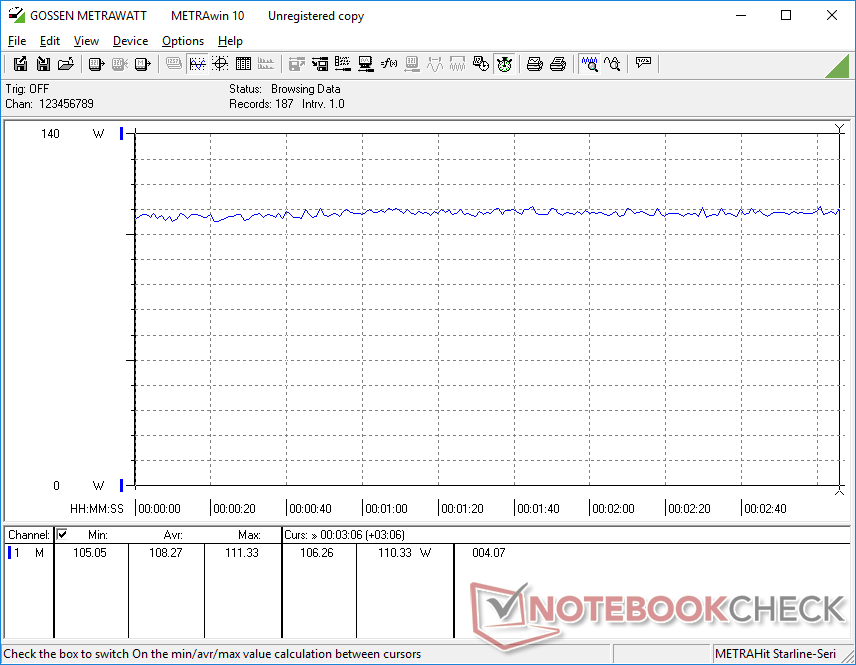
Unter höherer Last wie zum Beispiel im Gaming-Betrieb gibt unser Laptop von seiner potenziellen Effizienz schon etwas mehr preis. Beim Spielen von The Witcher 3 werden hier 108 W verbraucht, während das Asus ROG Zephyrus M15, das mit der auf dem 12-nm-Verfahren basierenden GTX 1660 Ti ausgestattet ist, 143 W benötigt. Obwohl die Grafikleistung konstant unter der der meisten GTX-1660-Ti-Laptops liegt, ist die Leistung-pro-Watt bei unserem Dell Testlaptop etwas höher.
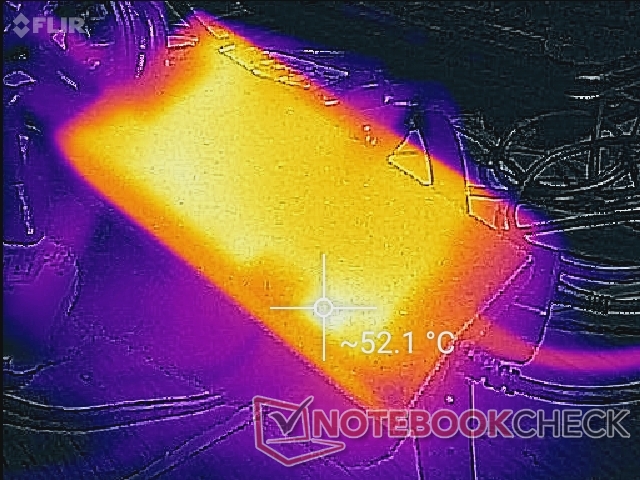
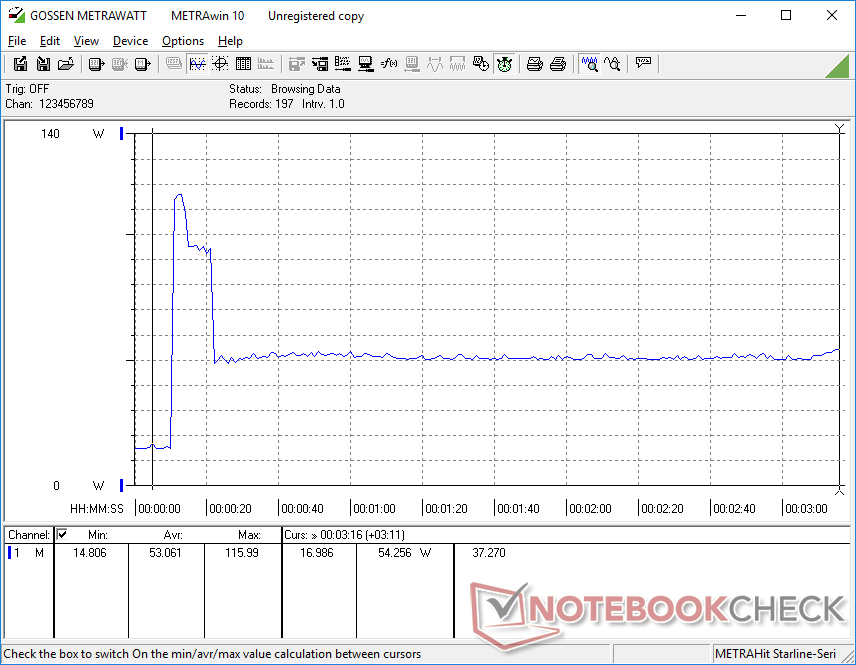
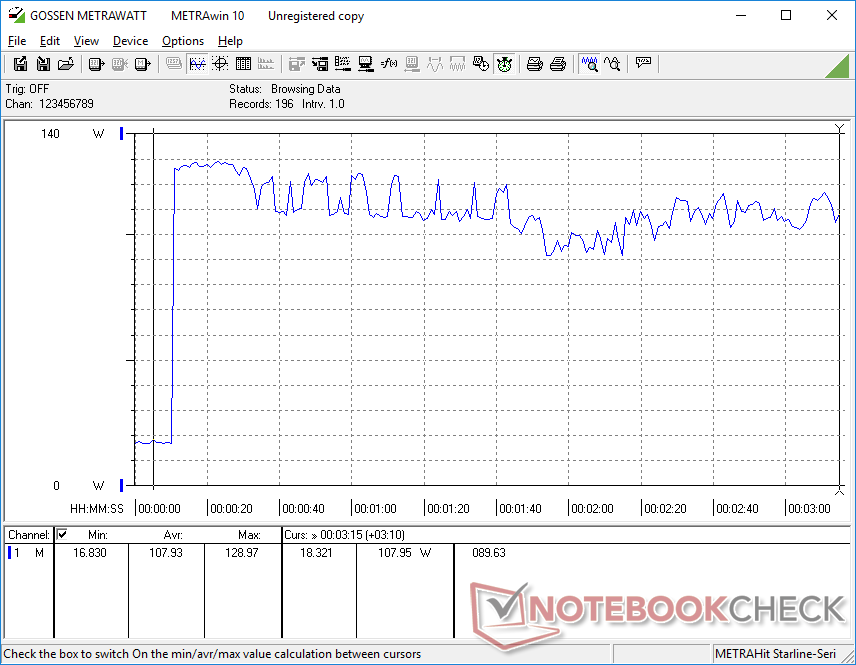
Unter extrem hoher Last konnten wir von dem mittelgroßen (~15,3 x 7,5 x 2,6 cm) 130-W-Netzteil einen Maximalverbrauch von 129 W messen. Wie das Diagramm unten zeigt, wird dieses Verbrauchsniveau nur für wenige Sekunden aufrechterhalten. Daher ist das Netzteil ausreichend dimensioniert, um den Laptop auch während einer hohen Auslastung noch laden zu können.
| Aus / Standby | |
| Idle | |
| Last |
|
Legende:
min: | |
| Dell Inspiron 16 Plus 7610 i7-11800H, GeForce RTX 3050 4GB Laptop GPU, Kingston OM3PDP3512B, IPS, 3072x1920, 16" | Asus ROG Zephyrus M16 GU603H i9-11900H, GeForce RTX 3070 Laptop GPU, Samsung PM9A1 MZVL22T0HBLB, IPS, 2560x1600, 16" | LG Gram 16 (2021) i7-1165G7, Iris Xe G7 96EUs, SK Hynix PC601 1TB HFS001TD9TNG, IPS, 2560x1600, 16" | HP Pavilion Gaming 16-a0242ng i5-10300H, GeForce GTX 1650 Ti Mobile, Intel SSD 660p SSDPEKNW512G8, IPS, 1920x1080, 16.1" | Dell Inspiron 15 7000 7506 2-in-1 Black Edition i7-1165G7, Xe MAX, Micron 2300 1TB MTFDHBA1T0TDV, IPS, 3840x2160, 15.6" | |
|---|---|---|---|---|---|
| Stromverbrauch | -53% | 46% | 19% | 23% | |
| Idle min * (Watt) | 7.7 | 11 -43% | 3.8 51% | 3 61% | 4 48% |
| Idle avg * (Watt) | 10.7 | 20 -87% | 9 16% | 7 35% | 15.5 -45% |
| Idle max * (Watt) | 16.8 | 30 -79% | 11.3 33% | 18 -7% | 16.2 4% |
| Last avg * (Watt) | 100.39 | 111 -11% | 35.2 65% | 86 14% | 49.7 50% |
| Witcher 3 ultra * (Watt) | 108 | 156 -44% | 82 24% | 52.2 52% | |
| Last max * (Watt) | 129 | 197 -53% | 43.5 66% | 144 -12% | 92.7 28% |
* ... kleinere Werte sind besser
Energieaufnahme Witcher 3 / Stresstest
Akkulaufzeit — Großer 86-Wh-Akku
Mit fast zehn Stunden praxisnaher WLAN-Laufzeit sind die Laufzeiten lang, was vermutlich mit dem großen 86-Wh-Akku zusammenhängt. Da es keine Nvidia GPU und allgemein langsamere Hardware besitzt, hält das LG Gram 16 einige Stunden länger durch.
Den leeren Akku voll aufzuladen, dauert zwei ganze Stunden. Während der Laptop auch mit USB-C-Netzteilen von Drittanbietern geladen werden kann, ist die Ladegeschwindigkeit gegenüber der des mitgelieferten 130-W-Hohlsteckernetzteils deutlich niedriger.
| Dell Inspiron 16 Plus 7610 i7-11800H, GeForce RTX 3050 4GB Laptop GPU, 86 Wh | Lenovo Legion 5 Pro 16ACH6H (82JQ001PGE) R7 5800H, GeForce RTX 3070 Laptop GPU, 80 Wh | Asus ROG Zephyrus M16 GU603H i9-11900H, GeForce RTX 3070 Laptop GPU, 90 Wh | LG Gram 16 (2021) i7-1165G7, Iris Xe G7 96EUs, 80 Wh | HP Pavilion Gaming 16-a0242ng i5-10300H, GeForce GTX 1650 Ti Mobile, 52 Wh | Dell Inspiron 15 7000 7506 2-in-1 Black Edition i7-1165G7, Xe MAX, 68 Wh | |
|---|---|---|---|---|---|---|
| Akkulaufzeit | -55% | -36% | 43% | -25% | -11% | |
| Idle (h) | 20.5 | 9.1 -56% | 13.3 -35% | 28.6 40% | 16.5 -20% | 25 22% |
| WLAN (h) | 9.9 | 7 -29% | 7.7 -22% | 15.7 59% | 8.3 -16% | 9.7 -2% |
| Last (h) | 3.3 | 0.7 -79% | 1.6 -52% | 4.3 30% | 2 -39% | 1.6 -52% |
Pro
Contra
Fazit — Tolles Design, magere Leistung
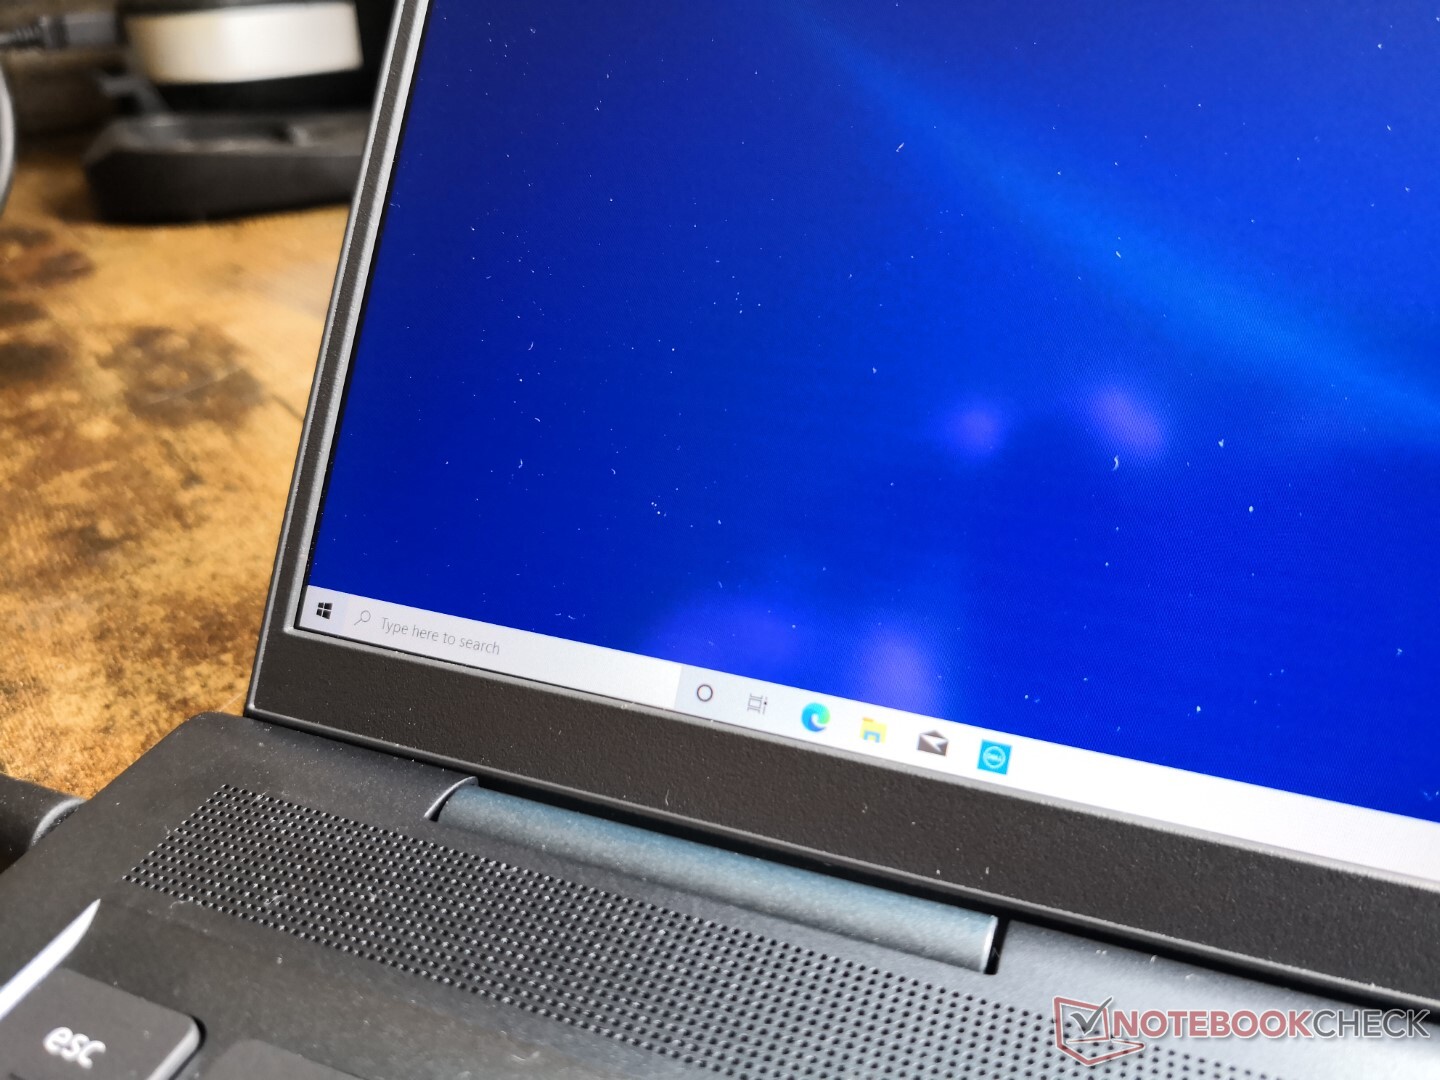
Optisch ist das Inspiron 16 der ansprechendste Laptop seiner Produktfamilie. Die Displayränder sind angesichts der energiehungrigen Prozessoren im Inneren überraschend schmal, und das schwere Metallgehäuse vermittelt eine haptische Qualität, die der des teureren XPS 15 nahe kommt. Die Anschlussausstattung ist umfangreich, die Wartung einfach und das matte 3K-Display rundet das Gesamtpaket ausgezeichnet ab.
Das Inspiron 16 Plus 7610 sieht klasse aus, bietet viele Anschlüsse und lässt sich leicht aufrüsten, könnte jedoch einen Leistungsschub vertragen, um die Bedürfnisse anspruchsvoller digitaler Künstler und Multimedia-Nutzer noch besser zu erfüllen.
Bei der Leistung sieht es bedauerlicherweise nicht so gut aus. Sowohl die CPU als auch die GPU sind im Vergleich mit identisch oder ähnlich ausgestatteten Konkurrenten langsamer als erwartet. Das Asus TUF F15 ist mit dem gleichen Core i7-11800H 25 % schneller, und das MSI Stealth 15M mit der älteren RTX 2060 schlägt unsere RTX 3050 in den meisten Fällen. Sogar das zwei Jahre alte HP Gaming Pavilion 15, das mit einer GTX 1660 Ti ausgestattet ist, liegt in Bezug auf die Grafikleistung gleichauf oder vor unserem Dell. Alle, die viel unterwegs sind, könnten außerdem von einem helleren Display wie beim MacBook Pro 16 oder dem Legion 5 Pro profitieren.
Preis und Verfügbarkeit
Verschiedene Modelle sind auf Amazon und auf Dells Webseite verfügbar. Eine ähnliche Konfiguration wie die unseres Testgeräts kostet bei Amazon derzeit rund 1.400 Euro.
Dell Inspiron 16 Plus 7610
- 11.08.2021 v7 (old)
Allen Ngo
Preisvergleich

