Dell Inspiron 14 7435 2-in-1 Convertible Test: Ryzen 5 7530U für preisbewusste Nutzer

Das Inspiron 14 7435 2-in-1 ist die AMD Version des Intel basierten Inspiron 14 7430 2-in-1. Es ersetzt direkt das letztjährige Inspiron 14 7420 2-in-1 mit verbesserten internen und externen Komponenten.
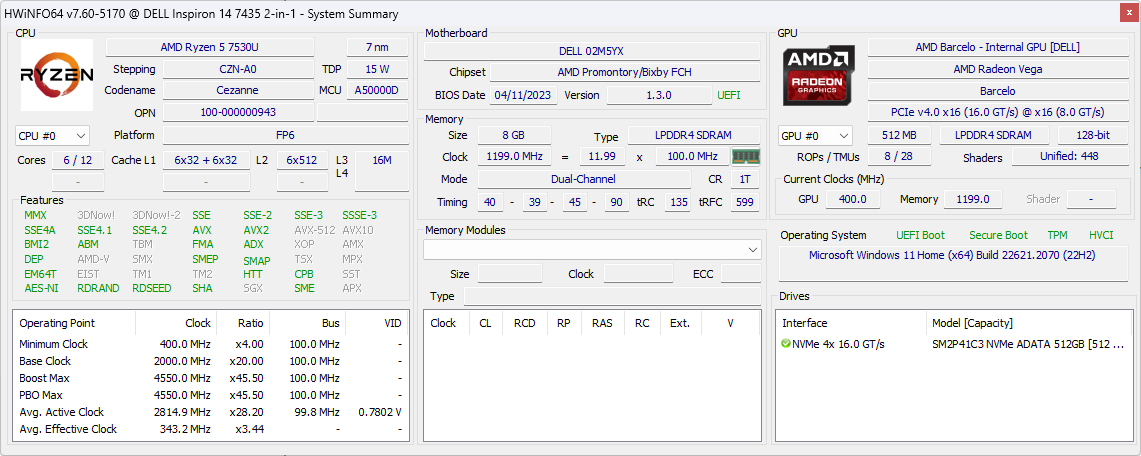
Unsere spezifische Testkonfiguration ist eine niedrigere SKU mit der Ryzen-5-7530U-CPU und 8 GB verlötetem LPDDR4x-4266-RAM für nur 550 USD. Eine höherwertige Version mit dem doppelten RAM und der Ryzen-7-7730U-CPU ist ebenfalls erhältlich, aber alle Konfigurationen verfügen über den gleichen 1.200p-IPS-Touchscreen und eine integrierte Radeon-Vega-Grafik.
Zu den Konkurrenten gehören andere preisorientierte Convertibles wie das Acer Aspire 5 Spin 14, Lenovo IdeaPad Flex 7i oder HP Pavilion x360 14. Von dem vorliegenden Modell gibt es eine 16-Zoll-Version mit der Bezeichnung Inspiron 16 7635 2-in-1.
Mehr Dell Bewertungen:
Mögliche Konkurrenten im Vergleich
Bew. | Datum | Modell | Gewicht | Dicke | Größe | Auflösung | Preis ab |
|---|---|---|---|---|---|---|---|
| 84.5 % v7 (old) | 08 / 2023 | Dell Inspiron 14 7435 2-in-1 R5 7530U, Vega 7 | 1.6 kg | 18.6 mm | 14.00" | 1920x1200 | |
| 83.7 % v7 (old) | 06 / 2022 | Dell Inspiron 14 7420 2-in-1 i7-1255U, Iris Xe G7 96EUs | 1.6 kg | 17.86 mm | 14.00" | 1920x1200 | |
| 83.2 % v7 (old) | 12 / 2022 | Lenovo IdeaPad Flex 7i 14IAU7 i7-1255U, Iris Xe G7 96EUs | 1.5 kg | 18.9 mm | 14.00" | 2240x1400 | |
| 82.2 % v7 (old) | 06 / 2023 | Acer Aspire 5 Spin 14 i5-1335U, Iris Xe G7 80EUs | 1.6 kg | 17.99 mm | 14.00" | 1920x1200 | |
| 87.5 % v7 (old) | 05 / 2022 | LG Gram 14T90P i5-1135G7, Iris Xe G7 80EUs | 1.2 kg | 17 mm | 14.00" | 1900x1200 | |
| 81.8 % v7 (old) | 07 / 2021 | HP Pavilion x360 14-dy0157ng i5-1135G7, Iris Xe G7 80EUs | 1.5 kg | 19.9 mm | 14.00" | 1920x1080 |
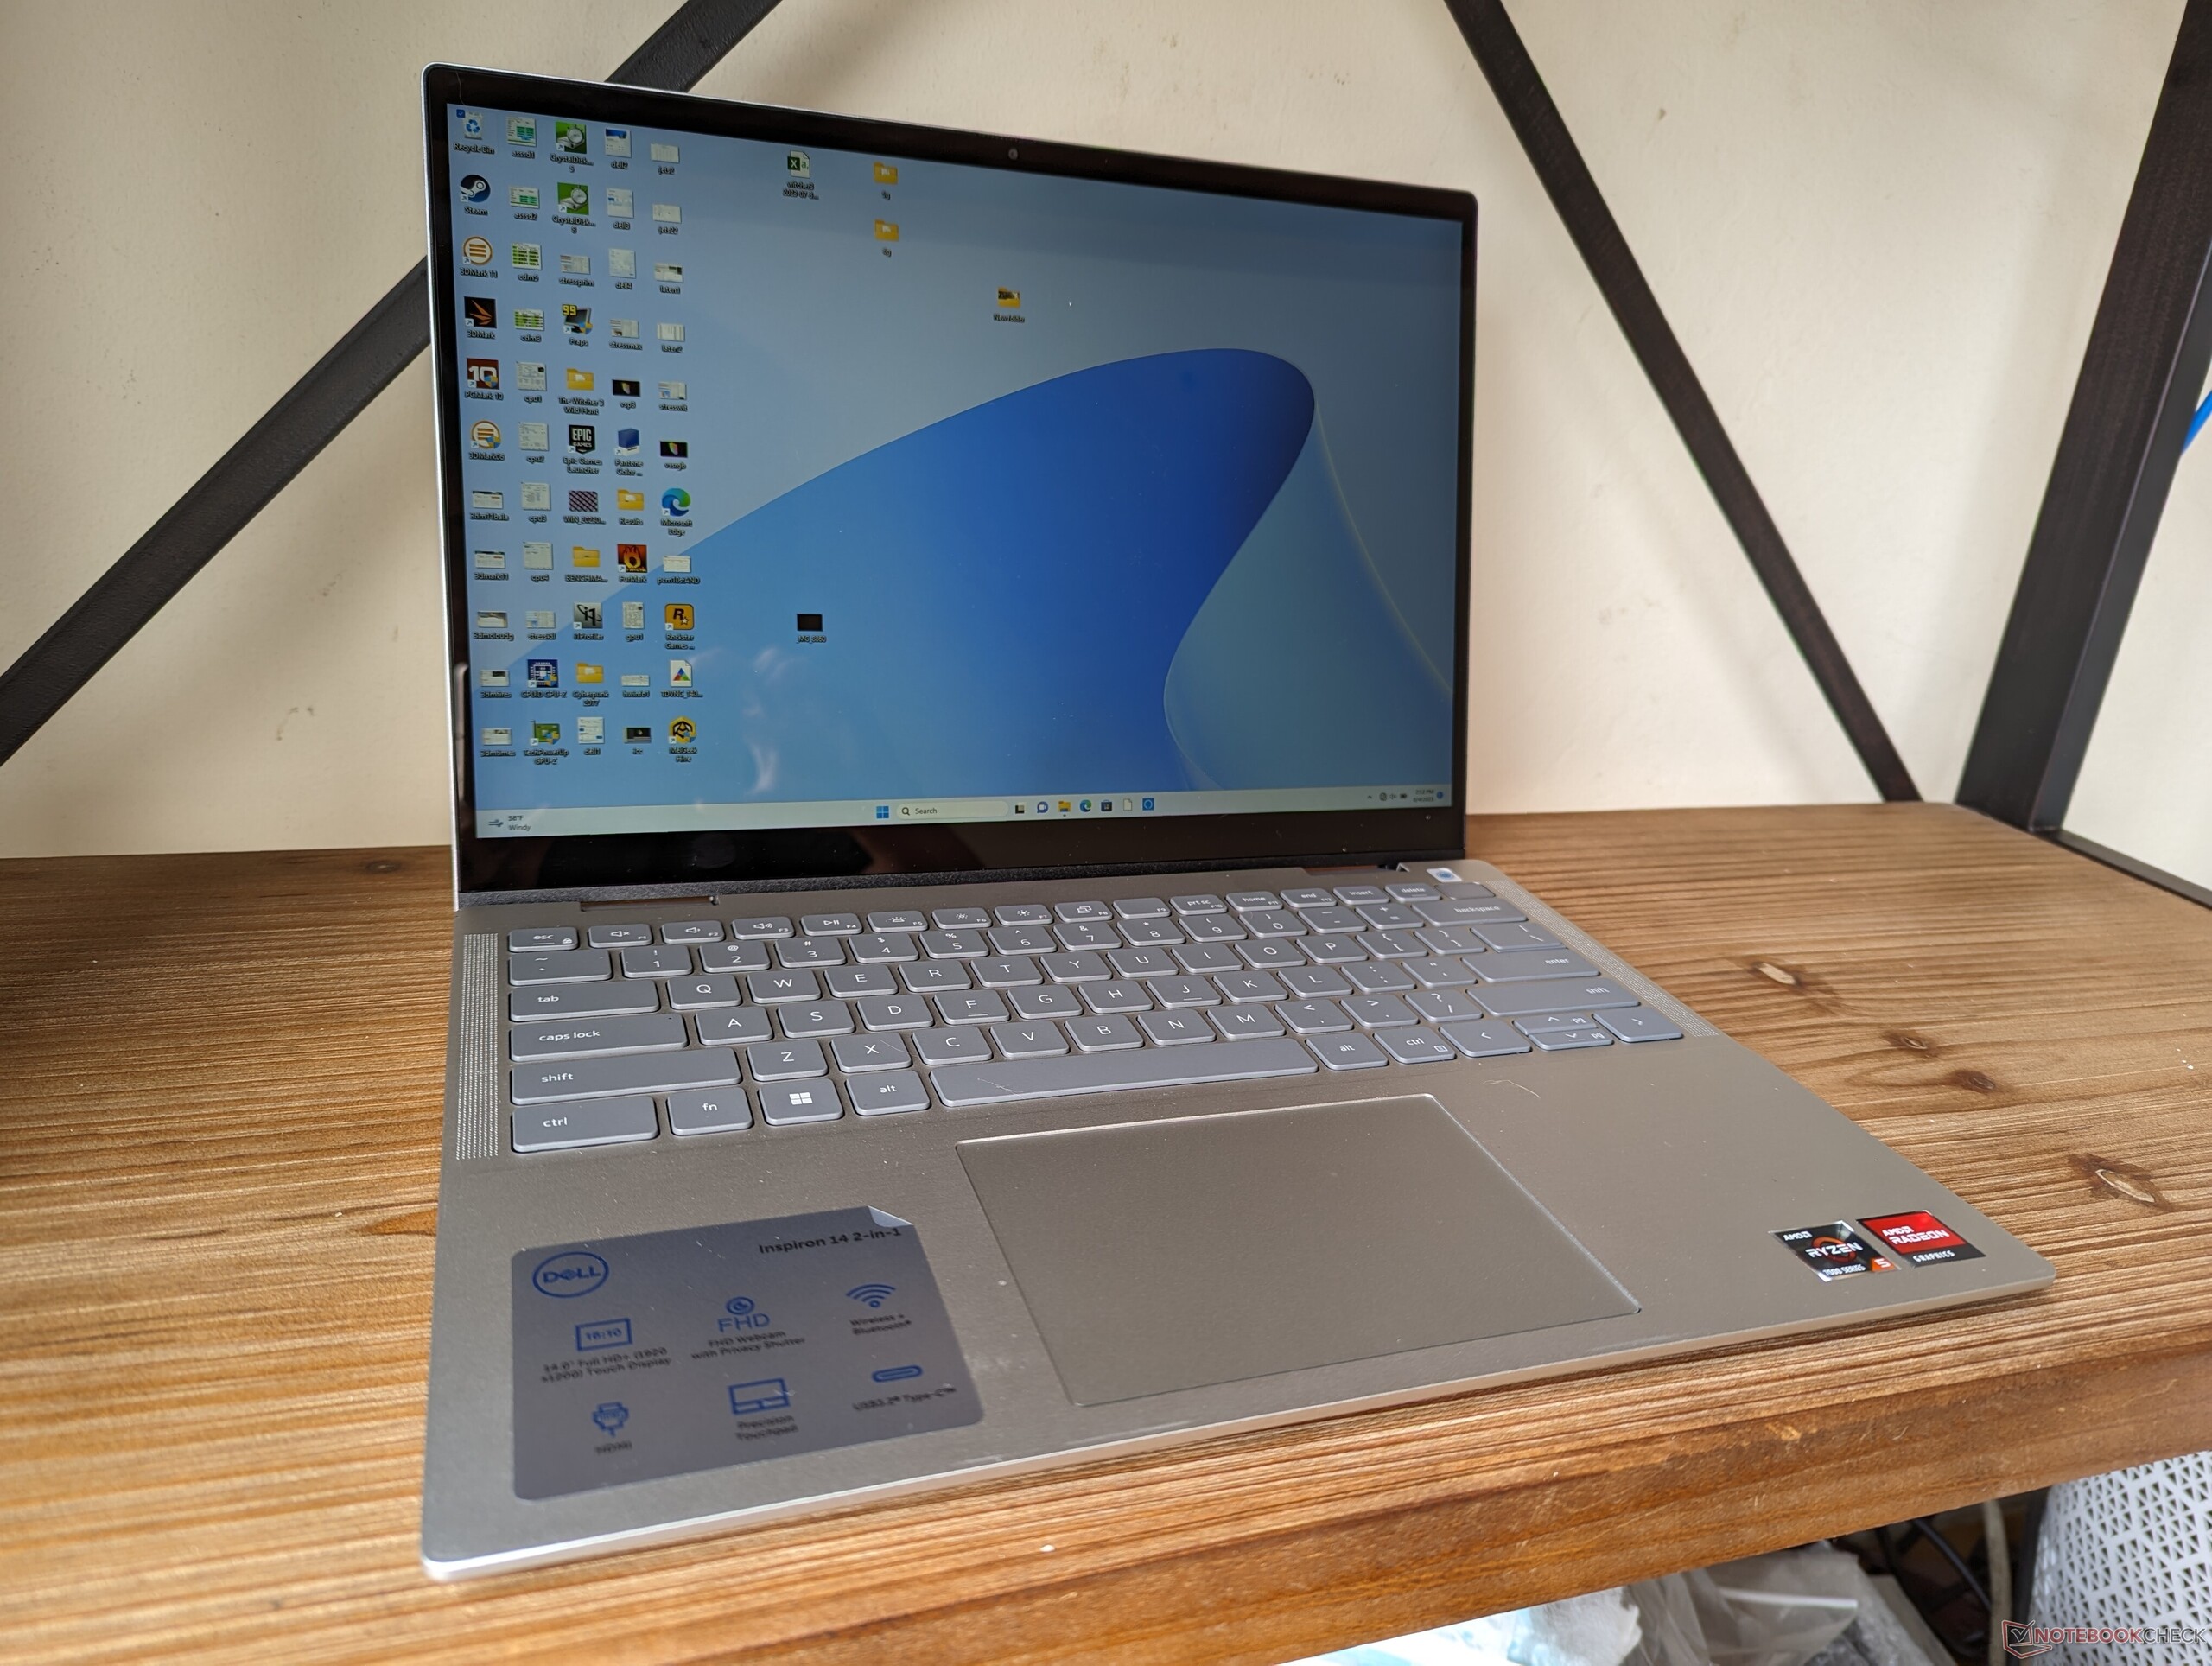
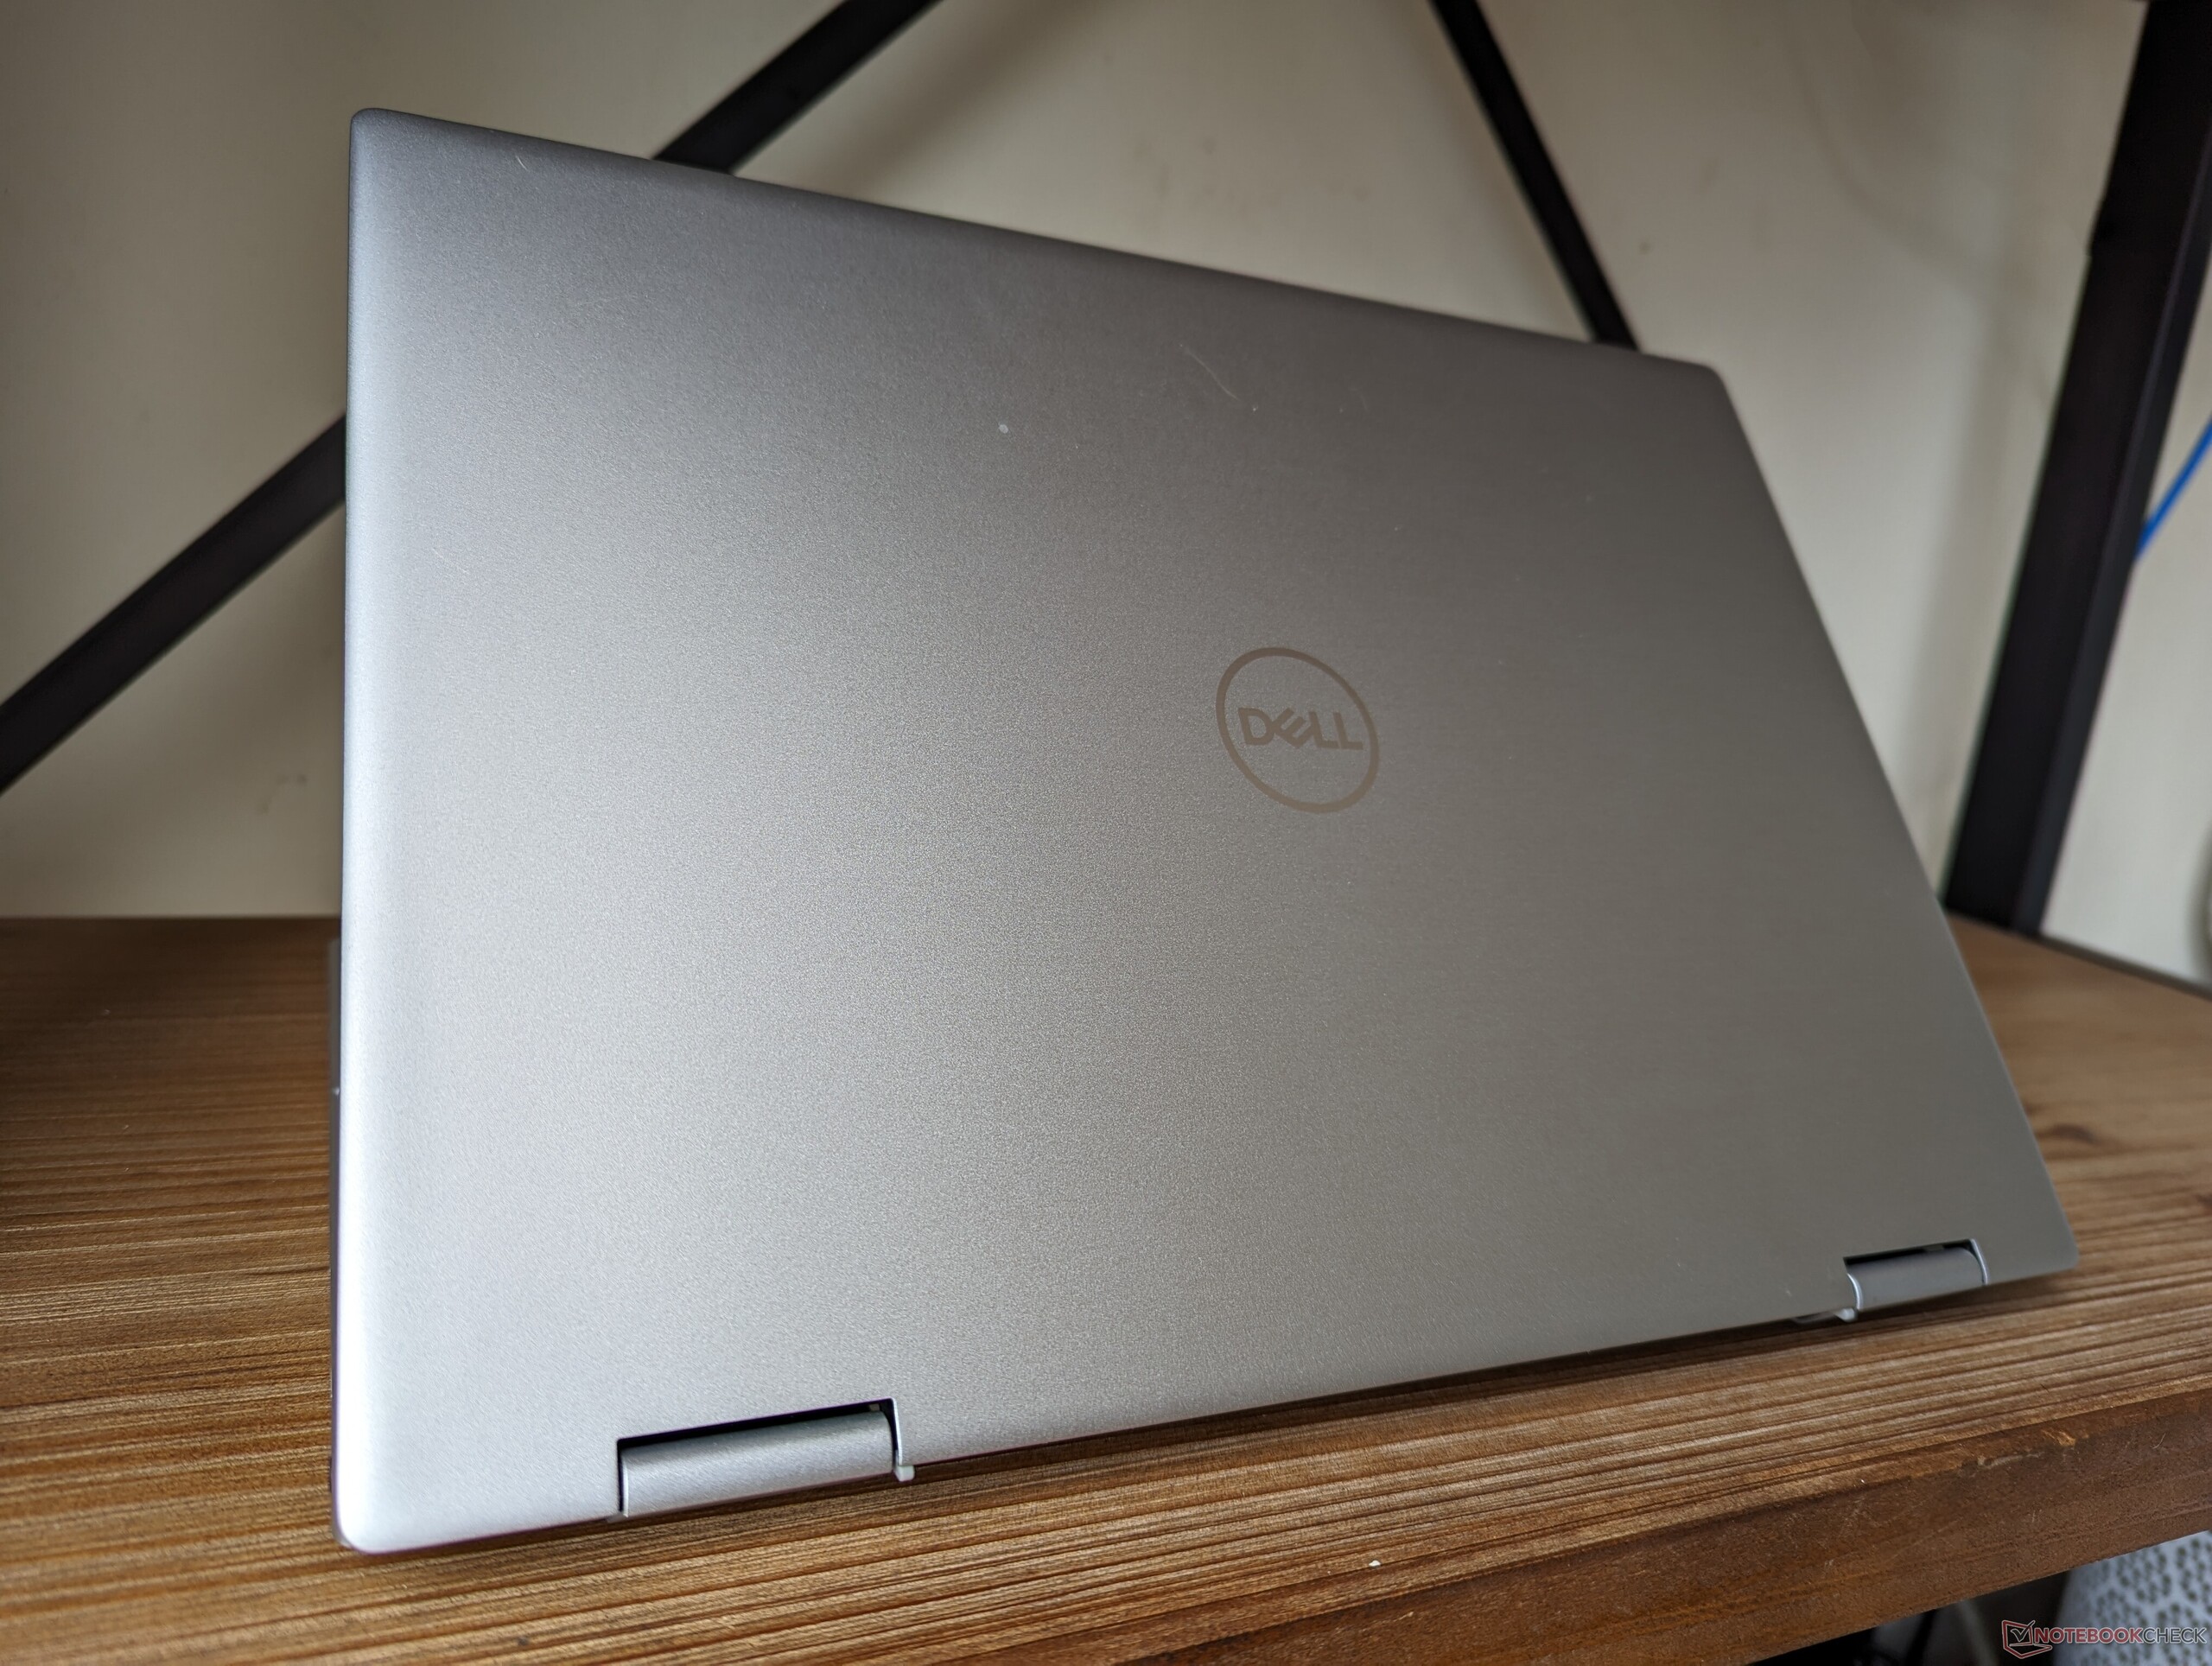
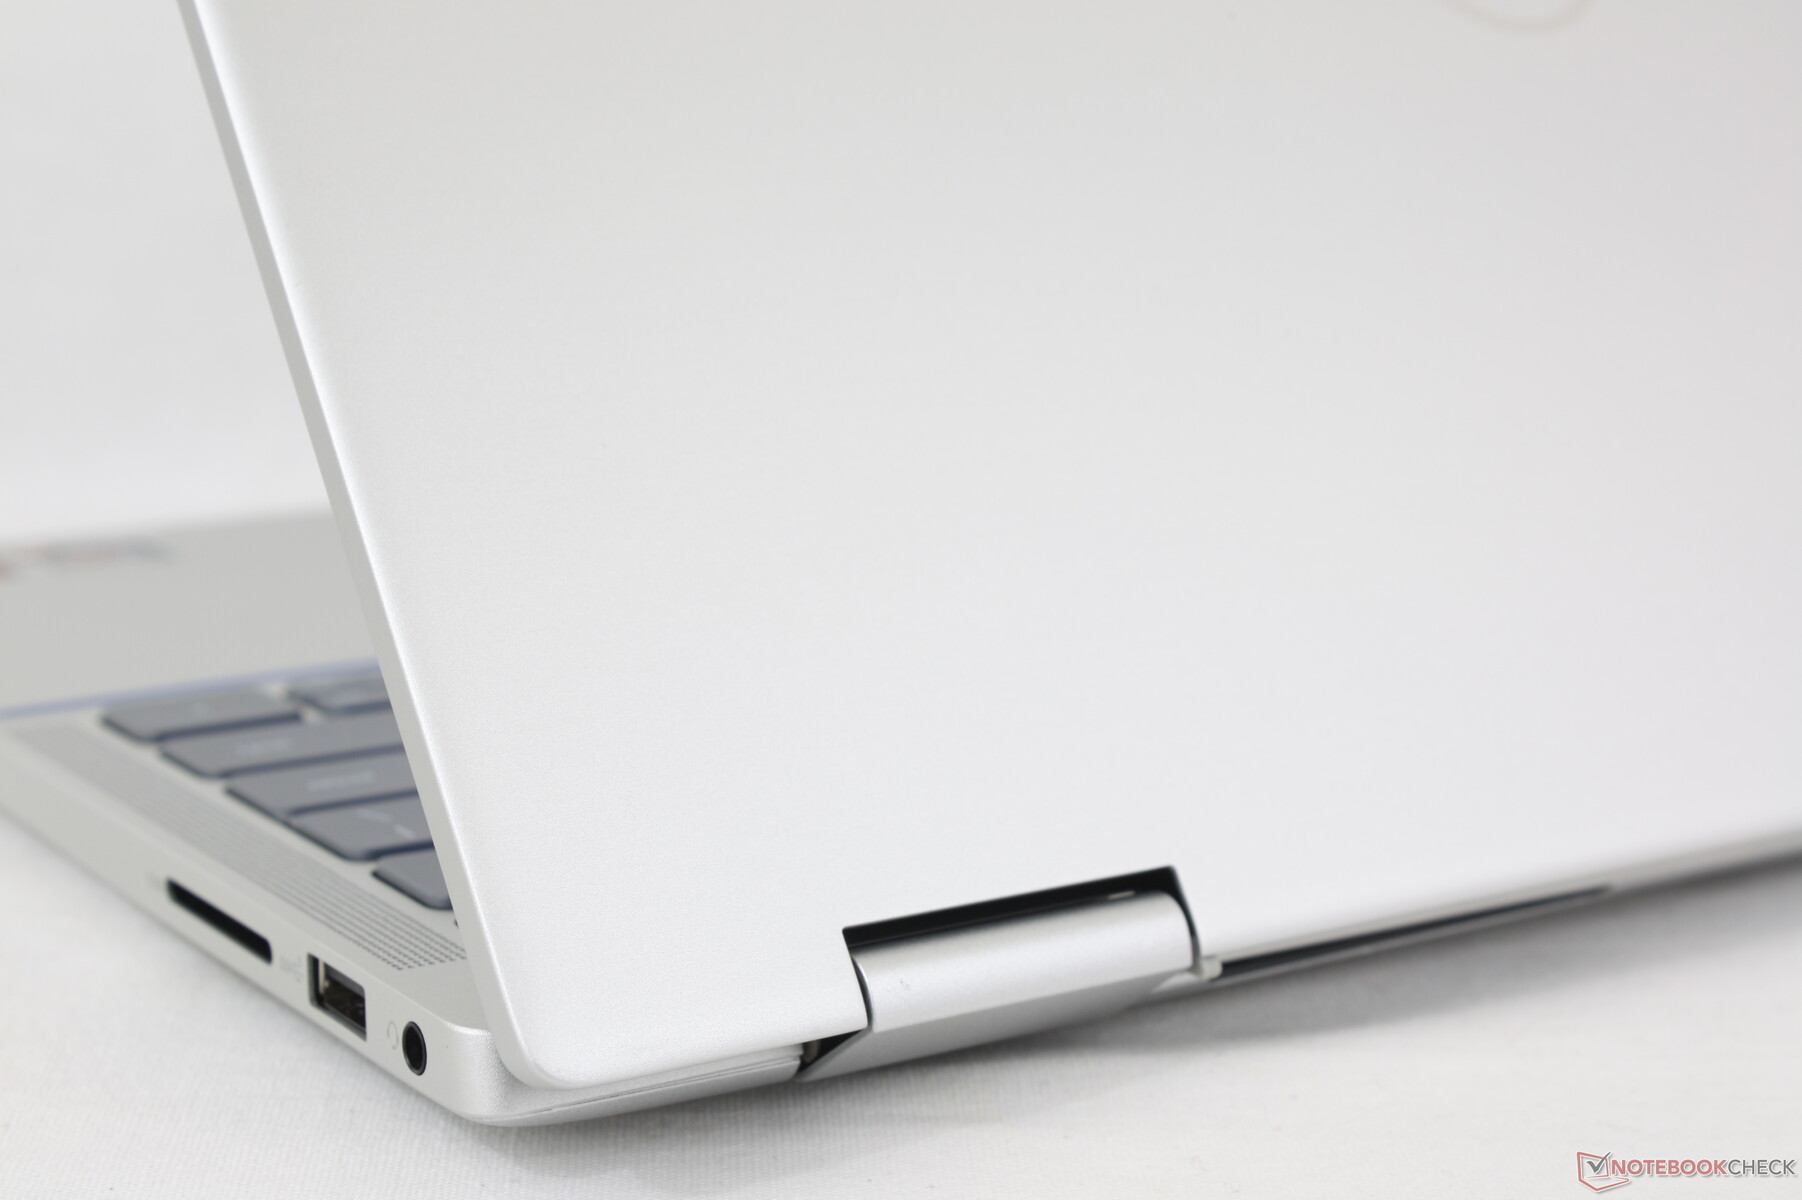
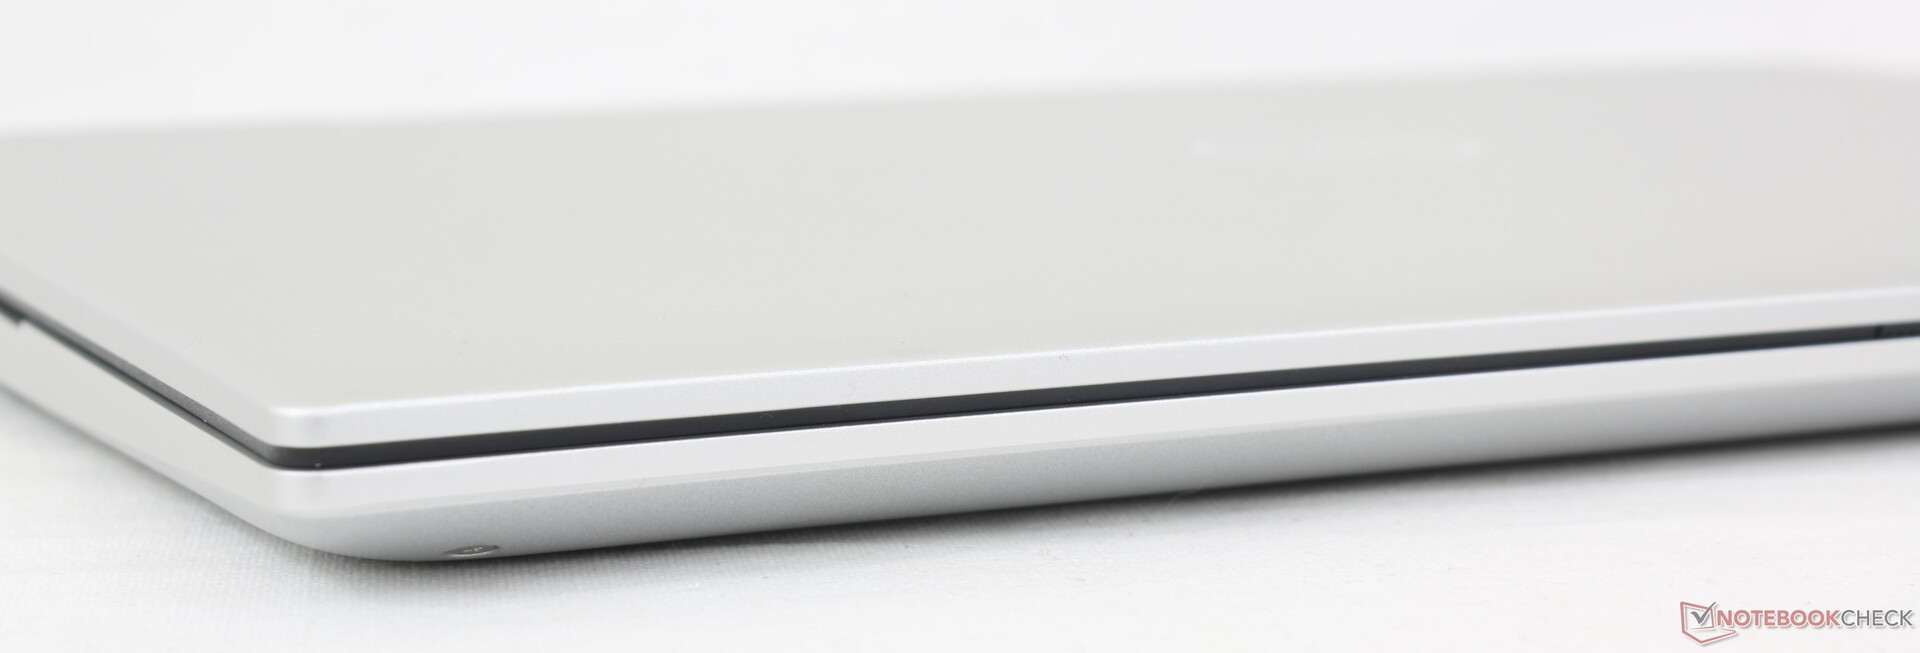
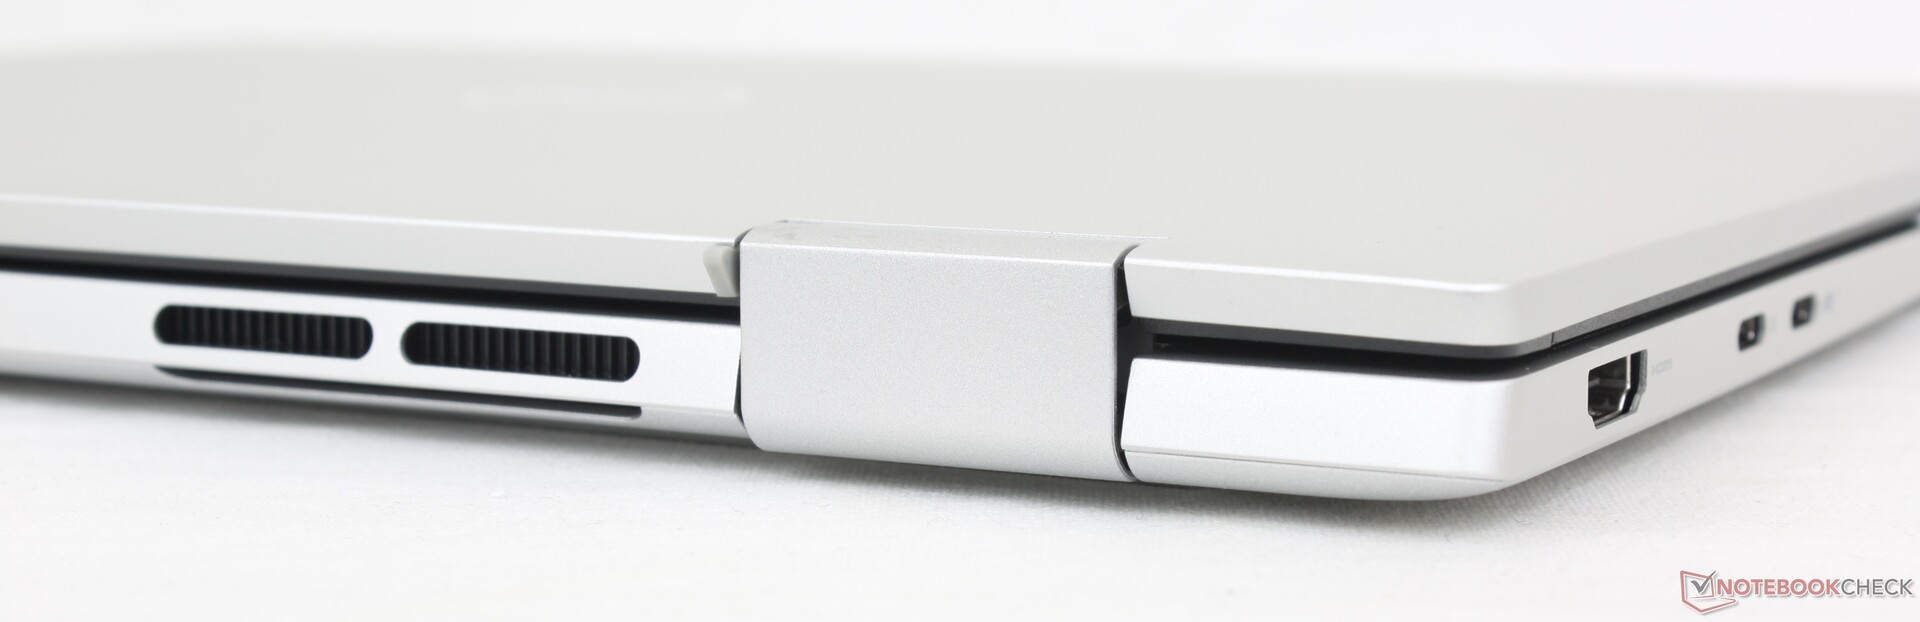
Gehäuse - Überarbeitete Lautsprecher und Scharniere
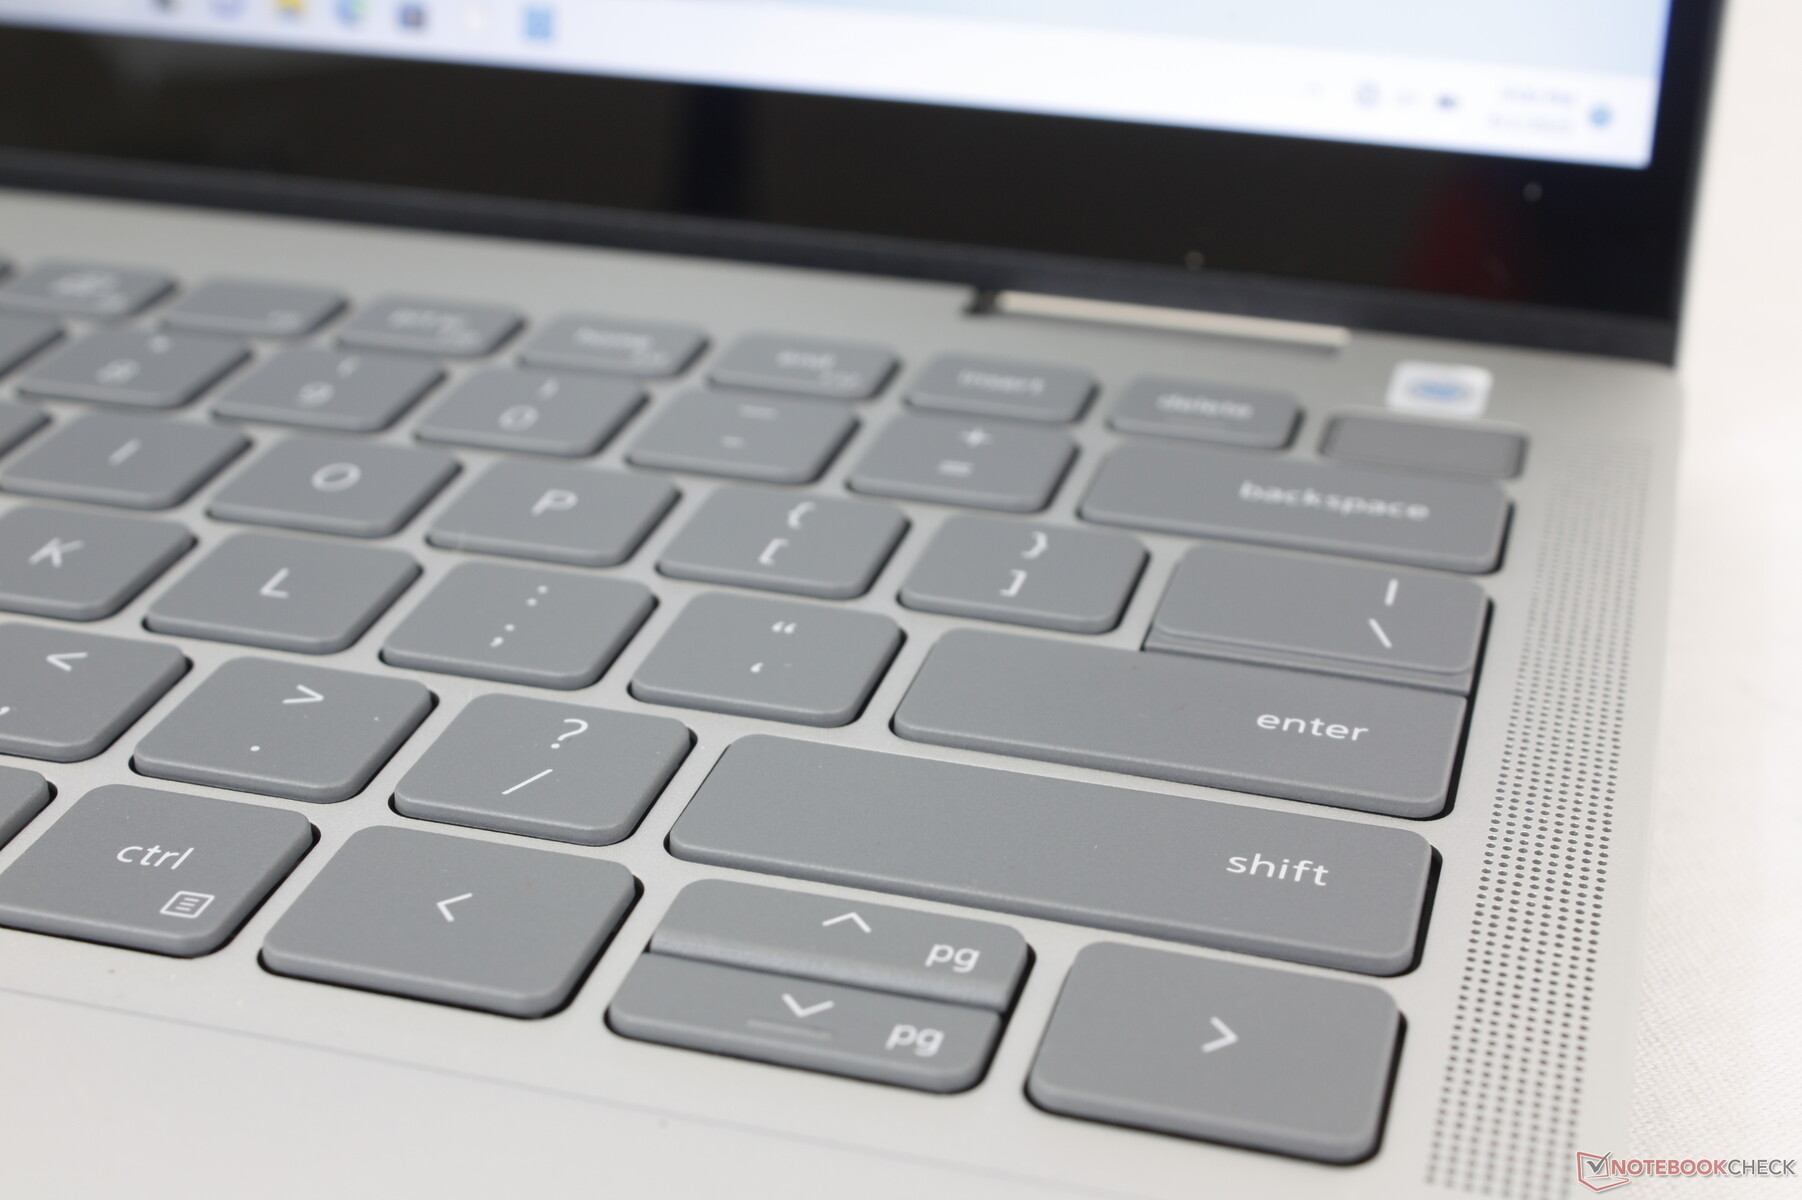
Obwohl es mit dem 2022 Inspiron 14 7620 2-in-1 auf den ersten Blick identisch ist, sind bei näherer Betrachtung mehrere Unterschiede erkennbar: Erstens wurden die viel gepriesenen Mylar-Handballenauflagen zugunsten von ABS-Kunststoff entfernt. Das spezielle Material sollte die Handballenauflagen und das Clickpad vor Fettablagerungen schützen, erwies sich aber bei einem günstigen Notebook wie diesem letztlich als unnötig. Zweitens wurden die Scharniere neu gestaltet und sind nun etwas größer und flacher, was hoffentlich die Langlebigkeit verbessert. Und schließlich wurden die Lautsprecher von den vorderen Ecken des Gehäuses zu den Tastaturkanten verlagert, so dass sie nun direkt nach oben zum Benutzer zeigen.
Die Gehäusesteifigkeit bleibt aufgrund des ähnlichen Skeletts und der Wahl der Kunststoffmaterialien in etwa gleich wie zuvor.
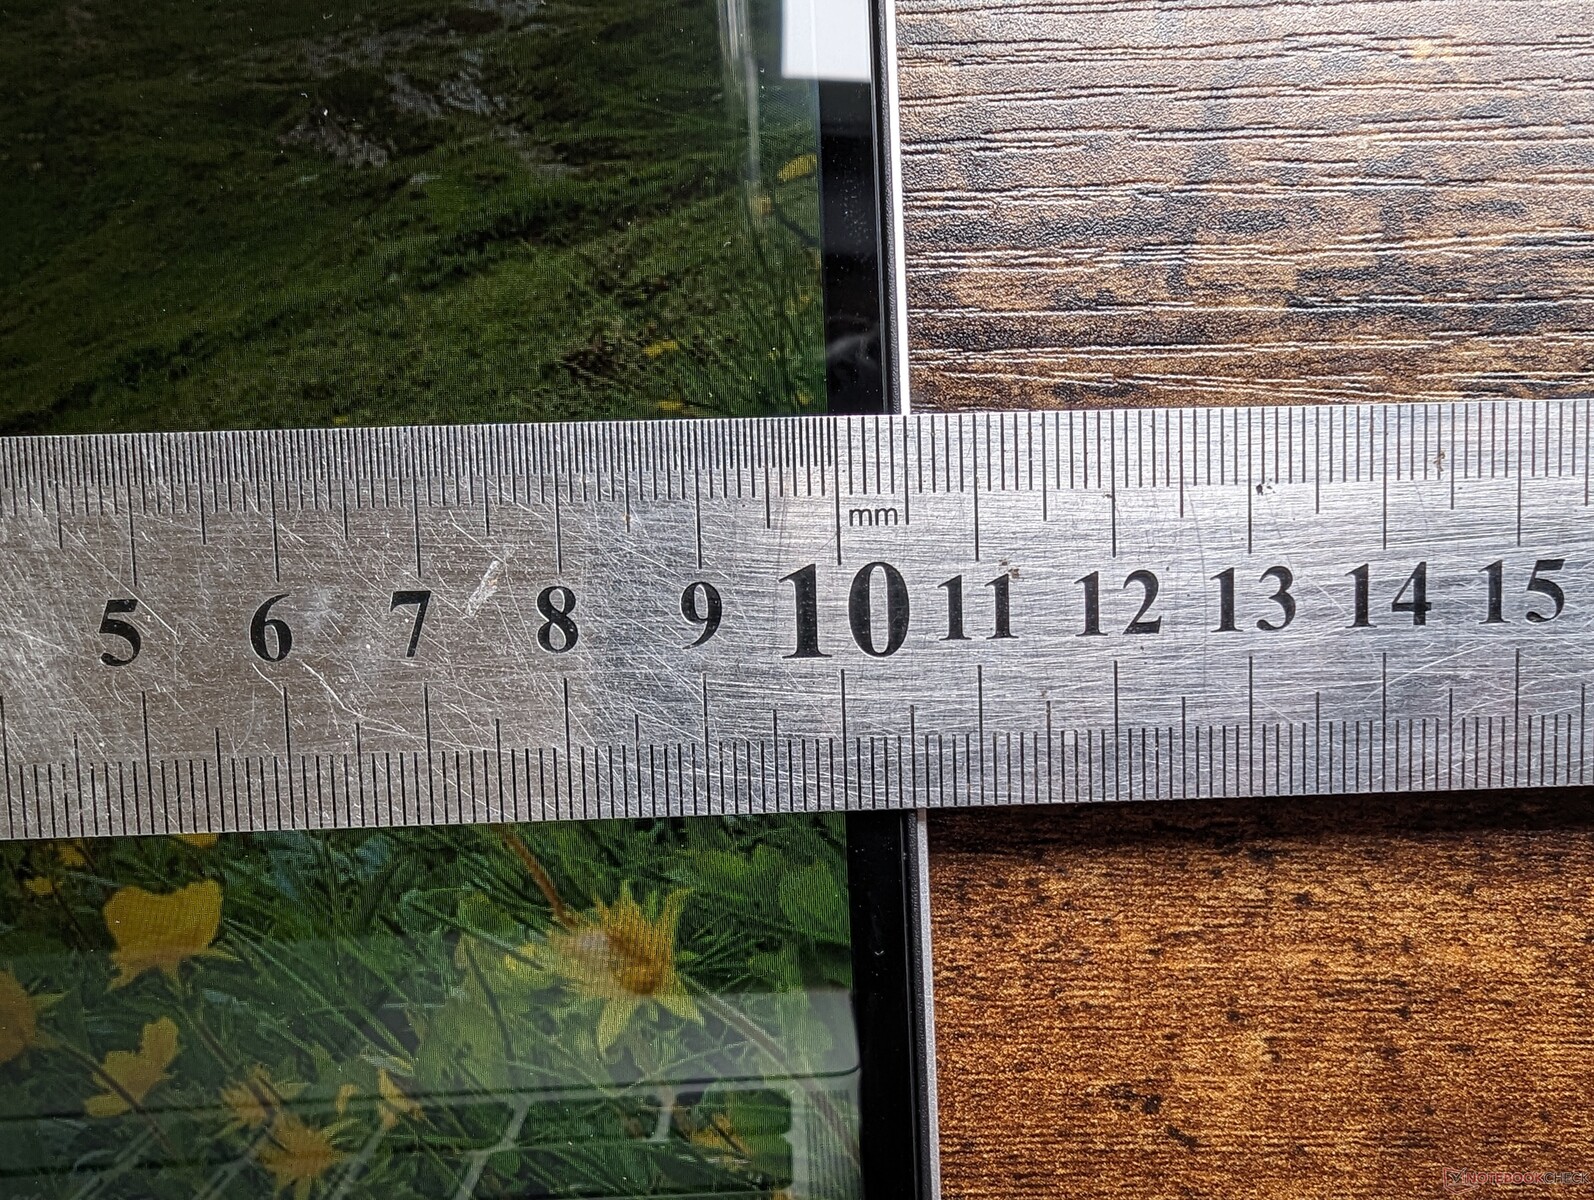
Abmessungen und Gewicht sind trotz aller äußeren und inneren Veränderungen nahezu identisch mit dem letztjährigen Modell. Das ist nicht unbedingt eine schlechte Sache, da das Modell immer noch mit Alternativen wie dem Pavilion x360 14 oder dem IdeaPad Flex 14 7i vergleichbar ist. Aber Dell hätte noch einen Schritt weiter gehen können, um das Inspiron noch portabler und lukrativer für potenzielle Käufer zu machen.
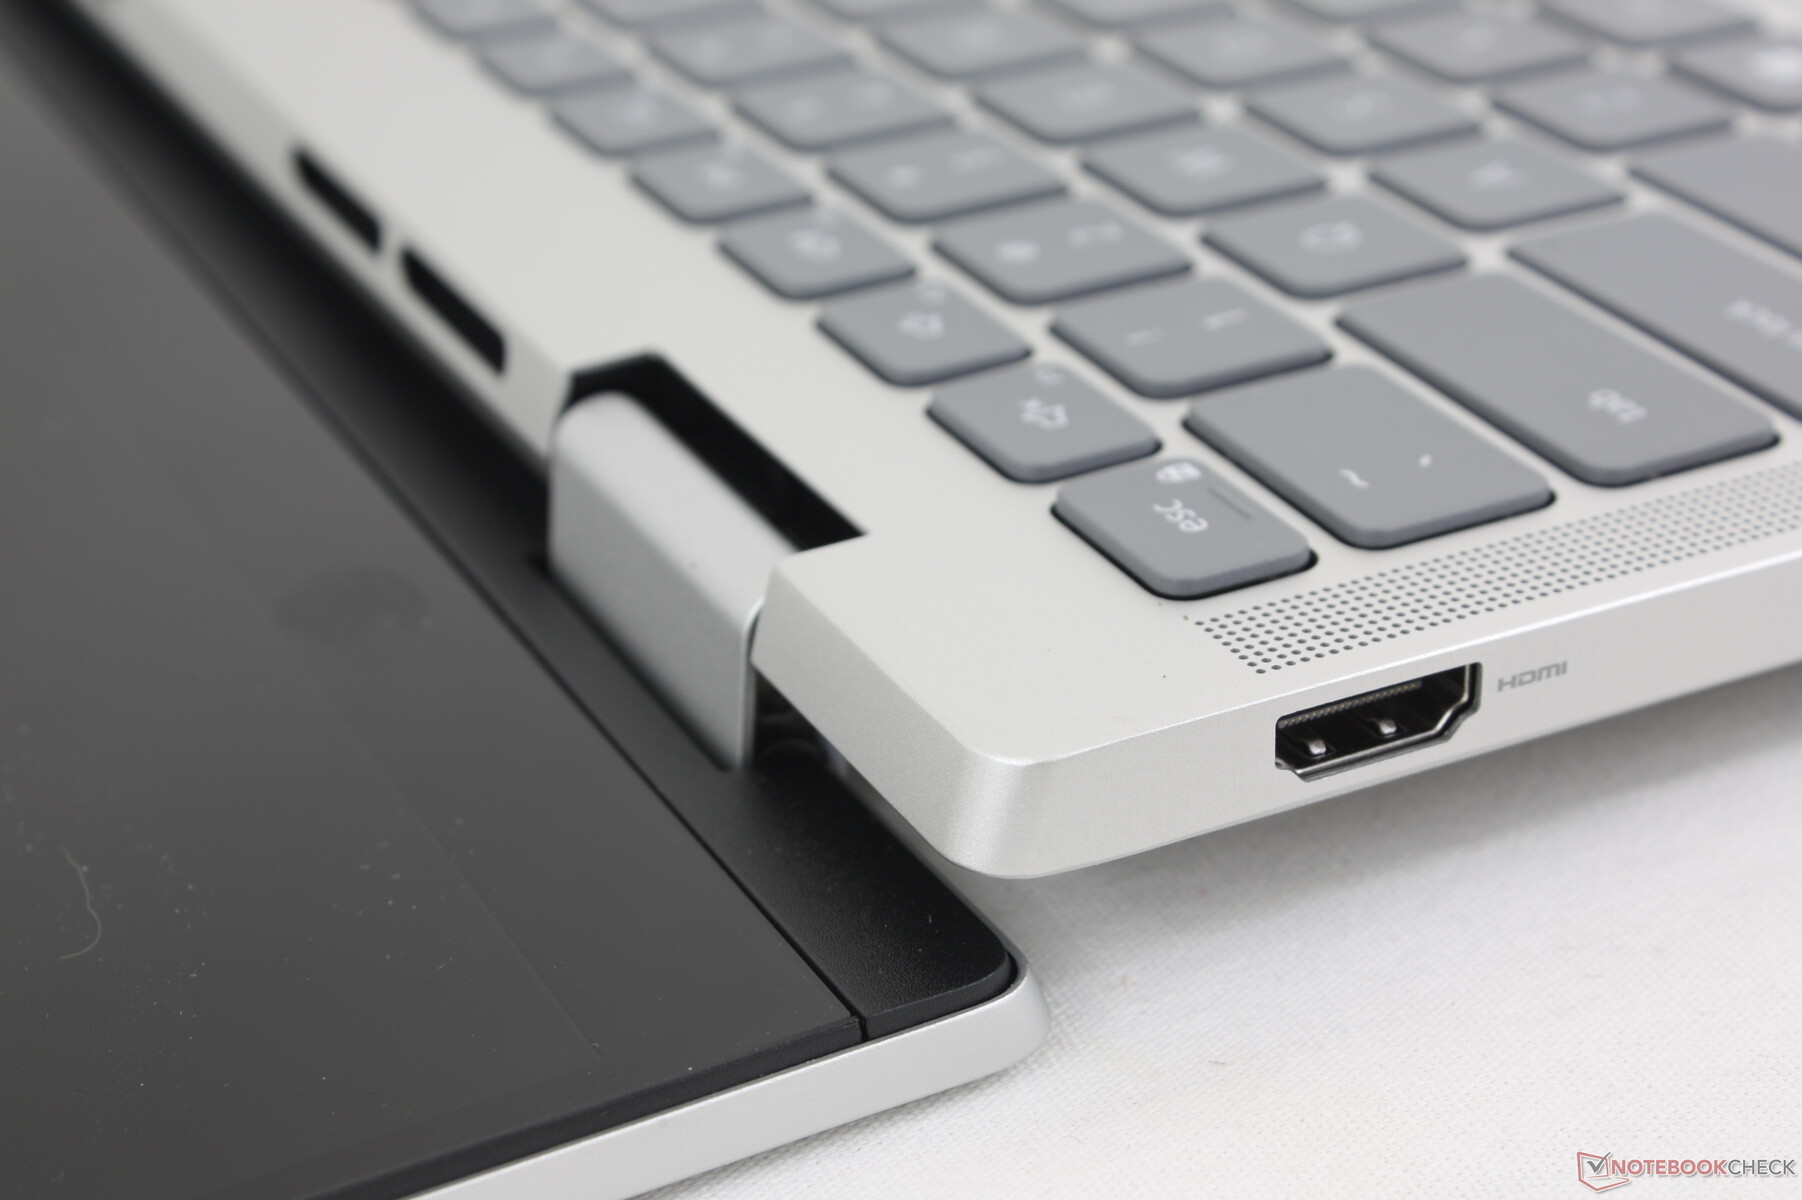
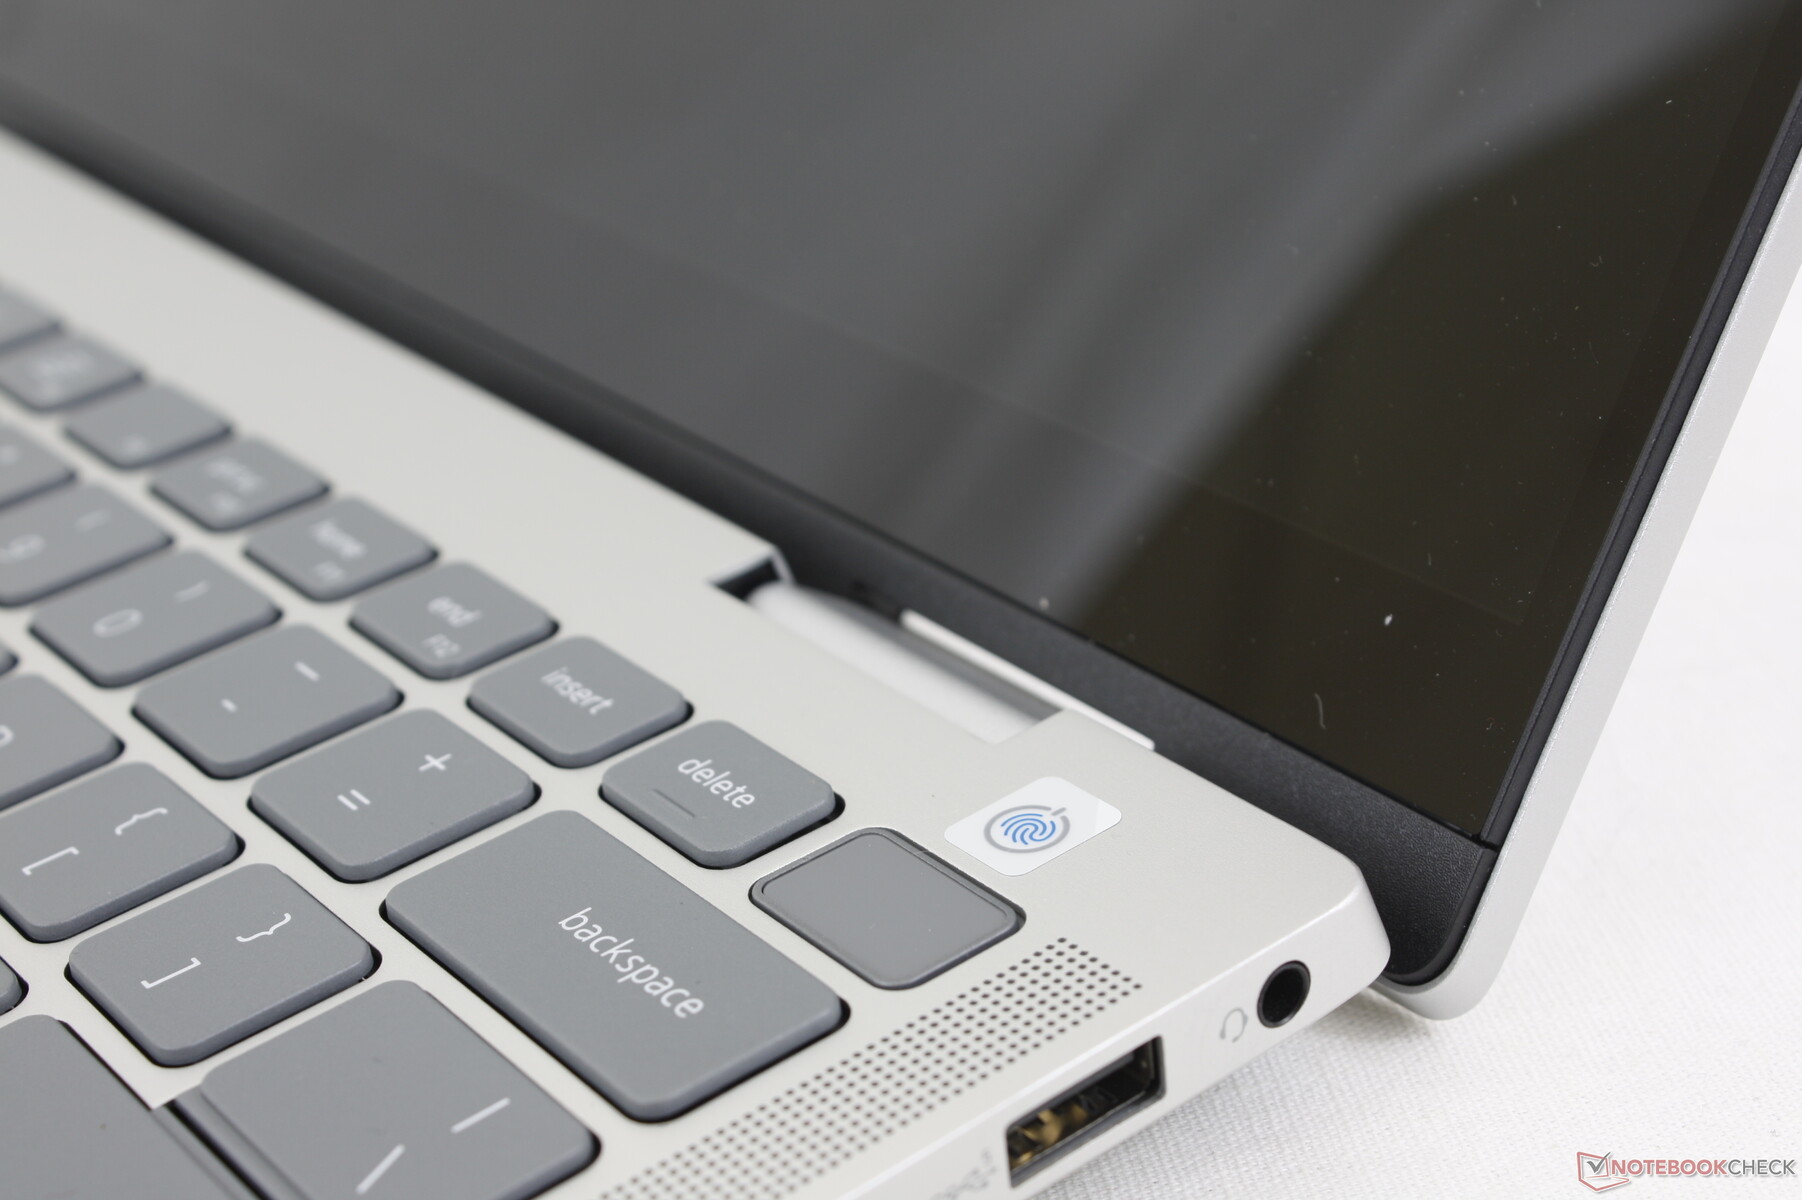

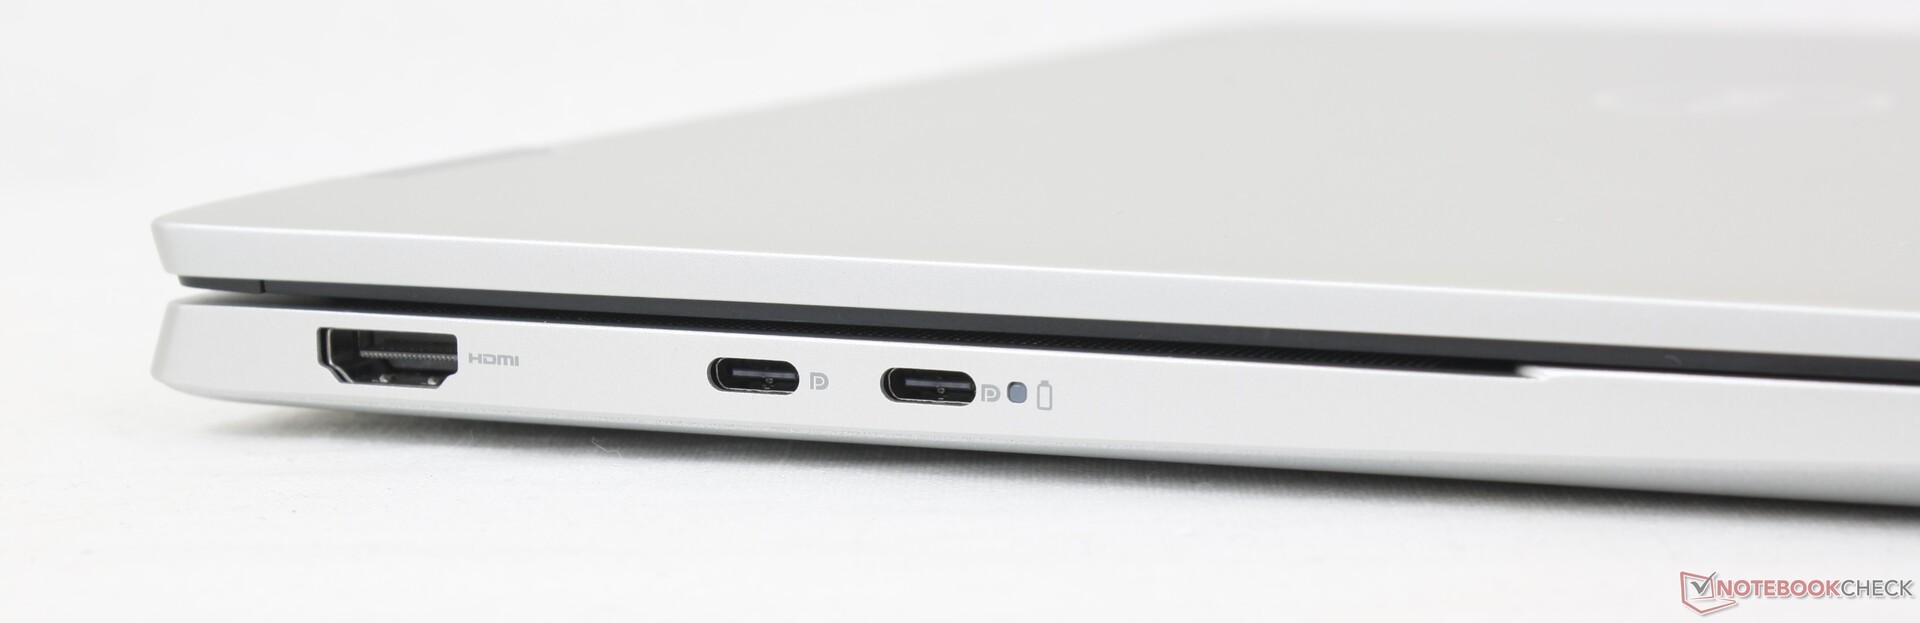
Anschlussausstattung
Die Anschlussoptionen sind vergleichbar mit denen des IdeaPad Flex 5i 14 und Pavilion x360 14, mit nur geringen Unterschieden in der Anzahl der USB-Ports. Beachten Sie, dass die USB-C-Ports bei unserer AMD Konfiguration im Gegensatz zum Intel Inspiron 7430 2-in-1 keine Thunderbolt-Unterstützung bieten.
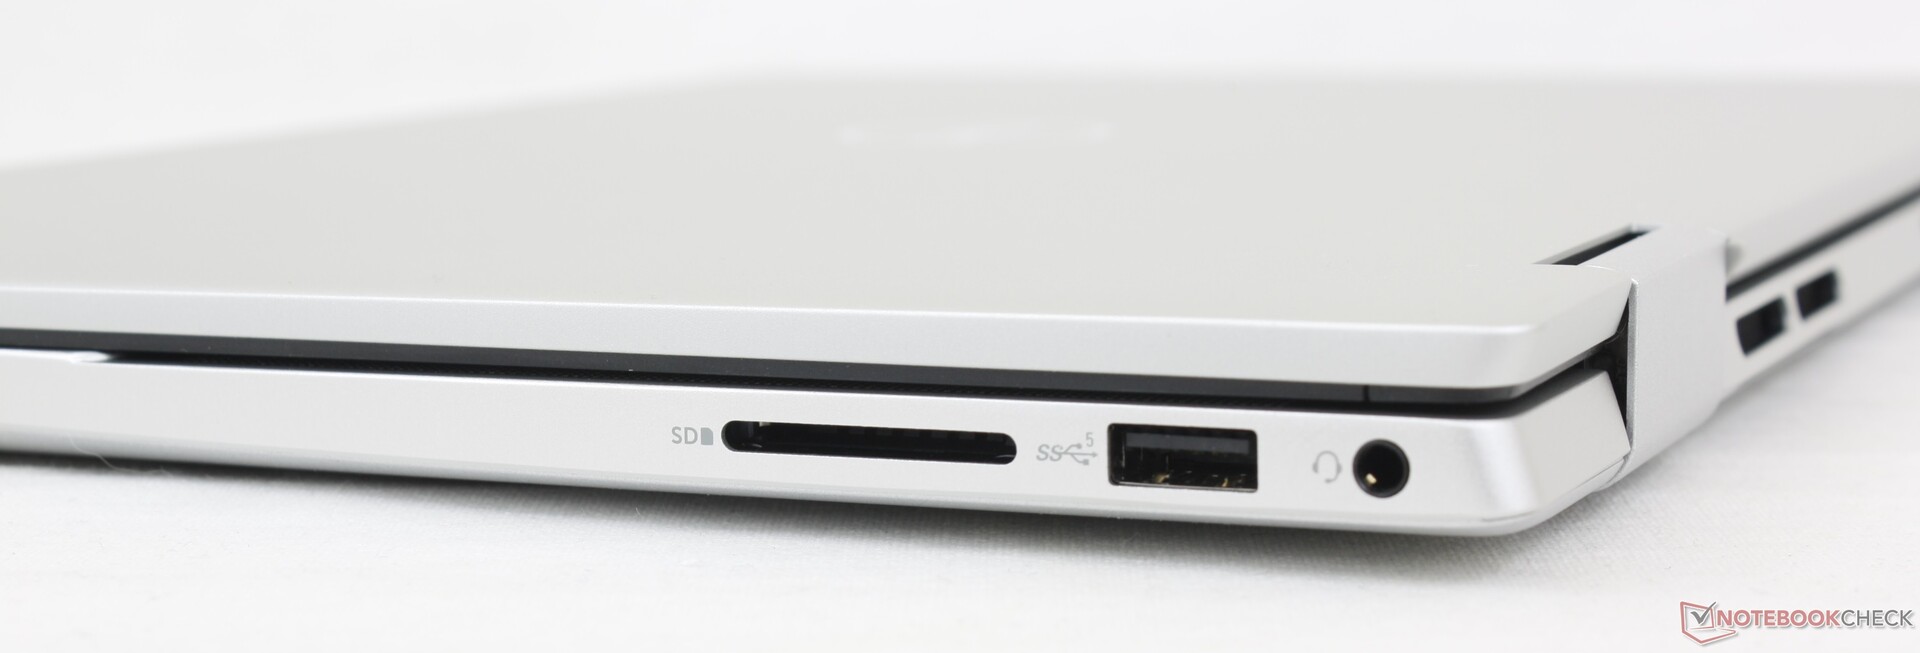
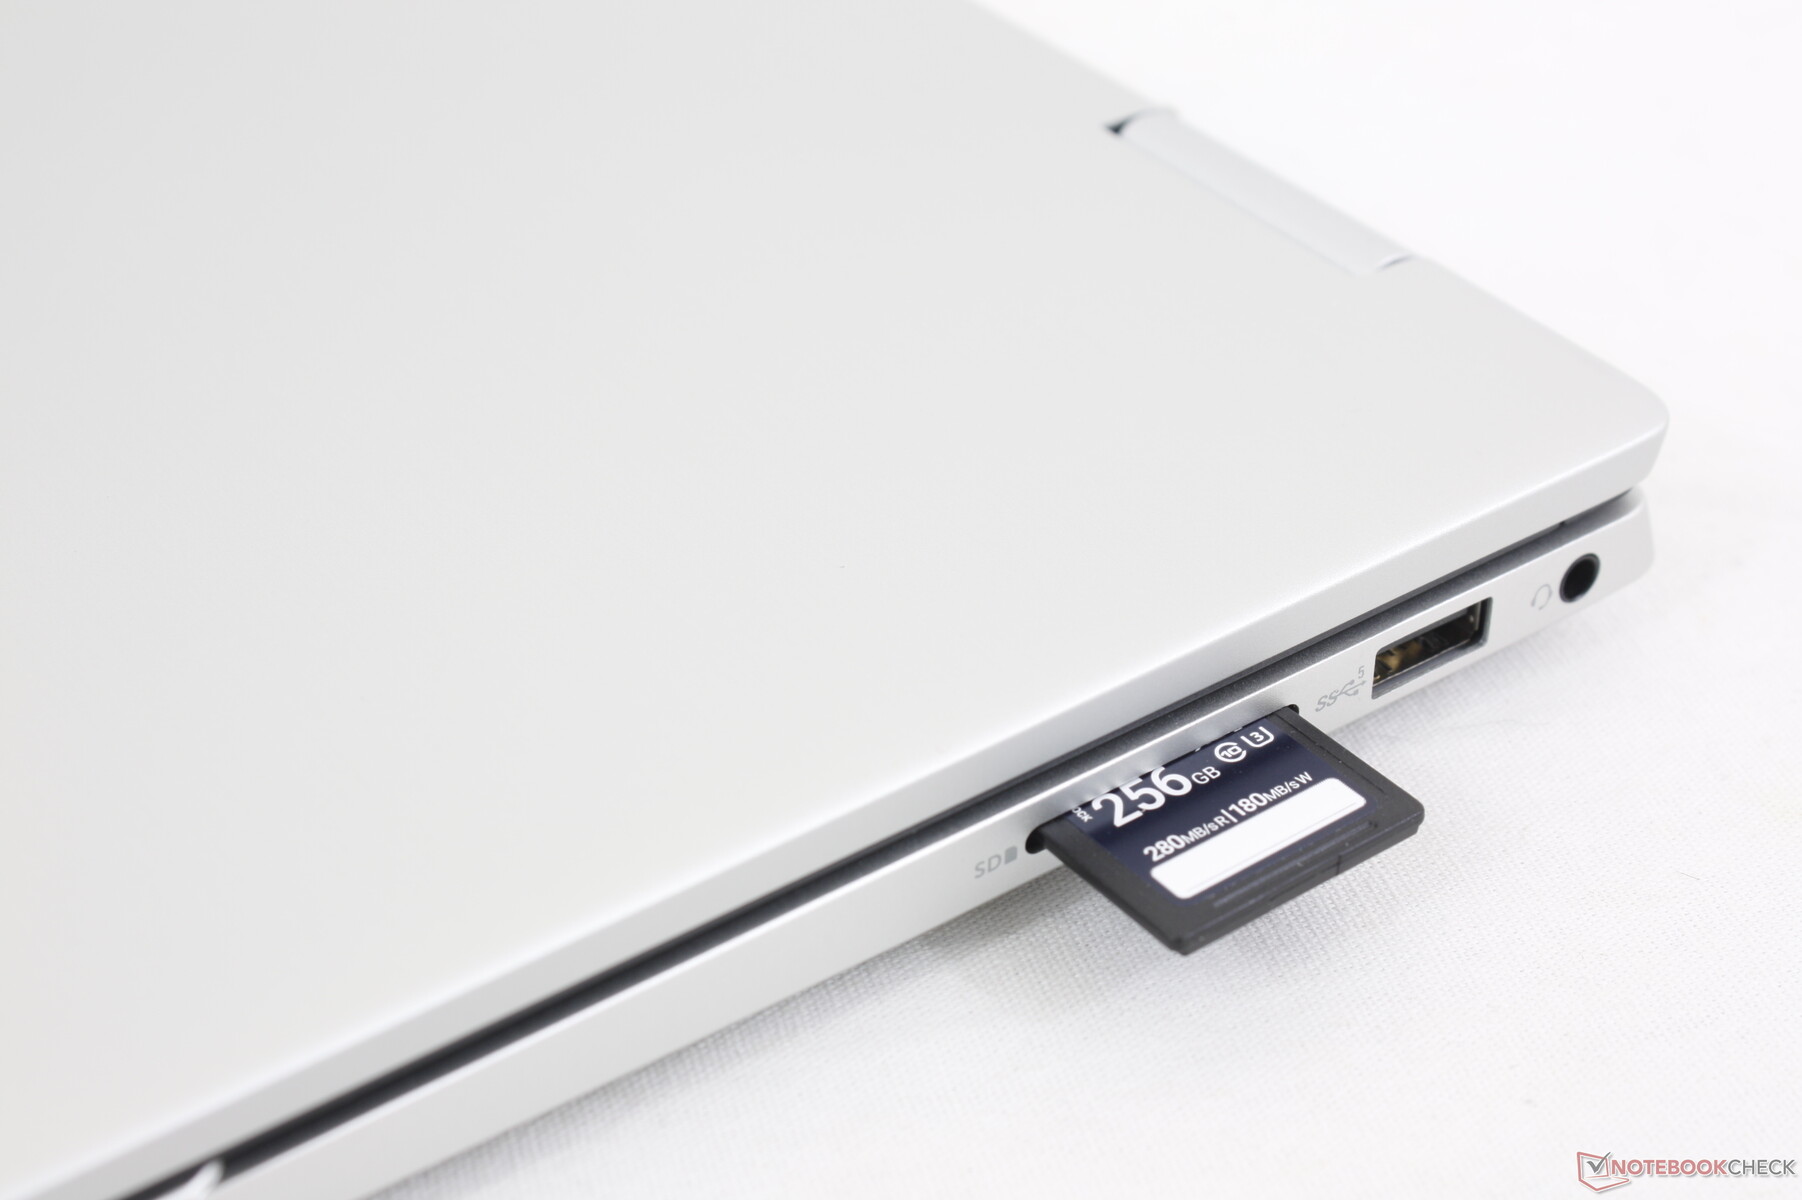
SD-Kartenleser
Die Übertragungsraten des integrierten SD-Kartenlesers haben sich von ~20 MB/s beim letztjährigen Inspiron 7420 auf ~35 MB/s bei unserem neuesten Modell leicht verbessert. Dennoch sind die SD-Leser von Konkurrenzmodellen wie dem IdeaPad Flex 7i oder Pavilion x360 14 um mehr als das Doppelte schneller.
| SD Card Reader | |
| average JPG Copy Test (av. of 3 runs) | |
| Lenovo IdeaPad Flex 7i 14IAU7 (Toshiba Exceria Pro SDXC 64 GB UHS-II) | |
| HP Pavilion x360 14-dy0157ng (Toshiba Exceria Pro M501 microSDXC 64GB) | |
| LG Gram 14T90P (AV Pro V60) | |
| Dell Inspiron 14 7435 2-in-1 (PNY EliteX-Pro60 V60 256 GB) | |
| Dell Inspiron 14 7420 2-in-1 (Toshiba Exceria Pro SDXC 64 GB UHS-II) | |
| maximum AS SSD Seq Read Test (1GB) | |
| Lenovo IdeaPad Flex 7i 14IAU7 (Toshiba Exceria Pro SDXC 64 GB UHS-II) | |
| LG Gram 14T90P (AV Pro V60) | |
| HP Pavilion x360 14-dy0157ng (Toshiba Exceria Pro M501 microSDXC 64GB) | |
| Dell Inspiron 14 7435 2-in-1 (PNY EliteX-Pro60 V60 256 GB) | |
| Dell Inspiron 14 7420 2-in-1 (Toshiba Exceria Pro SDXC 64 GB UHS-II) | |
Kommunikation
Wir sind überrascht, dass unsere Basiskonfiguration Wi-Fi6E unterstützt. Die Übertragungsraten sind stabil, wenn sie mit unserem Asus-AXE11000-6-GHz-Netzwerk gekoppelt sind, aber die Empfangsraten sind definitiv um fast die Hälfte langsamer als erwartet, verglichen mit Laptops mit Intel AX211.
| Networking | |
| iperf3 transmit AX12 | |
| HP Pavilion x360 14-dy0157ng | |
| iperf3 receive AX12 | |
| HP Pavilion x360 14-dy0157ng | |
| iperf3 transmit AXE11000 | |
| Acer Aspire 5 Spin 14 | |
| Dell Inspiron 14 7435 2-in-1 | |
| Lenovo IdeaPad Flex 7i 14IAU7 | |
| LG Gram 14T90P | |
| iperf3 receive AXE11000 | |
| Acer Aspire 5 Spin 14 | |
| LG Gram 14T90P | |
| Lenovo IdeaPad Flex 7i 14IAU7 | |
| Dell Inspiron 14 7435 2-in-1 | |
| iperf3 transmit AXE11000 6GHz | |
| Dell Inspiron 14 7435 2-in-1 | |
| Acer Aspire 5 Spin 14 | |
| Lenovo IdeaPad Flex 7i 14IAU7 | |
| Dell Inspiron 14 7420 2-in-1 | |
| iperf3 receive AXE11000 6GHz | |
| Acer Aspire 5 Spin 14 | |
| Dell Inspiron 14 7420 2-in-1 | |
| Lenovo IdeaPad Flex 7i 14IAU7 | |
| Dell Inspiron 14 7435 2-in-1 | |
Webcam
Dell hat keine Änderungen an der 2-MP- oder 1.080p-Webcam vorgenommen. Ein Privacy Shutter ist enthalten, während IR weiterhin weggelassen wurde, um Kosten zu sparen.


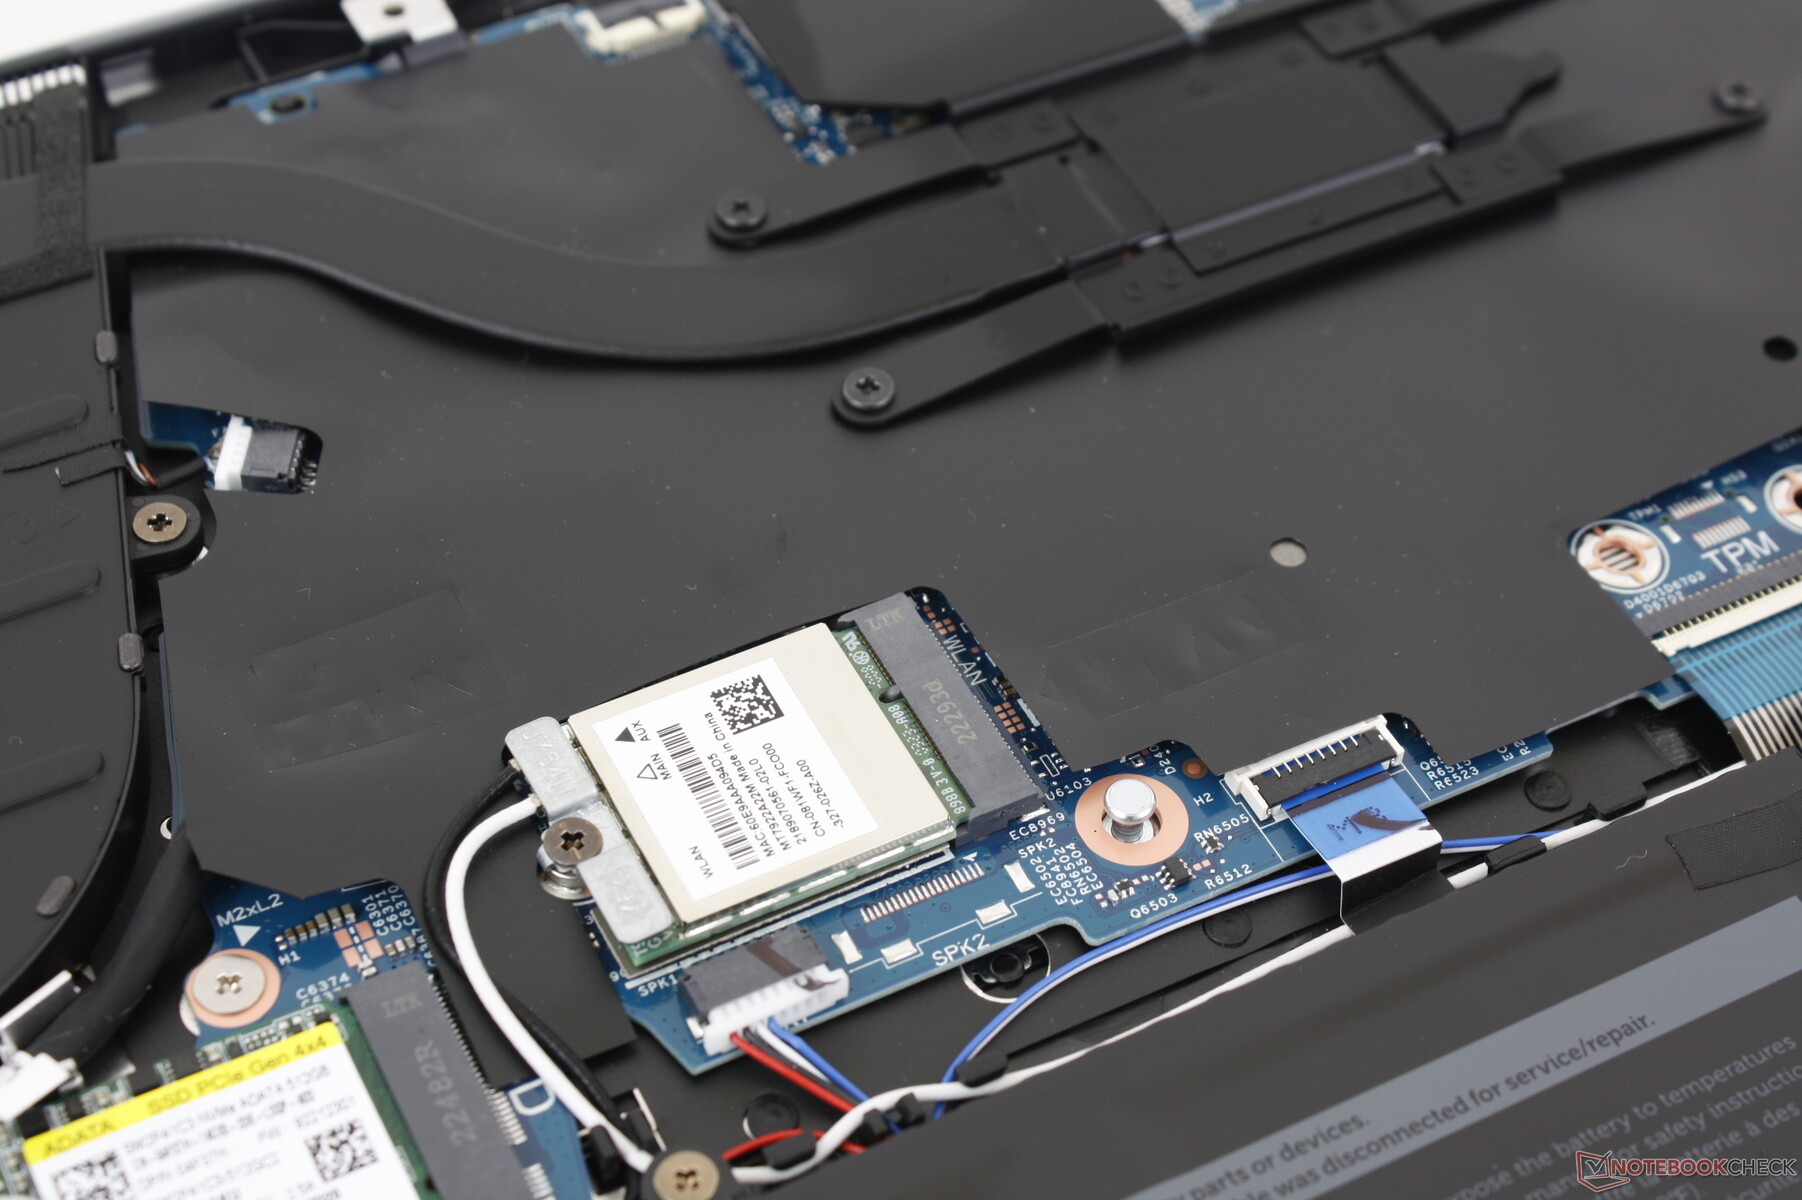
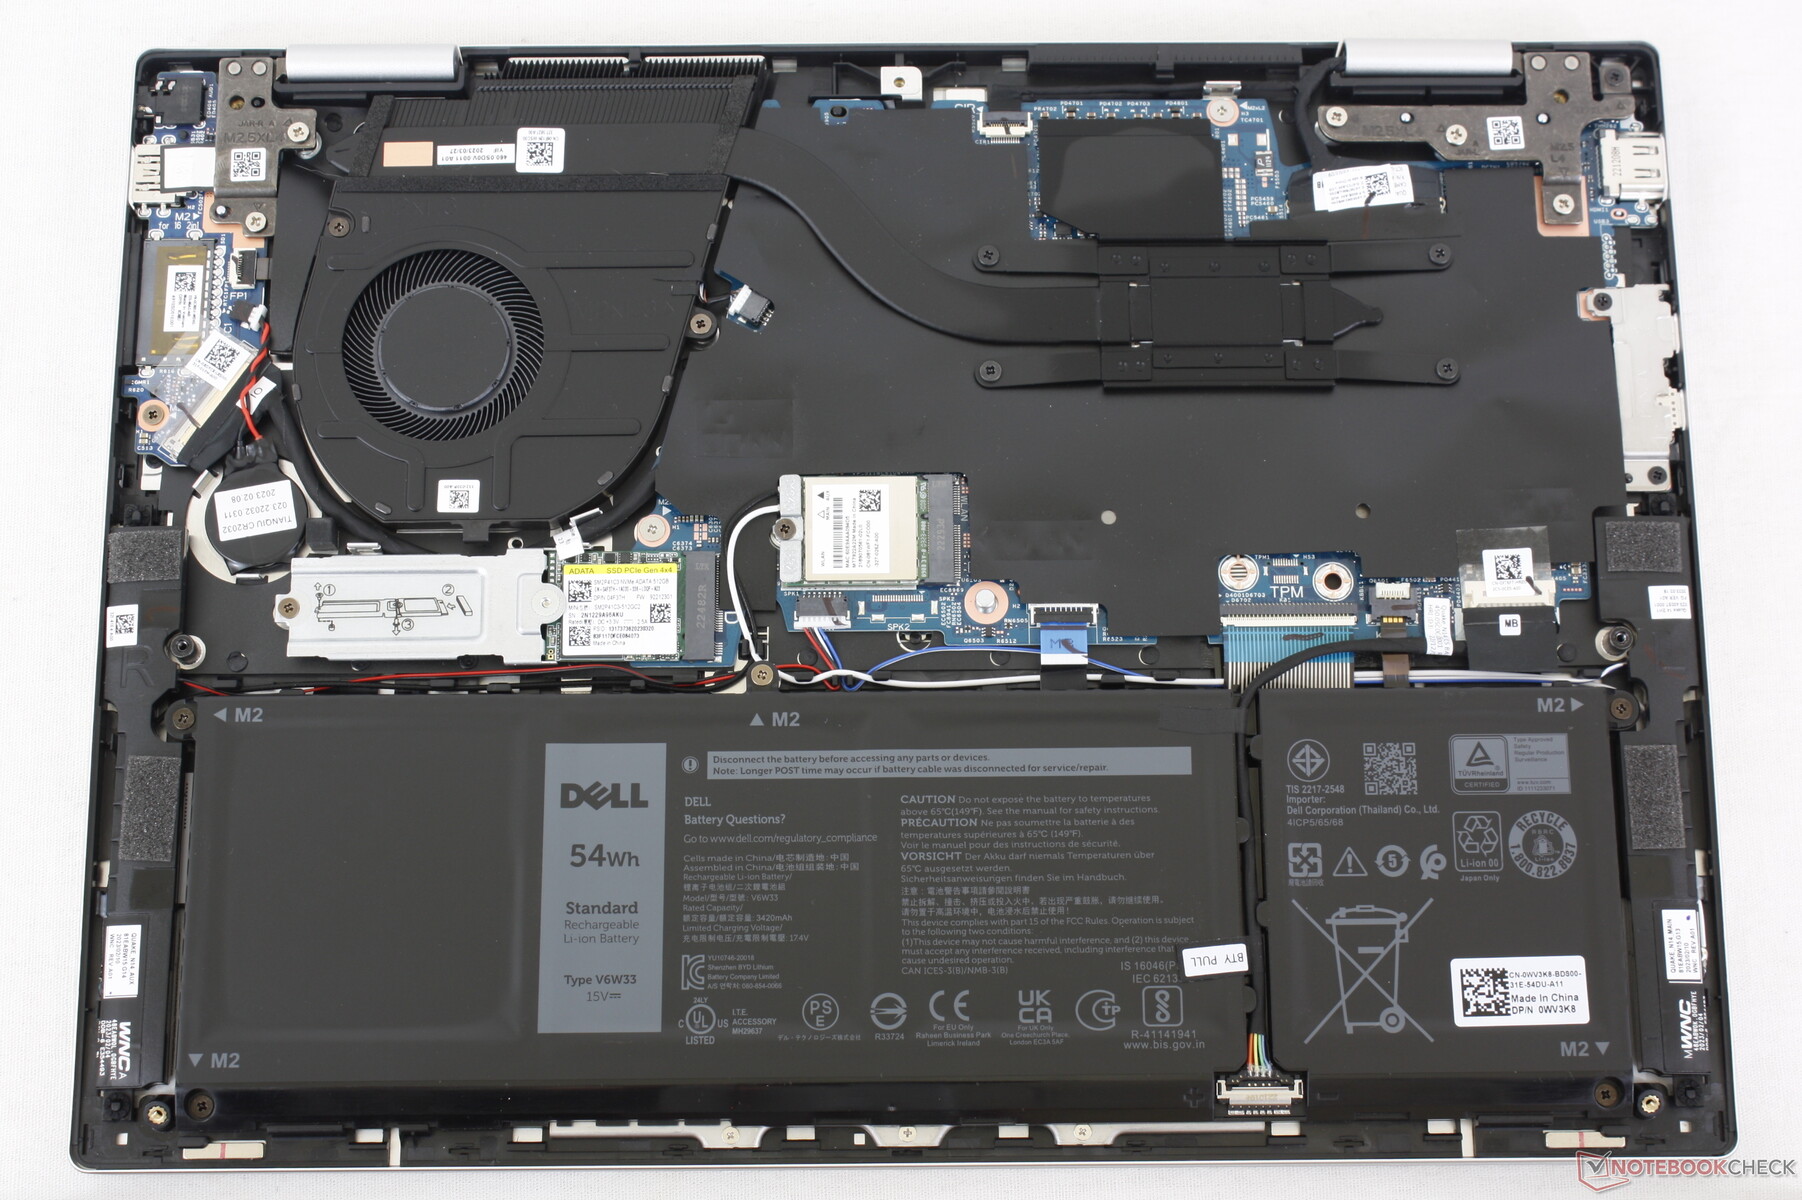
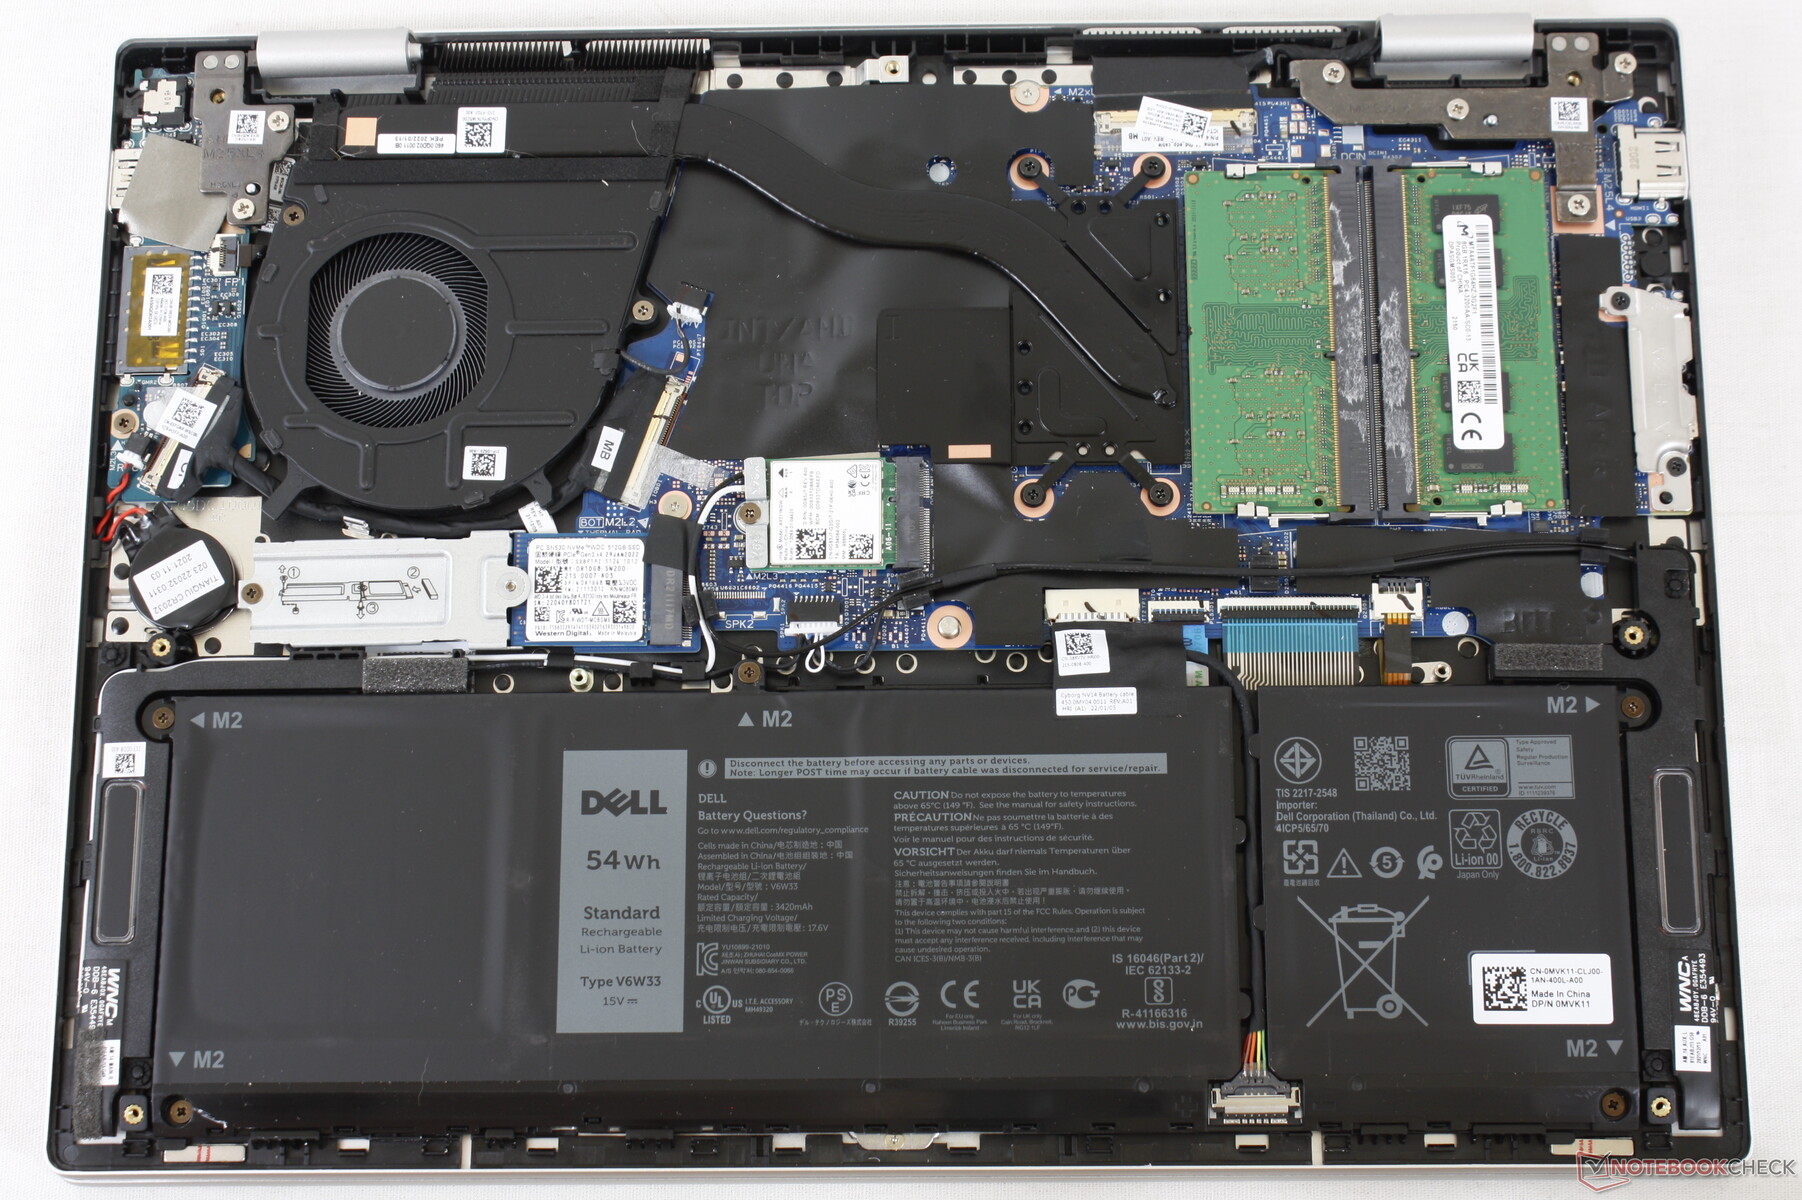
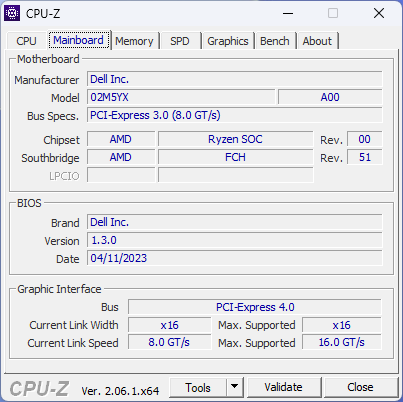
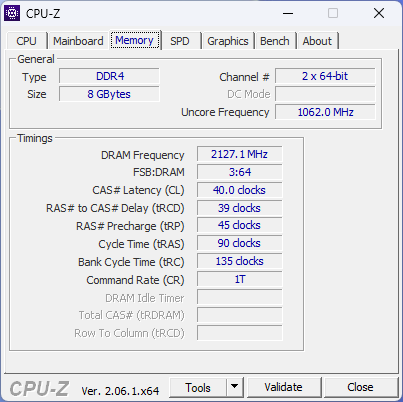
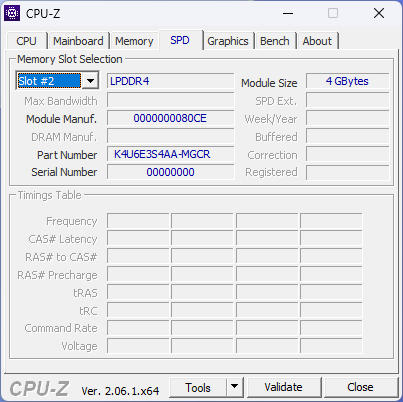
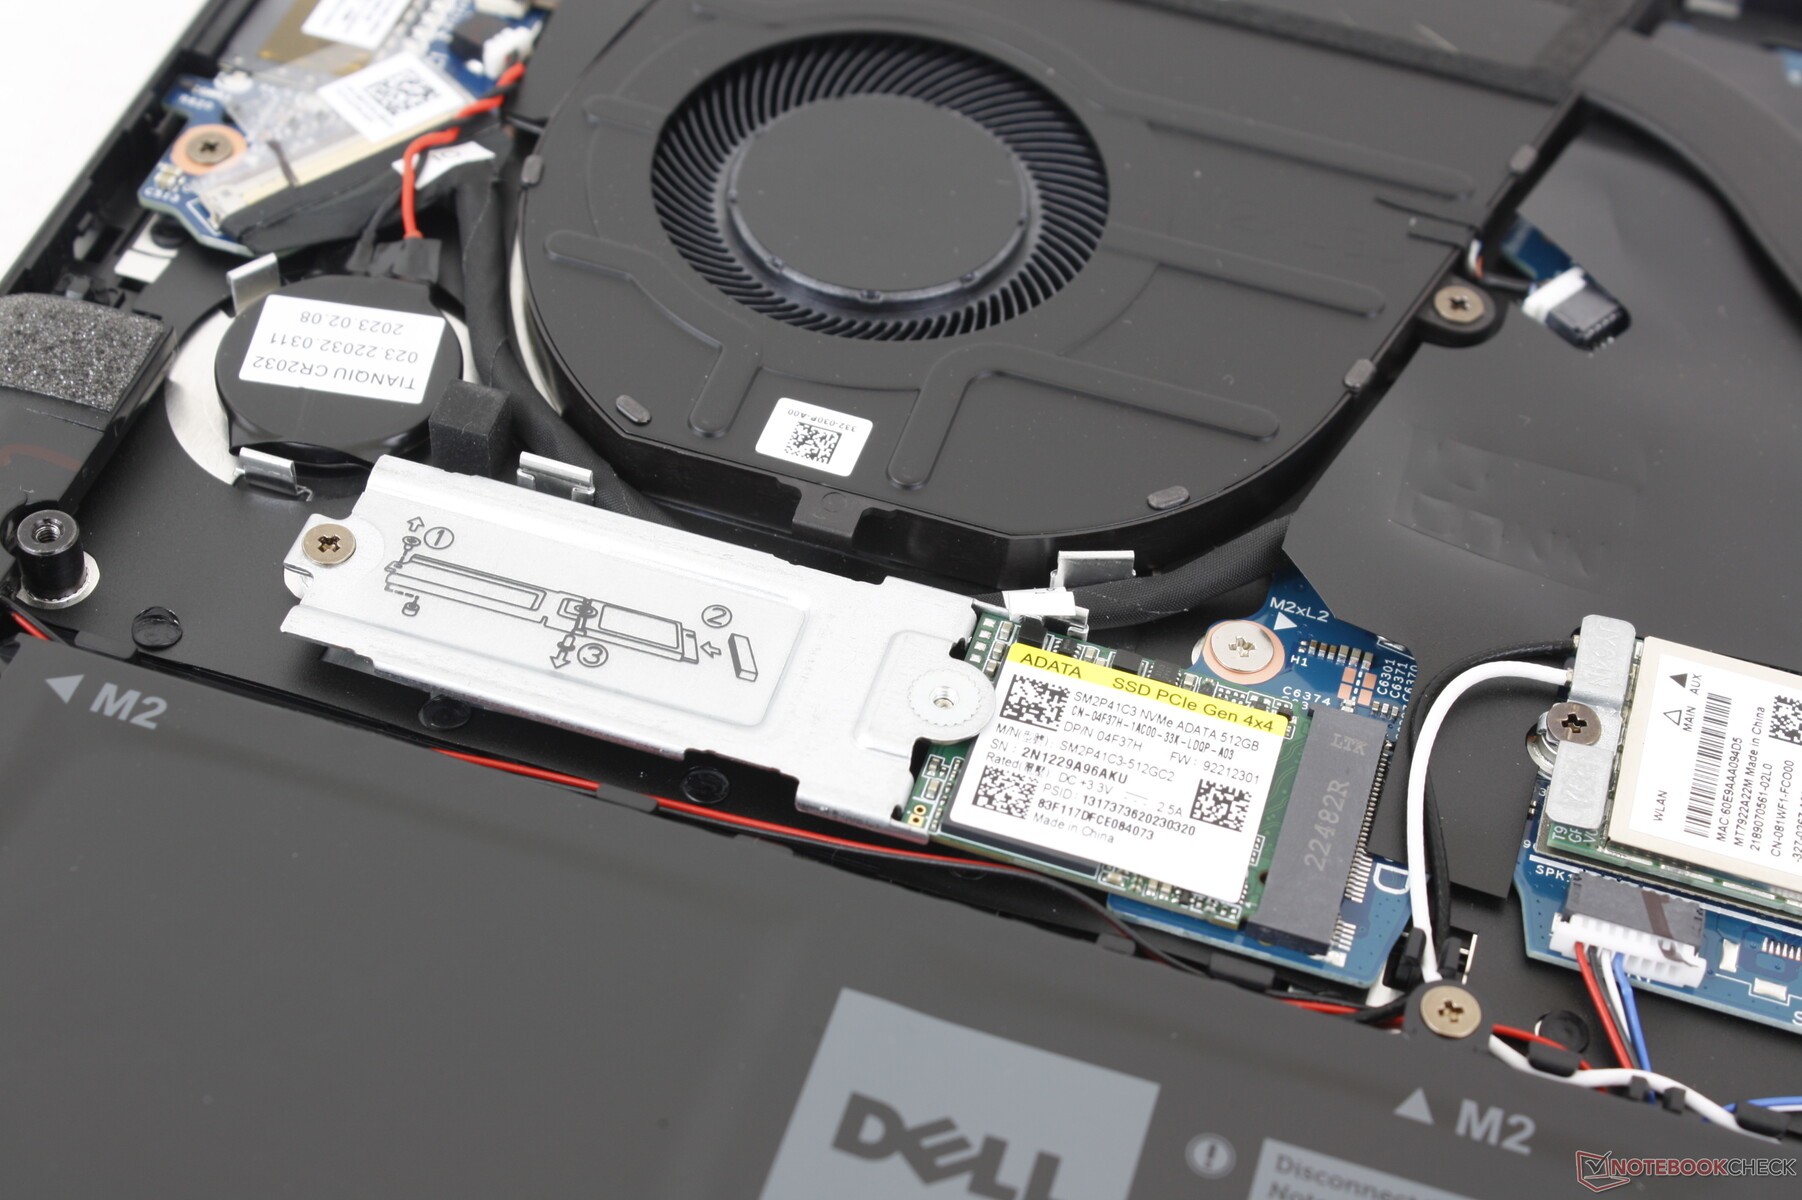
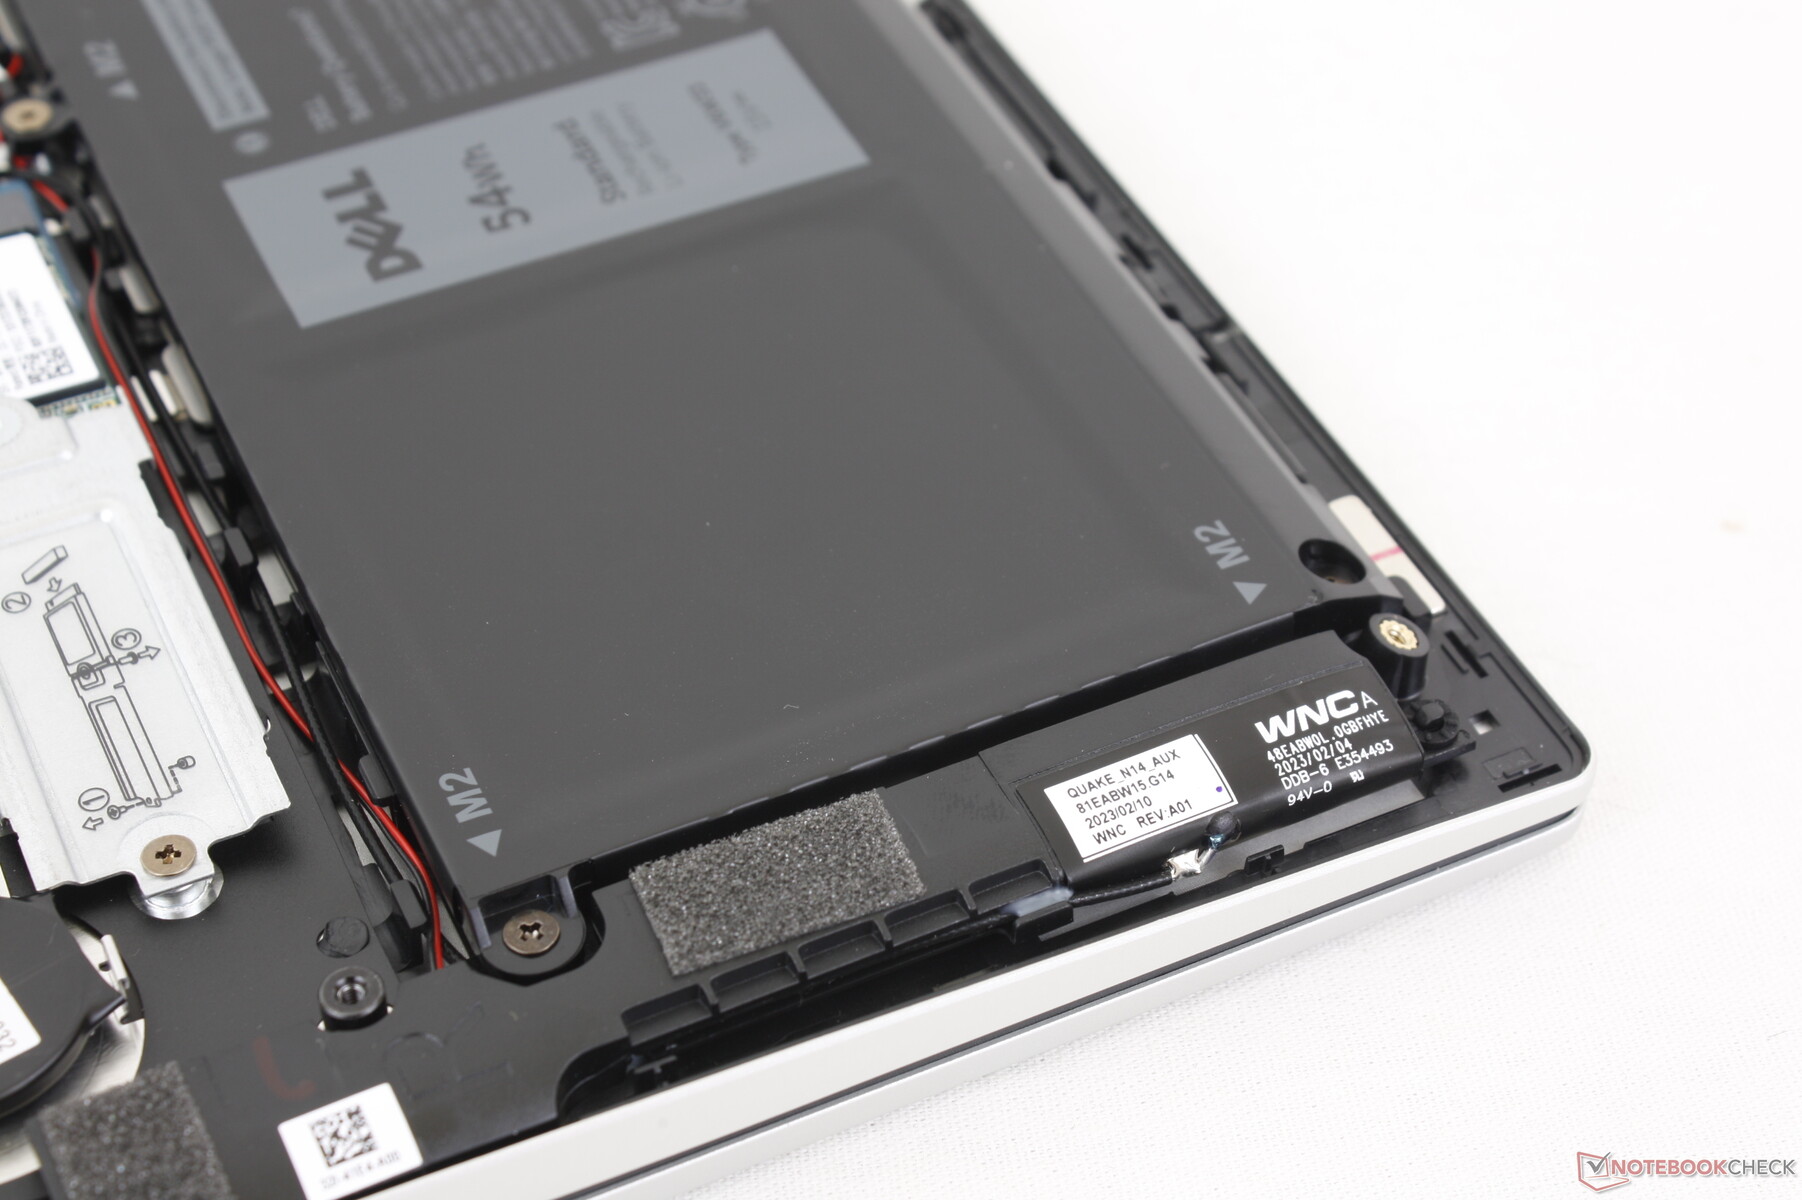
Wartung
Dell hat eine wesentliche Änderung am Motherboard im Vergleich zum letztjährigen Design vorgenommen: Der Arbeitsspeicher ist nun gelötet statt gesockelt, wie die Bilder unten zeigen. Das ist zwar bedauerlich, aber gelötete Arbeitsspeicher sind auch bei anderen günstigen Convertibles wie dem IdeaPad Flex 7 oder dem Acer Aspire 5 Spin 14 anzutreffen.
Zubehör und Garantie
In der Verpackung befinden sich außer dem Netzgerät und den Unterlagen keine weiteren Extras. Es gilt die übliche einjährige beschränkte Herstellergarantie.
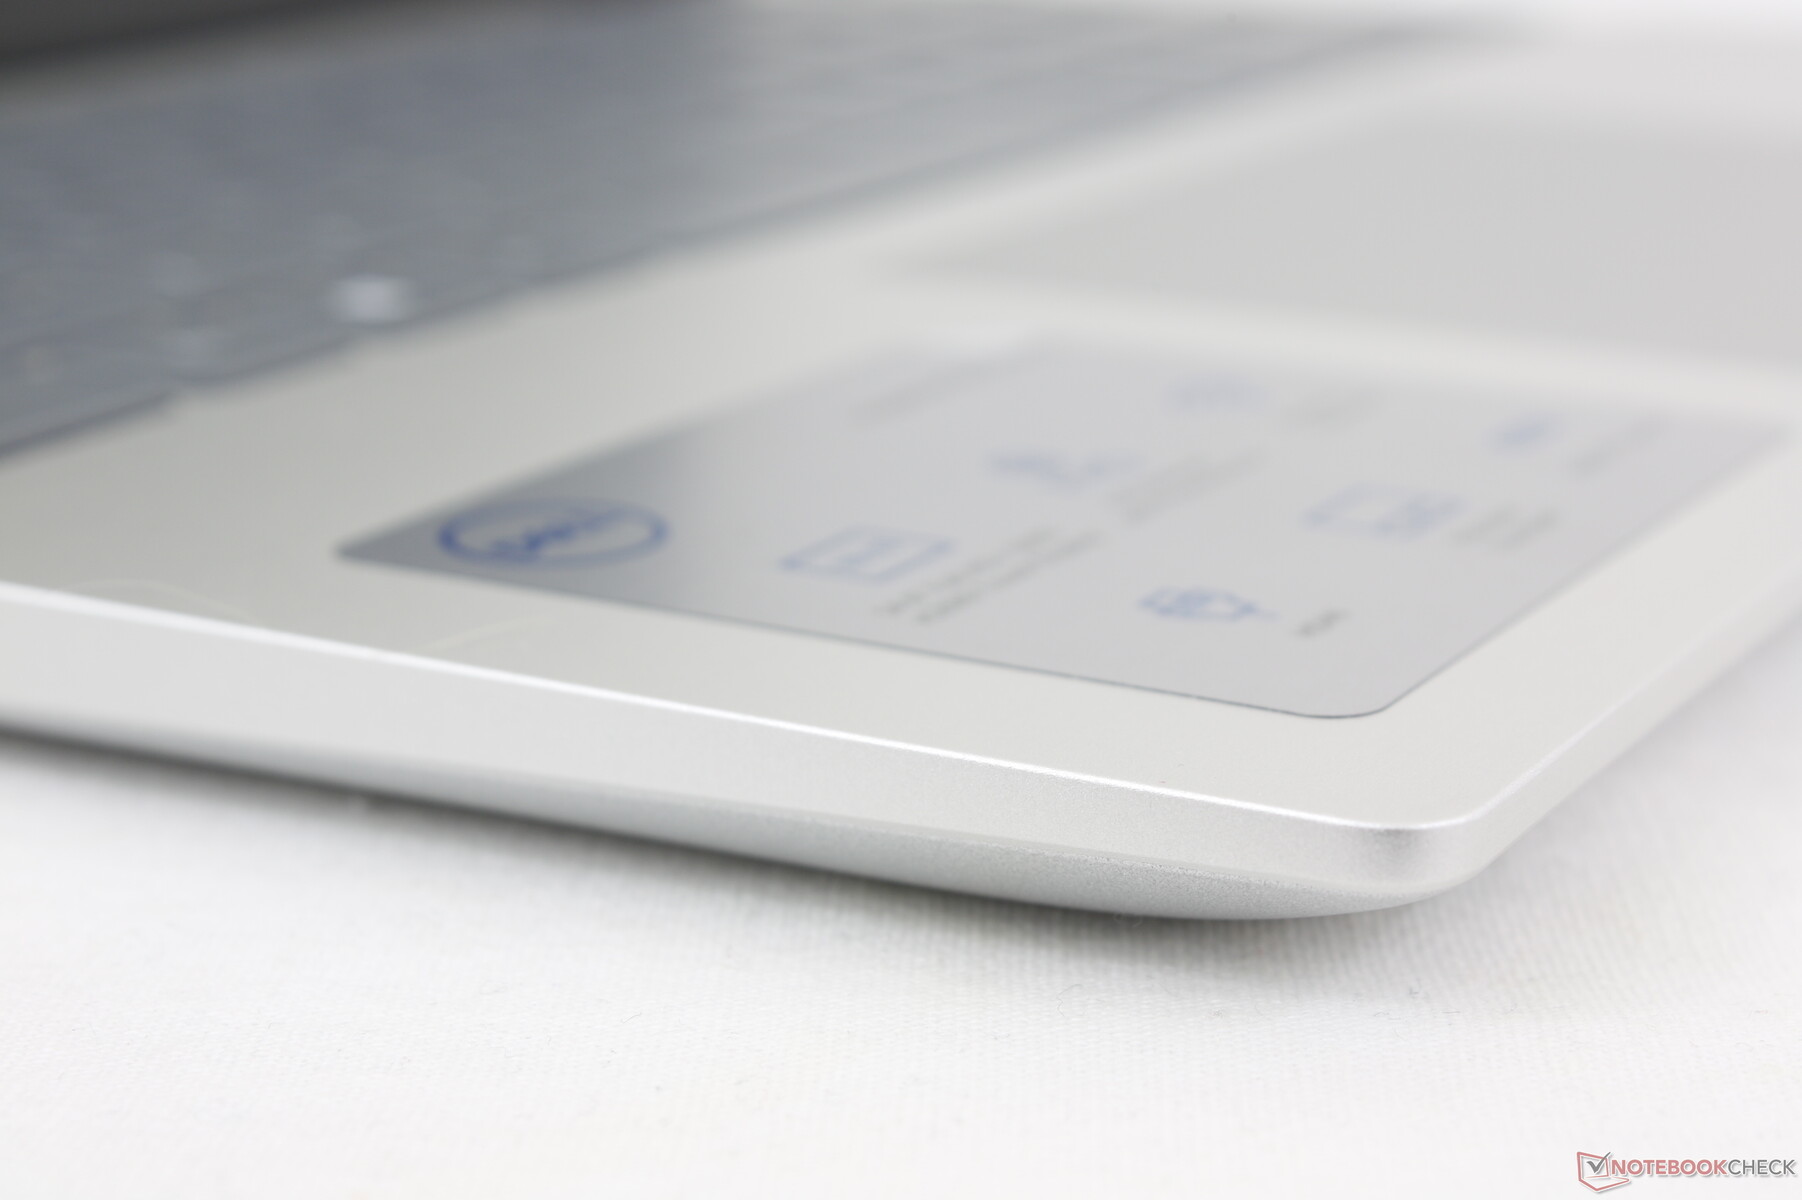
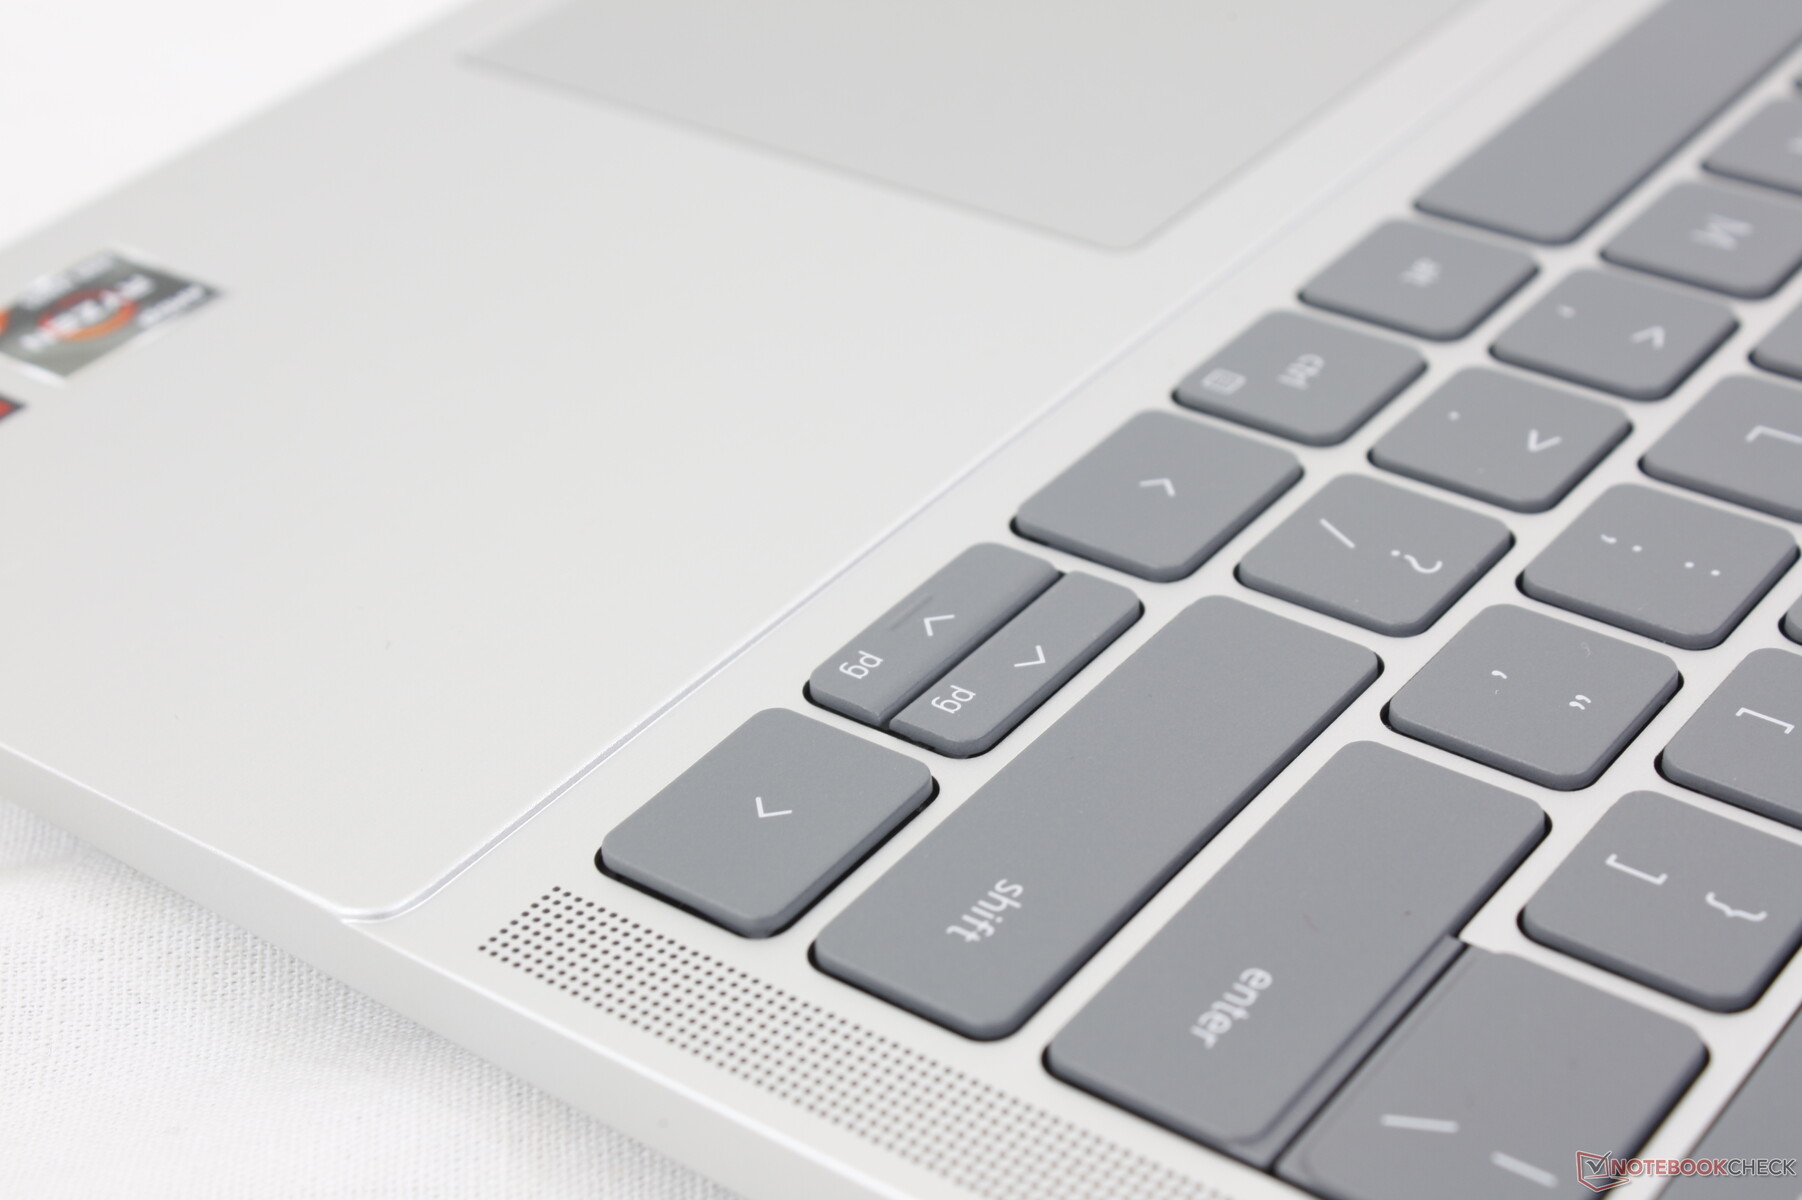
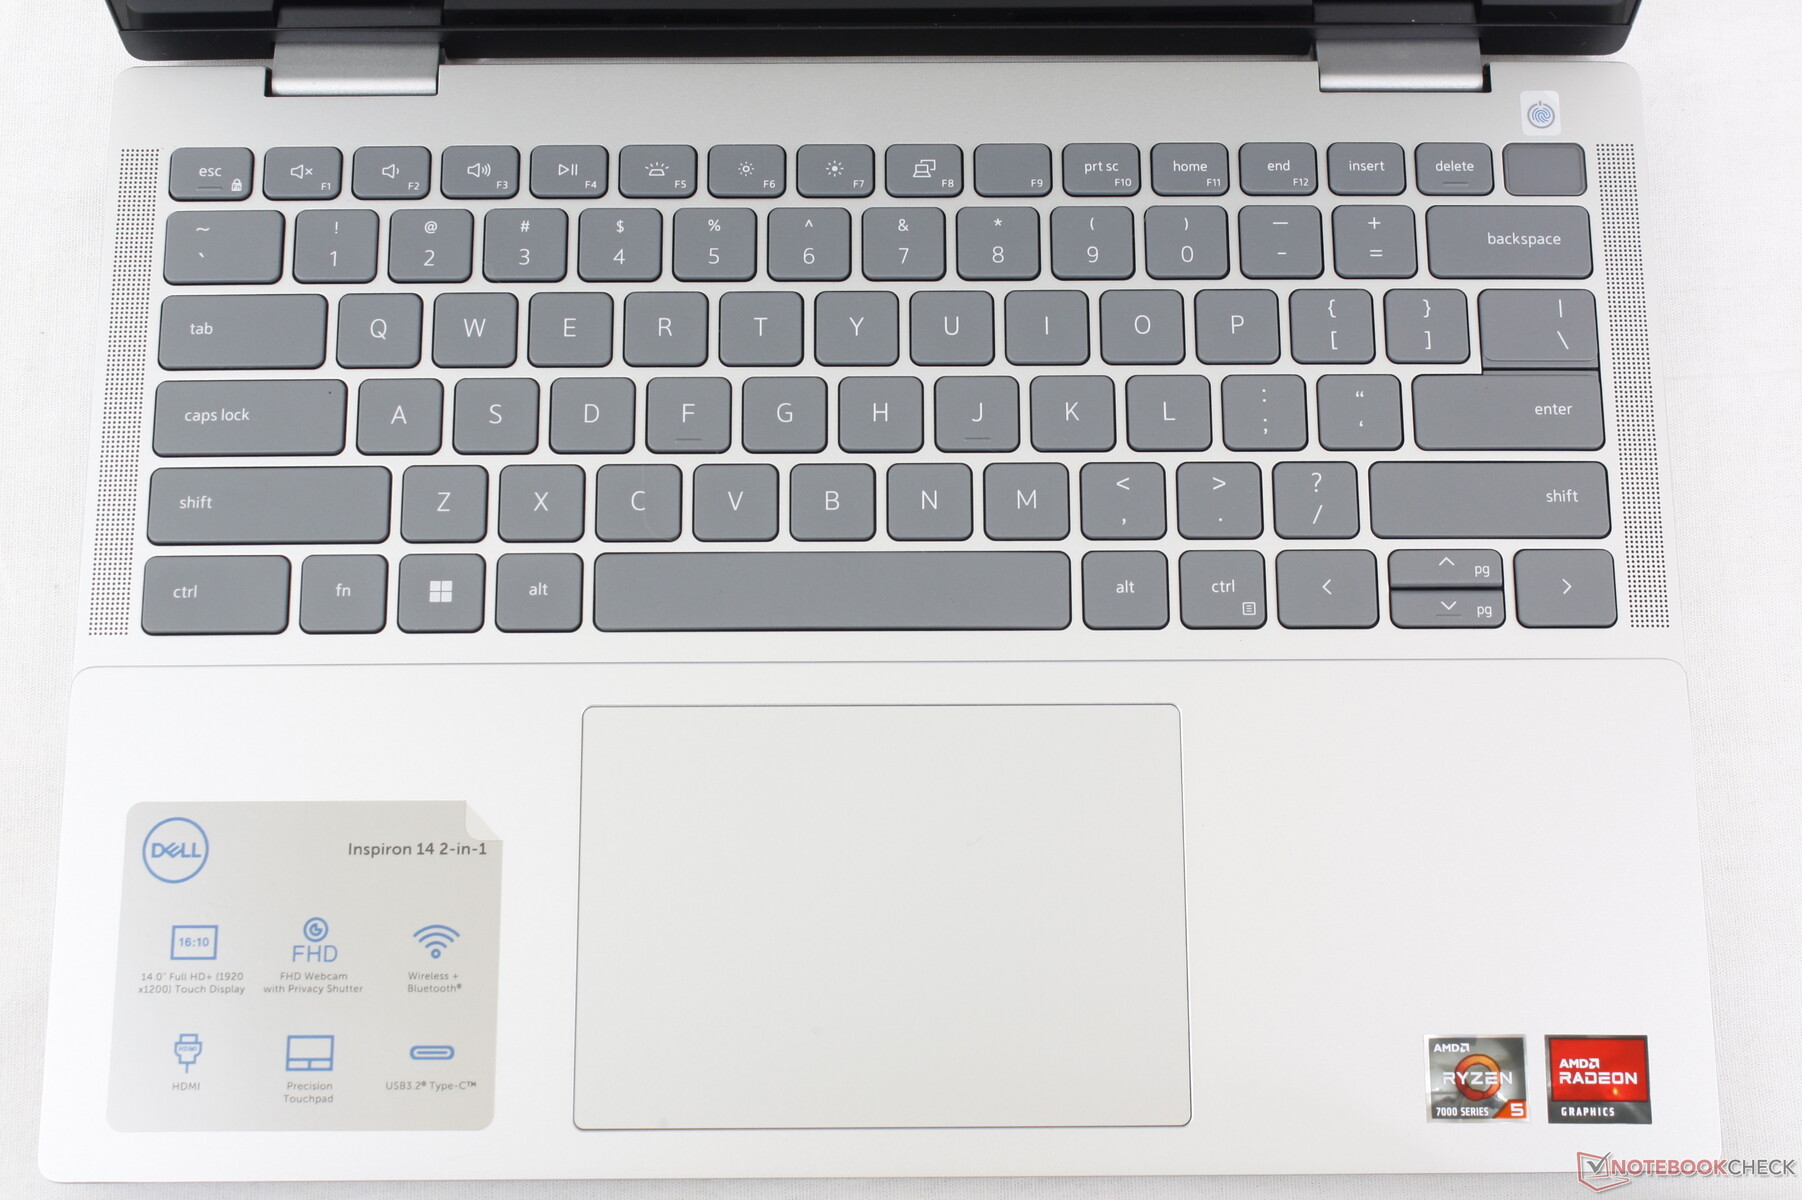
Eingabegeräte - Kein Mylar mehr
Tastatur und Touchpad
Während die Tastatur das gleiche Tipperlebnis wie beim letztjährigen Inspiron 14 7420 bietet, hat sich das Design des Clickpads durch die Entfernung der Mylar-Schicht verändert. Es hat nun ein traditionelleres Aussehen, während die ursprüngliche Fläche von 11,5 x 8 cm beibehalten wurde. Leider hat sich das Feedback beim Klicken nicht verbessert, denn es fühlt sich immer noch schwammig und ein wenig zu flach an.


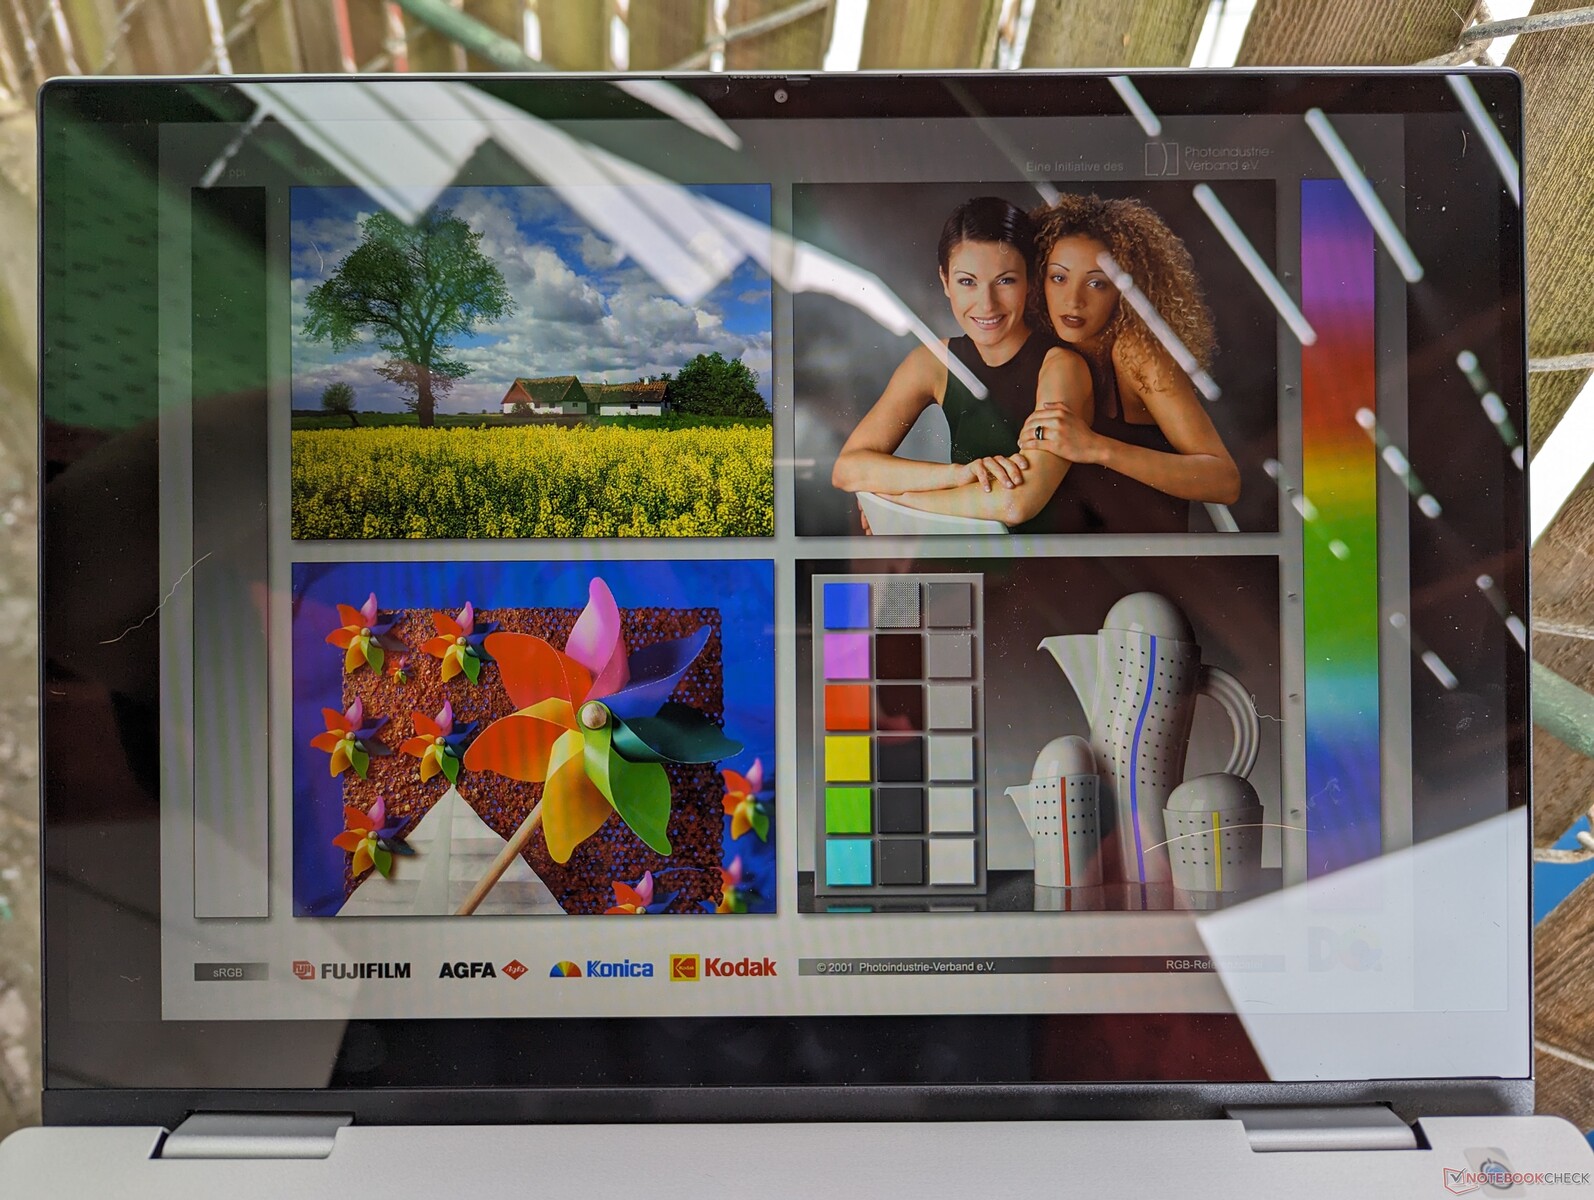
Display - 60 Hz, 45 % NTSC, 1.200p, 16:10
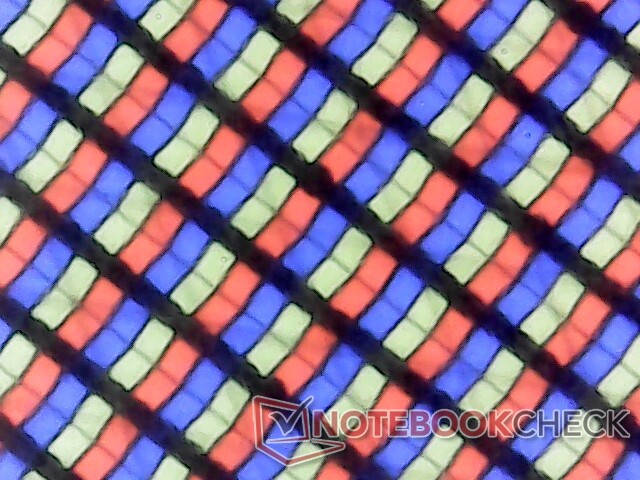
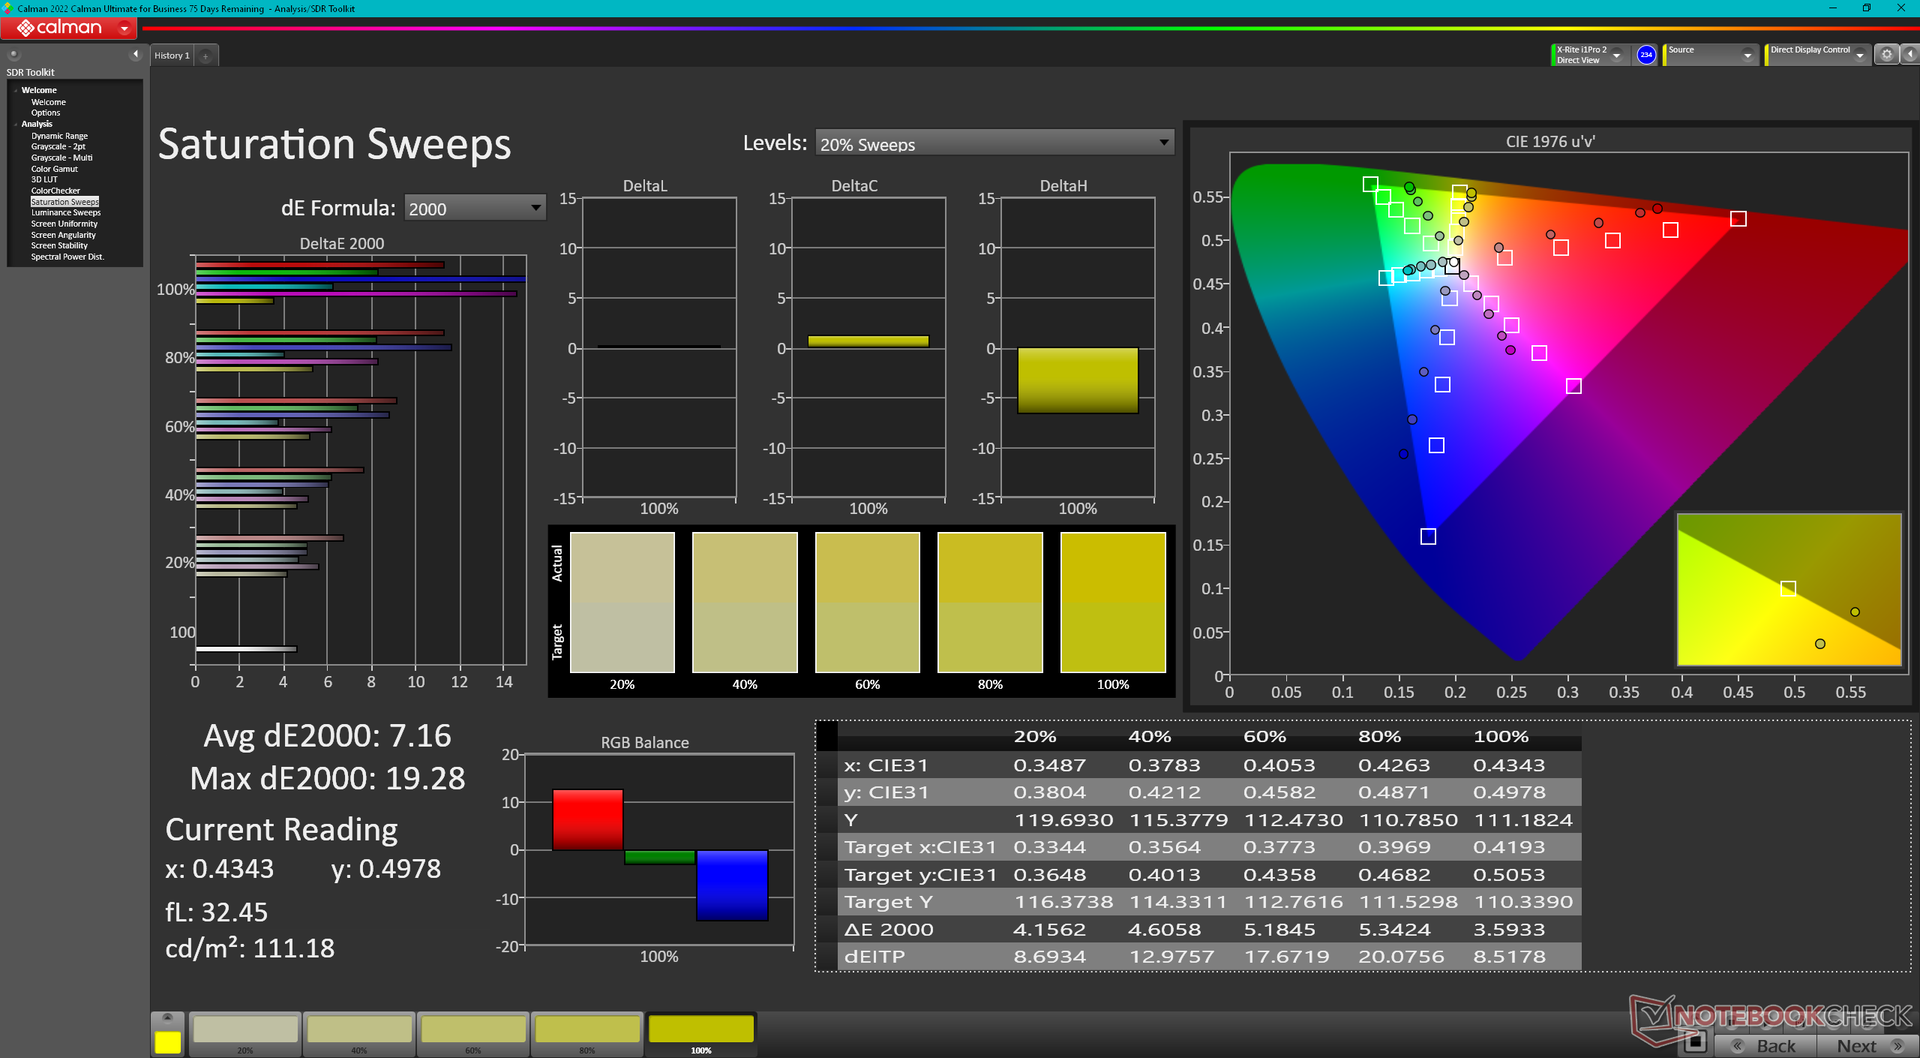
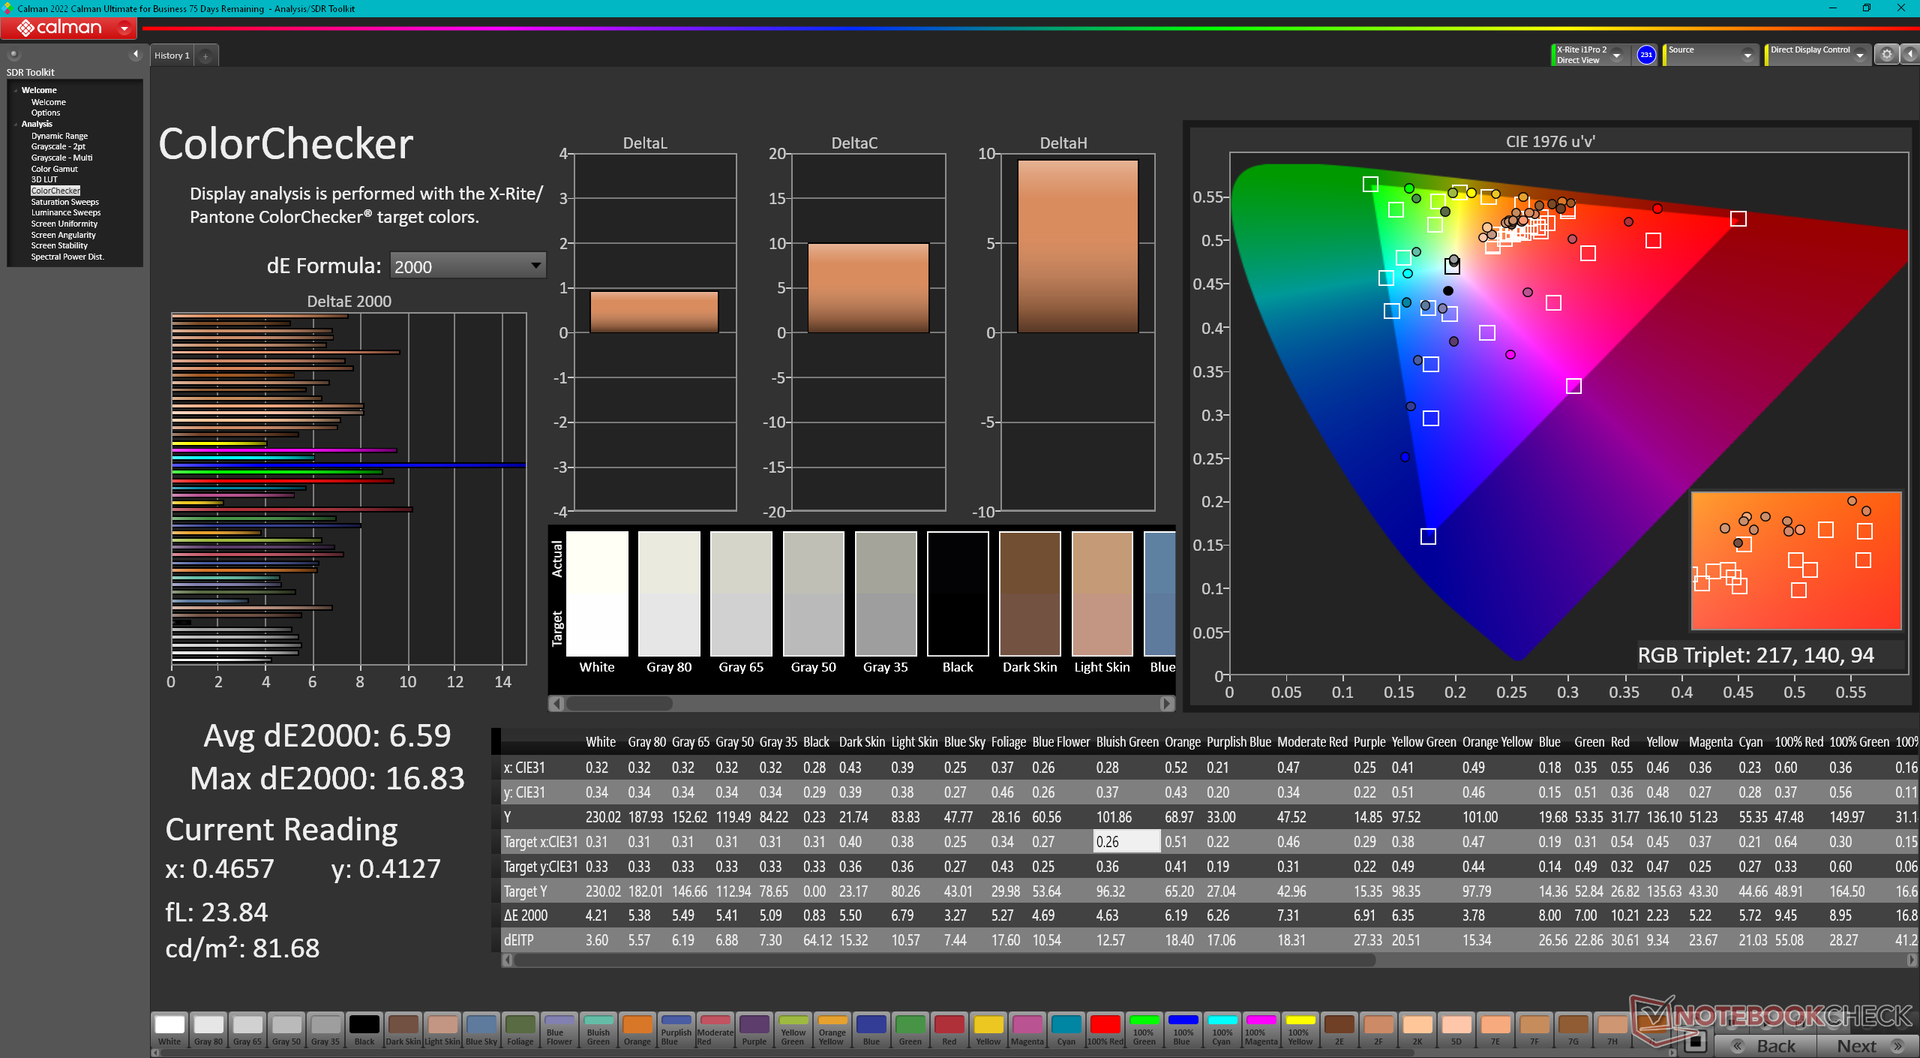
Das diesjährige Modell wird mit dem LG-Philips-140WU2-IPS-Panel ausgeliefert, welches das BOE-NV14N42-Panel des Inspiron 14 9420 2-in-1 aus dem letzten Jahr ersetzt. Die Kerneigenschaften sind ansonsten fast identisch und sorgen für ein ähnliches Seherlebnis. Der schmale Farbbereich, die durchschnittlichen Reaktionszeiten und das mittelmäßige Kontrastverhältnis sind in dieser Preisklasse die Regel.
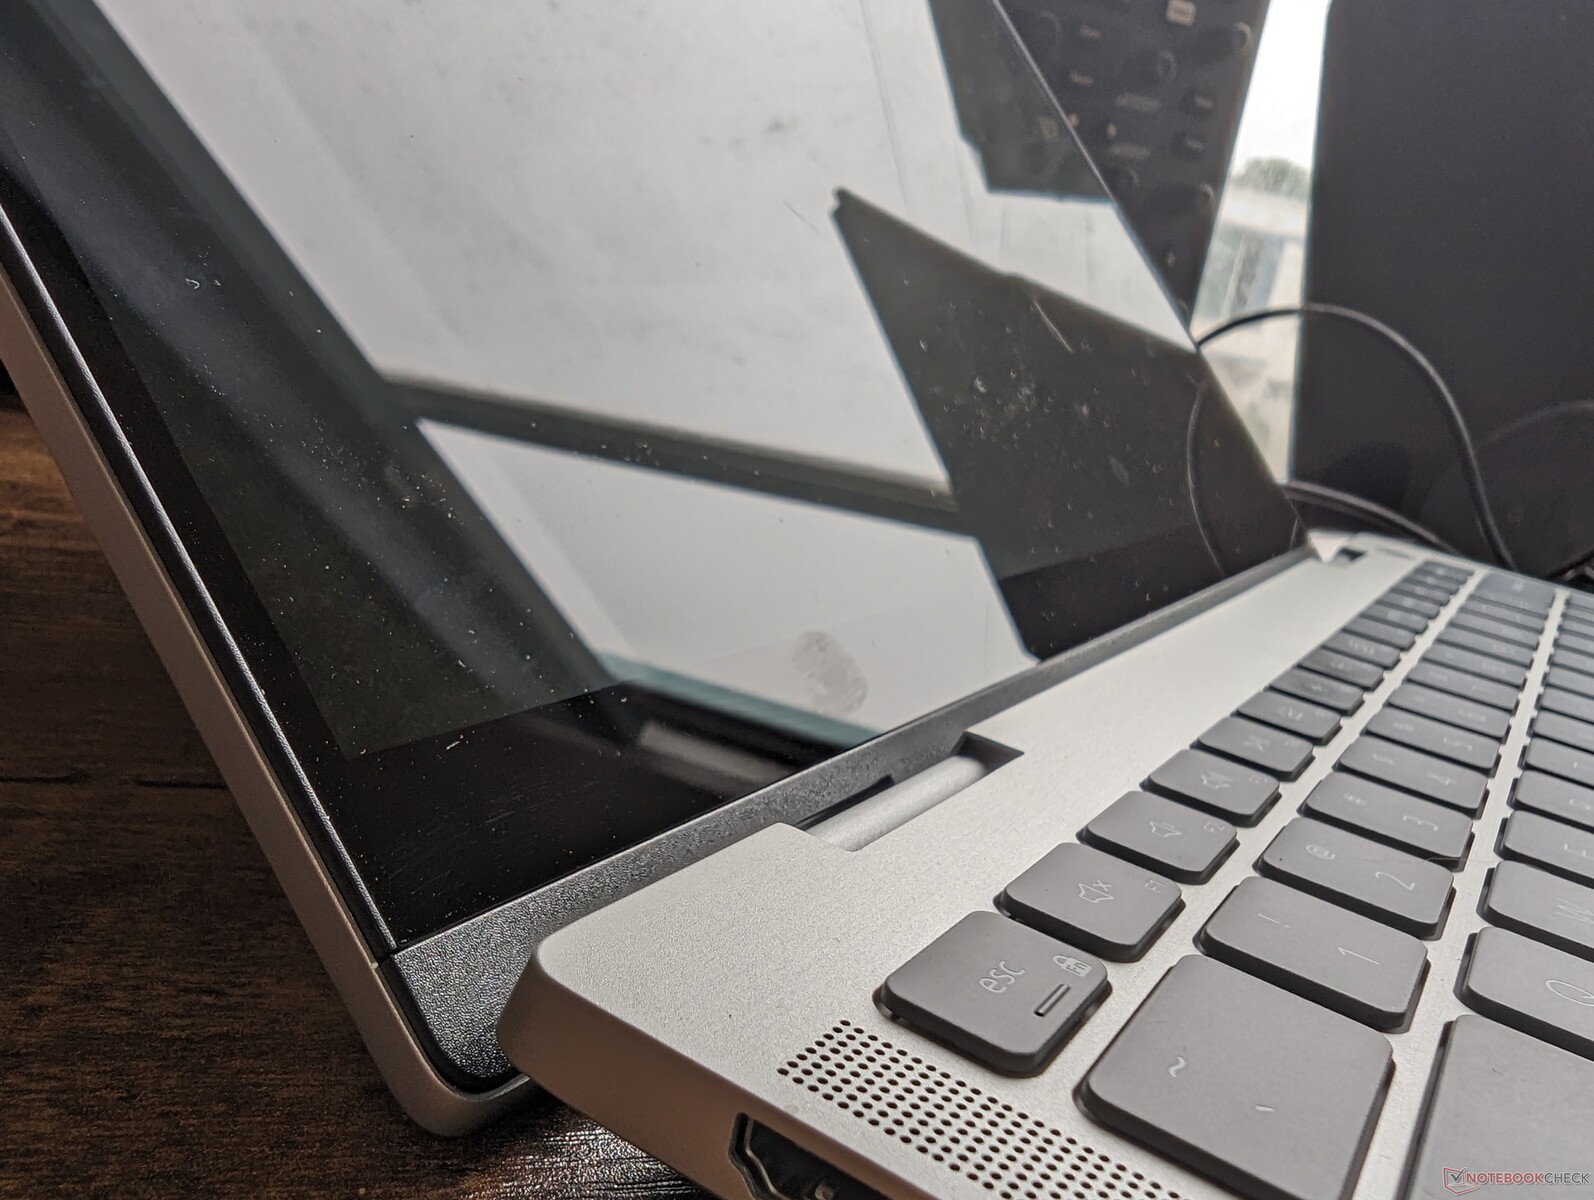
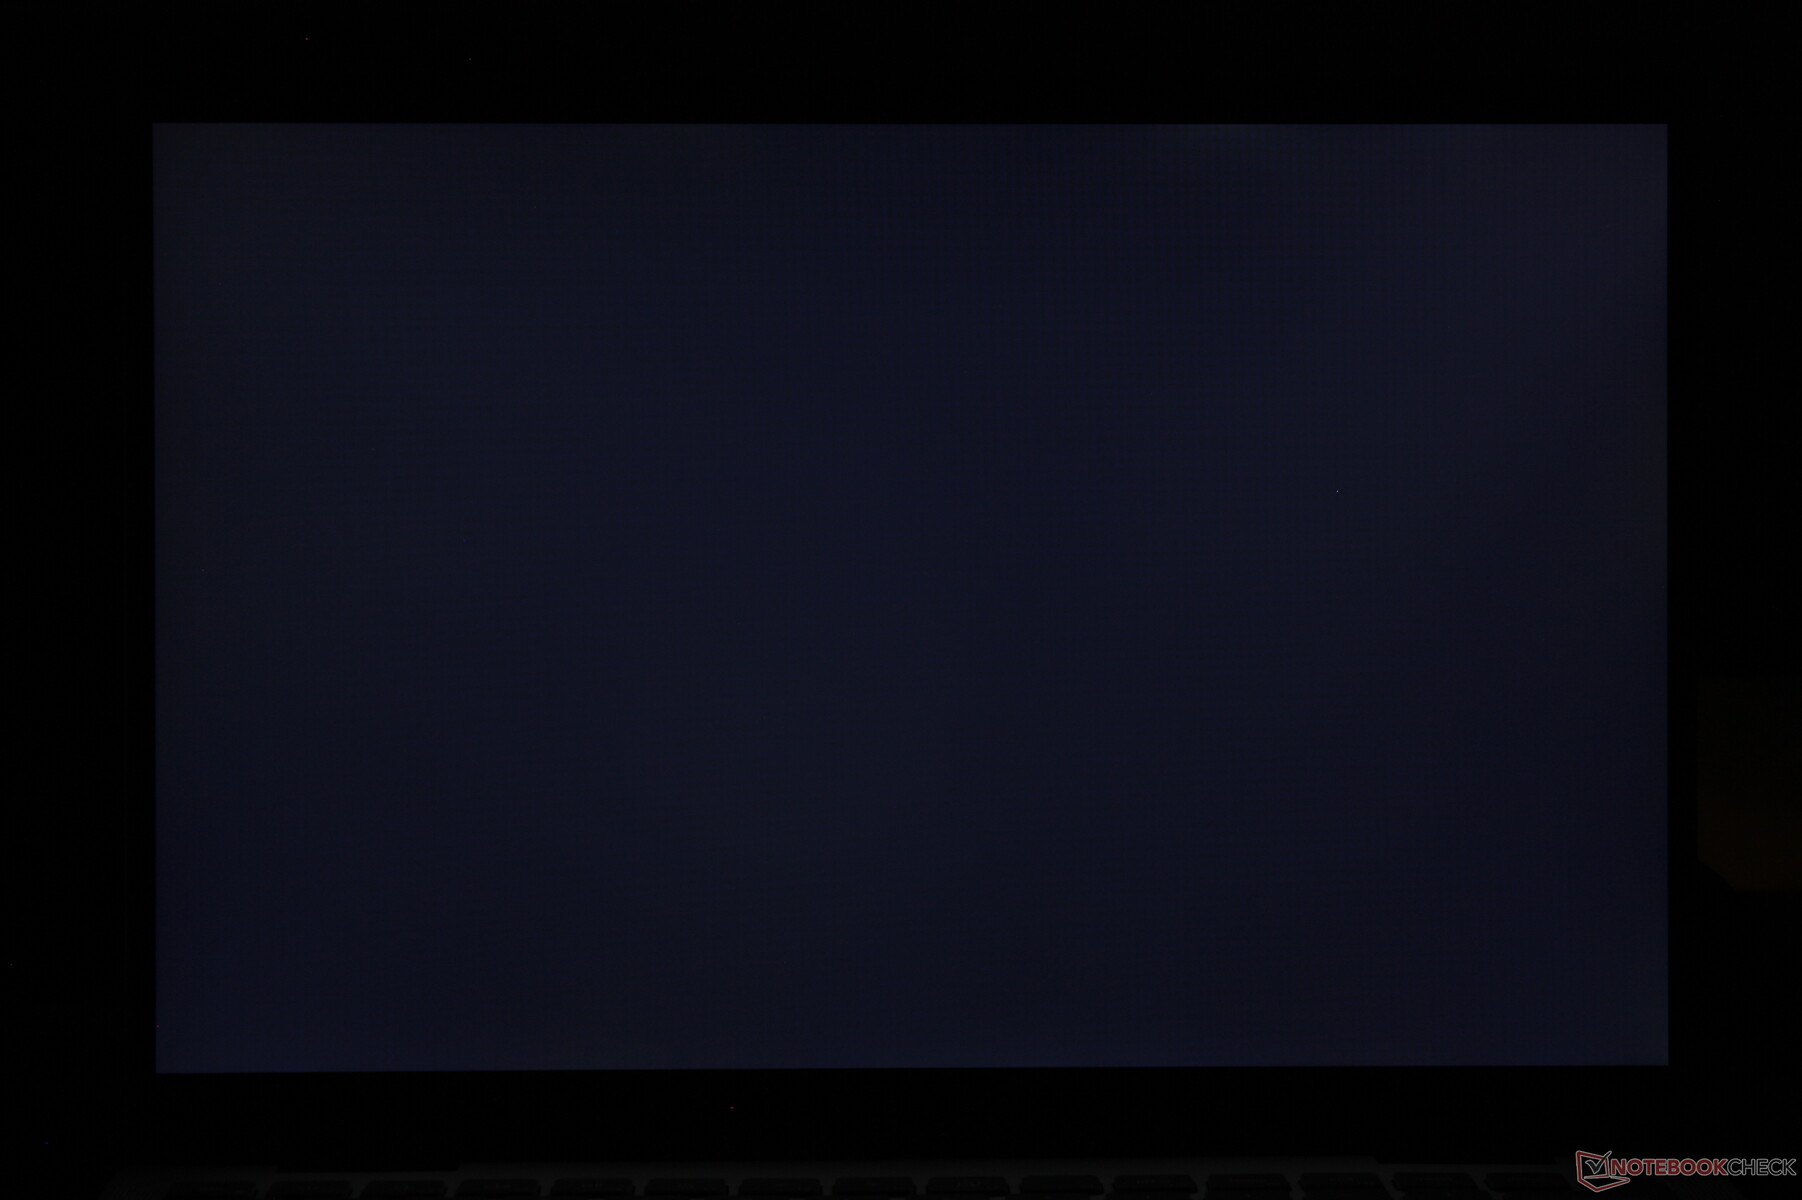
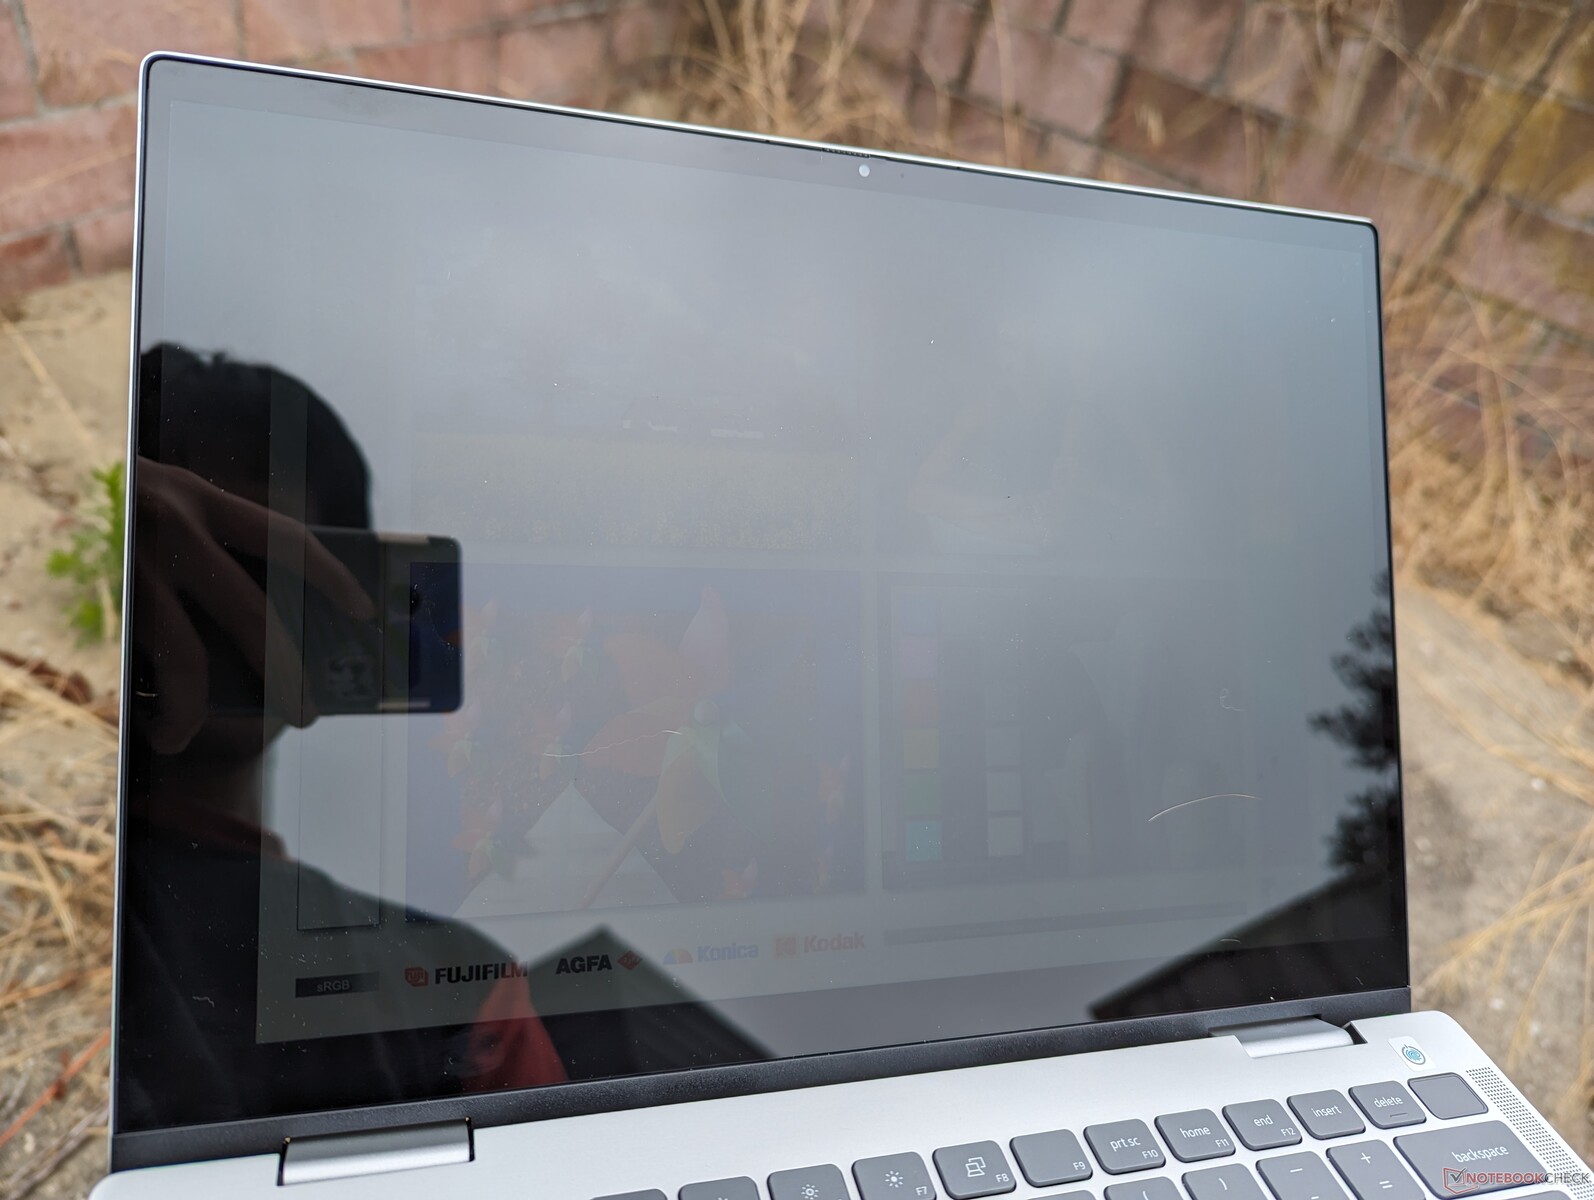
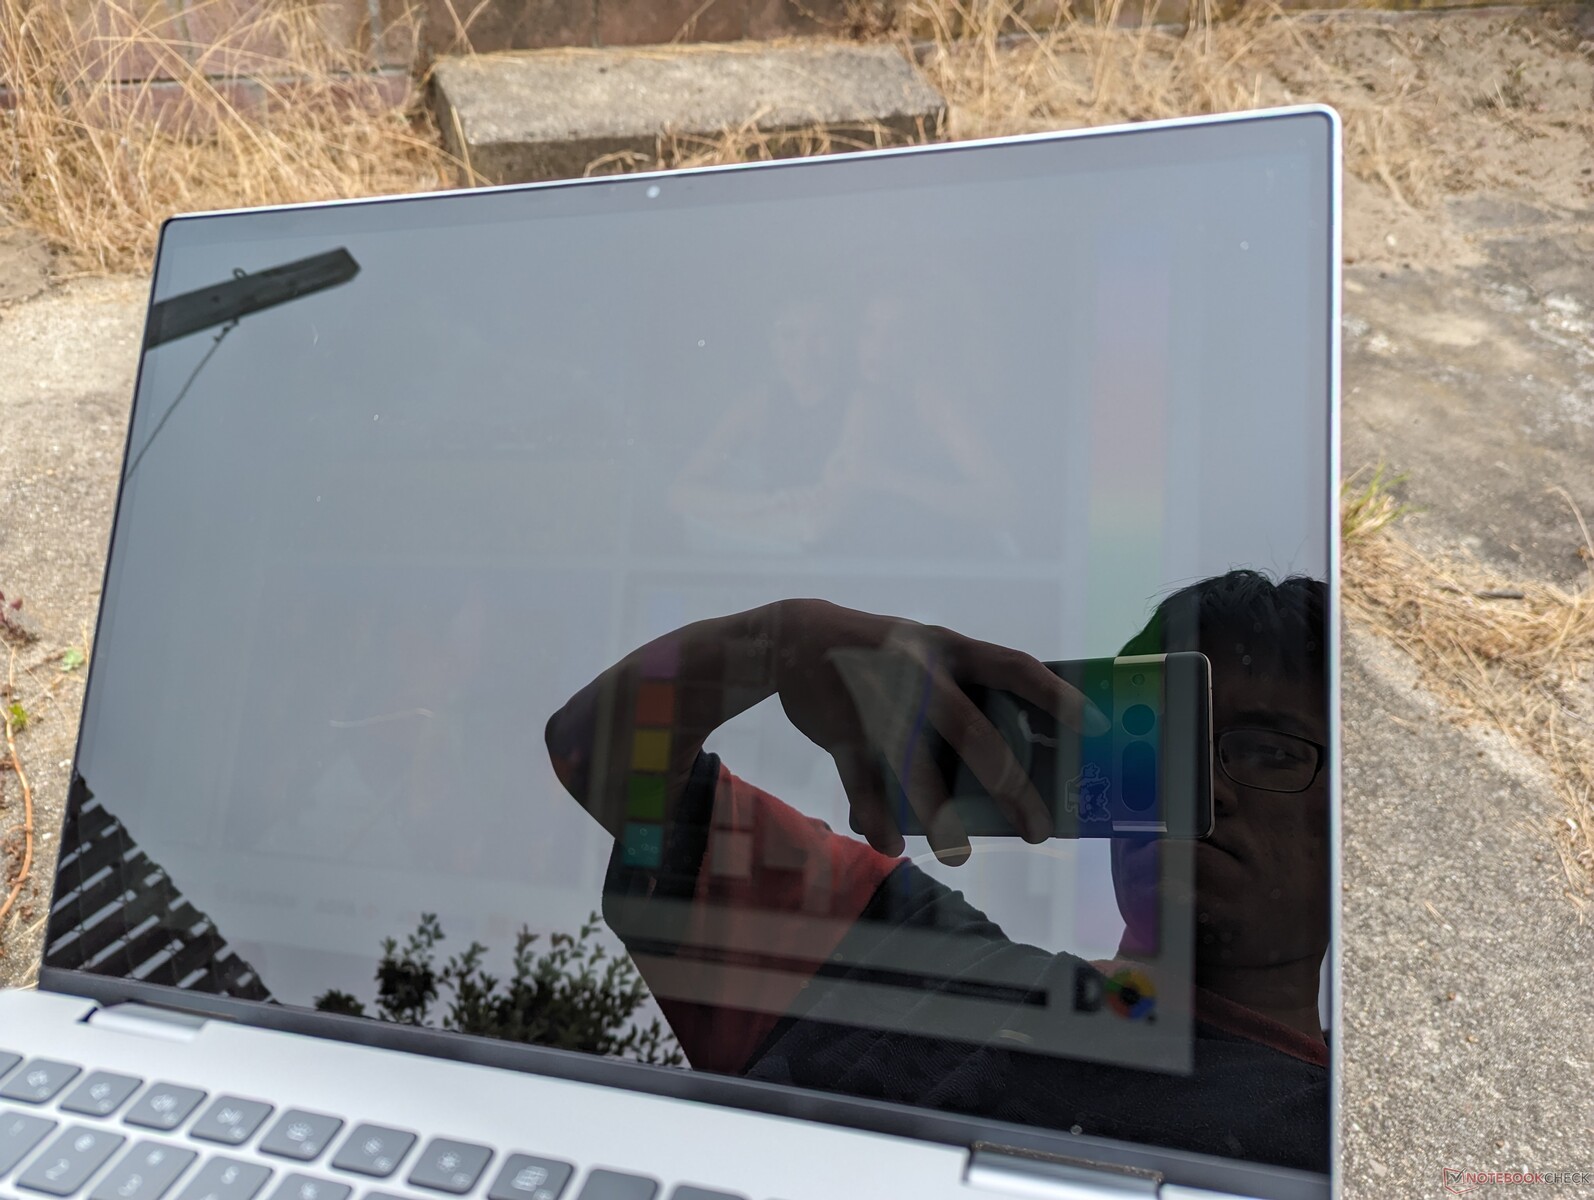
Ein Aspekt, der mehr Aufmerksamkeit verdient hätte, betrifft die geringe Helligkeit des Touchscreens. Der niedrige Helligkeitsbereich von 200 cd/m² ist für Innenräume ausreichend, aber unsere Erwartungen sind bei Convertibles höher, da die Besitzer diese eher auf Reisen oder bei helleren Außenbedingungen verwenden. Wenn die Sichtbarkeit im Freien ein Thema ist, dann sollten potenzielle Käufer das teurere XPS 13 9315 2-in-1 in Betracht ziehen, das 2x heller ist als unser Inspiron.
| |||||||||||||||||||||||||
Ausleuchtung: 87 %
Helligkeit Akku: 231.8 cd/m²
Kontrast: 859:1 (Schwarzwert: 0.27 cd/m²)
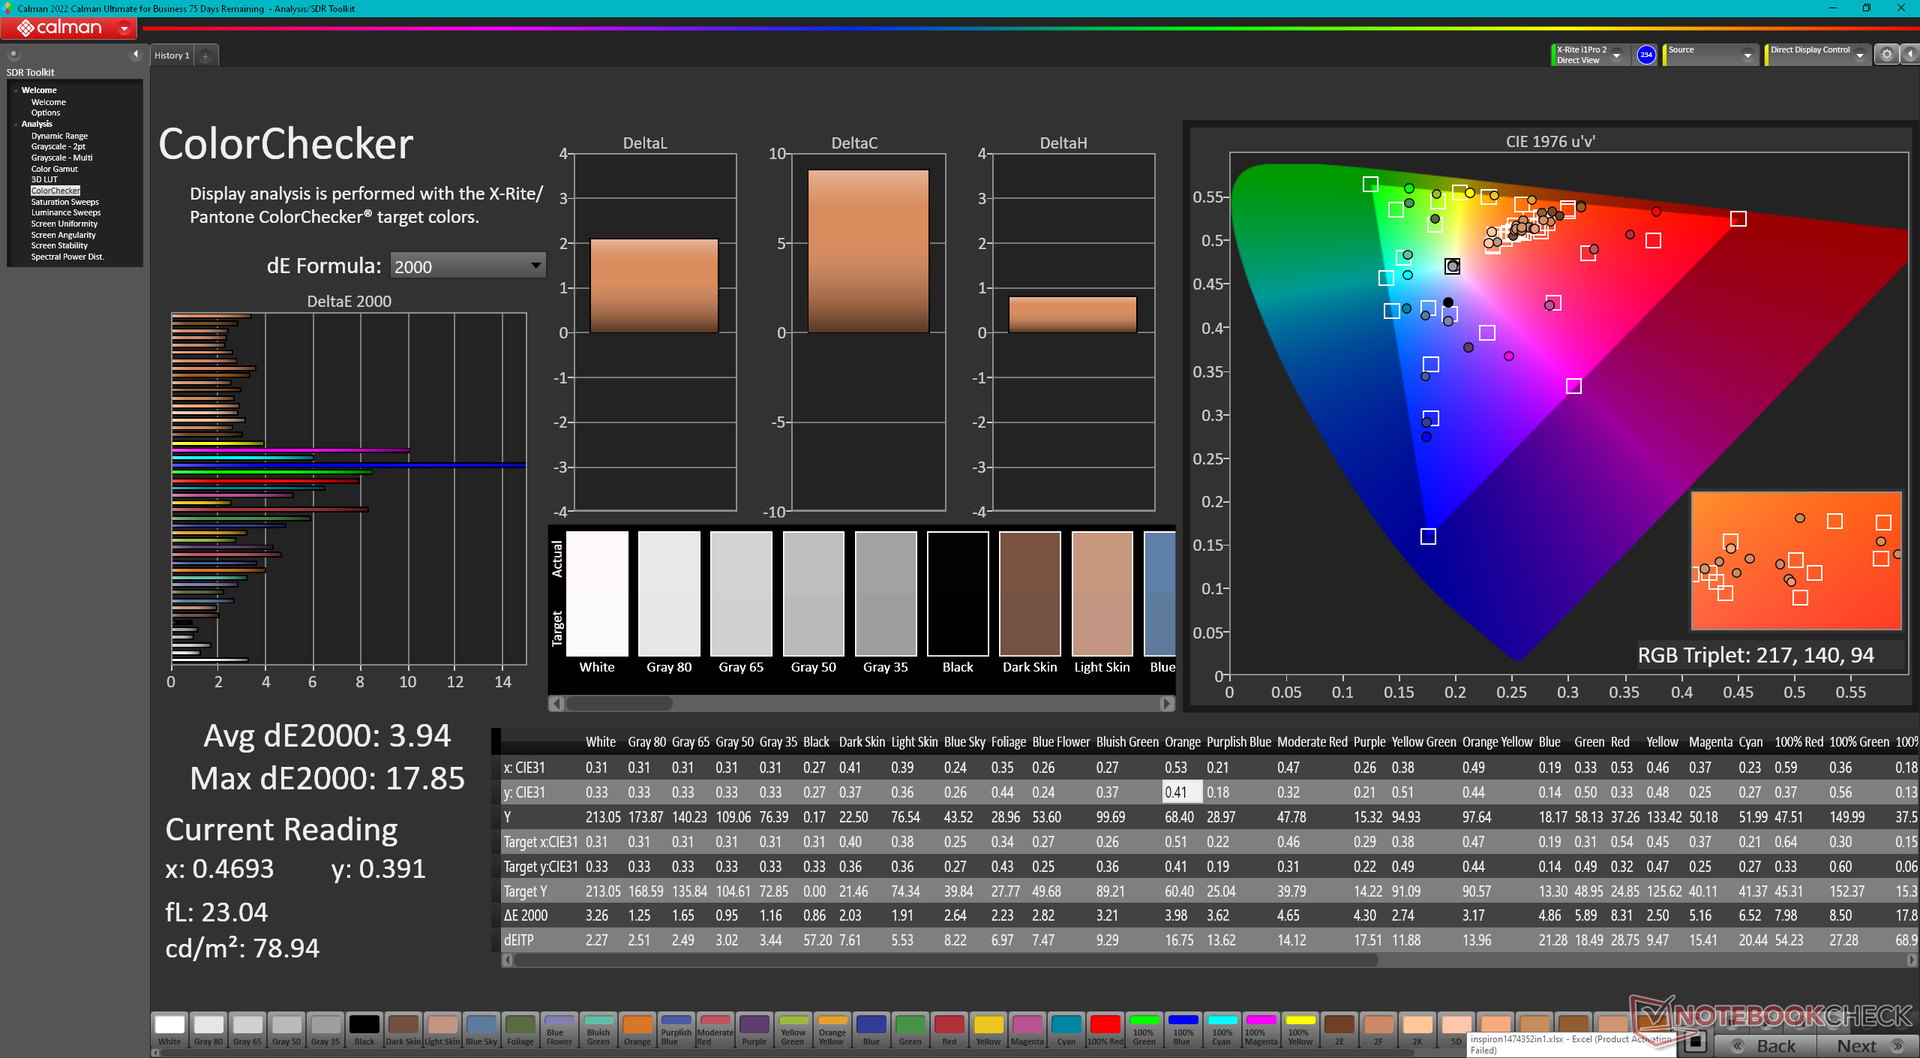
ΔE ColorChecker Calman: 6.59 | ∀{0.5-29.43 Ø4.72}
calibrated: 3.94
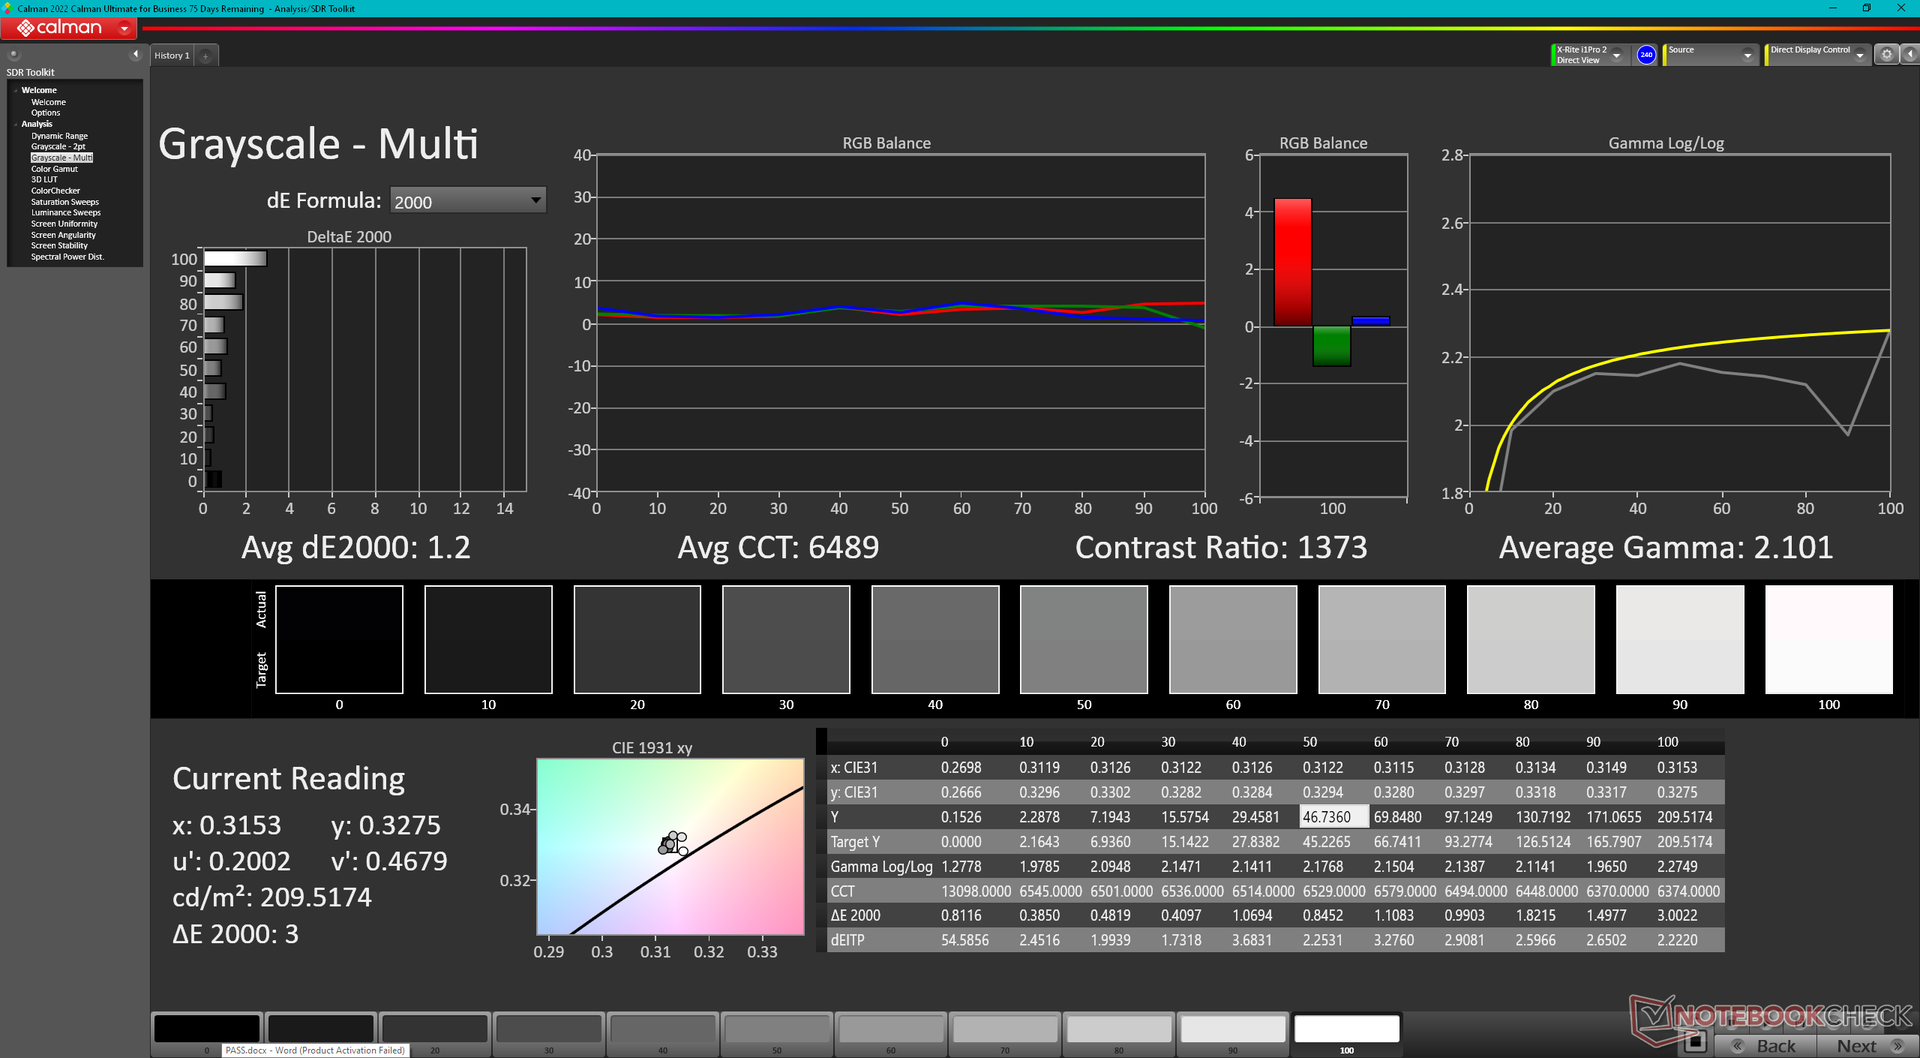
ΔE Greyscale Calman: 4.5 | ∀{0.09-98 Ø4.97}
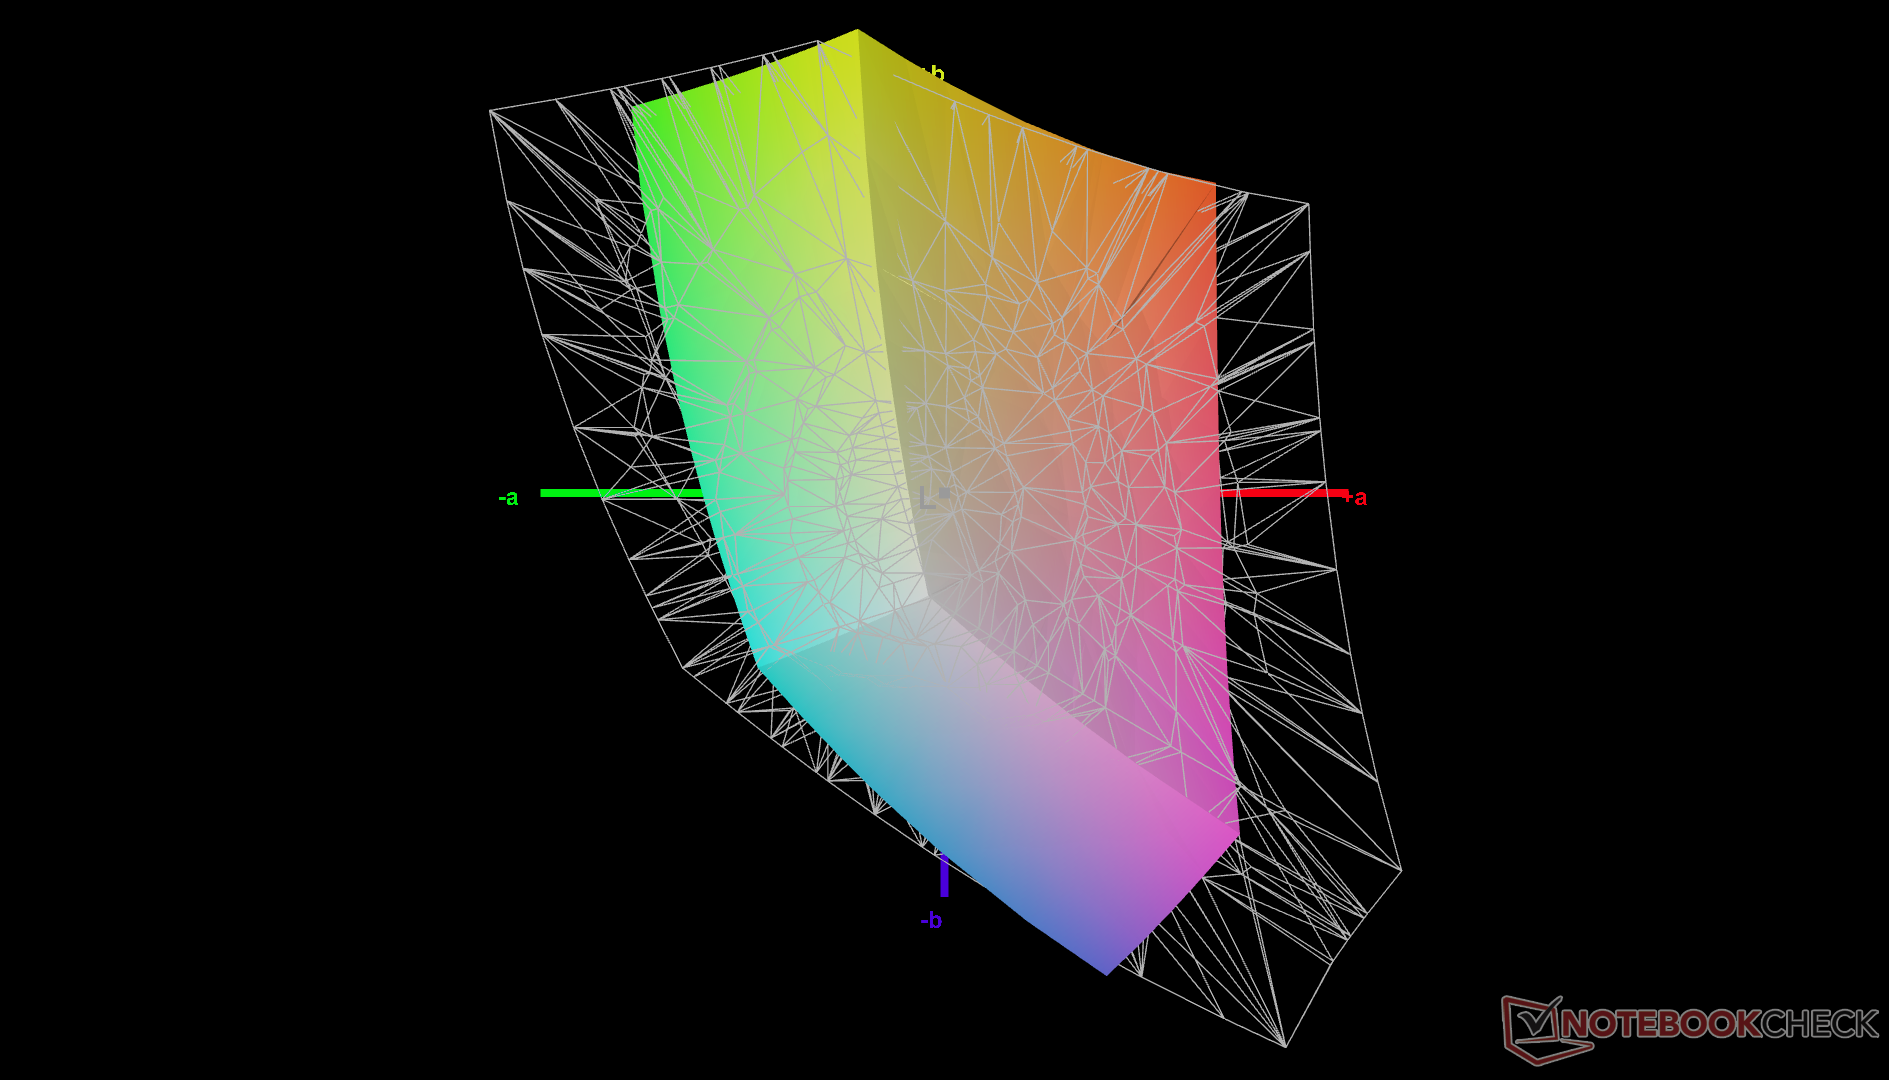
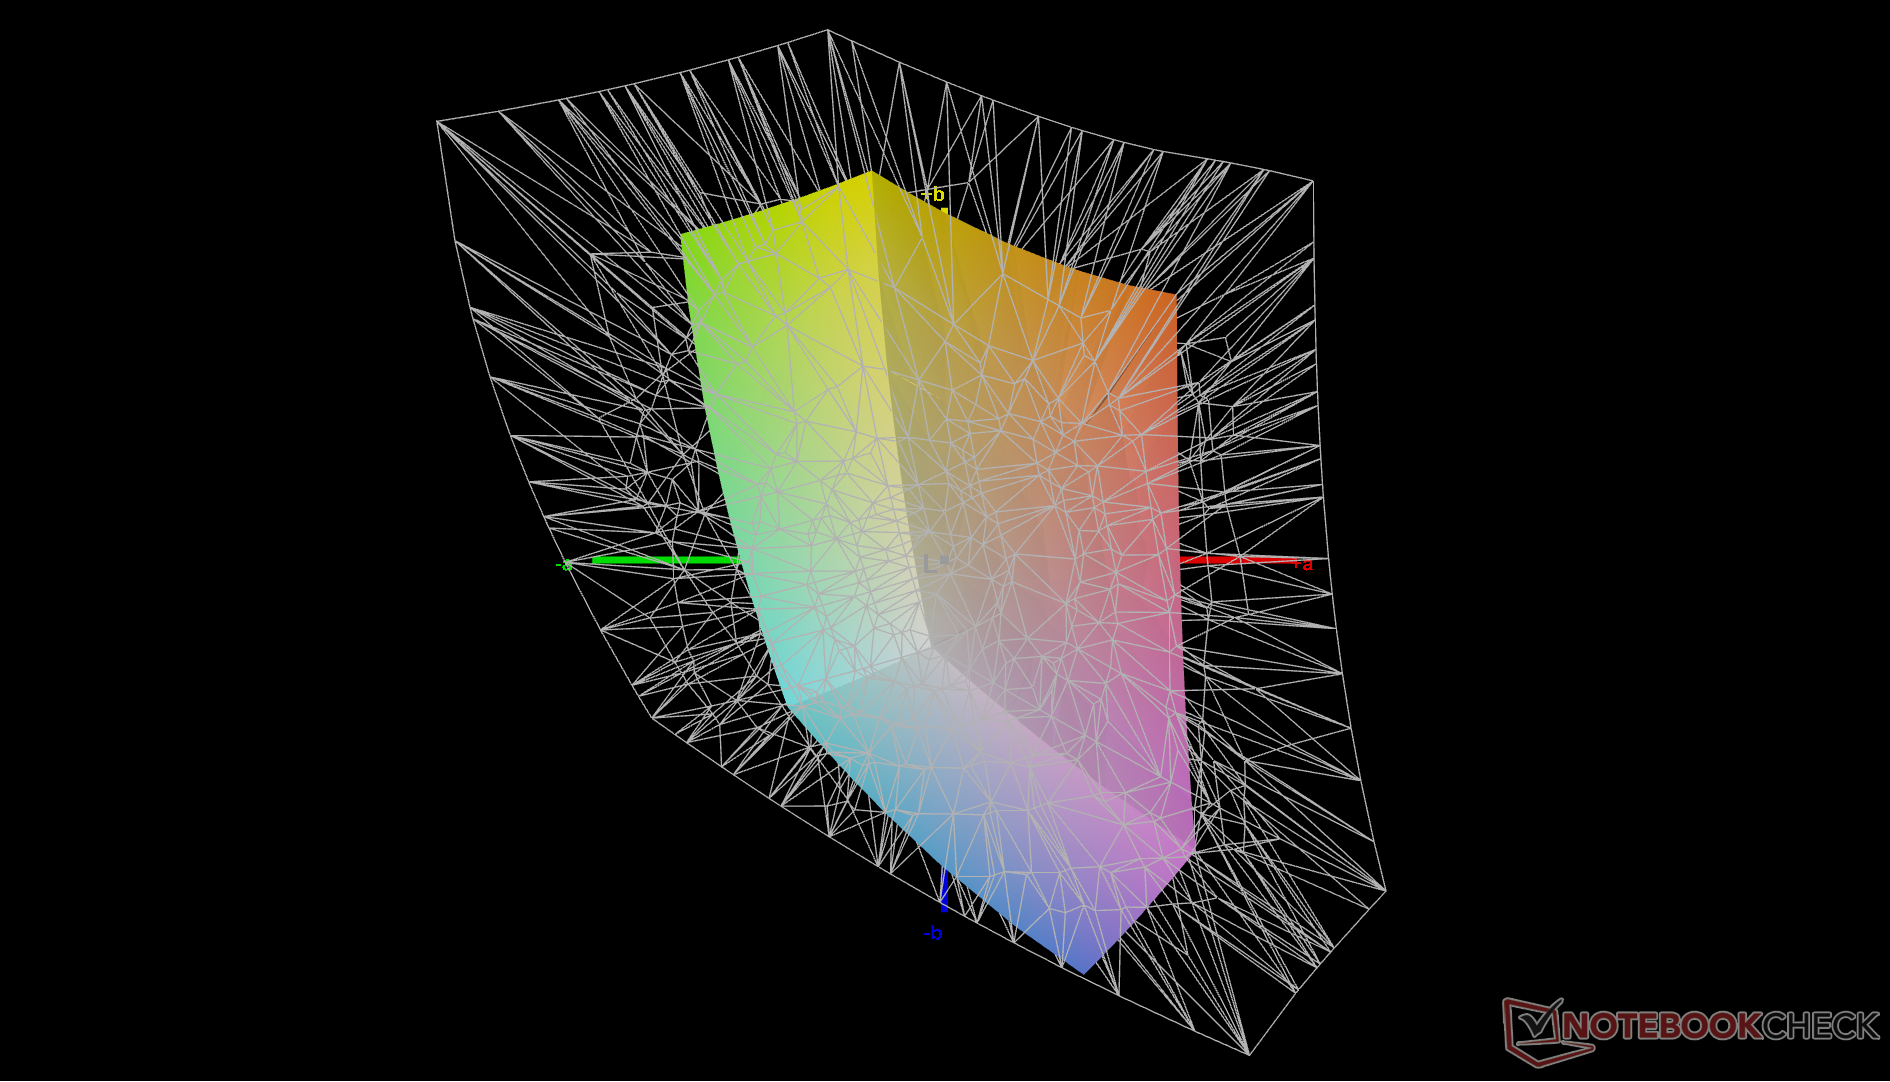
45.8% AdobeRGB 1998 (Argyll 3D)
64.4% sRGB (Argyll 3D)
44.4% Display P3 (Argyll 3D)
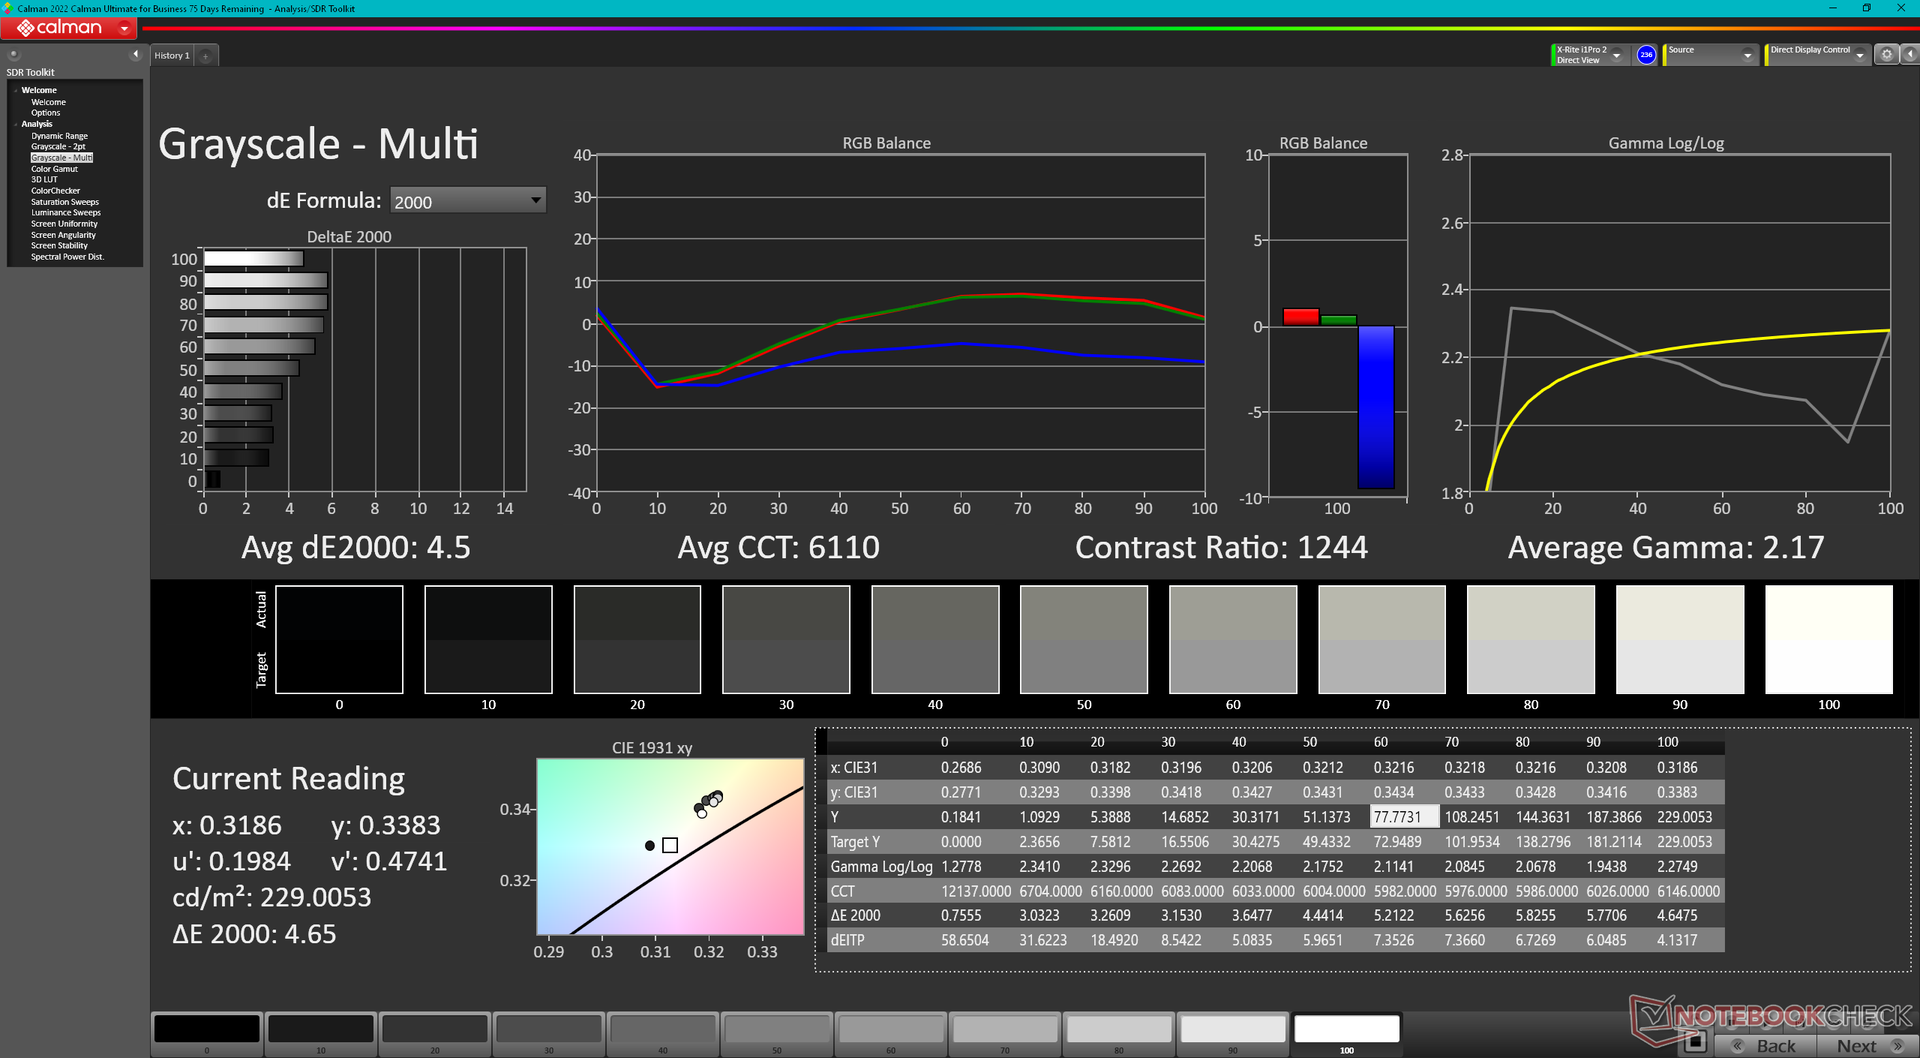
Gamma: 2.17
CCT: 6110 K
| Dell Inspiron 14 7435 2-in-1 LG Philips 140WU2, IPS, 1920x1200, 14" | Dell Inspiron 14 7420 2-in-1 BOE NV14N42, IPS, 1920x1200, 14" | Lenovo IdeaPad Flex 7i 14IAU7 BOE CQ NV140DRM-162, IPS, 2240x1400, 14" | Acer Aspire 5 Spin 14 BOE CQ NV140WUM-N41, IPS, 1920x1200, 14" | LG Gram 14T90P LG Philips LP140WU1-SPA1, IPS, 1900x1200, 14" | HP Pavilion x360 14-dy0157ng Chi Mei N140HCA-E5B, IPS, 1920x1080, 14" | |
|---|---|---|---|---|---|---|
| Display | -13% | 56% | -12% | 89% | -3% | |
| Display P3 Coverage (%) | 44.4 | 38.6 -13% | 69.8 57% | 38.5 -13% | 98.8 123% | 42.7 -4% |
| sRGB Coverage (%) | 64.4 | 56.2 -13% | 98 52% | 57.3 -11% | 100 55% | 63.7 -1% |
| AdobeRGB 1998 Coverage (%) | 45.8 | 39.9 -13% | 72.2 58% | 39.8 -13% | 44.2 -3% | |
| Response Times | -24% | -101% | -23% | -90% | -39% | |
| Response Time Grey 50% / Grey 80% * (ms) | 19.6 ? | 27.2 ? -39% | 44.4 ? -127% | 29 ? -48% | 44 ? -124% | 32 ? -63% |
| Response Time Black / White * (ms) | 19.3 ? | 20.8 ? -8% | 33.6 ? -74% | 19 ? 2% | 30 ? -55% | 22 ? -14% |
| PWM Frequency (Hz) | ||||||
| Bildschirm | -6% | 31% | 12% | 34% | 39% | |
| Helligkeit Bildmitte (cd/m²) | 231.8 | 269.4 16% | 317.3 37% | 249 7% | 305.5 32% | 269 16% |
| Brightness (cd/m²) | 216 | 260 20% | 301 39% | 235 9% | 289 34% | 241 12% |
| Brightness Distribution (%) | 87 | 89 2% | 90 3% | 85 -2% | 87 0% | 82 -6% |
| Schwarzwert * (cd/m²) | 0.27 | 0.41 -52% | 0.22 19% | 0.27 -0% | 0.27 -0% | 0.11 59% |
| Kontrast (:1) | 859 | 657 -24% | 1442 68% | 922 7% | 1131 32% | 2445 185% |
| Delta E Colorchecker * | 6.59 | 6.53 1% | 3.99 39% | 5 24% | 3.31 50% | 5.68 14% |
| Colorchecker dE 2000 max. * | 16.83 | 19.76 -17% | 9.34 45% | 8.32 51% | 6.12 64% | 9.61 43% |
| Colorchecker dE 2000 calibrated * | 3.94 | 3.13 21% | 0.6 85% | 5.06 -28% | ||
| Delta E Graustufen * | 4.5 | 5.4 -20% | 6.9 -53% | 2.86 36% | 1.9 58% | 4.95 -10% |
| Gamma | 2.17 101% | 2.05 107% | 2.19 100% | 2.19 100% | 2.04 108% | 2.17 101% |
| CCT | 6110 106% | 6007 108% | 6161 106% | 6419 101% | 6706 97% | 6628 98% |
| Farbraum (Prozent von AdobeRGB 1998) (%) | 44.2 | |||||
| Color Space (Percent of sRGB) (%) | 63.7 | |||||
| Durchschnitt gesamt (Programm / Settings) | -14% /
-10% | -5% /
18% | -8% /
2% | 11% /
22% | -1% /
18% |
* ... kleinere Werte sind besser
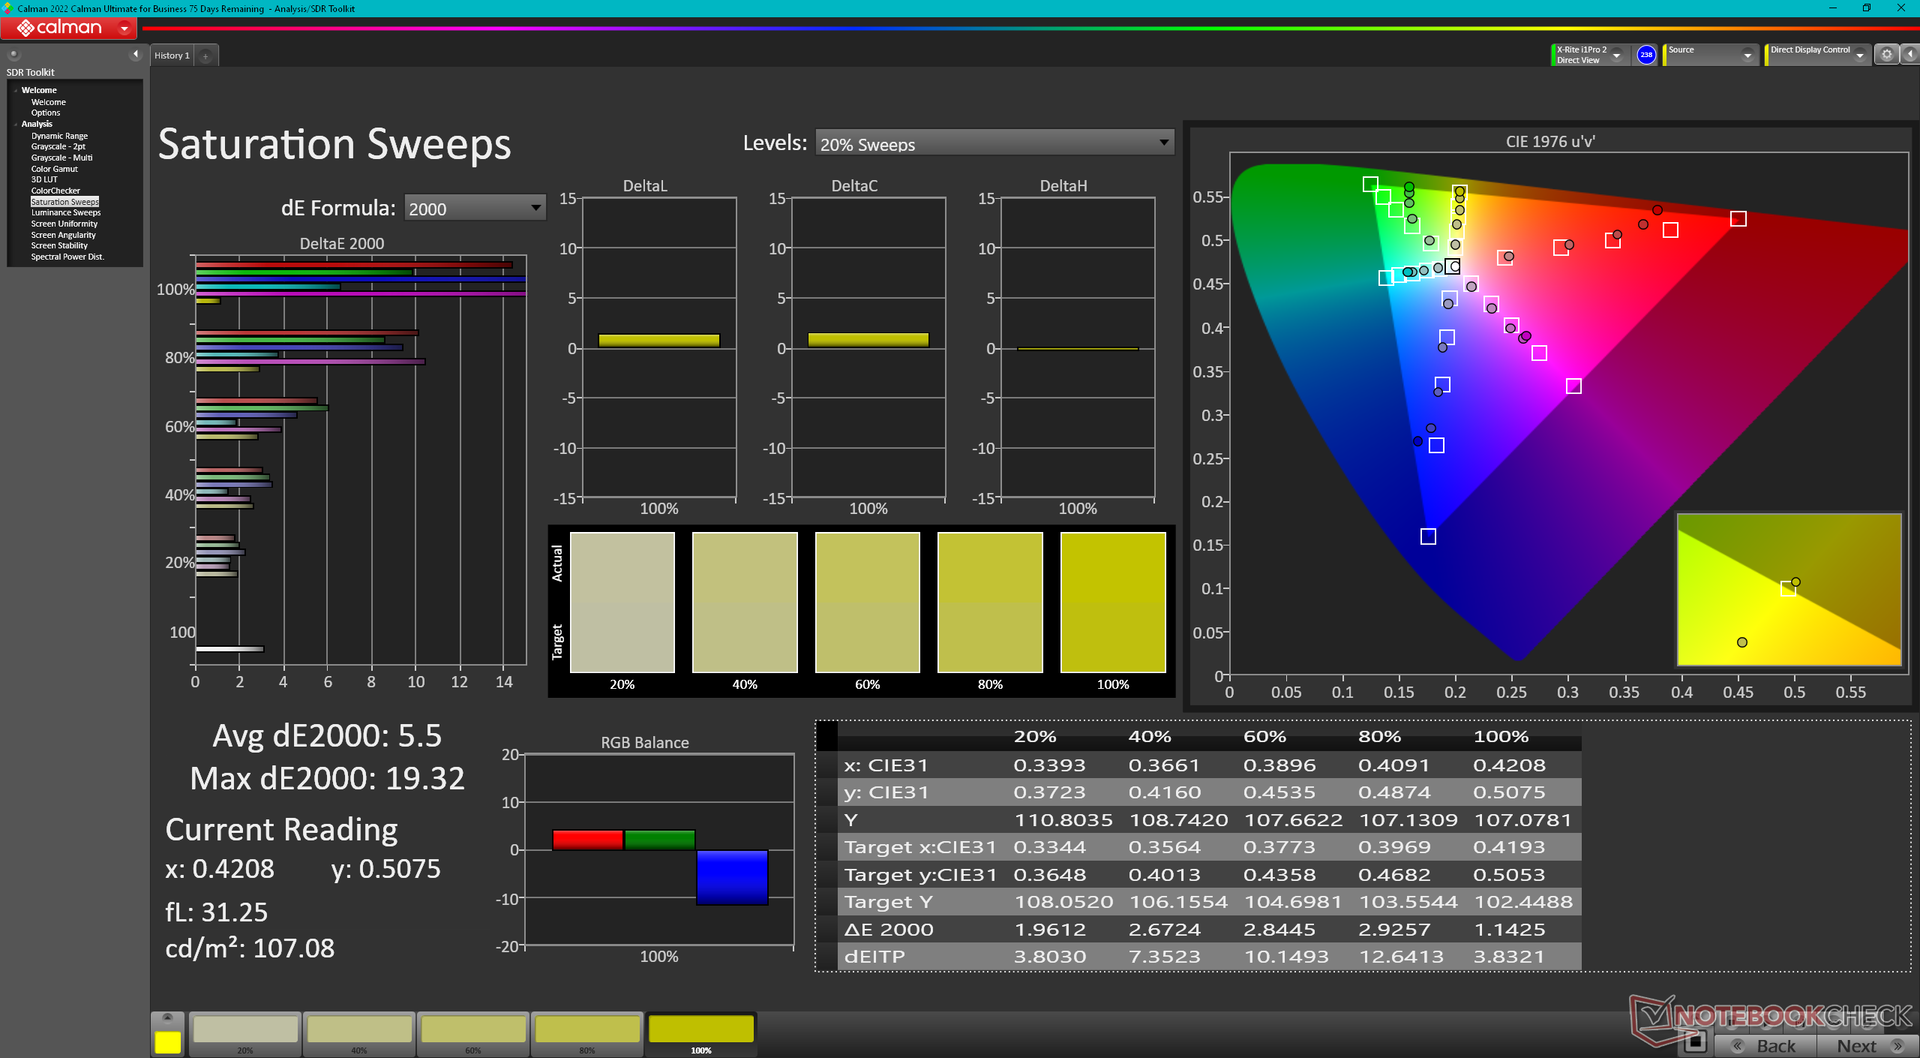
Die Farbtemperatur ist etwas zu warm ab Werk. Eine Kalibrierung mit unserem X-Rite-Kolorimeter behebt dieses Problem und sorgt für insgesamt genauere Farben. Beachten Sie jedoch, dass die Farben bei höheren Sättigungswerten aufgrund der oben erwähnten begrenzten sRGB-Abdeckung immer noch ungenau sind.
Reaktionszeiten (Response Times) des Displays
| ↔ Reaktionszeiten Schwarz zu Weiß | ||
|---|---|---|
| 19.3 ms ... steigend ↗ und fallend ↘ kombiniert | ↗ 10.6 ms steigend | 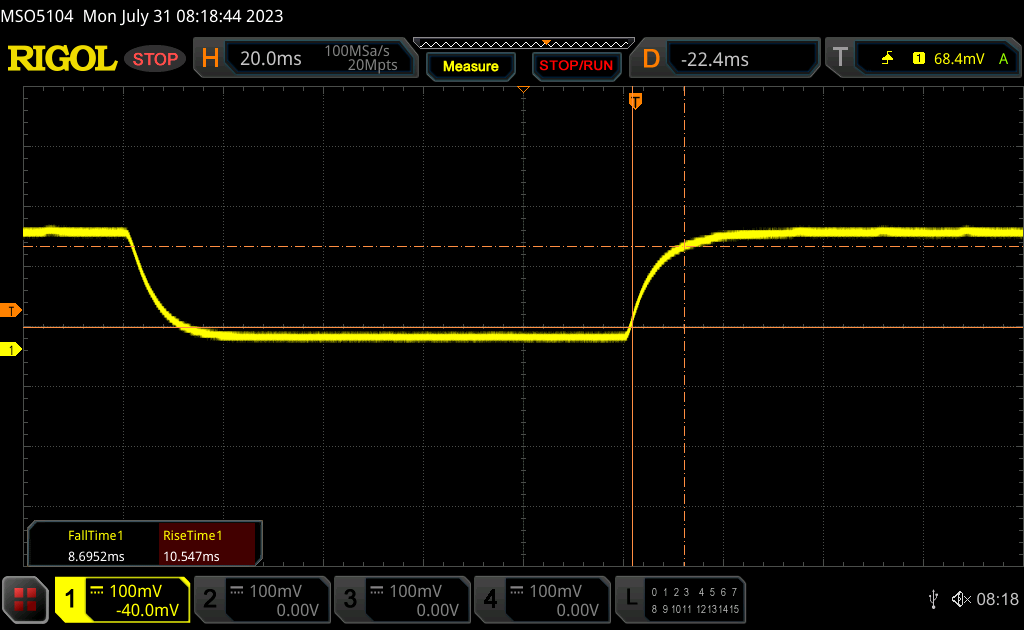 |
| ↘ 8.7 ms fallend | ||
| Die gemessenen Reaktionszeiten sind gut, für anspruchsvolle Spieler könnten der Bildschirm jedoch zu langsam sein. Im Vergleich rangierten die bei uns getesteten Geräte von 0.1 (Minimum) zu 240 (Maximum) ms. » 43 % aller Screens waren schneller als der getestete. Daher sind die gemessenen Reaktionszeiten durchschnittlich (19.8 ms). | ||
| ↔ Reaktionszeiten 50% Grau zu 80% Grau | ||
| 19.6 ms ... steigend ↗ und fallend ↘ kombiniert | ↗ 13.6 ms steigend | 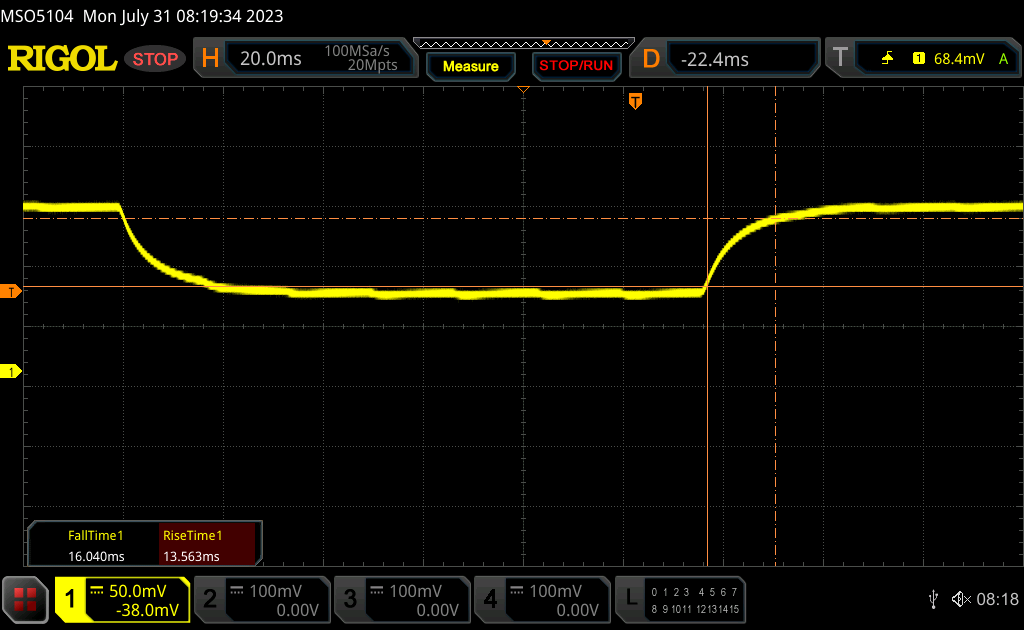 |
| ↘ 16 ms fallend | ||
| Die gemessenen Reaktionszeiten sind gut, für anspruchsvolle Spieler könnten der Bildschirm jedoch zu langsam sein. Im Vergleich rangierten die bei uns getesteten Geräte von 0.165 (Minimum) zu 636 (Maximum) ms. » 33 % aller Screens waren schneller als der getestete. Daher sind die gemessenen Reaktionszeiten besser als der Durchschnitt aller vermessenen Geräte (31 ms). | ||
Bildschirm-Flackern / PWM (Pulse-Width Modulation)
| Flackern / PWM nicht festgestellt |  | ||
Im Vergleich: 52 % aller getesteten Geräte nutzten kein PWM um die Helligkeit zu reduzieren. Wenn PWM eingesetzt wurde, dann bei einer Frequenz von durchschnittlich 7763 (Minimum 5, Maximum 343500) Hz. | |||
Blendeffekte sind selbst bei der Verwendung des Laptops in Innenräumen oder im Schatten spürbar. Die schwache Hintergrundbeleuchtung ist nicht in der Lage, einen Großteil der Blendung durch das glänzende Overlay zu überdecken, was die Sichtbarkeit unter Außenbedingungen stark beeinträchtigt.
Performance - AMD Zen 3 im Herzen
Testbedingungen
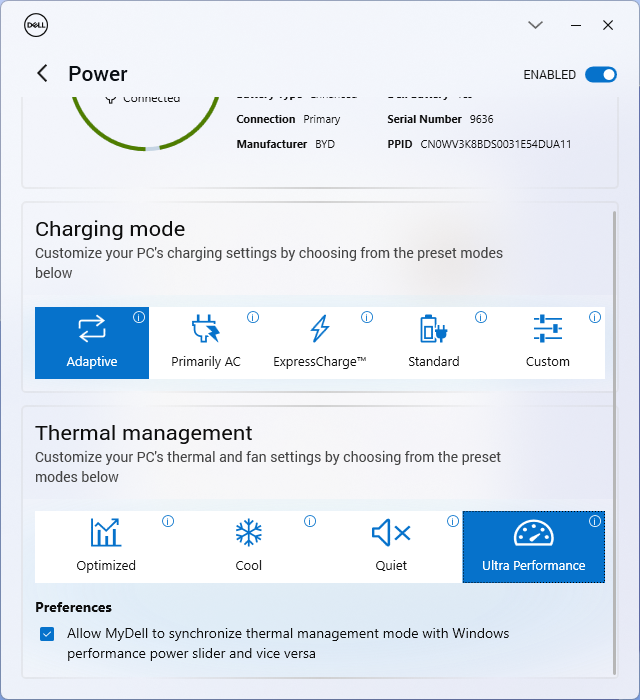
Wir haben unser Gerät über die MyDell Software auf den Modus Performance eingestellt, bevor wir die folgenden Benchmarks durchgeführt haben. Praktischerweise sind die MyDell Energieprofile mit den Windows Energieprofilen synchronisiert, anders als bei den meisten anderen Modellen konkurrierender Hersteller.
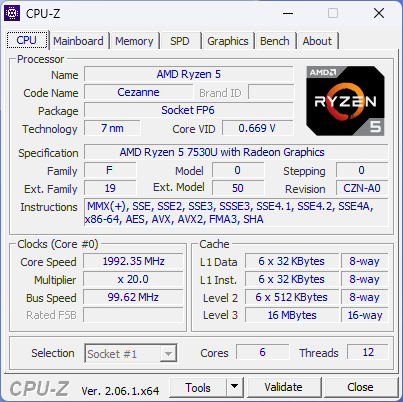
Prozessor
Der 6-Kern-Ryzen-5-7530U bietet fast die gleiche Leistung wie der Ryzen 5 6600U, da beide auf der Zen-3-Architektur basieren. Die Gesamtleistung ist vergleichbar mit der des Mittelklasse Core i5-1335U, wie man ihn in Modellen wie dem Acer Aspire 5 Spin 14 antrifft, und liegt deutlich über jeder mobilen Core-i3-Lösung. AMD hat diese CPU so getunt, dass sie sowohl bei der Leistung als auch beim Preis mit der Core-i5-Serie konkurrieren kann.
Aufrüstung auf den 8-Kern-Ryzen-7-7730U dürfte die Multi-Thread-Leistung um etwa 30 bis 40 Prozent steigern, wie wir in unserer Zeit mit dem Asus Zenbook 14.
Cinebench R15 Multi Loop
Cinebench R23: Multi Core | Single Core
Cinebench R20: CPU (Multi Core) | CPU (Single Core)
Cinebench R15: CPU Multi 64Bit | CPU Single 64Bit
Blender: v2.79 BMW27 CPU
7-Zip 18.03: 7z b 4 | 7z b 4 -mmt1
Geekbench 5.5: Multi-Core | Single-Core
HWBOT x265 Benchmark v2.2: 4k Preset
LibreOffice : 20 Documents To PDF
R Benchmark 2.5: Overall mean
* ... kleinere Werte sind besser
* ... kleinere Werte sind besser
AIDA64: FP32 Ray-Trace | FPU Julia | CPU SHA3 | CPU Queen | FPU SinJulia | FPU Mandel | CPU AES | CPU ZLib | FP64 Ray-Trace | CPU PhotoWorxx
| Performance Rating | |
| Durchschnittliche AMD Ryzen 5 7530U | |
| Dell Inspiron 14 7435 2-in-1 | |
| Lenovo IdeaPad Flex 7i 14IAU7 | |
| Acer Aspire 5 Spin 14 | |
| LG Gram 14T90P | |
| HP Pavilion x360 14-dy0157ng | |
| Dell Inspiron 14 7420 2-in-1 | |
| AIDA64 / FP32 Ray-Trace | |
| Dell Inspiron 14 7435 2-in-1 | |
| Durchschnittliche AMD Ryzen 5 7530U (7609 - 10970, n=9) | |
| Lenovo IdeaPad Flex 7i 14IAU7 | |
| Acer Aspire 5 Spin 14 | |
| LG Gram 14T90P | |
| HP Pavilion x360 14-dy0157ng | |
| Dell Inspiron 14 7420 2-in-1 | |
| AIDA64 / FPU Julia | |
| Dell Inspiron 14 7435 2-in-1 | |
| Durchschnittliche AMD Ryzen 5 7530U (48473 - 68384, n=9) | |
| Lenovo IdeaPad Flex 7i 14IAU7 | |
| Acer Aspire 5 Spin 14 | |
| LG Gram 14T90P | |
| HP Pavilion x360 14-dy0157ng | |
| Dell Inspiron 14 7420 2-in-1 | |
| AIDA64 / CPU SHA3 | |
| Durchschnittliche AMD Ryzen 5 7530U (1591 - 2323, n=9) | |
| Lenovo IdeaPad Flex 7i 14IAU7 | |
| Dell Inspiron 14 7435 2-in-1 | |
| LG Gram 14T90P | |
| Acer Aspire 5 Spin 14 | |
| HP Pavilion x360 14-dy0157ng | |
| Dell Inspiron 14 7420 2-in-1 | |
| AIDA64 / CPU Queen | |
| Dell Inspiron 14 7435 2-in-1 | |
| Durchschnittliche AMD Ryzen 5 7530U (66646 - 78105, n=8) | |
| Lenovo IdeaPad Flex 7i 14IAU7 | |
| Dell Inspiron 14 7420 2-in-1 | |
| Acer Aspire 5 Spin 14 | |
| LG Gram 14T90P | |
| HP Pavilion x360 14-dy0157ng | |
| AIDA64 / FPU SinJulia | |
| Dell Inspiron 14 7435 2-in-1 | |
| Durchschnittliche AMD Ryzen 5 7530U (7611 - 9248, n=9) | |
| Lenovo IdeaPad Flex 7i 14IAU7 | |
| Dell Inspiron 14 7420 2-in-1 | |
| LG Gram 14T90P | |
| Acer Aspire 5 Spin 14 | |
| HP Pavilion x360 14-dy0157ng | |
| AIDA64 / FPU Mandel | |
| Dell Inspiron 14 7435 2-in-1 | |
| Durchschnittliche AMD Ryzen 5 7530U (26912 - 37624, n=9) | |
| Lenovo IdeaPad Flex 7i 14IAU7 | |
| LG Gram 14T90P | |
| Acer Aspire 5 Spin 14 | |
| HP Pavilion x360 14-dy0157ng | |
| Dell Inspiron 14 7420 2-in-1 | |
| AIDA64 / CPU AES | |
| Acer Aspire 5 Spin 14 | |
| LG Gram 14T90P | |
| HP Pavilion x360 14-dy0157ng | |
| Durchschnittliche AMD Ryzen 5 7530U (33314 - 92360, n=9) | |
| Lenovo IdeaPad Flex 7i 14IAU7 | |
| Dell Inspiron 14 7435 2-in-1 | |
| Dell Inspiron 14 7420 2-in-1 | |
| AIDA64 / CPU ZLib | |
| Acer Aspire 5 Spin 14 | |
| Lenovo IdeaPad Flex 7i 14IAU7 | |
| Dell Inspiron 14 7420 2-in-1 | |
| Dell Inspiron 14 7435 2-in-1 | |
| Durchschnittliche AMD Ryzen 5 7530U (443 - 612, n=9) | |
| LG Gram 14T90P | |
| HP Pavilion x360 14-dy0157ng | |
| AIDA64 / FP64 Ray-Trace | |
| Dell Inspiron 14 7435 2-in-1 | |
| Durchschnittliche AMD Ryzen 5 7530U (4008 - 5738, n=9) | |
| Lenovo IdeaPad Flex 7i 14IAU7 | |
| LG Gram 14T90P | |
| Acer Aspire 5 Spin 14 | |
| HP Pavilion x360 14-dy0157ng | |
| Dell Inspiron 14 7420 2-in-1 | |
| AIDA64 / CPU PhotoWorxx | |
| Lenovo IdeaPad Flex 7i 14IAU7 | |
| LG Gram 14T90P | |
| Acer Aspire 5 Spin 14 | |
| HP Pavilion x360 14-dy0157ng | |
| Dell Inspiron 14 7420 2-in-1 | |
| Dell Inspiron 14 7435 2-in-1 | |
| Durchschnittliche AMD Ryzen 5 7530U (9832 - 19525, n=9) | |
System Performance
Die PCMark Scores sind höher als bei den meisten anderen preiswerten Subnotebooks, insbesondere im Subtest Produktivität. Wir vermuten, dass dies an der 6-Core-/12-Thread-Konfiguration des Prozessors liegen könnte, die einen größeren Einfluss auf den Benchmark hat als die P-Core- und E-Core-Konfigurationen der Intel CPUs.

CrossMark: Overall | Productivity | Creativity | Responsiveness
| PCMark 10 / Score | |
| Dell Inspiron 14 7435 2-in-1 | |
| Durchschnittliche AMD Ryzen 5 7530U, AMD Radeon RX Vega 7 (5686 - 6209, n=8) | |
| Lenovo IdeaPad Flex 7i 14IAU7 | |
| Dell Inspiron 14 7420 2-in-1 | |
| Acer Aspire 5 Spin 14 | |
| LG Gram 14T90P | |
| HP Pavilion x360 14-dy0157ng | |
| PCMark 10 / Essentials | |
| Lenovo IdeaPad Flex 7i 14IAU7 | |
| Durchschnittliche AMD Ryzen 5 7530U, AMD Radeon RX Vega 7 (9183 - 11242, n=8) | |
| Acer Aspire 5 Spin 14 | |
| Dell Inspiron 14 7420 2-in-1 | |
| Dell Inspiron 14 7435 2-in-1 | |
| LG Gram 14T90P | |
| HP Pavilion x360 14-dy0157ng | |
| PCMark 10 / Productivity | |
| Durchschnittliche AMD Ryzen 5 7530U, AMD Radeon RX Vega 7 (8983 - 14037, n=8) | |
| Dell Inspiron 14 7435 2-in-1 | |
| Lenovo IdeaPad Flex 7i 14IAU7 | |
| Acer Aspire 5 Spin 14 | |
| Dell Inspiron 14 7420 2-in-1 | |
| LG Gram 14T90P | |
| HP Pavilion x360 14-dy0157ng | |
| PCMark 10 / Digital Content Creation | |
| Dell Inspiron 14 7435 2-in-1 | |
| Dell Inspiron 14 7420 2-in-1 | |
| Lenovo IdeaPad Flex 7i 14IAU7 | |
| Acer Aspire 5 Spin 14 | |
| Durchschnittliche AMD Ryzen 5 7530U, AMD Radeon RX Vega 7 (4941 - 6093, n=8) | |
| HP Pavilion x360 14-dy0157ng | |
| LG Gram 14T90P | |
| CrossMark / Overall | |
| Acer Aspire 5 Spin 14 | |
| Lenovo IdeaPad Flex 7i 14IAU7 | |
| Dell Inspiron 14 7420 2-in-1 | |
| LG Gram 14T90P | |
| Durchschnittliche AMD Ryzen 5 7530U, AMD Radeon RX Vega 7 (1029 - 1336, n=7) | |
| Dell Inspiron 14 7435 2-in-1 | |
| CrossMark / Productivity | |
| Acer Aspire 5 Spin 14 | |
| Dell Inspiron 14 7420 2-in-1 | |
| Lenovo IdeaPad Flex 7i 14IAU7 | |
| LG Gram 14T90P | |
| Durchschnittliche AMD Ryzen 5 7530U, AMD Radeon RX Vega 7 (1115 - 1370, n=7) | |
| Dell Inspiron 14 7435 2-in-1 | |
| CrossMark / Creativity | |
| Lenovo IdeaPad Flex 7i 14IAU7 | |
| Dell Inspiron 14 7420 2-in-1 | |
| Acer Aspire 5 Spin 14 | |
| Durchschnittliche AMD Ryzen 5 7530U, AMD Radeon RX Vega 7 (992 - 1390, n=7) | |
| Dell Inspiron 14 7435 2-in-1 | |
| LG Gram 14T90P | |
| CrossMark / Responsiveness | |
| Acer Aspire 5 Spin 14 | |
| LG Gram 14T90P | |
| Dell Inspiron 14 7420 2-in-1 | |
| Lenovo IdeaPad Flex 7i 14IAU7 | |
| Dell Inspiron 14 7435 2-in-1 | |
| Durchschnittliche AMD Ryzen 5 7530U, AMD Radeon RX Vega 7 (900 - 1096, n=7) | |
| PCMark 10 Score | 6001 Punkte | |
Hilfe | ||
| AIDA64 / Memory Copy | |
| LG Gram 14T90P | |
| Lenovo IdeaPad Flex 7i 14IAU7 | |
| Acer Aspire 5 Spin 14 | |
| HP Pavilion x360 14-dy0157ng | |
| Dell Inspiron 14 7420 2-in-1 | |
| Dell Inspiron 14 7435 2-in-1 | |
| Durchschnittliche AMD Ryzen 5 7530U (20155 - 42853, n=9) | |
| AIDA64 / Memory Read | |
| LG Gram 14T90P | |
| Lenovo IdeaPad Flex 7i 14IAU7 | |
| HP Pavilion x360 14-dy0157ng | |
| Acer Aspire 5 Spin 14 | |
| Dell Inspiron 14 7420 2-in-1 | |
| Dell Inspiron 14 7435 2-in-1 | |
| Durchschnittliche AMD Ryzen 5 7530U (23068 - 40270, n=9) | |
| AIDA64 / Memory Write | |
| Acer Aspire 5 Spin 14 | |
| LG Gram 14T90P | |
| Lenovo IdeaPad Flex 7i 14IAU7 | |
| HP Pavilion x360 14-dy0157ng | |
| Dell Inspiron 14 7420 2-in-1 | |
| Dell Inspiron 14 7435 2-in-1 | |
| Durchschnittliche AMD Ryzen 5 7530U (22954 - 41838, n=9) | |
| AIDA64 / Memory Latency | |
| Dell Inspiron 14 7435 2-in-1 | |
| Acer Aspire 5 Spin 14 | |
| Durchschnittliche AMD Ryzen 5 7530U (88.1 - 110.8, n=9) | |
| Lenovo IdeaPad Flex 7i 14IAU7 | |
| LG Gram 14T90P | |
| HP Pavilion x360 14-dy0157ng | |
| Dell Inspiron 14 7420 2-in-1 | |
* ... kleinere Werte sind besser
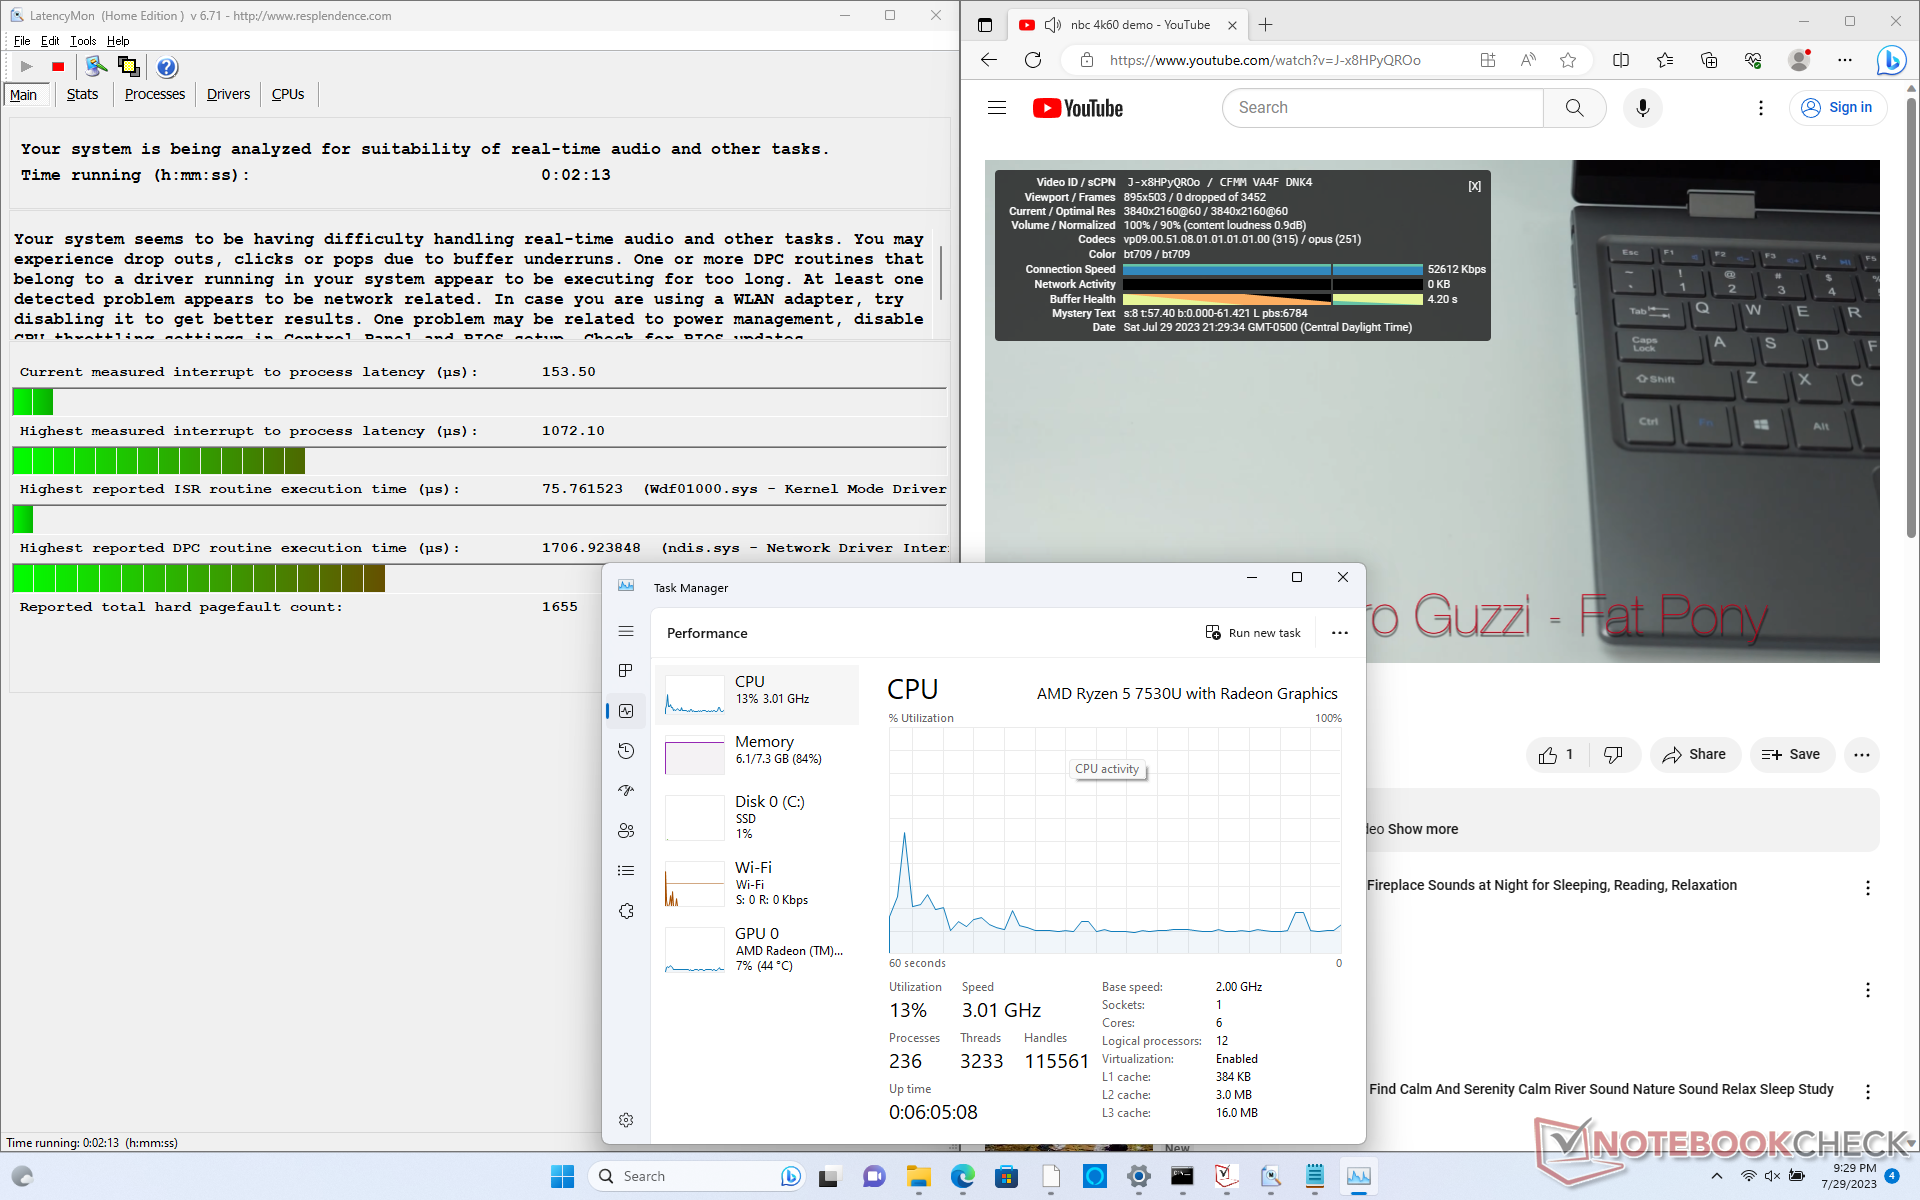
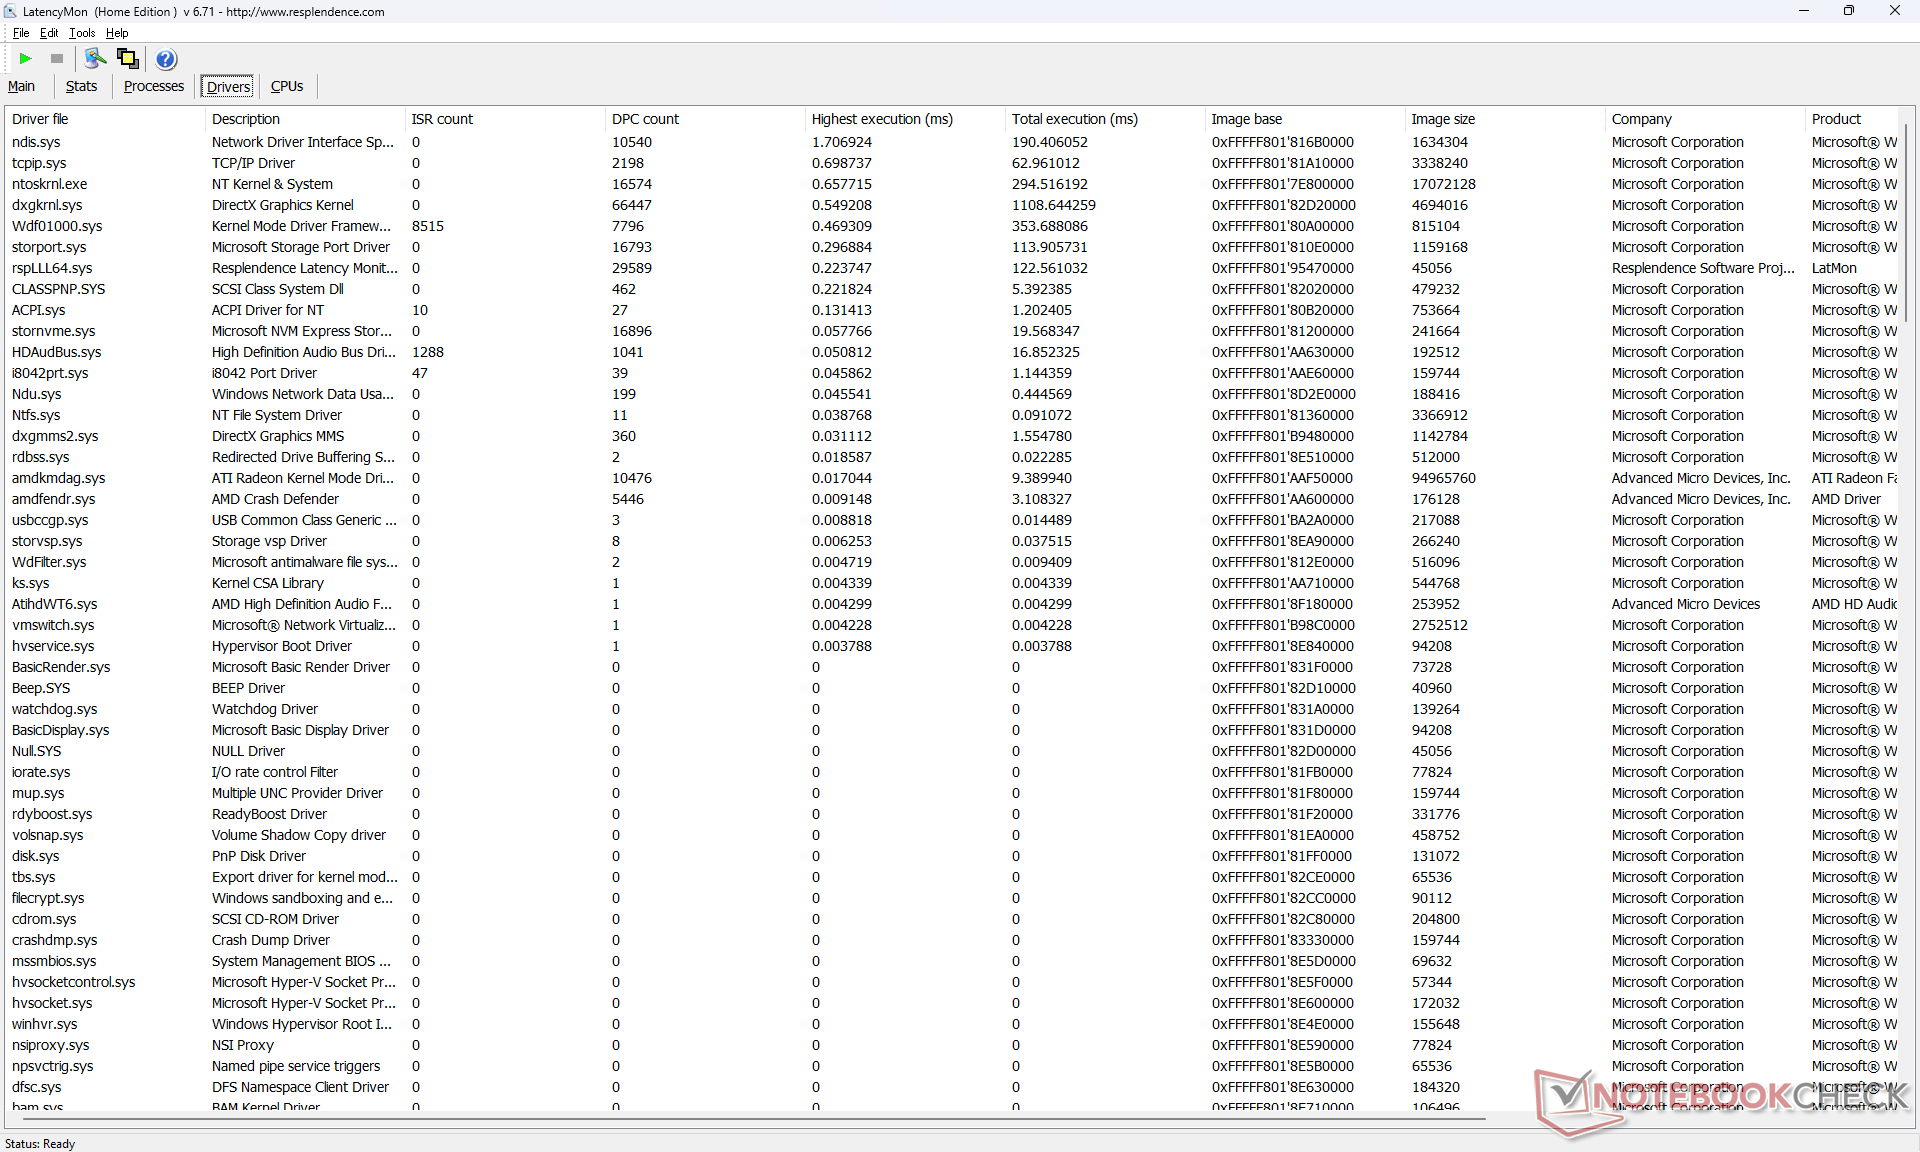
DPC-Latenzzeit
LatencyMon zeigt kleinere DPC-Probleme beim Öffnen mehrerer Browser Tabs unserer Homepage. Die 4K-Videowiedergabe bei 60 fps ist ansonsten perfekt, und es wurden keine Bildaussetzer registriert.
| DPC Latencies / LatencyMon - interrupt to process latency (max), Web, Youtube, Prime95 | |
| Acer Aspire 5 Spin 14 | |
| Dell Inspiron 14 7435 2-in-1 | |
| LG Gram 14T90P | |
| HP Pavilion x360 14-dy0157ng | |
| Lenovo IdeaPad Flex 7i 14IAU7 | |
| Dell Inspiron 14 7420 2-in-1 | |
* ... kleinere Werte sind besser
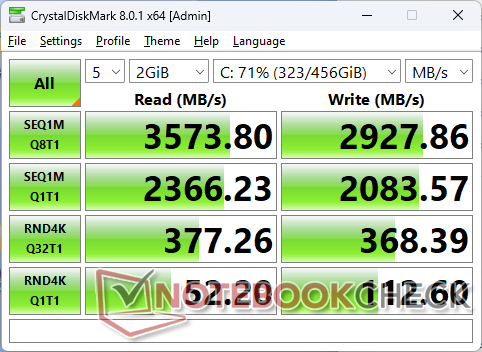
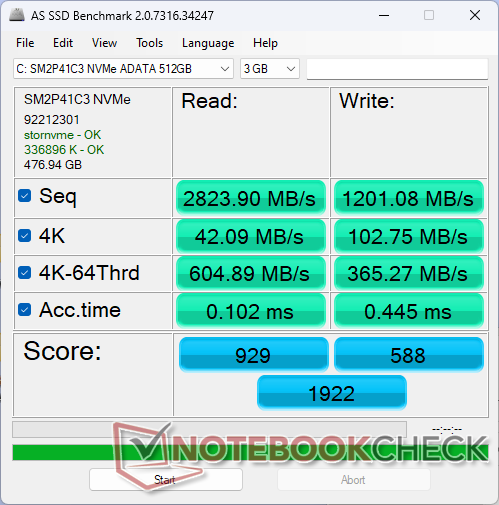
Speichergeräte
Unser Testgerät ist mit einer preiswerten 512 GB ADATA SM2P41C3 PCIe4 x4 NVMe SSD ausgestattet, die Lese- und Schreibgeschwindigkeiten von bis zu 3.600 bzw. 3.000 MB/s bietet. Das passt gut zur Ryzen 5-CPU, da superschnelle SSDs für die Zielgruppe der gelegentlichen Heimanwender oder Studenten kaum von Nutzen sind.
Es gibt keine internen sekundären SSD-Optionen, anders als bei dem teureren LG Gram 14T90P Convertible.

| Drive Performance Rating - Percent | |
| Acer Aspire 5 Spin 14 | |
| LG Gram 14T90P | |
| Lenovo IdeaPad Flex 7i 14IAU7 | |
| HP Pavilion x360 14-dy0157ng | |
| Dell Inspiron 14 7420 2-in-1 | |
| Dell Inspiron 14 7435 2-in-1 | |
* ... kleinere Werte sind besser
Disk Throttling: DiskSpd Read Loop, Queue Depth 8
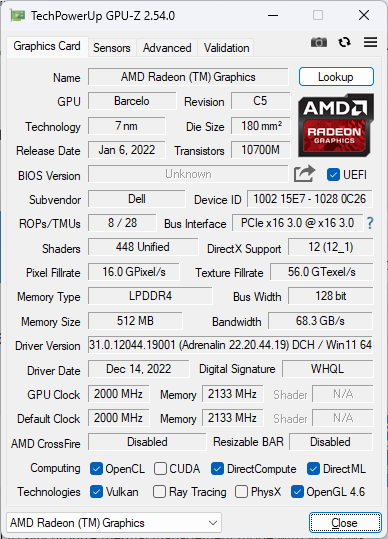
GPU Performance - Ältere Radeon RX Vega
Der Ryzen 5 7530U und der Ryzen 7 7730U laufen mit der älteren integrierten Radeon-RX-Vega-Grafik anstelle der neueren Radeon 680M oder 780M, was schade ist, da die neueren Lösungen bis zu 2x bis 2,5x schneller sein können. Abgesehen von sehr anspruchslosen Spielen wie Dota 2 Reborn, kann das System nicht mit modernen Titeln umgehen, besonders wenn man die begrenzten 8 GB RAM berücksichtigt. F1 22 zum Beispiel lief nur auf sehr niedrigen Einstellungen, da alles, was höher war, zum Absturz führte.
Die Frame-Raten fielen regelmäßig in den mittleren 50er-Bereich, bevor sie im Leerlauf von Witcher 3 wieder in den hohen 60er-Bereich anstiegen. Die Einbrüche traten in regelmäßigen Abständen auf, wie unser fps-Diagramm unten zeigt, was auf eine schlechte Handhabung aktiver Hintergrundanwendungen schließen lässt.
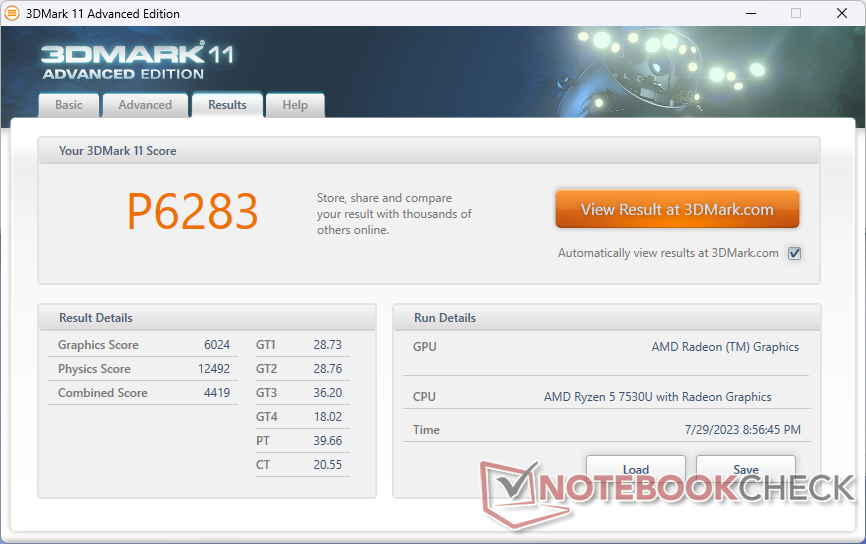
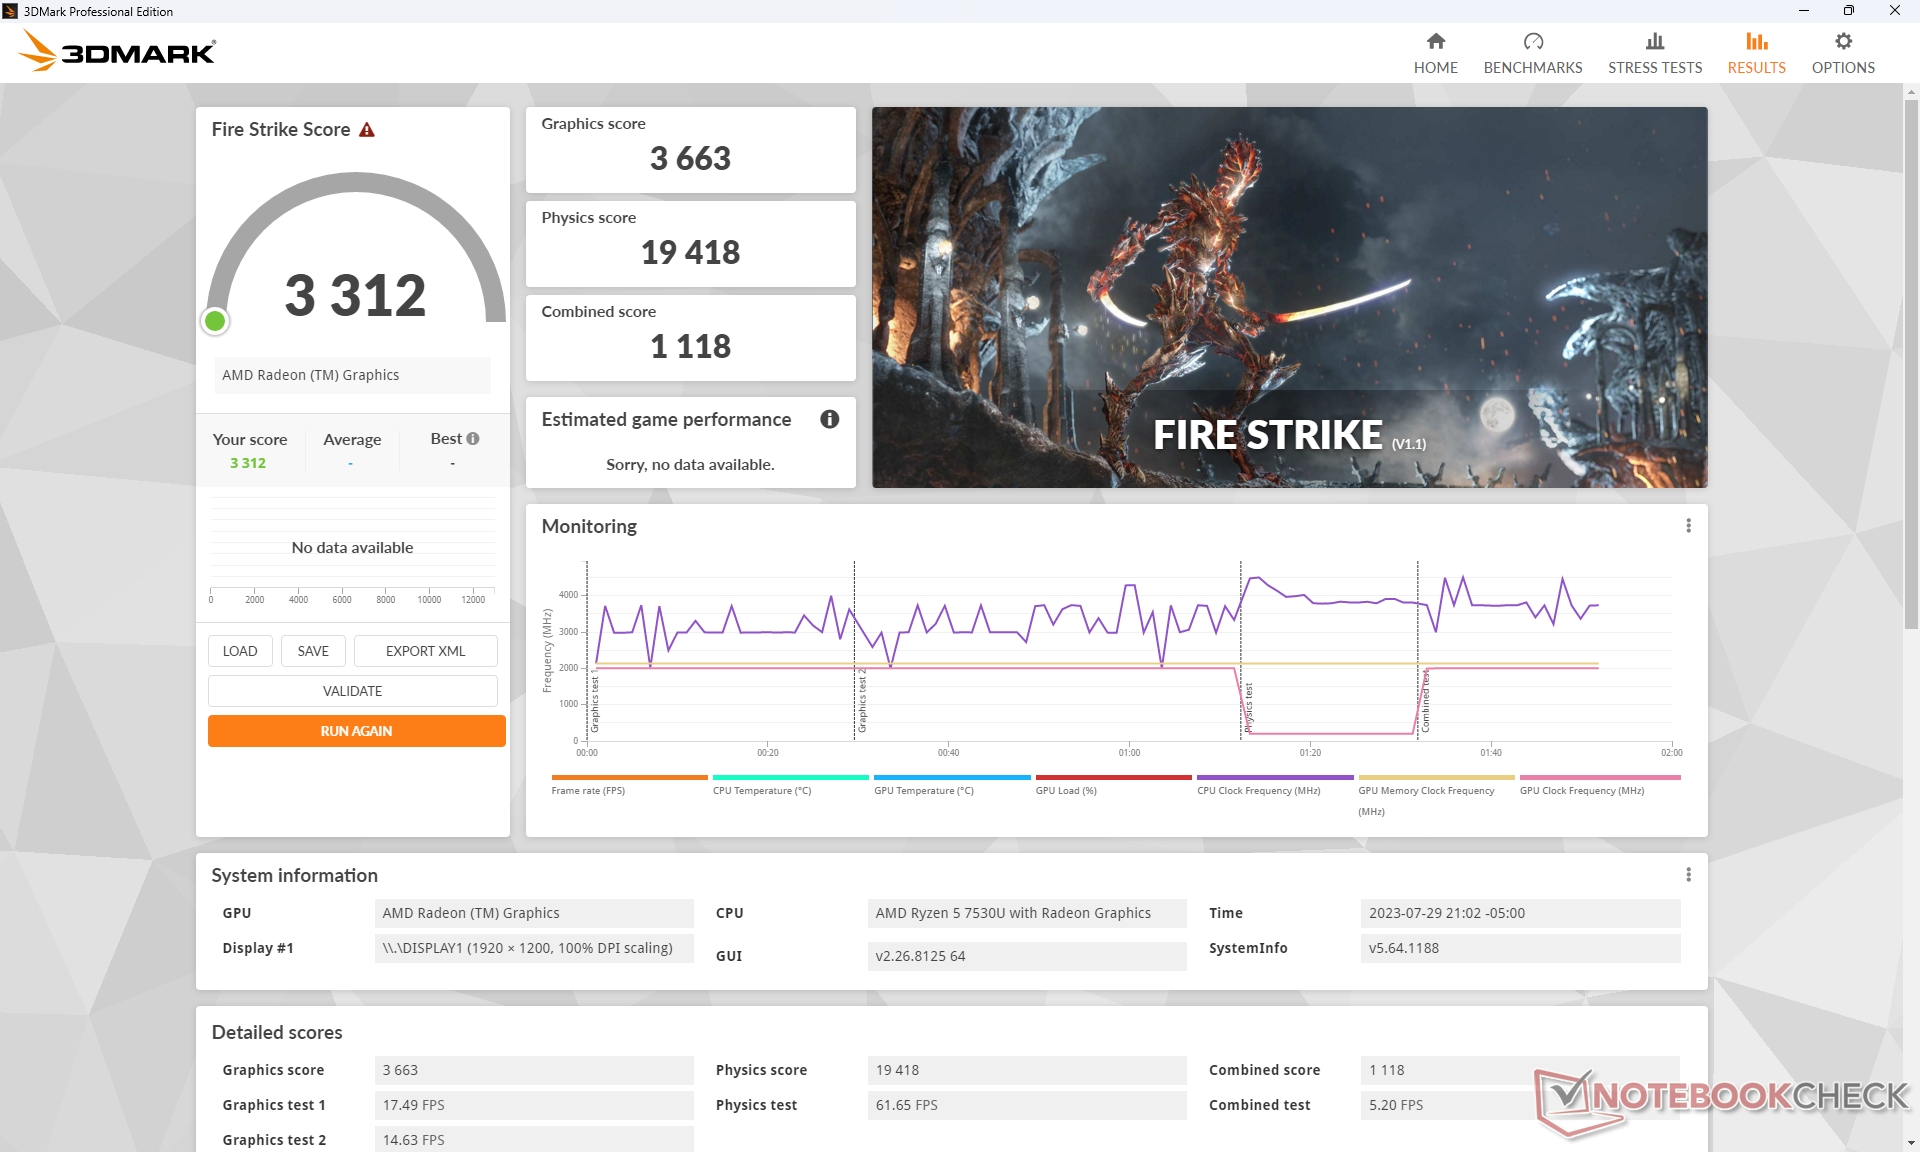
Die Gesamtleistung sinkt um etwa zehn Prozent, wenn der Modus "Ausbalanciert" verwendet wird, wie in unserer 3DMark-11-Tabelle unten zu lesen ist.
| Energie-Profil | Grafik-Punktzahl | Physik-Wertung | Kombinierte Punktzahl |
| Akku | 5.798 (-4 %) | 11.906 (-5 %) | 4.161 (-6 %) |
| Ausgewogen | 5.472 (-9 %) | 10.908 (-13 %) | 4.195 (-5 %) |
| Performance | 6.024 | 12.492 | 4.419 |
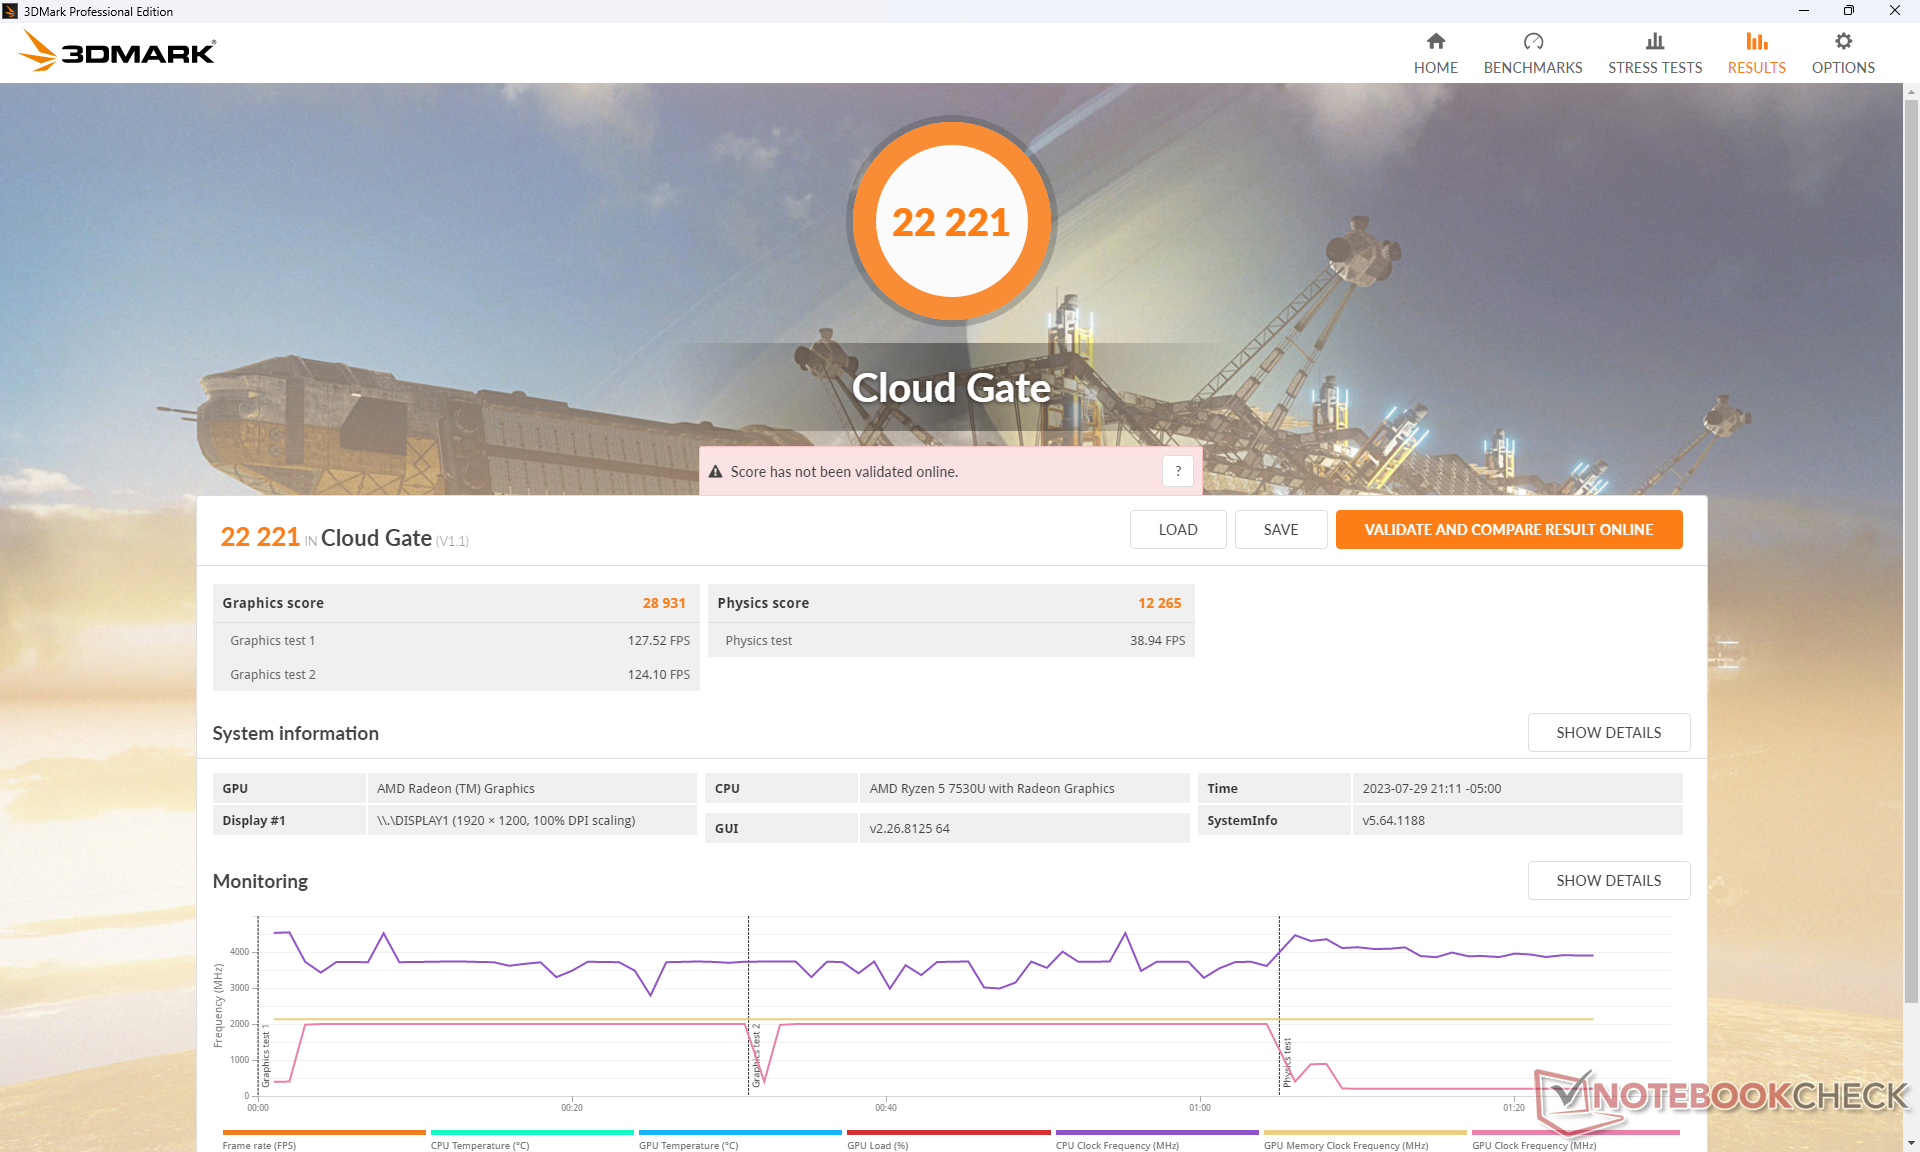
| 3DMark 11 Performance | 6283 Punkte | |
| 3DMark Cloud Gate Standard Score | 22221 Punkte | |
| 3DMark Fire Strike Score | 3312 Punkte | |
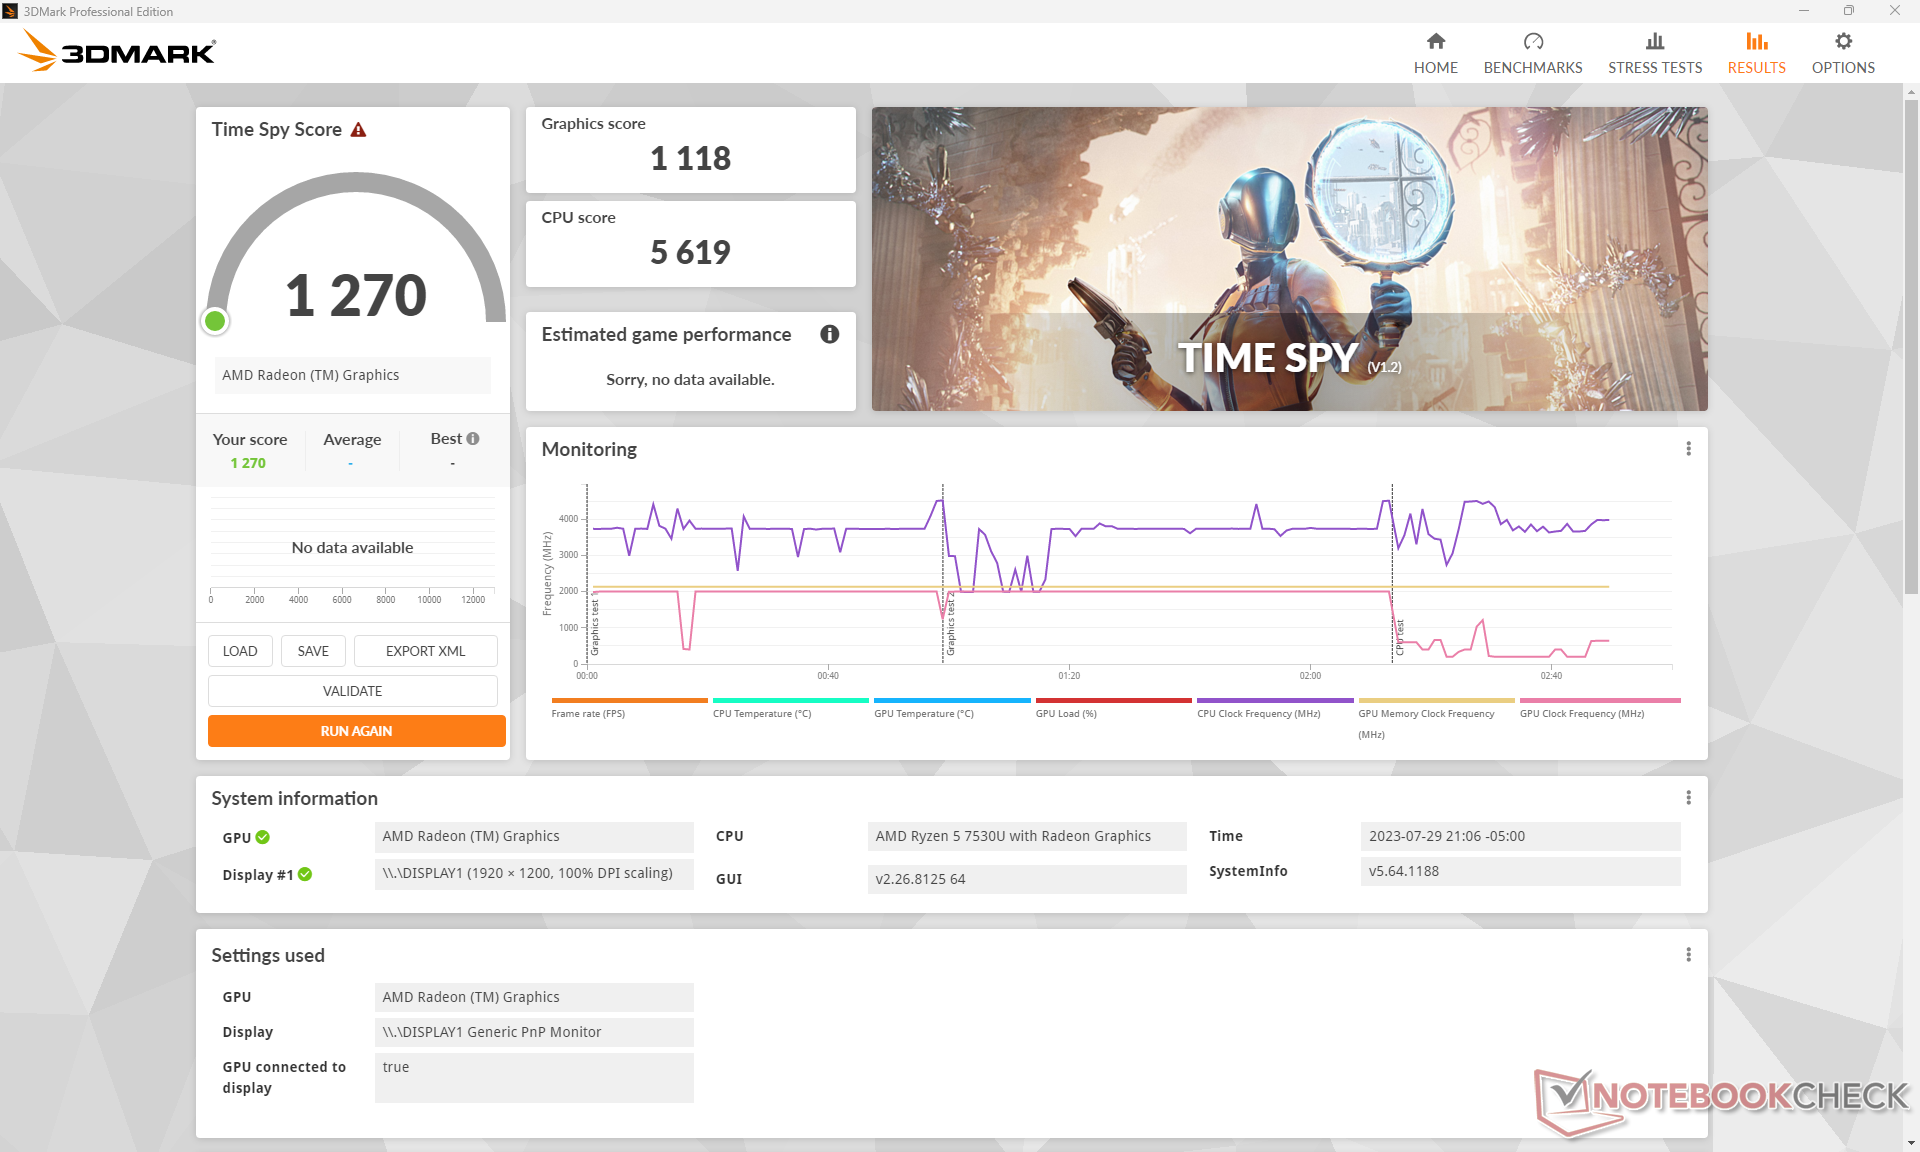
| 3DMark Time Spy Score | 1270 Punkte | |
Hilfe | ||
| F1 22 - 1280x720 Ultra Low Preset AA:T AF:16x | |
| Dell Latitude 9440 2-in-1 | |
| Lenovo ThinkPad X1 Yoga G8 i7-1355U | |
| Durchschnittliche AMD Radeon RX Vega 7 (43.6 - 80.8, n=11) | |
| Dell Inspiron 14 7435 2-in-1 | |
| Tiny Tina's Wonderlands - 1280x720 Lowest Preset (DX12) | |
| Durchschnittliche AMD Radeon RX Vega 7 (49.7 - 70.4, n=7) | |
| Dell Inspiron 14 7435 2-in-1 | |
| Dell Latitude 9440 2-in-1 | |
| Lenovo ThinkPad X1 Yoga G8 i7-1355U | |
Witcher 3 FPS Chart
| min. | mittel | hoch | max. | |
|---|---|---|---|---|
| GTA V (2015) | 107.7 | 25.7 | 10.2 | |
| The Witcher 3 (2015) | 76 | 21.5 | 14.5 | |
| Dota 2 Reborn (2015) | 107.4 | 87.3 | 49.9 | 47.1 |
| Final Fantasy XV Benchmark (2018) | 35.1 | 17.5 | 12.1 | |
| X-Plane 11.11 (2018) | 37.4 | 29.5 | 26.4 | |
| Strange Brigade (2018) | 79.5 | 31.4 | 25.6 | 22.3 |
| Cyberpunk 2077 1.6 (2022) | 16.3 | 12.8 | 8.9 | 6.7 |
| Tiny Tina's Wonderlands (2022) | 26.5 | |||
| F1 22 (2022) |
Emissionen
System-Rauschen
Der interne Lüfter neigt dazu, zwischen Leerlauf und 33,3 dB(A) zu pulsieren, wenn man im Internet surft oder Videos streamt. Der Anstieg des Lüftergeräusches ist eher plötzlich und stark als allmählich, was das Geräusch leider noch auffälliger macht.
Bei gleichbleibend hoher Belastung, z. B. bei Spielen, beträgt das Lüftergeräusch im Modus Performance fast 41 dB(A). Im Modus "Ausgewogen" sinkt das Lüftergeräusch geringfügig auf 39,8 dB(A).
Wir konnten bei unserem Testgerät ein leichtes Spulenwimmern oder elektronische Geräusche wahrnehmen, so dass der Lüfter auch im Leerlauf nie wirklich leise ist. Der niedrige 40-dB(A)-Bereich ist leiser als der des Acer Aspire 5 Spin 14, aber lauter als der des LG Gram 14T90P.


Lautstärkediagramm
| Idle |
| 23.2 / 23.2 / 23.2 dB(A) |
| Last |
| 33 / 41.3 dB(A) |
 | ||
30 dB leise 40 dB(A) deutlich hörbar 50 dB(A) störend |
||
min: | ||
| Dell Inspiron 14 7435 2-in-1 Vega 7, R5 7530U | Dell Inspiron 14 7420 2-in-1 Iris Xe G7 96EUs, i7-1255U, WDC PC SN530 SDBPMPZ-512G | Lenovo IdeaPad Flex 7i 14IAU7 Iris Xe G7 96EUs, i7-1255U, Samsung PM9B1 512GB MZAL4512HBLU | Acer Aspire 5 Spin 14 Iris Xe G7 80EUs, i5-1335U, Micron 2450 512GB MTFDKBA512TFK | LG Gram 14T90P Iris Xe G7 80EUs, i5-1135G7, Samsung SSD PM981a MZVLB512HBJQ | HP Pavilion x360 14-dy0157ng Iris Xe G7 80EUs, i5-1135G7, Toshiba KBG40ZNV512G | |
|---|---|---|---|---|---|---|
| Geräuschentwicklung | -3% | 1% | -22% | 0% | -10% | |
| aus / Umgebung * (dB) | 22.8 | 23.1 -1% | 23.3 -2% | 26 -14% | 25.4 -11% | 27 -18% |
| Idle min * (dB) | 23.2 | 24.7 -6% | 23.3 -0% | 27.7 -19% | 25.5 -10% | 27 -16% |
| Idle avg * (dB) | 23.2 | 24.7 -6% | 23.3 -0% | 27.7 -19% | 25.5 -10% | 27 -16% |
| Idle max * (dB) | 23.2 | 24.7 -6% | 23.3 -0% | 29.7 -28% | 25.5 -10% | 27 -16% |
| Last avg * (dB) | 33 | 27.7 16% | 34.3 -4% | 46.3 -40% | 28.3 14% | 38.3 -16% |
| Witcher 3 ultra * (dB) | 40.9 | 45.1 -10% | 37.8 8% | 35 14% | ||
| Last max * (dB) | 41.3 | 45.1 -9% | 37.8 8% | 45.4 -10% | 35 15% | 33.2 20% |
* ... kleinere Werte sind besser
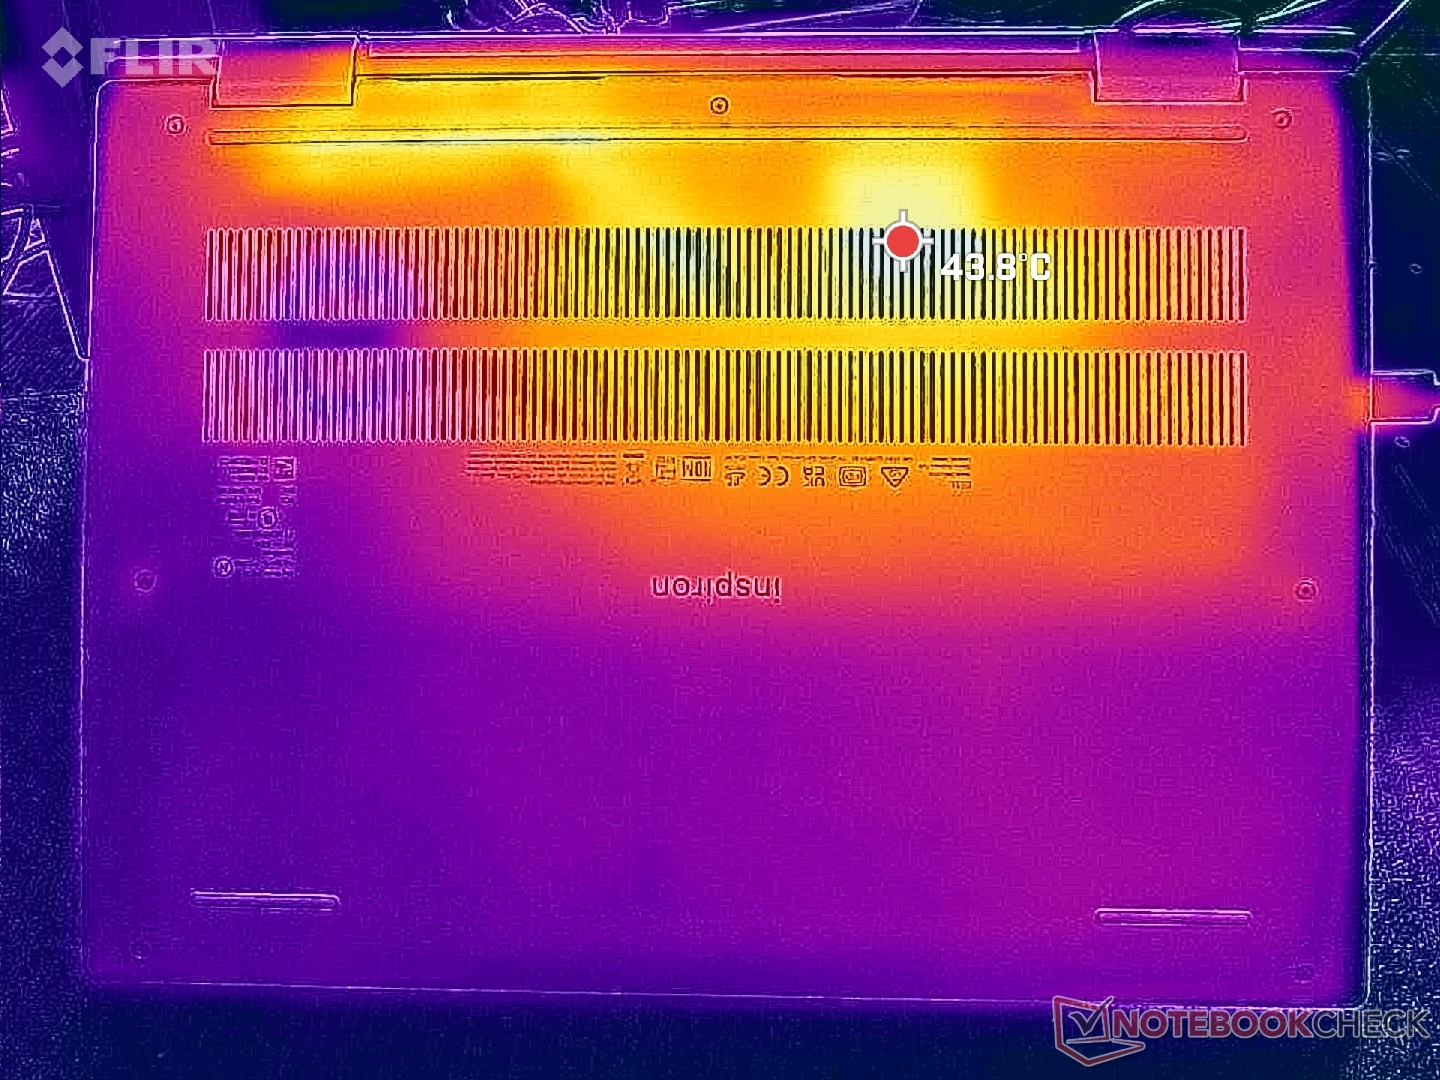
Temperatur
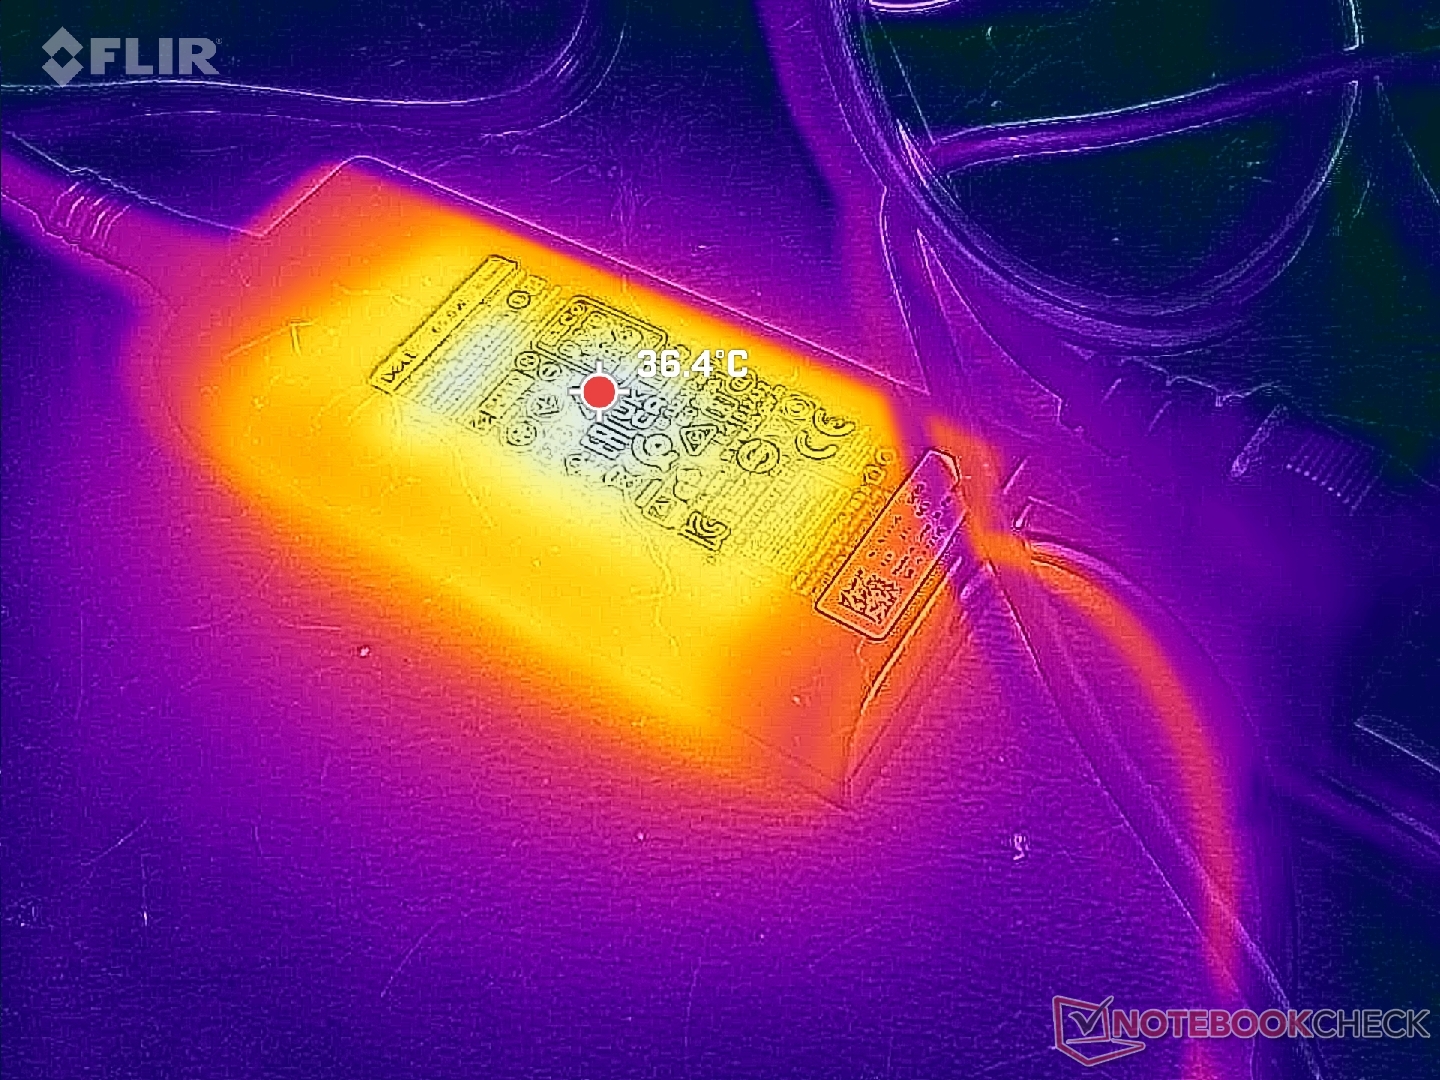
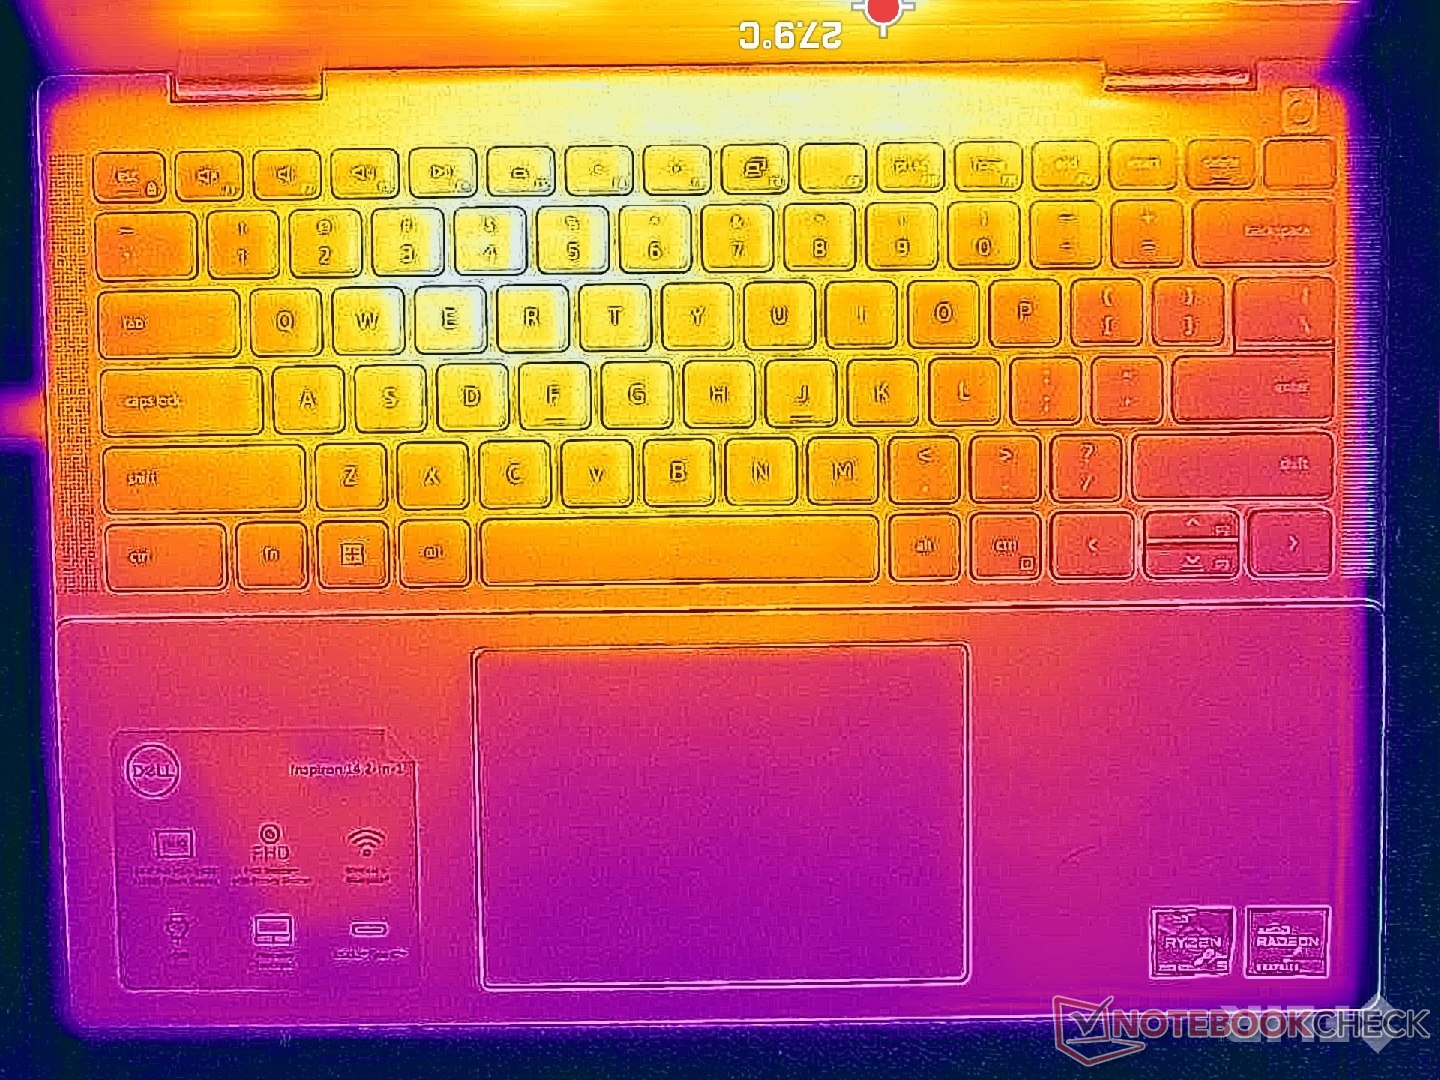
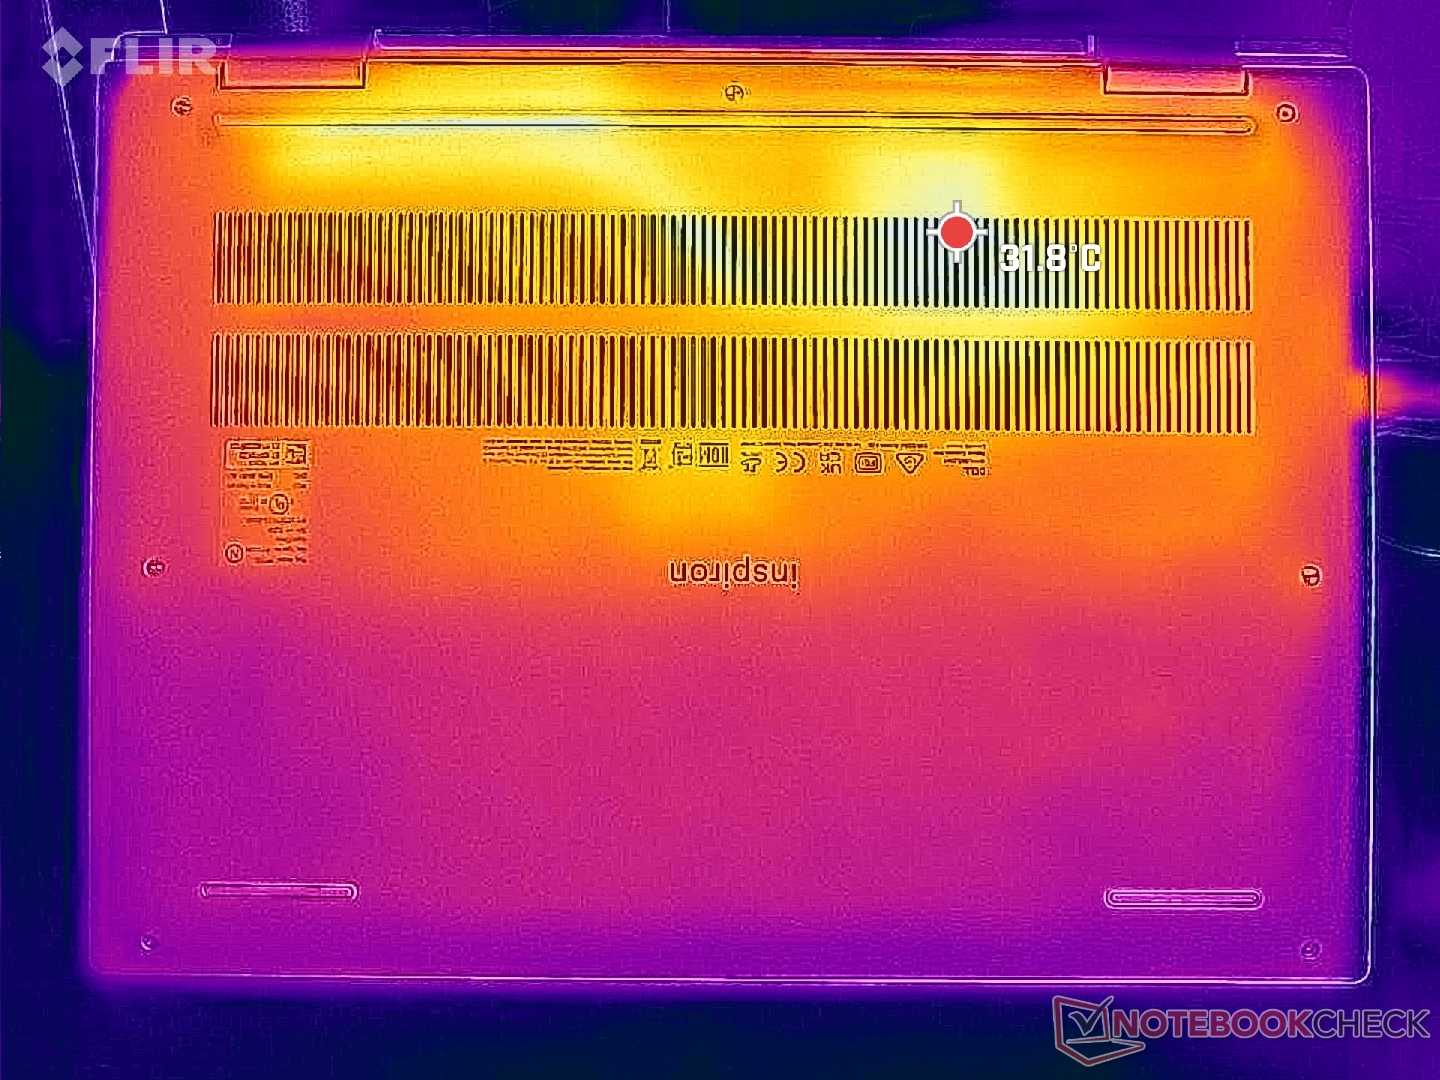
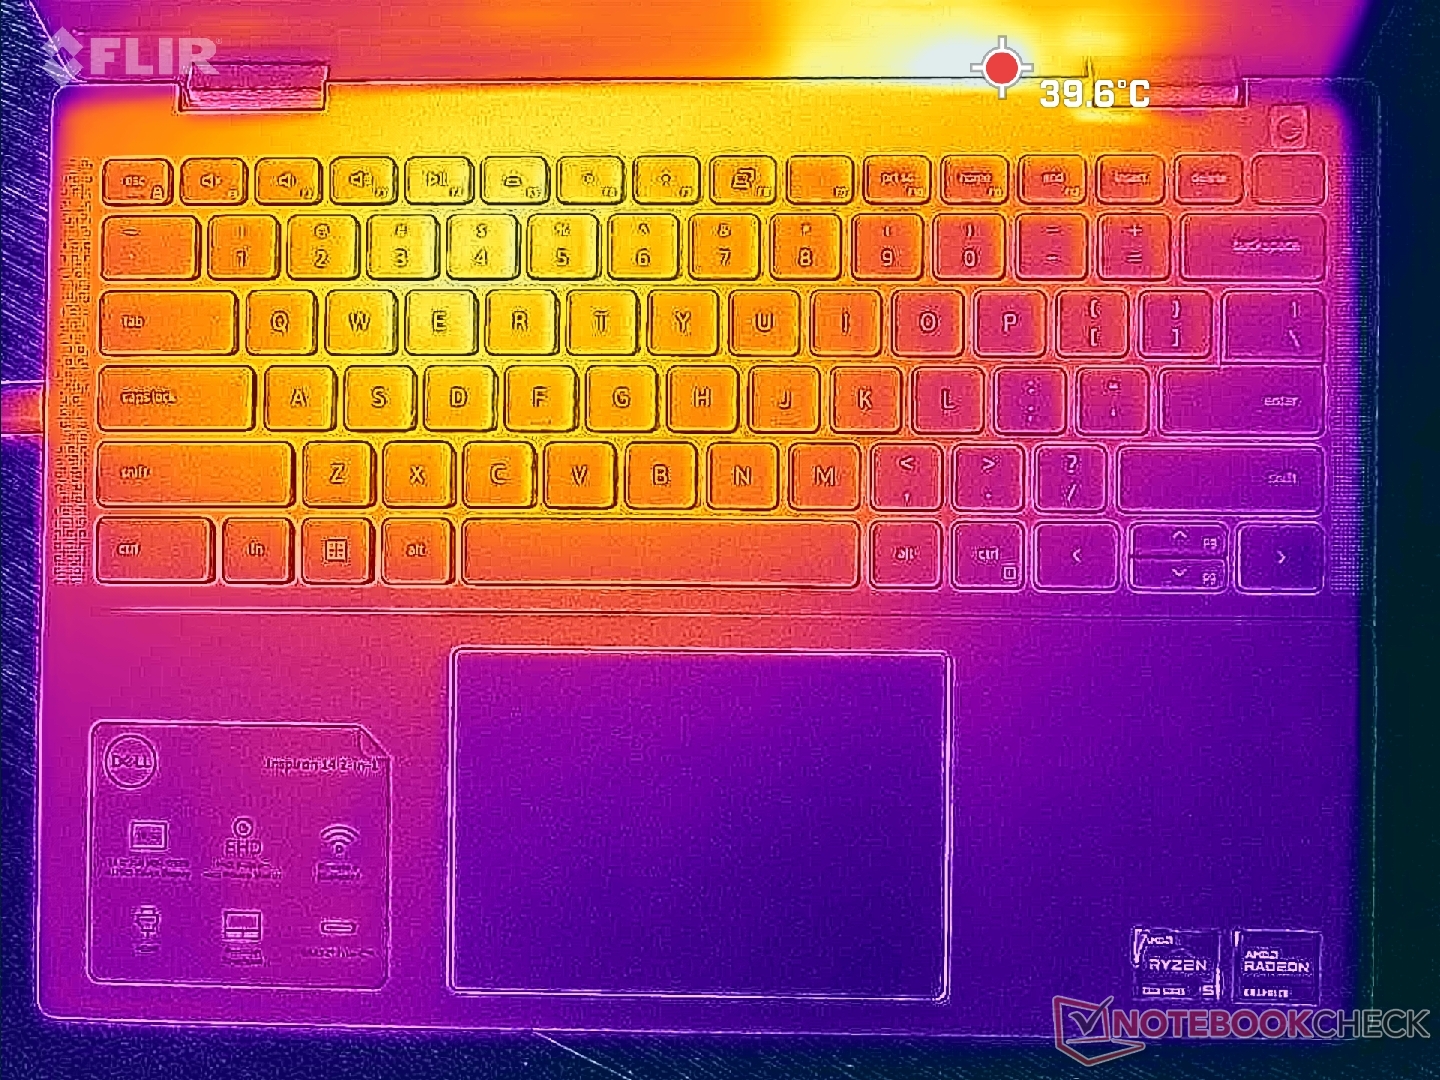
Die Oberflächentemperaturen sind kühler als beim Inspiron 14 7620 2-in-1 aus dem letzten Jahr. Unter Last beispielsweise erreichen die Hotspots auf der Ober- und Unterseite nur 36 bzw. 39 °C, verglichen mit 46 °C beim Vorjahresmodell. Der hohe Temperaturbereich von 30 °C ist vergleichbar mit Modellen wie dem IdeaPad Flex 7i 14.
Auch das Netzteil läuft mit etwa 36 °C anstelle von 46 °C kühler.
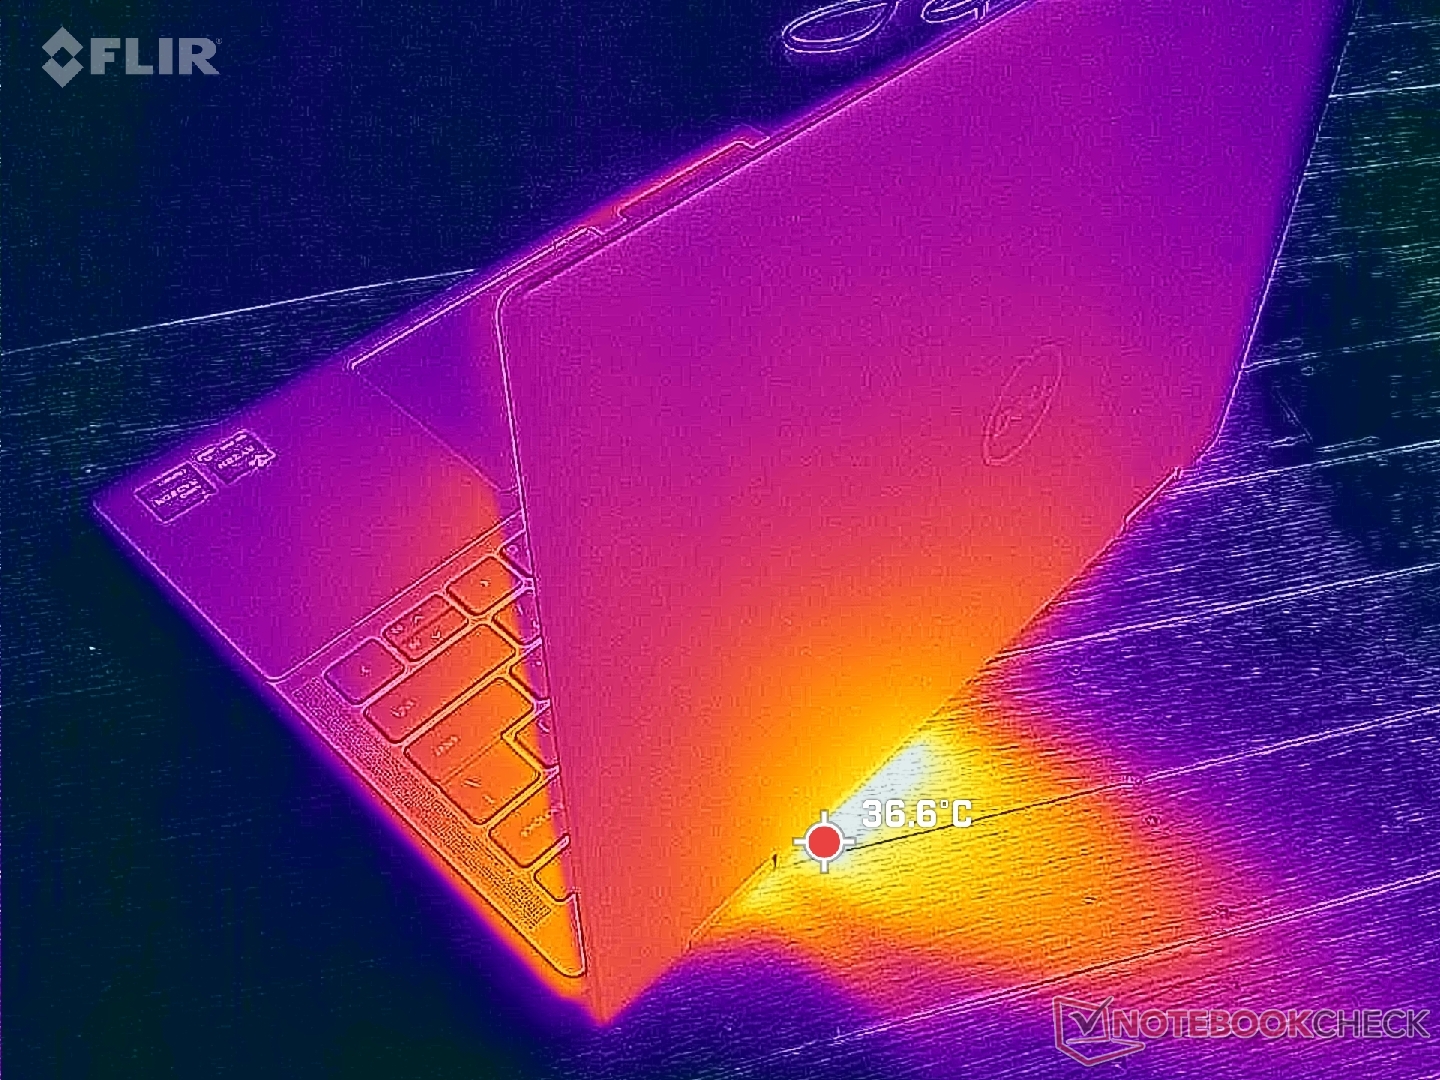
(+) Die maximale Temperatur auf der Oberseite ist 35.2 °C. Im Vergleich liegt der Klassendurchschnitt bei 35.4 °C (von 19.6 bis 60 °C für die Klasse Convertible).
(+) Auf der Unterseite messen wir eine maximalen Wert von 38.2 °C (im Vergleich zum Durchschnitt von 36.9 °C).
(+) Ohne Last messen wir eine durchschnittliche Temperatur von 28.7 °C auf der Oberseite. Der Klassendurchschnitt erreicht 30.3 °C.
(+) Die Handballen und der Touchpad-Bereich sind mit gemessenen 26.6 °C kühler als die typische Hauttemperatur und fühlen sich dadurch kühl an.
(±) Die durchschnittliche Handballen-Temperatur anderer getesteter Geräte war 28 °C (+1.4 °C).
| Dell Inspiron 14 7435 2-in-1 AMD Ryzen 5 7530U, AMD Radeon RX Vega 7 | Dell Inspiron 14 7420 2-in-1 Intel Core i7-1255U, Intel Iris Xe Graphics G7 96EUs | Lenovo IdeaPad Flex 7i 14IAU7 Intel Core i7-1255U, Intel Iris Xe Graphics G7 96EUs | Acer Aspire 5 Spin 14 Intel Core i5-1335U, Intel Iris Xe Graphics G7 80EUs | LG Gram 14T90P Intel Core i5-1135G7, Intel Iris Xe Graphics G7 80EUs | HP Pavilion x360 14-dy0157ng Intel Core i5-1135G7, Intel Iris Xe Graphics G7 80EUs | |
|---|---|---|---|---|---|---|
| Hitze | -2% | 11% | -14% | 3% | -2% | |
| Last oben max * (°C) | 35.2 | 38.2 -9% | 35.4 -1% | 41.7 -18% | 41.6 -18% | 38.9 -11% |
| Last unten max * (°C) | 38.2 | 45.6 -19% | 38.8 -2% | 54.4 -42% | 46.2 -21% | 40.3 -5% |
| Idle oben max * (°C) | 31.2 | 27.4 12% | 22.6 28% | 30.4 3% | 22.6 28% | 31.8 -2% |
| Idle unten max * (°C) | 30.4 | 28.4 7% | 24.2 20% | 29.8 2% | 23.2 24% | 27.4 10% |
* ... kleinere Werte sind besser
Stresstest
Wenn Prime95 läuft, steigt die CPU für ein paar Sekunden auf 3,8 GHz und 34 W, bevor sie auf 2,7 GHz und 20 W fällt und sich stabilisiert. Die Kerntemperatur bleibt auch unter Last relativ kühl bei 66 °C, was mit dem Intel Inspiron 14 7420 2-in-1 unter ähnlichen Bedingungen vergleichbar ist. Wir vermuten, dass die höherwertigen Ryzen-7- oder Core-i7-SKUs wärmer laufen als das, was wir bei unserer Ryzen-5-Basiskonfiguration gemessen haben.
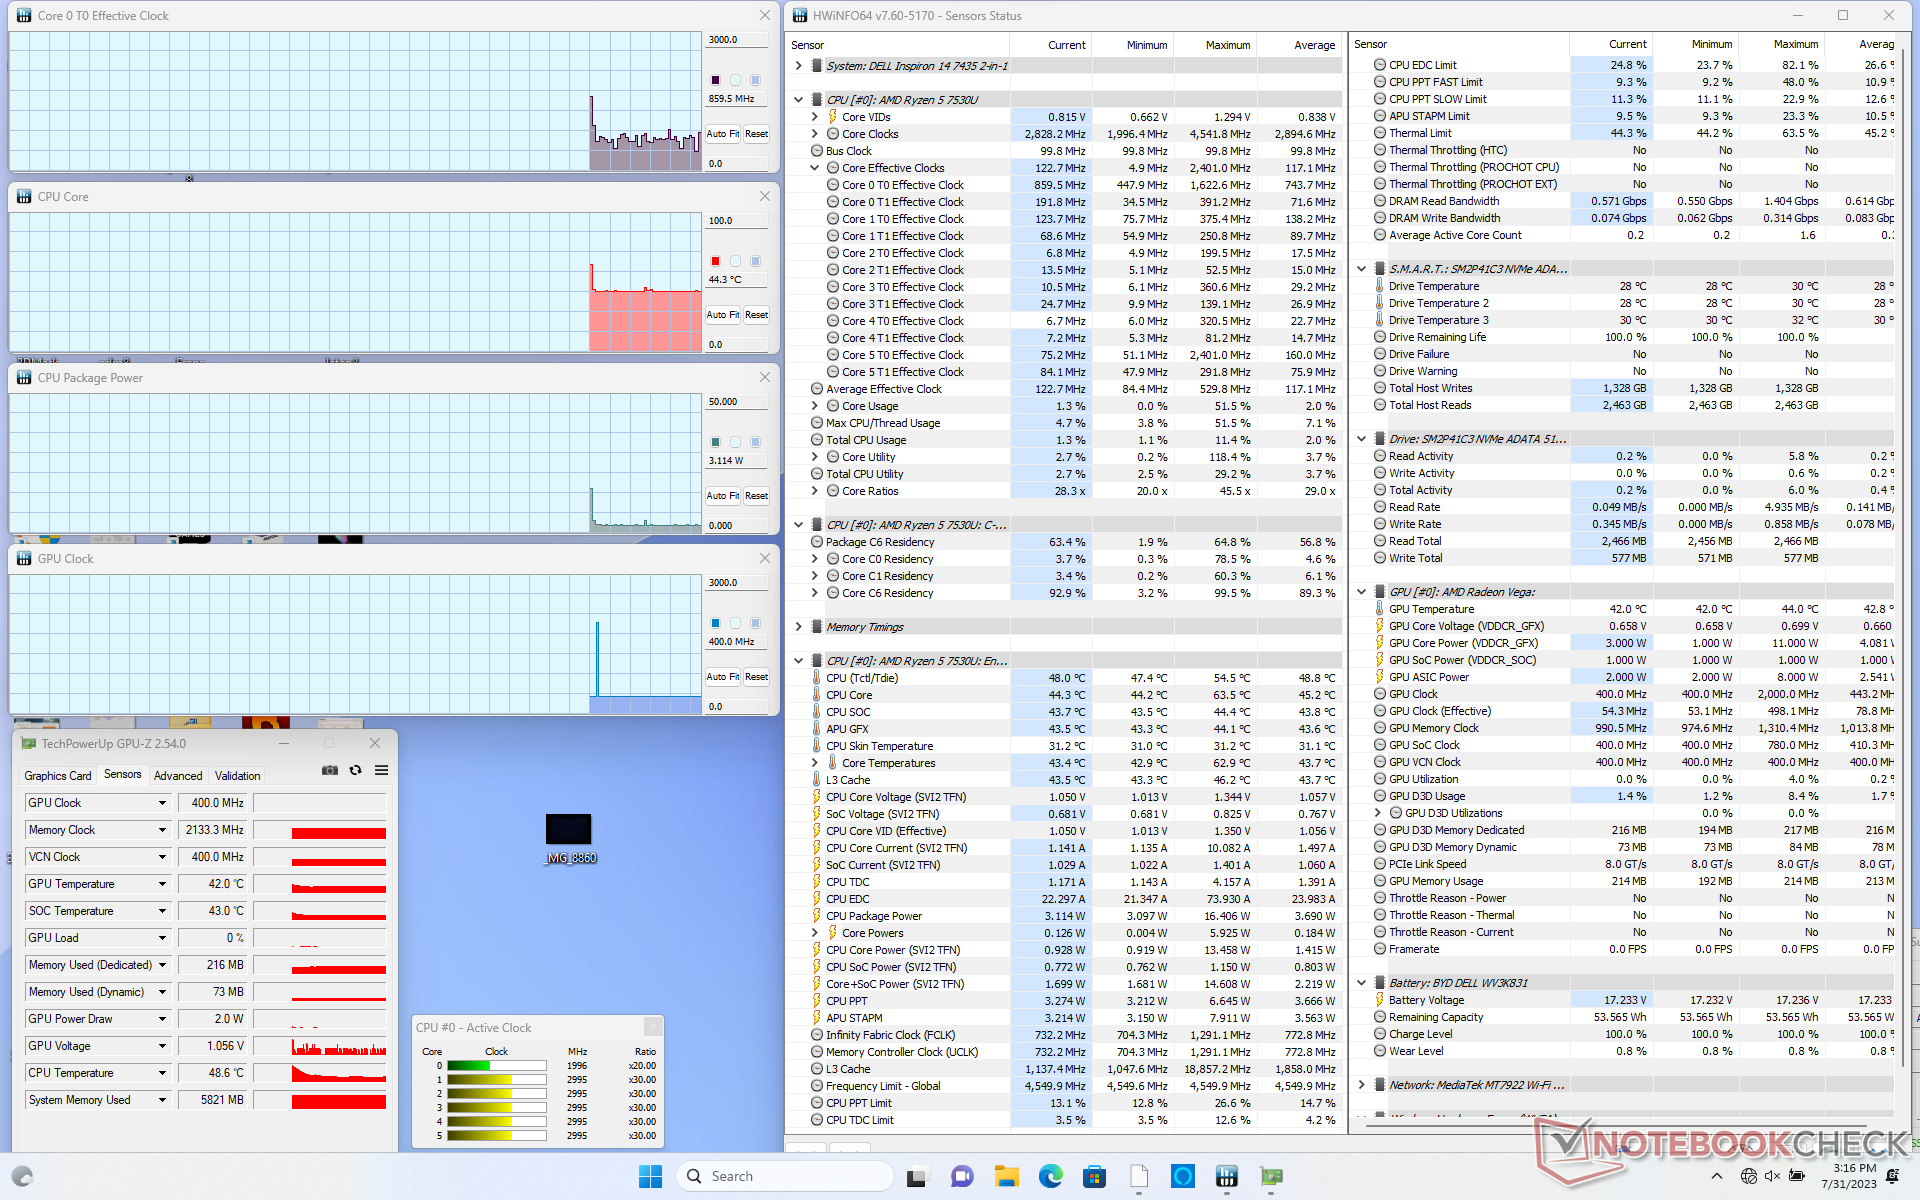
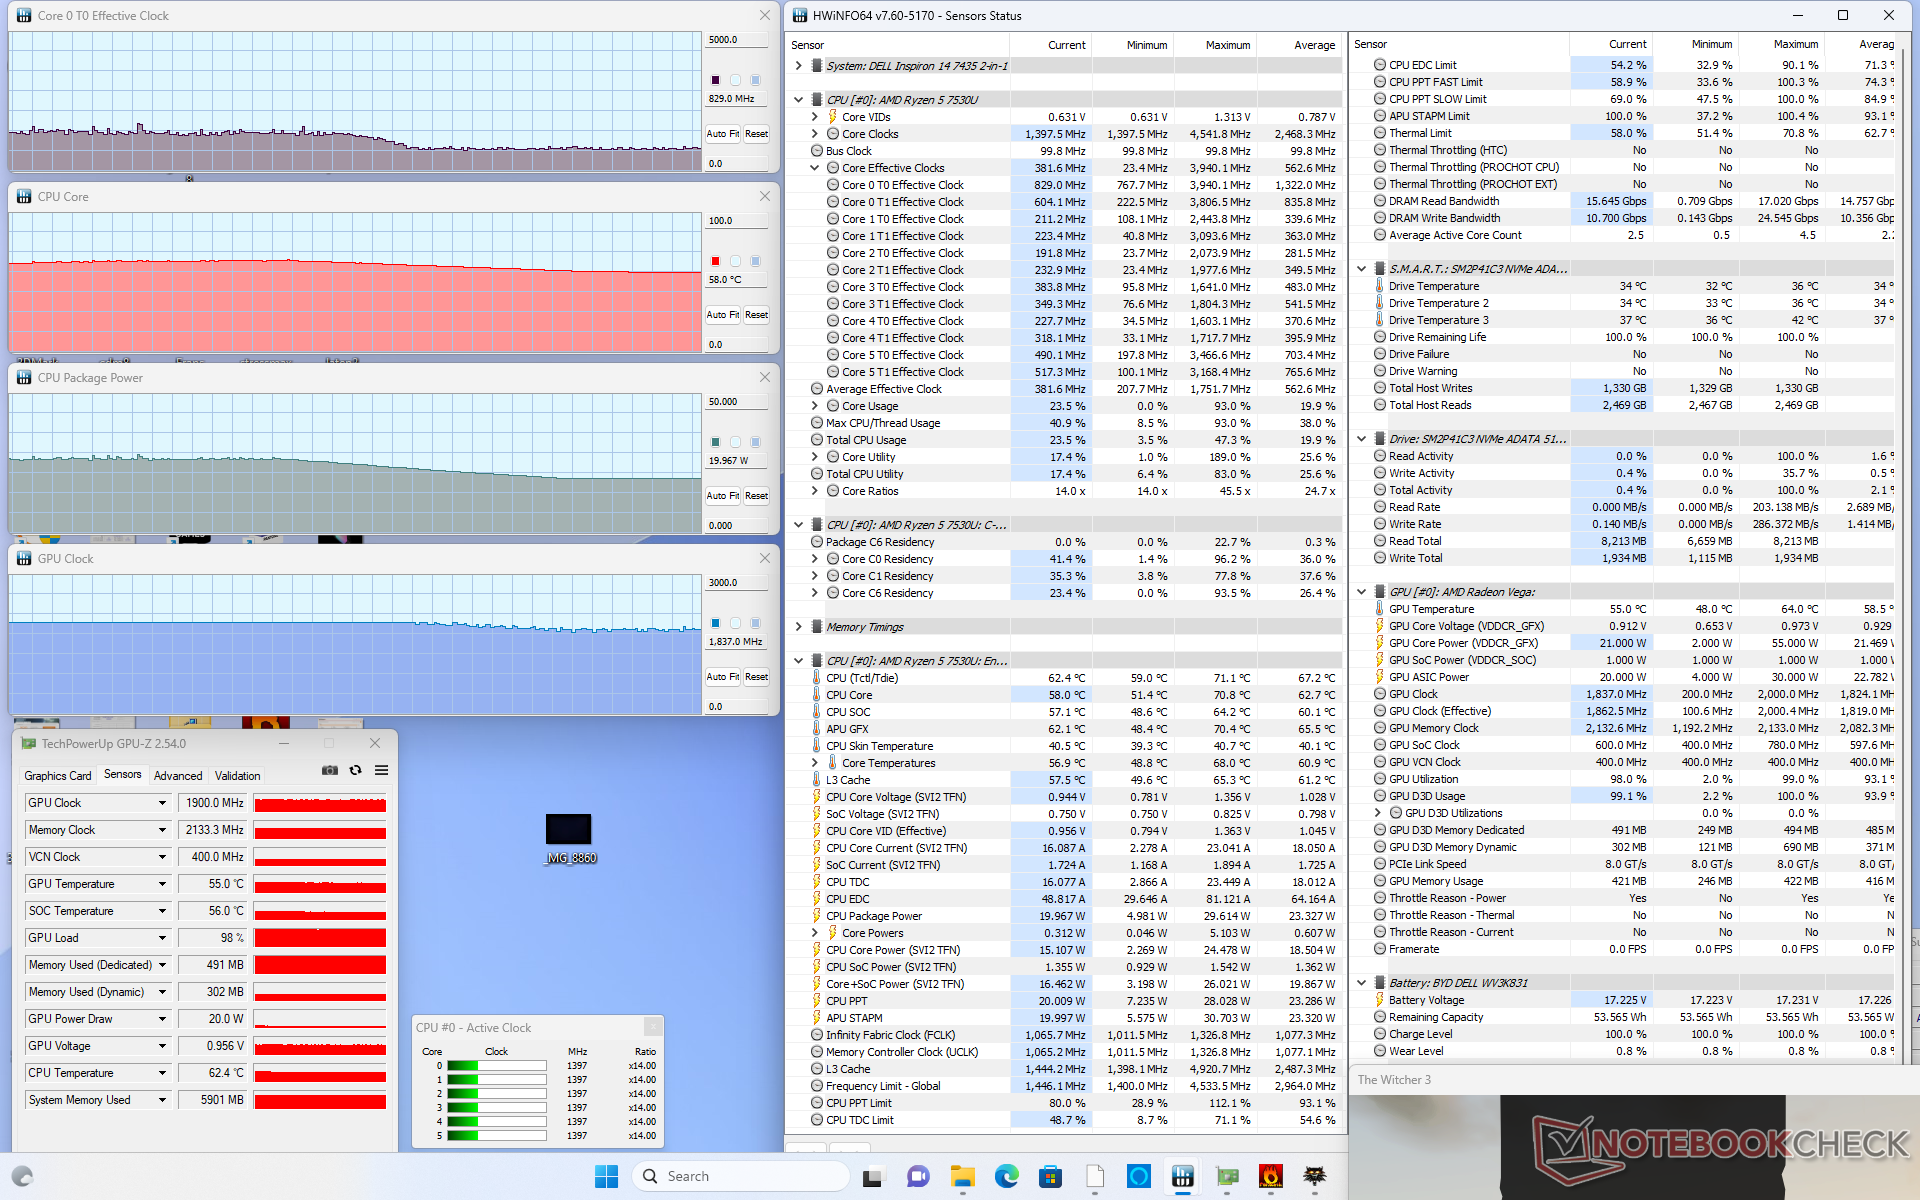
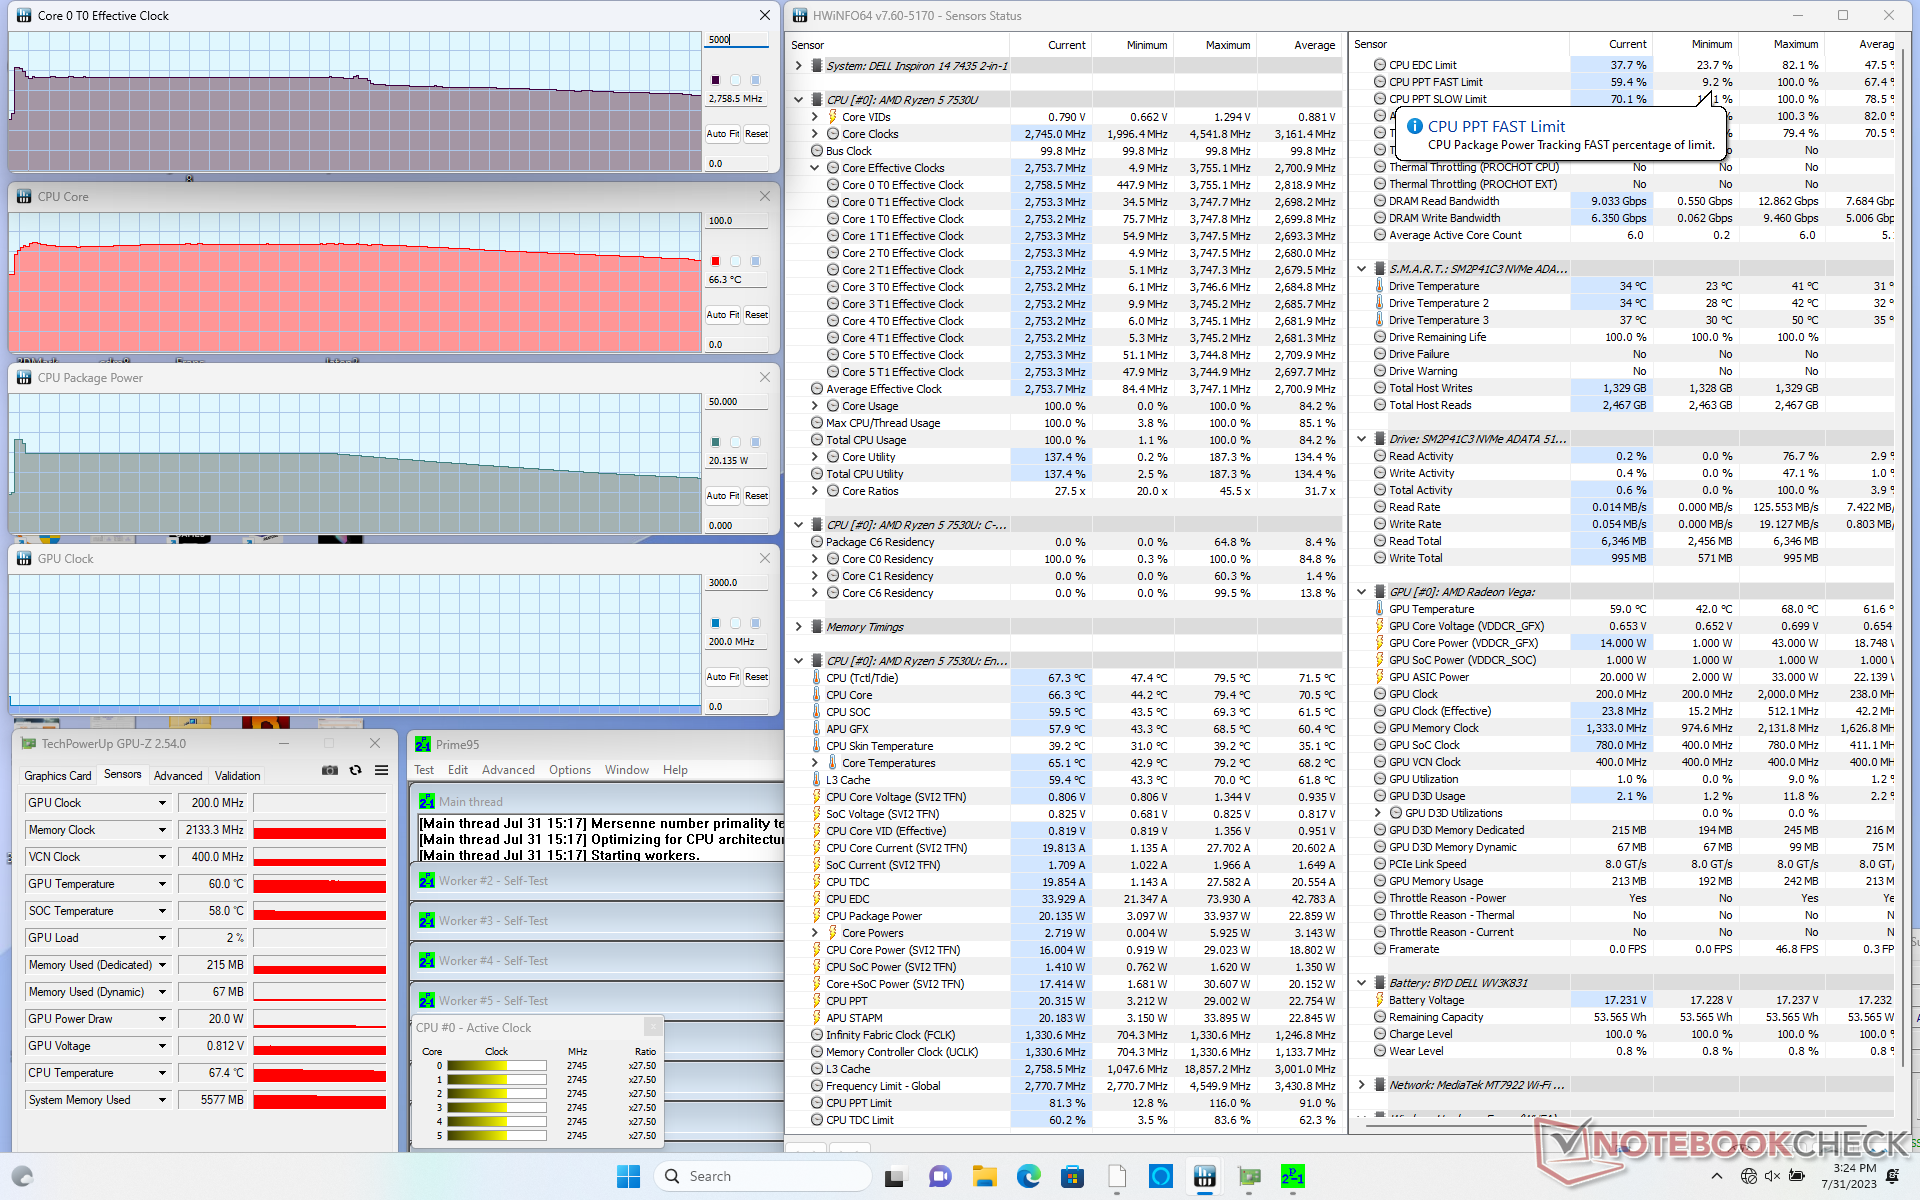
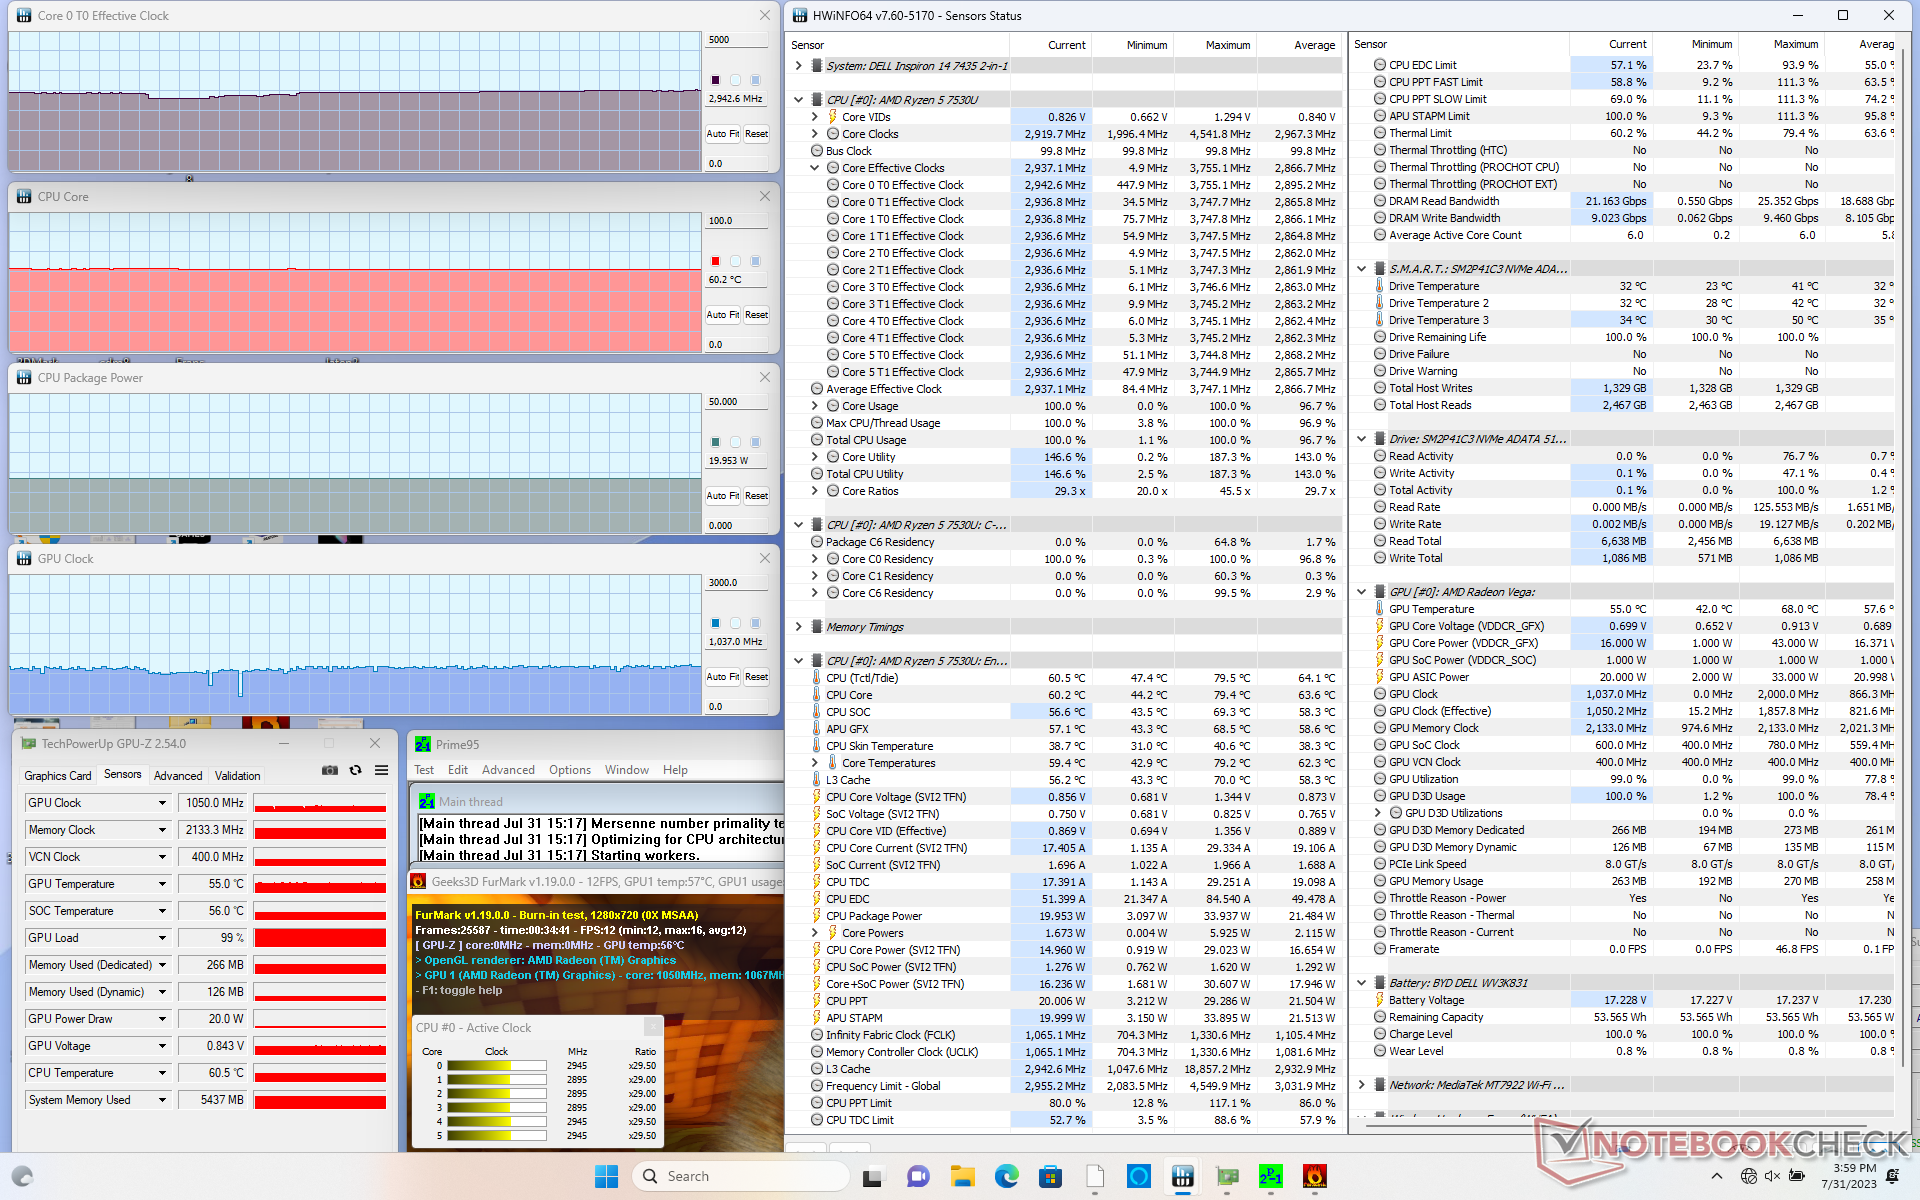
| CPU-Takt (GHz) | GPU-Takt (MHz) | durchschnittliche CPU-Temperatur (°C) | |
| System Leerlauf | -- | -- | 44 |
| Prime95 Stress | 2,7 | -- | 66 |
| Prime95 + FurMark, Stress | 2,9 | 1.050 | 60 |
| Witcher 3, Stress | 0,8 | 1.900 | 58 |
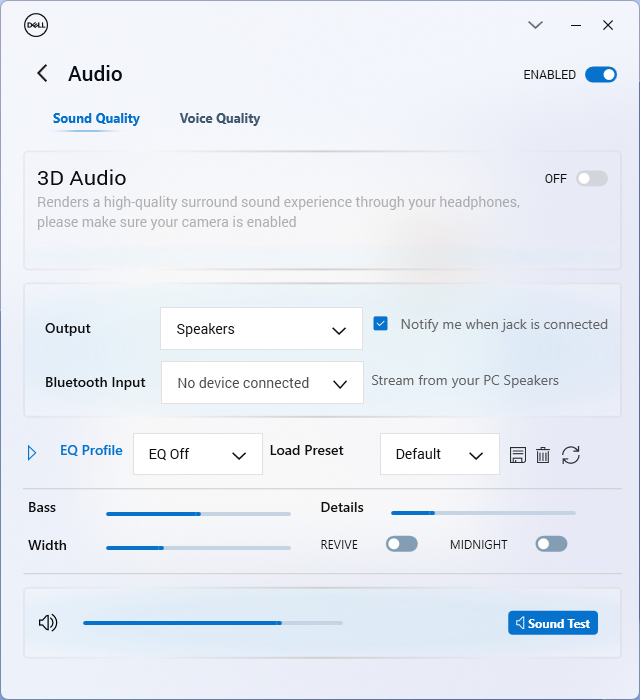
Lautsprecher
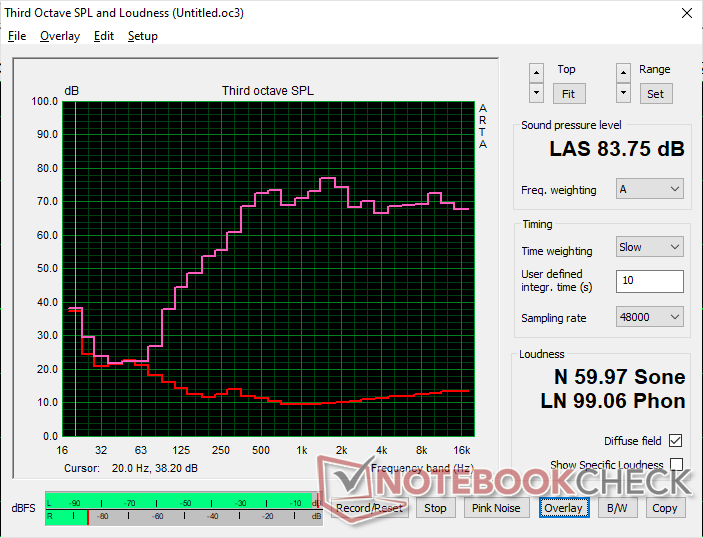
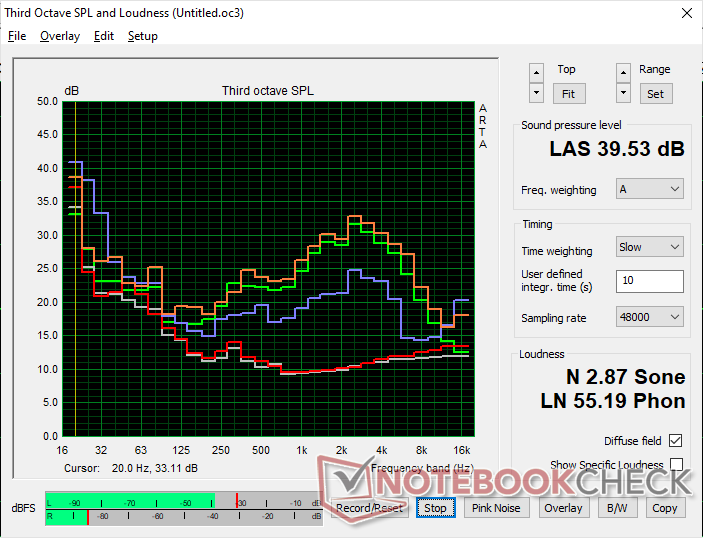
Dell Inspiron 14 7435 2-in-1 Audio Analyse
(+) | Die Lautsprecher können relativ laut spielen (83.8 dB)
Bass 100 - 315 Hz
(-) | kaum Bass - 18.8% niedriger als der Median
(±) | durchschnittlich lineare Bass-Wiedergabe (9.9% Delta zum Vorgänger)
Mitteltöne 400 - 2000 Hz
(+) | ausgeglichene Mitten, vom Median nur 3.5% abweichend
(+) | lineare Mitten (6.1% Delta zum Vorgänger)
Hochtöne 2 - 16 kHz
(+) | ausgeglichene Hochtöne, vom Median nur 1.2% abweichend
(+) | sehr lineare Hochtöne (4.4% Delta zum Vorgänger)
Gesamt im hörbaren Bereich 100 - 16.000 Hz
(+) | hörbarer Bereich ist sehr linear (12.3% Abstand zum Median
Im Vergleich zu allen Geräten derselben Klasse
» 14% aller getesteten Geräte dieser Klasse waren besser, 3% vergleichbar, 83% schlechter
» Das beste Gerät hat einen Delta-Wert von 6%, durchschnittlich ist 20%, das schlechteste Gerät hat 57%
Im Vergleich zu allen Geräten im Test
» 10% aller getesteten Geräte waren besser, 3% vergleichbar, 87% schlechter
» Das beste Gerät hat einen Delta-Wert von 4%, durchschnittlich ist 24%, das schlechteste Gerät hat 134%
Apple MacBook Pro 16 2021 M1 Pro Audio Analyse
(+) | Die Lautsprecher können relativ laut spielen (84.7 dB)
Bass 100 - 315 Hz
(+) | guter Bass - nur 3.8% Abweichung vom Median
(+) | lineare Bass-Wiedergabe (5.2% Delta zum Vorgänger)
Mitteltöne 400 - 2000 Hz
(+) | ausgeglichene Mitten, vom Median nur 1.3% abweichend
(+) | lineare Mitten (2.1% Delta zum Vorgänger)
Hochtöne 2 - 16 kHz
(+) | ausgeglichene Hochtöne, vom Median nur 1.9% abweichend
(+) | sehr lineare Hochtöne (2.7% Delta zum Vorgänger)
Gesamt im hörbaren Bereich 100 - 16.000 Hz
(+) | hörbarer Bereich ist sehr linear (4.6% Abstand zum Median
Im Vergleich zu allen Geräten derselben Klasse
» 0% aller getesteten Geräte dieser Klasse waren besser, 0% vergleichbar, 100% schlechter
» Das beste Gerät hat einen Delta-Wert von 5%, durchschnittlich ist 17%, das schlechteste Gerät hat 45%
Im Vergleich zu allen Geräten im Test
» 0% aller getesteten Geräte waren besser, 0% vergleichbar, 100% schlechter
» Das beste Gerät hat einen Delta-Wert von 4%, durchschnittlich ist 24%, das schlechteste Gerät hat 134%
Energieverwaltung
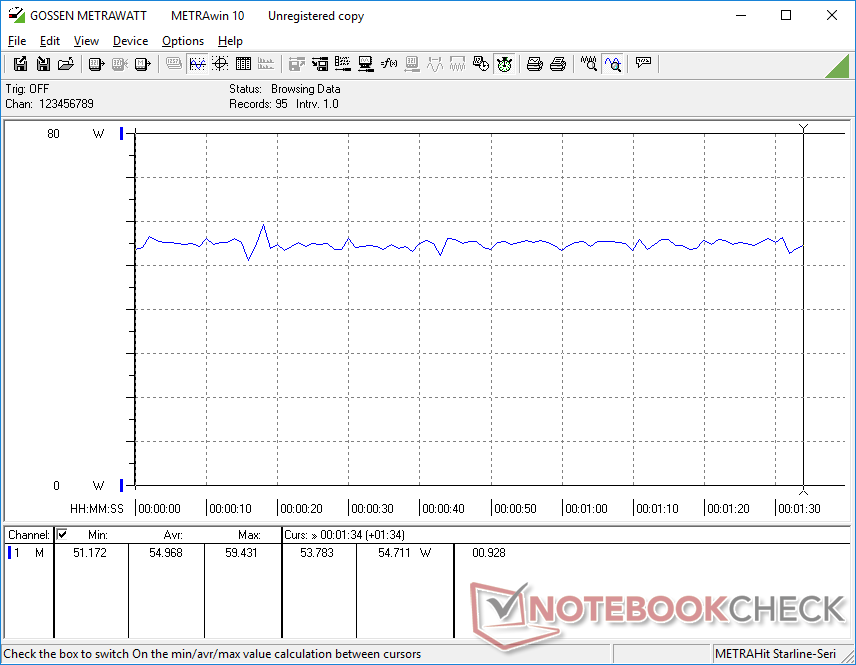
Stromverbrauch
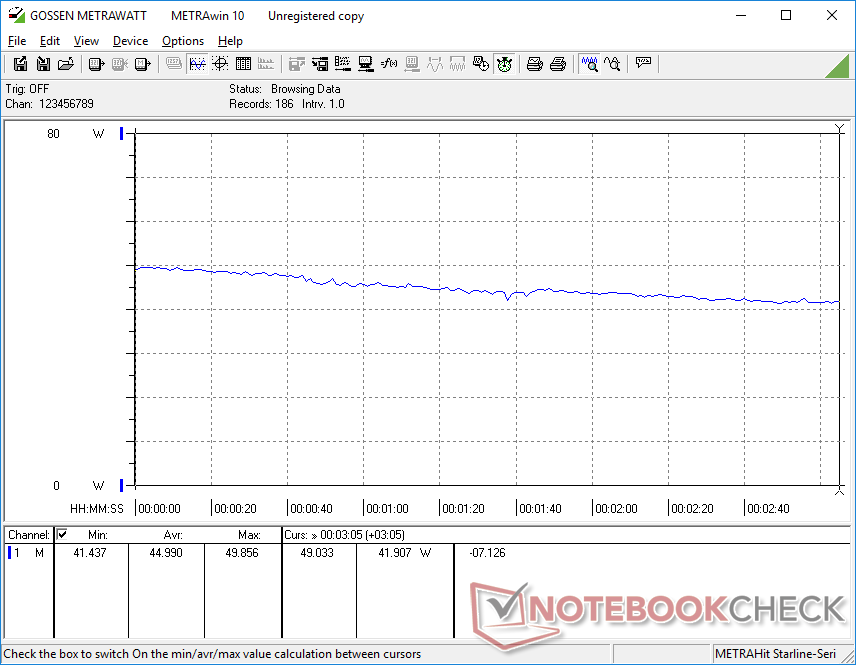
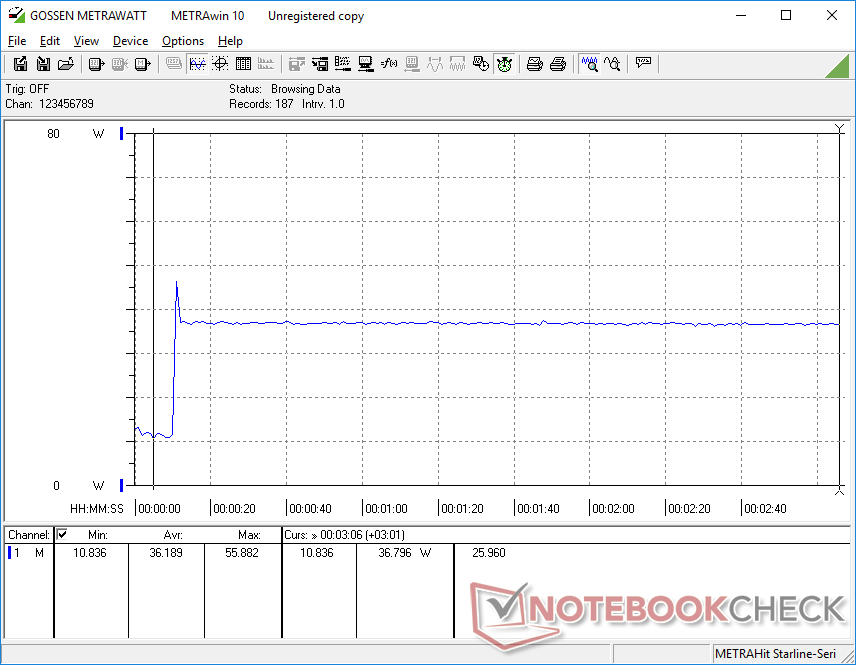
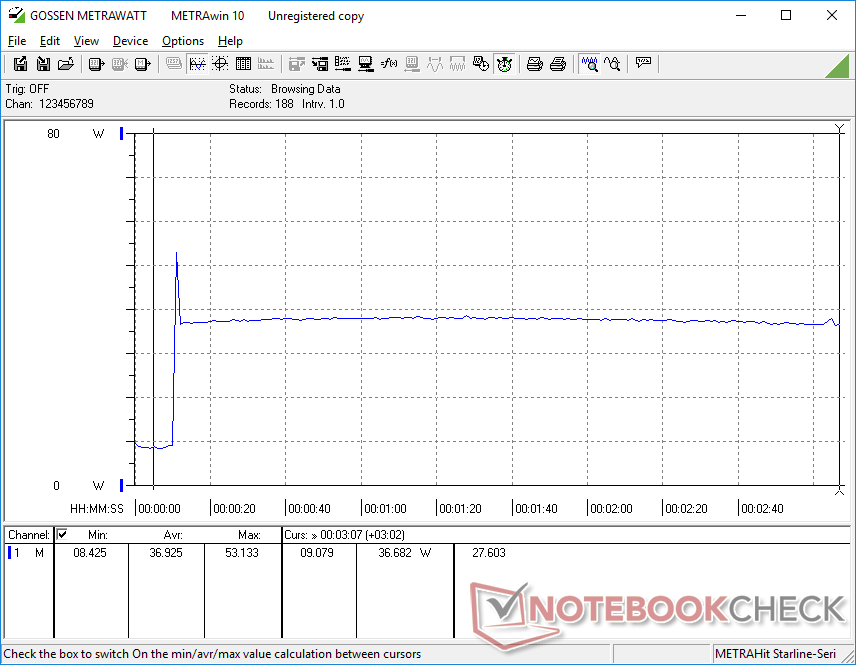
Die Leistungsaufnahme ist bei geringer Last vergleichbar mit der des Intel Inspiron 14 7420, bei anspruchsvolleren Aufgaben wie Spielen ist sie jedoch durchweg höher. Das deutet darauf hin, dass die integrierte AMD GPU etwas weniger energieeffizient ist als die konkurrierenden Iris Xe 96 EUs, während die CPU-Leistung pro Watt eher ähnlich ist.
Wir konnten eine maximale Leistungsaufnahme von 56 W von dem kleinen (11,1 x 5,1 x 2,8 cm) 65-W-USB-C-Adapter messen, wenn die CPU zu 100 Prozent ausgelastet ist. Dieser Wert ist jedoch sehr kurzlebig, wie unsere Screenshots unten zeigen, was auf das begrenzte Turbo-Boost-Potenzial des Systems zurückzuführen ist.
| Aus / Standby | |
| Idle | |
| Last |
|
Legende:
min: | |
| Dell Inspiron 14 7435 2-in-1 R5 7530U, Vega 7, , IPS, 1920x1200, 14" | Dell Inspiron 14 7420 2-in-1 i7-1255U, Iris Xe G7 96EUs, WDC PC SN530 SDBPMPZ-512G, IPS, 1920x1200, 14" | Lenovo IdeaPad Flex 7i 14IAU7 i7-1255U, Iris Xe G7 96EUs, Samsung PM9B1 512GB MZAL4512HBLU, IPS, 2240x1400, 14" | Acer Aspire 5 Spin 14 i5-1335U, Iris Xe G7 80EUs, Micron 2450 512GB MTFDKBA512TFK, IPS, 1920x1200, 14" | LG Gram 14T90P i5-1135G7, Iris Xe G7 80EUs, Samsung SSD PM981a MZVLB512HBJQ, IPS, 1900x1200, 14" | HP Pavilion x360 14-dy0157ng i5-1135G7, Iris Xe G7 80EUs, Toshiba KBG40ZNV512G, IPS, 1920x1080, 14" | |
|---|---|---|---|---|---|---|
| Stromverbrauch | 6% | -10% | 12% | 24% | 33% | |
| Idle min * (Watt) | 5.3 | 5.2 2% | 7.1 -34% | 4.3 19% | 2.8 47% | 4 25% |
| Idle avg * (Watt) | 9.1 | 8.2 10% | 11 -21% | 5.8 36% | 5.5 40% | 6.7 26% |
| Idle max * (Watt) | 9.4 | 9.9 -5% | 11.4 -21% | 8.8 6% | 6.4 32% | 8.2 13% |
| Last avg * (Watt) | 54.9 | 44.4 19% | 43.7 20% | 44 20% | 45.4 17% | 29.6 46% |
| Witcher 3 ultra * (Watt) | 45 | 35 22% | 35.1 22% | 41.5 8% | 34 24% | 29.6 34% |
| Last max * (Watt) | 55.8 | 62.5 -12% | 71 -27% | 67 -20% | 65.9 -18% | 26.7 52% |
* ... kleinere Werte sind besser
Stromverbrauch Witcher 3 / Stresstest
Stromverbrauch externer Monitor
Akkulaufzeit

Die Laufzeiten haben sich im Vergleich zum Vorjahr deutlich erhöht, obwohl sich die Akkukapazität nicht verändert hat. Wir konnten mit unserem AMD Gerät elf Stunden im WLAN surfen, verglichen mit 7,5 Stunden mit dem Intel Modell aus dem letzten Jahr. Das Inspiron 14 7435 2-in-1 hält also länger durch als viele andere Subnotebooks in dieser Preisklasse.
Das Aufladen von der leeren bis zur vollen Kapazität dauert etwa zwei Stunden.
| Dell Inspiron 14 7435 2-in-1 R5 7530U, Vega 7, 54 Wh | Dell Inspiron 14 7420 2-in-1 i7-1255U, Iris Xe G7 96EUs, 54 Wh | Lenovo IdeaPad Flex 7i 14IAU7 i7-1255U, Iris Xe G7 96EUs, 59 Wh | Acer Aspire 5 Spin 14 i5-1335U, Iris Xe G7 80EUs, 54.6 Wh | LG Gram 14T90P i5-1135G7, Iris Xe G7 80EUs, 72 Wh | HP Pavilion x360 14-dy0157ng i5-1135G7, Iris Xe G7 80EUs, 43 Wh | |
|---|---|---|---|---|---|---|
| Akkulaufzeit | -16% | -32% | 0% | 12% | -22% | |
| Idle (h) | 19.9 | 15.9 -20% | 17.7 -11% | |||
| WLAN (h) | 11.1 | 7.6 -32% | 7.6 -32% | 11.1 0% | 12.1 9% | 7.1 -36% |
| Last (h) | 2 | 2.1 5% | 2.3 15% | 1.6 -20% | ||
| H.264 (h) | 8.9 |
Pro
Contra
Fazit - Gute Performance für den Preis, aber das Display könnte einige Verbesserungen vertragen
Von der Leistung her ist unser 550-US-Dollar-Ryzen-5-Inspiron-14-7435 2-in-1 genauso gut wie das 800-US-Dollar-Core-i5-Inspiron-14-7430-2-in-1, ohne Kompromisse bei der Akkulaufzeit, der Displayqualität, den Lautsprechern oder anderen physikalischen Eigenschaften. Wenn Thunderbolt-Unterstützung nicht ganz oben auf Ihrer Liste steht, können Sie fast 200 Dollar sparen, wenn Sie sich bei diesem Modell für AMD statt für Intel entscheiden.
Die Ryzen-5-Konfiguration ist perfekt darauf abgestimmt, genauso gut zu funktionieren wie die Core-i5-Konfiguration - und das für Hunderte von Dollar weniger. Die kostspieligen RAM-Upgrades und der schwache Touchscreen ziehen das Modell jedoch ein wenig herunter.
Der verlötete Arbeitsspeicher ist in diesem Jahr ein großer Nachteil des Modells, denn ein einfaches Upgrade von 8 auf 16 GB kostet mindestens 150 Dollar extra. Für ein vermeintlich günstiges Convertible-Modell kann die kostspielige Aufrüstung die Zielgruppe abschrecken. Ansonsten sind die Änderungen an den Lautsprechern, dem Clickpad und den Scharnieren allesamt willkommene Verbesserungen.
Wir würden es begrüßen, wenn zukünftige Revisionen hellere Touchscreen-Optionen für eine bessere Sichtbarkeit im Freien enthalten würden. Das aktuelle 250-Nit-Display beschränkt das Modell auf Innenräume, was bedauerlich ist, da die Käufer das 14-Zoll-Convertible vielleicht auch unterwegs nutzen möchten. Eine solche Funktion würde dem Inspiron 14 7435 2-in-1 einen deutlichen Vorsprung gegenüber Konkurrenten wie dem Acer Aspire 5 Spin 14, Lenovo IdeaPad Flex 7i oder HP Pavilion x360 14 verleihen.
Preis und Verfügbarkeit
Dell liefert sein Inspiron 14 7435 2-in-1 derzeit zum Sonderpreis von 649 Euro für unsere getestete Ryzen-5-Konfiguration und zu 839 Euro für die Ryzen-7-Konfiguration aus. Alternativ gibt es das Intel Inspiron 14 7430 2-in-1 ab 839 Euro für die Core-i5-Konfiguration.
Dell Inspiron 14 7435 2-in-1
- 08.08.2023 v7 (old)
Allen Ngo
Transparenz
Die Auswahl der zu testenden Geräte erfolgt innerhalb der Redaktion. Das vorliegende Testmuster wurde dem Autor vom Hersteller oder einem Shop zu Testzwecken leihweise zur Verfügung gestellt. Eine Einflussnahme des Leihstellers auf den Testbericht gab es nicht, der Hersteller erhielt keine Version des Reviews vor der Veröffentlichung. Es bestand keine Verpflichtung zur Publikation. Als eigenständiges, unabhängiges Unternehmen unterliegt Notebookcheck keiner Diktion von Herstellern, Shops und Verlagen.
So testet Notebookcheck
Pro Jahr werden von Notebookcheck hunderte Laptops und Smartphones unabhängig in von uns standardisierten technischen Verfahren getestet, um eine Vergleichbarkeit aller Testergebnisse zu gewährleisten. Seit rund 20 Jahren entwickeln wir diese Testmethoden kontinuierlich weiter und setzen damit Branchenstandards. In unseren Testlaboren kommt ausschließlich hochwertiges Messequipment in die Hände erfahrener Techniker und Redakteure. Die Tests unterliegen einer mehrstufigen Kontrolle. Unsere komplexe Gesamtbewertung basiert auf hunderten fundierten Messergebnissen und Benchmarks, womit Ihnen Objektivität garantiert ist. Weitere Informationen zu unseren Testmethoden gibt es hier.
Preisvergleich

