Dell Latitude 7340 Laptop im Test - 100 g Gewichtsersparnis kosten wenige Prozent Leistung
Nachdem wir vor einigen Wochen den 14 Zoll kompakten Dell Latitude 7440 im Test hatten, wird es nun noch einmal knapp ein Zoll kompakter. Der Dell Latitude 7340 fällt mit seinen 13,3 Zoll noch etwas handlicher aus, wartet technisch aber mit der größtenteils identischen Ausstattung auf. Auch dieses Notebook ist mit dem Intel Core i5-1345U aus der 13. Generation samt vPro bestückt. Dazu kommen 16 GB LPDDR5 RAM sowie eine 512 GB M.2 PCIe NVMe SSD.
Wirkt sich der Formfaktor auf die Performance aus? Sprich bietet das noch kleinere Gehäuse dennoch die gleiche Leistung, obwohl weniger Platz für Kühlung, Akku und Co vorhanden ist. Dies ist einer unserer Schwerpunkte im Test des Dell Latitude 7340. Aber auch mit anderen Kompakt-Notebooks muss sich der Testkandidat duellieren, unter anderem dem günstigeren Dell Latitude 3440 mit gleicher CPU oder dem stärkeren, aber auch teureren HP Dragonfly G4.
Preisvergleich
Mögliche Konkurrenten im Vergleich
Bew. | Datum | Modell | Gewicht | Dicke | Größe | Auflösung | Preis ab |
|---|---|---|---|---|---|---|---|
| 90.2 % v7 (old) | 10 / 2023 | Dell Latitude 13 7340 i5-1345U i5-1345U, Iris Xe G7 80EUs | 1.1 kg | 18.2 mm | 13.30" | 1920x1200 | |
| 90.3 % v7 (old) | 07 / 2023 | Dell Latitude 7440 i5-1345U, Iris Xe G7 80EUs | 1.2 kg | 17.95 mm | 14.00" | 2560x1600 | |
| 85.3 % v7 (old) | 06 / 2023 | Dell Latitude 3440 i5-1345U, Iris Xe G7 80EUs | 1.5 kg | 19.4 mm | 14.00" | 1920x1080 | |
| 89 % v7 (old) | 07 / 2022 | Dell Latitude 13 7330 i7-1265U, Iris Xe G7 96EUs | 1 kg | 16.96 mm | 13.30" | 1920x1080 | |
| 91.9 % v7 (old) | 07 / 2023 | HP Dragonfly G4 i7-1365U, Iris Xe G7 96EUs | 1.1 kg | 16.3 mm | 13.50" | 1920x1280 | |
| 87.4 % v7 (old) | 09 / 2023 | Lenovo ThinkBook Plus Gen4 IRU i7-1355U, Iris Xe G7 96EUs | 1.4 kg | 17.7 mm | 13.30" | 2880x1800 |
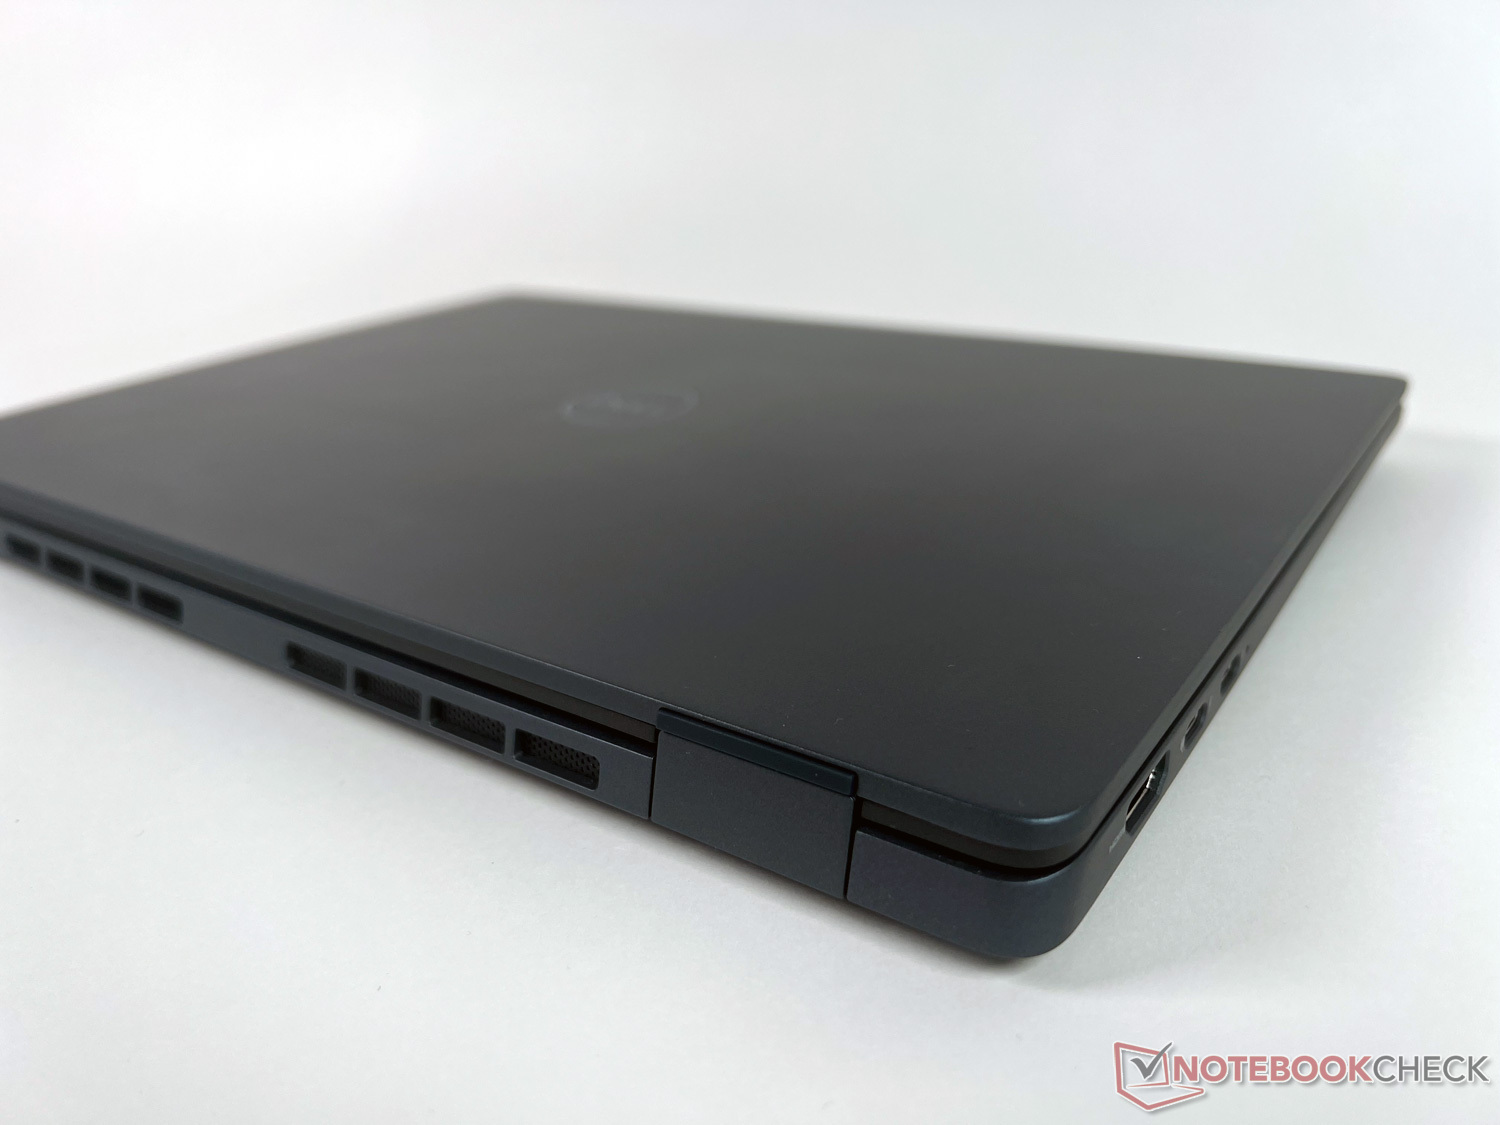
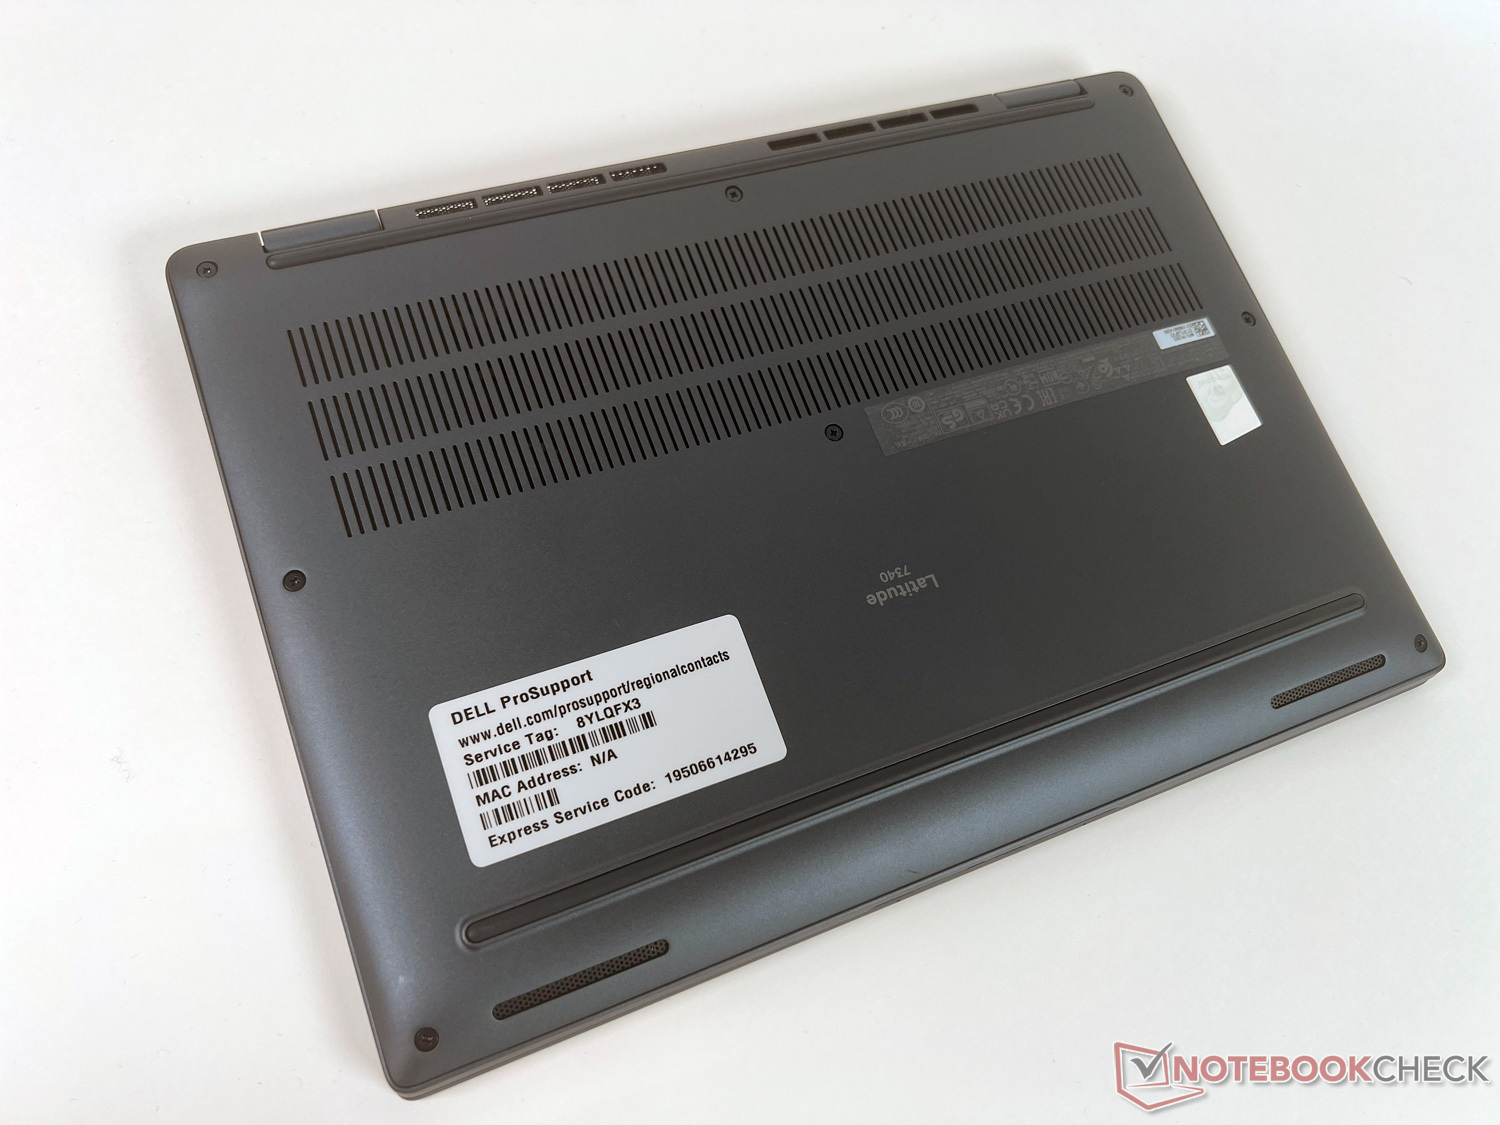
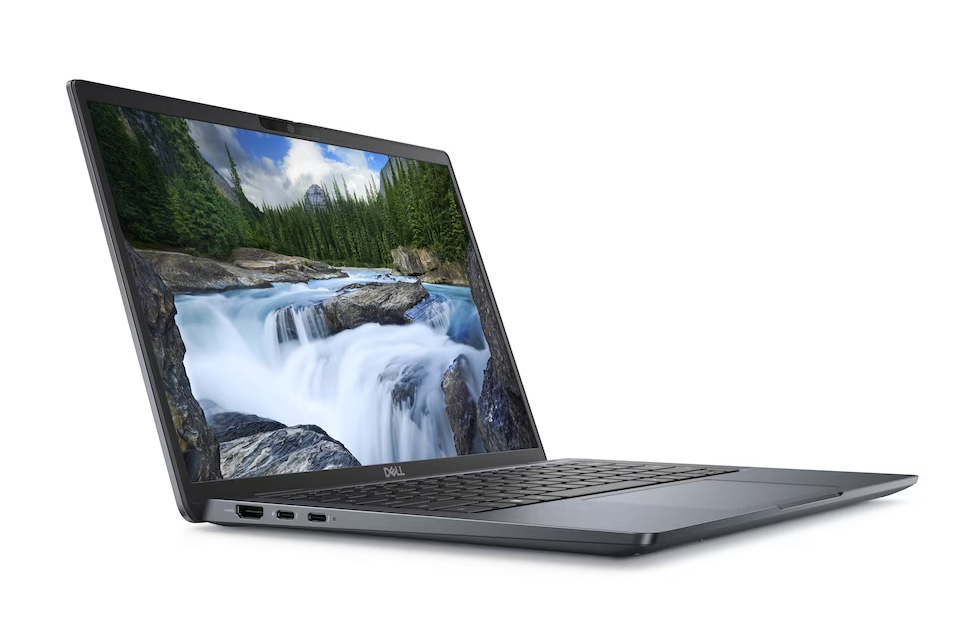
Gehäuse & Ausstattung - ultraleichtes und kompaktes Magnesiumgehäuse
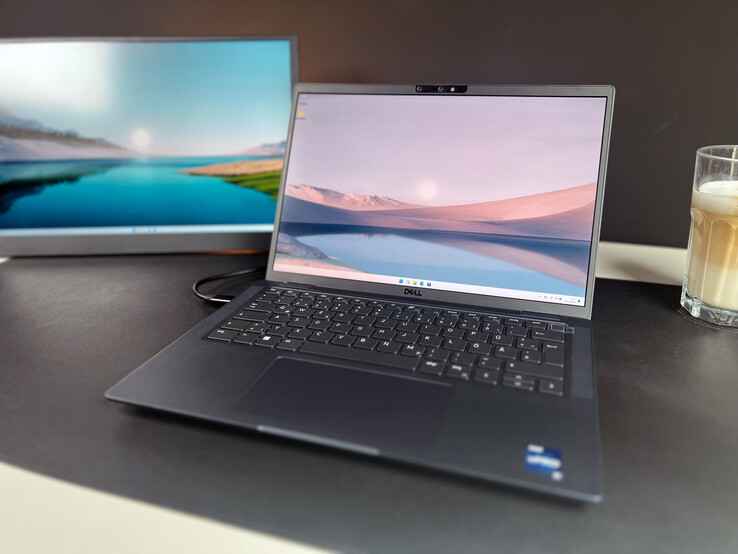
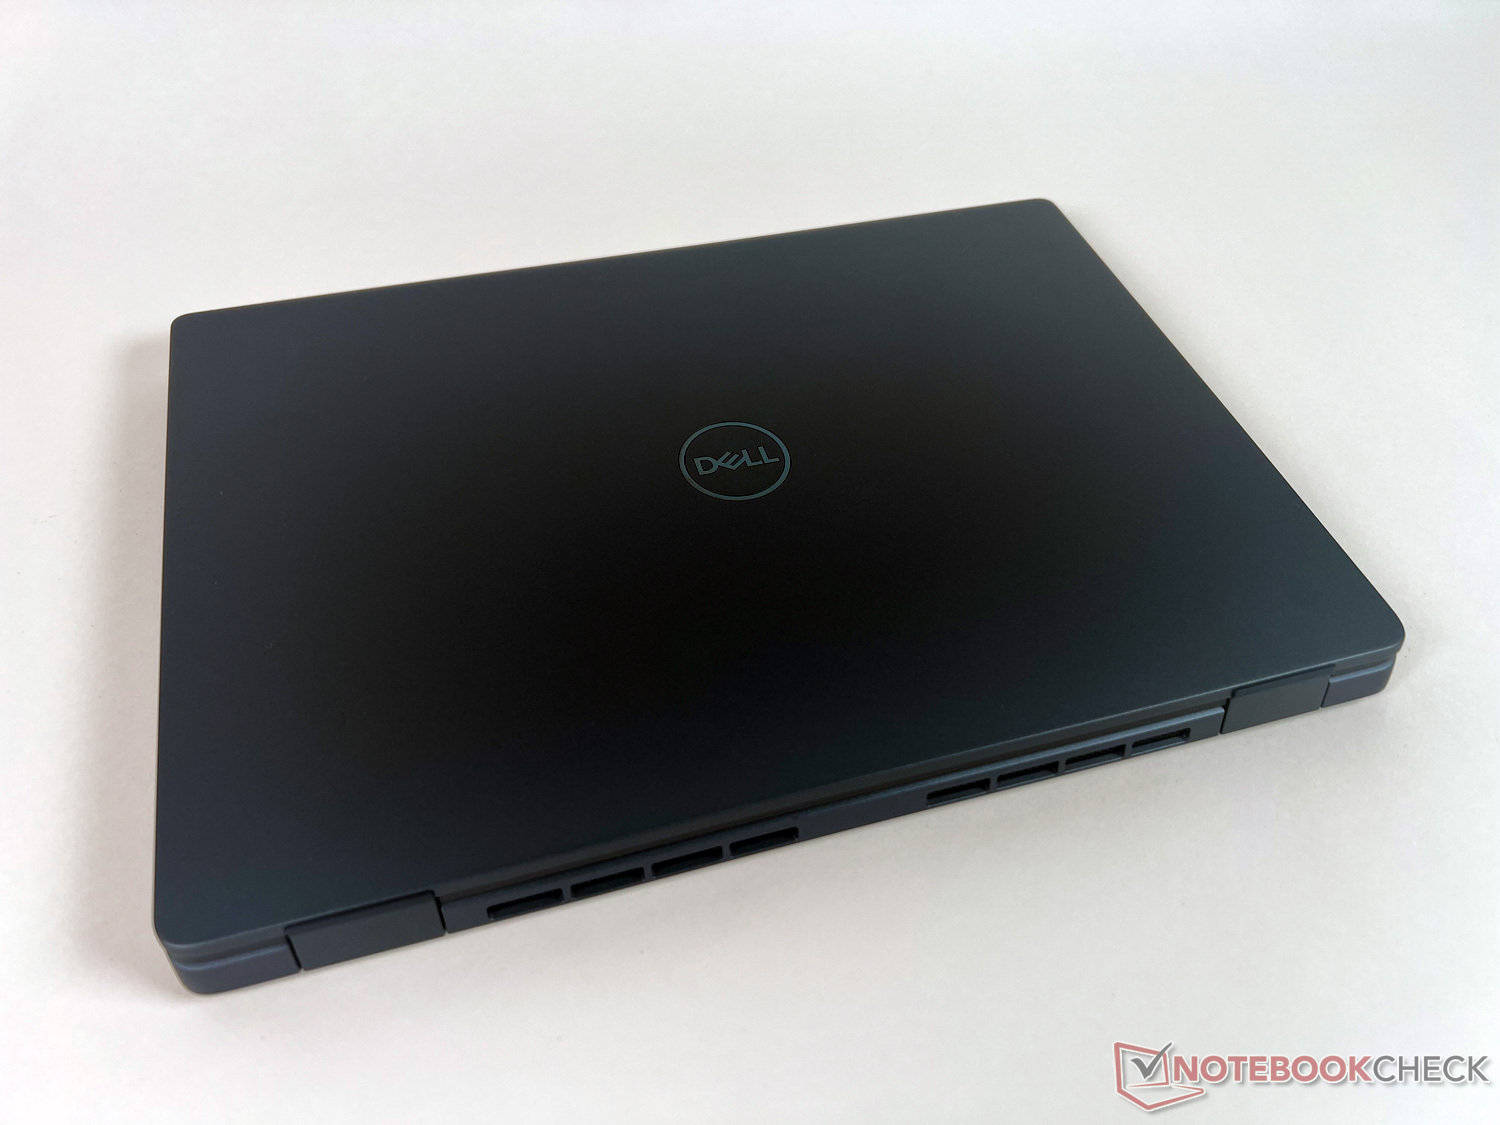
Das Dell Latitude 7340 präsentiert sich im schlichten, hochwertig verarbeiteten und haptisch angenehm anzufassenden Magnesiumgehäuse in einem dunkleren Grauton. Das Gerät bringt in der vorliegenden Ultralight-Ausführung rund 1,1 kg auf die Waage und liegt damit auf Augenhöhe mit den anderen 13,3-Zöllern. Im Vergleich zum Latitude 7440 werden trotz weniger Displaydiagonale aber lediglich knapp 100 g gespart. Der Unterschied fällt also kaum ins Gewicht.
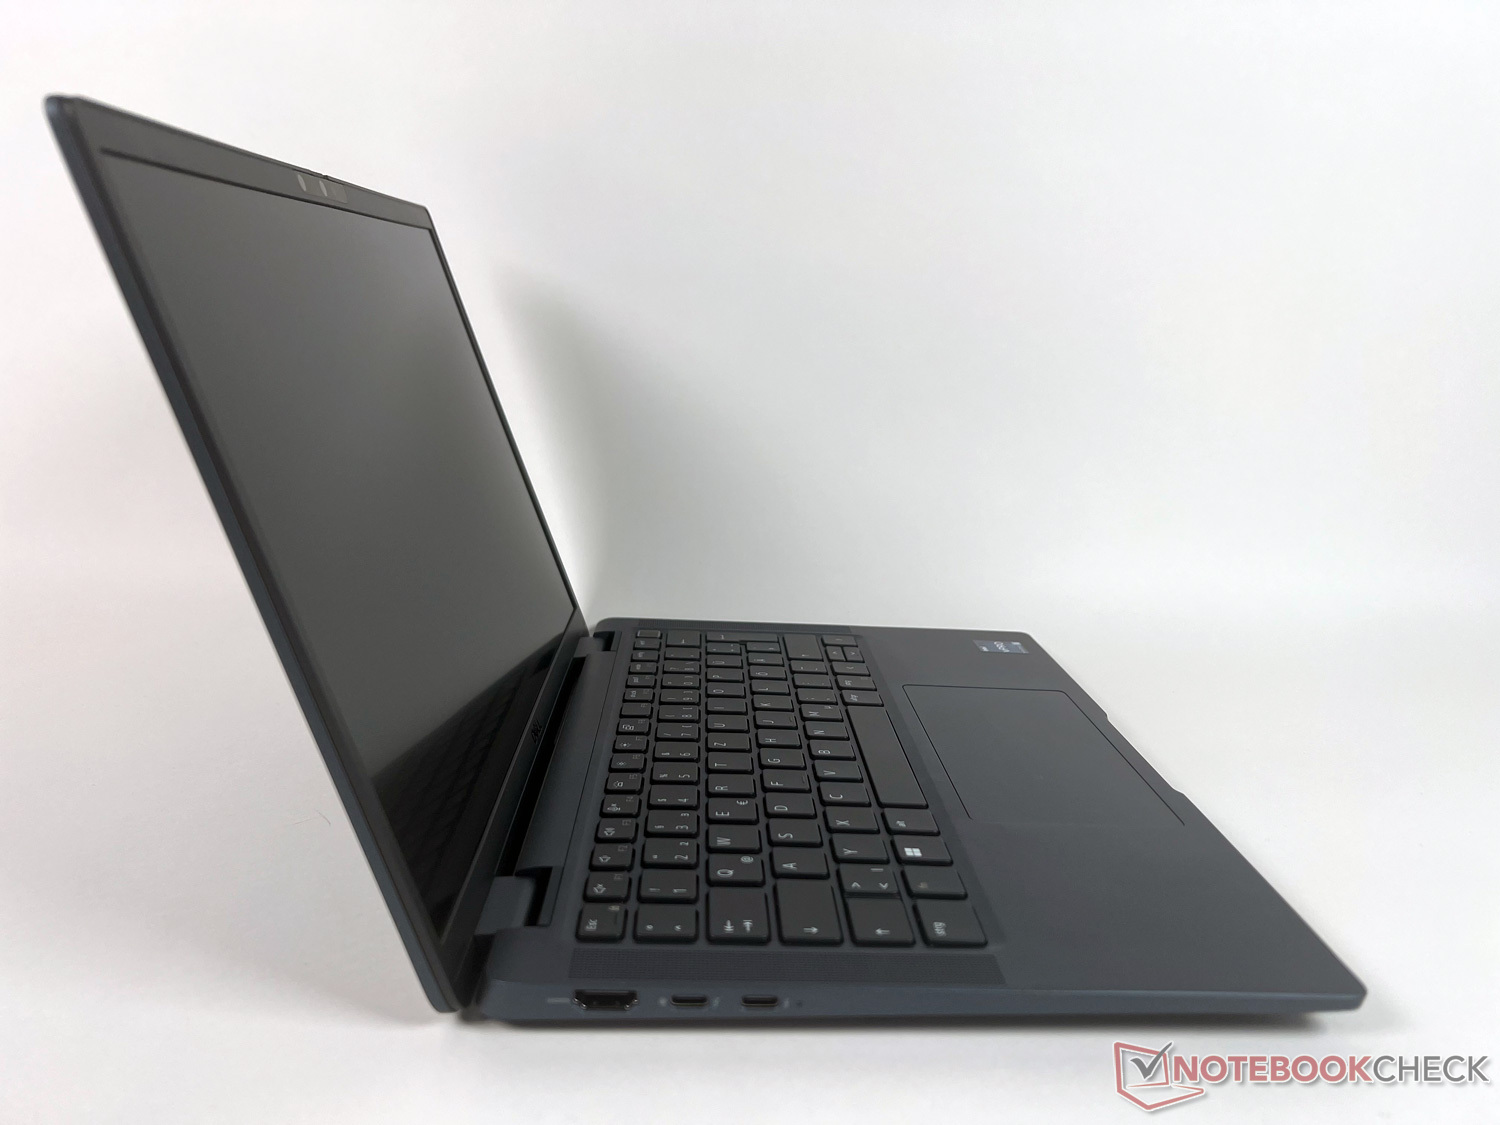
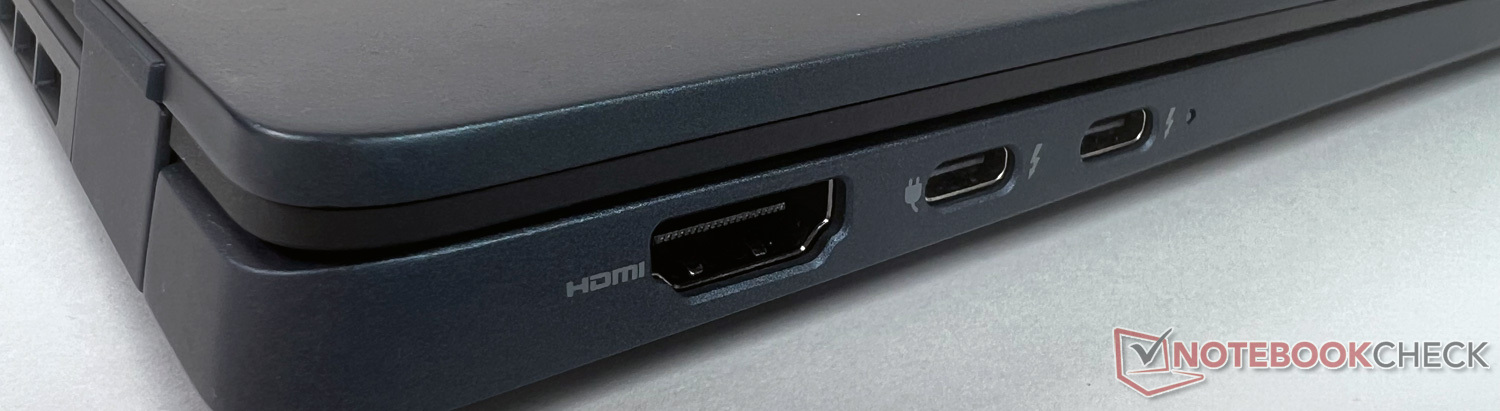
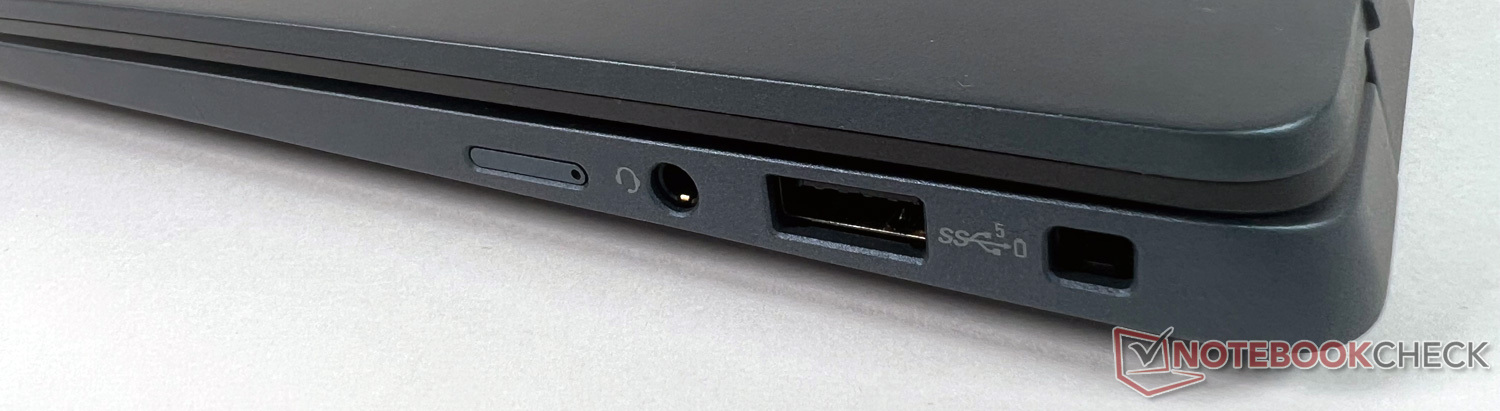
Als Anschlüsse stehen auf der linken Seite zweimal Thunderbolt 4 samt DisplayPort und Power Delivery zur Verfügung. Zudem gibt es u.a. einen HDMI-Port und einmal USB 3.2 Typ-A. Optional ist das Gerät mit LTE-Mobilfunk-Konnektivität (WWAN) ausgestattet. Dazu kommen Wi-Fi 6E und Bluetooth. Die WLAN-Geschwindigkeit ist bei 6 GHz top, sonst (im Vergleich zur Konkurrenz) flop.
Die verbaute 1080p-Webcam, die per Schieber manuell abgedeckt werden kann, fängt Farben nicht sonderlich naturgetreu ein (11.8 ∆E) und schneidet deutlich schlechter ab als in der vorherigen Generation Latitude 7330.
Positiv an dieser Stelle zu erwähnen ist zudem, dass Dell im Sinne der Nachhaltigkeit bei der Verpackung auf jegliches Plastik verzichtet.
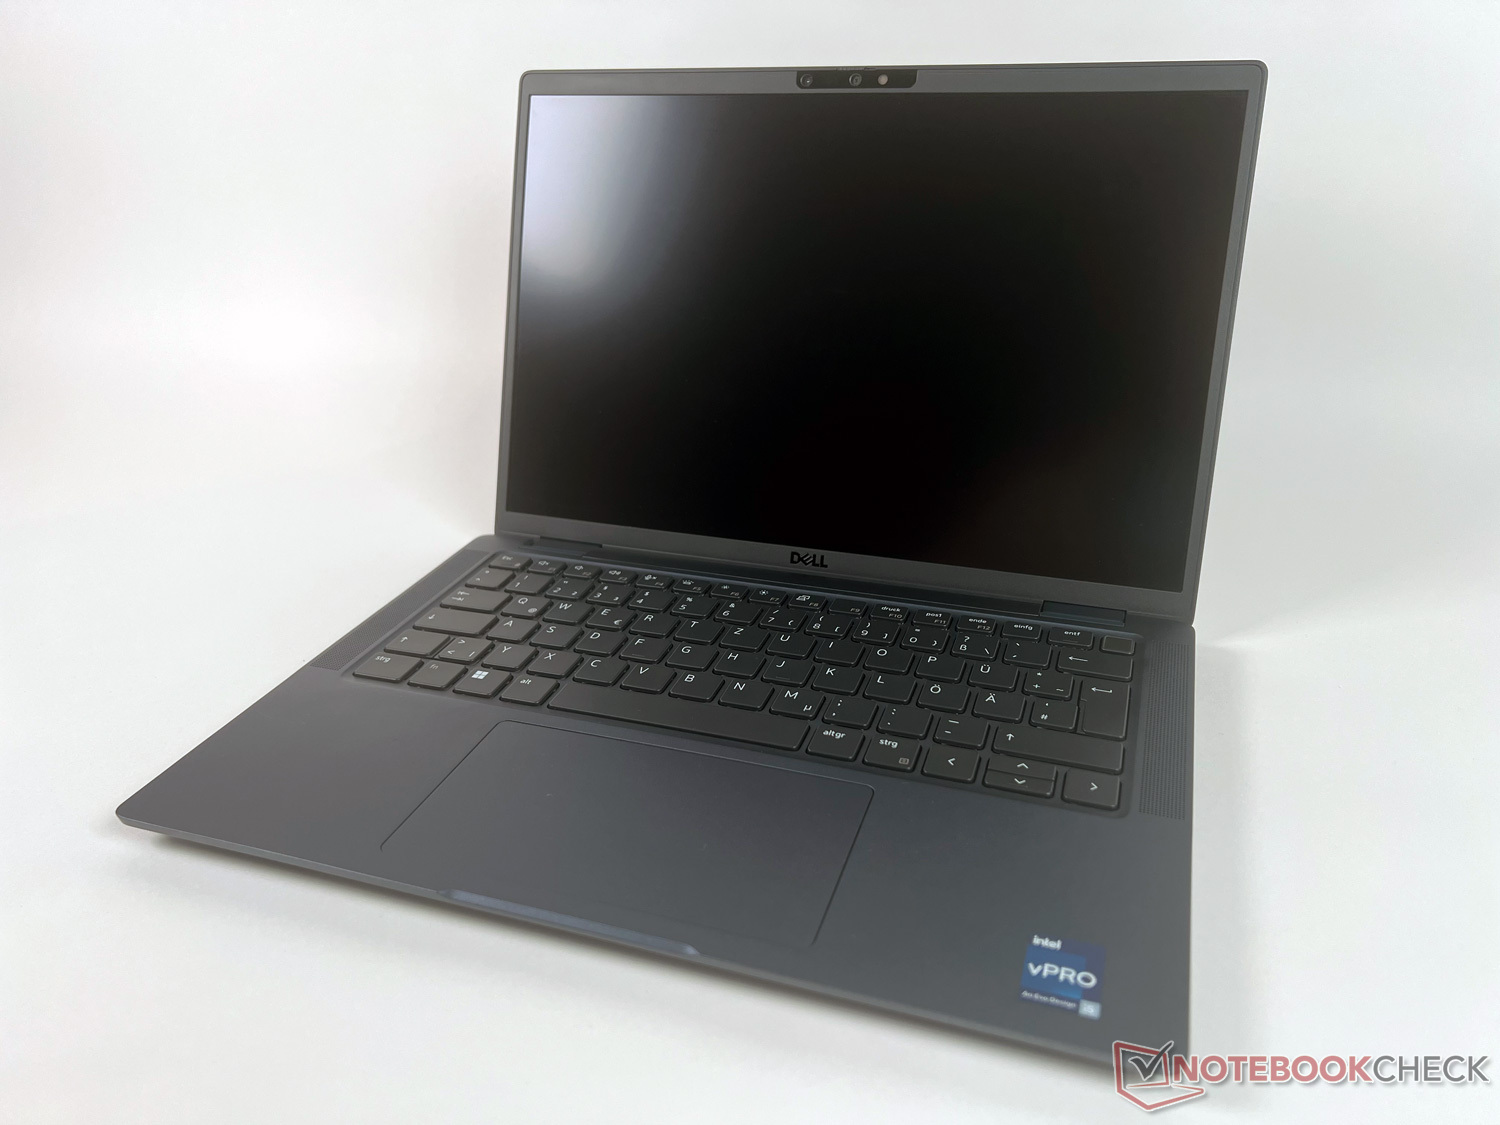
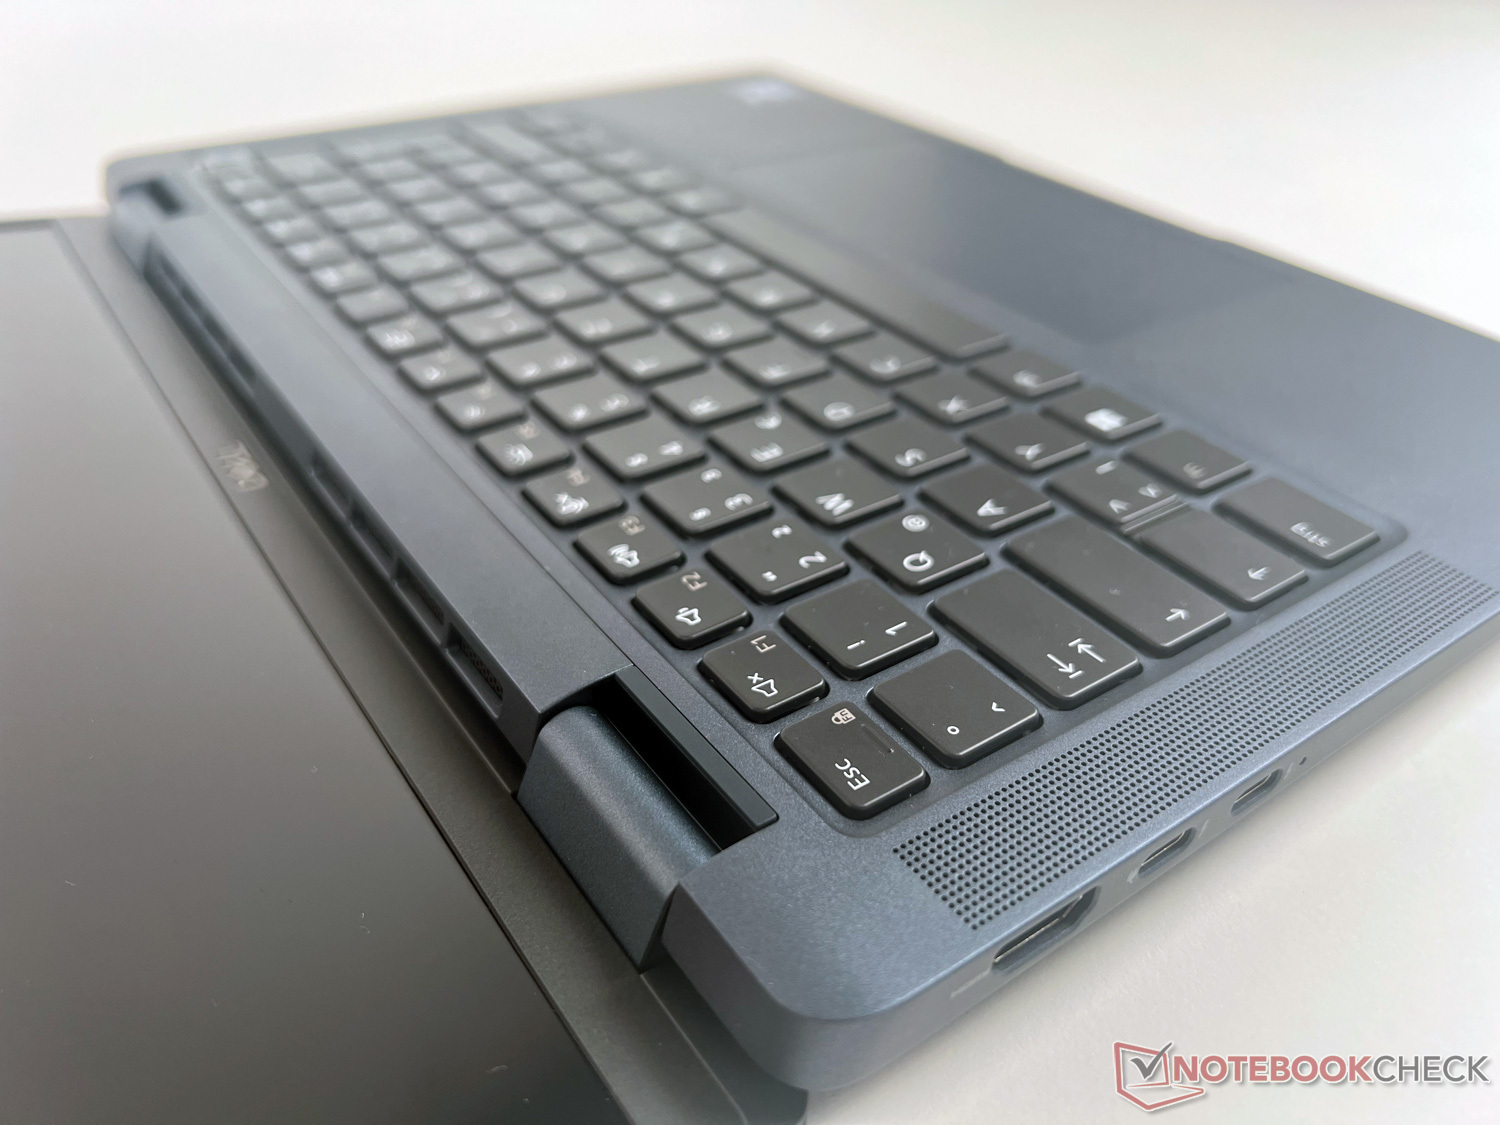


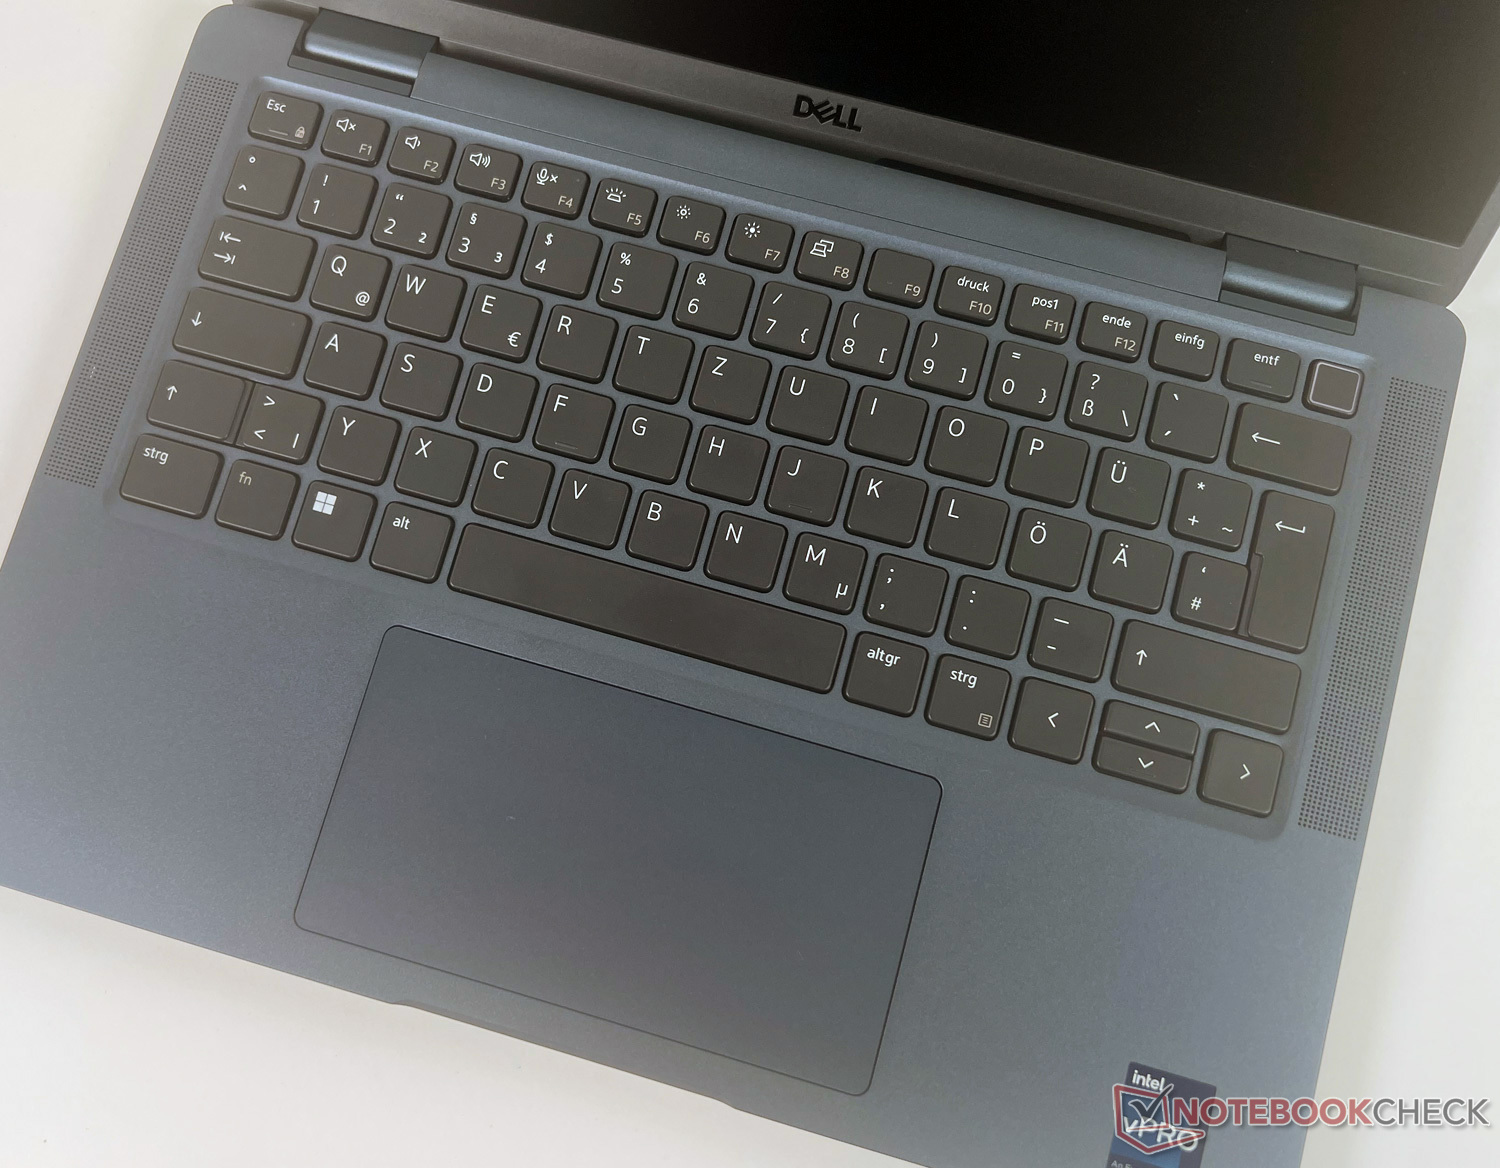
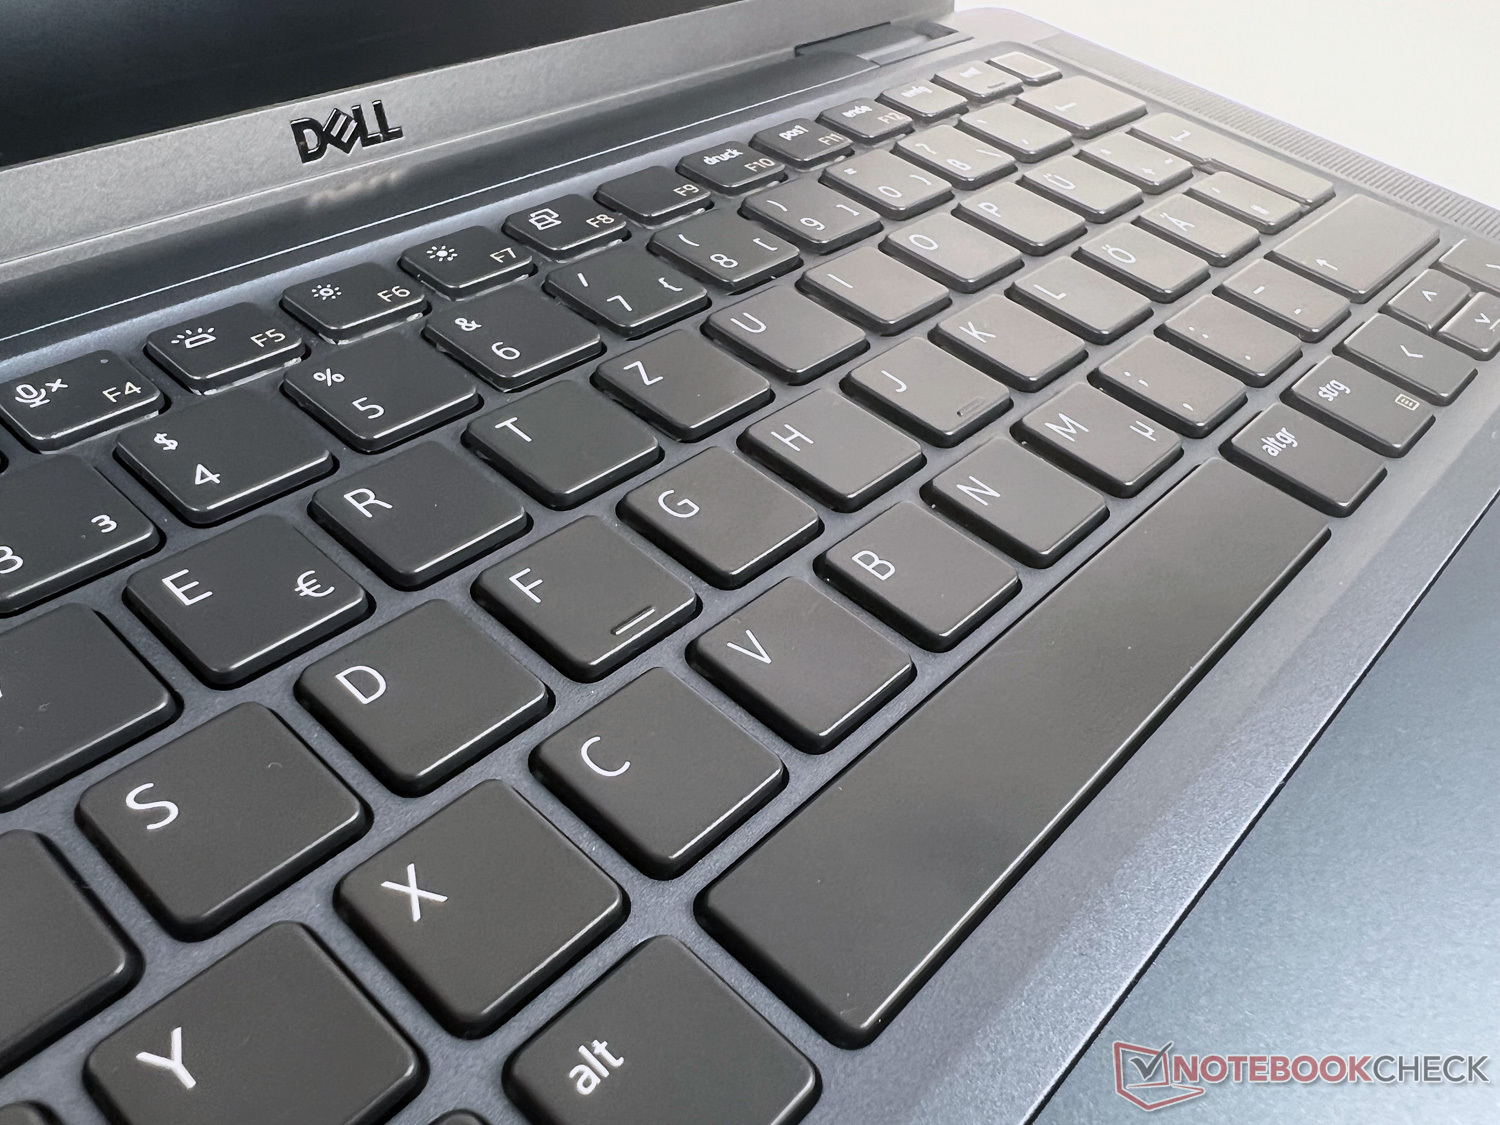
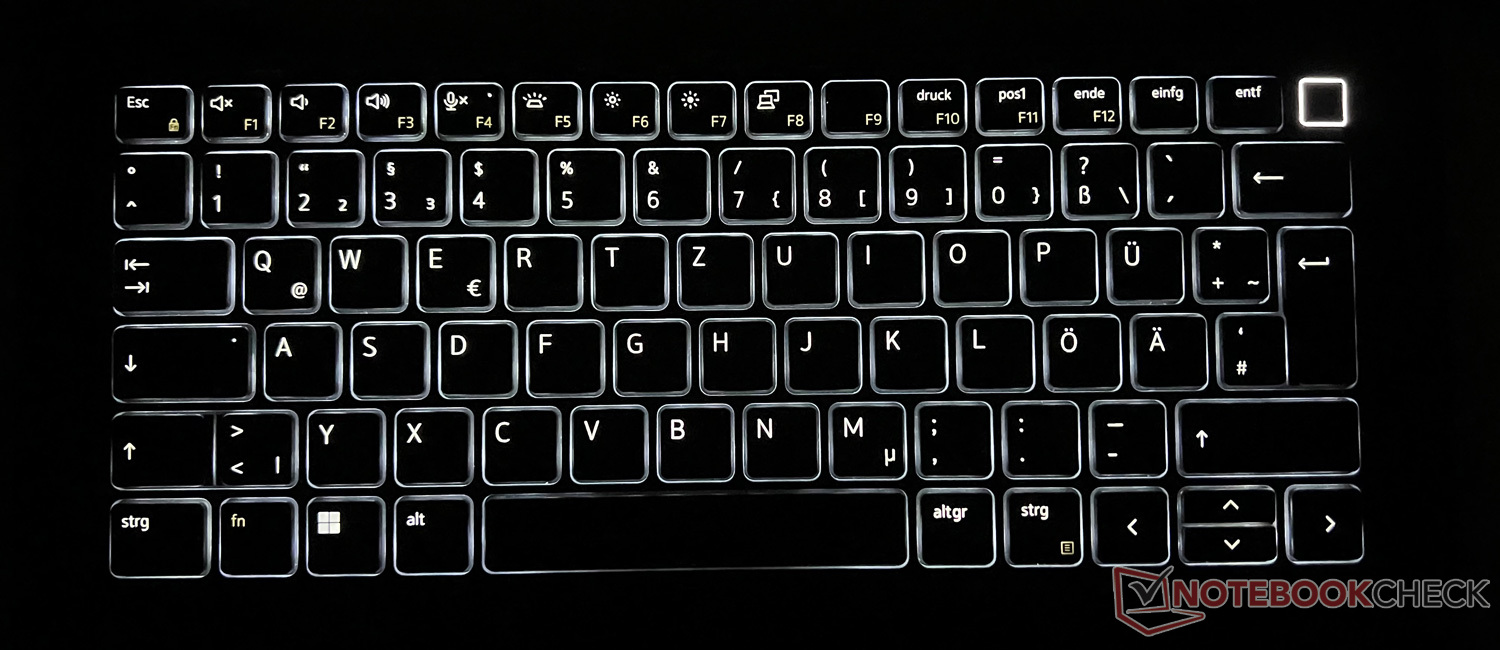
Eingabegeräte - geringes Platzangebot fast optimal genutzt
Ein kompaktes Gehäuse hat auch wenig Platz für die Tastatur zur Folge. Dell nutzt die gebotene Gerätebreite bis auf 2 cm links und rechts aus, was Platz für ca. 16 x 16 mm große Tasten, aber kein Numpad schafft. Nach kurzer Eingewöhnung stellt sich aber auch bei größeren Händen ein solides Tippgefühl ein.
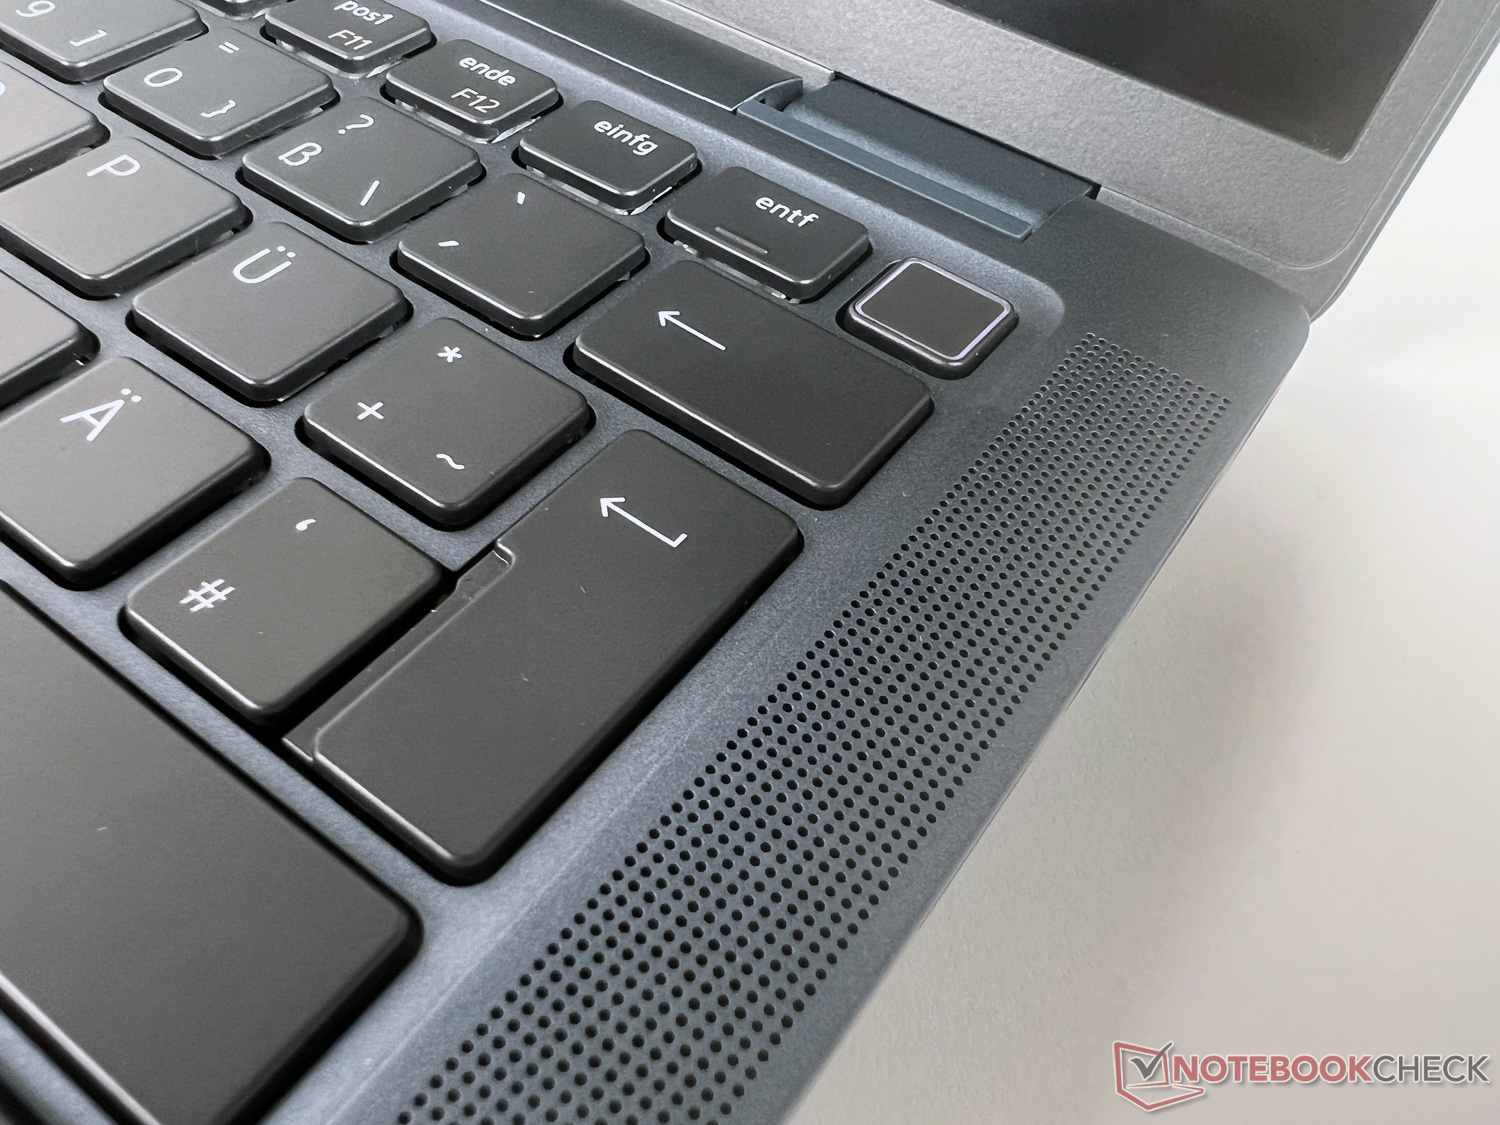
Oben rechts bringt Dell einen Fingerabdrucksensor in der Powertaste unter. Die Tasten F1 bis F12 belegt man mit den üblichen Funktionen wie Lautstärke- und Helligkeitsregelung. Dort lässt sich auch die Tastaturbeleuchtung in ihren drei Stufen (aus, dunkel, hell) regeln.
Mittig im unteren Bereich verbaut Dell ein ca. 12,5 x 6,8 cm großes Touchpad, das eine angenehme Haptik sowie leise Klickgeräusche aufweist und insgesamt wenig Grund für Kritik liefert.
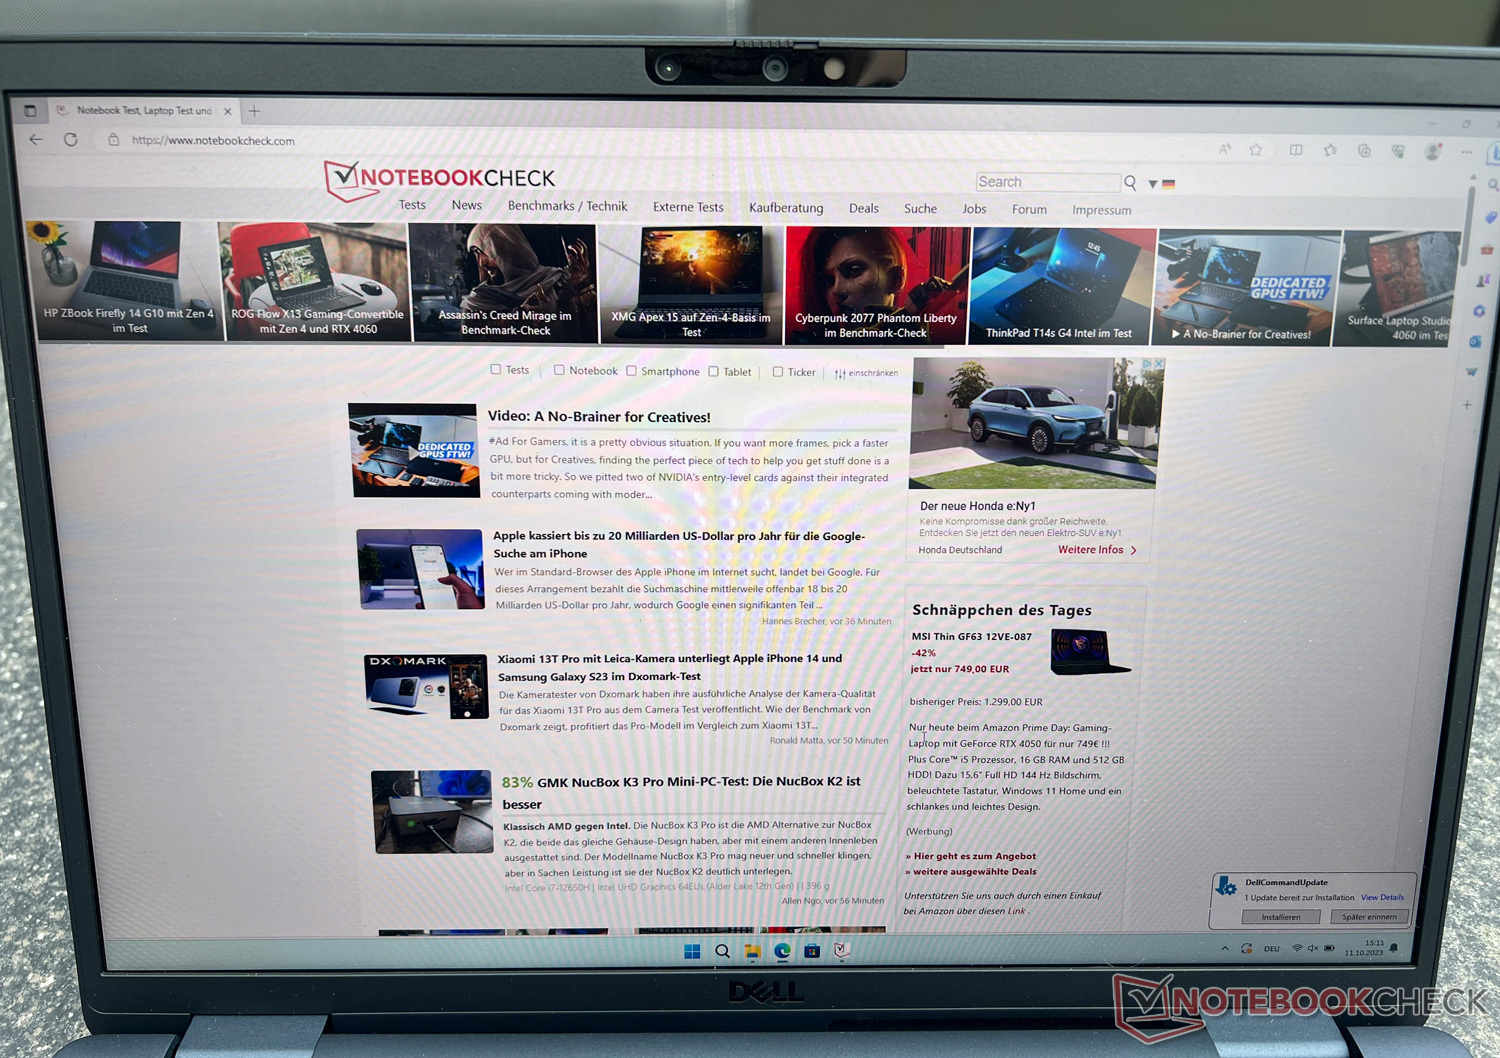
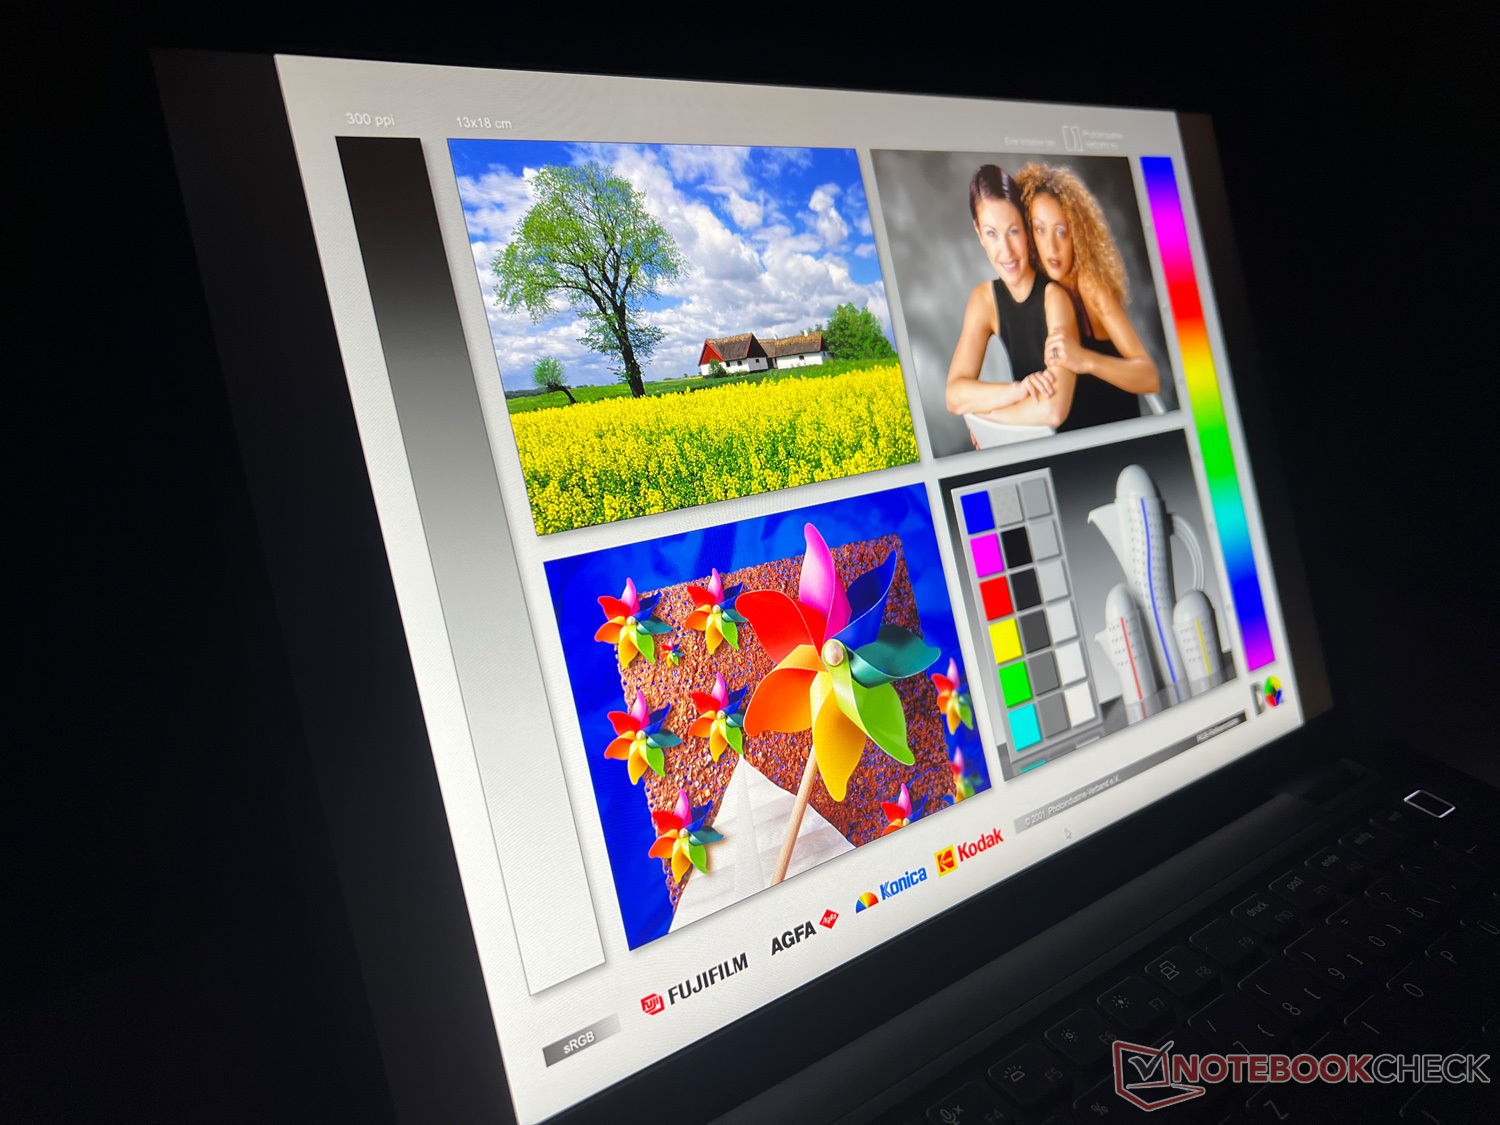
Display - matt und ausreichend heller FHD+-Bildschirm
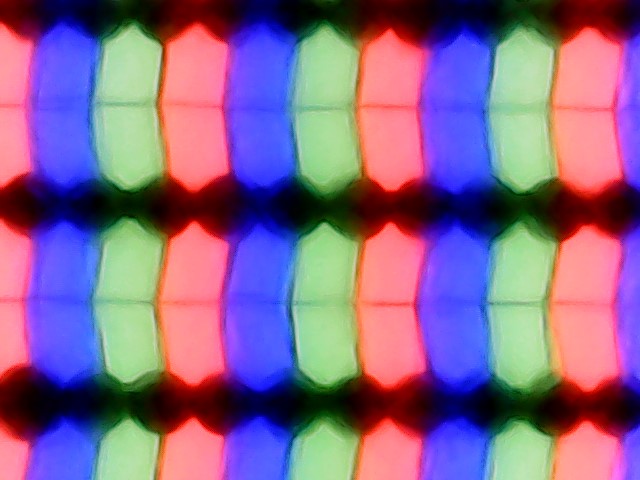
Das verbaute IPS-Panel weist ein Seitenverhältnis von 16:10 auf und löst mit 1.920 x 1.200 Pixeln (FHD+) auf. So steht in der Bildhöhe etwas mehr Platz zur Verfügung, was sich bei gerade einmal 13,3 Zoll Diagonale positiv auswirkt.
Lobenswert ist die Bildhelligkeit, die im Schnitt bei deutlich über 400 cd/m², aber etwas unter den Werten des 1600p-Panels im getesteten Latitude 7440 liegt. In Kombination mit dem matten Display ist das Gerät gut im Freien nutzbar, was gerade bei einem auf Mobilität ausgelegten Laptop wie diesem wichtig, aber nicht immer selbstverständlich ist.
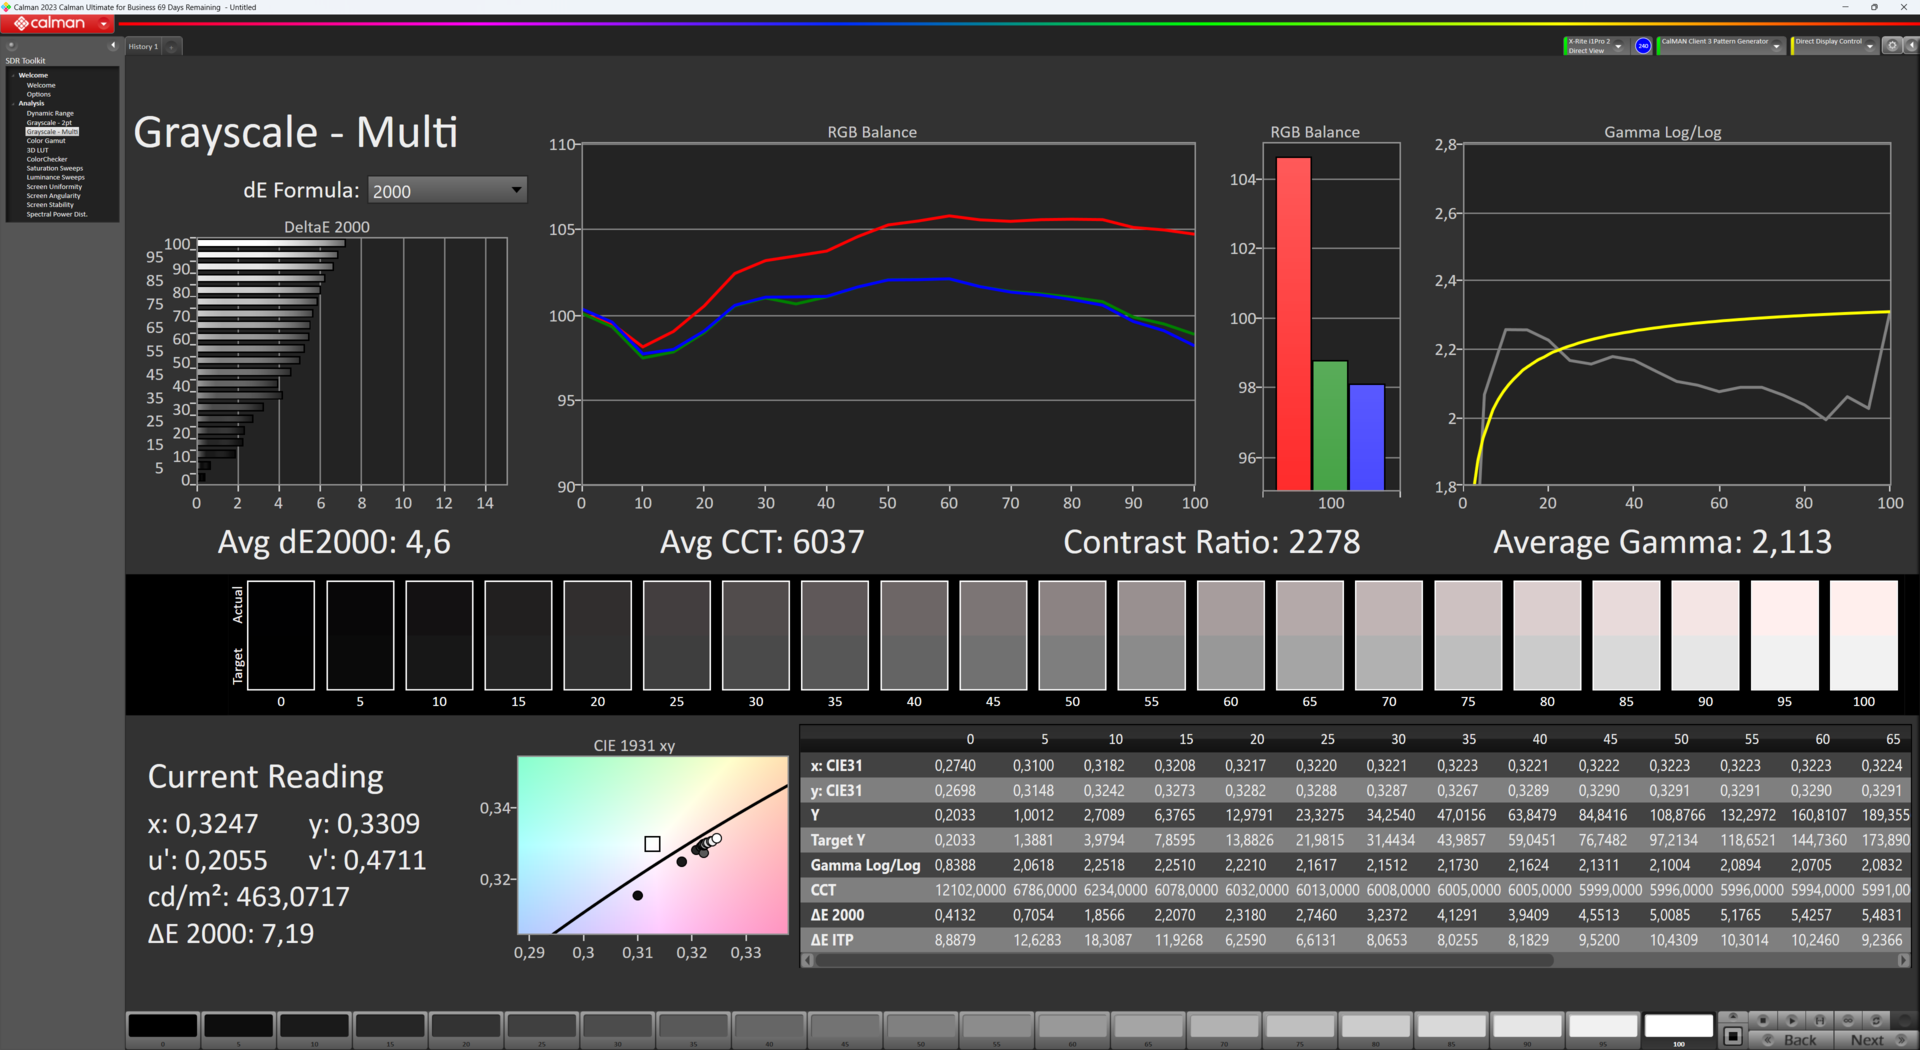
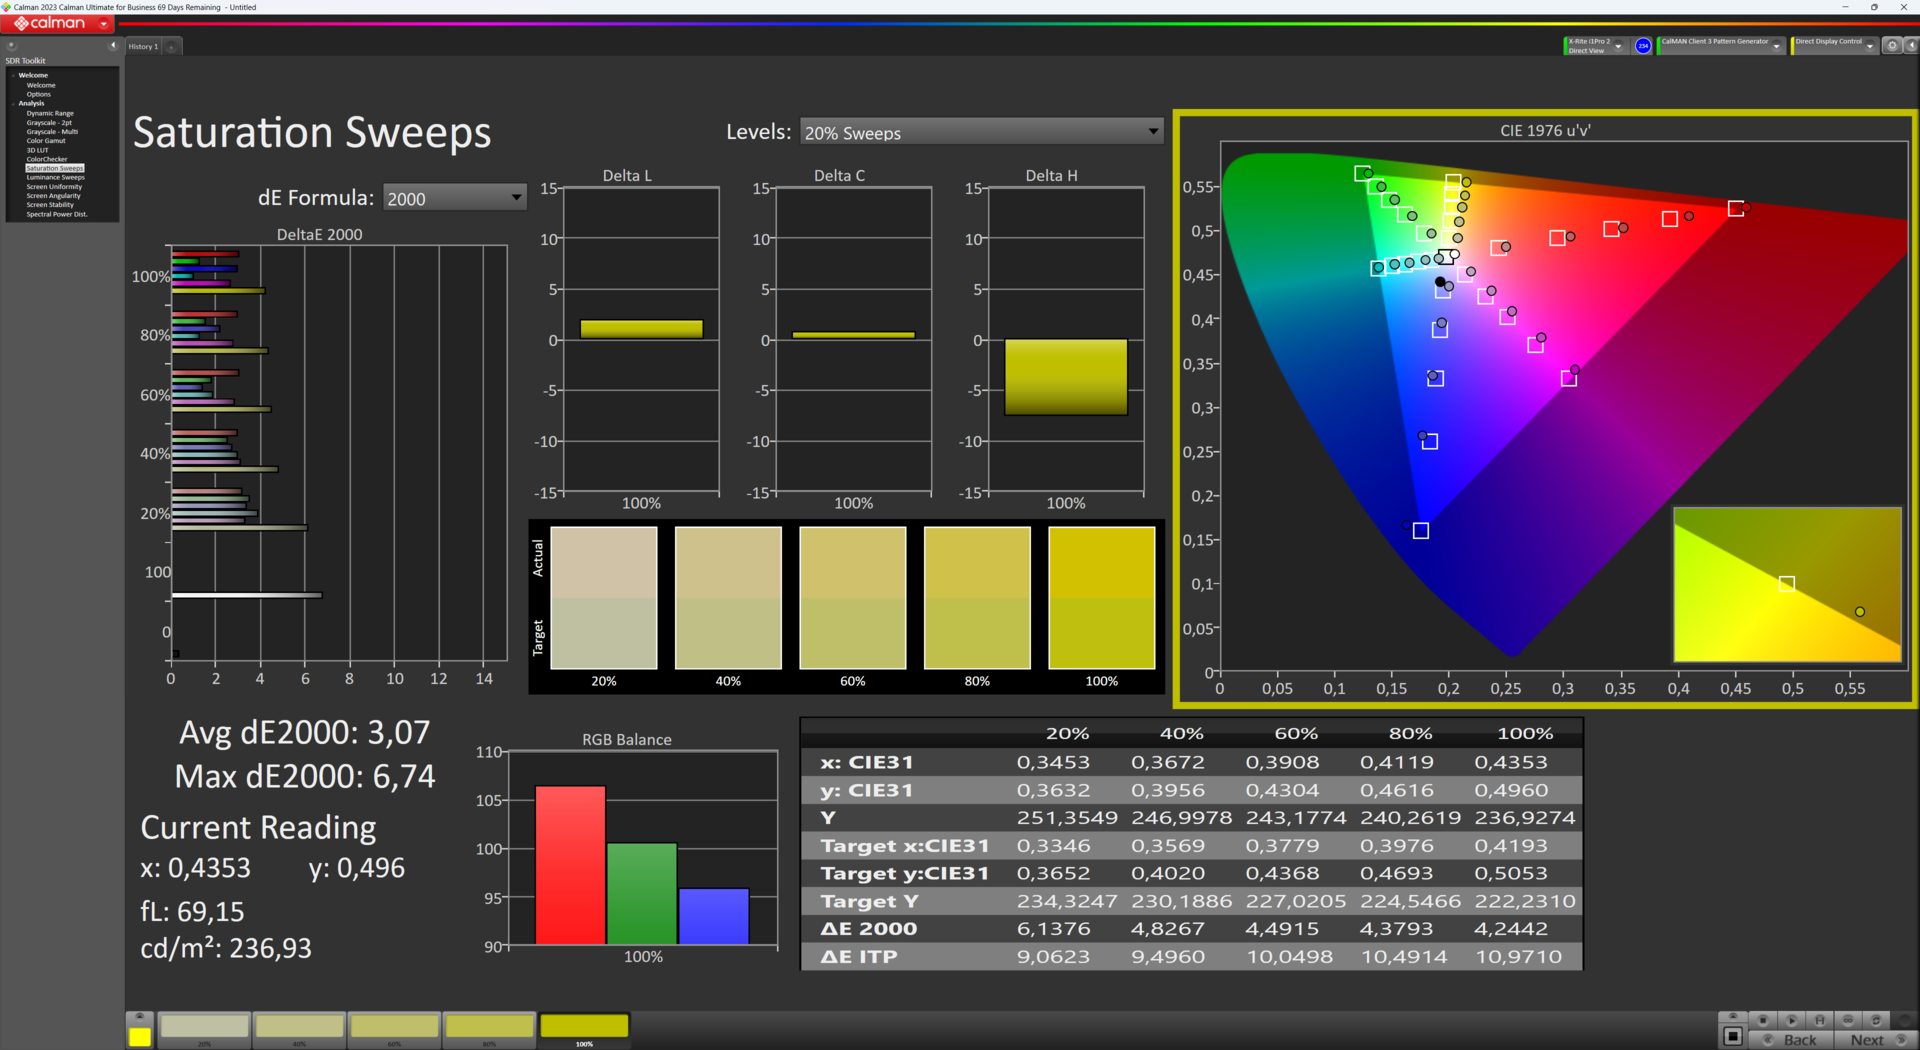
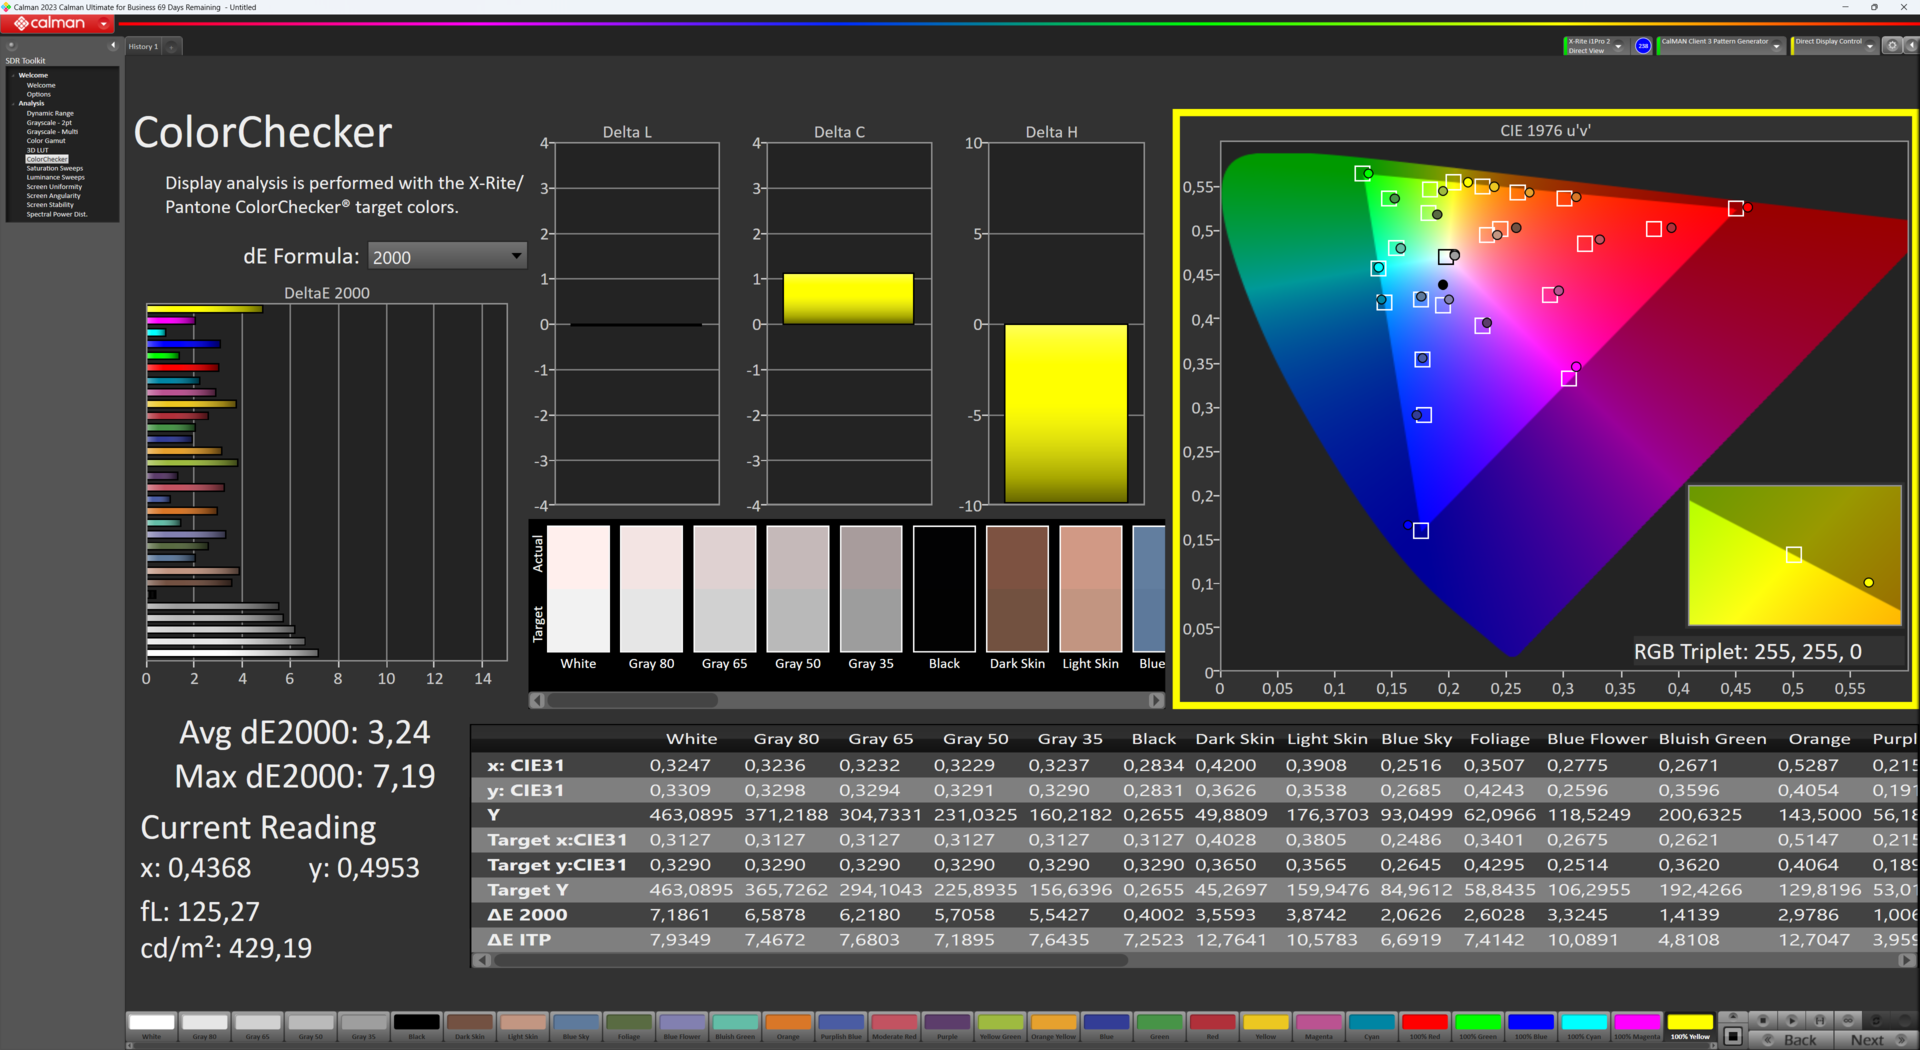
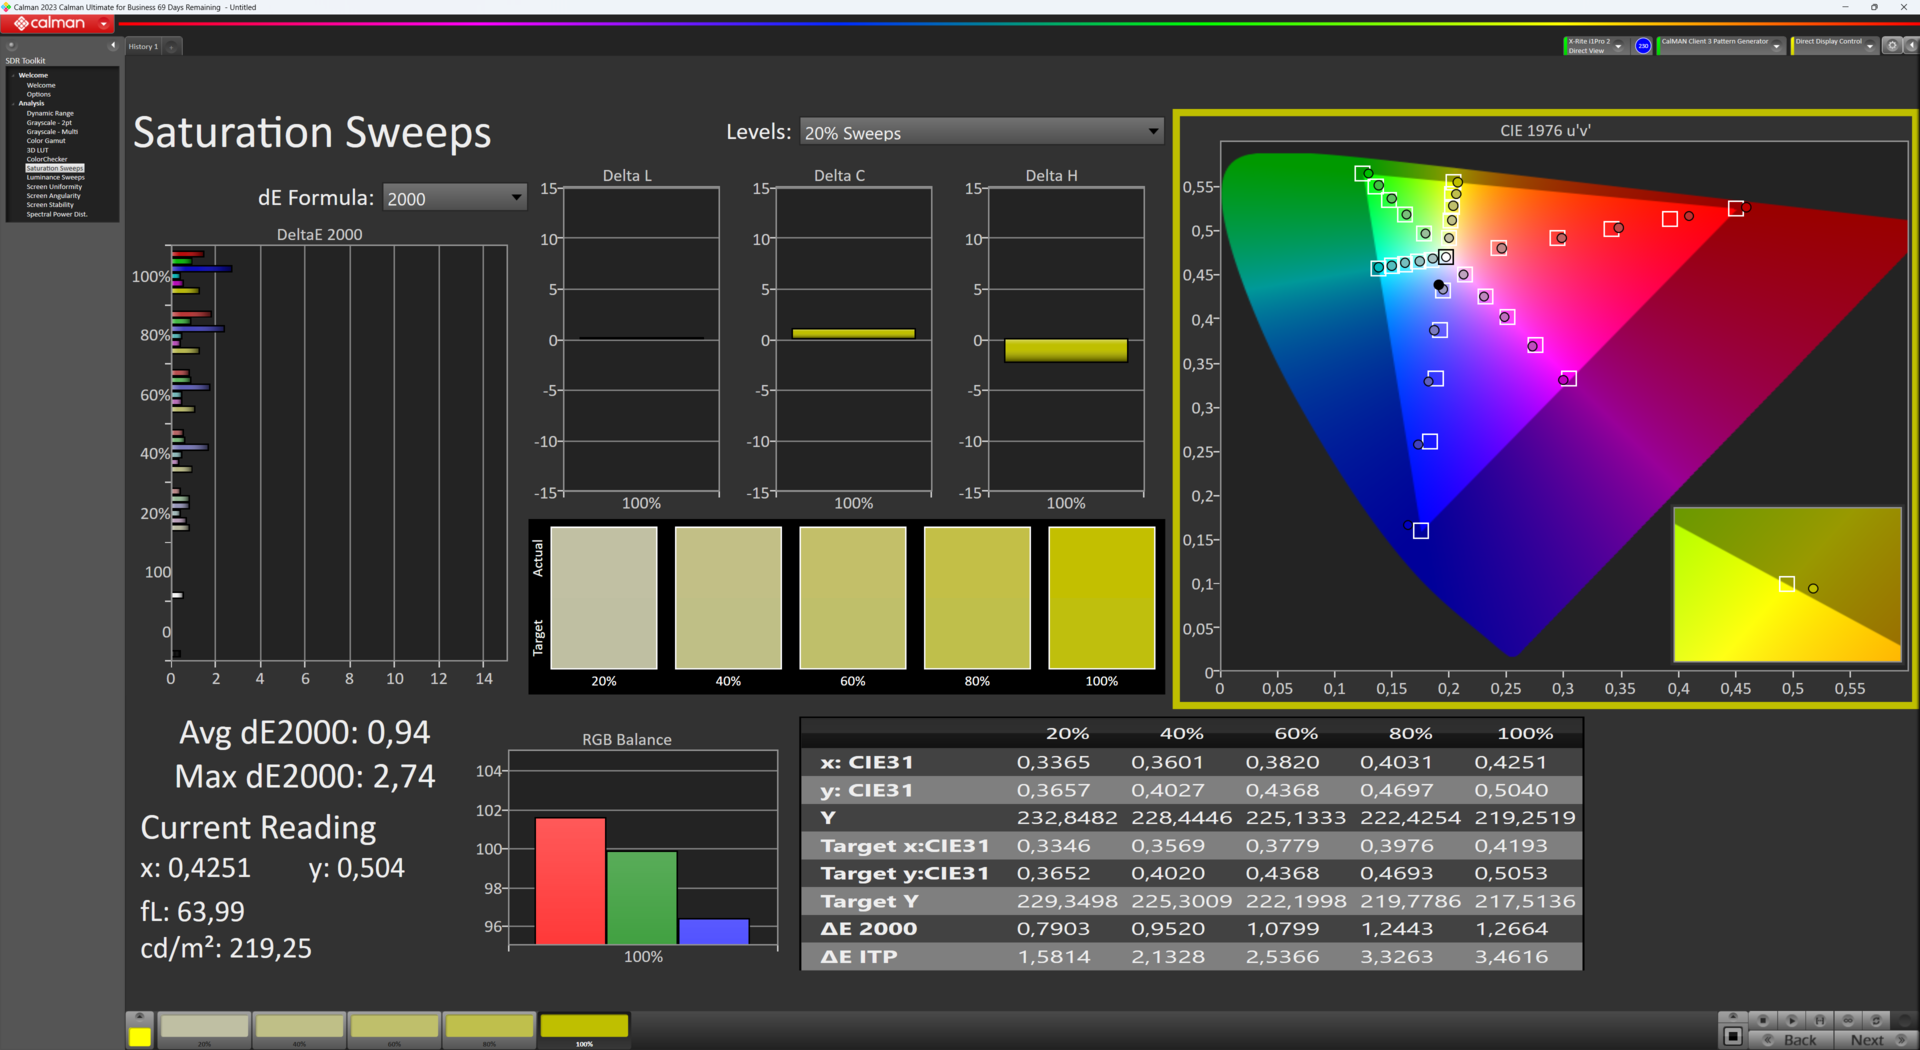
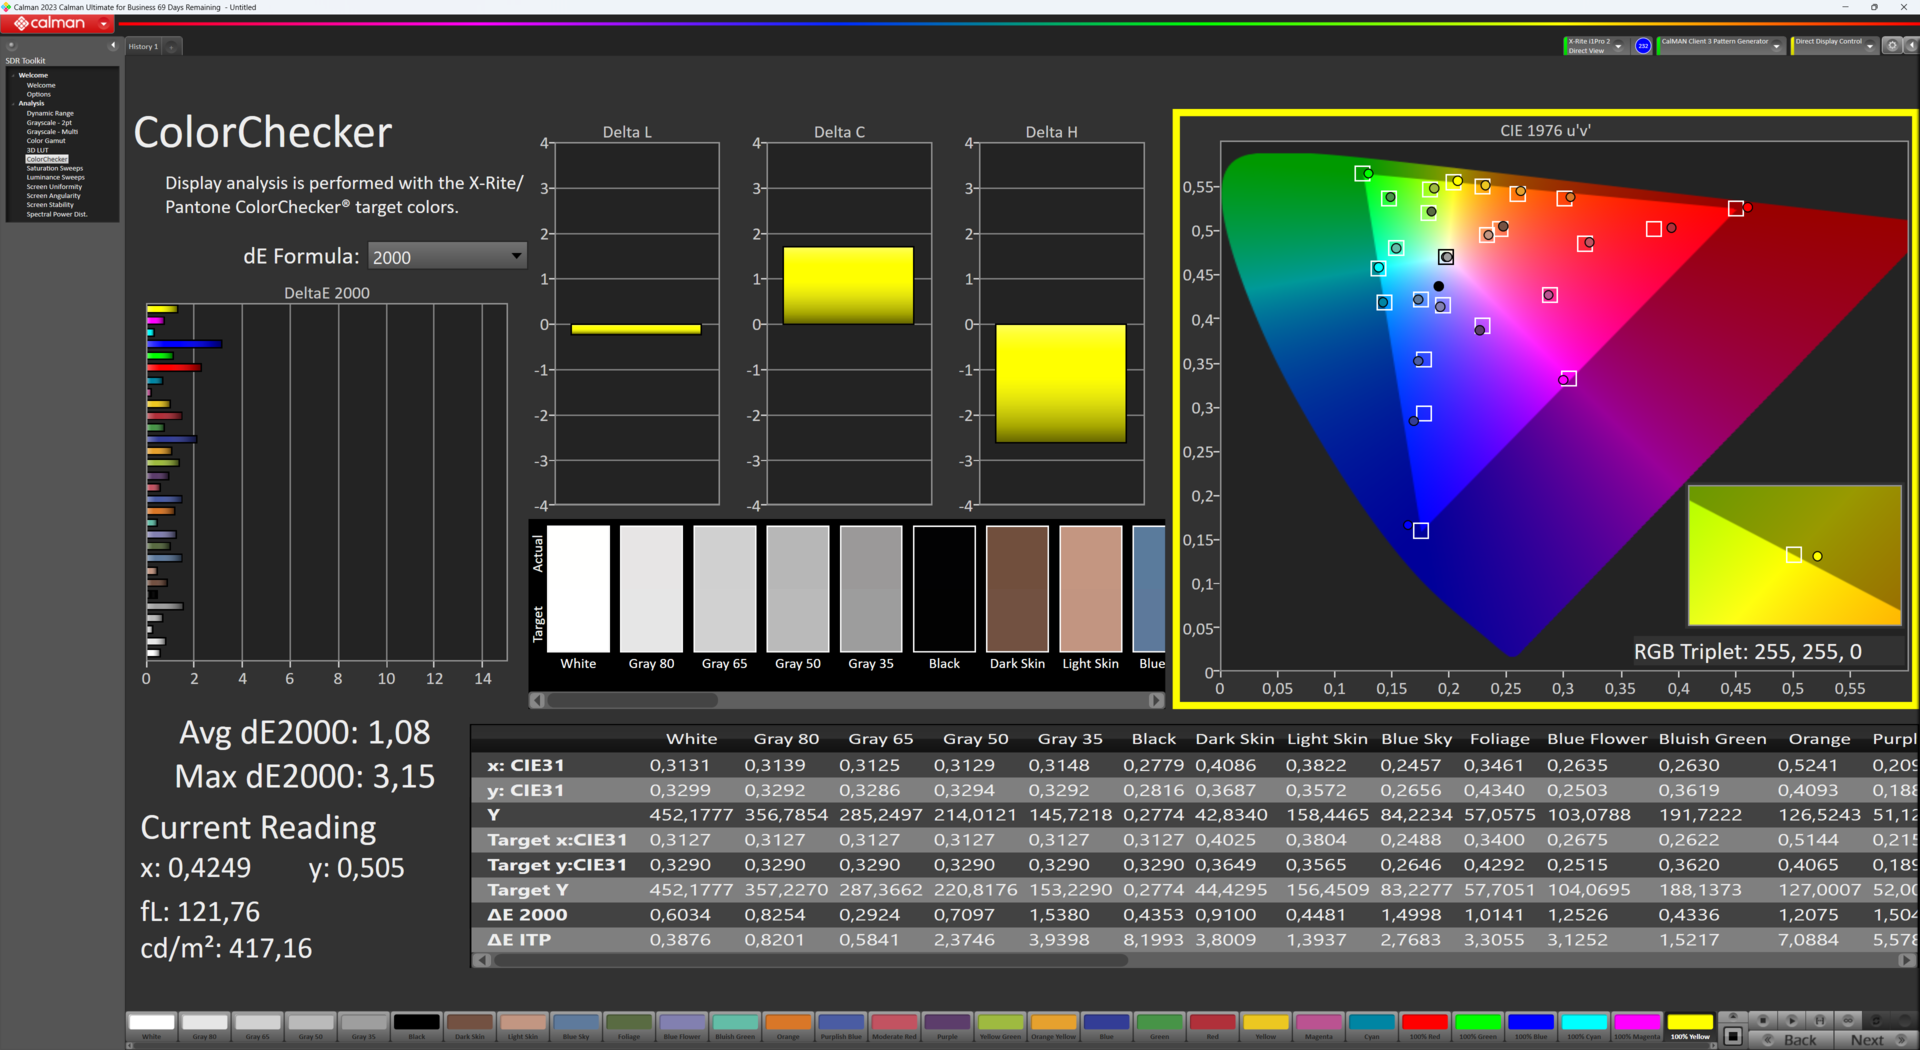
Bei den restlichen Messwerten schwimmt das Dell Latitude 7340 im Test solide mit und leistet sich keine Ausrutscher. Während die Farbraumabdeckung solide ist, aber nicht für professionelle Grafikbearbeitung langt, lässt sich die Farbwiedergabe per Kalibrierung deutlich verbessern.
| |||||||||||||||||||||||||
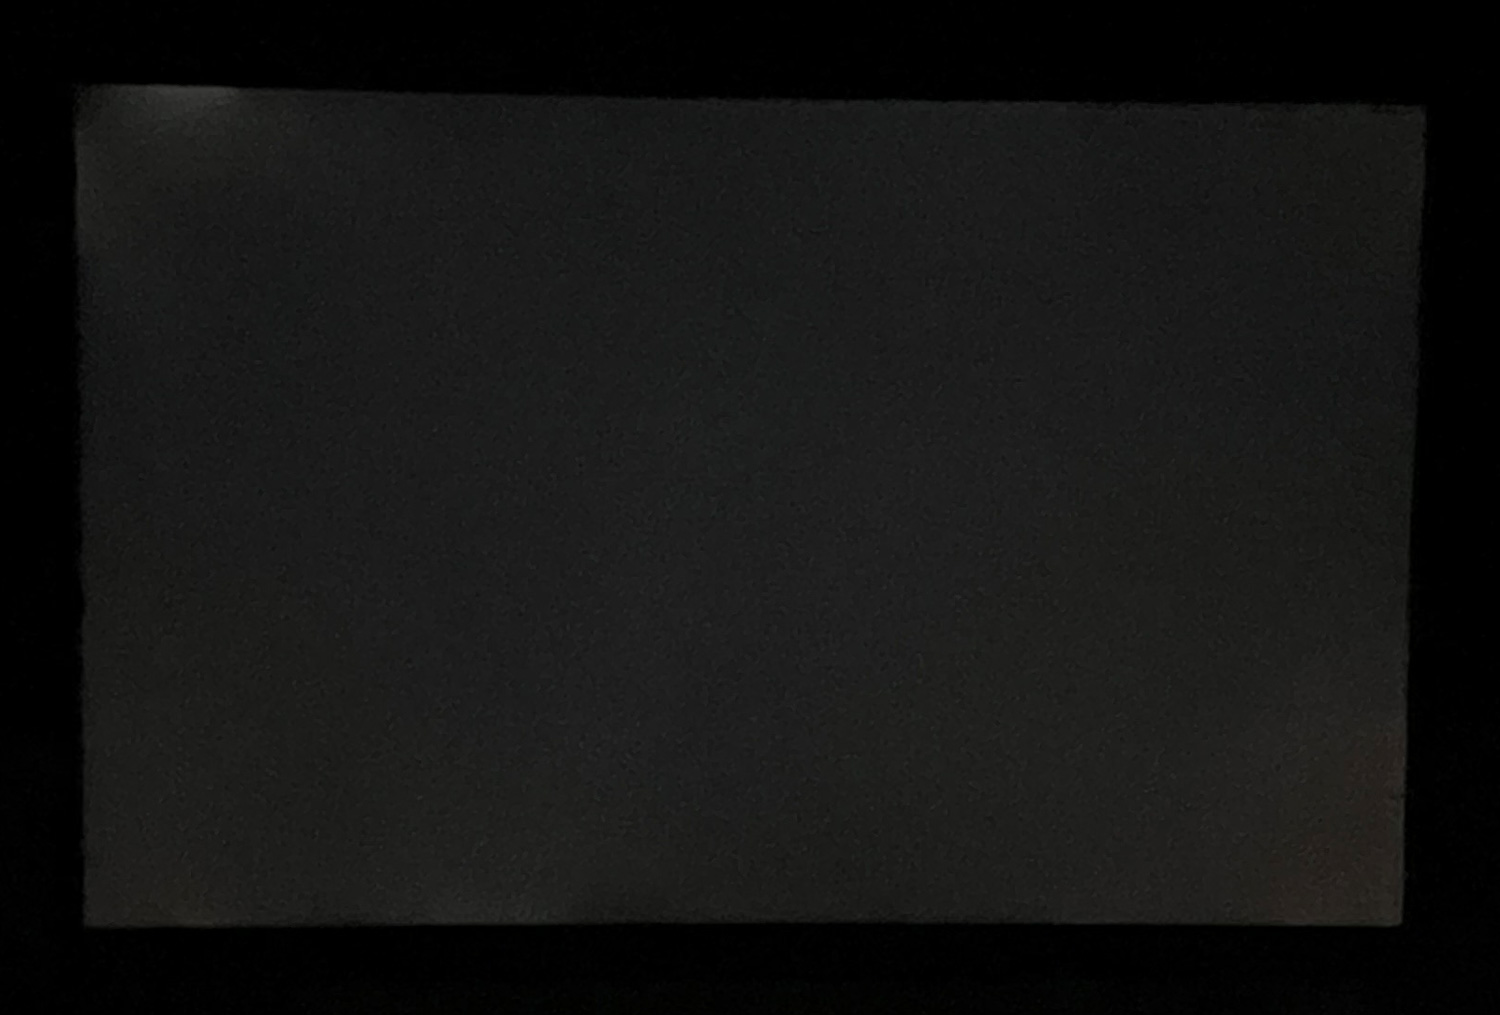
Ausleuchtung: 87 %
Helligkeit Akku: 465 cd/m²
Kontrast: 2317:1 (Schwarzwert: 0.2033 cd/m²)
ΔE ColorChecker Calman: 3.24 | ∀{0.5-29.43 Ø4.72}
calibrated: 1.08
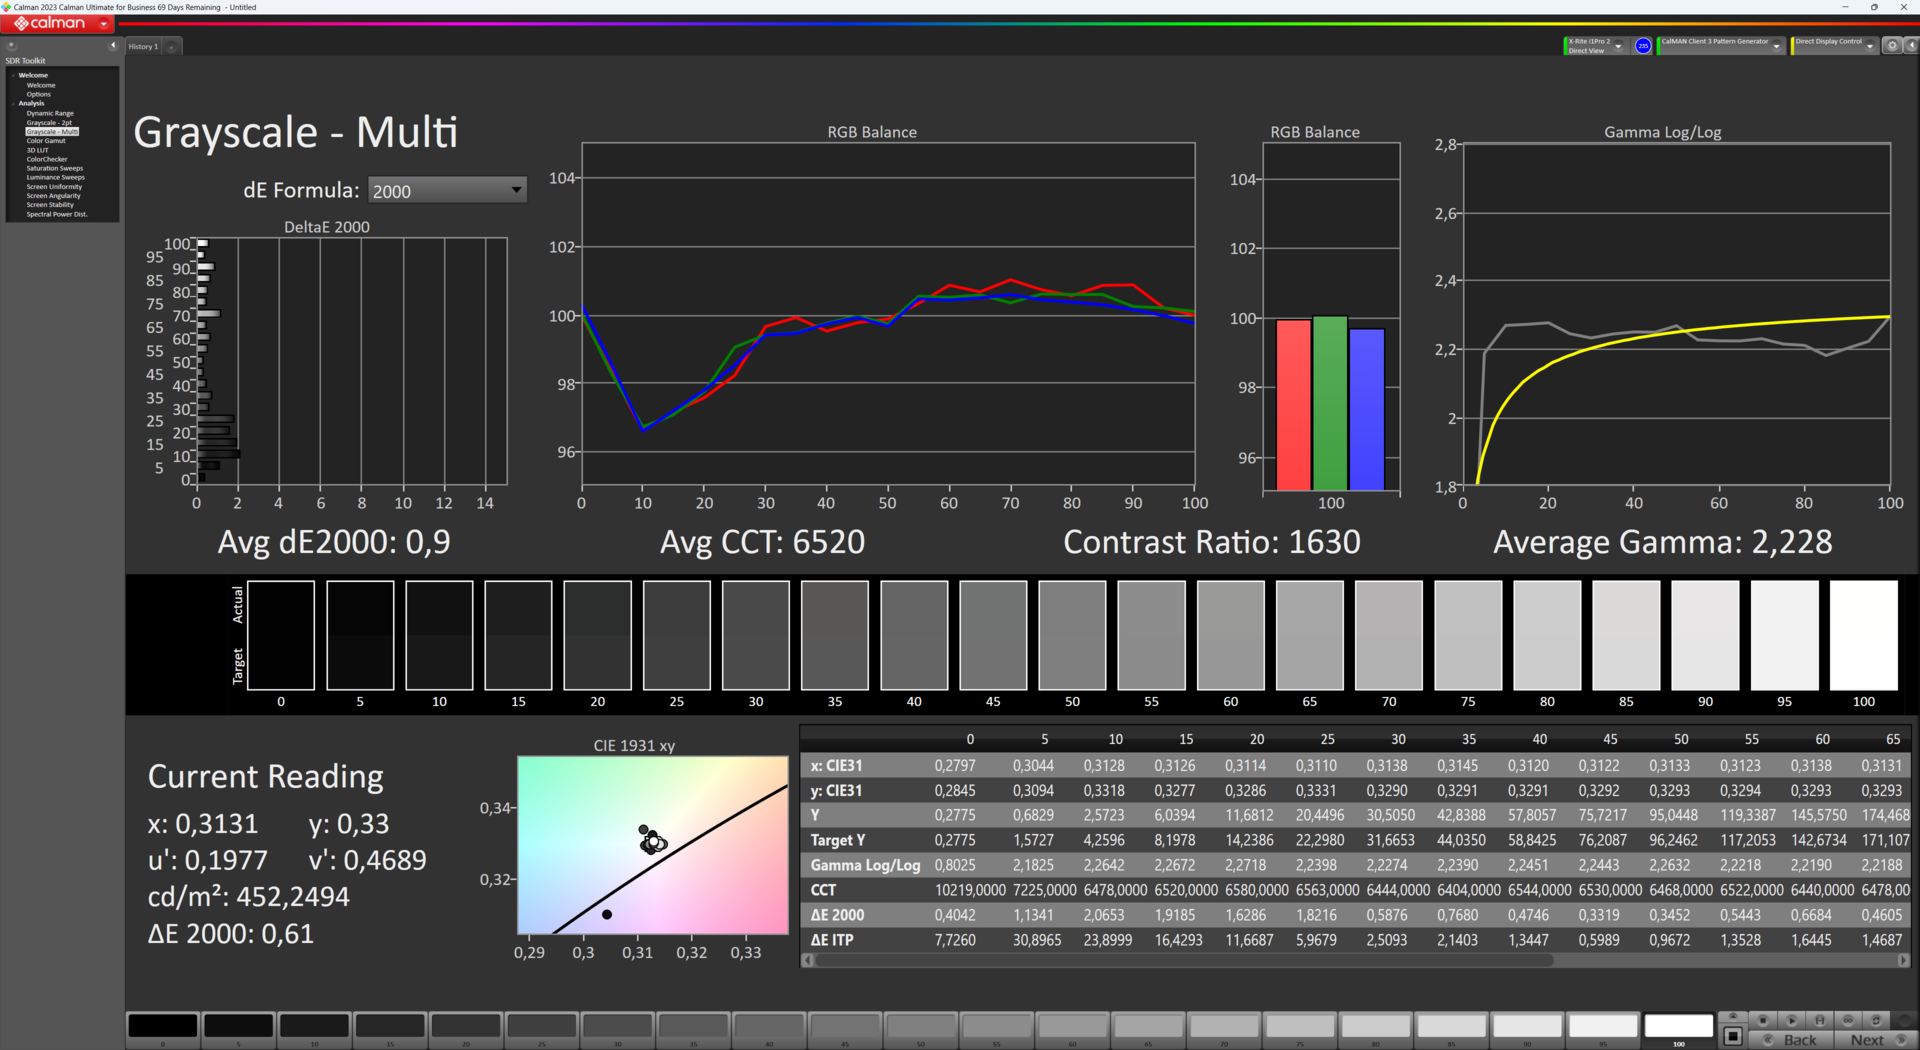
ΔE Greyscale Calman: 4.6 | ∀{0.09-98 Ø4.97}
67.8% AdobeRGB 1998 (Argyll 3D)
96.8% sRGB (Argyll 3D)
65.9% Display P3 (Argyll 3D)
CCT: 6520 K
| Dell Latitude 13 7340 i5-1345U Chi Mei 133JCG, IPS, 1920x1200, 13.3" | Dell Latitude 7440 AU Optronics B140QAX, IPS, 2560x1600, 14" | Dell Latitude 3440 BOE NE140FH, IPS, 1920x1080, 14" | Dell Latitude 13 7330 LG Philips 133WF9, IPS, 1920x1080, 13.3" | HP Dragonfly G4 Chi Mei CMN13C0, IPS, 1920x1280, 13.5" | Lenovo ThinkBook Plus Gen4 IRU SDC ATNA33AA06-0, OLED, 2880x1800, 13.3" | |
|---|---|---|---|---|---|---|
| Display | 10% | -38% | -1% | 3% | 32% | |
| Display P3 Coverage (%) | 65.9 | 75.4 14% | 40.4 -39% | 66.1 0% | 68.4 4% | 99.6 51% |
| sRGB Coverage (%) | 96.8 | 99.9 3% | 60.7 -37% | 93.5 -3% | 98.3 2% | 100 3% |
| AdobeRGB 1998 Coverage (%) | 67.8 | 76.2 12% | 41.8 -38% | 68.2 1% | 70.4 4% | 97.1 43% |
| Response Times | -8% | 14% | 2% | -2% | 95% | |
| Response Time Grey 50% / Grey 80% * (ms) | 51 ? | 56 ? -10% | 35.3 ? 31% | 48.4 ? 5% | 48.8 ? 4% | 1.9 ? 96% |
| Response Time Black / White * (ms) | 29.04 ? | 30.8 ? -6% | 29.8 ? -3% | 29.6 ? -2% | 31.3 ? -8% | 2.1 ? 93% |
| PWM Frequency (Hz) | 60 ? | |||||
| Bildschirm | -12% | -39% | 7% | 6% | 1% | |
| Helligkeit Bildmitte (cd/m²) | 471 | 517.3 10% | 292.6 -38% | 460.1 -2% | 408.8 -13% | 367.5 -22% |
| Brightness (cd/m²) | 437 | 488 12% | 270 -38% | 445 2% | 399 -9% | 370 -15% |
| Brightness Distribution (%) | 87 | 88 1% | 88 1% | 89 2% | 90 3% | 98 13% |
| Schwarzwert * (cd/m²) | 0.2033 | 0.34 -67% | 0.19 7% | 0.31 -52% | 0.32 -57% | |
| Kontrast (:1) | 2317 | 1521 -34% | 1540 -34% | 1484 -36% | 1278 -45% | |
| Delta E Colorchecker * | 3.24 | 3.3 -2% | 4.63 -43% | 2.42 25% | 2.02 38% | 4.61 -42% |
| Colorchecker dE 2000 max. * | 7.19 | 7.81 -9% | 17.1 -138% | 3.97 45% | 3.84 47% | 7.68 -7% |
| Colorchecker dE 2000 calibrated * | 1.08 | 1.02 6% | 2.13 -97% | 0.77 29% | 0.61 44% | 0.66 39% |
| Delta E Graustufen * | 4.6 | 5.6 -22% | 3.2 30% | 2.3 50% | 2.3 50% | 2.7 41% |
| CCT | 6520 100% | 6804 96% | 7184 90% | 6262 104% | 6203 105% | 6079 107% |
| Gamma | 2.37 93% | 2.34 94% | 2.23 99% | 2.2 100% | 2.17 101% | |
| Durchschnitt gesamt (Programm / Settings) | -3% /
-7% | -21% /
-31% | 3% /
5% | 2% /
5% | 43% /
24% |
* ... kleinere Werte sind besser
Reaktionszeiten (Response Times) des Displays
| ↔ Reaktionszeiten Schwarz zu Weiß | ||
|---|---|---|
| 29.04 ms ... steigend ↗ und fallend ↘ kombiniert | ↗ 14.6 ms steigend |  |
| ↘ 14.75 ms fallend | ||
| Die gemessenen Reaktionszeiten sind mittelmäßig und dadurch für Spieler eventuell zu langsam. Im Vergleich rangierten die bei uns getesteten Geräte von 0.1 (Minimum) zu 240 (Maximum) ms. » 78 % aller Screens waren schneller als der getestete. Daher sind die gemessenen Reaktionszeiten schlechter als der Durchschnitt aller vermessenen Geräte (19.8 ms). | ||
| ↔ Reaktionszeiten 50% Grau zu 80% Grau | ||
| 51 ms ... steigend ↗ und fallend ↘ kombiniert | ↗ 22.8 ms steigend |  |
| ↘ 28.2 ms fallend | ||
| Die gemessenen Reaktionszeiten sind langsam und dadurch für viele Spieler wahrscheinlich zu langsam. Im Vergleich rangierten die bei uns getesteten Geräte von 0.165 (Minimum) zu 636 (Maximum) ms. » 87 % aller Screens waren schneller als der getestete. Daher sind die gemessenen Reaktionszeiten schlechter als der Durchschnitt aller vermessenen Geräte (31 ms). | ||
Bildschirm-Flackern / PWM (Pulse-Width Modulation)
| Flackern / PWM nicht festgestellt |  | ||
Im Vergleich: 52 % aller getesteten Geräte nutzten kein PWM um die Helligkeit zu reduzieren. Wenn PWM eingesetzt wurde, dann bei einer Frequenz von durchschnittlich 7763 (Minimum 5, Maximum 343500) Hz. | |||

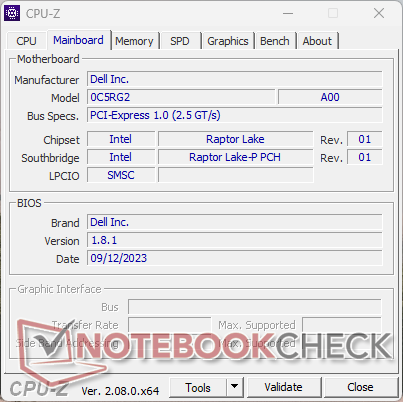
Leistung - Raptor Lake-U mit vPro und kleinen Leistungsabstrichen
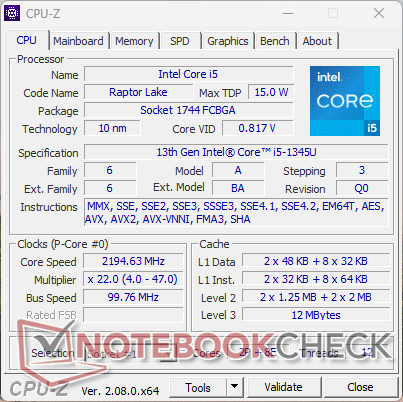
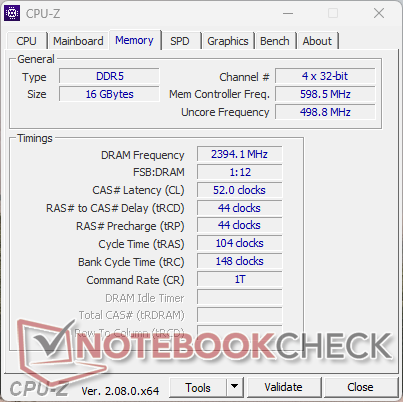
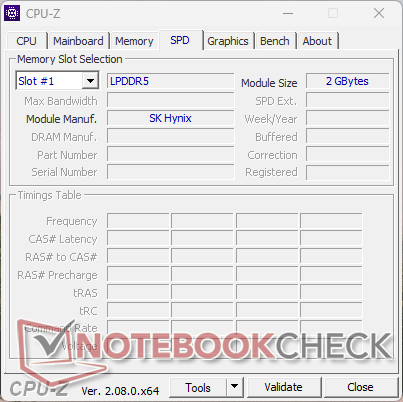
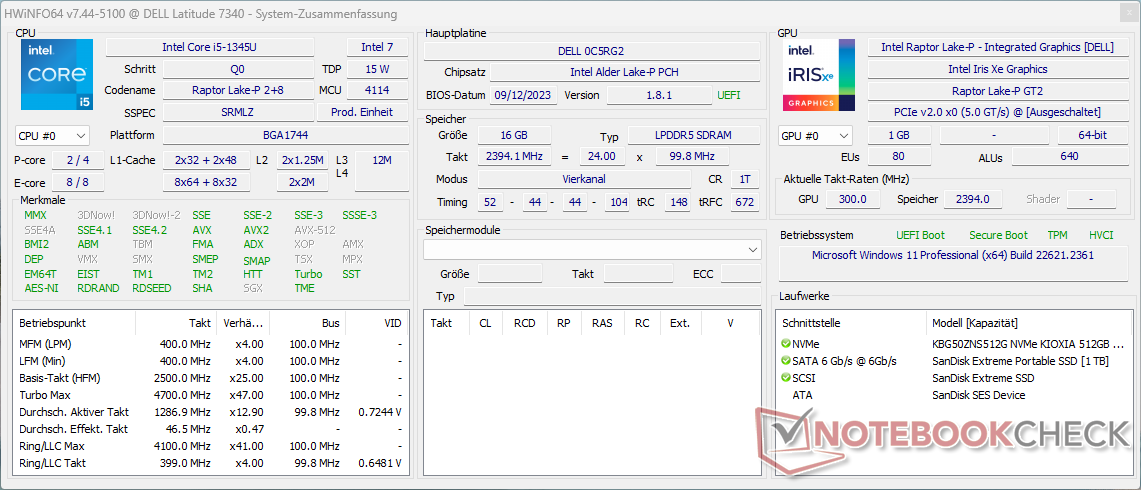
Das vorliegende Dell Latitude 7340 basiert auf einem Intel-Prozessor der 13. Generation mit vPro. Verbaut ist der Intel Core i5-1345U gepaart mit Intel Iris Xe Graphics (80 EUs), 16 GB LPDDR5 RAM sowie einer 512 GB M.2 PCIe NVMe SSD.
Alternativ bietet Dell das Gerät auch in verschiedenen anderen Konfigurationen an. Zur Wahl stehen u.a. Intel Core i5-1335U und Intel Core i7-1365U.
Testbedingungen
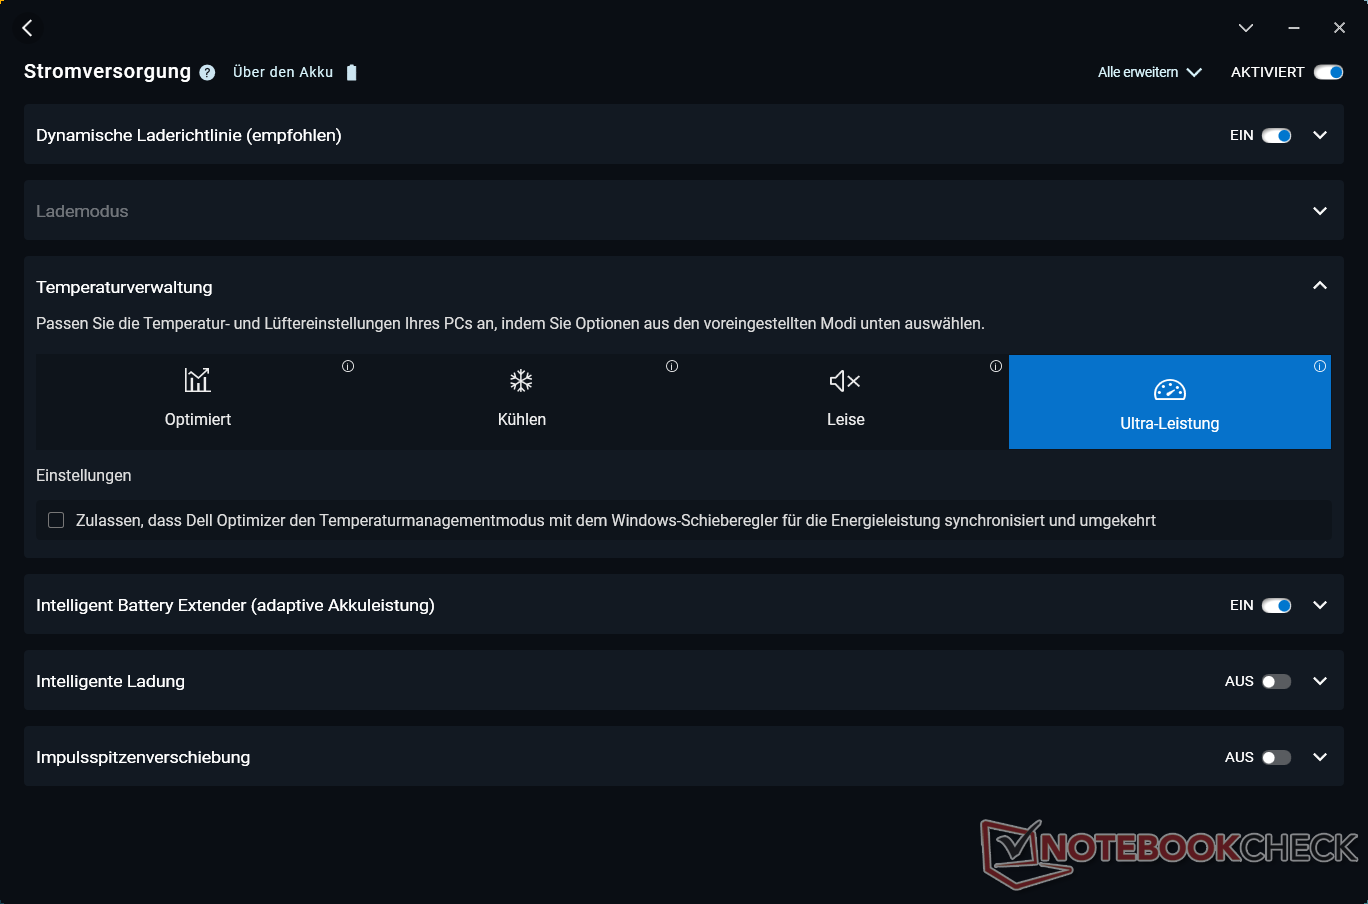
Die Leistungstests haben wir überwiegend im Modus "Ultra-Leistung" der herstellereigenen Software Dell Optimizer durchgeführt. Diese kann auf Wunsch den Temperaturmanagementmodus mit den Windows-Einstellungen für die Energieleistung synchronisieren. Alternativ stehen die Modi "Optimiert", "Kühlen" und "Leise" zur Wahl, um die Parameter entsprechend der Verwendung und der eigenen Ansprüche anzupassen.
Prozessor
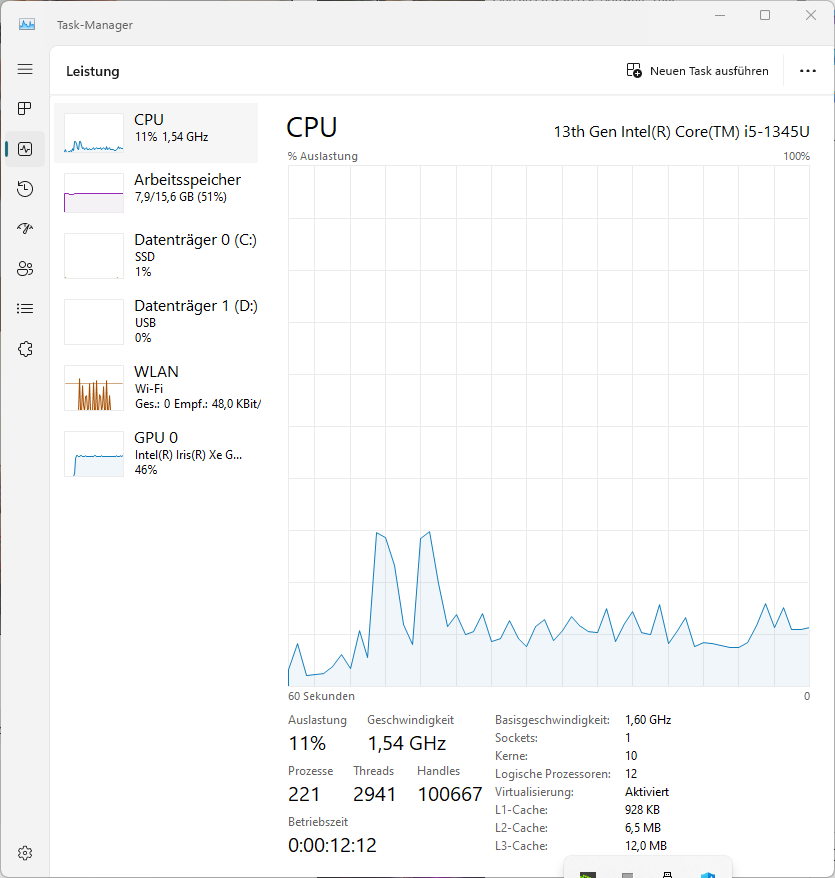
Der verbaute Intel Core i5-1345U zählt zur Raptor Lake-U-Serie und wartet mit insgesamt zehn Kernen (zwei Performance- und acht Effizienzkerne) mit bis zu 4,7 GHz auf. Dazu unterstützt er die vPro-Enterprise-Management-Features.
Der Prozessor werkelt auch im größeren Latitude 7440 und kann dort seine Leistung besser entfalten. Bei unseren Leistungstests blieb das Latitude 7340 zumeist mit gewissem Respektabstand hinter seinem etwas größeren Serienbruder zurück. Demnach scheint die kompaktere Größe mit den damit einhergehenden Nachteilen hier einen Einfluss auf die Leistung zu haben.
Es pendelt sich auf dem Niveau des ebenfalls 13,3 Zoll kompakten Latitude 3440 ein, das auch mit der gleichen CPU aufwartet, aber eine Klasse tiefer einsortiert ist. Insgesamt schöpft das vorliegende Testgerät das Potential des Prozessors somit nicht vollends aus und rangiert unter dem CPU-Schnitt.
Cinebench R15 Multi Dauertest
Cinebench R23: Multi Core | Single Core
Cinebench R20: CPU (Multi Core) | CPU (Single Core)
Cinebench R15: CPU Multi 64Bit | CPU Single 64Bit
Blender: v2.79 BMW27 CPU
7-Zip 18.03: 7z b 4 | 7z b 4 -mmt1
Geekbench 5.5: Multi-Core | Single-Core
HWBOT x265 Benchmark v2.2: 4k Preset
LibreOffice : 20 Documents To PDF
R Benchmark 2.5: Overall mean
| CPU Performance Rating | |
| Durchschnitt der Klasse Subnotebook | |
| Dell Latitude 7440 | |
| Lenovo ThinkBook Plus Gen4 IRU | |
| HP Dragonfly G4 | |
| Dell Latitude 13 7330 | |
| Durchschnittliche Intel Core i5-1345U | |
| Dell Latitude 3440 | |
| Dell Latitude 13 7340 i5-1345U | |
| Cinebench R23 / Multi Core | |
| Durchschnitt der Klasse Subnotebook (1555 - 21812, n=59, der letzten 2 Jahre) | |
| Dell Latitude 7440 | |
| Durchschnittliche Intel Core i5-1345U (7710 - 9795, n=3) | |
| Lenovo ThinkBook Plus Gen4 IRU | |
| Dell Latitude 13 7330 | |
| Dell Latitude 13 7340 i5-1345U | |
| Dell Latitude 3440 | |
| HP Dragonfly G4 | |
| Cinebench R23 / Single Core | |
| HP Dragonfly G4 | |
| Lenovo ThinkBook Plus Gen4 IRU | |
| Dell Latitude 7440 | |
| Dell Latitude 13 7330 | |
| Durchschnitt der Klasse Subnotebook (358 - 2213, n=60, der letzten 2 Jahre) | |
| Durchschnittliche Intel Core i5-1345U (1716 - 1757, n=3) | |
| Dell Latitude 13 7340 i5-1345U | |
| Dell Latitude 3440 | |
| Cinebench R20 / CPU (Multi Core) | |
| Durchschnitt der Klasse Subnotebook (579 - 8541, n=56, der letzten 2 Jahre) | |
| Dell Latitude 7440 | |
| Lenovo ThinkBook Plus Gen4 IRU | |
| Dell Latitude 13 7330 | |
| Durchschnittliche Intel Core i5-1345U (2806 - 3610, n=3) | |
| Dell Latitude 13 7340 i5-1345U | |
| HP Dragonfly G4 | |
| Dell Latitude 3440 | |
| Cinebench R20 / CPU (Single Core) | |
| HP Dragonfly G4 | |
| Lenovo ThinkBook Plus Gen4 IRU | |
| Dell Latitude 13 7340 i5-1345U | |
| Dell Latitude 3440 | |
| Durchschnittliche Intel Core i5-1345U (656 - 661, n=3) | |
| Durchschnitt der Klasse Subnotebook (128 - 832, n=56, der letzten 2 Jahre) | |
| Dell Latitude 7440 | |
| Dell Latitude 13 7330 | |
| Cinebench R15 / CPU Multi 64Bit | |
| Durchschnitt der Klasse Subnotebook (327 - 3345, n=56, der letzten 2 Jahre) | |
| Dell Latitude 7440 | |
| Dell Latitude 13 7330 | |
| Lenovo ThinkBook Plus Gen4 IRU | |
| Durchschnittliche Intel Core i5-1345U (1193 - 1542, n=3) | |
| HP Dragonfly G4 | |
| Dell Latitude 13 7340 i5-1345U | |
| Dell Latitude 3440 | |
| Cinebench R15 / CPU Single 64Bit | |
| Durchschnitt der Klasse Subnotebook (72.4 - 322, n=56, der letzten 2 Jahre) | |
| HP Dragonfly G4 | |
| Lenovo ThinkBook Plus Gen4 IRU | |
| Dell Latitude 13 7330 | |
| Dell Latitude 7440 | |
| Dell Latitude 13 7340 i5-1345U | |
| Durchschnittliche Intel Core i5-1345U (237 - 244, n=3) | |
| Dell Latitude 3440 | |
| Blender / v2.79 BMW27 CPU | |
| Dell Latitude 13 7340 i5-1345U | |
| HP Dragonfly G4 | |
| Dell Latitude 3440 | |
| Durchschnittliche Intel Core i5-1345U (332 - 495, n=3) | |
| Dell Latitude 13 7330 | |
| Lenovo ThinkBook Plus Gen4 IRU | |
| Durchschnitt der Klasse Subnotebook (159 - 2271, n=57, der letzten 2 Jahre) | |
| Dell Latitude 7440 | |
| 7-Zip 18.03 / 7z b 4 | |
| Durchschnitt der Klasse Subnotebook (11668 - 77867, n=56, der letzten 2 Jahre) | |
| Dell Latitude 7440 | |
| Lenovo ThinkBook Plus Gen4 IRU | |
| Durchschnittliche Intel Core i5-1345U (30098 - 40563, n=3) | |
| Dell Latitude 3440 | |
| HP Dragonfly G4 | |
| Dell Latitude 13 7330 | |
| Dell Latitude 13 7340 i5-1345U | |
| 7-Zip 18.03 / 7z b 4 -mmt1 | |
| HP Dragonfly G4 | |
| Dell Latitude 3440 | |
| Dell Latitude 13 7330 | |
| Lenovo ThinkBook Plus Gen4 IRU | |
| Durchschnitt der Klasse Subnotebook (2643 - 6699, n=58, der letzten 2 Jahre) | |
| Durchschnittliche Intel Core i5-1345U (5212 - 5626, n=3) | |
| Dell Latitude 7440 | |
| Dell Latitude 13 7340 i5-1345U | |
| Geekbench 5.5 / Multi-Core | |
| Durchschnitt der Klasse Subnotebook (2557 - 17218, n=47, der letzten 2 Jahre) | |
| HP Dragonfly G4 | |
| Dell Latitude 7440 | |
| Lenovo ThinkBook Plus Gen4 IRU | |
| Dell Latitude 13 7340 i5-1345U | |
| Durchschnittliche Intel Core i5-1345U (6300 - 8263, n=3) | |
| Dell Latitude 13 7330 | |
| Dell Latitude 3440 | |
| Geekbench 5.5 / Single-Core | |
| Durchschnitt der Klasse Subnotebook (726 - 2224, n=47, der letzten 2 Jahre) | |
| HP Dragonfly G4 | |
| Lenovo ThinkBook Plus Gen4 IRU | |
| Dell Latitude 13 7330 | |
| Dell Latitude 7440 | |
| Durchschnittliche Intel Core i5-1345U (1613 - 1710, n=3) | |
| Dell Latitude 3440 | |
| Dell Latitude 13 7340 i5-1345U | |
| HWBOT x265 Benchmark v2.2 / 4k Preset | |
| Durchschnitt der Klasse Subnotebook (0.97 - 25.1, n=56, der letzten 2 Jahre) | |
| Dell Latitude 7440 | |
| Lenovo ThinkBook Plus Gen4 IRU | |
| Dell Latitude 13 7330 | |
| Durchschnittliche Intel Core i5-1345U (7.46 - 10.8, n=3) | |
| Dell Latitude 3440 | |
| HP Dragonfly G4 | |
| Dell Latitude 13 7340 i5-1345U | |
| LibreOffice / 20 Documents To PDF | |
| Durchschnitt der Klasse Subnotebook (39.9 - 220, n=55, der letzten 2 Jahre) | |
| Dell Latitude 3440 | |
| Dell Latitude 13 7330 | |
| Lenovo ThinkBook Plus Gen4 IRU | |
| Dell Latitude 7440 | |
| HP Dragonfly G4 | |
| Durchschnittliche Intel Core i5-1345U (40.3 - 49.8, n=3) | |
| Dell Latitude 13 7340 i5-1345U | |
| R Benchmark 2.5 / Overall mean | |
| Durchschnitt der Klasse Subnotebook (0.4024 - 1.456, n=57, der letzten 2 Jahre) | |
| Dell Latitude 13 7340 i5-1345U | |
| Dell Latitude 3440 | |
| Durchschnittliche Intel Core i5-1345U (0.4948 - 0.4999, n=3) | |
| Dell Latitude 7440 | |
| Lenovo ThinkBook Plus Gen4 IRU | |
| Dell Latitude 13 7330 | |
| HP Dragonfly G4 | |
* ... kleinere Werte sind besser
AIDA64: FP32 Ray-Trace | FPU Julia | CPU SHA3 | CPU Queen | FPU SinJulia | FPU Mandel | CPU AES | CPU ZLib | FP64 Ray-Trace | CPU PhotoWorxx
| Performance Rating | |
| Durchschnitt der Klasse Subnotebook | |
| Dell Latitude 7440 | |
| Lenovo ThinkBook Plus Gen4 IRU | |
| HP Dragonfly G4 | |
| Durchschnittliche Intel Core i5-1345U | |
| Dell Latitude 3440 | |
| Dell Latitude 13 7330 | |
| Dell Latitude 13 7340 i5-1345U | |
| AIDA64 / FP32 Ray-Trace | |
| Durchschnitt der Klasse Subnotebook (1135 - 32888, n=57, der letzten 2 Jahre) | |
| Dell Latitude 7440 | |
| Lenovo ThinkBook Plus Gen4 IRU | |
| Durchschnittliche Intel Core i5-1345U (5500 - 8830, n=3) | |
| Dell Latitude 3440 | |
| HP Dragonfly G4 | |
| Dell Latitude 13 7330 | |
| Dell Latitude 13 7340 i5-1345U | |
| AIDA64 / FPU Julia | |
| Durchschnitt der Klasse Subnotebook (5218 - 123315, n=57, der letzten 2 Jahre) | |
| Dell Latitude 7440 | |
| Lenovo ThinkBook Plus Gen4 IRU | |
| Dell Latitude 13 7330 | |
| Durchschnittliche Intel Core i5-1345U (28617 - 43149, n=3) | |
| Dell Latitude 3440 | |
| HP Dragonfly G4 | |
| Dell Latitude 13 7340 i5-1345U | |
| AIDA64 / CPU SHA3 | |
| Durchschnitt der Klasse Subnotebook (444 - 5287, n=57, der letzten 2 Jahre) | |
| Dell Latitude 7440 | |
| Dell Latitude 13 7330 | |
| Dell Latitude 3440 | |
| Durchschnittliche Intel Core i5-1345U (1459 - 2265, n=3) | |
| Lenovo ThinkBook Plus Gen4 IRU | |
| HP Dragonfly G4 | |
| Dell Latitude 13 7340 i5-1345U | |
| AIDA64 / CPU Queen | |
| HP Dragonfly G4 | |
| Dell Latitude 13 7330 | |
| Lenovo ThinkBook Plus Gen4 IRU | |
| Dell Latitude 7440 | |
| Dell Latitude 13 7340 i5-1345U | |
| Durchschnittliche Intel Core i5-1345U (61382 - 62953, n=3) | |
| Dell Latitude 3440 | |
| Durchschnitt der Klasse Subnotebook (10579 - 95002, n=49, der letzten 2 Jahre) | |
| AIDA64 / FPU SinJulia | |
| Durchschnitt der Klasse Subnotebook (744 - 18418, n=57, der letzten 2 Jahre) | |
| Dell Latitude 7440 | |
| Lenovo ThinkBook Plus Gen4 IRU | |
| Dell Latitude 3440 | |
| Durchschnittliche Intel Core i5-1345U (4077 - 5206, n=3) | |
| HP Dragonfly G4 | |
| Dell Latitude 13 7330 | |
| Dell Latitude 13 7340 i5-1345U | |
| AIDA64 / FPU Mandel | |
| Durchschnitt der Klasse Subnotebook (3341 - 65433, n=57, der letzten 2 Jahre) | |
| Dell Latitude 7440 | |
| Lenovo ThinkBook Plus Gen4 IRU | |
| Durchschnittliche Intel Core i5-1345U (13914 - 21556, n=3) | |
| Dell Latitude 3440 | |
| Dell Latitude 13 7330 | |
| HP Dragonfly G4 | |
| Dell Latitude 13 7340 i5-1345U | |
| AIDA64 / CPU AES | |
| Durchschnitt der Klasse Subnotebook (638 - 96917, n=57, der letzten 2 Jahre) | |
| Dell Latitude 7440 | |
| Dell Latitude 13 7330 | |
| Lenovo ThinkBook Plus Gen4 IRU | |
| Dell Latitude 3440 | |
| Durchschnittliche Intel Core i5-1345U (29897 - 41994, n=3) | |
| HP Dragonfly G4 | |
| Dell Latitude 13 7340 i5-1345U | |
| AIDA64 / CPU ZLib | |
| Durchschnitt der Klasse Subnotebook (164.9 - 1379, n=57, der letzten 2 Jahre) | |
| Dell Latitude 7440 | |
| Dell Latitude 13 7330 | |
| Dell Latitude 3440 | |
| Lenovo ThinkBook Plus Gen4 IRU | |
| Durchschnittliche Intel Core i5-1345U (434 - 640, n=3) | |
| HP Dragonfly G4 | |
| Dell Latitude 13 7340 i5-1345U | |
| AIDA64 / FP64 Ray-Trace | |
| Durchschnitt der Klasse Subnotebook (610 - 17495, n=57, der letzten 2 Jahre) | |
| Dell Latitude 7440 | |
| Dell Latitude 3440 | |
| Lenovo ThinkBook Plus Gen4 IRU | |
| Durchschnittliche Intel Core i5-1345U (2812 - 4640, n=3) | |
| HP Dragonfly G4 | |
| Dell Latitude 13 7330 | |
| Dell Latitude 13 7340 i5-1345U | |
| AIDA64 / CPU PhotoWorxx | |
| Durchschnitt der Klasse Subnotebook (6569 - 85600, n=57, der letzten 2 Jahre) | |
| Lenovo ThinkBook Plus Gen4 IRU | |
| Dell Latitude 7440 | |
| HP Dragonfly G4 | |
| Dell Latitude 13 7340 i5-1345U | |
| Durchschnittliche Intel Core i5-1345U (22065 - 39231, n=3) | |
| Dell Latitude 13 7330 | |
| Dell Latitude 3440 | |
System Performance
Folgerichtig kann auch die System-Performance am Ende nicht ganz mit dem Latitude 7440 mithalten, wobei der Unterschied gering ist. Auch hier positioniert sich der Testkandidat im mittleren bis hinteren Bereich des Testfeldes, das allerdings zum Teil auch stärker motorisiert ist. Letztendlich langt die Performance für einen Platz vor dem Vorgänger Dell Latitude 7330 mit dem höherwertigen Intel Core i7-1265U und alle üblichen Office-Aufgaben für diesen kompakten Begleiter.
CrossMark: Overall | Productivity | Creativity | Responsiveness
| PCMark 10 / Score | |
| Durchschnitt der Klasse Subnotebook (4920 - 9939, n=44, der letzten 2 Jahre) | |
| Lenovo ThinkBook Plus Gen4 IRU | |
| HP Dragonfly G4 | |
| Dell Latitude 7440 | |
| Durchschnittliche Intel Core i5-1345U, Intel Iris Xe Graphics G7 80EUs (5276 - 5554, n=3) | |
| Dell Latitude 13 7340 i5-1345U | |
| Dell Latitude 3440 | |
| Dell Latitude 13 7330 | |
| PCMark 10 / Essentials | |
| Lenovo ThinkBook Plus Gen4 IRU | |
| HP Dragonfly G4 | |
| Dell Latitude 7440 | |
| Dell Latitude 13 7330 | |
| Durchschnittliche Intel Core i5-1345U, Intel Iris Xe Graphics G7 80EUs (10352 - 10758, n=3) | |
| Dell Latitude 3440 | |
| Durchschnitt der Klasse Subnotebook (8552 - 11646, n=44, der letzten 2 Jahre) | |
| Dell Latitude 13 7340 i5-1345U | |
| PCMark 10 / Productivity | |
| Durchschnitt der Klasse Subnotebook (5435 - 16606, n=44, der letzten 2 Jahre) | |
| HP Dragonfly G4 | |
| Dell Latitude 7440 | |
| Dell Latitude 13 7340 i5-1345U | |
| Durchschnittliche Intel Core i5-1345U, Intel Iris Xe Graphics G7 80EUs (6832 - 7189, n=3) | |
| Lenovo ThinkBook Plus Gen4 IRU | |
| Dell Latitude 13 7330 | |
| Dell Latitude 3440 | |
| PCMark 10 / Digital Content Creation | |
| Durchschnitt der Klasse Subnotebook (5722 - 13779, n=44, der letzten 2 Jahre) | |
| HP Dragonfly G4 | |
| Lenovo ThinkBook Plus Gen4 IRU | |
| Dell Latitude 7440 | |
| Durchschnittliche Intel Core i5-1345U, Intel Iris Xe Graphics G7 80EUs (5530 - 6012, n=3) | |
| Dell Latitude 13 7340 i5-1345U | |
| Dell Latitude 3440 | |
| Dell Latitude 13 7330 | |
| CrossMark / Overall | |
| Durchschnitt der Klasse Subnotebook (365 - 2356, n=59, der letzten 2 Jahre) | |
| HP Dragonfly G4 | |
| Lenovo ThinkBook Plus Gen4 IRU | |
| Dell Latitude 13 7340 i5-1345U | |
| Dell Latitude 13 7330 | |
| Durchschnittliche Intel Core i5-1345U, Intel Iris Xe Graphics G7 80EUs (1416 - 1531, n=2) | |
| Dell Latitude 3440 | |
| CrossMark / Productivity | |
| HP Dragonfly G4 | |
| Lenovo ThinkBook Plus Gen4 IRU | |
| Durchschnitt der Klasse Subnotebook (364 - 2277, n=59, der letzten 2 Jahre) | |
| Dell Latitude 13 7340 i5-1345U | |
| Dell Latitude 13 7330 | |
| Durchschnittliche Intel Core i5-1345U, Intel Iris Xe Graphics G7 80EUs (1420 - 1504, n=2) | |
| Dell Latitude 3440 | |
| CrossMark / Creativity | |
| Durchschnitt der Klasse Subnotebook (372 - 2743, n=59, der letzten 2 Jahre) | |
| HP Dragonfly G4 | |
| Lenovo ThinkBook Plus Gen4 IRU | |
| Dell Latitude 13 7340 i5-1345U | |
| Durchschnittliche Intel Core i5-1345U, Intel Iris Xe Graphics G7 80EUs (1482 - 1635, n=2) | |
| Dell Latitude 13 7330 | |
| Dell Latitude 3440 | |
| CrossMark / Responsiveness | |
| Lenovo ThinkBook Plus Gen4 IRU | |
| HP Dragonfly G4 | |
| Durchschnitt der Klasse Subnotebook (312 - 1854, n=59, der letzten 2 Jahre) | |
| Dell Latitude 13 7340 i5-1345U | |
| Durchschnittliche Intel Core i5-1345U, Intel Iris Xe Graphics G7 80EUs (1226 - 1325, n=2) | |
| Dell Latitude 13 7330 | |
| Dell Latitude 3440 | |
| PCMark 10 Score | 5338 Punkte | |
Hilfe | ||
| AIDA64 / Memory Copy | |
| Durchschnitt der Klasse Subnotebook (14554 - 131023, n=57, der letzten 2 Jahre) | |
| Lenovo ThinkBook Plus Gen4 IRU | |
| HP Dragonfly G4 | |
| Dell Latitude 7440 | |
| Dell Latitude 13 7340 i5-1345U | |
| Durchschnittliche Intel Core i5-1345U (38526 - 57716, n=3) | |
| Dell Latitude 13 7330 | |
| Dell Latitude 3440 | |
| AIDA64 / Memory Read | |
| Durchschnitt der Klasse Subnotebook (15948 - 127174, n=57, der letzten 2 Jahre) | |
| Lenovo ThinkBook Plus Gen4 IRU | |
| Dell Latitude 7440 | |
| HP Dragonfly G4 | |
| Dell Latitude 13 7340 i5-1345U | |
| Durchschnittliche Intel Core i5-1345U (41894 - 50185, n=3) | |
| Dell Latitude 3440 | |
| Dell Latitude 13 7330 | |
| AIDA64 / Memory Write | |
| Lenovo ThinkBook Plus Gen4 IRU | |
| Durchschnitt der Klasse Subnotebook (15709 - 135141, n=57, der letzten 2 Jahre) | |
| Dell Latitude 7440 | |
| Dell Latitude 13 7340 i5-1345U | |
| HP Dragonfly G4 | |
| Durchschnittliche Intel Core i5-1345U (44821 - 72373, n=3) | |
| Dell Latitude 13 7330 | |
| Dell Latitude 3440 | |
| AIDA64 / Memory Latency | |
| Dell Latitude 13 7340 i5-1345U | |
| Dell Latitude 7440 | |
| Lenovo ThinkBook Plus Gen4 IRU | |
| Durchschnitt der Klasse Subnotebook (6.1 - 159.9, n=55, der letzten 2 Jahre) | |
| Durchschnittliche Intel Core i5-1345U (73.8 - 103.9, n=3) | |
| HP Dragonfly G4 | |
| Dell Latitude 13 7330 | |
| Dell Latitude 3440 | |
* ... kleinere Werte sind besser
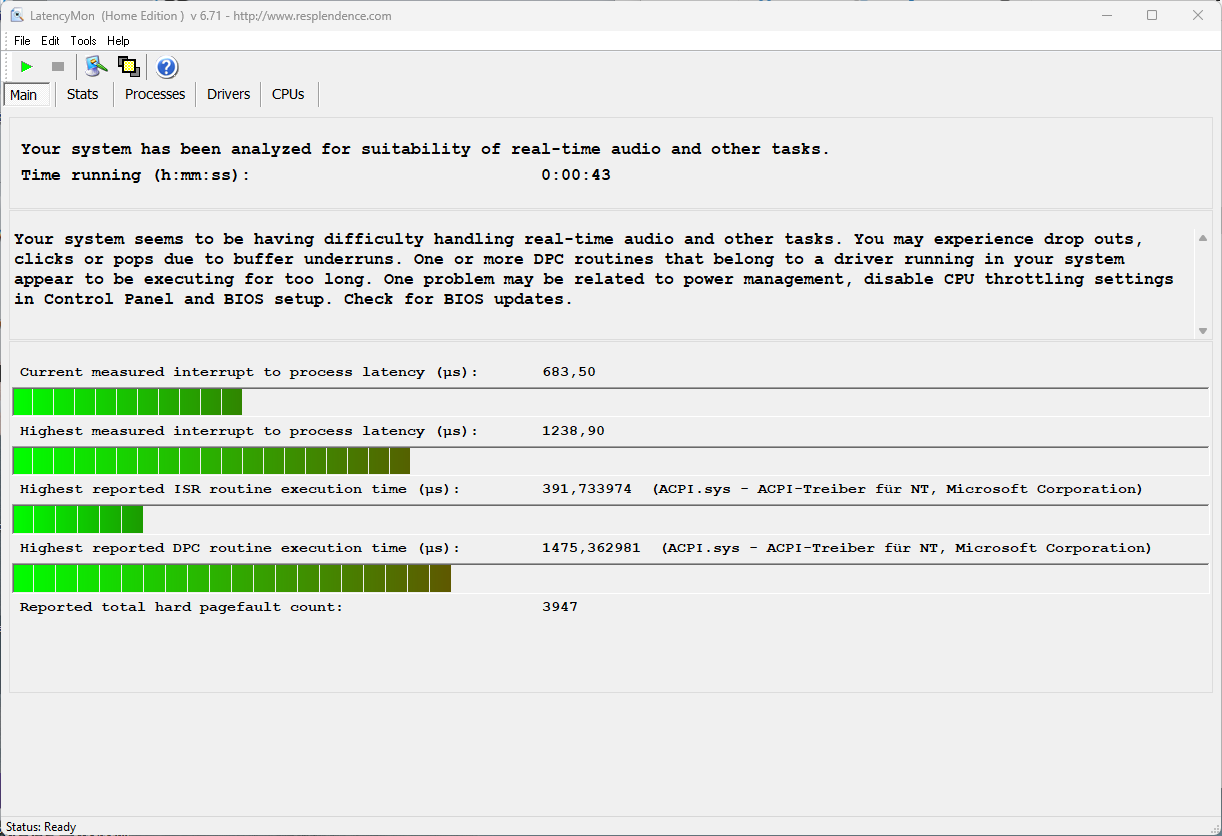
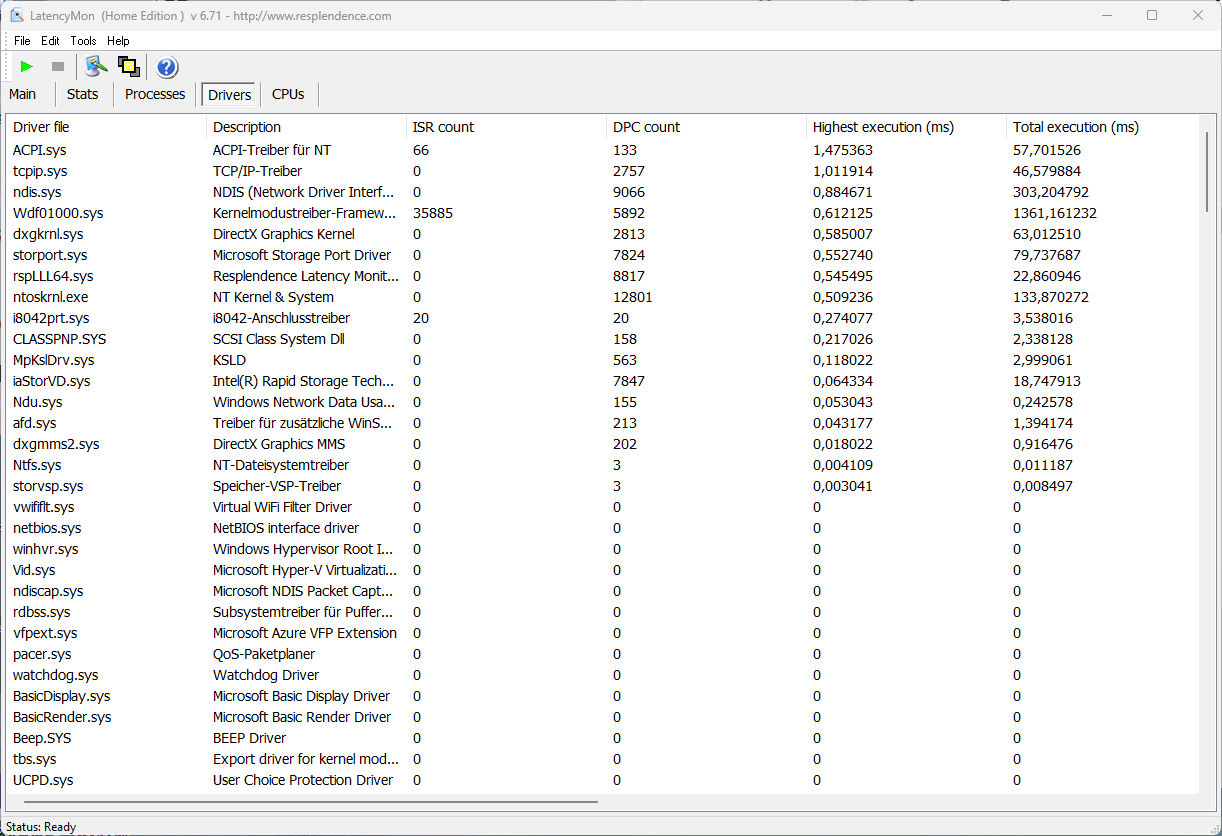
DPC-Latenzen
Die gemessenen DPC-Latenzen liegen über dem Schnitt der Vergleichsgeräte. Dies spricht dafür, dass das Dell Latitude 7340 nicht sonderlich gut für Echtzeitaudio oder Videobearbeitung geeignet ist, wobei dies ohnehin nicht zu den Standardaufgaben für ein Gerät wie dieses zählt.
| DPC Latencies / LatencyMon - interrupt to process latency (max), Web, Youtube, Prime95 | |
| Dell Latitude 3440 | |
| Dell Latitude 13 7340 i5-1345U | |
| Dell Latitude 7440 | |
| HP Dragonfly G4 | |
| Lenovo ThinkBook Plus Gen4 IRU | |
| Dell Latitude 13 7330 | |
* ... kleinere Werte sind besser
Massenspeicher
Die verbaute SSD von Kioxa mit 512 GB bleibt größtenteils hinter dem Modell von Samsung im Latitude 7440 zurück. Im gesamten Vergleichsfeld positioniert man sich am unteren Ende, kann aber zumindest über dem SSD-Schnitt und seinem Vorgänger Latitude 7330 abschneiden.

* ... kleinere Werte sind besser
Dauerleistung Lesen: DiskSpd Read Loop, Queue Depth 8
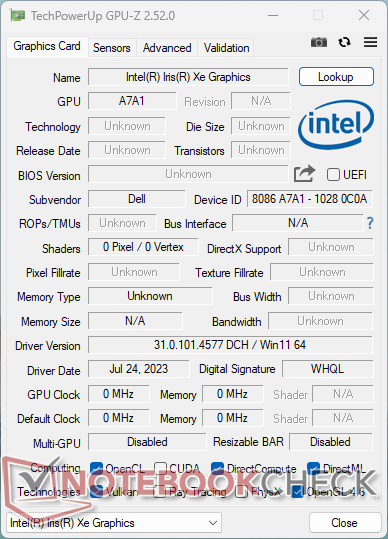
Grafikkarte
Auf eine dedizierte Grafiklösung verzichtet Dell im Latitude 7340. Das würde auch nicht zum Konzept des leichtgewichtigen Subnotebook passen. Die Grafikausgabe übernimmt stattdessen die Intel Iris Xe Graphics (80 EUs), die auch im Latitude 7440 Vergleichsmodell werkelt.
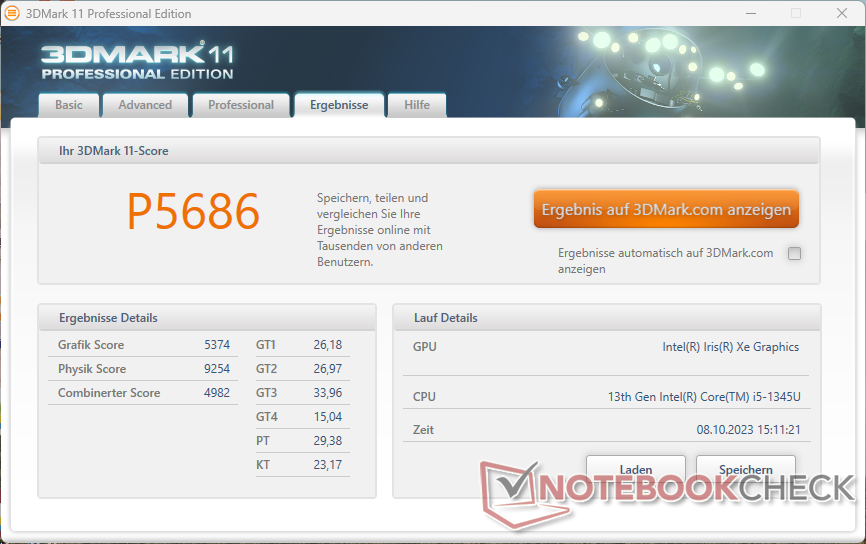
Hier zeichnet sich ab, dass der Formfaktor keine signifikanten Einflüsse auf die Grafikleistung hat. Das kompaktere Modell liegt bei den gängigen 3DMark-Benchmarks meist minimal hinter, teils auch vor dem 14-Zöller. Der Unterschied ist extrem gering und damit zu vernachlässigen.
Etwas größer fallen hingegen die Unterschiede bei den gemessenen Gaming-Framerates aus. Hier gibt das Latitude 7340 meist einige Bilder weniger pro Sekunde aus, wobei dies letztendlich keinen großen Einfluss auf die Spielbarkeit hat. Die meisten Games laufen auf geringster Stufe ordentlich. Mehr darf zumeist nicht erwartet werden, was für ein Gerät dieser Klasse aber auch in Ordnung ist.
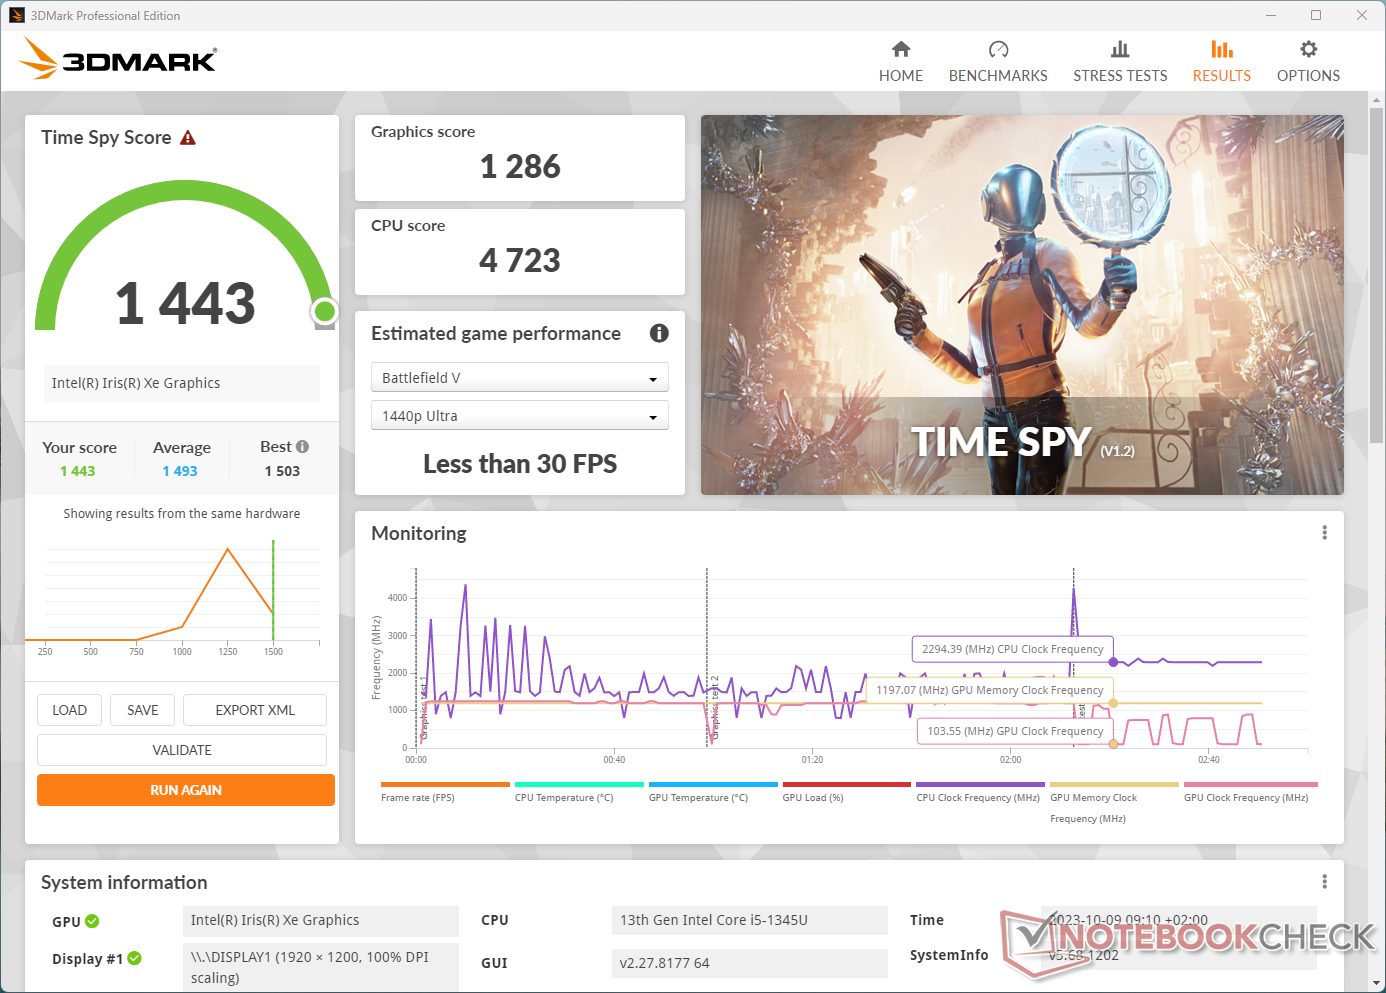
Positiv ist, dass die Leistung über die Zeit relativ konstant bleibt, wie 96 Prozent beim 3DMark Time Spy Stress-Test zeigen. Im Akkubetrieb stehen laut Benchmarks gut 90 Prozent der Leistung zur Verfügung.
| 3DMark Performance Rating - Percent | |
| Durchschnitt der Klasse Subnotebook | |
| Lenovo ThinkBook Plus Gen4 IRU -1! | |
| HP Dragonfly G4 -1! | |
| Dell Latitude 13 7340 i5-1345U | |
| Dell Latitude 13 7330 | |
| Dell Latitude 7440 -1! | |
| Durchschnittliche Intel Iris Xe Graphics G7 80EUs | |
| Dell Latitude 3440 -1! | |
| 3DMark 11 Performance | 5686 Punkte | |
| 3DMark Ice Storm Standard Score | 106842 Punkte | |
| 3DMark Cloud Gate Standard Score | 18213 Punkte | |
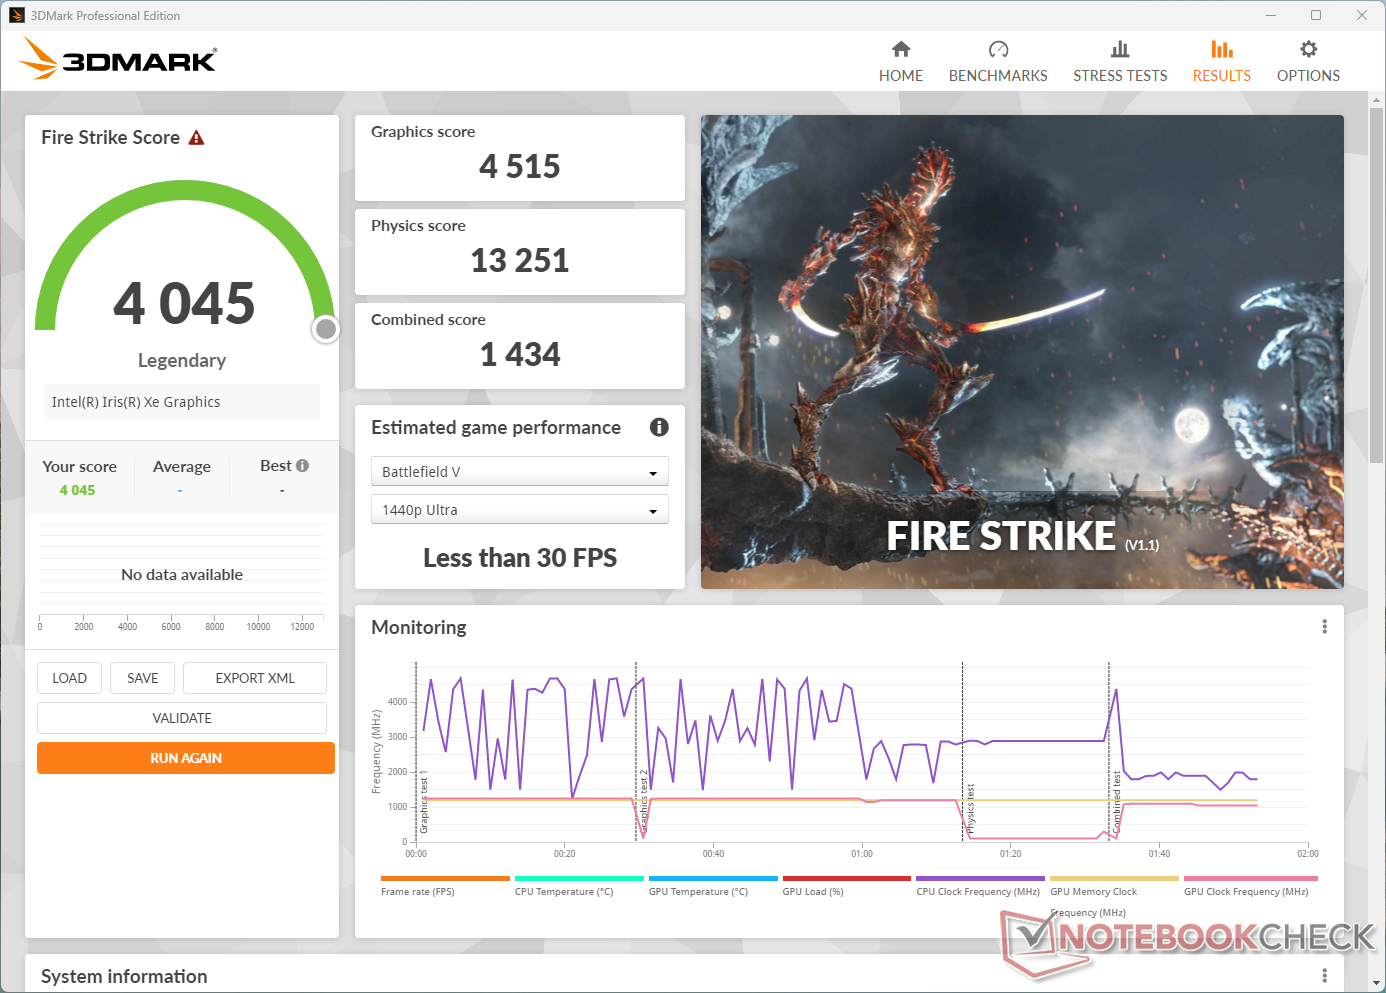
| 3DMark Fire Strike Score | 4045 Punkte | |
| 3DMark Time Spy Score | 1443 Punkte | |
Hilfe | ||
* ... kleinere Werte sind besser
| Performance Rating - Percent | |
| Durchschnitt der Klasse Subnotebook | |
| Lenovo ThinkBook Plus Gen4 IRU | |
| HP Dragonfly G4 | |
| Dell Latitude 7440 | |
| Dell Latitude 13 7340 i5-1345U | |
| Dell Latitude 13 7330 | |
| Dell Latitude 3440 | |
| The Witcher 3 - 1920x1080 Ultra Graphics & Postprocessing (HBAO+) | |
| Durchschnitt der Klasse Subnotebook (13.9 - 34.6, n=13, der letzten 2 Jahre) | |
| Lenovo ThinkBook Plus Gen4 IRU | |
| HP Dragonfly G4 | |
| Dell Latitude 7440 | |
| Dell Latitude 13 7340 i5-1345U | |
| Dell Latitude 13 7330 | |
| Dell Latitude 3440 | |
| Final Fantasy XV Benchmark - 1920x1080 High Quality | |
| Durchschnitt der Klasse Subnotebook (11.6 - 54.5, n=53, der letzten 2 Jahre) | |
| Lenovo ThinkBook Plus Gen4 IRU | |
| Dell Latitude 7440 | |
| HP Dragonfly G4 | |
| Dell Latitude 13 7340 i5-1345U | |
| Dell Latitude 13 7330 | |
| Dell Latitude 3440 | |
| Strange Brigade - 1920x1080 ultra AA:ultra AF:16 | |
| Durchschnitt der Klasse Subnotebook (19 - 101.3, n=49, der letzten 2 Jahre) | |
| Lenovo ThinkBook Plus Gen4 IRU | |
| HP Dragonfly G4 | |
| Dell Latitude 7440 | |
| Dell Latitude 13 7340 i5-1345U | |
| Dell Latitude 13 7330 | |
| Dell Latitude 3440 | |
| Dota 2 Reborn - 1920x1080 ultra (3/3) best looking | |
| Durchschnitt der Klasse Subnotebook (13 - 97, n=60, der letzten 2 Jahre) | |
| Lenovo ThinkBook Plus Gen4 IRU | |
| Dell Latitude 7440 | |
| HP Dragonfly G4 | |
| Dell Latitude 13 7340 i5-1345U | |
| Dell Latitude 3440 | |
| Dell Latitude 13 7330 | |
Witcher 3 FPS-Diagramm
| min. | mittel | hoch | max. | QHD | |
|---|---|---|---|---|---|
| GTA V (2015) | 84.3 | 74.9 | 20 | 8.64 | |
| The Witcher 3 (2015) | 74.6 | 45.5 | 24.7 | 12.3 | |
| Dota 2 Reborn (2015) | 95.5 | 68.8 | 51.6 | 47 | |
| Final Fantasy XV Benchmark (2018) | 33.5 | 18.9 | 13.9 | 10.5 | |
| X-Plane 11.11 (2018) | 40 | 28.7 | 25.1 | ||
| Strange Brigade (2018) | 80.4 | 32.9 | 26.3 | 21 | |
| Tiny Tina's Wonderlands (2022) | 21.16 | 16.53 | 10.21 | 9.87 | |
| F1 22 (2022) | 58.8 | 33.6 | 30.9 | 23.4 |
Emissionen & Energie - leise, sparsam und ausdauernder
Geräuschemissionen
Im Idle-Zustand arbeitet das Gerät lautlos. Wird die verbaute Hardware gefordert, säuselt der Lüfter mit bis zu 38 dB(A). Das ist akzeptabel, zumal der Lüfterlauf gleichmäßig erfolgt.
Lautstärkediagramm
| Idle |
| 25.02 / 25.02 / 25.02 dB(A) |
| Last |
| 35.07 / 38.2 dB(A) |
 | ||
30 dB leise 40 dB(A) deutlich hörbar 50 dB(A) störend |
||
min: | ||
| Dell Latitude 13 7340 i5-1345U Iris Xe G7 80EUs, i5-1345U, Kioxia BG5 KBG50ZNS512G | Dell Latitude 7440 Iris Xe G7 80EUs, i5-1345U, Samsung MZ9L4512HBLU-00BMV | Dell Latitude 3440 Iris Xe G7 80EUs, i5-1345U, Samsung PM9A1 MZVL2512HCJQ | Dell Latitude 13 7330 Iris Xe G7 96EUs, i7-1265U, Toshiba KBG40ZNS512G NVMe | HP Dragonfly G4 Iris Xe G7 96EUs, i7-1365U, Micron 3400 MTFDKBA512TFH 512GB | Lenovo ThinkBook Plus Gen4 IRU Iris Xe G7 96EUs, i7-1355U, SK hynix PC801 HFS512GEJ9X115N | |
|---|---|---|---|---|---|---|
| Geräuschentwicklung | 10% | -0% | 1% | 7% | -1% | |
| aus / Umgebung * (dB) | 25.02 | 22.8 9% | 23.9 4% | 23.4 6% | 23.3 7% | 24.3 3% |
| Idle min * (dB) | 25.02 | 22.8 9% | 24.4 2% | 23.4 6% | 23.5 6% | 24.3 3% |
| Idle avg * (dB) | 25.02 | 22.8 9% | 24.4 2% | 23.4 6% | 23.5 6% | 24.3 3% |
| Idle max * (dB) | 25.02 | 22.8 9% | 24.4 2% | 23.4 6% | 26.8 -7% | 24.3 3% |
| Last avg * (dB) | 35.07 | 26.3 25% | 37.1 -6% | 37.8 -8% | 27.2 22% | 38.2 -9% |
| Last max * (dB) | 38.2 | 38.3 -0% | 40.2 -5% | 43 -13% | 35 8% | 41.8 -9% |
| Witcher 3 ultra * (dB) | 30 | 38.2 | 39.2 | 32.7 | 41.9 |
* ... kleinere Werte sind besser
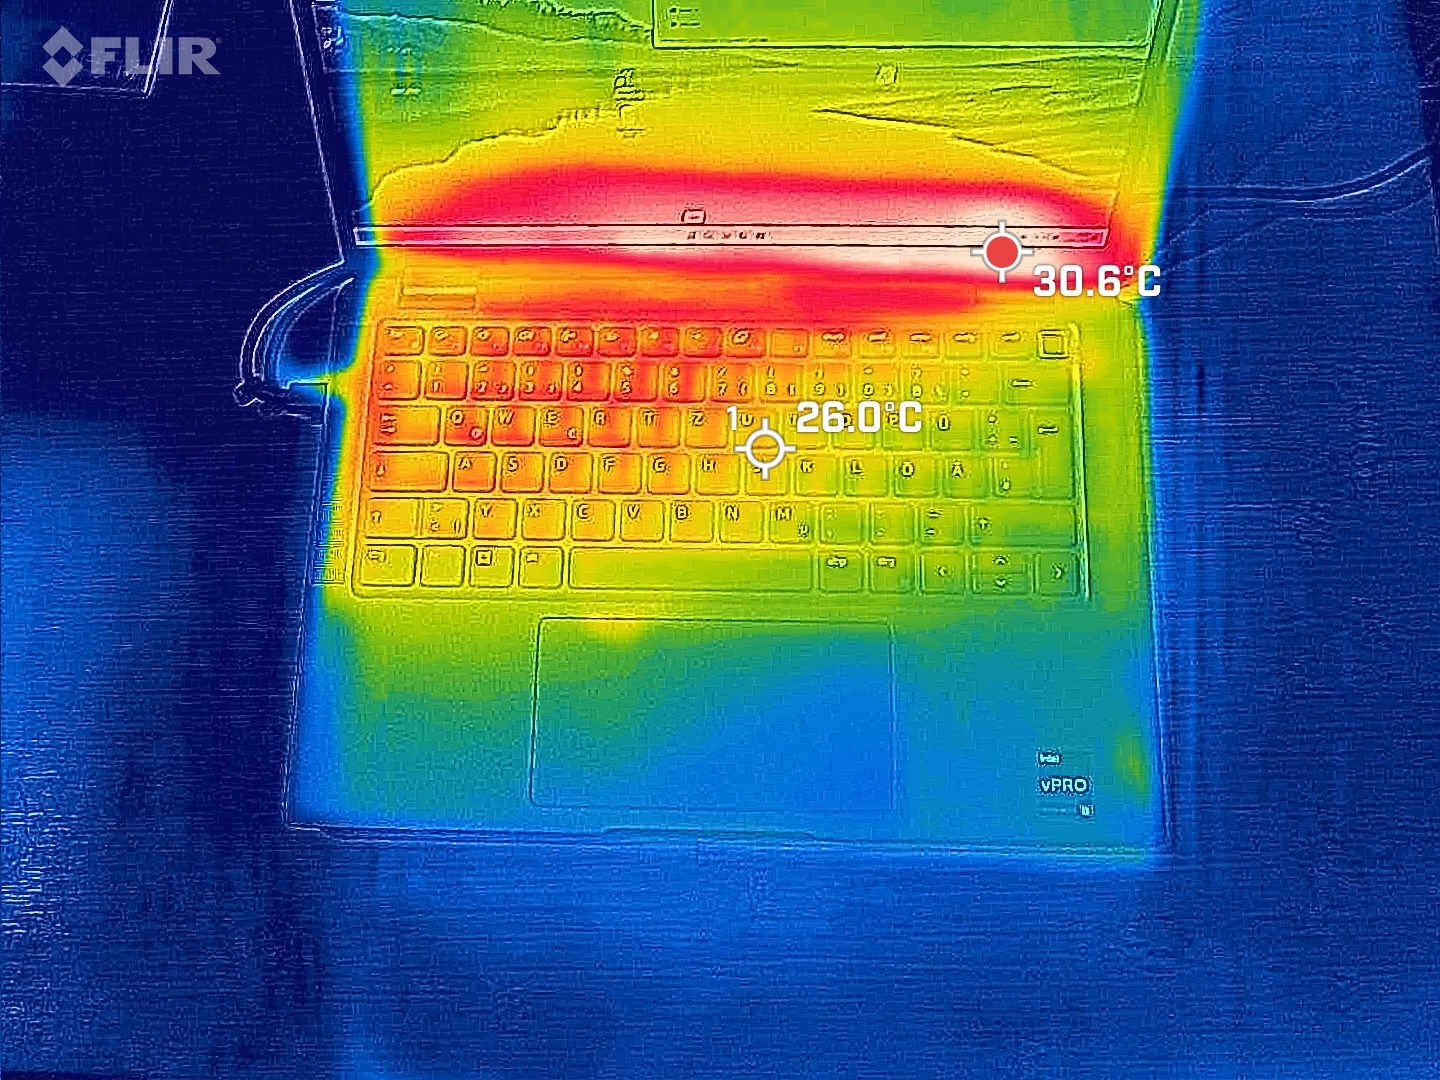
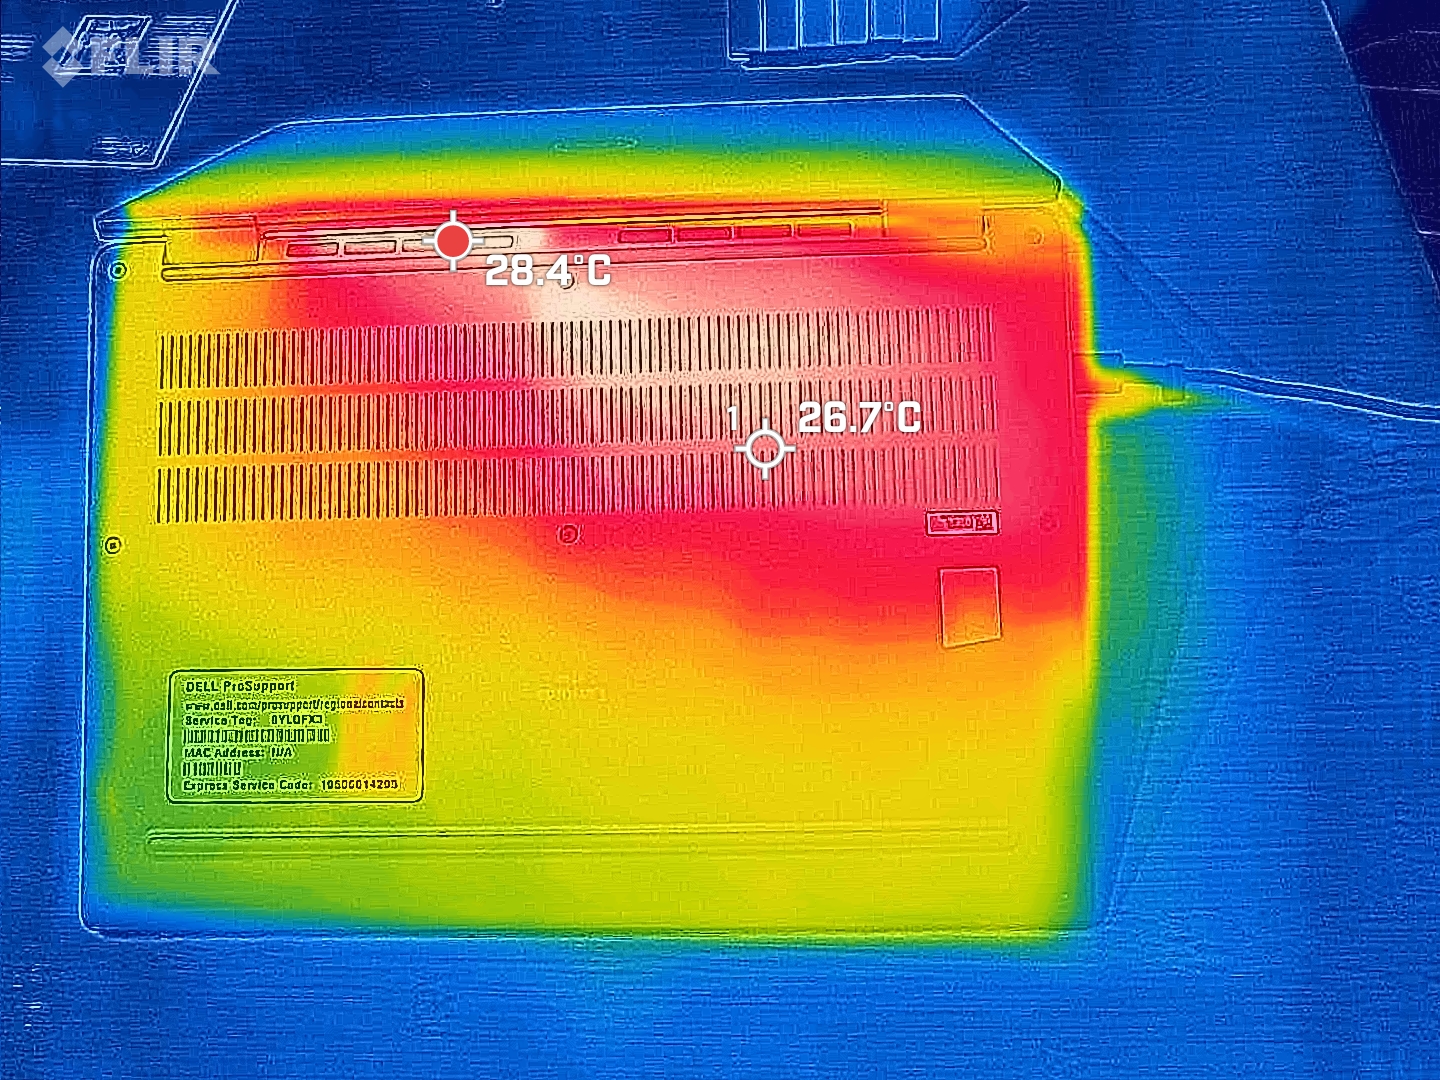
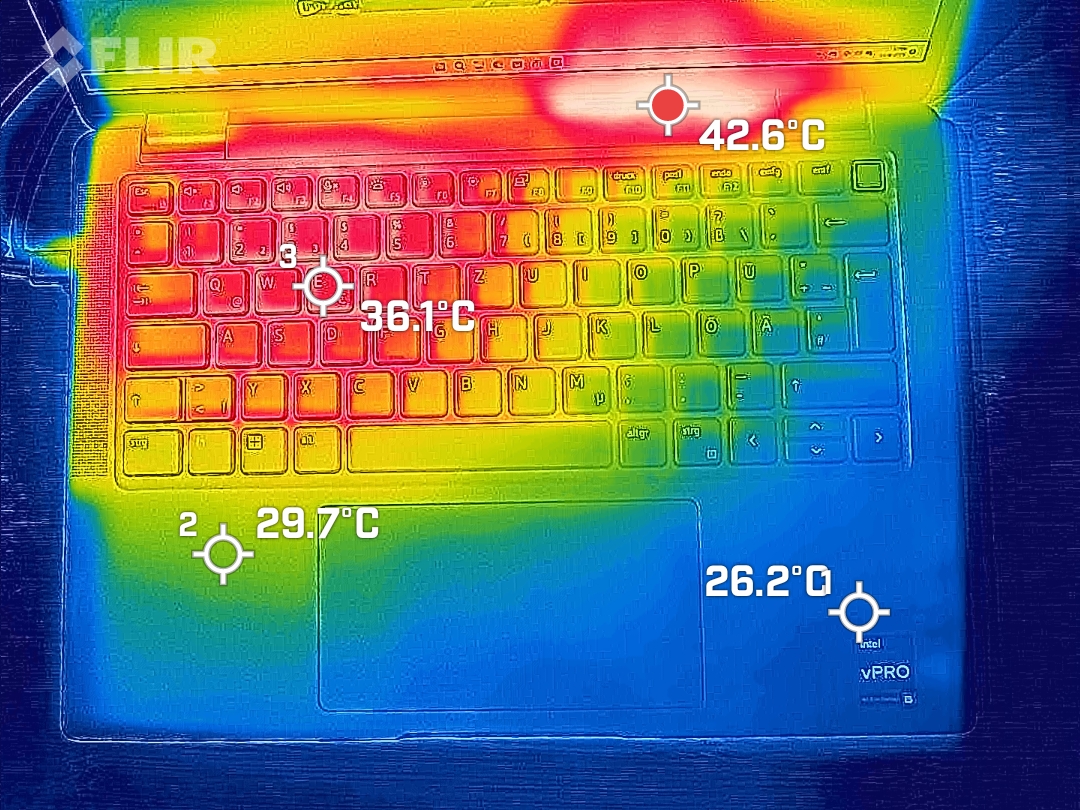
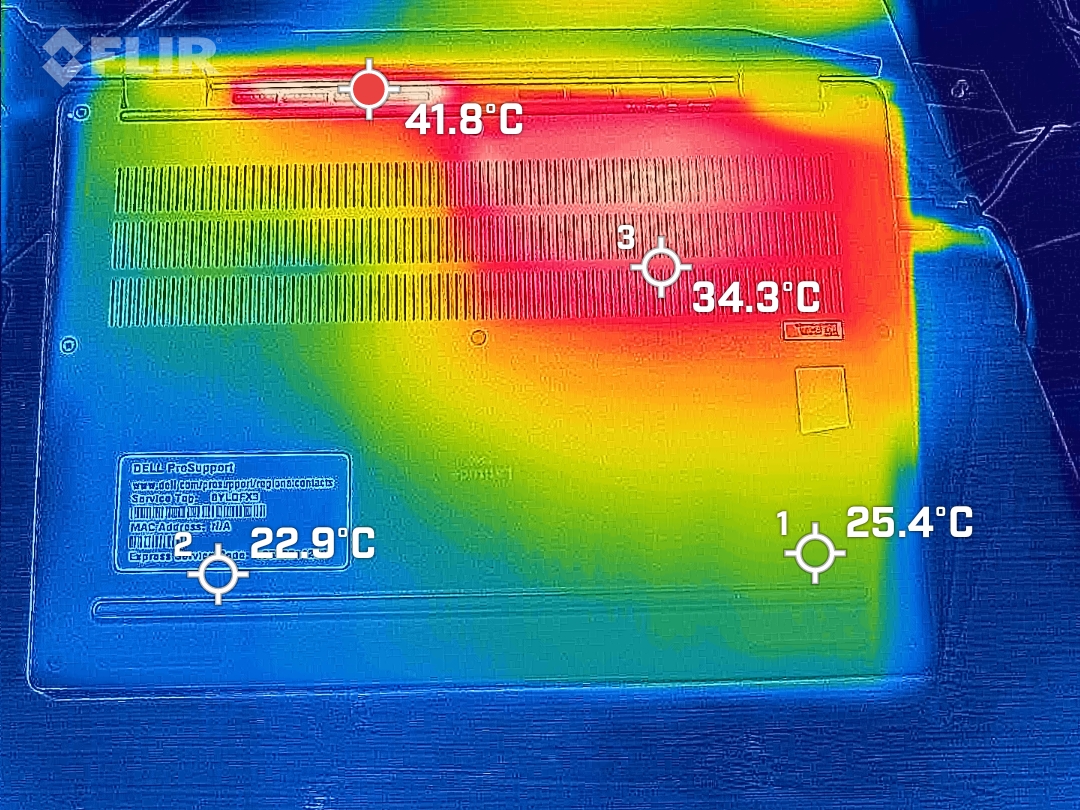
Temperatur
Nicht bemerkbar macht sich die beengte Kühlung bei den Temperaturen des Gehäuses. Hier bleibt der 13 Zoll kleine Latitude 7430 sogar etwas unter dem Latitude 7440 mit 14 Zoll zurück, wobei beide Geräte kühl laufen und keine Auffälligkeiten zeigen.
(+) Die maximale Temperatur auf der Oberseite ist 34.3 °C. Im Vergleich liegt der Klassendurchschnitt bei 35.9 °C (von 21.4 bis 59 °C für die Klasse Subnotebook).
(+) Auf der Unterseite messen wir eine maximalen Wert von 37.6 °C (im Vergleich zum Durchschnitt von 39.2 °C).
(+) Ohne Last messen wir eine durchschnittliche Temperatur von 27.5 °C auf der Oberseite. Der Klassendurchschnitt erreicht 30.8 °C.
(+) Die Handballen und der Touchpad-Bereich sind mit gemessenen 28.1 °C kühler als die typische Hauttemperatur und fühlen sich dadurch kühl an.
(±) Die durchschnittliche Handballen-Temperatur anderer getesteter Geräte war 28.2 °C (+0.1 °C).
| Dell Latitude 13 7340 i5-1345U Intel Core i5-1345U, Intel Iris Xe Graphics G7 80EUs | Dell Latitude 7440 Intel Core i5-1345U, Intel Iris Xe Graphics G7 80EUs | Dell Latitude 3440 Intel Core i5-1345U, Intel Iris Xe Graphics G7 80EUs | Dell Latitude 13 7330 Intel Core i7-1265U, Intel Iris Xe Graphics G7 96EUs | HP Dragonfly G4 Intel Core i7-1365U, Intel Iris Xe Graphics G7 96EUs | Lenovo ThinkBook Plus Gen4 IRU Intel Core i7-1355U, Intel Iris Xe Graphics G7 96EUs | |
|---|---|---|---|---|---|---|
| Hitze | -5% | -7% | 2% | -5% | -1% | |
| Last oben max * (°C) | 34.3 | 39 -14% | 35.2 -3% | 38.6 -13% | 38.6 -13% | 34.2 -0% |
| Last unten max * (°C) | 37.6 | 40.6 -8% | 41 -9% | 42 -12% | 40.4 -7% | 35.8 5% |
| Idle oben max * (°C) | 28.4 | 28 1% | 29.8 -5% | 23.8 16% | 28.2 1% | 28.6 -1% |
| Idle unten max * (°C) | 28.8 | 28.8 -0% | 32 -11% | 24.6 15% | 29 -1% | 30.4 -6% |
* ... kleinere Werte sind besser
Lautsprecher
Insgesamt vier Lautsprecher verbaut Dell in dem kompakten Notebook. Zwei davon sind nach oben, zwei nach unten gerichtet. Die Stereo-Wiedergabe kann relativ laut erfolgen und klingt im Vergleich zu den meisten Klassenkontrahenten recht gut.
Dell Latitude 13 7340 i5-1345U Audio Analyse
(+) | Die Lautsprecher können relativ laut spielen (83 dB)
Bass 100 - 315 Hz
(±) | abgesenkter Bass - 6.2% geringer als der Median
(±) | durchschnittlich lineare Bass-Wiedergabe (9.6% Delta zum Vorgänger)
Mitteltöne 400 - 2000 Hz
(+) | ausgeglichene Mitten, vom Median nur 2.3% abweichend
(+) | lineare Mitten (5.1% Delta zum Vorgänger)
Hochtöne 2 - 16 kHz
(±) | zu hohe Hochtöne, vom Median nur 5.6% abweichend
(±) | durchschnittlich lineare Hochtöne (7.9% Delta zum Vorgänger)
Gesamt im hörbaren Bereich 100 - 16.000 Hz
(+) | hörbarer Bereich ist sehr linear (9% Abstand zum Median
Im Vergleich zu allen Geräten derselben Klasse
» 4% aller getesteten Geräte dieser Klasse waren besser, 1% vergleichbar, 95% schlechter
» Das beste Gerät hat einen Delta-Wert von 5%, durchschnittlich ist 18%, das schlechteste Gerät hat 53%
Im Vergleich zu allen Geräten im Test
» 3% aller getesteten Geräte waren besser, 1% vergleichbar, 96% schlechter
» Das beste Gerät hat einen Delta-Wert von 4%, durchschnittlich ist 23%, das schlechteste Gerät hat 134%
Apple MacBook Pro 16 2021 M1 Pro Audio Analyse
(+) | Die Lautsprecher können relativ laut spielen (84.7 dB)
Bass 100 - 315 Hz
(+) | guter Bass - nur 3.8% Abweichung vom Median
(+) | lineare Bass-Wiedergabe (5.2% Delta zum Vorgänger)
Mitteltöne 400 - 2000 Hz
(+) | ausgeglichene Mitten, vom Median nur 1.3% abweichend
(+) | lineare Mitten (2.1% Delta zum Vorgänger)
Hochtöne 2 - 16 kHz
(+) | ausgeglichene Hochtöne, vom Median nur 1.9% abweichend
(+) | sehr lineare Hochtöne (2.7% Delta zum Vorgänger)
Gesamt im hörbaren Bereich 100 - 16.000 Hz
(+) | hörbarer Bereich ist sehr linear (4.6% Abstand zum Median
Im Vergleich zu allen Geräten derselben Klasse
» 0% aller getesteten Geräte dieser Klasse waren besser, 0% vergleichbar, 100% schlechter
» Das beste Gerät hat einen Delta-Wert von 5%, durchschnittlich ist 17%, das schlechteste Gerät hat 45%
Im Vergleich zu allen Geräten im Test
» 0% aller getesteten Geräte waren besser, 0% vergleichbar, 100% schlechter
» Das beste Gerät hat einen Delta-Wert von 4%, durchschnittlich ist 23%, das schlechteste Gerät hat 134%
Energieaufnahme
Beim Energieverbrauch zeigt sich das Latitude 7340 etwas sparsamer als das 7440er, was aufgrund des etwas kleineren und geringer auflösenden Displays nicht verwundert. In der Spitze haben wir bis zu 69 W gemessen, was etwas über den angegebenen 65 W des Netzteils liegt.
| Aus / Standby | |
| Idle | |
| Last |
|
Legende:
min: | |
Energieaufnahme Witcher 3 / Stresstest
Energieaufnahme mit externem Monitor
Akkulaufzeit
Trotz weniger Platz steckt im Latitude 7340 mit 57 Wh ein gleich großer Akku wie im 14 Zoll messenden Latitude 7440. Das kleinere Display kommt hierbei den Akkulaufzeiten zugute, die z. B. beim WLAN-Test um satte zwei Stunden höher ausfallen. Insgesamt zeigt sich das Testgerät als deutlich ausdauernder als die meisten Wettbewerber. Einzig das Dragonfly G4 hält dank deutlich größerem Akku noch etwas länger durch.
| Dell Latitude 13 7340 i5-1345U i5-1345U, Iris Xe G7 80EUs, 57 Wh | Dell Latitude 7440 i5-1345U, Iris Xe G7 80EUs, 57 Wh | Dell Latitude 3440 i5-1345U, Iris Xe G7 80EUs, 54 Wh | Dell Latitude 13 7330 i7-1265U, Iris Xe G7 96EUs, 41 Wh | HP Dragonfly G4 i7-1365U, Iris Xe G7 96EUs, 68 Wh | Lenovo ThinkBook Plus Gen4 IRU i7-1355U, Iris Xe G7 96EUs, 56 Wh | Durchschnitt der Klasse Subnotebook | |
|---|---|---|---|---|---|---|---|
| Akkulaufzeit | -10% | -41% | -49% | 8% | -51% | -20% | |
| WLAN (h) | 15 | 13 -13% | 8.8 -41% | 8.3 -45% | 15.9 6% | 8 -47% | 14 ? -7% |
| Last (h) | 2.9 | 2.7 -7% | 1.4 -52% | 3.2 10% | 1.3 -55% | 1.969 ? -32% | |
| Idle (h) | 23.8 | 21.9 | 42.5 | 15.5 | 28.6 ? |
Pro
Contra
Fazit - Gutes Kompakt-Notebook offenbart im Test kaum Schwächen
Vergleichen wir das Dell Latitude 7340 mit 13,3 Zoll mit dem etwas größeren 14-Zoll-Modell Latitude 7440, dann fällt das hier getestete Subnotebook etwas leichter und kompakter aus, kann in vielen Belangen aber mit dem größeren Serienbruder mit nahezu gleicher Hardware mithalten. Die Performance liegt zwar meist leicht darunter, der Unterschied ist aber überschaubar.
Positiv fallen die längere Akkulaufzeit auf, die dem identischen Akku bei geringerem Stromverbrauch zu verdanken sind.
Letztendlich zeigt sich das Dell Latitude 7340 in unserem Test als kompakter Begleiter, der den üblichen Office-Aufgaben gewachsen ist und mit seinem ausreichend hellen und matten Display auch zum Arbeiten im Freien geeignet ist.
Wem 13,3 Zoll etwas zu klein ist, der bekommt mit der 14-Zoll-Alternative etwas mehr Diagonale und minimal mehr Performance. Wem hingegen die Leistung des verbauten Prozessors nicht langt, sollte sich beispielsweise das ebenso kompakte HP Dragonfly G4 genauer anschauen.
Preis und Verfügbarkeit
Dell bietet das Latitude 7340 in verschiedenen Konfigurationen an. Preislich geht es ab gut 1.500 Euro los. Das Testgerät (Intel Core i5-1345U, 16 GB DDR5 RAM, 512 GB SSD) in der Ultralight-Ausführung liegt laut UVP bei rund 1.950 Euro. Erhältlich ist das Dell Latitude 7340 direkt beim Hersteller, wird in verschiedenen Konfigurationen aber auch von Händlern wie Cyberport oder Notebooksbilliger vertrieben.
Dell Latitude 13 7340 i5-1345U
- 16.10.2023 v7 (old)
Marcus Schwarten
Transparenz
Die Auswahl der zu testenden Geräte erfolgt innerhalb der Redaktion. Das vorliegende Testmuster wurde dem Autor vom Hersteller oder einem Shop zu Testzwecken leihweise zur Verfügung gestellt. Eine Einflussnahme des Leihstellers auf den Testbericht gab es nicht, der Hersteller erhielt keine Version des Reviews vor der Veröffentlichung. Es bestand keine Verpflichtung zur Publikation. Als eigenständiges, unabhängiges Unternehmen unterliegt Notebookcheck keiner Diktion von Herstellern, Shops und Verlagen.
So testet Notebookcheck
Pro Jahr werden von Notebookcheck hunderte Laptops und Smartphones unabhängig in von uns standardisierten technischen Verfahren getestet, um eine Vergleichbarkeit aller Testergebnisse zu gewährleisten. Seit rund 20 Jahren entwickeln wir diese Testmethoden kontinuierlich weiter und setzen damit Branchenstandards. In unseren Testlaboren kommt ausschließlich hochwertiges Messequipment in die Hände erfahrener Techniker und Redakteure. Die Tests unterliegen einer mehrstufigen Kontrolle. Unsere komplexe Gesamtbewertung basiert auf hunderten fundierten Messergebnissen und Benchmarks, womit Ihnen Objektivität garantiert ist. Weitere Informationen zu unseren Testmethoden gibt es hier.
Preisvergleich
