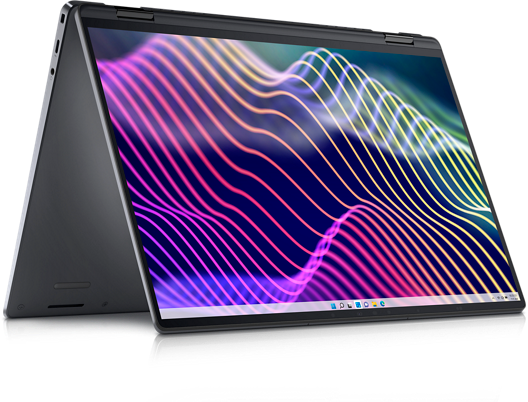
Das XPS-Convertible im Business-Segment: Dell Latitude 9440 2-in-1 im Test

Während das Latitude 9420 2-in-1 und das Latitude 9430 2-in-1 auf dem selben Design basierten, wurde das diesjährige Latitude 9440 2-in-1 einer kompletten Frischzellenkur unterzogen. Das auf der CES 2023 enthüllte Latitude 9440 2-in-1 bekommt ein attraktiveres Erscheinungsbild mit Designelementen vom XPS 13 Plus. Intern hat es ein Upgrade von Intels 12. CPU-Generation namens Alder Lake auf die Raptor-Lake-Prozessoren der 13. Generation gegeben.
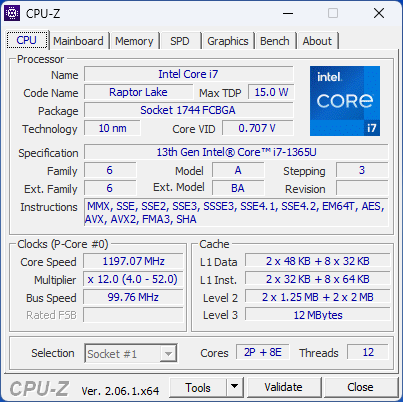
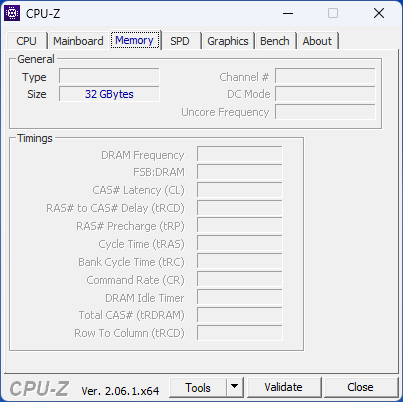
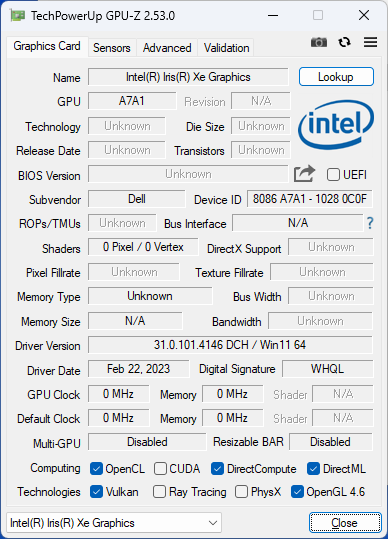
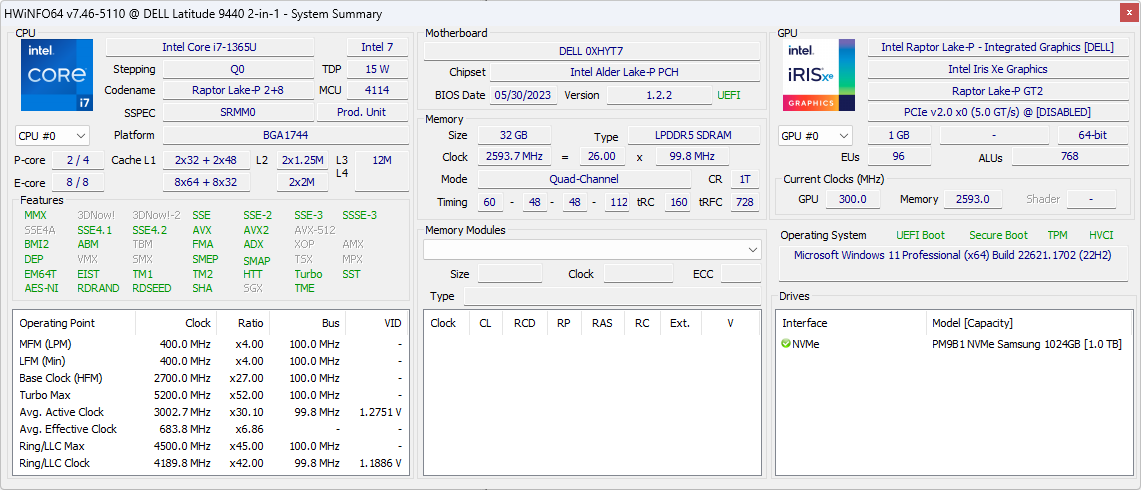
Unser Testgerät ist eine gehobene Konfiguration mit dem Core i7-1365U vPro, verlöteten 32GB LPDDR5x-6400 RAM und einer 1TB fassenden NVMe SSD für rund 3.100 Euro. Günstigere Ausführungen mit dem Core i5-1335U starten bei etwas über 2.300 Euro, alle Modelle sind mit dem gleichen IPS-Touchscreen mit einer Auflösung von 2560 mal 1600 Pixeln sowie der integrierten Intel Iris Xe Grafikeinheit bestückt.
Das Latitude 9440 2-in-1 muss sich gegen andere Business-Subnotebooks aus dem High-End-Segment messen, zu den nennenswerten Alternativen gehören das Lenovo ThinkPad X1 Yoga G8, Asus ExpertBook B7 Flip und die HP EliteBook Baureihe.
Weitere Dell-Testberichte:
Potentielle Konkurrenten im Vergleich
Bew. | Datum | Modell | Gewicht | Dicke | Größe | Auflösung | Preis ab |
|---|---|---|---|---|---|---|---|
| 87.9 % v7 (old) | 06 / 2023 | Dell Latitude 9440 2-in-1 i7-1365U, Iris Xe G7 96EUs | 1.6 kg | 16.28 mm | 14.00" | 2560x1600 | |
| 89.8 % v7 (old) | 08 / 2022 | Dell Latitude 9430 2-in-1 i7-1265U, Iris Xe G7 96EUs | 1.5 kg | 13.94 mm | 14.00" | 2560x1600 | |
| 90 % v7 (old) | 06 / 2023 | Lenovo ThinkPad X1 Yoga G8 i7-1355U i7-1355U, Iris Xe G7 96EUs | 1.4 kg | 15.53 mm | 14.00" | 1920x1200 | |
| 87.5 % v7 (old) | 05 / 2022 | LG Gram 14T90P i5-1135G7, Iris Xe G7 80EUs | 1.2 kg | 17 mm | 14.00" | 1900x1200 | |
| 89.4 % v7 (old) | 02 / 2022 | Asus ExpertBook B7 Flip B7402FEA i7-1195G7, Iris Xe G7 96EUs | 1.4 kg | 18.9 mm | 14.00" | 1900x1200 | |
| 89.4 % v7 (old) | 03 / 2023 | HP Dragonfly Pro 2023 R7 7736U, Radeon 680M | 1.5 kg | 18.3 mm | 14.00" | 1920x1200 |
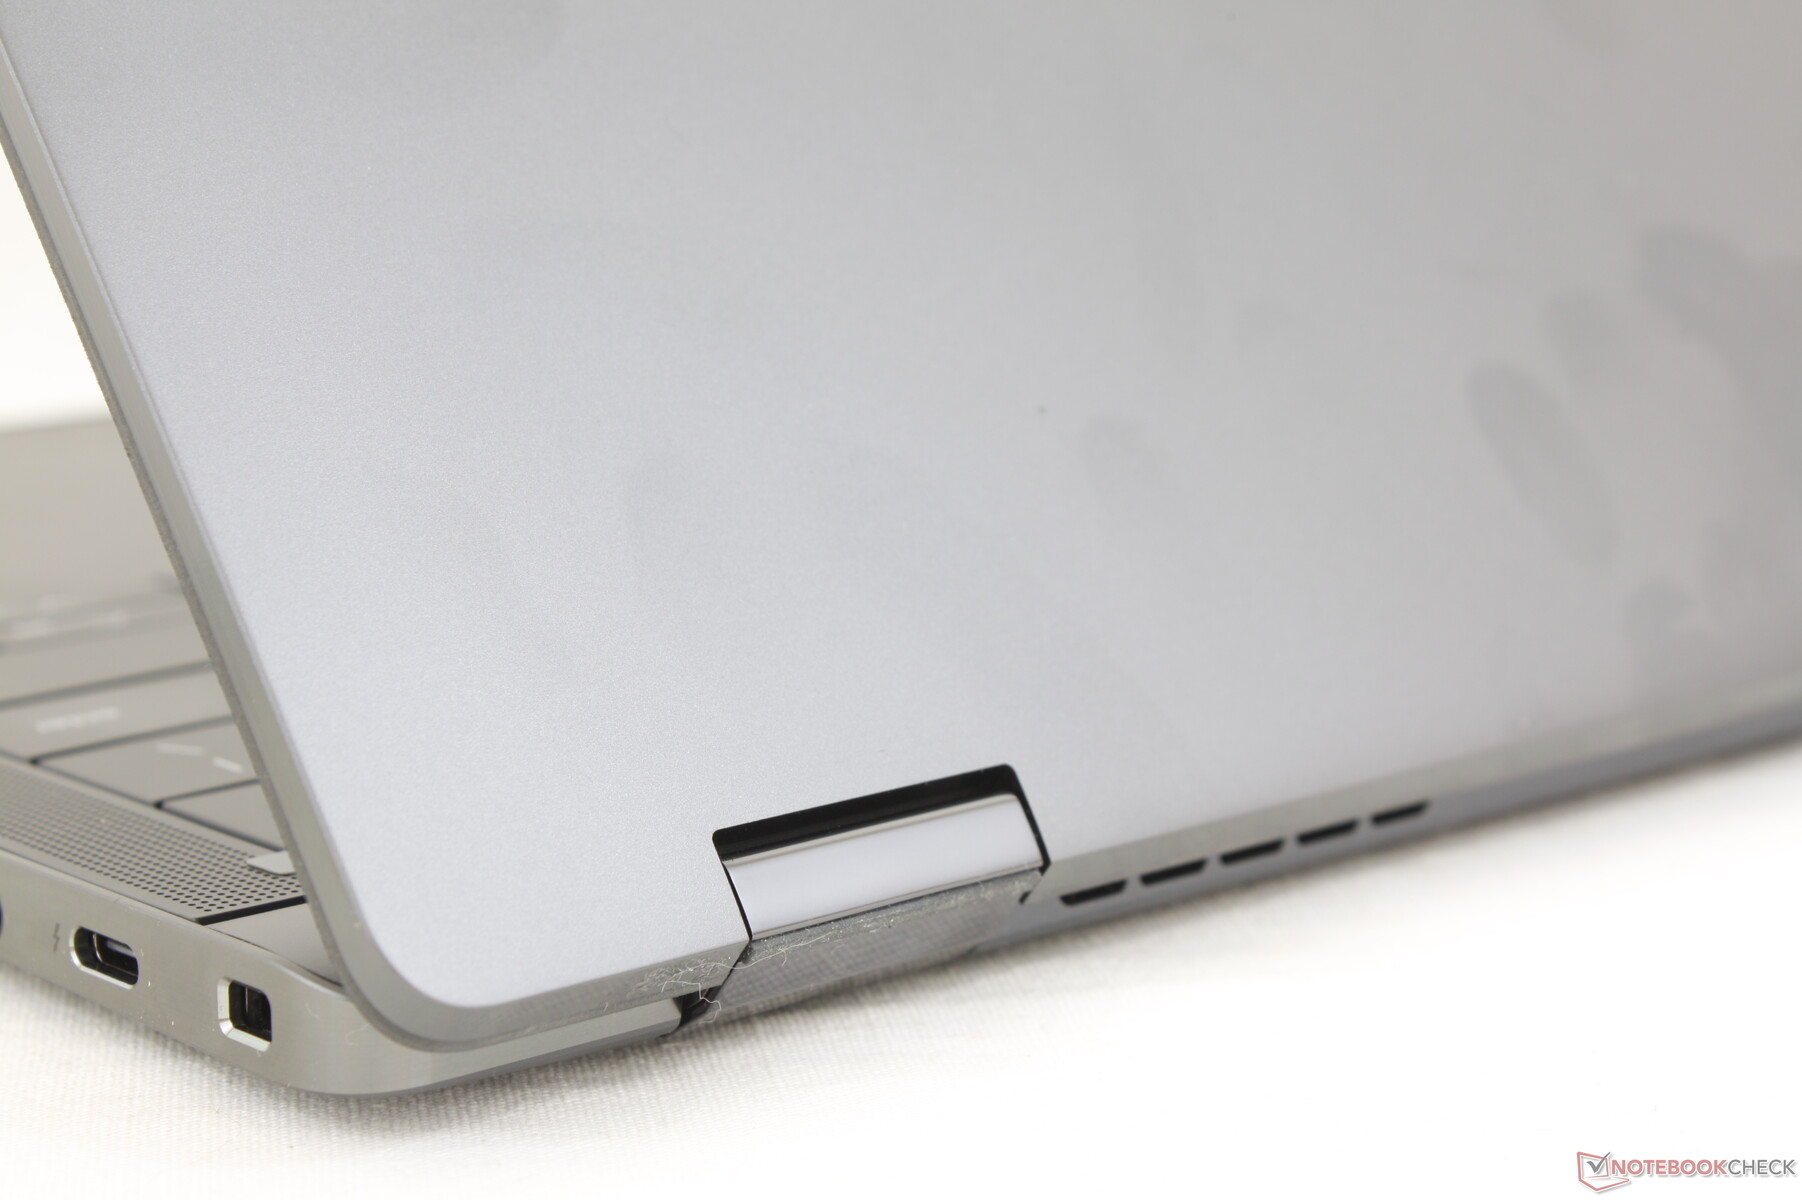
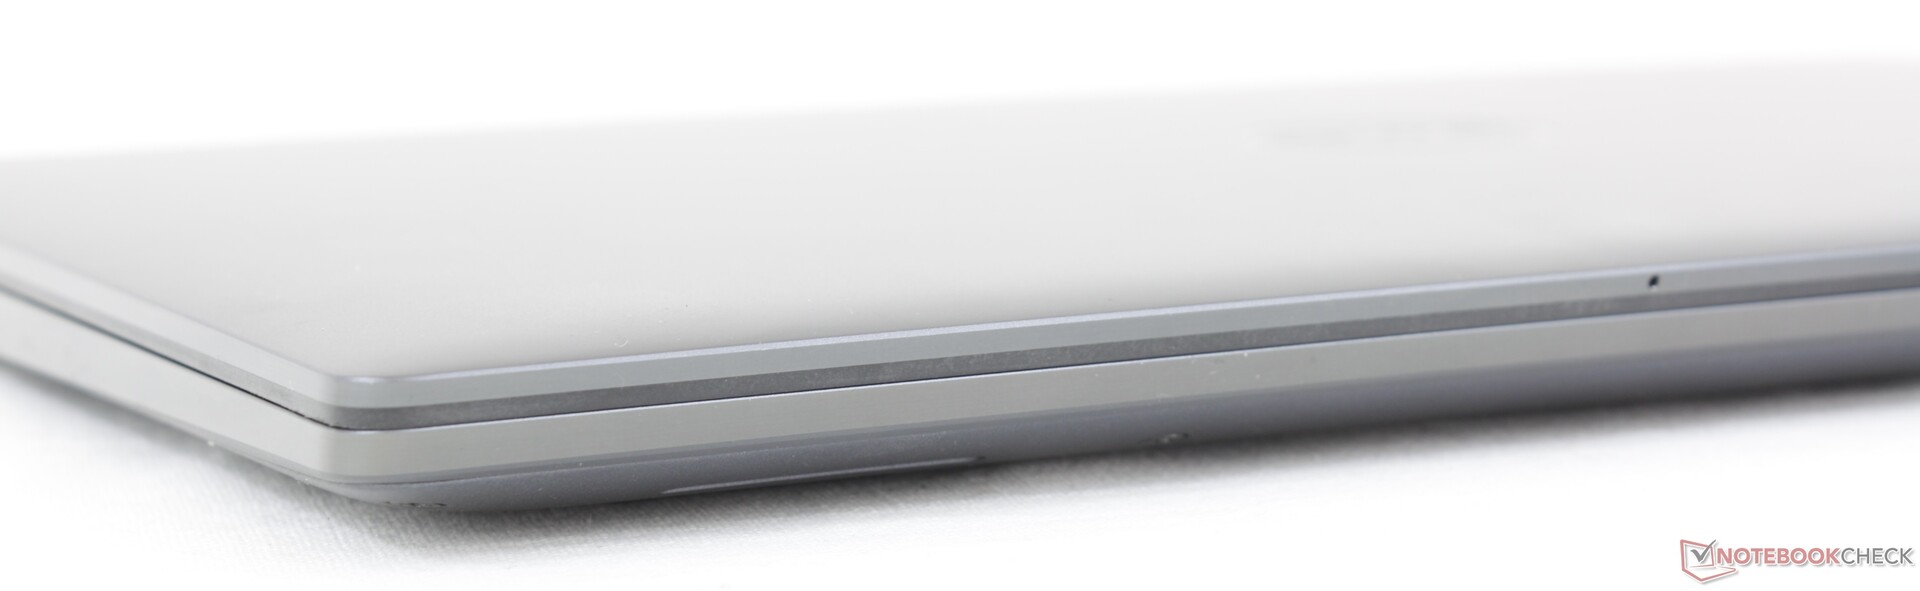
Gehäuse — Sieht besser aus und ist genauso stabil
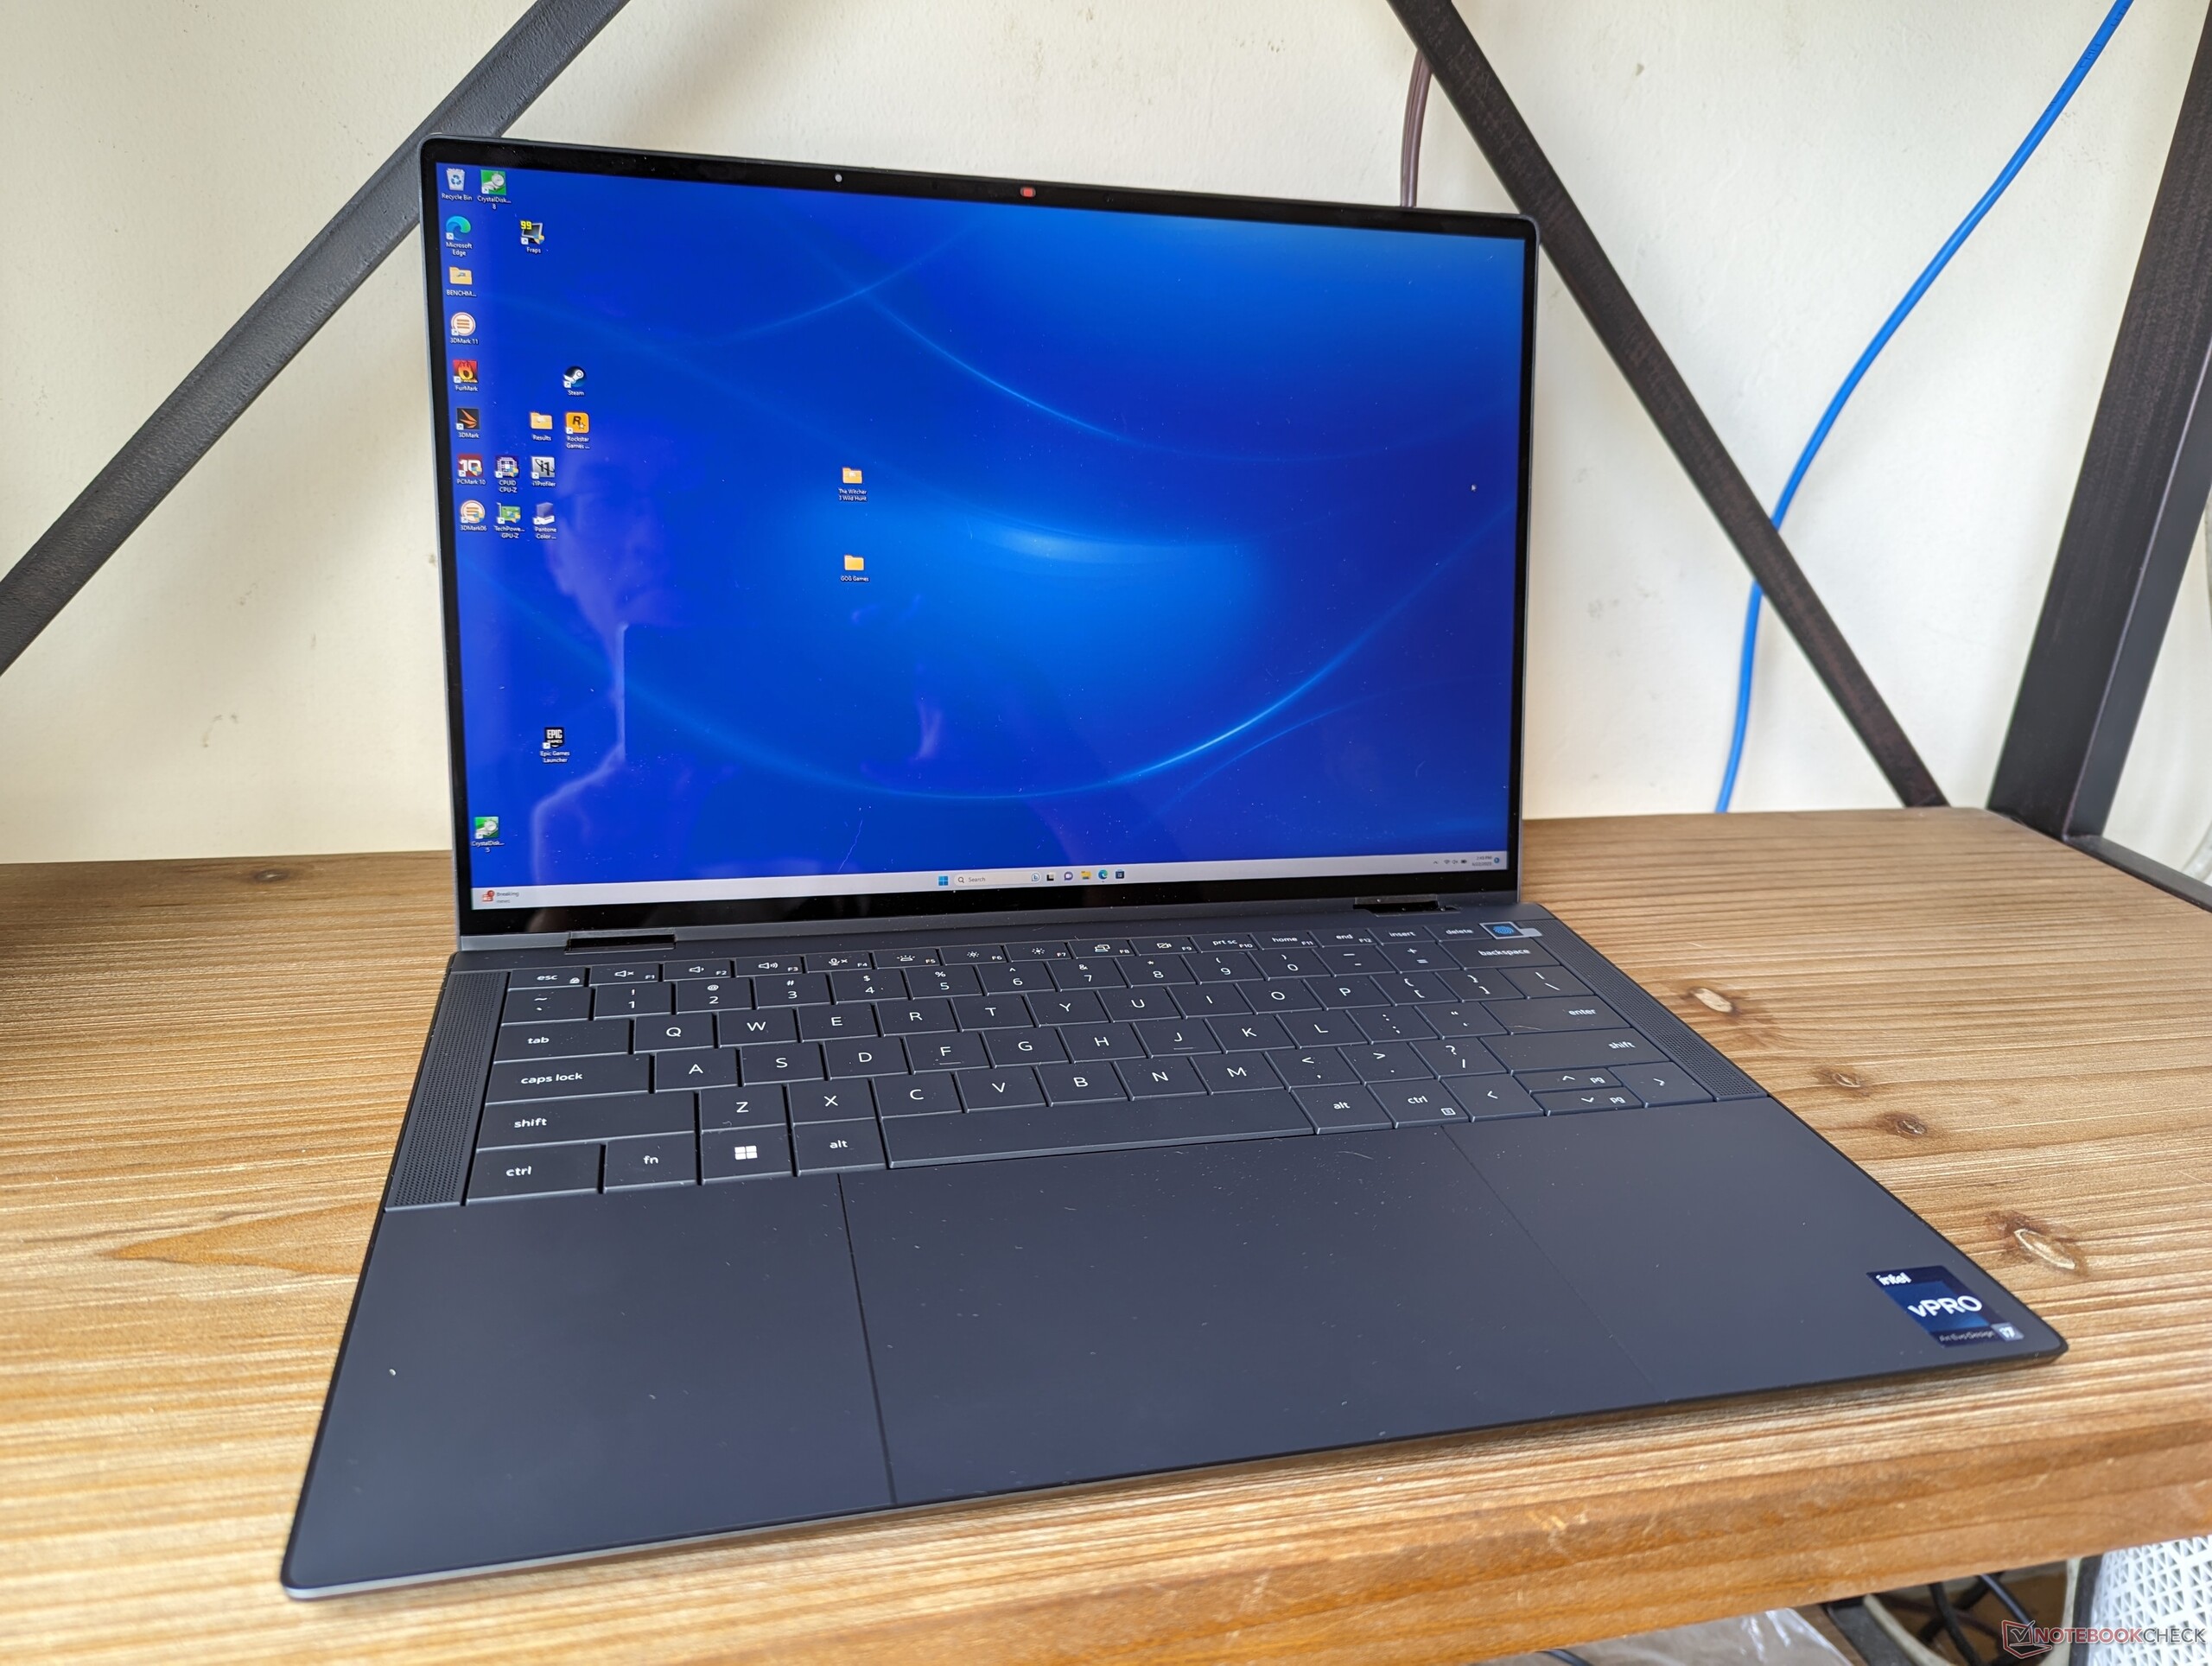
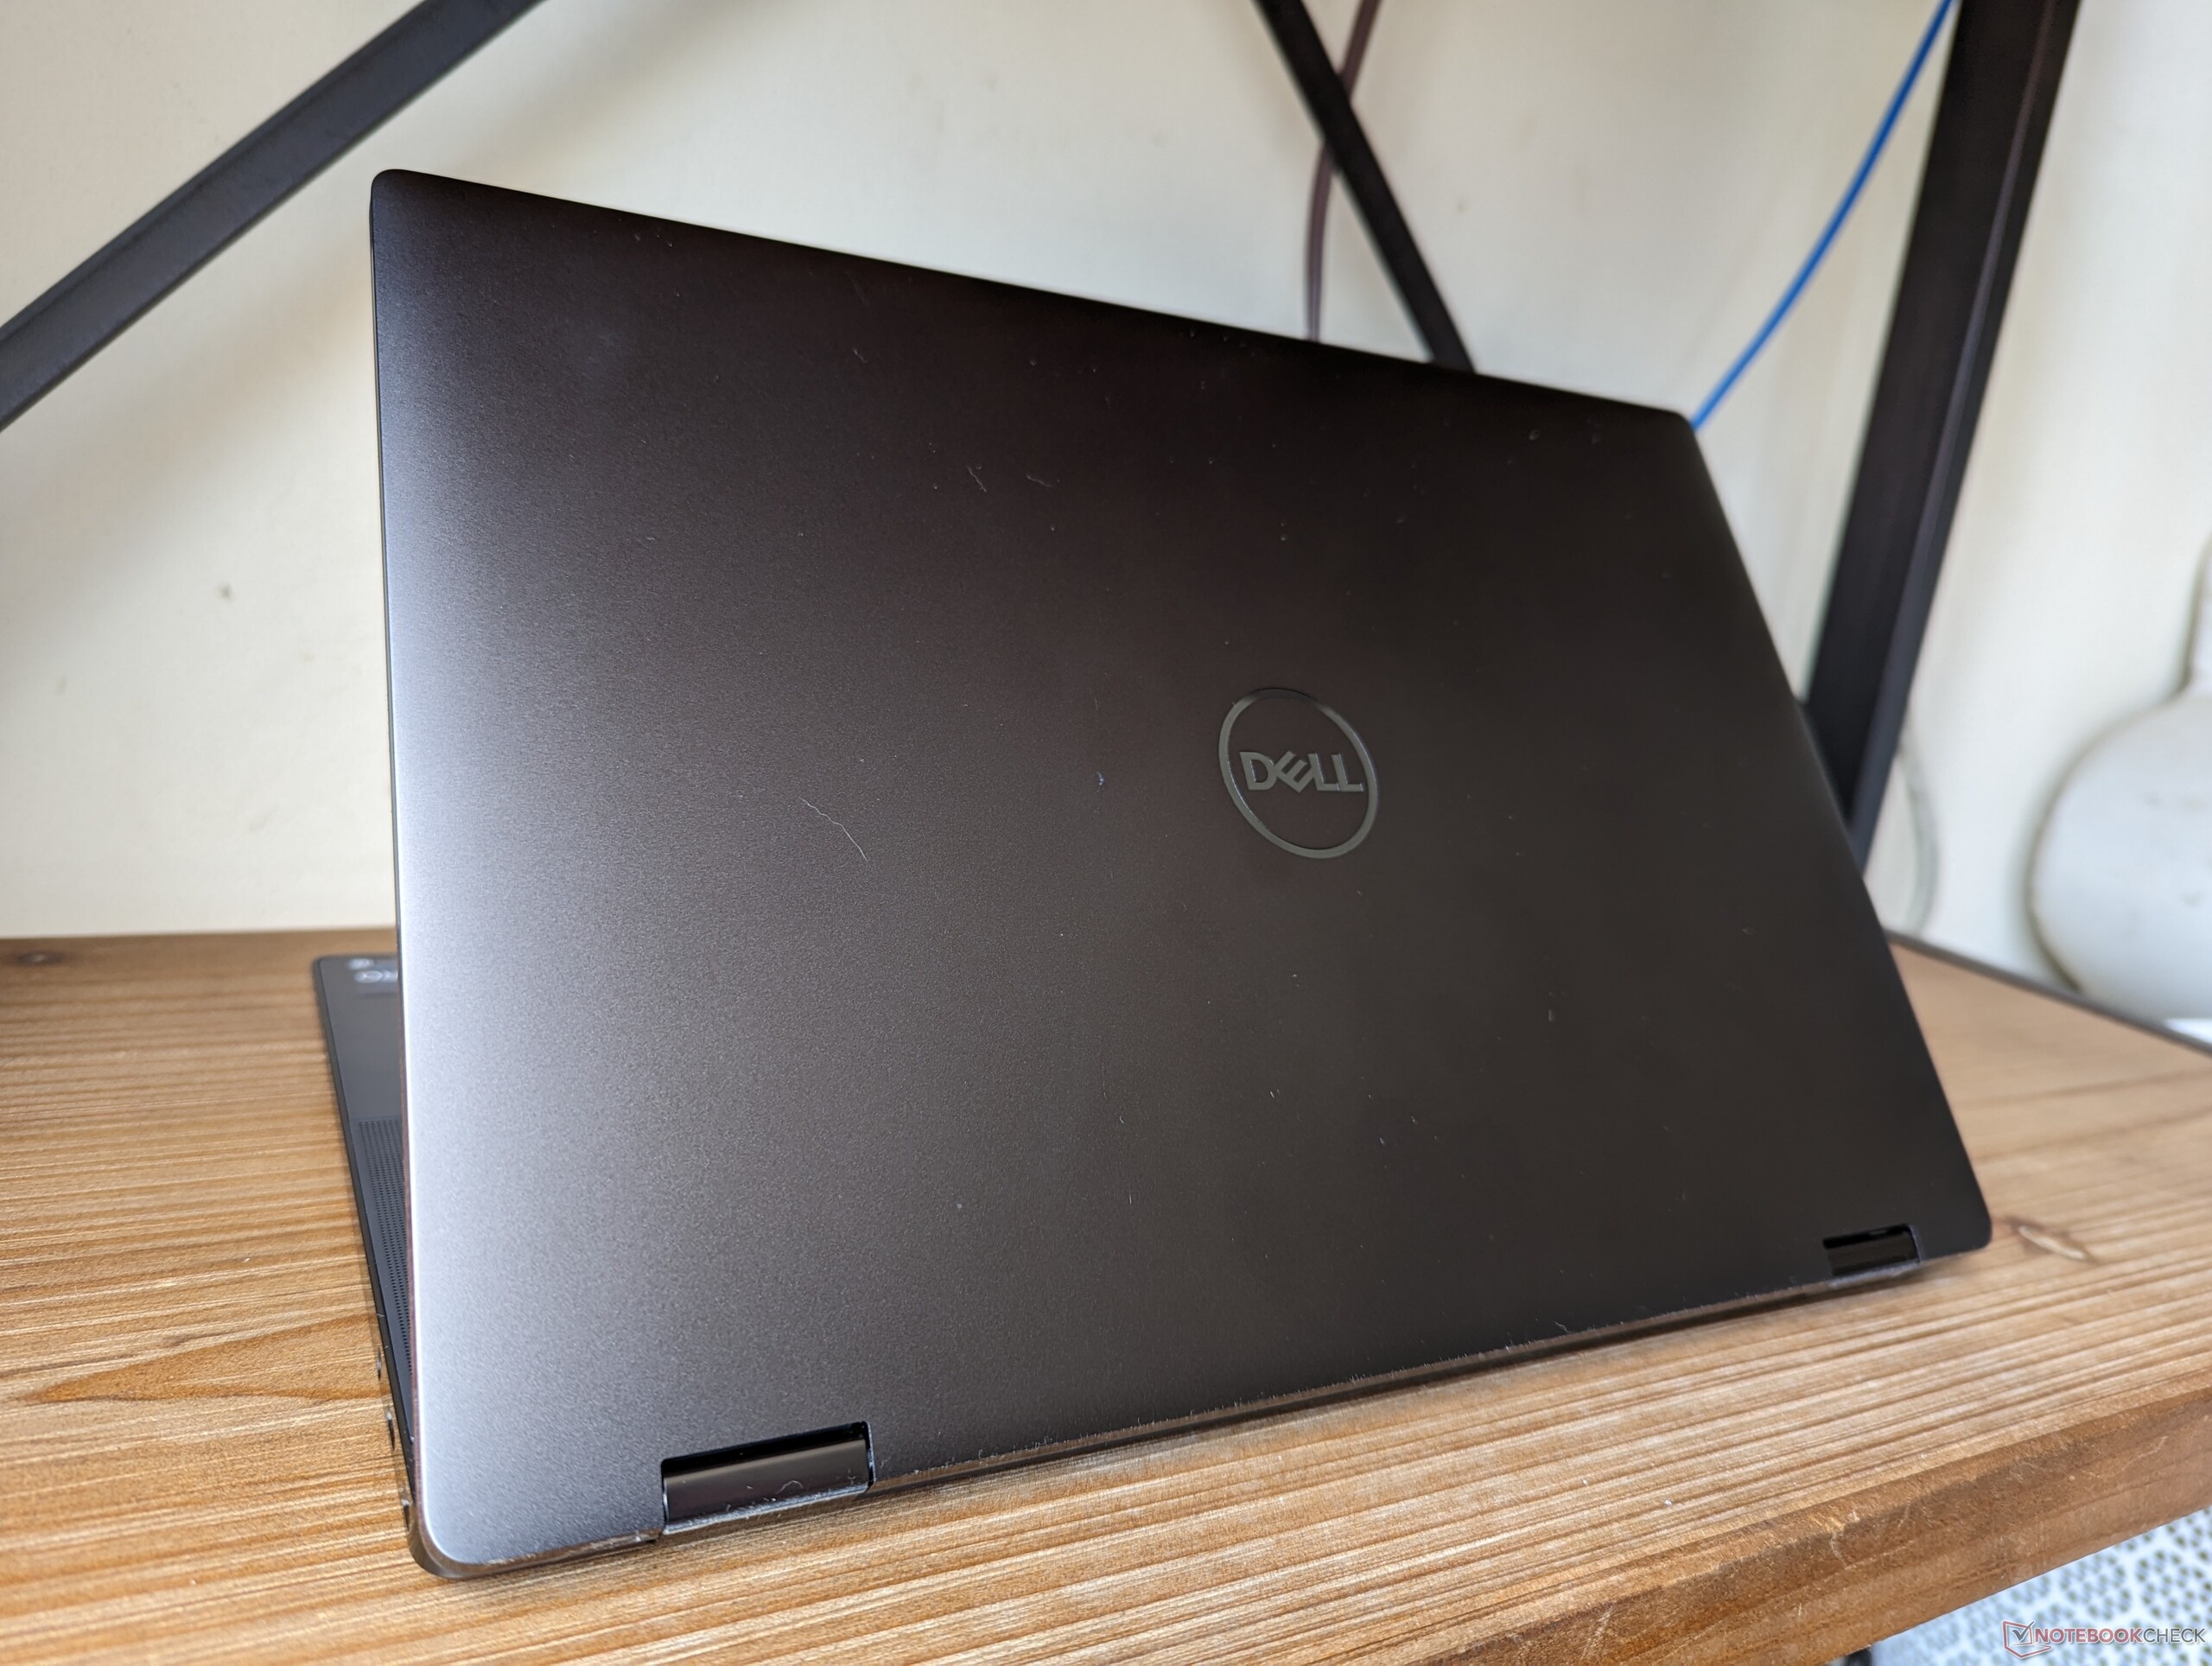
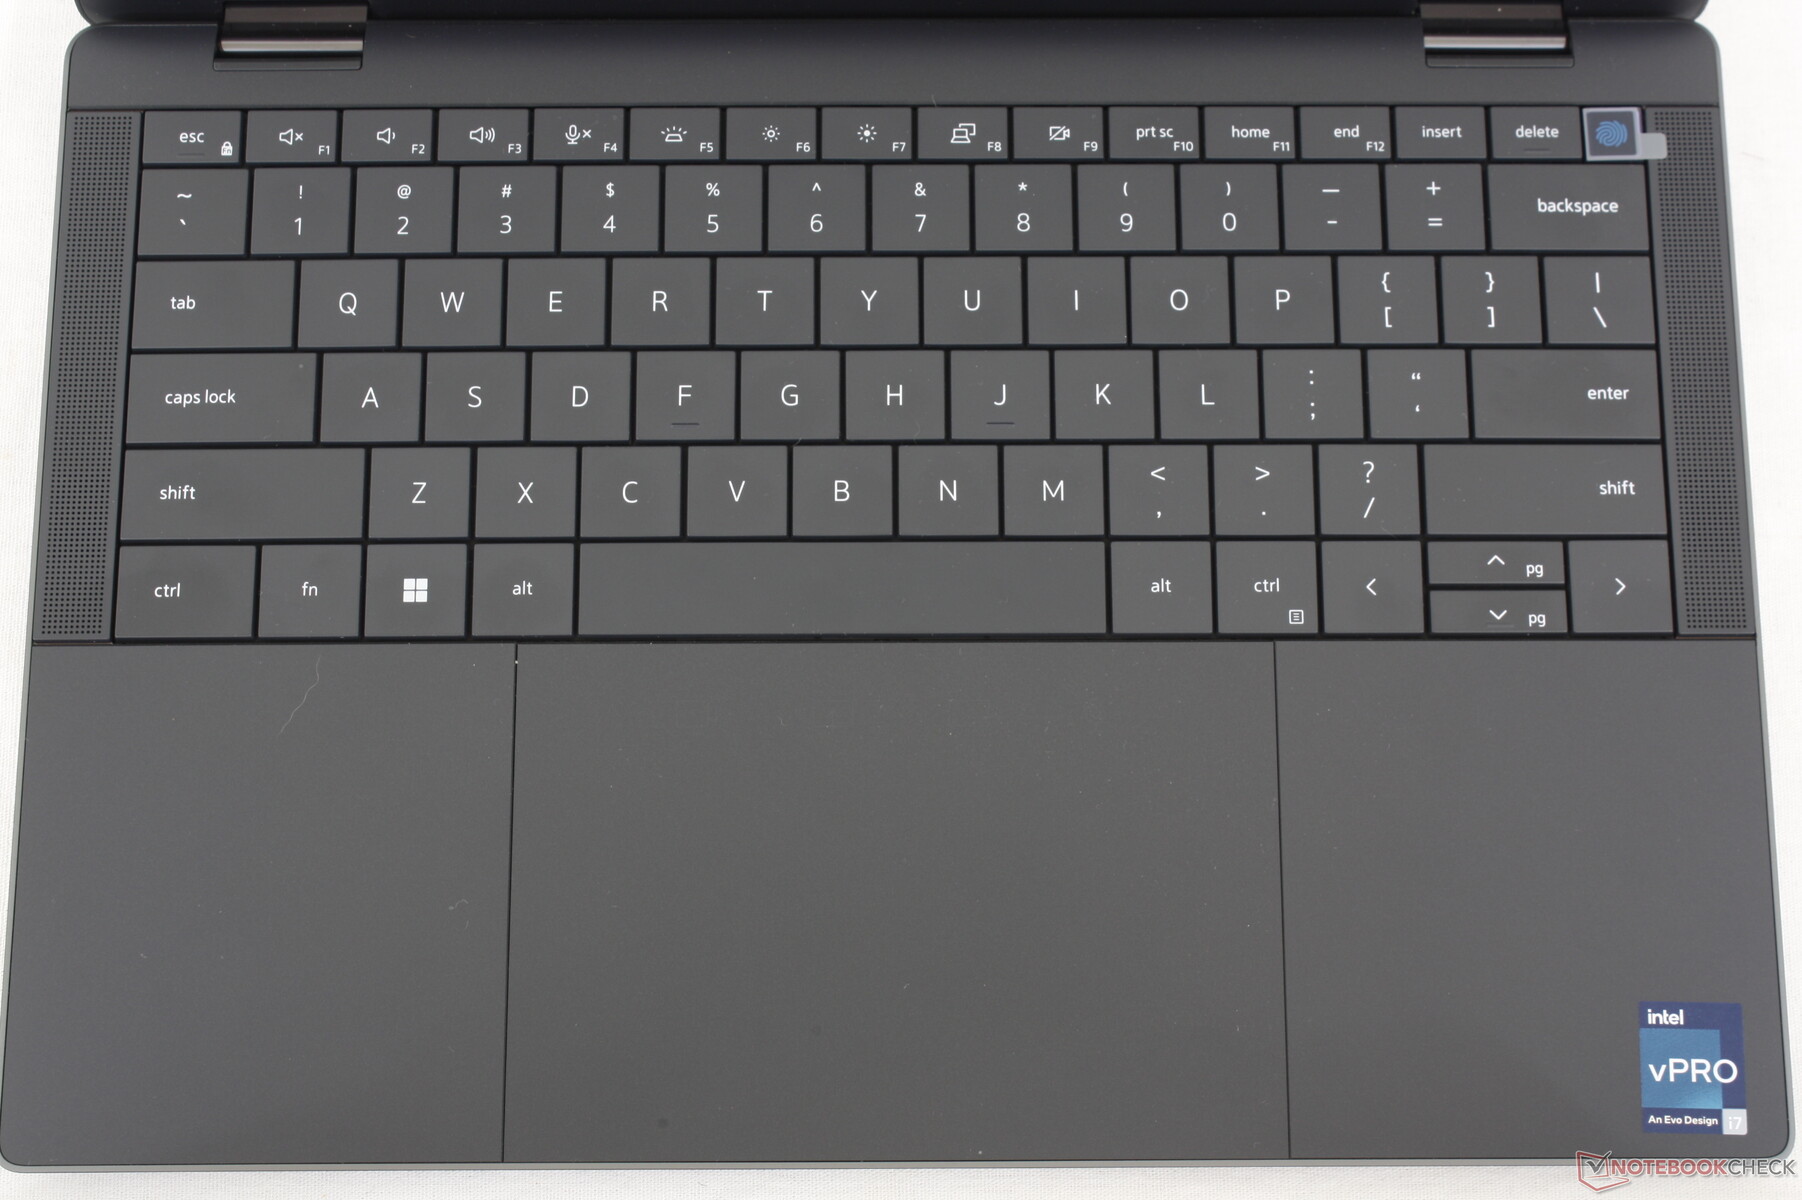
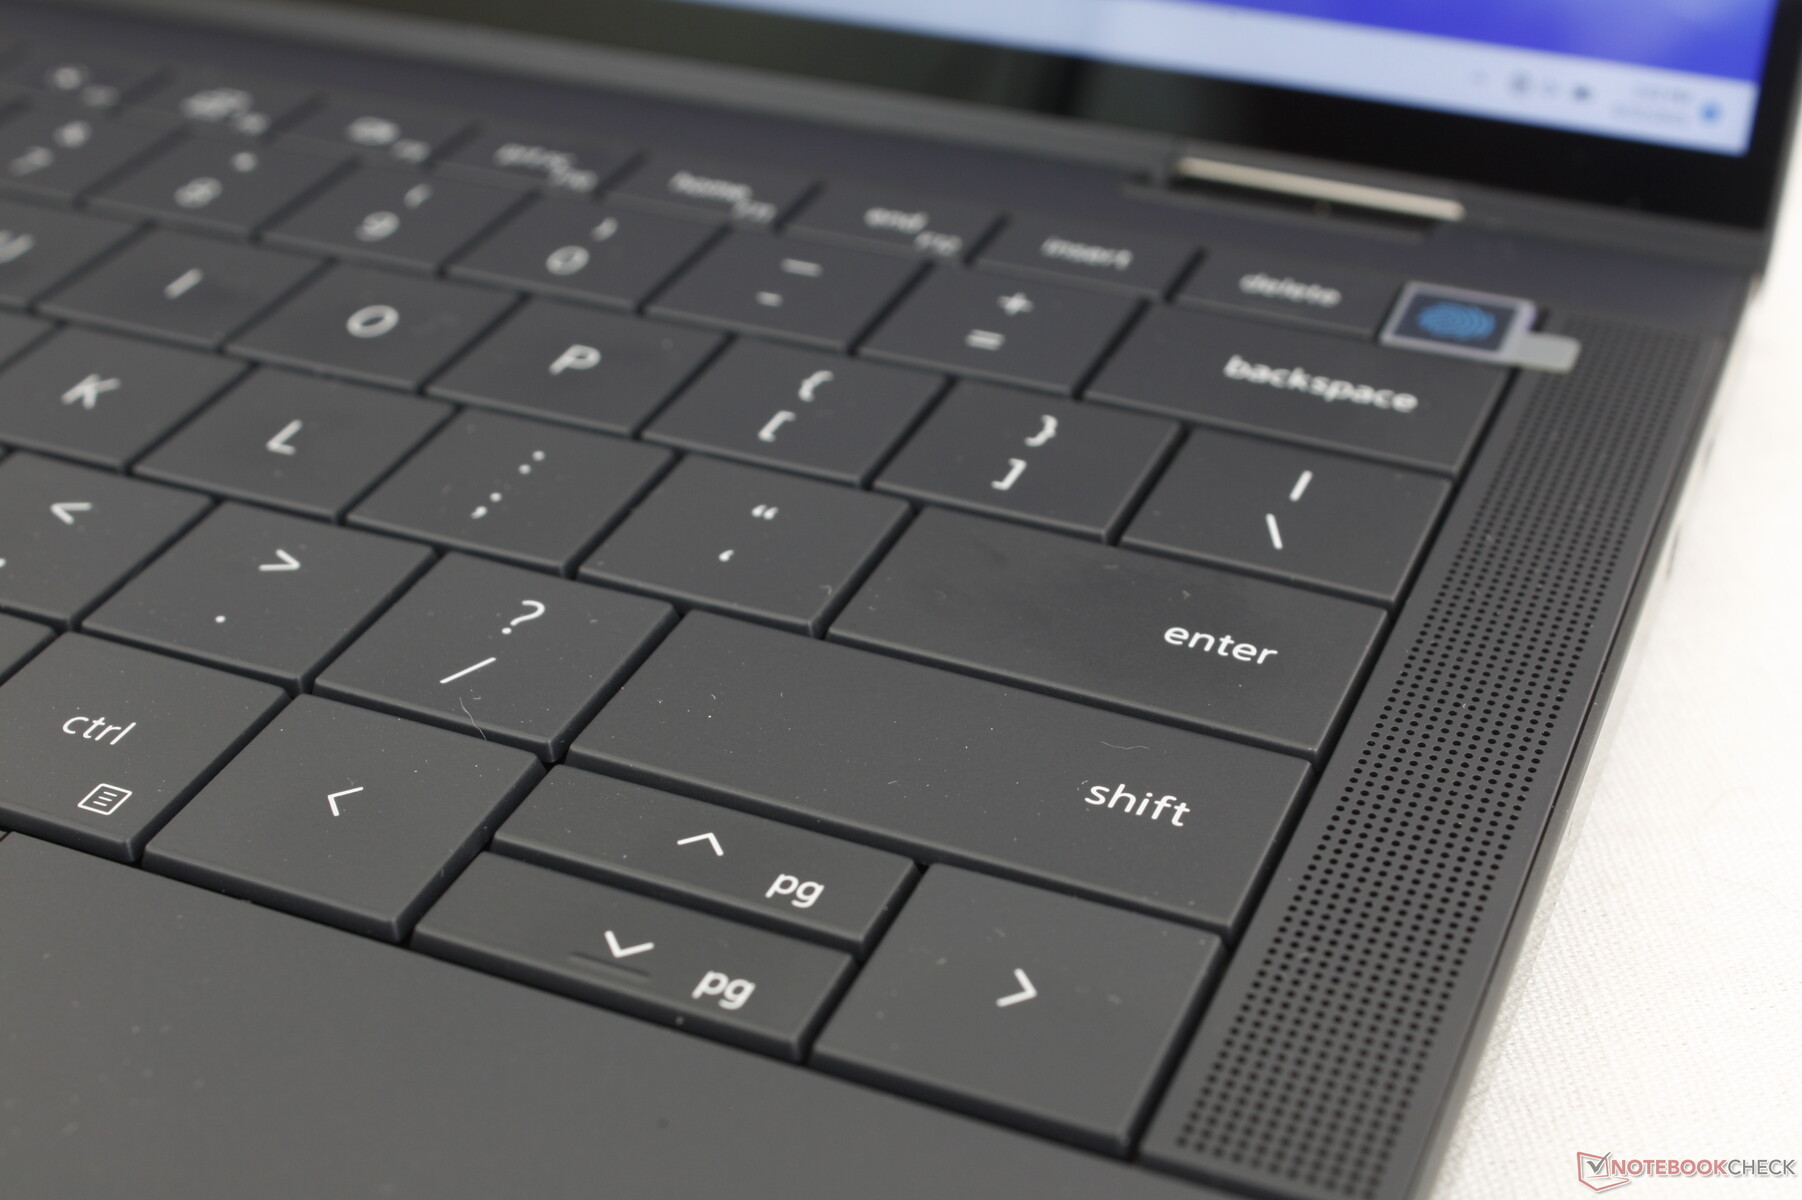
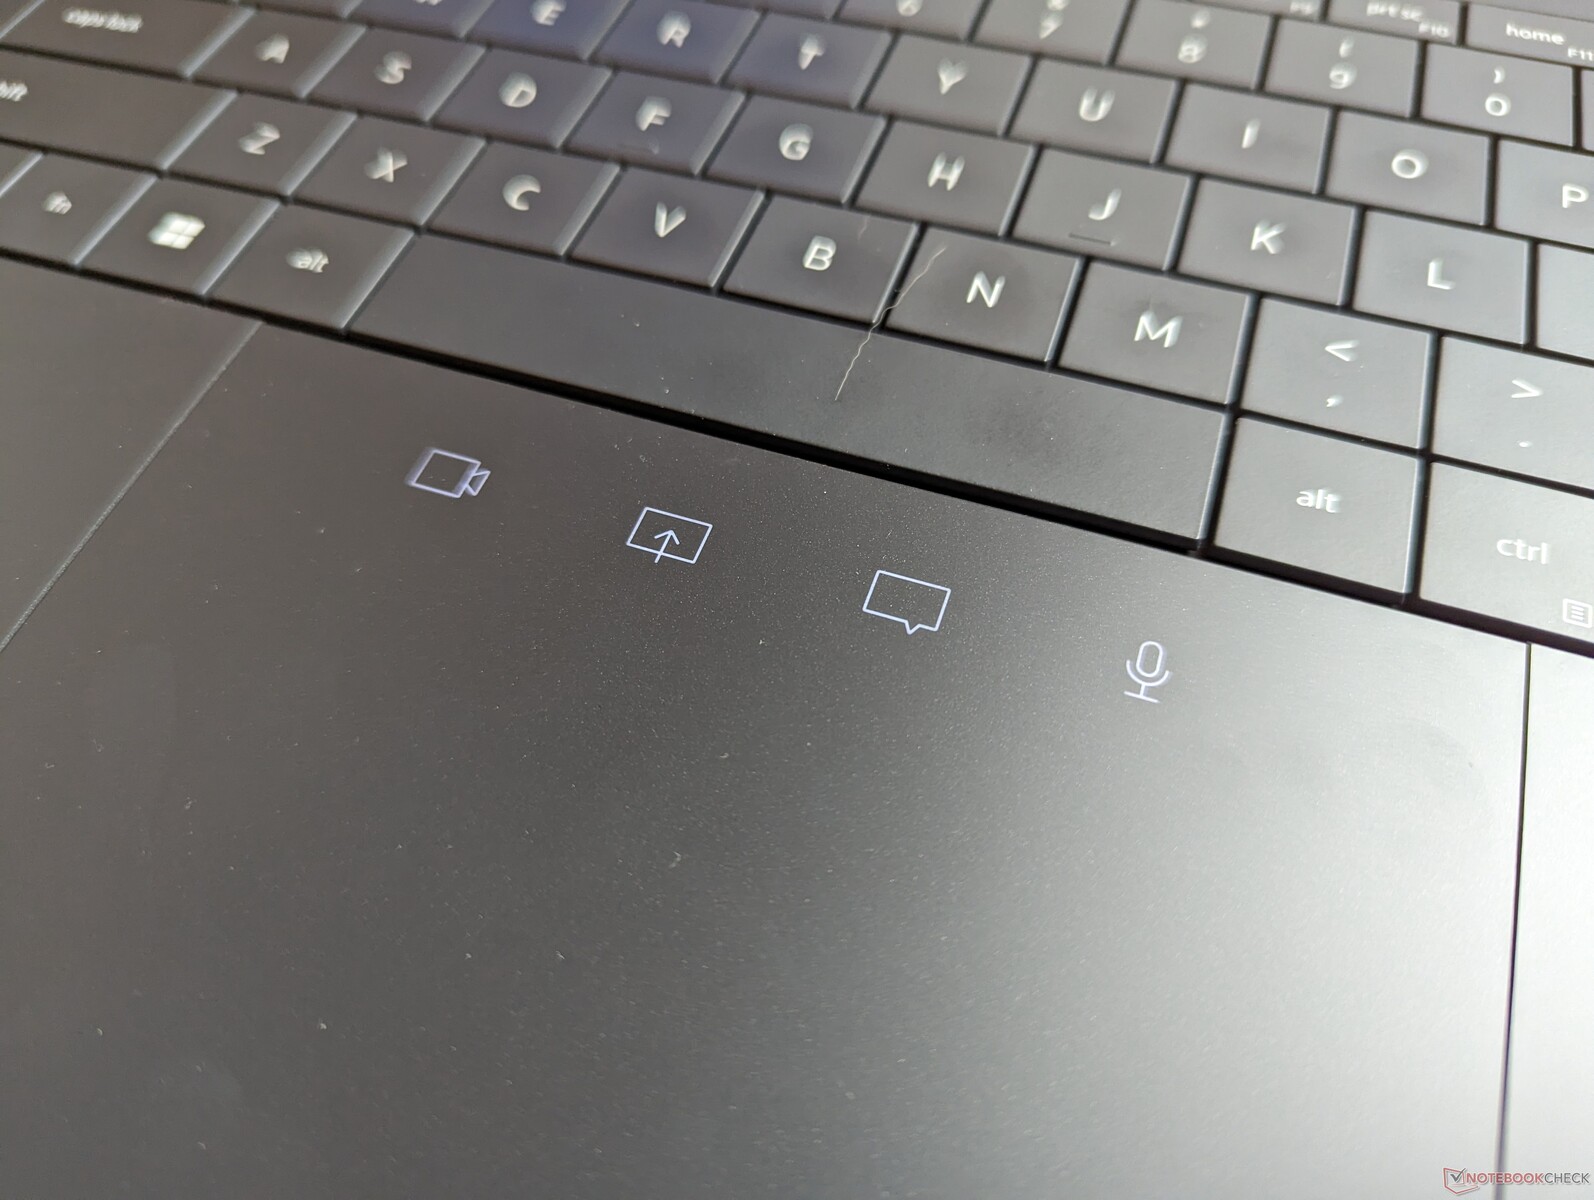
Im geschlossenen Zustand sieht das Latitude 9440 2-in-1 ähnlich aus wie die meisten anderen Latitude-Modelle. Die vom XPS inspirierten Änderungen fallen erst nach dem Öffnen des Notebooks auf. Die sogenannte "Zero Lattice" Tastatur wurde direkt vom XPS 13 Plus übernommen, während das Touchpad erkennbare und nicht unsichtbare Kanten hat wie beim oft kritisierten Clickpad des XPS 13 Plus. Unterdessen wurde die berührungsempfindliche Tastenreihe vom XPS umkonzipiert und auf der oberen Hälfte des Touchpads platziert. Die nach oben gerichteten Lautsprecher an den Seiten der Tastatur wurden vom Latitude 9430 2-in-1 aus dem letzten Jahr übernommen.
All diese Änderungen haben sich glücklicherweise nicht negativ auf die Stabilität und Verarbeitungsqualität ausgewirkt. Die Basis, der Bildschirm und die Mitte der Tastatur geben bei Verwindungsversuchen nur minimal nach, ähnlich wie beim Latitude 9430 2-in-1 oder dem HP Spectre x360 13. Durch das größere 14-Zoll-Format fühlt sich das Convertible tatsächlich etwas solider an als das 13 Zoll große XPS 13 Plus.
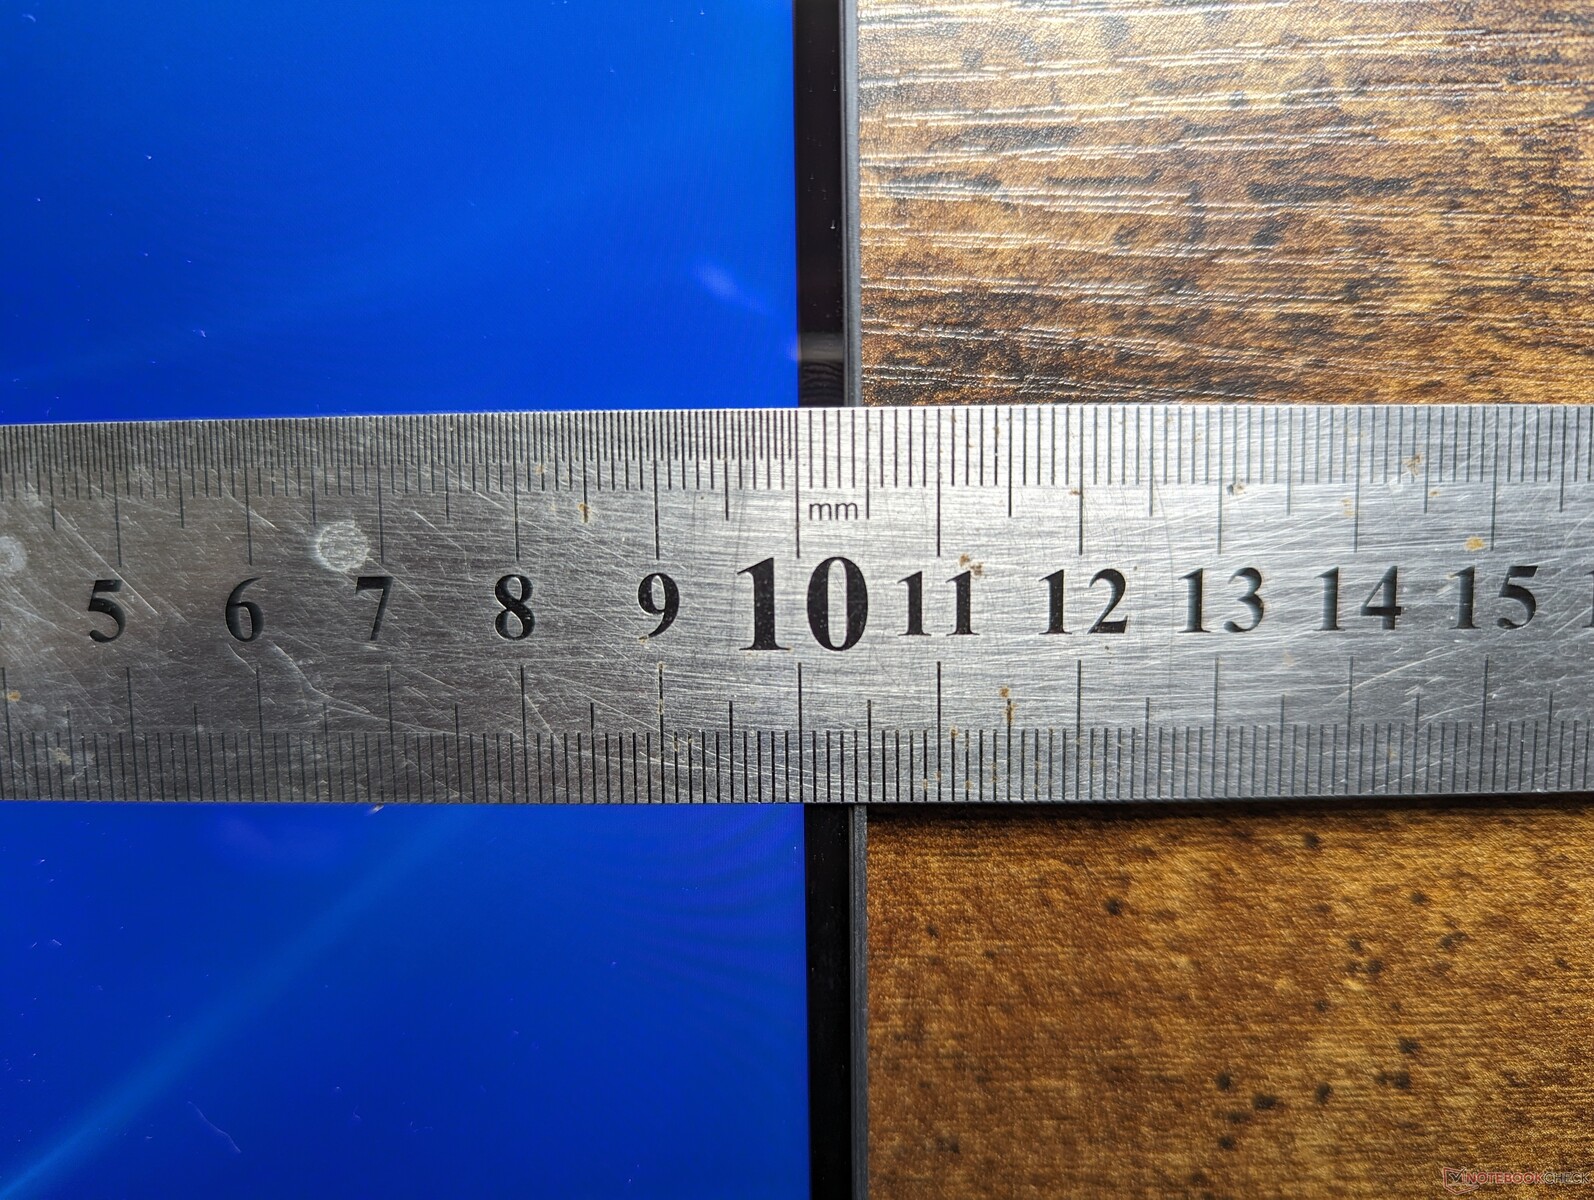
Trotz der Änderungen ist das neue 2023er Modell dicker und schwerer als sein Vorgänger. Der Zuwachs ist zwar eher gering, aber im Vergleich zu Konkurrenten wie dem ThinkPad X1 Yoga G8 oder dem ExpertBook B7 Flip ist das Gerät rund 200 Gramm schwerer.
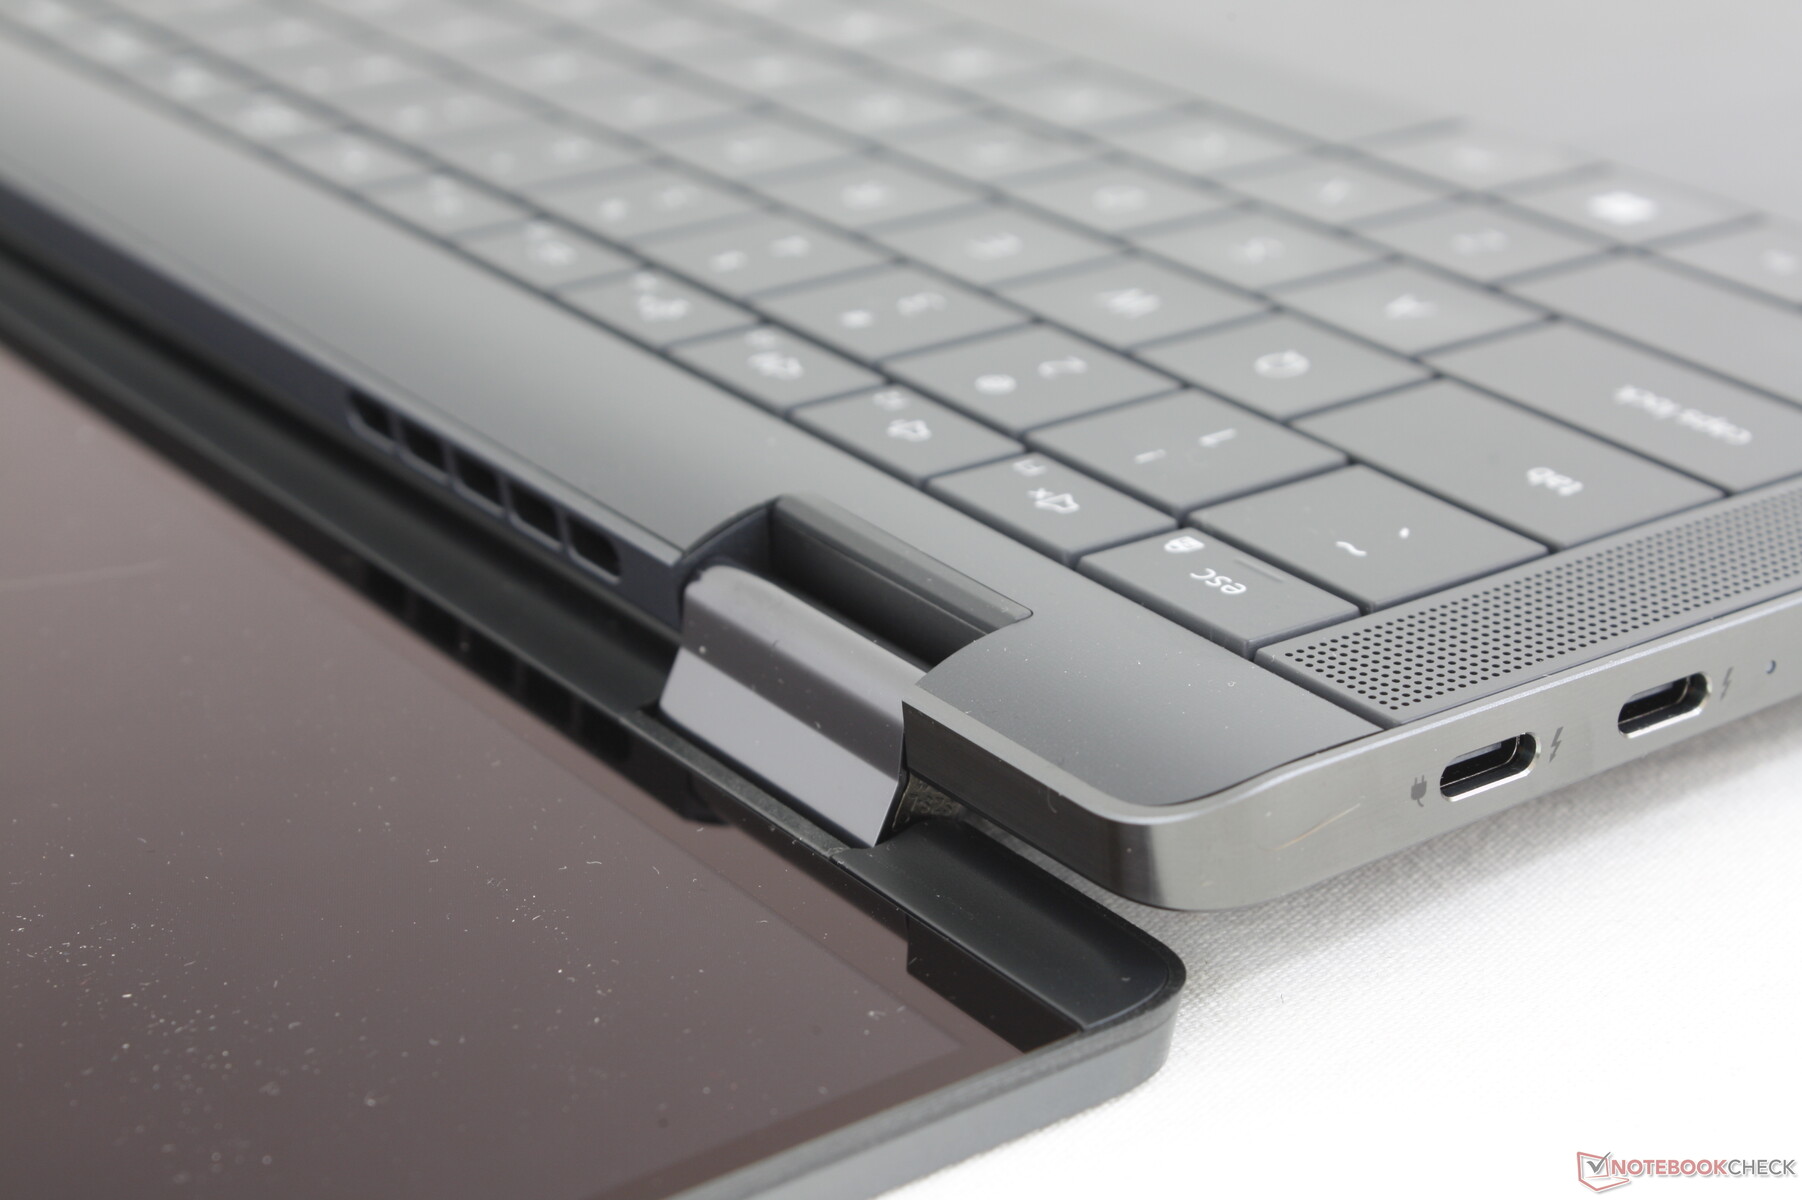
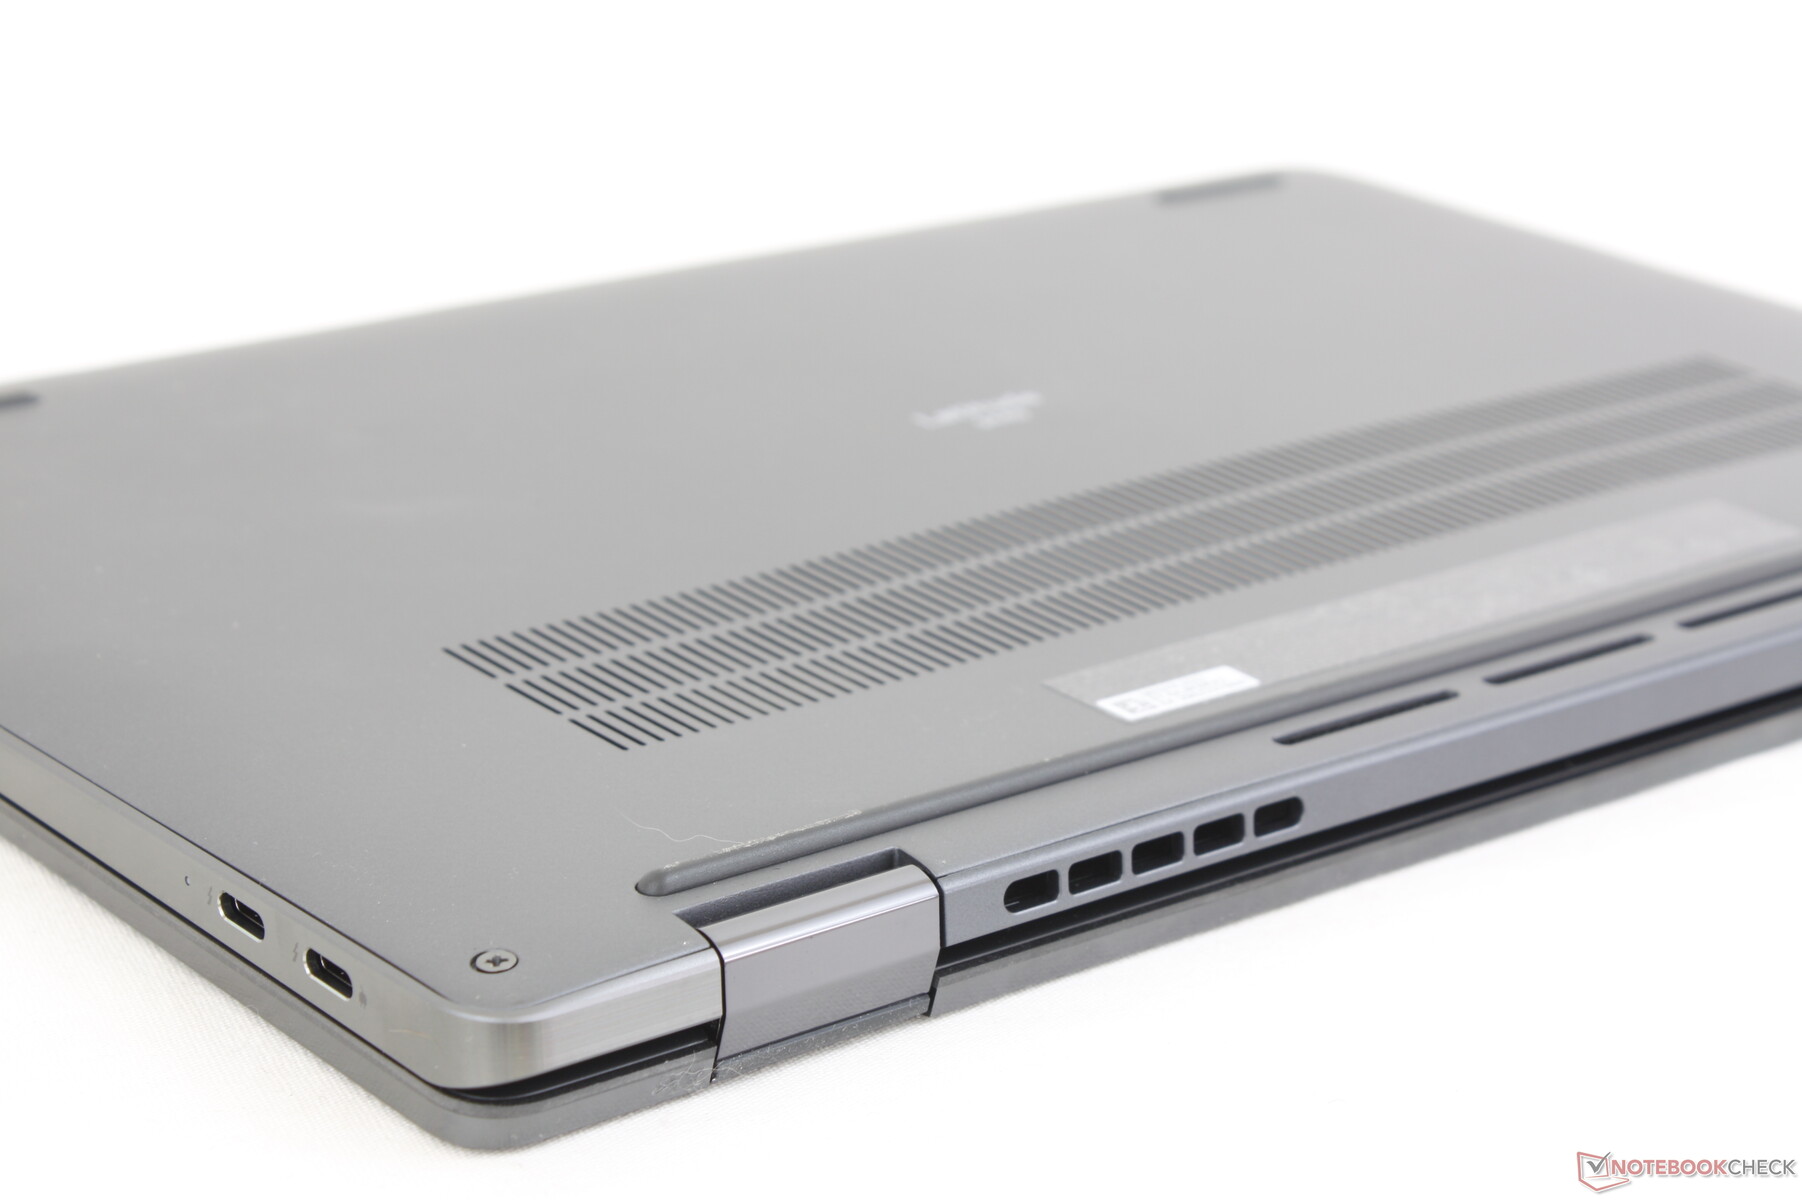
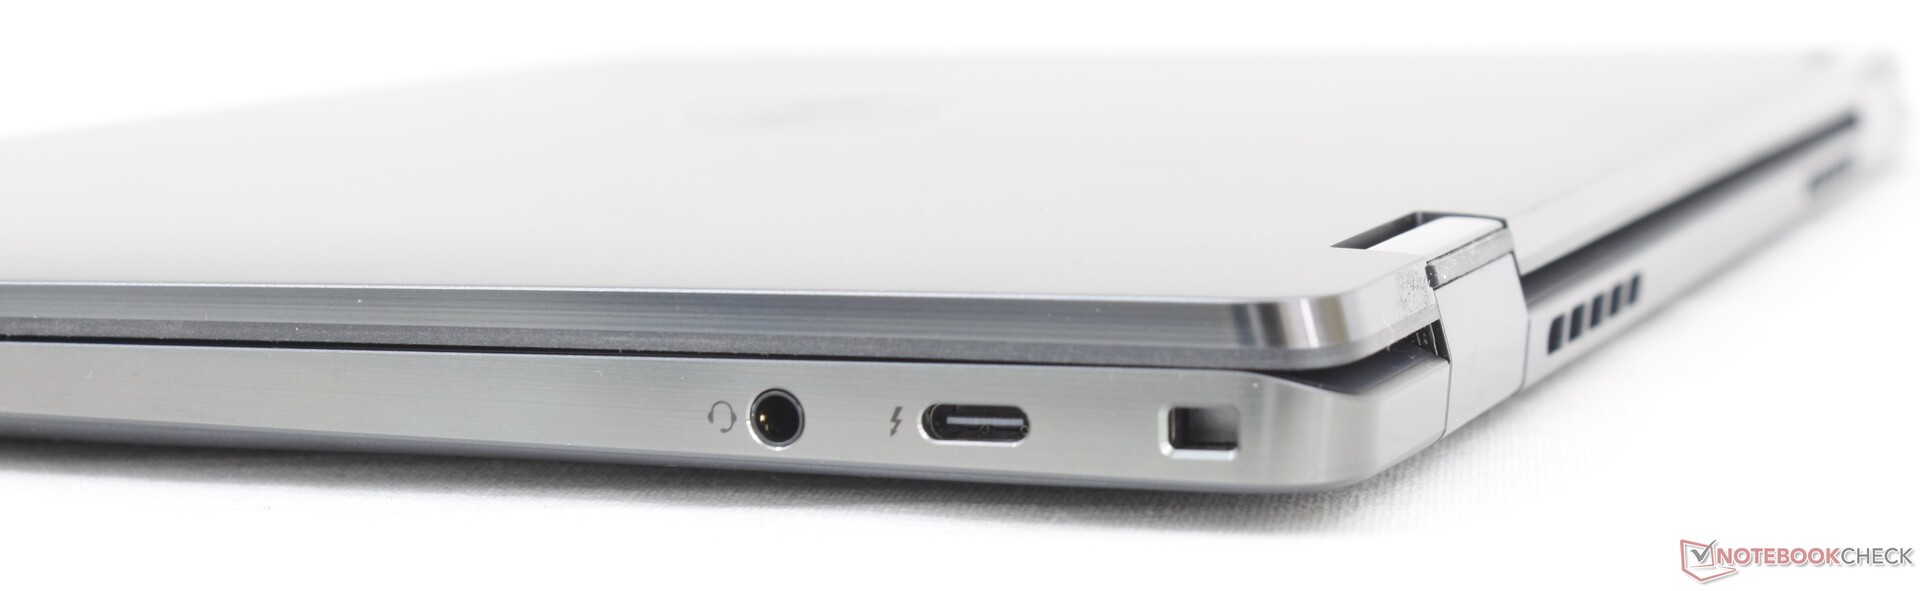
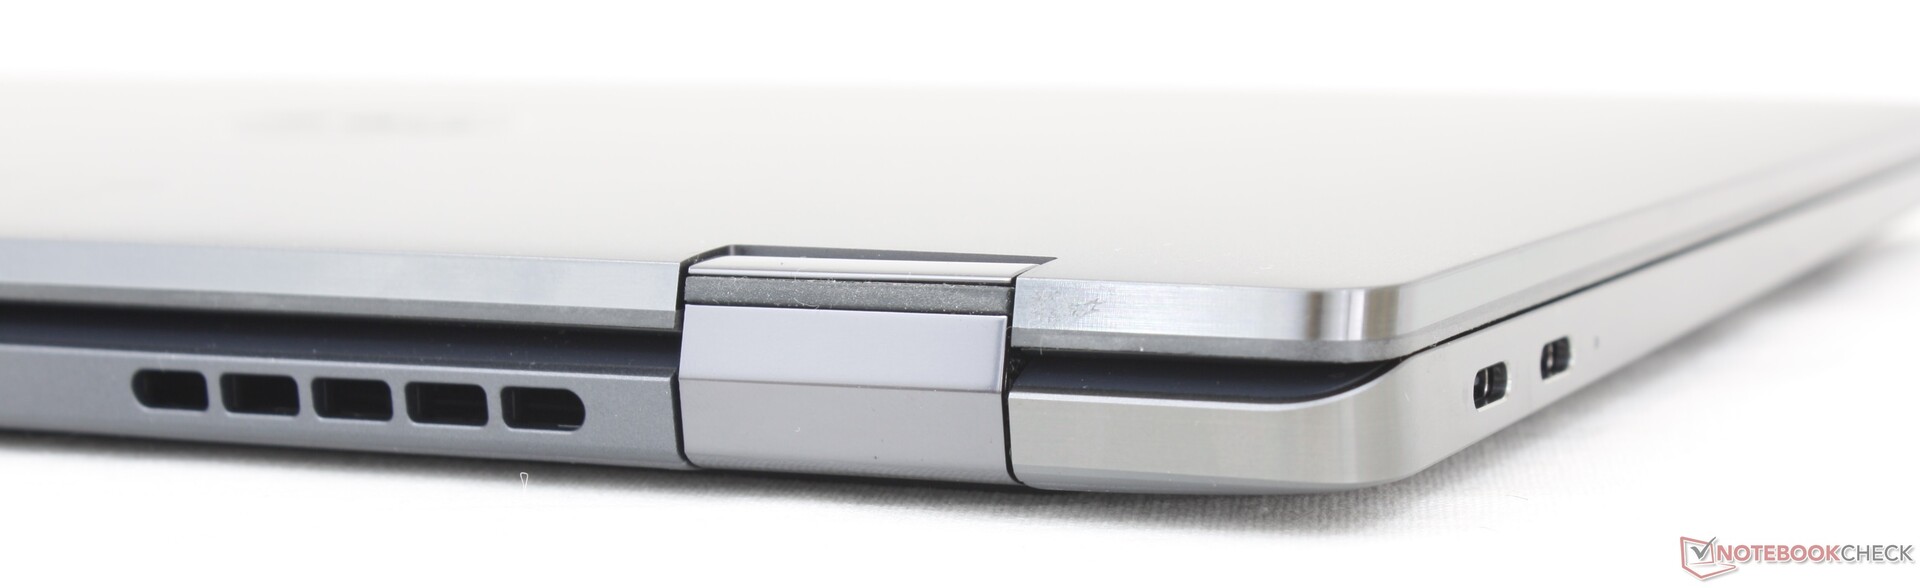
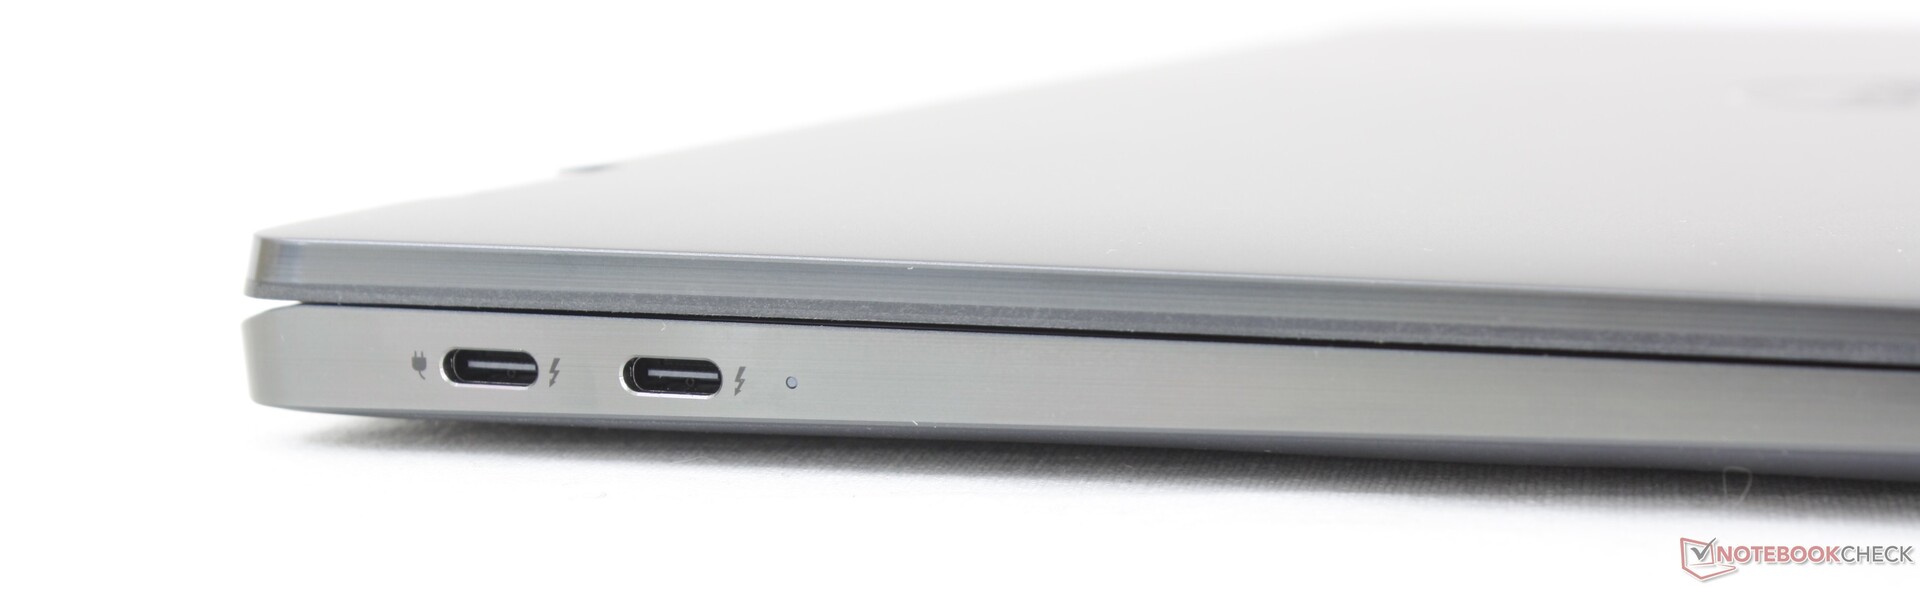
Konnektivität — Käufer sollten USB-C mögen
Die Anschlussvielfalt ist schlechter als beim letztjährigen Latitude 9430 2-in-1. Während das ältere Modell USB-A, MicroSD und sogar HDMI geboten hat, setzt das Latitude 9440 2-in-1 ausschließlich auf USB-C. Natürlich ist USB-C vielseitig und zukunftsorientiert, aber Mitbewerber wie das Asus ExpertBook B7 Flip oder das Lenovo ThinkPad X1 Yoga G8 bieten trotzdem mehr Anschlussmöglichkeiten und reduzieren damit die Abhängigkeit von Adaptern.
Kommunikation
Standardmäßig ist das Intel AX211 Modul mit Wi-Fi 6E und Bluetooth 5.2 verbaut. Bei unserem Test mit dem Asus AXE11000 Router haben wir im 6-GHz-WLAN konstante Übertragungsraten ohne jegliche Aussetzer beobachtet.
| Networking | |
| iperf3 transmit AX12 | |
| Asus ExpertBook B7 Flip B7402FEA | |
| iperf3 receive AX12 | |
| Asus ExpertBook B7 Flip B7402FEA | |
| iperf3 transmit AXE11000 | |
| HP Dragonfly Pro 2023 | |
| Lenovo ThinkPad X1 Yoga G8 i7-1355U | |
| Dell Latitude 9440 2-in-1 | |
| LG Gram 14T90P | |
| iperf3 receive AXE11000 | |
| Lenovo ThinkPad X1 Yoga G8 i7-1355U | |
| HP Dragonfly Pro 2023 | |
| LG Gram 14T90P | |
| Dell Latitude 9440 2-in-1 | |
| iperf3 transmit AXE11000 6GHz | |
| HP Dragonfly Pro 2023 | |
| Dell Latitude 9430 2-in-1 | |
| Dell Latitude 9440 2-in-1 | |
| Lenovo ThinkPad X1 Yoga G8 i7-1355U | |
| iperf3 receive AXE11000 6GHz | |
| HP Dragonfly Pro 2023 | |
| Dell Latitude 9430 2-in-1 | |
| Lenovo ThinkPad X1 Yoga G8 i7-1355U | |
| Dell Latitude 9440 2-in-1 | |
Webcam
Die 2-Megapixel-Webcam wurde vom letzten Jahr übernommen und hat keine Verbesserungen erhalten. Infrarot und eine per Taste aktivierbare Blende für Windows Hello und die Privatsphäre sind vorhanden.


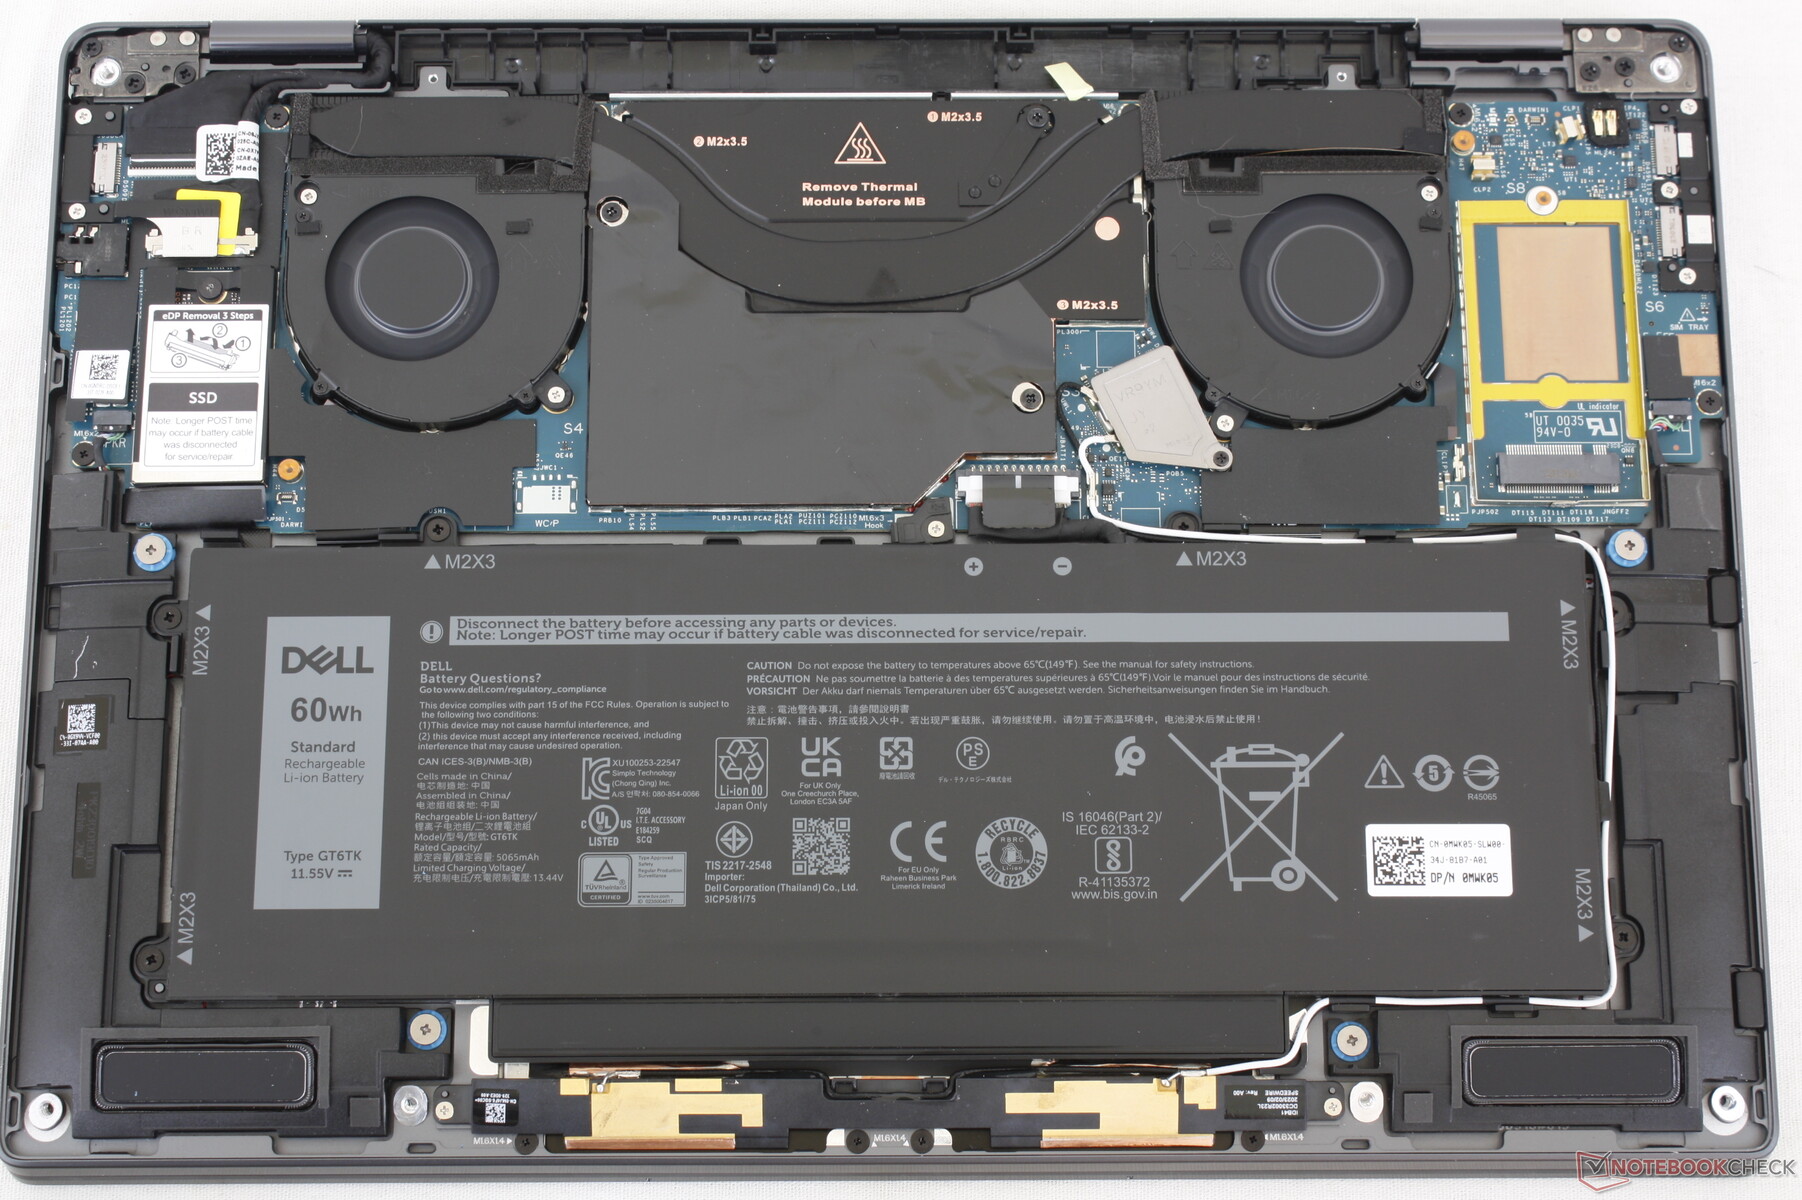
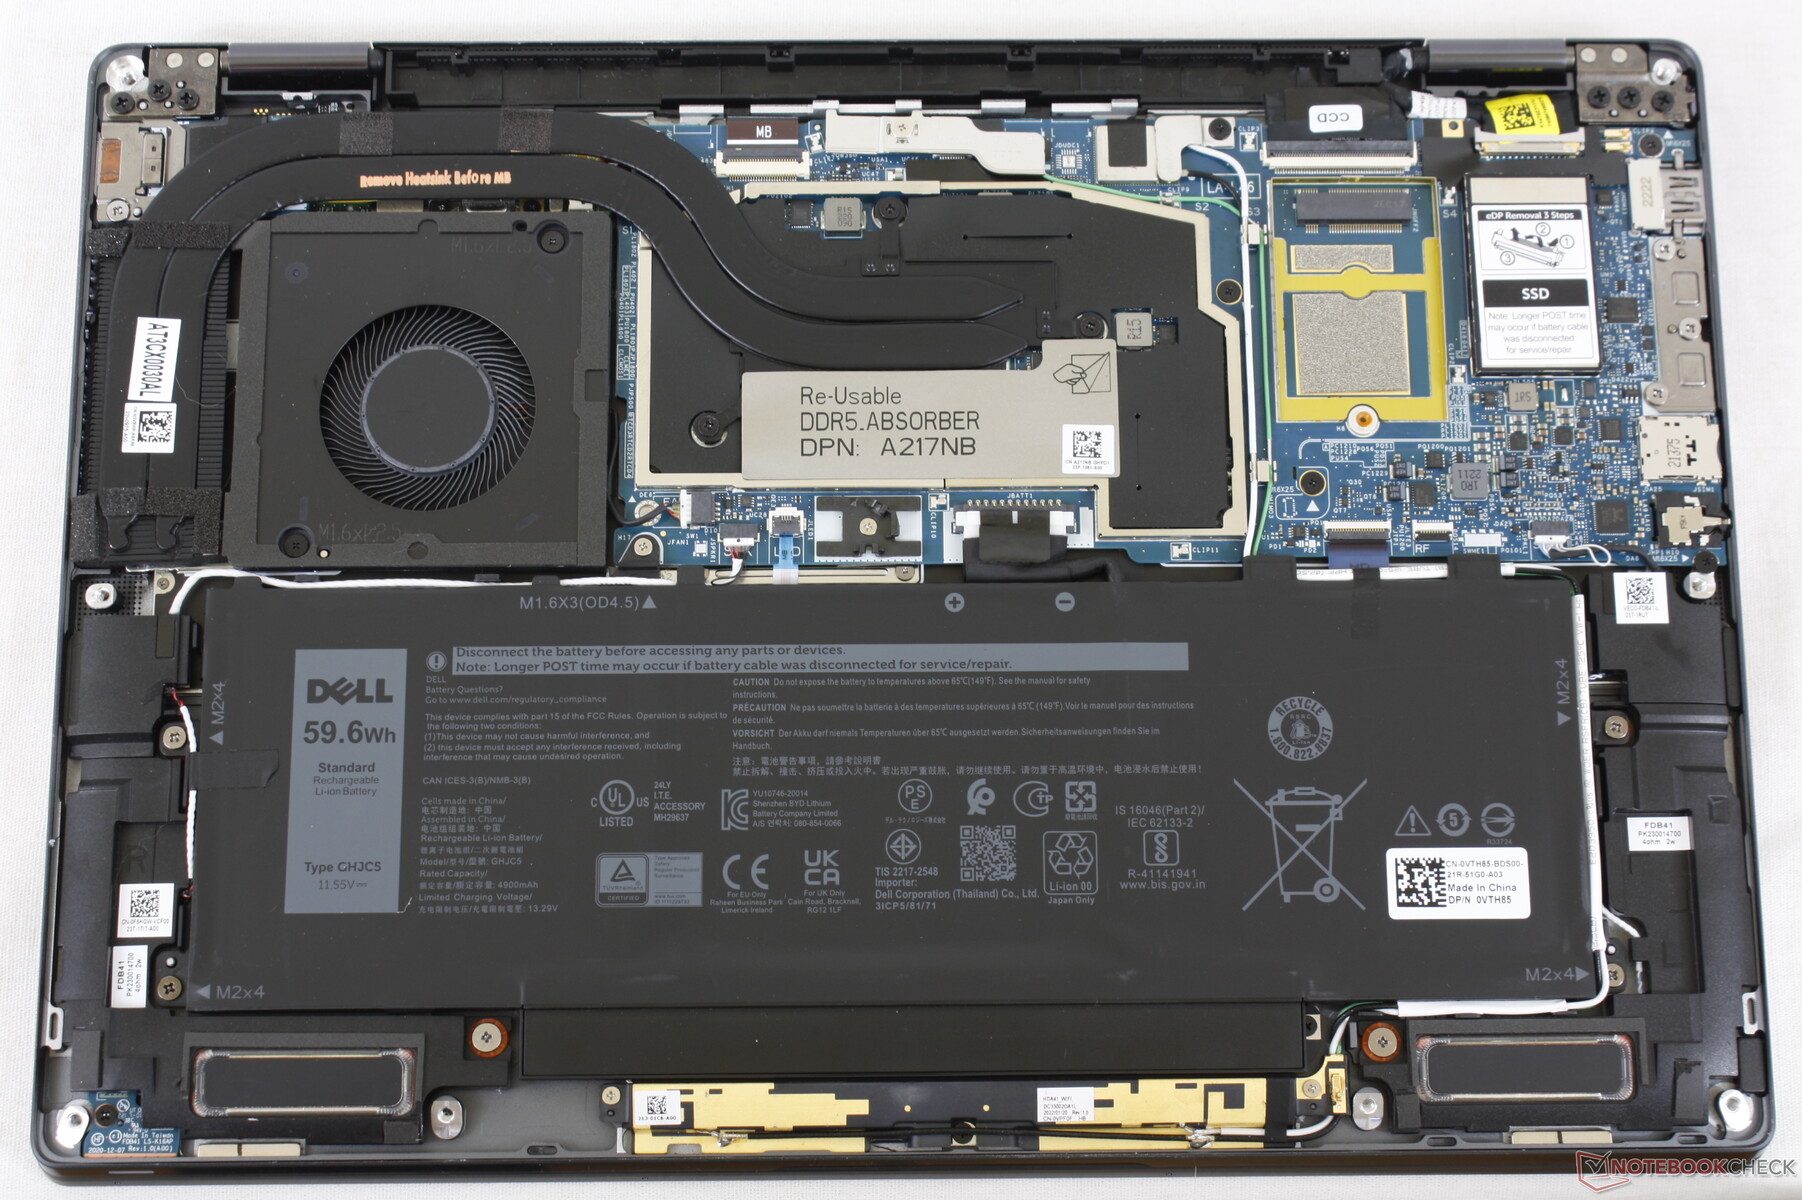
Wartung
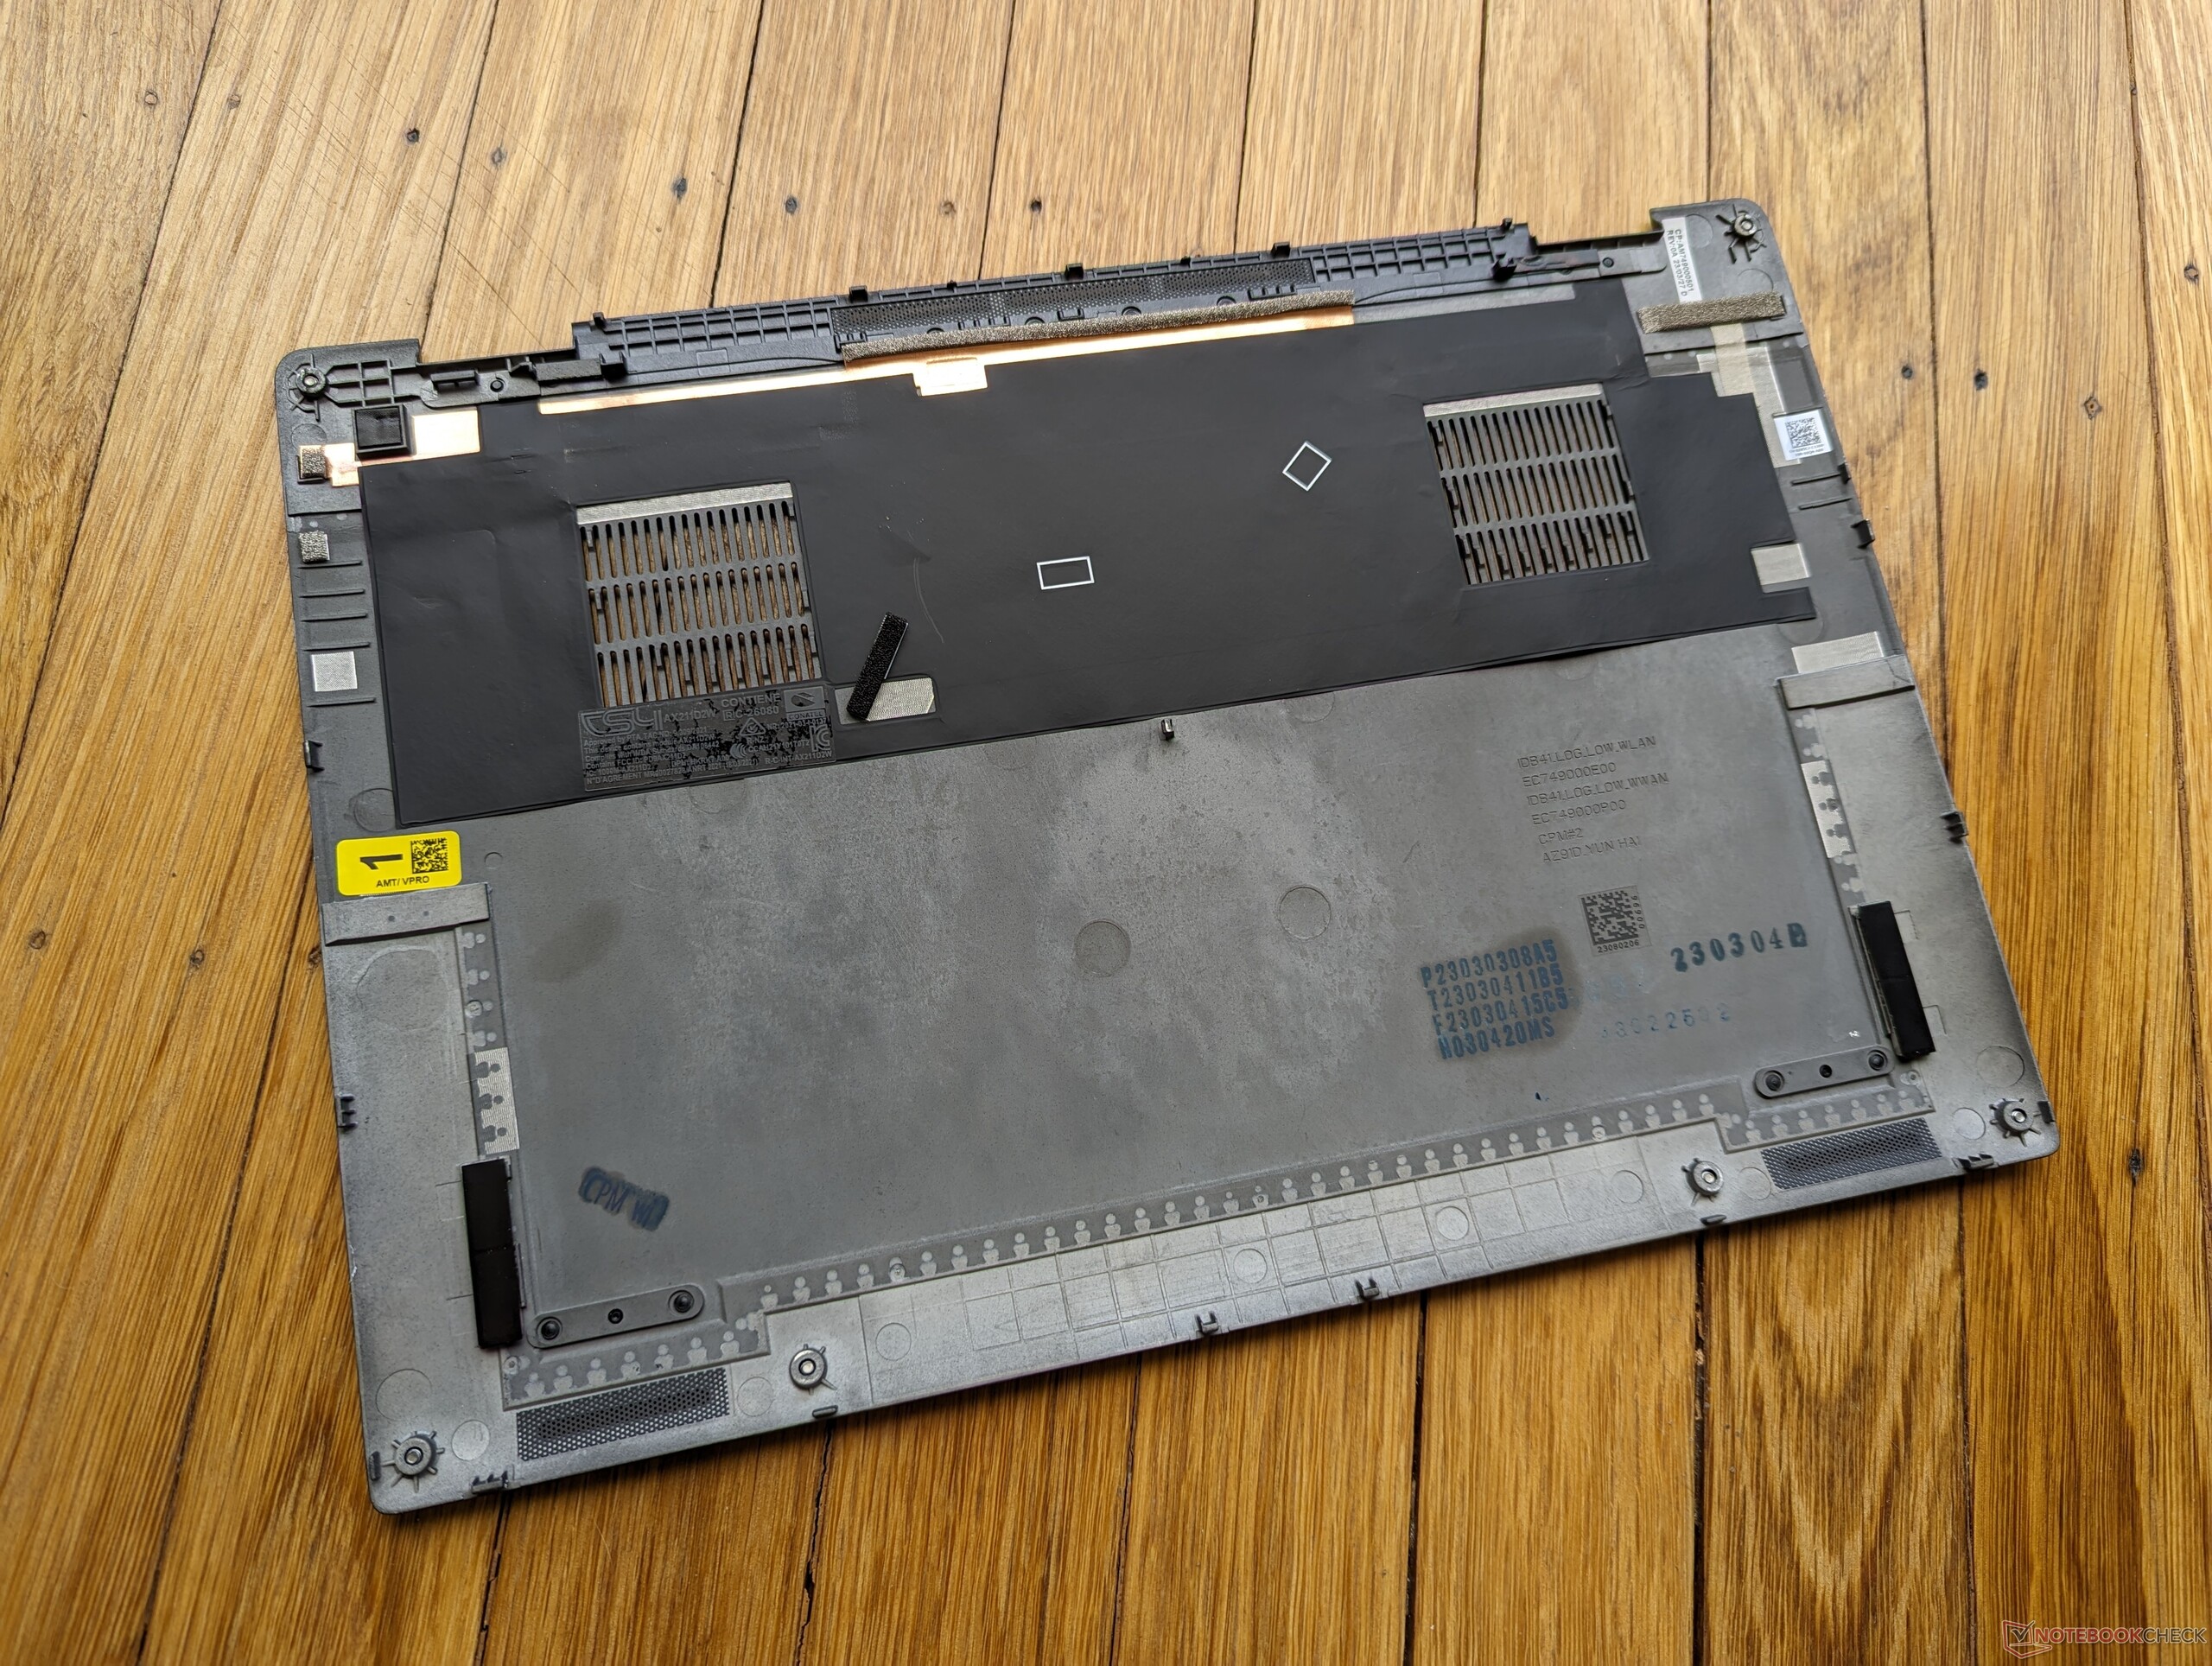
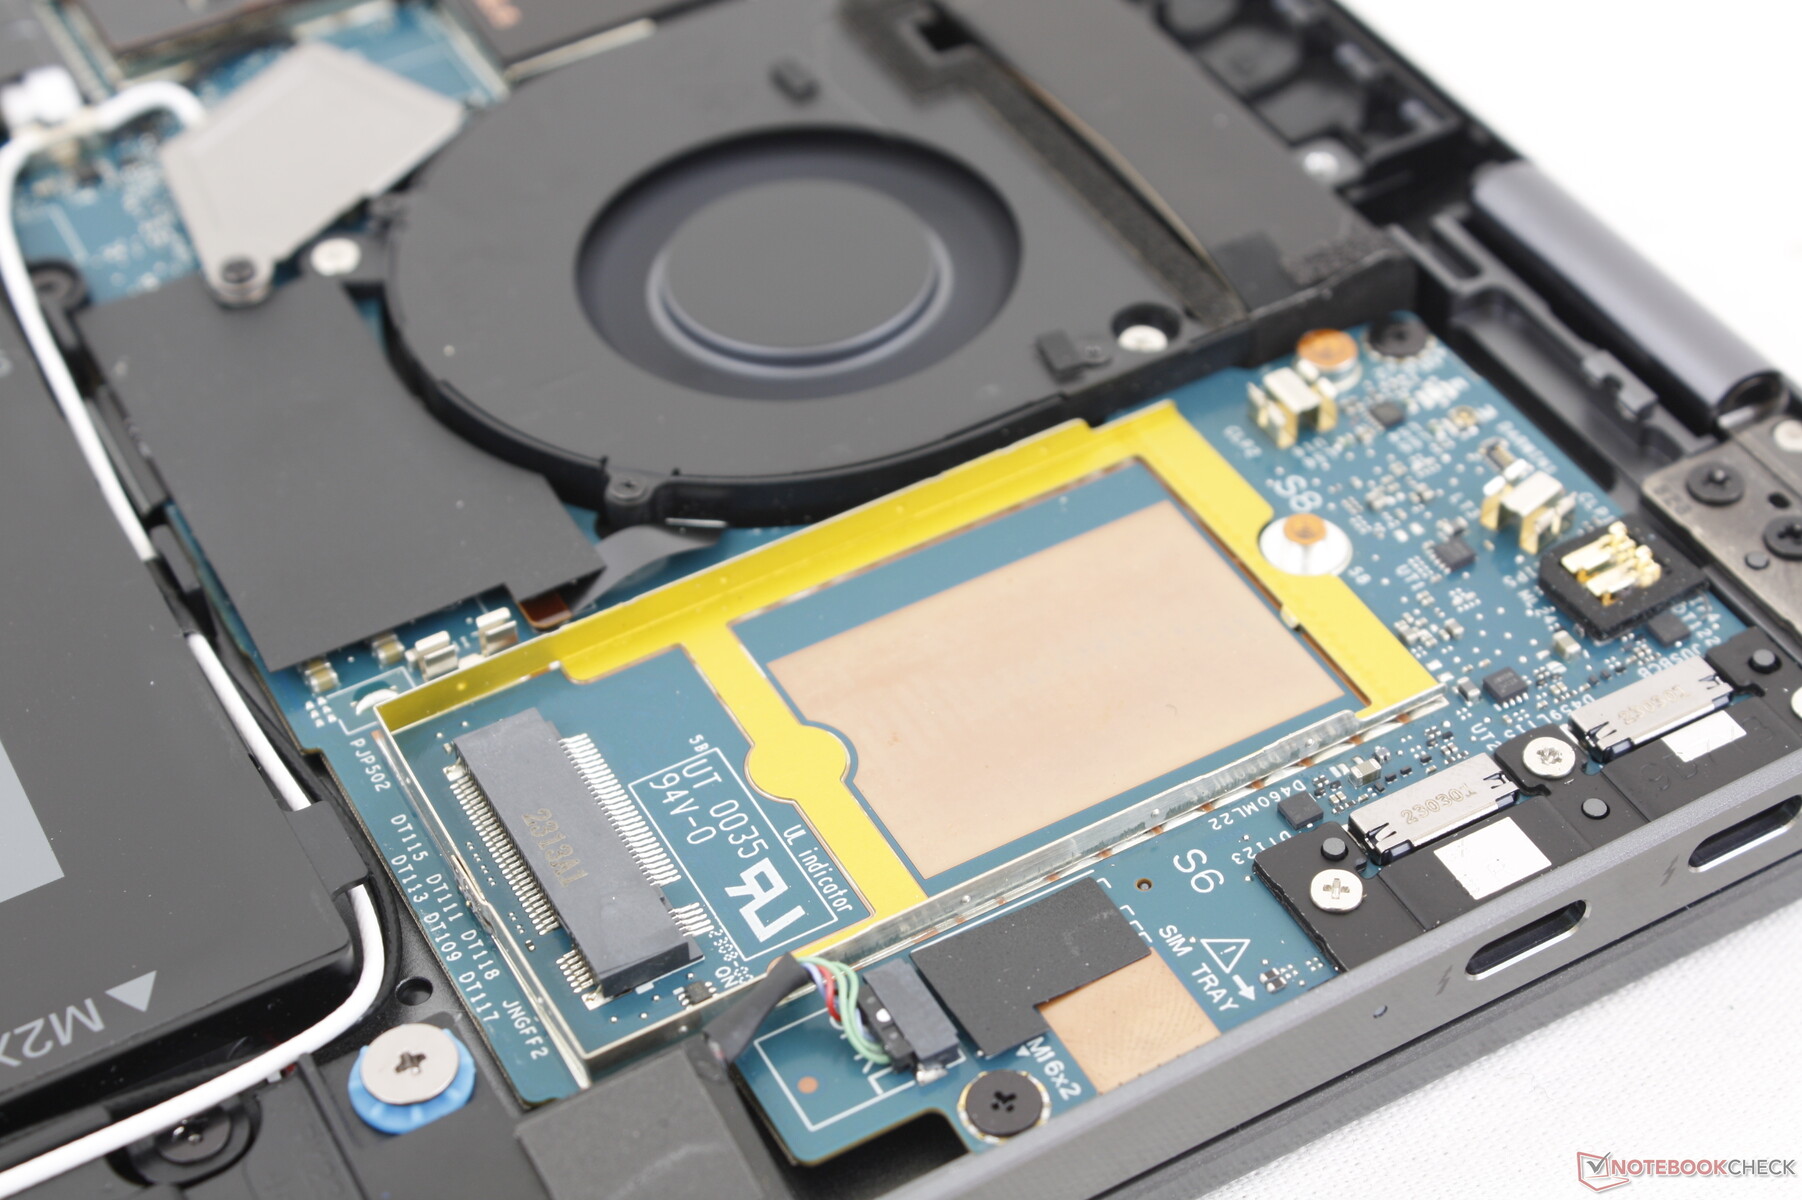
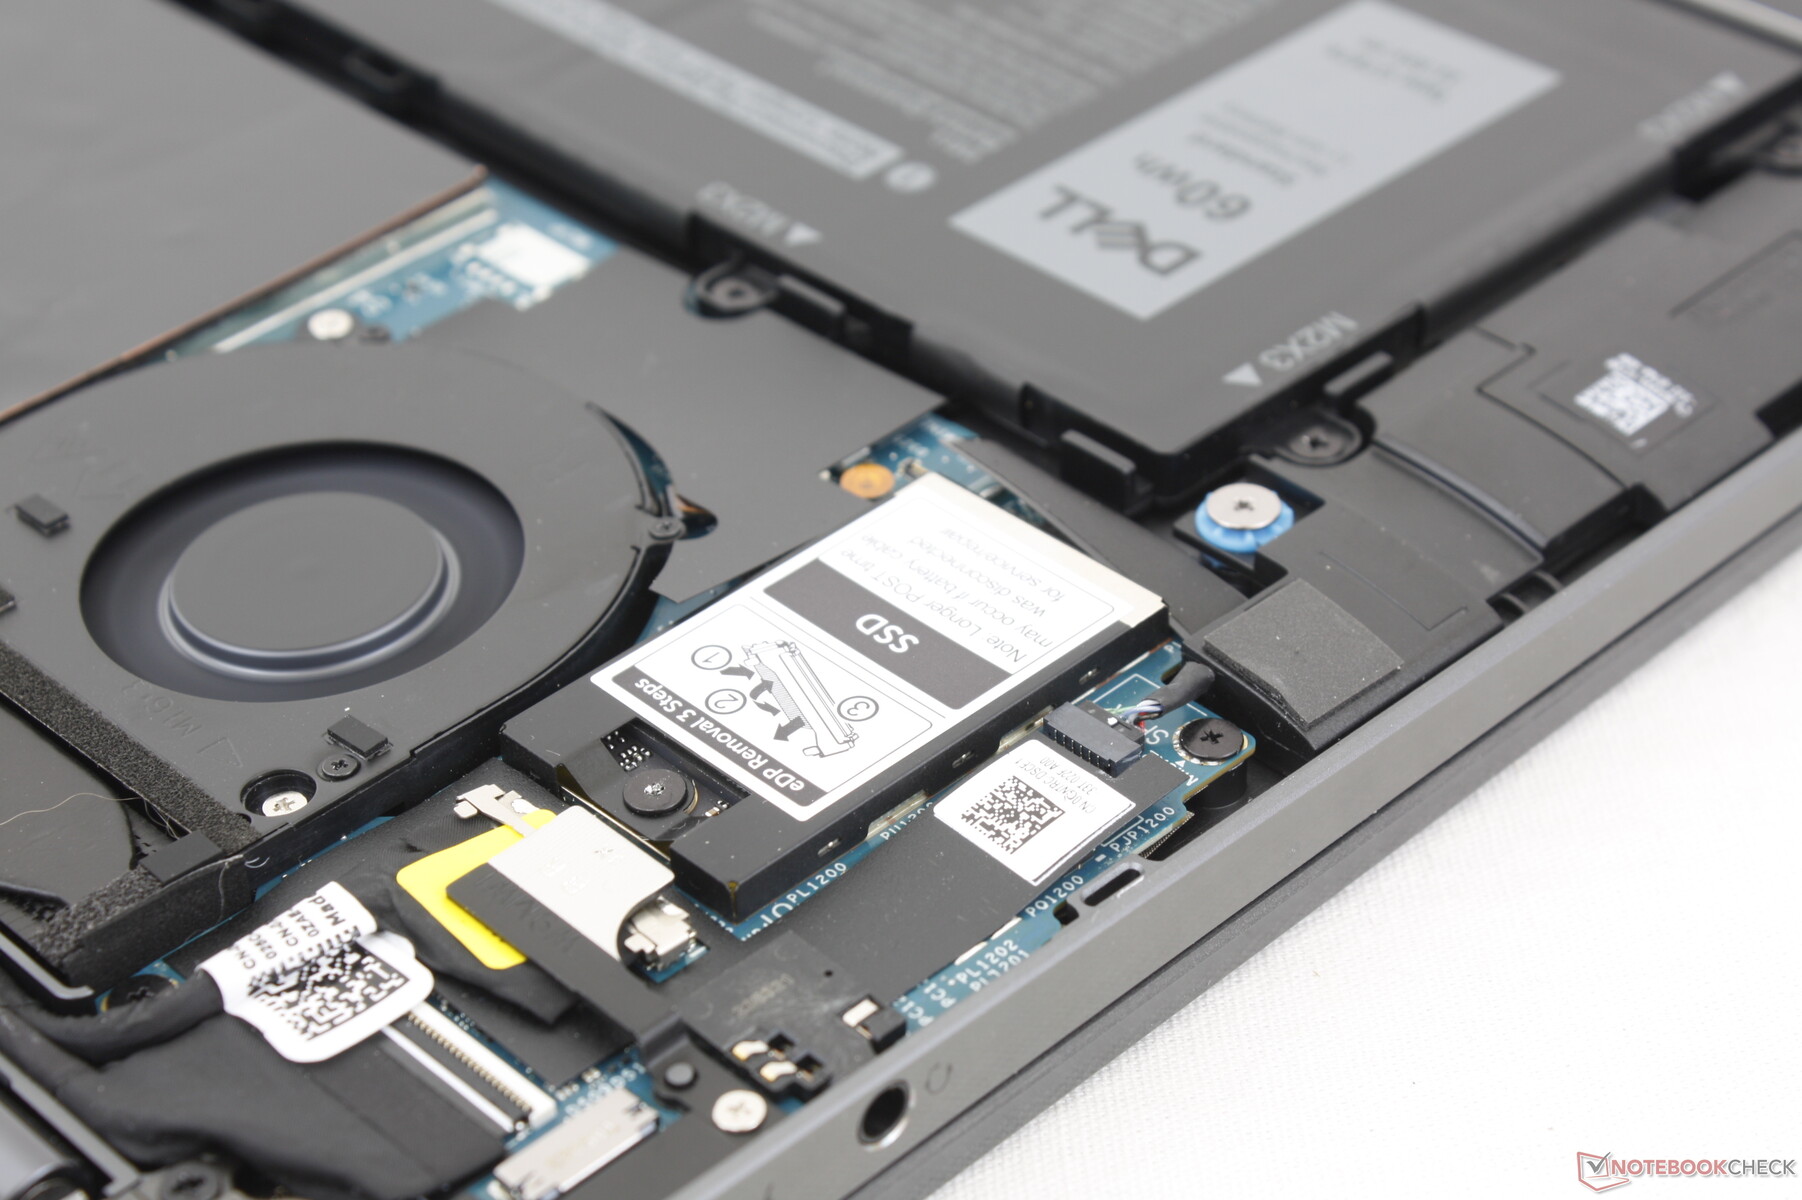
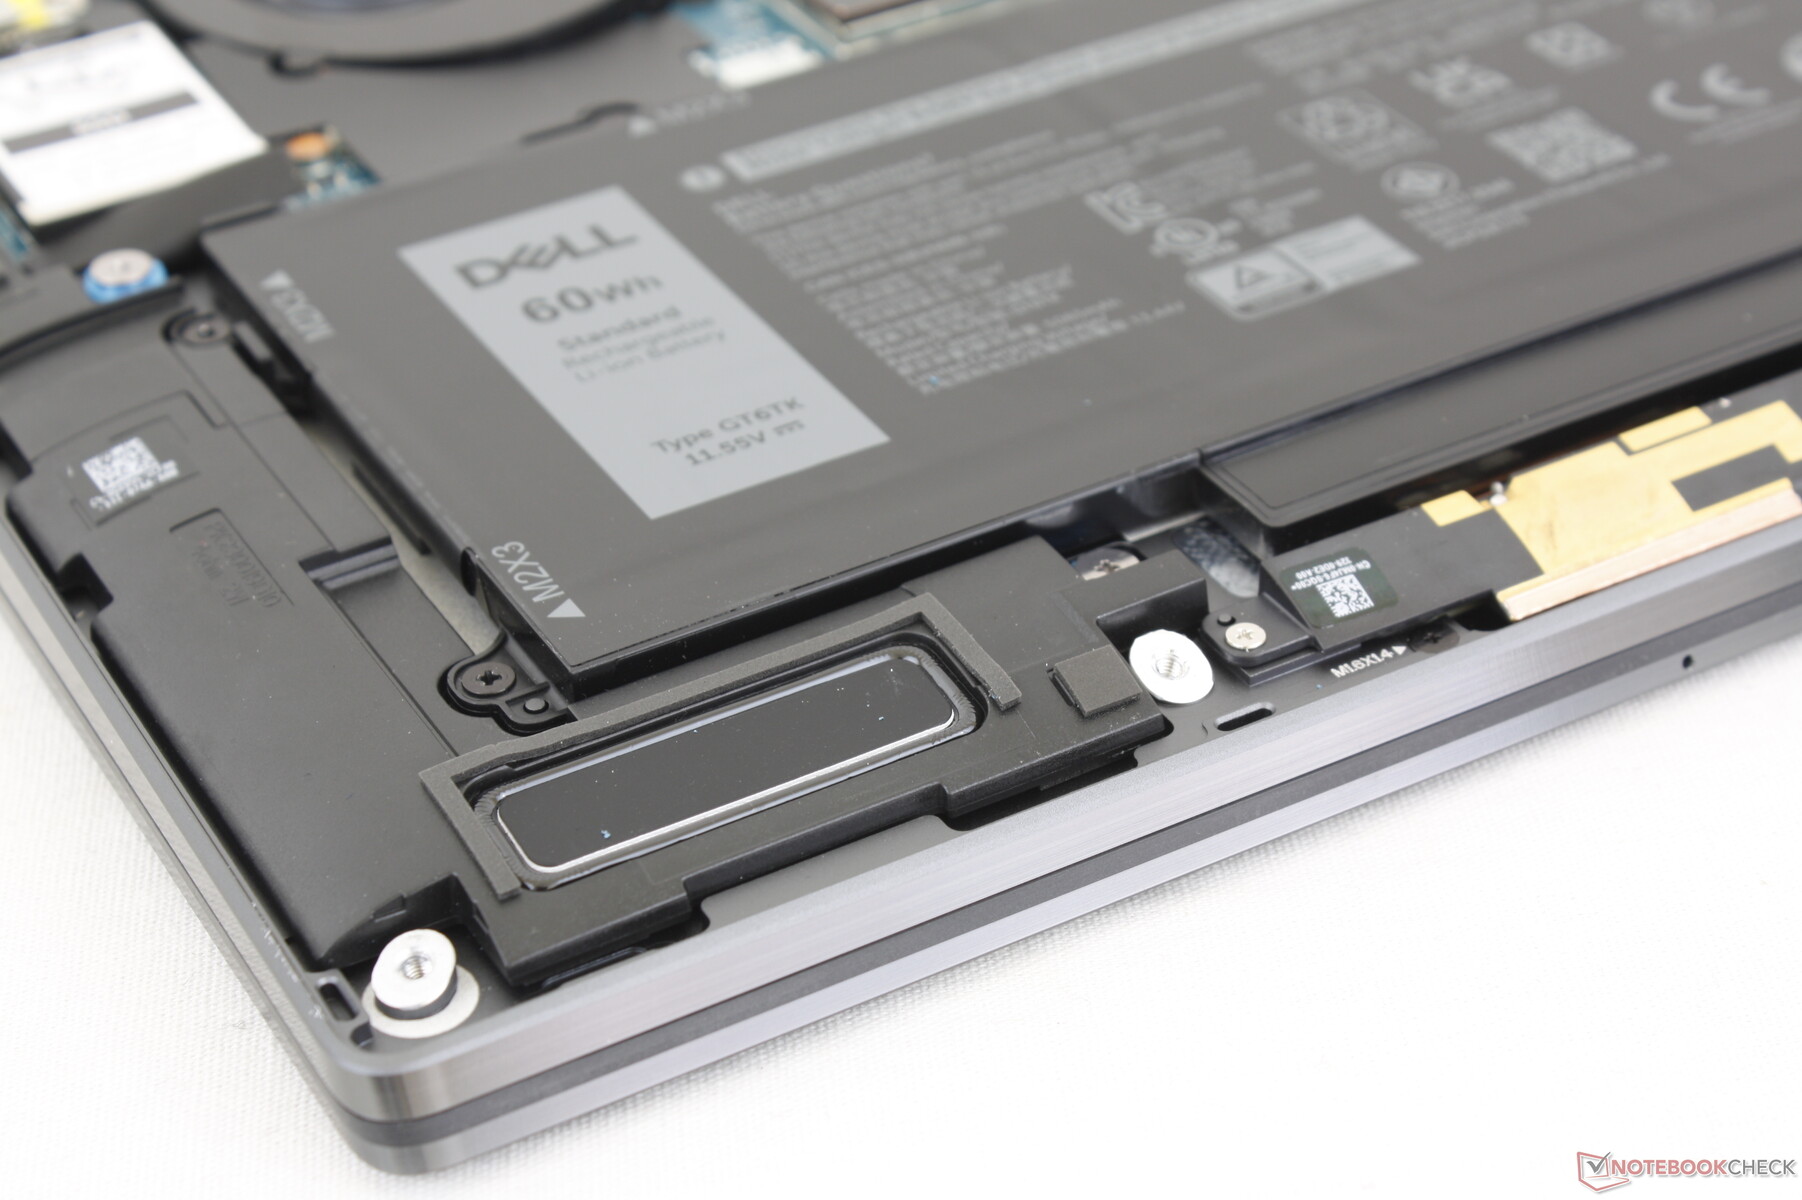
Zum Entfernen der Bodenplatte ist lediglich ein Kreuzschlitzschraubenzieher nötig. Neben der M.2-SSD und dem M.2-WAN-Slot gibt es aber nicht viel aufzurüsten. WAN-Antennen sind in Konfigurationen ohne das entsprechende Modul leider nicht vorhanden.
Zubehör und Garantie
Als Entschädigung für die mickrige Anschlussvielfalt wird ein kleiner USB-C auf USB-A Adapter mitgeliefert. Der Hersteller gewährt eine einjährige Garantie anstatt der drei Jahre die bei manchen Precision-Modellen mit inbegriffen sind.
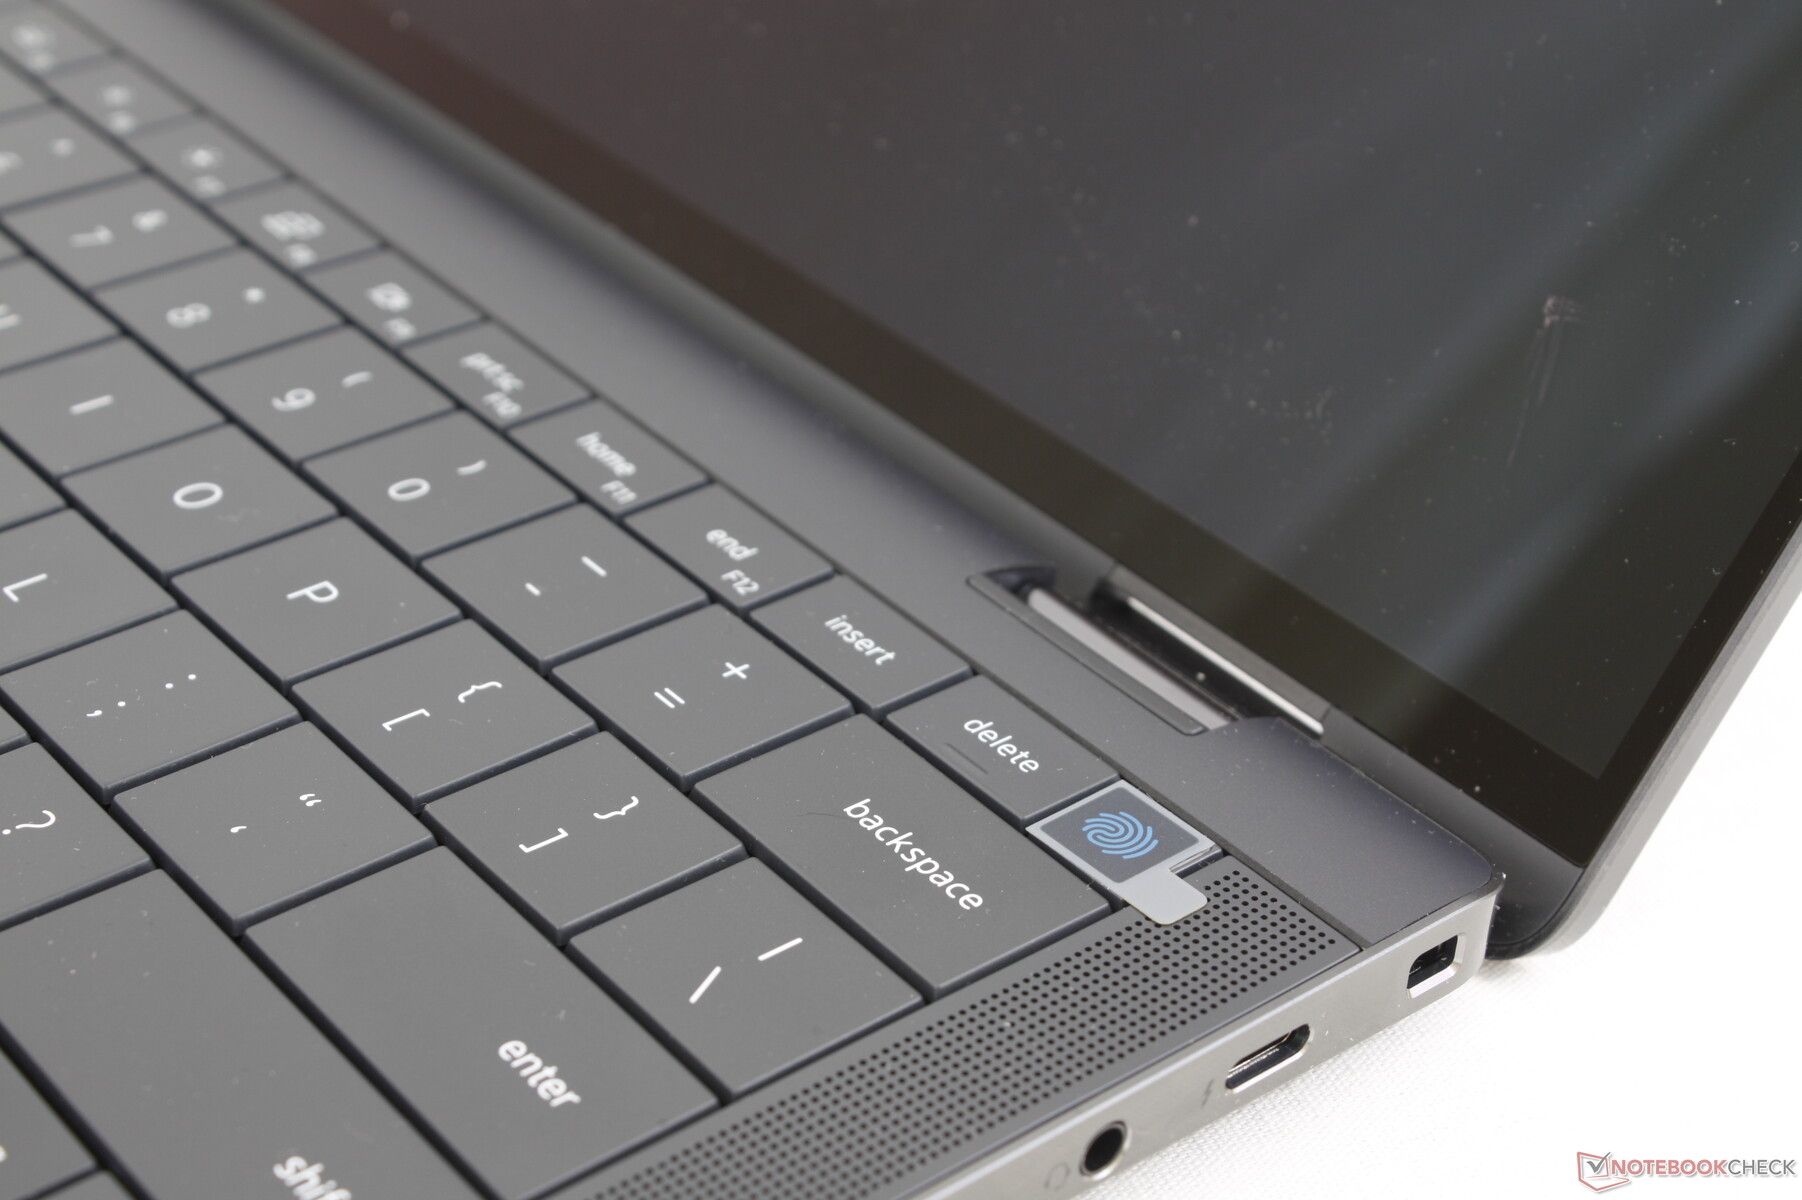
Eingabegeräte — Sieht aus und fühlt sich an wie ein XPS 13 Plus
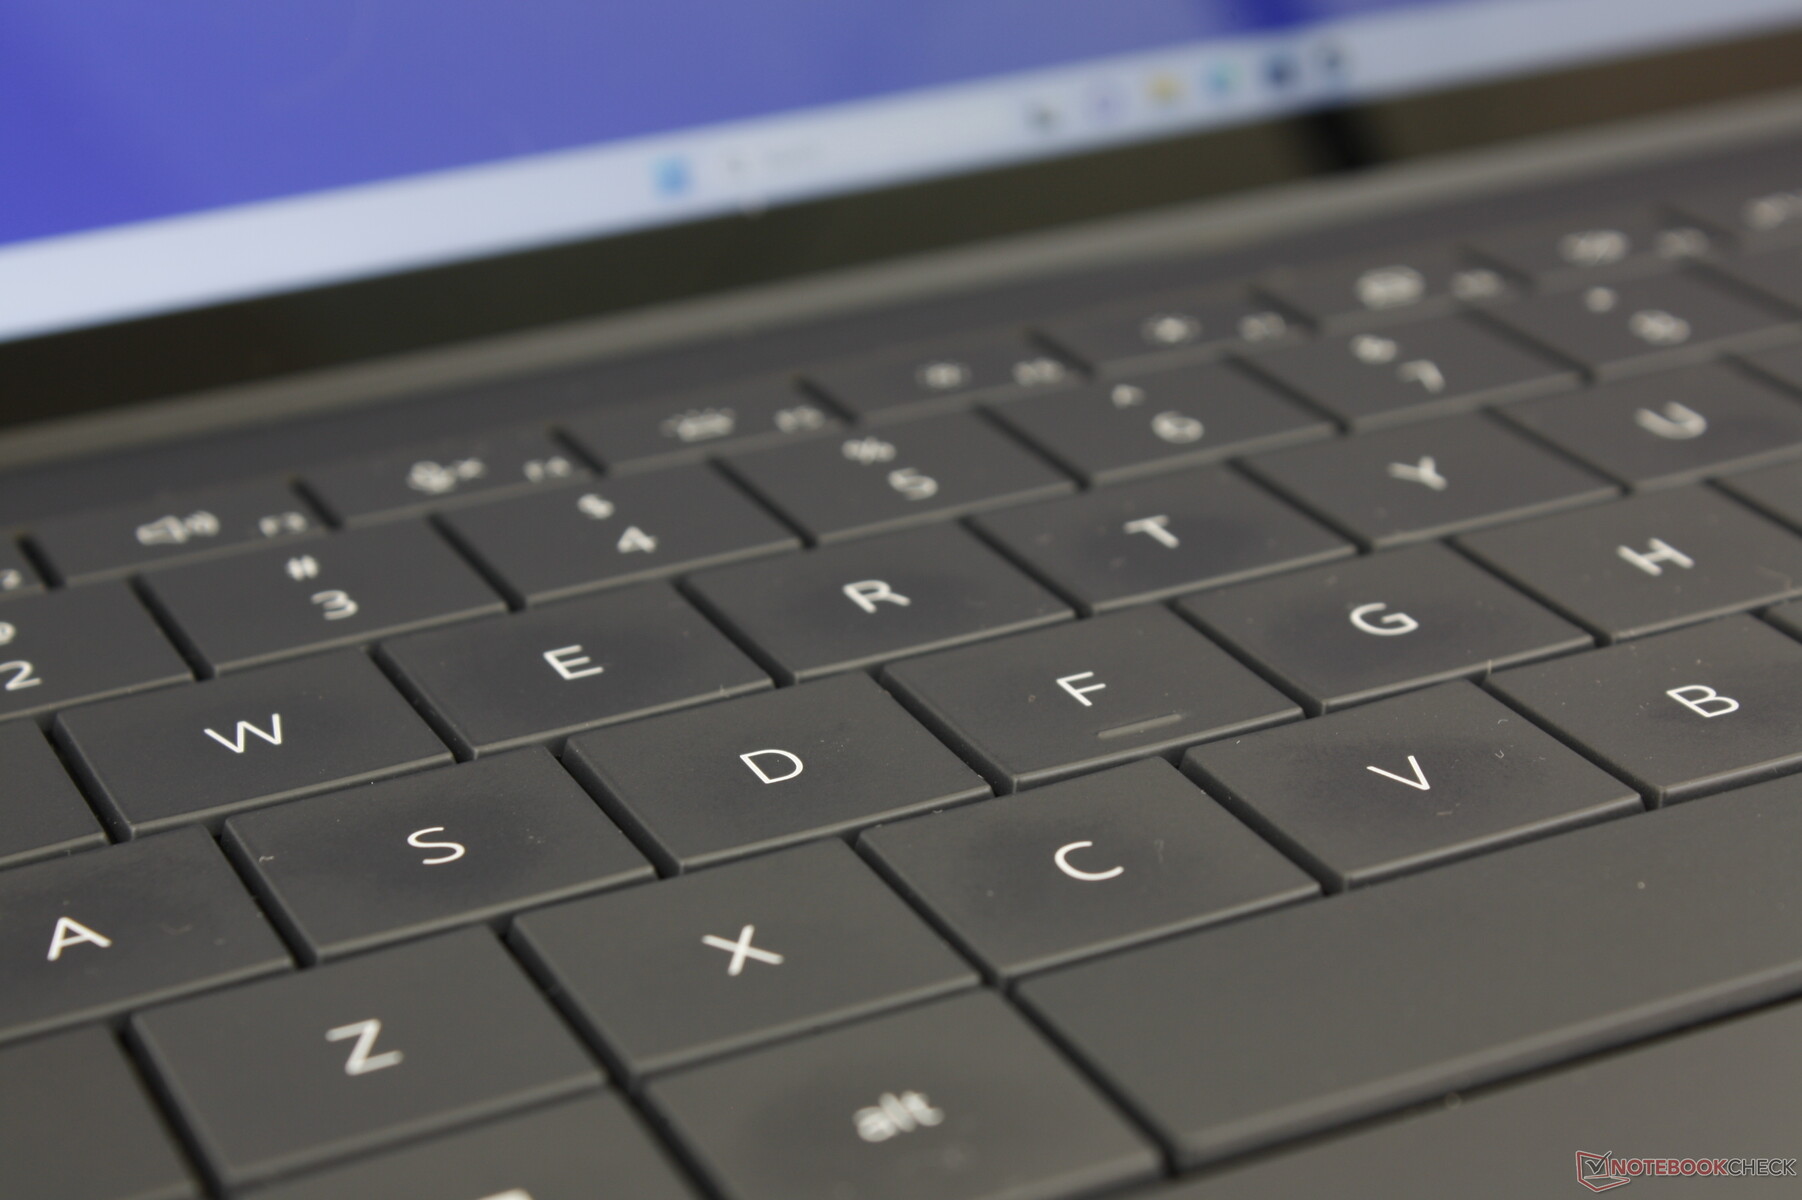
Tastatur
Das Zero-Lattice-Keyboard unterscheidet sich optisch von den Tastaturen anderer Laptops und ermöglicht den Einsatz von größeren Tasten. Auf der anderen Seite ist das Tippgefühl nicht merklich besser weil der Hub und das Feedback ziemlich kurz beziehungsweise weich ausfallen. Die Tastaturen eines HP EliteBook oder LG Gram sind beispielsweise etwas straffer und haben einen längeren Hub. Immerhin ist das Tastengeklimper dank des weicheren Anschlags ziemlich leise.
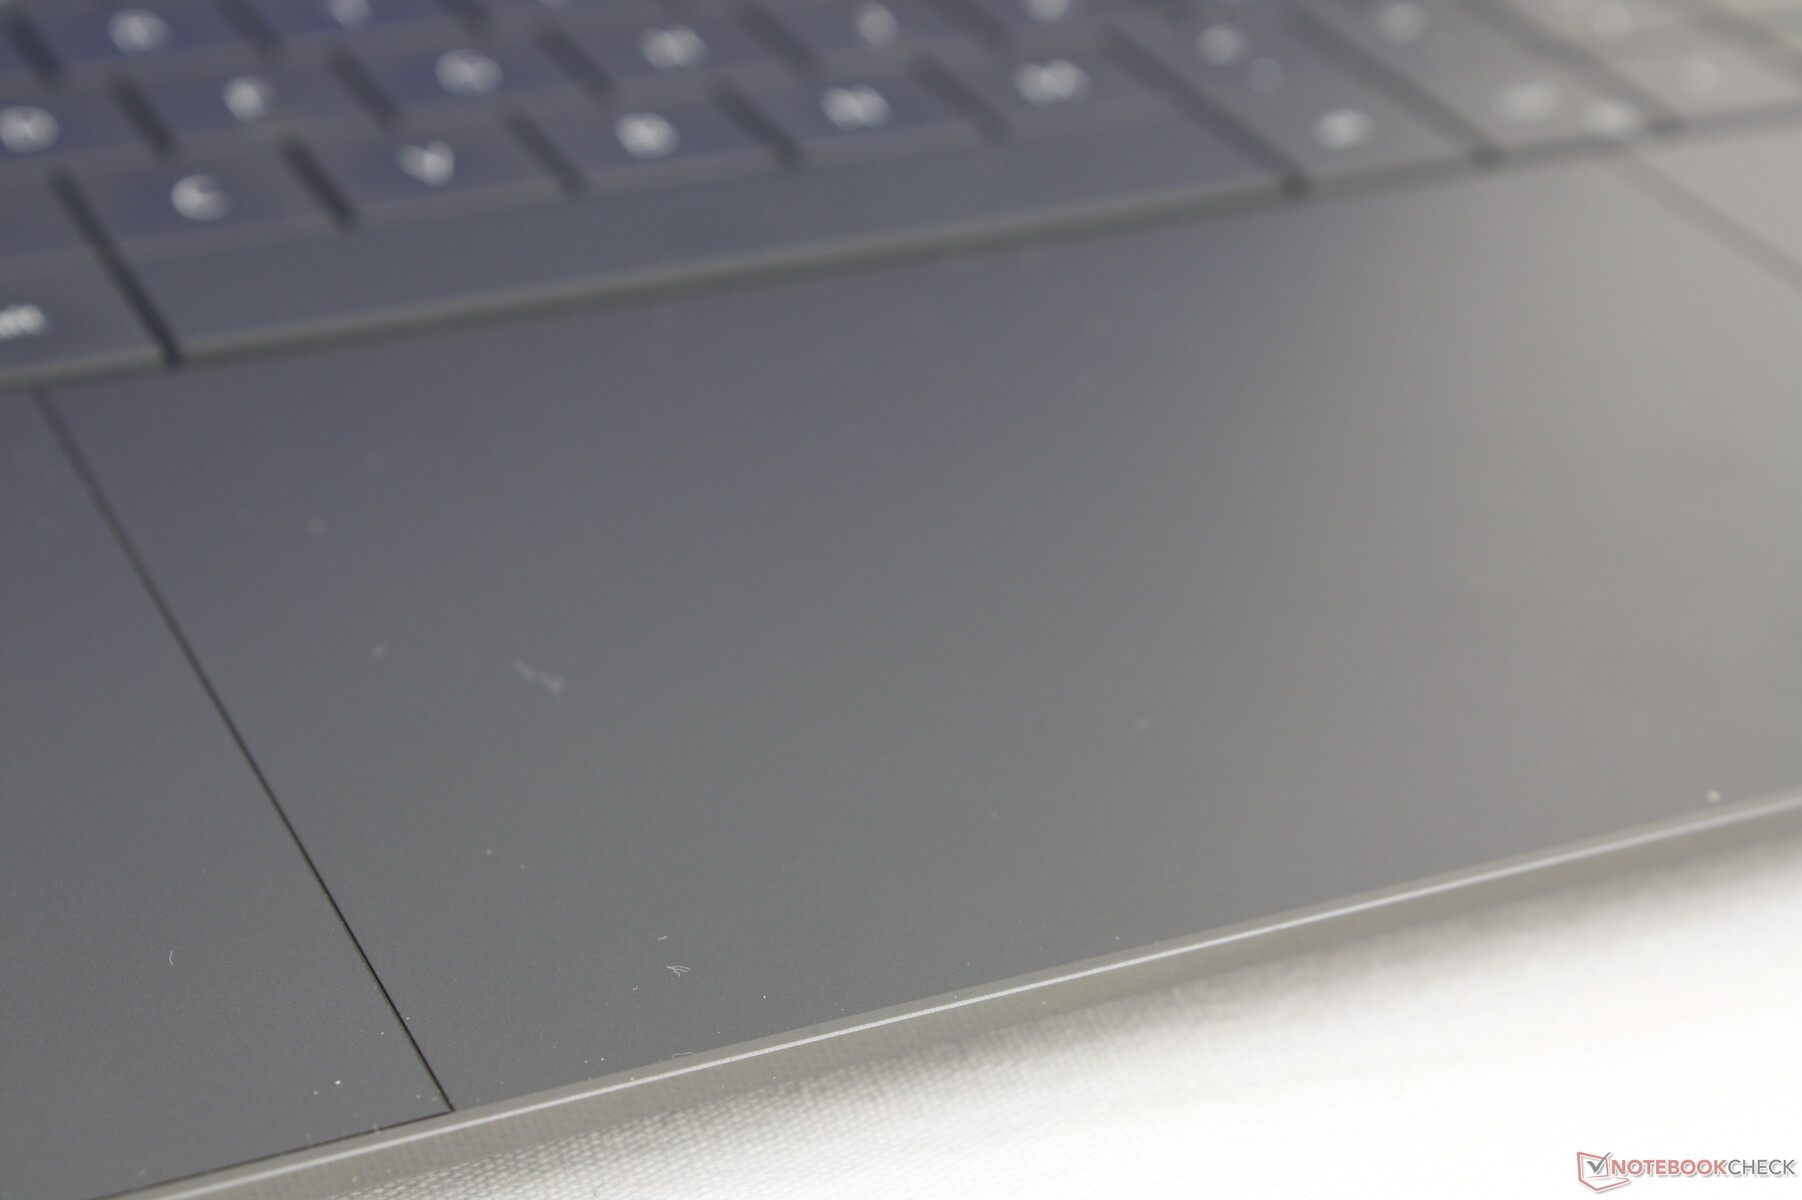
Touchpad
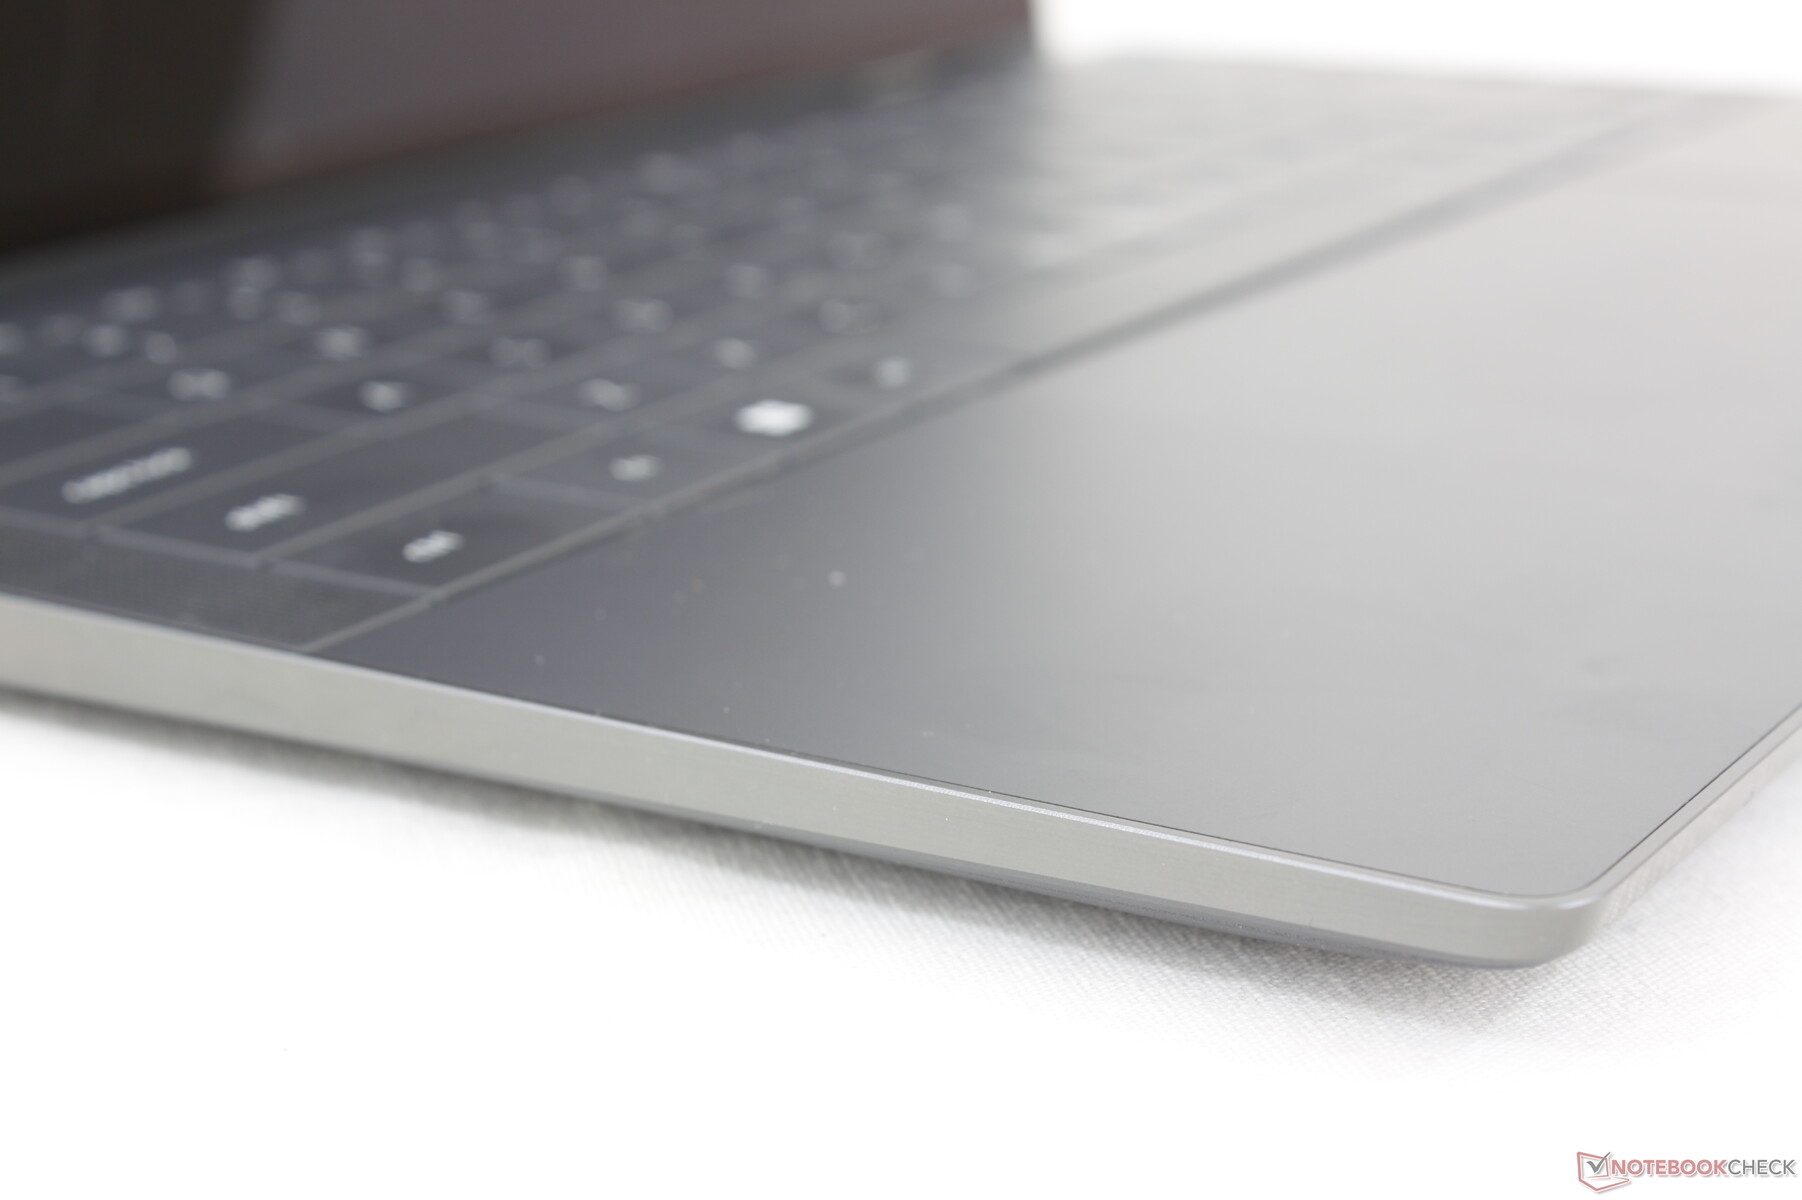
Das Clickpad ist größer als beim alten Design (13.5 x 9 cm gegen 11.5 x 7.2 cm) und auch den meisten anderen 14-Zoll-Notebooks. Es fühlt sich unglaublich glatt, geschmeidig und bei langsameren Eingaben sogar fast rutschig an. Leider ist die Rückmeldung beim Drücken des Touchpads schwammig und das Klickgeräusch eher unbefriedigend. Dadurch werden simple Eingaben wie beispielsweise das "Drag and Drop" erschwert. Bei einem Gaming-Laptop wäre dies eine eher kleine Beanstandung, bei einem auf Business-Nutzer ausgelegten Notebook wie dem Latitude wiegt diese Schwachstelle aber etwas schwerer.
Als neues einzigartiges Feature erhält das Latitude 9440 2-in-1 ein haptisches "Collaboration Touchpad" mit vier berührungsempfindlichen Tasten zur Bedienung der Kamera, des Mikrofons, der Screen-Sharing-Funktion und dem Chat-Fenster. Das größte Problem ist allerdings, dass diese Bedienungselemente nur in Zoom-Konferenzen funktionieren. Nutzer von Microsoft Teams, Discord, Google Hangouts oder anderer Software werden komplett im Regen stehen gelassen.
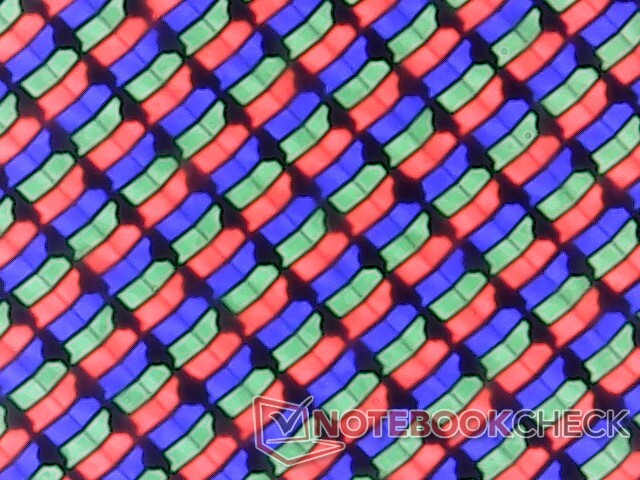
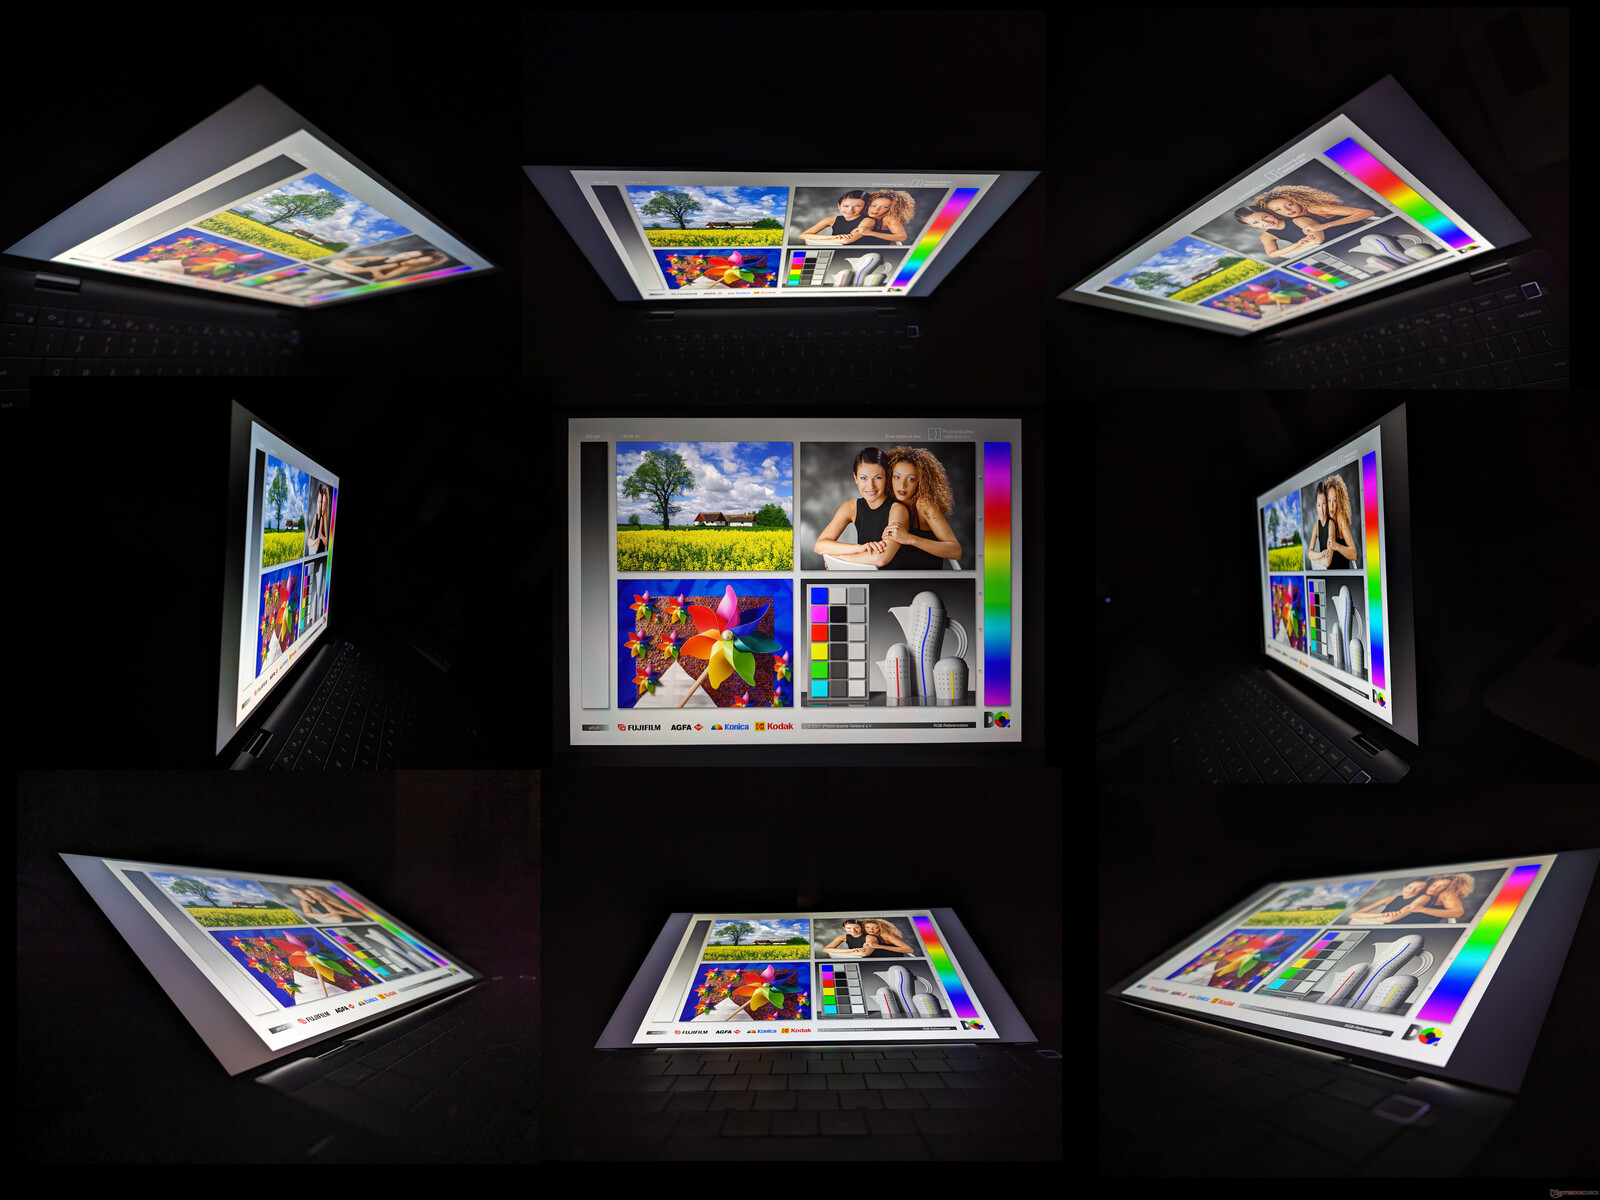
Display — Wie beim Latitude 9420 2-in-1
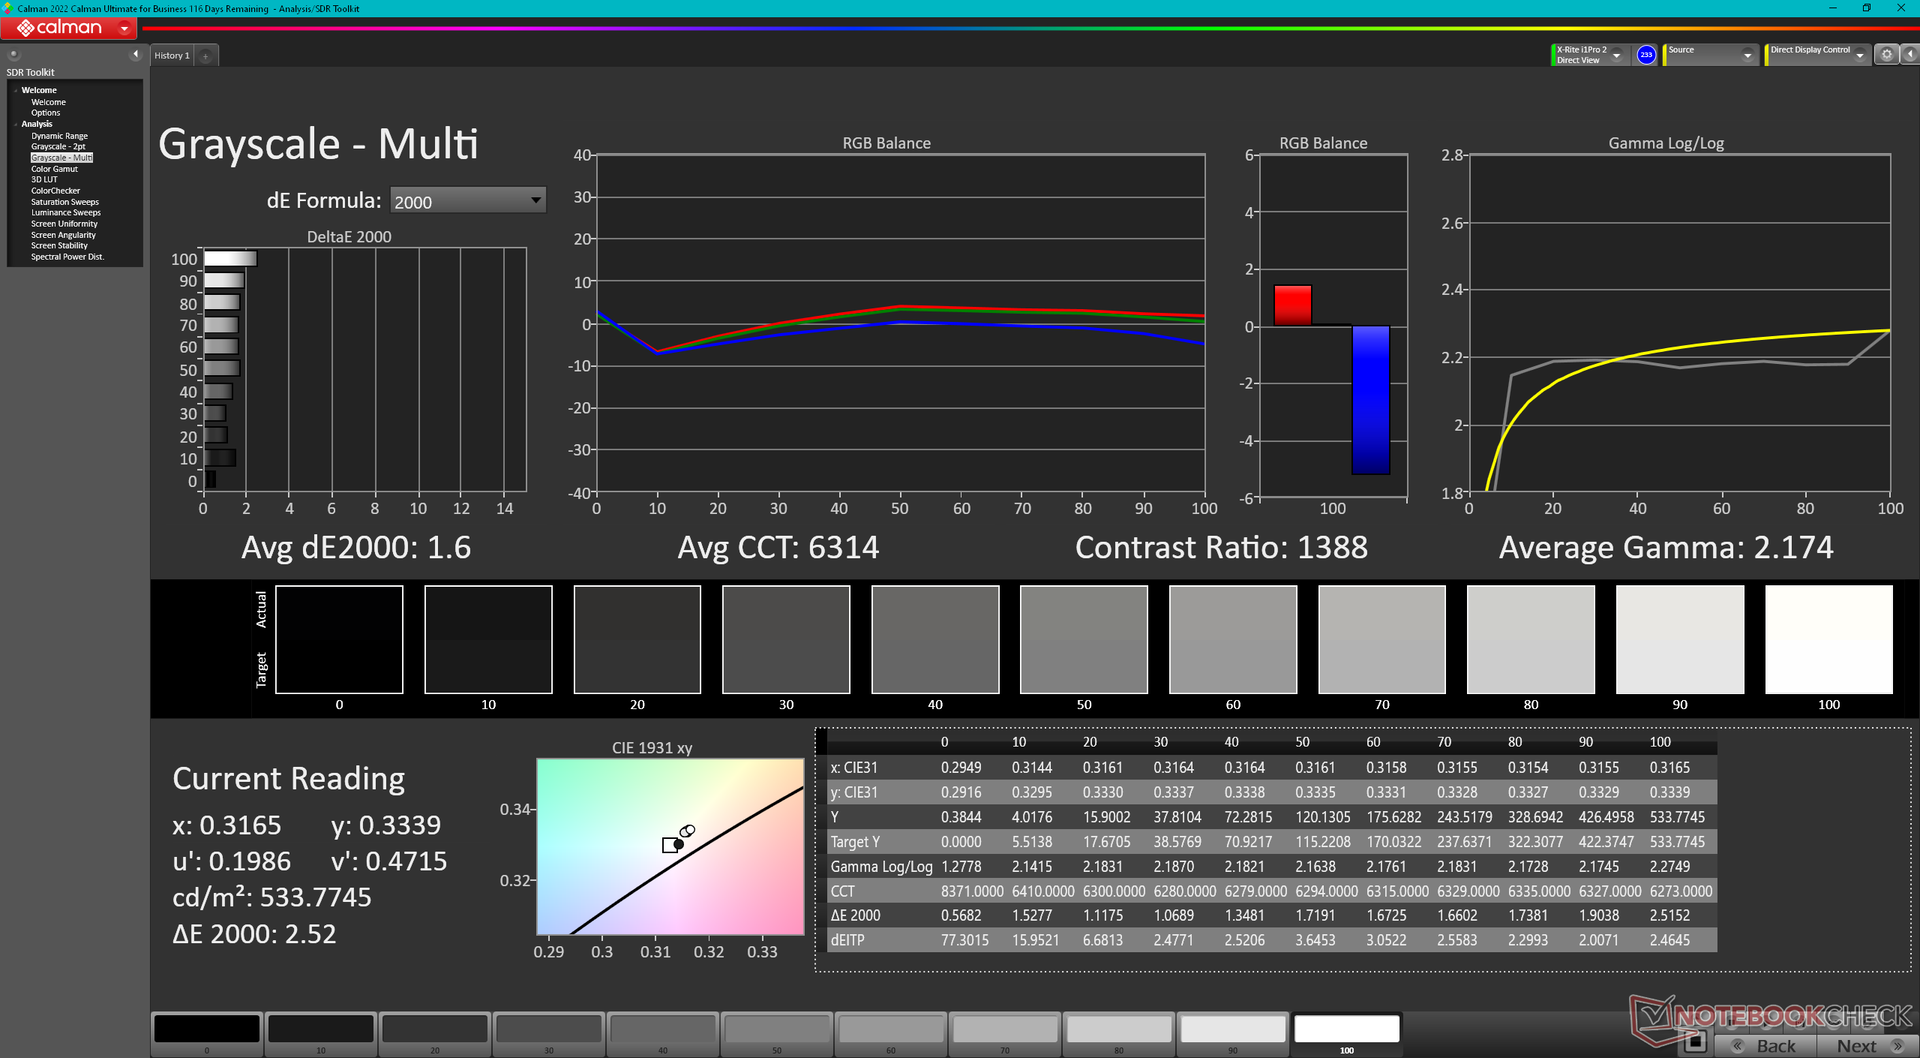
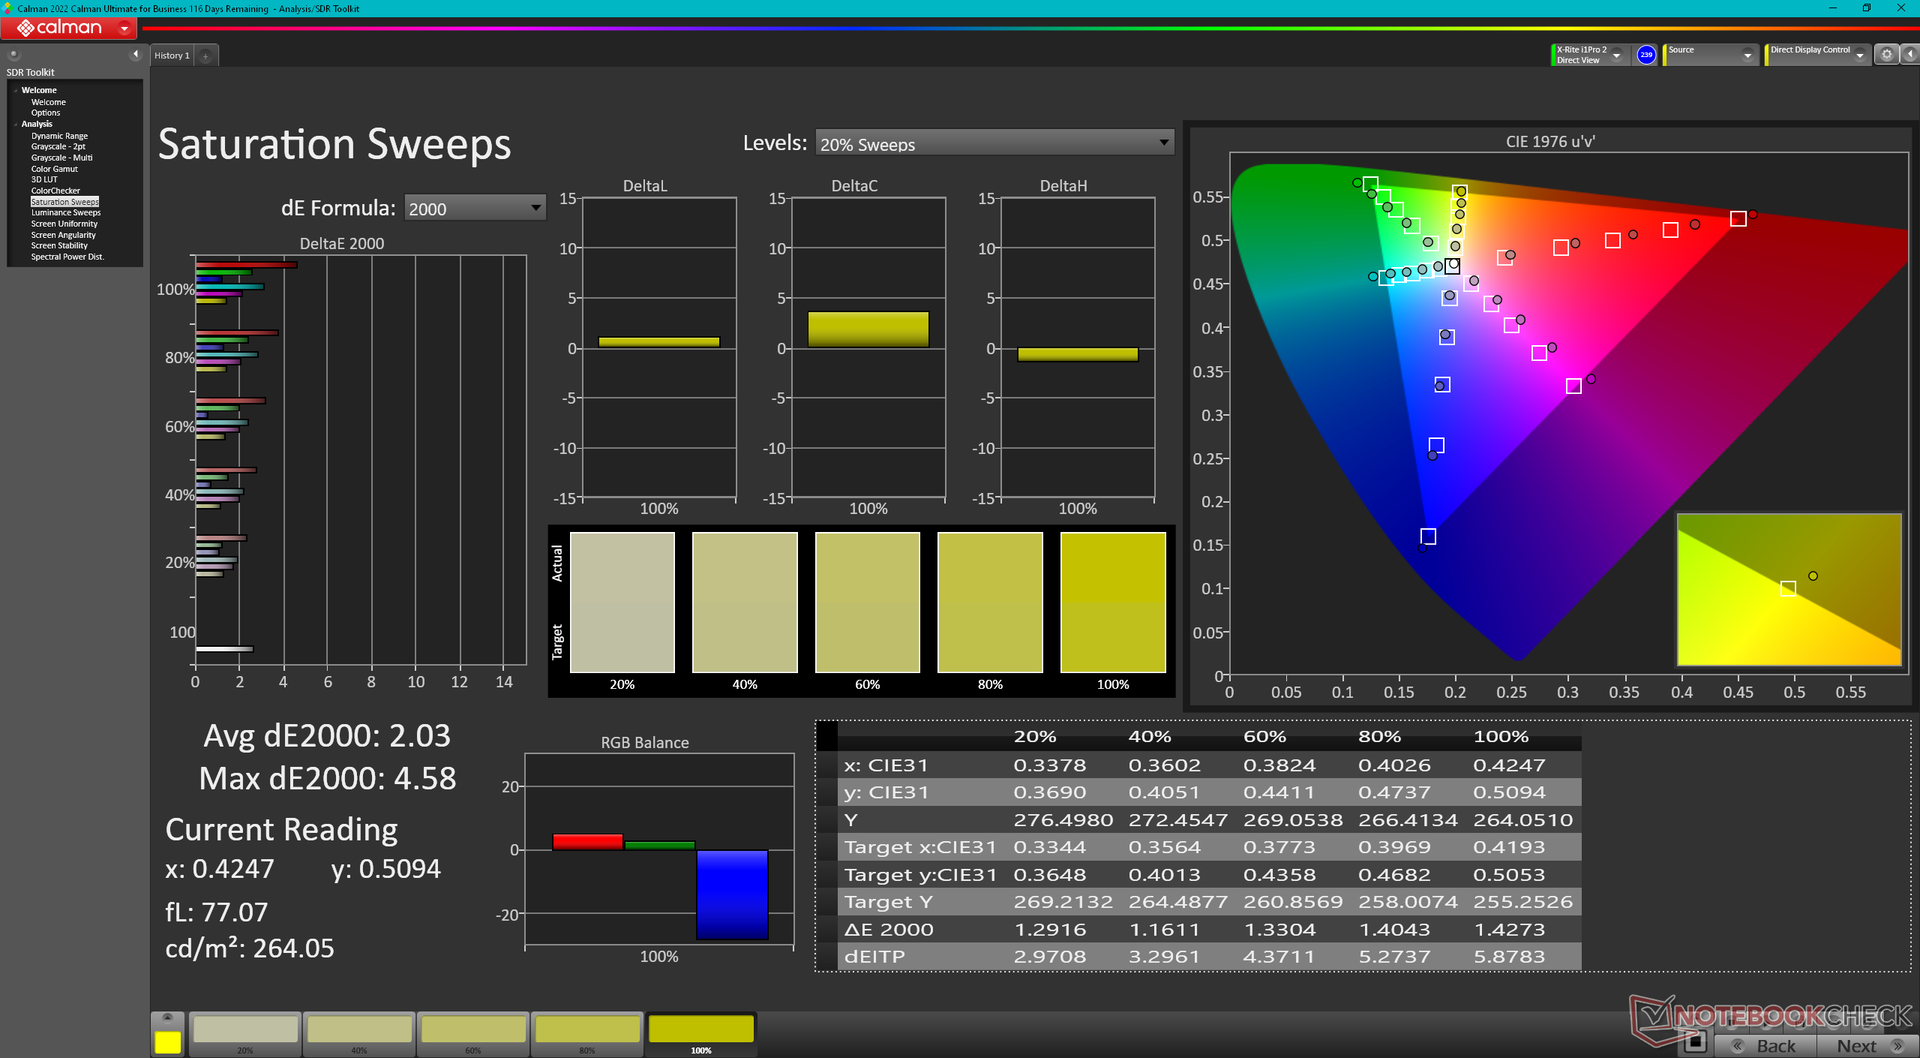
Dell verbaut in seinen 14-Zoll-Latitude-Notebooks seit mehreren Jahren das gleiche IPS-Display B140QAN von AU Optronics. Das Panel ist somit auch im Latitude 9440 2-in-1 verbaut, welches diesbezüglich also keine großartigen Upgrades im Vergleich zum älteren Latitude 9420 2-in-1 erhalten hat. Das ist nicht unbedingt schlimm, denn das AUO B140QAN ist ein großartiges Panel für Office-Anwendungen. Eine höhere Bildfrequenz oder eine bessere P3-Farbraumabdeckung wäre aber trotzdem gut gewesen, um das Latitude 9440 2-in-1 von seinen Vorgängern abzugrenzen.
| |||||||||||||||||||||||||
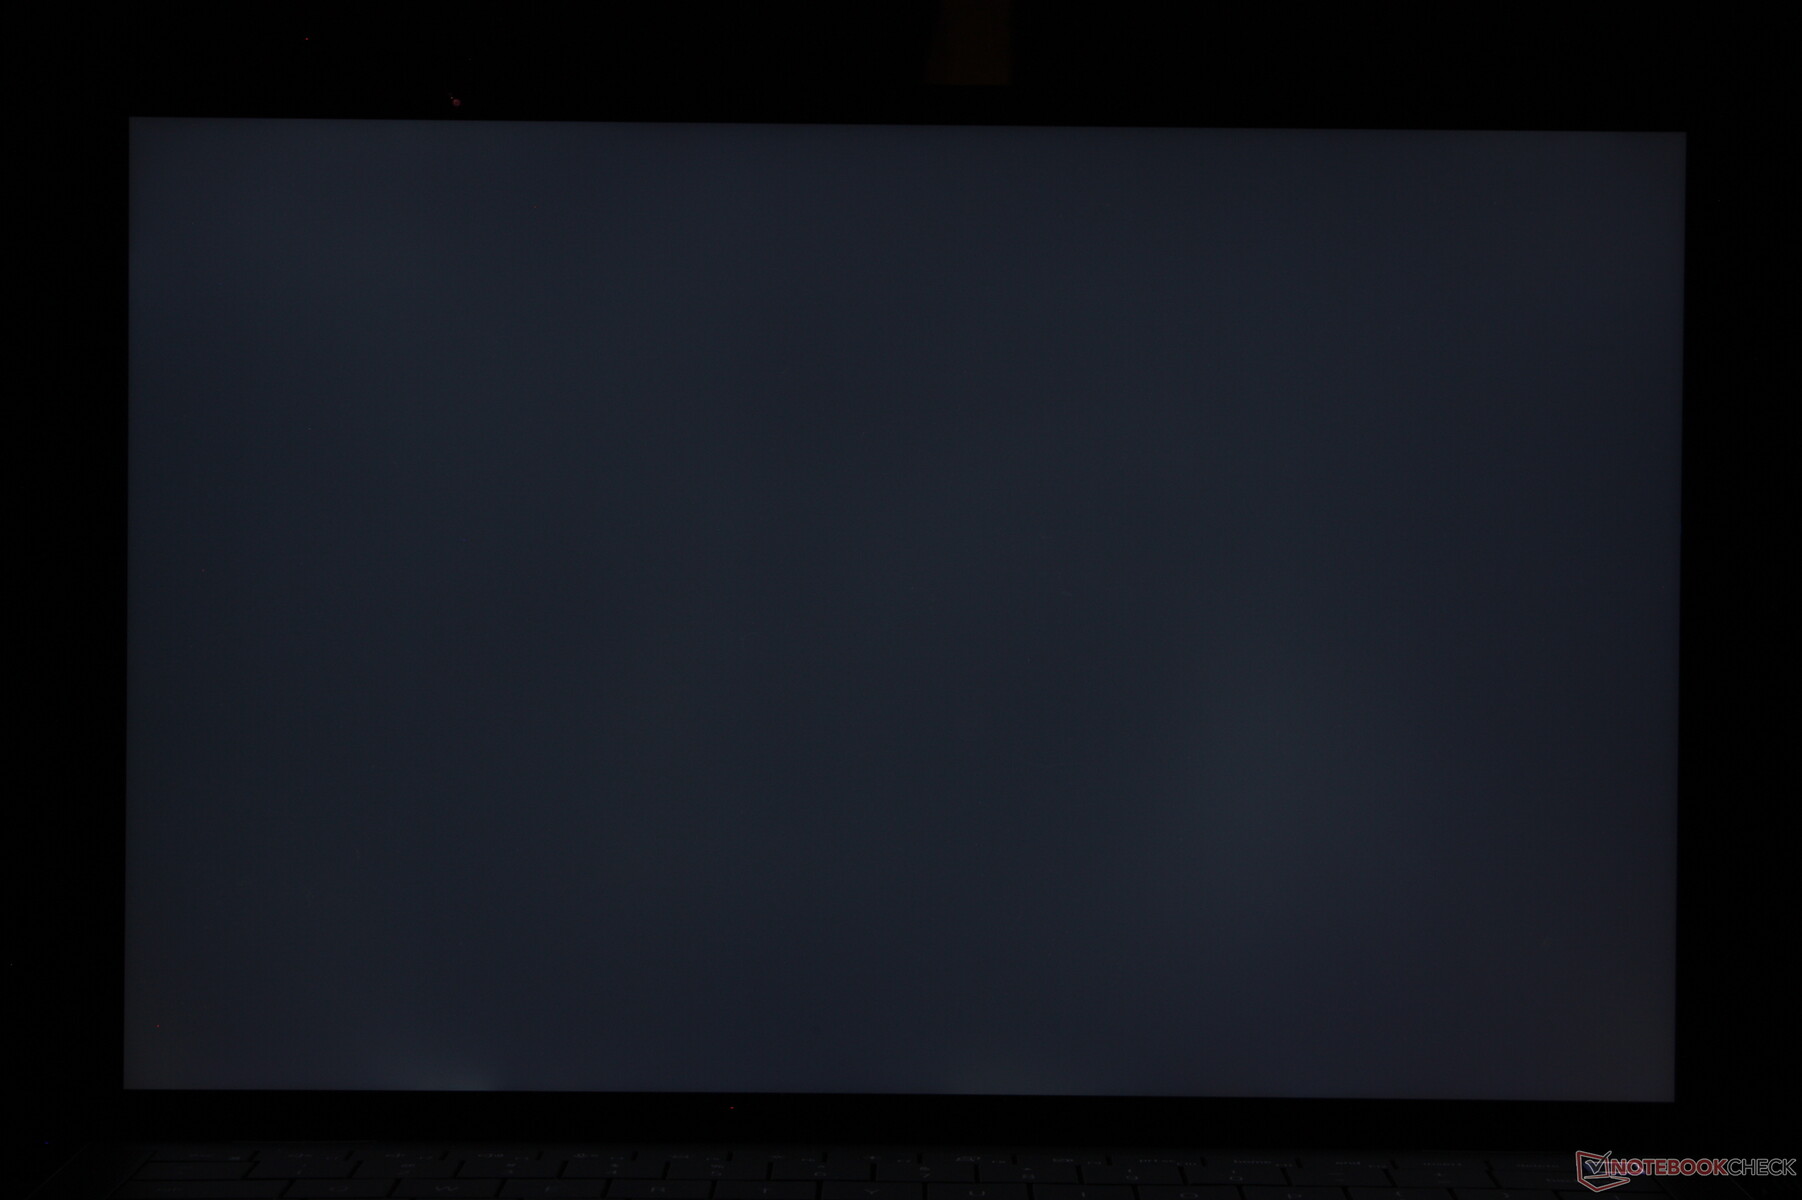
Ausleuchtung: 91 %
Helligkeit Akku: 532.4 cd/m²
Kontrast: 1109:1 (Schwarzwert: 0.48 cd/m²)
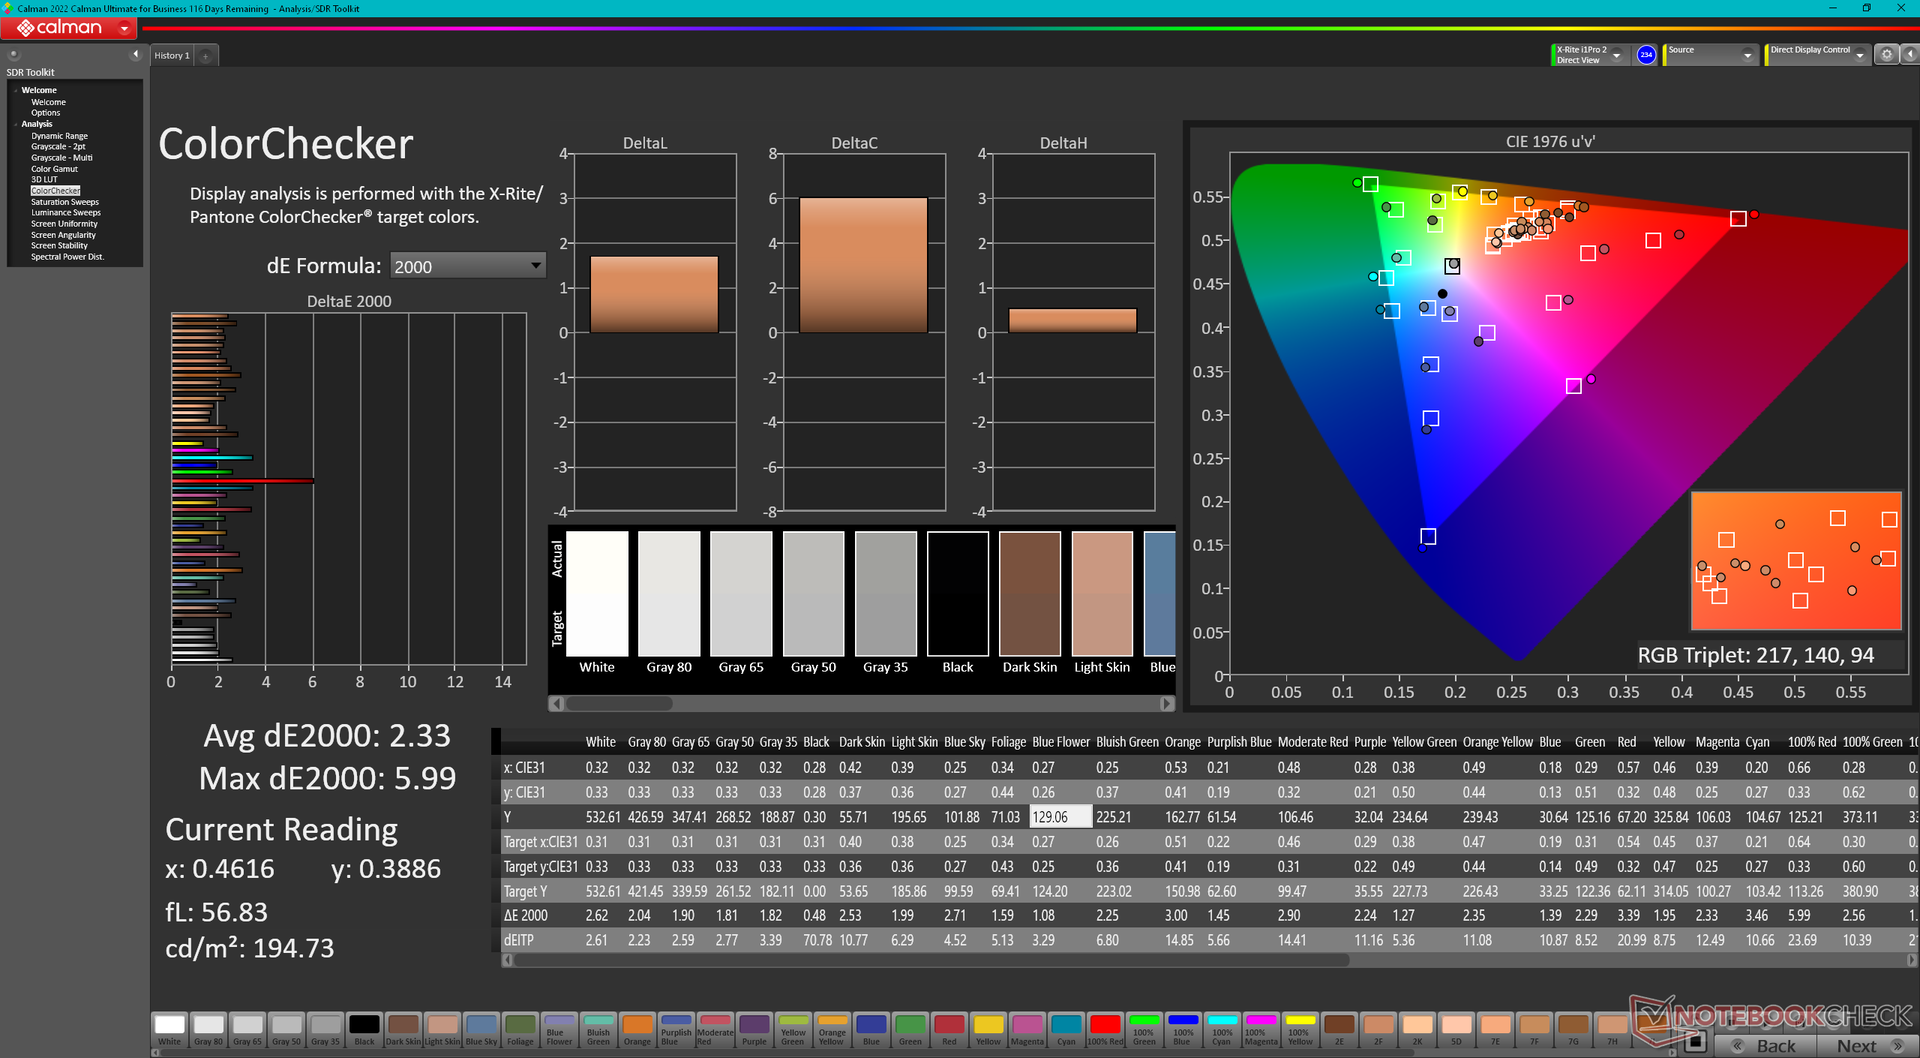
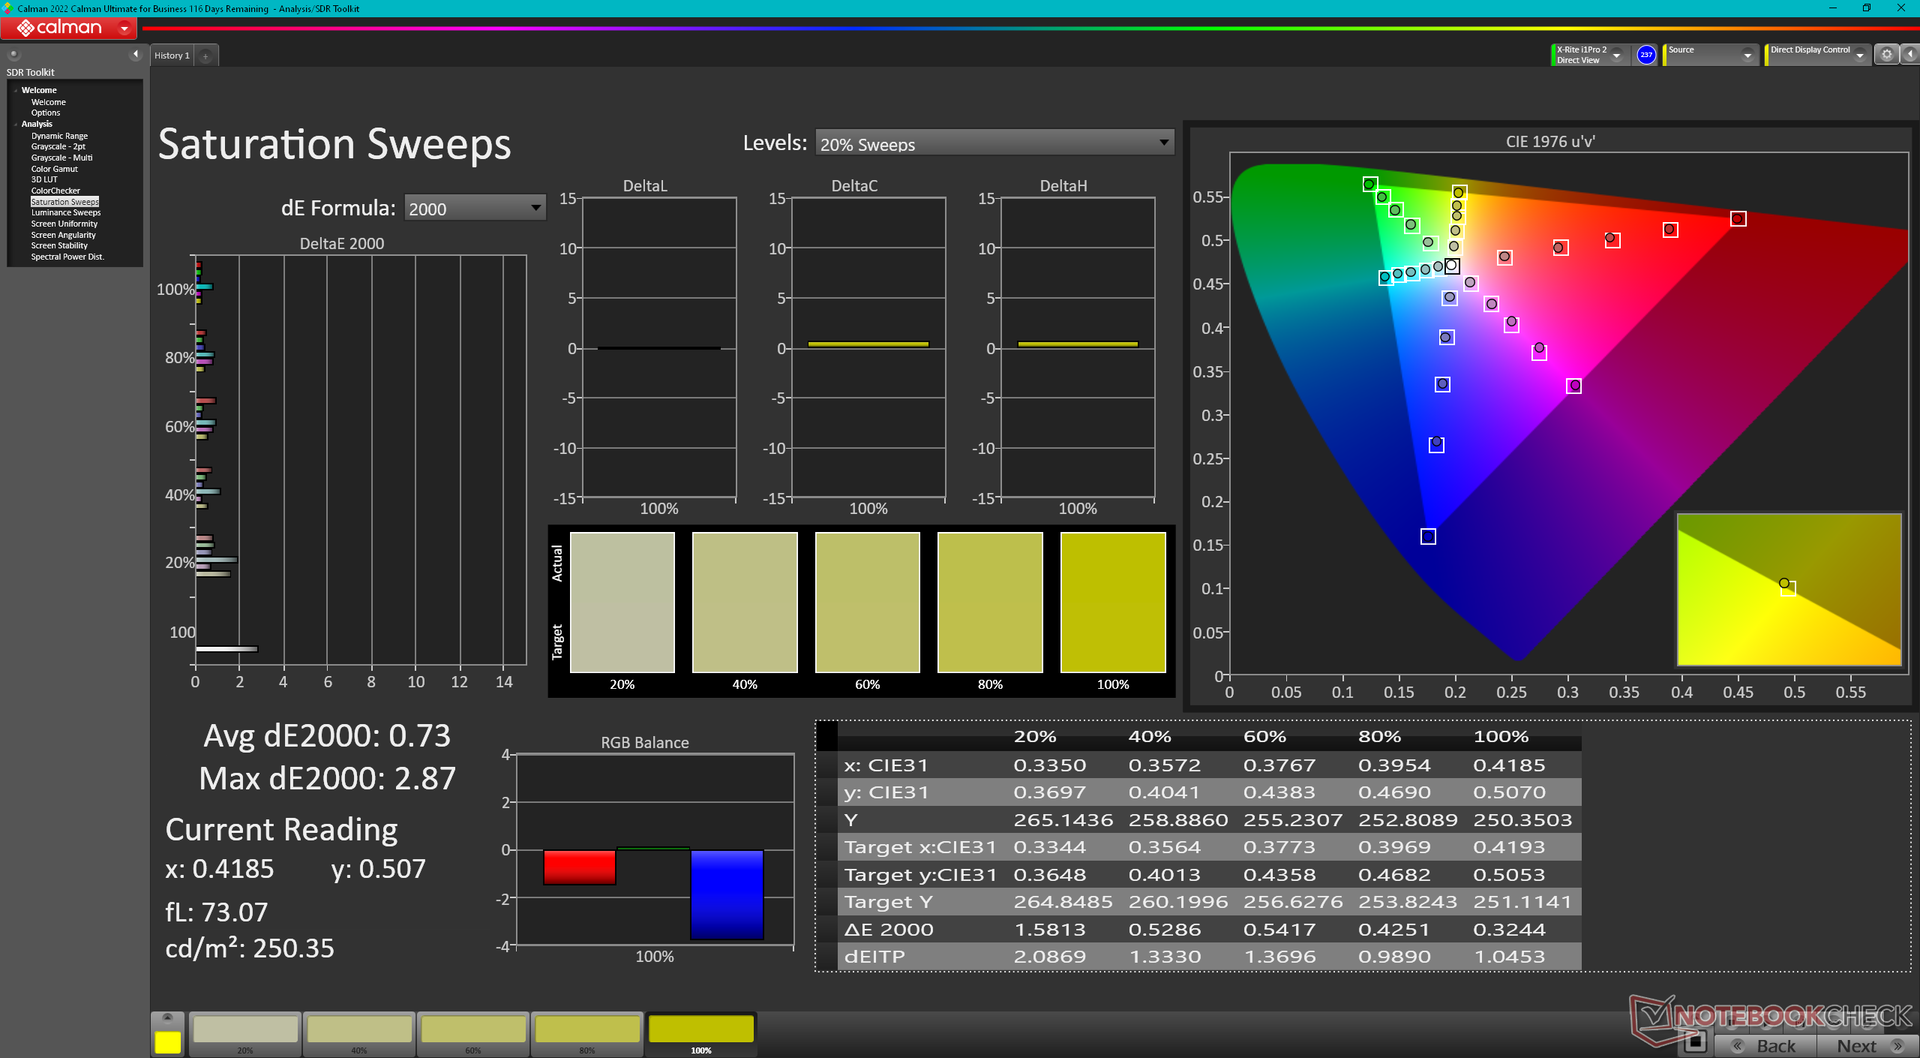
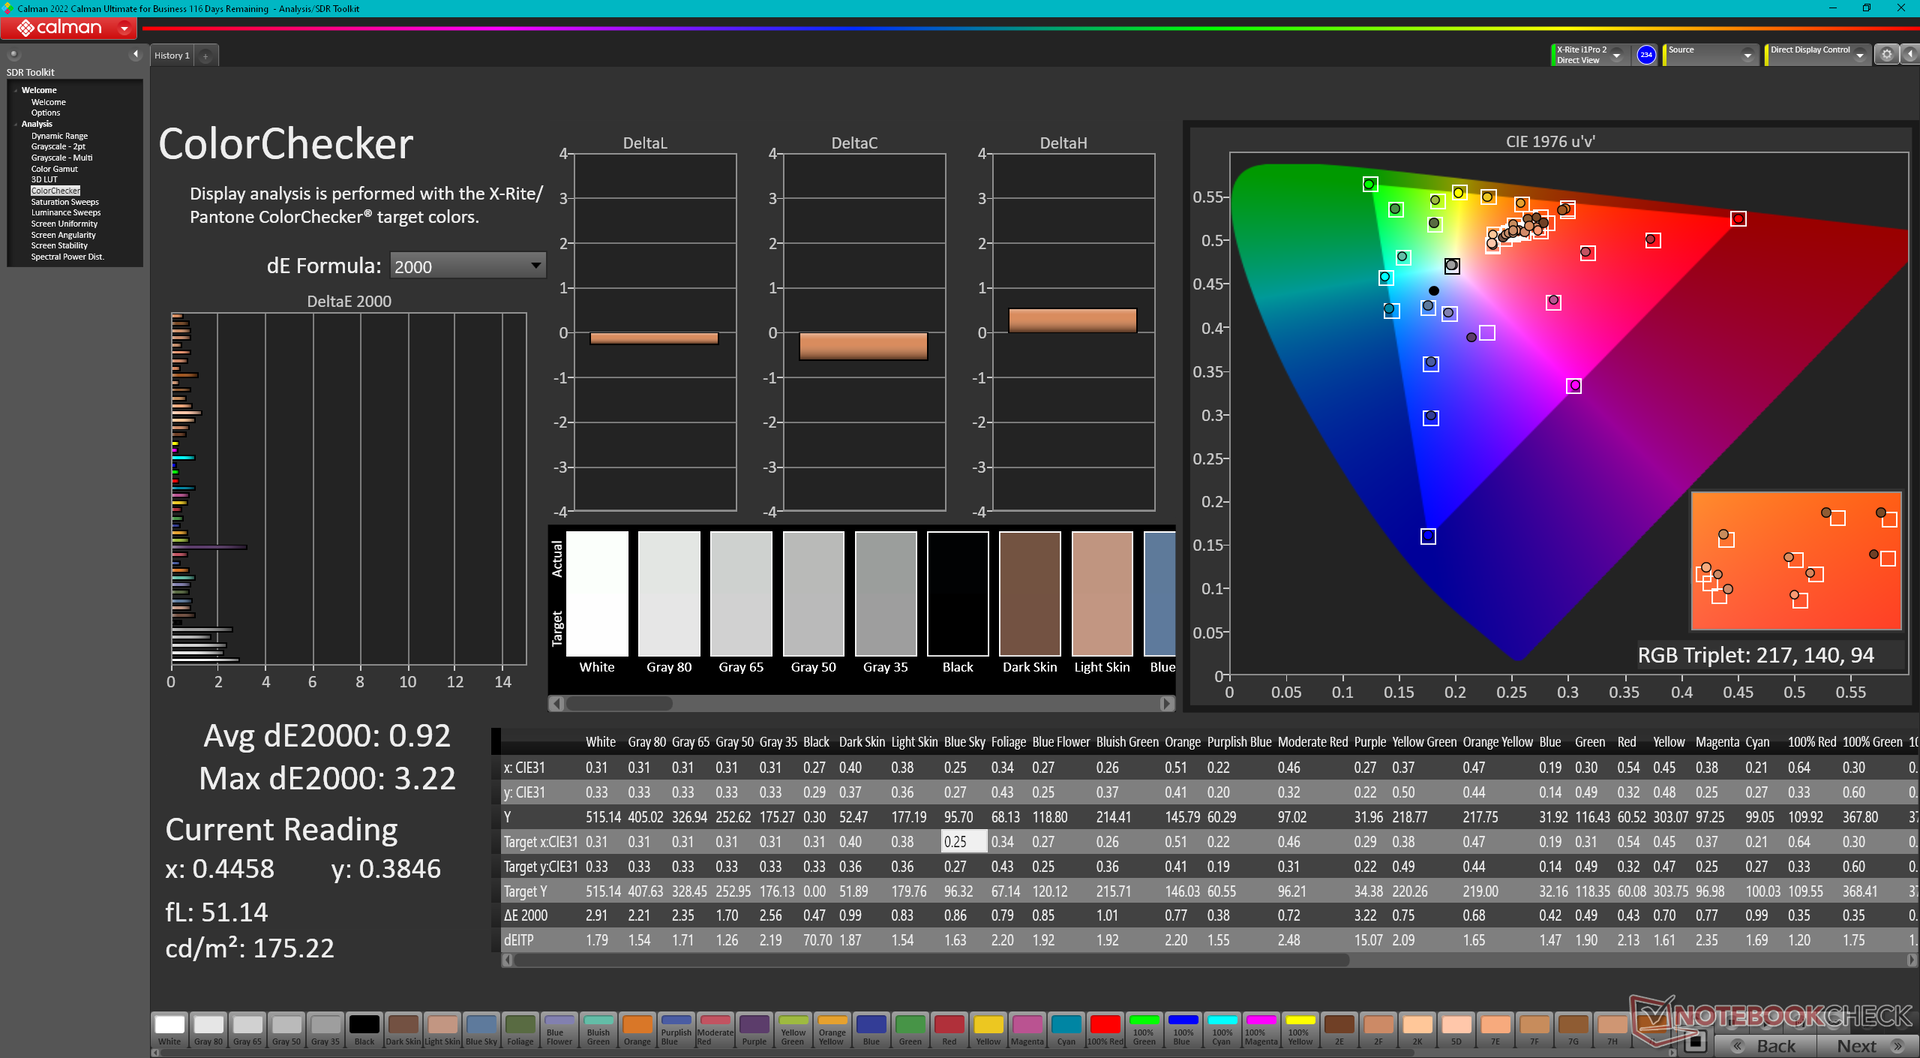
ΔE ColorChecker Calman: 2.33 | ∀{0.5-29.43 Ø4.72}
calibrated: 0.92
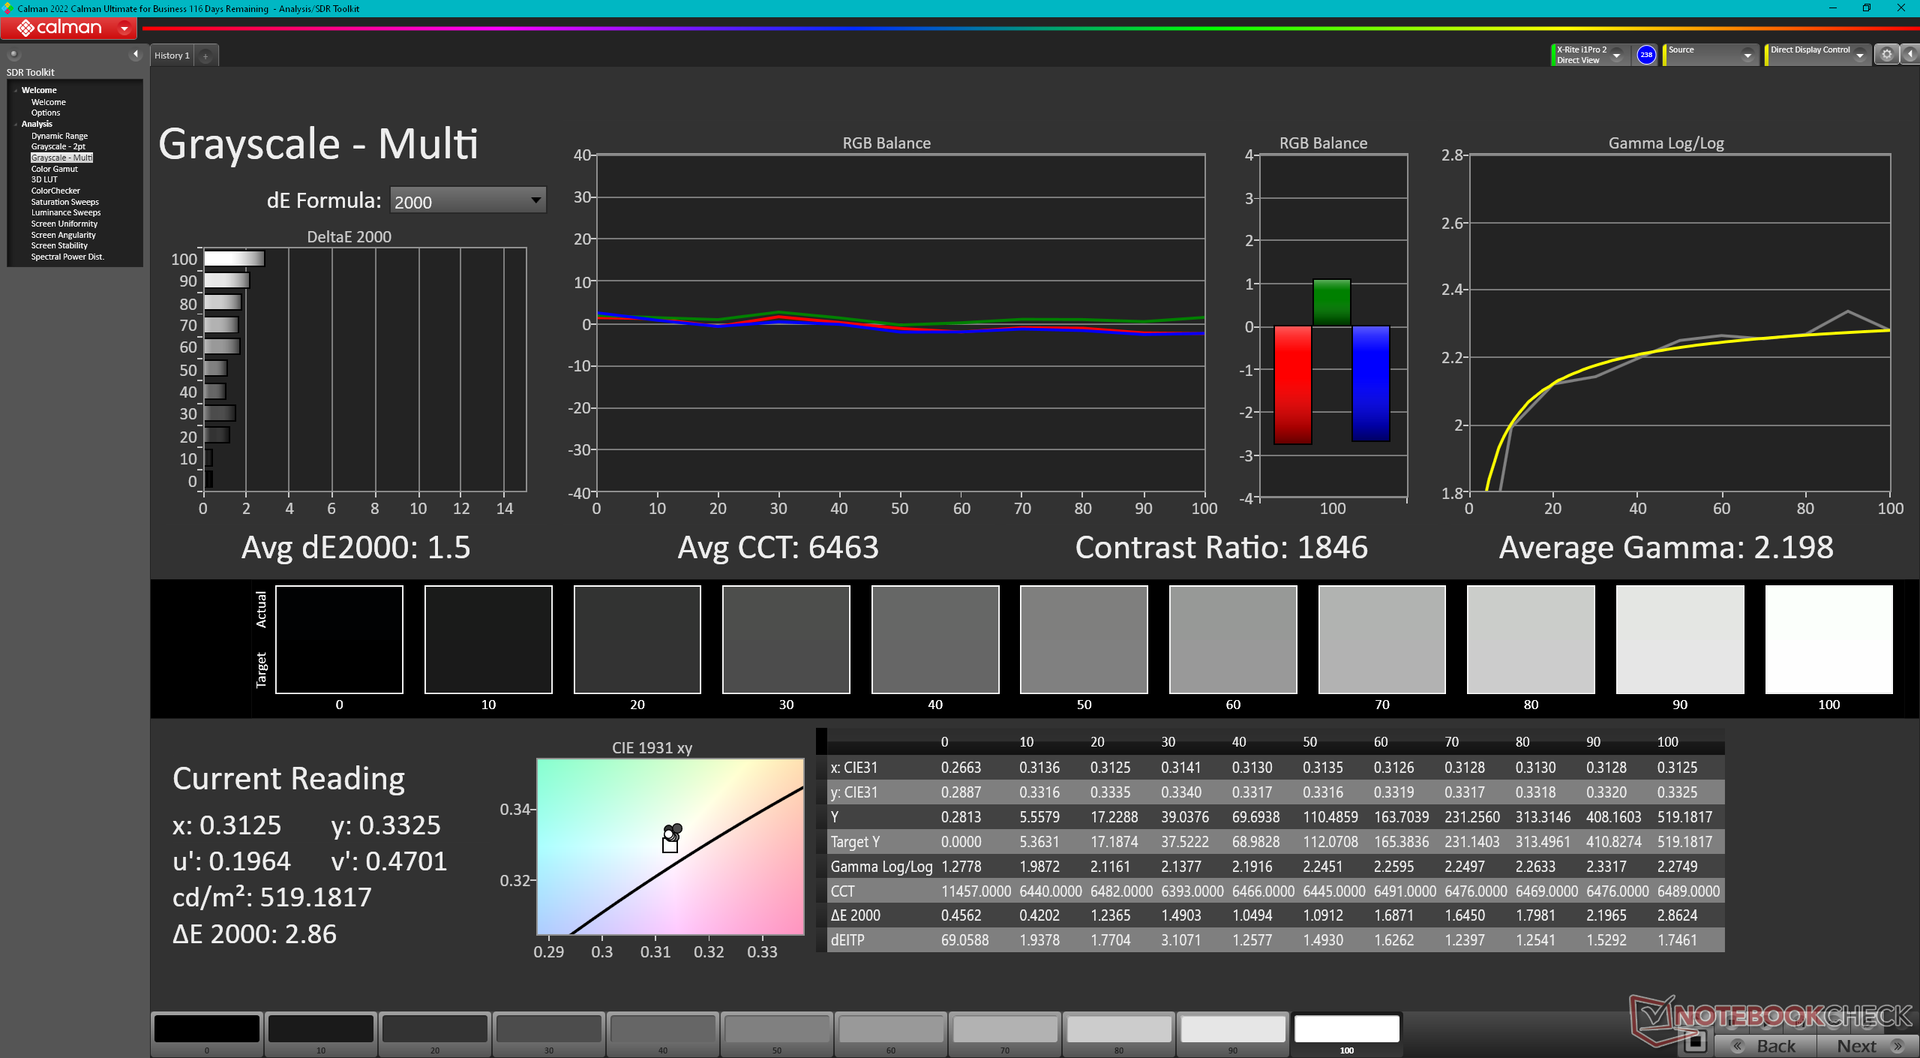
ΔE Greyscale Calman: 1.6 | ∀{0.09-98 Ø4.97}
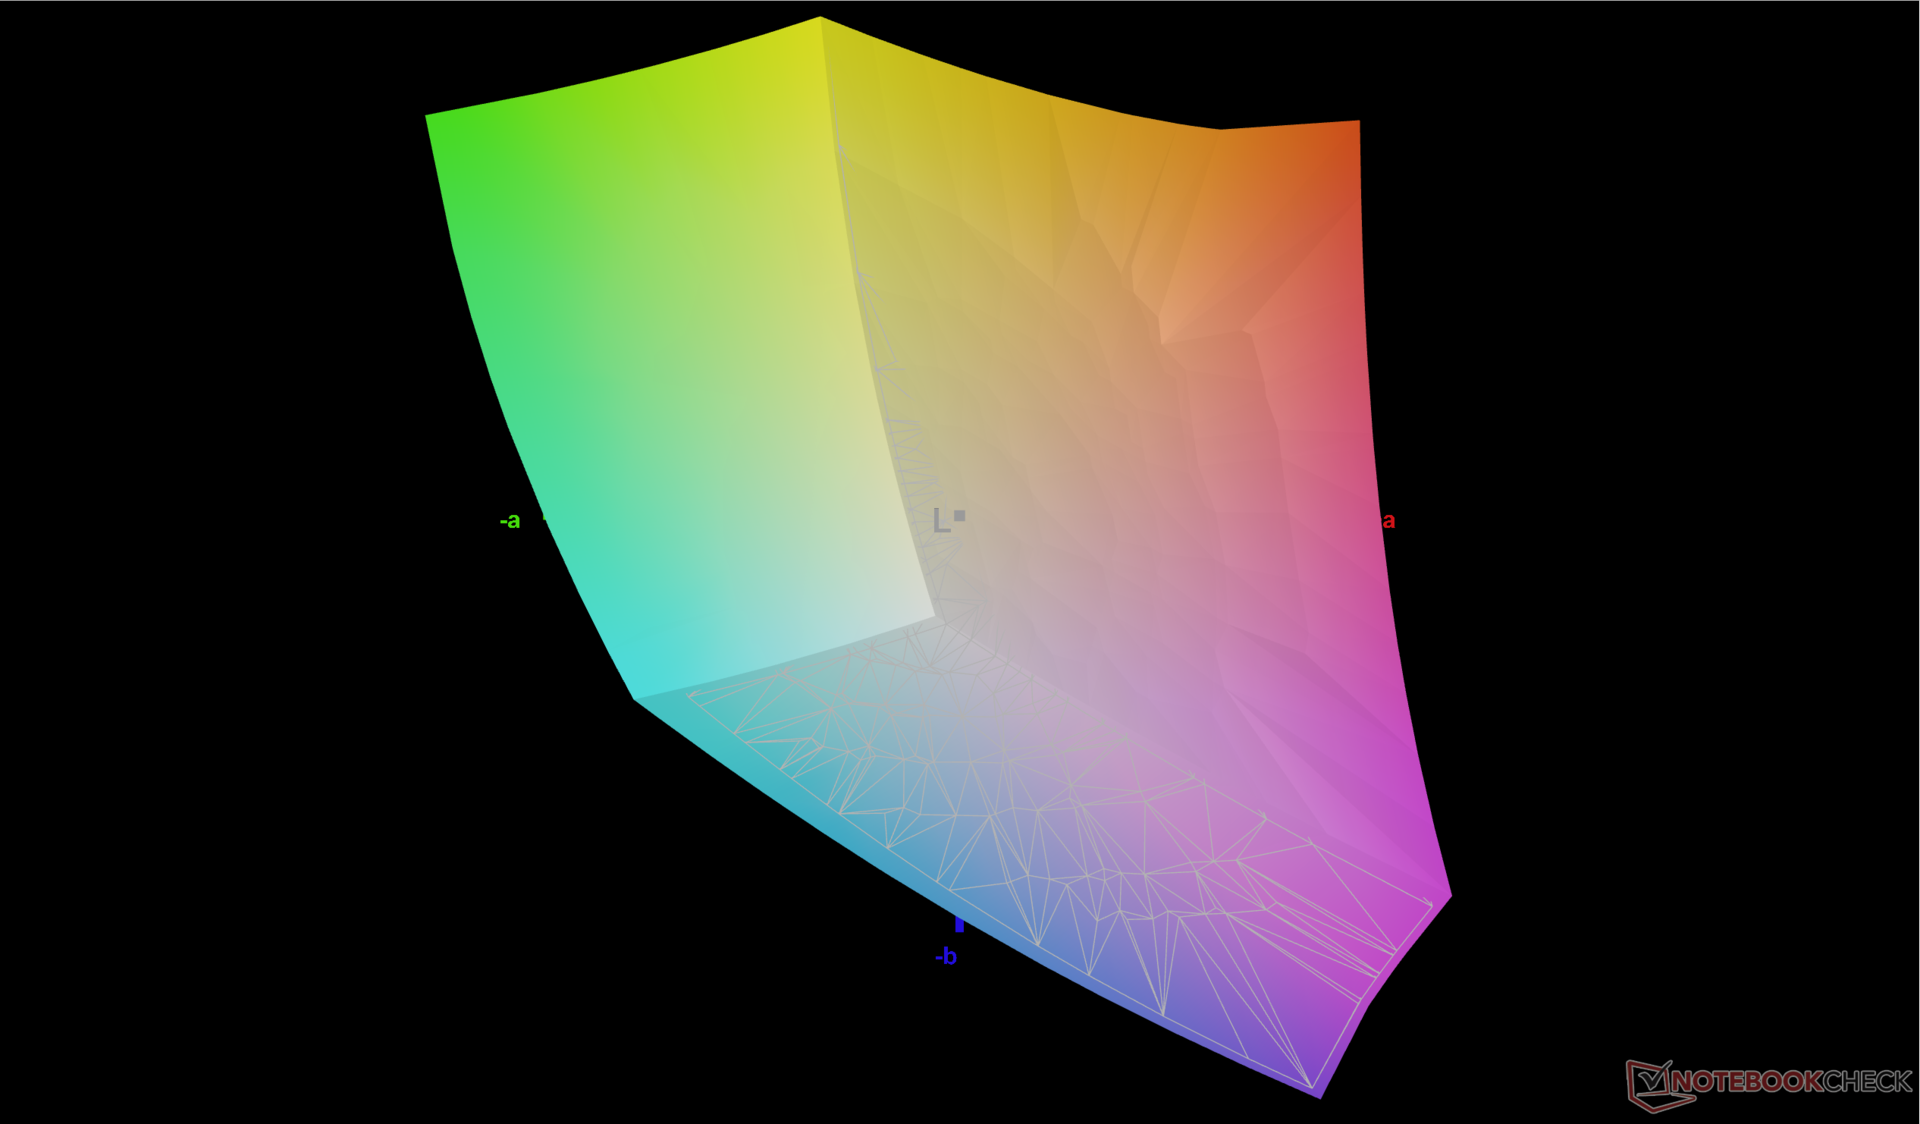
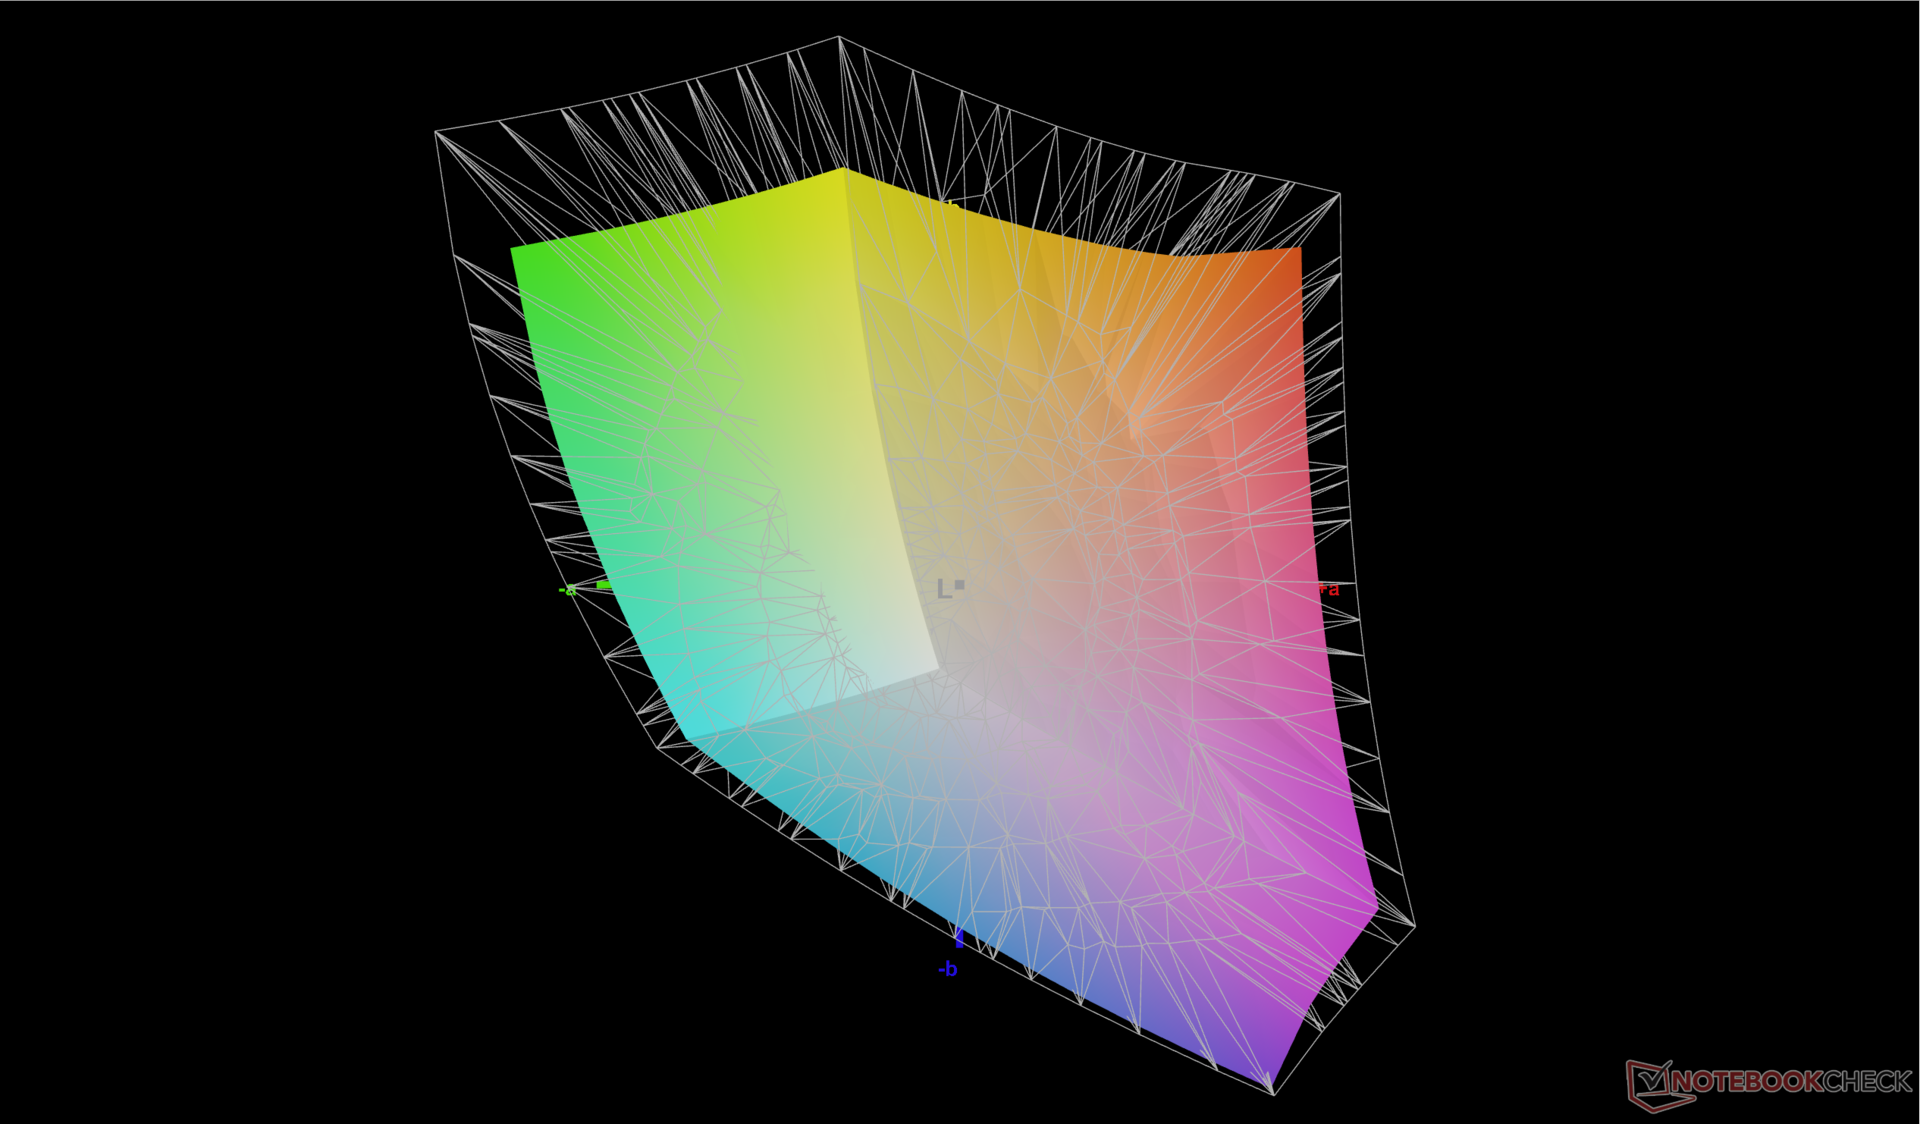
77.4% AdobeRGB 1998 (Argyll 3D)
99.6% sRGB (Argyll 3D)
77.2% Display P3 (Argyll 3D)
Gamma: 2.17
CCT: 6314 K
| Dell Latitude 9440 2-in-1 AU Optronics B140QAN, IPS, 2560x1600, 14" | Dell Latitude 9430 2-in-1 AU Optronics B140QAN, IPS, 2560x1600, 14" | Lenovo ThinkPad X1 Yoga G8 i7-1355U BOE NE140WUM-N62, IPS, 1920x1200, 14" | LG Gram 14T90P LG Philips LP140WU1-SPA1, IPS, 1900x1200, 14" | Asus ExpertBook B7 Flip B7402FEA BOE CQ NE140WUM-N65, IPS, 1900x1200, 14" | HP Dragonfly Pro 2023 AU Optronics AUOA49A, IPS, 1920x1200, 14" | |
|---|---|---|---|---|---|---|
| Display | 2% | -6% | 14% | -8% | -0% | |
| Display P3 Coverage (%) | 77.2 | 79.4 3% | 69.3 -10% | 98.8 28% | 68 -12% | 76.6 -1% |
| sRGB Coverage (%) | 99.6 | 100 0% | 98.6 -1% | 100 0% | 98.9 -1% | 100 0% |
| AdobeRGB 1998 Coverage (%) | 77.4 | 79.4 3% | 71.1 -8% | 69.3 -10% | 77.4 0% | |
| Response Times | -11% | 22% | 14% | 11% | -16% | |
| Response Time Grey 50% / Grey 80% * (ms) | 53.5 ? | 63.6 ? -19% | 43.1 ? 19% | 44 ? 18% | 50 ? 7% | 65.6 ? -23% |
| Response Time Black / White * (ms) | 33 ? | 33.6 ? -2% | 24.9 ? 25% | 30 ? 9% | 28 ? 15% | 36 ? -9% |
| PWM Frequency (Hz) | ||||||
| Bildschirm | -9% | -28% | -13% | -5% | 6% | |
| Helligkeit Bildmitte (cd/m²) | 532.4 | 517.7 -3% | 425.2 -20% | 305.5 -43% | 548 3% | 425.9 -20% |
| Brightness (cd/m²) | 502 | 493 -2% | 381 -24% | 289 -42% | 515 3% | 405 -19% |
| Brightness Distribution (%) | 91 | 90 -1% | 87 -4% | 87 -4% | 87 -4% | 87 -4% |
| Schwarzwert * (cd/m²) | 0.48 | 0.33 31% | 0.23 52% | 0.27 44% | 0.17 65% | 0.26 46% |
| Kontrast (:1) | 1109 | 1569 41% | 1849 67% | 1131 2% | 3224 191% | 1638 48% |
| Delta E Colorchecker * | 2.33 | 3.38 -45% | 3.29 -41% | 3.31 -42% | 3.67 -58% | 2.81 -21% |
| Colorchecker dE 2000 max. * | 5.99 | 6.25 -4% | 8.55 -43% | 6.12 -2% | 7.15 -19% | 4.91 18% |
| Colorchecker dE 2000 calibrated * | 0.92 | 0.41 55% | 0.57 38% | 0.49 47% | ||
| Delta E Graustufen * | 1.6 | 4 -150% | 6.1 -281% | 1.9 -19% | 5.13 -221% | 2.2 -38% |
| Gamma | 2.17 101% | 2.13 103% | 2.24 98% | 2.04 108% | 2.46 89% | 2.04 108% |
| CCT | 6314 103% | 6186 105% | 6925 94% | 6706 97% | 7703 84% | 6688 97% |
| Durchschnitt gesamt (Programm / Settings) | -6% /
-7% | -4% /
-17% | 5% /
-4% | -1% /
-3% | -3% /
2% |
* ... kleinere Werte sind besser
Das Panel ist von Werk aus gut kalibriert, die durchschnittlichen DeltaE-Werte für Graustufen und Farben liegen bei 1,6 beziehungsweise 2,33. Nach einer zusätzlichen Kalibrierung erhalten wir DeltaE-Werte von nur 1,5 und 0,93. Käufer können unser oben verlinktes ICM-Profil verwenden, was in diesem Fall aber nicht unbedingt nötig ist.
Reaktionszeiten (Response Times) des Displays
| ↔ Reaktionszeiten Schwarz zu Weiß | ||
|---|---|---|
| 33 ms ... steigend ↗ und fallend ↘ kombiniert | ↗ 16 ms steigend | 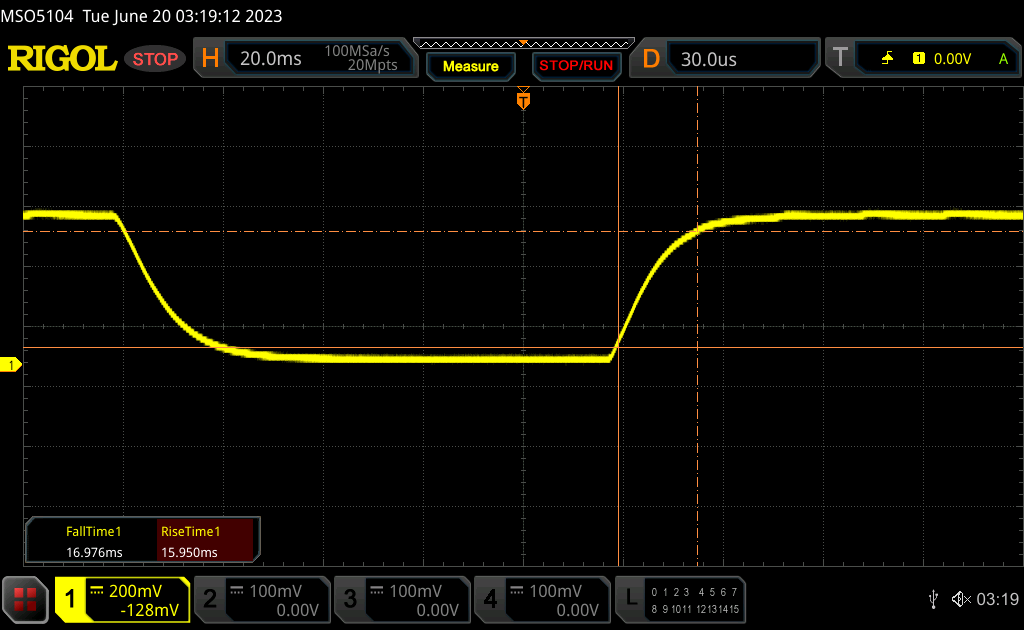 |
| ↘ 17 ms fallend | ||
| Die gemessenen Reaktionszeiten sind langsam und dadurch für viele Spieler wahrscheinlich zu langsam. Im Vergleich rangierten die bei uns getesteten Geräte von 0.1 (Minimum) zu 240 (Maximum) ms. » 89 % aller Screens waren schneller als der getestete. Daher sind die gemessenen Reaktionszeiten schlechter als der Durchschnitt aller vermessenen Geräte (19.8 ms). | ||
| ↔ Reaktionszeiten 50% Grau zu 80% Grau | ||
| 53.5 ms ... steigend ↗ und fallend ↘ kombiniert | ↗ 23.6 ms steigend | 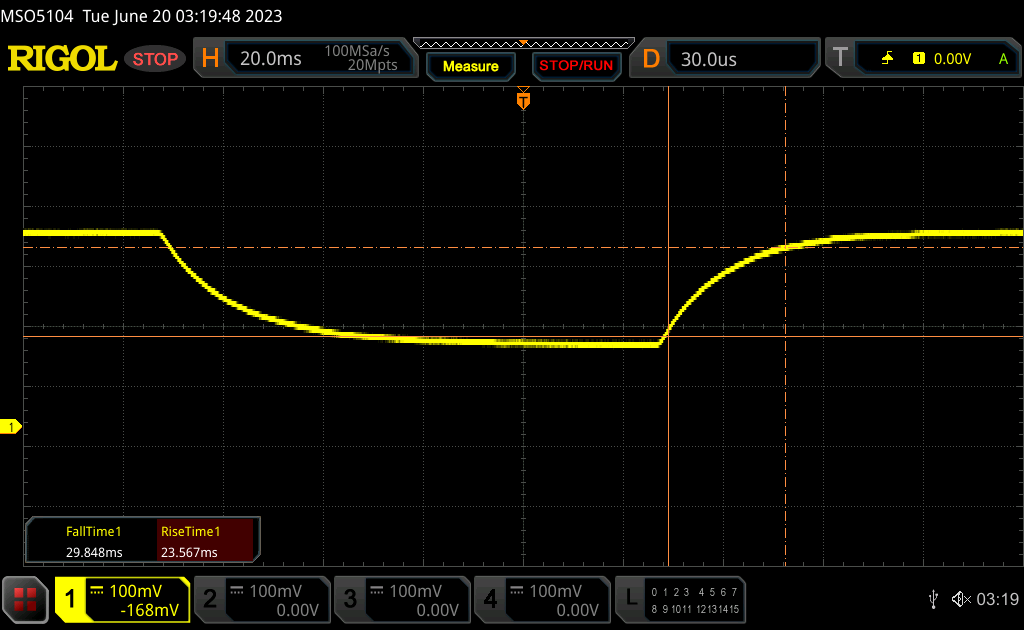 |
| ↘ 29.9 ms fallend | ||
| Die gemessenen Reaktionszeiten sind langsam und dadurch für viele Spieler wahrscheinlich zu langsam. Im Vergleich rangierten die bei uns getesteten Geräte von 0.165 (Minimum) zu 636 (Maximum) ms. » 90 % aller Screens waren schneller als der getestete. Daher sind die gemessenen Reaktionszeiten schlechter als der Durchschnitt aller vermessenen Geräte (31 ms). | ||
Bildschirm-Flackern / PWM (Pulse-Width Modulation)
| Flackern / PWM nicht festgestellt | 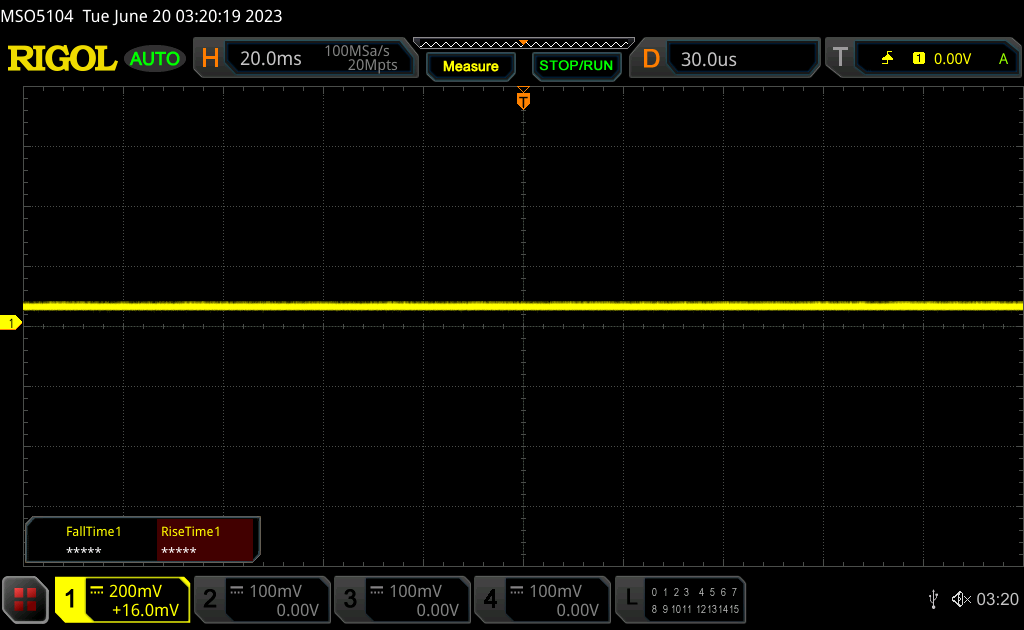 | ||
Im Vergleich: 52 % aller getesteten Geräte nutzten kein PWM um die Helligkeit zu reduzieren. Wenn PWM eingesetzt wurde, dann bei einer Frequenz von durchschnittlich 7763 (Minimum 5, Maximum 343500) Hz. | |||
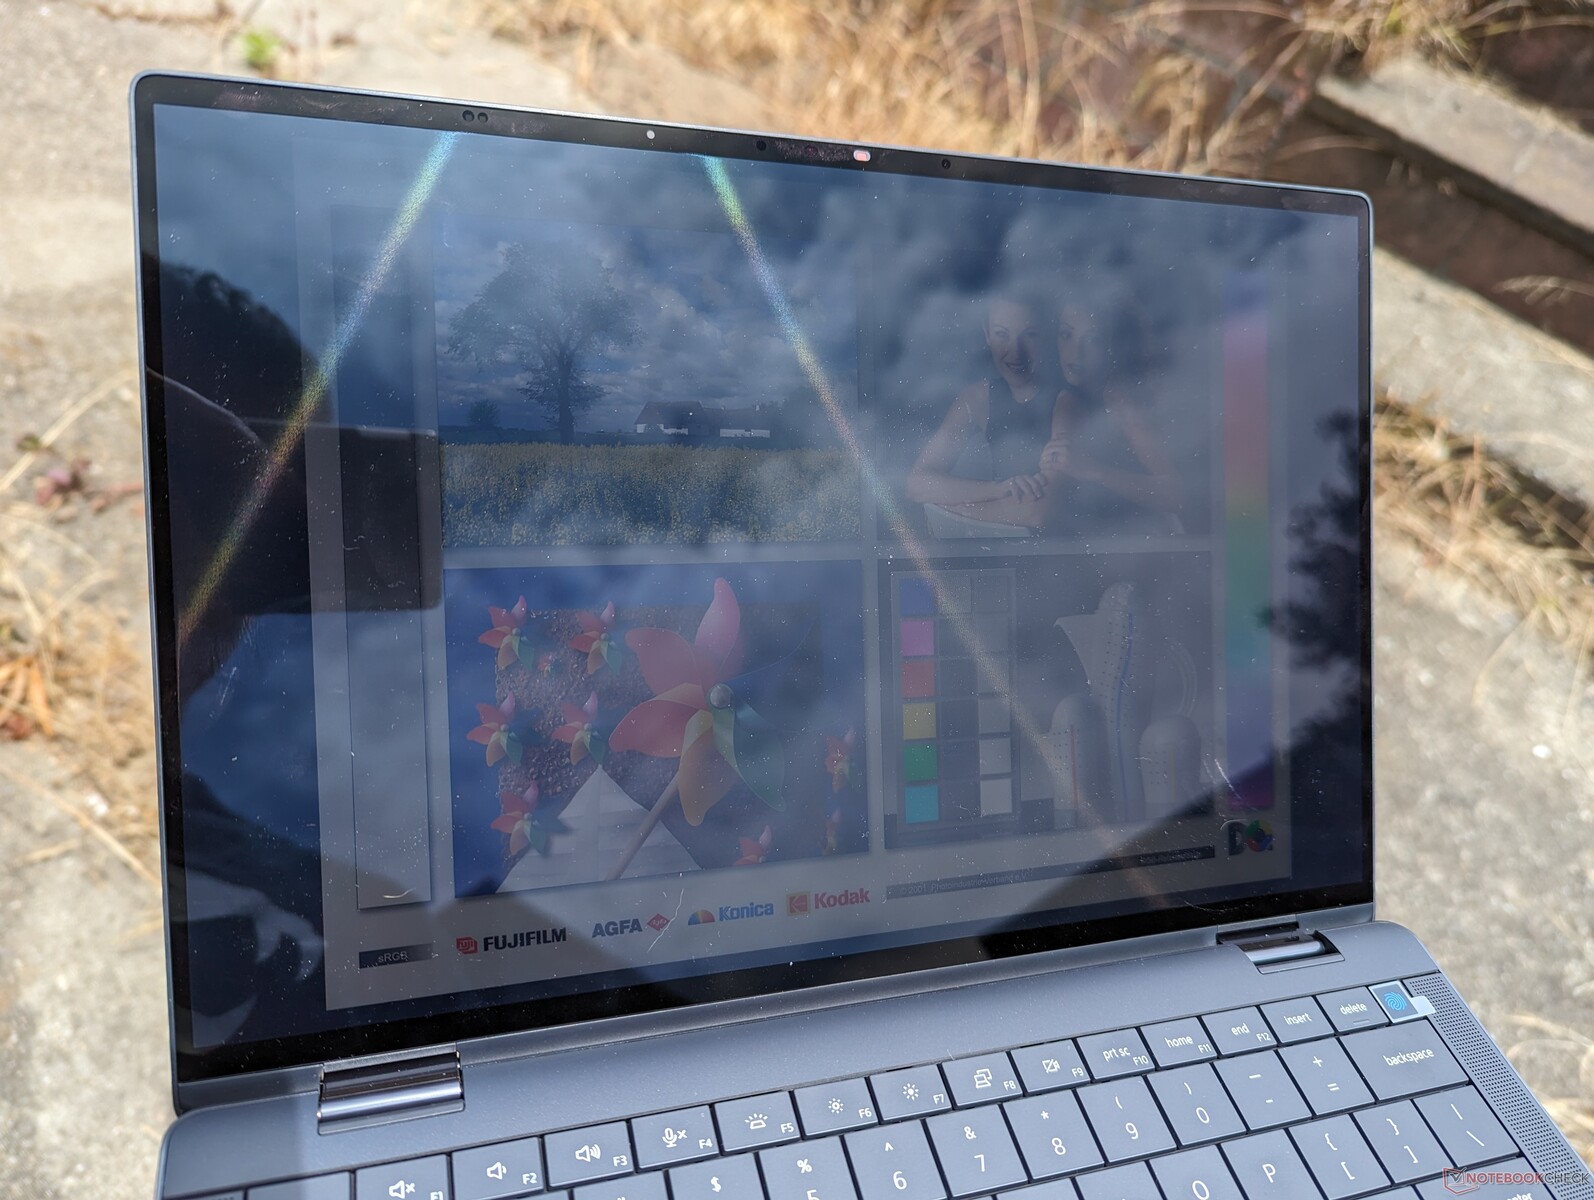
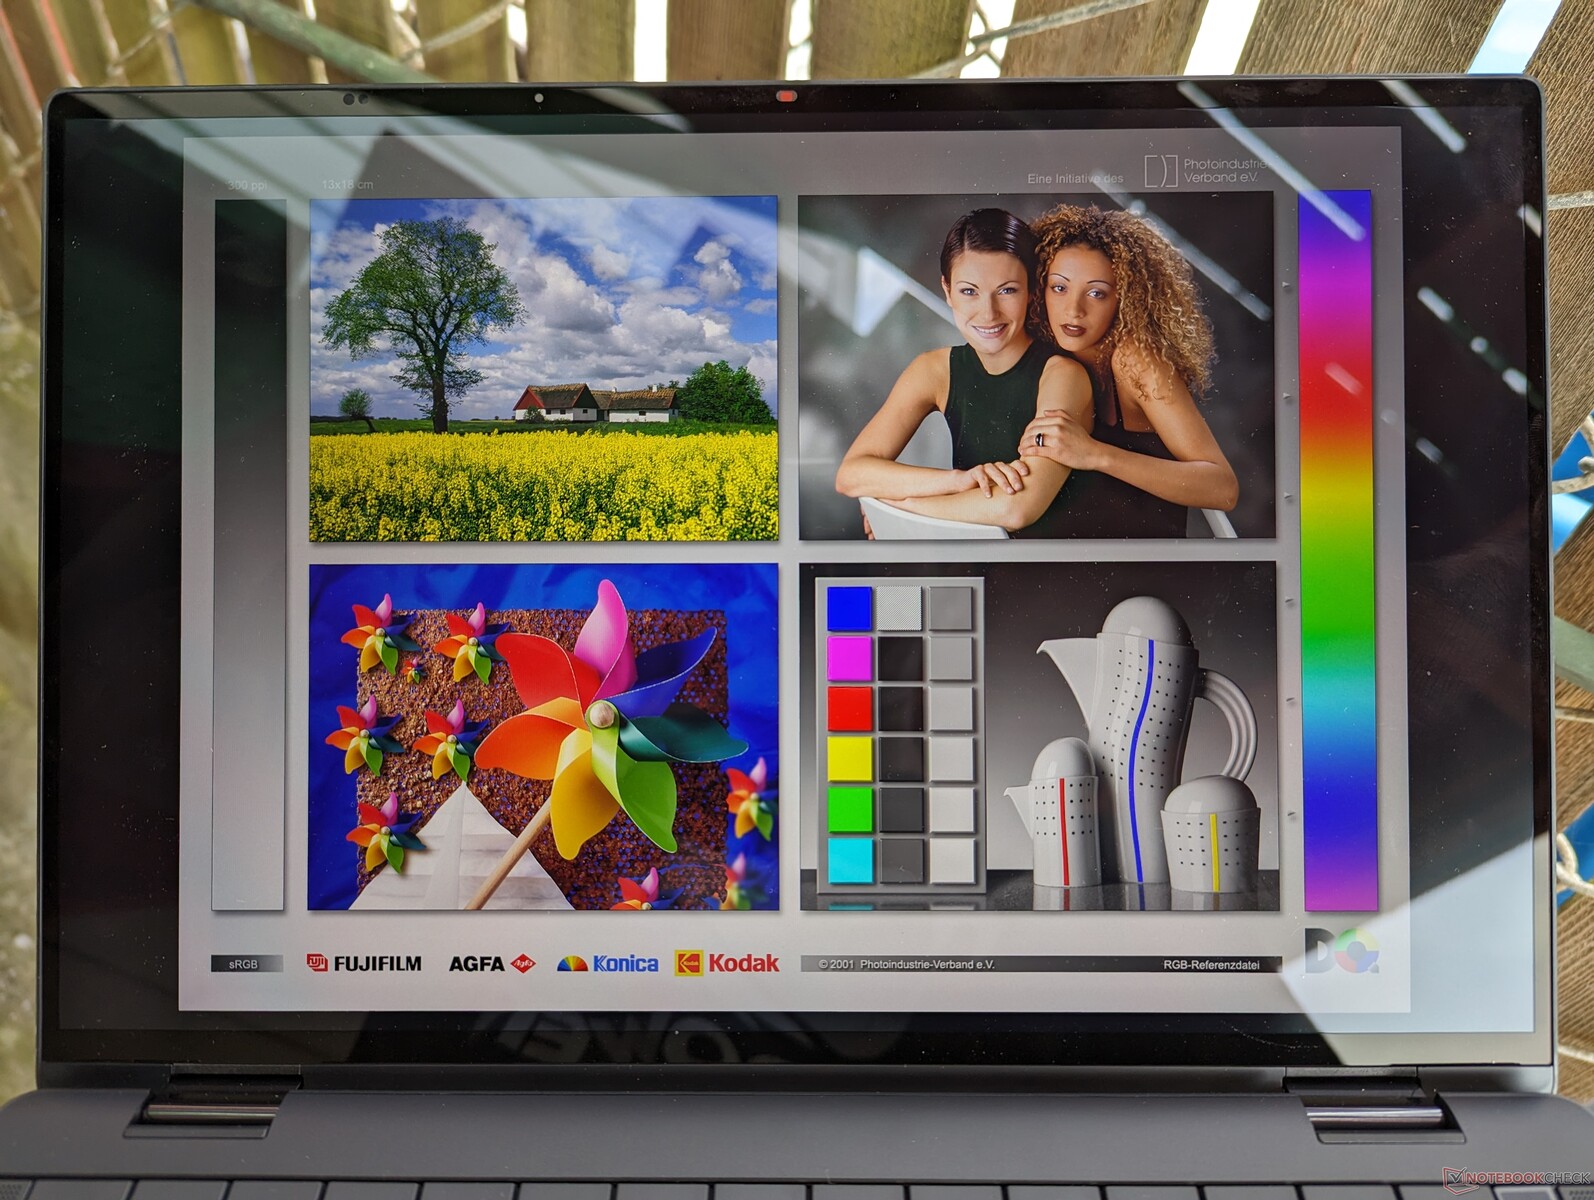
Die Ablesbarkeit im Freien ist ähnlich wie beim Vorgänger, da sich an der Display-Helligkeit nichts geändert hat. Wir würden uns künftig über ein 1000 Nits helles Display wie beim HP EliteBook 840 freuen.

Leistung — Ähnlich wie beim Vorjahresmodell
Testbedingungen
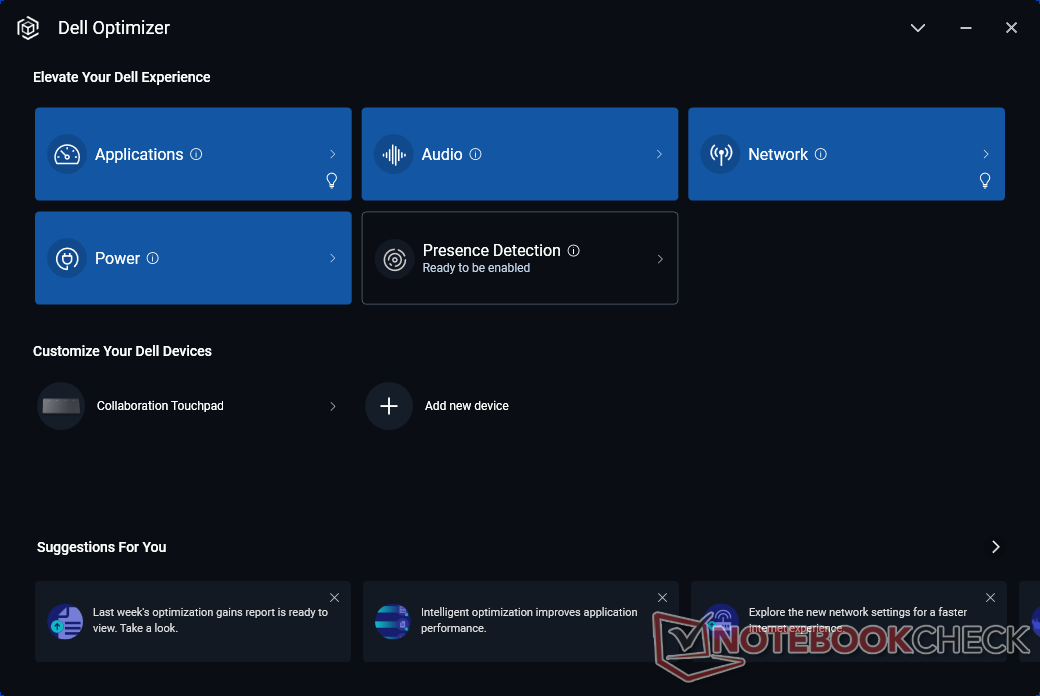
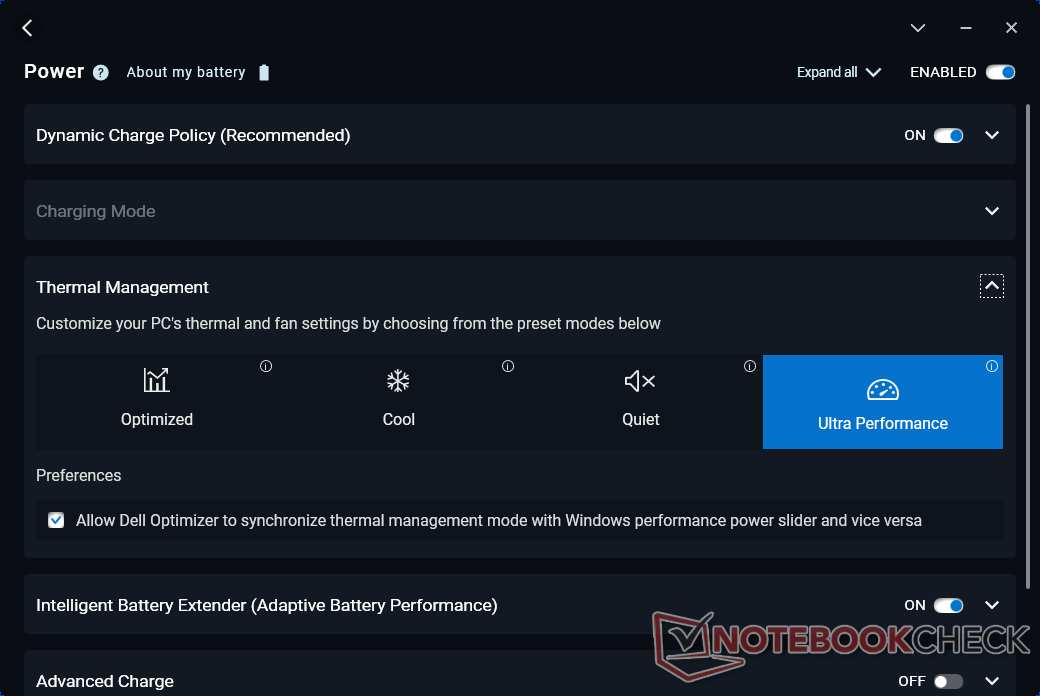
Der Dell Optimizer wurde vor der Durchführung der Benchmarks auf den Modus "Ultra Performance" gestellt. Bequemer Weise können die Einstellungen in Dells Software mit den entsprechenden Energieoptionen von Windows synchronisiert werden, was die meisten Notebooks nicht zu bieten haben.
Prozessor
Der Core i7-1365U ist zwar neuer als der Core i7-1265U des letztjährigen Latitudes, die zwei CPUs bieten aber fast die gleiche Leistung. Selbst der Turbo Boost und das Drossel-Verhalten sind sich sehr ähnlich, wie die Ergebnisse unseres CineBench R15 Dauertests unten zeigen. Es ist schade, dass Dell keine Core-P-Konfiguration anbietet, die eine um bis zu 40 Prozent höhere Multi-Thread-Leistung erreichen könnte, wie unser Test des Framework Laptops aufzeigt.
Das Downgrade von unserem Core i7-1365U auf den Core i5-1345U vPro oder i5-1335U dürfte erwartungsgemäß in einer um 20 Prozent niedrigeren Multi-Thread-Leistung resultieren.
Cinebench R15 Multi Dauertest
Cinebench R20: CPU (Multi Core) | CPU (Single Core)
Cinebench R23: Multi Core | Single Core
Cinebench R15: CPU Multi 64Bit | CPU Single 64Bit
Blender: v2.79 BMW27 CPU
7-Zip 18.03: 7z b 4 | 7z b 4 -mmt1
Geekbench 5.5: Multi-Core | Single-Core
HWBOT x265 Benchmark v2.2: 4k Preset
LibreOffice : 20 Documents To PDF
R Benchmark 2.5: Overall mean
* ... kleinere Werte sind besser
* ... kleinere Werte sind besser
AIDA64: FP32 Ray-Trace | FPU Julia | CPU SHA3 | CPU Queen | FPU SinJulia | FPU Mandel | CPU AES | CPU ZLib | FP64 Ray-Trace | CPU PhotoWorxx
| Performance Rating | |
| Dell Latitude 9430 2-in-1 | |
| Dell Latitude 9440 2-in-1 | |
| Lenovo ThinkPad X1 Yoga G8 i7-1355U | |
| Durchschnittliche Intel Core i7-1365U | |
| Asus ExpertBook B7 Flip B7402FEA | |
| LG Gram 14T90P | |
| AIDA64 / FP32 Ray-Trace | |
| Dell Latitude 9430 2-in-1 | |
| Dell Latitude 9440 2-in-1 | |
| Lenovo ThinkPad X1 Yoga G8 i7-1355U | |
| Durchschnittliche Intel Core i7-1365U (6720 - 8270, n=4) | |
| Asus ExpertBook B7 Flip B7402FEA | |
| LG Gram 14T90P | |
| AIDA64 / FPU Julia | |
| Lenovo ThinkPad X1 Yoga G8 i7-1355U | |
| Dell Latitude 9430 2-in-1 | |
| Dell Latitude 9440 2-in-1 | |
| Durchschnittliche Intel Core i7-1365U (33777 - 41487, n=4) | |
| Asus ExpertBook B7 Flip B7402FEA | |
| LG Gram 14T90P | |
| AIDA64 / CPU SHA3 | |
| Dell Latitude 9440 2-in-1 | |
| Dell Latitude 9430 2-in-1 | |
| Lenovo ThinkPad X1 Yoga G8 i7-1355U | |
| Durchschnittliche Intel Core i7-1365U (1754 - 2216, n=4) | |
| Asus ExpertBook B7 Flip B7402FEA | |
| LG Gram 14T90P | |
| AIDA64 / CPU Queen | |
| Durchschnittliche Intel Core i7-1365U (67557 - 69991, n=4) | |
| Dell Latitude 9440 2-in-1 | |
| Dell Latitude 9430 2-in-1 | |
| Lenovo ThinkPad X1 Yoga G8 i7-1355U | |
| Asus ExpertBook B7 Flip B7402FEA | |
| LG Gram 14T90P | |
| AIDA64 / FPU SinJulia | |
| Dell Latitude 9440 2-in-1 | |
| Dell Latitude 9430 2-in-1 | |
| Lenovo ThinkPad X1 Yoga G8 i7-1355U | |
| Asus ExpertBook B7 Flip B7402FEA | |
| Durchschnittliche Intel Core i7-1365U (4589 - 5145, n=4) | |
| LG Gram 14T90P | |
| AIDA64 / FPU Mandel | |
| Dell Latitude 9430 2-in-1 | |
| Dell Latitude 9440 2-in-1 | |
| Lenovo ThinkPad X1 Yoga G8 i7-1355U | |
| Durchschnittliche Intel Core i7-1365U (16808 - 20668, n=4) | |
| Asus ExpertBook B7 Flip B7402FEA | |
| LG Gram 14T90P | |
| AIDA64 / CPU AES | |
| Asus ExpertBook B7 Flip B7402FEA | |
| LG Gram 14T90P | |
| Dell Latitude 9430 2-in-1 | |
| Dell Latitude 9440 2-in-1 | |
| Durchschnittliche Intel Core i7-1365U (34968 - 41413, n=4) | |
| Lenovo ThinkPad X1 Yoga G8 i7-1355U | |
| AIDA64 / CPU ZLib | |
| Lenovo ThinkPad X1 Yoga G8 i7-1355U | |
| Dell Latitude 9440 2-in-1 | |
| Dell Latitude 9430 2-in-1 | |
| Durchschnittliche Intel Core i7-1365U (519 - 650, n=4) | |
| Asus ExpertBook B7 Flip B7402FEA | |
| LG Gram 14T90P | |
| AIDA64 / FP64 Ray-Trace | |
| Dell Latitude 9430 2-in-1 | |
| Dell Latitude 9440 2-in-1 | |
| Lenovo ThinkPad X1 Yoga G8 i7-1355U | |
| Durchschnittliche Intel Core i7-1365U (3513 - 4367, n=4) | |
| Asus ExpertBook B7 Flip B7402FEA | |
| LG Gram 14T90P | |
| AIDA64 / CPU PhotoWorxx | |
| Dell Latitude 9430 2-in-1 | |
| Lenovo ThinkPad X1 Yoga G8 i7-1355U | |
| Dell Latitude 9440 2-in-1 | |
| Durchschnittliche Intel Core i7-1365U (37846 - 43780, n=4) | |
| LG Gram 14T90P | |
| Asus ExpertBook B7 Flip B7402FEA | |
Systemleistung
Die PCMark-Scores sind allesamt höher als beim Latitude 9430 2-in-1 aus dem Vorjahr, aber nur marginal. Der GPU-lastige Benchmark, der das Kreieren von digitalem Content simuliert, endet hingegen mit deutlich schlechteren Ergebnissen als beim HP Dragonfly Pro, das mit der schnelleren Radeon 680M iGPU ausgerüstet ist.

CrossMark: Overall | Productivity | Creativity | Responsiveness
| PCMark 10 / Score | |
| HP Dragonfly Pro 2023 | |
| Dell Latitude 9440 2-in-1 | |
| Lenovo ThinkPad X1 Yoga G8 i7-1355U | |
| Durchschnittliche Intel Core i7-1365U, Intel Iris Xe Graphics G7 96EUs (5690 - 5980, n=4) | |
| Dell Latitude 9430 2-in-1 | |
| Asus ExpertBook B7 Flip B7402FEA | |
| LG Gram 14T90P | |
| PCMark 10 / Essentials | |
| Dell Latitude 9440 2-in-1 | |
| Lenovo ThinkPad X1 Yoga G8 i7-1355U | |
| Durchschnittliche Intel Core i7-1365U, Intel Iris Xe Graphics G7 96EUs (10635 - 11827, n=4) | |
| Dell Latitude 9430 2-in-1 | |
| Asus ExpertBook B7 Flip B7402FEA | |
| LG Gram 14T90P | |
| HP Dragonfly Pro 2023 | |
| PCMark 10 / Productivity | |
| HP Dragonfly Pro 2023 | |
| Durchschnittliche Intel Core i7-1365U, Intel Iris Xe Graphics G7 96EUs (7206 - 7708, n=4) | |
| Dell Latitude 9440 2-in-1 | |
| Lenovo ThinkPad X1 Yoga G8 i7-1355U | |
| Asus ExpertBook B7 Flip B7402FEA | |
| Dell Latitude 9430 2-in-1 | |
| LG Gram 14T90P | |
| PCMark 10 / Digital Content Creation | |
| HP Dragonfly Pro 2023 | |
| Lenovo ThinkPad X1 Yoga G8 i7-1355U | |
| Durchschnittliche Intel Core i7-1365U, Intel Iris Xe Graphics G7 96EUs (6392 - 6735, n=4) | |
| Dell Latitude 9440 2-in-1 | |
| Dell Latitude 9430 2-in-1 | |
| Asus ExpertBook B7 Flip B7402FEA | |
| LG Gram 14T90P | |
| CrossMark / Overall | |
| Dell Latitude 9440 2-in-1 | |
| Durchschnittliche Intel Core i7-1365U, Intel Iris Xe Graphics G7 96EUs (1605 - 1675, n=4) | |
| Lenovo ThinkPad X1 Yoga G8 i7-1355U | |
| Dell Latitude 9430 2-in-1 | |
| HP Dragonfly Pro 2023 | |
| Asus ExpertBook B7 Flip B7402FEA | |
| LG Gram 14T90P | |
| CrossMark / Productivity | |
| Dell Latitude 9440 2-in-1 | |
| Durchschnittliche Intel Core i7-1365U, Intel Iris Xe Graphics G7 96EUs (1582 - 1650, n=4) | |
| Lenovo ThinkPad X1 Yoga G8 i7-1355U | |
| Dell Latitude 9430 2-in-1 | |
| Asus ExpertBook B7 Flip B7402FEA | |
| HP Dragonfly Pro 2023 | |
| LG Gram 14T90P | |
| CrossMark / Creativity | |
| Durchschnittliche Intel Core i7-1365U, Intel Iris Xe Graphics G7 96EUs (1713 - 1797, n=4) | |
| Dell Latitude 9440 2-in-1 | |
| Lenovo ThinkPad X1 Yoga G8 i7-1355U | |
| Dell Latitude 9430 2-in-1 | |
| HP Dragonfly Pro 2023 | |
| Asus ExpertBook B7 Flip B7402FEA | |
| LG Gram 14T90P | |
| CrossMark / Responsiveness | |
| Asus ExpertBook B7 Flip B7402FEA | |
| Dell Latitude 9440 2-in-1 | |
| Dell Latitude 9430 2-in-1 | |
| Durchschnittliche Intel Core i7-1365U, Intel Iris Xe Graphics G7 96EUs (1373 - 1427, n=4) | |
| Lenovo ThinkPad X1 Yoga G8 i7-1355U | |
| LG Gram 14T90P | |
| HP Dragonfly Pro 2023 | |
| PCMark 10 Score | 5896 Punkte | |
Hilfe | ||
| AIDA64 / Memory Copy | |
| Dell Latitude 9430 2-in-1 | |
| Lenovo ThinkPad X1 Yoga G8 i7-1355U | |
| Dell Latitude 9440 2-in-1 | |
| Durchschnittliche Intel Core i7-1365U (57654 - 69736, n=4) | |
| LG Gram 14T90P | |
| Asus ExpertBook B7 Flip B7402FEA | |
| AIDA64 / Memory Read | |
| LG Gram 14T90P | |
| Dell Latitude 9430 2-in-1 | |
| Lenovo ThinkPad X1 Yoga G8 i7-1355U | |
| Dell Latitude 9440 2-in-1 | |
| Durchschnittliche Intel Core i7-1365U (49203 - 54068, n=4) | |
| Asus ExpertBook B7 Flip B7402FEA | |
| AIDA64 / Memory Write | |
| Lenovo ThinkPad X1 Yoga G8 i7-1355U | |
| Dell Latitude 9440 2-in-1 | |
| Durchschnittliche Intel Core i7-1365U (70434 - 85570, n=4) | |
| LG Gram 14T90P | |
| Dell Latitude 9430 2-in-1 | |
| Asus ExpertBook B7 Flip B7402FEA | |
| AIDA64 / Memory Latency | |
| Dell Latitude 9430 2-in-1 | |
| Lenovo ThinkPad X1 Yoga G8 i7-1355U | |
| Durchschnittliche Intel Core i7-1365U (90.2 - 102.2, n=4) | |
| Dell Latitude 9440 2-in-1 | |
| Asus ExpertBook B7 Flip B7402FEA | |
| LG Gram 14T90P | |
* ... kleinere Werte sind besser
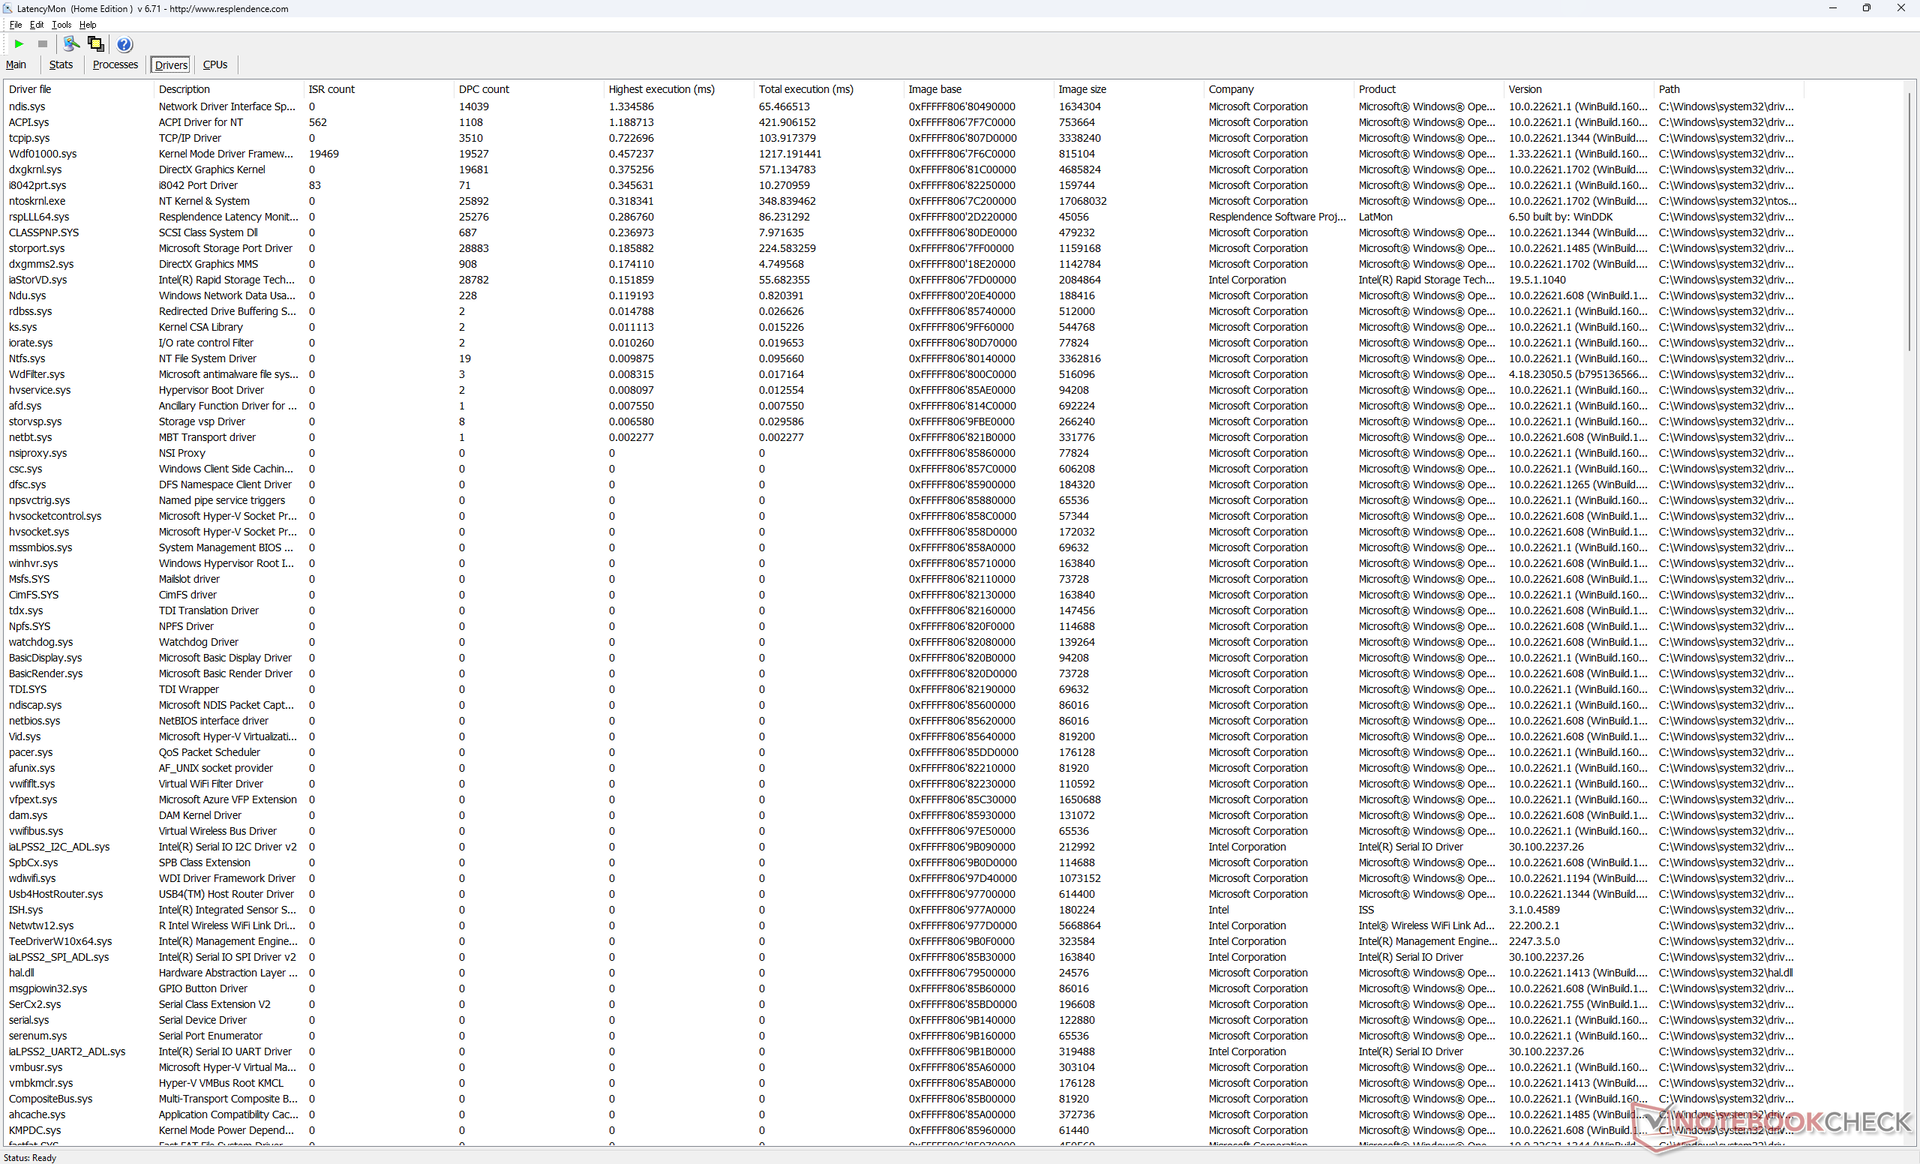
DPC Latenzen
LatencyMon erkennt DPC-Probleme beim Öffnen mehrerer Browser-Fenster unserer Webseite. 4K-Videos mit 60 Bildern pro Sekunde werden aber perfekt und ohne übersprungene Frames wiedergegeben.
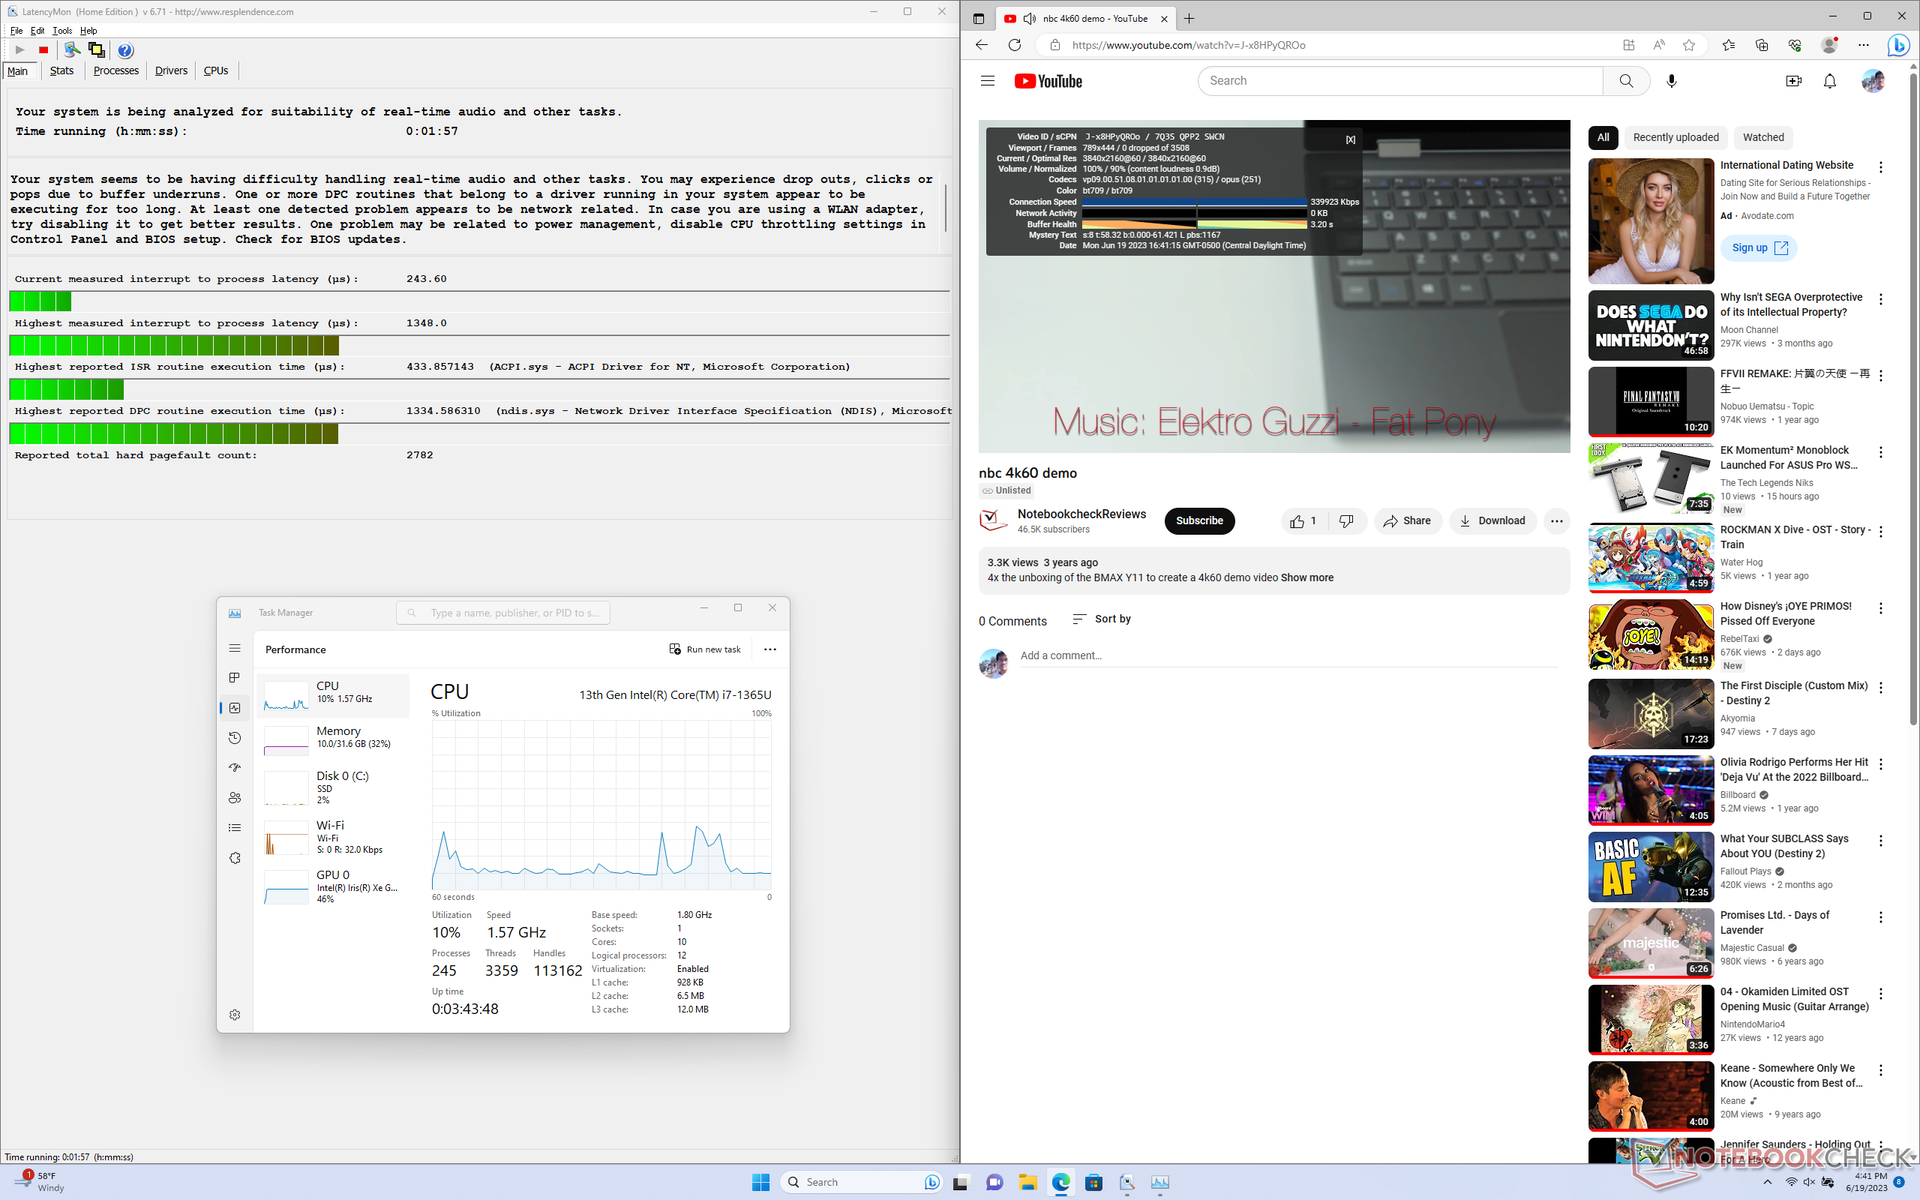
| DPC Latencies / LatencyMon - interrupt to process latency (max), Web, Youtube, Prime95 | |
| Dell Latitude 9440 2-in-1 | |
| LG Gram 14T90P | |
| Asus ExpertBook B7 Flip B7402FEA | |
| Lenovo ThinkPad X1 Yoga G8 i7-1355U | |
| Dell Latitude 9430 2-in-1 | |
| HP Dragonfly Pro 2023 | |
* ... kleinere Werte sind besser
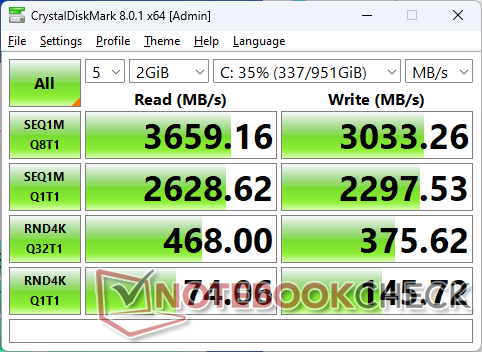
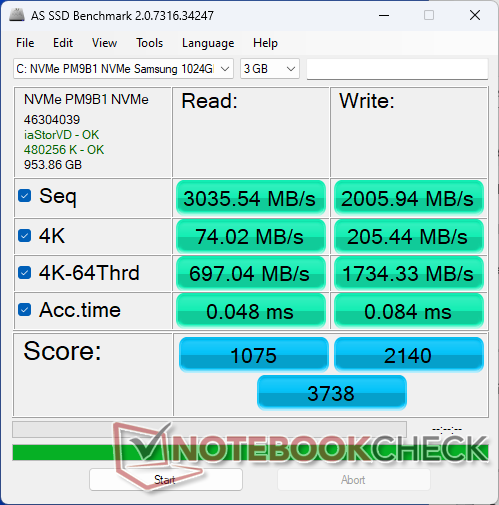
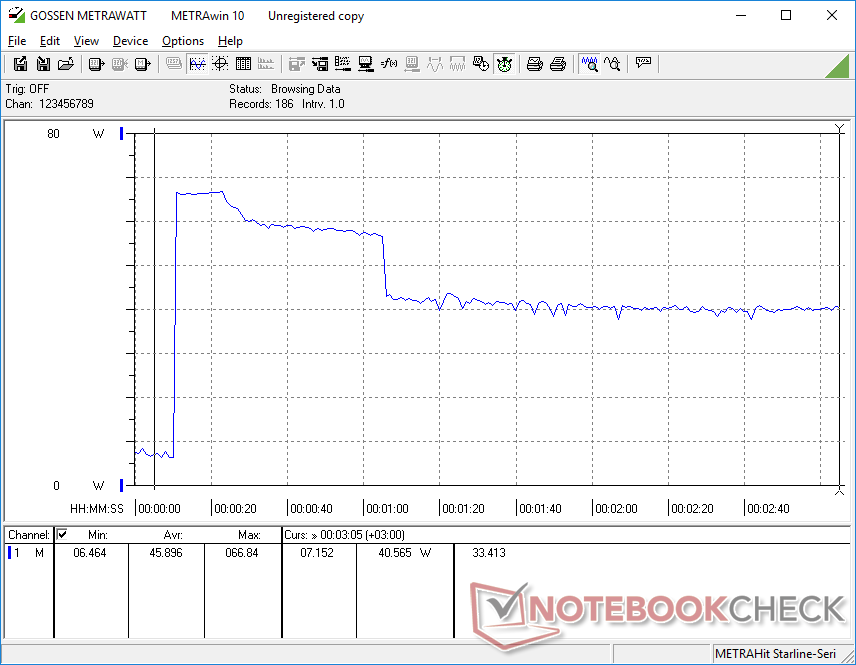
Massenspeicher
Unser Testgerät ist mit der 1TB fassenden Samsung PM9B1 PCIe 4.0 x 4 NVMe SSD bestückt, die Lese- und Schreibgeschwindigkeiten von 3700 respektive 3000 MB/s erreicht. Nach nur einer Minute unter hoher Last verringern sich diese Geschwindigkeiten allerdings. Wie die Grafik unten zeigt, fallen die Übertragungsraten in unserem achtminütigen Test mit DiskSpd von 3700 MB/s sukzessive auf bis zu 2600 MB/s. Diese Leistung reicht für einen Laptop mit Core-U-CPU aber trotzdem aus.
Es sollte außerdem beachtet werden, dass das Notebook auf das kürzere M.2 2242 und nicht das übliche 2280-Format setzt, vermutlich um Gewicht einzusparen.

| Drive Performance Rating - Percent | |
| Asus ExpertBook B7 Flip B7402FEA | |
| Lenovo ThinkPad X1 Yoga G8 i7-1355U | |
| LG Gram 14T90P | |
| Dell Latitude 9440 2-in-1 | |
| HP Dragonfly Pro 2023 | |
| Dell Latitude 9430 2-in-1 | |
* ... kleinere Werte sind besser
Dauerleistung Lesen: DiskSpd Read Loop, Queue Depth 8
GPU Leistung — Die Iris Xe kommt ins Alter
In Sachen Grafikleistung hat sich seit zwei bis drei Jahren nichts geändert, weil Intel seiner integrierten Iris Xe noch kein Update spendiert hat. Wer von einer UHD-iGPU kommt, der wird sich über den ordentlichen Leistungszuwachs freuen, Nutzer mit größeren Hoffnungen werden aber enttäuscht. Konkurrenten wie das HP Dragonfly Pro und das Lenovo ThinkPad P14s sind unterdessen mit der leistungsfähigeren AMD Radeon 680M bestückt.
Wer ein Core-i5-Modell mit der schwächeren Iris Xe mit 80 EUs im Auge hat, der muss im Vergleich zu unserer Iris Xe mit 96 EUs mit 15 bis 30 Prozent weniger Leistung rechnen.
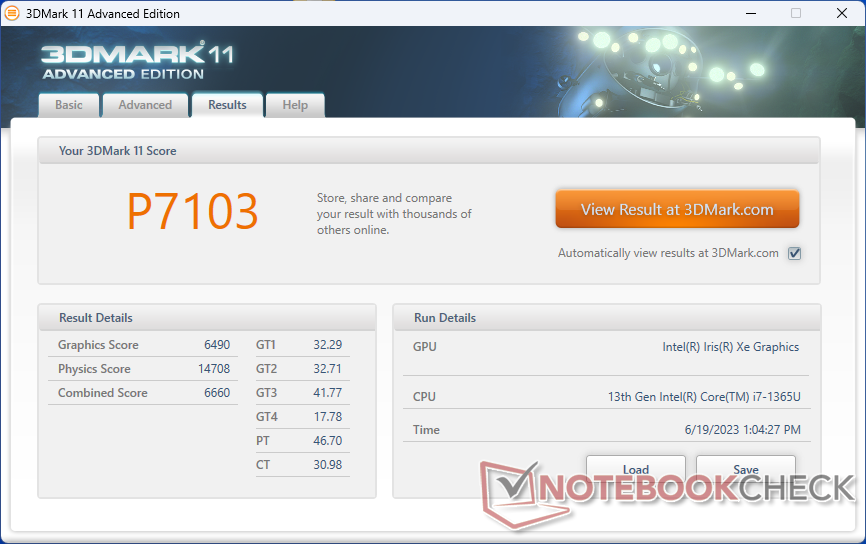
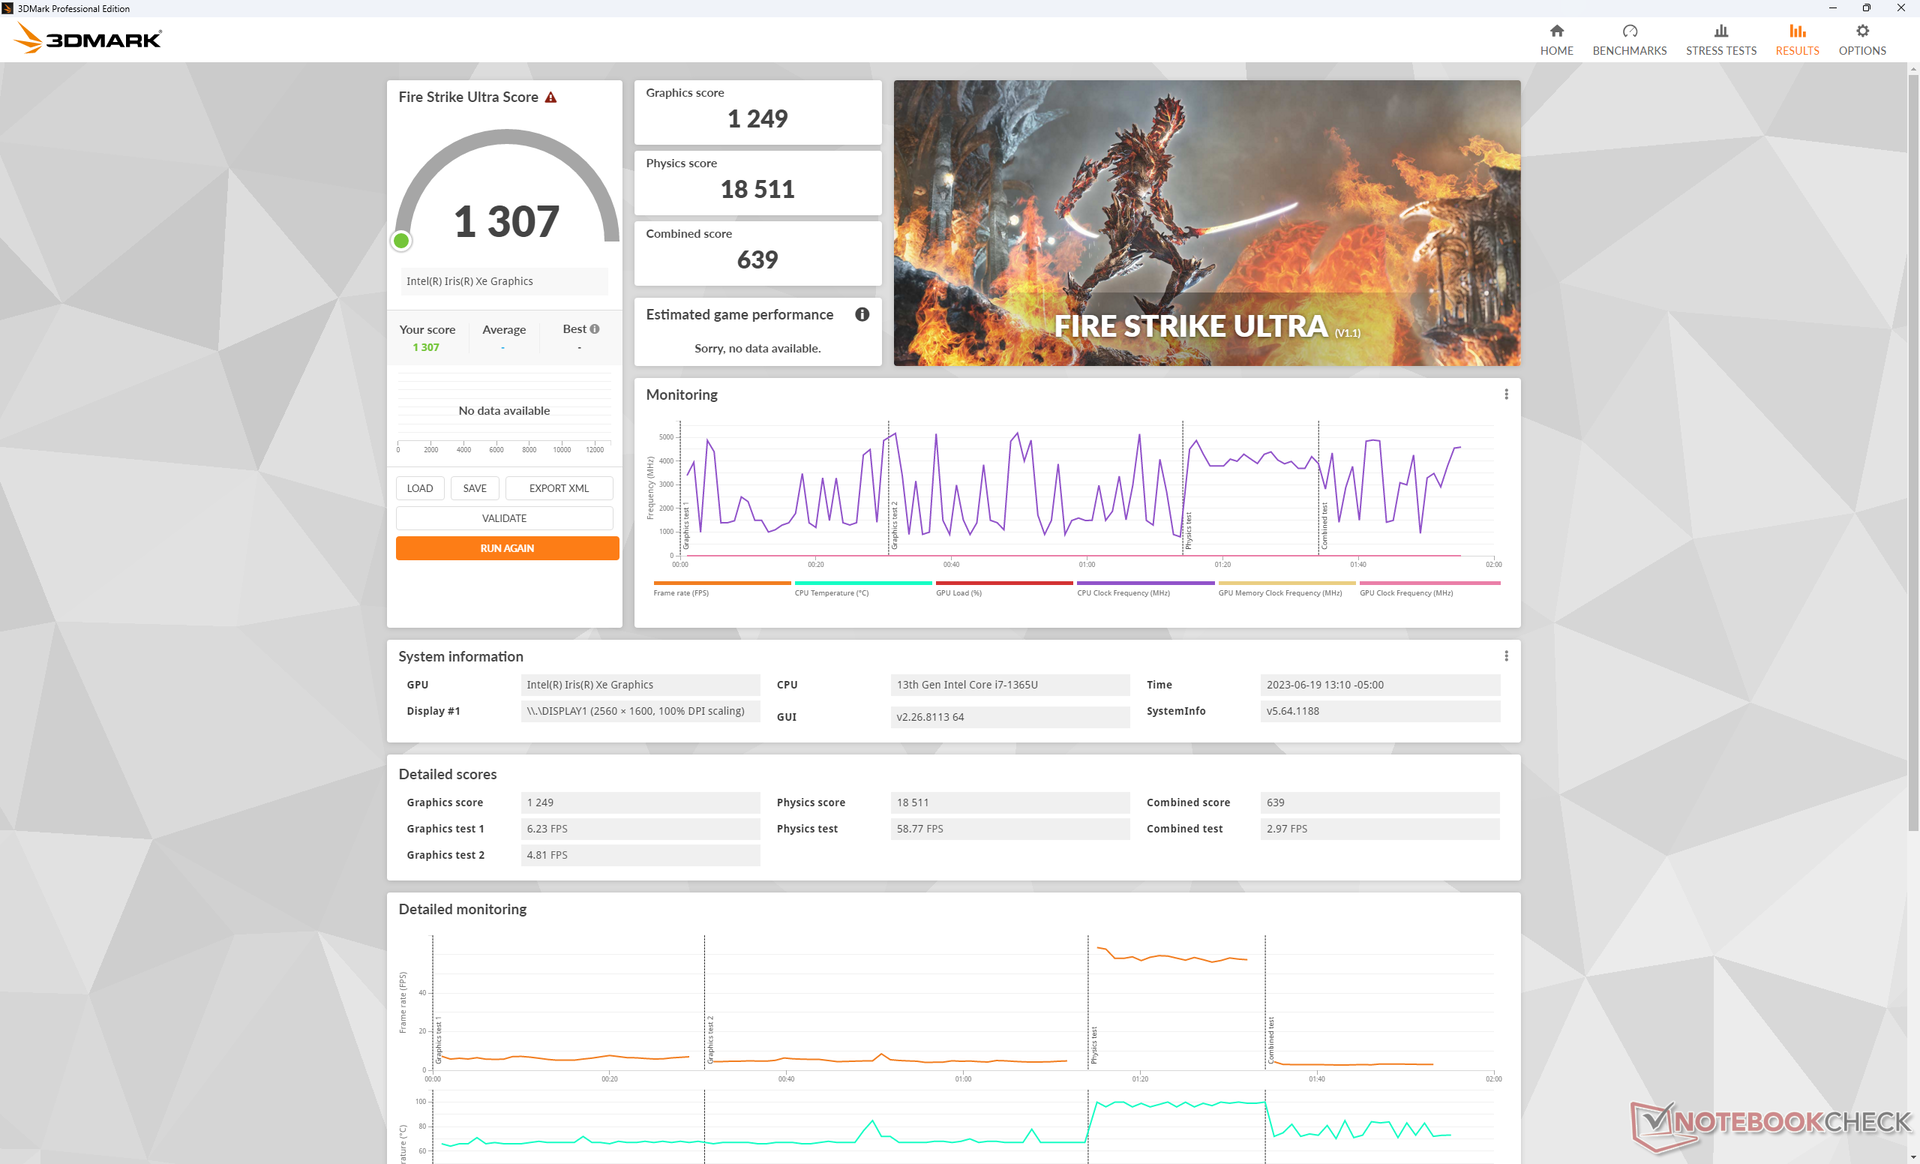
| 3DMark 11 Performance | 7103 Punkte | |
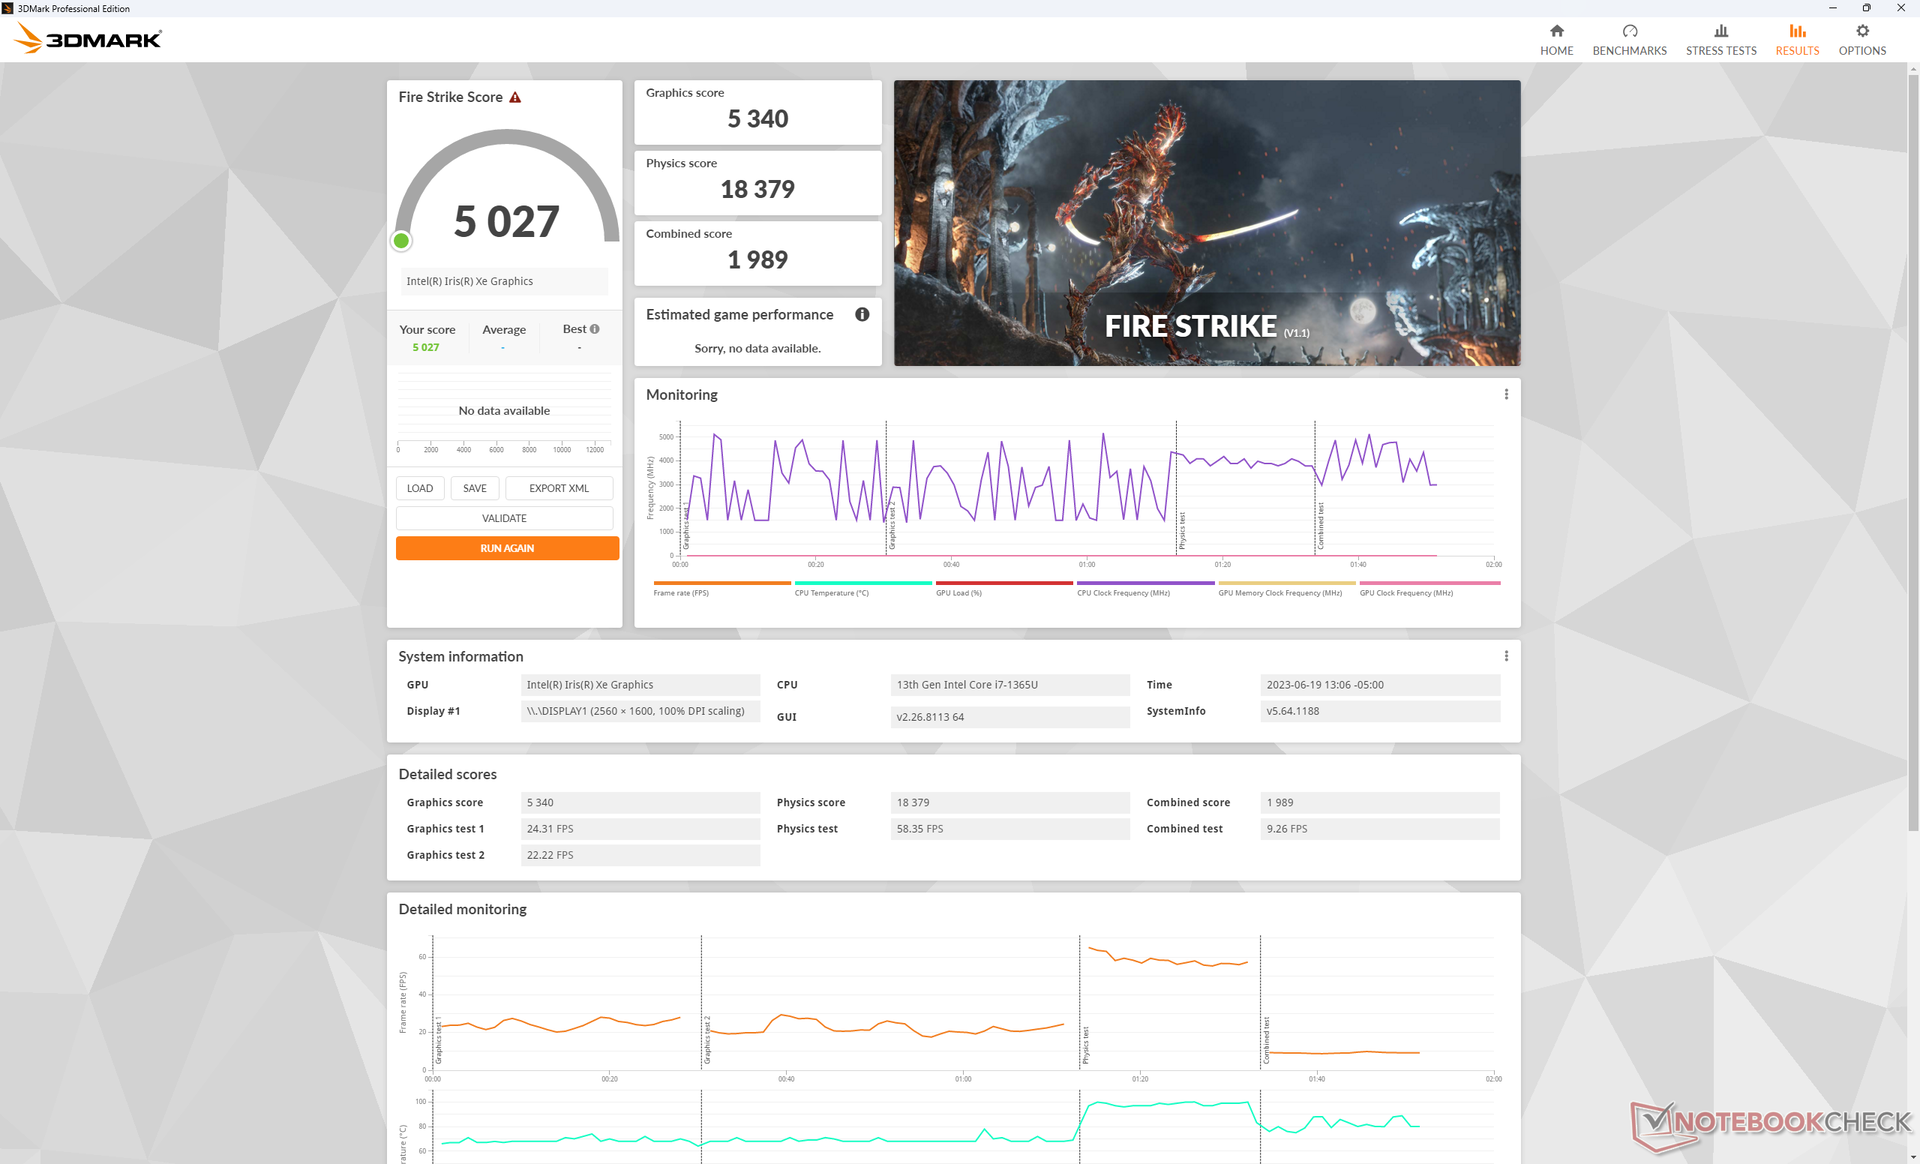
| 3DMark Fire Strike Score | 5027 Punkte | |
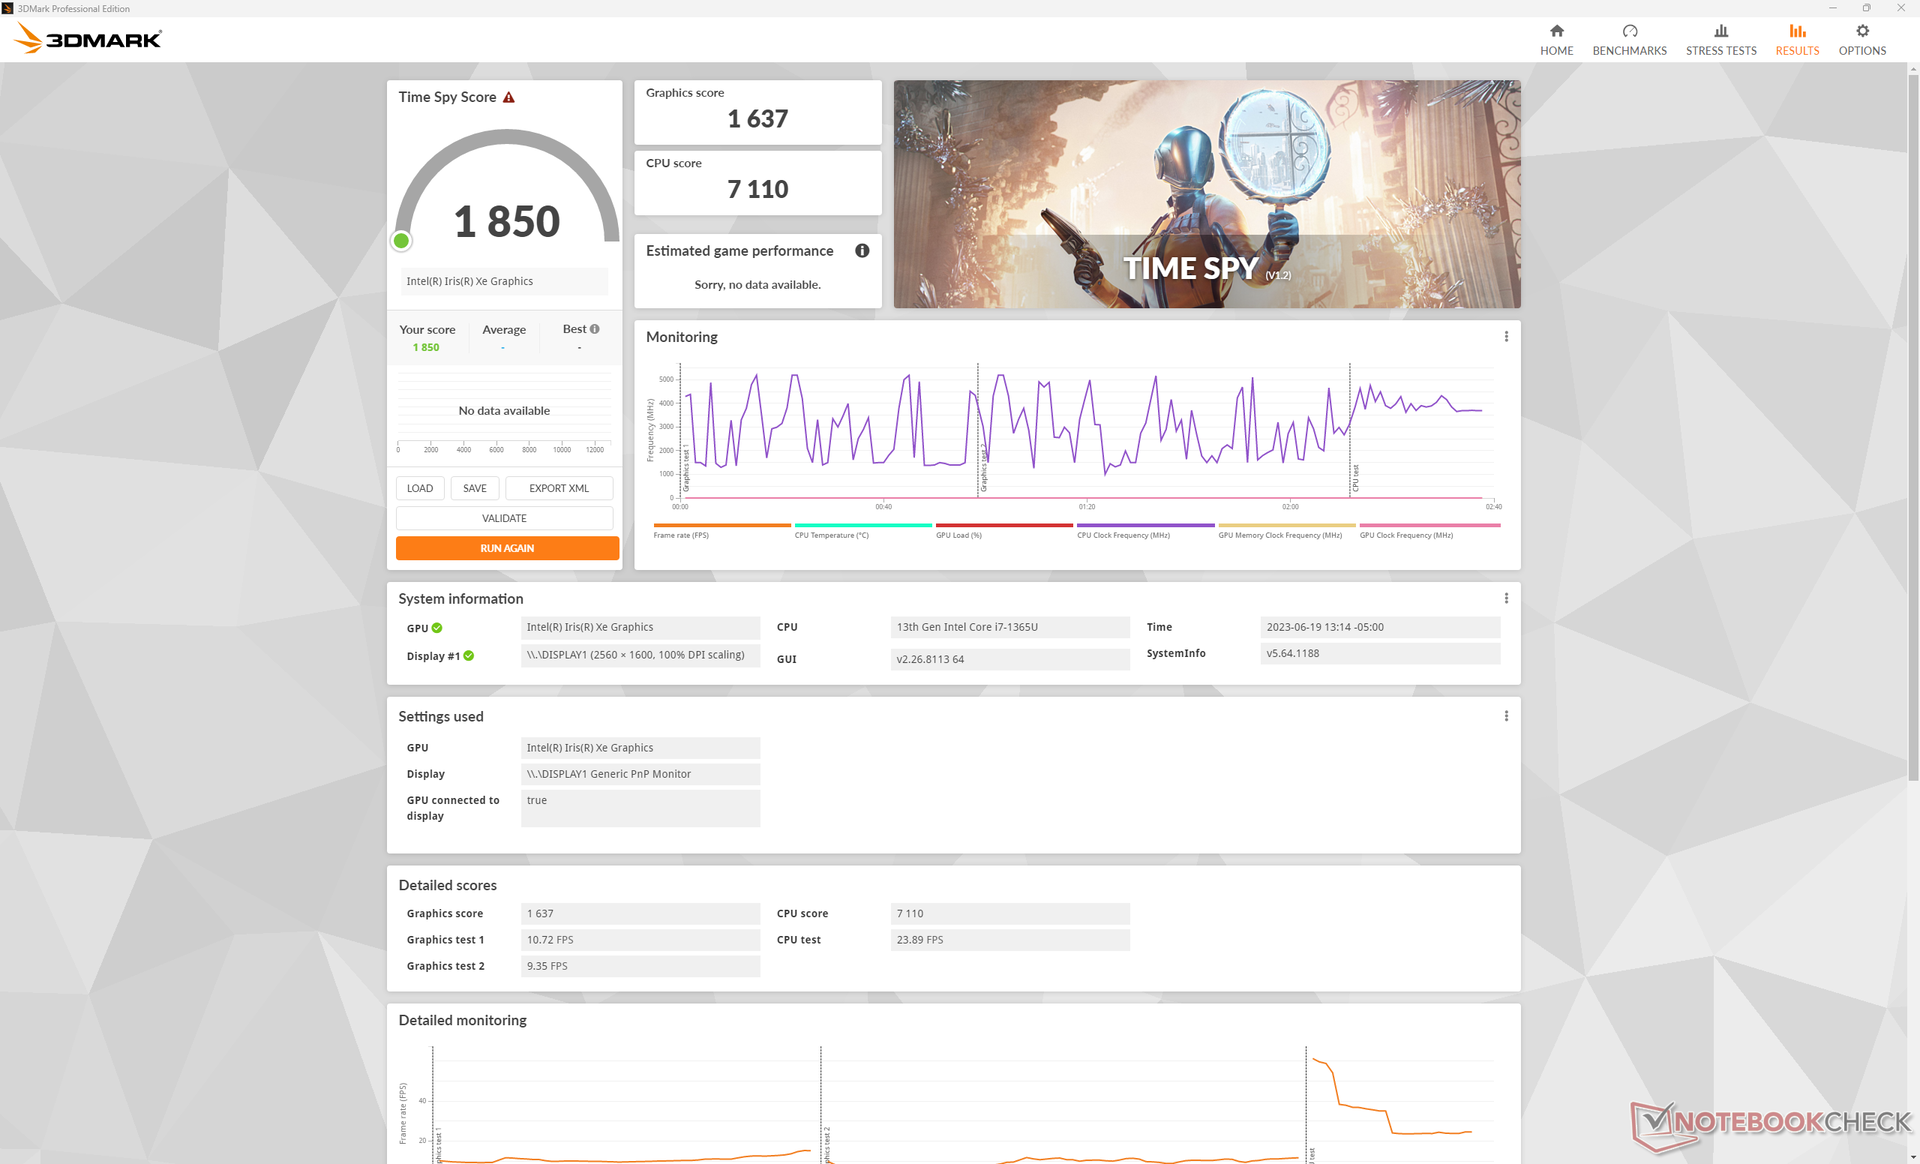
| 3DMark Time Spy Score | 1850 Punkte | |
Hilfe | ||
Witcher 3 FPS Diagramm
| min. | mittel | hoch | max. | |
|---|---|---|---|---|
| GTA V (2015) | 111.4 | 92.7 | 26 | 10.9 |
| The Witcher 3 (2015) | 97.7 | 62.5 | 34.2 | 15.2 |
| Dota 2 Reborn (2015) | 108.8 | 85.1 | 66.5 | 57.8 |
| Final Fantasy XV Benchmark (2018) | 46.7 | 24.5 | 17.1 | |
| X-Plane 11.11 (2018) | 58.4 | 43 | 37.4 | |
| Strange Brigade (2018) | 90.3 | 40.5 | 31.9 | 25.8 |
| Cyberpunk 2077 1.6 (2022) | 21.9 | 18.2 | 14.1 | 11.2 |
| Tiny Tina's Wonderlands (2022) | 29.9 | 23.8 | 15.2 | 12 |
| F1 22 (2022) | 46.8 | 41.2 | 30.6 | 23.1 |
Emissionen
System Lautstärke
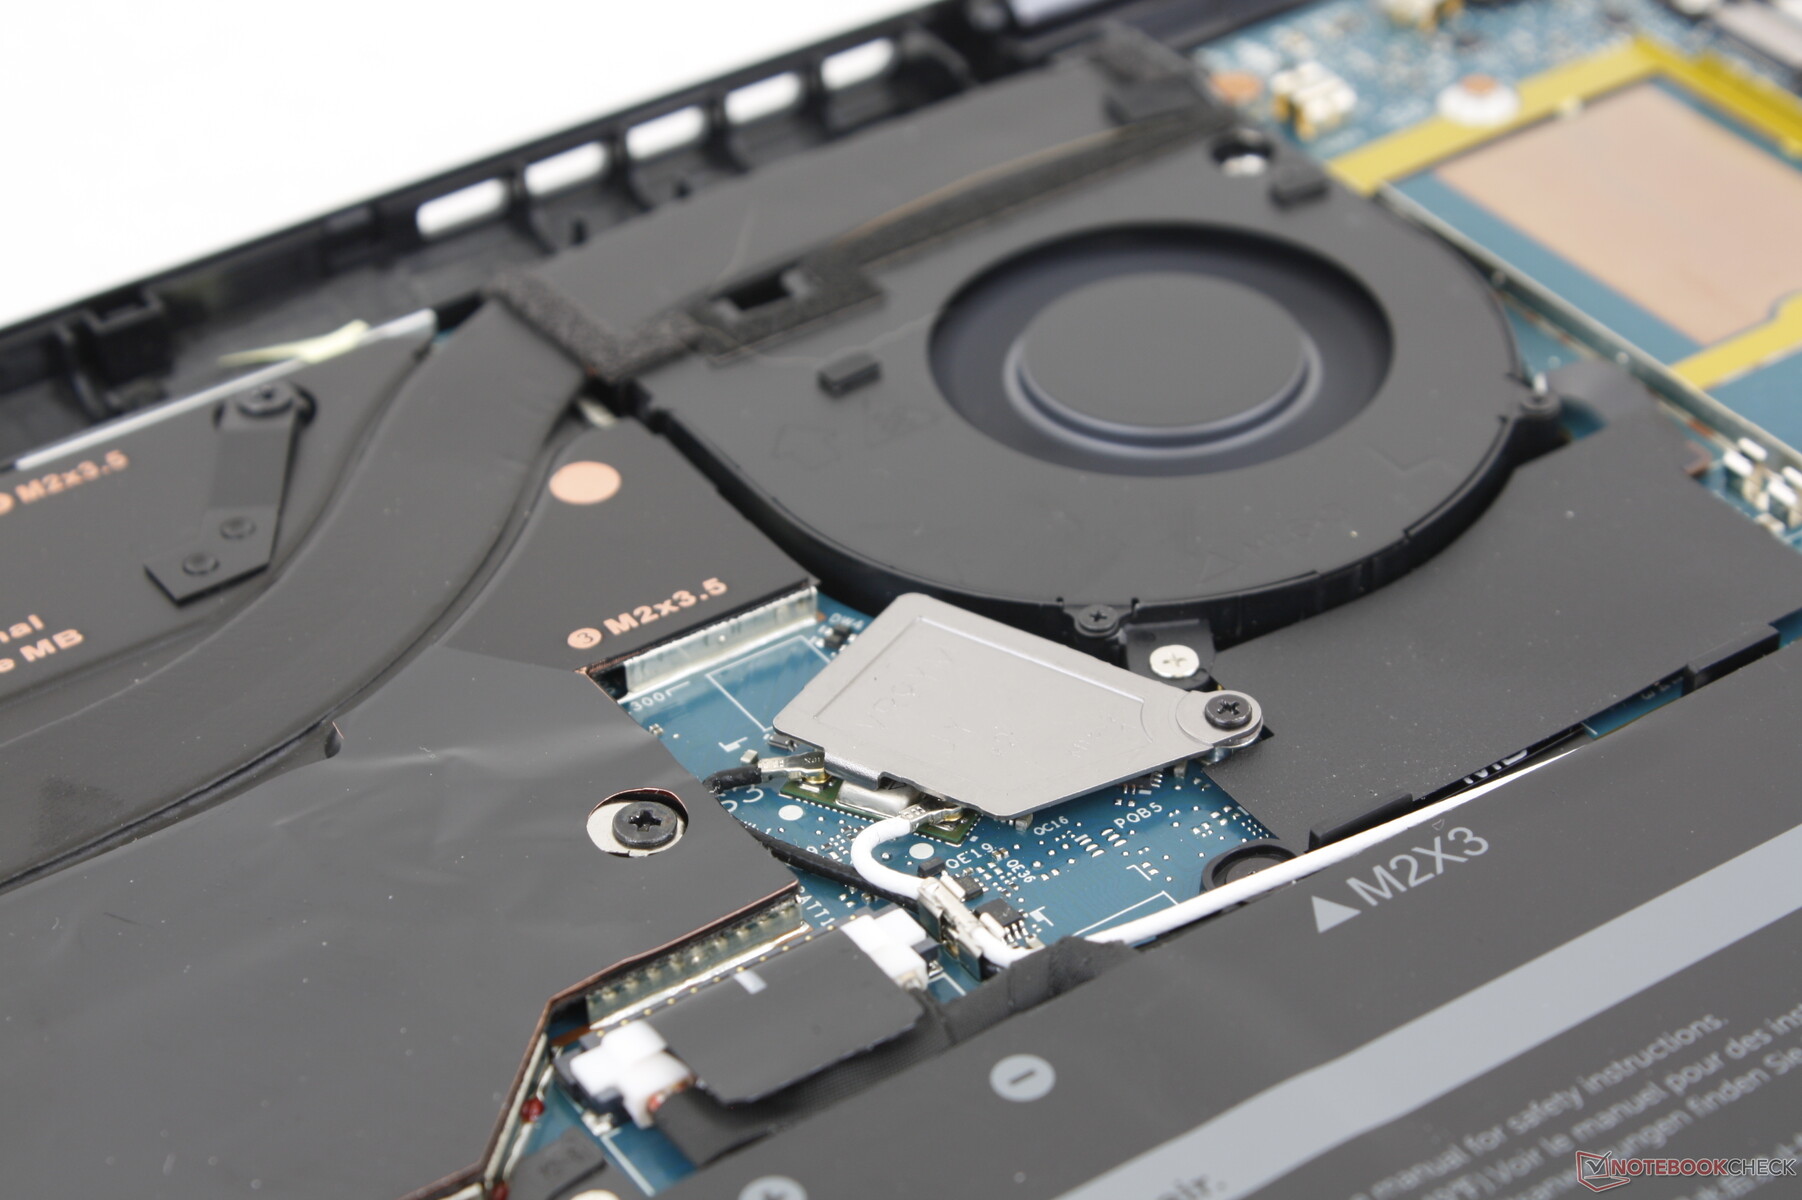
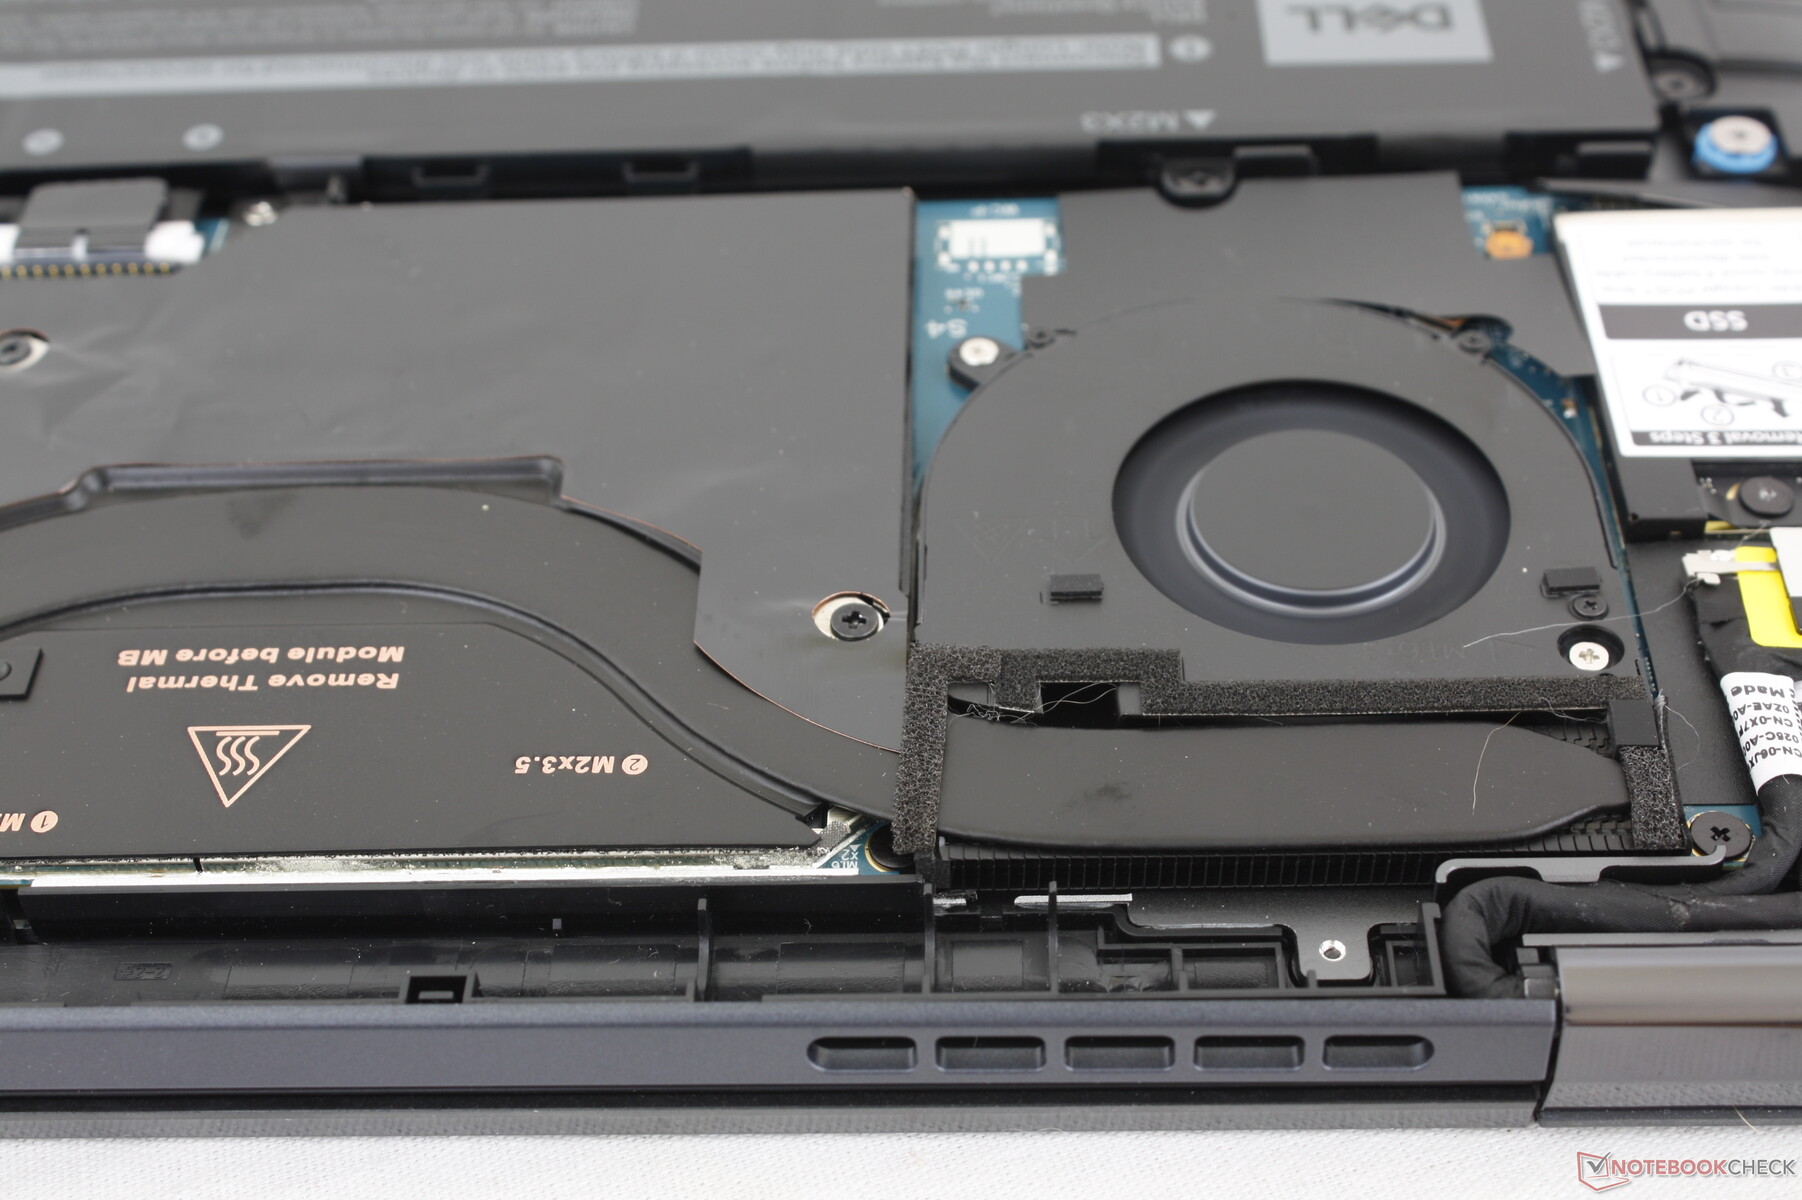
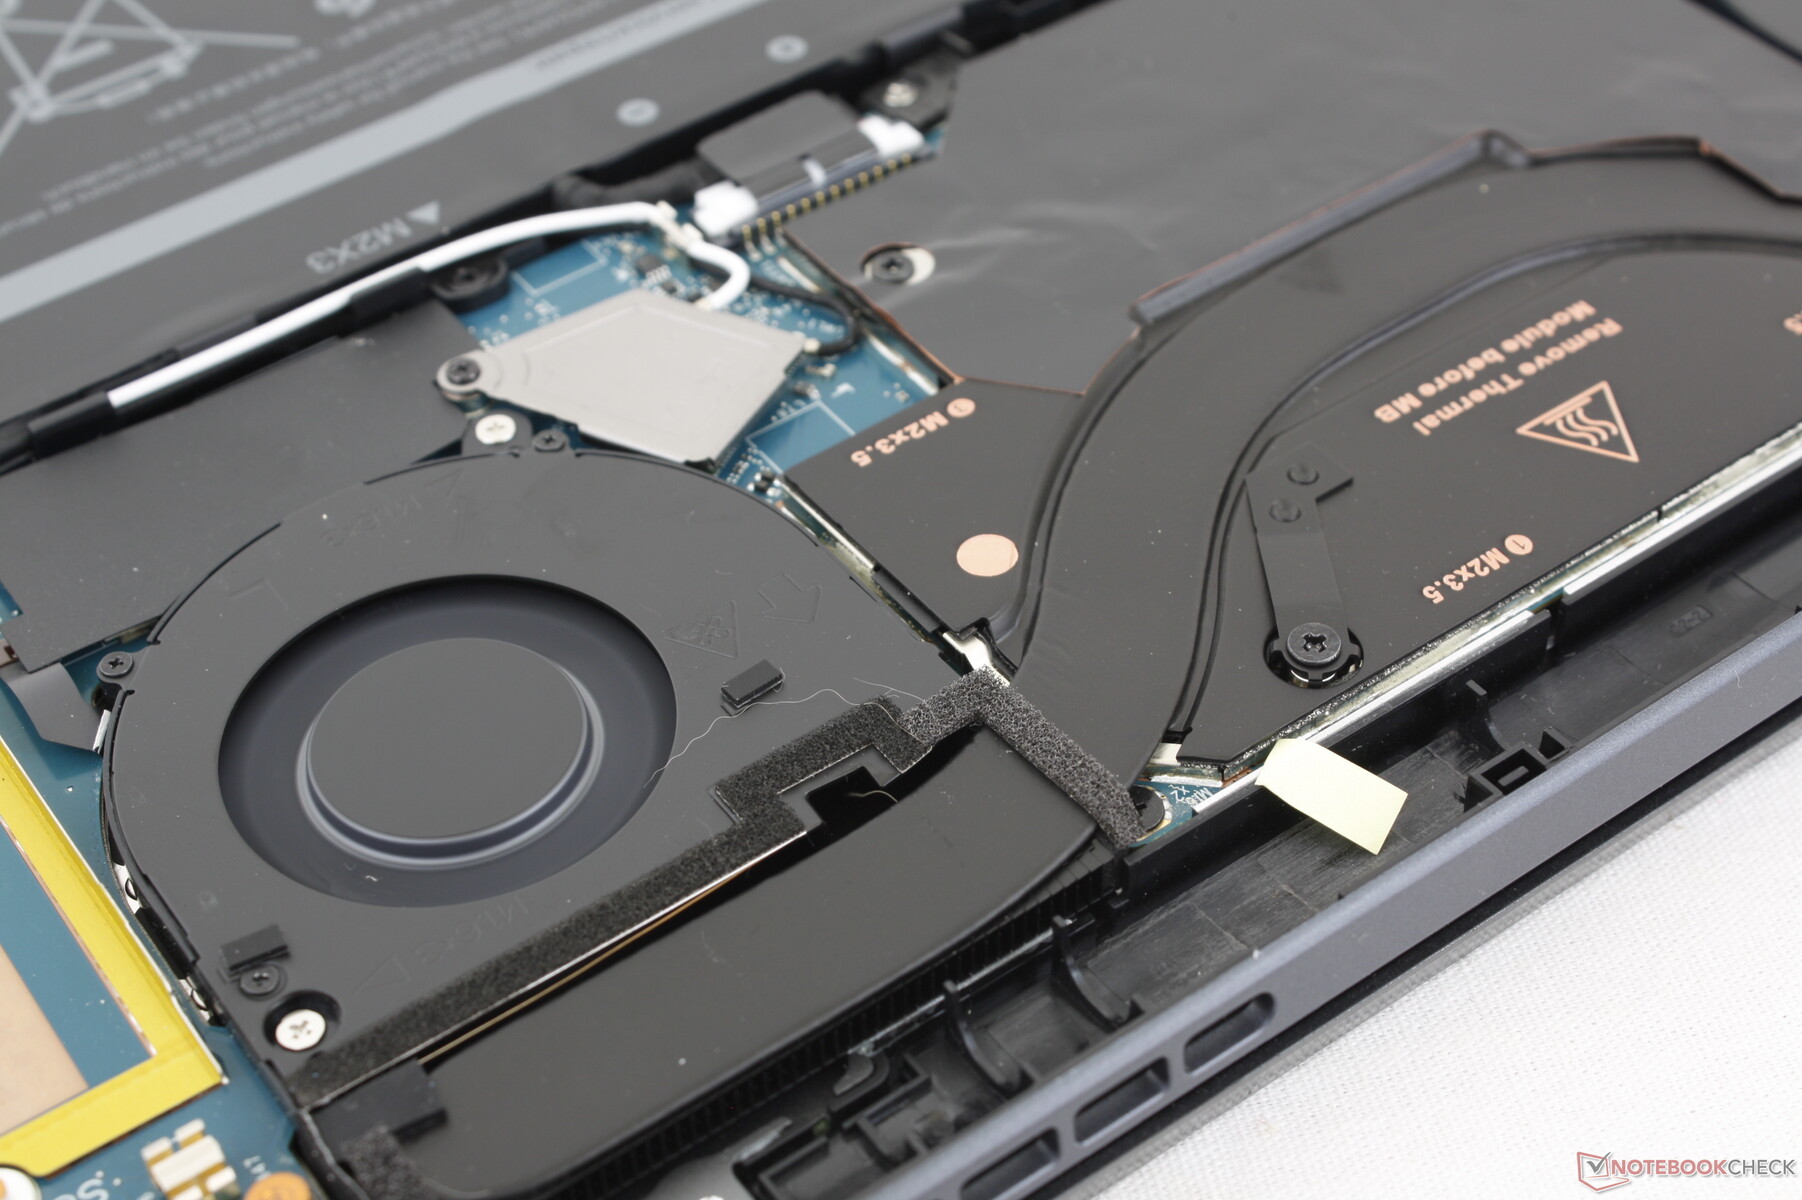
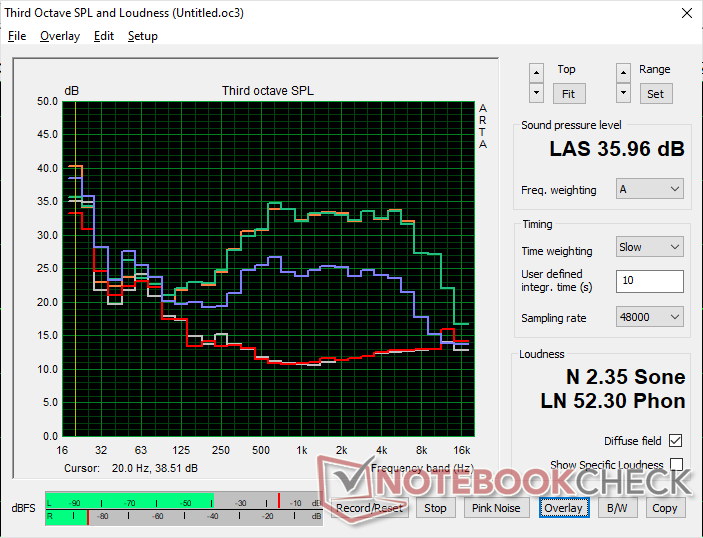
Dell hat das Kühlsystem aufgerüstet, anstelle eines circa 45mm großen Lüfters kommen im 2023er Modell zwei kleinere 30mm-Lüfter zum Einsatz. Interessanterweise hat sich die Lautstärke kaum verändert, im 3DMark 06 messen wir 36 dB(A), bei 100% CPU-Auslastung sind es 44 dB(A). Was sich allerdings geändert hat ist die Geräuschfrequenz der Lüfter, diese liegt nun nämlich etwas tiefer und ist somit weniger störend. Diese Beobachtung wird auch von den unten eingebundenen Grafiken illustriert, das 9430 2-in-1 zeigt dort eine spitzere Frequenzkurve.
Lautstärkediagramm
| Idle |
| 24.3 / 24.3 / 24.3 dB(A) |
| Last |
| 36.3 / 44.5 dB(A) |
 | ||
30 dB leise 40 dB(A) deutlich hörbar 50 dB(A) störend |
||
min: | ||
| Dell Latitude 9440 2-in-1 Iris Xe G7 96EUs, i7-1365U, Samsung PM9B1 1024GB MZAL41T0HBLB | Dell Latitude 9430 2-in-1 Iris Xe G7 96EUs, i7-1265U | Lenovo ThinkPad X1 Yoga G8 i7-1355U Iris Xe G7 96EUs, i7-1355U, WDC PC SN810 512GB | LG Gram 14T90P Iris Xe G7 80EUs, i5-1135G7, Samsung SSD PM981a MZVLB512HBJQ | Asus ExpertBook B7 Flip B7402FEA Iris Xe G7 96EUs, i7-1195G7, Samsung PM9A1 MZVL21T0HCLR | HP Dragonfly Pro 2023 Radeon 680M, R7 7736U, PSEIB512GABBMC0 | |
|---|---|---|---|---|---|---|
| Geräuschentwicklung | 2% | 10% | 6% | -7% | 9% | |
| aus / Umgebung * (dB) | 24.1 | 23.7 2% | 22.7 6% | 25.4 -5% | 25 -4% | 23 5% |
| Idle min * (dB) | 24.3 | 23.7 2% | 22.8 6% | 25.5 -5% | 25 -3% | 23 5% |
| Idle avg * (dB) | 24.3 | 23.7 2% | 22.8 6% | 25.5 -5% | 25 -3% | 23 5% |
| Idle max * (dB) | 24.3 | 23.7 2% | 22.8 6% | 25.5 -5% | 29 -19% | 23 5% |
| Last avg * (dB) | 36.3 | 35.1 3% | 29.4 19% | 28.3 22% | 39.6 -9% | 27.8 23% |
| Witcher 3 ultra * (dB) | 44.5 | 43.3 3% | 35.5 20% | 35 21% | 40.6 9% | |
| Last max * (dB) | 44.5 | 43 3% | 42 6% | 35 21% | 46.9 -5% | 40.3 9% |
* ... kleinere Werte sind besser
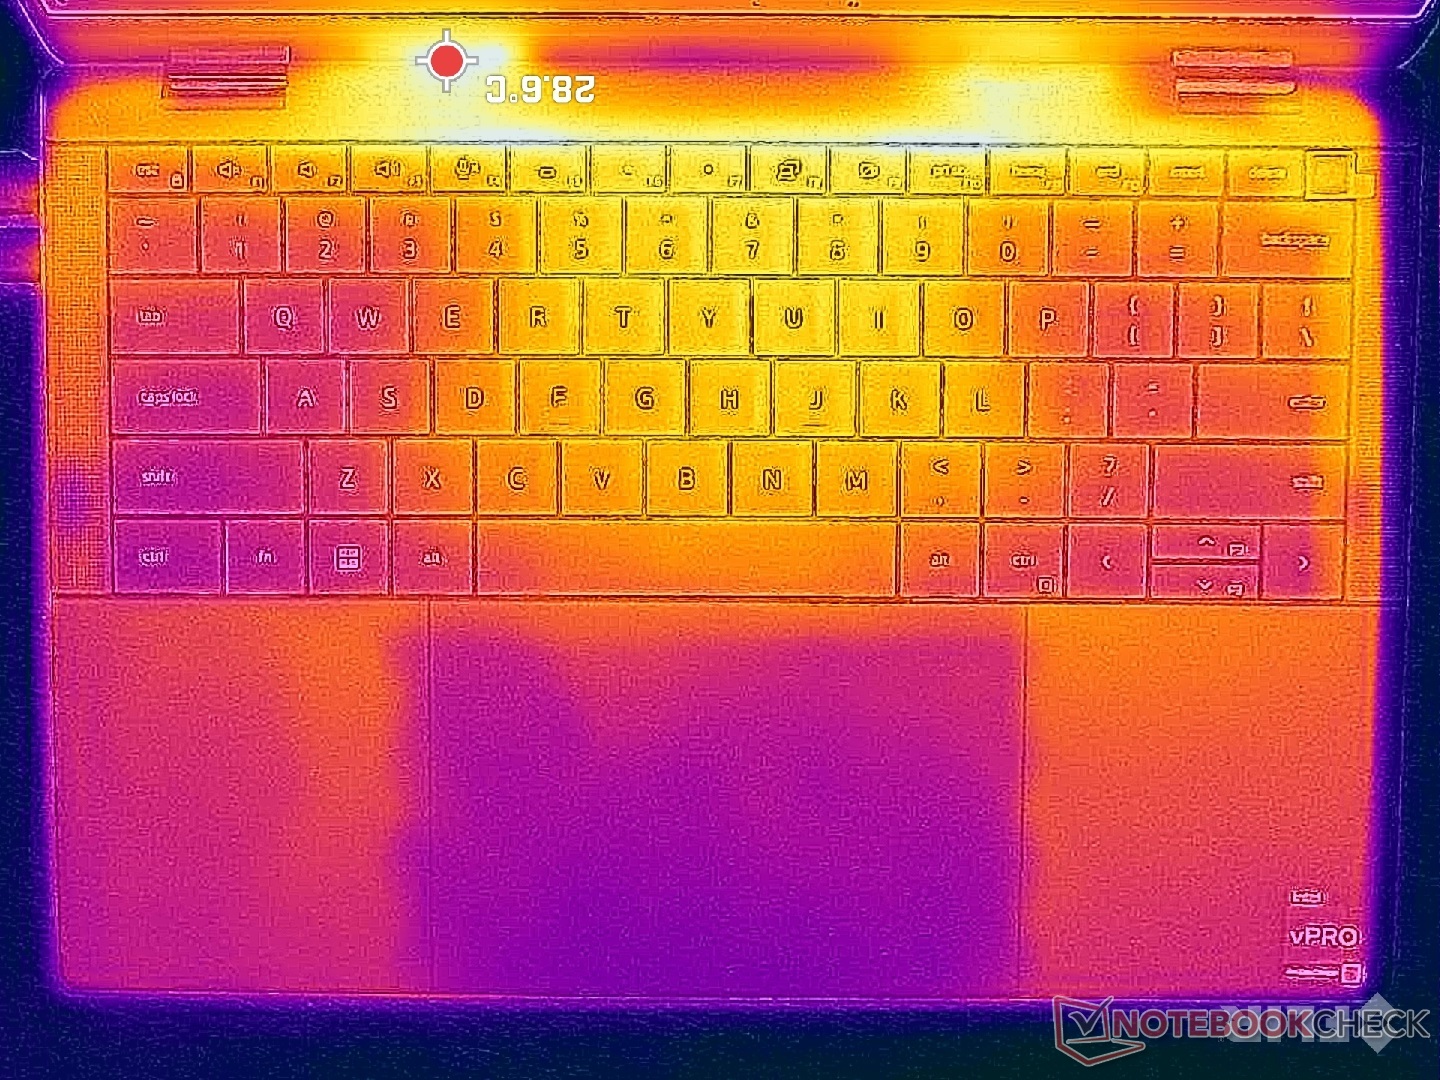
Temperatur
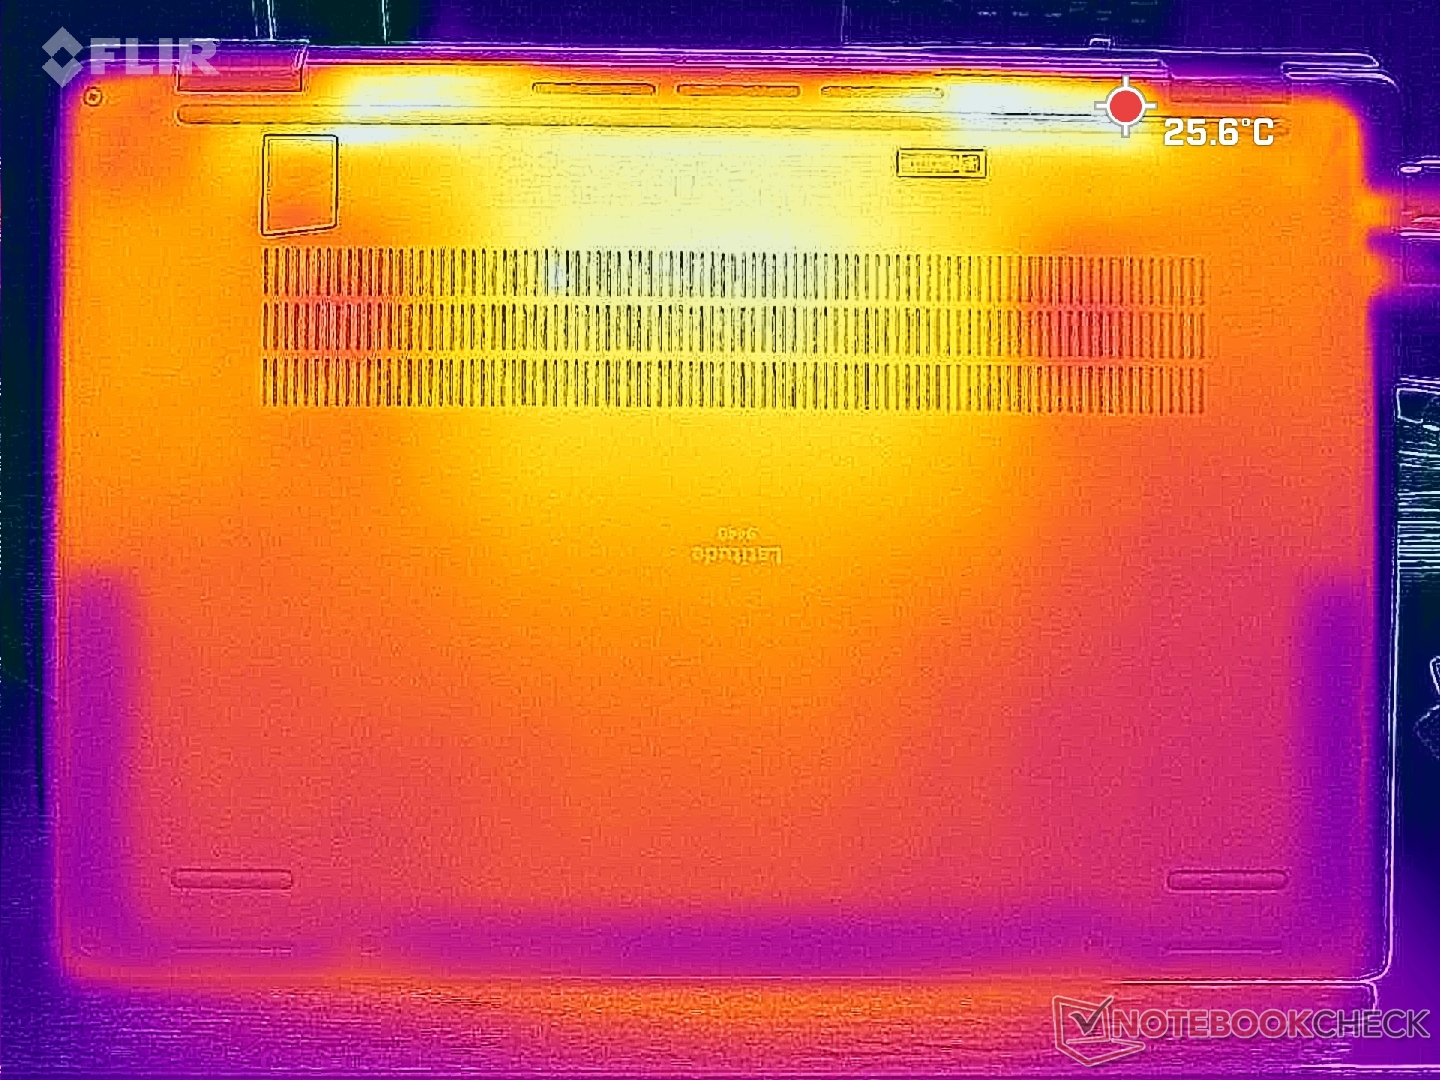
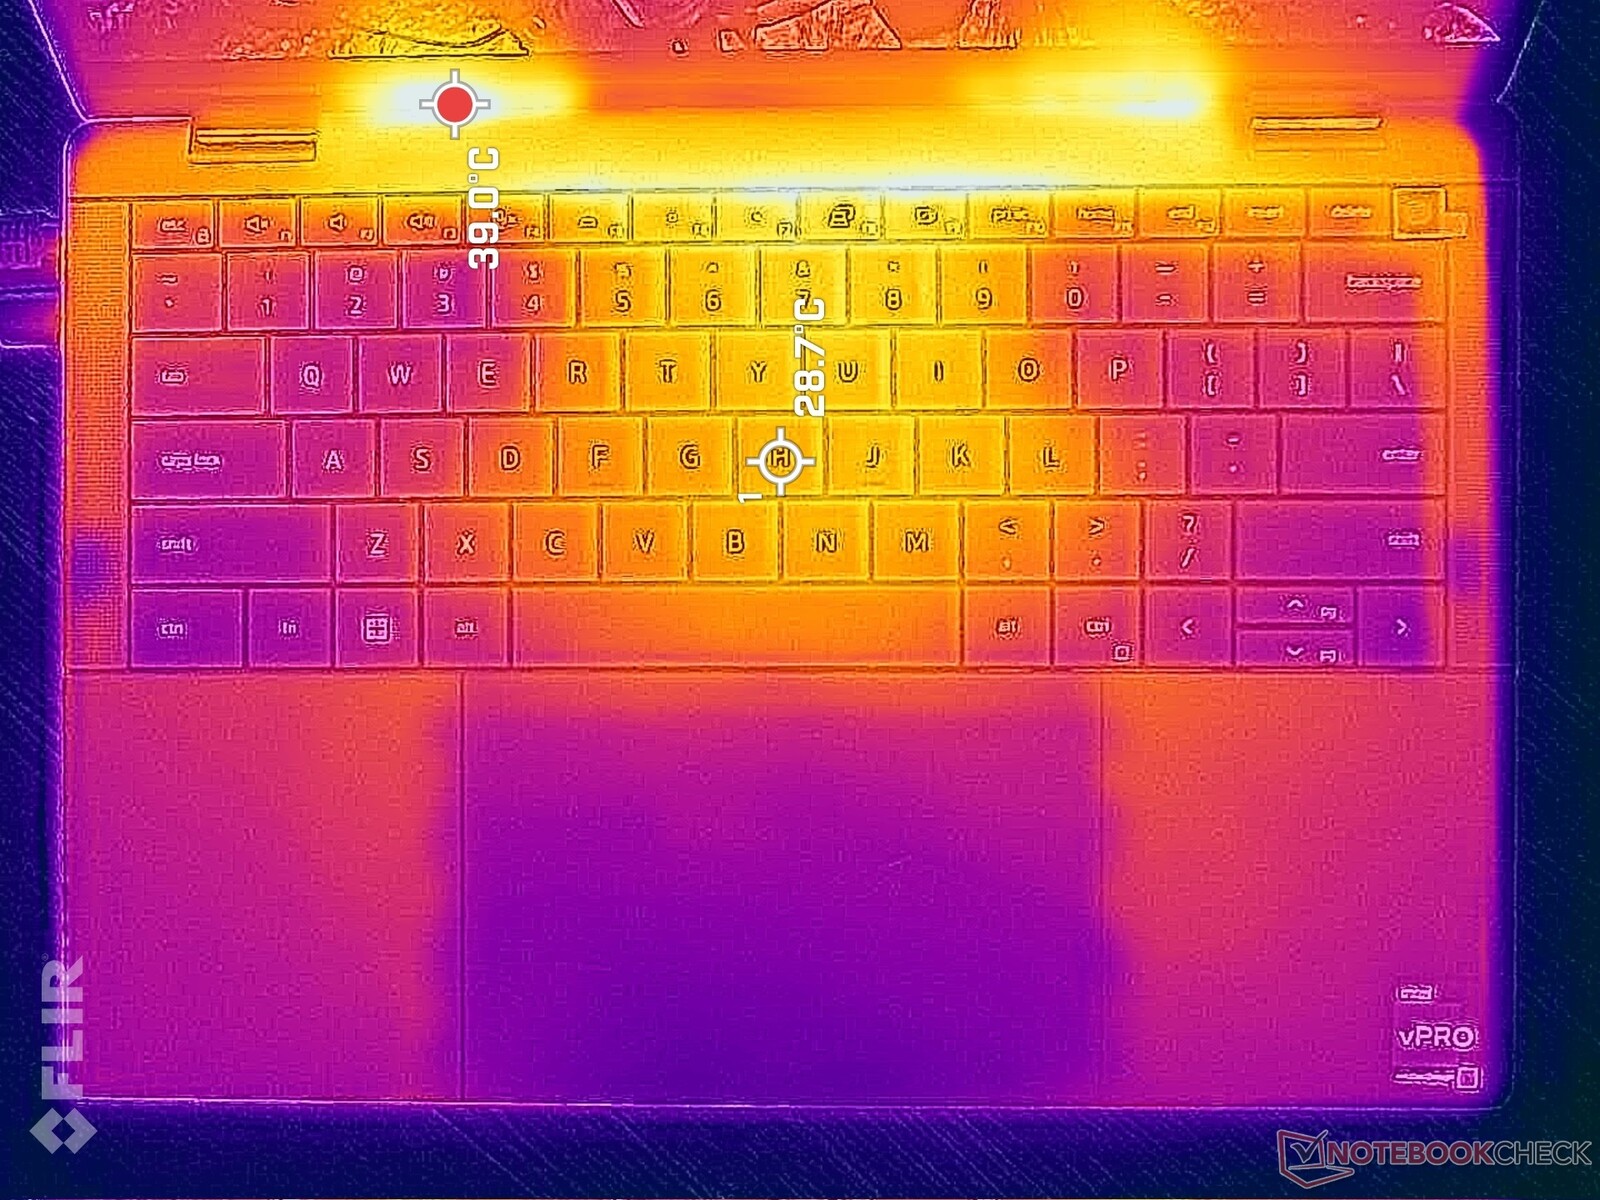
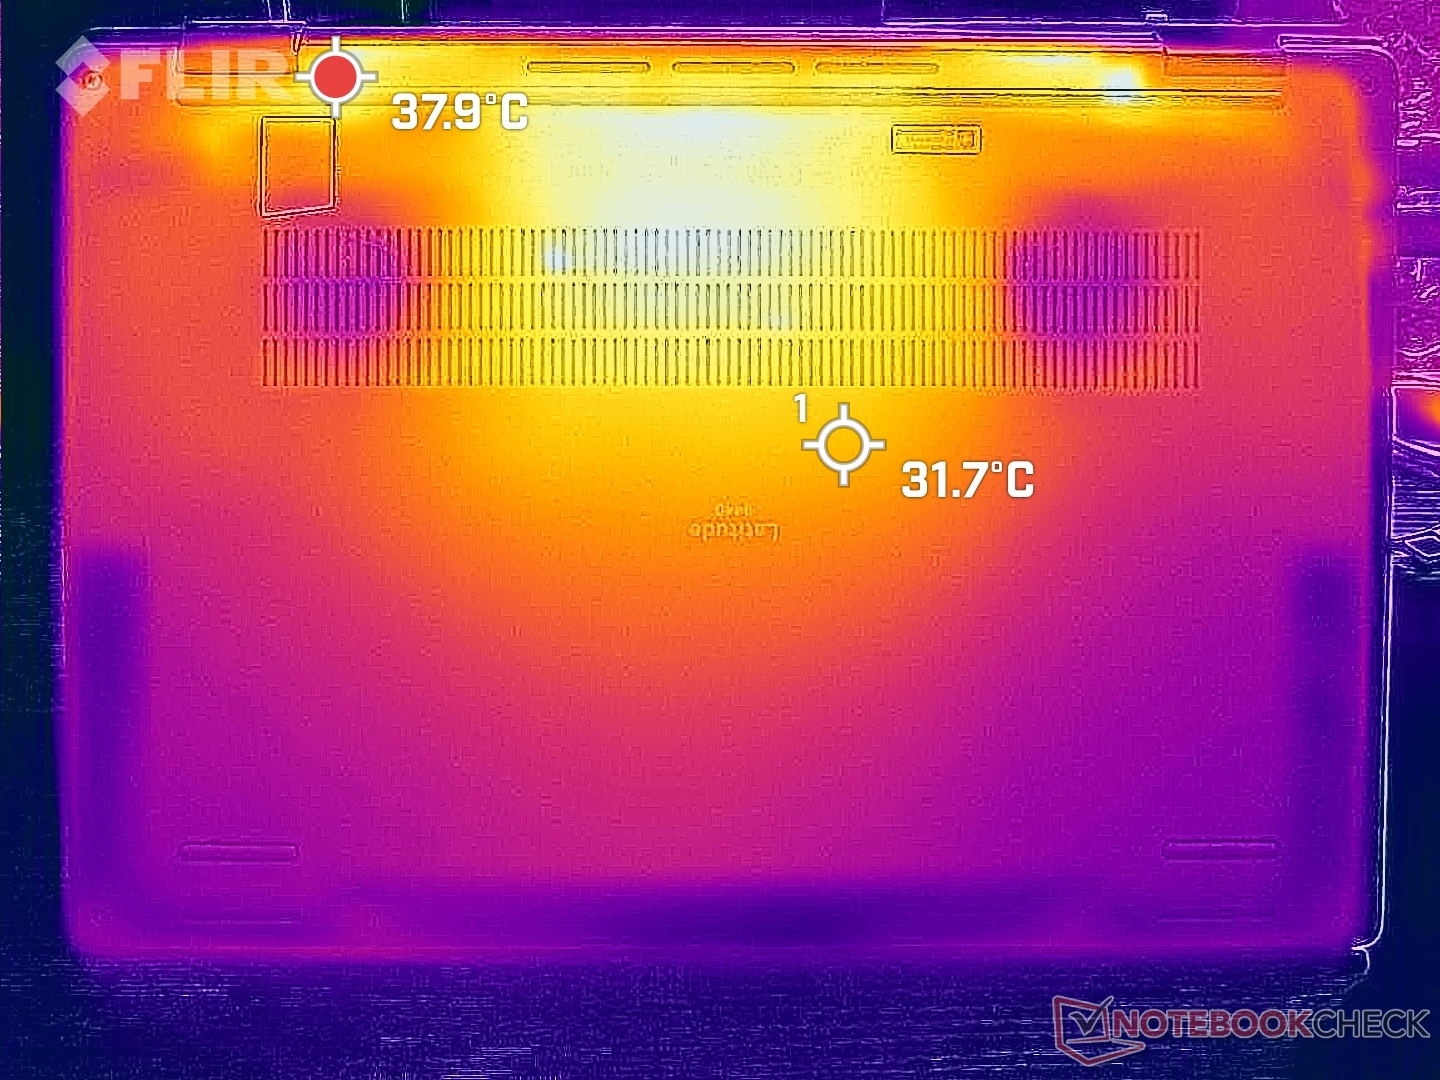
Durch die symmetrische Kühllösung sind auch die Oberflächentemperaturen gleichmäßig. Der Hot-Spot in der Mitte der Tastatur erwärmt sich bei fordernden Anwendungen auf 36 bis 38 Grad Celsius, damit wird das Gerät nicht wärmer als das Latitude 9430 2-in-1 und ist auch etwas kühler als das konkurrierende ThinkPad X1 Yoga G8. Beim Browsen und Video-Streaming wird das Notebook aber merklich wärmer als der Vorgänger, unangenehm heiß wird es dabei jedoch nicht.
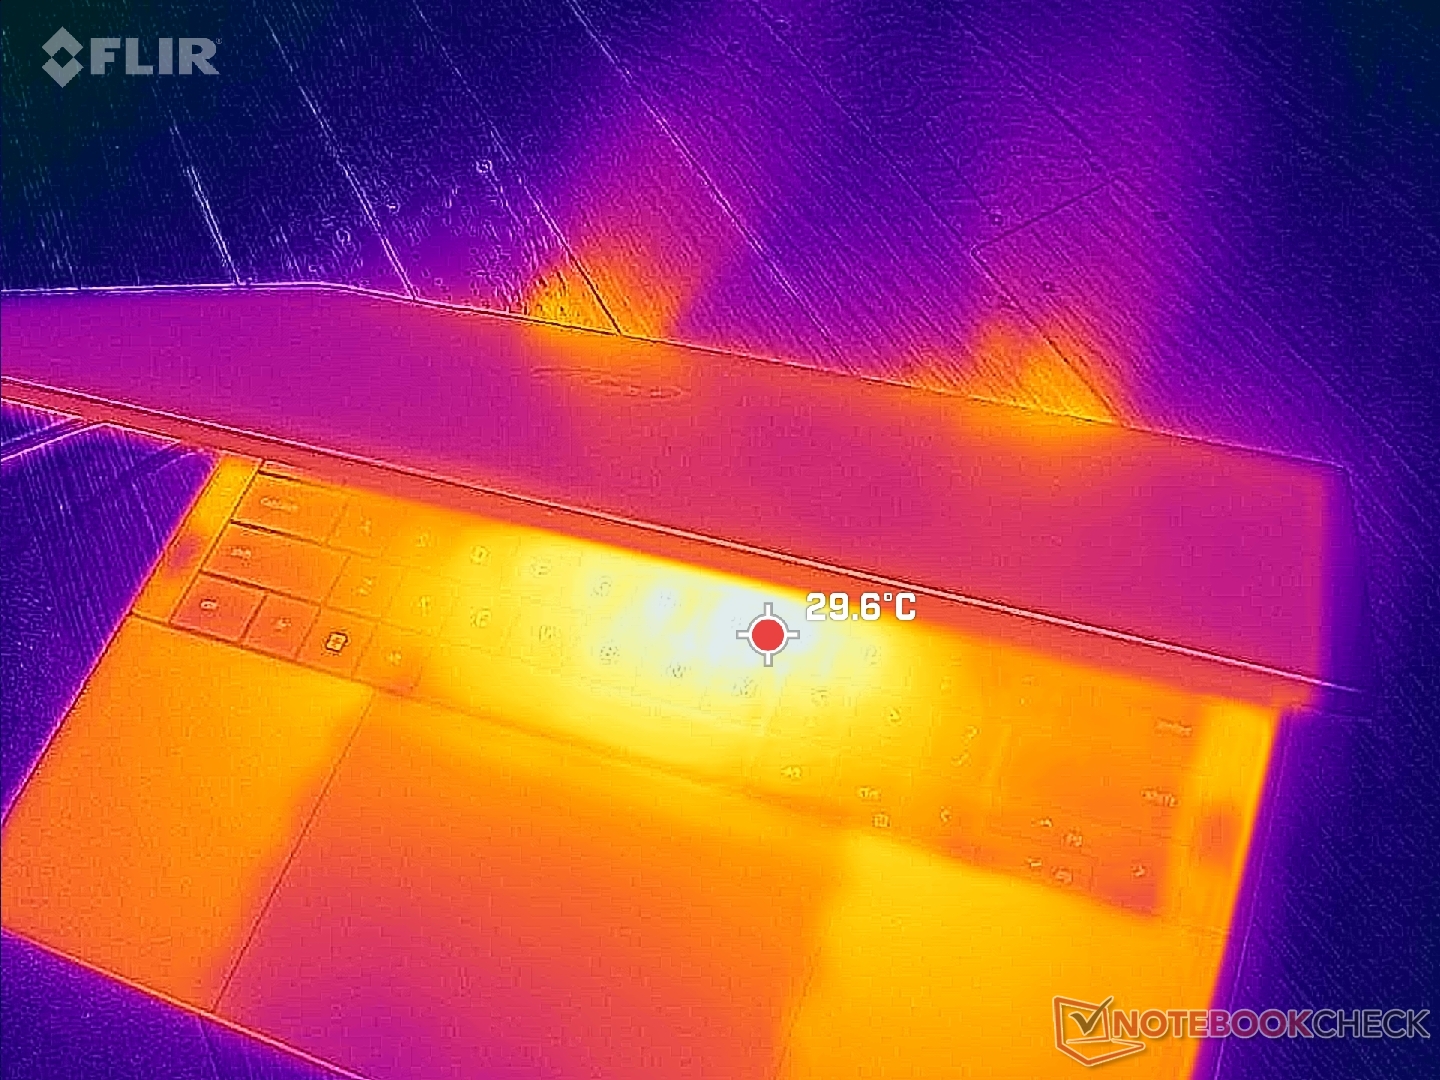
(±) Die maximale Temperatur auf der Oberseite ist 40.8 °C. Im Vergleich liegt der Klassendurchschnitt bei 35.4 °C (von 19.6 bis 60 °C für die Klasse Convertible).
(±) Auf der Unterseite messen wir eine maximalen Wert von 40 °C (im Vergleich zum Durchschnitt von 36.9 °C).
(+) Ohne Last messen wir eine durchschnittliche Temperatur von 28 °C auf der Oberseite. Der Klassendurchschnitt erreicht 30.3 °C.
(+) Die Handballen und der Touchpad-Bereich sind mit gemessenen 29 °C kühler als die typische Hauttemperatur und fühlen sich dadurch kühl an.
(±) Die durchschnittliche Handballen-Temperatur anderer getesteter Geräte war 28 °C (-1 °C).
| Dell Latitude 9440 2-in-1 Intel Core i7-1365U, Intel Iris Xe Graphics G7 96EUs | Dell Latitude 9430 2-in-1 Intel Core i7-1265U, Intel Iris Xe Graphics G7 96EUs | Lenovo ThinkPad X1 Yoga G8 i7-1355U Intel Core i7-1355U, Intel Iris Xe Graphics G7 96EUs | LG Gram 14T90P Intel Core i5-1135G7, Intel Iris Xe Graphics G7 80EUs | Asus ExpertBook B7 Flip B7402FEA Intel Core i7-1195G7, Intel Iris Xe Graphics G7 96EUs | HP Dragonfly Pro 2023 AMD Ryzen 7 7736U, AMD Radeon 680M | |
|---|---|---|---|---|---|---|
| Hitze | 14% | -6% | 9% | 6% | 13% | |
| Last oben max * (°C) | 40.8 | 39.2 4% | 41.6 -2% | 41.6 -2% | 38.7 5% | 38.6 5% |
| Last unten max * (°C) | 40 | 44.8 -12% | 47.6 -19% | 46.2 -16% | 45.3 -13% | 42.8 -7% |
| Idle oben max * (°C) | 30.4 | 21.4 30% | 30.6 -1% | 22.6 26% | 25.9 15% | 22.2 27% |
| Idle unten max * (°C) | 32.8 | 22.4 32% | 33.2 -1% | 23.2 29% | 28 15% | 23.6 28% |
* ... kleinere Werte sind besser
Stresstest
Beim Prime95 Stresstest taktet die CPU anfangs mit 3,5 GHz bei 100 Grad Celsius und 45 Watt. Aufgrund der hohen Temperatur wird die Taktfrequenz und die Leistungsaufnahme schnell und gleichmäßig auf 2,8 GHz und 30 Watt verringert, um bei kühleren 90 Grad zu bleiben. Das ThinkPad X1 Yoga G8 hat bei diesem Test ähnlich hohe Temperaturen erreicht. Es ist auch nicht wirklich zu erwarten, dass kompakte Core-U-Notebooks wie das Latitude ihre höheren Turbo-Boost-Taktraten über längere Zeiträume aufrecht halten können.
Im Akku-Betrieb gibt es keine Leistungseinbußen. Unser 3DMark 11 Benchmark lieferte praktisch die gleichen Ergebnisse wie im Netzbetrieb, der Unterschied lag bei weniger als einem Prozentpunkt.
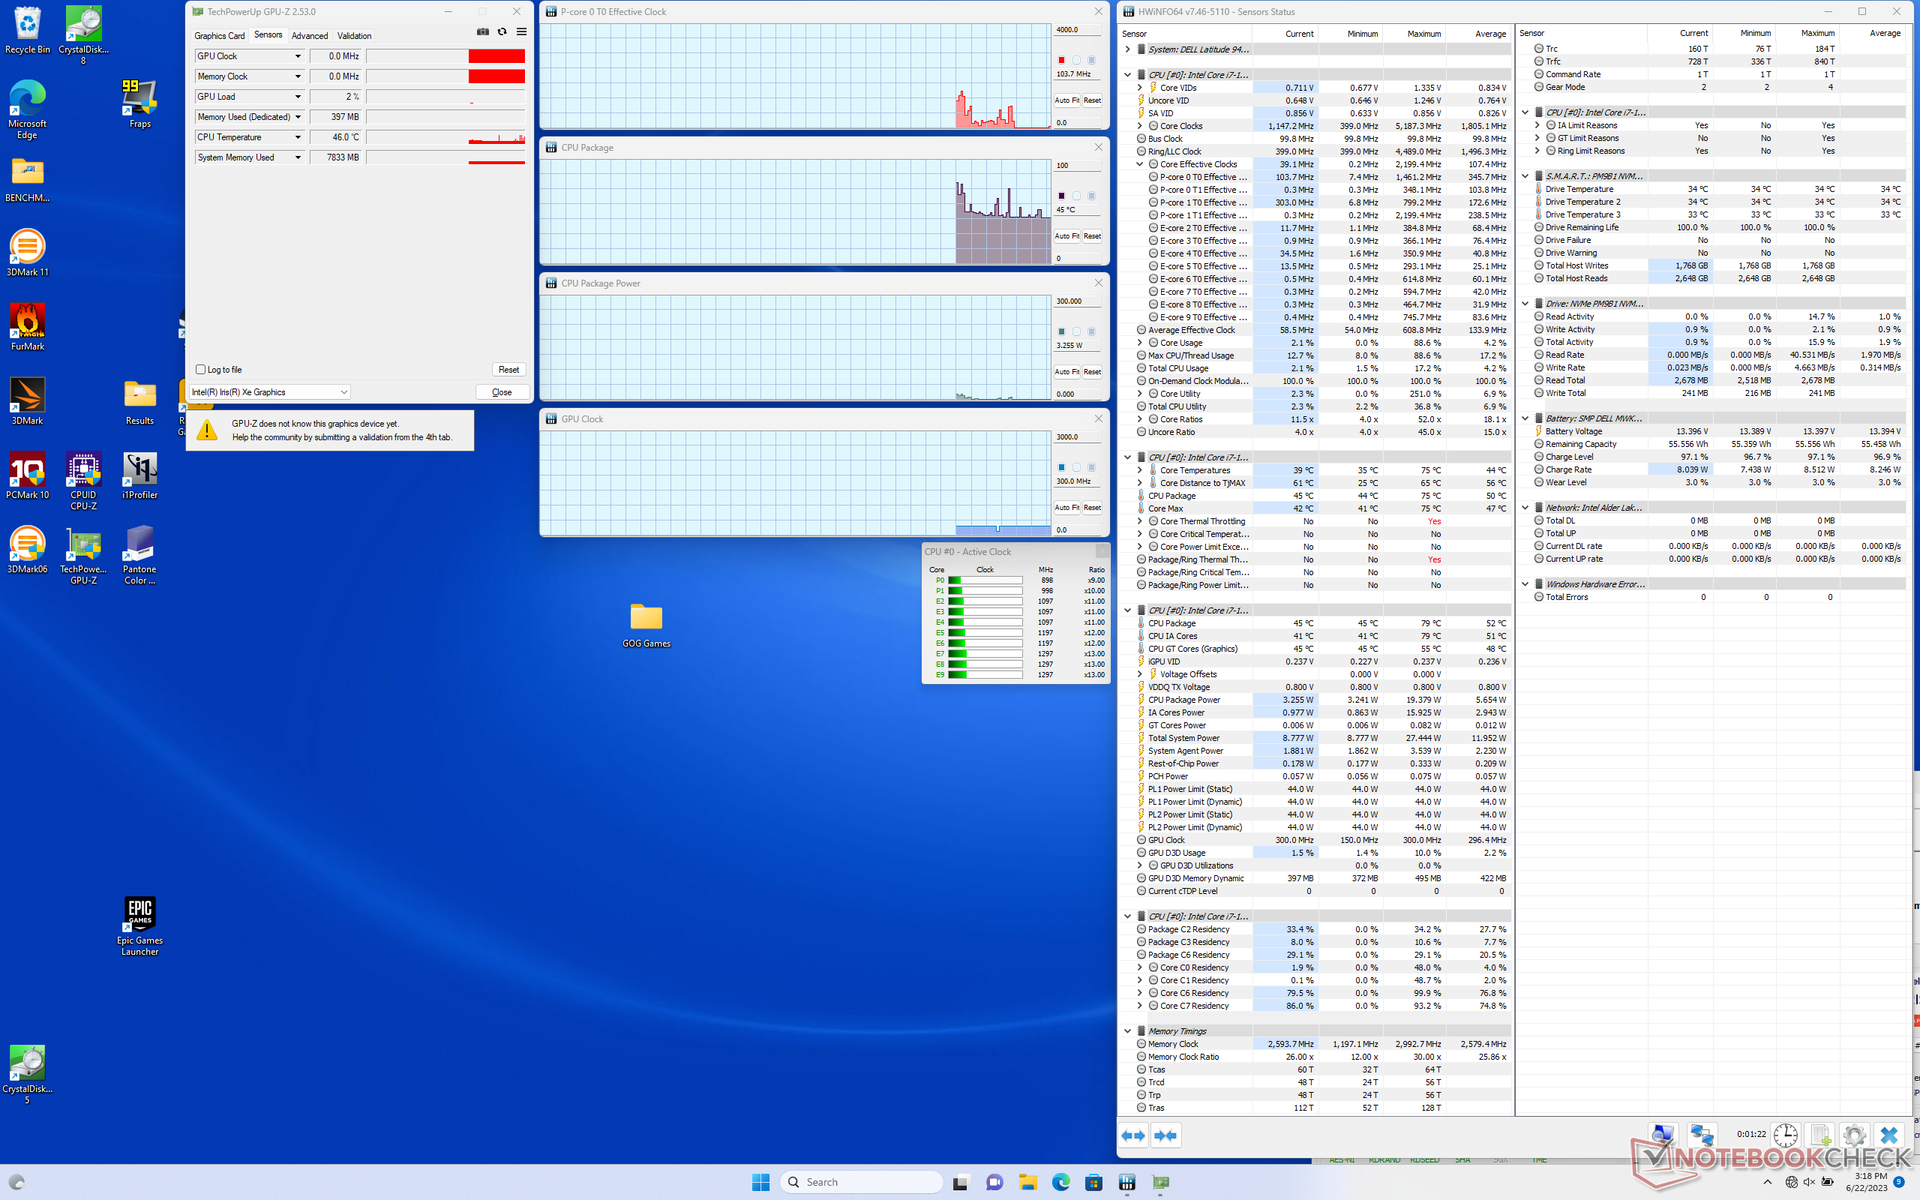
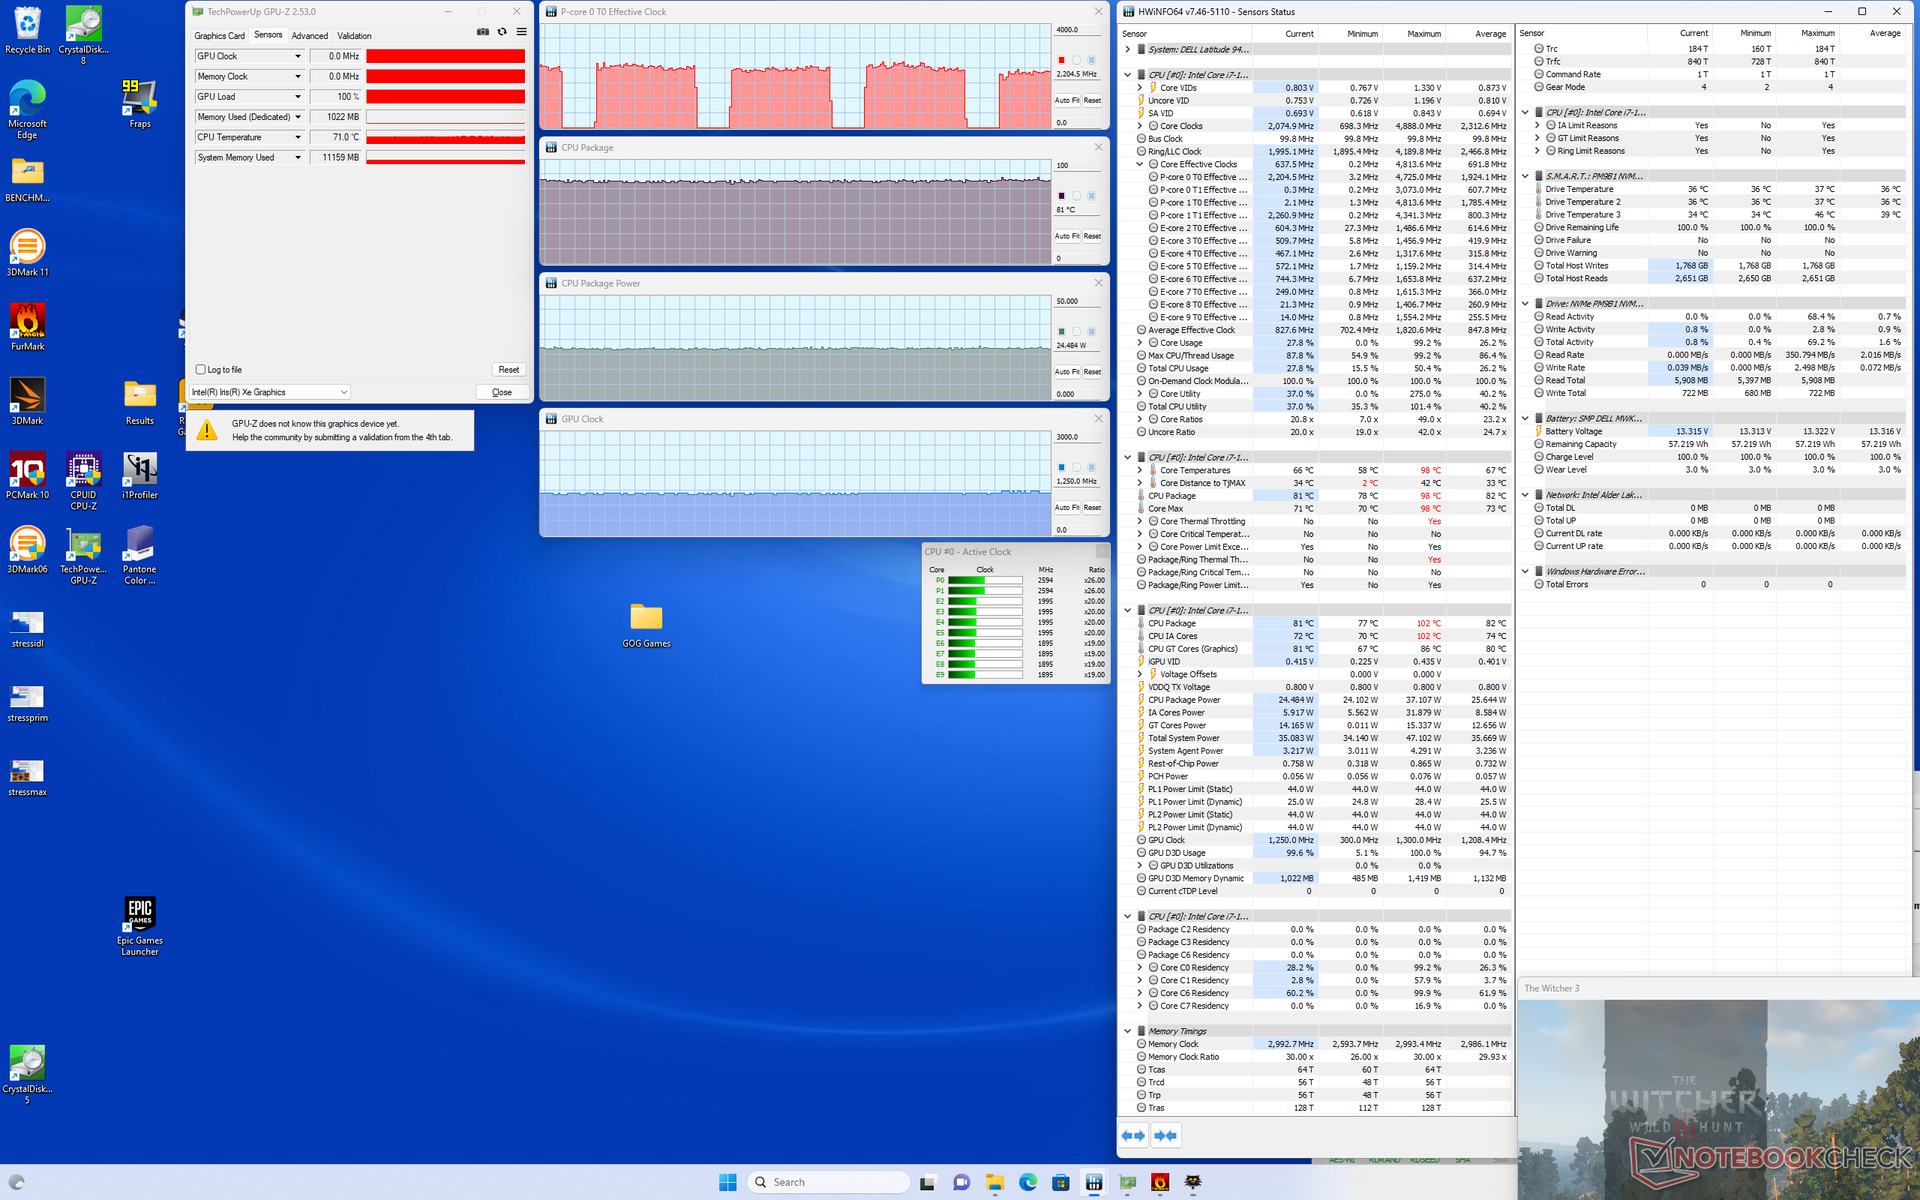
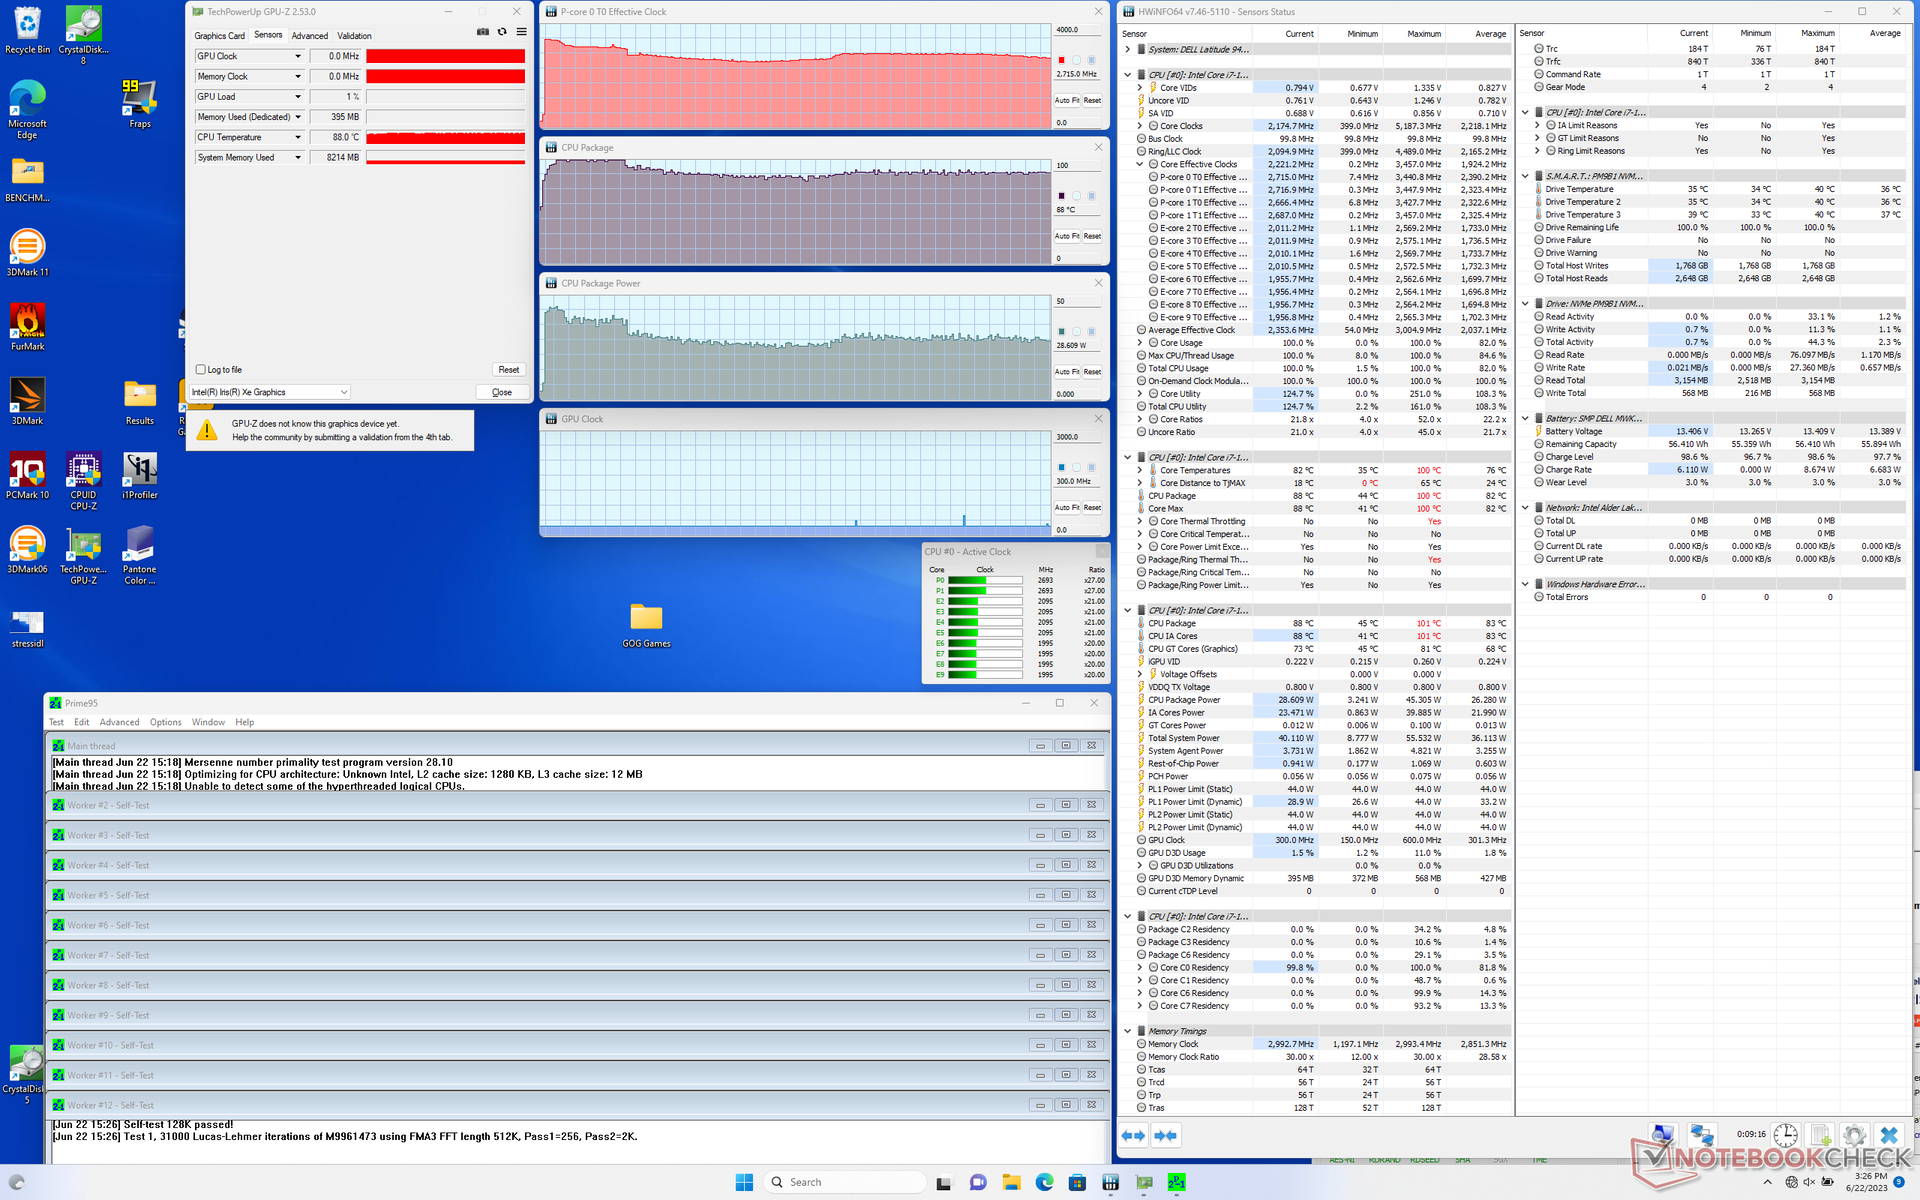
| CPU-Taktrate (GHz) | GPU-Taktrate (MHz) | Durchschnittliche CPU-Temperatur (°C) | |
| Leerlauf | -- | -- | 45 |
| Prime95 Stresstest | 2.7 | -- | 88 |
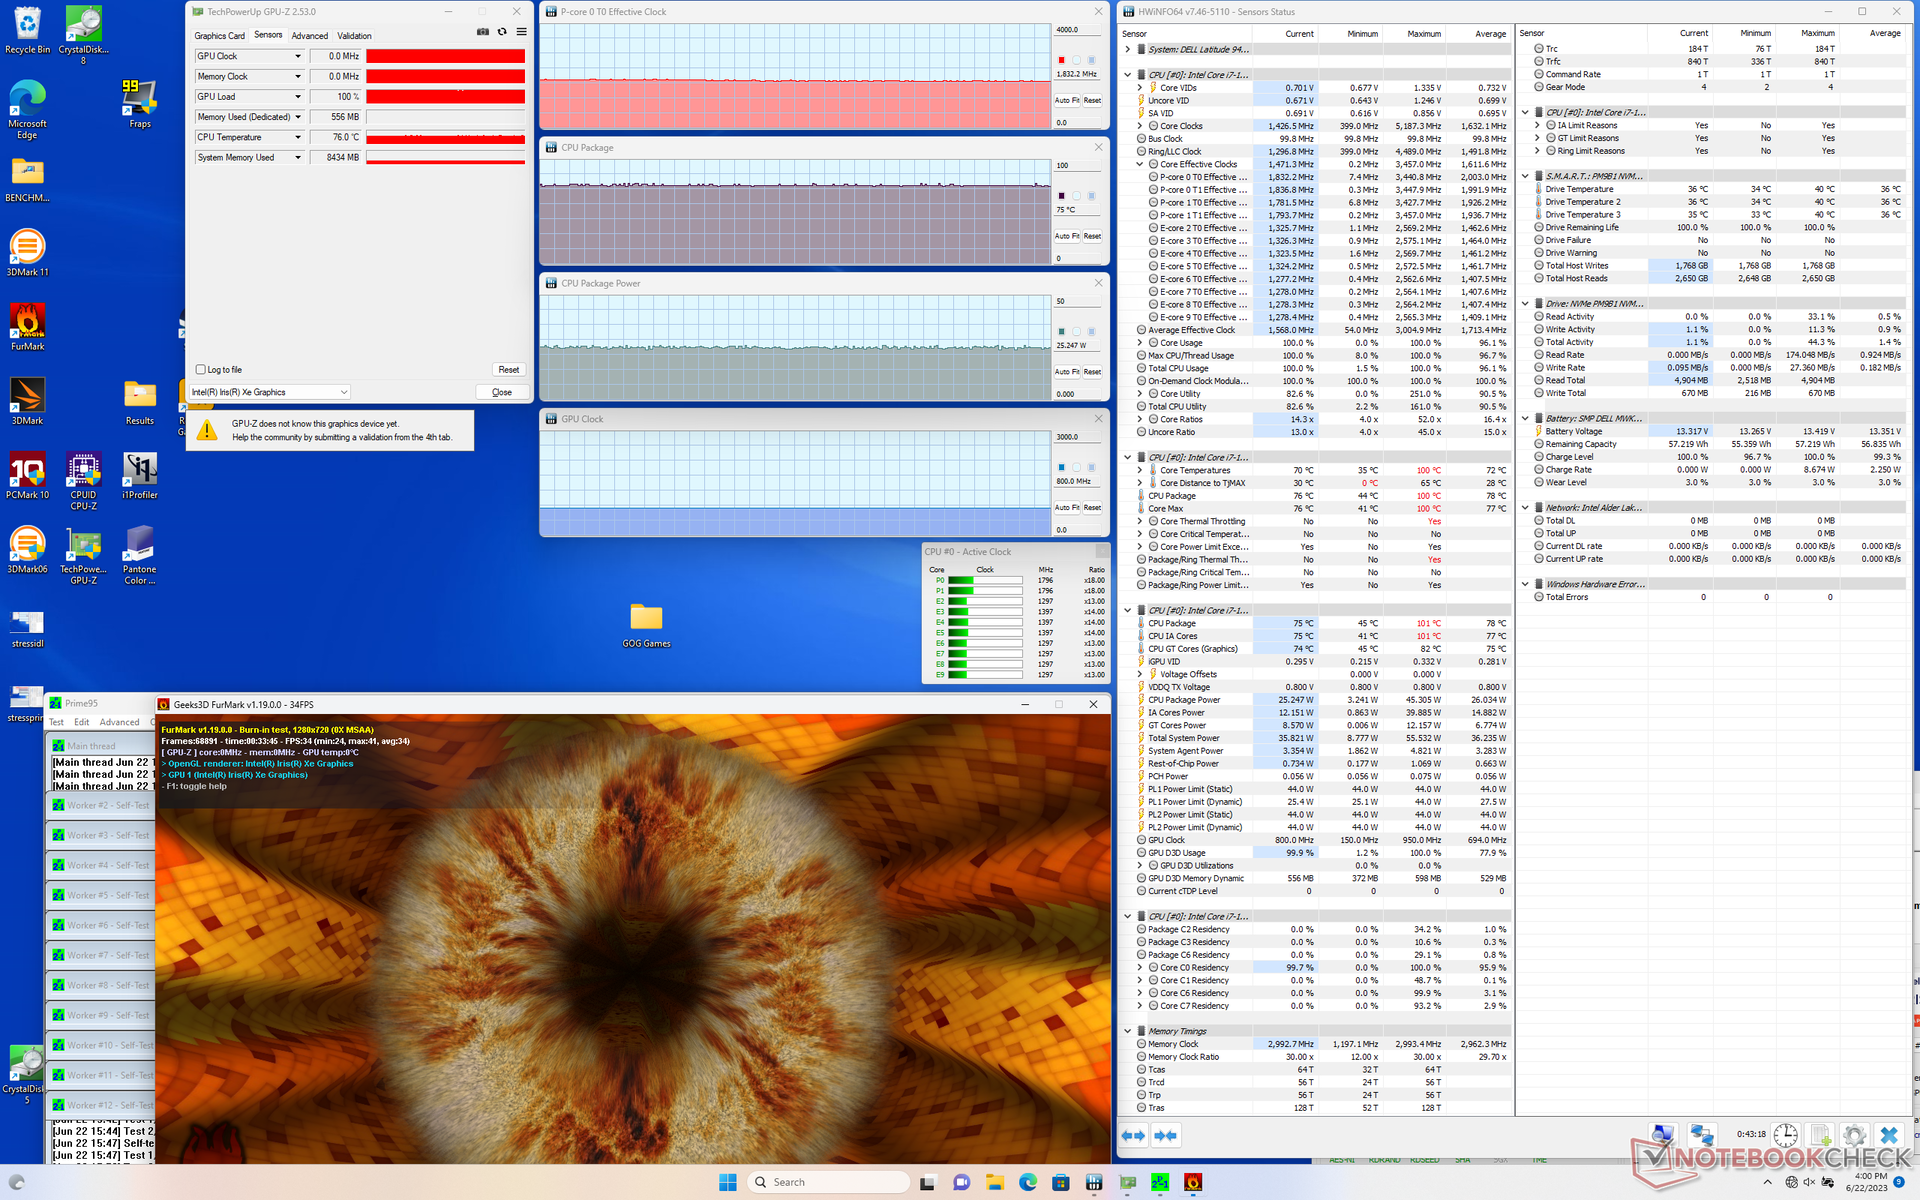
| Prime95 + FurMark Stresstest | 1.8 | 800 | 75 |
| Witcher 3 Stresstest | 2.2 | 1250 | 81 |
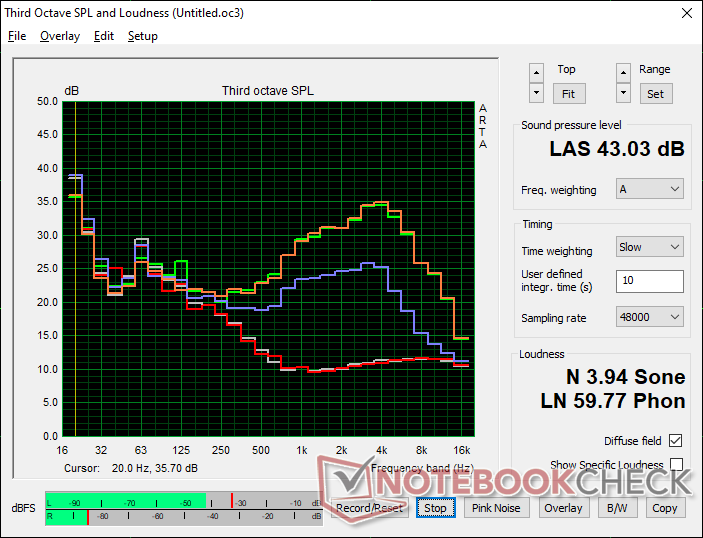
Lautsprecher
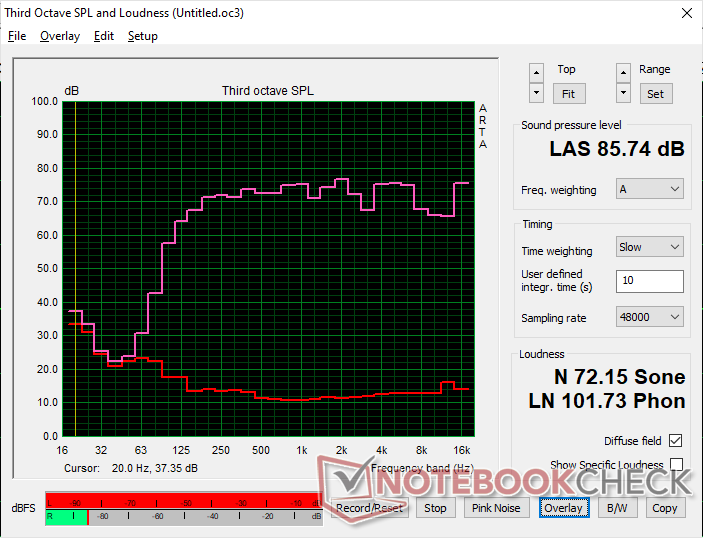
Dell Latitude 9440 2-in-1 Audio Analyse
(+) | Die Lautsprecher können relativ laut spielen (85.7 dB)
Bass 100 - 315 Hz
(+) | guter Bass - nur 4.8% Abweichung vom Median
(±) | durchschnittlich lineare Bass-Wiedergabe (8.4% Delta zum Vorgänger)
Mitteltöne 400 - 2000 Hz
(+) | ausgeglichene Mitten, vom Median nur 2.1% abweichend
(+) | lineare Mitten (3.4% Delta zum Vorgänger)
Hochtöne 2 - 16 kHz
(+) | ausgeglichene Hochtöne, vom Median nur 3.5% abweichend
(+) | sehr lineare Hochtöne (6.4% Delta zum Vorgänger)
Gesamt im hörbaren Bereich 100 - 16.000 Hz
(+) | hörbarer Bereich ist sehr linear (6.3% Abstand zum Median
Im Vergleich zu allen Geräten derselben Klasse
» 0% aller getesteten Geräte dieser Klasse waren besser, 0% vergleichbar, 100% schlechter
» Das beste Gerät hat einen Delta-Wert von 6%, durchschnittlich ist 20%, das schlechteste Gerät hat 57%
Im Vergleich zu allen Geräten im Test
» 0% aller getesteten Geräte waren besser, 0% vergleichbar, 99% schlechter
» Das beste Gerät hat einen Delta-Wert von 4%, durchschnittlich ist 24%, das schlechteste Gerät hat 134%
Apple MacBook Pro 16 2021 M1 Pro Audio Analyse
(+) | Die Lautsprecher können relativ laut spielen (84.7 dB)
Bass 100 - 315 Hz
(+) | guter Bass - nur 3.8% Abweichung vom Median
(+) | lineare Bass-Wiedergabe (5.2% Delta zum Vorgänger)
Mitteltöne 400 - 2000 Hz
(+) | ausgeglichene Mitten, vom Median nur 1.3% abweichend
(+) | lineare Mitten (2.1% Delta zum Vorgänger)
Hochtöne 2 - 16 kHz
(+) | ausgeglichene Hochtöne, vom Median nur 1.9% abweichend
(+) | sehr lineare Hochtöne (2.7% Delta zum Vorgänger)
Gesamt im hörbaren Bereich 100 - 16.000 Hz
(+) | hörbarer Bereich ist sehr linear (4.6% Abstand zum Median
Im Vergleich zu allen Geräten derselben Klasse
» 0% aller getesteten Geräte dieser Klasse waren besser, 0% vergleichbar, 100% schlechter
» Das beste Gerät hat einen Delta-Wert von 5%, durchschnittlich ist 17%, das schlechteste Gerät hat 45%
Im Vergleich zu allen Geräten im Test
» 0% aller getesteten Geräte waren besser, 0% vergleichbar, 100% schlechter
» Das beste Gerät hat einen Delta-Wert von 4%, durchschnittlich ist 24%, das schlechteste Gerät hat 134%
Energiemanagement — Keine Verbesserungen bei der Akkulaufzeit
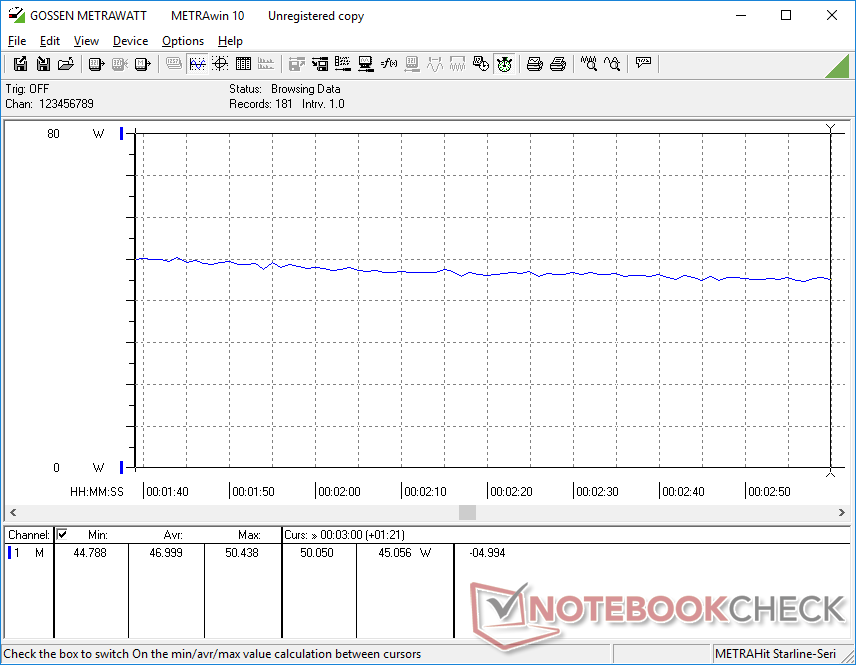
Energieverbrauch
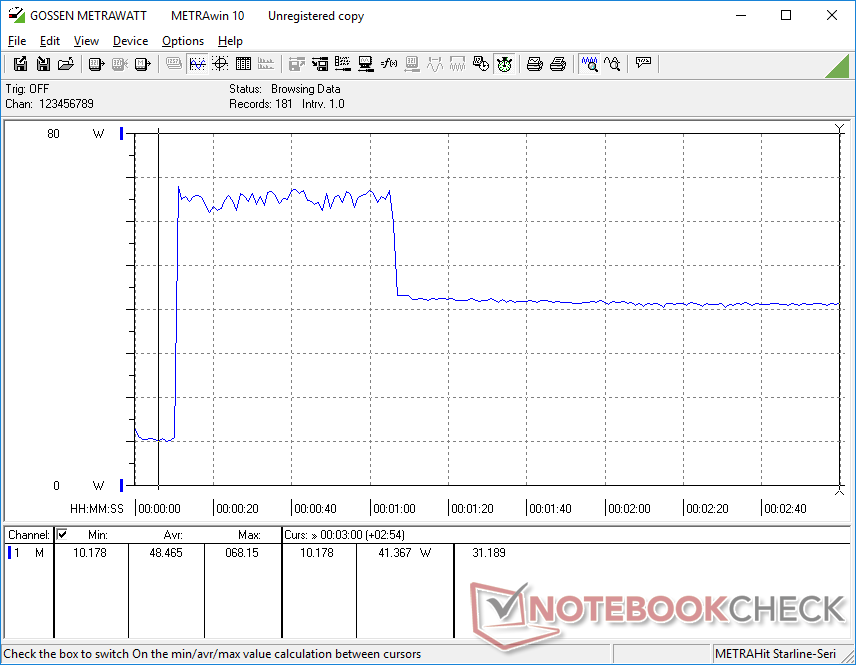
Trotz der praktisch identischen Leistungswerte verbraucht das Convertible etwas mehr Energie als sein Vorgänger. Dies könnte auch die kürzeren Akkulaufzeiten erklären, die weiter unten thematisiert werden.
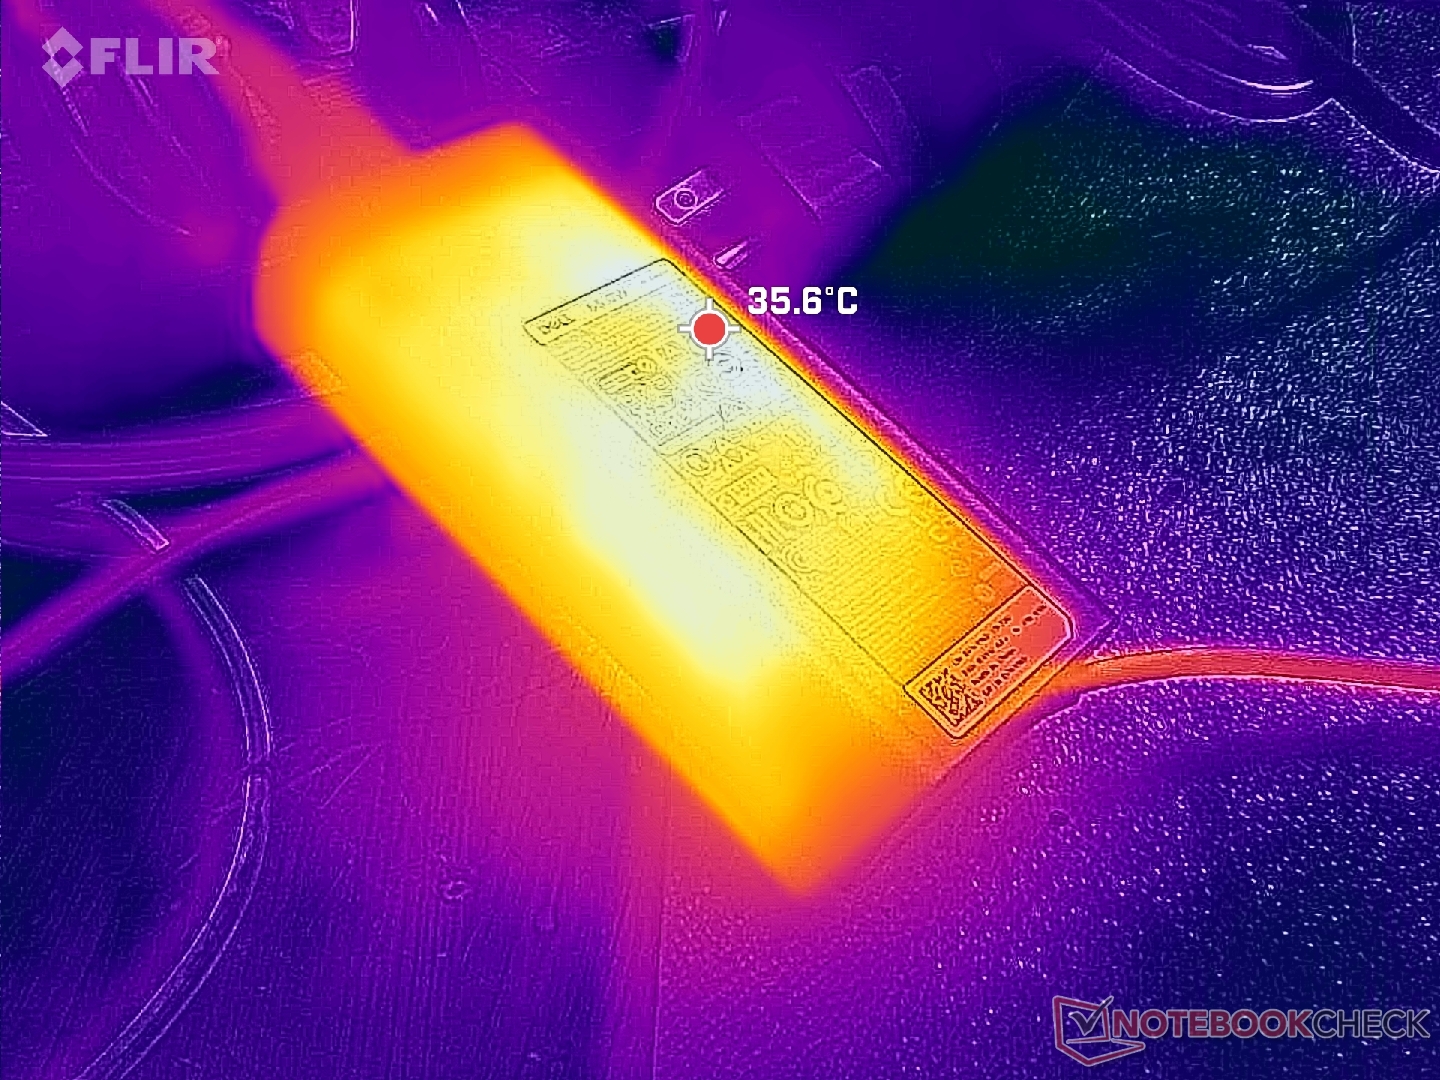
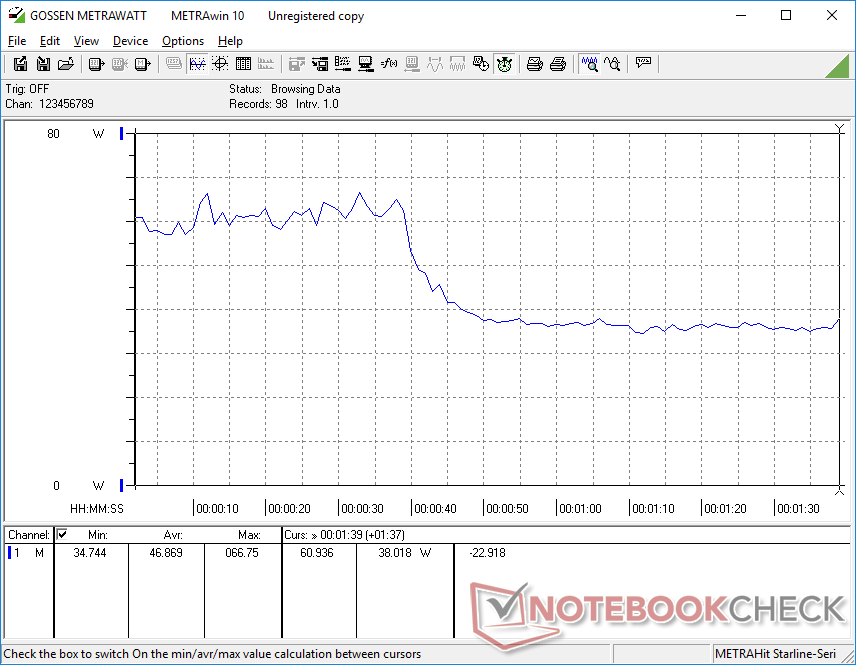
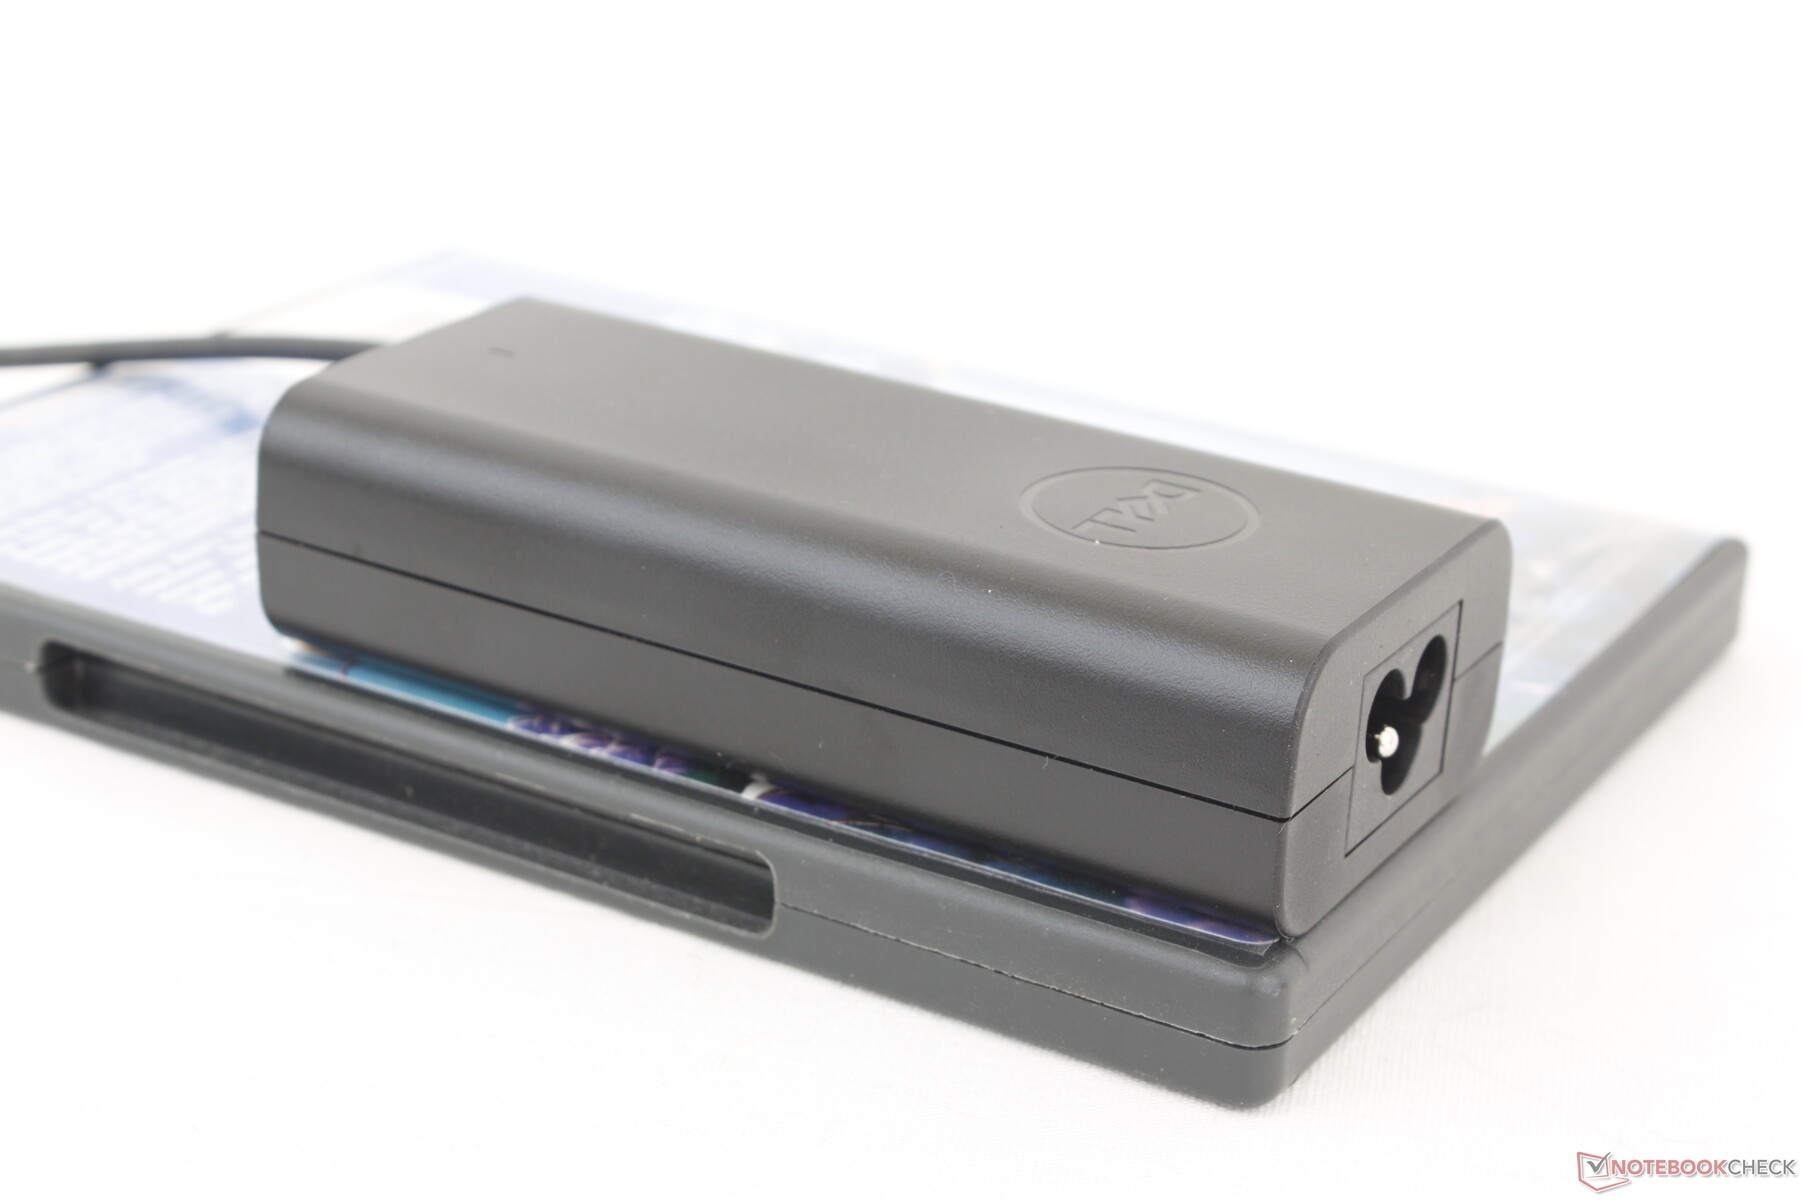
Beim Prime95-Benchmark zog das kleine 65-Watt-Netzteil (circa 11.2 x 5 x 2.7 cm) maximal 68 Watt aus der Steckdose. Aufgrund der zu erwartenden Drosselung des Core-U-Prozessors verringert sich der Verbrauch mit der Zeit. Neuere AMD-Laptops auf Zen-3-Basis, wie das Dragonfly Pro, bieten mehr Leistung pro Watt als die meisten Laptops mit Intel Core-U-CPU der 13. Generation.
| Aus / Standby | |
| Idle | |
| Last |
|
Legende:
min: | |
| Dell Latitude 9440 2-in-1 i7-1365U, Iris Xe G7 96EUs, Samsung PM9B1 1024GB MZAL41T0HBLB, IPS, 2560x1600, 14" | Dell Latitude 9430 2-in-1 i7-1265U, Iris Xe G7 96EUs, , IPS, 2560x1600, 14" | Lenovo ThinkPad X1 Yoga G8 i7-1355U i7-1355U, Iris Xe G7 96EUs, WDC PC SN810 512GB, IPS, 1920x1200, 14" | LG Gram 14T90P i5-1135G7, Iris Xe G7 80EUs, Samsung SSD PM981a MZVLB512HBJQ, IPS, 1900x1200, 14" | Asus ExpertBook B7 Flip B7402FEA i7-1195G7, Iris Xe G7 96EUs, Samsung PM9A1 MZVL21T0HCLR, IPS, 1900x1200, 14" | HP Dragonfly Pro 2023 R7 7736U, Radeon 680M, PSEIB512GABBMC0, IPS, 1920x1200, 14" | |
|---|---|---|---|---|---|---|
| Stromverbrauch | 16% | 5% | 18% | 17% | 8% | |
| Idle min * (Watt) | 4.2 | 2.9 31% | 2.9 31% | 2.8 33% | 3.2 24% | 3.2 24% |
| Idle avg * (Watt) | 6.9 | 5.8 16% | 5.4 22% | 5.5 20% | 6.3 9% | 5.4 22% |
| Idle max * (Watt) | 7.8 | 6.6 15% | 9.6 -23% | 6.4 18% | 7.5 4% | 5.6 28% |
| Last avg * (Watt) | 46 | 49.2 -7% | 55.9 -22% | 45.4 1% | 35 24% | 42.2 8% |
| Witcher 3 ultra * (Watt) | 51.9 | 35.3 32% | 42.6 18% | 34 34% | 35.4 32% | 60 -16% |
| Last max * (Watt) | 68.2 | 63.1 7% | 65.3 4% | 65.9 3% | 63 8% | 82 -20% |
* ... kleinere Werte sind besser
Energieverbrauch Witcher 3 / Stresstest
Energieverbrauch mit externem Monitor
Akkulaufzeit
Die Akkukapazität bleibt wie beim letztjährigen Latitude 9430 2-in-1, trotzdem sind die Laufzeiten durchgängig kürzer. In unserem WLAN-Test hält das Convertible rund 9 Stunden durch, das Latitude 9430 2-in-1 machte hier erst nach über 12 Stunden schlapp. Nichtsdestotrotz sind die Akkulaufzeiten exzellent und lang genug für den Alltag.
Eine komplette Ladung des Akkus von 0 auf 100 Prozent dauert rund 90 Minuten.
| Dell Latitude 9440 2-in-1 i7-1365U, Iris Xe G7 96EUs, 60 Wh | Dell Latitude 9430 2-in-1 i7-1265U, Iris Xe G7 96EUs, 60 Wh | Lenovo ThinkPad X1 Yoga G8 i7-1355U i7-1355U, Iris Xe G7 96EUs, 57 Wh | LG Gram 14T90P i5-1135G7, Iris Xe G7 80EUs, 72 Wh | Asus ExpertBook B7 Flip B7402FEA i7-1195G7, Iris Xe G7 96EUs, 63 Wh | HP Dragonfly Pro 2023 R7 7736U, Radeon 680M, 65 Wh | |
|---|---|---|---|---|---|---|
| Akkulaufzeit | 52% | -28% | 61% | 27% | 52% | |
| Idle (h) | 23.7 | 27.8 17% | 23.2 -2% | |||
| WLAN (h) | 9.3 | 12.8 38% | 6.7 -28% | 12.1 30% | 11.8 27% | 13 40% |
| Last (h) | 1.2 | 2.4 100% | 2.3 92% | 2.6 117% |
Pro
Contra
Fazit — Das Latitude 9430 2-in-1 sagt uns mehr zu
Das Latitude 9440 2-in-1 sieht äußerlich großartig aus. Leider bringen die optischen Änderungen im Vergleich zum letztjährigen Latitude 9430 2-in-1 auch eine ziemlich lange Liste an Nachteilen mit sich, die Käufer beachten sollten.
Zum einen ist das neue Modell dicker und schwerer als sein Vorgänger. Dies wäre nicht unbedingt ein Nachteil, wenn die größeren Abmessungen auch für zusätzliche Ports oder Features genutzt werden würden, was aber leider nicht der Fall ist. Stattdessen hat das Latitude 9440 2-in-1 sogar weniger Anschlussmöglichkeiten und die selbe Akkukapazität wie das 9430 2-in-1.
Des Weiteren ist das Clickpad etwas schwerer zu bedienen, speziell beim "Drag and Drop" fällt dies auf. Außerdem ist es etwas unverständlich, dass die neuen haptischen Buttons auf dem Clickpad nur in Zoom und nicht in anderen Programmen genutzt werden können, was beispielsweise mit der programmierbaren Taste mancher HP-EliteBook-Modelle möglich ist.
Drittens bringt das Prozessor-Upgrade von der 12. auf die 13. Core-U-Generation selbst im besten Fall nur minimale Steigerungen in Sachen Performance und Akkulaufzeit mit sich. In Kombination mit einem drei Jahre alten 1600p-Touchscreen kann man also nur schwer argumentieren, dass sich das Nutzererlebnis im Vergleich zum exzellenten Latitude 9430 2-in-1 vom letzten Jahr tatsächlich verbessert hat.
Für das coolere Design des Dell Latitude 9440 2-in-1 wurden manche benutzerfreundlichen Eigenschaften des Vorgängers geopfert.
Potenzielle Käufer des Latitude 9440 2-in-1 müssten also schon besonderen Wert auf das äußerliche Design und die haptischen Zoom-Hotkeys des Touchpads legen. Andernfalls bietet das ältere Latitude 9430 2-in-1 eine bessere Anschlussvielfalt, ein zuverlässigeres Clickpad, ein leichteres und dünneres Gehäuse sowie die praktisch gleiche Leistung und Bildqualität zum niedrigeren Preis. Wir würden uns künftig außerdem mehr Konfigurationsmöglichkeiten wünschen. Ein 1000 Nits helles Display, eine Core-P-CPU, eine höher auflösende Webcam und ein vielleicht etwas traditionelleres Touchpad mit dedizierten Maus-Tasten könnte manche Käufer vermutlich überzeugen.
Preis und Verfügbarkeit
Das Dell Latitude 9440 2-in-1 kann im deutschen Online-Shop des Herstellers zu Preisen ab rund 2.300 Euro für die Core-i5-Konfiguration bestellt werden, mit dem Core i7-1365U werden über 2.500 Euro fällig.
Dell Latitude 9440 2-in-1
- 26.06.2023 v7 (old)
Allen Ngo

