HP Dragonfly Pro Laptop Test: AMD Ryzen 7 7736U sorgt für Furore

Während die Dragonfly Serie zunächst als Business-orientiertes Elite-Notebook auf den Markt kam, haben sich spätere Modelle langsam in Richtung Prosumer entwickelt, um Freiberufler oder Content Creators anzusprechen. Das neueste Modell ist das Dragonfly Pro Clamshell, das mit hochwertigen Materialien, den neuesten AMD-Zen-3+-Hardware-Optionen und einem neuen dünnen und leichten Design ausgestattet ist, das sich von den bestehenden Pavilion-, Envy-, Spectre- und EliteBook Familien unterscheidet.
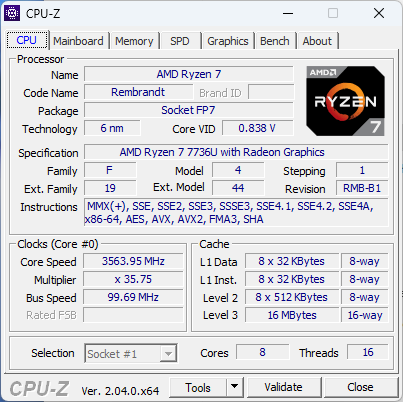
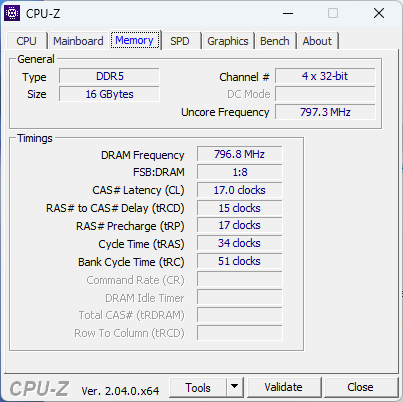
Unsere Konfiguration im Test ist eine der ersten auf dem Markt mit einem AMD-Zen-3+-Ryzen-7-7736U-Prozessor und superschnellem 6.400-MHz-LPDDR5-RAM für ca. 1.399 US-Dollar im Einzelhandel. Alle SKUs werden derzeit mit der gleichen CPU und einem 14-Zoll-IPS-Touchscreen mit 1.920 x 1.200 Pixeln ausgeliefert und unterscheiden sich nur in der Gehäusefarbe, dem RAM und der Speicherkapazität.
Zu den Alternativen zum Dragonfly Pro gehören andere 14-Zoll-Subnotebooks der Spitzenklasse wie das Apple MacBook Pro 14, Asus ZenBook 14, Lenovo Yoga 7 14, LG Gram 14 und das Honor MagicBook 14.
Weitere HP Testberichte:
Mögliche Konkurrenten im Vergleich
Bew. | Datum | Modell | Gewicht | Dicke | Größe | Auflösung | Preis ab |
|---|---|---|---|---|---|---|---|
| 89.4 % v7 (old) | 03 / 2023 | HP Dragonfly Pro 2023 R7 7736U, Radeon 680M | 1.5 kg | 18.3 mm | 14.00" | 1920x1200 | |
| 90.3 % v7 (old) | 08 / 2022 | HP Spectre x360 13.5 14t-ef000 i7-1255U, Iris Xe G7 96EUs | 1.4 kg | 17 mm | 13.50" | 3000x2000 | |
| 89.3 % v7 (old) | 03 / 2023 | Lenovo Yoga 9 14IRP G8 i7-1360P, Iris Xe G7 96EUs | 1.4 kg | 15.25 mm | 14.00" | 2880x1800 | |
| 93.9 % v7 (old) | 03 / 2023 | Apple MacBook Pro 14 2023 M2 Pro M2 Pro, M2 Pro 19-Core GPU | 1.6 kg | 15.5 mm | 14.20" | 3024x1964 | |
| 87.3 % v7 (old) | 09 / 2022 | Dell XPS 13 Plus 9320 i7-1280P OLED i7-1280P, Iris Xe G7 96EUs | 1.3 kg | 15.28 mm | 13.40" | 3456x2160 |
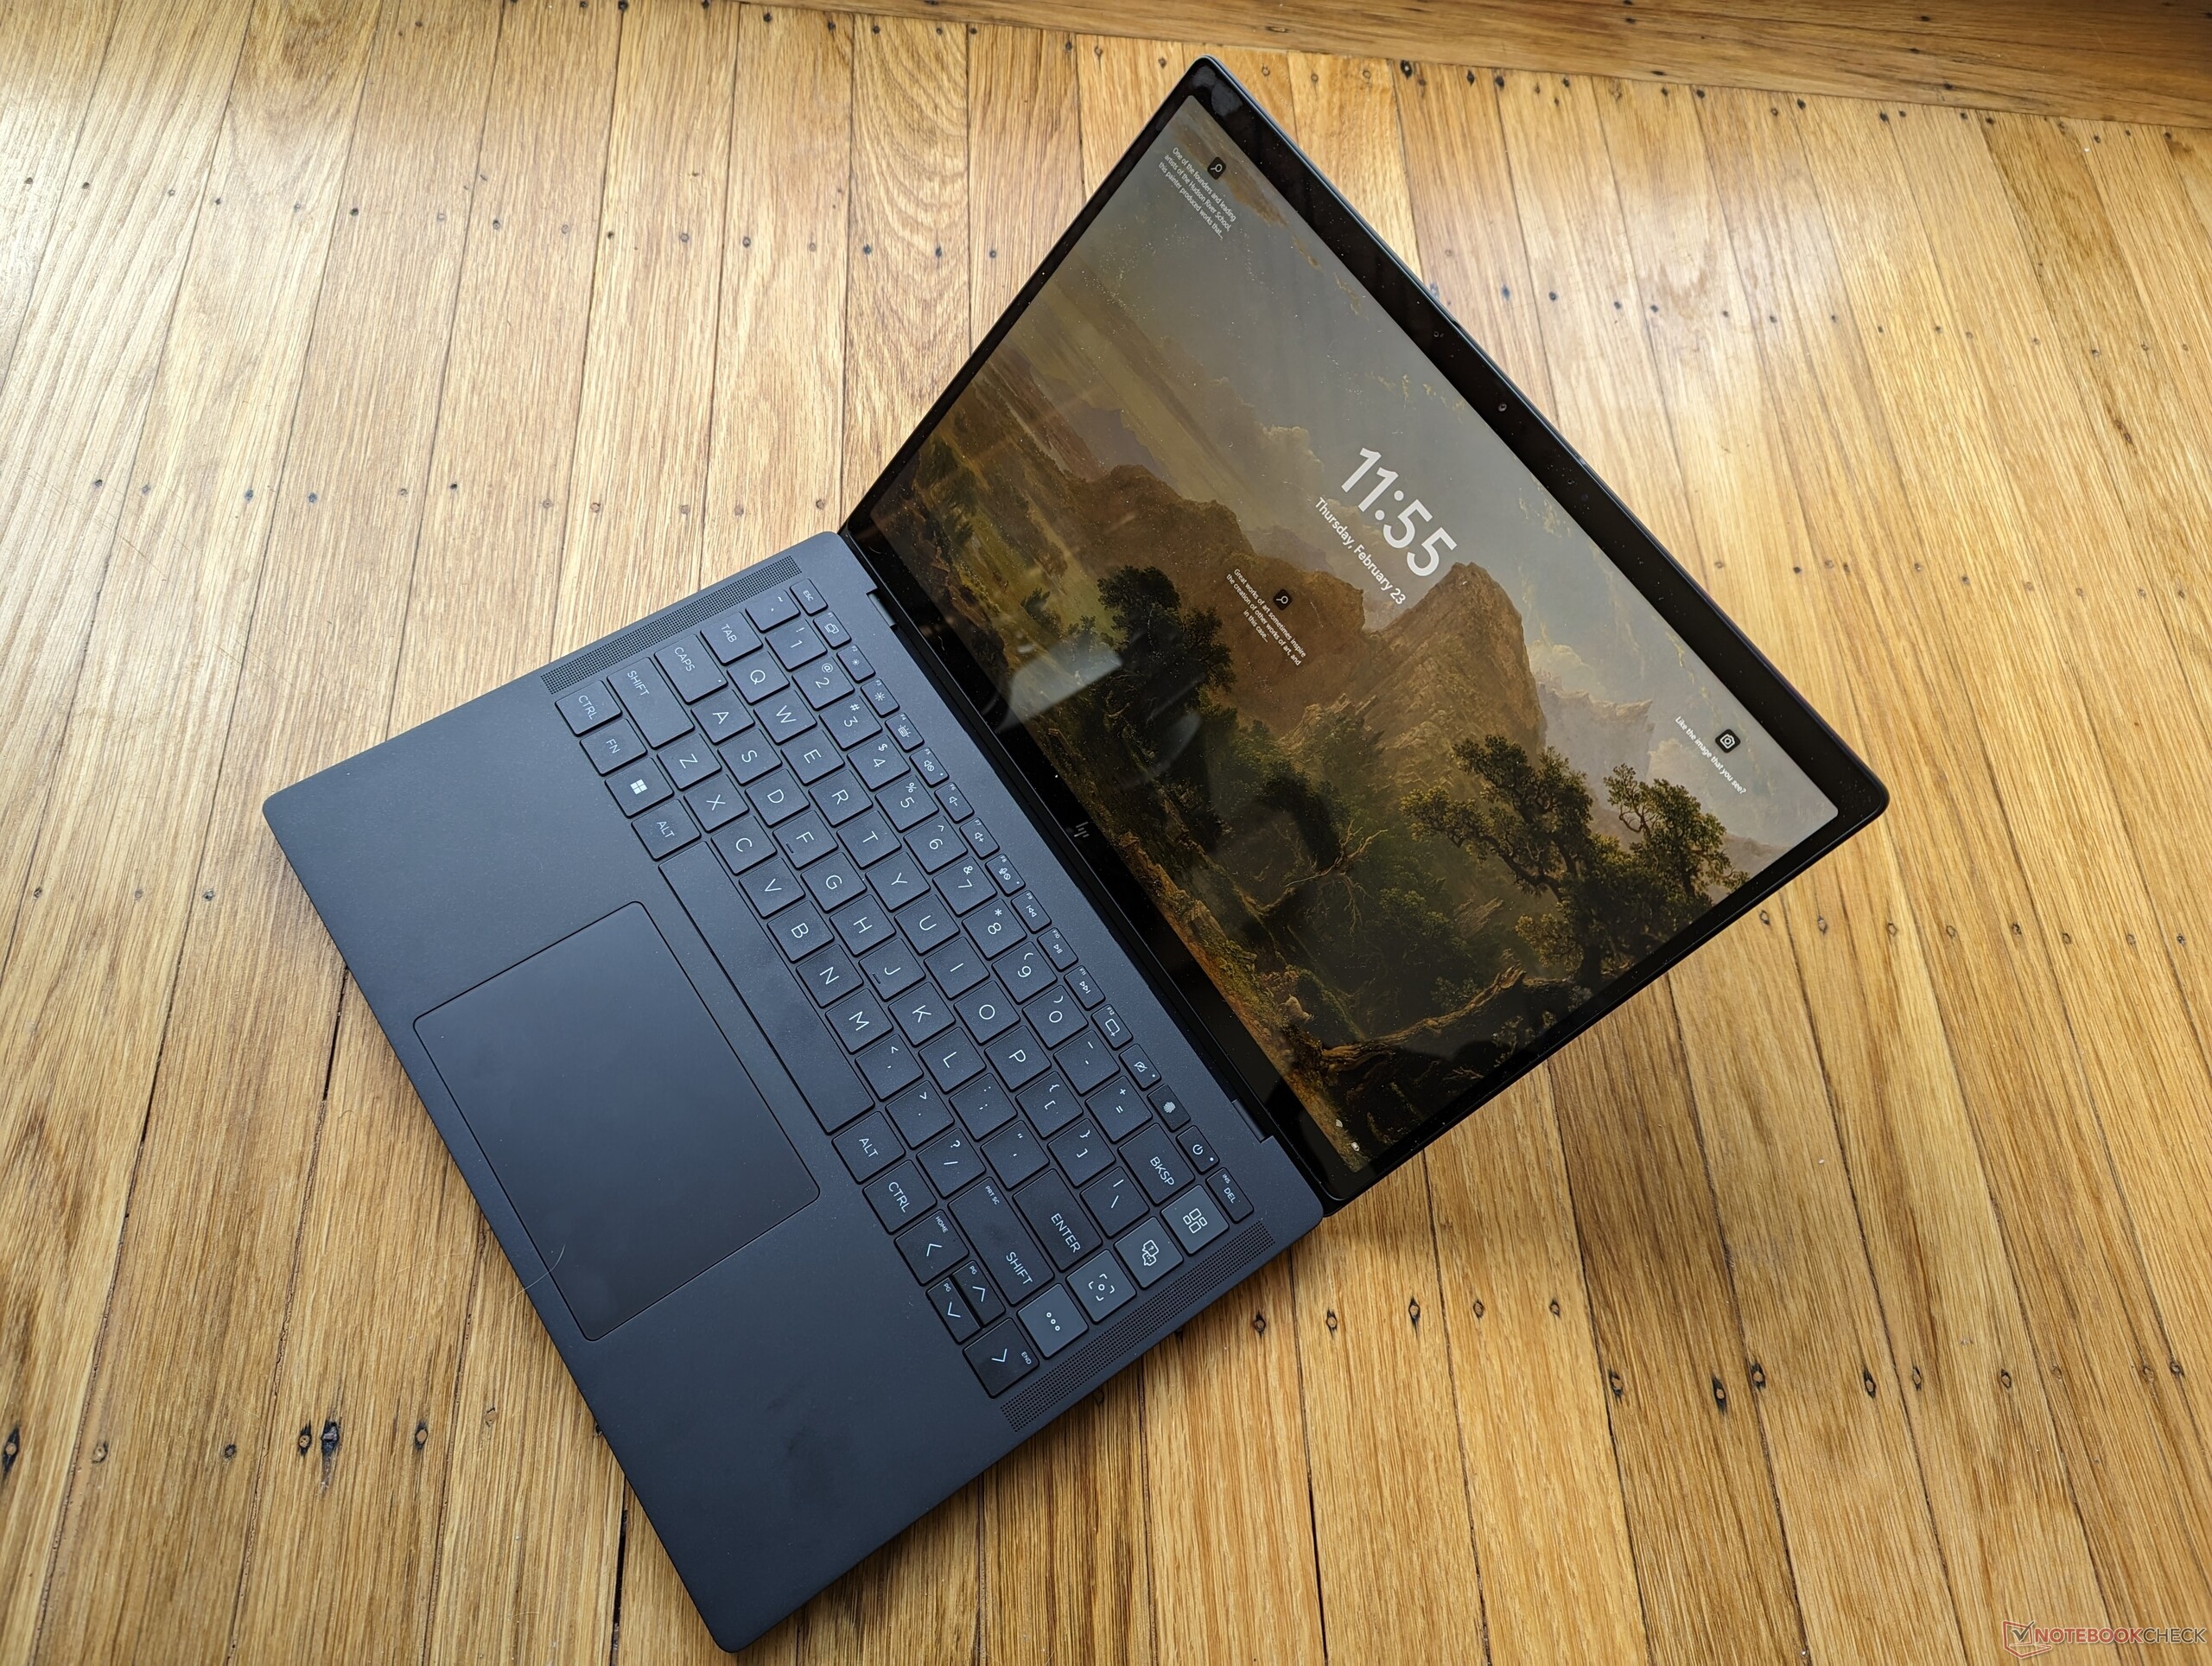
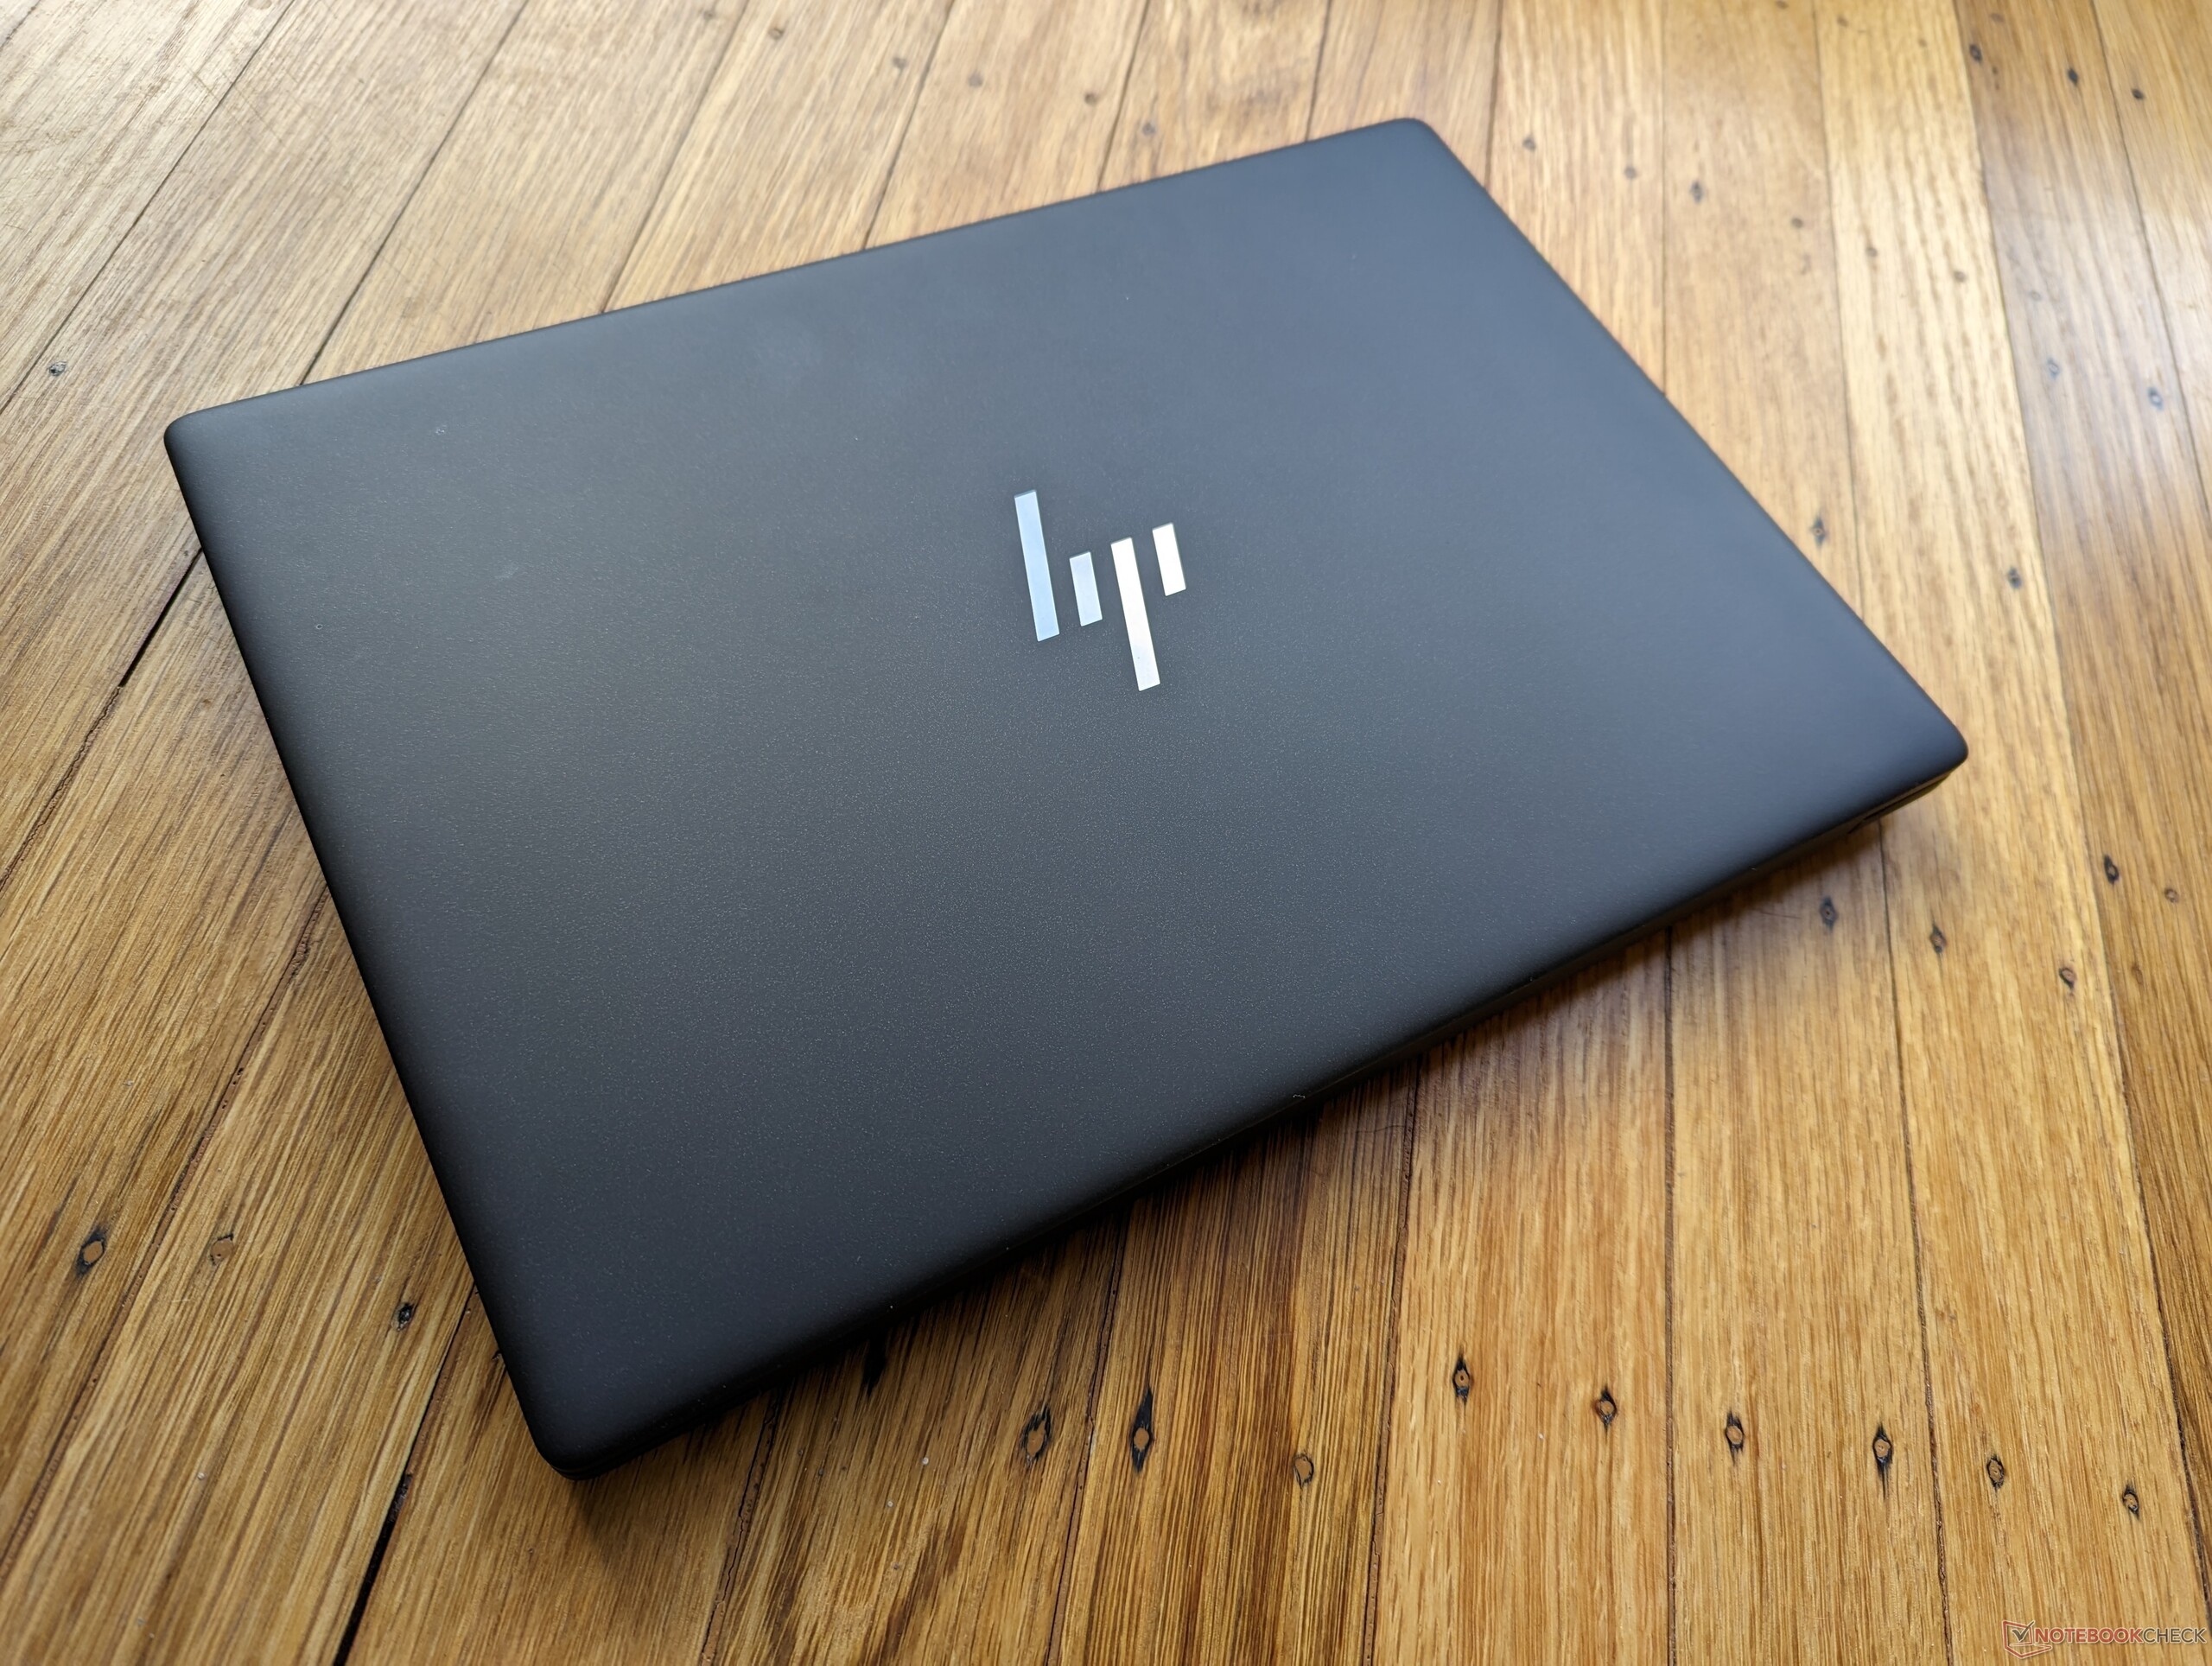
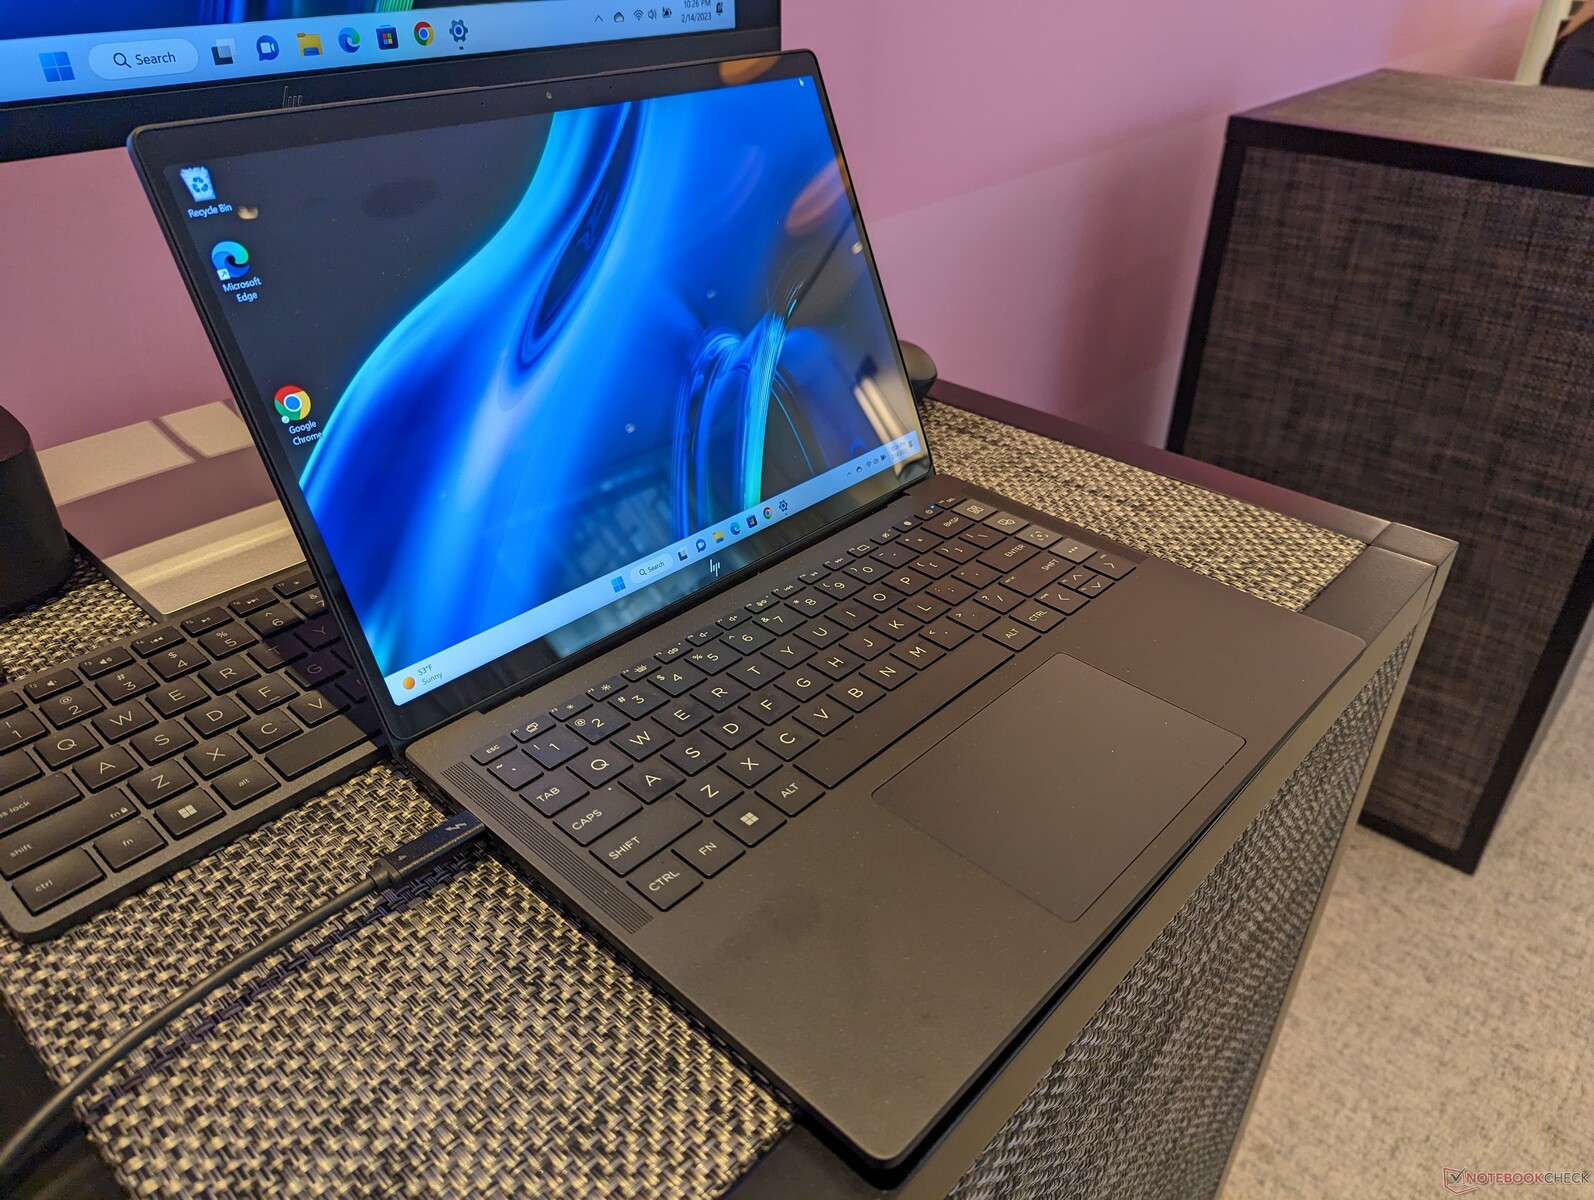
Gehäuse - EliteBook Vibes
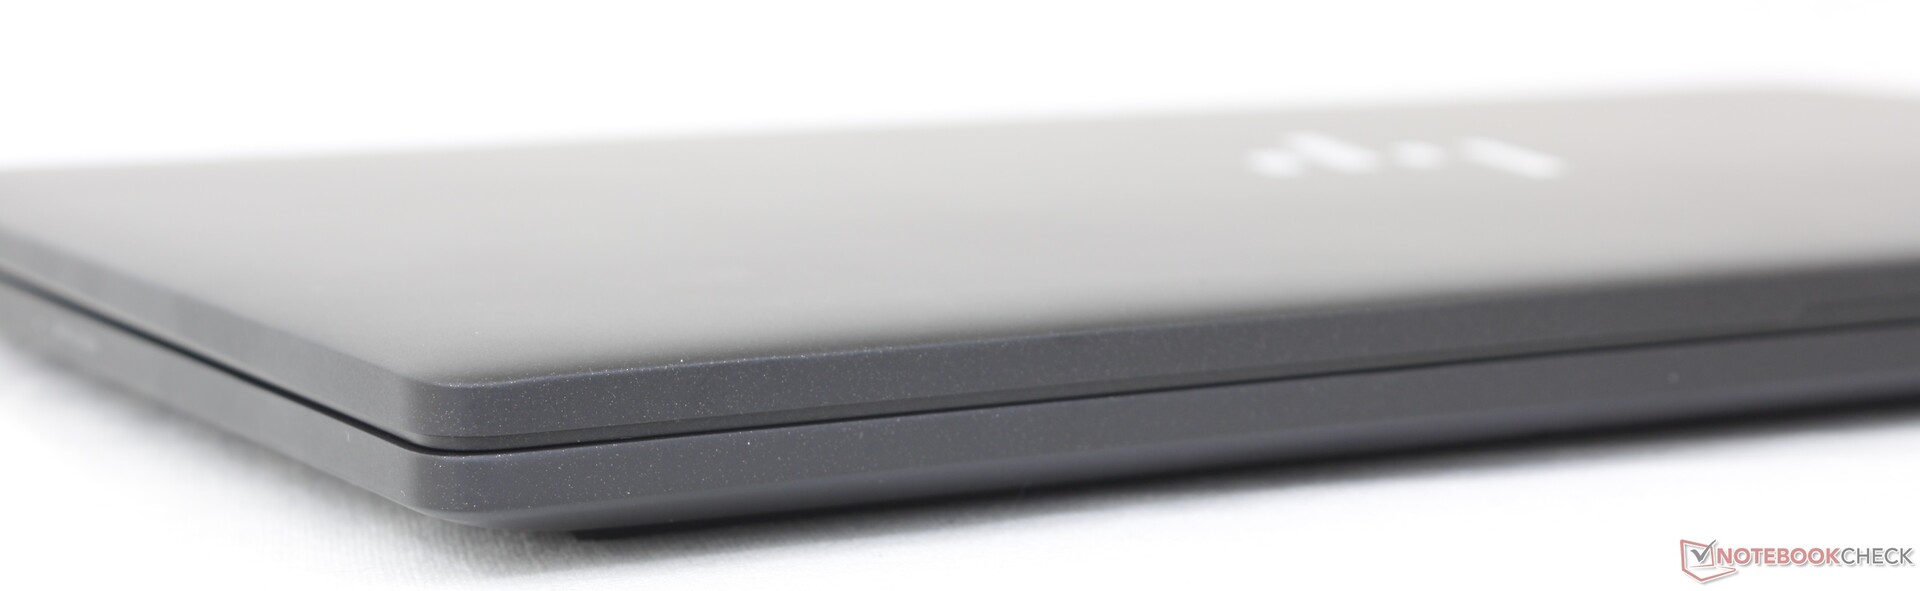
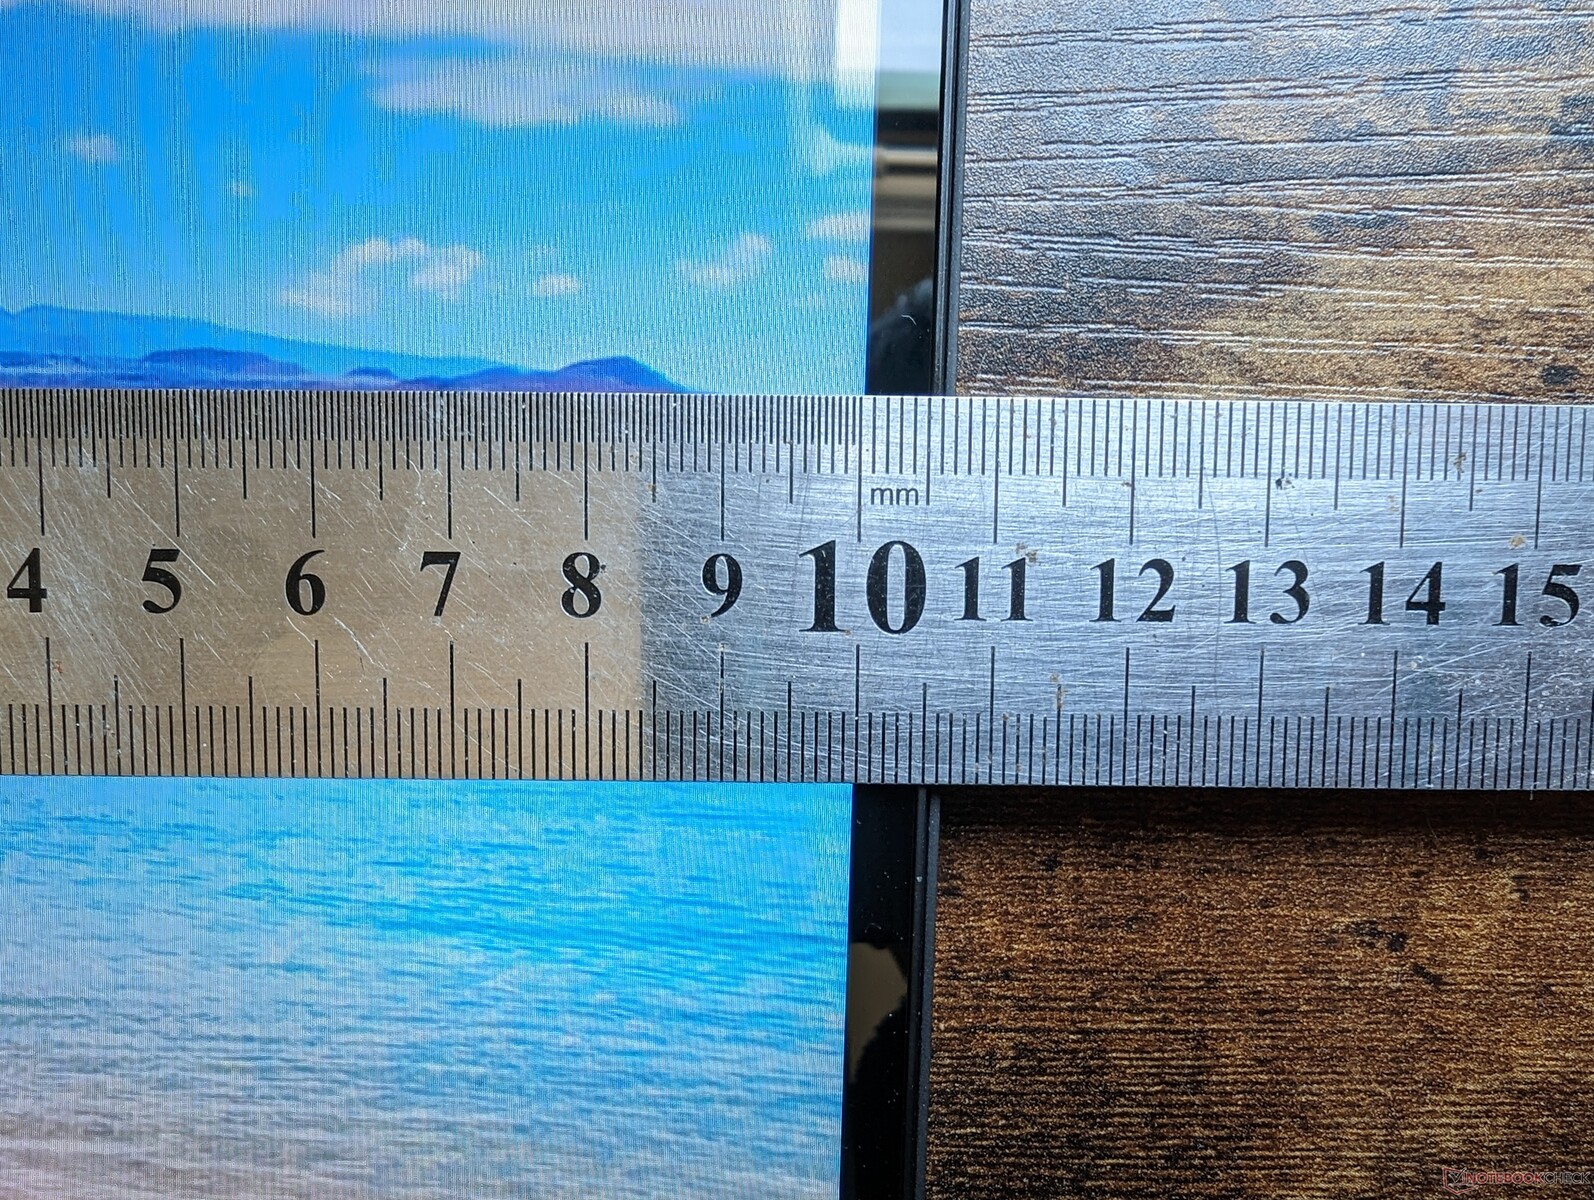
Die komplett matte Gehäuse-Oberfläche steht im Gegensatz zur glänzenden Spectre Serie und sorgt für eine hochwertige Optik und Haptik. Der Gesamteindruck ist immer noch ähnlich wie bei der EliteBook-840-Serie, da die Dragonfly Serie als Elitebook Modell begann. Im Vergleich zum letztjährigen Elite Dragonfly G3 ist das größere Dragonfly Pro substanzieller und stabiler, vor allem in Bezug auf das Display.
Die Gesamtabmessungen des HP Dragonfly Pro sind nur geringfügig größer als die des MacBook Pro 14, während es etwa 100 Gramm weniger wiegt. Es ist auch ein wenig dicker als viele andere Subnotebooks, darunter das XPS 13 Plus und HPs Elite Dragonfly G3. Es handelt sich zweifelsohne um ein starkes Gehäuse-Design, aber es geht auf Kosten einer größeren Bauweise.
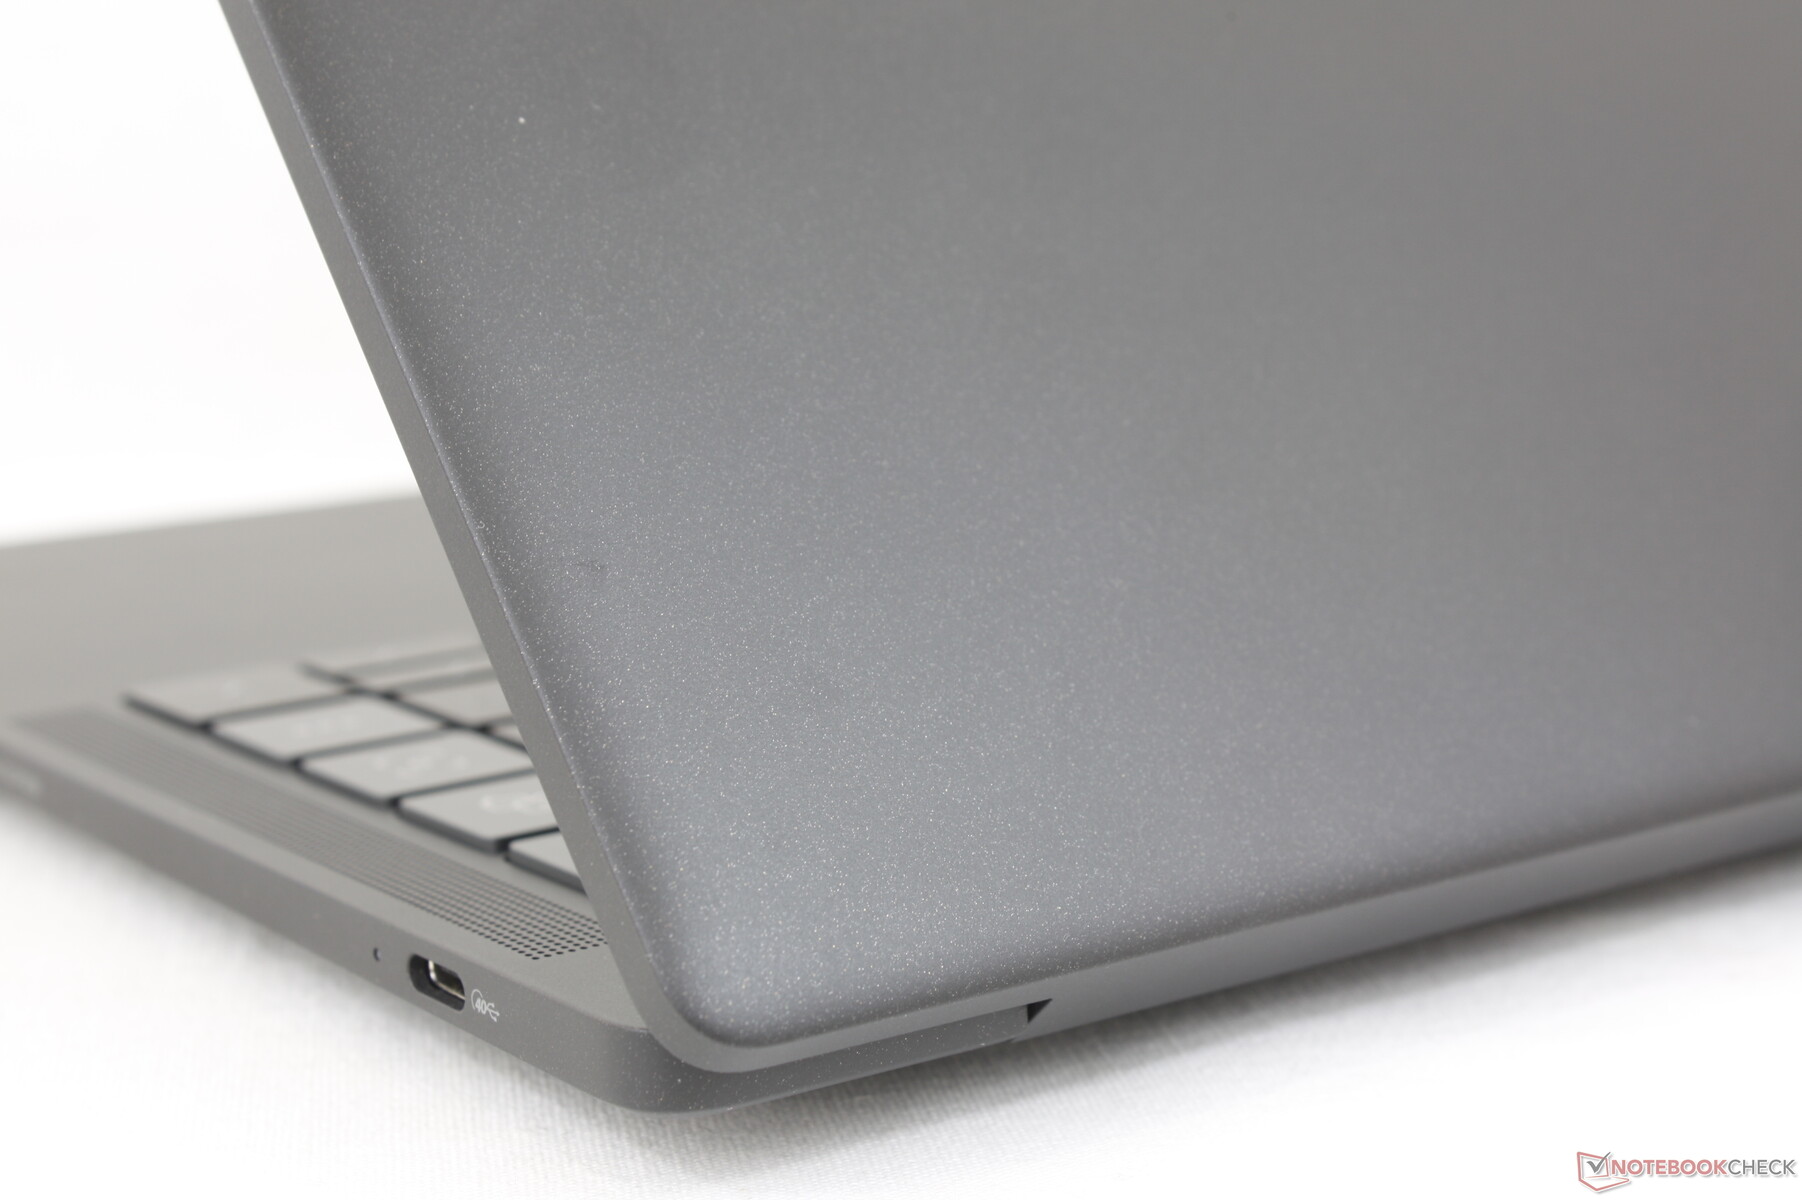

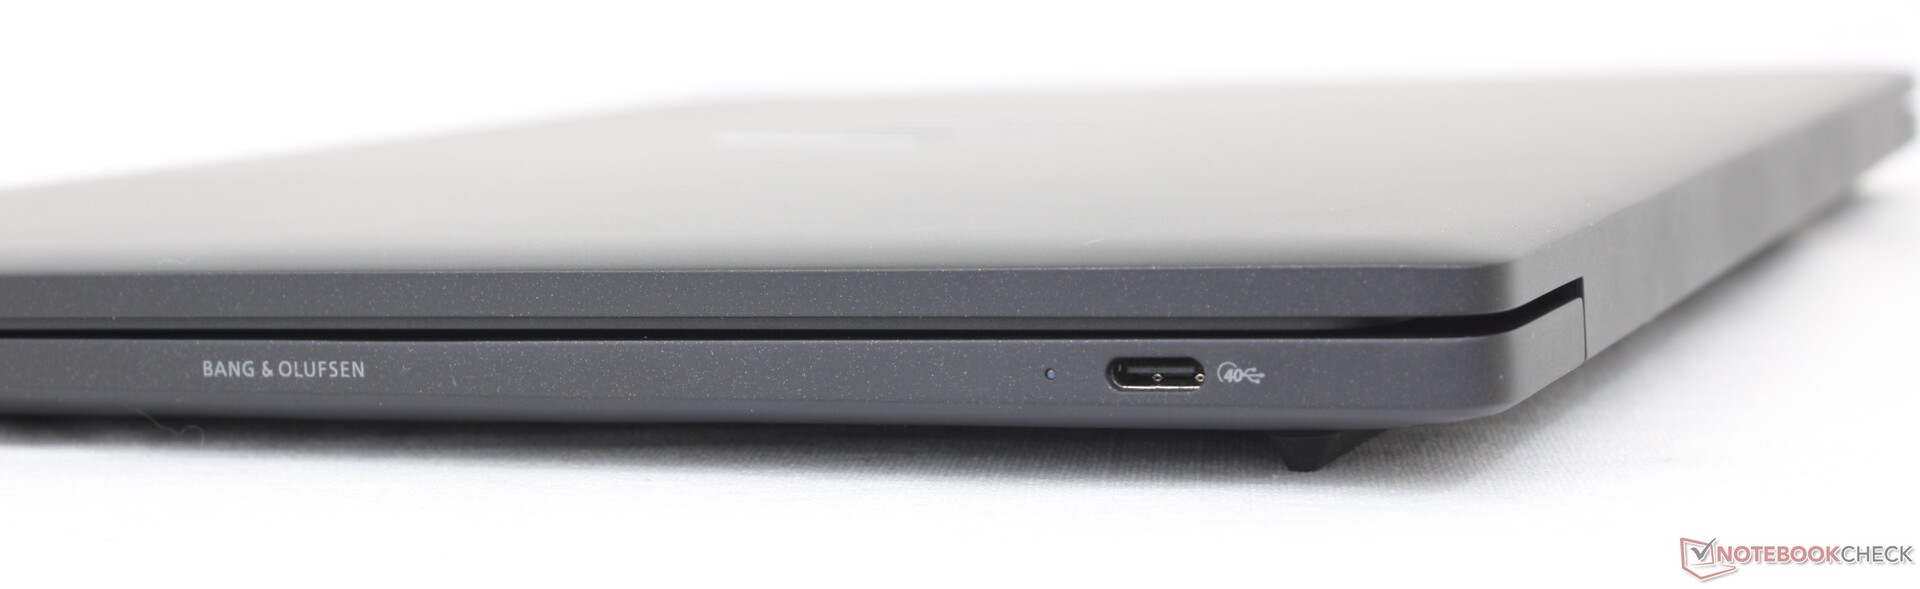
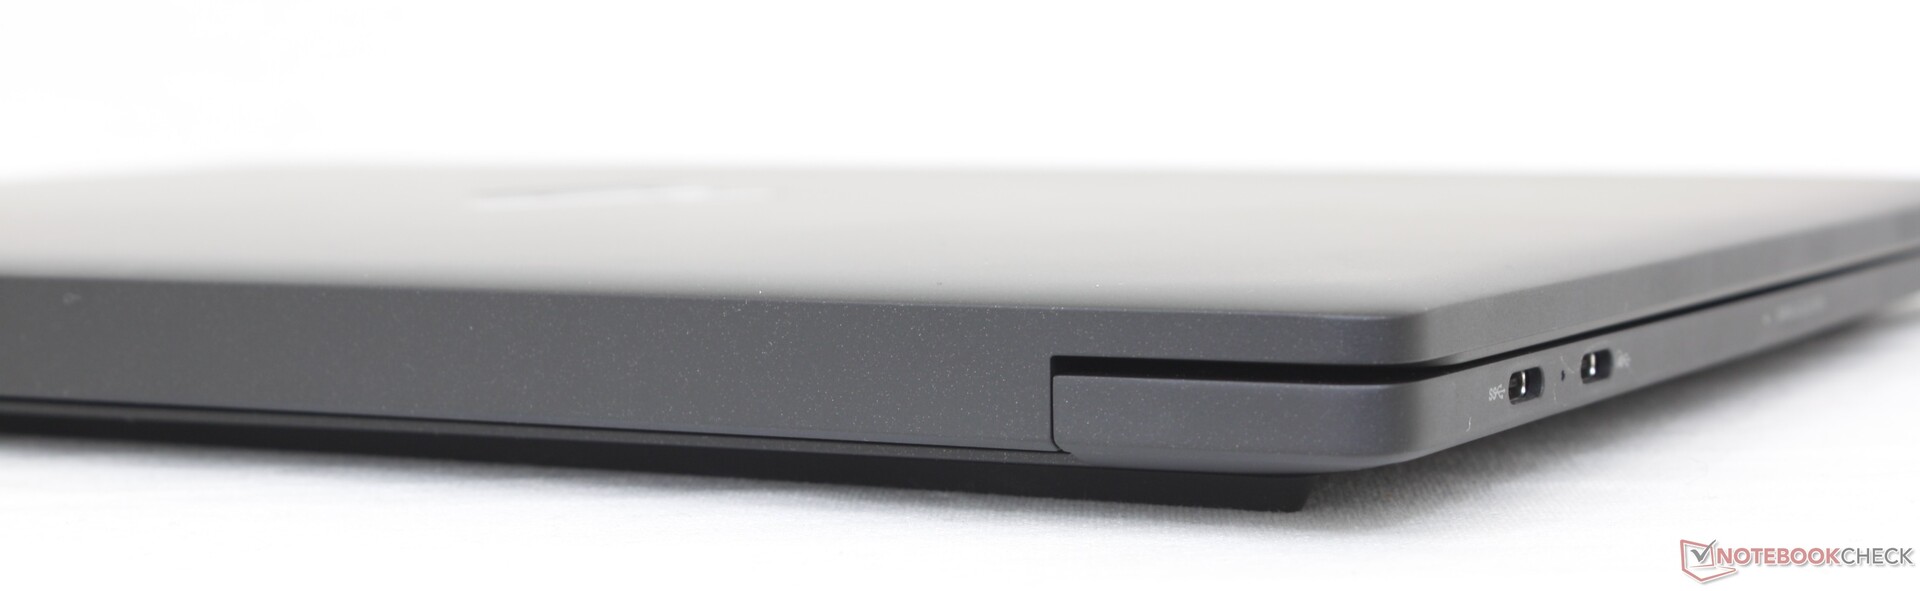
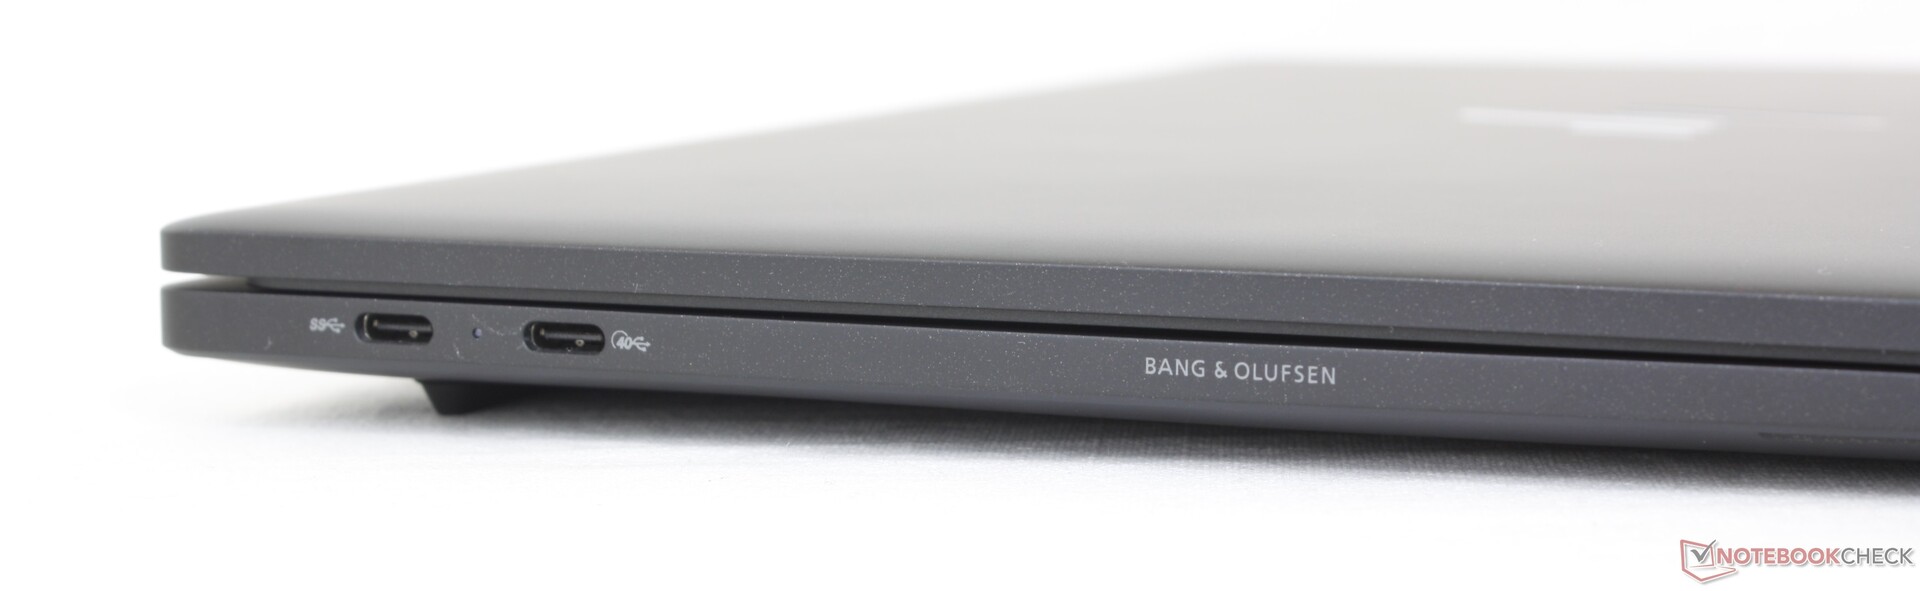
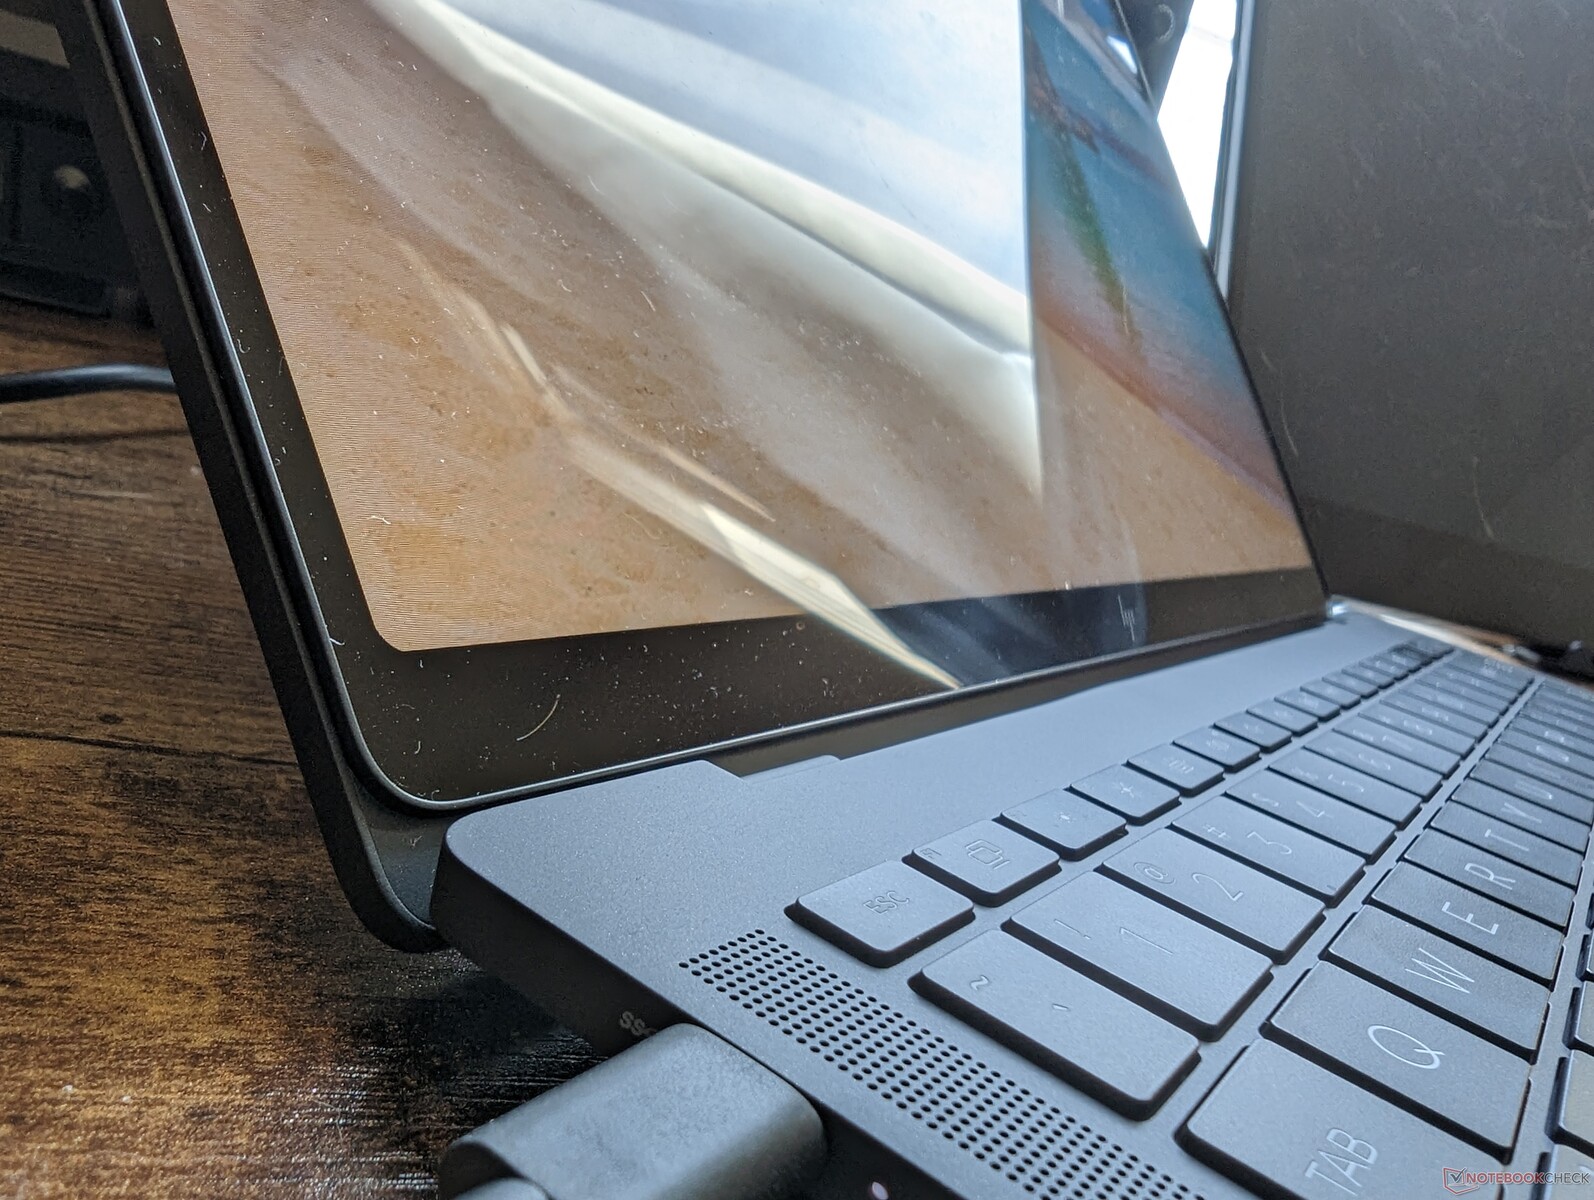
Anschlussausstattung - Thunderbolt 3 ist da!
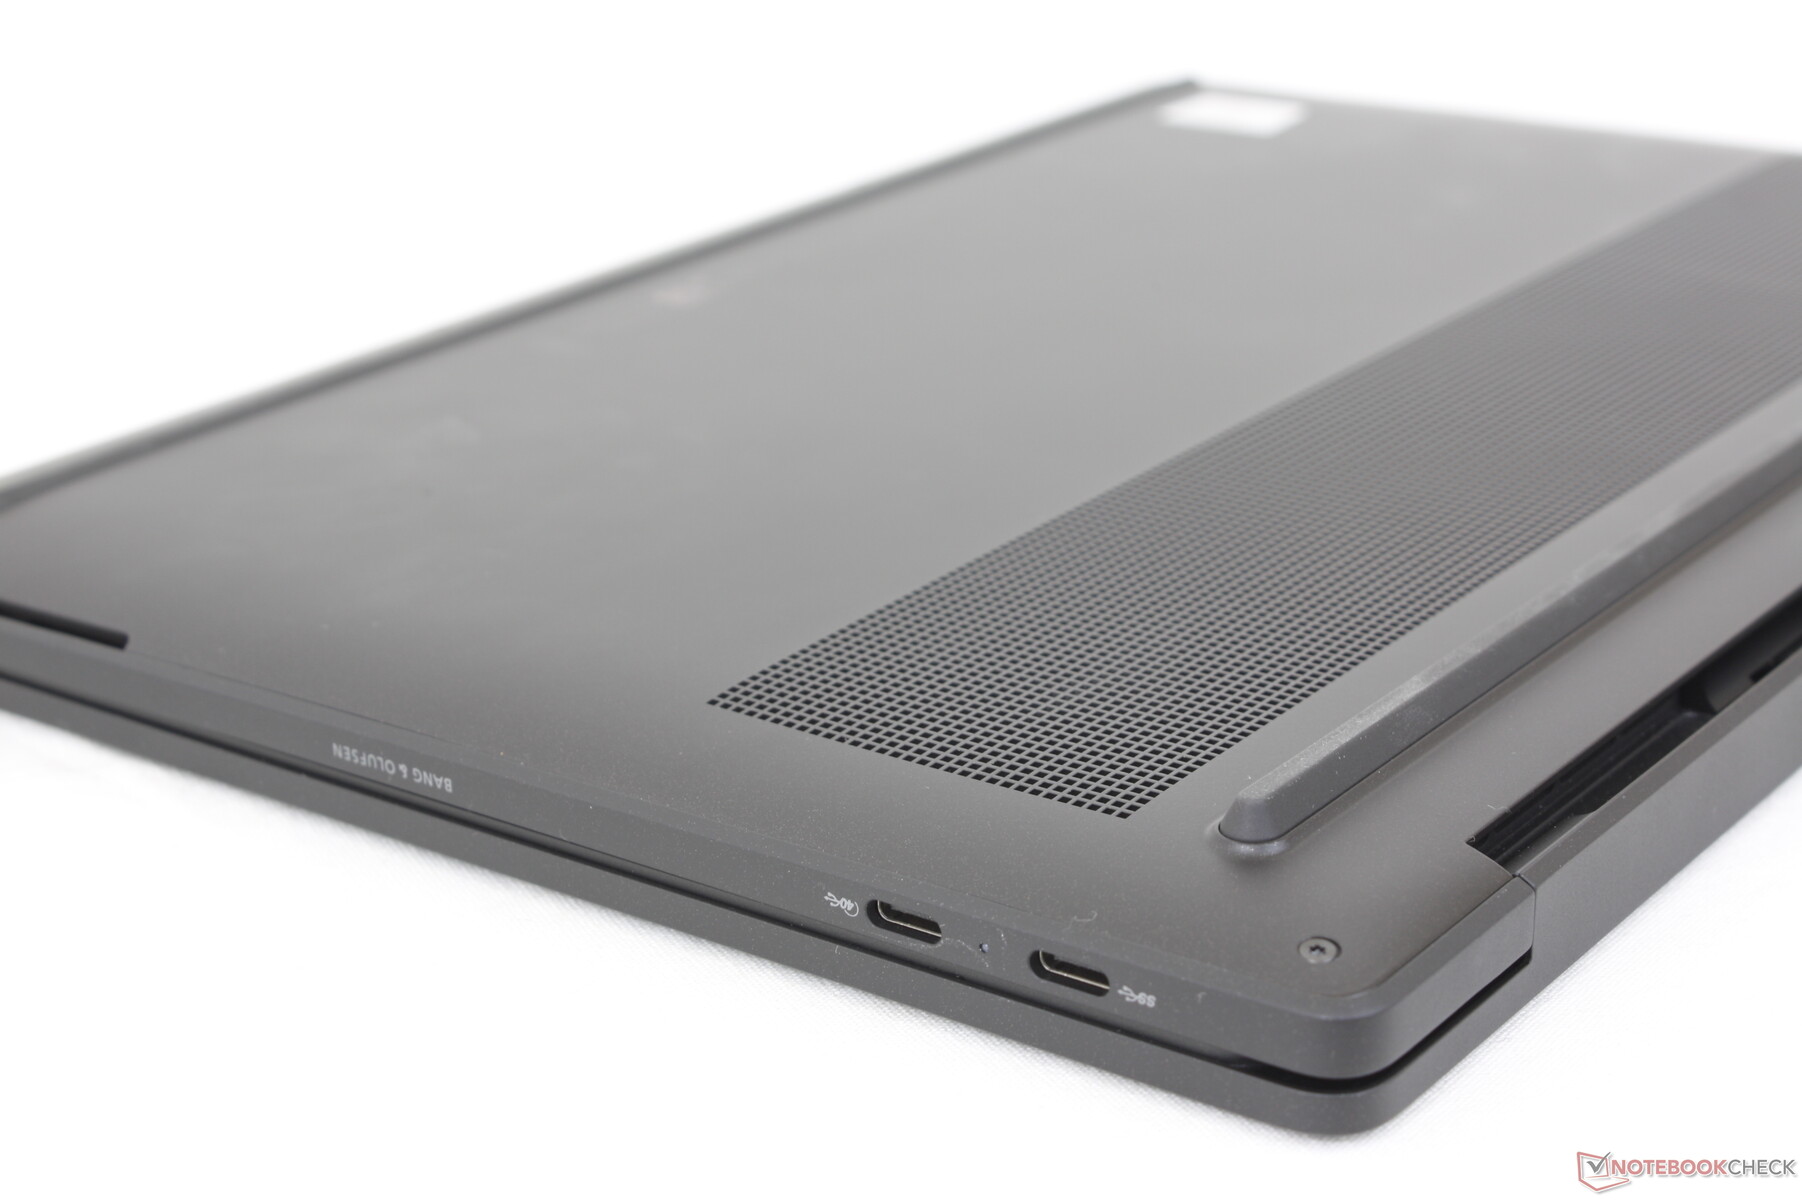
Die integrierten Anschlüsse sind auf nur drei USB-C-Ports beschränkt. Zwei der Ports unterstützen USB4 und Thunderbolt 3 für Geschwindigkeiten von bis zu 40 Gbit/s, während der letzte Anschluss nur USB-C 3.2 für Geschwindigkeiten von bis zu 10 Gbit/s bietet. Alle drei Ports können ansonsten zum Aufladen oder als Videoausgang genutzt werden.
Auf die Frage, warum das Modell keine USB-A-Anschlüsse habe, lautete die Antwort, dass die Entscheidung rein ästhetisch sei; HP sagt, dass ein USB-A-Anschluss eine Ausbuchtung an der Kante des Laptops erfordert hätte, um die Dicke zu gewährleisten. Die Benutzer müssen stattdessen auf Dockingstationen und Adapter zurückgreifen.
Beachten Sie, dass es auch keinen 3,5-mm-Kopfhöreranschluss gibt.
Kommunikation
Das Dragonfly Pro ist eines der wenigen Laptops, die mit dem neuen Qualcomm WCN685x anstelle eines Intel-AX-Moduls ausgestattet sind. Die Übertragungsraten sind hoch und sehr stabil, wenn Wi-Fi 6 oder 6E verwendet wird.
| Networking | |
| iperf3 transmit AXE11000 | |
| Lenovo Yoga 9 14IRP G8 | |
| HP Dragonfly Pro 2023 | |
| iperf3 receive AXE11000 | |
| Lenovo Yoga 9 14IRP G8 | |
| HP Dragonfly Pro 2023 | |
| iperf3 transmit AXE11000 6GHz | |
| Apple MacBook Pro 14 2023 M2 Pro | |
| HP Dragonfly Pro 2023 | |
| HP Spectre x360 13.5 14t-ef000 | |
| HP Elite Dragonfly G3 | |
| iperf3 receive AXE11000 6GHz | |
| Apple MacBook Pro 14 2023 M2 Pro | |
| HP Dragonfly Pro 2023 | |
| HP Elite Dragonfly G3 | |
| HP Spectre x360 13.5 14t-ef000 | |
Webcam
HP Laptops der gehobenen Preisklasse sind in der Regel mit einer der höchstauflösenden Webcams ausgestattet, die für Laptops erhältlich sind. Das Dragonfly Pro setzt diesen Trend mit seinem 5-MP-Sensor fort, der für ein deutlich schärferes Bild sorgt.
Zum Schutz der Privatsphäre gibt es einen elektronischen Webcam-Verschluss anstelle eines physischen Schiebereglers. Wenn man den elektronischen Verschluss betätigt, wird die Webcam nicht wie beim Spectre mit einem undurchsichtigen weißen Film überzogen.
IR kommt standardmäßig als Hello Unterstützung.


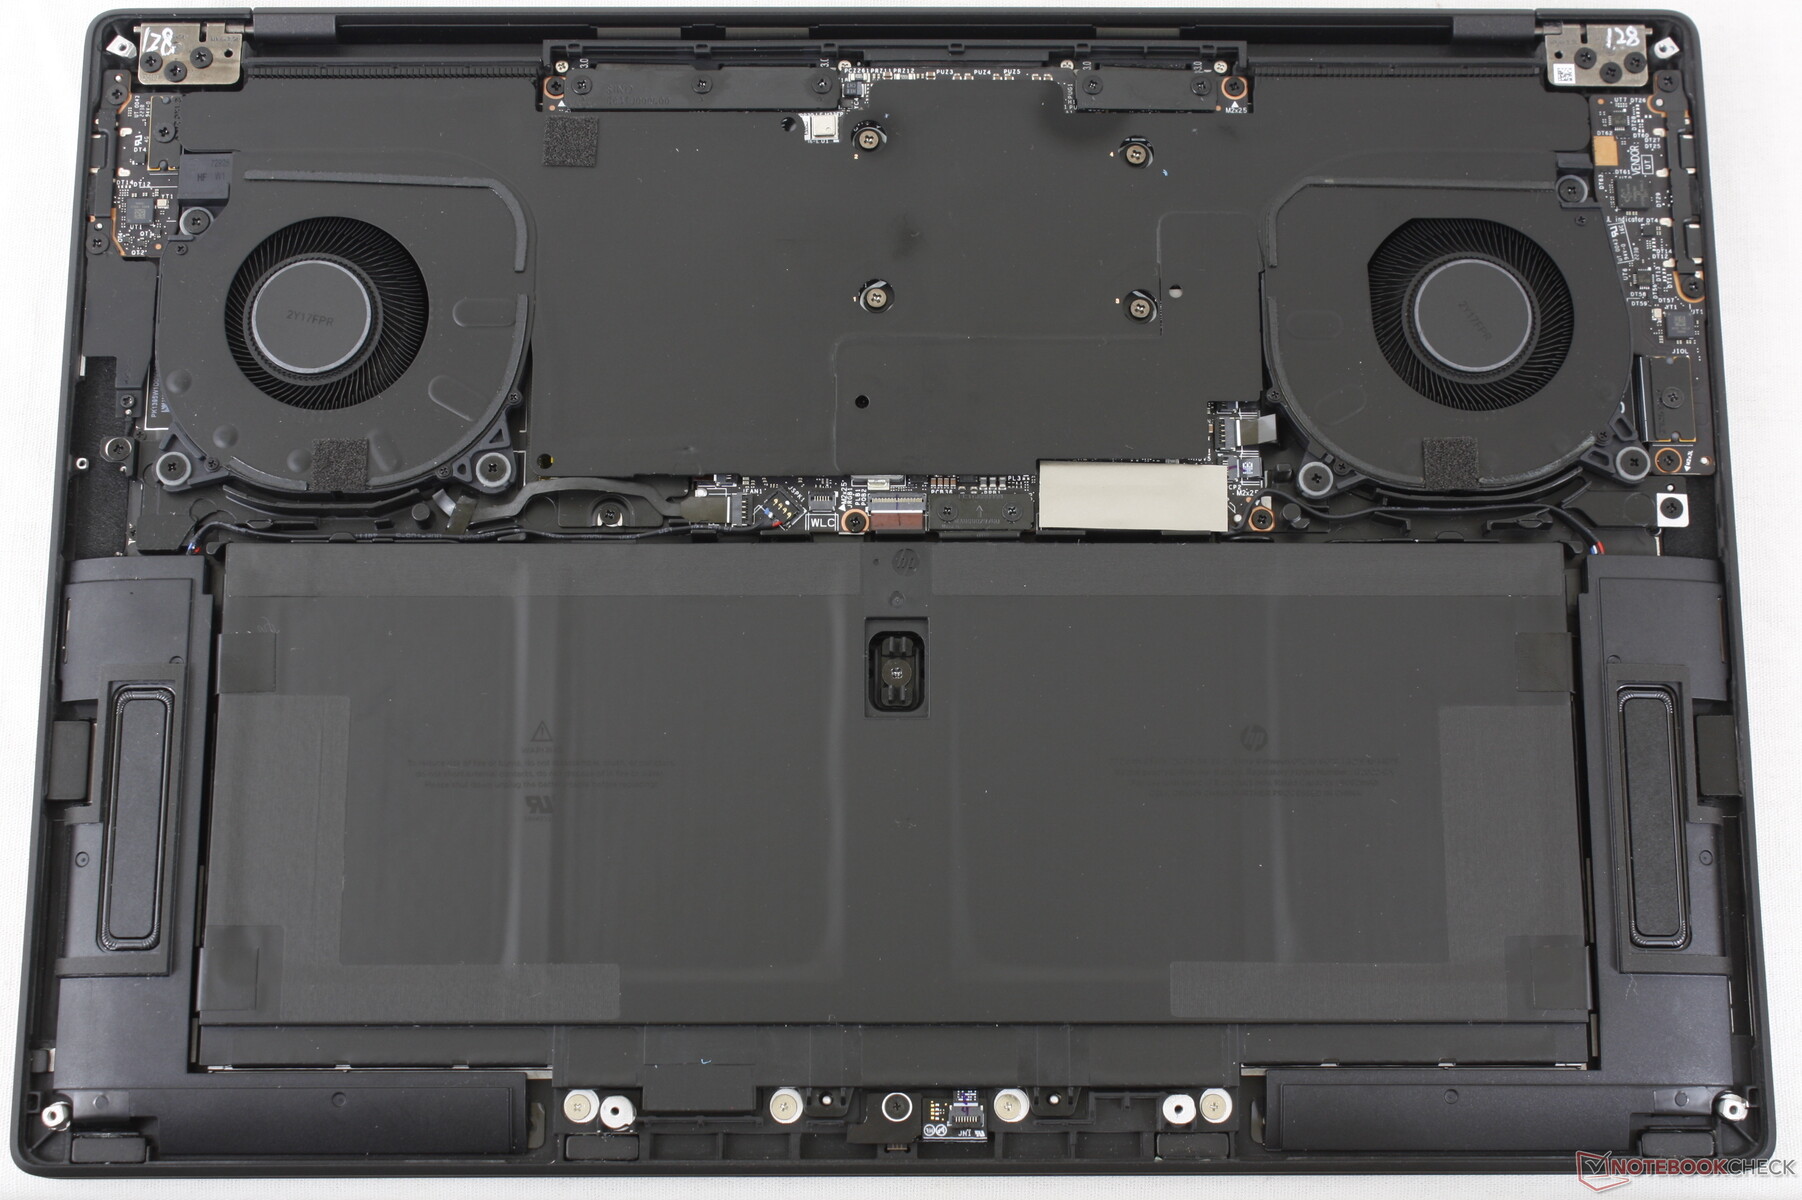
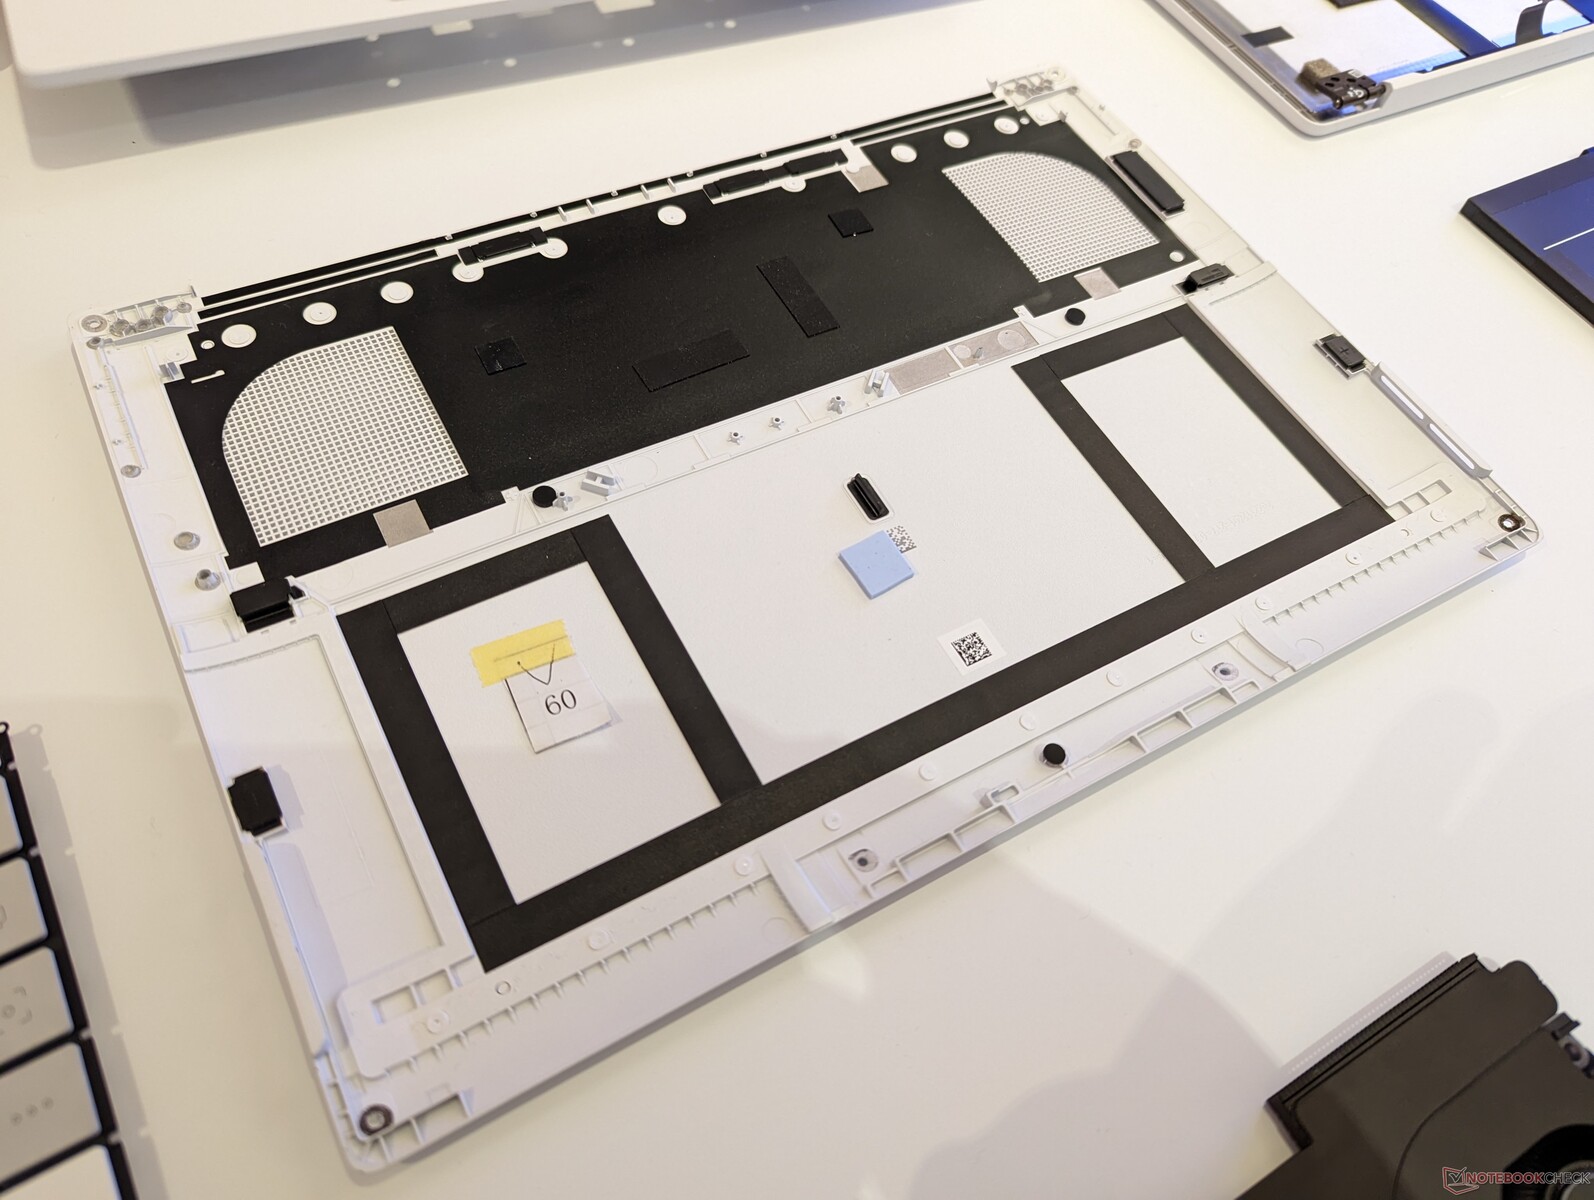
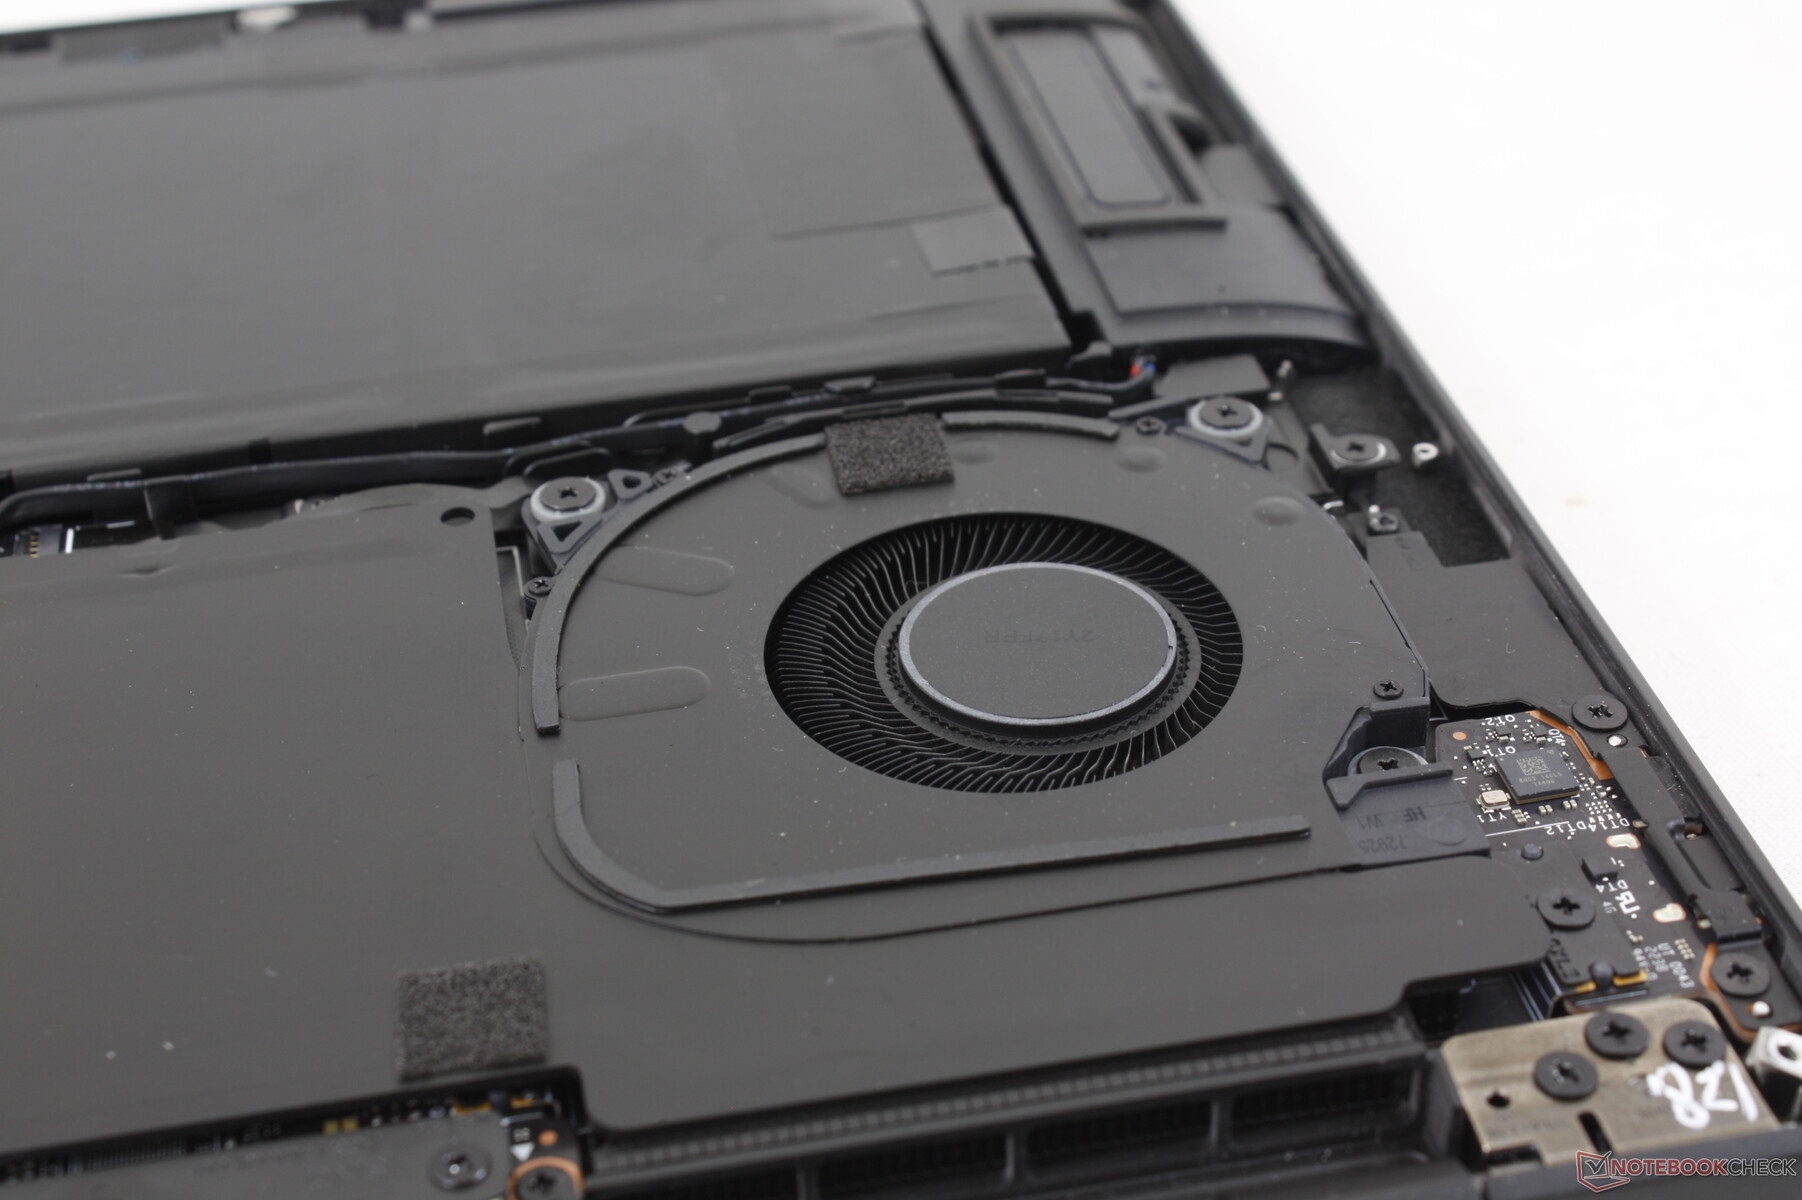
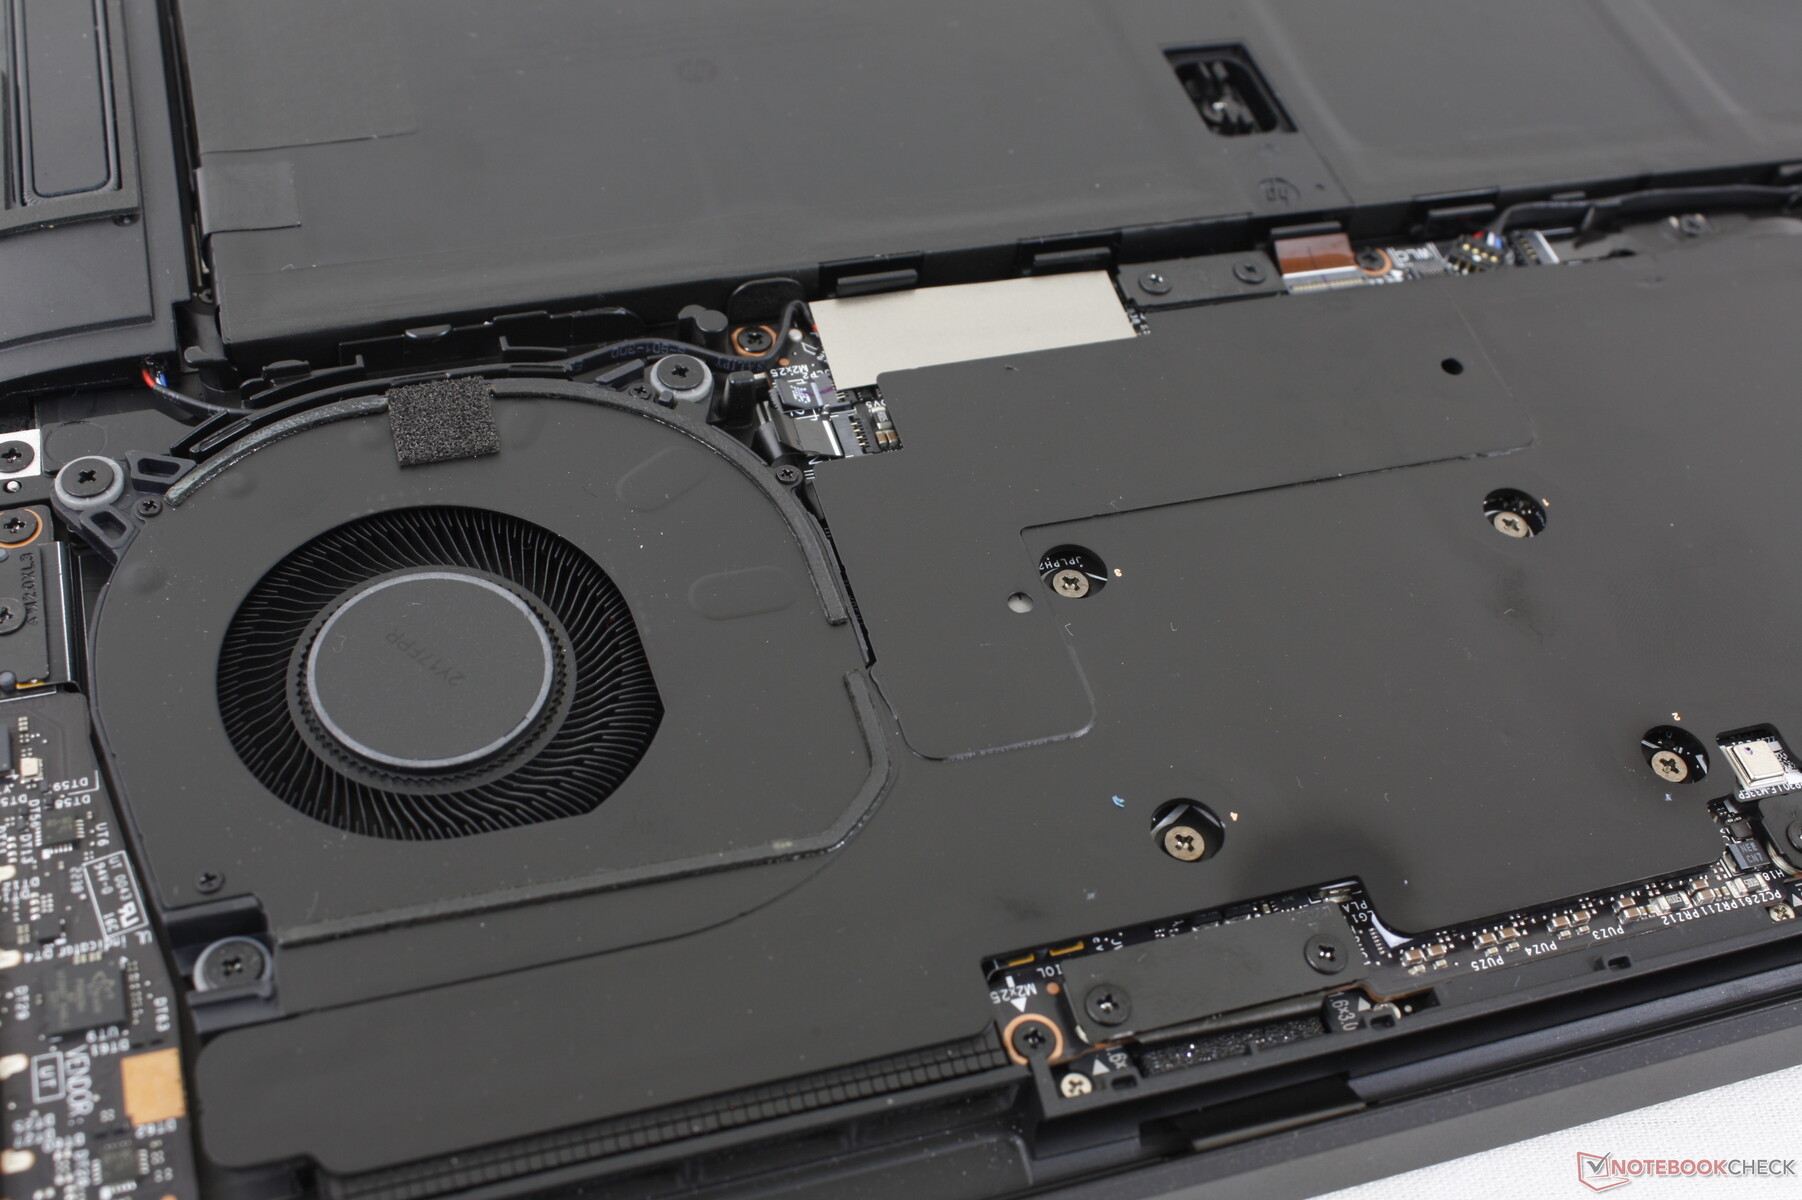
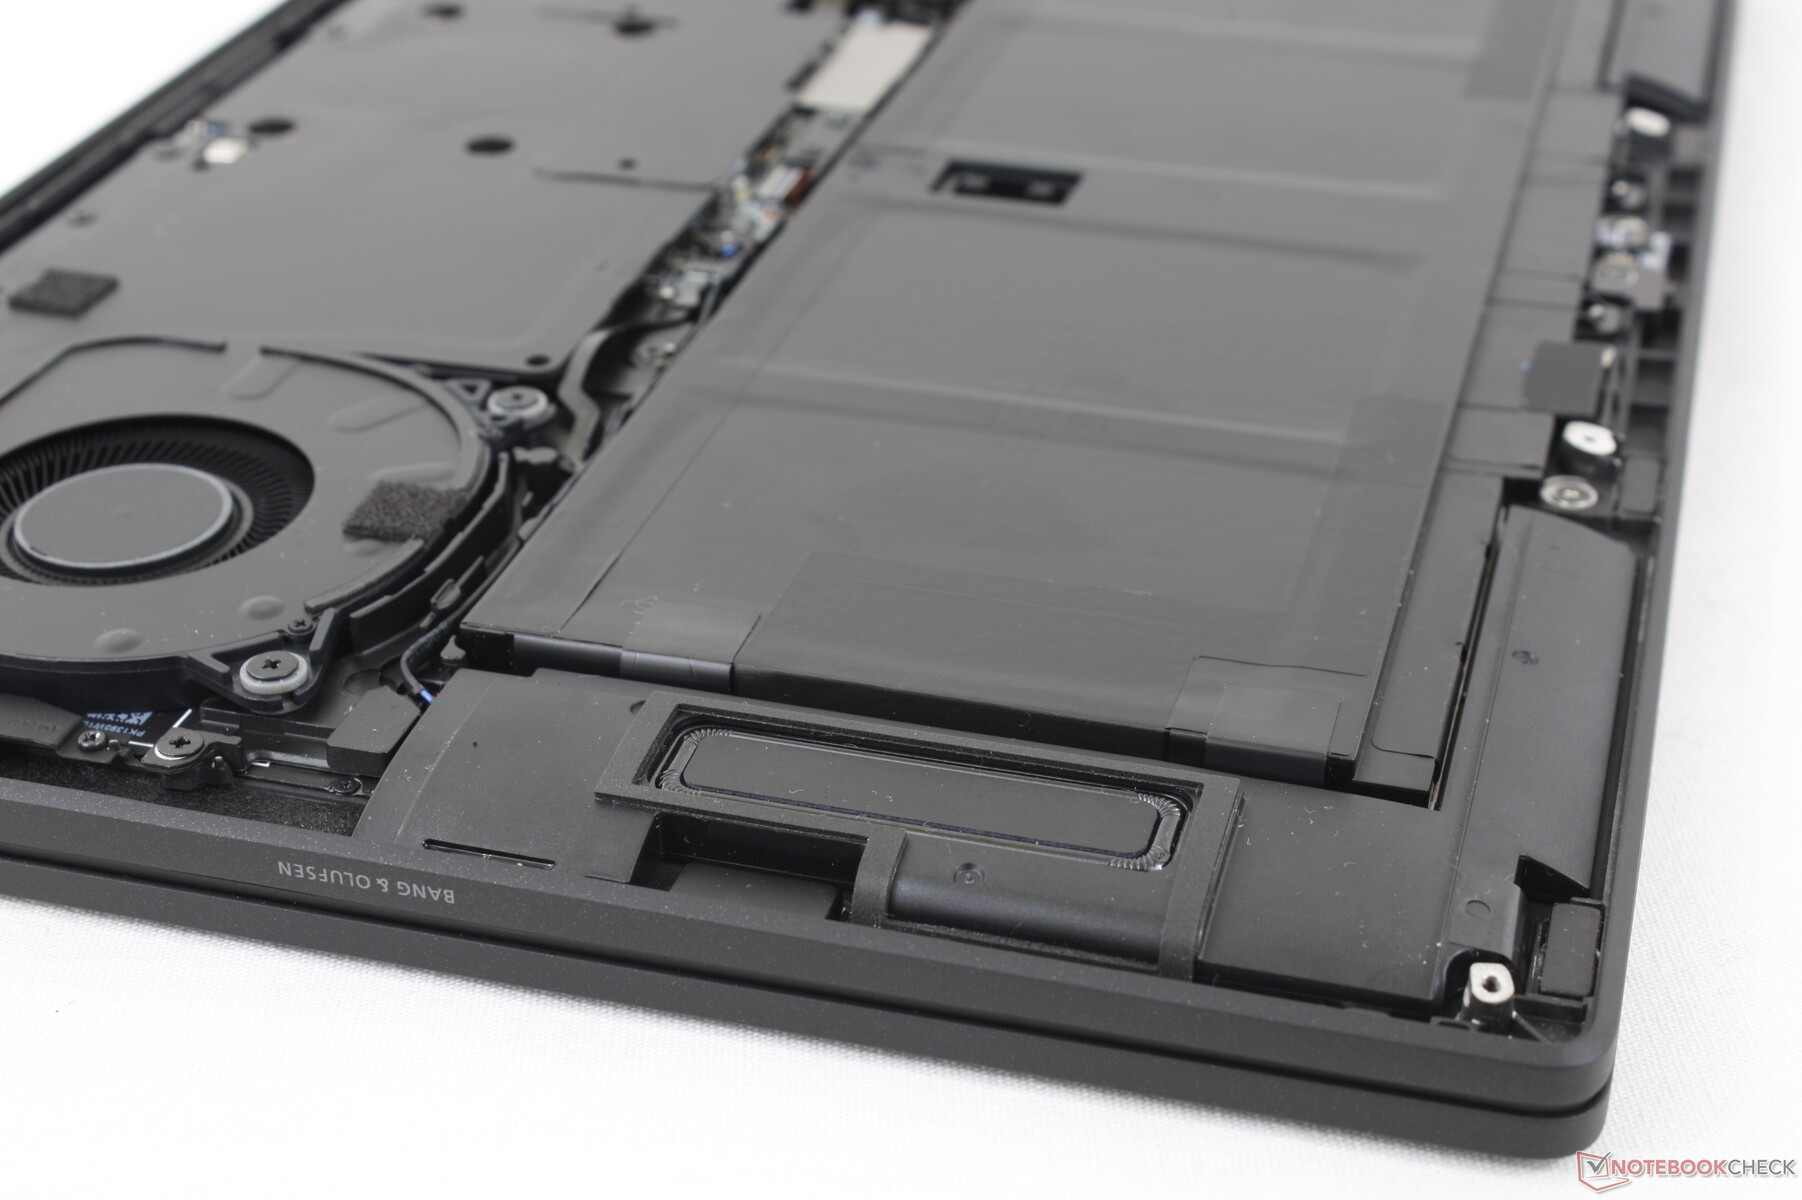
Wartung
Die Wartungsfreundlichkeit des Systems scheint im Widerspruch zu sich selbst zu stehen. Während die Bodenplatte mit einem T5-Torx-Schlüssel sehr einfach zu entfernen ist, kann im Inneren nichts aufgerüstet werden, da die RAM-, SSD- und WLAN-Module laut HP alle verlötet sind. Lediglich der Hauptakku ist bei Bedarf leicht zu wechseln. Im Gegensatz dazu sind die SSD- und WLAN-Module im Elite Dragonfly G3 oder Spectre x360 13.5 leicht austauschbar.

Zubehör und Garantie
In der Verpackung befinden sich außer dem Netzgerät und den Unterlagen keine weiteren Extras. Es gilt die übliche einjährige beschränkte Herstellergarantie.
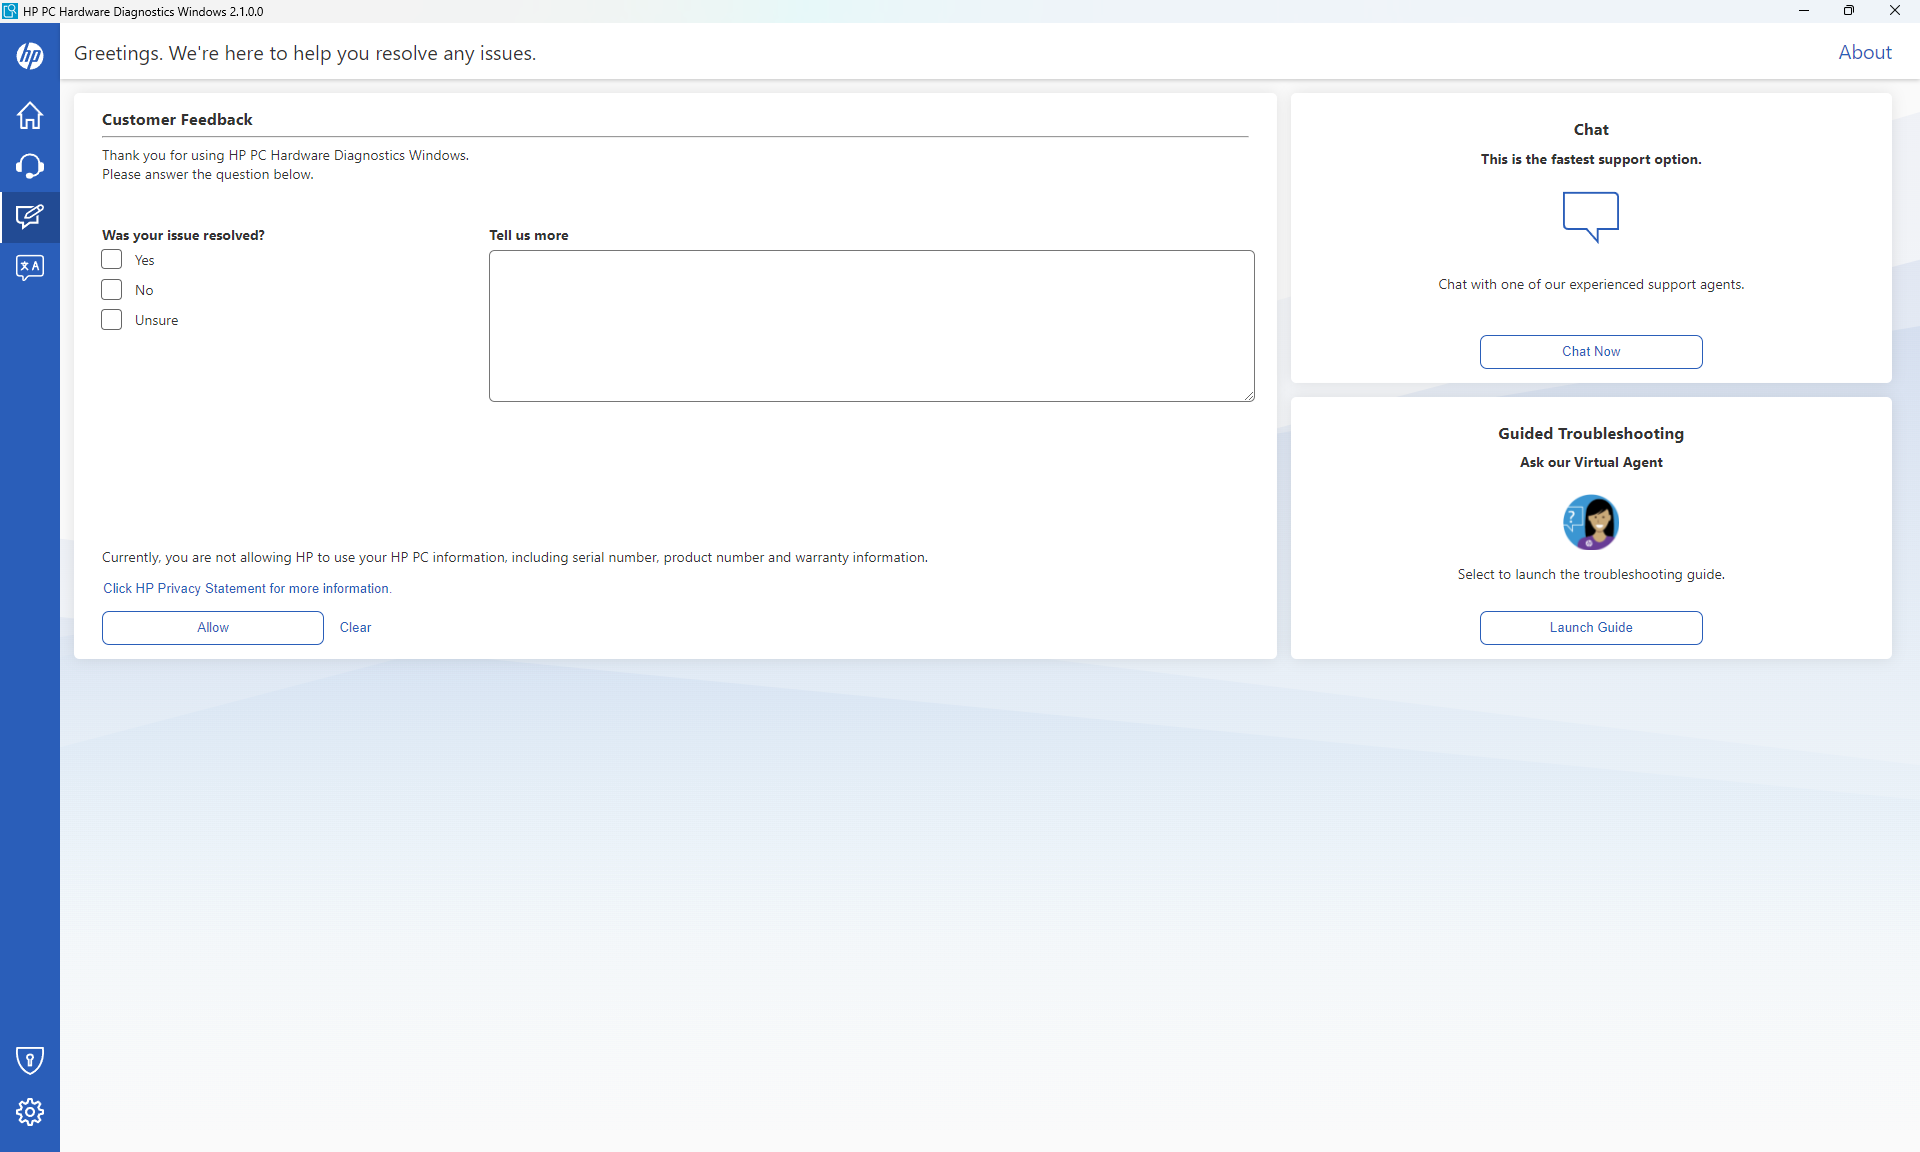
Neu in der Serie ist der 24/7-Live-Chat-Support, der in der Basisgarantie enthalten ist. Das Chat-Programm ist in die MyHP Anwendung integriert, so dass es nicht nötig ist, auf HP.com verschiedene Wege zu beschreiten, nur um einen Service-Mitarbeiter zu erreichen. HP verspricht, dass die Agenten auf die Dragonfly-Pro-Serie spezialisiert sein werden, um bei bestimmten Problemen oder Anfragen besser helfen zu können.
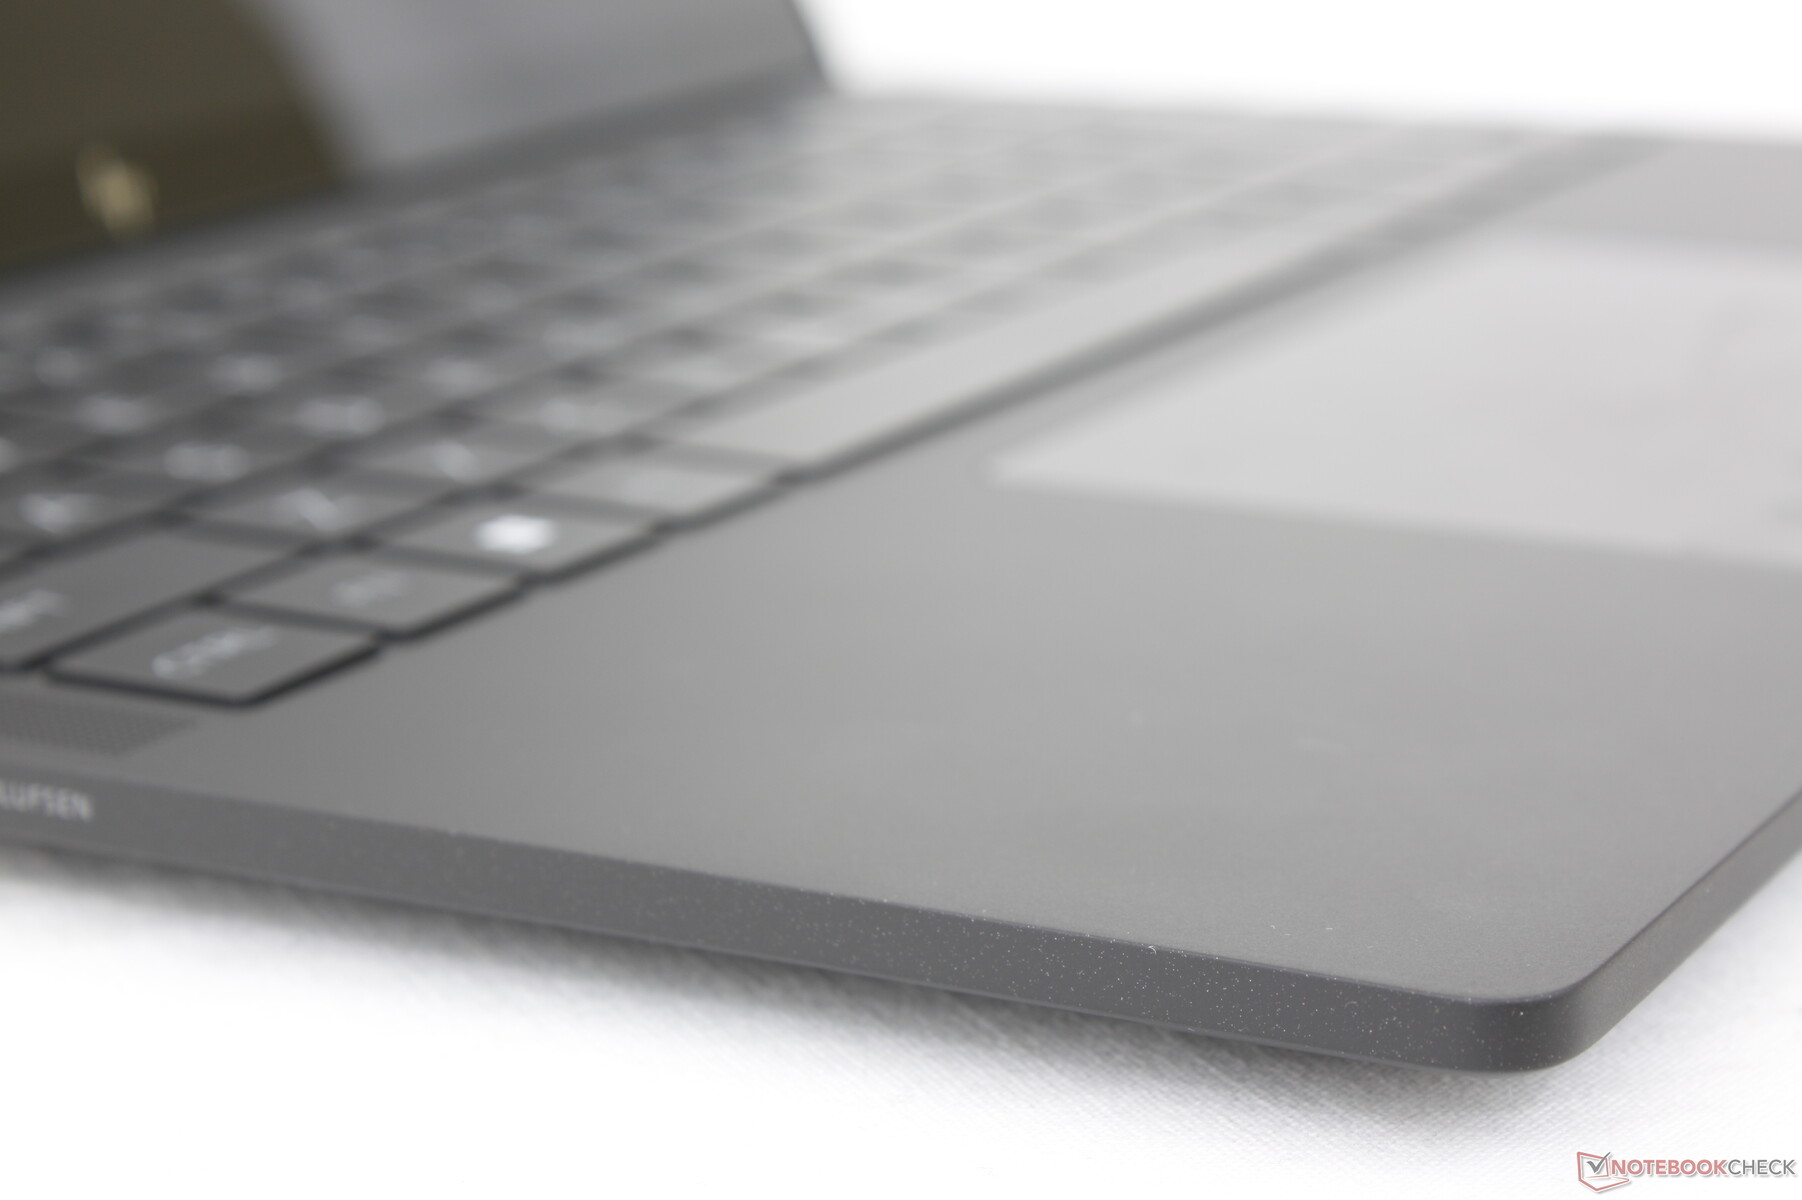
Eingabegeräte
Tastatur
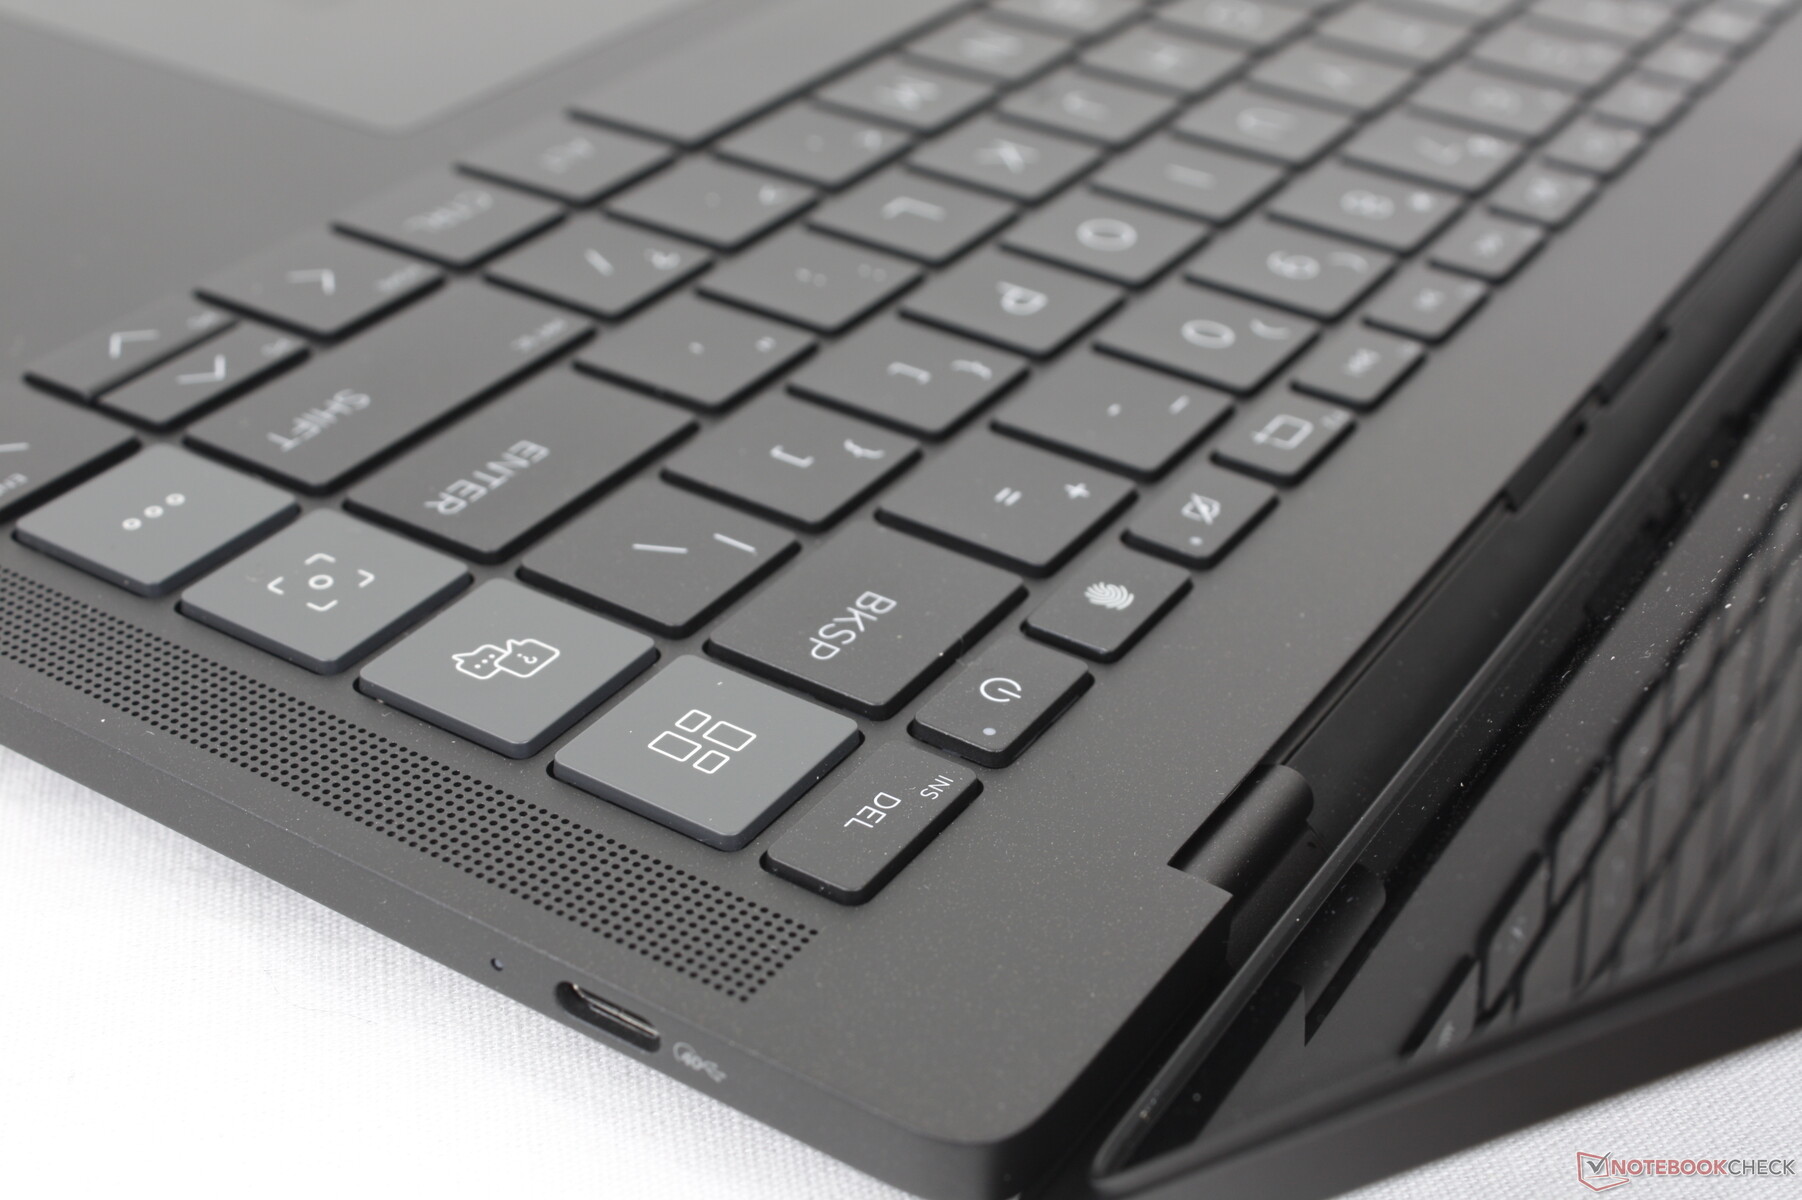
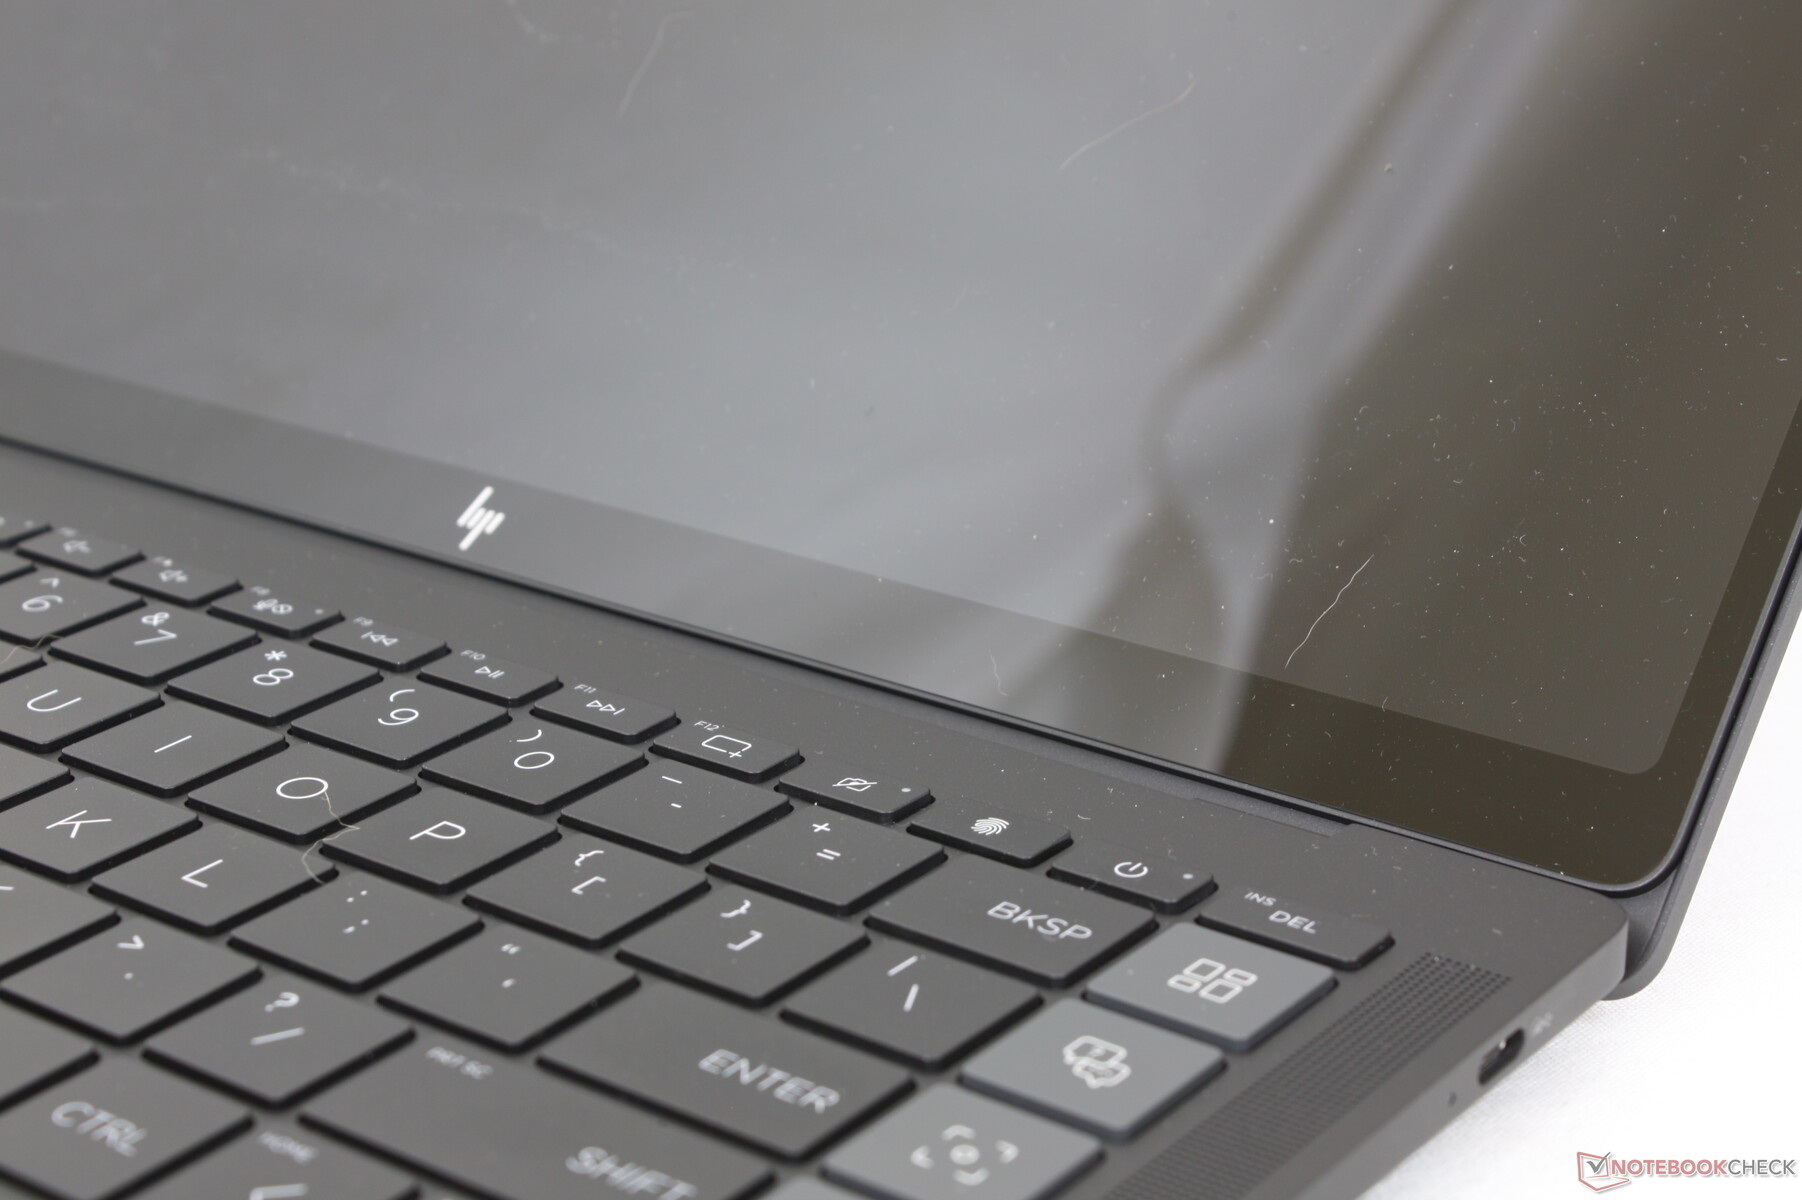
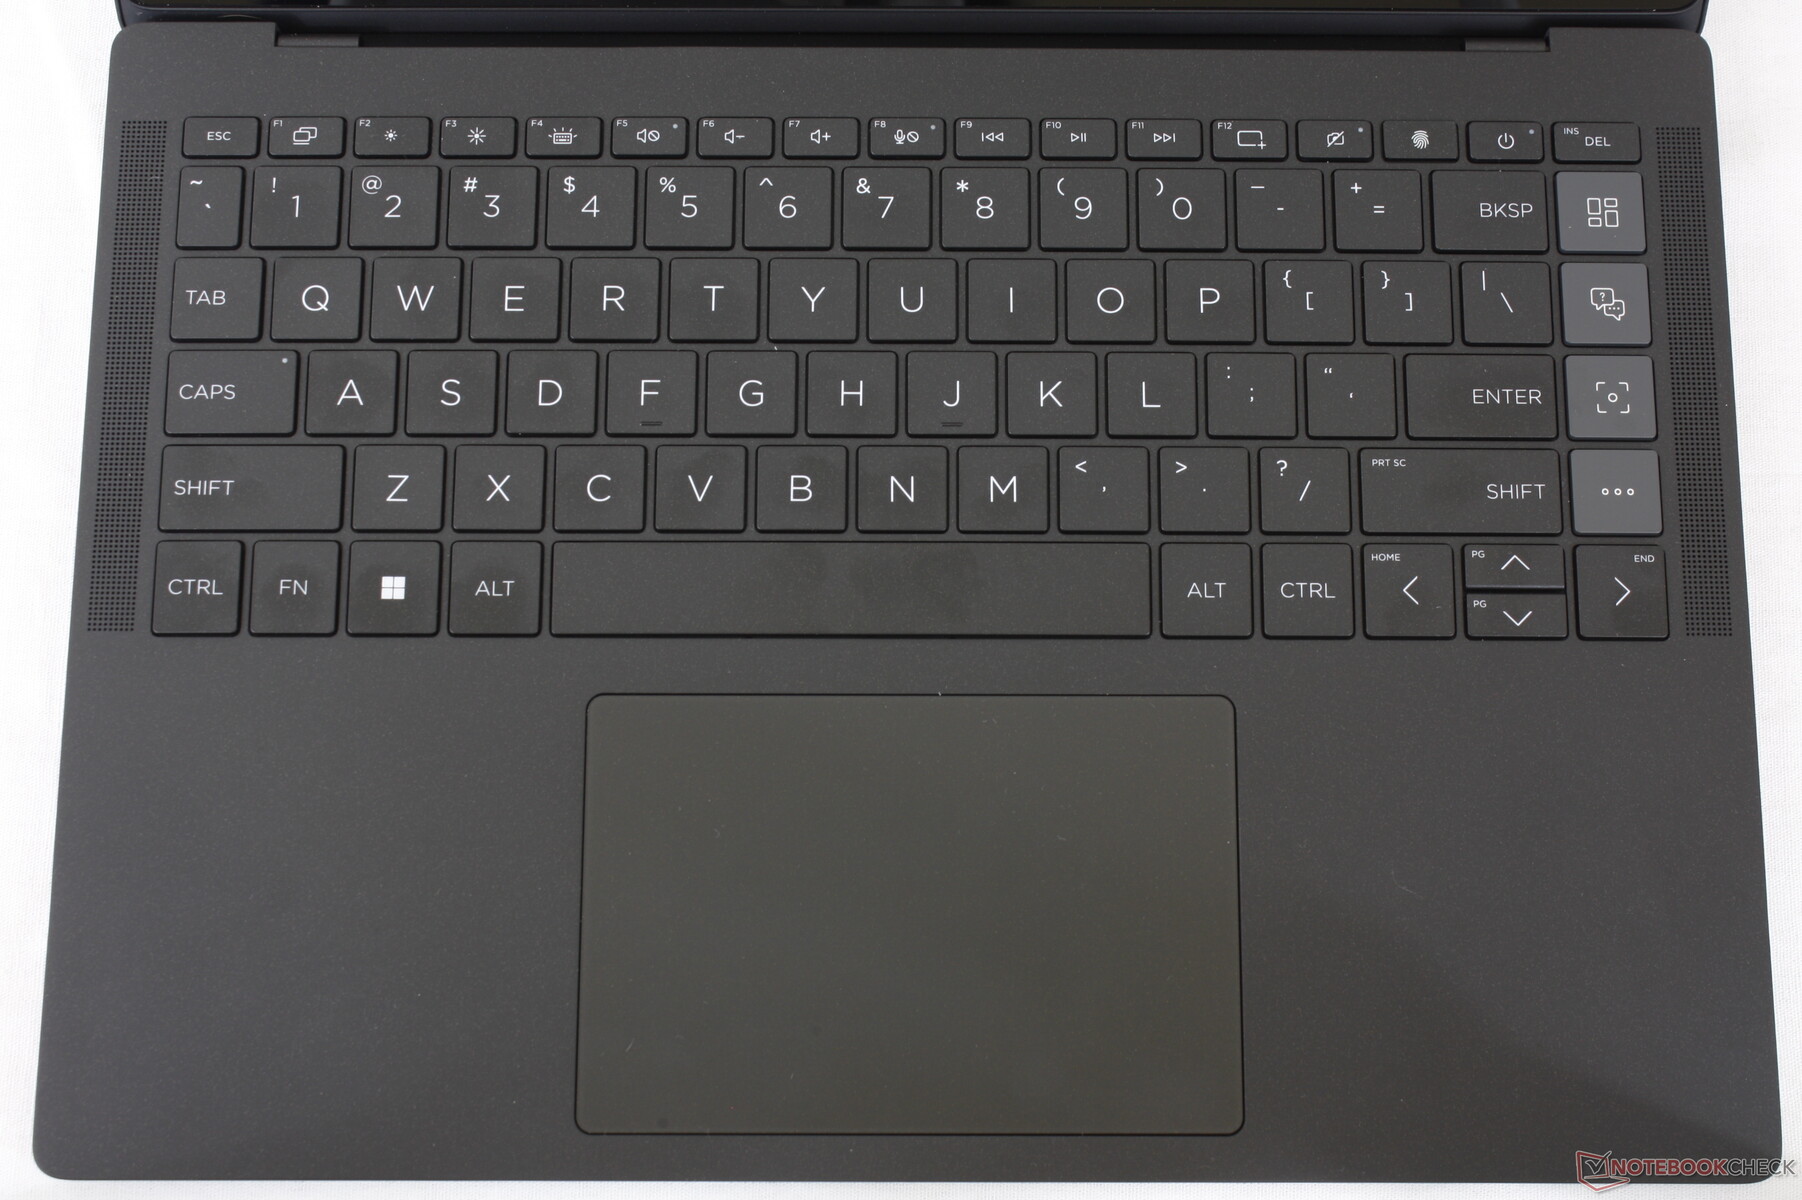
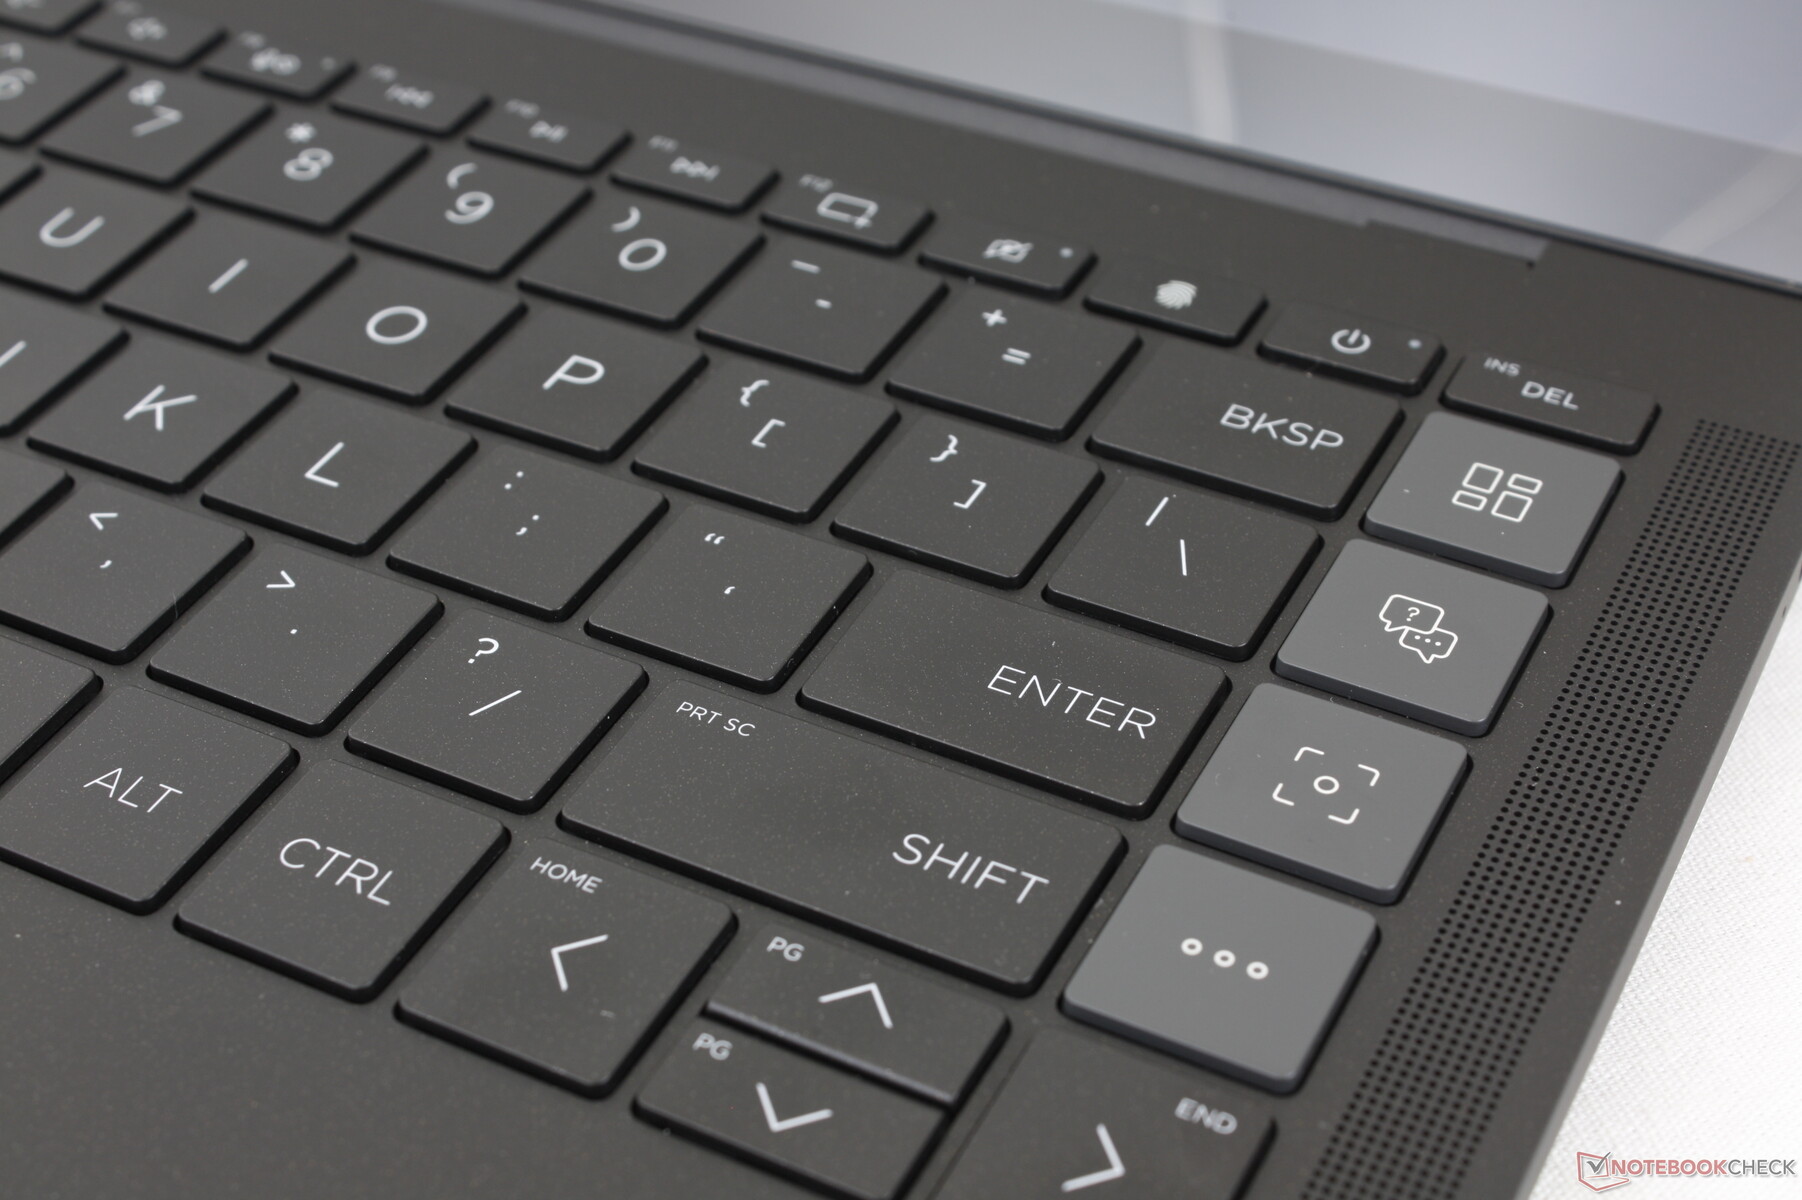
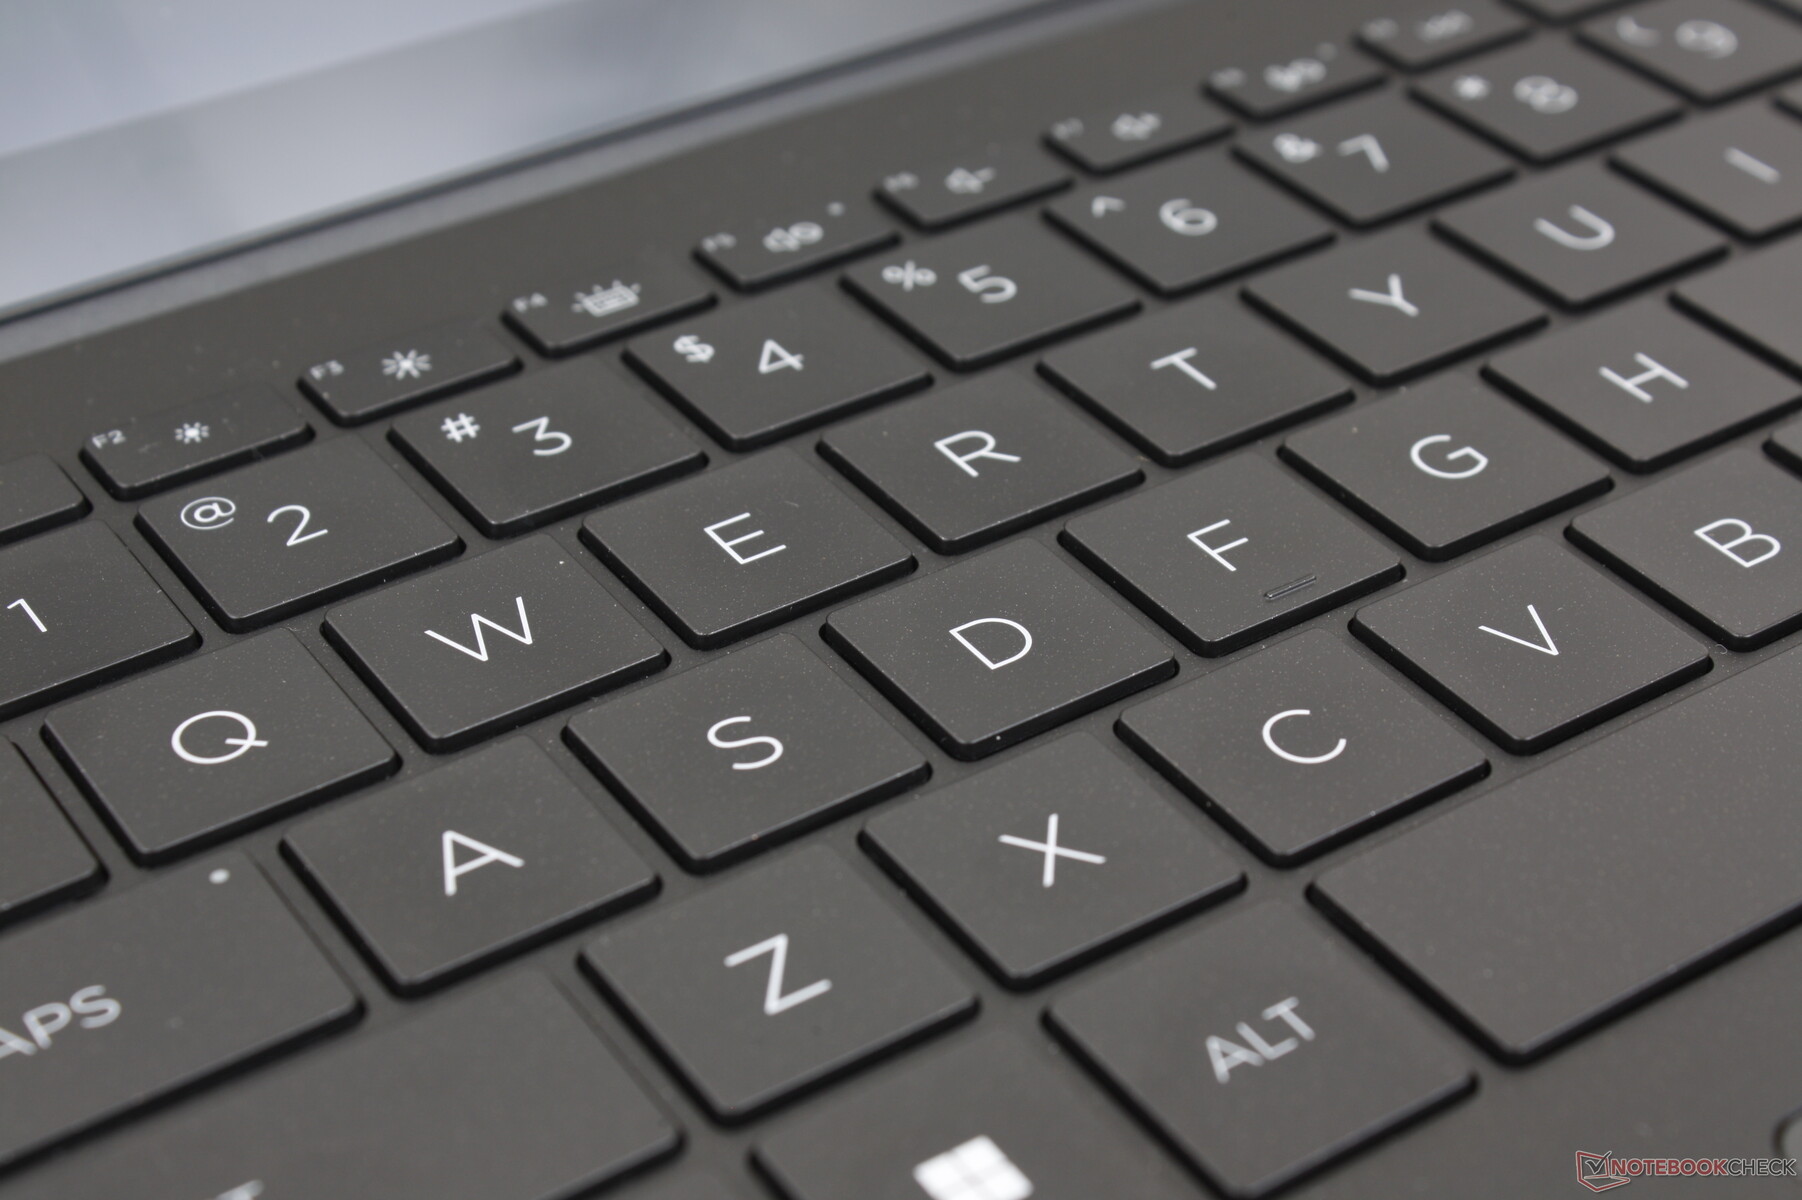
Der Tastenhub und das Feedback fühlen sich etwas flacher und leichter an als bei der Spectre-, EliteBook- oder ThinkPad Serie. Selbst die Leertaste und die Eingabetaste klappern merklich leiser, was einige Nutzer vielleicht zu schätzen wissen.
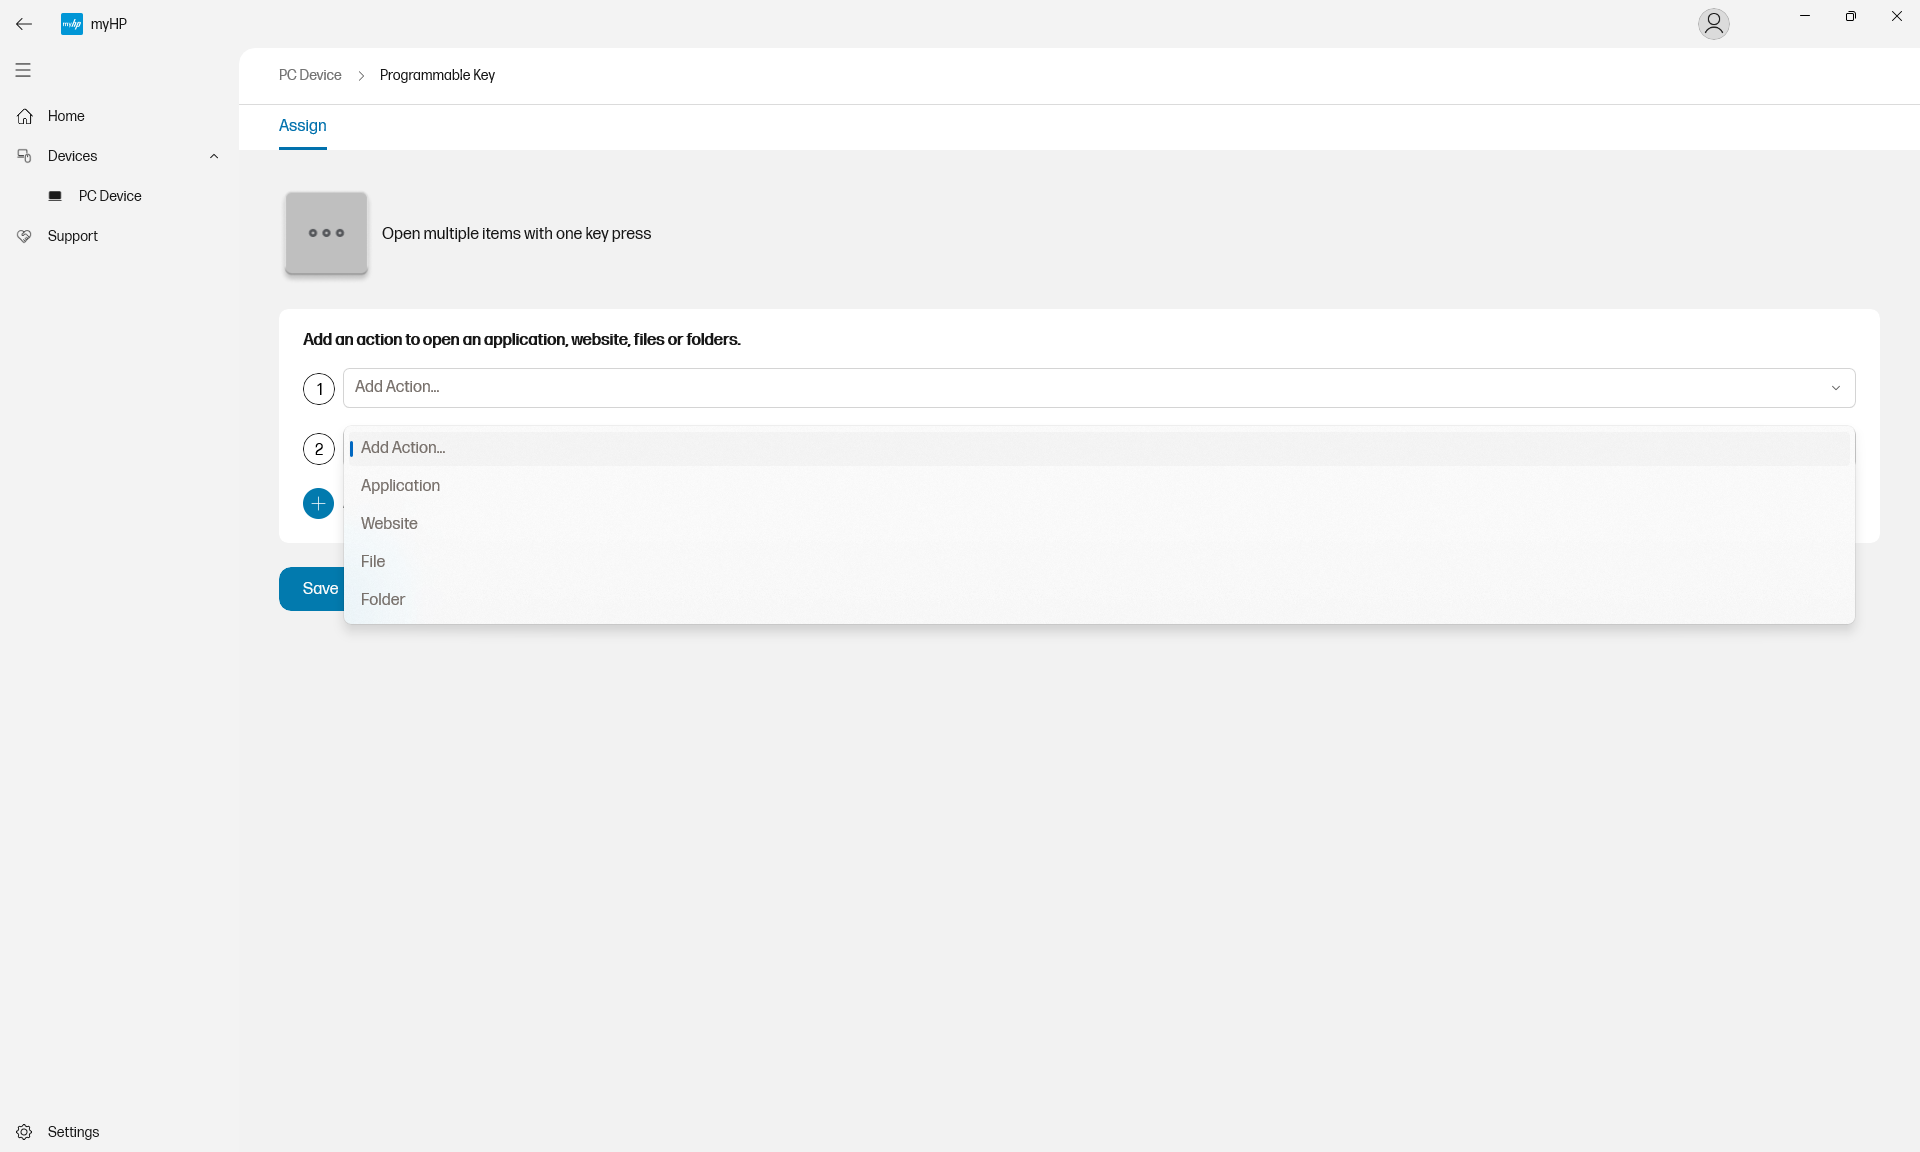
Das vielleicht größte Ärgernis an der Tastatur ist die große Spalte mit Zusatztasten am rechten Rand der Tastatur. Dabei handelt es sich um MyHP Schnelltasten für die Steuerung der Webcam und die Laptop-Unterstützung. Das Problem ist jedoch, dass diese selten genutzten Tasten wertvollen Platz für die Rücktaste, den Schrägstrich und die Eingabetaste beanspruchen, die nun alle kürzer und enger sind. So kam es häufig vor, dass wir MyHP versehentlich starteten, obwohl wir eigentlich die Eingabetaste oder die Rücktaste drücken wollten.
Touchpad
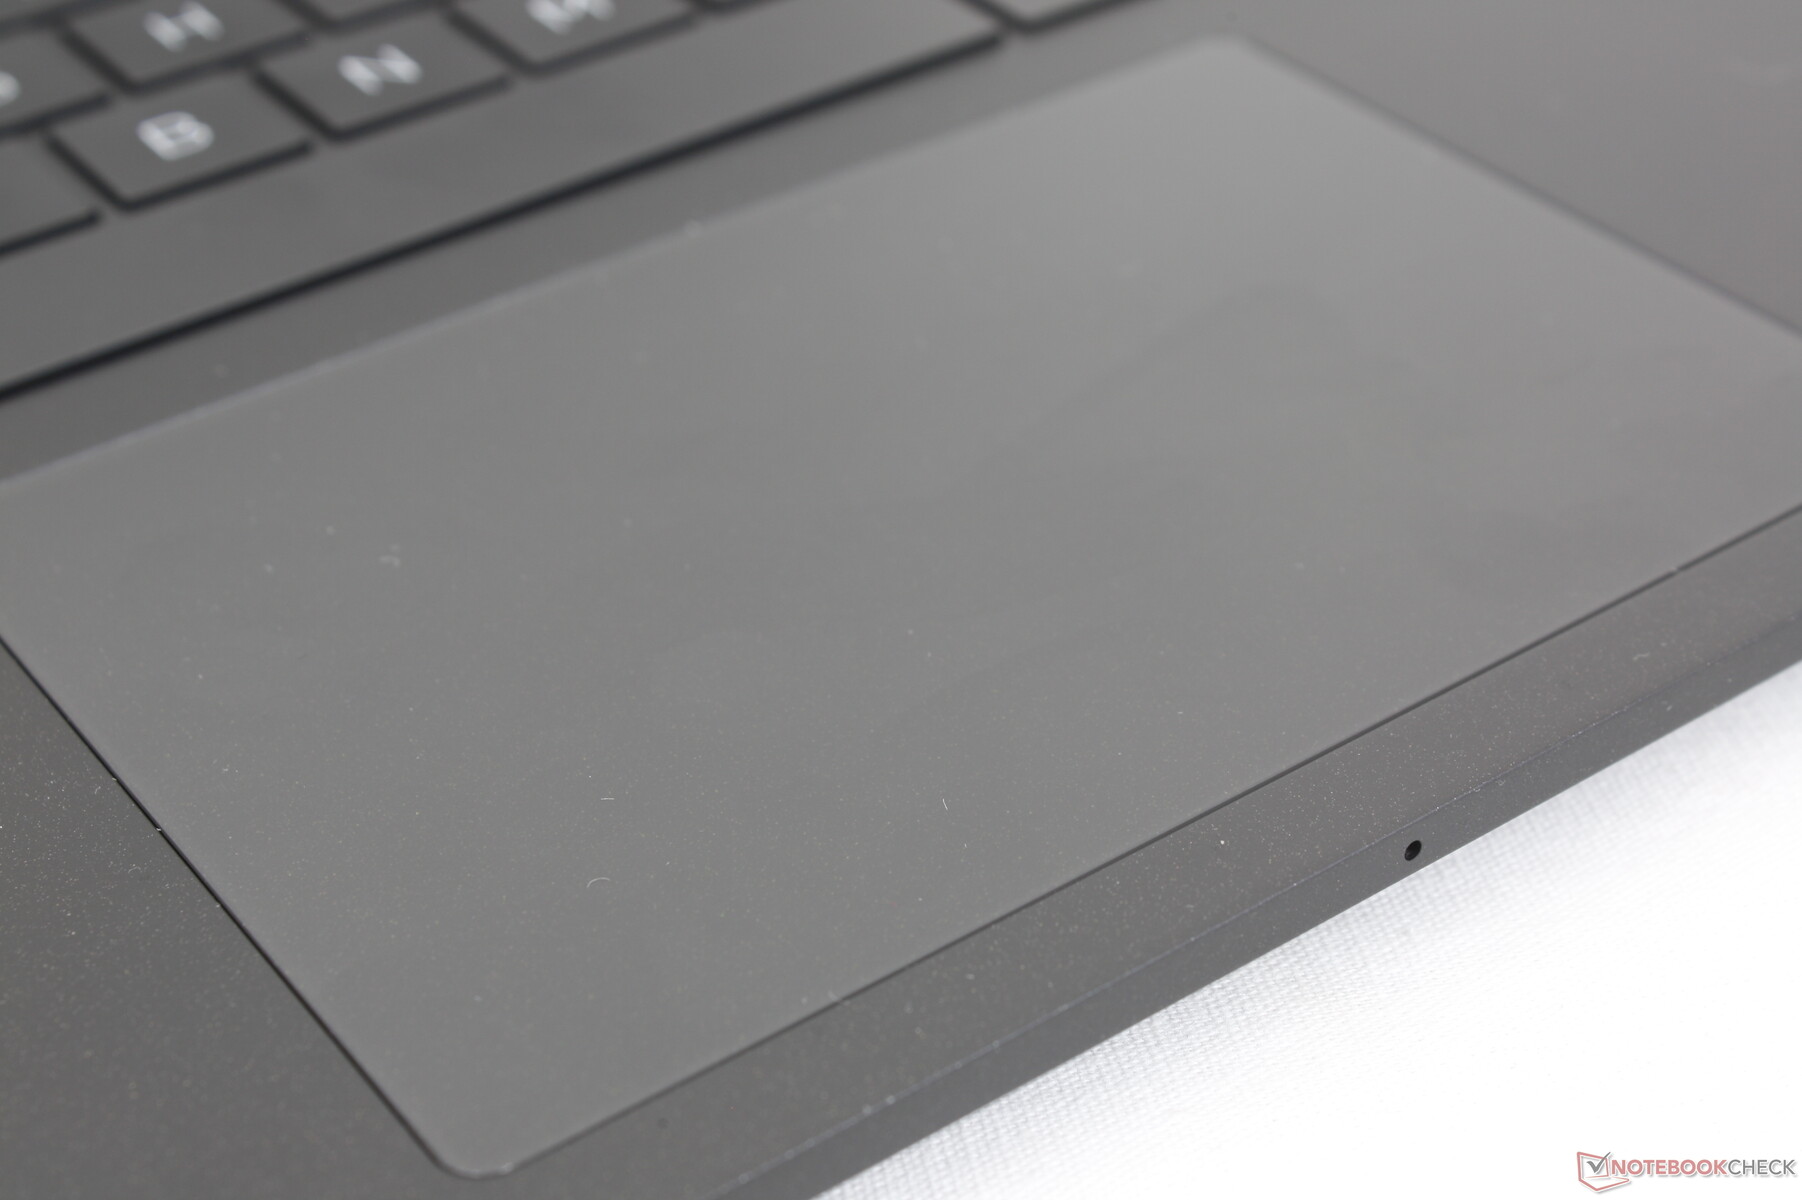
Das Clickpad hat genau dieselbe Größe wie das des letztjährigen Dragonfly G3 13.5 mit 12 x 8 cm. Davon abgesehen unterscheidet sich das Clickpad des Dragonfly Pro dadurch, dass es beim Drücken auf die Oberfläche fast völlig geräuschlos ist. Es handelt sich um ein haptisches Trackpad, ähnlich wie bei der MacBook Serie, im Gegensatz zu den Standard-Clickpads der meisten anderen Windows Notebooks. Es ist etwas gewöhnungsbedürftig, aber ein stärkeres Feedback wäre dennoch wünschenswert gewesen. Dell verfolgt bei bestimmten Latitude Modellen einen ähnlichen Ansatz, allerdings mit stärkerem Vibrations-Feedback.
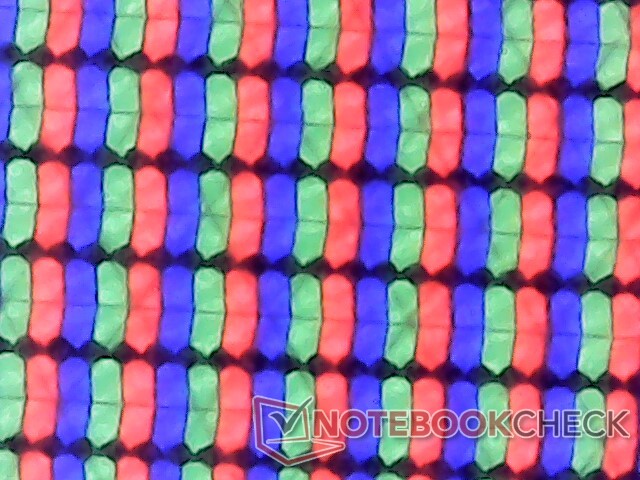
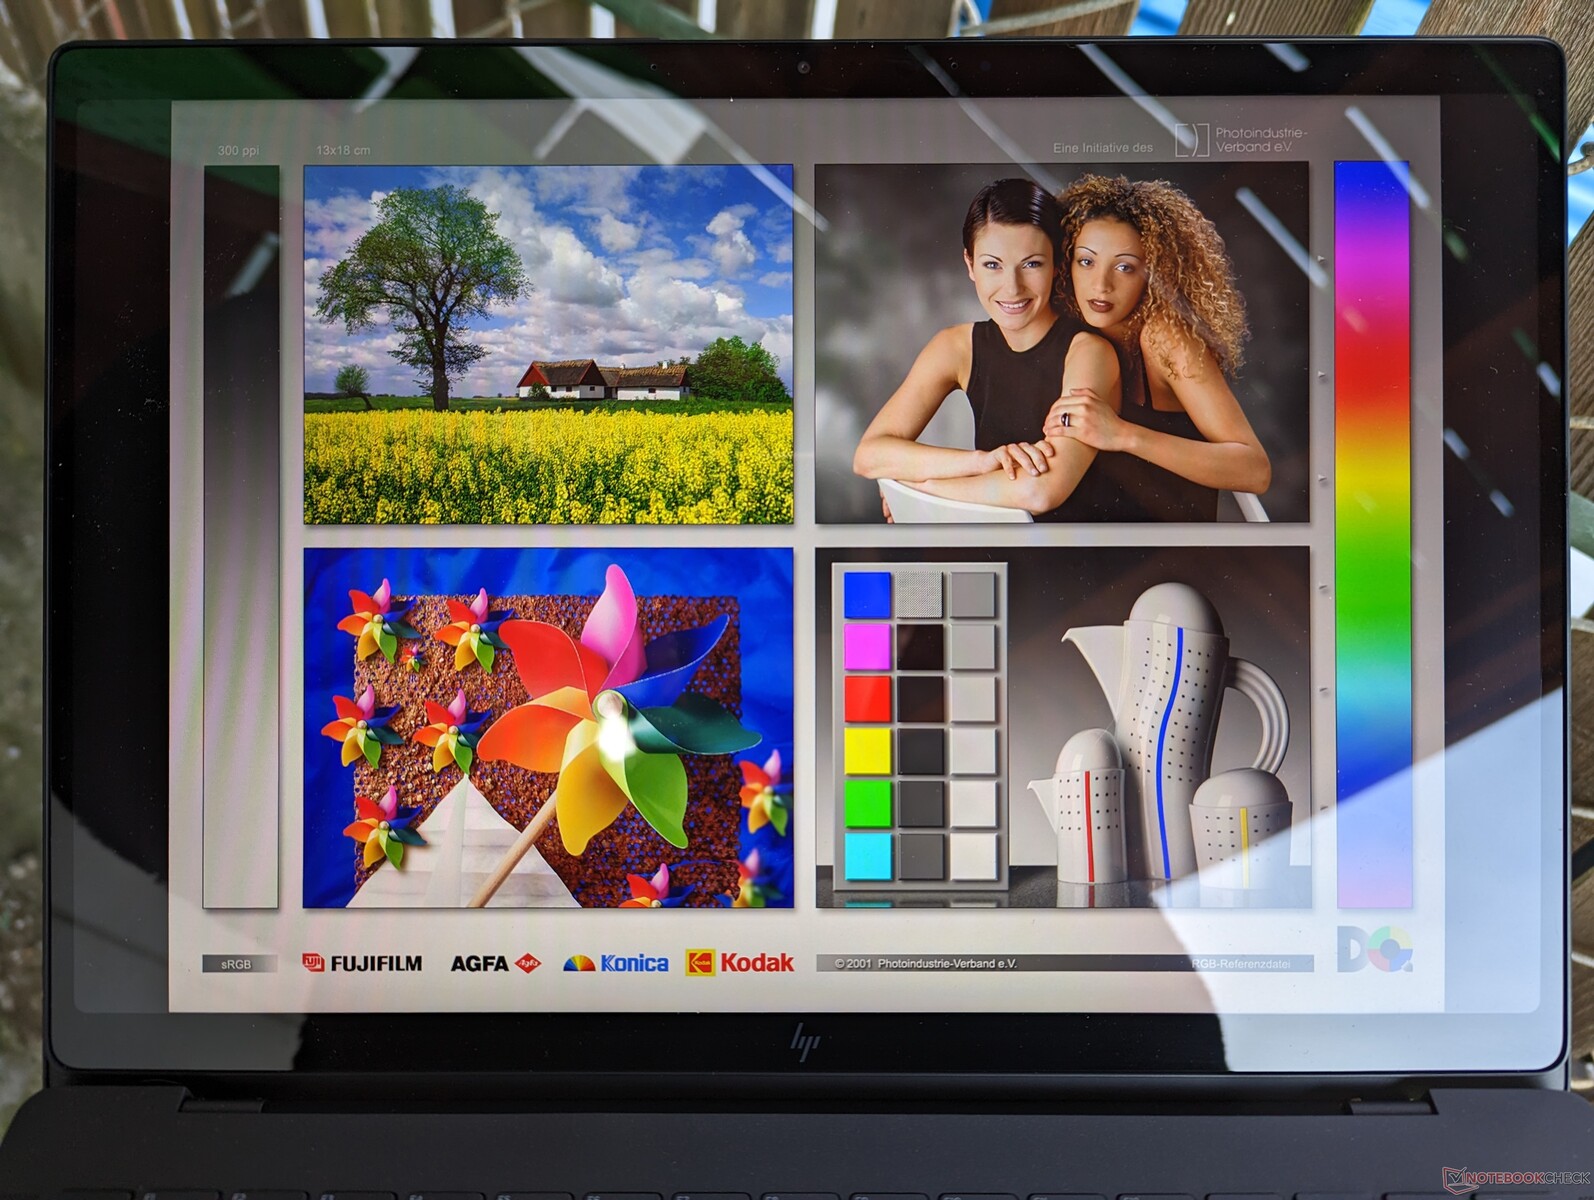
Display - 1.200p-IPS-Touchscreen
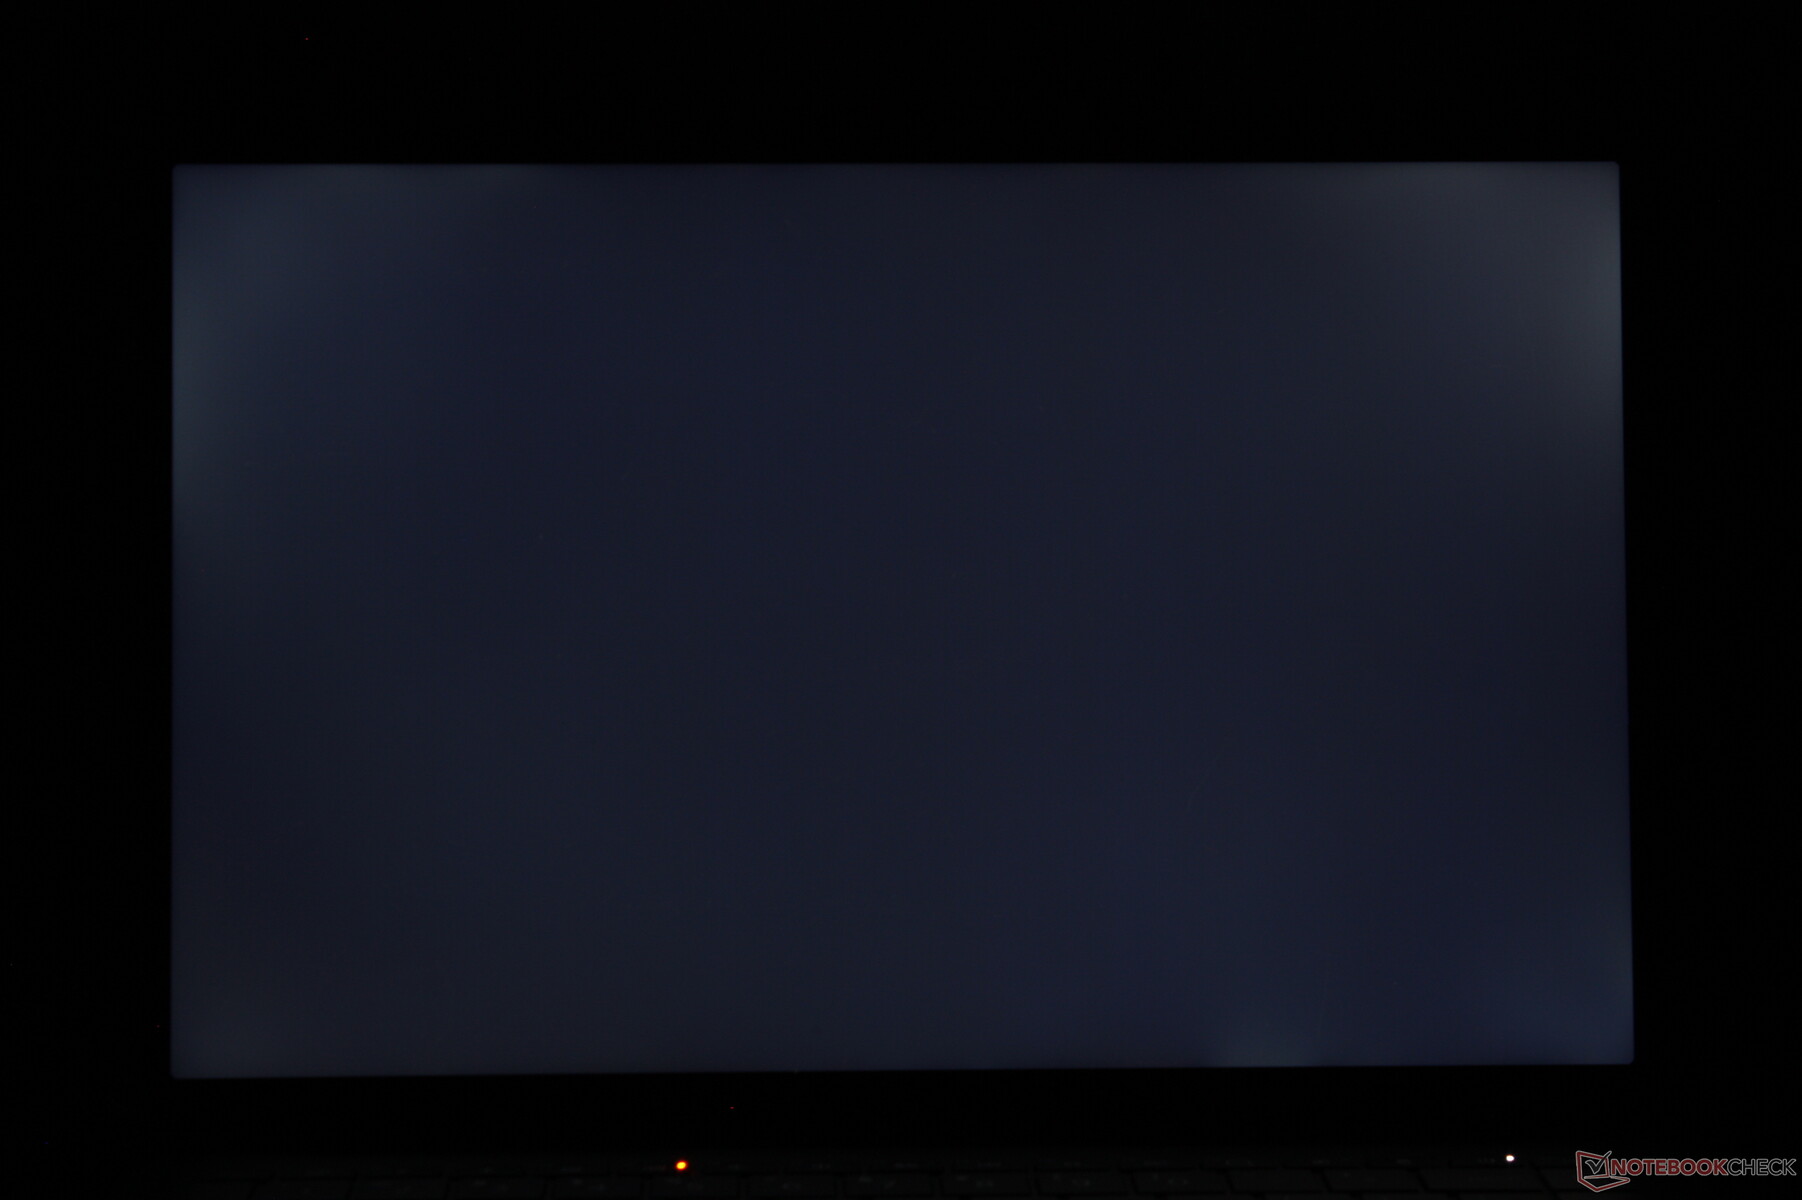
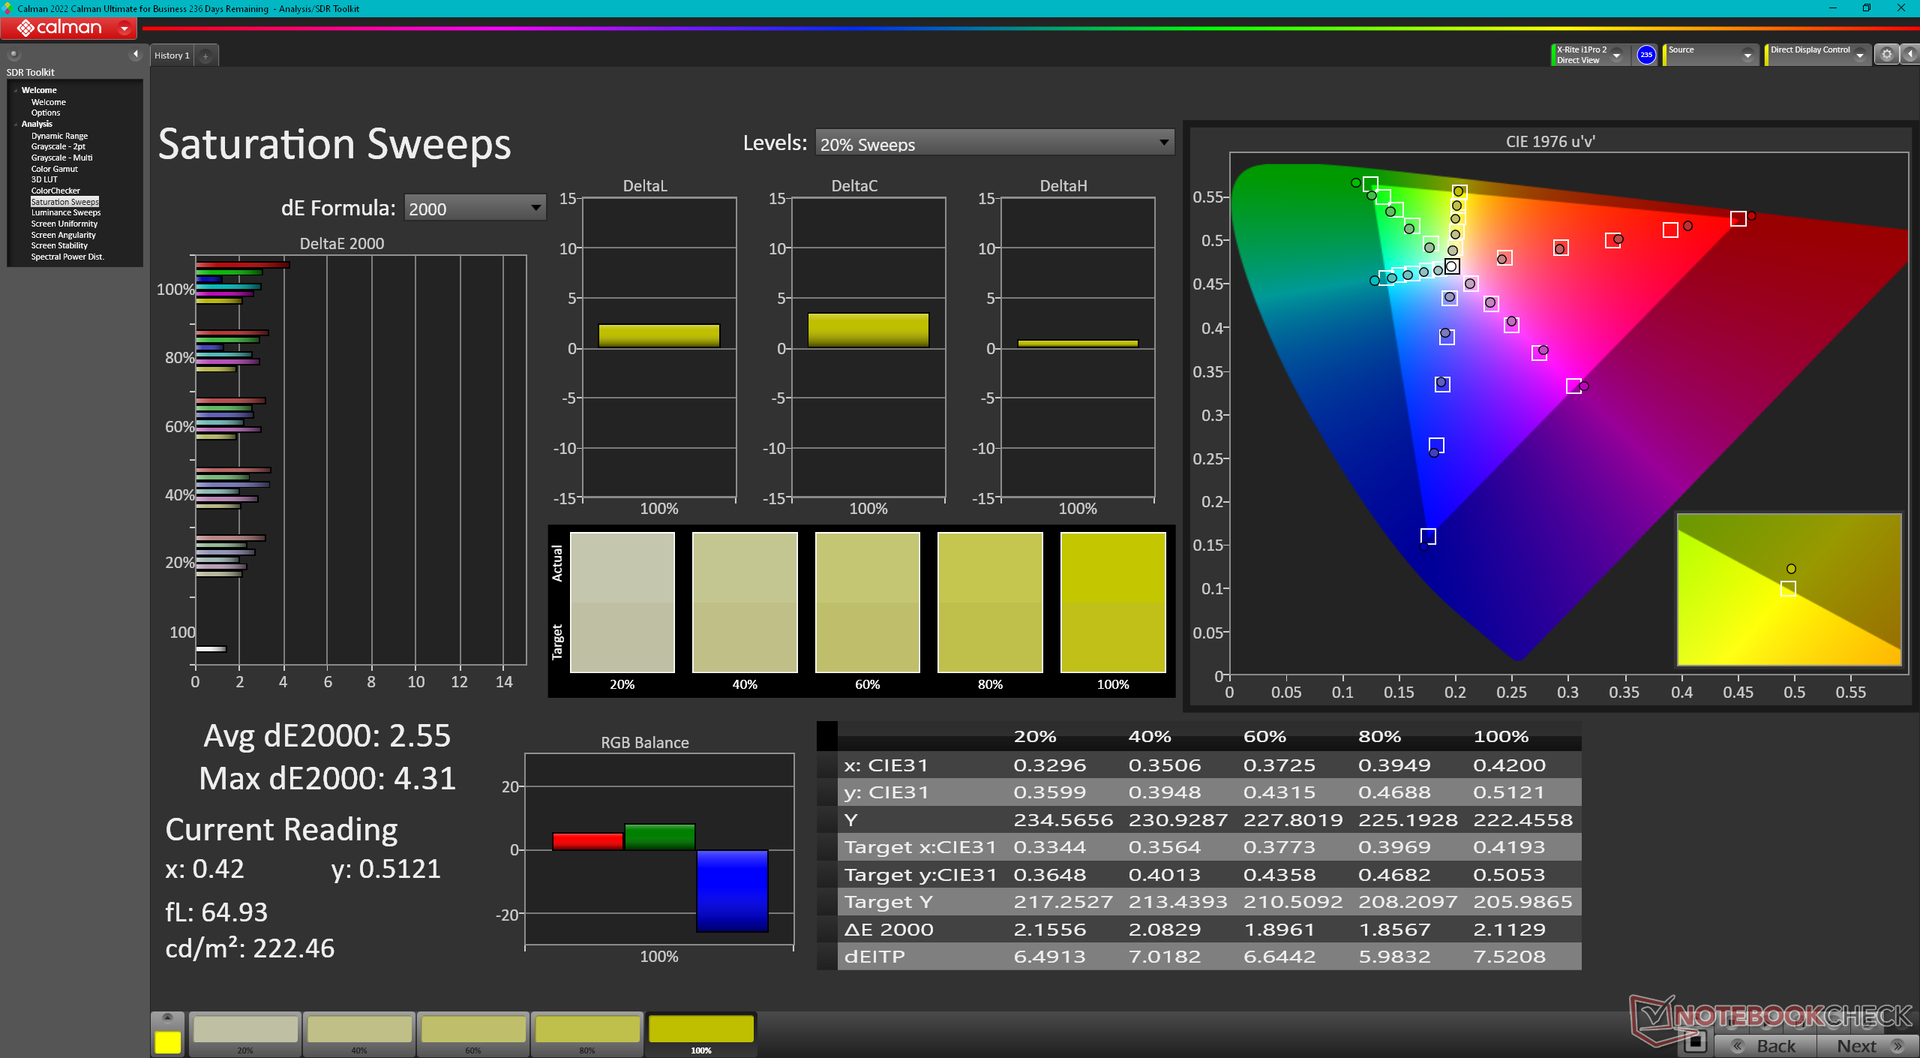
Es gibt nur eine Panel-Option, während die meisten EliteBook Modelle eine große Auswahl an Auflösungen, Helligkeitsoptionen, Farbabdeckungen, Bildwiederholraten und mehr bieten. Dennoch bietet der 1.200p-Touchscreen des Dragonfly Pro eine vollständige sRGB-Abdeckung und ein relativ hohes Kontrastverhältnis für ein IPS-Panel. Der größte Nachteil ist vielleicht die langsame Schwarz-Weiß- und Grau-Grau-Reaktionszeit für auffälligeres Ghosting.
| |||||||||||||||||||||||||
Ausleuchtung: 87 %
Helligkeit Akku: 425.9 cd/m²
Kontrast: 1638:1 (Schwarzwert: 0.26 cd/m²)
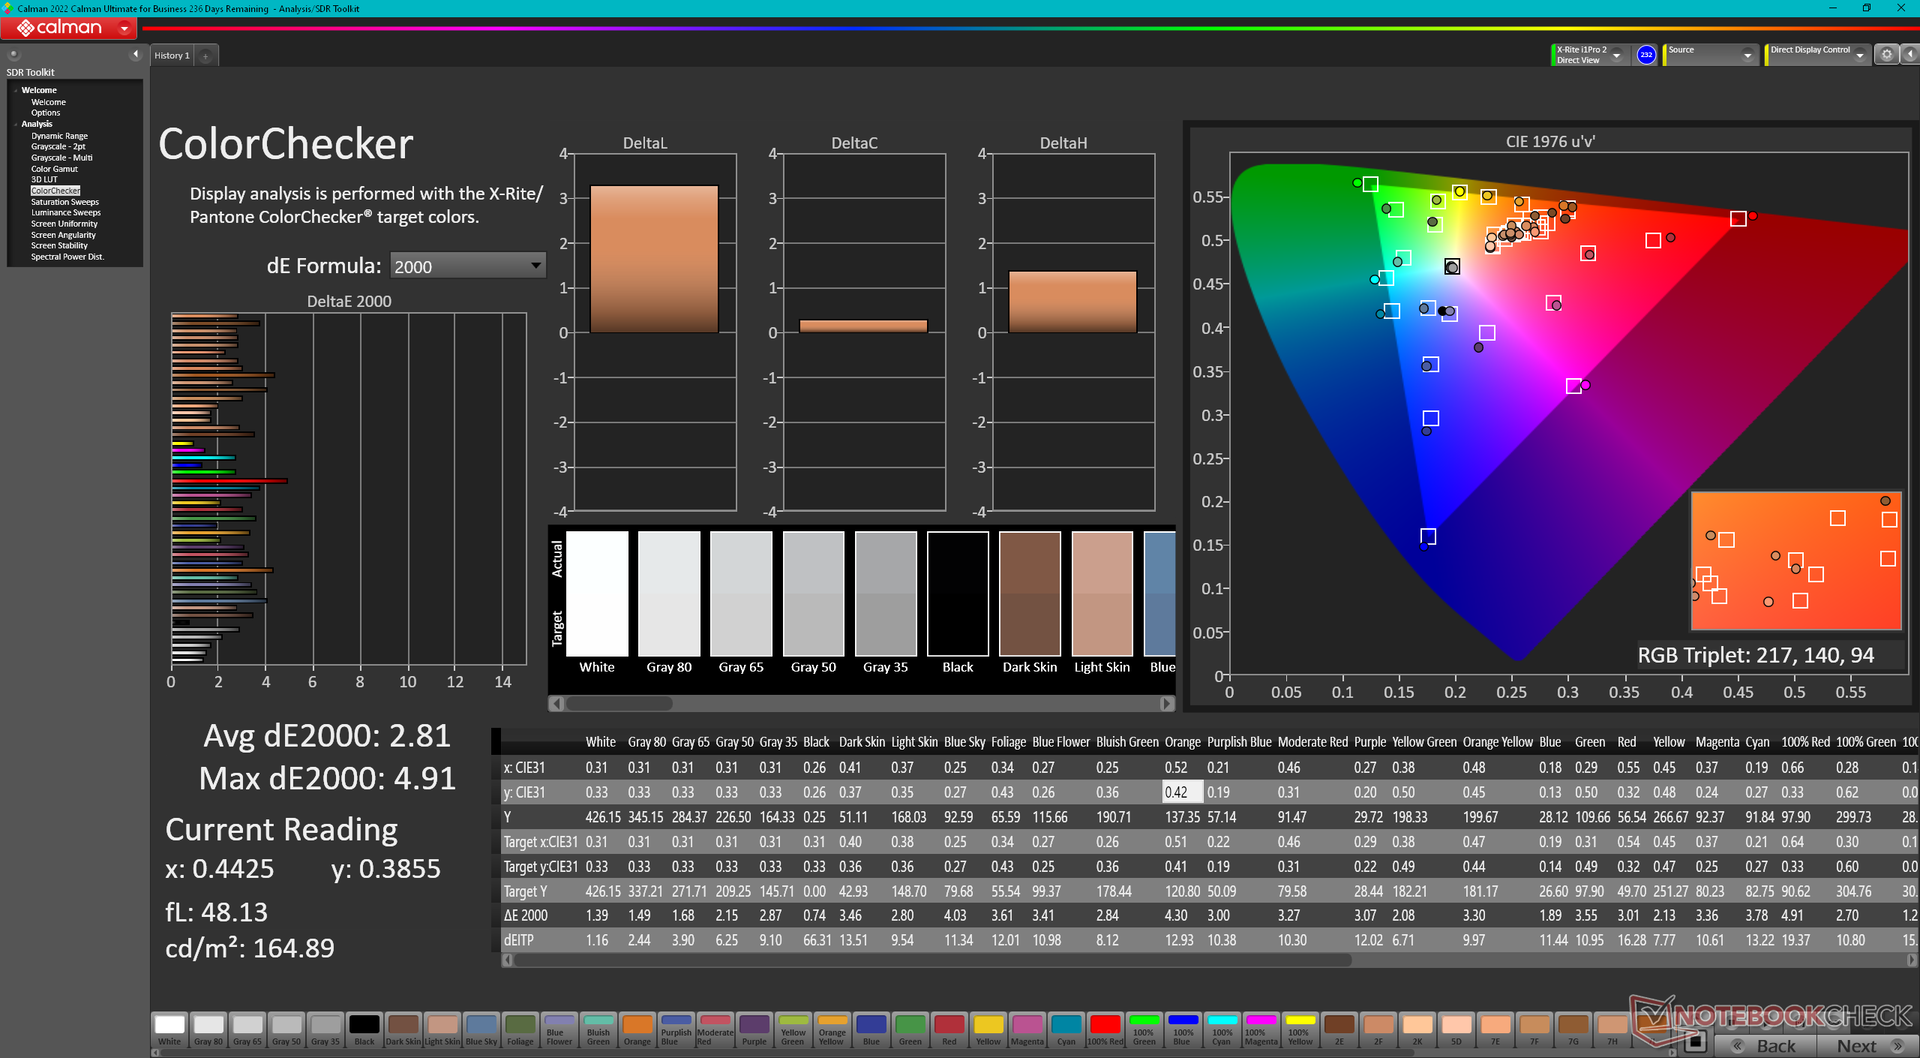
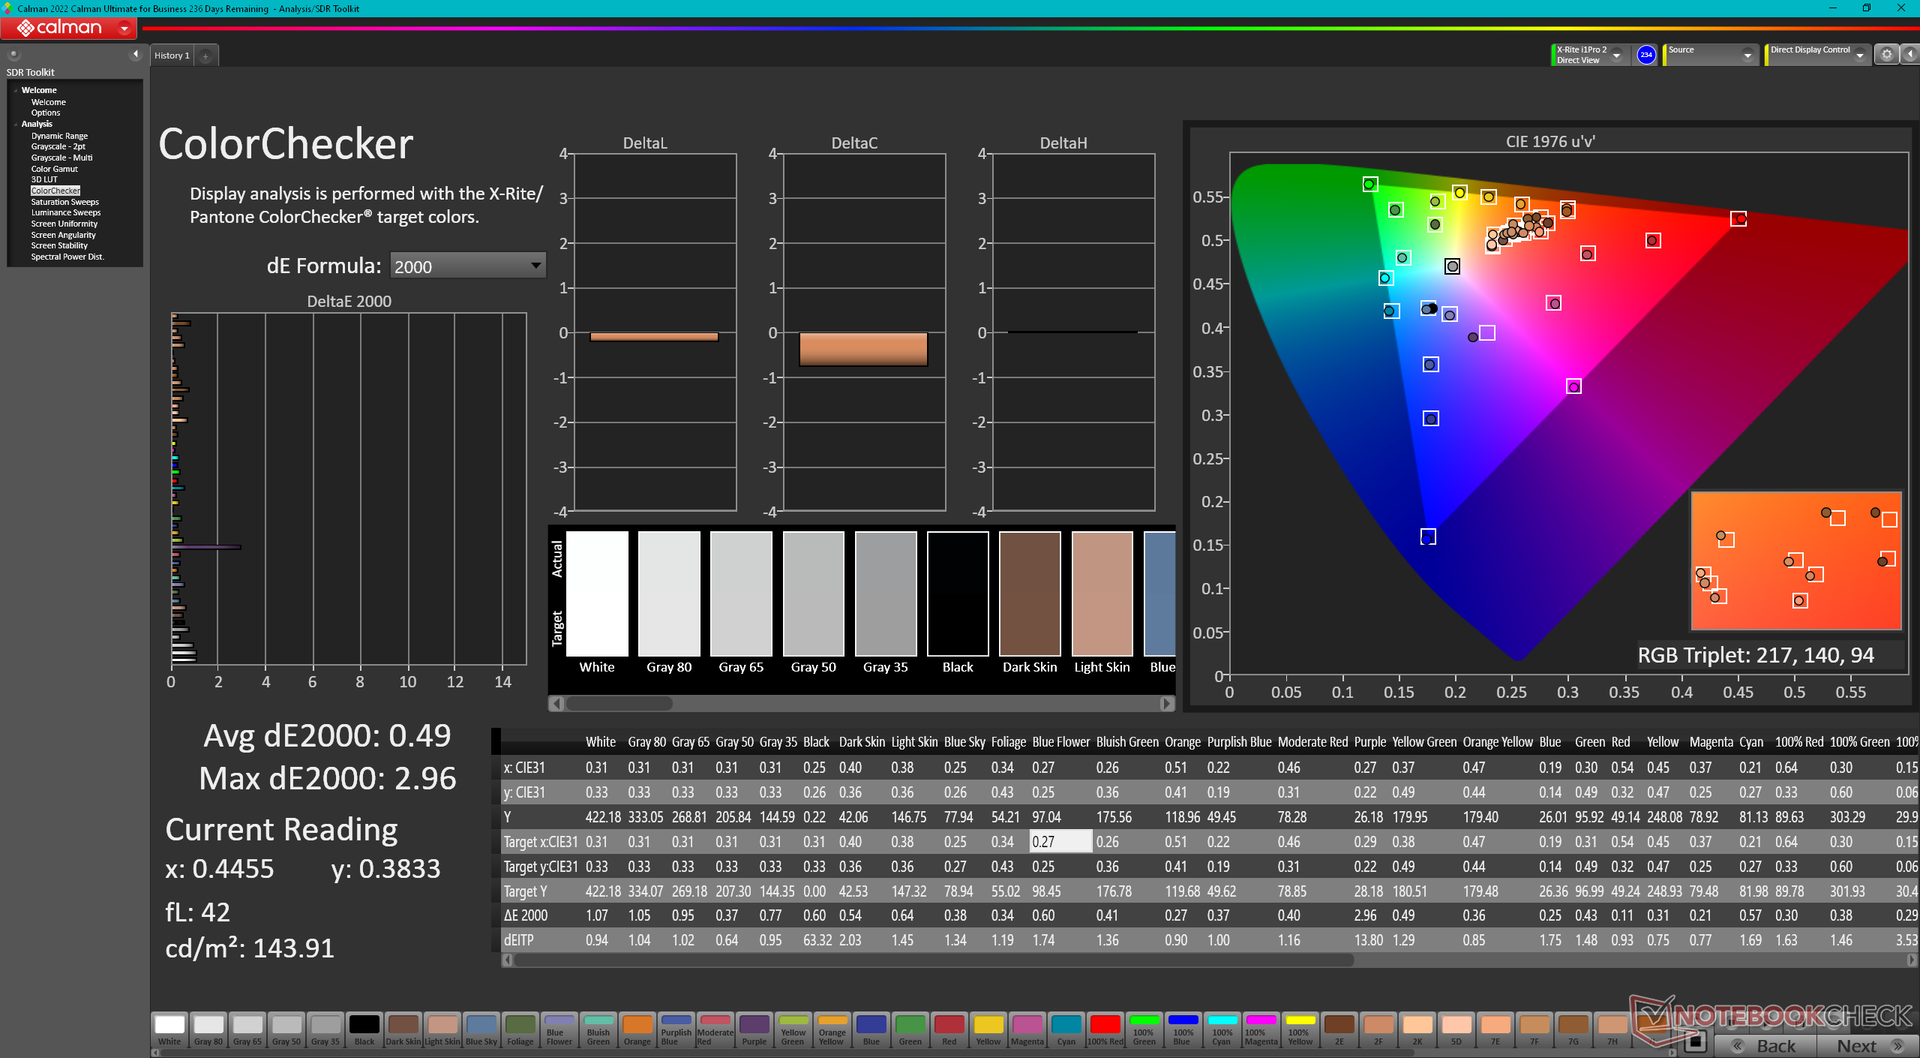
ΔE ColorChecker Calman: 2.81 | ∀{0.5-29.43 Ø4.72}
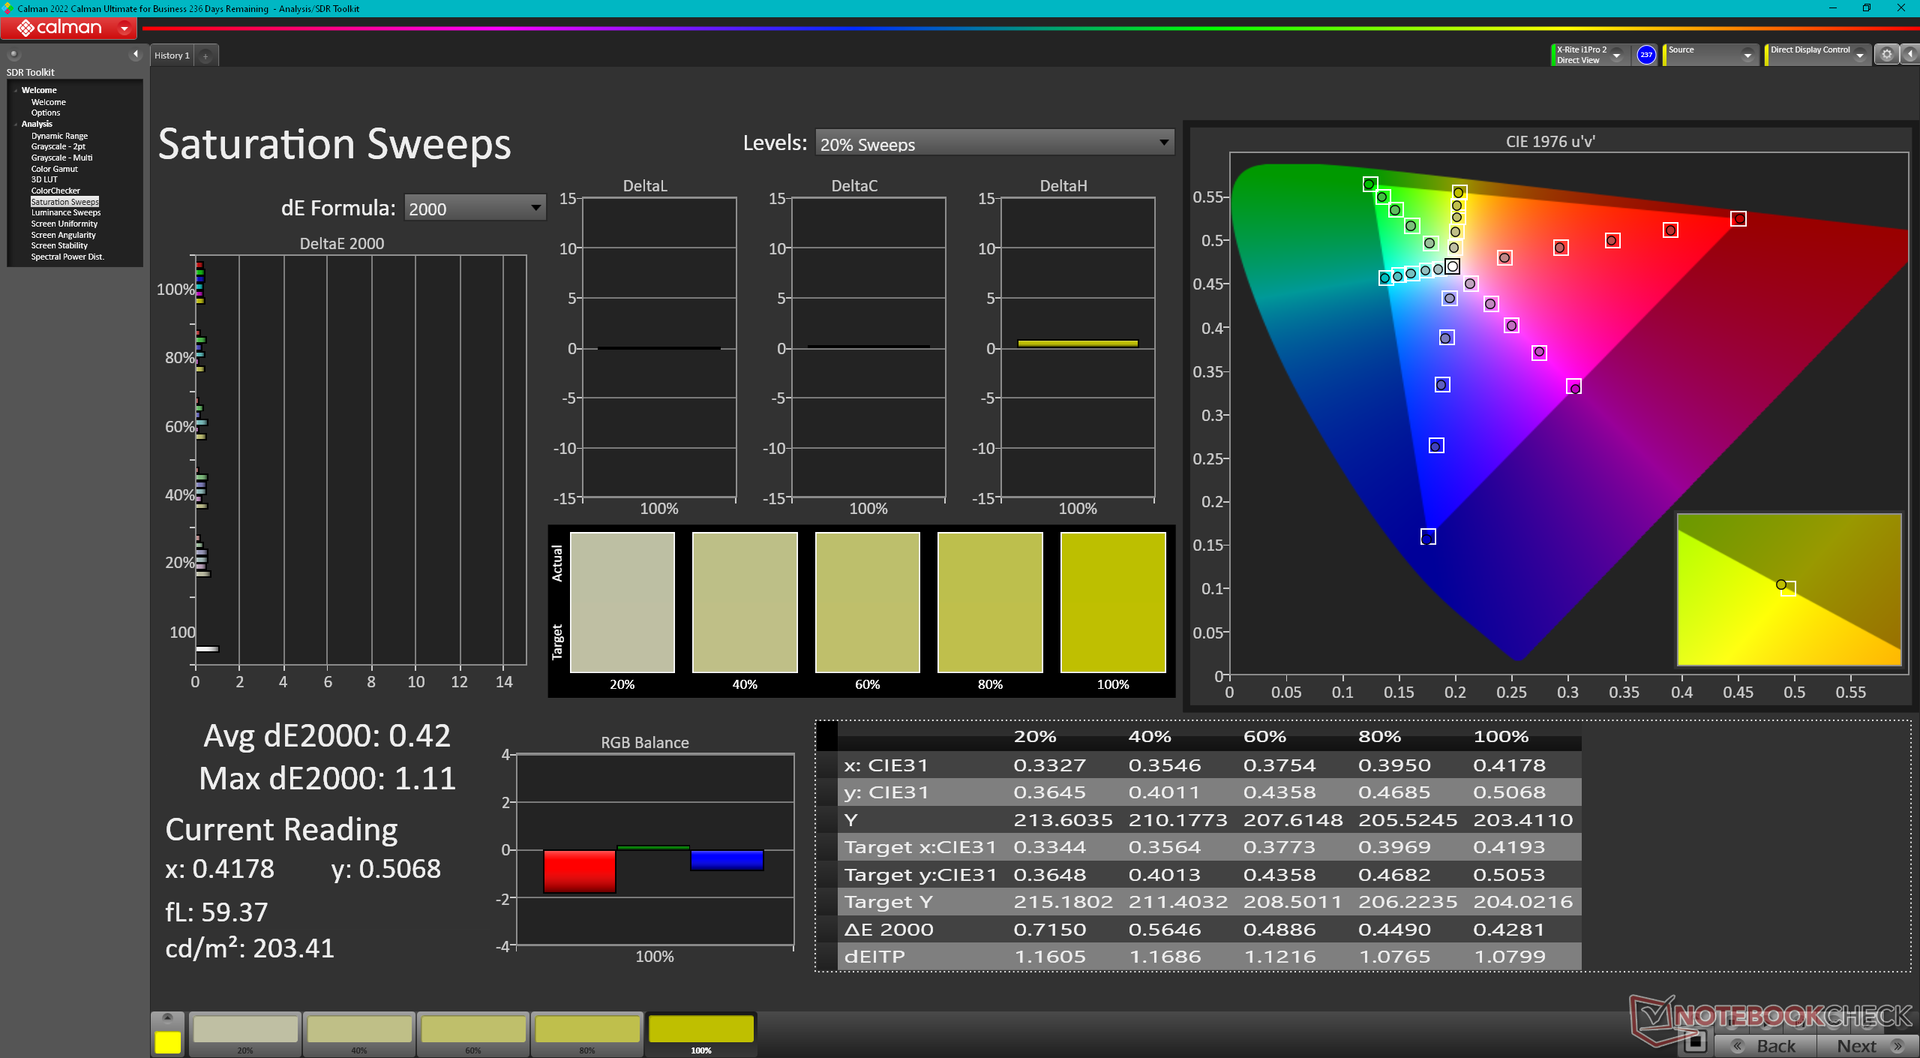
calibrated: 0.49
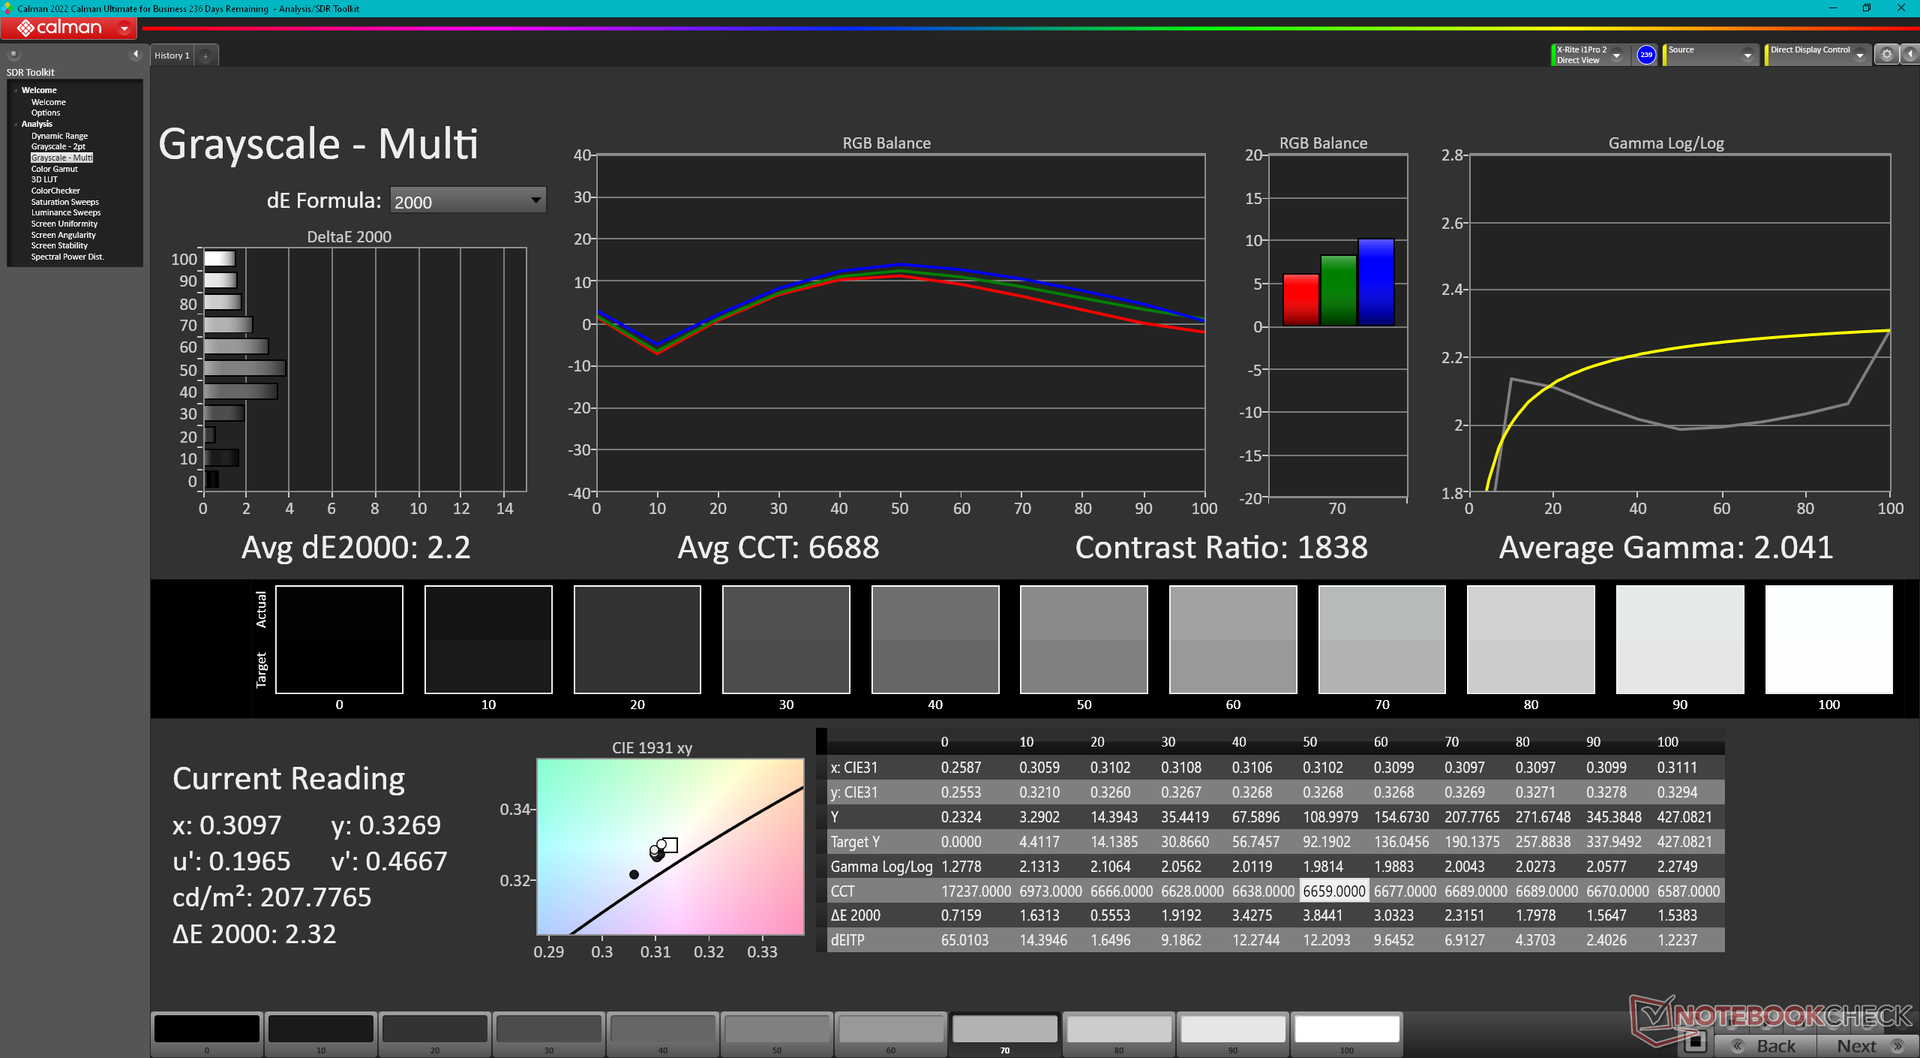
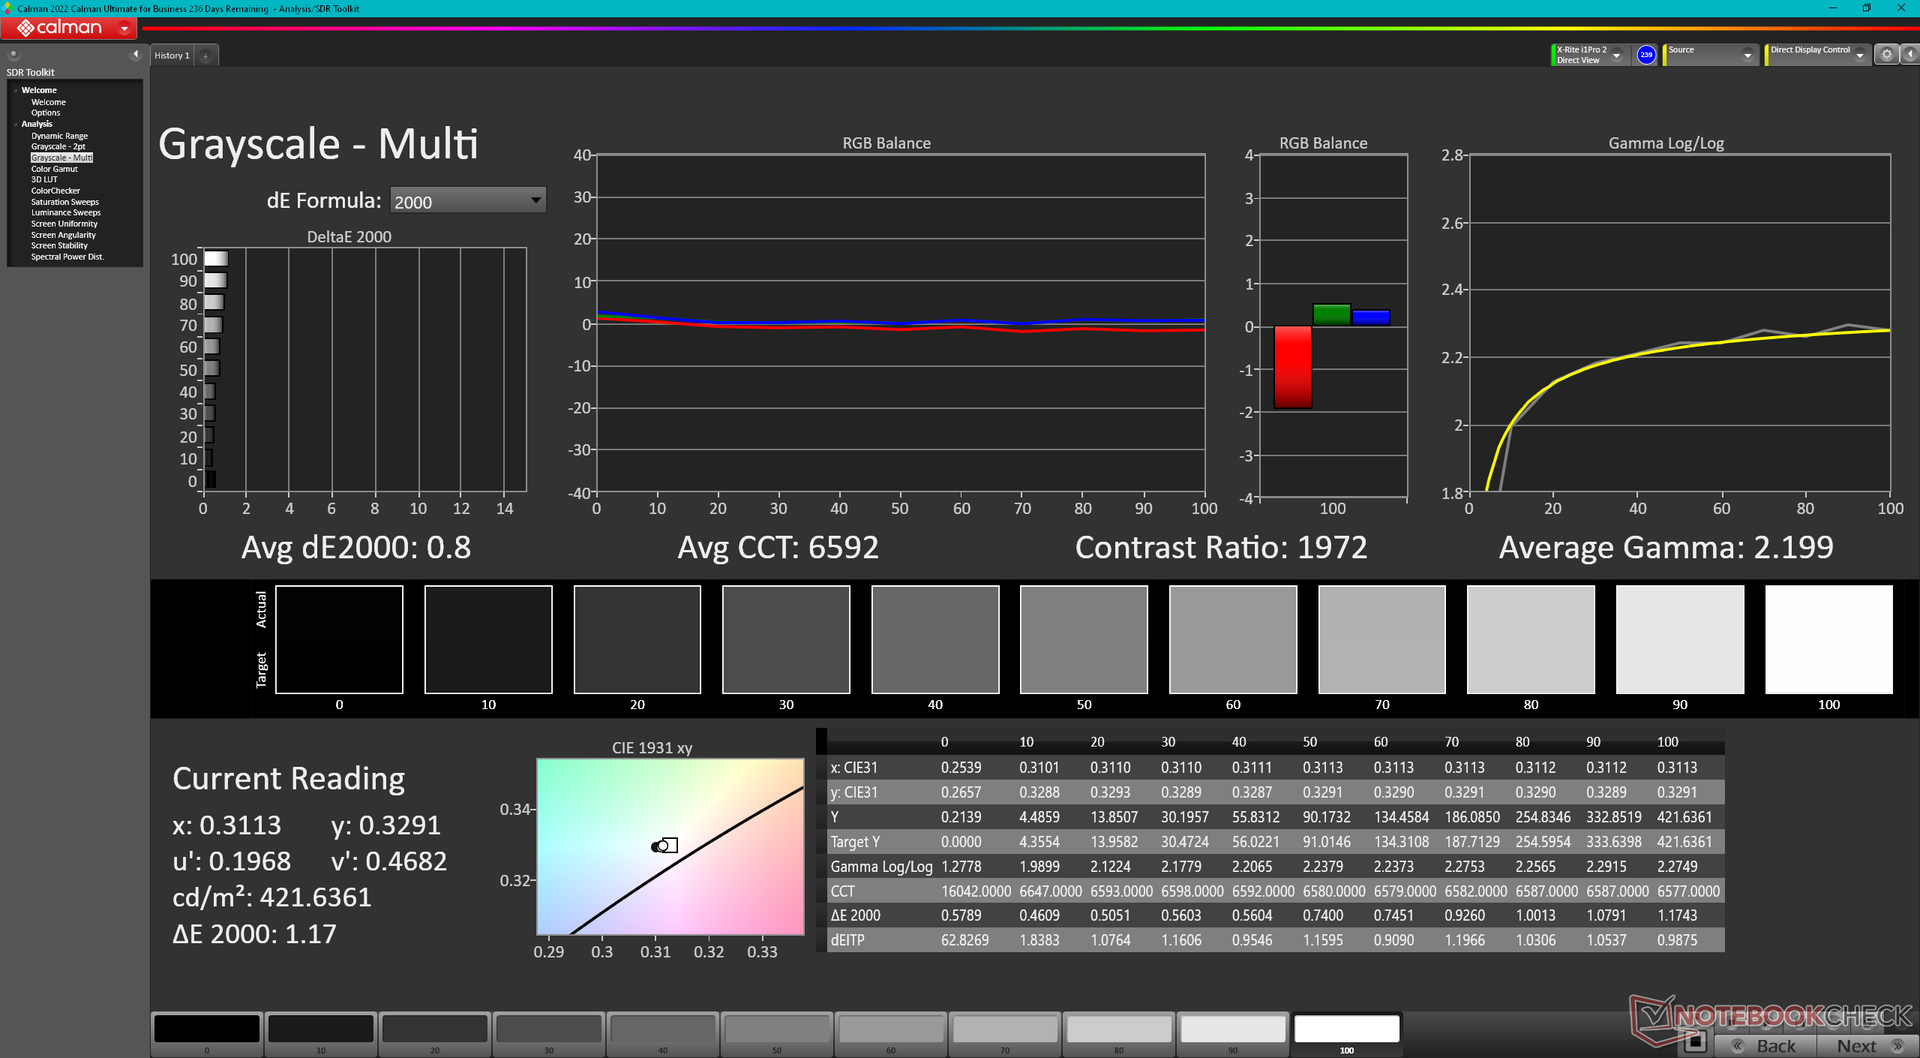
ΔE Greyscale Calman: 2.2 | ∀{0.09-98 Ø4.97}
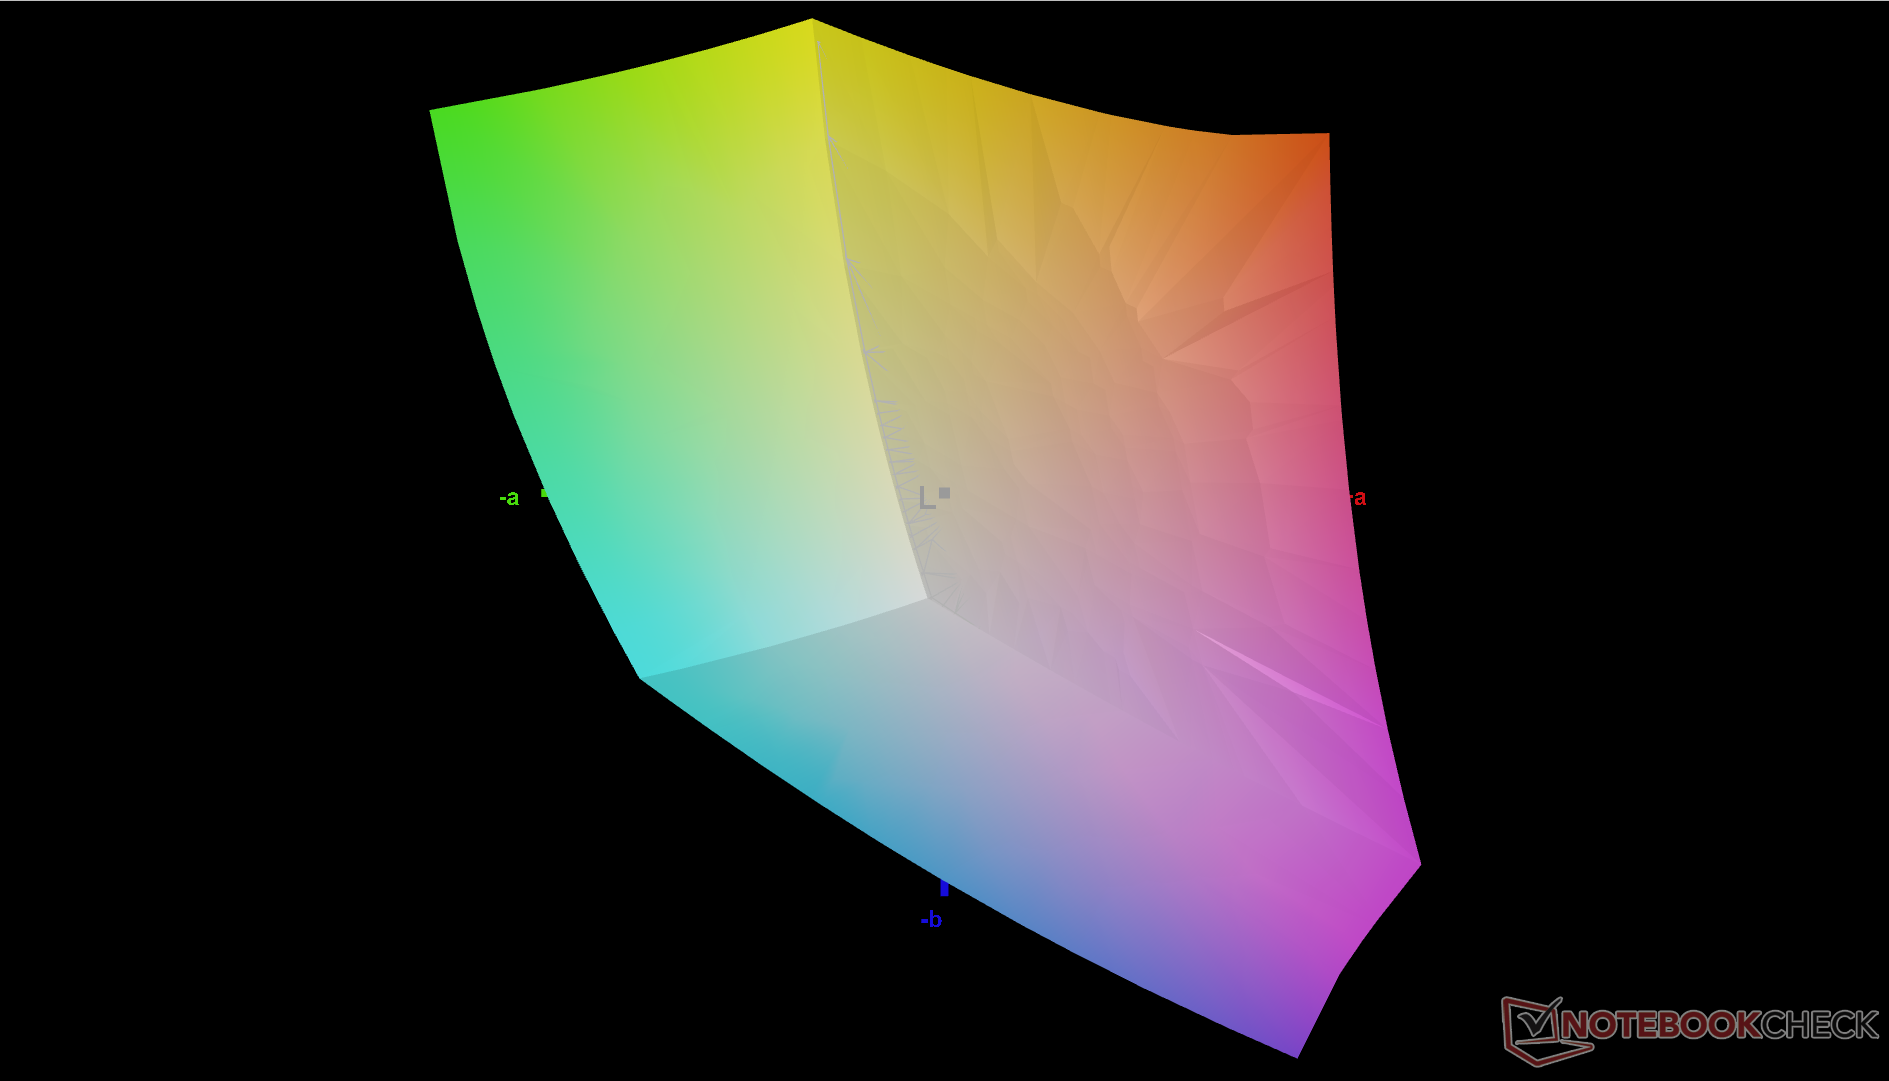
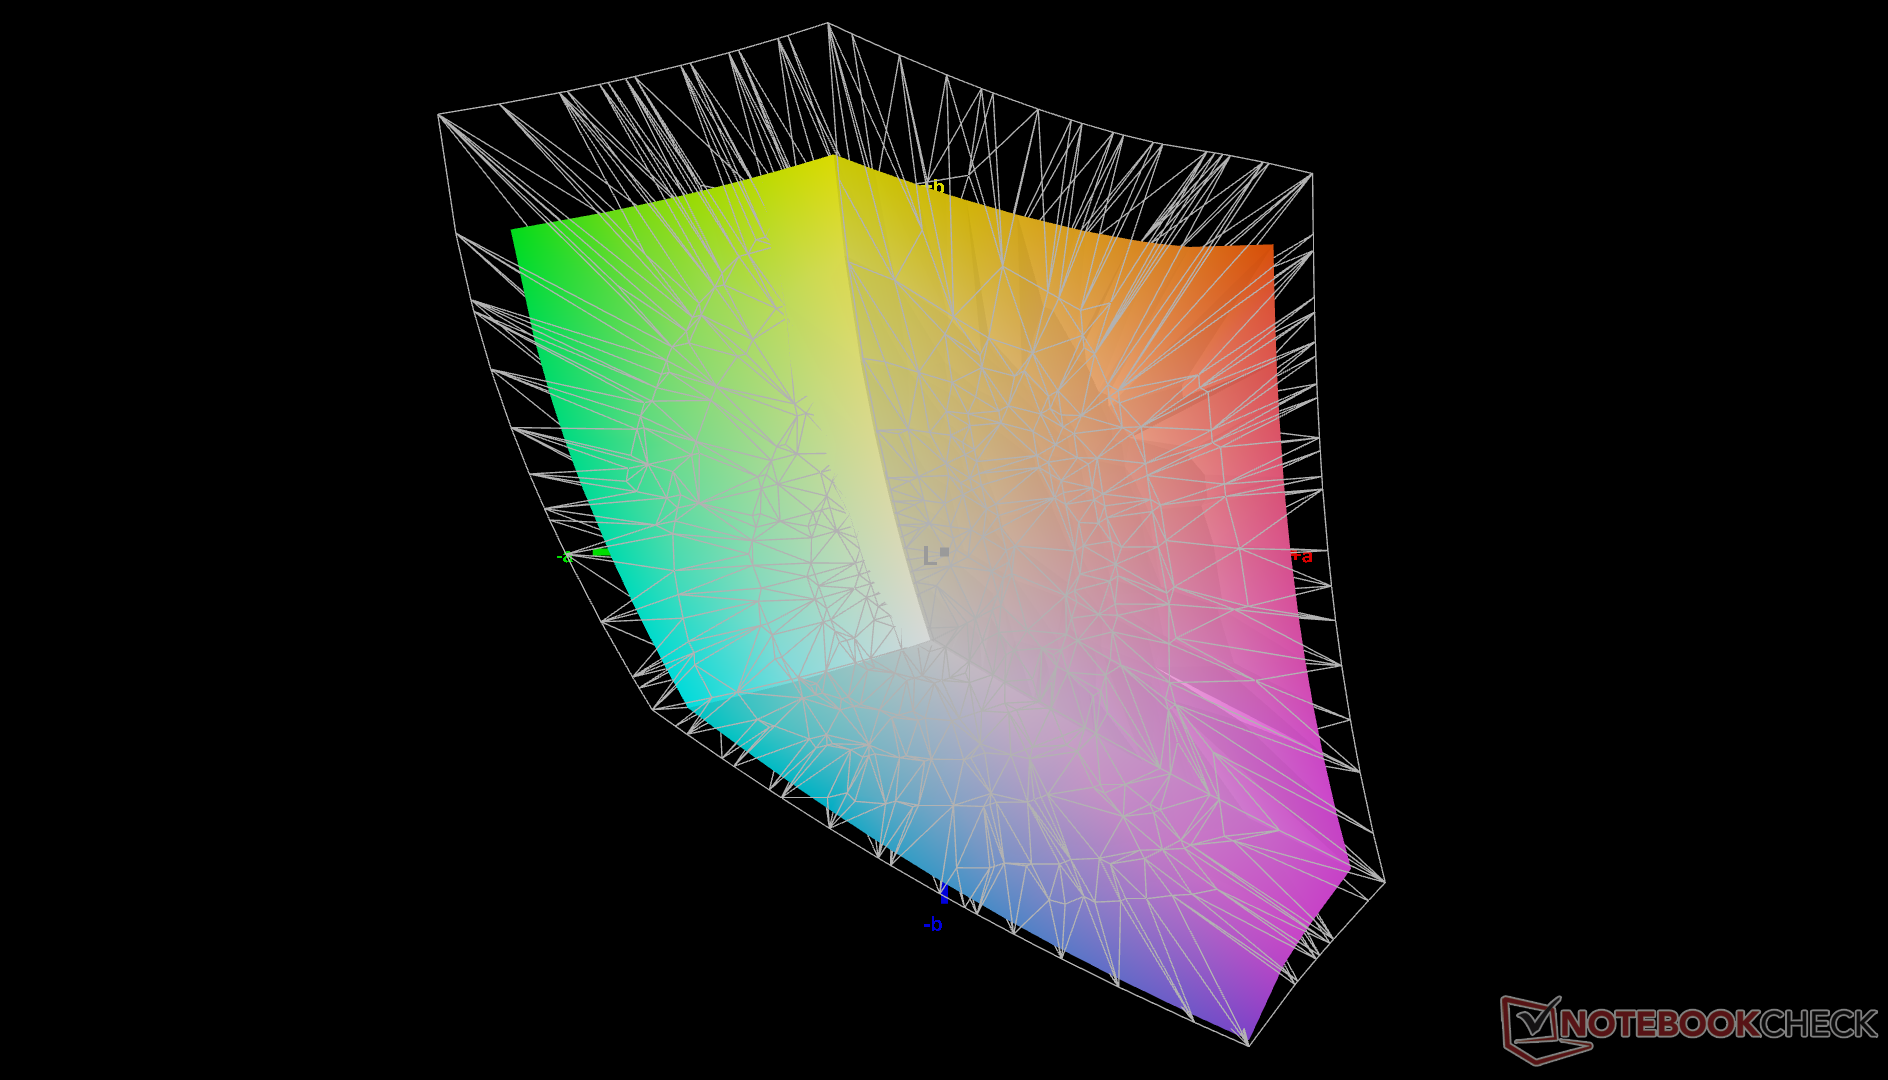
77.4% AdobeRGB 1998 (Argyll 3D)
100% sRGB (Argyll 3D)
76.6% Display P3 (Argyll 3D)
Gamma: 2.04
CCT: 6688 K
| HP Dragonfly Pro 2023 AU Optronics AUOA49A, IPS, 1920x1200, 14" | HP Spectre x360 13.5 14t-ef000 SDC4160, OLED, 3000x2000, 13.5" | HP Elite Dragonfly G3 Chi Mei CMN13C0, IPS, 1920x1280, 13.5" | Apple MacBook Pro 14 2023 M2 Pro Mini-LED, 3024x1964, 14.2" | Dell XPS 13 Plus 9320 i7-1280P OLED Samsung 134XK04, OLED, 3456x2160, 13.4" | Lenovo Yoga 9 14IAP7 82LU0001US Lenovo LEN140WQ+, OLED, 2880x1800, 14" | |
|---|---|---|---|---|---|---|
| Display | 16% | -8% | 30% | 19% | 19% | |
| Display P3 Coverage (%) | 76.6 | 99.9 30% | 68 -11% | 99.2 30% | 99.5 30% | 99.8 30% |
| sRGB Coverage (%) | 100 | 100 0% | 98.3 -2% | 100 0% | 100 0% | |
| AdobeRGB 1998 Coverage (%) | 77.4 | 90.8 17% | 69.9 -10% | 98.4 27% | 98.7 28% | |
| Response Times | 96% | 13% | 37% | 95% | 98% | |
| Response Time Grey 50% / Grey 80% * (ms) | 65.6 ? | 1.9 ? 97% | 50.8 ? 23% | 35.2 ? 46% | 2.6 ? 96% | 1.2 ? 98% |
| Response Time Black / White * (ms) | 36 ? | 2.16 ? 94% | 35.2 ? 2% | 26.4 ? 27% | 2.1 ? 94% | 1.2 ? 97% |
| PWM Frequency (Hz) | 60.2 ? | 14880 ? | 59.5 | 347.2 ? | ||
| Bildschirm | -4% | -9% | 211% | -1% | -31% | |
| Helligkeit Bildmitte (cd/m²) | 425.9 | 351.7 -17% | 387.2 -9% | 500 17% | 371.8 -13% | 367.3 -14% |
| Brightness (cd/m²) | 405 | 351 -13% | 360 -11% | 489 21% | 374 -8% | 369 -9% |
| Brightness Distribution (%) | 87 | 87 0% | 80 -8% | 94 8% | 98 13% | 97 11% |
| Schwarzwert * (cd/m²) | 0.26 | 0.26 -0% | 0.02 92% | |||
| Kontrast (:1) | 1638 | 1489 -9% | 25000 1426% | |||
| Delta E Colorchecker * | 2.81 | 1.78 37% | 2.36 16% | 1.2 57% | 2.37 16% | 5.2 -85% |
| Colorchecker dE 2000 max. * | 4.91 | 6.14 -25% | 4.79 2% | 2.6 47% | 6.1 -24% | 8.04 -64% |
| Colorchecker dE 2000 calibrated * | 0.49 | 0.63 -29% | ||||
| Delta E Graustufen * | 2.2 | 2.3 -5% | 3 -36% | 1.7 23% | 2 9% | 2.8 -27% |
| Gamma | 2.04 108% | 2.11 104% | 2.17 101% | 2.24 98% | 2.29 96% | 2.21 100% |
| CCT | 6688 97% | 6683 97% | 6137 106% | 6791 96% | 6261 104% | 5992 108% |
| Durchschnitt gesamt (Programm / Settings) | 36% /
20% | -1% /
-6% | 93% /
163% | 38% /
22% | 29% /
6% |
* ... kleinere Werte sind besser
Obwohl das Display nicht vorkalibriert geliefert wird, sind die durchschnittlichen Graustufen- und Farb-DeltaE-Werte dennoch nicht schlecht. Eine Kalibrierung des Panels mit einem X-Rite-Kolorimeter würde die Graustufen- und Farbwerte von 2,2 und 2,81 auf nur 0,8 bzw. 0,49 verbessern. Wir empfehlen die Anwendung unseres kalibrierten ICM-Profils (siehe oben), um mehr aus dem Display herauszuholen.
Reaktionszeiten (Response Times) des Displays
| ↔ Reaktionszeiten Schwarz zu Weiß | ||
|---|---|---|
| 36 ms ... steigend ↗ und fallend ↘ kombiniert | ↗ 17.6 ms steigend | 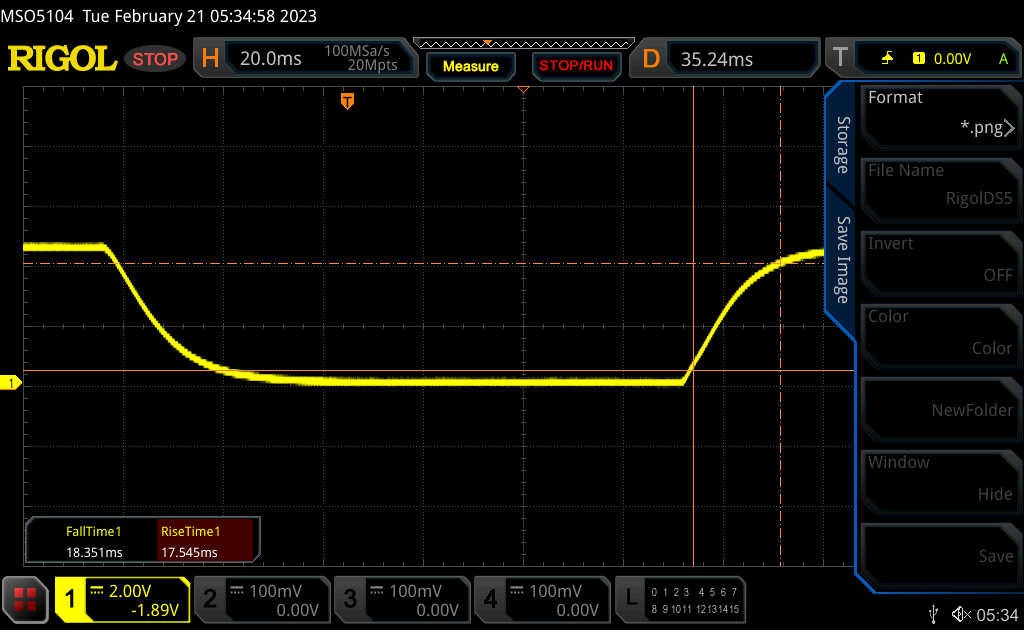 |
| ↘ 18.4 ms fallend | ||
| Die gemessenen Reaktionszeiten sind langsam und dadurch für viele Spieler wahrscheinlich zu langsam. Im Vergleich rangierten die bei uns getesteten Geräte von 0.1 (Minimum) zu 240 (Maximum) ms. » 94 % aller Screens waren schneller als der getestete. Daher sind die gemessenen Reaktionszeiten schlechter als der Durchschnitt aller vermessenen Geräte (19.8 ms). | ||
| ↔ Reaktionszeiten 50% Grau zu 80% Grau | ||
| 65.6 ms ... steigend ↗ und fallend ↘ kombiniert | ↗ 31.1 ms steigend | 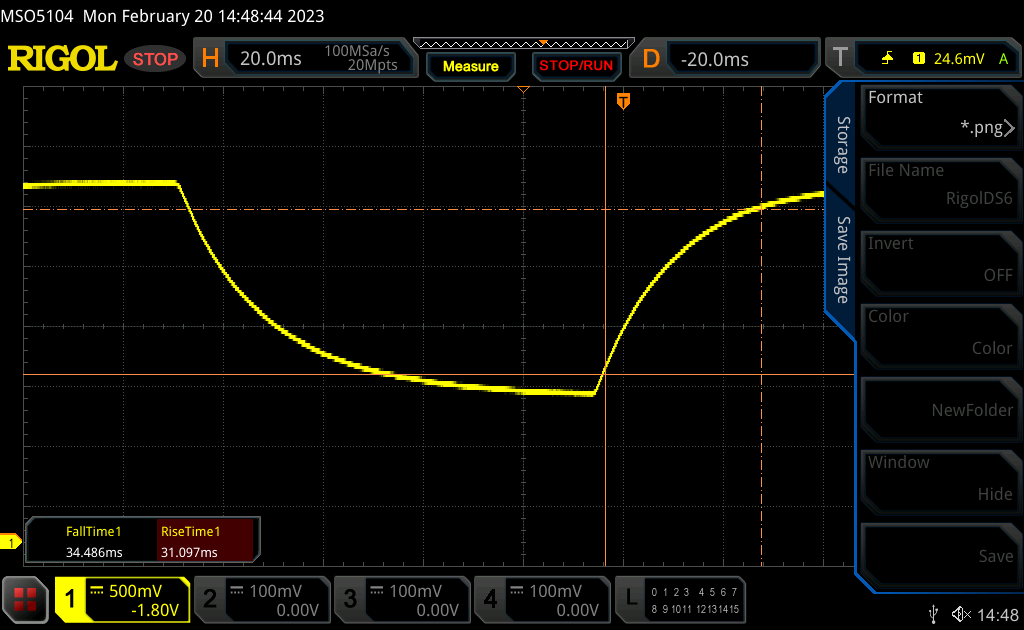 |
| ↘ 34.5 ms fallend | ||
| Die gemessenen Reaktionszeiten sind langsam und dadurch für viele Spieler wahrscheinlich zu langsam. Im Vergleich rangierten die bei uns getesteten Geräte von 0.165 (Minimum) zu 636 (Maximum) ms. » 98 % aller Screens waren schneller als der getestete. Daher sind die gemessenen Reaktionszeiten schlechter als der Durchschnitt aller vermessenen Geräte (31 ms). | ||
Bildschirm-Flackern / PWM (Pulse-Width Modulation)
| Flackern / PWM nicht festgestellt | 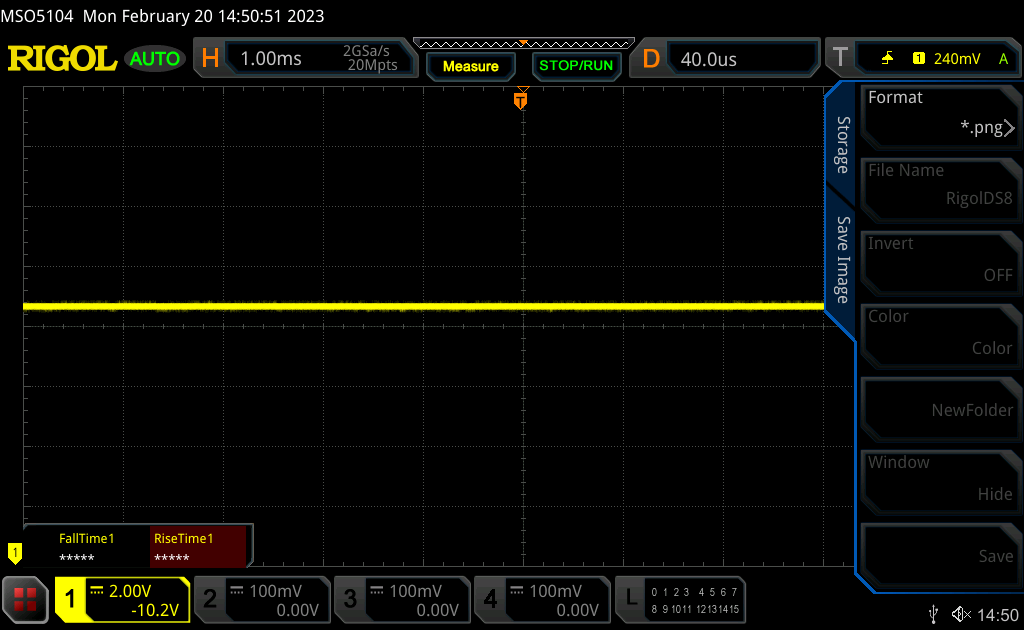 | ||
Im Vergleich: 52 % aller getesteten Geräte nutzten kein PWM um die Helligkeit zu reduzieren. Wenn PWM eingesetzt wurde, dann bei einer Frequenz von durchschnittlich 7763 (Minimum 5, Maximum 343500) Hz. | |||
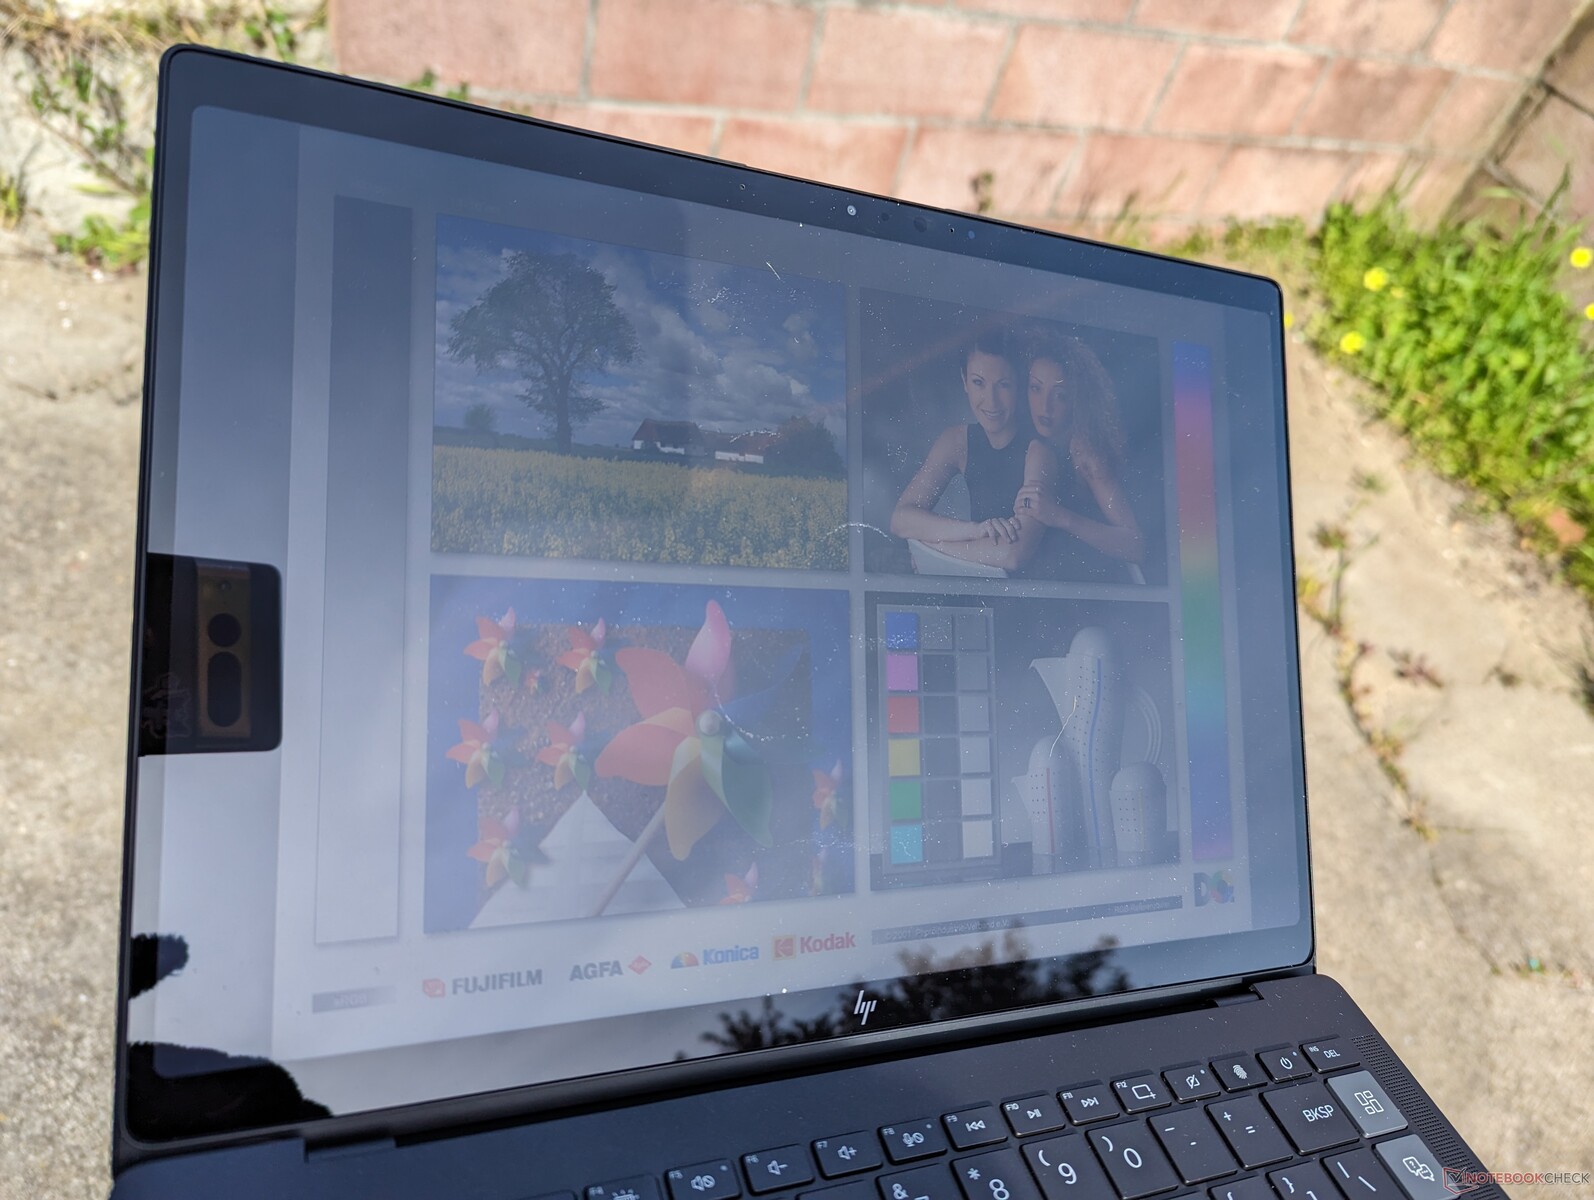
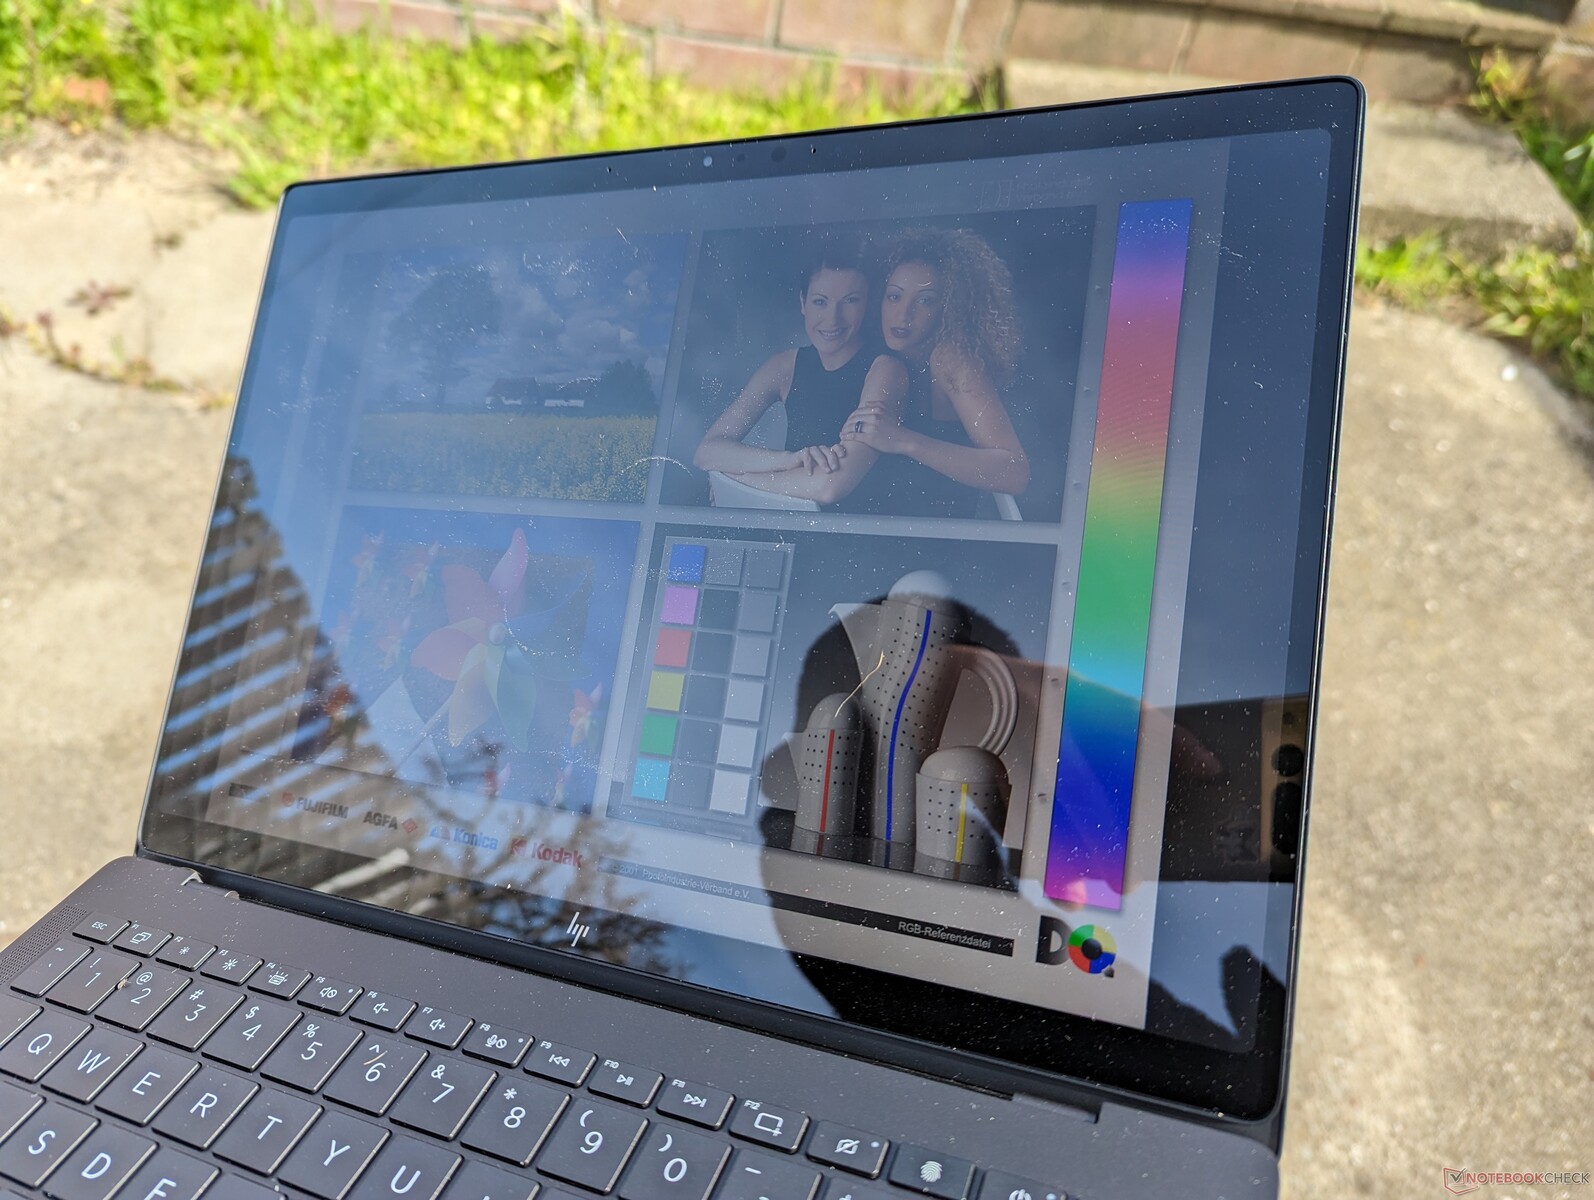
Das 400-Nit-Display ist vielleicht nicht so hell wie bei einigen EliteBook Modellen, bei denen 1000-Nit-Optionen verfügbar sind, aber im Schatten ist es ausreichend. Sonnenlicht sollte dennoch vermieden werden, um die Auswirkungen von Blendungen auf dem glänzenden Bildschirm zu reduzieren. Achten Sie darauf, AMD Vari-Bright über das Radeon-Bedienfeld zu deaktivieren, sonst sinkt die maximale Helligkeitsgrenze im Akkubetrieb automatisch.
Performance
Testbedingungen
Wir haben Windows in den Performance-Modus versetzt, bevor wir die folgenden Benchmarks durchgeführt haben. Im Gegensatz zu vielen anderen Notebook-Modellen von HP gibt es keine vorinstallierte "Command Center"-Software, mit der man das Lüftergeräusch oder die Leistung einstellen kann.
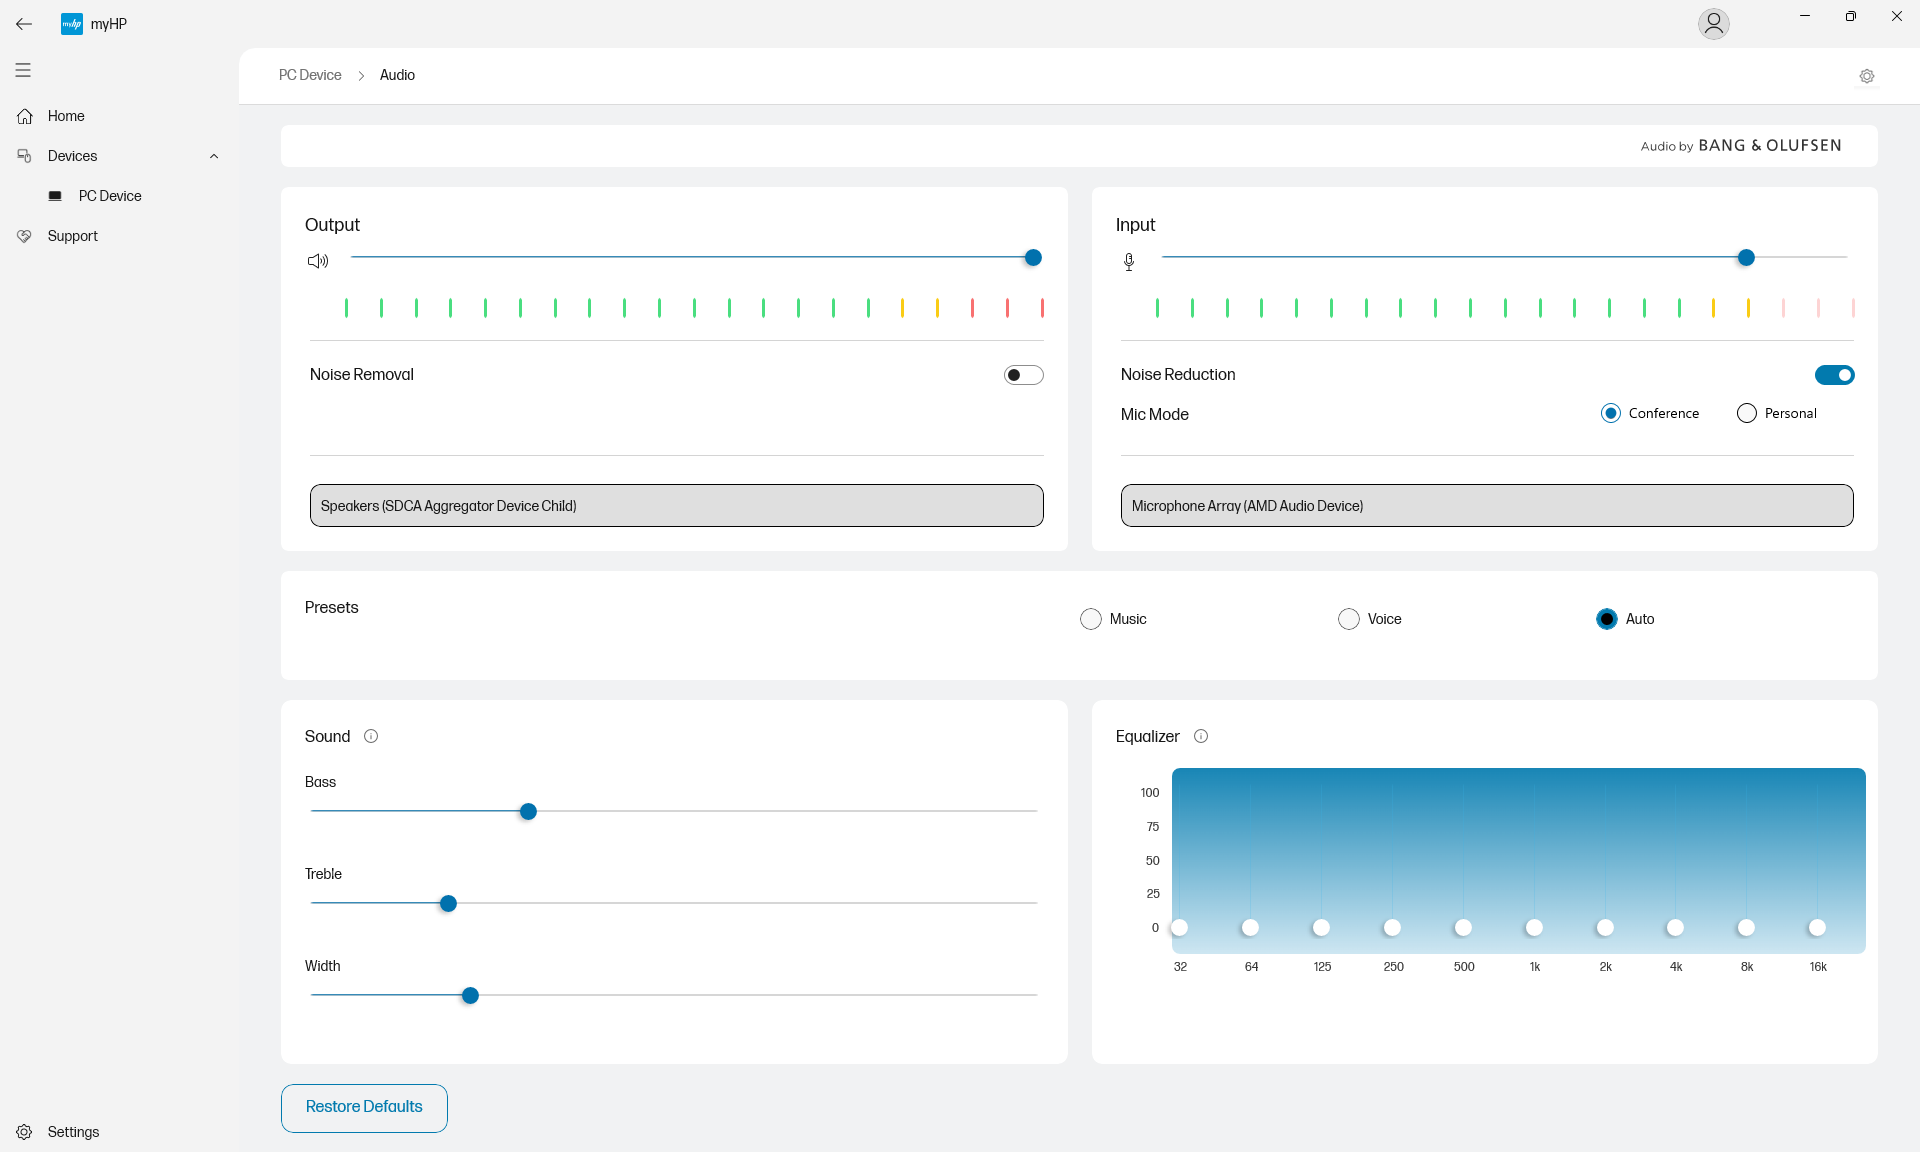
Es wird empfohlen, sich mit der MyHP Software vertraut zu machen, die mit jedem System vorinstalliert ist. Bestimmte Funktionen des Laptops sind über MyHP zugänglich, darunter die programmierbare Taste, Webcam-Einstellungen, Audiosteuerung, Support-Unterstützung und mehr.
Es ist erwähnenswert, dass bestimmte Benchmarks wie Geekbench 5.0 und AIDA automatisch einen Bluescreen verursachen würden, weshalb die Ergebnisse dieser Benchmarks unten nicht aufgeführt sind.
Prozessor - ähnlich der H-Serien-Performance
Die CPU-Leistung ist für einen U-Serien-Prozessor sehr schnell, auch wenn der Ryzen 7 7736U ein Rebranding des Ryzen 7 6800U ist. Die Multi-Thread-Leistung ist 30 Prozent schneller als die des letztjährigen Ryzen 7 5825U, was ihn vor jede Intel-Core-U oder Core-P-Option der 12. Generation stellt, sogar vor den Core i7-1280P. In der Tat liegt die Gesamtleistung innerhalb von 5 bis 10 Prozent des leistungshungrigeren Core i7-12700H, wie er in vielen größeren Gaming-Laptops zu finden ist. Es ist klar, dass der Ryzen 7 7736U für ein Kopf-an-Kopf-Rennen mit Intels bald verfügbarer 13. Generation der Core-U-Serie entwickelt wurde.
In Anbetracht des kleinen Formfaktors ist die Performance-Nachhaltigkeit anständig. Wenn man CineBench R15 xT in einer Schleife laufen lässt, sinkt die Leistung mit der Zeit langsam, bevor sie sich bei einem Defizit von elf Prozent stabilisiert, wie die Grafik unten zeigt. Im Vergleich dazu kann das MacBook Pro 14 unter ähnlichen Bedingungen unbegrenzt höhere Leistungswerte beibehalten.
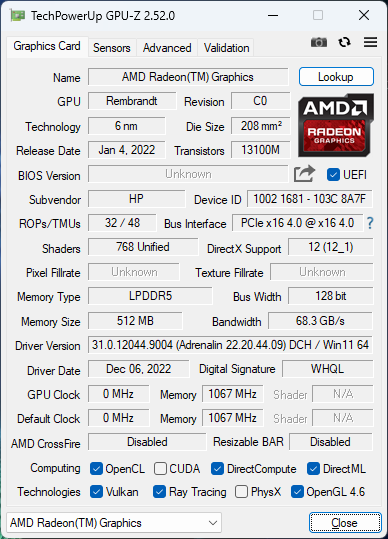
Beachten Sie, dass der Ryzen 7 7736U Zen 3+ und nicht Zen 4 ist. Die zweite Ziffer von rechts steht für die Generation des Prozessor in AMDs neuer (und verwirrender) Namenskonvention in diesem Jahr.
Cinebench R15 Multi Loop
Cinebench R23: Multi Core | Single Core
Cinebench R20: CPU (Multi Core) | CPU (Single Core)
Cinebench R15: CPU Multi 64Bit | CPU Single 64Bit
Blender: v2.79 BMW27 CPU
7-Zip 18.03: 7z b 4 | 7z b 4 -mmt1
Geekbench 5.5: Multi-Core | Single-Core
HWBOT x265 Benchmark v2.2: 4k Preset
LibreOffice : 20 Documents To PDF
R Benchmark 2.5: Overall mean
* ... kleinere Werte sind besser
AIDA64: FP32 Ray-Trace | FPU Julia | CPU SHA3 | CPU Queen | FPU SinJulia | FPU Mandel | CPU AES | CPU ZLib | FP64 Ray-Trace | CPU PhotoWorxx
| Performance Rating | |
| Dell XPS 13 Plus 9320 i7-1280P OLED | |
| HP Spectre x360 13.5 14t-ef000 | |
| Lenovo Yoga 9 14IAP7 82LU0001US | |
| HP Elite Dragonfly G3 | |
| AIDA64 / FP32 Ray-Trace | |
| Dell XPS 13 Plus 9320 i7-1280P OLED | |
| HP Spectre x360 13.5 14t-ef000 | |
| HP Elite Dragonfly G3 | |
| Lenovo Yoga 9 14IAP7 82LU0001US | |
| AIDA64 / FPU Julia | |
| Dell XPS 13 Plus 9320 i7-1280P OLED | |
| HP Spectre x360 13.5 14t-ef000 | |
| HP Elite Dragonfly G3 | |
| Lenovo Yoga 9 14IAP7 82LU0001US | |
| AIDA64 / CPU SHA3 | |
| Dell XPS 13 Plus 9320 i7-1280P OLED | |
| HP Spectre x360 13.5 14t-ef000 | |
| Lenovo Yoga 9 14IAP7 82LU0001US | |
| HP Elite Dragonfly G3 | |
| AIDA64 / CPU Queen | |
| Dell XPS 13 Plus 9320 i7-1280P OLED | |
| Lenovo Yoga 9 14IAP7 82LU0001US | |
| HP Spectre x360 13.5 14t-ef000 | |
| HP Elite Dragonfly G3 | |
| AIDA64 / FPU SinJulia | |
| Dell XPS 13 Plus 9320 i7-1280P OLED | |
| Lenovo Yoga 9 14IAP7 82LU0001US | |
| HP Spectre x360 13.5 14t-ef000 | |
| HP Elite Dragonfly G3 | |
| AIDA64 / FPU Mandel | |
| Dell XPS 13 Plus 9320 i7-1280P OLED | |
| HP Spectre x360 13.5 14t-ef000 | |
| HP Elite Dragonfly G3 | |
| Lenovo Yoga 9 14IAP7 82LU0001US | |
| AIDA64 / CPU AES | |
| HP Spectre x360 13.5 14t-ef000 | |
| Dell XPS 13 Plus 9320 i7-1280P OLED | |
| Lenovo Yoga 9 14IAP7 82LU0001US | |
| HP Elite Dragonfly G3 | |
| AIDA64 / CPU ZLib | |
| Dell XPS 13 Plus 9320 i7-1280P OLED | |
| Lenovo Yoga 9 14IAP7 82LU0001US | |
| HP Spectre x360 13.5 14t-ef000 | |
| HP Elite Dragonfly G3 | |
| AIDA64 / FP64 Ray-Trace | |
| Dell XPS 13 Plus 9320 i7-1280P OLED | |
| HP Spectre x360 13.5 14t-ef000 | |
| HP Elite Dragonfly G3 | |
| Lenovo Yoga 9 14IAP7 82LU0001US | |
| AIDA64 / CPU PhotoWorxx | |
| Dell XPS 13 Plus 9320 i7-1280P OLED | |
| HP Spectre x360 13.5 14t-ef000 | |
| Lenovo Yoga 9 14IAP7 82LU0001US | |
| HP Elite Dragonfly G3 | |
System Performance
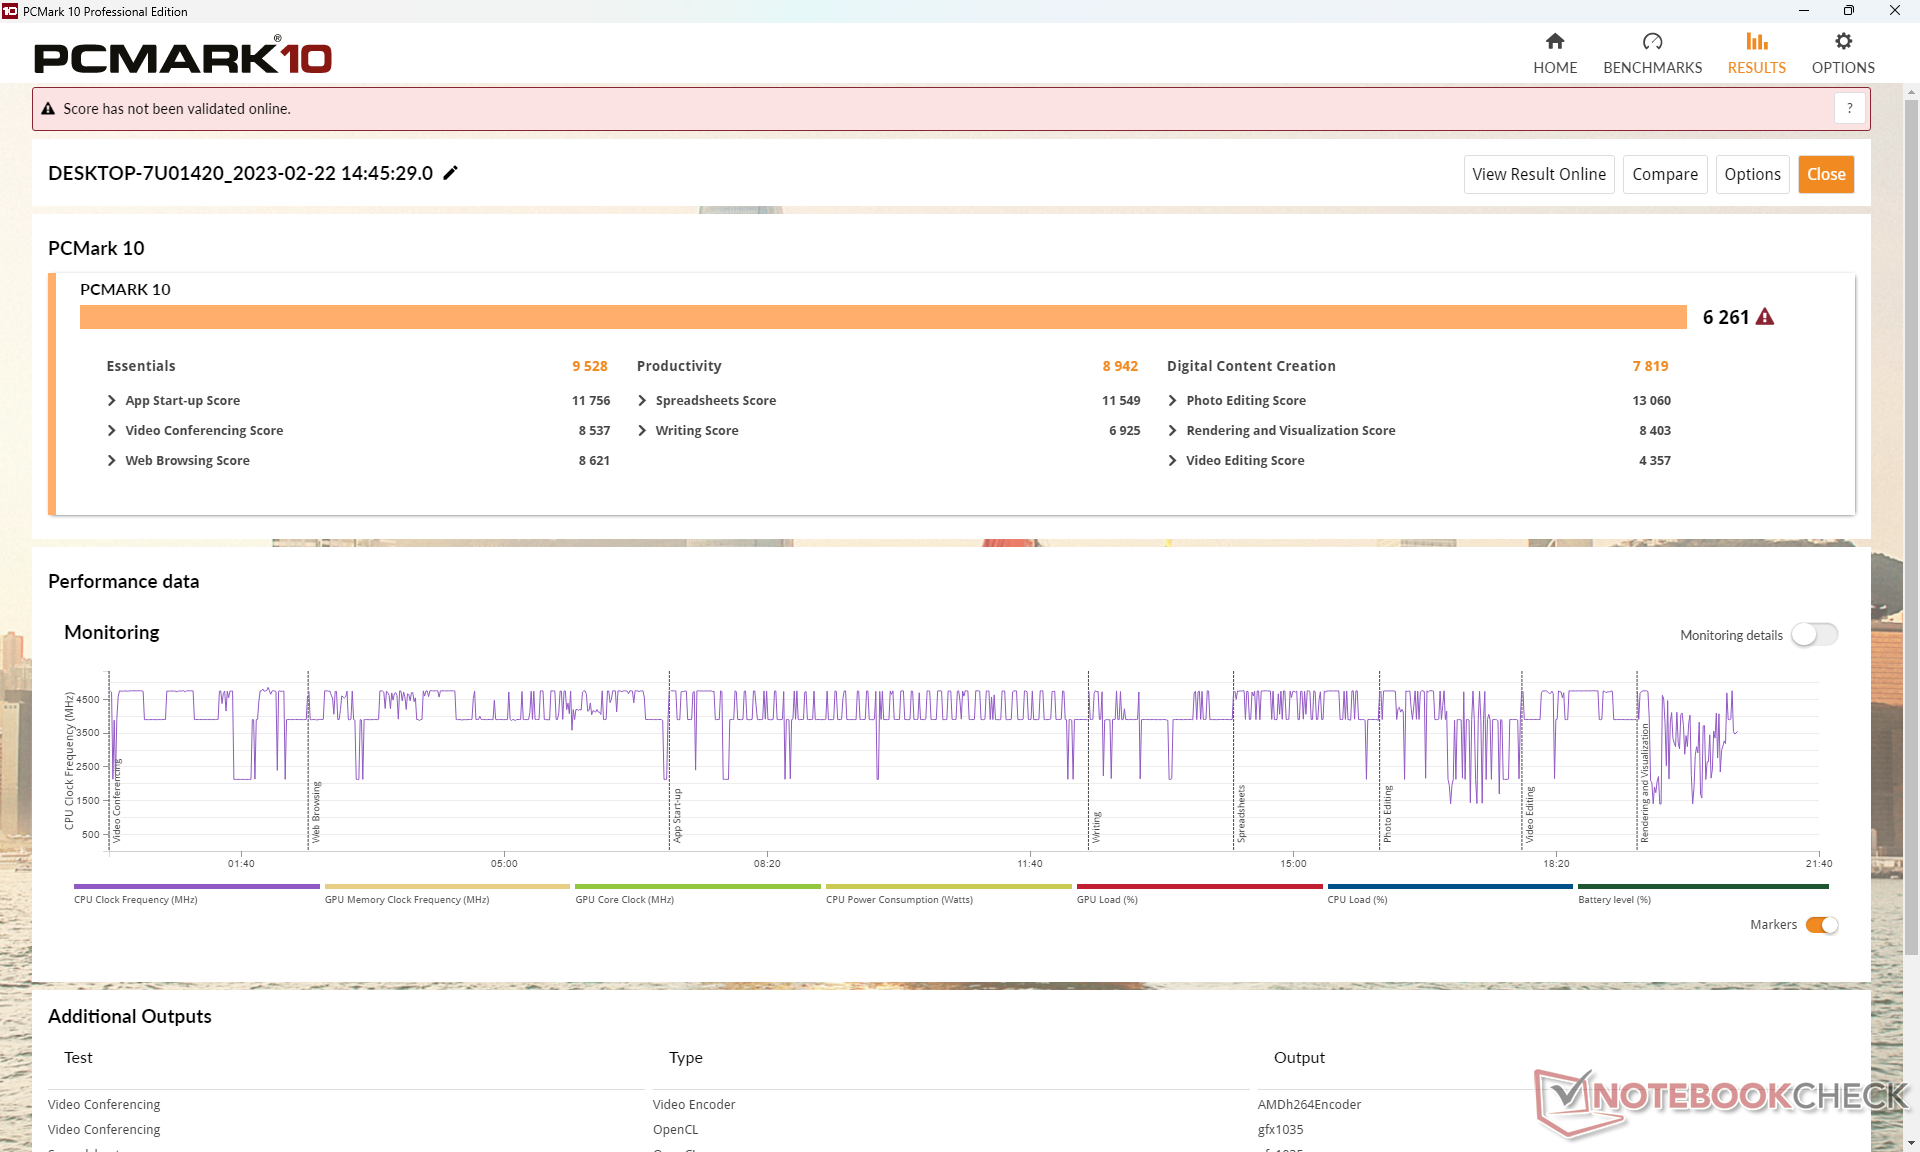
Unser PCMark-10-Gesamtergebnis ist eines der höchsten aller Notebooks, die mit einer CPU der Core-U-Serie ausgestattet sind. Die schnelle Prozessor und die Grafikkarte helfen dem Notebook, in den Untertests "Produktivität" und "Erstellung digitaler Inhalte" zu glänzen.
CrossMark: Overall | Productivity | Creativity | Responsiveness
| PCMark 10 / Score | |
| HP Dragonfly Pro 2023 | |
| Durchschnittliche AMD Ryzen 7 7736U, AMD Radeon 680M (n=1) | |
| Dell XPS 13 Plus 9320 i7-1280P OLED | |
| HP Spectre x360 13.5 14t-ef000 | |
| Lenovo Yoga 9 14IAP7 82LU0001US | |
| HP Elite Dragonfly G3 | |
| PCMark 10 / Essentials | |
| HP Spectre x360 13.5 14t-ef000 | |
| Lenovo Yoga 9 14IAP7 82LU0001US | |
| Dell XPS 13 Plus 9320 i7-1280P OLED | |
| HP Dragonfly Pro 2023 | |
| Durchschnittliche AMD Ryzen 7 7736U, AMD Radeon 680M (n=1) | |
| HP Elite Dragonfly G3 | |
| PCMark 10 / Productivity | |
| HP Dragonfly Pro 2023 | |
| Durchschnittliche AMD Ryzen 7 7736U, AMD Radeon 680M (n=1) | |
| HP Spectre x360 13.5 14t-ef000 | |
| Dell XPS 13 Plus 9320 i7-1280P OLED | |
| Lenovo Yoga 9 14IAP7 82LU0001US | |
| HP Elite Dragonfly G3 | |
| PCMark 10 / Digital Content Creation | |
| HP Dragonfly Pro 2023 | |
| Durchschnittliche AMD Ryzen 7 7736U, AMD Radeon 680M (n=1) | |
| Dell XPS 13 Plus 9320 i7-1280P OLED | |
| Lenovo Yoga 9 14IAP7 82LU0001US | |
| HP Elite Dragonfly G3 | |
| HP Spectre x360 13.5 14t-ef000 | |
| CrossMark / Overall | |
| Apple MacBook Pro 14 2023 M2 Pro | |
| Dell XPS 13 Plus 9320 i7-1280P OLED | |
| Lenovo Yoga 9 14IAP7 82LU0001US | |
| HP Spectre x360 13.5 14t-ef000 | |
| HP Dragonfly Pro 2023 | |
| Durchschnittliche AMD Ryzen 7 7736U, AMD Radeon 680M (n=1) | |
| HP Elite Dragonfly G3 | |
| CrossMark / Productivity | |
| Dell XPS 13 Plus 9320 i7-1280P OLED | |
| Apple MacBook Pro 14 2023 M2 Pro | |
| Lenovo Yoga 9 14IAP7 82LU0001US | |
| HP Spectre x360 13.5 14t-ef000 | |
| HP Dragonfly Pro 2023 | |
| Durchschnittliche AMD Ryzen 7 7736U, AMD Radeon 680M (n=1) | |
| HP Elite Dragonfly G3 | |
| CrossMark / Creativity | |
| Apple MacBook Pro 14 2023 M2 Pro | |
| Dell XPS 13 Plus 9320 i7-1280P OLED | |
| Lenovo Yoga 9 14IAP7 82LU0001US | |
| HP Spectre x360 13.5 14t-ef000 | |
| HP Dragonfly Pro 2023 | |
| Durchschnittliche AMD Ryzen 7 7736U, AMD Radeon 680M (n=1) | |
| HP Elite Dragonfly G3 | |
| CrossMark / Responsiveness | |
| Dell XPS 13 Plus 9320 i7-1280P OLED | |
| HP Spectre x360 13.5 14t-ef000 | |
| Lenovo Yoga 9 14IAP7 82LU0001US | |
| Apple MacBook Pro 14 2023 M2 Pro | |
| HP Dragonfly Pro 2023 | |
| Durchschnittliche AMD Ryzen 7 7736U, AMD Radeon 680M (n=1) | |
| HP Elite Dragonfly G3 | |
| PCMark 10 Score | 6261 Punkte | |
Hilfe | ||
| AIDA64 / Memory Copy | |
| Dell XPS 13 Plus 9320 i7-1280P OLED | |
| Lenovo Yoga 9 14IAP7 82LU0001US | |
| HP Elite Dragonfly G3 | |
| HP Spectre x360 13.5 14t-ef000 | |
| AIDA64 / Memory Read | |
| Dell XPS 13 Plus 9320 i7-1280P OLED | |
| Lenovo Yoga 9 14IAP7 82LU0001US | |
| HP Elite Dragonfly G3 | |
| HP Spectre x360 13.5 14t-ef000 | |
| AIDA64 / Memory Write | |
| HP Spectre x360 13.5 14t-ef000 | |
| Dell XPS 13 Plus 9320 i7-1280P OLED | |
| Lenovo Yoga 9 14IAP7 82LU0001US | |
| HP Elite Dragonfly G3 | |
| AIDA64 / Memory Latency | |
| HP Elite Dragonfly G3 | |
| Dell XPS 13 Plus 9320 i7-1280P OLED | |
| HP Spectre x360 13.5 14t-ef000 | |
* ... kleinere Werte sind besser
DPC-Latenzzeit
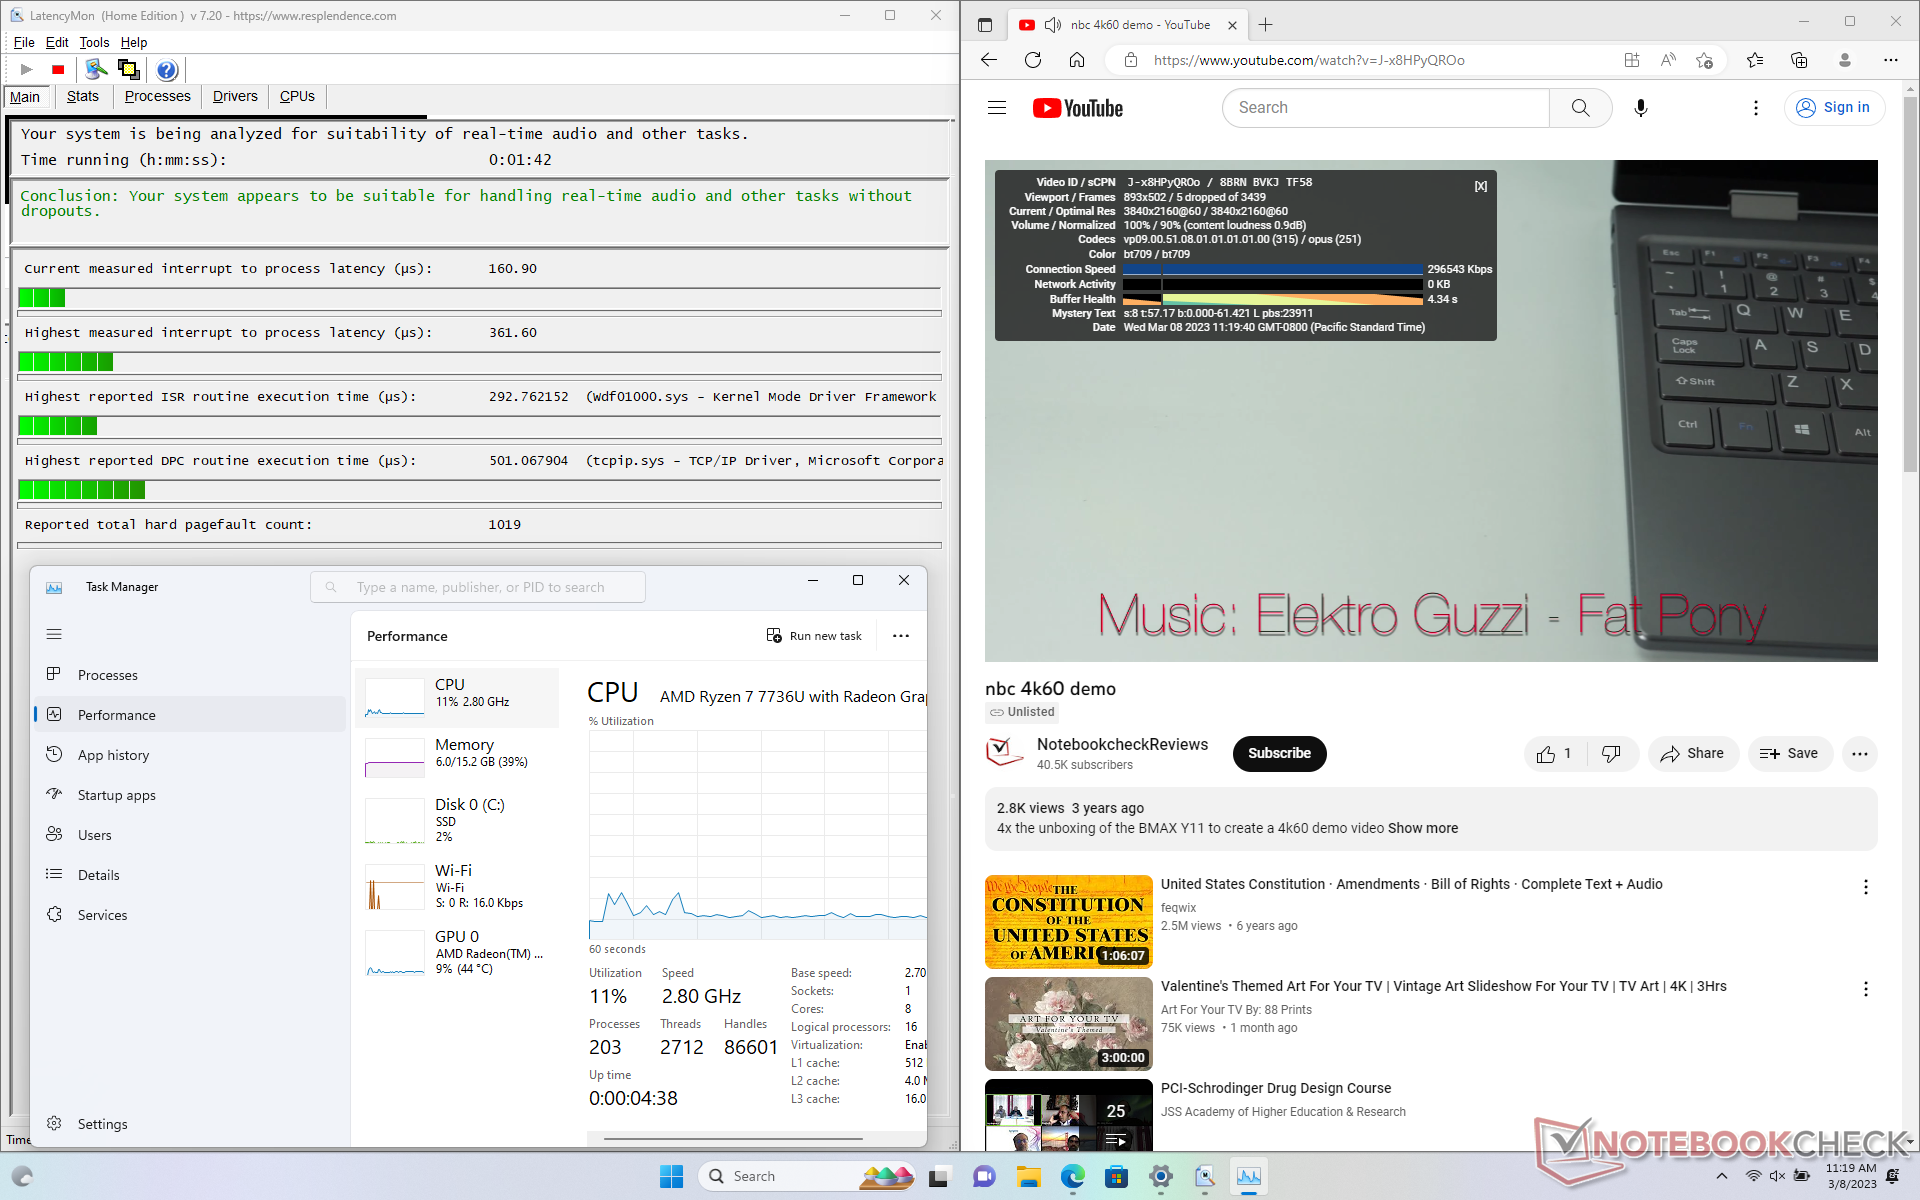
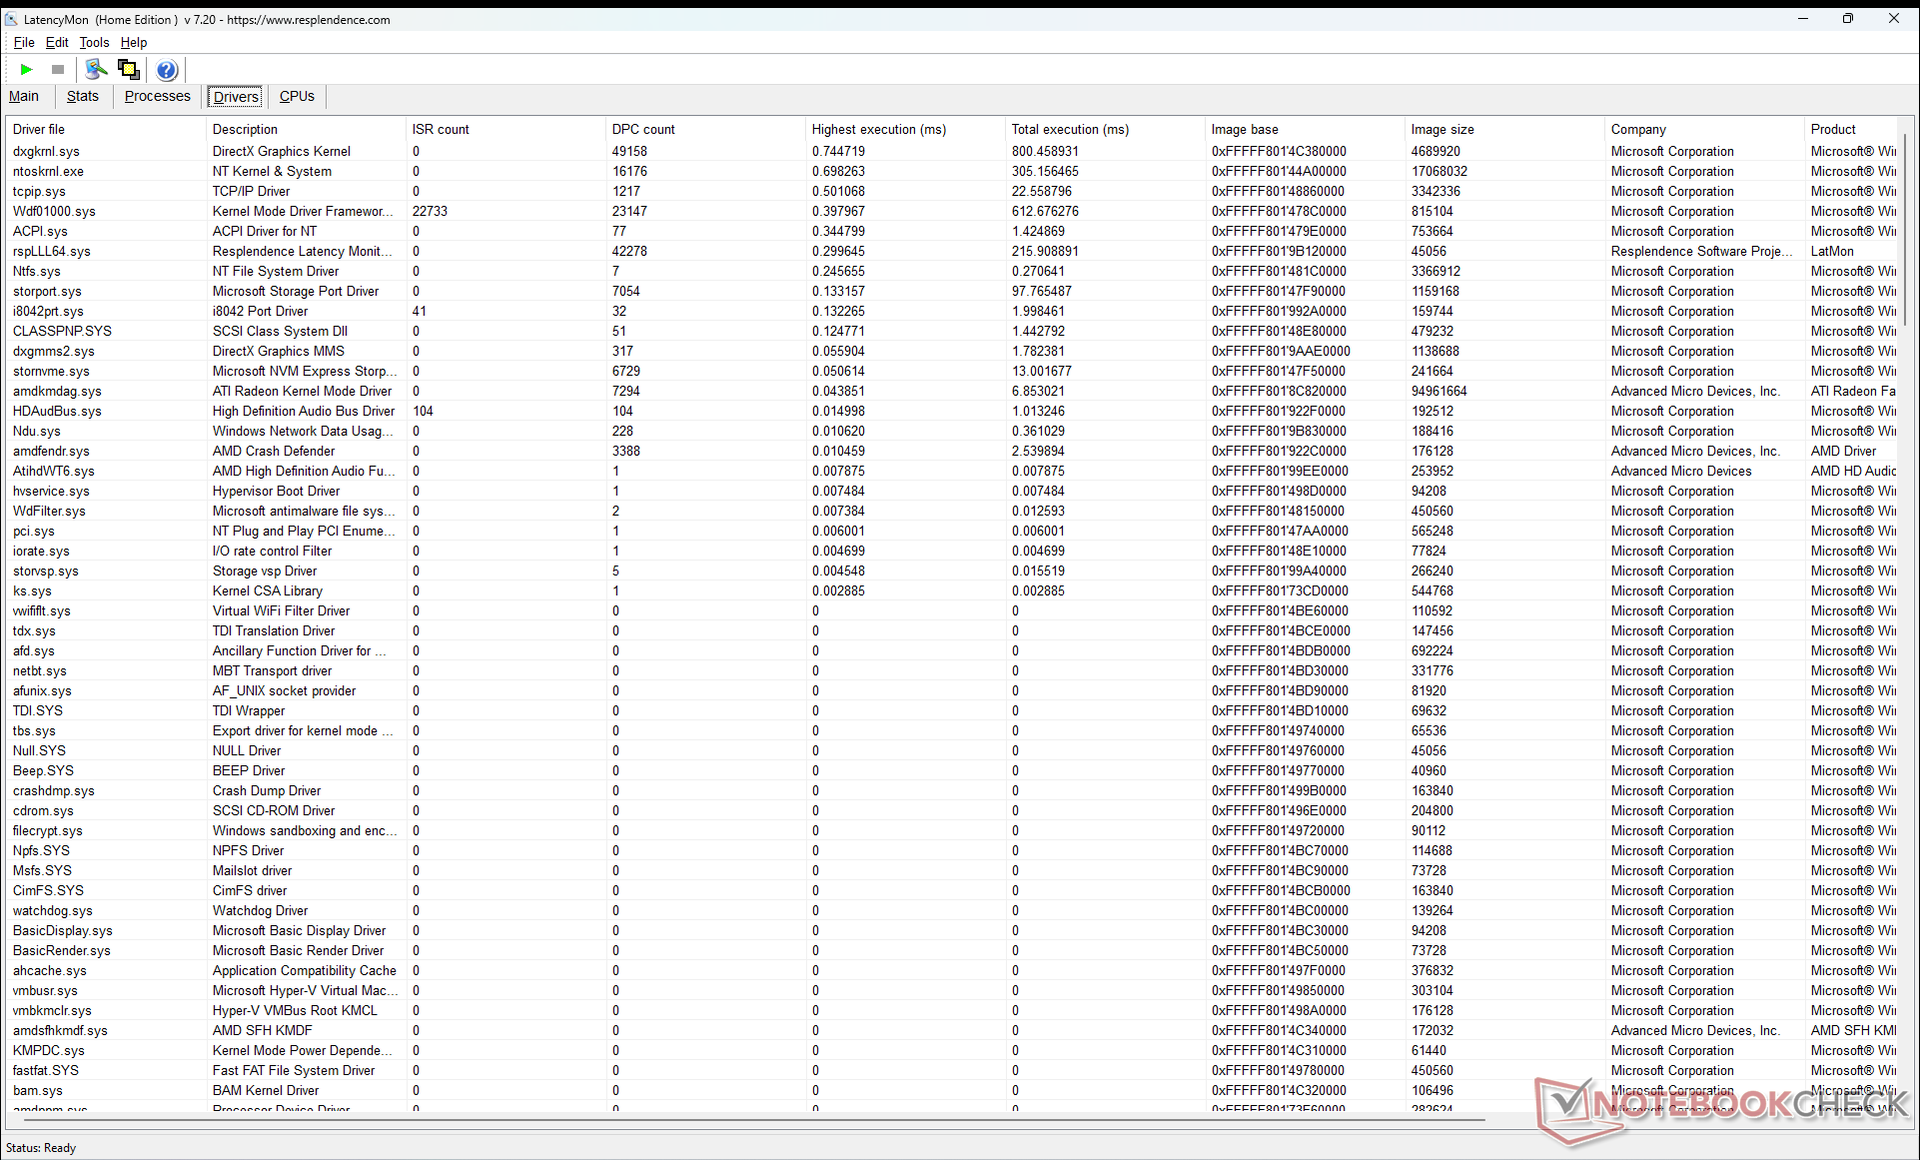
LatencyMon zeigt keine größeren DPC-Probleme, wenn wir mehrere Browser Tabs unserer Homepage öffnen oder wenn Prime95 Stress läuft. Es gibt jedoch ein kleines Problem bei der Wiedergabe von 4K-Inhalten mit 60 fps, da wir während unseres einminütigen Testvideos auch nach mehrfachen Wiederholungen fünf dropped frames aufzeichnen konnten. Es ist nicht genug, um während der Nutzung aufzufallen, aber es gibt keinen Grund, warum es überhaupt zu Bildausfällen kommt. Wir hatten ähnliche Probleme bereits 2020 bei der Einführung des mobilen Zen 2 erlebt, daher ist es enttäuschend, diese Probleme auch bei der neuen mobilen Zen-3+-Serie zu sehen. Wir hoffen, dass AMD wie beim letzten Mal bald einen Hotfix veröffentlichen wird.
| DPC Latencies / LatencyMon - interrupt to process latency (max), Web, Youtube, Prime95 | |
| Lenovo Yoga 9 14IAP7 82LU0001US | |
| HP Elite Dragonfly G3 | |
| HP Spectre x360 13.5 14t-ef000 | |
| Dell XPS 13 Plus 9320 i7-1280P OLED | |
| HP Dragonfly Pro 2023 | |
* ... kleinere Werte sind besser
Speichergeräte
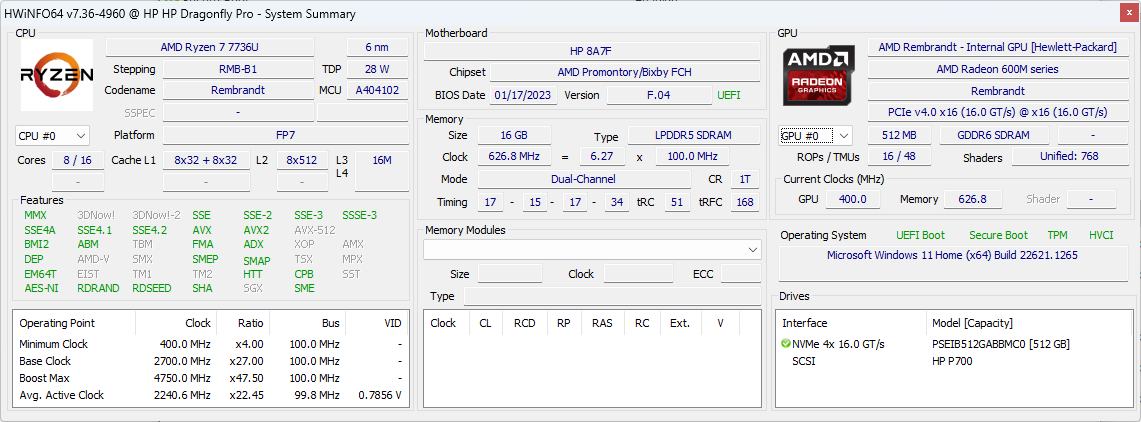
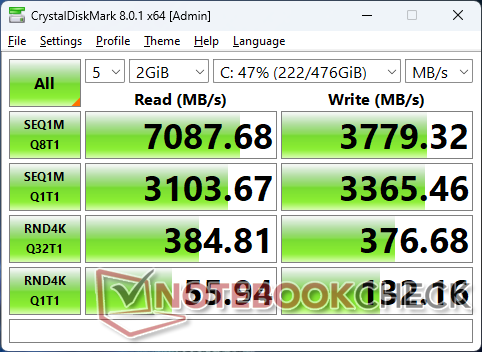
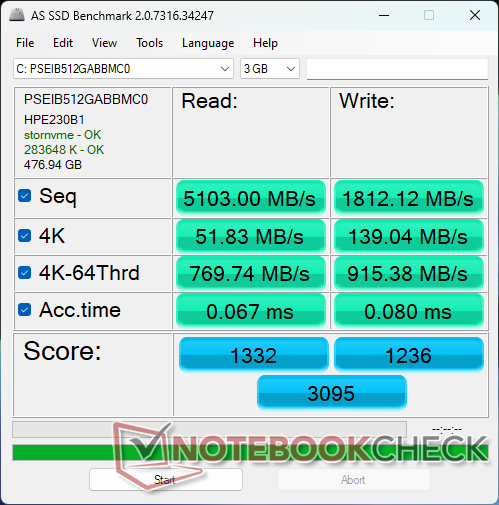
Die PCIe4 x4 SSD ist nicht vom Benutzer herausnehmbar, und es sind keine sekundären Erweiterungssteckplätze vorhanden. HWiNFO identifiziert sie als Modell PSEIB512GABBMC0 mit einem Phison-PS5018-Controller. Die Performance ist dennoch hervorragend mit sequentiellen Lese- und Schreibraten von bis zu 6.800 bzw. 3.800 MB/s. Sie ist auch stabil, ohne Throttling, selbst nach langen Perioden von Stress.

| Drive Performance Rating - Percent | |
| Dell XPS 13 Plus 9320 i7-1280P OLED | |
| HP Spectre x360 13.5 14t-ef000 | |
| Lenovo Yoga 9 14IAP7 82LU0001US | |
| HP Elite Dragonfly G3 | |
| HP Dragonfly Pro 2023 | |
* ... kleinere Werte sind besser
Disk Throttling: DiskSpd Read Loop, Queue Depth 8
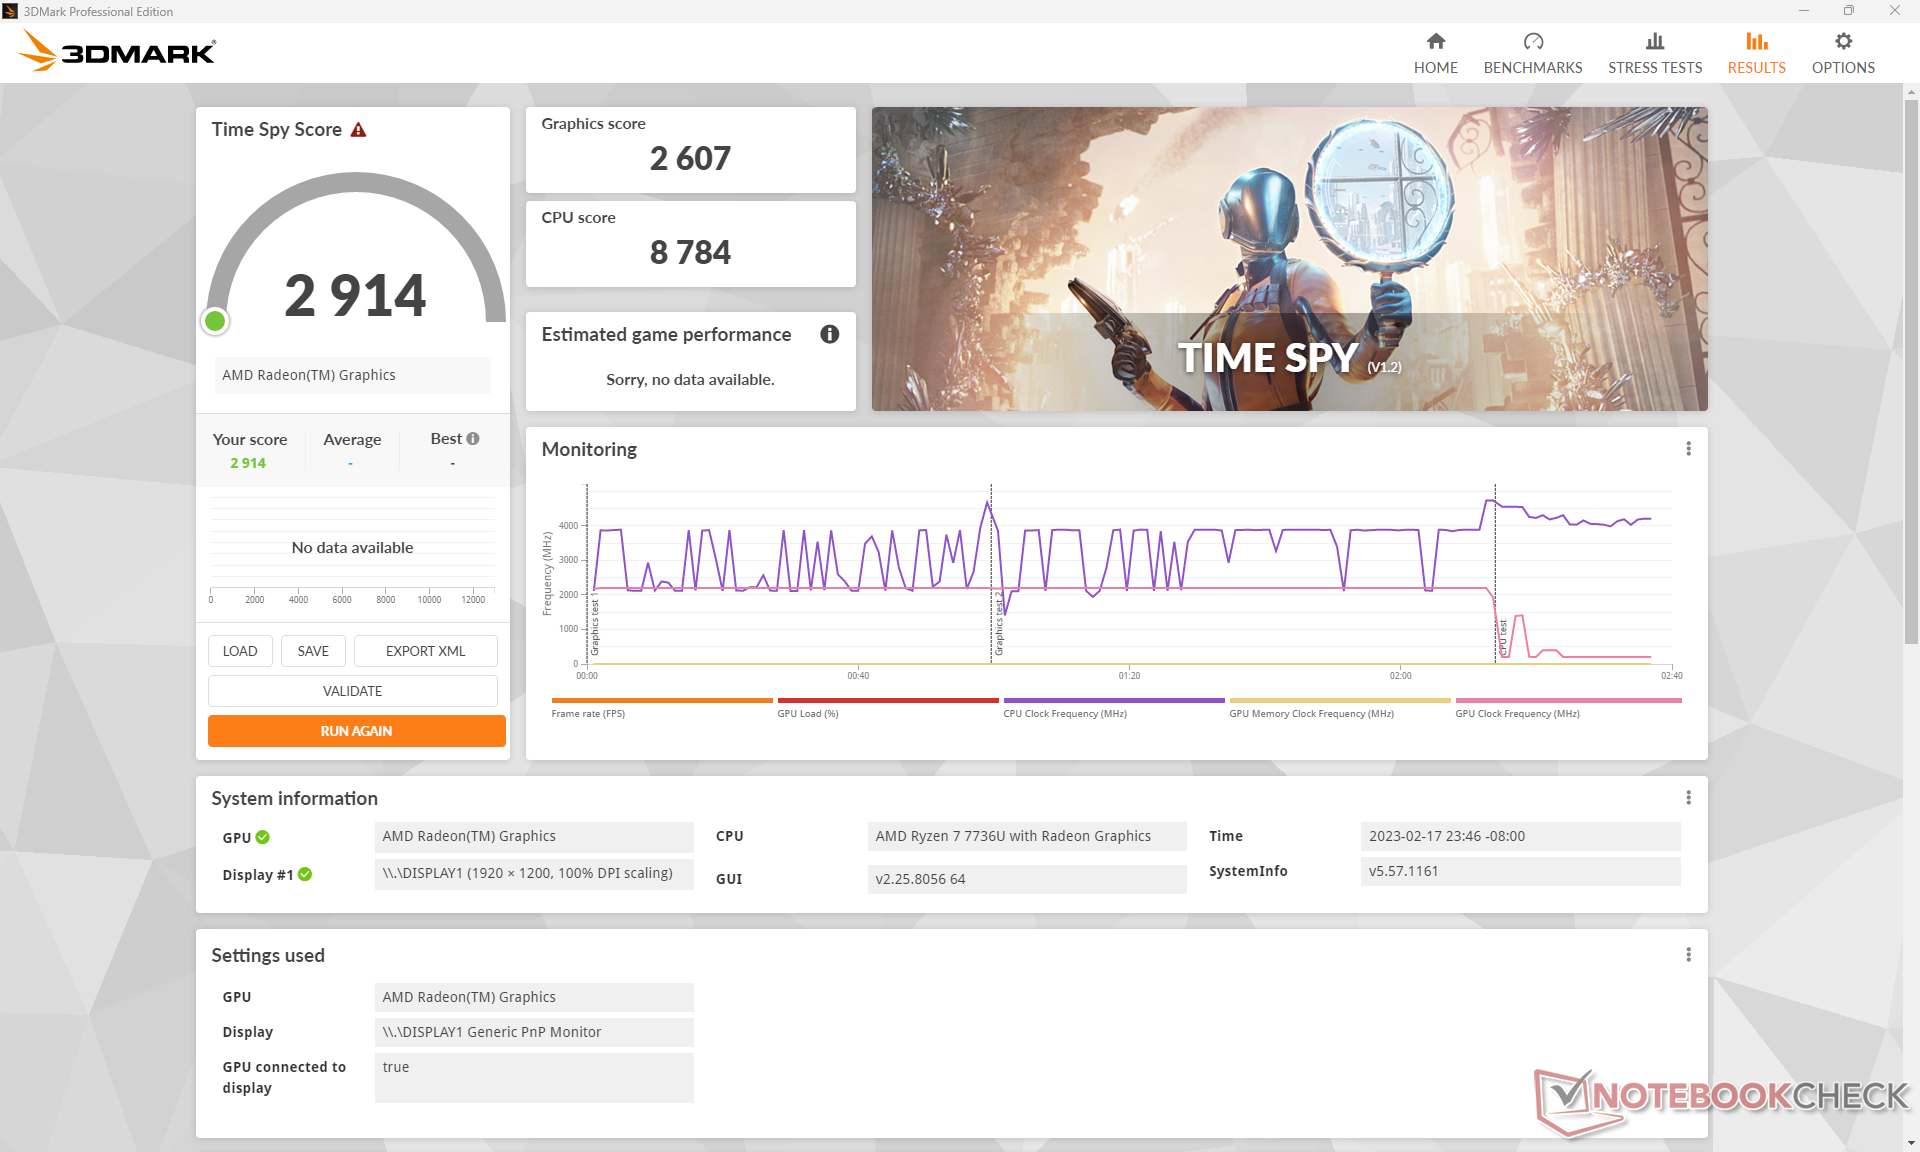
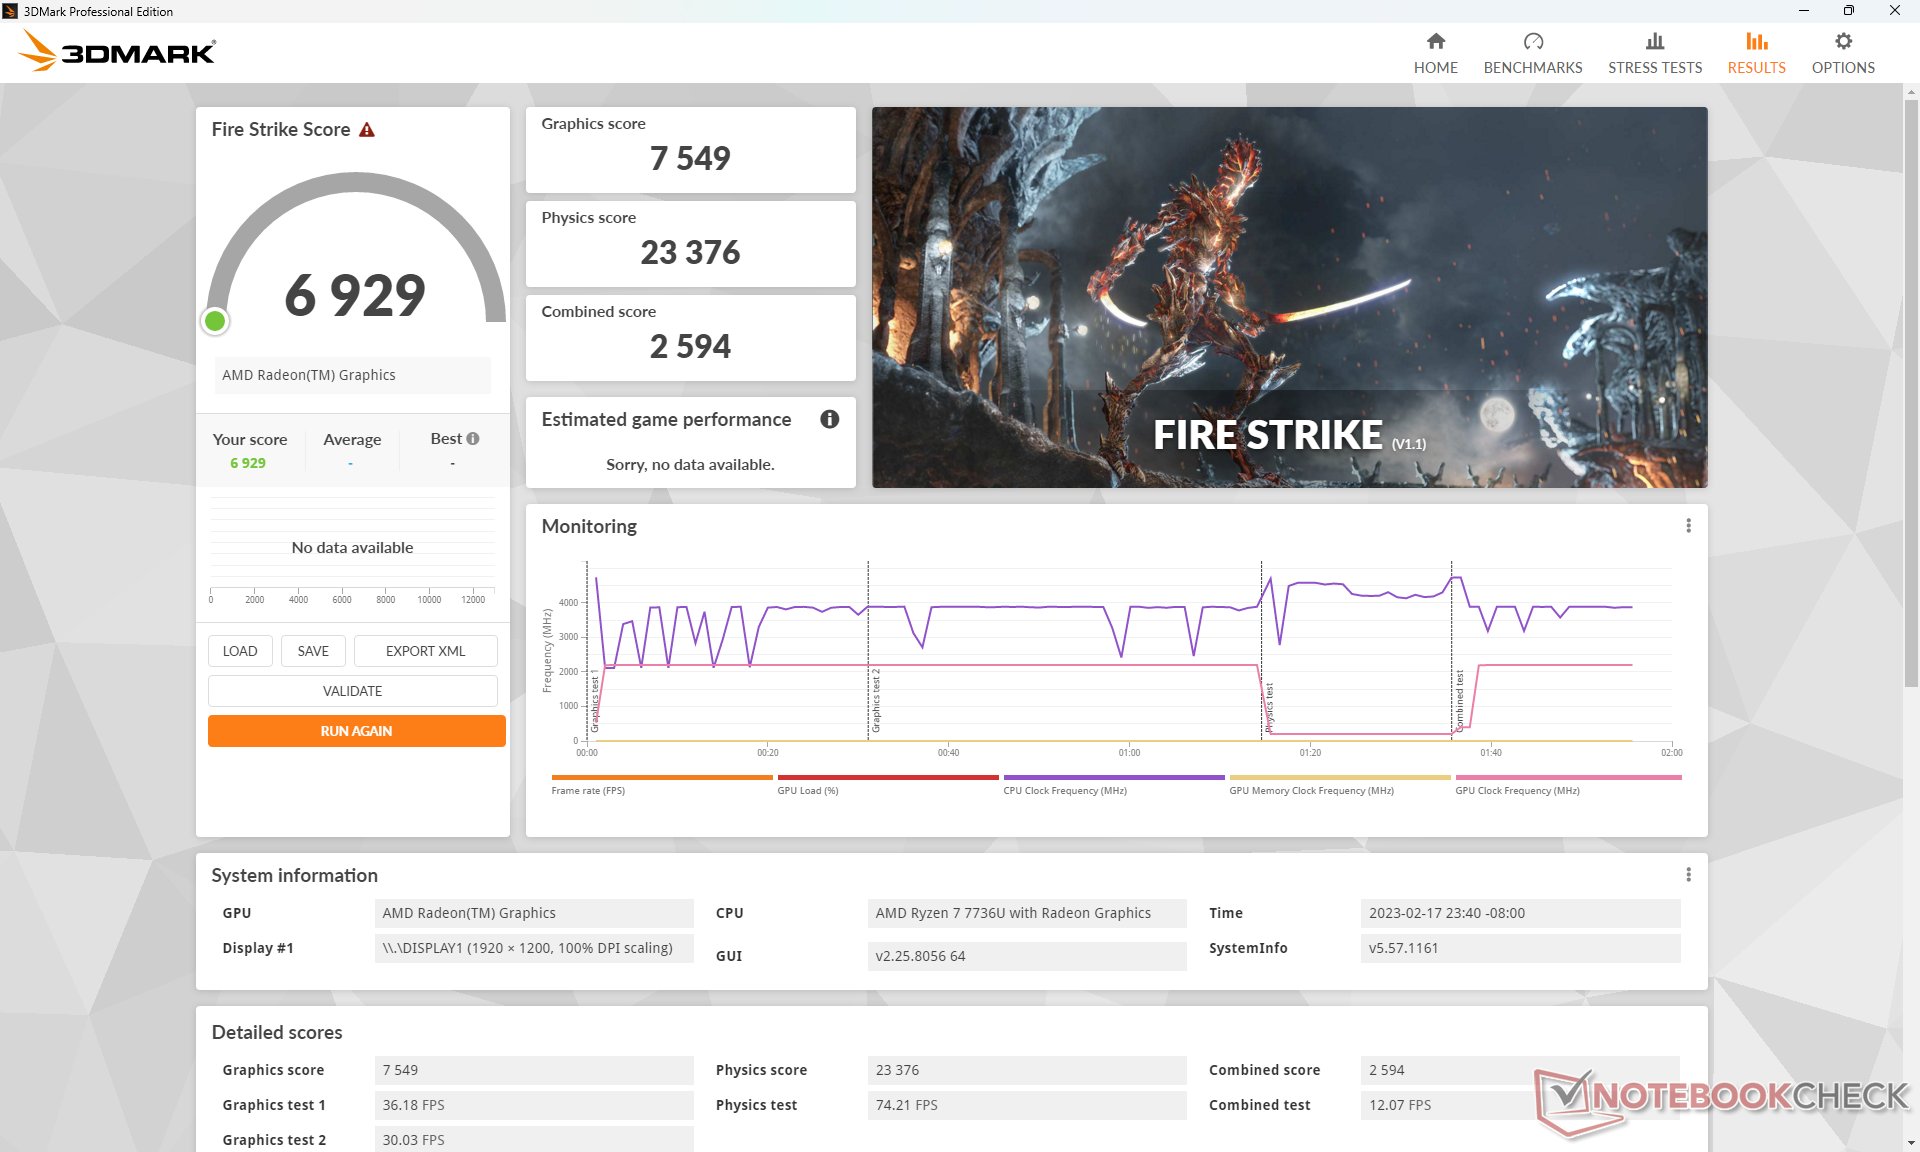
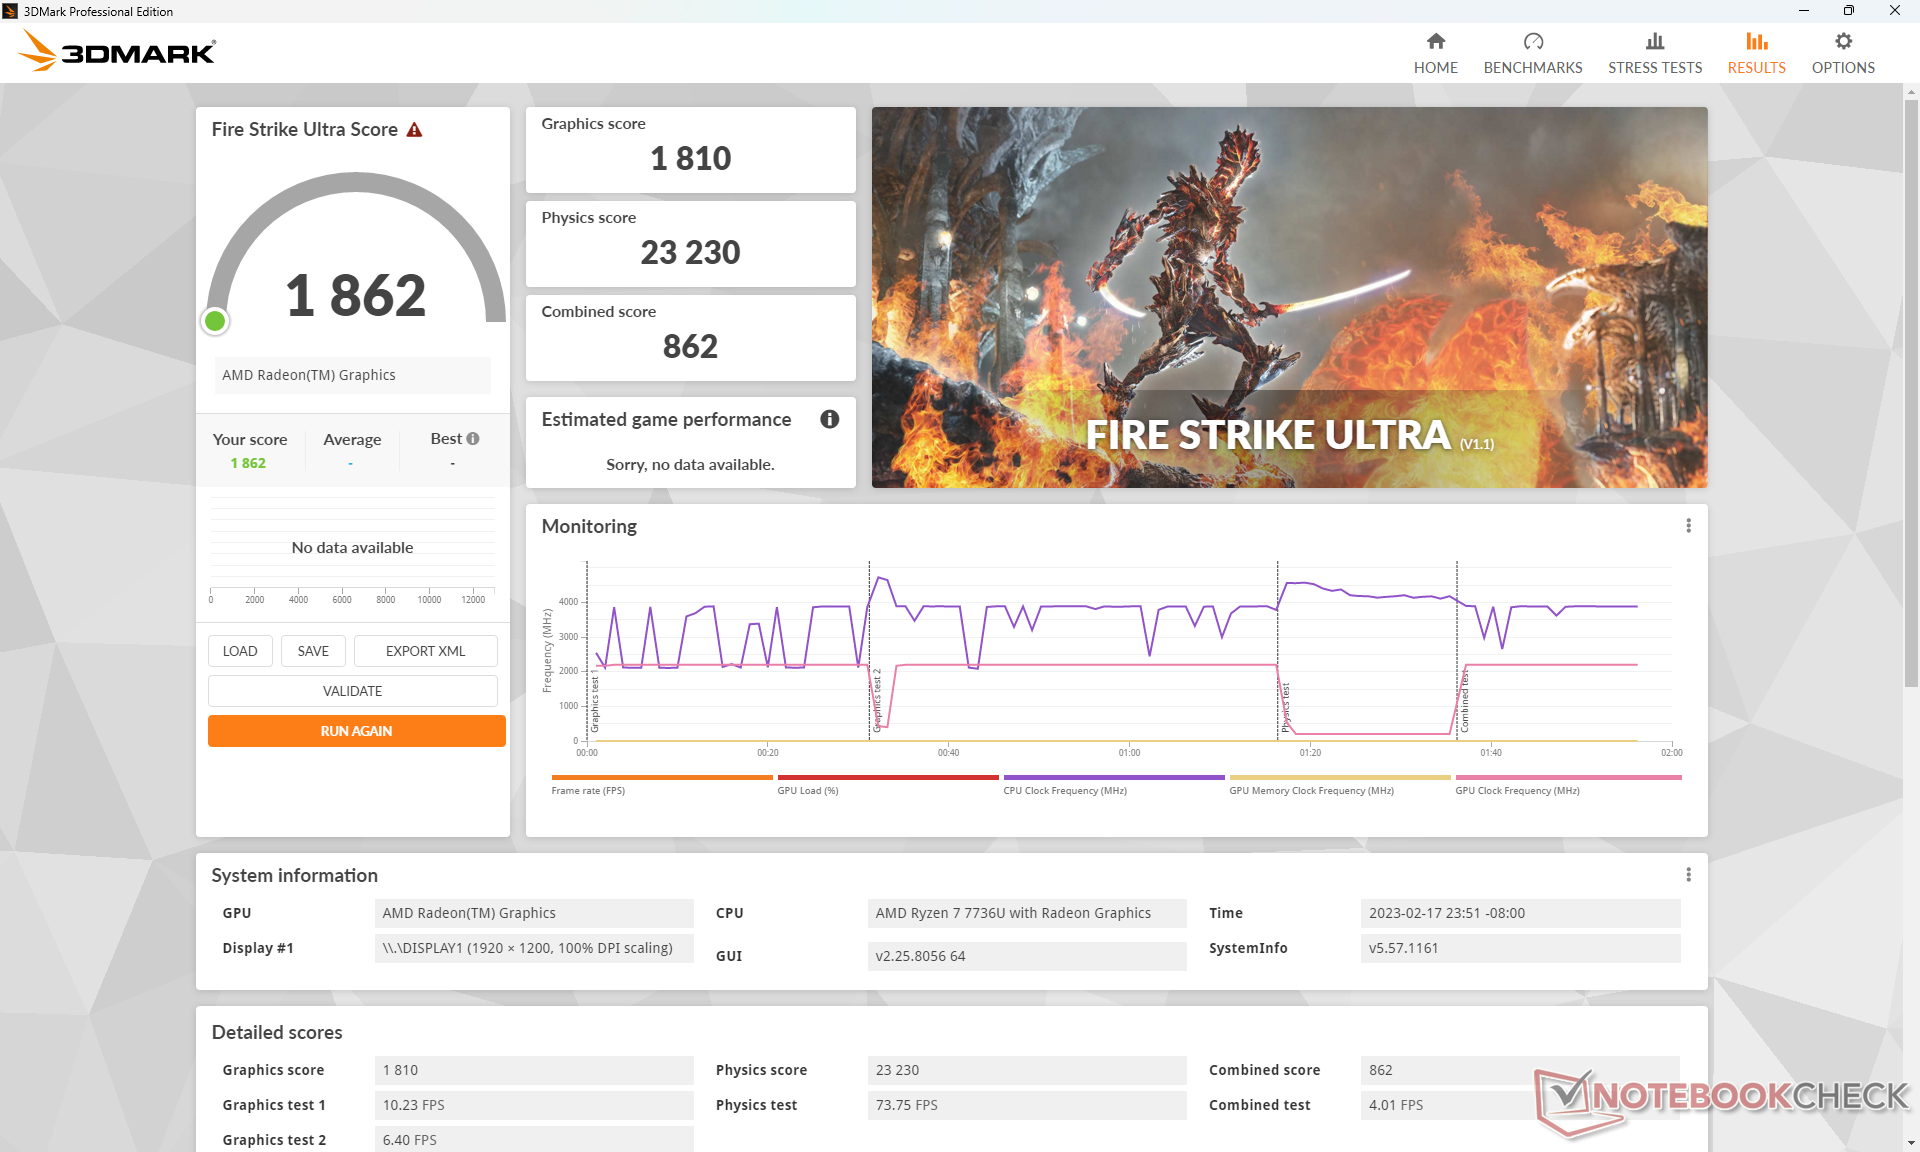
GPU-Performance - Grafik auf Playstation-4-Niveau
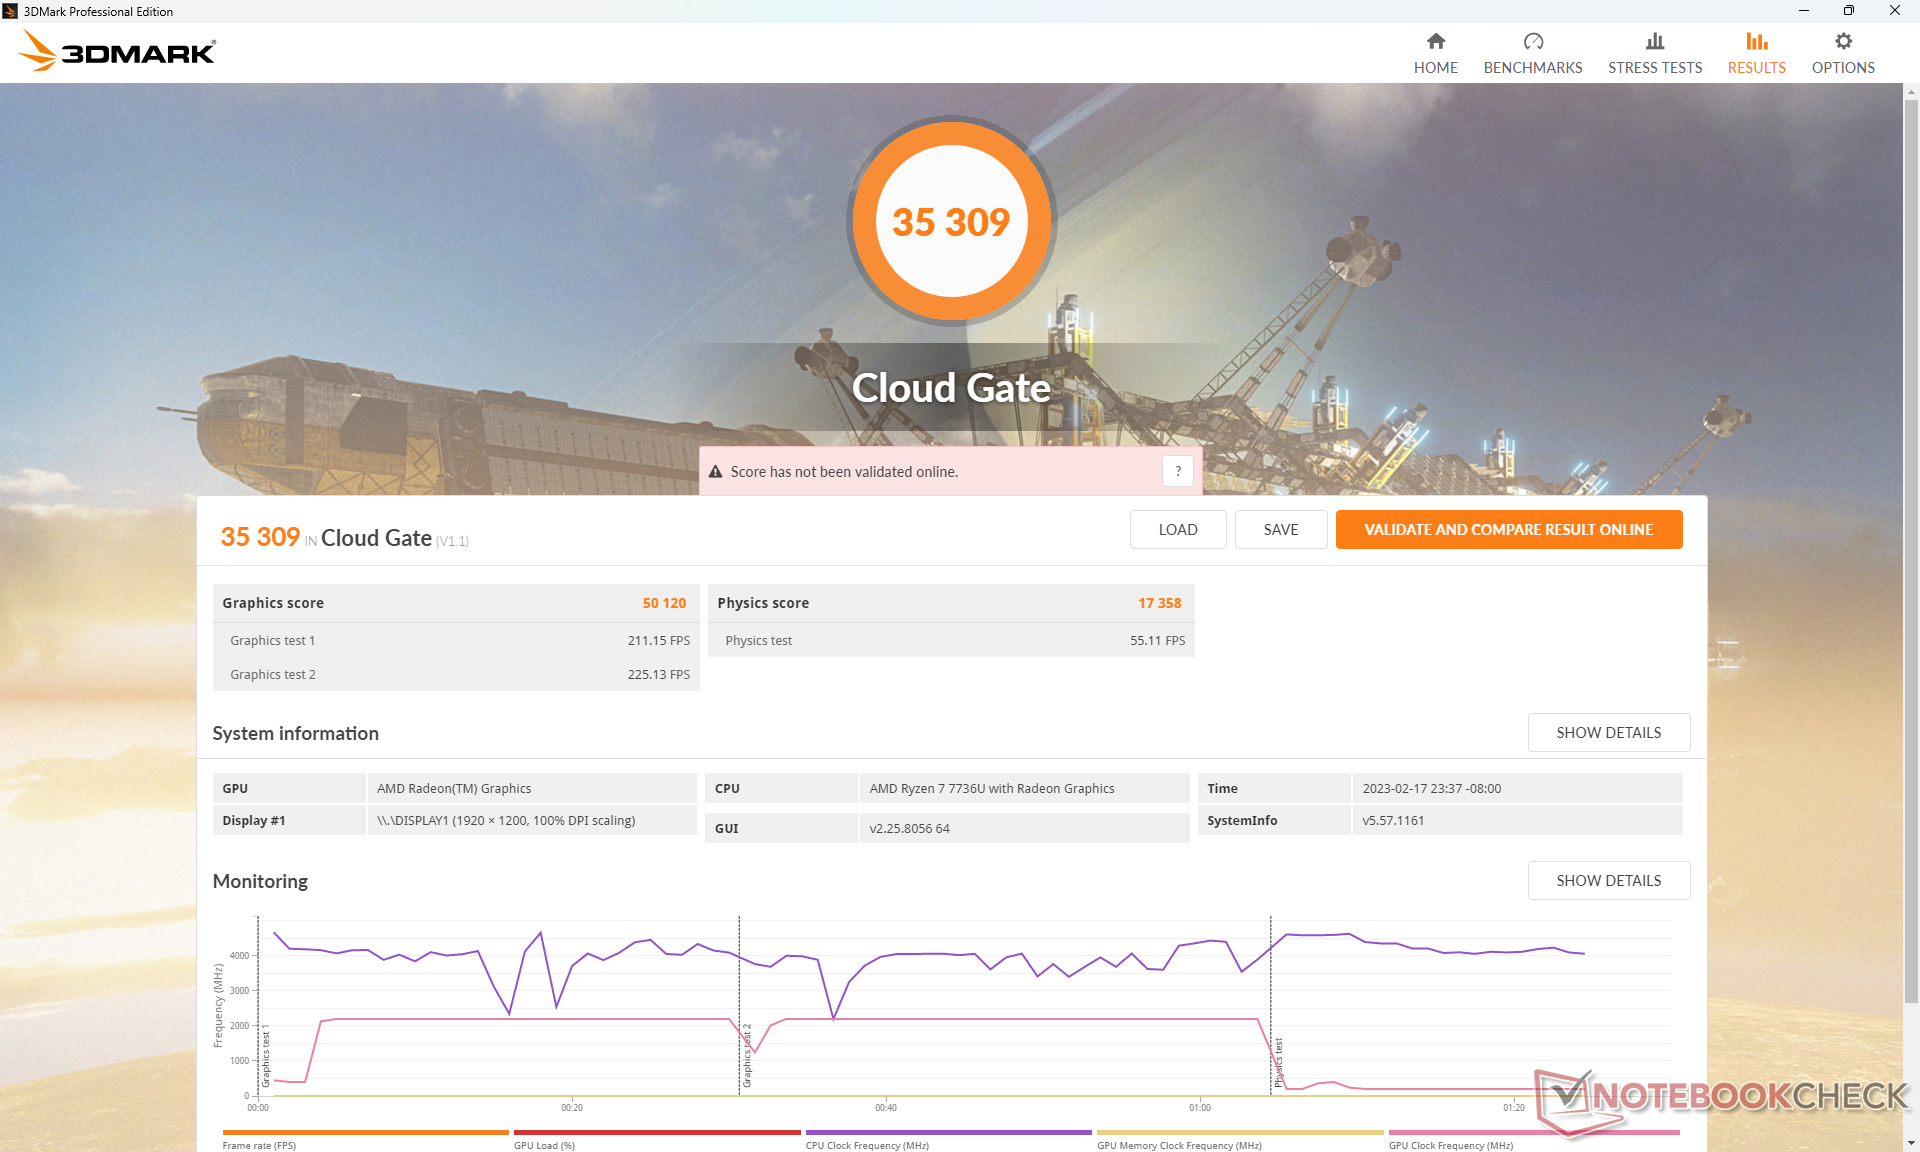
Die integrierte Grafikleistung ist beeindruckend: Die 3DMark-Ergebnisse sind 15 bis 20 Prozent höher als die eines durchschnittlichen Notebooks in unserer Datenbank mit der gleichen Radeon 680M GPU. Somit können Nutzer einen ordentlichen Leistungszuwachs im Vergleich zum Vorjahr erwarten, obwohl es keine signifikanten iGPU-Änderungen zwischen der Ryzen-6000U- und -7000U-Serie gibt. Der Leistungssprung reicht aus, damit unsere Radeon 680M mit der diskreten GeForce 1650 Max-Q konkurrieren kann. Mit anderen Worten: Sie erhalten eine Leistung auf PS4-Niveau, wobei die meisten Spiele im Durchschnitt 30 fps bei mittleren 1.080p-Einstellungen erreichen.
Die Steigerung der iGPU-Leistung im Vergleich zu älteren Ryzen-6000U-CPUs kann teilweise auf den sehr schnellen 6.400-MHz-LPDDR5-Dual-Channel-RAM zurückgeführt werden. Die meisten Subnotebooks haben im Vergleich dazu RAM im 5.000-MHz-Bereich oder langsamer.
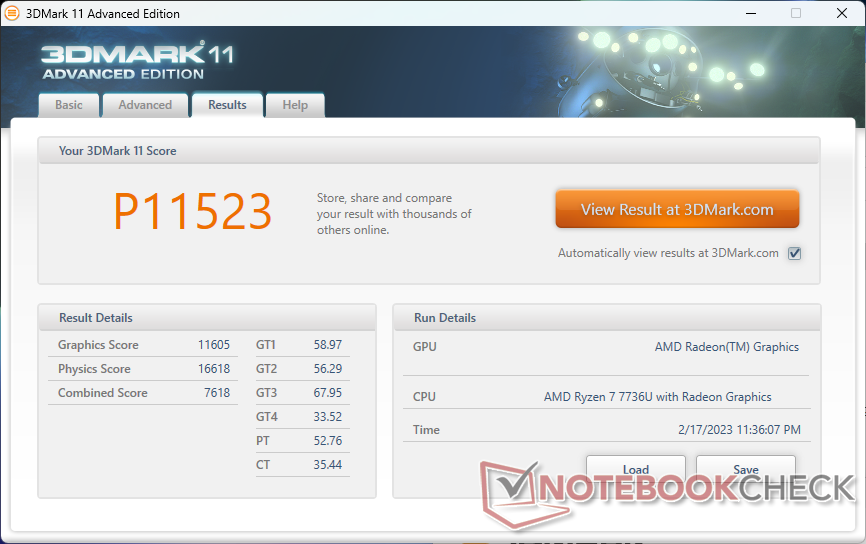
| 3DMark 11 Performance | 11523 Punkte | |
| 3DMark Cloud Gate Standard Score | 35309 Punkte | |
| 3DMark Fire Strike Score | 6929 Punkte | |
| 3DMark Time Spy Score | 2914 Punkte | |
Hilfe | ||
* ... kleinere Werte sind besser
Witcher 3 FPS Chart
| min. | mittel | hoch | max. | |
|---|---|---|---|---|
| GTA V (2015) | 145.8 | 48.7 | 22.8 | |
| The Witcher 3 (2015) | 132.8 | 41 | 24.8 | |
| Dota 2 Reborn (2015) | 118.8 | 101.7 | 76.6 | 65.7 |
| Final Fantasy XV Benchmark (2018) | 65.4 | 33.6 | 23.5 | |
| X-Plane 11.11 (2018) | 54.8 | 42.8 | 34.6 | |
| Strange Brigade (2018) | 155.8 | 57.7 | 46.5 | 40.1 |
| Horizon Zero Dawn (2020) | 78 | 37 | 32 | 27 |
| God of War (2022) | 34 | 27.9 | 22.9 | 15.2 |
| Cyberpunk 2077 1.6 (2022) | 36.9 | 28.1 | 20.2 | 15.7 |
Emissionen
Systemrauschen - Hohe Tonhöhe beim Rauschen
Die Lüftergeräusche sind bei den meisten niedrigen bis mittleren Belastungen wie Webbrowsing oder Videostreaming gering bis gar nicht vorhanden. Das Lüftergeräusch bewegt sich unter solchen Bedingungen typischerweise um die 26 dB(A) gegen einen leisen Hintergrund von 23 dB(A), was fast unhörbar ist, wenn man in normalem Abstand zum Bildschirm sitzt.
Bei höherer Last wie Spielen stabilisiert sich das Lüftergeräusch bei 40 dB(A) und ist damit lauter als beim letztjährigen Elite Dragonfly G3 oder etwa genauso laut wie beim XPS 13 Plus unter ähnlichen Bedingungen. Das hohe Lüftergeräusch ist beim Dragonfly Pro aufgrund der kleinen internen Lüfter leider stärker wahrnehmbar.
Lautstärkediagramm
| Idle |
| 23 / 23 / 23 dB(A) |
| Last |
| 27.8 / 40.3 dB(A) |
 | ||
30 dB leise 40 dB(A) deutlich hörbar 50 dB(A) störend |
||
min: | ||
| HP Dragonfly Pro 2023 Radeon 680M, R7 7736U, PSEIB512GABBMC0 | HP Spectre x360 13.5 14t-ef000 Iris Xe G7 96EUs, i7-1255U, Micron 3400 1TB MTFDKBA1T0TFH | HP Elite Dragonfly G3 Iris Xe G7 96EUs, i7-1265U, Micron 3400 MTFDKBA512TFH 512GB | Apple MacBook Pro 14 2023 M2 Pro M2 Pro 19-Core GPU, M2 Pro, Apple SSD AP2048Z | Dell XPS 13 Plus 9320 i7-1280P OLED Iris Xe G7 96EUs, i7-1280P, WDC PC SN810 512GB | Lenovo Yoga 9 14IAP7 82LU0001US Iris Xe G7 96EUs, i7-1260P, Samsung PM9A1 MZVL2512HCJQ | |
|---|---|---|---|---|---|---|
| Geräuschentwicklung | 0% | 6% | -3% | -5% | -7% | |
| aus / Umgebung * (dB) | 23 | 23.5 -2% | 22.8 1% | 23.9 -4% | 23.4 -2% | 22.9 -0% |
| Idle min * (dB) | 23 | 23.5 -2% | 23.2 -1% | 23.9 -4% | 23.4 -2% | 23.3 -1% |
| Idle avg * (dB) | 23 | 23.5 -2% | 23.2 -1% | 23.9 -4% | 23.4 -2% | 23.5 -2% |
| Idle max * (dB) | 23 | 23.5 -2% | 23.2 -1% | 23.9 -4% | 23.4 -2% | 23.5 -2% |
| Last avg * (dB) | 27.8 | 27 3% | 25.1 10% | 26 6% | 35 -26% | 33.2 -19% |
| Witcher 3 ultra * (dB) | 40.6 | 36.2 11% | 32 21% | 41.6 -2% | 44.9 -11% | |
| Last max * (dB) | 40.3 | 42.4 -5% | 35.2 13% | 43.2 -7% | 39.9 1% | 44.6 -11% |
* ... kleinere Werte sind besser
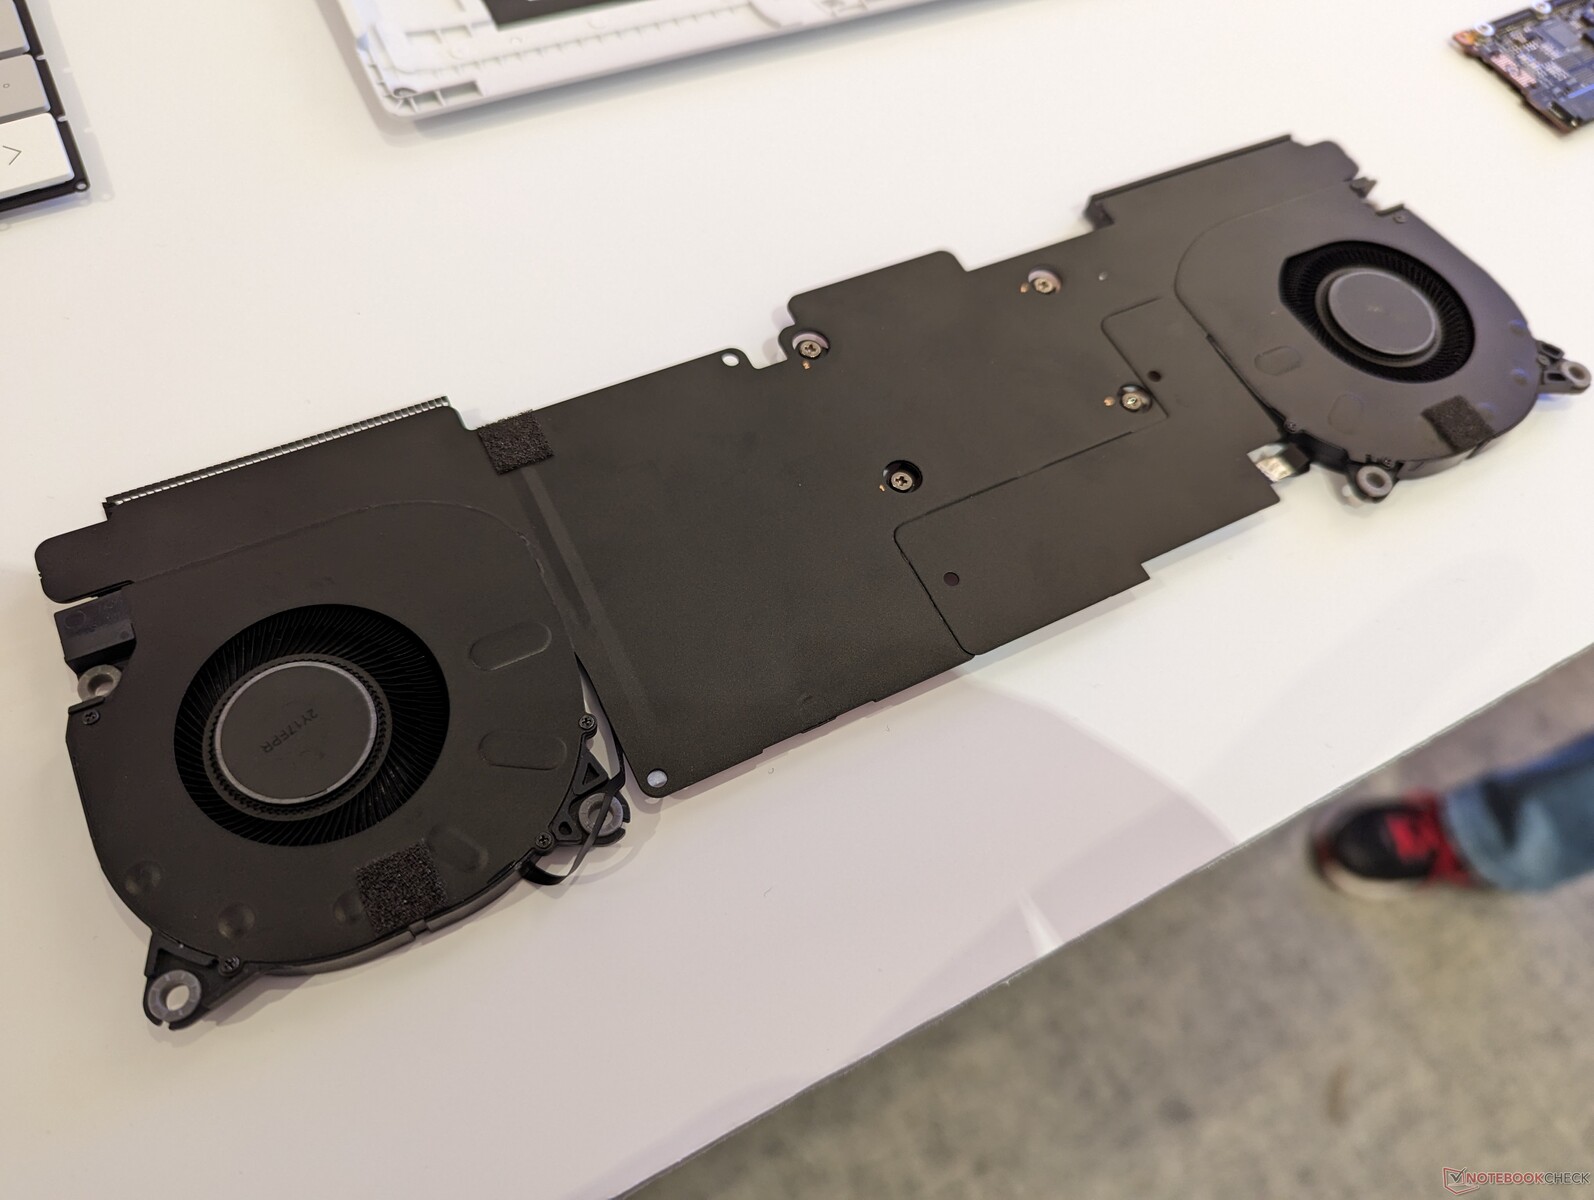
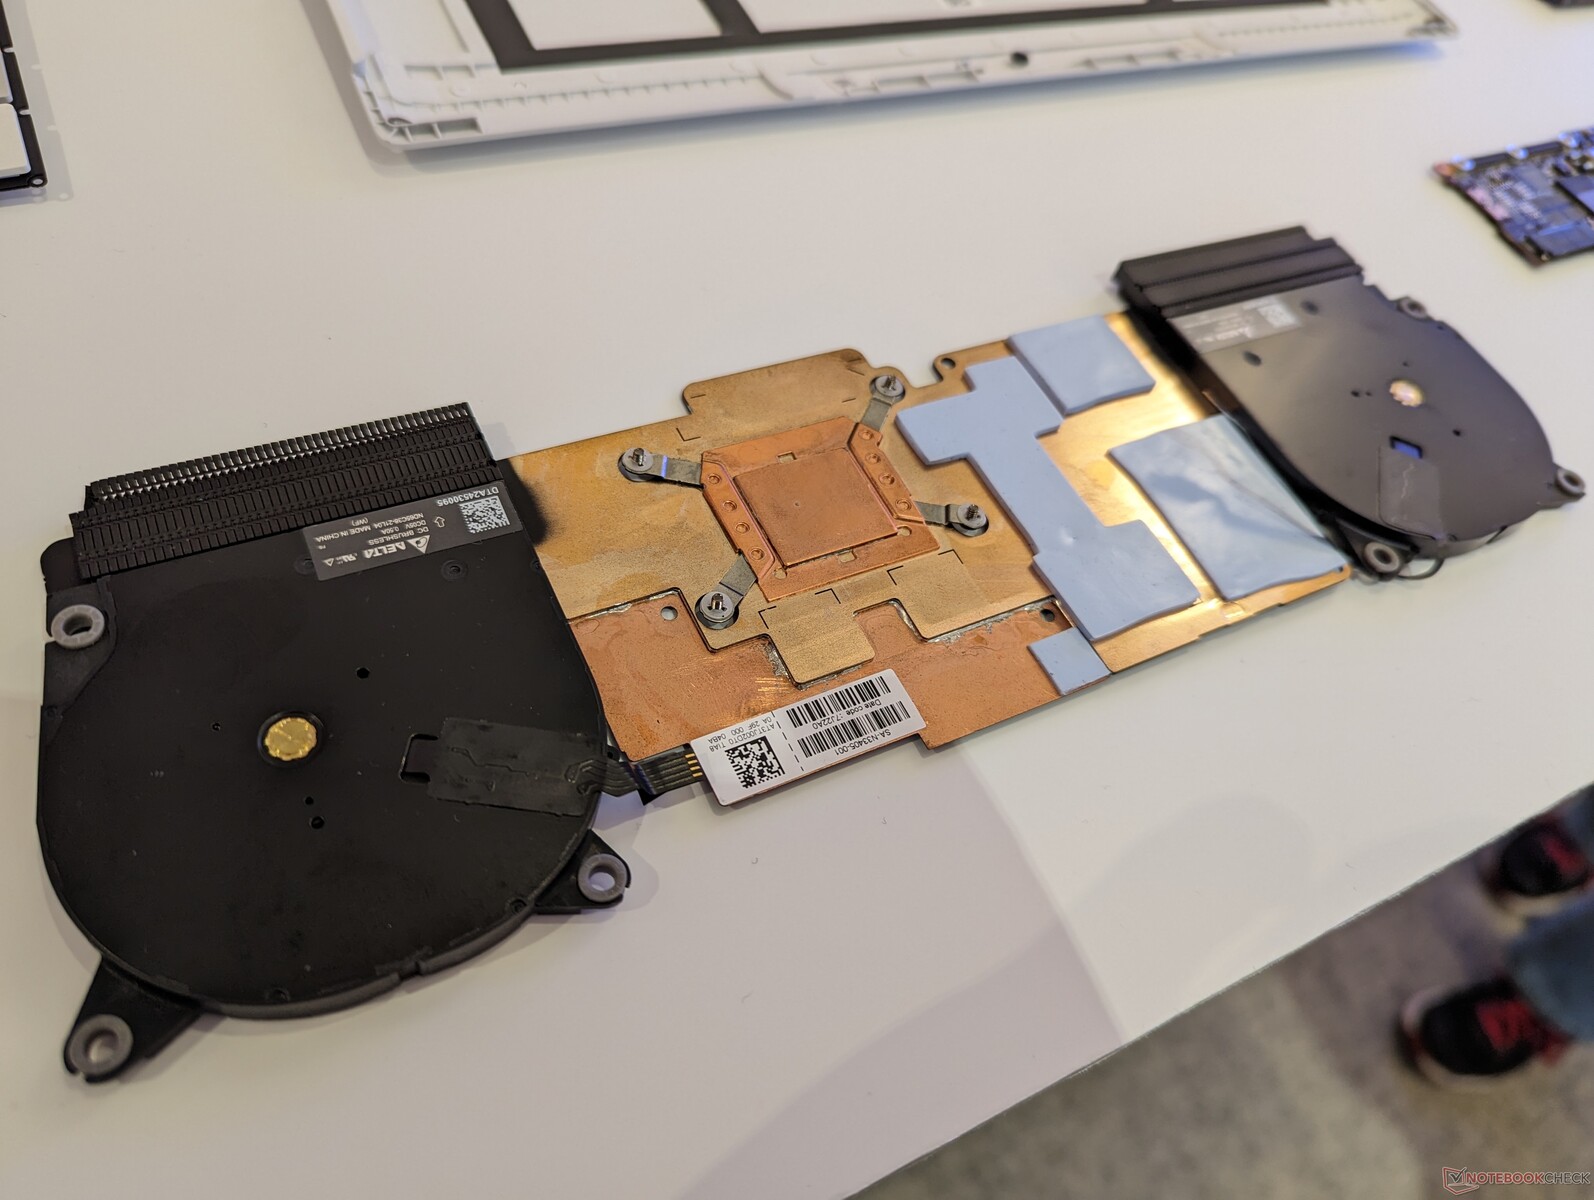
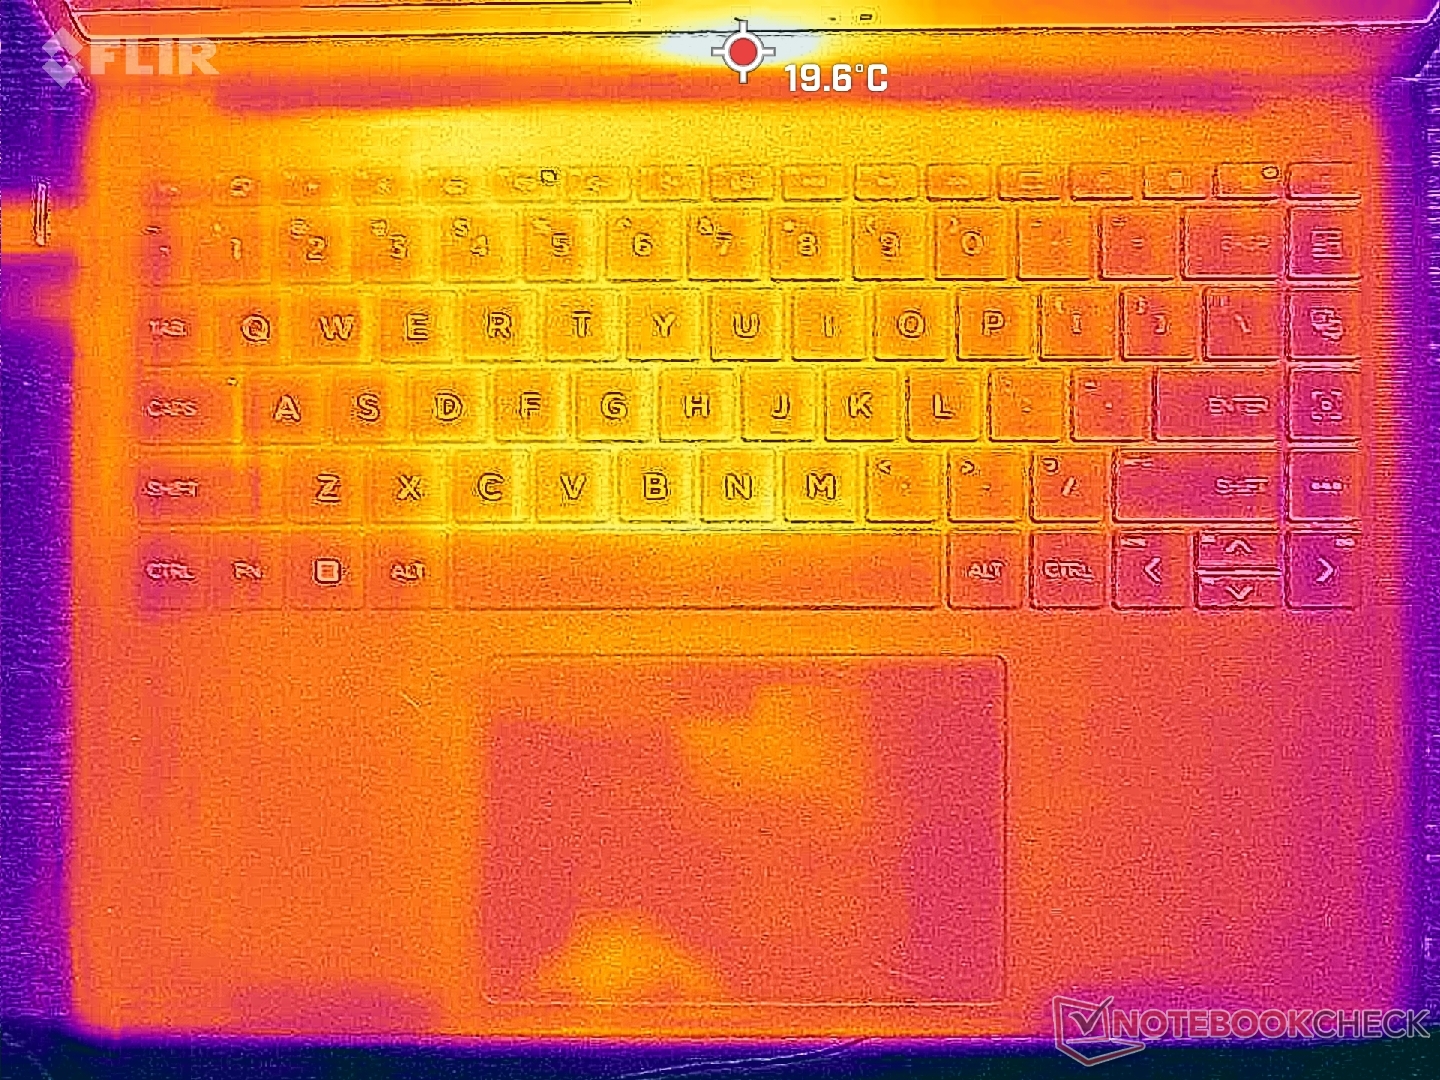
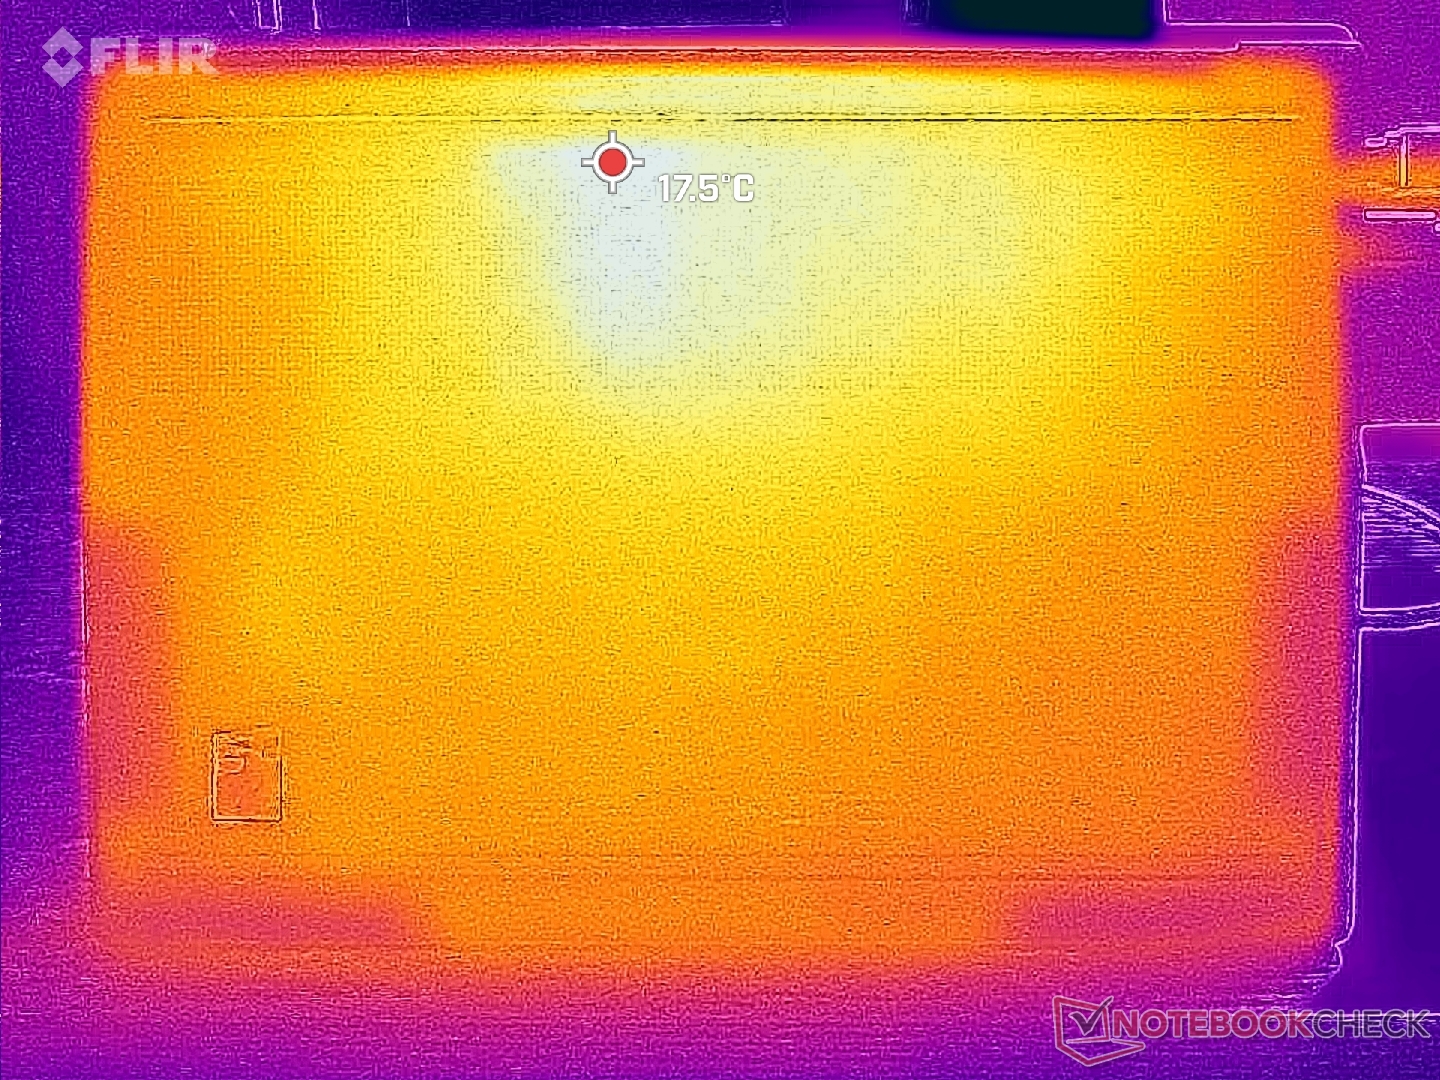
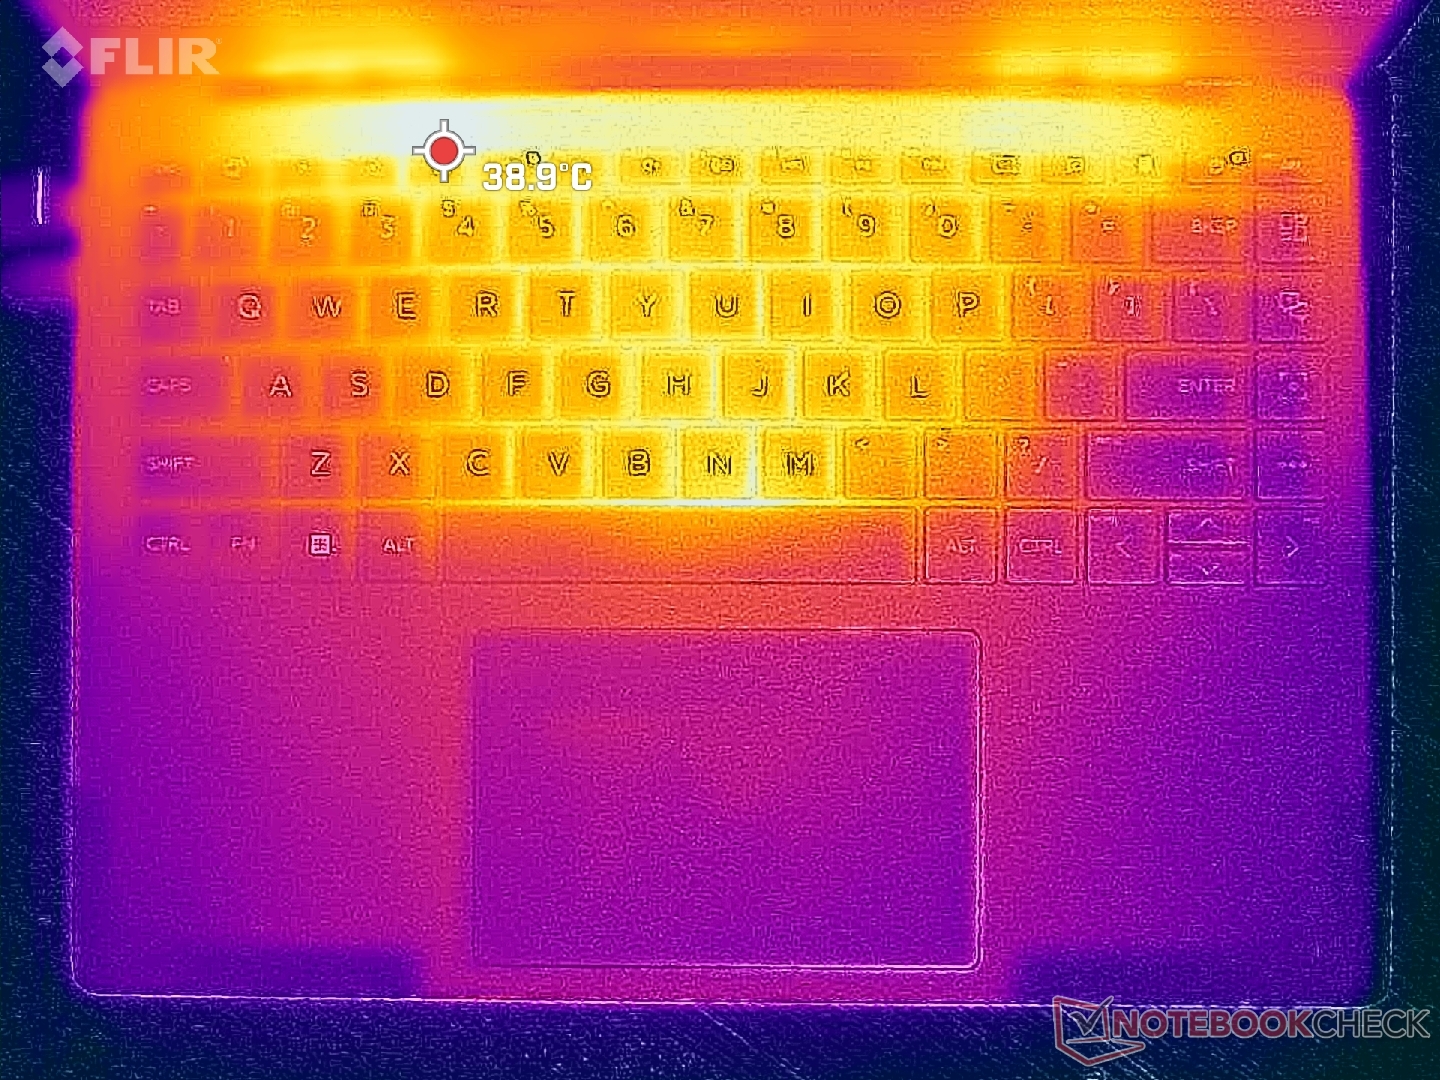
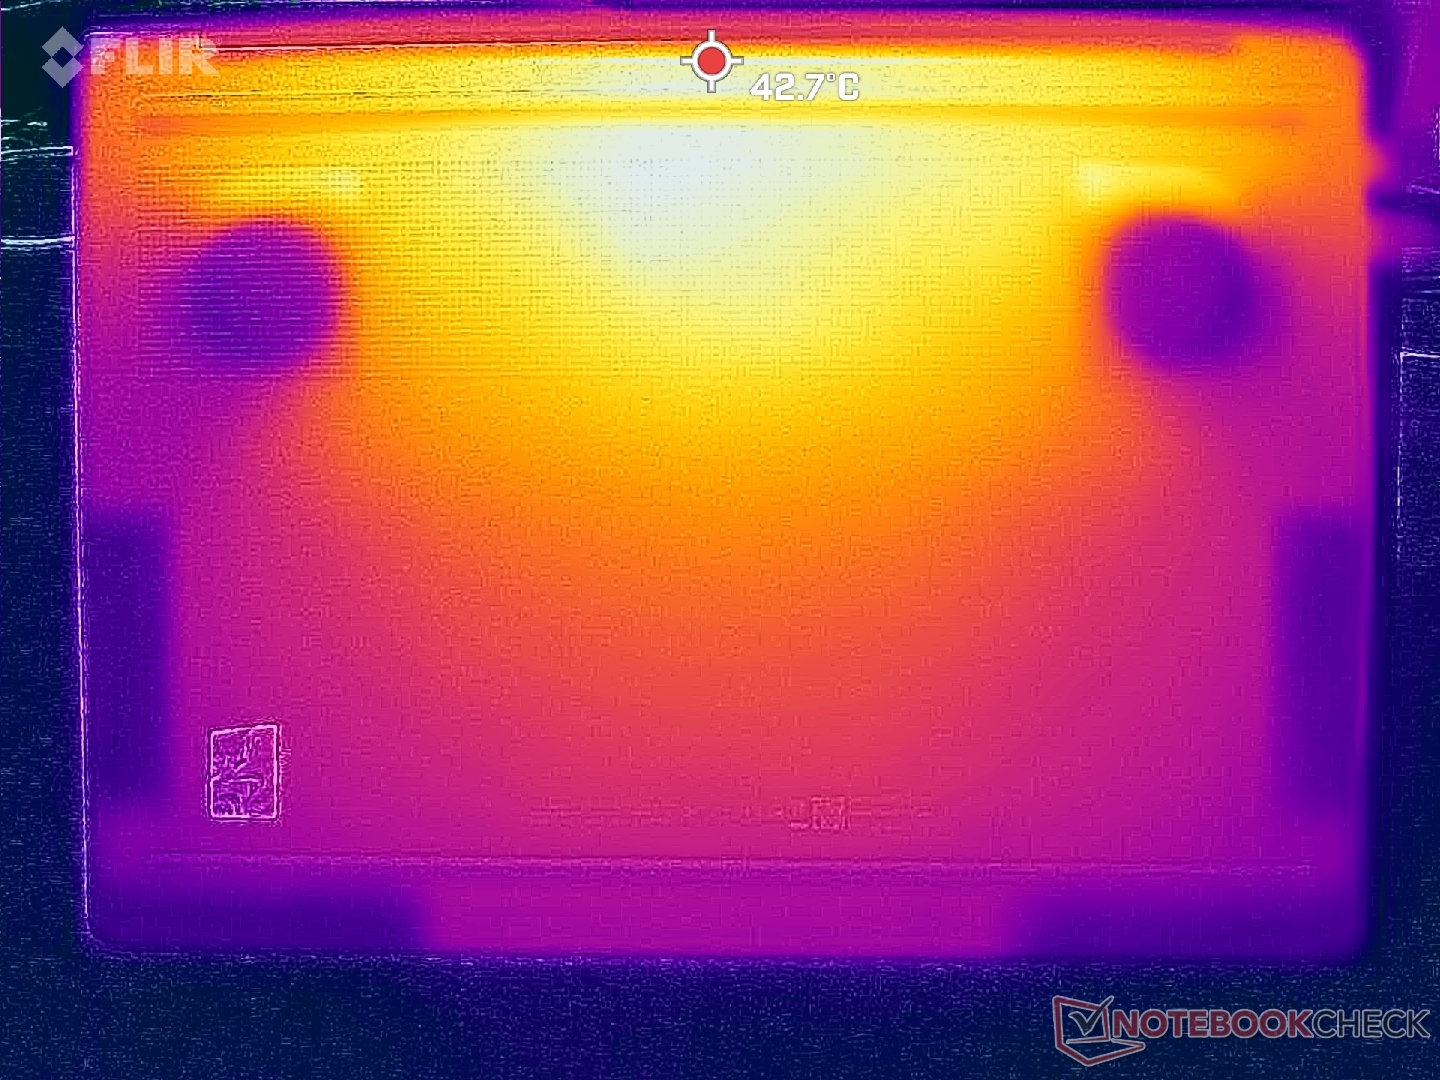
Temperatur
Die Temperaturentwicklung ist aufgrund der symmetrischen Kühllösung im Inneren weitgehend symmetrisch. Die Hotspots in der Tastaturmitte und auf der Unterseite können bei längerer Belastung bis zu 39 bzw. 43 °C warm werden. Das ist wärmer als beim Spectre x360 13.5, während es kühler ist als beim Framework Laptop 13.5, die beide von langsameren Intel CPUs angetrieben werden.
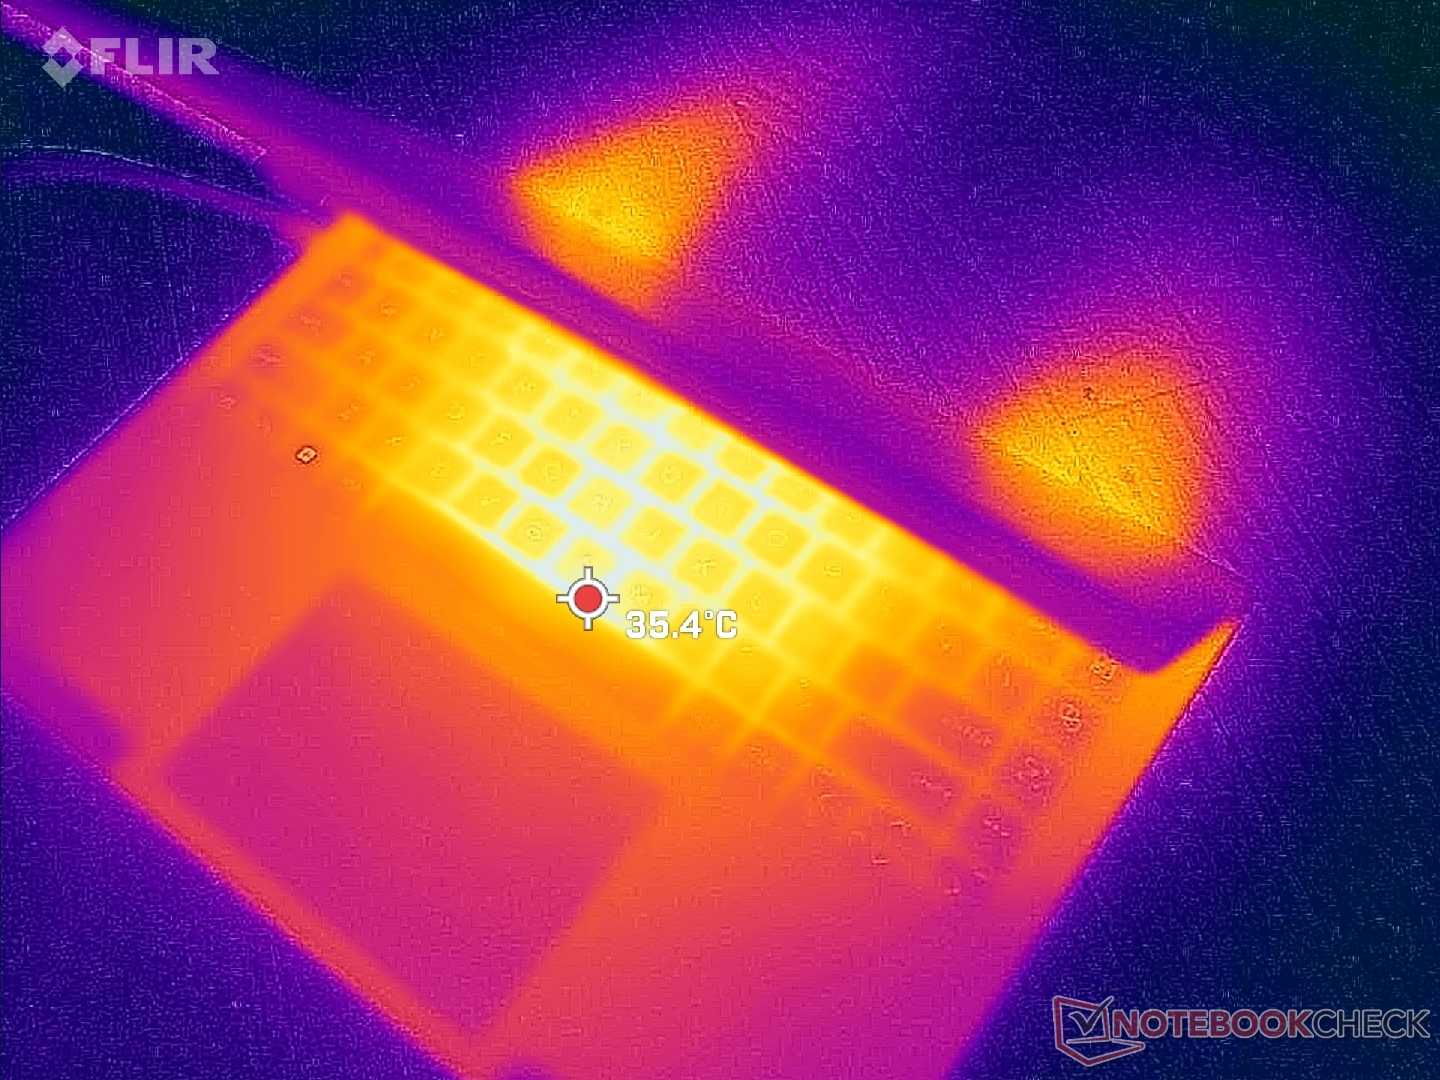
(+) Die maximale Temperatur auf der Oberseite ist 38.6 °C. Im Vergleich liegt der Klassendurchschnitt bei 36.8 °C (von 21 bis 71 °C für die Klasse Multimedia).
(±) Auf der Unterseite messen wir eine maximalen Wert von 42.8 °C (im Vergleich zum Durchschnitt von 39.1 °C).
(+) Ohne Last messen wir eine durchschnittliche Temperatur von 21.1 °C auf der Oberseite. Der Klassendurchschnitt erreicht 31.3 °C.
(+) Die Handballen und der Touchpad-Bereich sind mit gemessenen 23.8 °C kühler als die typische Hauttemperatur und fühlen sich dadurch kühl an.
(+) Die durchschnittliche Handballen-Temperatur anderer getesteter Geräte war 28.7 °C (+4.9 °C).
| HP Dragonfly Pro 2023 AMD Ryzen 7 7736U, AMD Radeon 680M | HP Spectre x360 13.5 14t-ef000 Intel Core i7-1255U, Intel Iris Xe Graphics G7 96EUs | HP Elite Dragonfly G3 Intel Core i7-1265U, Intel Iris Xe Graphics G7 96EUs | Apple MacBook Pro 14 2023 M2 Pro Apple M2 Pro, Apple M2 Pro 19-Core GPU | Dell XPS 13 Plus 9320 i5-1240p Intel Core i5-1240P, Intel Iris Xe Graphics G7 80EUs | Lenovo Yoga 9 14IAP7 82LU0001US Intel Core i7-1260P, Intel Iris Xe Graphics G7 96EUs | |
|---|---|---|---|---|---|---|
| Hitze | 8% | -10% | -2% | -51% | -33% | |
| Last oben max * (°C) | 38.6 | 36.4 6% | 39 -1% | 46.9 -22% | 47.6 -23% | 43.2 -12% |
| Last unten max * (°C) | 42.8 | 37 14% | 42.2 1% | 41.7 3% | 57 -33% | 45.6 -7% |
| Idle oben max * (°C) | 22.2 | 20.8 6% | 26.8 -21% | 21.4 4% | 38.8 -75% | 34.6 -56% |
| Idle unten max * (°C) | 23.6 | 22.6 4% | 28.2 -19% | 21.4 9% | 41 -74% | 37 -57% |
* ... kleinere Werte sind besser
Stresstest
Als wir Prime95 laufen ließen, um Stress auf die CPU auszuüben, stiegen die Taktraten und die Leistungsaufnahme des Boards für einige Sekunden auf 3,9 GHz bzw. 51 W an, bevor sie auf 3,6 GHz und 40 W sanken und sich stabilisierten. Die Kerntemperatur stabilisierte sich bei 73 C, was fast der Temperatur des von Intel betriebenen Elite Dragonfly G3 13.5 unter ähnlichen Bedingungen entspricht.
Die GPU-Taktrate und die Temperatur im Betrieb Witcher 3 pendeln sich bei 1.974 MHz bzw. 62 °C ein, verglichen mit 1.097 MHz und 65 °C beim erwähnten Spectre. Das Dragonfly Pro bietet eine schnellere Grafikleistung, ohne dabei wärmer laufen zu müssen.
Die Leistungsperformance ist im Akkubetrieb leicht reduziert. Ein 3DMark-11-Test im Akkubetrieb liefert Physik- und Grafik-Scores von 15.823 bzw. 10.856 Punkten, verglichen mit 16.618 und 11.605 Punkten im Netzbetrieb.
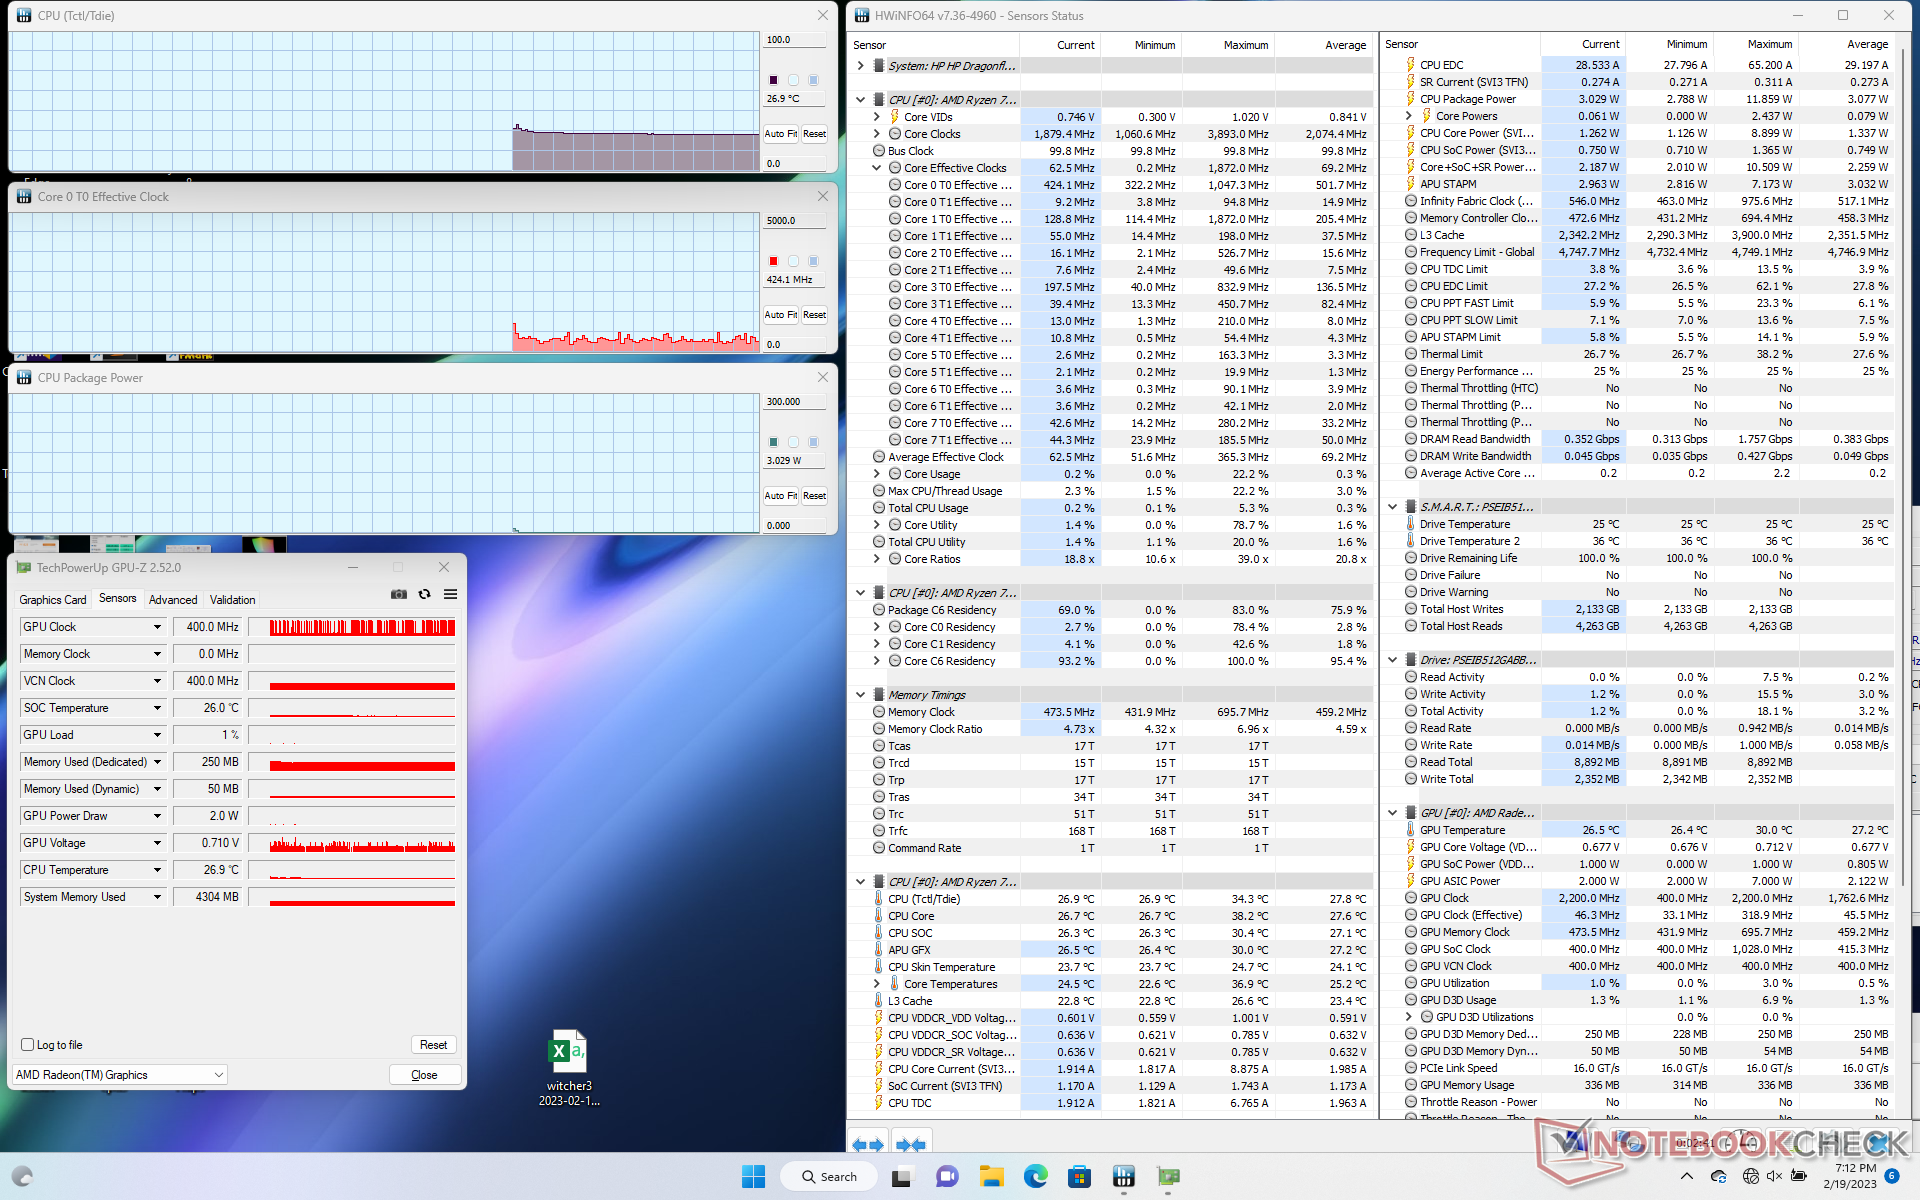
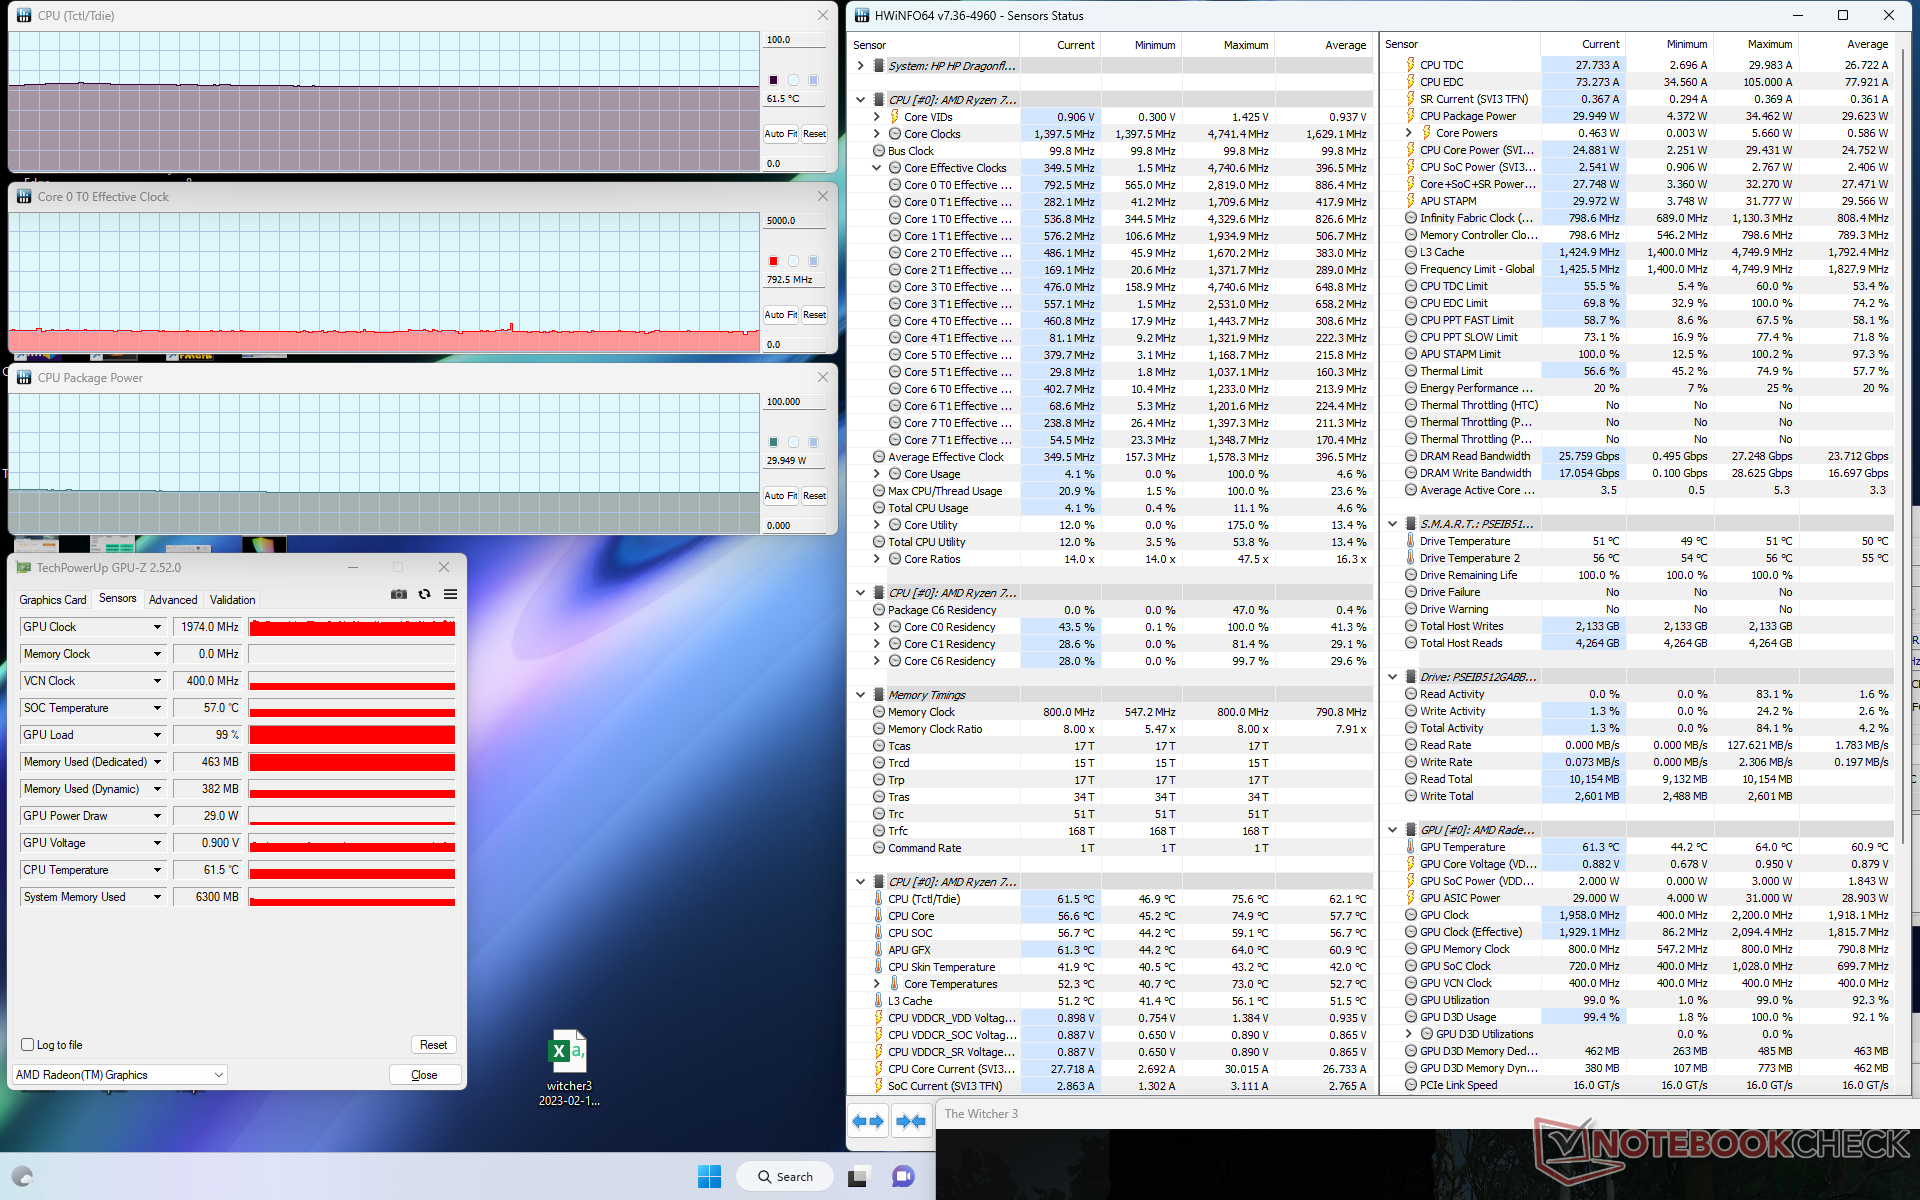
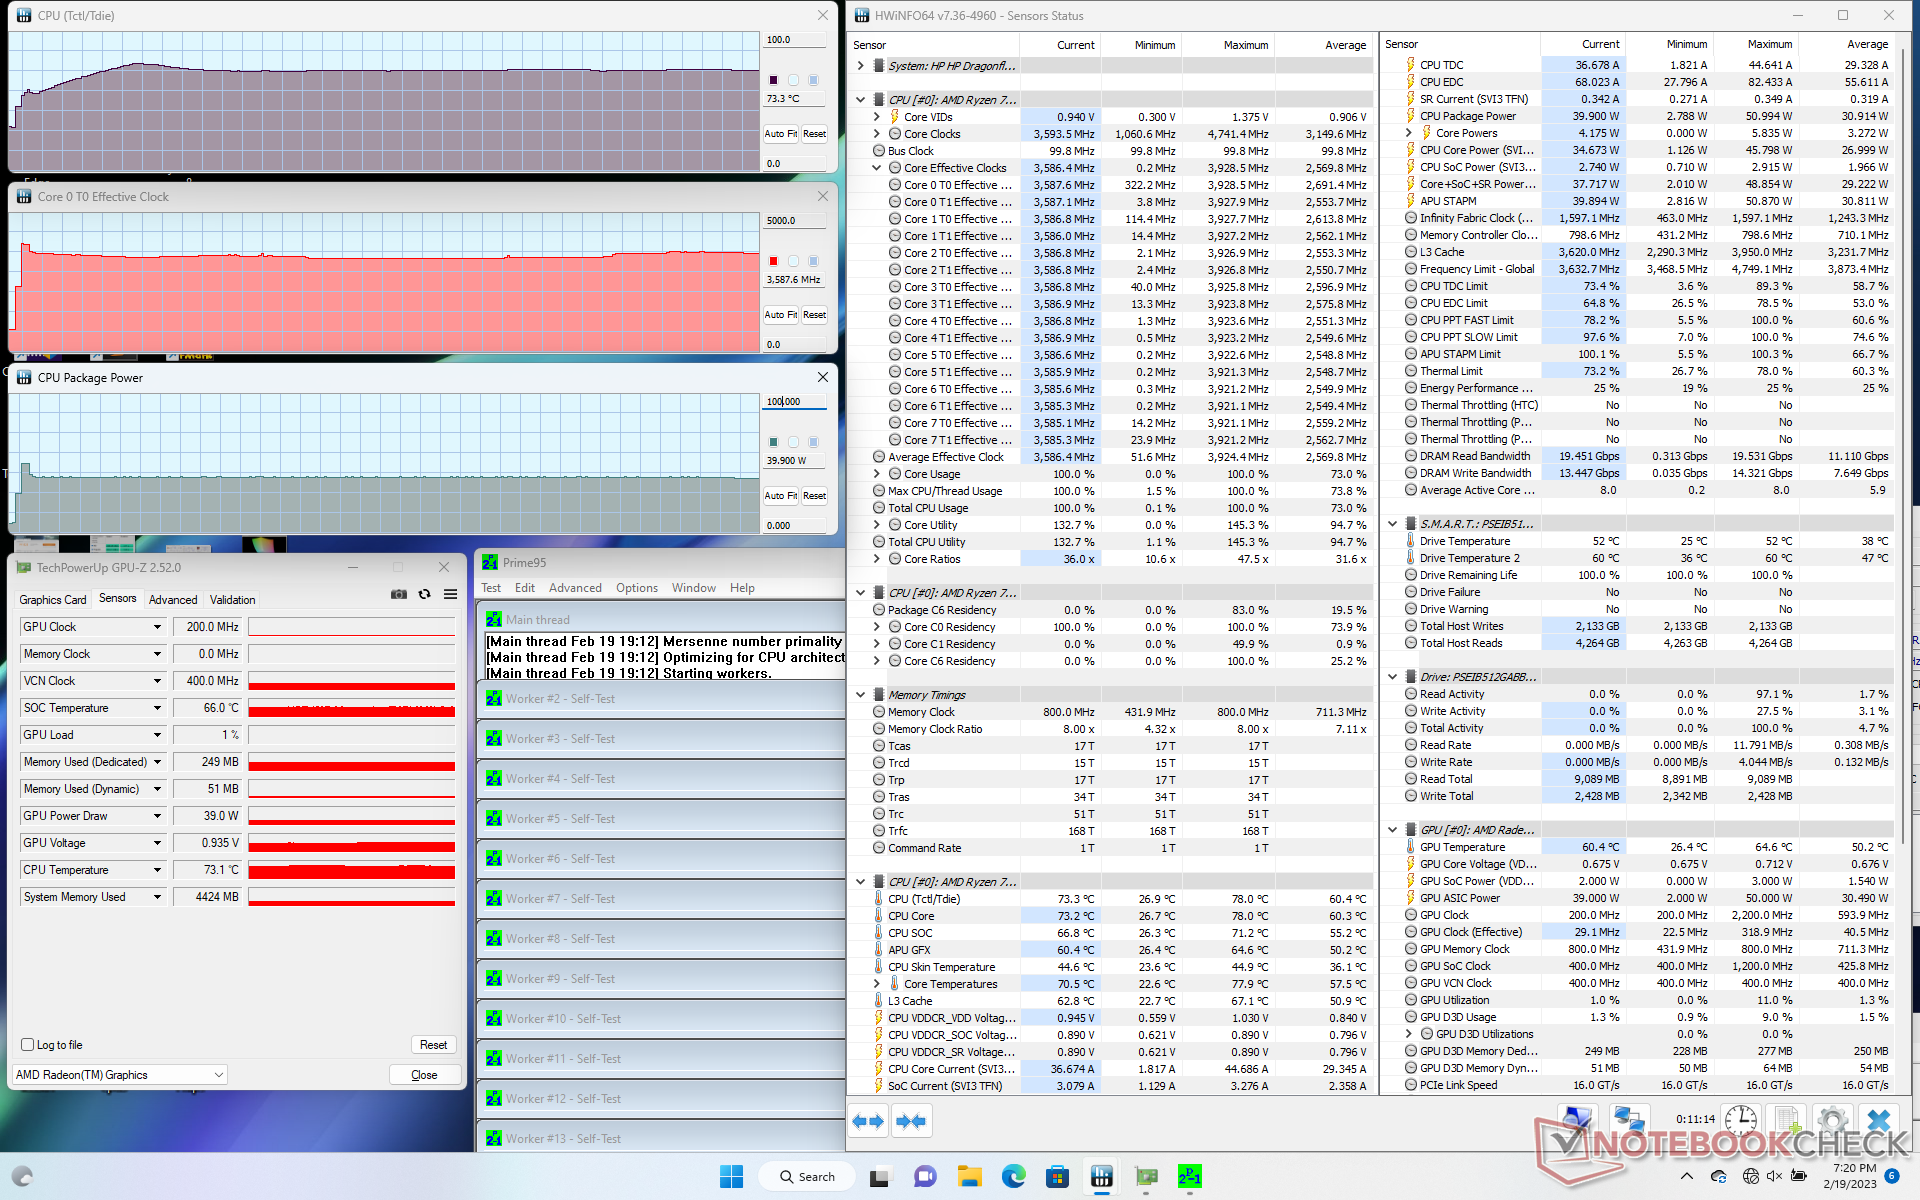
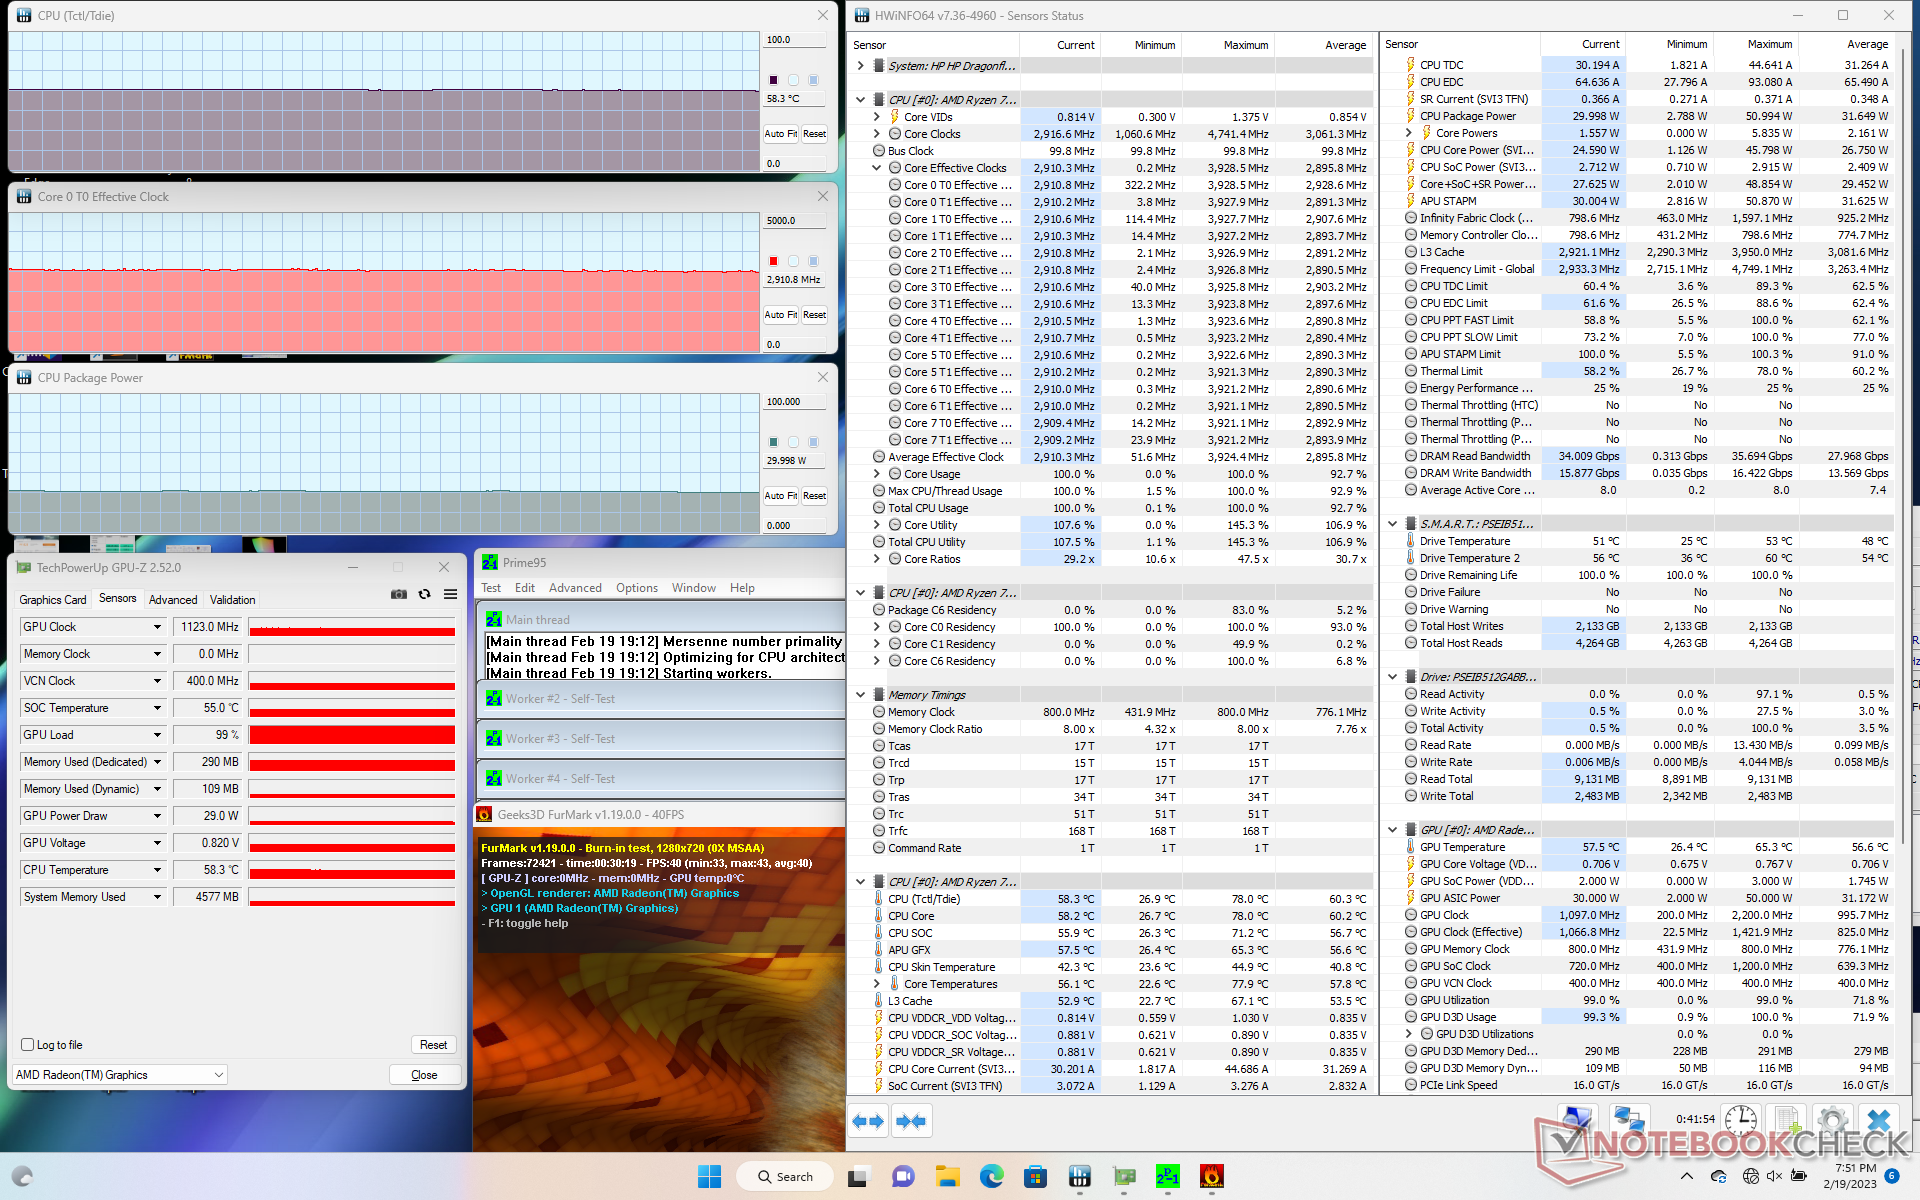
| CPU-Takt (GHz) | GPU-Takt (MHz) | durchschnittliche CPU-Temperatur (°C) | |
| System Leerlauf | -- | -- | 27 |
| Prime95, Stress | 3,5-3,6 | -- | 73 |
| Prime95 + FurMark Stress | 2,9 | 1.123 | 58 |
| Witcher 3, Stress | 0,8 | 1.974 | 62 |
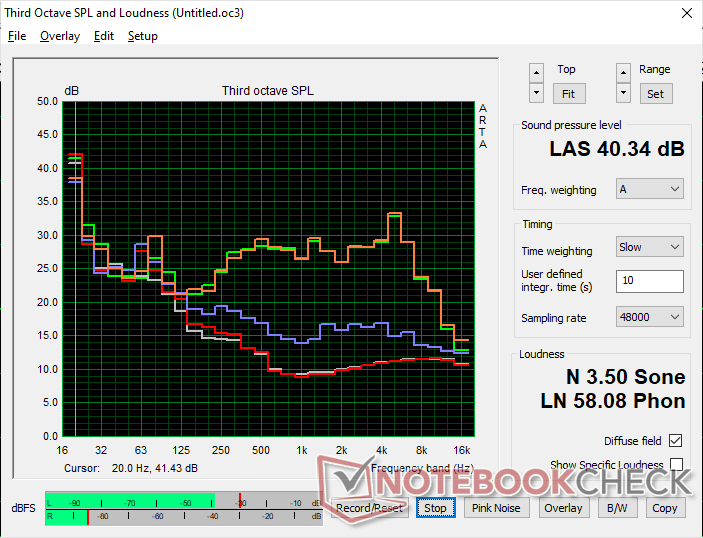
Lautsprecher
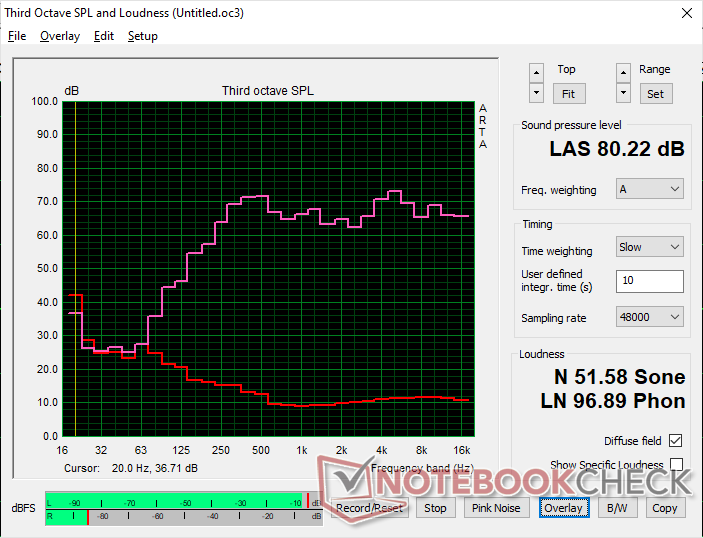
HP Dragonfly Pro 2023 Audio Analyse
(±) | Mittelmäßig laut spielende Lautsprecher (80.2 dB)
Bass 100 - 315 Hz
(±) | abgesenkter Bass - 10.9% geringer als der Median
(±) | durchschnittlich lineare Bass-Wiedergabe (10.3% Delta zum Vorgänger)
Mitteltöne 400 - 2000 Hz
(+) | ausgeglichene Mitten, vom Median nur 2.4% abweichend
(+) | lineare Mitten (4.1% Delta zum Vorgänger)
Hochtöne 2 - 16 kHz
(+) | ausgeglichene Hochtöne, vom Median nur 3.3% abweichend
(+) | sehr lineare Hochtöne (6.4% Delta zum Vorgänger)
Gesamt im hörbaren Bereich 100 - 16.000 Hz
(+) | hörbarer Bereich ist sehr linear (10% Abstand zum Median
Im Vergleich zu allen Geräten derselben Klasse
» 13% aller getesteten Geräte dieser Klasse waren besser, 2% vergleichbar, 84% schlechter
» Das beste Gerät hat einen Delta-Wert von 5%, durchschnittlich ist 17%, das schlechteste Gerät hat 45%
Im Vergleich zu allen Geräten im Test
» 4% aller getesteten Geräte waren besser, 1% vergleichbar, 94% schlechter
» Das beste Gerät hat einen Delta-Wert von 4%, durchschnittlich ist 23%, das schlechteste Gerät hat 134%
Apple MacBook Pro 16 2021 M1 Pro Audio Analyse
(+) | Die Lautsprecher können relativ laut spielen (84.7 dB)
Bass 100 - 315 Hz
(+) | guter Bass - nur 3.8% Abweichung vom Median
(+) | lineare Bass-Wiedergabe (5.2% Delta zum Vorgänger)
Mitteltöne 400 - 2000 Hz
(+) | ausgeglichene Mitten, vom Median nur 1.3% abweichend
(+) | lineare Mitten (2.1% Delta zum Vorgänger)
Hochtöne 2 - 16 kHz
(+) | ausgeglichene Hochtöne, vom Median nur 1.9% abweichend
(+) | sehr lineare Hochtöne (2.7% Delta zum Vorgänger)
Gesamt im hörbaren Bereich 100 - 16.000 Hz
(+) | hörbarer Bereich ist sehr linear (4.6% Abstand zum Median
Im Vergleich zu allen Geräten derselben Klasse
» 0% aller getesteten Geräte dieser Klasse waren besser, 0% vergleichbar, 100% schlechter
» Das beste Gerät hat einen Delta-Wert von 5%, durchschnittlich ist 17%, das schlechteste Gerät hat 45%
Im Vergleich zu allen Geräten im Test
» 0% aller getesteten Geräte waren besser, 0% vergleichbar, 100% schlechter
» Das beste Gerät hat einen Delta-Wert von 4%, durchschnittlich ist 23%, das schlechteste Gerät hat 134%
Energieverwaltung
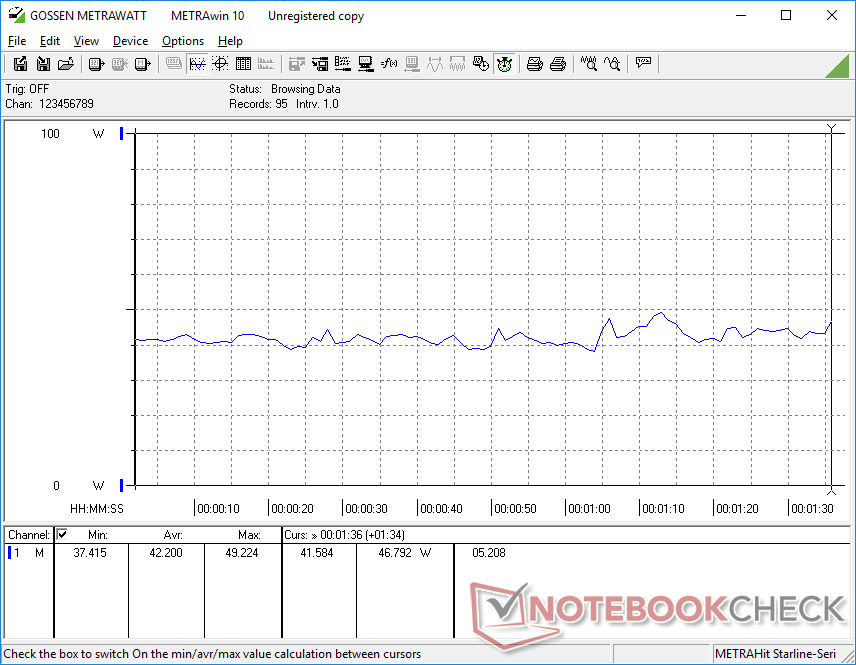
Stromverbrauch - Niedrige Werte und hohe Werte
Das System ist sehr energieeffizient, was die relativ langen Akkulaufzeit-Ergebnisse im nächsten Abschnitt erklärt. Der Leerlauf auf dem Desktop verbraucht je nach Helligkeit und Energieprofil nur 3 bis 6 W im Vergleich zu 3 bis 8 W beim Elite Dragonfly G3 oder 6 bis 13 W beim XPS 13 Plus OLED.
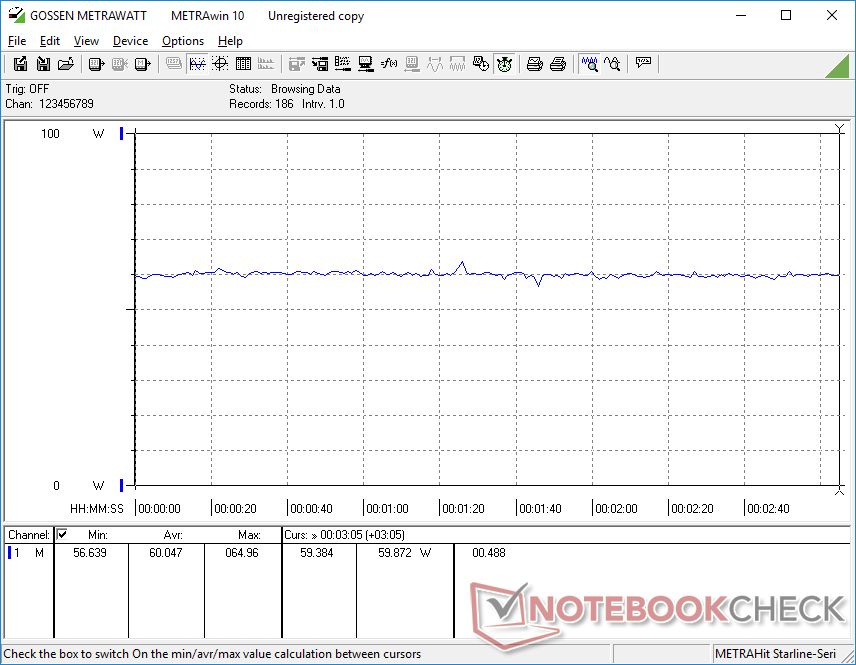
Gaming erfordert mehr Strom als bei den meisten anderen Notebooks der U-Serie, aber die höhere Grafikleistung könnte sich für die Nutzer lohnen. Witcher 3 beispielsweise verbraucht auf unserem Dragonfly Pro durchschnittlich 60 W. Das sind 67 % bzw. 22 % mehr als auf dem Iris-Xe-betriebenen Spectre x360 13.5 bzw. XPS 13 Plus, während die Grafikleistung um 40 bis 60 % höher ist als bei beiden.
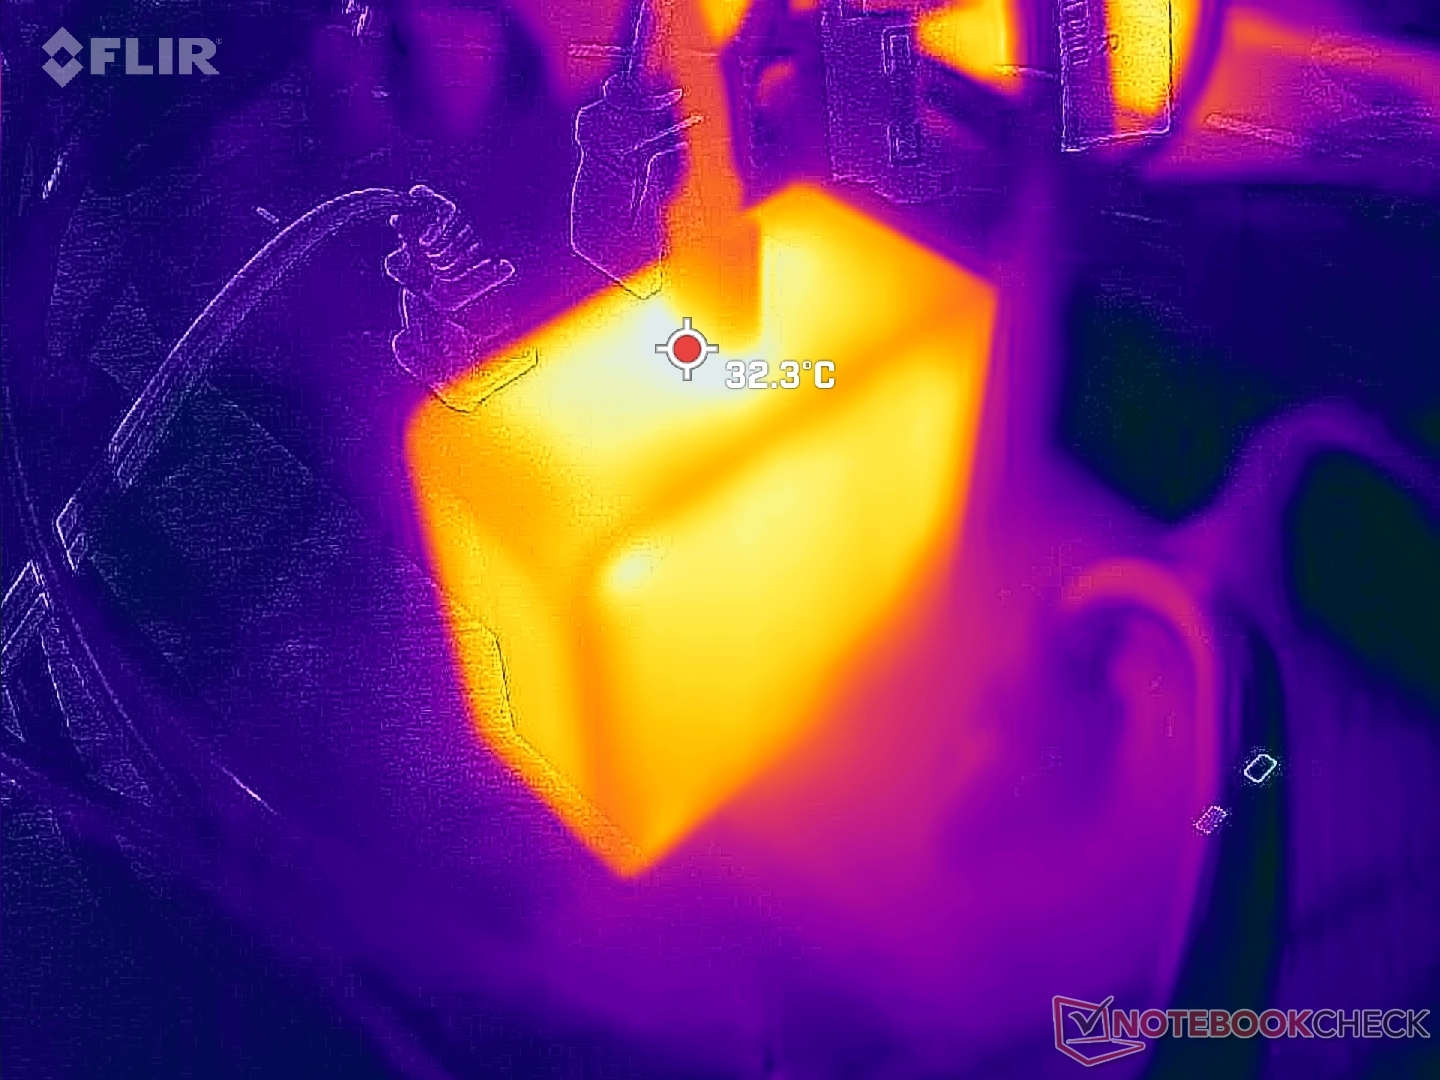
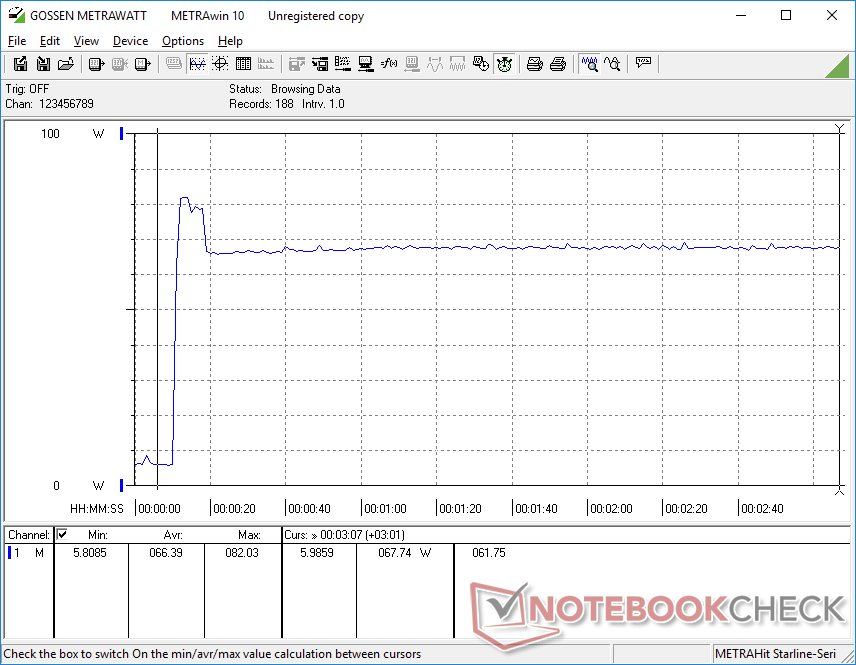
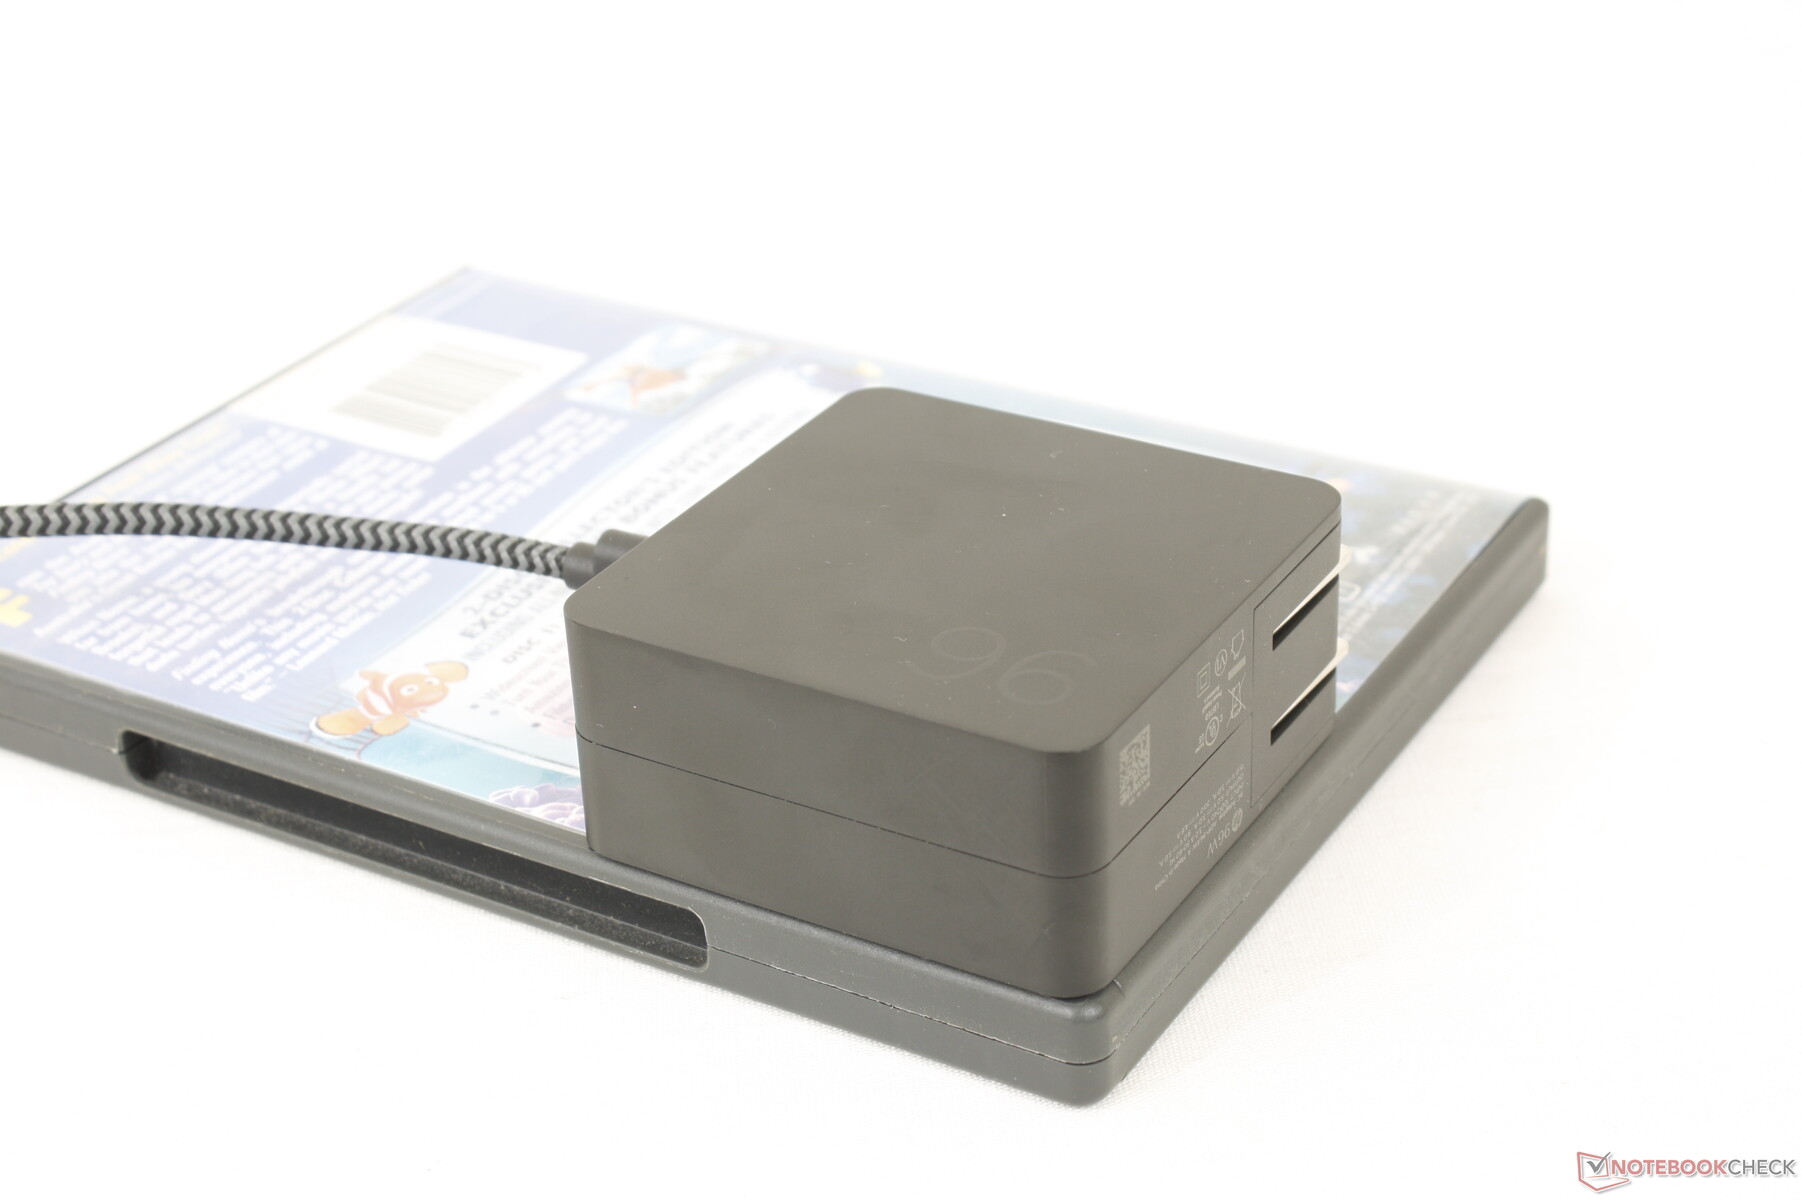
Wir konnten eine maximale Leistungsaufnahme von 82 W aus dem kleinen (6,8 x 6,8 x 3 cm) 96-W-GaN-Netzteil aufzeichnen, wenn die CPU und die iGPU jeweils zu 100 Prozent ausgelastet sind. Dieser Maximalwert ist nur vorübergehend, wie die folgenden Diagramme zeigen.

| Aus / Standby | |
| Idle | |
| Last |
|
Legende:
min: | |
| HP Dragonfly Pro 2023 R7 7736U, Radeon 680M, PSEIB512GABBMC0, IPS, 1920x1200, 14" | HP Spectre x360 13.5 14t-ef000 i7-1255U, Iris Xe G7 96EUs, Micron 3400 1TB MTFDKBA1T0TFH, OLED, 3000x2000, 13.5" | HP Elite Dragonfly G3 i7-1265U, Iris Xe G7 96EUs, Micron 3400 MTFDKBA512TFH 512GB, IPS, 1920x1280, 13.5" | Apple MacBook Pro 14 2023 M2 Pro M2 Pro, M2 Pro 19-Core GPU, Apple SSD AP2048Z, Mini-LED, 3024x1964, 14.2" | Dell XPS 13 Plus 9320 i7-1280P OLED i7-1280P, Iris Xe G7 96EUs, WDC PC SN810 512GB, OLED, 3456x2160, 13.4" | Lenovo Yoga 9 14IAP7 82LU0001US i7-1260P, Iris Xe G7 96EUs, Samsung PM9A1 MZVL2512HCJQ, OLED, 2880x1800, 14" | |
|---|---|---|---|---|---|---|
| Stromverbrauch | -16% | 0% | -41% | -45% | -80% | |
| Idle min * (Watt) | 3.2 | 4 -25% | 3.4 -6% | 2.4 25% | 6.5 -103% | 8 -150% |
| Idle avg * (Watt) | 5.4 | 4.9 9% | 5.6 -4% | 11.3 -109% | 7.8 -44% | 14 -159% |
| Idle max * (Watt) | 5.6 | 12.5 -123% | 8.4 -50% | 11.5 -105% | 13 -132% | 14.4 -157% |
| Last avg * (Watt) | 42.2 | 48.1 -14% | 40.8 3% | 59.6 -41% | 56.6 -34% | 59.6 -41% |
| Witcher 3 ultra * (Watt) | 60 | 35.8 40% | 35.5 41% | 55.9 7% | 49.2 18% | 53.6 11% |
| Last max * (Watt) | 82 | 65.2 20% | 68.4 17% | 100 -22% | 63 23% | 68.1 17% |
* ... kleinere Werte sind besser
Power Consumption Witcher 3 / Stresstest
Power Consumption external Monitor
Akkulaufzeit - Super lang
Die Laufzeiten sind sehr lang im Verhältnis zu der Leistung, die man von der Hardware erhält. Wir konnten fast 13 Stunden WLAN-Surfen unter realen Bedingungen messen, was einige Stunden länger ist als bei vielen anderen Subnotebooks, einschließlich dem Intel betriebenen Lenovo Yoga 9 14 oder Dell XPS 13 Plus 9320. Die Akkukapazität ist Standard für die Größenklasse mit 65 Wh.
Der Ladevorgang von leer bis zur vollen Kapazität dauert etwa 90 Minuten.
| HP Dragonfly Pro 2023 R7 7736U, Radeon 680M, 65 Wh | HP Spectre x360 13.5 14t-ef000 i7-1255U, Iris Xe G7 96EUs, 66 Wh | HP Elite Dragonfly G3 i7-1265U, Iris Xe G7 96EUs, 68 Wh | Apple MacBook Pro 14 2023 M2 Pro M2 Pro, M2 Pro 19-Core GPU, 70 Wh | Dell XPS 13 Plus 9320 i7-1280P OLED i7-1280P, Iris Xe G7 96EUs, 55 Wh | Lenovo Yoga 9 14IAP7 82LU0001US i7-1260P, Iris Xe G7 96EUs, 75 Wh | |
|---|---|---|---|---|---|---|
| Akkulaufzeit | -22% | 30% | -25% | -55% | -48% | |
| Idle (h) | 23.2 | 20.4 -12% | 37.8 63% | |||
| WLAN (h) | 13 | 8 -38% | 11.8 -9% | 13.5 4% | 5.8 -55% | 6.8 -48% |
| Last (h) | 2.6 | 2.2 -15% | 3.5 35% | 1.2 -54% | ||
| H.264 (h) | 15.3 |
Pro
Contra
Fazit - HPs Antwort auf das MacBook Pro 14 und das Dell XPS 13 Plus
Das Dragonfly Pro richtet sich an eine ähnliche Zielgruppe wie das kürzlich vorgestellte Spectre x360 13.5, aber mit einem ganz anderen Ansatz. Anstatt Intel Prozessoren mit ausgefalleneren Display-Optionen, einer größeren Auswahl an Ports und glänzenderen Farben bietet das Dragonfly Pro AMD-Prozessoren mit begrenzten Konfigurationen und gedämpften, matten Farben. Das Endergebnis ist ein schnörkelloses Klappgehäuse mit einem fokussierten, aber nüchternen Gefühl: Wir finden das vorliegende Gerät großartig, aber Benutzer könnten all die ausgelassenen Funktionen vermissen, die bei anderen PCs verfügbar sind wie HDMI, USB-A, Kartenleser, Audiobuchse, OLED oder erweiterbaren Speicher oder Memory-xSpeicher.
Das Dragonfly Pro ist im Grunde genommen ein Spectre ohne all den Schnickschnack für einen konzentrierteren Ansatz zur Produktivität.
Anwender, die Wert auf Verarbeitungsqualität und Leistung legen, ohne auf leistungshungrige diskrete Grafikkarten zurückgreifen zu müssen, werden das Dragonfly Pro wahrscheinlich attraktiver finden. Die hochintegrierten Innereien und das Fehlen von physischen Merkmalen sorgen für eine sehr saubere Ästhetik, während die Leistung des Ryzen 7 7736U leicht zu den schnellsten in der U-Serie gehört. Insbesondere die Radeon 680M übertrifft ihr Gewicht bei Weitem, was digitale Künstler und Gelegenheitsspieler zu schätzen wissen.
Ein weiterer Aspekt, den man im Auge behalten sollte, ist der relativ teure Startpreis von 1.400 US-Dollar, der ähnlich hoch ist wie bei der Spectre-x360-Serie oder dem schnelleren Lenovo Yoga Slim 7 Pro X mit diskreter Nvidia-Studio-Grafik. Diese Alternativen sind tendenziell vielseitiger, wenn es um Zusatzfunktionen und Optionen geht.
Preis und Verfügbarkeit
Das HP Dragonfly Pro soll in Kürze auf den deutschen Markt kommen, HP hatte zum Testzeitpunkt noch keine Informationen zum Preis genannt. Auf der internationalen Website von HP.com wird der Laptop zu Preisen ab 1.400 bzw. 1.550 US-Dollar für die Konfigurationen mit 512-GB-SSD/16-GB-RAM bzw. 1-TB-SSD/32-GB-RAM angeboten.
HP Dragonfly Pro 2023
- 23.02.2023 v7 (old)
Allen Ngo
Transparenz
Die Auswahl der zu testenden Geräte erfolgt innerhalb der Redaktion. Das vorliegende Testmuster wurde dem Autor vom Hersteller oder einem Shop zu Testzwecken leihweise zur Verfügung gestellt. Eine Einflussnahme des Leihstellers auf den Testbericht gab es nicht, der Hersteller erhielt keine Version des Reviews vor der Veröffentlichung. Es bestand keine Verpflichtung zur Publikation. Als eigenständiges, unabhängiges Unternehmen unterliegt Notebookcheck keiner Diktion von Herstellern, Shops und Verlagen.
So testet Notebookcheck
Pro Jahr werden von Notebookcheck hunderte Laptops und Smartphones unabhängig in von uns standardisierten technischen Verfahren getestet, um eine Vergleichbarkeit aller Testergebnisse zu gewährleisten. Seit rund 20 Jahren entwickeln wir diese Testmethoden kontinuierlich weiter und setzen damit Branchenstandards. In unseren Testlaboren kommt ausschließlich hochwertiges Messequipment in die Hände erfahrener Techniker und Redakteure. Die Tests unterliegen einer mehrstufigen Kontrolle. Unsere komplexe Gesamtbewertung basiert auf hunderten fundierten Messergebnissen und Benchmarks, womit Ihnen Objektivität garantiert ist. Weitere Informationen zu unseren Testmethoden gibt es hier.
Preisvergleich

