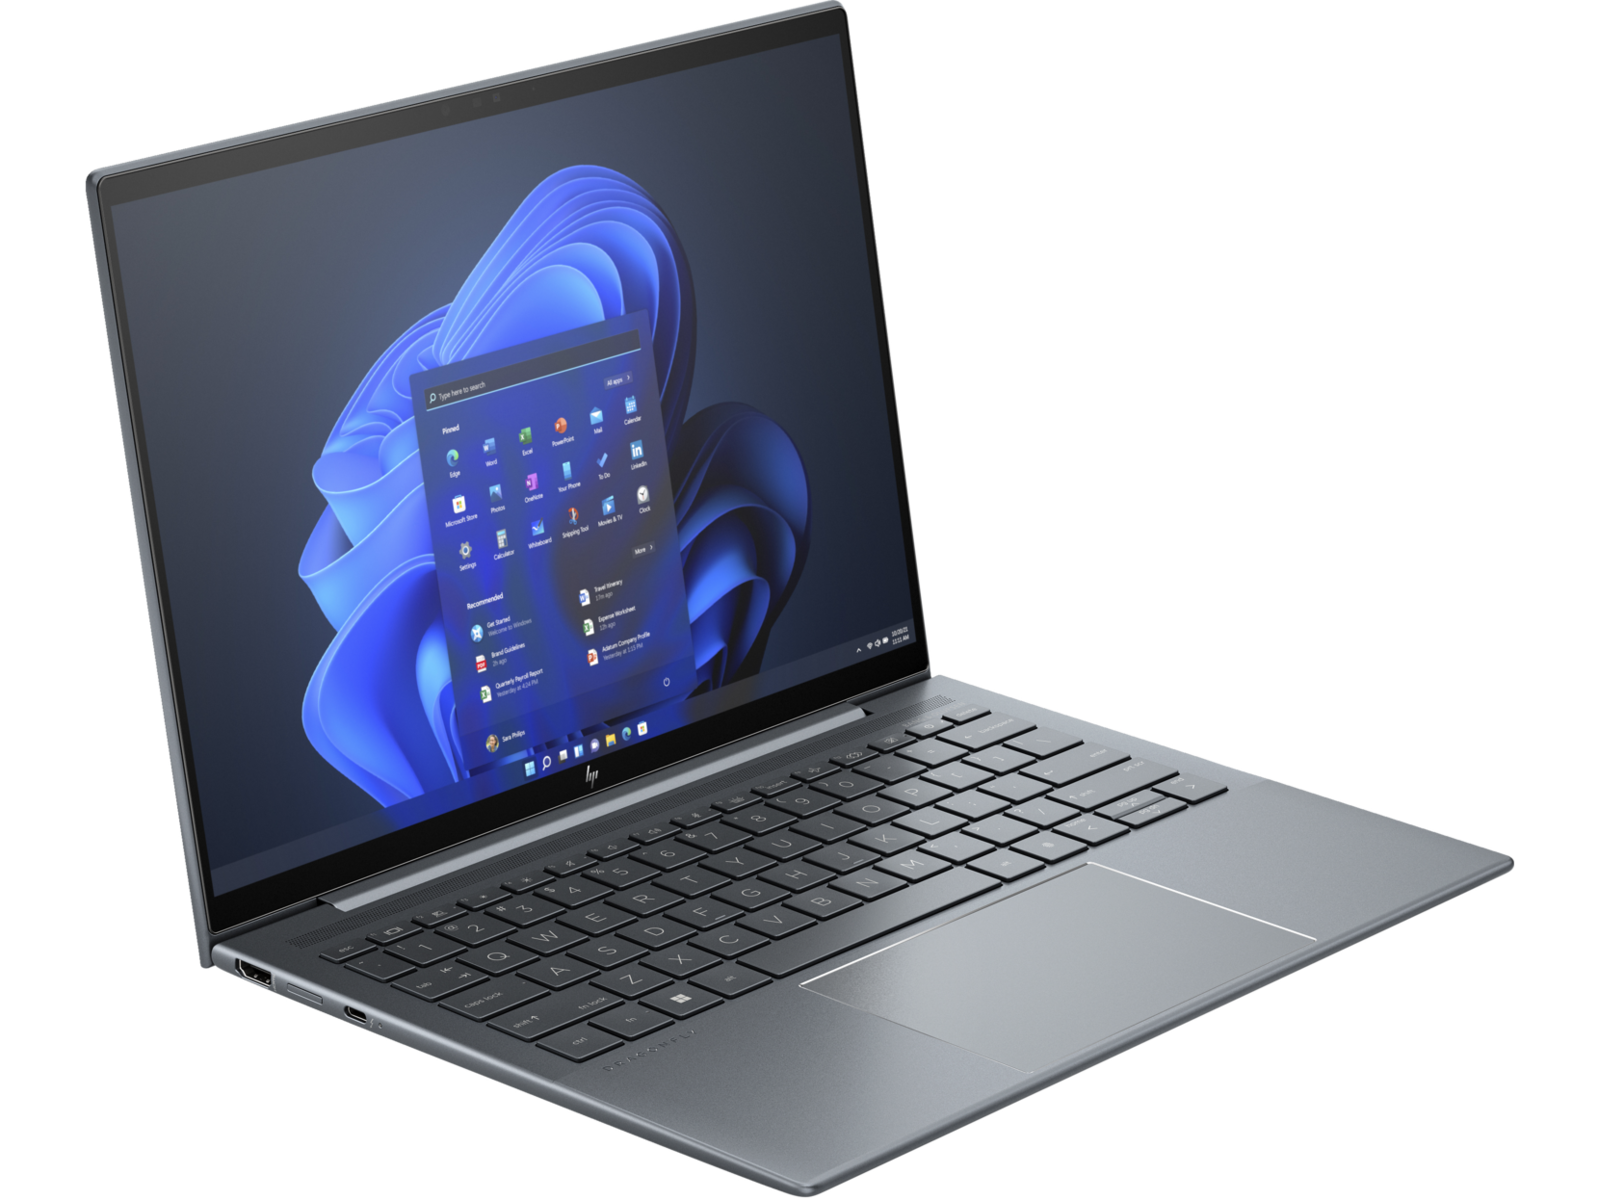
HP Dragonfly G4 Notebook im Test: Kleine Upgrades im Vergleich zum exzellenten Dragonfly G3

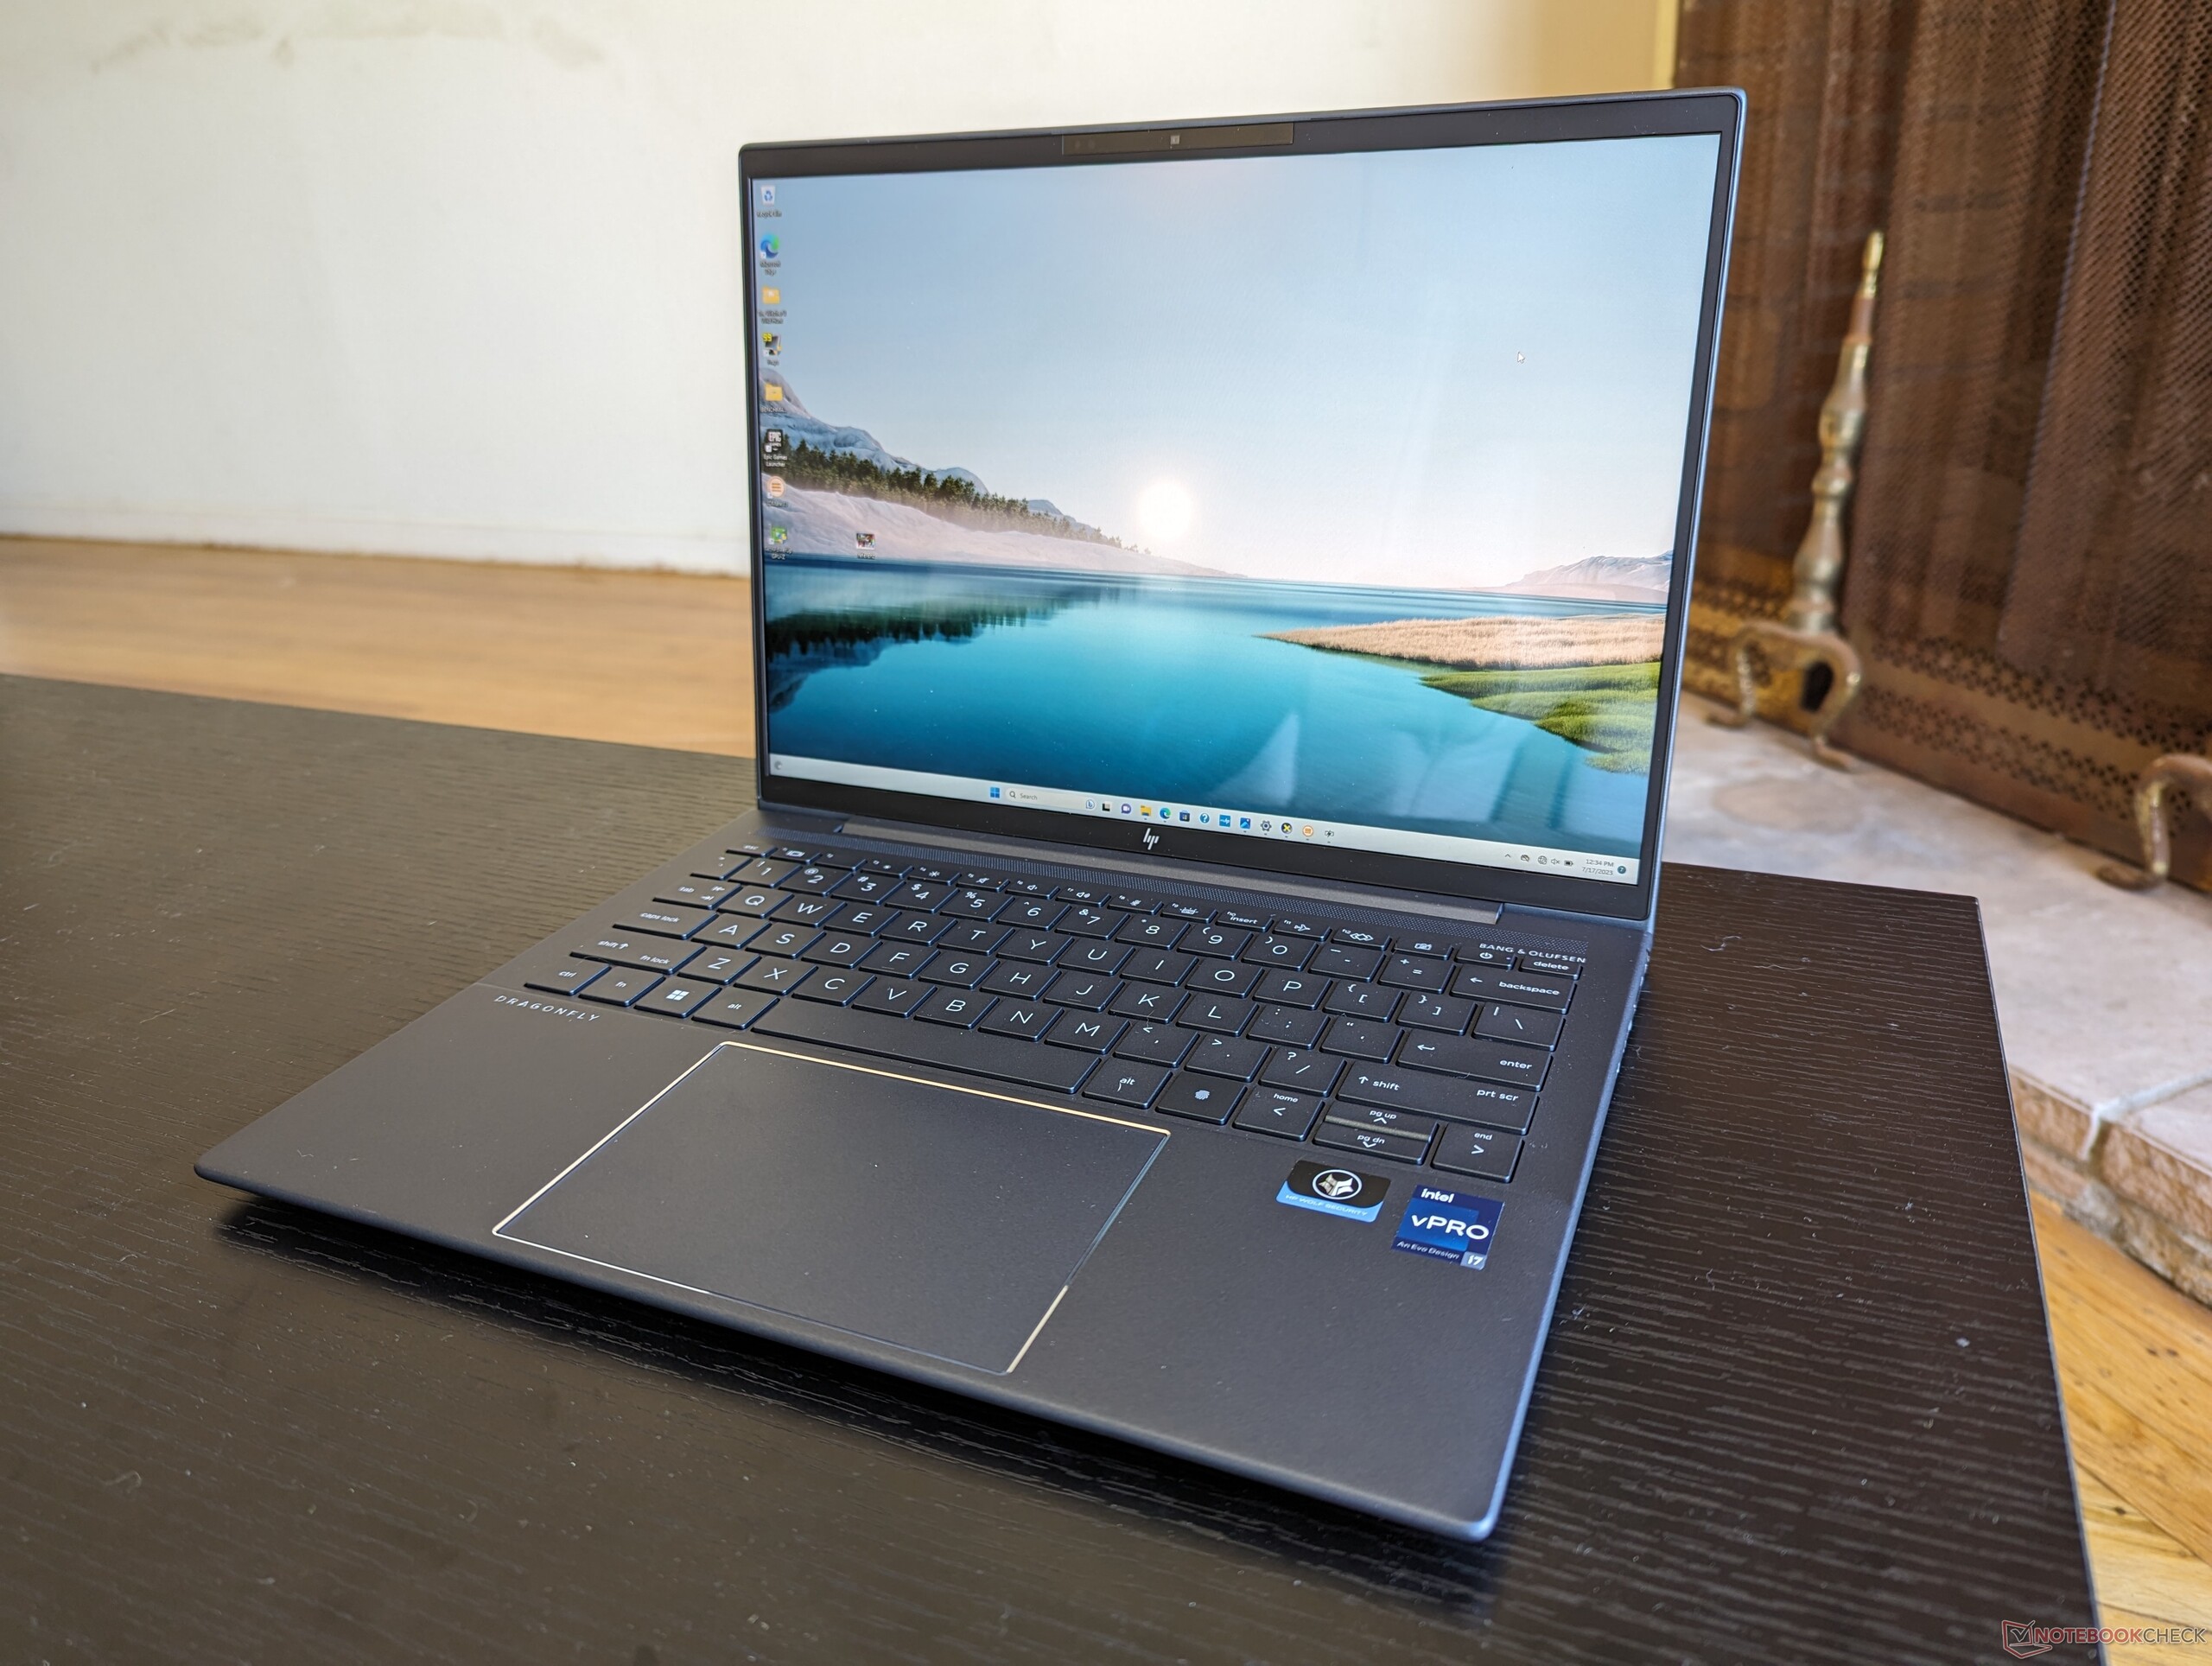
Das HP Dragonfly G4 ist der direkte Nachfolger des Elite Dragonfly G3 aus dem letzten Jahr. Der "Elite"-Namenszusatz wird für das Modelljahr 2023 gestrichen, außerdem steht ein Upgrade von einer Alder-Lake-CPU der 12. Generation auf die aktuellen Raptor-Lake-Prozessoren der 13. Generation auf dem Programm. Abgesehen davon bleibt das Gehäuse unverändert, weshalb wir an dieser Stelle auf unser ausführliches Review zum Elite Dragonfly G3 verweisen, welches weitere Informationen zu den äußerlichen Eigenschaften des Notebooks liefert.
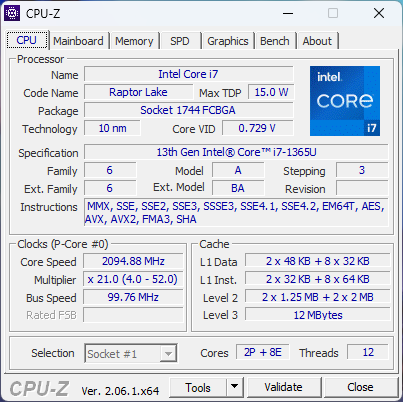
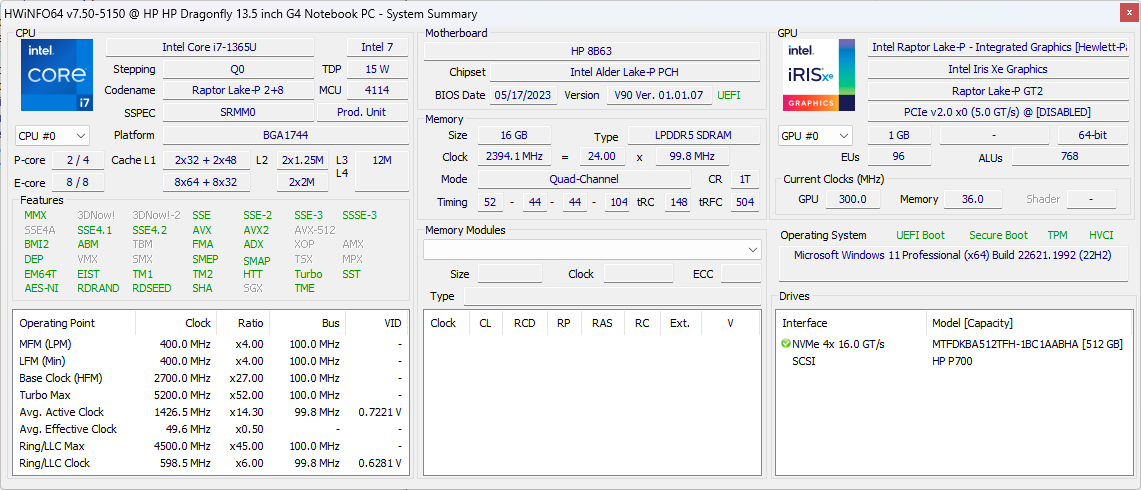
Unser Testgerät ist eine Mid-Range-Konfiguration mit dem Core i7-1365U und einem IPS-Display mit 400 Nits und einer 1280p-Auflösung, welches umgerechnet rund 1.520 Euro kostet. Die Preise andere Modelle mit dem Core i5-1335U, einem optionalen 3K-OLED-Display schwanken je nach RAM-Menge, in Deutschland werden momentan aber mindestens 1.865 Euro für das HP Dragonfly G4 fällig.
Das Dragonfly G4 konkurriert direkt mit anderen ultradünnen High-End-Notebooks wie beispielsweise dem Lenovo ThinkPad X13 G3, Dell Latitude 9330, Microsoft Surface oder dem Asus ZenBook S 13.
Weitere HP-Testberichte:
Mögliche Konkurrenten im Vergleich
Bew. | Datum | Modell | Gewicht | Dicke | Größe | Auflösung | Preis ab |
|---|---|---|---|---|---|---|---|
| 91.9 % v7 (old) | 07 / 2023 | HP Dragonfly G4 i7-1365U, Iris Xe G7 96EUs | 1.1 kg | 16.3 mm | 13.50" | 1920x1280 | |
| 91 % v7 (old) | 08 / 2022 | HP Elite Dragonfly G3 i7-1265U, Iris Xe G7 96EUs | 1.2 kg | 16.3 mm | 13.50" | 1920x1280 | |
| 86.2 % v7 (old) | 05 / 2023 | Framework Laptop 13.5 13th Gen Intel i7-1370P, Iris Xe G7 96EUs | 1.3 kg | 15.85 mm | 13.50" | 2256x1504 | |
| 90.6 % v7 (old) | 06 / 2023 | Lenovo ThinkPad X13 G3 21CM002UGE R5 PRO 6650U, Radeon 660M | 1.3 kg | 18.1 mm | 13.30" | 1920x1200 | |
| 89 % v7 (old) | 11 / 2022 | Dell Latitude 9330 i7-1260U, Iris Xe G7 96EUs | 1.2 kg | 14.1 mm | 13.30" | 2560x1600 | |
| 92.3 % v7 (old) | 07 / 2022 | Apple MacBook Air M2 Entry M2, M2 8-Core GPU | 1.2 kg | 11.3 mm | 13.60" | 2560x1664 |
Gehäuse — Teils Business, teils "Prosumer"
Kommunikation
Webcam
Das HP Spectre, EliteBook und die Dragonfly-Laptops werden weiterhin mit einer hochauflösenden 5-Megapixel-Webcam bestückt und produzieren somit deutlich schärfere Bilder als die meisten anderen Notebooks, bei denen noch 1MP oder 2MP-Sensoren zum Einsatz kommen. Infrarot und eine Privacy-Blende sind standardmäßig mit dabei.
Die HP-Software bietet jetzt eine Perspektivkorrektur und kann das Video beim Teilen von Whiteboards oder Dokumenten dementsprechend anpassen. Eine KI-unterstützte Auto-Kamera sorgt für simulierten Augenkontakt mit der Webcam anstelle des Bildschirms, und mit der Multi-Kamera-Unterstützung können zwei Video-Übertragungen gleichzeitig geteilt werden.


Wartung
Im Gegensatz zu anderen Herstellern bietet HP sehr praktische Videos, die zeigen wie man Laptops wie das Dragonfly G4 warten und auseinanderbauen kann. Ein kompletter Teardown kann im unten eingebundenen Video begutachtet werden.
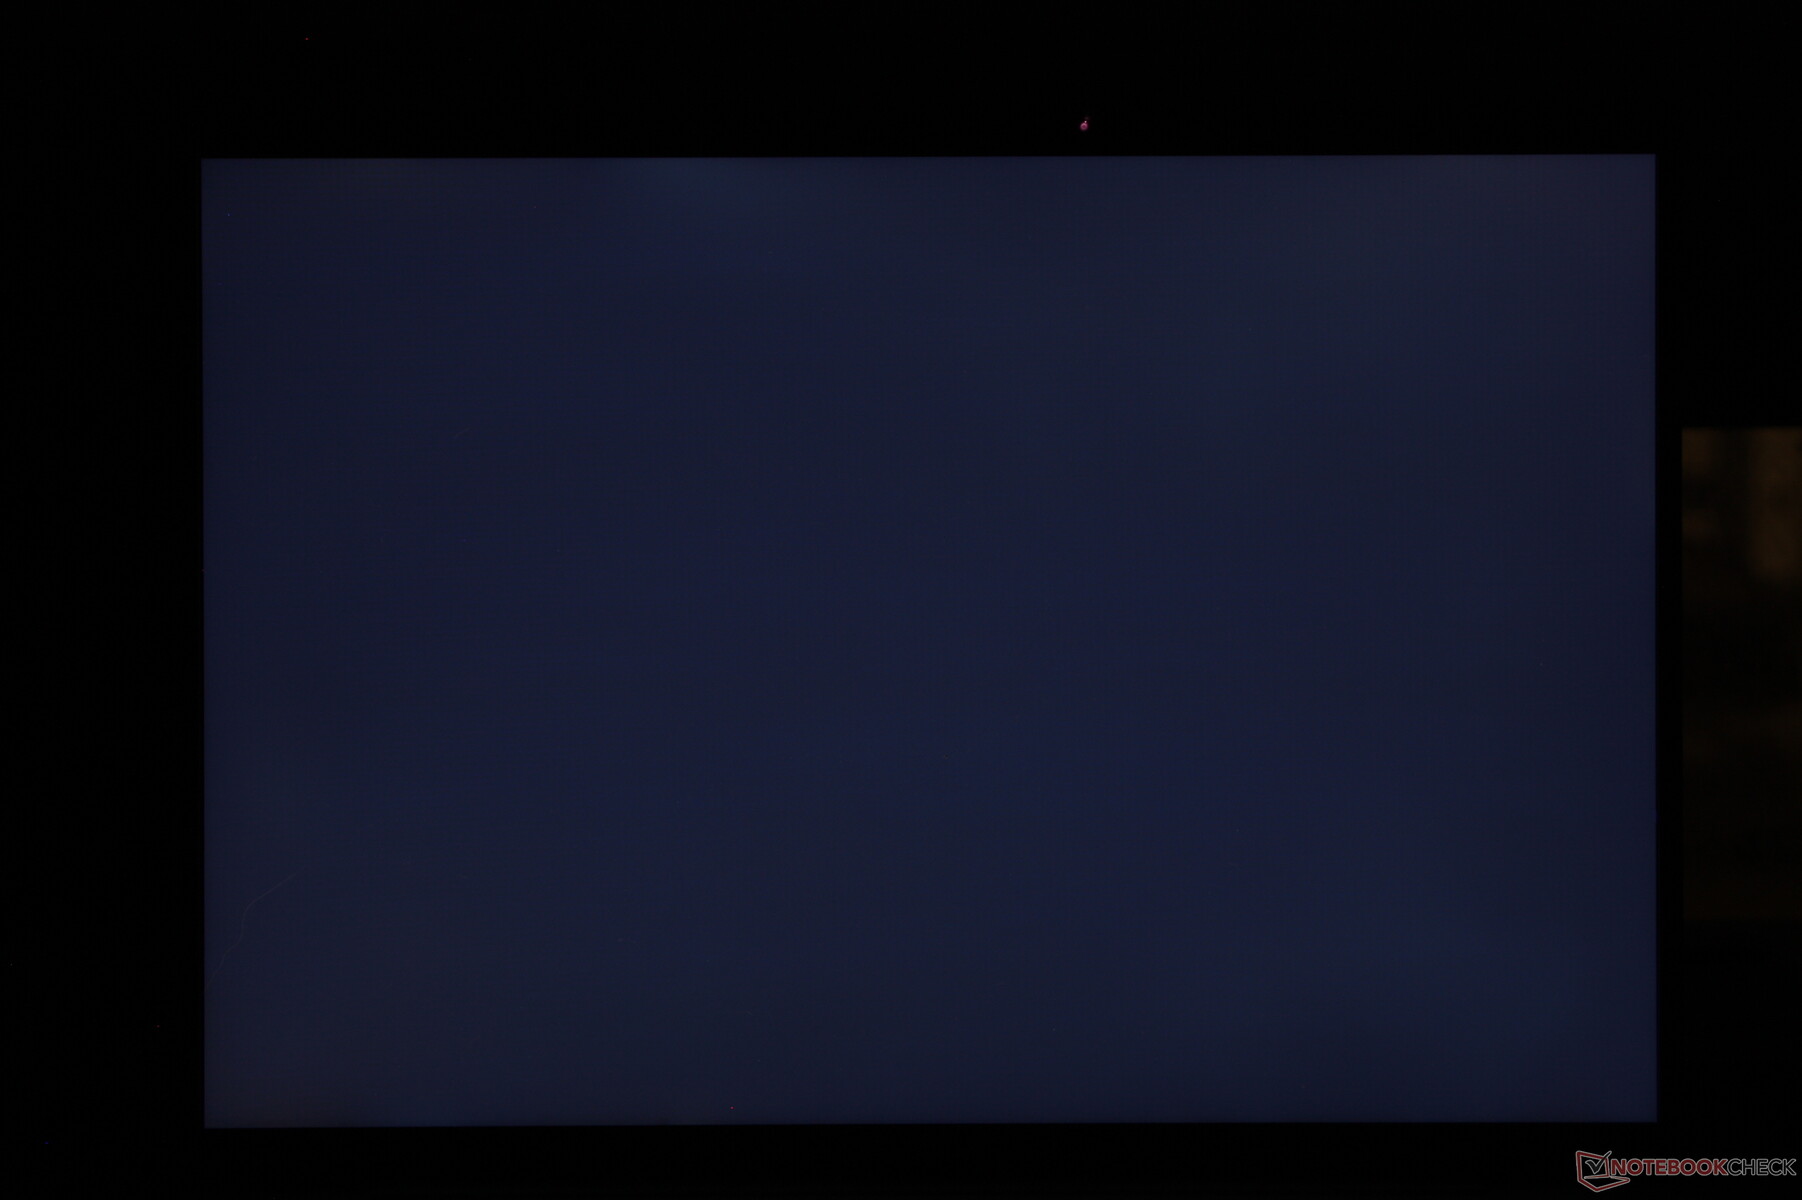
Display
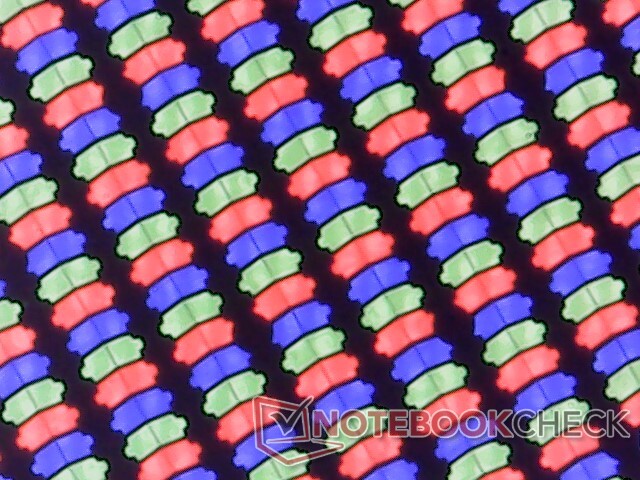
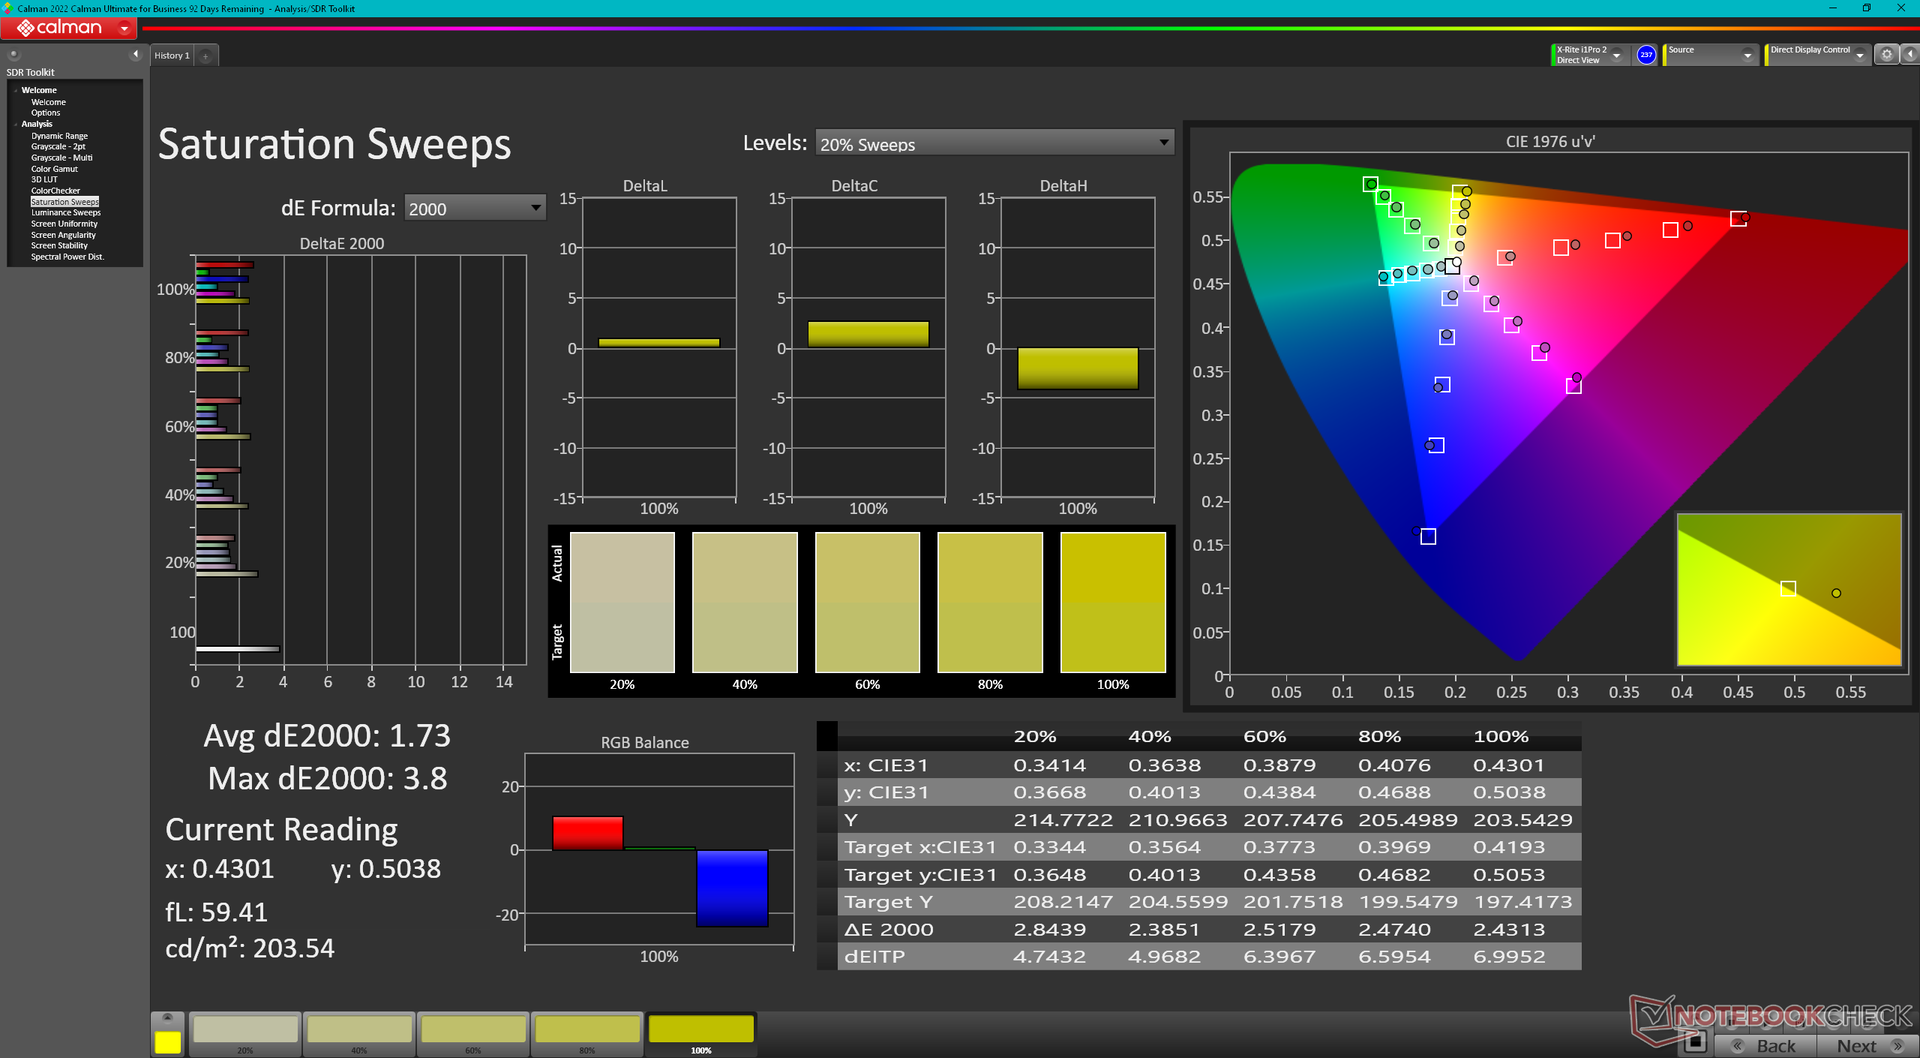
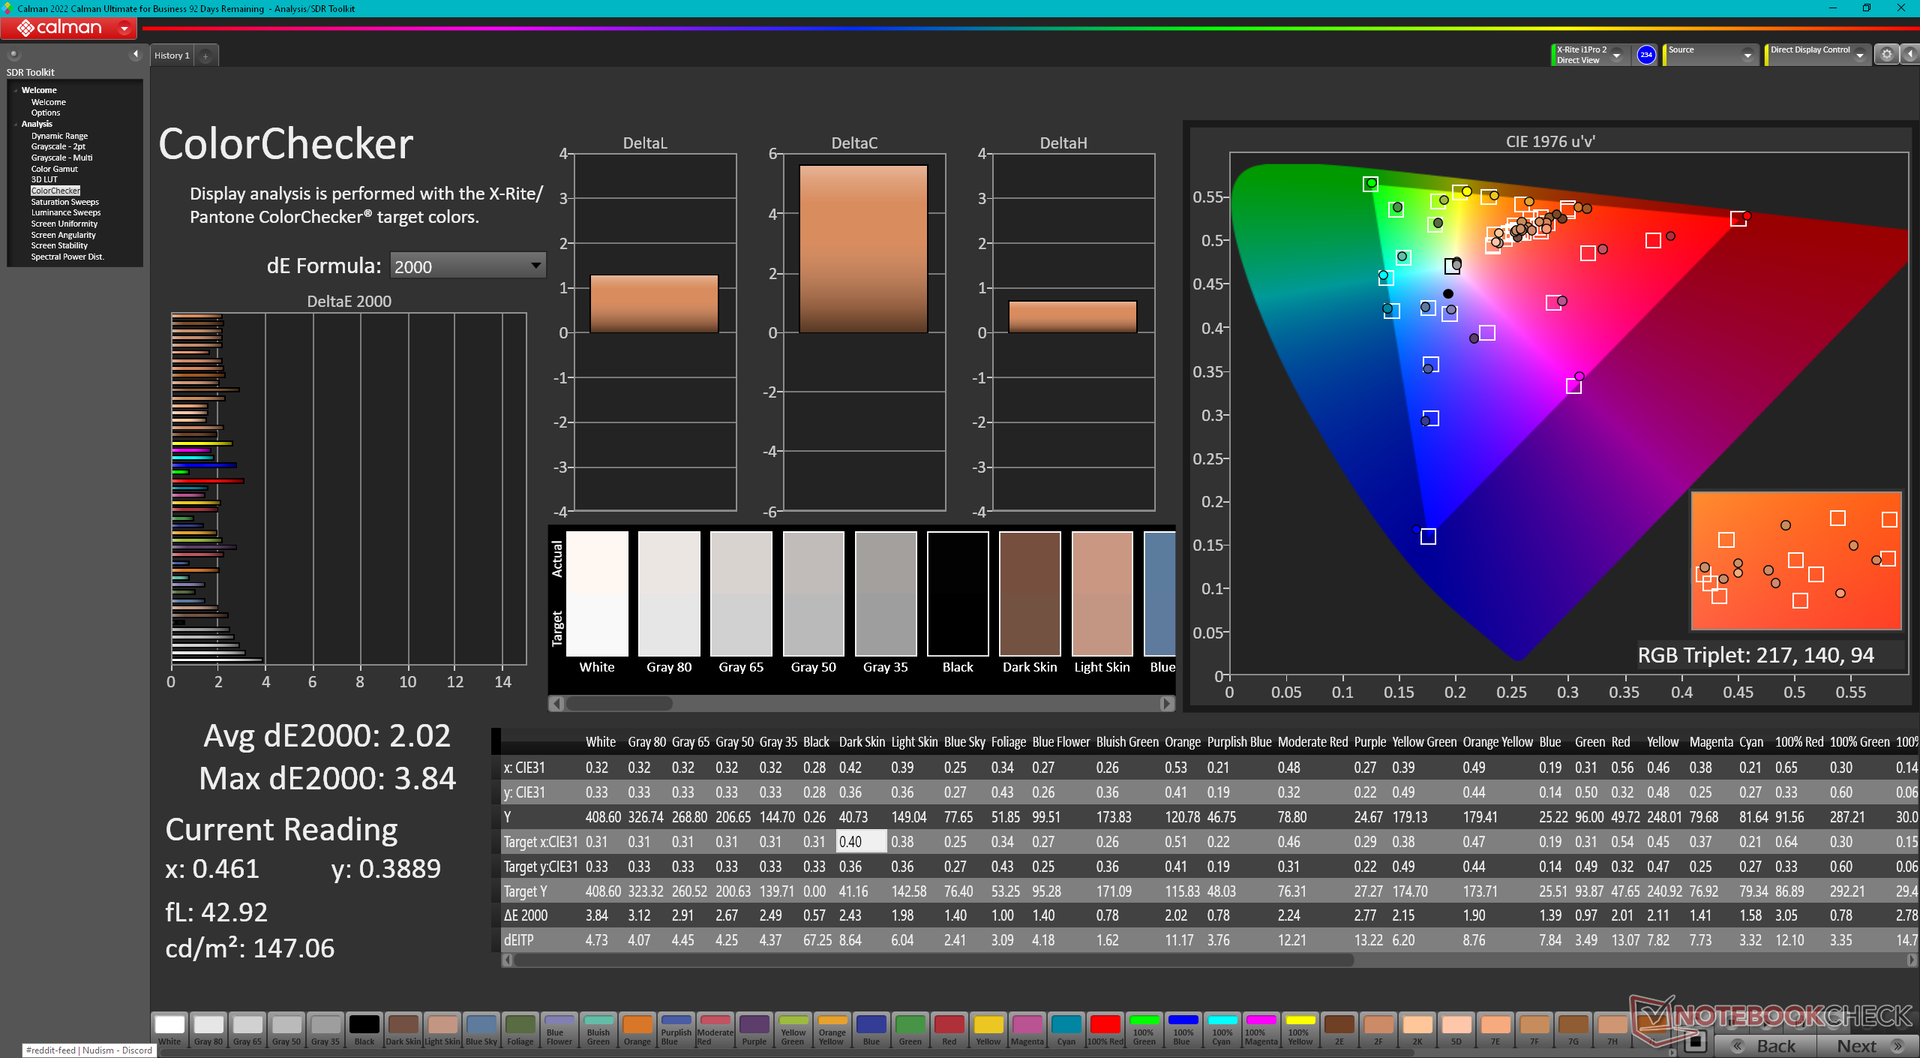
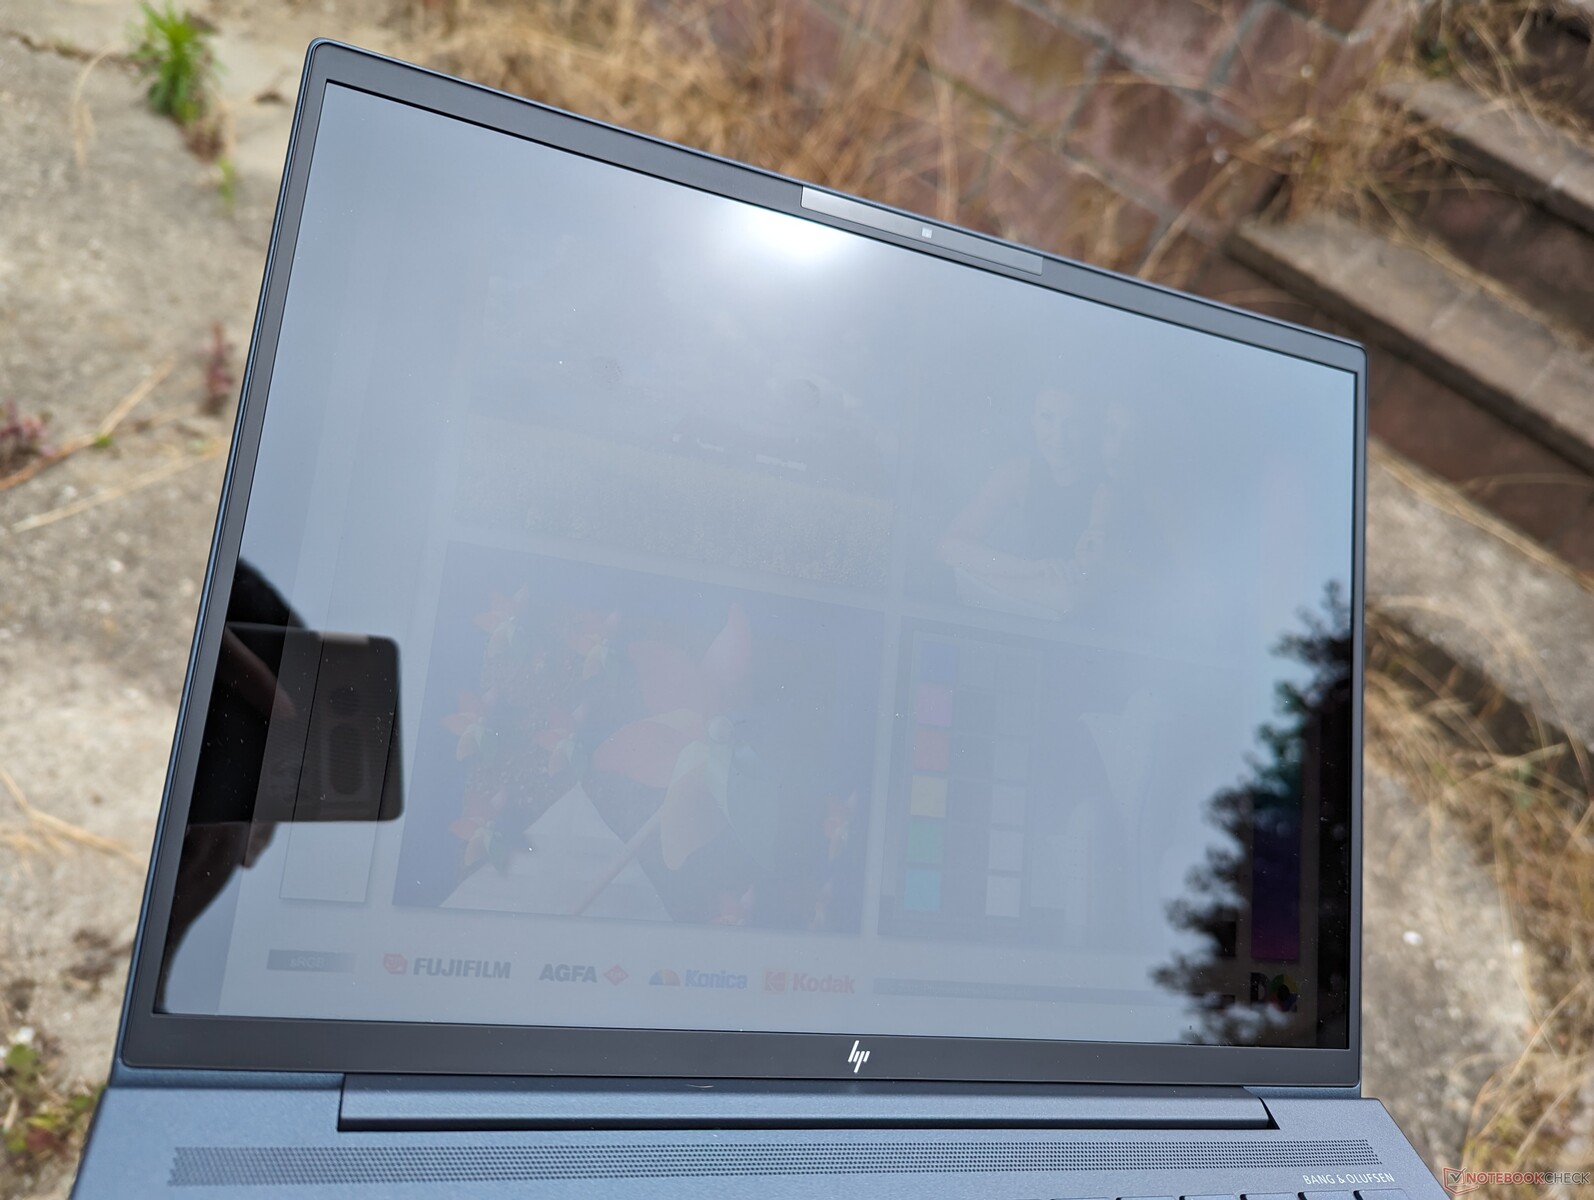
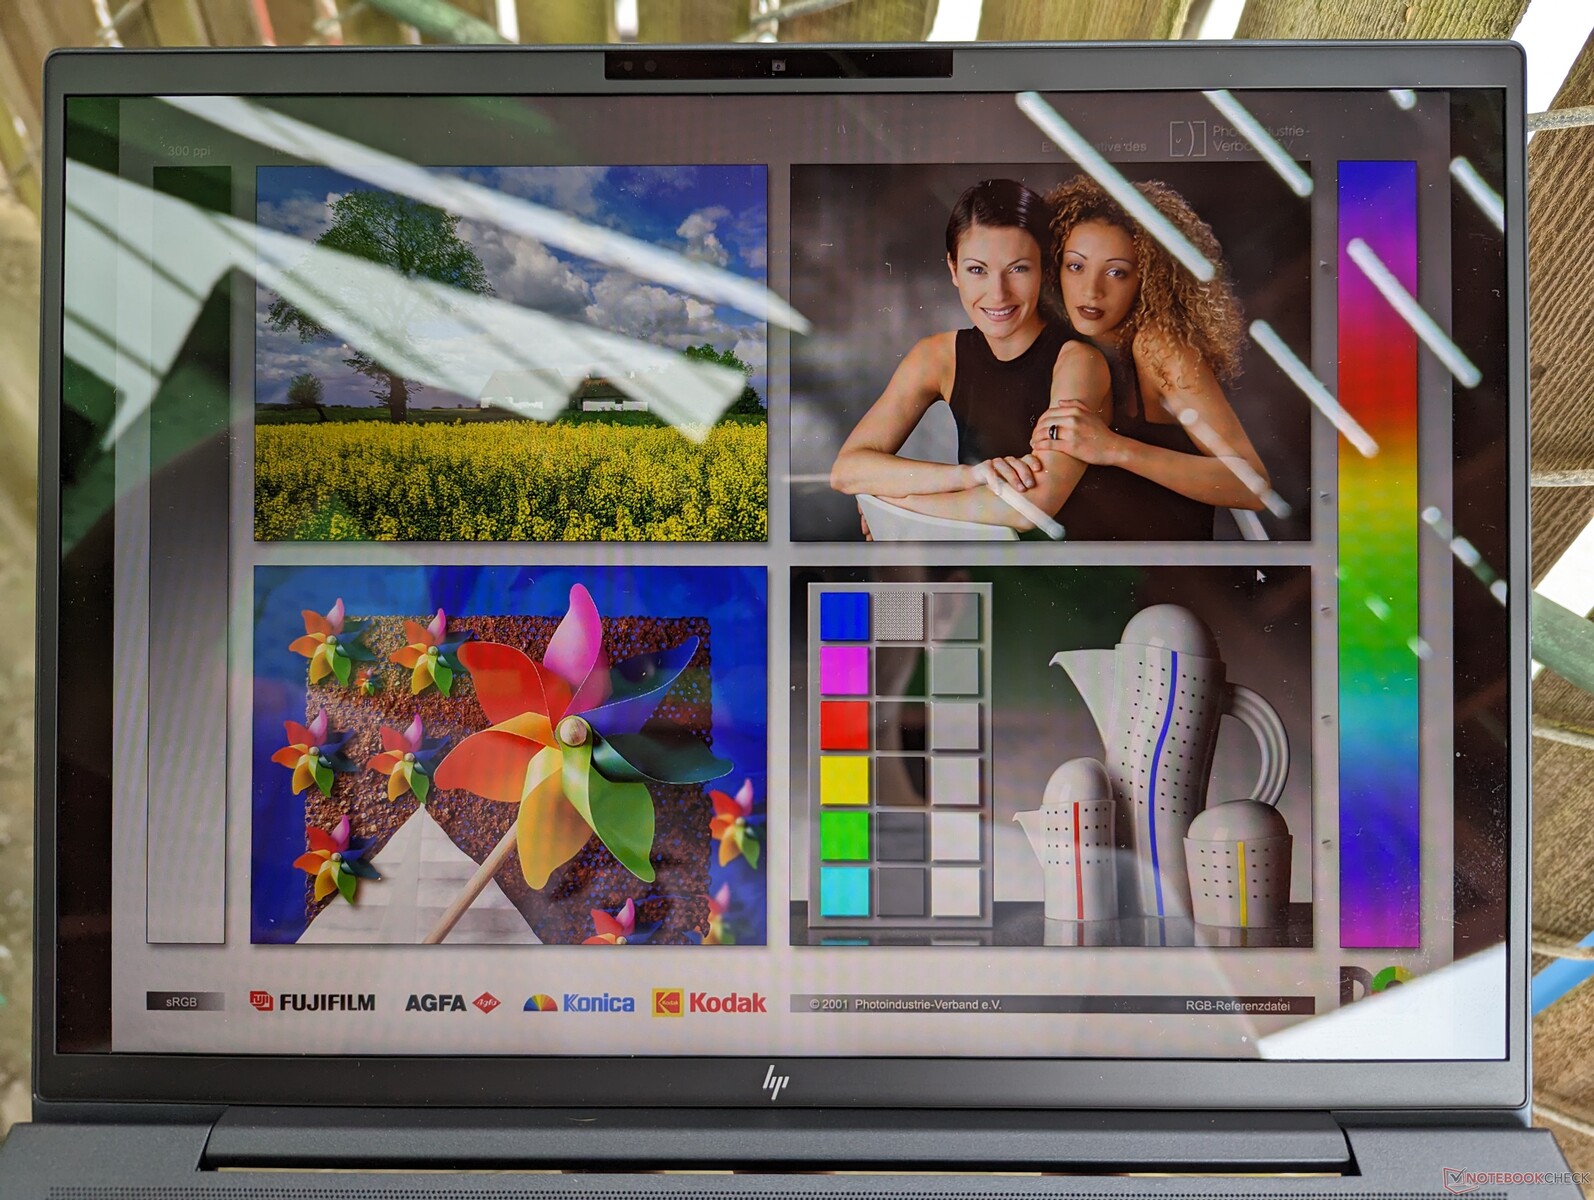
Das Notebook kann in den USA mit insgesamt sechs verschiedenen Displays ausgestattet werden, zwischen einem 1280p-IPS-Panel und einem 2K-OLED-Display ist alles mit dabei. Ein Touchscreen, Sure View und bis zu 1000 Nits helle Displays sind auch verfügbar, allerdings nur bei den IPS-Konfigurationen. Unser Testmodell ist mit dem 1280p-Basisdisplay mit 400 Nits, dem Chi Mei CMN13C0, ausgestattet und somit identisch mit dem Bildschirm des letztjährigen Dragonfly G3. Deshalb bleibt die Bildqualität im Vergleich zum Vorgänger auch unverändert.
| |||||||||||||||||||||||||
Ausleuchtung: 90 %
Helligkeit Akku: 408.8 cd/m²
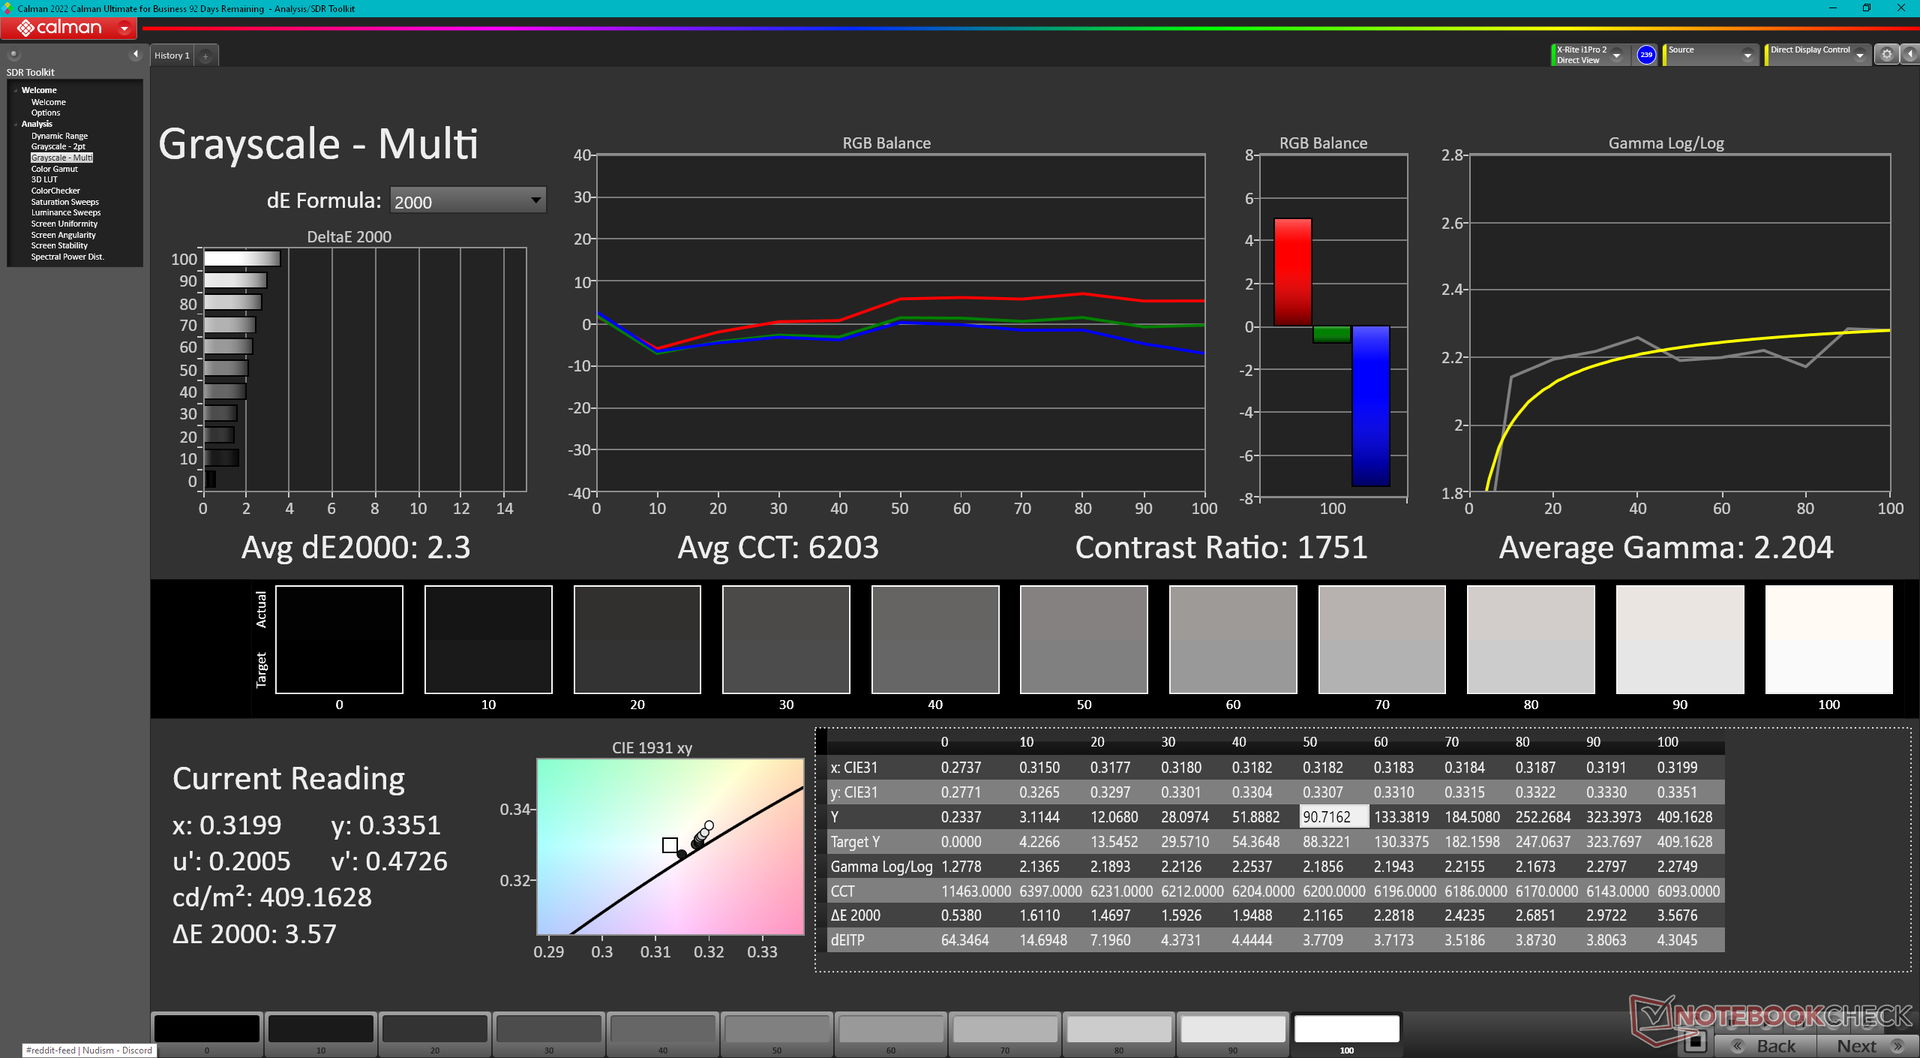
Kontrast: 1278:1 (Schwarzwert: 0.32 cd/m²)
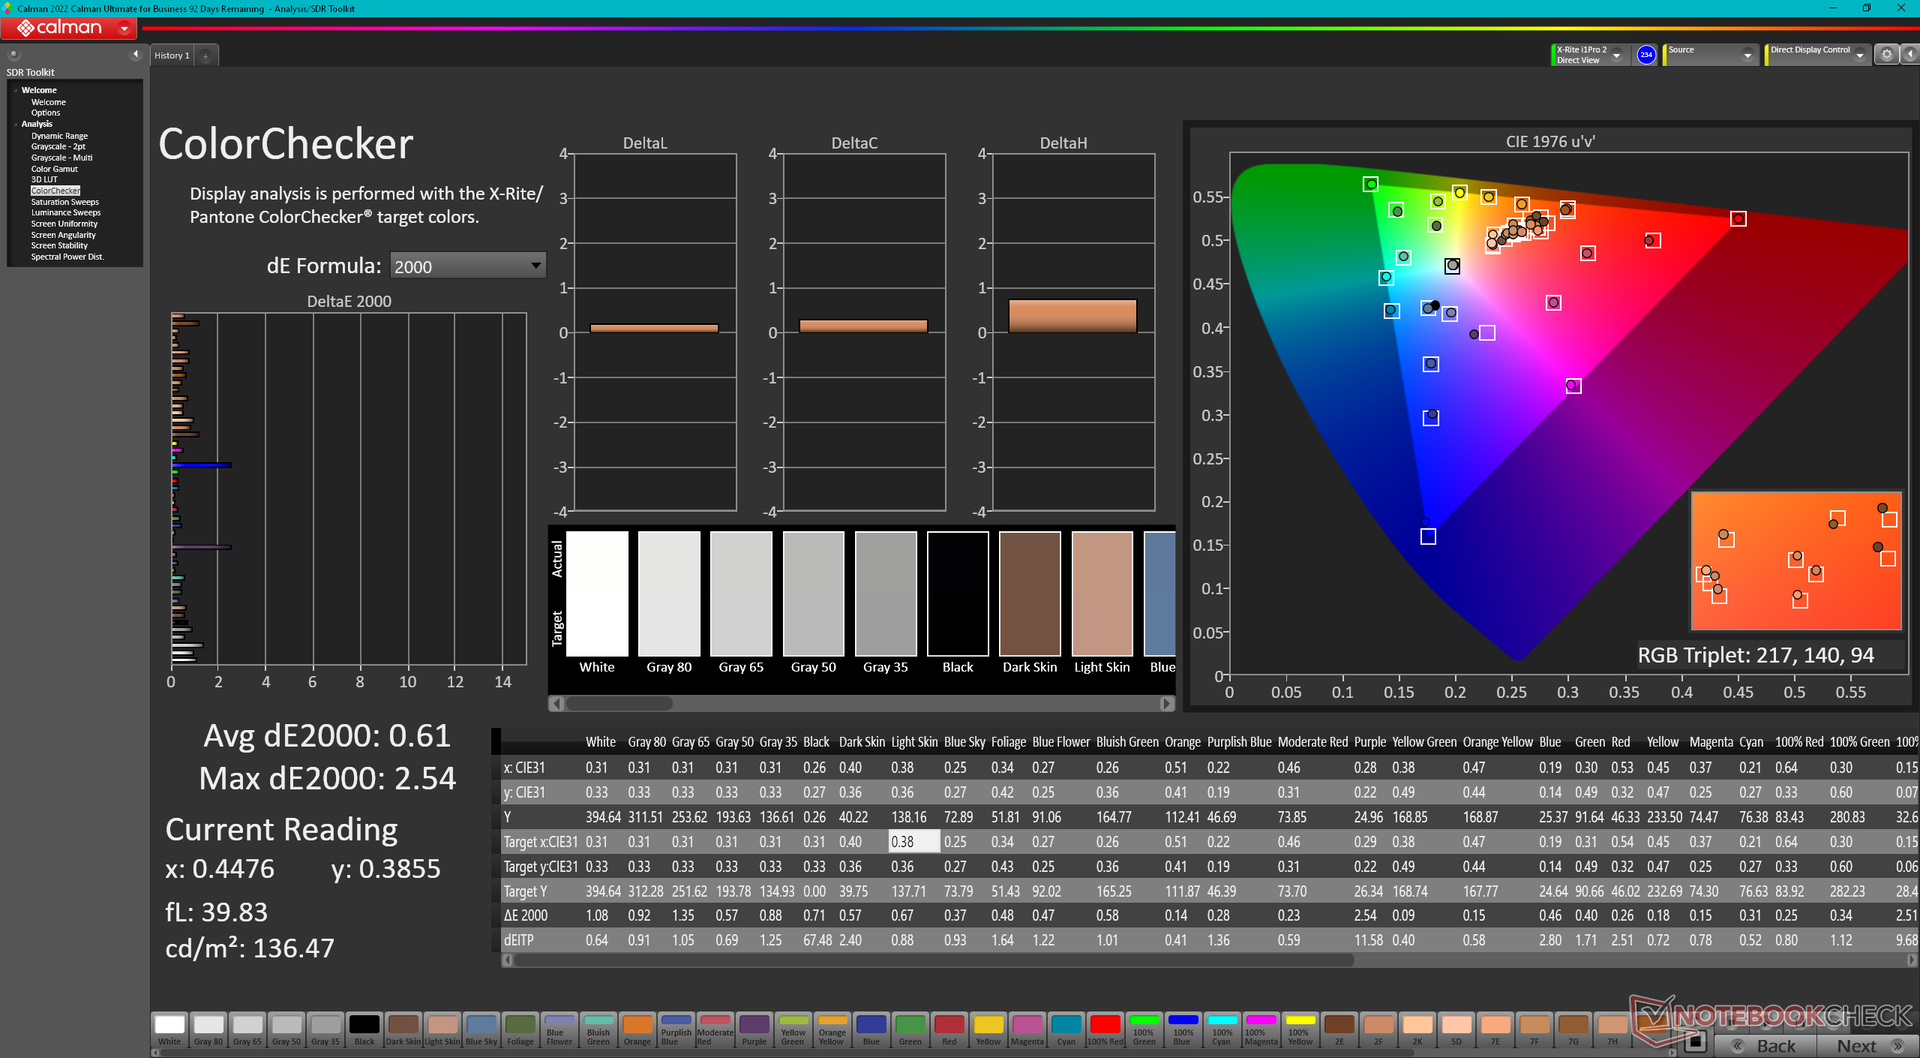
ΔE ColorChecker Calman: 2.02 | ∀{0.5-29.43 Ø4.72}
calibrated: 0.61
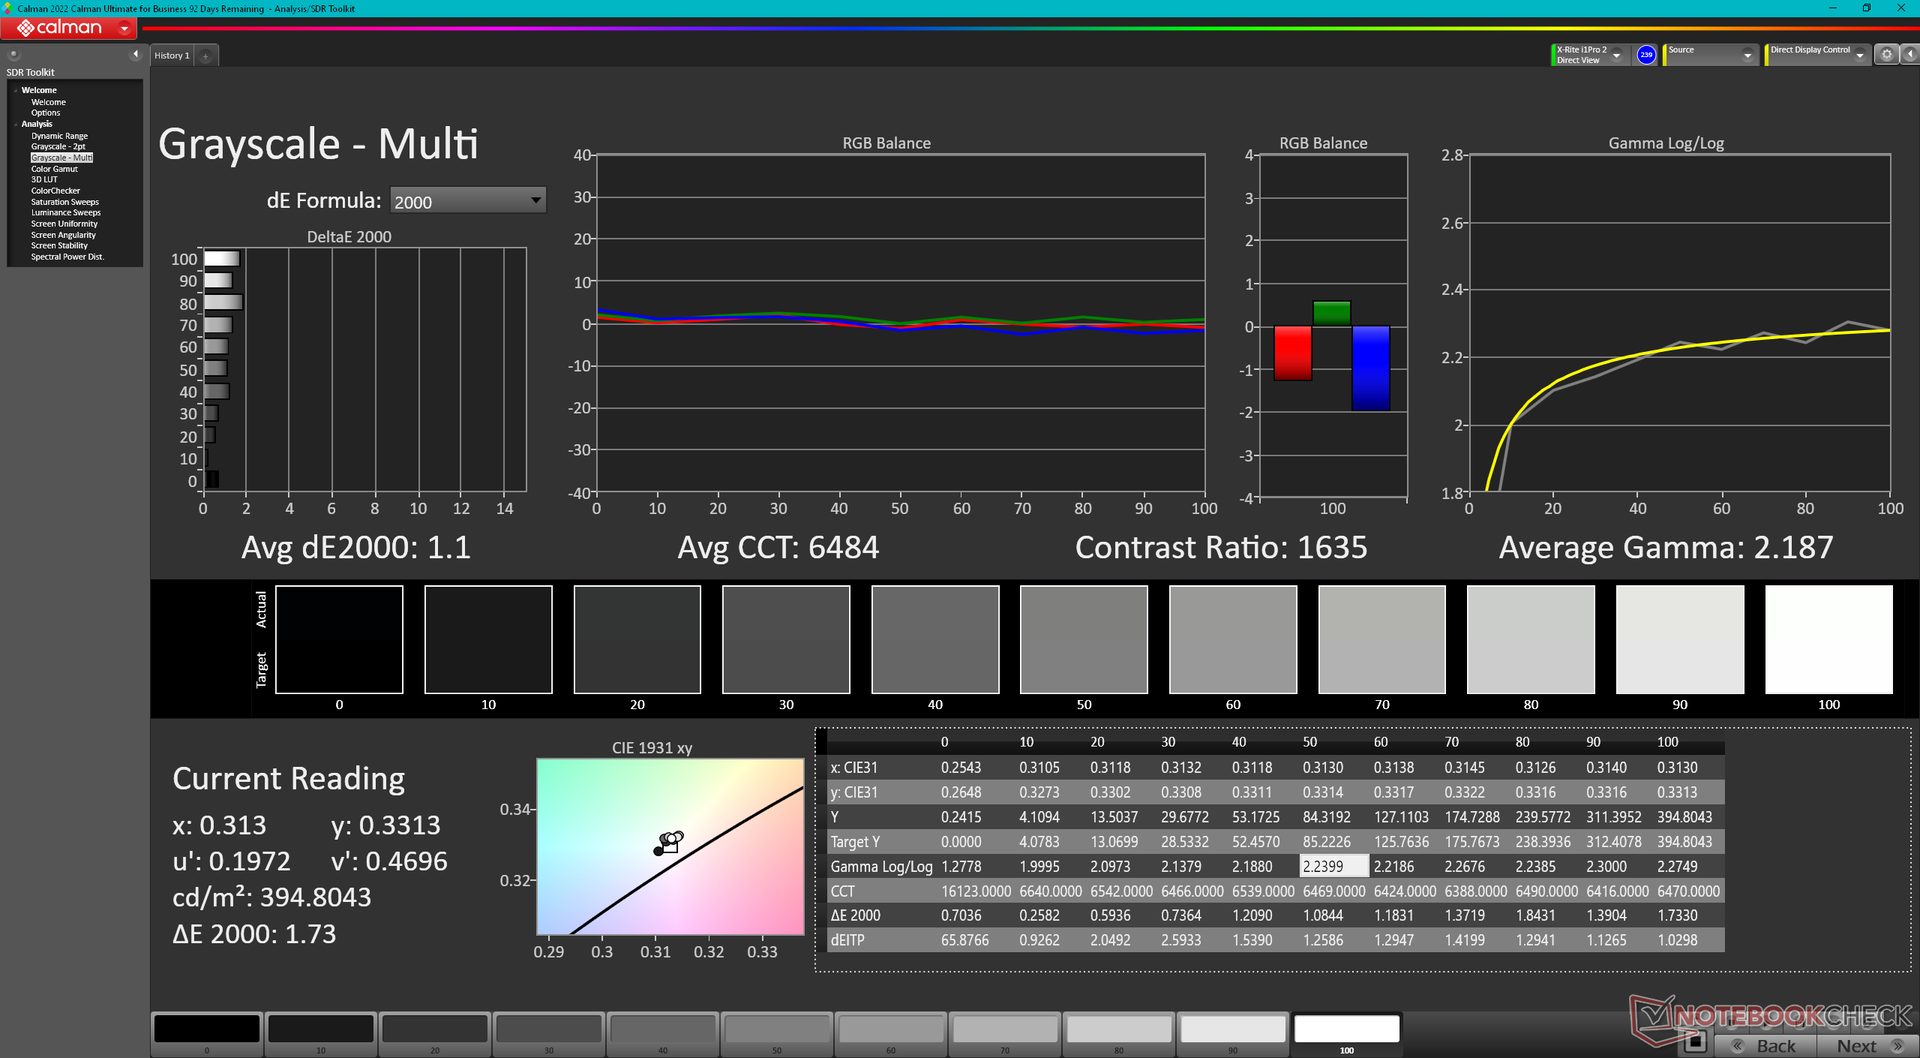
ΔE Greyscale Calman: 2.3 | ∀{0.09-98 Ø4.97}
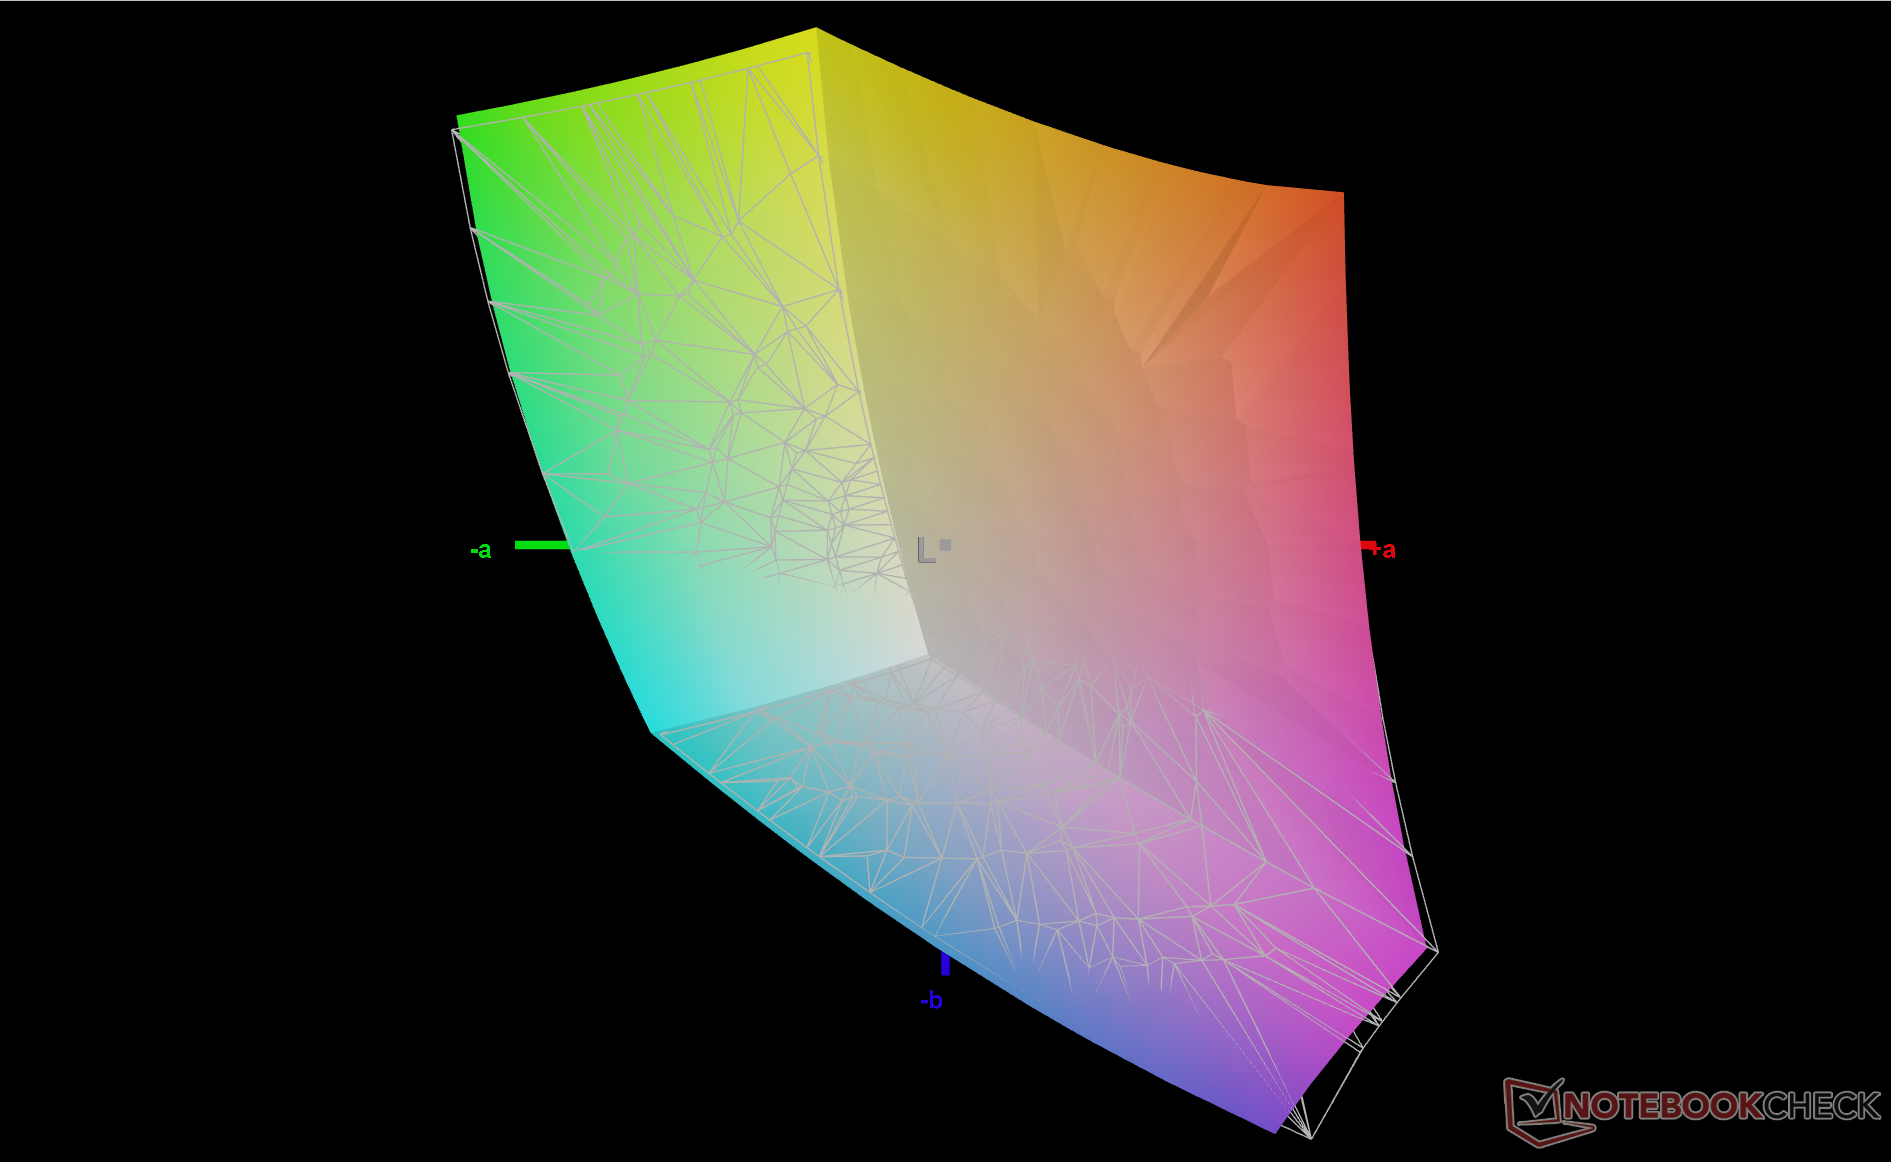
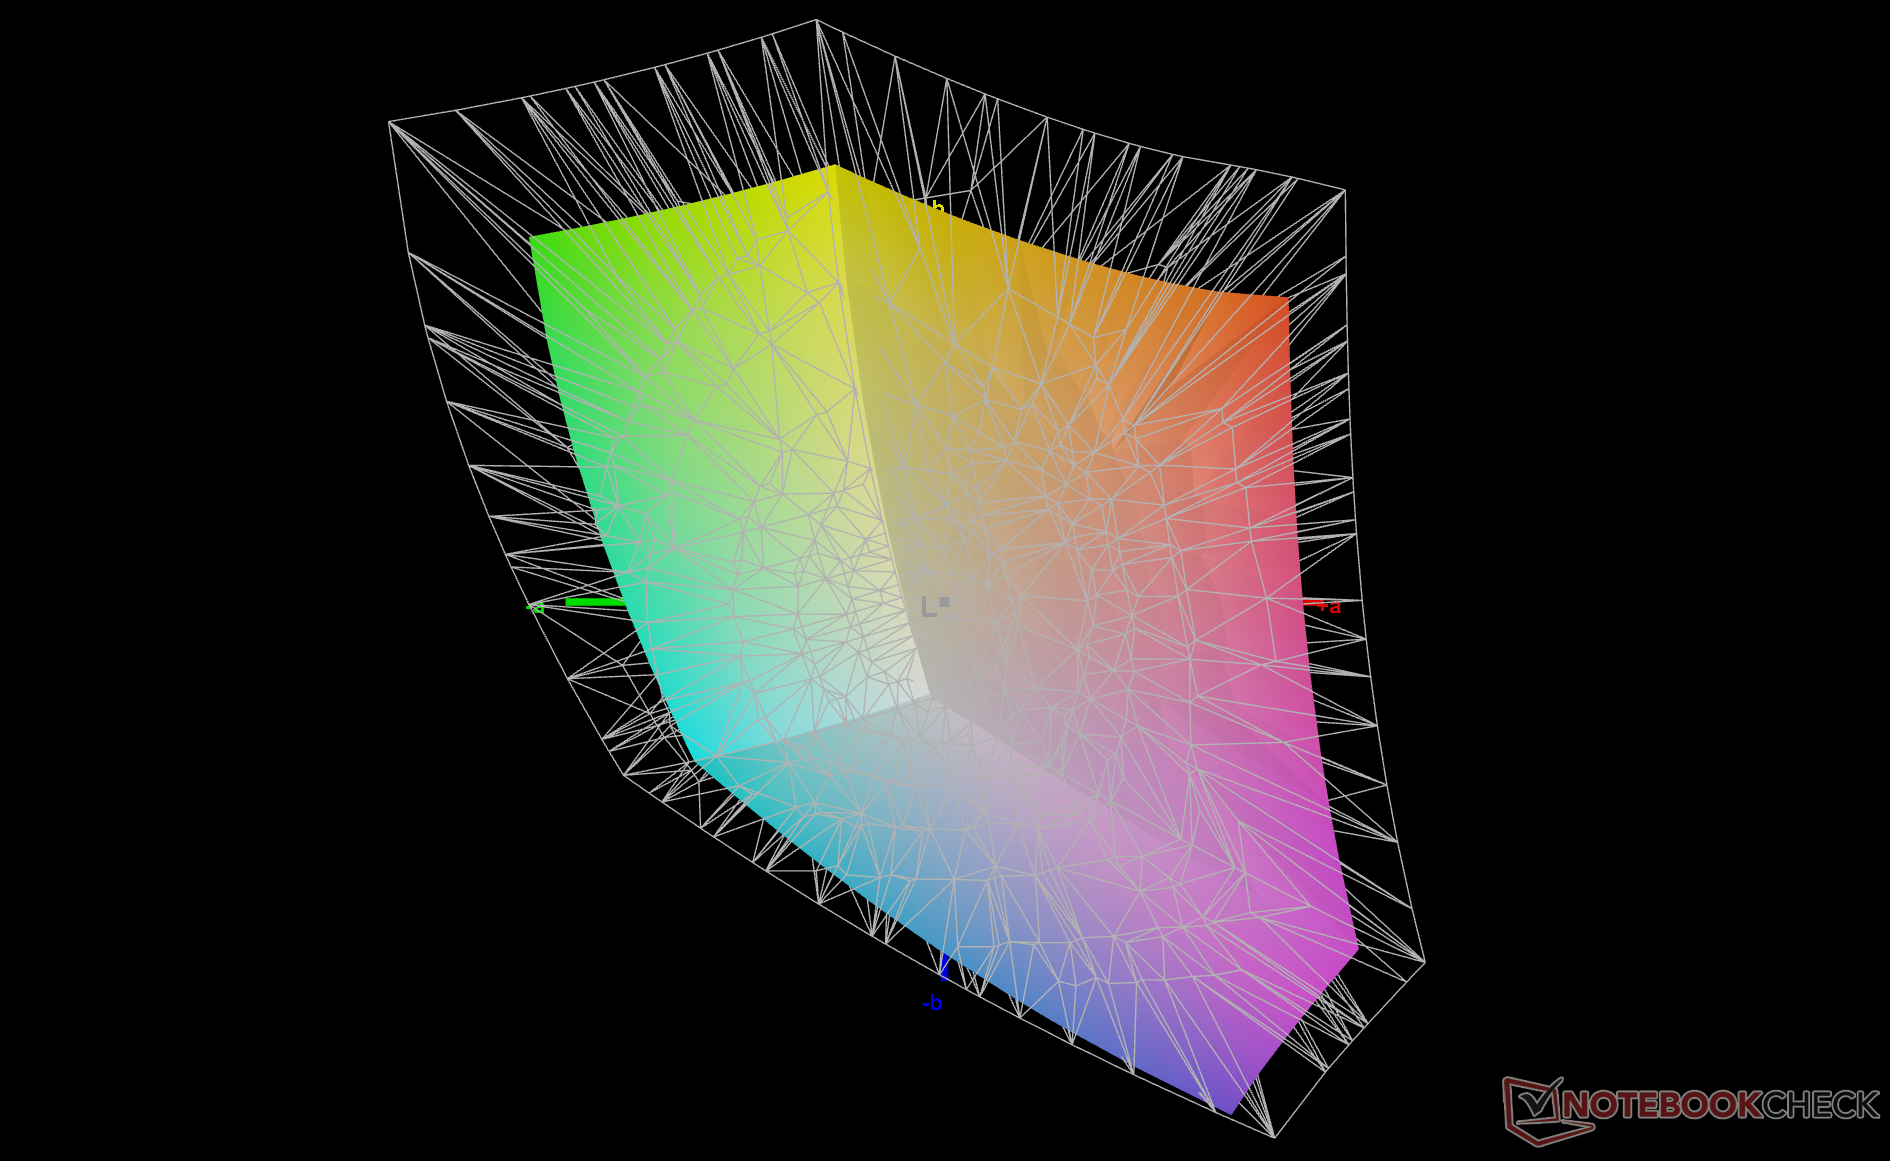
70.4% AdobeRGB 1998 (Argyll 3D)
98.3% sRGB (Argyll 3D)
68.4% Display P3 (Argyll 3D)
Gamma: 2.2
CCT: 6203 K
| HP Dragonfly G4 Chi Mei CMN13C0, IPS, 1920x1280, 13.5" | HP Elite Dragonfly G3 Chi Mei CMN13C0, IPS, 1920x1280, 13.5" | Framework Laptop 13.5 13th Gen Intel BOE CQ NE135FBM-N41, IPS, 2256x1504, 13.5" | Lenovo ThinkPad X13 G3 21CM002UGE M133NW4J R3, IPS LED, 1920x1200, 13.3" | Dell Latitude 9330 AU Optronics B133QAA, IPS, 2560x1600, 13.3" | Apple MacBook Air M2 Entry IPS, 2560x1664, 13.6" | |
|---|---|---|---|---|---|---|
| Display | -1% | 0% | 0% | 9% | 23% | |
| Display P3 Coverage (%) | 68.4 | 68 -1% | 68.9 1% | 69 1% | 77.8 14% | 98.4 44% |
| sRGB Coverage (%) | 98.3 | 98.3 0% | 97.5 -1% | 98.4 0% | 99.9 2% | 99.9 2% |
| AdobeRGB 1998 Coverage (%) | 70.4 | 69.9 -1% | 71.1 1% | 70.3 0% | 77.5 10% | 87.6 24% |
| Response Times | -8% | -10% | 10% | -50% | 27% | |
| Response Time Grey 50% / Grey 80% * (ms) | 48.8 ? | 50.8 ? -4% | 54.9 ? -13% | 44.2 ? 9% | 67.6 ? -39% | 32.9 ? 33% |
| Response Time Black / White * (ms) | 31.3 ? | 35.2 ? -12% | 33.5 ? -7% | 28.1 ? 10% | 50.4 ? -61% | 24.9 ? 20% |
| PWM Frequency (Hz) | ||||||
| Bildschirm | -7% | -36% | 0% | -12% | 11% | |
| Helligkeit Bildmitte (cd/m²) | 408.8 | 387.2 -5% | 503 23% | 348 -15% | 542.3 33% | 526 29% |
| Brightness (cd/m²) | 399 | 360 -10% | 472 18% | 321 -20% | 516 29% | 486 22% |
| Brightness Distribution (%) | 90 | 80 -11% | 87 -3% | 85 -6% | 85 -6% | 87 -3% |
| Schwarzwert * (cd/m²) | 0.32 | 0.26 19% | 0.36 -13% | 0.34 -6% | 0.38 -19% | 0.38 -19% |
| Kontrast (:1) | 1278 | 1489 17% | 1397 9% | 1024 -20% | 1427 12% | 1384 8% |
| Delta E Colorchecker * | 2.02 | 2.36 -17% | 3.38 -67% | 1.3 36% | 3.18 -57% | 1.3 36% |
| Colorchecker dE 2000 max. * | 3.84 | 4.79 -25% | 7.08 -84% | 2.5 35% | 6.05 -58% | 2.7 30% |
| Colorchecker dE 2000 calibrated * | 0.61 | 0.63 -3% | 1.21 -98% | 1 -64% | 0.67 -10% | 0.7 -15% |
| Delta E Graustufen * | 2.3 | 3 -30% | 4.8 -109% | 0.9 61% | 3.1 -35% | 2 13% |
| Gamma | 2.2 100% | 2.17 101% | 2.13 103% | 2.16 102% | 2.08 106% | 2.25 98% |
| CCT | 6203 105% | 6137 106% | 6235 104% | 6431 101% | 6140 106% | 6858 95% |
| Durchschnitt gesamt (Programm / Settings) | -5% /
-6% | -15% /
-25% | 3% /
2% | -18% /
-13% | 20% /
16% |
* ... kleinere Werte sind besser
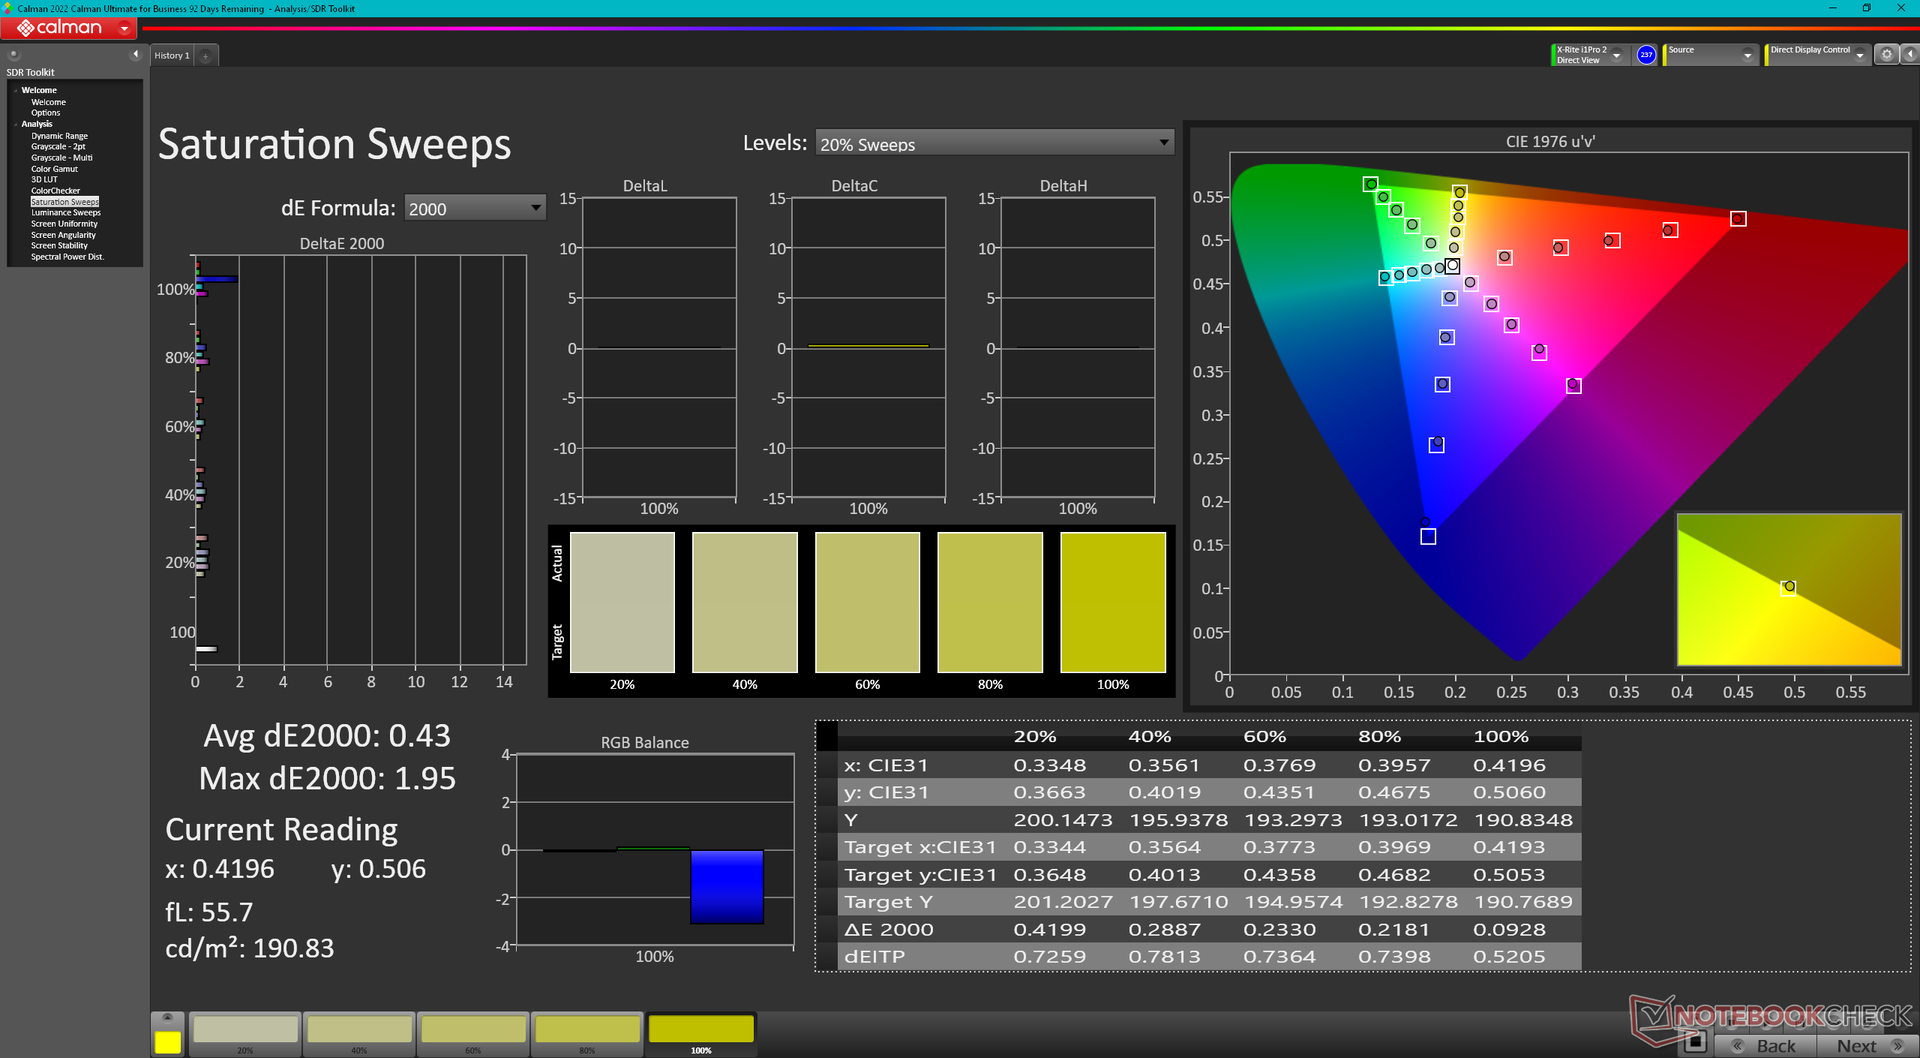
Das Display ist im Werkzustand bereits gut kalibriert, obwohl HP damit überhaupt nicht wirbt. Mit unserem X-Rite-Farbmessgerät konnten wir die durchschnittlichen Delta-E-Werte für Graustufen und Farben von 2,3 und 2,02 auf 1,1 und 0,61 verbessern. Unser ICM-Profil ist oben verlinkt und kann kostenlos heruntergeladen werden.
Reaktionszeiten (Response Times) des Displays
| ↔ Reaktionszeiten Schwarz zu Weiß | ||
|---|---|---|
| 31.3 ms ... steigend ↗ und fallend ↘ kombiniert | ↗ 16.3 ms steigend | 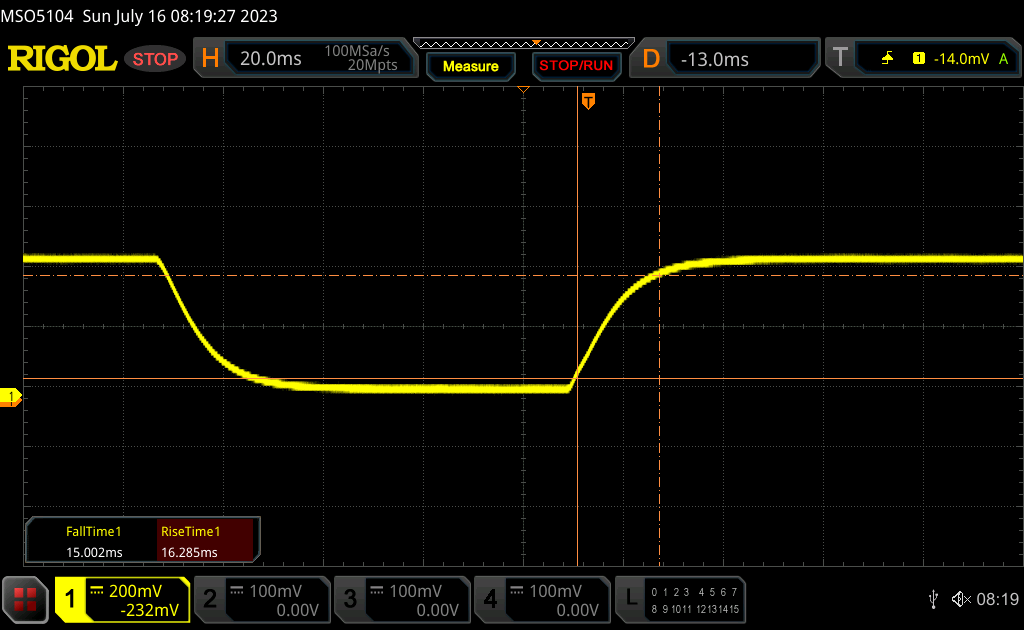 |
| ↘ 15 ms fallend | ||
| Die gemessenen Reaktionszeiten sind langsam und dadurch für viele Spieler wahrscheinlich zu langsam. Im Vergleich rangierten die bei uns getesteten Geräte von 0.1 (Minimum) zu 240 (Maximum) ms. » 85 % aller Screens waren schneller als der getestete. Daher sind die gemessenen Reaktionszeiten schlechter als der Durchschnitt aller vermessenen Geräte (19.8 ms). | ||
| ↔ Reaktionszeiten 50% Grau zu 80% Grau | ||
| 48.8 ms ... steigend ↗ und fallend ↘ kombiniert | ↗ 22.9 ms steigend | 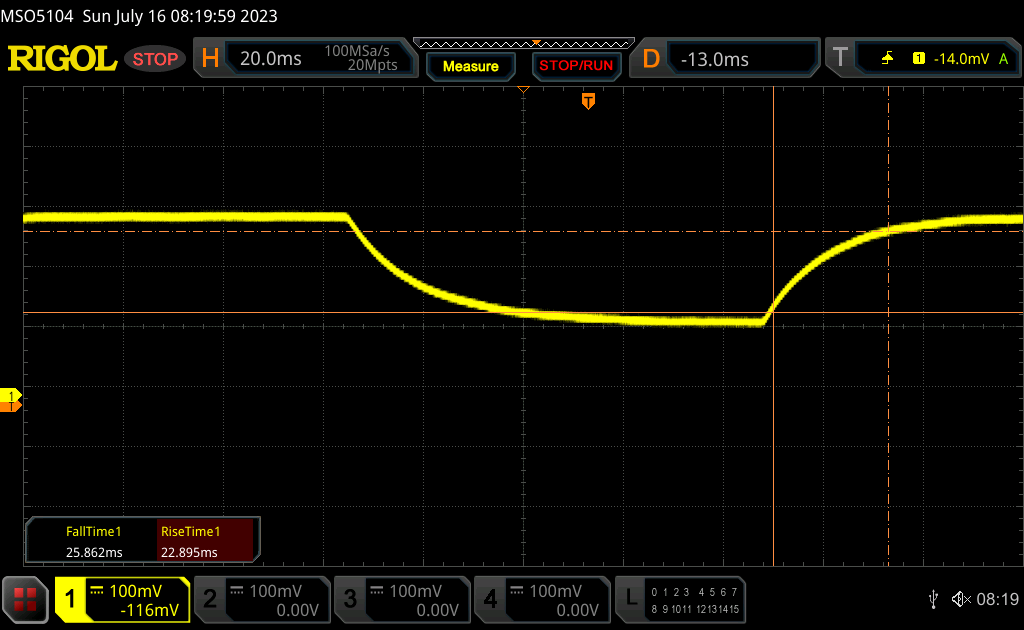 |
| ↘ 25.9 ms fallend | ||
| Die gemessenen Reaktionszeiten sind langsam und dadurch für viele Spieler wahrscheinlich zu langsam. Im Vergleich rangierten die bei uns getesteten Geräte von 0.165 (Minimum) zu 636 (Maximum) ms. » 84 % aller Screens waren schneller als der getestete. Daher sind die gemessenen Reaktionszeiten schlechter als der Durchschnitt aller vermessenen Geräte (31 ms). | ||
Bildschirm-Flackern / PWM (Pulse-Width Modulation)
| Flackern / PWM nicht festgestellt | 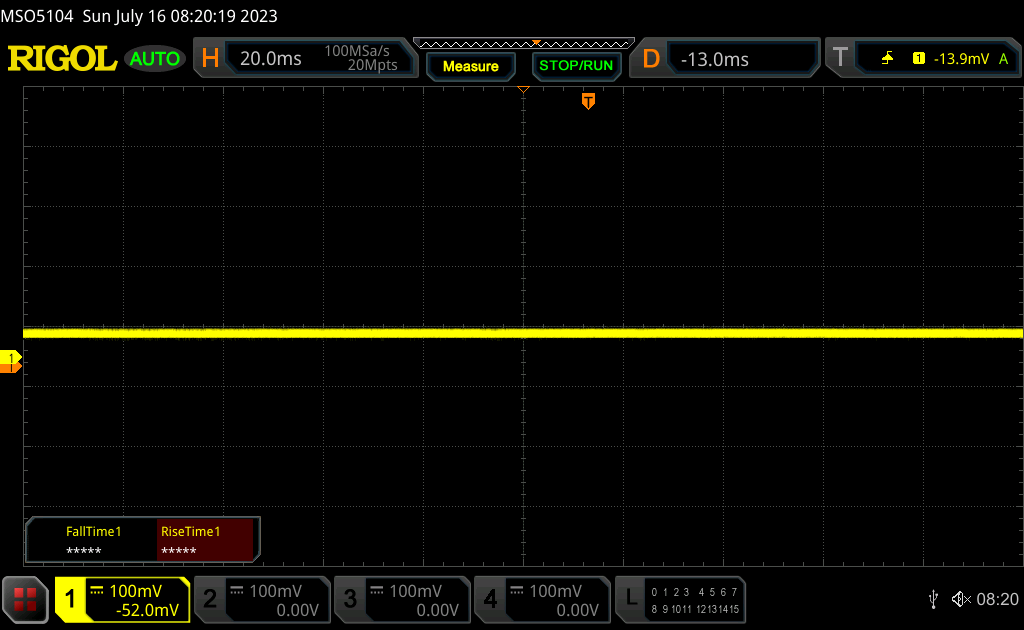 | ||
Im Vergleich: 52 % aller getesteten Geräte nutzten kein PWM um die Helligkeit zu reduzieren. Wenn PWM eingesetzt wurde, dann bei einer Frequenz von durchschnittlich 7769 (Minimum 5, Maximum 343500) Hz. | |||
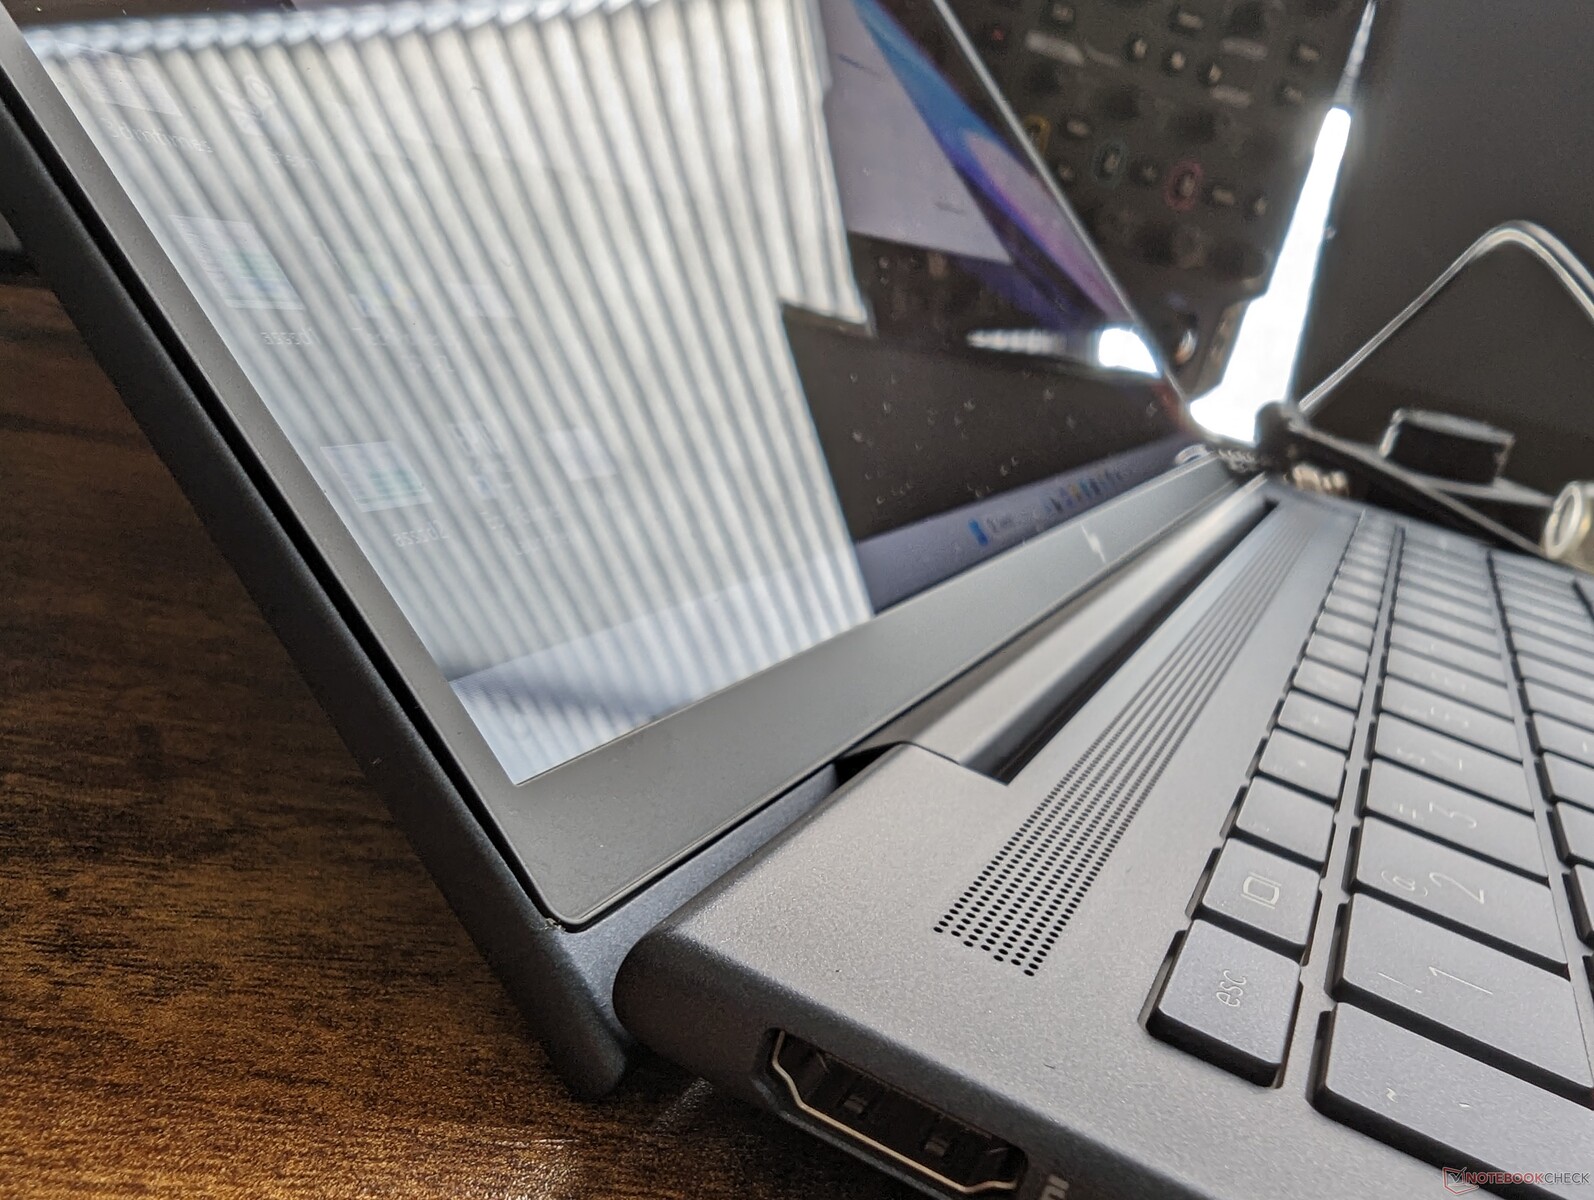
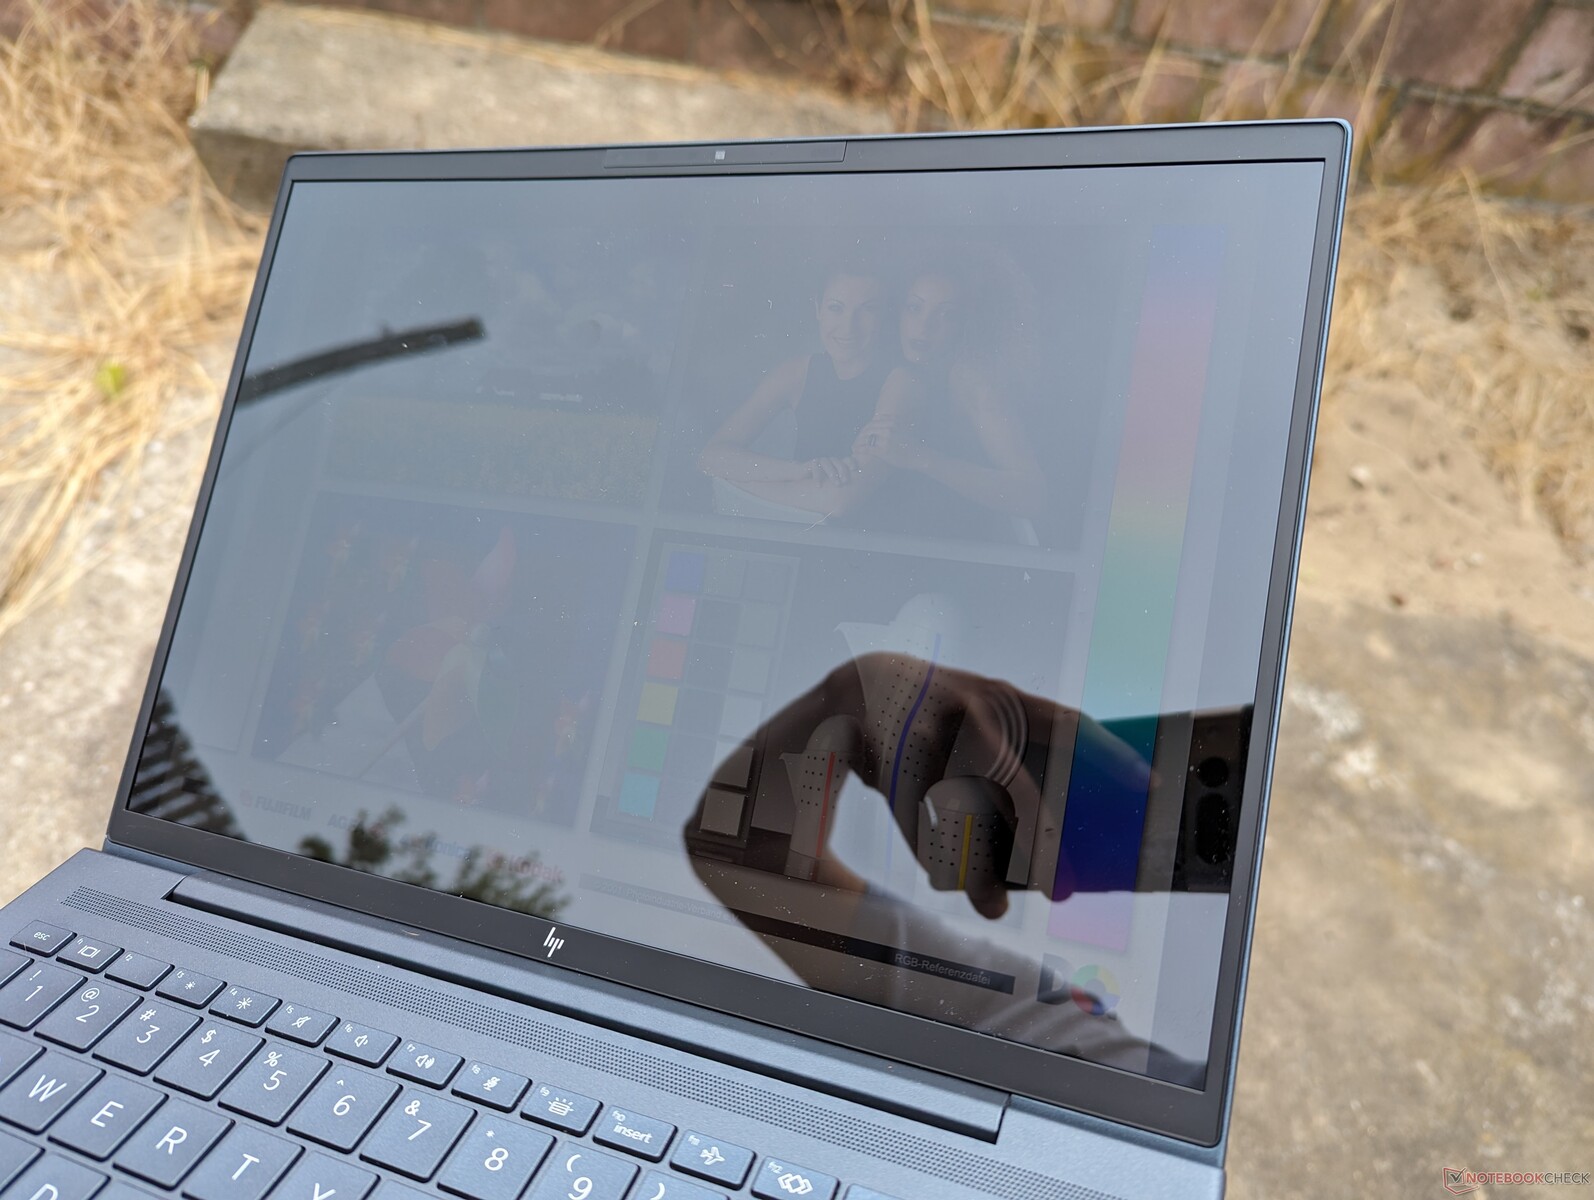
Die extrem glänzende Beschichtung sorgt im Außeneinsatz für deutliche Spiegelungen. Glücklicherweise ist HP einer der wenigen großen Hersteller, der ein 1000-Nits-Display anbietet, was doppelt so hell ist wie die Bildschirme der meisten anderen Business-Notebooks.
Leistung
Testbedingungen
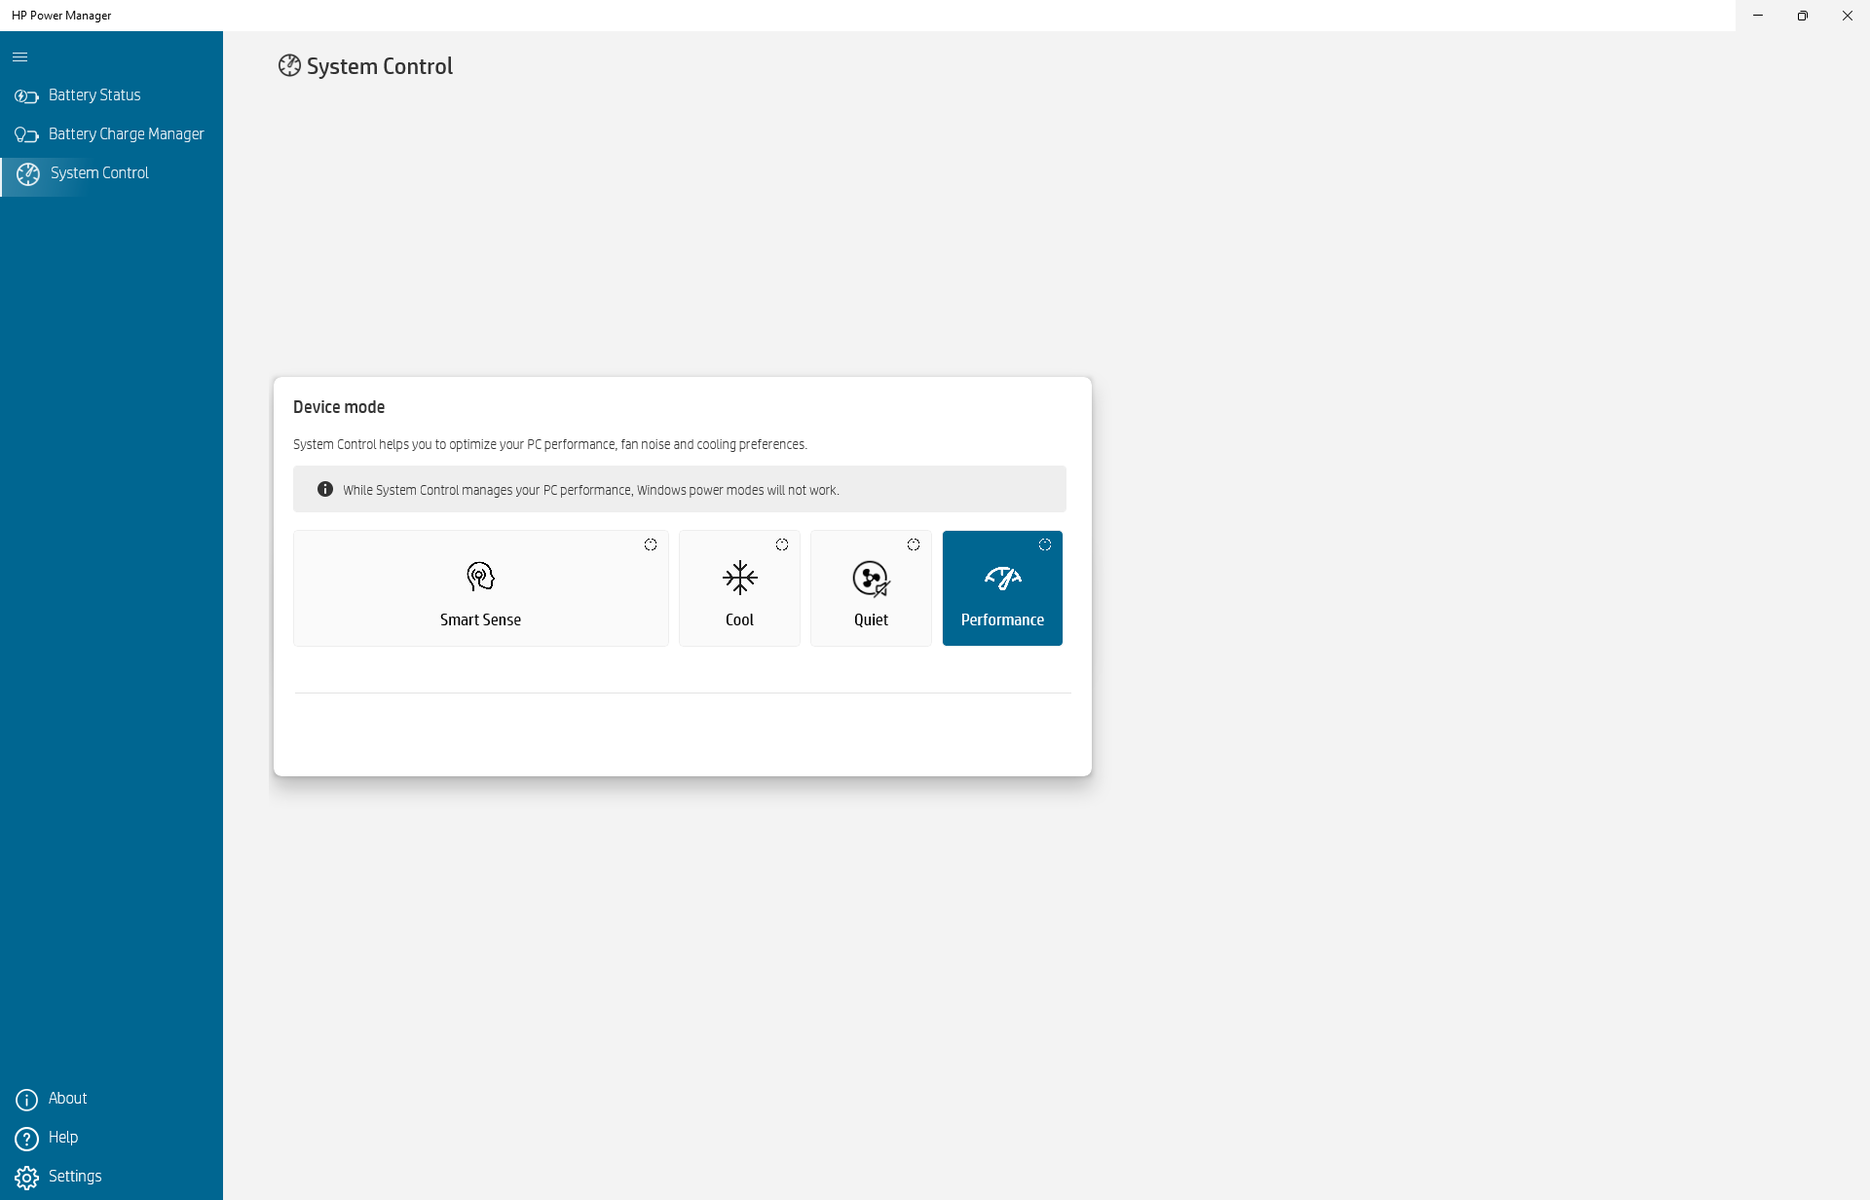
Wir haben unser Testgerät vor den unten durchgeführten Benchmarks im "HP Power Manager" in den Leistungsmodus versetzt. Die Power-Manager-Software wurde dieses Jahr neu eingeführt und synchronisiert seine Einstellungen bequemer Weise mit den entsprechenden Windows-Energieoptionen, wie auf den Screenshots unten zu erkennen ist.

Prozessor
Die pure Multi-Thread-Leistung ist um bis zu 20 Prozent höher als beim Core i7-1265U des Dragonfly G3 vom letzten Jahr. Wenn der Turbo-Boost heruntergeregelt wird, schrumpft der Leistungsvorsprung des i7-1365U auf den Core i7-1265U auf 10 Prozent, wie unser CineBench-R15-Dauertest unten aufzeigt. Der neue Prozessor ist also nur ein kleines Upgrade im Vergleich zur Alder-Lake-U-CPU vom Vorjahr.
Die Leistung ist insgesamt circa 15 Prozent niedriger als bei den meisten anderen Notebooks mit dem gleichen Core i7-1365U Prozessor. Tatsächlich ist das Samsung Galaxy Book3 15, das mit dem günstigeren Core i5-1335U ausgerüstet ist, im Multi-Thread-Test durchgängig schneller als der Core-i7 im Dragonfly G4. HP hat sich angewöhnt, die CPUs in der Dragonfly-Baureihe etwas langsamer laufen zu lassen als die Konkurrenz.
Leider bietet die Serie keine Core-P-Prozessoren wie den Core i7-1370P an, der die Multi-Thread-Leistung um bis zu 75 Prozent steigern könnte, wie unsere Erfahrungen mit dem Framework 13.5 Laptop belegen.
Cinebench R15 Dauertest
Cinebench R23: Multi Core | Single Core
Cinebench R20: CPU (Multi Core) | CPU (Single Core)
Cinebench R15: CPU Multi 64Bit | CPU Single 64Bit
Blender: v2.79 BMW27 CPU
7-Zip 18.03: 7z b 4 | 7z b 4 -mmt1
Geekbench 5.5: Multi-Core | Single-Core
HWBOT x265 Benchmark v2.2: 4k Preset
LibreOffice : 20 Documents To PDF
R Benchmark 2.5: Overall mean
* ... kleinere Werte sind besser
AIDA64: FP32 Ray-Trace | FPU Julia | CPU SHA3 | CPU Queen | FPU SinJulia | FPU Mandel | CPU AES | CPU ZLib | FP64 Ray-Trace | CPU PhotoWorxx
| Performance Rating | |
| Framework Laptop 13.5 13th Gen Intel | |
| Lenovo ThinkPad X13 G3 21CM002UGE | |
| Durchschnittliche Intel Core i7-1365U | |
| HP Dragonfly G4 | |
| Dell Latitude 9330 | |
| HP Elite Dragonfly G3 | |
| AIDA64 / FP32 Ray-Trace | |
| Framework Laptop 13.5 13th Gen Intel | |
| Lenovo ThinkPad X13 G3 21CM002UGE | |
| Durchschnittliche Intel Core i7-1365U (6720 - 8270, n=4) | |
| HP Dragonfly G4 | |
| Dell Latitude 9330 | |
| HP Elite Dragonfly G3 | |
| AIDA64 / FPU Julia | |
| Framework Laptop 13.5 13th Gen Intel | |
| Lenovo ThinkPad X13 G3 21CM002UGE | |
| Durchschnittliche Intel Core i7-1365U (33777 - 41487, n=4) | |
| Dell Latitude 9330 | |
| HP Dragonfly G4 | |
| HP Elite Dragonfly G3 | |
| AIDA64 / CPU SHA3 | |
| Framework Laptop 13.5 13th Gen Intel | |
| Durchschnittliche Intel Core i7-1365U (1754 - 2216, n=4) | |
| Lenovo ThinkPad X13 G3 21CM002UGE | |
| Dell Latitude 9330 | |
| HP Dragonfly G4 | |
| HP Elite Dragonfly G3 | |
| AIDA64 / CPU Queen | |
| Framework Laptop 13.5 13th Gen Intel | |
| HP Dragonfly G4 | |
| Lenovo ThinkPad X13 G3 21CM002UGE | |
| Durchschnittliche Intel Core i7-1365U (67557 - 69991, n=4) | |
| HP Elite Dragonfly G3 | |
| Dell Latitude 9330 | |
| AIDA64 / FPU SinJulia | |
| Framework Laptop 13.5 13th Gen Intel | |
| Lenovo ThinkPad X13 G3 21CM002UGE | |
| Durchschnittliche Intel Core i7-1365U (4589 - 5145, n=4) | |
| HP Dragonfly G4 | |
| HP Elite Dragonfly G3 | |
| Dell Latitude 9330 | |
| AIDA64 / FPU Mandel | |
| Lenovo ThinkPad X13 G3 21CM002UGE | |
| Framework Laptop 13.5 13th Gen Intel | |
| Durchschnittliche Intel Core i7-1365U (16808 - 20668, n=4) | |
| Dell Latitude 9330 | |
| HP Dragonfly G4 | |
| HP Elite Dragonfly G3 | |
| AIDA64 / CPU AES | |
| Framework Laptop 13.5 13th Gen Intel | |
| Durchschnittliche Intel Core i7-1365U (34968 - 41413, n=4) | |
| Lenovo ThinkPad X13 G3 21CM002UGE | |
| HP Dragonfly G4 | |
| Dell Latitude 9330 | |
| HP Elite Dragonfly G3 | |
| AIDA64 / CPU ZLib | |
| Framework Laptop 13.5 13th Gen Intel | |
| Durchschnittliche Intel Core i7-1365U (519 - 650, n=4) | |
| HP Dragonfly G4 | |
| Dell Latitude 9330 | |
| Lenovo ThinkPad X13 G3 21CM002UGE | |
| HP Elite Dragonfly G3 | |
| AIDA64 / FP64 Ray-Trace | |
| Framework Laptop 13.5 13th Gen Intel | |
| Lenovo ThinkPad X13 G3 21CM002UGE | |
| Durchschnittliche Intel Core i7-1365U (3513 - 4367, n=4) | |
| Dell Latitude 9330 | |
| HP Dragonfly G4 | |
| HP Elite Dragonfly G3 | |
| AIDA64 / CPU PhotoWorxx | |
| Durchschnittliche Intel Core i7-1365U (37846 - 43780, n=4) | |
| HP Elite Dragonfly G3 | |
| HP Dragonfly G4 | |
| Dell Latitude 9330 | |
| Framework Laptop 13.5 13th Gen Intel | |
| Lenovo ThinkPad X13 G3 21CM002UGE | |
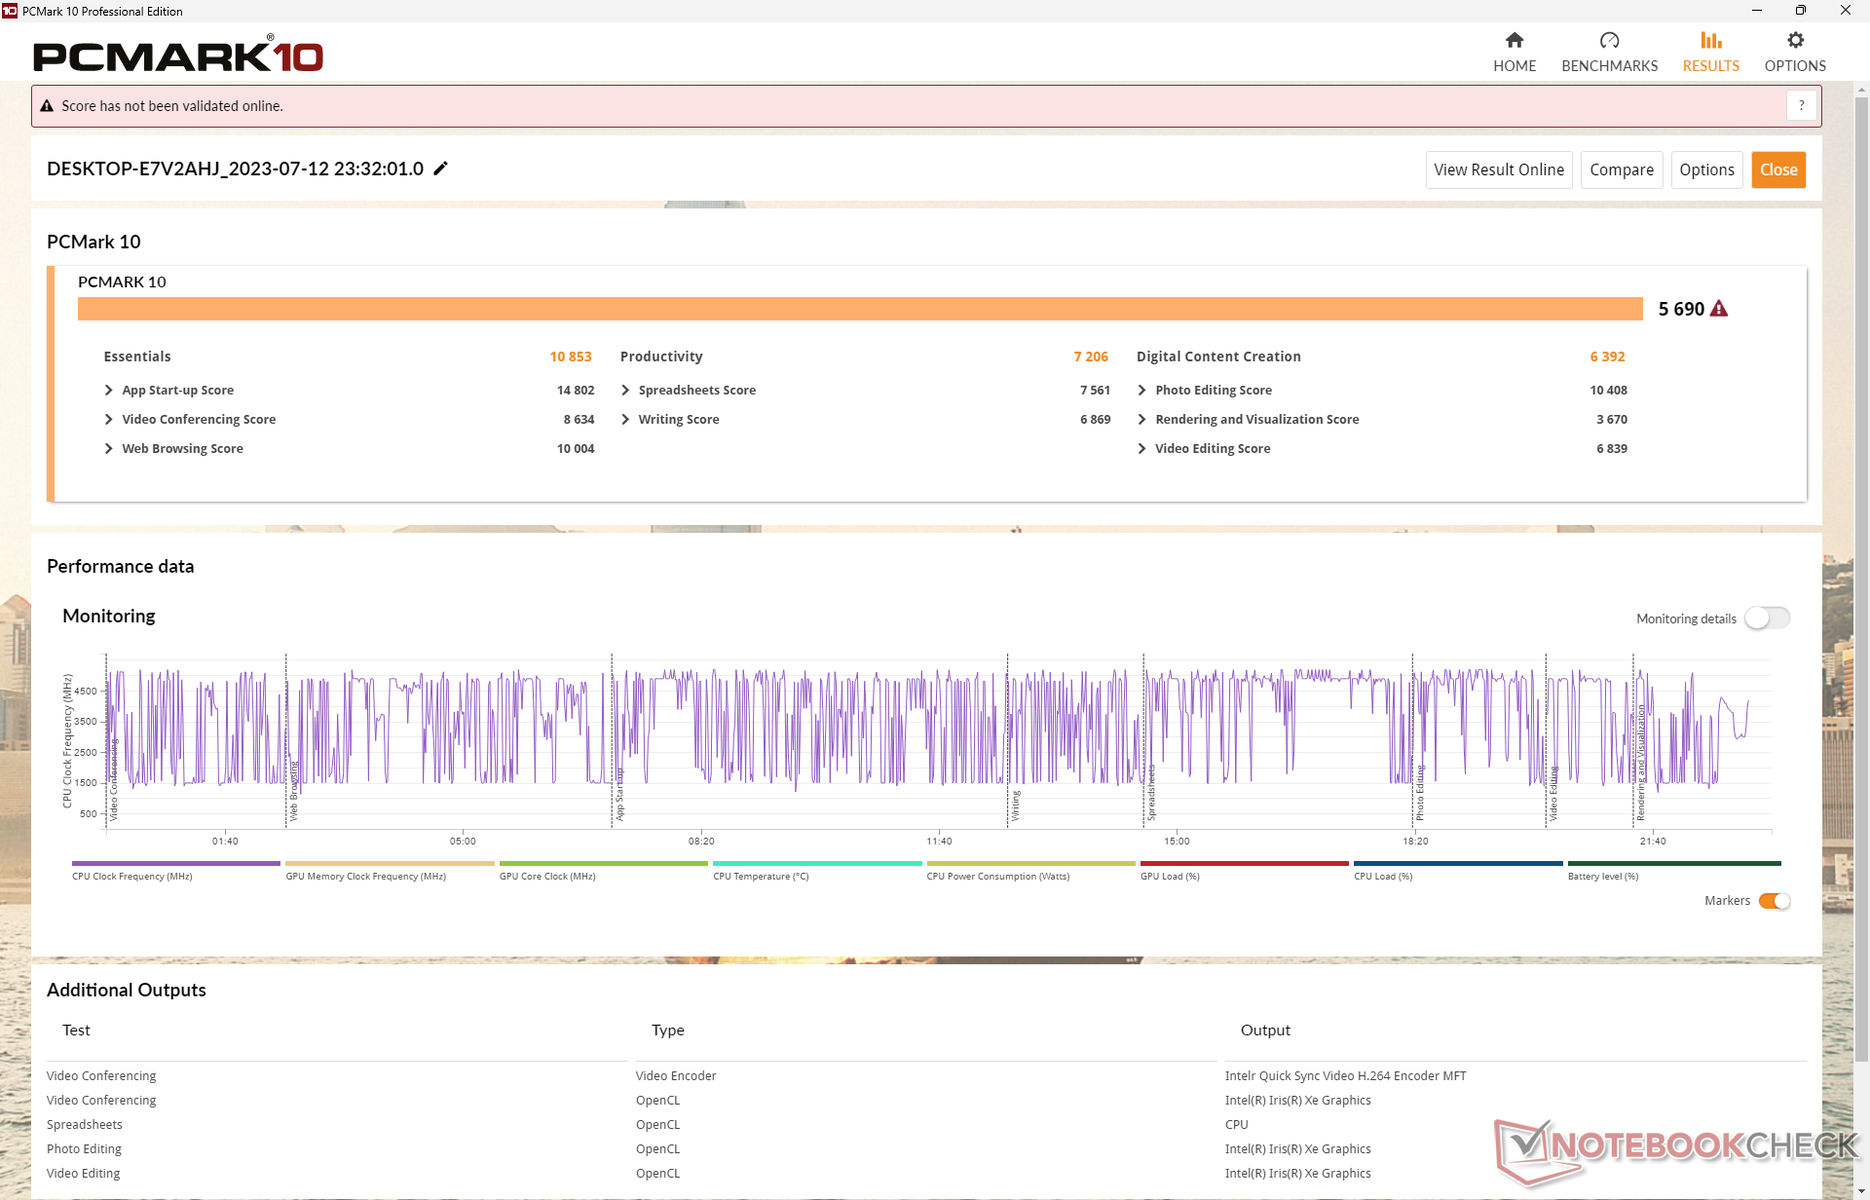
Systemleistung
Die Ergebnisse in PCMark sind konstant höher als beim Vorgänger und liegen nur etwas unter den Scores des Framework-Laptops und seiner schnelleren Core-P-CPU. Die Resultate sind vergleichbar mit denen des Dell Latitude 9440 2-in-1, das mit dem gleichen Core i7-1365U ausgerüstet ist.
CrossMark: Overall | Productivity | Creativity | Responsiveness
| PCMark 10 / Score | |
| Framework Laptop 13.5 13th Gen Intel | |
| Durchschnittliche Intel Core i7-1365U, Intel Iris Xe Graphics G7 96EUs (5690 - 5980, n=4) | |
| HP Dragonfly G4 | |
| Lenovo ThinkPad X13 G3 21CM002UGE | |
| Dell Latitude 9330 | |
| HP Elite Dragonfly G3 | |
| PCMark 10 / Essentials | |
| Framework Laptop 13.5 13th Gen Intel | |
| Durchschnittliche Intel Core i7-1365U, Intel Iris Xe Graphics G7 96EUs (10635 - 11827, n=4) | |
| HP Dragonfly G4 | |
| Dell Latitude 9330 | |
| Lenovo ThinkPad X13 G3 21CM002UGE | |
| HP Elite Dragonfly G3 | |
| PCMark 10 / Productivity | |
| Lenovo ThinkPad X13 G3 21CM002UGE | |
| Framework Laptop 13.5 13th Gen Intel | |
| Durchschnittliche Intel Core i7-1365U, Intel Iris Xe Graphics G7 96EUs (7206 - 7708, n=4) | |
| HP Dragonfly G4 | |
| Dell Latitude 9330 | |
| HP Elite Dragonfly G3 | |
| PCMark 10 / Digital Content Creation | |
| Framework Laptop 13.5 13th Gen Intel | |
| Durchschnittliche Intel Core i7-1365U, Intel Iris Xe Graphics G7 96EUs (6392 - 6735, n=4) | |
| HP Dragonfly G4 | |
| Lenovo ThinkPad X13 G3 21CM002UGE | |
| HP Elite Dragonfly G3 | |
| Dell Latitude 9330 | |
| CrossMark / Overall | |
| Framework Laptop 13.5 13th Gen Intel | |
| Durchschnittliche Intel Core i7-1365U, Intel Iris Xe Graphics G7 96EUs (1605 - 1675, n=4) | |
| HP Dragonfly G4 | |
| Apple MacBook Air M2 Entry | |
| HP Elite Dragonfly G3 | |
| Lenovo ThinkPad X13 G3 21CM002UGE | |
| CrossMark / Productivity | |
| Framework Laptop 13.5 13th Gen Intel | |
| HP Dragonfly G4 | |
| Durchschnittliche Intel Core i7-1365U, Intel Iris Xe Graphics G7 96EUs (1582 - 1650, n=4) | |
| HP Elite Dragonfly G3 | |
| Apple MacBook Air M2 Entry | |
| Lenovo ThinkPad X13 G3 21CM002UGE | |
| CrossMark / Creativity | |
| Framework Laptop 13.5 13th Gen Intel | |
| Apple MacBook Air M2 Entry | |
| Durchschnittliche Intel Core i7-1365U, Intel Iris Xe Graphics G7 96EUs (1713 - 1797, n=4) | |
| HP Dragonfly G4 | |
| HP Elite Dragonfly G3 | |
| Lenovo ThinkPad X13 G3 21CM002UGE | |
| CrossMark / Responsiveness | |
| Framework Laptop 13.5 13th Gen Intel | |
| Durchschnittliche Intel Core i7-1365U, Intel Iris Xe Graphics G7 96EUs (1373 - 1427, n=4) | |
| HP Dragonfly G4 | |
| HP Elite Dragonfly G3 | |
| Lenovo ThinkPad X13 G3 21CM002UGE | |
| Apple MacBook Air M2 Entry | |
| PCMark 10 Score | 5690 Punkte | |
Hilfe | ||
| AIDA64 / Memory Copy | |
| Dell Latitude 9330 | |
| HP Elite Dragonfly G3 | |
| Durchschnittliche Intel Core i7-1365U (57654 - 69736, n=4) | |
| HP Dragonfly G4 | |
| Lenovo ThinkPad X13 G3 21CM002UGE | |
| Framework Laptop 13.5 13th Gen Intel | |
| AIDA64 / Memory Read | |
| HP Elite Dragonfly G3 | |
| Dell Latitude 9330 | |
| Durchschnittliche Intel Core i7-1365U (49203 - 54068, n=4) | |
| Framework Laptop 13.5 13th Gen Intel | |
| HP Dragonfly G4 | |
| Lenovo ThinkPad X13 G3 21CM002UGE | |
| AIDA64 / Memory Write | |
| Durchschnittliche Intel Core i7-1365U (70434 - 85570, n=4) | |
| HP Dragonfly G4 | |
| Dell Latitude 9330 | |
| HP Elite Dragonfly G3 | |
| Lenovo ThinkPad X13 G3 21CM002UGE | |
| Framework Laptop 13.5 13th Gen Intel | |
| AIDA64 / Memory Latency | |
| Lenovo ThinkPad X13 G3 21CM002UGE | |
| Dell Latitude 9330 | |
| HP Elite Dragonfly G3 | |
| Durchschnittliche Intel Core i7-1365U (90.2 - 102.2, n=4) | |
| HP Dragonfly G4 | |
| Framework Laptop 13.5 13th Gen Intel | |
* ... kleinere Werte sind besser
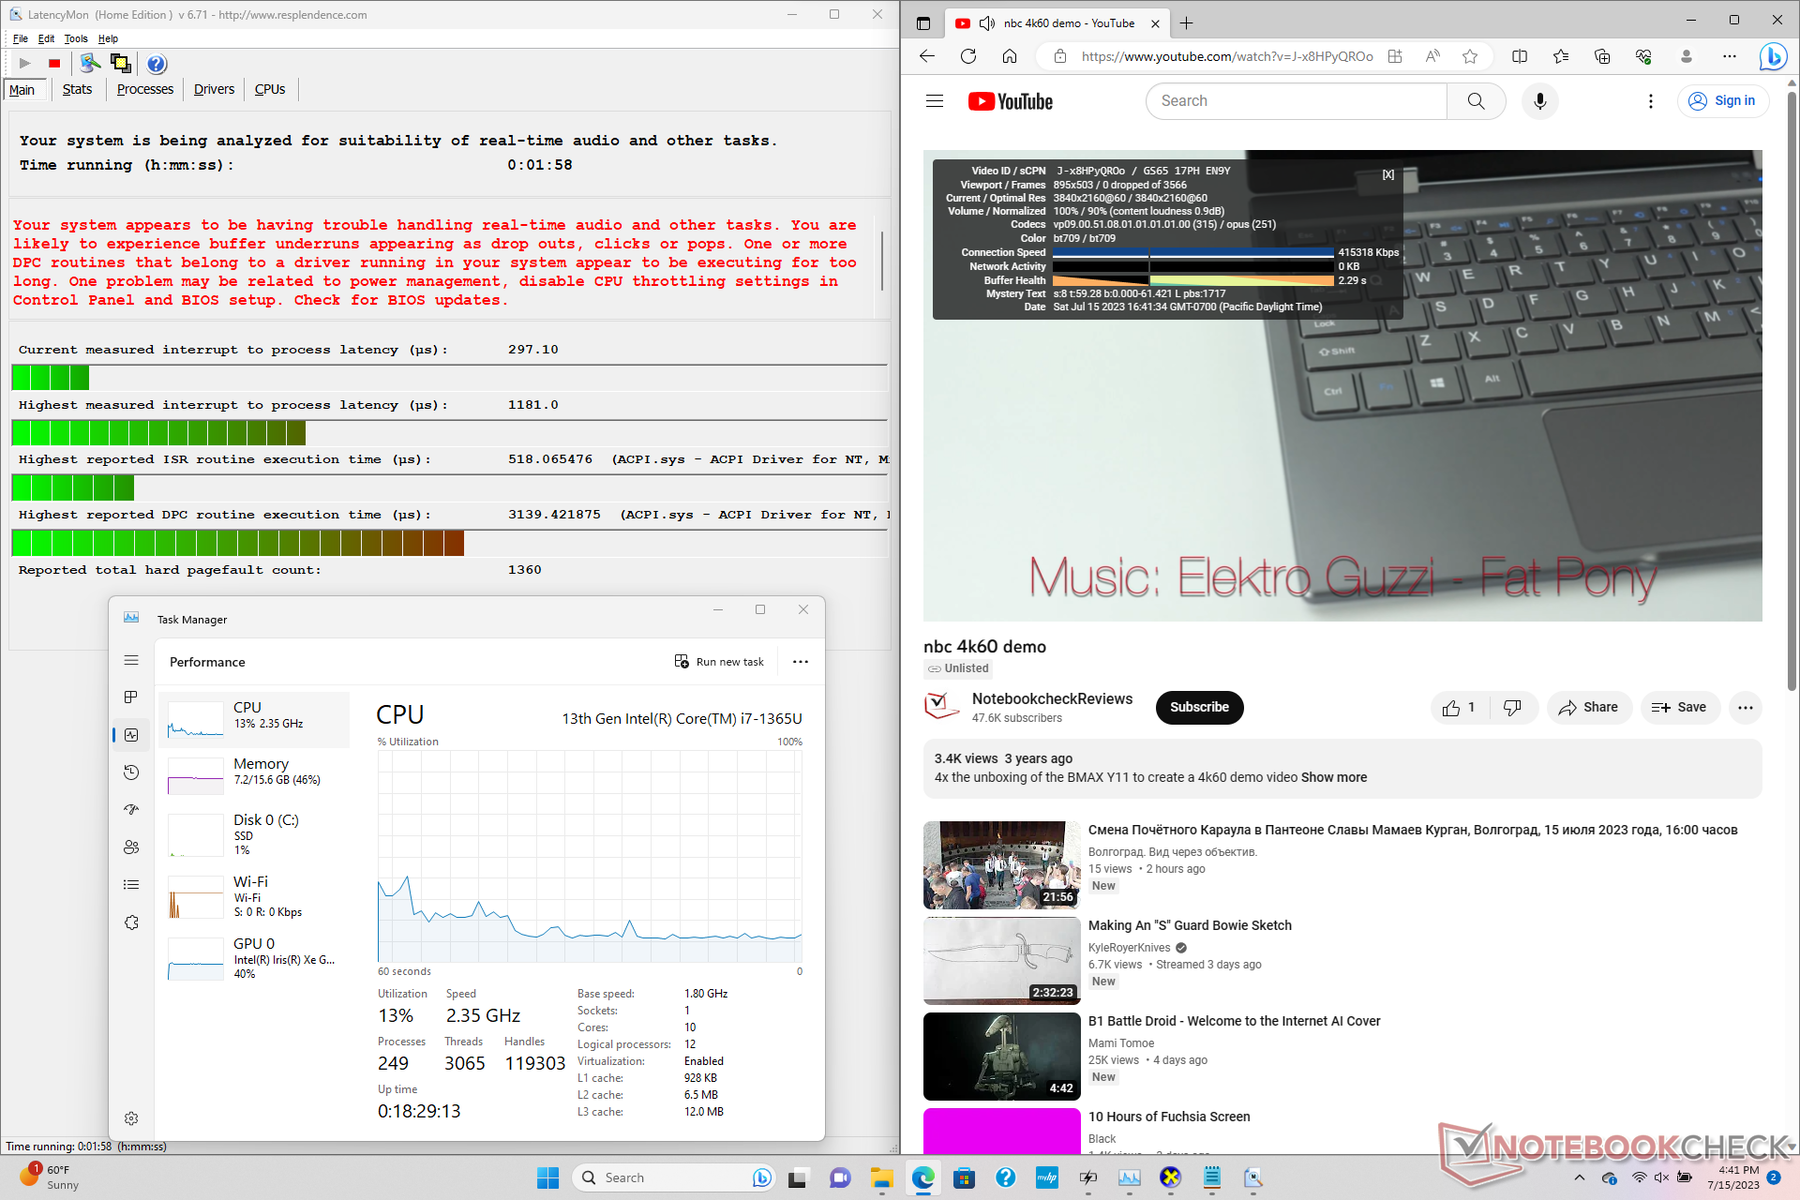
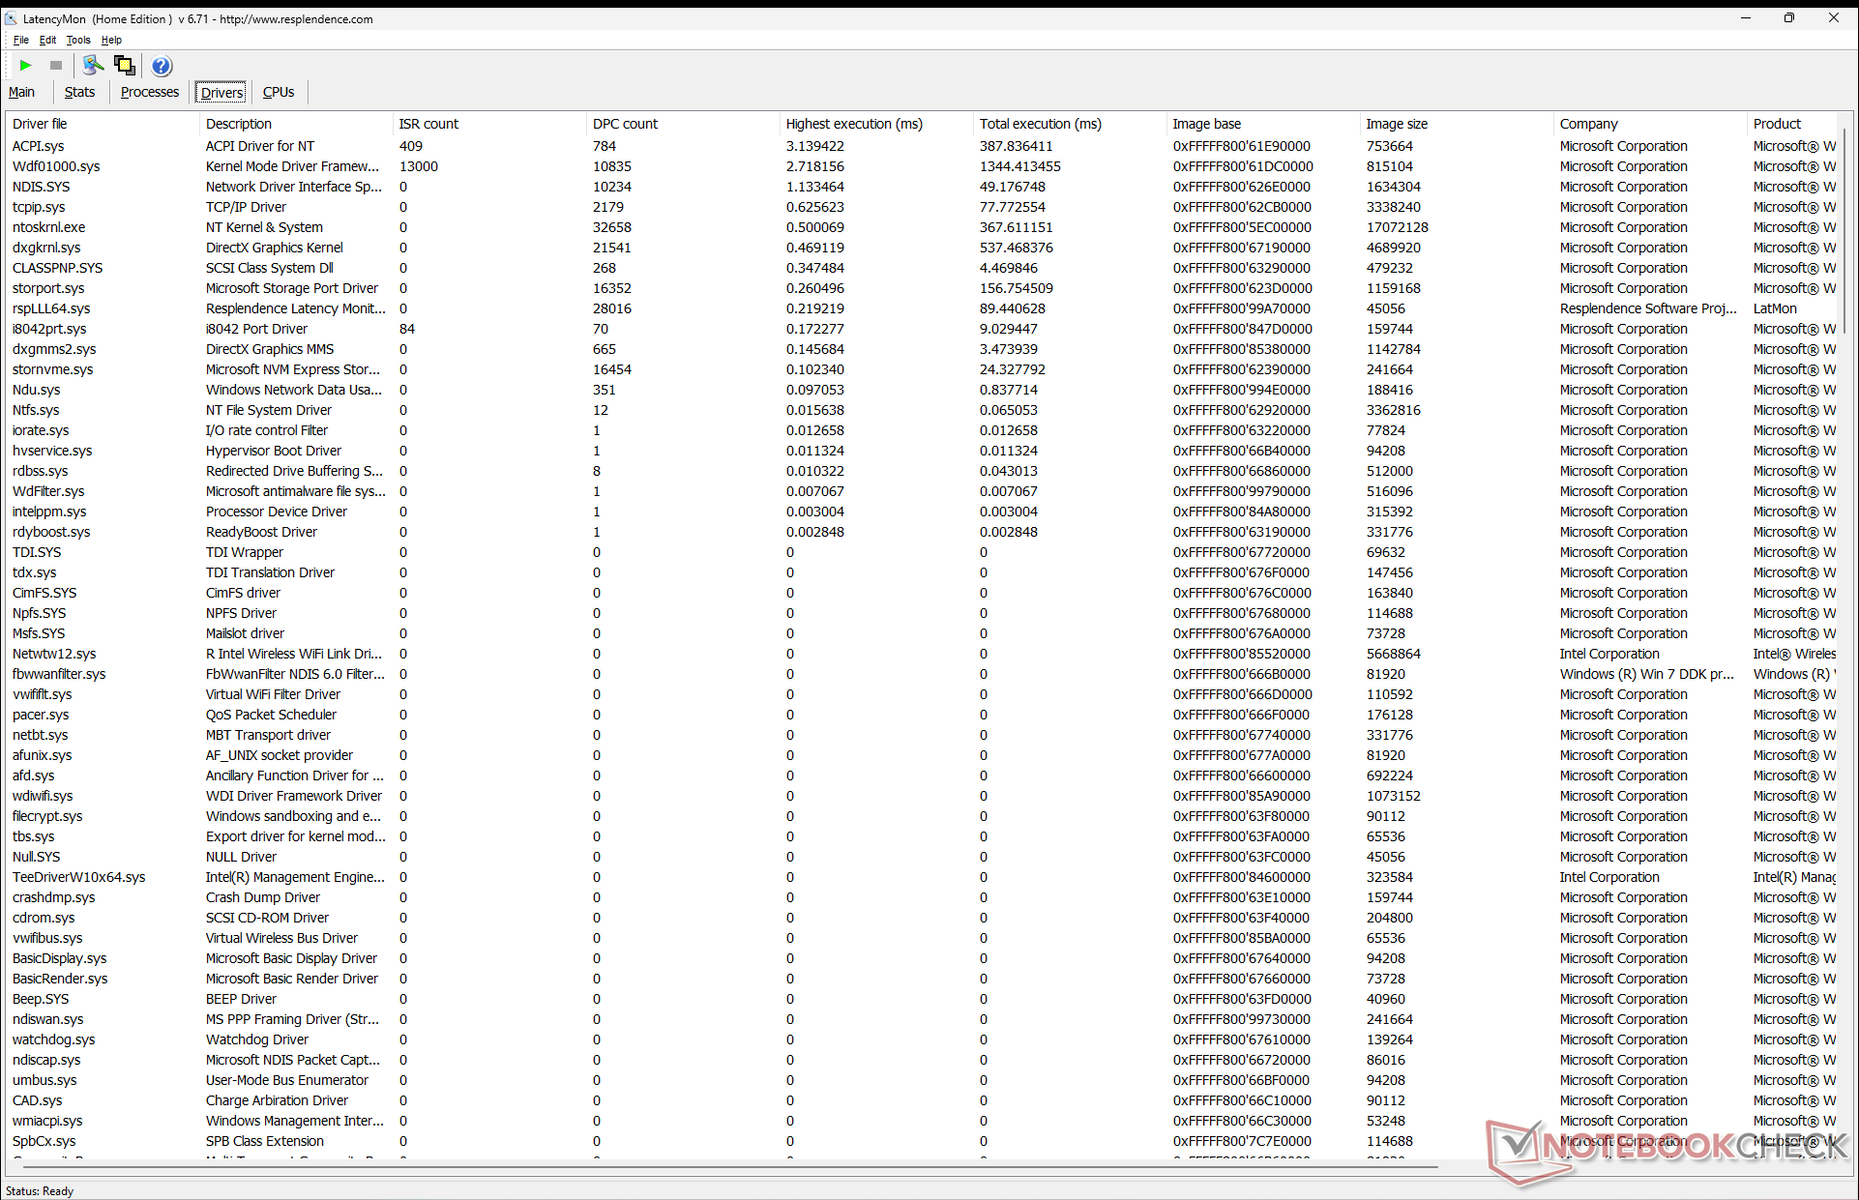
DPC-Latenz
LatencyMon erkennt nur kleine DPC-Probleme beim Öffnen mehrere Browserfenster mit unserer Notebookcheck-Homepage. Die Wiedergabe von 4K-Videos mit 60 Bildern pro Sekunde ist ansonsten perfekt und überspringt keinerlei Frames.
| DPC Latencies / LatencyMon - interrupt to process latency (max), Web, Youtube, Prime95 | |
| Dell Latitude 9330 | |
| HP Dragonfly G4 | |
| HP Elite Dragonfly G3 | |
| Lenovo ThinkPad X13 G3 21CM002UGE | |
| Framework Laptop 13.5 13th Gen Intel | |
* ... kleinere Werte sind besser
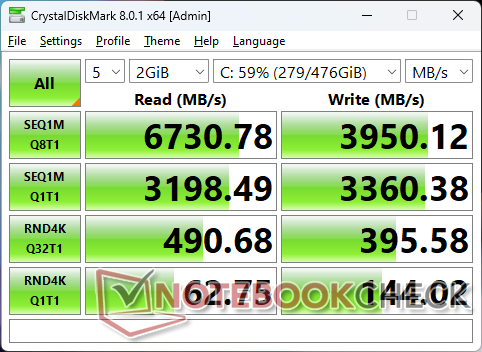
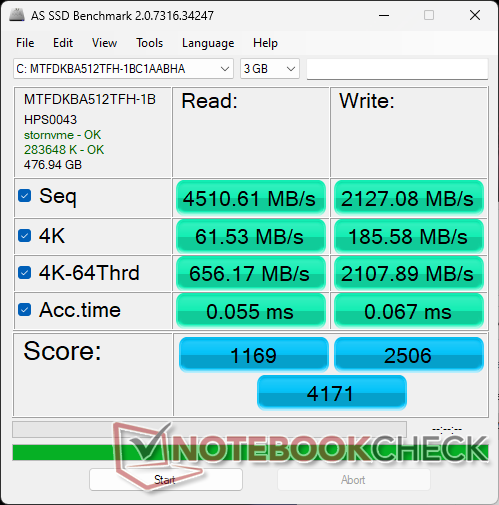
Massenspeicher
HP bleibt der Micron 3400 NVMe-SSD zum zweiten Jahr in Folge treu, während das Dell XPS 13 mit SSDs von Samsung, Micron oder Western Digital bestückt wird.

| Drive Performance Rating - Percent | |
| Framework Laptop 13.5 13th Gen Intel | |
| HP Dragonfly G4 | |
| Lenovo ThinkPad X13 G3 21CM002UGE | |
| HP Elite Dragonfly G3 | |
| Dell Latitude 9330 | |
* ... kleinere Werte sind besser
Dauerleistung Lesen: DiskSpd Read Loop, Queue Depth 8
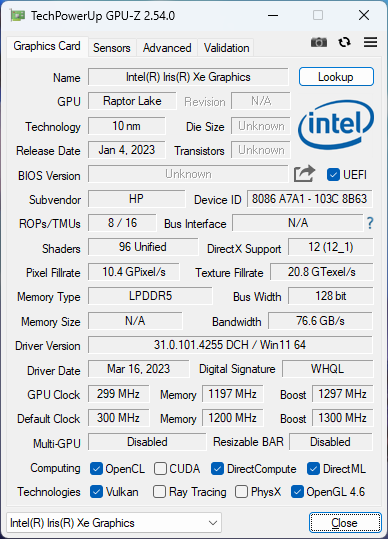
Grafikleistung
Dank der etwas schnelleren CPU ist auch die GPU-Performance etwas höher als beim Dragonfly G3 von 2022. Für einen größeren Leistungssprung müssten Käufer zum Asus Zenbook S 13 oder Lenovo Yoga Pro 7 14 greifen, in denen die AMD Radeon 680M beziehungsweise 780M zum Einsatz kommen.
Wenn das Notebook im ausgeglichenen Modus anstatt im Leistungsmodus betrieben wird, kann sich die CPU und GPU-Leistung um 12 respektive 6 Prozent verringern, wie unsere Vergleichstabelle zum 3DMark 11 Benchmark unten illustriert.
| Betriebsmodus | GPU-Score | Physik-Score | kombinierter Score |
| Ausgeglichener Modus | 6061 (-6%) | 10145 (-12%) | 4879 (-16%) |
| Leistungsmodus | 6440 | 11465 | 5780 |
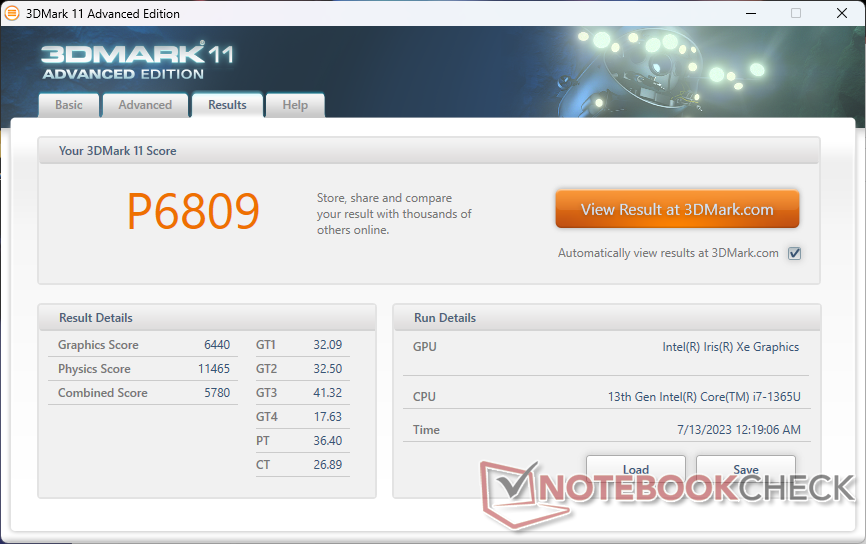
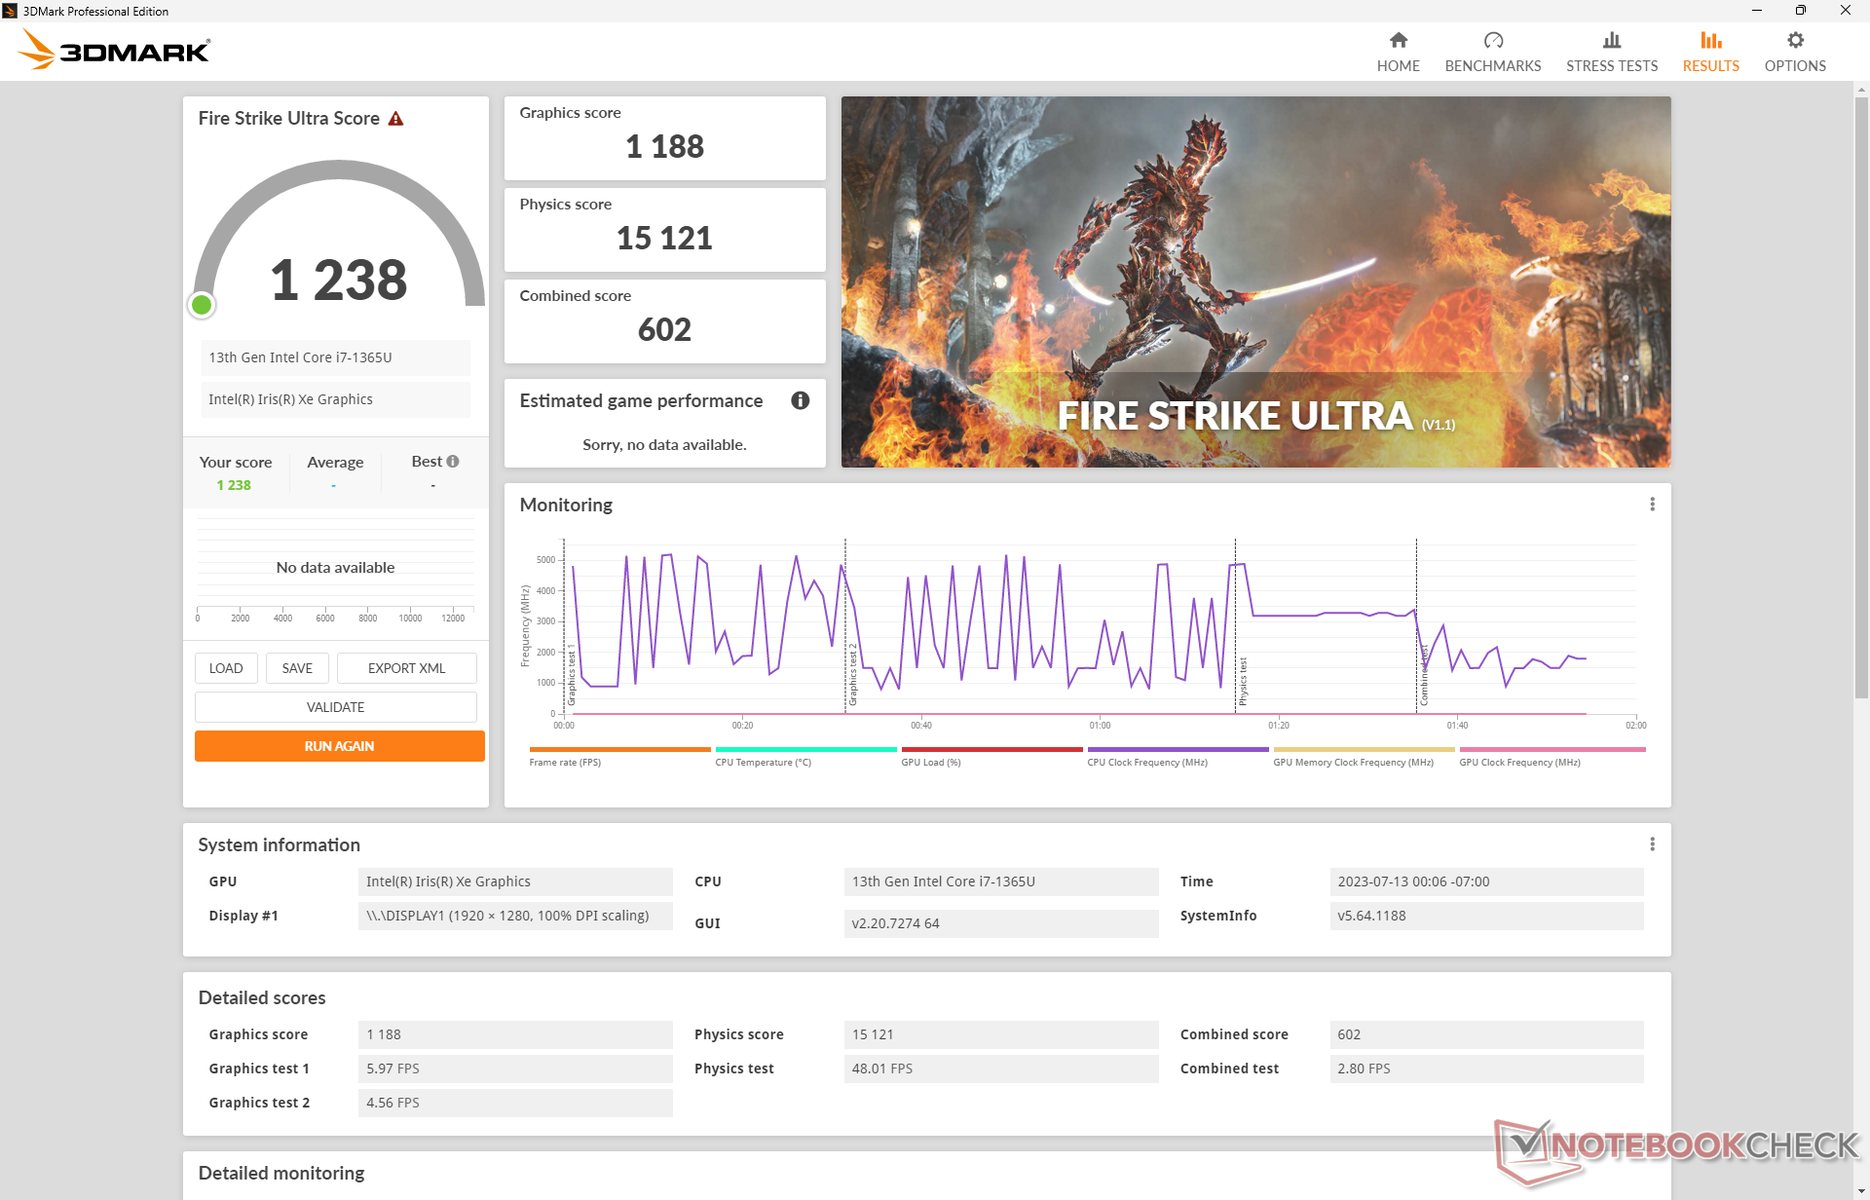
| 3DMark 11 Performance | 6809 Punkte | |
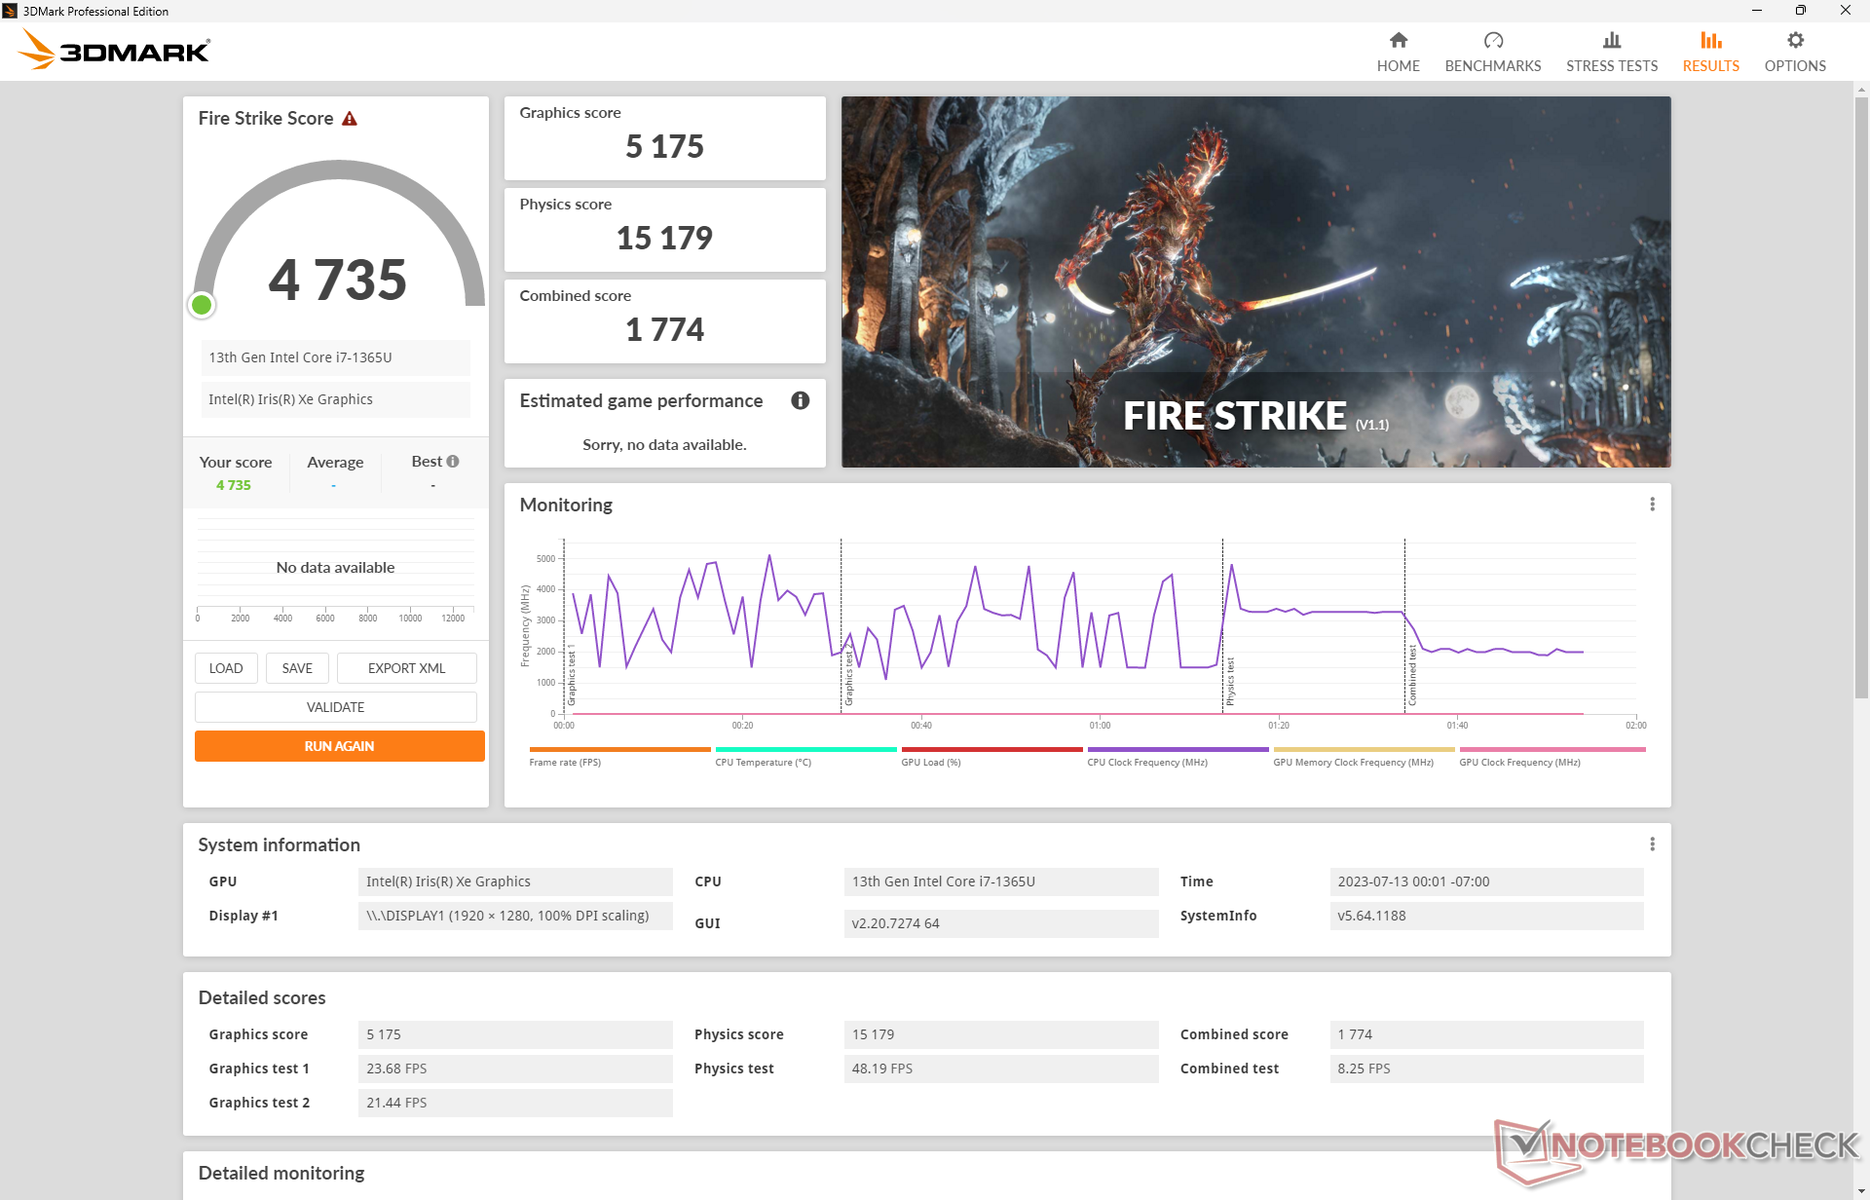
| 3DMark Fire Strike Score | 4735 Punkte | |
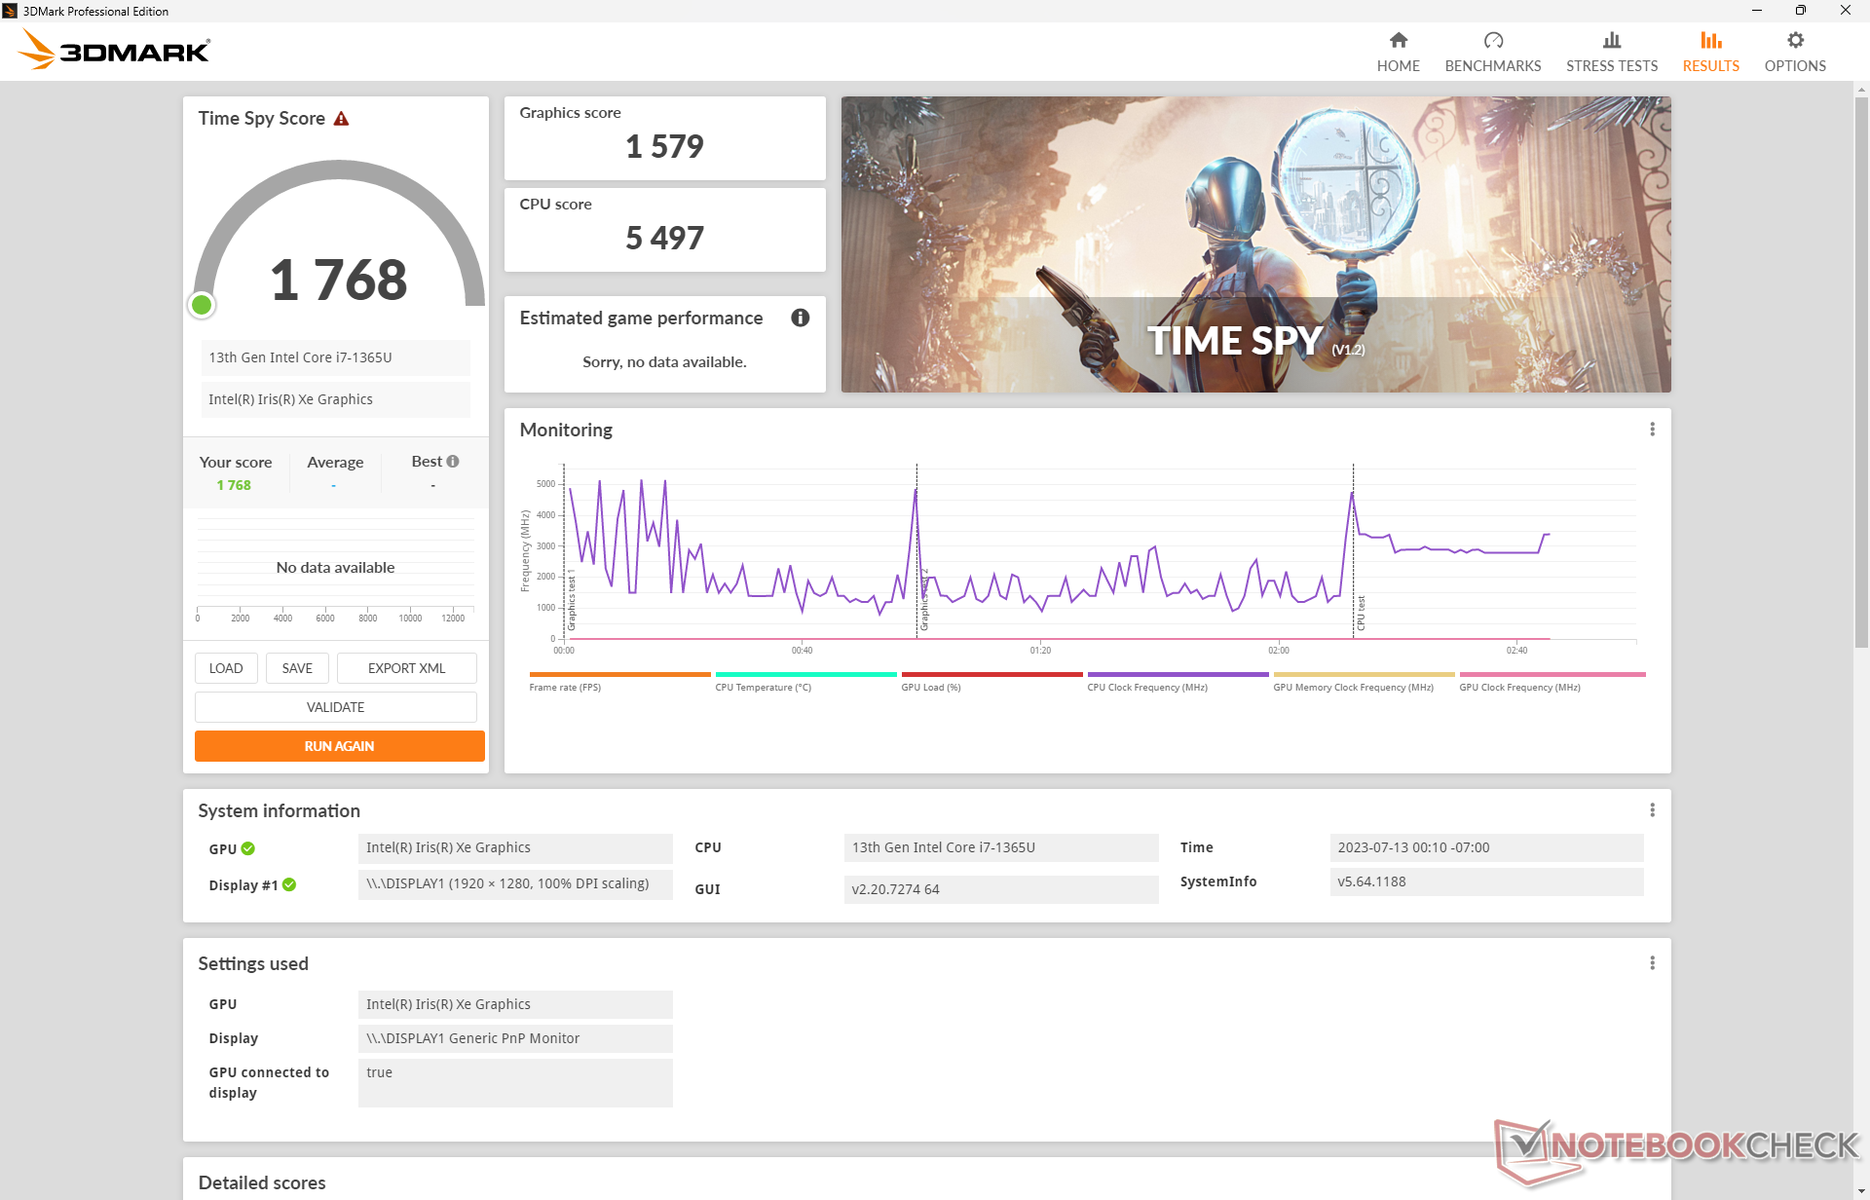
| 3DMark Time Spy Score | 1768 Punkte | |
Hilfe | ||
* ... kleinere Werte sind besser
| Tiny Tina's Wonderlands | |
| 1280x720 Lowest Preset (DX12) | |
| HP Dragonfly G4 | |
| Durchschnittliche Intel Iris Xe Graphics G7 96EUs (25.9 - 67.3, n=32) | |
| 1920x1080 Low Preset (DX12) | |
| Framework Laptop 13.5 13th Gen Intel | |
| Durchschnittliche Intel Iris Xe Graphics G7 96EUs (22.3 - 53, n=32) | |
| HP Dragonfly G4 | |
| 1920x1080 Medium Preset (DX12) | |
| Framework Laptop 13.5 13th Gen Intel | |
| Durchschnittliche Intel Iris Xe Graphics G7 96EUs (17 - 40.1, n=30) | |
| HP Dragonfly G4 | |
| 1920x1080 High Preset (DX12) | |
| Framework Laptop 13.5 13th Gen Intel | |
| Durchschnittliche Intel Iris Xe Graphics G7 96EUs (10.6 - 24.1, n=29) | |
| HP Dragonfly G4 | |
| 1920x1080 Badass Preset (DX12) | |
| Framework Laptop 13.5 13th Gen Intel | |
| Durchschnittliche Intel Iris Xe Graphics G7 96EUs (8.4 - 18.4, n=26) | |
| HP Dragonfly G4 | |
| F1 22 | |
| 1280x720 Ultra Low Preset AA:T AF:16x | |
| Framework Laptop 13.5 13th Gen Intel | |
| Durchschnittliche Intel Iris Xe Graphics G7 96EUs (57.4 - 94.9, n=53) | |
| HP Dragonfly G4 | |
| Lenovo ThinkPad X13 G3 21CM002UGE | |
| 1920x1080 Low Preset AA:T AF:16x | |
| Framework Laptop 13.5 13th Gen Intel | |
| Durchschnittliche Intel Iris Xe Graphics G7 96EUs (33.3 - 57.2, n=58) | |
| HP Dragonfly G4 | |
| Lenovo ThinkPad X13 G3 21CM002UGE | |
| 1920x1080 Medium Preset AA:T AF:16x | |
| Framework Laptop 13.5 13th Gen Intel | |
| Durchschnittliche Intel Iris Xe Graphics G7 96EUs (28 - 52.3, n=58) | |
| HP Dragonfly G4 | |
| Lenovo ThinkPad X13 G3 21CM002UGE | |
| 1920x1080 High Preset AA:T AF:16x | |
| Framework Laptop 13.5 13th Gen Intel | |
| Durchschnittliche Intel Iris Xe Graphics G7 96EUs (21.7 - 37.1, n=58) | |
| HP Dragonfly G4 | |
| Lenovo ThinkPad X13 G3 21CM002UGE | |
| 1920x1080 Ultra High Preset AA:T AF:16x | |
| Framework Laptop 13.5 13th Gen Intel | |
| Durchschnittliche Intel Iris Xe Graphics G7 96EUs (16.1 - 28.2, n=49) | |
| HP Dragonfly G4 | |
| Lenovo ThinkPad X13 G3 21CM002UGE | |
Witcher 3 FPS-Diagramm
| min. | mittel | hoch | max. | |
|---|---|---|---|---|
| GTA V (2015) | 99.8 | 84.1 | 23.4 | 10.1 |
| The Witcher 3 (2015) | 78.9 | 54.2 | 31 | 14.7 |
| Dota 2 Reborn (2015) | 101.4 | 76.3 | 60.2 | 53.3 |
| Final Fantasy XV Benchmark (2018) | 40.9 | 23.2 | 16.4 | |
| X-Plane 11.11 (2018) | 37.6 | 31.8 | 29.1 | |
| Strange Brigade (2018) | 88.8 | 38.4 | 30.4 | 24.7 |
| Cyberpunk 2077 1.6 (2022) | 19.7 | 16.3 | 12.7 | 9.3 |
| Tiny Tina's Wonderlands (2022) | 25.9 | 21.2 | 14.1 | 11.1 |
| F1 22 (2022) | 43.6 | 39.4 | 27.4 | 22.2 |
Emissionen
Systemlautstärke
HP-Dragonfly-Laptops sind aufgrund der unterdurchschnittlichen CPU-Taktraten generell etwas leiser als die meisten Konkurrenzmodelle. Wir haben eine maximale Lüfterlautstärke von gerade einmal 35 dB(A) gemessen, während das Latitude 9330 mehr als 40 dB(A) laut wird. Die Spitze von 35 dB(A) wird außerdem nur kurzzeitig erreicht, unter hoher Last stabilisiert sich das Lüftergeräusch bei rund 33 dB(A).
Lautstärkediagramm
| Idle |
| 23.5 / 23.5 / 26.8 dB(A) |
| Last |
| 27.2 / 35 dB(A) |
 | ||
30 dB leise 40 dB(A) deutlich hörbar 50 dB(A) störend |
||
min: | ||
| HP Dragonfly G4 Iris Xe G7 96EUs, i7-1365U, Micron 3400 MTFDKBA512TFH 512GB | HP Elite Dragonfly G3 Iris Xe G7 96EUs, i7-1265U, Micron 3400 MTFDKBA512TFH 512GB | Framework Laptop 13.5 13th Gen Intel Iris Xe G7 96EUs, i7-1370P, WD PC SN740 SDDPNQD-1T00 | Lenovo ThinkPad X13 G3 21CM002UGE Radeon 660M, R5 PRO 6650U, Samsung PM9A1 MZVL2512HCJQ | Dell Latitude 9330 Iris Xe G7 96EUs, i7-1260U | |
|---|---|---|---|---|---|
| Geräuschentwicklung | 4% | -20% | 0% | -8% | |
| aus / Umgebung * (dB) | 23.3 | 22.8 2% | 23.2 -0% | 23.1 1% | 23 1% |
| Idle min * (dB) | 23.5 | 23.2 1% | 23.2 1% | 23.1 2% | 23 2% |
| Idle avg * (dB) | 23.5 | 23.2 1% | 23.2 1% | 23.1 2% | 23.1 2% |
| Idle max * (dB) | 26.8 | 23.2 13% | 23.2 13% | 23.1 14% | 23.1 14% |
| Last avg * (dB) | 27.2 | 25.1 8% | 45.3 -67% | 27 1% | 37.1 -36% |
| Witcher 3 ultra * (dB) | 32.7 | 32 2% | 47.9 -46% | 38.7 -18% | 40.6 -24% |
| Last max * (dB) | 35 | 35.2 -1% | 49.2 -41% | 35.5 -1% | 40.5 -16% |
* ... kleinere Werte sind besser
Temperatur
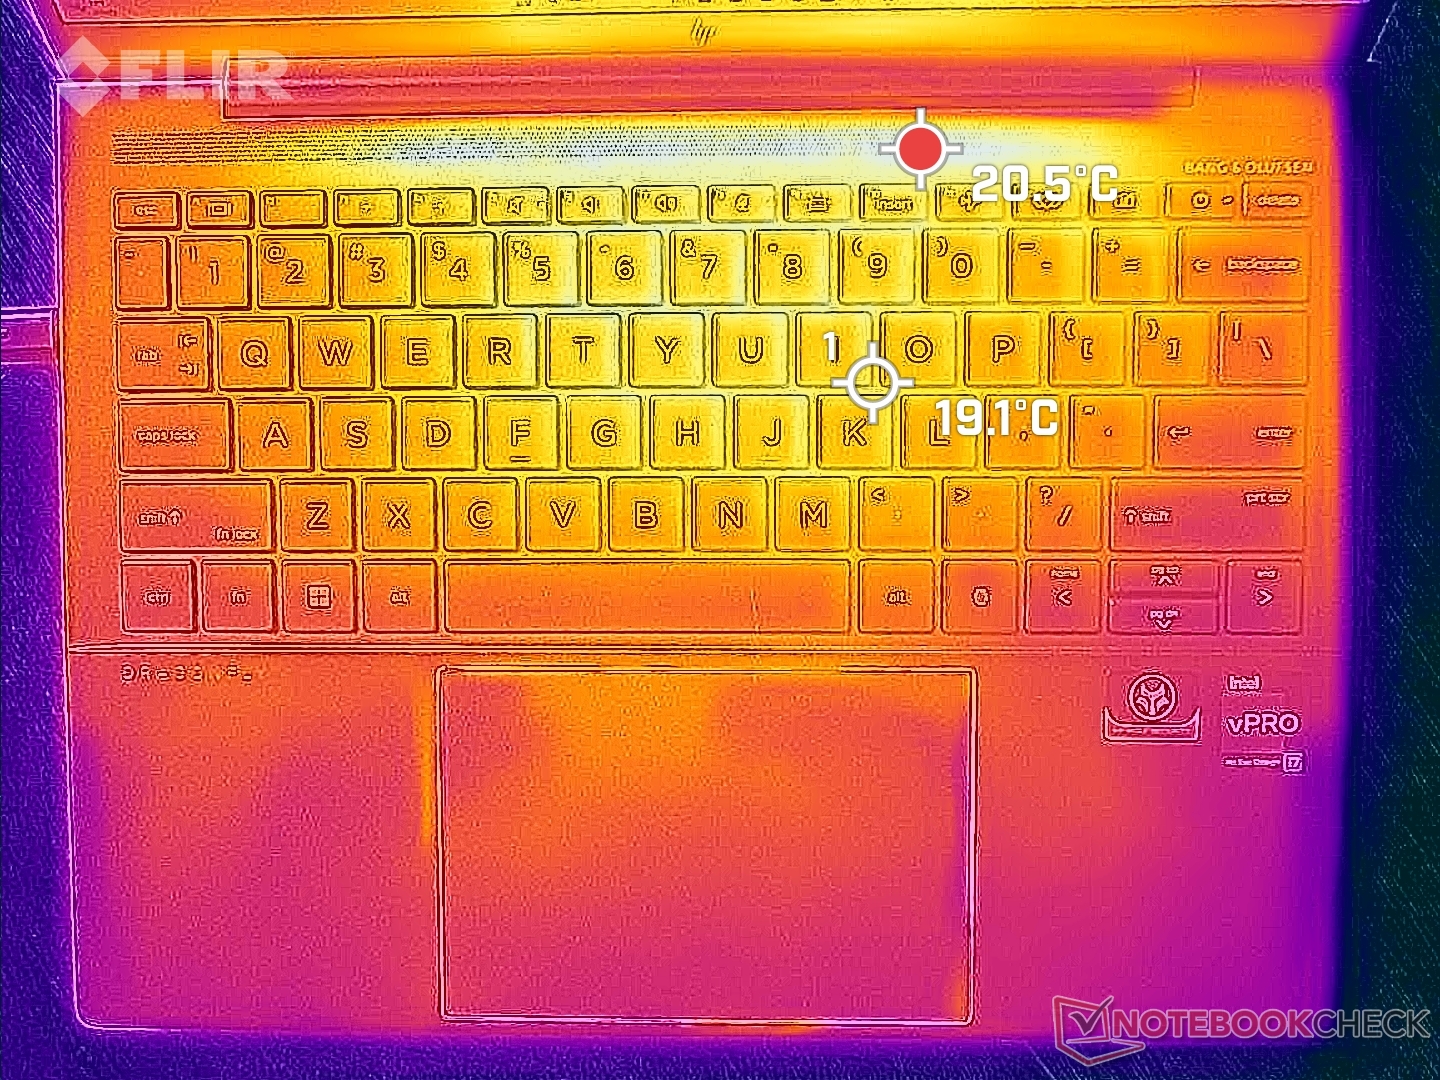
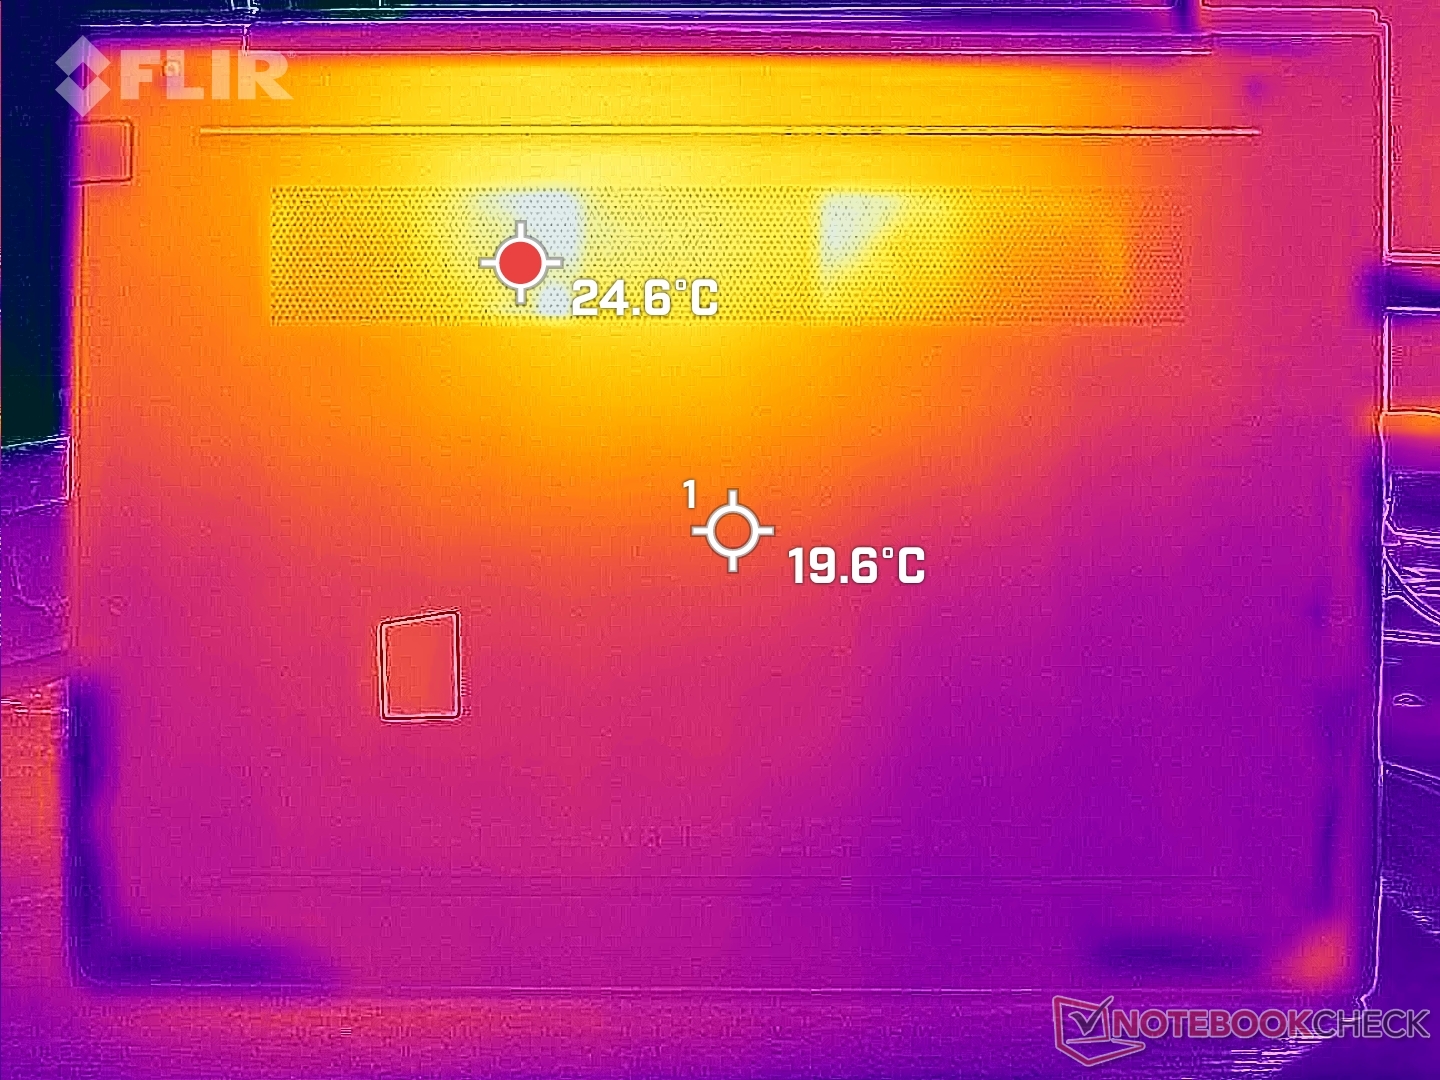
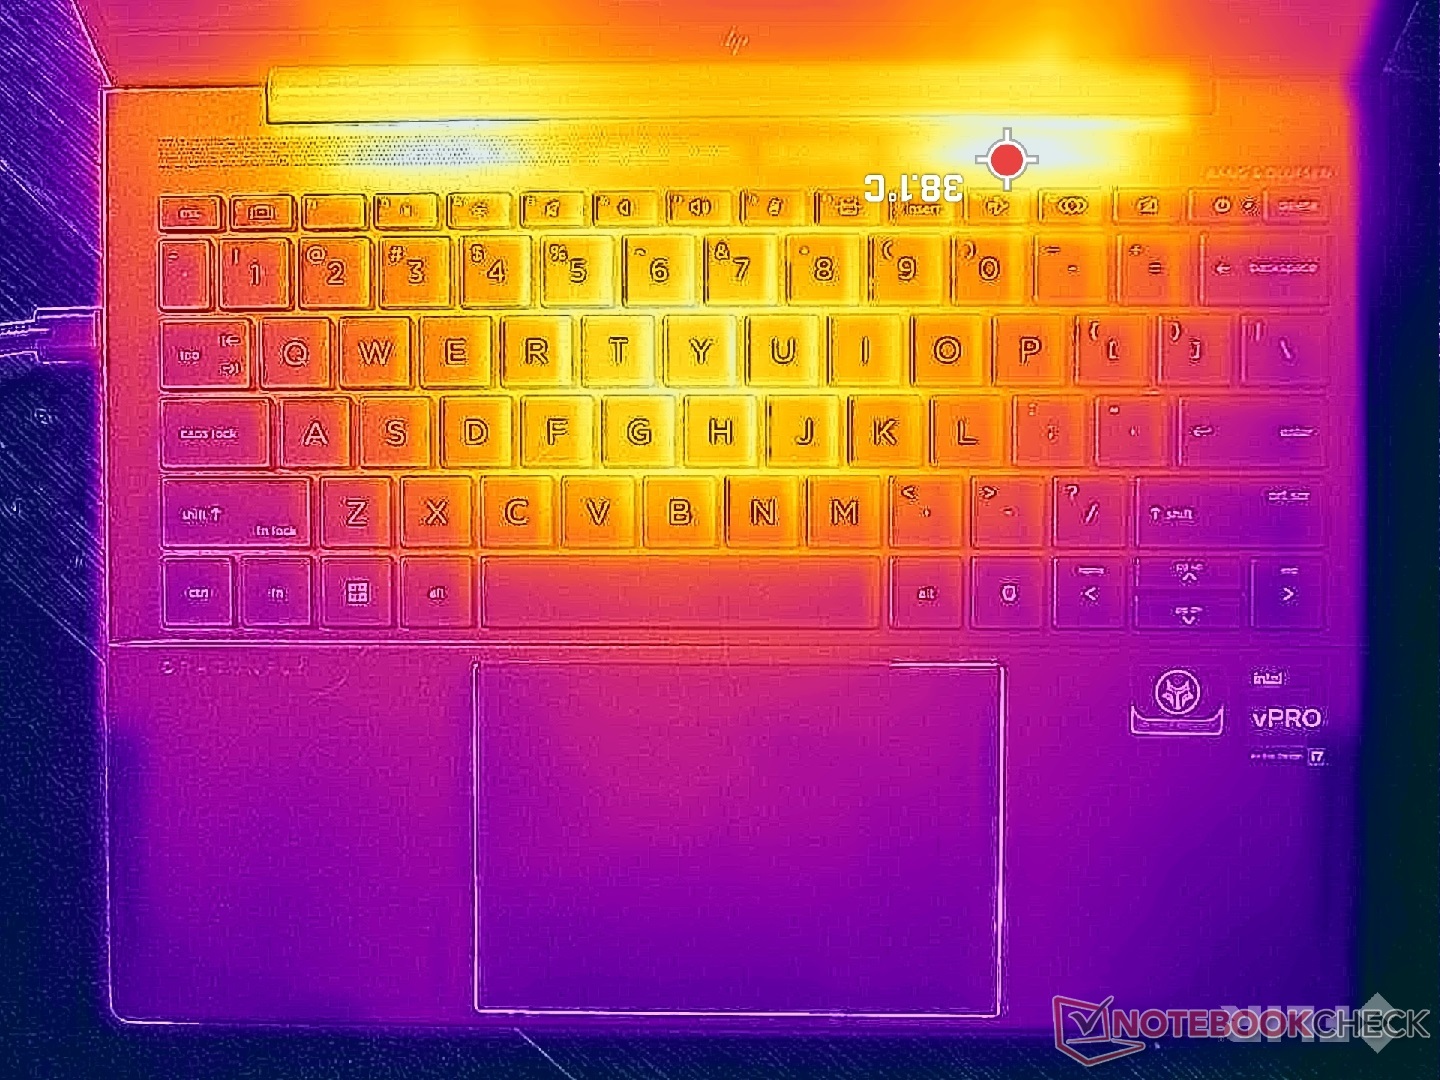
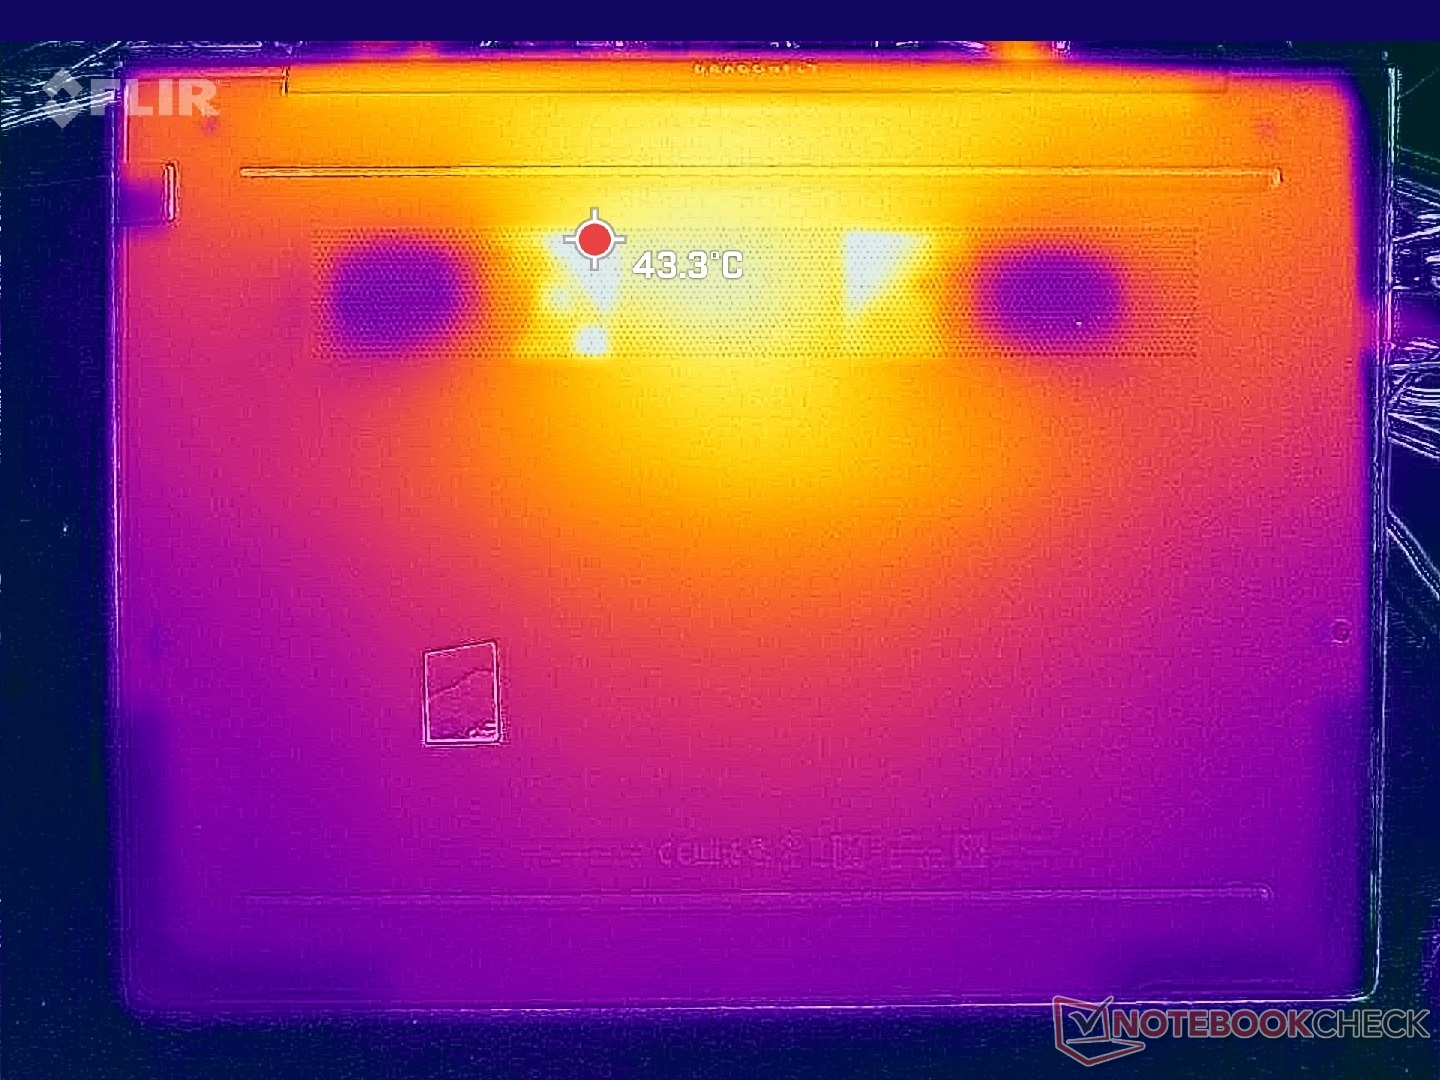
Die Oberflächentemperaturen können unter starker Last auf etwas über 40 Grad Celsius klettern, während das schnellere XPS 13 Plus 45 Grad und das Latitude 13 9330 sogar 50 Grad Celsius warm wird. Die Hotspots des HP Dragonfly sind am hinteren Teil des Gehäuses und somit weit entfernt von der Handballenauflage und dem Trackpad angesiedelt.
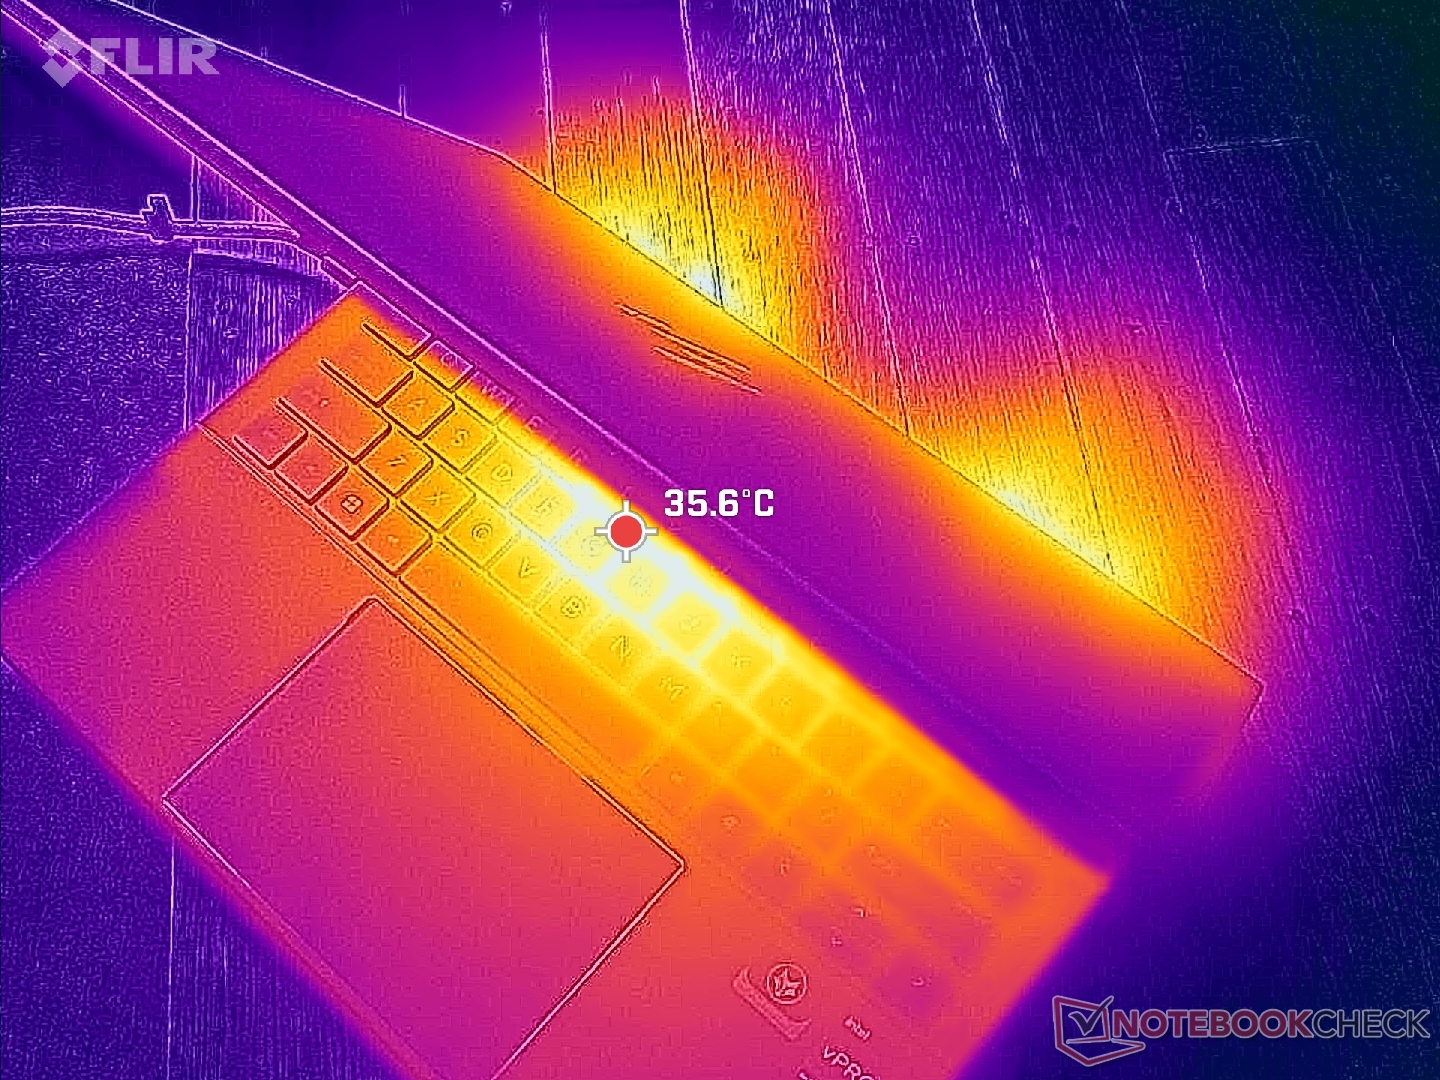
(+) Die maximale Temperatur auf der Oberseite ist 38.6 °C. Im Vergleich liegt der Klassendurchschnitt bei 35.9 °C (von 21.4 bis 59 °C für die Klasse Subnotebook).
(±) Auf der Unterseite messen wir eine maximalen Wert von 40.4 °C (im Vergleich zum Durchschnitt von 39.2 °C).
(+) Ohne Last messen wir eine durchschnittliche Temperatur von 26.5 °C auf der Oberseite. Der Klassendurchschnitt erreicht 30.8 °C.
(+) Die Handballen und der Touchpad-Bereich sind mit gemessenen 27 °C kühler als die typische Hauttemperatur und fühlen sich dadurch kühl an.
(±) Die durchschnittliche Handballen-Temperatur anderer getesteter Geräte war 28.2 °C (+1.2 °C).
| HP Dragonfly G4 Intel Core i7-1365U, Intel Iris Xe Graphics G7 96EUs | HP Elite Dragonfly G3 Intel Core i7-1265U, Intel Iris Xe Graphics G7 96EUs | Framework Laptop 13.5 13th Gen Intel Intel Core i7-1370P, Intel Iris Xe Graphics G7 96EUs | Lenovo ThinkPad X13 G3 21CM002UGE AMD Ryzen 5 PRO 6650U, AMD Radeon 660M | Dell Latitude 9330 Intel Core i7-1260U, Intel Iris Xe Graphics G7 96EUs | Apple MacBook Air M2 Entry Apple M2, Apple M2 8-Core GPU | |
|---|---|---|---|---|---|---|
| Hitze | 1% | 3% | -8% | -3% | 2% | |
| Last oben max * (°C) | 38.6 | 39 -1% | 38.2 1% | 38.1 1% | 40.6 -5% | 44.5 -15% |
| Last unten max * (°C) | 40.4 | 42.2 -4% | 41.4 -2% | 40.1 1% | 50.2 -24% | 44.4 -10% |
| Idle oben max * (°C) | 28.2 | 26.8 5% | 25.8 9% | 33.6 -19% | 25 11% | 23.9 15% |
| Idle unten max * (°C) | 29 | 28.2 3% | 27.6 5% | 33.4 -15% | 27.6 5% | 23.6 19% |
* ... kleinere Werte sind besser
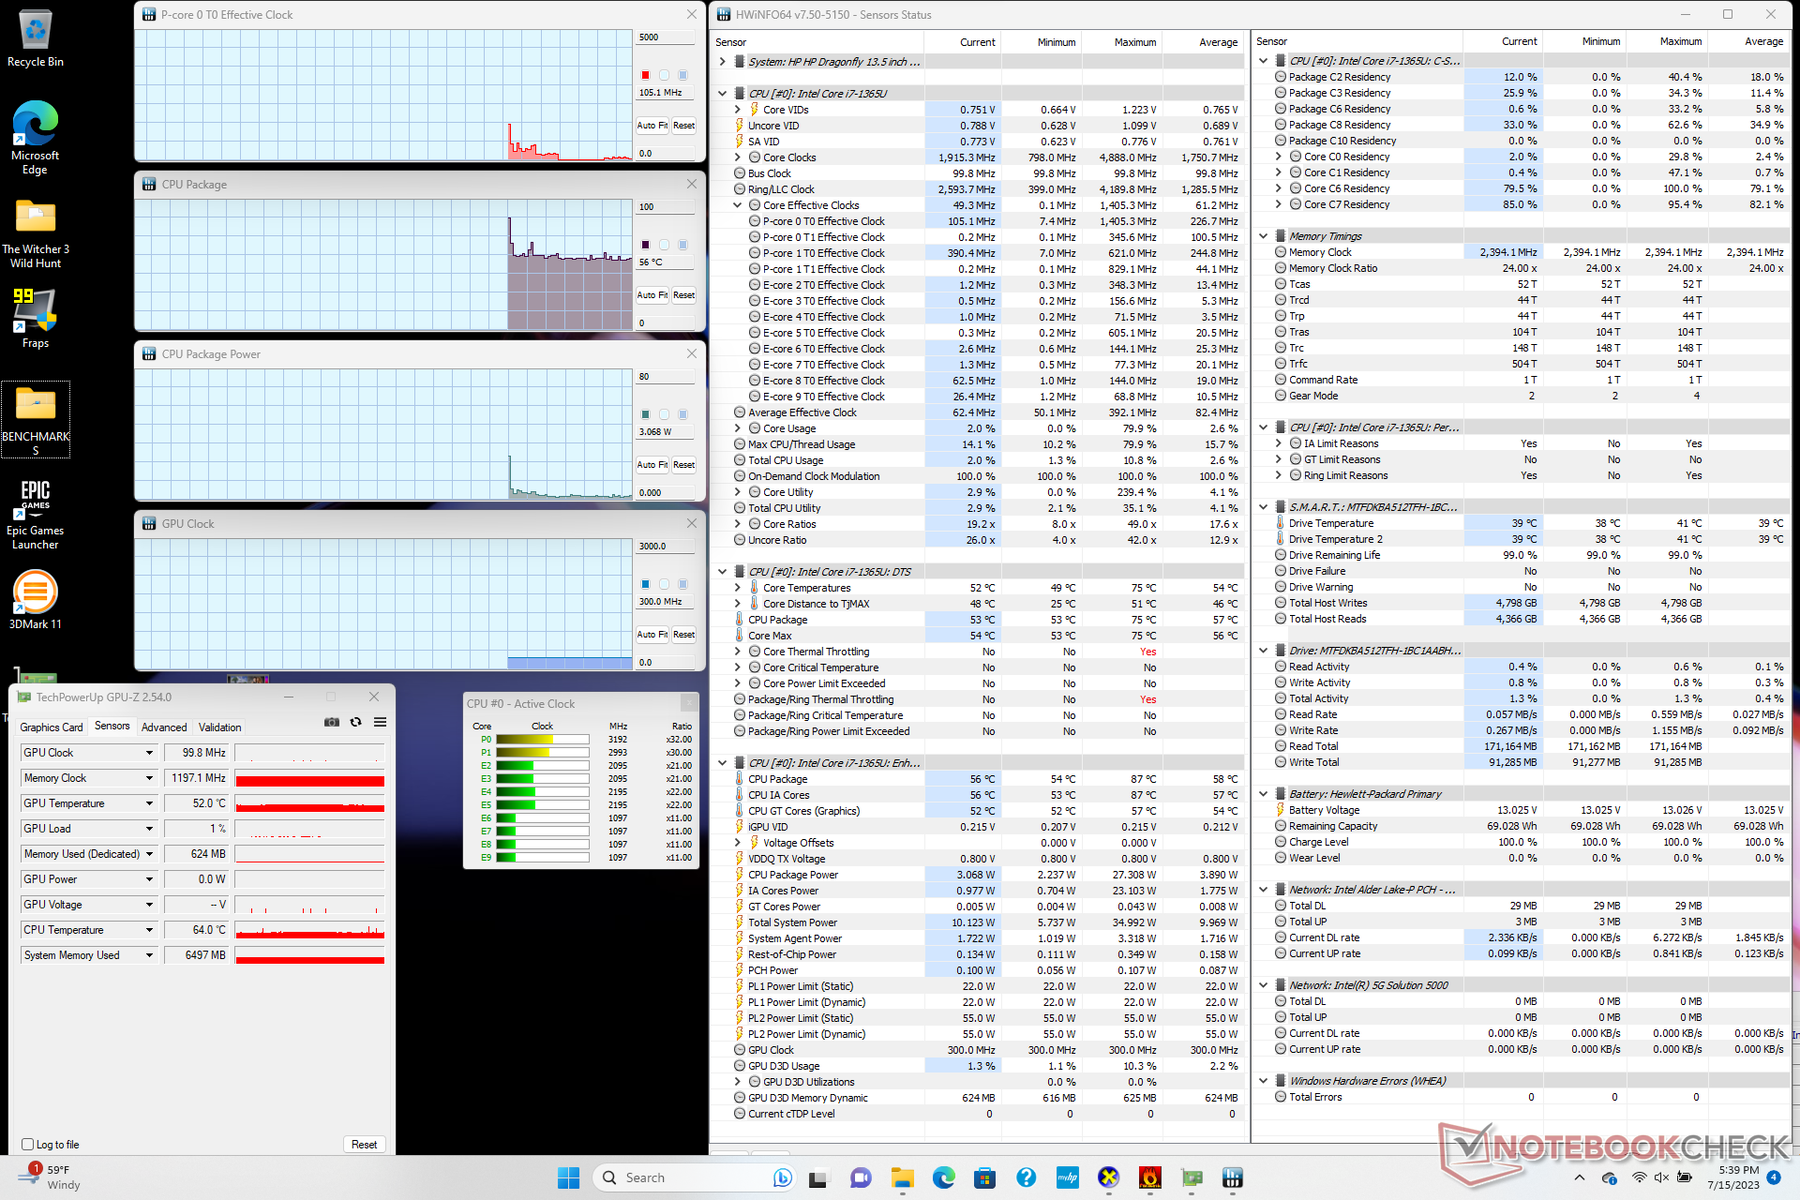
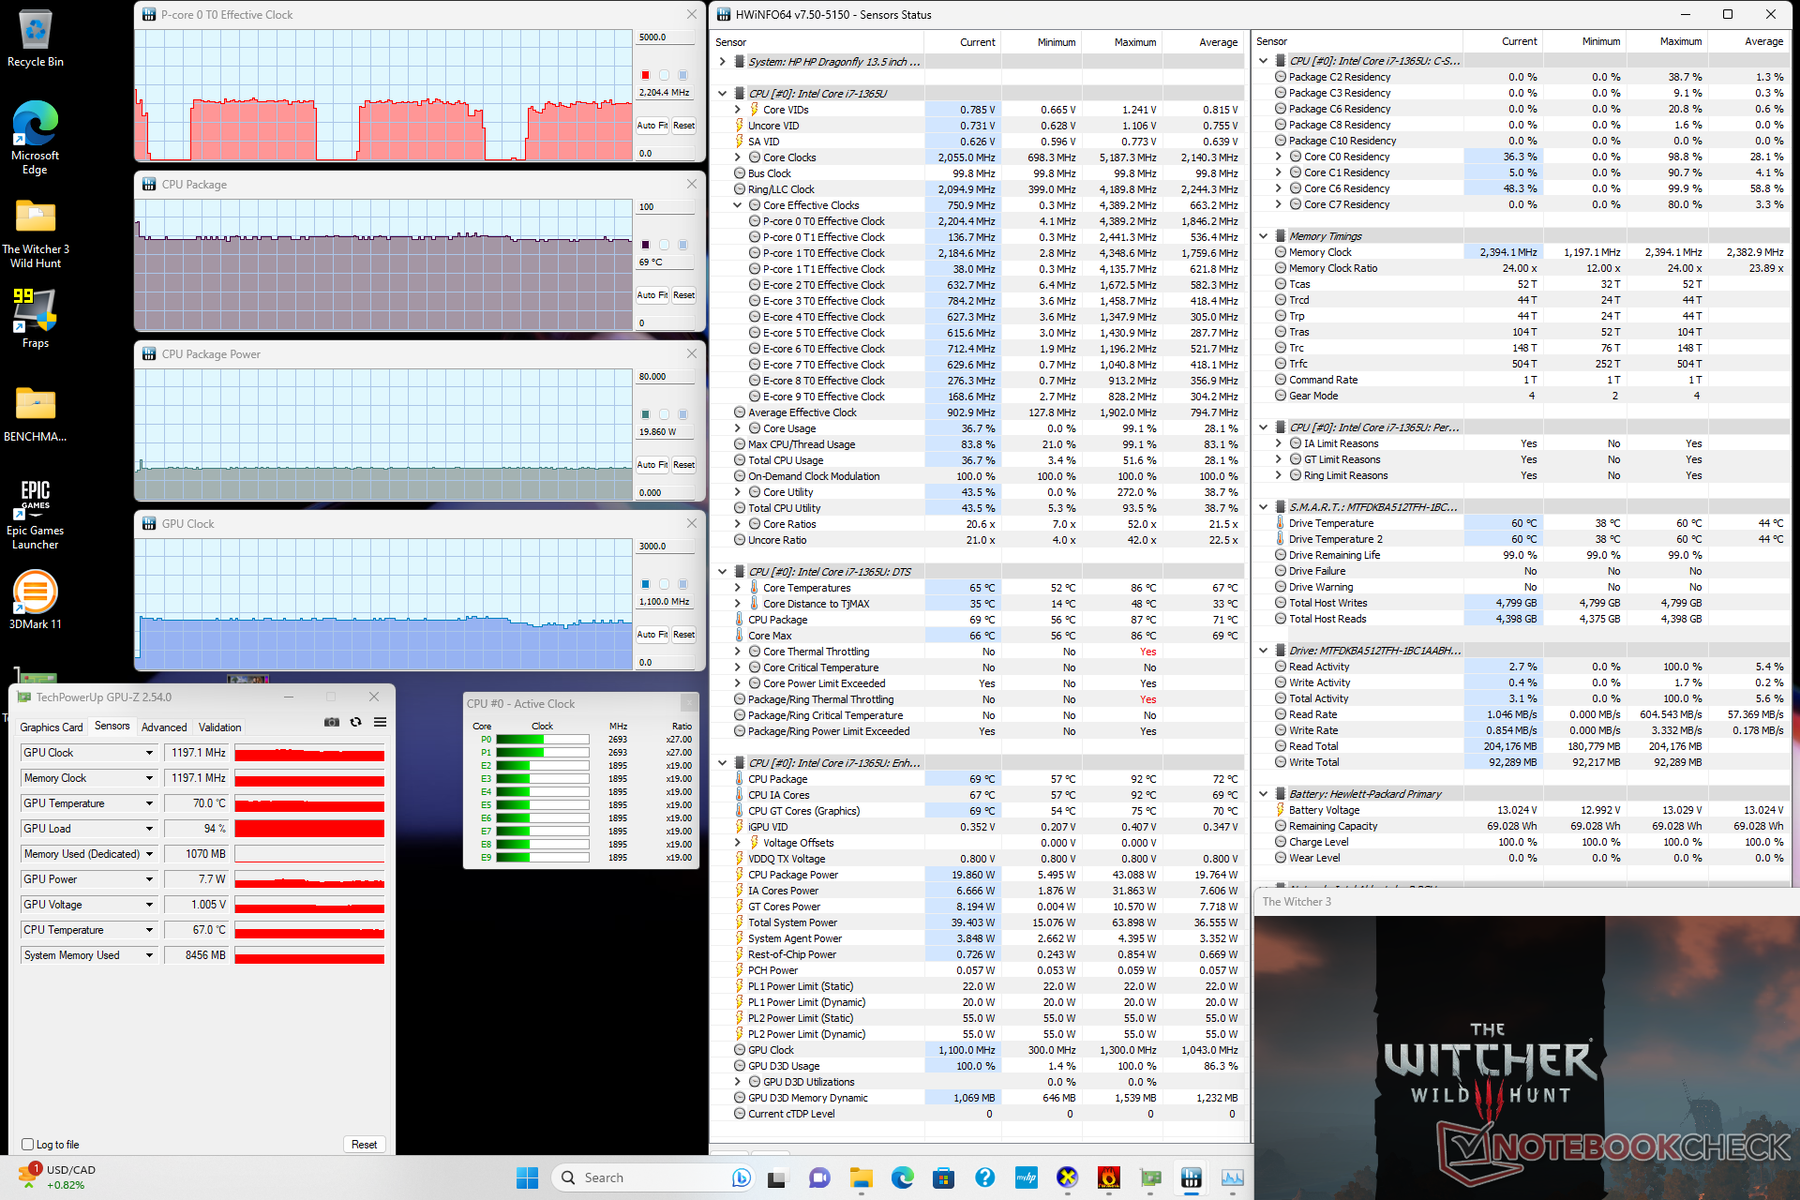
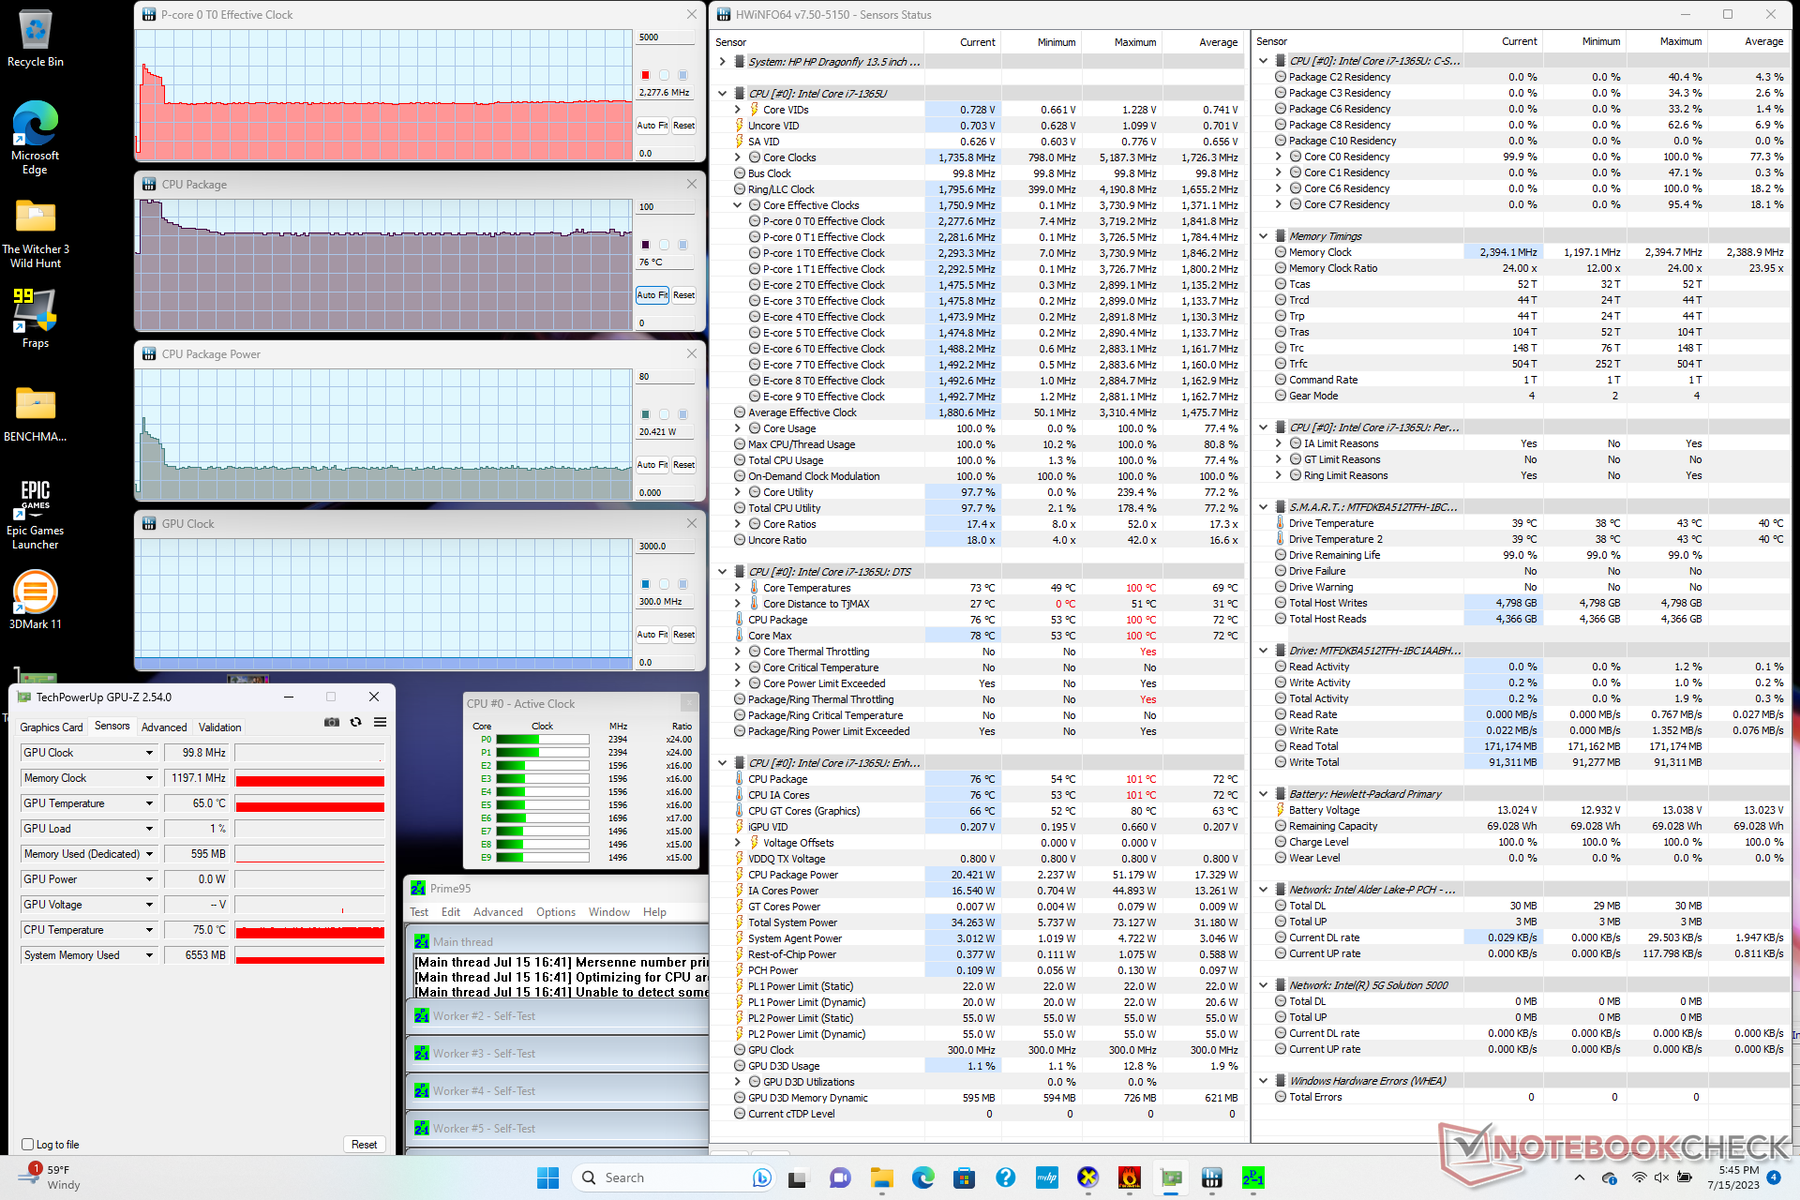
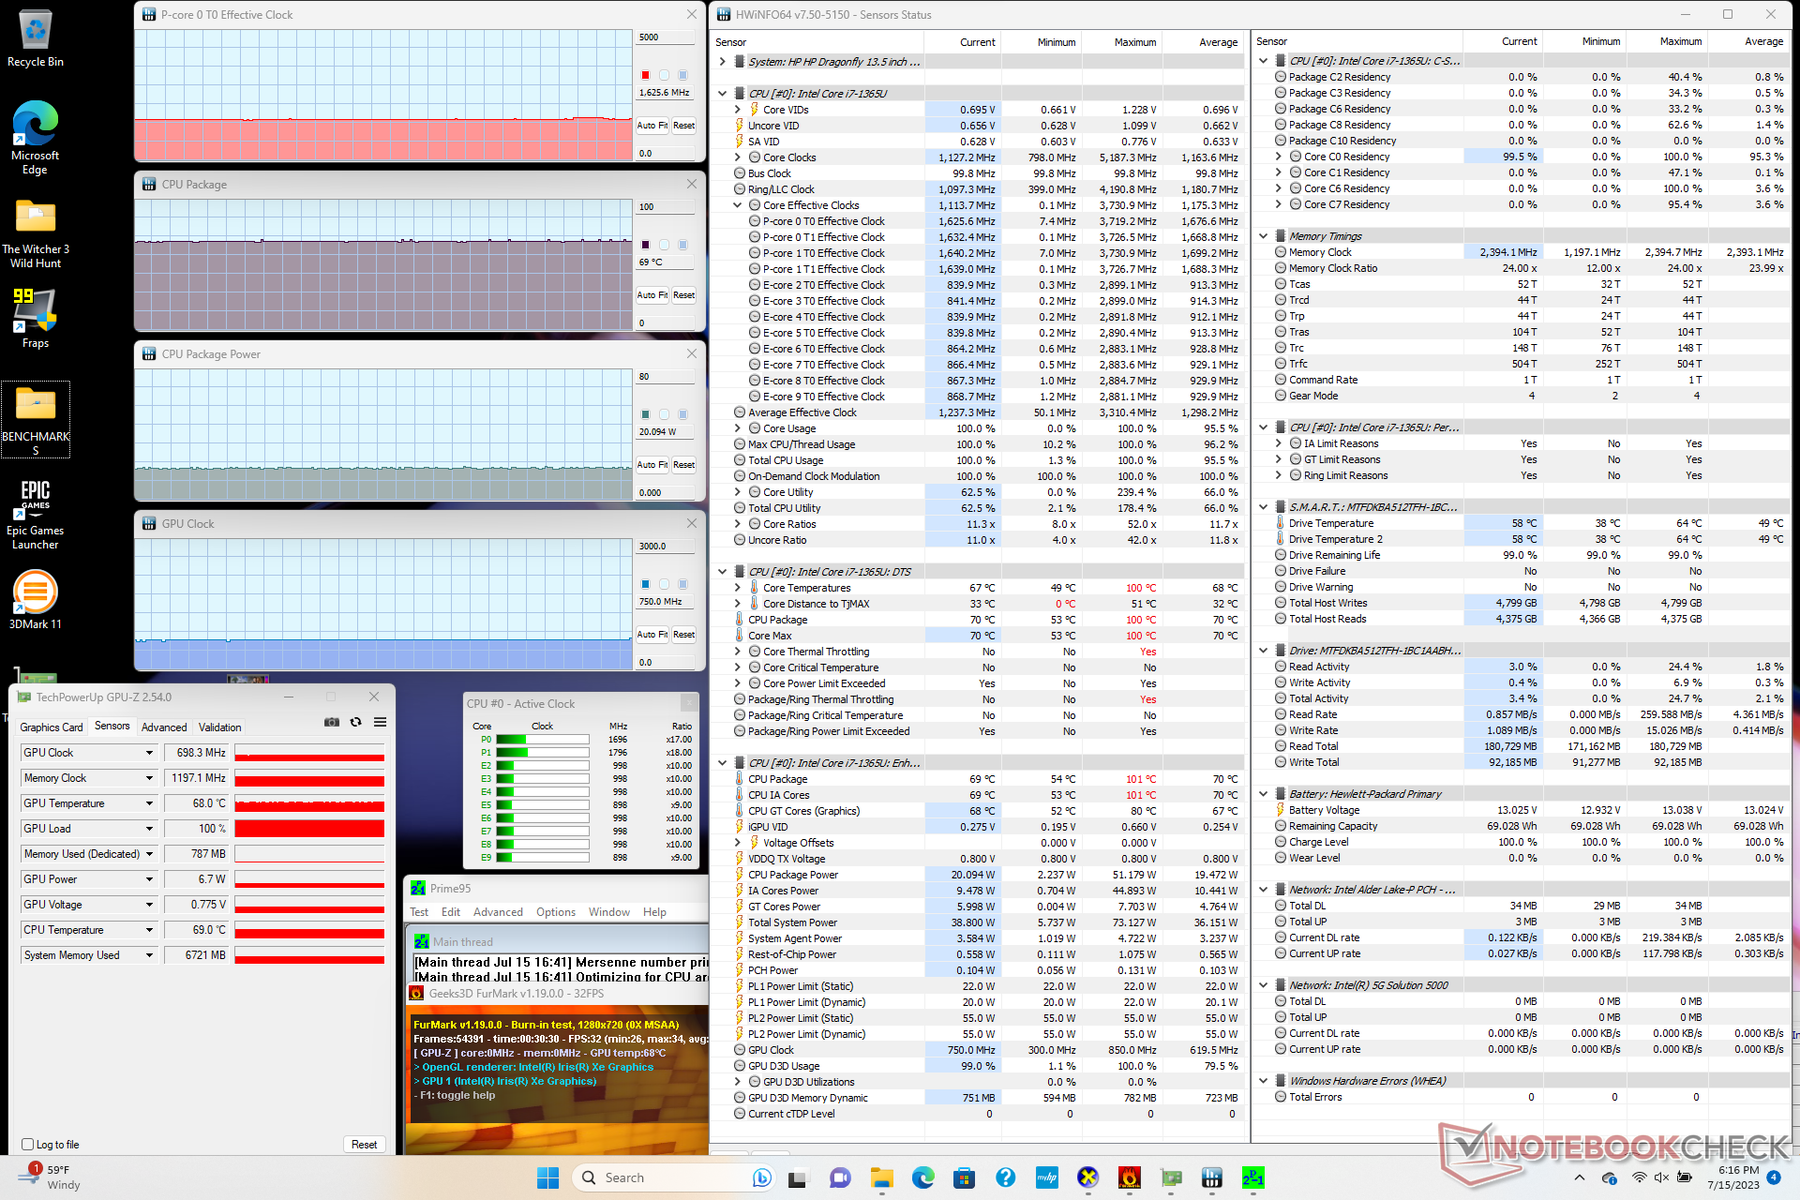
Stresstest
Beim Stresstest mit Prime95 taktet die CPU mit bis zu 3,7 GHz bei einer Energieaufnahme von 51 Watt, dabei erreicht der Chip aber auch eine Kerntemperatur von 100 Grad Celsius. Da eine derartige Temperatur für die Langlebigkeit des Prozessors nicht gut ist, wird schnell auf nur 2,3 GHz bei 20 Watt heruntergetaktet, um eine vernünftigere Kerntemperatur von 76 Grad Celsius zu erreichen.
Die GPU-Taktraten beziehungsweise Temperatur liegt unter Last in Witcher 3 bei 1200 MHz und 69 Grad, was ungefähr den Werten des kürzlich getesteten Dell Latitude 7440 entspricht.
Im Akkubetrieb wird die CPU-Leistung leicht gedrosselt. Im 3DMark-11-Benchmark kommen wir abseits der Steckdose auf einen Physik- beziehungsweise Grafik-Score von 10619 und 5780, während wir im Netzbetrieb 11465 und 5959 Punkte ermittelt haben.
| CPU-Taktrate (GHz) | GPU-Taktrate (MHz) | Durchschnittliche CPU-Temperatur (°C) | |
| Leerlauf | -- | -- | 56 |
| Prime95 Stresstest | 2.3 | -- | 76 |
| Prime95 + FurMark Stresstest | 1.6 | 698 | 69 |
| Witcher 3 Stresstest | ~2.2 | 1197 | 69 |
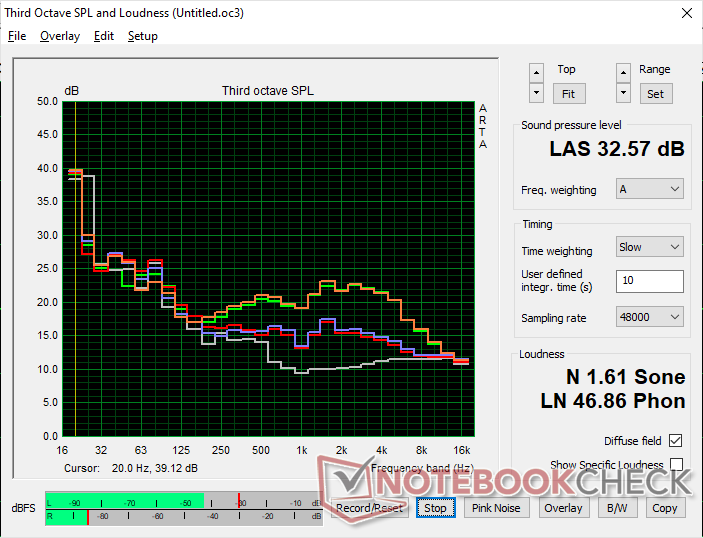
Lautsprecher
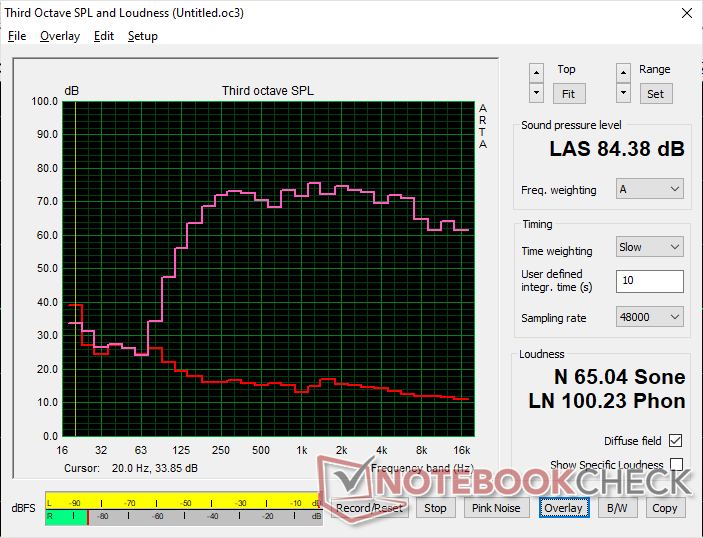
HP Dragonfly G4 Audio Analyse
(+) | Die Lautsprecher können relativ laut spielen (84.4 dB)
Bass 100 - 315 Hz
(±) | abgesenkter Bass - 8.4% geringer als der Median
(±) | durchschnittlich lineare Bass-Wiedergabe (11.6% Delta zum Vorgänger)
Mitteltöne 400 - 2000 Hz
(+) | ausgeglichene Mitten, vom Median nur 2.3% abweichend
(+) | lineare Mitten (4.8% Delta zum Vorgänger)
Hochtöne 2 - 16 kHz
(+) | ausgeglichene Hochtöne, vom Median nur 3.2% abweichend
(+) | sehr lineare Hochtöne (4.6% Delta zum Vorgänger)
Gesamt im hörbaren Bereich 100 - 16.000 Hz
(+) | hörbarer Bereich ist sehr linear (9.1% Abstand zum Median
Im Vergleich zu allen Geräten derselben Klasse
» 4% aller getesteten Geräte dieser Klasse waren besser, 1% vergleichbar, 95% schlechter
» Das beste Gerät hat einen Delta-Wert von 5%, durchschnittlich ist 18%, das schlechteste Gerät hat 53%
Im Vergleich zu allen Geräten im Test
» 3% aller getesteten Geräte waren besser, 1% vergleichbar, 96% schlechter
» Das beste Gerät hat einen Delta-Wert von 4%, durchschnittlich ist 24%, das schlechteste Gerät hat 134%
Apple MacBook Pro 16 2021 M1 Pro Audio Analyse
(+) | Die Lautsprecher können relativ laut spielen (84.7 dB)
Bass 100 - 315 Hz
(+) | guter Bass - nur 3.8% Abweichung vom Median
(+) | lineare Bass-Wiedergabe (5.2% Delta zum Vorgänger)
Mitteltöne 400 - 2000 Hz
(+) | ausgeglichene Mitten, vom Median nur 1.3% abweichend
(+) | lineare Mitten (2.1% Delta zum Vorgänger)
Hochtöne 2 - 16 kHz
(+) | ausgeglichene Hochtöne, vom Median nur 1.9% abweichend
(+) | sehr lineare Hochtöne (2.7% Delta zum Vorgänger)
Gesamt im hörbaren Bereich 100 - 16.000 Hz
(+) | hörbarer Bereich ist sehr linear (4.6% Abstand zum Median
Im Vergleich zu allen Geräten derselben Klasse
» 0% aller getesteten Geräte dieser Klasse waren besser, 0% vergleichbar, 100% schlechter
» Das beste Gerät hat einen Delta-Wert von 5%, durchschnittlich ist 17%, das schlechteste Gerät hat 45%
Im Vergleich zu allen Geräten im Test
» 0% aller getesteten Geräte waren besser, 0% vergleichbar, 100% schlechter
» Das beste Gerät hat einen Delta-Wert von 4%, durchschnittlich ist 24%, das schlechteste Gerät hat 134%
Energieverwaltung
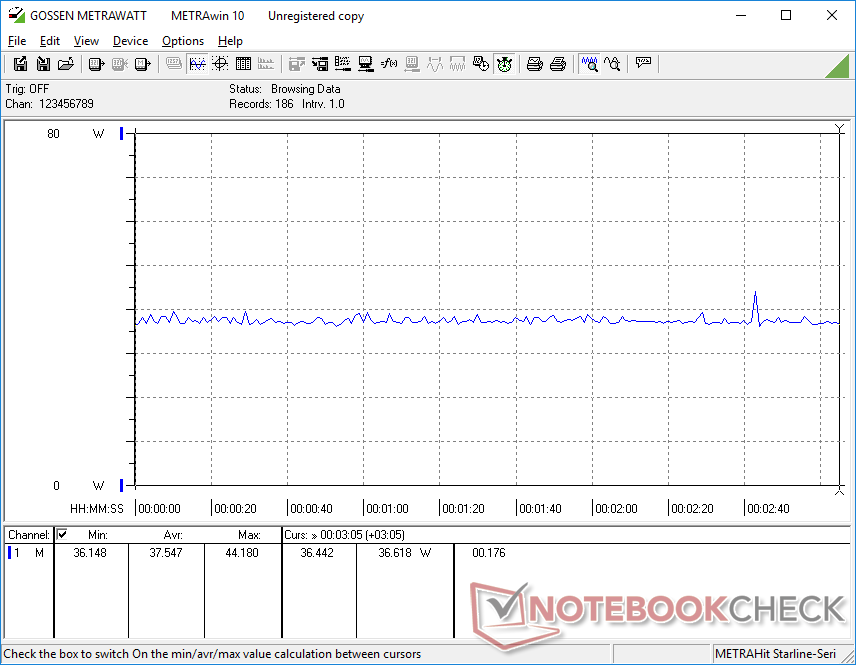
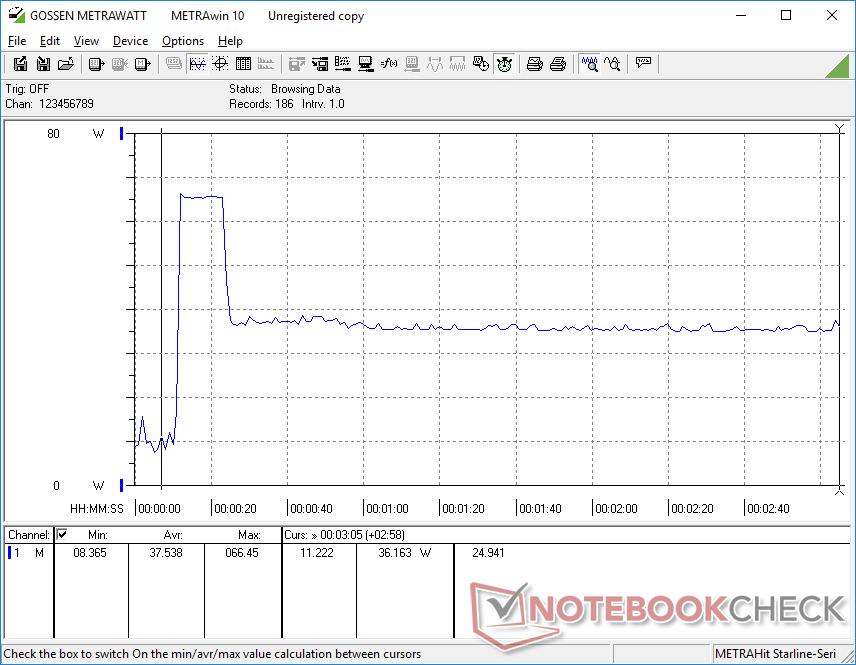
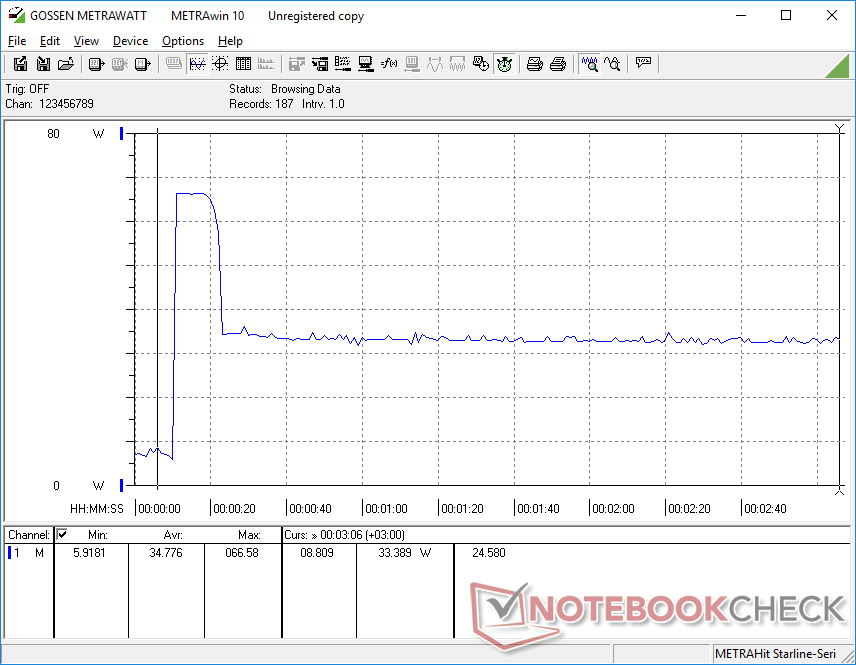
Energieverbrauch
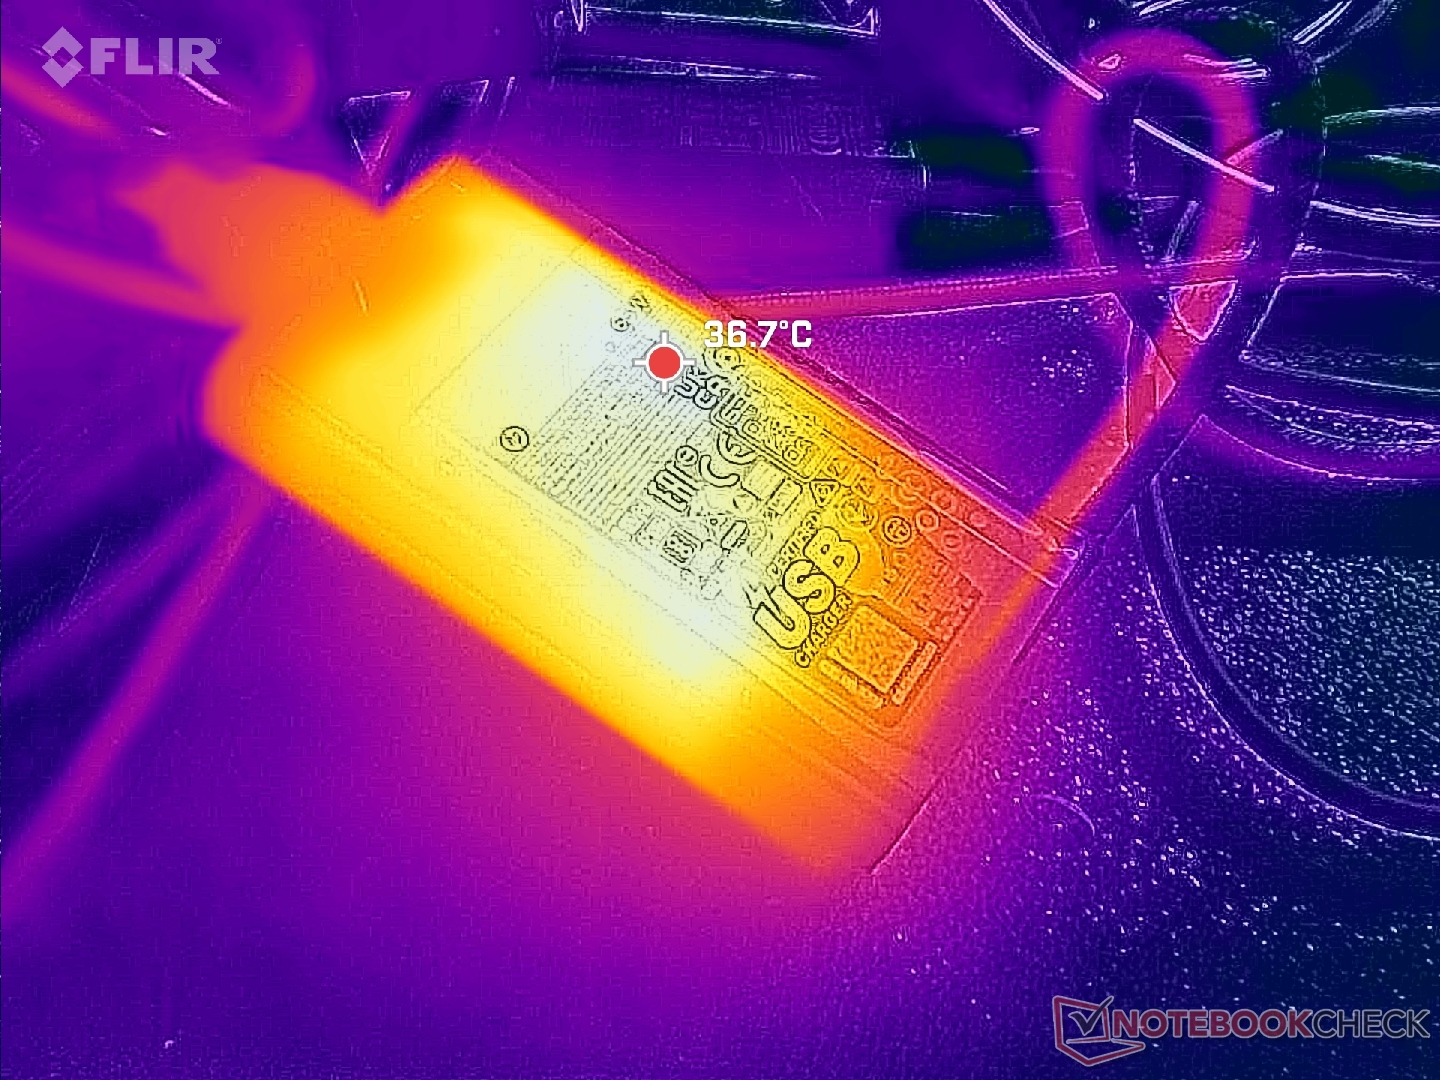
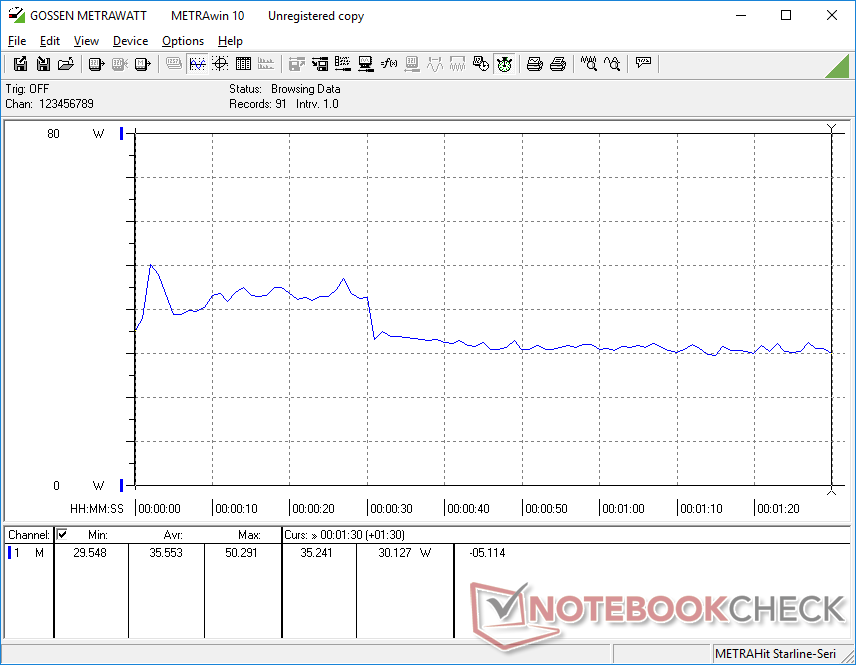
Die Energieaufnahme ist insgesamt fast identisch zum Dragonfly G3, was angesichts des gleichen Displays, Gehäuses, der SSD und sogar den PL2 und PL1-Limits auch zu erwarten war. Die Leistung pro Watt des Core i7-1365U ist somit nur minimal besser und praktisch auf einem Level mit dem des Core i7-1265U. Laptops mit der konkurrierenden Radeon 680M, wie beispielsweise das Acer Swift Edge SFE16, verbrauchen unter Last mehr Strom, bieten dafür aber auch eine viel höhere Grafikleistung.
In der Spitze zieht das kleine 65-Watt-USB-C-Netzteil (circa 9.8 x 5.3 x 2 cm) kurzzeitig 67 Watt aus der Steckdose.
| Aus / Standby | |
| Idle | |
| Last |
|
Legende:
min: | |
| HP Dragonfly G4 i7-1365U, Iris Xe G7 96EUs, Micron 3400 MTFDKBA512TFH 512GB, IPS, 1920x1280, 13.5" | HP Elite Dragonfly G3 i7-1265U, Iris Xe G7 96EUs, Micron 3400 MTFDKBA512TFH 512GB, IPS, 1920x1280, 13.5" | Framework Laptop 13.5 13th Gen Intel i7-1370P, Iris Xe G7 96EUs, WD PC SN740 SDDPNQD-1T00, IPS, 2256x1504, 13.5" | Lenovo ThinkPad X13 G3 21CM002UGE R5 PRO 6650U, Radeon 660M, Samsung PM9A1 MZVL2512HCJQ, IPS LED, 1920x1200, 13.3" | Dell Latitude 9330 i7-1260U, Iris Xe G7 96EUs, , IPS, 2560x1600, 13.3" | Apple MacBook Air M2 Entry M2, M2 8-Core GPU, Apple SSD AP0256Z, IPS, 2560x1664, 13.6" | |
|---|---|---|---|---|---|---|
| Stromverbrauch | 5% | -13% | 18% | 2% | 20% | |
| Idle min * (Watt) | 4.1 | 3.4 17% | 2.9 29% | 3.2 22% | 4.7 -15% | 1.87 54% |
| Idle avg * (Watt) | 7.5 | 5.6 25% | 6.3 16% | 5.2 31% | 8.2 -9% | 9.2 -23% |
| Idle max * (Watt) | 8.2 | 8.4 -2% | 9.9 -21% | 6.1 26% | 8.4 -2% | 9.3 -13% |
| Last avg * (Watt) | 35.5 | 40.8 -15% | 56.2 -58% | 33.6 5% | 36.8 -4% | 28.5 20% |
| Witcher 3 ultra * (Watt) | 37.5 | 35.5 5% | 56.6 -51% | 39.3 -5% | 30.4 19% | 27.4 27% |
| Last max * (Watt) | 66.5 | 68.4 -3% | 60.8 9% | 49.1 26% | 49.9 25% | 31 53% |
* ... kleinere Werte sind besser
Energieaufnahme Witcher 3 / Stresstest
Energieverbrauch mit externem Monitor
Akkulaufzeit
Die Akkukapazität beträgt 68 Wattstunden, genau wie beim HP Dragonfly Gen 3. Die Laufzeit im WLAN-Test ist trotzdem länger, das neue Modell macht erst nach fast 16 Stunden schlapp. Die Laufzeit ist somit um mehrere Stunden länger als bei den meisten anderen Windows-Notebooks und sogar vergleichbar mit dem ausdauernden MacBook Air M2.
Den Akku von 0 auf 100 Prozent aufzuladen dauert ungefähr 90 Minuten.
| HP Dragonfly G4 i7-1365U, Iris Xe G7 96EUs, 68 Wh | HP Elite Dragonfly G3 i7-1265U, Iris Xe G7 96EUs, 68 Wh | Framework Laptop 13.5 13th Gen Intel i7-1370P, Iris Xe G7 96EUs, 61 Wh | Lenovo ThinkPad X13 G3 21CM002UGE R5 PRO 6650U, Radeon 660M, 54.7 Wh | Dell Latitude 9330 i7-1260U, Iris Xe G7 96EUs, 50 Wh | Apple MacBook Air M2 Entry M2, M2 8-Core GPU, 52.6 Wh | |
|---|---|---|---|---|---|---|
| Akkulaufzeit | -9% | -45% | -37% | -44% | -15% | |
| Idle (h) | 42.5 | 37.8 -11% | 15.4 -64% | |||
| WLAN (h) | 15.9 | 11.8 -26% | 8.8 -45% | 12.5 -21% | 9.4 -41% | 15.2 -4% |
| Last (h) | 3.2 | 3.5 9% | 1.5 -53% | 2.3 -28% | 2.4 -25% | |
| H.264 (h) | 16.5 |
Pro
Contra
Fazit — Nur ein kleiner Sprung dank der neuen Prozessorgeneration
Wie schon das Dell XPS 13 Plus (2023), bekommt auch das HP Dragonfly Gen 4 nur ein kleines Update im Vergleich zum letztjährigen Elite Dragonfly G3. Der Unterschied ist so gering, dass die meisten Nutzer den Sprung von der 12. CPU-Generation des Dragonfly G3 auf die 13. Generation im Dragonfly Gen 4 kaum bemerken dürften. Auch die anderen Modelleigenschaften haben sich nicht geändert, und die neue Power-Manager-Software ist nicht gerade eine weltbewegende Neuerung.
Das Dragonfly der vierten Generation ist ein kleines Update für das bereits exzellente Dragonfly der dritten Generation. Wer sich nicht um den neuen Prozessor schert, der bekommt beim Dragonfly G3 das praktisch gleiche Nutzererlebnis.
Die eher geringfügigen Änderungen sind keine sonderliche Überraschung, weil das Dragonfly erst 2022 ein brandneues Design verpasst bekommen hat, welches zu diesem Zeitpunkt also kaum ein Jahr alt ist. Das Dragonfly G3 haben wir bereits für seine Funktionalität, Features und das attraktive Erscheinungsbild gelobt, und das Dragonfly G4 baut auf diesen Stärken auf. Potentielle Käufer sollten womöglich also das günstigere Dragonfly G3 in Erwägung ziehen, weil das 2023er Dragonfly G4 praktisch nichts Neues bietet. Wer mehr Leistung benötigt, der sollte einen Blick auf den Framework-Laptop oder das Asus Zenbook S 13 werfen, die beide leistungsstärkere Prozessoren als die Core-U-Serie bieten.
Preis und Verfügbarkeit
HP bietet in seinem offiziellen deutschen Online-Shop derzeit zwei Konfigurationen des Dragonfly G4 an. Zum Zeitpunkt der Veröffentlichung dieses Testberichts werden Preise zwischen circa 1.800 Euro und 2.500 Euro aufgerufen.
HP Dragonfly G4
- 18.07.2023 v7 (old)
Allen Ngo
Transparenz
Die Auswahl der zu testenden Geräte erfolgt innerhalb der Redaktion. Das vorliegende Testmuster wurde dem Autor vom Hersteller oder einem Shop zu Testzwecken leihweise zur Verfügung gestellt. Eine Einflussnahme des Leihstellers auf den Testbericht gab es nicht, der Hersteller erhielt keine Version des Reviews vor der Veröffentlichung. Es bestand keine Verpflichtung zur Publikation. Als eigenständiges, unabhängiges Unternehmen unterliegt Notebookcheck keiner Diktion von Herstellern, Shops und Verlagen.
So testet Notebookcheck
Pro Jahr werden von Notebookcheck hunderte Laptops und Smartphones unabhängig in von uns standardisierten technischen Verfahren getestet, um eine Vergleichbarkeit aller Testergebnisse zu gewährleisten. Seit rund 20 Jahren entwickeln wir diese Testmethoden kontinuierlich weiter und setzen damit Branchenstandards. In unseren Testlaboren kommt ausschließlich hochwertiges Messequipment in die Hände erfahrener Techniker und Redakteure. Die Tests unterliegen einer mehrstufigen Kontrolle. Unsere komplexe Gesamtbewertung basiert auf hunderten fundierten Messergebnissen und Benchmarks, womit Ihnen Objektivität garantiert ist. Weitere Informationen zu unseren Testmethoden gibt es hier.
Preisvergleich

