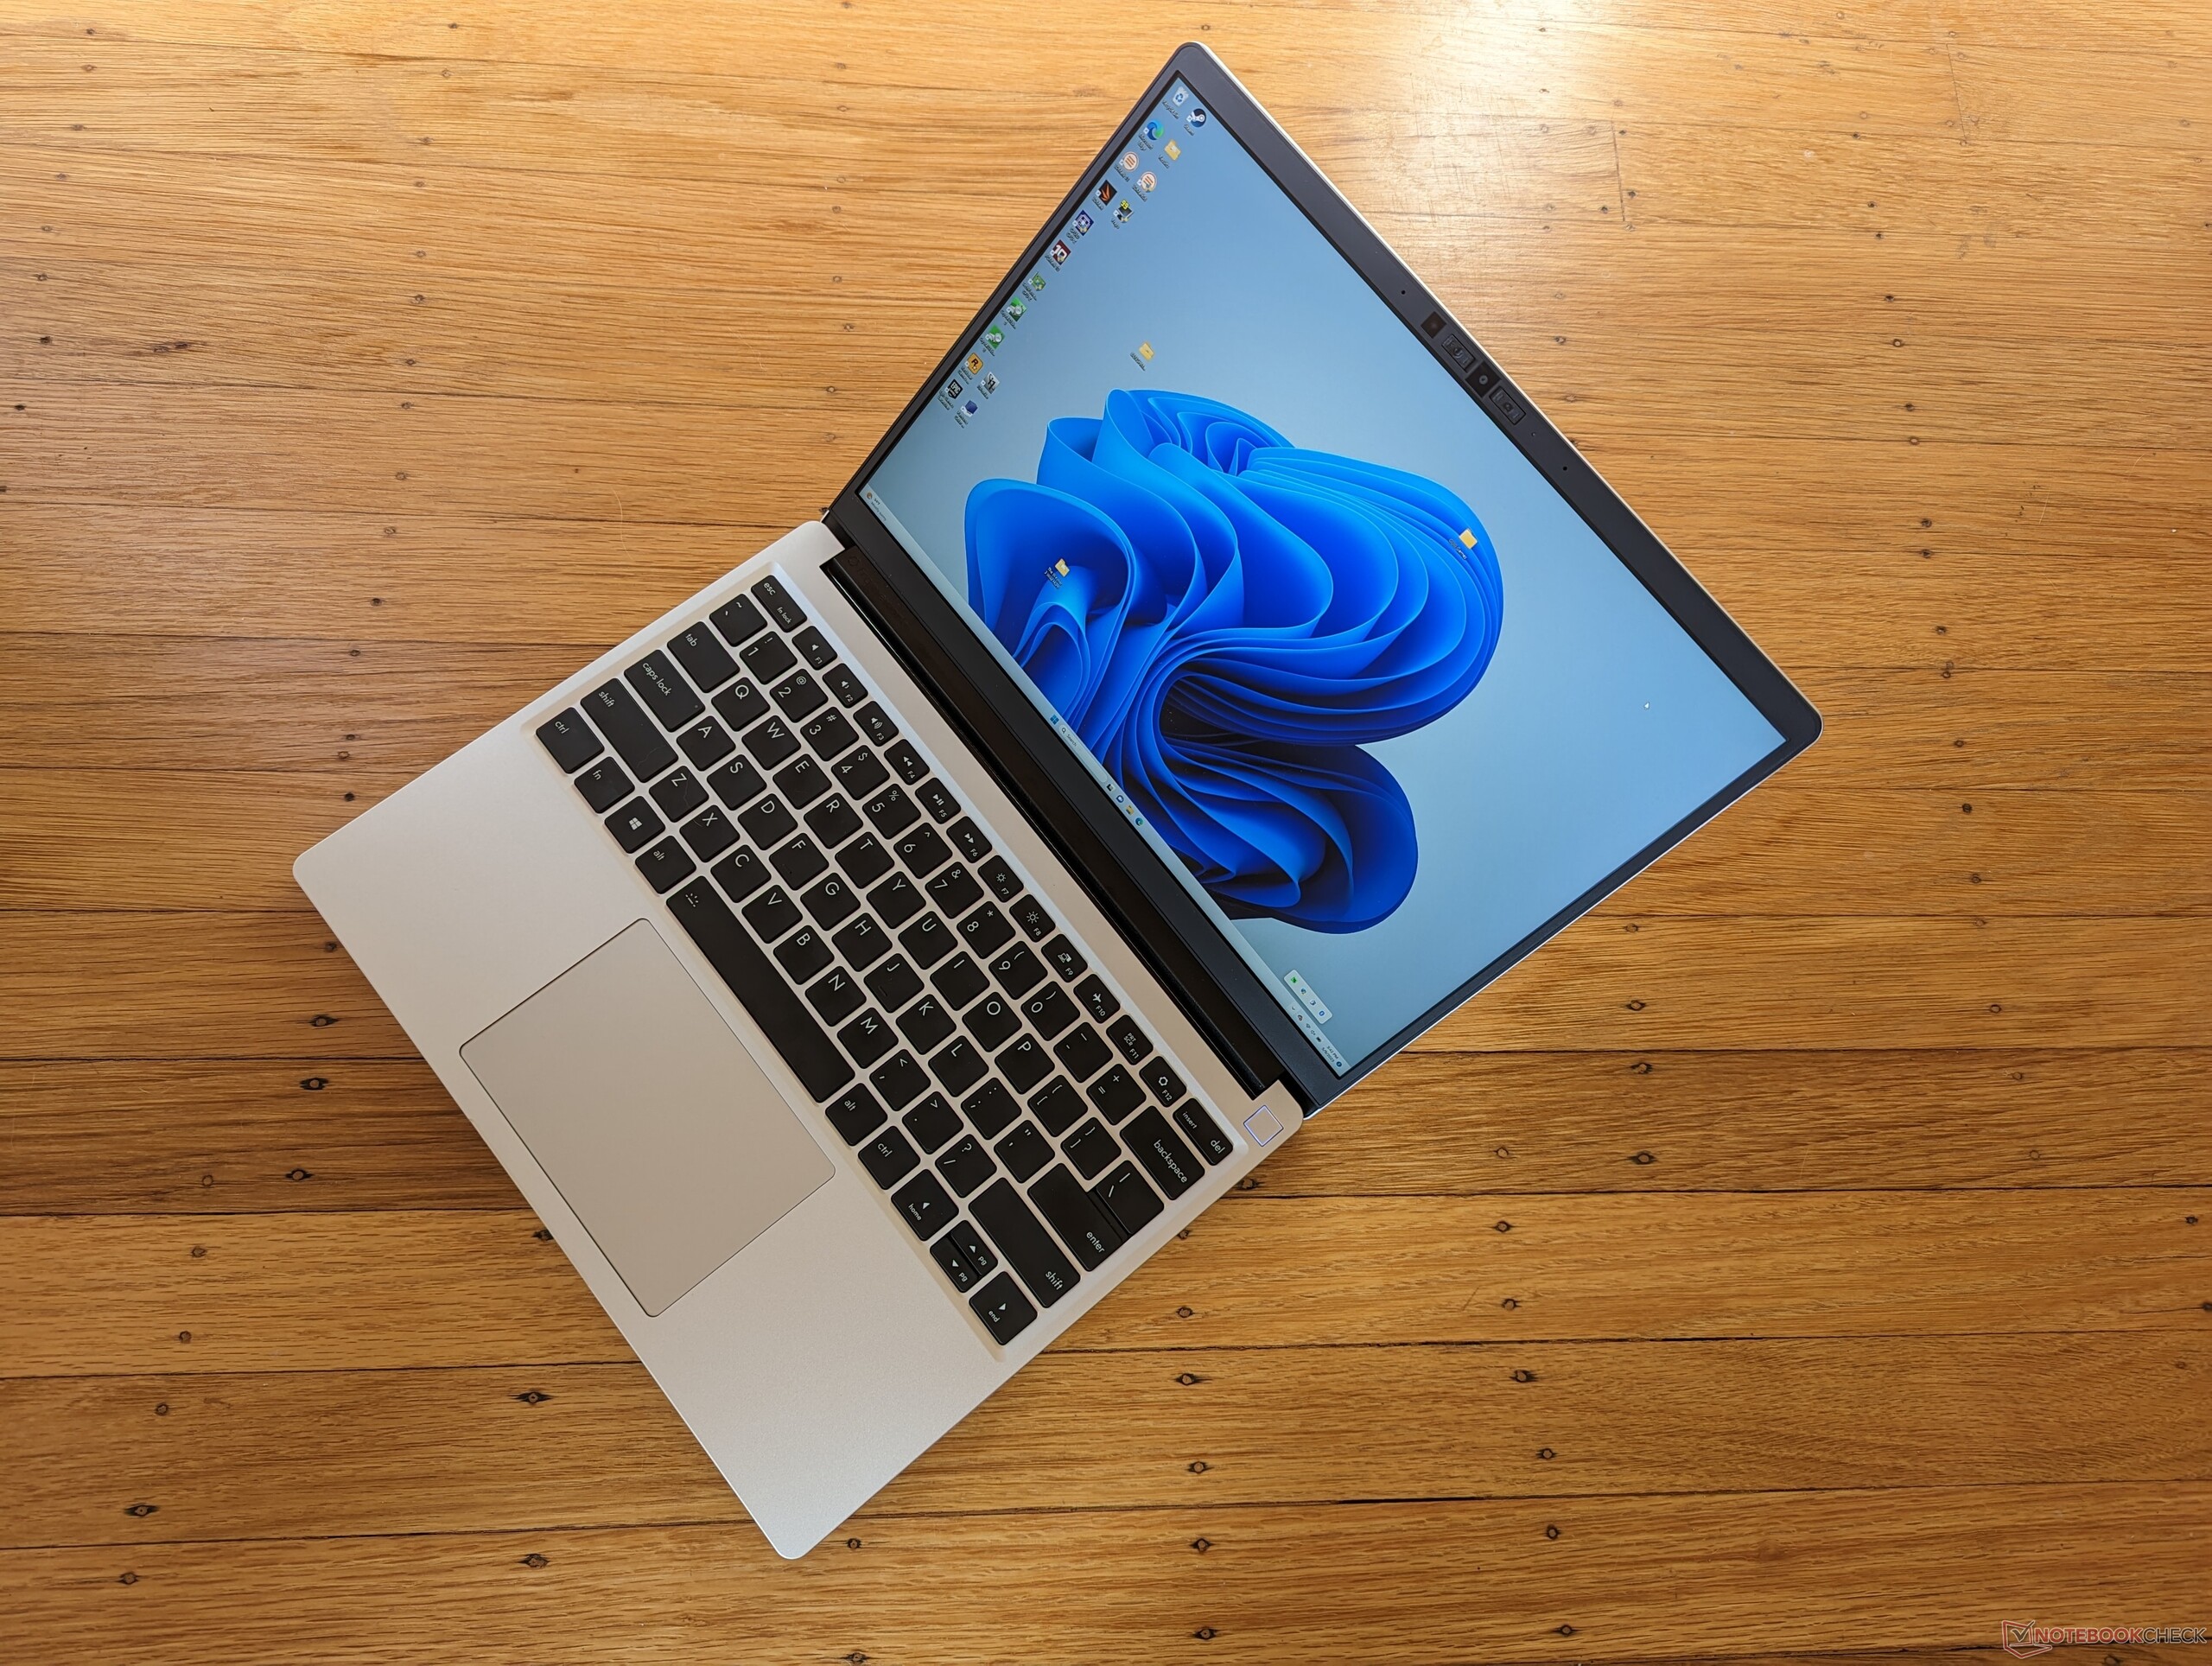
Erster Auftritt des Core i7-1370P: Framework Laptop 13.5 mit Intel Gen13

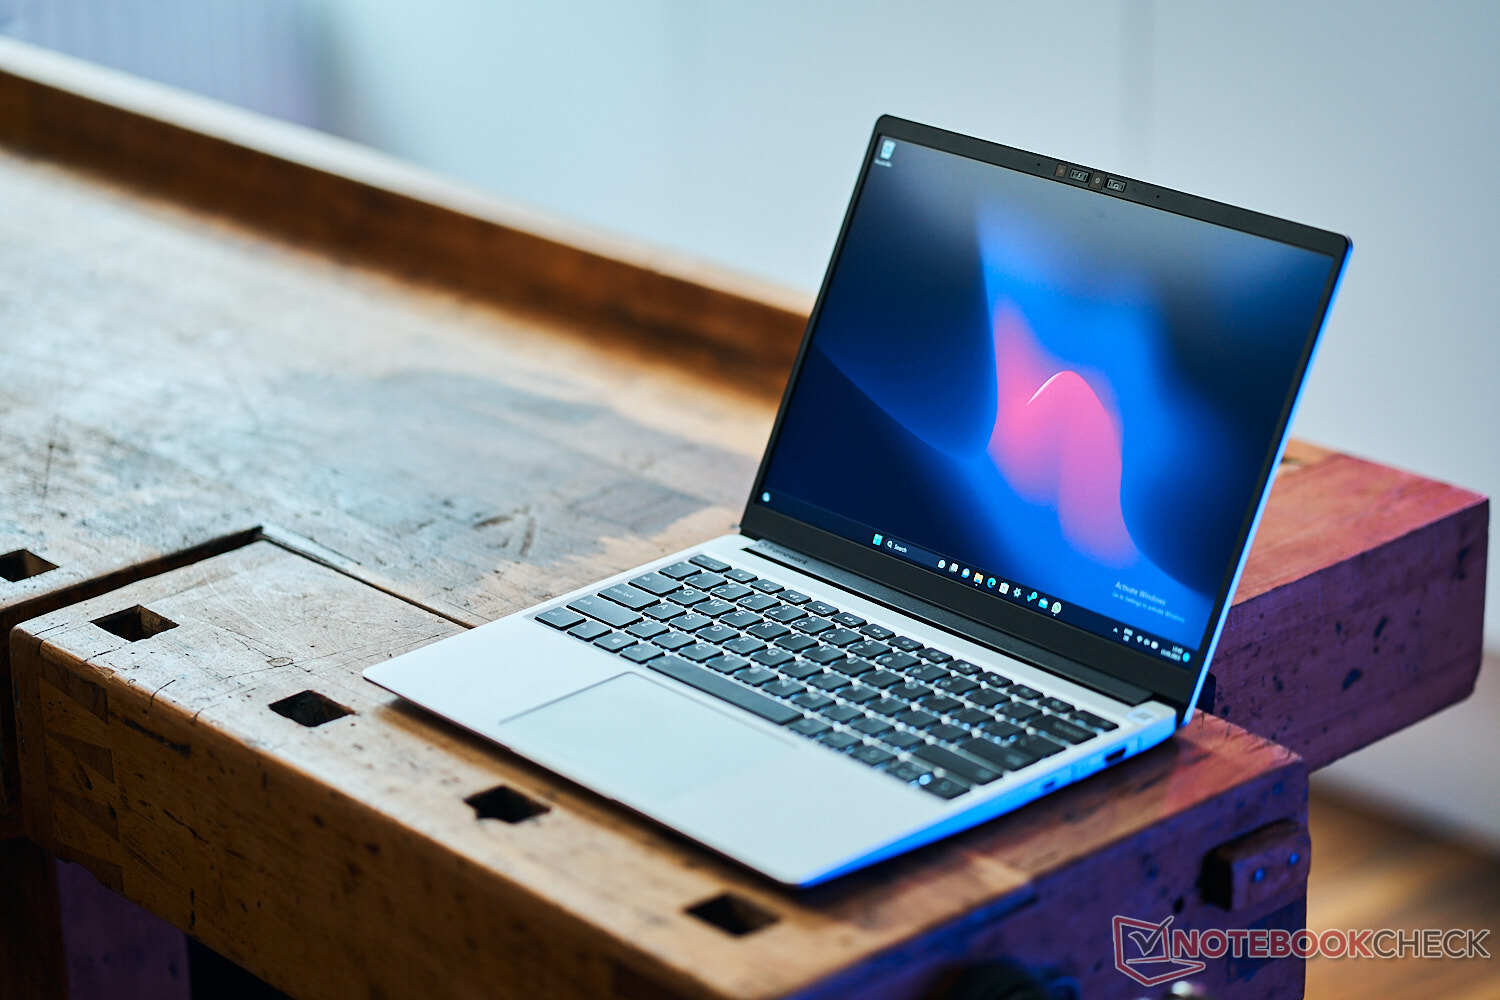
In diesem Jahr geht der 13,5-Zoll-Framework-Laptop in die dritte Generation. Wie erwartet, verwendet auch die 2023er-Version quasi das gleiche Gehäuseskelett und die gleichen Materialien wie die Modelle von 2022 und 2021, um die Nutzer-Nachhaltigkeit, den Reparatur- und Recycling-Aspekt auch weiter zu fördern. Daher verweisen wir an dieser Stelle auf unsere Tests des 2021er Modells, um alles Notwendige bezüglich der konstant gebliebenen, physischen Merkmale der Serie zu erfahren.
Unterscheidungsmerkmal Nummer eins im 2023er Modell ist die Intel-Gen13-Core-P-CPU, welche Gen12 und Gen11 aus den Vorgängern verdrängt. Eine AMD-Version wird ebenfalls noch in diesem Jahr erwartet, ebenso wie ein 16-Zoll-Modell mit dedizierter Grafikkarte. Die Erweiterung des Portfolios zeigt, dass das Unternehmen mit seinem einzigartigen Ansatz des Laptopdesigns gute Fortschritte erzielt und erfolgreich ist.
Unsere Testkonfiguration ist die beste SKU, kostet mit Core i7-1370P rund 2.360 Euro. Etwas schwächere Konfigurationen mit dem Core i5-1340P oder dem i7-1360P sind ebenfalls verfügbar und kosten entsprechend weniger.
Konkurrenz zum Framework 13.5 findet sich in anderen "Prosumer"-Subnotebooks wie dem Microsoft Surface Laptop, dem Dell XPS 13 Plus, dem HP Spectre x360 13.5 oder auch dem Lenovo Yoga Pro 7 14. Natürlich sind die meisten, wenn nicht alle, Alternativen weitaus weniger einfach zu warten oder auseinanderzunehmen wie das Framework.
Weitere Framework-Tests:
Potentielle Konkurrenten im Vergleich
Bew. | Datum | Modell | Gewicht | Dicke | Größe | Auflösung | Preis ab |
|---|---|---|---|---|---|---|---|
| 86.2 % v7 (old) | 05 / 2023 | Framework Laptop 13.5 13th Gen Intel i7-1370P, Iris Xe G7 96EUs | 1.3 kg | 15.85 mm | 13.50" | 2256x1504 | |
| 85.1 % v7 (old) | 07 / 2022 | Framework Laptop 13.5 12th Gen Intel i7-1260P, Iris Xe G7 96EUs | 1.3 kg | 15.85 mm | 13.50" | 2256x1504 | |
| 90.3 % v7 (old) | 08 / 2022 | HP Spectre x360 13.5 14t-ef000 i7-1255U, Iris Xe G7 96EUs | 1.4 kg | 17 mm | 13.50" | 3000x2000 | |
| 84.7 % v7 (old) | 05 / 2021 | Microsoft Surface Laptop 4 13 i7 i7-1185G7, Iris Xe G7 96EUs | 1.3 kg | 14.5 mm | 13.50" | 2256x1504 | |
| 85.4 % v7 (old) | 04 / 2023 | Asus ZenBook S13 OLED UX5304 i7-1355U, Iris Xe G7 96EUs | 1 kg | 11.8 mm | 13.30" | 2880x1800 | |
| 85.3 % v7 (old) | 07 / 2022 | HP ProBook 445 G8-3Z6Q8ES R5 5600U, Vega 7 | 1.4 kg | 19.8 mm | 14.00" | 1920x1080 | |
| 86.9 % v7 (old) | 03 / 2023 | Lenovo Slim 7 Pro X 14ARH7 R9 6900HS, GeForce RTX 3050 4GB Laptop GPU | 1.6 kg | 15.9 mm | 14.50" | 3072x1920 |
Gehäuse — Gleich dem Original von 2021


Kommunikation
| Networking | |
| iperf3 transmit AX12 | |
| Microsoft Surface Laptop 4 13 Ryzen 5 | |
| Framework Laptop 13.5 | |
| iperf3 receive AX12 | |
| Microsoft Surface Laptop 4 13 Ryzen 5 | |
| Framework Laptop 13.5 | |
| iperf3 transmit AXE11000 | |
| Dell XPS 13 Plus 9320 4K | |
| Framework Laptop 13.5 13th Gen Intel | |
| iperf3 receive AXE11000 | |
| Dell XPS 13 Plus 9320 4K | |
| Framework Laptop 13.5 13th Gen Intel | |
| iperf3 transmit AXE11000 6GHz | |
| HP Spectre x360 13.5 14t-ef000 | |
| Framework Laptop 13.5 12th Gen Intel | |
| Framework Laptop 13.5 13th Gen Intel | |
| iperf3 receive AXE11000 6GHz | |
| Framework Laptop 13.5 12th Gen Intel | |
| Framework Laptop 13.5 13th Gen Intel | |
| HP Spectre x360 13.5 14t-ef000 | |
Webcam
Die 2-MP-Webcam ist von ordentlicher Qualität, dennoch liefert beispielsweise HP viele Laptops bereits mit 5-MP- oder gar 8-MP-Modellen aus, was für deutlich schärfere Bilder sorgt. Es ist wirklich schade, dass Framework keinerlei Kamera-Upgrades anbietet, dabei wäre der Austausch des Moduls gerade hier so einfach.


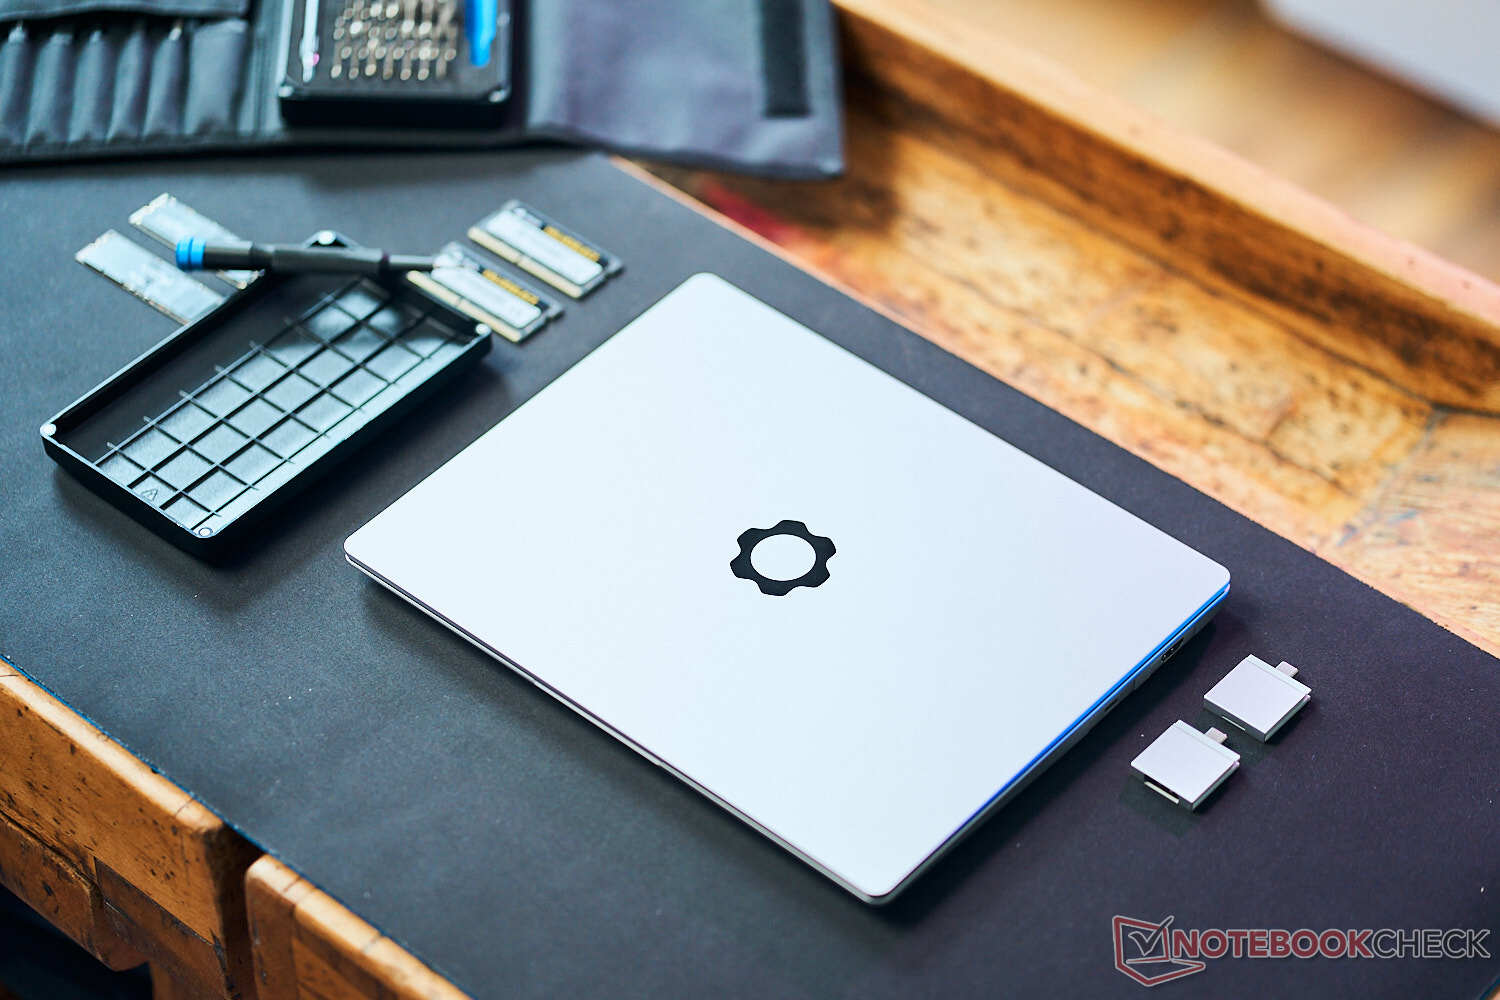
Wartung
Die Wartung durch den Endnutzer ist und bleibt bei Framework die beste auf dem ganzen Markt, immerhin stellt sie die Grundlage und Firmenphilosophie dar. Der Laptop lässt sich sehr leicht auseinander nehmen und anders als die meisten Konkurrenzunternehmen verkauft Framework viele individuelle Komponenten. Diese Komponenten stehen bislang nur in ausgewählten Märkten für den 13,5-Zoll-Laptop zur Verfügung (US, Kanada, UK, Deutschland, Frankreich, Irland, Niederlande, Österreich und Australien), weitere Länder kommen jedoch schon in diesem Sommer hinzu (Belgien, Italien, Spanien, Taiwan).
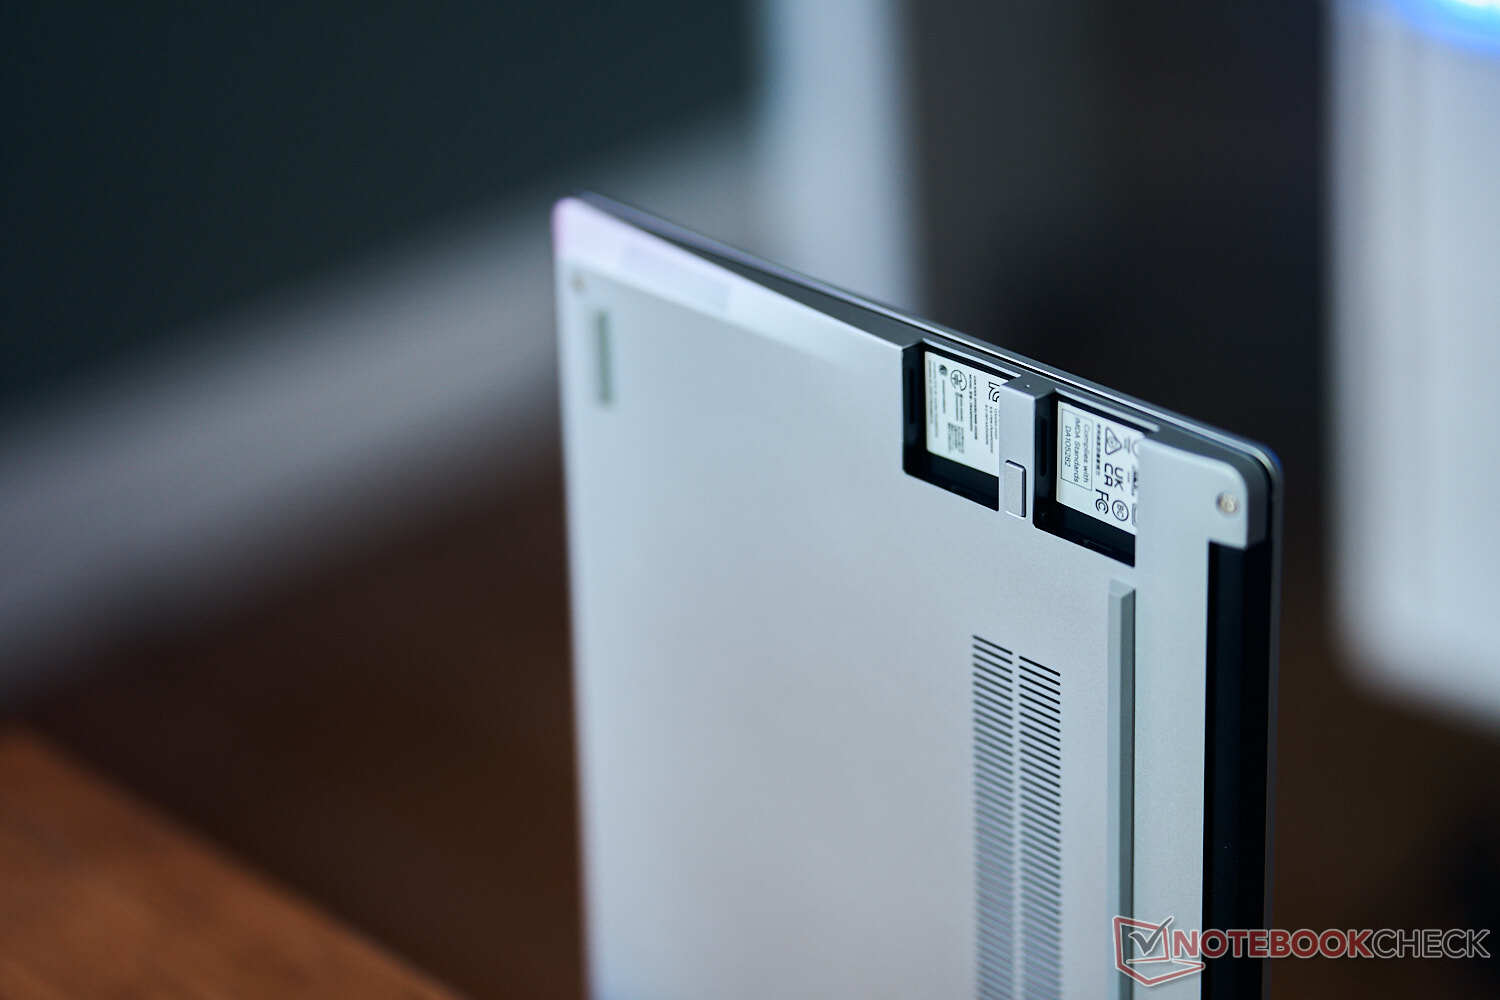
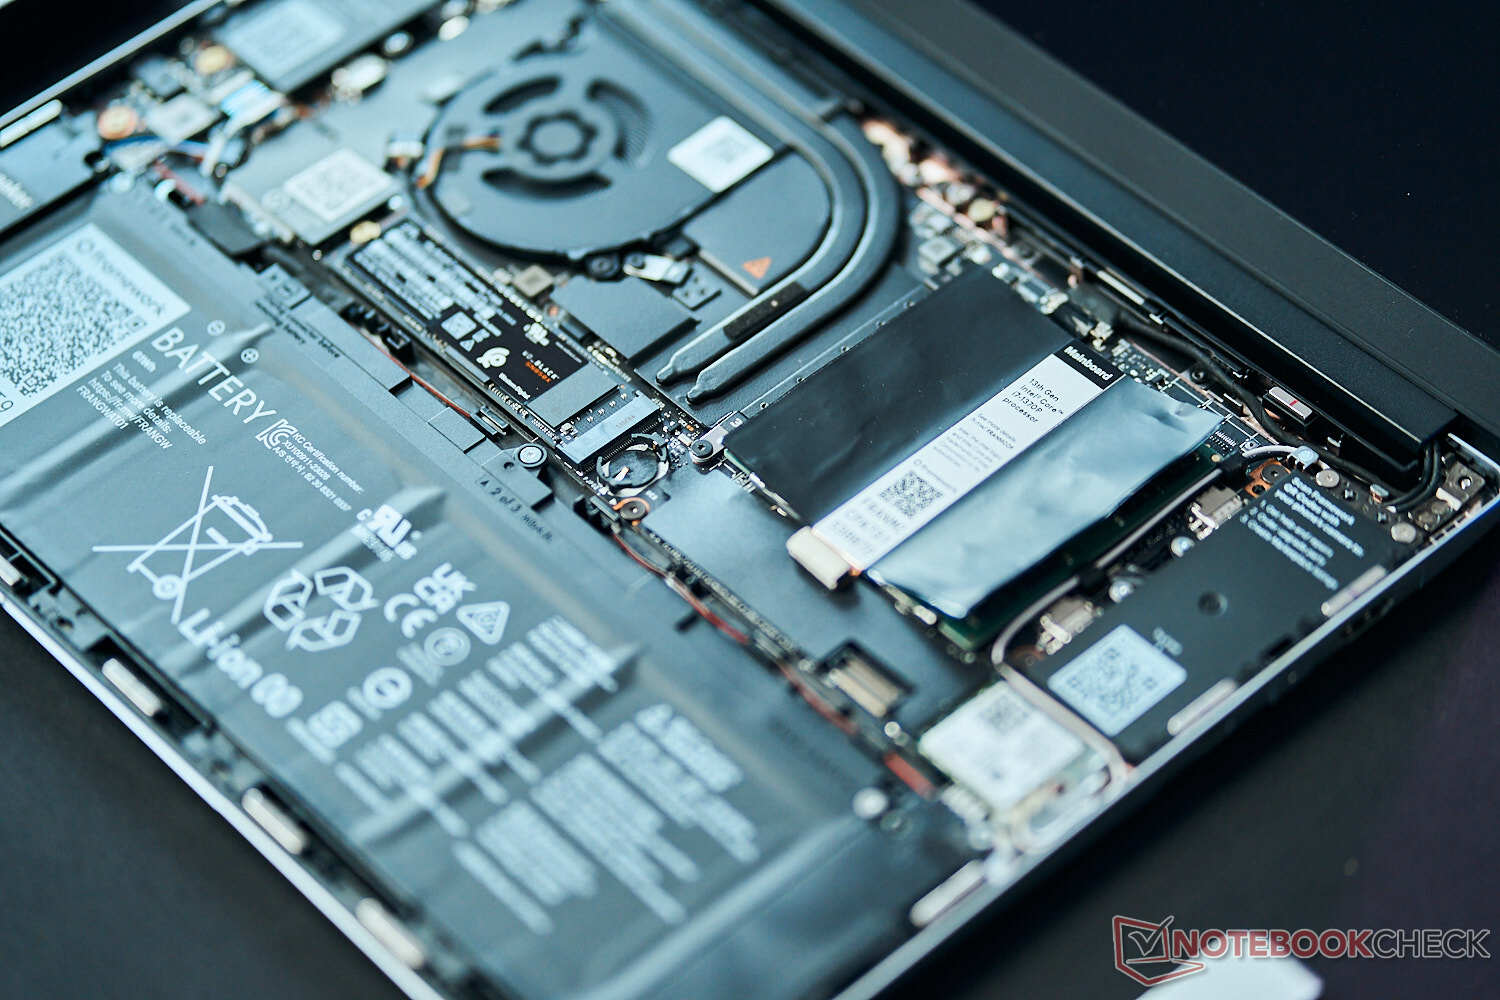
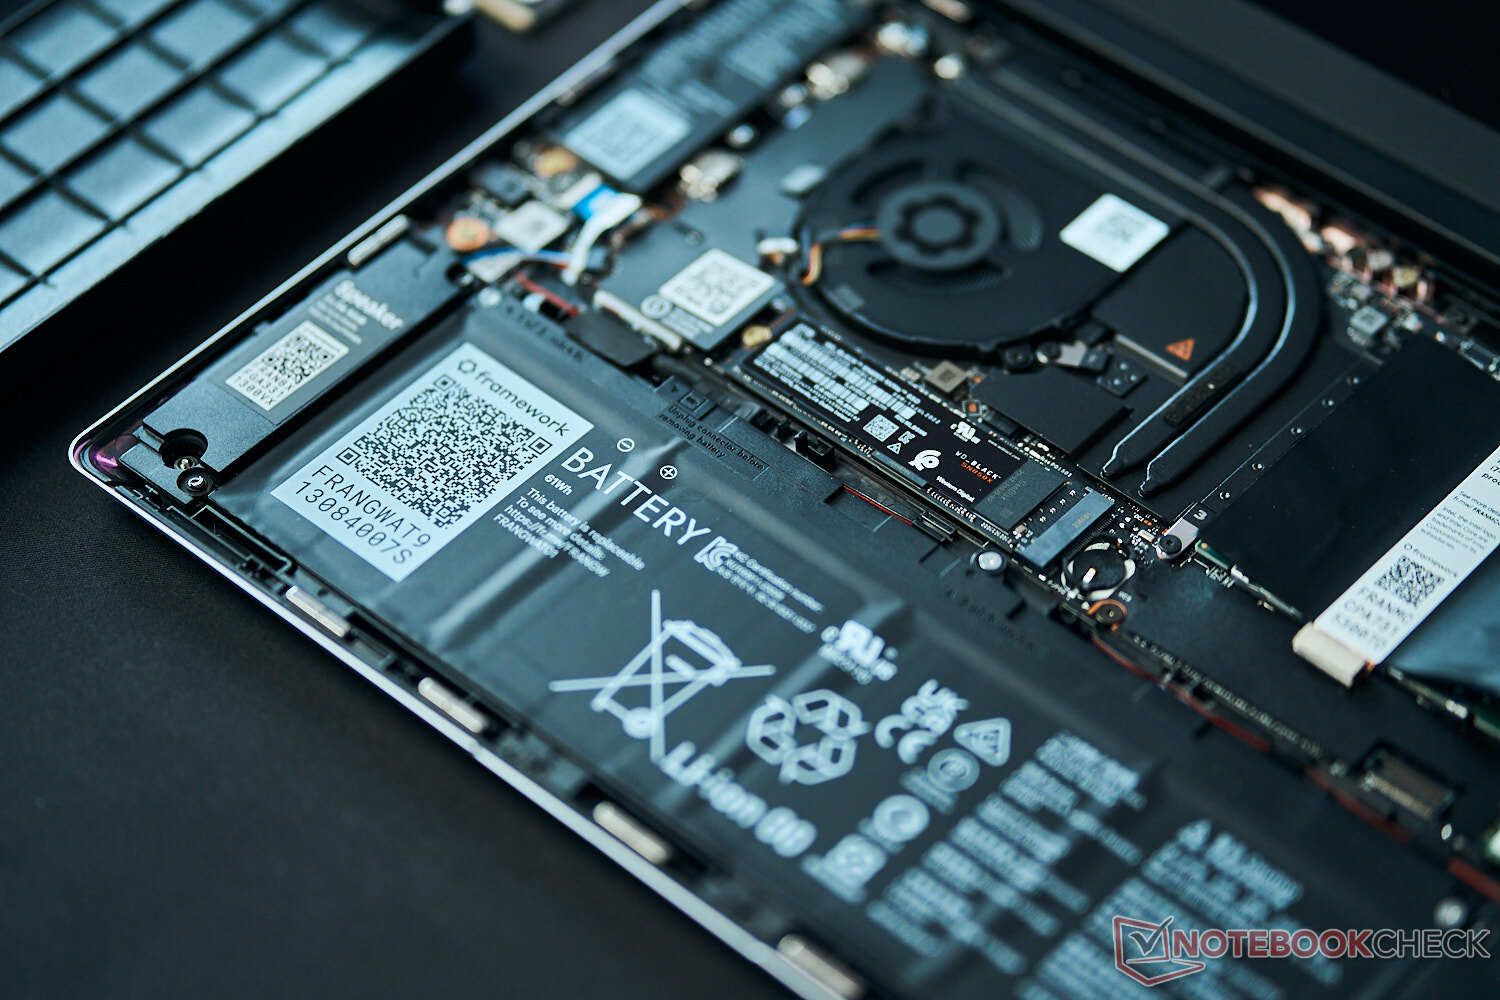
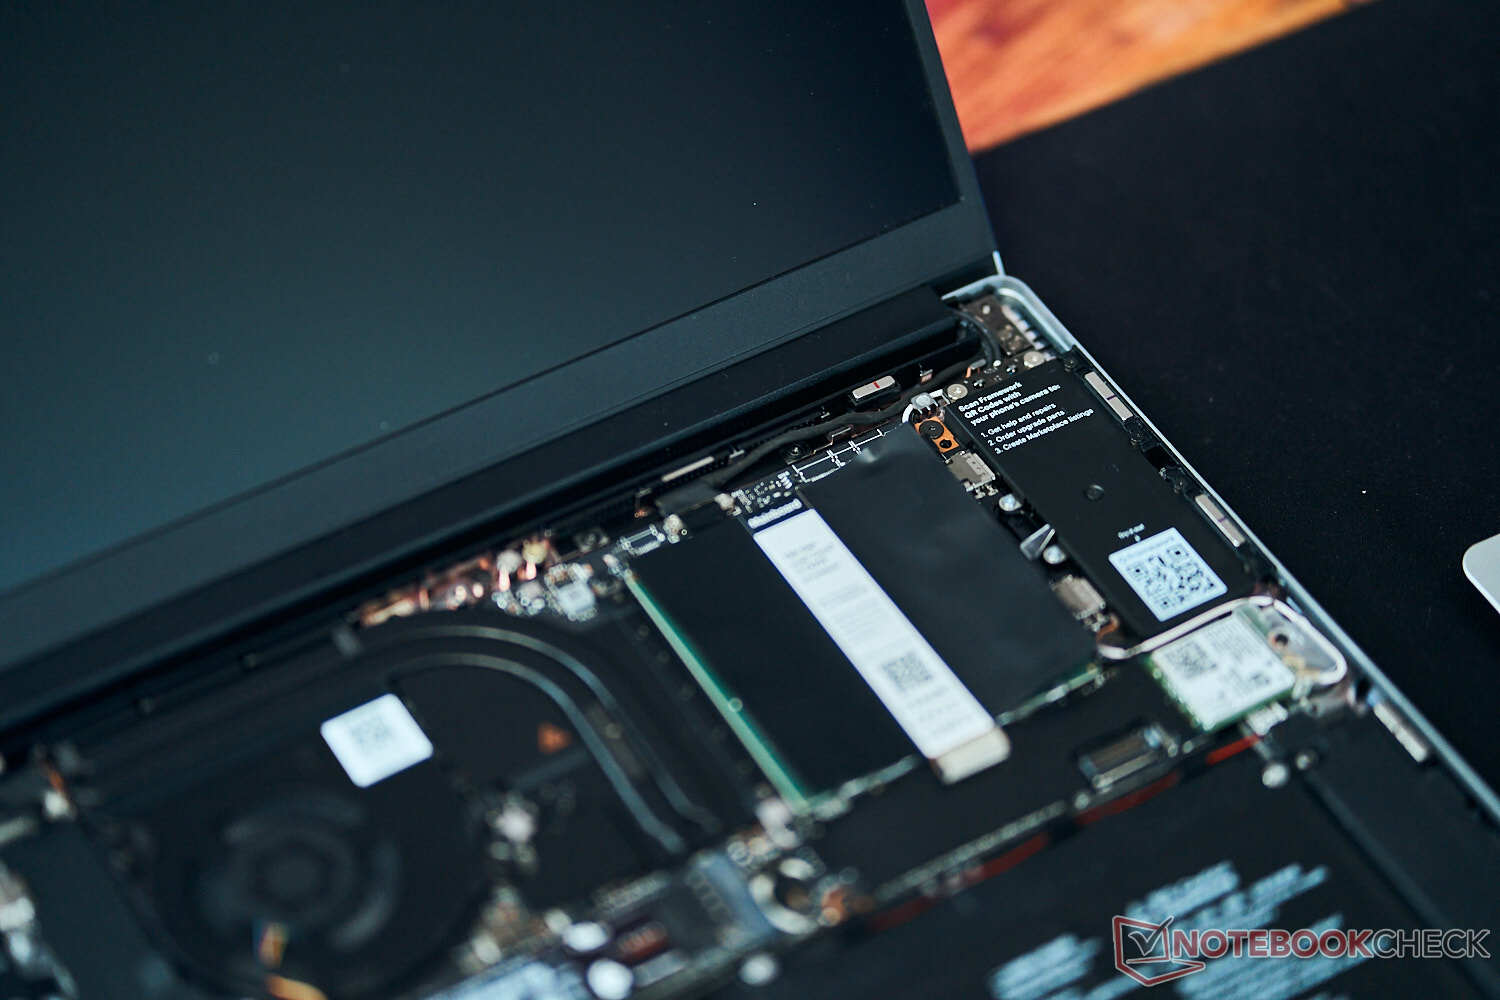
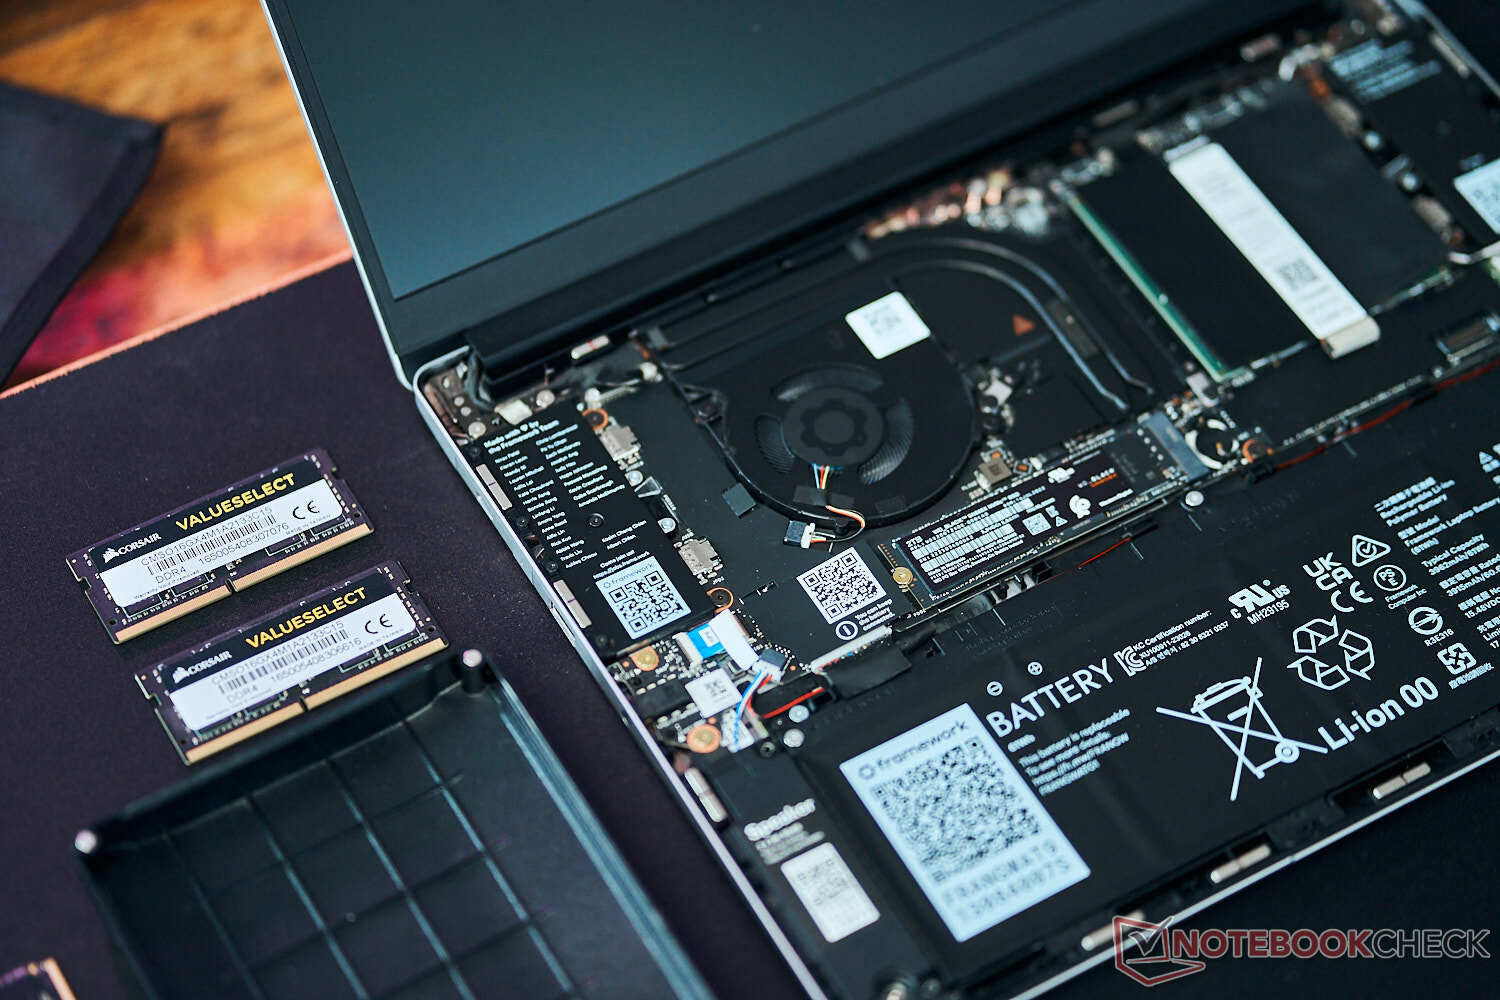
Für eine Öffnung des Gerätes müssen nur fünf Schrauben an der Unterseite entfernt werden. Danach legt man den Laptop auf die linke Seite, öffnet das Display auf volle 180 Grad und hebelt mit eine dünne Kante unter die magnetische Tastatur, um sie zu entfernen. Darunter befindet sich schon das Mainboard, welches auf den Bildern unten zu sehen ist. Man sollte sicher stellen zunächst die schwarzen Flachbandkabel zu entfernen, welche Tastatur und Akku mit dem Mainboard verbinden, bevor man weiter vorgeht.
Das Framework-Design unterscheidet sich von denen der meisten anderen Laptops, hier kann man das Mainboard von oben her warten und muss es nicht erst entfernen, um an die Unterseite zu gelangen.
Zusätzlich zu unserem vor-konfigurierten Modell für diesen Test hat Alex von unserem YouTube-Kanal ein DIY-Set des Framework-Notebooks erhalten. Im folgenden Video erklärt er Schritt-für-Schritt den Zusammenbau des Framework 13.5:
Es braucht lediglich den beiliegenden T5-Schraubendreher, um den Laptop komplett auseinander zu nehmen. Für andere Laptops benötigt man hingegen oft gleich mehrere Tools. Nachteil ist, dass man sich hier genau merken muss, welche Schraube wohin gehört, denn es gibt gleich zwei Dutzend davon in unterschiedlichen Größen. Würde der Hersteller jetzt noch einen Weg finden die Schrauben farblich zu markieren und gleichzeitig deren Anzahl zu reduzieren, dann wäre die Wartung noch einfacher.
Um das Display-Panel auszutauschen, muss zunächst der magnetisch haftende Displayrand entfernt werden, um alle vier Schrauben in den Ecken freizulegen. Danach entfernt man die vier Schrauben sowie des Flachbandkabel unten links. Trotz der einfachen Vorgehensweise bietet Framework aktuell leider keine alternativen Displayoptionen an.
Das Kühlsystem fällt, verglichen mit anderen Laptops wie dem HP Spectre x360 13.5 oder dem Asus Zenbook S 13, vergleichsweise klein aus. Die Konkurrenten setzen für gewöhnlich Dual-Lüfter in symmetrischen Layouts ein. Das hat einen direkten Einfluss auf die Temperaturen und das Betriebsgeräusch des Framework, wie wir weiter unten zeigen.
Zubehör und Garantie
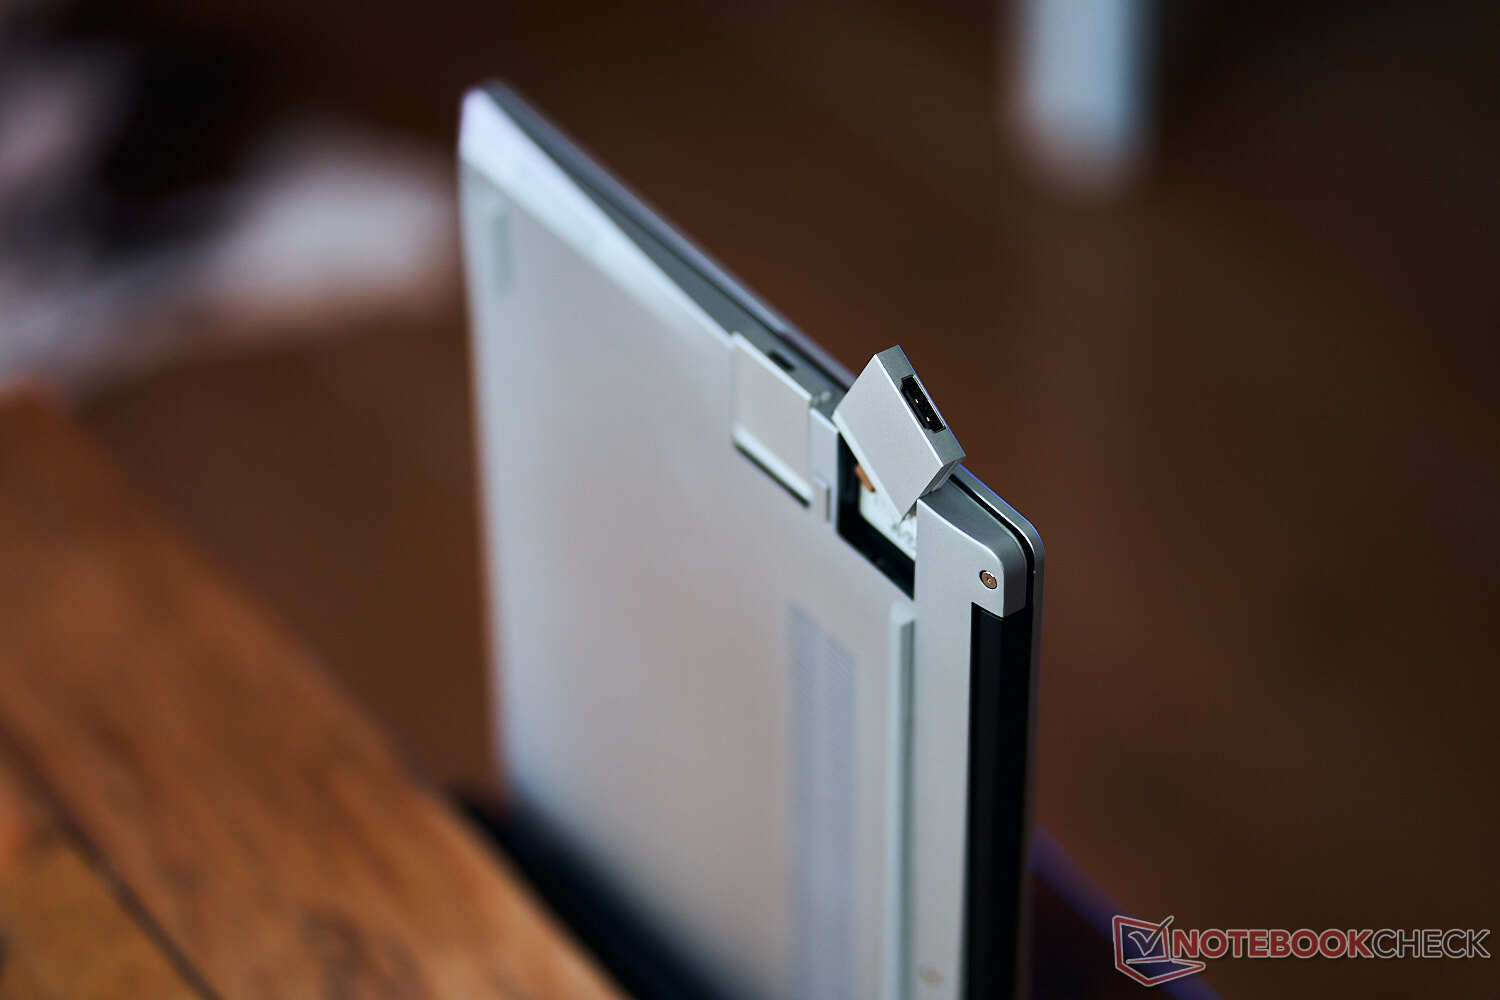
Erweiterungskarten für die Anschlüsse gehören nicht zum Standardpreis und müssen an der Kasse zusätzlich hinzugefügt werden. Die Karten rangieren preislich zwischen 10 (z.B. USB-Port) und 160 Euro (1 TB Speicherkarte), je nach Auswahl. Neu sind in diesem Jahr die SSD-Erweiterungskarten, mit denen man mal eben schnell 1 TB an Speicher per USB-C-Port hinzufügt.
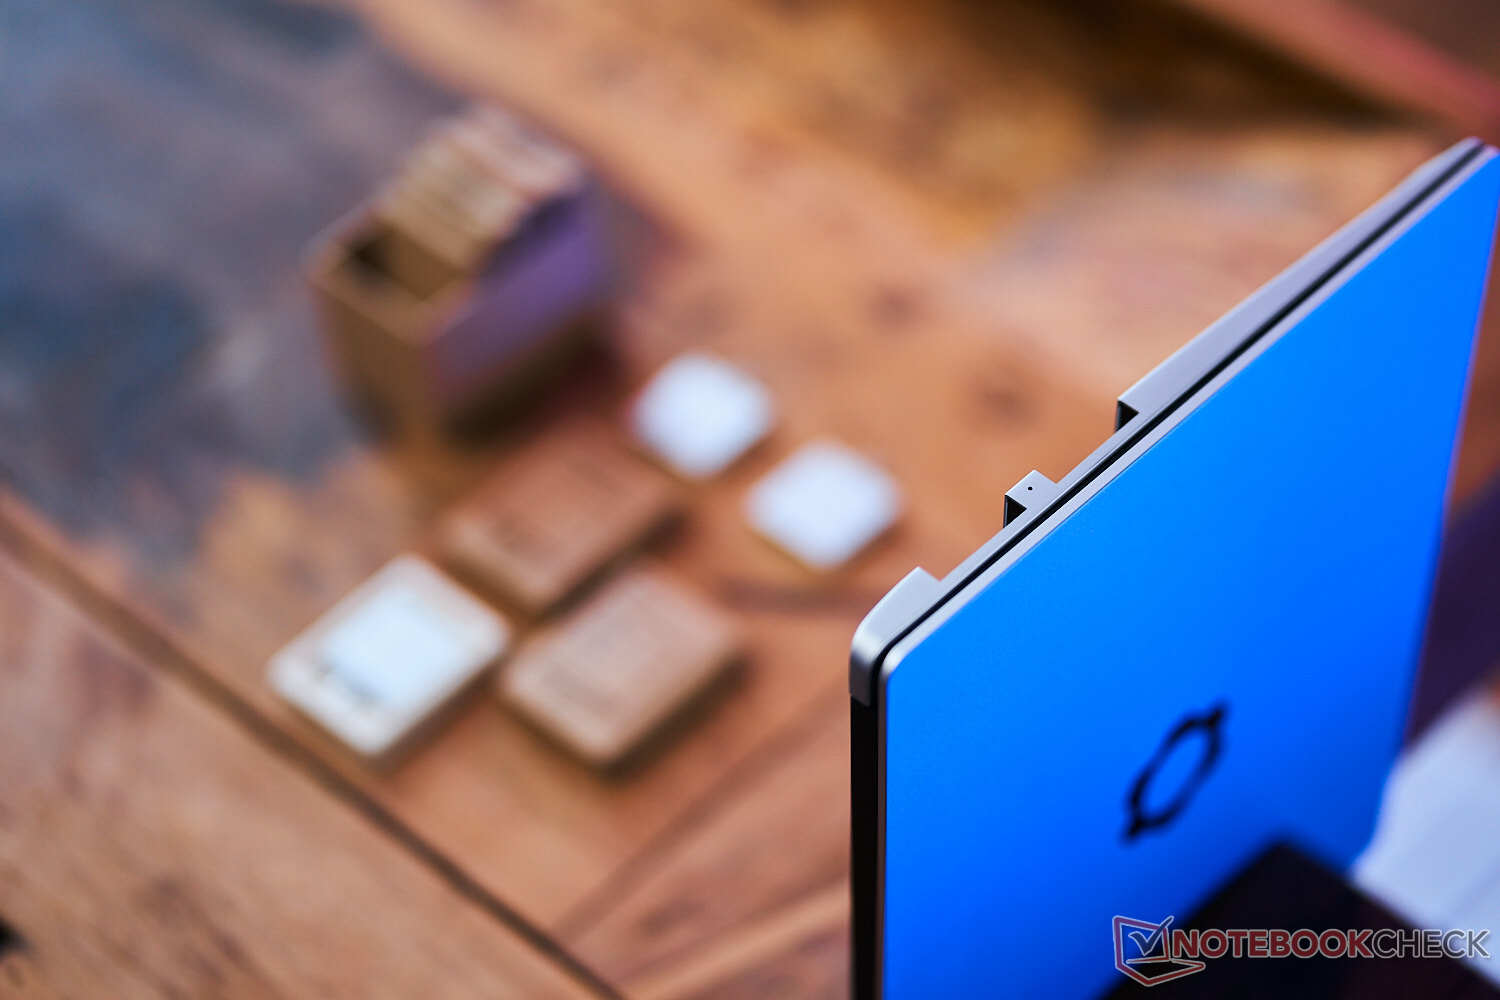
Framework versendet nun auch die zweite Generation an HDMI- und DisplayPort-Erweiterungen, welche die Form der ersten Generation beibehalten. Aber Gen2 erlaubt es dem Laptop länger im Low-Power-Zustand zu verweilen wenn externe Monitore verbunden sind. Das sollte einige der Sleep- und Verbrauchsprobleme lösen, von denen einige Kunden zuvor berichtet hatten. Der Hersteller sagt, dass immerhin die Gen1-DisplayPort-Karten leicht durch ein Firmwareupdate auf Gen2 gebracht werden können, allerdings brauchen die Gen1-HDMI-Karten einen Hardwaretausch. Leider gibt es kein Trade-in-Programm für Nutzer der Gen1-HDMI-Karten. Nutzer können die erste von der zweiten Generation leicht unterscheiden, wenn sie nach dem blauen Punkt auf den Karten der zweiten Generation Ausschau halten.
Unabhängig vom Baujahr oder Generation sind alle Erweiterungskarten mit allen 13,5-Zoll-Framework-Laptops kompatibel. So ist die Upgrade-Tauglichkeit von älteren Maschinen auch weiter garantiert. Dennoch muss man zumindest das gesamte Mainboard tauschen, wenn man den Prozessor auf Gen13 wechseln möchte und es reicht leider auch kein reiner Mainboardtausch, wenn man von Intel auf AMD wechseln möchte.
Als Garantie sieht Framework nur ein Jahr vor, während große Hersteller wie Dell oder Lenovo für ihre High-End-Business-Laptops oftmals drei Jahre anbieten.
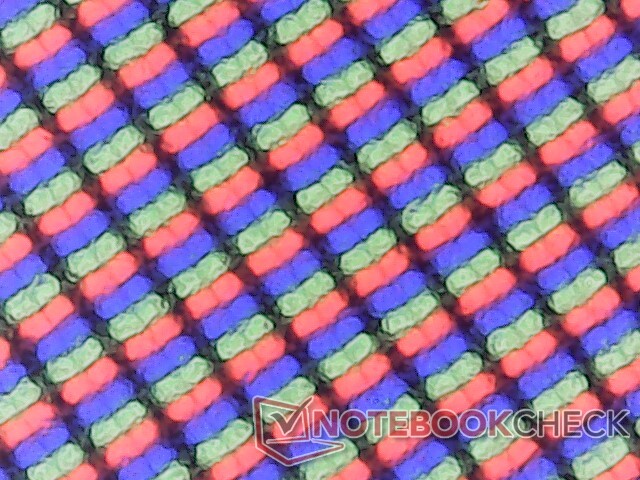
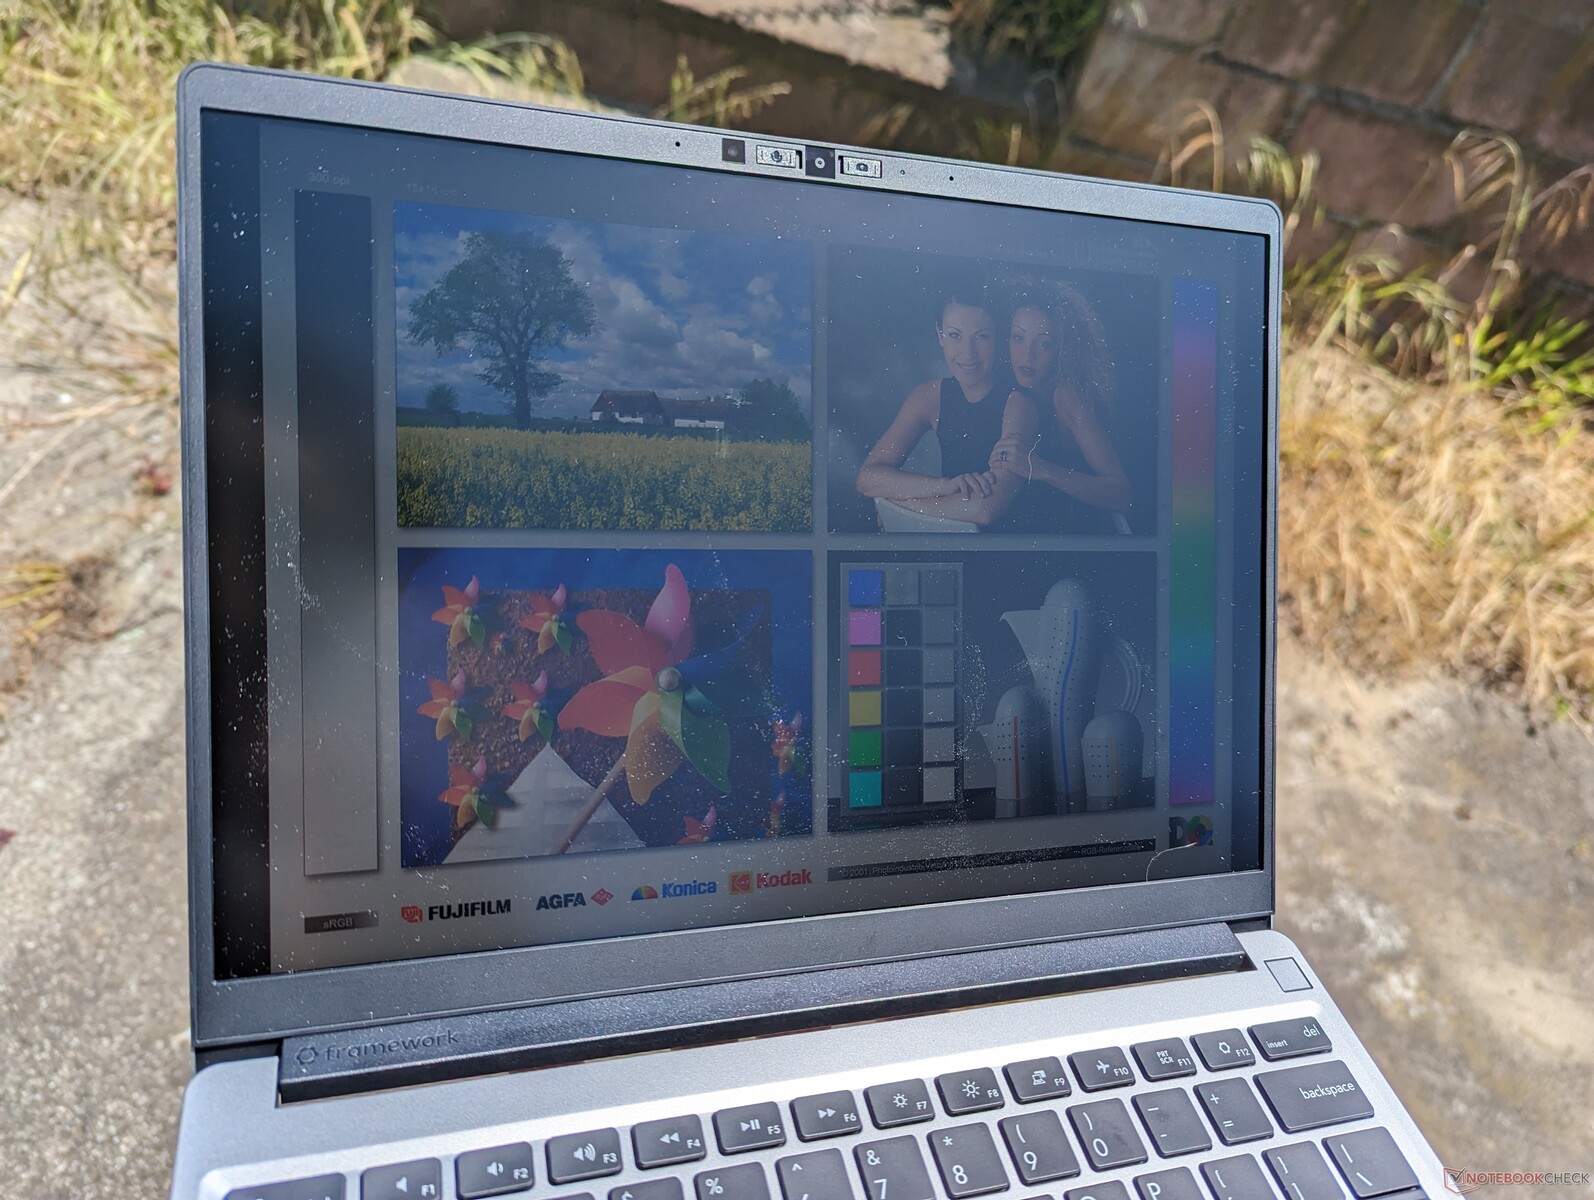
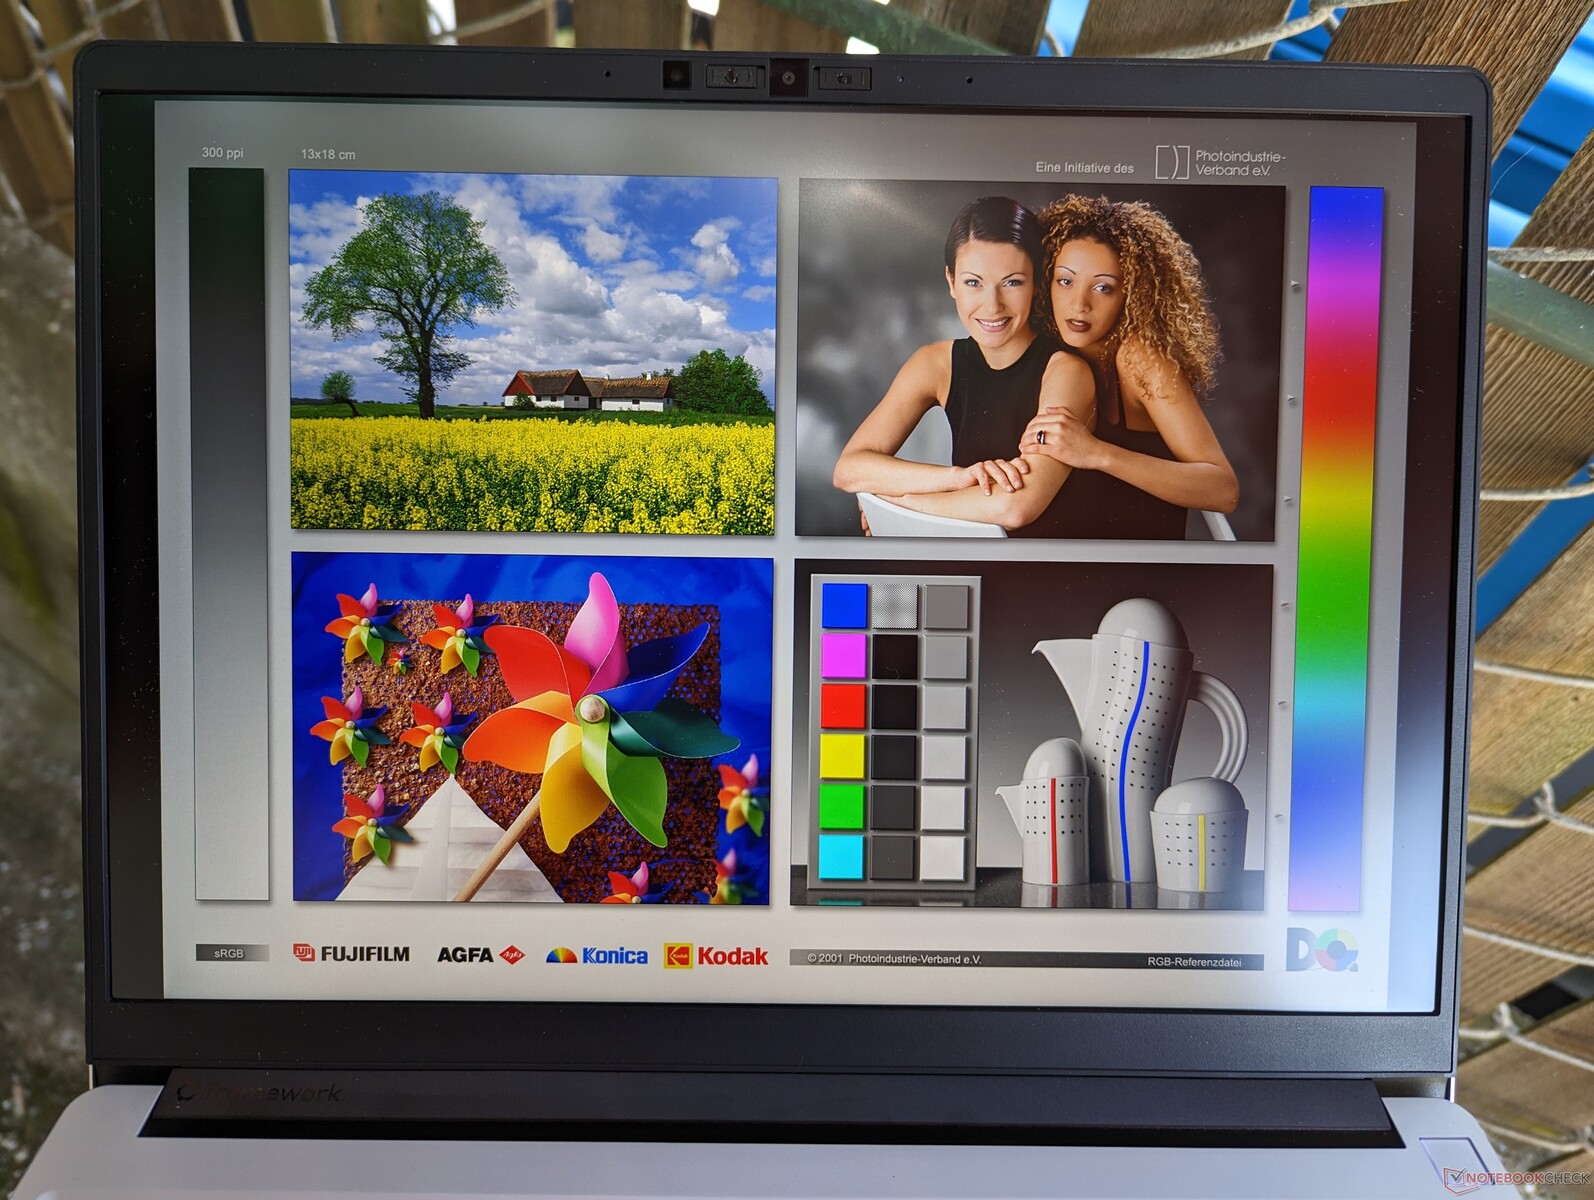
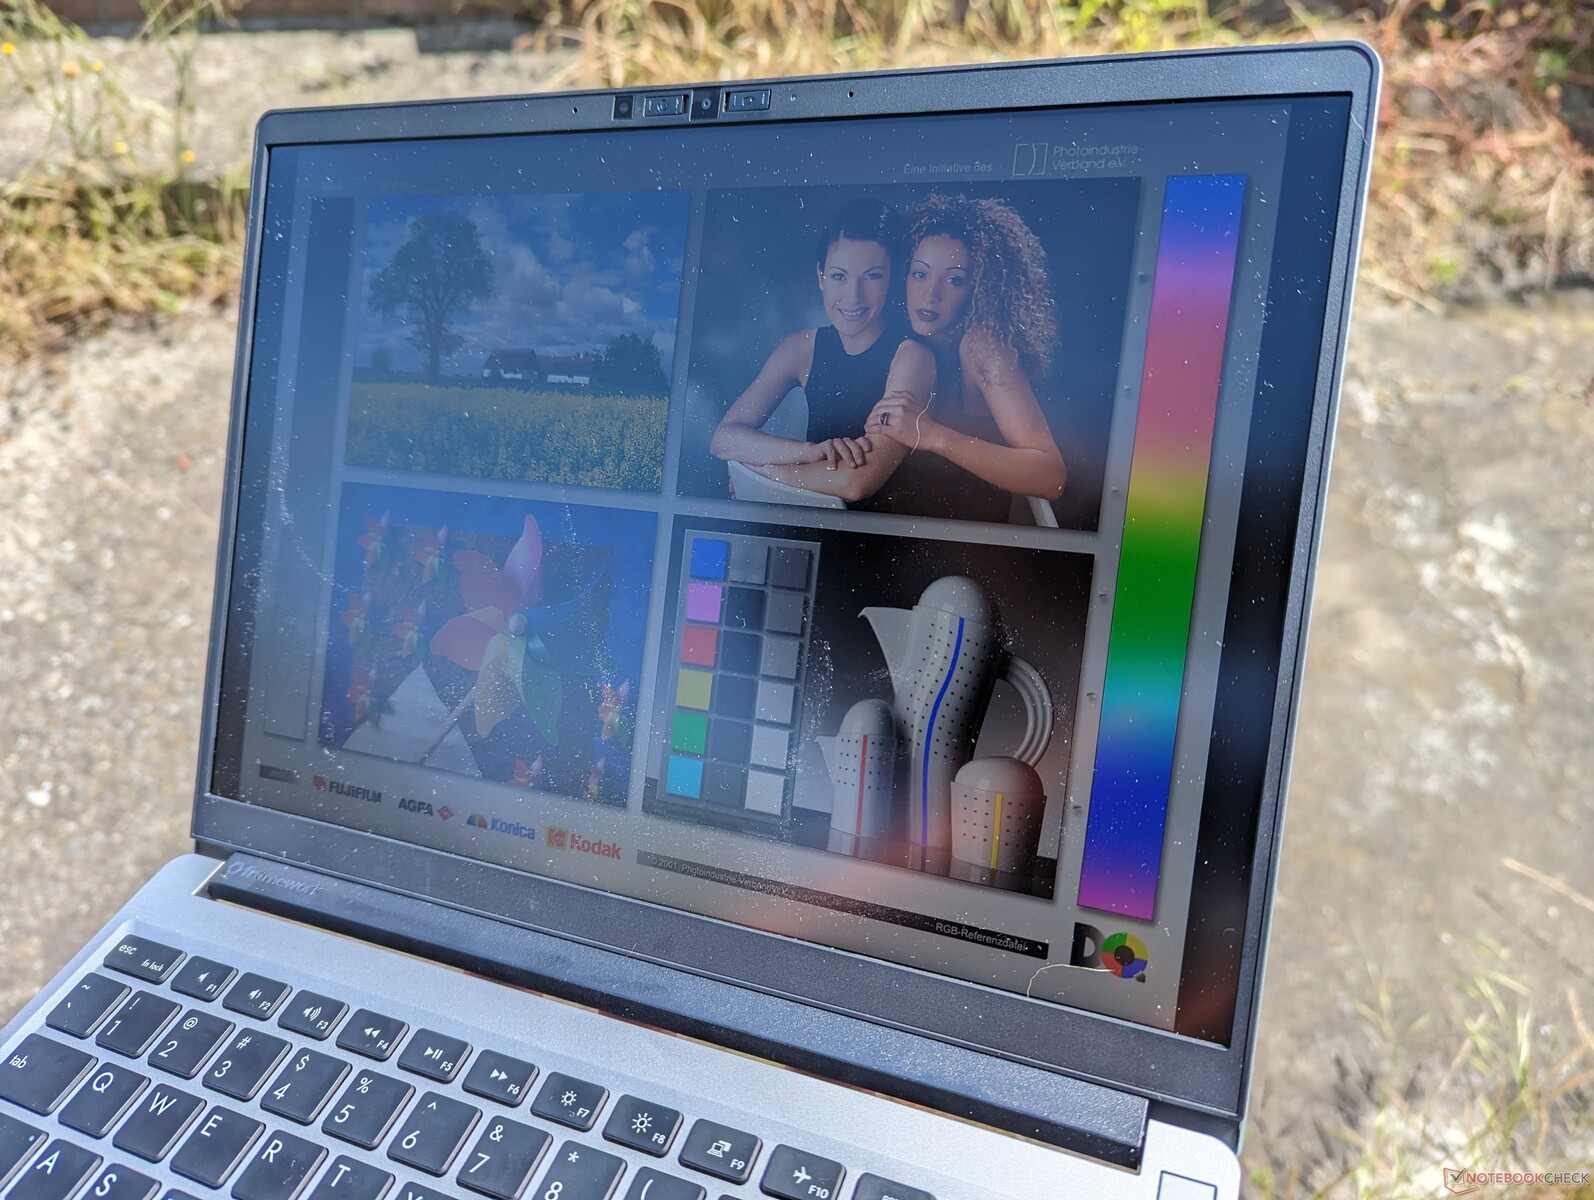
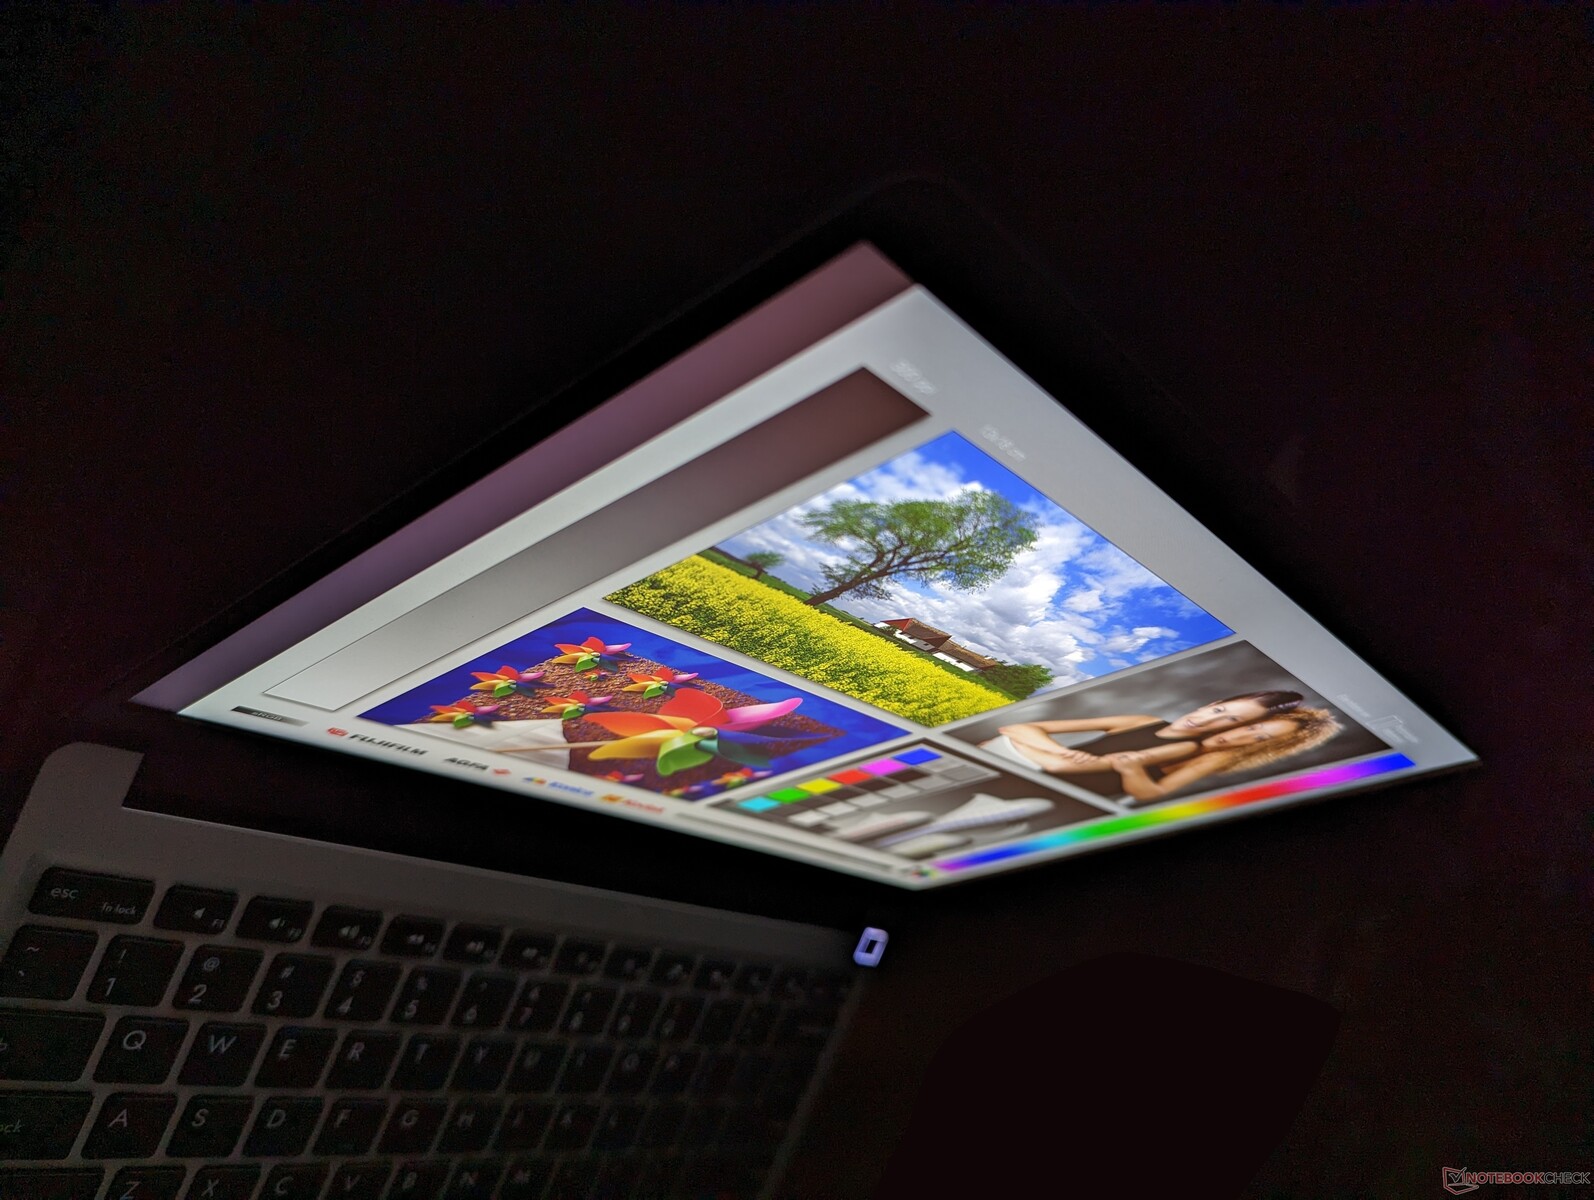
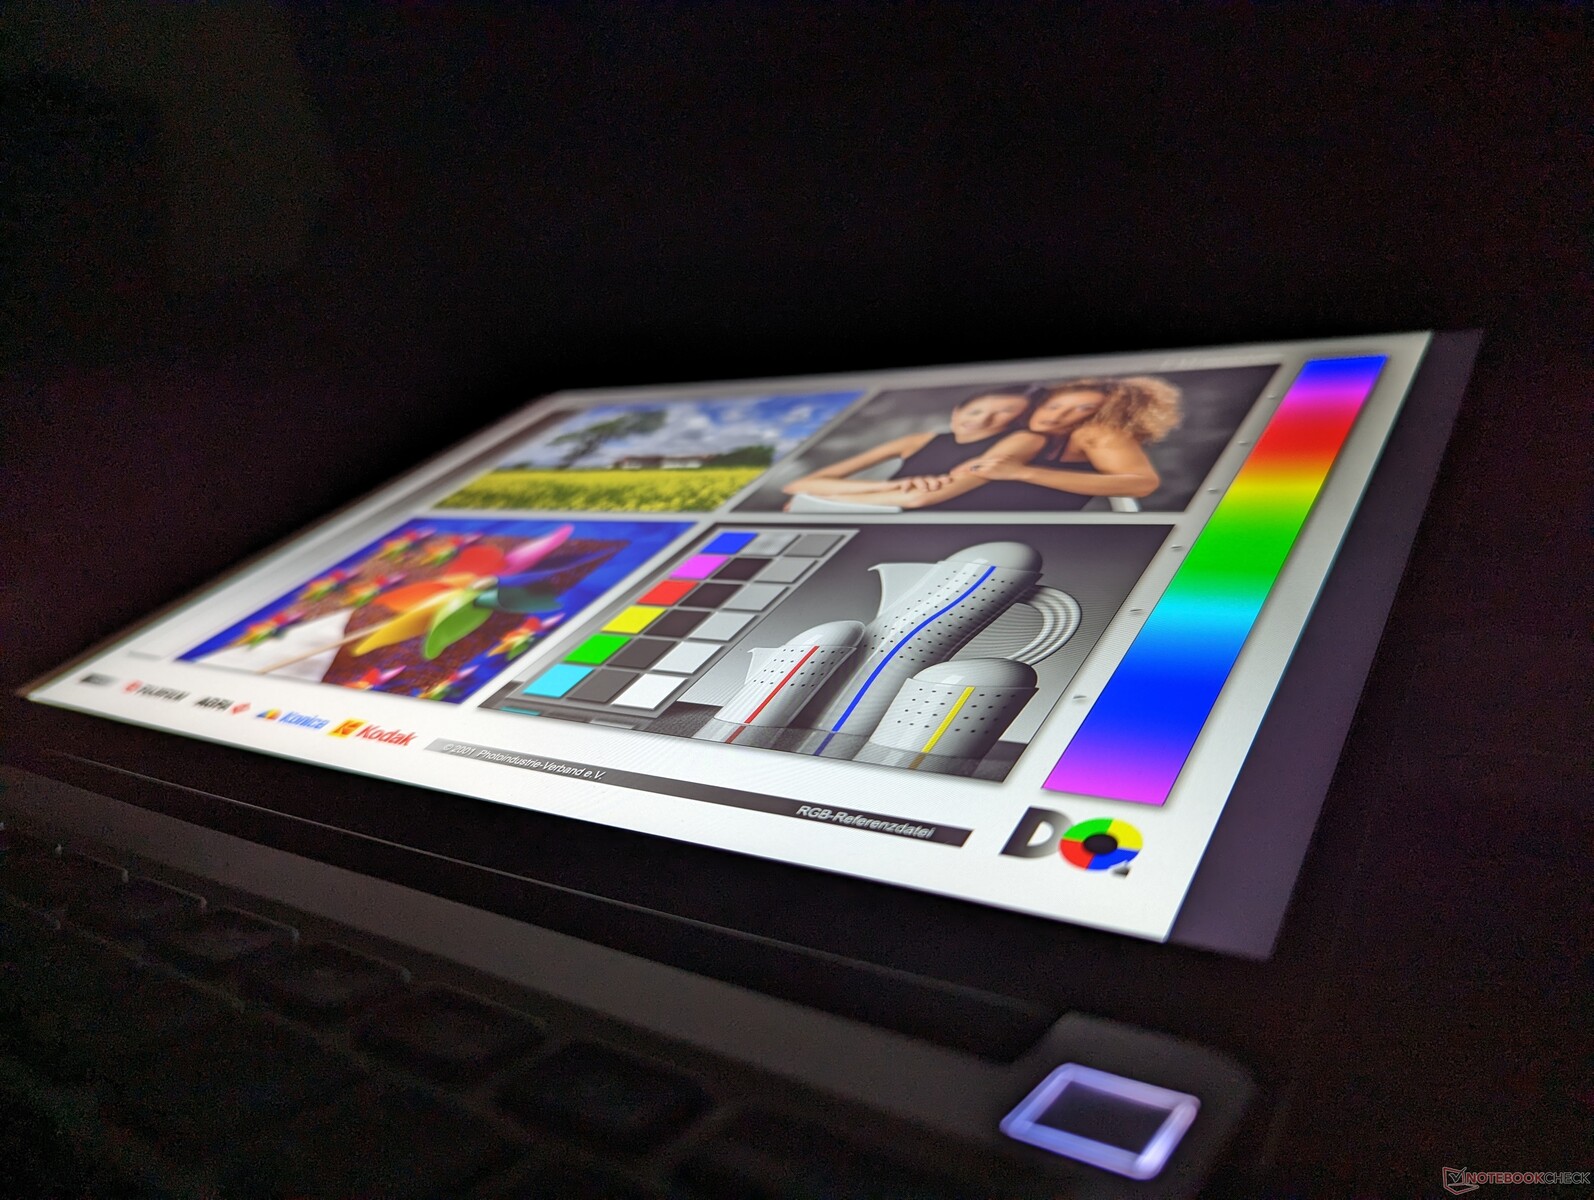
Display — IPS mit nur 60 Hz
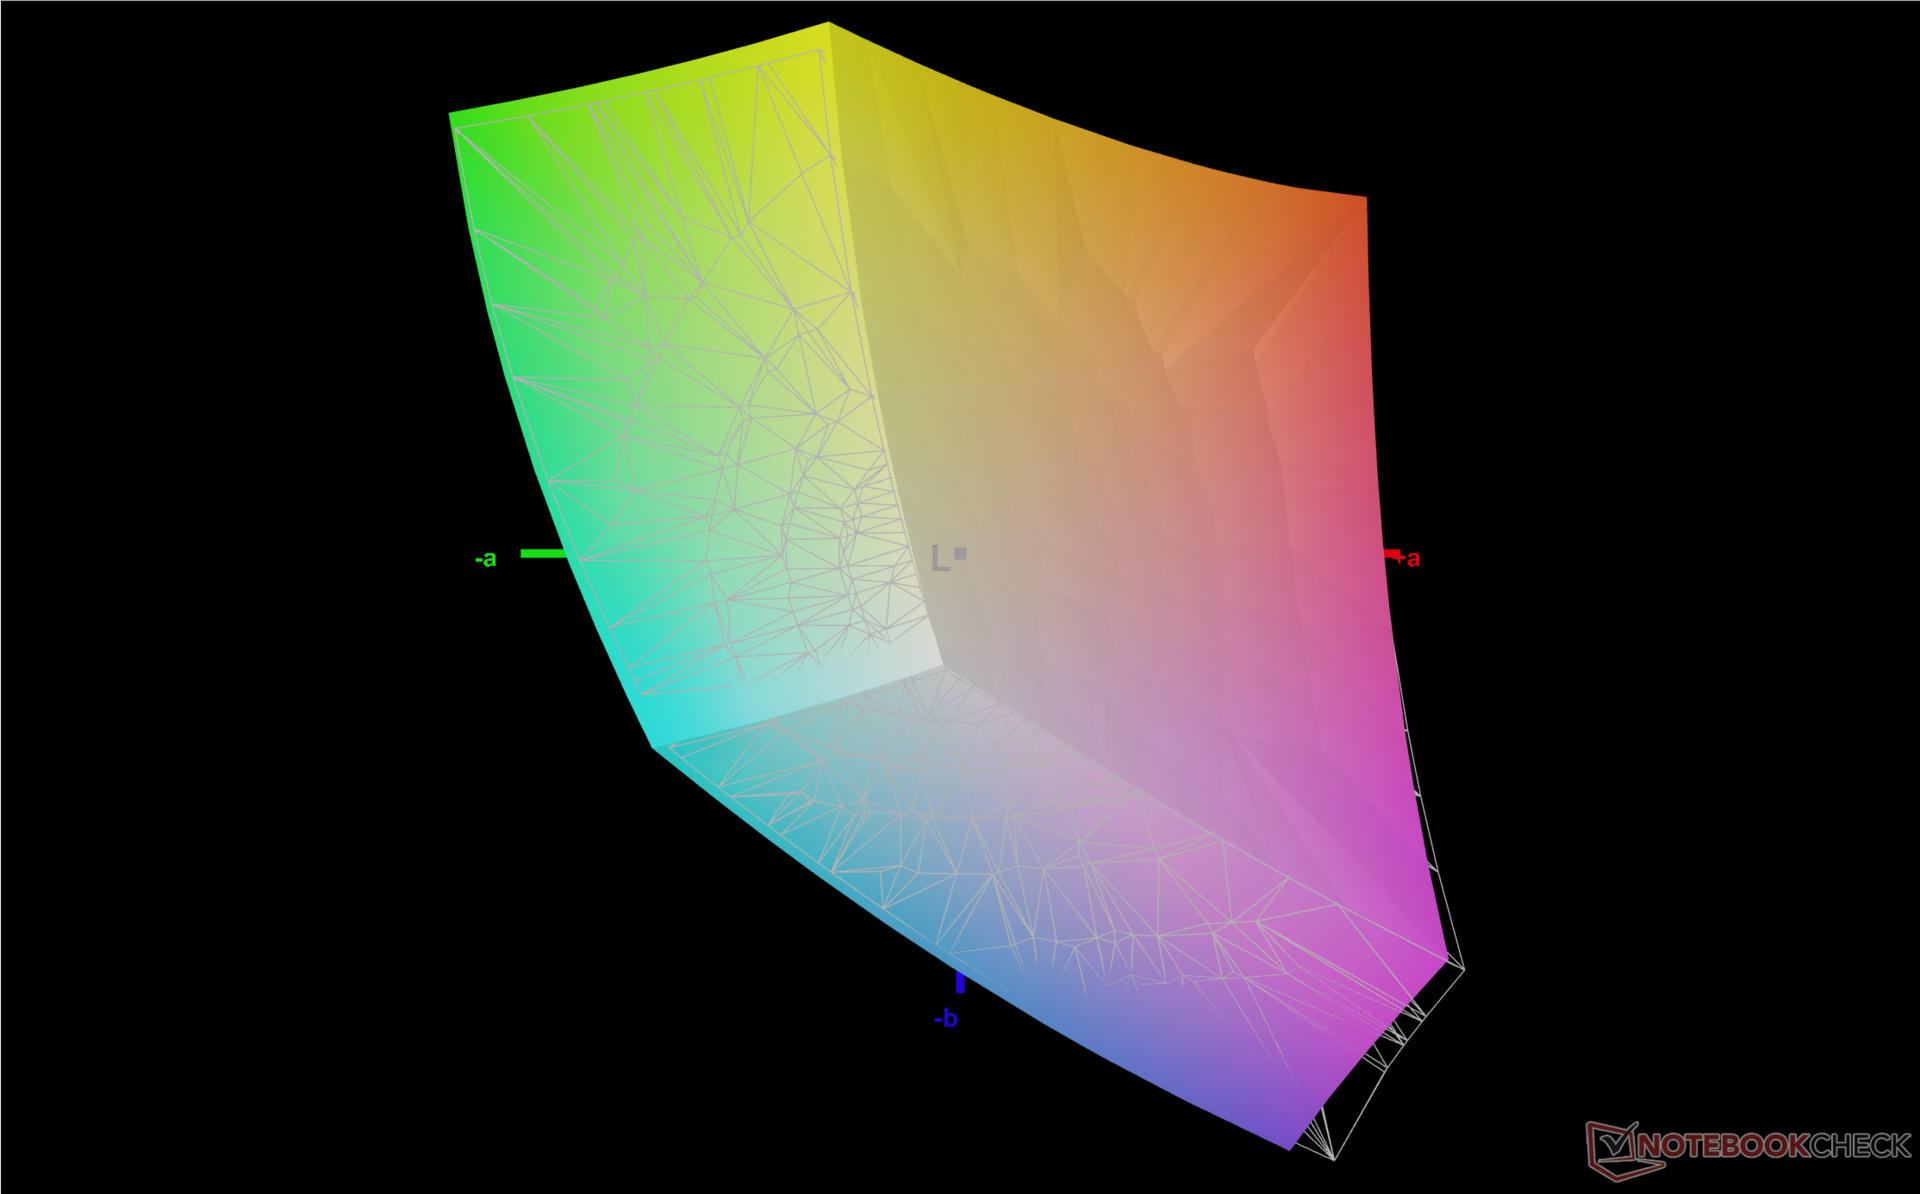
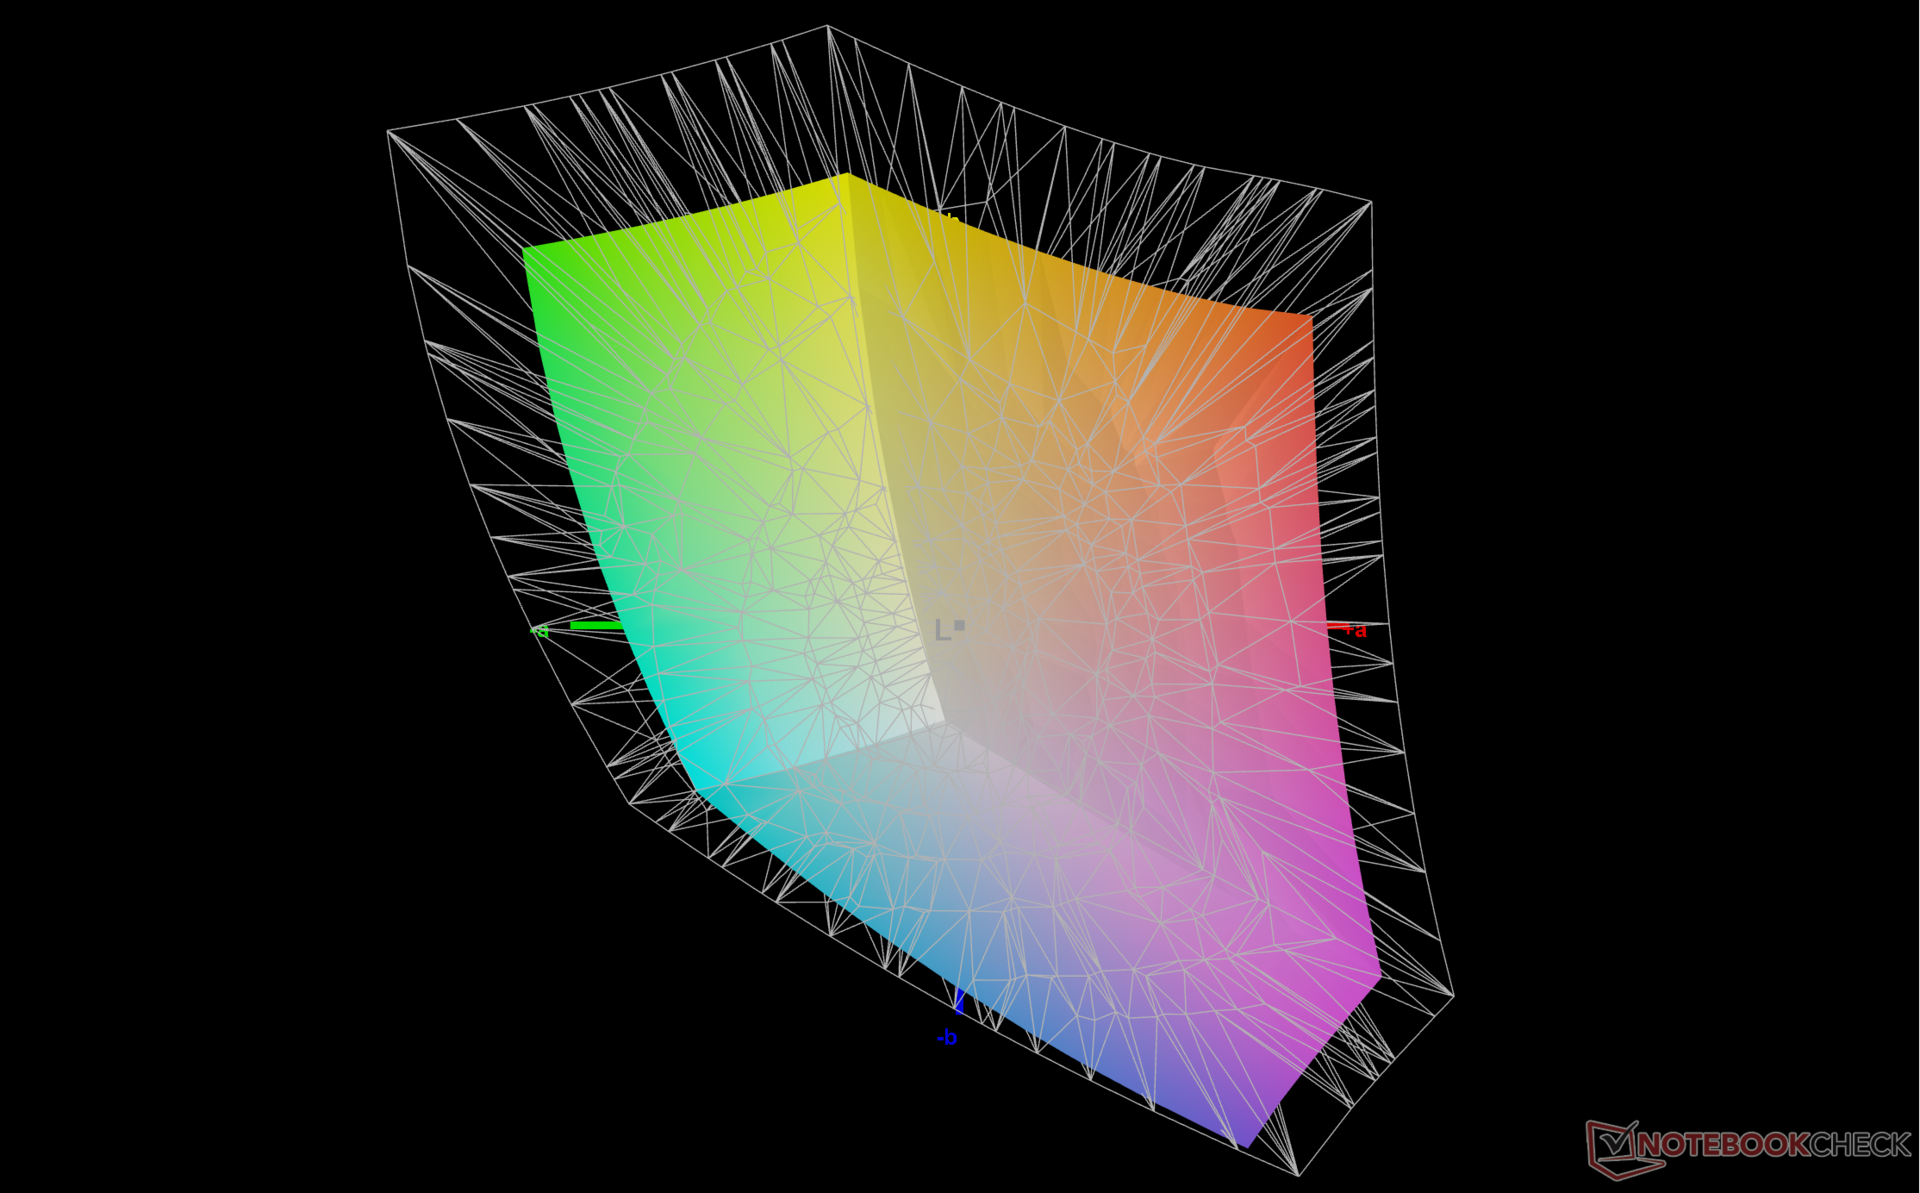
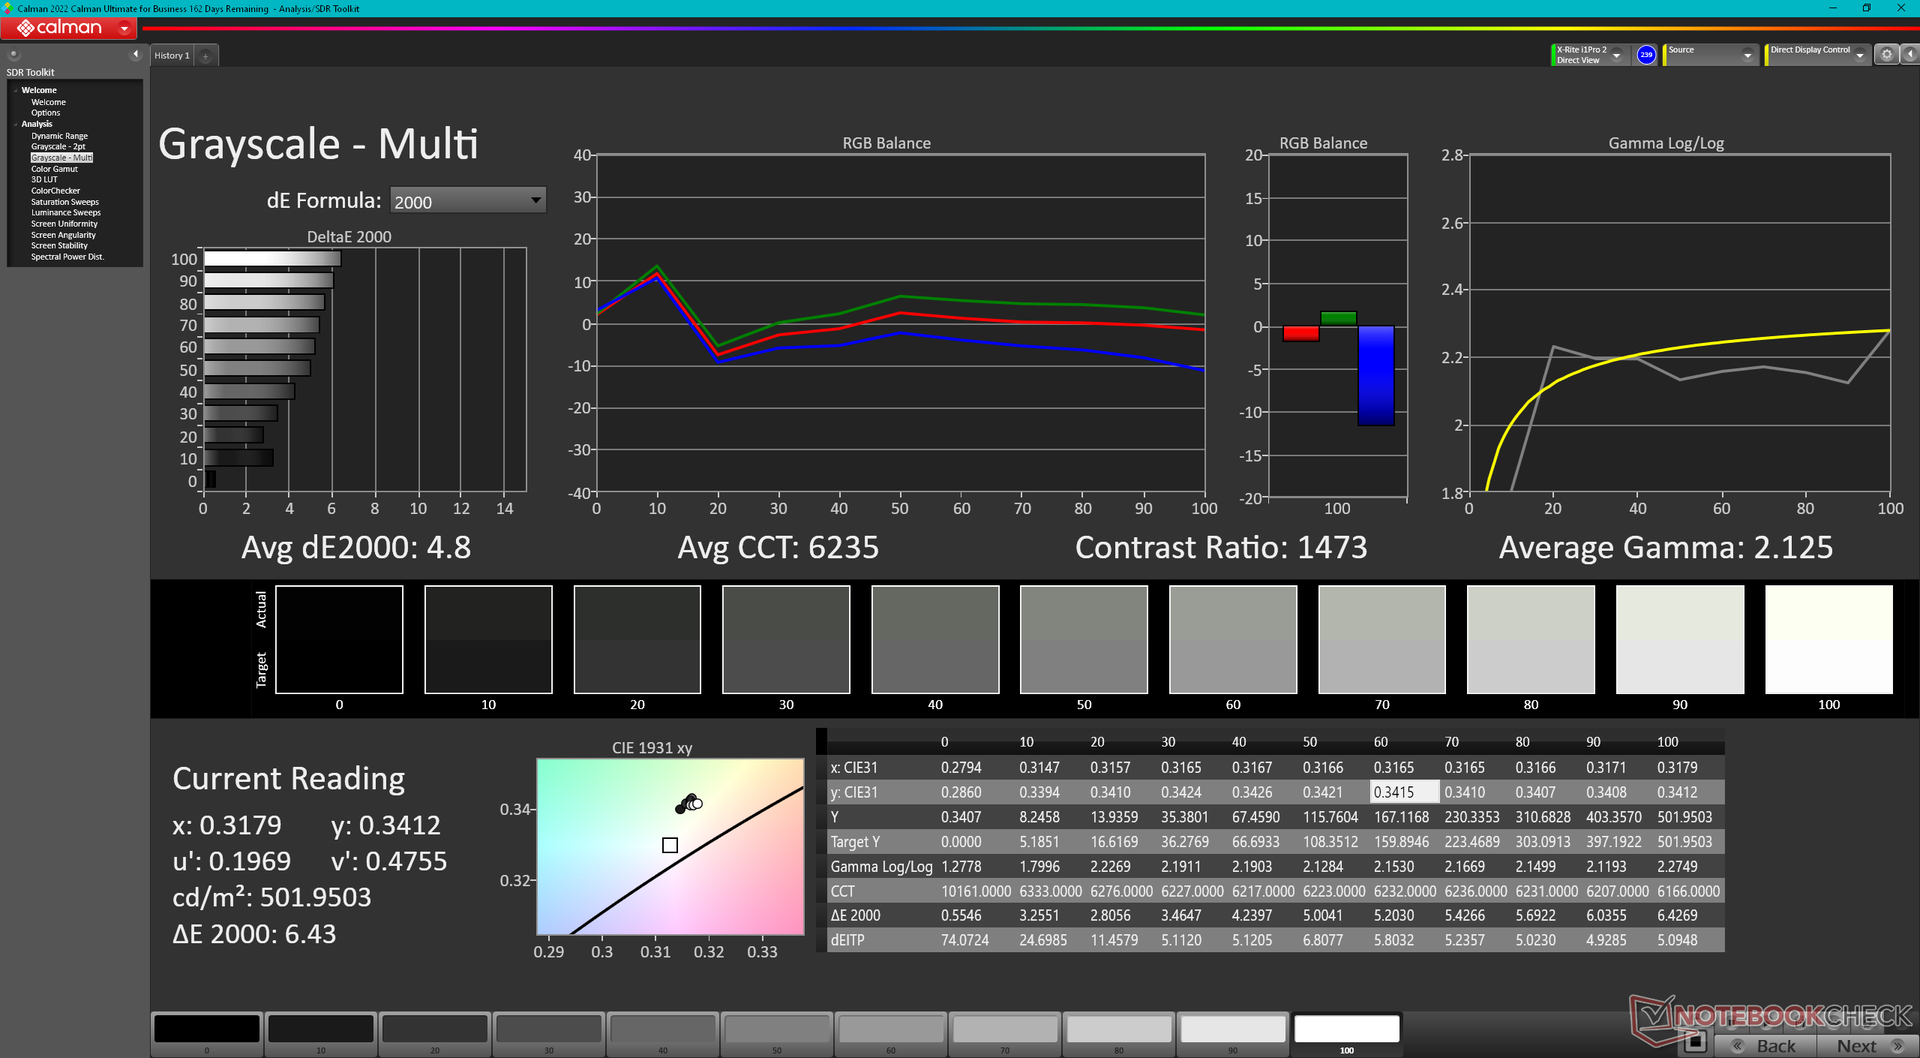
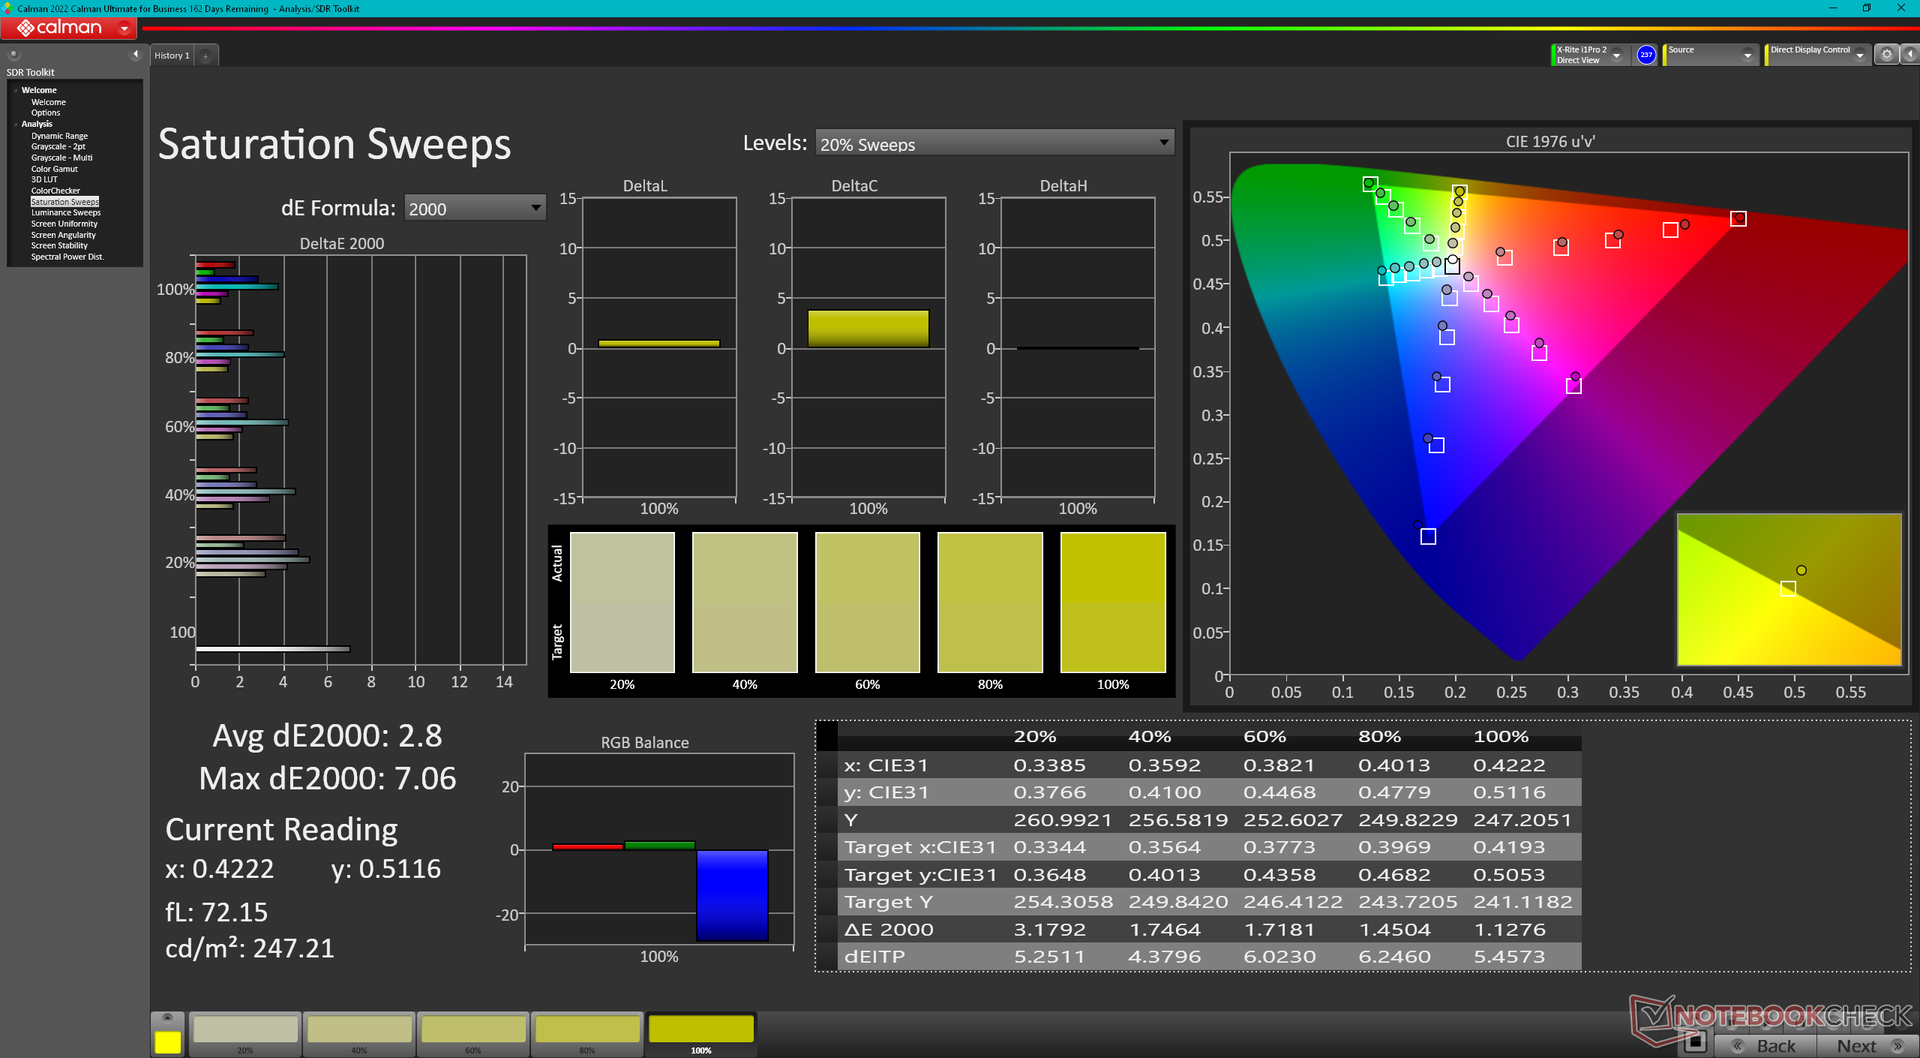
Das 2023er Modell verwendet das gleiche BOE-CQ-NE135FBM-N41-IPS-Panel wie die Modelle aus den Jahren 2022 und 2021, andere Optionen gibt es leider nicht. Derweil werden Konkurrenten wie das HP Spectre x360 13.5 oder das Asus Zenbook S 13 mit OLED-Displays ausgeliefert und bieten eine farbstärkere Darstellung. Zwar ist das BOE-Panel nicht schlecht, Grafikdesigner oder Editoren mit Verwendung für AdobeRGB oder DCI P3 müssen sich derzeit aber auch abseits der Framework-Serie umschauen.
| |||||||||||||||||||||||||
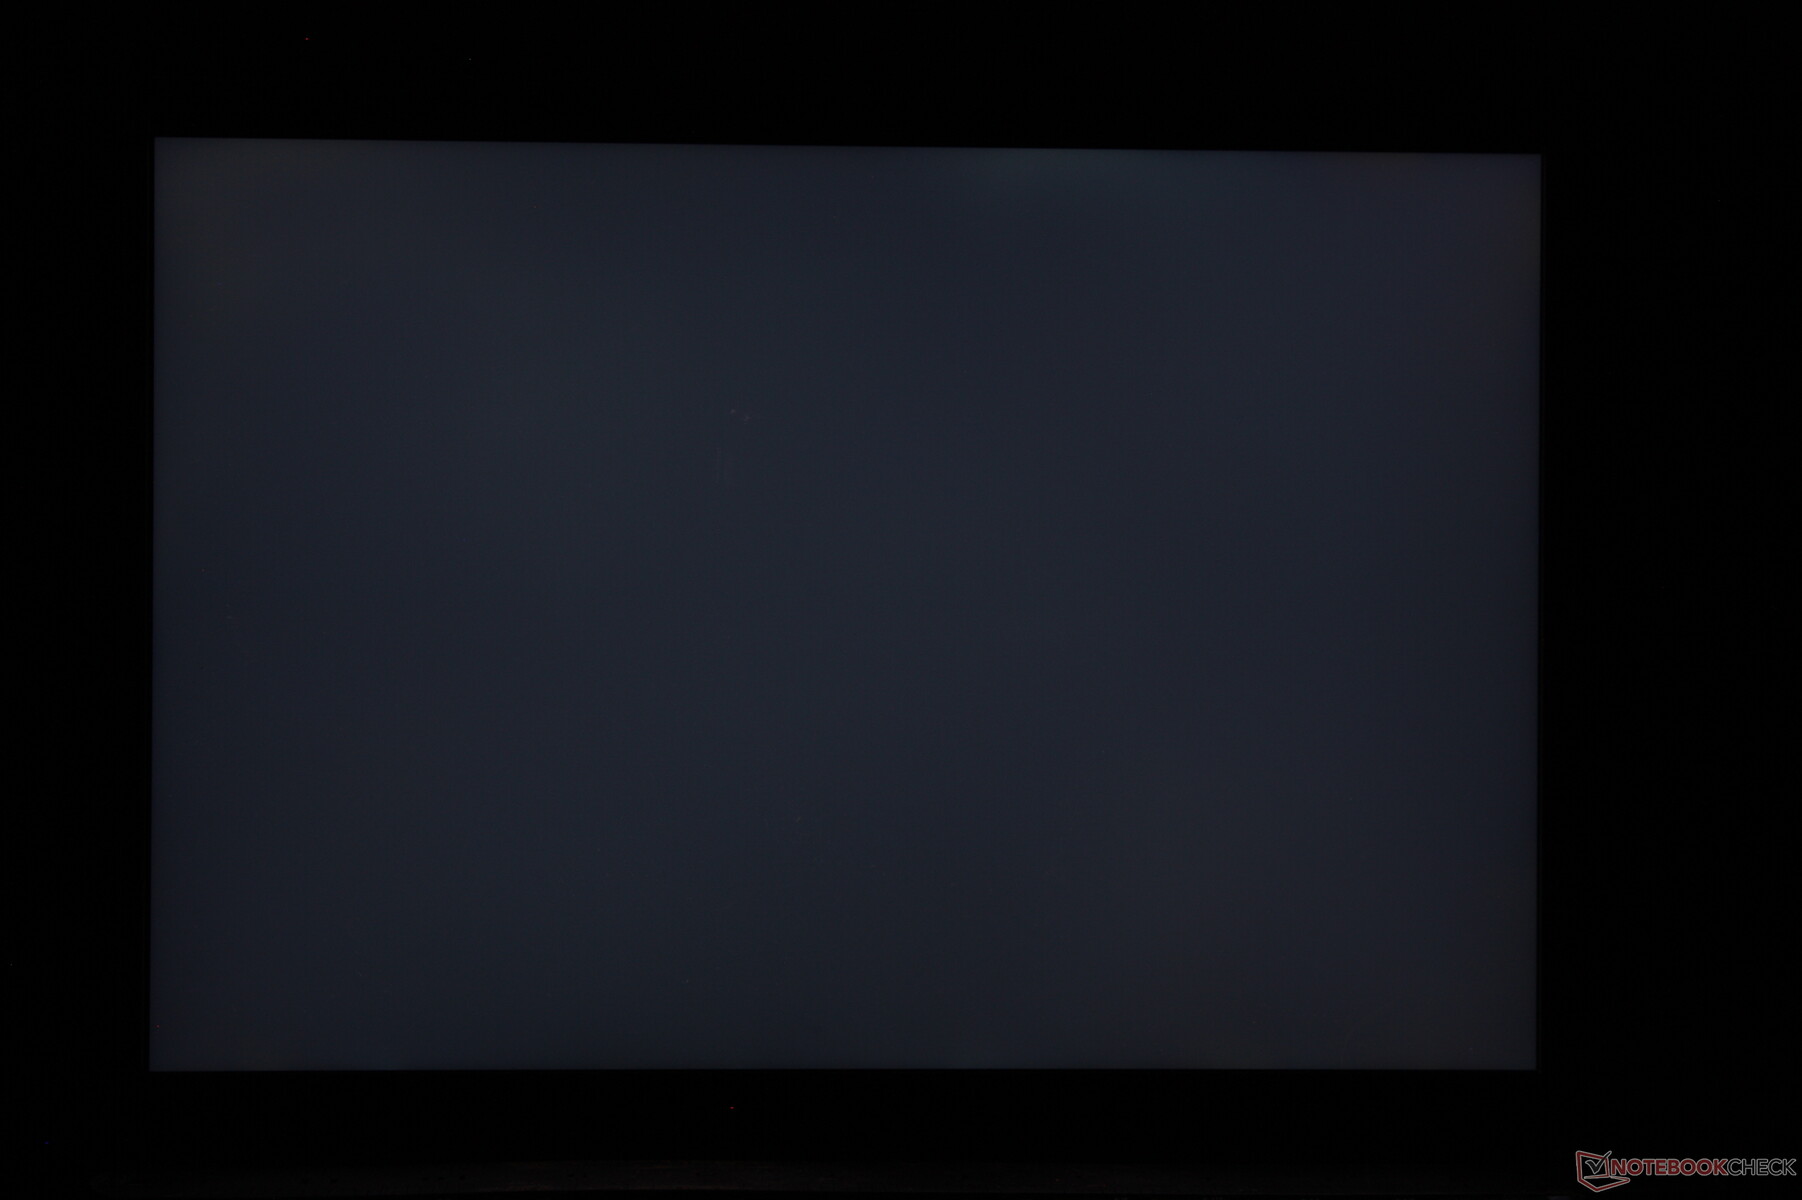
Ausleuchtung: 87 %
Helligkeit Akku: 503 cd/m²
Kontrast: 1397:1 (Schwarzwert: 0.36 cd/m²)
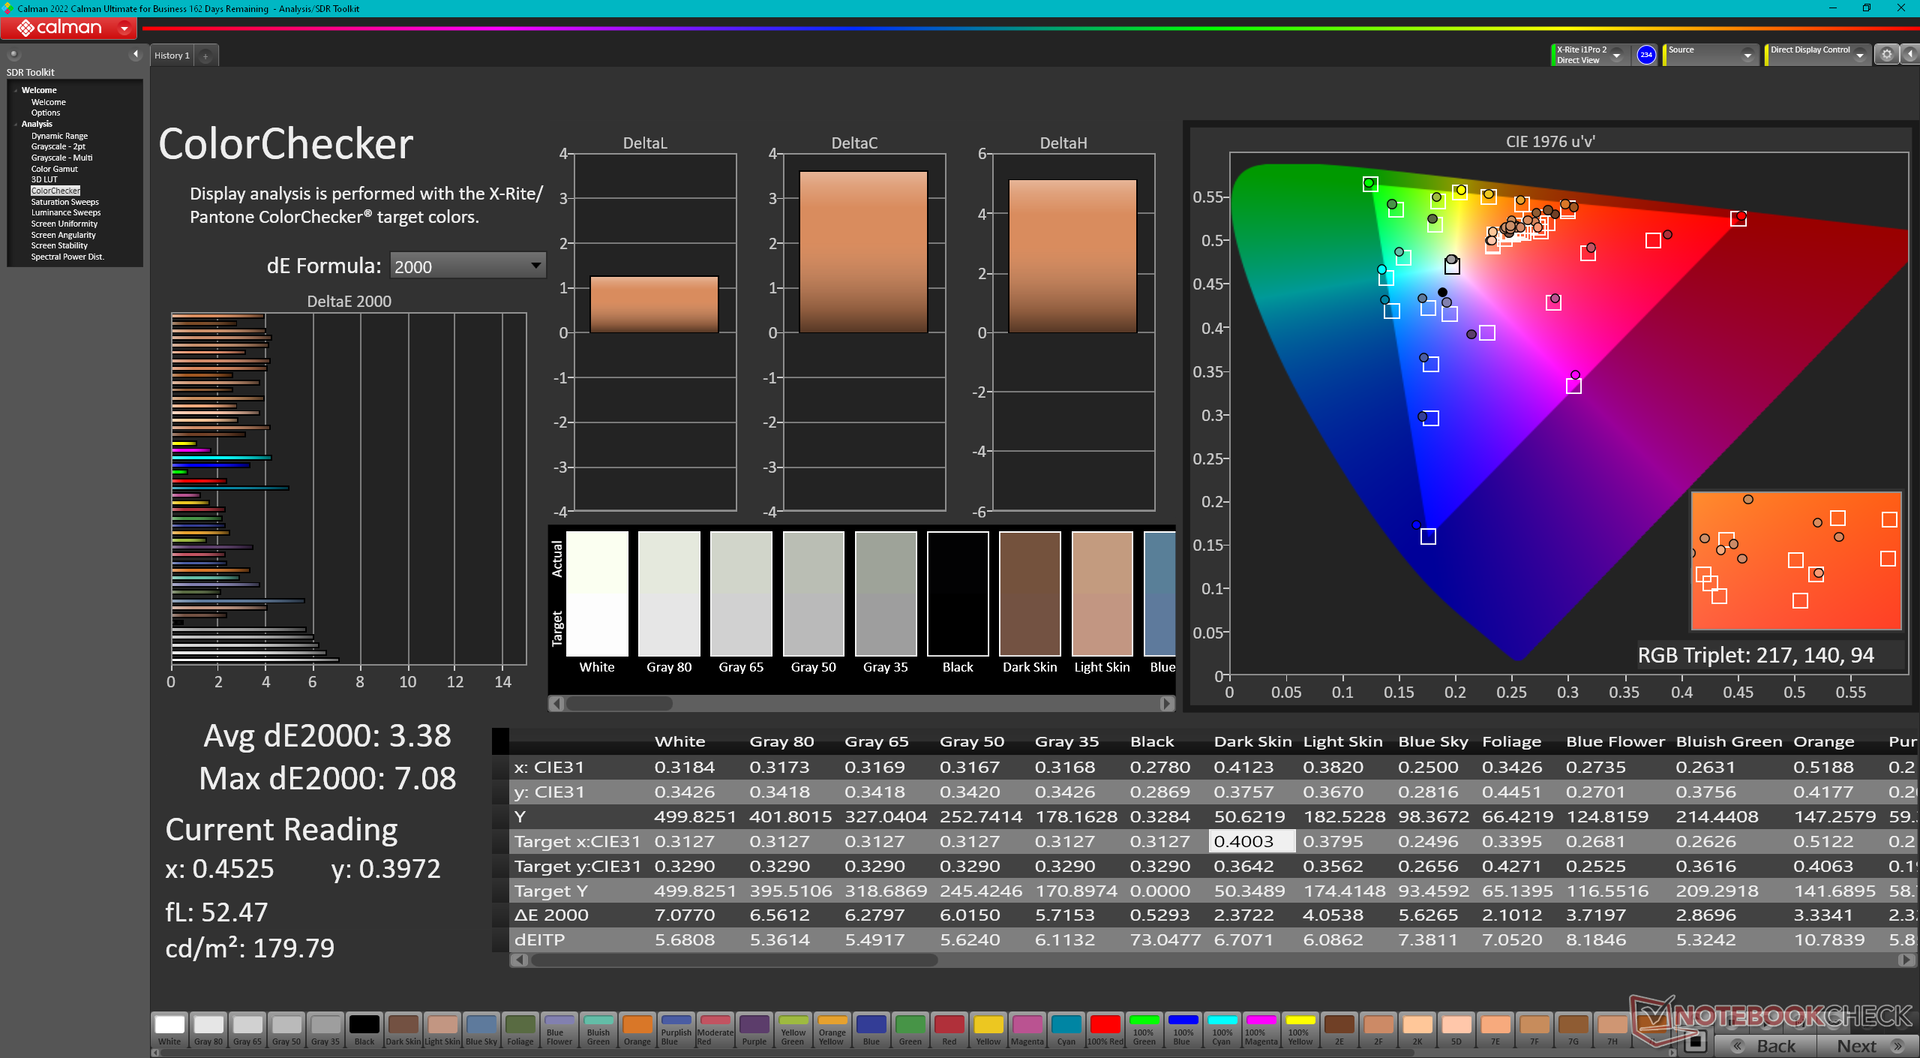
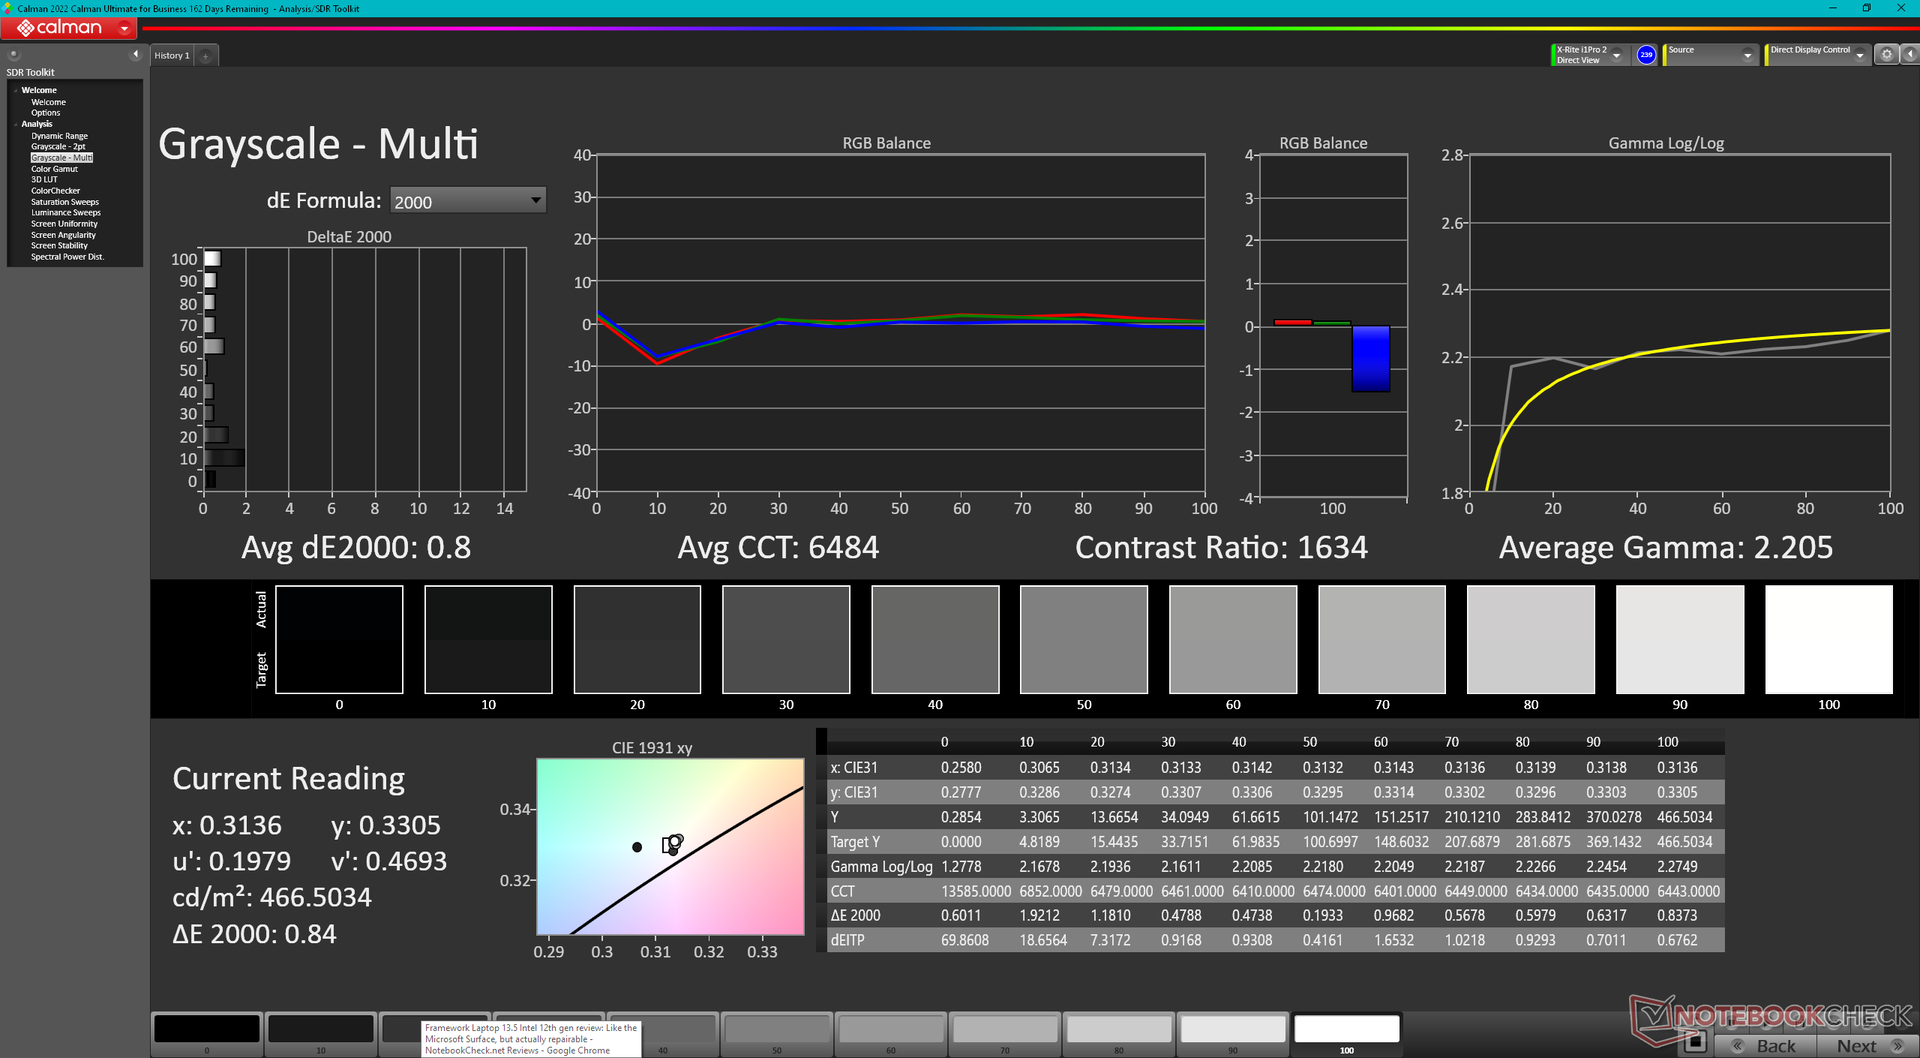
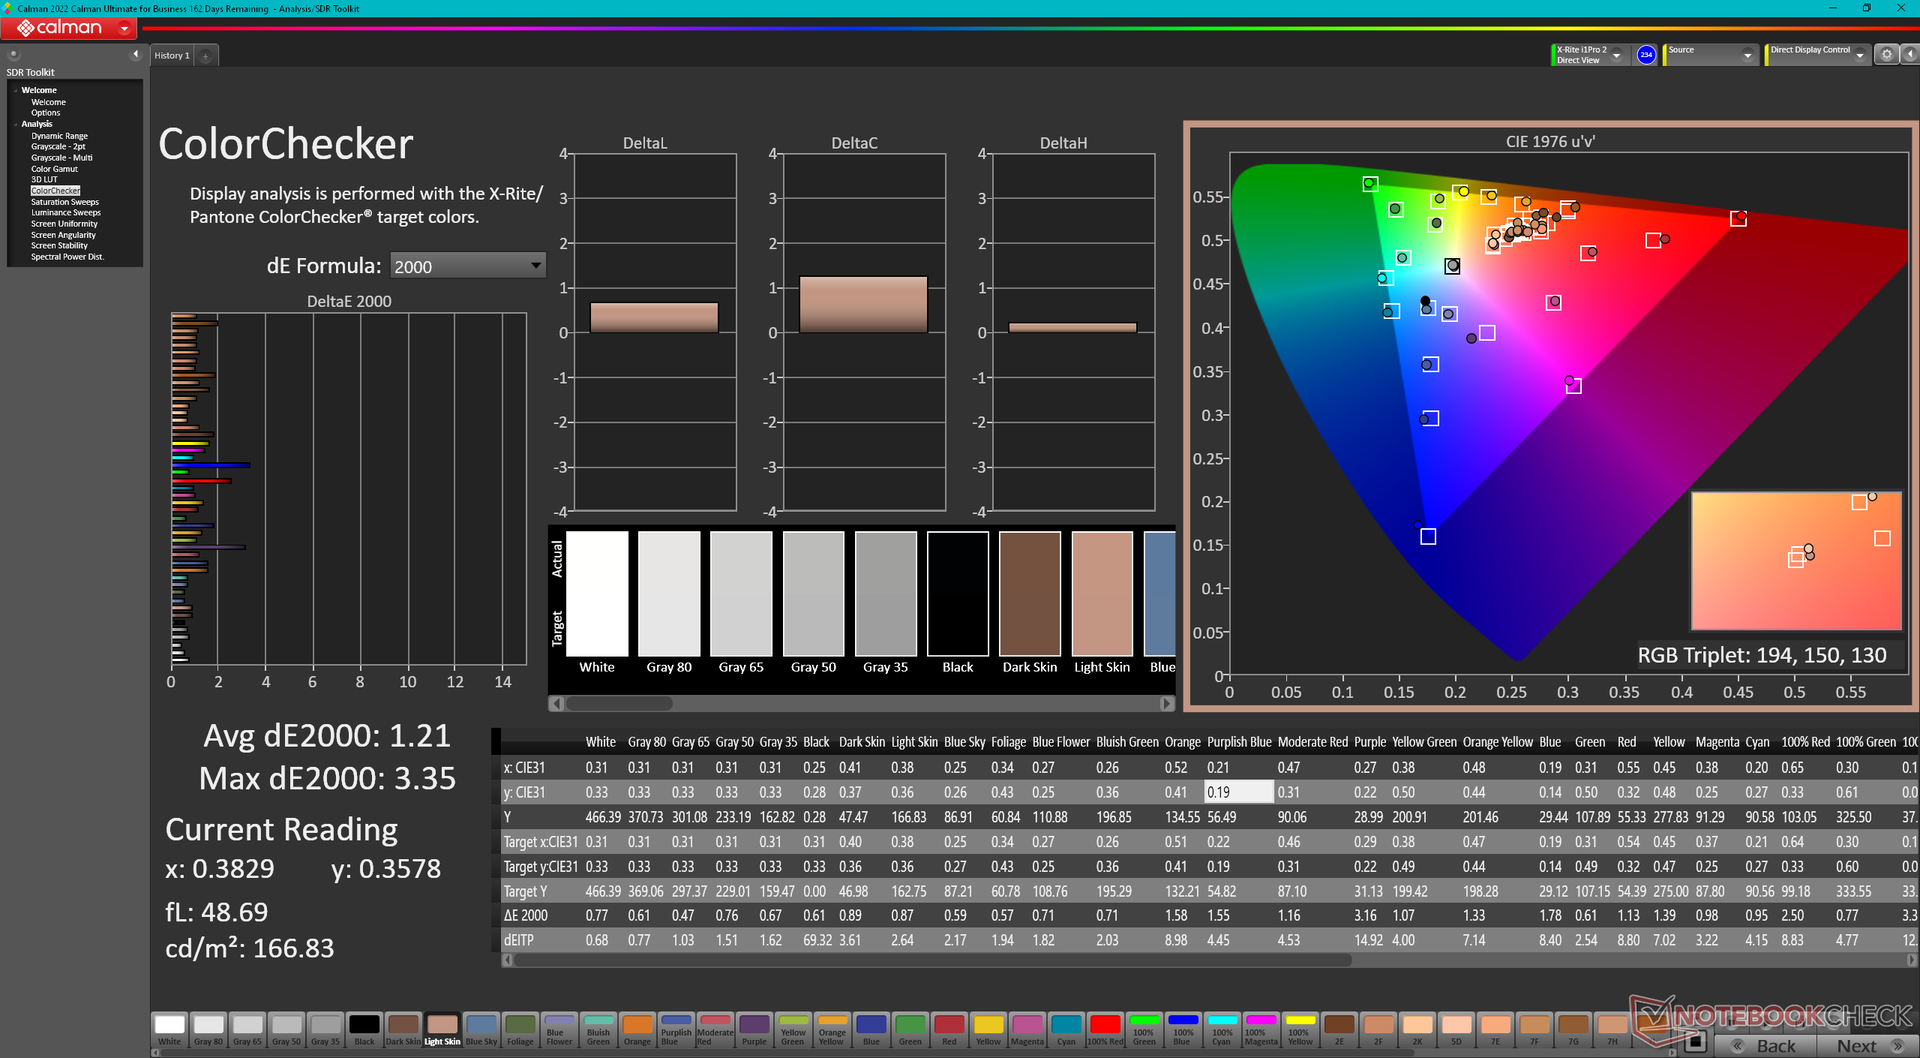
ΔE ColorChecker Calman: 3.38 | ∀{0.5-29.43 Ø4.73}
calibrated: 1.21
ΔE Greyscale Calman: 4.8 | ∀{0.09-98 Ø4.97}
71.1% AdobeRGB 1998 (Argyll 3D)
97.5% sRGB (Argyll 3D)
68.9% Display P3 (Argyll 3D)
Gamma: 2.13
CCT: 6235 K
| Framework Laptop 13.5 13th Gen Intel BOE CQ NE135FBM-N41, IPS, 2256x1504, 13.5" | Framework Laptop 13.5 12th Gen Intel BOE CQ NE135FBM-N41, IPS, 2256x1504, 13.5" | Framework Laptop 13.5 BOE CQ NE135FBM-N41, IPS, 2256x1504, 13.5" | HP Spectre x360 13.5 14t-ef000 SDC4160, OLED, 3000x2000, 13.5" | Dell XPS 13 Plus 9320 4K LQ134R1, IPS, 3840x2400, 13.4" | Microsoft Surface Laptop 4 13 i7 LQ135P1JX51, IPS, 2256x1504, 13.5" | |
|---|---|---|---|---|---|---|
| Display | 1% | 0% | 25% | 7% | -4% | |
| Display P3 Coverage (%) | 68.9 | 69.9 1% | 69 0% | 99.9 45% | 76.5 11% | 64.7 -6% |
| sRGB Coverage (%) | 97.5 | 99.4 2% | 99.3 2% | 100 3% | 100 3% | 97.2 0% |
| AdobeRGB 1998 Coverage (%) | 71.1 | 71.1 0% | 70.3 -1% | 90.8 28% | 76 7% | 66.9 -6% |
| Response Times | 28% | -4% | 96% | 32% | -17% | |
| Response Time Grey 50% / Grey 80% * (ms) | 54.9 ? | 34.7 ? 37% | 55.6 ? -1% | 1.9 ? 97% | 38.9 ? 29% | 62.8 ? -14% |
| Response Time Black / White * (ms) | 33.5 ? | 27.5 ? 18% | 36 ? -7% | 2.16 ? 94% | 21.9 ? 35% | 39.8 ? -19% |
| PWM Frequency (Hz) | 60.2 ? | 21930 ? | ||||
| Bildschirm | 6% | 2% | 9% | 12% | 12% | |
| Helligkeit Bildmitte (cd/m²) | 503 | 449.6 -11% | 449 -11% | 351.7 -30% | 494 -2% | 413 -18% |
| Brightness (cd/m²) | 472 | 431 -9% | 435 -8% | 351 -26% | 474 0% | 400 -15% |
| Brightness Distribution (%) | 87 | 90 3% | 93 7% | 87 0% | 89 2% | 94 8% |
| Schwarzwert * (cd/m²) | 0.36 | 0.31 14% | 0.39 -8% | 0.28 22% | 0.29 19% | |
| Kontrast (:1) | 1397 | 1450 4% | 1151 -18% | 1764 26% | 1424 2% | |
| Delta E Colorchecker * | 3.38 | 2.76 18% | 2.34 31% | 1.78 47% | 3.1 8% | 2.8 17% |
| Colorchecker dE 2000 max. * | 7.08 | 7.96 -12% | 7.07 -0% | 6.14 13% | 4.2 41% | 7.2 -2% |
| Colorchecker dE 2000 calibrated * | 1.21 | 0.58 52% | 0.96 21% | 1.5 -24% | 0.8 34% | |
| Delta E Graustufen * | 4.8 | 5.2 -8% | 4.7 2% | 2.3 52% | 3.2 33% | 1.9 60% |
| Gamma | 2.13 103% | 2.23 99% | 2.29 96% | 2.11 104% | 2.41 91% | 2.12 104% |
| CCT | 6235 104% | 6475 100% | 6760 96% | 6683 97% | 6189 105% | 6510 100% |
| Farbraum (Prozent von AdobeRGB 1998) (%) | 61.6 | |||||
| Color Space (Percent of sRGB) (%) | 97.2 | |||||
| Durchschnitt gesamt (Programm / Settings) | 12% /
8% | -1% /
1% | 43% /
29% | 17% /
14% | -3% /
4% |
* ... kleinere Werte sind besser

Reaktionszeiten (Response Times) des Displays
| ↔ Reaktionszeiten Schwarz zu Weiß | ||
|---|---|---|
| 33.5 ms ... steigend ↗ und fallend ↘ kombiniert | ↗ 18.2 ms steigend |  |
| ↘ 15.3 ms fallend | ||
| Die gemessenen Reaktionszeiten sind langsam und dadurch für viele Spieler wahrscheinlich zu langsam. Im Vergleich rangierten die bei uns getesteten Geräte von 0.1 (Minimum) zu 240 (Maximum) ms. » 90 % aller Screens waren schneller als der getestete. Daher sind die gemessenen Reaktionszeiten schlechter als der Durchschnitt aller vermessenen Geräte (19.9 ms). | ||
| ↔ Reaktionszeiten 50% Grau zu 80% Grau | ||
| 54.9 ms ... steigend ↗ und fallend ↘ kombiniert | ↗ 24.2 ms steigend | 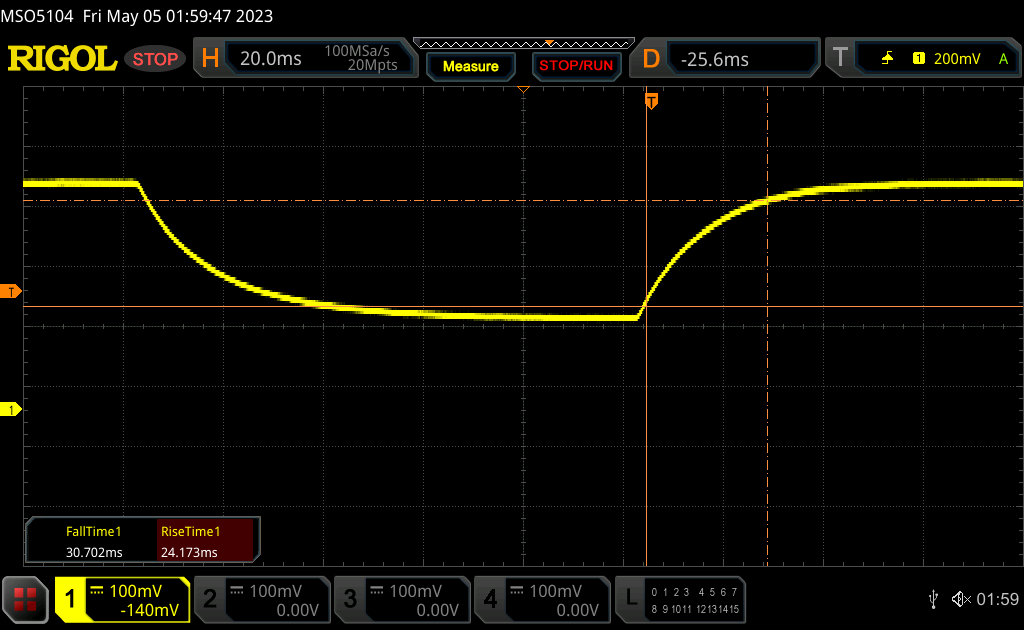 |
| ↘ 30.7 ms fallend | ||
| Die gemessenen Reaktionszeiten sind langsam und dadurch für viele Spieler wahrscheinlich zu langsam. Im Vergleich rangierten die bei uns getesteten Geräte von 0.165 (Minimum) zu 636 (Maximum) ms. » 92 % aller Screens waren schneller als der getestete. Daher sind die gemessenen Reaktionszeiten schlechter als der Durchschnitt aller vermessenen Geräte (31.1 ms). | ||
Bildschirm-Flackern / PWM (Pulse-Width Modulation)
| Flackern / PWM nicht festgestellt | 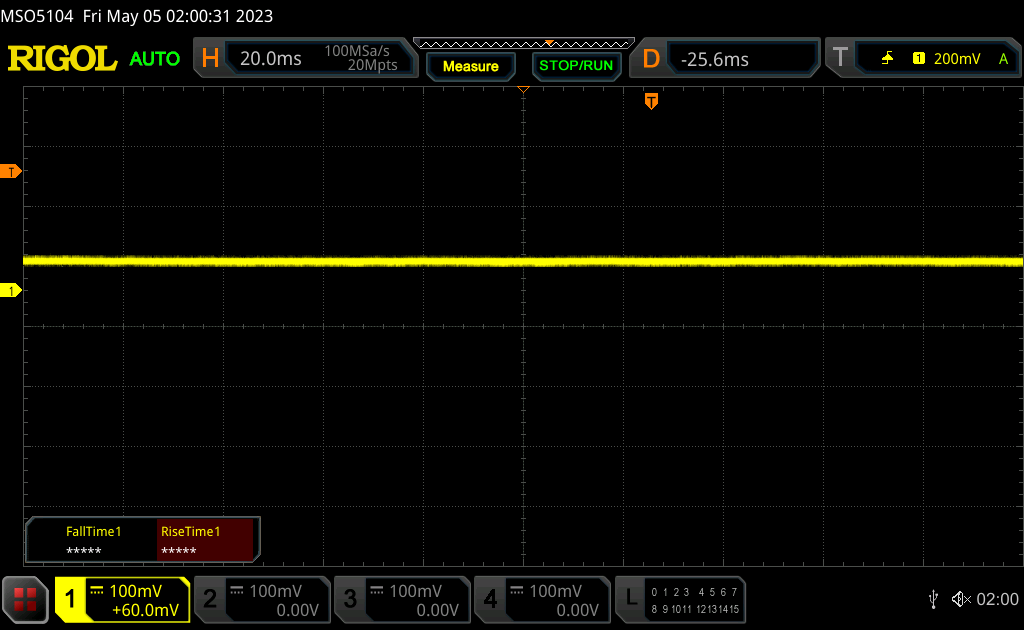 | ||
Im Vergleich: 52 % aller getesteten Geräte nutzten kein PWM um die Helligkeit zu reduzieren. Wenn PWM eingesetzt wurde, dann bei einer Frequenz von durchschnittlich 7794 (Minimum 5, Maximum 343500) Hz. | |||

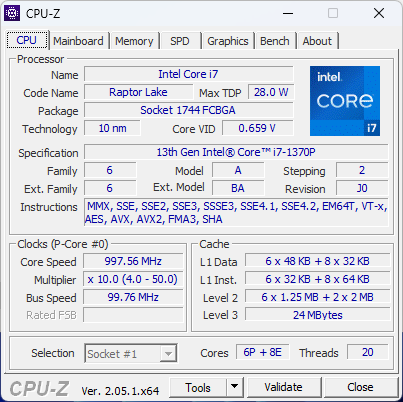
Leistung — Raptor Lake Core i7-1370P
Testbedingungen
Wir haben unsere Einheit in den Leistungsmodus via Windows versetzt. Framework installiert kein spezialisiertes Command Center oder ähnliche Bloatware, wie es leider der Großteil der anderen, großen Hersteller tut.
Prozessor
Aktuell ist das Framework 13.5 mit seinem Gen13 Core i7-1370P eines der schnellsten Subnotebooks auf dem Markt. Die rohe Multi-Thread-Leistung ist mit der des deutlich energiehungrigeren Ryzen 9 6900HS vergleichbar, bei gleichzeitig 25 bis 30 Prozent höherer Single-Thread-Leistung. Damit stellt es ein ordentliches Upgrade zum Core i7-1260P vom letzten Jahr dar, mit ebenfalls zwischen 20 und 30 Prozent Vorsprung. Der Leistungsgewinn zum Vorjahr genügt, um dem Core i7-12700H Konkurrenz zu machen, welcher in vielen großen Gaming-Laptops, wie dem MSI Pulse GL76, eingesetzt wurde.
Wählt man stattdessen den Core i7-1360P oder den Core i5-1340P dürfte die Leistung um zwischen 10 bis 15 Prozent beziehungsweise 20 bis 25 Prozent sinken, die Angaben basieren auf unseren Erfahrungen mit dem Lenovo Yoga 9i 14IRP G8 sowie dem Samsung Galaxy Book3 Pro 16. Alle drei CPU-Optionen sind signifikant schneller als ein typisches Ultrabook mit Core-U-CPU.
Cinebench R15 Multi Loop
Cinebench R23: Multi Core | Single Core
Cinebench R20: CPU (Multi Core) | CPU (Single Core)
Cinebench R15: CPU Multi 64Bit | CPU Single 64Bit
Blender: v2.79 BMW27 CPU
7-Zip 18.03: 7z b 4 | 7z b 4 -mmt1
Geekbench 5.5: Multi-Core | Single-Core
HWBOT x265 Benchmark v2.2: 4k Preset
LibreOffice : 20 Documents To PDF
R Benchmark 2.5: Overall mean
* ... kleinere Werte sind besser
AIDA64: FP32 Ray-Trace | FPU Julia | CPU SHA3 | CPU Queen | FPU SinJulia | FPU Mandel | CPU AES | CPU ZLib | FP64 Ray-Trace | CPU PhotoWorxx
| Performance Rating | |
| Framework Laptop 13.5 13th Gen Intel | |
| Durchschnittliche Intel Core i7-1370P | |
| HP Spectre x360 13.5 14t-ef000 | |
| Framework Laptop 13.5 12th Gen Intel | |
| Dell XPS 13 Plus 9320 4K | |
| Microsoft Surface Laptop 4 13 i7 | |
| Framework Laptop 13.5 | |
| AIDA64 / FP32 Ray-Trace | |
| Framework Laptop 13.5 13th Gen Intel | |
| Durchschnittliche Intel Core i7-1370P (5618 - 11995, n=3) | |
| HP Spectre x360 13.5 14t-ef000 | |
| Framework Laptop 13.5 | |
| Microsoft Surface Laptop 4 13 i7 | |
| Framework Laptop 13.5 12th Gen Intel | |
| Dell XPS 13 Plus 9320 4K | |
| AIDA64 / FPU Julia | |
| Framework Laptop 13.5 13th Gen Intel | |
| Durchschnittliche Intel Core i7-1370P (31165 - 60283, n=3) | |
| HP Spectre x360 13.5 14t-ef000 | |
| Framework Laptop 13.5 | |
| Microsoft Surface Laptop 4 13 i7 | |
| Framework Laptop 13.5 12th Gen Intel | |
| Dell XPS 13 Plus 9320 4K | |
| AIDA64 / CPU SHA3 | |
| Framework Laptop 13.5 13th Gen Intel | |
| Durchschnittliche Intel Core i7-1370P (1439 - 2799, n=3) | |
| HP Spectre x360 13.5 14t-ef000 | |
| Framework Laptop 13.5 | |
| Framework Laptop 13.5 12th Gen Intel | |
| Microsoft Surface Laptop 4 13 i7 | |
| Dell XPS 13 Plus 9320 4K | |
| AIDA64 / CPU Queen | |
| Framework Laptop 13.5 13th Gen Intel | |
| Durchschnittliche Intel Core i7-1370P (100027 - 104796, n=3) | |
| Dell XPS 13 Plus 9320 4K | |
| Framework Laptop 13.5 12th Gen Intel | |
| HP Spectre x360 13.5 14t-ef000 | |
| Framework Laptop 13.5 | |
| Microsoft Surface Laptop 4 13 i7 | |
| AIDA64 / FPU SinJulia | |
| Framework Laptop 13.5 13th Gen Intel | |
| Durchschnittliche Intel Core i7-1370P (7906 - 8733, n=3) | |
| Framework Laptop 13.5 12th Gen Intel | |
| Dell XPS 13 Plus 9320 4K | |
| Framework Laptop 13.5 | |
| Microsoft Surface Laptop 4 13 i7 | |
| HP Spectre x360 13.5 14t-ef000 | |
| AIDA64 / FPU Mandel | |
| Durchschnittliche Intel Core i7-1370P (28284 - 32966, n=3) | |
| Framework Laptop 13.5 13th Gen Intel | |
| HP Spectre x360 13.5 14t-ef000 | |
| Framework Laptop 13.5 | |
| Microsoft Surface Laptop 4 13 i7 | |
| Framework Laptop 13.5 12th Gen Intel | |
| Dell XPS 13 Plus 9320 4K | |
| AIDA64 / CPU AES | |
| Framework Laptop 13.5 13th Gen Intel | |
| Framework Laptop 13.5 | |
| HP Spectre x360 13.5 14t-ef000 | |
| Durchschnittliche Intel Core i7-1370P (32334 - 107331, n=3) | |
| Framework Laptop 13.5 12th Gen Intel | |
| Microsoft Surface Laptop 4 13 i7 | |
| Dell XPS 13 Plus 9320 4K | |
| AIDA64 / CPU ZLib | |
| Framework Laptop 13.5 13th Gen Intel | |
| Framework Laptop 13.5 12th Gen Intel | |
| Durchschnittliche Intel Core i7-1370P (406 - 818, n=3) | |
| Dell XPS 13 Plus 9320 4K | |
| HP Spectre x360 13.5 14t-ef000 | |
| Framework Laptop 13.5 | |
| Microsoft Surface Laptop 4 13 i7 | |
| AIDA64 / FP64 Ray-Trace | |
| Framework Laptop 13.5 13th Gen Intel | |
| Durchschnittliche Intel Core i7-1370P (2964 - 6372, n=3) | |
| HP Spectre x360 13.5 14t-ef000 | |
| Framework Laptop 13.5 | |
| Microsoft Surface Laptop 4 13 i7 | |
| Framework Laptop 13.5 12th Gen Intel | |
| Dell XPS 13 Plus 9320 4K | |
| AIDA64 / CPU PhotoWorxx | |
| HP Spectre x360 13.5 14t-ef000 | |
| Microsoft Surface Laptop 4 13 i7 | |
| Dell XPS 13 Plus 9320 4K | |
| Durchschnittliche Intel Core i7-1370P (27048 - 39240, n=3) | |
| Framework Laptop 13.5 13th Gen Intel | |
| Framework Laptop 13.5 12th Gen Intel | |
| Framework Laptop 13.5 | |
Systemleistung
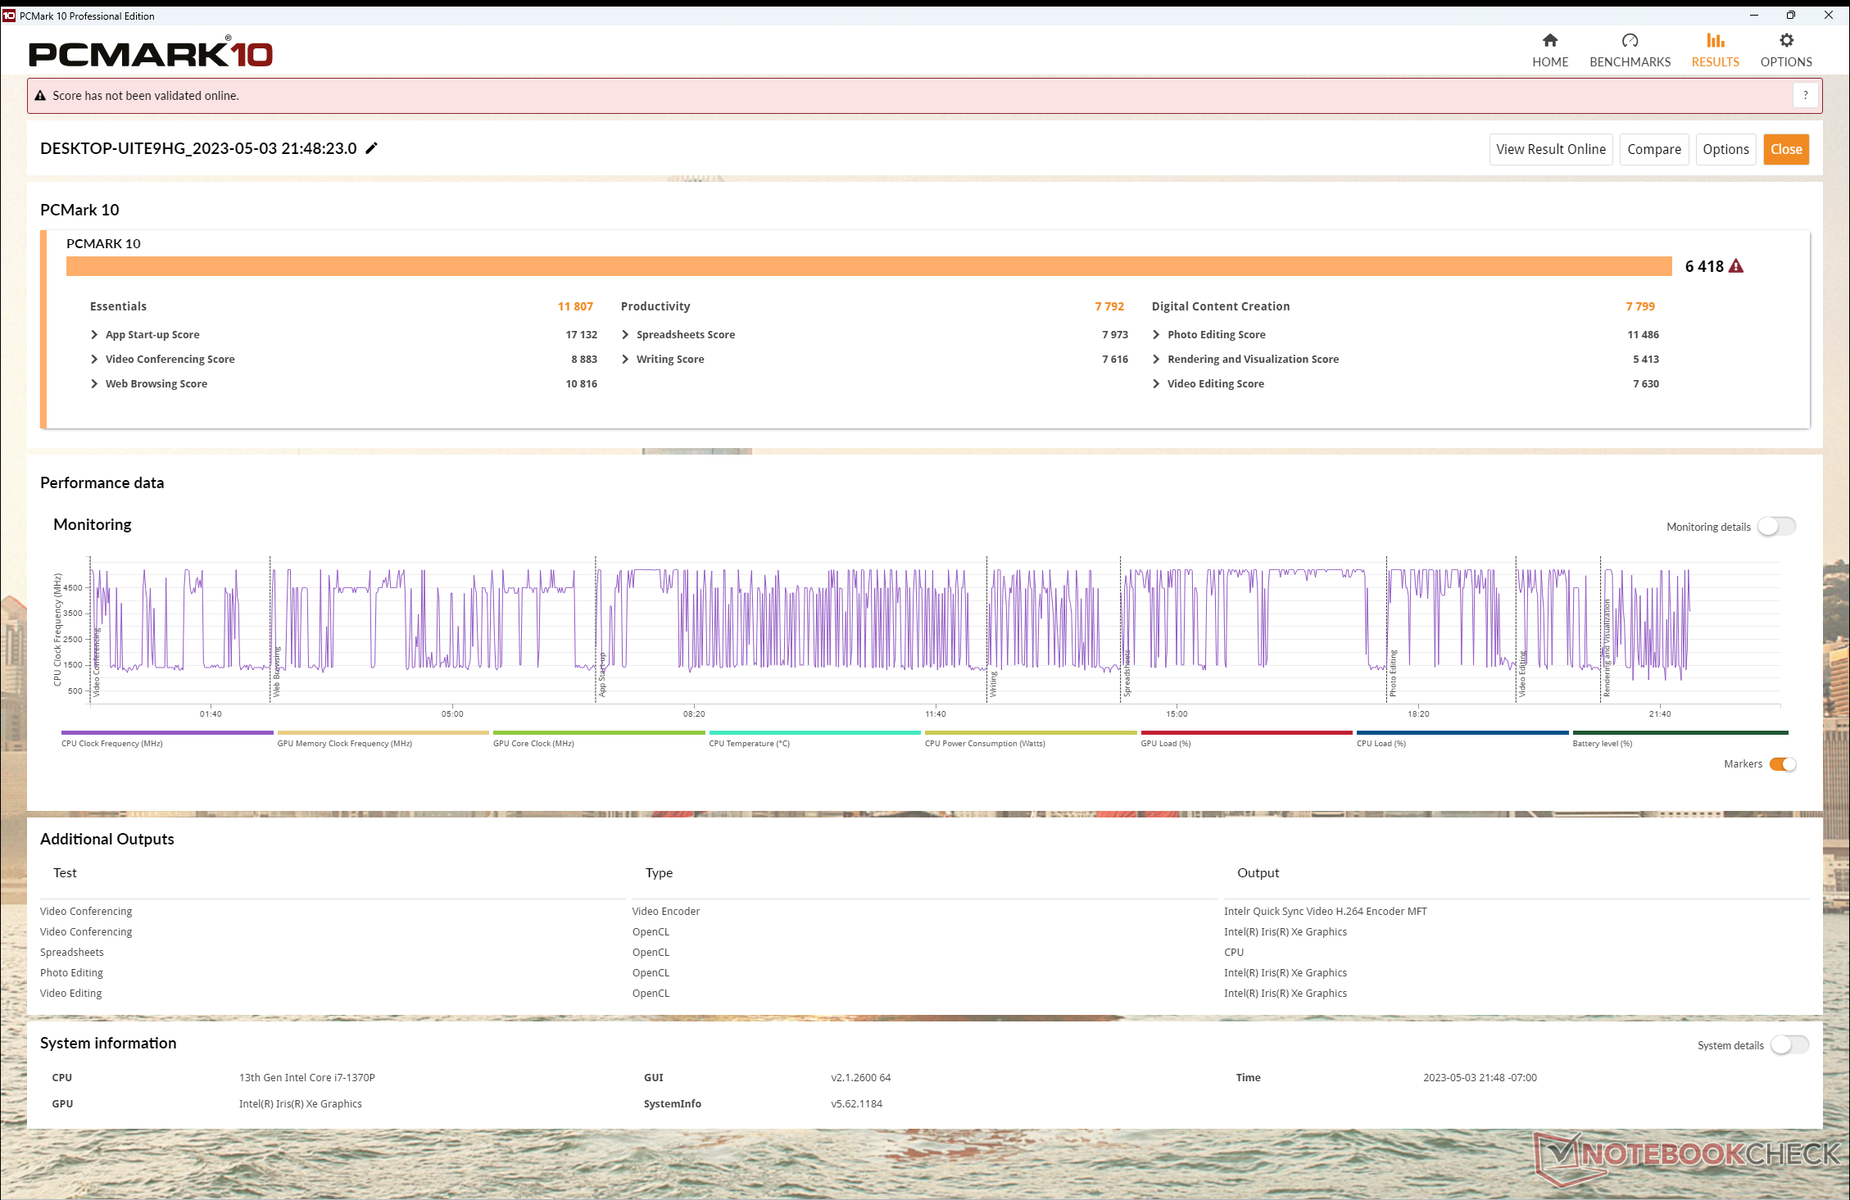
Durch den schnellen Core i7-1370P überbietet der neue Framework-Laptop die PCMark-10-Scores des Vorgängers und der meisten Konkurrenten. Dennoch sind einige Top-End-Ultrabooks wie das Asus Zenbook S 13 mit Ryzen-7-CPUs noch schneller, da die Iris-Xe-Grafik signifikant langsamer rechnet als die konkurrierende Radeon 680M.
CrossMark: Overall | Productivity | Creativity | Responsiveness
| PCMark 10 / Score | |
| Framework Laptop 13.5 13th Gen Intel | |
| Asus Zenbook S 13 OLED | |
| Durchschnittliche Intel Core i7-1370P, Intel Iris Xe Graphics G7 96EUs (5466 - 6418, n=2) | |
| Framework Laptop 13.5 12th Gen Intel | |
| Dell XPS 13 Plus 9320 4K | |
| HP Spectre x360 13.5 14t-ef000 | |
| Microsoft Surface Laptop 4 13 i7 | |
| Framework Laptop 13.5 | |
| PCMark 10 / Essentials | |
| Framework Laptop 13.5 13th Gen Intel | |
| HP Spectre x360 13.5 14t-ef000 | |
| Durchschnittliche Intel Core i7-1370P, Intel Iris Xe Graphics G7 96EUs (10693 - 11807, n=2) | |
| Framework Laptop 13.5 12th Gen Intel | |
| Asus Zenbook S 13 OLED | |
| Dell XPS 13 Plus 9320 4K | |
| Framework Laptop 13.5 | |
| Microsoft Surface Laptop 4 13 i7 | |
| PCMark 10 / Productivity | |
| Asus Zenbook S 13 OLED | |
| Framework Laptop 13.5 13th Gen Intel | |
| Durchschnittliche Intel Core i7-1370P, Intel Iris Xe Graphics G7 96EUs (7320 - 7792, n=2) | |
| HP Spectre x360 13.5 14t-ef000 | |
| Framework Laptop 13.5 12th Gen Intel | |
| Dell XPS 13 Plus 9320 4K | |
| Microsoft Surface Laptop 4 13 i7 | |
| Framework Laptop 13.5 | |
| PCMark 10 / Digital Content Creation | |
| Framework Laptop 13.5 13th Gen Intel | |
| Asus Zenbook S 13 OLED | |
| Framework Laptop 13.5 12th Gen Intel | |
| Durchschnittliche Intel Core i7-1370P, Intel Iris Xe Graphics G7 96EUs (5662 - 7799, n=2) | |
| Dell XPS 13 Plus 9320 4K | |
| HP Spectre x360 13.5 14t-ef000 | |
| Framework Laptop 13.5 | |
| Microsoft Surface Laptop 4 13 i7 | |
| CrossMark / Overall | |
| Durchschnittliche Intel Core i7-1370P, Intel Iris Xe Graphics G7 96EUs (1728 - 1827, n=2) | |
| Framework Laptop 13.5 13th Gen Intel | |
| Framework Laptop 13.5 12th Gen Intel | |
| Dell XPS 13 Plus 9320 4K | |
| HP Spectre x360 13.5 14t-ef000 | |
| Asus Zenbook S 13 OLED | |
| CrossMark / Productivity | |
| Durchschnittliche Intel Core i7-1370P, Intel Iris Xe Graphics G7 96EUs (1675 - 1722, n=2) | |
| Framework Laptop 13.5 13th Gen Intel | |
| Framework Laptop 13.5 12th Gen Intel | |
| Dell XPS 13 Plus 9320 4K | |
| HP Spectre x360 13.5 14t-ef000 | |
| Asus Zenbook S 13 OLED | |
| CrossMark / Creativity | |
| Durchschnittliche Intel Core i7-1370P, Intel Iris Xe Graphics G7 96EUs (1875 - 2068, n=2) | |
| Framework Laptop 13.5 13th Gen Intel | |
| Dell XPS 13 Plus 9320 4K | |
| Framework Laptop 13.5 12th Gen Intel | |
| HP Spectre x360 13.5 14t-ef000 | |
| Asus Zenbook S 13 OLED | |
| CrossMark / Responsiveness | |
| Durchschnittliche Intel Core i7-1370P, Intel Iris Xe Graphics G7 96EUs (1484 - 1504, n=2) | |
| Framework Laptop 13.5 13th Gen Intel | |
| Framework Laptop 13.5 12th Gen Intel | |
| Dell XPS 13 Plus 9320 4K | |
| HP Spectre x360 13.5 14t-ef000 | |
| Asus Zenbook S 13 OLED | |
| PCMark 10 Score | 6418 Punkte | |
Hilfe | ||
| AIDA64 / Memory Copy | |
| Dell XPS 13 Plus 9320 4K | |
| HP Spectre x360 13.5 14t-ef000 | |
| Durchschnittliche Intel Core i7-1370P (46184 - 69471, n=3) | |
| Microsoft Surface Laptop 4 13 i7 | |
| Framework Laptop 13.5 13th Gen Intel | |
| Framework Laptop 13.5 12th Gen Intel | |
| Framework Laptop 13.5 | |
| AIDA64 / Memory Read | |
| Dell XPS 13 Plus 9320 4K | |
| HP Spectre x360 13.5 14t-ef000 | |
| Durchschnittliche Intel Core i7-1370P (50228 - 66704, n=3) | |
| Microsoft Surface Laptop 4 13 i7 | |
| Framework Laptop 13.5 13th Gen Intel | |
| Framework Laptop 13.5 12th Gen Intel | |
| Framework Laptop 13.5 | |
| AIDA64 / Memory Write | |
| Durchschnittliche Intel Core i7-1370P (47356 - 85119, n=3) | |
| HP Spectre x360 13.5 14t-ef000 | |
| Dell XPS 13 Plus 9320 4K | |
| Microsoft Surface Laptop 4 13 i7 | |
| Framework Laptop 13.5 13th Gen Intel | |
| Framework Laptop 13.5 12th Gen Intel | |
| Framework Laptop 13.5 | |
| AIDA64 / Memory Latency | |
| HP Spectre x360 13.5 14t-ef000 | |
| Microsoft Surface Laptop 4 13 i7 | |
| Durchschnittliche Intel Core i7-1370P (72.5 - 94.6, n=3) | |
| Framework Laptop 13.5 12th Gen Intel | |
| Framework Laptop 13.5 | |
| Framework Laptop 13.5 13th Gen Intel | |
* ... kleinere Werte sind besser
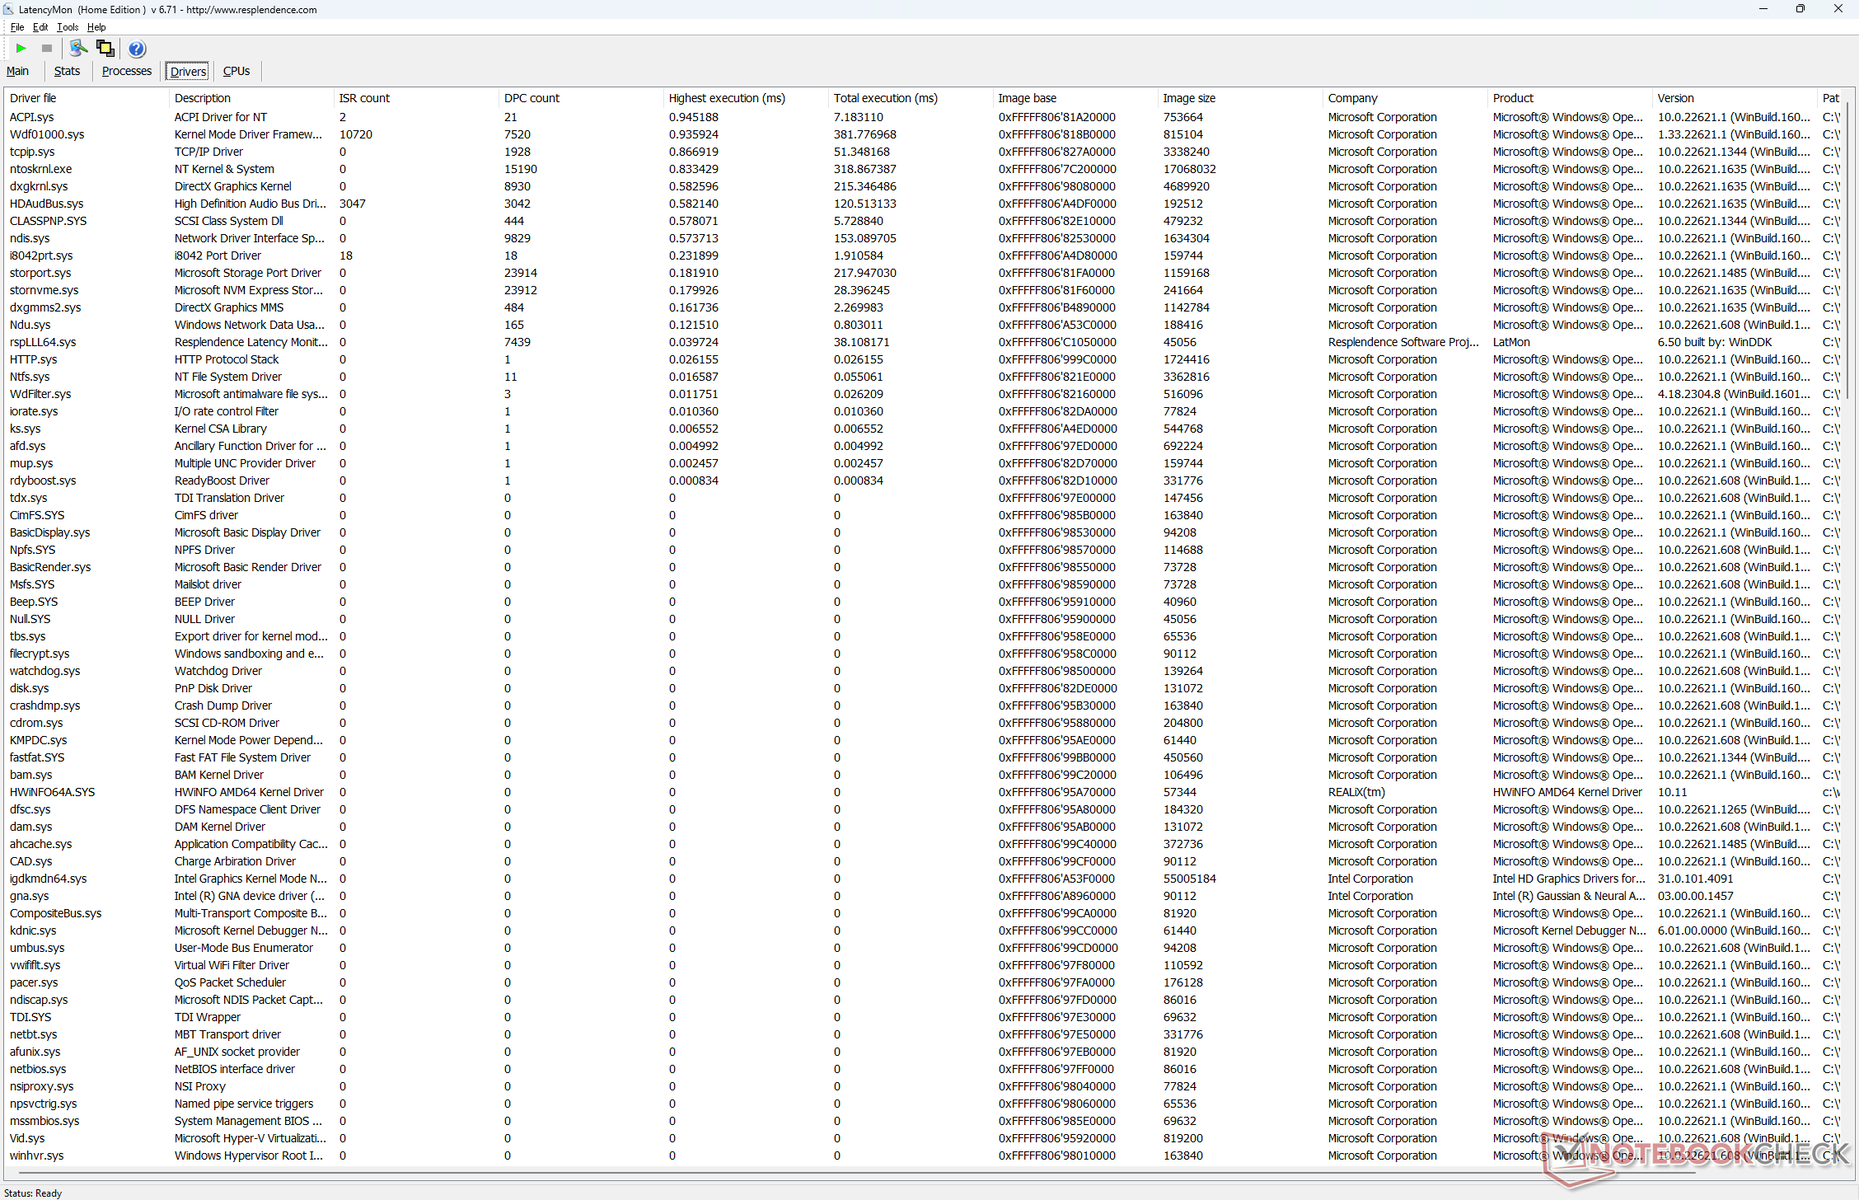
DPC Latency
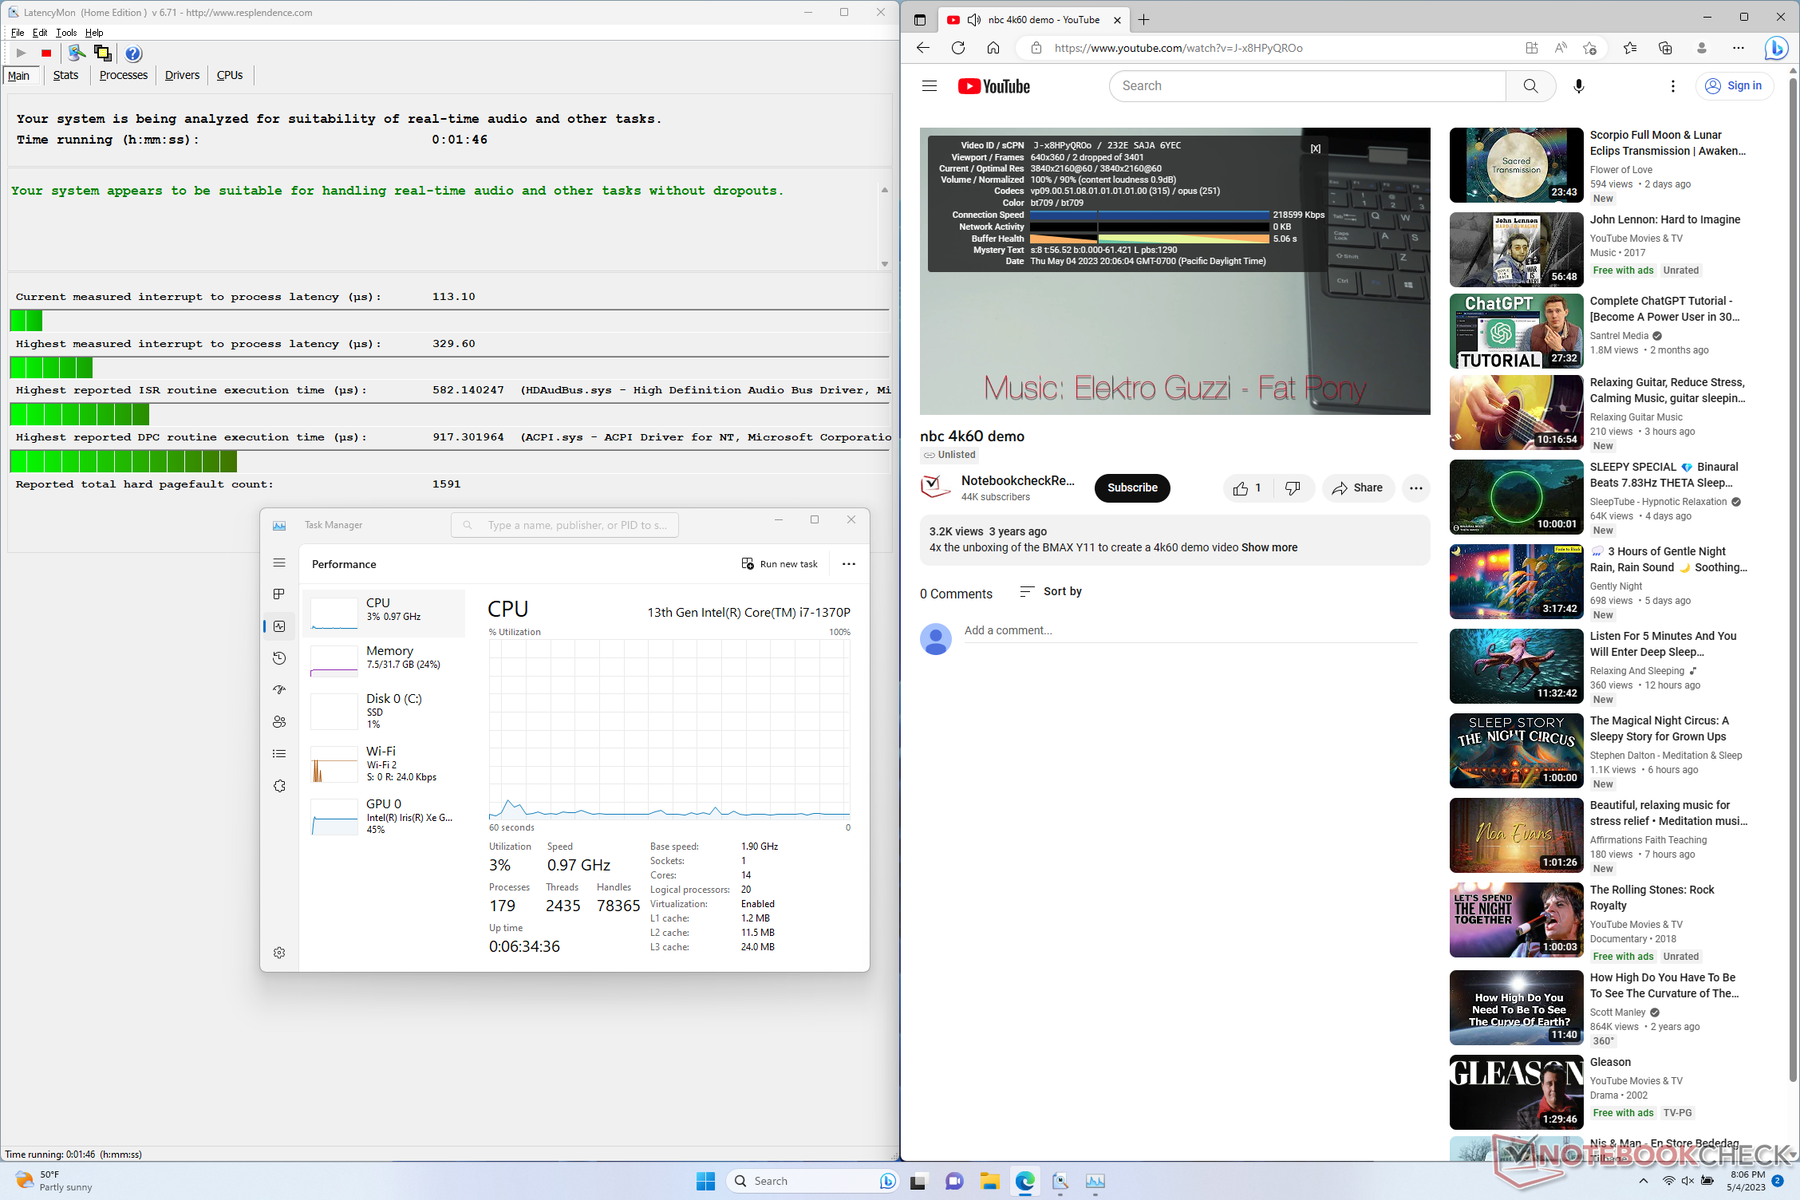
LatencyMon zeigt beim Öffnen mehrerer Browsertabs oder dem Starten von Prime95 für mehrere Sekunden keinerlei Latenzprobleme auf, was eine echte Verbesserung zu den vorherigen Modellen darstellt. Bei der Wiedergabe unseres 4K/60-fps-YouTubevideos verzeichnen wir 2 Dropped Frames.
| DPC Latencies / LatencyMon - interrupt to process latency (max), Web, Youtube, Prime95 | |
| Framework Laptop 13.5 | |
| Microsoft Surface Laptop 4 13 i7 | |
| Framework Laptop 13.5 12th Gen Intel | |
| Dell XPS 13 Plus 9320 4K | |
| HP Spectre x360 13.5 14t-ef000 | |
| Framework Laptop 13.5 13th Gen Intel | |
* ... kleinere Werte sind besser
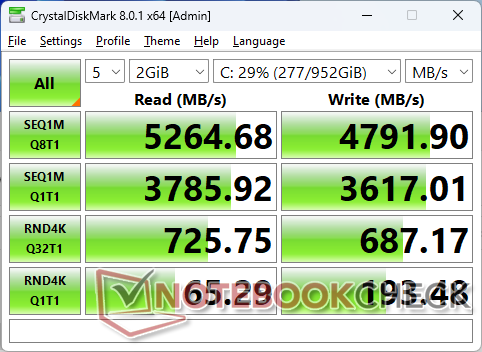
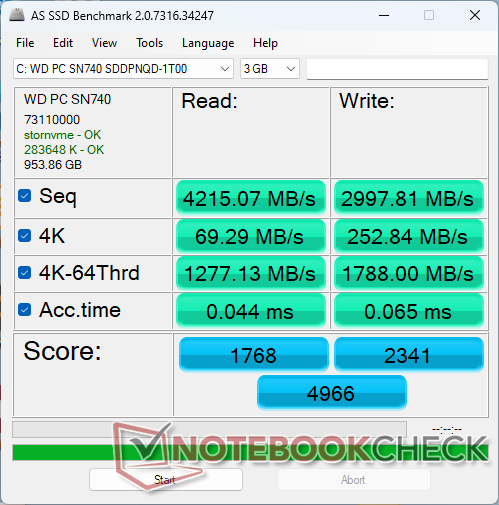
Massenspeicher
Unser Testmodell ist mit der Mittelklasse-PCIe4-x4-NVMe-SSD WD PC SN740 bestückt. Diese ist langsamer als eine SN850 aus der letztjährigen Testeinheit. Die Transferraten bewegen sich bei 5200 MB/s, letztes Jahr kamen wir mit der SN850 auf 7000 MB/s. Die Leistung ist dennoch sehr gut und für die Zielgruppe mehr als ausreichend. Auch über längeren Stress hinweg gab es während der Messung keine Drosselung.

* ... kleinere Werte sind besser
Disk Throttling: DiskSpd Read Loop, Queue Depth 8
Grafikleistung — Iris Xe schon im dritten Jahr in Folge
Einerseits fällt die Grafikleistung etwa 15 Prozent höher aus als im durchschnittlichen Laptop mit der gleichen integrierten Iris Xe 96 EUs-GPU in unserer Datenbank. Andererseits hat sich hier seit ihrer Einführung vor fast drei Jahren kaum etwas getan. Framework plant als Alternative die Einführung der schnelleren, integrierten AMD Radeon 680M im Verlaufe des Jahres.
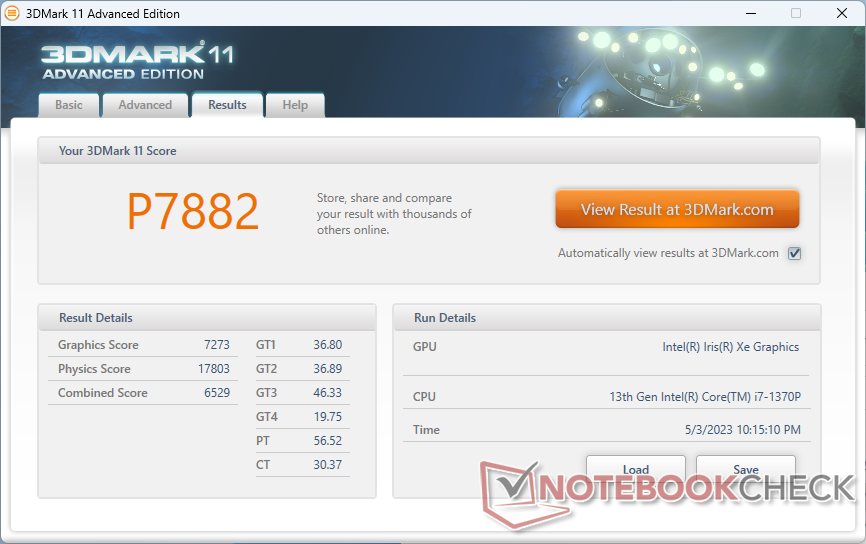
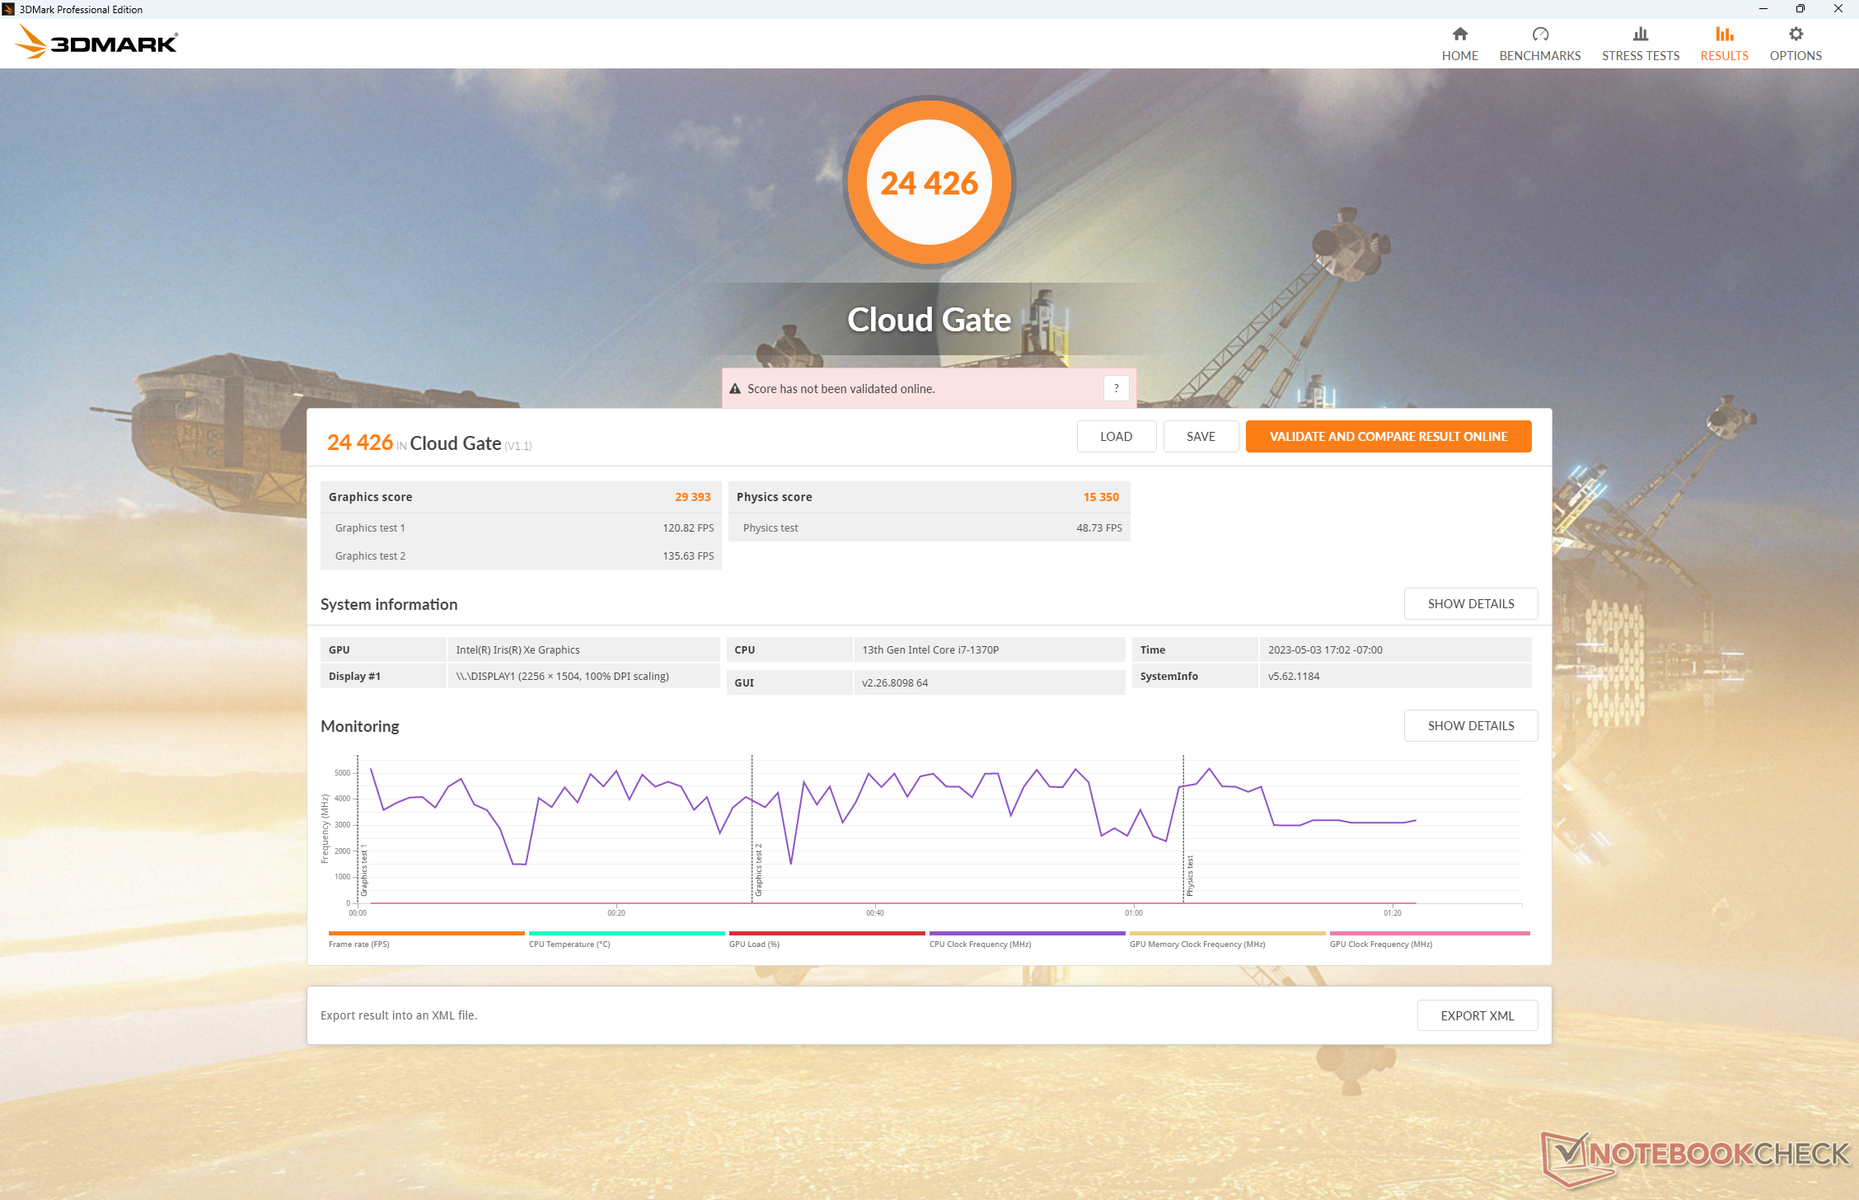
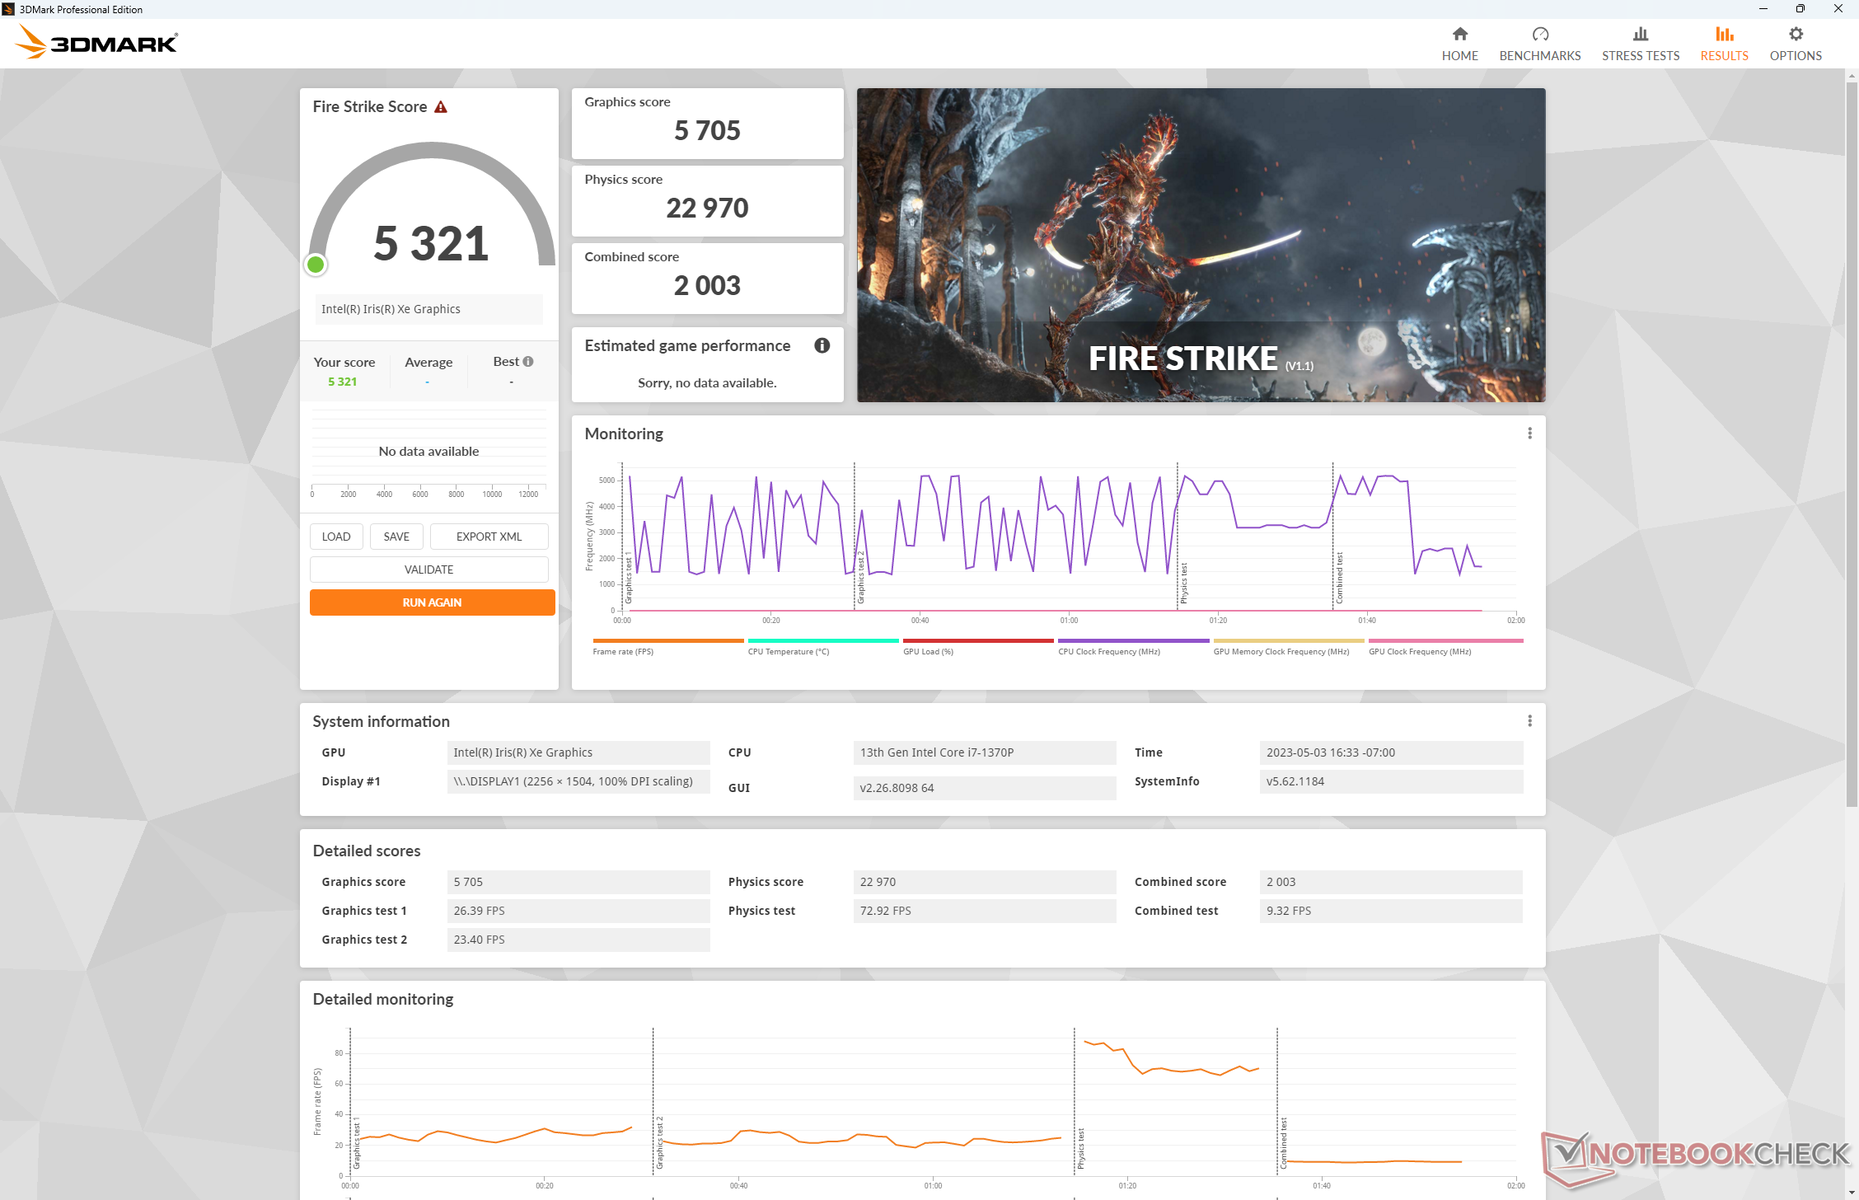
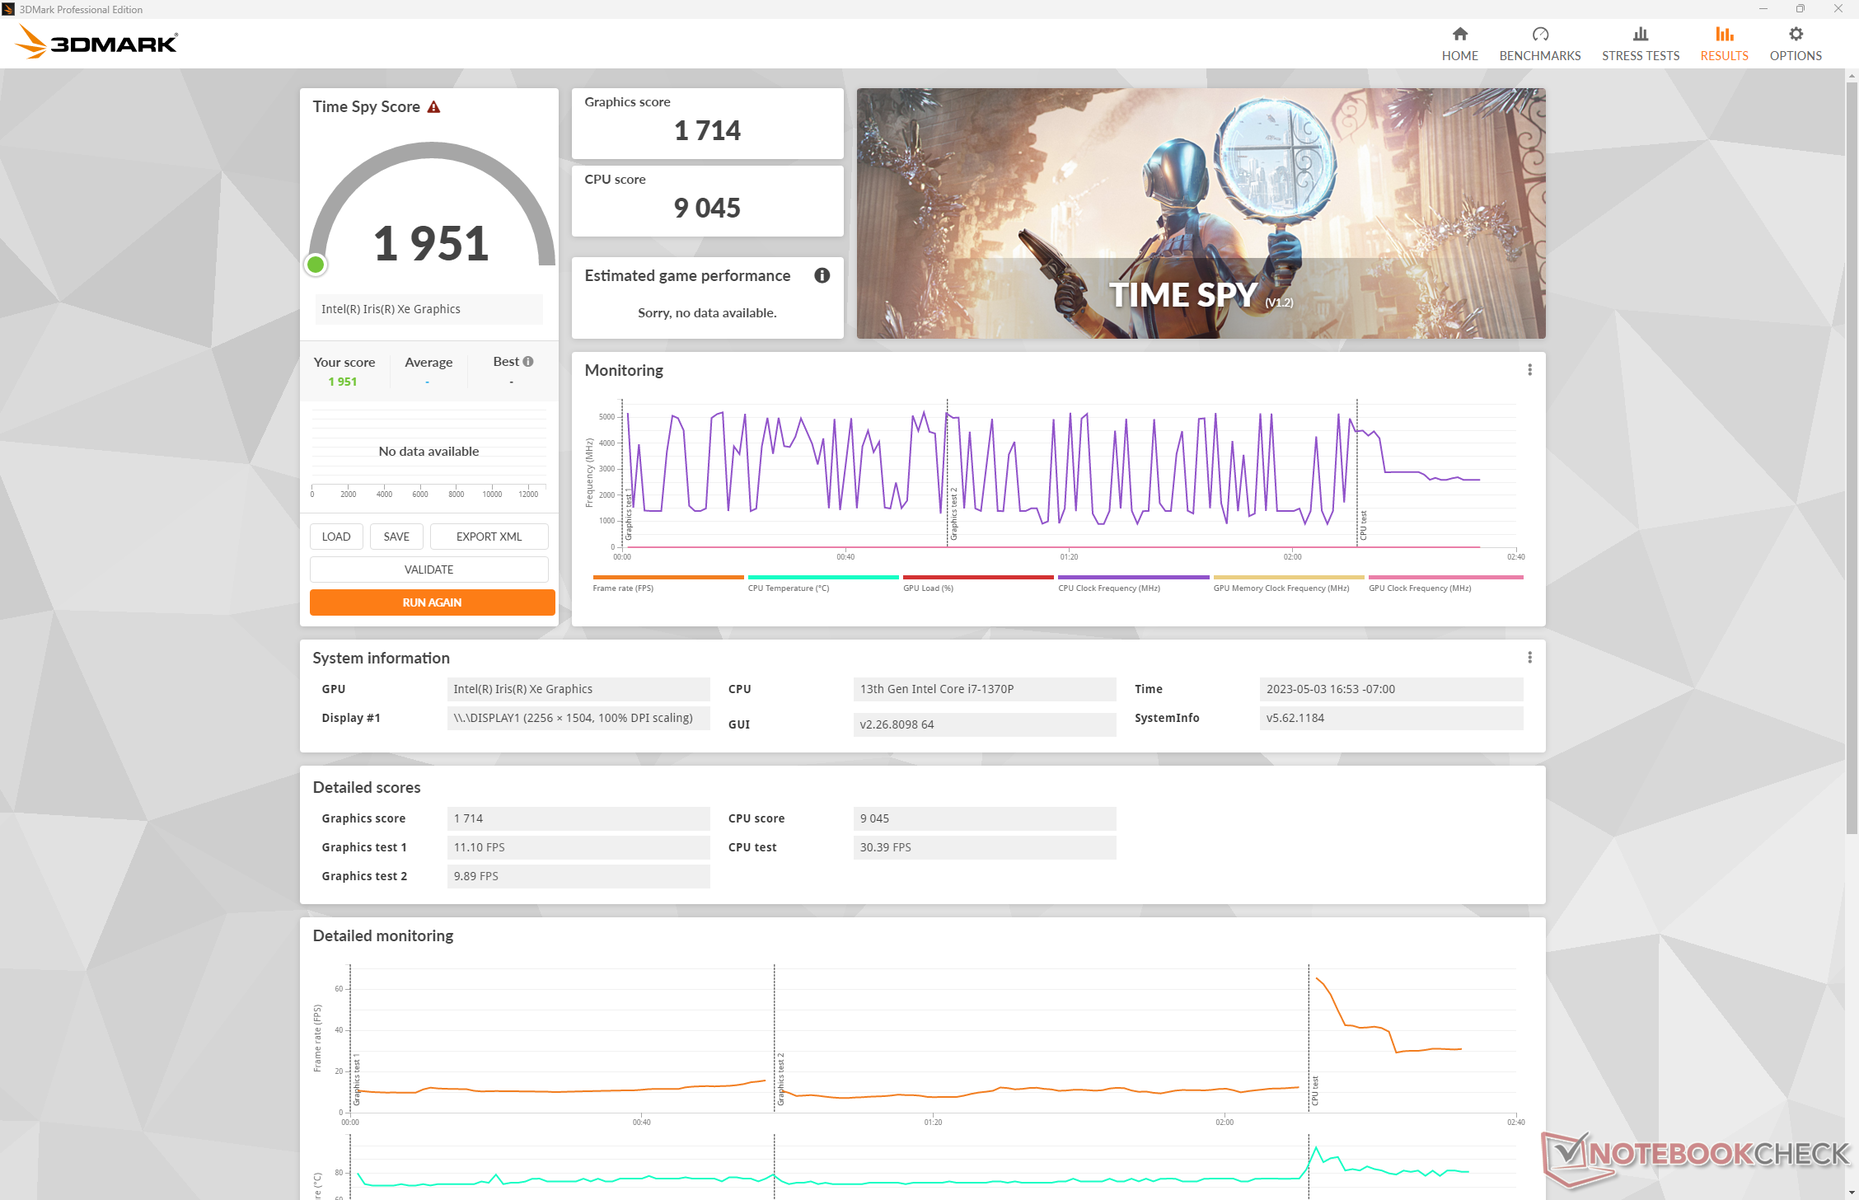
| 3DMark 11 Performance | 7882 Punkte | |
| 3DMark Cloud Gate Standard Score | 24426 Punkte | |
| 3DMark Fire Strike Score | 5321 Punkte | |
| 3DMark Time Spy Score | 1951 Punkte | |
Hilfe | ||
| Blender | |
| v3.3 Classroom OPTIX/RTX | |
| Lenovo Slim 7 Pro X 14ARH7 | |
| v3.3 Classroom CUDA | |
| Lenovo Slim 7 Pro X 14ARH7 | |
| v3.3 Classroom CPU | |
| Asus ZenBook S13 OLED UX5304 | |
| HP ProBook 445 G8-3Z6Q8ES | |
| HP Spectre x360 13.5 14t-ef000 | |
| Durchschnittliche Intel Iris Xe Graphics G7 96EUs (336 - 1259, n=109) | |
| Lenovo Slim 7 Pro X 14ARH7 | |
| Framework Laptop 13.5 13th Gen Intel | |
* ... kleinere Werte sind besser
Gaming Performance
Wenig anspruchsvolle Titel wie DOTA 2 sind in der nativen Auflösung mit niedrigen Details spielbar. Für den Großteil aller Spiele muss man jedoch die Auflösung reduzieren, um flüssige Frameraten zu erhalten. Immerhin ist das System mit externen GPUs kompatibel, falls Gaming ein wichtiger Aspekt sein sollte.
Witcher 3 FPS Chart
| min. | mittel | hoch | max. | |
|---|---|---|---|---|
| GTA V (2015) | 119.5 | 106.3 | 22.2 | 8.95 |
| The Witcher 3 (2015) | 107.2 | 67.6 | 35.4 | 16.5 |
| Dota 2 Reborn (2015) | 131.8 | 92.4 | 69 | 62.7 |
| Final Fantasy XV Benchmark (2018) | 45.1 | 24.3 | 18 | |
| X-Plane 11.11 (2018) | 50.5 | 36.9 | 36.5 | |
| Strange Brigade (2018) | 99.7 | 42.4 | 34.1 | 27.6 |
| Tiny Tina's Wonderlands (2022) | 32.5 | 26.4 | 16.4 | 14.1 |
| F1 22 (2022) | 49.8 | 45.3 | 33 | 25.4 |
Emissionen — Unter hoher Last sehr laut
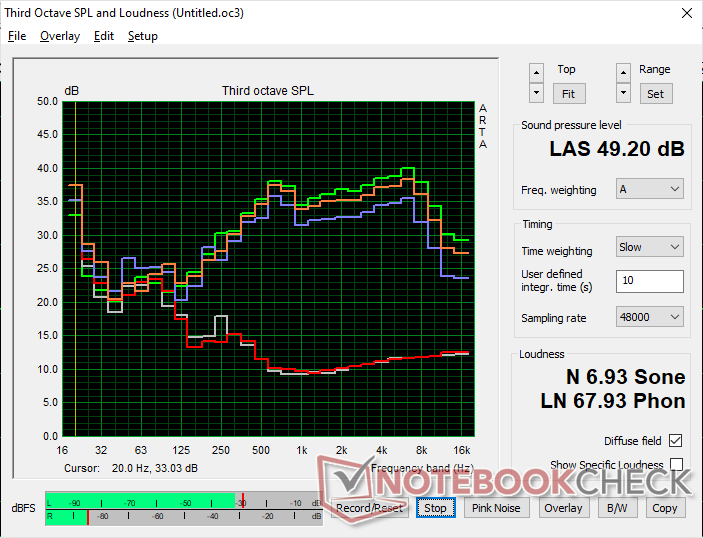
Systemlautstärke
Der Framework Laptop bleibt eines der lauteren Subnotebooks seiner Größenklasse. Bei geringen Lasten wie Browsing oder Videostreaming bleibt er zwar ruhig, aber der Single-Lüfter dreht schnell auf, sobald anspruchsvollere Lasten anliegen. Beispielsweise erreicht die Lüfterlautstärke schon auf halbem Wege durch die erste 3DMark-06-Benchmarkszene über 45 dB(A), das Spectre x360 13.5 kommt auf nur 27 dB(A), das XPS 13 Plus auf 40 dB(A). Beim Gaming wird der Framework mit annähernd 50 dB(A) noch lauter.
Lautstärkediagramm
| Idle |
| 23.2 / 23.2 / 23.2 dB(A) |
| Last |
| 45.3 / 49.2 dB(A) |
 | ||
30 dB leise 40 dB(A) deutlich hörbar 50 dB(A) störend |
||
min: | ||
| Framework Laptop 13.5 13th Gen Intel Iris Xe G7 96EUs, i7-1370P, WD PC SN740 SDDPNQD-1T00 | Framework Laptop 13.5 12th Gen Intel Iris Xe G7 96EUs, i7-1260P, WDC PC SN730 SDBPNTY-512G | Framework Laptop 13.5 Iris Xe G7 96EUs, i7-1165G7, Western Digital WD_BLACK SN850 WDS100T1X0E | HP Spectre x360 13.5 14t-ef000 Iris Xe G7 96EUs, i7-1255U, Micron 3400 1TB MTFDKBA1T0TFH | Dell XPS 13 Plus 9320 4K Iris Xe G7 96EUs, i7-1260P, Samsung PM9A1 MZVL21T0HCLR | Microsoft Surface Laptop 4 13 i7 Iris Xe G7 96EUs, i7-1185G7, Samsung PM991 MZ9LQ512HALU | |
|---|---|---|---|---|---|---|
| Geräuschentwicklung | 0% | -1% | 11% | -0% | 3% | |
| aus / Umgebung * (dB) | 23.2 | 22.8 2% | 23.9 -3% | 23.5 -1% | 24.4 -5% | 24.2 -4% |
| Idle min * (dB) | 23.2 | 23 1% | 23.9 -3% | 23.5 -1% | 24.4 -5% | 24.2 -4% |
| Idle avg * (dB) | 23.2 | 23 1% | 23.9 -3% | 23.5 -1% | 24.4 -5% | 24.2 -4% |
| Idle max * (dB) | 23.2 | 23 1% | 23.9 -3% | 23.5 -1% | 25.5 -10% | 24.2 -4% |
| Last avg * (dB) | 45.3 | 47.3 -4% | 45.6 -1% | 27 40% | 40.4 11% | 39.5 13% |
| Witcher 3 ultra * (dB) | 47.9 | 47.3 1% | 47.1 2% | 36.2 24% | 45.5 5% | |
| Last max * (dB) | 49.2 | 49.8 -1% | 47.9 3% | 42.4 14% | 45.5 8% | 39.5 20% |
* ... kleinere Werte sind besser
Temperatur
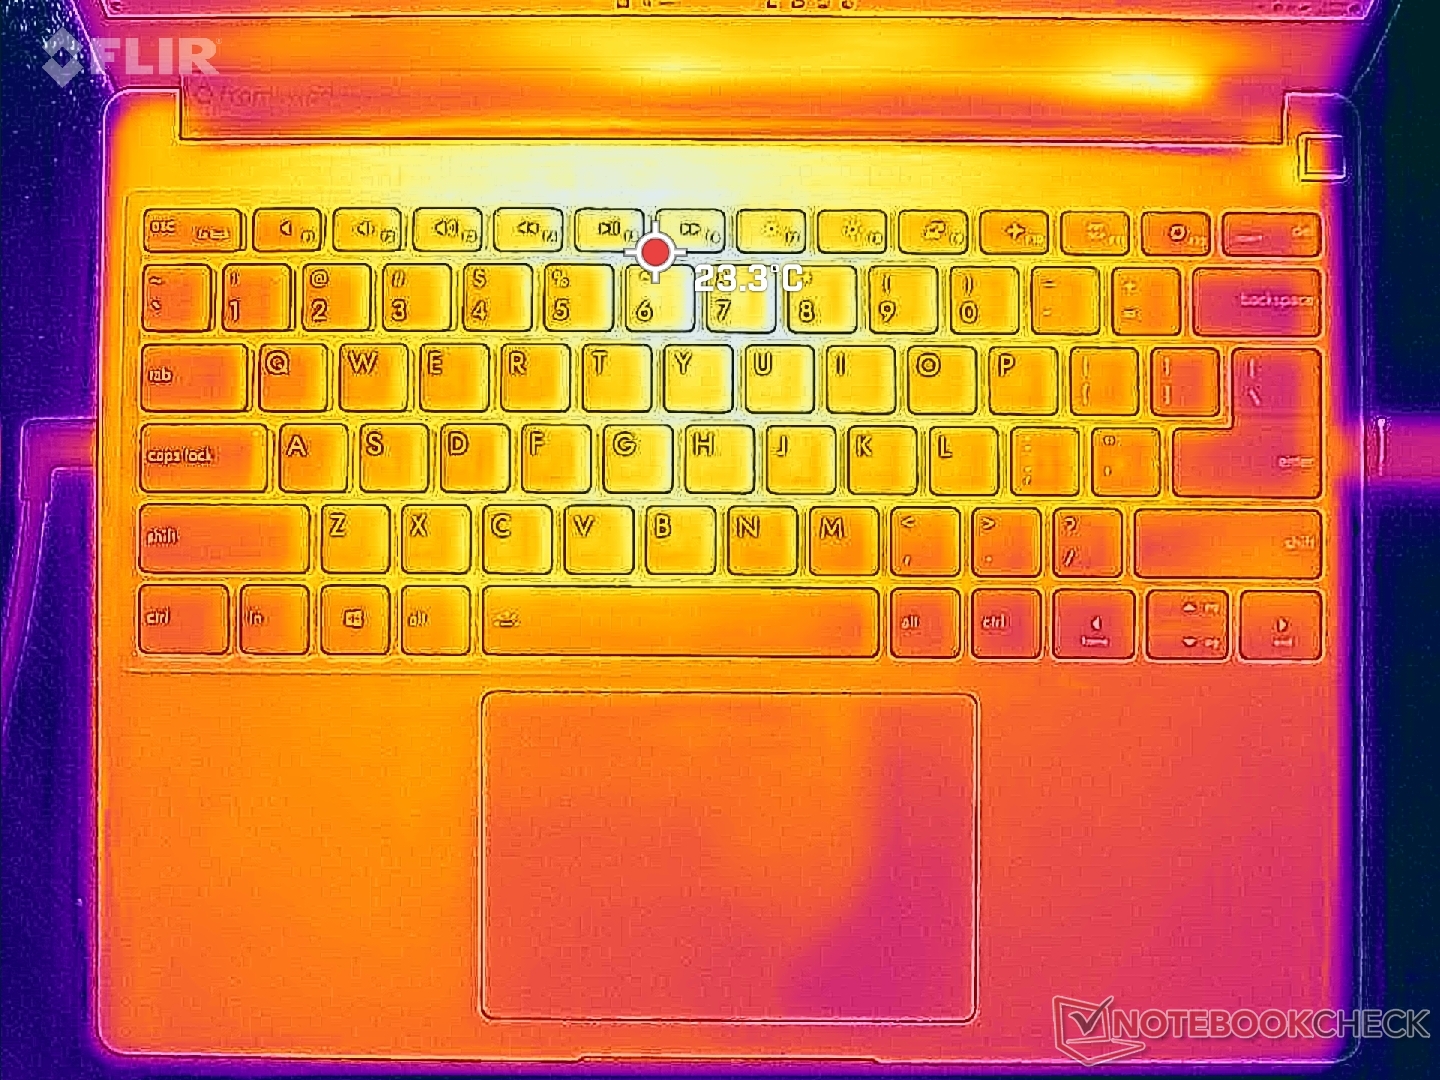
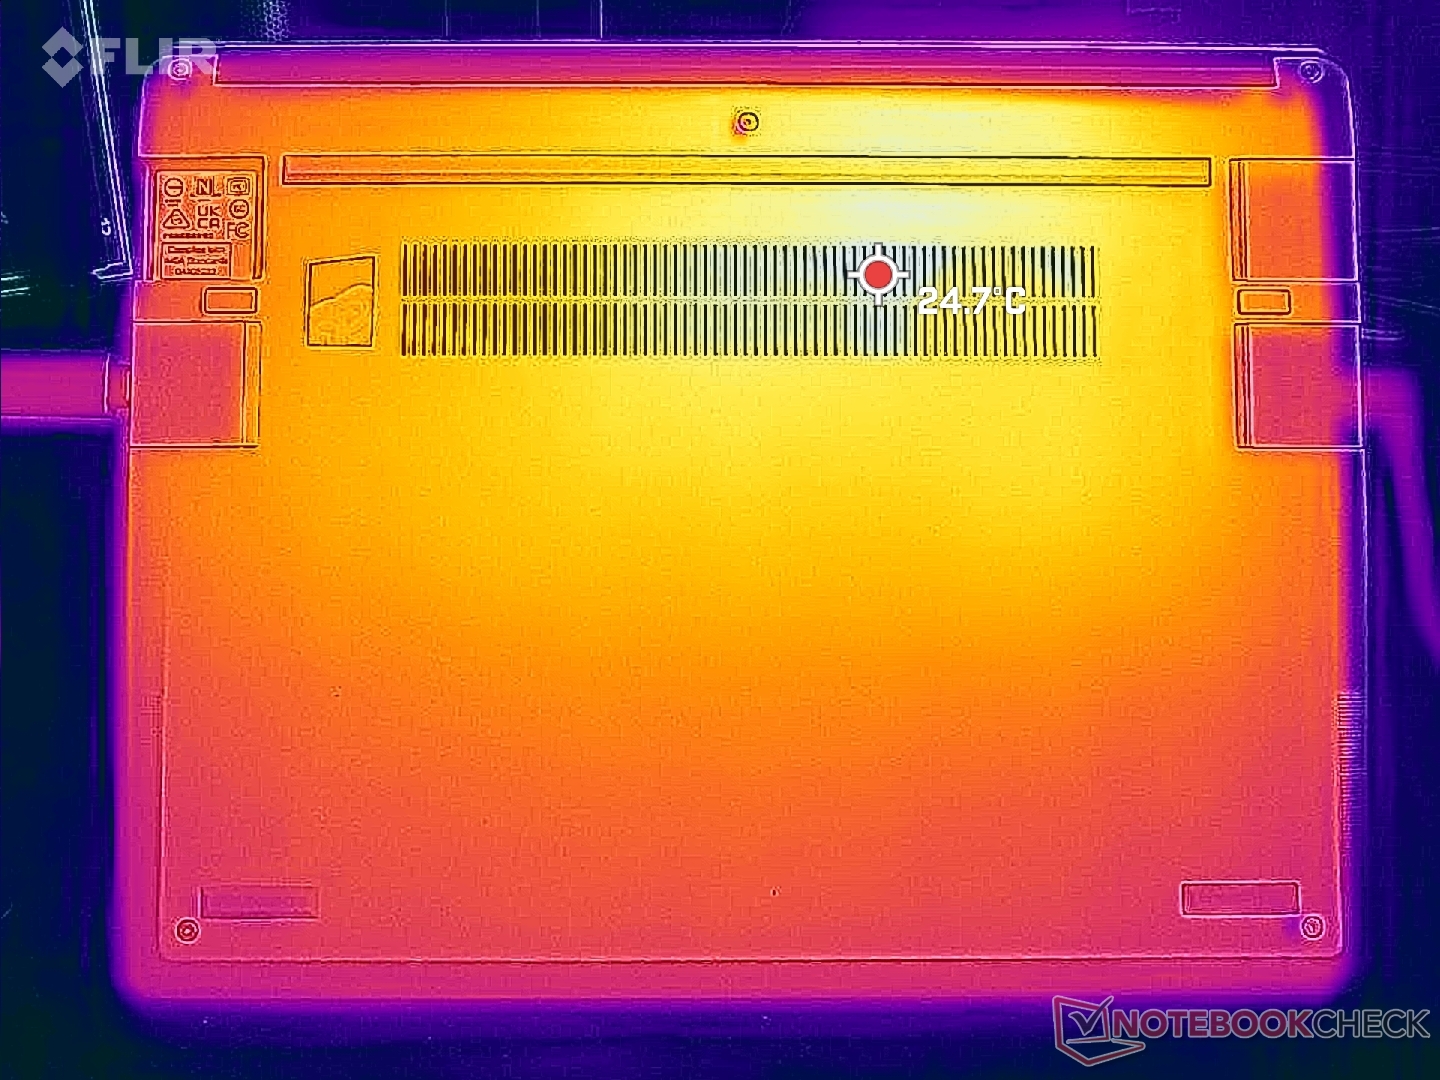
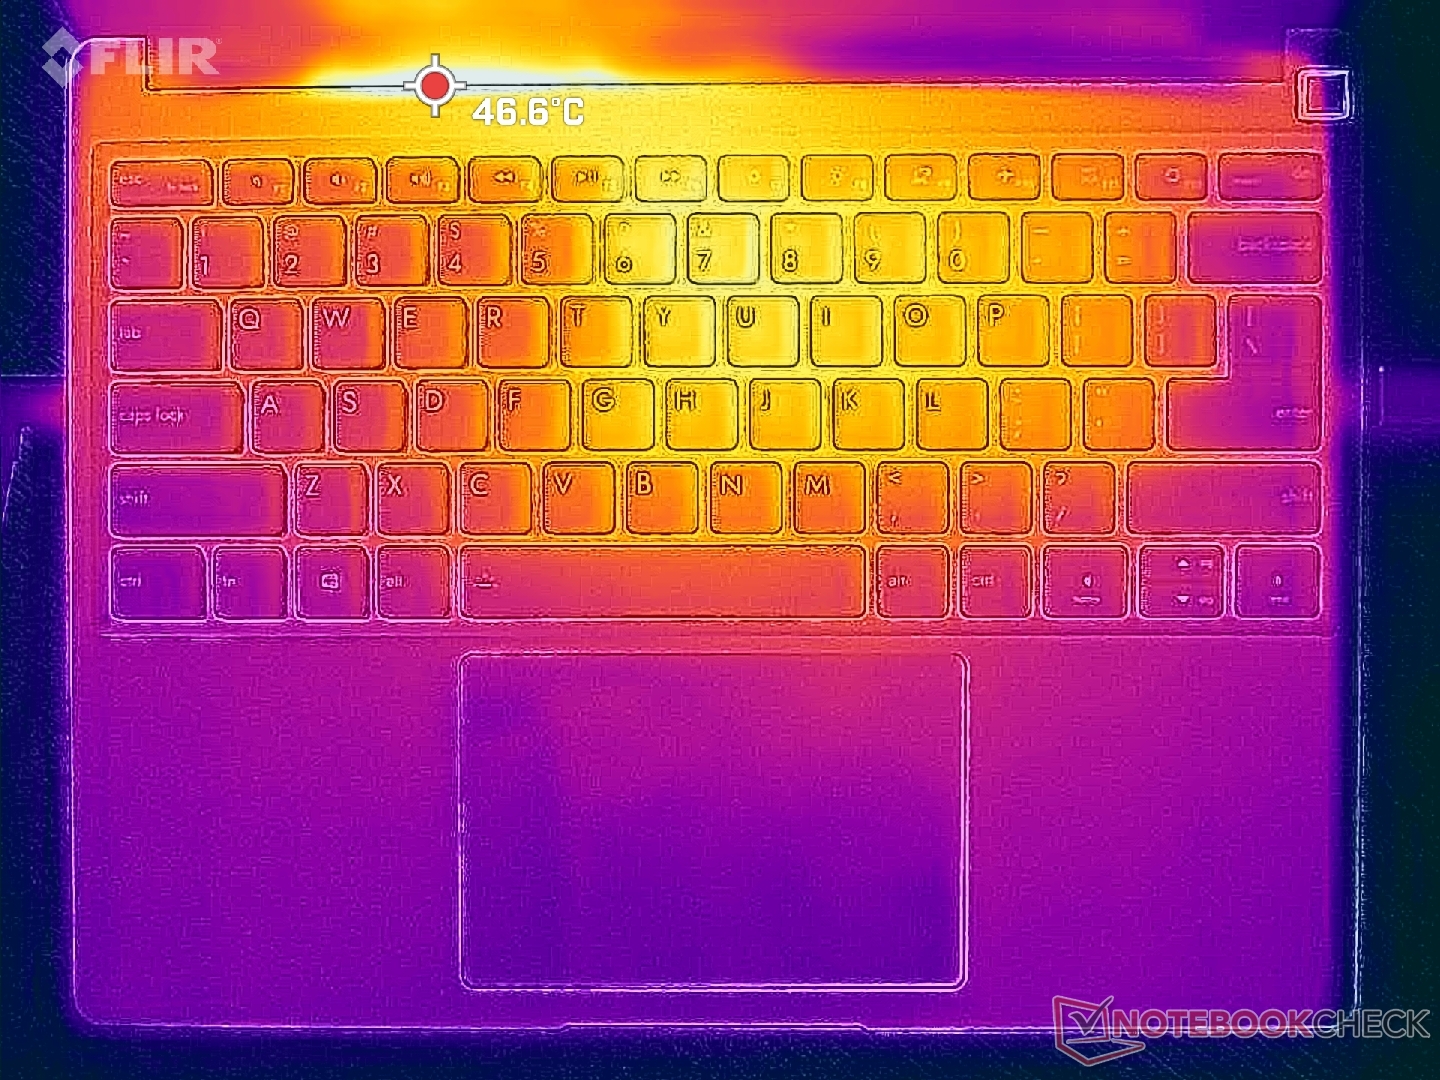
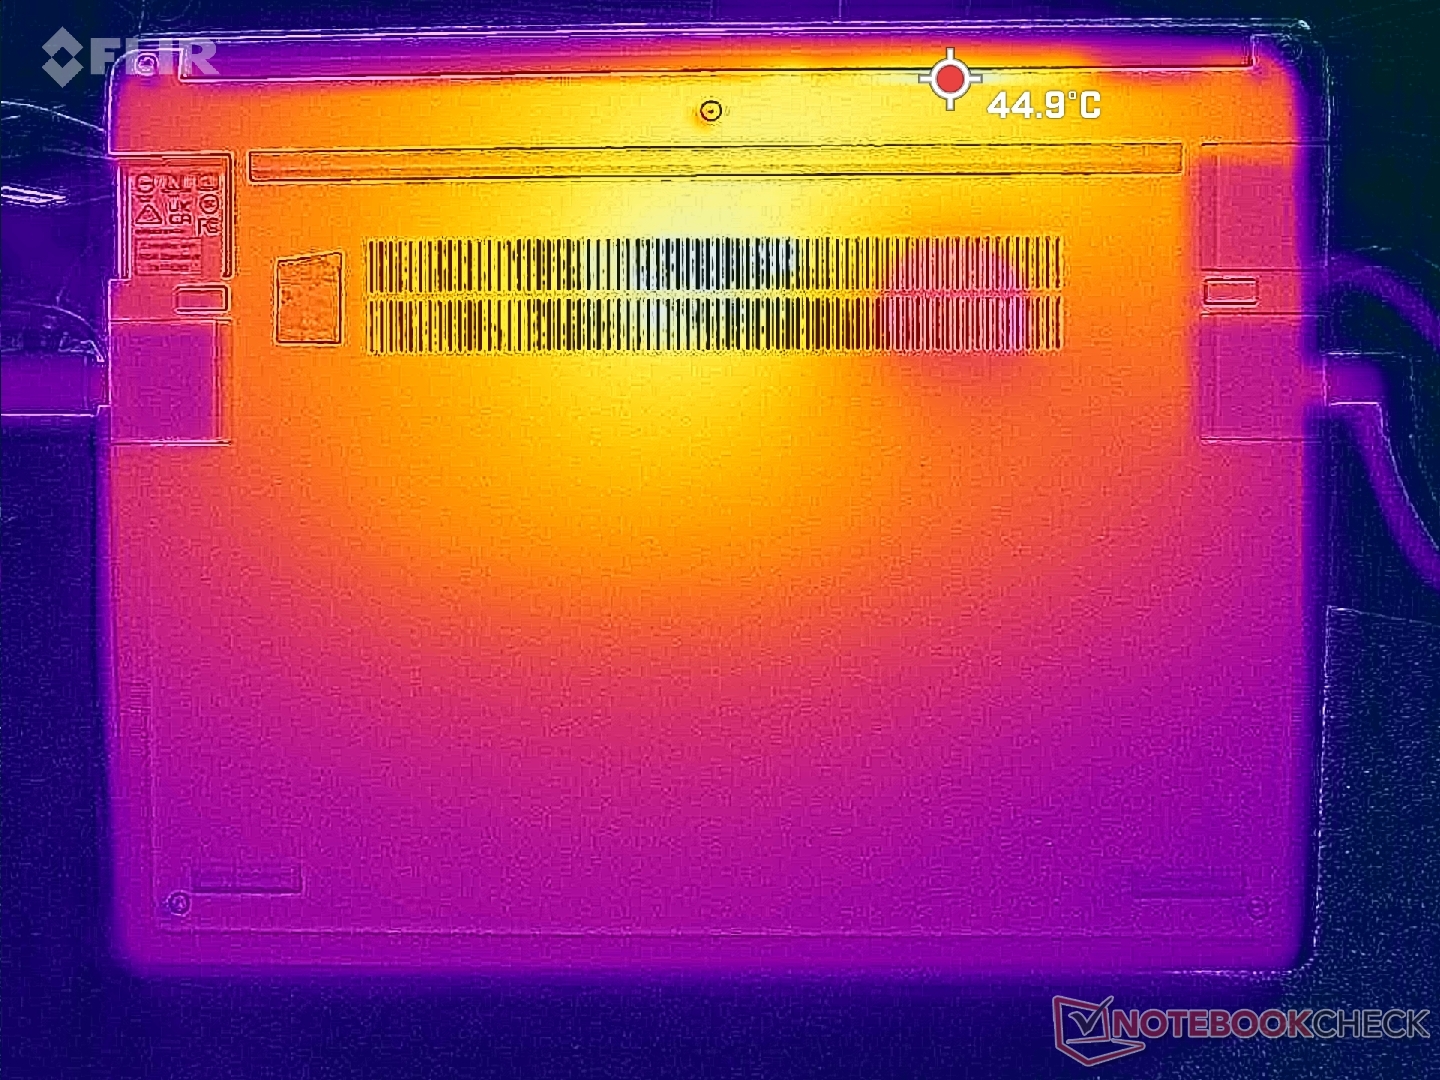
Die Oberflächentemperaturen erreichen bei länger anhaltenden, anspruchsvollen Lasten zwischen 39 und 42 °C, die Hot Spots liegen zur Rückseite hin. Das leichtere und dünnere XPS 13 Plus wird gar 49 °C warm. Während die Handballenauflagen vergleichsweise kühl bleiben, erhitzt sich vor allem die Unterseite stärker, aber es wird auch niemals unkomfortabel heiß.
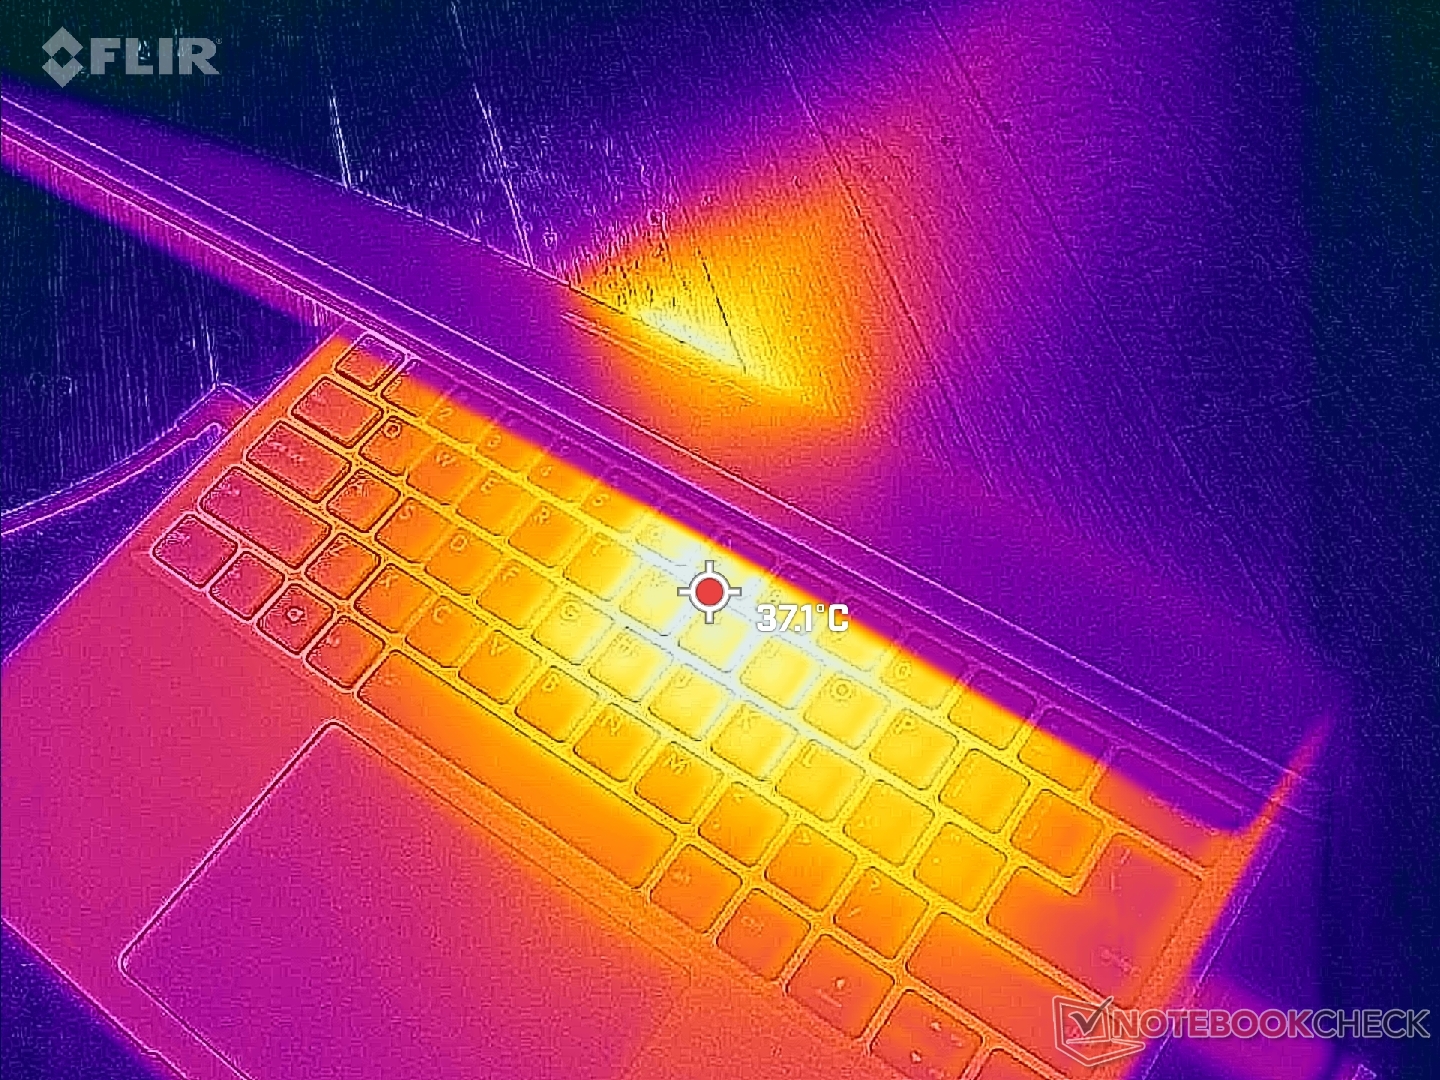
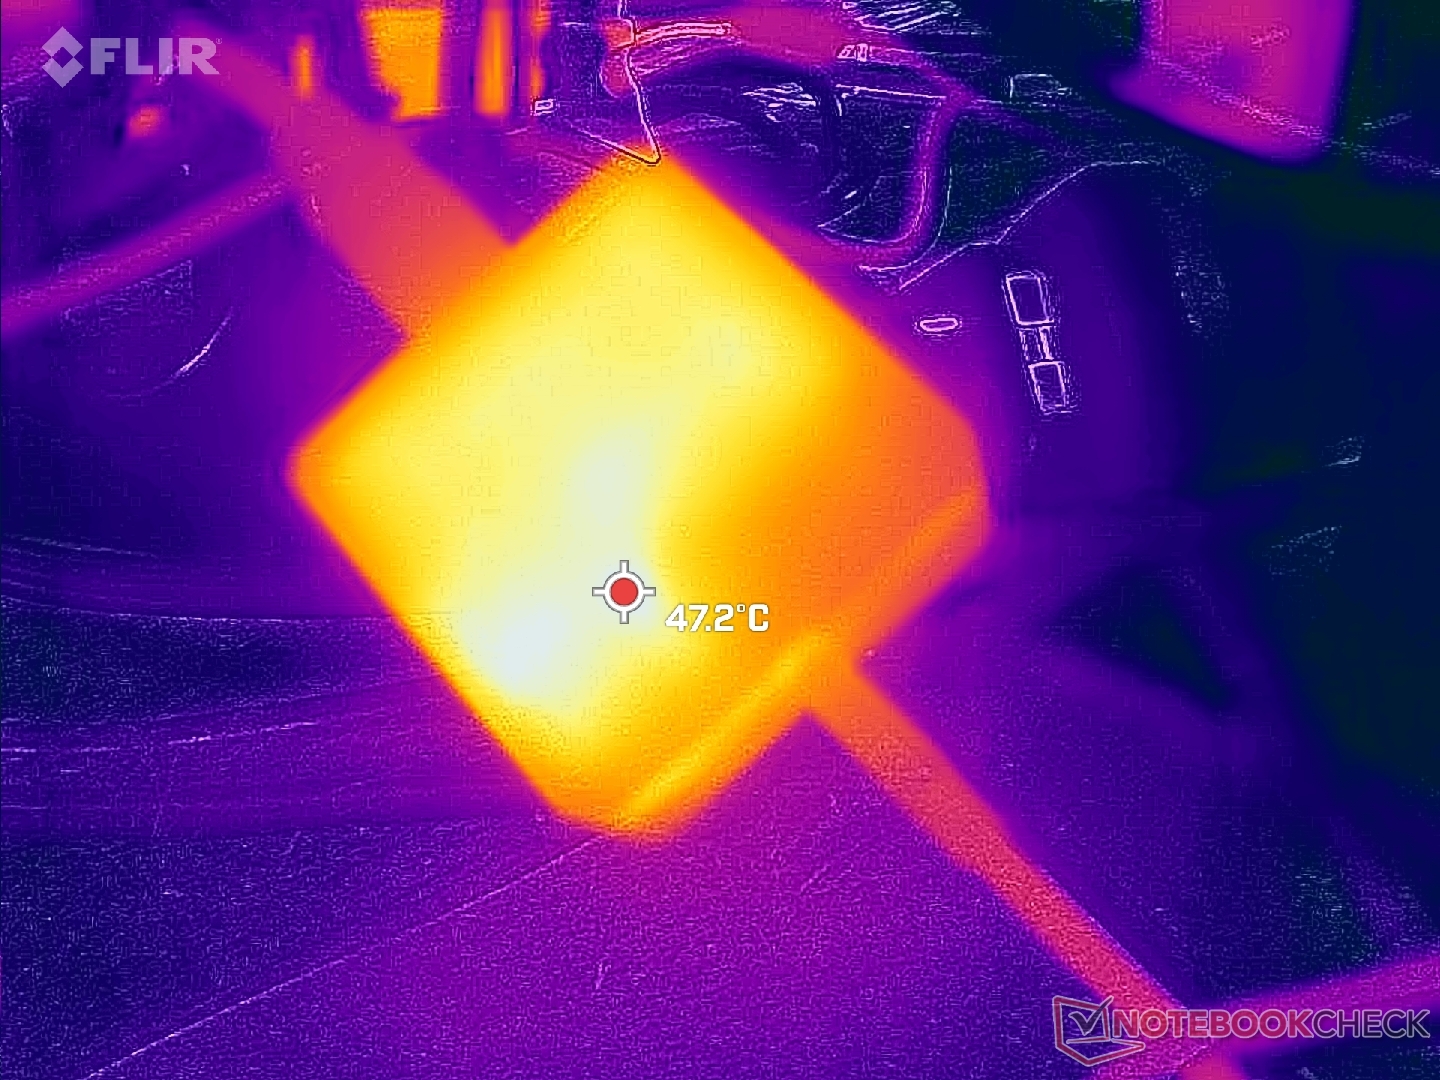
(+) Die maximale Temperatur auf der Oberseite ist 38.2 °C. Im Vergleich liegt der Klassendurchschnitt bei 34.3 °C (von 21.2 bis 62.5 °C für die Klasse Office).
(±) Auf der Unterseite messen wir eine maximalen Wert von 41.4 °C (im Vergleich zum Durchschnitt von 36.8 °C).
(+) Ohne Last messen wir eine durchschnittliche Temperatur von 24 °C auf der Oberseite. Der Klassendurchschnitt erreicht 29.5 °C.
(+) Die Handballen und der Touchpad-Bereich sind mit gemessenen 24.6 °C kühler als die typische Hauttemperatur und fühlen sich dadurch kühl an.
(+) Die durchschnittliche Handballen-Temperatur anderer getesteter Geräte war 27.5 °C (+2.9 °C).
| Framework Laptop 13.5 13th Gen Intel Intel Core i7-1370P, Intel Iris Xe Graphics G7 96EUs | Framework Laptop 13.5 12th Gen Intel Intel Core i7-1260P, Intel Iris Xe Graphics G7 96EUs | Framework Laptop 13.5 Intel Core i7-1165G7, Intel Iris Xe Graphics G7 96EUs | HP Spectre x360 13.5 14t-ef000 Intel Core i7-1255U, Intel Iris Xe Graphics G7 96EUs | Dell XPS 13 Plus 9320 4K Intel Core i7-1260P, Intel Iris Xe Graphics G7 96EUs | Microsoft Surface Laptop 4 13 i7 Intel Core i7-1185G7, Intel Iris Xe Graphics G7 96EUs | |
|---|---|---|---|---|---|---|
| Hitze | 1% | -5% | 13% | -10% | -2% | |
| Last oben max * (°C) | 38.2 | 36.8 4% | 47.2 -24% | 36.4 5% | 41.1 -8% | 44.6 -17% |
| Last unten max * (°C) | 41.4 | 42.4 -2% | 39.4 5% | 37 11% | 48.8 -18% | 46.9 -13% |
| Idle oben max * (°C) | 25.8 | 24.2 6% | 25.2 2% | 20.8 19% | 28 -9% | 23.7 8% |
| Idle unten max * (°C) | 27.6 | 29 -5% | 27.8 -1% | 22.6 18% | 29.3 -6% | 24.1 13% |
* ... kleinere Werte sind besser
Stresstest
Im Prime95-Stress boostet der Core i7-1370P für etwa 20 s auf 3,6 GHz und 54 W hoch. Nachdem eine Kerntemperatur von 92 °C erreicht wird, sinken Taktraten und TDP kontinuierlich ab und stabilisieren sich bei 2,1 GHz und 30 W. Die Ergebnisse ähneln denen vom Vorjahr, was wenig überrascht, schließlich rechnet der dortige Core i7-1260P unter vergleichbaren Energie- und Kühlbedingungen.
Die GPU-Taktraten unter Witcher 3 stabilisieren sich bei 1.500 MHz, beim Vorgänger waren es noch niedrigere 1.200 bis 1.400 MHz. Die leicht gestiegene Grafikleistung hat jedoch höhere Kerntemperaturen und einen höheren Energieverbrauch zur Folge. So stabilisiert sich die CPU im neuen Modell erst bei 93 °C, was 10 °C höher ist als im Vorgänger.
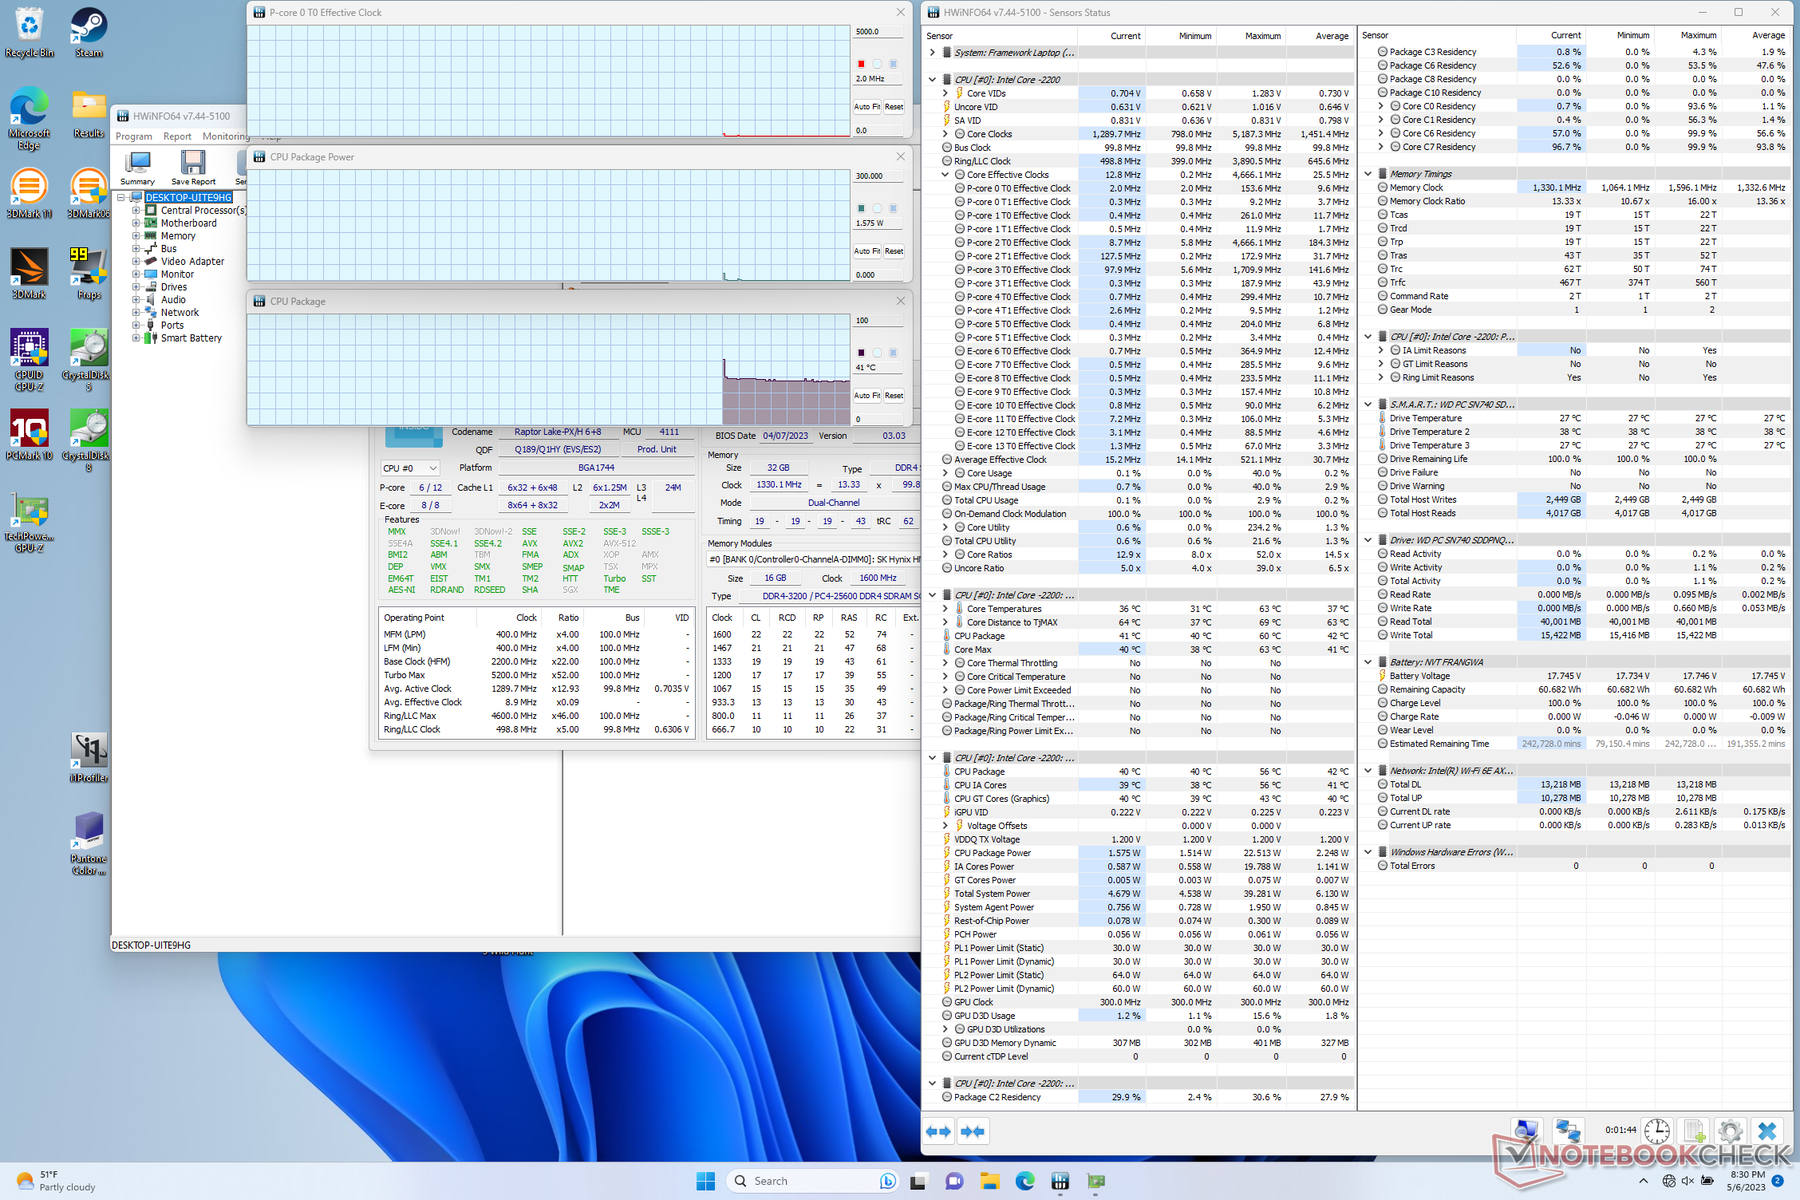
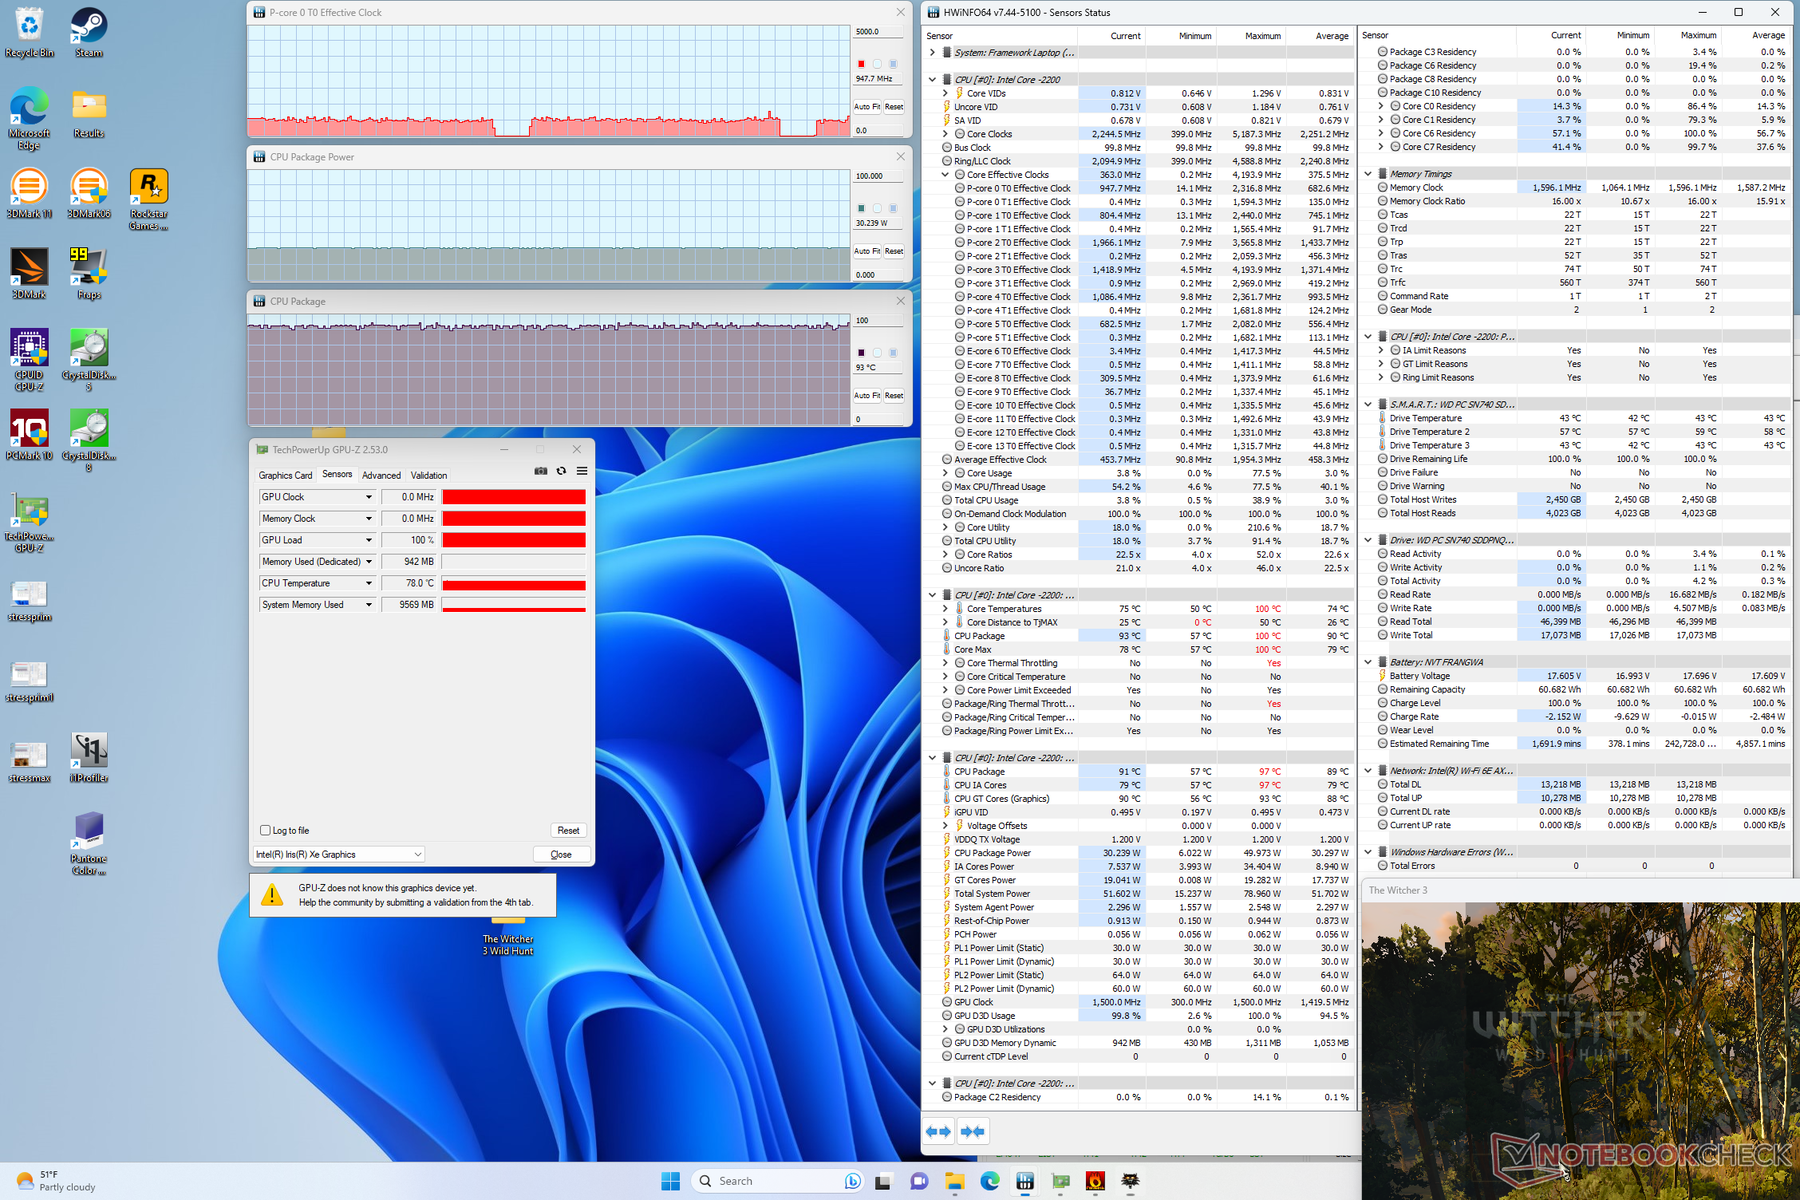
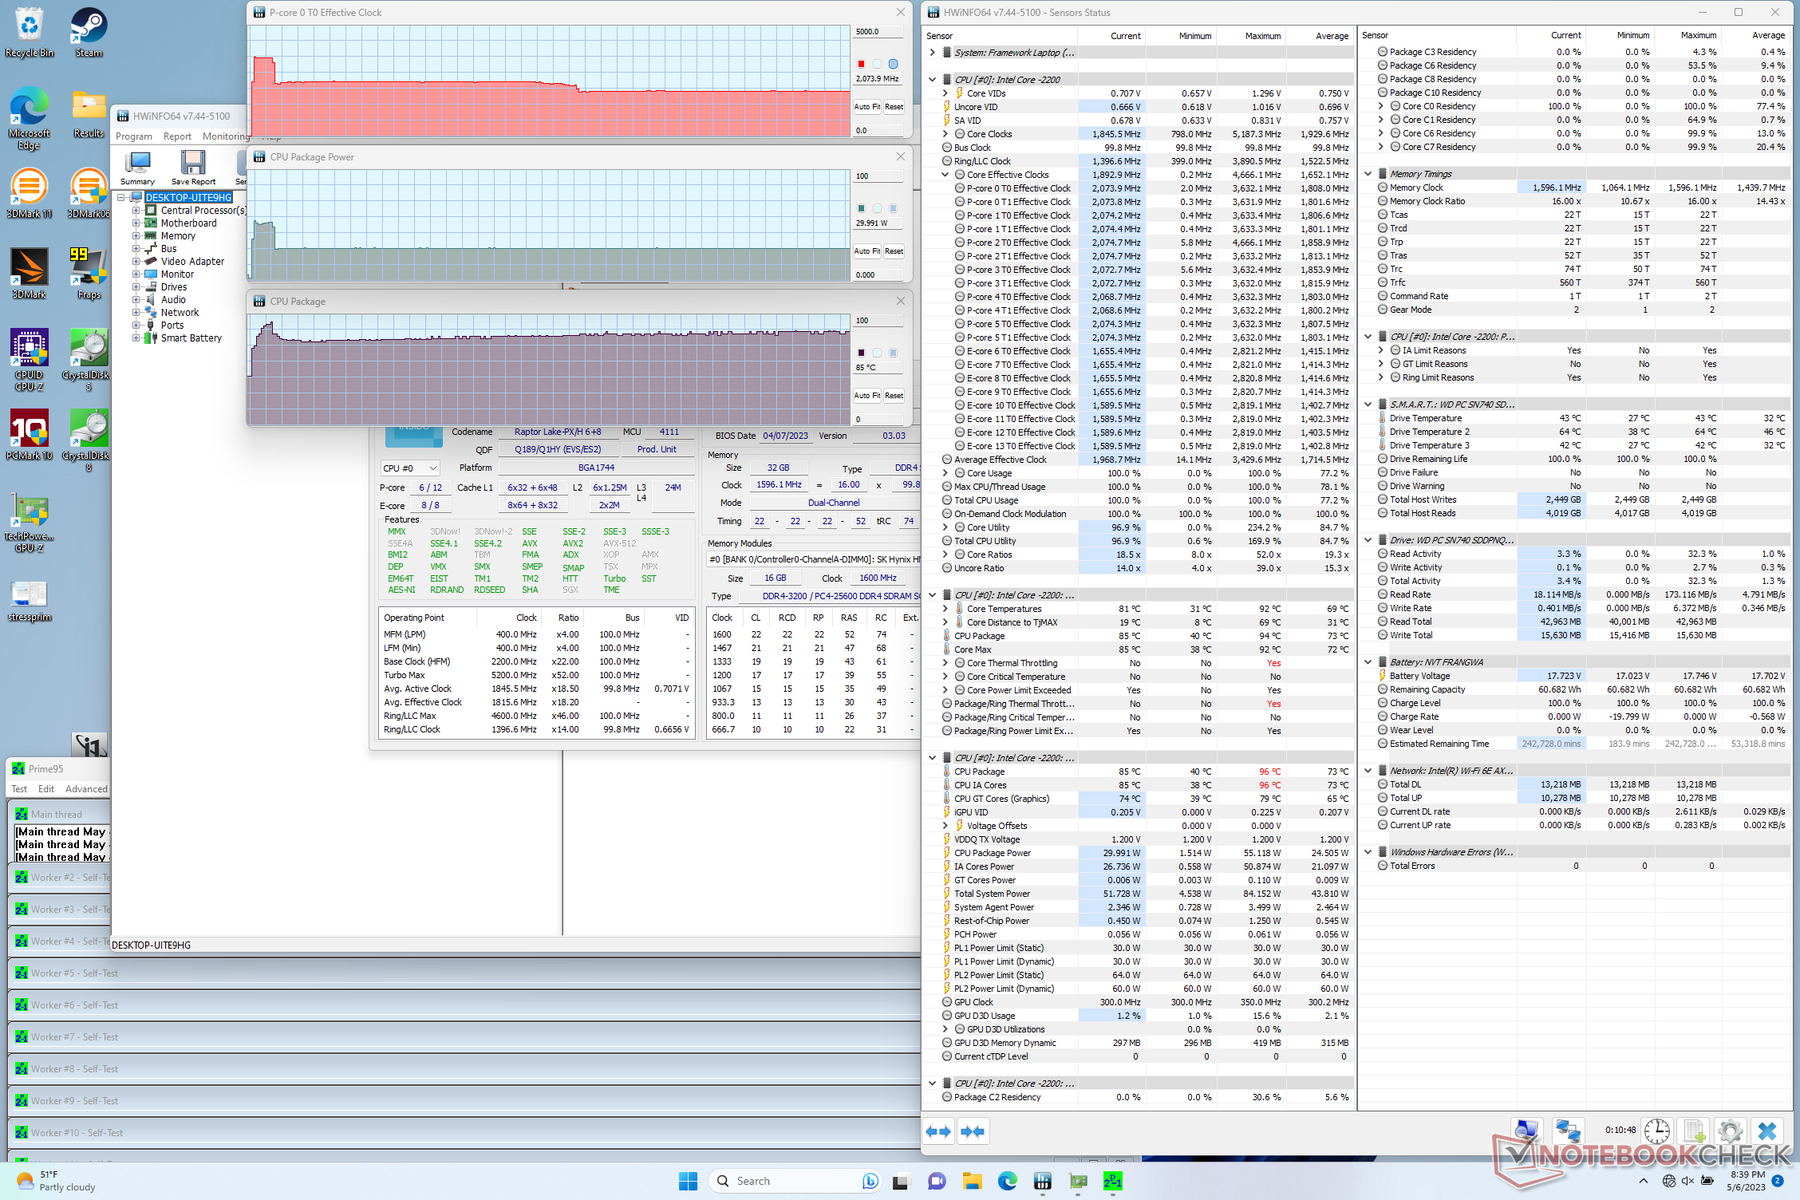
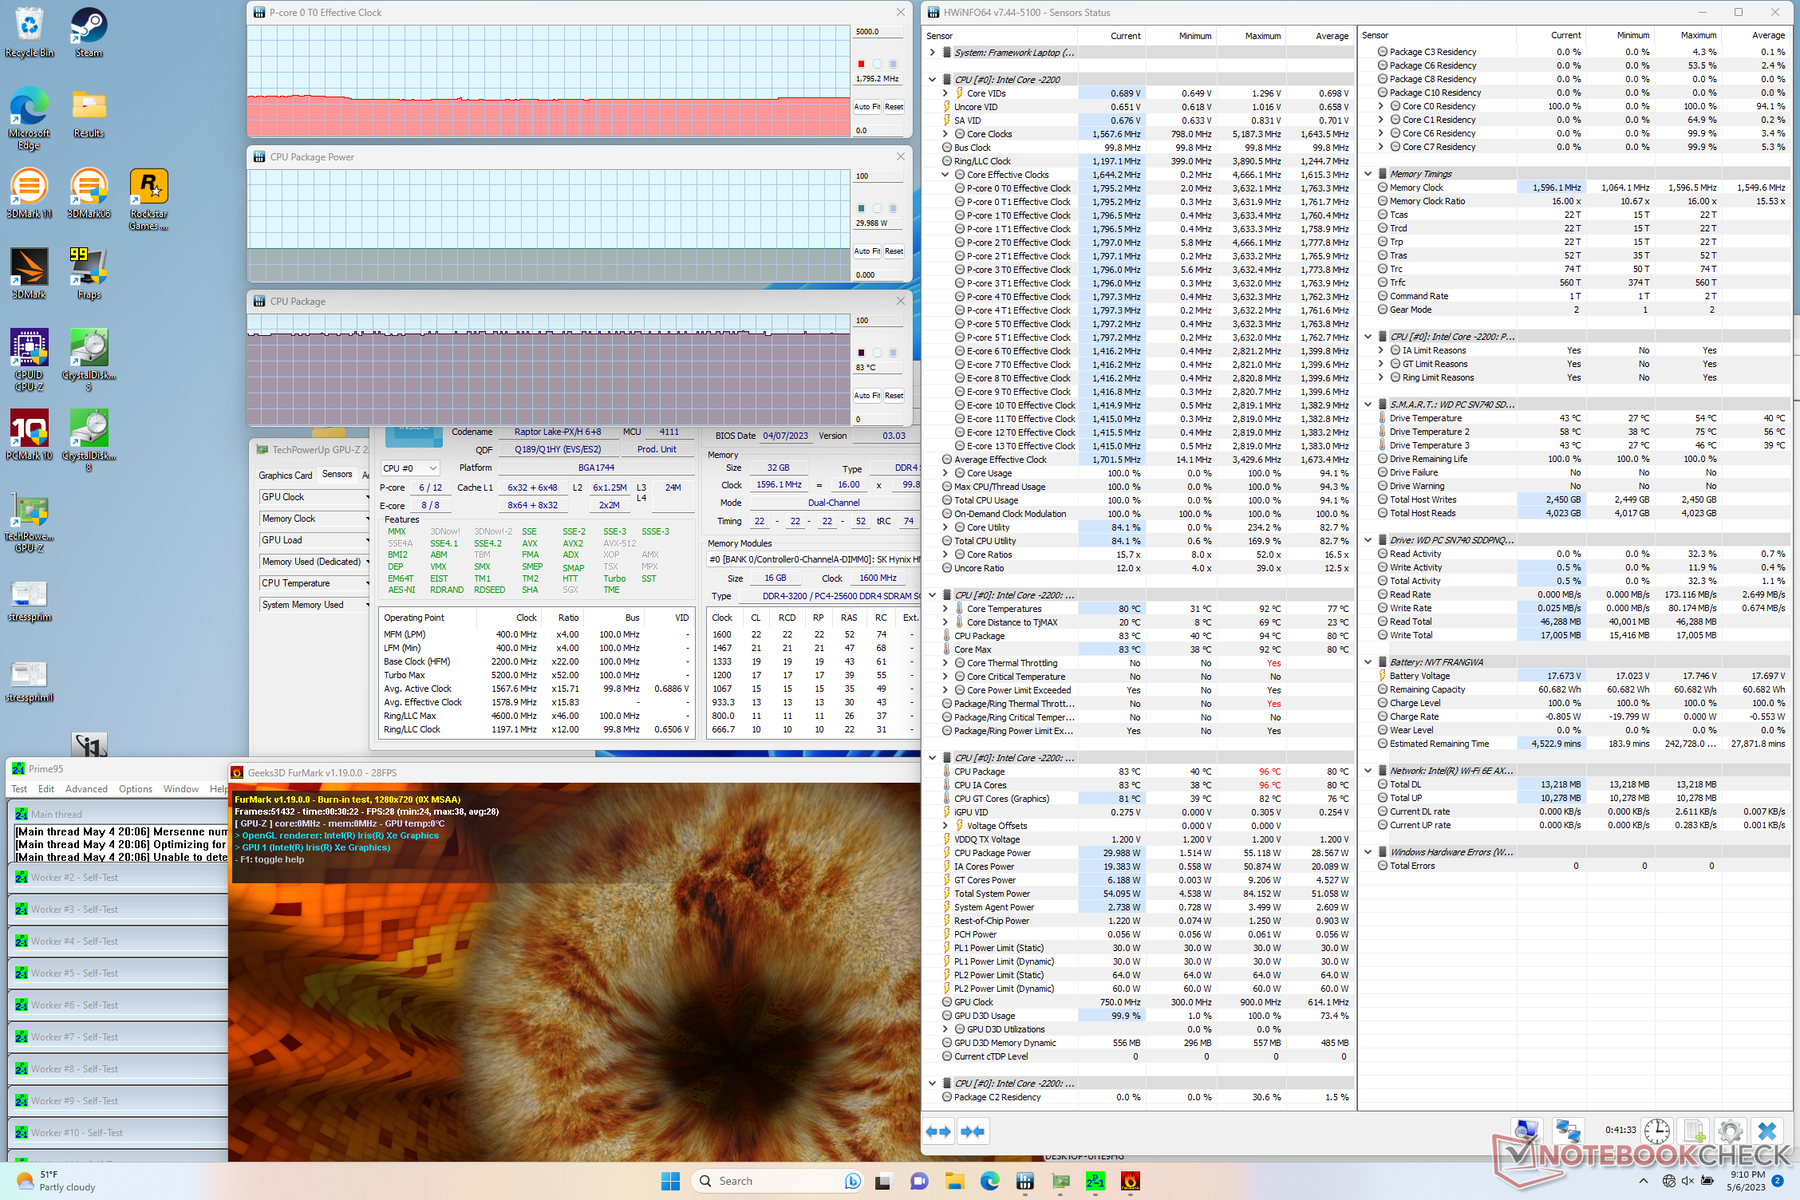
| CPU Clock (GHz) | GPU Clock (MHz) | Average CPU Temperature (°C) | |
| System Idle | -- | -- | 41 |
| Prime95 Stress | 2.1 | -- | 85 |
| Prime95 + FurMark Stress | 1.8 | 750 | 83 |
| Witcher 3 Stress | 0.9 | 1500 | 93 |
Lautsprecher
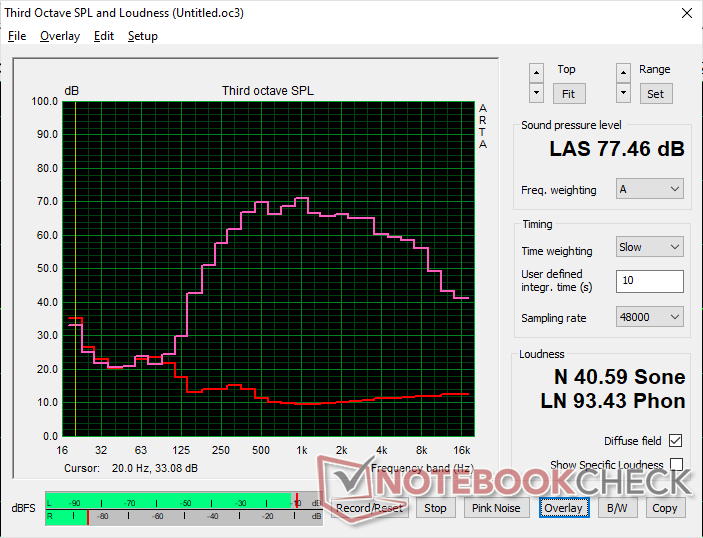
Framework Laptop 13.5 13th Gen Intel Audio Analyse
(±) | Mittelmäßig laut spielende Lautsprecher (77.5 dB)
Bass 100 - 315 Hz
(-) | kaum Bass - 16.2% niedriger als der Median
(±) | durchschnittlich lineare Bass-Wiedergabe (13.8% Delta zum Vorgänger)
Mitteltöne 400 - 2000 Hz
(±) | zu hohe Mitten, vom Median 7.3% abweichend
(+) | lineare Mitten (5.7% Delta zum Vorgänger)
Hochtöne 2 - 16 kHz
(+) | ausgeglichene Hochtöne, vom Median nur 4% abweichend
(+) | sehr lineare Hochtöne (5% Delta zum Vorgänger)
Gesamt im hörbaren Bereich 100 - 16.000 Hz
(±) | hörbarer Bereich ist durchschnittlich linear (21.1% Abstand zum Median)
Im Vergleich zu allen Geräten derselben Klasse
» 50% aller getesteten Geräte dieser Klasse waren besser, 9% vergleichbar, 41% schlechter
» Das beste Gerät hat einen Delta-Wert von 7%, durchschnittlich ist 21%, das schlechteste Gerät hat 53%
Im Vergleich zu allen Geräten im Test
» 58% aller getesteten Geräte waren besser, 7% vergleichbar, 35% schlechter
» Das beste Gerät hat einen Delta-Wert von 4%, durchschnittlich ist 24%, das schlechteste Gerät hat 134%
Apple MacBook Pro 16 2021 M1 Pro Audio Analyse
(+) | Die Lautsprecher können relativ laut spielen (84.7 dB)
Bass 100 - 315 Hz
(+) | guter Bass - nur 3.8% Abweichung vom Median
(+) | lineare Bass-Wiedergabe (5.2% Delta zum Vorgänger)
Mitteltöne 400 - 2000 Hz
(+) | ausgeglichene Mitten, vom Median nur 1.3% abweichend
(+) | lineare Mitten (2.1% Delta zum Vorgänger)
Hochtöne 2 - 16 kHz
(+) | ausgeglichene Hochtöne, vom Median nur 1.9% abweichend
(+) | sehr lineare Hochtöne (2.7% Delta zum Vorgänger)
Gesamt im hörbaren Bereich 100 - 16.000 Hz
(+) | hörbarer Bereich ist sehr linear (4.6% Abstand zum Median
Im Vergleich zu allen Geräten derselben Klasse
» 0% aller getesteten Geräte dieser Klasse waren besser, 0% vergleichbar, 100% schlechter
» Das beste Gerät hat einen Delta-Wert von 5%, durchschnittlich ist 17%, das schlechteste Gerät hat 45%
Im Vergleich zu allen Geräten im Test
» 0% aller getesteten Geräte waren besser, 0% vergleichbar, 100% schlechter
» Das beste Gerät hat einen Delta-Wert von 4%, durchschnittlich ist 24%, das schlechteste Gerät hat 134%
Energiemanagement
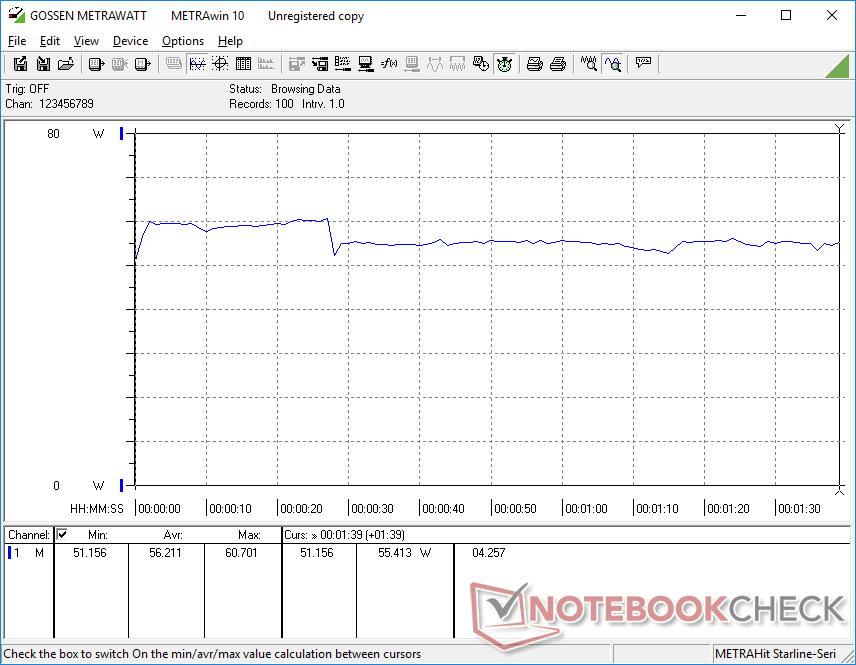
Energieverbrauch
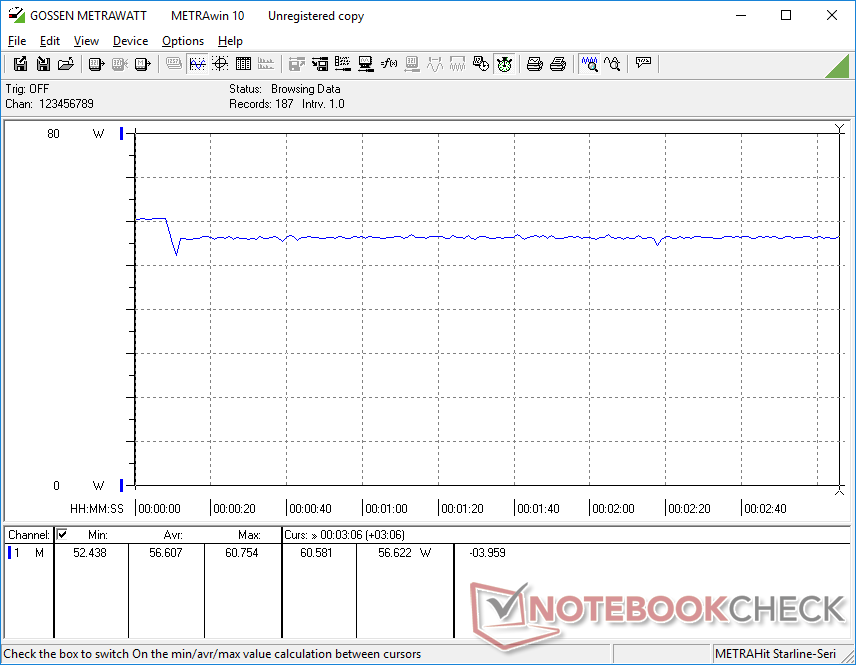
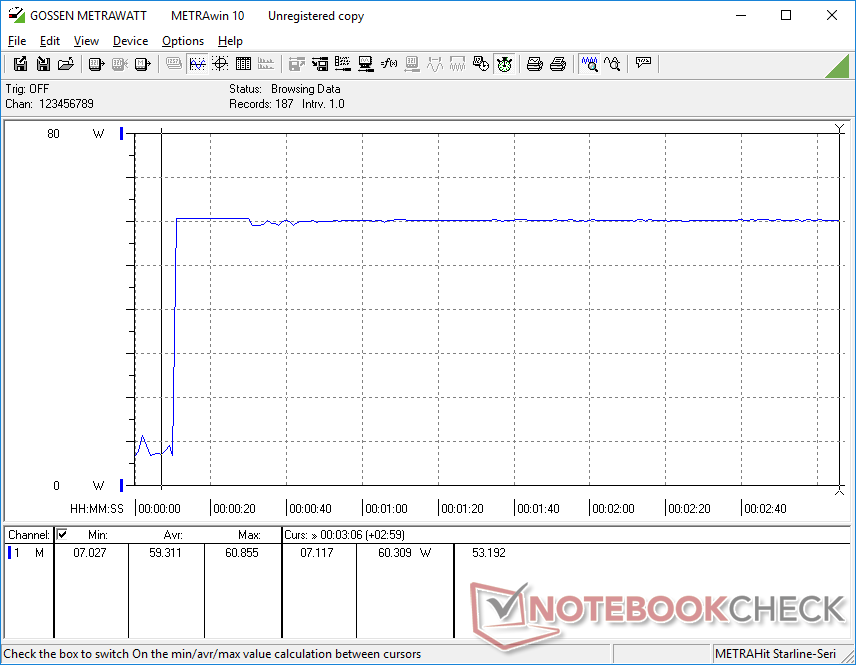
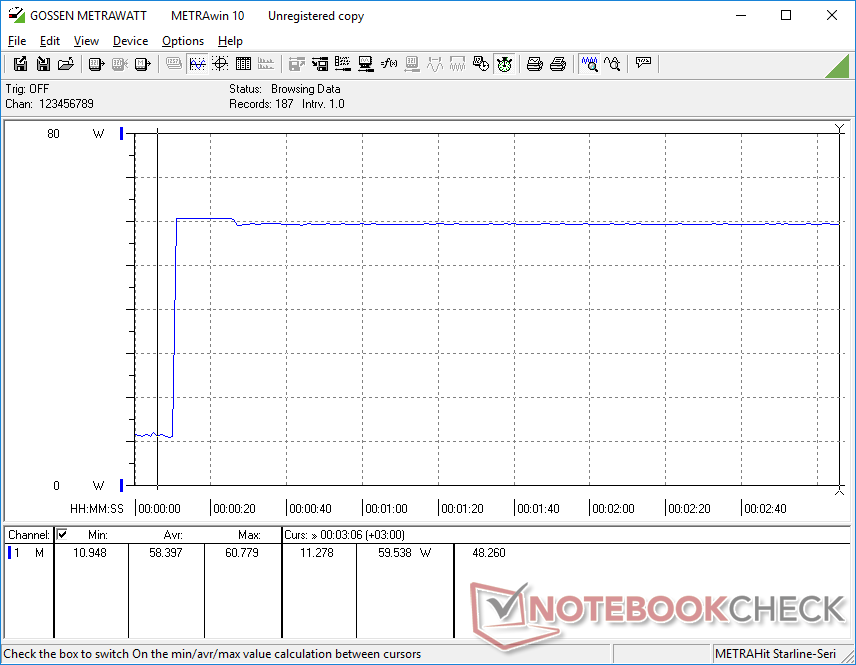
Im Leerlauf auf dem Desktop verbraucht der neue Framework ein paar Watt weniger als der Vorgänger, was die leicht gestiegene Akkulaufzeit im nächsten Abschnitt zum Teil erklären dürfte. Unter Prime95 ist der Verbrauch zwischen dem 2022er und dem neuen 20023 Modell dann nahezu identisch, trotz der höheren Leistung des aktuellen Modells. Demzufolge ist die Leistung-pro-Watt leicht gestiegen, was das Upgrade vom Gen12 Core i7-1260P auf den Gen13 Core i7-1370P angeht.
Andererseits liegt der Verbrauch unter Witcher 3, also beim Gaming und GPU-lastigen Arbeiten, ungefähr 21 Prozent höher als beim letztjährigen Modell. Die Ergebnisse korrelieren mit den leicht höheren und konstanteren GPU-Taktraten, die wir weiter oben erwähnt haben.
Wir messen einen Maximalverbrauch von 60,8 W aus dem kleinen (~5,8 x 5,8 x 2,7 cm) 60-W-Netzteil unter Prime95. Die Ladegeschwindigkeit des Akkus dürfte sich demnach rapide verschlechtern, sobald hohe Lasten anliegen. Ein 80-W-Netzteil oder höher hätte dieses Problem entschärft.
| Aus / Standby | |
| Idle | |
| Last |
|
Legende:
min: | |
| Framework Laptop 13.5 13th Gen Intel i7-1370P, Iris Xe G7 96EUs, WD PC SN740 SDDPNQD-1T00, IPS, 2256x1504, 13.5" | Framework Laptop 13.5 12th Gen Intel i7-1260P, Iris Xe G7 96EUs, WDC PC SN730 SDBPNTY-512G, IPS, 2256x1504, 13.5" | Framework Laptop 13.5 i7-1165G7, Iris Xe G7 96EUs, Western Digital WD_BLACK SN850 WDS100T1X0E, IPS, 2256x1504, 13.5" | HP Spectre x360 13.5 14t-ef000 i7-1255U, Iris Xe G7 96EUs, Micron 3400 1TB MTFDKBA1T0TFH, OLED, 3000x2000, 13.5" | Dell XPS 13 Plus 9320 4K i7-1260P, Iris Xe G7 96EUs, Samsung PM9A1 MZVL21T0HCLR, IPS, 3840x2400, 13.4" | Microsoft Surface Laptop 4 13 i7 i7-1185G7, Iris Xe G7 96EUs, Samsung PM991 MZ9LQ512HALU, IPS, 2256x1504, 13.5" | |
|---|---|---|---|---|---|---|
| Stromverbrauch | -19% | -4% | 0% | -38% | 11% | |
| Idle min * (Watt) | 2.9 | 5.3 -83% | 4.3 -48% | 4 -38% | 7 -141% | 2.6 10% |
| Idle avg * (Watt) | 6.3 | 8.4 -33% | 8.2 -30% | 4.9 22% | 11 -75% | 6 5% |
| Idle max * (Watt) | 9.9 | 11.2 -13% | 8.7 12% | 12.5 -26% | 11.4 -15% | 8.2 17% |
| Last avg * (Watt) | 56.2 | 57.4 -2% | 43.5 23% | 48.1 14% | 59.7 -6% | 41.4 26% |
| Witcher 3 ultra * (Watt) | 56.6 | 46.7 17% | 43.5 23% | 35.8 37% | 49.4 13% | |
| Last max * (Watt) | 60.8 | 61.2 -1% | 61.8 -2% | 65.2 -7% | 63 -4% | 64.1 -5% |
* ... kleinere Werte sind besser
Verbrauch Witcher 3 / Stresstest
Verbrauch mit externem Monitor
Akkulaufzeit
Die WLAN-Laufzeit fällt über eine Stunde länger aus als im Vorgänger. Das liegt vor allem an der leicht gestiegenen Akkukapazität (61 Wh vs. 55 Wh). Mit 8,5 Stunden werden auch viele Konkurrenten übertroffen, darunter das Microsoft Surface Laptop 4 13.
Eine komplette Aufladung dauert etwa 90 Minuten. Manchmal berechnet Windows die ausbleibende Ladedauer auf über 5 Stunden, das ist aber nicht korrekt, sofern man keine starken Lasten anlegt.
| Framework Laptop 13.5 13th Gen Intel i7-1370P, Iris Xe G7 96EUs, 61 Wh | Framework Laptop 13.5 12th Gen Intel i7-1260P, Iris Xe G7 96EUs, 55 Wh | Framework Laptop 13.5 i7-1165G7, Iris Xe G7 96EUs, 55 Wh | HP Spectre x360 13.5 14t-ef000 i7-1255U, Iris Xe G7 96EUs, 66 Wh | Dell XPS 13 Plus 9320 4K i7-1260P, Iris Xe G7 96EUs, 55 Wh | Microsoft Surface Laptop 4 13 i7 i7-1185G7, Iris Xe G7 96EUs, 47.4 Wh | |
|---|---|---|---|---|---|---|
| Akkulaufzeit | -15% | -9% | -9% | -22% | -14% | |
| WLAN (h) | 8.8 | 7.5 -15% | 8 -9% | 8 -9% | 6.9 -22% | 7.6 -14% |
| Idle (h) | 20.4 | |||||
| Last (h) | 2.2 | 1.3 | 1.4 | |||
| H.264 (h) | 11 | 11.1 |
Pro
Contra
Fazit — Nicht genug Anpassungsoptionen für den Endnutzer

Die drei besten Aspekte des Framework Laptop 13.5 sind seine Reparierbarkeit, seine Prozessorleistung und seine Anschlussflexibilität. Die neuen Gen13-Core-P-CPUs sind für diesen Formfaktor sehr schnell und liefern sich ein Kopf-an-Kopf-Rennen mit vielen Serie-H-CPUs aus Intels Gen12-Serie und der AMD-Zen-3+-Generation. Unterdessen bleiben die Reparierbarkeit und die Anschlussflexibilität im Framework-Design konkurrenzlos.
Der Framework Laptop 13.5 ist Klassenbester, wenn es um Reparierbarkeit und Anschlussflexibilität geht und ist jetzt noch schneller. Einige Design-Aspekte fühlen sich verglichen mit der Konkurrenz aber so langsam etwas überholt an.
Dennoch zeigen sich nach drei Jahren im gleichen Gehäuse so langsam ein paar Nachteile auf. Konkurrierende Modelle von HP, Dell, Asus und anderen bieten mittlerweile bessere Displayoptionen mit mehr Farben, schnelleren Bildwiederholraten oder gleich OLED-Panels zum gleichen Preispunkt an. Einige aktuelle Modelle wie das HP Dragonfly Pro Chromebook bieten sogar RGB-Backlighting. Diese Alternativen sind zwar nicht so wartungsfreundlich, fühlen sich aber oftmals stabiler und widerstandsfähiger an, besonders in Hinsicht auf die eher fragilen Scharniere des Framework.
Wenn Framework zugunsten der Reparierbarkeit und der Kostenersparnis beim gleichen Design bleiben möchte, so sollten sie zumindest anfangen mehr Teile für eine größere Nutzer-Individualisierung anzubieten. Spiegelnde oder matte OLED-Displays, RGB-Tastaturen, verschiedene Farben, DDR5- statt DDR4-RAM und höher auflösende Webcams könnten dabei helfen mit der Konkurrenz mitzuhalten. Die jährlichen CPU-Updates sind zwar ganz nett, aber die Stagnation in Sachen Display und Gehäusedesign beinhalten das Risiko irgendwann fade zu wirken.
Preis und Verfügbarkeit
Der 2023er Framework Laptop 13.5 kann über die Seite des Herstellers bezogen werden. Die Preise starten bei 1.200 Euro für die Basiskonfiguration mit Core i5-1340P, 8 GB RAM und 256 GB SSD und gehen hoch bis 2.350 Euro für einen Core i7, 32 GB RAM und 1 TB Speicher.
Framework Laptop 13.5 13th Gen Intel
- 10.05.2023 v7 (old)
Allen Ngo

