Framework Laptop 13,5 mit Ryzen AI 9 im Test: Mehr Power ohne Intel
Kontinuierlich mehr Leistung.
Framework holt so viel wie möglich aus seinem veralteten Design heraus, ganz im Namen der Nachhaltigkeit. In Bezug auf die reine Leistung funktioniert das besser als erwartet, aber es gibt immer noch ein paar wichtige Funktionen, die wir gerne sehen würden.Allen Ngo, ✓ Stefanie Voigt (übersetzt von DeepL / Ninh Duy) Veröffentlicht am 🇺🇸 🇫🇷 ...
Fazit - Vertraut, aber schneller
Der neue Ryzen AI 9 HX 370 ist ein beträchtliches Upgrade gegenüber den Core-Ultra-7- und den Zen-4-Ryzen-U-Konfigurationen von 2024. Die Leistung hat sich verbessert, ohne dass die Leistungsaufnahme erhöht oder die Kühllösung vergrößert werden musste, um die Kompatibilität mit älteren Laptop-13,5-Konfigurationen zu gewährleisten.
Wenn man nicht so viel Leistung benötigt, dann können ältere Konfigurationen des Laptop 13,5 immer noch im Wesentlichen die gleiche Benutzererfahrung für weniger Geld bieten. Die Top-End-Framework-Konfigurationen werden merklich teurer, wobei insbesondere unser Testgerät die Grenze von 2000 US-Dollar knackt. Die langsameren und günstigeren Core-Ultra-Konfigurationen bieten eine längere Akkulaufzeit sowie vier identische USB-C-4.0-Anschlüsse und sind damit ein guter Kompromiss, wenn die reine Leistung keine Priorität hat.
Ein paar Aspekte des fünf Jahre alten Framework-Designs sind in die Jahre gekommen. Die 2-MP-Webcam, das Fehlen von OLED- oder P3-Farboptionen und die relativ schwachen Lautsprecher fallen hinter die neuesten Konkurrenzmodelle von Lenovo, HP oder Dell. Framework hat trotz der flexiblen Designphilosophie der Laptop-13,5-Serie noch keine entsprechenden Upgrades angeboten.
Pro
Contra
Preis und Verfügbarkeit
Framework liefert jetzt den Laptop 13,5 mit Optionen der Ryzen-AI-300-Serie ab 1.330 US-Dollar. Unser Testgerät wird für 2.100 US-Dollar verkauft.
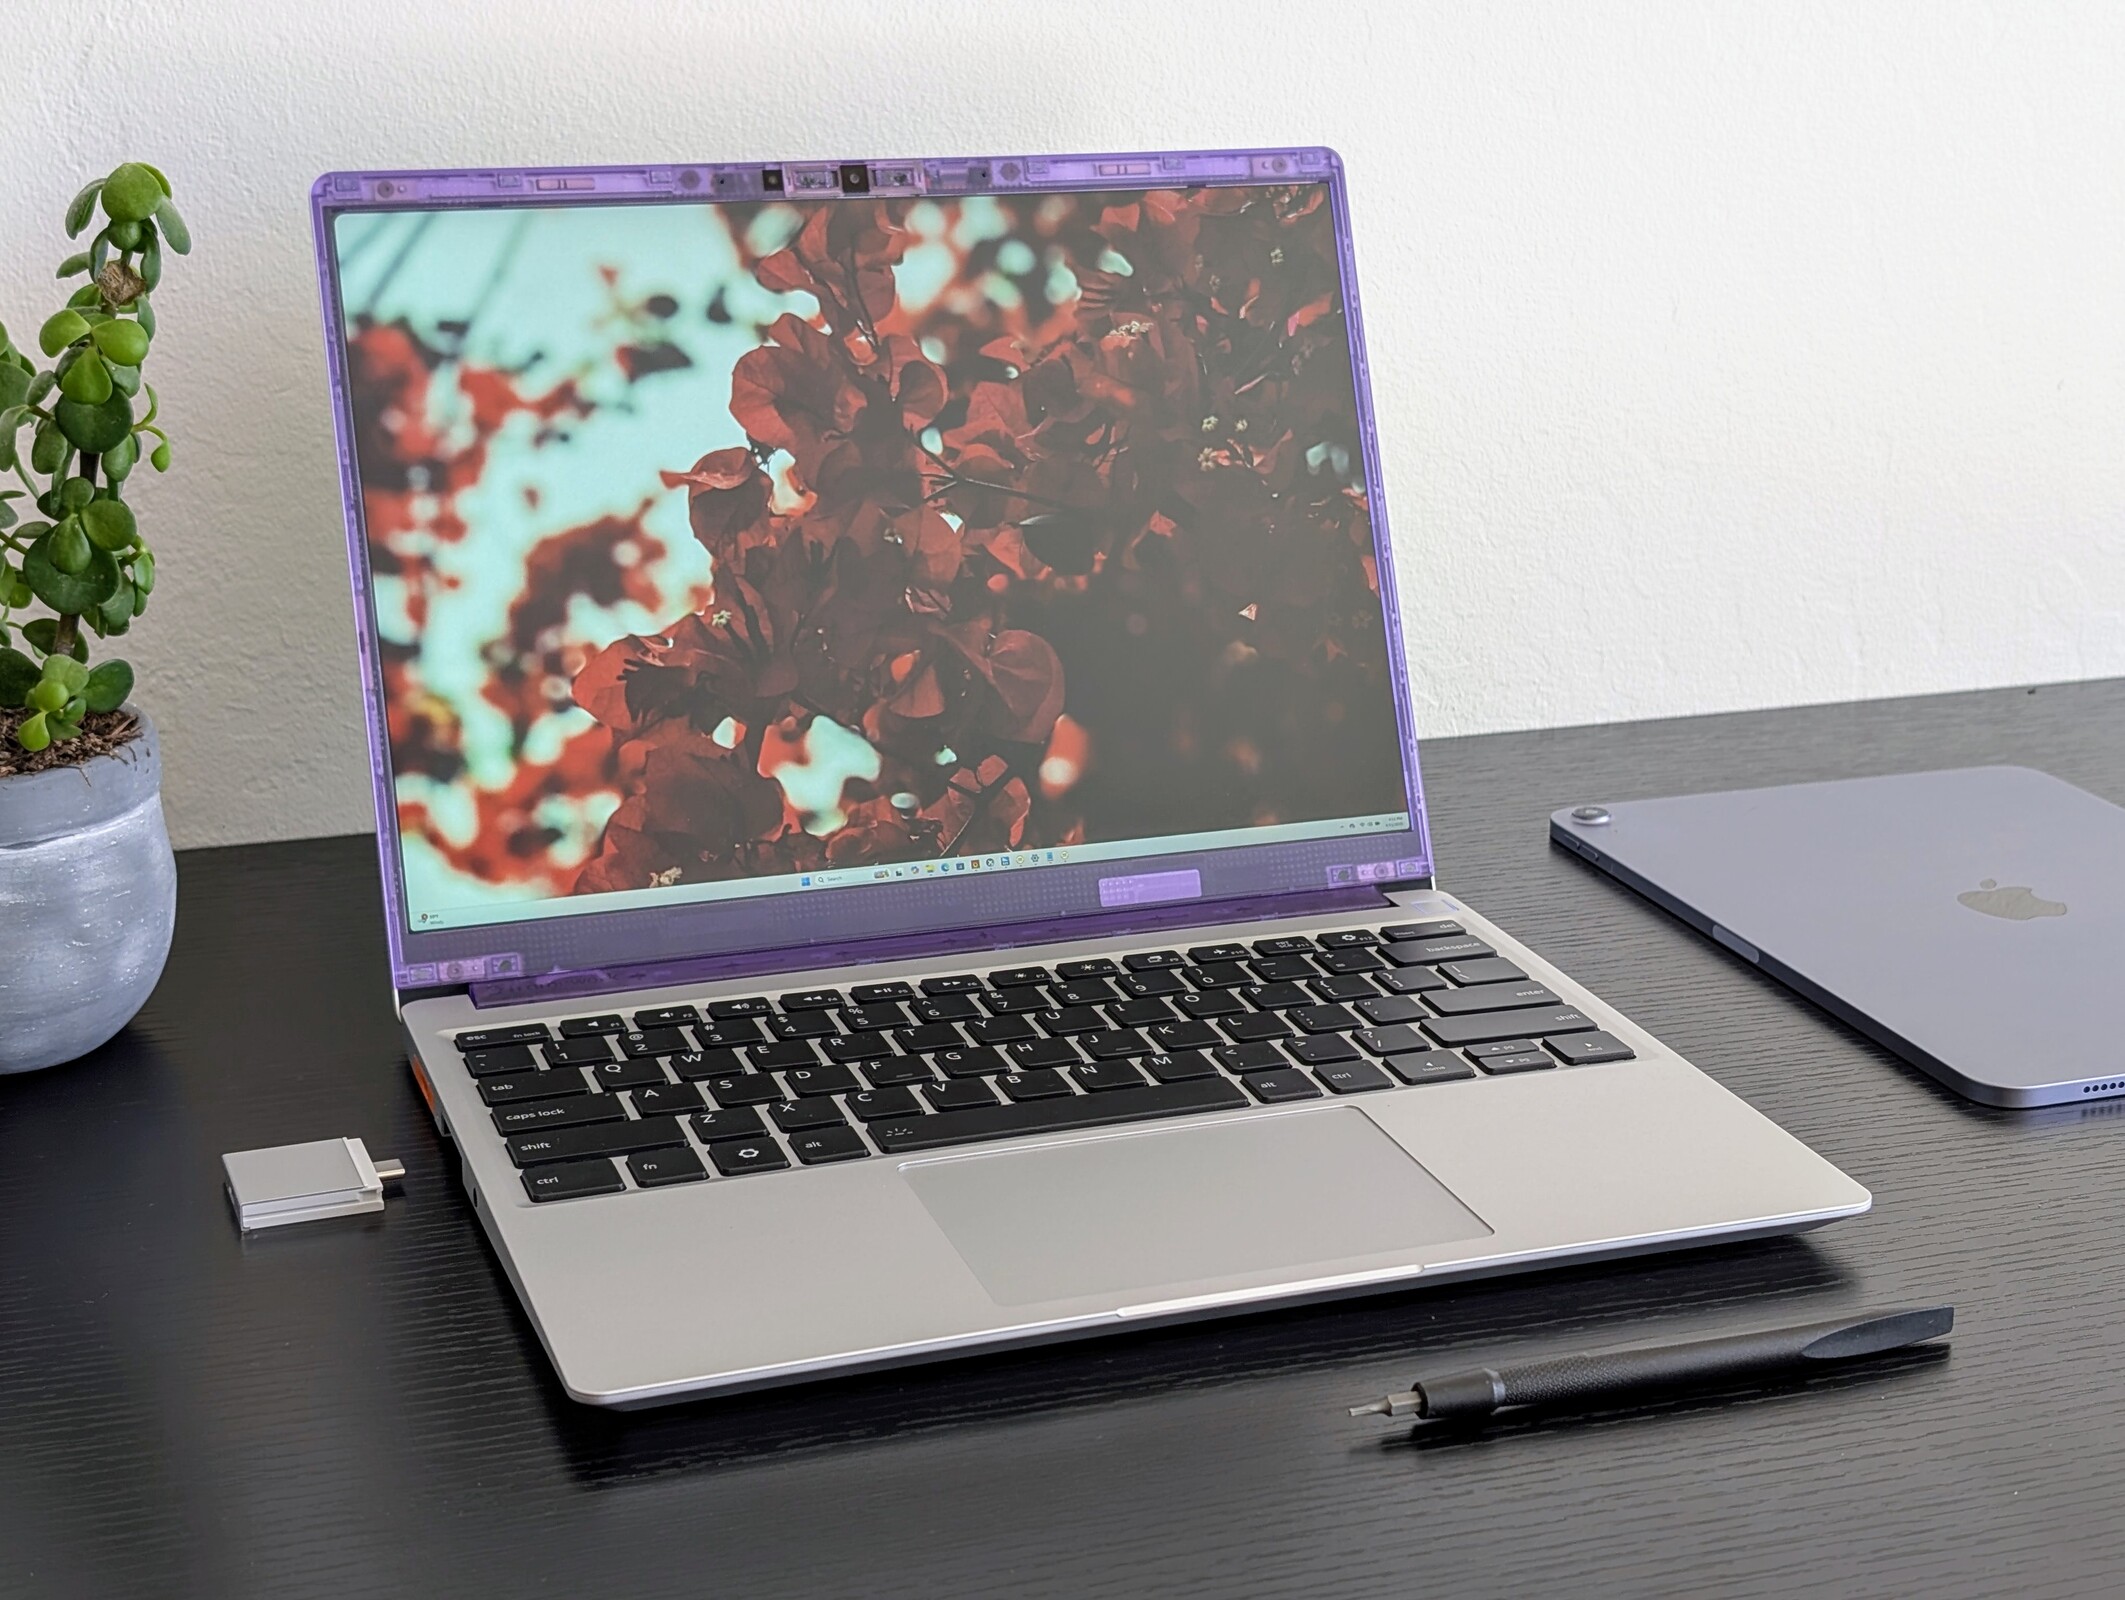
Framework hat seinen Laptop 13,5 in diesem Jahr mit Prozessoren der AMD-Zen-5-HX-Serie aktualisiert, welche die Core-Ultra-7-Optionen der Zen-4-U-Serie vom letzten Jahr ablösen. Das Gehäuse ist ansonsten identisch, daher empfehlen wir einen Blick auf unseren Test des ursprünglichen Modells, um mehr über die physischen Eigenschaften des Systems zu erfahren.
Bei unserem Testgerät handelt es sich um die High-End-Konfiguration mit der Ryzen-AI-9-HX-370-CPU und einem 2.880x1.920-120-Hz-IPS-Display für über 2.100 US-Dollar. Niedrigere Konfigurationen beginnen stattdessen mit dem Ryzen AI 5 340 oder einem 2.256x1.504-60-Hz-Display.
Zu den Konkurrenten des Laptop 13,5 gehören beliebte Flaggschiff-Prosumer- oder Business-Subnotebooks wie das Lenovo ThinkPad T14s, Dell Pro 13 oder die HP-EliteBook-Reihe.
Mehr Testberichte zu Framework Geräten:
Spezifikationen
Gehäuse
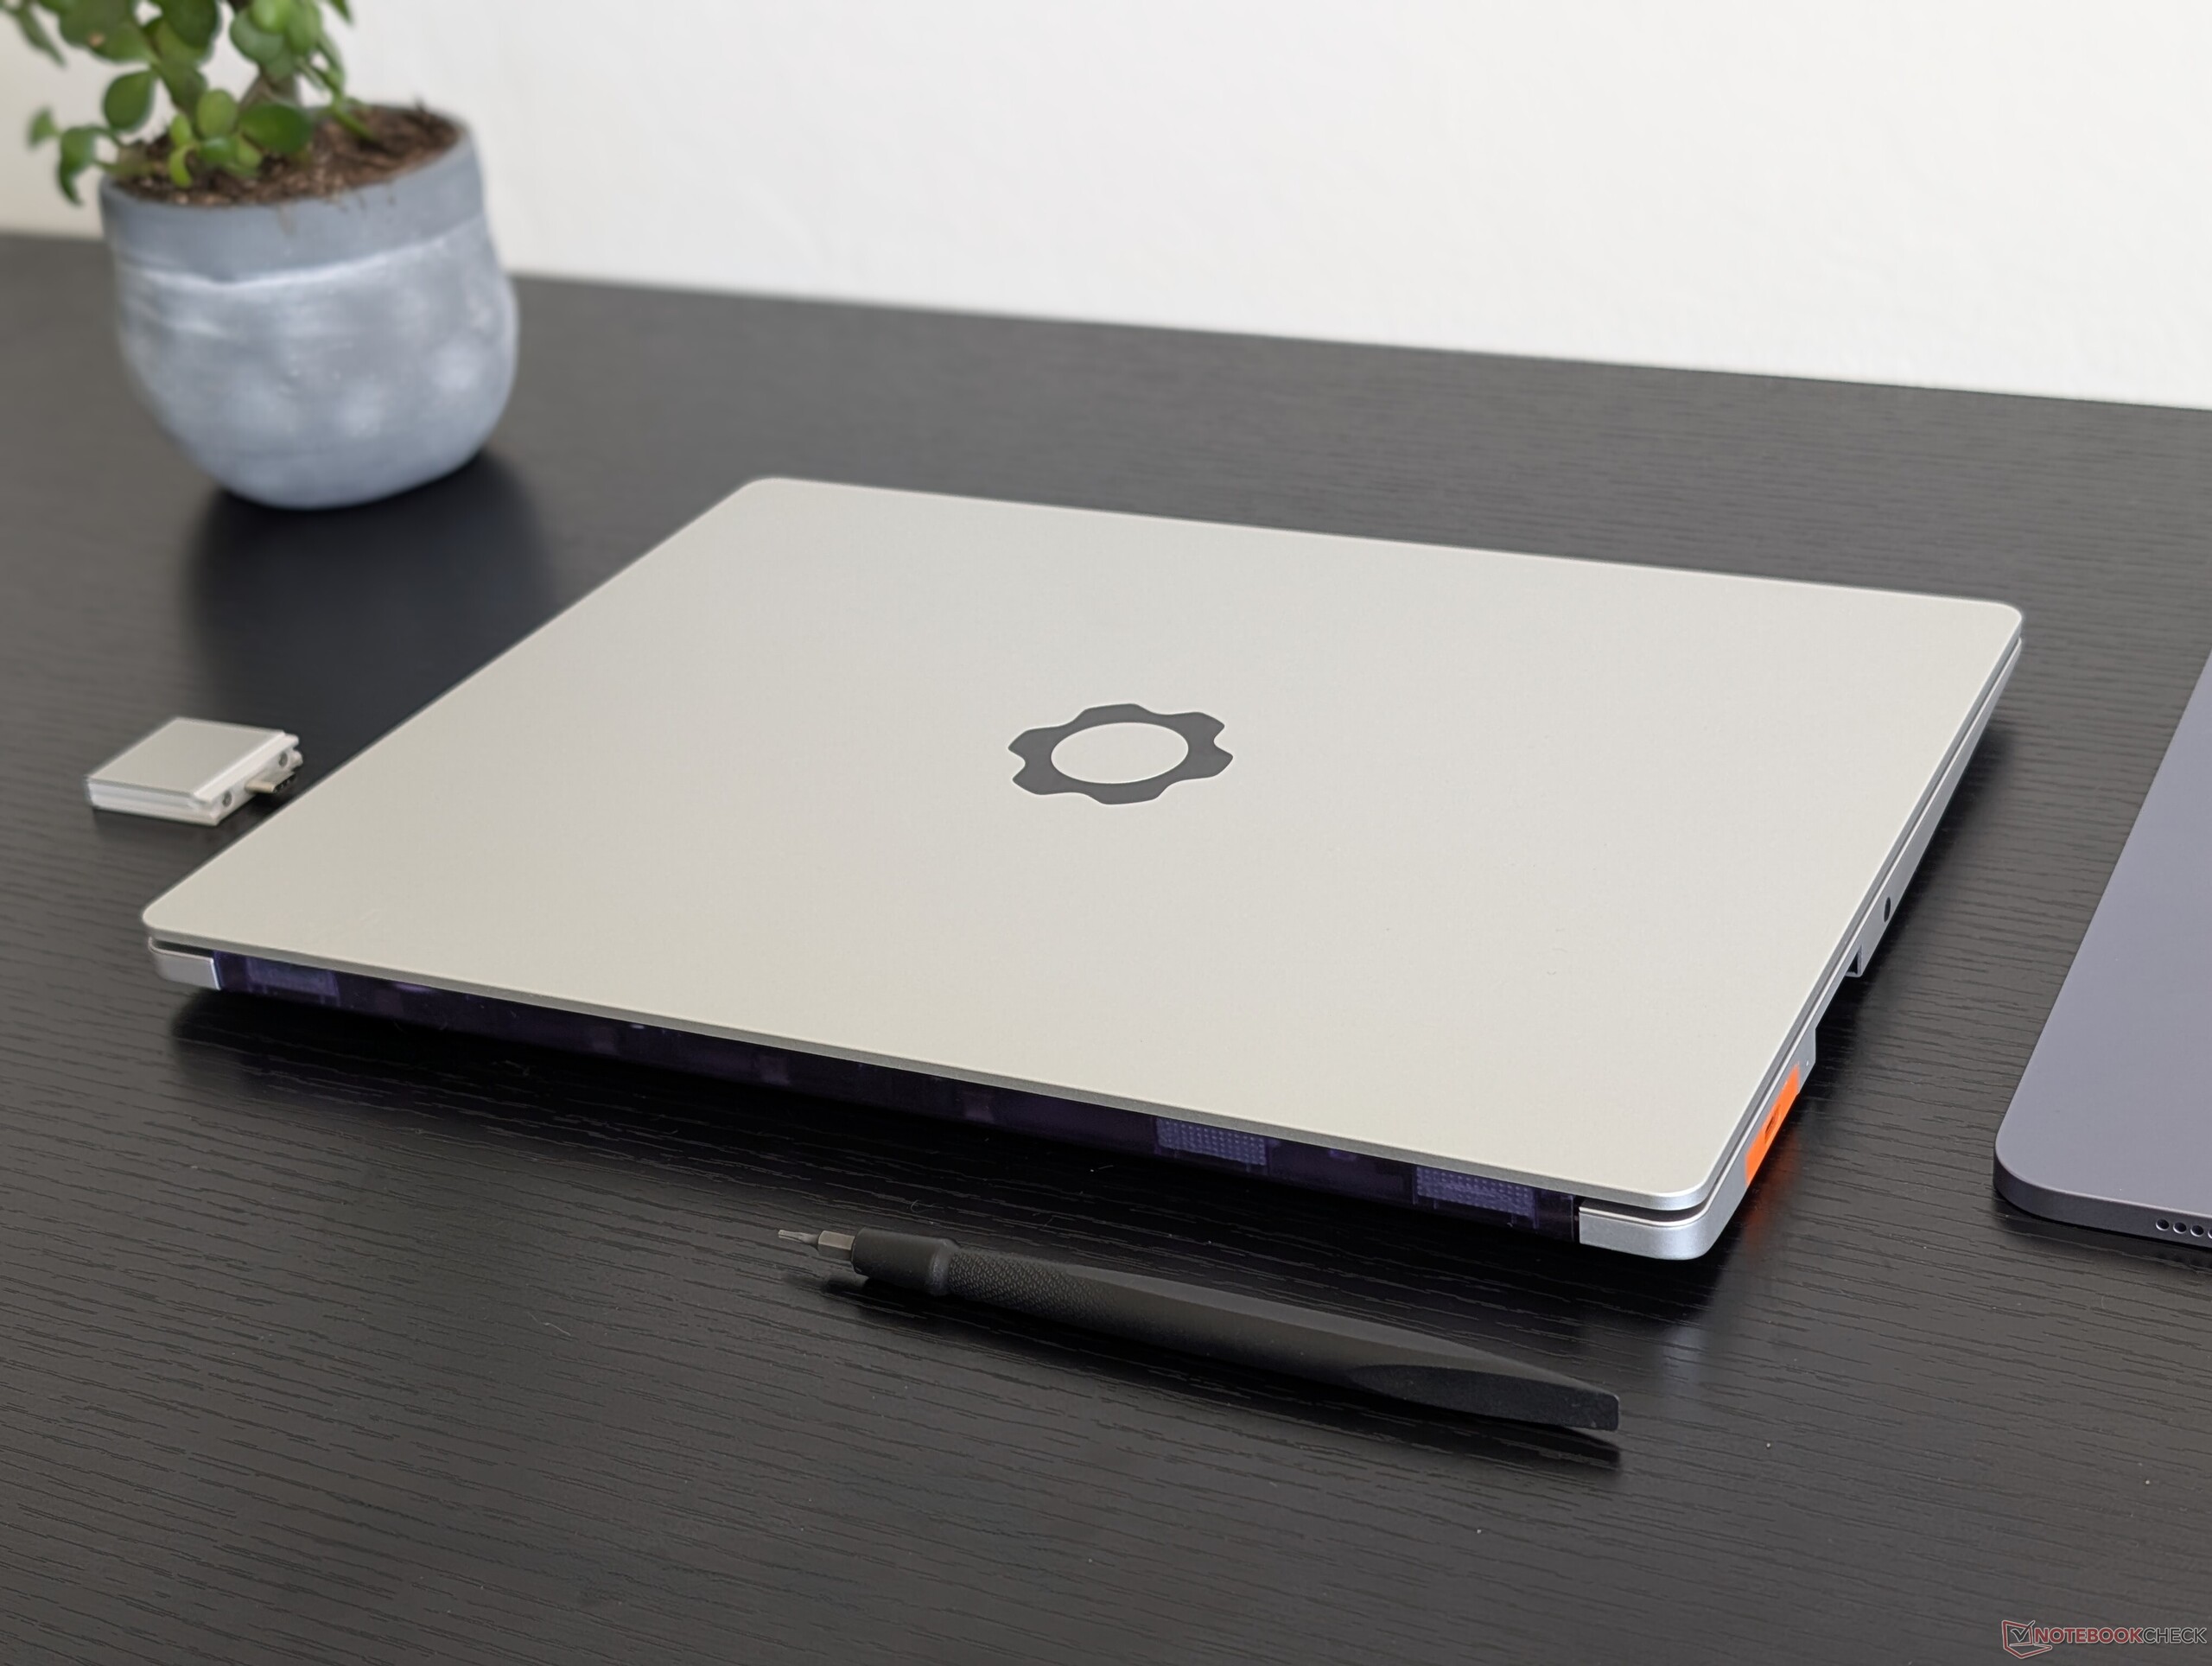
Das Gehäuse-Design wurde nicht verändert, um die Kompatibilität mit bestehenden Ersatzteilen und Zubehör zu gewährleisten.
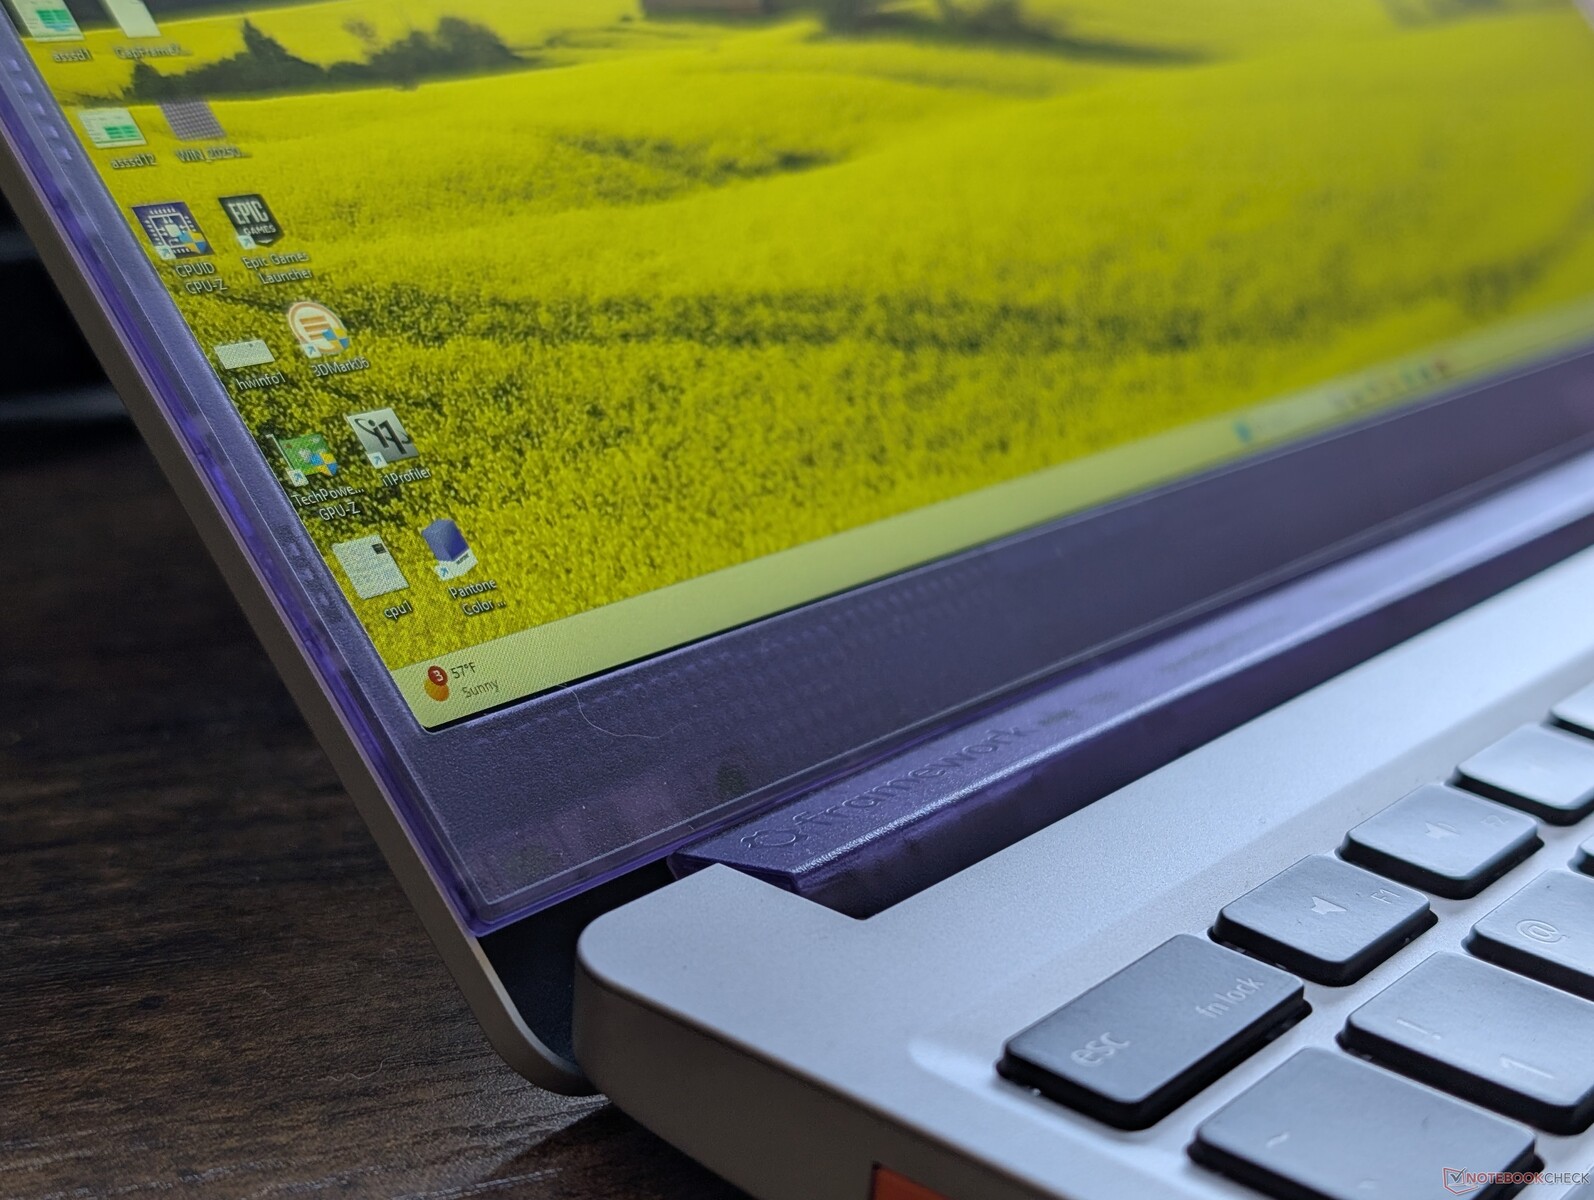
Zu den neuen Optionen in diesem Jahr gehören die durchsichtigen farbigen Kunststoffrahmen für Bastler, die ihrem System ein wenig Farbe verleihen möchten, und eine Tastatur der zweiten Generation, die das Tastengeräusch und die Vibrationen der integrierten Lautsprecher reduziert. Dennoch sind die Unterschiede wohl eher gering und vor allem ästhetisch.
Anschlussausstattung
Während die vier USB-C-Ports zurückgekehrt sind, sollten man bedenken, dass sie im Gegensatz zur Intel Version dieses Laptops nicht alle identisch sind, was auf die Unterschiede in der Architektur des AMD Prozessors zurückzuführen ist. Insbesondere sind nur die beiden hinteren USB-C-Anschlüsse mit USB4-Geschwindigkeiten kompatibel, während die beiden vorderen USB-C-Ports USB 3.2 sind.
SD-Kartenleser
| SD Card Reader | |
| average JPG Copy Test (av. of 3 runs) | |
| Framework Laptop 13.5 Core Ultra 7 155H (Toshiba Exceria Pro SDXC 64 GB UHS-II) | |
| Framework Laptop 13.5 Ryzen AI 9 HX 370 (AV PRO microSD 128 GB V60) | |
| maximum AS SSD Seq Read Test (1GB) | |
| Framework Laptop 13.5 Core Ultra 7 155H (Toshiba Exceria Pro SDXC 64 GB UHS-II) | |
| Framework Laptop 13.5 Ryzen AI 9 HX 370 (AV PRO microSD 128 GB V60) | |
Kommunikation
Webcam
Die 2-MP-Webcam ist wieder da, allerdings ohne höhere Auflösungsoptionen.


Wartung
Die Wartungsfreundlichkeit bleibt unverändert und unangefochten im Vergleich zu anderen Subnotebooks der großen Hersteller. In unserem Video unten finden Sie eine ausführlichere Anleitung zu den Wartungsfunktionen.
Nachhaltigkeit
Framework verwendet 75 Prozent recyceltes Aluminium für die obere Abdeckung und die Lautsprecher, 50 Prozent recyceltes Aluminium für die untere Abdeckung und das Tastaturdeck, 50 Prozent recyceltes Plastik für die Tastenkappen und bis zu 30 Prozent recyceltes Plastik für die Erweiterungskarten. Die Verpackung besteht vollständig aus Papier und Karton und ist somit komplett recyclebar.
Der Hersteller bietet außerdem Ersatzteile, Aufrüstungsmodule und detaillierte Wartungsanleitungen an, die selbst von den größeren Herstellern noch nicht erreicht wurden.
Zubehör und Garantie
Neu bei den Erweiterungskarten sind in diesem Jahr durchscheinende Kunststofffarben und aktualisierte HDMI-2.0b-Optionen. Die durchscheinenden Farben kosten keinen Aufpreis im Vergleich zu den bestehenden grauen Aluminium- oder Vollplastikfarben.
Es gilt die einjährige beschränkte Herstellergarantie.
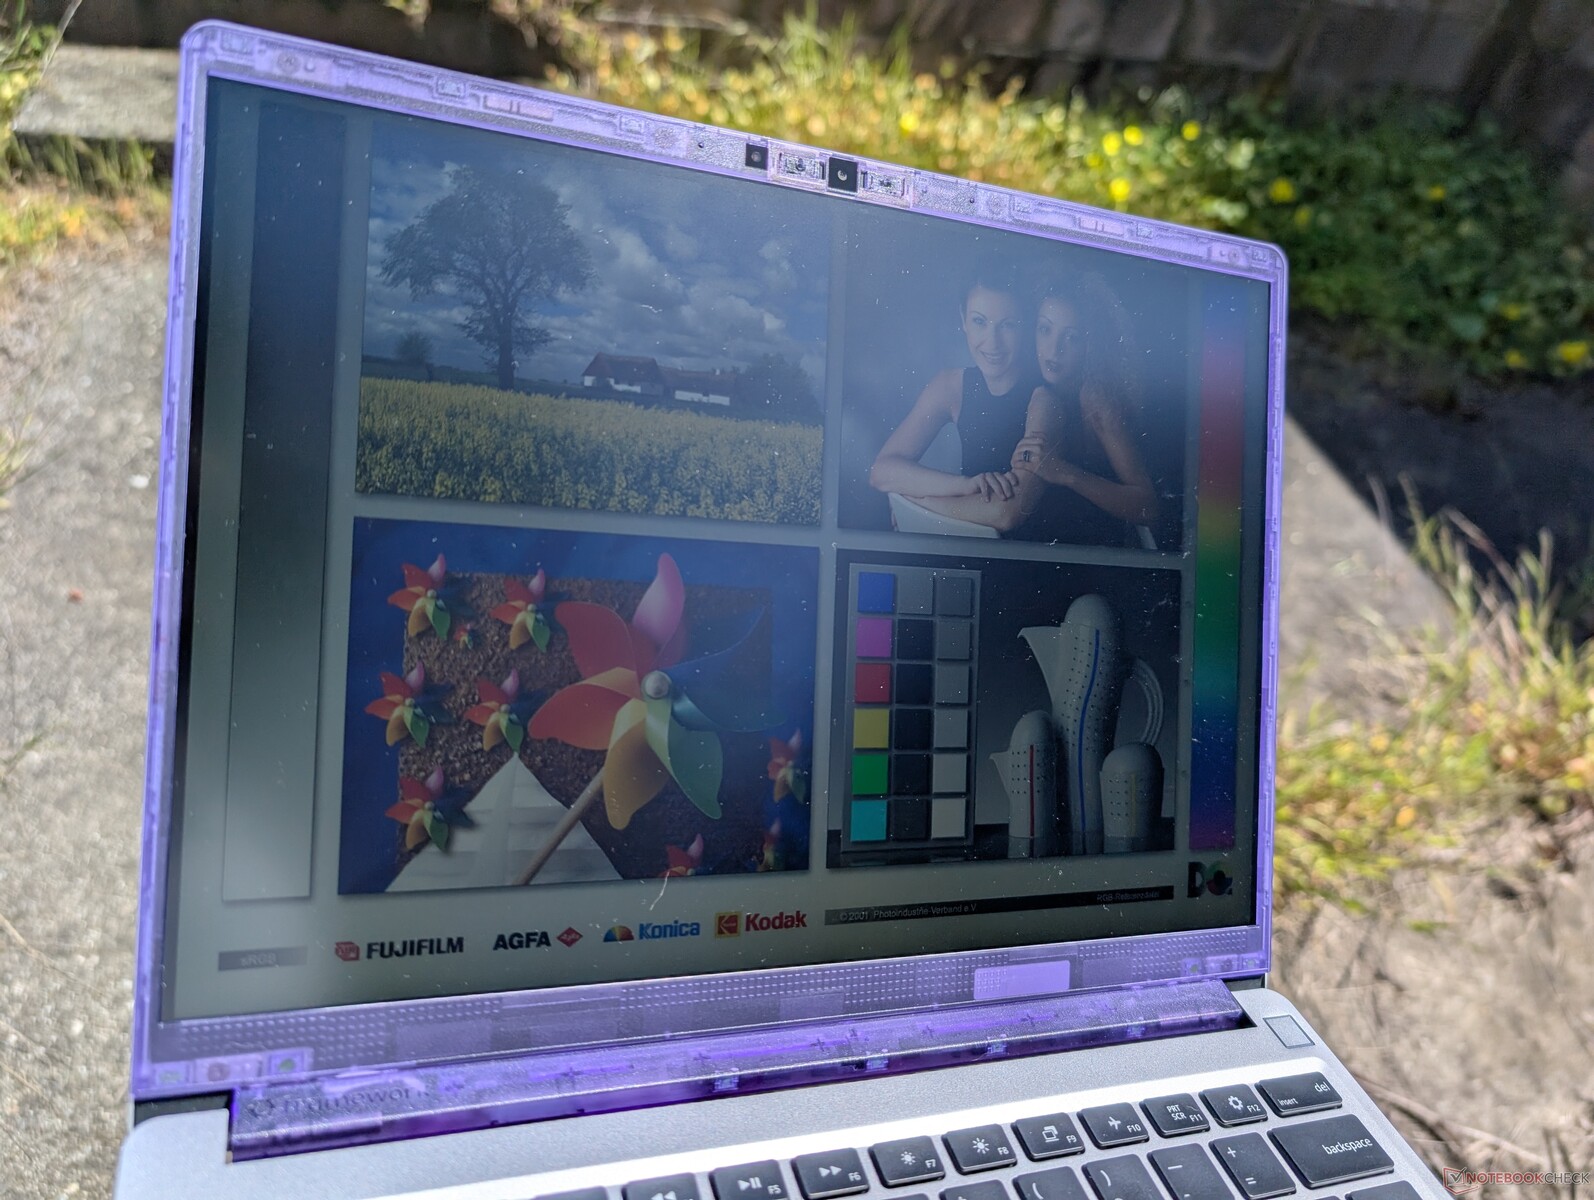
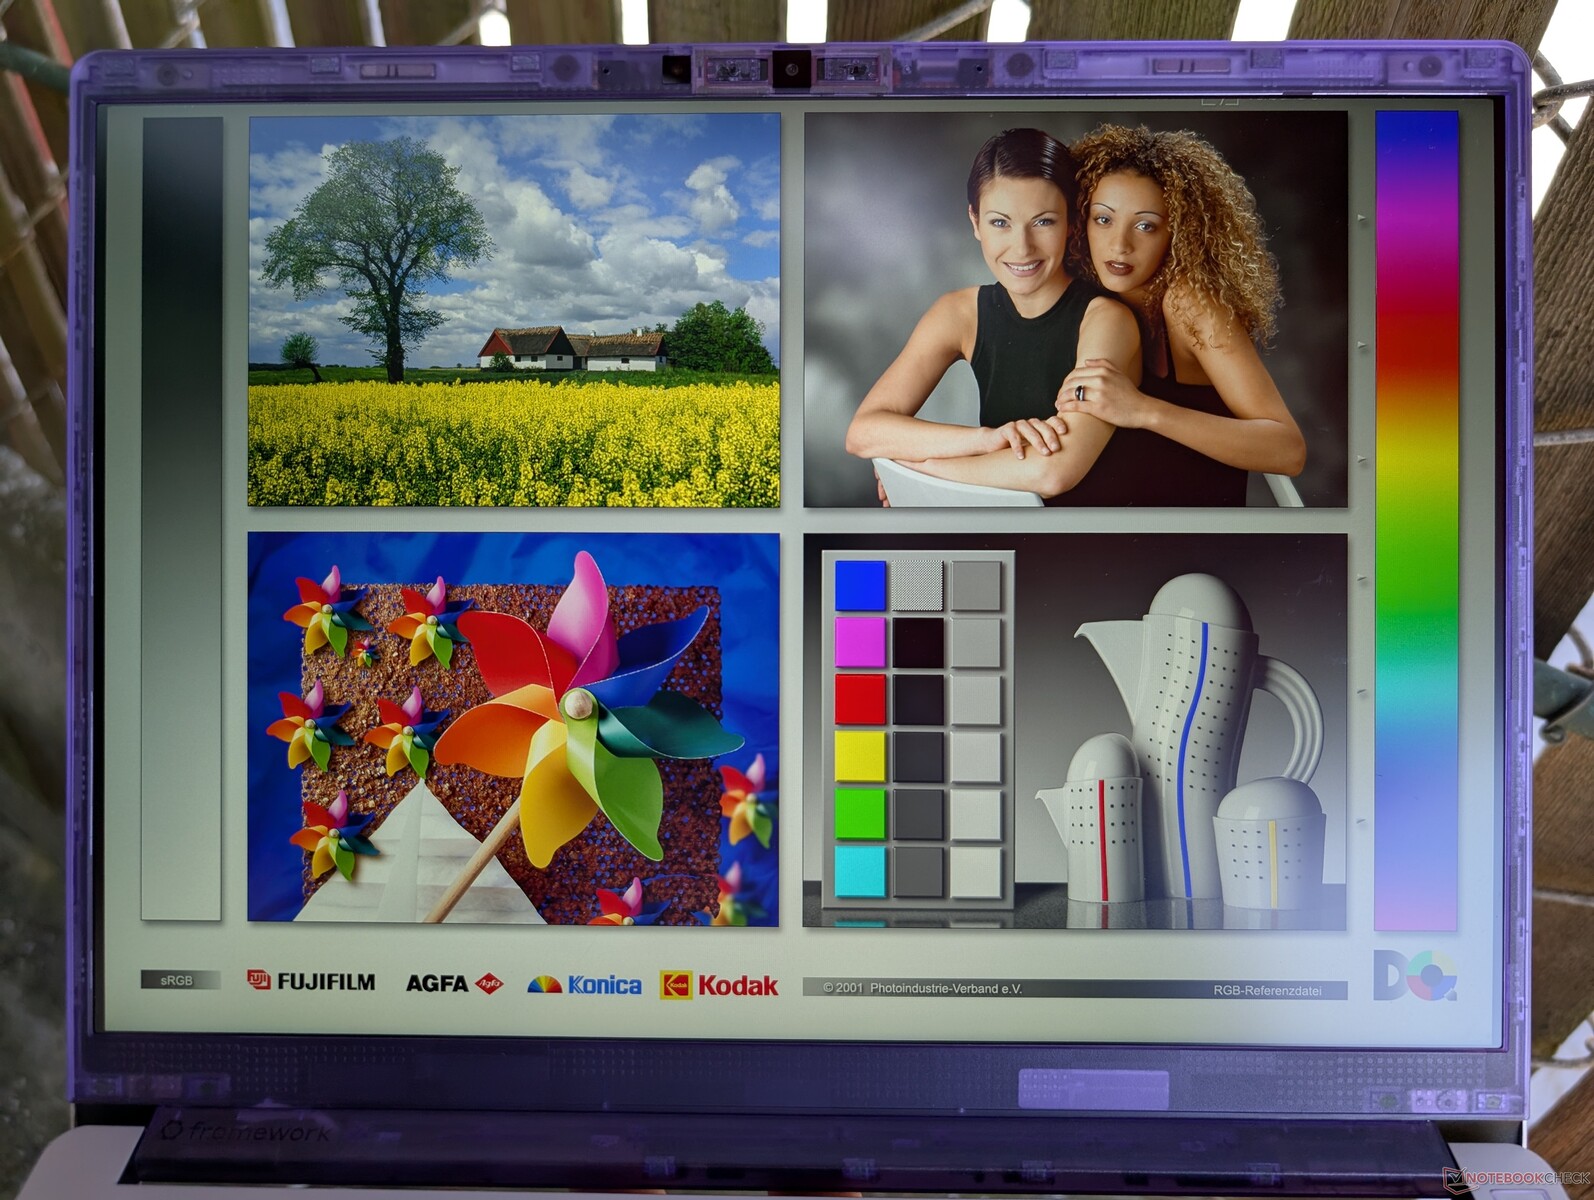
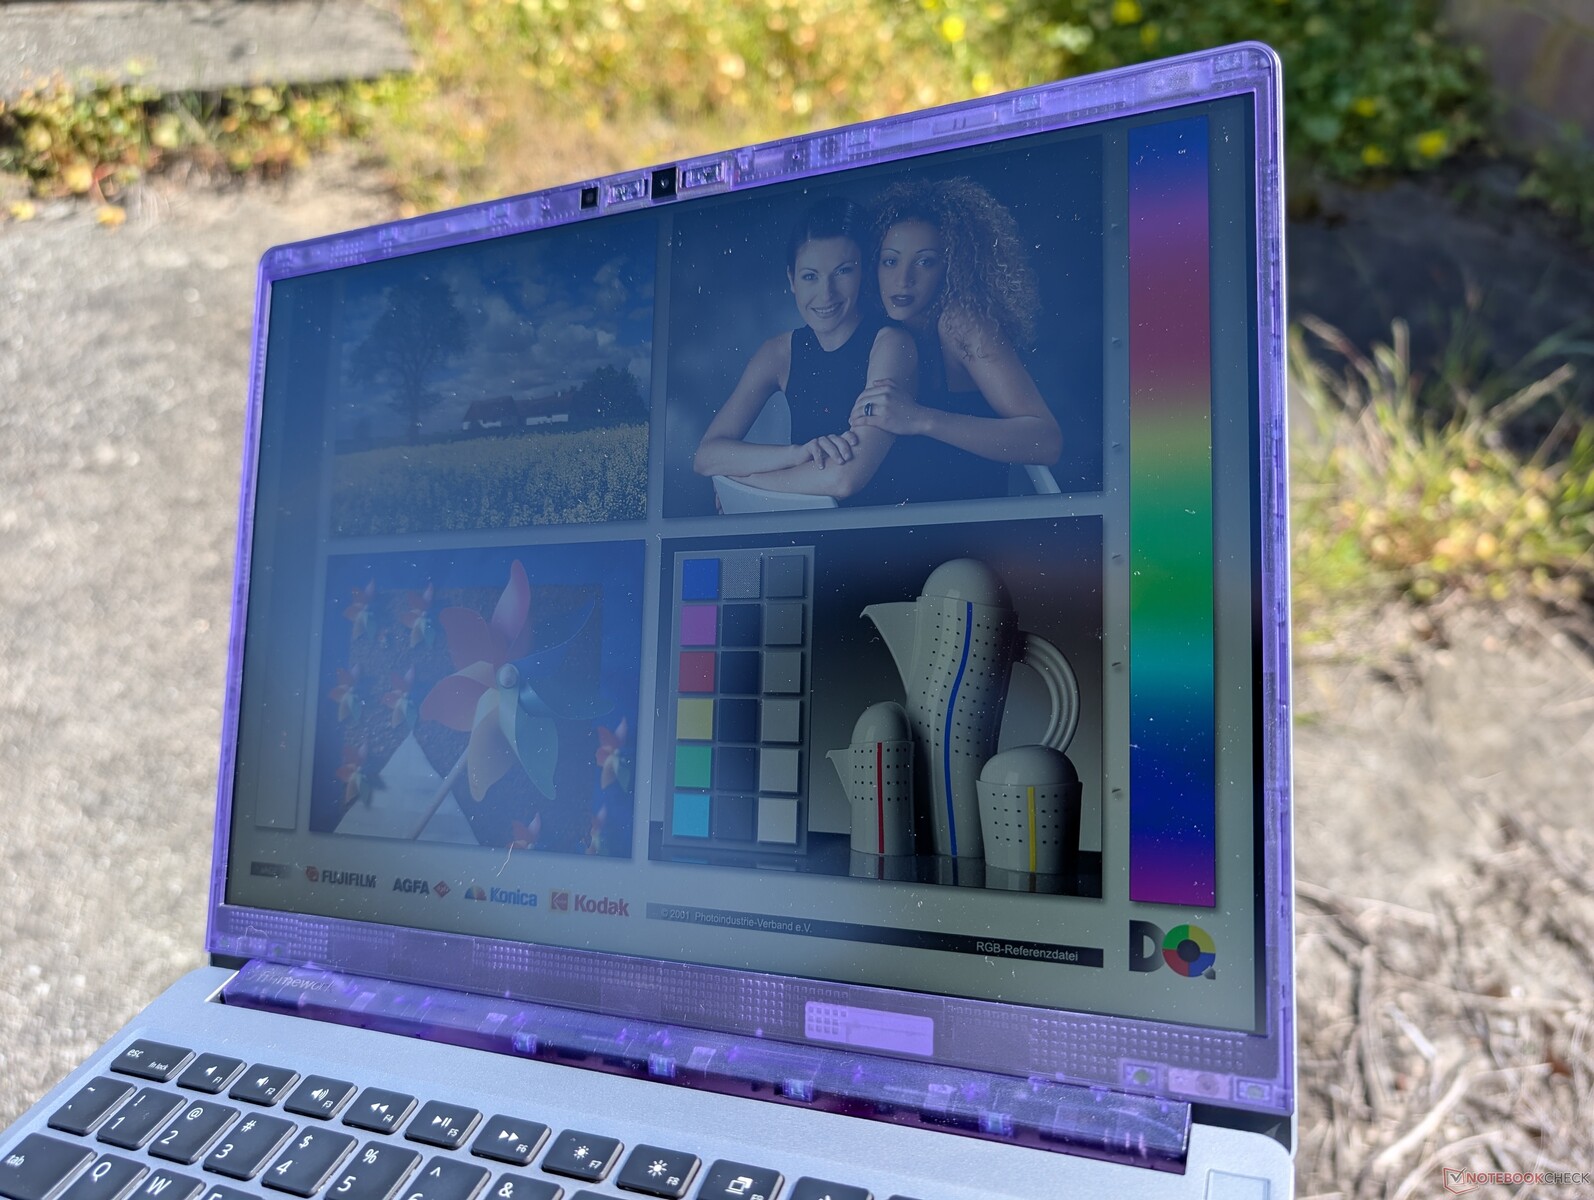
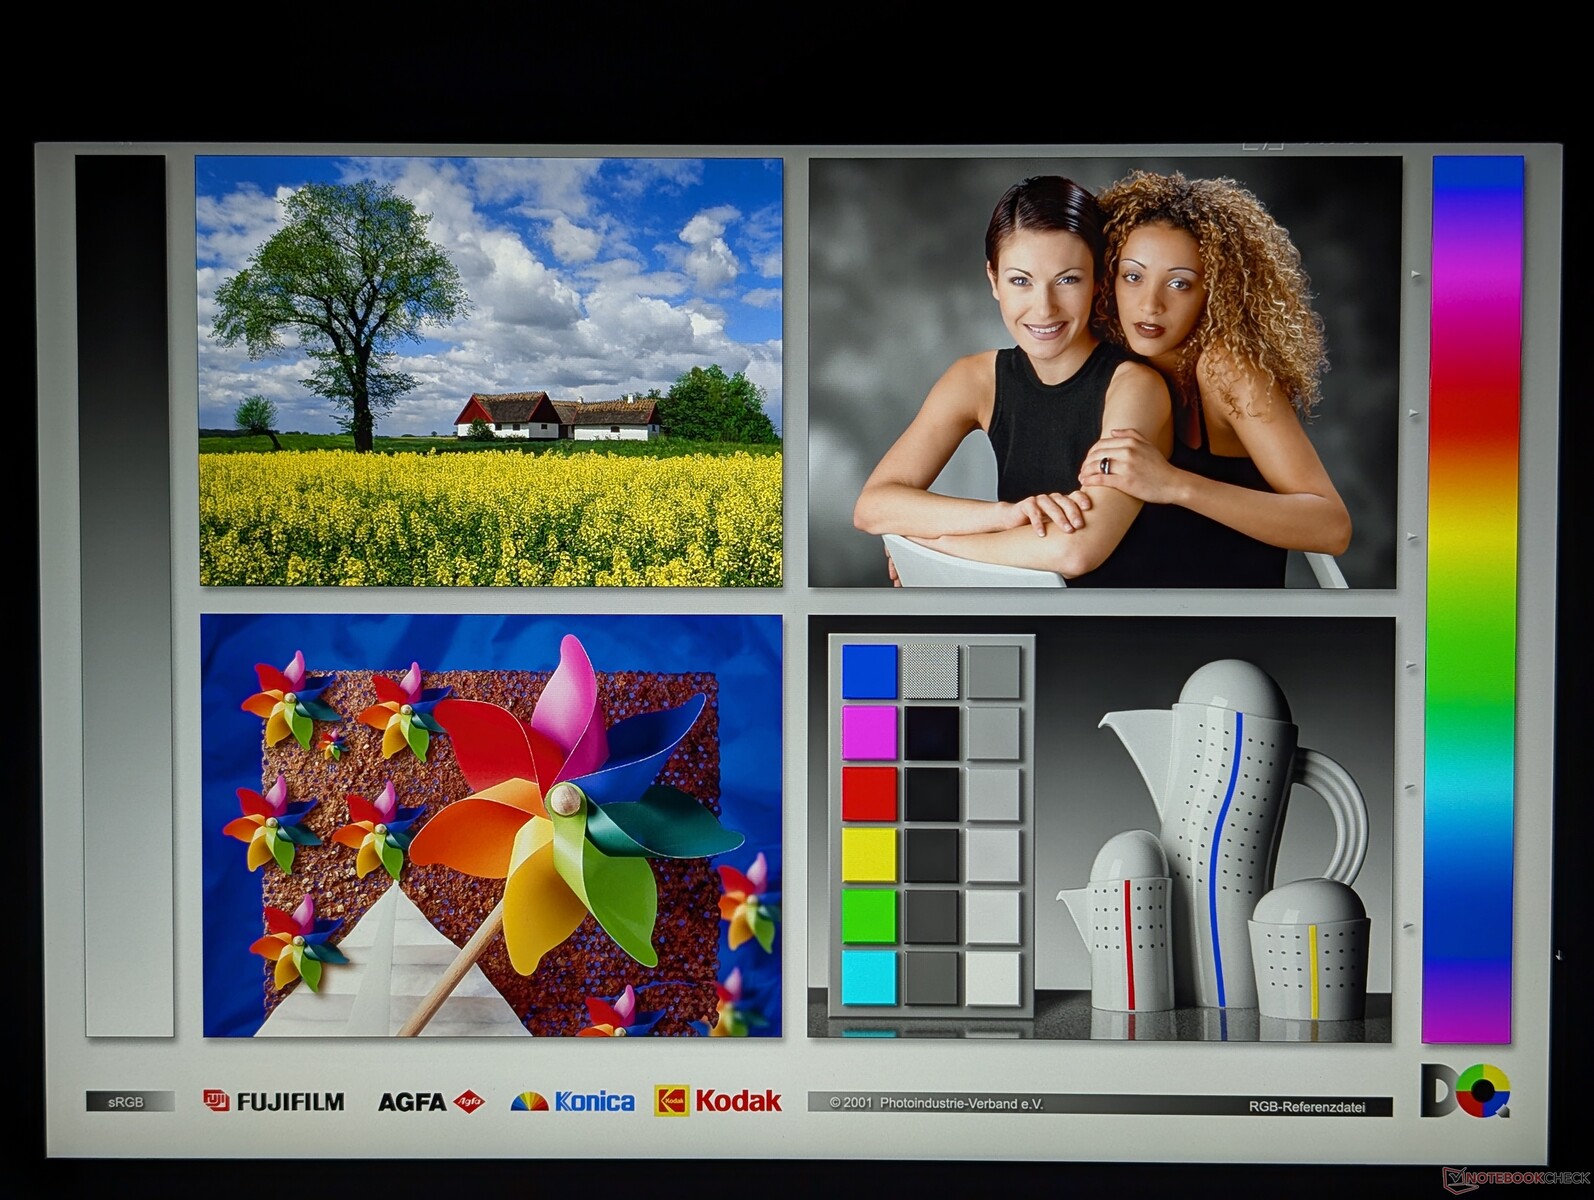
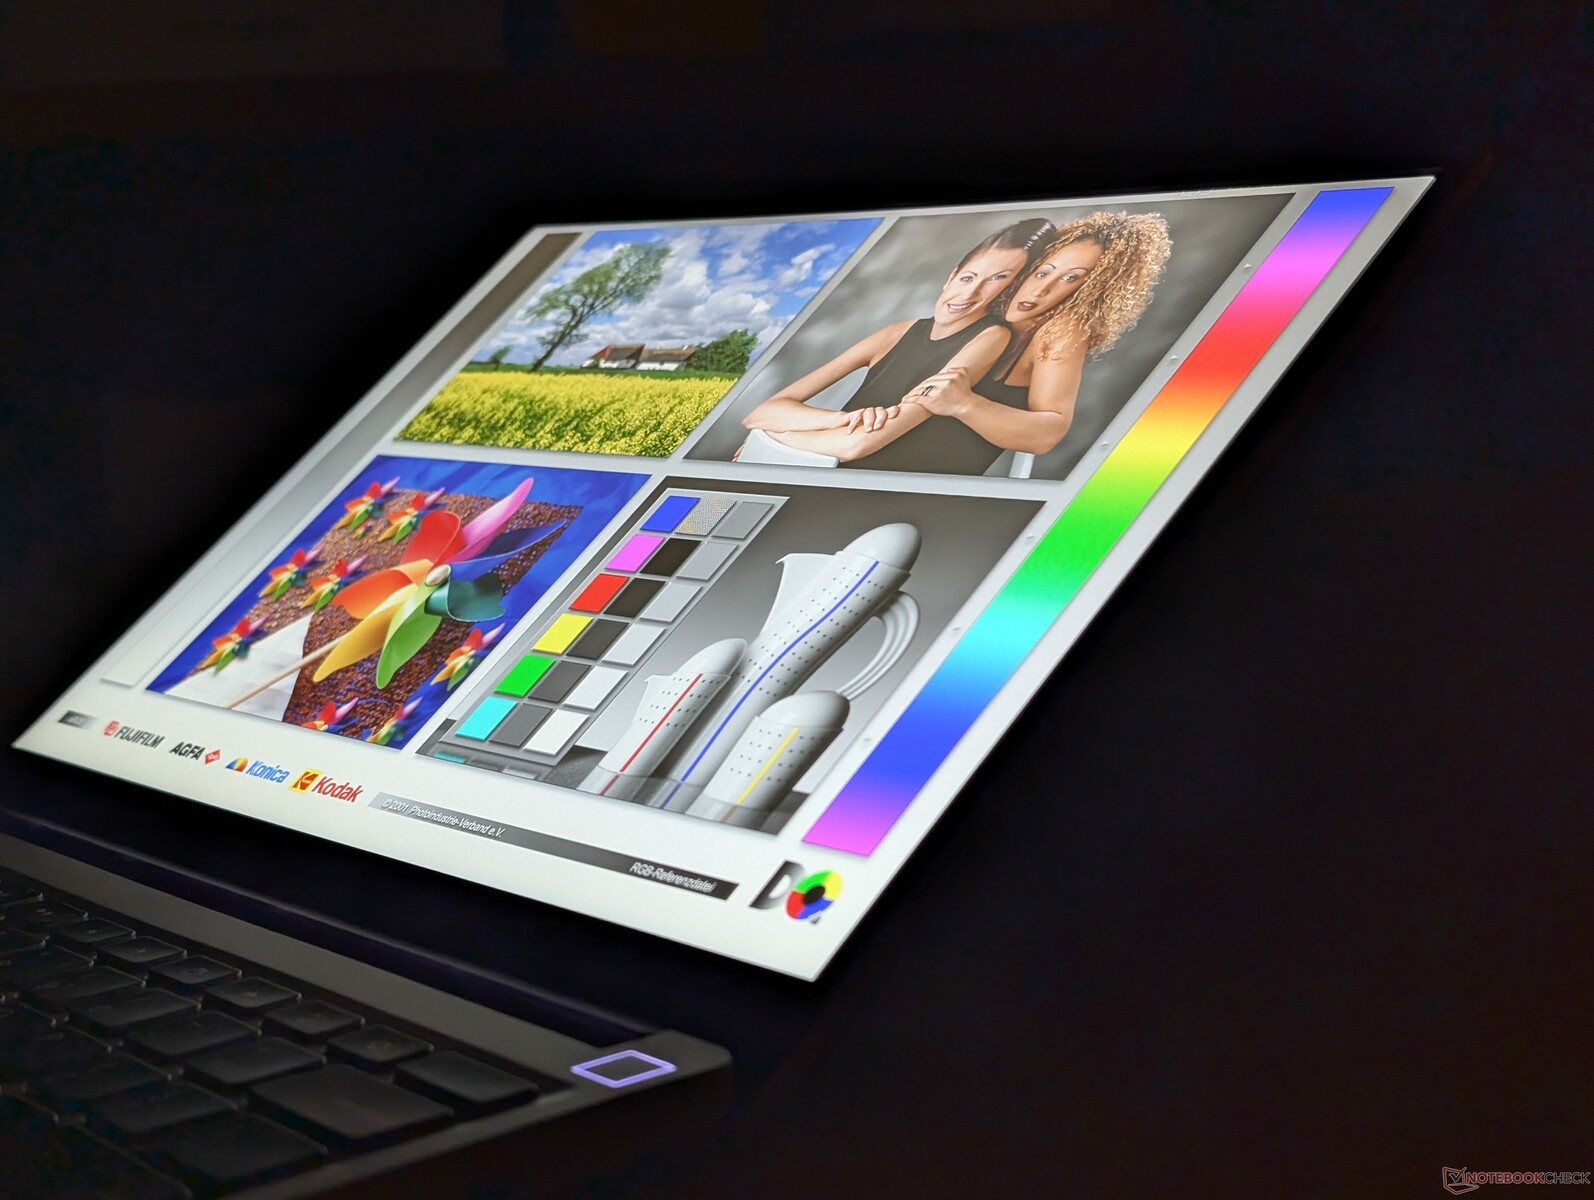
Display
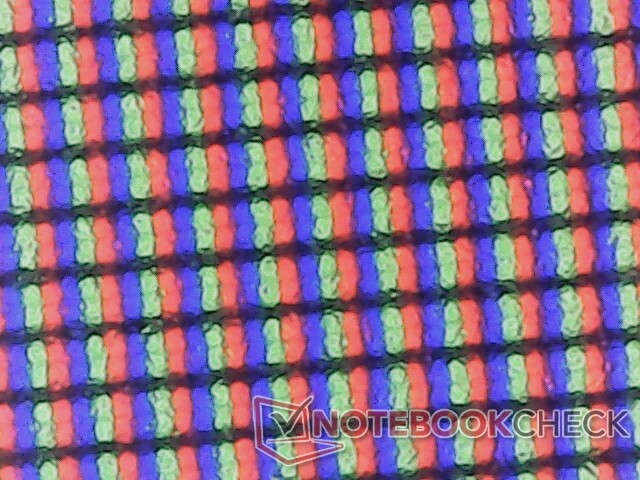
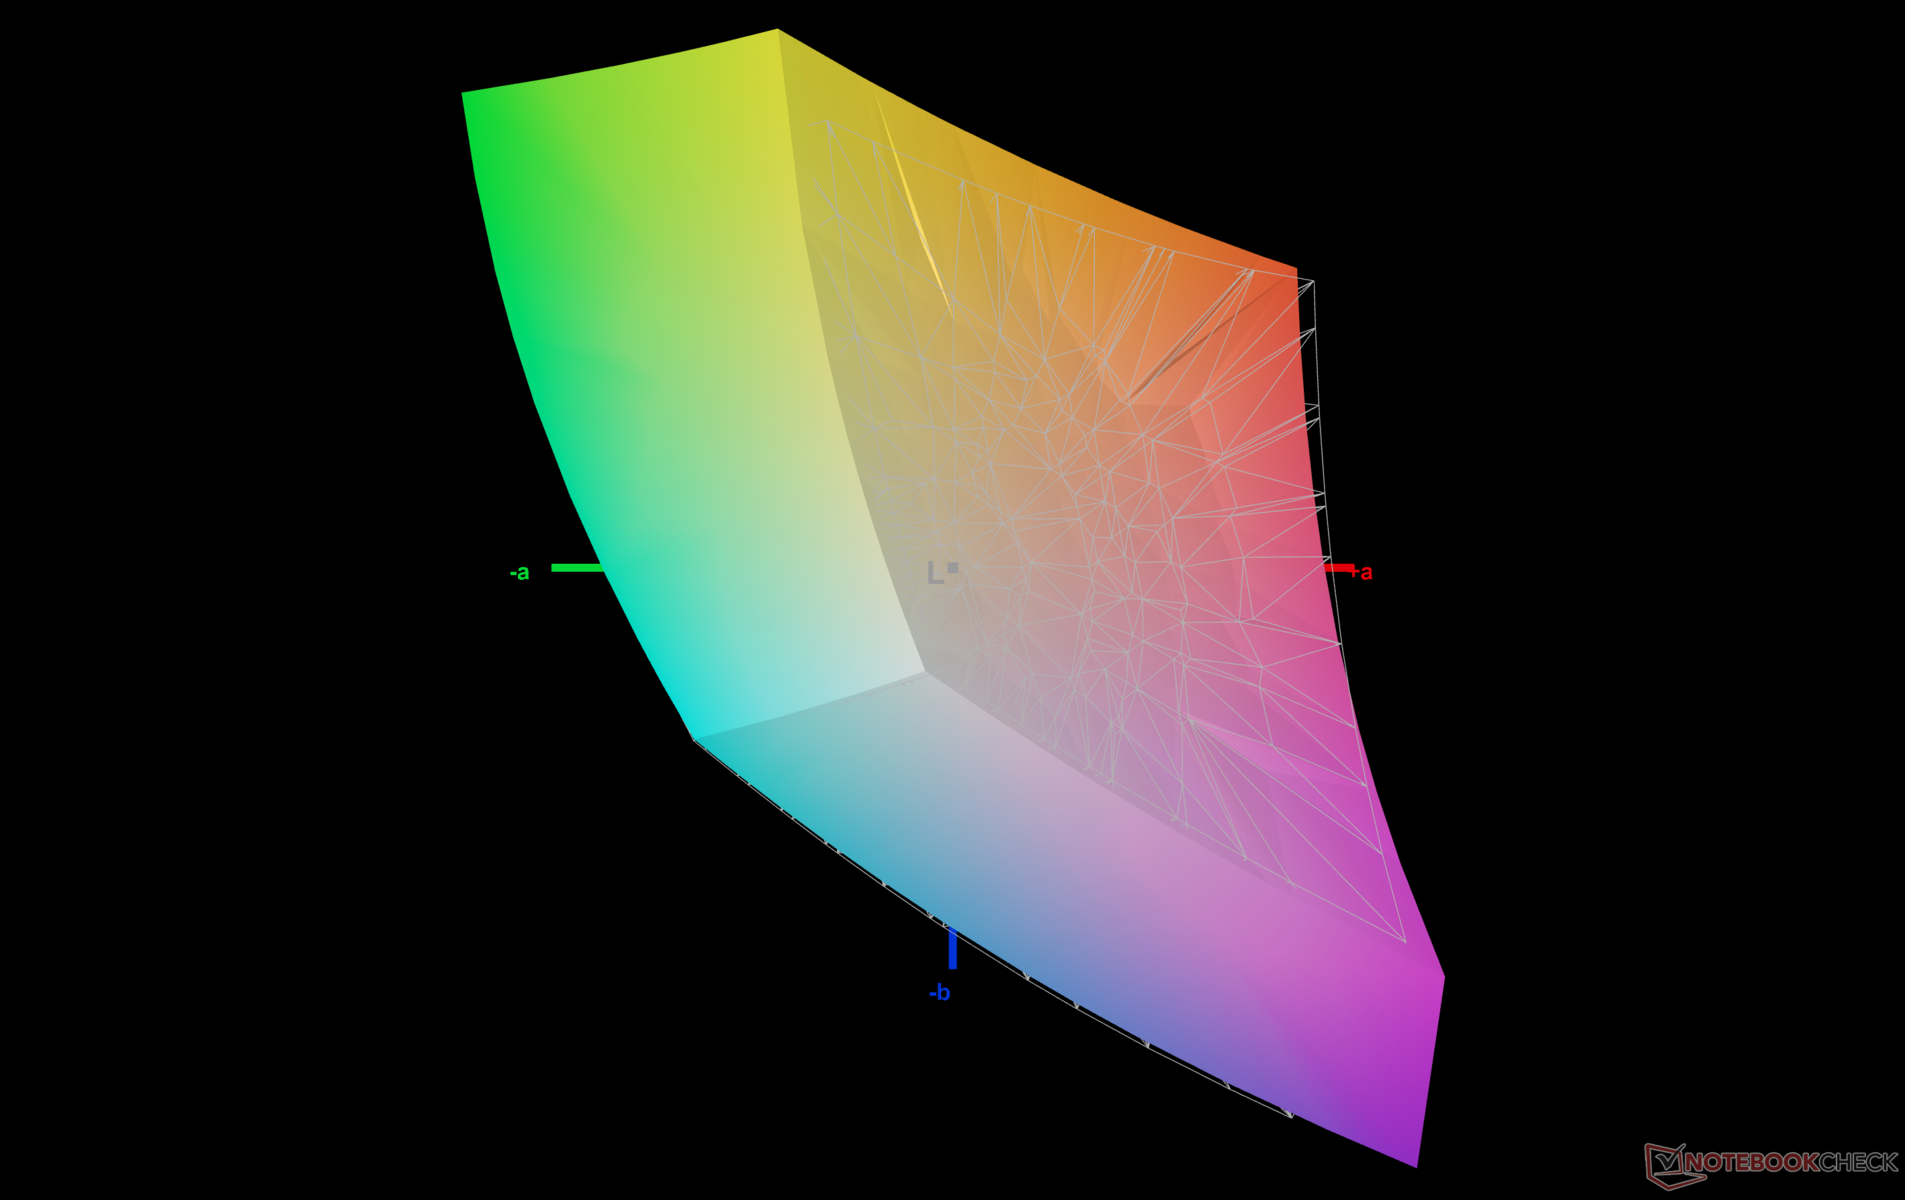
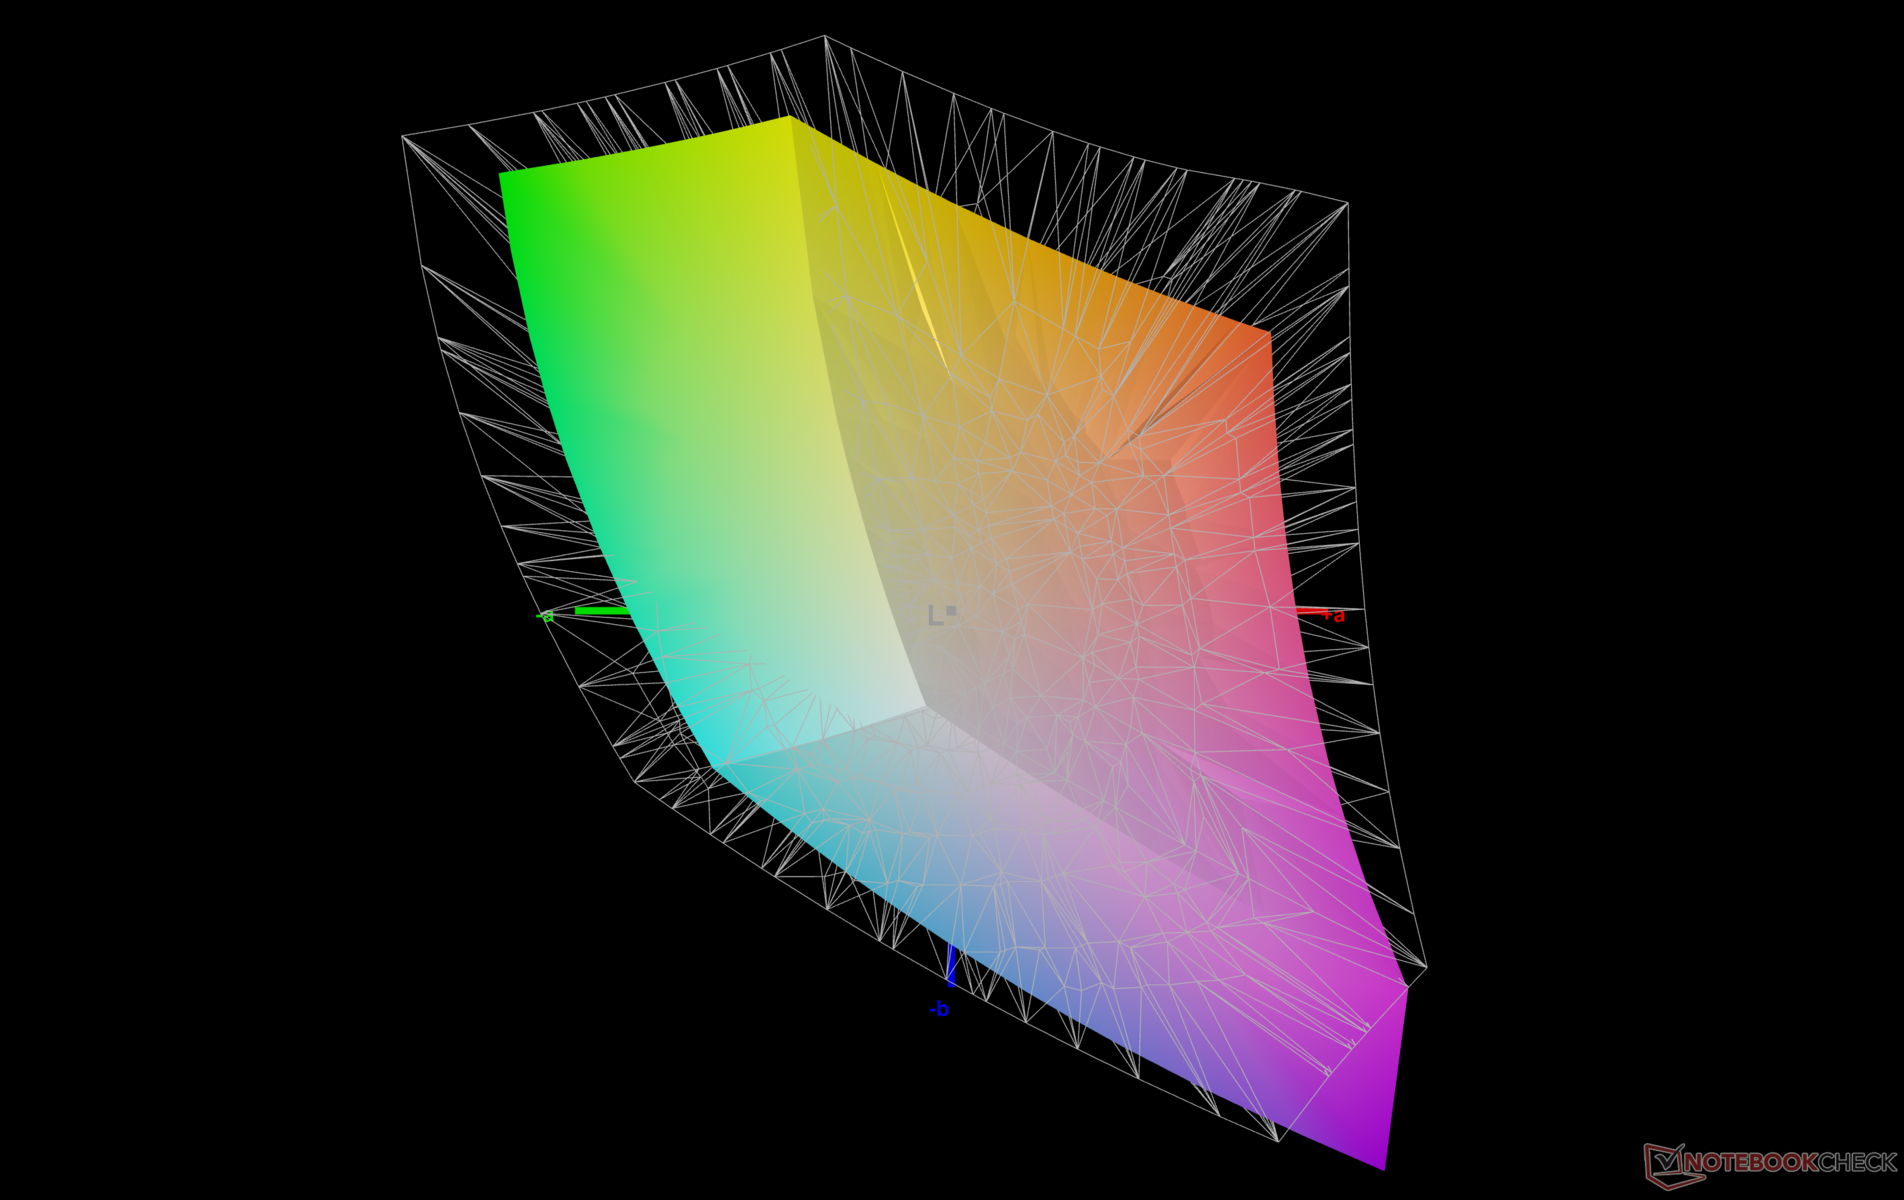
Framework verwendet für das diesjährige AMD Refresh das gleiche BOE NE135A1M-NY1 IPS-Panel wie beim letztjährigen Intel Modell. Es ist zwar immer noch ein exzellentes Panel, aber es wäre schön gewesen, OLED-Optionen oder P3-Farben für diejenigen zu sehen, die diese wünschen.

| |||||||||||||||||||||||||
Ausleuchtung: 94 %
Helligkeit Akku: 529.9 cd/m²
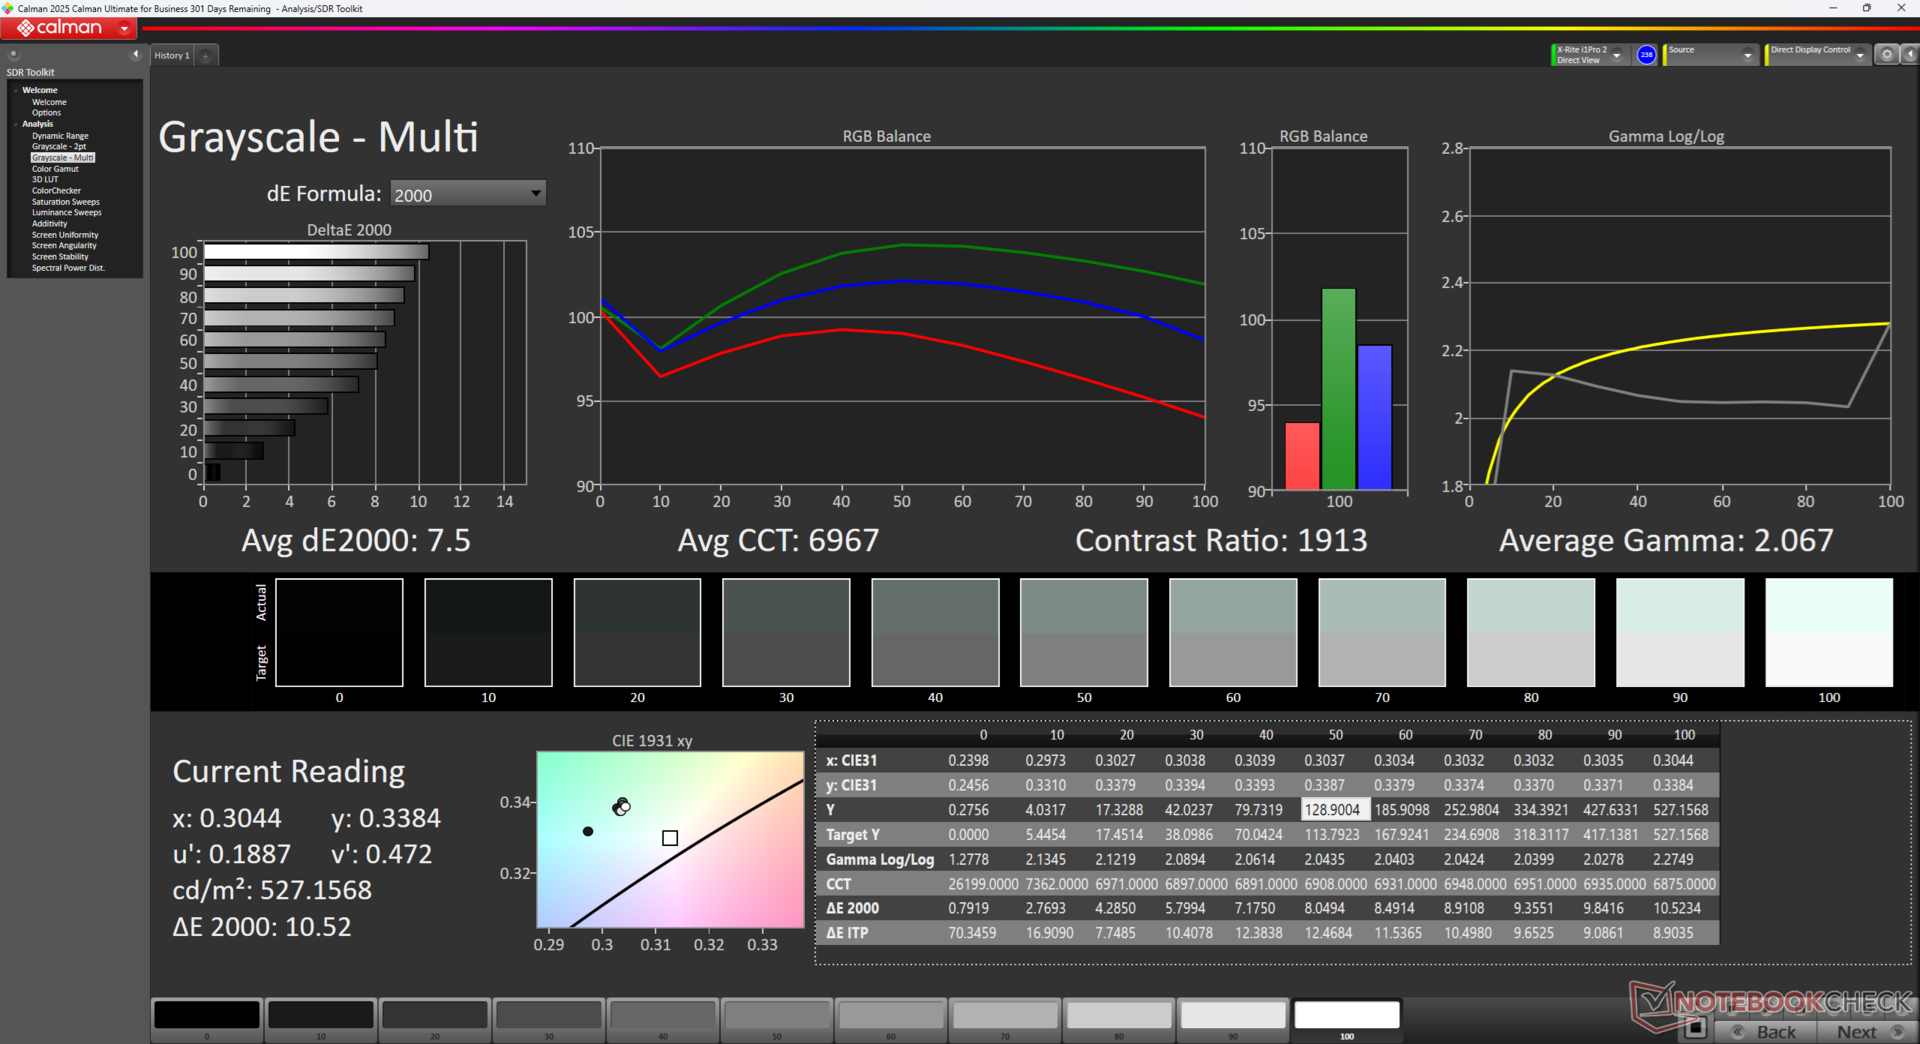
Kontrast: 1766:1 (Schwarzwert: 0.3 cd/m²)
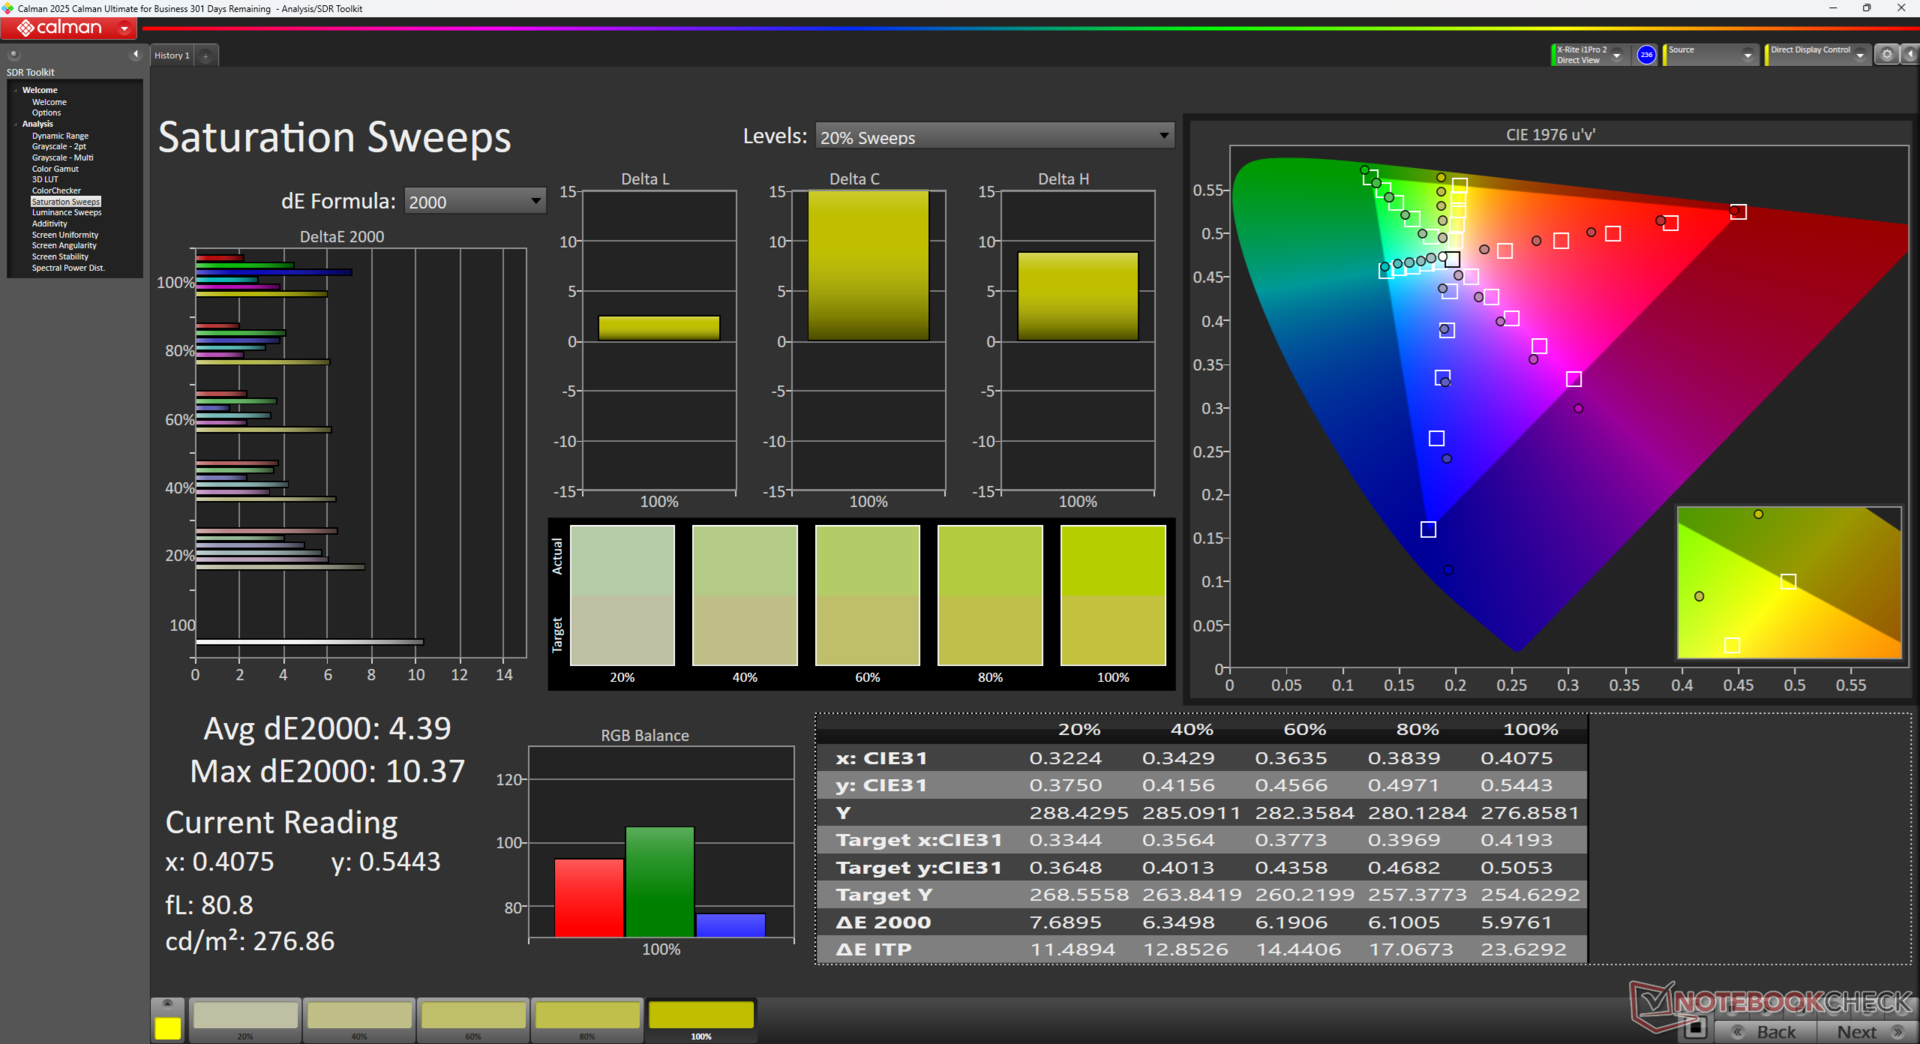
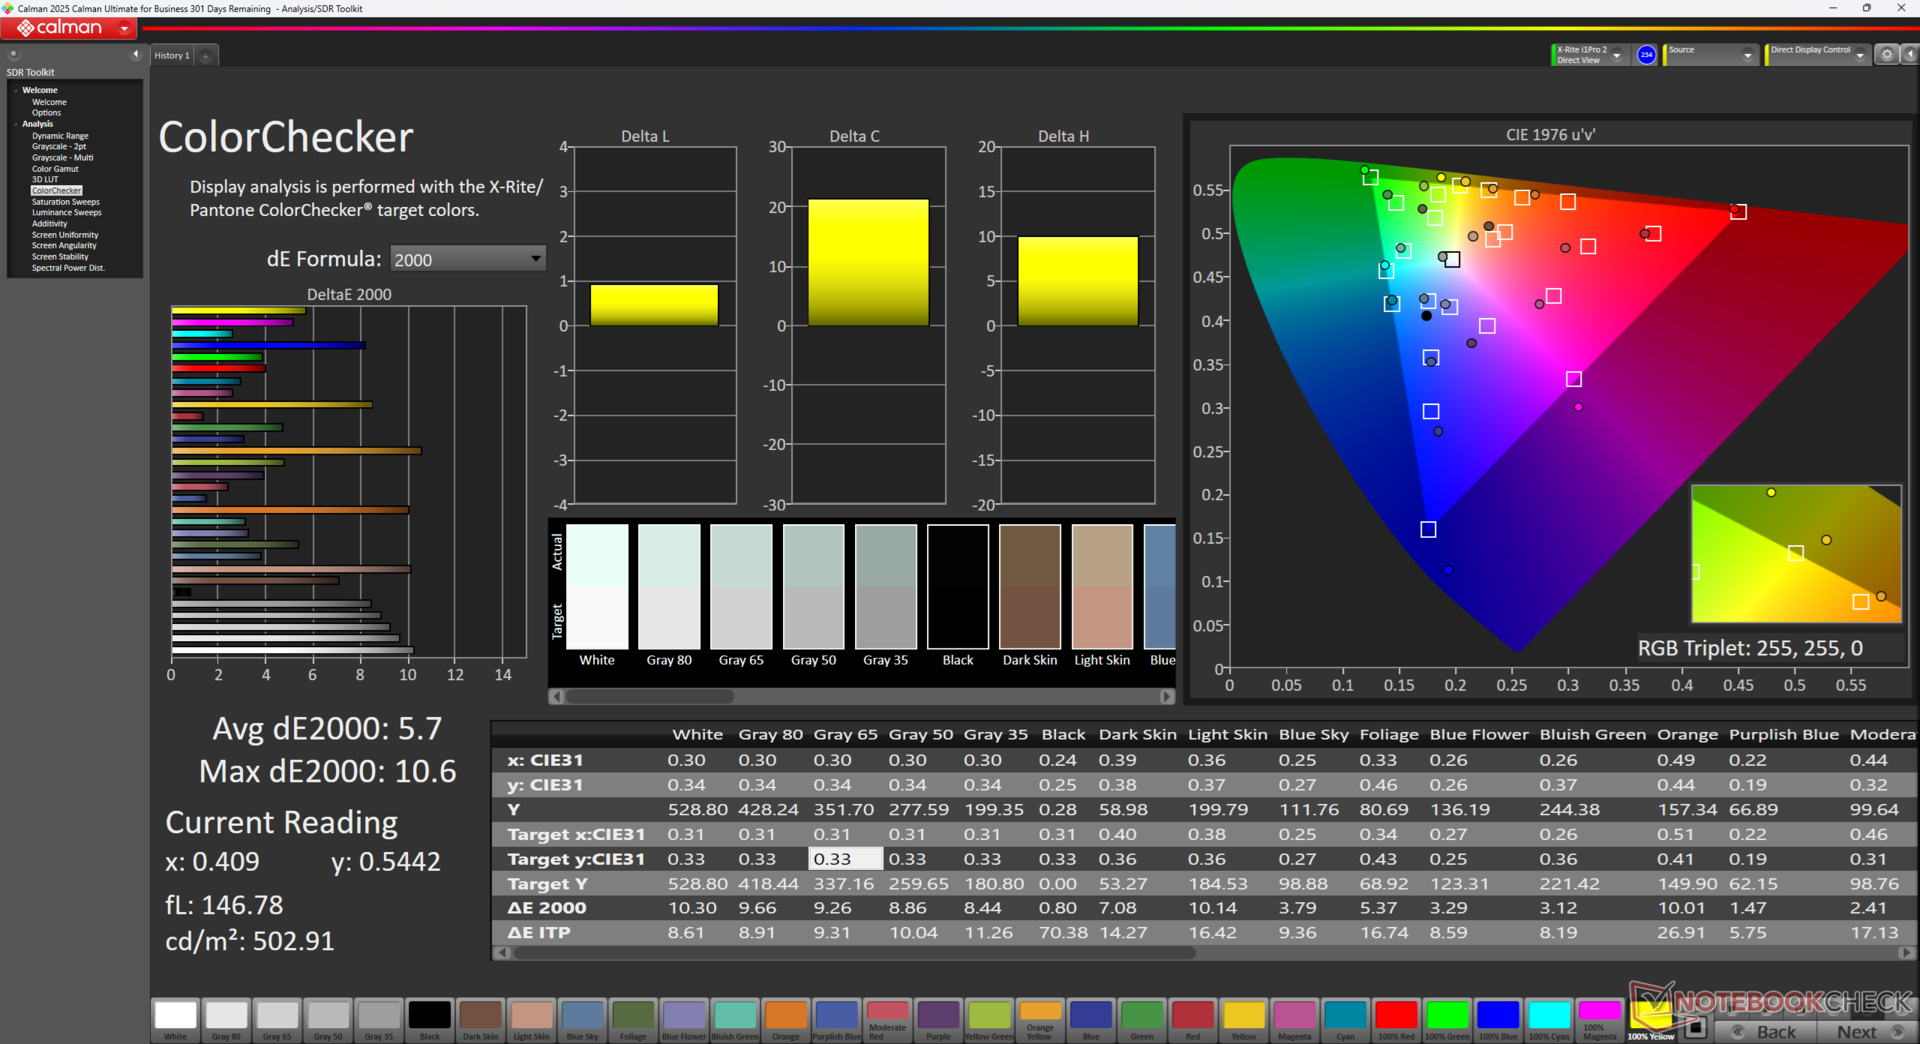
ΔE ColorChecker Calman: 5.7 | ∀{0.5-29.43 Ø4.71}
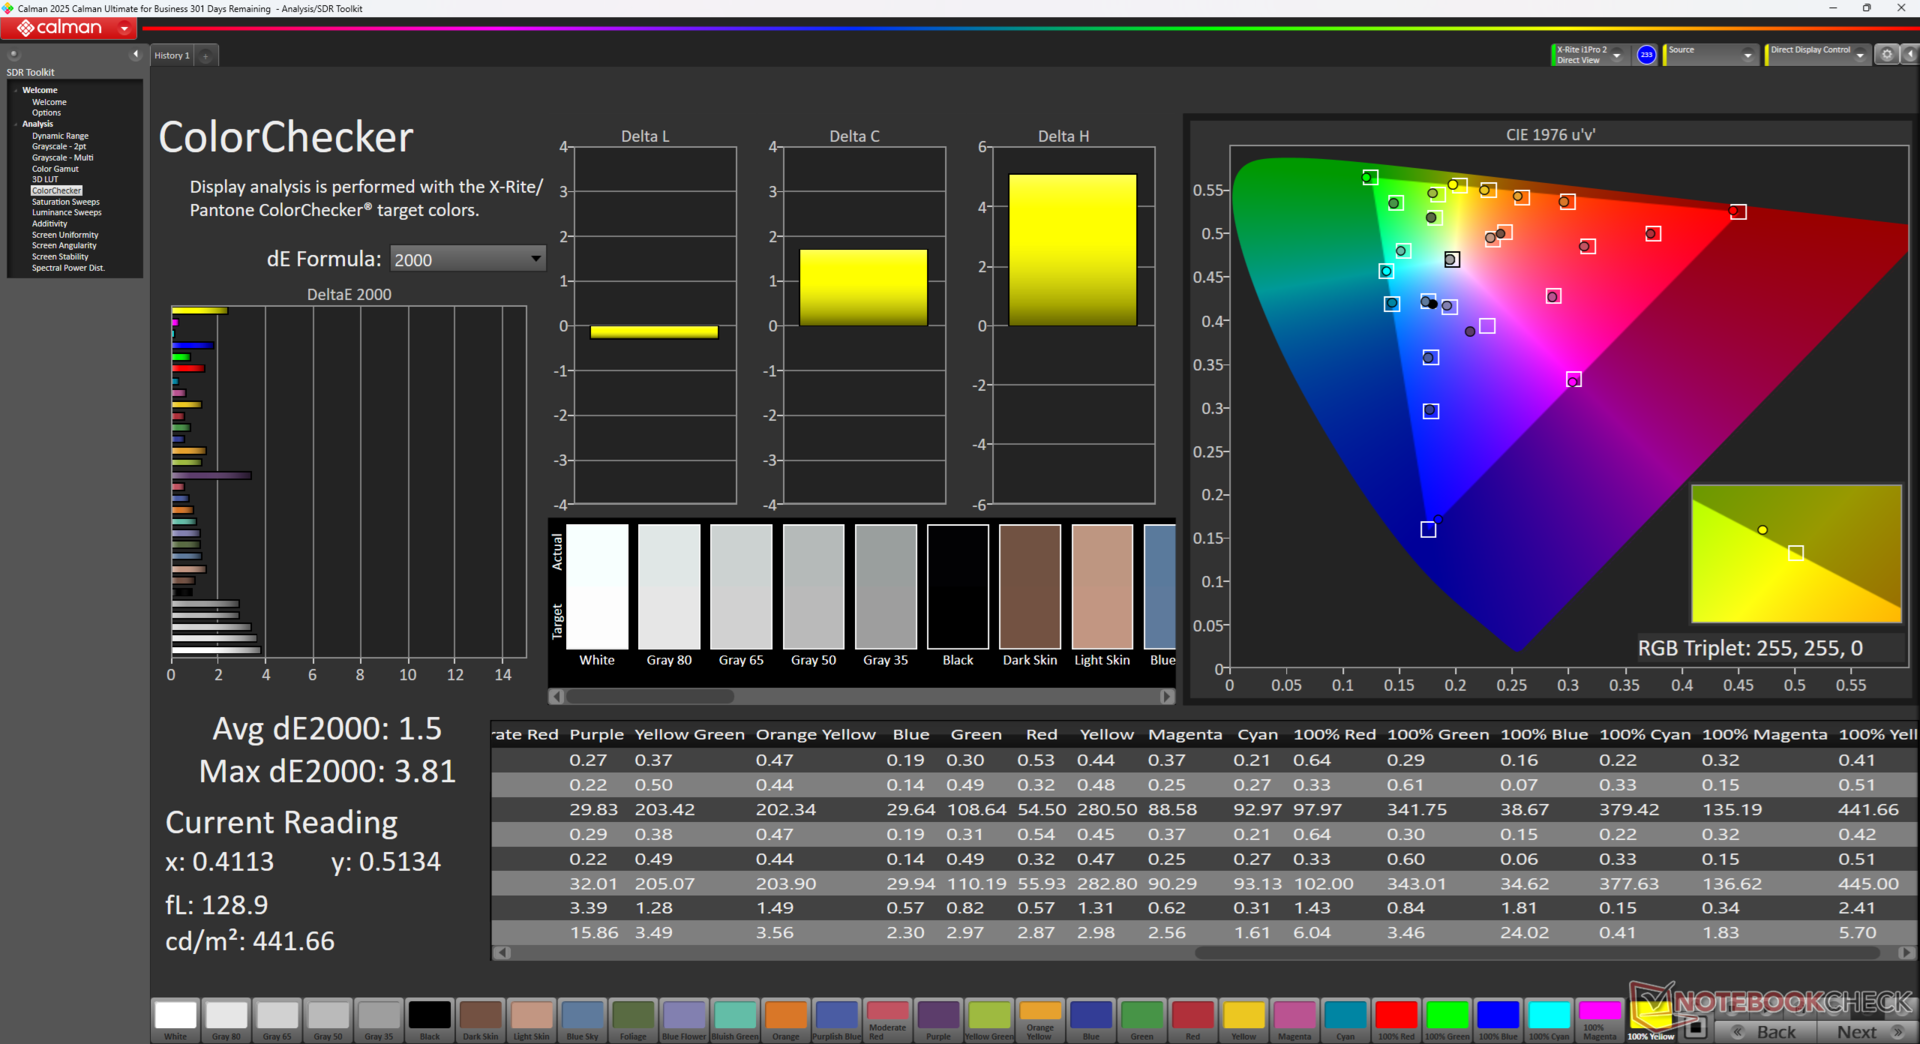
calibrated: 1.5
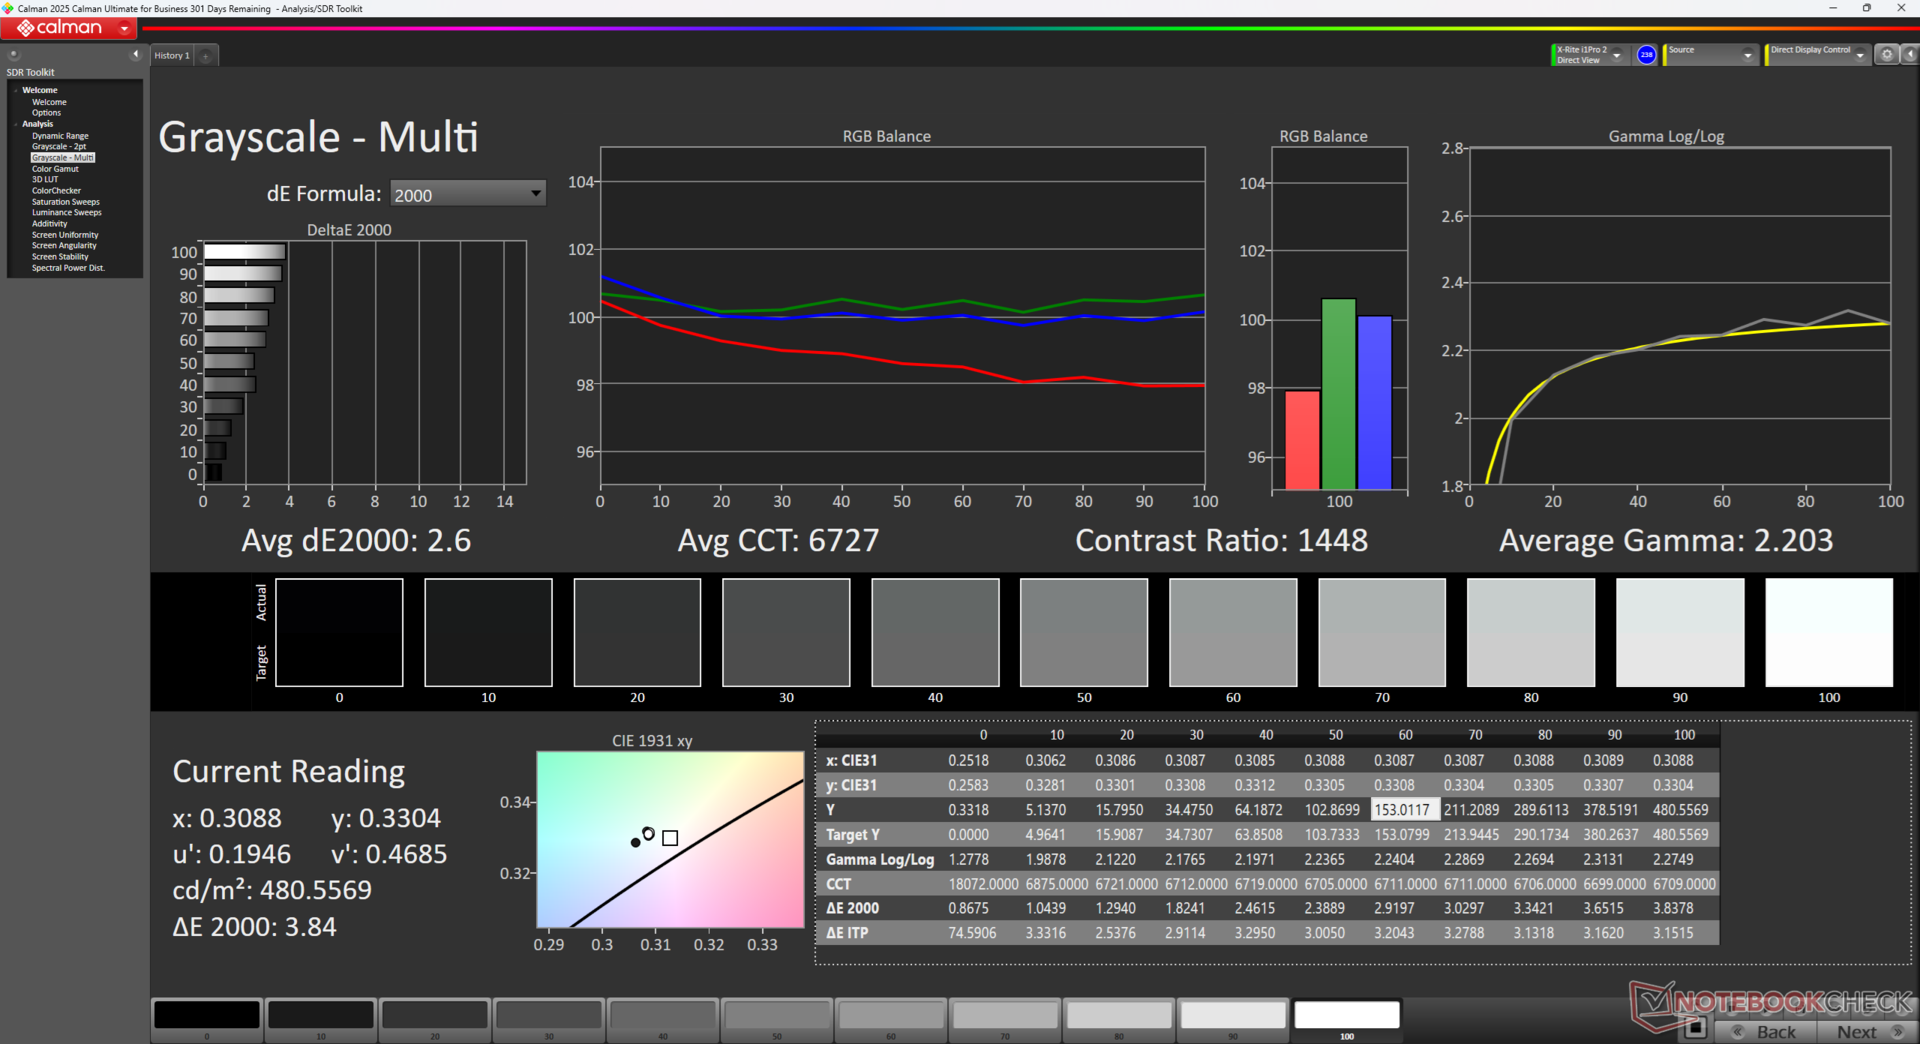
ΔE Greyscale Calman: 7.5 | ∀{0.09-98 Ø4.96}
70.8% AdobeRGB 1998 (Argyll 3D)
95.9% sRGB (Argyll 3D)
71.9% Display P3 (Argyll 3D)
Gamma: 2.07
CCT: 6967 K
| Framework Laptop 13.5 Ryzen AI 9 HX 370 BOE NE135A1M-NY1, IPS, 2880x1920, 13.5", 120 Hz | Framework Laptop 13.5 Core Ultra 7 155H BOE NE135A1M-NY1, IPS, 2880x1920, 13.5", 120 Hz | Dell Pro 13 Premium PA13250 B133UAN (AUOBEB0), IPS, 1920x1200, 13.3", 60 Hz | MSI Summit E13 AI Evo A1MTG CMN13C6, IPS, 1920x1200, 13.3", 60 Hz | HP EliteBook x360 830 G10 7L7U1ET LGD06E5, IPS LED, 1920x1200, 13.3", Hz | Lenovo ThinkPad Z13 Gen 2 ATNA33AA02-0, OLED, 2880x1800, 13.3", 60 Hz | |
|---|---|---|---|---|---|---|
| Display | 2% | 4% | 2% | -8% | 27% | |
| Display P3 Coverage (%) | 71.9 | 72.8 1% | 74.3 3% | 71.6 0% | 63.2 -12% | 99.7 39% |
| sRGB Coverage (%) | 95.9 | 98.6 3% | 99.1 3% | 98.6 3% | 92.7 -3% | 100 4% |
| AdobeRGB 1998 Coverage (%) | 70.8 | 72.9 3% | 75.9 7% | 73.1 3% | 65.1 -8% | 97.3 37% |
| Response Times | -6% | -25% | -54% | -10% | 93% | |
| Response Time Grey 50% / Grey 80% * (ms) | 40 ? | 41.9 ? -5% | 52.8 ? -32% | 60 ? -50% | 39.8 ? 1% | 2.1 ? 95% |
| Response Time Black / White * (ms) | 22.3 ? | 23.7 ? -6% | 26.4 ? -18% | 35.1 ? -57% | 26.8 ? -20% | 2.2 ? 90% |
| PWM Frequency (Hz) | 60.1 ? | |||||
| Bildschirm | 5% | 13% | 18% | 9% | 31% | |
| Helligkeit Bildmitte (cd/m²) | 529.9 | 498.5 -6% | 456 -14% | 405.2 -24% | 394 -26% | 372 -30% |
| Brightness (cd/m²) | 506 | 464 -8% | 460 -9% | 372 -26% | 372 -26% | 375 -26% |
| Brightness Distribution (%) | 94 | 86 -9% | 89 -5% | 88 -6% | 84 -11% | 99 5% |
| Schwarzwert * (cd/m²) | 0.3 | 0.36 -20% | 0.23 23% | 0.34 -13% | 0.17 43% | |
| Kontrast (:1) | 1766 | 1385 -22% | 1983 12% | 1192 -33% | 2318 31% | |
| Delta E Colorchecker * | 5.7 | 4.27 25% | 3.3 42% | 2.4 58% | 4.1 28% | 0.88 85% |
| Colorchecker dE 2000 max. * | 10.6 | 7.08 33% | 6.47 39% | 3.56 66% | 8.3 22% | 3.22 70% |
| Colorchecker dE 2000 calibrated * | 1.5 | 1.26 16% | 1.7 -13% | 0.54 64% | ||
| Delta E Graustufen * | 7.5 | 4.7 37% | 4.35 42% | 1.9 75% | 6.6 12% | 1.2 84% |
| Gamma | 2.07 106% | 2.09 105% | 2.51 88% | 2 110% | 2.17 101% | 2.18 101% |
| CCT | 6967 93% | 7417 88% | 6215 105% | 6503 100% | 6019 108% | 6326 103% |
| Durchschnitt gesamt (Programm / Settings) | 0% /
3% | -3% /
6% | -11% /
4% | -3% /
2% | 50% /
41% |
* ... kleinere Werte sind besser
Das Display wird nicht vorkalibriert geliefert. Wir empfehlen die Anwendung unseres kalibrierten ICM-Profils (siehe oben), um genauere sRGB-Farben zu erhalten.
Reaktionszeiten (Response Times) des Displays
| ↔ Reaktionszeiten Schwarz zu Weiß | ||
|---|---|---|
| 22.3 ms ... steigend ↗ und fallend ↘ kombiniert | ↗ 11.1 ms steigend | 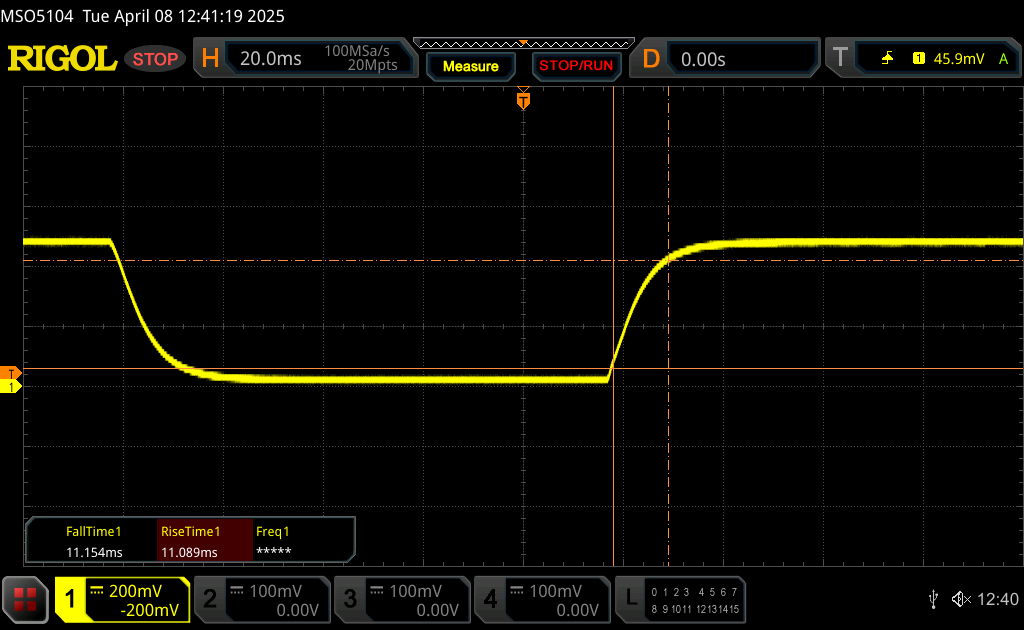 |
| ↘ 11.2 ms fallend | ||
| Die gemessenen Reaktionszeiten sind gut, für anspruchsvolle Spieler könnten der Bildschirm jedoch zu langsam sein. Im Vergleich rangierten die bei uns getesteten Geräte von 0.1 (Minimum) zu 240 (Maximum) ms. » 51 % aller Screens waren schneller als der getestete. Daher sind die gemessenen Reaktionszeiten schlechter als der Durchschnitt aller vermessenen Geräte (19.8 ms). | ||
| ↔ Reaktionszeiten 50% Grau zu 80% Grau | ||
| 40 ms ... steigend ↗ und fallend ↘ kombiniert | ↗ 18.2 ms steigend | 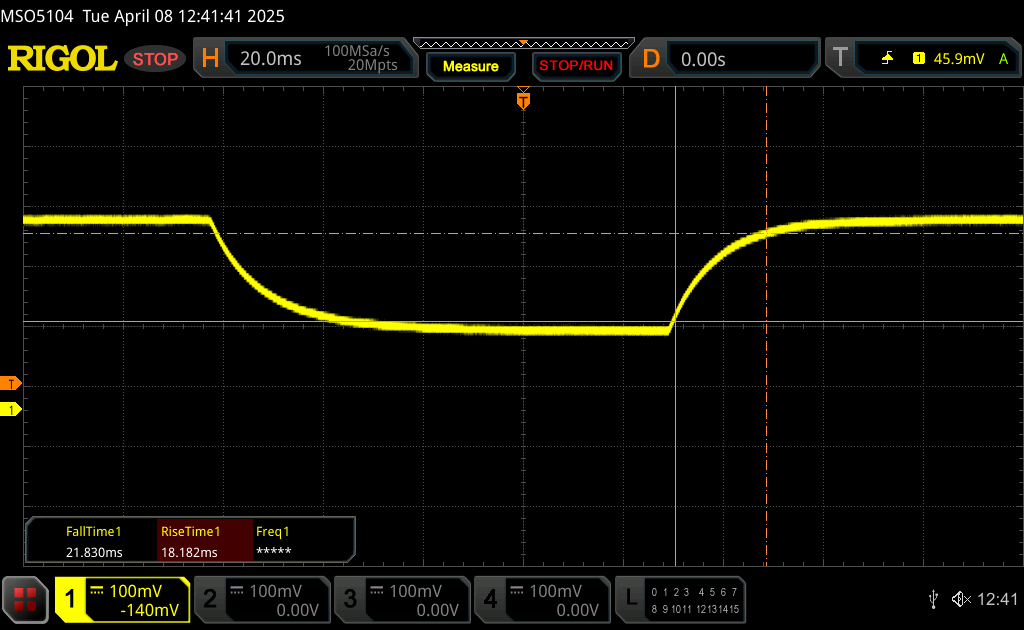 |
| ↘ 21.8 ms fallend | ||
| Die gemessenen Reaktionszeiten sind langsam und dadurch für viele Spieler wahrscheinlich zu langsam. Im Vergleich rangierten die bei uns getesteten Geräte von 0.165 (Minimum) zu 636 (Maximum) ms. » 61 % aller Screens waren schneller als der getestete. Daher sind die gemessenen Reaktionszeiten schlechter als der Durchschnitt aller vermessenen Geräte (30.9 ms). | ||
Bildschirm-Flackern / PWM (Pulse-Width Modulation)
| Flackern / PWM nicht festgestellt | 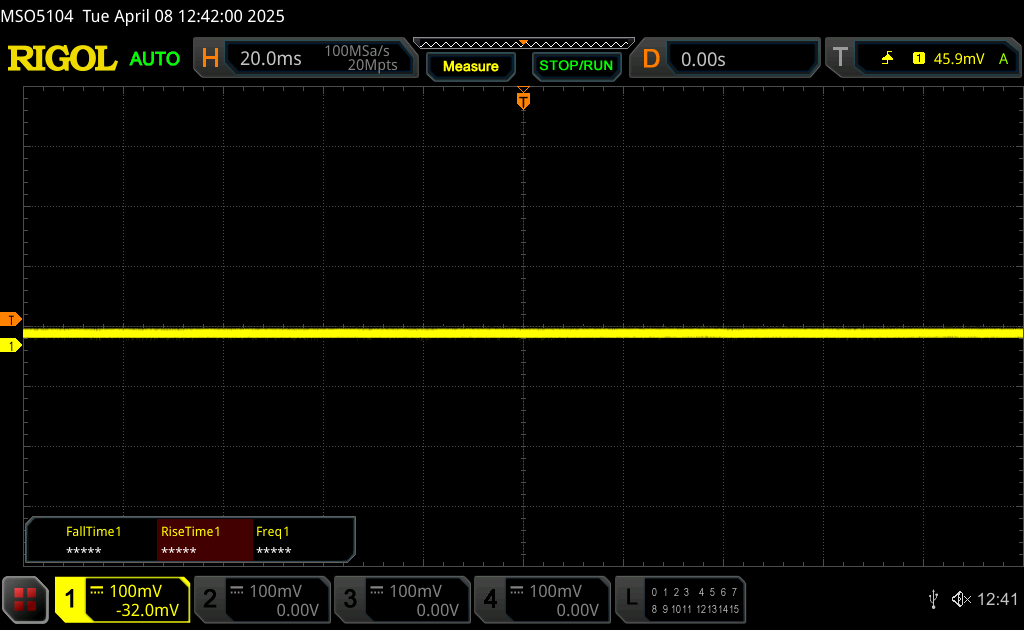 | ||
Im Vergleich: 52 % aller getesteten Geräte nutzten kein PWM um die Helligkeit zu reduzieren. Wenn PWM eingesetzt wurde, dann bei einer Frequenz von durchschnittlich 7744 (Minimum 5, Maximum 343500) Hz. | |||

Performance
Testbedingungen
Wir haben Windows in den Modus Performance versetzt, bevor wir die folgenden Benchmarks durchgeführt haben.
Prozessor
Der Ryzen AI 9 HX 370 ist leicht 30 bis 35 Prozent schneller als der letztjährige Intel Core-Ultra-7-155H-Konfiguration, wenn es um Multi-Thread-Workloads geht. Die Nachhaltigkeit der Leistung könnte jedoch besser sein, da die Ergebnisse bei unserem CineBench-R15-xT-Schleifentest mit der Zeit um bis zu 15 Prozent sinken, wie die Grafik unten zeigt. Nichtsdestotrotz ist diese Konfiguration immer noch schneller als die früherer Laptop-13,5-Konfigurationen, selbst wenn man die leichte Drosselung berücksichtigt.
Cinebench R15 Multi Loop
Cinebench R23: Multi Core | Single Core
Cinebench R20: CPU (Multi Core) | CPU (Single Core)
Cinebench R15: CPU Multi 64Bit | CPU Single 64Bit
Blender: v2.79 BMW27 CPU
7-Zip 18.03: 7z b 4 | 7z b 4 -mmt1
Geekbench 6.7: Multi-Core | Single-Core
Geekbench 5.5: Multi-Core | Single-Core
HWBOT x265 Benchmark v2.2: 4k Preset
LibreOffice : 20 Documents To PDF
R Benchmark 2.5: Overall mean
| CPU Performance Rating | |
| Durchschnittliche AMD Ryzen AI 9 HX 370 | |
| Framework Laptop 13.5 Ryzen AI 9 HX 370 | |
| Framework Laptop 13.5 13th Gen Intel -2! | |
| Framework Laptop 13.5 Ryzen 7 7840U | |
| Framework Laptop 13.5 Core Ultra 7 155H | |
| Dell XPS 13 Plus 9320 Core i7-1360P -2! | |
| Dell Pro 13 Premium PA13250 | |
| MSI Summit E13 AI Evo A1MTG | |
| Framework Laptop 13.5 12th Gen Intel -2! | |
| HP Dragonfly G4 -2! | |
| Dell Latitude 13 7350 | |
| Framework Laptop 13.5 -4! | |
| Geekbench 6.7 / Multi-Core | |
| Durchschnittliche AMD Ryzen AI 9 HX 370 (11973 - 16311, n=26) | |
| Framework Laptop 13.5 Ryzen AI 9 HX 370 | |
| Framework Laptop 13.5 Core Ultra 7 155H | |
| Framework Laptop 13.5 Ryzen 7 7840U | |
| MSI Summit E13 AI Evo A1MTG | |
| Dell Pro 13 Premium PA13250 | |
| Dell Latitude 13 7350 | |
| Geekbench 6.7 / Single-Core | |
| Durchschnittliche AMD Ryzen AI 9 HX 370 (2780 - 2965, n=26) | |
| Framework Laptop 13.5 Ryzen AI 9 HX 370 | |
| Dell Pro 13 Premium PA13250 | |
| Framework Laptop 13.5 Ryzen 7 7840U | |
| Framework Laptop 13.5 Core Ultra 7 155H | |
| MSI Summit E13 AI Evo A1MTG | |
| Dell Latitude 13 7350 | |
* ... kleinere Werte sind besser
AIDA64: FP32 Ray-Trace | FPU Julia | CPU SHA3 | CPU Queen | FPU SinJulia | FPU Mandel | CPU AES | CPU ZLib | FP64 Ray-Trace | CPU PhotoWorxx
| Performance Rating | |
| Durchschnittliche AMD Ryzen AI 9 HX 370 | |
| Framework Laptop 13.5 Ryzen AI 9 HX 370 | |
| Lenovo ThinkPad Z13 Gen 2 | |
| Framework Laptop 13.5 Core Ultra 7 155H | |
| MSI Summit E13 AI Evo A1MTG | |
| Dell Pro 13 Premium PA13250 | |
| HP EliteBook x360 830 G10 7L7U1ET | |
| AIDA64 / FP32 Ray-Trace | |
| Durchschnittliche AMD Ryzen AI 9 HX 370 (24673 - 37804, n=25) | |
| Framework Laptop 13.5 Ryzen AI 9 HX 370 | |
| Lenovo ThinkPad Z13 Gen 2 | |
| Framework Laptop 13.5 Core Ultra 7 155H | |
| Dell Pro 13 Premium PA13250 | |
| MSI Summit E13 AI Evo A1MTG | |
| HP EliteBook x360 830 G10 7L7U1ET | |
| AIDA64 / FPU Julia | |
| Durchschnittliche AMD Ryzen AI 9 HX 370 (95655 - 148045, n=26) | |
| Framework Laptop 13.5 Ryzen AI 9 HX 370 | |
| Lenovo ThinkPad Z13 Gen 2 | |
| Framework Laptop 13.5 Core Ultra 7 155H | |
| MSI Summit E13 AI Evo A1MTG | |
| Dell Pro 13 Premium PA13250 | |
| HP EliteBook x360 830 G10 7L7U1ET | |
| AIDA64 / CPU SHA3 | |
| Durchschnittliche AMD Ryzen AI 9 HX 370 (4421 - 5932, n=26) | |
| Framework Laptop 13.5 Ryzen AI 9 HX 370 | |
| Lenovo ThinkPad Z13 Gen 2 | |
| Framework Laptop 13.5 Core Ultra 7 155H | |
| MSI Summit E13 AI Evo A1MTG | |
| Dell Pro 13 Premium PA13250 | |
| HP EliteBook x360 830 G10 7L7U1ET | |
| AIDA64 / CPU Queen | |
| Lenovo ThinkPad Z13 Gen 2 | |
| Framework Laptop 13.5 Core Ultra 7 155H | |
| Durchschnittliche AMD Ryzen AI 9 HX 370 (41744 - 99088, n=24) | |
| Framework Laptop 13.5 Ryzen AI 9 HX 370 | |
| MSI Summit E13 AI Evo A1MTG | |
| HP EliteBook x360 830 G10 7L7U1ET | |
| Dell Pro 13 Premium PA13250 | |
| AIDA64 / FPU SinJulia | |
| Durchschnittliche AMD Ryzen AI 9 HX 370 (16445 - 19120, n=26) | |
| Framework Laptop 13.5 Ryzen AI 9 HX 370 | |
| Lenovo ThinkPad Z13 Gen 2 | |
| Framework Laptop 13.5 Core Ultra 7 155H | |
| MSI Summit E13 AI Evo A1MTG | |
| Dell Pro 13 Premium PA13250 | |
| HP EliteBook x360 830 G10 7L7U1ET | |
| AIDA64 / FPU Mandel | |
| Durchschnittliche AMD Ryzen AI 9 HX 370 (50357 - 93798, n=25) | |
| Framework Laptop 13.5 Ryzen AI 9 HX 370 | |
| Lenovo ThinkPad Z13 Gen 2 | |
| Framework Laptop 13.5 Core Ultra 7 155H | |
| MSI Summit E13 AI Evo A1MTG | |
| Dell Pro 13 Premium PA13250 | |
| HP EliteBook x360 830 G10 7L7U1ET | |
| AIDA64 / CPU AES | |
| Framework Laptop 13.5 Ryzen AI 9 HX 370 | |
| Durchschnittliche AMD Ryzen AI 9 HX 370 (67015 - 118993, n=26) | |
| Lenovo ThinkPad Z13 Gen 2 | |
| Framework Laptop 13.5 Core Ultra 7 155H | |
| MSI Summit E13 AI Evo A1MTG | |
| Dell Pro 13 Premium PA13250 | |
| HP EliteBook x360 830 G10 7L7U1ET | |
| AIDA64 / CPU ZLib | |
| Durchschnittliche AMD Ryzen AI 9 HX 370 (1077 - 1530, n=26) | |
| Framework Laptop 13.5 Ryzen AI 9 HX 370 | |
| Lenovo ThinkPad Z13 Gen 2 | |
| Framework Laptop 13.5 Core Ultra 7 155H | |
| MSI Summit E13 AI Evo A1MTG | |
| HP EliteBook x360 830 G10 7L7U1ET | |
| Dell Pro 13 Premium PA13250 | |
| AIDA64 / FP64 Ray-Trace | |
| Durchschnittliche AMD Ryzen AI 9 HX 370 (13665 - 20648, n=26) | |
| Framework Laptop 13.5 Ryzen AI 9 HX 370 | |
| Lenovo ThinkPad Z13 Gen 2 | |
| Framework Laptop 13.5 Core Ultra 7 155H | |
| Dell Pro 13 Premium PA13250 | |
| MSI Summit E13 AI Evo A1MTG | |
| HP EliteBook x360 830 G10 7L7U1ET | |
| AIDA64 / CPU PhotoWorxx | |
| Durchschnittliche AMD Ryzen AI 9 HX 370 (36752 - 52671, n=26) | |
| Framework Laptop 13.5 Ryzen AI 9 HX 370 | |
| Dell Pro 13 Premium PA13250 | |
| Framework Laptop 13.5 Core Ultra 7 155H | |
| MSI Summit E13 AI Evo A1MTG | |
| Lenovo ThinkPad Z13 Gen 2 | |
| HP EliteBook x360 830 G10 7L7U1ET | |
Stresstest
Beim Starten des Prime95-Stresstests wurde die CPU auf 3,2 GHz und 46 W hochgefahren, bevor sie nach einer Minute des Tests auf 2,6 GHz und 33 W zurückfiel, um den begrenzten maximalen Turbo Boost darzustellen. Die Kerntemperaturen sind ansonsten ähnlich wie bei der Intel Konfiguration, wenn nicht sogar etwas kühler beim Spielen.
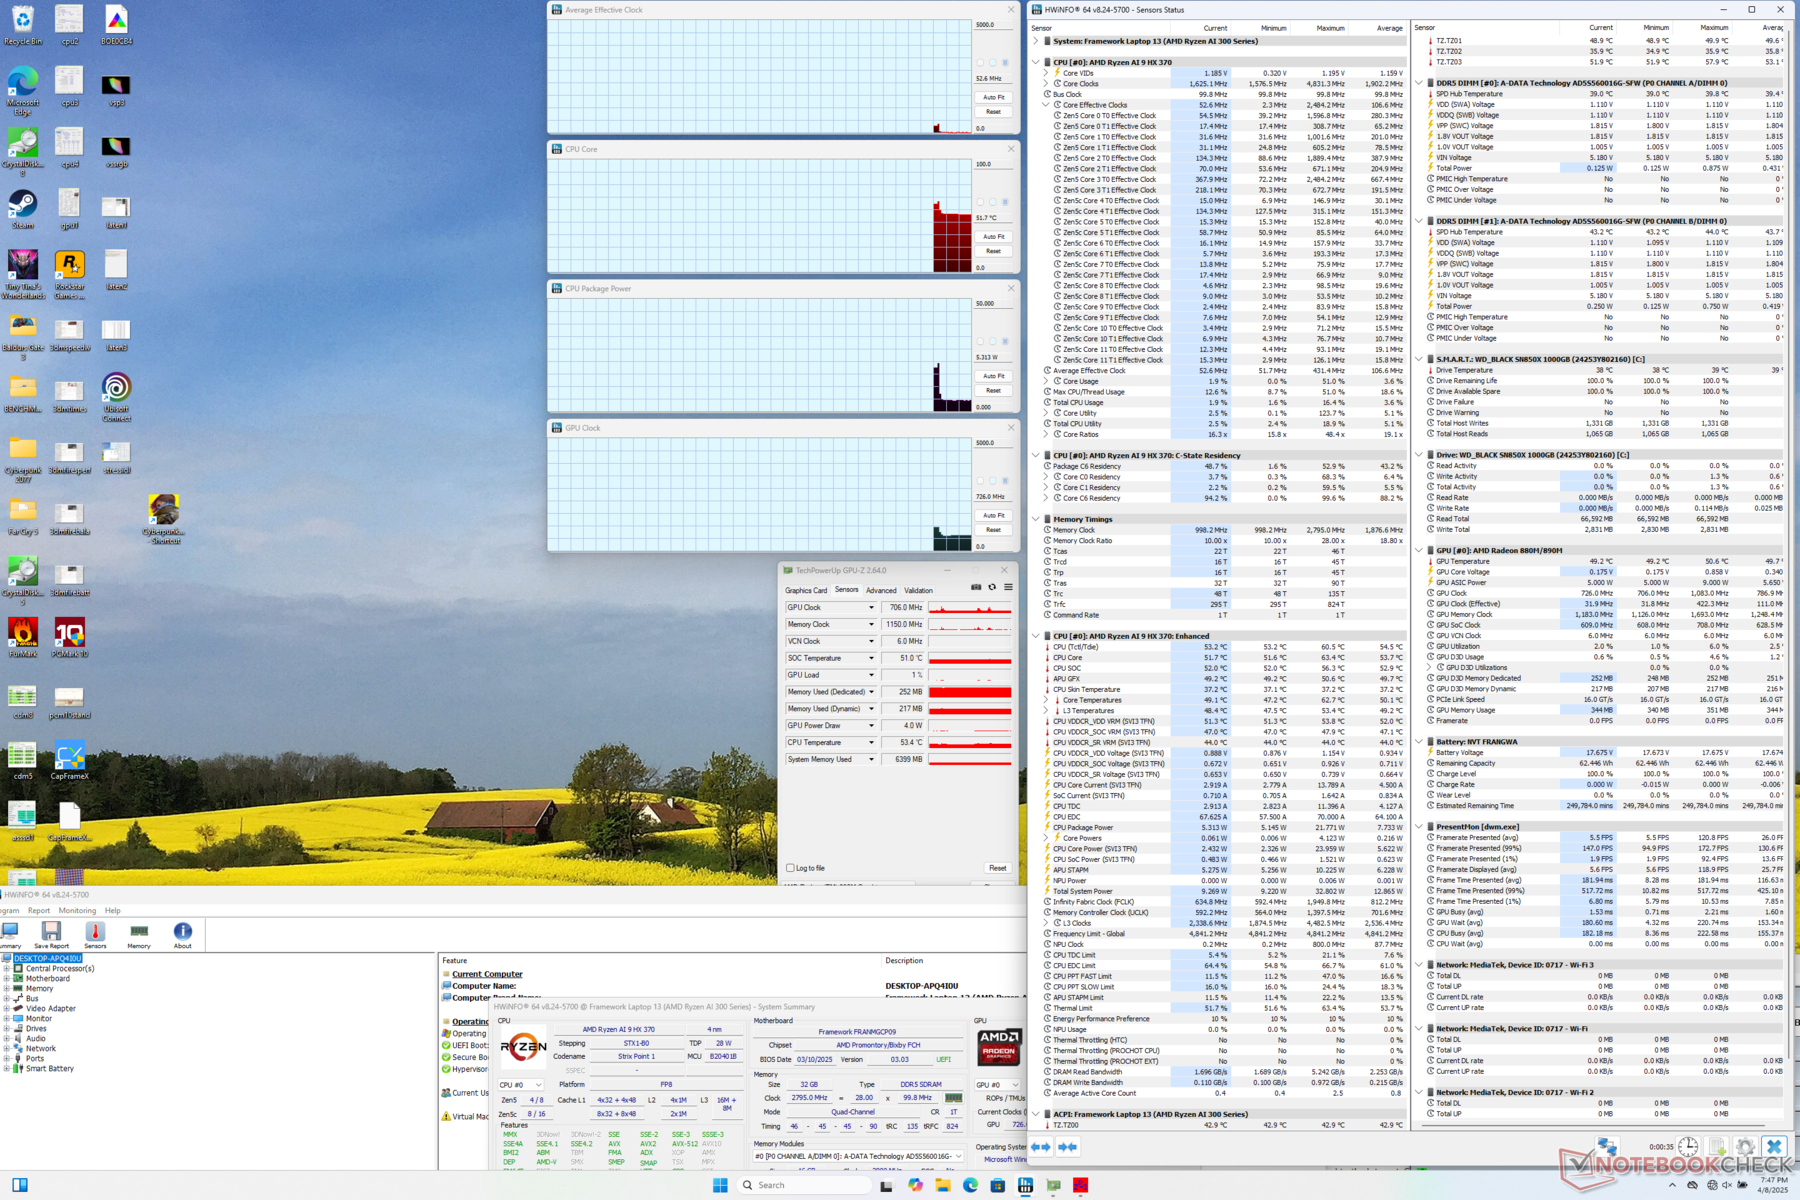
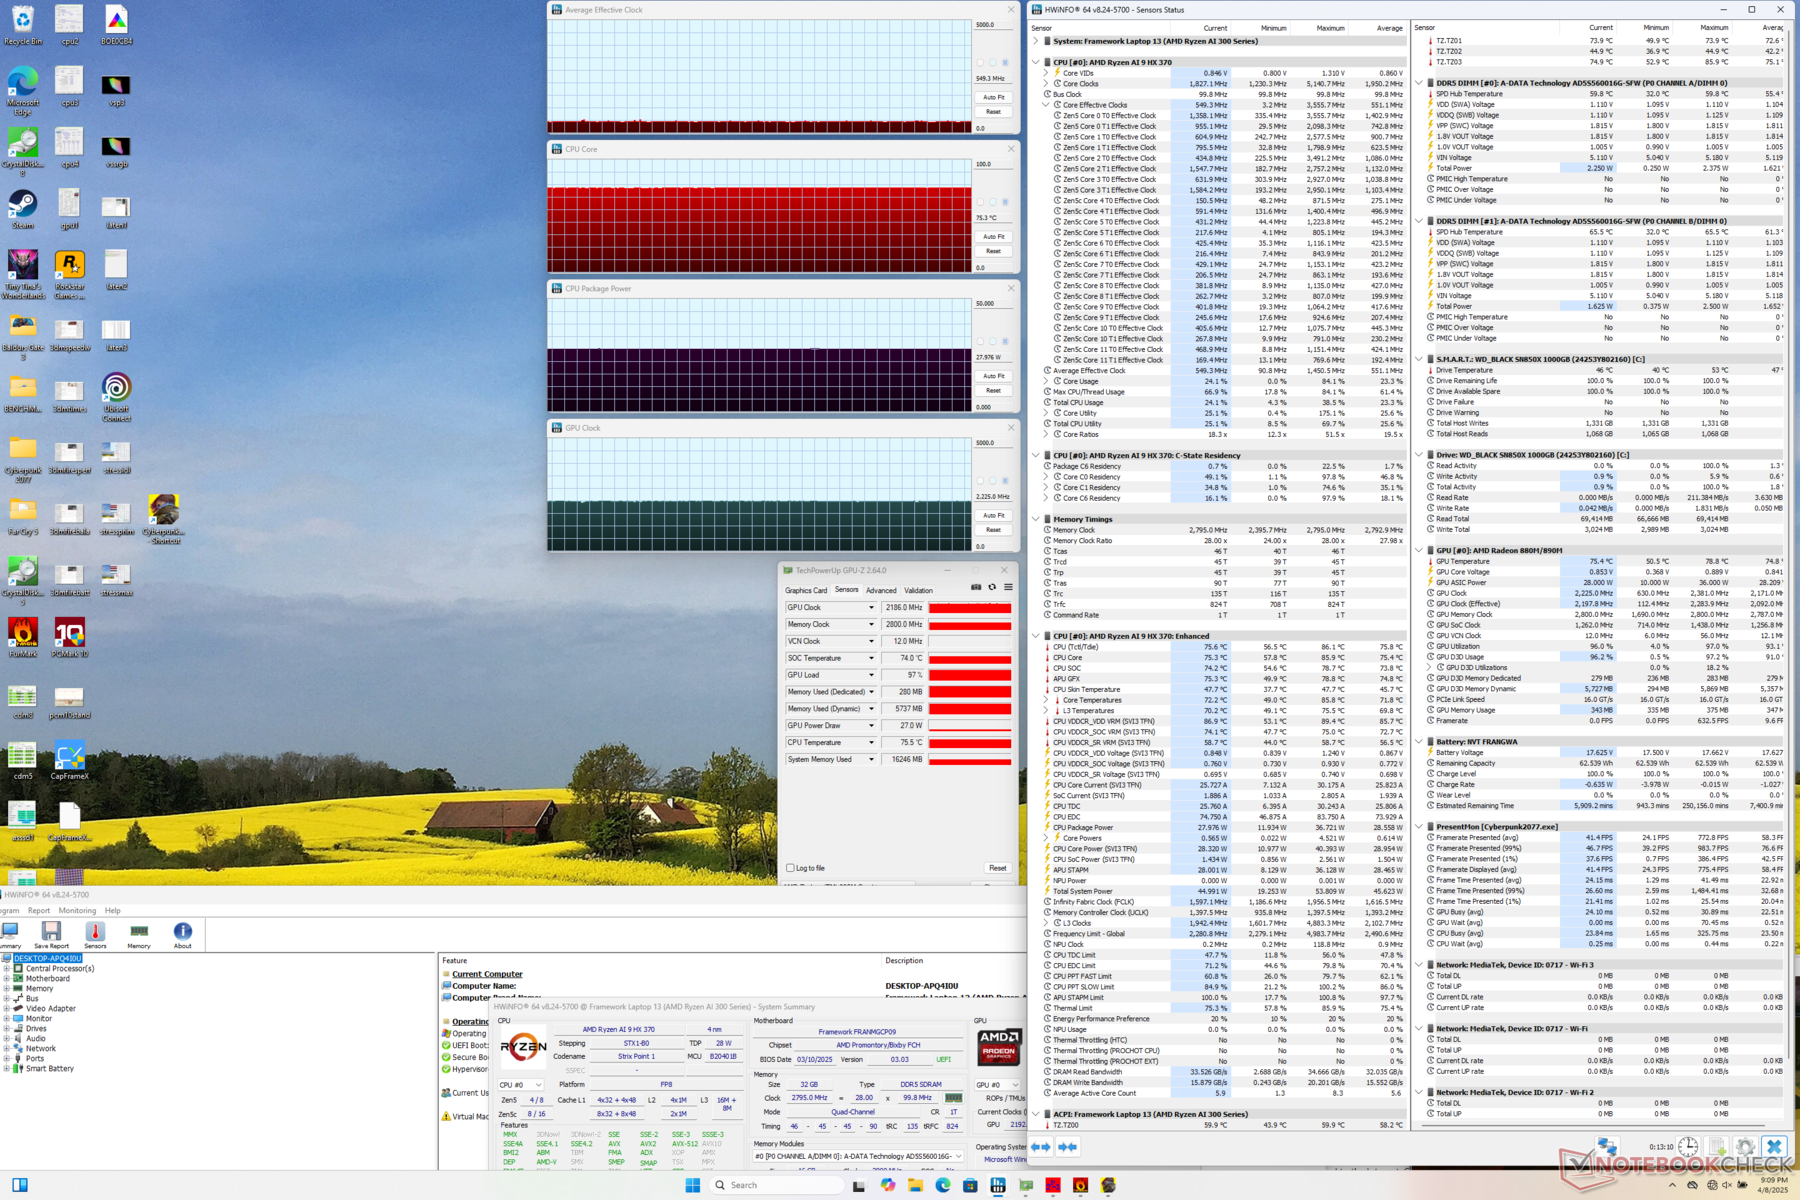
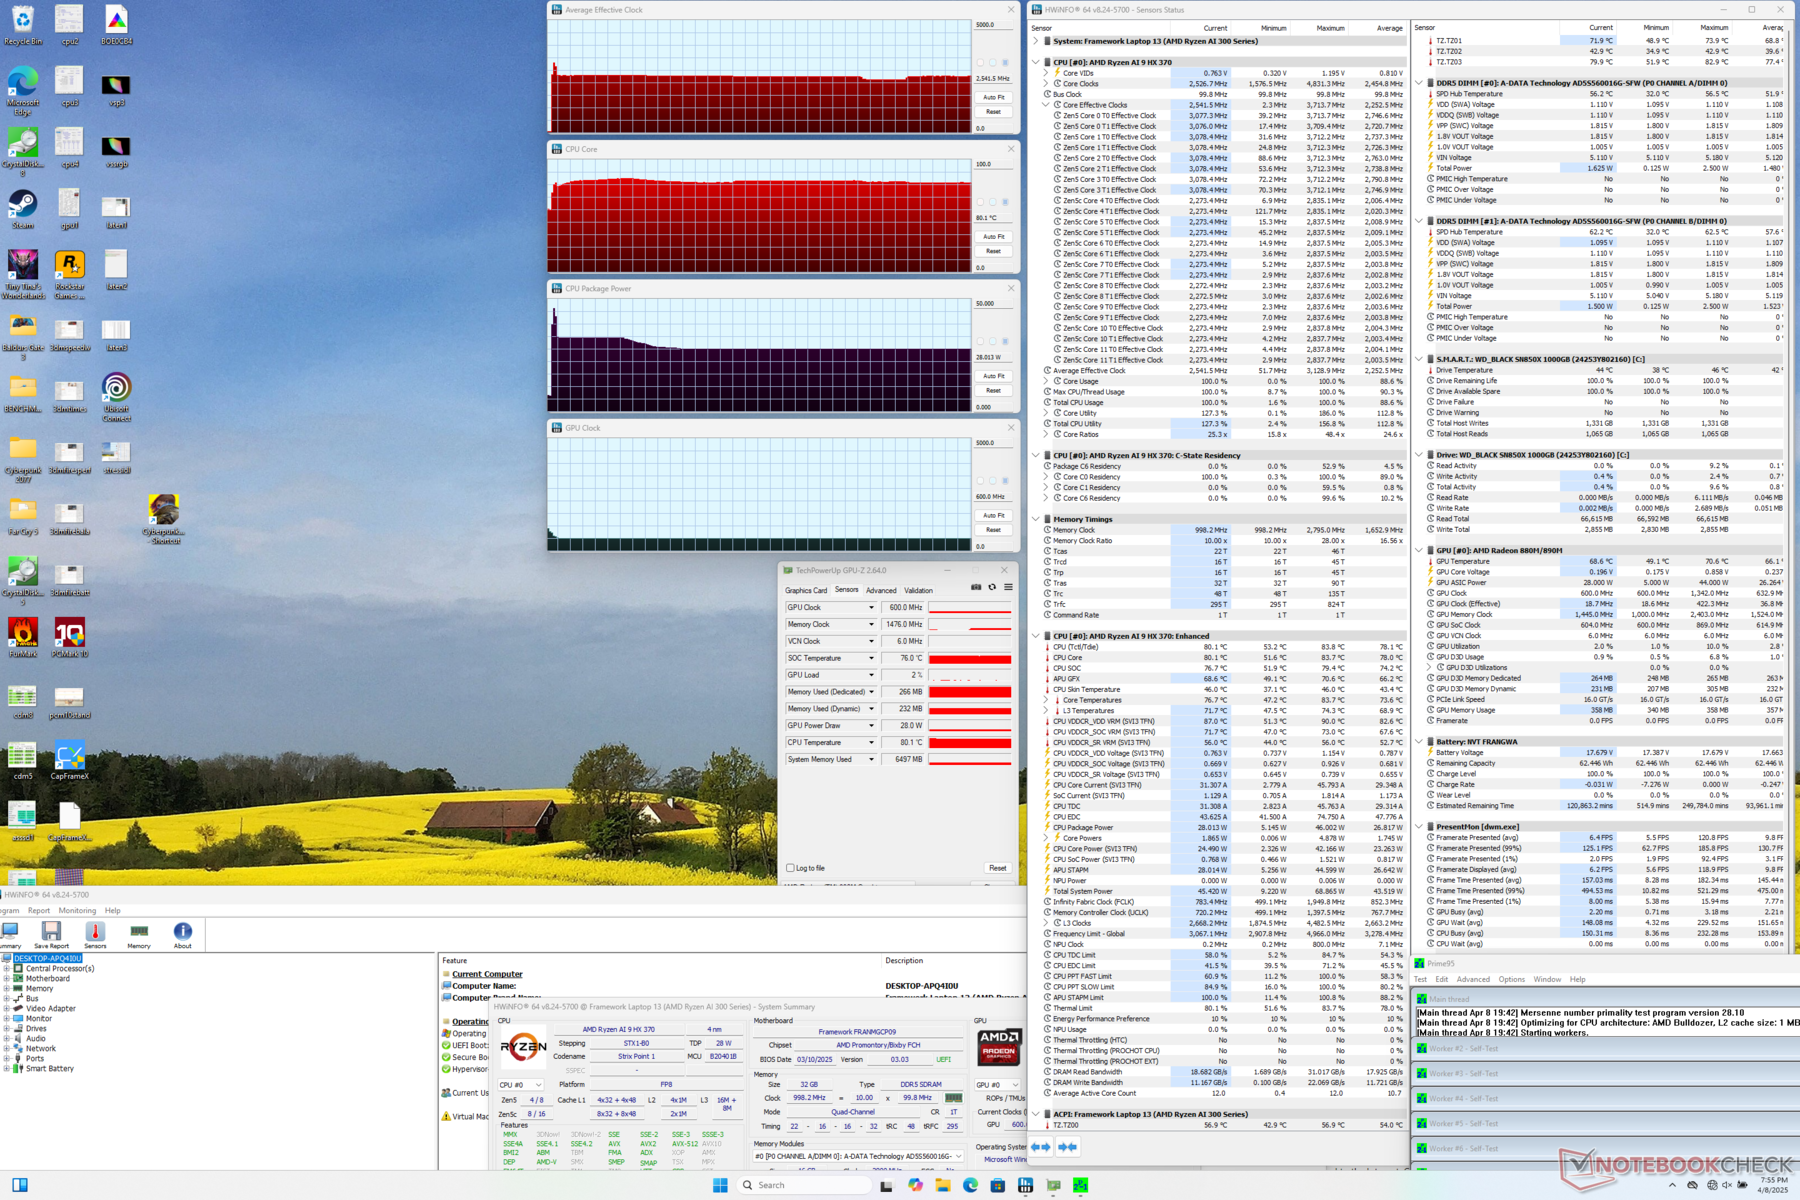
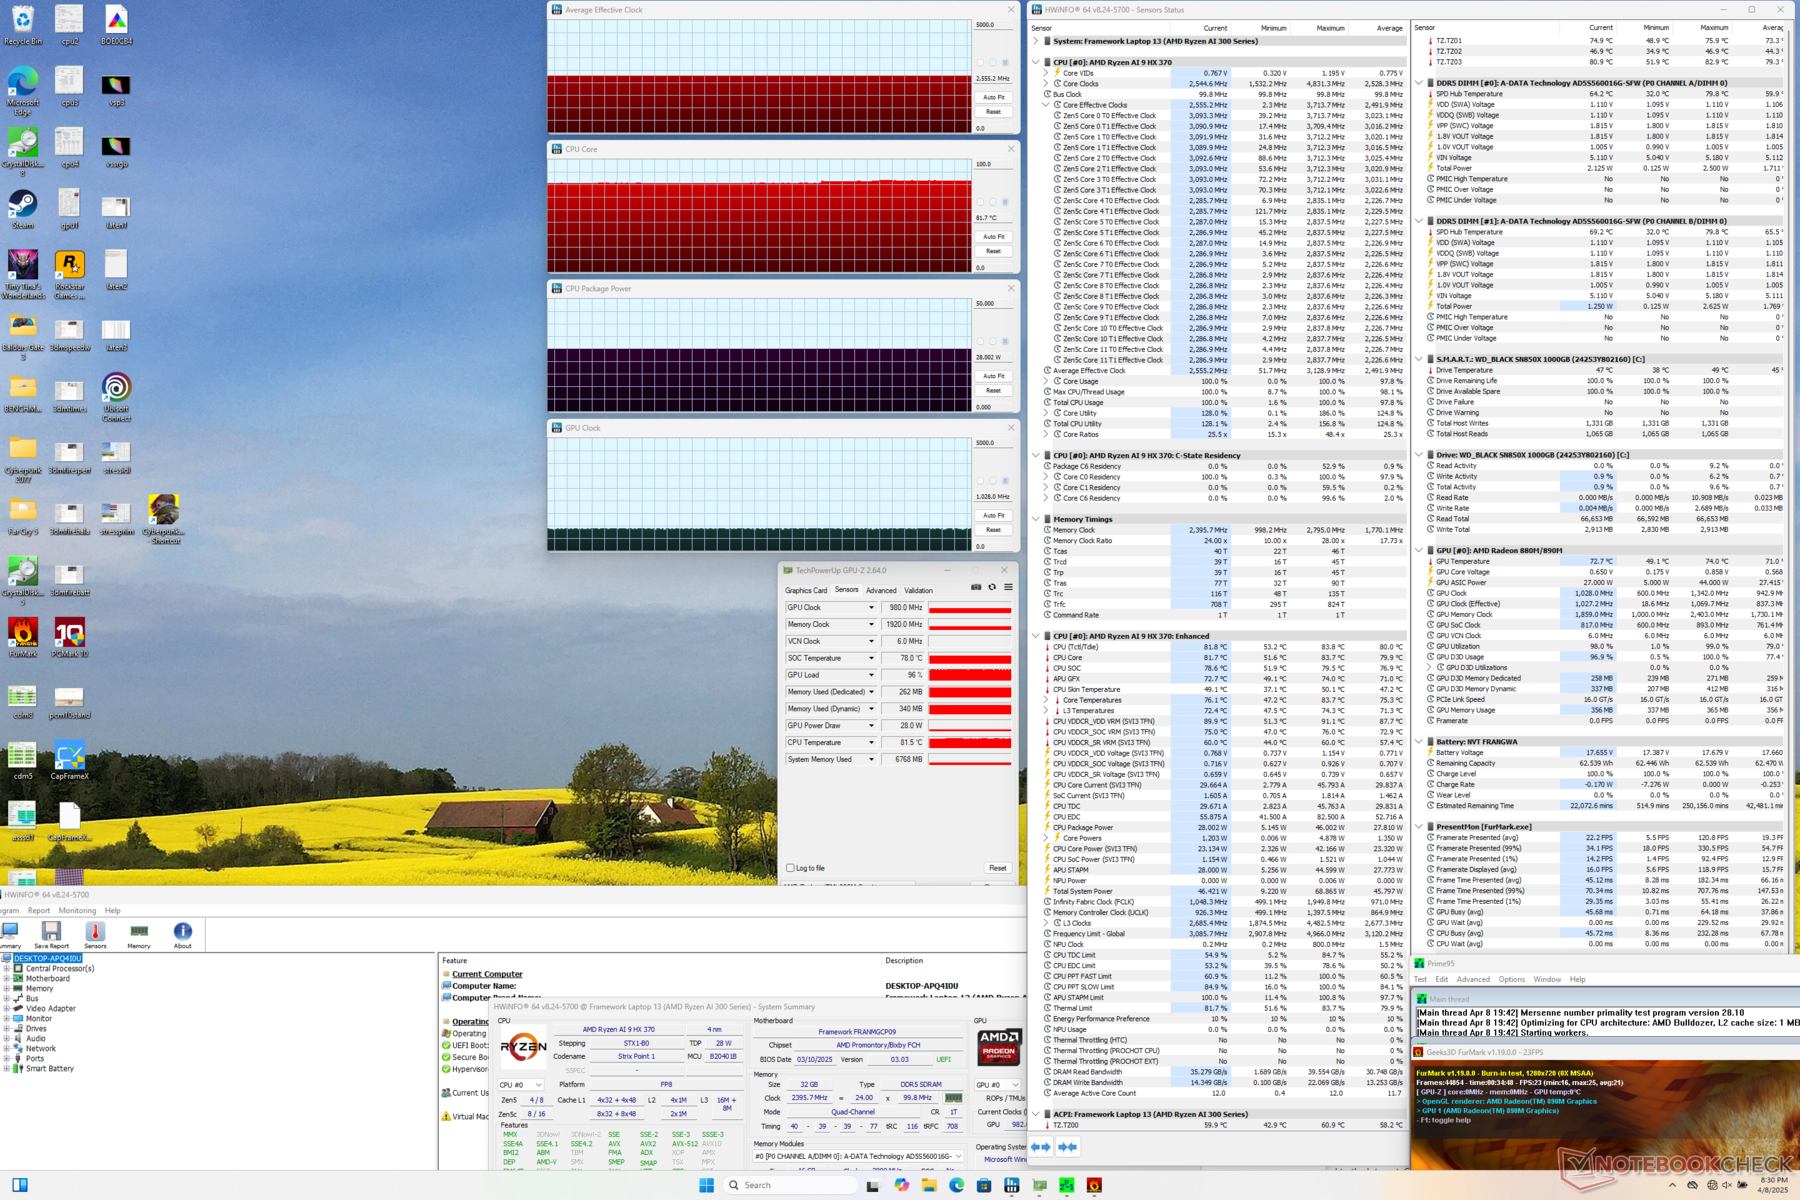
| durchschnittlicher CPU-Takt (GHz) | GPU-Takt (MHz) | durchschnittliche CPU-Temperatur (°C) | |
| System Leerlauf | -- | -- | 52 |
| Prime95, Stress | 2,5 | -- | 80 |
| Prime95 + FurMark, Stress | 2,6 | 980 | 82 |
| Cyberpunk 2077, Stress | 0,6 | 2.186 | 75 |
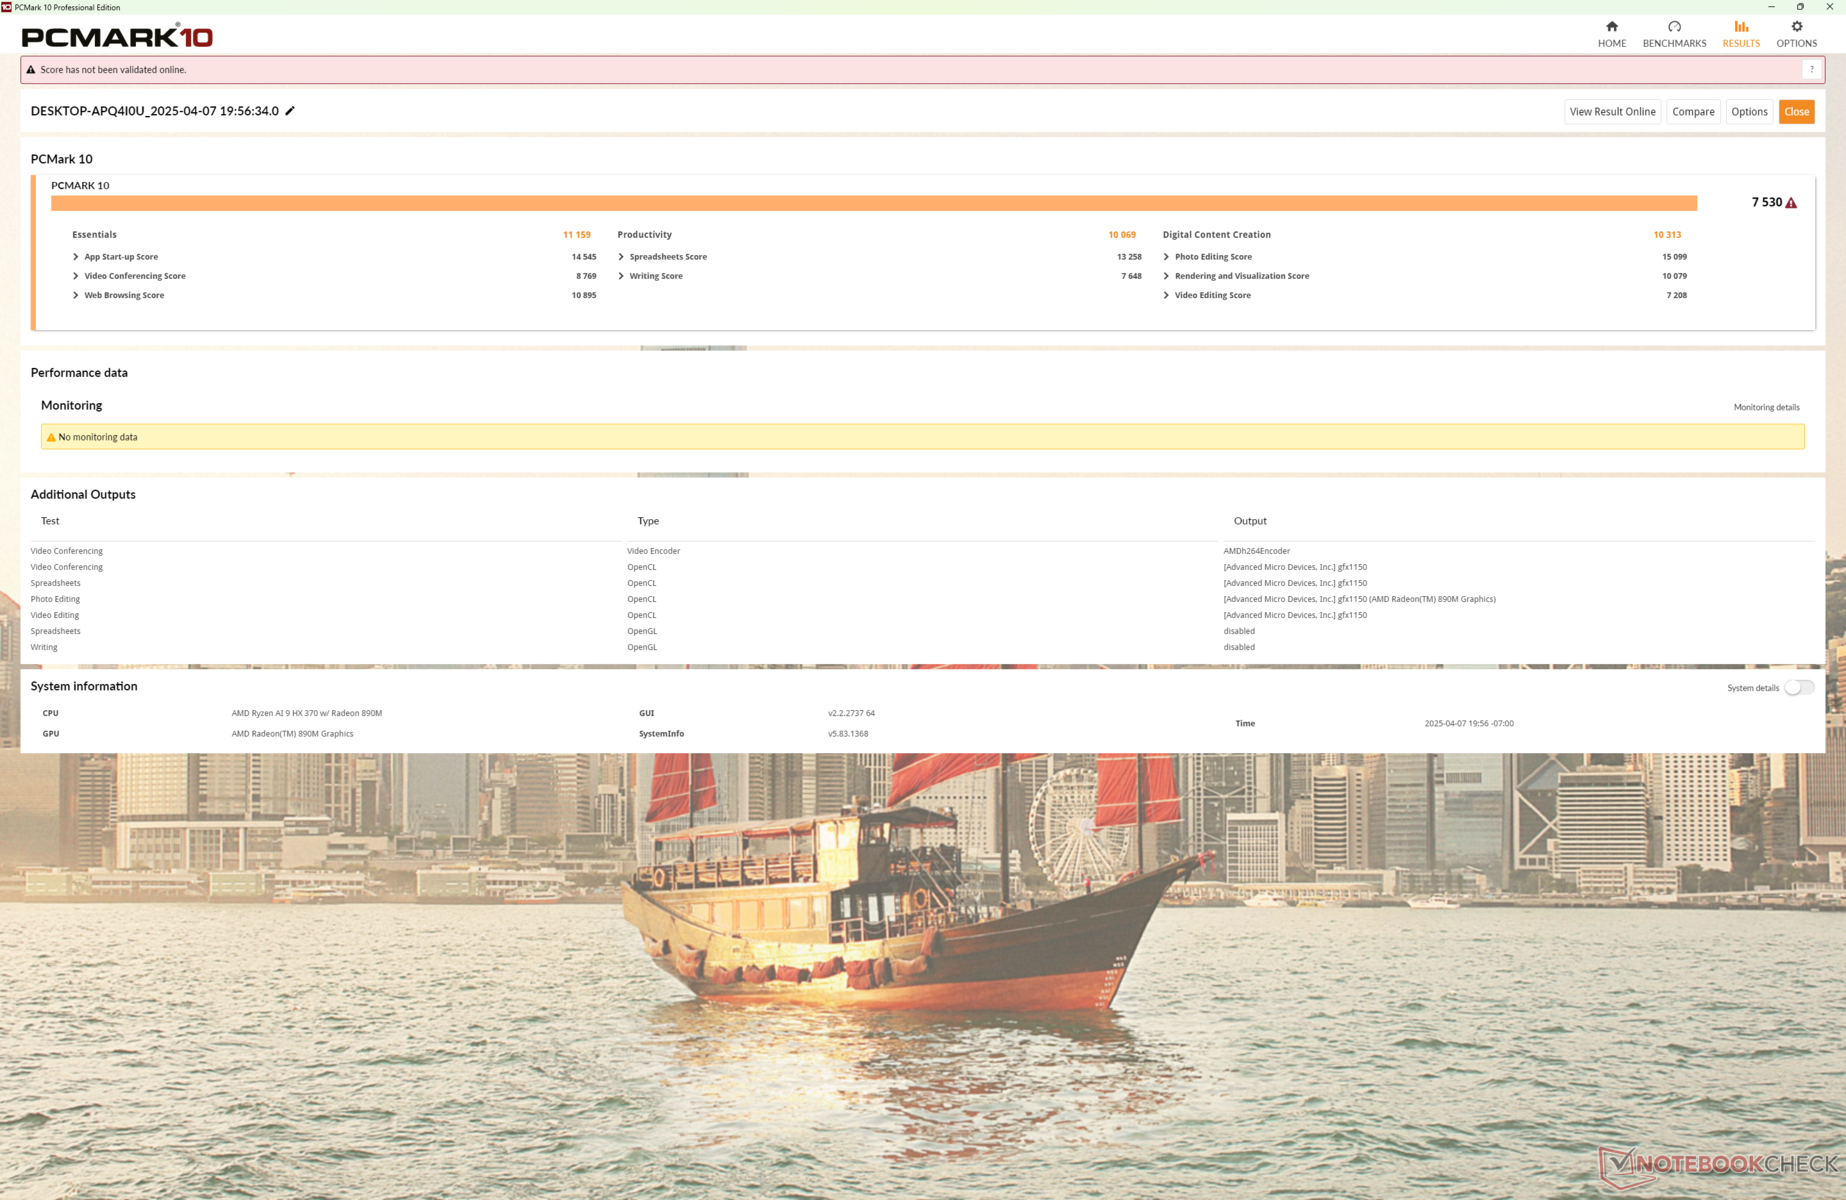
System Performance
CrossMark: Overall | Productivity | Creativity | Responsiveness
WebXPRT 3: Overall
WebXPRT 4: Overall
Mozilla Kraken 1.1: Total
| PCMark 10 / Score | |
| Framework Laptop 13.5 Ryzen AI 9 HX 370 | |
| Durchschnittliche AMD Ryzen AI 9 HX 370, AMD Radeon 890M (6577 - 7755, n=14) | |
| Lenovo ThinkPad Z13 Gen 2 | |
| Framework Laptop 13.5 Core Ultra 7 155H | |
| Dell Pro 13 Premium PA13250 | |
| HP EliteBook x360 830 G10 7L7U1ET | |
| MSI Summit E13 AI Evo A1MTG | |
| PCMark 10 / Essentials | |
| Framework Laptop 13.5 Ryzen AI 9 HX 370 | |
| Lenovo ThinkPad Z13 Gen 2 | |
| Framework Laptop 13.5 Core Ultra 7 155H | |
| Durchschnittliche AMD Ryzen AI 9 HX 370, AMD Radeon 890M (9277 - 11262, n=14) | |
| HP EliteBook x360 830 G10 7L7U1ET | |
| Dell Pro 13 Premium PA13250 | |
| MSI Summit E13 AI Evo A1MTG | |
| PCMark 10 / Productivity | |
| Framework Laptop 13.5 Ryzen AI 9 HX 370 | |
| Durchschnittliche AMD Ryzen AI 9 HX 370, AMD Radeon 890M (8497 - 10615, n=14) | |
| Lenovo ThinkPad Z13 Gen 2 | |
| Dell Pro 13 Premium PA13250 | |
| Framework Laptop 13.5 Core Ultra 7 155H | |
| HP EliteBook x360 830 G10 7L7U1ET | |
| MSI Summit E13 AI Evo A1MTG | |
| PCMark 10 / Digital Content Creation | |
| Durchschnittliche AMD Ryzen AI 9 HX 370, AMD Radeon 890M (9334 - 11422, n=14) | |
| Framework Laptop 13.5 Ryzen AI 9 HX 370 | |
| Framework Laptop 13.5 Core Ultra 7 155H | |
| Dell Pro 13 Premium PA13250 | |
| Lenovo ThinkPad Z13 Gen 2 | |
| MSI Summit E13 AI Evo A1MTG | |
| HP EliteBook x360 830 G10 7L7U1ET | |
| CrossMark / Overall | |
| Framework Laptop 13.5 Ryzen AI 9 HX 370 | |
| Durchschnittliche AMD Ryzen AI 9 HX 370, AMD Radeon 890M (1344 - 2040, n=13) | |
| Framework Laptop 13.5 Core Ultra 7 155H | |
| Dell Pro 13 Premium PA13250 | |
| MSI Summit E13 AI Evo A1MTG | |
| Lenovo ThinkPad Z13 Gen 2 | |
| HP EliteBook x360 830 G10 7L7U1ET | |
| CrossMark / Productivity | |
| Framework Laptop 13.5 Ryzen AI 9 HX 370 | |
| Framework Laptop 13.5 Core Ultra 7 155H | |
| Durchschnittliche AMD Ryzen AI 9 HX 370, AMD Radeon 890M (1166 - 1833, n=13) | |
| Dell Pro 13 Premium PA13250 | |
| MSI Summit E13 AI Evo A1MTG | |
| Lenovo ThinkPad Z13 Gen 2 | |
| HP EliteBook x360 830 G10 7L7U1ET | |
| CrossMark / Creativity | |
| Framework Laptop 13.5 Ryzen AI 9 HX 370 | |
| Durchschnittliche AMD Ryzen AI 9 HX 370, AMD Radeon 890M (1672 - 2439, n=13) | |
| Framework Laptop 13.5 Core Ultra 7 155H | |
| Dell Pro 13 Premium PA13250 | |
| Lenovo ThinkPad Z13 Gen 2 | |
| MSI Summit E13 AI Evo A1MTG | |
| HP EliteBook x360 830 G10 7L7U1ET | |
| CrossMark / Responsiveness | |
| Framework Laptop 13.5 Ryzen AI 9 HX 370 | |
| MSI Summit E13 AI Evo A1MTG | |
| Durchschnittliche AMD Ryzen AI 9 HX 370, AMD Radeon 890M (1067 - 1667, n=13) | |
| Framework Laptop 13.5 Core Ultra 7 155H | |
| Dell Pro 13 Premium PA13250 | |
| Lenovo ThinkPad Z13 Gen 2 | |
| HP EliteBook x360 830 G10 7L7U1ET | |
| WebXPRT 3 / Overall | |
| Framework Laptop 13.5 Ryzen AI 9 HX 370 | |
| Durchschnittliche AMD Ryzen AI 9 HX 370, AMD Radeon 890M (252 - 363, n=13) | |
| Lenovo ThinkPad Z13 Gen 2 | |
| Framework Laptop 13.5 Core Ultra 7 155H | |
| MSI Summit E13 AI Evo A1MTG | |
| HP EliteBook x360 830 G10 7L7U1ET | |
| Dell Pro 13 Premium PA13250 | |
| WebXPRT 4 / Overall | |
| Framework Laptop 13.5 Ryzen AI 9 HX 370 | |
| Framework Laptop 13.5 Core Ultra 7 155H | |
| Durchschnittliche AMD Ryzen AI 9 HX 370, AMD Radeon 890M (210 - 277, n=14) | |
| Dell Pro 13 Premium PA13250 | |
| Lenovo ThinkPad Z13 Gen 2 | |
| MSI Summit E13 AI Evo A1MTG | |
| Mozilla Kraken 1.1 / Total | |
| Lenovo ThinkPad Z13 Gen 2 | |
| HP EliteBook x360 830 G10 7L7U1ET | |
| MSI Summit E13 AI Evo A1MTG | |
| Framework Laptop 13.5 Core Ultra 7 155H | |
| Dell Pro 13 Premium PA13250 | |
| Framework Laptop 13.5 Ryzen AI 9 HX 370 | |
| Durchschnittliche AMD Ryzen AI 9 HX 370, AMD Radeon 890M (308 - 503, n=15) | |
* ... kleinere Werte sind besser
| PCMark 10 Score | 7530 Punkte | |
Hilfe | ||
| AIDA64 / Memory Copy | |
| Durchschnittliche AMD Ryzen AI 9 HX 370 (71902 - 93640, n=26) | |
| Framework Laptop 13.5 Core Ultra 7 155H | |
| Framework Laptop 13.5 Ryzen AI 9 HX 370 | |
| Framework Laptop 13.5 Ryzen 7 7840U | |
| Framework Laptop 13.5 13th Gen Intel | |
| Framework Laptop 13.5 12th Gen Intel | |
| Framework Laptop 13.5 | |
| AIDA64 / Memory Read | |
| Durchschnittliche AMD Ryzen AI 9 HX 370 (81367 - 102937, n=26) | |
| Framework Laptop 13.5 Ryzen AI 9 HX 370 | |
| Framework Laptop 13.5 Core Ultra 7 155H | |
| Framework Laptop 13.5 Ryzen 7 7840U | |
| Framework Laptop 13.5 13th Gen Intel | |
| Framework Laptop 13.5 12th Gen Intel | |
| Framework Laptop 13.5 | |
| AIDA64 / Memory Write | |
| Durchschnittliche AMD Ryzen AI 9 HX 370 (78939 - 108954, n=26) | |
| Framework Laptop 13.5 Ryzen AI 9 HX 370 | |
| Framework Laptop 13.5 Ryzen 7 7840U | |
| Framework Laptop 13.5 Core Ultra 7 155H | |
| Framework Laptop 13.5 13th Gen Intel | |
| Framework Laptop 13.5 12th Gen Intel | |
| Framework Laptop 13.5 | |
| AIDA64 / Memory Latency | |
| Framework Laptop 13.5 Core Ultra 7 155H | |
| Durchschnittliche AMD Ryzen AI 9 HX 370 (86.7 - 119.4, n=26) | |
| Framework Laptop 13.5 Ryzen AI 9 HX 370 | |
| Framework Laptop 13.5 Ryzen 7 7840U | |
| Framework Laptop 13.5 12th Gen Intel | |
| Framework Laptop 13.5 | |
| Framework Laptop 13.5 13th Gen Intel | |
* ... kleinere Werte sind besser
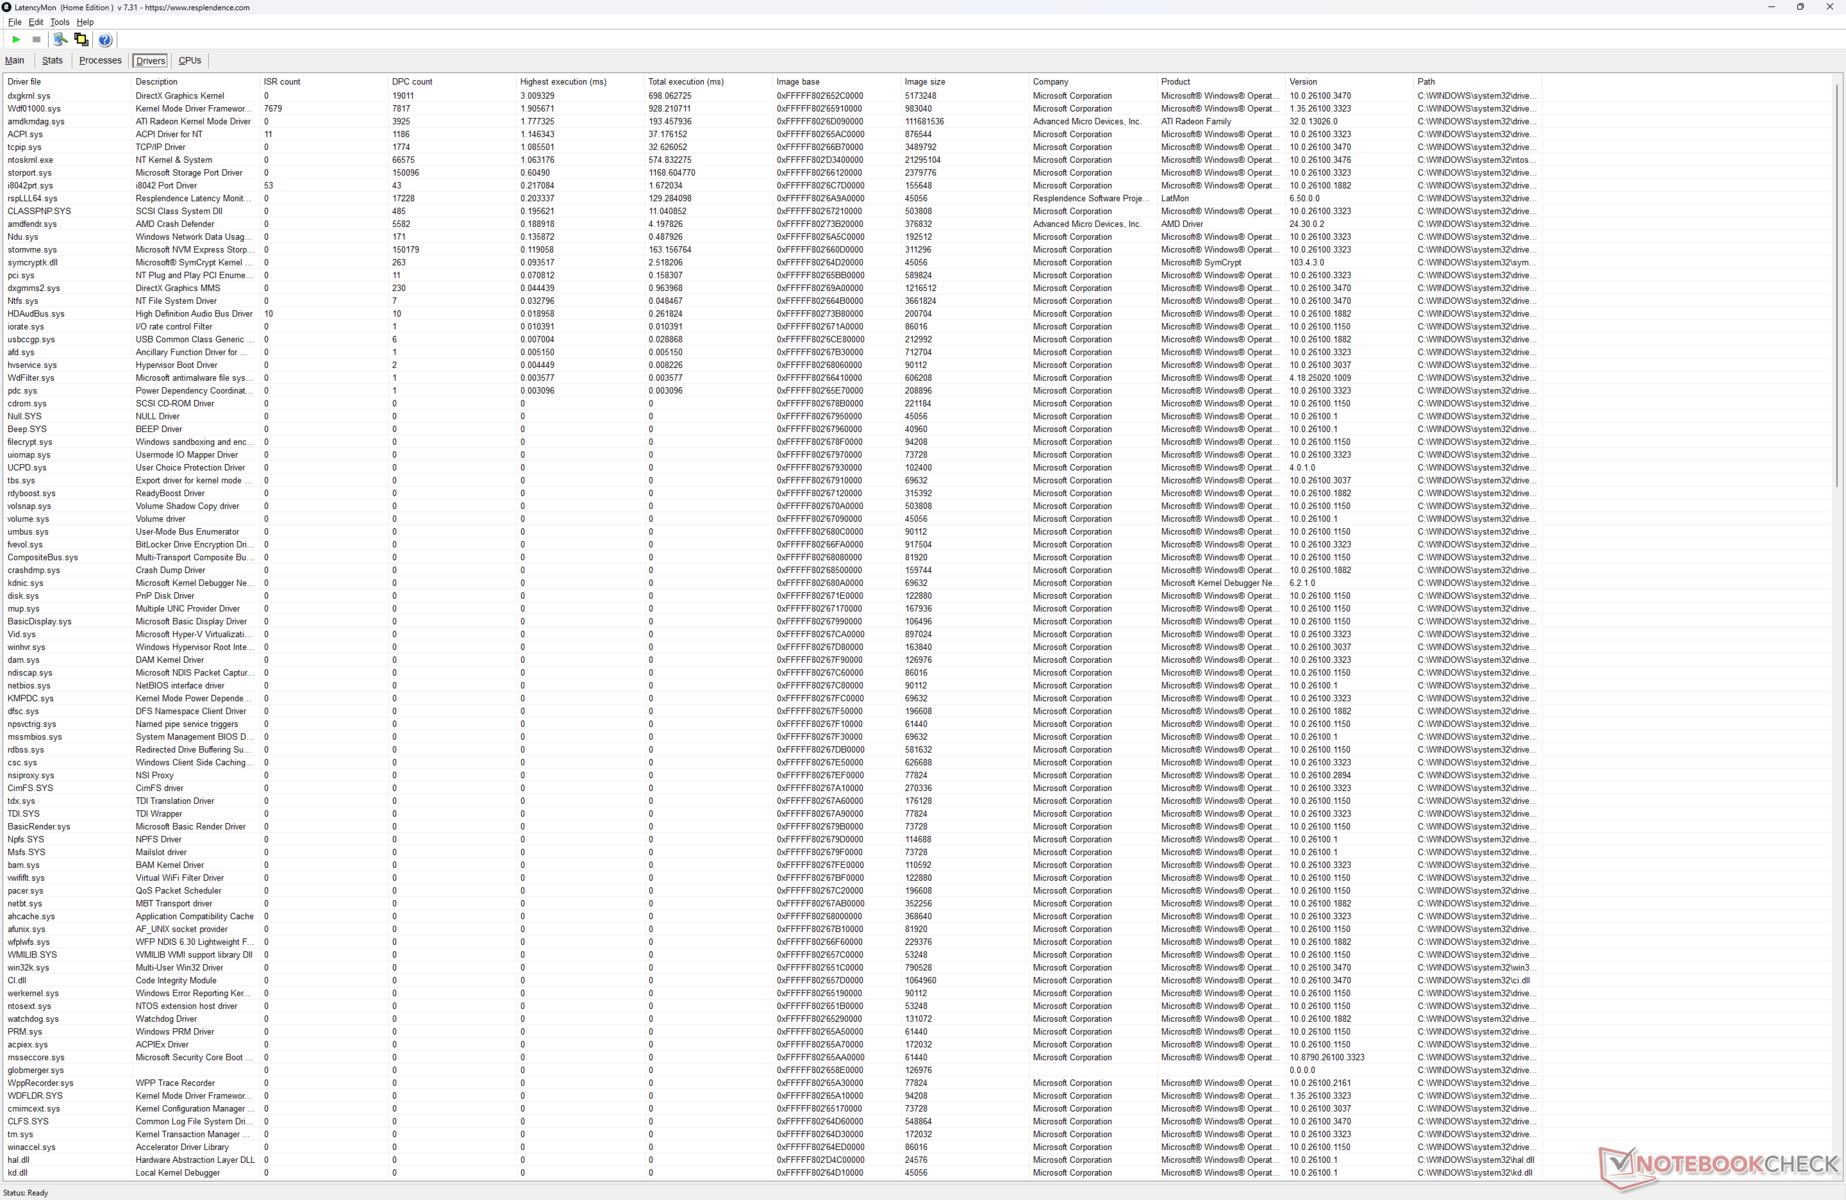
DPC-Latenzzeit
Bei der AMD Konfiguration treten während der Wiedergabe von 4K60-Videos etwas höhere Latenzzeiten und Frame Drops auf als bei der Intel Konfiguration.
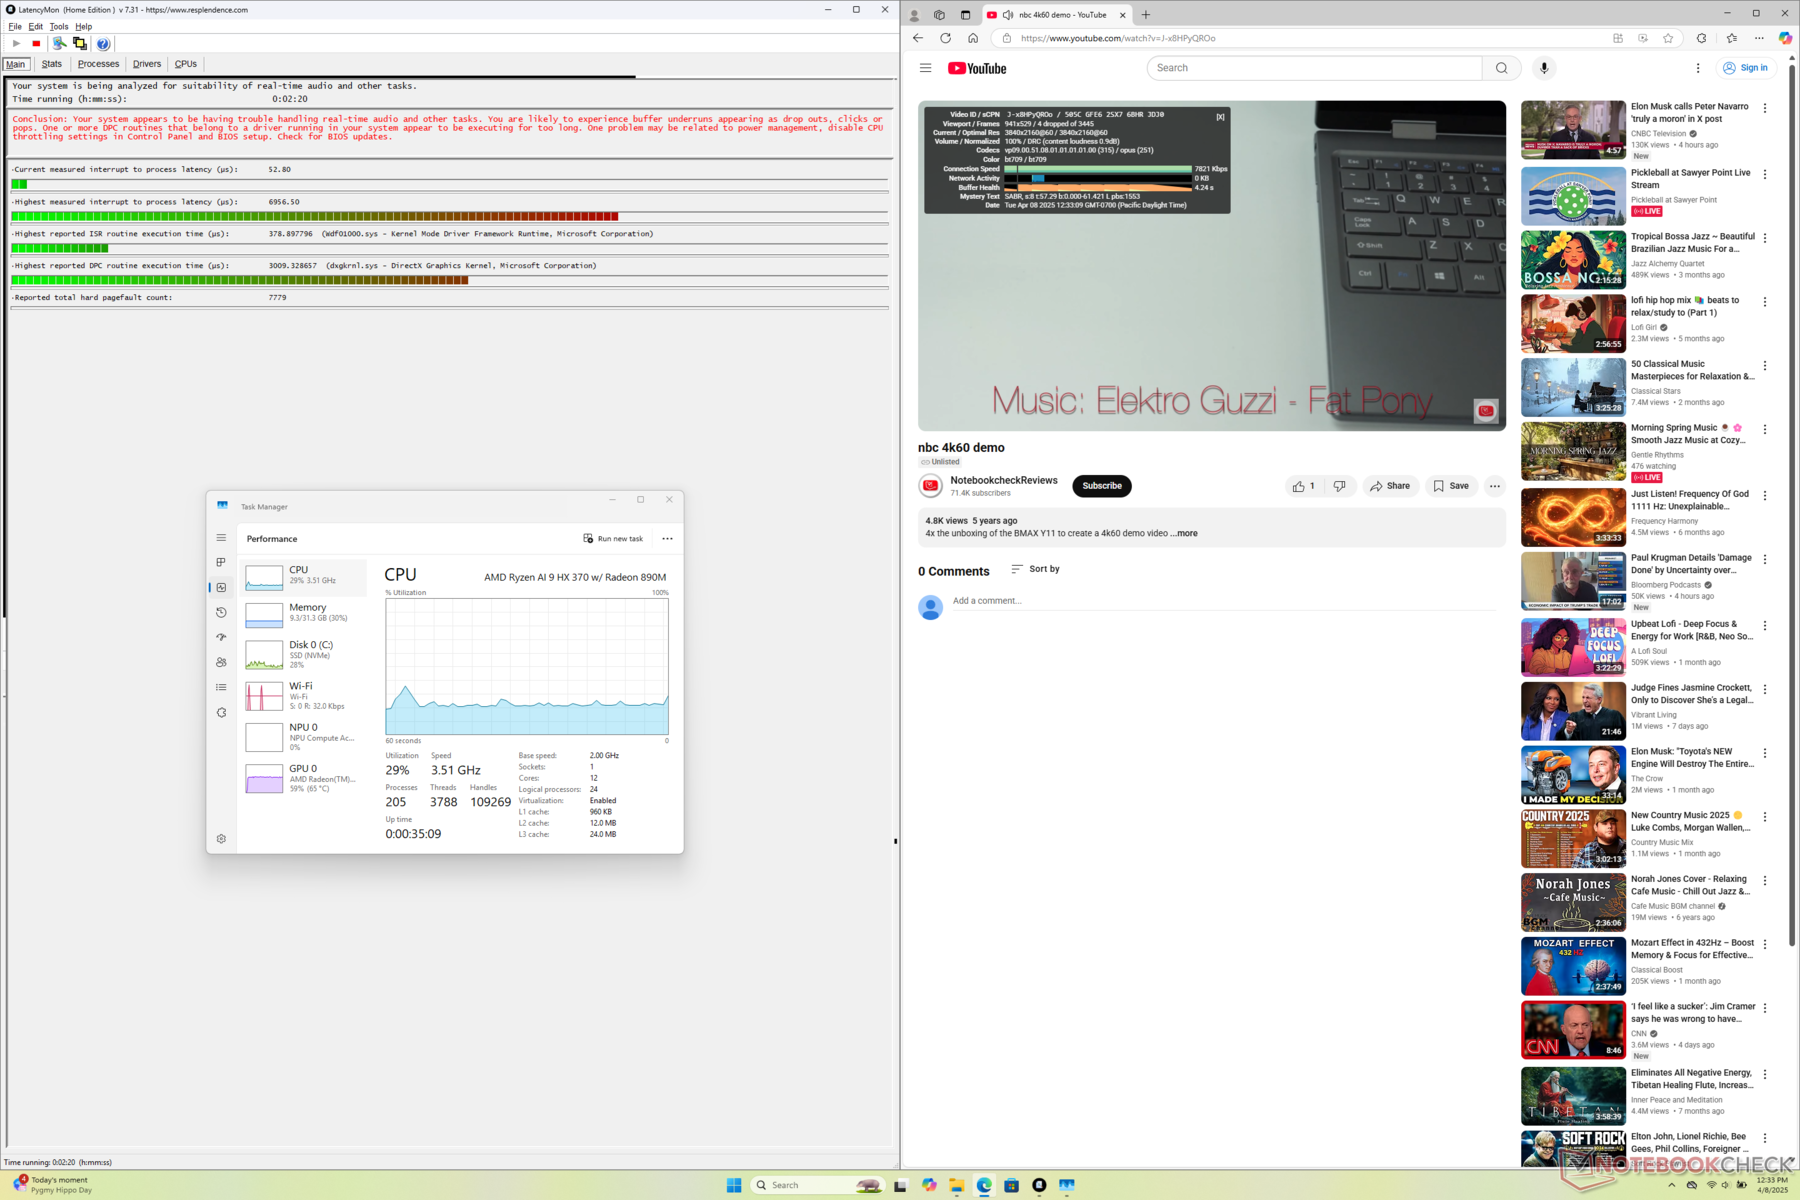
| DPC Latencies / LatencyMon - interrupt to process latency (max), Web, Youtube, Prime95 | |
| Framework Laptop 13.5 Ryzen AI 9 HX 370 | |
| MSI Summit E13 AI Evo A1MTG | |
| HP EliteBook x360 830 G10 7L7U1ET | |
| Lenovo ThinkPad Z13 Gen 2 | |
| Dell Pro 13 Premium PA13250 | |
| Framework Laptop 13.5 Core Ultra 7 155H | |
* ... kleinere Werte sind besser
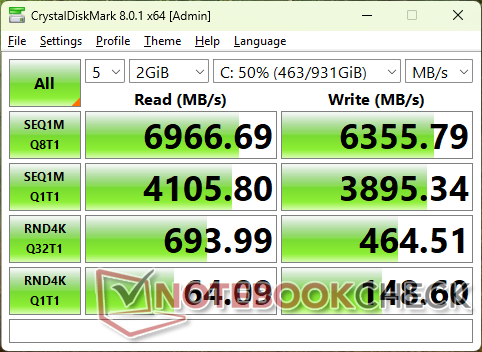
Speichergeräte
Framework bietet die gleiche WD Black SN850X PCIe4 NVMe SSD wie bei dem letztjährigen Modell.
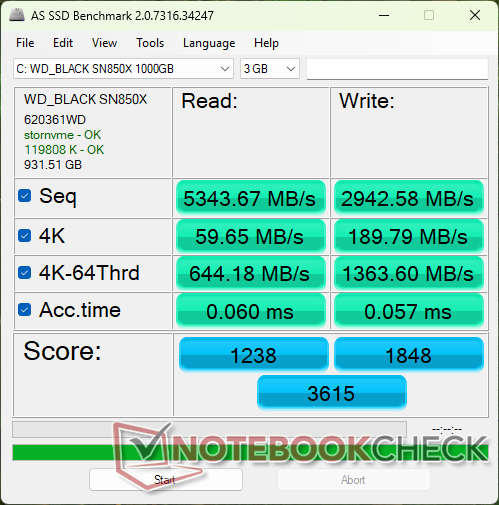

* ... kleinere Werte sind besser
Disk Throttling: DiskSpd Read Loop, Queue Depth 8
GPU-Performance
Die 3DMark Ergebnisse sind um bis zu 15 Prozent niedriger als erwartet, wenn man sie mit dem durchschnittlichen Laptop in unserer Datenbank mit der gleichen Radeon RX 890M GPU vergleicht. Bei der Ausführung aktueller Spiele übertraf unser Gerät jedoch immer noch durchweg die älteren Core-Ultra-7-155H- und Arc-8-Konfiguration mit komfortablen Vorsprüngen.
| 3DMark 11 Performance | 12491 Punkte | |
| 3DMark Fire Strike Score | 7387 Punkte | |
| 3DMark Time Spy Score | 3287 Punkte | |
Hilfe | ||
* ... kleinere Werte sind besser
Cyberpunk 2077 Ultra FPS Chart
| min. | mittel | hoch | max. | |
|---|---|---|---|---|
| GTA V (2015) | 172.7 | 159.9 | 71.2 | 29.7 |
| Dota 2 Reborn (2015) | 171.3 | 138.8 | 47.7 | 45.1 |
| Final Fantasy XV Benchmark (2018) | 73 | 39.1 | 27.8 | |
| X-Plane 11.11 (2018) | 71.6 | 55 | 45.4 | |
| Far Cry 5 (2018) | 80 | 45 | 42 | 40 |
| Strange Brigade (2018) | 174.4 | 70.8 | 58.7 | 48.5 |
| Tiny Tina's Wonderlands (2022) | 68.1 | 52.2 | 36.1 | 29.4 |
| F1 22 (2022) | 99.2 | 90.6 | 67.8 | 20.1 |
| Baldur's Gate 3 (2023) | 44.6 | 36.9 | 30.8 | 30 |
| Cyberpunk 2077 (2023) | 44.5 | 34.7 | 27.4 | 24.4 |
| Monster Hunter Wilds (2025) | 25 | 19.5 | 14 |
Emissionen
Systemrauschen
Das Geräuschprofil der Lüfter bleibt weitgehend gleich, mit einer ähnlichen Unter- und Obergrenze wie bei der Intel Konfiguration. Die Lüfterdrehzahl steigt jedoch bei der AMD Konfiguration tendenziell etwas früher an.
Lautstärkediagramm
| Idle |
| 24.4 / 24.4 / 28 dB(A) |
| Last |
| 46.2 / 45.9 dB(A) |
 | ||
30 dB leise 40 dB(A) deutlich hörbar 50 dB(A) störend |
||
min: | ||
| Framework Laptop 13.5 Ryzen AI 9 HX 370 Radeon 890M, Ryzen AI 9 HX 370 | Framework Laptop 13.5 Core Ultra 7 155H Arc 8-Core, Ultra 7 155H | Dell Pro 13 Premium PA13250 Arc 140V, Core Ultra 7 268V, Micron 2550 1TB | MSI Summit E13 AI Evo A1MTG Arc 8-Core, Ultra 7 155H, Micron 2400 MTFDKBA1T0QFM | HP EliteBook x360 830 G10 7L7U1ET Iris Xe G7 80EUs, i5-1335U, Samsung PM991 MZVLQ512HBLU | Lenovo ThinkPad Z13 Gen 2 Radeon 780M, R7 PRO 7840U, SK hynix BC901 HFS001TEJ4X164N | |
|---|---|---|---|---|---|---|
| Geräuschentwicklung | 4% | 10% | 2% | 12% | 4% | |
| aus / Umgebung * (dB) | 24.2 | 24 1% | 23 5% | 24 1% | 23.2 4% | 25.1 -4% |
| Idle min * (dB) | 24.4 | 24.1 1% | 23 6% | 24.1 1% | 23.2 5% | 25.8 -6% |
| Idle avg * (dB) | 24.4 | 25.1 -3% | 23 6% | 24.8 -2% | 23.2 5% | 25.8 -6% |
| Idle max * (dB) | 28 | 27 4% | 23 18% | 26.5 5% | 23.2 17% | 28.3 -1% |
| Last avg * (dB) | 46.2 | 38.4 17% | 37 20% | 39.3 15% | 29.4 36% | 28.3 39% |
| Cyberpunk 2077 ultra * (dB) | 45.8 | 43.7 5% | 42.74 7% | 45 2% | ||
| Last max * (dB) | 45.9 | 45.8 -0% | 42.74 7% | 49.1 -7% | 42.5 7% | 44.8 2% |
| Witcher 3 ultra * (dB) | 42.3 | 44.8 |
* ... kleinere Werte sind besser
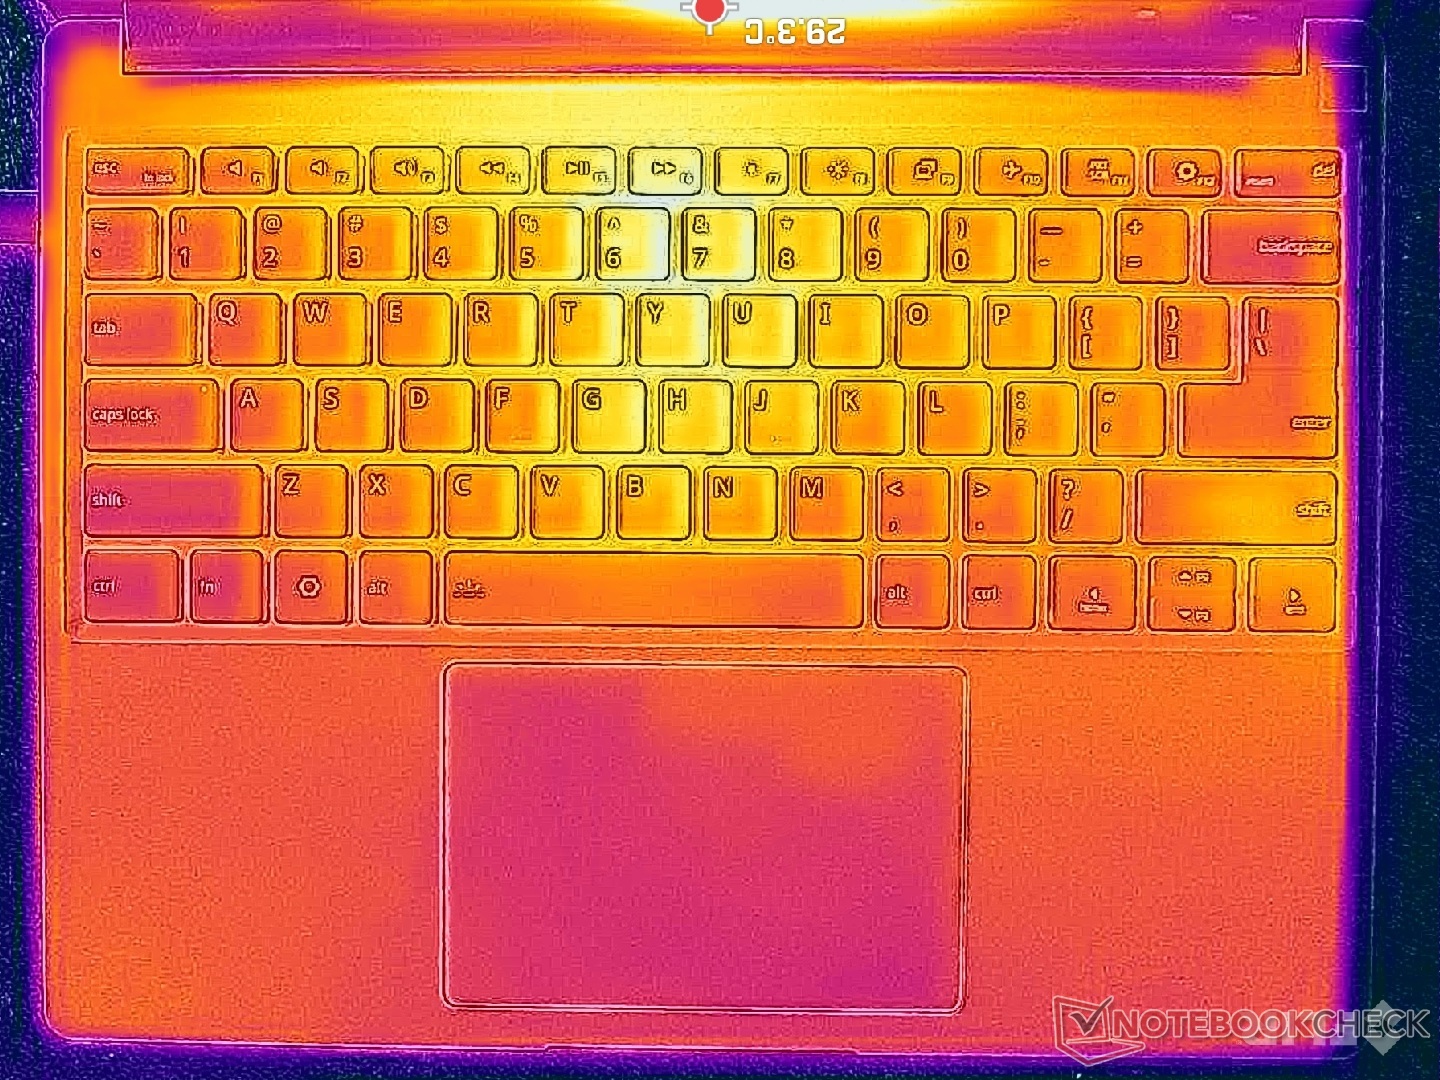
Temperatur
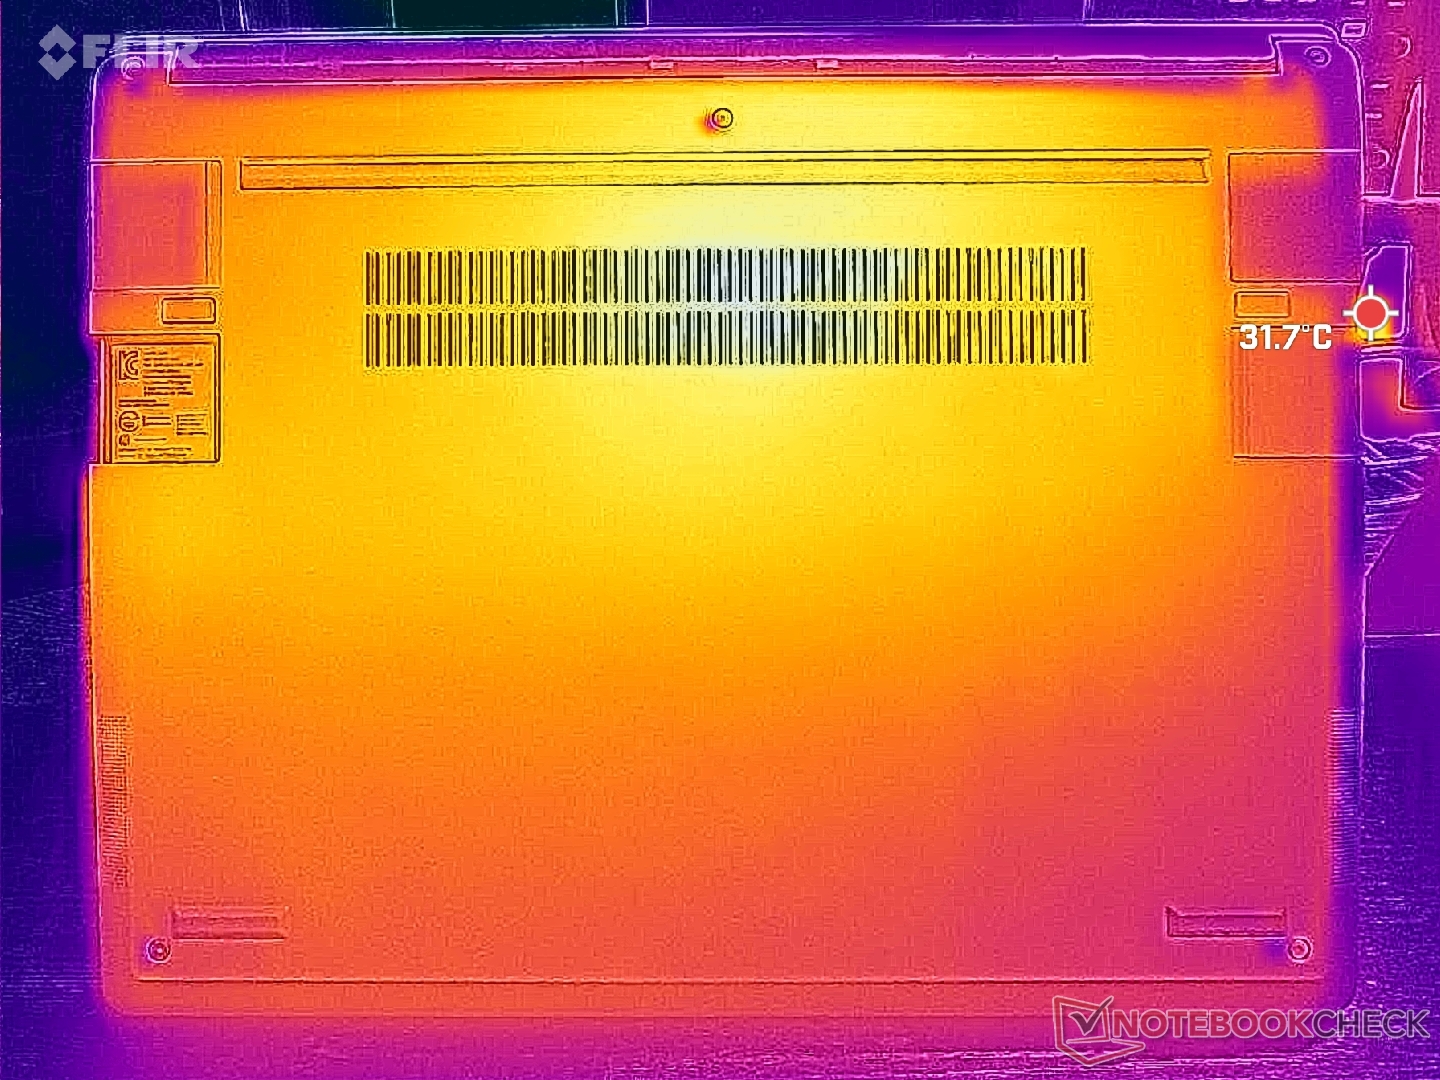
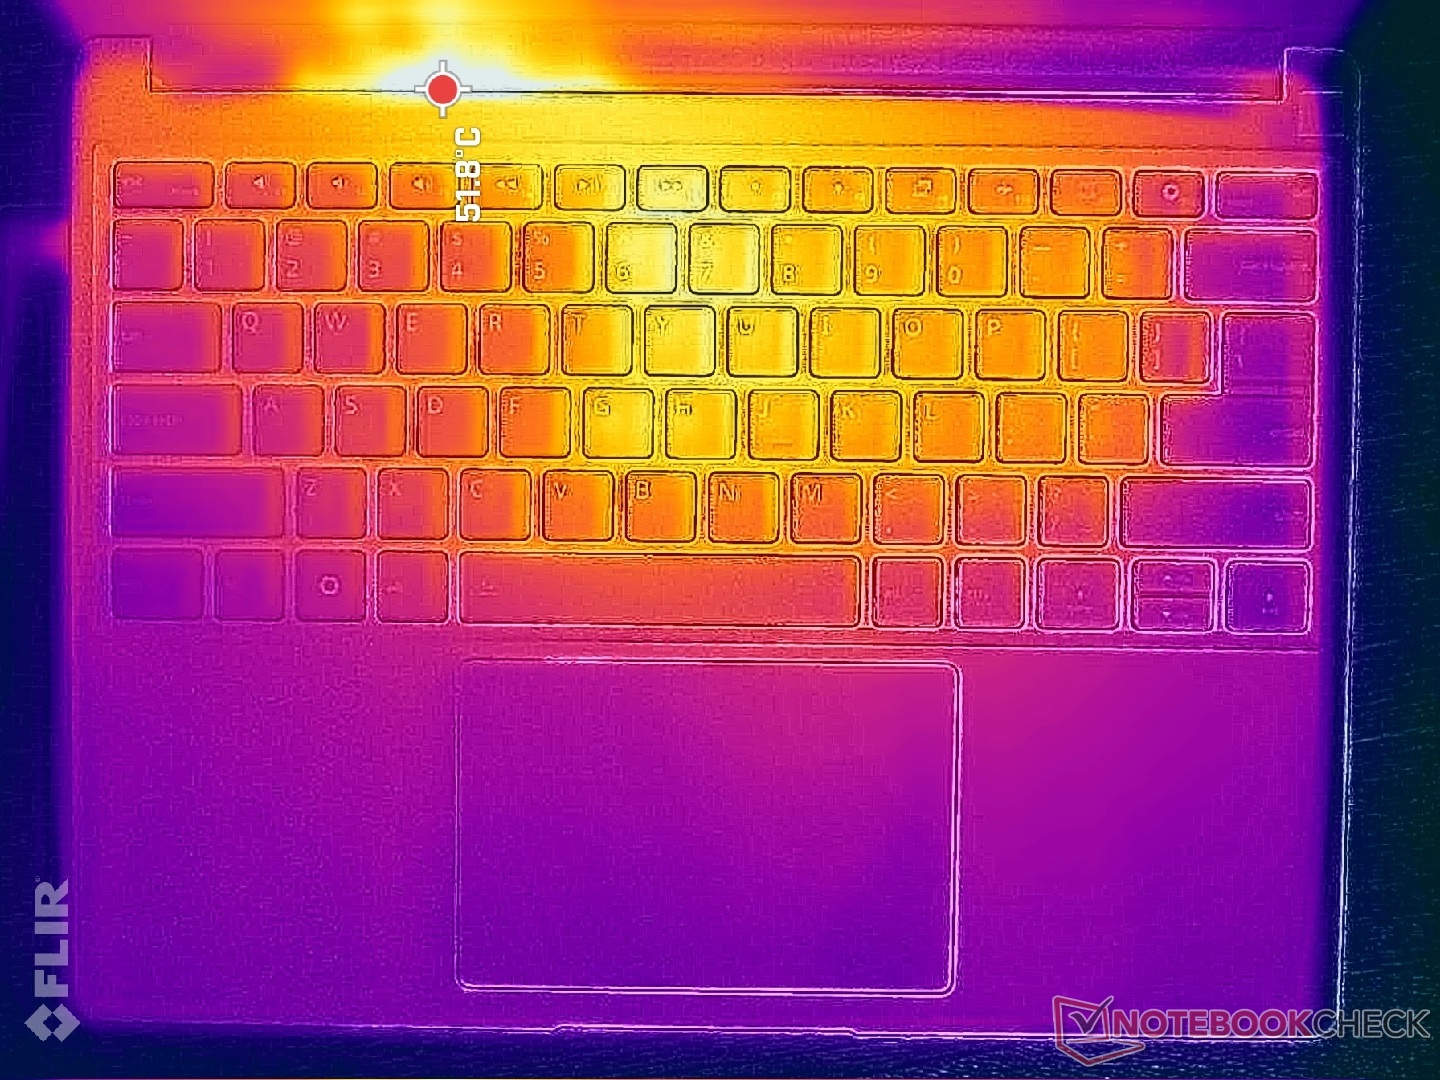
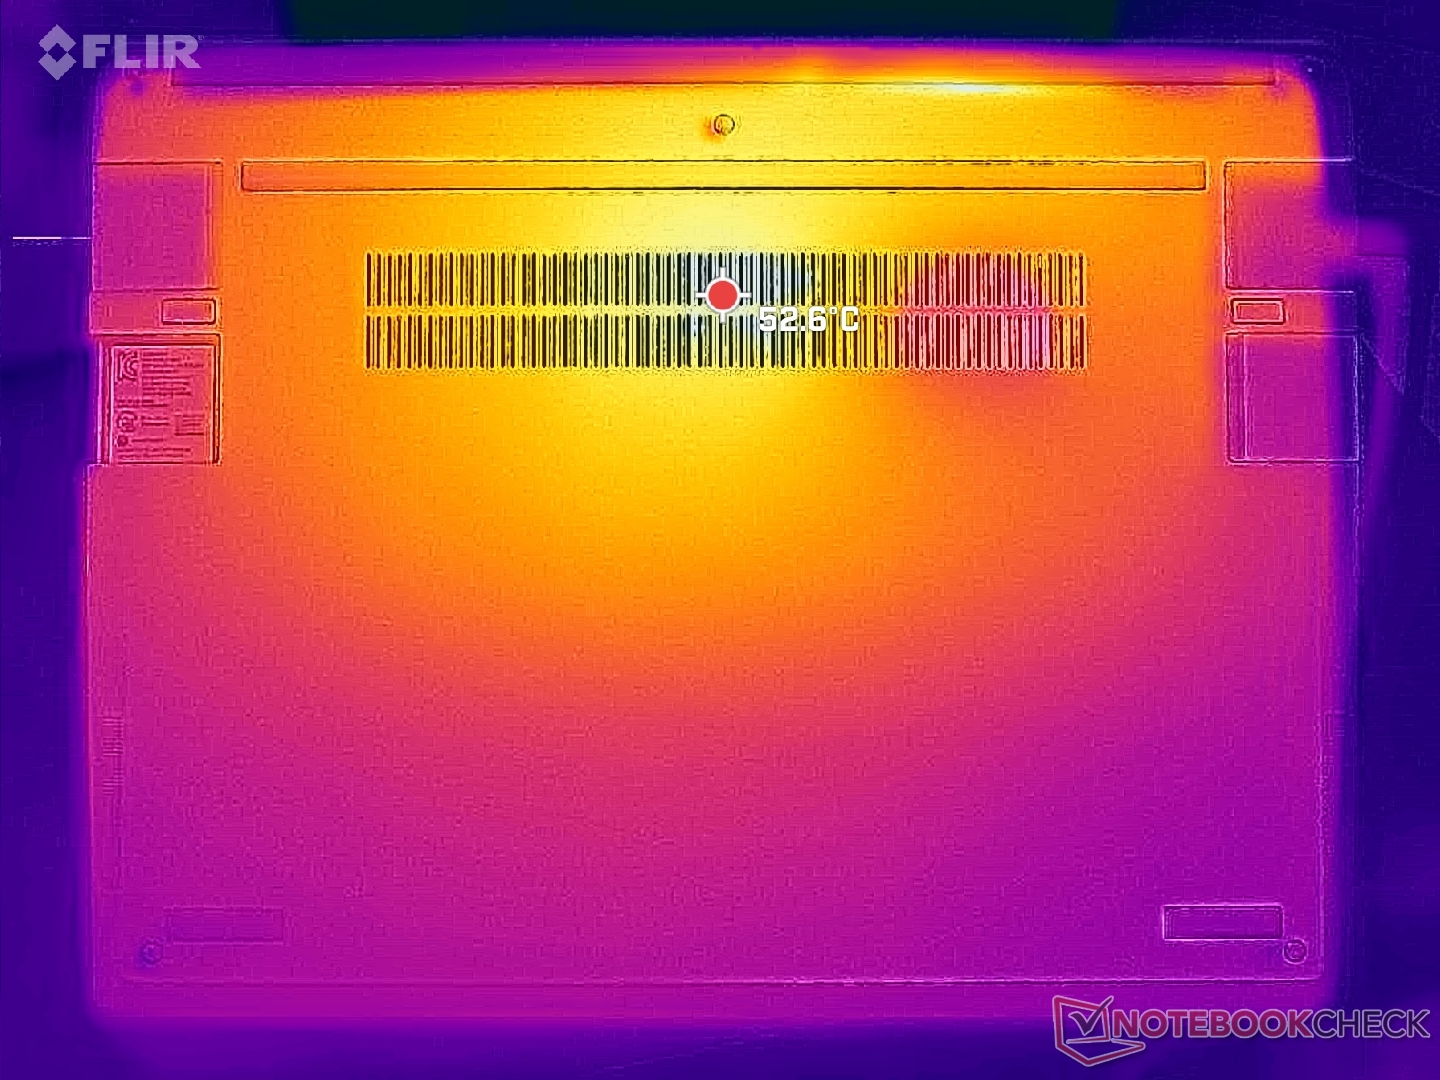
Die Entwicklung der Oberflächentemperatur bleibt weitgehend gleich, da sich die thermische Hülle und die Kühllösung nicht verändert haben.
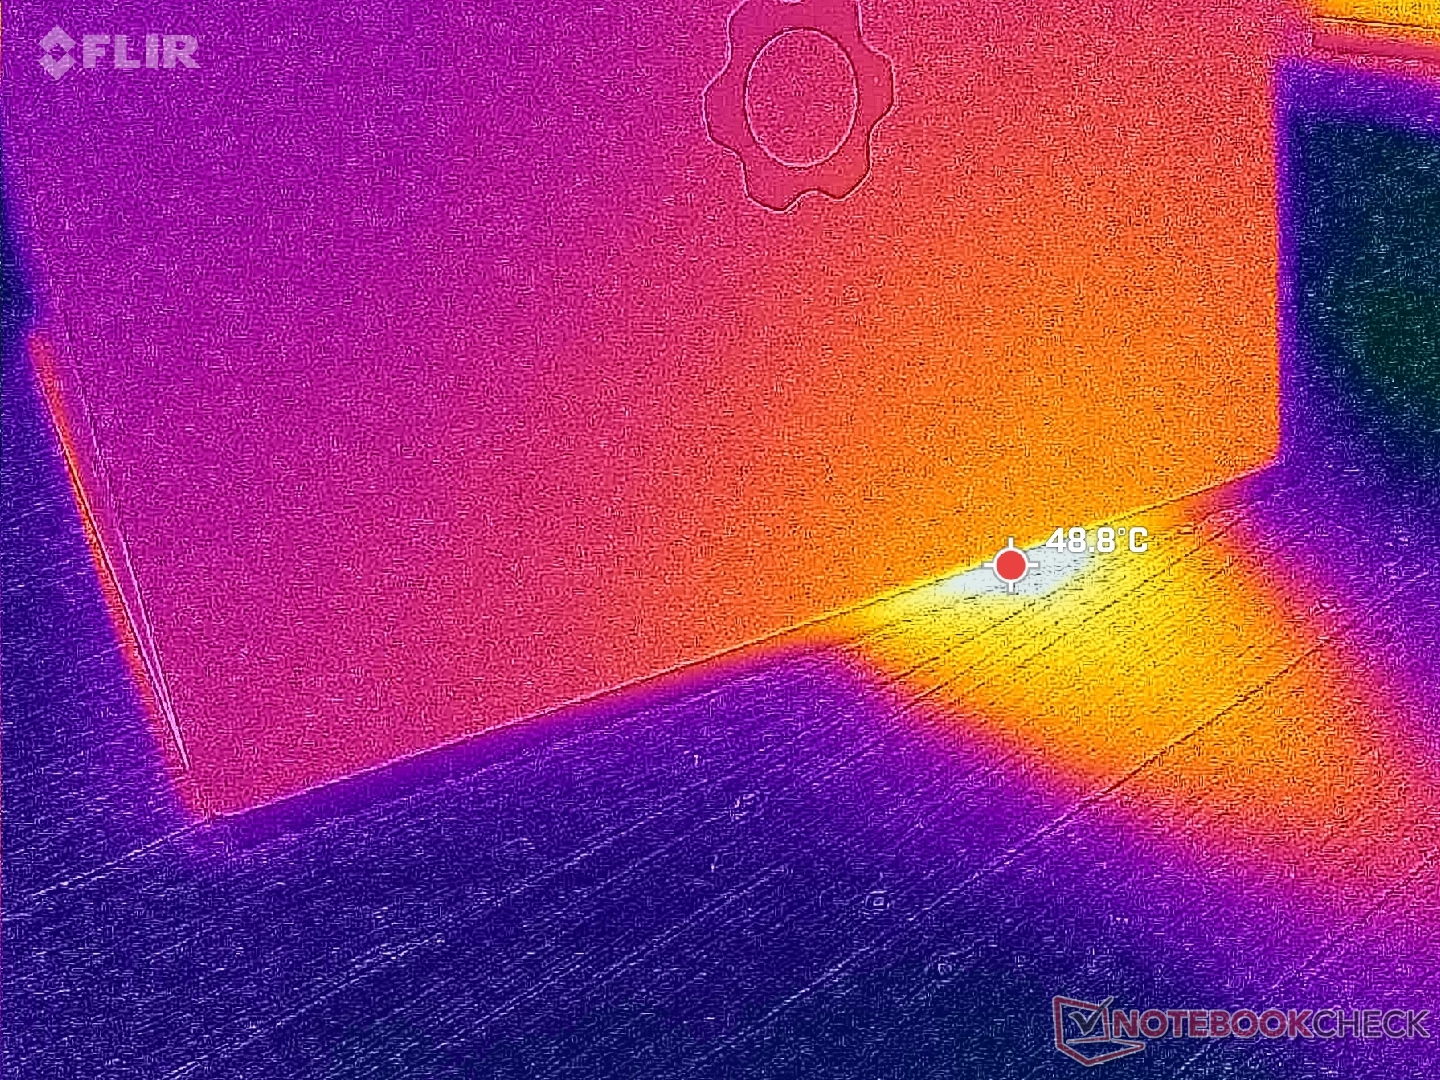

(±) Die maximale Temperatur auf der Oberseite ist 42.2 °C. Im Vergleich liegt der Klassendurchschnitt bei 34.3 °C (von 21.2 bis 62.5 °C für die Klasse Office).
(-) Auf der Unterseite messen wir eine maximalen Wert von 46.8 °C (im Vergleich zum Durchschnitt von 36.8 °C).
(+) Ohne Last messen wir eine durchschnittliche Temperatur von 29.2 °C auf der Oberseite. Der Klassendurchschnitt erreicht 29.5 °C.
(+) Die Handballen und der Touchpad-Bereich sind mit gemessenen 29 °C kühler als die typische Hauttemperatur und fühlen sich dadurch kühl an.
(±) Die durchschnittliche Handballen-Temperatur anderer getesteter Geräte war 27.6 °C (-1.4 °C).
| Framework Laptop 13.5 Ryzen AI 9 HX 370 AMD Ryzen AI 9 HX 370, AMD Radeon 890M | Framework Laptop 13.5 Core Ultra 7 155H Intel Core Ultra 7 155H, Intel Arc 8-Core iGPU | Dell Pro 13 Premium PA13250 Intel Core Ultra 7 268V, Intel Arc Graphics 140V | MSI Summit E13 AI Evo A1MTG Intel Core Ultra 7 155H, Intel Arc 8-Core iGPU | HP EliteBook x360 830 G10 7L7U1ET Intel Core i5-1335U, Intel Iris Xe Graphics G7 80EUs | Lenovo ThinkPad Z13 Gen 2 AMD Ryzen 7 PRO 7840U, AMD Radeon 780M | |
|---|---|---|---|---|---|---|
| Hitze | 6% | 27% | -7% | 5% | 11% | |
| Last oben max * (°C) | 42.2 | 42.8 -1% | 31 27% | 45.2 -7% | 40.2 5% | 46.2 -9% |
| Last unten max * (°C) | 46.8 | 45.2 3% | 31 34% | 44.8 4% | 42.4 9% | 48.4 -3% |
| Idle oben max * (°C) | 31 | 27.2 12% | 24 23% | 34.8 -12% | 30 3% | 23.2 25% |
| Idle unten max * (°C) | 32.2 | 28.6 11% | 24 25% | 35.8 -11% | 31.8 1% | 23 29% |
* ... kleinere Werte sind besser
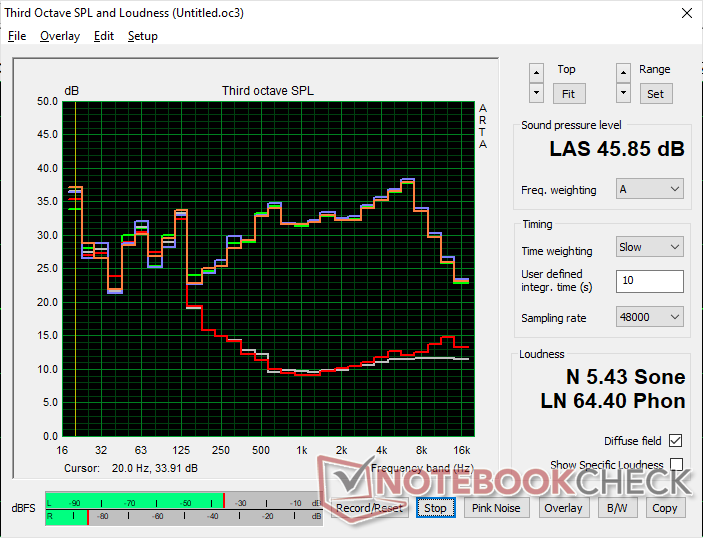
Lautsprecher
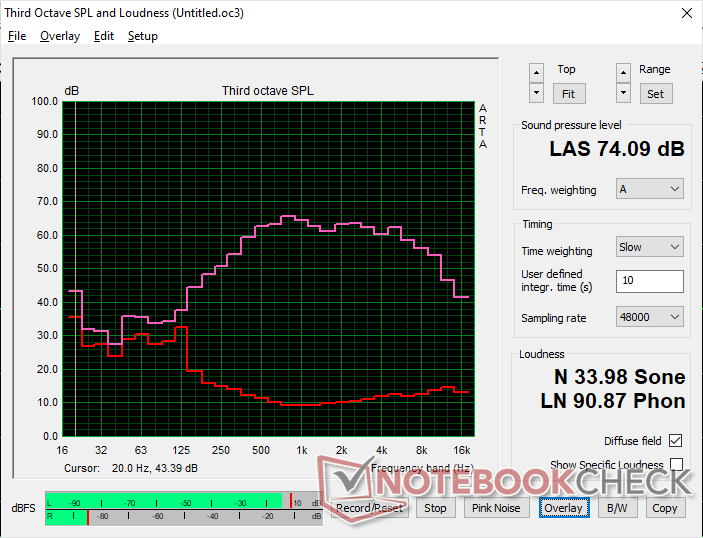
Framework Laptop 13.5 Ryzen AI 9 HX 370 Audio Analyse
(±) | Mittelmäßig laut spielende Lautsprecher (74.1 dB)
Bass 100 - 315 Hz
(±) | abgesenkter Bass - 14.3% geringer als der Median
(±) | durchschnittlich lineare Bass-Wiedergabe (7.3% Delta zum Vorgänger)
Mitteltöne 400 - 2000 Hz
(+) | ausgeglichene Mitten, vom Median nur 3.5% abweichend
(+) | lineare Mitten (4.7% Delta zum Vorgänger)
Hochtöne 2 - 16 kHz
(+) | ausgeglichene Hochtöne, vom Median nur 2.9% abweichend
(+) | sehr lineare Hochtöne (4.3% Delta zum Vorgänger)
Gesamt im hörbaren Bereich 100 - 16.000 Hz
(±) | hörbarer Bereich ist durchschnittlich linear (17.4% Abstand zum Median)
Im Vergleich zu allen Geräten derselben Klasse
» 27% aller getesteten Geräte dieser Klasse waren besser, 7% vergleichbar, 66% schlechter
» Das beste Gerät hat einen Delta-Wert von 7%, durchschnittlich ist 21%, das schlechteste Gerät hat 53%
Im Vergleich zu allen Geräten im Test
» 33% aller getesteten Geräte waren besser, 8% vergleichbar, 58% schlechter
» Das beste Gerät hat einen Delta-Wert von 4%, durchschnittlich ist 23%, das schlechteste Gerät hat 134%
Apple MacBook Pro 16 2021 M1 Pro Audio Analyse
(+) | Die Lautsprecher können relativ laut spielen (84.7 dB)
Bass 100 - 315 Hz
(+) | guter Bass - nur 3.8% Abweichung vom Median
(+) | lineare Bass-Wiedergabe (5.2% Delta zum Vorgänger)
Mitteltöne 400 - 2000 Hz
(+) | ausgeglichene Mitten, vom Median nur 1.3% abweichend
(+) | lineare Mitten (2.1% Delta zum Vorgänger)
Hochtöne 2 - 16 kHz
(+) | ausgeglichene Hochtöne, vom Median nur 1.9% abweichend
(+) | sehr lineare Hochtöne (2.7% Delta zum Vorgänger)
Gesamt im hörbaren Bereich 100 - 16.000 Hz
(+) | hörbarer Bereich ist sehr linear (4.6% Abstand zum Median
Im Vergleich zu allen Geräten derselben Klasse
» 0% aller getesteten Geräte dieser Klasse waren besser, 0% vergleichbar, 100% schlechter
» Das beste Gerät hat einen Delta-Wert von 5%, durchschnittlich ist 17%, das schlechteste Gerät hat 45%
Im Vergleich zu allen Geräten im Test
» 0% aller getesteten Geräte waren besser, 0% vergleichbar, 100% schlechter
» Das beste Gerät hat einen Delta-Wert von 4%, durchschnittlich ist 23%, das schlechteste Gerät hat 134%
Energieverwaltung
Stromverbrauch
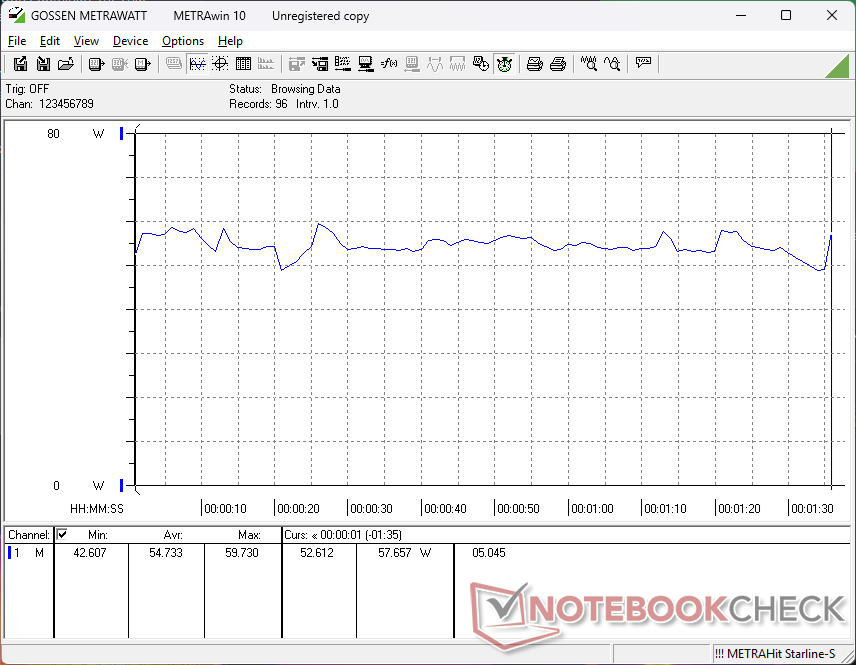
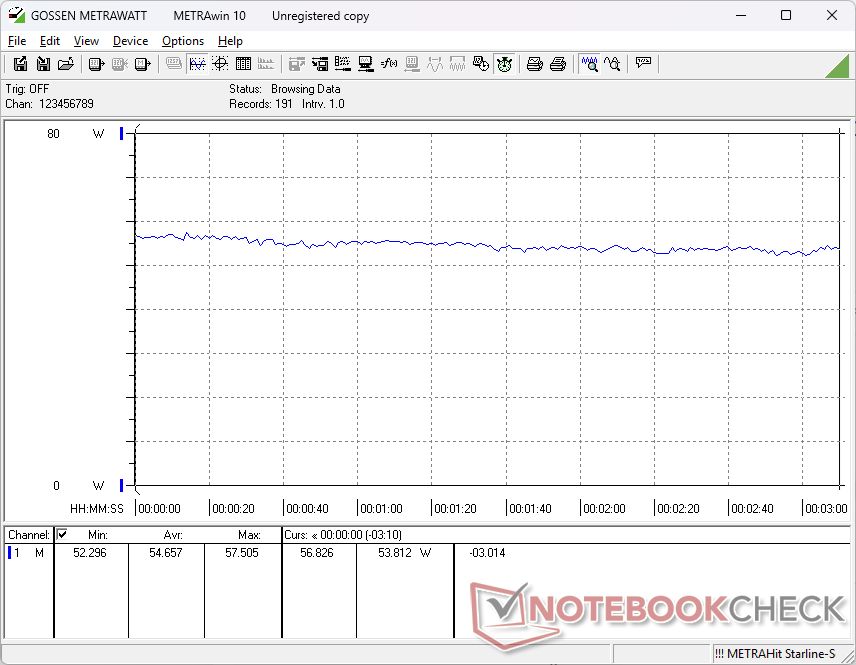
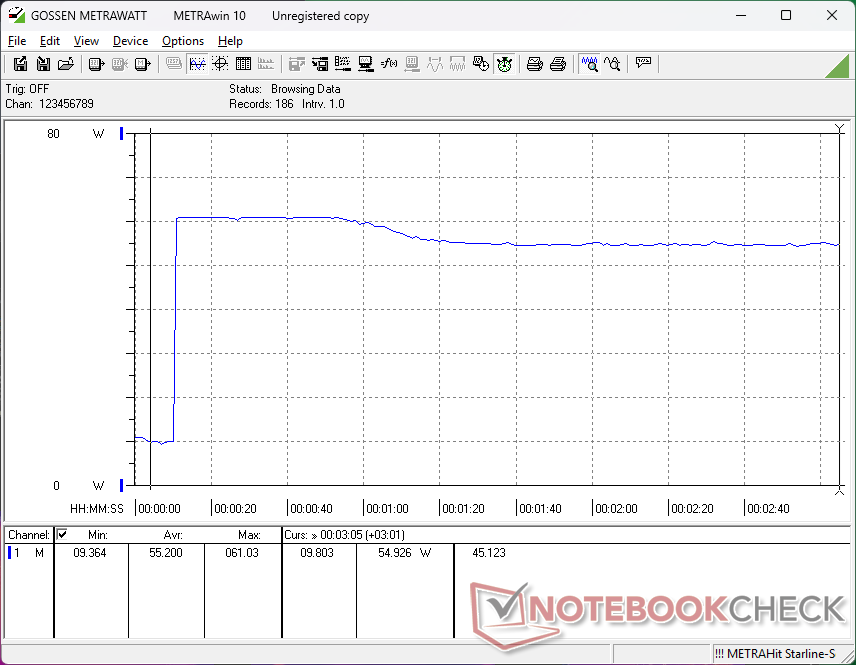
Die Verbrauchswerte liegen in der Nähe der Werte, die wir bei der letztjährigen Core-Ultra-7-155H-Option gemessen haben. Gleichzeitig bietet unsere AMD Konfiguration eine schnellere CPU- und GPU-Leistung und damit ein besseres Leistungsverhältnis pro Watt. Dennoch ist das AMD System im Leerlauf auf dem Desktop etwas anspruchsvoller, was sich auch auf die Akkulaufzeit auswirkt.

| Aus / Standby | |
| Idle | |
| Last |
|
Legende:
min: | |
| Framework Laptop 13.5 Ryzen AI 9 HX 370 Ryzen AI 9 HX 370, Radeon 890M, , IPS, 2880x1920, 13.5" | Framework Laptop 13.5 Core Ultra 7 155H Ultra 7 155H, Arc 8-Core, , IPS, 2880x1920, 13.5" | Framework Laptop 13.5 Ryzen 7 7840U R7 7840U, Radeon 780M, WD PC SN740 512GB SDDPNQD-512G, IPS, 2256x1504, 13.5" | Framework Laptop 13.5 13th Gen Intel i7-1370P, Iris Xe G7 96EUs, WD PC SN740 SDDPNQD-1T00, IPS, 2256x1504, 13.5" | Framework Laptop 13.5 12th Gen Intel i7-1260P, Iris Xe G7 96EUs, WDC PC SN730 SDBPNTY-512G, IPS, 2256x1504, 13.5" | Framework Laptop 13.5 i7-1165G7, Iris Xe G7 96EUs, Western Digital WD_BLACK SN850 WDS100T1X0E, IPS, 2256x1504, 13.5" | |
|---|---|---|---|---|---|---|
| Stromverbrauch | 26% | 30% | 23% | 11% | 23% | |
| Idle min * (Watt) | 7.6 | 2.5 67% | 4 47% | 2.9 62% | 5.3 30% | 4.3 43% |
| Idle avg * (Watt) | 11.3 | 5.2 54% | 6.5 42% | 6.3 44% | 8.4 26% | 8.2 27% |
| Idle max * (Watt) | 11.5 | 5.8 50% | 6.8 41% | 9.9 14% | 11.2 3% | 8.7 24% |
| Last avg * (Watt) | 54.7 | 47.5 13% | 48 12% | 56.2 -3% | 57.4 -5% | 43.5 20% |
| Cyberpunk 2077 ultra external monitor * (Watt) | 51.3 | 52.4 -2% | ||||
| Cyberpunk 2077 ultra * (Watt) | 54.6 | 54.5 -0% | ||||
| Last max * (Watt) | 60.9 | 61.5 -1% | 55.2 9% | 60.8 -0% | 61.2 -0% | 61.8 -1% |
| Witcher 3 ultra * (Watt) | 52.3 | 56.6 | 46.7 | 43.5 |
* ... kleinere Werte sind besser
Energieverbrauch Cyberpunk/Stresstest
Energieverbrauch external Monitor
Akkulaufzeit
Die Laufzeiten sind gut, aber merklich kürzer als bei den älteren Prozessoroptionen.
| Framework Laptop 13.5 Ryzen AI 9 HX 370 Ryzen AI 9 HX 370, Radeon 890M, 61 Wh | Framework Laptop 13.5 Core Ultra 7 155H Ultra 7 155H, Arc 8-Core, 61 Wh | Framework Laptop 13.5 Ryzen 7 7840U R7 7840U, Radeon 780M, 61 Wh | Framework Laptop 13.5 13th Gen Intel i7-1370P, Iris Xe G7 96EUs, 61 Wh | Framework Laptop 13.5 12th Gen Intel i7-1260P, Iris Xe G7 96EUs, 55 Wh | Framework Laptop 13.5 i7-1165G7, Iris Xe G7 96EUs, 55 Wh | |
|---|---|---|---|---|---|---|
| Akkulaufzeit | 31% | 51% | 10% | -6% | 0% | |
| WLAN (h) | 8 | 10.5 31% | 12.1 51% | 8.8 10% | 7.5 -6% | 8 0% |
| Idle (h) | 38.3 | |||||
| Last (h) | 1.5 |
Notebookcheck Bewertung
Framework Laptop 13.5 Ryzen AI 9 HX 370
- 14.04.2025 v8
Allen Ngo
 Total Sustainability Score:
 Potential Competitors in Comparison
Bild | Modell / Test | Preis ab | Gewicht | Dicke | Display |
|---|---|---|---|---|---|
1. 83.8%  | Framework Laptop 13.5 Ryzen AI 9 HX 370 AMD Ryzen AI 9 HX 370 ⎘ AMD Radeon 890M ⎘ 32 GB RAM | Amazon: Listenpreis: 2100 USD | 1.3 kg | 15.85 mm | 13.50" 2880x1920 256 PPI IPS |
2. 84%  | Framework Laptop 13.5 Core Ultra 7 155H Intel Core Ultra 7 155H ⎘ Intel Arc 8-Core iGPU ⎘ 32 GB RAM | Amazon: 1. 1.249,99 € Acer Swift 14 AI | Laptop | ... 2. Acer Swift Go 14 AI OLED (SF... 3. 3.280,34 € ASUS ExpertBook Ultra 14 Zol... Listenpreis: 1500 USD | 1.4 kg | 15.85 mm | 13.50" 2880x1920 256 PPI IPS |
3. 90%  | Dell Pro 13 Premium PA13250 Intel Core Ultra 7 268V ⎘ Intel Arc Graphics 140V ⎘ 32 GB RAM, 1024 GB SSD | Amazon: Bestpreis 2446€ Alternate 2. 2476€ Alternate.at 3. 2492.89€ technik-guenstiger | 1.1 kg | 17.2 mm | 13.30" 1920x1200 170 PPI IPS |
4. 78.6%  | MSI Summit E13 AI Evo A1MTG Intel Core Ultra 7 155H ⎘ Intel Arc 8-Core iGPU ⎘ 16 GB RAM, 1024 GB SSD | Amazon: 1.155,67 € Geizhals Suche | 1.3 kg | 16.2 mm | 13.30" 1920x1200 170 PPI IPS |
5. 89.4% v7 (old)  | HP EliteBook x360 830 G10 7L7U1ET Intel Core i5-1335U ⎘ Intel Iris Xe Graphics G7 80EUs ⎘ 16 GB RAM, 512 GB SSD | Amazon: Geizhals Suche | 1.3 kg | 19.2 mm | 13.30" 1920x1200 170 PPI IPS LED |
6. 89.5% v7 (old)  | Lenovo ThinkPad Z13 Gen 2 AMD Ryzen 7 PRO 7840U ⎘ AMD Radeon 780M ⎘ 32 GB RAM, 1024 GB SSD | Amazon: 1. 697,64 € Lenovo Thinkpad T14 Gen 2 14... 2. 349,00 € Lenovo ThinkPad T14 Gen 2 14... 3. 499,00 € Lenovo ThinkPad L14 Gen 2 Ry... Listenpreis: 1800 USD | 1.2 kg | 13.99 mm | 13.30" 2880x1800 255 PPI OLED |
Transparenz
Die Auswahl der zu testenden Geräte erfolgt innerhalb der Redaktion. Das vorliegende Testmuster wurde dem Autor vom Hersteller oder einem Shop zu Testzwecken leihweise zur Verfügung gestellt. Eine Einflussnahme des Leihstellers auf den Testbericht gab es nicht, der Hersteller erhielt keine Version des Reviews vor der Veröffentlichung. Es bestand keine Verpflichtung zur Publikation. Als eigenständiges, unabhängiges Unternehmen unterliegt Notebookcheck keiner Diktion von Herstellern, Shops und Verlagen.
So testet Notebookcheck
Pro Jahr werden von Notebookcheck hunderte Laptops und Smartphones unabhängig in von uns standardisierten technischen Verfahren getestet, um eine Vergleichbarkeit aller Testergebnisse zu gewährleisten. Seit rund 20 Jahren entwickeln wir diese Testmethoden kontinuierlich weiter und setzen damit Branchenstandards. In unseren Testlaboren kommt ausschließlich hochwertiges Messequipment in die Hände erfahrener Techniker und Redakteure. Die Tests unterliegen einer mehrstufigen Kontrolle. Unsere komplexe Gesamtbewertung basiert auf hunderten fundierten Messergebnissen und Benchmarks, womit Ihnen Objektivität garantiert ist. Weitere Informationen zu unseren Testmethoden gibt es hier.

