Framework Laptop 13.5 Ryzen 7 7840U im Test: So viel besser als die Intel-Version

Seit der Einführung des DIY-freundlichen Framework Laptops im Jahr 2021 warten Nutzer sehnsüchtig auf eine AMD-Version. Da Ryzen-CPUs von Jahr zu Jahr wettbewerbsfähiger gegenüber Intel werden, ist jetzt der ideale Zeitpunkt für die Markteinführung des ersten AMD Framework Laptops.
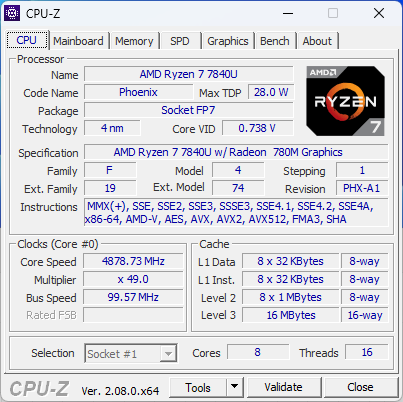
Unser Testgerät ist eine High-End-Konfiguration mit dem Ryzen 7 7840U für knapp 1450 Euro, während der Ryzen 5 7640U für niedrigere Preise verfügbar ist. Das Framework Laptop 13.5 ist eines der ersten Geräte auf dem Markt, das mit dem Ryzen 7 7840U ausgeliefert wird.
Wir empfehlen Ihnen, unsere bestehenden Testberichte und Videos zum Framework Laptop zu lesen, um mehr über die technischen Eigenschaften zu erfahren, da das Design unverändert bleibt.
Der Framework Laptop 13.5 konkurriert mit anderen führenden Subnotebooks wie dem Lenovo ThinkPad X1 Nano Gen 3, HP Dragonfly G4, Dell XPS 13 Plus 9320, oder dem Asus ZenBook S13.
Weitere Testberichte zum Framework finden Sie unter:
Mögliche Konkurrenten im Vergleich
Bew. | Datum | Modell | Gewicht | Dicke | Größe | Auflösung | Preis ab |
|---|---|---|---|---|---|---|---|
| 87.5 % v7 (old) | 10 / 2023 | Framework Laptop 13.5 Ryzen 7 7840U R7 7840U, Radeon 780M | 1.3 kg | 15.85 mm | 13.50" | 2256x1504 | |
| 85.4 % v7 (old) | 07 / 2021 | Framework Laptop 13.5 i7-1165G7, Iris Xe G7 96EUs | 1.3 kg | 15.85 mm | 13.50" | 2256x1504 | |
| 89.5 % v7 (old) | 08 / 2023 | Lenovo ThinkPad X1 Nano Gen 3 i7-1360P, Iris Xe G7 96EUs | 989 g | 14.8 mm | 13.00" | 2160x1350 | |
| 91.9 % v7 (old) | 07 / 2023 | HP Dragonfly G4 i7-1365U, Iris Xe G7 96EUs | 1.1 kg | 16.3 mm | 13.50" | 1920x1280 | |
| 87.4 % v7 (old) | 07 / 2023 | Dell XPS 13 Plus 9320 Core i7-1360P i7-1360P, Iris Xe G7 96EUs | 1.3 kg | 15.3 mm | 13.40" | 3456x2160 | |
| 85.4 % v7 (old) | 04 / 2023 | Asus ZenBook S13 OLED UX5304 i7-1355U, Iris Xe G7 96EUs | 1 kg | 11.8 mm | 13.30" | 2880x1800 |
Gehäuse
Ausstattung
Obwohl alle vier USB-C-Anschlüsse noch vorhanden sind, sind die Details kompliziert, da die Thunderbolt-Unterstützung bei AMD-PCs eher unklar ist. Nur die beiden hinteren Anschlüsse unterstützen USB4, während der untere linke Anschluss nur USB-C 3.2 und der untere rechte Anschluss USB-C 3.2 mit DisplayPort ist. Dies konnten wir selbst bestätigen, da unser externer Monitor nur an drei der vier USB-C-Anschlüsse funktioniert. Das Aufladen ist jedoch über jeden der vier Anschlüsse möglich.
Thunderbolt-Geräte werden an den beiden hinteren USB-C-Anschlüssen unterstützt.
Kommunikation
Das AMD-Modell wird mit einem MediaTek RZ616 für Wi-Fi 6E und Bluetooth 5.2-Unterstützung anstelle des üblichen Intel AX210 oder AX211 ausgeliefert. Die Übertragungsraten sind dennoch hervorragend, könnten aber etwas gleichmäßiger sein.
| Networking | |
| iperf3 transmit AX12 | |
| Framework Laptop 13.5 | |
| iperf3 receive AX12 | |
| Framework Laptop 13.5 | |
| iperf3 transmit AXE11000 | |
| Asus ZenBook S13 OLED UX5304 | |
| Framework Laptop 13.5 Ryzen 7 7840U | |
| Lenovo ThinkPad X1 Nano Gen 3 | |
| Dell XPS 13 Plus 9320 Core i7-1360P | |
| HP Dragonfly G4 | |
| iperf3 receive AXE11000 | |
| Asus ZenBook S13 OLED UX5304 | |
| Framework Laptop 13.5 Ryzen 7 7840U | |
| Lenovo ThinkPad X1 Nano Gen 3 | |
| Dell XPS 13 Plus 9320 Core i7-1360P | |
| HP Dragonfly G4 | |
| iperf3 transmit AXE11000 6GHz | |
| Framework Laptop 13.5 Ryzen 7 7840U | |
| Lenovo ThinkPad X1 Nano Gen 3 | |
| HP Dragonfly G4 | |
| Dell XPS 13 Plus 9320 Core i7-1360P | |
| iperf3 receive AXE11000 6GHz | |
| Lenovo ThinkPad X1 Nano Gen 3 | |
| Framework Laptop 13.5 Ryzen 7 7840U | |
| HP Dragonfly G4 | |
| Dell XPS 13 Plus 9320 Core i7-1360P | |
Webcam


Wartung
Das Framework ist sehr benutzerfreundlich, wenn es um Reparaturen und Upgrades geht, wie in unserem Testbericht beschrieben.
Zubehör & Garantie
Die AMD-Version verwendet dieselben Port-Erweiterungskarten wie die Intel-Version, einschließlich der überarbeiteten HDMI- und DP-Karten. Beachten Sie, dass keine Erweiterungskarten kostenlos mitgeliefert werden, und es wird dringend empfohlen, beim Kauf eines Laptops mindestens eine oder zwei Karten mitzunehmen.
Die standardmäßige Garantie liegt bei 2 Jahren.
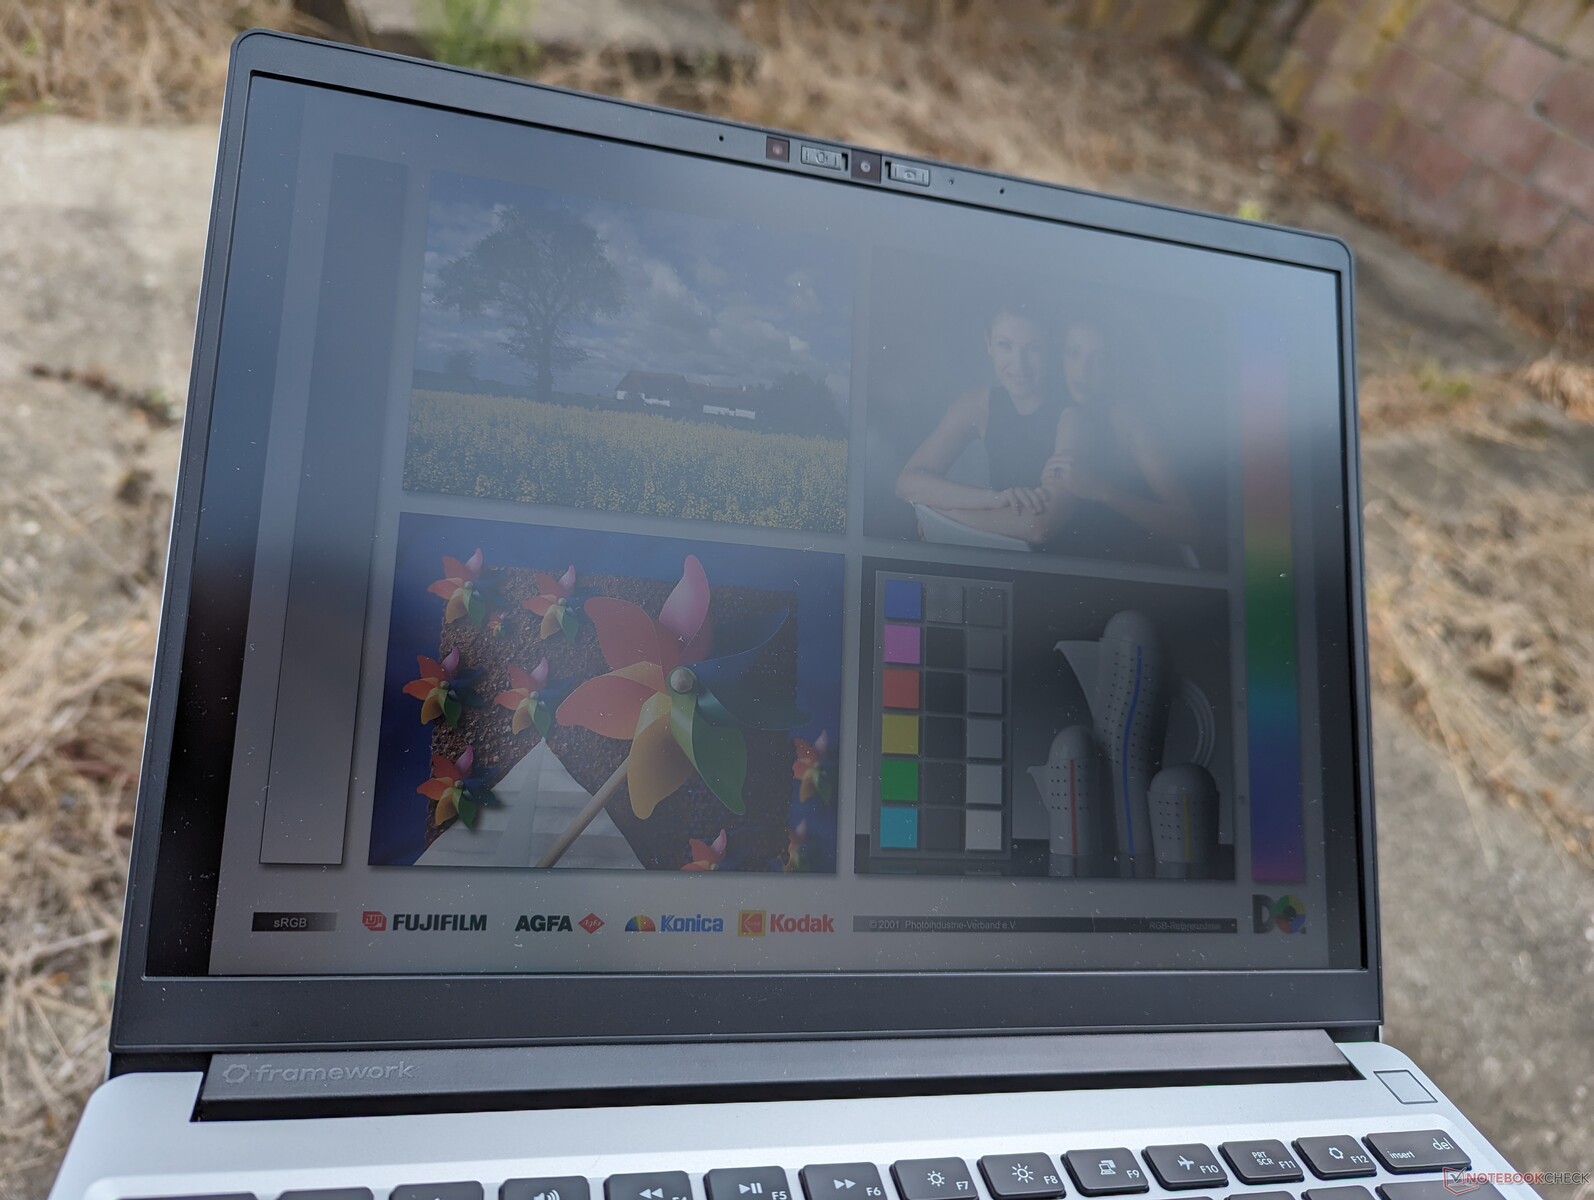
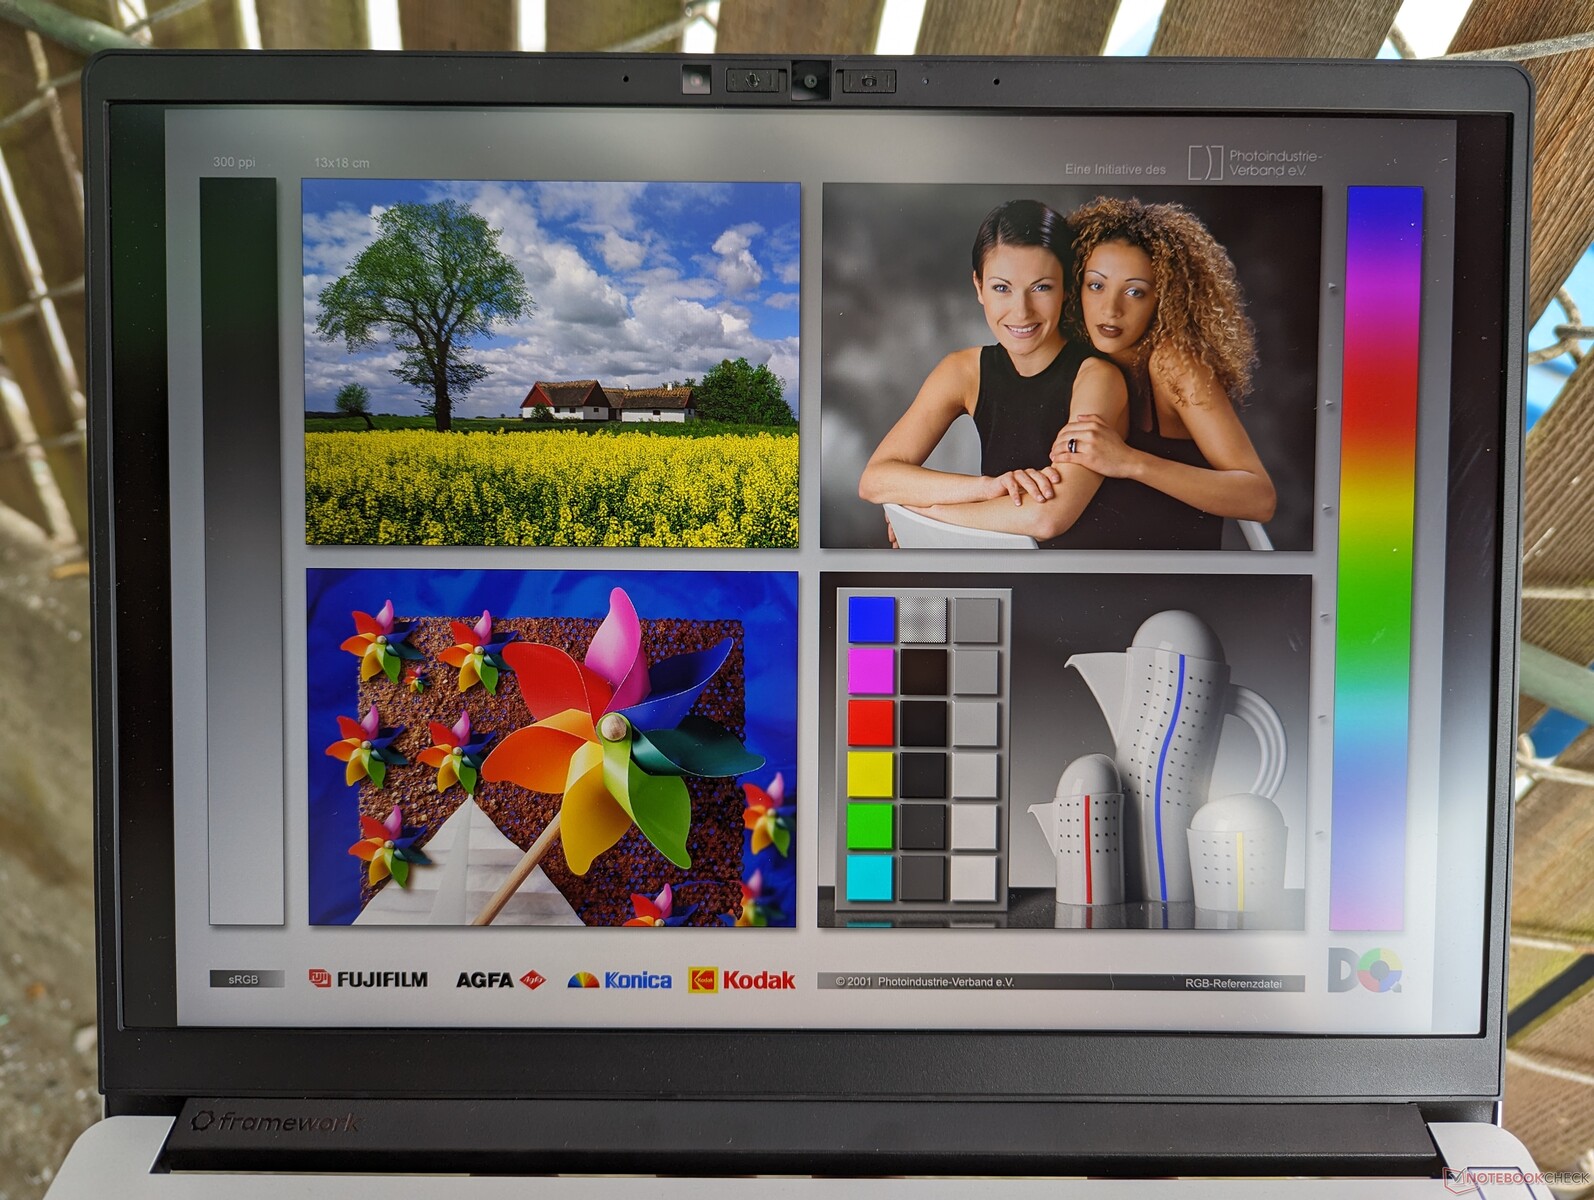
Display
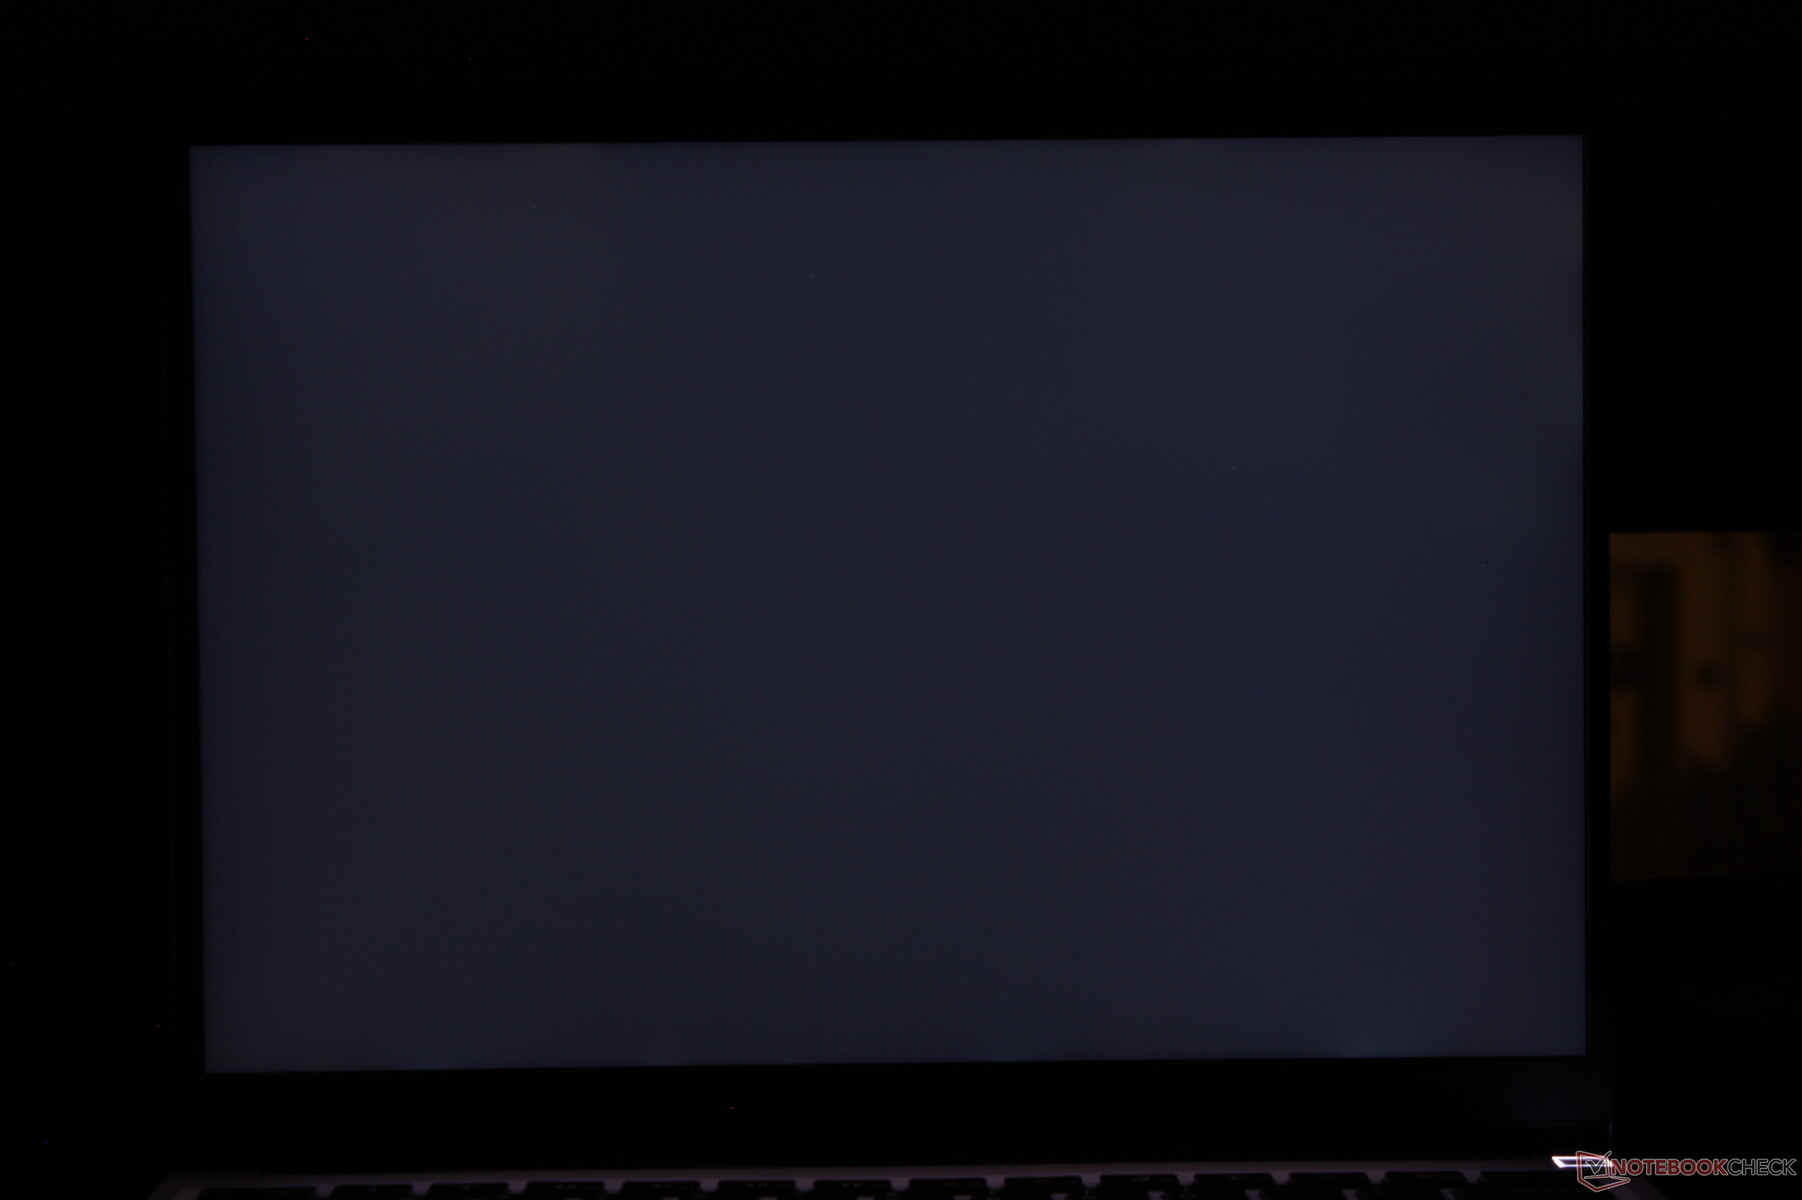
Das 2256 x 1504 BOE CQ NE135FBM-N41 IPS-Display hat sich seit dem ursprünglichen Framework Laptop 2021 nicht verändert. Framework hat noch keine anderen Display-Optionen mit neueren oder besseren Technologien wie OLED, Mini-LED, >60 Hz Bildwiederholrate oder schnellere Reaktionszeiten angeboten.

| |||||||||||||||||||||||||
Ausleuchtung: 89 %
Helligkeit Akku: 436 cd/m²
Kontrast: 1211:1 (Schwarzwert: 0.36 cd/m²)
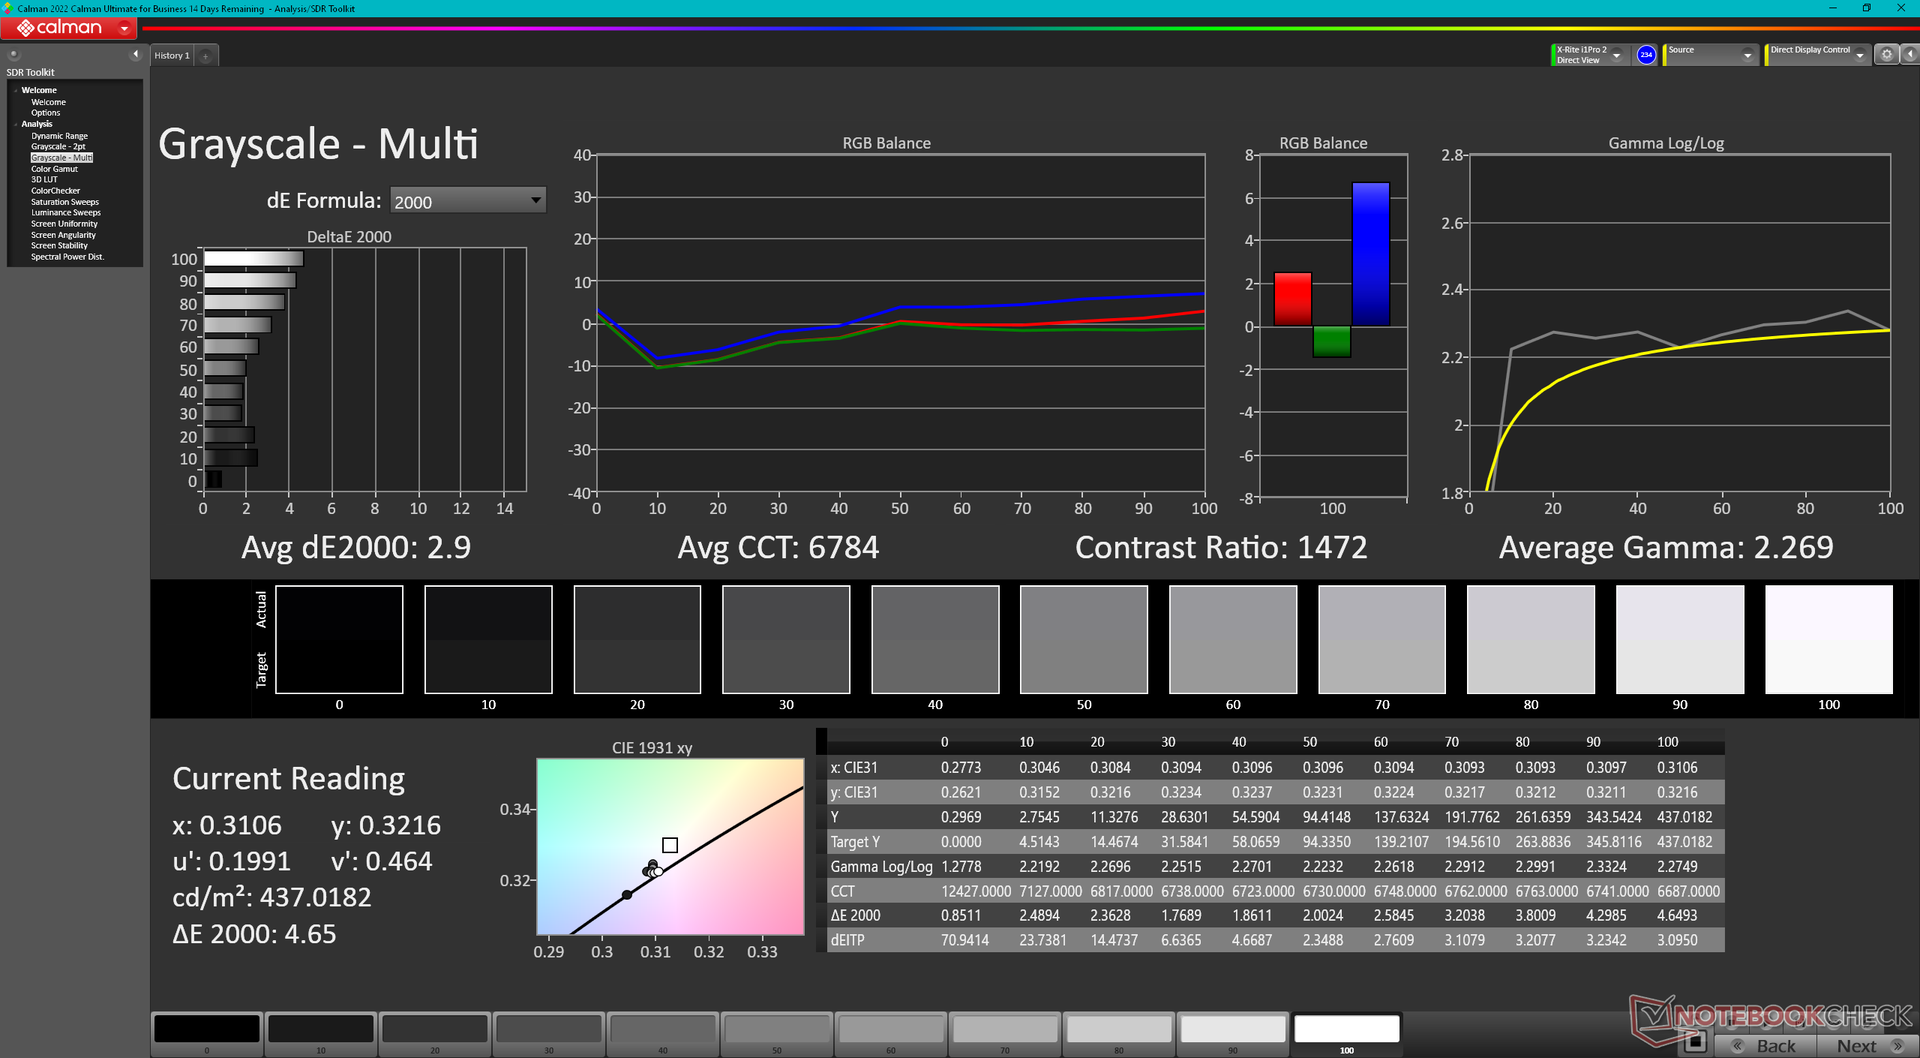
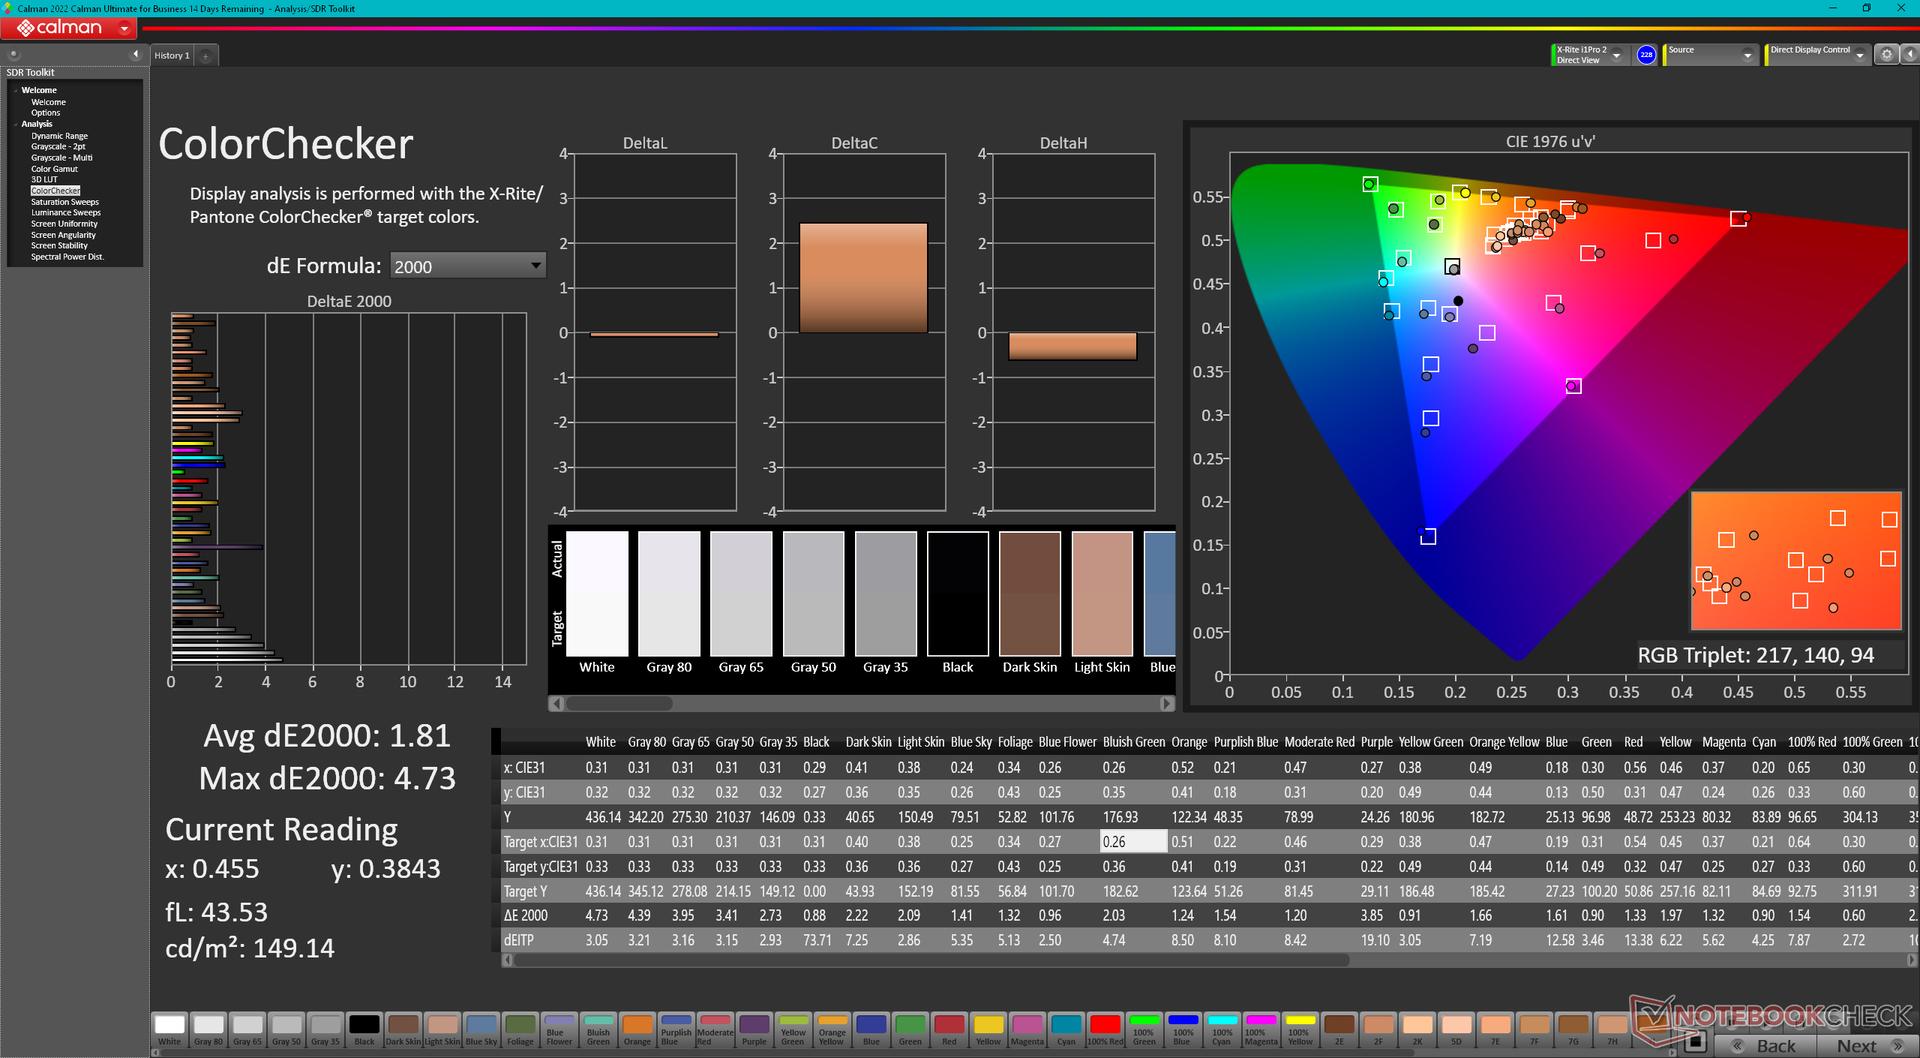
ΔE ColorChecker Calman: 1.81 | ∀{0.5-29.43 Ø4.72}
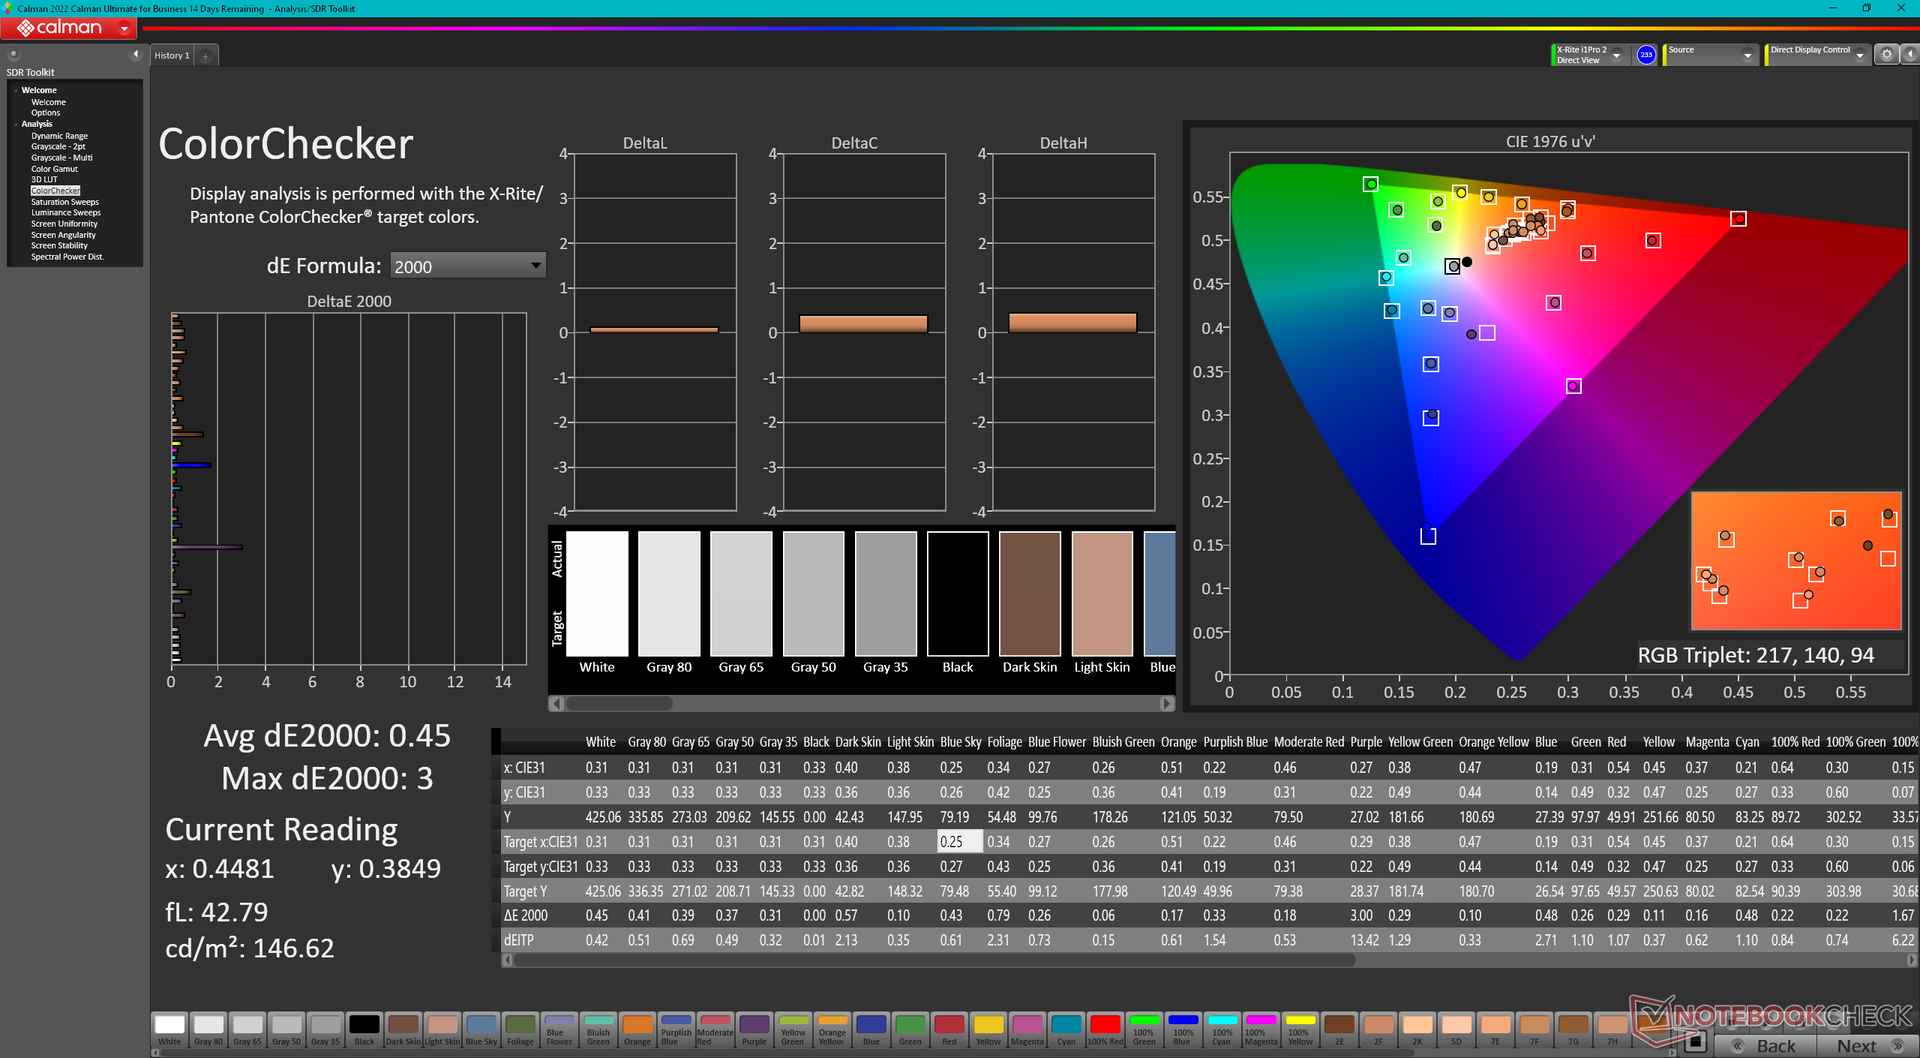
calibrated: 0.45
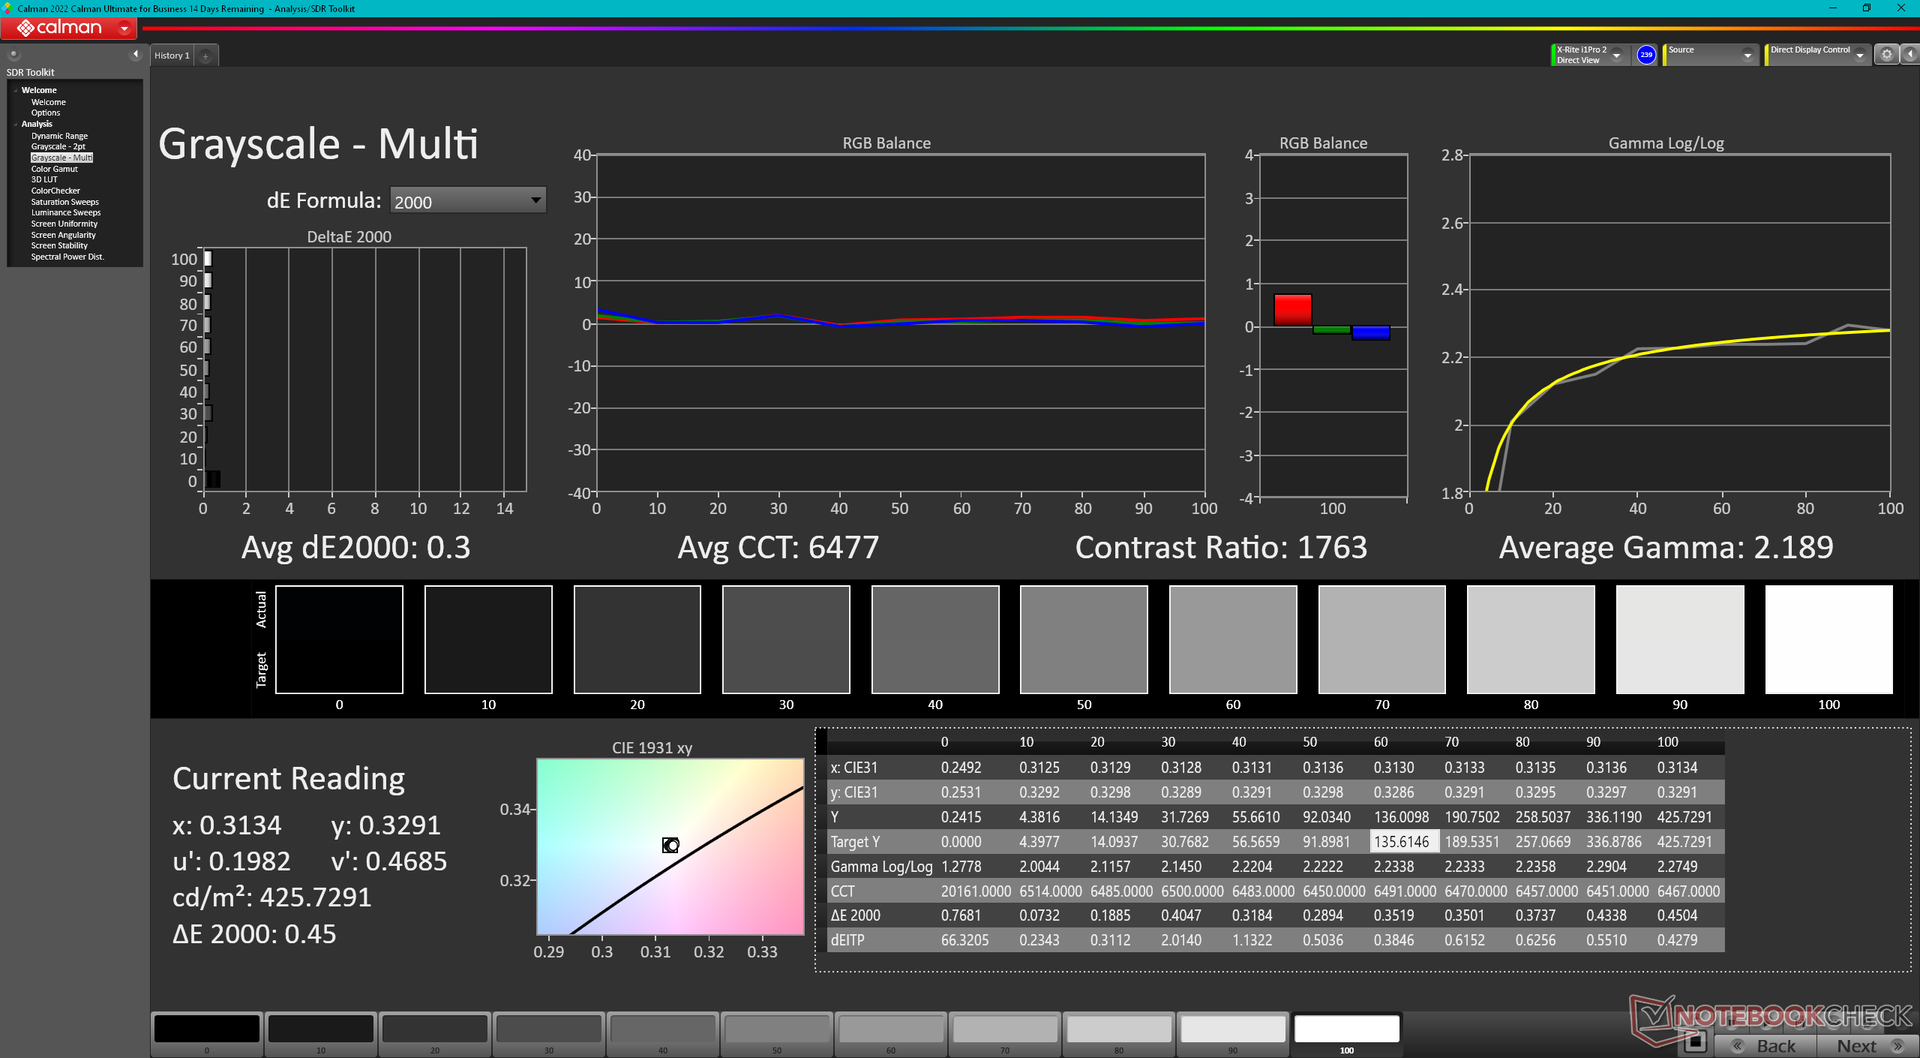
ΔE Greyscale Calman: 2.9 | ∀{0.09-98 Ø4.97}
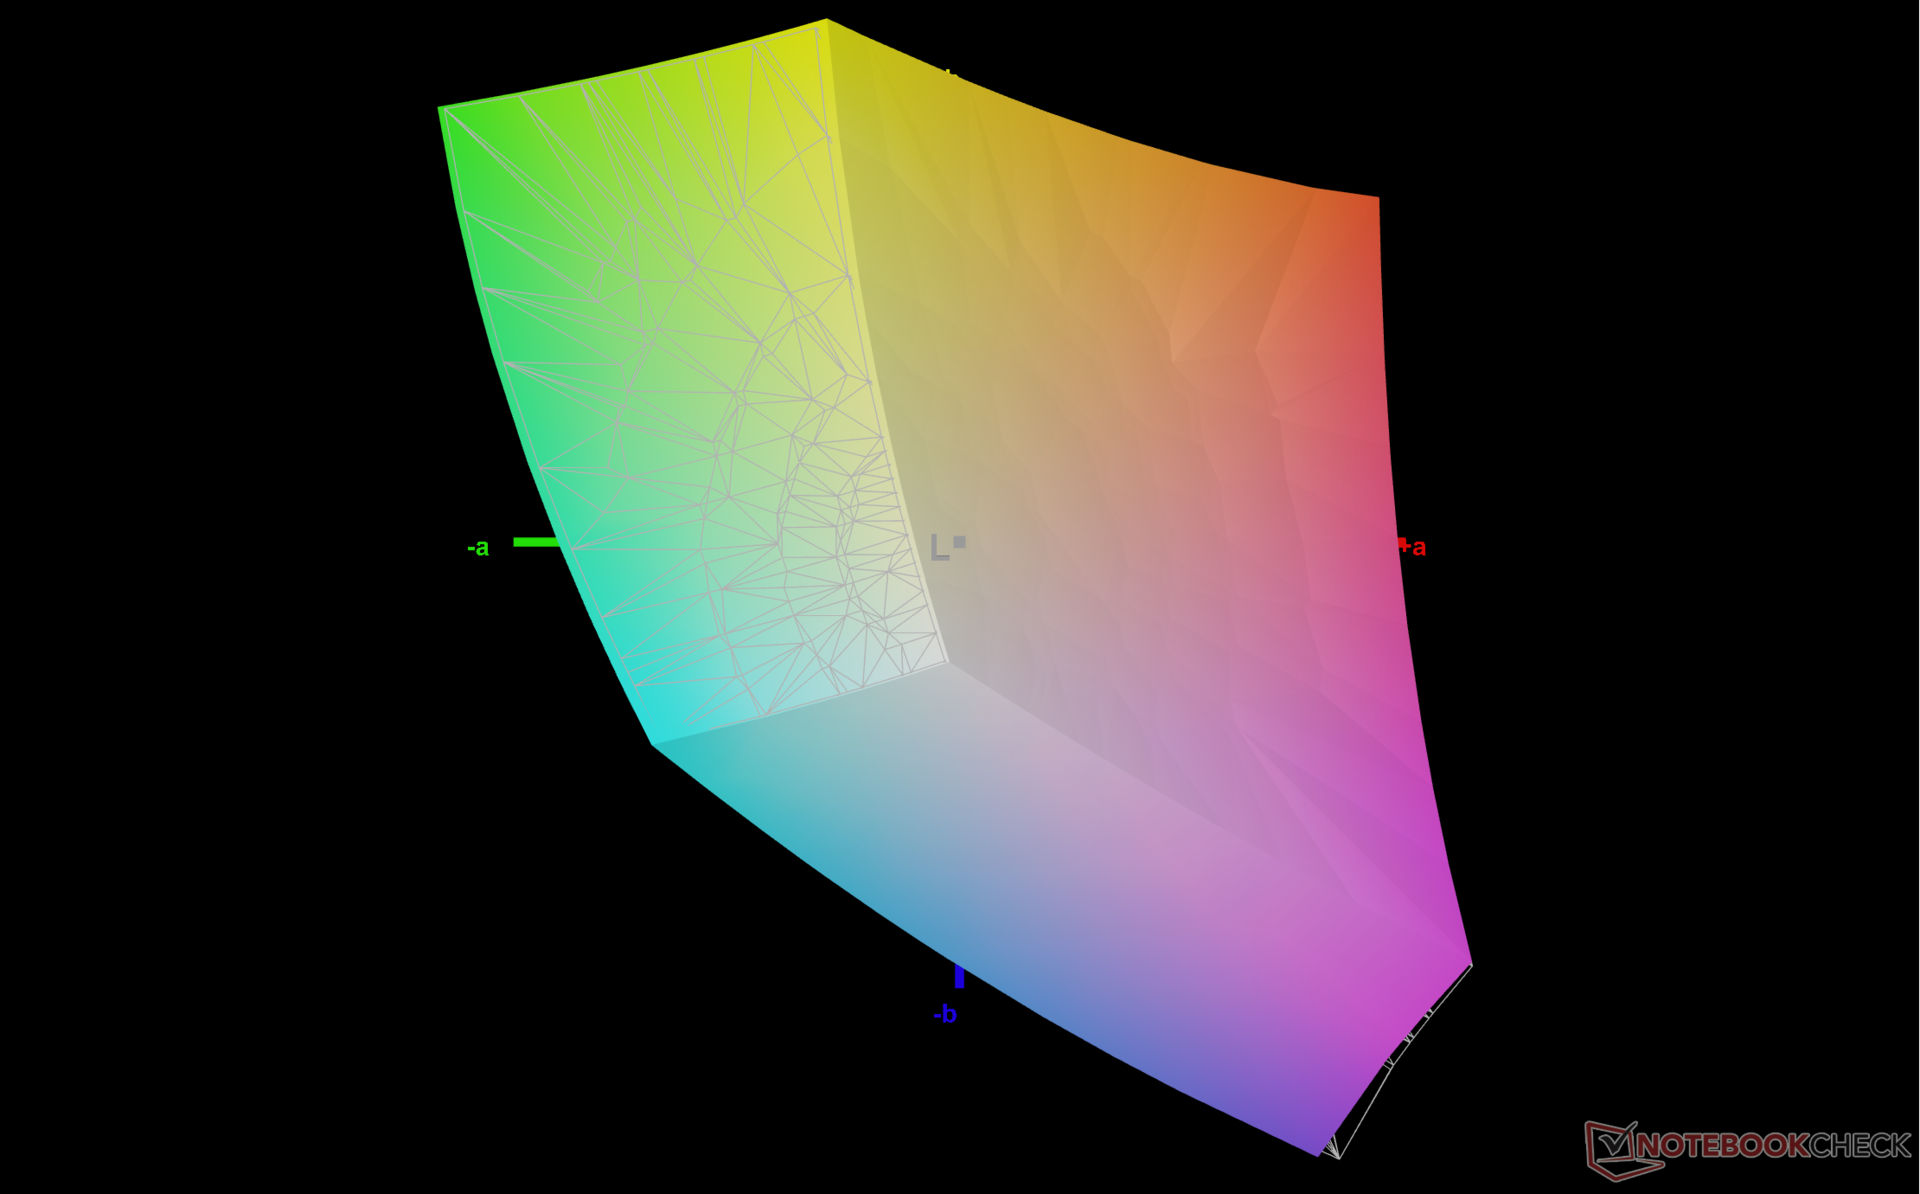
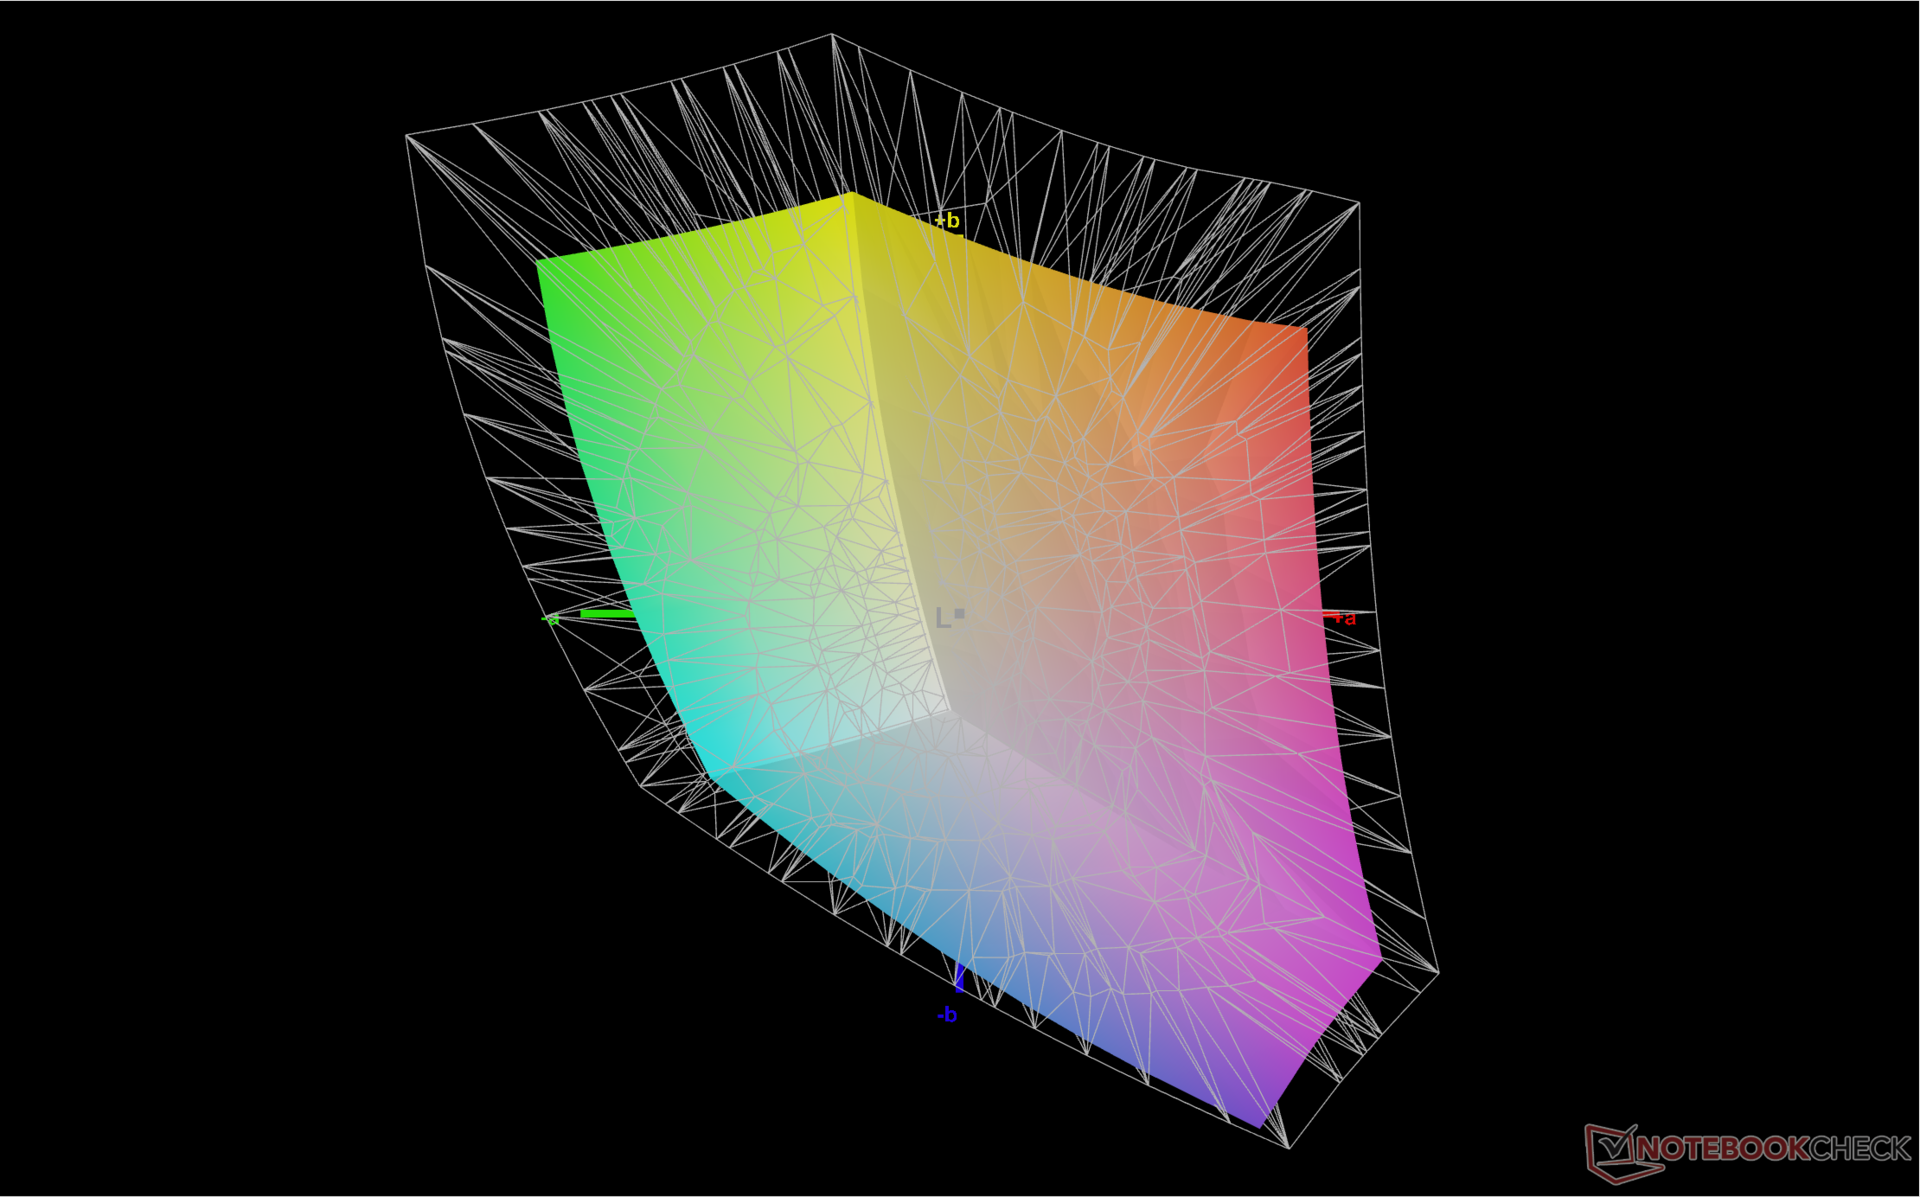
71.1% AdobeRGB 1998 (Argyll 3D)
99.1% sRGB (Argyll 3D)
69% Display P3 (Argyll 3D)
Gamma: 2.27
CCT: 6784 K
| Framework Laptop 13.5 Ryzen 7 7840U BOE CQ NE135FBM-N41, IPS, 2256x1504, 13.5" | Framework Laptop 13.5 13th Gen Intel BOE CQ NE135FBM-N41, IPS, 2256x1504, 13.5" | Framework Laptop 13.5 12th Gen Intel BOE CQ NE135FBM-N41, IPS, 2256x1504, 13.5" | Framework Laptop 13.5 BOE CQ NE135FBM-N41, IPS, 2256x1504, 13.5" | Lenovo ThinkPad X1 Nano Gen 3 MND007ZA1-3, IPS, 2160x1350, 13" | HP Dragonfly G4 Chi Mei CMN13C0, IPS, 1920x1280, 13.5" | |
|---|---|---|---|---|---|---|
| Display | -1% | 0% | -0% | -1% | -1% | |
| Display P3 Coverage (%) | 69 | 68.9 0% | 69.9 1% | 69 0% | 68.5 -1% | 68.4 -1% |
| sRGB Coverage (%) | 99.1 | 97.5 -2% | 99.4 0% | 99.3 0% | 99.5 0% | 98.3 -1% |
| AdobeRGB 1998 Coverage (%) | 71.1 | 71.1 0% | 71.1 0% | 70.3 -1% | 69.7 -2% | 70.4 -1% |
| Response Times | -8% | 22% | -12% | 20% | 2% | |
| Response Time Grey 50% / Grey 80% * (ms) | 50.4 ? | 54.9 ? -9% | 34.7 ? 31% | 55.6 ? -10% | 39.9 ? 21% | 48.8 ? 3% |
| Response Time Black / White * (ms) | 31.5 ? | 33.5 ? -6% | 27.5 ? 13% | 36 ? -14% | 25.8 ? 18% | 31.3 ? 1% |
| PWM Frequency (Hz) | ||||||
| Bildschirm | -37% | -21% | -28% | 13% | 0% | |
| Helligkeit Bildmitte (cd/m²) | 436 | 503 15% | 449.6 3% | 449 3% | 461.2 6% | 408.8 -6% |
| Brightness (cd/m²) | 416 | 472 13% | 431 4% | 435 5% | 428 3% | 399 -4% |
| Brightness Distribution (%) | 89 | 87 -2% | 90 1% | 93 4% | 86 -3% | 90 1% |
| Schwarzwert * (cd/m²) | 0.36 | 0.36 -0% | 0.31 14% | 0.39 -8% | 0.29 19% | 0.32 11% |
| Kontrast (:1) | 1211 | 1397 15% | 1450 20% | 1151 -5% | 1590 31% | 1278 6% |
| Delta E Colorchecker * | 1.81 | 3.38 -87% | 2.76 -52% | 2.34 -29% | 1.79 1% | 2.02 -12% |
| Colorchecker dE 2000 max. * | 4.73 | 7.08 -50% | 7.96 -68% | 7.07 -49% | 3.3 30% | 3.84 19% |
| Colorchecker dE 2000 calibrated * | 0.45 | 1.21 -169% | 0.58 -29% | 0.96 -113% | 0.47 -4% | 0.61 -36% |
| Delta E Graustufen * | 2.9 | 4.8 -66% | 5.2 -79% | 4.7 -62% | 1.8 38% | 2.3 21% |
| Gamma | 2.27 97% | 2.13 103% | 2.23 99% | 2.29 96% | 2.24 98% | 2.2 100% |
| CCT | 6784 96% | 6235 104% | 6475 100% | 6760 96% | 6588 99% | 6203 105% |
| Durchschnitt gesamt (Programm / Settings) | -15% /
-25% | 0% /
-10% | -13% /
-20% | 11% /
11% | 0% /
0% |
* ... kleinere Werte sind besser

Reaktionszeiten (Response Times) des Displays
| ↔ Reaktionszeiten Schwarz zu Weiß | ||
|---|---|---|
| 31.5 ms ... steigend ↗ und fallend ↘ kombiniert | ↗ 17.7 ms steigend | 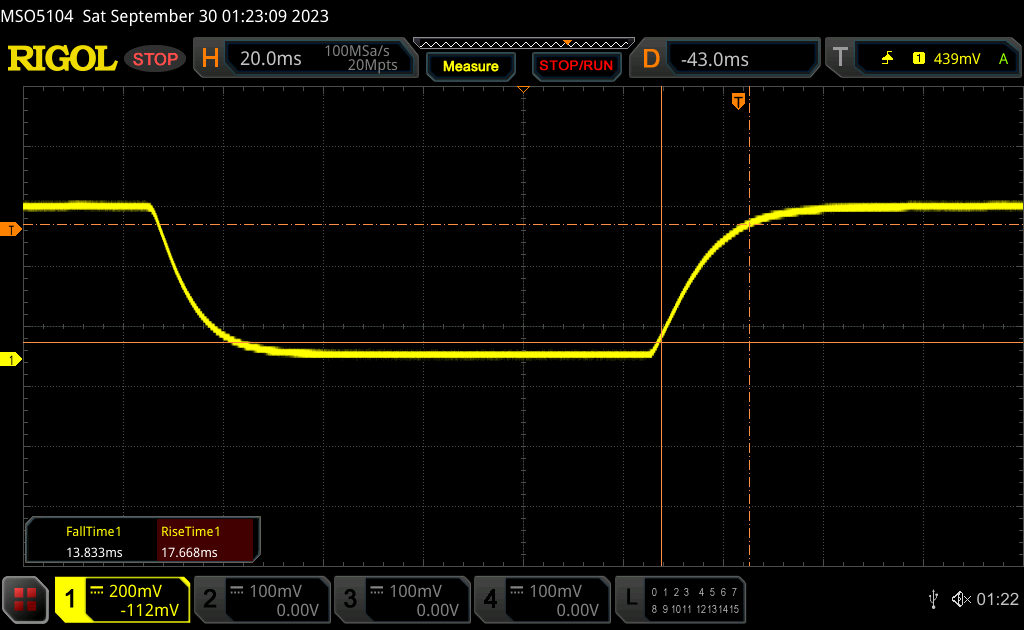 |
| ↘ 13.8 ms fallend | ||
| Die gemessenen Reaktionszeiten sind langsam und dadurch für viele Spieler wahrscheinlich zu langsam. Im Vergleich rangierten die bei uns getesteten Geräte von 0.1 (Minimum) zu 240 (Maximum) ms. » 85 % aller Screens waren schneller als der getestete. Daher sind die gemessenen Reaktionszeiten schlechter als der Durchschnitt aller vermessenen Geräte (19.8 ms). | ||
| ↔ Reaktionszeiten 50% Grau zu 80% Grau | ||
| 50.4 ms ... steigend ↗ und fallend ↘ kombiniert | ↗ 23.8 ms steigend | 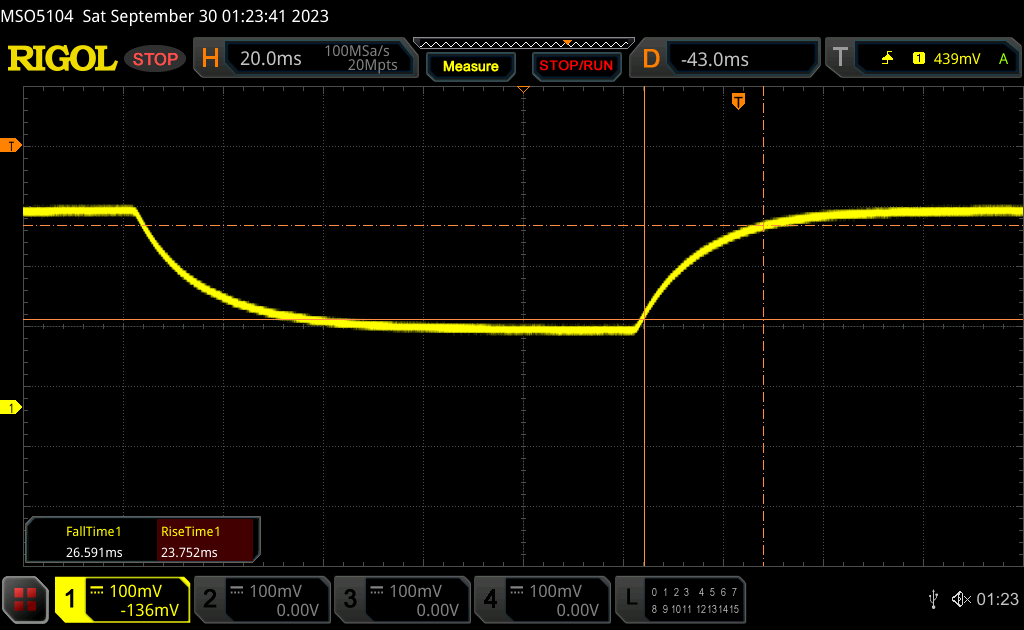 |
| ↘ 26.6 ms fallend | ||
| Die gemessenen Reaktionszeiten sind langsam und dadurch für viele Spieler wahrscheinlich zu langsam. Im Vergleich rangierten die bei uns getesteten Geräte von 0.165 (Minimum) zu 636 (Maximum) ms. » 87 % aller Screens waren schneller als der getestete. Daher sind die gemessenen Reaktionszeiten schlechter als der Durchschnitt aller vermessenen Geräte (31 ms). | ||
Bildschirm-Flackern / PWM (Pulse-Width Modulation)
| Flackern / PWM nicht festgestellt | 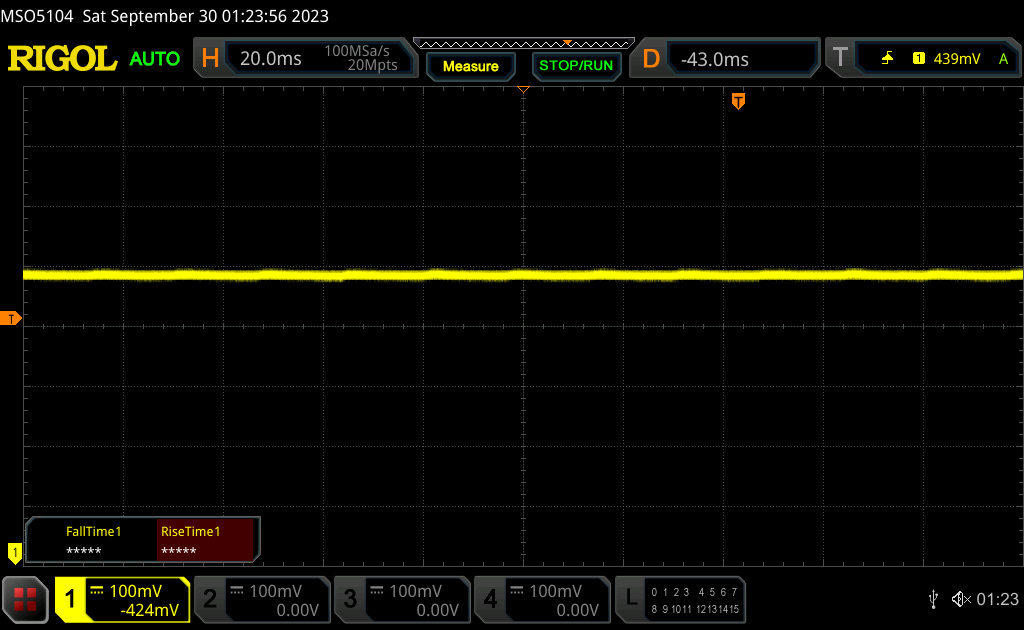 | ||
Im Vergleich: 52 % aller getesteten Geräte nutzten kein PWM um die Helligkeit zu reduzieren. Wenn PWM eingesetzt wurde, dann bei einer Frequenz von durchschnittlich 7778 (Minimum 5, Maximum 343500) Hz. | |||

Leistung
Testbedingungen
Wir haben Windows im Performance-Modus eingestellt, bevor wir die folgenden Benchmark Test durchgeführt haben. Das Framework enthält keine vorinstallierte Software ähnlich dem Control Center zur Anpassung spezifischer Funktionen, aber wir empfehlen die Installation von AMD Adrenalin für eine bessere Kontrolle über die integrierte GPU.
Prozessor
Nach der Enttäuschung mit dem Zen 3 Ryzen 7 7730U sind nun endlich mehr Laptops mit dem Zen 4 Ryzen 7 7840U erhältlich. Diese lang erwartete U-Serie CPU steht dem Core i7-12700H der H-Serie gleichwertig gegenüber und benötigt dabei nur einen Bruchteil der Energie. Bei Multi-Thread-Workloads übertrifft sie auch geringfügig den Core i7-1370P der 13. Generation, der im Intel-basierten Framework Laptop zu finden ist.
Nichtsdestotrotz ist die Single-Thread-Leistung etwa 15 Prozent langsamer als die des Core i7-1370P und liegt damit eher auf dem Niveau einer Intel-CPU der 12. Generation, wie beispielsweise dem Core i7-1260P. Dieses Defizit sollte keine große Überraschung sein, da AMD-CPUs in dieser Hinsicht normalerweise etwas zurückliegen.
Wir haben den Ryzen 5 7640U noch nicht selbst getestet und können daher nicht mit Sicherheit sagen, wie groß der Leistungsverlust beim Downgrade von unserem Ryzen 7 7840U auf den Ryzen 5 7640U sein wird.
Cinebench R15 Multi Dauertest
Cinebench R23: Multi Core | Single Core
Cinebench R20: CPU (Multi Core) | CPU (Single Core)
Cinebench R15: CPU Multi 64Bit | CPU Single 64Bit
Blender: v2.79 BMW27 CPU
7-Zip 18.03: 7z b 4 | 7z b 4 -mmt1
Geekbench 5.5: Multi-Core | Single-Core
HWBOT x265 Benchmark v2.2: 4k Preset
LibreOffice : 20 Documents To PDF
R Benchmark 2.5: Overall mean
* ... kleinere Werte sind besser
AIDA64: FP32 Ray-Trace | FPU Julia | CPU SHA3 | CPU Queen | FPU SinJulia | FPU Mandel | CPU AES | CPU ZLib | FP64 Ray-Trace | CPU PhotoWorxx
AIDA64: FP32 Ray-Trace | FPU Julia | CPU SHA3 | CPU Queen | FPU SinJulia | FPU Mandel | CPU AES | CPU ZLib | FP64 Ray-Trace | CPU PhotoWorxx
System Performance
CrossMark: Overall | Productivity | Creativity | Responsiveness
| PCMark 10 / Score | |
| Framework Laptop 13.5 Ryzen 7 7840U | |
| Durchschnittliche AMD Ryzen 7 7840U, AMD Radeon 780M (5866 - 7157, n=10) | |
| Dell XPS 13 Plus 9320 Core i7-1360P | |
| Lenovo ThinkPad X1 Nano Gen 3 | |
| HP Dragonfly G4 | |
| Asus ZenBook S13 OLED UX5304 | |
| Framework Laptop 13.5 | |
| PCMark 10 / Essentials | |
| Dell XPS 13 Plus 9320 Core i7-1360P | |
| Framework Laptop 13.5 Ryzen 7 7840U | |
| HP Dragonfly G4 | |
| Lenovo ThinkPad X1 Nano Gen 3 | |
| Asus ZenBook S13 OLED UX5304 | |
| Framework Laptop 13.5 | |
| Durchschnittliche AMD Ryzen 7 7840U, AMD Radeon 780M (9068 - 11081, n=10) | |
| PCMark 10 / Productivity | |
| Framework Laptop 13.5 Ryzen 7 7840U | |
| Durchschnittliche AMD Ryzen 7 7840U, AMD Radeon 780M (7323 - 10099, n=10) | |
| Lenovo ThinkPad X1 Nano Gen 3 | |
| Dell XPS 13 Plus 9320 Core i7-1360P | |
| HP Dragonfly G4 | |
| Asus ZenBook S13 OLED UX5304 | |
| Framework Laptop 13.5 | |
| PCMark 10 / Digital Content Creation | |
| Framework Laptop 13.5 Ryzen 7 7840U | |
| Durchschnittliche AMD Ryzen 7 7840U, AMD Radeon 780M (7204 - 8987, n=10) | |
| Dell XPS 13 Plus 9320 Core i7-1360P | |
| Lenovo ThinkPad X1 Nano Gen 3 | |
| HP Dragonfly G4 | |
| Asus ZenBook S13 OLED UX5304 | |
| Framework Laptop 13.5 | |
| CrossMark / Overall | |
| Dell XPS 13 Plus 9320 Core i7-1360P | |
| Lenovo ThinkPad X1 Nano Gen 3 | |
| Framework Laptop 13.5 Ryzen 7 7840U | |
| HP Dragonfly G4 | |
| Asus ZenBook S13 OLED UX5304 | |
| Durchschnittliche AMD Ryzen 7 7840U, AMD Radeon 780M (1256 - 1804, n=10) | |
| CrossMark / Productivity | |
| Lenovo ThinkPad X1 Nano Gen 3 | |
| Dell XPS 13 Plus 9320 Core i7-1360P | |
| Framework Laptop 13.5 Ryzen 7 7840U | |
| HP Dragonfly G4 | |
| Asus ZenBook S13 OLED UX5304 | |
| Durchschnittliche AMD Ryzen 7 7840U, AMD Radeon 780M (1261 - 1798, n=10) | |
| CrossMark / Creativity | |
| Dell XPS 13 Plus 9320 Core i7-1360P | |
| Lenovo ThinkPad X1 Nano Gen 3 | |
| Framework Laptop 13.5 Ryzen 7 7840U | |
| HP Dragonfly G4 | |
| Asus ZenBook S13 OLED UX5304 | |
| Durchschnittliche AMD Ryzen 7 7840U, AMD Radeon 780M (1251 - 1835, n=10) | |
| CrossMark / Responsiveness | |
| Dell XPS 13 Plus 9320 Core i7-1360P | |
| Lenovo ThinkPad X1 Nano Gen 3 | |
| Framework Laptop 13.5 Ryzen 7 7840U | |
| Asus ZenBook S13 OLED UX5304 | |
| HP Dragonfly G4 | |
| Durchschnittliche AMD Ryzen 7 7840U, AMD Radeon 780M (1082 - 1775, n=10) | |
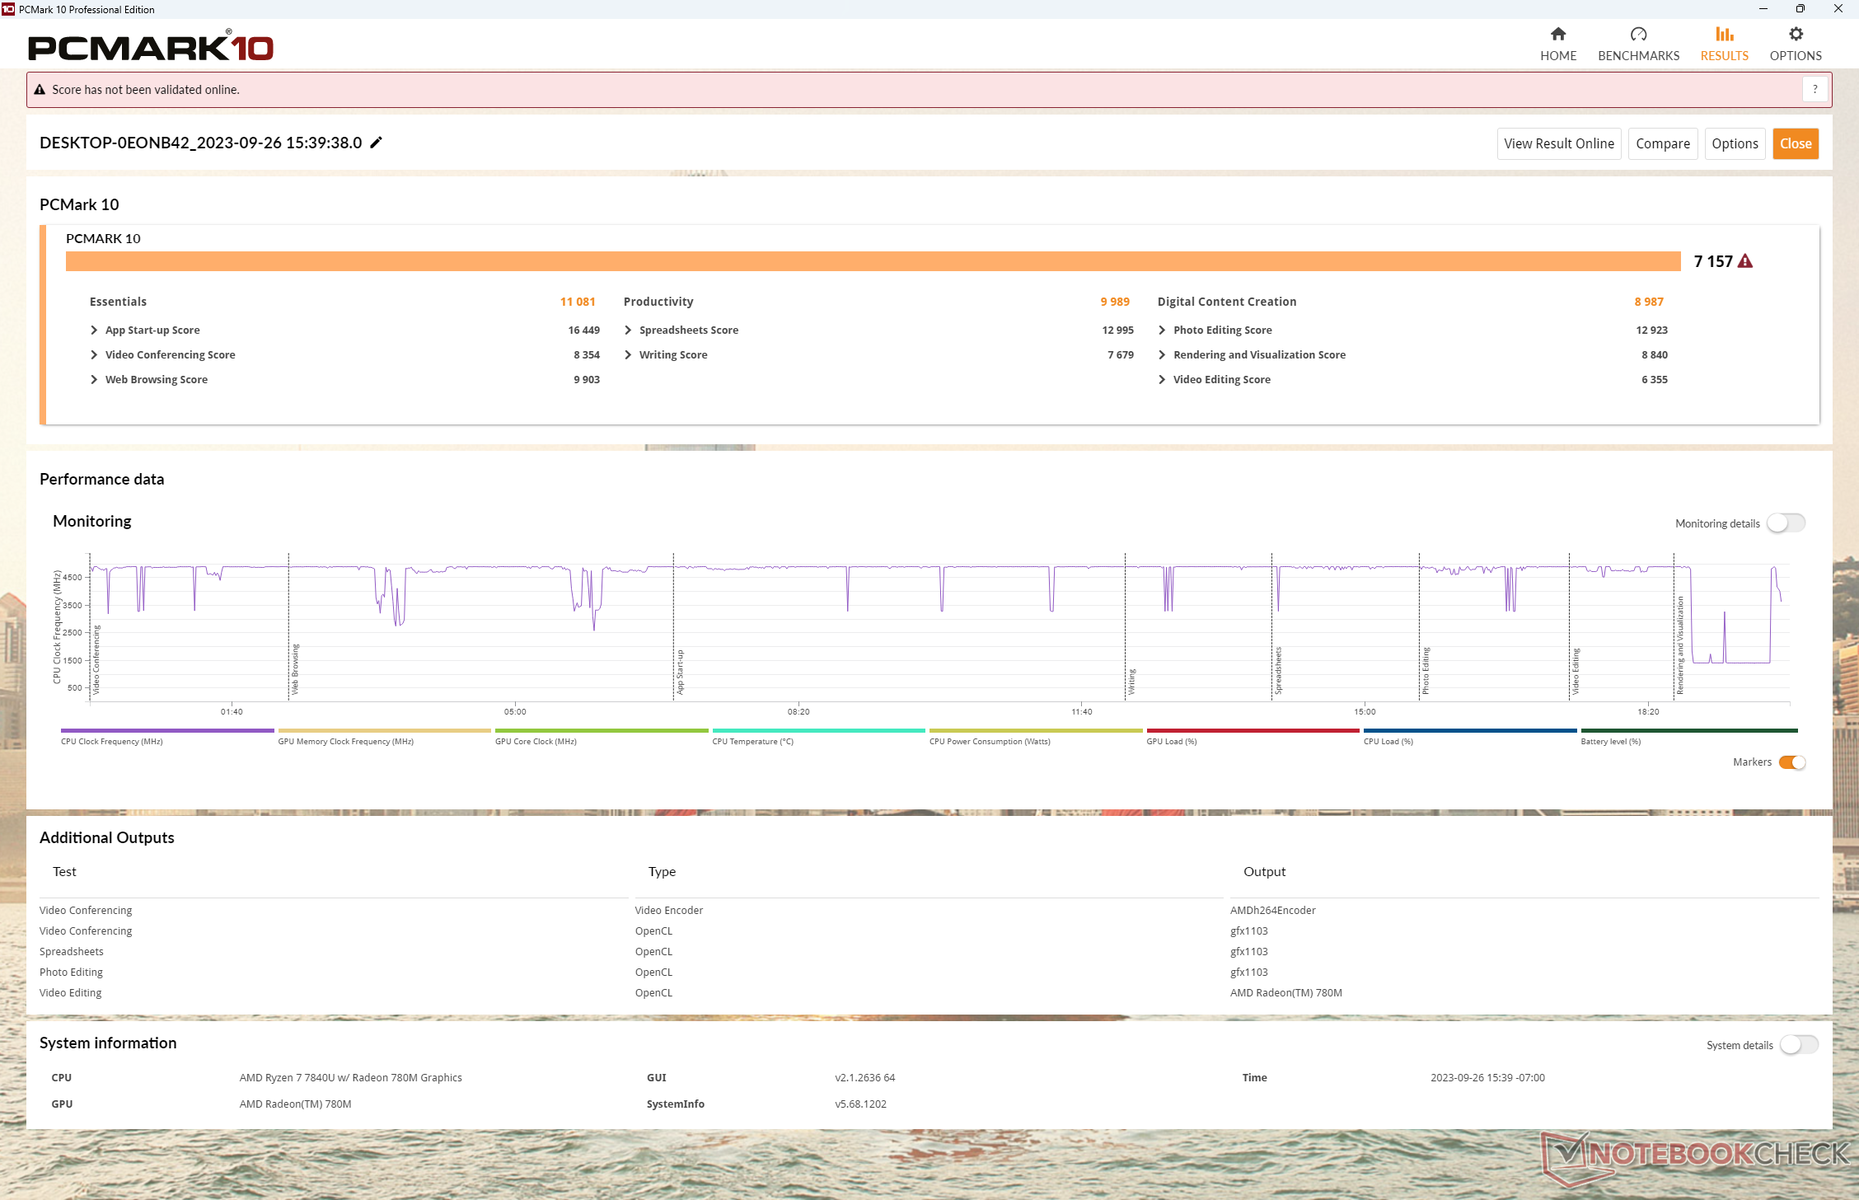
| PCMark 10 Score | 7157 Punkte | |
Hilfe | ||
| AIDA64 / Memory Copy | |
| Dell XPS 13 Plus 9320 Core i7-1360P | |
| Lenovo ThinkPad X1 Nano Gen 3 | |
| Framework Laptop 13.5 Ryzen 7 7840U | |
| Asus ZenBook S13 OLED UX5304 | |
| HP Dragonfly G4 | |
| Durchschnittliche AMD Ryzen 7 7840U (43255 - 70532, n=12) | |
| Framework Laptop 13.5 | |
| AIDA64 / Memory Read | |
| Dell XPS 13 Plus 9320 Core i7-1360P | |
| Lenovo ThinkPad X1 Nano Gen 3 | |
| Framework Laptop 13.5 Ryzen 7 7840U | |
| Asus ZenBook S13 OLED UX5304 | |
| HP Dragonfly G4 | |
| Durchschnittliche AMD Ryzen 7 7840U (37399 - 61602, n=11) | |
| Framework Laptop 13.5 | |
| AIDA64 / Memory Write | |
| Lenovo ThinkPad X1 Nano Gen 3 | |
| Dell XPS 13 Plus 9320 Core i7-1360P | |
| Framework Laptop 13.5 Ryzen 7 7840U | |
| Asus ZenBook S13 OLED UX5304 | |
| HP Dragonfly G4 | |
| Durchschnittliche AMD Ryzen 7 7840U (46797 - 92289, n=13) | |
| Framework Laptop 13.5 | |
| AIDA64 / Memory Latency | |
| Durchschnittliche AMD Ryzen 7 7840U (90 - 137.2, n=12) | |
| Dell XPS 13 Plus 9320 Core i7-1360P | |
| Lenovo ThinkPad X1 Nano Gen 3 | |
| HP Dragonfly G4 | |
| Asus ZenBook S13 OLED UX5304 | |
| Framework Laptop 13.5 Ryzen 7 7840U | |
| Framework Laptop 13.5 | |
* ... kleinere Werte sind besser
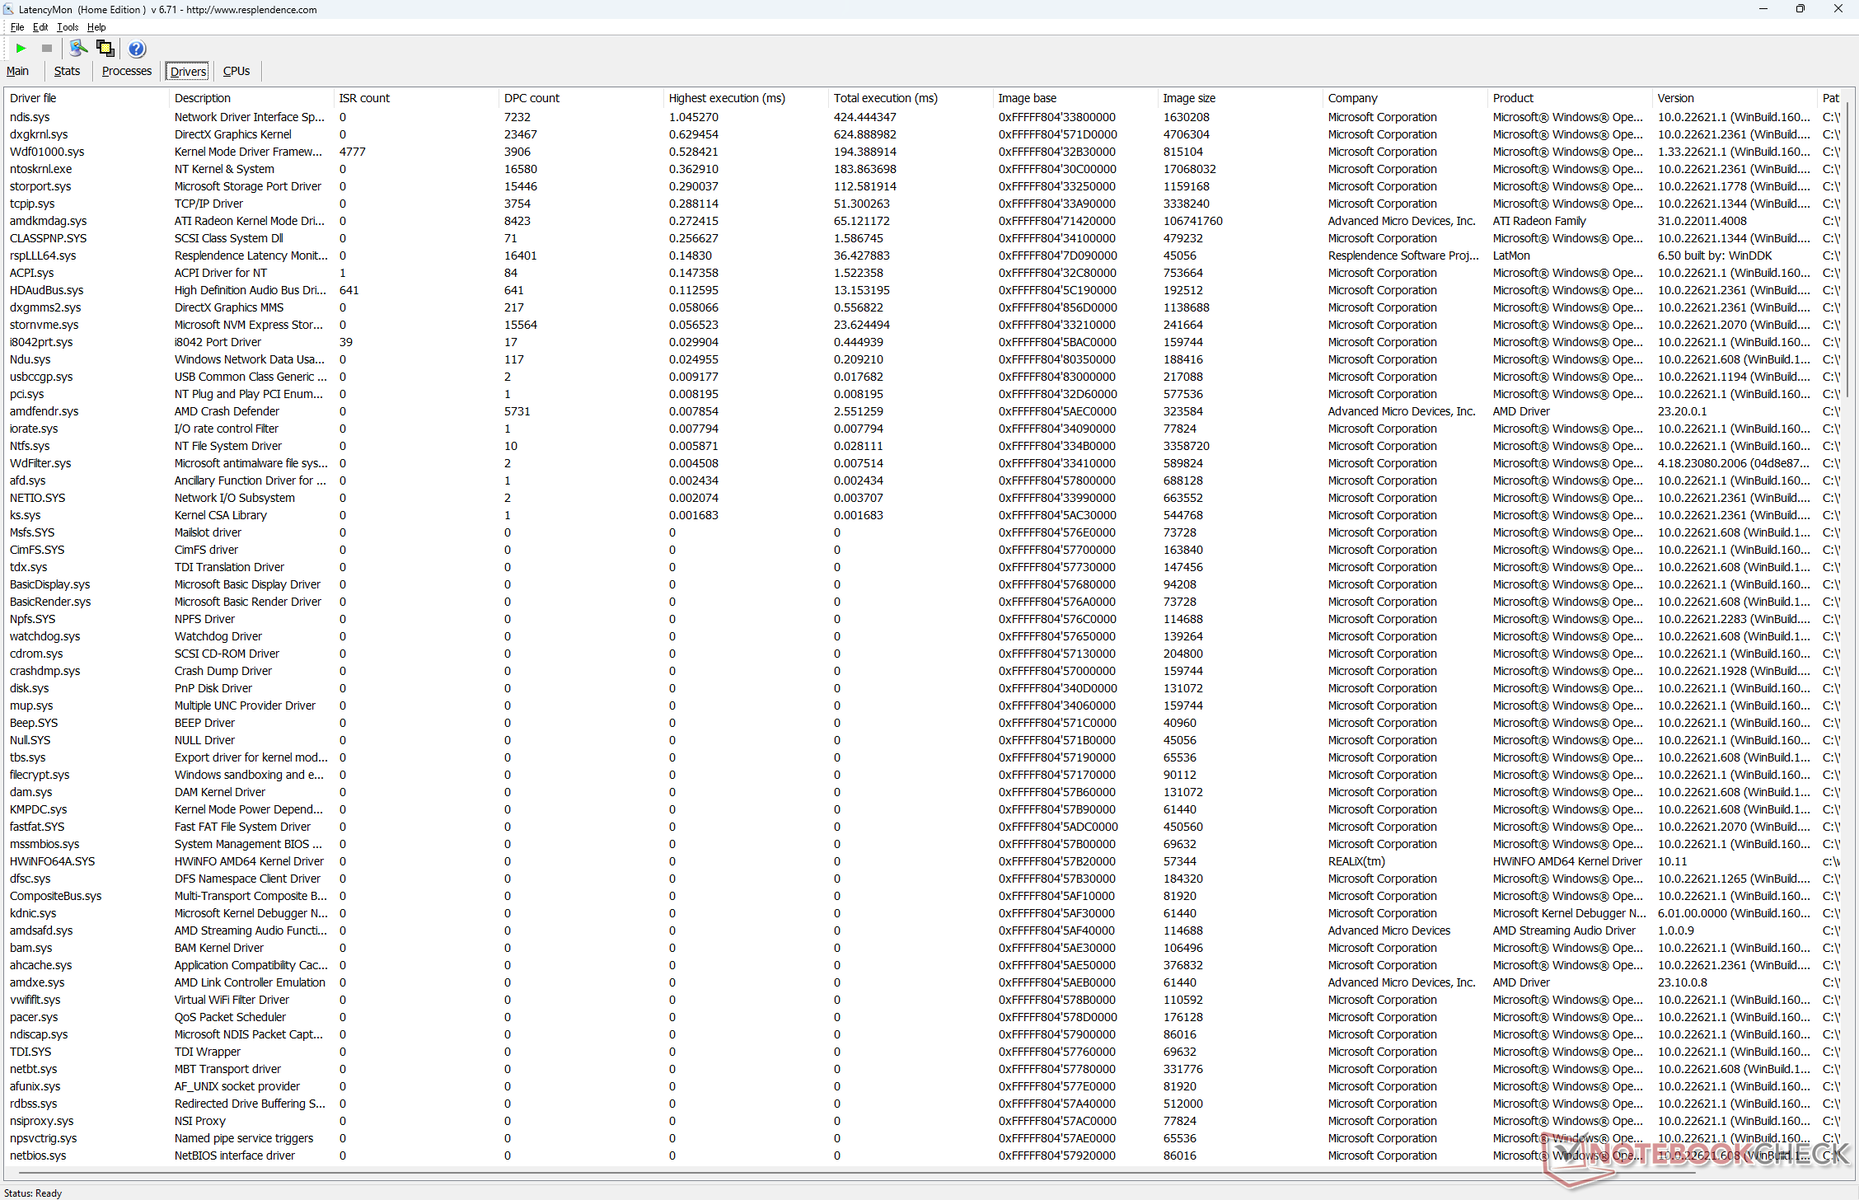
DPC-Latenzen
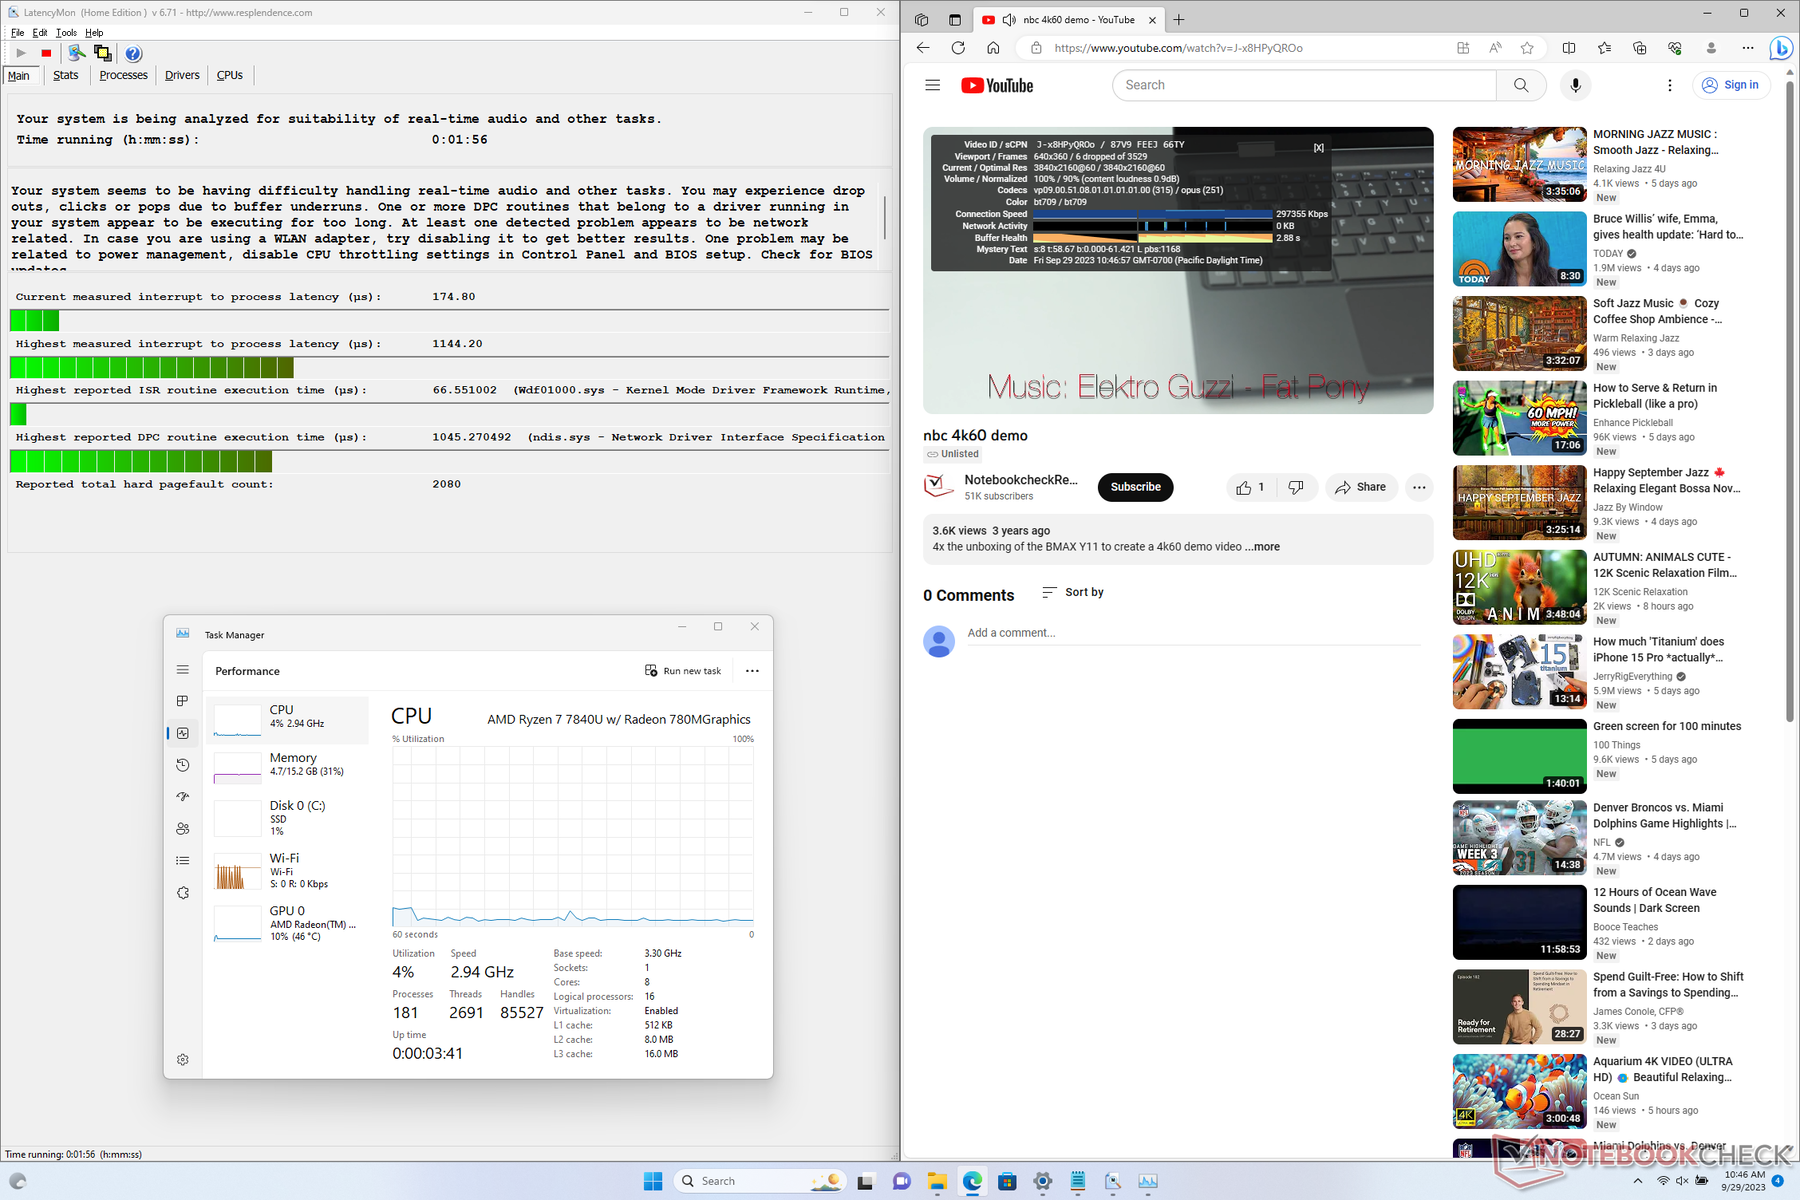
LatencyMon zeigt nur leichte Abweichungen bei der DPC-Wiedergabe, wenn mehrere Tabs unserer Homepage geöffnet werden. Die 4K-Videowiedergabe bei 60 FPS ist unvollkommen, wobei 6 Bildaussetzer während eines einminütigen Zeitraums aufgezeichnet wurden. AMD-Systeme wie das Legion Slim 5 14 oder das Aokzoe A1 scheinen in letzter Zeit mehr Probleme mit Frame-Abbrüchen zu haben als Intel.
| DPC Latencies / LatencyMon - interrupt to process latency (max), Web, Youtube, Prime95 | |
| Dell XPS 13 Plus 9320 Core i7-1360P | |
| Lenovo ThinkPad X1 Nano Gen 3 | |
| Framework Laptop 13.5 | |
| Asus ZenBook S13 OLED UX5304 | |
| HP Dragonfly G4 | |
| Framework Laptop 13.5 Ryzen 7 7840U | |
* ... kleinere Werte sind besser
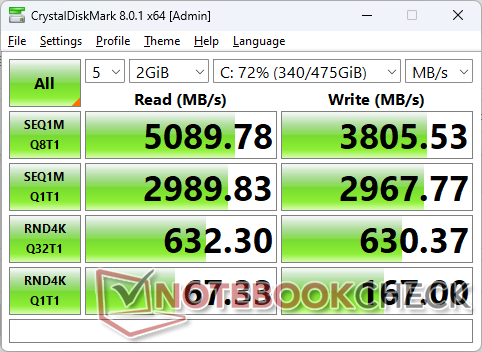
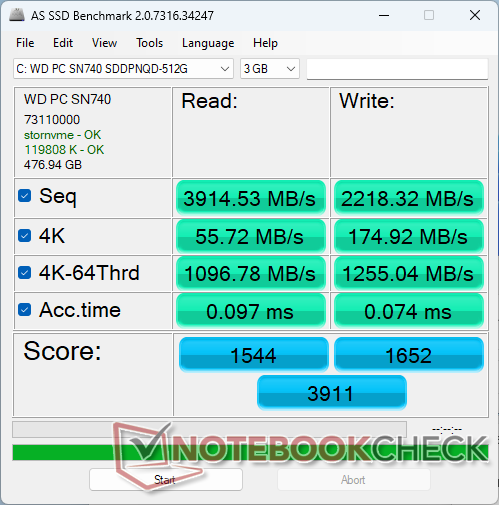
Massenspeicher
Framework bietet nur Western Digital-Laufwerke an, wahrscheinlich aufgrund einer Exklusivitätsvereinbarung mit dem SSD-Hersteller. Natürlich können Nutzer stattdessen auch einfach ihre eigenen Laufwerke installieren.

* ... kleinere Werte sind besser
Disk Throttling: DiskSpd Read Loop, Queue Depth 8
GPU-Leistung
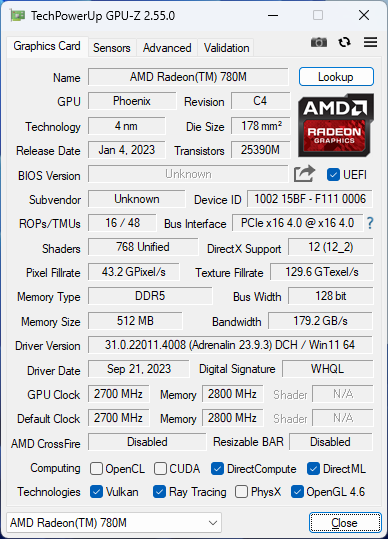
Die letztjährige Radeon 680M war bereits schneller als jede integrierte Lösung von Intel und die diesjährige Radeon 780M zementiert den Vorsprung von AMD noch weiter. Die rohe Grafikleistung ist 30 bis 50 Prozent schneller als die Iris Xe 96 EUs in der aktuellen Intel-Version des Framework Laptop 13.5 der 13. Die Leistungsvorteile werden bei DX12-fähigen Anwendungen noch deutlicher.
| Energieprofile | Grafikleistung | Physics Score | Combined Score |
| Performance-Modus | 7455 | 24735 | 2646 |
| Balanced-Modus | 7426 (-0%) | 24403 (-1%) | 2646 (-0%) |
| Battery Power | 6591 (-12%) | 24183 (-2%) | 2223 (-16%) |
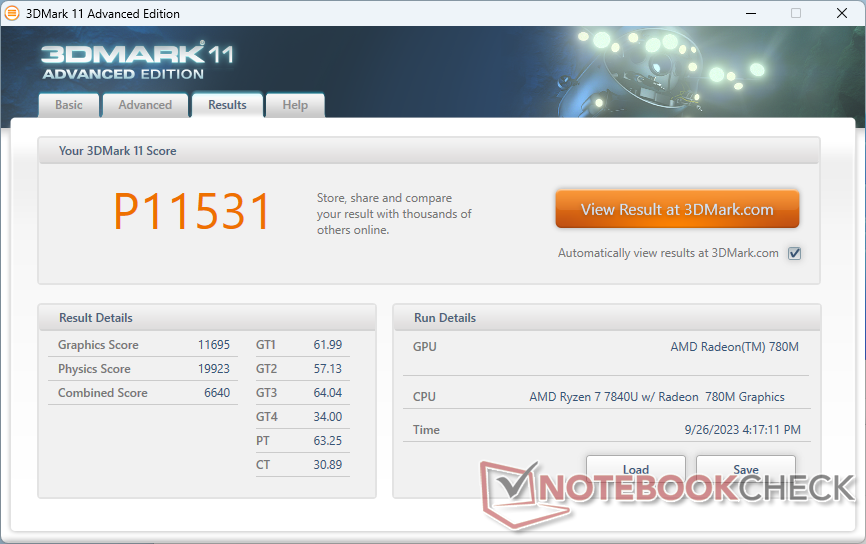
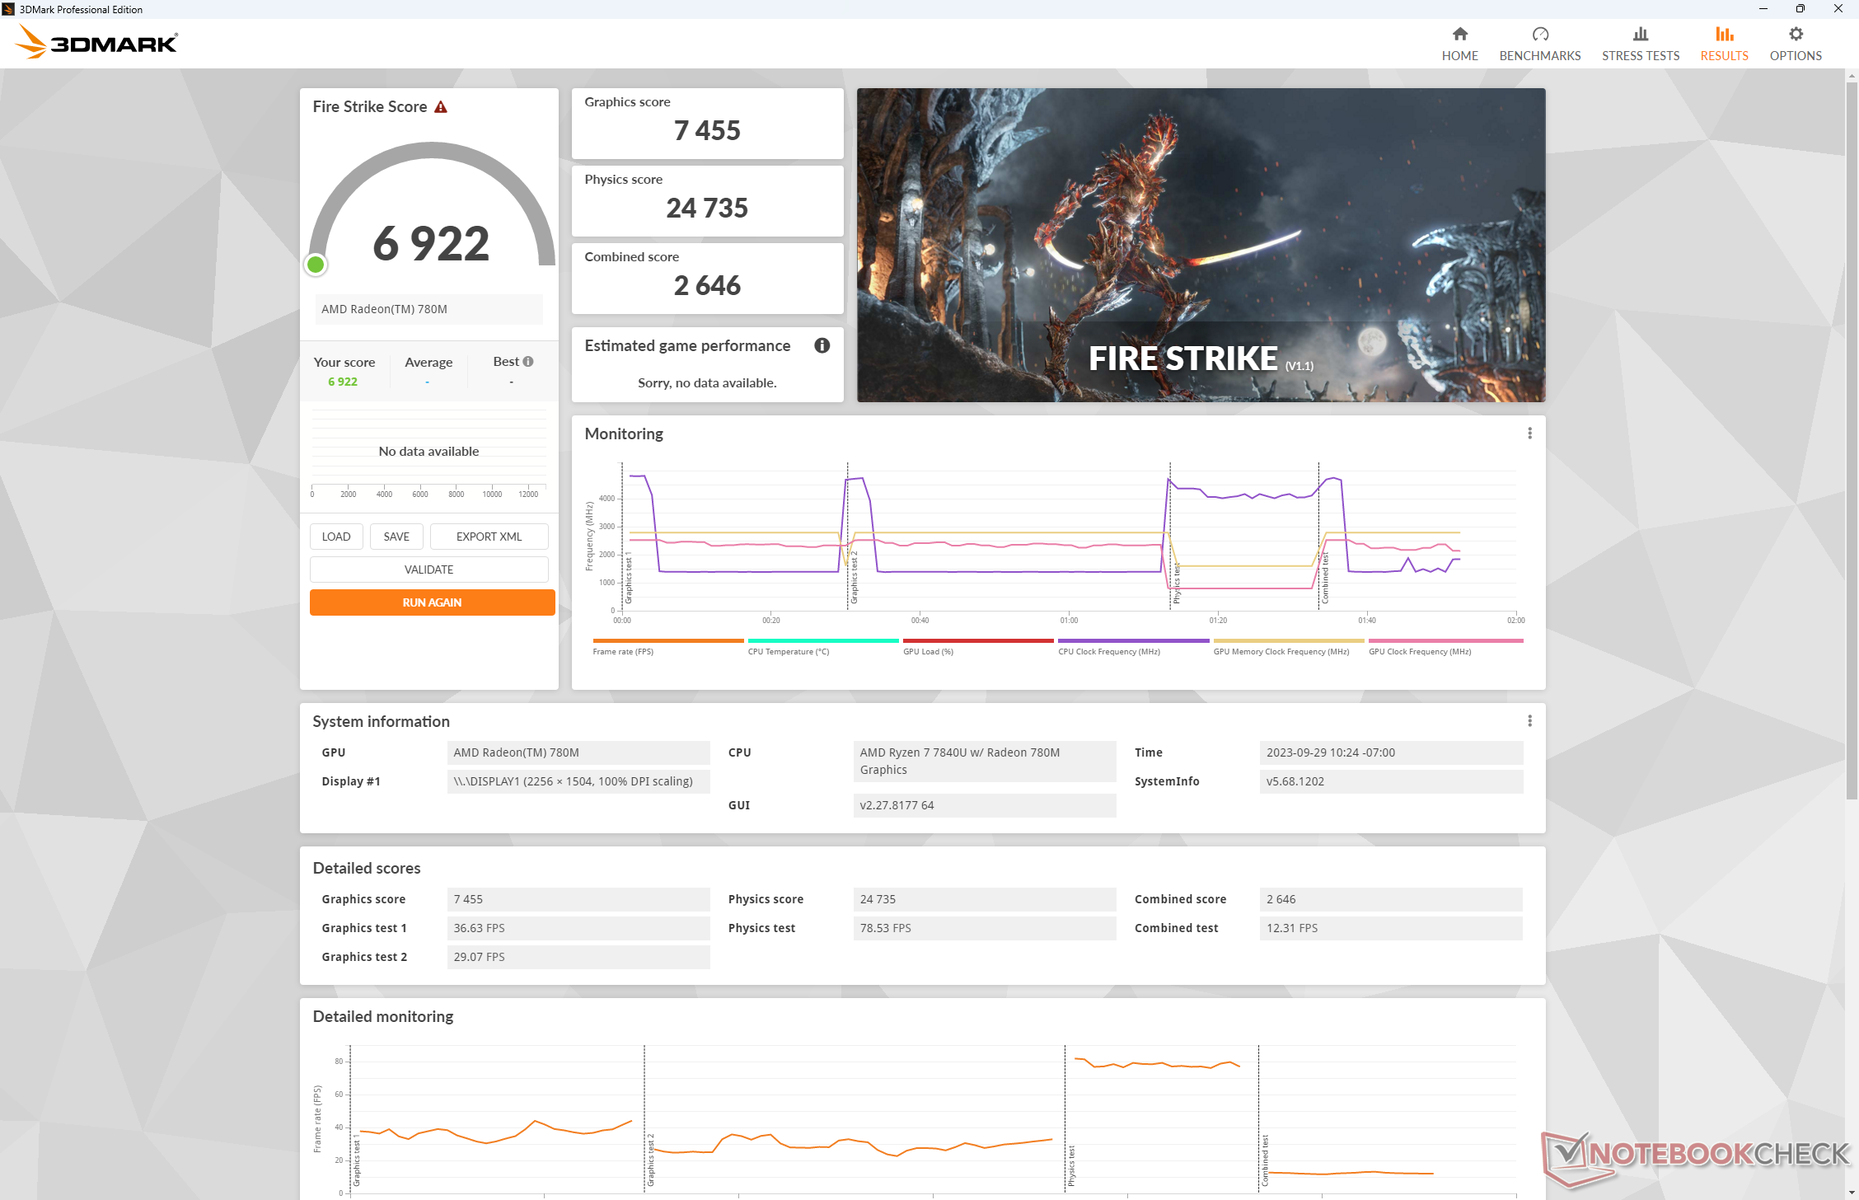

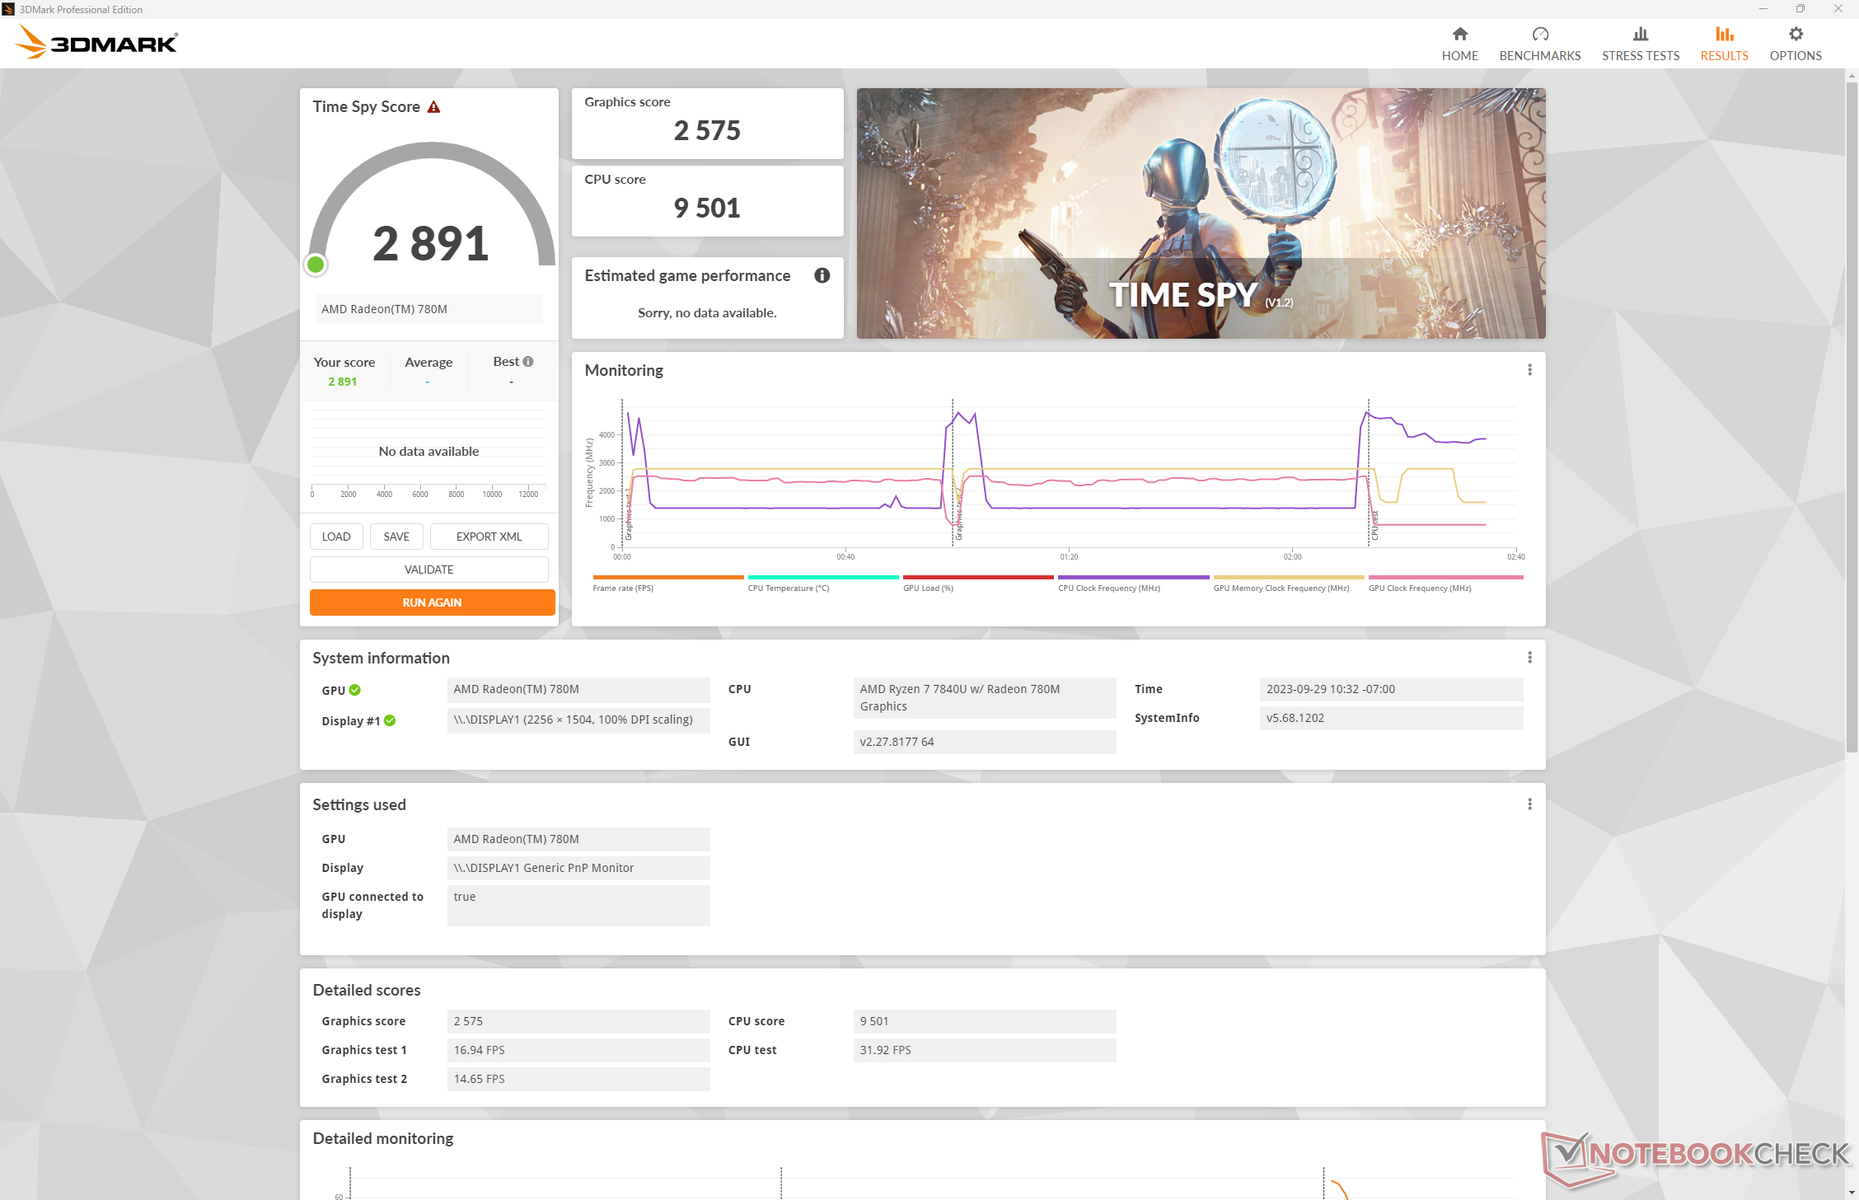
| 3DMark 11 Performance | 11531 Punkte | |
| 3DMark Fire Strike Score | 6922 Punkte | |
| 3DMark Time Spy Score | 2891 Punkte | |
Hilfe | ||
* ... kleinere Werte sind besser
Gaming Performance
Das Framework Laptop 13.5 ist keine Gaming-Maschine, aber die Zen-4-CPU ist dennoch in der Lage, die meisten Spiele bei 1080p einigermaßen gut auszuführen, sogar Cyberpunk 2077. Allerdings kam es bei einigen, darunter F1 22 und Ratchet & Clank Rift Apart, zu Abstürzen.
Witcher 3 FPS Chart
| min. | mittel | hoch | max. | |
|---|---|---|---|---|
| The Witcher 3 (2015) | 136.2 | 45.9 | 28.7 | |
| Dota 2 Reborn (2015) | 154.1 | 119.3 | 76.2 | 71.2 |
| Final Fantasy XV Benchmark (2018) | 66.6 | 34.4 | 25.7 | |
| X-Plane 11.11 (2018) | 60 | 44.4 | 37.5 | |
| Far Cry 5 (2018) | 74 | 39 | 37 | 35 |
| Strange Brigade (2018) | 139.8 | 59.7 | 50.5 | 43 |
| Cyberpunk 2077 1.6 (2022) | 39.5 | 30.9 | 24.6 | 23 |
| Tiny Tina's Wonderlands (2022) | 60.4 | 44.8 | 30.4 | 25.2 |
| F1 22 (2022) | 80.6 | 72.5 | 54.2 |
Emissionen
Geräuschemissionen
Das Lüftergeräusch bei anspruchsvoller Last entspricht in etwa dem, was wir bei der Intel Core-P Konfiguration gemessen haben. Das Framework bleibt mit 46 bis 49 dB(A) eines der lautesten Subnotebooks, verglichen mit dem niedrigen 40-dB(A)-Bereich der meisten anderen Subnotebooks. Wir konnten auch ein häufigeres Pulsieren des Lüfters feststellen.
Das bedeutet, dass das System auch bei weniger anspruchsvollen Aufgaben wie Surfen oder Videostreaming relativ leise bleibt.
Lautstärkediagramm
| Idle |
| 22.6 / 22.6 / 24.2 dB(A) |
| Last |
| 35.8 / 48.9 dB(A) |
 | ||
30 dB leise 40 dB(A) deutlich hörbar 50 dB(A) störend |
||
min: | ||
| Framework Laptop 13.5 Ryzen 7 7840U Radeon 780M, R7 7840U, WD PC SN740 512GB SDDPNQD-512G | Framework Laptop 13.5 Iris Xe G7 96EUs, i7-1165G7, Western Digital WD_BLACK SN850 WDS100T1X0E | Lenovo ThinkPad X1 Nano Gen 3 Iris Xe G7 96EUs, i7-1360P, Lenovo UMIS AM6A0 RPJTJ512MKP1QDQ | HP Dragonfly G4 Iris Xe G7 96EUs, i7-1365U, Micron 3400 MTFDKBA512TFH 512GB | Dell XPS 13 Plus 9320 Core i7-1360P Iris Xe G7 96EUs, i7-1360P, Samsung PM9A1 MZVL2512HCJQ | Asus ZenBook S13 OLED UX5304 Iris Xe G7 96EUs, i7-1355U, Samsung PM9A1 MZVL21T0HCLR | |
|---|---|---|---|---|---|---|
| Geräuschentwicklung | -6% | 8% | 9% | 0% | 3% | |
| aus / Umgebung * (dB) | 22.6 | 23.9 -6% | 22.9 -1% | 23.3 -3% | 23.7 -5% | 23.3 -3% |
| Idle min * (dB) | 22.6 | 23.9 -6% | 23 -2% | 23.5 -4% | 24 -6% | 23.3 -3% |
| Idle avg * (dB) | 22.6 | 23.9 -6% | 23 -2% | 23.5 -4% | 24 -6% | 23.3 -3% |
| Idle max * (dB) | 24.2 | 23.9 1% | 23 5% | 26.8 -11% | 24.4 -1% | 23.3 4% |
| Last avg * (dB) | 35.8 | 45.6 -27% | 32.8 8% | 27.2 24% | 37 -3% | 37.7 -5% |
| Witcher 3 ultra * (dB) | 46.5 | 47.1 -1% | 36.9 21% | 32.7 30% | 42.1 9% | 40.1 14% |
| Last max * (dB) | 48.9 | 47.9 2% | 36.9 25% | 35 28% | 42 14% | 40.1 18% |
* ... kleinere Werte sind besser
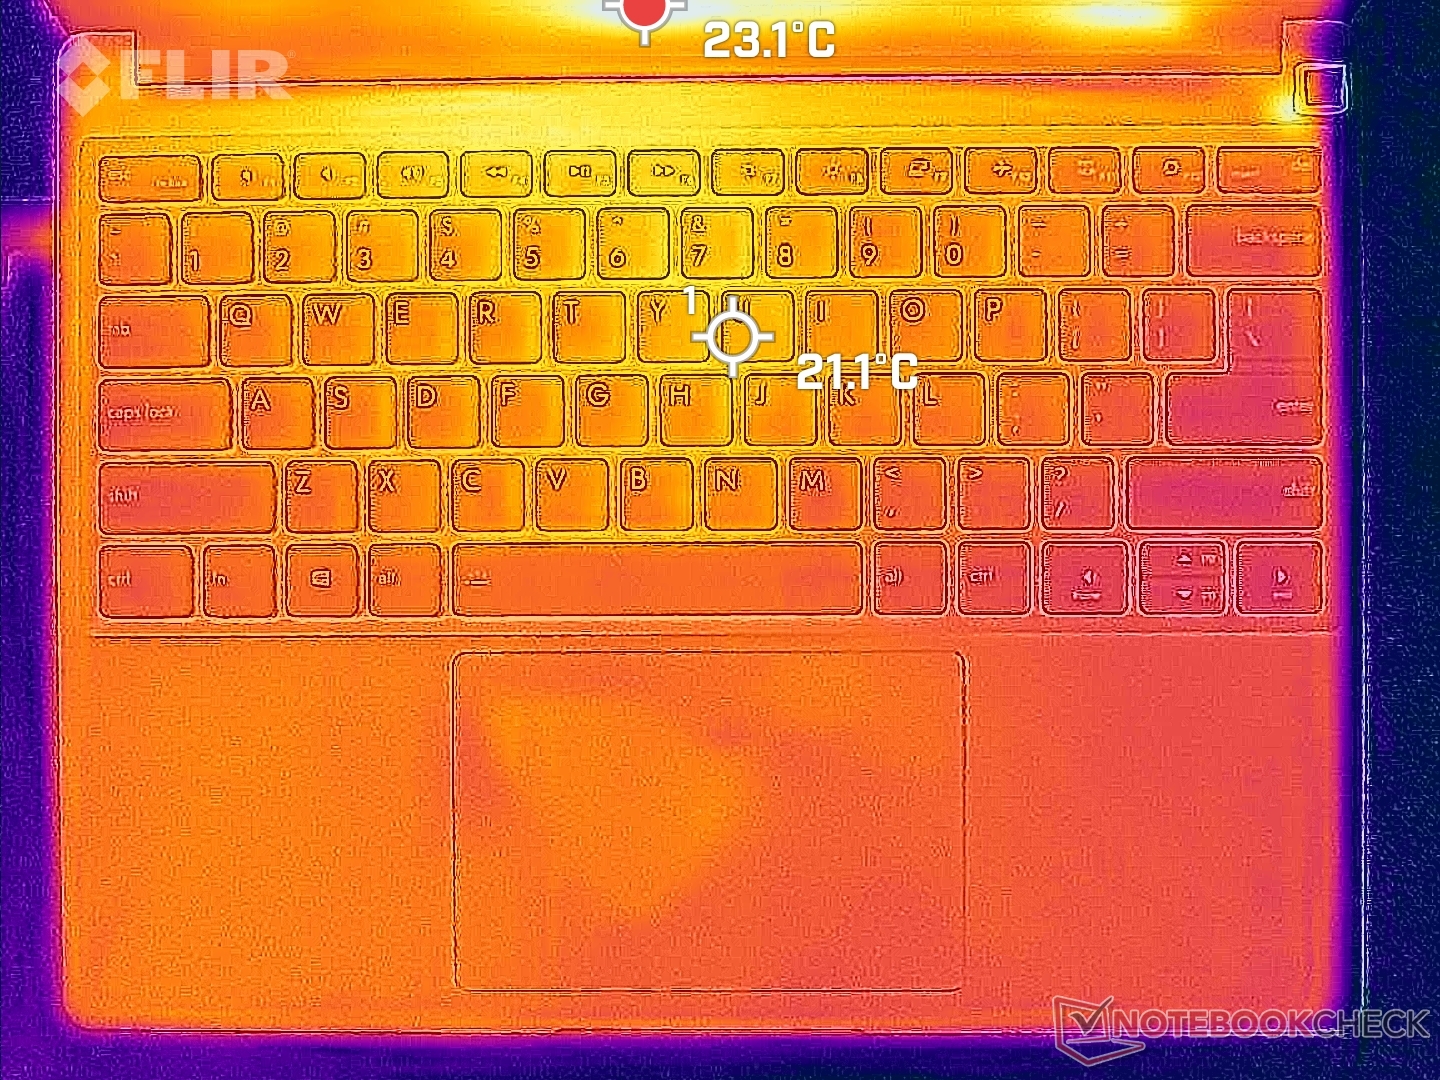
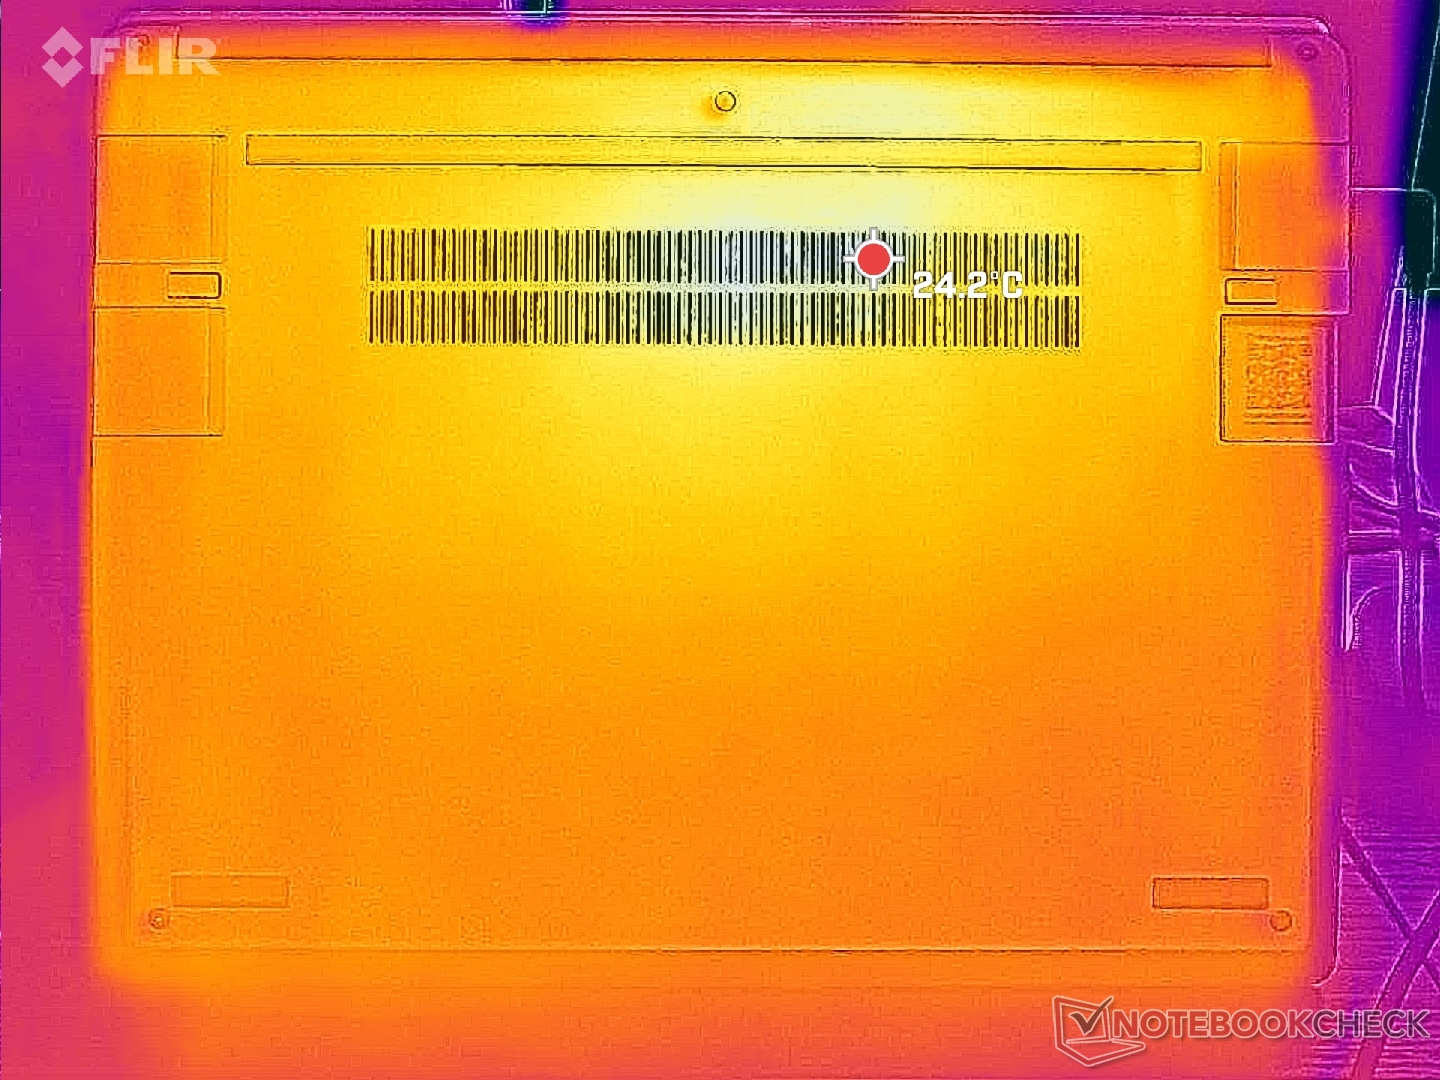
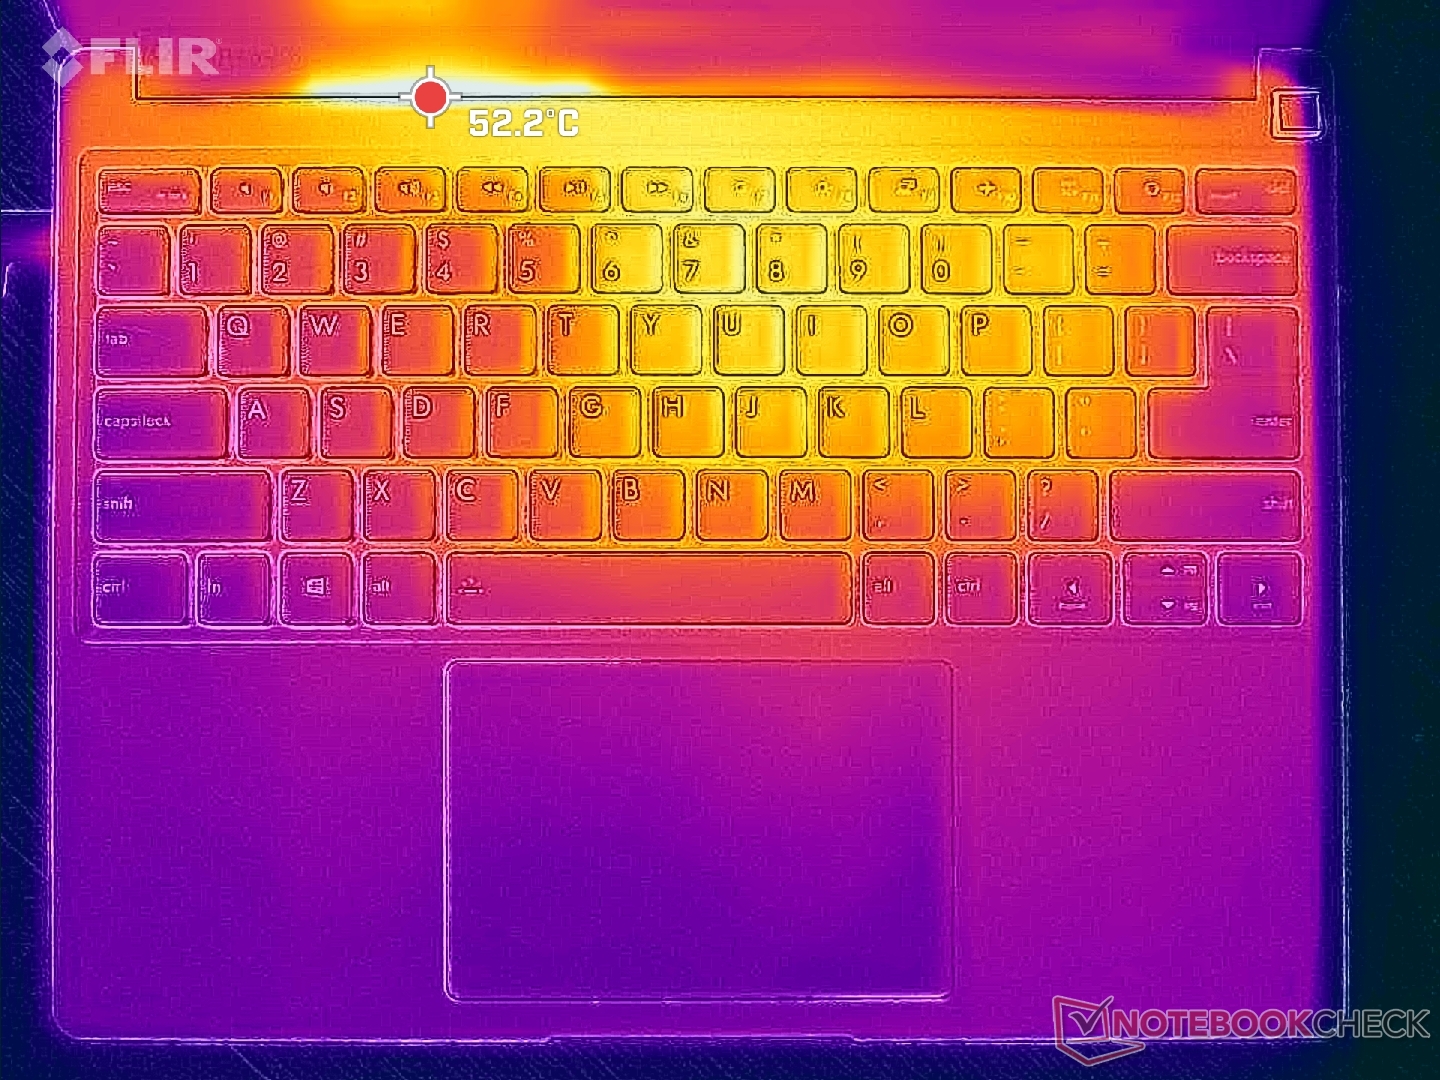
Temperatur
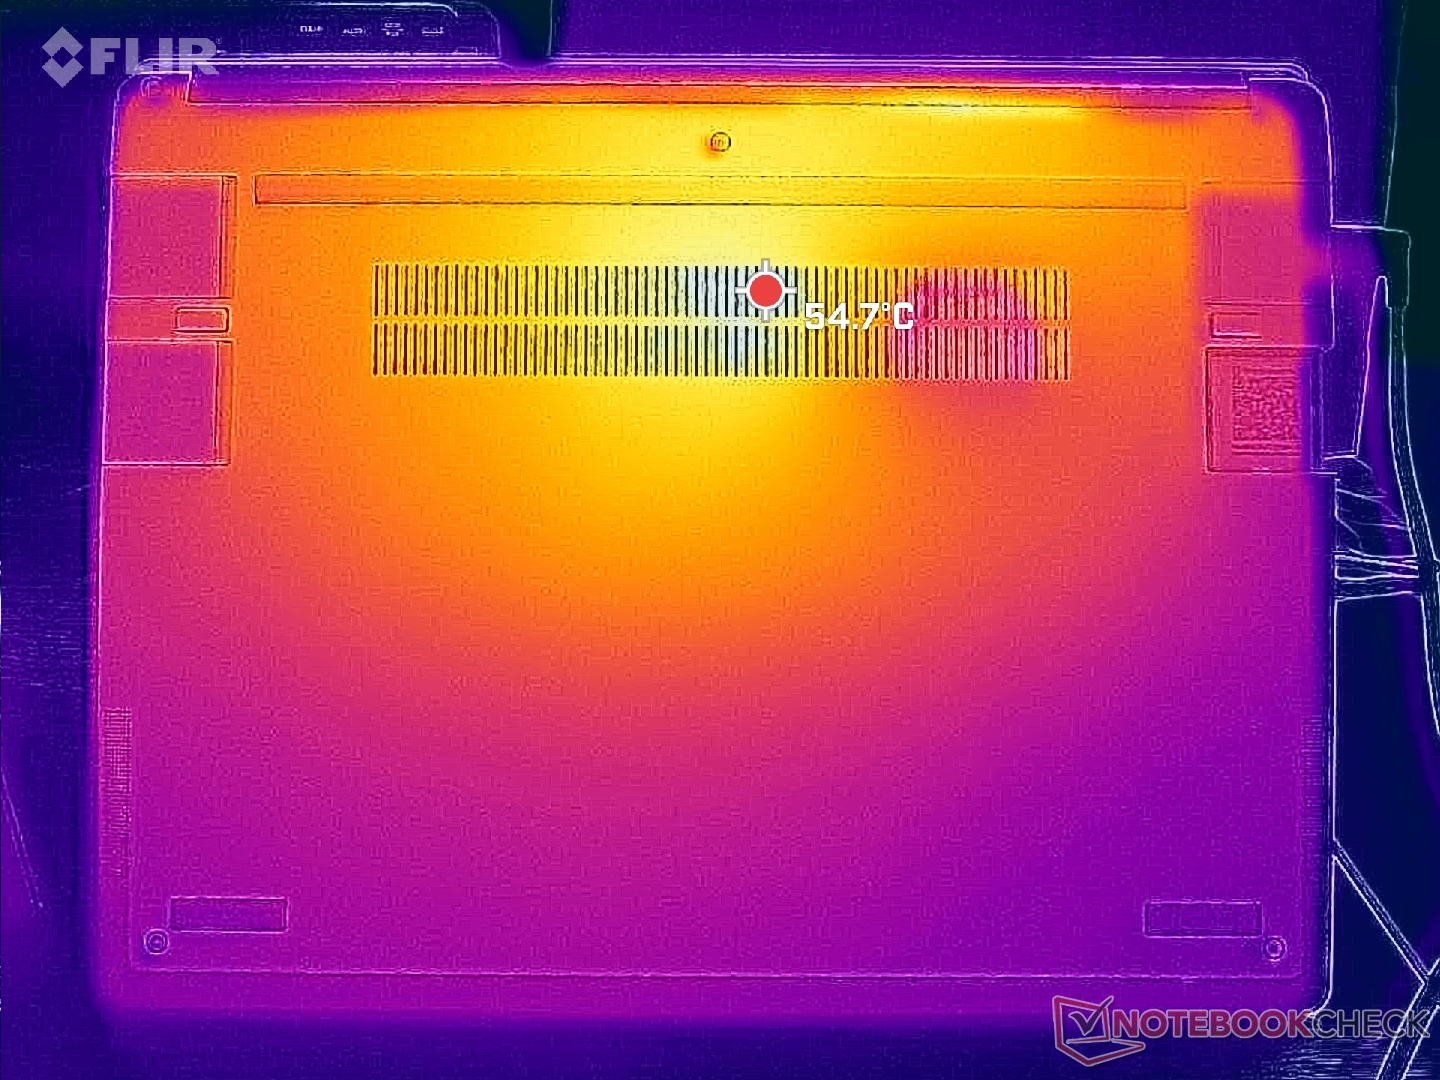
Die Oberflächentemperaturen sind nicht kühler als bei der Intel-Version, sie könnten sogar wärmer sein. Die durchschnittlichen Temperaturen auf unserem AMD-System sind sowohl auf der Ober- als auch auf der Unterseite ein paar Grad Celsius wärmer, aber Unterschiede in der Hintergrundtemperatur können nie ganz ausgeschlossen werden. Alternativen mit langsameren CPUs wie das HP Spectre x360 13.5 laufen kühler.
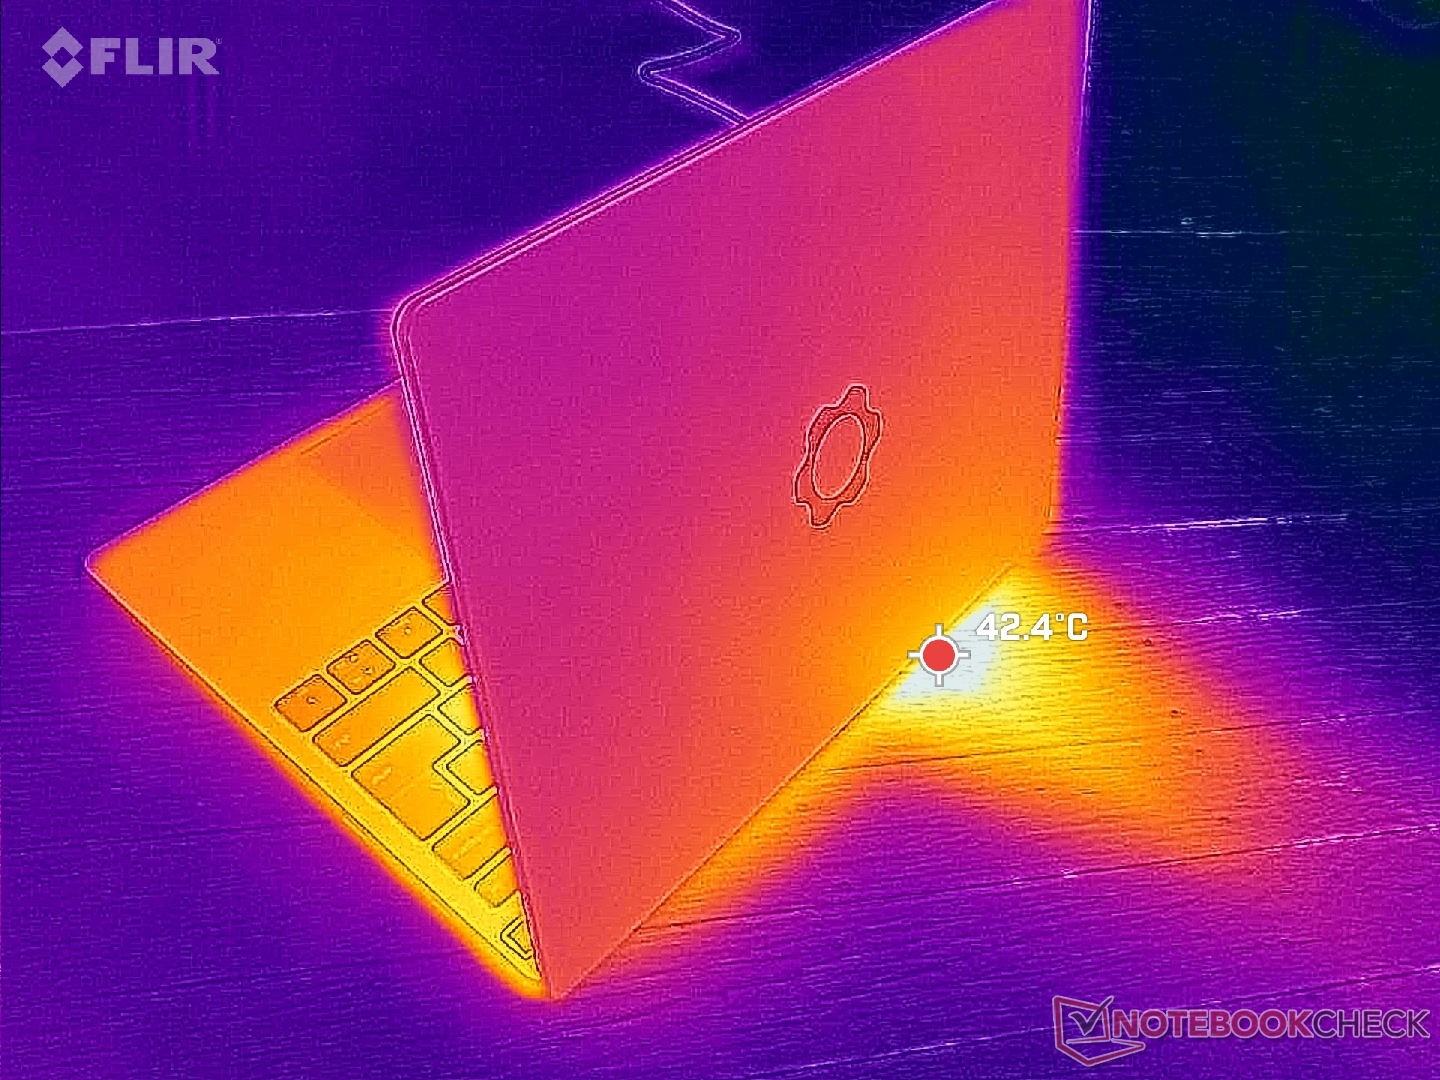
(±) Die maximale Temperatur auf der Oberseite ist 42 °C. Im Vergleich liegt der Klassendurchschnitt bei 34.3 °C (von 21.2 bis 62.5 °C für die Klasse Office).
(-) Auf der Unterseite messen wir eine maximalen Wert von 47.4 °C (im Vergleich zum Durchschnitt von 36.8 °C).
(+) Ohne Last messen wir eine durchschnittliche Temperatur von 27.5 °C auf der Oberseite. Der Klassendurchschnitt erreicht 29.5 °C.
(+) Die Handballen und der Touchpad-Bereich sind mit gemessenen 27.8 °C kühler als die typische Hauttemperatur und fühlen sich dadurch kühl an.
(±) Die durchschnittliche Handballen-Temperatur anderer getesteter Geräte war 27.5 °C (-0.3 °C).
| Framework Laptop 13.5 Ryzen 7 7840U AMD Ryzen 7 7840U, AMD Radeon 780M | Framework Laptop 13.5 Intel Core i7-1165G7, Intel Iris Xe Graphics G7 96EUs | Lenovo ThinkPad X1 Nano Gen 3 Intel Core i7-1360P, Intel Iris Xe Graphics G7 96EUs | HP Dragonfly G4 Intel Core i7-1365U, Intel Iris Xe Graphics G7 96EUs | Dell XPS 13 Plus 9320 Core i7-1360P Intel Core i7-1360P, Intel Iris Xe Graphics G7 96EUs | Asus ZenBook S13 OLED UX5304 Intel Core i7-1355U, Intel Iris Xe Graphics G7 96EUs | |
|---|---|---|---|---|---|---|
| Hitze | 6% | 7% | 7% | 9% | 3% | |
| Last oben max * (°C) | 42 | 47.2 -12% | 44 -5% | 38.6 8% | 43.8 -4% | 43.1 -3% |
| Last unten max * (°C) | 47.4 | 39.4 17% | 43.2 9% | 40.4 15% | 44.4 6% | 45 5% |
| Idle oben max * (°C) | 28.8 | 25.2 12% | 25.6 11% | 28.2 2% | 24 17% | 27.3 5% |
| Idle unten max * (°C) | 29.6 | 27.8 6% | 25.6 14% | 29 2% | 25.2 15% | 27.8 6% |
* ... kleinere Werte sind besser
Stresstest
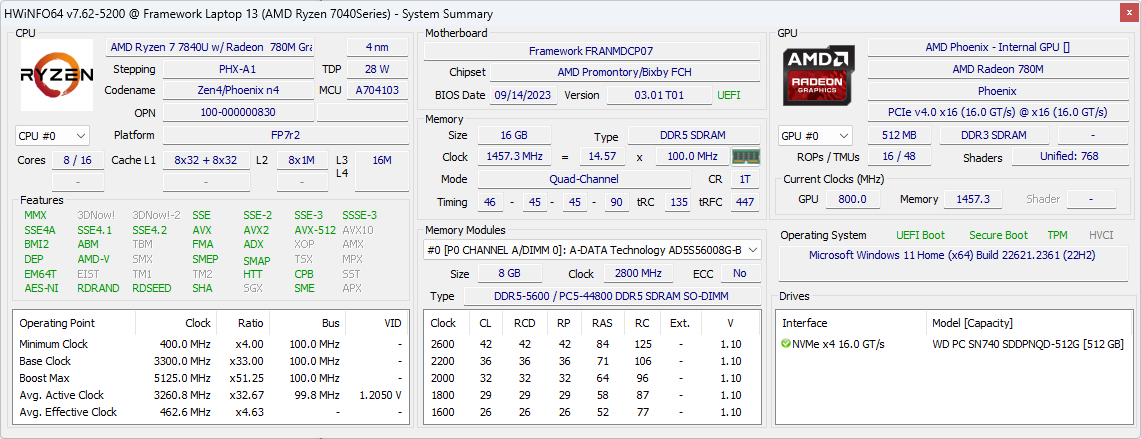
Die CPU-Taktraten und die Leistungsaufnahme der Platine stiegen auf 4 GHz bzw. 51 W und hielten höchstens ein paar Sekunden an, bevor sie sich bei 3,2 GHz, 35 W und 85 C stabilisierten. Die Wiederholung dieses Tests mit der Intel Core i7-Version führte zu ähnlichen Kerntemperaturen, jedoch bei einer etwas geringeren Leistungsaufnahme von 30 W.
Bei der Ausführung von Witcher 3 zur Darstellung anspruchsvoller Grafiklasten stabilisierte sich die Kerntemperatur bei nur 71 °C im Vergleich zu 93 °C bei der Intel-Version, obwohl die Radeon 780M viel schneller als die Iris Xe ist.
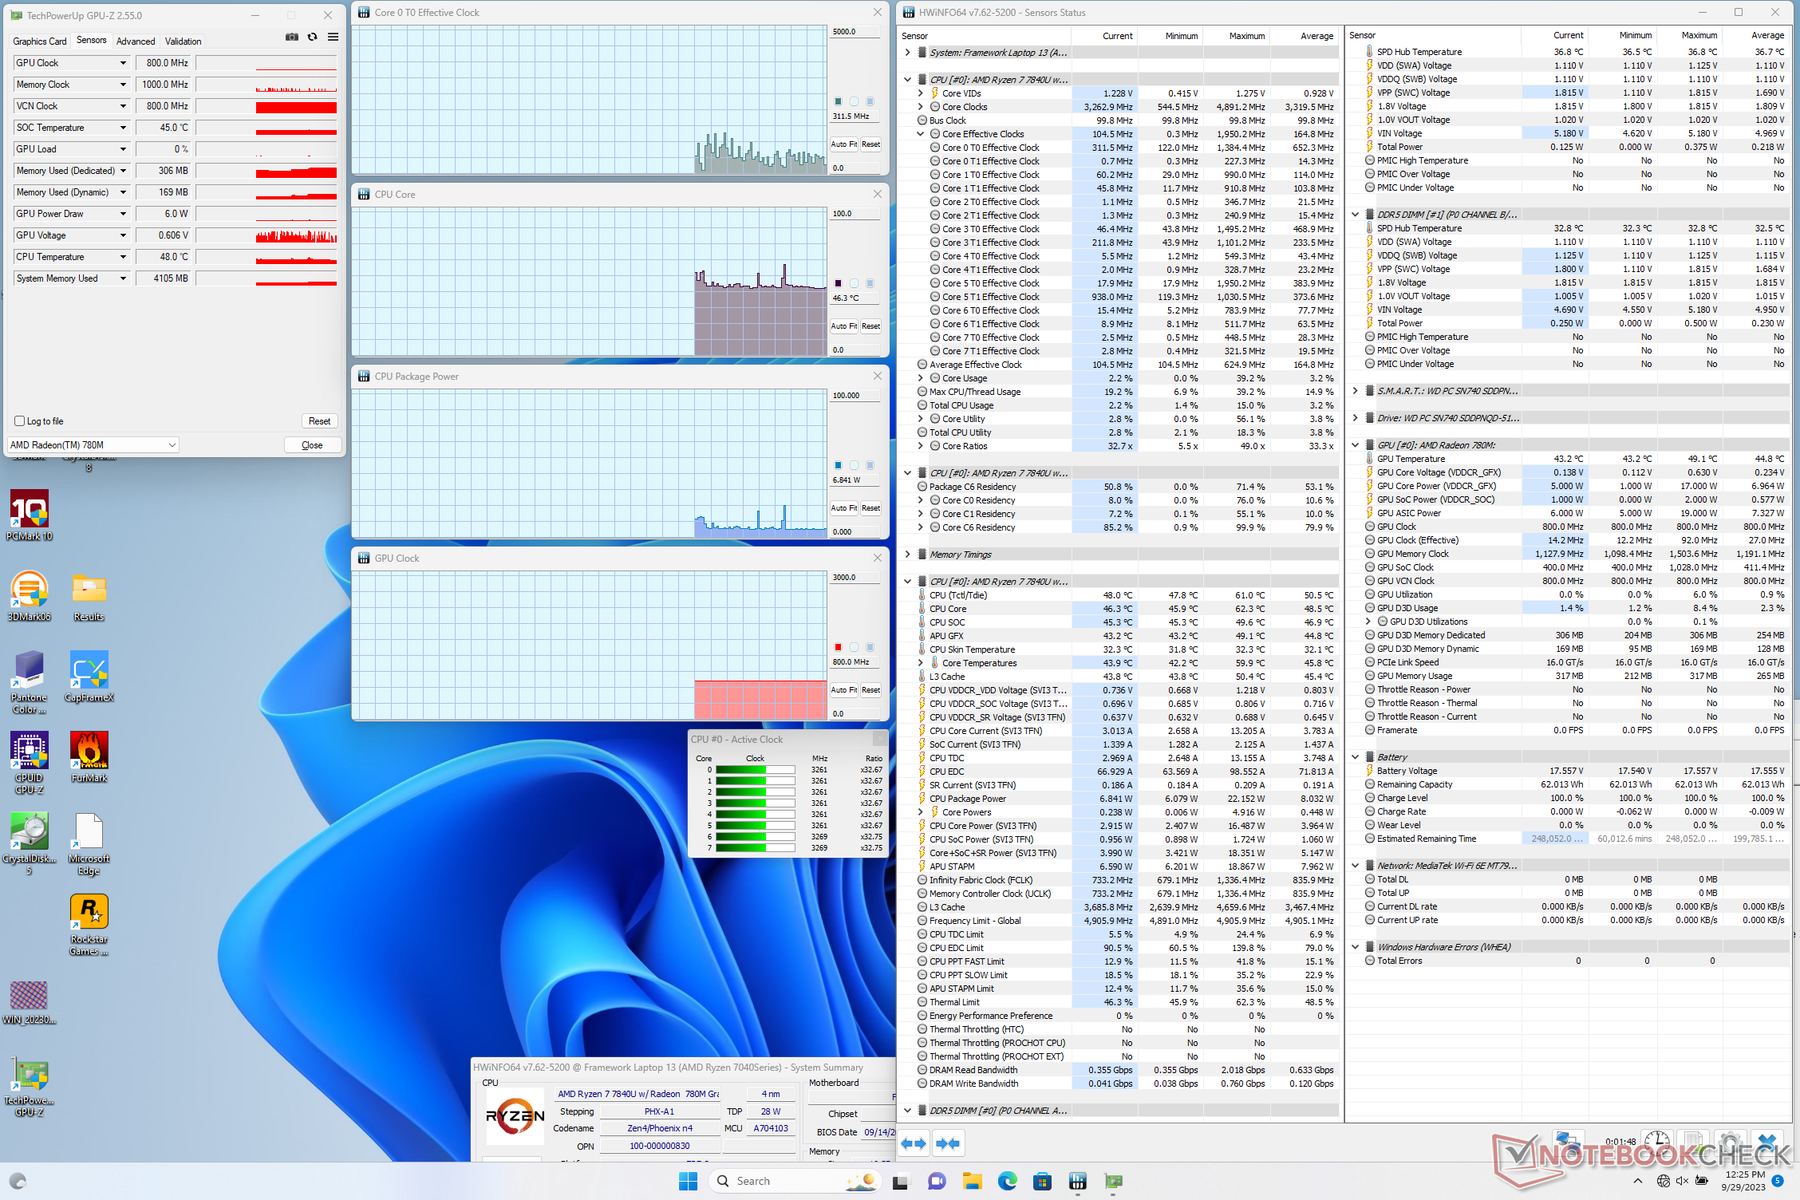
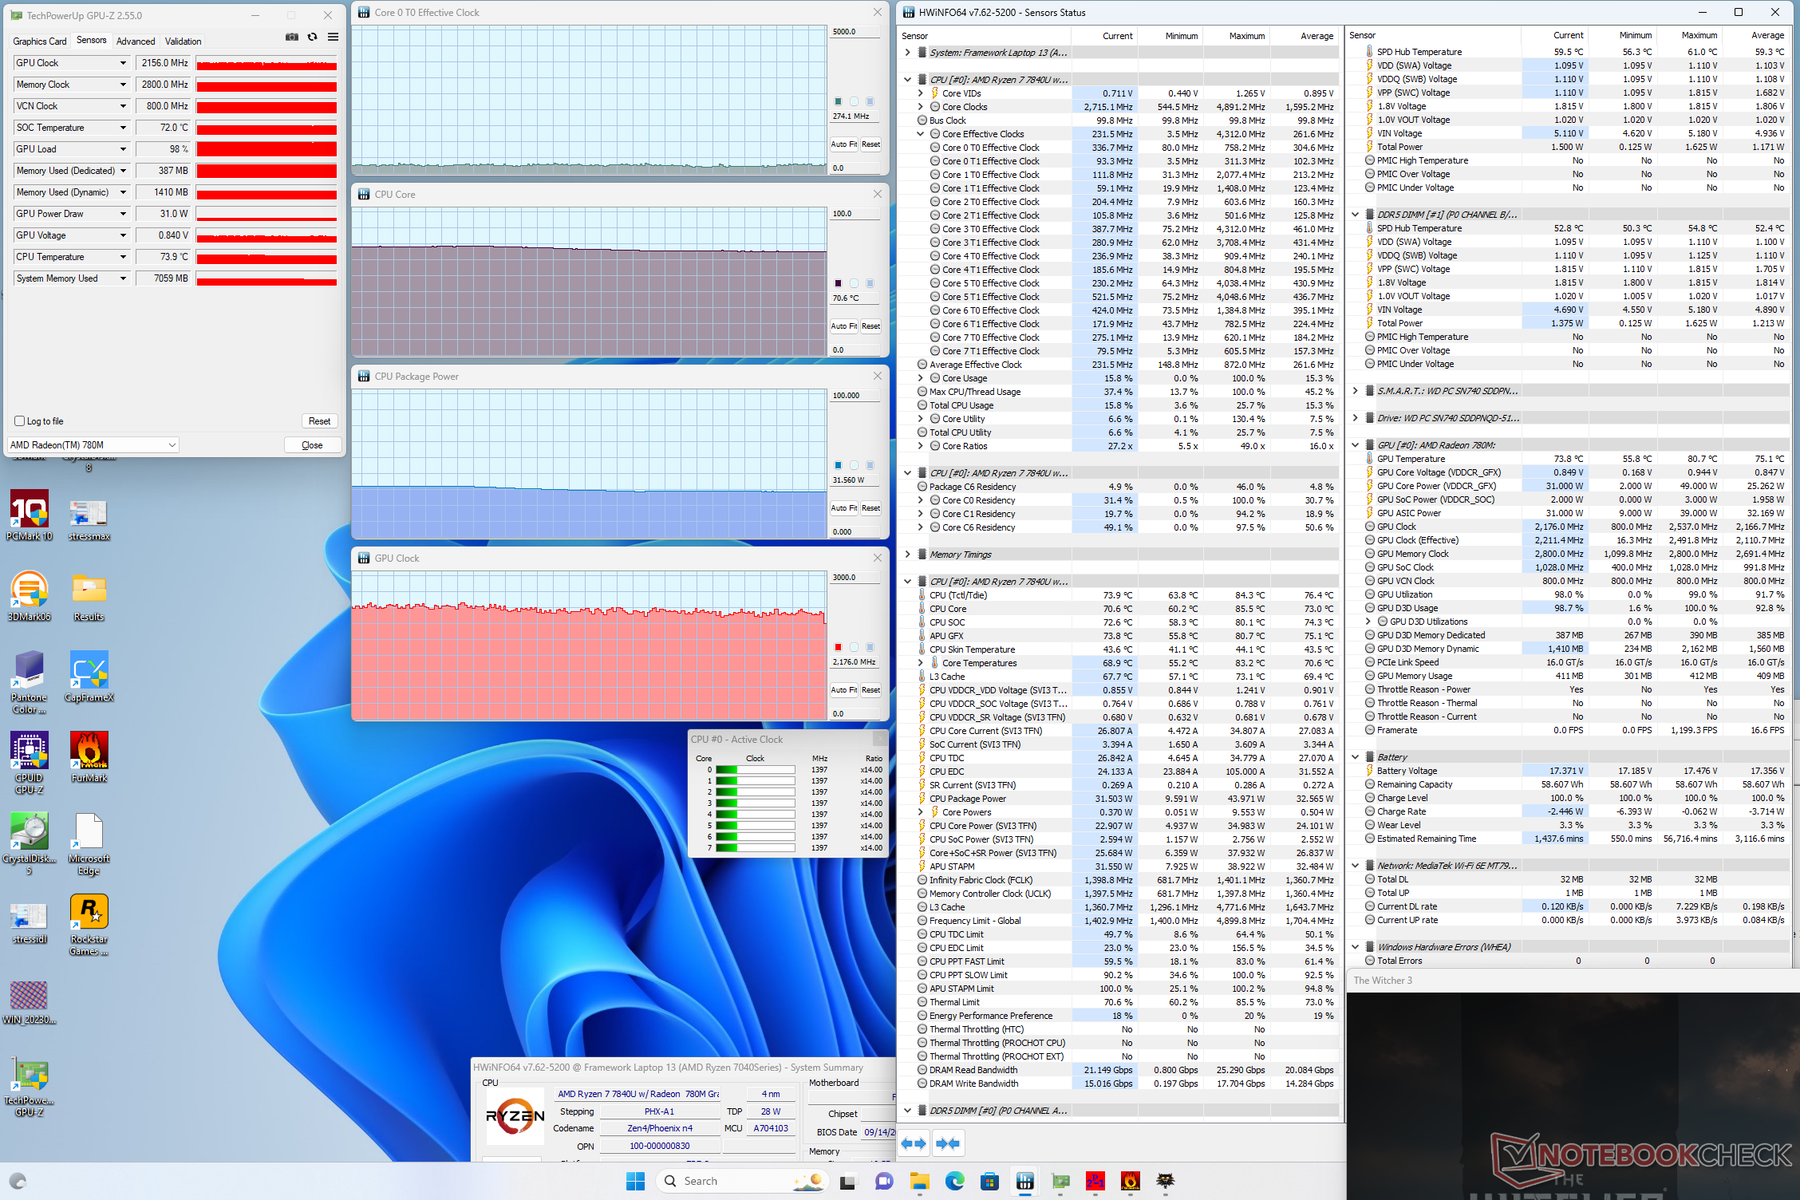
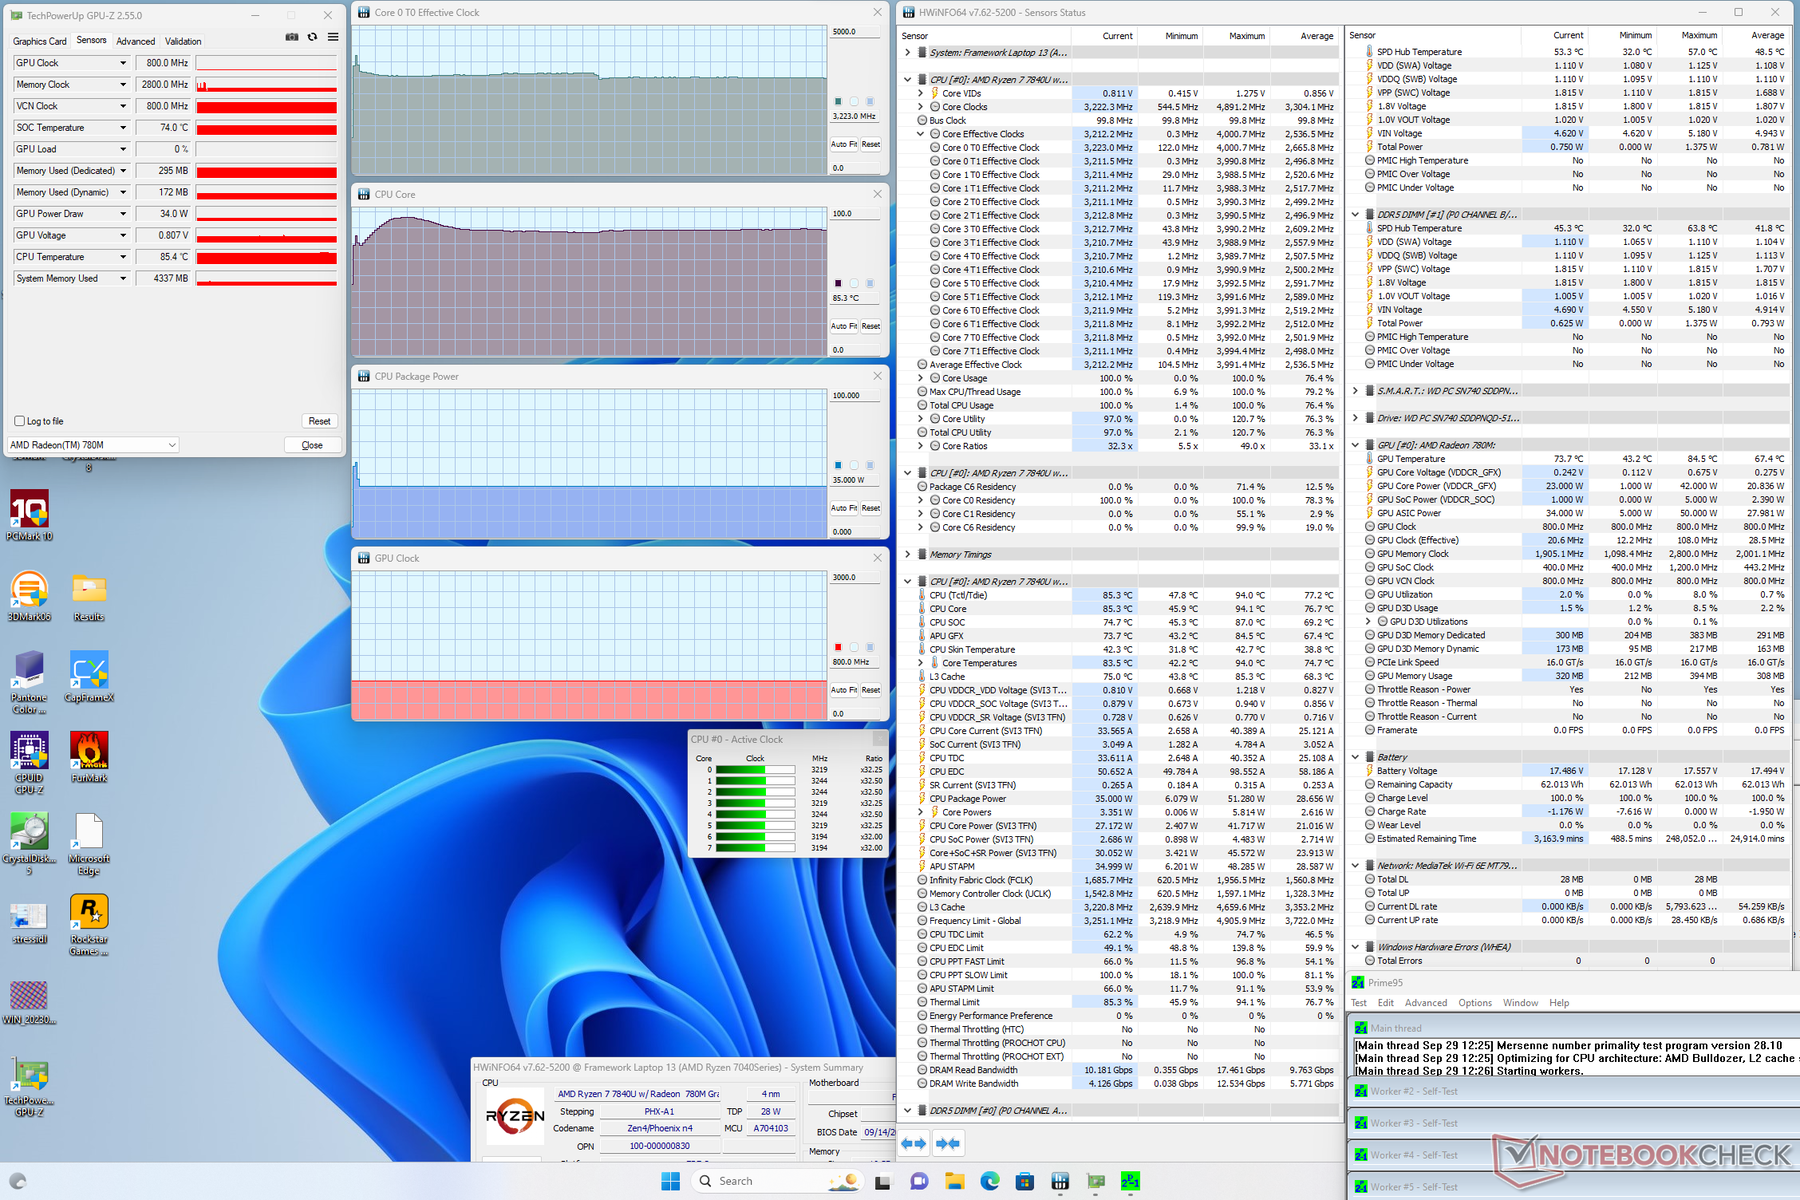
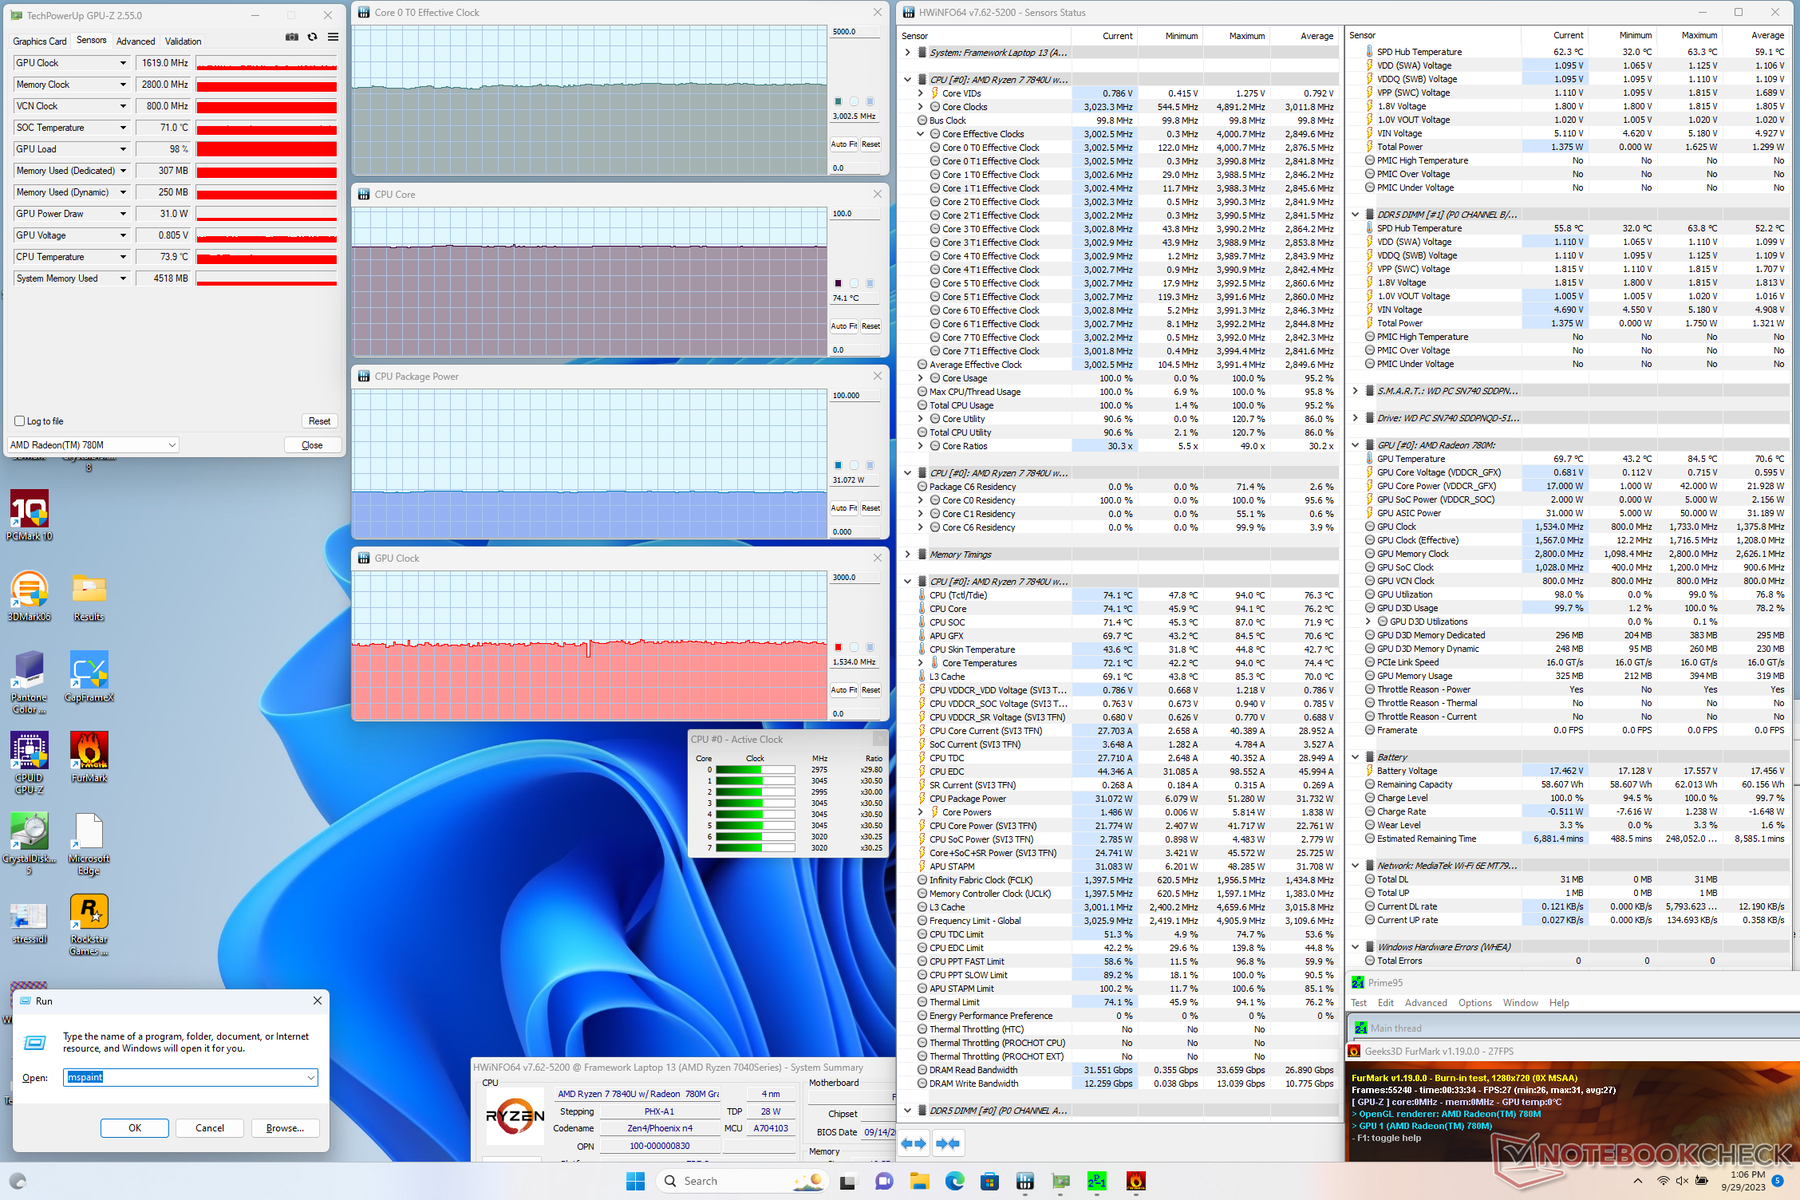
| CPU Clock (GHz) | GPU Clock (MHz) | Average CPU Temperature (°C) | |
| System Idle | -- | -- | 46 |
| Prime95 Stress | 3.2 | -- | 85 |
| Prime95 + FurMark Stress | 3.0 | 1534 | 74 |
| Witcher 3 Stress | ~0.3 | 2176 | 71 |
Lausprecher

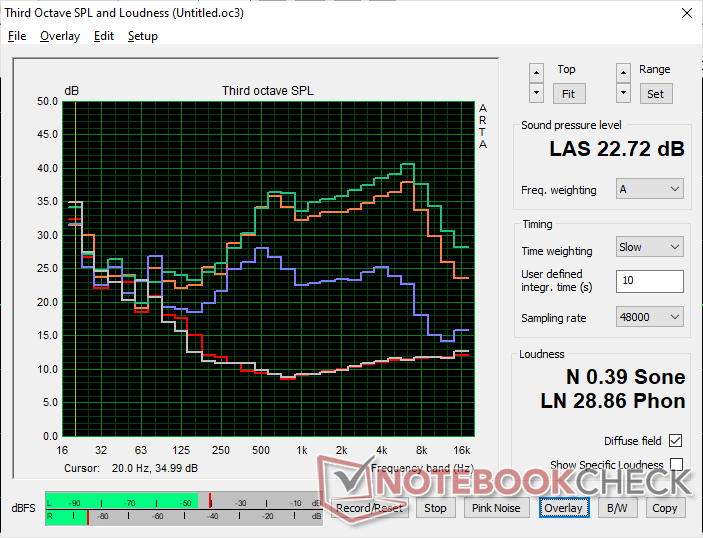
Framework Laptop 13.5 Ryzen 7 7840U Audio Analyse
(+) | Die Lautsprecher können relativ laut spielen (82.8 dB)
Bass 100 - 315 Hz
(±) | abgesenkter Bass - 10.7% geringer als der Median
(±) | durchschnittlich lineare Bass-Wiedergabe (9.2% Delta zum Vorgänger)
Mitteltöne 400 - 2000 Hz
(±) | zu hohe Mitten, vom Median 6.7% abweichend
(+) | lineare Mitten (3.9% Delta zum Vorgänger)
Hochtöne 2 - 16 kHz
(+) | ausgeglichene Hochtöne, vom Median nur 2.8% abweichend
(+) | sehr lineare Hochtöne (3.2% Delta zum Vorgänger)
Gesamt im hörbaren Bereich 100 - 16.000 Hz
(+) | hörbarer Bereich ist sehr linear (13.9% Abstand zum Median
Im Vergleich zu allen Geräten derselben Klasse
» 8% aller getesteten Geräte dieser Klasse waren besser, 4% vergleichbar, 87% schlechter
» Das beste Gerät hat einen Delta-Wert von 7%, durchschnittlich ist 21%, das schlechteste Gerät hat 53%
Im Vergleich zu allen Geräten im Test
» 16% aller getesteten Geräte waren besser, 4% vergleichbar, 80% schlechter
» Das beste Gerät hat einen Delta-Wert von 4%, durchschnittlich ist 24%, das schlechteste Gerät hat 134%
Apple MacBook Pro 16 2021 M1 Pro Audio Analyse
(+) | Die Lautsprecher können relativ laut spielen (84.7 dB)
Bass 100 - 315 Hz
(+) | guter Bass - nur 3.8% Abweichung vom Median
(+) | lineare Bass-Wiedergabe (5.2% Delta zum Vorgänger)
Mitteltöne 400 - 2000 Hz
(+) | ausgeglichene Mitten, vom Median nur 1.3% abweichend
(+) | lineare Mitten (2.1% Delta zum Vorgänger)
Hochtöne 2 - 16 kHz
(+) | ausgeglichene Hochtöne, vom Median nur 1.9% abweichend
(+) | sehr lineare Hochtöne (2.7% Delta zum Vorgänger)
Gesamt im hörbaren Bereich 100 - 16.000 Hz
(+) | hörbarer Bereich ist sehr linear (4.6% Abstand zum Median
Im Vergleich zu allen Geräten derselben Klasse
» 0% aller getesteten Geräte dieser Klasse waren besser, 0% vergleichbar, 100% schlechter
» Das beste Gerät hat einen Delta-Wert von 5%, durchschnittlich ist 17%, das schlechteste Gerät hat 45%
Im Vergleich zu allen Geräten im Test
» 0% aller getesteten Geräte waren besser, 0% vergleichbar, 100% schlechter
» Das beste Gerät hat einen Delta-Wert von 4%, durchschnittlich ist 24%, das schlechteste Gerät hat 134%
Energieverwaltung
Energieverbrauch
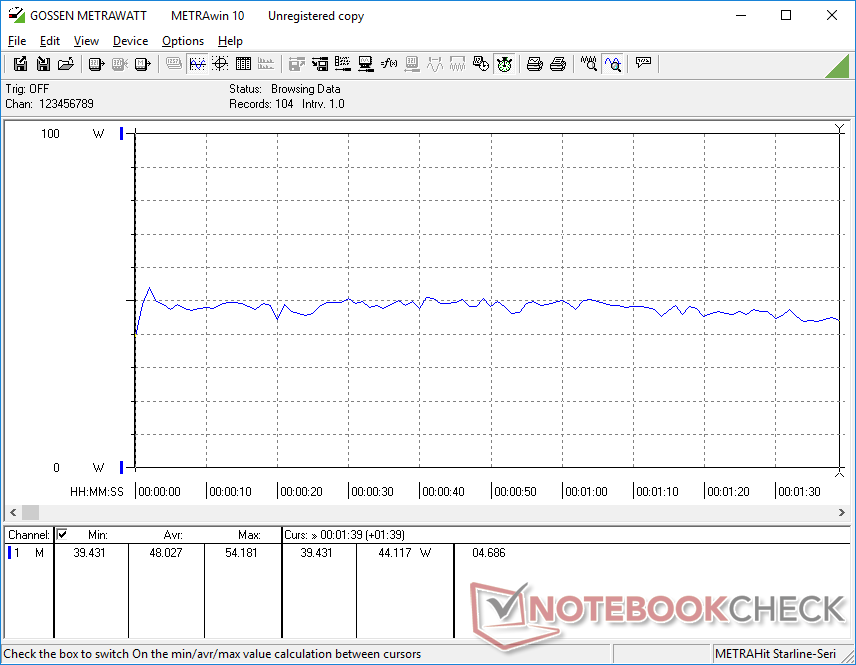
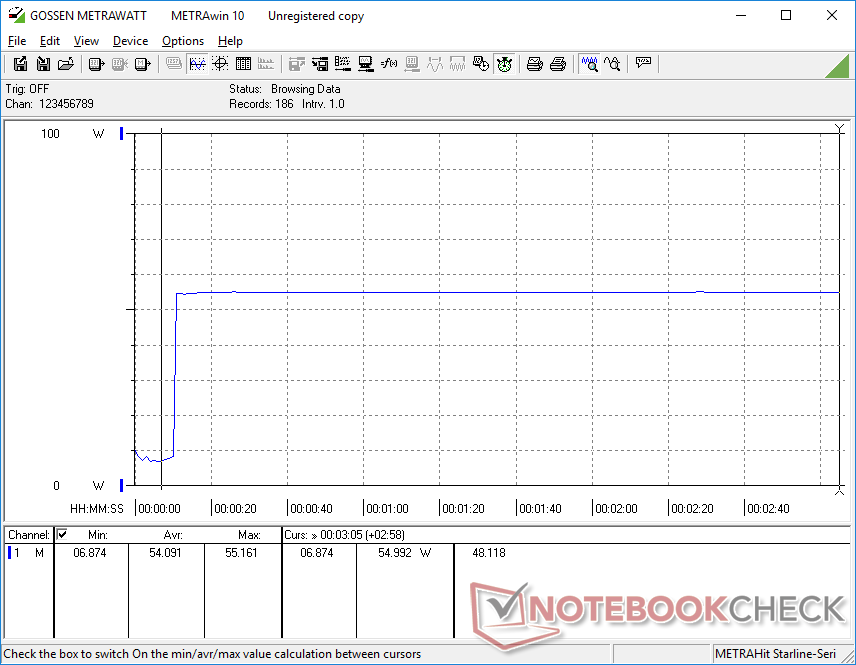
Der Energieverbrauch liegt durchweg niedriger als bei der von uns gemessenen Core i7-1370P-Konfiguration. Zusätzlich dazu übertrifft unser Ryzen 7 7840U in den meisten Anwendungen die Intel-CPU. Im Leerlauf auf dem Desktop werden lediglich 4 bis 7 W benötigt, im Vergleich zu 3 bis 10 W bei der Intel-Version.
Selbst bei der Ausführung von Witcher 3, einem typischen Belastungstest für Spiele, würde die Leistungsaufnahme etwa 8 % niedriger sein als bei der Core i7-1370P-Konfiguration, trotz einer um 30 bis 50 % höheren Grafikleistung. Die Radeon 780M ist also nicht nur schneller als die Iris Xe 96 EUs, sondern benötigt auch weniger Energie für eine höhere Leistung pro Watt.
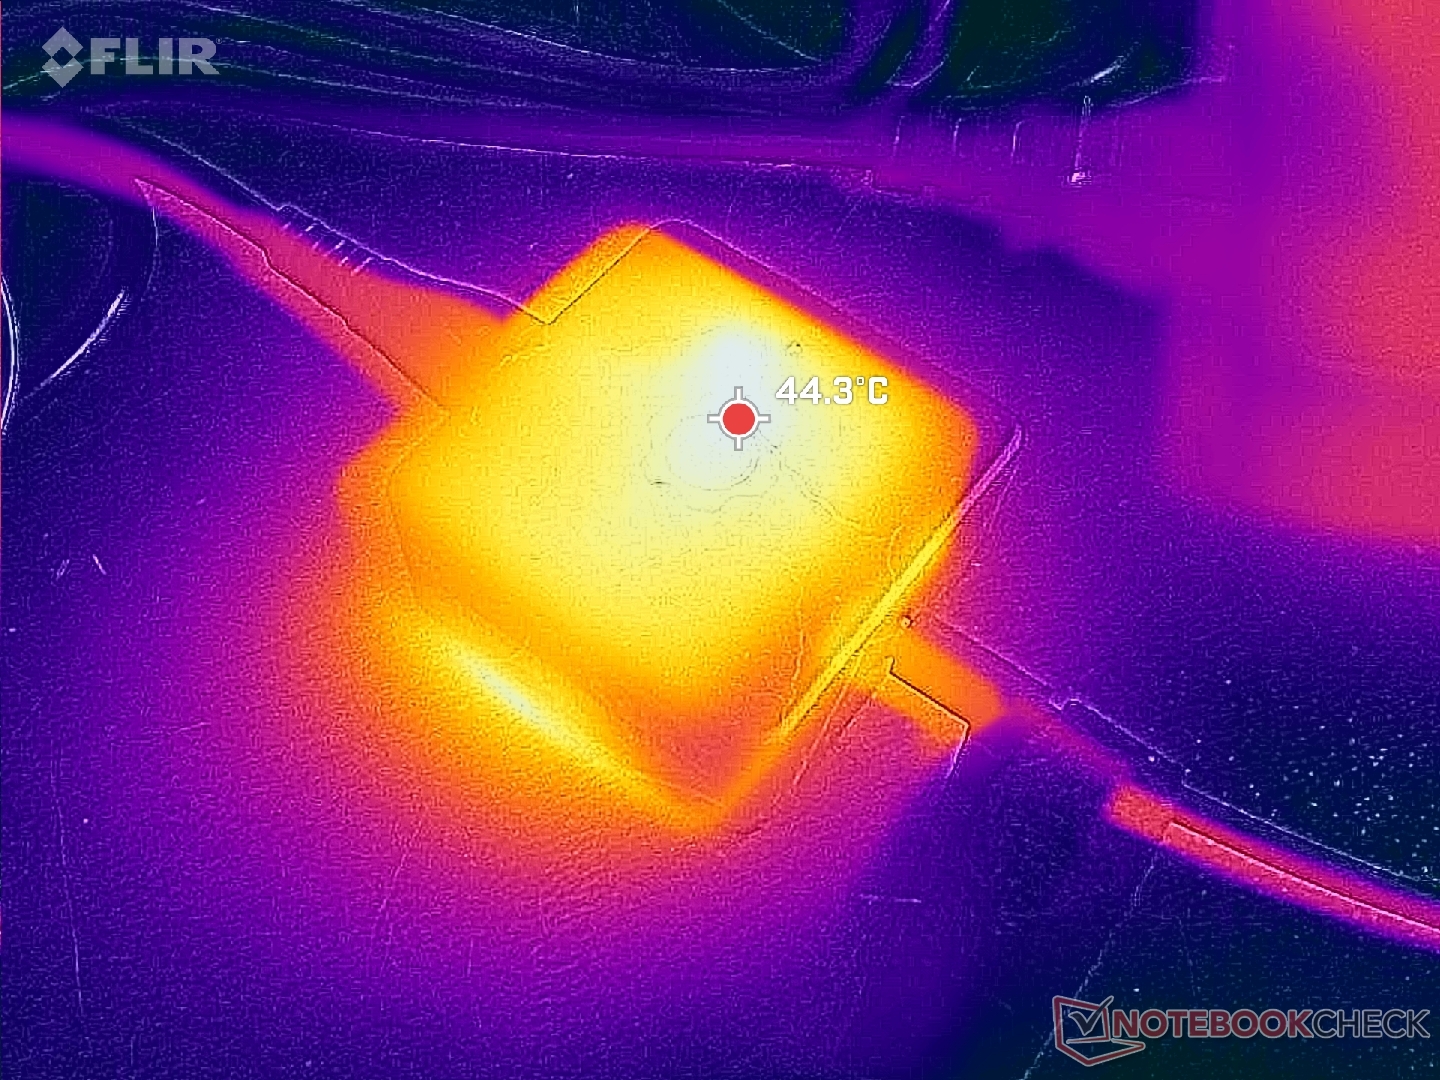
Das kompakte (ungefähr 5,8 x 5,8 x 2,6 cm) 60-Watt-GaN-USB-C-Netzteil bleibt unabhängig von der gewählten CPU-Option in allen Konfigurationen gleich.


| Aus / Standby | |
| Idle | |
| Last |
|
Legende:
min: | |
| Framework Laptop 13.5 Ryzen 7 7840U R7 7840U, Radeon 780M, WD PC SN740 512GB SDDPNQD-512G, IPS, 2256x1504, 13.5" | Framework Laptop 13.5 13th Gen Intel i7-1370P, Iris Xe G7 96EUs, WD PC SN740 SDDPNQD-1T00, IPS, 2256x1504, 13.5" | Framework Laptop 13.5 12th Gen Intel i7-1260P, Iris Xe G7 96EUs, WDC PC SN730 SDBPNTY-512G, IPS, 2256x1504, 13.5" | Framework Laptop 13.5 i7-1165G7, Iris Xe G7 96EUs, Western Digital WD_BLACK SN850 WDS100T1X0E, IPS, 2256x1504, 13.5" | Lenovo ThinkPad X1 Nano Gen 3 i7-1360P, Iris Xe G7 96EUs, Lenovo UMIS AM6A0 RPJTJ512MKP1QDQ, IPS, 2160x1350, 13" | HP Dragonfly G4 i7-1365U, Iris Xe G7 96EUs, Micron 3400 MTFDKBA512TFH 512GB, IPS, 1920x1280, 13.5" | |
|---|---|---|---|---|---|---|
| Stromverbrauch | -9% | -25% | -8% | 9% | -1% | |
| Idle min * (Watt) | 4 | 2.9 27% | 5.3 -33% | 4.3 -8% | 3.3 17% | 4.1 -2% |
| Idle avg * (Watt) | 6.5 | 6.3 3% | 8.4 -29% | 8.2 -26% | 6.5 -0% | 7.5 -15% |
| Idle max * (Watt) | 6.8 | 9.9 -46% | 11.2 -65% | 8.7 -28% | 7.1 -4% | 8.2 -21% |
| Last avg * (Watt) | 48 | 56.2 -17% | 57.4 -20% | 43.5 9% | 40.7 15% | 35.5 26% |
| Witcher 3 ultra * (Watt) | 52.3 | 56.6 -8% | 46.7 11% | 43.5 17% | 37 29% | 37.5 28% |
| Last max * (Watt) | 55.2 | 60.8 -10% | 61.2 -11% | 61.8 -12% | 58.6 -6% | 66.5 -20% |
* ... kleinere Werte sind besser
Energieverbrauch Witcher 3 / Stresstest
Energieverbrauch externer Monitor
Akkulaufzeit
Aufgrund des bereits erwähnten geringeren Stromverbrauchs sind die Laufzeiten deutlich länger als bei den Intel-basierten Konfigurationen. Mit unserem AMD-Modell können wir im Internet über 3 Stunden länger surfen als mit dem Core i7-1370P-Modell, wenn beide auf den Balanced-Modus und eine Helligkeit von 150 Nit eingestellt sind. Das bedeutet nicht, dass die Akkulaufzeit der Intel-Konfiguration schlecht ist, aber AMD hat in dieser Hinsicht einen klaren Vorteil.
Es sei darauf hingewiesen, dass die Ryzen-5-Basiskonfiguration nur über einen 55-Wh-Akku verfügt, im Vergleich zu dem 61-Wh-Akku unserer Ryzen-7-7840U-Konfiguration.
| Framework Laptop 13.5 Ryzen 7 7840U R7 7840U, Radeon 780M, 61 Wh | Framework Laptop 13.5 13th Gen Intel i7-1370P, Iris Xe G7 96EUs, 61 Wh | Framework Laptop 13.5 12th Gen Intel i7-1260P, Iris Xe G7 96EUs, 55 Wh | Framework Laptop 13.5 i7-1165G7, Iris Xe G7 96EUs, 55 Wh | Lenovo ThinkPad X1 Nano Gen 3 i7-1360P, Iris Xe G7 96EUs, 49.5 Wh | HP Dragonfly G4 i7-1365U, Iris Xe G7 96EUs, 68 Wh | |
|---|---|---|---|---|---|---|
| Akkulaufzeit | -27% | -38% | -34% | -36% | 31% | |
| WLAN (h) | 12.1 | 8.8 -27% | 7.5 -38% | 8 -34% | 7.8 -36% | 15.9 31% |
| Idle (h) | 42.5 | |||||
| Last (h) | 3.2 |
Pro
Contra
Fazit — Zweimal so schnelle Grafikleistung als bei Intel
Wenn Sie Wert auf Multi-Thread-Leistung und Grafik legen, ist die AMD-Konfiguration ohne Zweifel die bessere Wahl im Vergleich zu Intel. Der Ryzen 7 7840U und die Radeon 780M sind schneller als jeder Intel Core-U- oder Core-P-Prozessor der 13. Generation, insbesondere wenn es um Leistung pro Watt und Akkulaufzeit geht. Die Tatsache, dass die Ryzen 7- und Core i7-Konfigurationen jeweils etwa 1430 Euro kosten, macht die AMD-Version nur noch attraktiver.
Es sei denn, Sie benötigen unbedingt Ryzen PRO oder Intel vPro, dann ist das AMD-basierte Framework Laptop 13.5 schneller und viel einfacher zu empfehlen als das Intel-Modell, vor allem, da sie ungefähr gleich viel kosten.
Es gibt immer noch ein paar Gründe, sich für Intel zu entscheiden. Erstens sind die Zen 4 Ryzen PRO-CPUs noch nicht bei Framework erhältlich, daher ist Intel vPro die einzige Option. Zweitens hat die Core-P-Serie immer noch einen leichten Vorsprung vor AMD, besonders in Bezug auf die Single-Thread-Leistung. Und schließlich sind die USB-C-Anschlüsse des Intel-Modells einheitlich, wenn es um Funktionen und Kompatibilität geht. Von diesen drei Unterschieden ist der erste wohl der wertvollste, vor allem für Unternehmen oder Nutzer, die eine zusätzliche Hardware-Sicherheitsebene benötigen. Ansonsten ist es schwer, auf eine längere Akkulaufzeit und eine doppelt so hohe Grafikleistung zum gleichen Preis zu verzichten.
Preis und Verfügbarkeit
Der Hersteller liefert jetzt seine AMD-Version des Framework Laptop 13.5 ab 979 Euro für die Ryzen 5-Basiskonfiguration bis zu über 1370 Euro bei voller Konfiguration mit dem Ryzen 7 7840U.
Framework Laptop 13.5 Ryzen 7 7840U
- 02.10.2023 v7 (old)
Allen Ngo
Transparenz
Die Auswahl der zu testenden Geräte erfolgt innerhalb der Redaktion. Das vorliegende Testmuster wurde dem Autor vom Hersteller oder einem Shop zu Testzwecken leihweise zur Verfügung gestellt. Eine Einflussnahme des Leihstellers auf den Testbericht gab es nicht, der Hersteller erhielt keine Version des Reviews vor der Veröffentlichung. Es bestand keine Verpflichtung zur Publikation. Als eigenständiges, unabhängiges Unternehmen unterliegt Notebookcheck keiner Diktion von Herstellern, Shops und Verlagen.
So testet Notebookcheck
Pro Jahr werden von Notebookcheck hunderte Laptops und Smartphones unabhängig in von uns standardisierten technischen Verfahren getestet, um eine Vergleichbarkeit aller Testergebnisse zu gewährleisten. Seit rund 20 Jahren entwickeln wir diese Testmethoden kontinuierlich weiter und setzen damit Branchenstandards. In unseren Testlaboren kommt ausschließlich hochwertiges Messequipment in die Hände erfahrener Techniker und Redakteure. Die Tests unterliegen einer mehrstufigen Kontrolle. Unsere komplexe Gesamtbewertung basiert auf hunderten fundierten Messergebnissen und Benchmarks, womit Ihnen Objektivität garantiert ist. Weitere Informationen zu unseren Testmethoden gibt es hier.
Preisvergleich

