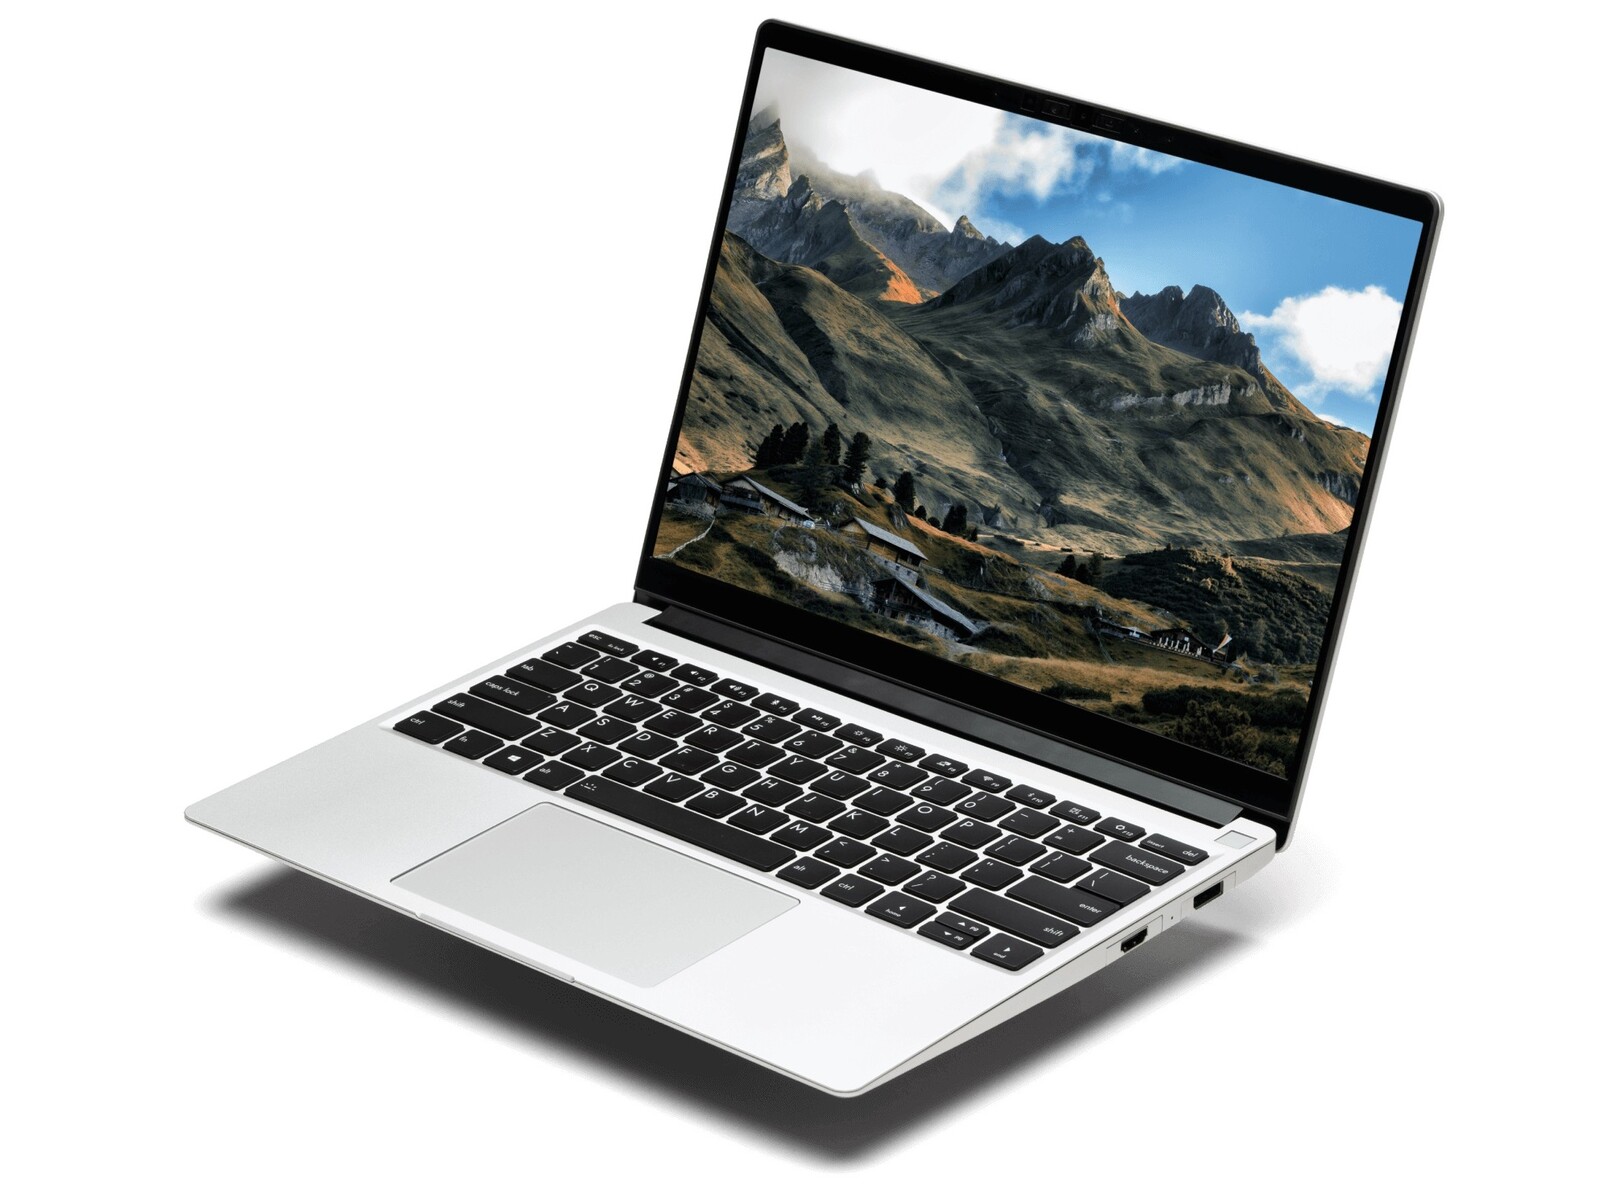
Framework Laptop 13.5 im Test: So würde Microsofts Surface Laptop aussehen, wenn man ihn reparieren könnte
Laptops werden niemals so aufrüstbar oder so leicht zu reparieren sein wie Desktop-PCs, aber das bedeutet nicht, dass man es nicht zumindest versuchen sollte. Ein kleines Entwicklerteam bei Framework hat einen eigenen ultradünnen Laptop gebaut, bei dem der Nutzer so viel wie möglich aufrüsten bzw. austauschen kann. Weitere Details zu dem Projekt sind auf der englischen Webseite des Herstellers verfügbar. Aktuell wird das Gerät noch nicht nach Deutschland geliefert.
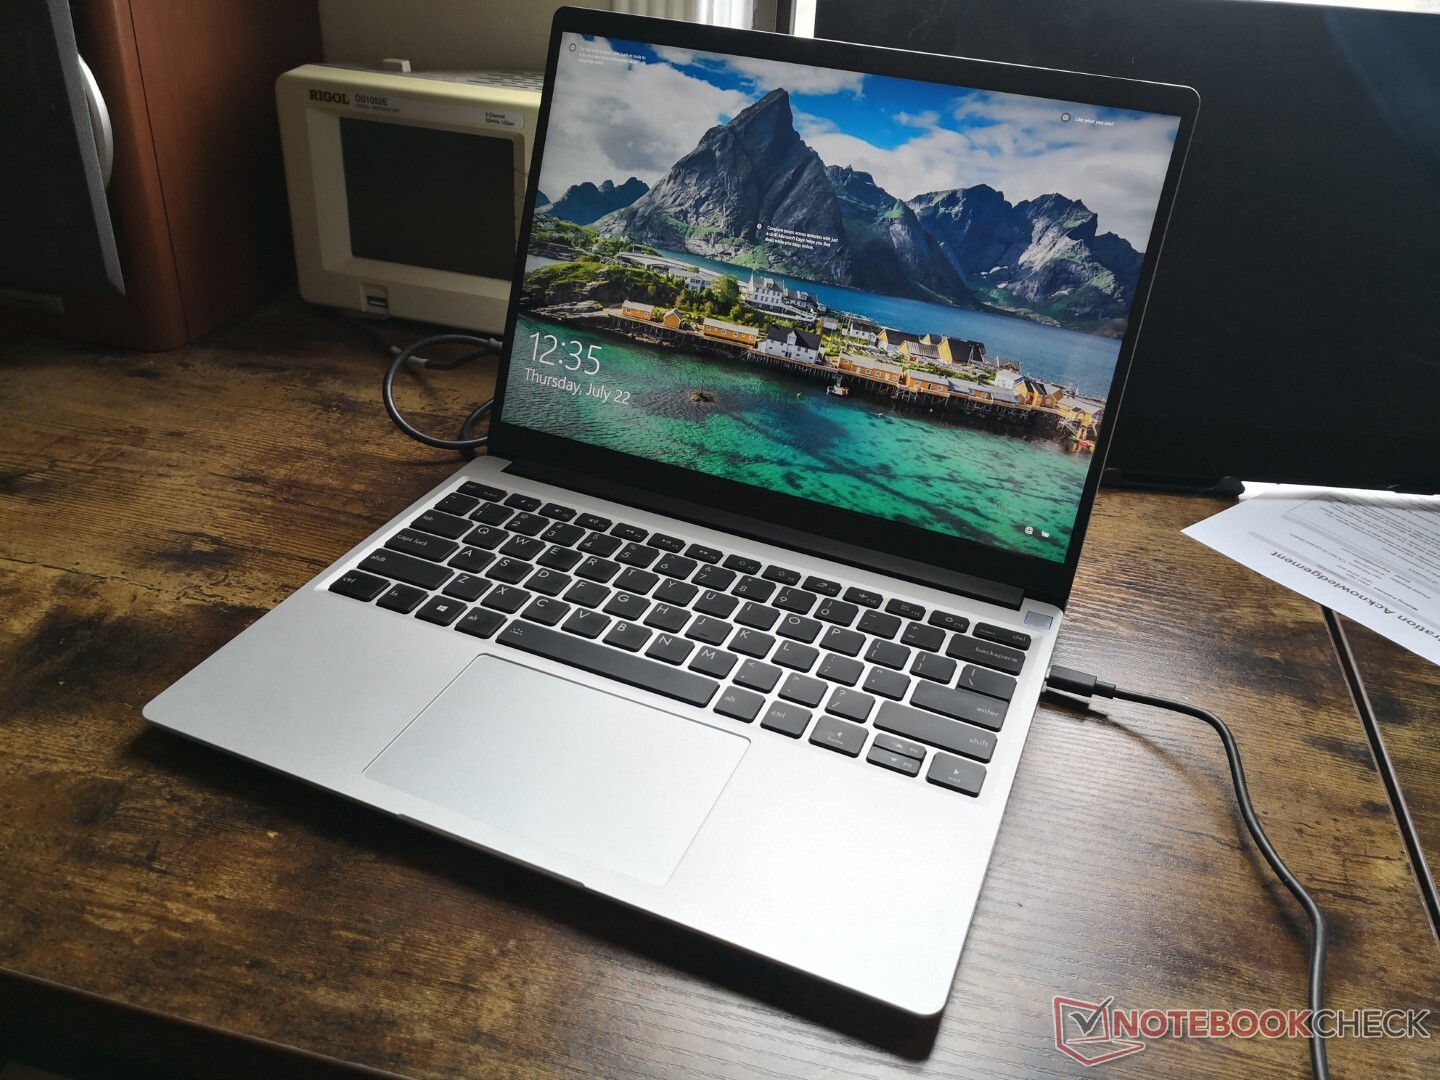
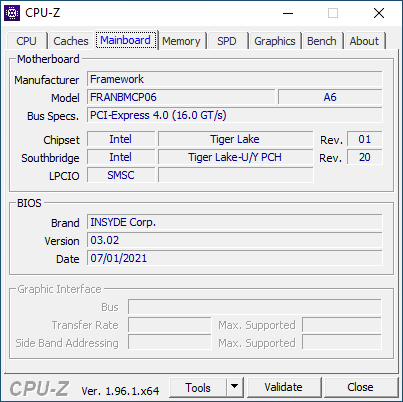
Der 13,5 Zoll große Framework Laptop nutzt einen 3:2-Display und folgt dabei dem Vorbild des HP Spectre x360 14 oder Microsofts Surface Laptop 4. Im Inneren kommen die gleichen aktuellen Tiger-Lake-U-Prozessoren von Intel zum Einsatz, die man auch bei den bekannten Herstellern bekommt. Tiger Lake ist zudem der Schlüssel zu vielen anpassbaren Funktionen des Framework Laptop. In diesem Test sehen wir uns die Leistung der i7-Konfiguration an und vergleichen das neue Gerät mit bekannten Notebooks von den großen Herstellern wie HP, Lenovo und Microsoft.
Mögliche Konkurrenten im Vergleich
Bew. | Datum | Modell | Gewicht | Dicke | Größe | Auflösung | Preis ab |
|---|---|---|---|---|---|---|---|
| 85.4 % v7 (old) | 07 / 2021 | Framework Laptop 13.5 i7-1165G7, Iris Xe G7 96EUs | 1.3 kg | 15.85 mm | 13.50" | 2256x1504 | |
| 89.5 % v7 (old) | 05 / 2021 | HP Spectre x360 14-ea0378ng i7-1165G7, Iris Xe G7 96EUs | 1.3 kg | 16.9 mm | 13.50" | 3000x2000 | |
| 84.7 % v7 (old) | 05 / 2021 | Microsoft Surface Laptop 4 13 i7 i7-1185G7, Iris Xe G7 96EUs | 1.3 kg | 14.5 mm | 13.50" | 2256x1504 | |
| 87.3 % v7 (old) | 04 / 2021 | Lenovo ThinkPad X1 Titanium Yoga G1 20QA001RGE i7-1160G7, Iris Xe G7 96EUs | 1.2 kg | 11.5 mm | 13.50" | 2256x1504 | |
| 85.7 % v7 (old) | 07 / 2021 | HP ProBook x360 435 G8 R7-5800U R7 5800U, Vega 8 | 1.5 kg | 18 mm | 13.30" | 1920x1080 | |
| 84.7 % v7 (old) | 07 / 2021 | Lenovo Yoga 6 13 82ND0009US R5 5500U, Vega 7 | 1.3 kg | 18.2 mm | 13.30" | 1920x1080 |
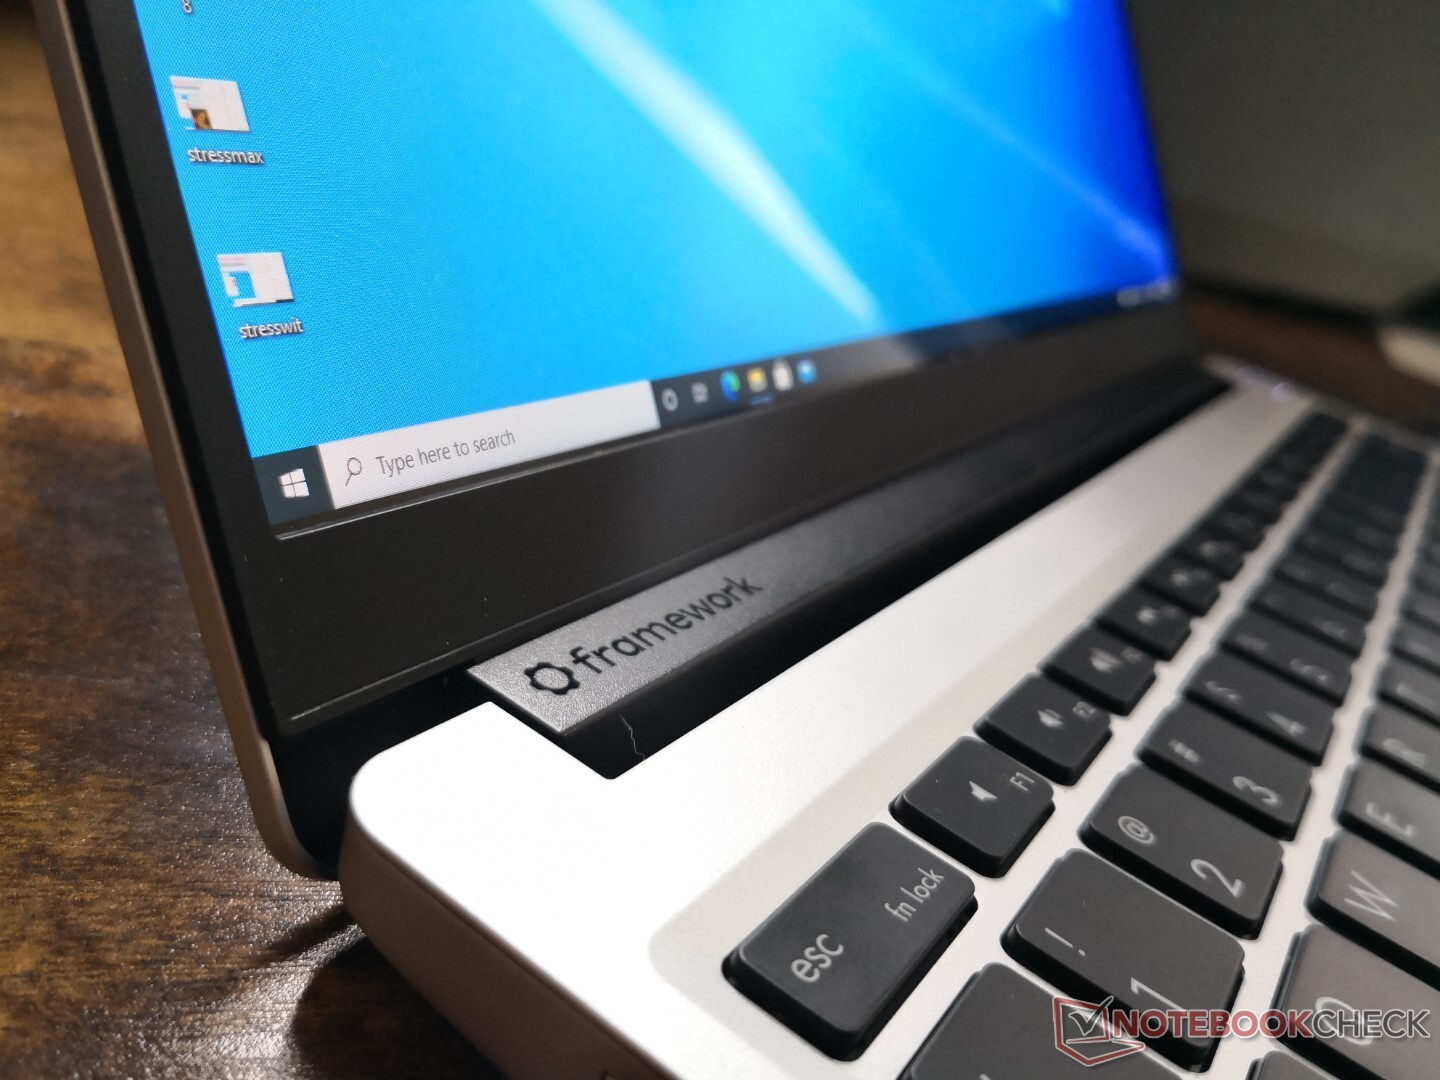
Gehäuse - Fast wie ein Apple MacBook
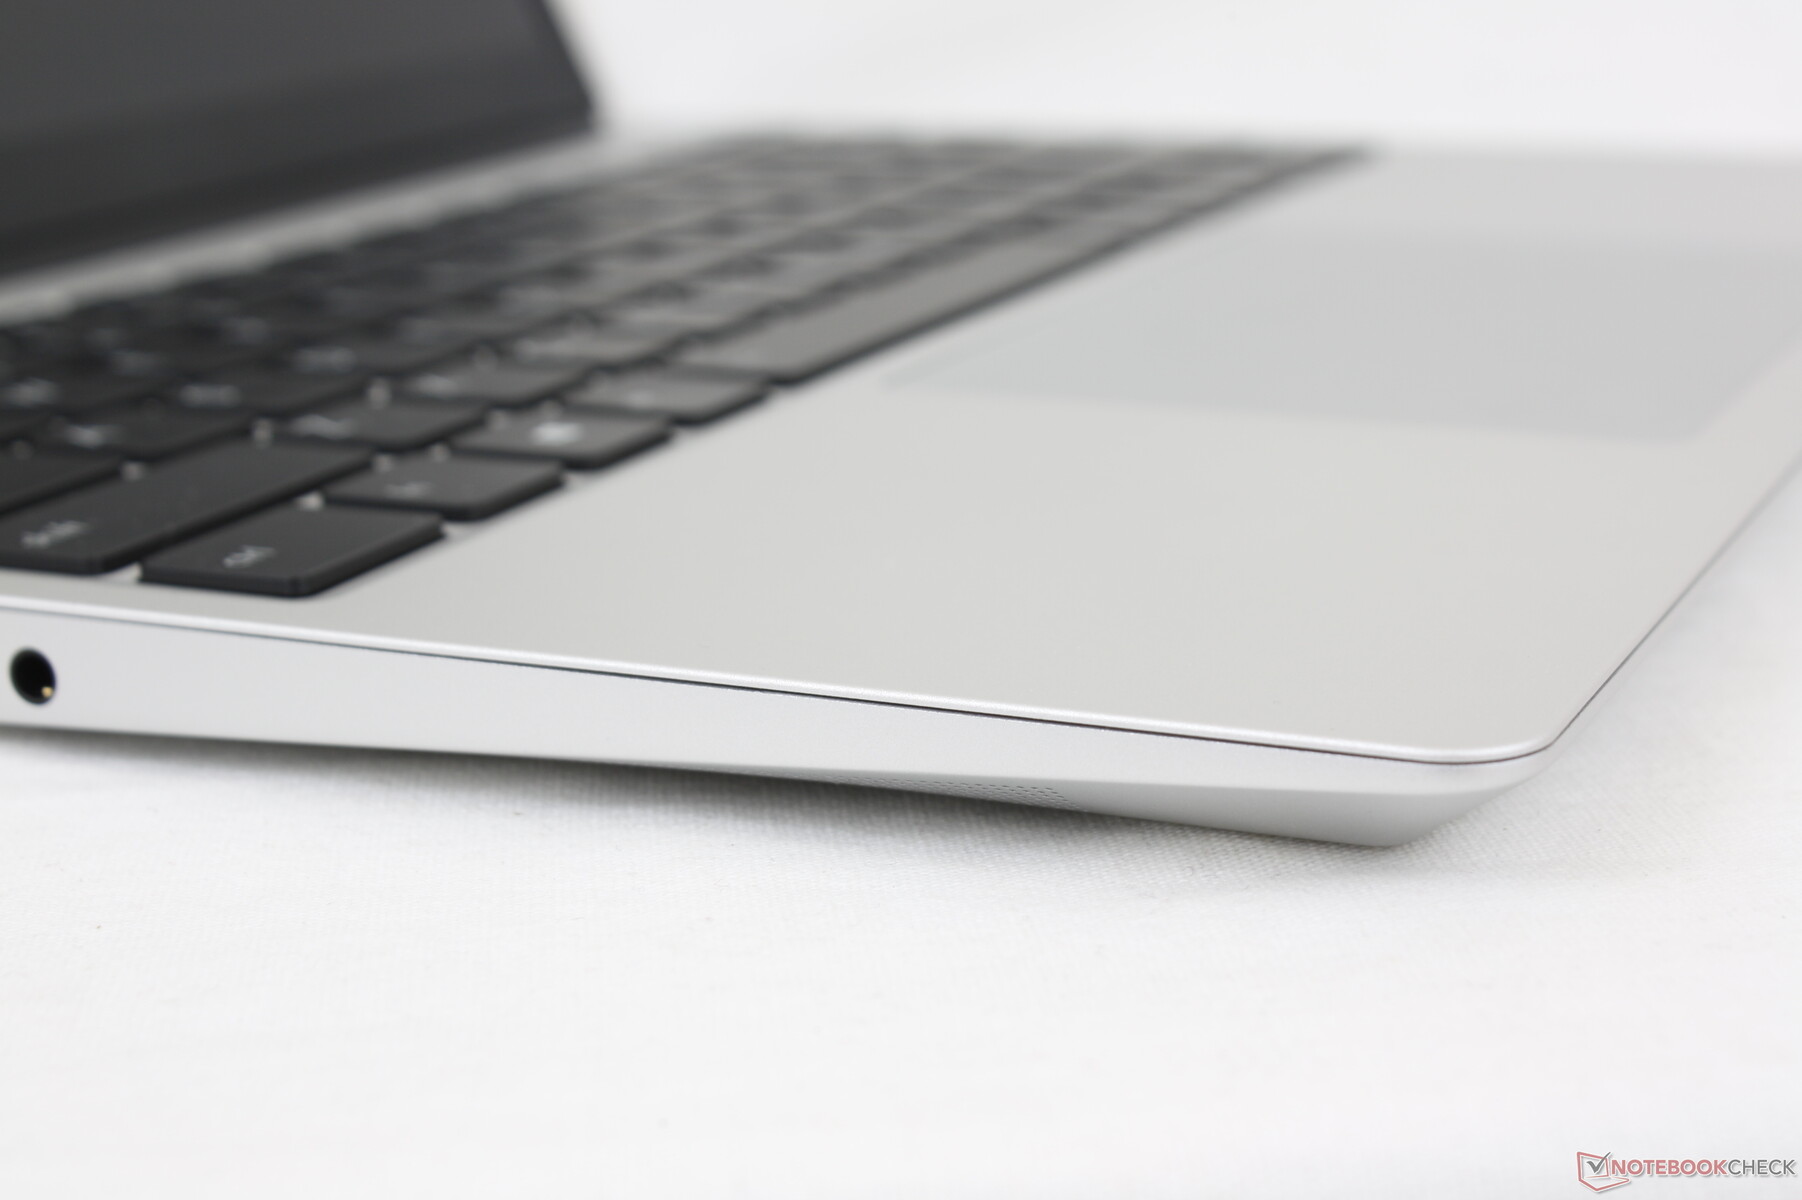
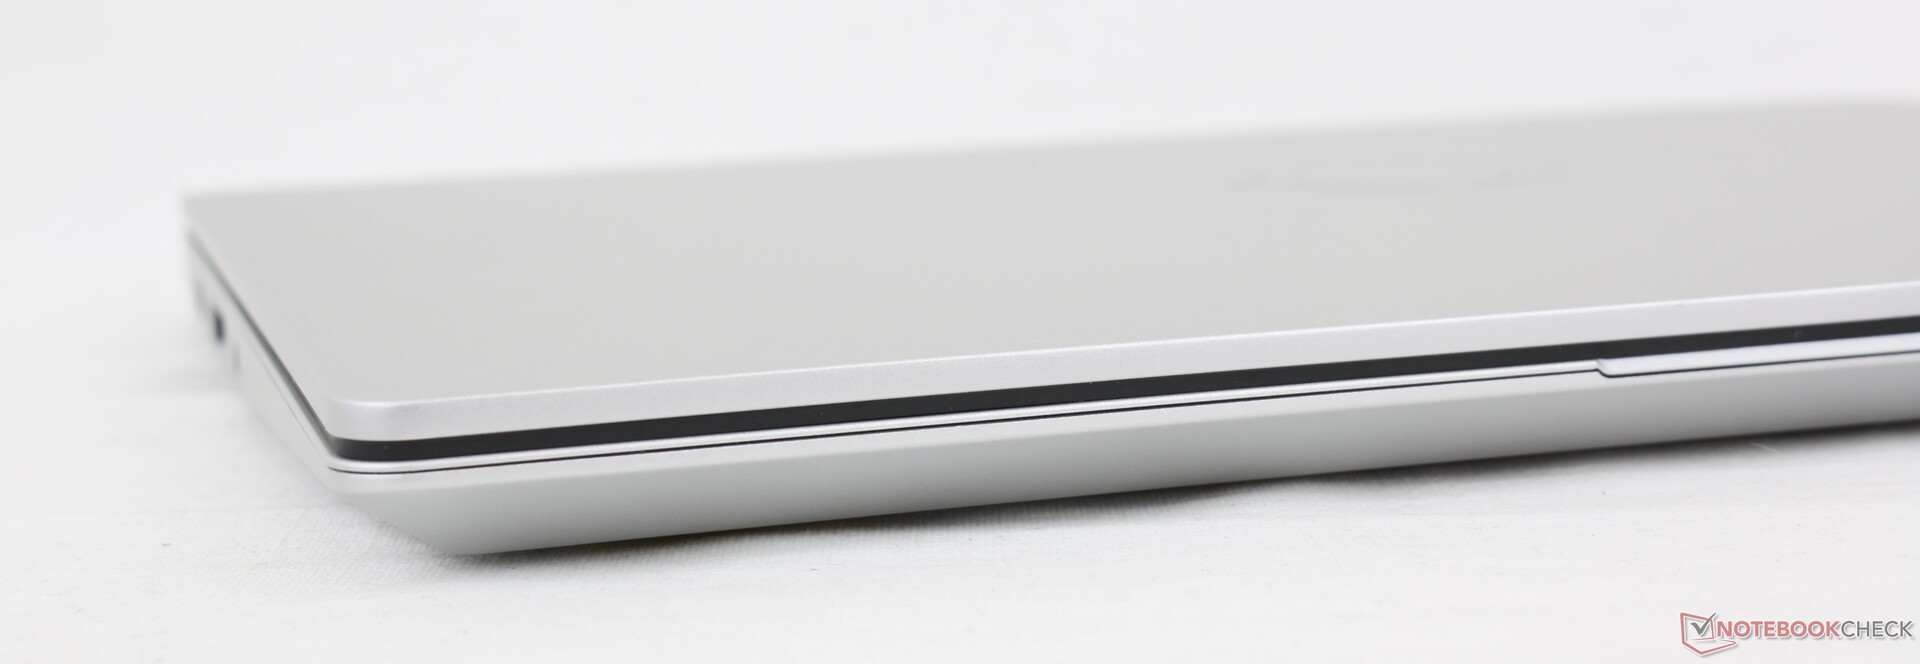
Beim Gehäuse des Framework Laptop haben sich die Designer ganz klar am Apple MacBook orientiert. Die Stabilität fällt aber deutlich schlechter aus, denn vor allem der Bildschirmdeckel lässt sich leicht verbiegen und die Scharniere sind auch zu leichtgängig, weshalb es zu deutlichem nachwippen kommt. Ansonsten sind aber sowohl die Größe als auch das Gewicht des Framework Laptop vergleichbar mit dem ebenfalls 13,5 Zoll großen ThinkPad X1 Titanium Yoga G1 und es ist etwas kleiner als beispielsweise das Acer Swift 3 SF313.
Ausstattung - 4x USB 4
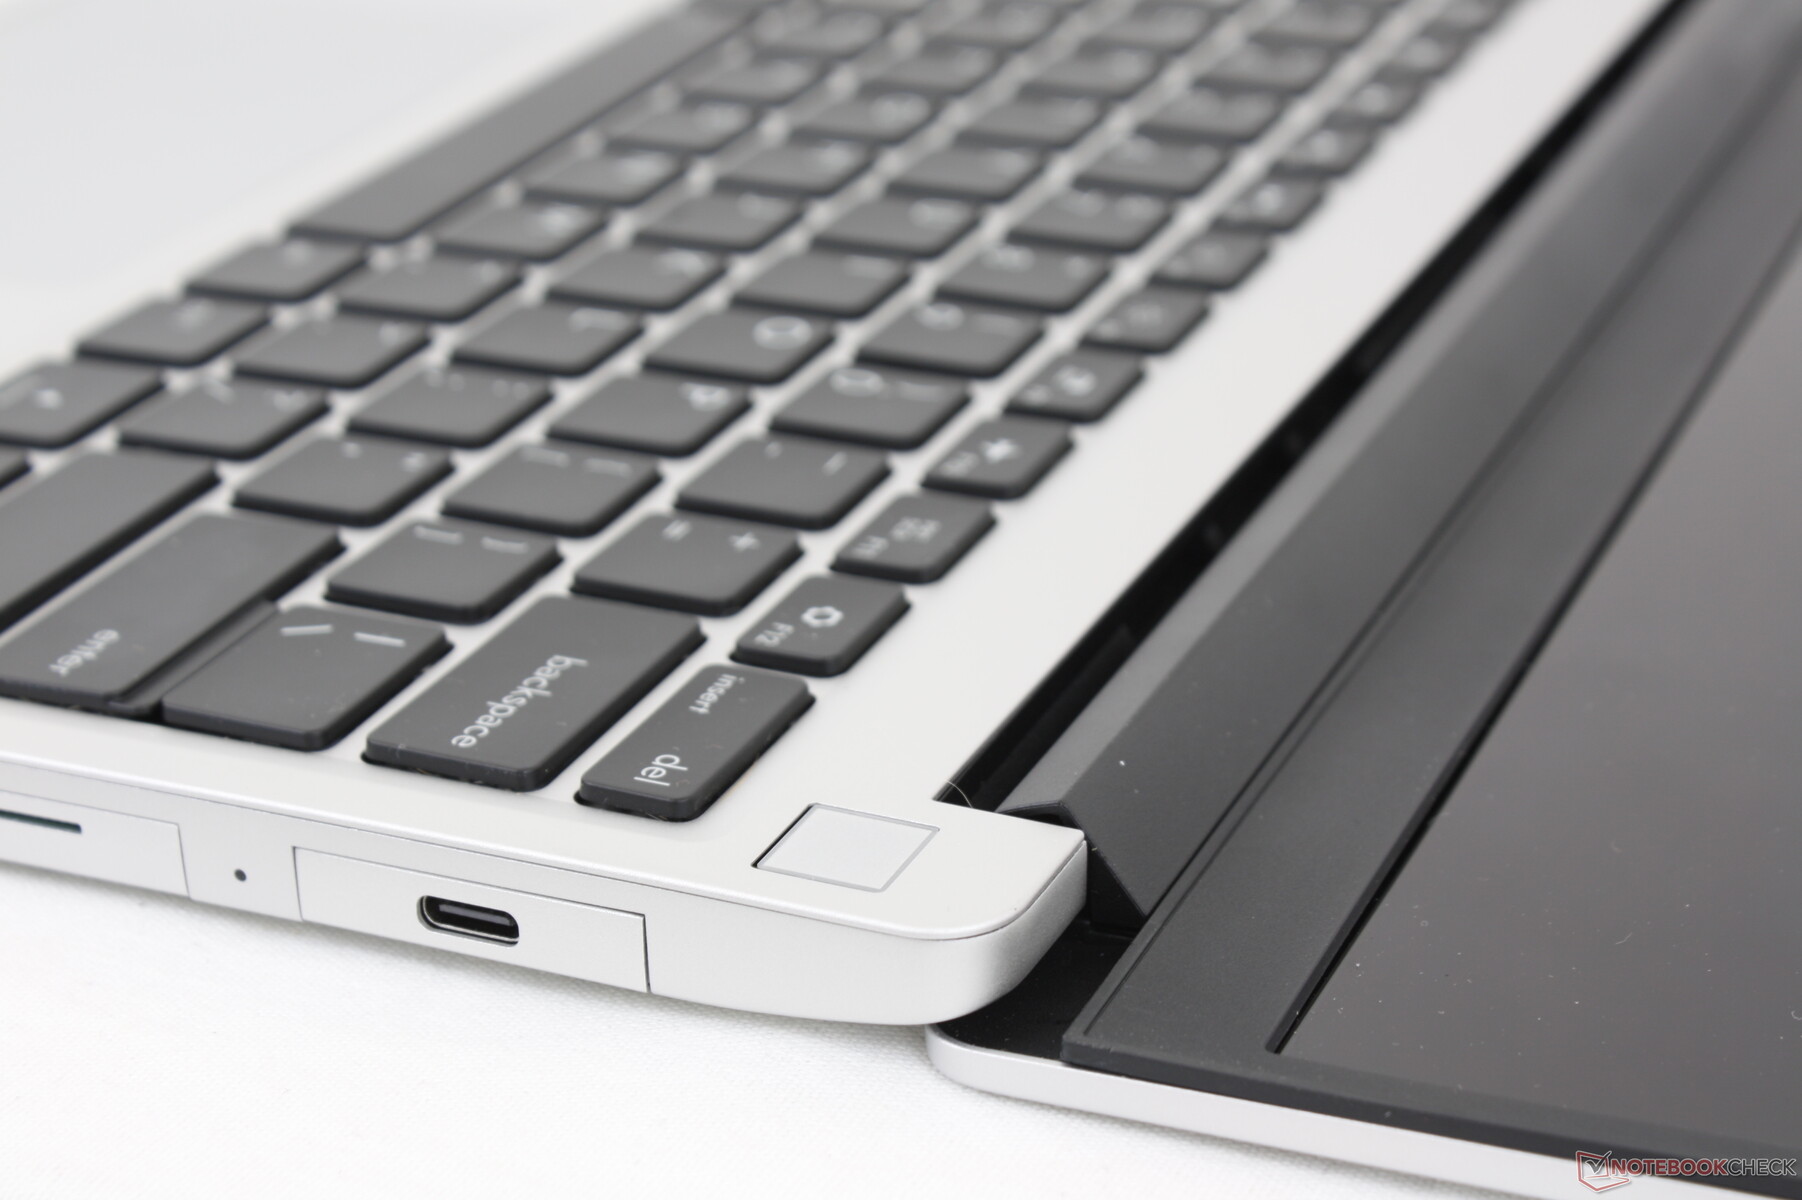
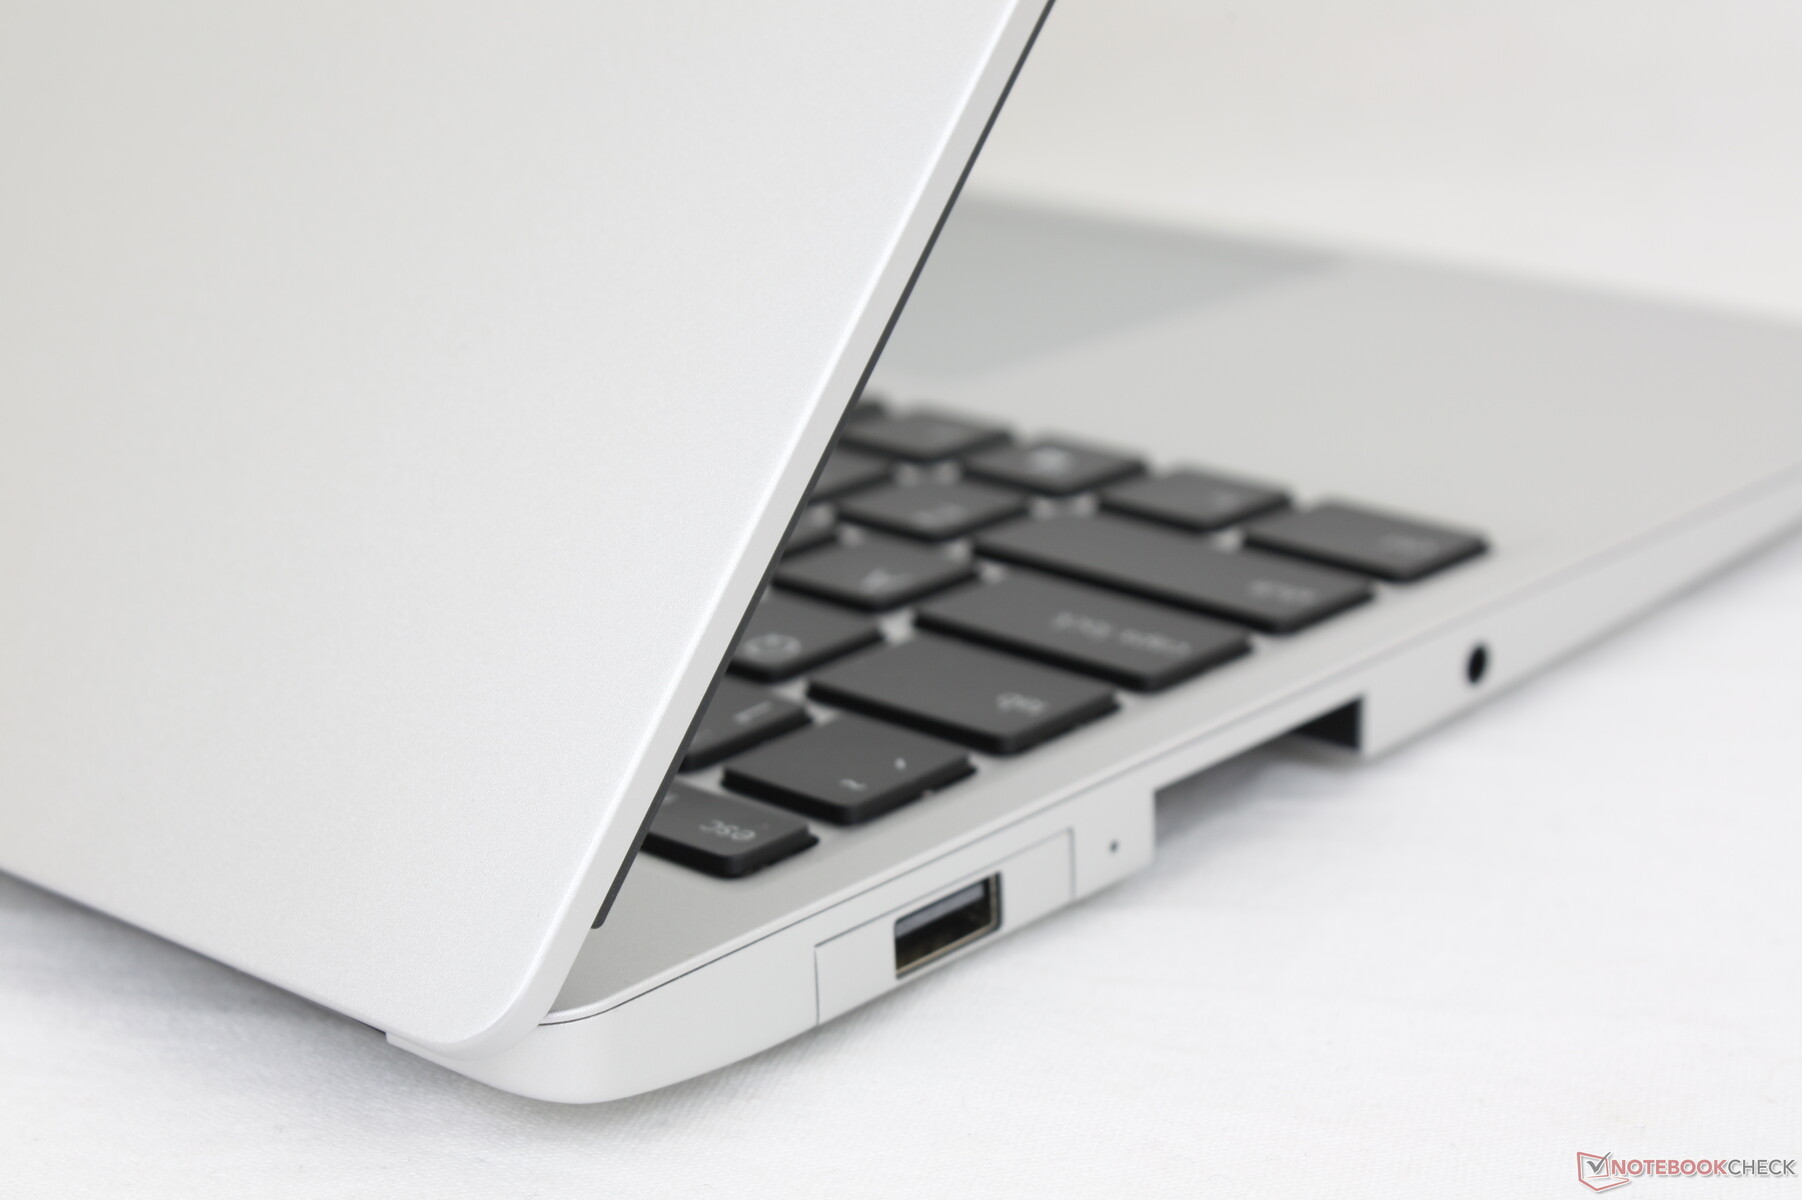
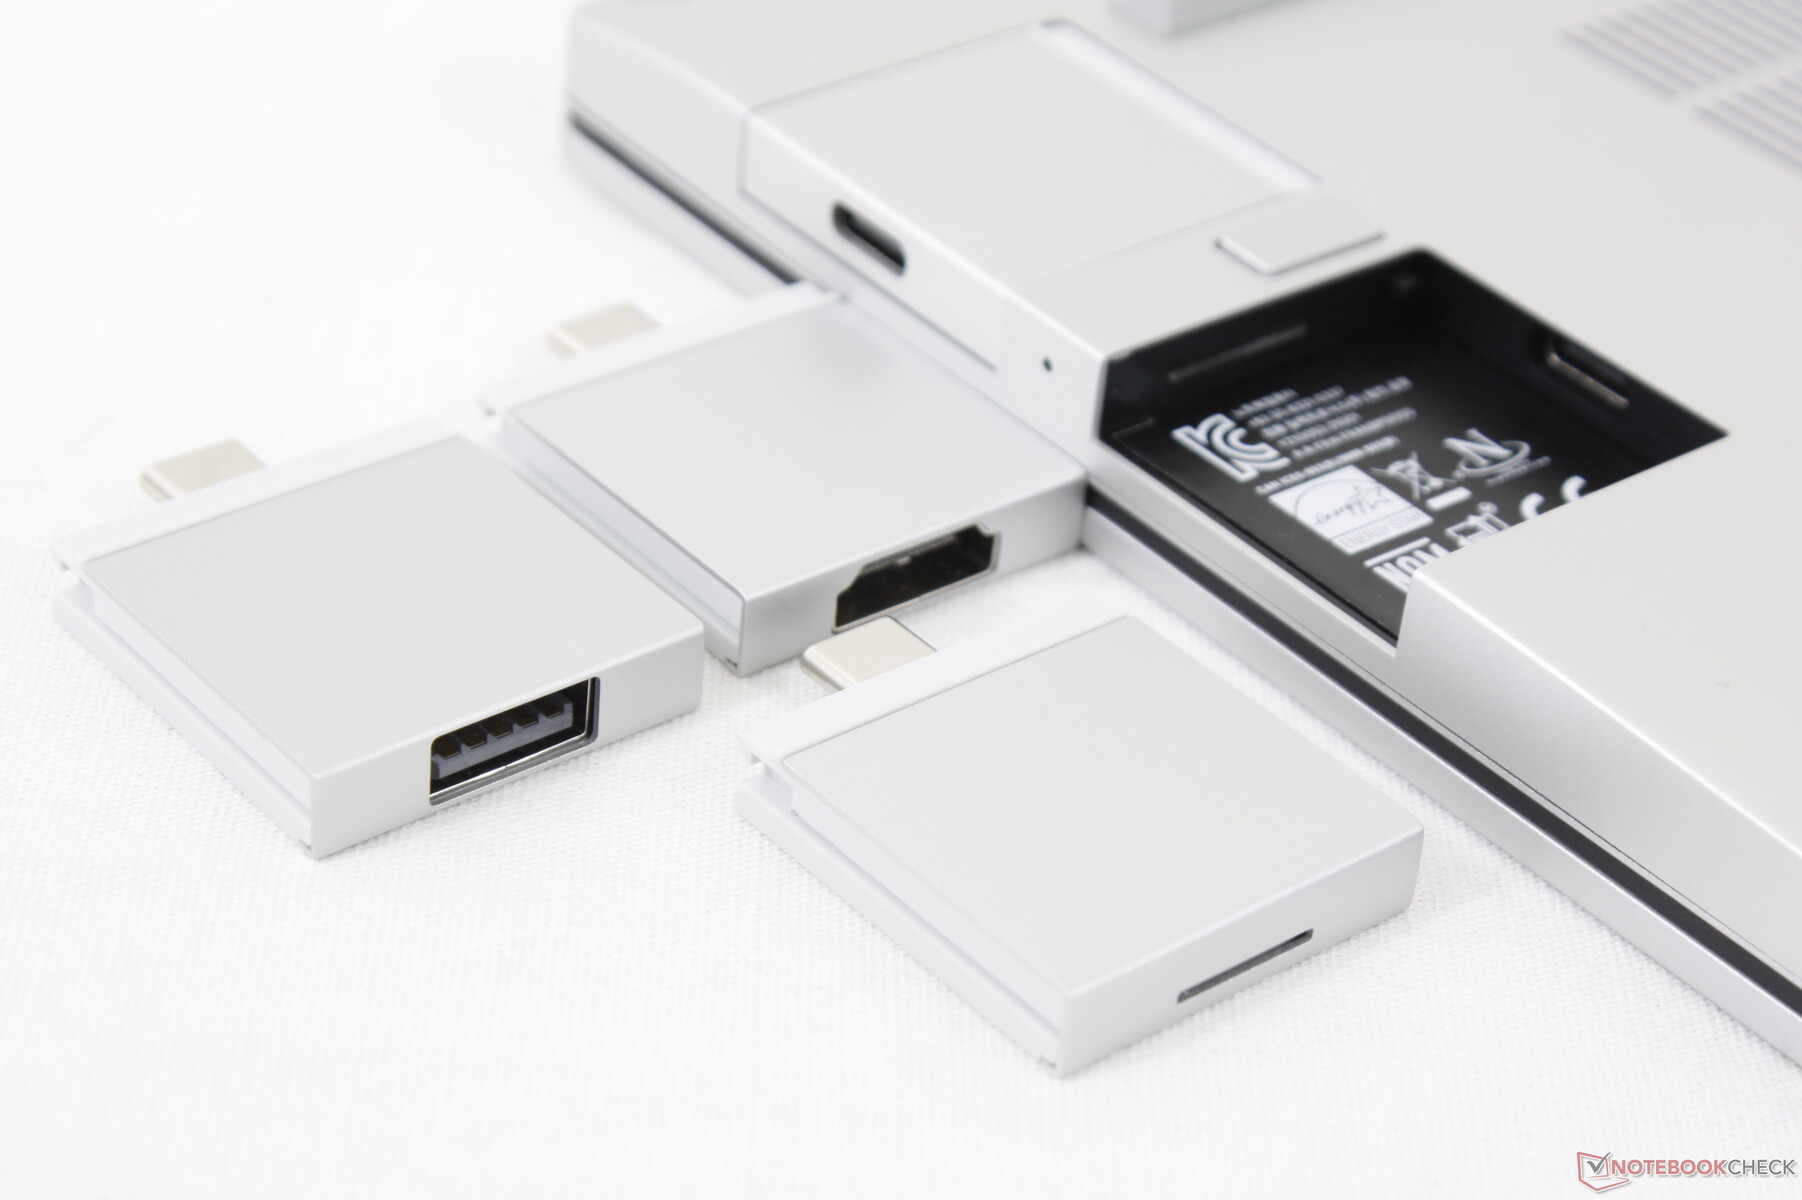
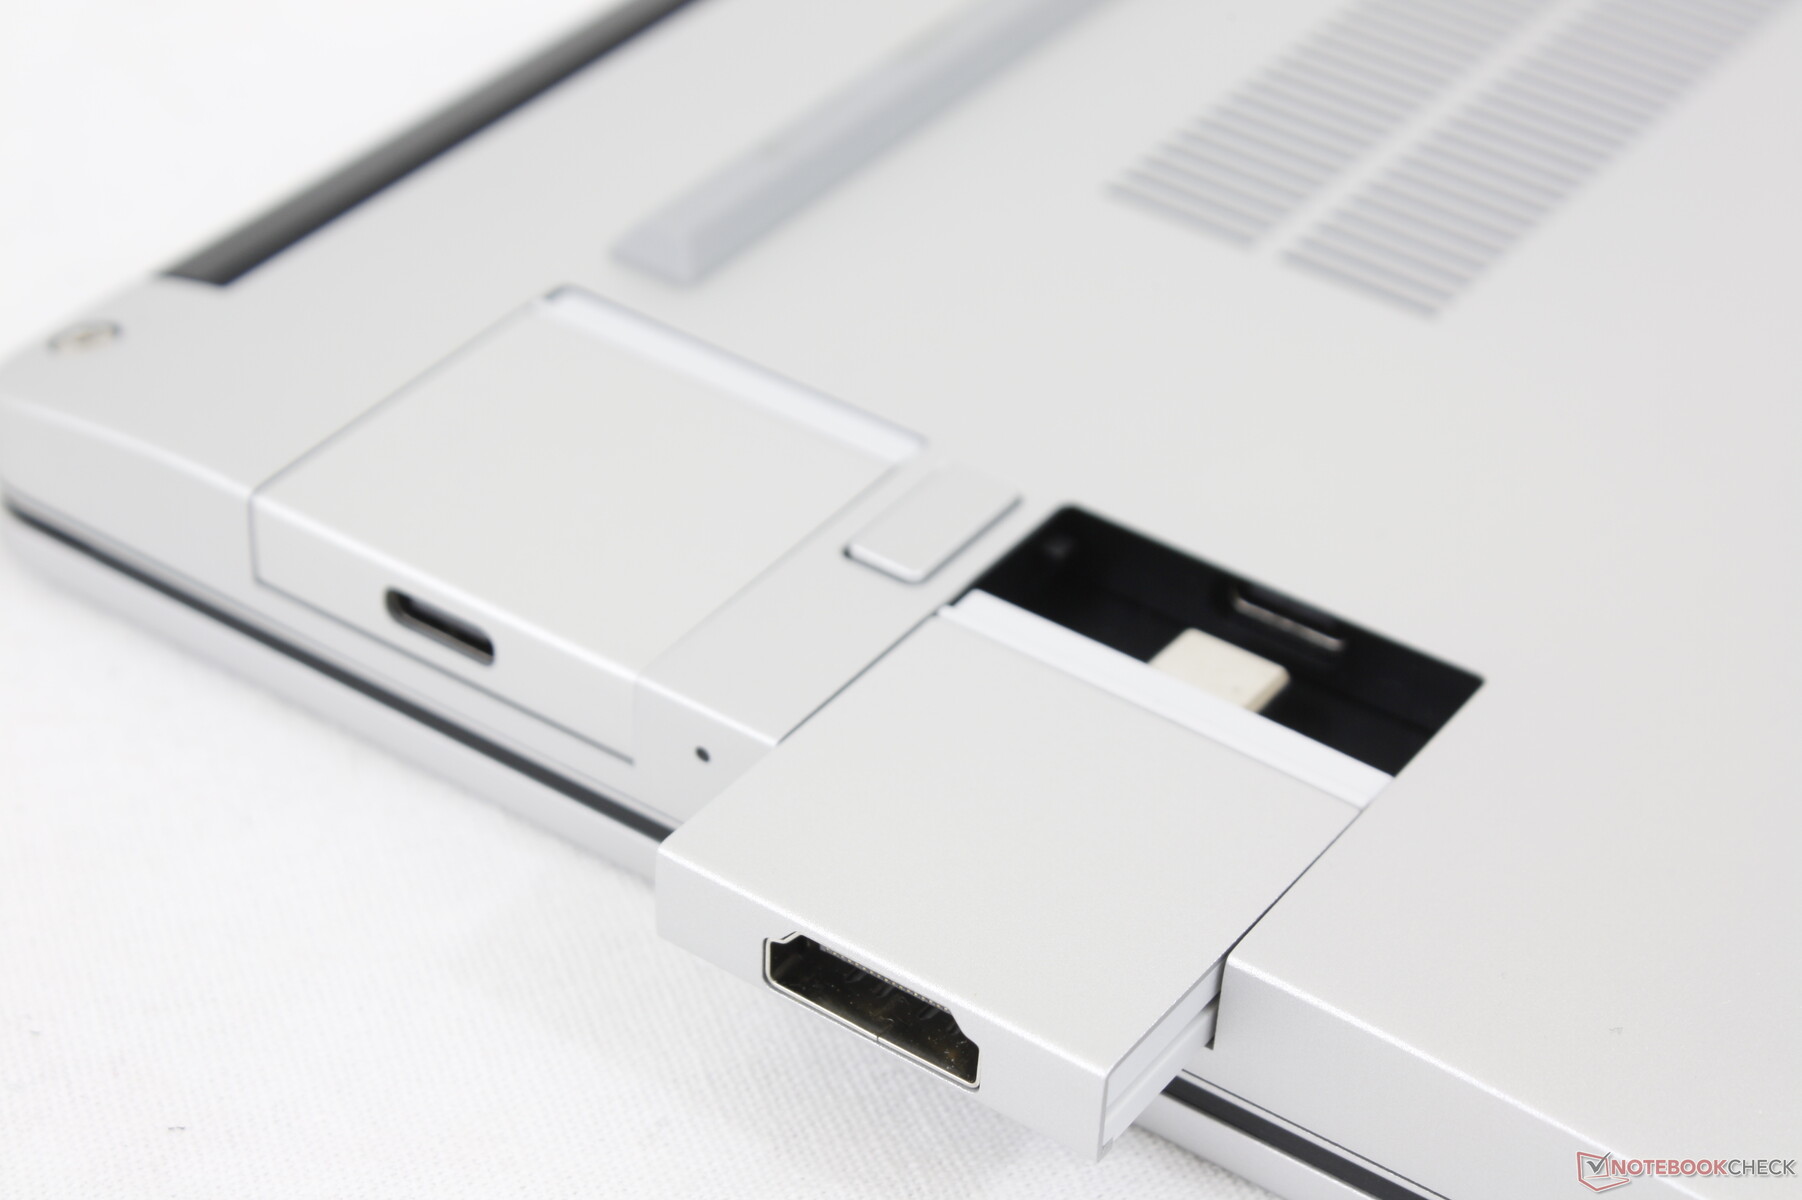
Der Framework Laptop bietet vier identische USB-C-Anschlüsse, die sich gleichmäßig auf beide Seiten verteilen. Alle Anschlüsse unterstützen USB 4 und sind technisch zudem kompatibel mit Thunderbolt-Peripherie wie beispielsweise der Aorus Gaming Box. Zum Zeitpunkt des Tests werden laut dem Hersteller aber lediglich USB-Geräte unterstützt.
Die vier USB-C-Anschlüsse sitzen vertieft im Gehäuse, damit man Erweiterungsmodule einsetzen kann. Die Adapter selbst nutzen ein proprietäres Design, doch die Anschlüsse selbst entsprechen den gängigen Standards. Hier können Nutzer beliebig zwischen verschiedenen Modulen wie einem microSD-Kartenleser, HDMI, DisplayPort etc. wählen.
Die vertieften USB-C-Anschlüsse selbst verhalten sich wie jeder andere USB-C-Stecker inklusive Power Delivery und DisplayPort, falls man keine Erweiterung verwendet.
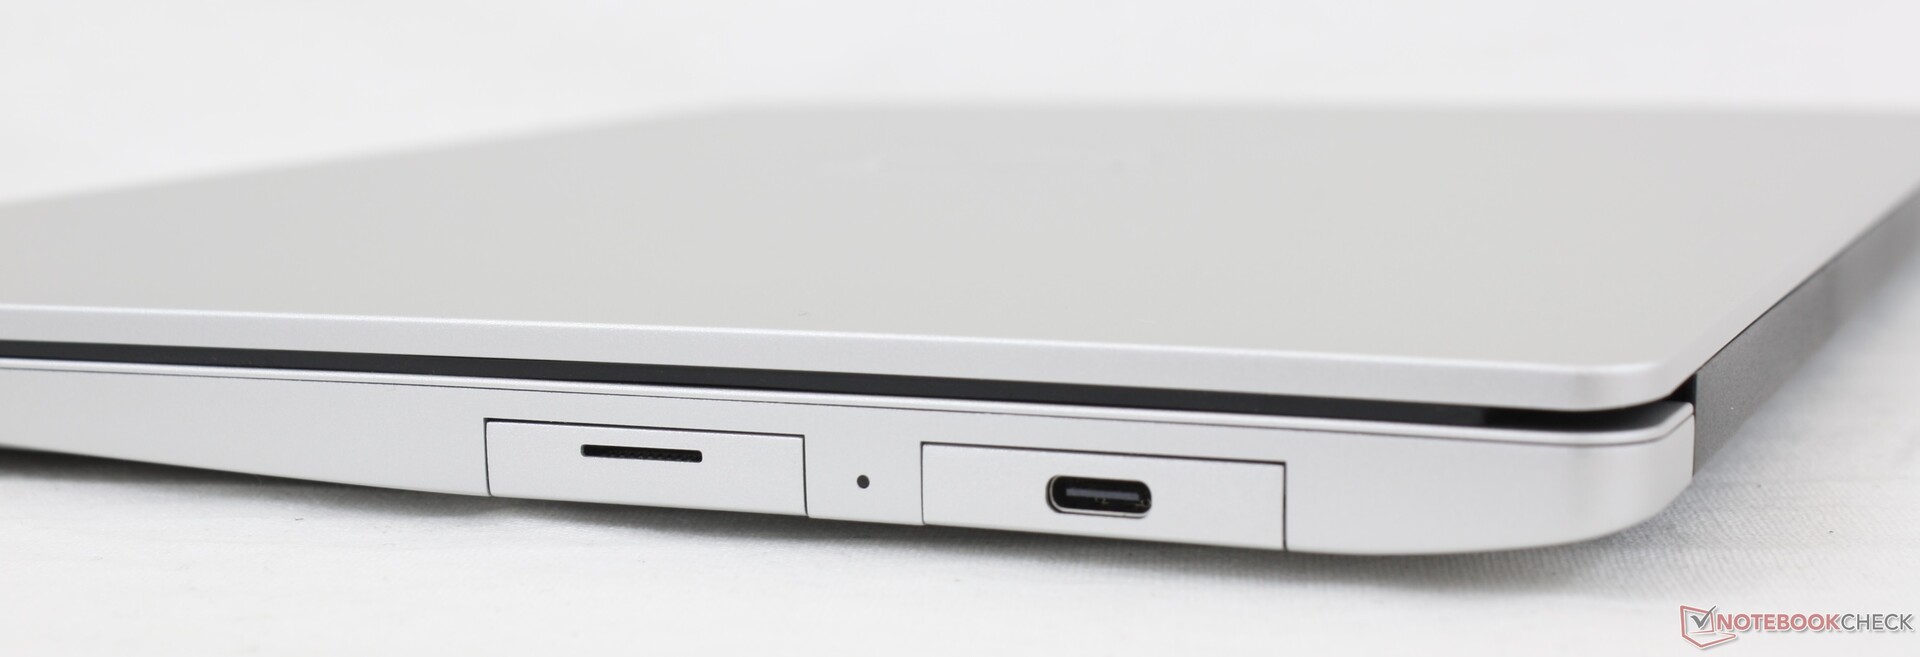
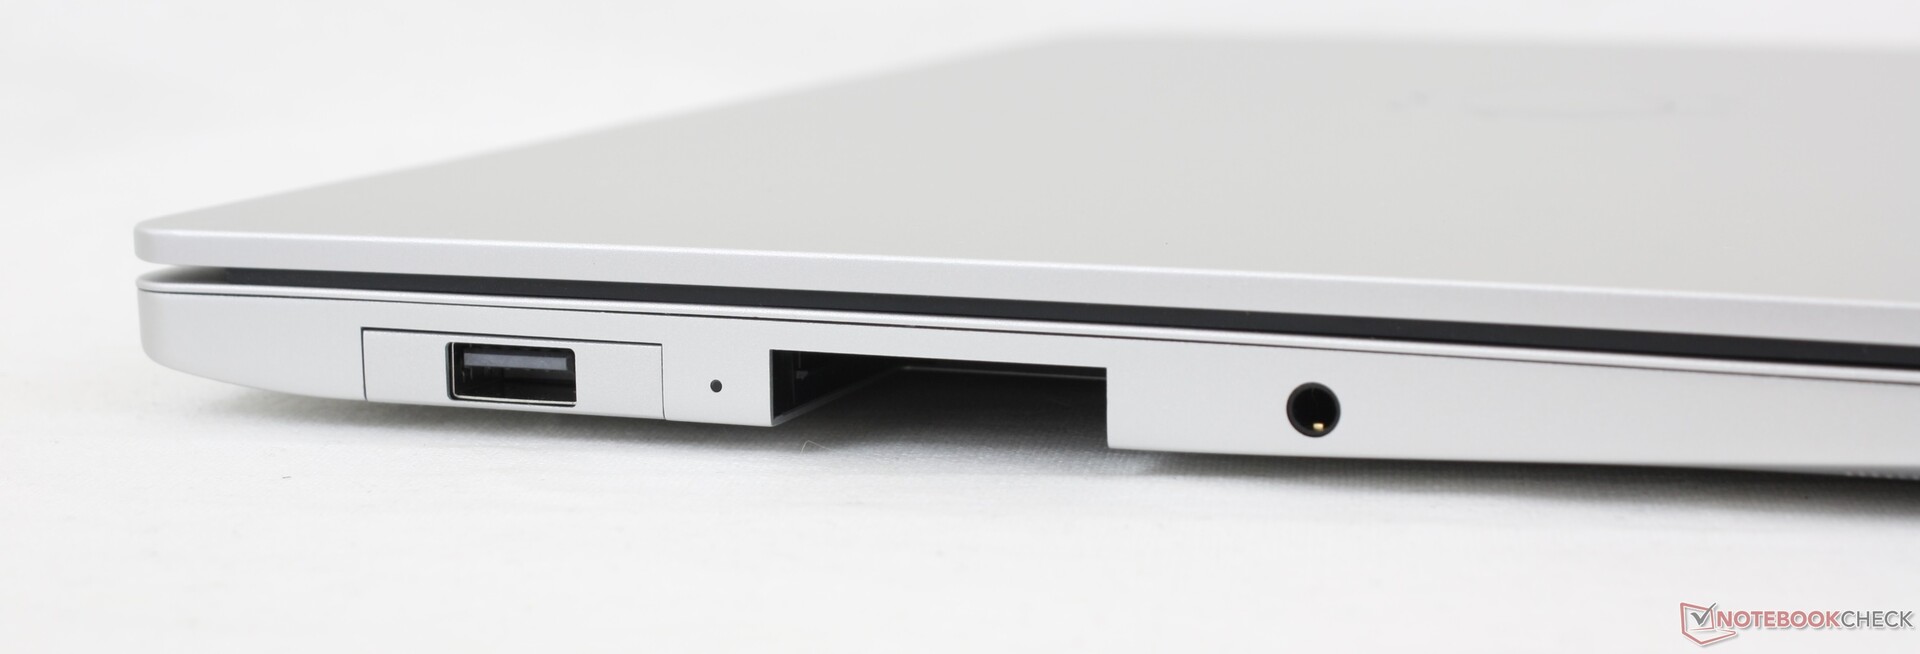
SD-Kartenleser
Der microSD-Leser ist alles andere als Nutzerfreundlich. Es gibt keinen Federmechanismus, weshalb das Einlegen und das Auswerfen einer Speicherkarte schwierig ist. Bei jeder Nutzung fühlt es sich fast so an, als würde unsere Karte brechen.
Die Transferraten sind ordentlich aber nicht beeindruckend. Das Kopieren eines 1 GB großen Bilderordners von unserer UHS-II-Referenzkarte (AV PRO V60) dauert rund 14 Sekunden und damit etwa doppelt so lange wie beim Dell XPS 13.
| SD Card Reader | |
| average JPG Copy Test (av. of 3 runs) | |
| HP Spectre x360 14-ea0378ng (Toshiba Exceria Pro M501 microSDXC 64GB) | |
| Framework Laptop 13.5 (AV Pro UHS-II V60) | |
| HP ProBook x360 435 G8 R7-5800U (AV Pro UHS-II V60) | |
| maximum AS SSD Seq Read Test (1GB) | |
| HP Spectre x360 14-ea0378ng (Toshiba Exceria Pro M501 microSDXC 64GB) | |
| Framework Laptop 13.5 (AV Pro UHS-II V60) | |
| HP ProBook x360 435 G8 R7-5800U (AV Pro UHS-II V60) | |
Kommunikation
Webcam


Wartung
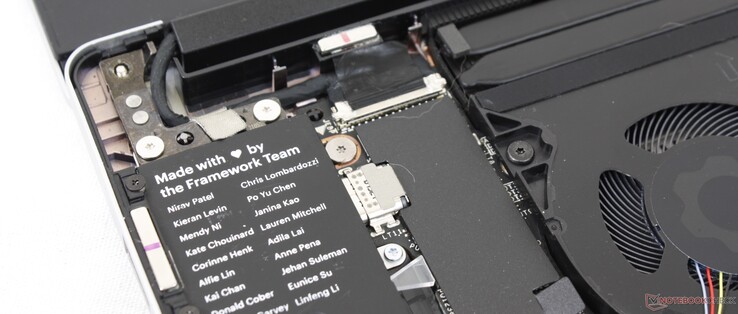
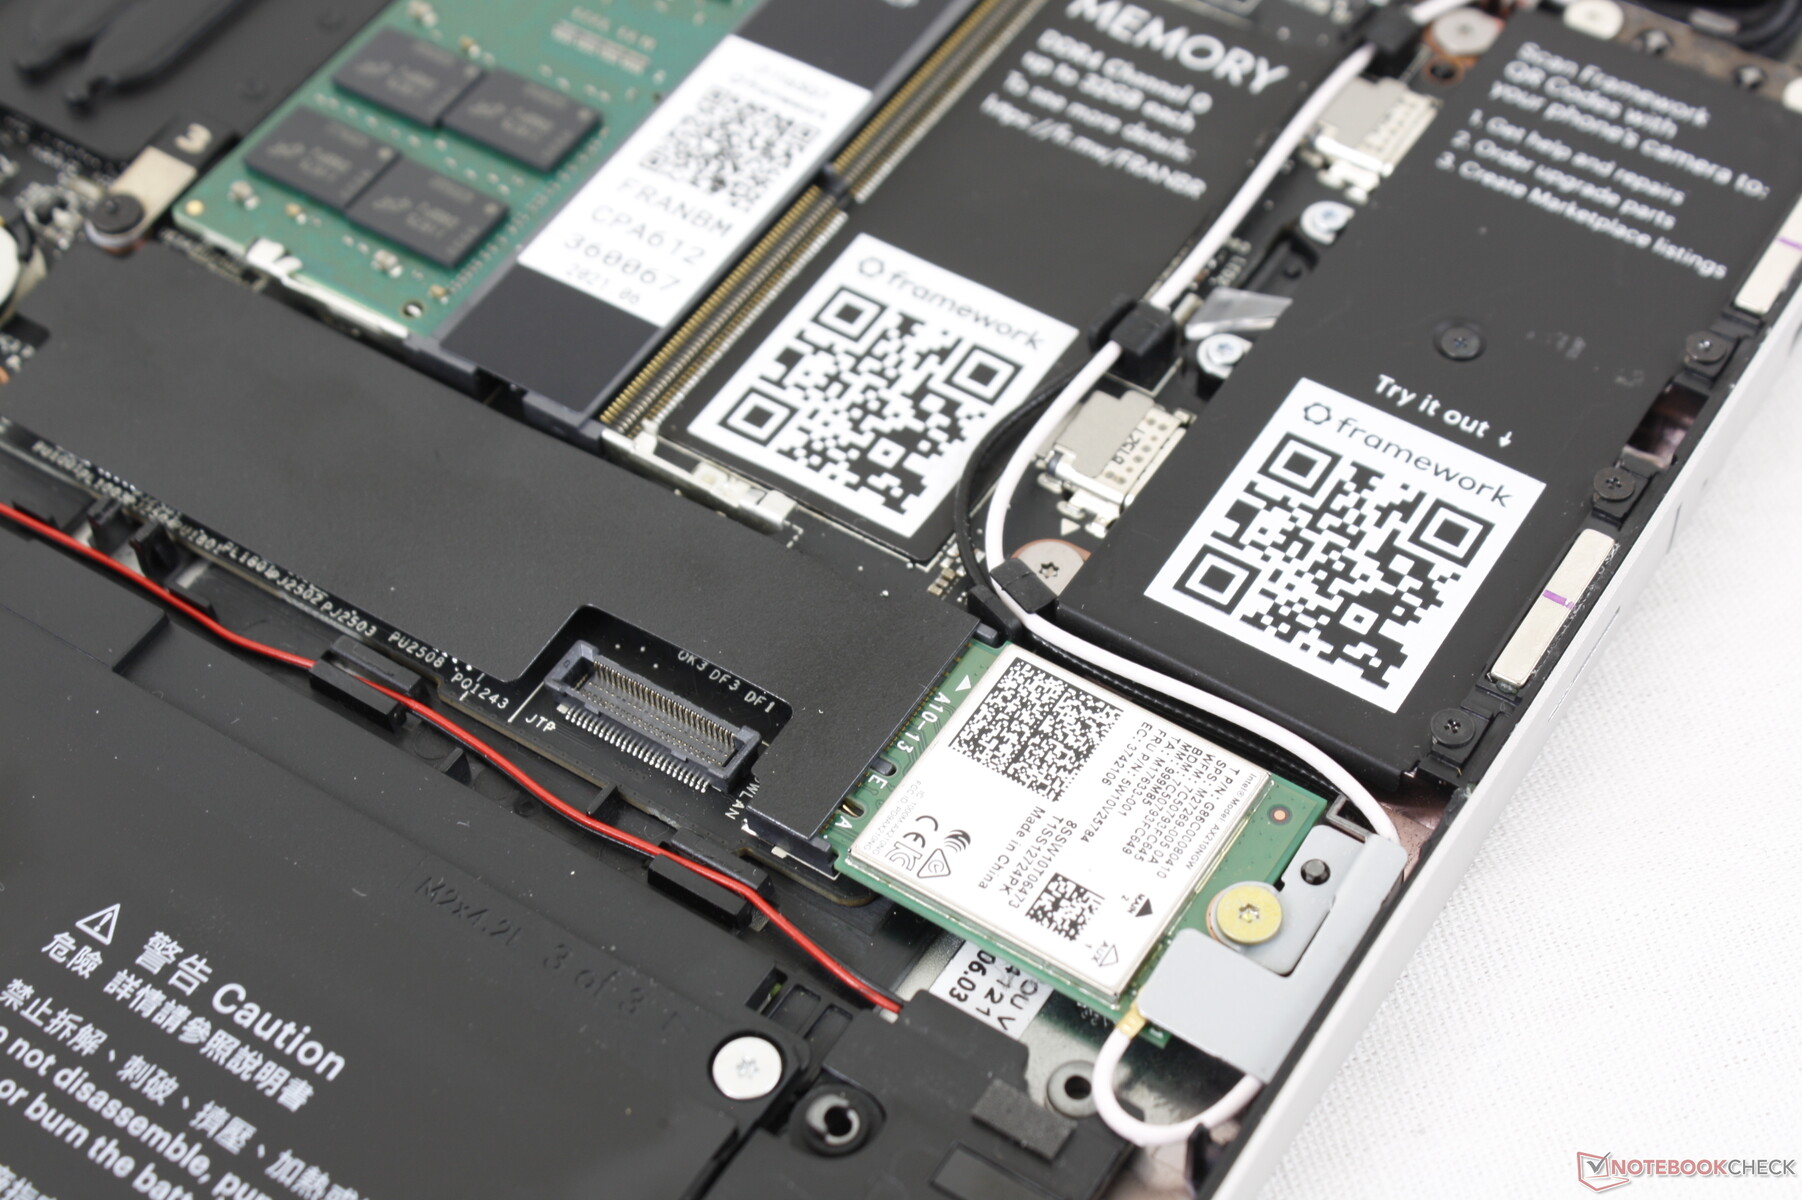
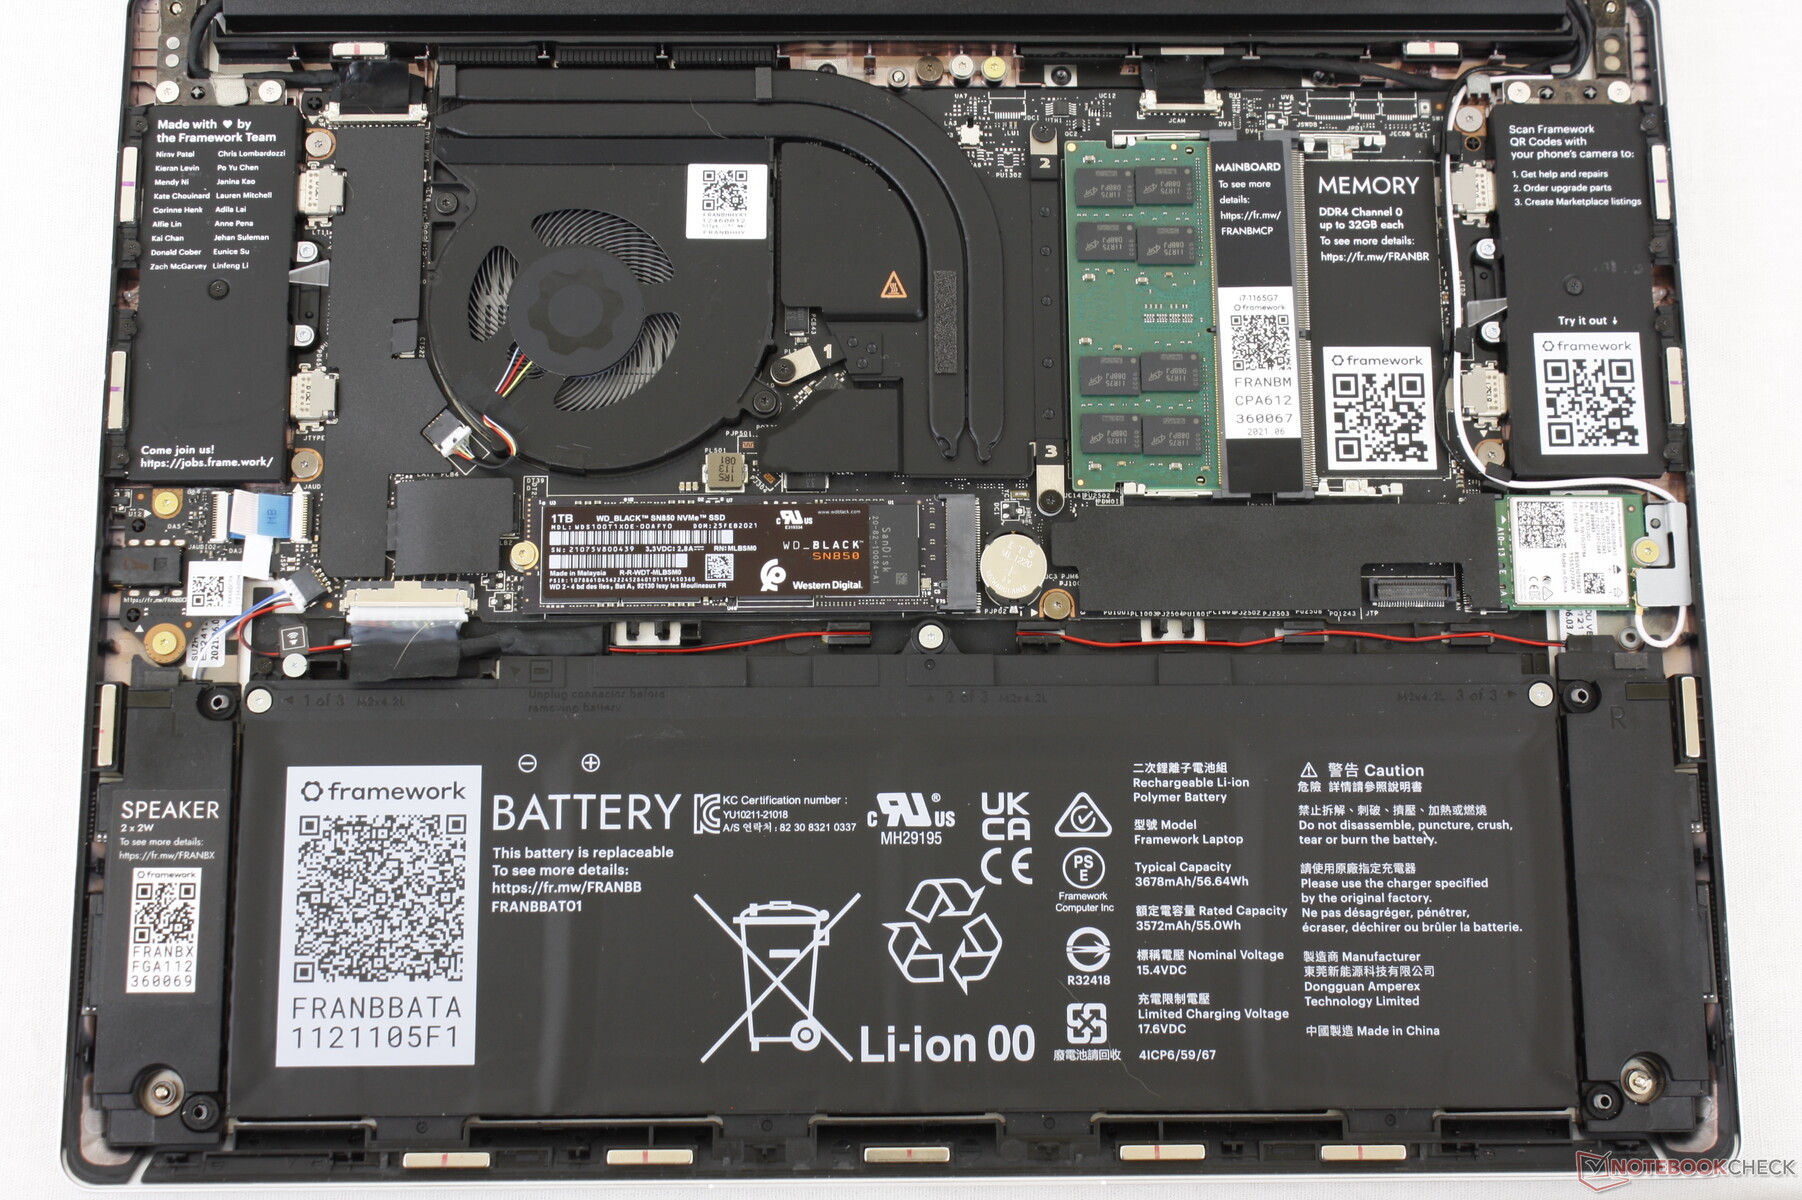
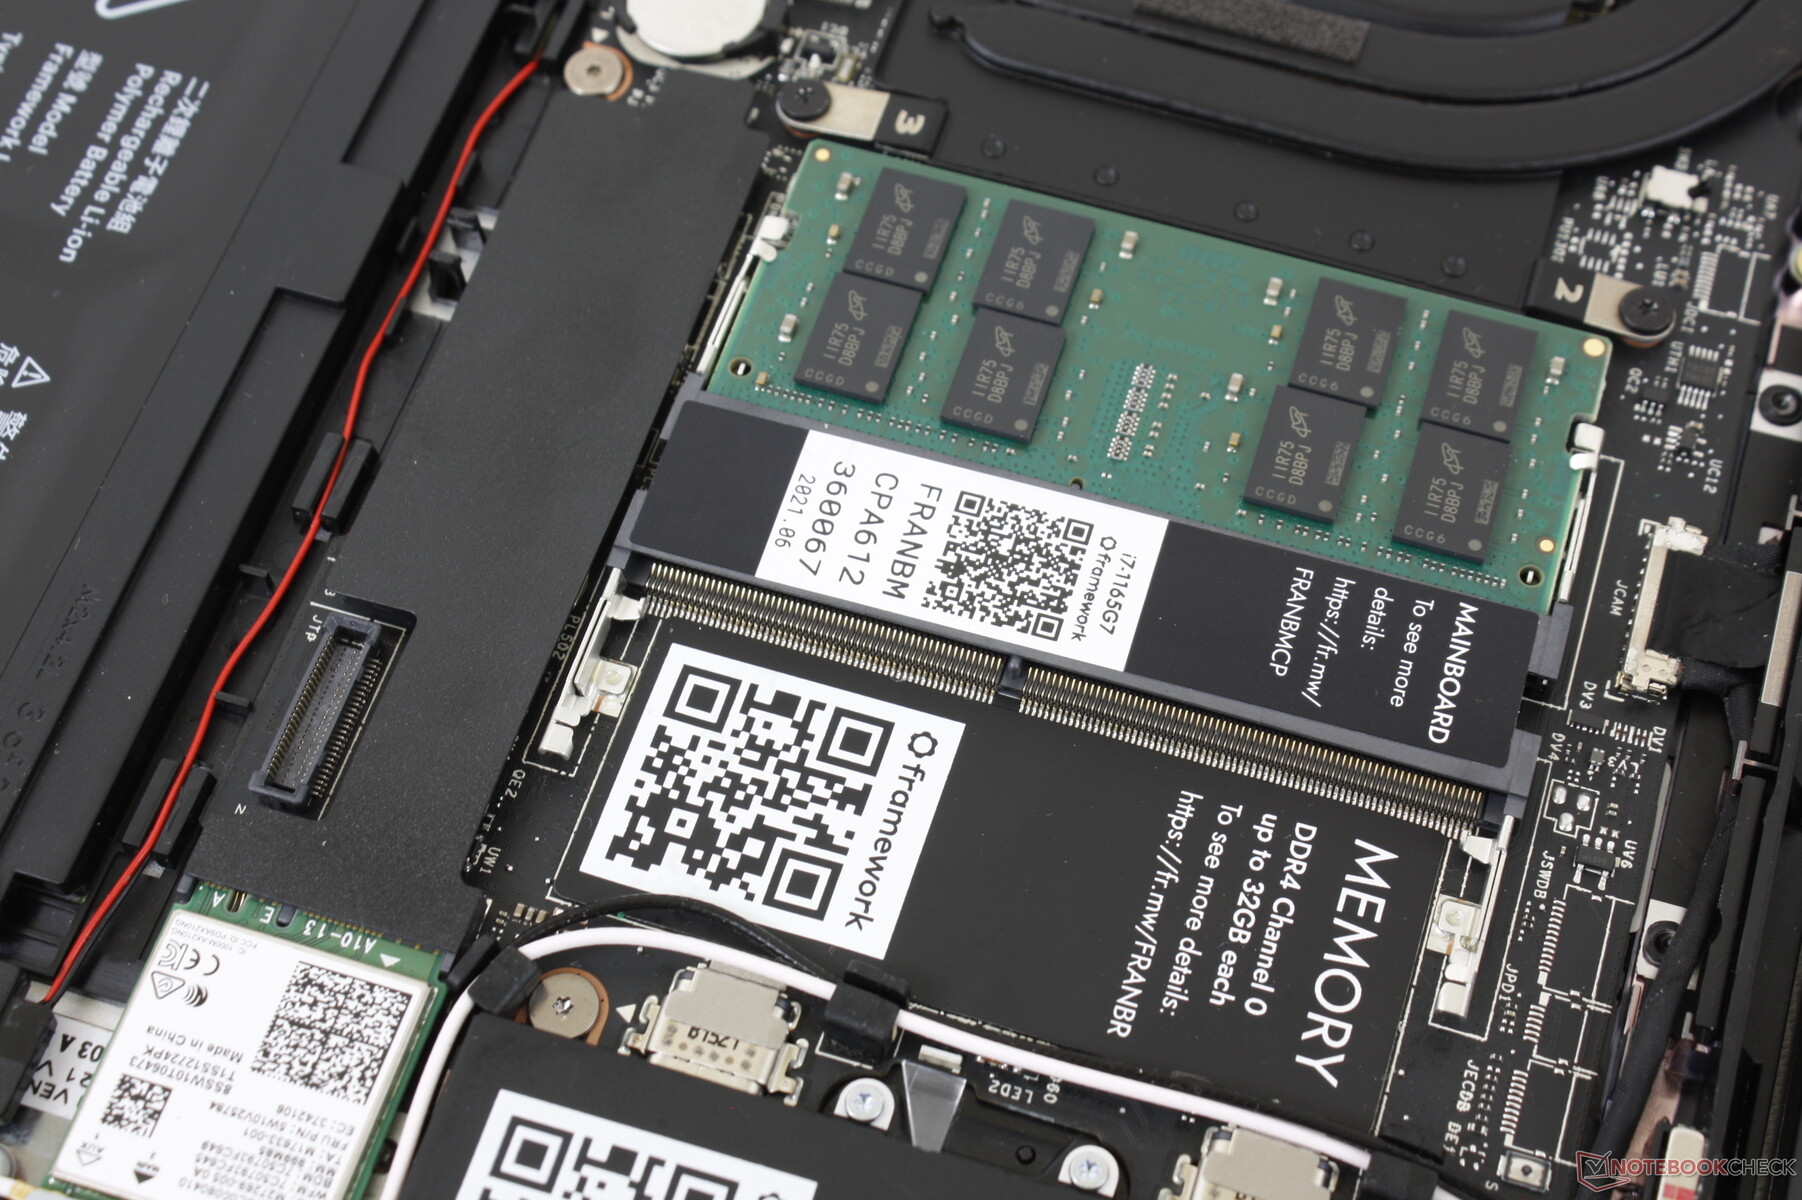
Im Gegensatz zu den meisten Laptops ist das Mainboard um 180 Grad gedreht. Für den Zugang muss man also nicht die untere Abdeckung, sondern die Tastatur entfernen. Dieser Vorgang ist aber recht simpel, wenn man den passenden Torx-Schraubendreher (T5) nutzt.
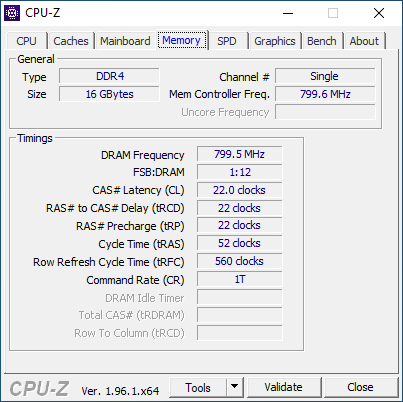
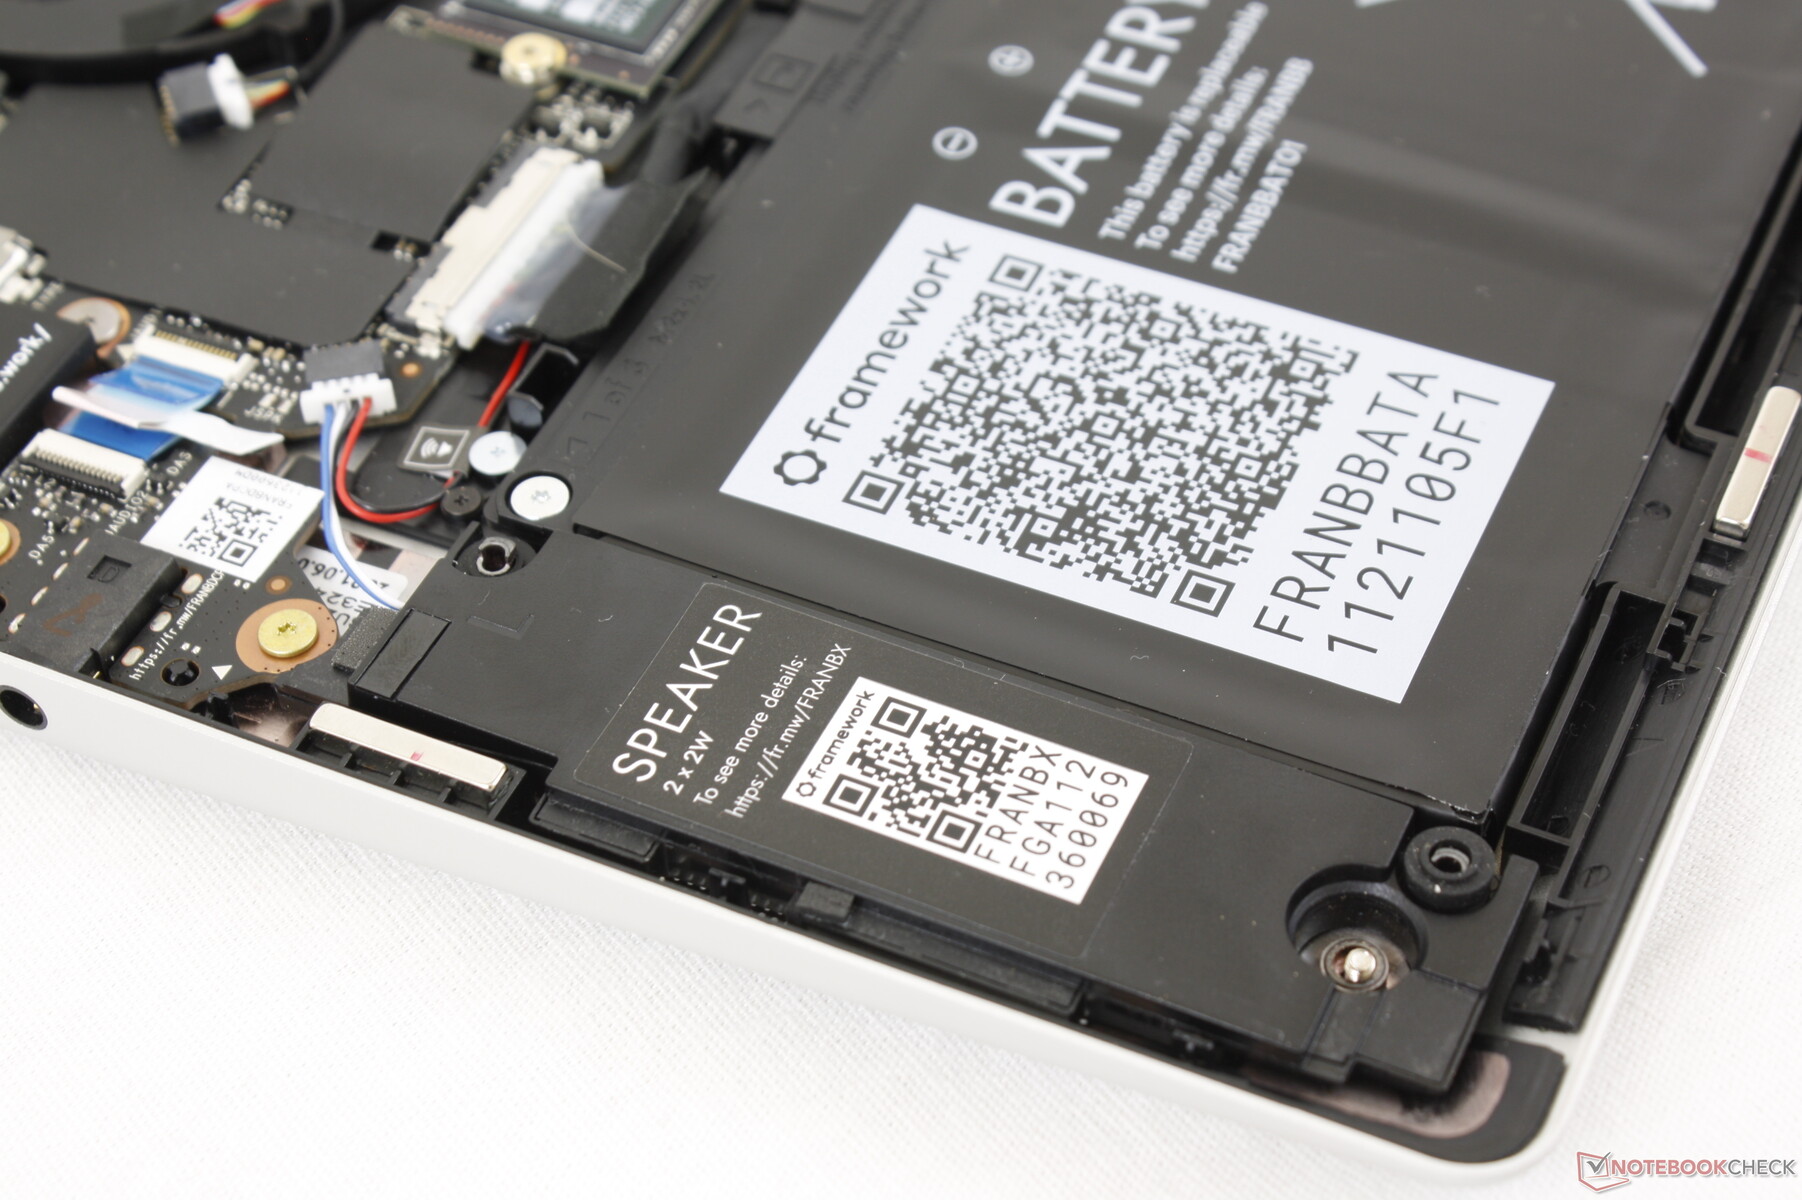
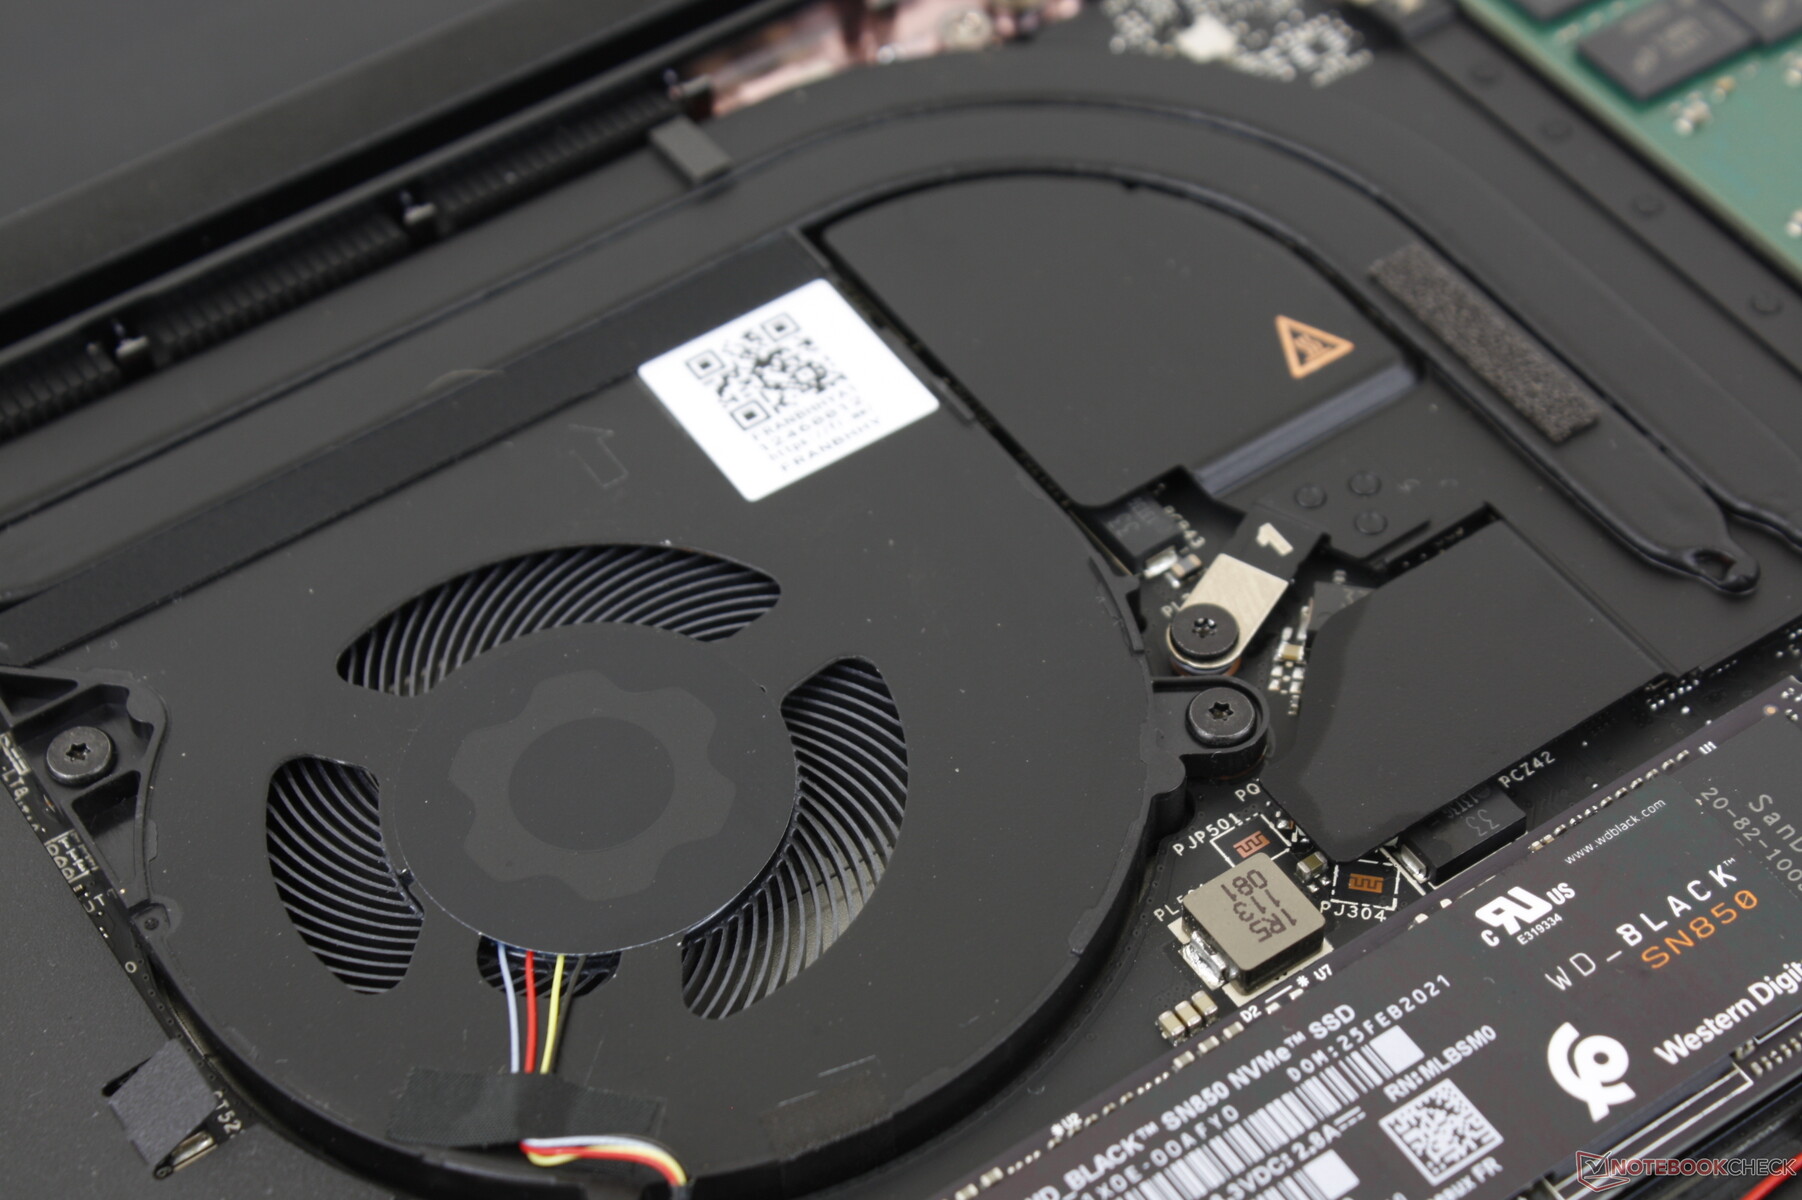
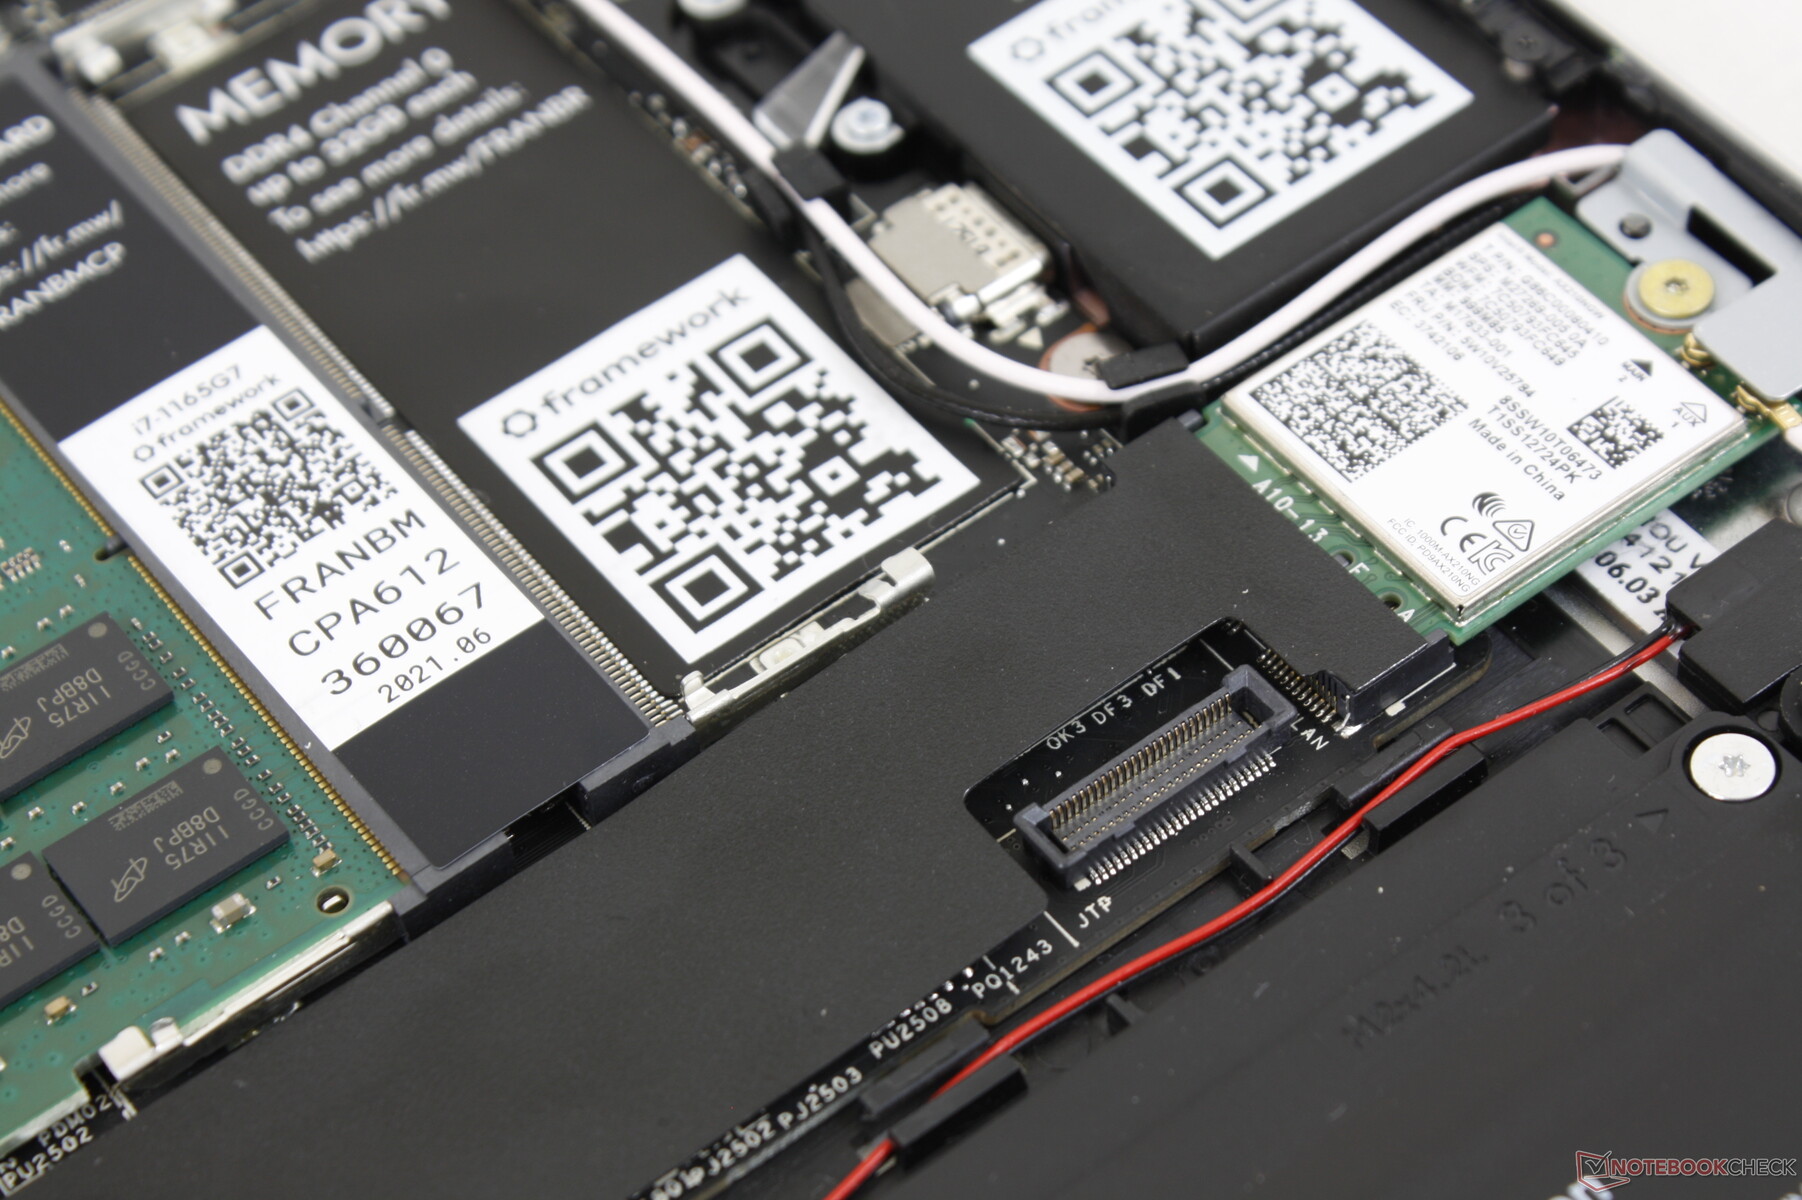
Man bekommt direkten Zugang zu den beiden SODIMM-Steckplätzen, der M.2-2280-SSD (PCIe 4.0), dem WLAN-Modul sowie dem Akku.
Zubehör und Garantie
Die DIY-Version des Laptops beinhaltet einen passenden Torx-Schraubendreher, einen USB-Stick mit Windows-Treibern sowie einigen Erweiterungs-Adaptern für HDMI, microSD-Karten, USB-C, USB-A sowie einen Mini-DisplayPort.
Der standardmäßige Garantiezeitraum liegt bei einem Jahr.
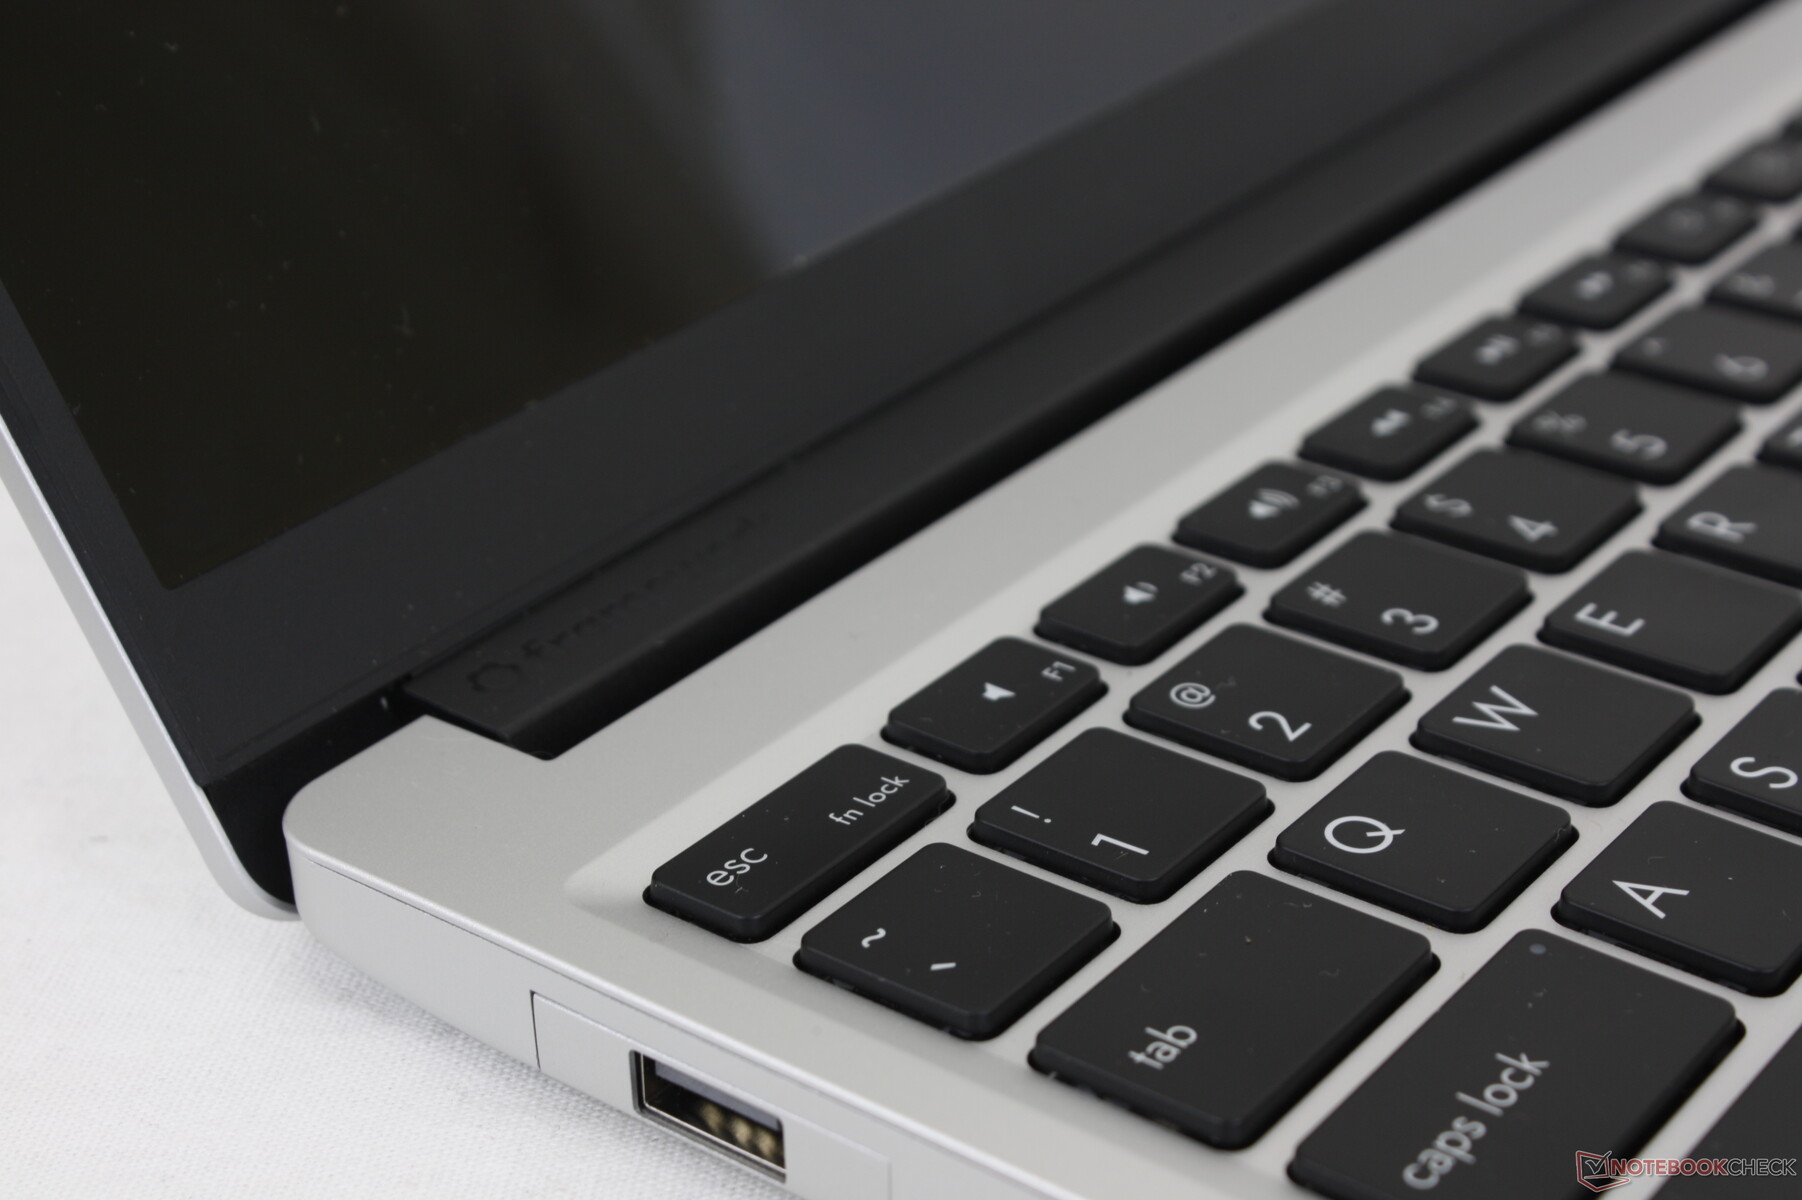
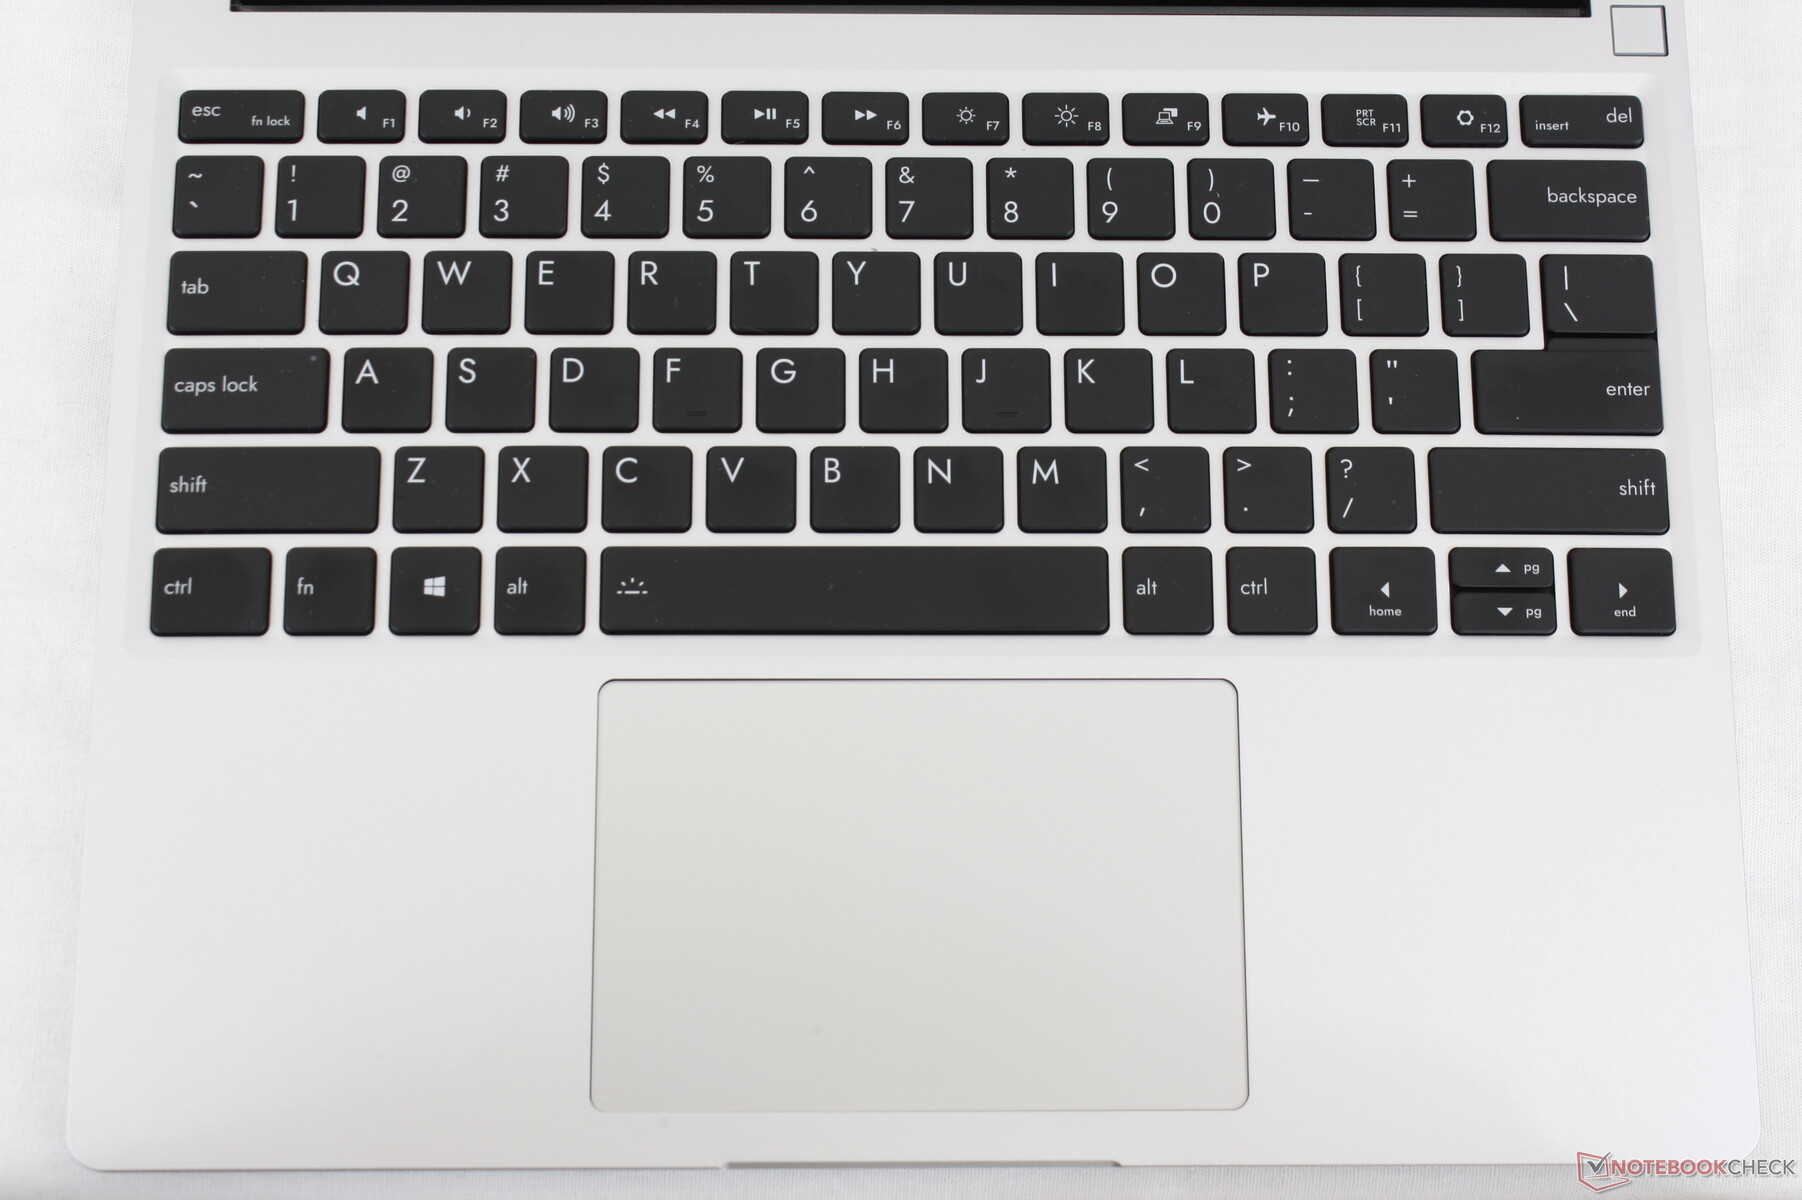
Eingabegeräte
Tastatur
Das Tippgefühl ist vergleichbar mit den Eingaben, die HP bei seinem EliteBooks oder der Spectre-Baureihe verwendet, die zu unseren Favoriten gehören. Die Rückmeldung ist präziser und der Tastenhub ist auch länger als bei vielen anderen Ultrabooks wie beispielsweise dem Asus ZenBook.
Bei einem Laptop mit einem derart großen Fokus auf die Modularität würden wir uns zudem Tasten wünschen, die der Nutzer entweder frei belegen oder zumindest anpassen kann.
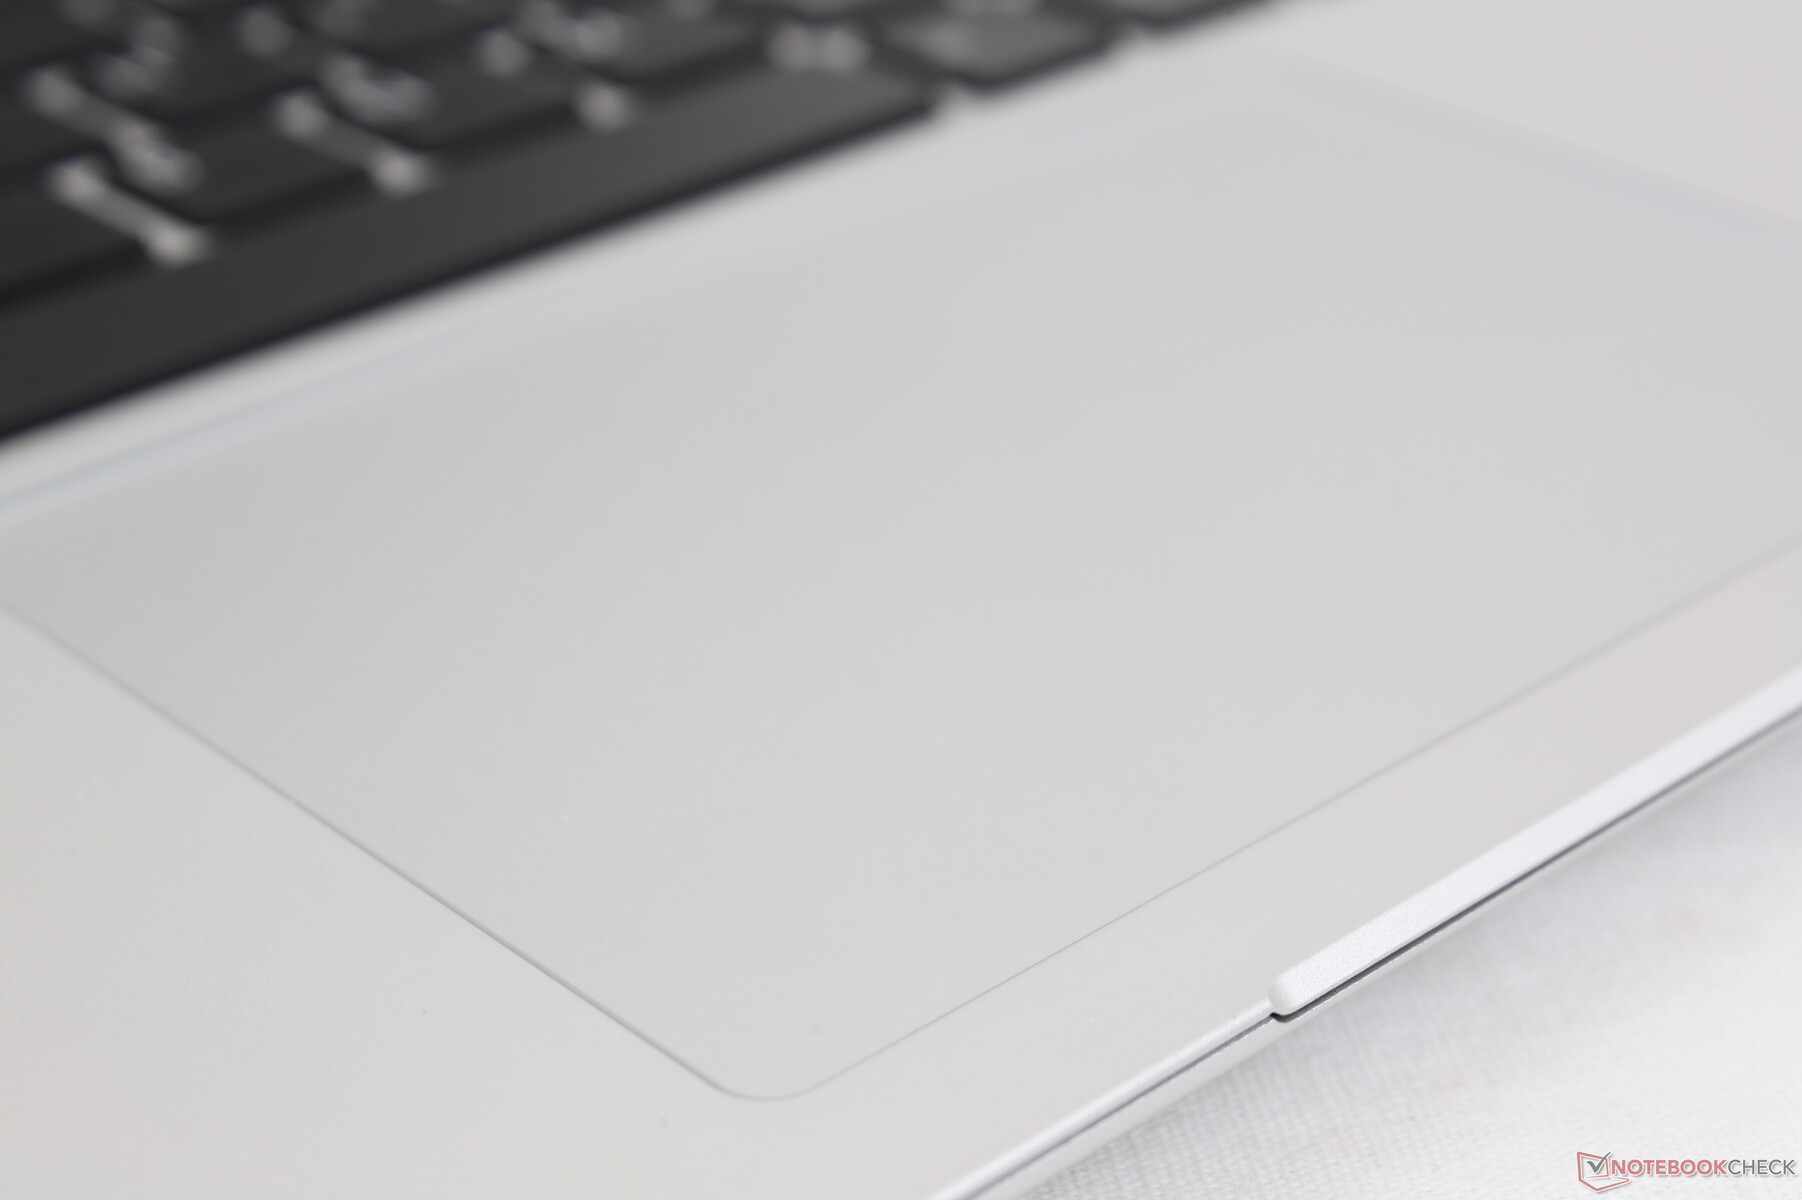
Touchpad
Das ClickPad entspricht dem Precision-Standard von Microsoft und die Größe (11,5 x 7,6 cm) entspricht dem Clickpad des Surface Laptop 3. Anders als bei Microsofts Gerät ist das Klickgeräusch hier aber lauter und der Anschlag ist etwas weicher.


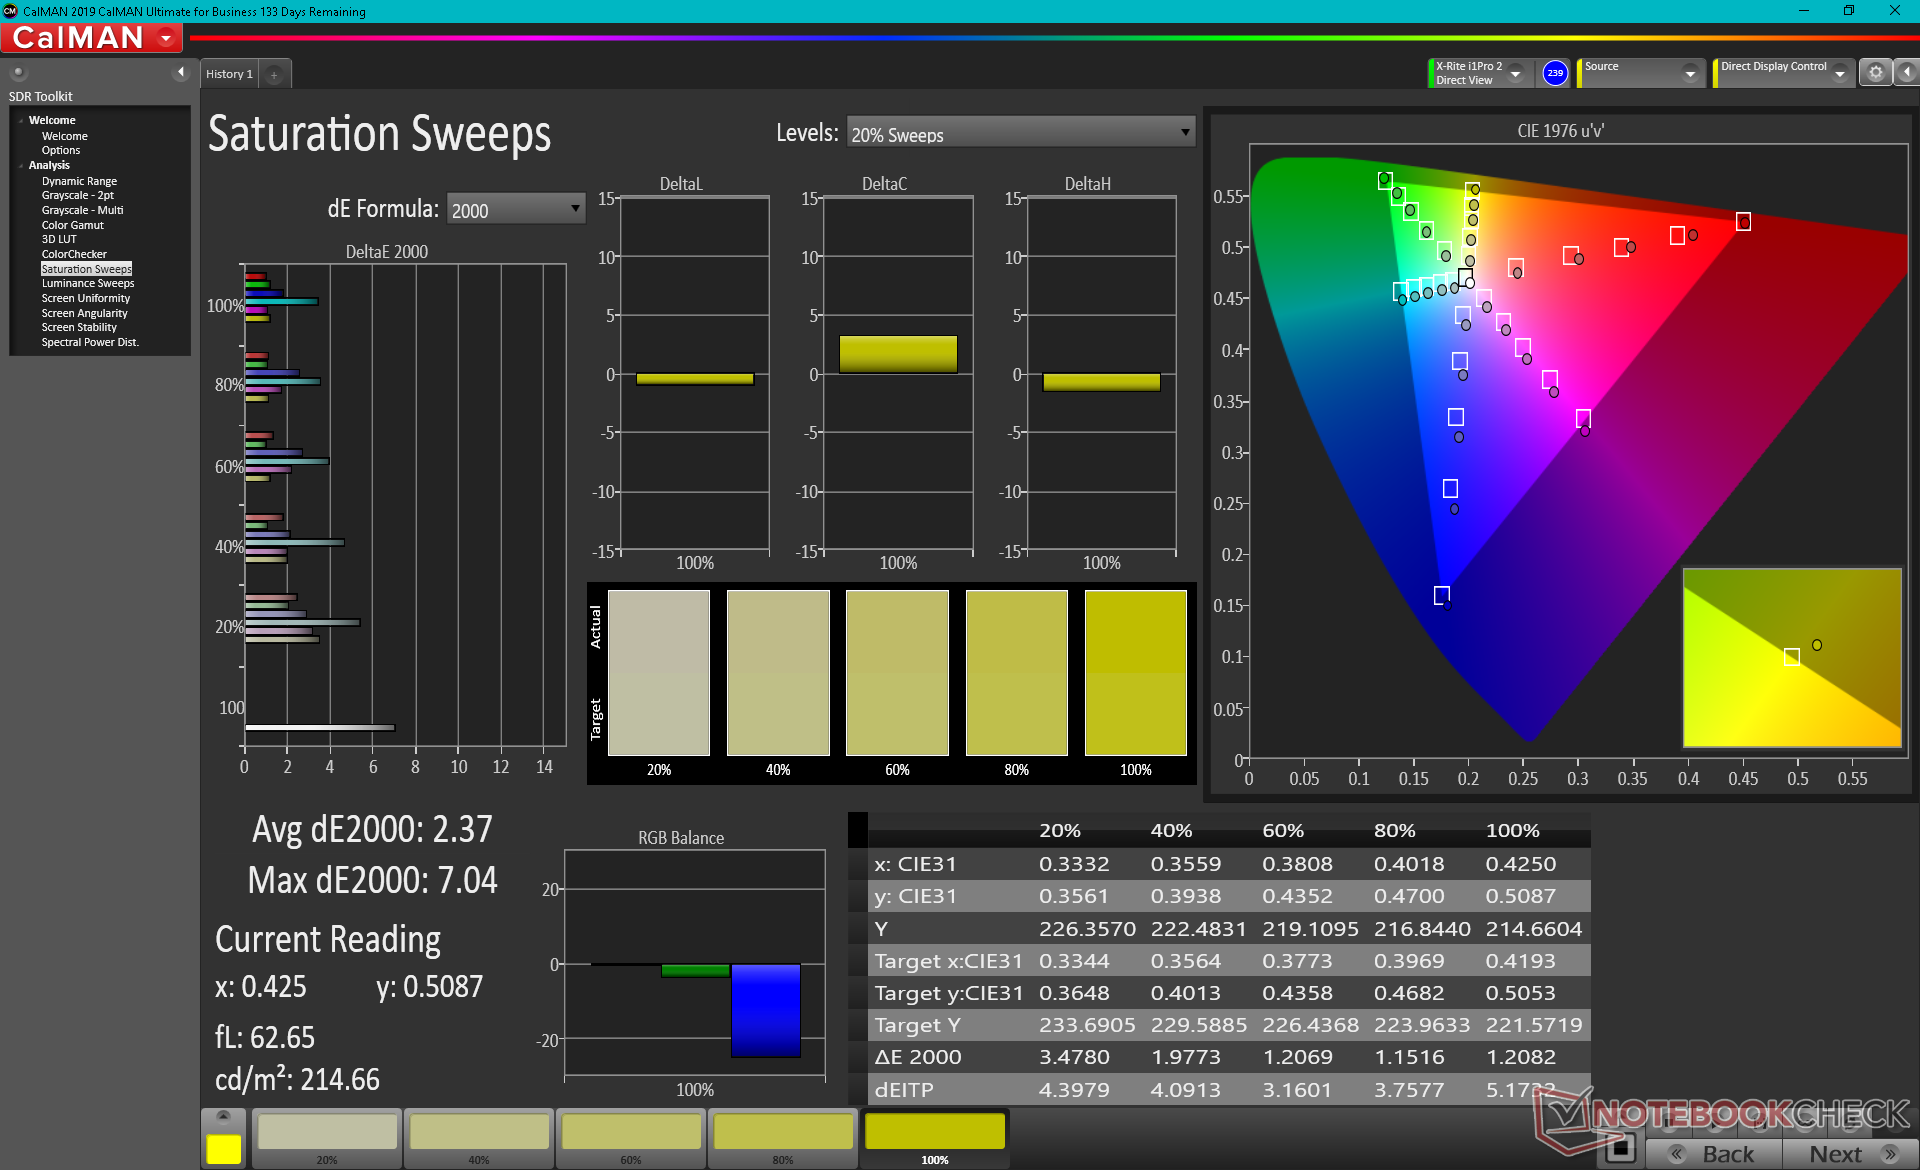
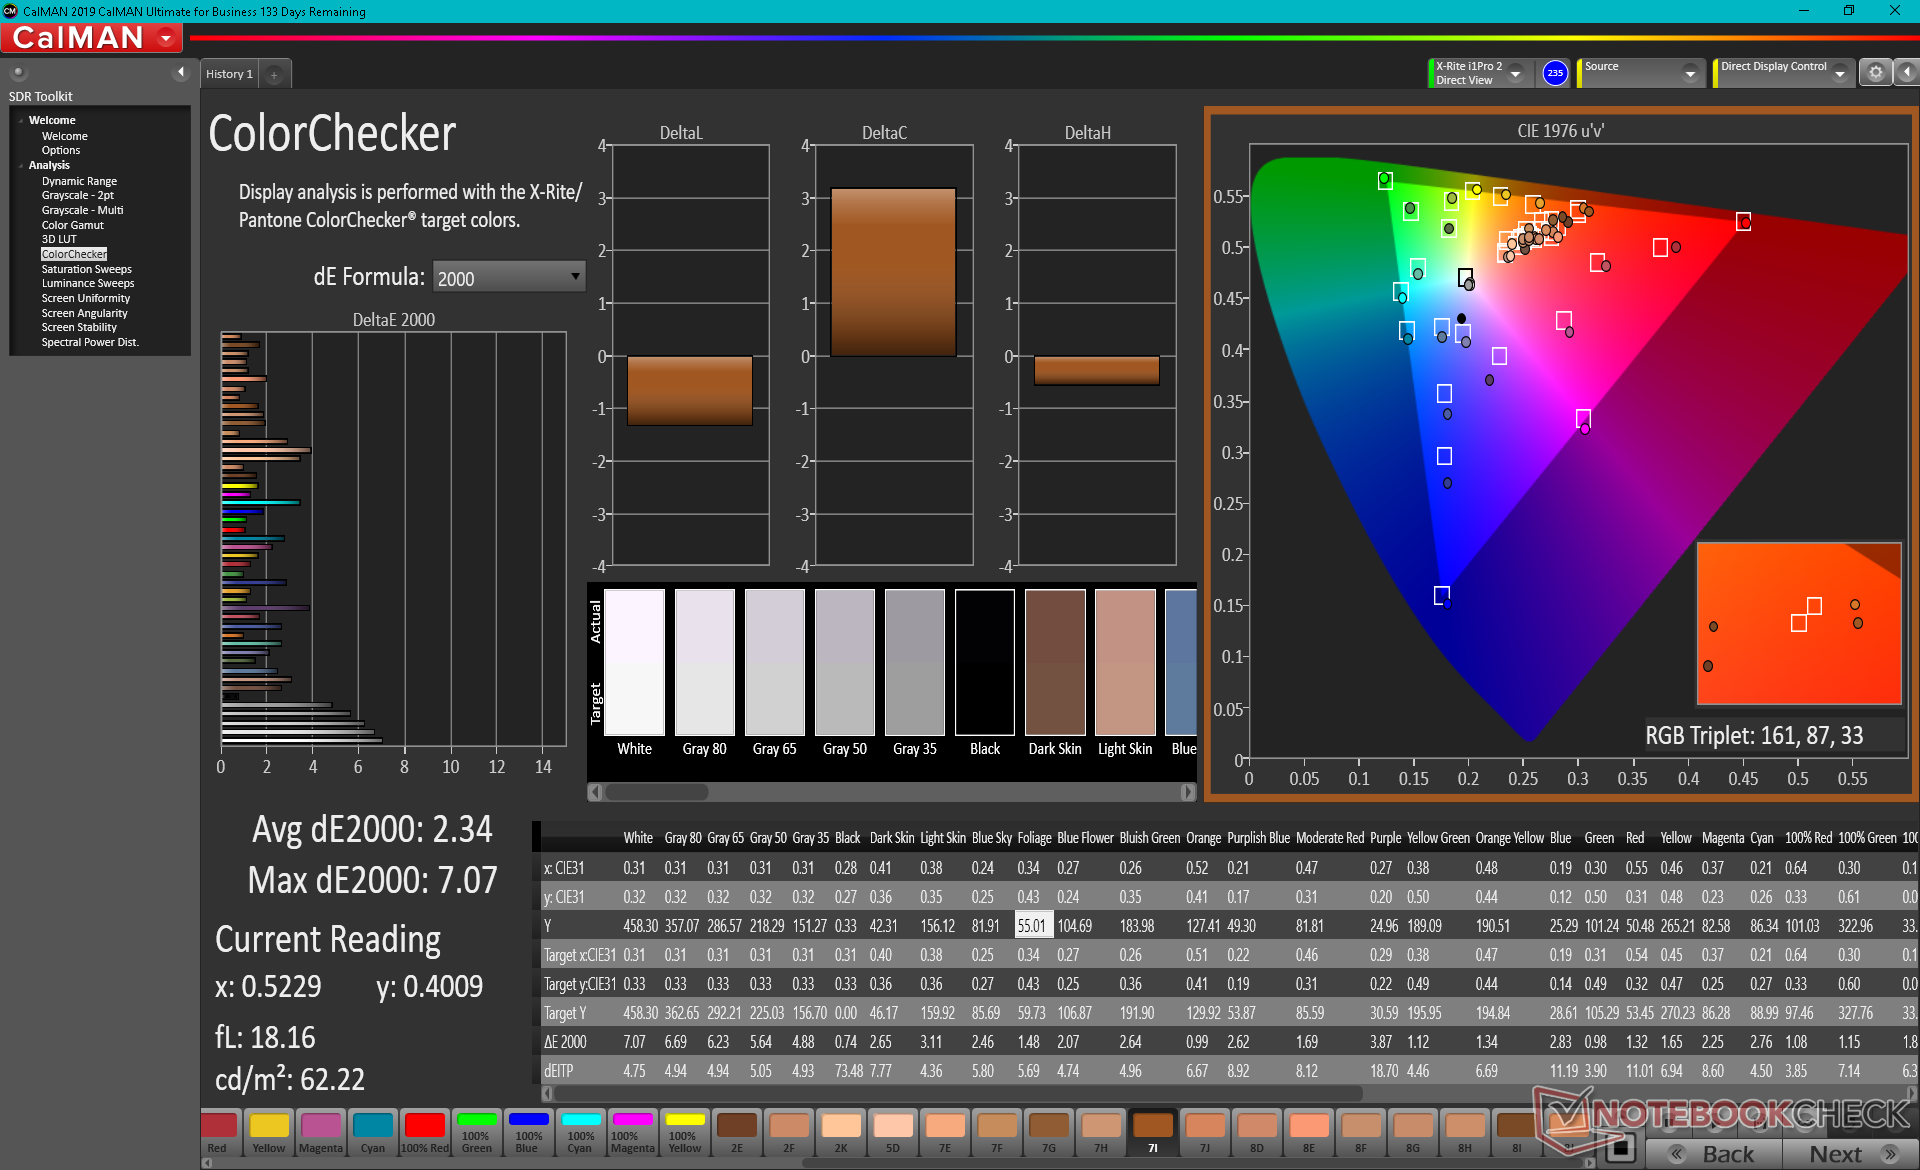
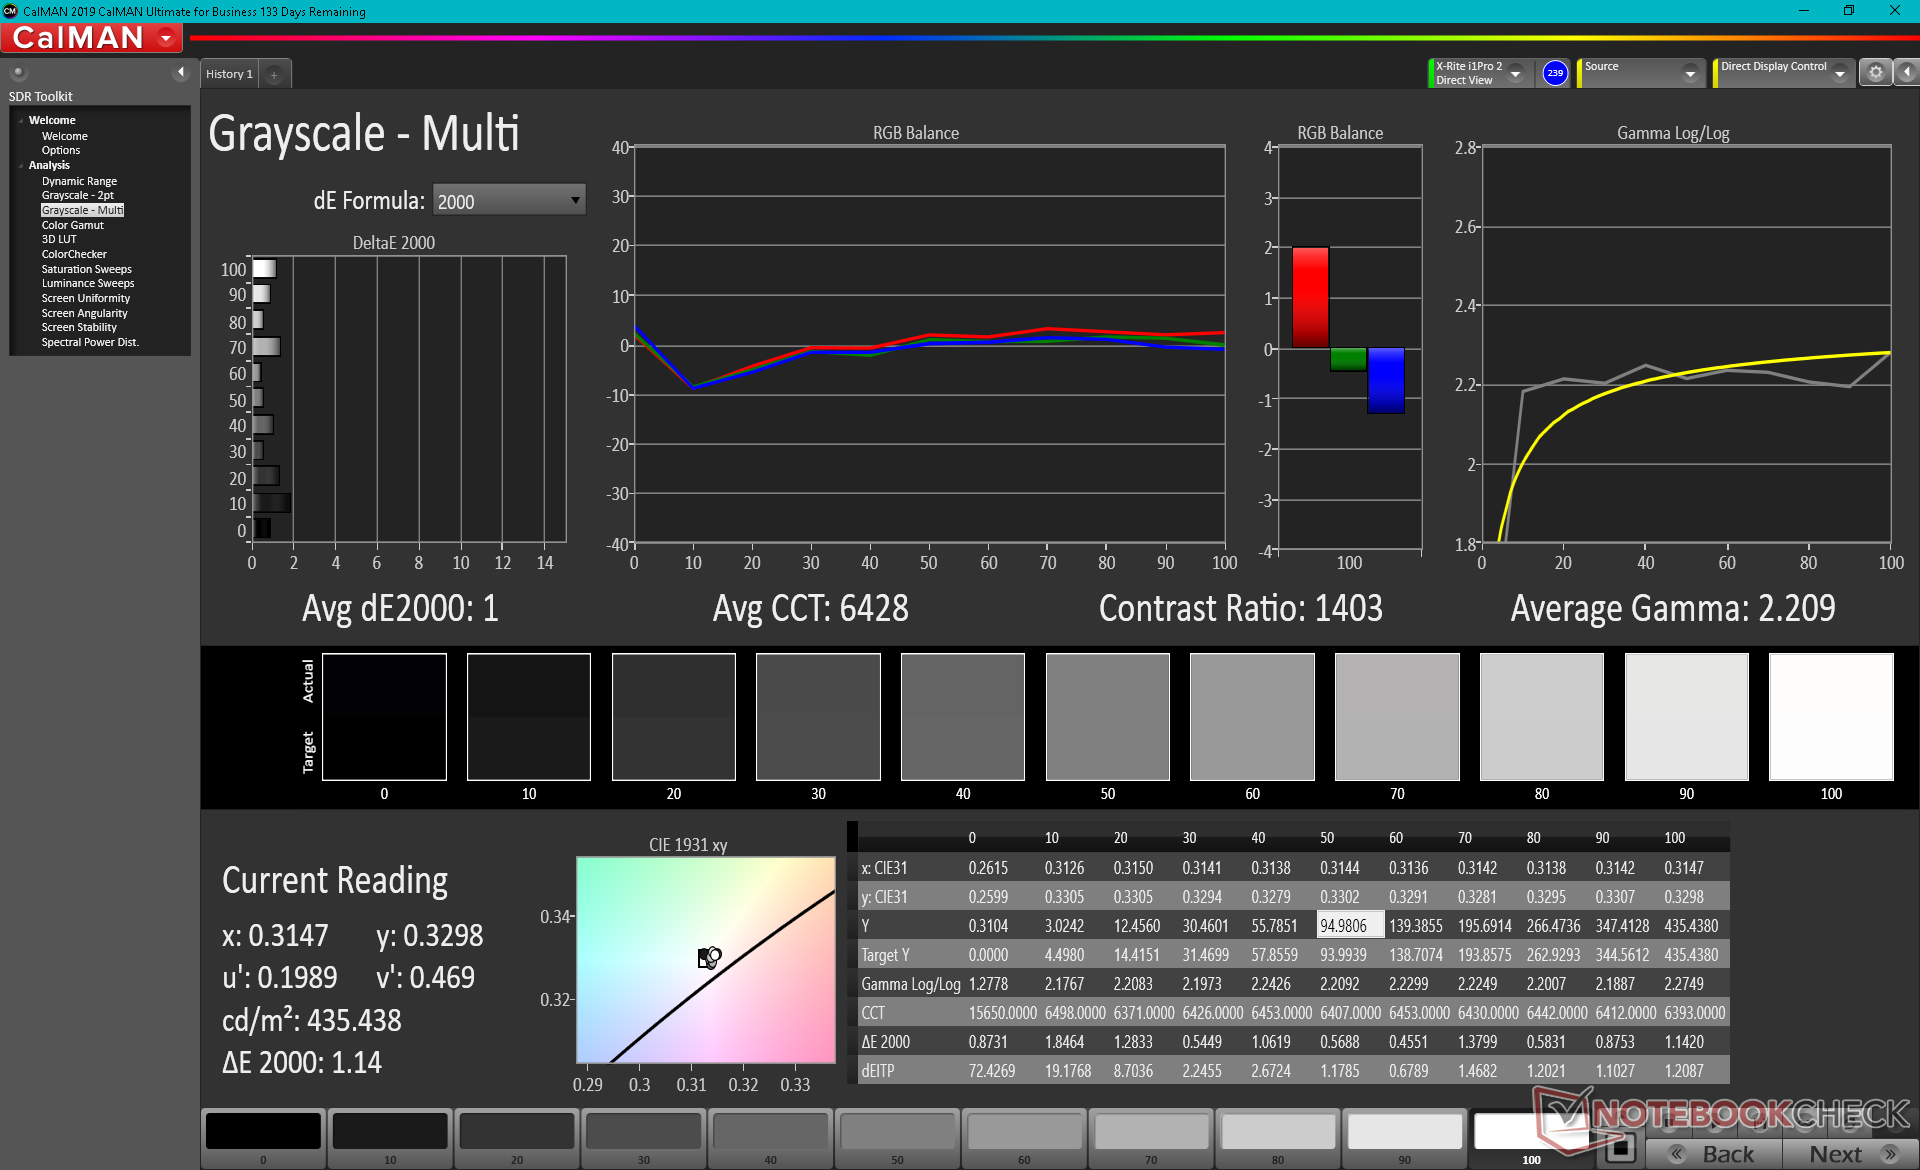
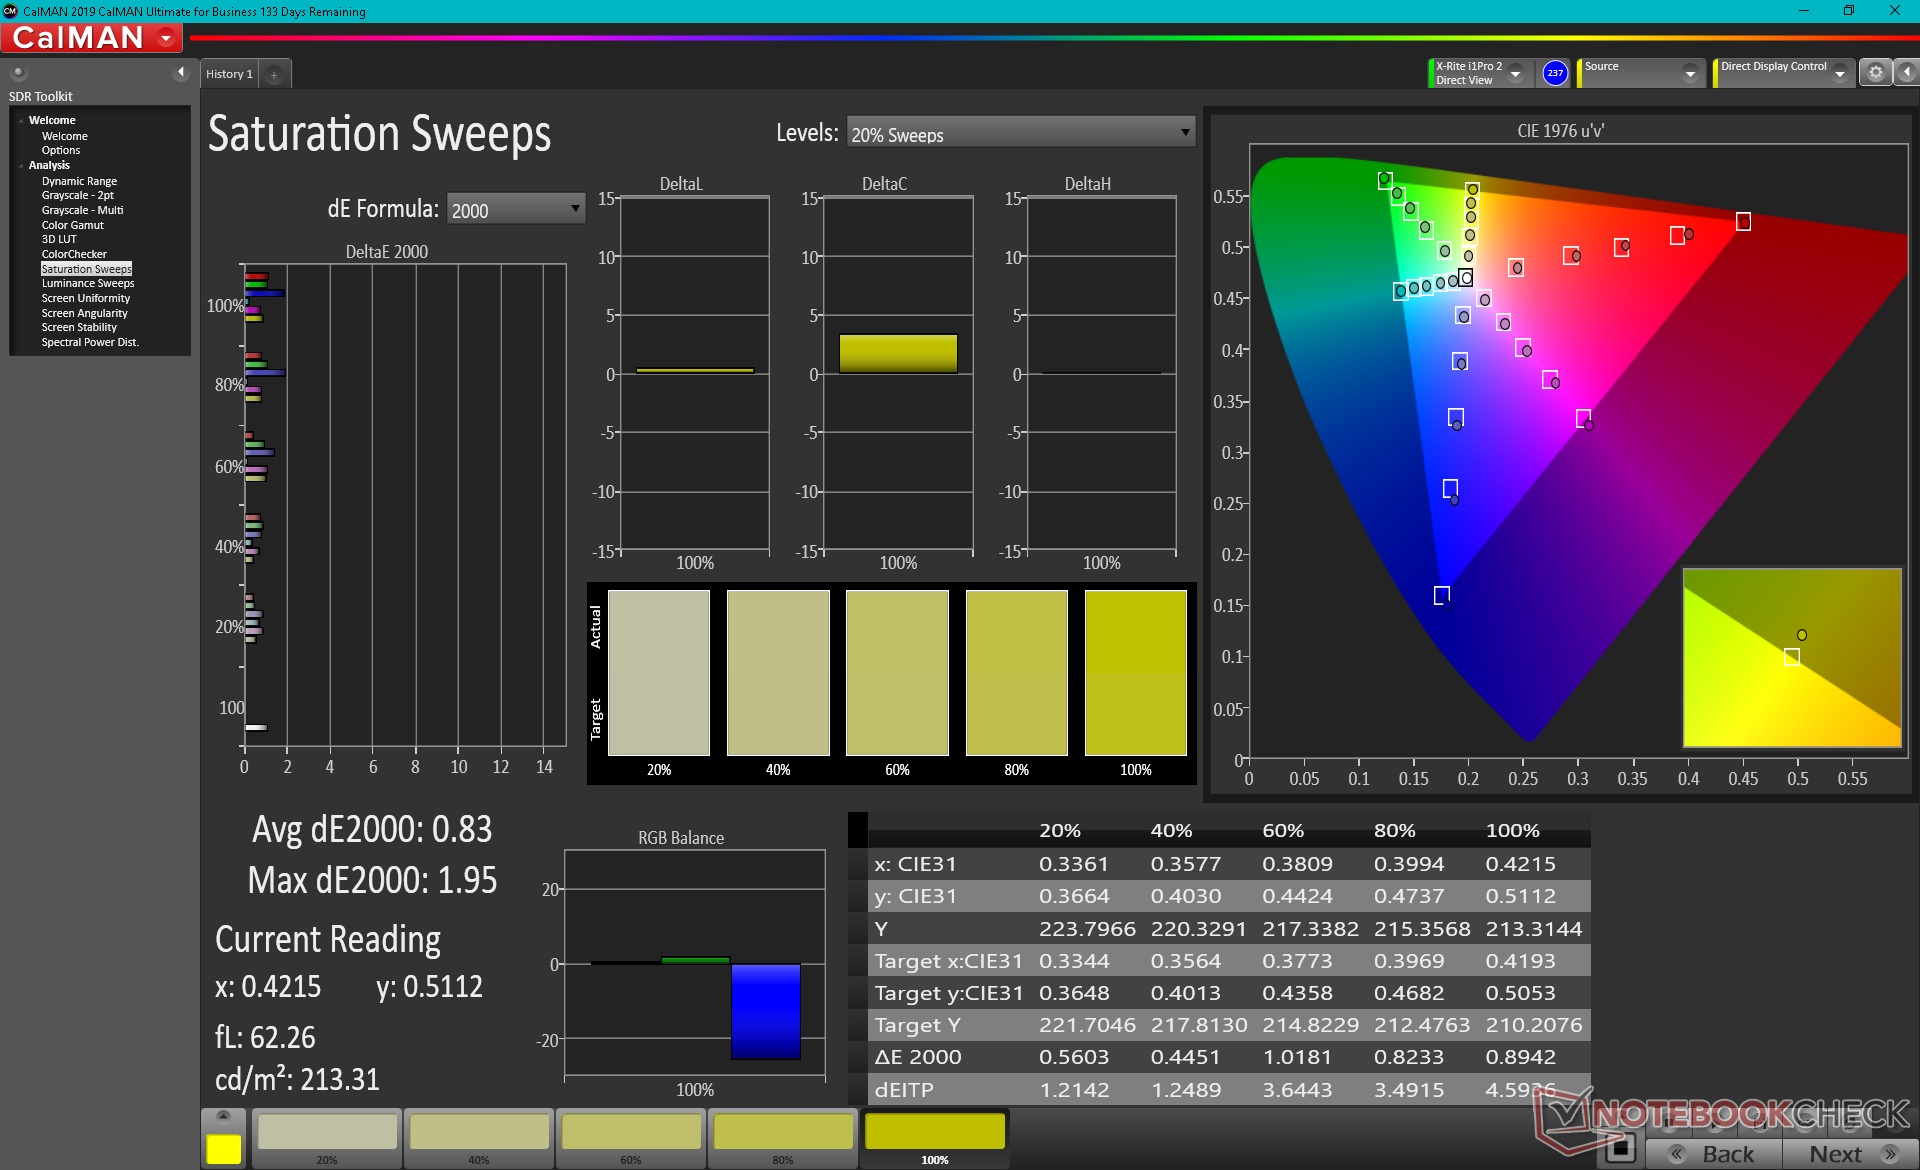
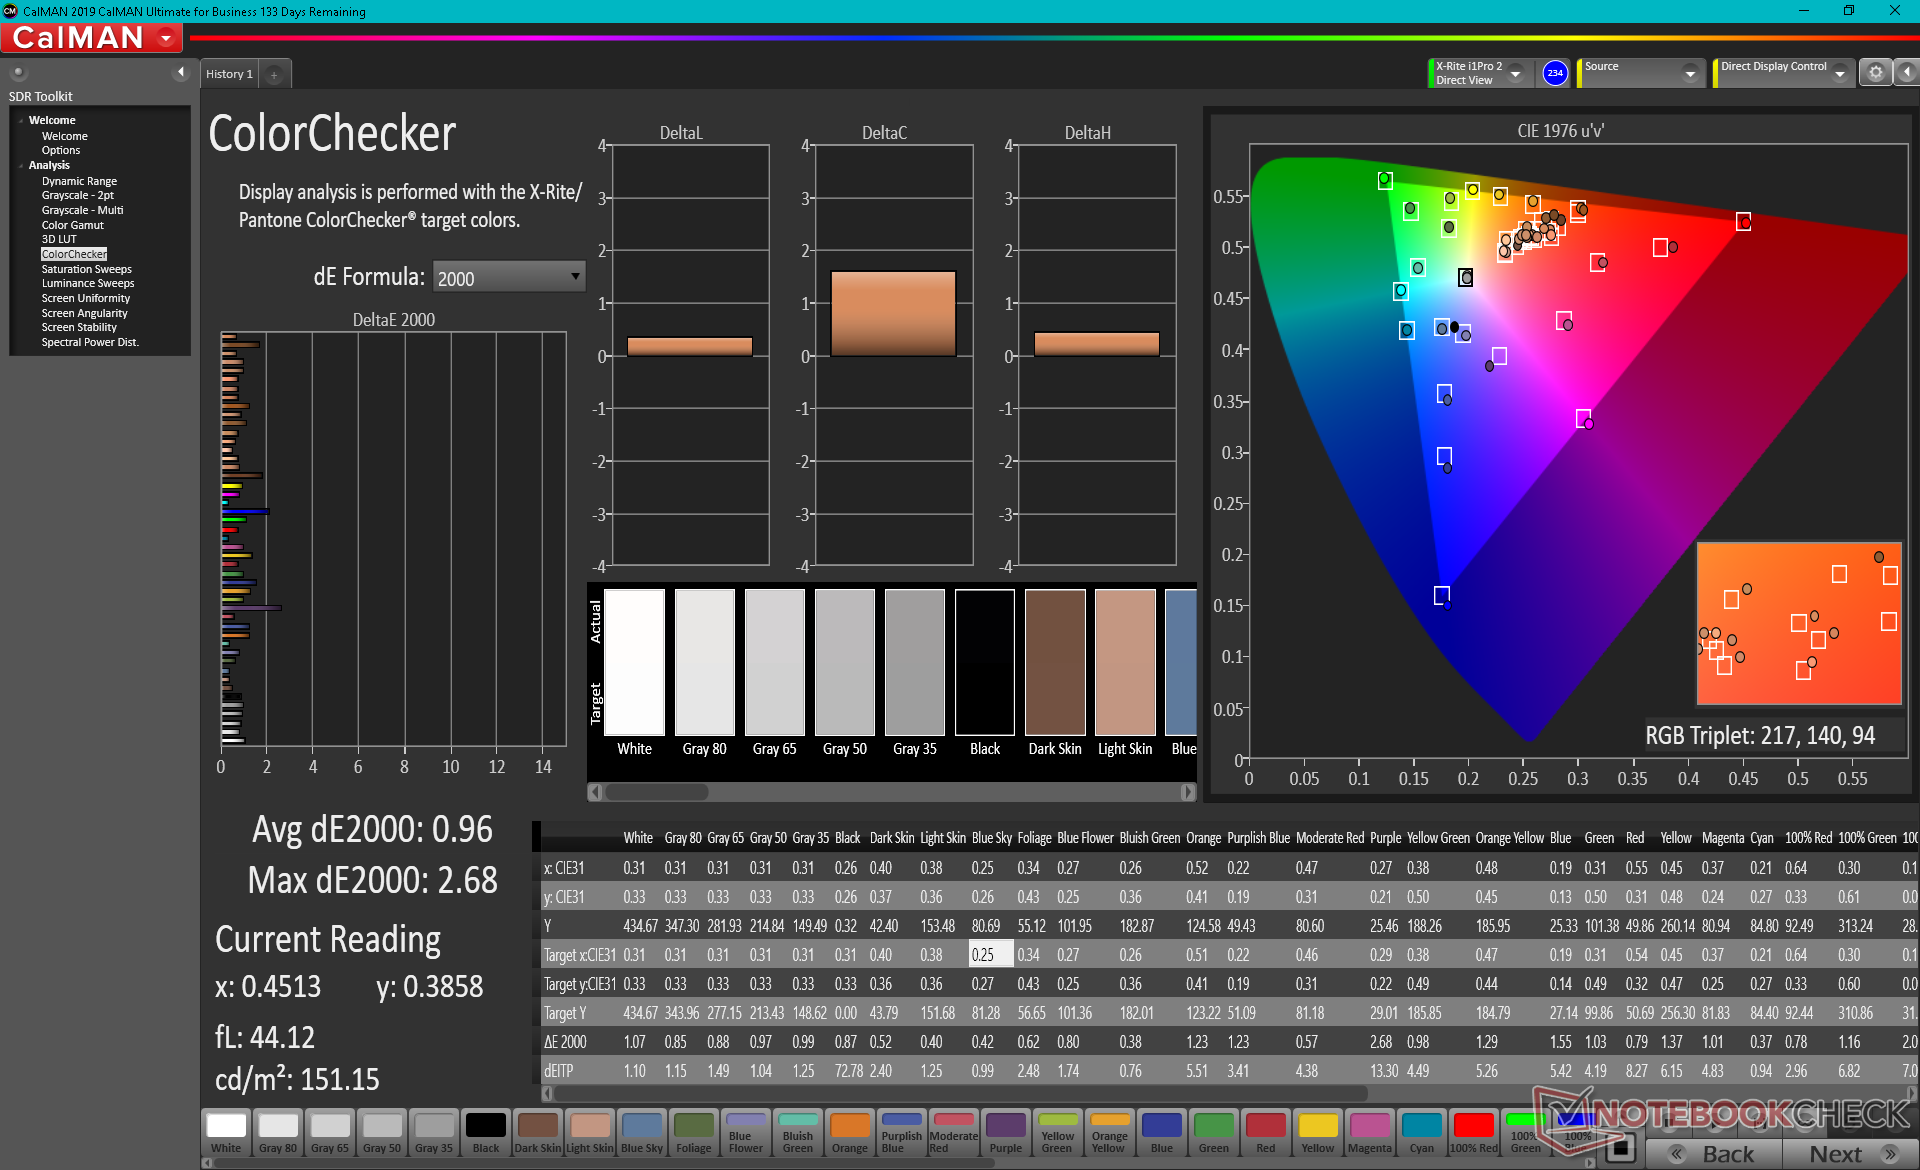
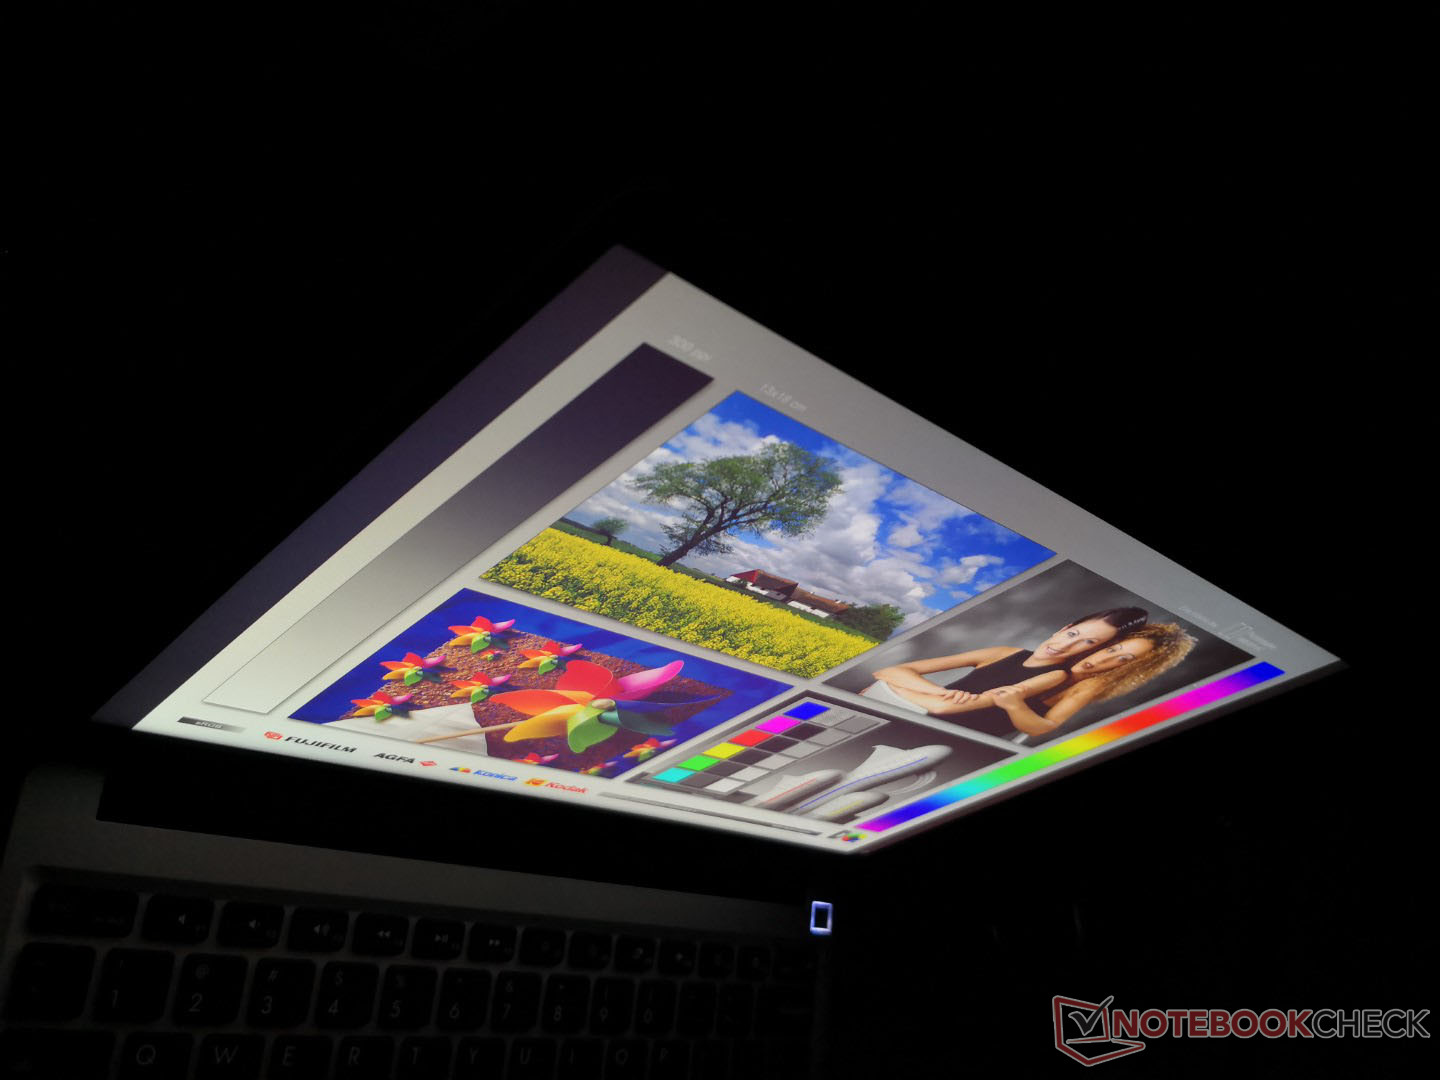
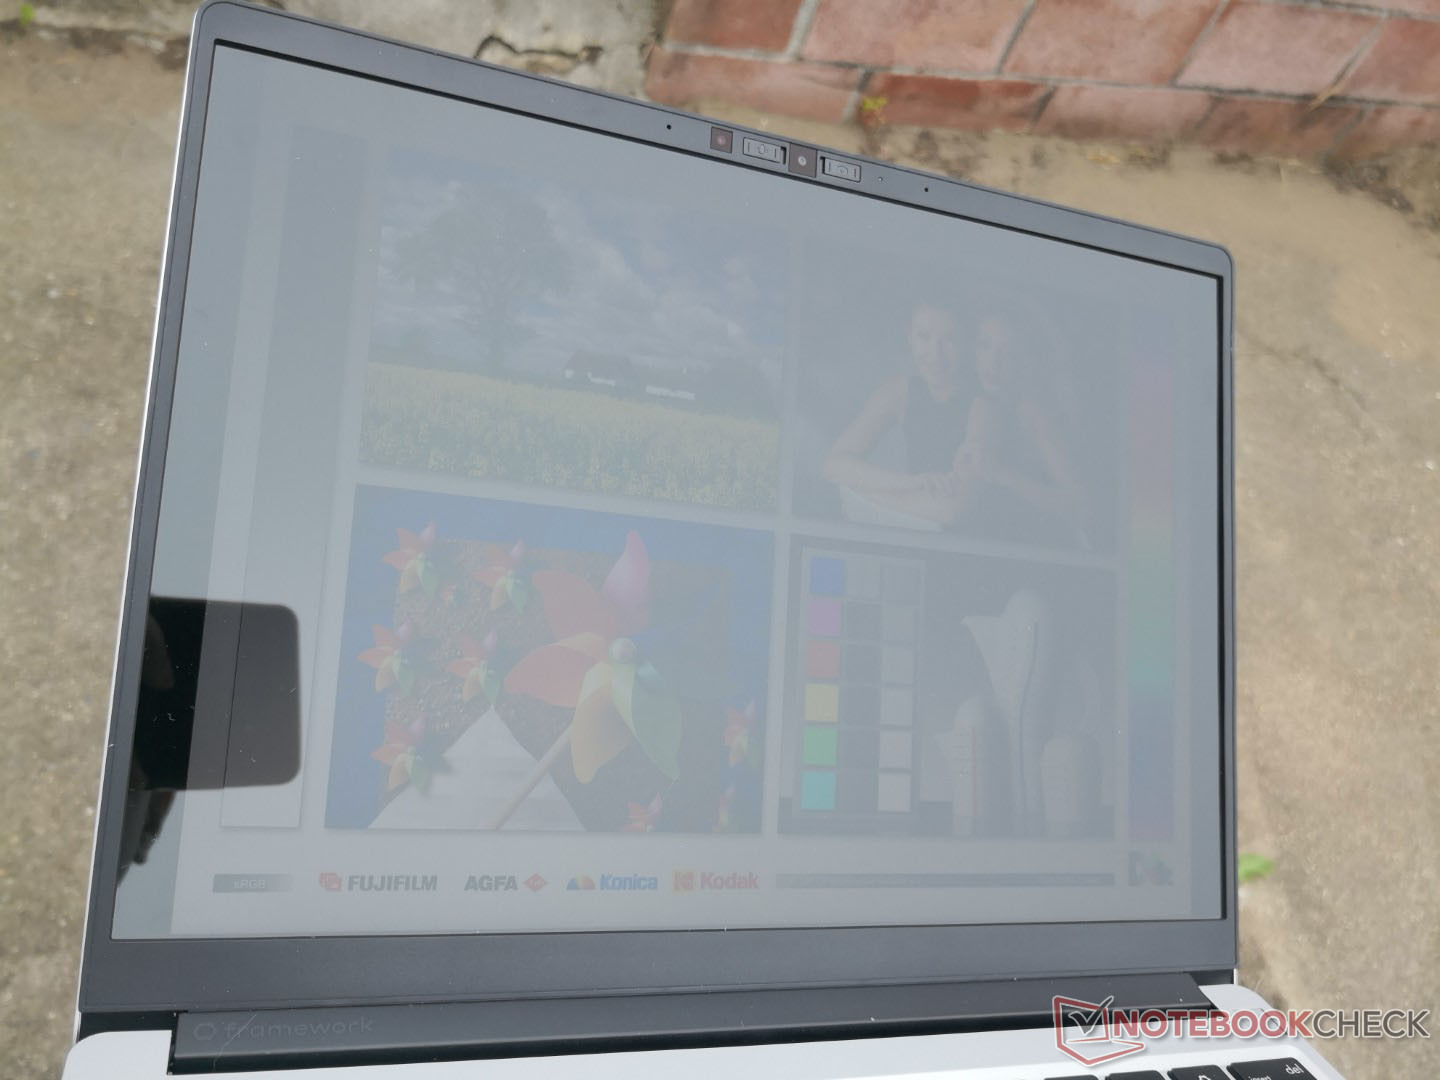
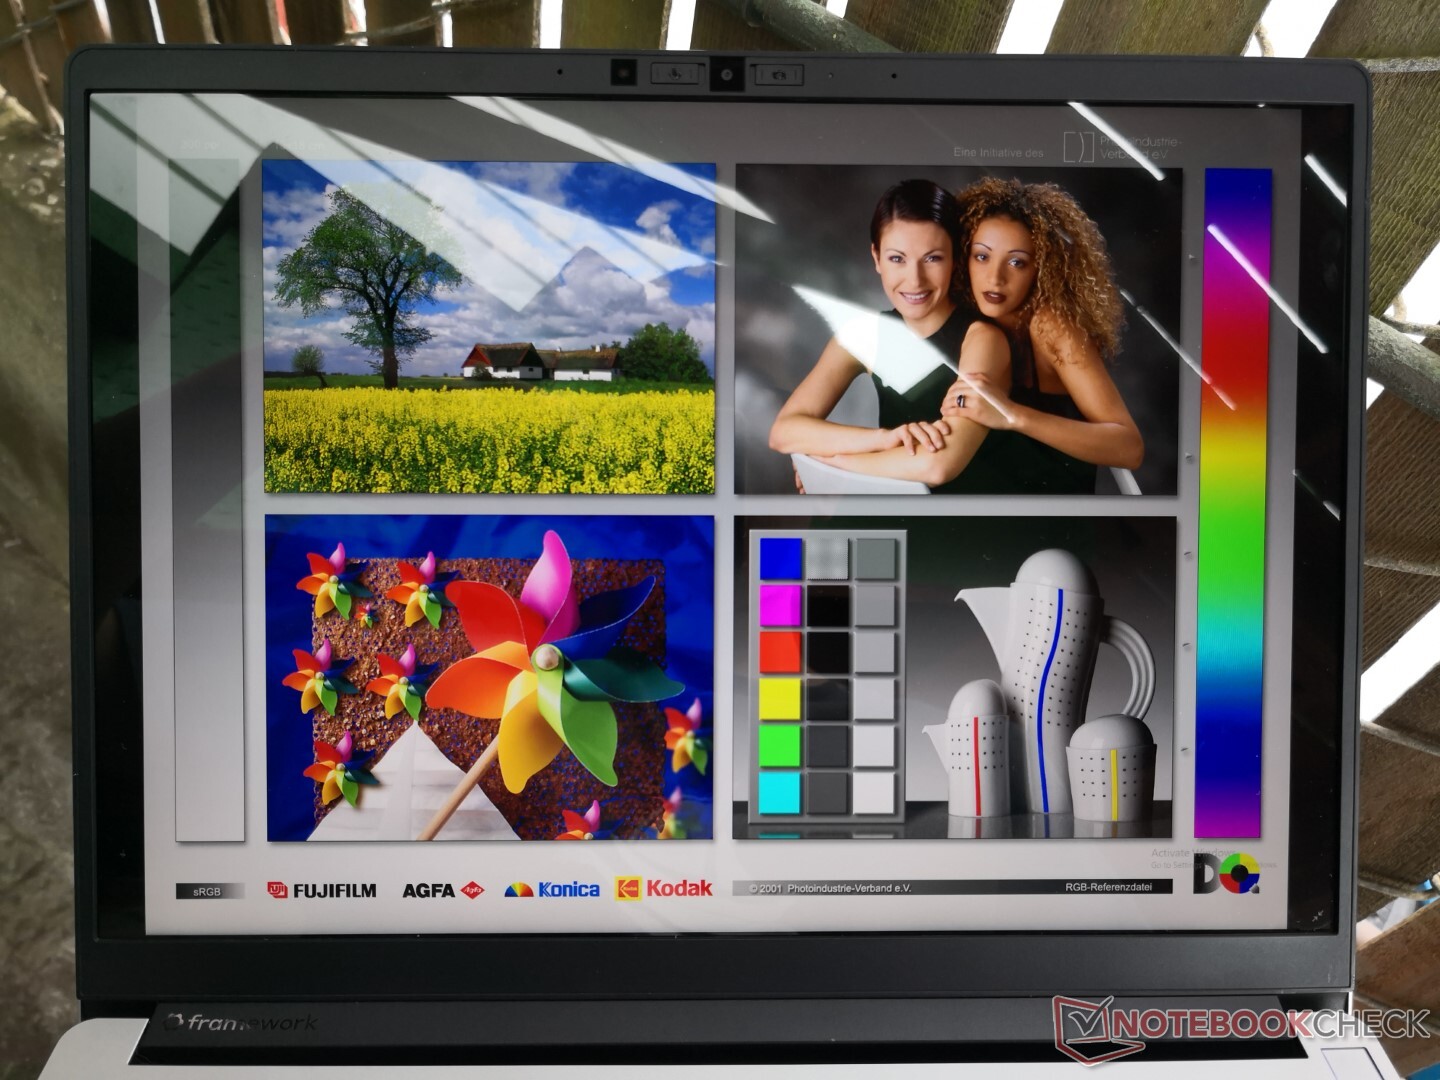
Display - 3:2 IPS-Panel
Framework verwendet das 13,5-Zoll-IPS-Panel NE135FBM-N41 von BOE, welches auch im Acer Swift 3 SF313 zum Einsatz kommt. Die beiden Laptops erreichen daher auch vergleichbare Werte inklusive der hohen Farbraumabdeckung und dem hohen Kontrastverhältnis. Die Reaktionszeiten sind allerdings langsam, beim Spielen wird es also Nachzieh-Effekte (Ghosting) geben. Bei normalen Bürotätigkeiten sind die Reaktionszeiten aber unproblematisch.

| |||||||||||||||||||||||||
Ausleuchtung: 93 %
Helligkeit Akku: 449 cd/m²
Kontrast: 1151:1 (Schwarzwert: 0.39 cd/m²)
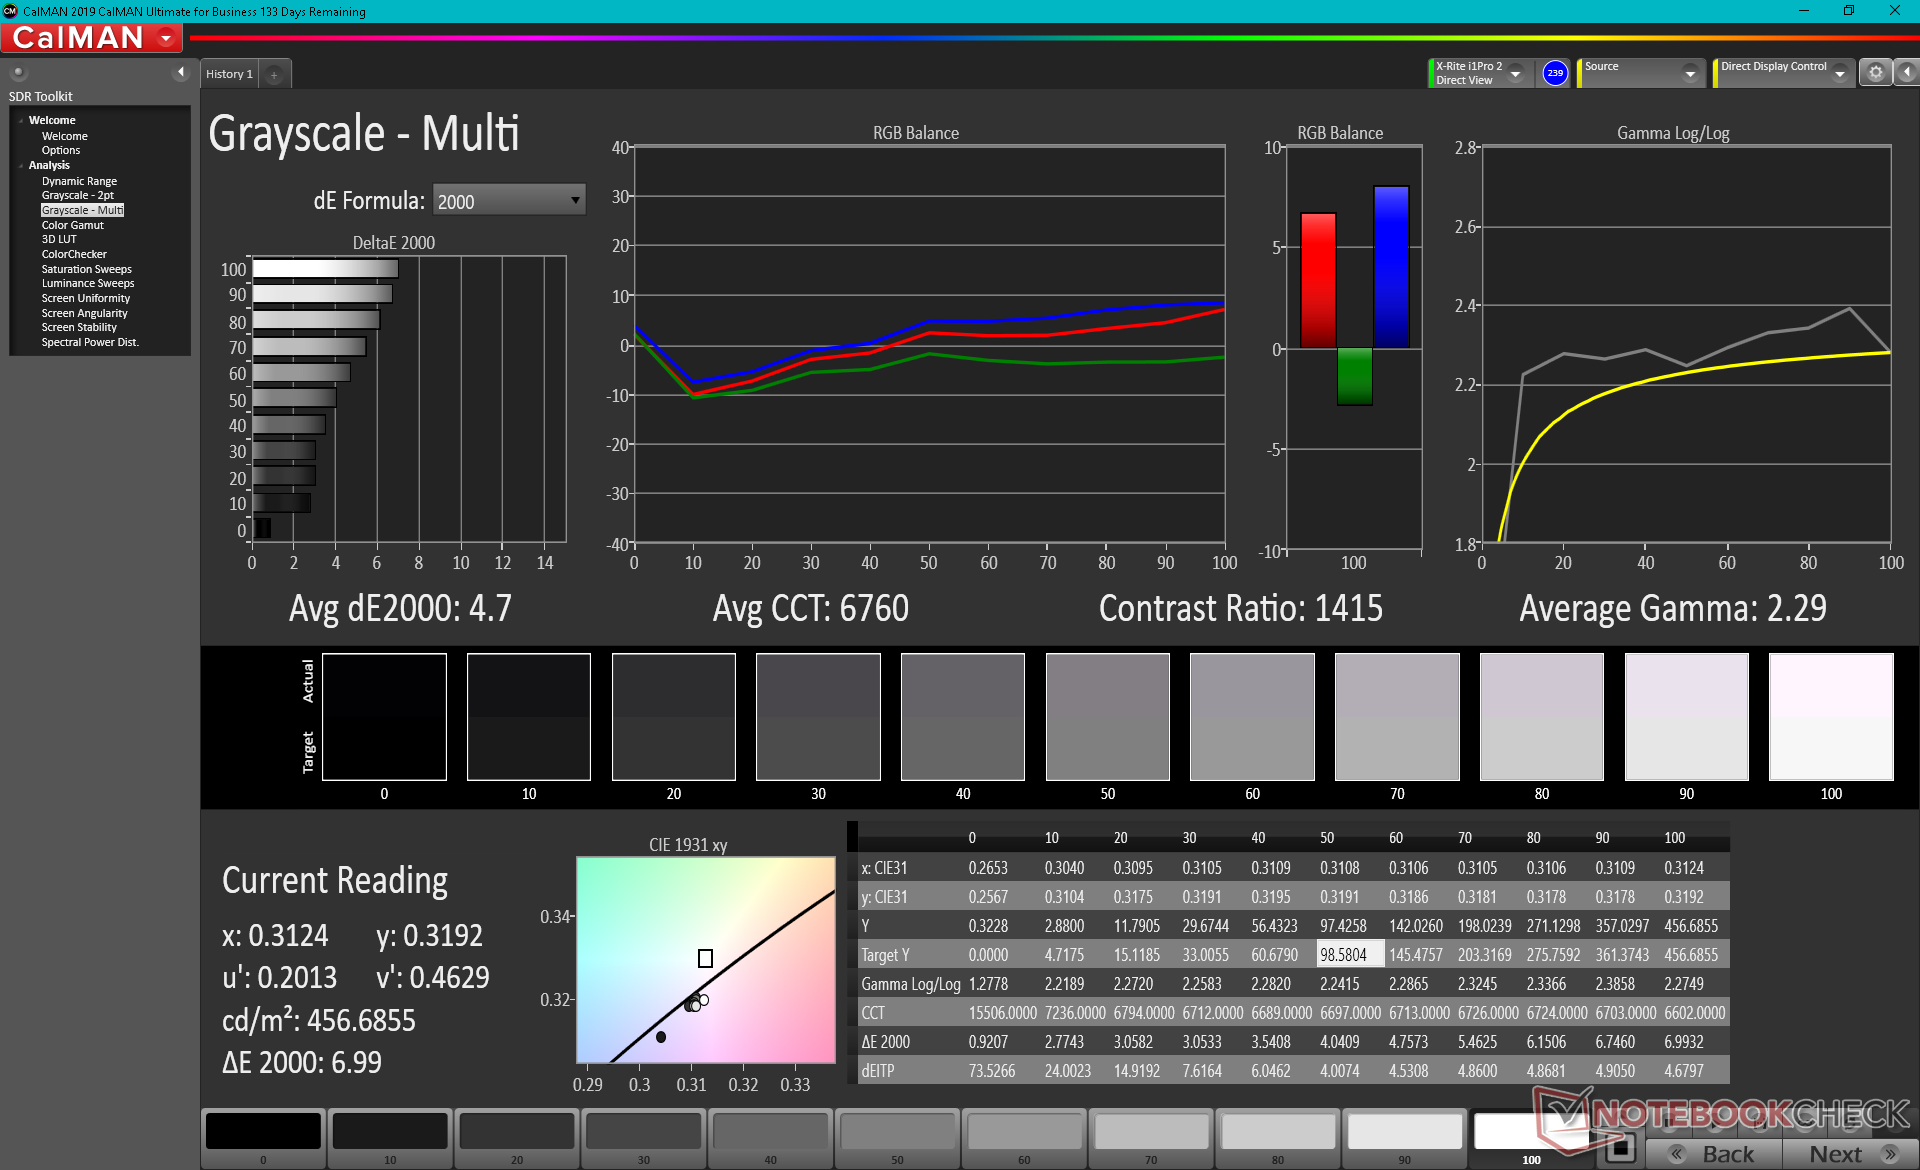
ΔE ColorChecker Calman: 2.34 | ∀{0.5-29.43 Ø4.72}
calibrated: 0.96
ΔE Greyscale Calman: 4.7 | ∀{0.09-98 Ø4.97}
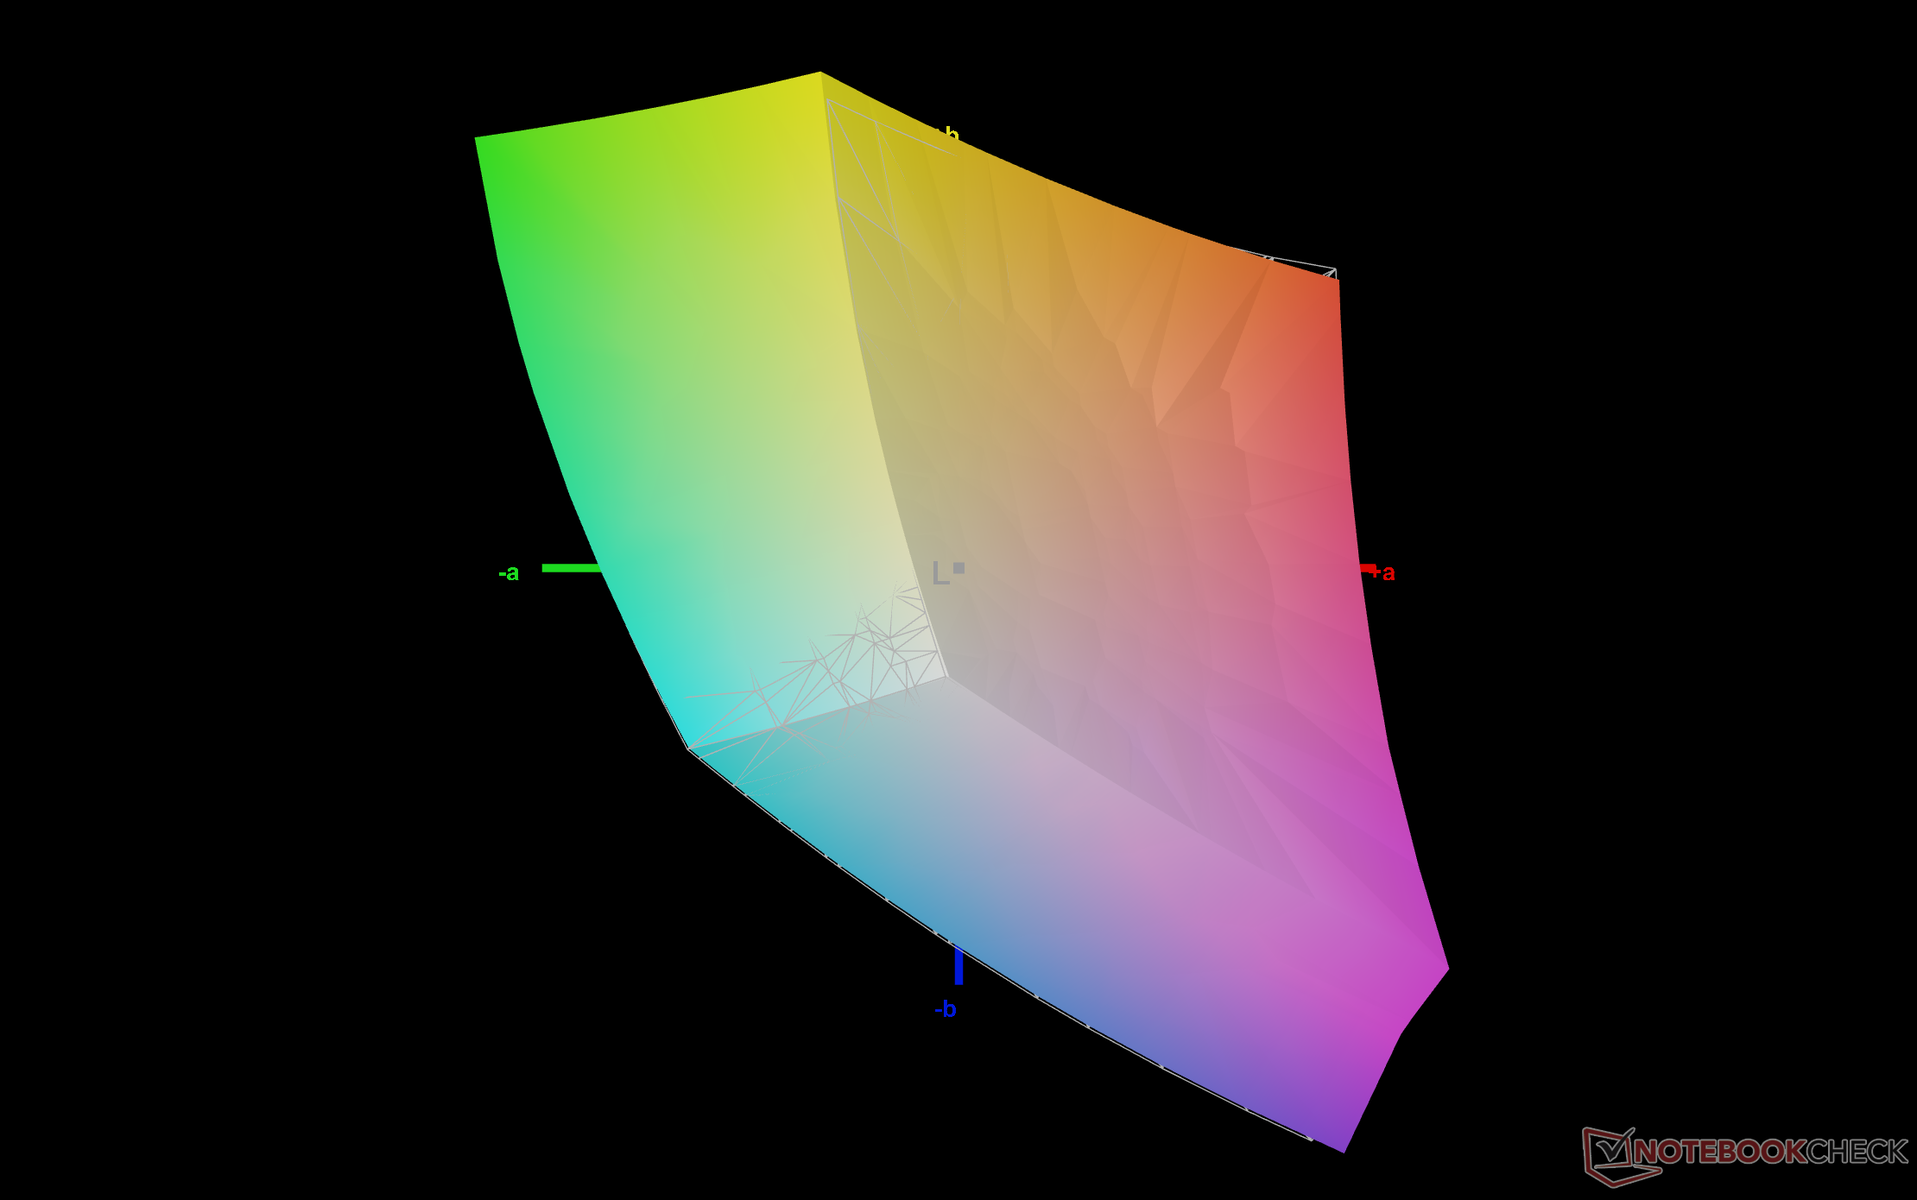
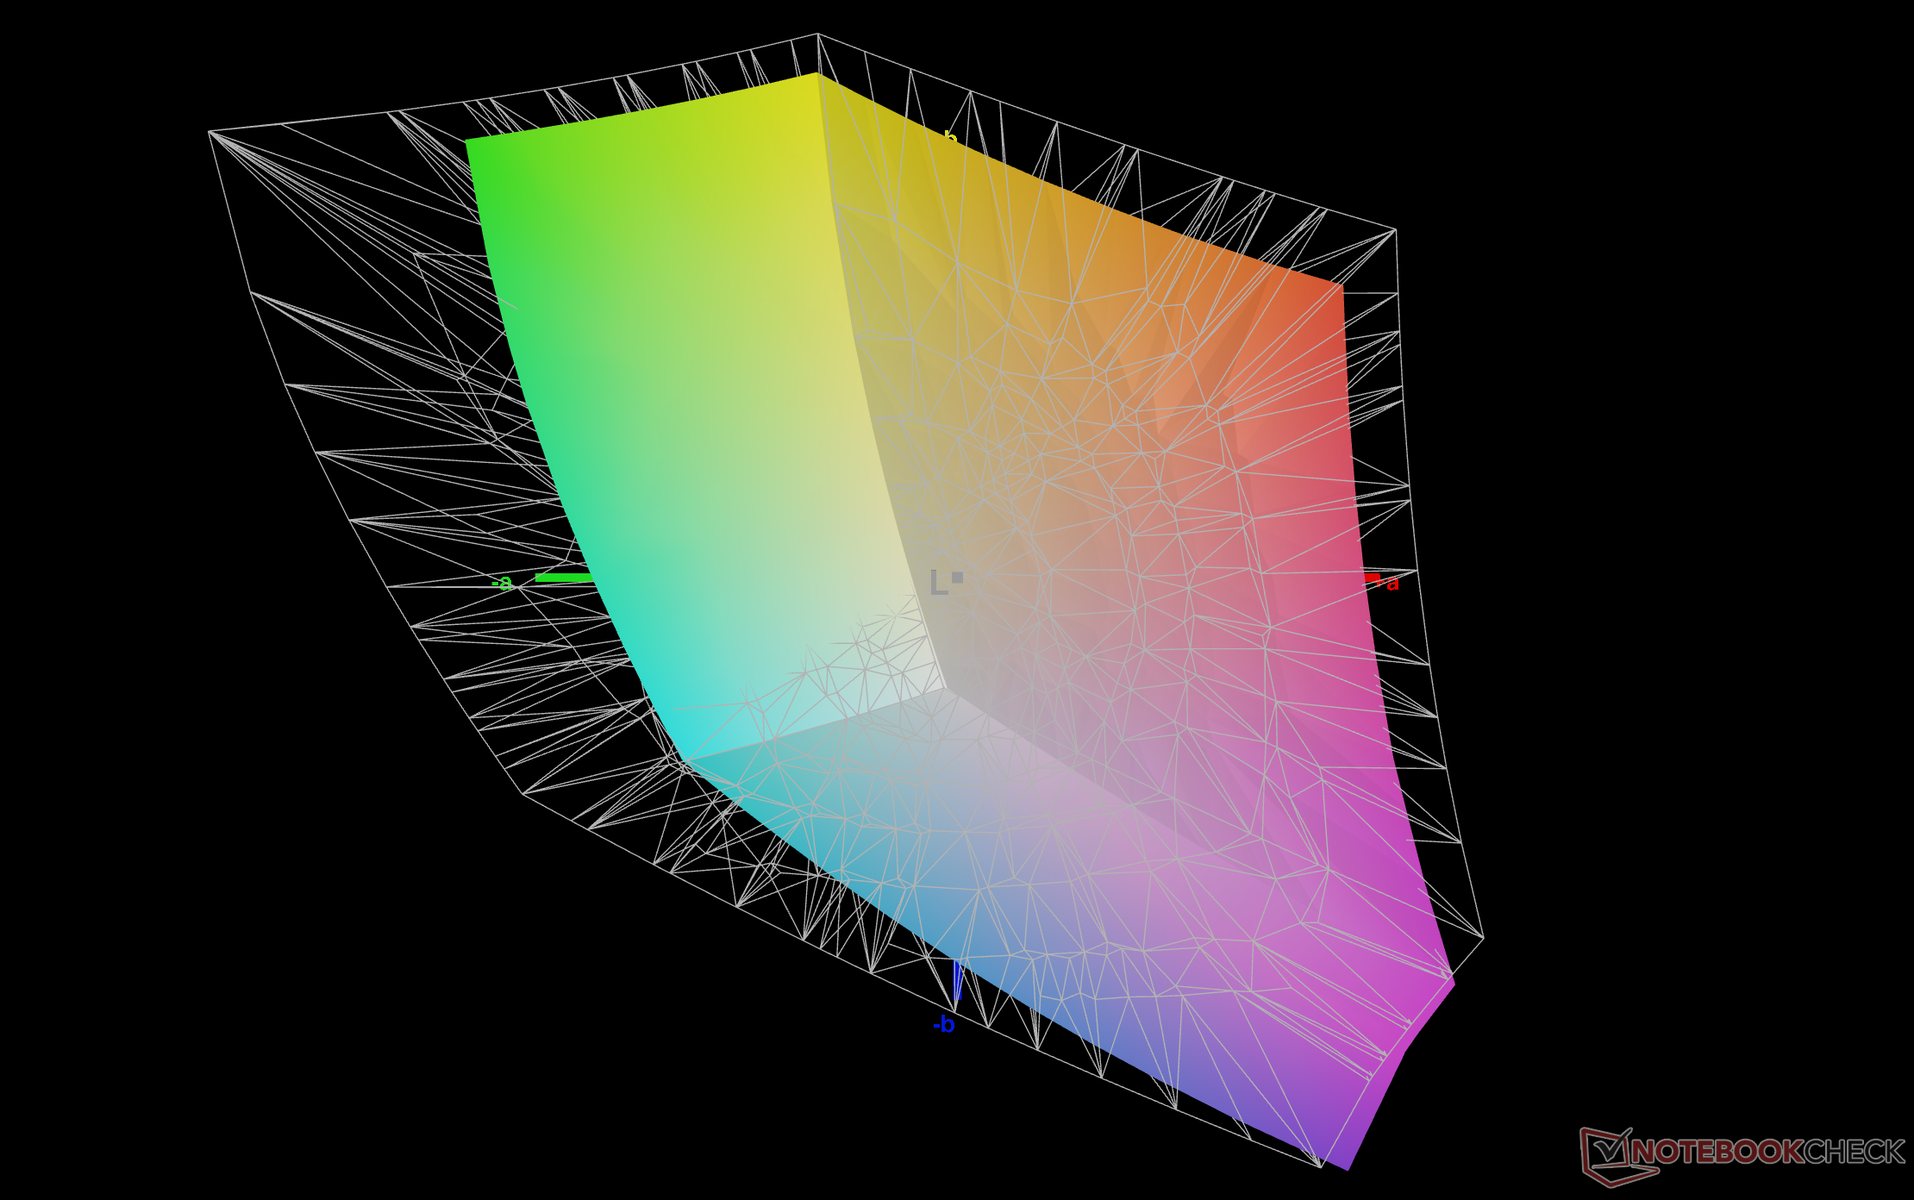
70.3% AdobeRGB 1998 (Argyll 3D)
99.3% sRGB (Argyll 3D)
69% Display P3 (Argyll 3D)
Gamma: 2.29
CCT: 6760 K
| Framework Laptop 13.5 BOE CQ NE135FBM-N41, IPS, 13.5", 2256x1504 | HP Spectre x360 14-ea0378ng Samsung SDC4148, OLED, 13.5", 3000x2000 | Microsoft Surface Laptop 4 13 i7 LQ135P1JX51, IPS, 13.5", 2256x1504 | Lenovo ThinkPad X1 Titanium Yoga G1 20QA001RGE LPM135M467, IPS, 13.5", 2256x1504 | HP ProBook x360 435 G8 R7-5800U AUO4B2D, IPS, 13.3", 1920x1080 | Lenovo Yoga 6 13 82ND0009US AU Optronics B133HAN05.F, IPS, 13.3", 1920x1080 | |
|---|---|---|---|---|---|---|
| Display | 28% | -4% | -41% | 1% | ||
| Display P3 Coverage (%) | 69 | 99.9 45% | 64.7 -6% | 40.1 -42% | 69.7 1% | |
| sRGB Coverage (%) | 99.3 | 100 1% | 97.2 -2% | 59.9 -40% | 99.2 0% | |
| AdobeRGB 1998 Coverage (%) | 70.3 | 96.1 37% | 66.9 -5% | 41.4 -41% | 71.4 2% | |
| Response Times | 95% | -12% | 19% | 17% | 18% | |
| Response Time Grey 50% / Grey 80% * (ms) | 55.6 ? | 2 ? 96% | 62.8 ? -13% | 53.6 ? 4% | 42.8 ? 23% | 46.8 ? 16% |
| Response Time Black / White * (ms) | 36 ? | 2 ? 94% | 39.8 ? -11% | 24 ? 33% | 32 ? 11% | 28.8 ? 20% |
| PWM Frequency (Hz) | 250 ? | 21930 ? | ||||
| Bildschirm | 346% | 10% | 27% | -62% | -12% | |
| Helligkeit Bildmitte (cd/m²) | 449 | 370 -18% | 413 -8% | 466 4% | 304 -32% | 291.5 -35% |
| Brightness (cd/m²) | 435 | 374 -14% | 400 -8% | 454 4% | 292 -33% | 294 -32% |
| Brightness Distribution (%) | 93 | 90 -3% | 94 1% | 94 1% | 89 -4% | 93 0% |
| Schwarzwert * (cd/m²) | 0.39 | 0.01 97% | 0.29 26% | 0.23 41% | 0.23 41% | 0.19 51% |
| Kontrast (:1) | 1151 | 37000 3115% | 1424 24% | 2026 76% | 1322 15% | 1534 33% |
| Delta E Colorchecker * | 2.34 | 2.57 -10% | 2.8 -20% | 2.1 10% | 5 -114% | 3.83 -64% |
| Colorchecker dE 2000 max. * | 7.07 | 4.52 36% | 7.2 -2% | 4.5 36% | 17.7 -150% | 8.43 -19% |
| Colorchecker dE 2000 calibrated * | 0.96 | 2.31 -141% | 0.8 17% | 4.2 -338% | 1.07 -11% | |
| Delta E Graustufen * | 4.7 | 2.2 53% | 1.9 60% | 2.7 43% | 2.1 55% | 6.2 -32% |
| Gamma | 2.29 96% | 2.36 93% | 2.12 104% | 2.08 106% | 2.03 108% | 2.2 100% |
| CCT | 6760 96% | 6154 106% | 6510 100% | 6210 105% | 6443 101% | 6469 100% |
| Farbraum (Prozent von AdobeRGB 1998) (%) | 85.8 | 61.6 | 61.1 | |||
| Color Space (Percent of sRGB) (%) | 100 | 97.2 | 94.9 | |||
| Durchschnitt gesamt (Programm / Settings) | 156% /
242% | -2% /
4% | 23% /
25% | -29% /
-46% | 2% /
-5% |
* ... kleinere Werte sind besser
Wie bei den meisten anderen hochwertigen Ultrabooks wird der kleine sRGB-Farbraum vollständig abgedeckt. Wer hingegen im größeren P3-Farbraum arbeiten möchte, sollte sich andere Modelle mit 4K- oder OLED-Panels ansehen.
Unsere Analyse mit der professionellen CalMAN-Software und dem X-Rite Spektralfotometer zeigt, dass der Hersteller die Panels ab Werk nicht kalibriert. Mit unserer Kalibrierung verbessern sich die durchschnittlichen DeltaE-2000-Abweichungen gegenüber der sRGB-Referenz von 4,7 (Graustufen) und 2,34 (Farben) auf gerade einmal 1,0 bzw. 0,96. Um das volle Potenzial des Panels zu nutzen sollte es also kalibriert werden. Alternativ kann auch unser Profil verwendet werden, das wir weiter oben zum Download zur Verfügung stellen.
Reaktionszeiten (Response Times) des Displays
| ↔ Reaktionszeiten Schwarz zu Weiß | ||
|---|---|---|
| 36 ms ... steigend ↗ und fallend ↘ kombiniert | ↗ 21.2 ms steigend | 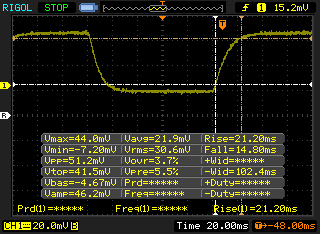 |
| ↘ 14.8 ms fallend | ||
| Die gemessenen Reaktionszeiten sind langsam und dadurch für viele Spieler wahrscheinlich zu langsam. Im Vergleich rangierten die bei uns getesteten Geräte von 0.1 (Minimum) zu 240 (Maximum) ms. » 94 % aller Screens waren schneller als der getestete. Daher sind die gemessenen Reaktionszeiten schlechter als der Durchschnitt aller vermessenen Geräte (19.8 ms). | ||
| ↔ Reaktionszeiten 50% Grau zu 80% Grau | ||
| 55.6 ms ... steigend ↗ und fallend ↘ kombiniert | ↗ 27.2 ms steigend | 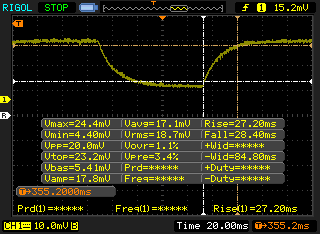 |
| ↘ 28.4 ms fallend | ||
| Die gemessenen Reaktionszeiten sind langsam und dadurch für viele Spieler wahrscheinlich zu langsam. Im Vergleich rangierten die bei uns getesteten Geräte von 0.165 (Minimum) zu 636 (Maximum) ms. » 92 % aller Screens waren schneller als der getestete. Daher sind die gemessenen Reaktionszeiten schlechter als der Durchschnitt aller vermessenen Geräte (31 ms). | ||
Bildschirm-Flackern / PWM (Pulse-Width Modulation)
| Flackern / PWM nicht festgestellt | 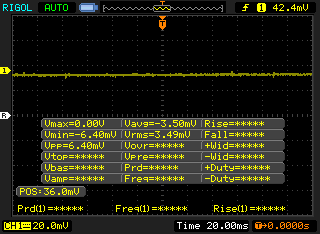 | ||
Im Vergleich: 52 % aller getesteten Geräte nutzten kein PWM um die Helligkeit zu reduzieren. Wenn PWM eingesetzt wurde, dann bei einer Frequenz von durchschnittlich 7763 (Minimum 5, Maximum 343500) Hz. | |||
Leistung - Intel Tiger Lake
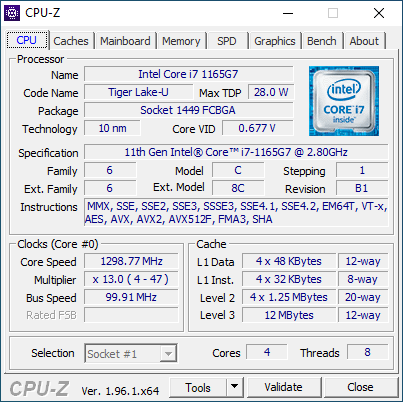
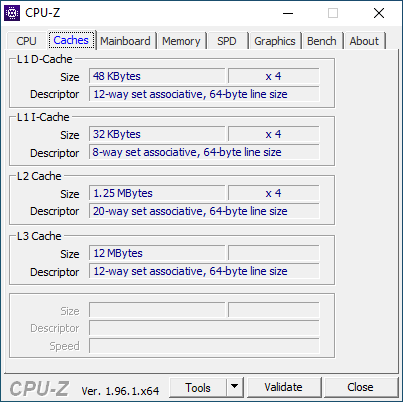
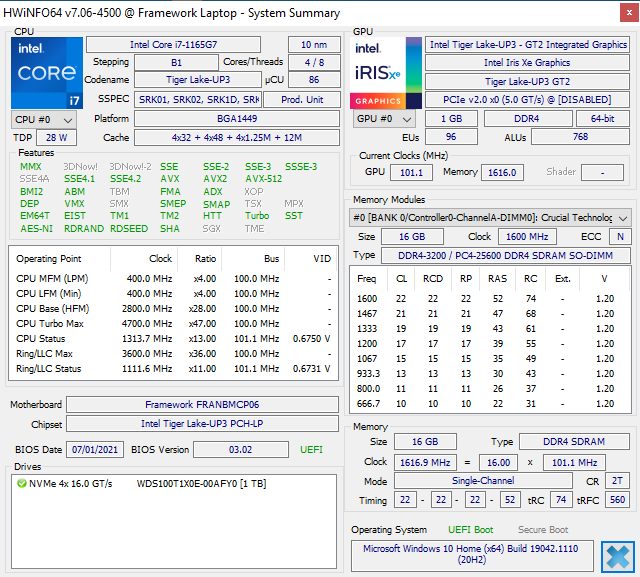
Prozessor - i7-1165G7
Die CPU-Leistung liegt innerhalb von 5% der durchschnittlichen Ergebnisse, die wir für den Core i7-1165G7 in unserer Datenbank haben. Der i7-1185G7 ist aufgrund seiner zusätzlichen vPro-Sicherheitsfunktionen etwas langsamer. Die aktuellen AMD-CPUs wie der Ryzen 5 5500U oder der Ryzen 7 5700U bieten mehr Multi-Core-Leistung, sind bei der Belastung von nur einem kern aber etwas langsamer als die Intel-Modelle.
Wenn man sich für den Core i5-1135G7 entscheidet, muss man in Multi-Tests mit einem Leistungsdefizit von 10-15% gegenüber dem i7-1165G7 rechnen.
Cinebench R15 Multi Schleife
Cinebench R23: Multi Core | Single Core
Cinebench R15: CPU Multi 64Bit | CPU Single 64Bit
Blender: v2.79 BMW27 CPU
7-Zip 18.03: 7z b 4 -mmt1 | 7z b 4
Geekbench 5.5: Single-Core | Multi-Core
HWBOT x265 Benchmark v2.2: 4k Preset
LibreOffice : 20 Documents To PDF
R Benchmark 2.5: Overall mean
| Cinebench R20 / CPU (Multi Core) | |
| Asus ZenBook 13 OLED UM325UA | |
| VAIO Z VJZ141C11L | |
| Lenovo Yoga 6 13 82ND0009US | |
| Framework Laptop 13.5 | |
| HP Envy x360 13-ay0010nr | |
| Durchschnittliche Intel Core i7-1165G7 (1060 - 2657, n=81) | |
| Microsoft Surface Laptop 4 13 i7 | |
| HP Spectre x360 13-aw2003dx | |
| Acer Spin 5 SP513-54N-79EY | |
| Asus VivoBook S13 S333JA-DS51 | |
| HP EliteBook x360 830 G6 | |
| Cinebench R20 / CPU (Single Core) | |
| VAIO Z VJZ141C11L | |
| Microsoft Surface Laptop 4 13 i7 | |
| Framework Laptop 13.5 | |
| Durchschnittliche Intel Core i7-1165G7 (442 - 589, n=81) | |
| HP Spectre x360 13-aw2003dx | |
| Asus ZenBook 13 OLED UM325UA | |
| Lenovo Yoga 6 13 82ND0009US | |
| Acer Spin 5 SP513-54N-79EY | |
| HP Envy x360 13-ay0010nr | |
| HP EliteBook x360 830 G6 | |
| Asus VivoBook S13 S333JA-DS51 | |
| Cinebench R23 / Multi Core | |
| Asus ZenBook 13 OLED UM325UA | |
| VAIO Z VJZ141C11L | |
| Lenovo Yoga 6 13 82ND0009US | |
| Framework Laptop 13.5 | |
| Microsoft Surface Laptop 4 13 i7 | |
| Durchschnittliche Intel Core i7-1165G7 (2525 - 6862, n=64) | |
| HP Spectre x360 13-aw2003dx | |
| Asus VivoBook S13 S333JA-DS51 | |
| Cinebench R23 / Single Core | |
| VAIO Z VJZ141C11L | |
| Microsoft Surface Laptop 4 13 i7 | |
| Framework Laptop 13.5 | |
| Durchschnittliche Intel Core i7-1165G7 (1110 - 1539, n=59) | |
| HP Spectre x360 13-aw2003dx | |
| Asus ZenBook 13 OLED UM325UA | |
| Lenovo Yoga 6 13 82ND0009US | |
| Asus VivoBook S13 S333JA-DS51 | |
| Cinebench R15 / CPU Multi 64Bit | |
| Asus ZenBook 13 OLED UM325UA | |
| Lenovo Yoga 6 13 82ND0009US | |
| Microsoft Surface Laptop 4 13 i7 | |
| VAIO Z VJZ141C11L | |
| Framework Laptop 13.5 | |
| Durchschnittliche Intel Core i7-1165G7 (553 - 1027, n=86) | |
| HP Envy x360 13-ay0010nr | |
| HP Spectre x360 13-aw2003dx | |
| Acer Spin 5 SP513-54N-79EY | |
| Asus VivoBook S13 S333JA-DS51 | |
| HP EliteBook x360 830 G6 | |
| Cinebench R15 / CPU Single 64Bit | |
| VAIO Z VJZ141C11L | |
| Microsoft Surface Laptop 4 13 i7 | |
| Framework Laptop 13.5 | |
| Durchschnittliche Intel Core i7-1165G7 (115 - 230, n=78) | |
| HP Spectre x360 13-aw2003dx | |
| Asus ZenBook 13 OLED UM325UA | |
| Acer Spin 5 SP513-54N-79EY | |
| Lenovo Yoga 6 13 82ND0009US | |
| HP Envy x360 13-ay0010nr | |
| HP EliteBook x360 830 G6 | |
| Asus VivoBook S13 S333JA-DS51 | |
| Blender / v2.79 BMW27 CPU | |
| Asus VivoBook S13 S333JA-DS51 | |
| Acer Spin 5 SP513-54N-79EY | |
| Microsoft Surface Laptop 4 13 i7 | |
| HP Spectre x360 13-aw2003dx | |
| Durchschnittliche Intel Core i7-1165G7 (468 - 1138, n=80) | |
| HP Envy x360 13-ay0010nr | |
| Framework Laptop 13.5 | |
| VAIO Z VJZ141C11L | |
| Lenovo Yoga 6 13 82ND0009US | |
| Asus ZenBook 13 OLED UM325UA | |
| 7-Zip 18.03 / 7z b 4 -mmt1 | |
| VAIO Z VJZ141C11L | |
| Framework Laptop 13.5 | |
| Microsoft Surface Laptop 4 13 i7 | |
| Durchschnittliche Intel Core i7-1165G7 (4478 - 5507, n=80) | |
| HP Spectre x360 13-aw2003dx | |
| Asus ZenBook 13 OLED UM325UA | |
| HP EliteBook x360 830 G6 | |
| Acer Spin 5 SP513-54N-79EY | |
| Lenovo Yoga 6 13 82ND0009US | |
| HP Envy x360 13-ay0010nr | |
| Asus VivoBook S13 S333JA-DS51 | |
| 7-Zip 18.03 / 7z b 4 | |
| Asus ZenBook 13 OLED UM325UA | |
| Lenovo Yoga 6 13 82ND0009US | |
| VAIO Z VJZ141C11L | |
| Framework Laptop 13.5 | |
| Microsoft Surface Laptop 4 13 i7 | |
| HP Envy x360 13-ay0010nr | |
| Durchschnittliche Intel Core i7-1165G7 (15347 - 27405, n=80) | |
| HP Spectre x360 13-aw2003dx | |
| Acer Spin 5 SP513-54N-79EY | |
| Asus VivoBook S13 S333JA-DS51 | |
| HP EliteBook x360 830 G6 | |
| Geekbench 5.5 / Single-Core | |
| VAIO Z VJZ141C11L | |
| Microsoft Surface Laptop 4 13 i7 | |
| Durchschnittliche Intel Core i7-1165G7 (1302 - 1595, n=77) | |
| HP Spectre x360 13-aw2003dx | |
| Acer Spin 5 SP513-54N-79EY | |
| Asus ZenBook 13 OLED UM325UA | |
| Asus VivoBook S13 S333JA-DS51 | |
| HP Envy x360 13-ay0010nr | |
| Geekbench 5.5 / Multi-Core | |
| Asus ZenBook 13 OLED UM325UA | |
| VAIO Z VJZ141C11L | |
| Microsoft Surface Laptop 4 13 i7 | |
| HP Spectre x360 13-aw2003dx | |
| Durchschnittliche Intel Core i7-1165G7 (3078 - 5926, n=77) | |
| HP Envy x360 13-ay0010nr | |
| Asus VivoBook S13 S333JA-DS51 | |
| Acer Spin 5 SP513-54N-79EY | |
| HWBOT x265 Benchmark v2.2 / 4k Preset | |
| Asus ZenBook 13 OLED UM325UA | |
| VAIO Z VJZ141C11L | |
| Lenovo Yoga 6 13 82ND0009US | |
| Framework Laptop 13.5 | |
| HP Envy x360 13-ay0010nr | |
| Durchschnittliche Intel Core i7-1165G7 (1.39 - 8.47, n=80) | |
| HP Spectre x360 13-aw2003dx | |
| Microsoft Surface Laptop 4 13 i7 | |
| Asus VivoBook S13 S333JA-DS51 | |
| LibreOffice / 20 Documents To PDF | |
| Lenovo Yoga 6 13 82ND0009US | |
| HP Envy x360 13-ay0010nr | |
| Asus VivoBook S13 S333JA-DS51 | |
| Asus ZenBook 13 OLED UM325UA | |
| HP Spectre x360 13-aw2003dx | |
| Acer Spin 5 SP513-54N-79EY | |
| Microsoft Surface Laptop 4 13 i7 | |
| Durchschnittliche Intel Core i7-1165G7 (21.5 - 88.1, n=78) | |
| VAIO Z VJZ141C11L | |
| Framework Laptop 13.5 | |
| R Benchmark 2.5 / Overall mean | |
| Asus VivoBook S13 S333JA-DS51 | |
| HP Spectre x360 13-aw2003dx | |
| Lenovo Yoga 6 13 82ND0009US | |
| HP Envy x360 13-ay0010nr | |
| Asus ZenBook 13 OLED UM325UA | |
| Durchschnittliche Intel Core i7-1165G7 (0.552 - 1.002, n=80) | |
| Microsoft Surface Laptop 4 13 i7 | |
| Framework Laptop 13.5 | |
| VAIO Z VJZ141C11L | |
* ... kleinere Werte sind besser
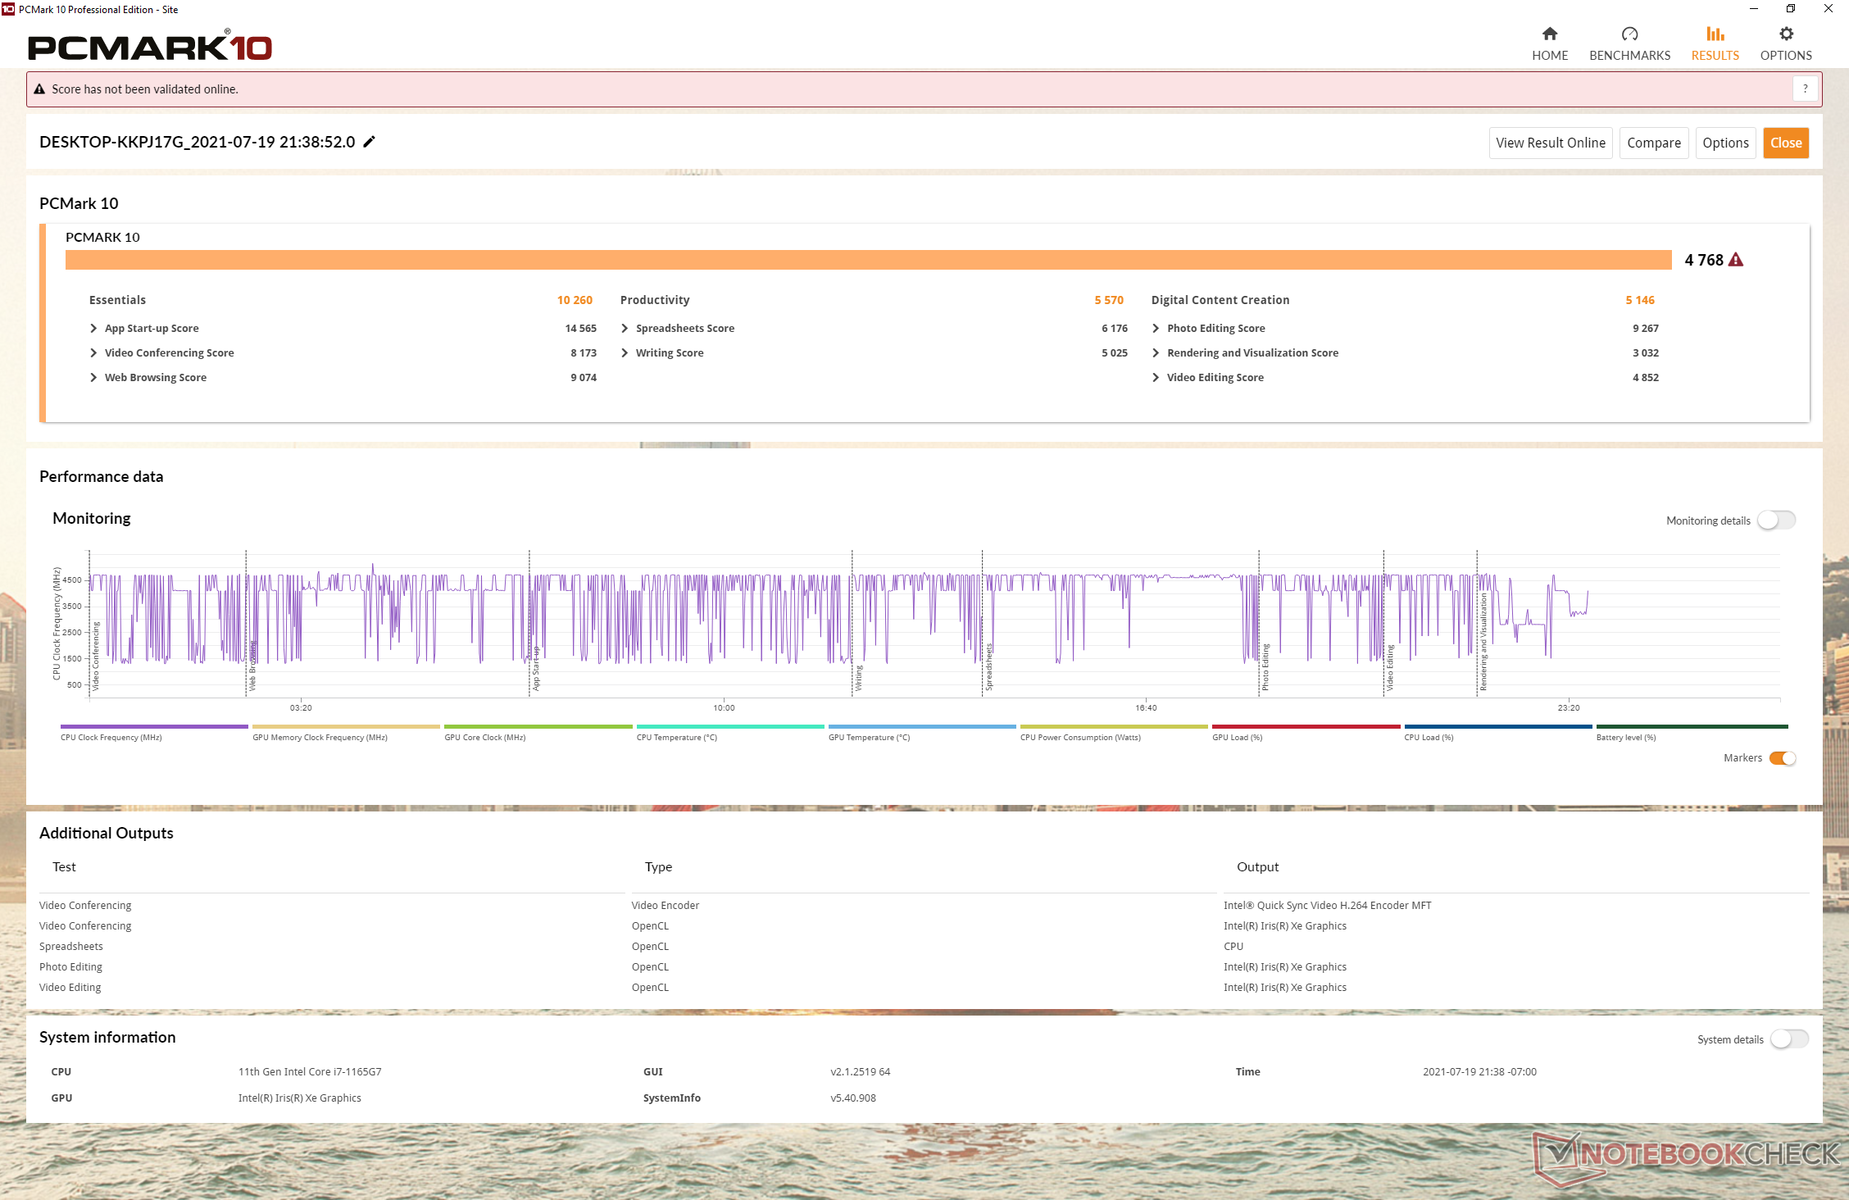
System Performance
Die durchschnittlichen PCMark-10-Ergebnisse liegen im normalen Bereich für Notebooks mit dem Core i7-1165G7. Lediglich das Ergebnis im Productivity-Test ist etwas geringer als erwartet.
| PCMark 10 / Score | |
| HP ProBook x360 435 G8 R7-5800U | |
| Lenovo Yoga 6 13 82ND0009US | |
| Durchschnittliche Intel Core i7-1165G7, Intel Iris Xe Graphics G7 96EUs (4531 - 5454, n=50) | |
| Microsoft Surface Laptop 4 13 i7 | |
| Framework Laptop 13.5 | |
| Lenovo ThinkPad X1 Titanium Yoga G1 20QA001RGE | |
| HP Spectre x360 14-ea0378ng | |
| PCMark 10 / Essentials | |
| Lenovo ThinkPad X1 Titanium Yoga G1 20QA001RGE | |
| Framework Laptop 13.5 | |
| Durchschnittliche Intel Core i7-1165G7, Intel Iris Xe Graphics G7 96EUs (8997 - 11505, n=50) | |
| Lenovo Yoga 6 13 82ND0009US | |
| HP ProBook x360 435 G8 R7-5800U | |
| HP Spectre x360 14-ea0378ng | |
| Microsoft Surface Laptop 4 13 i7 | |
| PCMark 10 / Productivity | |
| HP ProBook x360 435 G8 R7-5800U | |
| Lenovo Yoga 6 13 82ND0009US | |
| Durchschnittliche Intel Core i7-1165G7, Intel Iris Xe Graphics G7 96EUs (5570 - 7136, n=50) | |
| Microsoft Surface Laptop 4 13 i7 | |
| Lenovo ThinkPad X1 Titanium Yoga G1 20QA001RGE | |
| HP Spectre x360 14-ea0378ng | |
| Framework Laptop 13.5 | |
| PCMark 10 / Digital Content Creation | |
| Lenovo Yoga 6 13 82ND0009US | |
| HP ProBook x360 435 G8 R7-5800U | |
| Framework Laptop 13.5 | |
| Durchschnittliche Intel Core i7-1165G7, Intel Iris Xe Graphics G7 96EUs (4083 - 5550, n=50) | |
| Microsoft Surface Laptop 4 13 i7 | |
| HP Spectre x360 14-ea0378ng | |
| Lenovo ThinkPad X1 Titanium Yoga G1 20QA001RGE | |
| PCMark 10 Score | 4768 Punkte | |
Hilfe | ||
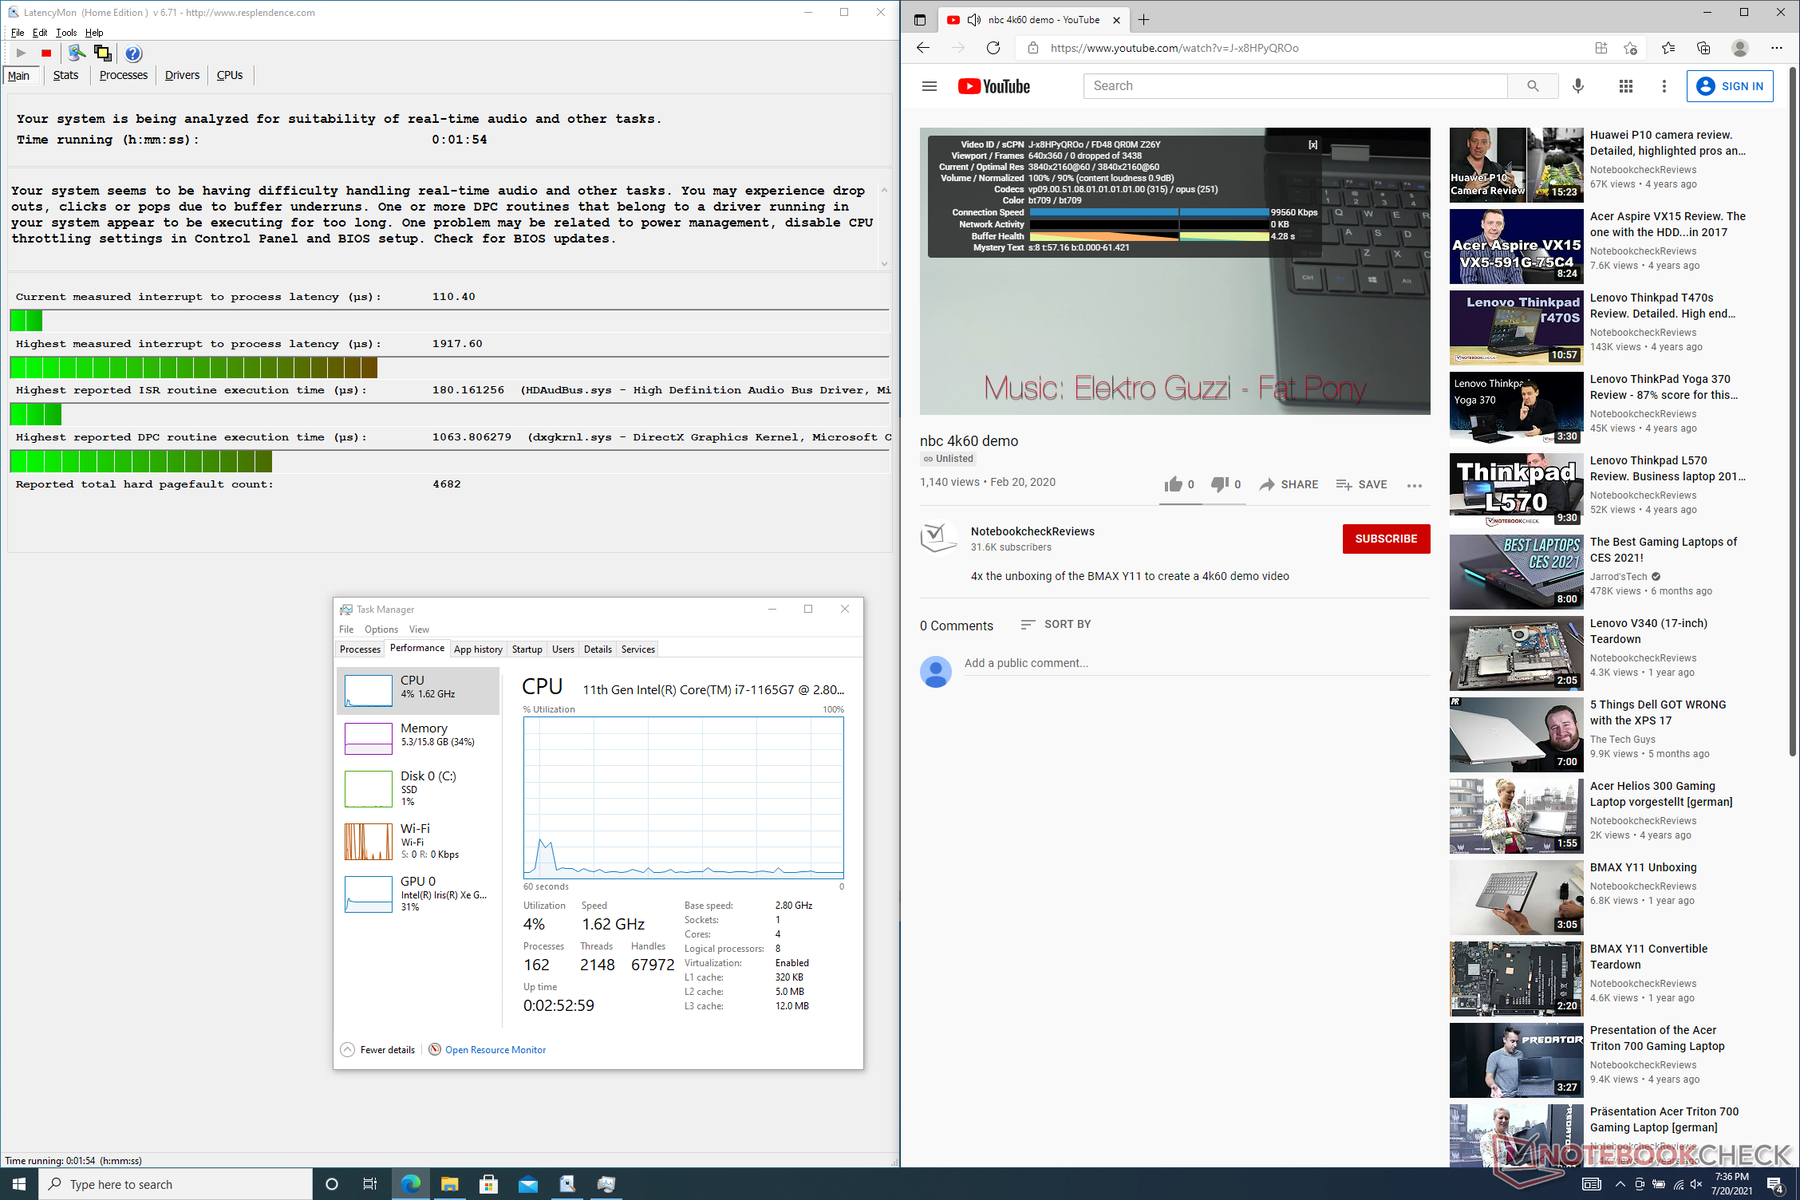
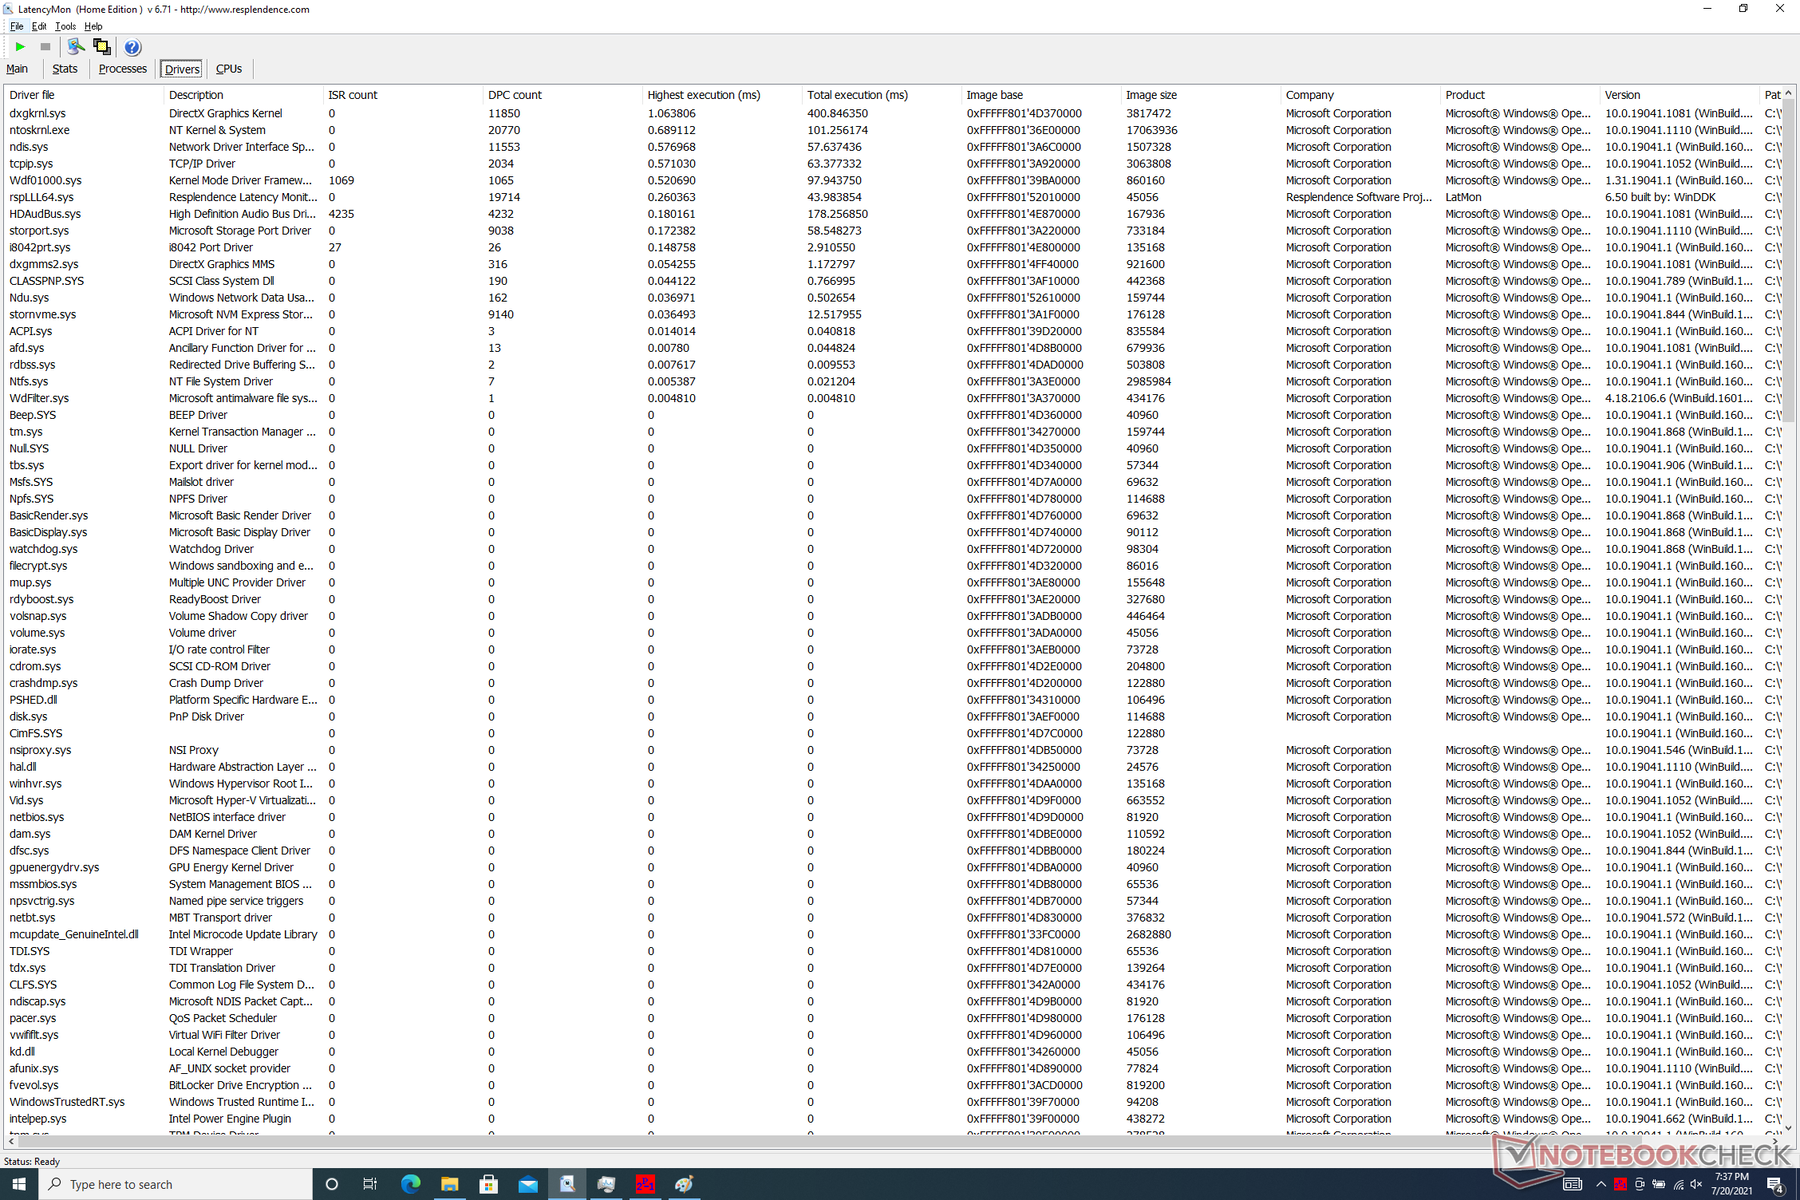
DPC Latency
LatencyMon zeigt leichte Latenzprobleme beim Öffnen von mehreren Browser-Tabs. Die 4K-Videowiedergabe bei 60 FPS ist aber flüssig und es gibt auch keine übersprungenen Einzelbilder (dropped Frames).
| DPC Latencies / LatencyMon - interrupt to process latency (max), Web, Youtube, Prime95 | |
| Framework Laptop 13.5 | |
| HP Spectre x360 14-ea0378ng | |
| Lenovo ThinkPad X1 Titanium Yoga G1 20QA001RGE | |
| Lenovo Yoga 6 13 82ND0009US | |
| Microsoft Surface Laptop 4 13 i7 | |
| HP ProBook x360 435 G8 R7-5800U | |
* ... kleinere Werte sind besser
Massenspeicher
Nutzer können eine M.2-2280-NVMe-SSD (PCIe 4.0) ihrer Wahl einbauen. Framework selbst verwendet ausschließlich SSDs von Western Digital mit Kapazitäten zwischen 250 GB (SN750) bis maximal 2 TB (SN850).
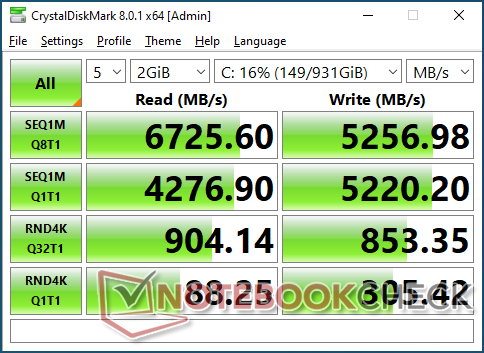
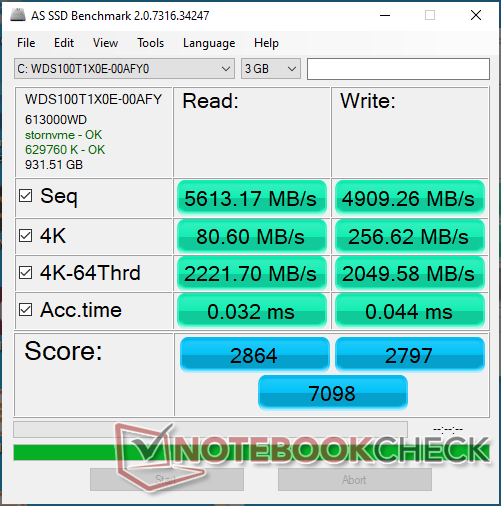
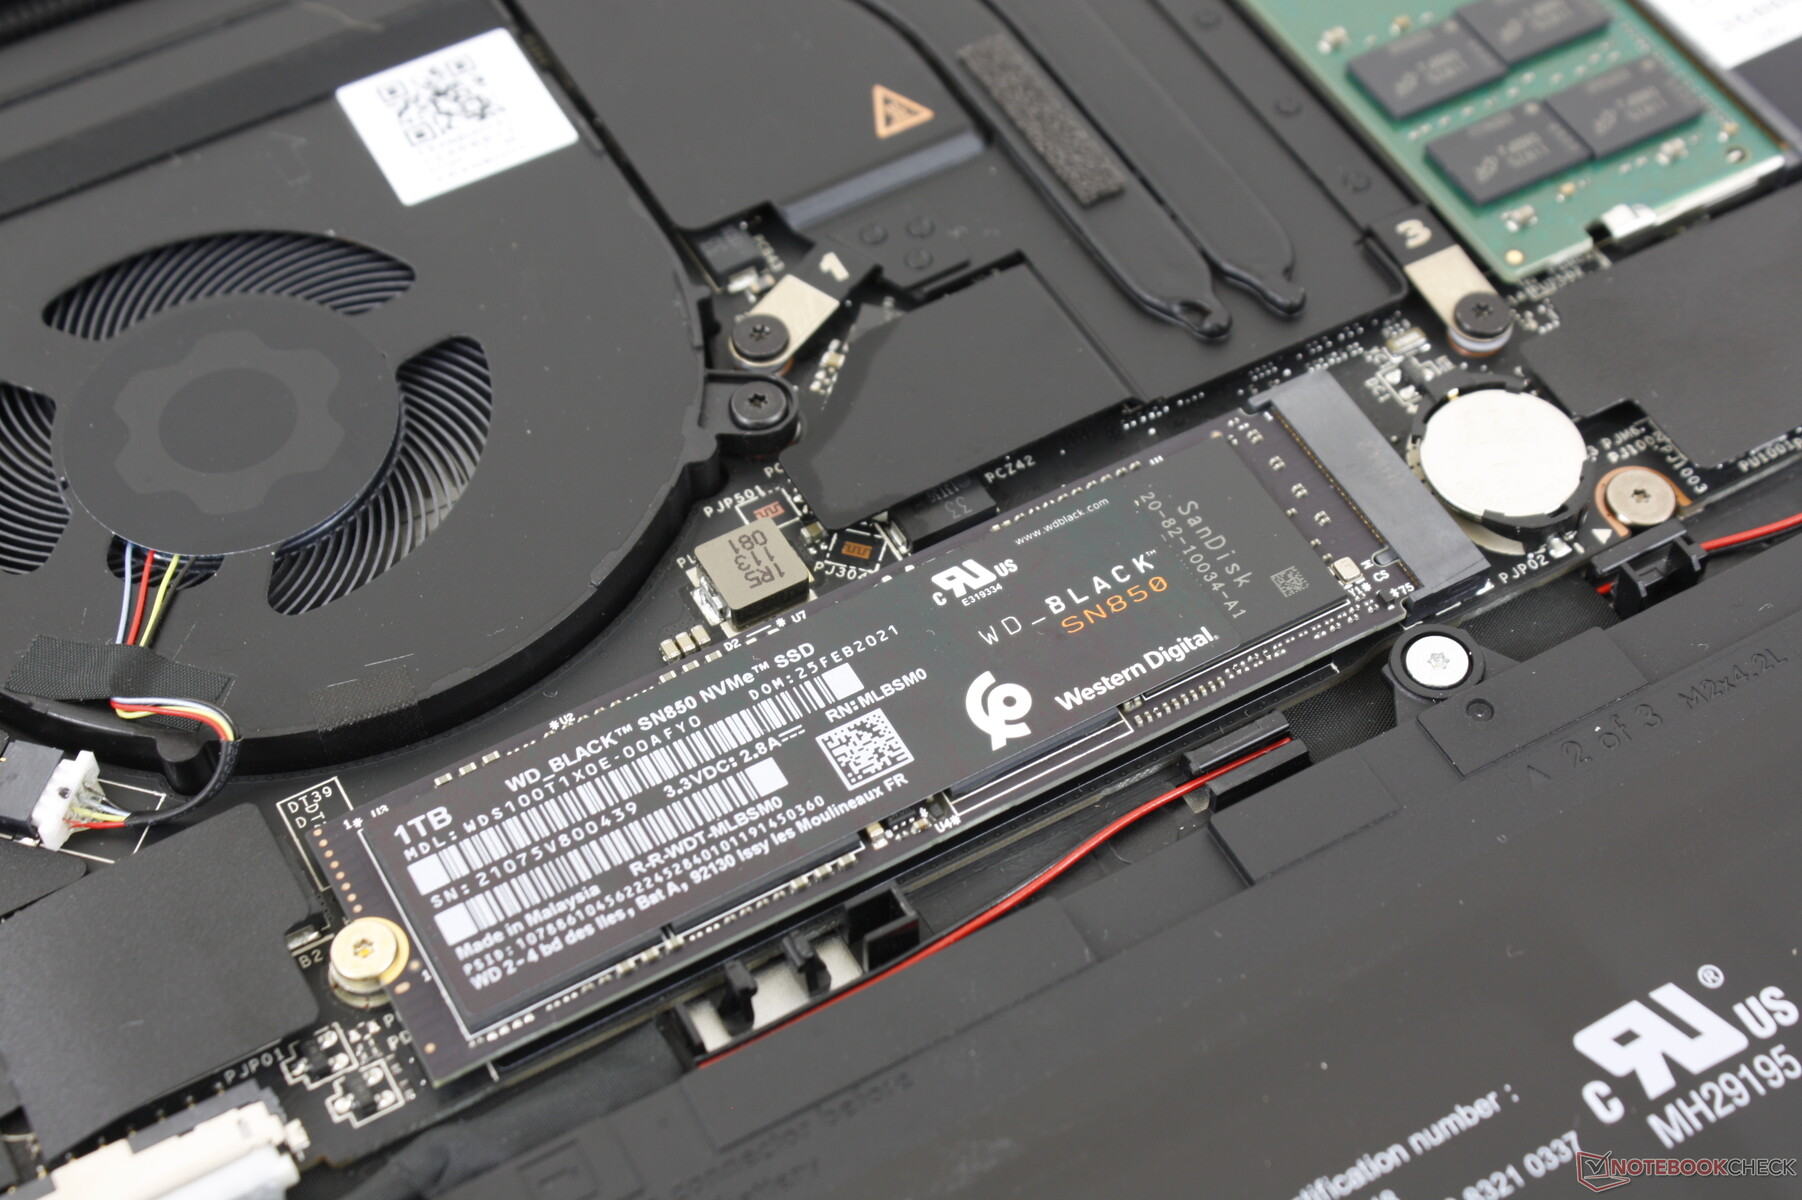
| Framework Laptop 13.5 Western Digital WD_BLACK SN850 WDS100T1X0E | HP Spectre x360 14-ea0378ng Intel Optane Memory H10 with Solid State Storage 32GB + 1TB HBRPEKNX0203AH(L/H) | Microsoft Surface Laptop 4 13 i7 Samsung PM991 MZ9LQ512HALU | Lenovo ThinkPad X1 Titanium Yoga G1 20QA001RGE Toshiba BG4 KBG40ZNT512G | HP ProBook x360 435 G8 R7-5800U Samsung PM991 MZVLQ512HALU | Lenovo Yoga 6 13 82ND0009US WDC PC SN530 SDBPMPZ-265G | |
|---|---|---|---|---|---|---|
| AS SSD | -76% | -81% | -69% | -76% | -101% | |
| Seq Read (MB/s) | 5613 | 1343 -76% | 1821 -68% | 1898 -66% | 1936 -66% | 1860 -67% |
| Seq Write (MB/s) | 4909 | 1222 -75% | 794 -84% | 1065 -78% | 1237 -75% | 500 -90% |
| 4K Read (MB/s) | 80.6 | 63.6 -21% | 47.54 -41% | 58 -28% | 40.35 -50% | 36.26 -55% |
| 4K Write (MB/s) | 256.6 | 107.8 -58% | 141.6 -45% | 200.7 -22% | 99.5 -61% | 118.6 -54% |
| 4K-64 Read (MB/s) | 2222 | 417.5 -81% | 782 -65% | 580 -74% | 645 -71% | 419 -81% |
| 4K-64 Write (MB/s) | 2050 | 496 -76% | 766 -63% | 779 -62% | 365.8 -82% | 219 -89% |
| Access Time Read * (ms) | 0.032 | 0.103 -222% | 0.191 -497% | 0.052 -63% | 0.104 -225% | 0.102 -219% |
| Access Time Write * (ms) | 0.044 | 0.043 2% | 0.027 39% | 0.16 -264% | 0.038 14% | 0.17 -286% |
| Score Read (Points) | 2864 | 615 -79% | 1012 -65% | 828 -71% | 879 -69% | 641 -78% |
| Score Write (Points) | 2797 | 726 -74% | 987 -65% | 1087 -61% | 589 -79% | 388 -86% |
| Score Total (Points) | 7098 | 1675 -76% | 2477 -65% | 2316 -67% | 1892 -73% | 1300 -82% |
| Copy ISO MB/s (MB/s) | 1926 | 334.9 -83% | 1243 -35% | 1659 -14% | 708 -63% | 880 -54% |
| Copy Program MB/s (MB/s) | 947 | 276.3 -71% | 628 -34% | 519 -45% | 132.1 -86% | 185.3 -80% |
| Copy Game MB/s (MB/s) | 1880 | 433.2 -77% | 976 -48% | 872 -54% | 326.7 -83% | 212.7 -89% |
| CrystalDiskMark 5.2 / 6 | -42% | -67% | -49% | -67% | -68% | |
| Write 4K (MB/s) | 299.4 | 128.9 -57% | 118.2 -61% | 226.6 -24% | 86.7 -71% | 89.2 -70% |
| Read 4K (MB/s) | 87.6 | 140 60% | 37.54 -57% | 62.8 -28% | 32.45 -63% | 33.09 -62% |
| Write Seq (MB/s) | 5205 | 1422 -73% | 1017 -80% | 1296 -75% | 1235 -76% | 988 -81% |
| Read Seq (MB/s) | 4276 | 1660 -61% | 926 -78% | 1445 -66% | 1417 -67% | 1322 -69% |
| Write 4K Q32T1 (MB/s) | 846 | 475.1 -44% | 354.2 -58% | 545 -36% | 390.8 -54% | 332.6 -61% |
| Read 4K Q32T1 (MB/s) | 905 | 581 -36% | 352.6 -61% | 687 -24% | 291 -68% | 389.3 -57% |
| Write Seq Q32T1 (MB/s) | 5189 | 1793 -65% | 1174 -77% | 1483 -71% | 1384 -73% | 984 -81% |
| Read Seq Q32T1 (MB/s) | 6921 | 2536 -63% | 2261 -67% | 2334 -66% | 2350 -66% | 2461 -64% |
| Durchschnitt gesamt (Programm / Settings) | -59% /
-64% | -74% /
-76% | -59% /
-62% | -72% /
-73% | -85% /
-89% |
* ... kleinere Werte sind besser

Dauerleistung Lesen: DiskSpd Read Loop, Queue Depth 8
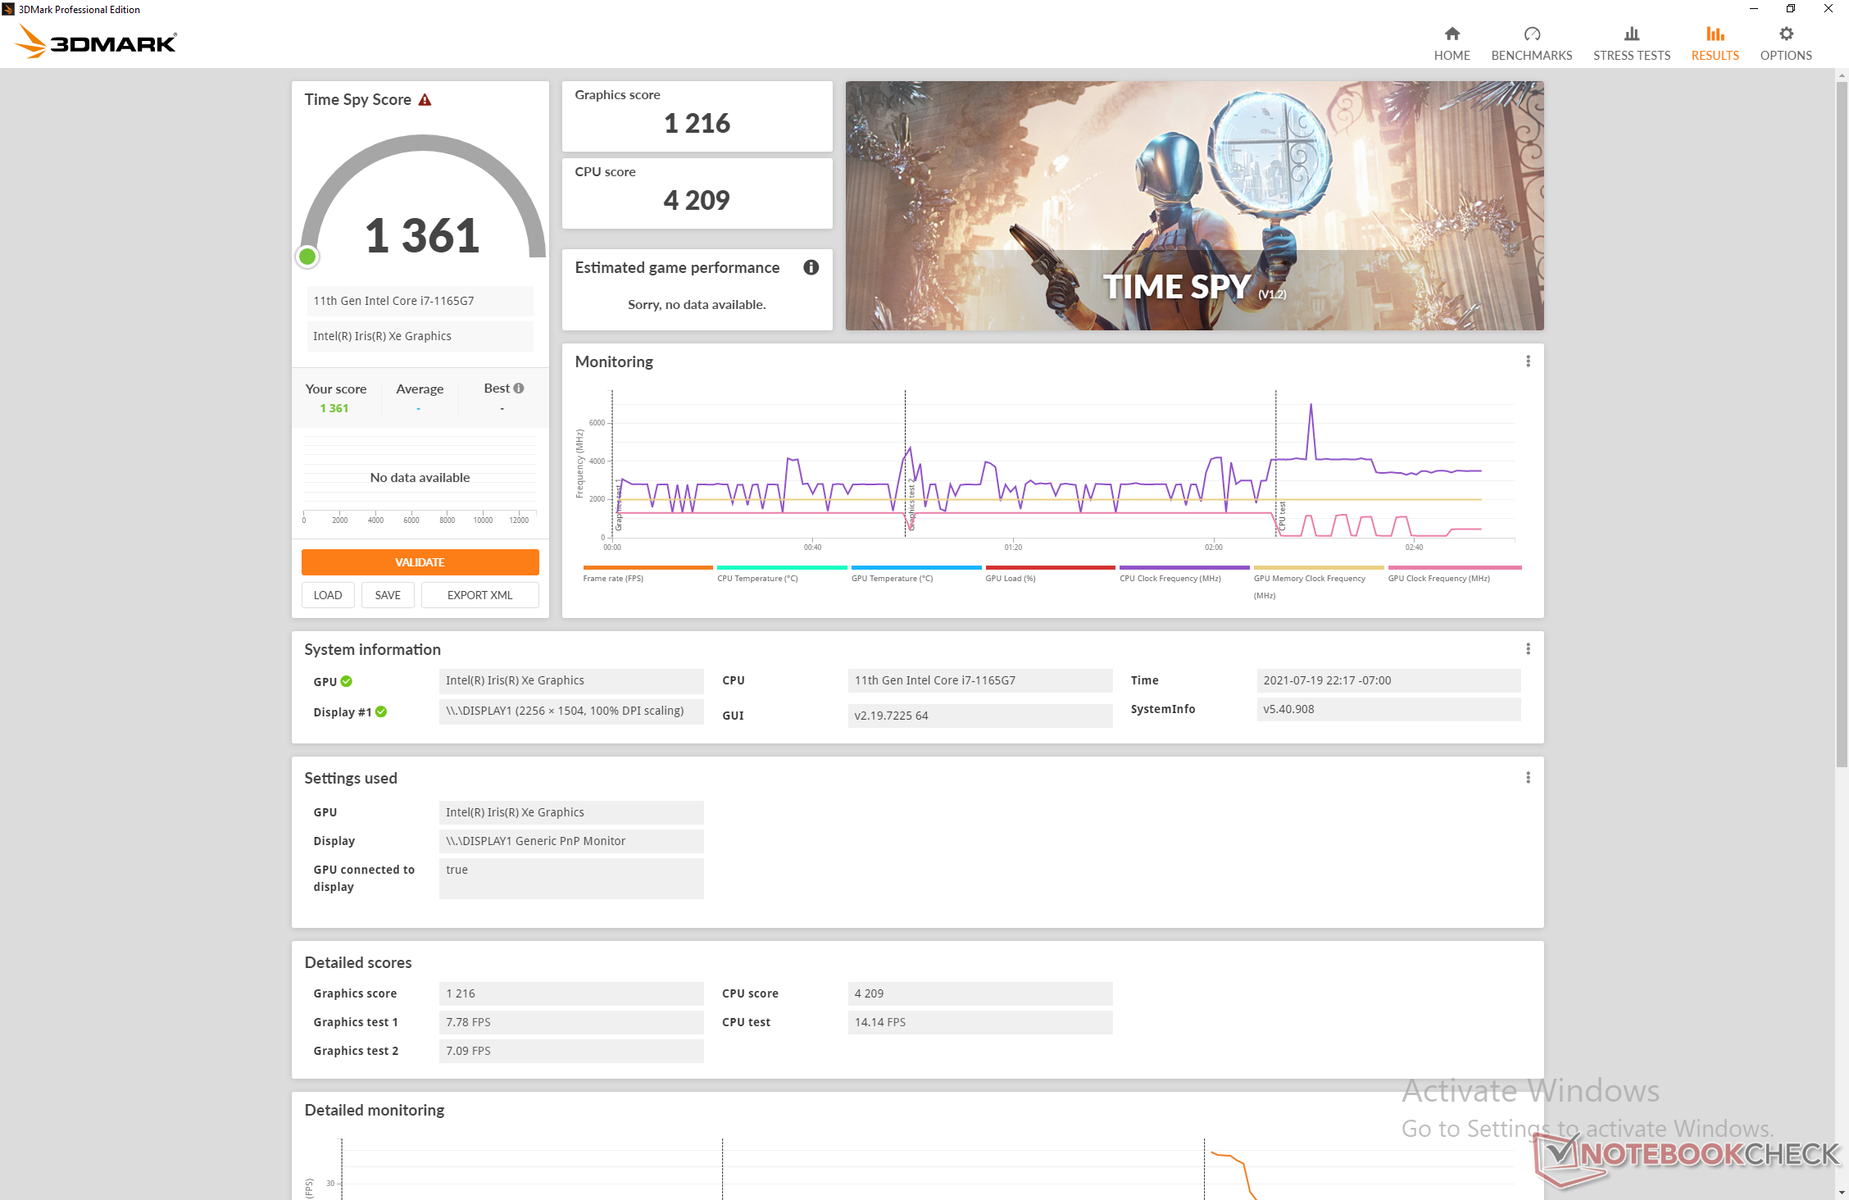
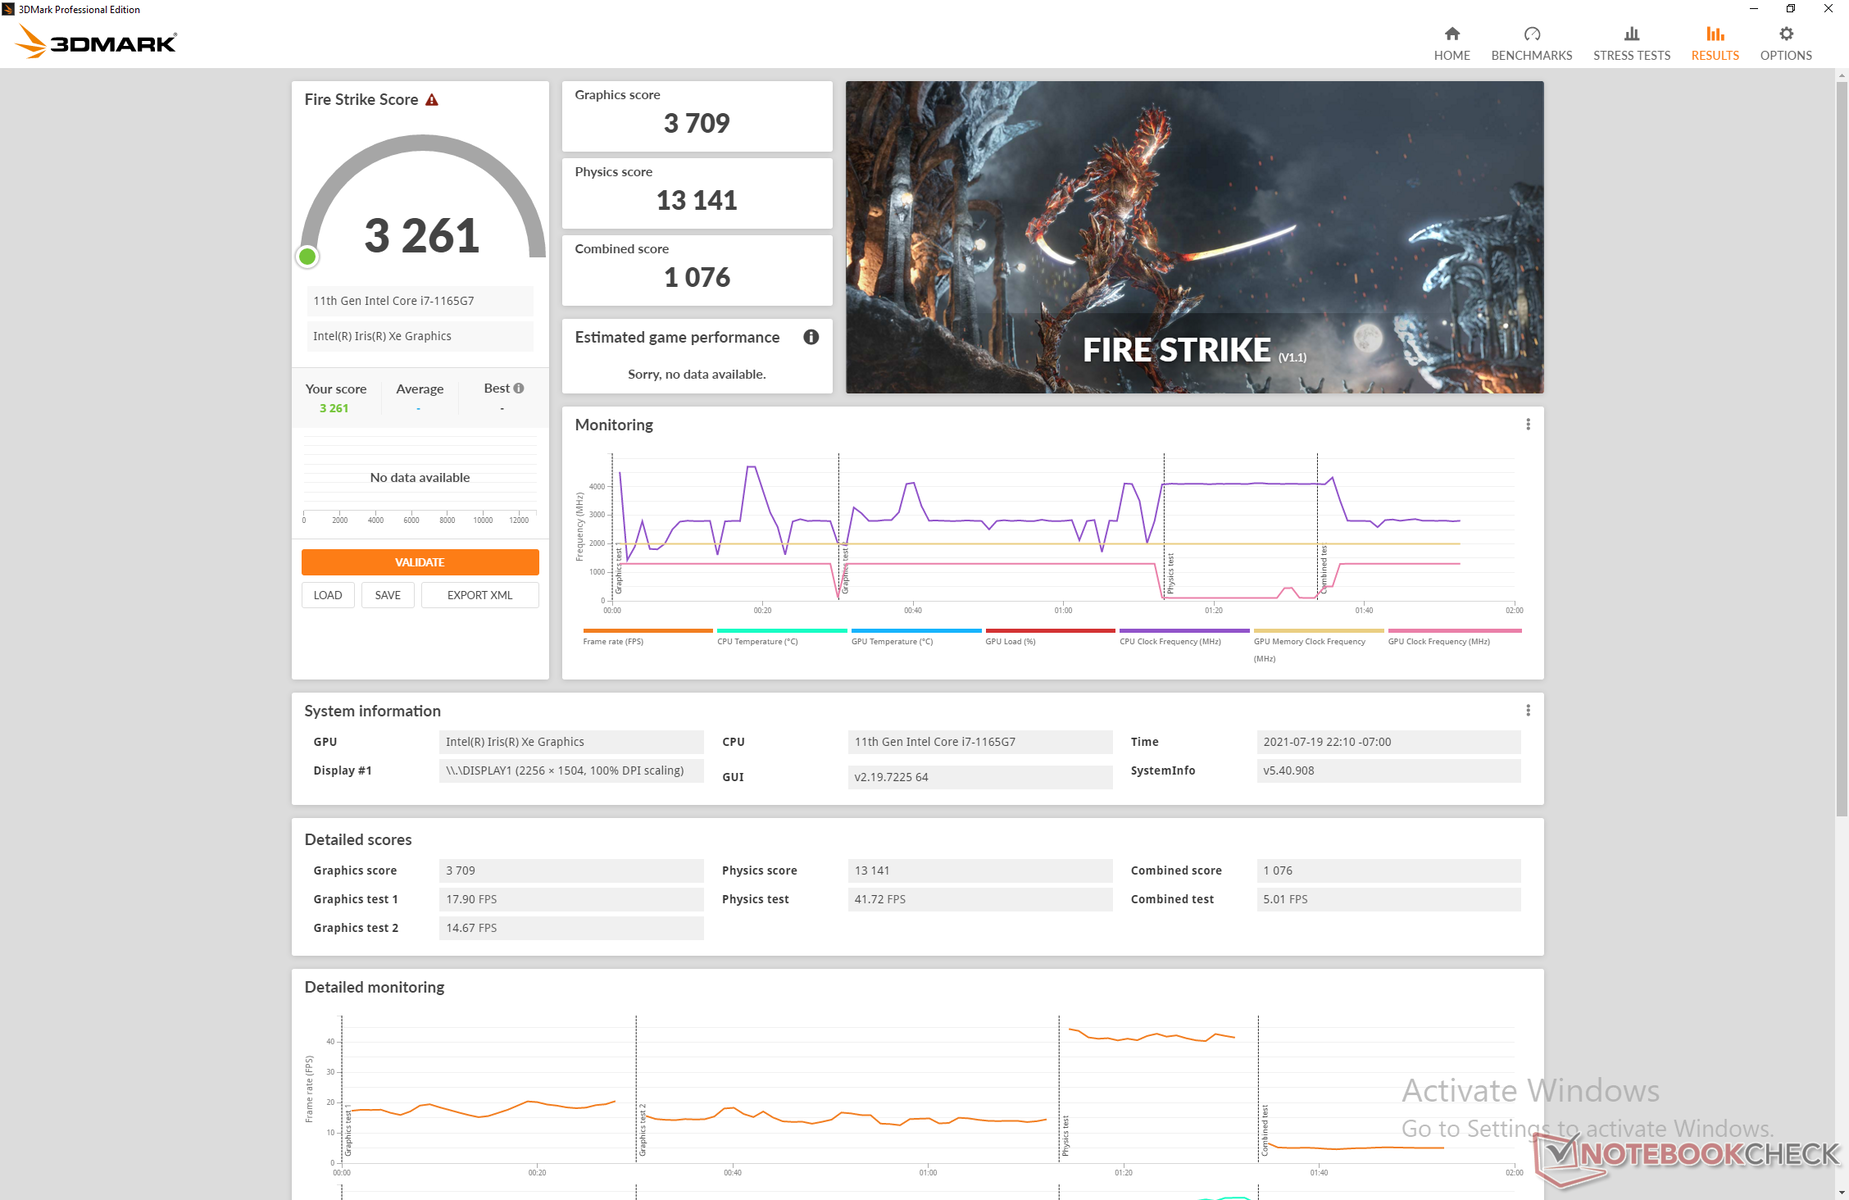
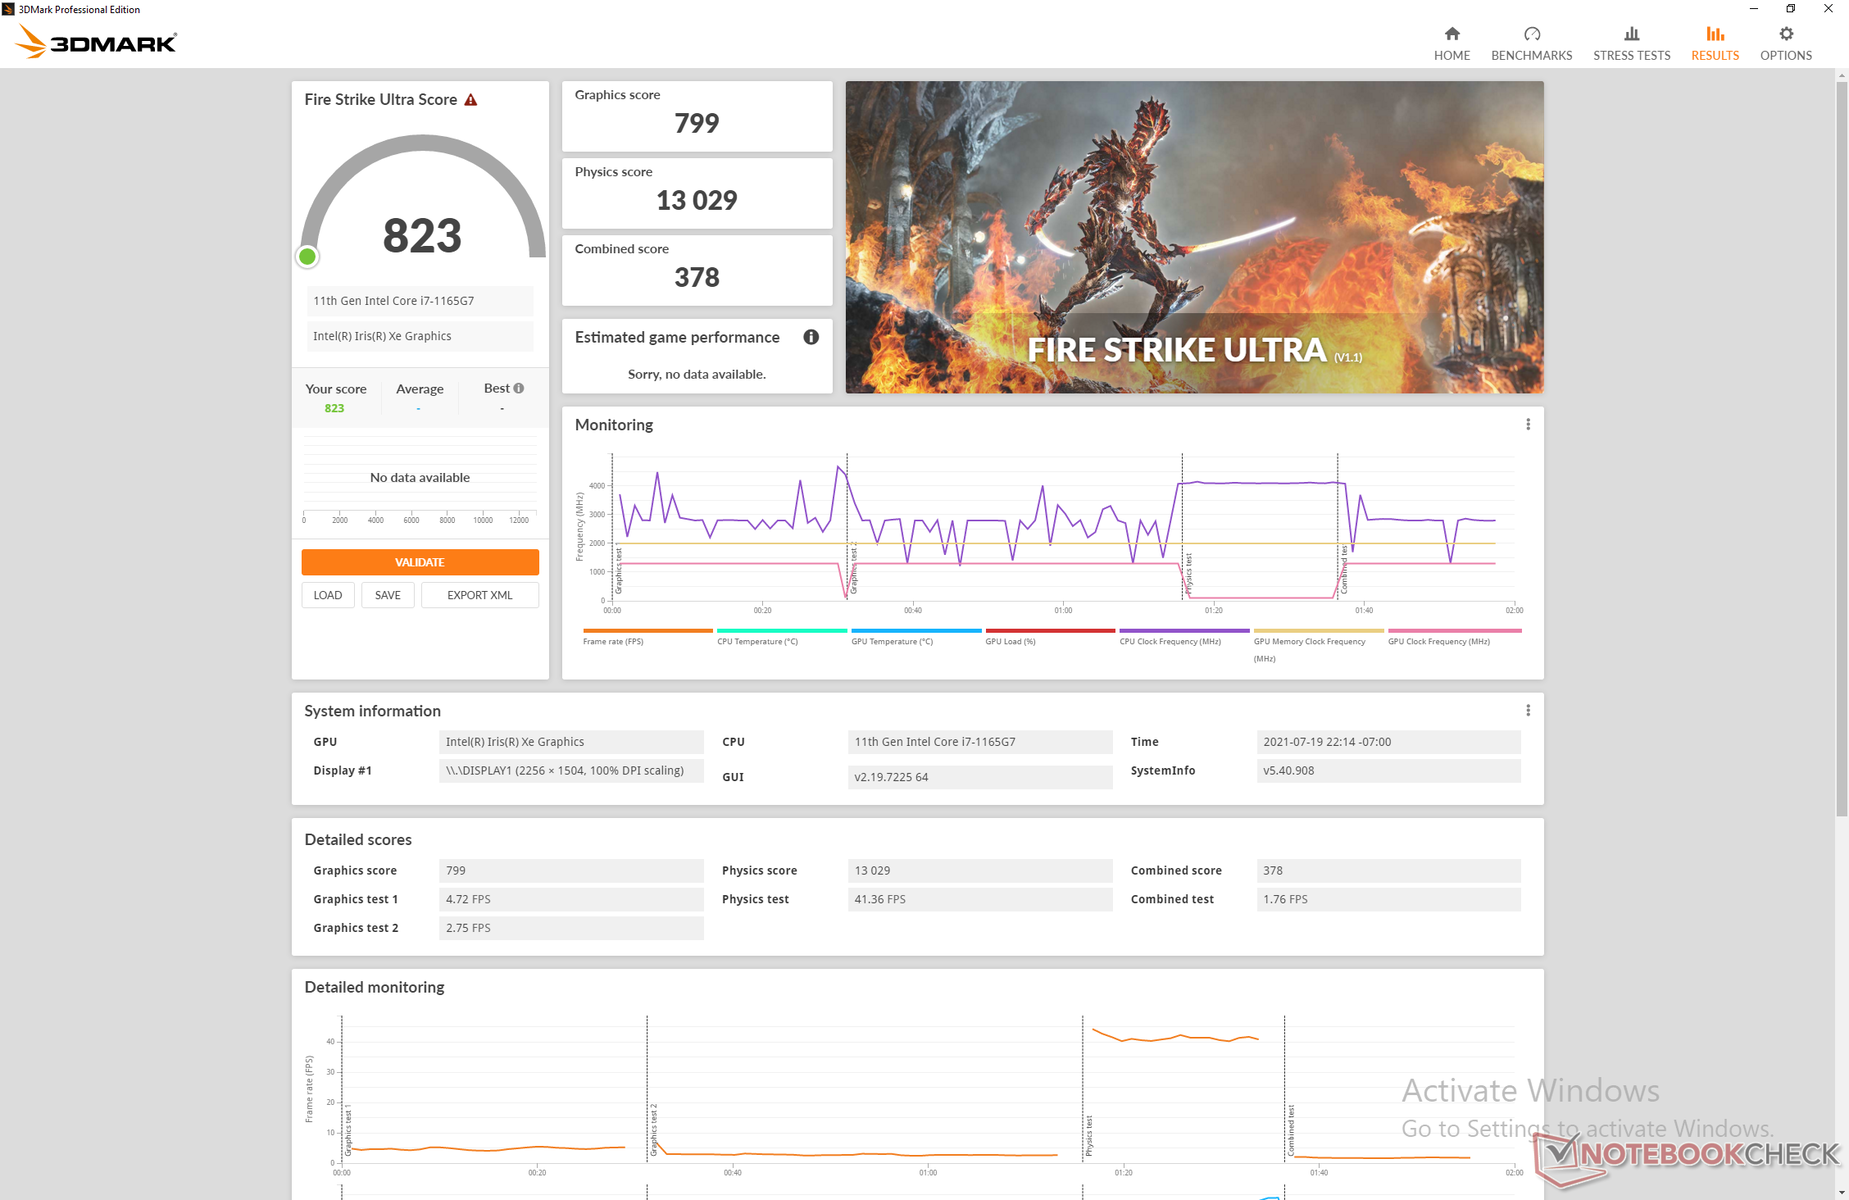
Grafikkarte
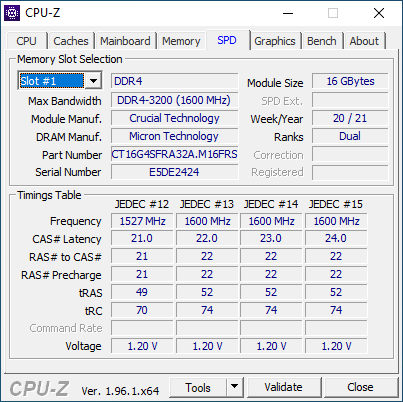
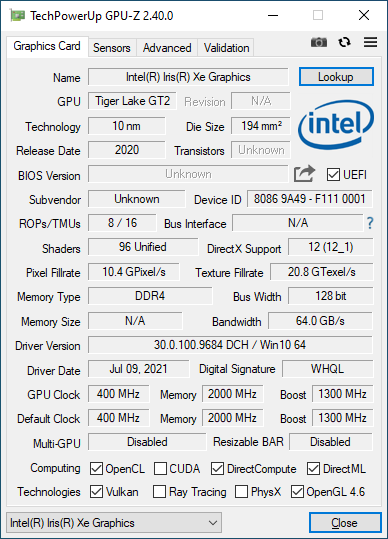
Aufgrund der Single-Channel-Konfiguration des Arbeitsspeichers in unserem Testgerät ist die GPU-Leistung etwa 15-25% unterhalb der durchschnittlichen Leistung für die Iris Xe Graphics G7 (96 EUs) in unserer Datenbank. Mit einem zweiten Modul kann man diesen Umstand aber leicht korrigieren.
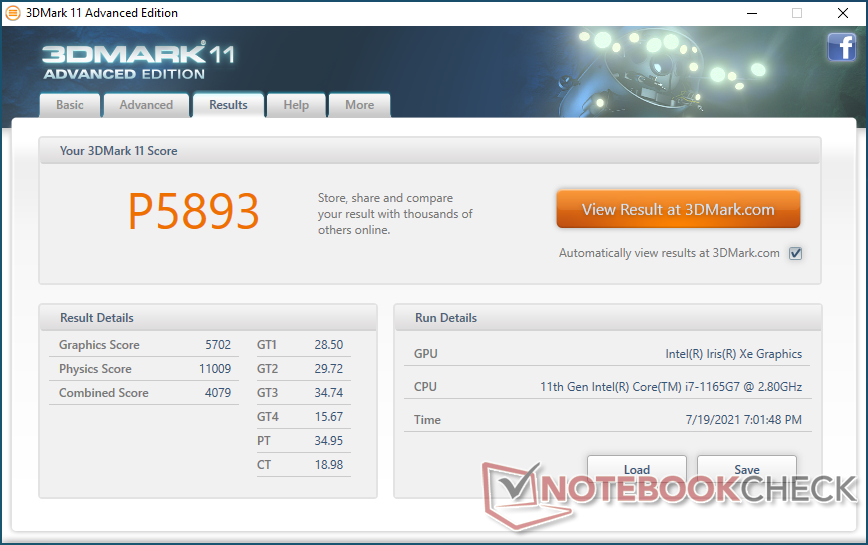
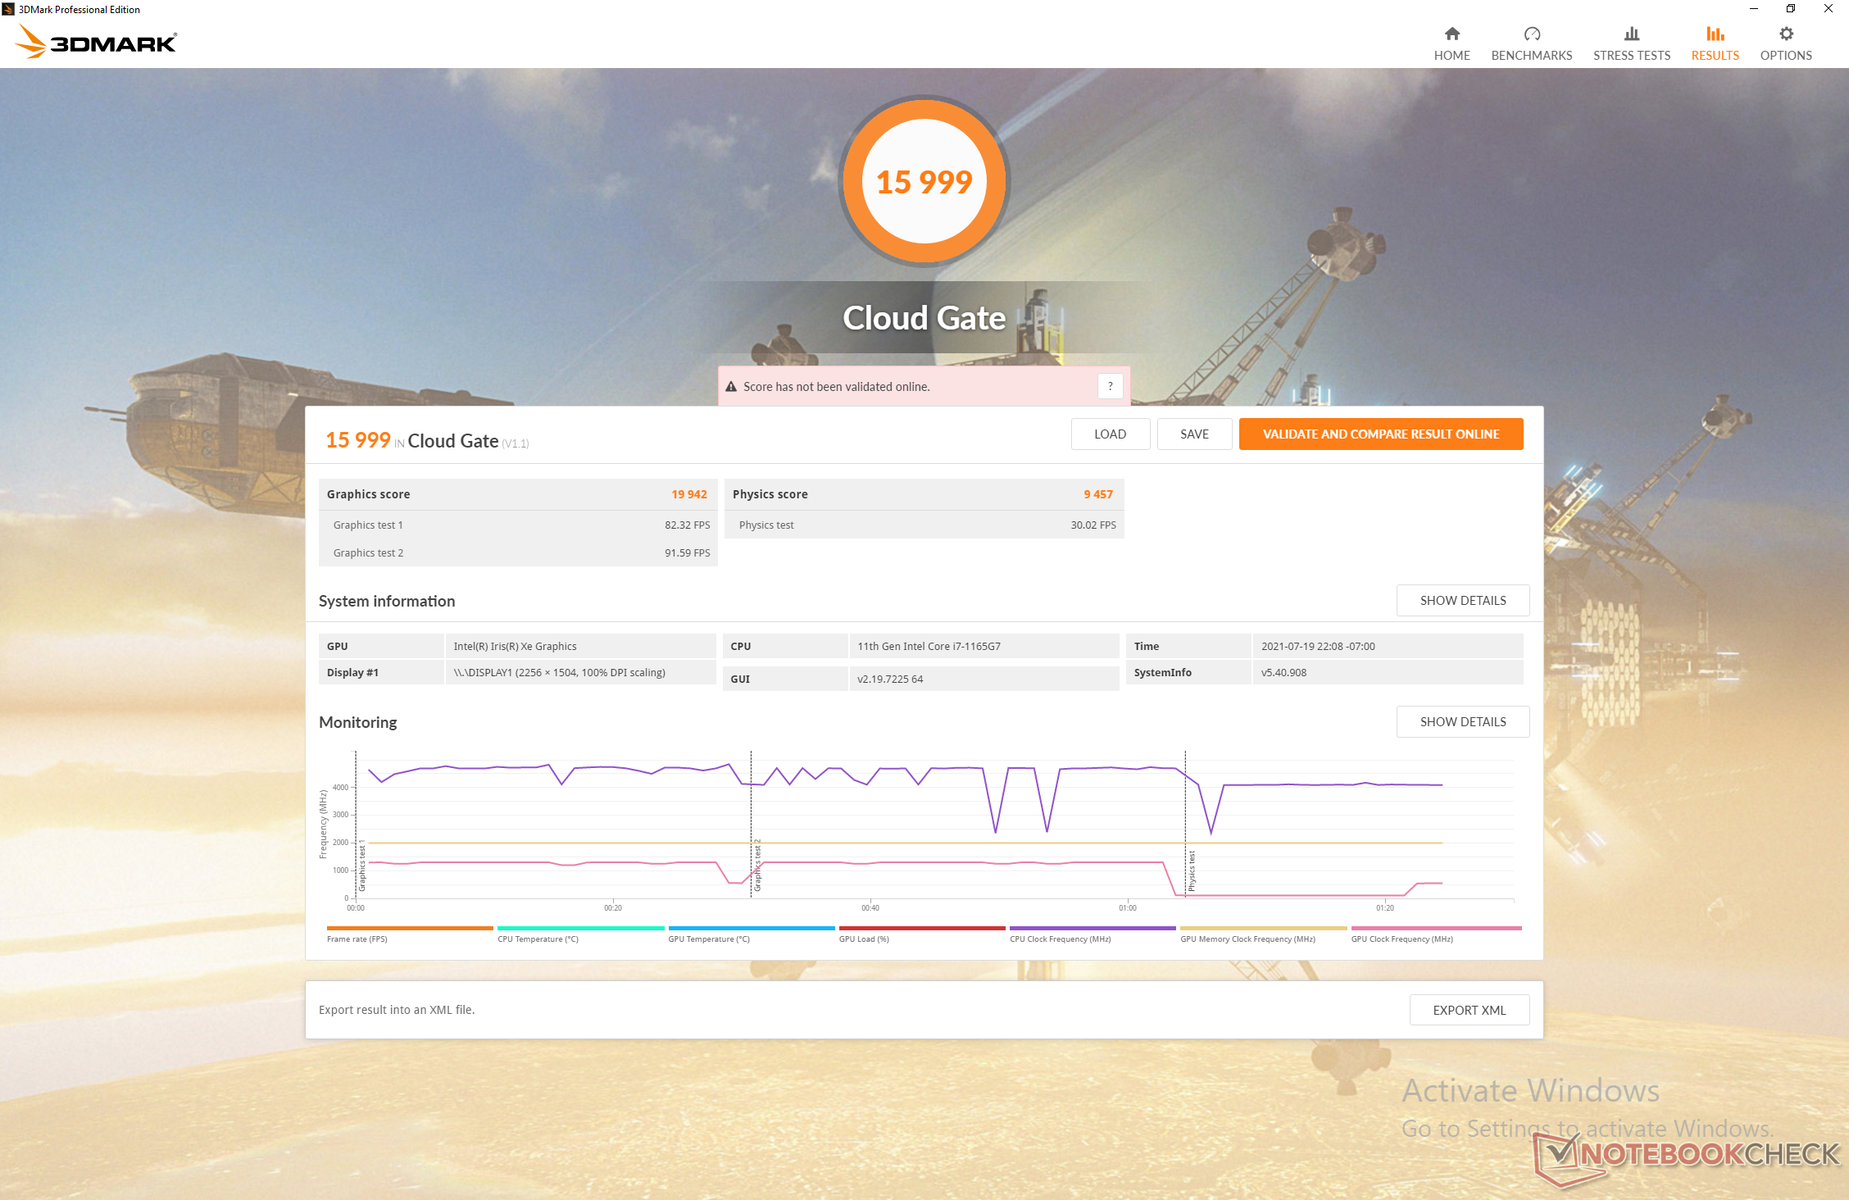
| 3DMark 11 Performance | 5893 Punkte | |
| 3DMark Cloud Gate Standard Score | 15999 Punkte | |
| 3DMark Fire Strike Score | 2361 Punkte | |
| 3DMark Time Spy Score | 1361 Punkte | |
Hilfe | ||
Witcher 3 FPS-Diagramm
| min. | mittel | hoch | max. | |
|---|---|---|---|---|
| The Witcher 3 (2015) | 75.9 | 45.1 | 22.1 | 12 |
| Dota 2 Reborn (2015) | 109 | 66.1 | 41.2 | 38.2 |
| Final Fantasy XV Benchmark (2018) | 29.4 | 15.7 | 12.1 | |
| X-Plane 11.11 (2018) | 41.3 | 36.5 | 29.5 |
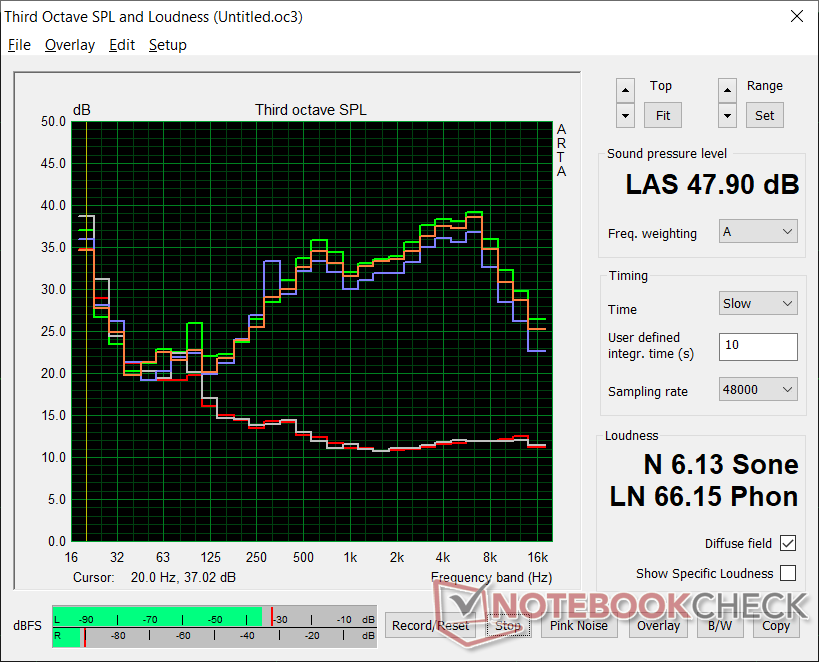
Emissionen - Lauter Lüfter
Geräuschemissionen
Bei einfachen Aufgaben wie der Textverarbeitung oder dem Browsen im Internet ist der Framework Laptop leise, doch unter Last wird das Notebook schneller lauter als viele andere Ultrabooks. Nach der ersten Szene des 3DMark 06 (~90 Sekunden) messen wir beispielsweise 45,6 dB(A), während es beim HP Spectre x360 14 nur 37,5 dB(A) und 39,5 dB(A) beim Surface Laptop 4 13 sind. Beim Spielen wird der Lüfter sogar noch lauter.
| Framework Laptop 13.5 Iris Xe G7 96EUs, i7-1165G7, Western Digital WD_BLACK SN850 WDS100T1X0E | HP Spectre x360 14-ea0378ng Iris Xe G7 96EUs, i7-1165G7, Intel Optane Memory H10 with Solid State Storage 32GB + 1TB HBRPEKNX0203AH(L/H) | Microsoft Surface Laptop 4 13 i7 Iris Xe G7 96EUs, i7-1185G7, Samsung PM991 MZ9LQ512HALU | Lenovo ThinkPad X1 Titanium Yoga G1 20QA001RGE Iris Xe G7 96EUs, i7-1160G7, Toshiba BG4 KBG40ZNT512G | Lenovo Yoga 6 13 82ND0009US Vega 7, R5 5500U, WDC PC SN530 SDBPMPZ-265G | Asus Zenbook 14 UX433FN-A6023T GeForce MX150, i7-8565U, Intel SSD 660p SSDPEKNW512G8 | |
|---|---|---|---|---|---|---|
| Geräuschentwicklung | 1% | 5% | 8% | 4% | -13% | |
| aus / Umgebung * (dB) | 23.9 | 26 -9% | 24.2 -1% | 25.1 -5% | 25.1 -5% | 30.7 -28% |
| Idle min * (dB) | 23.9 | 26 -9% | 24.2 -1% | 25.1 -5% | 25.1 -5% | 30.7 -28% |
| Idle avg * (dB) | 23.9 | 26 -9% | 24.2 -1% | 25.1 -5% | 25.1 -5% | 30.7 -28% |
| Idle max * (dB) | 23.9 | 26 -9% | 24.2 -1% | 27.1 -13% | 25.1 -5% | 30.7 -28% |
| Last avg * (dB) | 45.6 | 37.5 18% | 39.5 13% | 32.7 28% | 41 10% | 38.8 15% |
| Witcher 3 ultra * (dB) | 47.1 | 32.7 31% | 38.6 18% | |||
| Last max * (dB) | 47.9 | 36.3 24% | 39.5 18% | 35.8 25% | 38.7 19% | 39.3 18% |
* ... kleinere Werte sind besser
Lautstärkediagramm
| Idle |
| 23.9 / 23.9 / 23.9 dB(A) |
| Last |
| 45.6 / 47.9 dB(A) |
 | ||
30 dB leise 40 dB(A) deutlich hörbar 50 dB(A) störend |
||
min: | ||
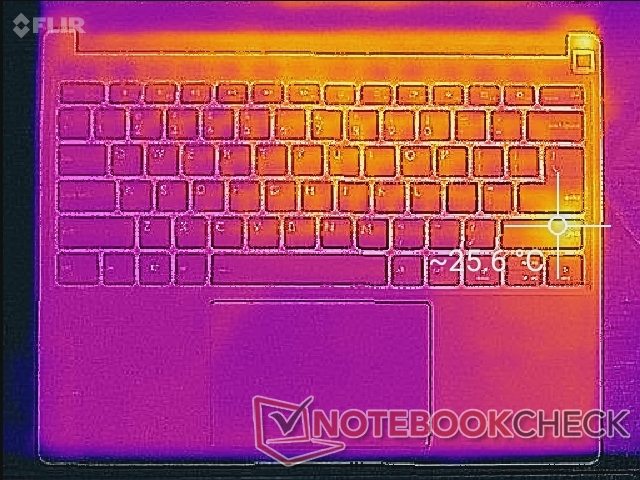
Temperatur
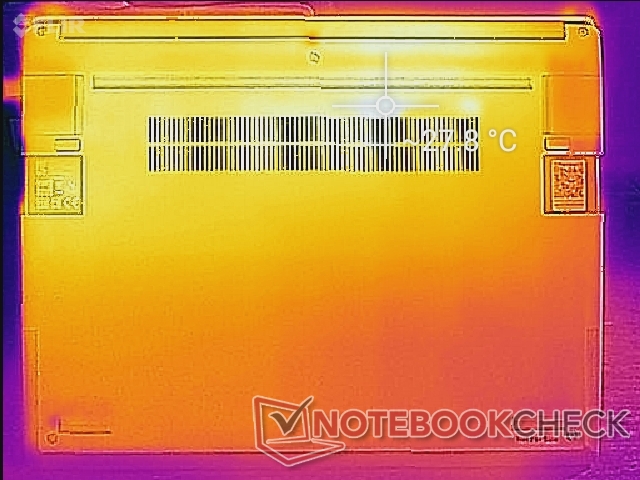
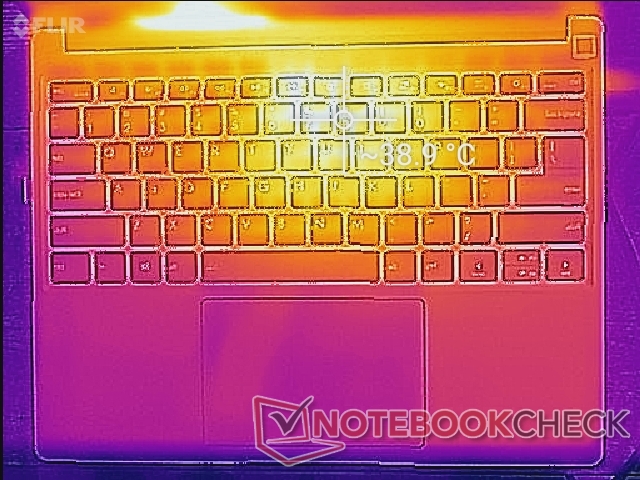
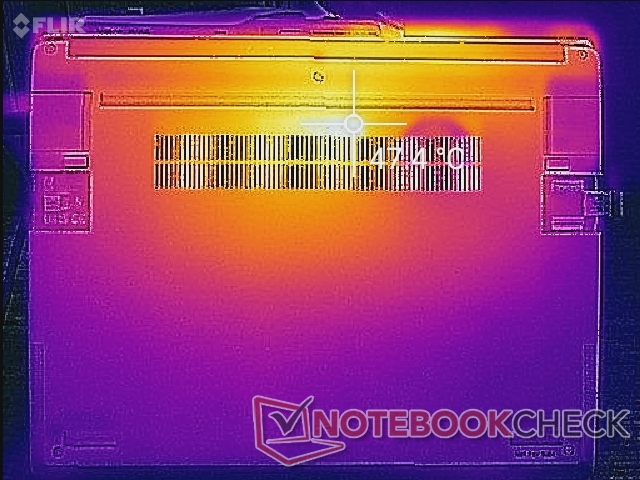
Die wärmsten Stellen befinden sich im zentralen hinteren Bereich des Gehäuses. Wir können bis zu 39 °C auf der Oberseite und 48 °C auf der Unterseite messen (siehe Infrarot-Bilder). Die Handballenauflage bleibt aber auch bei hoher Last angenehm kühl.
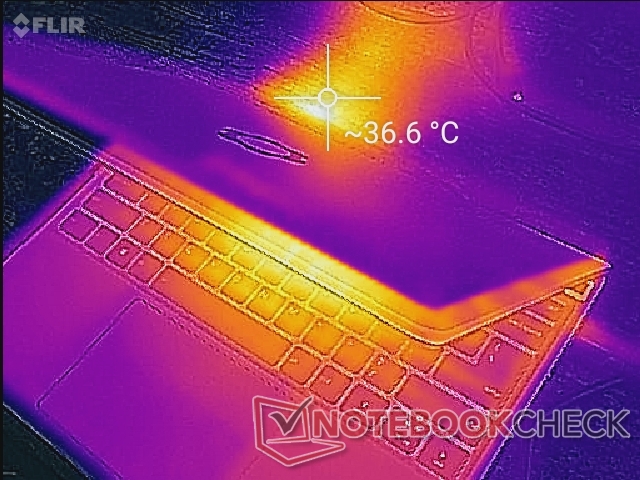
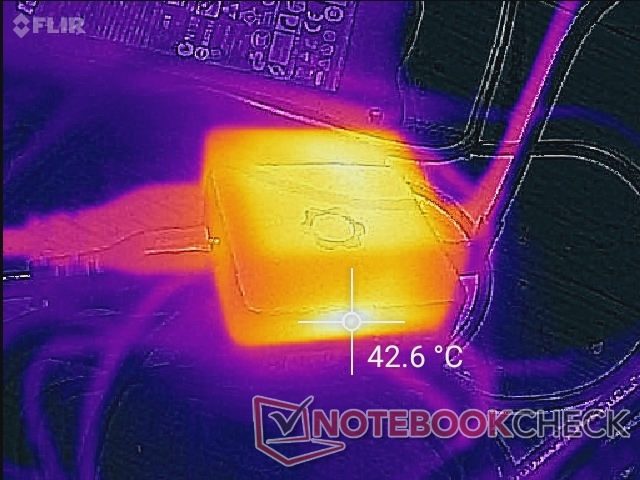
(-) Die maximale Temperatur auf der Oberseite ist 47.2 °C. Im Vergleich liegt der Klassendurchschnitt bei 34.3 °C (von 21.2 bis 62.5 °C für die Klasse Office).
(+) Auf der Unterseite messen wir eine maximalen Wert von 39.4 °C (im Vergleich zum Durchschnitt von 36.8 °C).
(+) Ohne Last messen wir eine durchschnittliche Temperatur von 23.5 °C auf der Oberseite. Der Klassendurchschnitt erreicht 29.5 °C.
(+) Die Handballen und der Touchpad-Bereich sind mit gemessenen 28.2 °C kühler als die typische Hauttemperatur und fühlen sich dadurch kühl an.
(±) Die durchschnittliche Handballen-Temperatur anderer getesteter Geräte war 27.5 °C (-0.7 °C).
Stresstest
Last durch Prime95 führt für einige Sekunden zu einem Takt von 4,1 GHz, was aber zu einer Temperatur von 101 °C führt. Danach fällt der Takt auf 3,0 GHz, um eine kühlere Kerntemperatur von 82 °C zu halten. Der gleiche Test auf dem ADATA XPG Xenia 14 mit dem gleichen Core-i7-Prozessor resultiert sowohl in einem höheren Takt als auch einer höheren Temperatur.
Im Akkubetrieb wird die Leistung ein wenig reduziert. Ein 3DMark-11-Test abseits der Steckdose ergibt 10.095 (Physics) und 5.563 Punkte (Graphics); mit angeschlossenem Netzteil sind es 11.009 bzw. 5.702 Punkte.
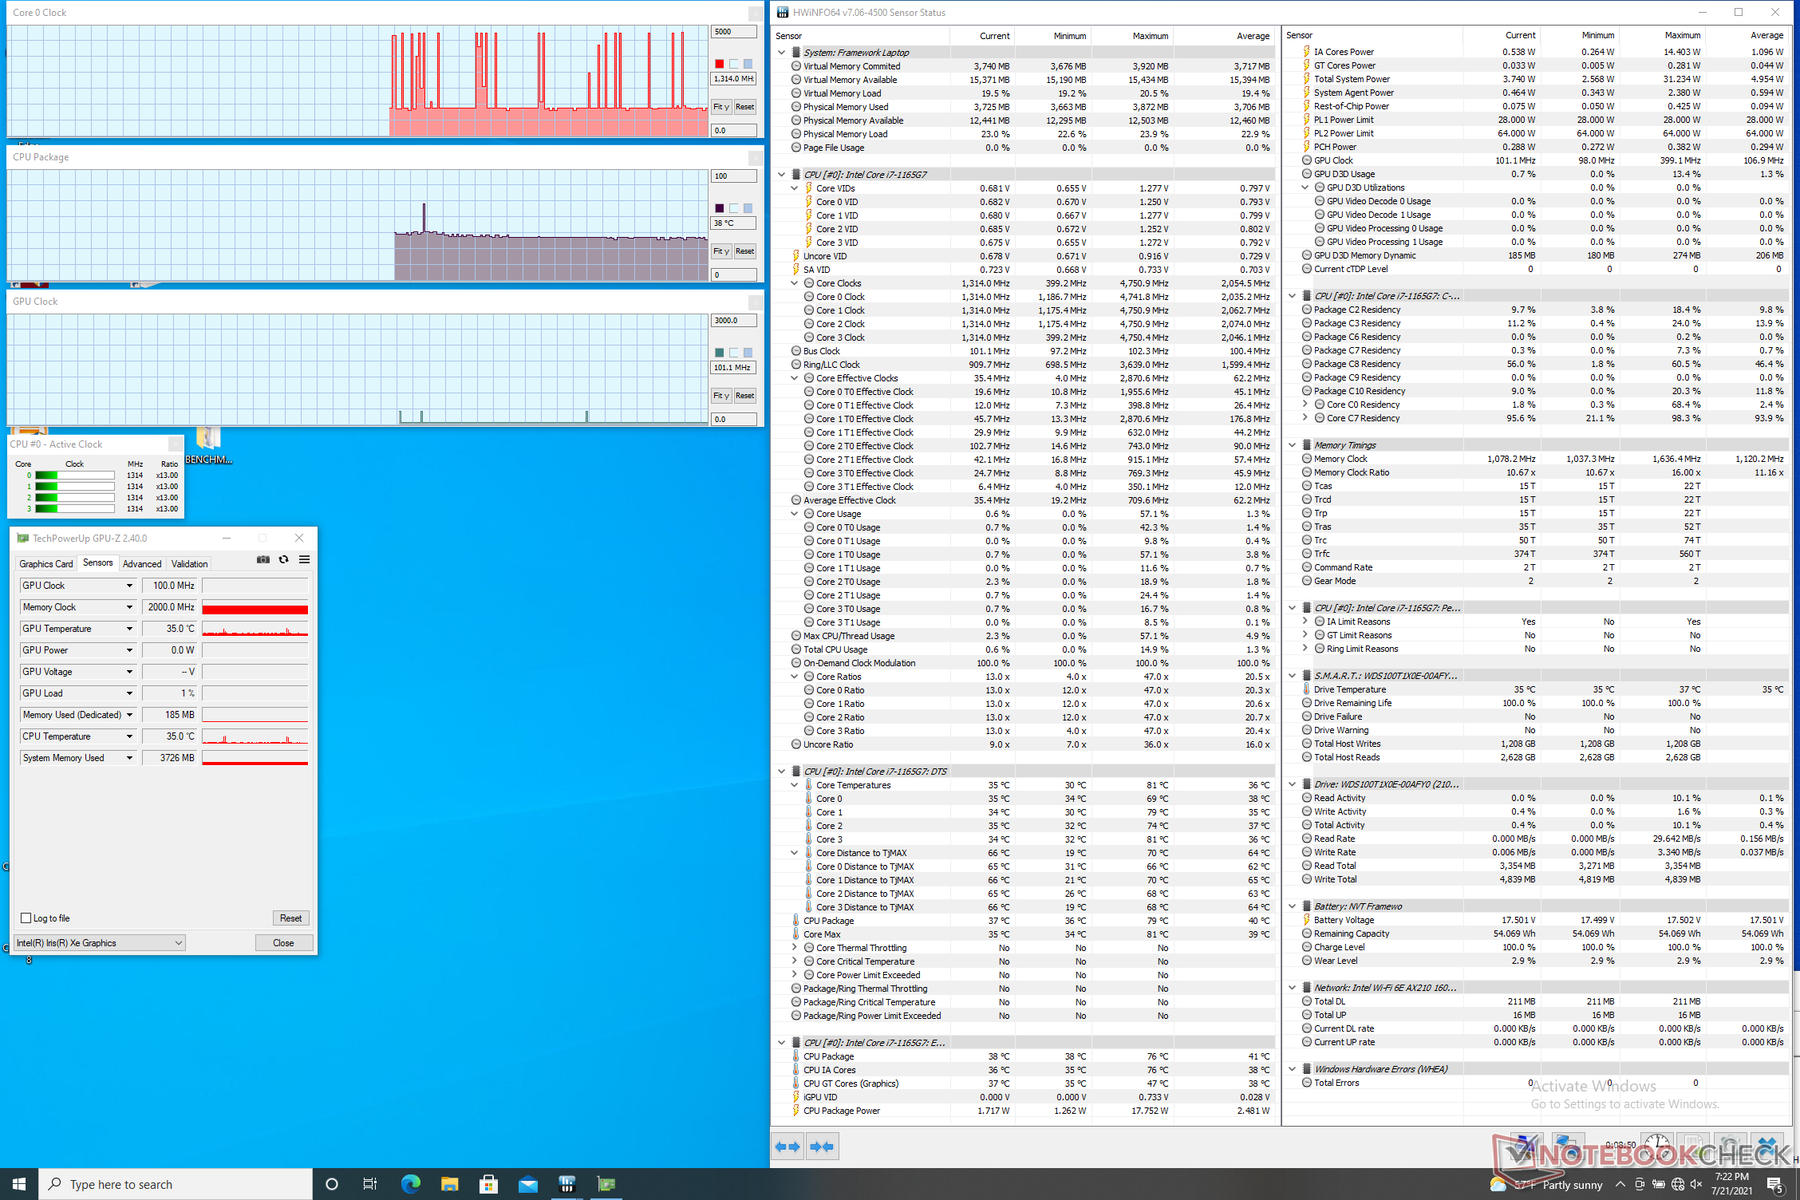
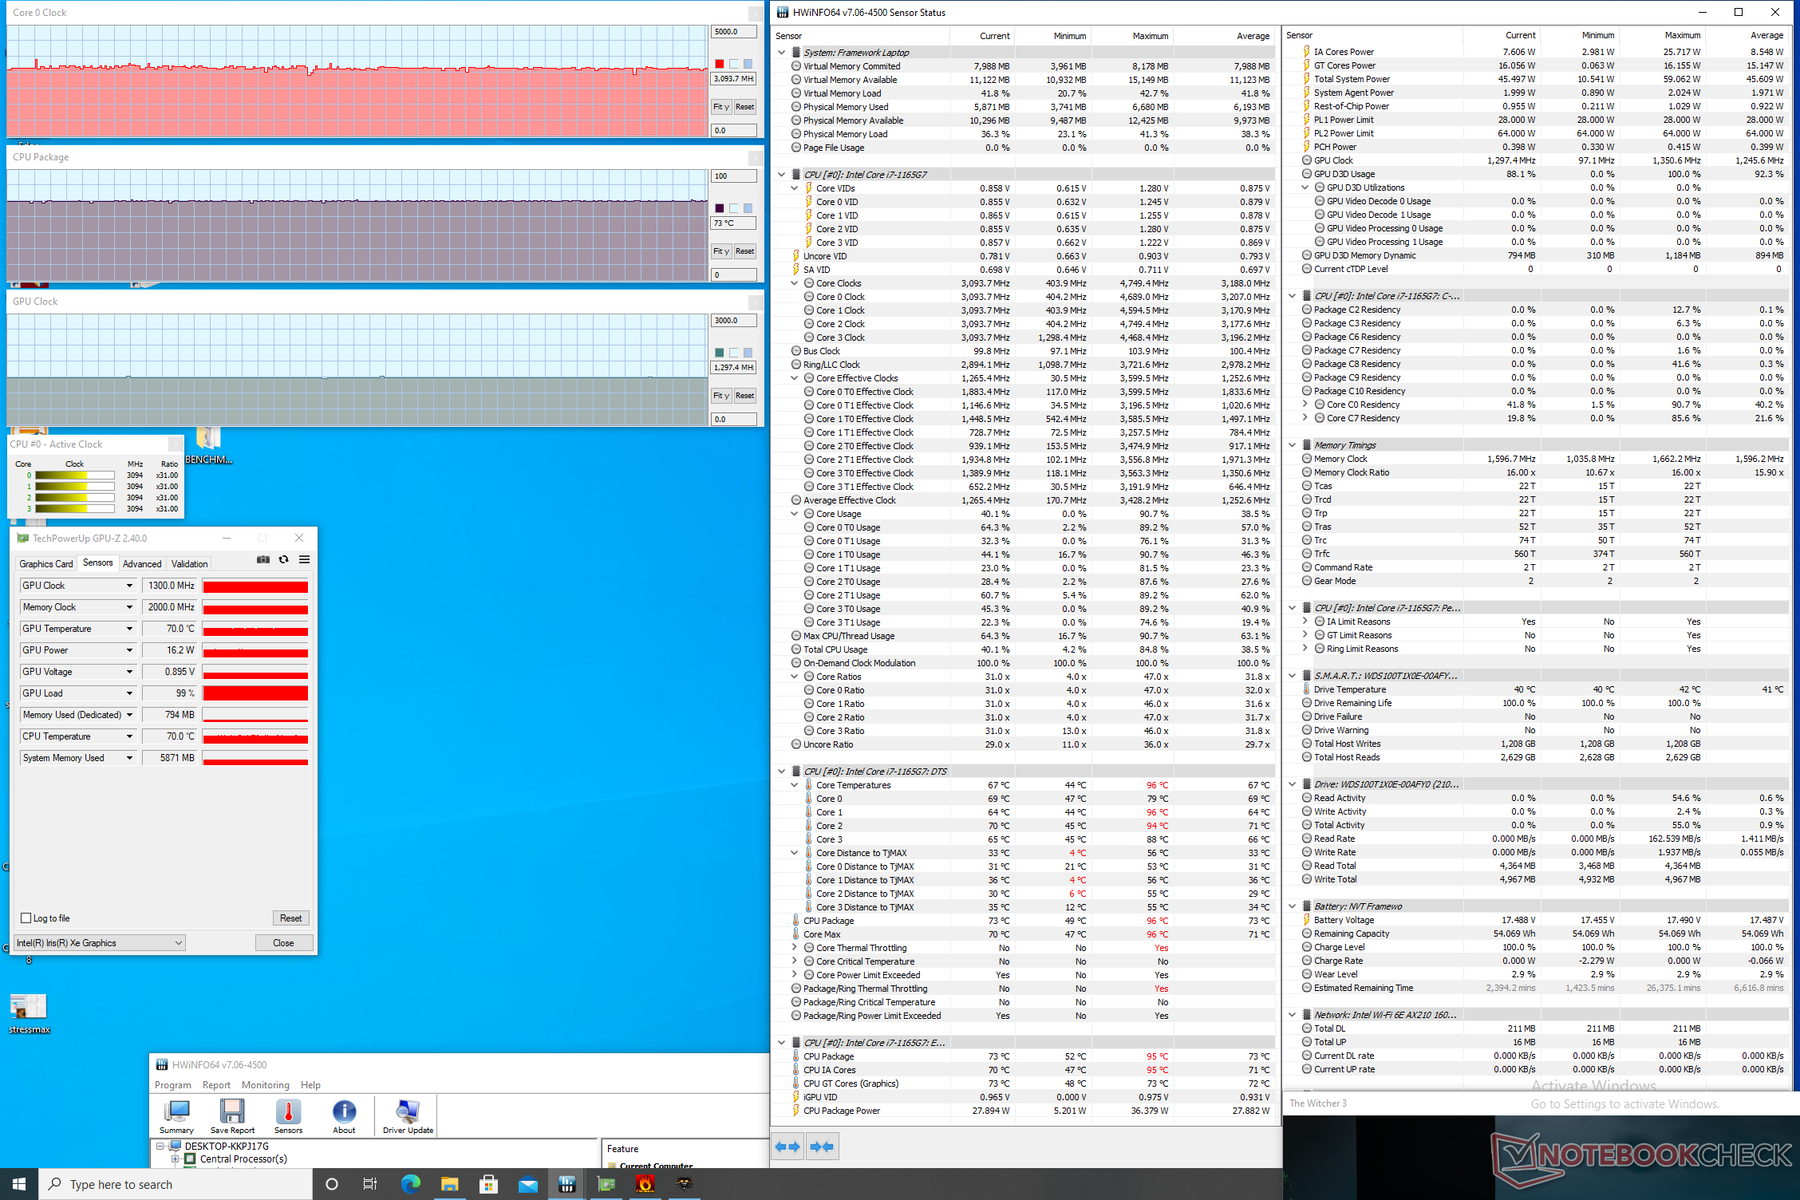


| CPU-Takt (GHz) | GPU-Takt (MHz) | Durchschnittliche CPU-Temperatur (°C) | |
| Leerlauf | -- | -- | 38 |
| Prime95 | ~3,0 | -- | 82 |
| Stresstest | 1,6 - 2,0 | 750 - 1.000 | 74 |
| Witcher 3 | 3,1 | 1.300 | 73 |
Lautsprecher

Framework Laptop 13.5 Audio Analyse
(±) | Mittelmäßig laut spielende Lautsprecher (78.2 dB)
Bass 100 - 315 Hz
(±) | abgesenkter Bass - 13.9% geringer als der Median
(±) | durchschnittlich lineare Bass-Wiedergabe (10.1% Delta zum Vorgänger)
Mitteltöne 400 - 2000 Hz
(+) | ausgeglichene Mitten, vom Median nur 4% abweichend
(+) | lineare Mitten (6% Delta zum Vorgänger)
Hochtöne 2 - 16 kHz
(±) | zu hohe Hochtöne, vom Median nur 5.2% abweichend
(+) | sehr lineare Hochtöne (6.1% Delta zum Vorgänger)
Gesamt im hörbaren Bereich 100 - 16.000 Hz
(±) | hörbarer Bereich ist durchschnittlich linear (17.3% Abstand zum Median)
Im Vergleich zu allen Geräten derselben Klasse
» 26% aller getesteten Geräte dieser Klasse waren besser, 7% vergleichbar, 67% schlechter
» Das beste Gerät hat einen Delta-Wert von 7%, durchschnittlich ist 21%, das schlechteste Gerät hat 53%
Im Vergleich zu allen Geräten im Test
» 32% aller getesteten Geräte waren besser, 8% vergleichbar, 59% schlechter
» Das beste Gerät hat einen Delta-Wert von 4%, durchschnittlich ist 23%, das schlechteste Gerät hat 134%
Apple MacBook 12 (Early 2016) 1.1 GHz Audio Analyse
(+) | Die Lautsprecher können relativ laut spielen (83.6 dB)
Bass 100 - 315 Hz
(±) | abgesenkter Bass - 11.3% geringer als der Median
(±) | durchschnittlich lineare Bass-Wiedergabe (14.2% Delta zum Vorgänger)
Mitteltöne 400 - 2000 Hz
(+) | ausgeglichene Mitten, vom Median nur 2.4% abweichend
(+) | lineare Mitten (5.5% Delta zum Vorgänger)
Hochtöne 2 - 16 kHz
(+) | ausgeglichene Hochtöne, vom Median nur 2% abweichend
(+) | sehr lineare Hochtöne (4.5% Delta zum Vorgänger)
Gesamt im hörbaren Bereich 100 - 16.000 Hz
(+) | hörbarer Bereich ist sehr linear (10.2% Abstand zum Median
Im Vergleich zu allen Geräten derselben Klasse
» 7% aller getesteten Geräte dieser Klasse waren besser, 2% vergleichbar, 91% schlechter
» Das beste Gerät hat einen Delta-Wert von 5%, durchschnittlich ist 18%, das schlechteste Gerät hat 53%
Im Vergleich zu allen Geräten im Test
» 5% aller getesteten Geräte waren besser, 1% vergleichbar, 94% schlechter
» Das beste Gerät hat einen Delta-Wert von 4%, durchschnittlich ist 23%, das schlechteste Gerät hat 134%
Energieverwaltung
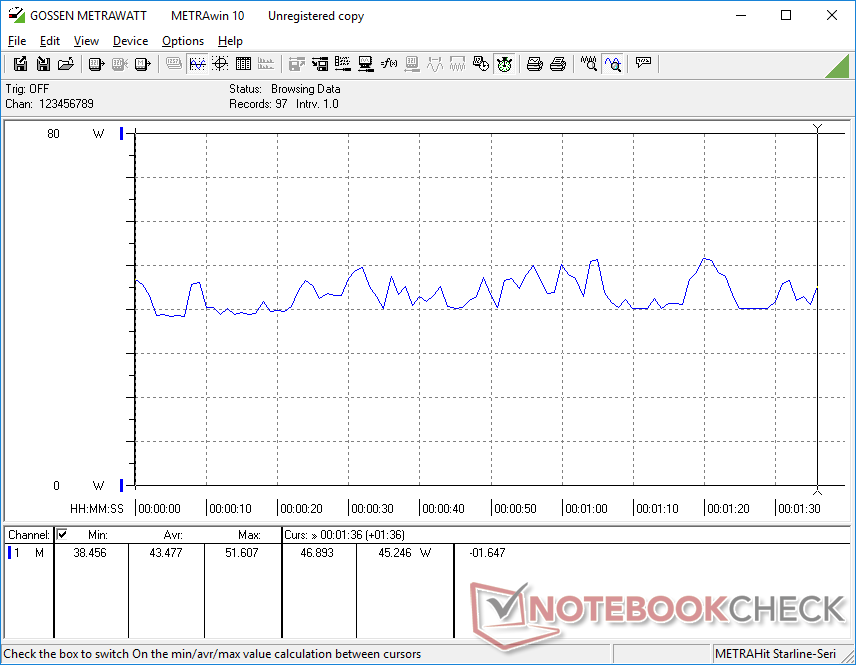
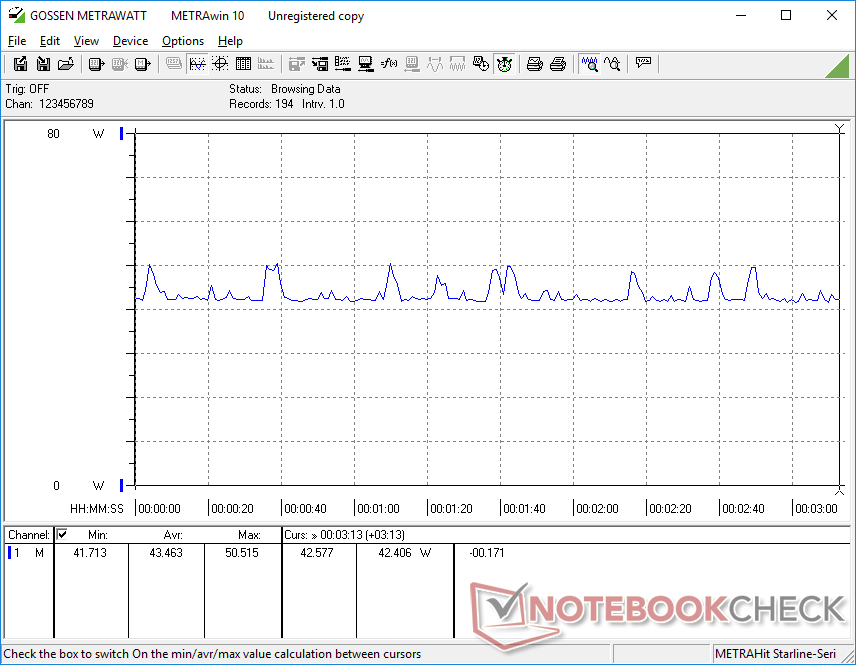
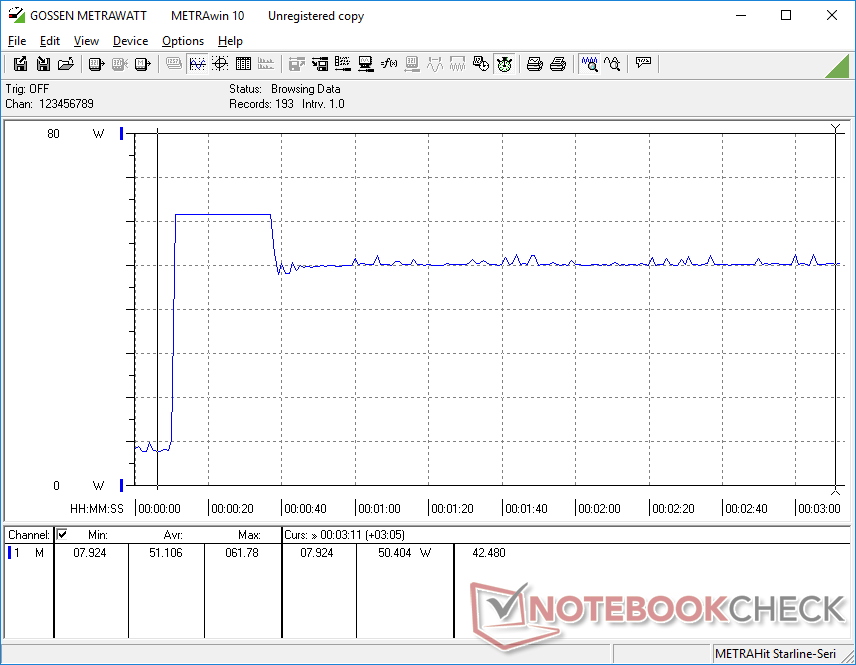
Energieaufnahme
Der Stromverbrauch ist sehr ähnlich zum Surface Laptop 4 13 mit dem gleichen Prozessor und der gleichen Bildschirmgröße.
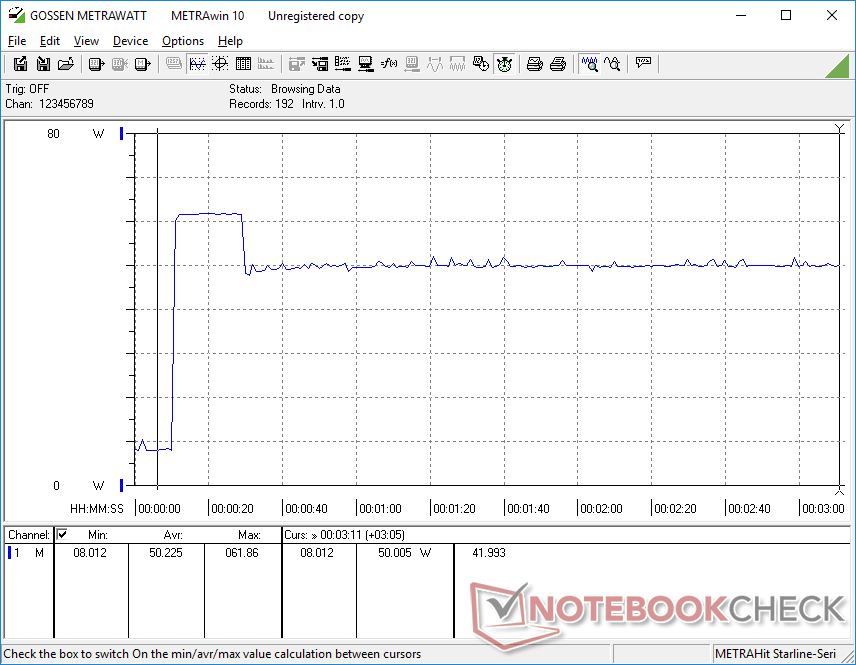
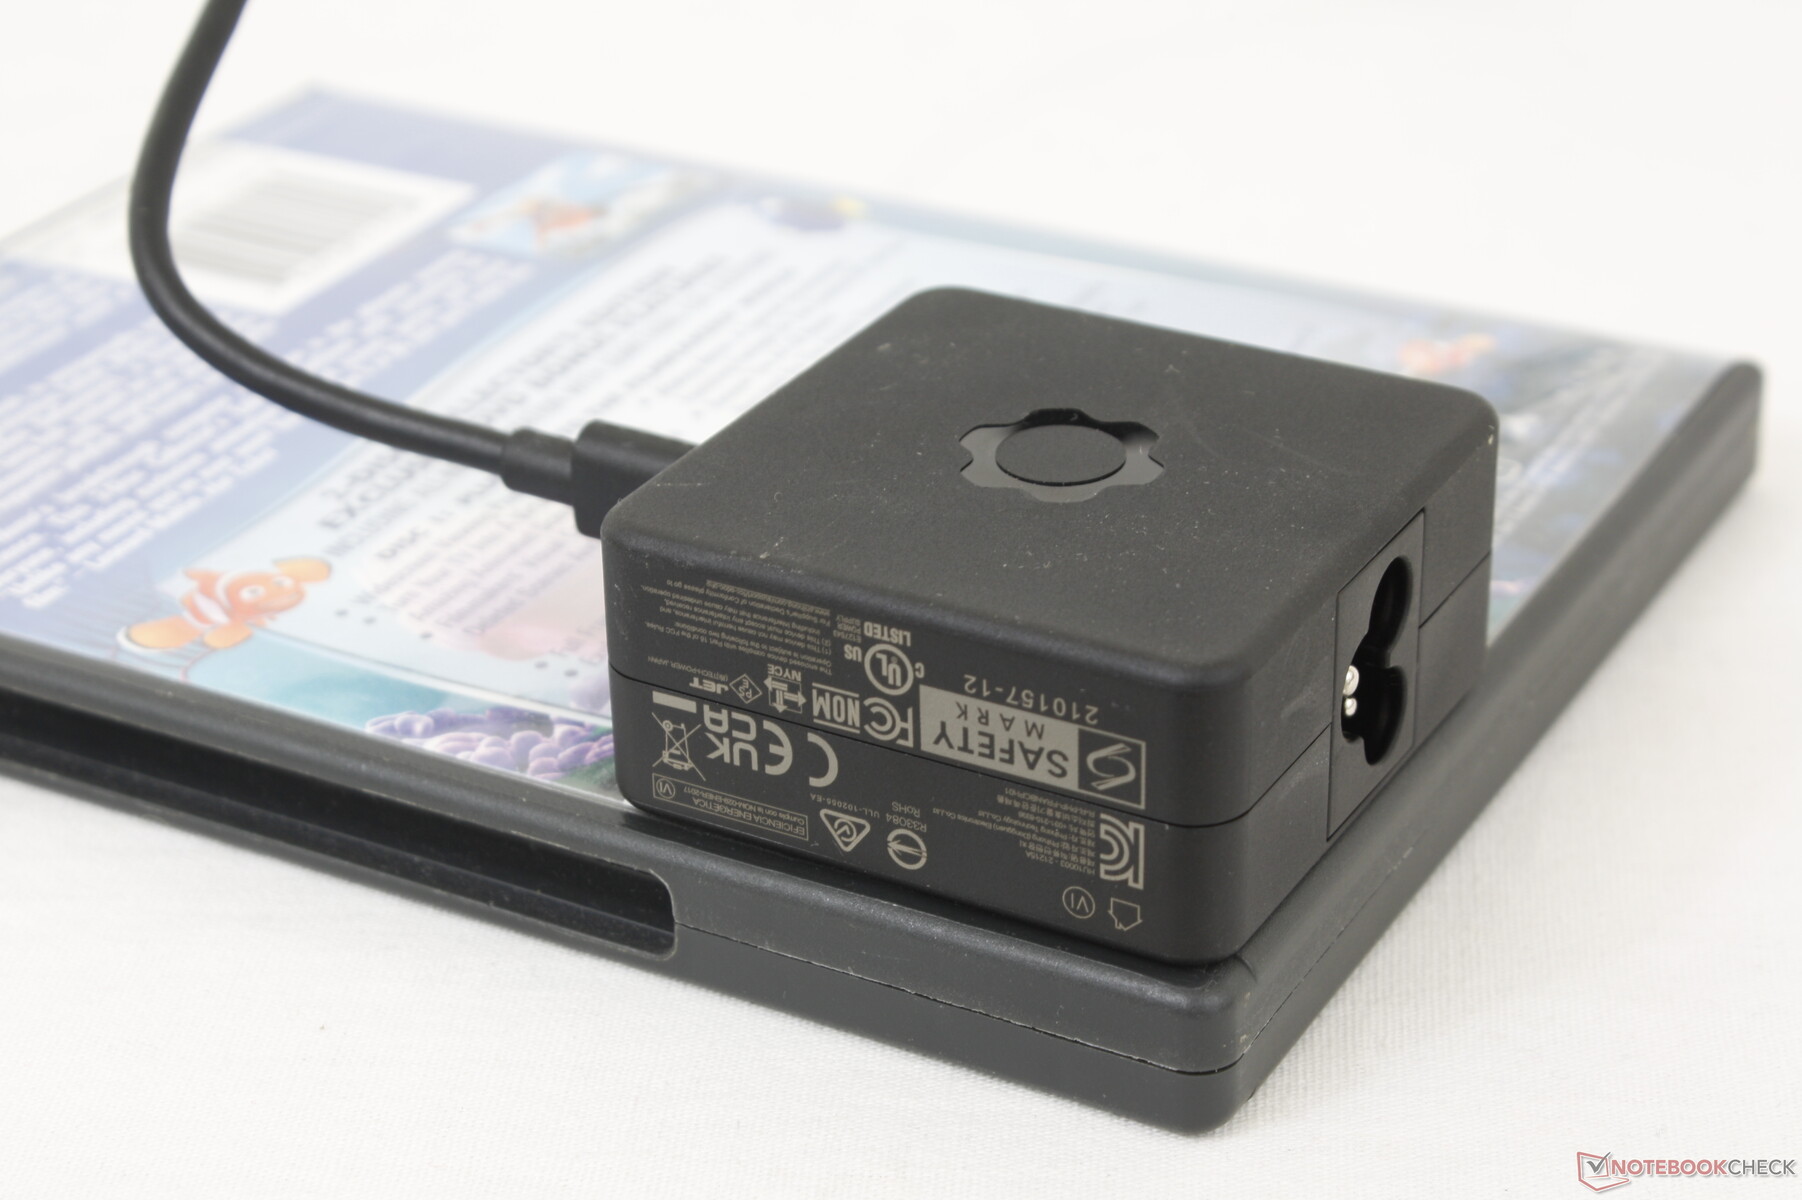
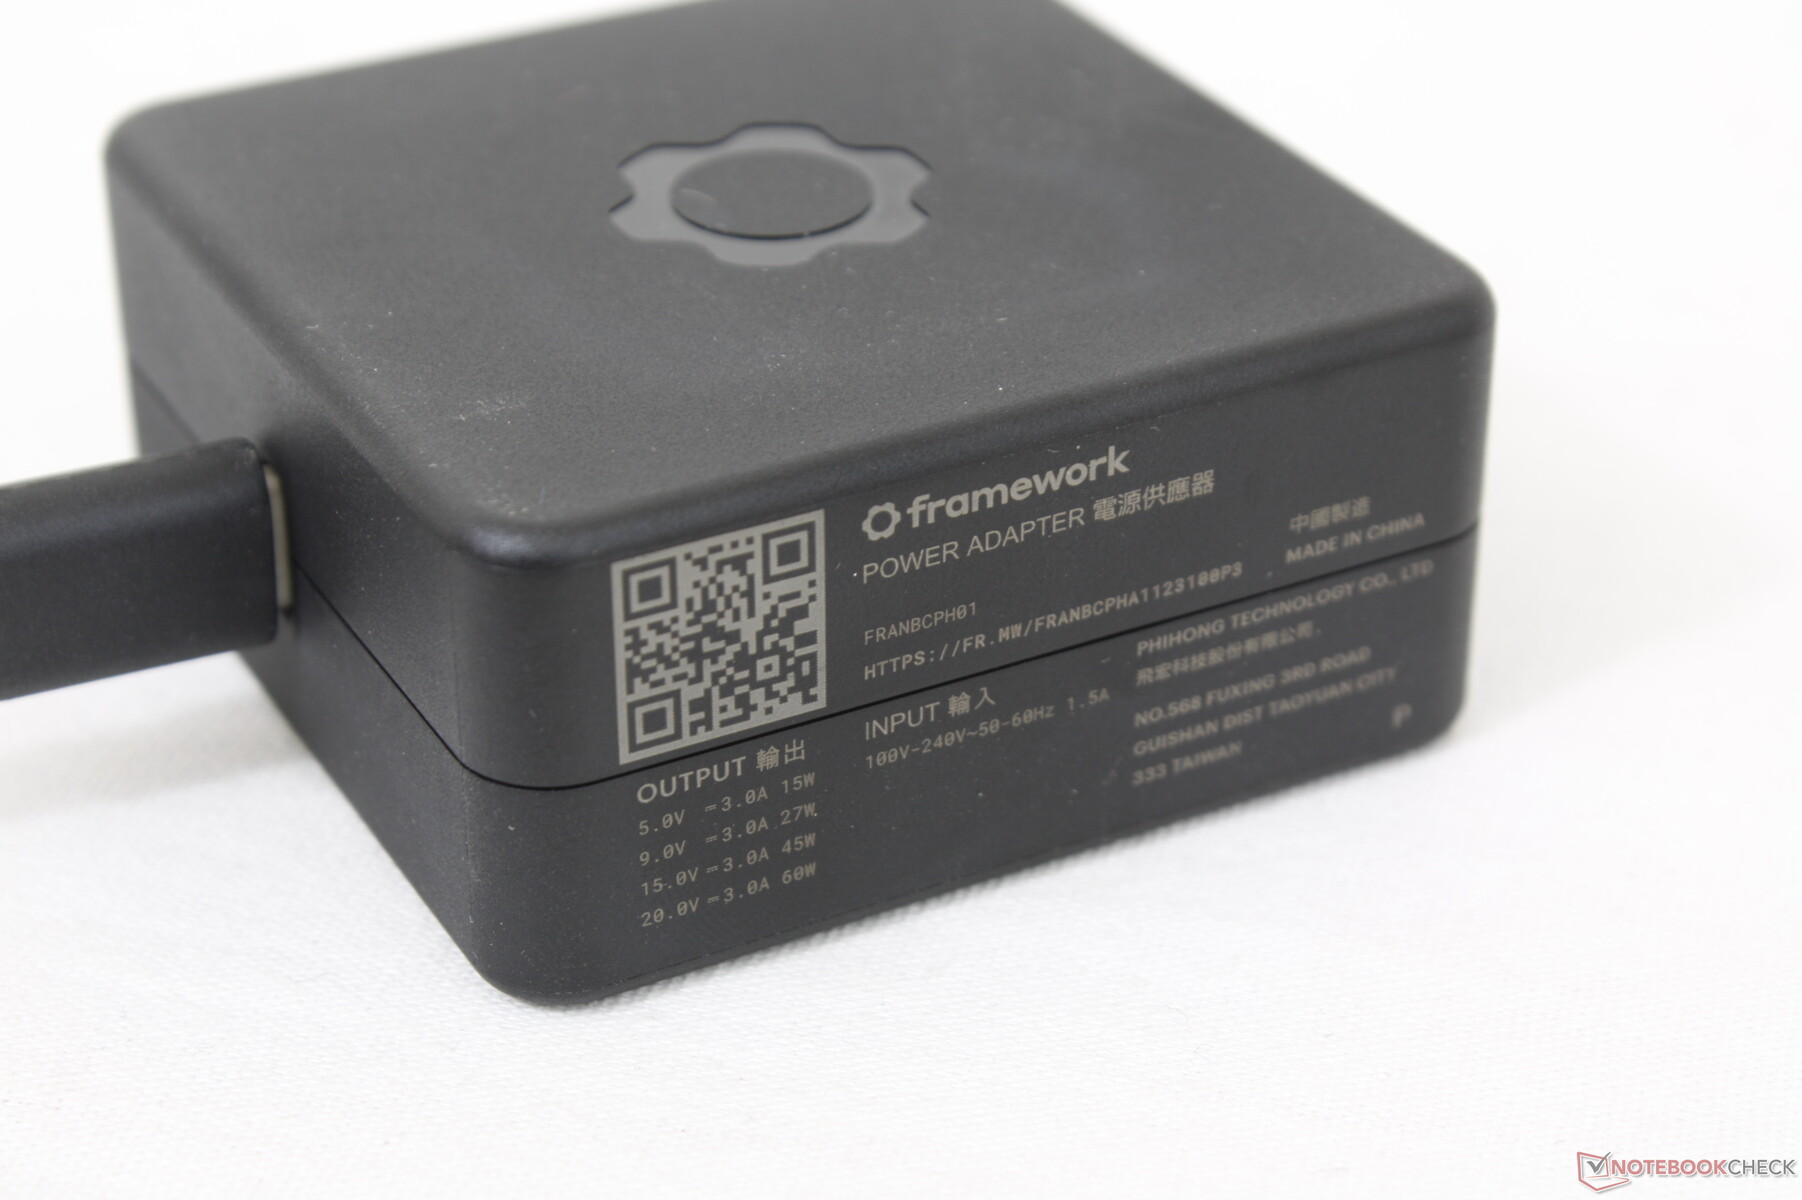
Wir konnten einen maximalen Stromverbrauch von 61,8 Watt mit dem kompakten 60-Watt-Netzteil (~5,8 x 5,8 x 2,7 cm) ermitteln. Dieser Wert ist aber nur von kurzer Dauer, da die Kühlung den hohen Turbo Boost des Prozessors nicht aufrechterhalten kann.
| Aus / Standby | |
| Idle | |
| Last |
|
Legende:
min: | |
| Framework Laptop 13.5 i7-1165G7, Iris Xe G7 96EUs, Western Digital WD_BLACK SN850 WDS100T1X0E, IPS, 2256x1504, 13.5" | HP Spectre x360 14-ea0378ng i7-1165G7, Iris Xe G7 96EUs, Intel Optane Memory H10 with Solid State Storage 32GB + 1TB HBRPEKNX0203AH(L/H), OLED, 3000x2000, 13.5" | Microsoft Surface Laptop 4 13 i7 i7-1185G7, Iris Xe G7 96EUs, Samsung PM991 MZ9LQ512HALU, IPS, 2256x1504, 13.5" | Lenovo ThinkPad X1 Titanium Yoga G1 20QA001RGE i7-1160G7, Iris Xe G7 96EUs, Toshiba BG4 KBG40ZNT512G, IPS, 2256x1504, 13.5" | HP ProBook x360 435 G8 R7-5800U R7 5800U, Vega 8, Samsung PM991 MZVLQ512HALU, IPS, 1920x1080, 13.3" | Lenovo Yoga 6 13 82ND0009US R5 5500U, Vega 7, WDC PC SN530 SDBPMPZ-265G, IPS, 1920x1080, 13.3" | |
|---|---|---|---|---|---|---|
| Stromverbrauch | -14% | 15% | 14% | 24% | 14% | |
| Idle min * (Watt) | 4.3 | 6.3 -47% | 2.6 40% | 3.9 9% | 3.2 26% | 5 -16% |
| Idle avg * (Watt) | 8.2 | 11.2 -37% | 6 27% | 7.3 11% | 5.5 33% | 6.3 23% |
| Idle max * (Watt) | 8.7 | 13.3 -53% | 8.2 6% | 10.3 -18% | 6.4 26% | 6.9 21% |
| Last avg * (Watt) | 43.5 | 32 26% | 41.4 5% | 30.6 30% | 35.5 18% | 41.5 5% |
| Witcher 3 ultra * (Watt) | 43.5 | 25.5 41% | 36.4 16% | 33.2 24% | ||
| Last max * (Watt) | 61.8 | 35.6 42% | 64.1 -4% | 57.1 8% | 47.5 23% | 46.5 25% |
* ... kleinere Werte sind besser
Energieverbrauch Witcher 3 / Stresstest
Akkulaufzeit
Mit fast 8 Stunden in unserem WLAN-Test ist die Akkulaufzeit vergleichbar mit dem Spectre x360 14 und dem Surface Laptop 4 13.
Ein vollständiger Ladevorgang dauert knapp 2 Stunden. Das laden erfolgt via USB-C, wenn man also alle vier Anschlüsse mit anderen Adaptern nutzt, kann man den Laptop nicht mehr Laden.
| Framework Laptop 13.5 i7-1165G7, Iris Xe G7 96EUs, 55 Wh | HP Spectre x360 14-ea0378ng i7-1165G7, Iris Xe G7 96EUs, 66 Wh | Microsoft Surface Laptop 4 13 i7 i7-1185G7, Iris Xe G7 96EUs, 47.4 Wh | Lenovo ThinkPad X1 Titanium Yoga G1 20QA001RGE i7-1160G7, Iris Xe G7 96EUs, 44.5 Wh | HP ProBook x360 435 G8 R7-5800U R7 5800U, Vega 8, 45 Wh | Lenovo Yoga 6 13 82ND0009US R5 5500U, Vega 7, 60 Wh | |
|---|---|---|---|---|---|---|
| Akkulaufzeit | -2% | -5% | 5% | 19% | 65% | |
| WLAN (h) | 8 | 7.8 -2% | 7.6 -5% | 8.4 5% | 9.5 19% | 13.2 65% |
| Idle (h) | 13.4 | 17.5 | ||||
| Last (h) | 2.6 | 1.4 | 1.9 | 1.1 | 2 |
Pro
Contra
Fazit - Framework Laptop beweist, dass nicht alles verlötet sein muss
Die Hersteller konstruieren oft dünne und attraktive Laptops, die aber meisten sehr schwer bzw. überhaupt nicht repariert werden können. Selbst einfache Upgrades wie beim Arbeitsspeicher oder dem Massenspeicher sind nicht immer möglich. Der Framework Laptop beweist nun, dass dünne und leichte Notebooks nicht auf Wartungsmöglichkeiten oder modulare Anschlüsse verzichten müssen.
Der Framework Laptop schlägt den Surface Laptop mit den eigenen Waffen. Er ist kleiner, deutlich einfacher zu warten und bietet mehr integrierte Anschlüsse, ohne dabei auf Leistung oder Mobilität zu verzichten.
Einige Dinge des Framework Laptops können noch verbessert werden. Vor allem der Bildschirmdeckel und die Scharniere sind schwächer als bei Konkurrenten wie dem Dell XPS 13, HP Spectre x360 14, Microsoft Surface Laptop oder den Lenovo ThinkBook-Modellen. Zudem ist der Lüfter bei hoher Belastung lauter. Das sind keine K.O-Argumente, aber straffere Scharniere, eine stärkere und leisere Kühlung und eine zusätzliche Glasscheibe für das Display würden das Framework noch besser machen.
Preis und Verfügbarkeit
In Deutschland ist der Framework Laptop aktuell noch nicht verfügbar.
Framework Laptop 13.5
- 26.07.2021 v7 (old)
Allen Ngo
Preisvergleich

