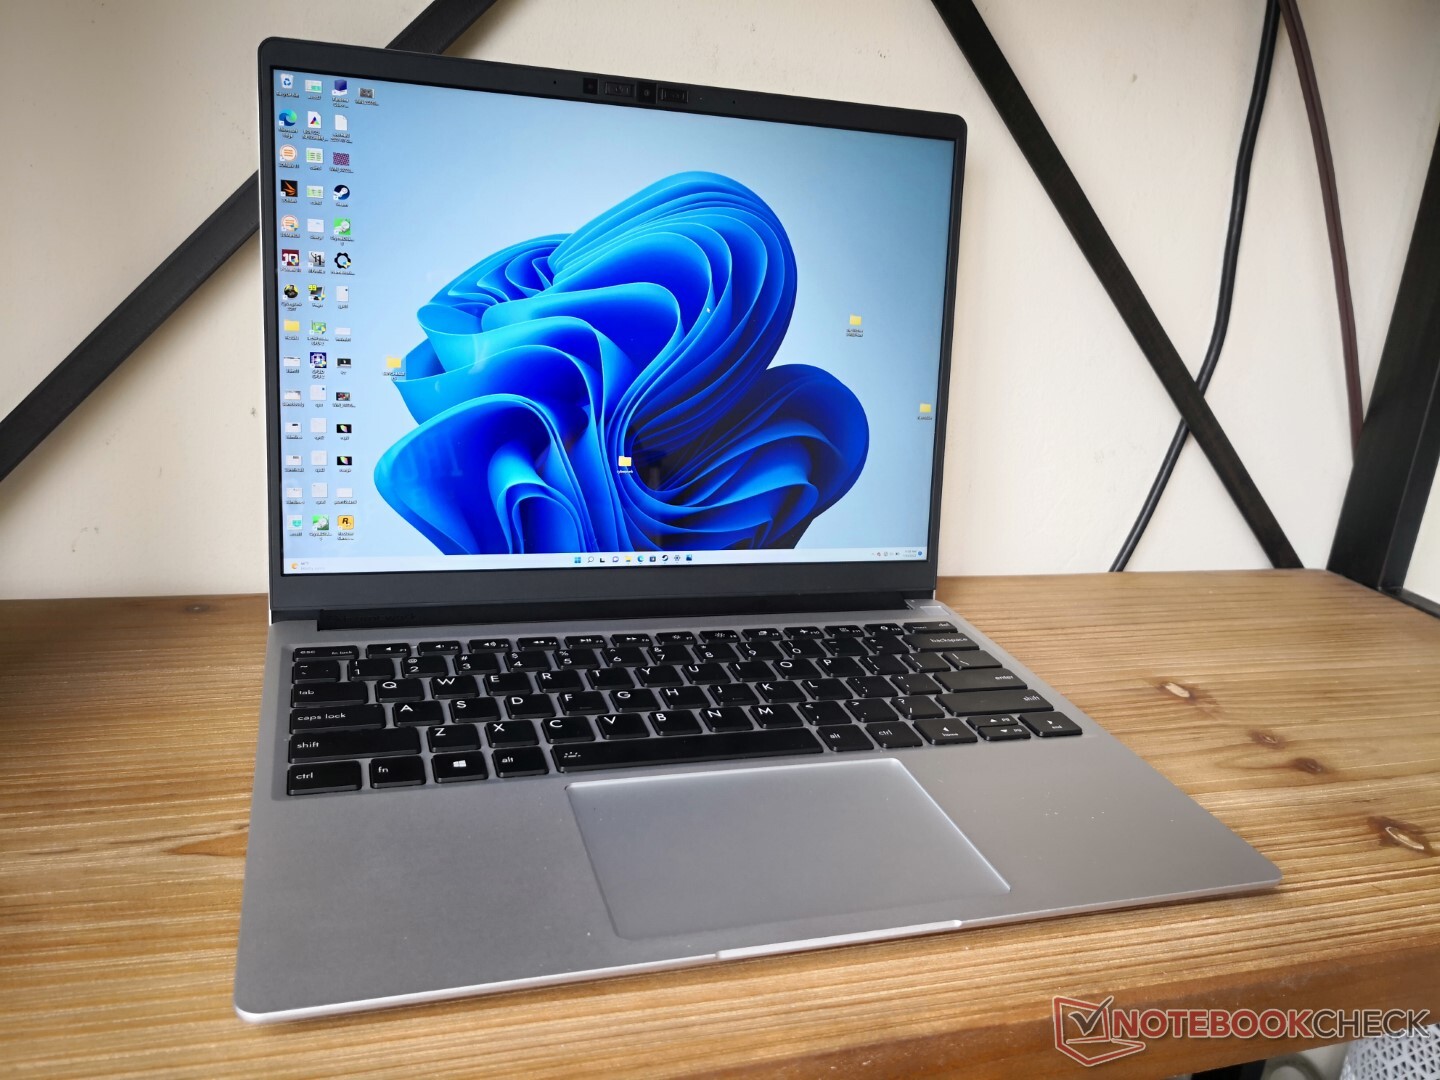
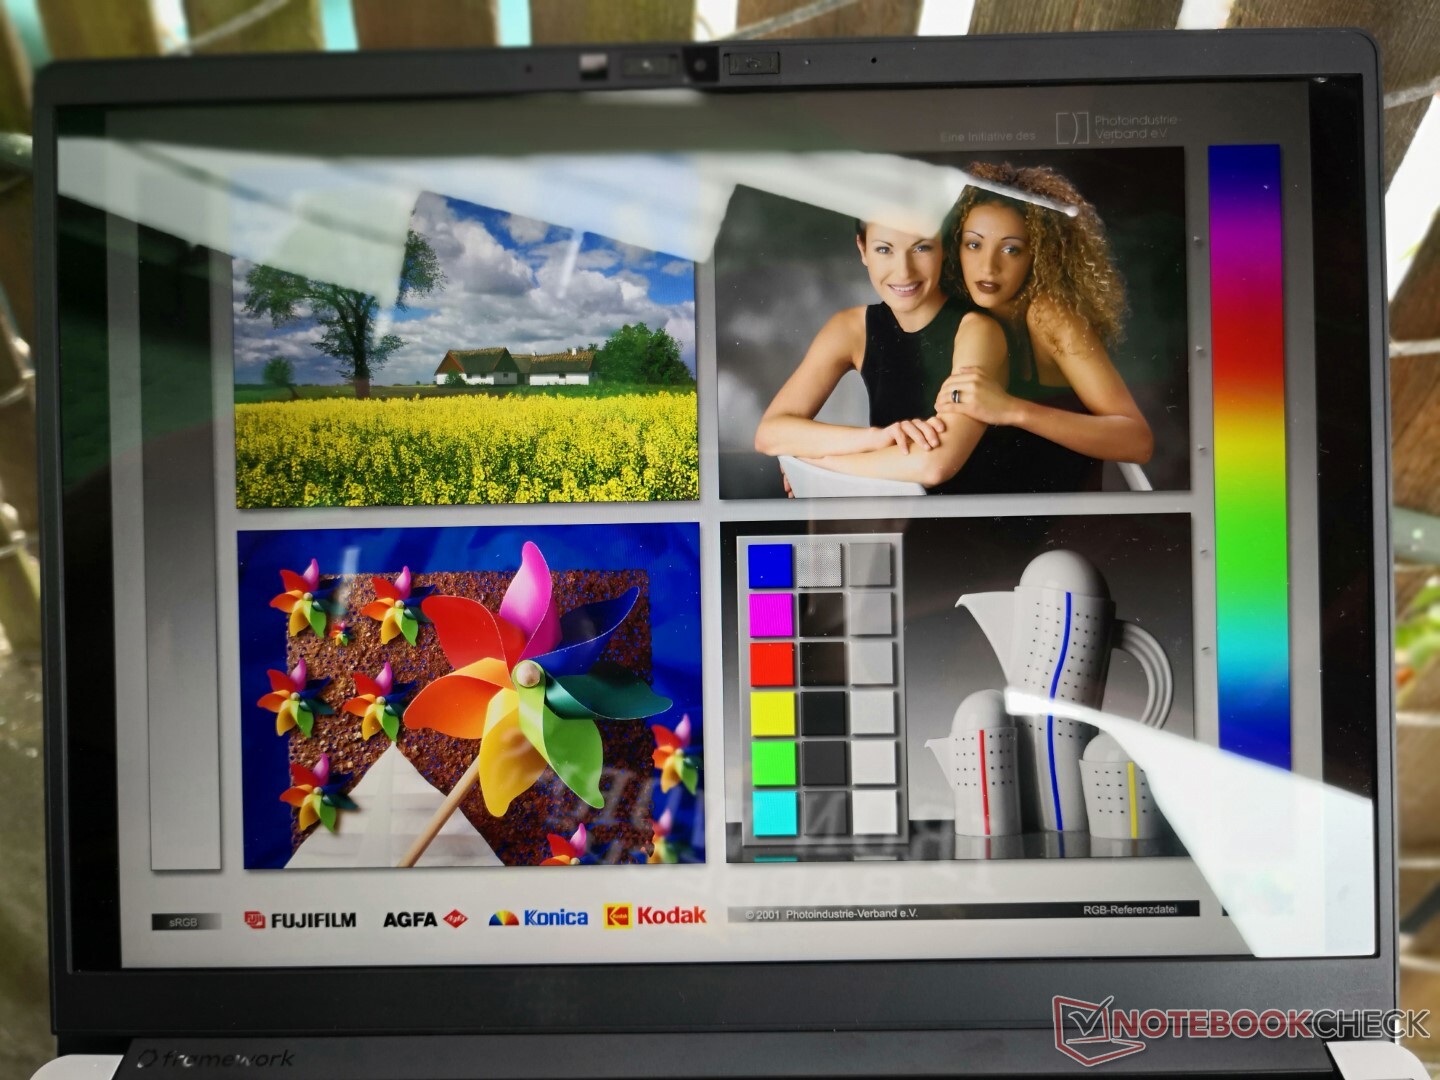
Framework Laptop 13.5 Intel 12. Generation Test: Wie das Microsoft Surface, aber tatsächlich reparierbar
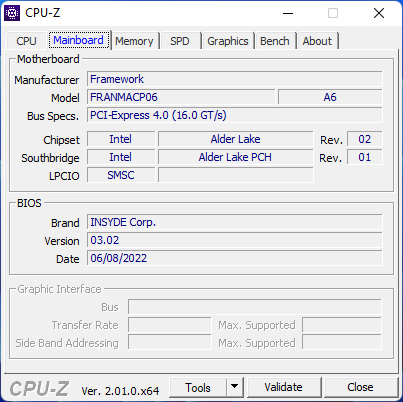
Der ursprüngliche 13,5-Zoll-Framework-Laptop kam 2021 auf den Markt und war mit Intel Prozessoren der 11. Generation Tiger Lake-U ausgestattet. Im Gegensatz zu anderen ultradünnen Modellen größerer Hersteller, die oft geschlossen und schwer zu warten sind, legt das Framework Design den Schwerpunkt auf Reparierbarkeit und fördert Upgrades durch den Endnutzer. In der Tat verkauft der Hersteller offen einzelne Komponenten des Framework Laptops à la carte, falls die Besitzer Teile ersetzen müssen. Das neueste Modell 2022 ist jetzt mit schnelleren Intel-Alder-Lake-P-CPUs der 12. Generation erhältlich, aber grundsätzlich mit dem gleichen Gehäusedesign, um die Abwärtskompatibilität mit vorhandenem Zubehör und Komponenten zu erhalten.
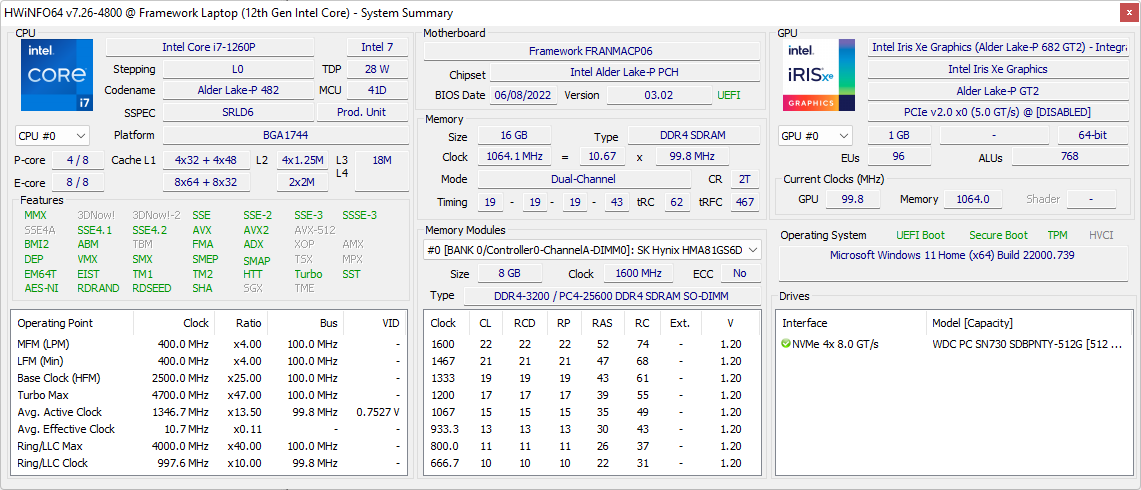
Da sich das Grundgerüst nicht geändert hat, empfehlen wir Ihnen, unseren bestehenden Test des 2021er Modells für weitere Informationen über die physischen Eigenschaften des 2022-Modells zu überprüfen. Alles, vom Display über die Tastatur bis hin zu den meisten Materialien, wurde ohne größere Änderungen übernommen. Unser spezielles Testgerät wird mit dem Core i7-1260P für ca. 1.450 USD ausgeliefert, aber Benutzer können es auch mit dem kleineren i5-1240P oder dem höheren i7-1280P konfigurieren, falls gewünscht. Alle SKUs sind jedoch mit dem gleichen 2.256x1.504-IPS-Panel ausgestattet.
Alternativen zum Framework Laptop sind andere 13-Zoll-Ultrabooks wie das HP Spectre x360 14, Lenovo ThinkPad X1, Asus Zenbook S13 und natürlich das Microsoft Surface Laptop 4 13.
Mögliche Konkurrenten im Vergleich
Bew | Datum | Modell | Gewicht | Dicke | Größe | Auflösung | Preis ab |
|---|---|---|---|---|---|---|---|
| 85.1 % v7 (old) | 07 / 2022 | Framework Laptop 13.5 12th Gen Intel i7-1260P, Iris Xe G7 96EUs | 1.3 kg | 15.85 mm | 13.50" | 2256x1504 | |
| 85.4 % v7 (old) | 07 / 2021 | Framework Laptop 13.5 i7-1165G7, Iris Xe G7 96EUs | 1.3 kg | 15.85 mm | 13.50" | 2256x1504 | |
| 88.5 % v7 (old) | 03 / 2022 | Lenovo ThinkPad X1 Titanium Yoga G1 20QB0016GE i5-1140G7, Iris Xe G7 80EUs | 1.2 kg | 11.5 mm | 13.50" | 2256x1504 | |
| 84 % v7 (old) | 08 / 2021 | HP EliteBook Folio 13.5-3G2L2EA SD 8cx Gen 2 5G, Adreno 680 | 1.3 kg | 16 mm | 13.50" | 1920x1280 | |
| 85.2 % v7 (old) | 05 / 2021 | Microsoft Surface Laptop 4 13 Ryzen 5 R5 4680U, Vega 7 | 1.3 kg | 14 mm | 13.50" | 2256x1504 | |
| 89.5 % v7 (old) | 05 / 2021 | HP Spectre x360 14-ea0378ng i7-1165G7, Iris Xe G7 96EUs | 1.3 kg | 16.9 mm | 13.50" | 3000x2000 |
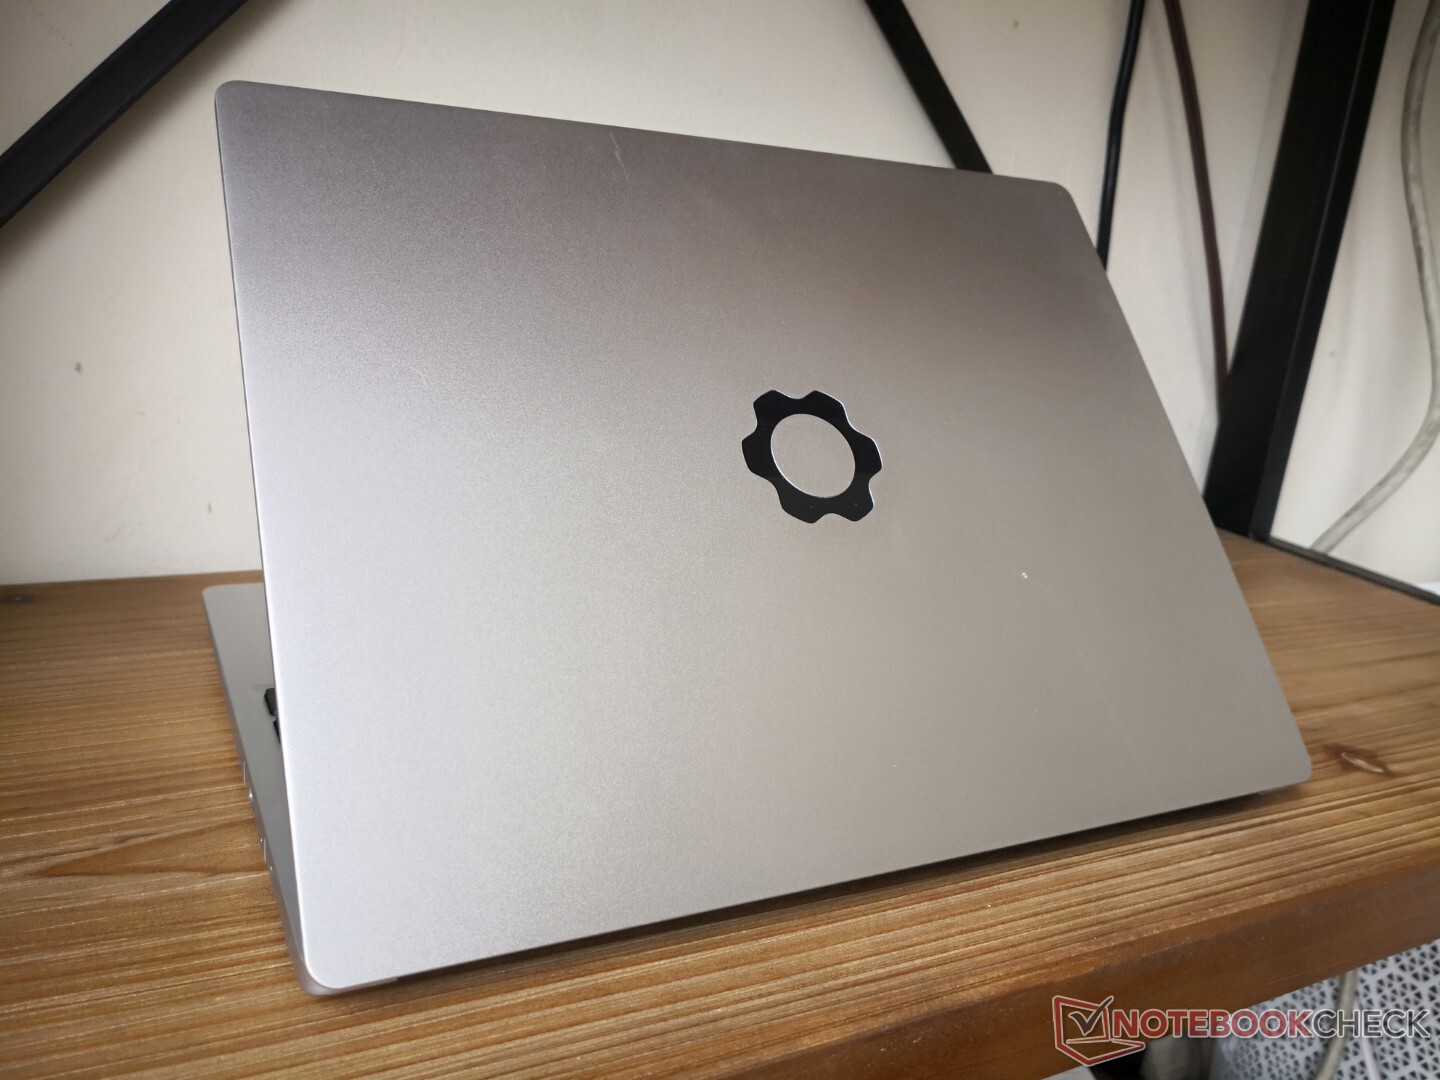
Gehäuse
Die einzige Änderung, die am Gehäuse vorgenommen wurde, ist die Umstellung auf CNC-Fertigung und -Montage der oberen Abdeckung, um die Steifigkeit des Deckels zu verbessern, ohne die Gesamtabmessungen zu verändern. Wir empfanden den Deckel der 2021er Version als sehr wackelig, daher ist das neue Design eine willkommene Veränderung. Dennoch sind die Deckel der meisten konkurrierenden Alternativen wie das XPS 13, Spectre x360 14, Zenbook S13, Razer Blade Stealth oder die MateBookX-Serie nach wie vor viel stabiler und steifer. Beim Framework Design fehlen die Gorilla-Glas-Optionen, die den Deckel verstärken und steifer machen würden.
SD-Kartenleser
| SD Card Reader | |
| average JPG Copy Test (av. of 3 runs) | |
| HP Spectre x360 14-ea0378ng (Toshiba Exceria Pro M501 microSDXC 64GB) | |
| Framework Laptop 13.5 (AV Pro UHS-II V60) | |
| Framework Laptop 13.5 12th Gen Intel (AV Pro UHS-II V60) | |
| maximum AS SSD Seq Read Test (1GB) | |
| HP Spectre x360 14-ea0378ng (Toshiba Exceria Pro M501 microSDXC 64GB) | |
| Framework Laptop 13.5 (AV Pro UHS-II V60) | |
| Framework Laptop 13.5 12th Gen Intel (AV Pro UHS-II V60) | |
Kommunikation
Obwohl sich das Intel-AX210-Modul im Vergleich zum letztjährigen Modell nicht verändert hat, haben wir unsere Testrouter inzwischen aufgerüstet, um 6 GHz Konnektivität zu unterstützen. Somit können schnellere durchschnittliche Übertragungsraten aufgezeichnet werden, wie unten gezeigt.
Es sind immer noch keine 4G- oder WAN-Optionen verfügbar.
| Networking | |
| iperf3 transmit AX12 | |
| Microsoft Surface Laptop 4 13 Ryzen 5 | |
| Framework Laptop 13.5 | |
| HP Spectre x360 14-ea0378ng | |
| HP EliteBook Folio 13.5-3G2L2EA | |
| iperf3 receive AX12 | |
| Microsoft Surface Laptop 4 13 Ryzen 5 | |
| Framework Laptop 13.5 | |
| HP Spectre x360 14-ea0378ng | |
| HP EliteBook Folio 13.5-3G2L2EA | |
| iperf3 receive AXE11000 6GHz | |
| Framework Laptop 13.5 12th Gen Intel | |
| iperf3 transmit AXE11000 6GHz | |
| Framework Laptop 13.5 12th Gen Intel | |
Webcam


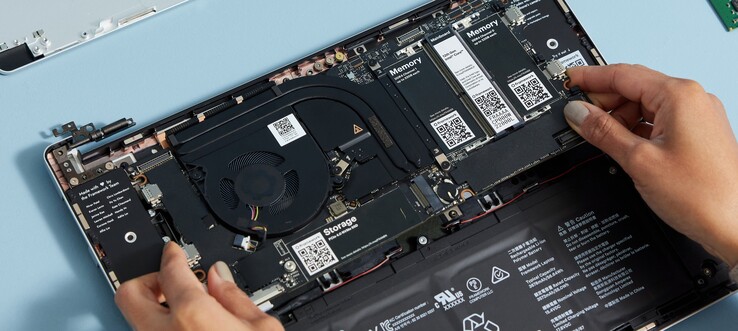
Wartung
Erwartungsgemäß ist das Gerät eines der am einfachsten zu wartenden Laptop-Modelle. Framework verkauft auch Motherboards und DIY-Kits für Benutzer, die das Notebook selbst zusammenbauen möchten.
Zubehör
Die einzigartigen USB-C-basierten Erweiterungskarten sind dieses Jahr alle wieder dabei, zusätzlich zu einer neuen Ethernet-Erweiterungskarte, die Geschwindigkeiten von bis zu 2,5 Gbit unterstützt. Alle sind optional und können an der Kasse konfiguriert werden. Der Hersteller wird weiterhin verschiedene Erweiterungskarten entwickeln, die auf der Nachfrage der Nutzer basieren.
Jeder Verkaufsverpackung liegt ein Torx-Schlüssel für die Wartung des Geräts bei.
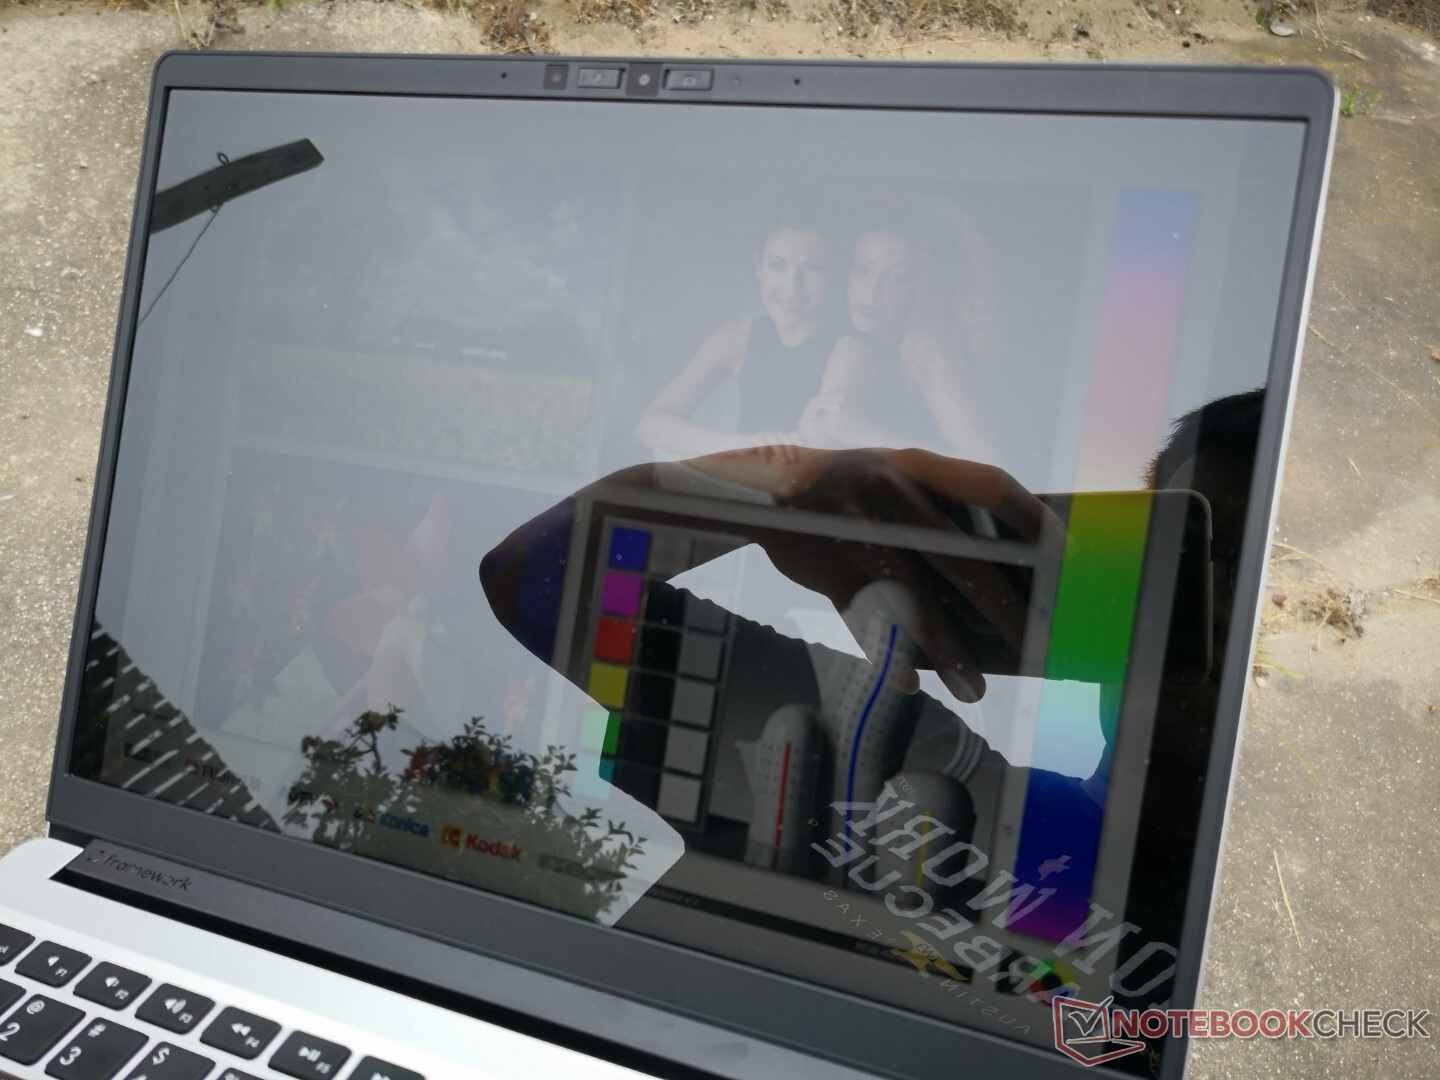
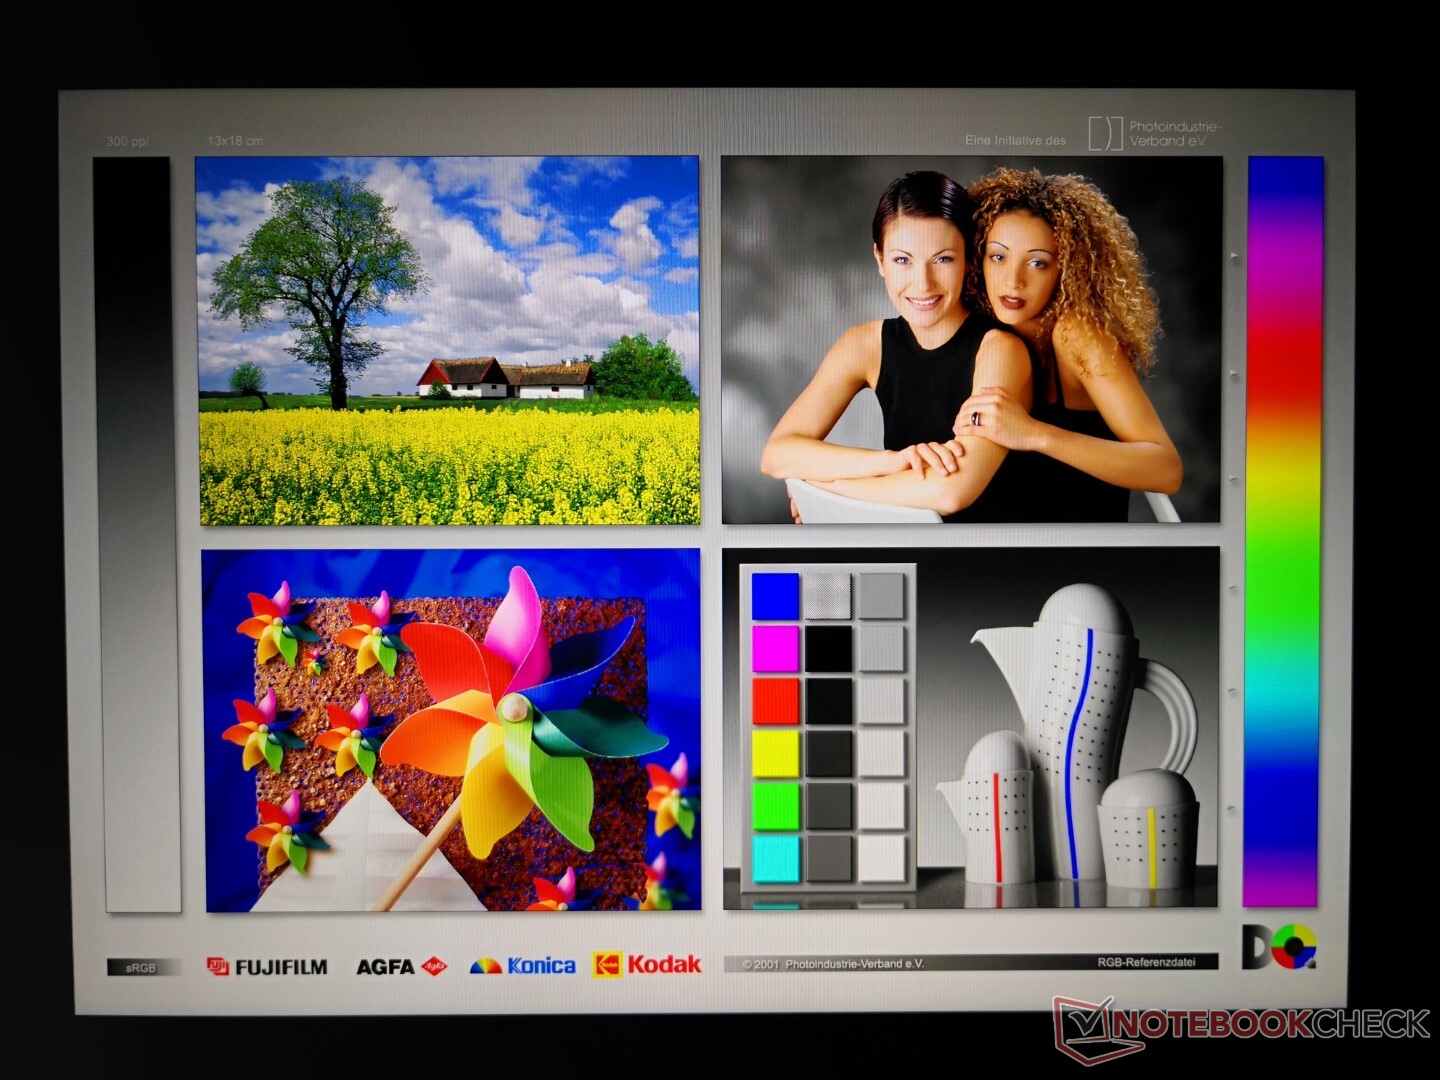
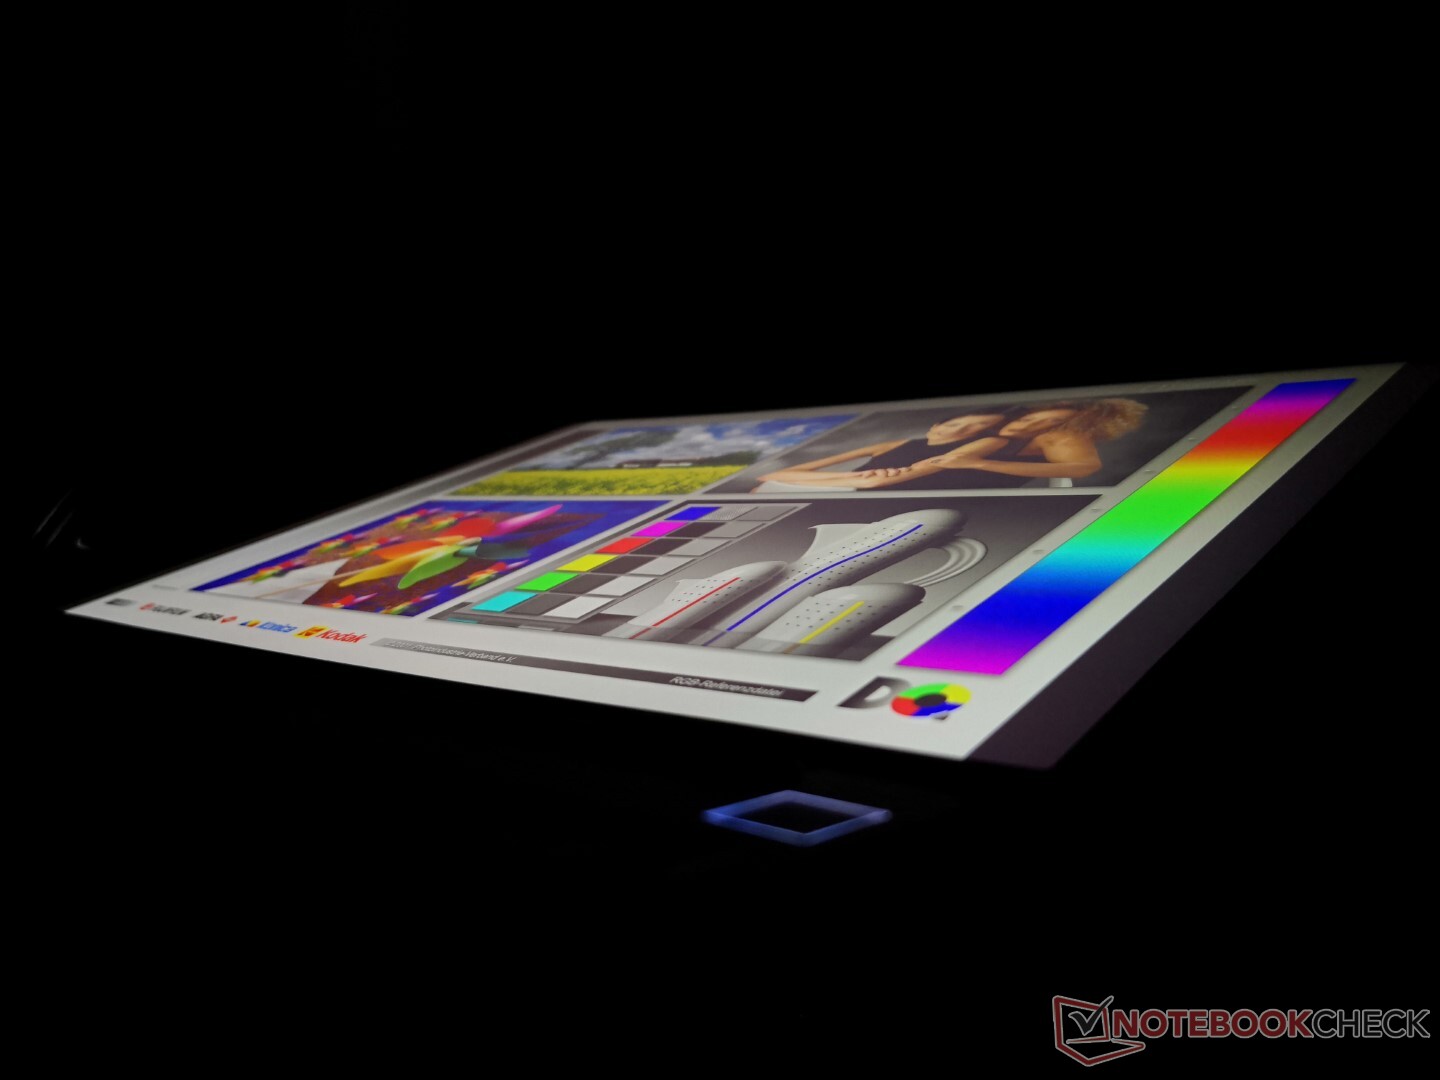
Display
| |||||||||||||||||||||||||
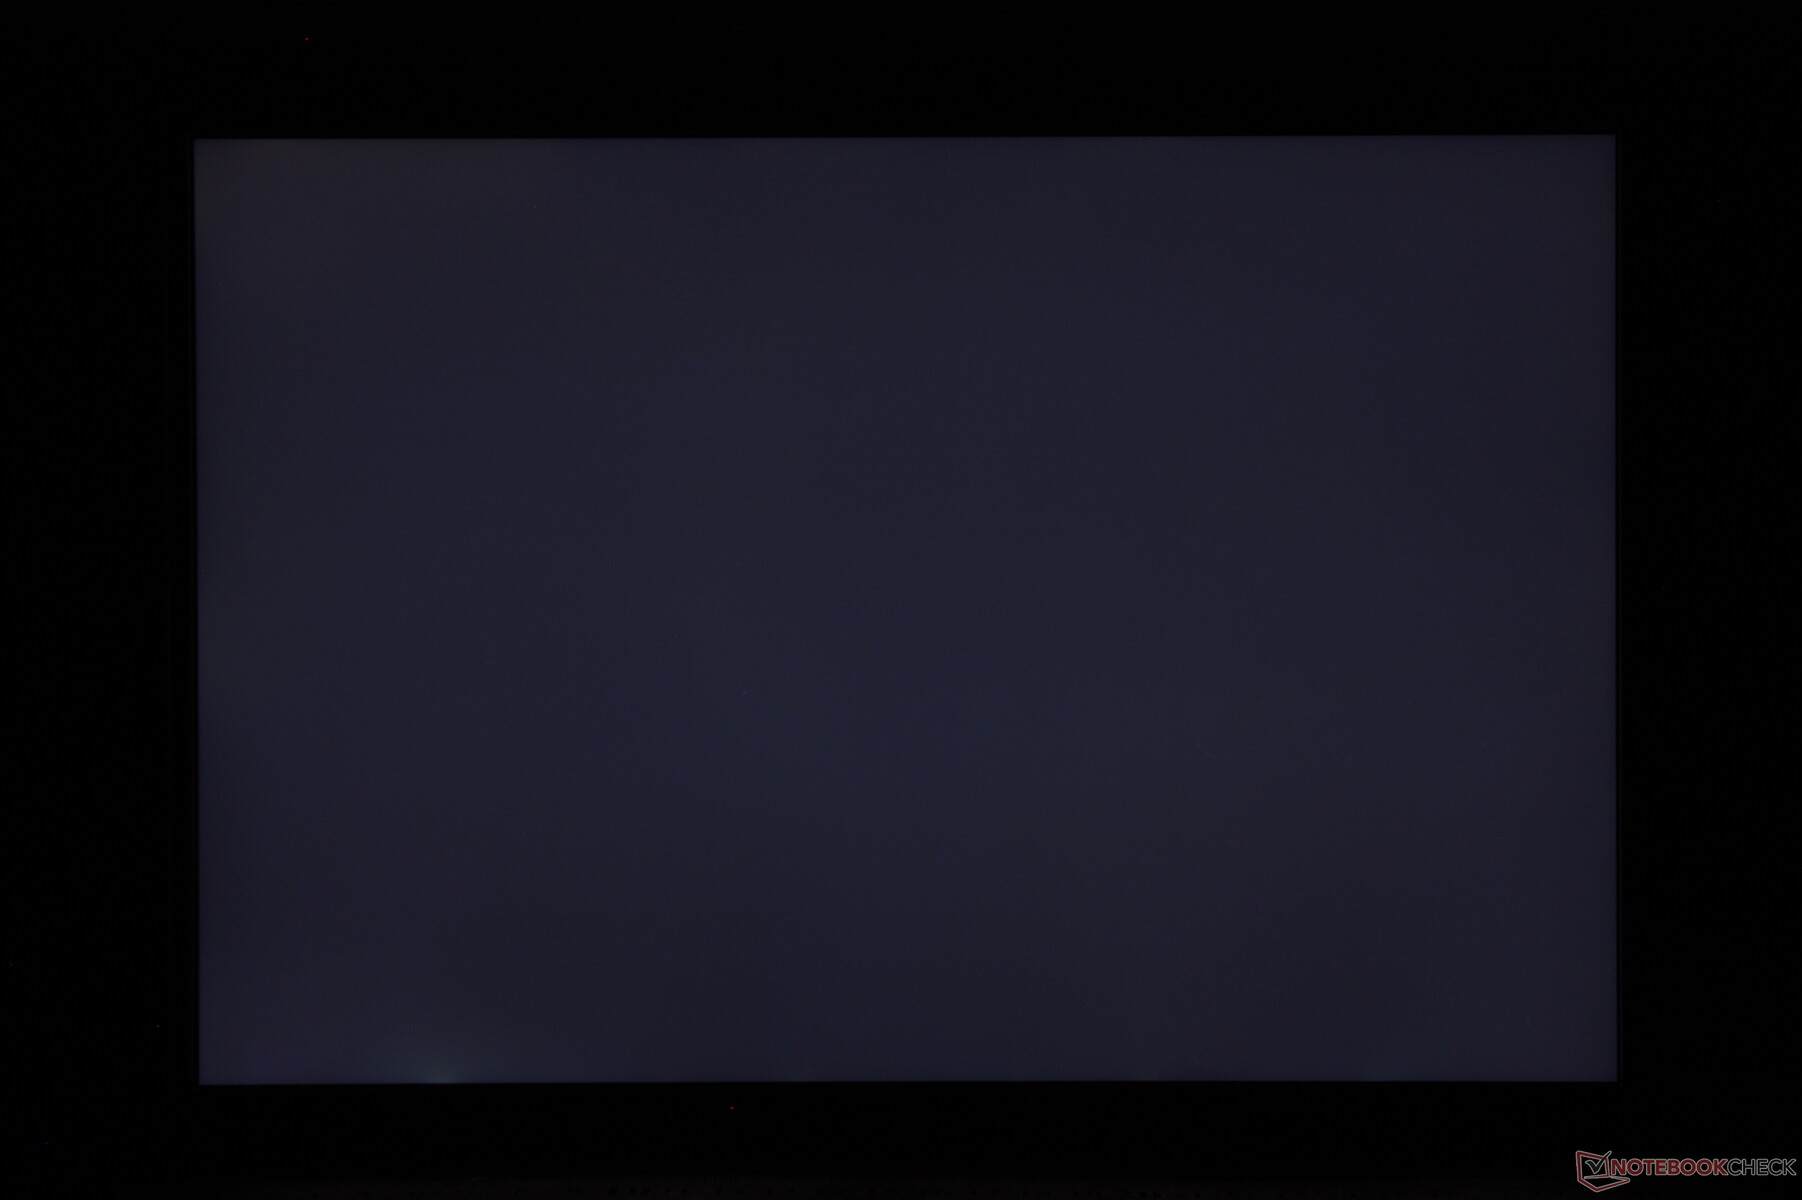
Ausleuchtung: 90 %
Helligkeit Akku: 449.6 cd/m²
Kontrast: 1450:1 (Schwarzwert: 0.31 cd/m²)
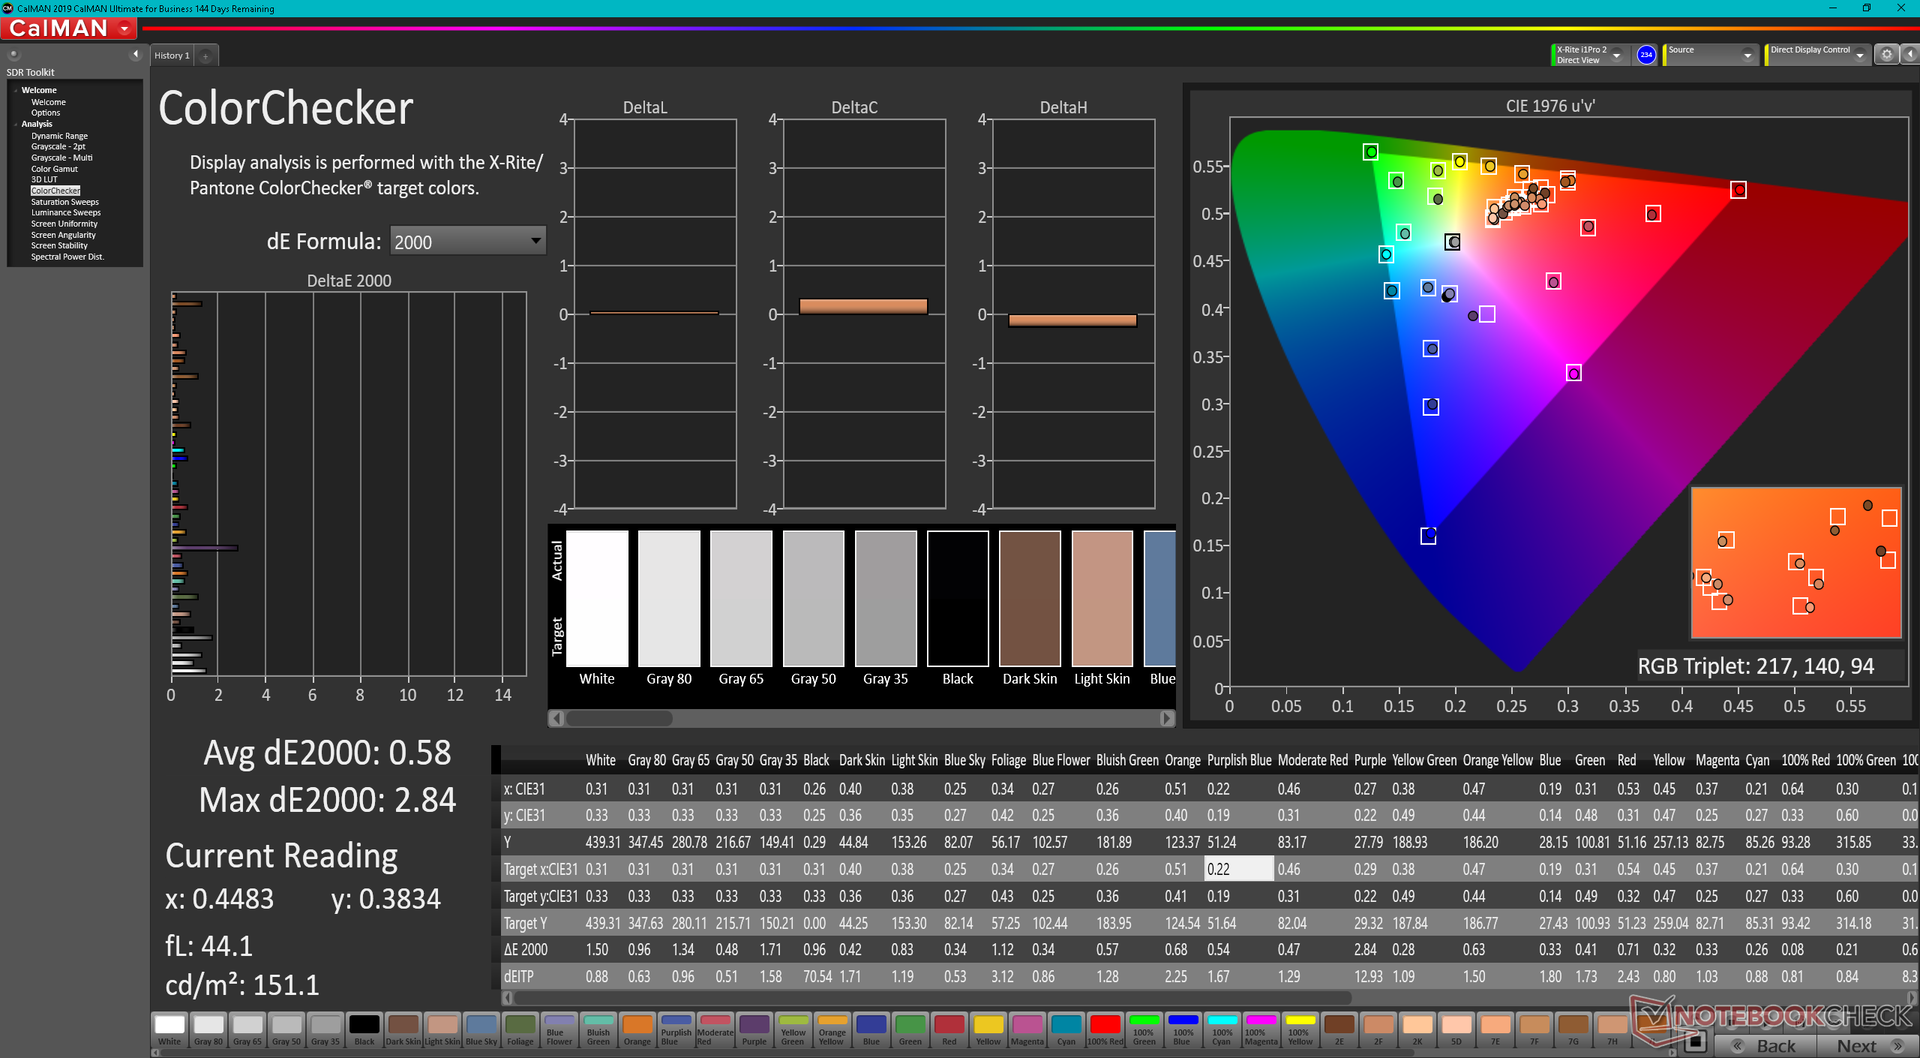
ΔE ColorChecker Calman: 2.76 | ∀{0.5-29.43 Ø4.72}
calibrated: 0.58
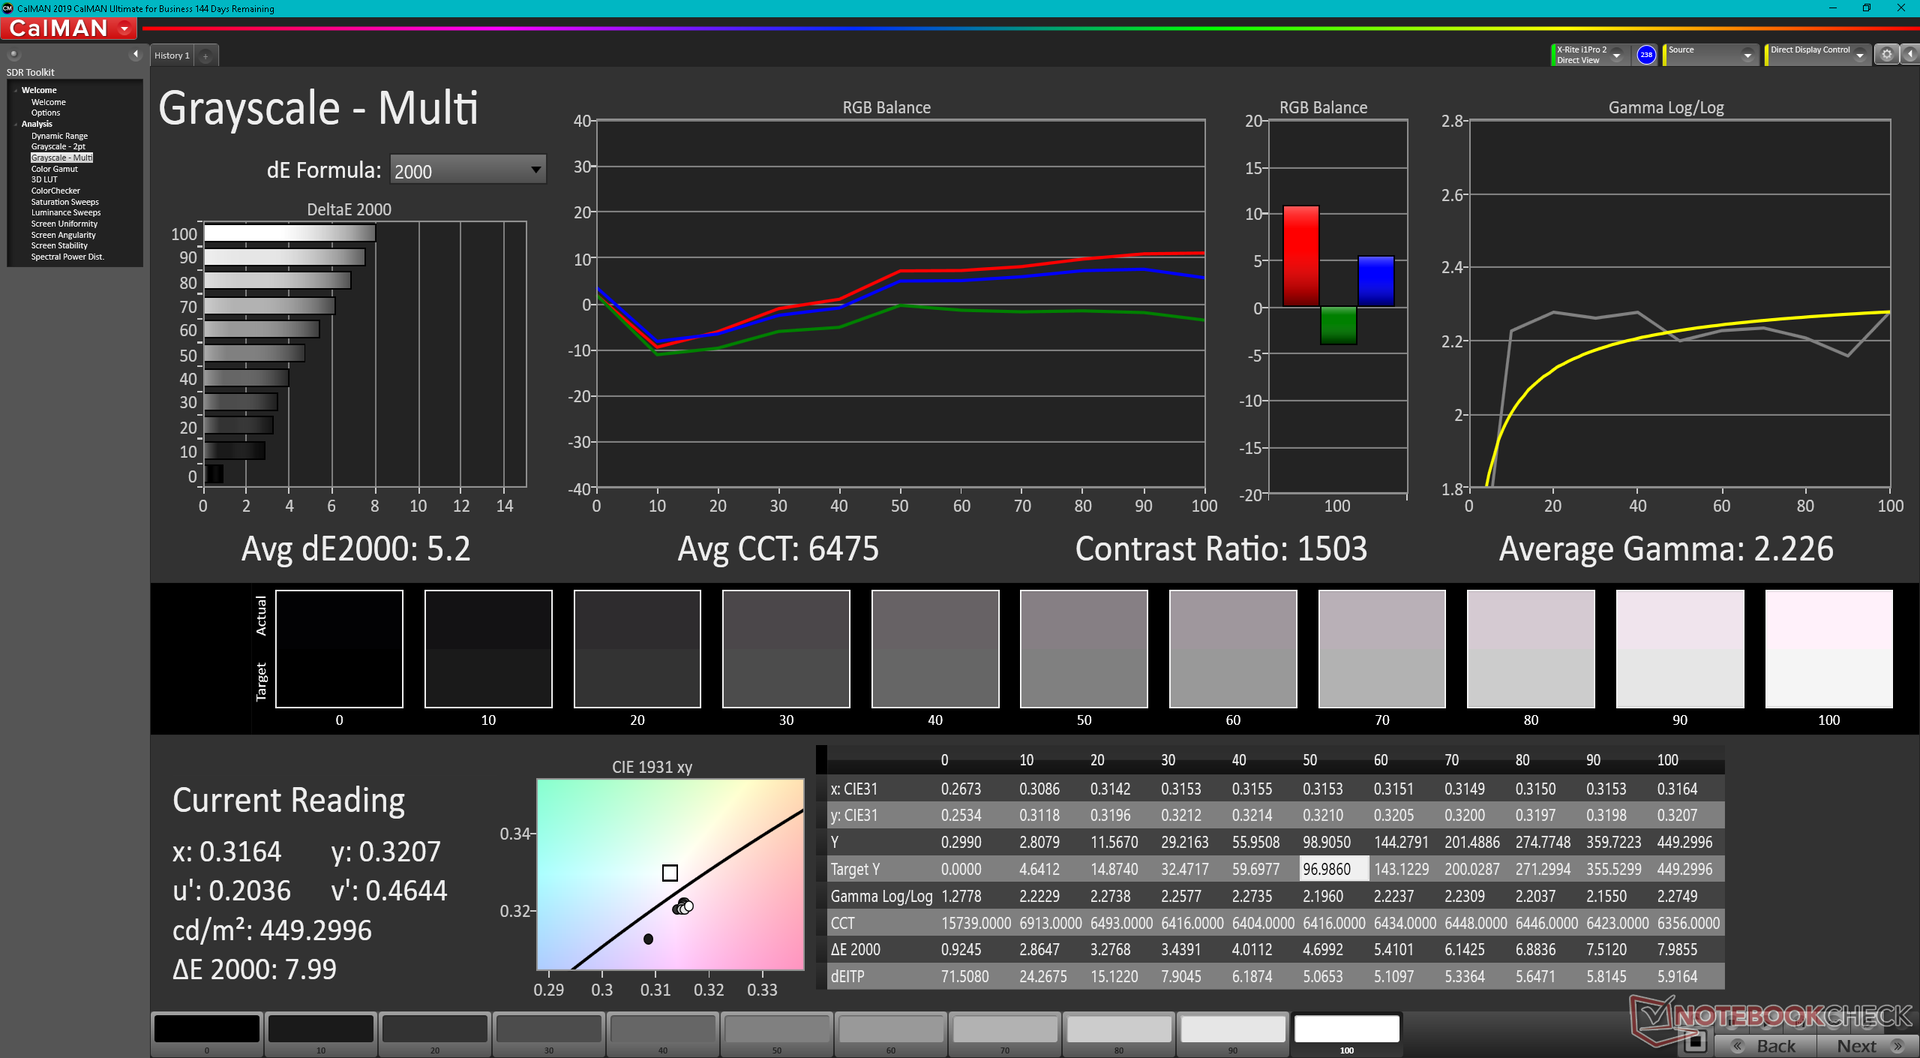
ΔE Greyscale Calman: 5.2 | ∀{0.09-98 Ø4.97}
71.1% AdobeRGB 1998 (Argyll 3D)
99.4% sRGB (Argyll 3D)
69.9% Display P3 (Argyll 3D)
Gamma: 2.23
CCT: 6475 K
| Framework Laptop 13.5 12th Gen Intel BOE CQ NE135FBM-N41, IPS, 2256x1504, 13.5" | Framework Laptop 13.5 BOE CQ NE135FBM-N41, IPS, 2256x1504, 13.5" | Lenovo ThinkPad X1 Titanium Yoga G1 20QB0016GE LPM135M467, IPS LED, 2256x1504, 13.5" | HP EliteBook Folio 13.5-3G2L2EA LGD0663, IPS, 1920x1280, 13.5" | HP Spectre x360 14-ea0378ng Samsung SDC4148, OLED, 3000x2000, 13.5" | Microsoft Surface Laptop 4 13 i7 LQ135P1JX51, IPS, 2256x1504, 13.5" | |
|---|---|---|---|---|---|---|
| Display | -1% | -3% | 26% | -5% | ||
| Display P3 Coverage (%) | 69.9 | 69 -1% | 66.8 -4% | 99.9 43% | 64.7 -7% | |
| sRGB Coverage (%) | 99.4 | 99.3 0% | 98 -1% | 100 1% | 97.2 -2% | |
| AdobeRGB 1998 Coverage (%) | 71.1 | 70.3 -1% | 68.6 -4% | 96.1 35% | 66.9 -6% | |
| Response Times | -46% | -72% | -13% | 94% | -63% | |
| Response Time Grey 50% / Grey 80% * (ms) | 34.7 ? | 55.6 ? -60% | 64 ? -84% | 44 ? -27% | 2 ? 94% | 62.8 ? -81% |
| Response Time Black / White * (ms) | 27.5 ? | 36 ? -31% | 44 ? -60% | 27 ? 2% | 2 ? 93% | 39.8 ? -45% |
| PWM Frequency (Hz) | 250 ? | 21930 ? | ||||
| Bildschirm | -8% | 14% | -9% | 259% | 3% | |
| Helligkeit Bildmitte (cd/m²) | 449.6 | 449 0% | 465 3% | 250 -44% | 370 -18% | 413 -8% |
| Brightness (cd/m²) | 431 | 435 1% | 451 5% | 226 -48% | 374 -13% | 400 -7% |
| Brightness Distribution (%) | 90 | 93 3% | 92 2% | 82 -9% | 90 0% | 94 4% |
| Schwarzwert * (cd/m²) | 0.31 | 0.39 -26% | 0.28 10% | 0.215 31% | 0.01 97% | 0.29 6% |
| Kontrast (:1) | 1450 | 1151 -21% | 1661 15% | 1163 -20% | 37000 2452% | 1424 -2% |
| Delta E Colorchecker * | 2.76 | 2.34 15% | 2 28% | 3.59 -30% | 2.57 7% | 2.8 -1% |
| Colorchecker dE 2000 max. * | 7.96 | 7.07 11% | 4.7 41% | 5.9 26% | 4.52 43% | 7.2 10% |
| Colorchecker dE 2000 calibrated * | 0.58 | 0.96 -66% | 0.7 -21% | 2.31 -298% | 0.8 -38% | |
| Delta E Graustufen * | 5.2 | 4.7 10% | 2.9 44% | 3.99 23% | 2.2 58% | 1.9 63% |
| Gamma | 2.23 99% | 2.29 96% | 2.09 105% | 2.98 74% | 2.36 93% | 2.12 104% |
| CCT | 6475 100% | 6760 96% | 6181 105% | 6765 96% | 6154 106% | 6510 100% |
| Farbraum (Prozent von AdobeRGB 1998) (%) | 85.8 | 61.6 | ||||
| Color Space (Percent of sRGB) (%) | 100 | 97.2 | ||||
| Durchschnitt gesamt (Programm / Settings) | -18% /
-12% | -20% /
-2% | -11% /
-10% | 126% /
185% | -22% /
-8% |
* ... kleinere Werte sind besser
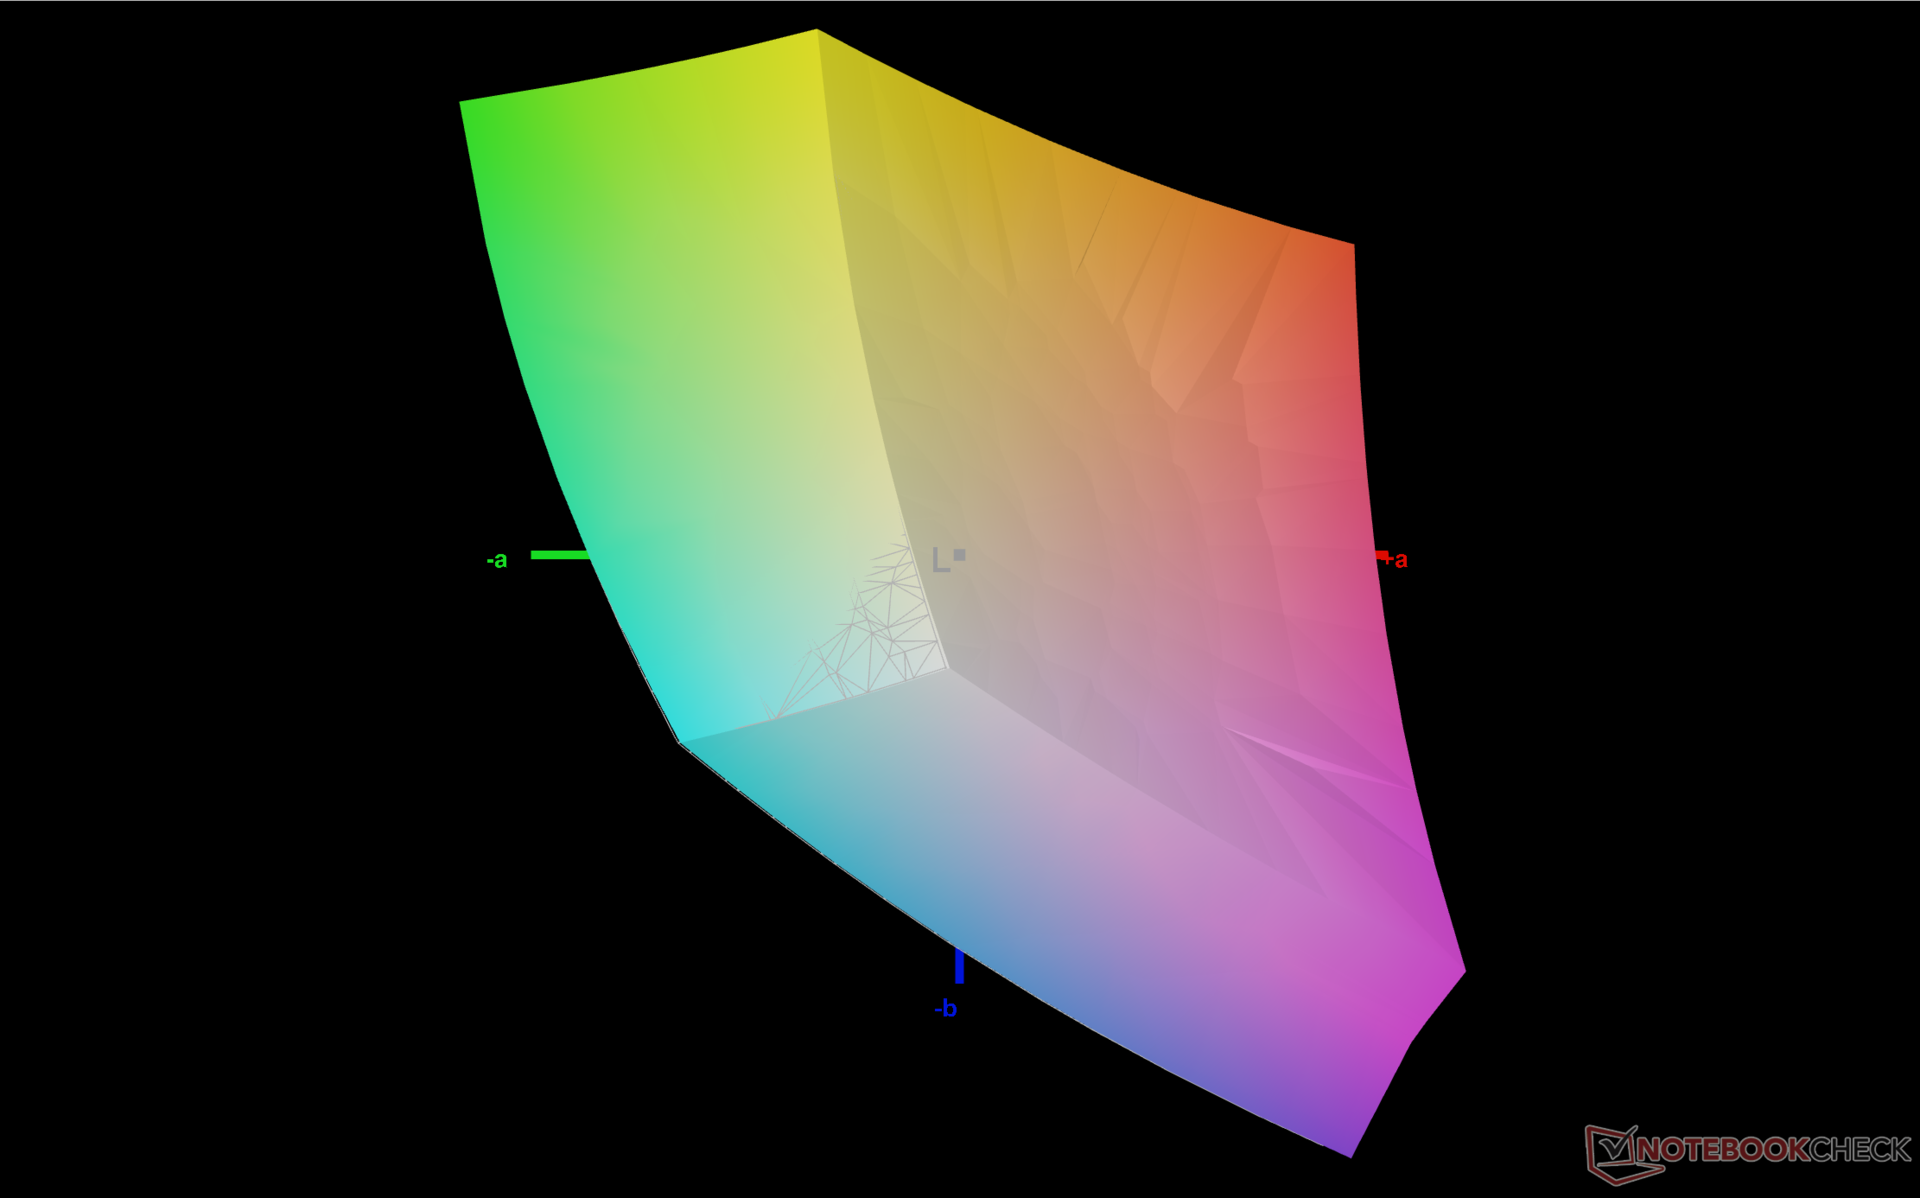
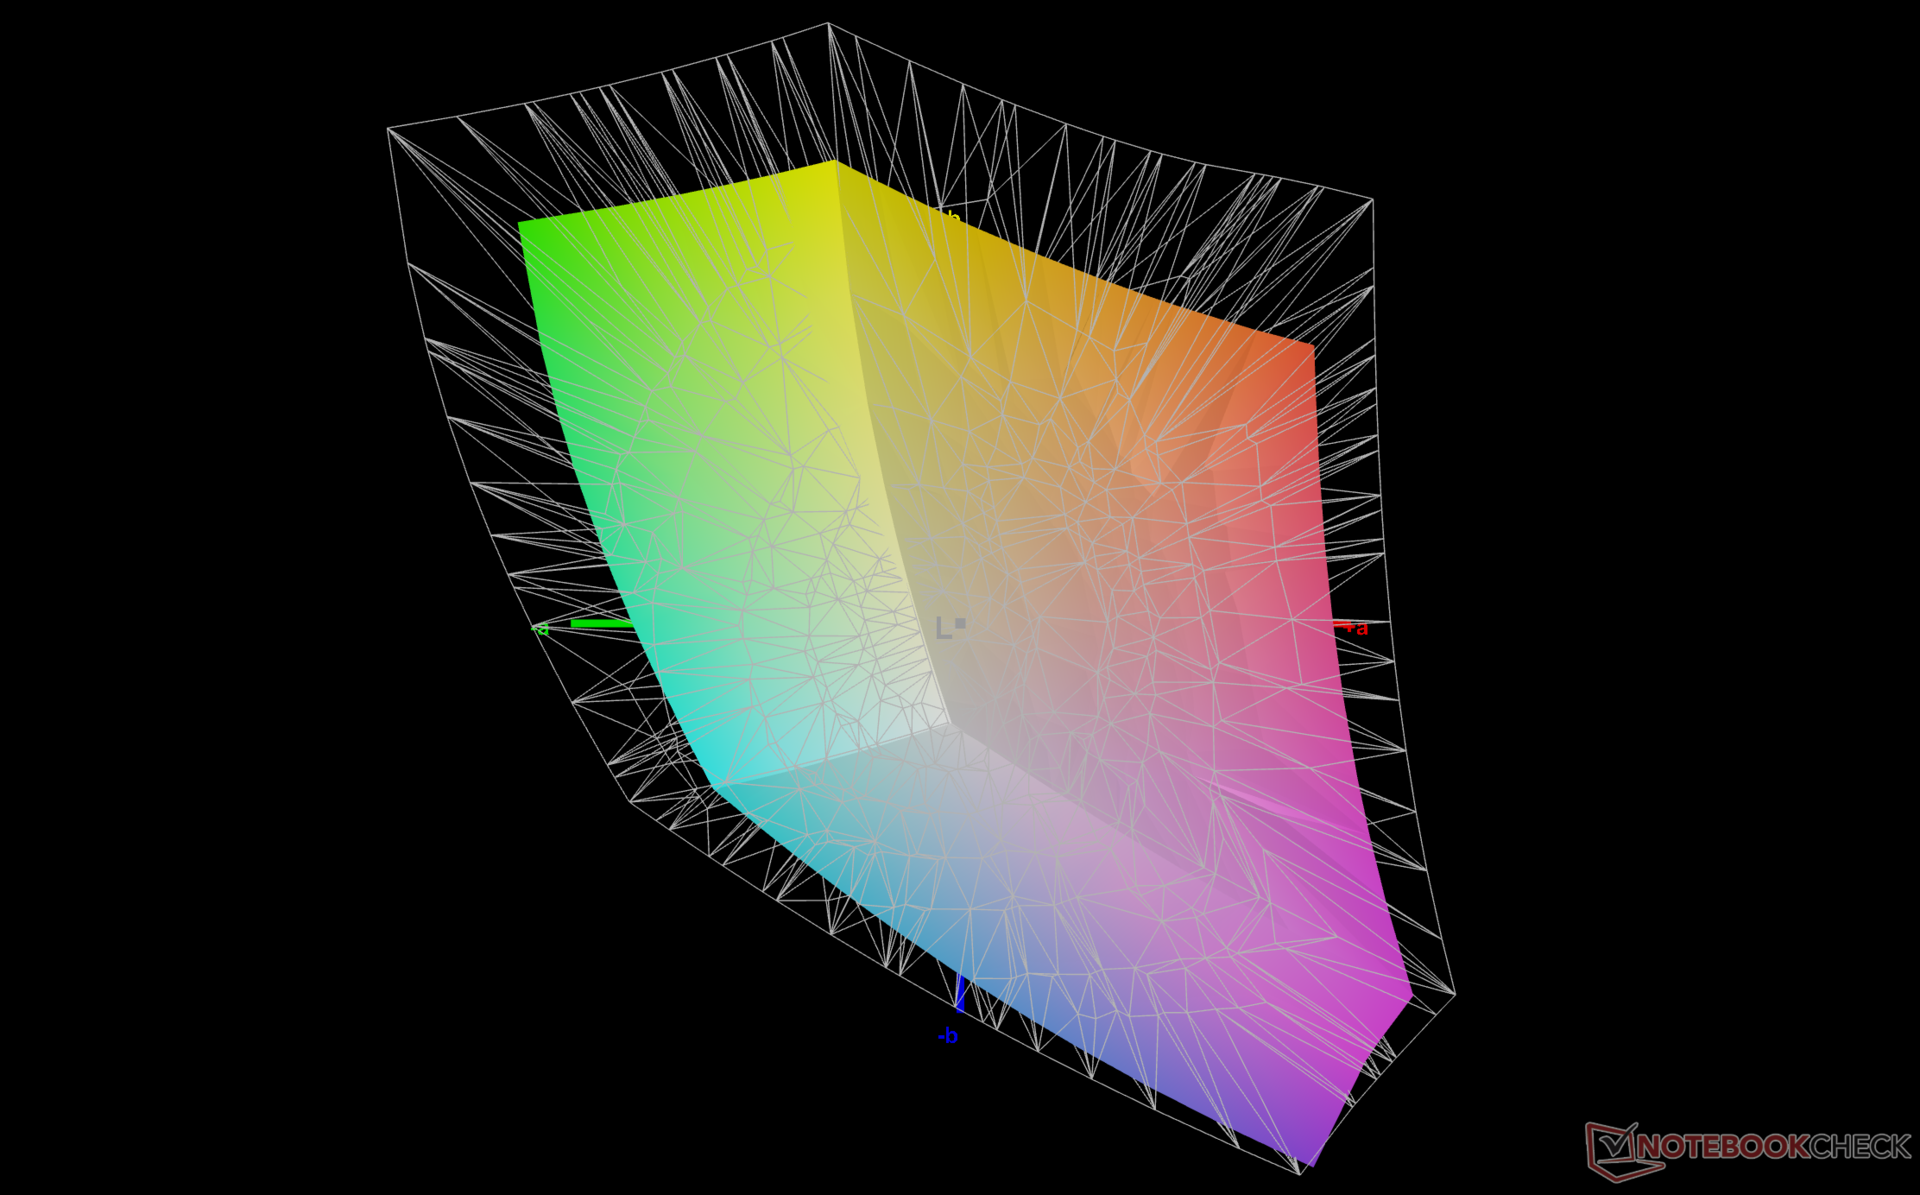
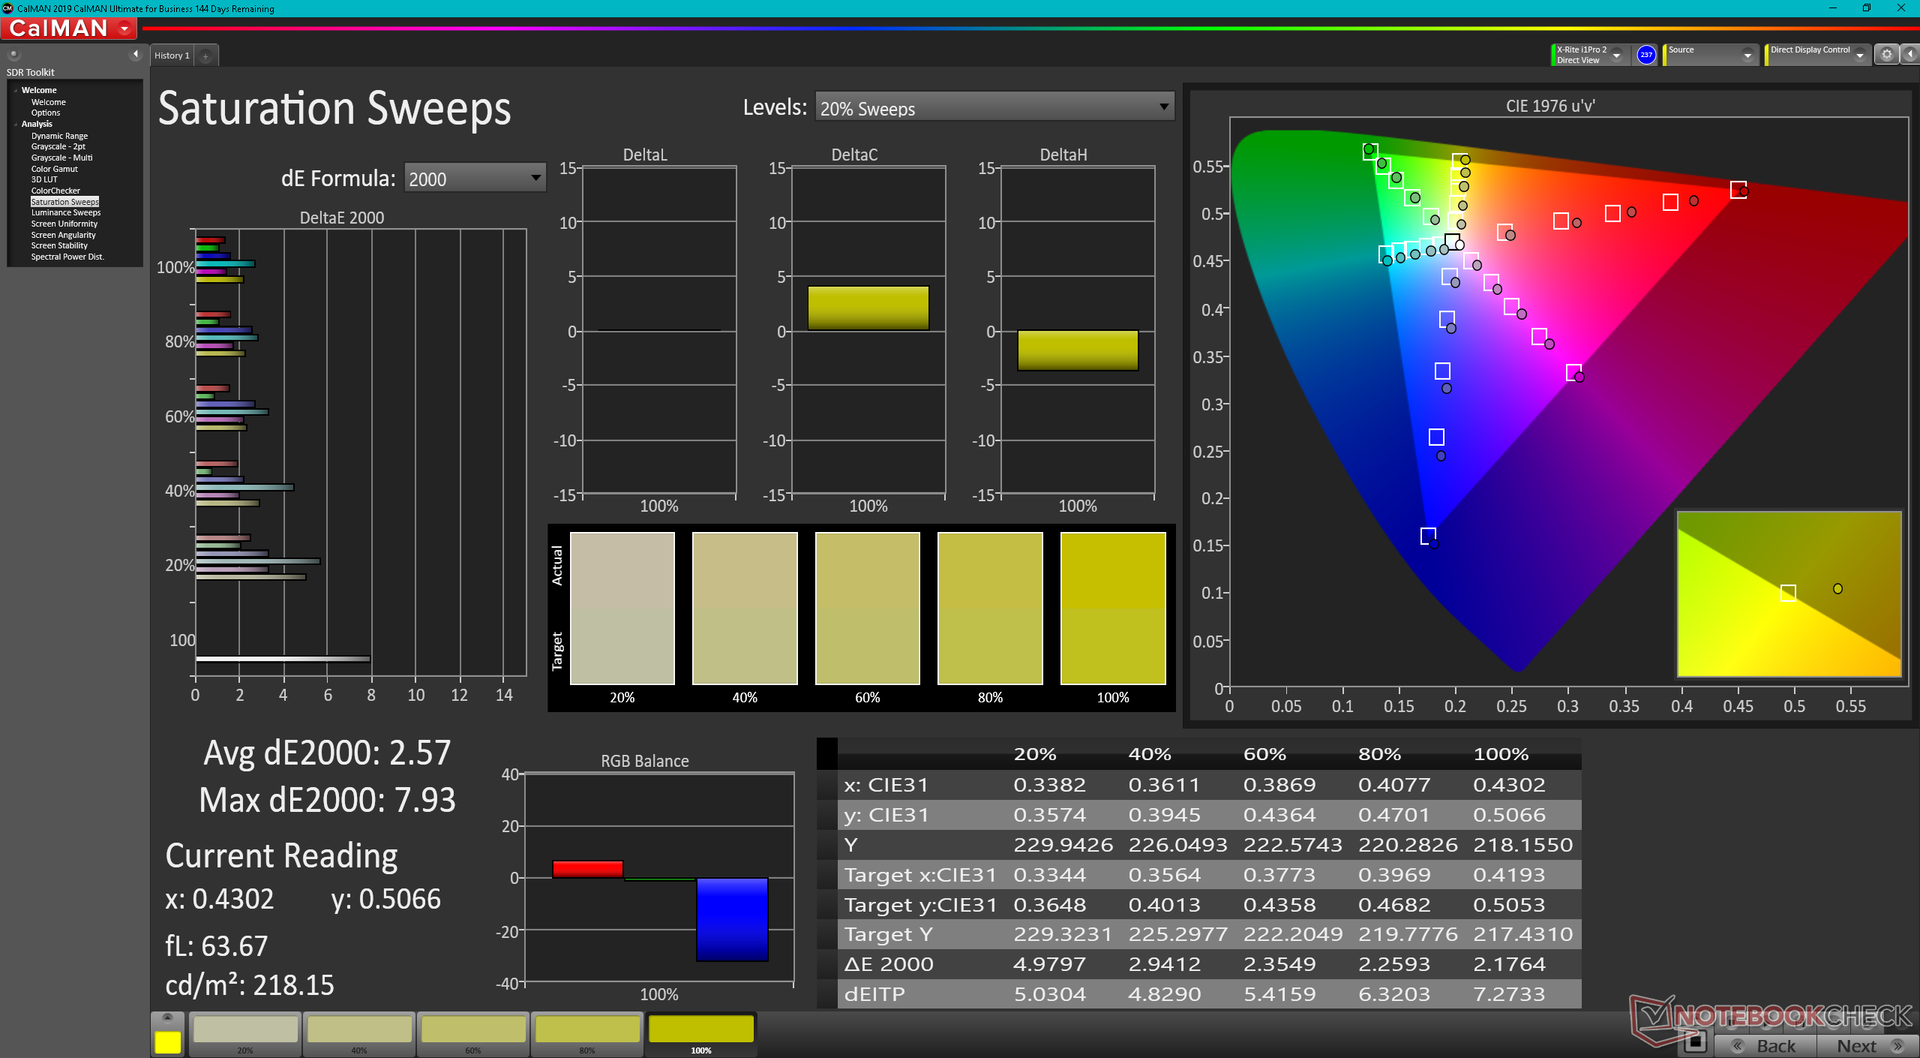
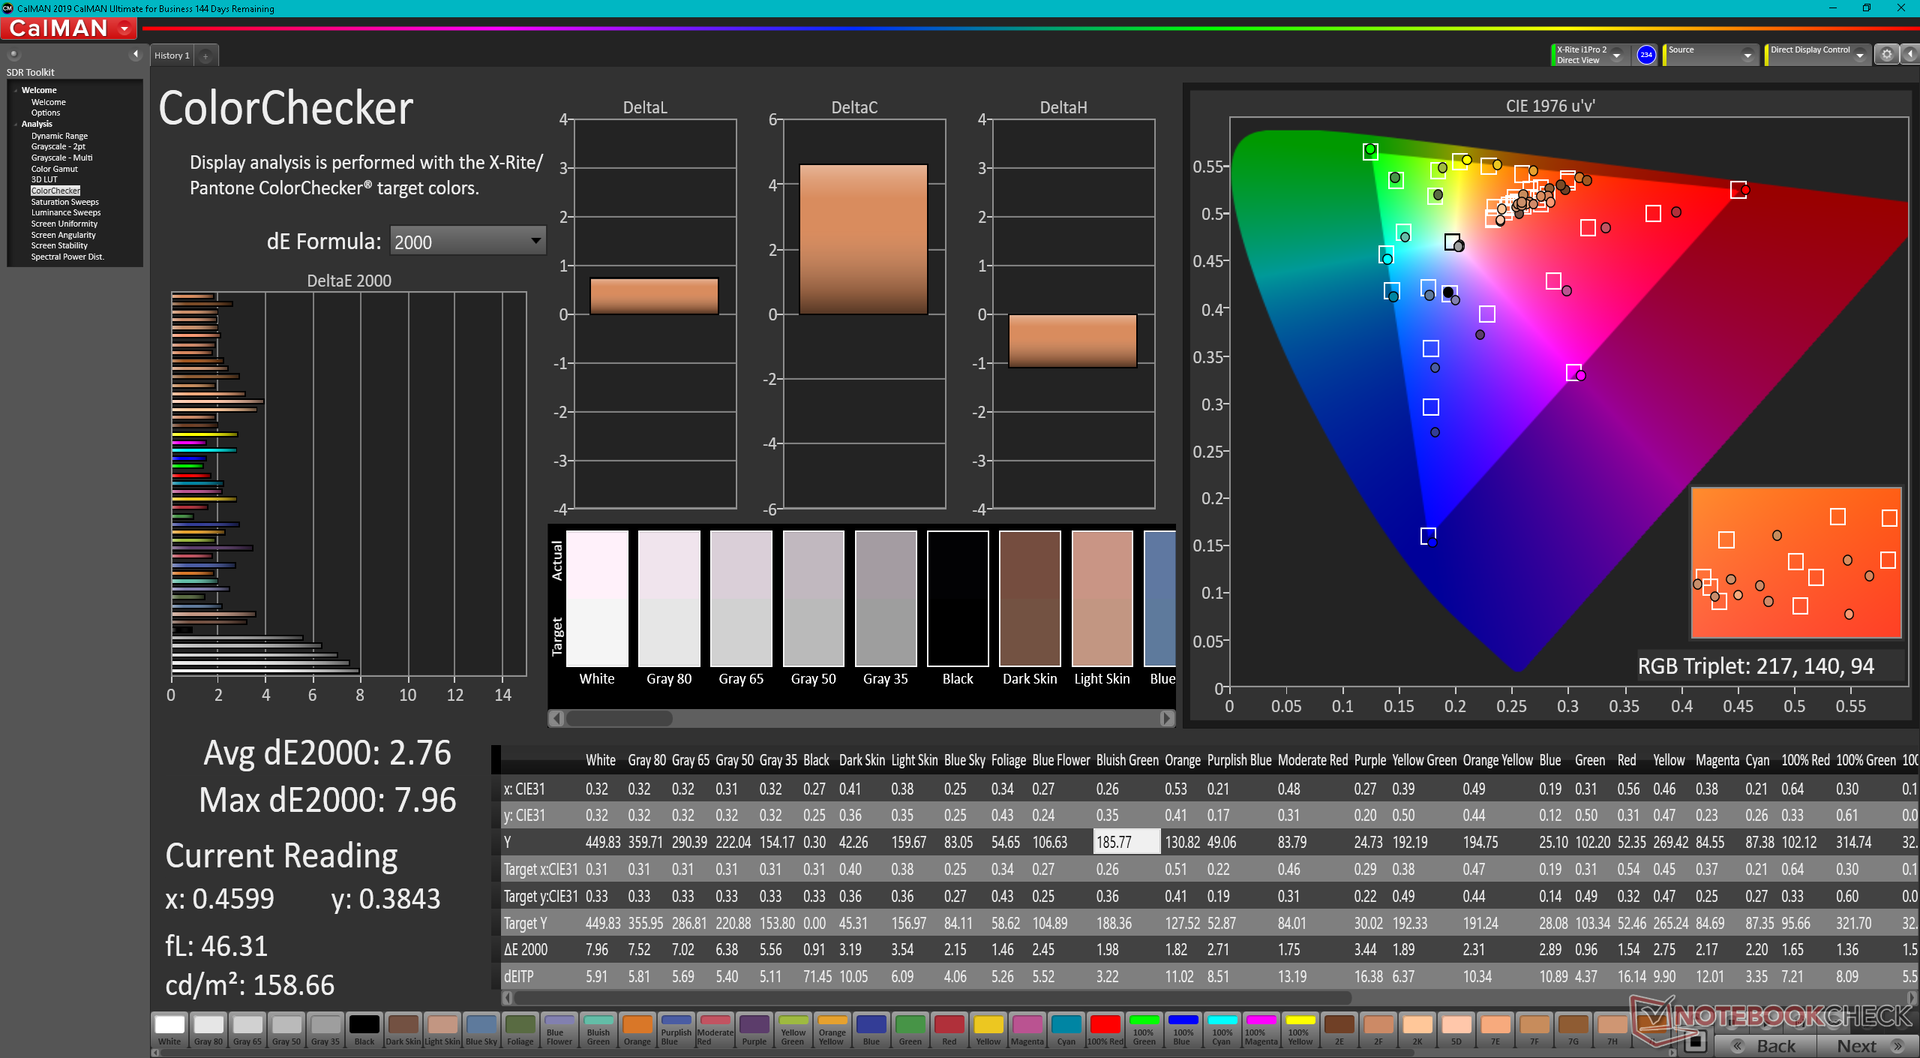
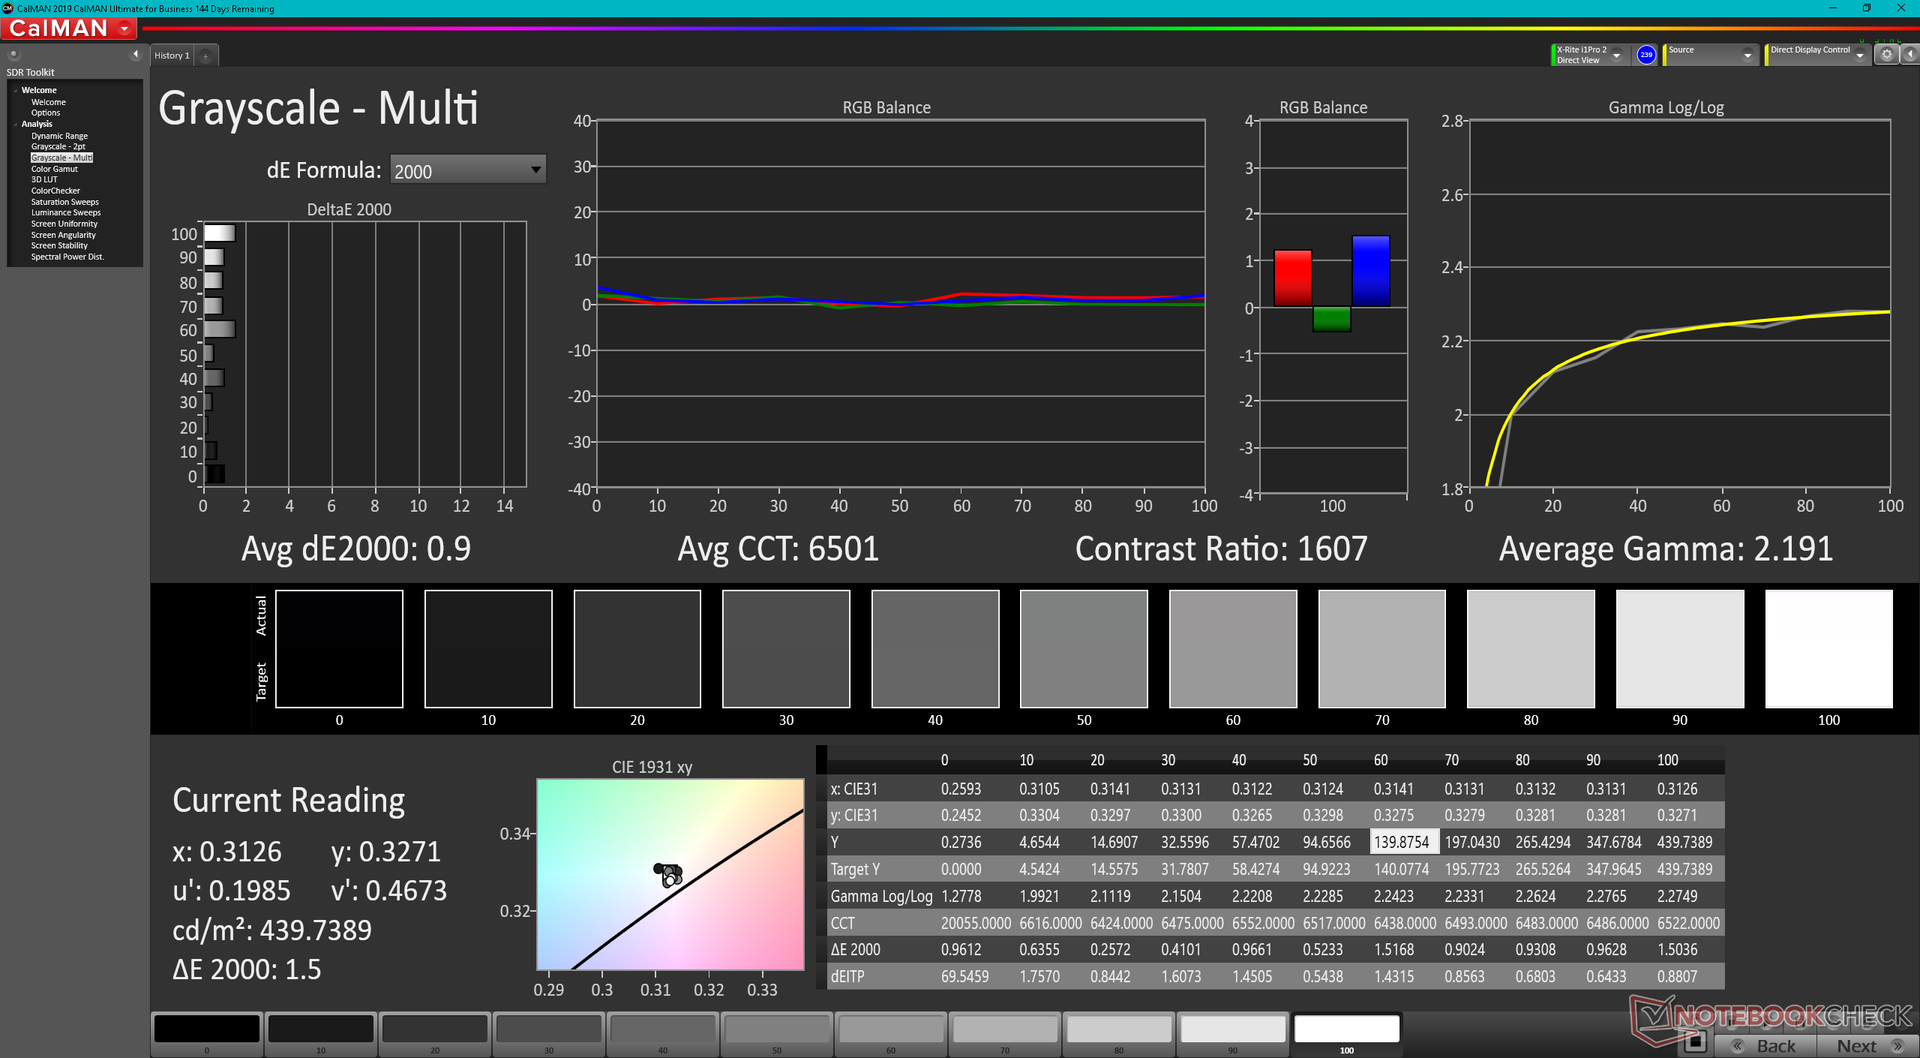
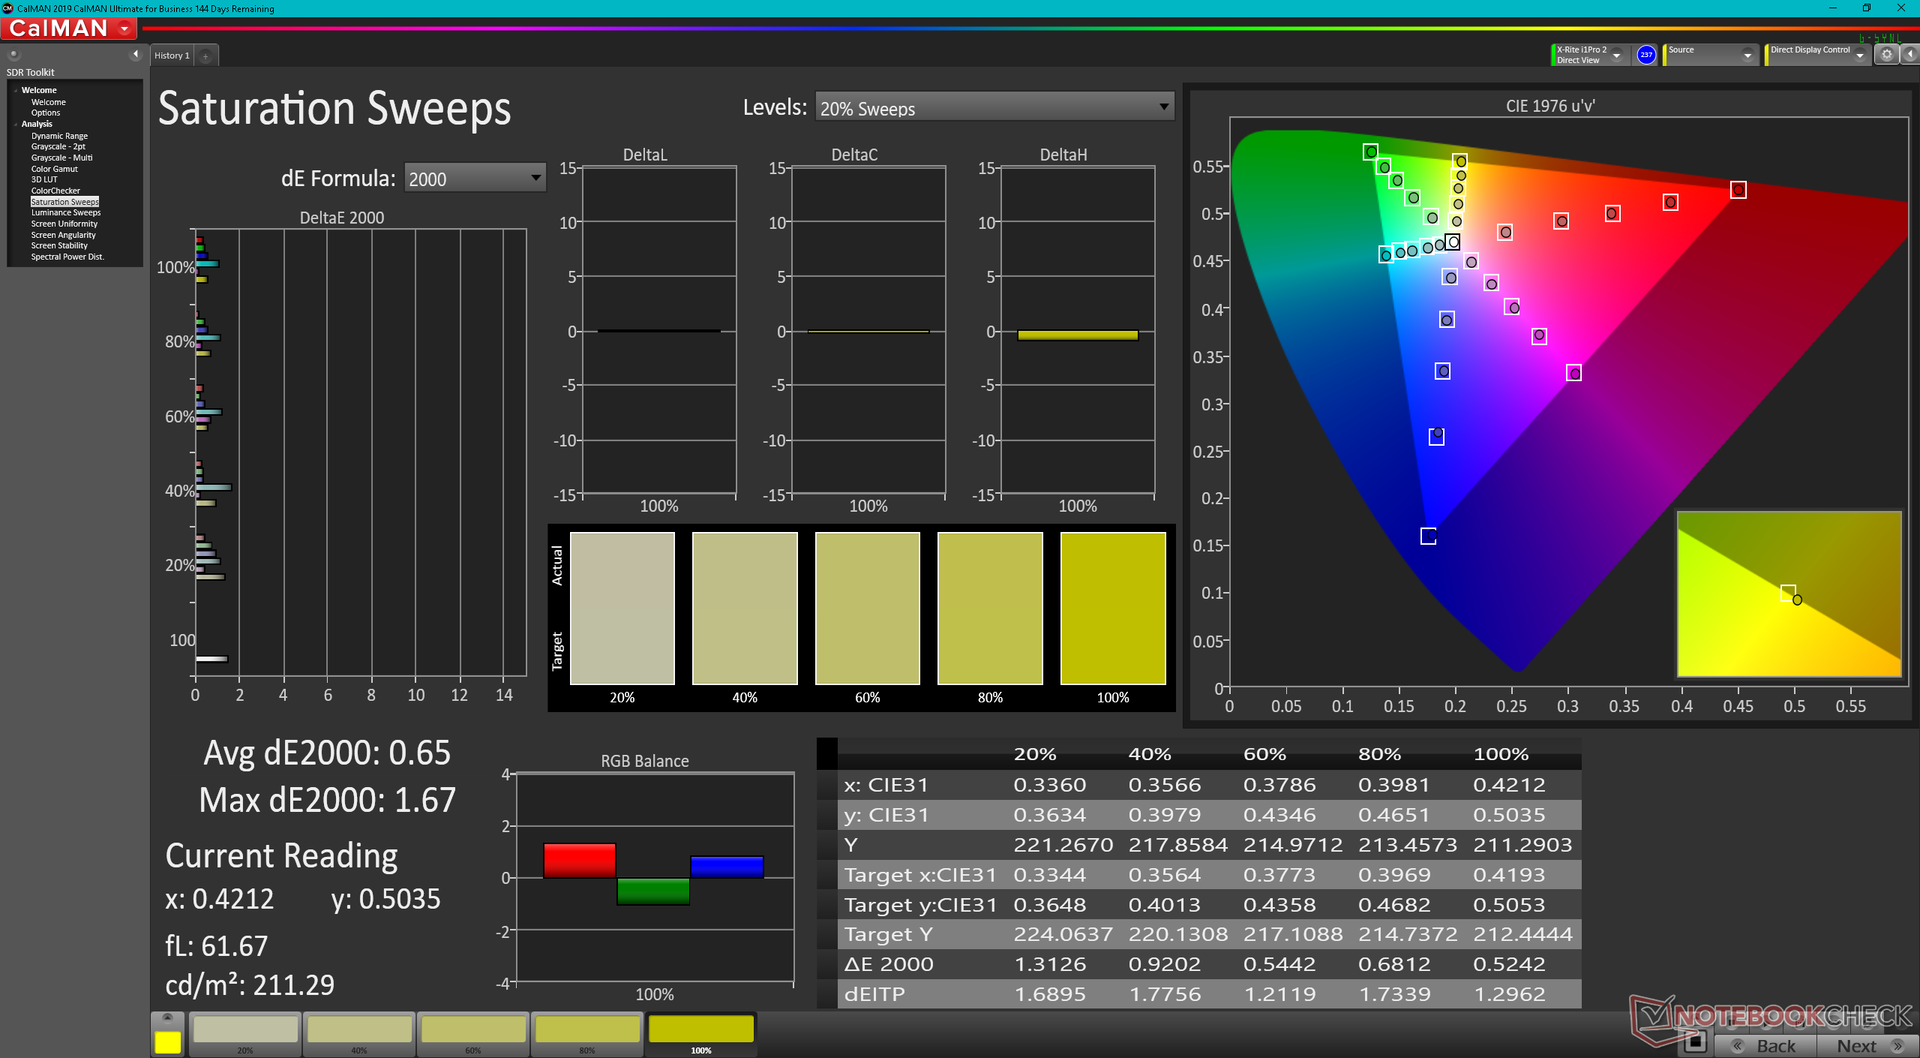
Der Hersteller kalibriert seinen Framework Laptop nicht im Werk, was schade ist, da das Panel eine vollständige sRGB-Abdeckung bietet. Die durchschnittlichen Graustufen- und Farb-DeltaE-Werte liegen bei unserem Testgerät bei 5,2 bzw. 2,76, verglichen mit nur 0,9 bzw. 0,58, nachdem wir das Panel selbst kalibriert haben. Vor allem die Farbtemperatur ist ohne richtige Kalibrierung viel zu warm. Wir empfehlen die Anwendung unseres ICM-Profils (siehe oben), um das Beste aus dem Display herauszuholen.
Reaktionszeiten (Response Times) des Displays
| ↔ Reaktionszeiten Schwarz zu Weiß | ||
|---|---|---|
| 27.5 ms ... steigend ↗ und fallend ↘ kombiniert | ↗ 14.8 ms steigend |  |
| ↘ 12.7 ms fallend | ||
| Die gemessenen Reaktionszeiten sind mittelmäßig und dadurch für Spieler eventuell zu langsam. Im Vergleich rangierten die bei uns getesteten Geräte von 0.1 (Minimum) zu 240 (Maximum) ms. » 70 % aller Screens waren schneller als der getestete. Daher sind die gemessenen Reaktionszeiten schlechter als der Durchschnitt aller vermessenen Geräte (19.8 ms). | ||
| ↔ Reaktionszeiten 50% Grau zu 80% Grau | ||
| 34.7 ms ... steigend ↗ und fallend ↘ kombiniert | ↗ 17.7 ms steigend | 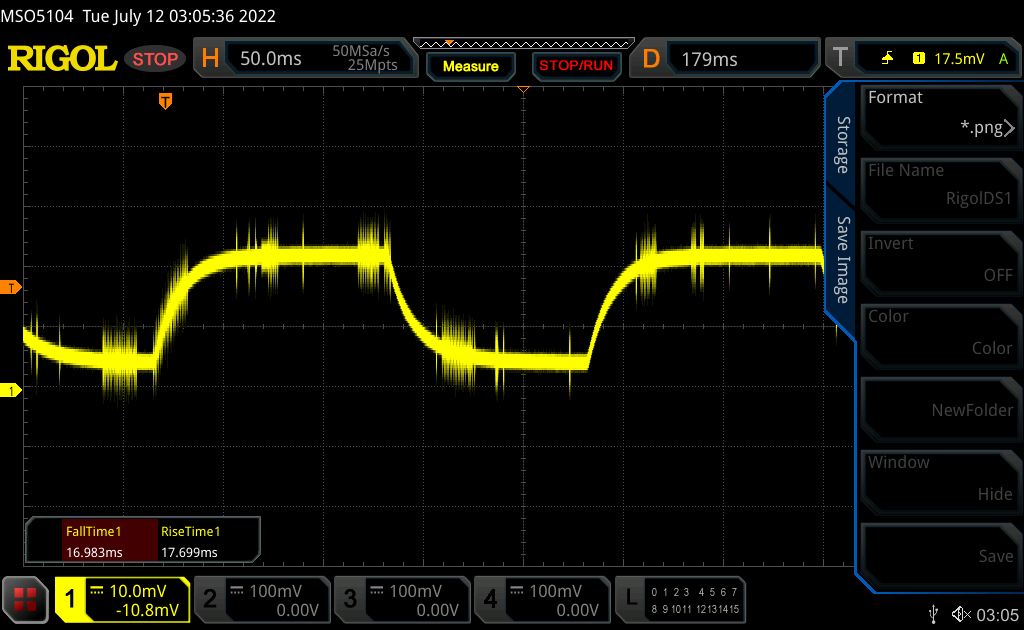 |
| ↘ 17 ms fallend | ||
| Die gemessenen Reaktionszeiten sind langsam und dadurch für viele Spieler wahrscheinlich zu langsam. Im Vergleich rangierten die bei uns getesteten Geräte von 0.165 (Minimum) zu 636 (Maximum) ms. » 48 % aller Screens waren schneller als der getestete. Daher sind die gemessenen Reaktionszeiten schlechter als der Durchschnitt aller vermessenen Geräte (31 ms). | ||
Bildschirm-Flackern / PWM (Pulse-Width Modulation)
| Flackern / PWM nicht festgestellt | 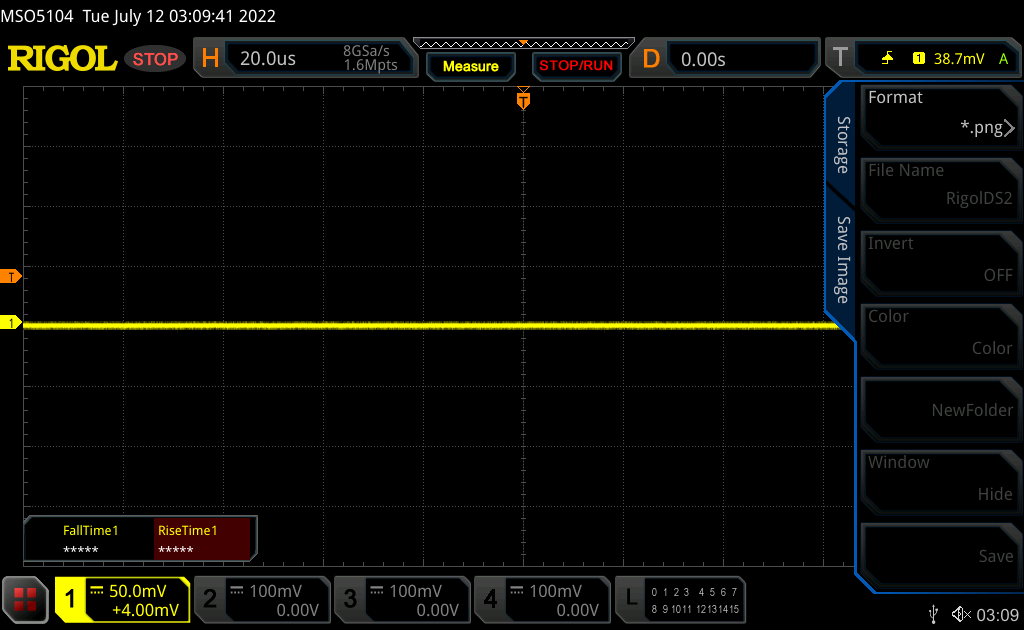 | ||
Im Vergleich: 52 % aller getesteten Geräte nutzten kein PWM um die Helligkeit zu reduzieren. Wenn PWM eingesetzt wurde, dann bei einer Frequenz von durchschnittlich 7781 (Minimum 5, Maximum 343500) Hz. | |||


Performance

Testbedingungen
Wir haben unser Gerät über Windows in den Performance-Modus versetzt, bevor wir die folgenden Leistungs-Benchmarks durchgeführt haben.
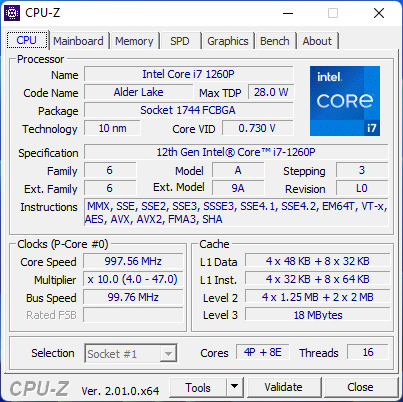
Prozessor
Im Vergleich zum Core i7-1165G7 im originalen Framework Laptop, hat der Core i7-1260P im Framework Modell 2022 eine um 20 bzw. 90 % schnellere Single-Thread- und Multi-Thread-Leistung. Tatsächlich läuft das aktuelle Framework Modell 20 bis 25 Prozent schneller als der durchschnittliche Laptop in unserer Datenbank, der bisher mit der gleichen Core i7-1260P-CPU läuft. Wir sind froh, dass der Hersteller CPUs der 12. Generation der P-Serie anbietet anstatt der 12. Generation der U-Serie, da etwa der Core i5-1235U und i7-1255U deutlich geringere Leistungsvorteile als die U-Serie der 11. Generation bieten.
Ein Downgrade auf die Option Core i5-1240P von unserem Core i7-1260P bringt voraussichtlich ein 45-prozentiges Multi-Thread-Leistungsdefizit mit sich, während ein Upgrade auf den Core i7-1280P die Leistung nur um etwa 10 Prozent steigern würde. Daher ist die Core i7-1260P SKU die empfehlenswerteste Option.
Cinebench R15 Multi Loop
Cinebench R23: Multi Core | Single Core
Cinebench R15: CPU Multi 64Bit | CPU Single 64Bit
Blender: v2.79 BMW27 CPU
7-Zip 18.03: 7z b 4 | 7z b 4 -mmt1
Geekbench 5.5: Multi-Core | Single-Core
HWBOT x265 Benchmark v2.2: 4k Preset
LibreOffice : 20 Documents To PDF
R Benchmark 2.5: Overall mean
| Geekbench 5.5 / Multi-Core | |
| Framework Laptop 13.5 12th Gen Intel | |
| Durchschnittliche Intel Core i7-1260P (3866 - 10570, n=25) | |
| Asus Zenbook S 13 OLED | |
| Dell Inspiron 14 7420 2-in-1 | |
| Dell Inspiron 13 7306-6TYH5 | |
| Gateway Ultra Slim 14.1 GWTC51427 | |
| MSI Summit E13 Flip Evo A11MT | |
| Samsung Galaxy Book2 Pro 13 NP930XED-KA1DE | |
| HP Envy 13-ba0001ng | |
| Geekbench 5.5 / Single-Core | |
| Framework Laptop 13.5 12th Gen Intel | |
| Durchschnittliche Intel Core i7-1260P (1436 - 1786, n=25) | |
| Dell Inspiron 14 7420 2-in-1 | |
| Dell Inspiron 13 7306-6TYH5 | |
| Asus Zenbook S 13 OLED | |
| MSI Summit E13 Flip Evo A11MT | |
| Gateway Ultra Slim 14.1 GWTC51427 | |
| HP Envy 13-ba0001ng | |
| Samsung Galaxy Book2 Pro 13 NP930XED-KA1DE | |
Cinebench R23: Multi Core | Single Core
Cinebench R15: CPU Multi 64Bit | CPU Single 64Bit
Blender: v2.79 BMW27 CPU
7-Zip 18.03: 7z b 4 | 7z b 4 -mmt1
Geekbench 5.5: Multi-Core | Single-Core
HWBOT x265 Benchmark v2.2: 4k Preset
LibreOffice : 20 Documents To PDF
R Benchmark 2.5: Overall mean
* ... kleinere Werte sind besser
AIDA64: FP32 Ray-Trace | FPU Julia | CPU SHA3 | CPU Queen | FPU SinJulia | FPU Mandel | CPU AES | CPU ZLib | FP64 Ray-Trace | CPU PhotoWorxx
| Performance Rating | |
| Microsoft Surface Laptop 4 13 Ryzen 5 | |
| Framework Laptop 13.5 12th Gen Intel | |
| Durchschnittliche Intel Core i7-1260P | |
| Framework Laptop 13.5 | |
| HP Spectre x360 14-ea0378ng | |
| Lenovo ThinkPad X1 Titanium Yoga G1 20QB0016GE | |
| AIDA64 / FP32 Ray-Trace | |
| Microsoft Surface Laptop 4 13 Ryzen 5 | |
| Framework Laptop 13.5 | |
| Durchschnittliche Intel Core i7-1260P (2176 - 10898, n=26) | |
| Framework Laptop 13.5 12th Gen Intel | |
| HP Spectre x360 14-ea0378ng | |
| Lenovo ThinkPad X1 Titanium Yoga G1 20QB0016GE | |
| AIDA64 / FPU Julia | |
| Microsoft Surface Laptop 4 13 Ryzen 5 | |
| Durchschnittliche Intel Core i7-1260P (11015 - 56906, n=26) | |
| Framework Laptop 13.5 | |
| Framework Laptop 13.5 12th Gen Intel | |
| Lenovo ThinkPad X1 Titanium Yoga G1 20QB0016GE | |
| HP Spectre x360 14-ea0378ng | |
| AIDA64 / CPU SHA3 | |
| Framework Laptop 13.5 | |
| Framework Laptop 13.5 12th Gen Intel | |
| Durchschnittliche Intel Core i7-1260P (669 - 2709, n=26) | |
| Microsoft Surface Laptop 4 13 Ryzen 5 | |
| Lenovo ThinkPad X1 Titanium Yoga G1 20QB0016GE | |
| HP Spectre x360 14-ea0378ng | |
| AIDA64 / CPU Queen | |
| Framework Laptop 13.5 12th Gen Intel | |
| Durchschnittliche Intel Core i7-1260P (42571 - 82493, n=26) | |
| Microsoft Surface Laptop 4 13 Ryzen 5 | |
| HP Spectre x360 14-ea0378ng | |
| Framework Laptop 13.5 | |
| Lenovo ThinkPad X1 Titanium Yoga G1 20QB0016GE | |
| AIDA64 / FPU SinJulia | |
| Microsoft Surface Laptop 4 13 Ryzen 5 | |
| Framework Laptop 13.5 12th Gen Intel | |
| Durchschnittliche Intel Core i7-1260P (2901 - 6975, n=26) | |
| Framework Laptop 13.5 | |
| HP Spectre x360 14-ea0378ng | |
| Lenovo ThinkPad X1 Titanium Yoga G1 20QB0016GE | |
| AIDA64 / FPU Mandel | |
| Microsoft Surface Laptop 4 13 Ryzen 5 | |
| Framework Laptop 13.5 | |
| Durchschnittliche Intel Core i7-1260P (5950 - 26376, n=26) | |
| Framework Laptop 13.5 12th Gen Intel | |
| HP Spectre x360 14-ea0378ng | |
| Lenovo ThinkPad X1 Titanium Yoga G1 20QB0016GE | |
| AIDA64 / CPU AES | |
| Framework Laptop 13.5 | |
| Framework Laptop 13.5 12th Gen Intel | |
| Lenovo ThinkPad X1 Titanium Yoga G1 20QB0016GE | |
| HP Spectre x360 14-ea0378ng | |
| Durchschnittliche Intel Core i7-1260P (16041 - 92356, n=26) | |
| Microsoft Surface Laptop 4 13 Ryzen 5 | |
| AIDA64 / CPU ZLib | |
| Framework Laptop 13.5 12th Gen Intel | |
| Durchschnittliche Intel Core i7-1260P (259 - 771, n=26) | |
| Microsoft Surface Laptop 4 13 Ryzen 5 | |
| Framework Laptop 13.5 | |
| HP Spectre x360 14-ea0378ng | |
| Lenovo ThinkPad X1 Titanium Yoga G1 20QB0016GE | |
| AIDA64 / FP64 Ray-Trace | |
| Microsoft Surface Laptop 4 13 Ryzen 5 | |
| Framework Laptop 13.5 | |
| Durchschnittliche Intel Core i7-1260P (1237 - 5858, n=26) | |
| Framework Laptop 13.5 12th Gen Intel | |
| HP Spectre x360 14-ea0378ng | |
| Lenovo ThinkPad X1 Titanium Yoga G1 20QB0016GE | |
| AIDA64 / CPU PhotoWorxx | |
| HP Spectre x360 14-ea0378ng | |
| Lenovo ThinkPad X1 Titanium Yoga G1 20QB0016GE | |
| Durchschnittliche Intel Core i7-1260P (13261 - 43652, n=26) | |
| Framework Laptop 13.5 12th Gen Intel | |
| Microsoft Surface Laptop 4 13 Ryzen 5 | |
| Framework Laptop 13.5 | |
System Performance
Die Ergebnisse des PCMark 10 sind durchweg besser als die des letztjährigen Framework Laptops und der meisten anderen Ultrabooks, die mit CPUs der 11. Generation oder älter ausgestattet sind.

CrossMark: Overall | Productivity | Creativity | Responsiveness
| PCMark 10 / Score | |
| Framework Laptop 13.5 12th Gen Intel | |
| Durchschnittliche Intel Core i7-1260P, Intel Iris Xe Graphics G7 96EUs (4796 - 6068, n=17) | |
| Framework Laptop 13.5 | |
| Microsoft Surface Laptop 4 13 Ryzen 5 | |
| HP Spectre x360 14-ea0378ng | |
| Lenovo ThinkPad X1 Titanium Yoga G1 20QB0016GE | |
| PCMark 10 / Essentials | |
| Framework Laptop 13.5 12th Gen Intel | |
| Durchschnittliche Intel Core i7-1260P, Intel Iris Xe Graphics G7 96EUs (9260 - 11251, n=17) | |
| Framework Laptop 13.5 | |
| Lenovo ThinkPad X1 Titanium Yoga G1 20QB0016GE | |
| HP Spectre x360 14-ea0378ng | |
| Microsoft Surface Laptop 4 13 Ryzen 5 | |
| PCMark 10 / Productivity | |
| Framework Laptop 13.5 12th Gen Intel | |
| Durchschnittliche Intel Core i7-1260P, Intel Iris Xe Graphics G7 96EUs (6167 - 8629, n=17) | |
| Microsoft Surface Laptop 4 13 Ryzen 5 | |
| HP Spectre x360 14-ea0378ng | |
| Lenovo ThinkPad X1 Titanium Yoga G1 20QB0016GE | |
| Framework Laptop 13.5 | |
| PCMark 10 / Digital Content Creation | |
| Framework Laptop 13.5 12th Gen Intel | |
| Durchschnittliche Intel Core i7-1260P, Intel Iris Xe Graphics G7 96EUs (5231 - 6908, n=17) | |
| Framework Laptop 13.5 | |
| Microsoft Surface Laptop 4 13 Ryzen 5 | |
| HP Spectre x360 14-ea0378ng | |
| Lenovo ThinkPad X1 Titanium Yoga G1 20QB0016GE | |
| CrossMark / Overall | |
| Framework Laptop 13.5 12th Gen Intel | |
| Durchschnittliche Intel Core i7-1260P, Intel Iris Xe Graphics G7 96EUs (1484 - 1811, n=16) | |
| CrossMark / Productivity | |
| Framework Laptop 13.5 12th Gen Intel | |
| Durchschnittliche Intel Core i7-1260P, Intel Iris Xe Graphics G7 96EUs (1486 - 1755, n=16) | |
| CrossMark / Creativity | |
| Framework Laptop 13.5 12th Gen Intel | |
| Durchschnittliche Intel Core i7-1260P, Intel Iris Xe Graphics G7 96EUs (1451 - 1872, n=16) | |
| CrossMark / Responsiveness | |
| Framework Laptop 13.5 12th Gen Intel | |
| Durchschnittliche Intel Core i7-1260P, Intel Iris Xe Graphics G7 96EUs (1253 - 1807, n=16) | |
| PCMark 10 Score | 5802 Punkte | |
Hilfe | ||
| AIDA64 / Memory Copy | |
| HP Spectre x360 14-ea0378ng | |
| Lenovo ThinkPad X1 Titanium Yoga G1 20QB0016GE | |
| Durchschnittliche Intel Core i7-1260P (25125 - 71544, n=25) | |
| Framework Laptop 13.5 12th Gen Intel | |
| Microsoft Surface Laptop 4 13 Ryzen 5 | |
| Framework Laptop 13.5 | |
| AIDA64 / Memory Read | |
| Lenovo ThinkPad X1 Titanium Yoga G1 20QB0016GE | |
| Durchschnittliche Intel Core i7-1260P (24983 - 72065, n=25) | |
| HP Spectre x360 14-ea0378ng | |
| Framework Laptop 13.5 12th Gen Intel | |
| Microsoft Surface Laptop 4 13 Ryzen 5 | |
| Framework Laptop 13.5 | |
| AIDA64 / Memory Write | |
| Lenovo ThinkPad X1 Titanium Yoga G1 20QB0016GE | |
| HP Spectre x360 14-ea0378ng | |
| Durchschnittliche Intel Core i7-1260P (23512 - 66799, n=25) | |
| Framework Laptop 13.5 12th Gen Intel | |
| Microsoft Surface Laptop 4 13 Ryzen 5 | |
| Framework Laptop 13.5 | |
| AIDA64 / Memory Latency | |
| Microsoft Surface Laptop 4 13 Ryzen 5 | |
| Lenovo ThinkPad X1 Titanium Yoga G1 20QB0016GE | |
| HP Spectre x360 14-ea0378ng | |
| Framework Laptop 13.5 12th Gen Intel | |
| Durchschnittliche Intel Core i7-1260P (77.9 - 118.4, n=21) | |
| Framework Laptop 13.5 | |
* ... kleinere Werte sind besser
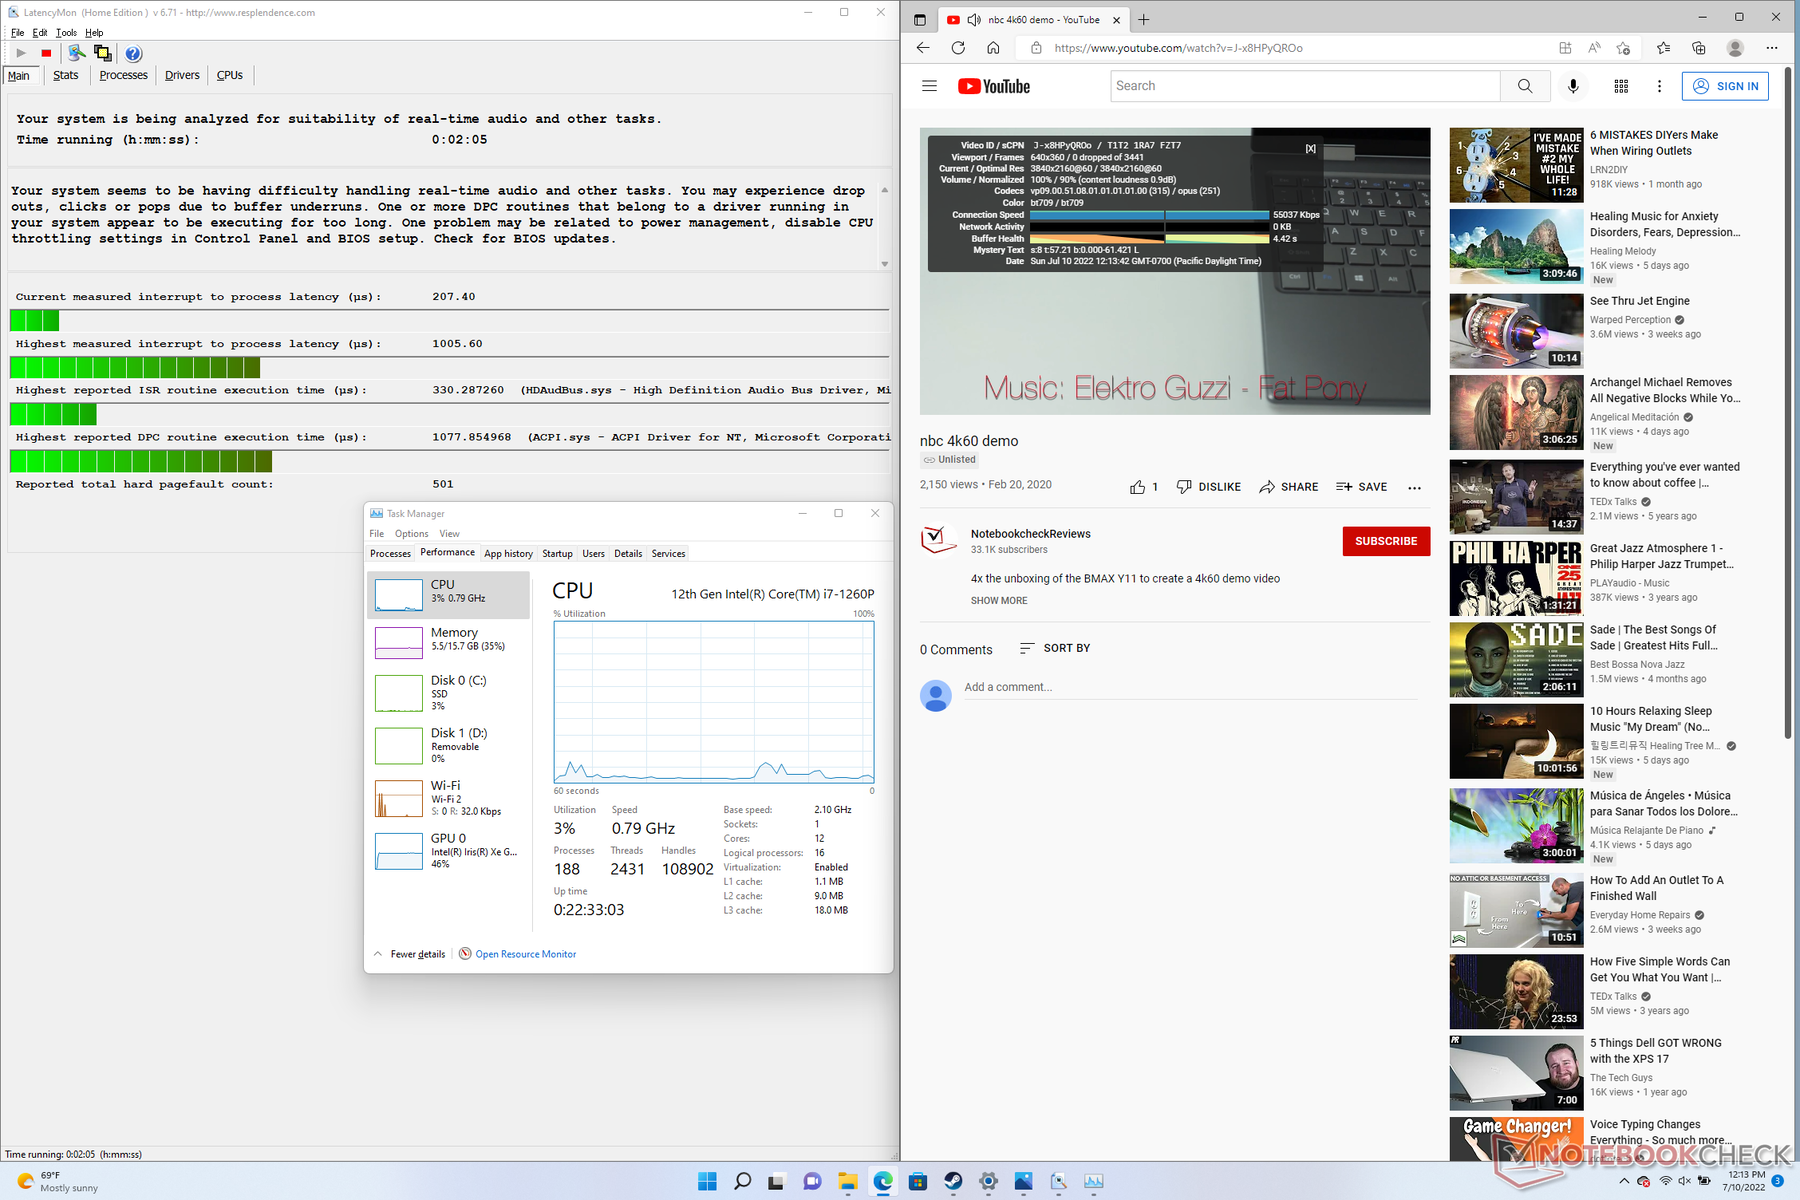
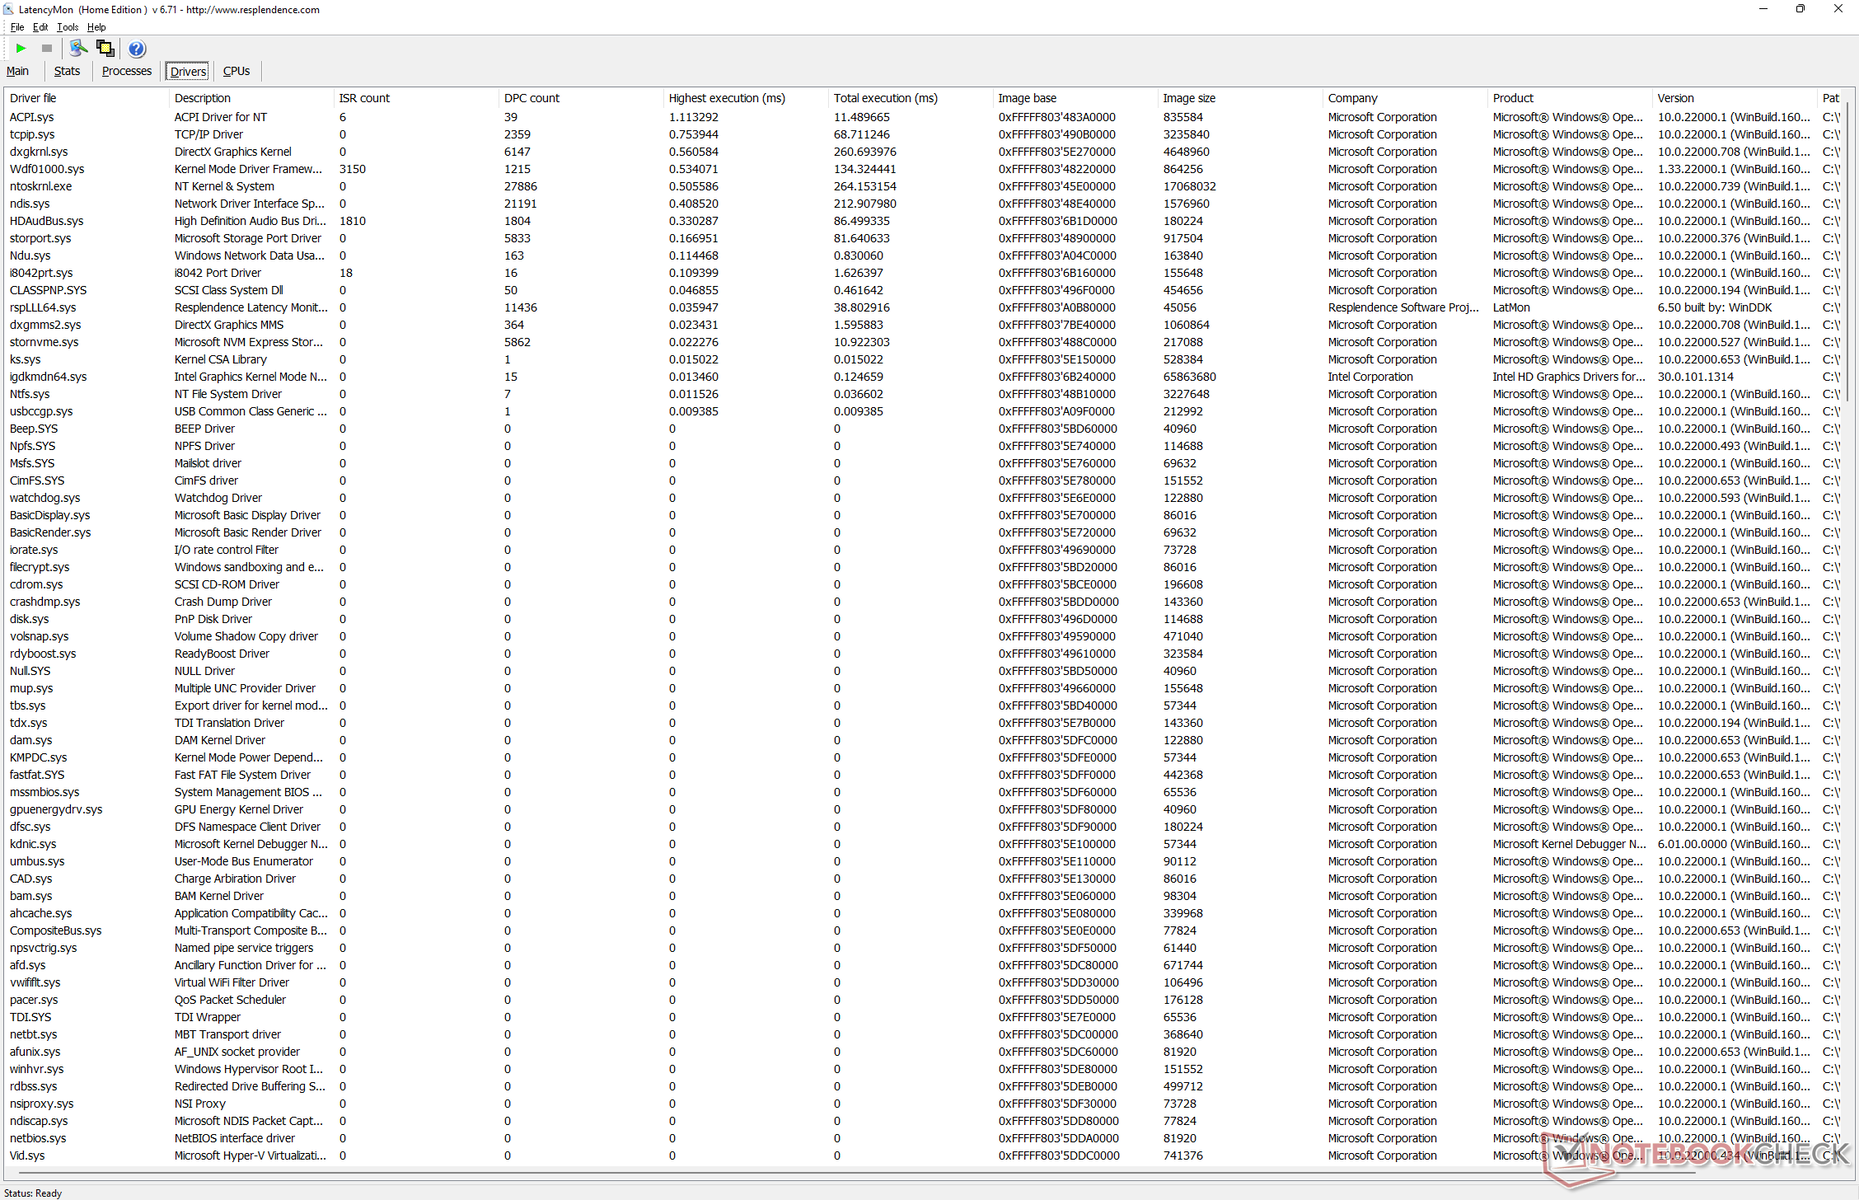
DPC-Latenzzeit
LatencyMon zeigt kleinere DPC-Probleme beim Öffnen mehrerer Browser Tabs unserer Homepage. Die 4K-Videowiedergabe bei 60 fps ist ansonsten perfekt und ohne Bildaussetzer.
| DPC Latencies / LatencyMon - interrupt to process latency (max), Web, Youtube, Prime95 | |
| Framework Laptop 13.5 | |
| HP Spectre x360 14-ea0378ng | |
| Framework Laptop 13.5 12th Gen Intel | |
| Microsoft Surface Laptop 4 13 Ryzen 5 | |
| Lenovo ThinkPad X1 Titanium Yoga G1 20QB0016GE | |
* ... kleinere Werte sind besser
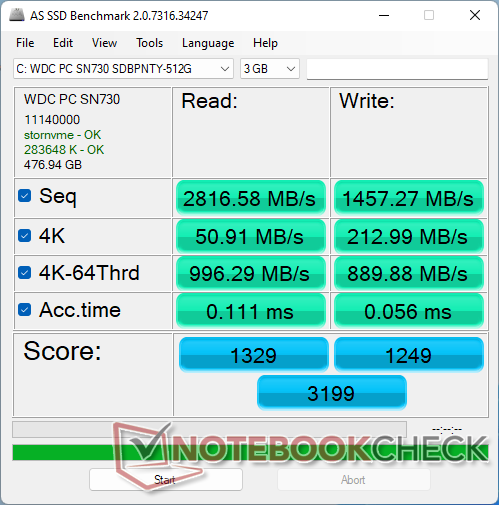
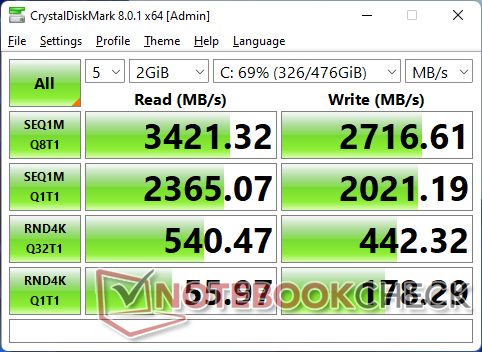
Speichergeräte
Während unser 2021-Framework-Gerät mit einer PCIe4 x4 WD SN850 M.2 NVMe SSD ausgestattet war, wird unser 2022-Gerät mit einer langsameren PCIe3 x4WD SN730 SSD ausgeliefert. Benutzer können natürlich immer noch auf eine schnellere PCIe4 x4 SSD aufrüsten.
Es wird nur ein internes Laufwerk unterstützt.

* ... kleinere Werte sind besser
Dauerleistung Lesen: DiskSpd Read Loop, Queue Depth 8
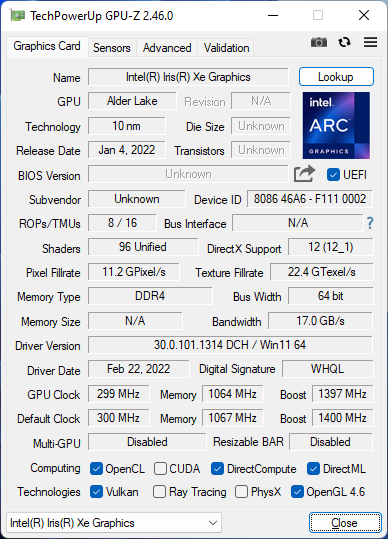
GPU Performance
Die Grafikleistung ist etwa 5 bis 15 Prozent schneller als die eines durchschnittlichen Notebooks in unserer Datenbank, das mit der gleichen integrierten Iris Xe 96 EUs versehen ist. Die Performance war auf unserem ursprünglichen 2021er Testgerät viel langsamer, da es mit Single-Channel-Speicher lief. Wenn die Grafikleistung für Ihre Arbeitslasten wichtig ist, sollten Sie unbedingt einen Dual-Channel-Speicher in die Konfiguration mit aufnehmen.
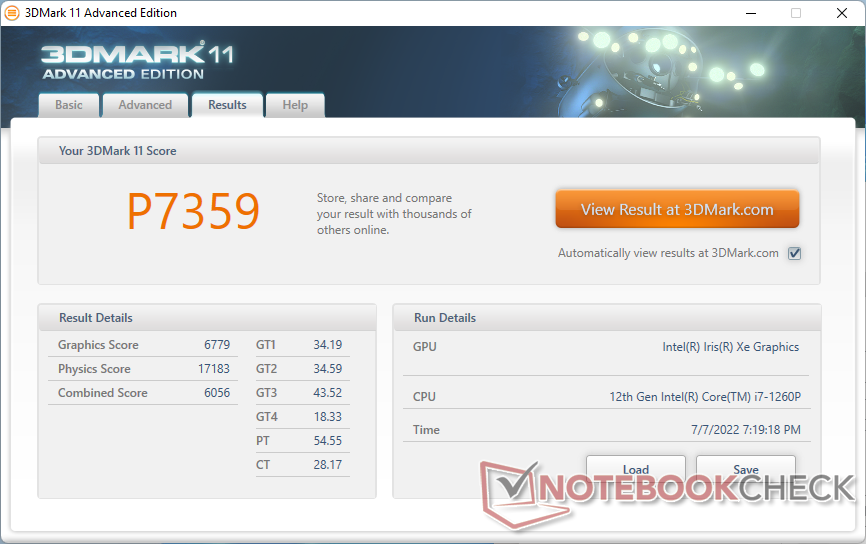
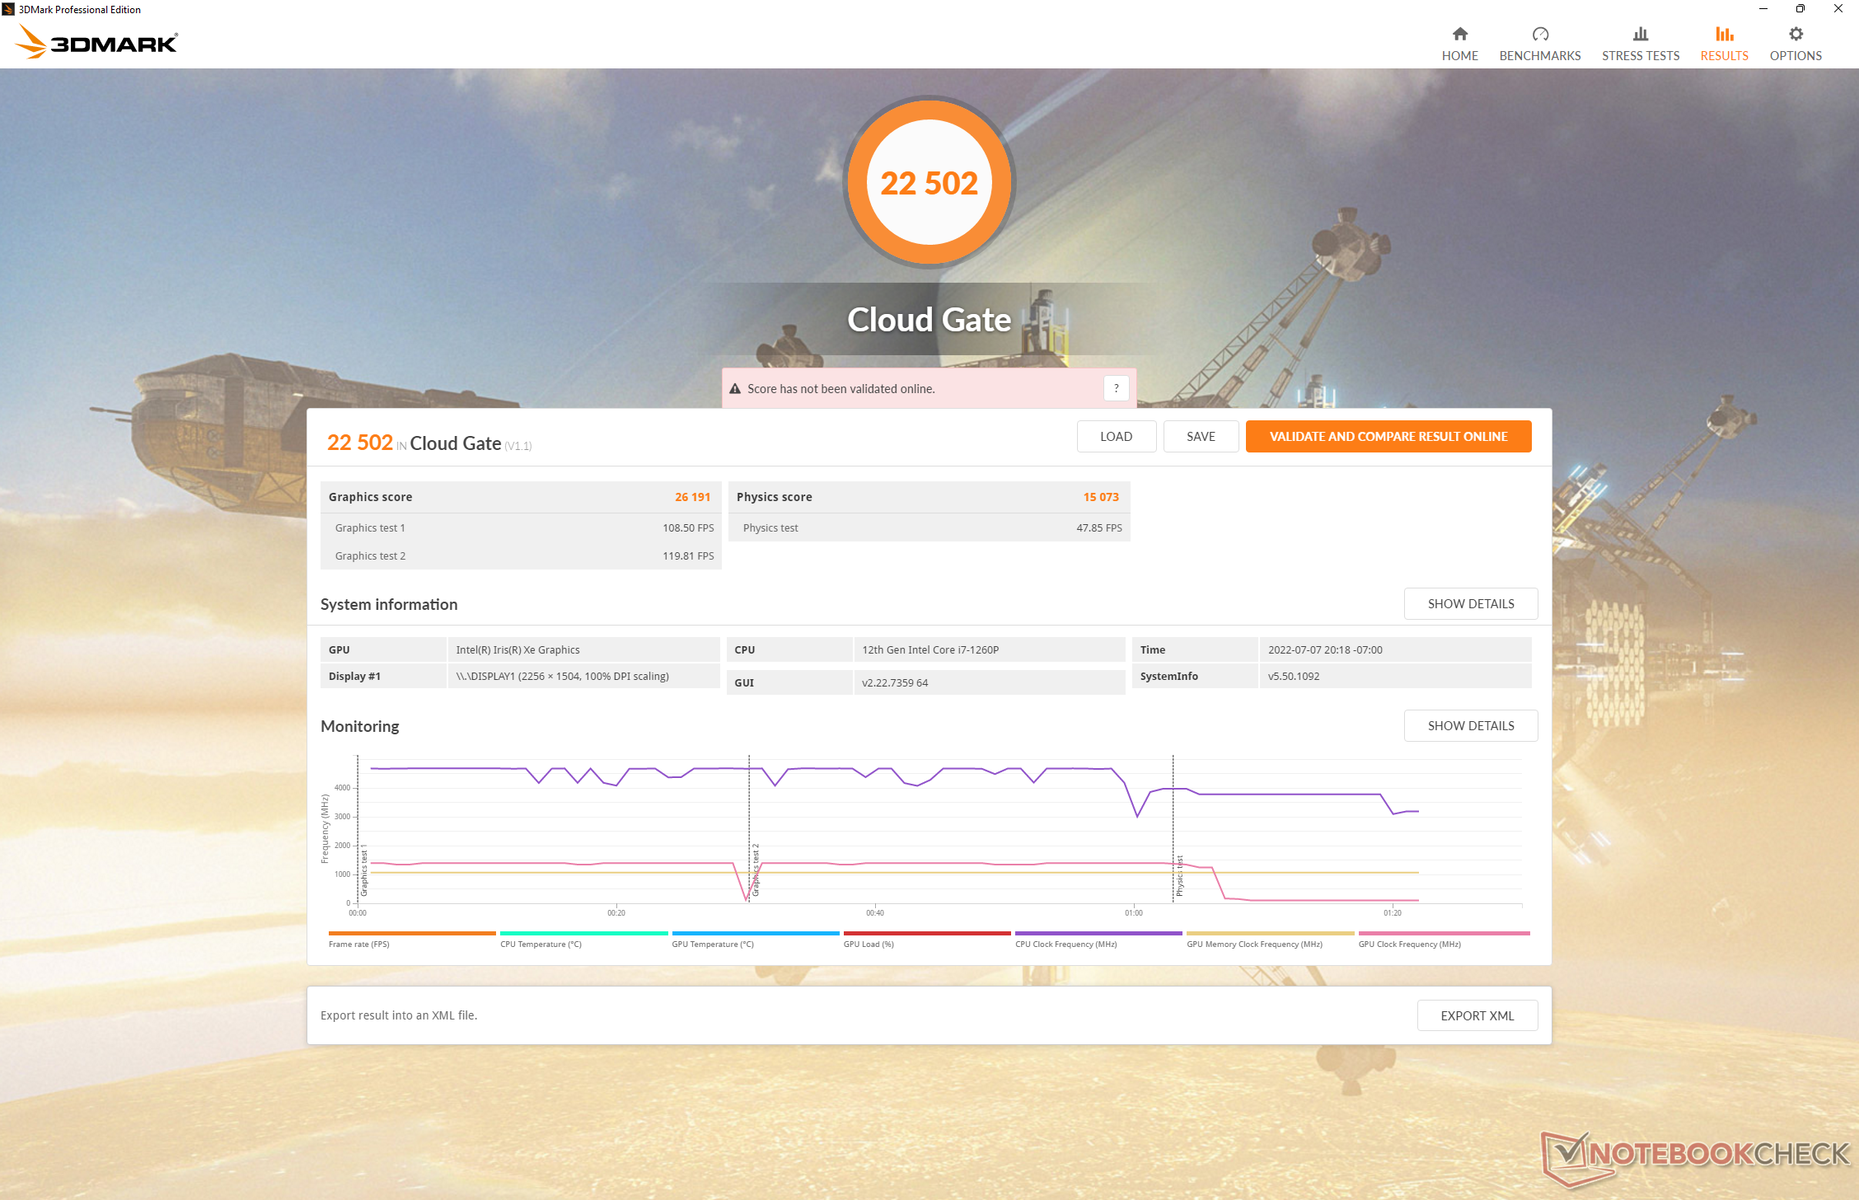
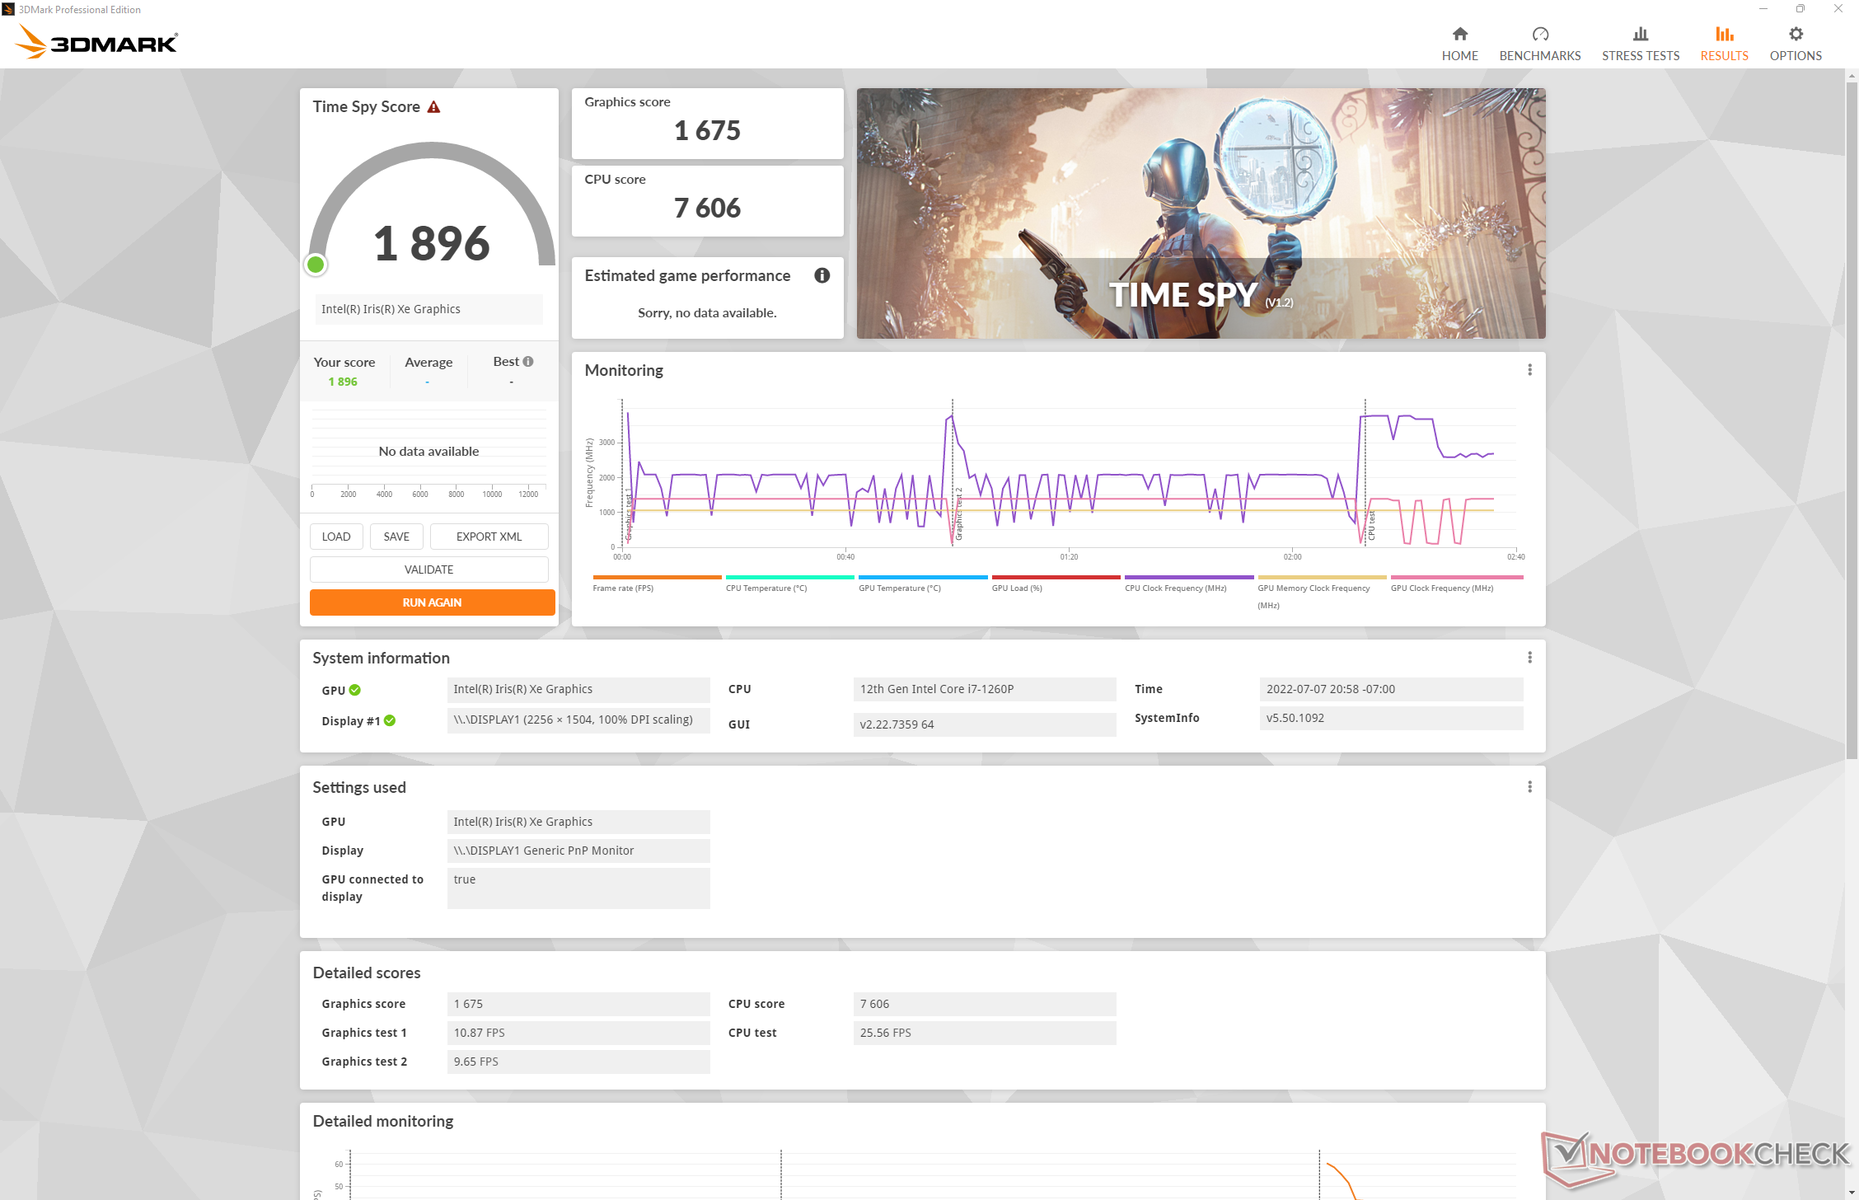
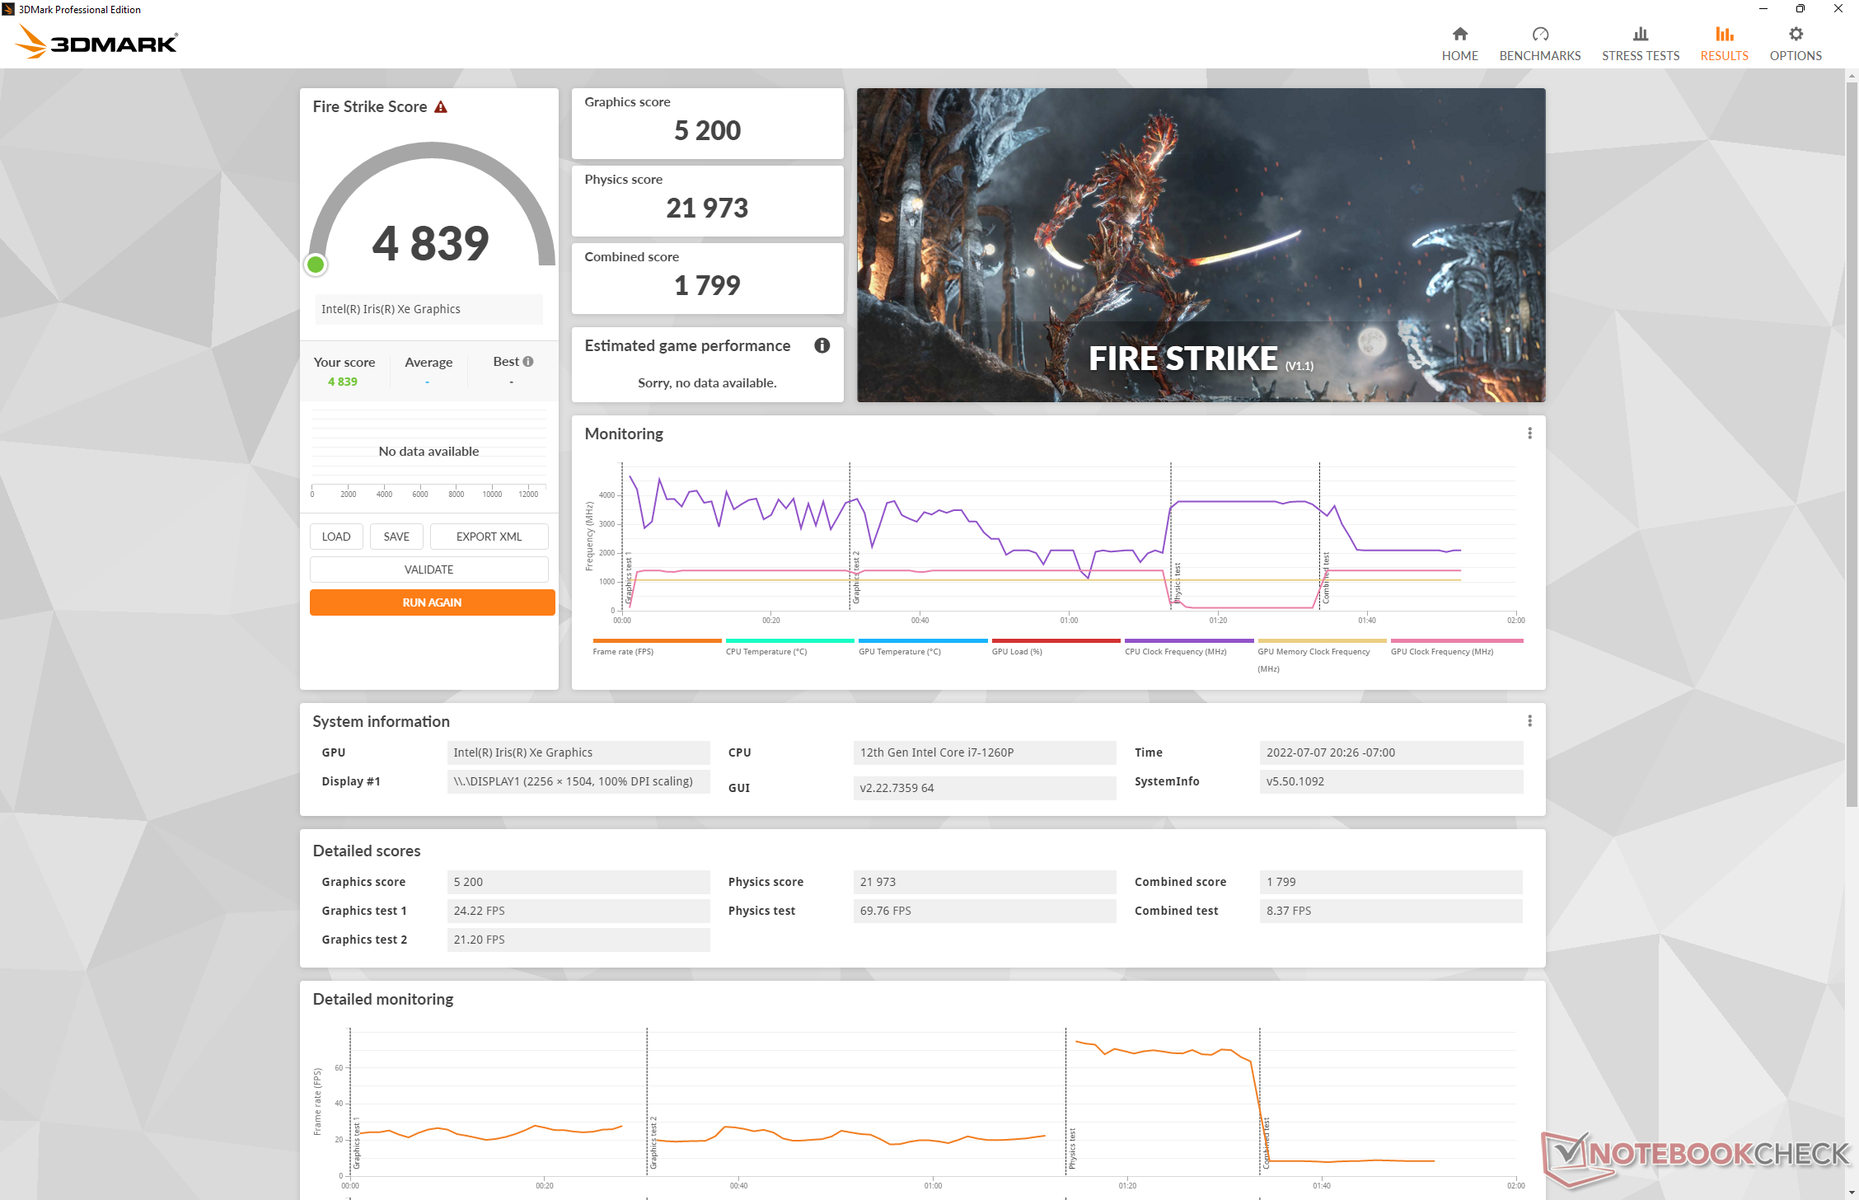
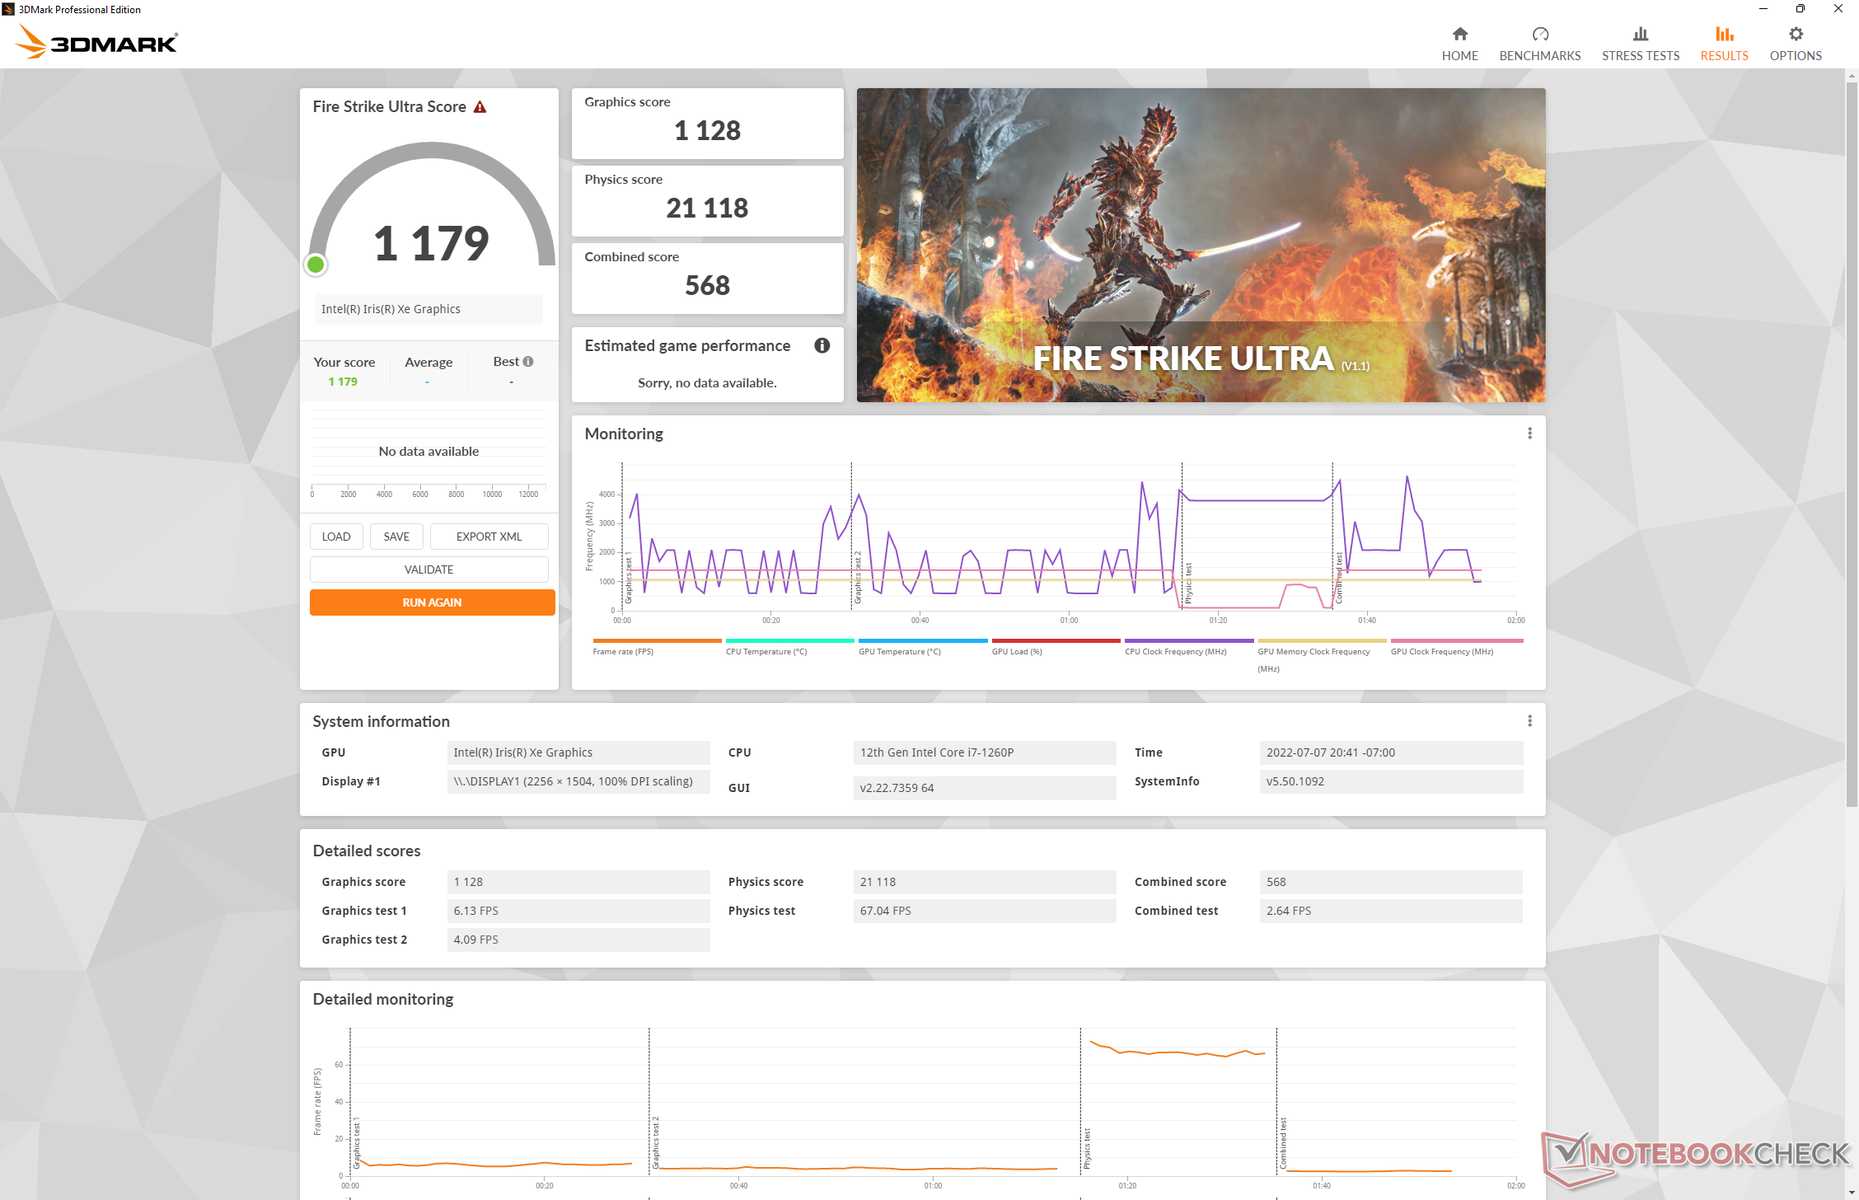
| 3DMark 11 Performance | 7359 Punkte | |
| 3DMark Cloud Gate Standard Score | 22502 Punkte | |
| 3DMark Fire Strike Score | 4839 Punkte | |
| 3DMark Time Spy Score | 1896 Punkte | |
Hilfe | ||
Witcher 3 FPS Chart
| min. | mittel | hoch | max. | |
|---|---|---|---|---|
| GTA V (2015) | 117.5 | 96.9 | 20 | 8.36 |
| The Witcher 3 (2015) | 97.5 | 60.5 | 32.3 | 15.1 |
| Dota 2 Reborn (2015) | 121.7 | 90.3 | 62.6 | 57.7 |
| Final Fantasy XV Benchmark (2018) | 42.5 | 23.3 | 23.3 | |
| X-Plane 11.11 (2018) | 62.6 | 45.9 | 41.3 | |
| Strange Brigade (2018) | 90.2 | 39.6 | 32.6 | 26.2 |
| Cyberpunk 2077 1.6 (2022) | 21.9 | 18.5 | 13.7 | 11.2 |
Emissionen
System-Rauschen
Das Lüftergeräusch ist lauter als bei den meisten anderen Ultrabooks, insbesondere unter Last. Wenn man die erste Benchmark-Szene des 3DMark 06 ausführt, um eine durchschnittliche Last zu simulieren, würde das Lüftergeräusch 47 dB(A) betragen und wäre damit eines der lautesten Subnotebooks der U-Serie, die wir getestet haben. Beim Spielen tendiert das Lüftergeräusch zwischen 41 und 47 dB(A). Rechnen Sie mit einem lauten System, wenn Sie vorhaben, anspruchsvolle Aufgaben auszuführen, um die schnelle Leistung des Prozessors zu nutzen.
Bei weniger anspruchsvollen Aufgaben wie Browsing oder Videostreaming bleibt das Lüftergeräusch in der Regel unter 28 dB(A) bei einem leisen Hintergrund von 22,8 dB(A). Das Pulsieren des Lüfters ist in diesem Bereich nicht laut genug, um zu stören.
Lautstärkediagramm
| Idle |
| 23 / 23 / 23 dB(A) |
| Last |
| 47.3 / 49.8 dB(A) |
 | ||
30 dB leise 40 dB(A) deutlich hörbar 50 dB(A) störend |
||
min: | ||
| Framework Laptop 13.5 12th Gen Intel Iris Xe G7 96EUs, i7-1260P, WDC PC SN730 SDBPNTY-512G | Framework Laptop 13.5 Iris Xe G7 96EUs, i7-1165G7, Western Digital WD_BLACK SN850 WDS100T1X0E | Lenovo ThinkPad X1 Titanium Yoga G1 20QB0016GE Iris Xe G7 80EUs, i5-1140G7, Lenovo UMIS RPJTJ256MEE1OWX | Microsoft Surface Laptop 4 13 Ryzen 5 Vega 7, R5 4680U, Samsung PM991 MZ9LQ256HBJQ | HP Spectre x360 14-ea0378ng Iris Xe G7 96EUs, i7-1165G7, Intel Optane Memory H10 with Solid State Storage 32GB + 1TB HBRPEKNX0203AH(L/H) | |
|---|---|---|---|---|---|
| Geräuschentwicklung | -1% | -2% | 1% | -1% | |
| aus / Umgebung * (dB) | 22.8 | 23.9 -5% | 25.61 -12% | 24.6 -8% | 26 -14% |
| Idle min * (dB) | 23 | 23.9 -4% | 25.61 -11% | 24.6 -7% | 26 -13% |
| Idle avg * (dB) | 23 | 23.9 -4% | 25.61 -11% | 24.6 -7% | 26 -13% |
| Idle max * (dB) | 23 | 23.9 -4% | 25.61 -11% | 24.6 -7% | 26 -13% |
| Last avg * (dB) | 47.3 | 45.6 4% | 40.14 15% | 39.5 16% | 37.5 21% |
| Witcher 3 ultra * (dB) | 47.3 | 47.1 -0% | |||
| Last max * (dB) | 49.8 | 47.9 4% | 40.14 19% | 39.5 21% | 36.3 27% |
* ... kleinere Werte sind besser
Temperatur
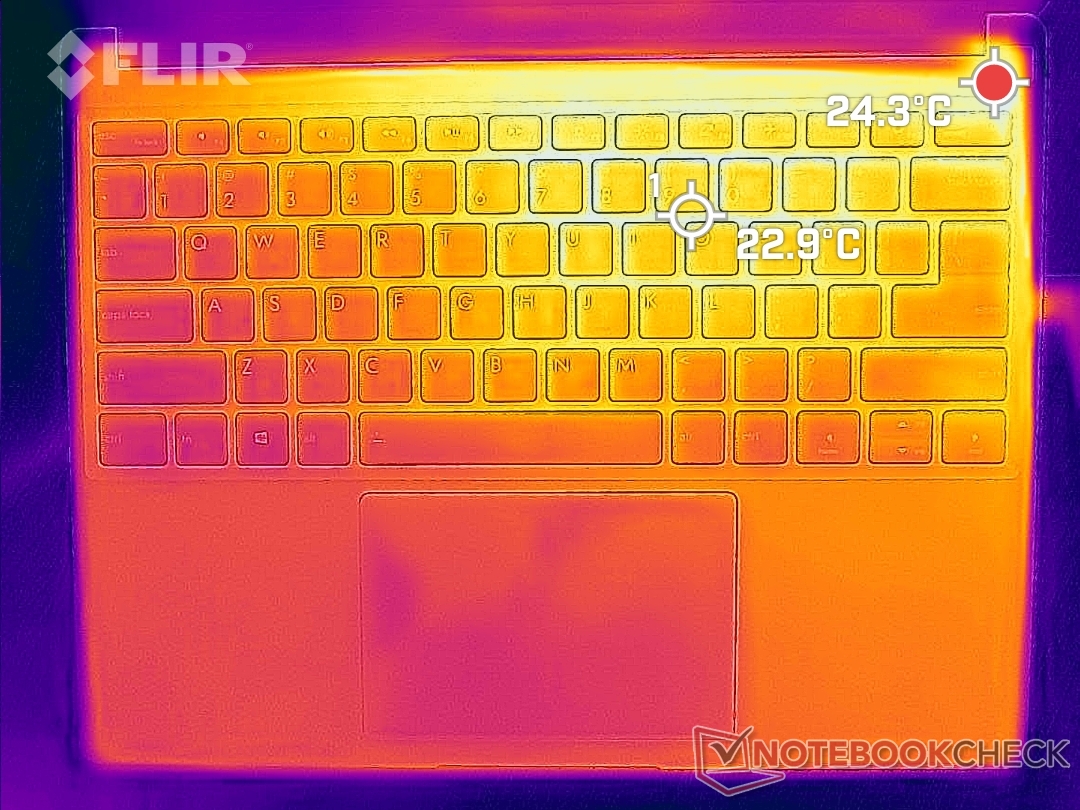
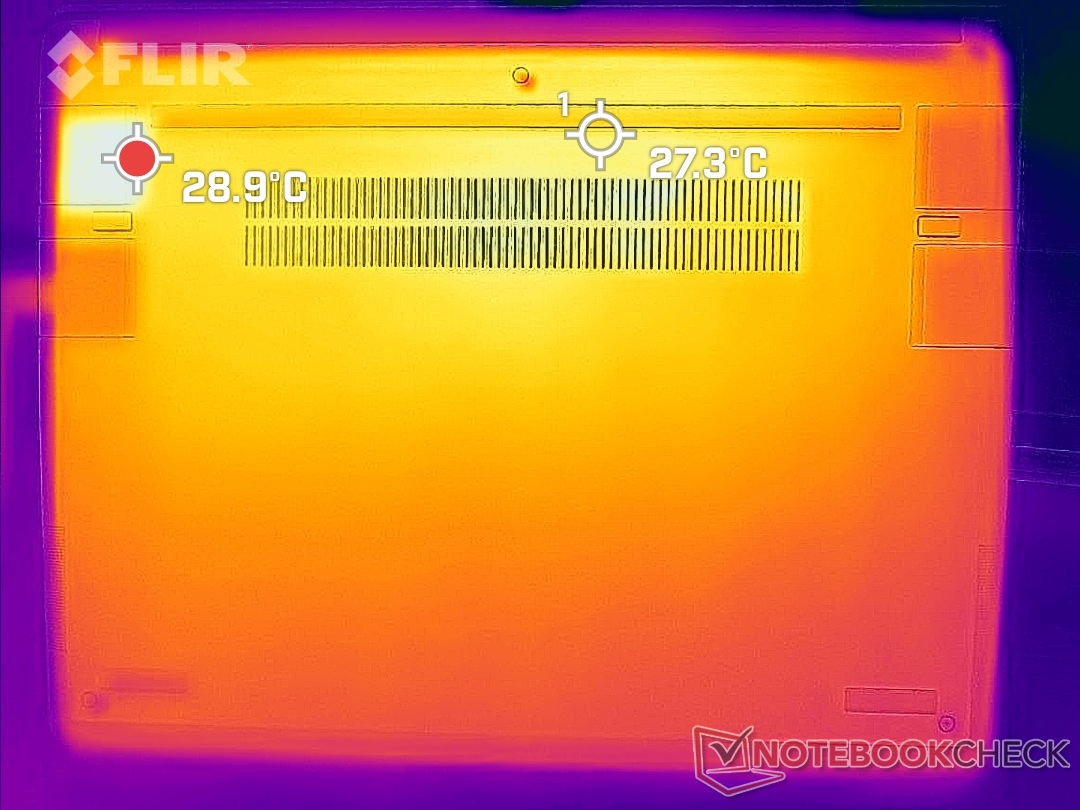
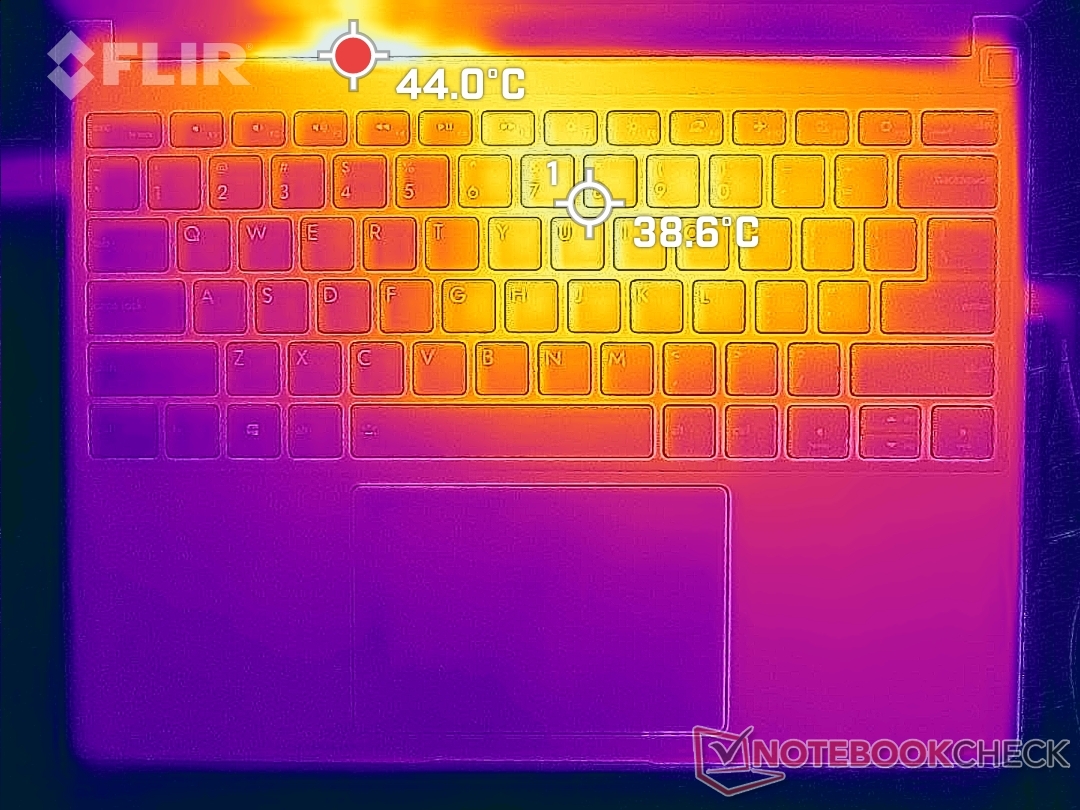
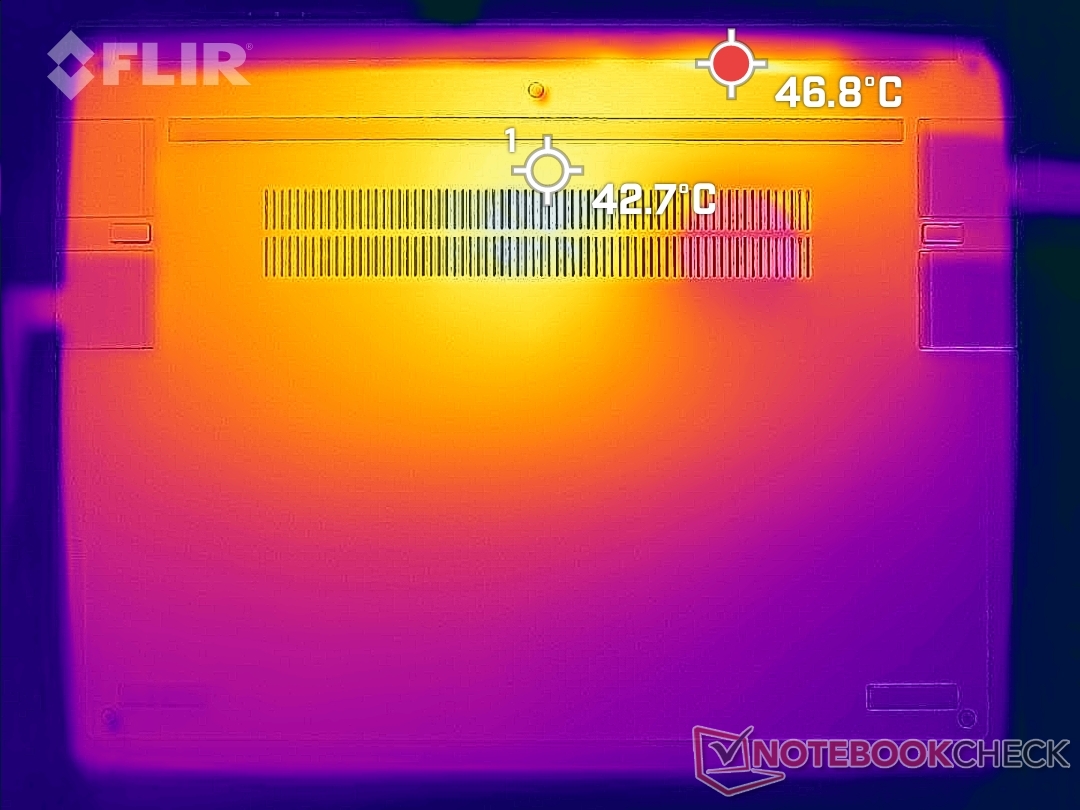
Die Hotspots auf der Oberfläche können 39 und 43 °C auf der Ober- bzw. Unterseite erreichen, verglichen mit 45 und 46 °C beim Surface Laptop 4 13 oder 40 °C und 51 °C beim HP Spectre x360 14. Es ist nicht warm genug, um störend zu sein, aber es ist definitiv spürbar während der Nutzung. Größere Belüftungsgitter auf der Unterseite hätten die Thermik möglicherweise verbessern können.
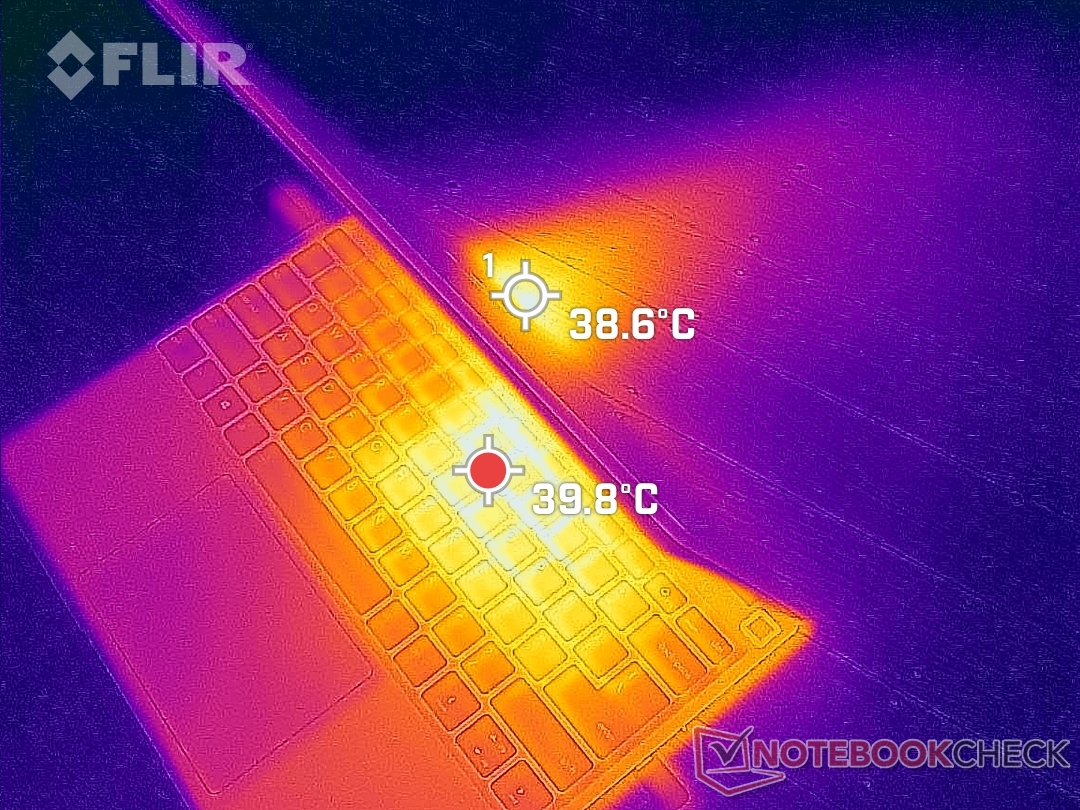
(+) Die maximale Temperatur auf der Oberseite ist 36.8 °C. Im Vergleich liegt der Klassendurchschnitt bei 34.3 °C (von 21.2 bis 62.5 °C für die Klasse Office).
(±) Auf der Unterseite messen wir eine maximalen Wert von 42.4 °C (im Vergleich zum Durchschnitt von 36.8 °C).
(+) Ohne Last messen wir eine durchschnittliche Temperatur von 21.2 °C auf der Oberseite. Der Klassendurchschnitt erreicht 29.5 °C.
(+) Die Handballen und der Touchpad-Bereich sind mit gemessenen 24.4 °C kühler als die typische Hauttemperatur und fühlen sich dadurch kühl an.
(+) Die durchschnittliche Handballen-Temperatur anderer getesteter Geräte war 27.5 °C (+3.1 °C).
| Framework Laptop 13.5 12th Gen Intel Intel Core i7-1260P, Intel Iris Xe Graphics G7 96EUs | Framework Laptop 13.5 Intel Core i7-1165G7, Intel Iris Xe Graphics G7 96EUs | Lenovo ThinkPad X1 Titanium Yoga G1 20QB0016GE Intel Core i5-1140G7, Intel Iris Xe Graphics G7 80EUs | HP EliteBook Folio 13.5-3G2L2EA Qualcomm Snapdragon 8cx Gen 2 5G, Qualcomm Adreno 680 | Microsoft Surface Laptop 4 13 Ryzen 5 AMD Ryzen 5 4680U, AMD Radeon RX Vega 7 | HP Spectre x360 14-ea0378ng Intel Core i7-1165G7, Intel Iris Xe Graphics G7 96EUs | |
|---|---|---|---|---|---|---|
| Hitze | -5% | -9% | 8% | -6% | -6% | |
| Last oben max * (°C) | 36.8 | 47.2 -28% | 46.3 -26% | 34.3 7% | 45.8 -24% | 37.1 -1% |
| Last unten max * (°C) | 42.4 | 39.4 7% | 43.3 -2% | 35.4 17% | 45.5 -7% | 43.1 -2% |
| Idle oben max * (°C) | 24.2 | 25.2 -4% | 26.8 -11% | 25.7 -6% | 24.9 -3% | 29 -20% |
| Idle unten max * (°C) | 29 | 27.8 4% | 28.3 2% | 25.1 13% | 25.7 11% | 28.6 1% |
* ... kleinere Werte sind besser
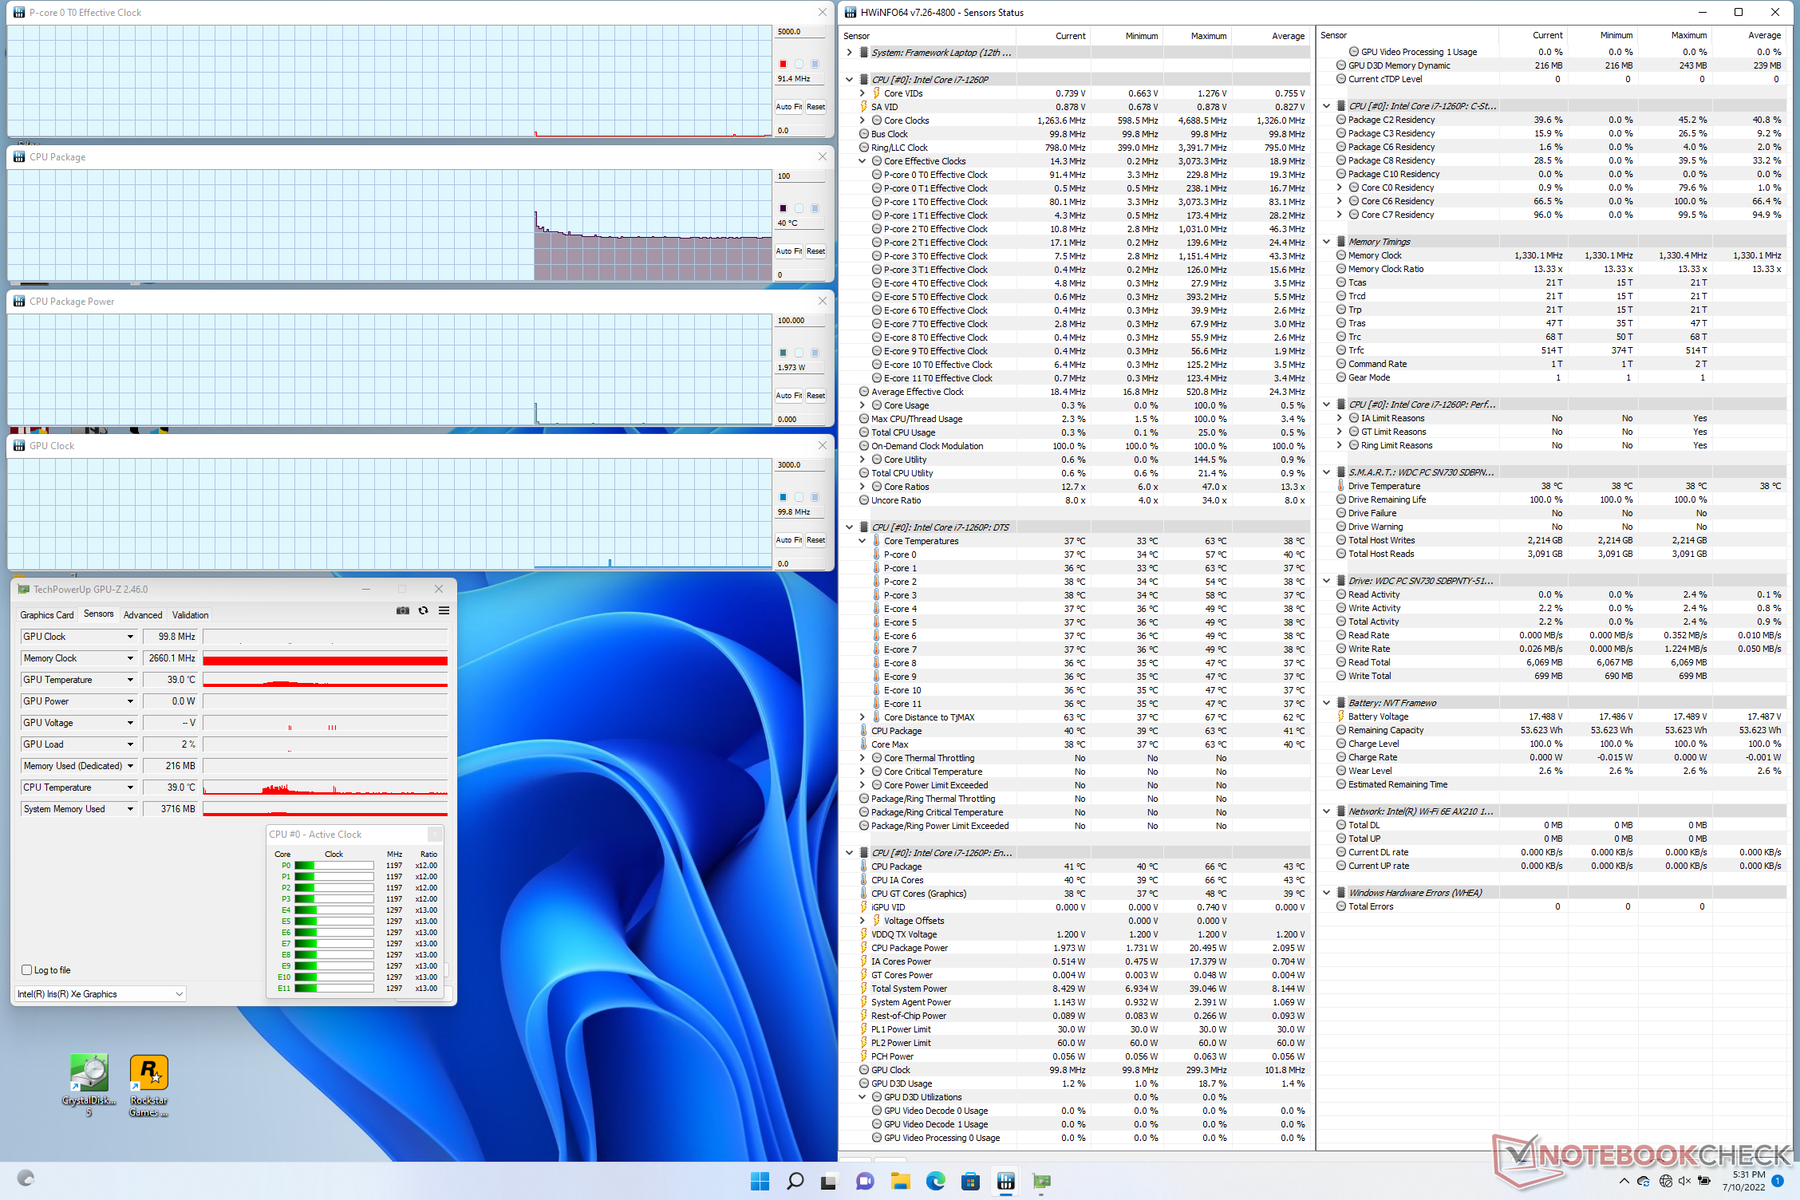
Stresstest
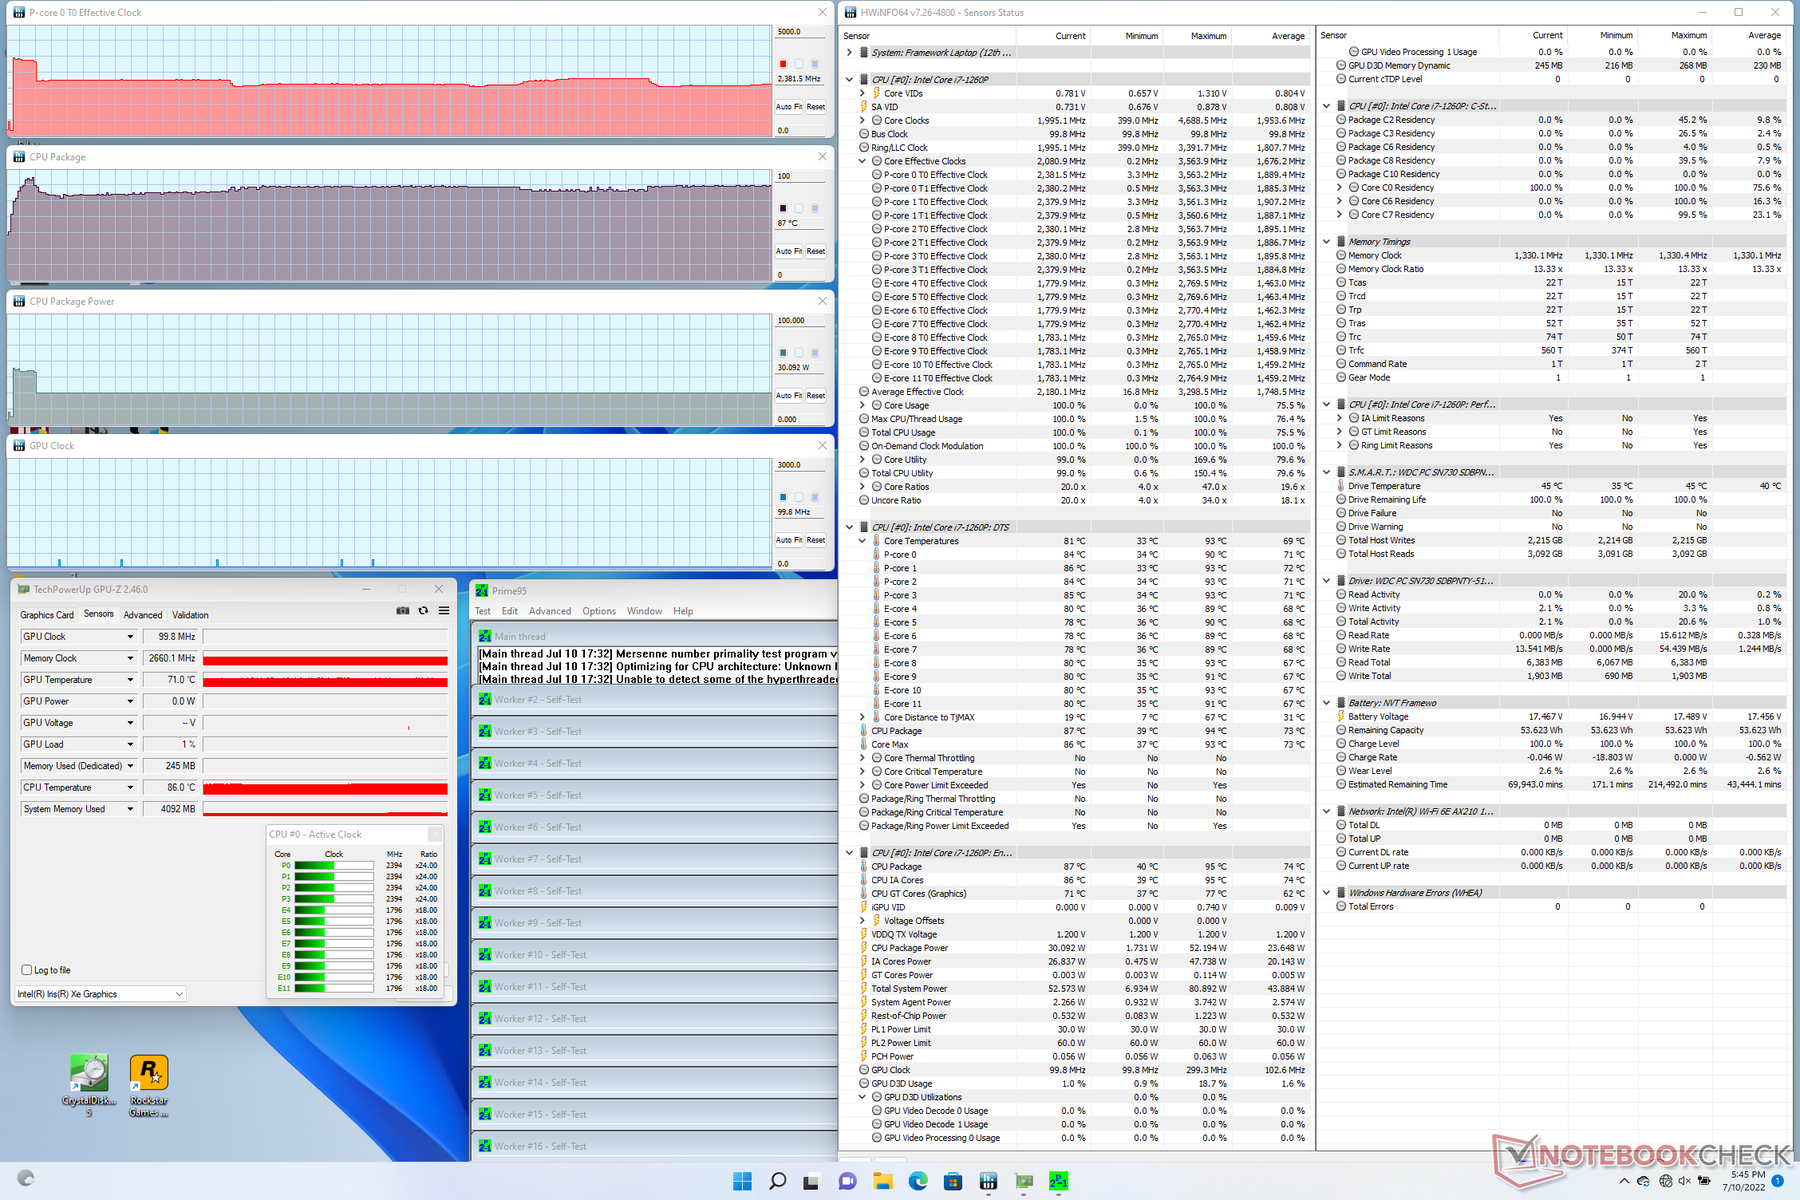
Bei der Ausführung von Prime95 steigen die CPU-Taktraten in den ersten zehn Sekunden auf 3,5 GHz, bis eine Kerntemperatur von 94 °C erreicht wird. Danach sinken die Taktraten und die CPU-Leistung auf 2,4 bis 2,6 GHz bzw. von 52 auf 30 W, um eine kühlere Kerntemperatur von 87 °C aufrechtzuerhalten. Die Kerntemperaturen sind insgesamt immer noch deutlich wärmer als beim Vorjahresmodell, bei dem sich die Temperaturen unter ähnlichen Bedingungen bei 82 °C stabilisierten.
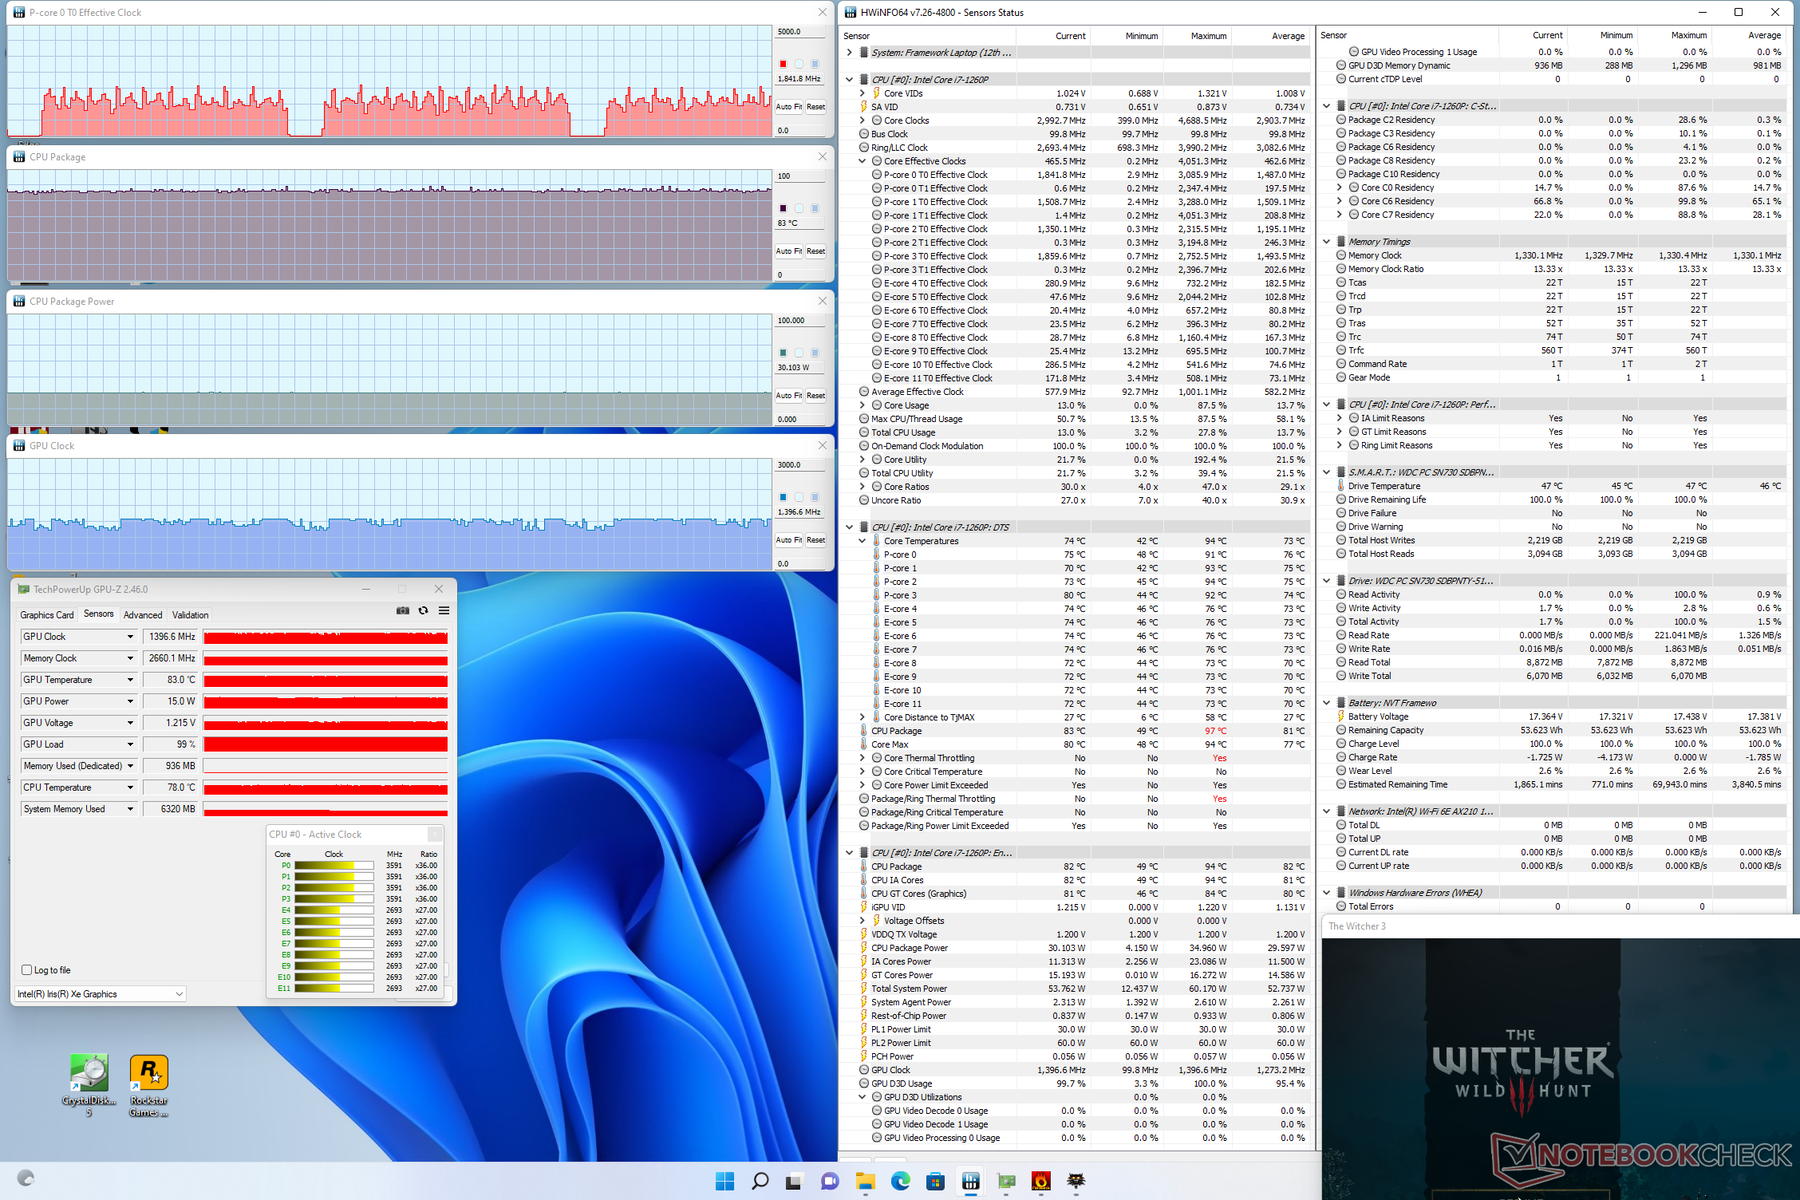
Bei der Ausführung von Witcher 3 zur Darstellung von Gaming-Lasten wird die Kerntemperatur wieder wärmer als beim Vorjahresmodell (83 °C gegenüber 73 °C).
Der Betrieb im Akkubetrieb kann die CPU-Leistung leicht beeinträchtigen. Ein 3DMark-11-Test im Akkubetrieb liefert Physik- und Grafik-Scores von 14.919 bzw. 6.604 Punkten, verglichen mit 17.183 und 6.779 Punkten im Netzbetrieb.
| CPU-Takt (GHz) | GPU-Takt (MHz) | durchschnittliche CPU-Temperatur (°C) | |
| System Leerlauf | -- | -- | 40 |
| Prime95, Stress | 2,4-2,6 | -- | 87 |
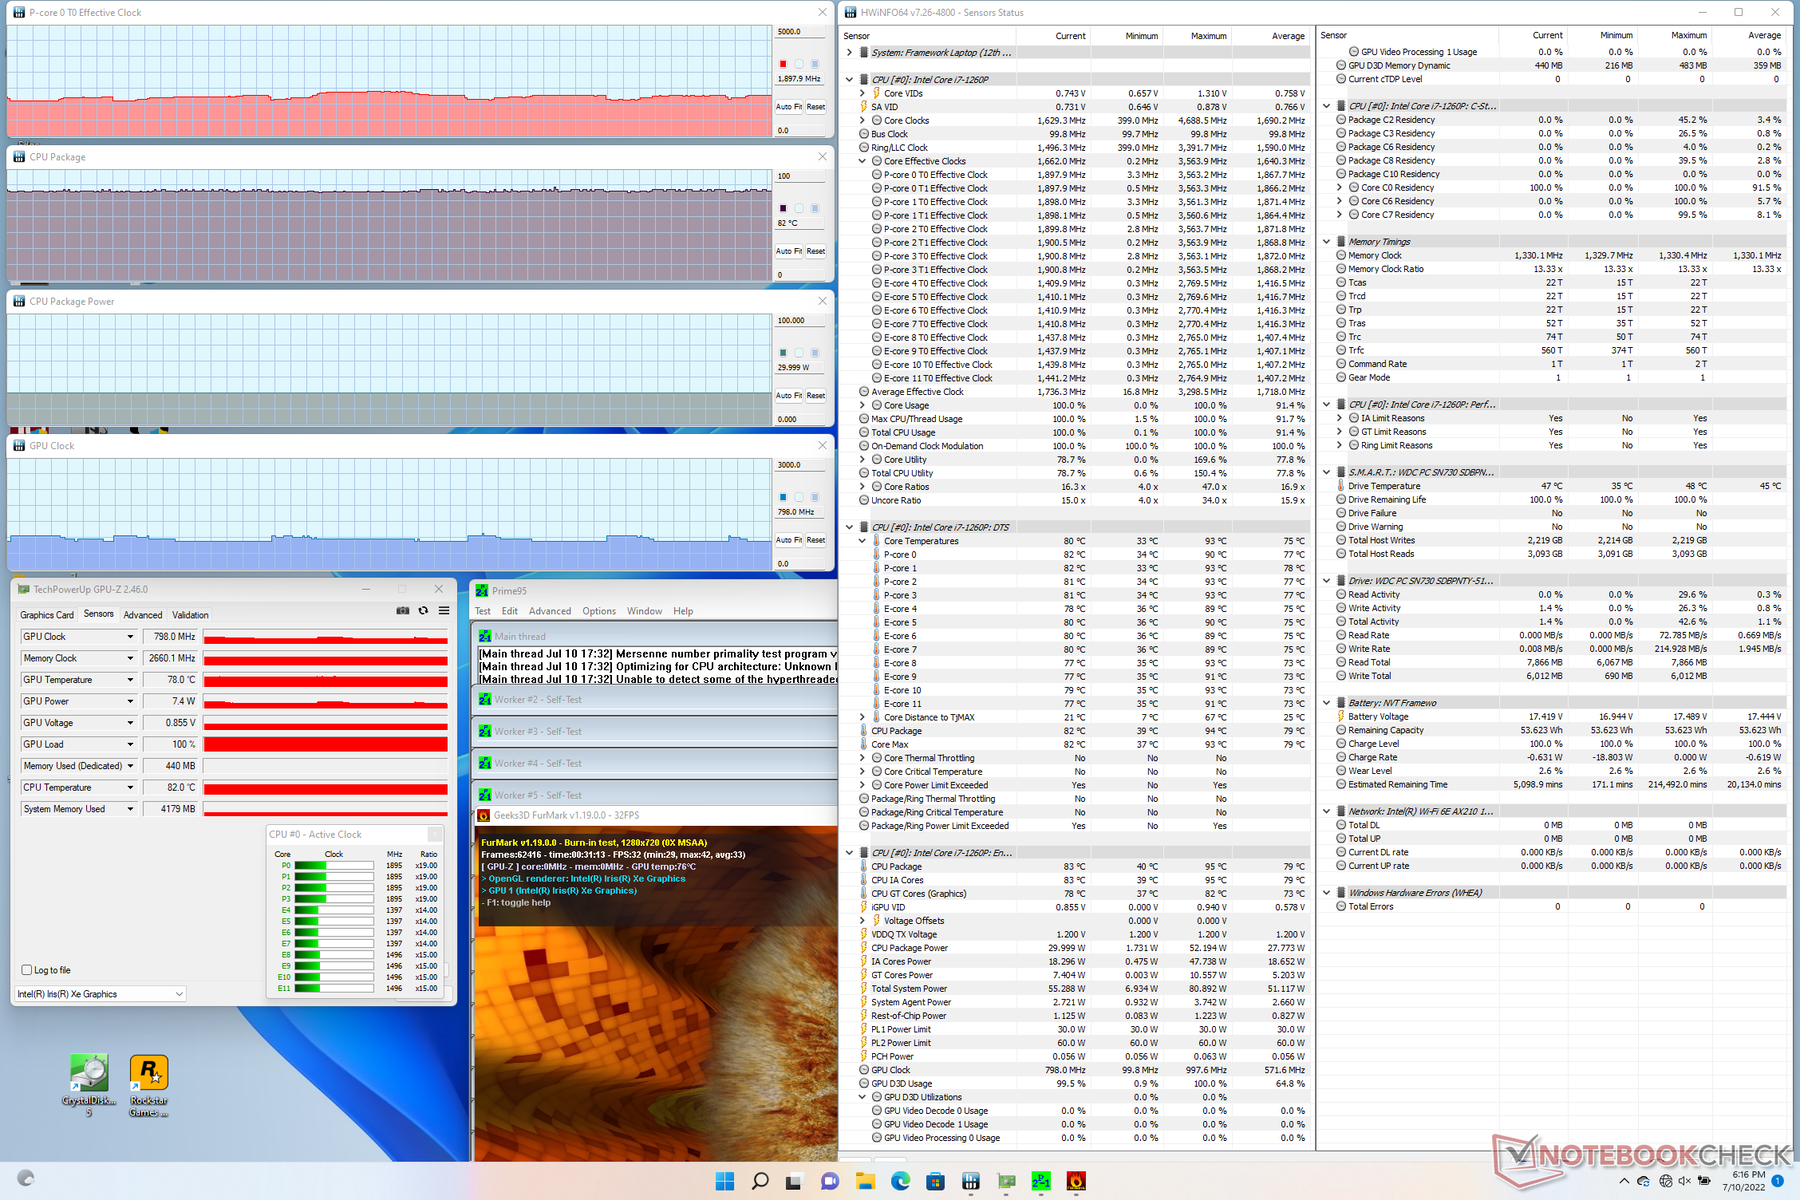
| Prime95+FurMark, Stress | 1,7-1,9 | 0,8-0,9 | 82 |
| Witcher 3, Stress | ~1,8 | 1.396 | 83 |
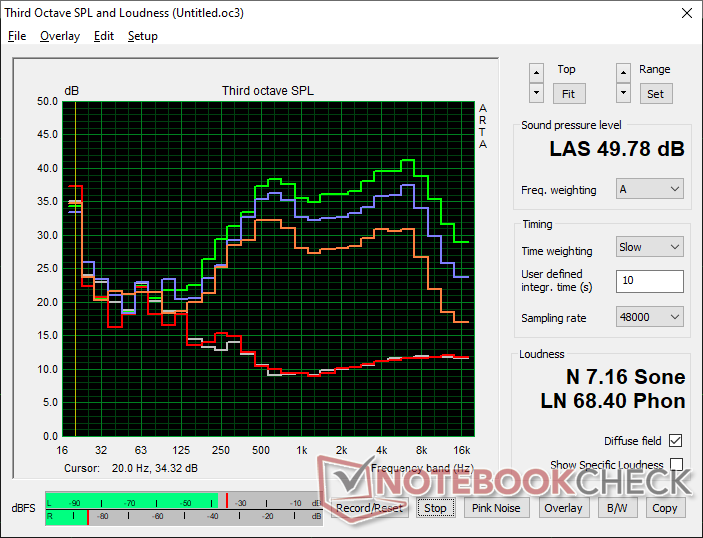
Lautsprecher
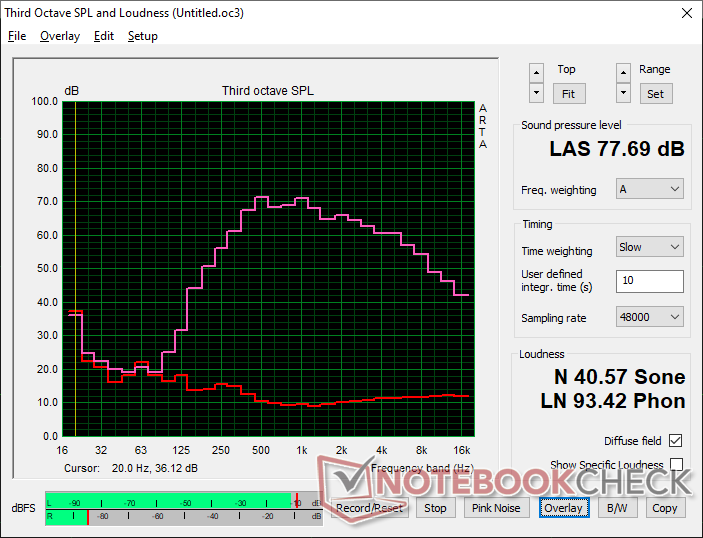
Framework Laptop 13.5 12th Gen Intel Audio Analyse
(±) | Mittelmäßig laut spielende Lautsprecher (77.7 dB)
Bass 100 - 315 Hz
(-) | kaum Bass - 16.1% niedriger als der Median
(±) | durchschnittlich lineare Bass-Wiedergabe (14.3% Delta zum Vorgänger)
Mitteltöne 400 - 2000 Hz
(±) | zu hohe Mitten, vom Median 7.5% abweichend
(+) | lineare Mitten (5.9% Delta zum Vorgänger)
Hochtöne 2 - 16 kHz
(+) | ausgeglichene Hochtöne, vom Median nur 4% abweichend
(+) | sehr lineare Hochtöne (5% Delta zum Vorgänger)
Gesamt im hörbaren Bereich 100 - 16.000 Hz
(±) | hörbarer Bereich ist durchschnittlich linear (20.7% Abstand zum Median)
Im Vergleich zu allen Geräten derselben Klasse
» 47% aller getesteten Geräte dieser Klasse waren besser, 10% vergleichbar, 43% schlechter
» Das beste Gerät hat einen Delta-Wert von 7%, durchschnittlich ist 21%, das schlechteste Gerät hat 53%
Im Vergleich zu allen Geräten im Test
» 56% aller getesteten Geräte waren besser, 8% vergleichbar, 37% schlechter
» Das beste Gerät hat einen Delta-Wert von 4%, durchschnittlich ist 24%, das schlechteste Gerät hat 134%
Apple MacBook Pro 16 2021 M1 Pro Audio Analyse
(+) | Die Lautsprecher können relativ laut spielen (84.7 dB)
Bass 100 - 315 Hz
(+) | guter Bass - nur 3.8% Abweichung vom Median
(+) | lineare Bass-Wiedergabe (5.2% Delta zum Vorgänger)
Mitteltöne 400 - 2000 Hz
(+) | ausgeglichene Mitten, vom Median nur 1.3% abweichend
(+) | lineare Mitten (2.1% Delta zum Vorgänger)
Hochtöne 2 - 16 kHz
(+) | ausgeglichene Hochtöne, vom Median nur 1.9% abweichend
(+) | sehr lineare Hochtöne (2.7% Delta zum Vorgänger)
Gesamt im hörbaren Bereich 100 - 16.000 Hz
(+) | hörbarer Bereich ist sehr linear (4.6% Abstand zum Median
Im Vergleich zu allen Geräten derselben Klasse
» 0% aller getesteten Geräte dieser Klasse waren besser, 0% vergleichbar, 100% schlechter
» Das beste Gerät hat einen Delta-Wert von 5%, durchschnittlich ist 17%, das schlechteste Gerät hat 45%
Im Vergleich zu allen Geräten im Test
» 0% aller getesteten Geräte waren besser, 0% vergleichbar, 100% schlechter
» Das beste Gerät hat einen Delta-Wert von 4%, durchschnittlich ist 24%, das schlechteste Gerät hat 134%
Energieverwaltung
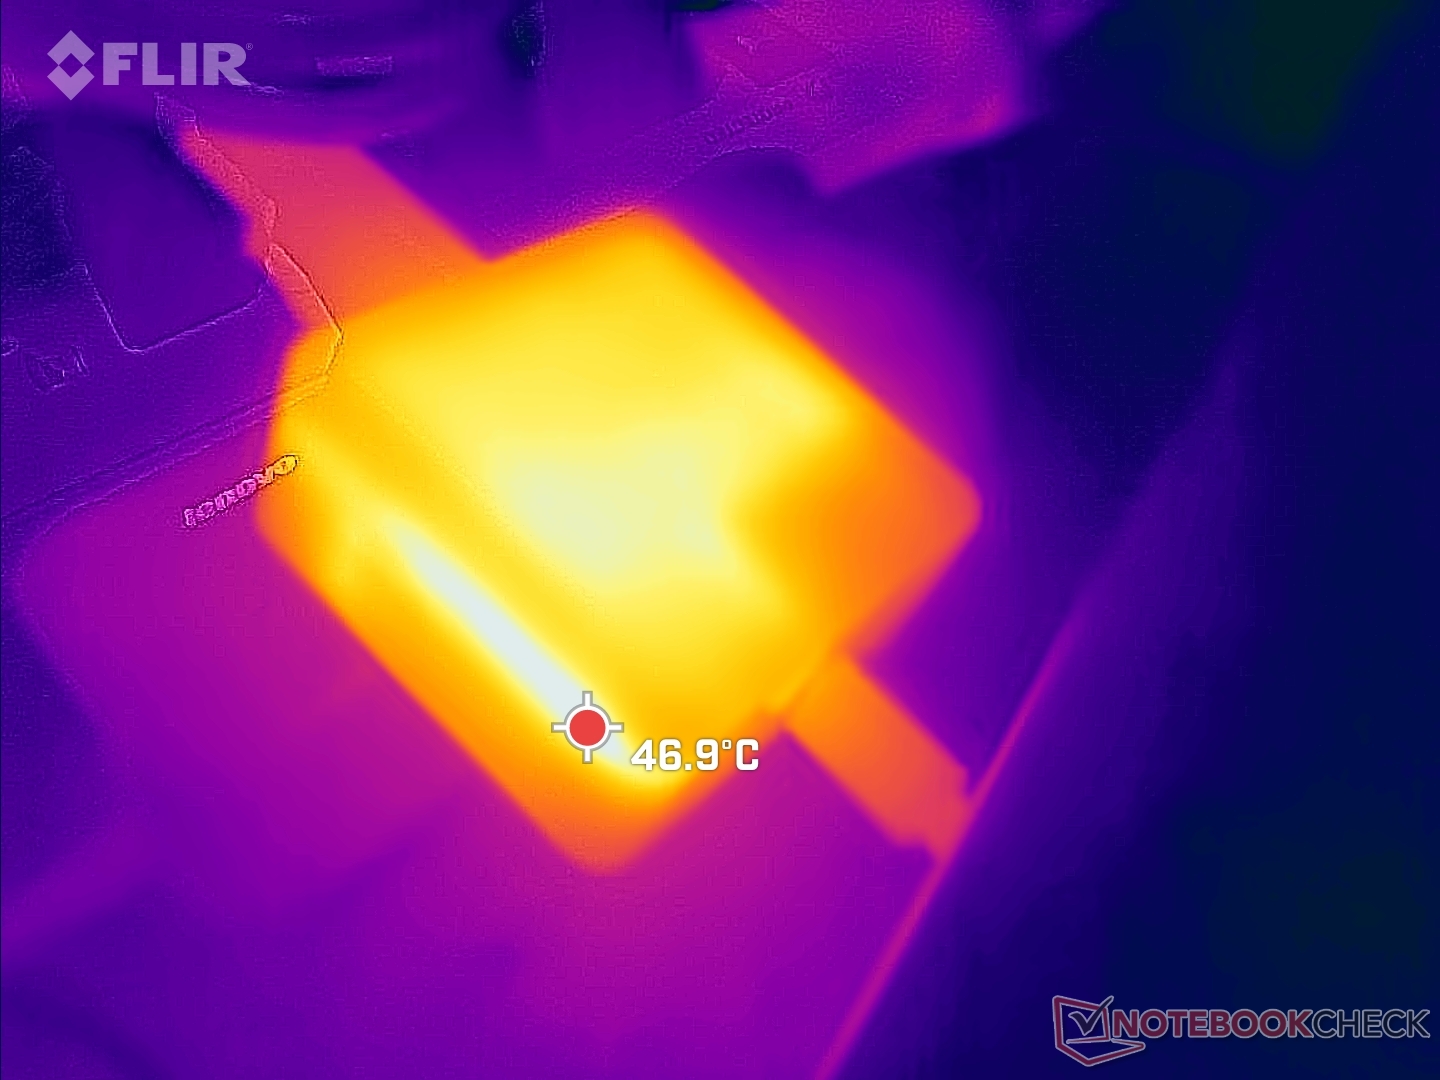
Stromverbrauch
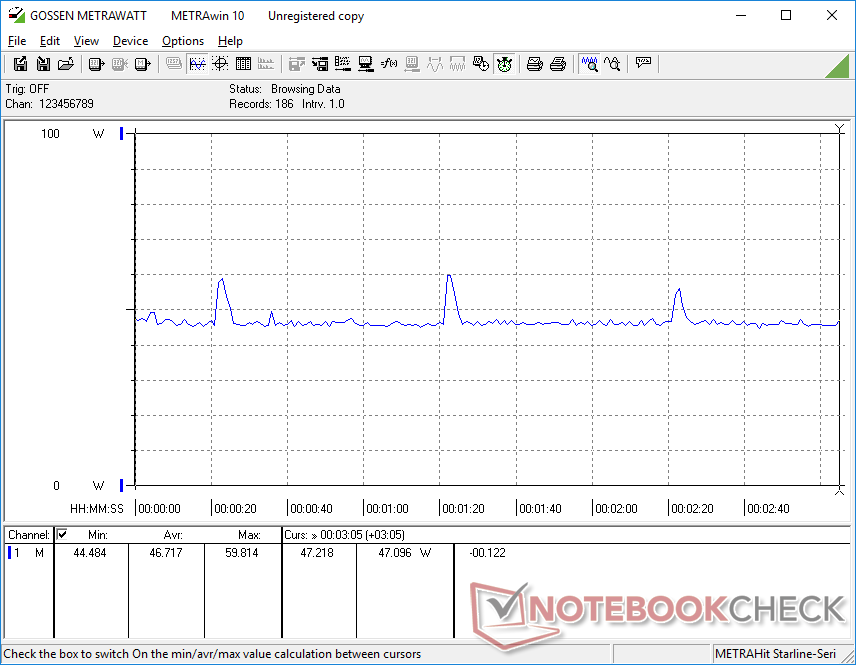
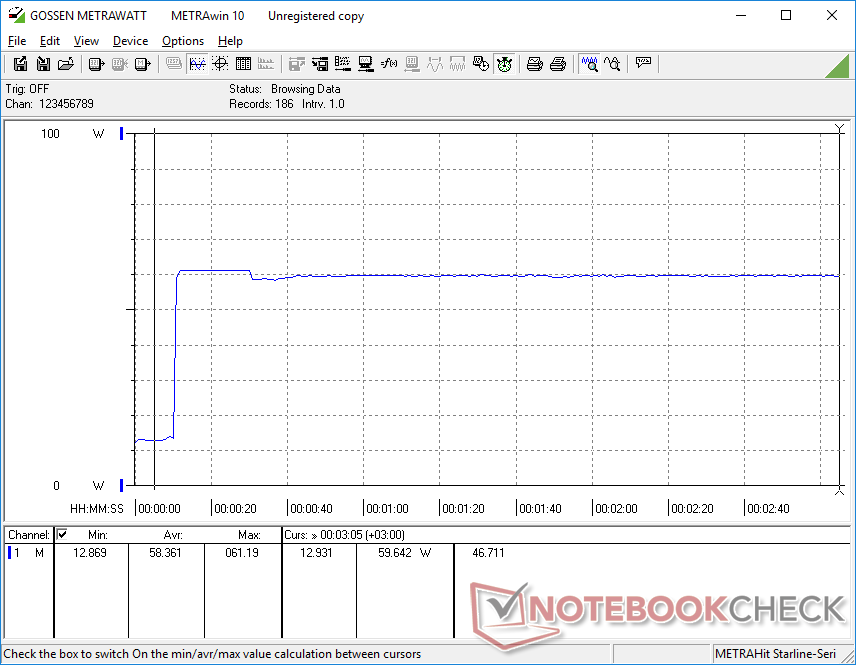
Wie von einem Alder-Lake-P-System der 12. Generation zu erwarten, ist der Gesamtstromverbrauch höher als bei vielen Laptops, die mit Tiger-Lake-U Prozessoren der 11. Generation ausgestattet sind. Die Ausführung von Prime95 verbraucht 60 W und ist damit 25 % anspruchsvoller als im Vorjahr. Die höhere Leistung des Prozessors gibt es in dieser Hinsicht nicht zum Nulltarif.
Mit dem kleinen (~5,8 x 5,8 x 2,7 cm) 60-Watt-Netzteil konnten wir unter Prime95-Lasten einen maximalen Verbrauch von 61,2 W verzeichnen. Der Hersteller hat keine Änderungen am Netzteil vorgenommen, obwohl der neuere Prozessor dieses Jahr anspruchsvoller ist. Ein Netzgerät mit höherer Kapazität hätte möglicherweise eine bessere Turbo-Boost-Leistung oder ein schnelleres Aufladen bei anspruchsvollen Lasten ermöglicht. Das GPD Win Max 2 beispielsweise ist mit der gleichen Core i7-1260P-CPU ausgestattet und wird dennoch mit einem 100-W-Netzteil geliefert.

| Aus / Standby | |
| Idle | |
| Last |
|
Legende:
min: | |
| Framework Laptop 13.5 12th Gen Intel i7-1260P, Iris Xe G7 96EUs, WDC PC SN730 SDBPNTY-512G, IPS, 2256x1504, 13.5" | Framework Laptop 13.5 i7-1165G7, Iris Xe G7 96EUs, Western Digital WD_BLACK SN850 WDS100T1X0E, IPS, 2256x1504, 13.5" | Lenovo ThinkPad X1 Titanium Yoga G1 20QB0016GE i5-1140G7, Iris Xe G7 80EUs, Lenovo UMIS RPJTJ256MEE1OWX, IPS LED, 2256x1504, 13.5" | HP EliteBook Folio 13.5-3G2L2EA SD 8cx Gen 2 5G, Adreno 680, Toshiba XG6 KXG60ZNV512G, IPS, 1920x1280, 13.5" | Microsoft Surface Laptop 4 13 Ryzen 5 R5 4680U, Vega 7, Samsung PM991 MZ9LQ256HBJQ, IPS, 2256x1504, 13.5" | HP Spectre x360 14-ea0378ng i7-1165G7, Iris Xe G7 96EUs, Intel Optane Memory H10 with Solid State Storage 32GB + 1TB HBRPEKNX0203AH(L/H), OLED, 3000x2000, 13.5" | |
|---|---|---|---|---|---|---|
| Stromverbrauch | 12% | 31% | 60% | 24% | 3% | |
| Idle min * (Watt) | 5.3 | 4.3 19% | 3.75 29% | 2.3 57% | 3.4 36% | 6.3 -19% |
| Idle avg * (Watt) | 8.4 | 8.2 2% | 7.75 8% | 3.7 56% | 6.3 25% | 11.2 -33% |
| Idle max * (Watt) | 11.2 | 8.7 22% | 8.69 22% | 5.6 50% | 8.1 28% | 13.3 -19% |
| Last avg * (Watt) | 57.4 | 43.5 24% | 33.12 42% | 13 77% | 36.2 37% | 32 44% |
| Witcher 3 ultra * (Watt) | 46.7 | 43.5 7% | 28.7 39% | |||
| Last max * (Watt) | 61.2 | 61.8 -1% | 35.19 43% | 25 59% | 64.1 -5% | 35.6 42% |
* ... kleinere Werte sind besser
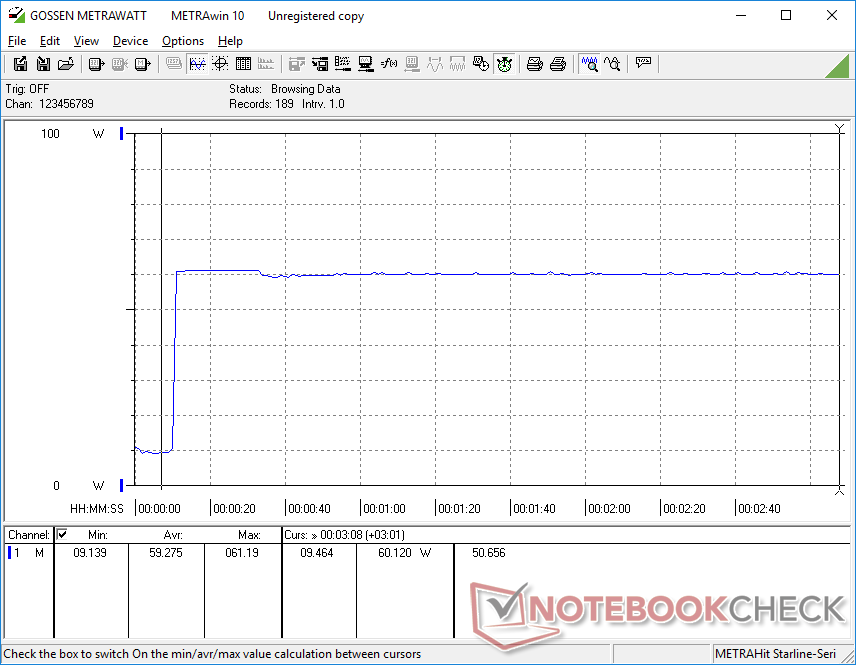
Power Consumption Witcher 3 / Stresstest
Power Consumption external Monitor
Akkulaufzeit
Die Laufzeit ist im Vergleich zum Vorjahresmodell um eine halbe Stunde kürzer trotz der viel schnelleren Prozessorleistung. 7,5 Stunden WLAN-Nutzung unter realen Bedingungen sollten für die meisten Nutzer ausreichen, auch wenn sie einige Stunden kürzer sind als beim Surface Laptop 4 13.
Das Aufladen von der leeren bis zur vollen Kapazität mit dem mitgelieferten Netzteil dauert etwa 90 Minuten. Allerdings verlangsamt sich der Ladevorgang aufgrund des oben erwähnten 60-Watt-Netzteils deutlich, wenn anspruchsvolle Lasten ausgeführt werden.
| Framework Laptop 13.5 12th Gen Intel i7-1260P, Iris Xe G7 96EUs, 55 Wh | Framework Laptop 13.5 i7-1165G7, Iris Xe G7 96EUs, 55 Wh | Lenovo ThinkPad X1 Titanium Yoga G1 20QA001RGE i7-1160G7, Iris Xe G7 96EUs, 44.5 Wh | HP EliteBook Folio 13.5-3G2L2EA SD 8cx Gen 2 5G, Adreno 680, 46 Wh | Microsoft Surface Laptop 4 13 Ryzen 5 R5 4680U, Vega 7, 47.4 Wh | HP Spectre x360 14-ea0378ng i7-1165G7, Iris Xe G7 96EUs, 66 Wh | |
|---|---|---|---|---|---|---|
| Akkulaufzeit | 7% | 12% | 95% | 45% | 4% | |
| WLAN (h) | 7.5 | 8 7% | 8.4 12% | 14.6 95% | 10.9 45% | 7.8 4% |
| H.264 (h) | 11.4 | 11.1 | ||||
| Last (h) | 1.9 | 4.2 | 2.6 | |||
| Idle (h) | 13.4 |
Pro
Contra
Fazit - Eine langfristige Lösung

Framework hatte versprochen, dass das Design seines Laptops einfache Upgrades ermöglicht, sobald die neueste Generation von Prozessor verfügbar ist. Beim Modell 2022 ist genau das der Fall, sowohl mit DIY-Motherboard-Upgrade-Kits für bestehende Besitzer als auch mit fertigen Konfigurationen für Neueinsteiger, die loslegen wollen. Im Vergleich zum 2021er Modell mit Intel der 11. Generation kann das 2022er Modell einen CPU-Leistungsschub von bis zu 90 Prozent bieten, den Enthusiasten sicherlich zu schätzen wissen. Dies geht jedoch auf Kosten von wärmeren Kerntemperaturen und einer etwas kürzeren Akkulaufzeit, aber je nach Nutzungsszenario kann sich dieser Kompromiss lohnen.
Abgesehen vom CPU-Upgrade bleibt die Erfahrung die gleiche, sowohl im Guten als auch im Schlechten. Es ist positiv für die garantierte Konsistenz und Vorhersehbarkeit zwischen den jährlichen Aktualisierungen, aber es ist auch negativ, da bestimmte Nachteile nicht so einfach behoben werden können. Neuere Ultrabooks wie die von Asus zum Beispiel werden jetzt sowohl mit Intel-/AMD- als auch mit OLED-Displays mit hoher Bildwiederholrate ausgeliefert, während das Framework Modell weiterhin nur eine Display-Option und keine Ryzen CPUs hat. Die Basis und der Deckel sind weiterhin anfälliger für Knarren und Verwinden als die Flaggschiffmodelle von Dell, HP oder Lenovo. Wir würden gerne auch WAN- und IR-Optionen sehen, vielleicht in Form einer Erweiterungskarte, wenn interne Motherboard-Änderungen nicht möglich sind. Die Integration einiger dieser Funktionen könnte sich als schwierig erweisen, da der Hersteller auf das ursprüngliche Design und die Teile des 2021er Gehäuses beschränkt ist.
Selbst wenn man diese Herausforderungen bedenkt, schmälern sie nicht die hohe Anpassungsfähigkeit oder das benutzerfreundliche Design des Framework Laptops. Besitzer, die Wert auf Reparierbarkeit und leicht zu beschaffende Ersatzteile für ihre teuren Produkte legen, werden den Framework Laptop weniger frustrierend finden als eine geschlossene Alternative wie den Surface Laptop.
Preis und Verfügbarkeit
Framework nimmt ab sofort Bestellungen für seinen Laptop mit Intel der 12. Generation ab 1.199 Euro für die Core-i5-Version oder 1.649 Euro für unsere Test-Konfiguration entgegen.
Framework Laptop 13.5 12th Gen Intel
- 12.07.2022 v7 (old)
Allen Ngo
Preisvergleich

