Testberichte für den Intel Core i7-1255U Prozessor
Microsoft Surface Laptop 5 15 im Test - Altes Design zum Premium-Preis
Microsoft aktualisiert den Surface Laptop 5 mit Intel Alder-Lake-Prozessoren sowie Thunderbolt 4, doch das restliche Gerät bleibt gleich. Angesichts des hohen Preises entsprechen aber weder die Leistung noch die Ausstattung den Erwartungen.
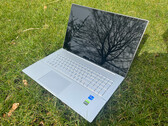
Intel Core i7-1255U, Iris Xe G7 96EUs, 15", 1.6 kgHP Envy 17 Laptop-Test: GeForce GPU bespielt schickes 4K-Display im Multimedia-Notebook
Ein großes Display mit hoher 4K-Auflösung im schlichten Gehäuse, dazu Rechenpower aus Intels 12. Generation, 32 GB DDR4 RAM und eine dedizierte GeForce GPU – das Paket des HP Envy 17-cr0079ng klingt interessant. Ob der Multimedia-Laptop auch in der Praxis überzeugen kann, verrät unser Notebook-Test.
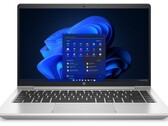
Intel Core i7-1255U, NVIDIA GeForce RTX 2050 Mobile, 17.3", 2.6 kgHP ProBook 440 G9 Laptop im Test: Effizienter i7-1255U ohne Glanz
Stabil, dank 14 Zoll schnell verstaut und keinesfalls untermotorisiert: Das ProBook glänzt mit Nüchternheit. Es bietet die nötige Ausstattung für mobiles Arbeiten, lässt viel Platz für Erweiterungen und stellt eine ganze Reihe an Sicherheitsmerkmalen zur Verfügung. Wo es auftrumpfen kann, soll unser Test zeigen.
Intel Core i7-1255U, Iris Xe G7 96EUs, 14", 1.4 kgAsus Chromebook Flip CX5 im Test: Hohe Leistung zum hohen Kaufpreis
... trifft beim Asus Chromebook Flip CX5 auf ein hochwertiges Gehäuse. Kaum ein anderes Chromebook hat einen potenteren Prozessor oder mehr Arbeitsspeicher. Die Leistung des Convertibles ist stark und eignet sich auch zum Zocken, wie einige Tests mit Steam-Games zeigen. Einzig der Preis des CX5 stört.
Intel Core i7-1255U, Iris Xe G7 96EUs, 15.8", 2.1 kgMicrosoft Surface Pro 9 im Test - Convertible jetzt mit deutlich mehr CPU-Leistung
Microsoft bietet das Surface Pro 9 jetzt entweder mit Intel- oder Qualcomm-CPUs an. Der aktualisierte Alder-Lake-U-Prozessor bietet deutlich mehr CPU-Leistung und das Convertible unterstützt nun Wi-Fi 6E, dafür wurde aber der Klinkenstecker gestrichen.
Intel Core i7-1255U, Iris Xe G7 96EUs, 13", 877 gAcer Aspire Vero AV14-51-72DL: Intel Iris Xe Graphics G7 96EUs, 14.00", 1.5 kg
Test » Acer Aspire Vero AV14 Office-Notebook im Test: Auffälliges Gehäuse aus Recycling-Materialien
Lenovo IdeaPad Flex 7i 14IAU7: Intel Iris Xe Graphics G7 96EUs, 14.00", 1.5 kg
Test » Lenovo IdeaPad Flex 7 vs. IdeaPad Flex 5 Test: Schneller Prozessor und besserer Touchscreen
HP ProBook 450 G9 6A180EA: Intel Iris Xe Graphics G7 96EUs, 15.60", 1.7 kg
Test » HP ProBook 450 G9 Laptop-Test: Endlich eine effiziente Intel-CPU
HP Spectre x360 13.5 14t-ef000: Intel Iris Xe Graphics G7 96EUs, 13.50", 1.4 kg
Test » Test HP Spectre x360 2022 13.5: Die Spitze der Subnotebook-Convertibles
Dell Inspiron 14 7420 2-in-1: Intel Iris Xe Graphics G7 96EUs, 14.00", 1.6 kg
Test » Premiere des Intel Core i7-1255U: 2-in-1-Convertible Dell Inspiron 14 7420 im Test
HP ProBook 440 G9-5Y3Z3EA: Intel Iris Xe Graphics G7 96EUs, 14.00", 1.4 kg
Externer Test » HP ProBook 440 G9-5Y3Z3EA
Acer Aspire Lite 16 AL16-51P: Intel Iris Xe Graphics G7 96EUs, 16.00", 1.8 kg
Externer Test » Acer Aspire Lite 16 AL16-51P
Asus Vivobook 14 X1404ZA, i7-1255U: Intel Iris Xe Graphics G7 96EUs, 14.00", 1.4 kg
Externer Test » Asus Vivobook 14 X1404ZA, i7-1255U
Asus ExpertBook B1 B1502CB, i7-1255U: Intel Iris Xe Graphics G7 96EUs, 15.60", 1.7 kg
Externer Test » Asus ExpertBook B1 B1502CB, i7-1255U
Infinix INBook Y3 Max: Intel Iris Xe Graphics G7 96EUs, 16.00", 1.8 kg
Externer Test » Infinix INBook Y3 Max
Medion Akoya S17413: Intel Iris Xe Graphics G7 96EUs, 17.30", 2.3 kg
Externer Test » Medion Akoya S17413
Asus VivoBook 16 X1605, i7-1255U: Intel Iris Xe Graphics G7 96EUs, 16.00", 1.9 kg
Externer Test » Asus VivoBook 16 X1605, i7-1255U
Lenovo ThinkBook 16 G4+: Intel Iris Xe Graphics G7 96EUs, 16.00", 1.8 kg
Externer Test » Lenovo ThinkBook 16 G4+
Asus VivoBook 16X X1605, i7-1255U: Intel Iris Xe Graphics G7 96EUs, 16.00", 1.9 kg
Externer Test » Asus VivoBook 16X X1605, i7-1255U
HP 15s-fq5121ns: Intel Iris Xe Graphics G7 96EUs, 15.60", 1.7 kg
Externer Test » HP 15s-fq5121ns
Lenovo IdeaPad 3 15IAU7: Intel Iris Xe Graphics G7 96EUs, 15.60", 1.6 kg
Externer Test » Lenovo IdeaPad 3 15IAU7
HP Pavilion 15-eg2772nd: Intel Iris Xe Graphics G7 96EUs, 15.60", 1.7 kg
Externer Test » HP Pavilion 15-eg2772n
Durabook R11 Rugged: Intel Iris Xe Graphics G7 96EUs, 11.60", 1.2 kg
Externer Test » Durabook R11 Rugged
HP 15s-fq5054ns: Intel Iris Xe Graphics G7 96EUs, 15.60", 1.7 kg
Externer Test » HP 15s-fq5054ns
Acer Aspire 5 A515-57-77VF: Intel Iris Xe Graphics G7 96EUs, 15.60", 1.8 kg
Externer Test » Acer Aspire 5 A515-57-77VF
HP EliteBook 1040 G9, i7-1255U: Intel Iris Xe Graphics G7 96EUs, 14.00", 1.2 kg
Externer Test » HP EliteBook 1040 G9, i7-1255U
Asus VivoBook 14 F1402ZA, i7-1255U: Intel Iris Xe Graphics G7 96EUs, 14.00", 1.5 kg
Externer Test » Asus VivoBook 14 F1402ZA, i7-1255U
HP ZBook Firefly 14 G9, i7-1255U: Intel Iris Xe Graphics G7 96EUs, 14.00", 1.5 kg
Externer Test » HP ZBook Firefly 14 G9, i7-1255U
HP EliteBook 840 G9: Intel Iris Xe Graphics G7 96EUs, 14.00", 1.4 kg
Externer Test » HP EliteBook 840 G9
Acer Aspire 5 A515-57-76BV: Intel Iris Xe Graphics G7 96EUs, 15.60", 1.8 kg
Externer Test » Acer Aspire 5 A515-57-76BV
HP 15s-fq5061ns: Intel Iris Xe Graphics G7 96EUs, 15.60", 1.7 kg
Externer Test » HP 15s-fq5061ns
Lenovo ThinkBook 13x Gen 2, i7-1255U: Intel Iris Xe Graphics G7 96EUs, 13.30", 1.2 kg
Externer Test » Lenovo ThinkBook 13x Gen 2, i7-1255U
HP 15s-fq5047ns: Intel Iris Xe Graphics G7 96EUs, 15.60", 1.7 kg
Externer Test » HP 15s-fq5047ns
HP 15s-fq5098ns: Intel Iris Xe Graphics G7 96EUs, 15.60", 1.6 kg
Externer Test » HP 15s-fq5098ns
HP Envy 17-cr0079ng: NVIDIA GeForce RTX 2050 Mobile, 17.30", 2.6 kg
Externer Test » HP Envy 17-cr0079ng
Lenovo V15 G3 IAP, i7-1255U: Intel Iris Xe Graphics G7 96EUs, 15.60", 1.7 kg
Externer Test » Lenovo V15 G3 IAP, i7-1255U
HP Spectre x360 14-ef0075ng: Intel Iris Xe Graphics G7 96EUs, 13.50", 1.4 kg
Externer Test » HP Spectre x360 14-ef0075ng
Acer Chromebook Vero 514 CBV514-1H, i7-1255U: Intel Iris Xe Graphics G7 96EUs, 14.00", 1.5 kg
Externer Test » Acer Chromebook Vero 514 CBV514-1H, i7-1255U
Asus VivoBook 14 F1402ZA-EK329W: Intel Iris Xe Graphics G7 96EUs, 14.00", 1.5 kg
Externer Test » Asus VivoBook 14 F1402ZA-EK329W
HP Pavilion Plus 14-eh0032TX: NVIDIA GeForce RTX 2050 Mobile, 14.00", 1.4 kg
Externer Test » HP Pavilion Plus 14-eh0032TX
Acer Aspire 3 A317-54-768S: Intel Iris Xe Graphics G7 96EUs, 13.30", 2.5 kg
Externer Test » Acer Aspire 3 A317-54-768S
Acer Aspire 5 A517-53G-757V: NVIDIA GeForce MX550, 17.30", 2.3 kg
Externer Test » Acer Aspire 5 A517-53G-757V
HP EliteBook 830 G9, i7-1255U: Intel Iris Xe Graphics G7 96EUs, 13.30", 1.3 kg
Externer Test » HP EliteBook 830 G9, i7-1255U
HP ProBook 450 G9 6A180EA: Intel Iris Xe Graphics G7 96EUs, 15.60", 1.7 kg
Externer Test » HP ProBook 450 G9 6A180EA
Acer Aspire Vero AV14-51-73LM: Intel Iris Xe Graphics G7 96EUs, 14.00", 1.5 kg
Externer Test » Acer Aspire Vero AV14-51-73LM
Acer Aspire Vero AV15-52-73F2: Intel Iris Xe Graphics G7 96EUs, 15.60", 1.8 kg
Externer Test » Acer Aspire Vero AV15-52-73F2
Lenovo IdeaPad Duet 5 12IAU7, i7-1255U: Intel Iris Xe Graphics G7 96EUs, 12.40", 0.8 kg
Externer Test » Lenovo IdeaPad Duet 5 12IAU7, i7-1255U
HP Envy x360 15-eu1026nr: Intel Iris Xe Graphics G7 96EUs, 15.60", 1.8 kg
Externer Test » HP Envy x360 15-eu1026nr
HP Envy x360 15-ew0170nd: NVIDIA GeForce RTX 2050 Mobile, 15.60", 1.7 kg
Externer Test » HP Envy x360 15-ew0170nd
Samsung Galaxy Book2 360 13-NP730QED: Intel Iris Xe Graphics G7 96EUs, 13.30", 1.2 kg
Externer Test » Samsung Galaxy Book2 360 13-NP730QED
HP Spectre x360 14-ef0073ng: Intel Iris Xe Graphics G7 96EUs, 13.50", 1.4 kg
Externer Test » HP Spectre x360 14-ef0073ng
HP EliteBook 860 G9, i7-1255U: Intel Iris Xe Graphics G7 96EUs, 16.00", 1.8 kg
Externer Test » HP EliteBook 860 G9, i7-1255U
MSI Modern 14 C12M, i7-1255U: Intel Iris Xe Graphics G7 96EUs, 14.00", 1.4 kg
Externer Test » MSI Modern 14 C12M, i7-1255U
Microsoft Surface Laptop 5 13, i7-1255U: Intel Iris Xe Graphics G7 96EUs, 13.50", 1.3 kg
Externer Test » Microsoft Surface Laptop 5 13, i7-1255U
Acer Aspire 5 A515-57G-74D3: NVIDIA GeForce MX550, 15.60", 1.8 kg
Externer Test » Acer Aspire 5 A515-57G-74D3
Asus ExpertBook B9 B9400, i7-1255U: Intel Iris Xe Graphics G7 96EUs, 14.00", 1 kg
Externer Test » Asus ExpertBook B9 B9400, i7-1255U
Acer Aspire Vero AV14-51-72DL: Intel Iris Xe Graphics G7 96EUs, 14.00", 1.5 kg
Externer Test » Acer Aspire Vero AV14-51-72DL
HP Pavilion Plus 14-eh0001nf: NVIDIA GeForce RTX 2050 Mobile, 14.00", 1.4 kg
Externer Test » HP Pavilion Plus 14-eh0001nf
Microsoft Surface Pro 9, i7-1255U: Intel Iris Xe Graphics G7 96EUs, 13.00", 0.9 kg
Externer Test » Microsoft Surface Pro 9, i7-1255U
Microsoft Surface Laptop 5 15, i7-1255U: Intel Iris Xe Graphics G7 96EUs, 15.00", 1.6 kg
Externer Test » Microsoft Surface Laptop 5 15, i7-1255U
MSI Modern 15 B12M, i7-1255U: Intel Iris Xe Graphics G7 96EUs, 15.60", 1.8 kg
Externer Test » MSI Modern 15 B12M, i7-1255U
Lenovo ThinkPad X1 Carbon G10-21CB009SGE: Intel Iris Xe Graphics G7 96EUs, 14.00", 1.1 kg
Externer Test » Lenovo ThinkPad X1 Carbon G10-21CB009SGE
Acer Aspire Vero AV15-52-712Q: Intel Iris Xe Graphics G7 96EUs, 15.60", 1.8 kg
Externer Test » Acer Aspire Vero AV15-52-712Q
Acer Aspire Vero AV15-52-772X: Intel Iris Xe Graphics G7 96EUs, 15.60", 1.8 kg
Externer Test » Acer Aspire Vero AV15-52-772X
HP Pavilion x360 14-ek0000: Intel Iris Xe Graphics G7 96EUs, 14.00", 1.5 kg
Externer Test » HP Pavilion x360 14-ek0000
Lenovo Yoga 7 14IAL7-82QE000KUS: Intel Iris Xe Graphics G7 96EUs, 14.00", 1.5 kg
Externer Test » Lenovo Yoga 7 14IAL7-82QE000KUS
HP Elite Dragonfly G3, i7-1255U: Intel Iris Xe Graphics G7 96EUs, 13.50", 1 kg
Externer Test » HP Elite Dragonfly G3, i7-1255U
Lenovo ThinkBook 14s Yoga G2 IAP 21DM000FGE: Intel Iris Xe Graphics G7 96EUs, 14.00", 1.5 kg
Externer Test » Lenovo ThinkBook 14s Yoga G2 IAP 21DM000FGE
VAIO FE 14.1 VWNC71429-BK: Intel Iris Xe Graphics G7 96EUs, 14.10", 1.6 kg
Externer Test » VAIO FE 14.1 VWNC71429-BK
HP 15-dw4020nu: NVIDIA GeForce MX550, 15.60", 1.8 kg
Externer Test » HP 15-dw4020nu
Lenovo ThinkPad E15 G4-21E60050GE: Intel Iris Xe Graphics G7 96EUs, 15.60", 1.7 kg
Externer Test » Lenovo ThinkPad E15 G4-21E60050GE
Samsung Galaxy Book2 15, i7-1255U: Intel Iris Xe Graphics G7 96EUs, 15.60", 1.6 kg
Externer Test » Samsung Galaxy Book2 15, i7-1255U
Dell Inspiron 14 7420 2-in-1: Intel Iris Xe Graphics G7 96EUs, 14.00", 1.6 kg
Externer Test » Dell Inspiron 14 7420 2-in-1
Lenovo IdeaPad Flex 5 14IAU7-82R7002QGE: Intel Iris Xe Graphics G7 96EUs, 14.00", 1.6 kg
Externer Test » Lenovo IdeaPad Flex 5 14IAU7-82R7002QGE
Samsung Galaxy Book2 Pro 360 13, i7-1255U: Intel Iris Xe Graphics G7 96EUs, 13.30", 1.2 kg
Externer Test » Samsung Galaxy Book2 360 Pro 13, i7-1255U
HP Spectre x360 13.5 14t-ef000: Intel Iris Xe Graphics G7 96EUs, 13.50", 1.4 kg
Externer Test » HP Spectre x360 13.5 14t-ef000
Asus Chromebook Flip CX5 CX5601FB: Intel Iris Xe Graphics G7 96EUs, 15.80", 2.1 kg
Artikel » Gaming auf dem Chromebook - Steam Beta mit vielen aktuellen Spielen getestet
HP EliteBook 830 G9, i7-1255U: Intel Iris Xe Graphics G7 96EUs, 13.30", 1.3 kg
» Deal: 13 Zoll Business-Laptop HP EliteBook 830 G10 mit Core i5, 16 GB RAM und LTE unschlagbar günstig
Microsoft Surface Pro 9, i7-1255U: Intel Iris Xe Graphics G7 96EUs, 13.00", 0.9 kg
» Deal: Microsoft Surface Pro 9 mit 16GB RAM zum Top-Preis bei Amazon
» Kaufland: Microsoft Surface Pro 9 Windows-Tablet mit 120Hz-Touchscreen zum Bestpreis von nur 799 Euro
» Deal: Surface Pro 9 Windows-Tablet mit 32GB RAM und 1TB SSD um fast 400 Euro reduziert direkt bei Microsoft
» Amazon: Microsoft Surface Pro 9 Windows-Tablet mit 16 GB RAM und 120Hz-Touchscreen zum neuen Bestpreis
Microsoft Surface Laptop 5 13, i7-1255U: Intel Iris Xe Graphics G7 96EUs, 13.50", 1.3 kg
» Surface Pro 10, Surface Laptop 6: Microsoft AI-PCs mit neuem Design, Snapdragon X Elite und Core Ultra gegen Apple M3 Macbook
Microsoft Surface Laptop 5 15, i7-1255U: Intel Iris Xe Graphics G7 96EUs, 15.00", 1.6 kg
» Surface Pro 10, Surface Laptop 6: Microsoft AI-PCs mit neuem Design, Snapdragon X Elite und Core Ultra gegen Apple M3 Macbook
Microsoft Surface Pro 9, i7-1255U: Intel Iris Xe Graphics G7 96EUs, 13.00", 0.9 kg
» Surface Pro 10, Surface Laptop 6: Microsoft AI-PCs mit neuem Design, Snapdragon X Elite und Core Ultra gegen Apple M3 Macbook
Acer Aspire Vero AV14-51-72DL: Intel Iris Xe Graphics G7 96EUs, 14.00", 1.5 kg
» Bestpreis-Deal: Schicker Öko-Laptop Acer Aspire Vero 14 mit extrem langer Akkulaufzeit und farbkräftigem Display
Microsoft Surface Pro 9, i7-1255U: Intel Iris Xe Graphics G7 96EUs, 13.00", 0.9 kg
» Amazon Black Friday: Microsoft Surface Pro 9 mit 16 GB RAM und 120-Hz-Touchscreen erneut zum Tiefpreis
» Deal: Microsoft Surface Pro 9 mit 120-Hz-Touchscreen und 16 GB RAM zum neuen Tiefpreis zum Amazon Prime Day
HP EliteBook 860 G9, i7-1255U: Intel Iris Xe Graphics G7 96EUs, 16.00", 1.8 kg
» HP EliteBook 860 G9 Business-Notebook mit LTE um satte 32% reduziert
Dell Inspiron 14 7420 2-in-1: Intel Iris Xe Graphics G7 96EUs, 14.00", 1.6 kg
» Deal: Dell Inspiron 14 Convertible mit AMD Ryzen 7 und 16GB RAM erhält 16% Rabatt direkt beim Hersteller
Microsoft Surface Pro 9, i7-1255U: Intel Iris Xe Graphics G7 96EUs, 13.00", 0.9 kg
» Deal: Microsoft Surface Pro 9 mit 120-Hz-Touchscreen und 16 GB RAM zum Bestpreis bei Amazon
Microsoft Surface Laptop 5 15, i7-1255U: Intel Iris Xe Graphics G7 96EUs, 15.00", 1.6 kg
» Der Microsoft Surface Laptop 5 15 ist einfach viel zu teuer
HP Envy 17-cr0079ng: NVIDIA GeForce RTX 2050 Mobile, 17.30", 2.6 kg
» HP Envy 17 getestet: Großes Multimedia-Notebook mit GeForce RTX und 4K-Display
Microsoft Surface Pro 9, i7-1255U: Intel Iris Xe Graphics G7 96EUs, 13.00", 0.9 kg
» Amazon-Deal: Microsoft Surface Pro 9 zum Bestpreis von 969 Euro
HP ProBook 440 G9-5Y3Z3EA: Intel Iris Xe Graphics G7 96EUs, 14.00", 1.4 kg
» Leistungssprung gegen Stromverbrauch: HP ProBook 440 G9 getestet
Microsoft Surface Pro 9, i7-1255U: Intel Iris Xe Graphics G7 96EUs, 13.00", 0.9 kg
» Deal: Microsoft Surface Pro 9 zum Tiefpreis von 999 Euro
» Microsofts Surface Pro 9 ist jetzt schneller, bietet aber keinen Klinkenstecker mehr
Acer Aspire Vero AV14-51-72DL: Intel Iris Xe Graphics G7 96EUs, 14.00", 1.5 kg
» Acer Aspire Vero AV14-51: 14-Zoll-Notebook bietet hervorragende Akkulaufzeiten
HP Spectre x360 13.5 14t-ef000: Intel Iris Xe Graphics G7 96EUs, 13.50", 1.4 kg
» Das HP Spectre x360 13.5 2022 hat weniger Tasten und einen langsameren microSD-Kartenleser als das 2020er-Modell