Testberichte für den Intel Core Ultra 5 125H Prozessor
Test Alldocube iWork GT Ultra Convertible: Alternative zu Android-Tablets mit echter PC-Leistung
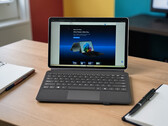
Mit dem iWork GT Ultra bietet Alldocube ein vielseitiges Windows-Convertible mit Intel Core Ultra 5 125H an. Stylus und Tastaturcover sind im Gesamtpaket für rund 799 Euro erhältlich. Doch wie überzeugt das Gerät im Alltag bei Leistung, Mobilität und Akkulaufzeit? Unser Test klärt die wichtigsten Fragen.
Intel Core Ultra 5 125H, Arc 7-Core, 13", 870 gBesonders sparsamer Core-Ultra-Mini-PC - Minix Elite EU512-AI im Check
Mini-PCs aus Fernost werben oft mit schwachen Prozessoren wie dem Intel N100 und dafür günstigen Preisen. Nicht so die Elite-Serie von Minix: Hier werden Intel-Core-Ultra-Modelle verbaut, dafür gehen die Preise auch erst bei 668 bzw. 829 Euro los. Wir testen was der AI-Mini-PC drauf hat.
Intel Core Ultra 5 125H, Arc 7-Core, 772 gGMK NucBox K9 Mini-PC im Test: Core Ultra 5 125H mit Arc 7 Grafik
Der Core Ultra 5 125H mag zu einem intelligenten PC beitragen, doch das bedeutet nicht zwangsläufig, dass er auch schneller ist. In puncto Rohleistung bleibt er klar hinter dem älteren und günstigeren Ryzen 7 7840HS zurück.
Intel Core Ultra 5 125H, Arc 7-Core, 528 gAsus NUC 14 Pro im Test: NUC-Mini-PC mit Intel Core Ultra 5 125H, schneller Intel-Arc-iGPU und 2x Thunderbolt 4
Asus hat die NUC-Sparte von Intel übernommen und bietet nunmehr die beliebten Mini-PCs mit Intels Meteor-Lake-Prozessoren an. Damit bekommen die kleinen Desktop-Computer nicht nur mehr CPU-Leistung, sondern können aufgrund der überarbeiteten iGPU deutlich an 3D-Leistung zulegen. Wir haben den Asus NUC 14 Pro mit Intel Core Ultra 5 125H ausführlich getestet und bewerten die Leistung anhand zahlreicher Messungen und Benchmarks.
Intel Core Ultra 5 125H, Arc 7-Core, 525 gMinisforum UH125 Pro im Test: AI-Mini-PC mit Intel Core Ultra 5 125H, 32 GB DDR5-RAM und 1-TB-SSD hat seinen Preis
Auf Grundlage der Intel-Meteor-Lake-Prozessoren erneuert Minisforum seine Modellpalette: Der UH125 Pro kommt basierend auf dem Intel Core Ultra 5 125H in die Verkaufsregale. Zudem kann man sich über eine üppige Anschlussausstattung freuen, welche mit USB4 und OCuLink aktuell zu den modernsten zählt. Wir haben uns das Gerät im Detail angeschaut und analysieren die Leistung anhand zahlreicher Messungen und Benchmarks.
Intel Core Ultra 5 125H, Arc 7-Core, 797 gLenovo ThinkBook 13x G4 21KR0008GE: Intel Arc 7-Core iGPU, 13.50", 1.2 kg
Test » Lenovo ThinkBook 13x G4 Laptop im Test - Abgesehen von der Tastatur eines der besten Subnotebooks
Samsung Galaxy Book4 Pro 360: Intel Arc 7-Core iGPU, 16.00", 1.7 kg
Test » Samsung Galaxy Book4 Pro 360 im Test - Extrem flaches Convertible mit Core Ultra 5 und 120-Hz AMOLED
Lenovo IdeaPad Slim 5 14IMH9: Intel Arc 7-Core iGPU, 14.00", 1.4 kg
Test » Test Lenovo IdeaPad Slim 5 14 Laptop: Gelungener Allrounder mit OLED-Display
Honor MagicBook X 16 (2026): Intel Arc 7-Core iGPU, 16.00", 1.8 kg
Externer Test » Honor MagicBook X 16 (2026)
Asus ExpertBook B3405: Intel Arc 7-Core iGPU, 14.00", 1.4 kg
Externer Test » Asus ExpertBook B3405
Acer Swift X 14 OLED SFX14-72G, Ultra 5 125H: NVIDIA GeForce RTX 4050 Laptop GPU, 14.50", 1.6 kg
Externer Test » Acer Swift X 14 OLED SFX14-72G, Ultra 5 125H
Acer Aspire Lite 16 AI AL16-71P: Intel Arc 7-Core iGPU, 16.00", 1.6 kg
Externer Test » Acer Aspire Lite 16 AI AL16-71P
Acer Aspire 16 A16-71M: Intel Arc 7-Core iGPU, 16.00", 1.6 kg
Externer Test » Acer Aspire 16 A16-71M
MSI Modern 15 H AI C1MG, Ultra 5 125H: Intel Arc 7-Core iGPU, 15.60", 1.9 kg
Externer Test » MSI Modern 15 H AI C1MG, Ultra 5 125H
Dynabook Portégé X30L-M: Intel Arc 7-Core iGPU, 13.30", 0.9 kg
Externer Test » Dynabook Portégé X30L-M
Asus Zenbook 14 OLED Q415MA: Intel Arc 7-Core iGPU, 14.00", 1.3 kg
Externer Test » Asus Zenbook 14 OLED Q415MA
Lenovo ThinkBook 13x G4 21KR0008GE: Intel Arc 7-Core iGPU, 13.50", 1.2 kg
Externer Test » Lenovo ThinkBook 13x G4 21KR0008GE
Lenovo ThinkBook 16 G7 IML, Ultra 5 125H: Intel Arc 7-Core iGPU, 16.00", 1.7 kg
Externer Test » Lenovo ThinkBook 16 G7 IML, Ultra 5 125H
HP Pavilion Plus 14-ew1000: Intel Arc 7-Core iGPU, 14.00", 1.4 kg
Externer Test » HP Pavilion Plus 14-ew1000
LG gram 14 2-in-1 14T90S: Intel Arc 7-Core iGPU, 14.00", 1.3 kg
Externer Test » LG gram 14 2-in-1 14T90S
Lenovo Yoga 7 14IML9, Ultra 5 125H: Intel Arc 7-Core iGPU, 14.00", 1.5 kg
Externer Test » Lenovo Yoga 7 14IML9, Ultra 5 125H
Acer Swift Go 14 SFG14-72, Ultra 5 125H: Intel Arc 7-Core iGPU, 14.00", 1.3 kg
Externer Test » Acer Swift Go 14 SFG14-72, Ultra 5 125H
MSI Prestige 14 AI Evo C1MG: Intel Arc 7-Core iGPU, 14.00", 1.7 kg
Externer Test » MSI Prestige 14 AI Evo C1MG
Asus VivoBook Pro 15 OLED N6506, Ultra 5 125H: NVIDIA GeForce RTX 4060 Laptop GPU, 15.60", 1.8 kg
Externer Test » Asus VivoBook Pro 15 OLED N6506, Ultra 5 125H
Lenovo Yoga Pro 7 14IMH9, RTX 4060: NVIDIA GeForce RTX 4060 Laptop GPU, 14.50", 1.6 kg
Externer Test » Lenovo Yoga Pro 7 14IMH9, RTX 4060
MSI Prestige 13 AI Evo, Ultra 5: Intel Arc 7-Core iGPU, 13.30", 1 kg
Externer Test » MSI Prestige 13 AI Evo, Ultra 5
Asus VivoBook S 14 OLED S5406MA: Intel Arc 7-Core iGPU, 14.00", 1.3 kg
Externer Test » Asus VivoBook S 14 OLED S5406MA
Lenovo IdeaPad Slim 5 14IMH9: Intel Arc 7-Core iGPU, 14.00", 1.4 kg
Externer Test » Lenovo IdeaPad Slim 5 14IMH9
Asus ZenBook 14 UX3405MA, Ultra 5: Intel Arc 7-Core iGPU, 14.00", 1.3 kg
Externer Test » Asus ZenBook 14 UX3405MA, Ultra 5
Lenovo ThinkBook 13x IMH G4: Intel Arc 7-Core iGPU, 13.50", 1.2 kg
Externer Test » Lenovo ThinkBook 13x IMH G4
Samsung Galaxy Book4 Pro 360: Intel Arc 7-Core iGPU, 16.00", 1.7 kg
Externer Test » Samsung Galaxy Book4 Pro 360
Lenovo IdeaPad Slim 5 14IMH9: Intel Arc 7-Core iGPU, 14.00", 1.4 kg
» Snapdragon X, 32 GB RAM, 1 TB SSD, OLED: Lenovo Office-Notebook (14 Zoll) im Angebot
Alldocube iWork GT Ultra: Intel Arc 7-Core iGPU, 13.00", 0.9 kg
» Windows-Convertible-Tablet unter 800 Euro: iWork GT Ultra – Preis-Leistungs-Tipp oder Kompromissgerät?
Lenovo IdeaPad Slim 5 14IMH9: Intel Arc 7-Core iGPU, 14.00", 1.4 kg
» OLED-Display (DCI-P3), Core Ultra 7, 32 GB RAM, 1 TB SSD: Lenovo IdeaPad Slim 5 (14 Zoll) im Angebot
Minix Elite EU512-AI: Intel Arc 7-Core iGPU, 0.8 kg
» AI-PCs von wegen! NPUs vs. GPUs - der zersplitterte KI-Markt
Lenovo IdeaPad Slim 5 14IMH9: Intel Arc 7-Core iGPU, 14.00", 1.4 kg
» Deal: Lenovo IdeaPad Slim 5 mit OLED-Display und Core Ultra 5 125H gibts jetzt für nur 699 Euro
» Amazon: Lenovo IdeaPad Slim 5 OLED-Laptop mit Ryzen 5 und 16 GB RAM im Bestpreis-Deal
Lenovo ThinkBook 13x G4 21KR0008GE: Intel Arc 7-Core iGPU, 13.50", 1.2 kg
» Das ThinkBook 13x G4 könnte eines der besten Ultrabooks sein, doch Lenovo patzt ausgerechnet bei der Tastatur
Samsung Galaxy Book4 Pro 360: Intel Arc 7-Core iGPU, 16.00", 1.7 kg
» Samsungs Galaxy Book4 Pro 360 Convertible überzeugt mit flachem Gehäuse und gutem OLED, bietet ansonsten aber viel Durchschnitt