Intel Core i5-13450HX
Der Intel Core i5-13450HX ist eine Mittelklasse-CPU mit 10 Kernen auf Basis der neuen Raptor-Lake-Architektur für große und schwere Notebooks.
Die insgesamt 16 Threads unterteilen sich in P-Cores und E-Cores, die wir bereits von Alder-Lake her kennen. Der 13450HX bietet 6 Performance-Kerne (P-Cores) mit Hyperthreading und 4 Effizienzkerne (E-Cores) ohne Hyperthreading. Die P-Kerne takten von 2,4 GHz (Basistakt) bis 4,5 GHz (alle Kerne) bzw. 4,6 GHz (einzelner Kern). Die E-Kerne takten von 1,8 - 3,4 GHz.
Die neue Raptor Lake Architektur bietet im Vergleich zu Alder Lake verbesserte P-Cores (Raptor Cove Architektur mit mehr Cache), mehr E-Cores (selbe Gracemont Architektur) und höhere Taktraten dank des verbesserten Intel 7 Prozesses. Weiters unterstützt Intel bei den Topmodellen nun schnelleren DDR5 Hauptspeicher (bis 5600 MHz bei den i9, jedoch nur 4800 MHz beim 13450HX).
Der 13450HX wird im weiter verbesserten 10nm FinFET Verfahren bei Intel gefertigt (Intel 7 Prozess) und ist spezifiziert mit 55 Watt Base Power und 157 Watt Turbo Power.
Serie Intel Raptor Lake-HX Codename Raptor Lake-HX Serie: Raptor Lake-HX Raptor Lake-HX Taktung 1800 - 4600 MHz Level 3 Cache 20 MB Anzahl von Kernen / Threads 10 / 16 6 x 4.5 GHz Intel Raptor Cove P-Core 4 x 3.4 GHz Intel Gracemont E-Core Stromverbrauch (TDP = Thermal Design Power) 55 Watt Herstellungstechnologie 10 nm Die Größe 257 mm2 Max. Temperatur 100 °C Socket BGA1964 Features DDR4-3200/DDR5-4800 RAM, PCIe 5, Thr. Director, DL Boost, GNA, MMX, SSE, SSE2, SSE3, SSSE3, SSE4.1, SSE4.2, AVX, AVX2, BMI2, ABM, FMA, ADX, SMEP, SMAP, EIST, TM1, TM2, HT, Turbo, SST, AES-NI, RDRAND, RDSEED, SHA GPU Intel UHD Graphics Xe 16EUs (Tiger Lake-H) ( - 1450 MHz)64 Bit 64 Bit wird unterstützt Architecture x86 Vorgestellt am 04.01.2023 Produktinformationen beim Hersteller ark.intel.com
Benchmarks Performance Rating - CB R15 + R20 + 7-Zip + X265 + Blender + 3DM11 CPU
38.5 pt (63%)
...
...
max:
Cinebench 2024 - Cinebench 2024 CPU Single Core
101.5 Points (70%)
...
...
Cinebench 2024 - Cinebench 2024 CPU Multi Core
812 Points (15%)
...
...
max:
Cinebench R23 - Cinebench R23 Multi Core
min: 16575 avg: 16869 median: 16797 (16%) max: 17234 Points
CPU TDP 55 W TDP 60 W TDP 90 W 96% 97% 100%
...
...
max:
Cinebench R23 - Cinebench R23 Single Core
min: 1710 avg: 1741 median: 1746 (74%) max: 1766 Points
CPU TDP 55 W TDP 60 W TDP 90 W 100% 97% 99%
...
...
max:
Cinebench R20 - Cinebench R20 CPU (Single Core)
min: 652 avg: 666 median: 667 (74%) max: 680 Points
CPU TDP 55 W TDP 60 W TDP 90 W 100% 96% 98%
...
...
max:
Cinebench R20 - Cinebench R20 CPU (Multi Core)
min: 6489 avg: 6539 median: 6532 (16%) max: 6595 Points
CPU TDP 55 W TDP 60 W TDP 90 W 98% 99% 100%
...
...
max:
Cinebench R15 - Cinebench R15 CPU Multi 64 Bit
min: 2427 avg: 2478 median: 2503 (16%) max: 2505 Points
CPU TDP 55 W TDP 60 W TDP 90 W 97% 100% 100%
...
...
max:
0 130 260 390 520 650 780 910 1040 1170 1300 1430 1560 1690 1820 1950 2080 2210 2340 2470 Tooltip Dell G15 5530, i5-13450HX RTX 4050: Ø2279 (1971.41-2426.6)
Lenovo LOQ 15IRX9: Ø2170 (2104.93-2503.76)
Lenovo LOQ 15IRX9 Leistungsmodus: Ø2491 (2449.93-2512.09)
Cinebench R15 - Cinebench R15 CPU Single 64 Bit
min: 239 avg: 246 median: 248 (75%) max: 251 Points
CPU TDP 55 W TDP 60 W TDP 90 W 100% 95% 99%
...
...
max:
Cinebench R11.5 - Cinebench R11.5 CPU Multi 64 Bit
29.2 Points (38%)
...
...
max:
Cinebench R11.5 - Cinebench R11.5 CPU Single 64 Bit
3.1 Points (76%)
...
...
max:
Cinebench R10 - Cinebench R10 Rend. Single (32bit)
9840 Punkte (59%)
...
...
max:
Cinebench R10 - Cinebench R10 Rend. Multi (32bit)
58749 Punkte (43%)
...
...
max:
6830 Punkte (11%)
...
...
max:
7-Zip 18.03 - 7-Zip 18.03 Multli Thread 4 runs
min: 59026 avg: 61014 median: 61811 (35%) max: 62204 MIPS
CPU TDP 55 W TDP 60 W TDP 90 W 99% 95% 100%
...
...
max:
7-Zip 18.03 - 7-Zip 18.03 Single Thread 4 runs
min: 5370 avg: 5506 median: 5571 (67%) max: 5576 MIPS
CPU TDP 55 W TDP 60 W TDP 90 W 100% 96% 100%
...
...
max:
X264 HD Benchmark 4.0 - x264 Pass 2
141.7 fps (49%)
...
...
max:
X264 HD Benchmark 4.0 - x264 Pass 1
324.6 fps (75%)
...
...
max:
HWBOT x265 Benchmark v2.2 - HWBOT x265 4k Preset
min: 16.9 avg: 18.3 median: 17.5 (31%) max: 20.5 fps
CPU TDP 55 W TDP 60 W TDP 90 W 82% 85% 100%
...
...
max:
0 5 10 15 20 25 30 Tooltip Dell G15 5530, i5-13450HX RTX 4050: Ø15.8 (0.24-17.4)
Lenovo LOQ 15IRX9: Ø17 (0.22-18.5)
Lenovo LOQ 15IRX9 Leistungsmodus: Ø21 (1.64-32)
TrueCrypt - TrueCrypt Serpent
1 GB/s (0%)
...
...
max:
TrueCrypt - TrueCrypt Twofish
1.6 GB/s (28%)
...
...
max:
TrueCrypt - TrueCrypt AES
13.5 GB/s (35%)
...
...
max:
Blender - Blender 3.3 Classroom CPU *
min: 338 avg: 374 median: 387 (5%) max: 397 Seconds
CPU TDP 55 W TDP 60 W TDP 90 W 100% 100% 101%
...
...
Blender - Blender 2.79 BMW27 CPU *
min: 196 avg: 208.3 median: 200 (1%) max: 229 Seconds
CPU TDP 55 W TDP 60 W TDP 90 W 100% 100% 100%
...
...
R Benchmark 2.5 - R Benchmark 2.5 *
min: 0.4582 avg: 0.5 median: 0.5 (10%) max: 0.4838 sec
CPU TDP 55 W TDP 60 W TDP 90 W 101% 100% 100%
...
...
3DMark 06 - CPU - 3DMark 06 - CPU
14017 Points (30%)
...
...
max:
Super Pi mod 1.5 XS 1M - Super Pi mod 1.5 XS 1M *
7.2 s (2%)
...
...
VIA C3-M C3-M-1200
Super Pi mod 1.5 XS 2M - Super Pi mod 1.5 XS 2M *
15.9 s (1%)
...
...
Super Pi Mod 1.5 XS 32M - Super Pi mod 1.5 XS 32M *
402 s (2%)
...
...
VIA C3-M C3-M-1200
3DMark 11 - 3DM11 Performance Physics
min: 21532 avg: 21934 median: 21982 (59%) max: 22288 Points
CPU TDP 55 W TDP 60 W TDP 90 W 99% 100% 97%
...
...
max:
3DMark - 3DMark Ice Storm Physics
82893 Points (67%)
...
...
max:
3DMark - 3DMark Cloud Gate Physics
19916 Points (50%)
...
...
max:
3DMark - 3DMark Fire Strike Standard Physics
min: 27233 avg: 27745 median: 27595 (49%) max: 28408 Points
CPU TDP 55 W TDP 60 W TDP 90 W 97% 96% 100%
...
...
max:
3DMark - 3DMark Time Spy CPU
min: 12644 avg: 12938 median: 13047 (55%) max: 13123 Points
CPU TDP 55 W TDP 60 W TDP 90 W 96% 100% 99%
...
...
max:
Geekbench 6.2 - Geekbench 6.2 Single-Core
min: 2381 avg: 2415 median: 2417 (65%) max: 2448 Punkte
CPU TDP 55 W TDP 60 W TDP 90 W 100% 97% 99%
...
...
Geekbench 6.2 - Geekbench 6.2 Multi-Core
min: 12619 avg: 12701 median: 12684 (50%) max: 12799 Punkte
CPU TDP 55 W TDP 60 W TDP 90 W 99% 99% 100%
...
...
max:
Geekbench 5.5 - Geekbench 5.1 - 5.4 64 Bit Single-Core
min: 1696 avg: 1739 median: 1757 (74%) max: 1763 Punkte
CPU TDP 55 W TDP 60 W TDP 90 W 100% 96% 100%
...
...
Geekbench 5.5 - Geekbench 5.1 - 5.4 64 Bit Multi-Core
min: 11973 avg: 12000 median: 12005 (22%) max: 12022 Punkte
CPU TDP 55 W TDP 60 W TDP 90 W 100% 100% 100%
...
...
max:
Geekbench 4.0 - Geekbench 4.0 64 Bit Single-Core
7348 Punkte (100%)
...
Geekbench 4.0 - Geekbench 4.0 64 Bit Multi-Core
41034 Punkte (100%)
...
max:
Mozilla Kraken 1.1 - Kraken 1.1 Total Score *
min: 531 avg: 537 median: 531 (1%) max: 550 ms
CPU TDP 55 W TDP 60 W 100% 100%
...
...
max:
Octane V2 - Octane V2 Total Score
87588 Points (77%)
...
...
WebXPRT 4 - WebXPRT 4 Score
243 Points (70%)
...
...
max:
WebXPRT 3 - WebXPRT 3 Score
min: 262 avg: 274.7 median: 281 (59%) max: 281 Points
CPU TDP 55 W TDP 60 W 100% 93%
...
...
CrossMark - CrossMark Overall
1804 Points (69%)
...
...
max:
Power Consumption - Prime95 Power Consumption - external Monitor *
min: 108.7 avg: 134.8 median: 134.8 (23%) max: 160.8 Watt
CPU TDP 55 W TDP 60 W 100% 112%
...
...
max:
0 10 20 30 40 50 60 70 80 90 100 110 120 130 140 150 160 170 Tooltip Lenovo LOQ 15IRX9: Ø108.7 (86.1-163.3)
Dell G15 5530, i5-13450HX RTX 4050: Ø160.8 (149.8-170.8)
Power Consumption - Idle Power Consumption - external Monitor *
min: 19.2 avg: 25.4 median: 25.4 (17%) max: 31.6 Watt
CPU TDP 55 W TDP 60 W 100% 110%
...
max:
0 5 10 15 20 25 30 35 Tooltip Lenovo LOQ 15IRX9: Ø19.2 (10.7-37)
Dell G15 5530, i5-13450HX RTX 4050: Ø31.6 (22.4-34.6)
Power Consumption - Idle Power Consumption 150cd 1min *
min: 11.5 avg: 14.8 median: 14.8 (16%) max: 18.1 Watt
CPU TDP 55 W TDP 60 W 109% 100%
...
...
max:
0 5 10 15 20 25 Tooltip Dell G15 5530, i5-13450HX RTX 4050: Ø11.5 (2.34-27.4)
Lenovo LOQ 15IRX9: Ø18.1 (13.4-24.2)
- Bereich der Benchmarkergebnisse für diese Grafikkarte
- Durchschnittliche Benchmarkergebnisse für diese Grafikkarte
* Smaller numbers mean a higher performance
v1.28
log 25. 09:22:52
#0 no ids found in url (should be separated by "_") +0s ... 0s
#1 not redirecting to Ajax server +0s ... 0s
#2 did not recreate cache, as it is less than 5 days old! Created at Thu, 25 Jul 2024 05:28:17 +0200 +0.001s ... 0.001s
#3 composed specs +0.009s ... 0.01s
#4 did output specs +0s ... 0.01s
#5 getting avg benchmarks for device 14673 +0.018s ... 0.028s
#6 got single benchmarks 14673 +0.016s ... 0.044s
#7 got avg benchmarks for devices +0s ... 0.044s
#8 min, max, avg, median took s +0.849s ... 0.893s
#9 return log +0.055s ... 0.948s
Testberichte für den Intel Core i5-13450HX Prozessor
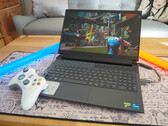
Lenovo LOQ 15 im Test: FHD-Gaming-Notebook mit RTX 4060 ab 899 Euro Lenovos 15,6-Zöller ist auf FHD-Gaming bei hohen bis maximalen Settings ausgelegt. Die stimmige Hardwarebasis setzt sich aus Core i5-13450HX, GeForce RTX 4060, ...
Intel Core i5-13450HX | NVIDIA GeForce RTX 4060 Laptop GPU | 15.60" | 2.4 kg
Test Dell G15 5530 Laptop: RTX-4050-Gamer in Dark Shadow Gray Dell stellt sich beim G15 5530 gegen den Schlankheitstrend und verpasst dem 15-Zöller ein recht wuchtiges und schweres Gehäuse. Wir haben den Gaming-Spross mit ...
Intel Core i5-13450HX | NVIDIA GeForce RTX 4050 Laptop GPU | 15.60" | 2.7 kg
Lenovo Legion 5 16IRX9 : NVIDIA GeForce RTX 4060 Laptop GPU, 16.00", 2.3 kg
Externer Test » Lenovo Legion 5 16IRX9
Lenovo LOQ 15IRX9, i5-13450HX : NVIDIA GeForce RTX 4050 Laptop GPU, 15.60", 2.4 kg
Externer Test » Lenovo LOQ 15IRX9, i5-13450HX
Lenovo LOQ 15IRH8, i5-13450HX RTX 3050 : NVIDIA GeForce RTX 3050 6GB Laptop GPU, 15.60", 2.4 kg
Externer Test » Lenovo LOQ 15IRH8, i5-13450HX RTX 3050
Dell G15 5530, i5-13450HX RTX 4050 : NVIDIA GeForce RTX 4050 Laptop GPU, 15.60", 2.7 kg
Externer Test » Dell G15 5530, i5-13450HX RTX 4050
Asus ROG Strix G16 G614JU : NVIDIA GeForce RTX 4050 Laptop GPU, 16.00", 2.5 kg
Externer Test » Asus ROG Strix G16 G614JU
Lenovo LOQ 15IRX9 : NVIDIA GeForce RTX 4060 Laptop GPU, 15.60", 2.4 kg
» Für den sparsamen Gamer: Lenovo LOQ mit GeForce RTX 4060 ab 899 Euro
Teilen Sie diesen Artikel, um uns zu unterstützen. Jeder Link hilft!
Prozessoren der Serie Raptor Lake-HX Ähnlich schnelle CPUs
Autor: Klaus Hinum (Update: 23.01.2023)