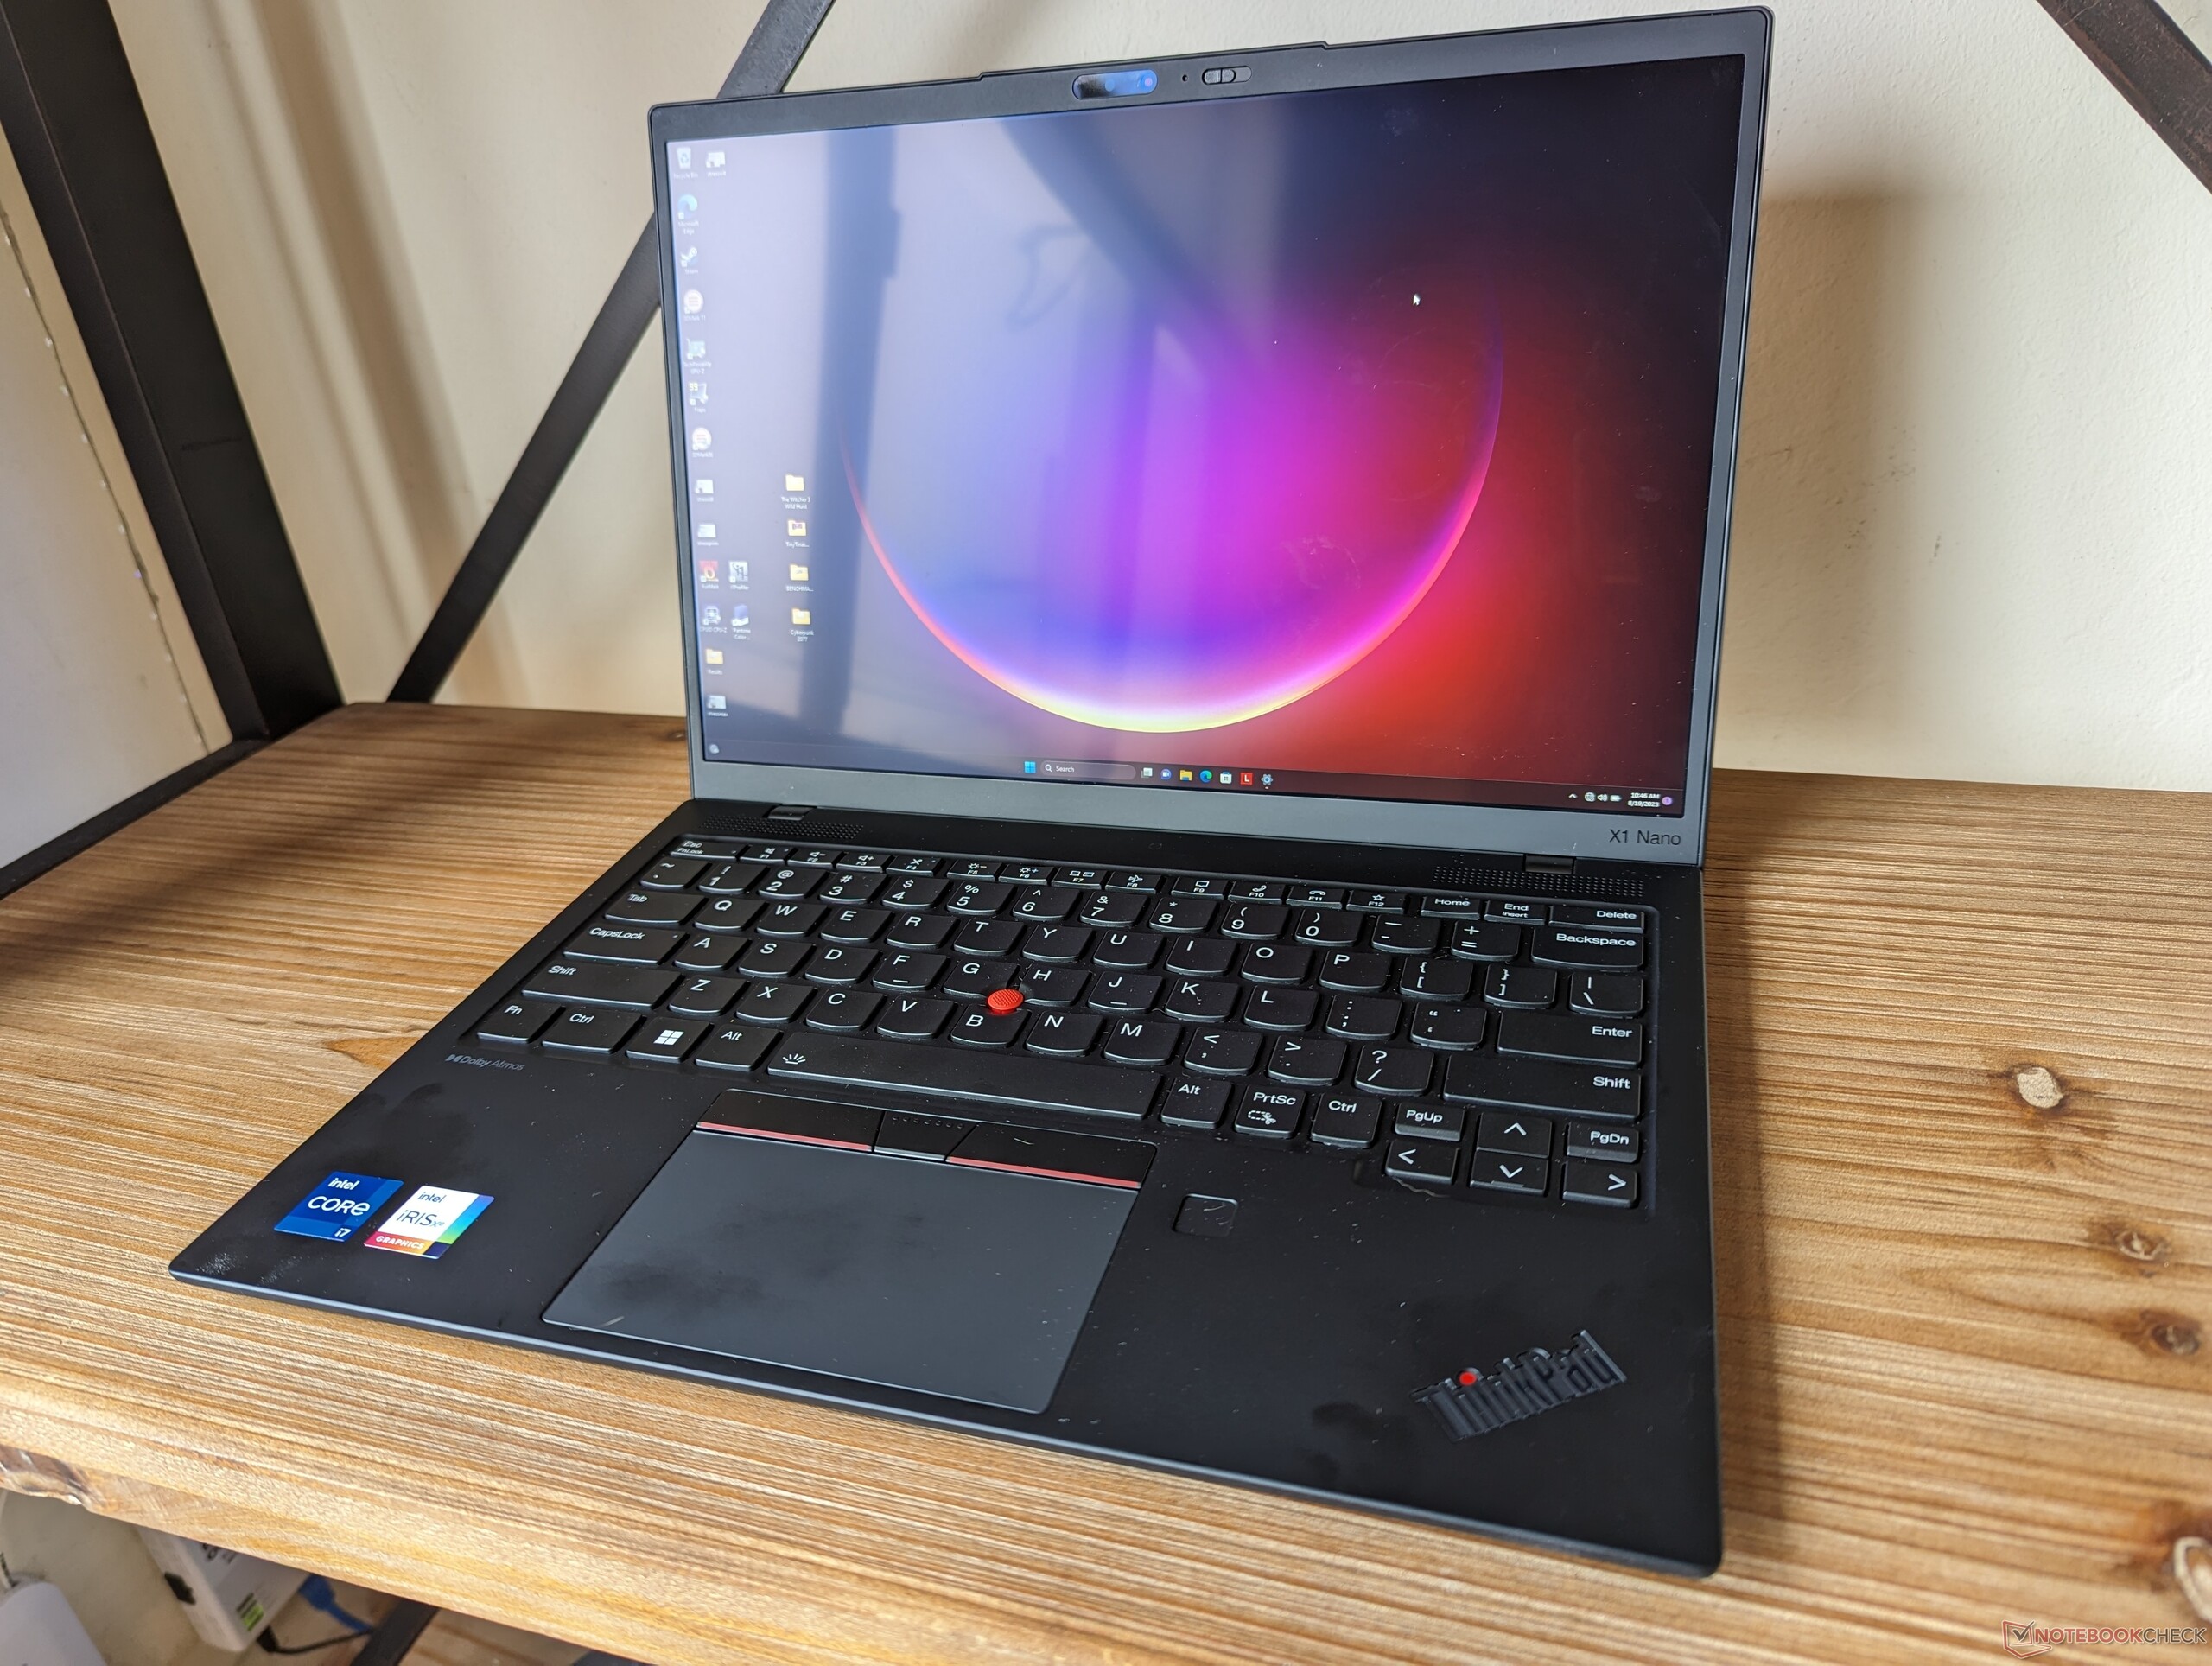
Lenovo ThinkPad X1 Nano Gen 3 Laptop im Test: Intel Core-P bei unter 1 kg

Das ThinkPad X1 Nano Gen 3 folgt dem ThinkPad X1 Nano Gen 2 des letzten Jahres und ersetzt die CPUs der 12. Generation Alder Lake durch neuere Optionen der 13. Generation Raptor Lake. Abgesehen vom CPU-Wechsel bleibt das extrem leichte Gehäuse identisch, daher gelten unsere bisherigen Kommentare zu den Anschlüssen und anderen physischen Aspekten des X1 Nano Gen 2 auch hier für das X1 Nano Gen 3. Diese Seite wird sich stattdessen auf die Leistungsunterschiede zwischen den beiden Modellen sowie auf andere bemerkenswerte Änderungen konzentrieren.
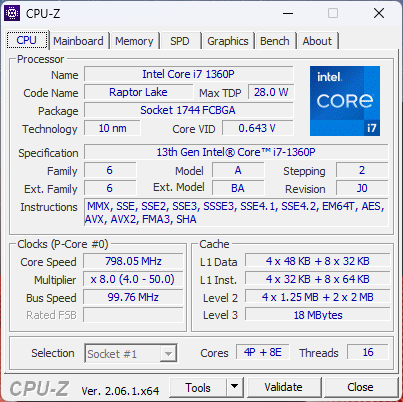
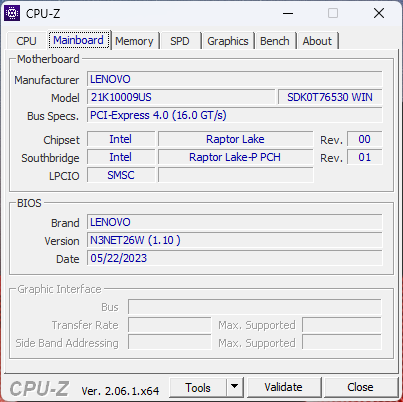
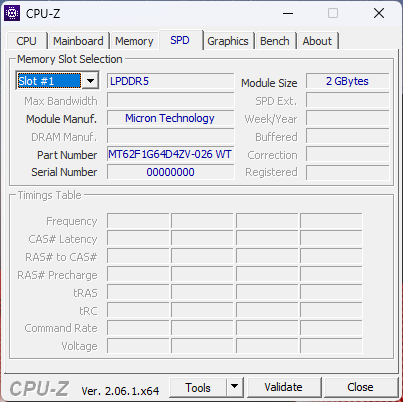
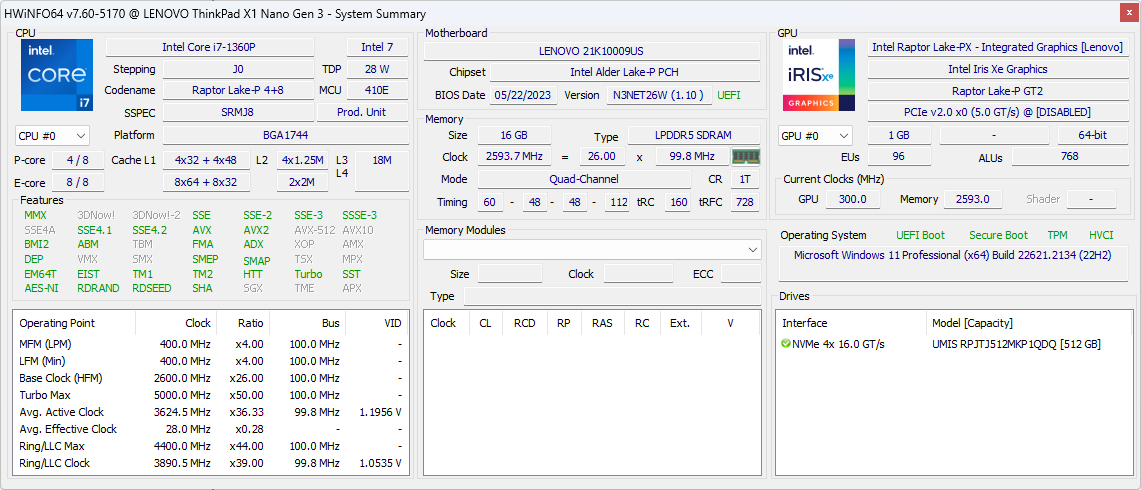
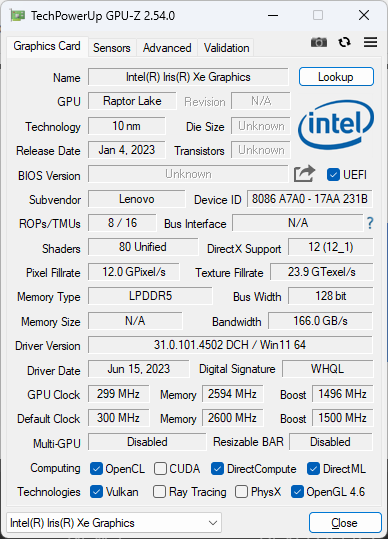
Unser Testgerät wurde mit dem Core i7-1360P für etwa 1.296 Euro EHP konfiguriert. Andere Konfigurationen umfassen den Core i5-1340P mit vPro- und Nicht-vPro-Optionen bis hin zum i7-1370P. Alle Konfigurationen beinhalten derzeit jedoch den gleichen fest verlöteten 16-GB-RAM und ein 13-Zoll-2K-(2160 x 1350)-IPS-Display mit optionaler Touch-Funktion.
Zu den Alternativen des ThinkPad X1 Nano Gen 3 gehören andere ultraleichte Subnotebooks wie das LG Gram 13, Dynabook Portege X30L, Dell Latitude 9330 oder HP Dragonfly G4.
Weitere Lenovo Bewertungen:
Mögliche Konkurrenten im Vergleich
Bew. | Datum | Modell | Gewicht | Dicke | Größe | Auflösung | Preis ab |
|---|---|---|---|---|---|---|---|
| 89.5 % v7 (old) | 08 / 2023 | Lenovo ThinkPad X1 Nano Gen 3 i7-1360P, Iris Xe G7 96EUs | 989 g | 14.8 mm | 13.00" | 2160x1350 | |
| 88.9 % v7 (old) | 09 / 2022 | Lenovo ThinkPad X1 Nano Gen 2 Core i7-1280P i7-1280P, Iris Xe G7 96EUs | 958 g | 14.4 mm | 13.00" | 2160x1350 | |
| 91.9 % v7 (old) | 07 / 2023 | HP Dragonfly G4 i7-1365U, Iris Xe G7 96EUs | 1.1 kg | 16.3 mm | 13.50" | 1920x1280 | |
| 86.2 % v7 (old) | 05 / 2023 | Framework Laptop 13.5 13th Gen Intel i7-1370P, Iris Xe G7 96EUs | 1.3 kg | 15.85 mm | 13.50" | 2256x1504 | |
| 89 % v7 (old) | 11 / 2022 | Dell Latitude 9330 i7-1260U, Iris Xe G7 96EUs | 1.2 kg | 14.1 mm | 13.30" | 2560x1600 | |
| 92 % v7 (old) | 08 / 2022 | Apple MacBook Air M2 10C GPU M2, M2 10-Core GPU | 1.2 kg | 11.3 mm | 13.60" | 2560x1664 | |
| 86.6 % v7 (old) | 10 / 2022 | LG Gram 14Z90Q i5-1240P, Iris Xe G7 80EUs | 980 g | 16.8 mm | 14.00" | 1920x1200 |
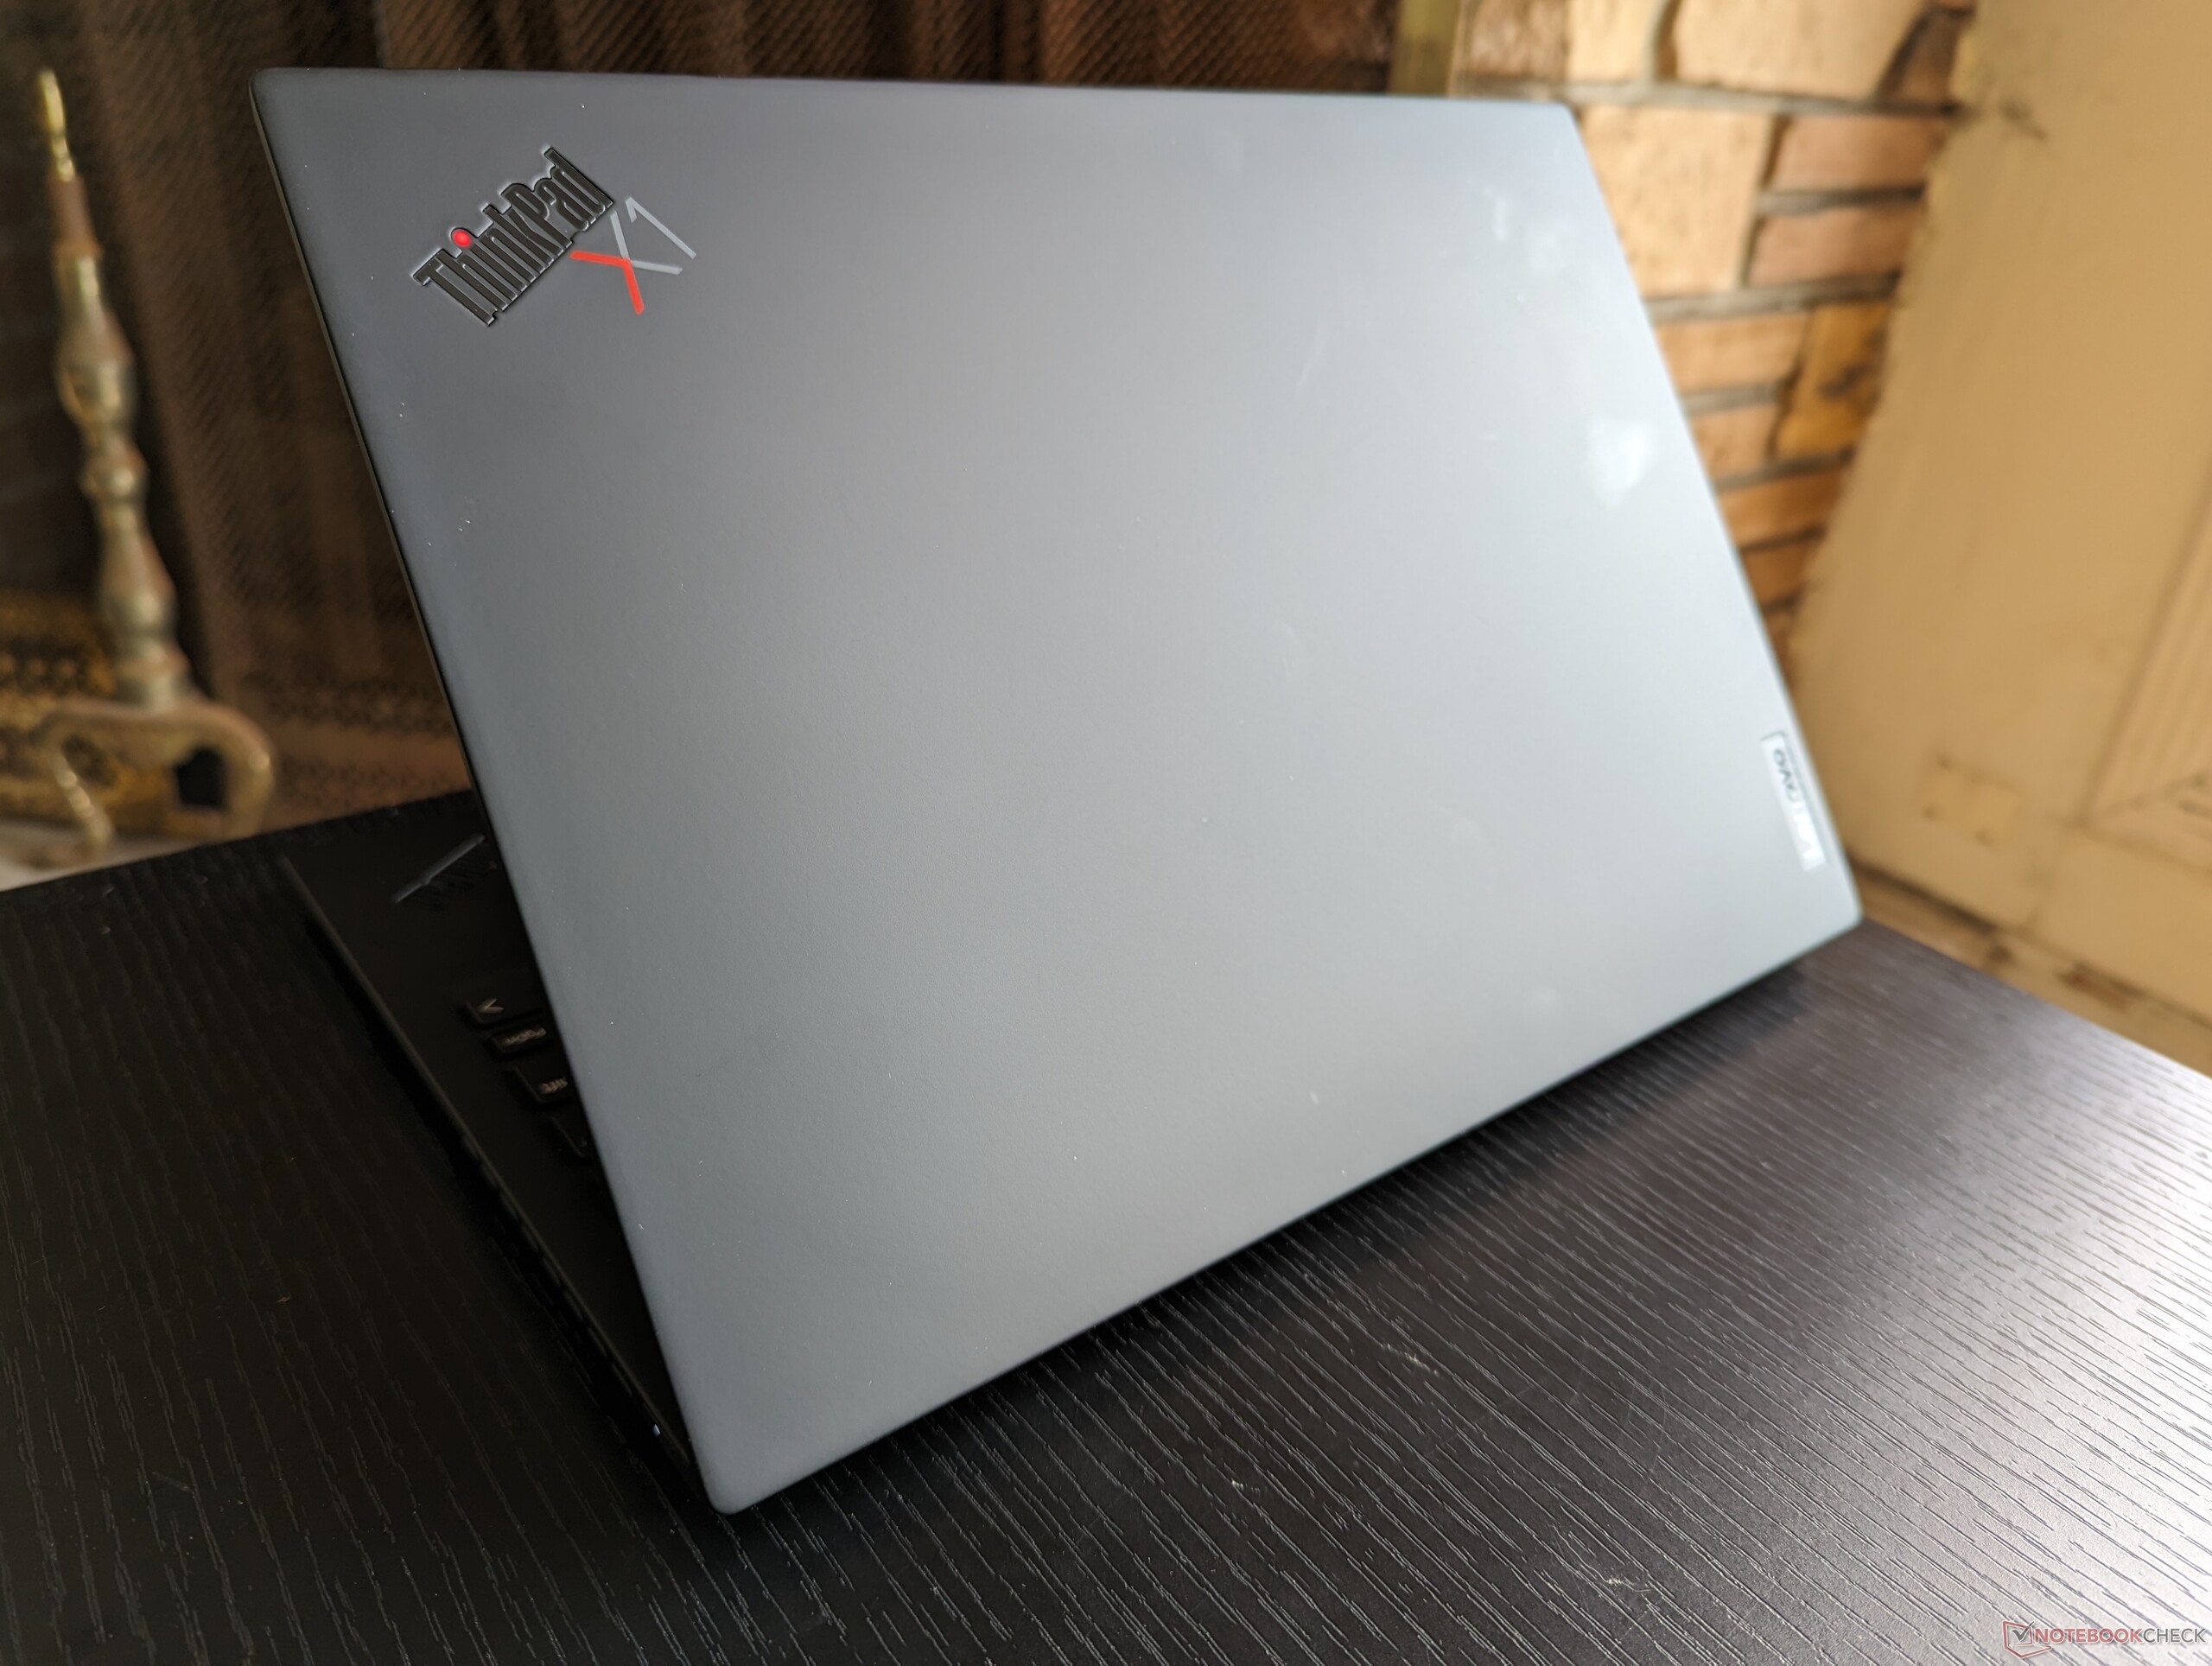
Gehäuse — Immer noch eines der leichtesten
Äußerlich gibt es keine großen Veränderungen gegenüber dem Vorjahr, aber die Touchscreen-Version ist etwas größer als die Version ohne Touchscreen. Die zusätzliche Dicke und das Gewicht sind in der Regel kaum spürbar.
| Touchscreen-Konfiguration | 208,1 mm (L) | 293,3 mm (W) | 14,8 mm (H) |
| Non-Touch-Konfiguration | 208,0 mm (L) | 293,2 mm (W) | 14,4 mm (H) |
Kommunikation
Webcam


Wartung
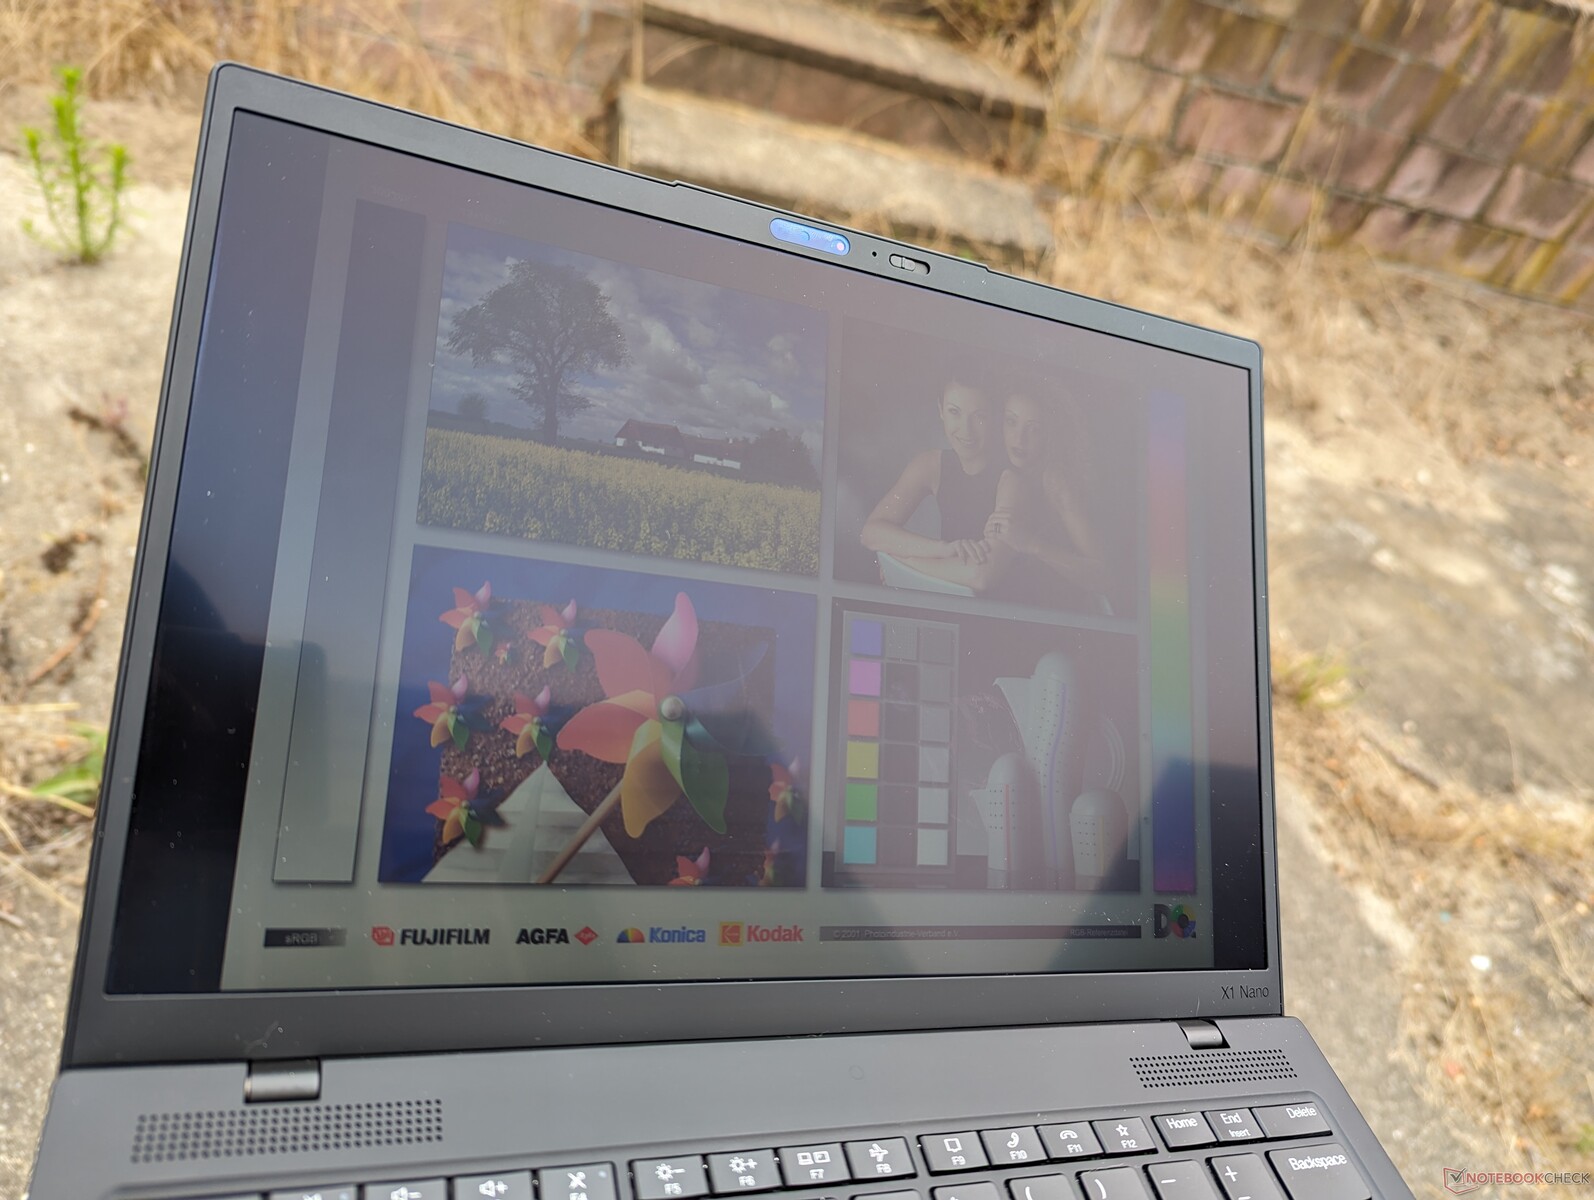
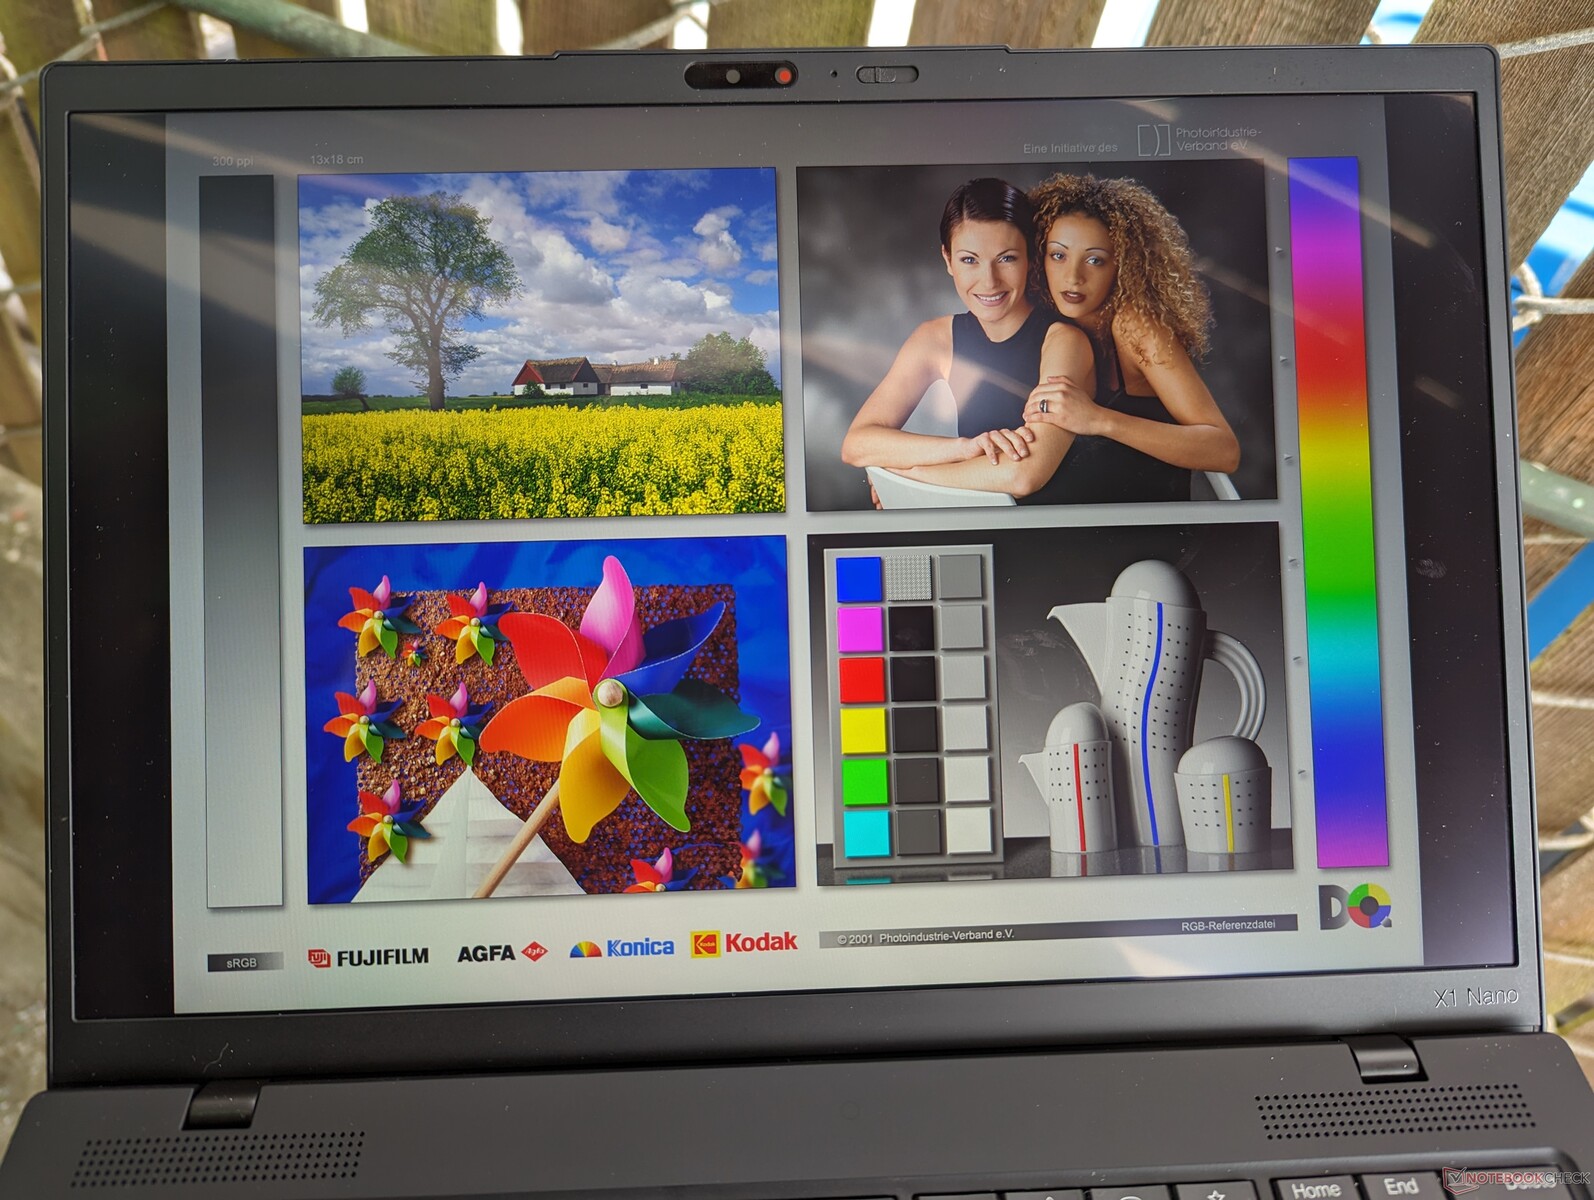
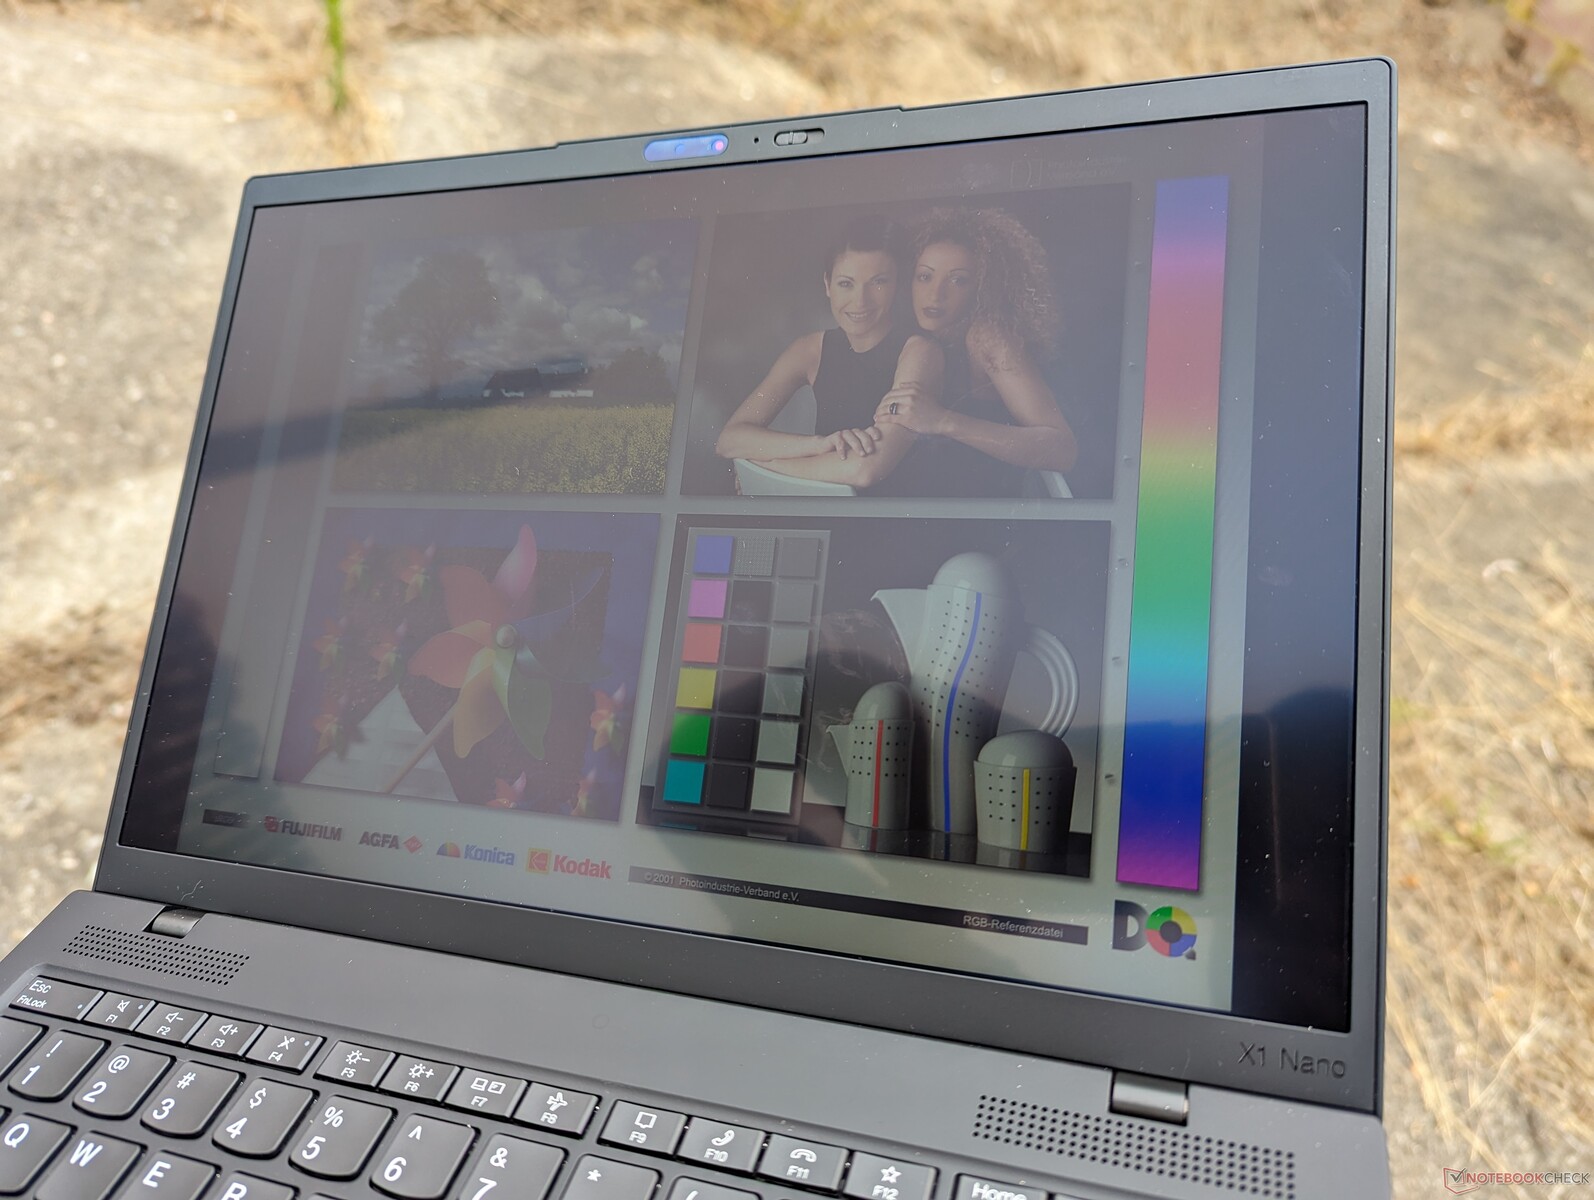
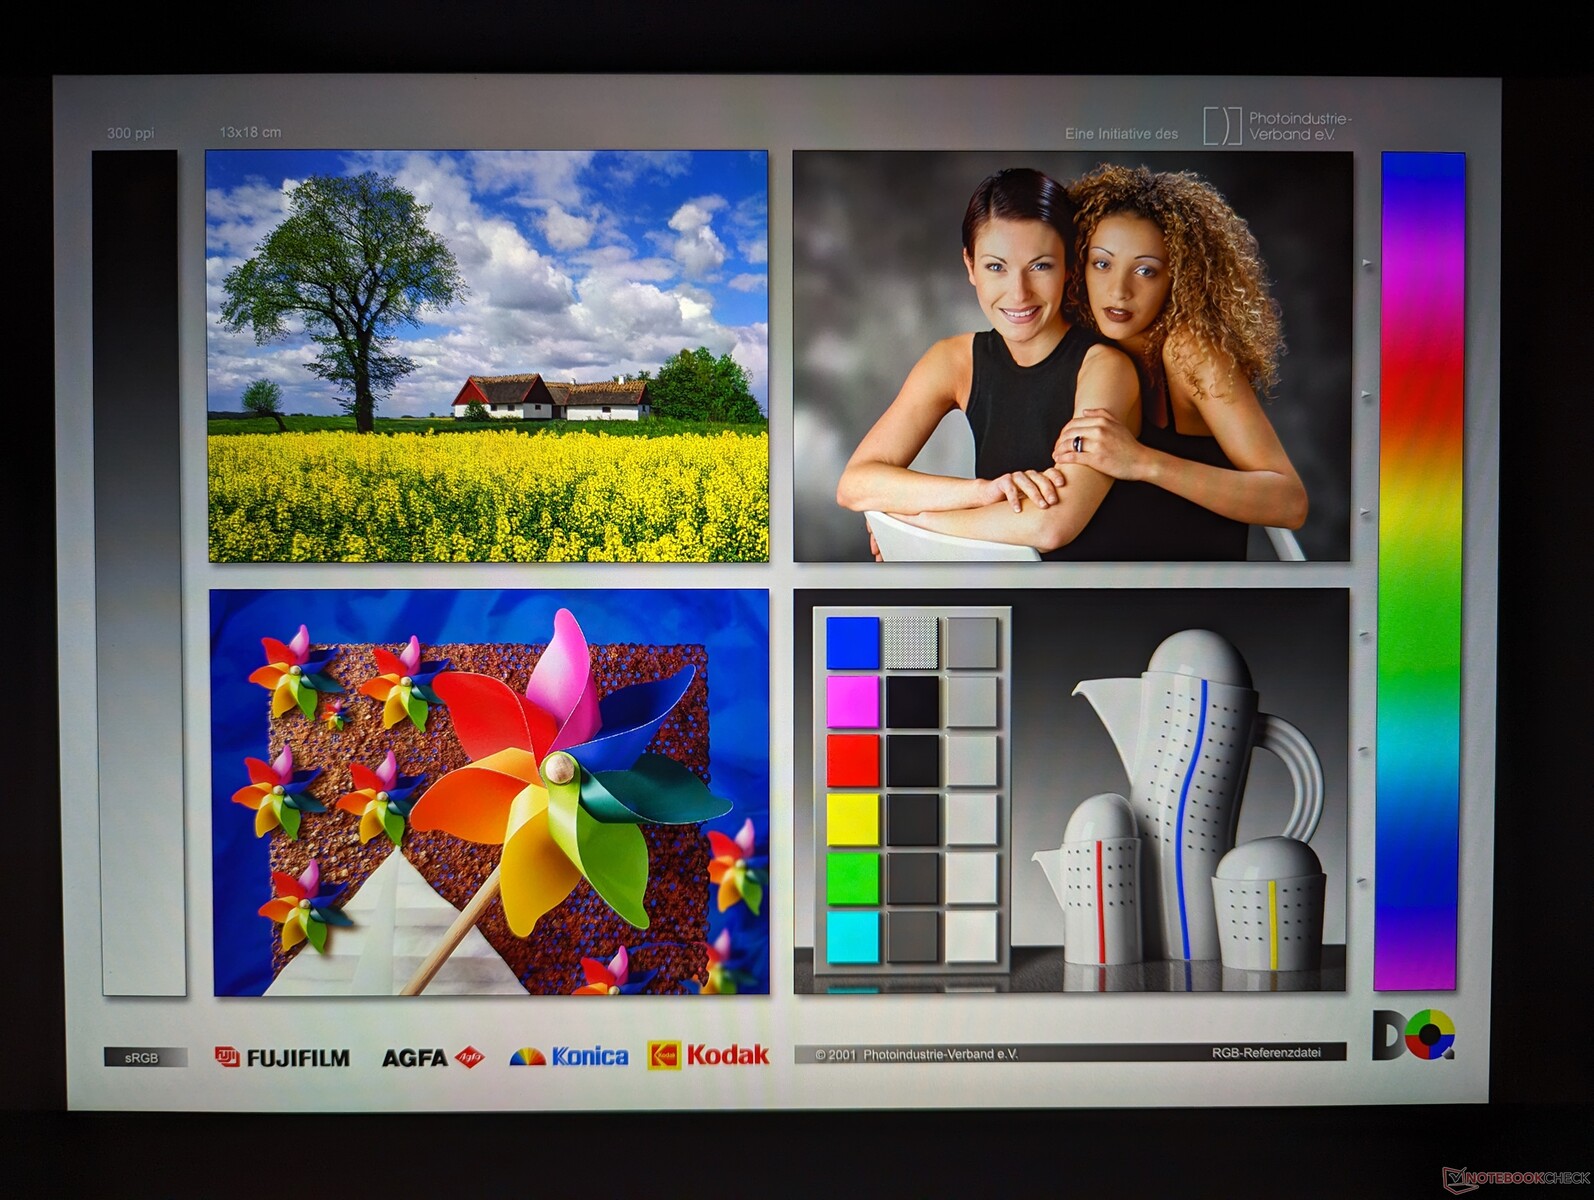
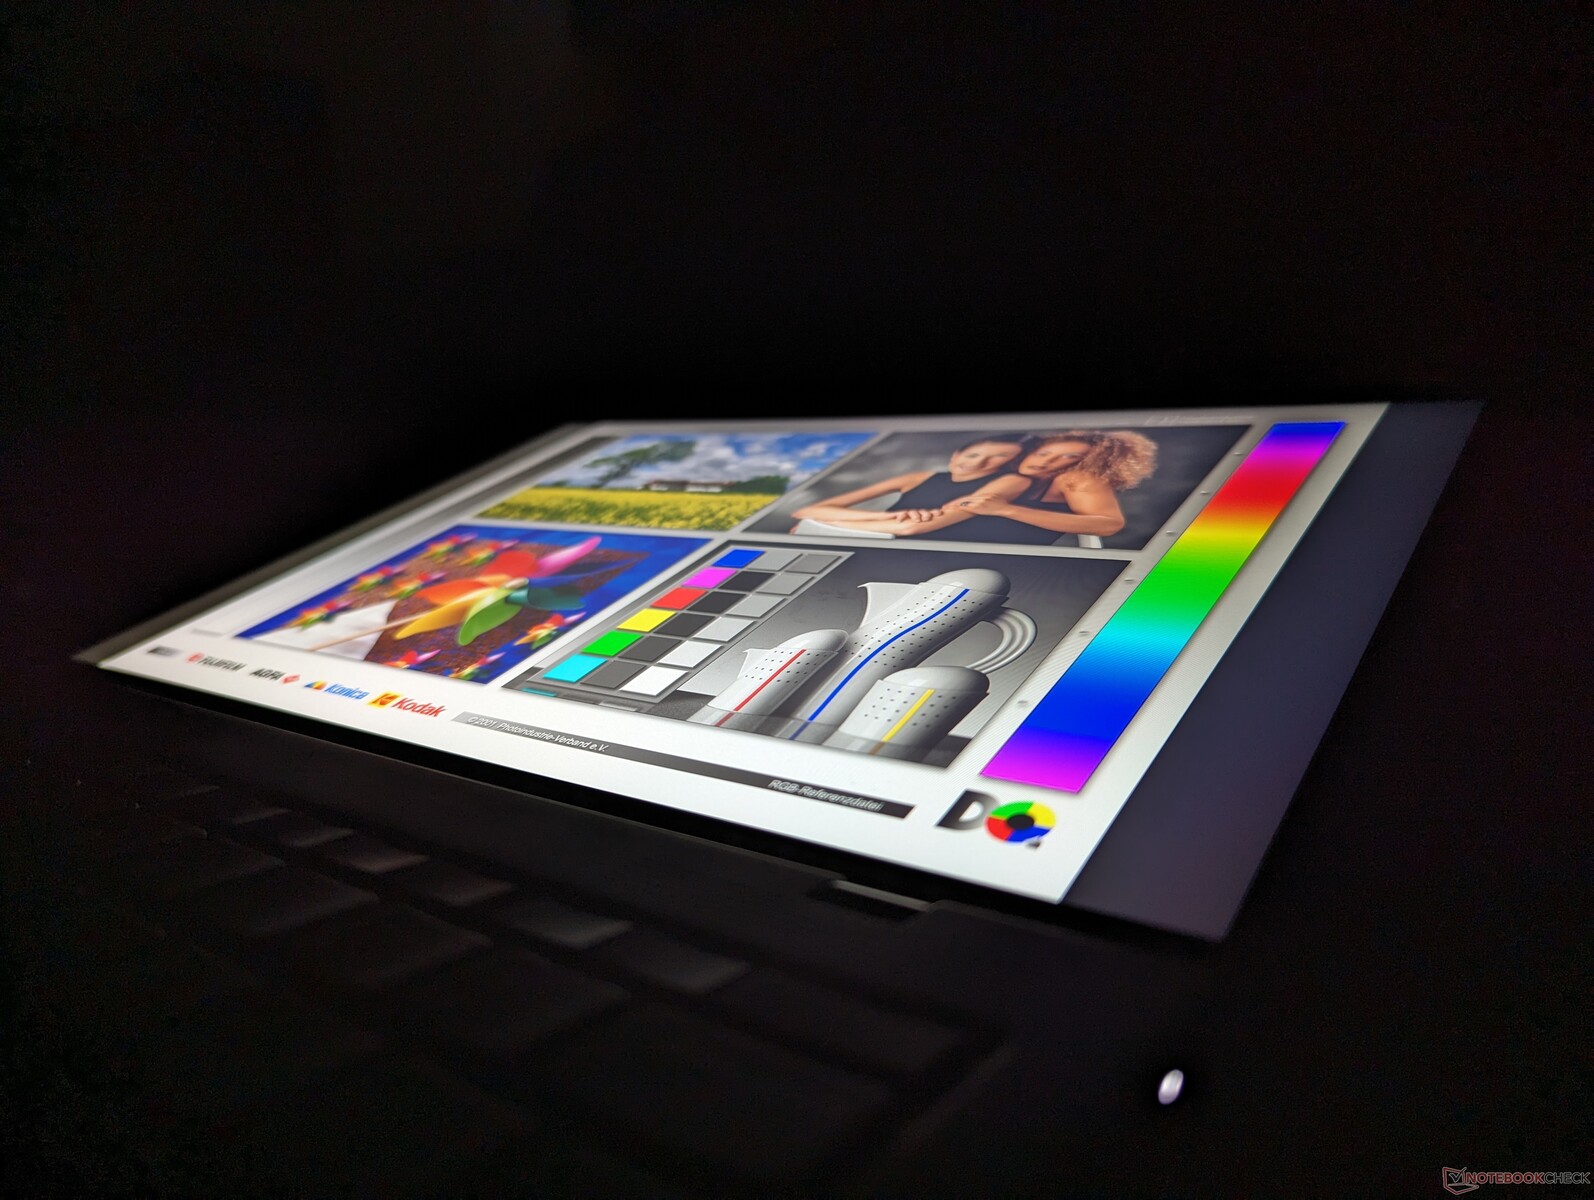
Display — Keine weiteren Optionen
Interessanterweise handelt es sich beim IPS-Panel des diesjährigen Modells um ein anderes als bei dem des Vorjahresmodells (MND007ZA1-3 vs. P101ZFZ-BH2). Trotz der Namensänderung weisen beide Displays jedoch ähnliche Farbbereiche, Reaktionszeiten, Helligkeitsstufen und Kontrastverhältnisse auf, was ein vergleichbares Seherlebnis gewährleistet.


| |||||||||||||||||||||||||
Ausleuchtung: 86 %
Helligkeit Akku: 461.2 cd/m²
Kontrast: 1590:1 (Schwarzwert: 0.29 cd/m²)
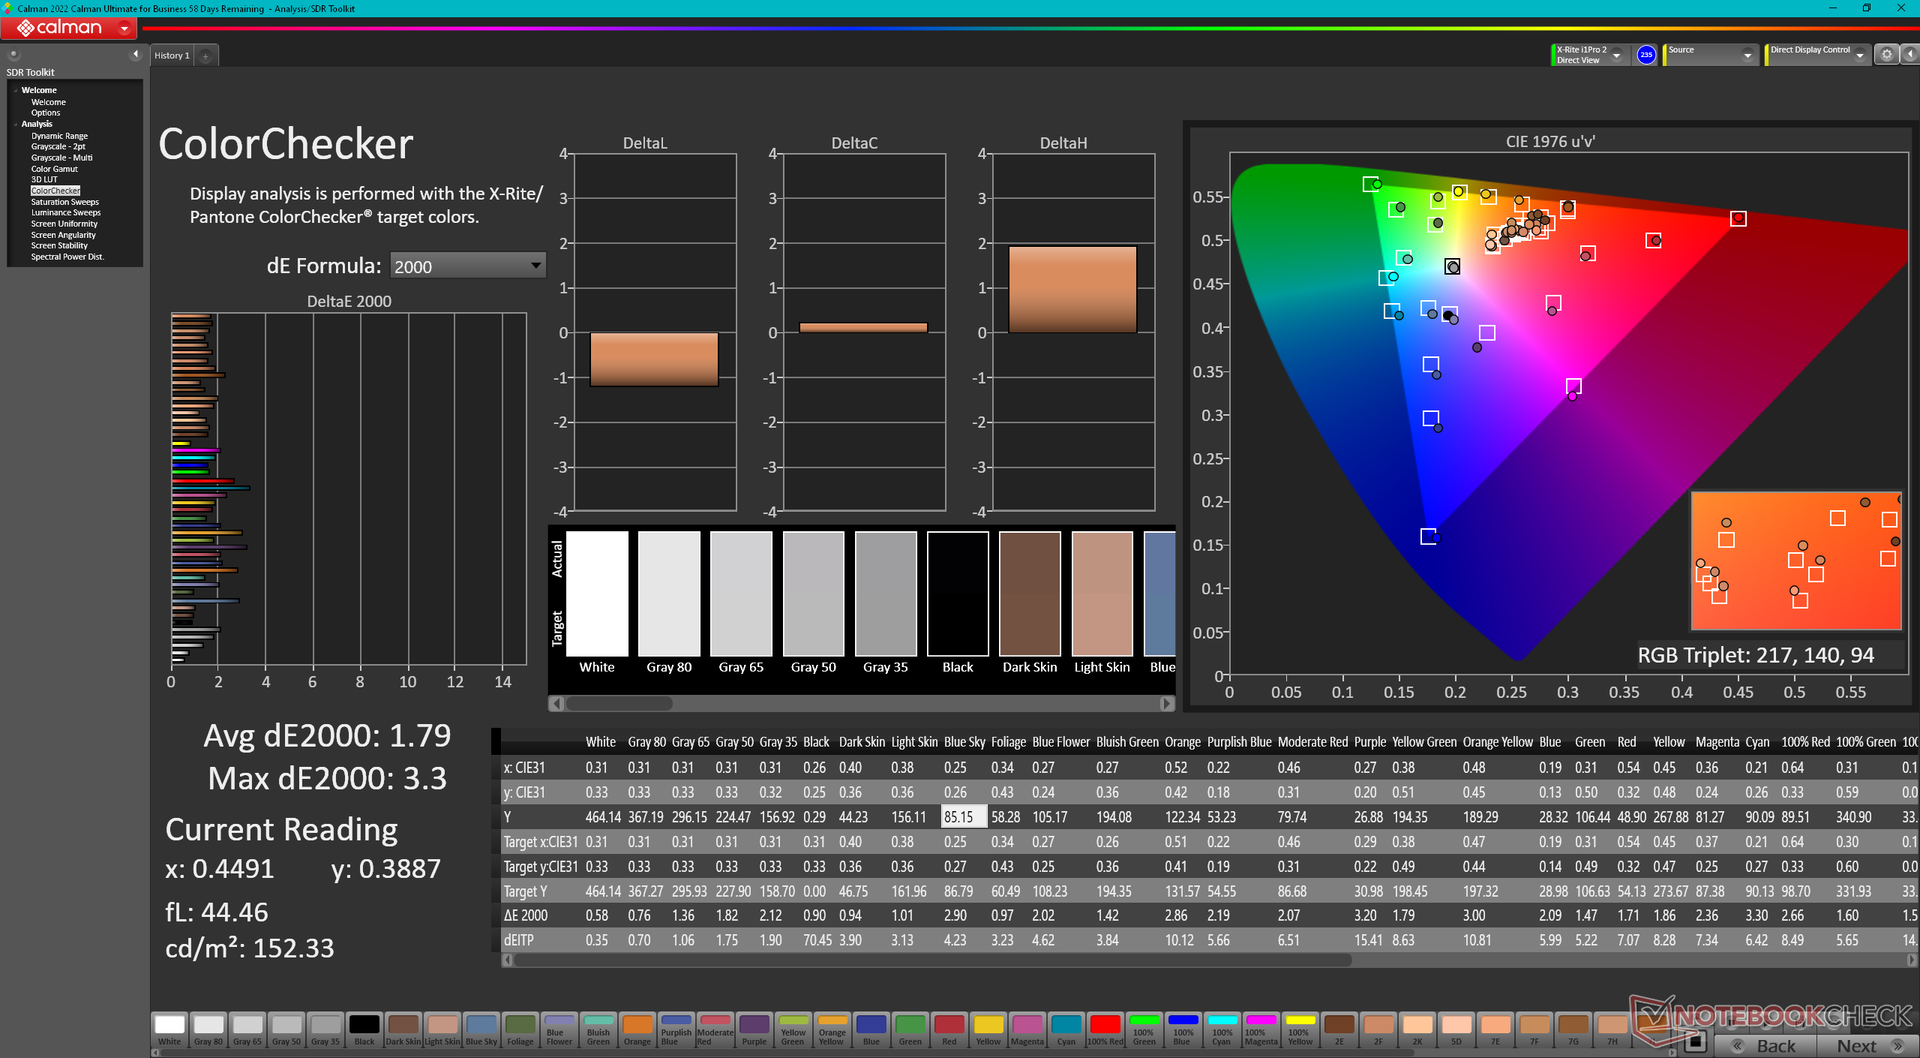
ΔE ColorChecker Calman: 1.79 | ∀{0.5-29.43 Ø4.72}
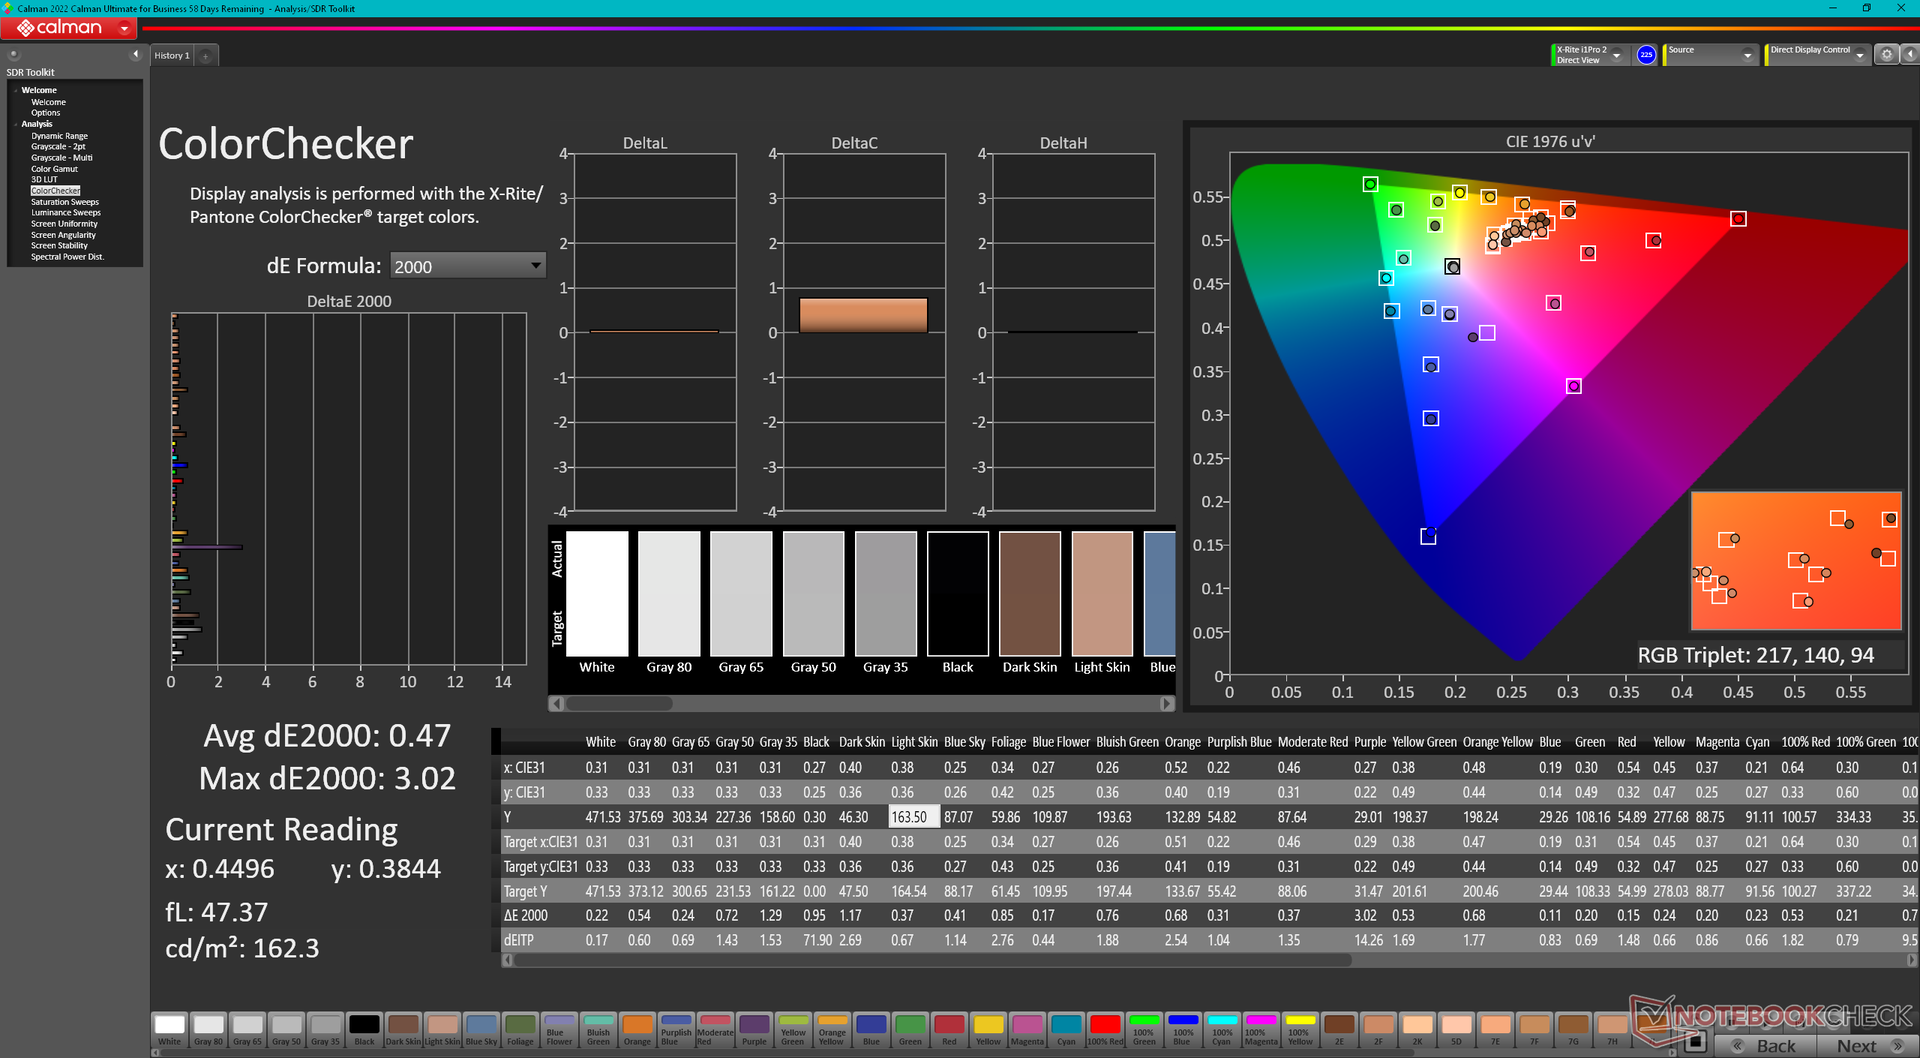
calibrated: 0.47
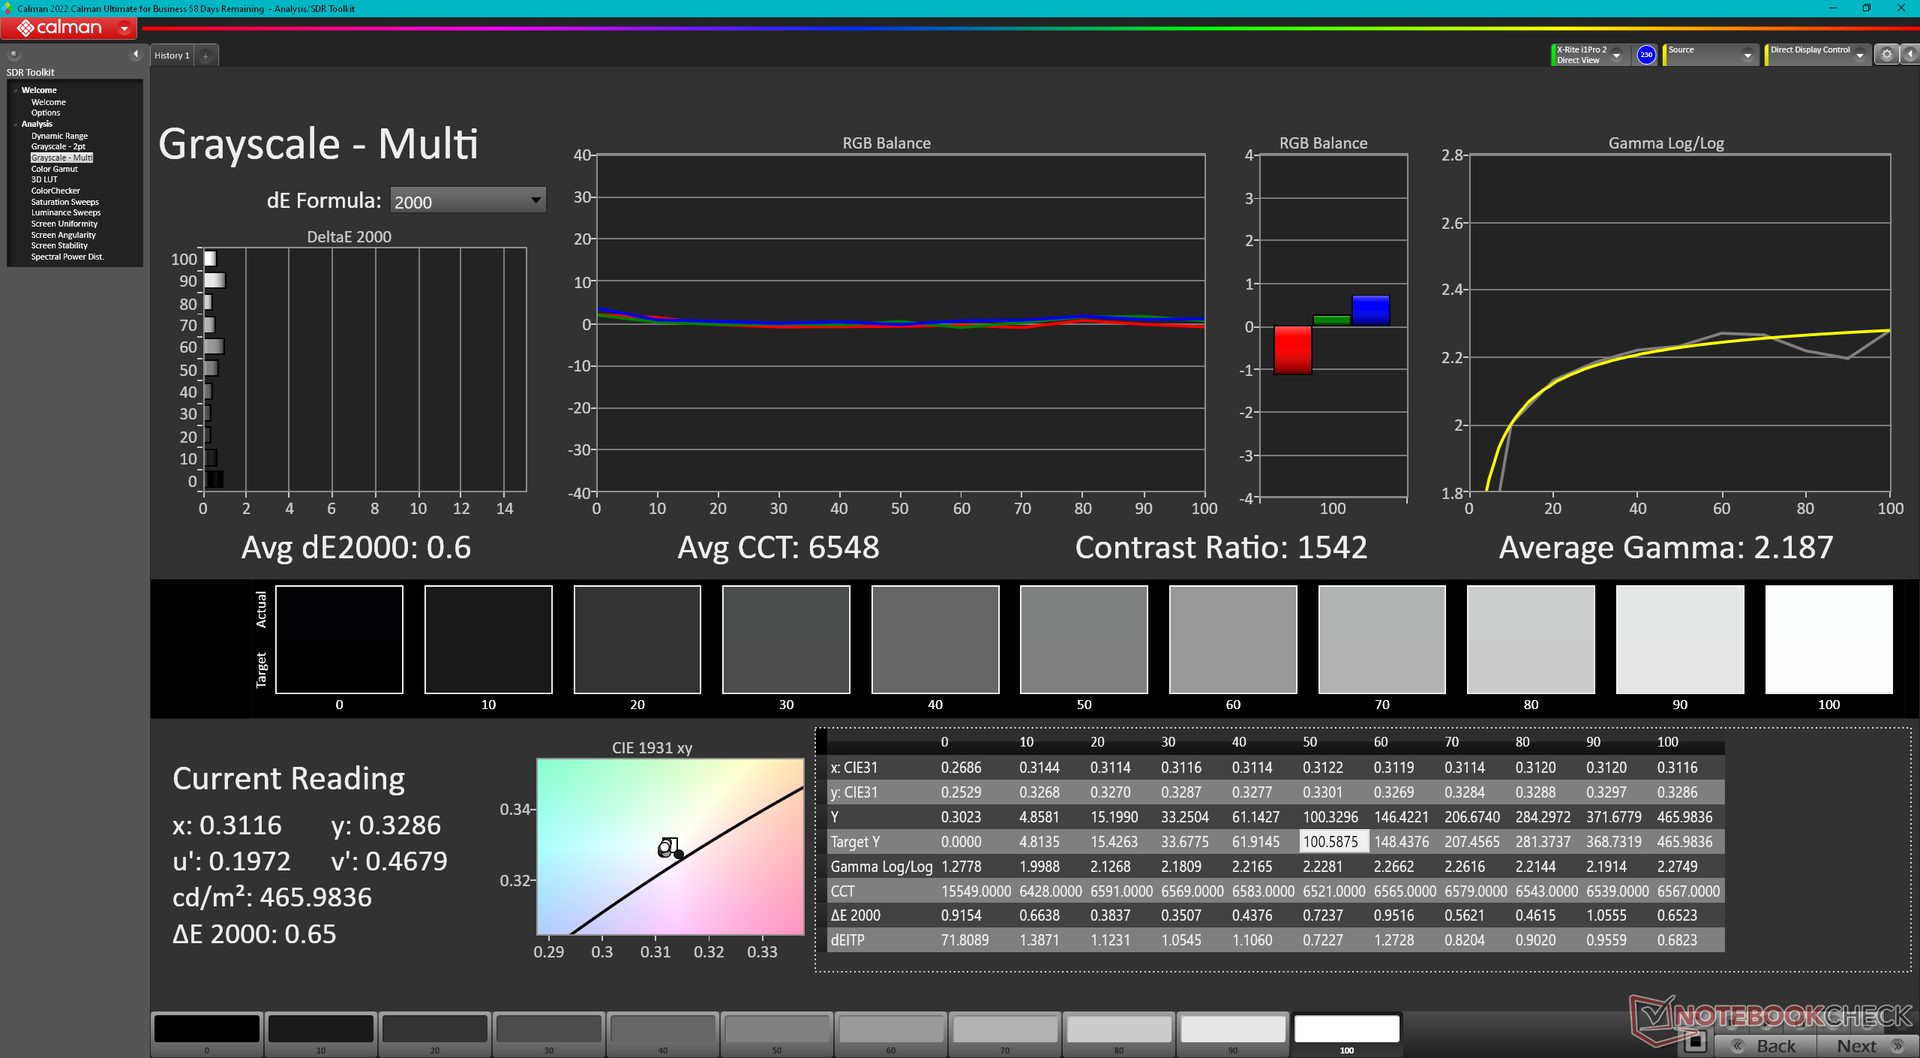
ΔE Greyscale Calman: 1.8 | ∀{0.09-98 Ø4.97}
69.7% AdobeRGB 1998 (Argyll 3D)
99.5% sRGB (Argyll 3D)
68.5% Display P3 (Argyll 3D)
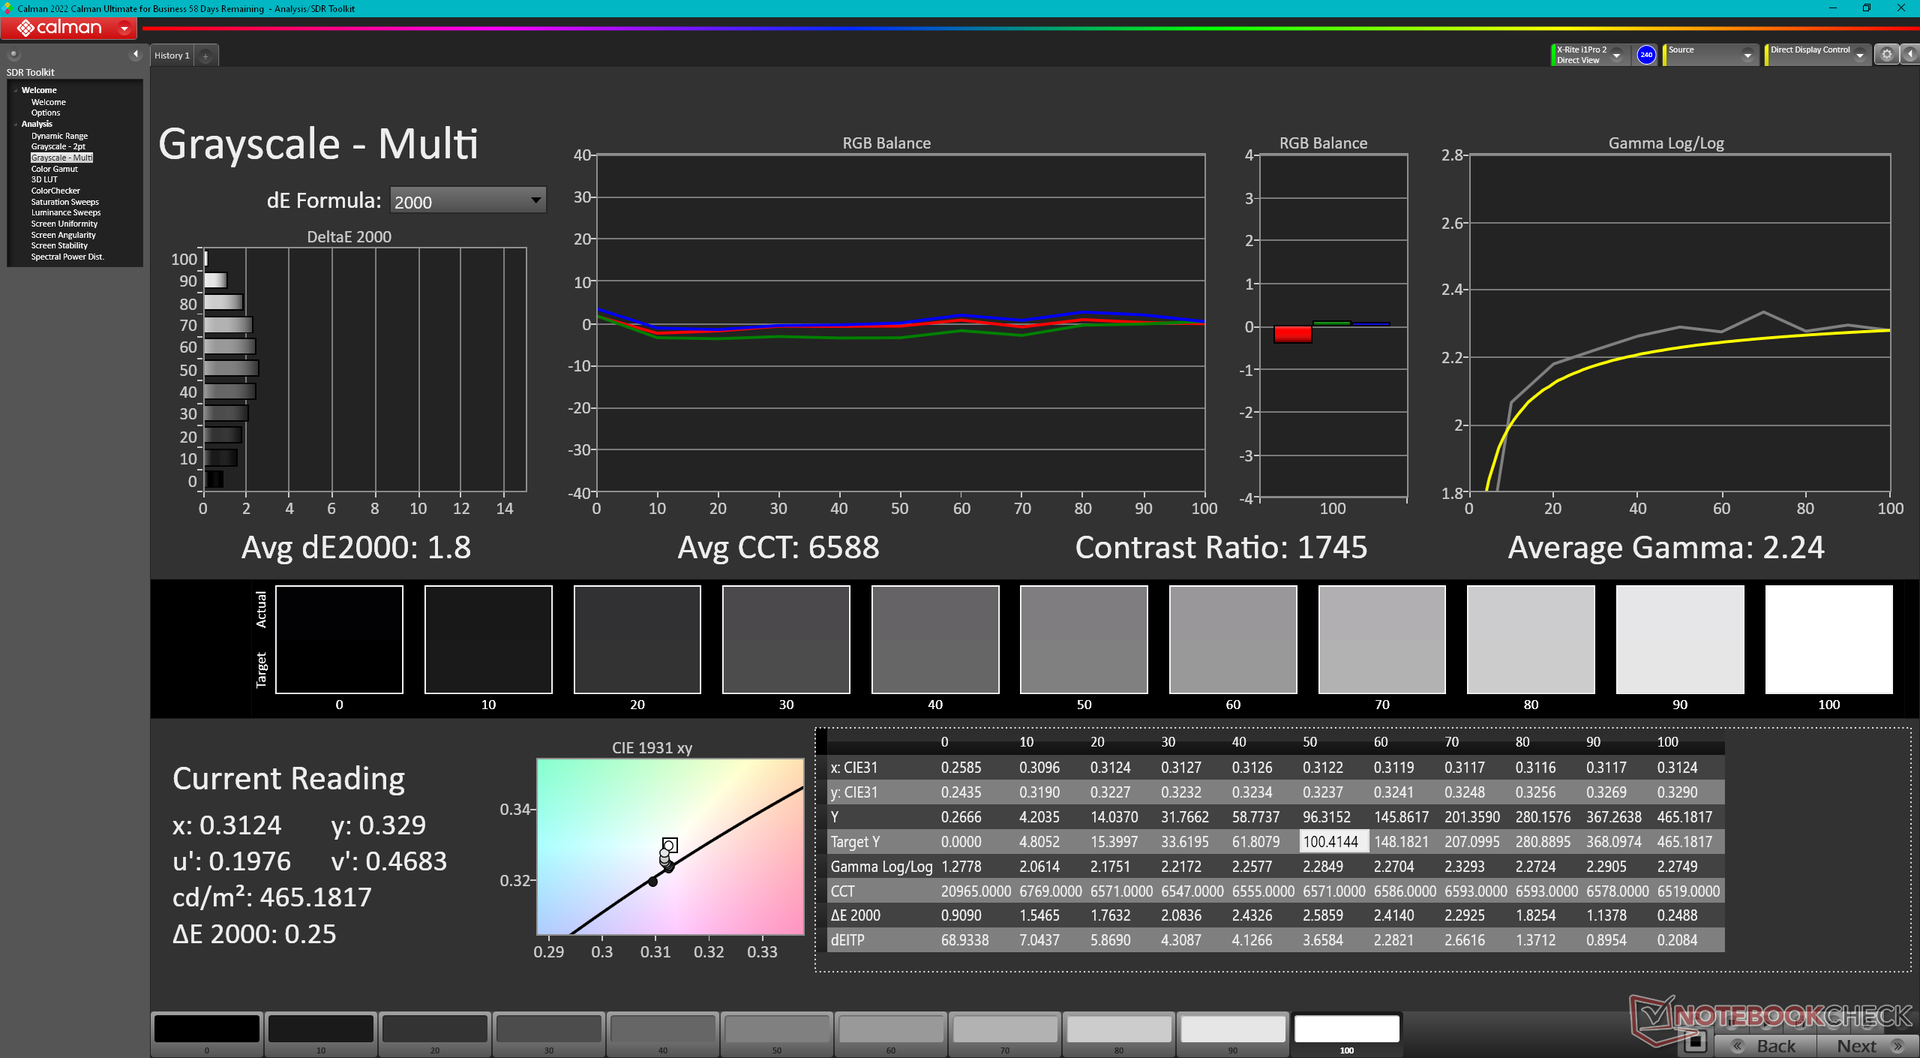
Gamma: 2.24
CCT: 6588 K
| Lenovo ThinkPad X1 Nano Gen 3 MND007ZA1-3, IPS, 2160x1350, 13" | Lenovo ThinkPad X1 Nano Gen 2 Core i7-1280P P101ZFZ-BH2, IPS, 2160x1350, 13" | HP Dragonfly G4 Chi Mei CMN13C0, IPS, 1920x1280, 13.5" | Framework Laptop 13.5 13th Gen Intel BOE CQ NE135FBM-N41, IPS, 2256x1504, 13.5" | Dell Latitude 9330 AU Optronics B133QAA, IPS, 2560x1600, 13.3" | LG Gram 14Z90Q LG LP140WU1-SPF1, IPS, 1920x1200, 14" | |
|---|---|---|---|---|---|---|
| Display | -3% | 0% | 0% | 8% | 22% | |
| Display P3 Coverage (%) | 68.5 | 66.2 -3% | 68.4 0% | 68.9 1% | 77.8 14% | 98.4 44% |
| sRGB Coverage (%) | 99.5 | 96.1 -3% | 98.3 -1% | 97.5 -2% | 99.9 0% | 99.9 0% |
| AdobeRGB 1998 Coverage (%) | 69.7 | 68.3 -2% | 70.4 1% | 71.1 2% | 77.5 11% | 85.9 23% |
| Response Times | -4% | -22% | -34% | -82% | -7% | |
| Response Time Grey 50% / Grey 80% * (ms) | 39.9 ? | 43.6 ? -9% | 48.8 ? -22% | 54.9 ? -38% | 67.6 ? -69% | 47.5 ? -19% |
| Response Time Black / White * (ms) | 25.8 ? | 25.6 ? 1% | 31.3 ? -21% | 33.5 ? -30% | 50.4 ? -95% | 24.5 ? 5% |
| PWM Frequency (Hz) | ||||||
| Bildschirm | -79% | -14% | -60% | -31% | -62% | |
| Helligkeit Bildmitte (cd/m²) | 461.2 | 469.6 2% | 408.8 -11% | 503 9% | 542.3 18% | 341 -26% |
| Brightness (cd/m²) | 428 | 460 7% | 399 -7% | 472 10% | 516 21% | 305 -29% |
| Brightness Distribution (%) | 86 | 94 9% | 90 5% | 87 1% | 85 -1% | 87 1% |
| Schwarzwert * (cd/m²) | 0.29 | 0.37 -28% | 0.32 -10% | 0.36 -24% | 0.38 -31% | 0.26 10% |
| Kontrast (:1) | 1590 | 1269 -20% | 1278 -20% | 1397 -12% | 1427 -10% | 1312 -17% |
| Delta E Colorchecker * | 1.79 | 4.85 -171% | 2.02 -13% | 3.38 -89% | 3.18 -78% | 3.11 -74% |
| Colorchecker dE 2000 max. * | 3.3 | 7.62 -131% | 3.84 -16% | 7.08 -115% | 6.05 -83% | 8.29 -151% |
| Colorchecker dE 2000 calibrated * | 0.47 | 1.22 -160% | 0.61 -30% | 1.21 -157% | 0.67 -43% | 0.83 -77% |
| Delta E Graustufen * | 1.8 | 5.7 -217% | 2.3 -28% | 4.8 -167% | 3.1 -72% | 5.3 -194% |
| Gamma | 2.24 98% | 2.13 103% | 2.2 100% | 2.13 103% | 2.08 106% | 2.037 108% |
| CCT | 6588 99% | 6931 94% | 6203 105% | 6235 104% | 6140 106% | 7571 86% |
| Durchschnitt gesamt (Programm / Settings) | -29% /
-52% | -12% /
-12% | -31% /
-44% | -35% /
-30% | -16% /
-36% |
* ... kleinere Werte sind besser
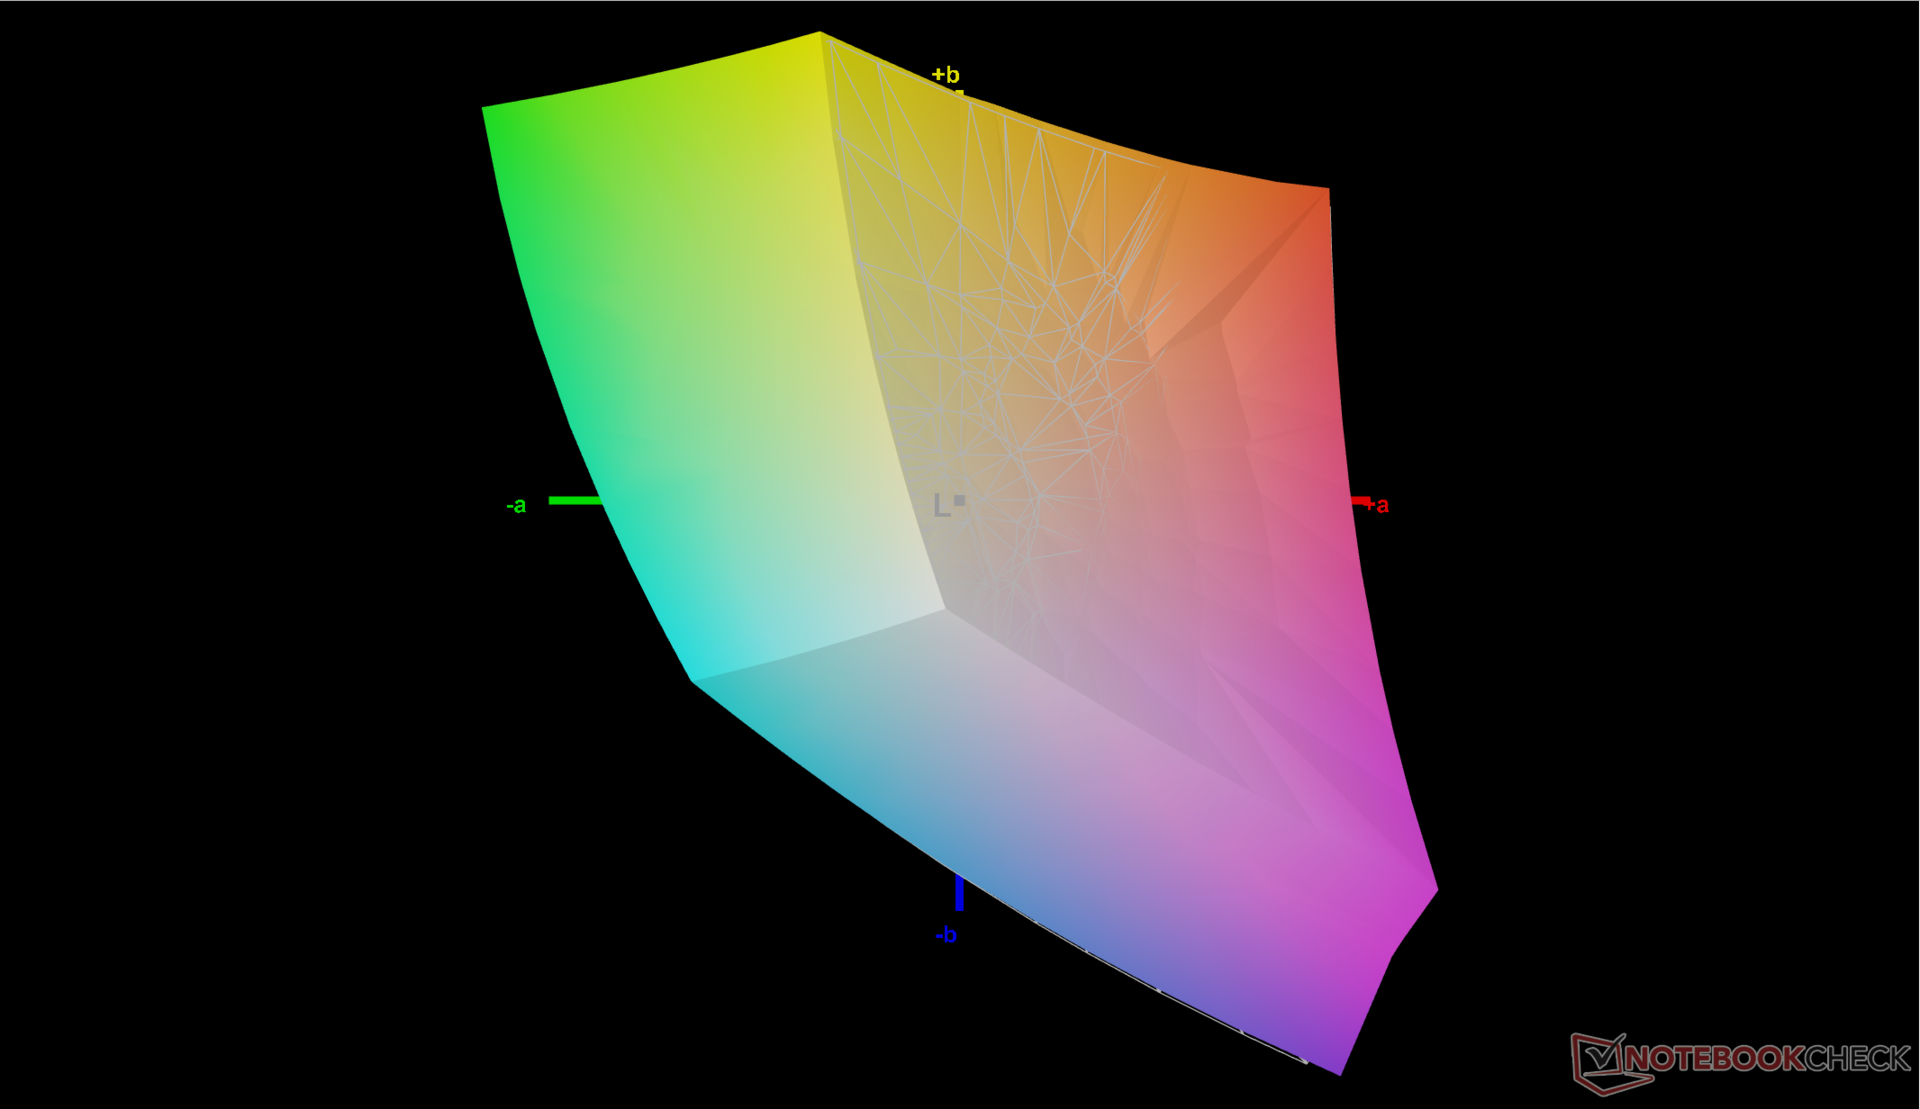
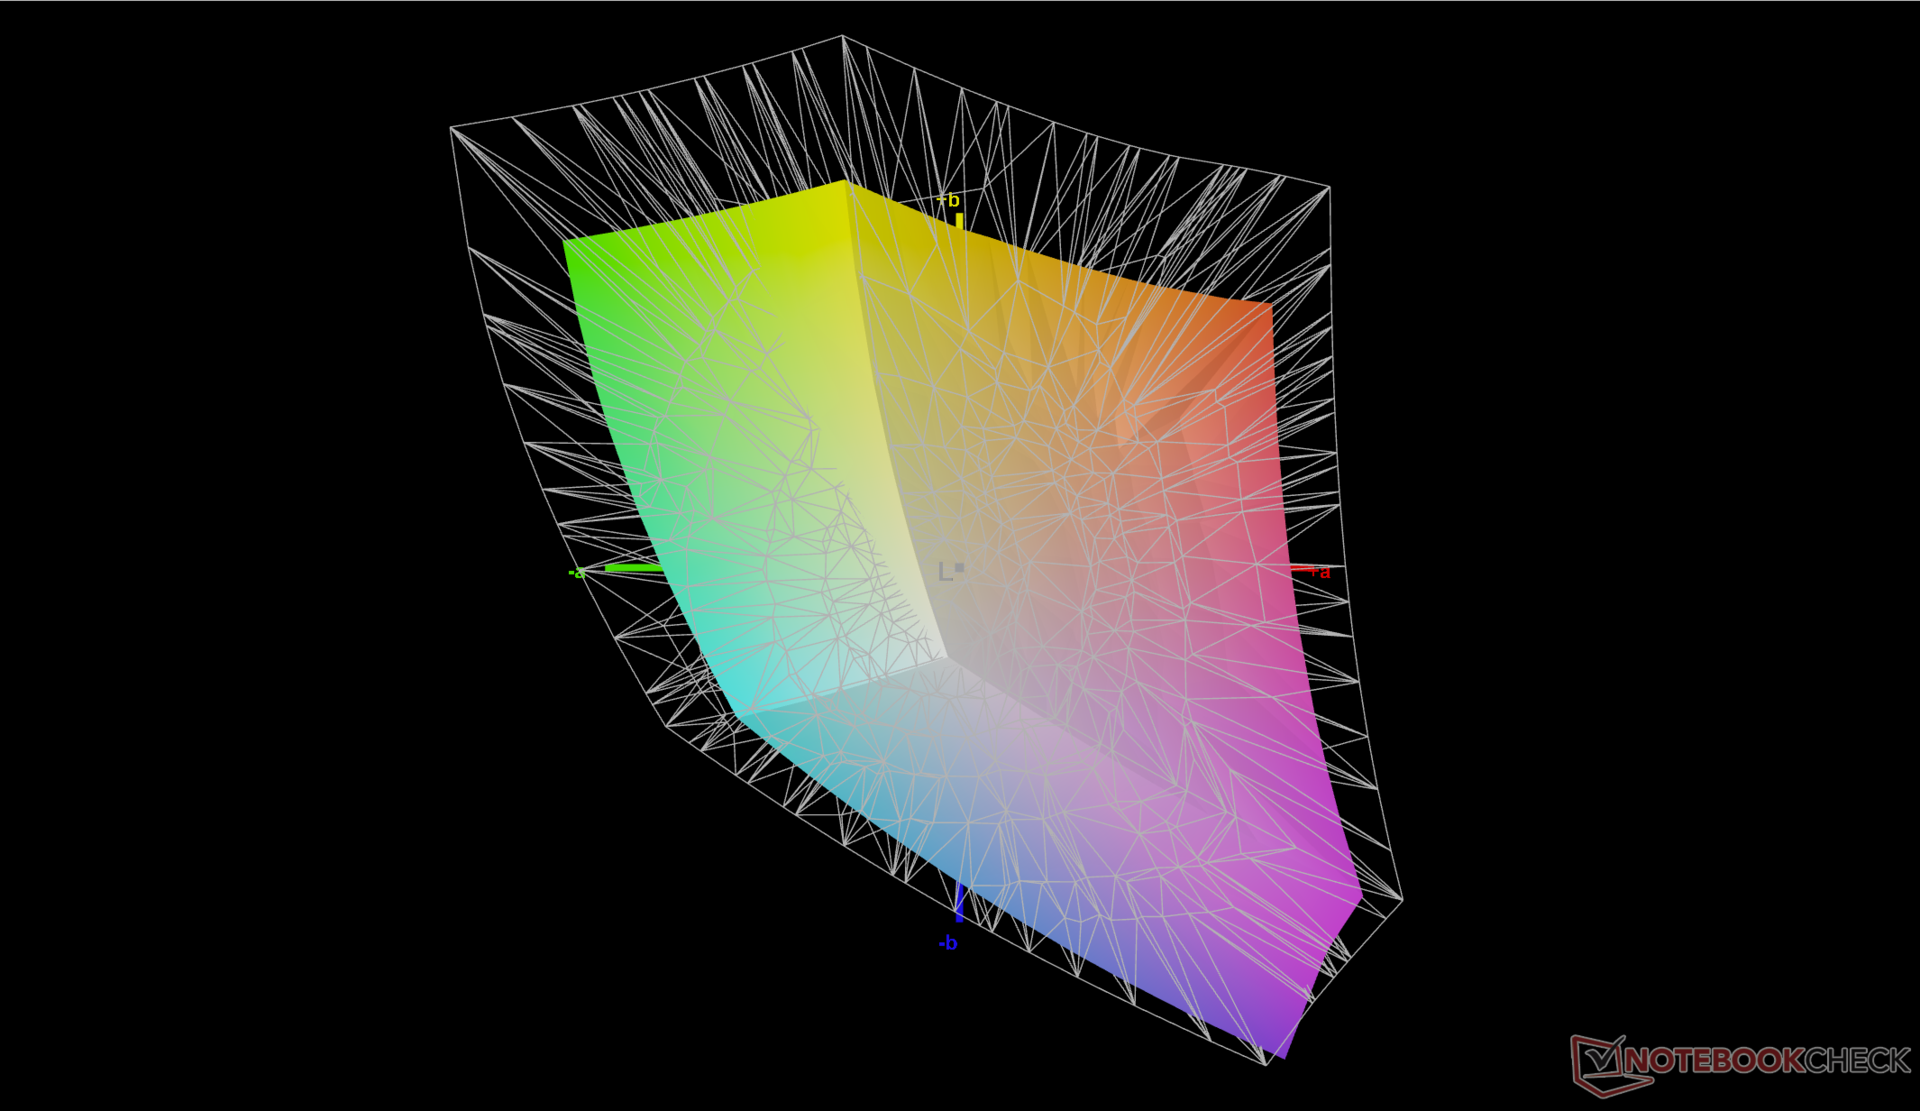
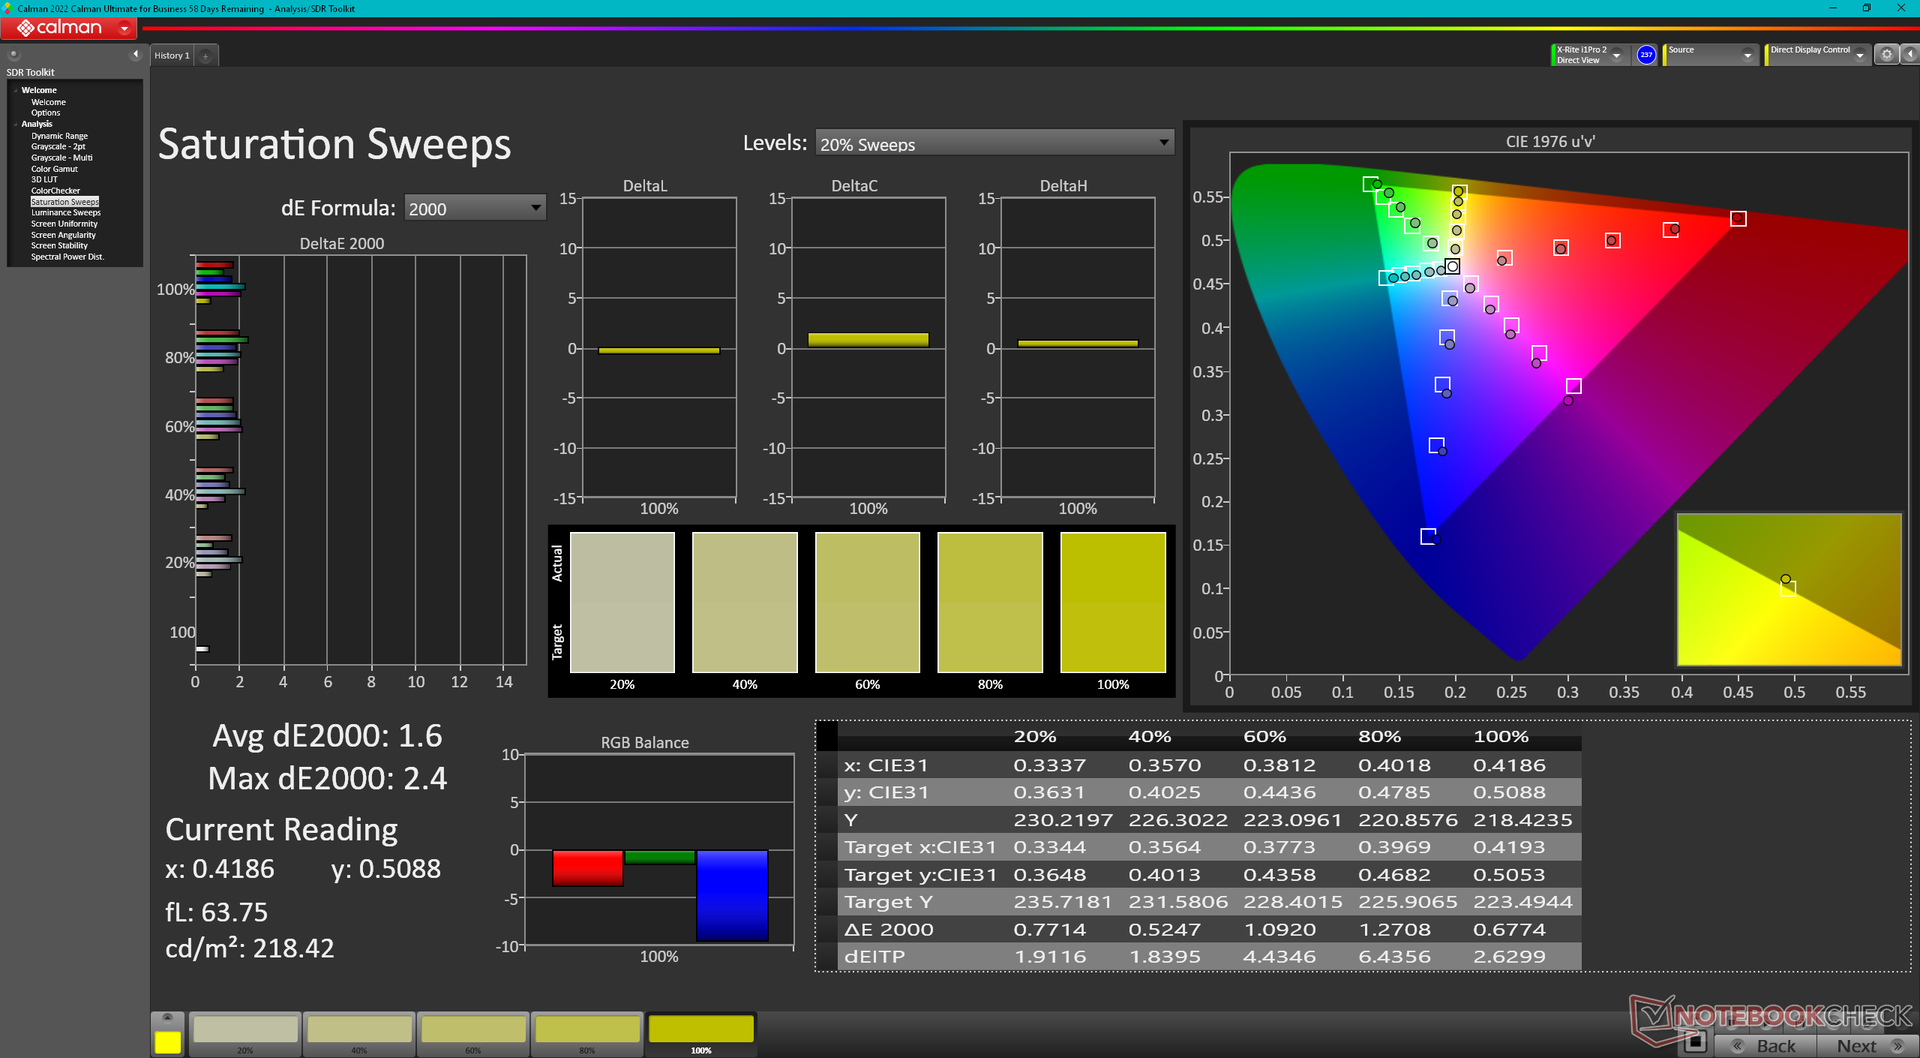
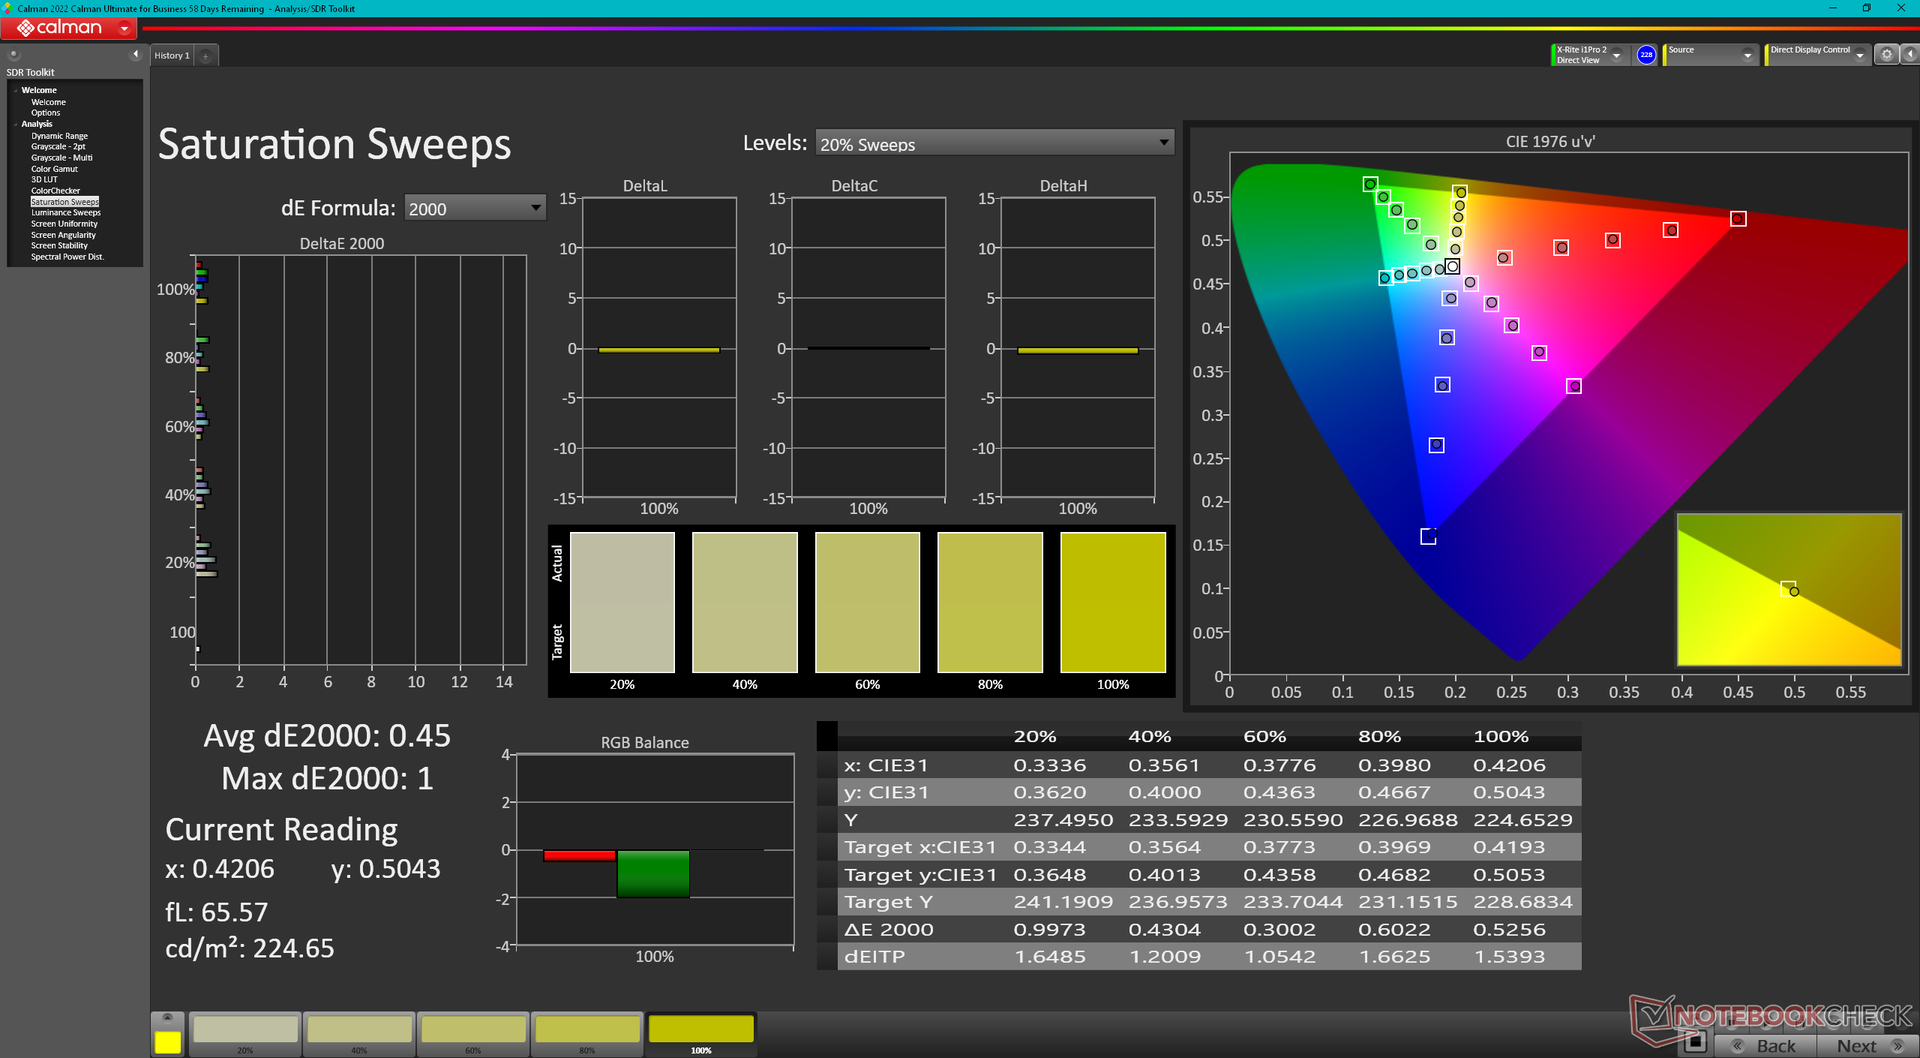
Das Display ist im Vergleich zum Vorjahresmodell besser kalibriert und bietet eine höhere Farbgenauigkeit. Die durchschnittlichen Graustufen- und Farb-DeltaE-Werte liegen bei nur 1,8 bzw. 1,79 im Vergleich zu 5,7 und 4,85 beim X1 Nano Gen 2. Das bedeutet, dass eine Kalibrierung durch den Endbenutzer diesmal nicht so notwendig ist.
Reaktionszeiten (Response Times) des Displays
| ↔ Reaktionszeiten Schwarz zu Weiß | ||
|---|---|---|
| 25.8 ms ... steigend ↗ und fallend ↘ kombiniert | ↗ 11.8 ms steigend | 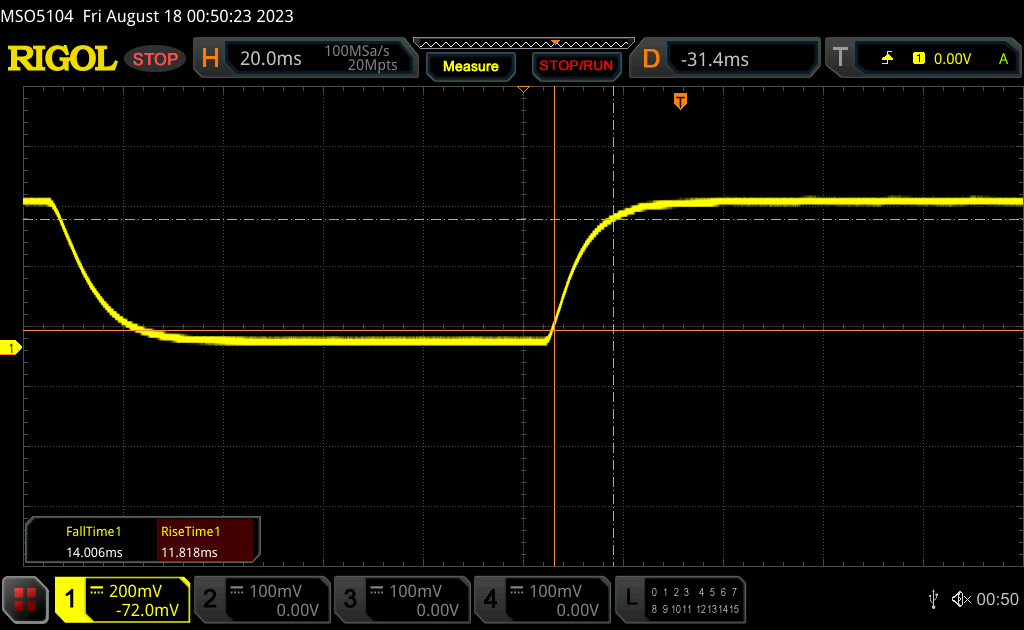 |
| ↘ 14 ms fallend | ||
| Die gemessenen Reaktionszeiten sind mittelmäßig und dadurch für Spieler eventuell zu langsam. Im Vergleich rangierten die bei uns getesteten Geräte von 0.1 (Minimum) zu 240 (Maximum) ms. » 62 % aller Screens waren schneller als der getestete. Daher sind die gemessenen Reaktionszeiten schlechter als der Durchschnitt aller vermessenen Geräte (19.8 ms). | ||
| ↔ Reaktionszeiten 50% Grau zu 80% Grau | ||
| 39.9 ms ... steigend ↗ und fallend ↘ kombiniert | ↗ 18.7 ms steigend | 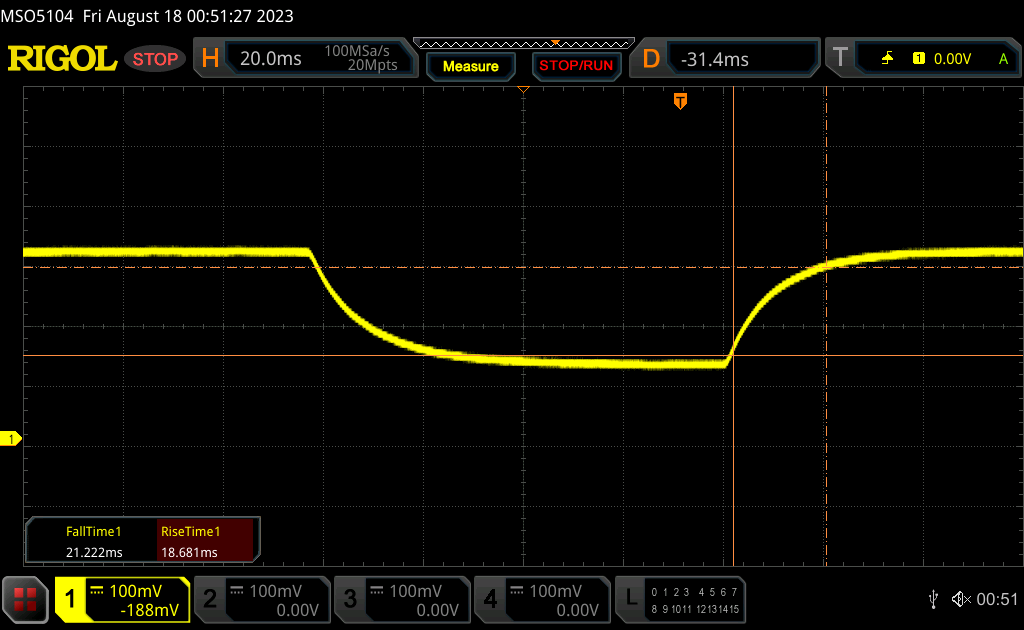 |
| ↘ 21.2 ms fallend | ||
| Die gemessenen Reaktionszeiten sind langsam und dadurch für viele Spieler wahrscheinlich zu langsam. Im Vergleich rangierten die bei uns getesteten Geräte von 0.165 (Minimum) zu 636 (Maximum) ms. » 61 % aller Screens waren schneller als der getestete. Daher sind die gemessenen Reaktionszeiten schlechter als der Durchschnitt aller vermessenen Geräte (31 ms). | ||
Bildschirm-Flackern / PWM (Pulse-Width Modulation)
| Flackern / PWM nicht festgestellt | 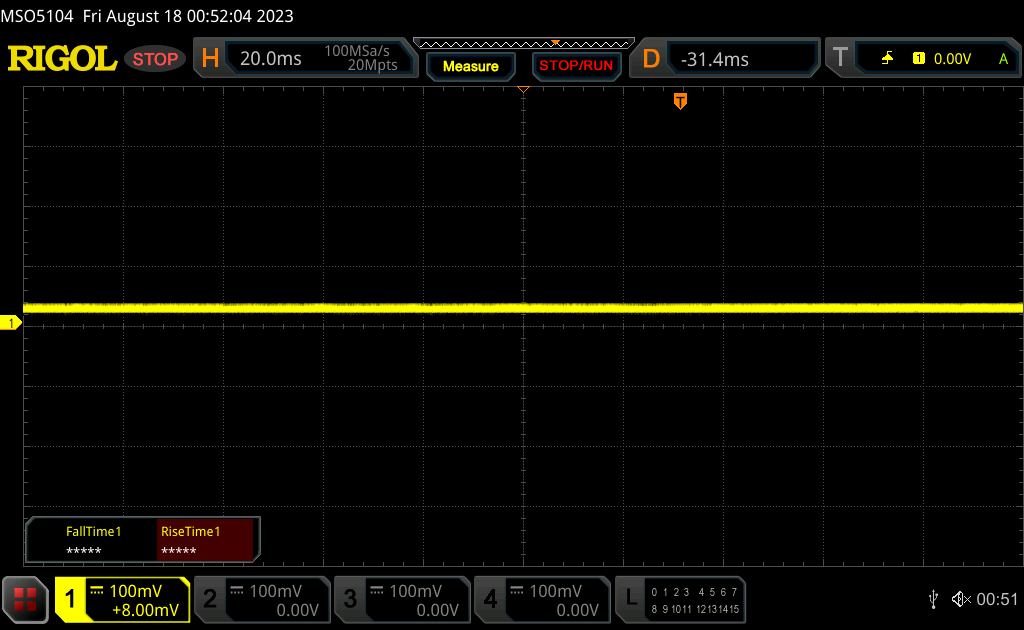 | ||
Im Vergleich: 52 % aller getesteten Geräte nutzten kein PWM um die Helligkeit zu reduzieren. Wenn PWM eingesetzt wurde, dann bei einer Frequenz von durchschnittlich 7778 (Minimum 5, Maximum 343500) Hz. | |||

Performance — Intel-Raptor-Lake-Upgrade

Testbedingungen
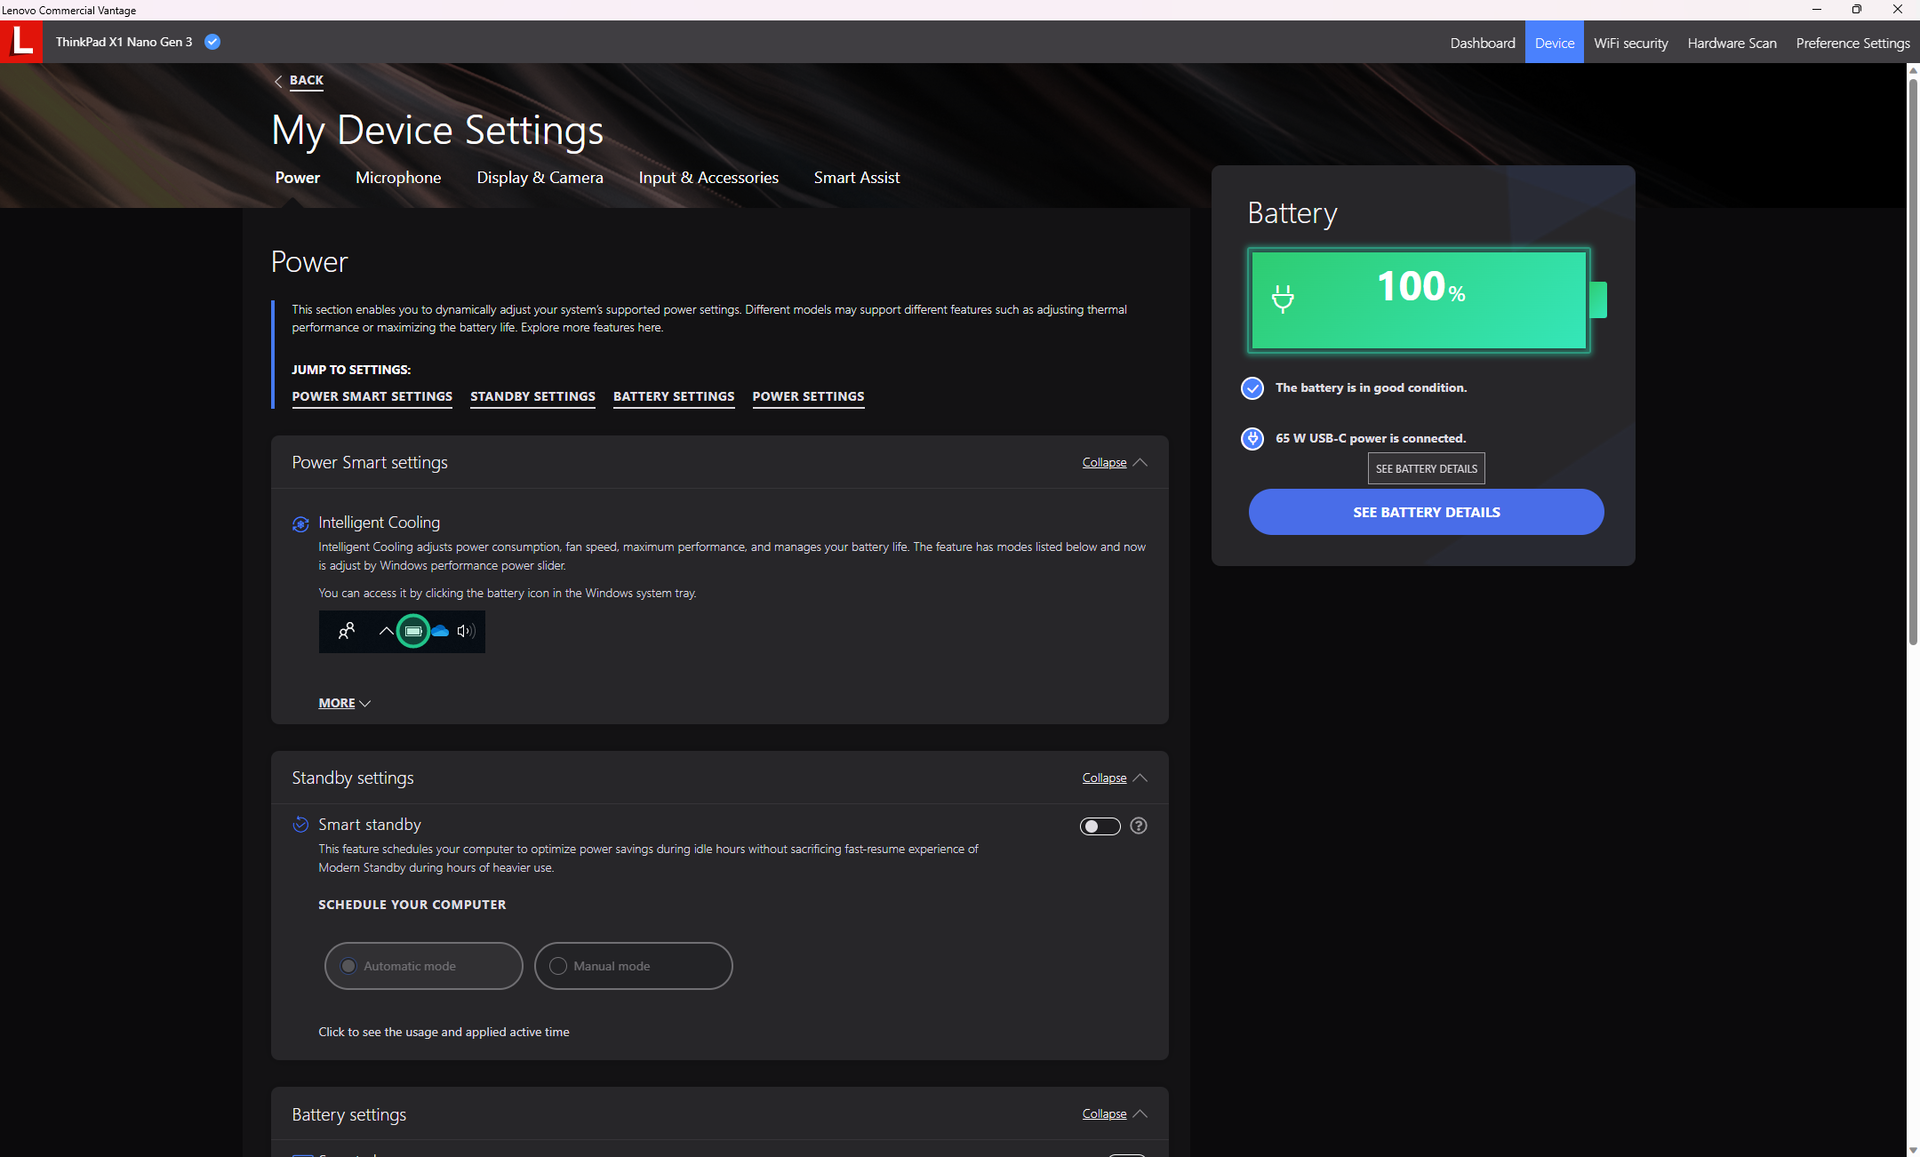
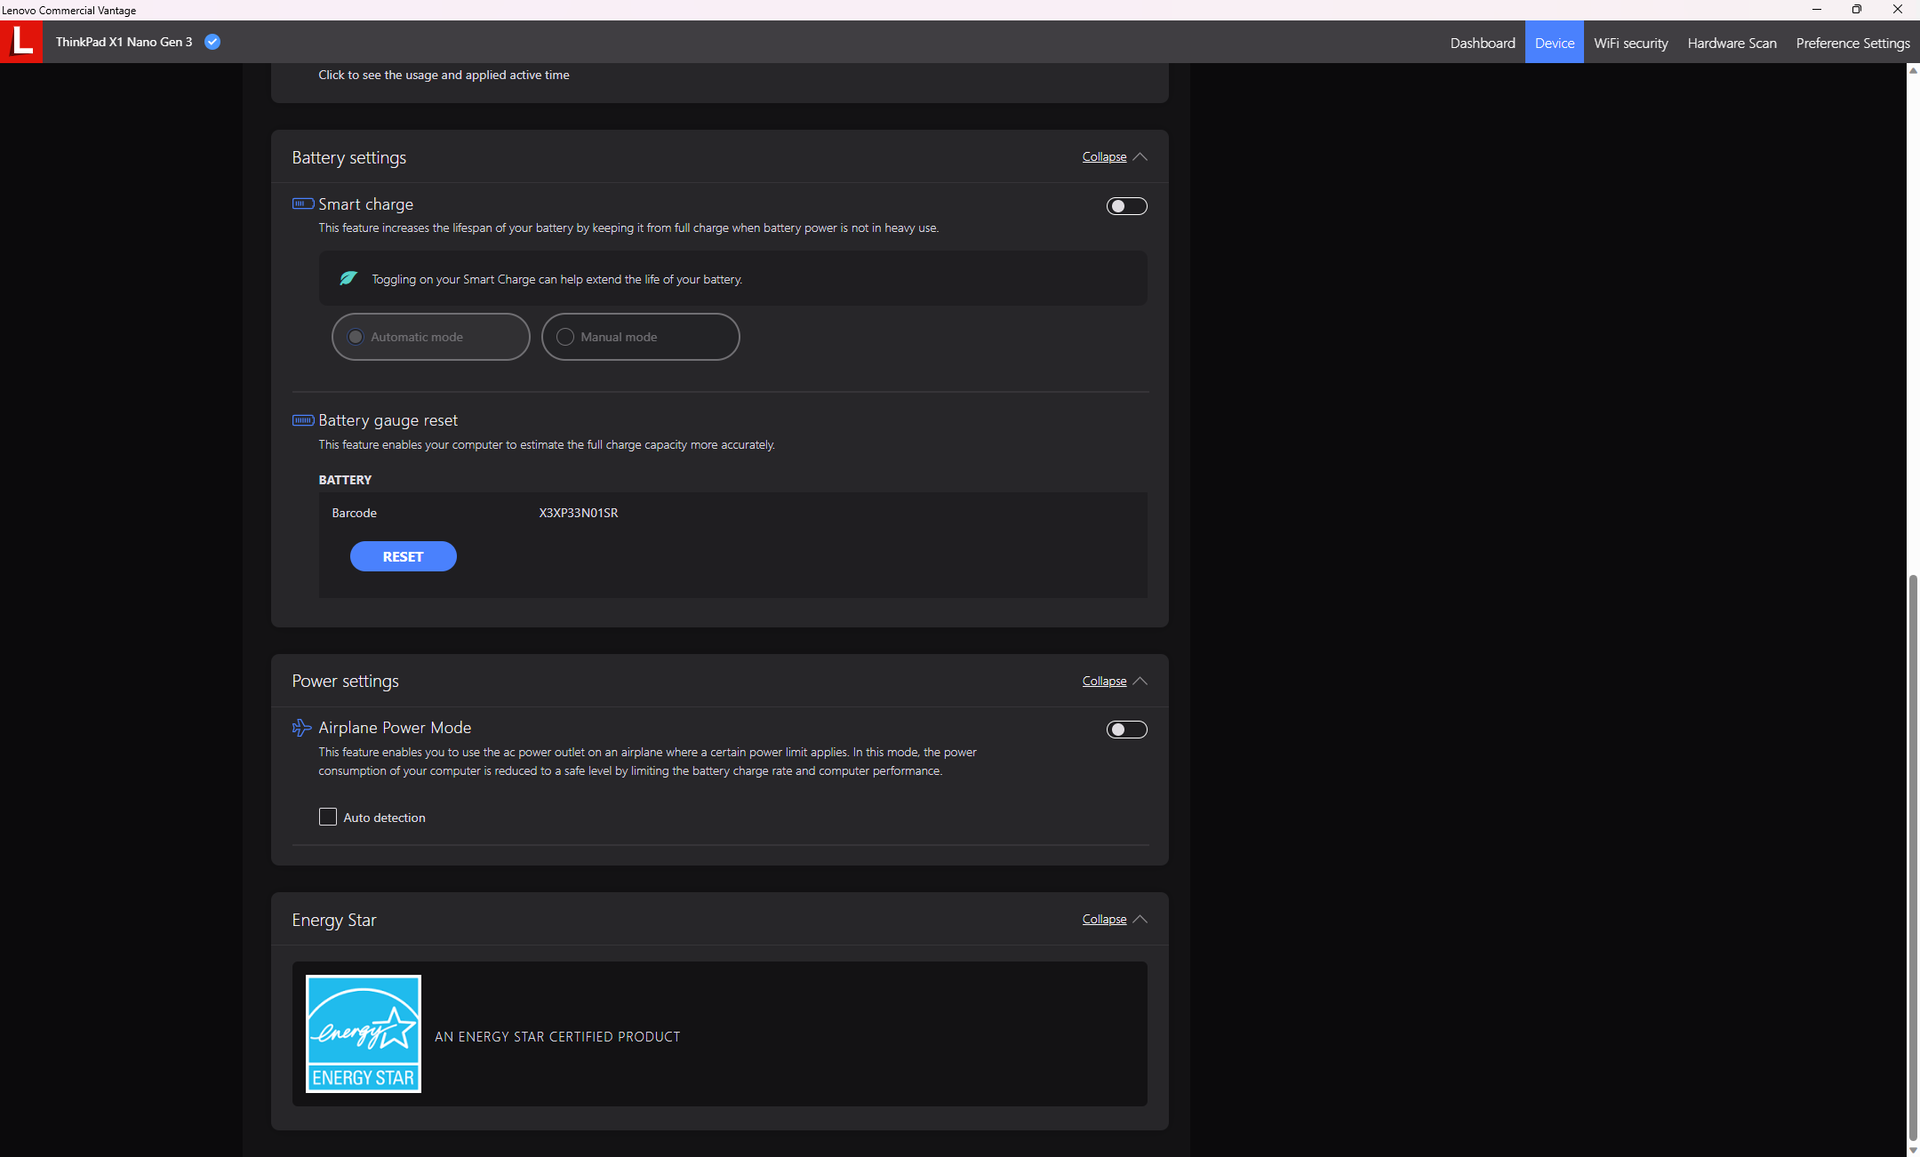
Wir haben Windows in den Leistungsmodus gesetzt, bevor wir die folgenden Benchmarks durchgeführt haben. Bei den meisten anderen Lenovo Notebooks verfügt die Vantage Software über bestimmte Energieeinstellungen, zusätzlich zu den üblichen Windows Energieeinstellungen. Auf dem ThinkPad X1 Nano hat Vantage jedoch keine besonderen Einstellungen, um Verwirrung zu vermeiden.

Prozessor
Unser Core i7-1360P der 13. Generation hat fast die gleiche Leistung wie der Core i7-1280P der 12. Generation. Manchmal fällt er sogar hinter den älteren Prozessor zurück, da er stärker gedrosselt wird, wie unsere CineBench-R15-xT-Dauertestergebnisse unten zeigen. Nichtsdestotrotz ist er im Vergleich zu konkurrierenden Subnotebooks mit Core-U-Serien-CPUs wie dem HP Dragonfly G4 oder dem Dell Latitude 9330 immer noch um bis zu 20 Prozent schneller.
Cinebench R15 Multi Dauertest
Cinebench R23: Multi Core | Single Core
Cinebench R20: CPU (Multi Core) | CPU (Single Core)
Cinebench R15: CPU Multi 64Bit | CPU Single 64Bit
Blender: v2.79 BMW27 CPU
7-Zip 18.03: 7z b 4 | 7z b 4 -mmt1
Geekbench 5.5: Multi-Core | Single-Core
HWBOT x265 Benchmark v2.2: 4k Preset
LibreOffice : 20 Documents To PDF
R Benchmark 2.5: Overall mean
* ... kleinere Werte sind besser
* ... kleinere Werte sind besser
AIDA64: FP32 Ray-Trace | FPU Julia | CPU SHA3 | CPU Queen | FPU SinJulia | FPU Mandel | CPU AES | CPU ZLib | FP64 Ray-Trace | CPU PhotoWorxx
| Performance Rating | |
| Framework Laptop 13.5 13th Gen Intel | |
| Durchschnittliche Intel Core i7-1360P | |
| Lenovo ThinkPad X1 Nano Gen 2 Core i7-1280P | |
| Lenovo ThinkPad X1 Nano Gen 3 | |
| HP Dragonfly G4 | |
| Dell Latitude 9330 | |
| LG Gram 14Z90Q | |
| AIDA64 / FP32 Ray-Trace | |
| Framework Laptop 13.5 13th Gen Intel | |
| Durchschnittliche Intel Core i7-1360P (5610 - 11188, n=17) | |
| Lenovo ThinkPad X1 Nano Gen 3 | |
| Lenovo ThinkPad X1 Nano Gen 2 Core i7-1280P | |
| HP Dragonfly G4 | |
| Dell Latitude 9330 | |
| LG Gram 14Z90Q | |
| AIDA64 / FPU Julia | |
| Framework Laptop 13.5 13th Gen Intel | |
| Durchschnittliche Intel Core i7-1360P (29251 - 56942, n=16) | |
| Lenovo ThinkPad X1 Nano Gen 2 Core i7-1280P | |
| Lenovo ThinkPad X1 Nano Gen 3 | |
| Dell Latitude 9330 | |
| HP Dragonfly G4 | |
| LG Gram 14Z90Q | |
| AIDA64 / CPU SHA3 | |
| Framework Laptop 13.5 13th Gen Intel | |
| Durchschnittliche Intel Core i7-1360P (1444 - 2728, n=16) | |
| Lenovo ThinkPad X1 Nano Gen 2 Core i7-1280P | |
| Lenovo ThinkPad X1 Nano Gen 3 | |
| Dell Latitude 9330 | |
| HP Dragonfly G4 | |
| LG Gram 14Z90Q | |
| AIDA64 / CPU Queen | |
| Framework Laptop 13.5 13th Gen Intel | |
| Lenovo ThinkPad X1 Nano Gen 2 Core i7-1280P | |
| Lenovo ThinkPad X1 Nano Gen 3 | |
| Durchschnittliche Intel Core i7-1360P (65324 - 89266, n=16) | |
| LG Gram 14Z90Q | |
| HP Dragonfly G4 | |
| Dell Latitude 9330 | |
| AIDA64 / FPU SinJulia | |
| Framework Laptop 13.5 13th Gen Intel | |
| Durchschnittliche Intel Core i7-1360P (4370 - 7269, n=16) | |
| Lenovo ThinkPad X1 Nano Gen 2 Core i7-1280P | |
| Lenovo ThinkPad X1 Nano Gen 3 | |
| HP Dragonfly G4 | |
| LG Gram 14Z90Q | |
| Dell Latitude 9330 | |
| AIDA64 / FPU Mandel | |
| Framework Laptop 13.5 13th Gen Intel | |
| Durchschnittliche Intel Core i7-1360P (14104 - 28019, n=16) | |
| Lenovo ThinkPad X1 Nano Gen 2 Core i7-1280P | |
| Lenovo ThinkPad X1 Nano Gen 3 | |
| Dell Latitude 9330 | |
| HP Dragonfly G4 | |
| LG Gram 14Z90Q | |
| AIDA64 / CPU AES | |
| Framework Laptop 13.5 13th Gen Intel | |
| Durchschnittliche Intel Core i7-1360P (30391 - 99244, n=16) | |
| Lenovo ThinkPad X1 Nano Gen 2 Core i7-1280P | |
| Lenovo ThinkPad X1 Nano Gen 3 | |
| HP Dragonfly G4 | |
| Dell Latitude 9330 | |
| LG Gram 14Z90Q | |
| AIDA64 / CPU ZLib | |
| Framework Laptop 13.5 13th Gen Intel | |
| Durchschnittliche Intel Core i7-1360P (420 - 807, n=16) | |
| Lenovo ThinkPad X1 Nano Gen 3 | |
| Lenovo ThinkPad X1 Nano Gen 2 Core i7-1280P | |
| HP Dragonfly G4 | |
| Dell Latitude 9330 | |
| LG Gram 14Z90Q | |
| AIDA64 / FP64 Ray-Trace | |
| Framework Laptop 13.5 13th Gen Intel | |
| Durchschnittliche Intel Core i7-1360P (2906 - 5957, n=16) | |
| Lenovo ThinkPad X1 Nano Gen 2 Core i7-1280P | |
| Lenovo ThinkPad X1 Nano Gen 3 | |
| Dell Latitude 9330 | |
| HP Dragonfly G4 | |
| LG Gram 14Z90Q | |
| AIDA64 / CPU PhotoWorxx | |
| Lenovo ThinkPad X1 Nano Gen 3 | |
| Lenovo ThinkPad X1 Nano Gen 2 Core i7-1280P | |
| Durchschnittliche Intel Core i7-1360P (29108 - 49328, n=16) | |
| HP Dragonfly G4 | |
| Dell Latitude 9330 | |
| Framework Laptop 13.5 13th Gen Intel | |
| LG Gram 14Z90Q | |
System Performance
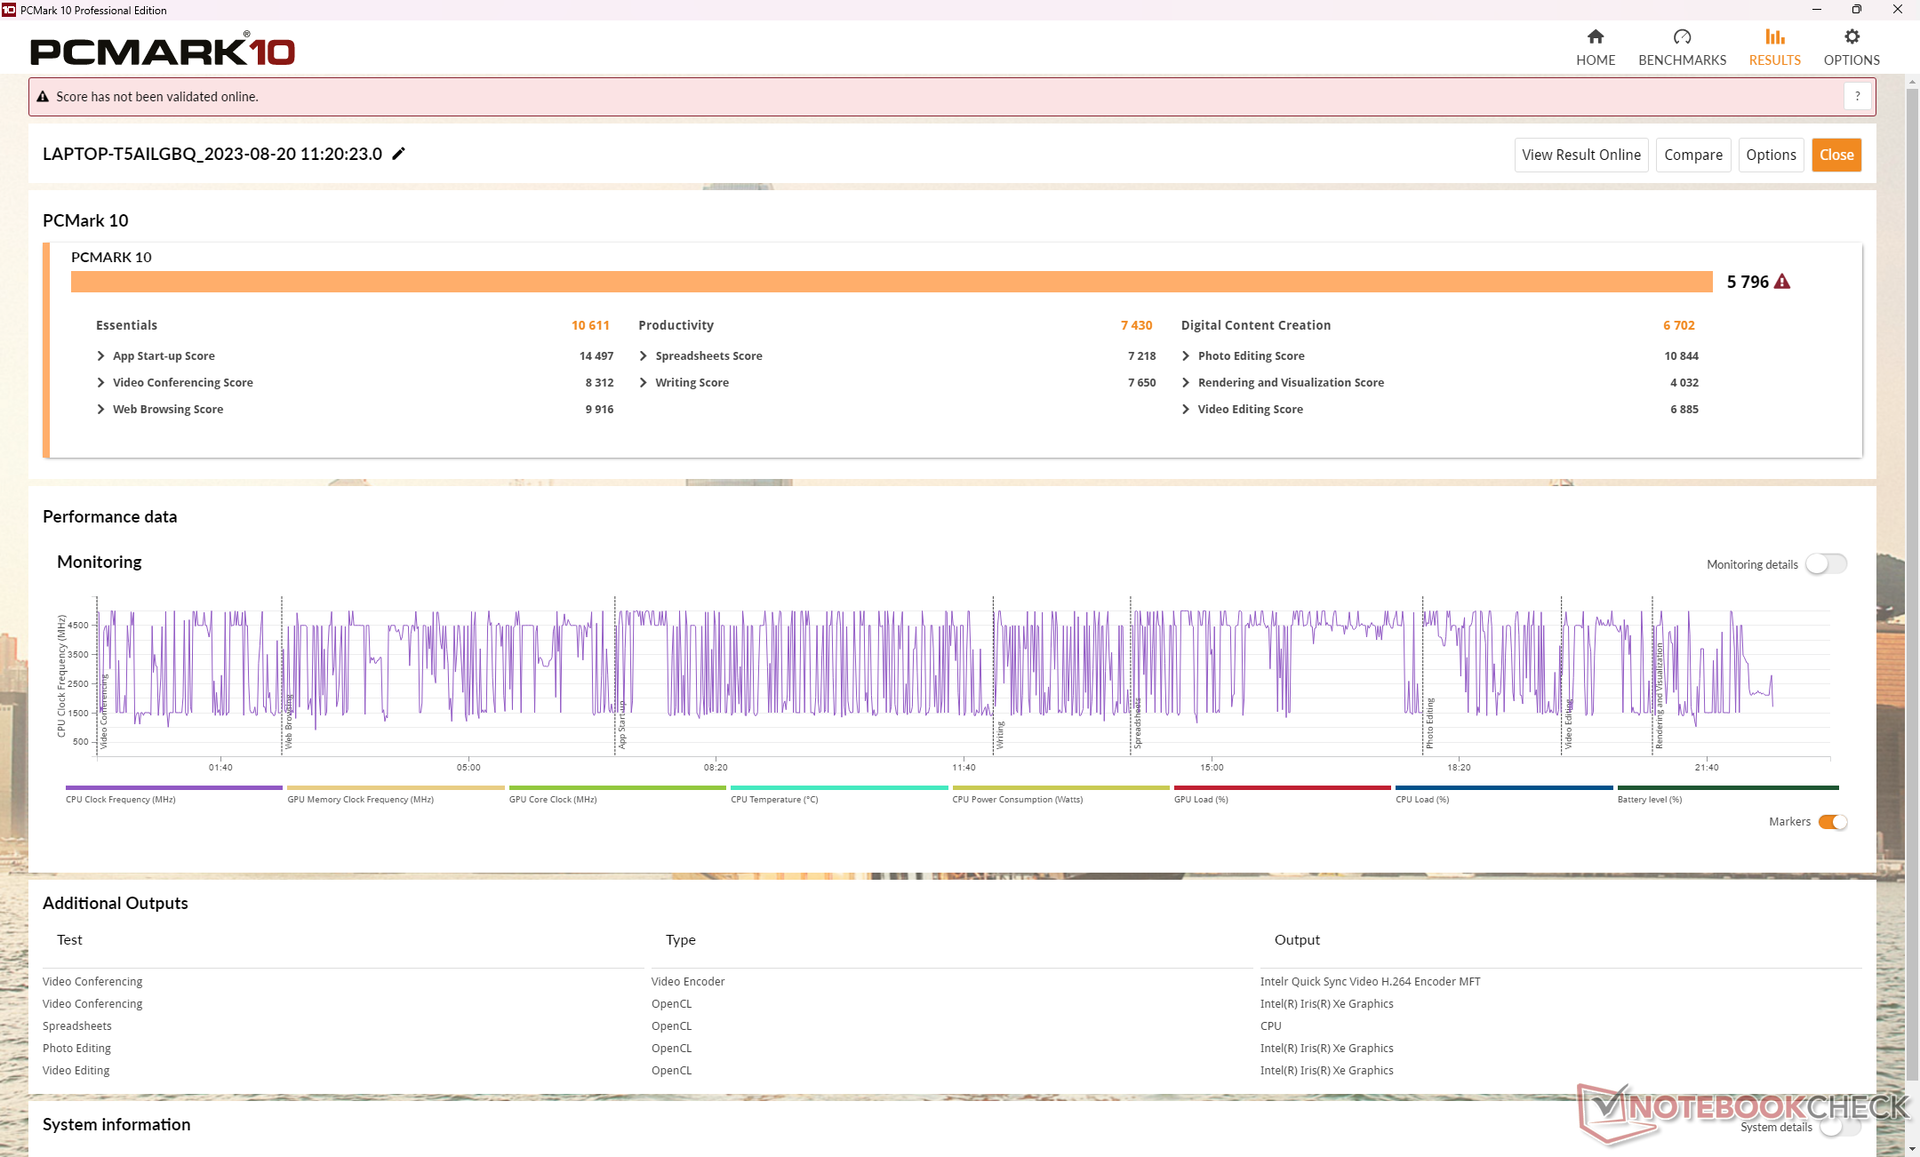
Die PCMark Ergebnisse liegen trotz der drosselanfälligen CPU und der integrierten GPU leicht über denen des Vorjahresmodells. Dies kann auf die SSD in unserem 2023er Modell zurückgeführt werden, die schneller ist als die SSD im 2022er Modell, wie in unserem Abschnitt zu den Massenspeicher unten gezeigt wird.
CrossMark: Overall | Productivity | Creativity | Responsiveness
| PCMark 10 / Score | |
| Framework Laptop 13.5 13th Gen Intel | |
| Durchschnittliche Intel Core i7-1360P, Intel Iris Xe Graphics G7 96EUs (5360 - 6281, n=14) | |
| Lenovo ThinkPad X1 Nano Gen 3 | |
| HP Dragonfly G4 | |
| Lenovo ThinkPad X1 Nano Gen 2 Core i7-1280P | |
| Dell Latitude 9330 | |
| LG Gram 14Z90Q | |
| PCMark 10 / Essentials | |
| Framework Laptop 13.5 13th Gen Intel | |
| Durchschnittliche Intel Core i7-1360P, Intel Iris Xe Graphics G7 96EUs (9883 - 12059, n=14) | |
| HP Dragonfly G4 | |
| Lenovo ThinkPad X1 Nano Gen 3 | |
| Dell Latitude 9330 | |
| Lenovo ThinkPad X1 Nano Gen 2 Core i7-1280P | |
| LG Gram 14Z90Q | |
| PCMark 10 / Productivity | |
| Framework Laptop 13.5 13th Gen Intel | |
| Lenovo ThinkPad X1 Nano Gen 3 | |
| Durchschnittliche Intel Core i7-1360P, Intel Iris Xe Graphics G7 96EUs (6572 - 8161, n=14) | |
| HP Dragonfly G4 | |
| Dell Latitude 9330 | |
| Lenovo ThinkPad X1 Nano Gen 2 Core i7-1280P | |
| LG Gram 14Z90Q | |
| PCMark 10 / Digital Content Creation | |
| Framework Laptop 13.5 13th Gen Intel | |
| Durchschnittliche Intel Core i7-1360P, Intel Iris Xe Graphics G7 96EUs (5723 - 7612, n=14) | |
| Lenovo ThinkPad X1 Nano Gen 3 | |
| Lenovo ThinkPad X1 Nano Gen 2 Core i7-1280P | |
| HP Dragonfly G4 | |
| LG Gram 14Z90Q | |
| Dell Latitude 9330 | |
| CrossMark / Overall | |
| Lenovo ThinkPad X1 Nano Gen 3 | |
| Framework Laptop 13.5 13th Gen Intel | |
| Durchschnittliche Intel Core i7-1360P, Intel Iris Xe Graphics G7 96EUs (1527 - 1891, n=15) | |
| Lenovo ThinkPad X1 Nano Gen 2 Core i7-1280P | |
| HP Dragonfly G4 | |
| Apple MacBook Air M2 10C GPU | |
| CrossMark / Productivity | |
| Framework Laptop 13.5 13th Gen Intel | |
| Lenovo ThinkPad X1 Nano Gen 3 | |
| Durchschnittliche Intel Core i7-1360P, Intel Iris Xe Graphics G7 96EUs (1503 - 1842, n=15) | |
| Lenovo ThinkPad X1 Nano Gen 2 Core i7-1280P | |
| HP Dragonfly G4 | |
| Apple MacBook Air M2 10C GPU | |
| CrossMark / Creativity | |
| Lenovo ThinkPad X1 Nano Gen 3 | |
| Lenovo ThinkPad X1 Nano Gen 2 Core i7-1280P | |
| Framework Laptop 13.5 13th Gen Intel | |
| Durchschnittliche Intel Core i7-1360P, Intel Iris Xe Graphics G7 96EUs (1558 - 2003, n=15) | |
| Apple MacBook Air M2 10C GPU | |
| HP Dragonfly G4 | |
| CrossMark / Responsiveness | |
| Durchschnittliche Intel Core i7-1360P, Intel Iris Xe Graphics G7 96EUs (1311 - 1899, n=15) | |
| Framework Laptop 13.5 13th Gen Intel | |
| Lenovo ThinkPad X1 Nano Gen 3 | |
| Lenovo ThinkPad X1 Nano Gen 2 Core i7-1280P | |
| HP Dragonfly G4 | |
| Apple MacBook Air M2 10C GPU | |
| PCMark 10 Score | 5796 Punkte | |
Hilfe | ||
| AIDA64 / Memory Copy | |
| Lenovo ThinkPad X1 Nano Gen 3 | |
| Lenovo ThinkPad X1 Nano Gen 2 Core i7-1280P | |
| Dell Latitude 9330 | |
| Durchschnittliche Intel Core i7-1360P (44299 - 72748, n=16) | |
| HP Dragonfly G4 | |
| LG Gram 14Z90Q | |
| Framework Laptop 13.5 13th Gen Intel | |
| AIDA64 / Memory Read | |
| Lenovo ThinkPad X1 Nano Gen 2 Core i7-1280P | |
| LG Gram 14Z90Q | |
| Lenovo ThinkPad X1 Nano Gen 3 | |
| Dell Latitude 9330 | |
| Durchschnittliche Intel Core i7-1360P (44751 - 68945, n=16) | |
| Framework Laptop 13.5 13th Gen Intel | |
| HP Dragonfly G4 | |
| AIDA64 / Memory Write | |
| Lenovo ThinkPad X1 Nano Gen 3 | |
| Durchschnittliche Intel Core i7-1360P (45887 - 93331, n=16) | |
| HP Dragonfly G4 | |
| Lenovo ThinkPad X1 Nano Gen 2 Core i7-1280P | |
| Dell Latitude 9330 | |
| LG Gram 14Z90Q | |
| Framework Laptop 13.5 13th Gen Intel | |
| AIDA64 / Memory Latency | |
| LG Gram 14Z90Q | |
| Dell Latitude 9330 | |
| Durchschnittliche Intel Core i7-1360P (85 - 110.5, n=16) | |
| Lenovo ThinkPad X1 Nano Gen 3 | |
| Lenovo ThinkPad X1 Nano Gen 2 Core i7-1280P | |
| HP Dragonfly G4 | |
| Framework Laptop 13.5 13th Gen Intel | |
* ... kleinere Werte sind besser
DPC-Latenzen
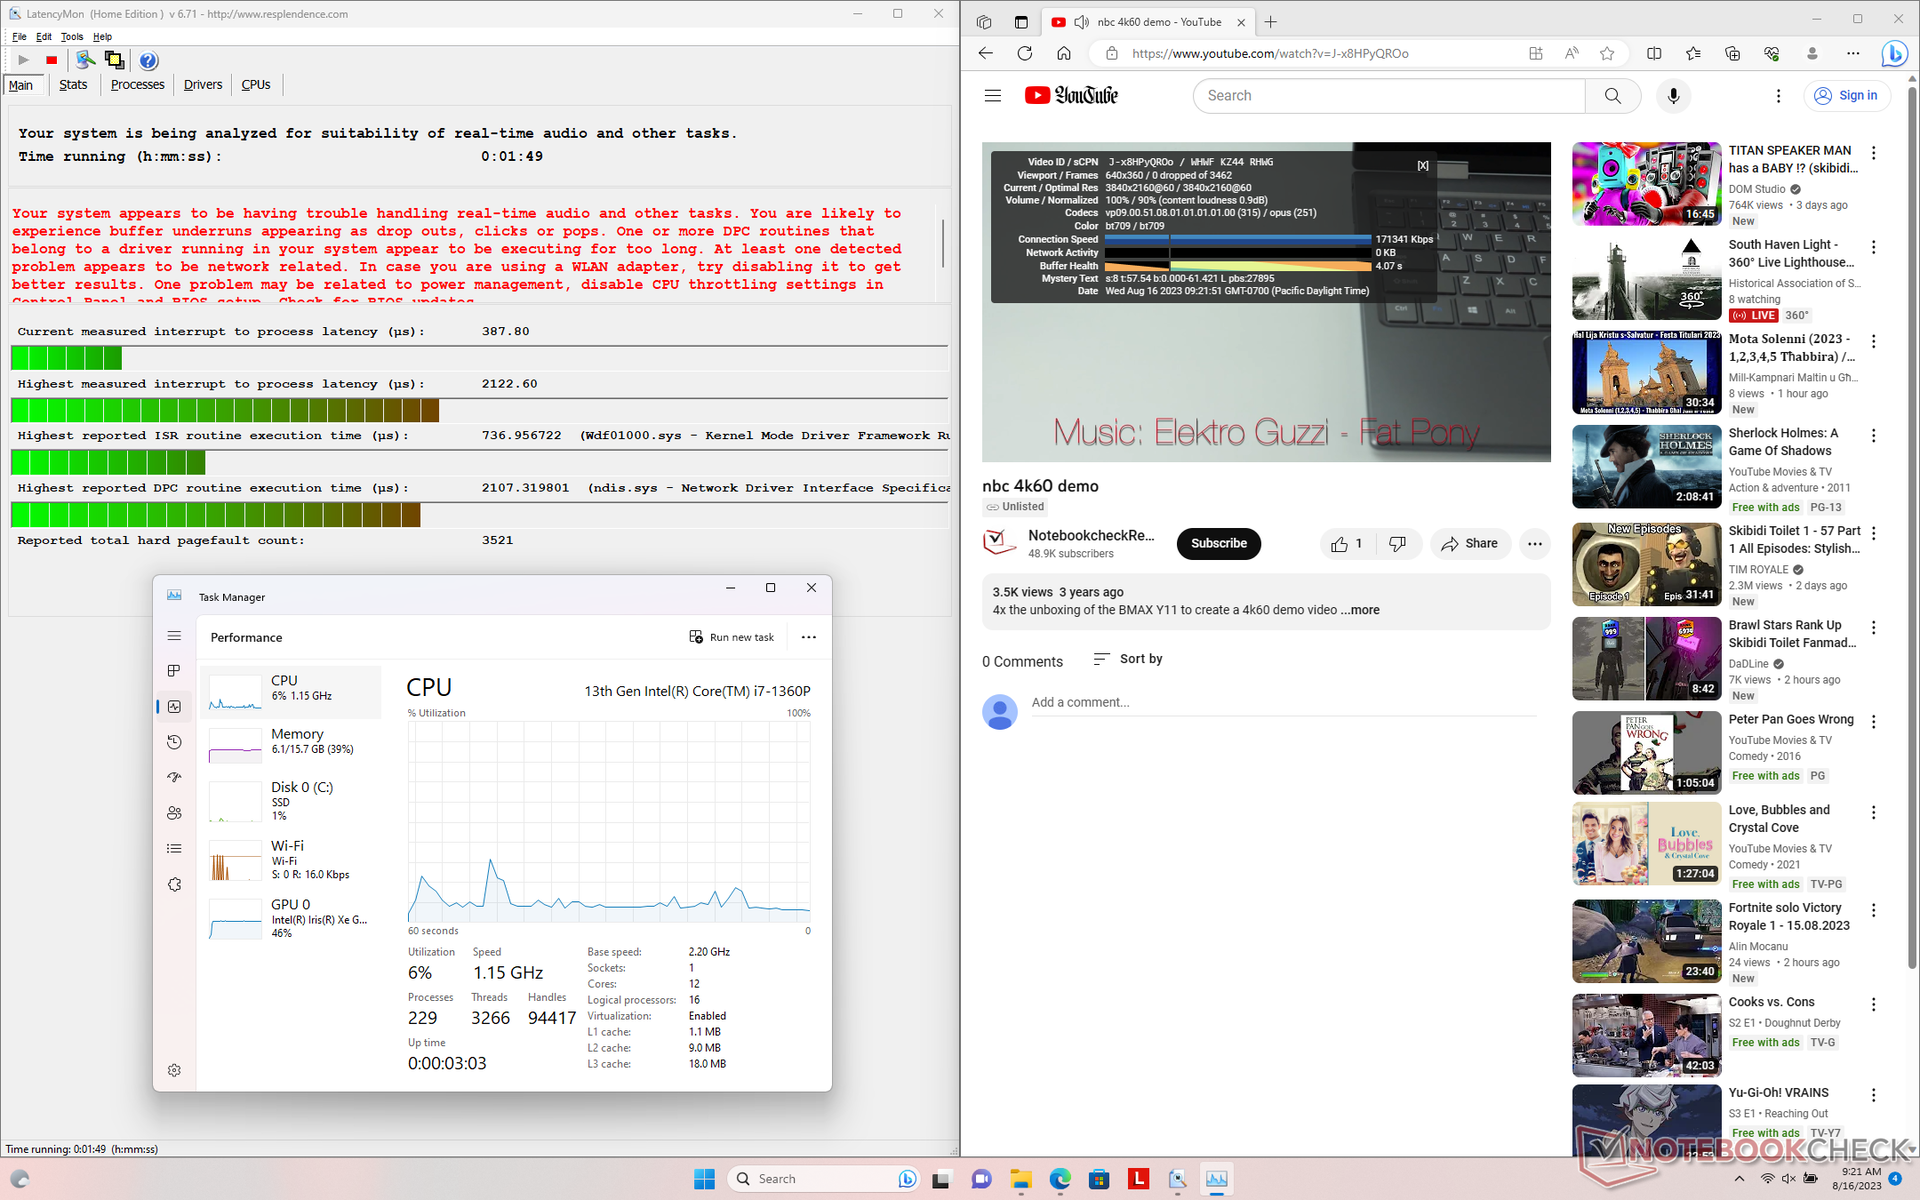
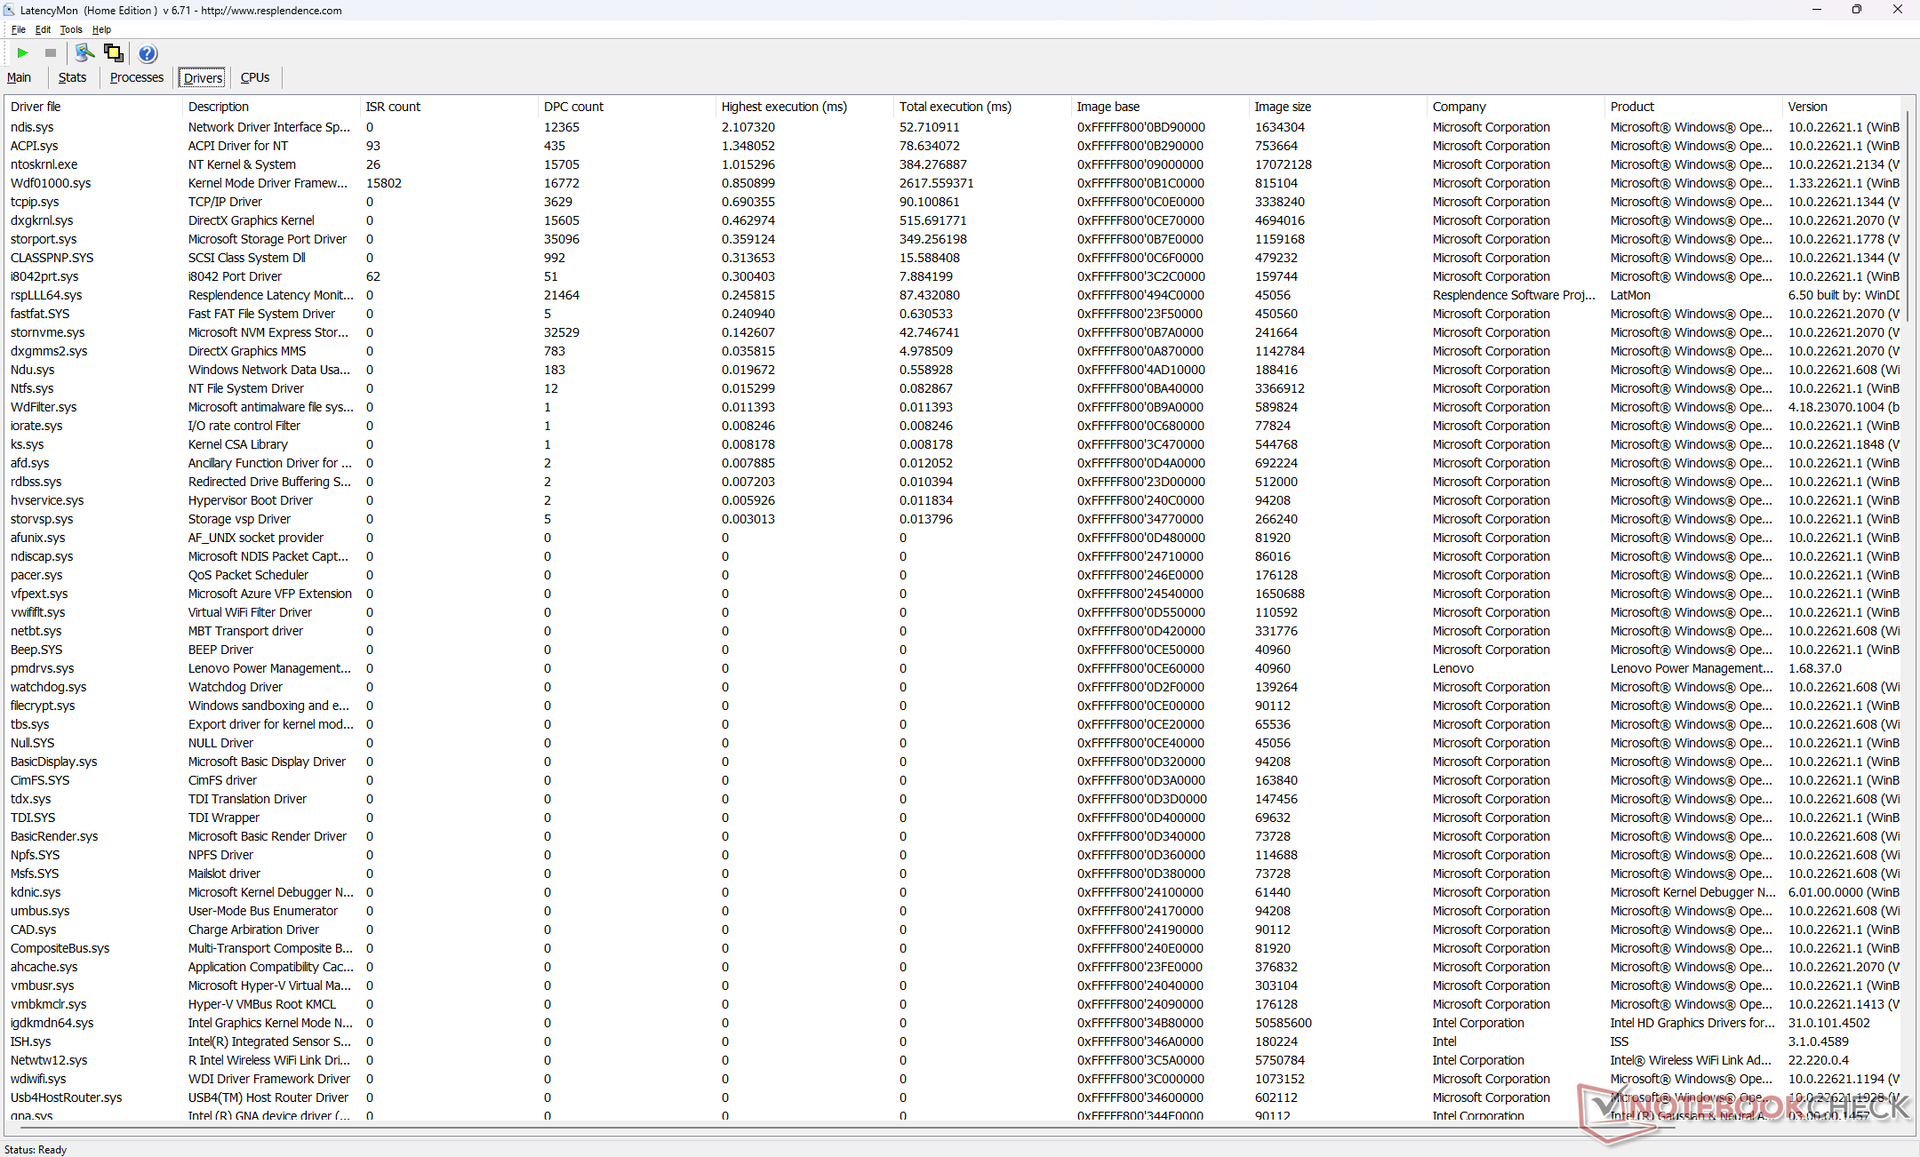
LatencyMon zeigt geringe DPC-Probleme beim Öffnen mehrerer Browser-Tabs unserer Homepage. Die 4K-Videowiedergabe bei 60 fps läuft ansonsten flüssig und ohne Bildaussetzer.
| DPC Latencies / LatencyMon - interrupt to process latency (max), Web, Youtube, Prime95 | |
| Dell Latitude 9330 | |
| Lenovo ThinkPad X1 Nano Gen 3 | |
| HP Dragonfly G4 | |
| LG Gram 14Z90Q | |
| Lenovo ThinkPad X1 Nano Gen 2 Core i7-1280P | |
| Framework Laptop 13.5 13th Gen Intel | |
* ... kleinere Werte sind besser
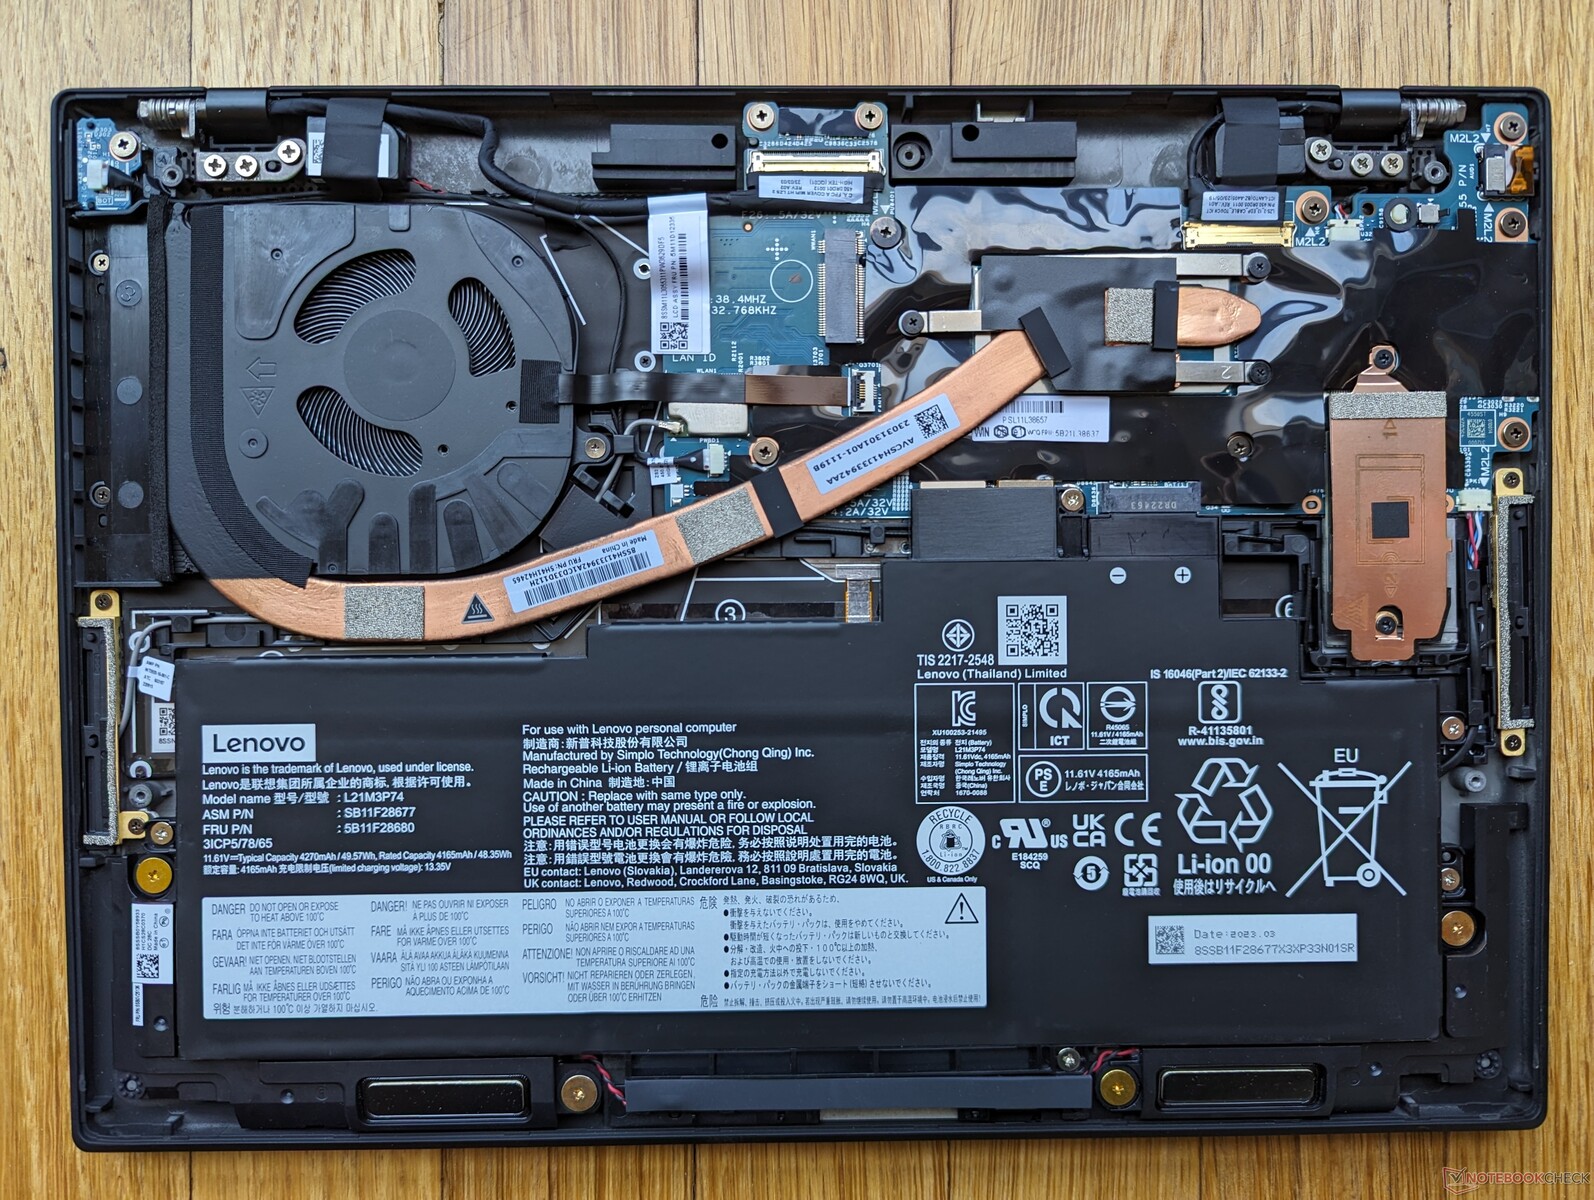
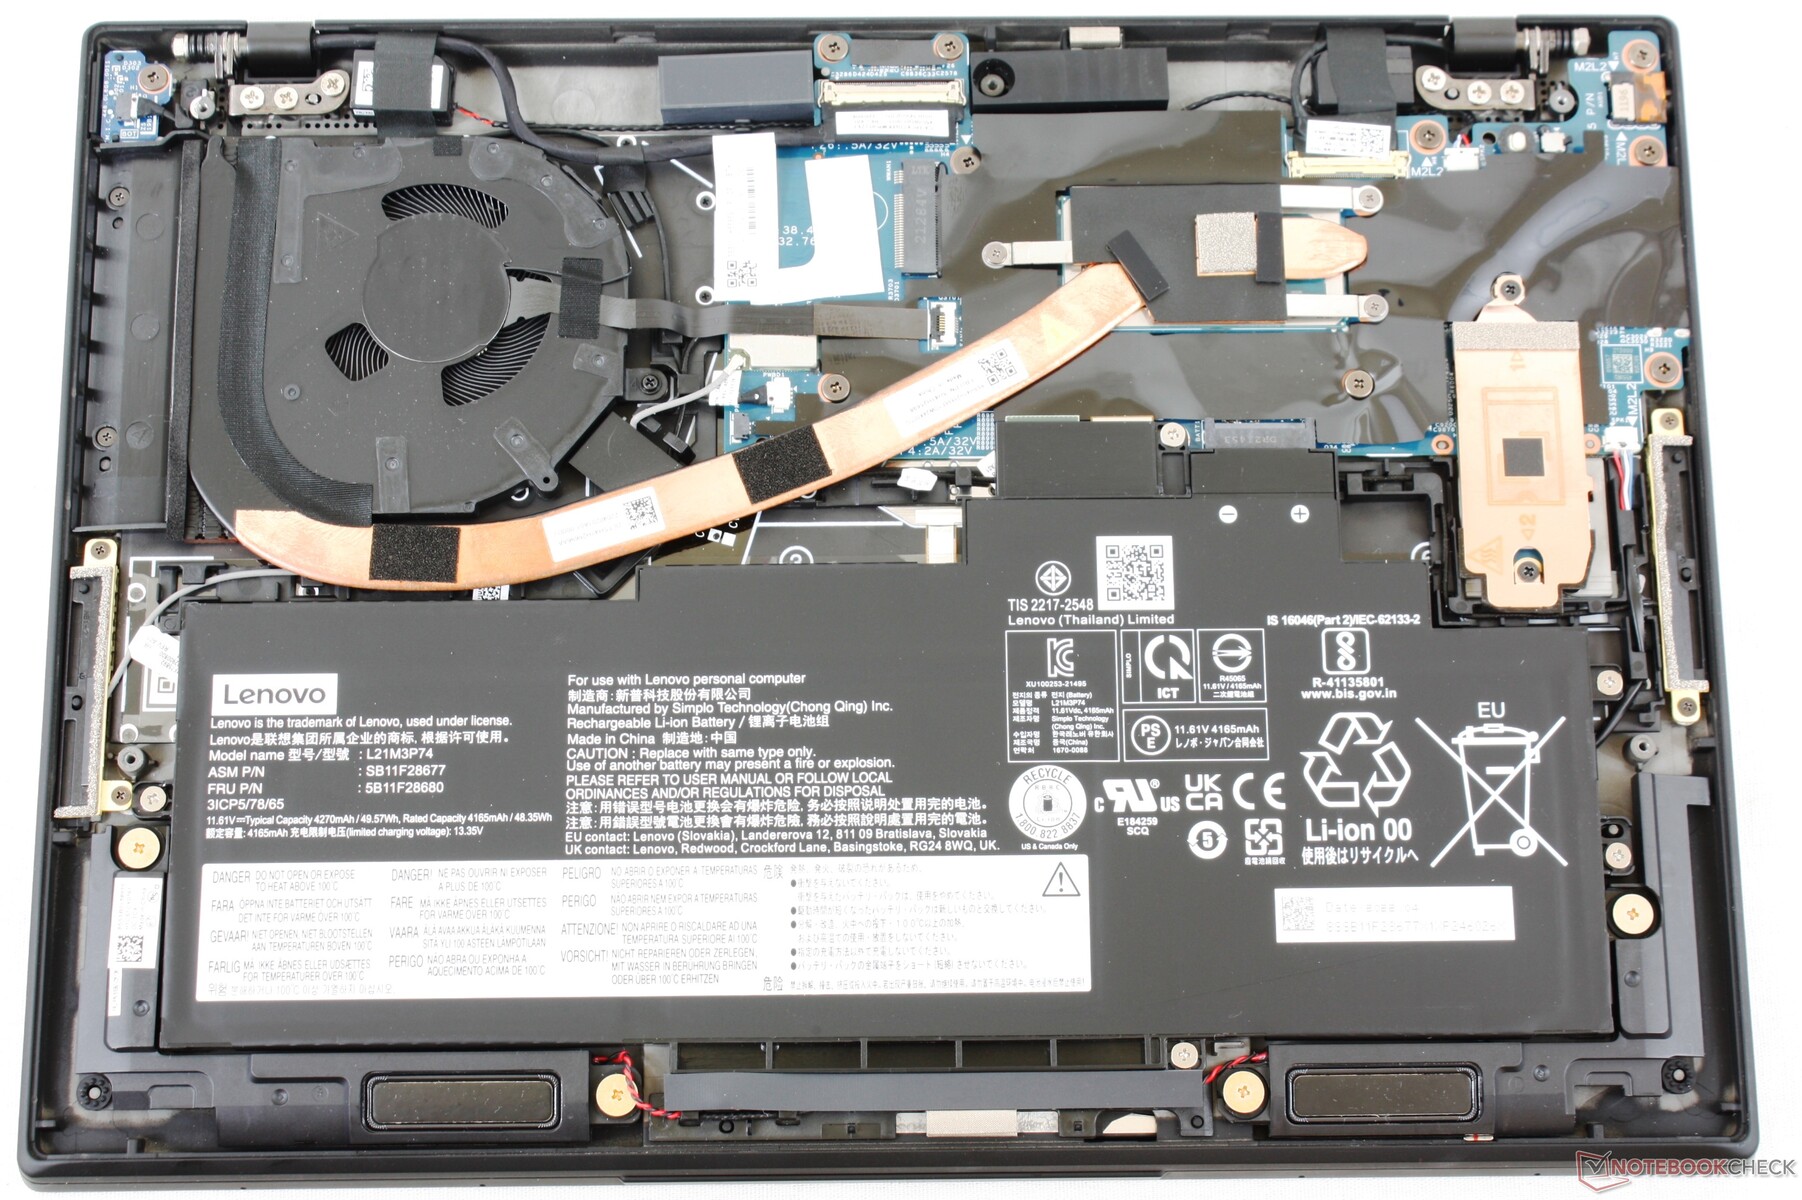
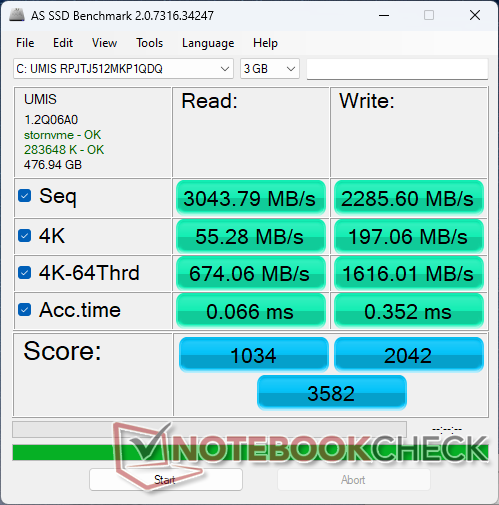
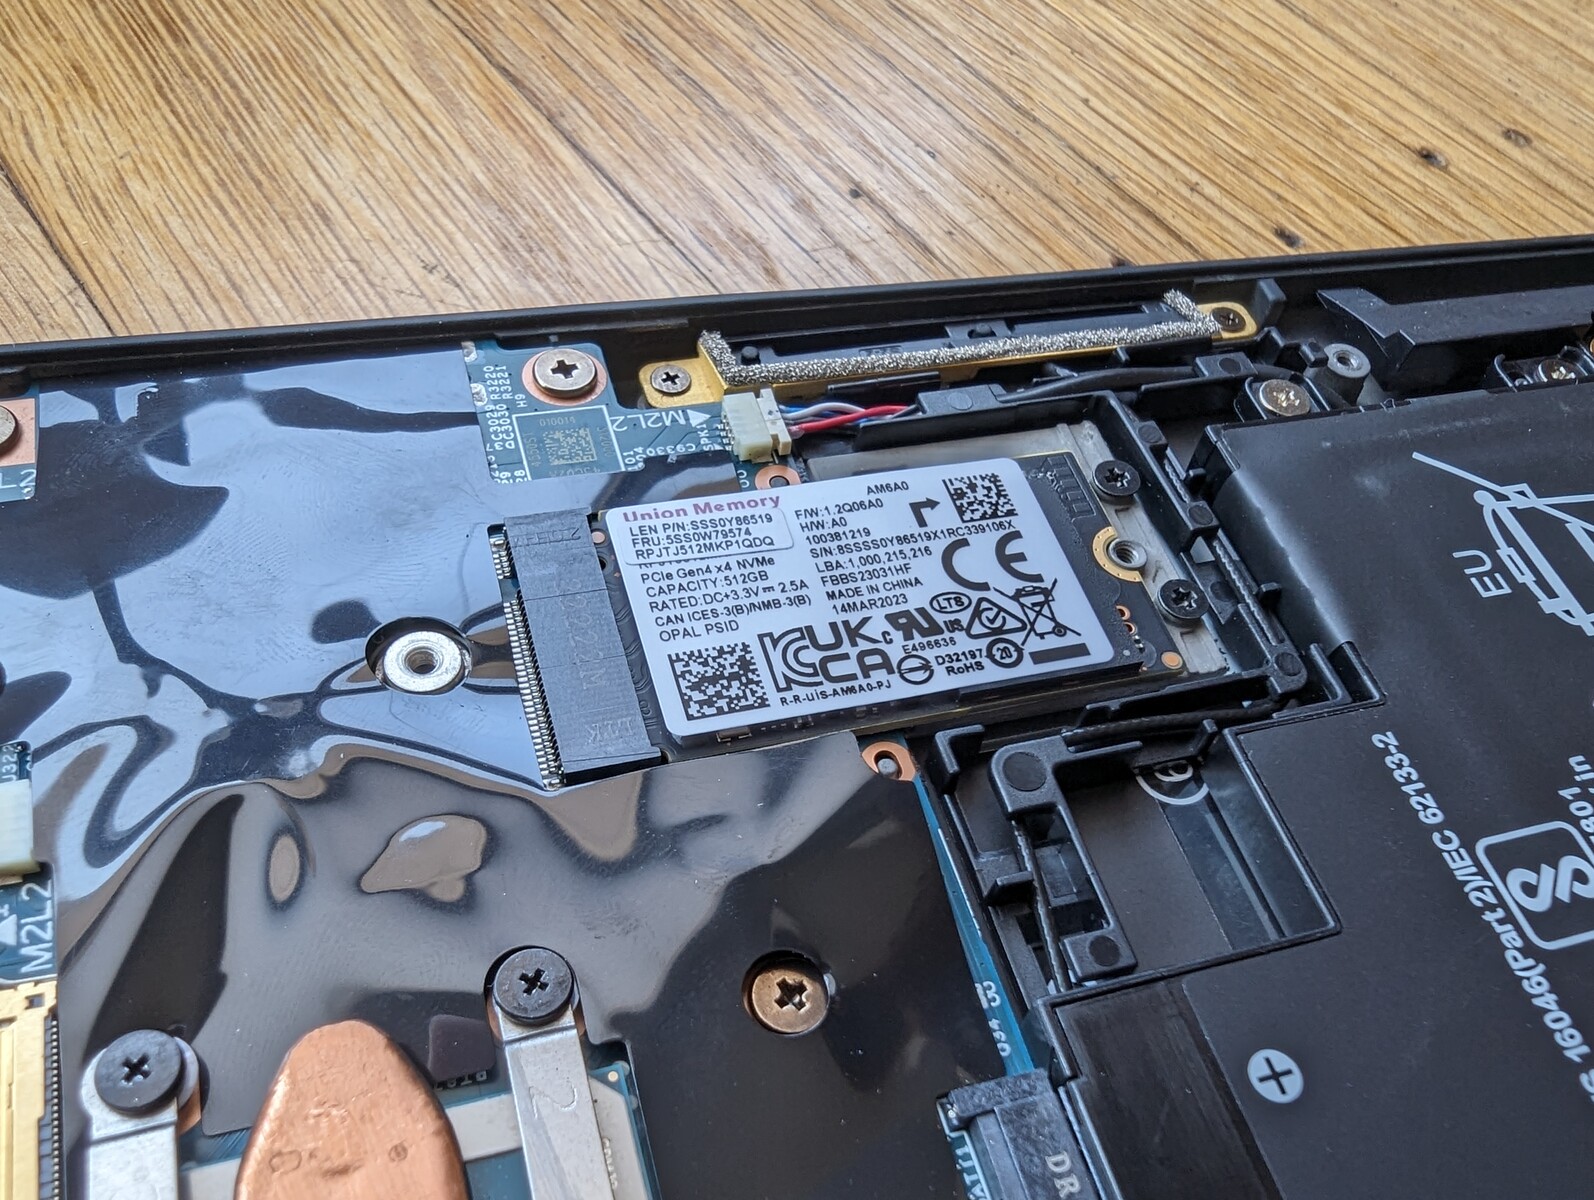
Massenspeicher — Unterstützt nur eine SSD
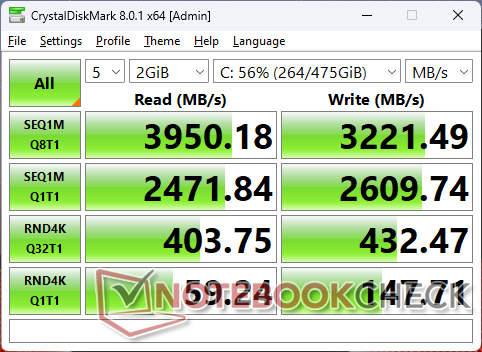
Lenovo hat die SSD von der 1-TB-Kioxia KBG5AZNT1T02 des letztjährigen Modells auf die 1-TB-Kioxia KXG80ZNV1T02 unseres 2023er-Modells umgestellt. Das neue Laufwerk erreicht bis zu 4.000 MB/s im Vergleich zu 3.000 MB/s auf dem älteren Laufwerk, aber die Leistung wird nach etwa einer Minute bei starker Nutzung gedrosselt.

| Drive Performance Rating - Percent | |
| LG Gram 14Z90Q | |
| Framework Laptop 13.5 13th Gen Intel | |
| HP Dragonfly G4 | |
| Dell Latitude 9330 | |
| Lenovo ThinkPad X1 Nano Gen 3 | |
| Lenovo ThinkPad X1 Nano Gen 2 Core i7-1280P | |
* ... kleinere Werte sind besser
Disk Throttling: DiskSpd Read Loop, Queue Depth 8
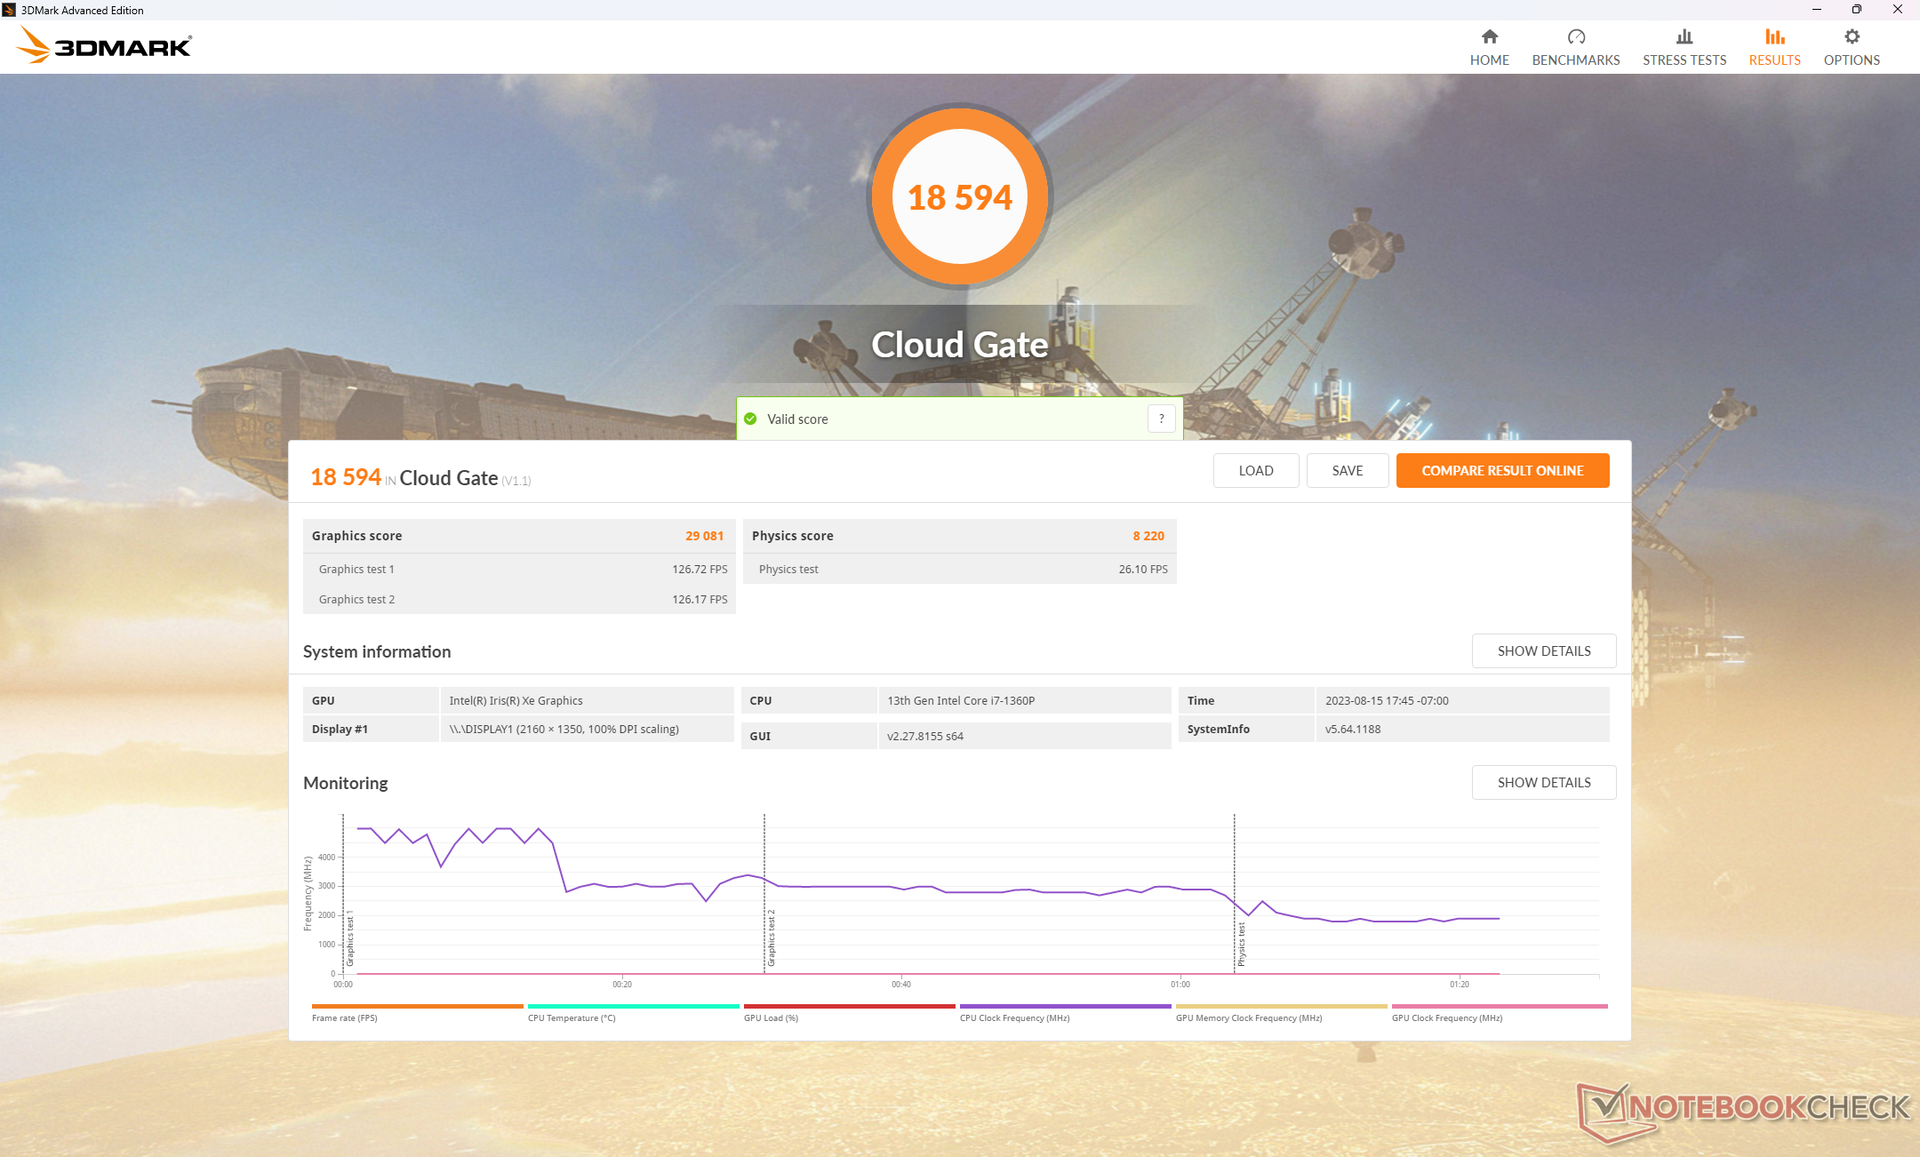
GPU-Leistung
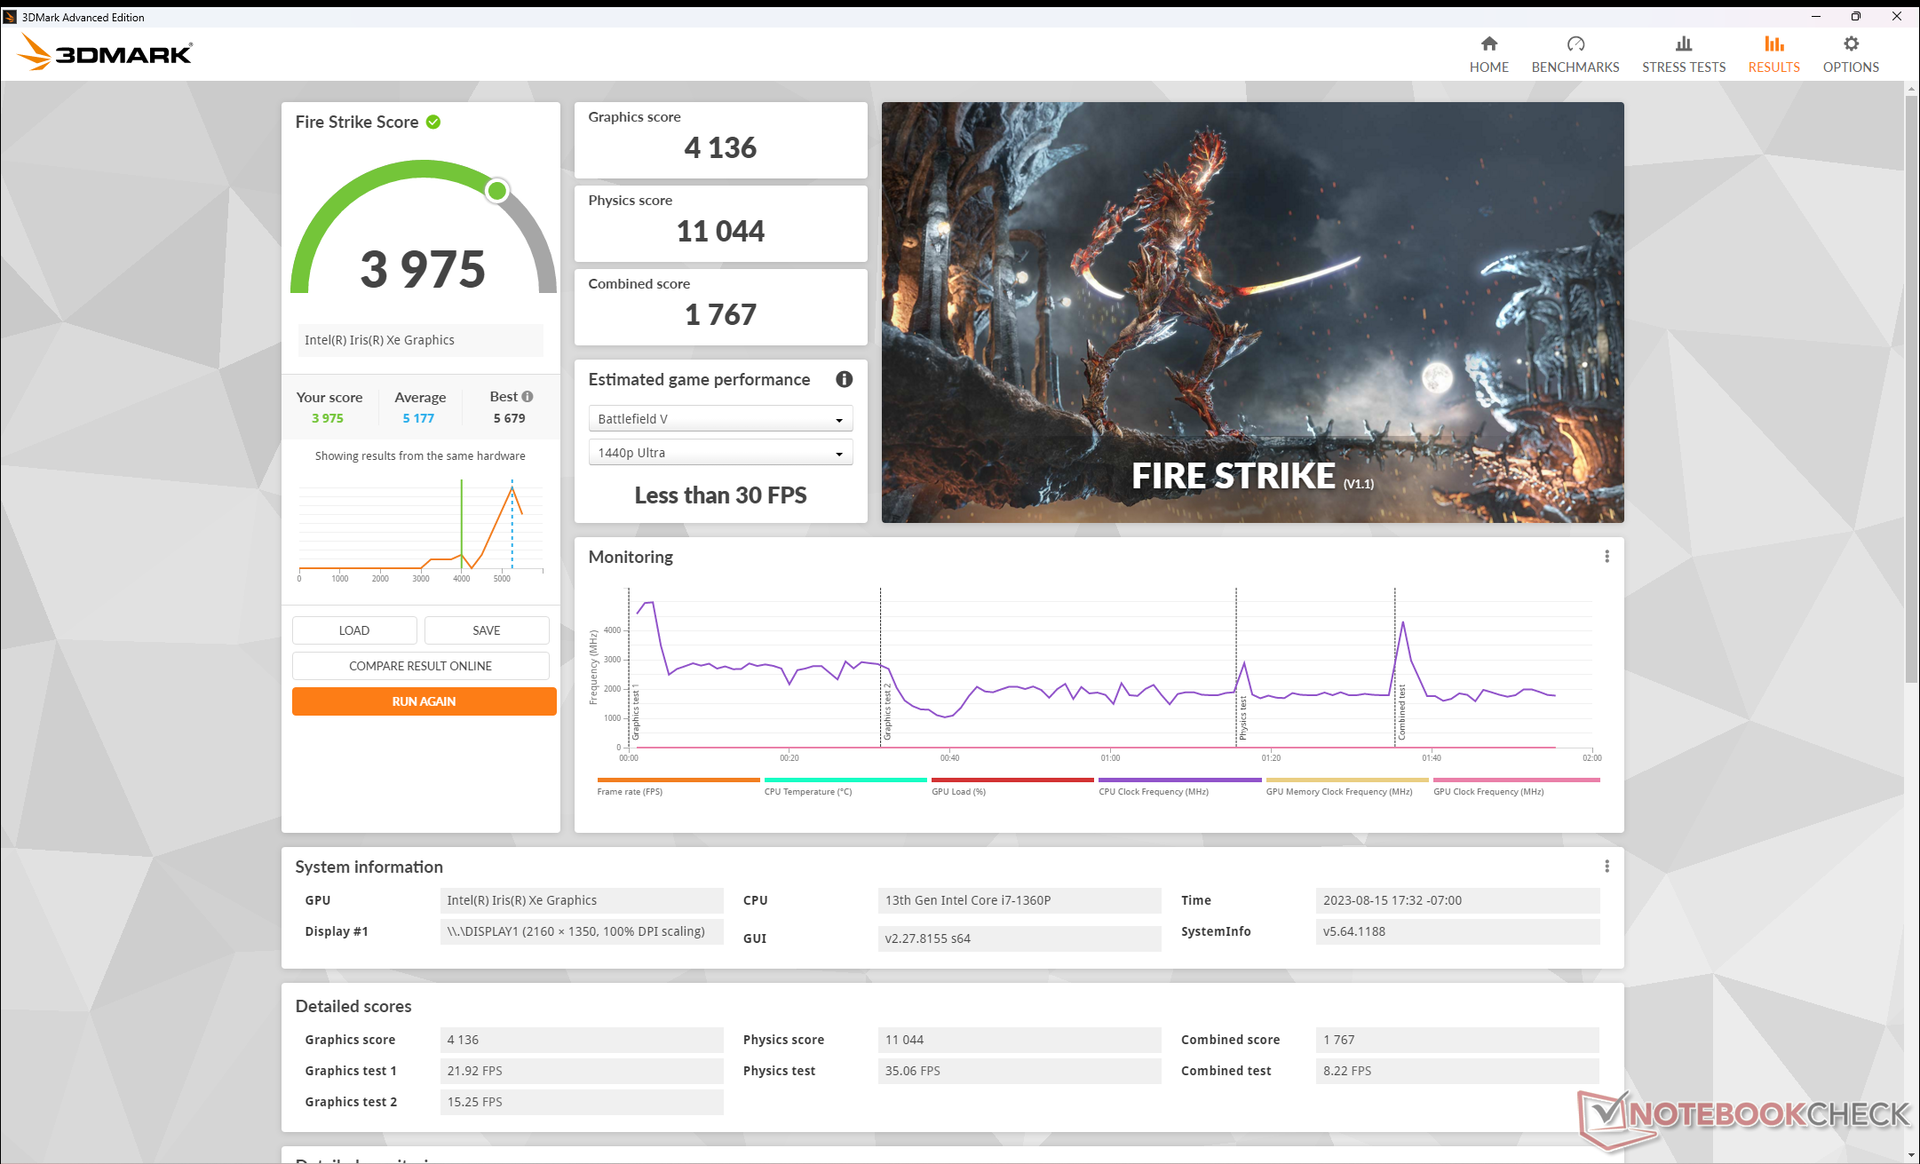
Die 3DMark-Fire-Strike- und Time-Spy-Ergebnisse sind etwa 25 Prozent langsamer als beim Vorjahresmodell, obwohl beide Modelle mit der gleichen integrierten Iris-Xe-96-EUs-GPU ausgestattet sind. Die Diskrepanz kann auf eine Zunahme des Throttling-Verhaltens auf unserem Gen-3-Gerät zurückgeführt werden.
Bemerkenswert ist, dass die Ergebnisse des 3DMark 11 im Vergleich zum Vorjahr ähnlicher sind. Dies könnte darauf hindeuten, dass die GPU-Leistung des Gen-3-Modells in einem kühleren Zustand für eine kurze Zeit stabil ist, bevor das Throttling unweigerlich einsetzt.
Leider bietet Lenovo keine AMD Optionen für seine X1-Nano-Serie an, obwohl die neuesten integrierten Radeon-680M- oder -780M-GPUs der alternden Iris-Xe-Serie deutlich überlegen sind.
| Energieprofile | Grafikleistung | CPU-Leistung | Gesamtwert |
| Akku | 6.525 (-0 %) | 13.950 (+25 %) | 6.222 (+7 %) |
| Balanced-Modus | 5.316 (-19 %) | 8.919 (-20 %) | 4.336 (-25 %) |
| Performance-Modus | 6.568 | 11.143 | 5.799 |
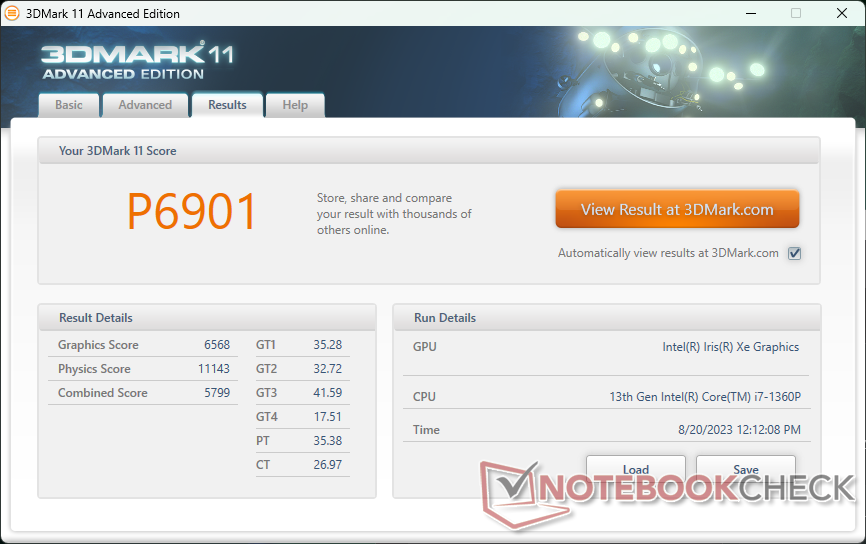

| 3DMark 11 Performance | 6901 Punkte | |
| 3DMark Cloud Gate Standard Score | 18594 Punkte | |
| 3DMark Fire Strike Score | 3975 Punkte | |
| 3DMark Time Spy Score | 1441 Punkte | |
Hilfe | ||
| Tiny Tina's Wonderlands | |
| 1280x720 Lowest Preset (DX12) | |
| HP Dragonfly G4 | |
| Durchschnittliche Intel Iris Xe Graphics G7 96EUs (25.9 - 67.3, n=32) | |
| Lenovo ThinkPad X1 Nano Gen 3 | |
| 1920x1080 Low Preset (DX12) | |
| Framework Laptop 13.5 13th Gen Intel | |
| Durchschnittliche Intel Iris Xe Graphics G7 96EUs (22.3 - 53, n=32) | |
| HP Dragonfly G4 | |
| Lenovo ThinkPad X1 Nano Gen 3 | |
| 1920x1080 Medium Preset (DX12) | |
| Framework Laptop 13.5 13th Gen Intel | |
| Durchschnittliche Intel Iris Xe Graphics G7 96EUs (17 - 40.1, n=30) | |
| HP Dragonfly G4 | |
| Lenovo ThinkPad X1 Nano Gen 3 | |
| 1920x1080 High Preset (DX12) | |
| Framework Laptop 13.5 13th Gen Intel | |
| Durchschnittliche Intel Iris Xe Graphics G7 96EUs (10.6 - 24.1, n=29) | |
| HP Dragonfly G4 | |
| Lenovo ThinkPad X1 Nano Gen 3 | |
| 1920x1080 Badass Preset (DX12) | |
| Framework Laptop 13.5 13th Gen Intel | |
| Durchschnittliche Intel Iris Xe Graphics G7 96EUs (8.4 - 18.4, n=26) | |
| HP Dragonfly G4 | |
| Lenovo ThinkPad X1 Nano Gen 3 | |
Die Frame-Raten im Leerlauf von Witcher 3 schwankten zwischen 62 und 88 fps, während die Raten auf dem ThinkPad X1 Nano Gen 2 aus dem letzten Jahr viel stabiler waren, wie die Grafik unten zeigt. Die instabilen Frame-Raten sind kein großes Hindernis, da die ThinkPad-X1-Nano-Serie nicht für Gaming entwickelt wurde, und die Benutzer immer noch problemlos Spiele über die Cloud streamen können. Aber eine konstante GPU-Leistung ist immer vorzuziehen.
Witcher 3 FPS Chart
| min. | mittel | hoch | max. | |
|---|---|---|---|---|
| The Witcher 3 (2015) | 90.7 | 60.9 | 32.4 | 12.6 |
| Dota 2 Reborn (2015) | 103.2 | 65.1 | 59 | 45.7 |
| Final Fantasy XV Benchmark (2018) | 35.2 | 20.6 | 14.6 | |
| X-Plane 11.11 (2018) | 40.1 | 32.6 | 30.2 | |
| Far Cry 5 (2018) | 41 | 24 | 22 | 22 |
| Strange Brigade (2018) | 78.5 | 35.1 | 27.3 | 21 |
| Cyberpunk 2077 1.6 (2022) | 13 | 10.8 | ||
| Tiny Tina's Wonderlands (2022) | 23.1 | 18.3 | 11.9 | 8.9 |
| F1 22 (2022) | 41.2 | 36.6 | 27.1 | 18.5 |
Emissionen — Etwas leiser
Geräuschemissionen
Das Lüftergeräusch ist im kühlen Zustand leise, bewegt sich aber in realistischen Browsing- oder Videostreaming-Szenarien typischerweise um die 25,6 dB(A), was in Büroräumen oder Klassenzimmern immer noch praktisch unhörbar ist. Bemerkenswert ist, dass das neuere Modell bei höherer Last leiser ist als das ältere (37 dB(A) vs. 41 dB(A)), was mit der oben erwähnten langsameren Leistung zusammenhängt.
Lautstärkediagramm
| Idle |
| 23 / 23 / 23 dB(A) |
| Last |
| 32.8 / 36.9 dB(A) |
 | ||
30 dB leise 40 dB(A) deutlich hörbar 50 dB(A) störend |
||
min: | ||
| Lenovo ThinkPad X1 Nano Gen 3 Iris Xe G7 96EUs, i7-1360P, Lenovo UMIS AM6A0 RPJTJ512MKP1QDQ | Lenovo ThinkPad X1 Nano Gen 2 Core i7-1280P Iris Xe G7 96EUs, i7-1280P, Kioxia BG5 KBG5AZNT1T02 | HP Dragonfly G4 Iris Xe G7 96EUs, i7-1365U, Micron 3400 MTFDKBA512TFH 512GB | Framework Laptop 13.5 13th Gen Intel Iris Xe G7 96EUs, i7-1370P, WD PC SN740 SDDPNQD-1T00 | Dell Latitude 9330 Iris Xe G7 96EUs, i7-1260U | Apple MacBook Air M2 10C GPU M2 10-Core GPU, M2, Apple SSD AP1024Z | LG Gram 14Z90Q Iris Xe G7 80EUs, i5-1240P, Samsung PM9A1 MZVL2512HCJQ | |
|---|---|---|---|---|---|---|---|
| Geräuschentwicklung | -1% | 1% | -15% | -5% | -9% | ||
| aus / Umgebung * (dB) | 22.9 | 23.3 -2% | 23.3 -2% | 23.2 -1% | 23 -0% | 25 -9% | |
| Idle min * (dB) | 23 | 23.9 -4% | 23.5 -2% | 23.2 -1% | 23 -0% | 26 -13% | |
| Idle avg * (dB) | 23 | 23.9 -4% | 23.5 -2% | 23.2 -1% | 23.1 -0% | 27 -17% | |
| Idle max * (dB) | 23 | 23.9 -4% | 26.8 -17% | 23.2 -1% | 23.1 -0% | 28 -22% | |
| Last avg * (dB) | 32.8 | 23.3 29% | 27.2 17% | 45.3 -38% | 37.1 -13% | 35 -7% | |
| Witcher 3 ultra * (dB) | 36.9 | 40.9 -11% | 32.7 11% | 47.9 -30% | 40.6 -10% | 36 2% | |
| Last max * (dB) | 36.9 | 40.9 -11% | 35 5% | 49.2 -33% | 40.5 -10% | 36 2% |
* ... kleinere Werte sind besser
Temperatur
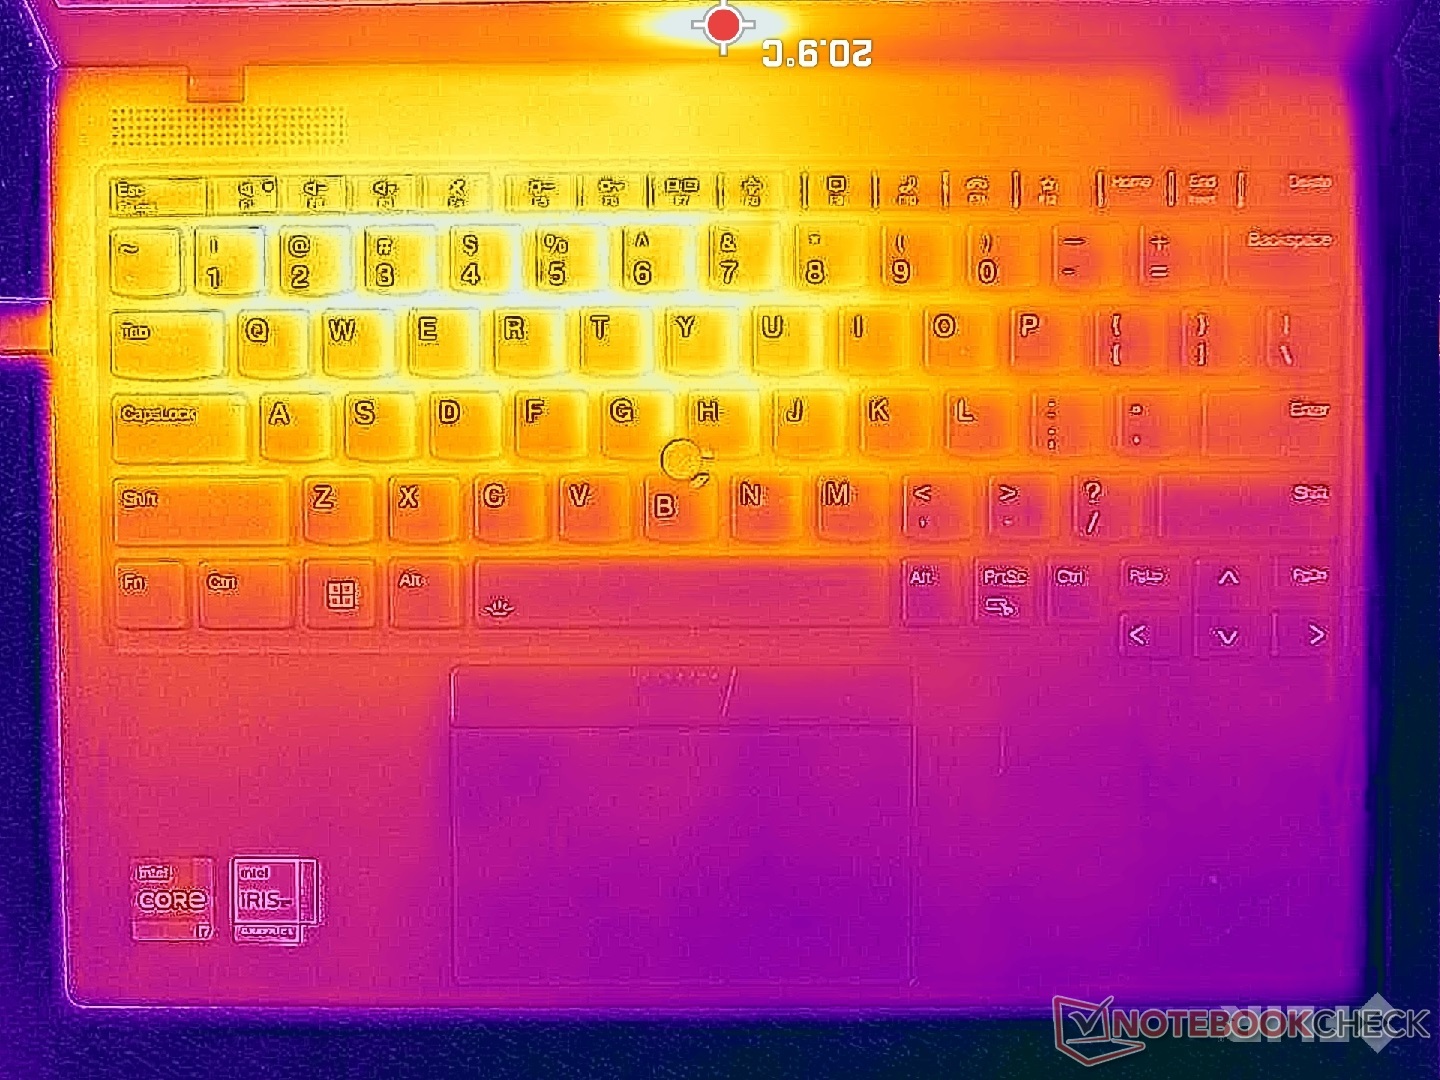
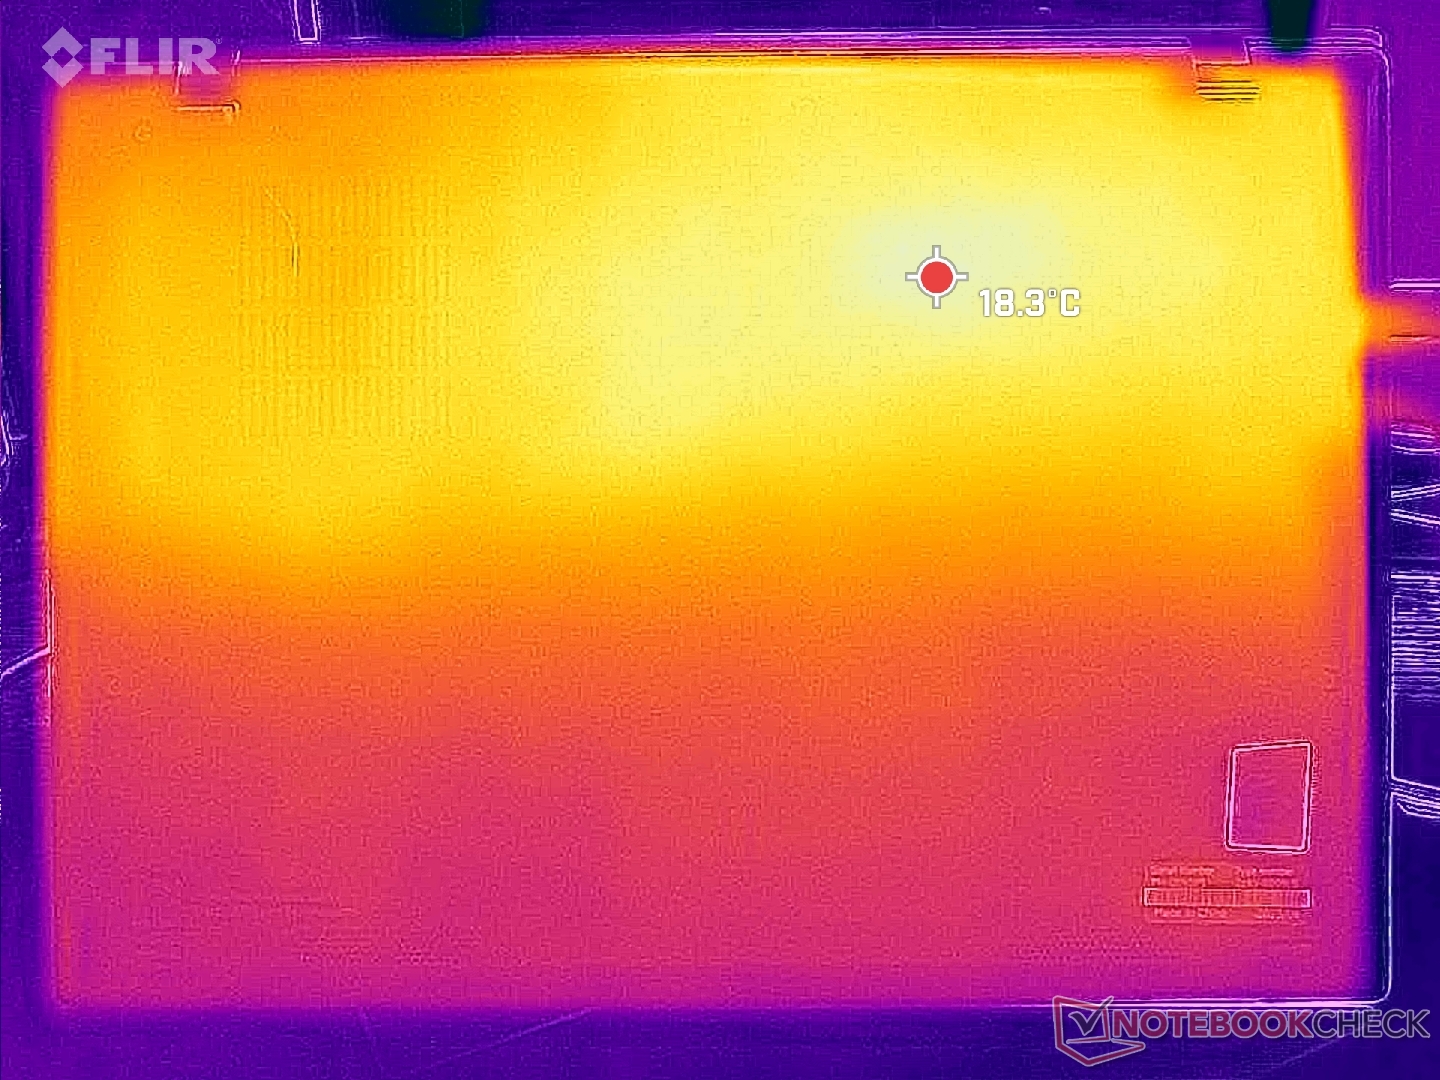
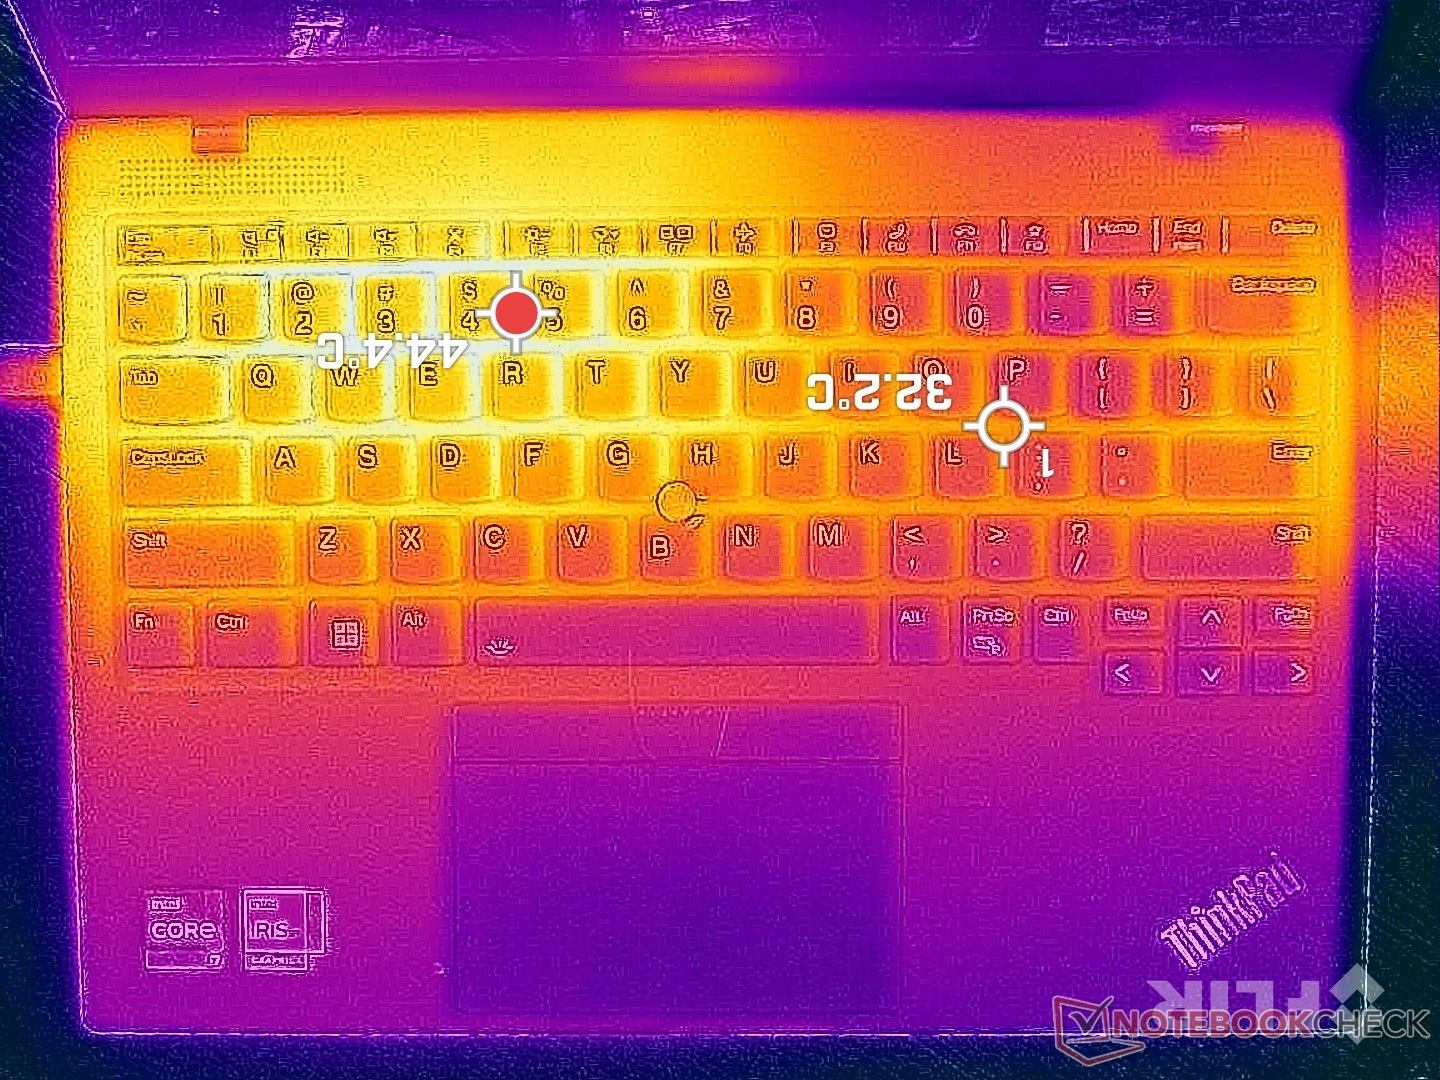
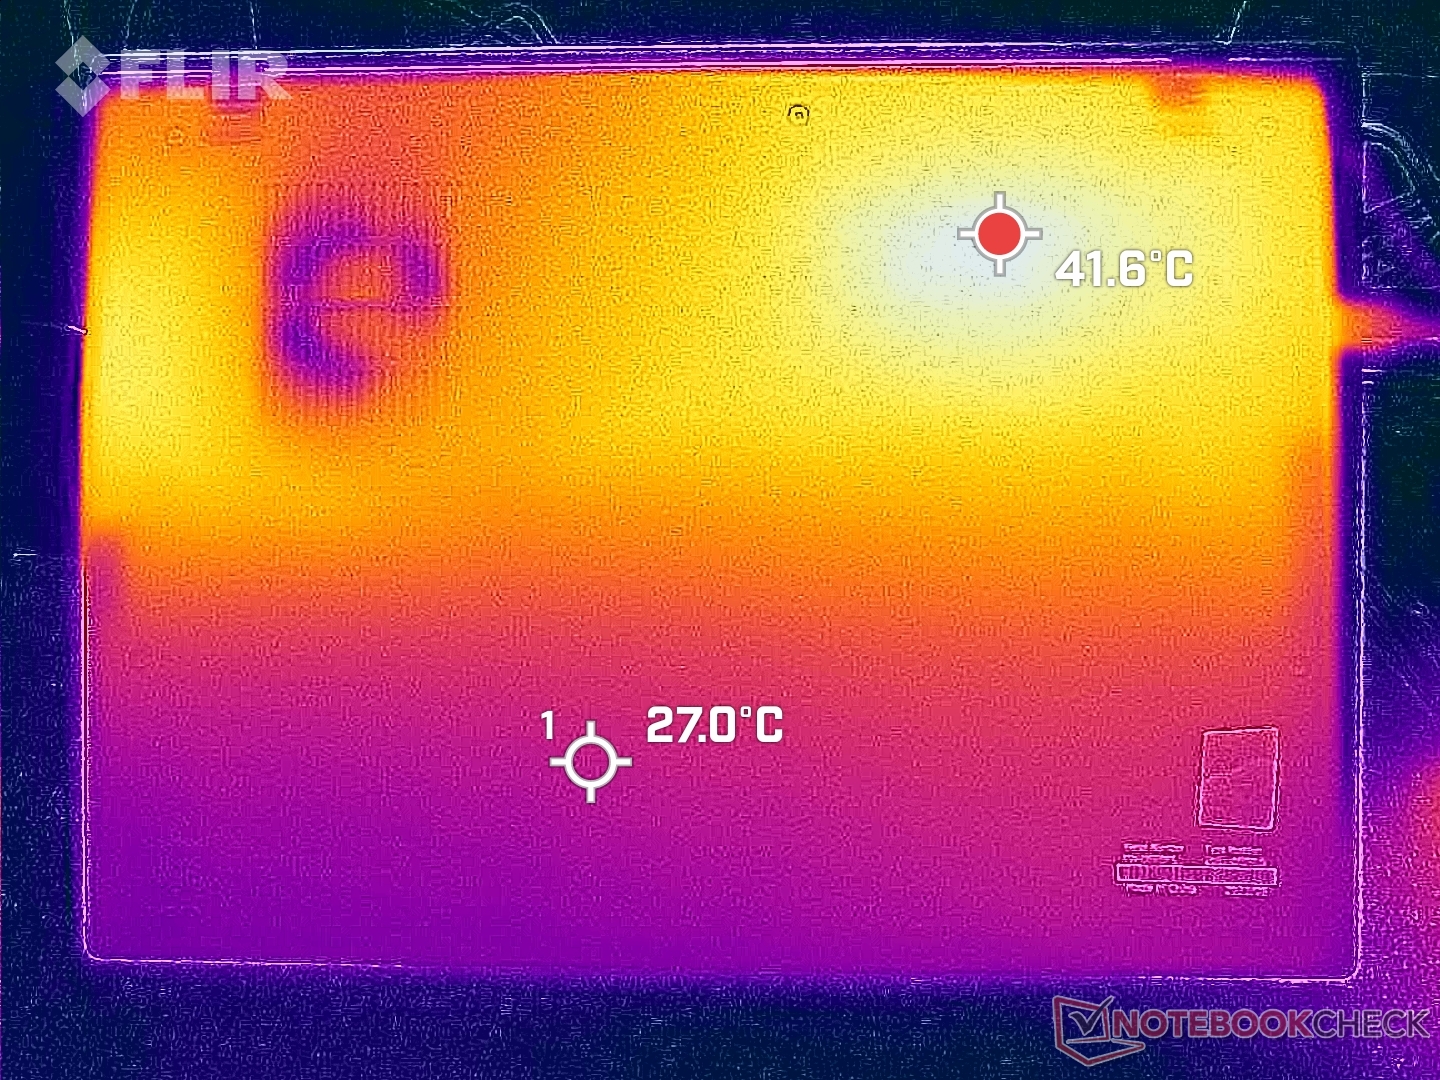
Die Oberflächentemperaturen sind höher als bei den meisten anderen Subnotebooks, da die Kühllösung für das ThinkPad X1 Nano so klein ist. Die Tastatur und die Unterseite können bis zu 38 bis 43 °C warm werden, was einige Grad wärmer ist als beim HP Dragonfly G4, wenn es ähnlich stark belastet wird.
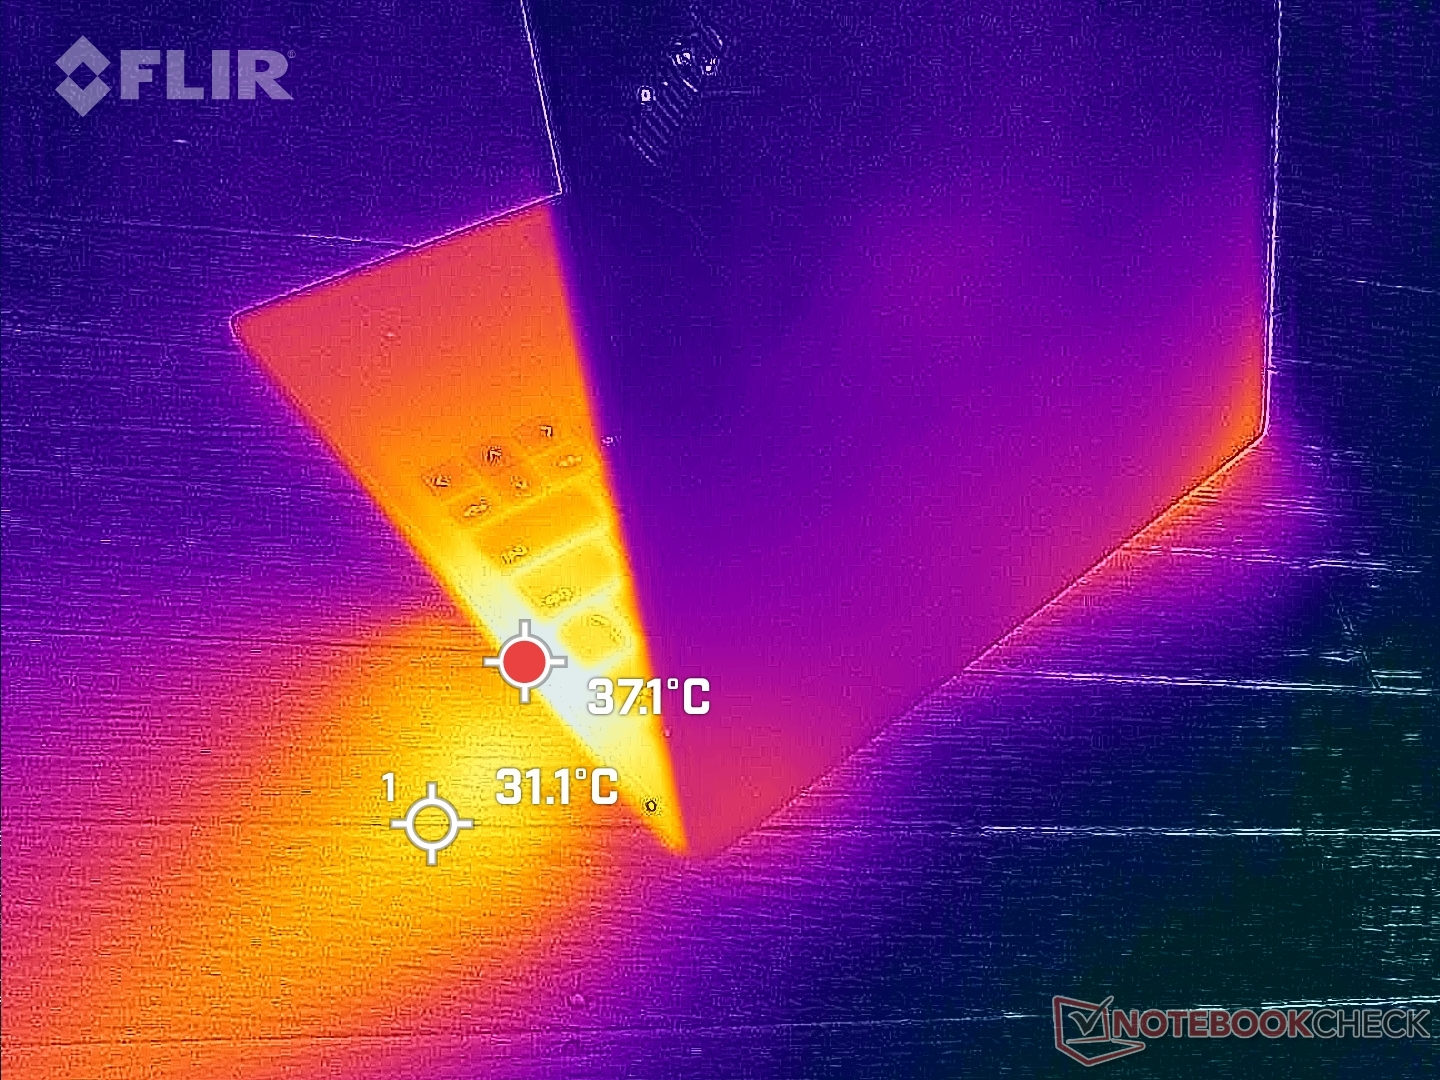
(±) Die maximale Temperatur auf der Oberseite ist 44 °C. Im Vergleich liegt der Klassendurchschnitt bei 35.9 °C (von 21.4 bis 59 °C für die Klasse Subnotebook).
(±) Auf der Unterseite messen wir eine maximalen Wert von 43.2 °C (im Vergleich zum Durchschnitt von 39.2 °C).
(+) Ohne Last messen wir eine durchschnittliche Temperatur von 24 °C auf der Oberseite. Der Klassendurchschnitt erreicht 30.8 °C.
(+) Die Handballen und der Touchpad-Bereich erreichen maximal 32 °C und damit die typische Hauttemperatur und fühlen sich daher nicht heiß an.
(-) Die durchschnittliche Handballen-Temperatur anderer getesteter Geräte war 28.2 °C (-3.8 °C).
| Lenovo ThinkPad X1 Nano Gen 3 Intel Core i7-1360P, Intel Iris Xe Graphics G7 96EUs | Lenovo ThinkPad X1 Nano Gen 2 Core i7-1280P Intel Core i7-1280P, Intel Iris Xe Graphics G7 96EUs | HP Dragonfly G4 Intel Core i7-1365U, Intel Iris Xe Graphics G7 96EUs | Framework Laptop 13.5 13th Gen Intel Intel Core i7-1370P, Intel Iris Xe Graphics G7 96EUs | Dell Latitude 9330 Intel Core i7-1260U, Intel Iris Xe Graphics G7 96EUs | Apple MacBook Air M2 10C GPU Apple M2, Apple M2 10-Core GPU | LG Gram 14Z90Q Intel Core i5-1240P, Intel Iris Xe Graphics G7 80EUs | |
|---|---|---|---|---|---|---|---|
| Hitze | -2% | -1% | 2% | -4% | -1% | -4% | |
| Last oben max * (°C) | 44 | 42.4 4% | 38.6 12% | 38.2 13% | 40.6 8% | 44.7 -2% | 43 2% |
| Last unten max * (°C) | 43.2 | 40.2 7% | 40.4 6% | 41.4 4% | 50.2 -16% | 44.6 -3% | 45 -4% |
| Idle oben max * (°C) | 25.6 | 27.8 -9% | 28.2 -10% | 25.8 -1% | 25 2% | 25.1 2% | 27 -5% |
| Idle unten max * (°C) | 25.6 | 27.8 -9% | 29 -13% | 27.6 -8% | 27.6 -8% | 25.3 1% | 28 -9% |
* ... kleinere Werte sind besser
Stresstest
Lassen wir Prime95 laufen, um die CPU zu belasten, steigen die Taktraten und die Leistungsaufnahme des Prozessors auf 3,1 GHz bzw. 64 W, was aufgrund der Kerntemperatur von 100 °C nur wenige Sekunden lang anhält. Danach stabilisiert sich die CPU bei 1,5 GHz und 23 W, um die Temperatur von 90 °C zu halten. Lenovo stößt angesichts des begrenzten Kühlungspotenzials des Modells definitiv an die Grenzen der Core-P-CPU. Diese Kerntemperaturen sind höher als die des Dragonfly G4 und vergleichbar mit denen des Latitude 9330 unter ähnlichen Bedingungen.
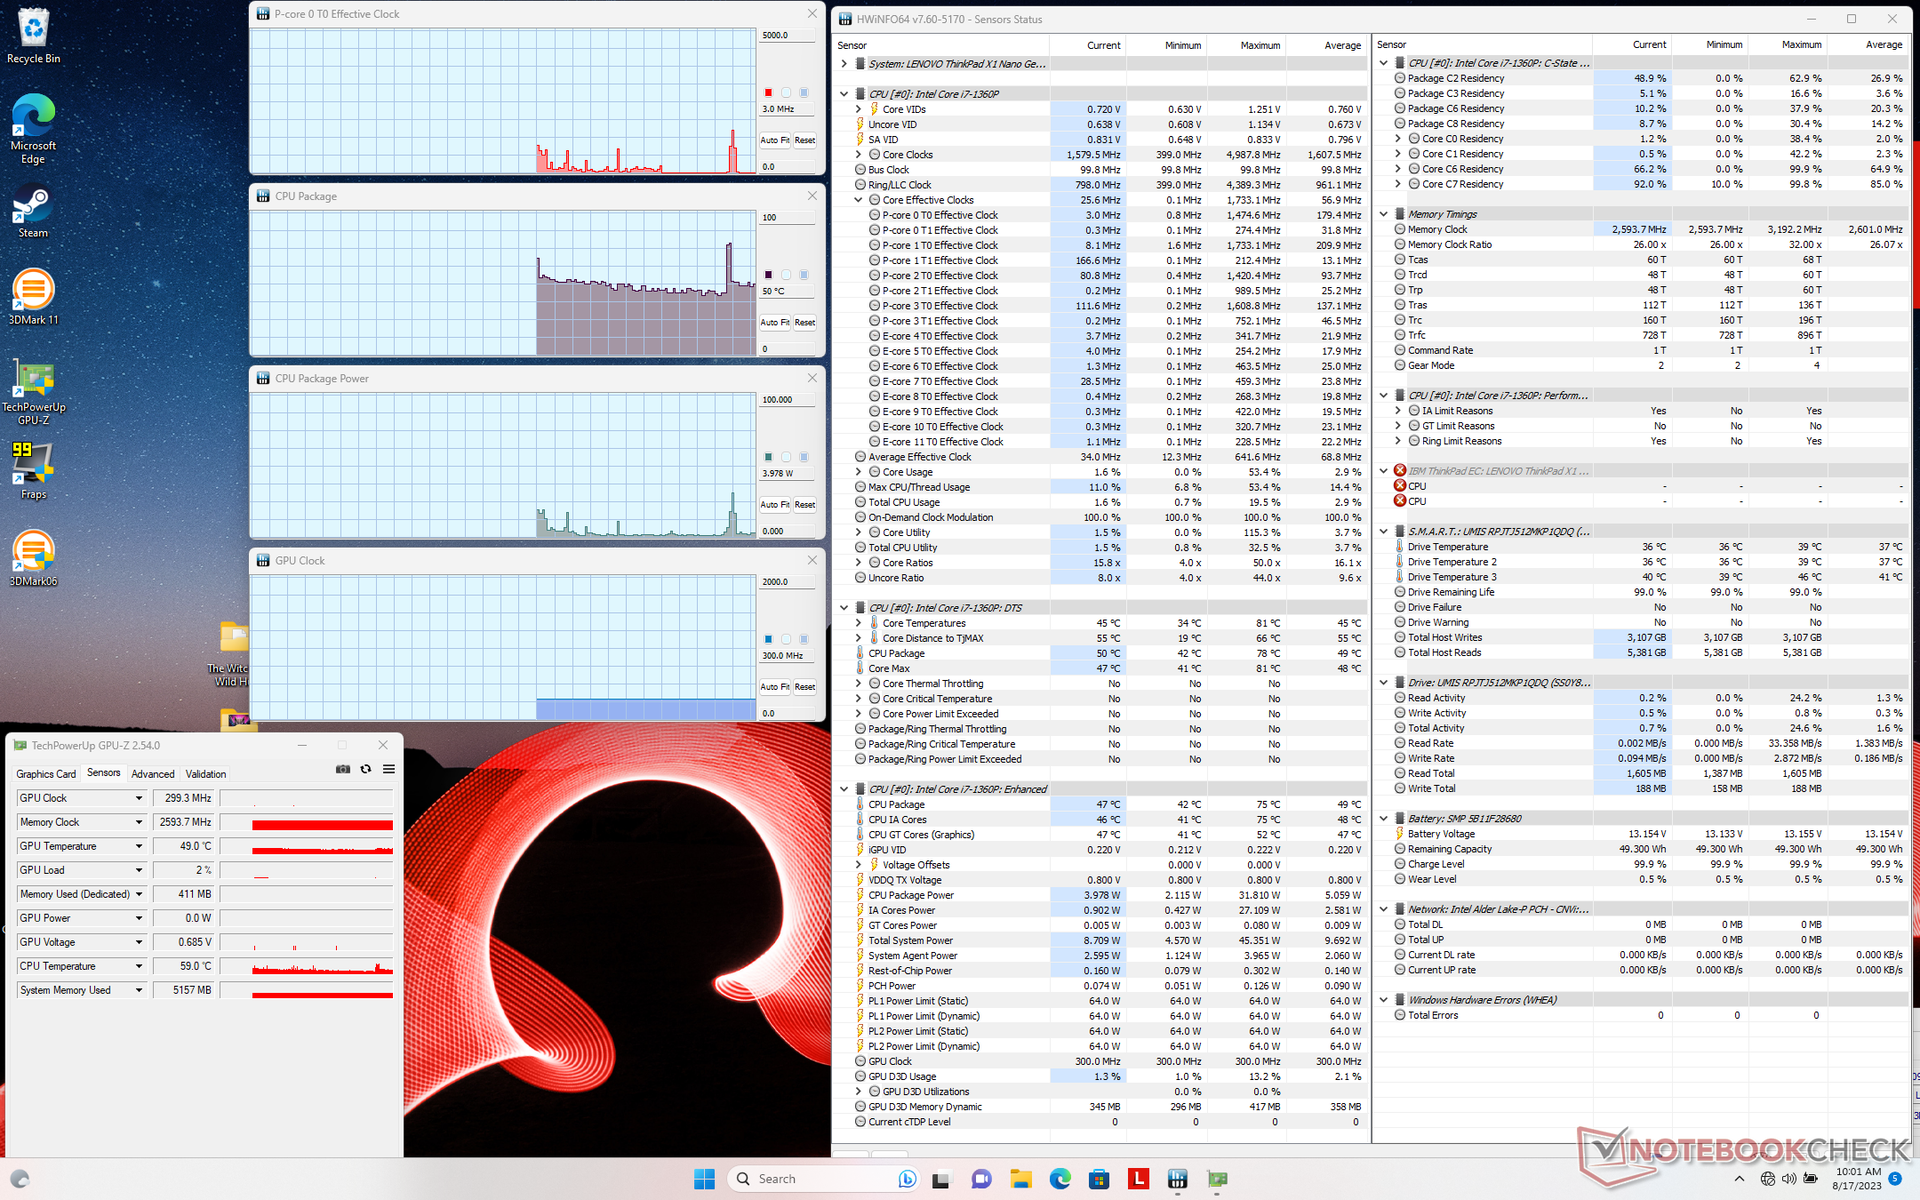
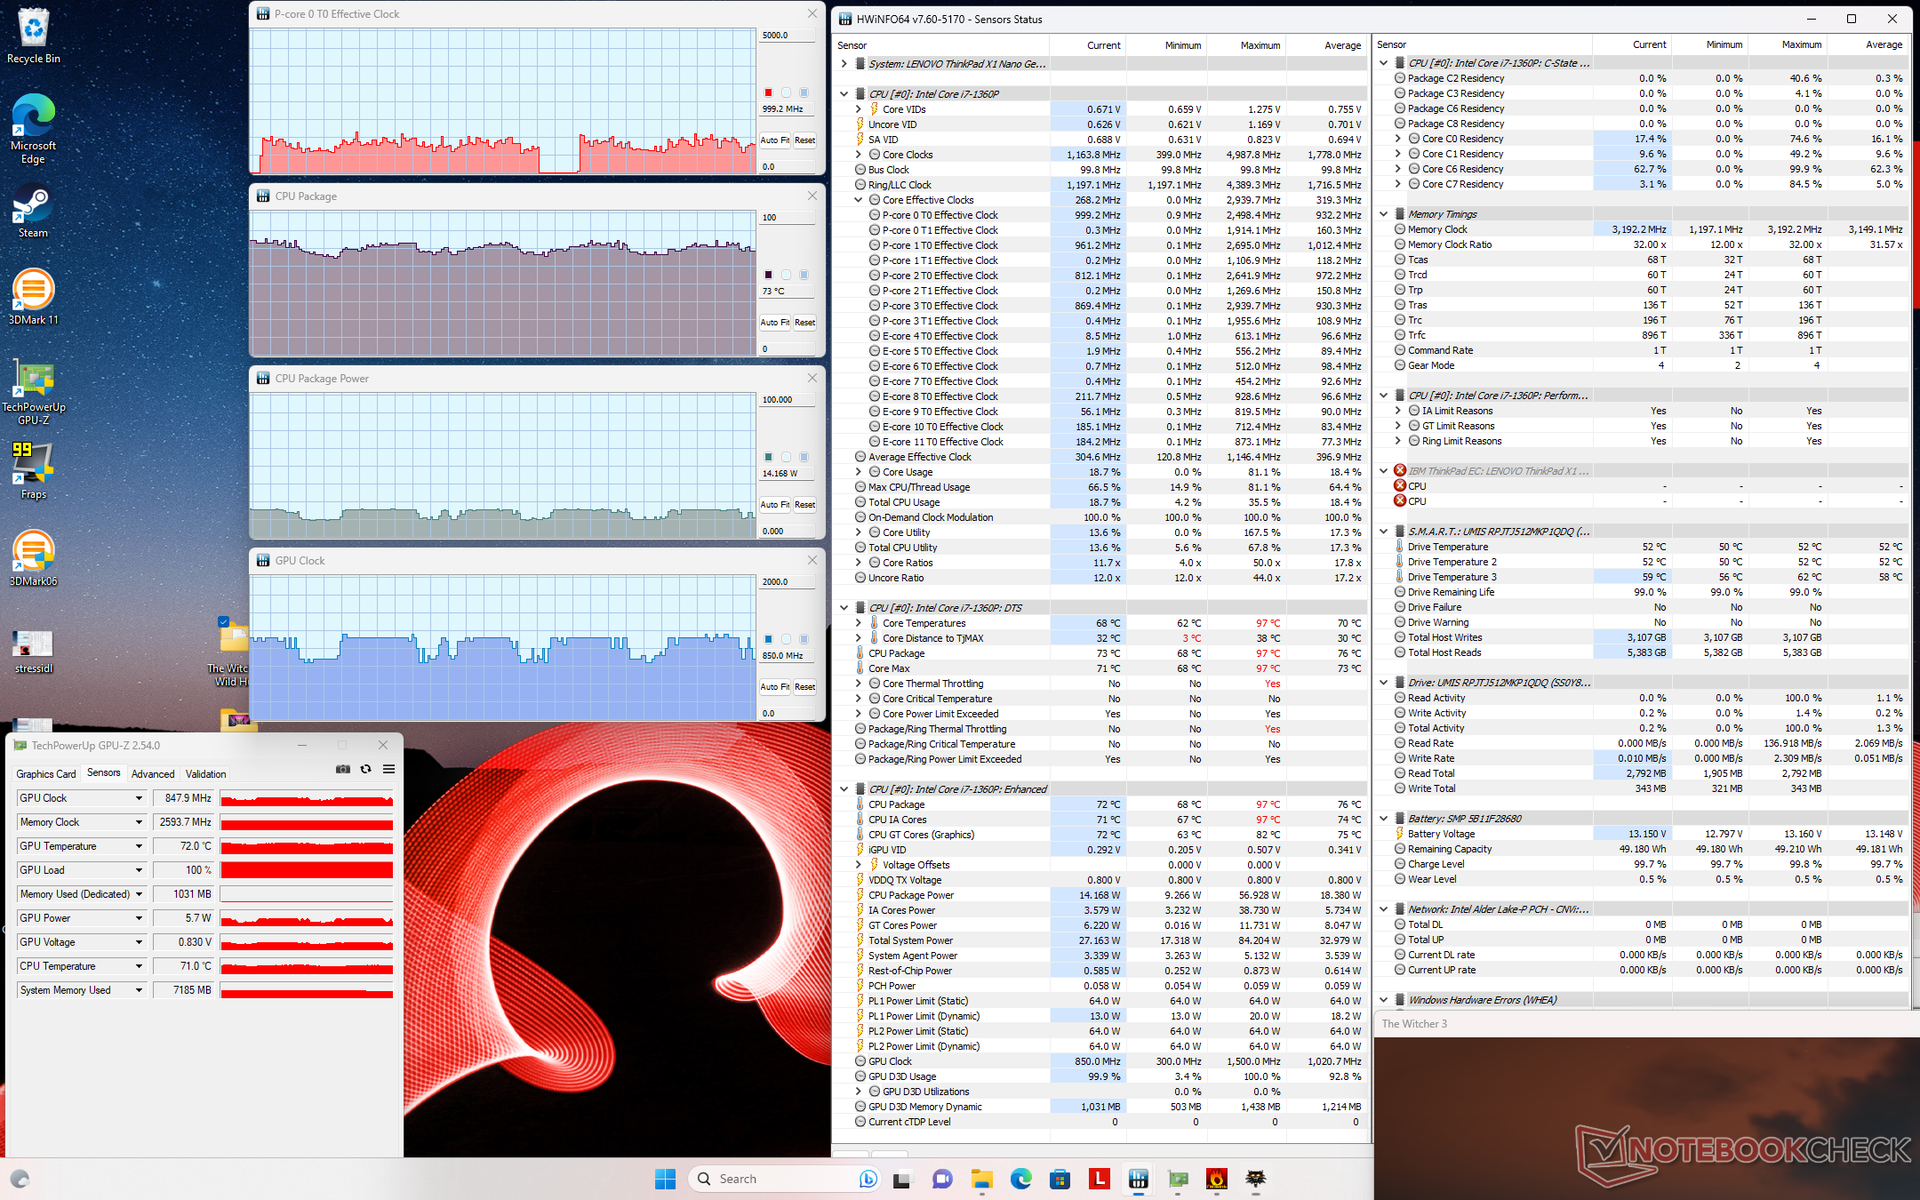
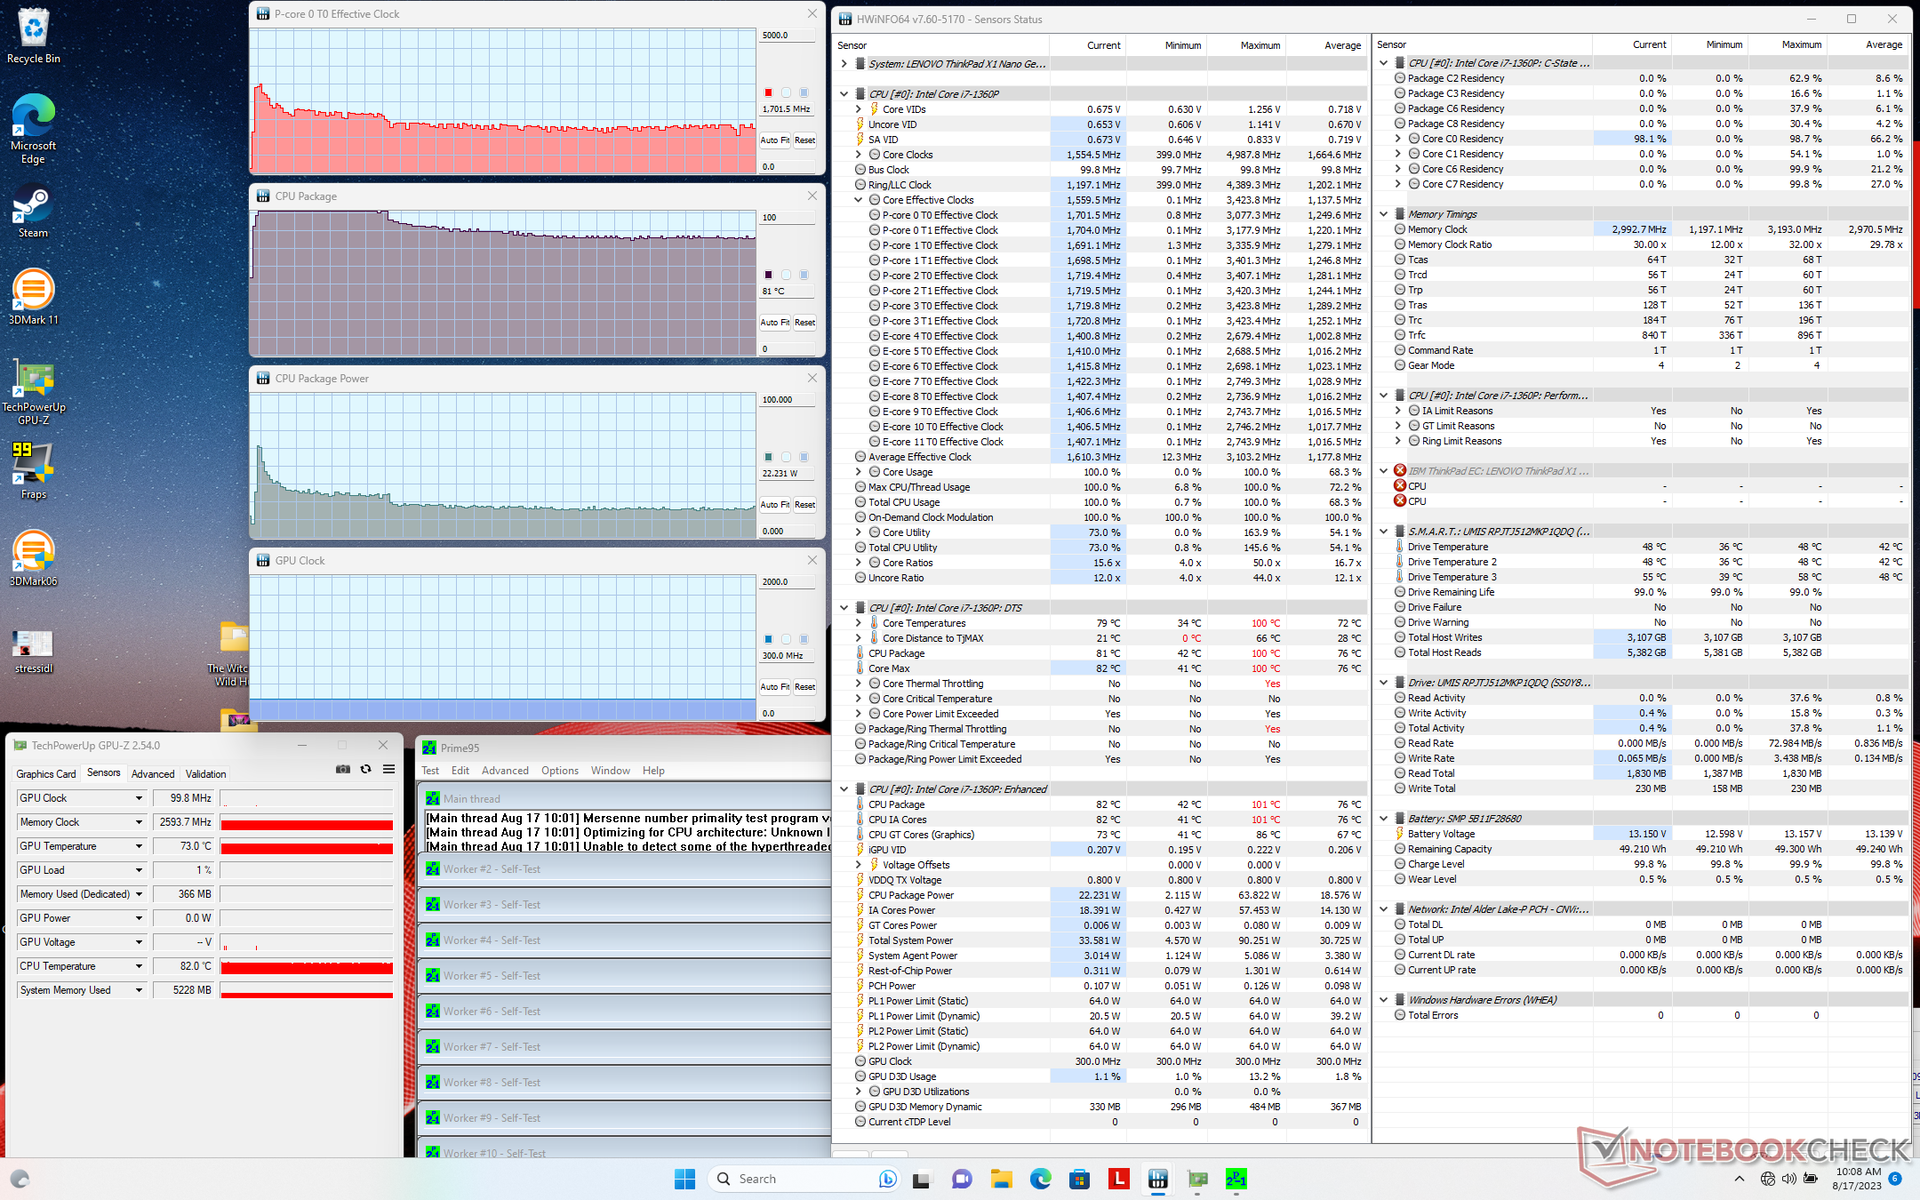

| CPU Clock (GHz) | GPU Clock (MHz) | Average CPU Temperature (°C) | |
| System im Leerlauf | -- | -- | 50 |
| Prime95, Stress | 1.7 | -- | 81 |
| Prime95 + FurMark, Stress | ~1,0 | 549 | 78 |
| Witcher 3, Stress | ~1.0 | 850-1.150 | 70-78 |
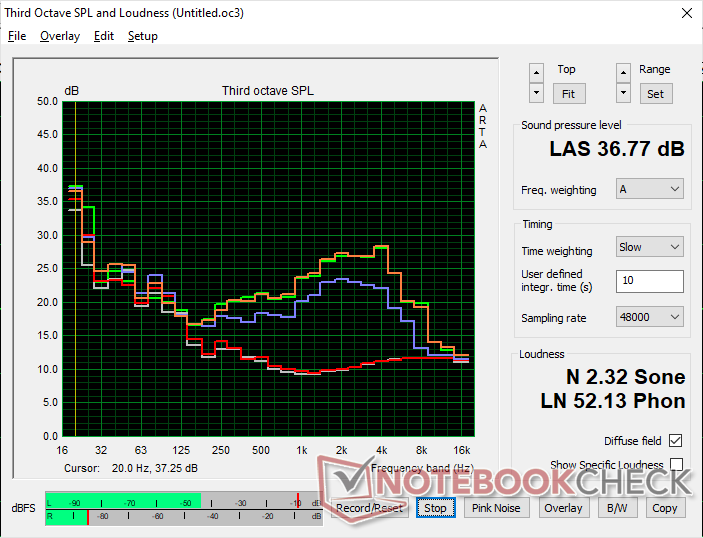
Lautsprecher
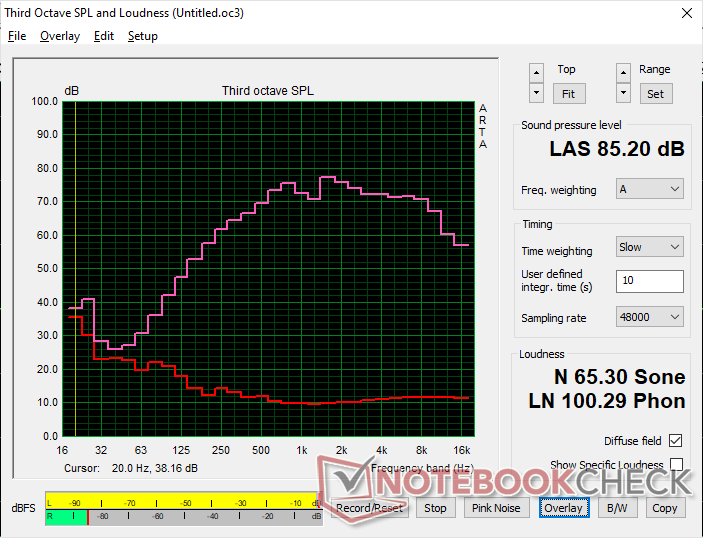
Lenovo ThinkPad X1 Nano Gen 3 Audio Analyse
(+) | Die Lautsprecher können relativ laut spielen (85.2 dB)
Bass 100 - 315 Hz
(-) | kaum Bass - 16.3% niedriger als der Median
(±) | durchschnittlich lineare Bass-Wiedergabe (7.9% Delta zum Vorgänger)
Mitteltöne 400 - 2000 Hz
(+) | ausgeglichene Mitten, vom Median nur 3.4% abweichend
(+) | lineare Mitten (5.1% Delta zum Vorgänger)
Hochtöne 2 - 16 kHz
(+) | ausgeglichene Hochtöne, vom Median nur 1.6% abweichend
(+) | sehr lineare Hochtöne (2.3% Delta zum Vorgänger)
Gesamt im hörbaren Bereich 100 - 16.000 Hz
(+) | hörbarer Bereich ist sehr linear (12.2% Abstand zum Median
Im Vergleich zu allen Geräten derselben Klasse
» 15% aller getesteten Geräte dieser Klasse waren besser, 4% vergleichbar, 81% schlechter
» Das beste Gerät hat einen Delta-Wert von 5%, durchschnittlich ist 18%, das schlechteste Gerät hat 53%
Im Vergleich zu allen Geräten im Test
» 10% aller getesteten Geräte waren besser, 2% vergleichbar, 88% schlechter
» Das beste Gerät hat einen Delta-Wert von 4%, durchschnittlich ist 24%, das schlechteste Gerät hat 134%
Apple MacBook Pro 16 2021 M1 Pro Audio Analyse
(+) | Die Lautsprecher können relativ laut spielen (84.7 dB)
Bass 100 - 315 Hz
(+) | guter Bass - nur 3.8% Abweichung vom Median
(+) | lineare Bass-Wiedergabe (5.2% Delta zum Vorgänger)
Mitteltöne 400 - 2000 Hz
(+) | ausgeglichene Mitten, vom Median nur 1.3% abweichend
(+) | lineare Mitten (2.1% Delta zum Vorgänger)
Hochtöne 2 - 16 kHz
(+) | ausgeglichene Hochtöne, vom Median nur 1.9% abweichend
(+) | sehr lineare Hochtöne (2.7% Delta zum Vorgänger)
Gesamt im hörbaren Bereich 100 - 16.000 Hz
(+) | hörbarer Bereich ist sehr linear (4.6% Abstand zum Median
Im Vergleich zu allen Geräten derselben Klasse
» 0% aller getesteten Geräte dieser Klasse waren besser, 0% vergleichbar, 100% schlechter
» Das beste Gerät hat einen Delta-Wert von 5%, durchschnittlich ist 17%, das schlechteste Gerät hat 45%
Im Vergleich zu allen Geräten im Test
» 0% aller getesteten Geräte waren besser, 0% vergleichbar, 100% schlechter
» Das beste Gerät hat einen Delta-Wert von 4%, durchschnittlich ist 24%, das schlechteste Gerät hat 134%
Energieverwaltung — Hohe Energieeffizienz gleicht die geringe Akkukapazität aus
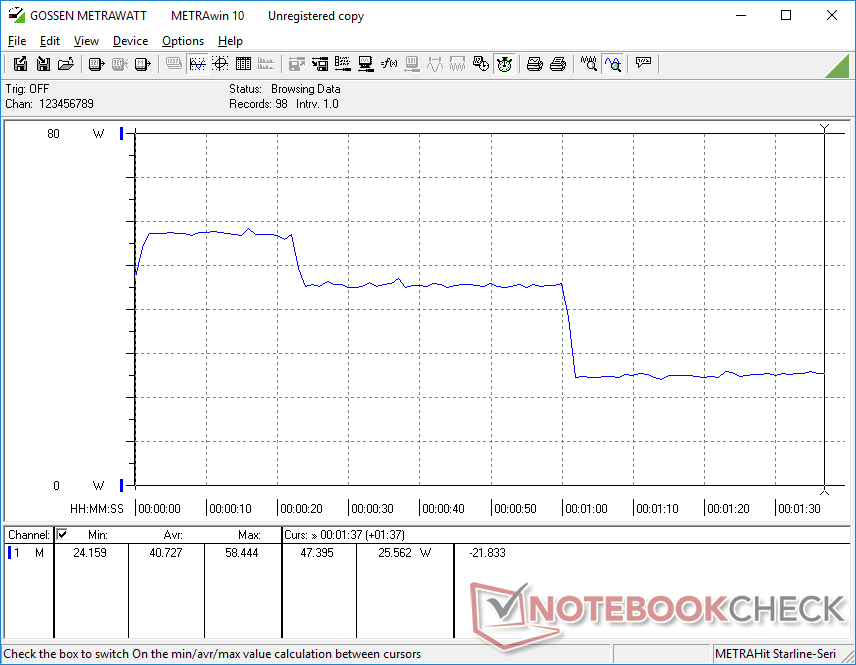
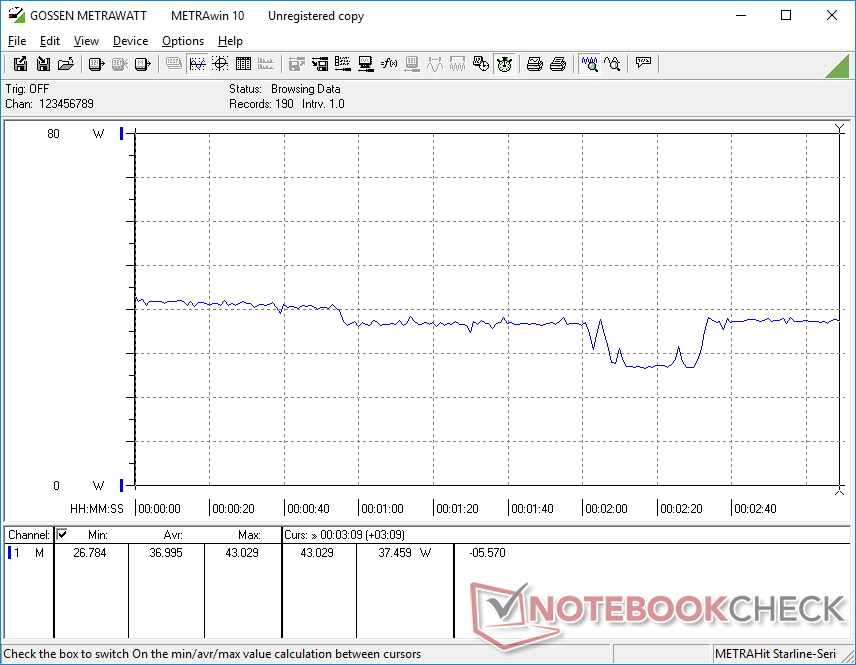
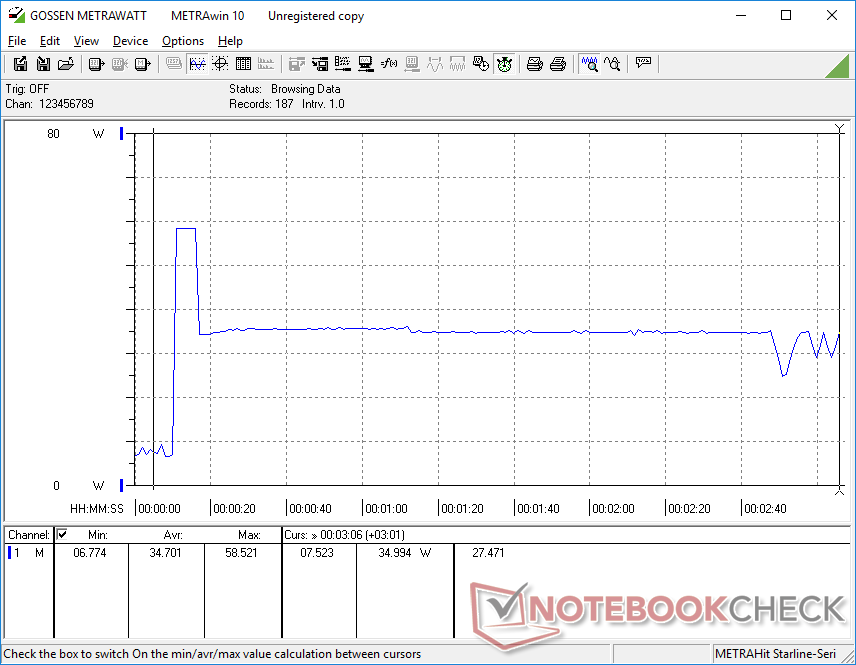
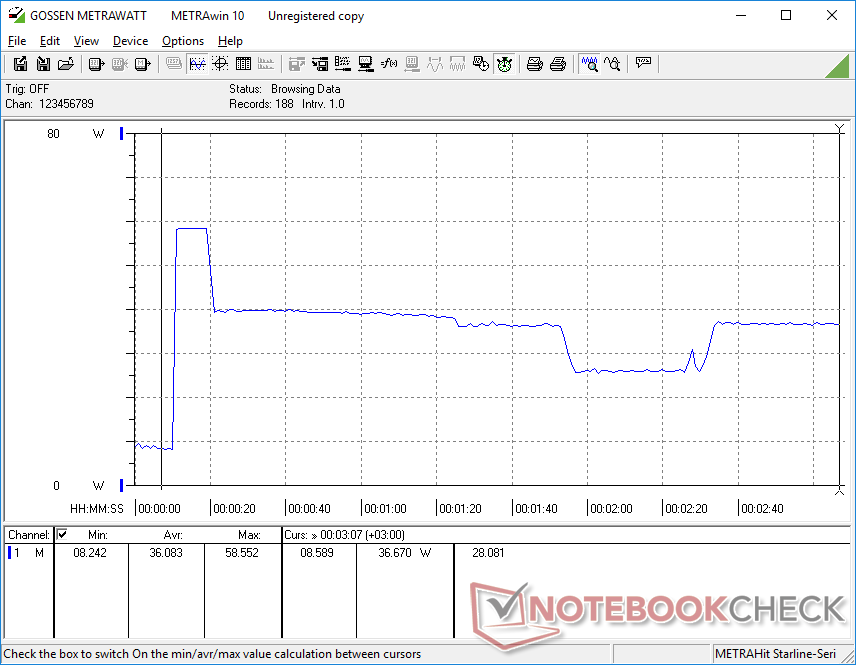
Energieaufnahme
Unser Modell der 3. Generation ist deutlich stromsparender als das ältere Modell der 2. Generation, wie die folgende Tabelle zeigt. Diese Verbesserungen sind wahrscheinlich für die insgesamt längere Akkulaufzeit verantwortlich.
Die Energieeinsparungen reichen bis zu höheren Lasten wie Spielen, wo unser Gerät 25 Prozent weniger Energie benötigt als im Vorjahr. Diese Ergebnisse stehen im Zusammenhang mit der bereits erwähnten, um 25 Prozent geringeren Grafikleistung und dem Drosselverhalten unseres Systems.
| Aus / Standby | |
| Idle | |
| Last |
|
Legende:
min: | |
| Lenovo ThinkPad X1 Nano Gen 3 i7-1360P, Iris Xe G7 96EUs, Lenovo UMIS AM6A0 RPJTJ512MKP1QDQ, IPS, 2160x1350, 13" | Lenovo ThinkPad X1 Nano Gen 2 Core i7-1280P i7-1280P, Iris Xe G7 96EUs, Kioxia BG5 KBG5AZNT1T02, IPS, 2160x1350, 13" | HP Dragonfly G4 i7-1365U, Iris Xe G7 96EUs, Micron 3400 MTFDKBA512TFH 512GB, IPS, 1920x1280, 13.5" | Framework Laptop 13.5 13th Gen Intel i7-1370P, Iris Xe G7 96EUs, WD PC SN740 SDDPNQD-1T00, IPS, 2256x1504, 13.5" | Dell Latitude 9330 i7-1260U, Iris Xe G7 96EUs, , IPS, 2560x1600, 13.3" | Apple MacBook Air M2 10C GPU M2, M2 10-Core GPU, Apple SSD AP1024Z, IPS, 2560x1664, 13.6" | LG Gram 14Z90Q i5-1240P, Iris Xe G7 80EUs, Samsung PM9A1 MZVL2512HCJQ, IPS, 1920x1200, 14" | |
|---|---|---|---|---|---|---|---|
| Stromverbrauch | -29% | -9% | -20% | -7% | 6% | -10% | |
| Idle min * (Watt) | 3.3 | 3.4 -3% | 4.1 -24% | 2.9 12% | 4.7 -42% | 1.9 42% | 3 9% |
| Idle avg * (Watt) | 6.5 | 6.5 -0% | 7.5 -15% | 6.3 3% | 8.2 -26% | 9.6 -48% | 6 8% |
| Idle max * (Watt) | 7.1 | 14.4 -103% | 8.2 -15% | 9.9 -39% | 8.4 -18% | 9.7 -37% | 12 -69% |
| Last avg * (Watt) | 40.7 | 54.5 -34% | 35.5 13% | 56.2 -38% | 36.8 10% | 32.4 20% | 40 2% |
| Witcher 3 ultra * (Watt) | 37 | 44 -19% | 37.5 -1% | 56.6 -53% | 30.4 18% | 30.8 17% | 36.5 1% |
| Last max * (Watt) | 58.6 | 65.4 -12% | 66.5 -13% | 60.8 -4% | 49.9 15% | 35.7 39% | 63 -8% |
* ... kleinere Werte sind besser
Energieverbrauch Witcher 3 / Stresstest
Energieverbrauch externer Monitor
Akkulaufzeit
Die Akkukapazität ist mit weniger als 50 Wh begrenzt, um das Gewicht sehr gering zu halten. Trotzdem beträgt die Akkulaufzeit bei praktischem WLAN-Browsing von fast acht Stunden immer noch sehr gut, was im Vergleich zum letztjährigen Modell eine Verbesserung um einige Stunden darstellt.
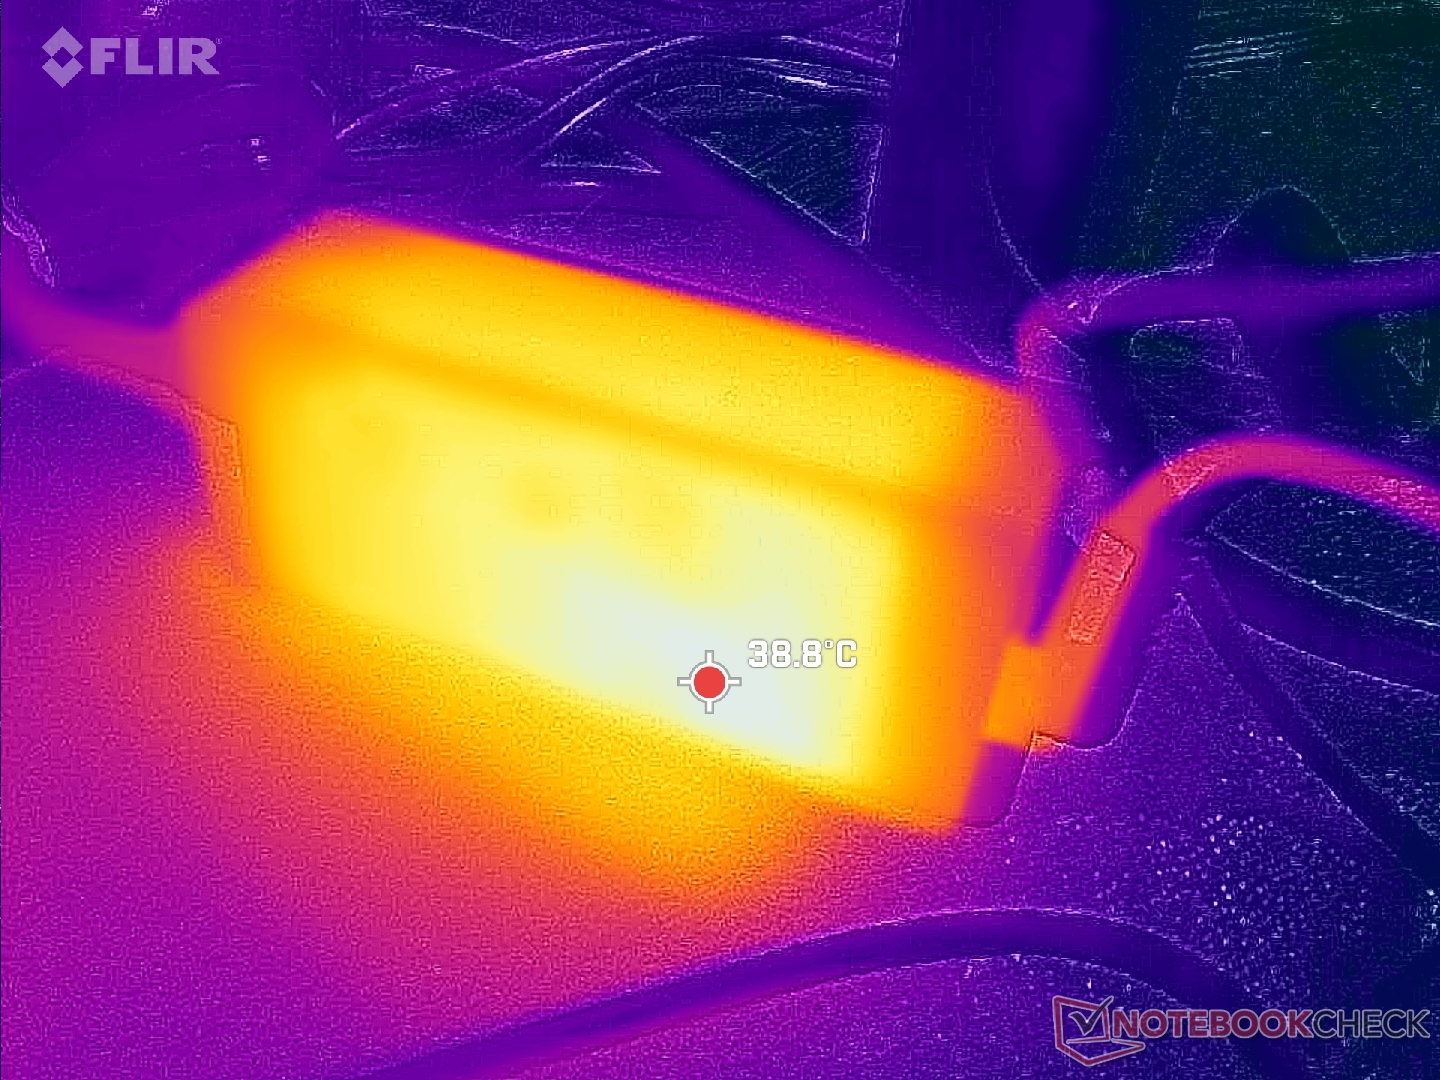
Das Aufladen von leer auf voll mit dem mitgelieferten Netzteil dauert etwa 90 Minuten.
| Lenovo ThinkPad X1 Nano Gen 3 i7-1360P, Iris Xe G7 96EUs, 49.5 Wh | Lenovo ThinkPad X1 Nano Gen 2 Core i7-1280P i7-1280P, Iris Xe G7 96EUs, 49.5 Wh | HP Dragonfly G4 i7-1365U, Iris Xe G7 96EUs, 68 Wh | Framework Laptop 13.5 13th Gen Intel i7-1370P, Iris Xe G7 96EUs, 61 Wh | Dell Latitude 9330 i7-1260U, Iris Xe G7 96EUs, 50 Wh | Apple MacBook Air M2 10C GPU M2, M2 10-Core GPU, 52.6 Wh | LG Gram 14Z90Q i5-1240P, Iris Xe G7 80EUs, 72 Wh | |
|---|---|---|---|---|---|---|---|
| Akkulaufzeit | -35% | 104% | 13% | 21% | 88% | 53% | |
| WLAN (h) | 7.8 | 5.1 -35% | 15.9 104% | 8.8 13% | 9.4 21% | 14.7 88% | 11.9 53% |
| Idle (h) | 42.5 | 15.4 | 28.9 | ||||
| Last (h) | 3.2 | 2.3 | 2.8 | ||||
| H.264 (h) | 15.8 |
Pro
Contra
Fazit — Leistungsabstriche für ein Gewicht unter 1 kg
Das ThinkPad X1 Nano von 2023 weist einige Verbesserungen im Vergleich zur Version von 2022 auf: Lüftergeräusche, Akkulaufzeit und SSD-Leistung wurden alle optimiert, was Nutzern zugute kommt, die häufig unterwegs sind und sich nicht in der Nähe einer Stromquelle befinden.
Zu beachten ist, dass jegliche jährliche Leistungsverbesserungen bestenfalls marginal sind, trotz des Updates auf die neuere Intel Plattform der 13. Das soll nicht heißen, dass das Lenovo langsam ist, denn seine Core-P-Serien-CPU ist der häufigeren Core-U-Serie voraus, die in den meisten anderen Subnotebooks zu finden ist. Aber das Delta ist nicht so groß, wie man aufgrund der begrenzten Kühlmöglichkeiten des ThinkPad-X1-Nano-Designs erwarten könnte. Schließlich sind Kompromisse unvermeidlich, wenn man ein Endgewicht von unter einem Kilogramm anstrebt. Die Core-P-CPU ist daher am besten für kurze Turbo-Boost-Leistungsspitzen geeignet, z. B. beim Starten von Anwendungen oder beim Bearbeiten von Fotos.
Das ThinkPad X1 Nano der Gen 3 ist eines der wenigen 13-Zoll-Notebooks unter 1 kg, das mit Core-P-CPUs ausgestattet ist. Die Leistung ist für kurze Zeit hervorragend, bevor Wärmeentwicklung und Throttling einsetzen.
Wenn Sie versuchen, etwas Geld zu sparen, können Sie im Wesentlichen die gleiche Benutzererfahrung erzielen, indem Sie sich für das ältere ThinkPad X1 Nano Gen 2 entscheiden, zumal Lenovo keine Änderungen an der Anzeige oder anderen physischen Aspekten des Modells vorgenommen hat.
Preis und Verfügbarkeit
Lenovo bietet nun das ThinkPad X1 Nano der Gen 3 ab 1.176 Euro für die Basis-Konfiguration mit Core i5-1340P bis hin zu 1.852 Euro für die High-End-Konfiguration mit Core i7-1370P an.
Lenovo ThinkPad X1 Nano Gen 3
- 25.08.2023 v7 (old)
Allen Ngo
Transparenz
Die Auswahl der zu testenden Geräte erfolgt innerhalb der Redaktion. Das vorliegende Testmuster wurde dem Autor vom Hersteller oder einem Shop zu Testzwecken leihweise zur Verfügung gestellt. Eine Einflussnahme des Leihstellers auf den Testbericht gab es nicht, der Hersteller erhielt keine Version des Reviews vor der Veröffentlichung. Es bestand keine Verpflichtung zur Publikation. Als eigenständiges, unabhängiges Unternehmen unterliegt Notebookcheck keiner Diktion von Herstellern, Shops und Verlagen.
So testet Notebookcheck
Pro Jahr werden von Notebookcheck hunderte Laptops und Smartphones unabhängig in von uns standardisierten technischen Verfahren getestet, um eine Vergleichbarkeit aller Testergebnisse zu gewährleisten. Seit rund 20 Jahren entwickeln wir diese Testmethoden kontinuierlich weiter und setzen damit Branchenstandards. In unseren Testlaboren kommt ausschließlich hochwertiges Messequipment in die Hände erfahrener Techniker und Redakteure. Die Tests unterliegen einer mehrstufigen Kontrolle. Unsere komplexe Gesamtbewertung basiert auf hunderten fundierten Messergebnissen und Benchmarks, womit Ihnen Objektivität garantiert ist. Weitere Informationen zu unseren Testmethoden gibt es hier.
Preisvergleich

