Test Lenovo ThinkPad X1 Nano Gen 2: Der kleinste X1-Laptop
")
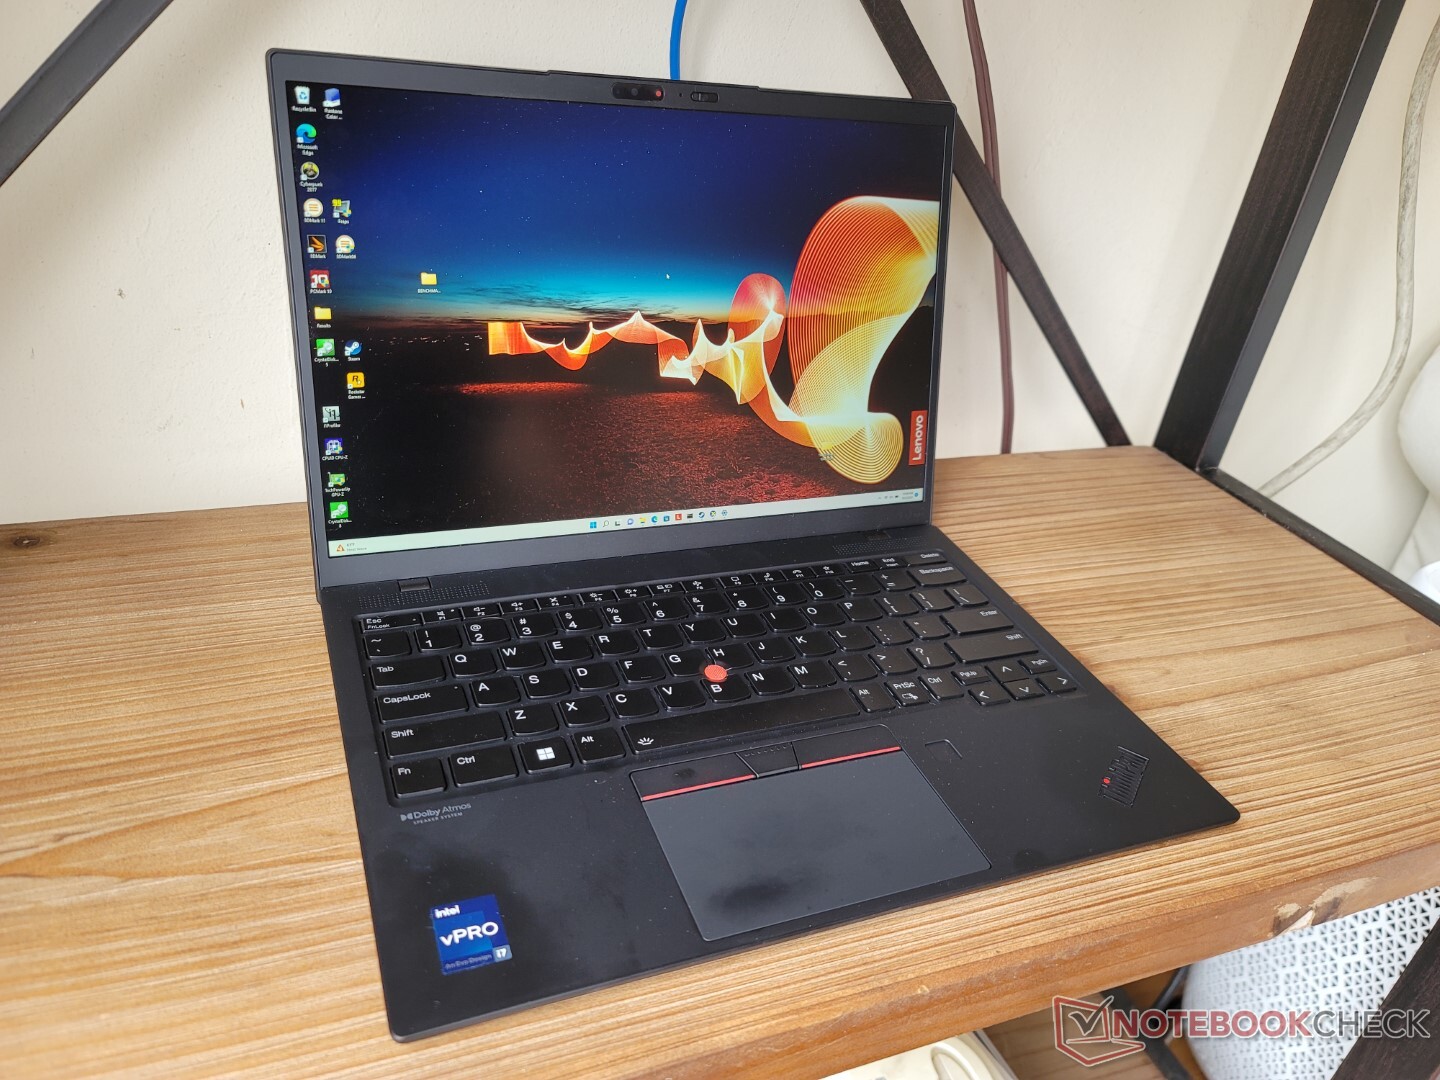
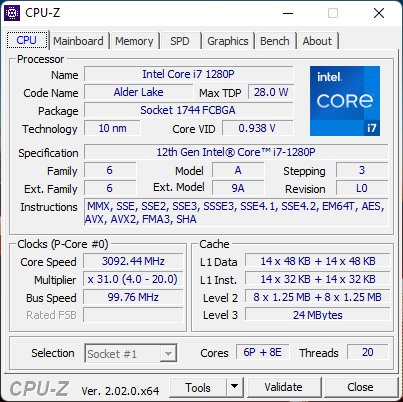
Der langsame Prozessor war unser Haupkritikpunkte am ThinkPad X1 Nano Gen. 1. Während die meisten anderen Subnotebooks mit einem Core i5-1135G7 bzw. Core i7-1165G7 mit den vollen 28 W ausgestattet war, bekam das Nano Gen. 1 nur den 15-W-Prozessor i7-1160G7. Obwohl es also extrem leicht war, wirkte es, als hätte das niedrige Gewicht einen negativen Einfluss auf das Leistungsniveau. Beim neuen ThinkPad X1 Nano Gen. 2 setzt Lenovo daher statt dem i7-1160G7 auf den Core i7-1280P vPro aus der 12. Generation mit den vollen 28 W, was das X1 Nano Gen. 2 zumindest theoretisch zu einem der schnellsten 13-Zoll-Business-Laptops macht.
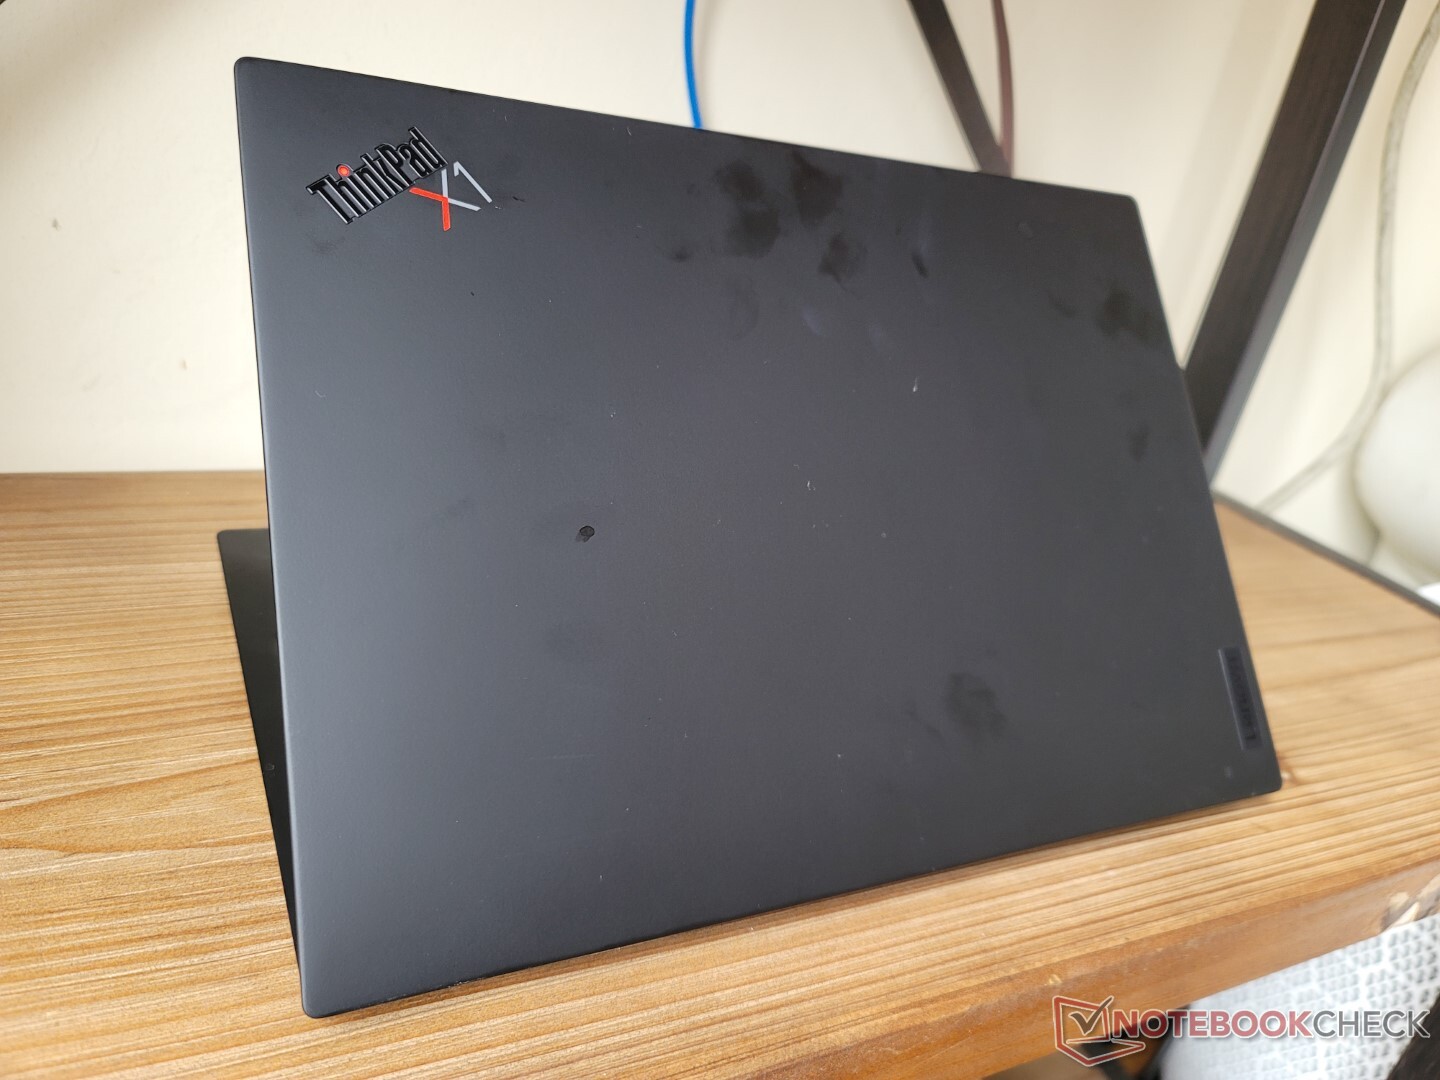
Abgesehen von der neuen CPU bekommt das Modell der 2. Generation außerdem eine höherauflösende Webcam, schnelleres WLAN und 5G-WAN-Unterstützung spendiert. Das Design ist mit dem des Vorgängers aus 2021 identisch, weshalb wir für weitere Details zu den physikalischen Merkmalen an dieser Stelle auf unseren bestehenden Test verweisen.
Zu den Konkurrenten in diesem Bereich zählen andere, sehr leichte 13-Zoll-Business-Laptops wie das HP Elite Dragonfly G3, Dell Latitude 13 7330, die LG-Gram-Reihe und das Dynabook Portege X30L.
Weitere Lenovo-Tests:
Mögliche Konkurrenten im Vergleich
Bew. | Datum | Modell | Gewicht | Dicke | Größe | Auflösung | Preis ab |
|---|---|---|---|---|---|---|---|
| 88.9 % v7 (old) | 09 / 2022 | Lenovo ThinkPad X1 Nano Gen 2 Core i7-1280P i7-1280P, Iris Xe G7 96EUs | 958 g | 14.4 mm | 13.00" | 2160x1350 | |
| 89.8 % v7 (old) | 02 / 2021 | Lenovo ThinkPad X1 Nano-20UN002UGE i7-1160G7, Iris Xe G7 96EUs | 946 g | 16 mm | 13.00" | 2160x1350 | |
| 91 % v7 (old) | 08 / 2022 | HP Elite Dragonfly G3 i7-1265U, Iris Xe G7 96EUs | 1.2 kg | 16.3 mm | 13.50" | 1920x1280 | |
| 89 % v7 (old) | 07 / 2022 | Dell Latitude 13 7330 i7-1265U, Iris Xe G7 96EUs | 1 kg | 16.96 mm | 13.30" | 1920x1080 | |
| 85.1 % v7 (old) | 07 / 2022 | Framework Laptop 13.5 12th Gen Intel i7-1260P, Iris Xe G7 96EUs | 1.3 kg | 15.85 mm | 13.50" | 2256x1504 | |
| 87.8 % v7 (old) | 03 / 2021 | Huawei MateBook X Pro 2021 i7-1165G7, Iris Xe G7 96EUs | 1.3 kg | 14.6 mm | 13.90" | 3000x2000 |
Gehäuse
Kommunikation
Lenovo hat das WLAN Modul Intel AX201 zugunsten von WLAN-6E-Unterstützung durch das AX211 ersetzt. Innerhalb unseres 6-GHz-Netzwerks sind keine Verbindungsprobleme aufgetreten.
Ein optionales LTE-5G-Cat-20- bzw. 4G-Cat-9-WWAN-Modul ist ebenfalls verfügbar. In diesem Fall hat der Laptop zusätzlich einen Nano-SIM-Slot.
| Networking | |
| iperf3 transmit AX12 | |
| Lenovo ThinkPad X1 Nano-20UN002UGE | |
| Huawei MateBook X Pro 2021 | |
| iperf3 receive AX12 | |
| Huawei MateBook X Pro 2021 | |
| Lenovo ThinkPad X1 Nano-20UN002UGE | |
| iperf3 receive AXE11000 6GHz | |
| Framework Laptop 13.5 12th Gen Intel | |
| Lenovo ThinkPad X1 Nano Gen 2 Core i7-1280P | |
| HP Elite Dragonfly G3 | |
| Dell Latitude 13 7330 | |
| iperf3 transmit AXE11000 6GHz | |
| Dell Latitude 13 7330 | |
| Framework Laptop 13.5 12th Gen Intel | |
| HP Elite Dragonfly G3 | |
| Lenovo ThinkPad X1 Nano Gen 2 Core i7-1280P | |
Webcam
Dell hat die 720p-Webcam des Vorgängers bei der 2. Generation durch eine 1080p-Webcam ersetzt. Sie bietet eine schärfere Darstellung, die Farbtreue bleibt jedoch unterdurchschnittlich.
IR und eine physikalische Webcam-Abdeckung, die eine bessere Privatsphäre verspricht, sind standardmäßig an Bord.


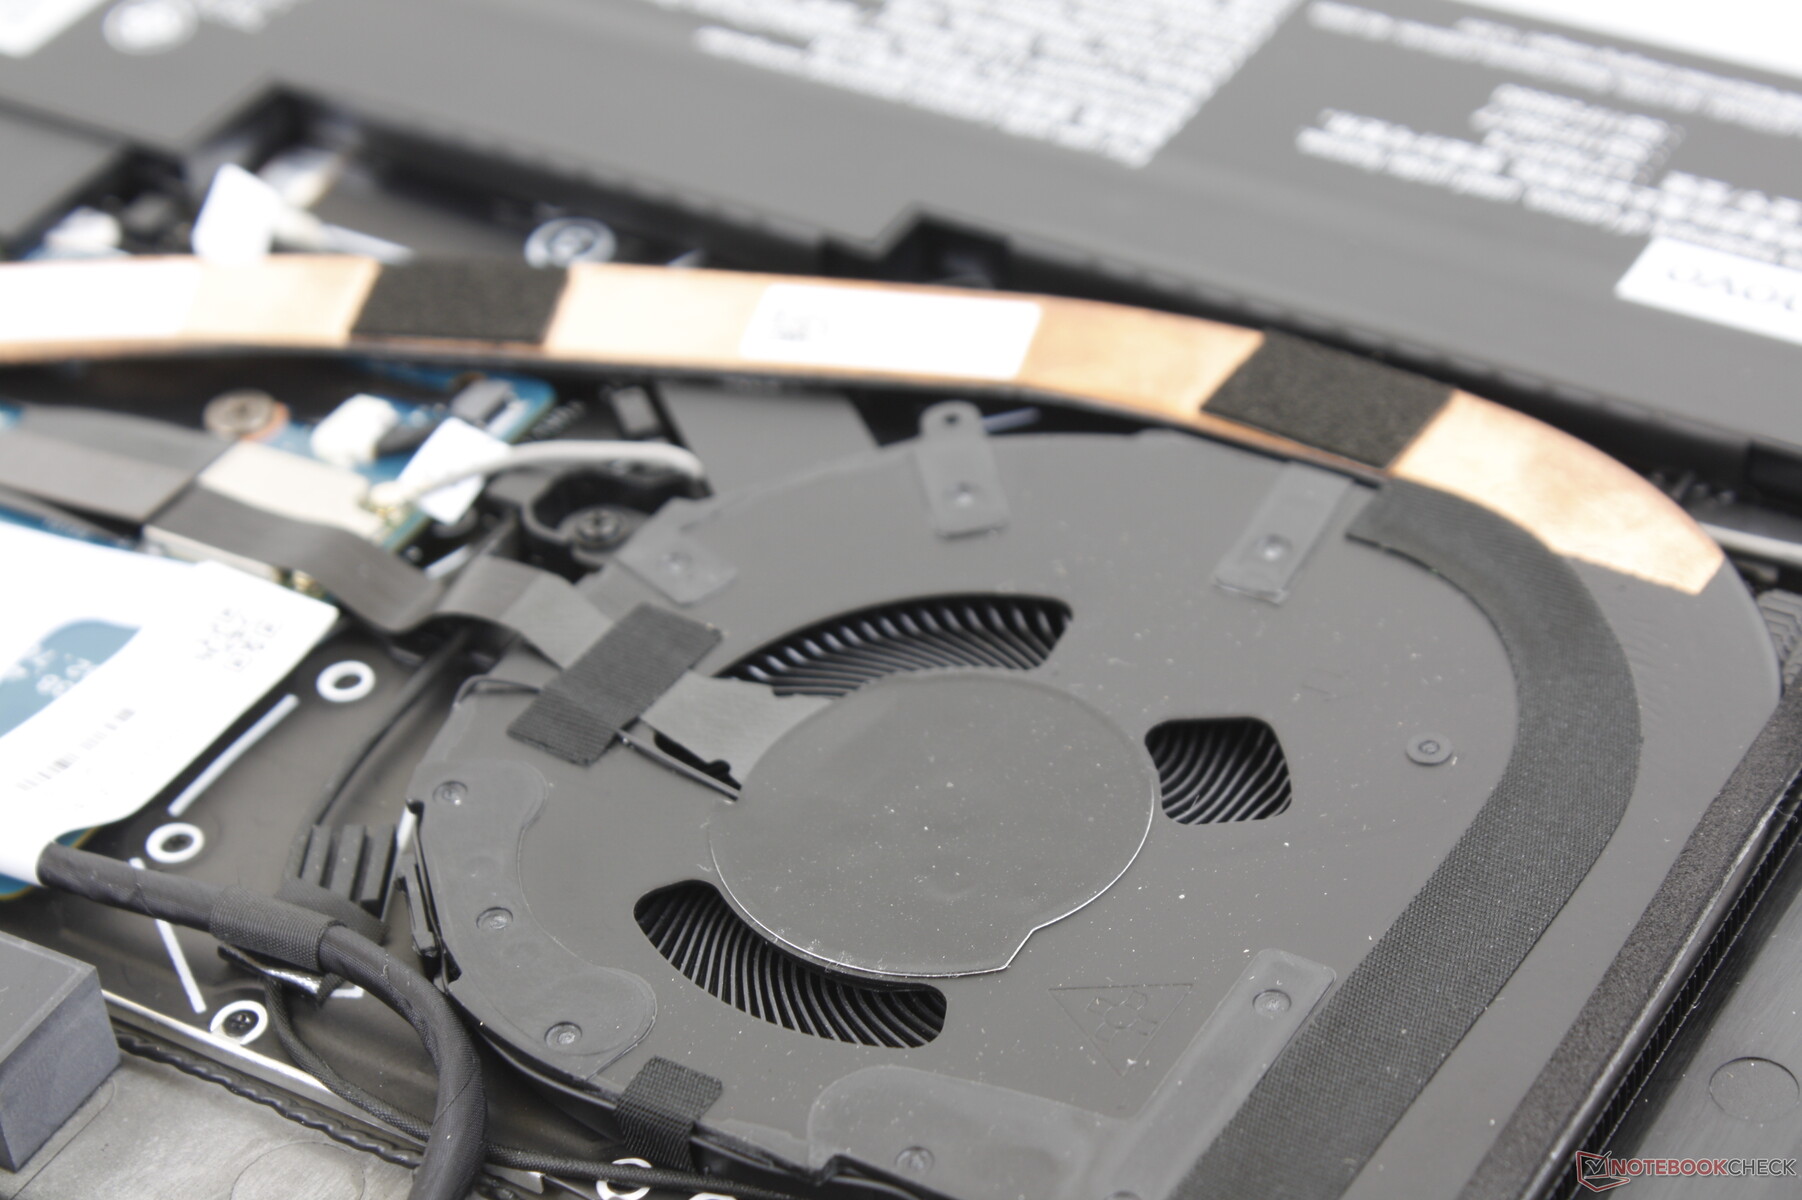
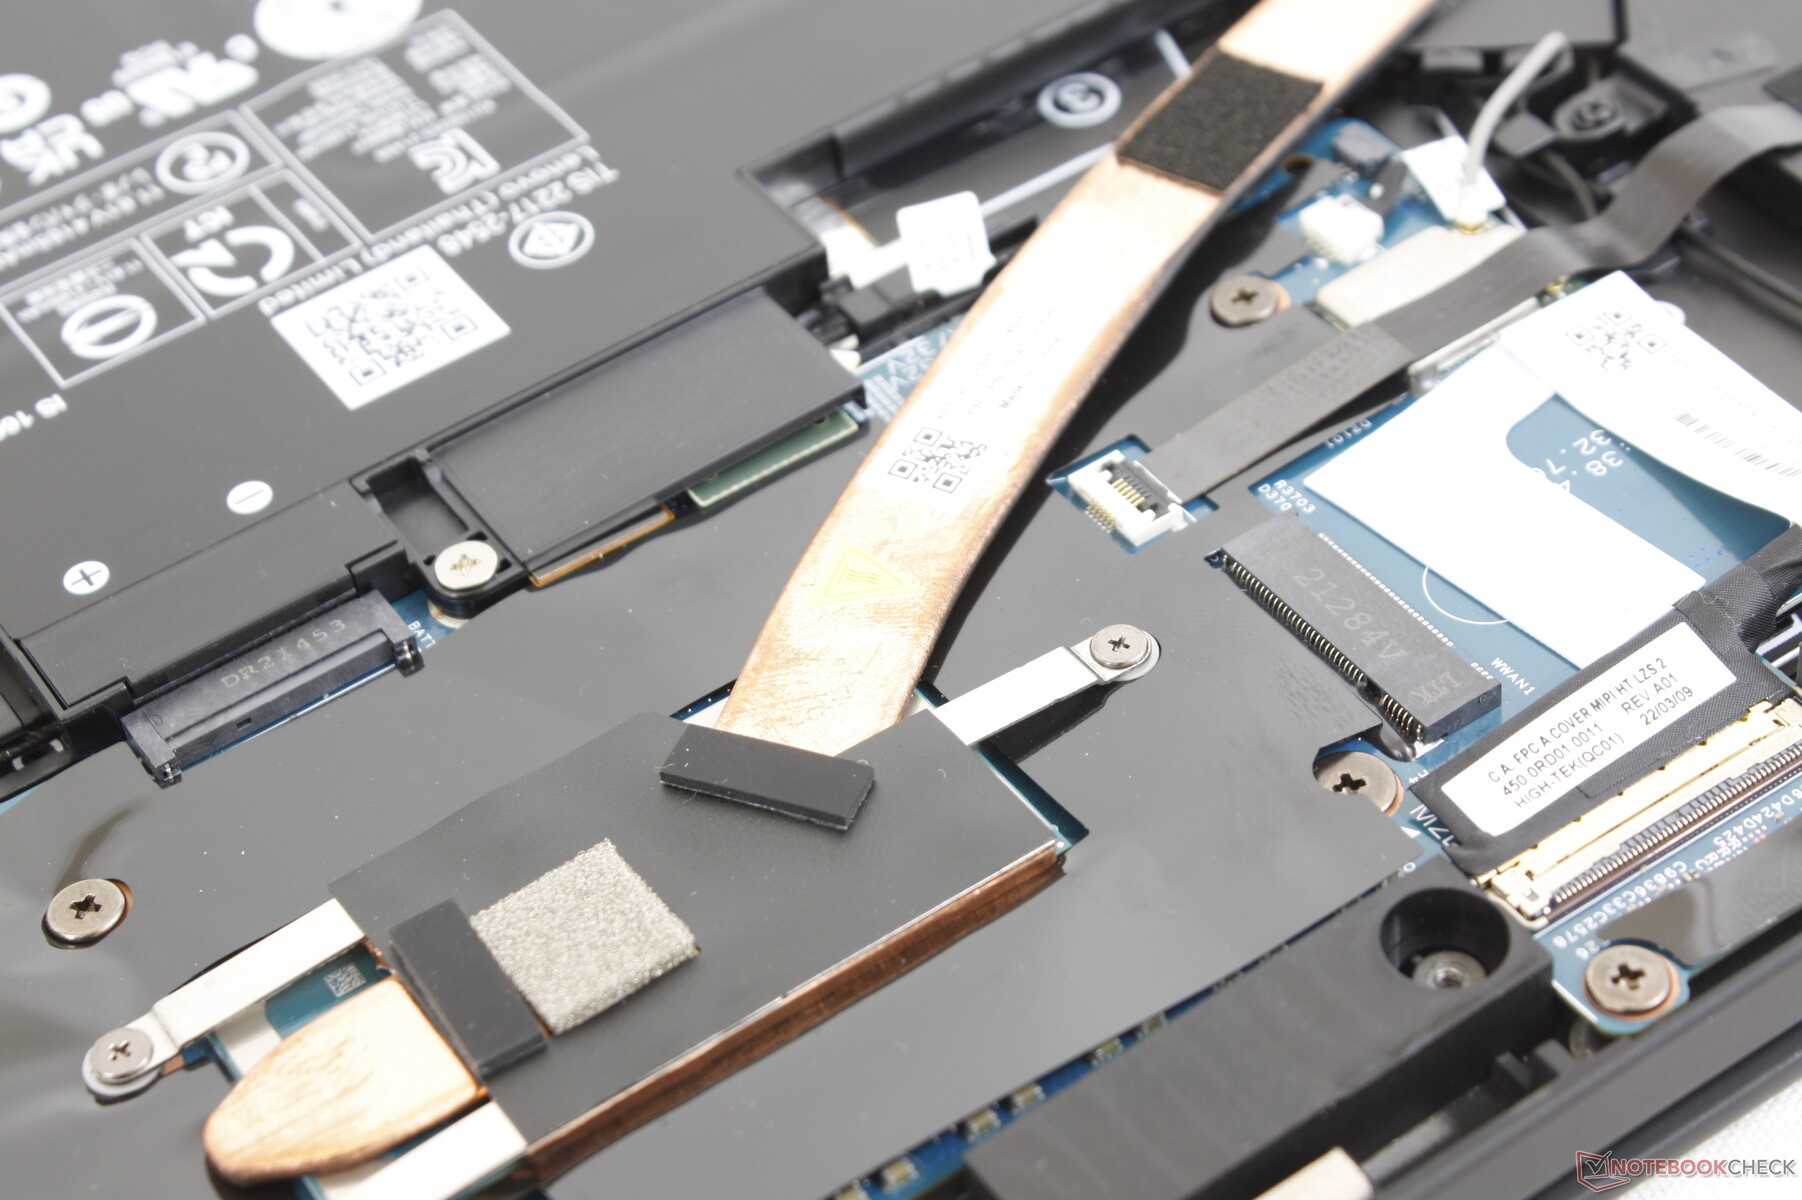
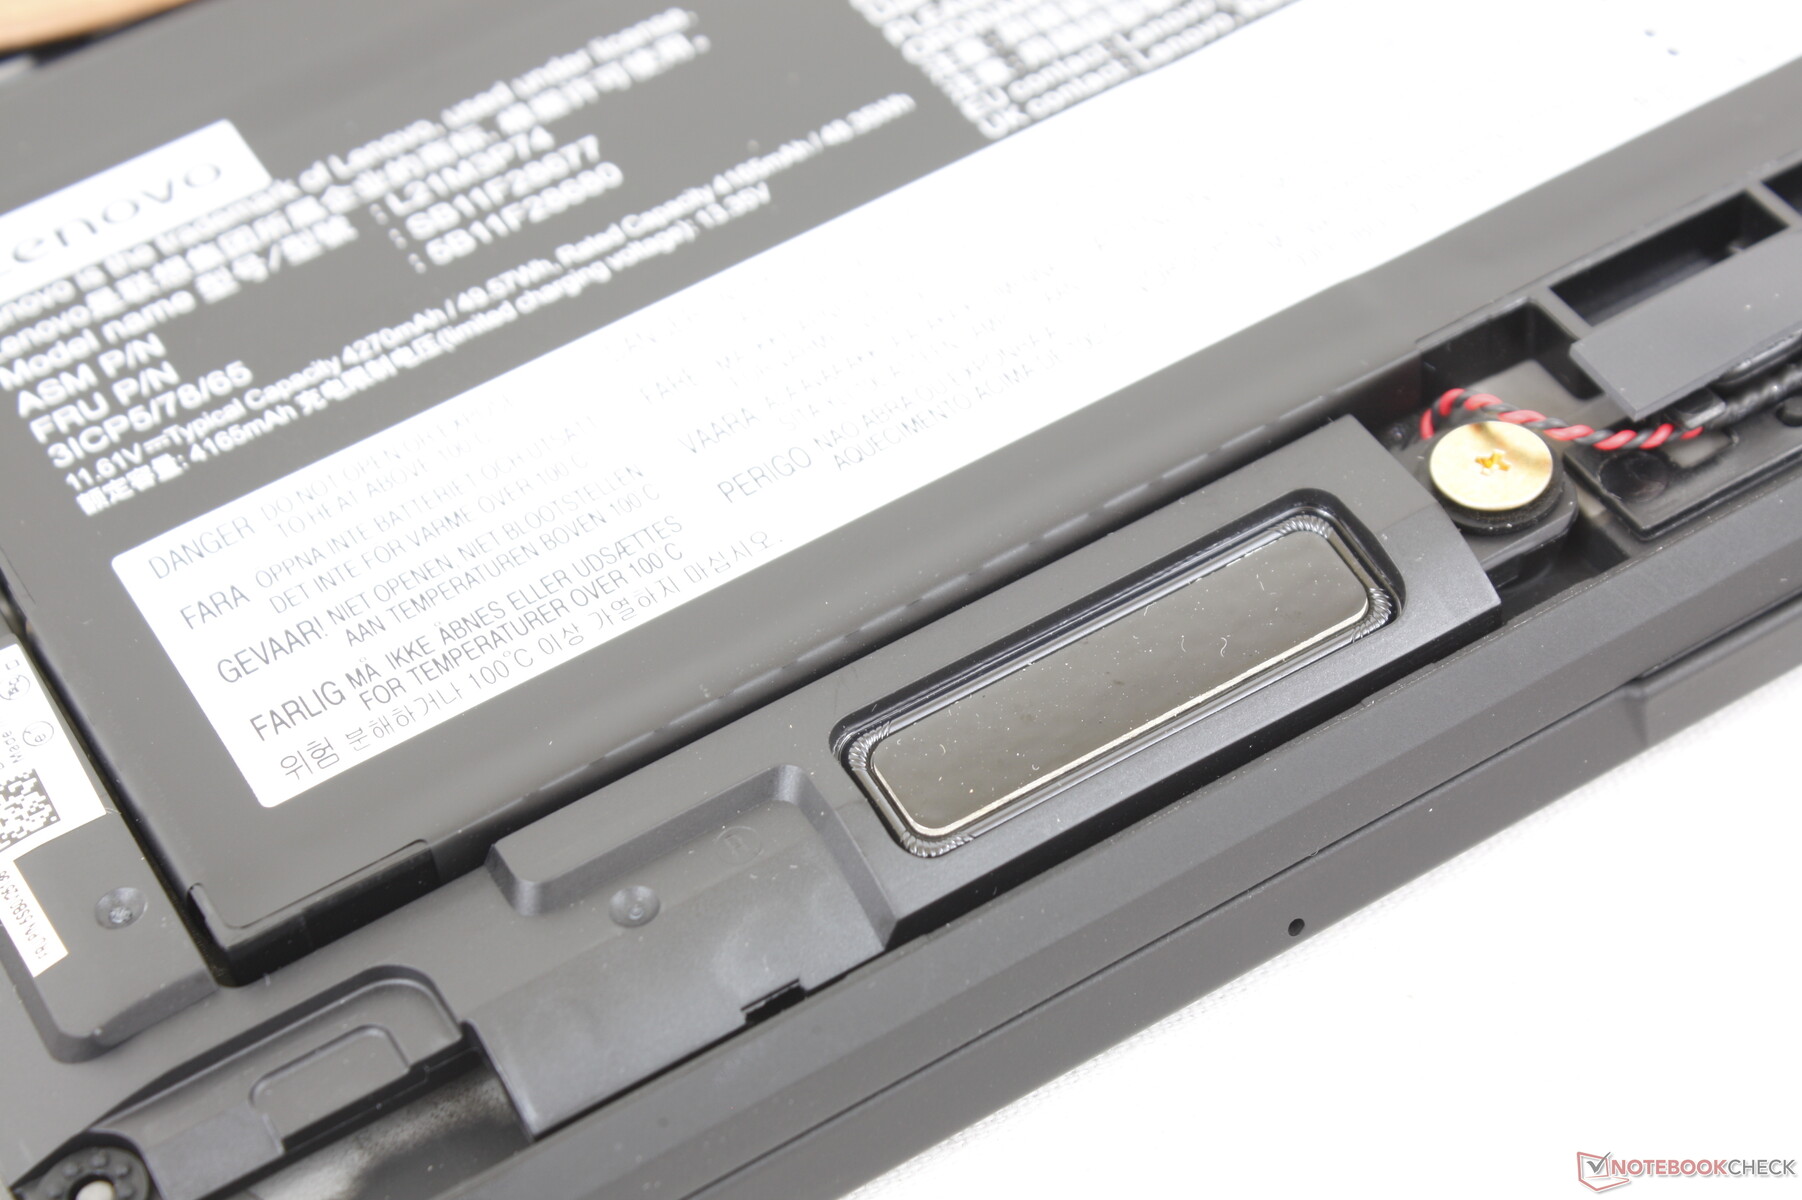
Wartung
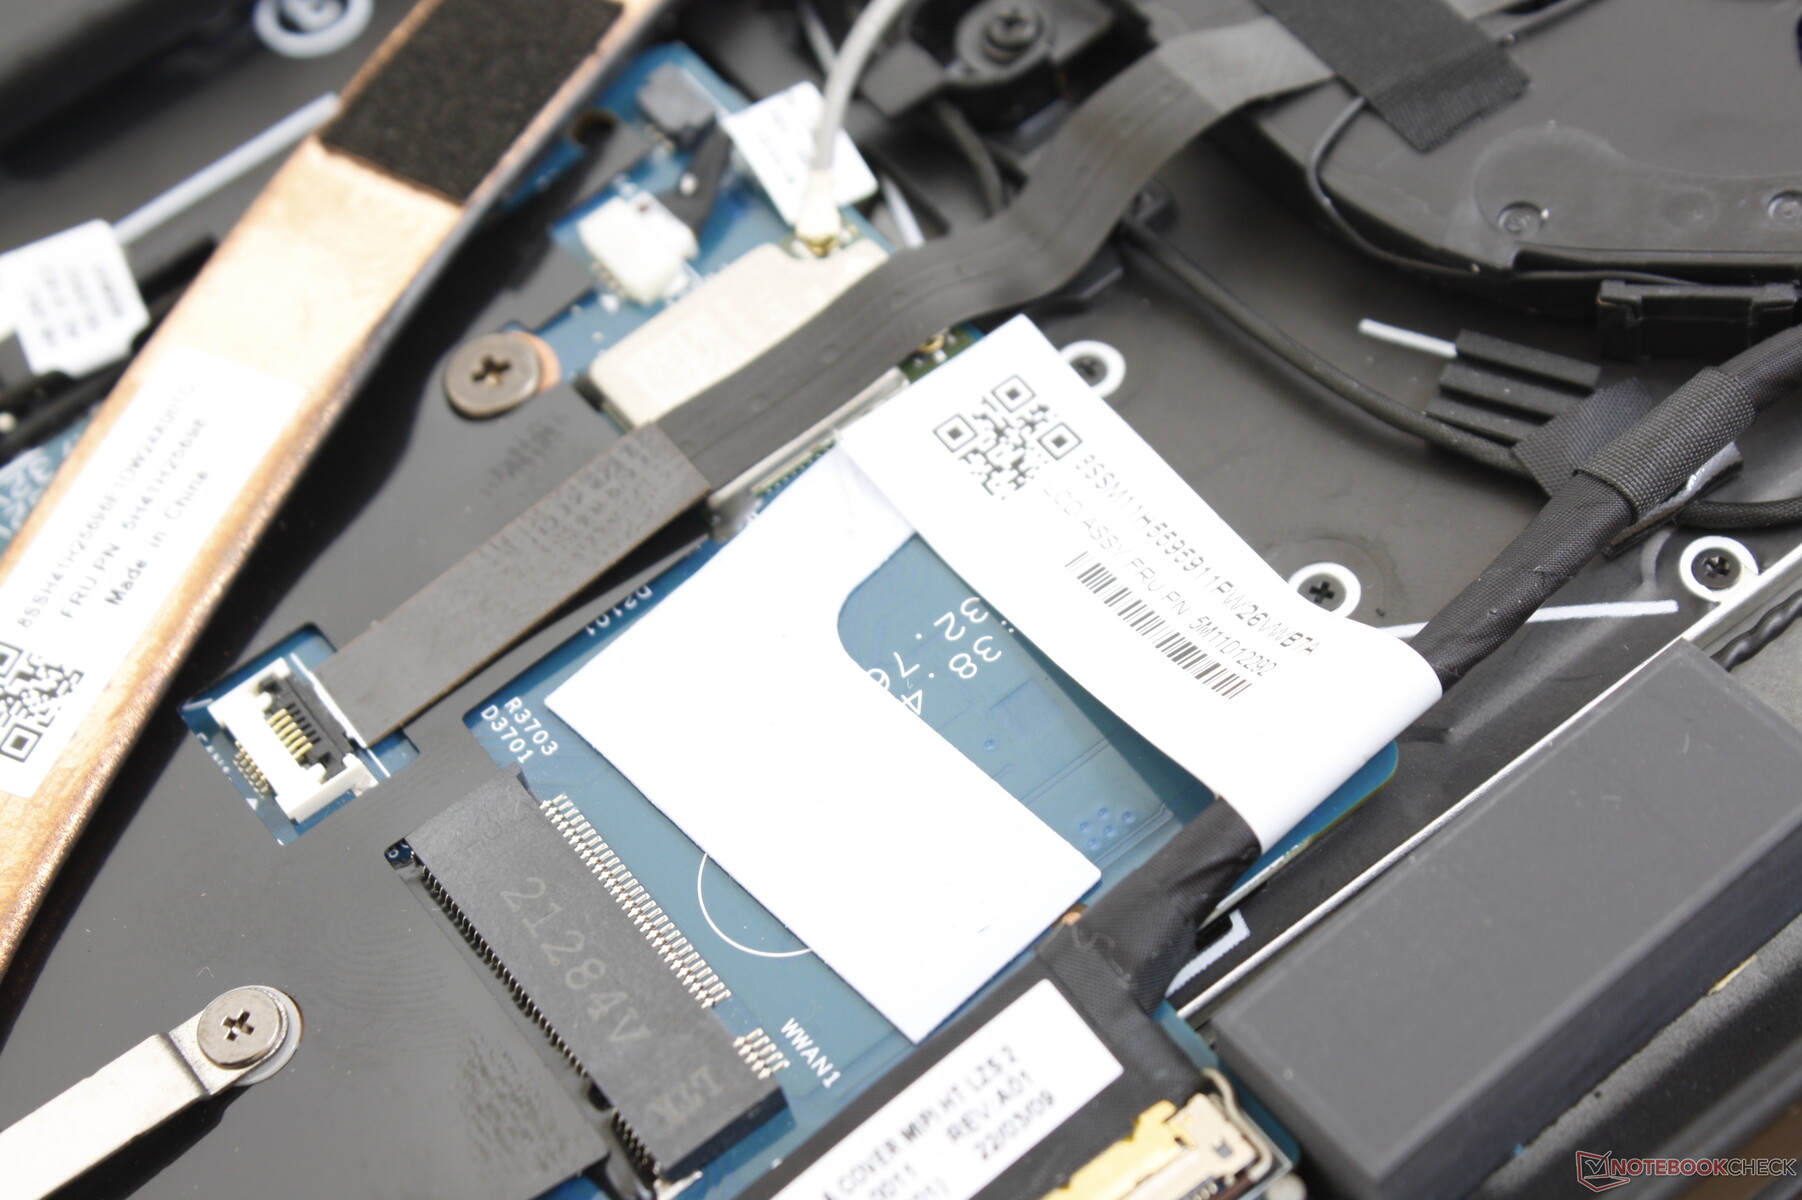
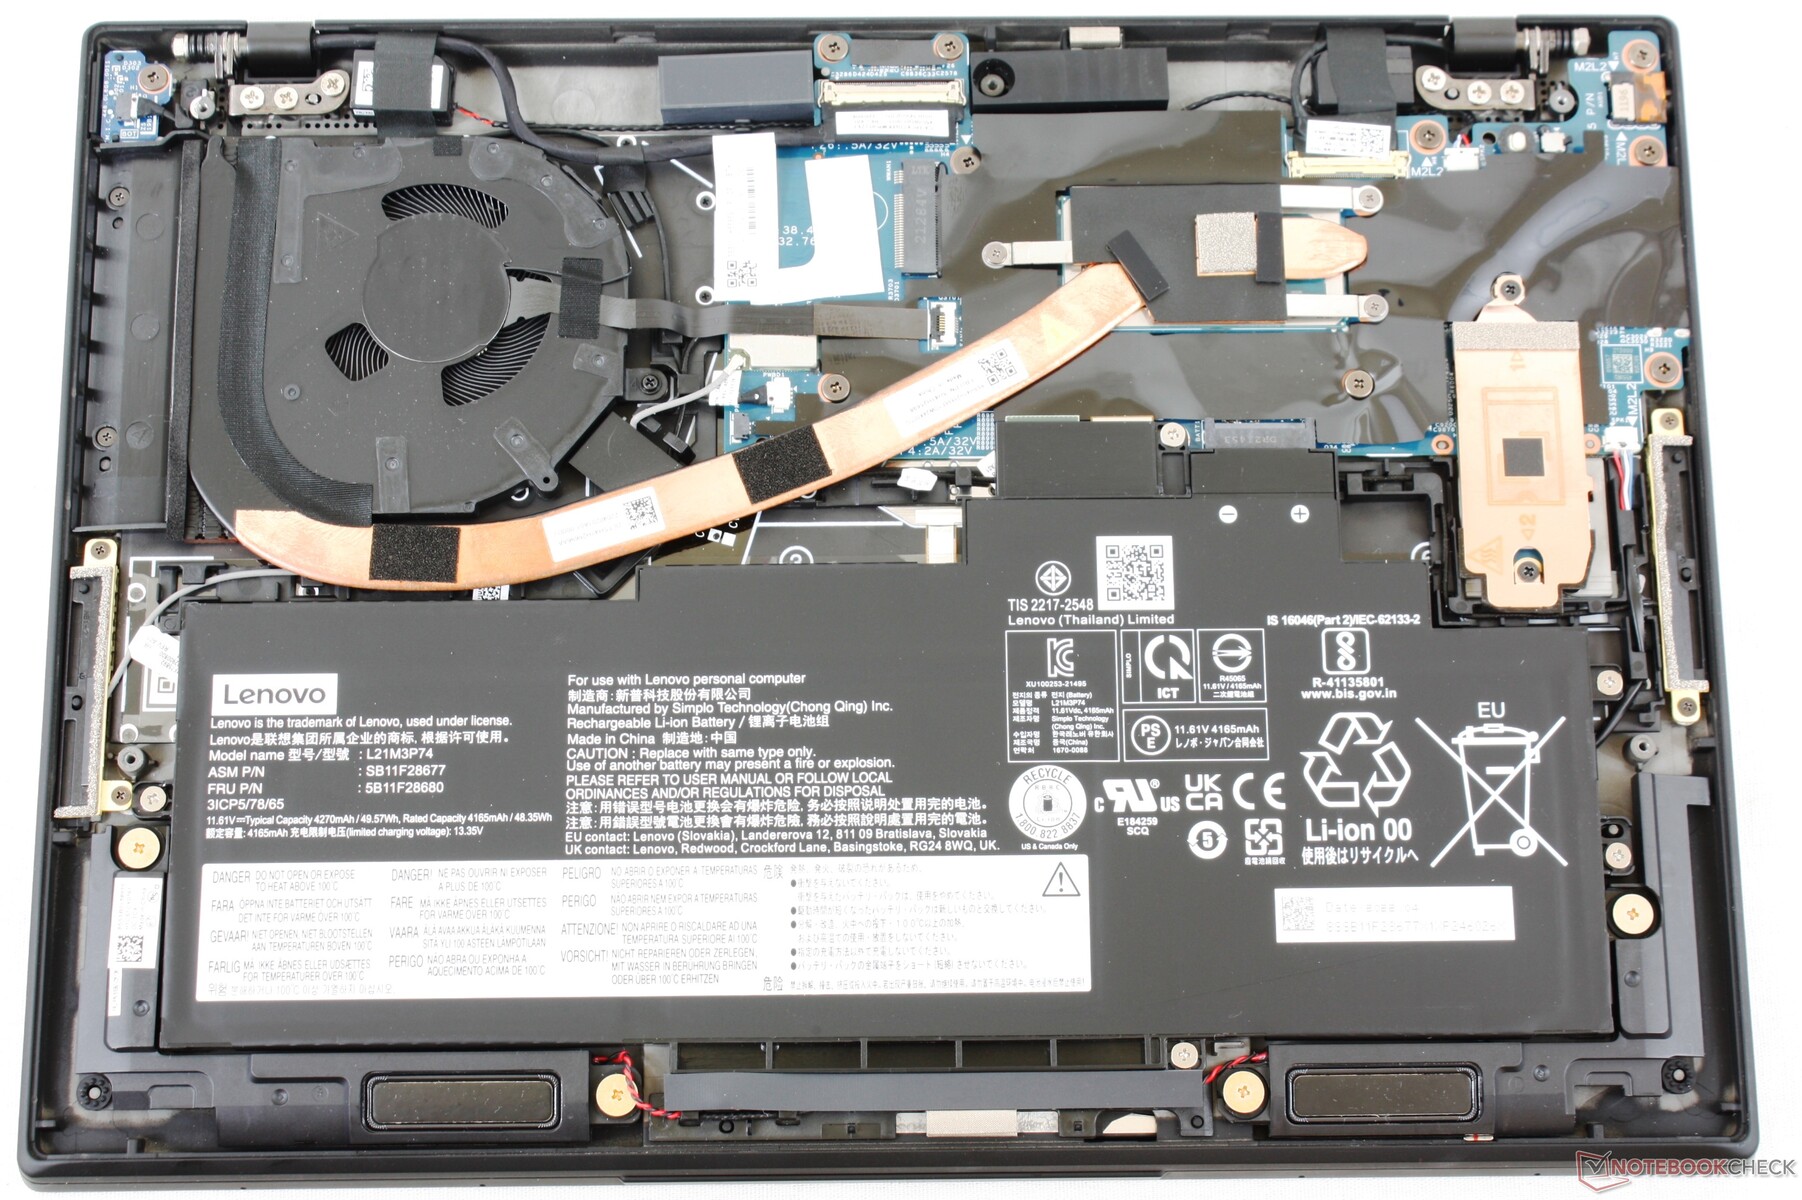
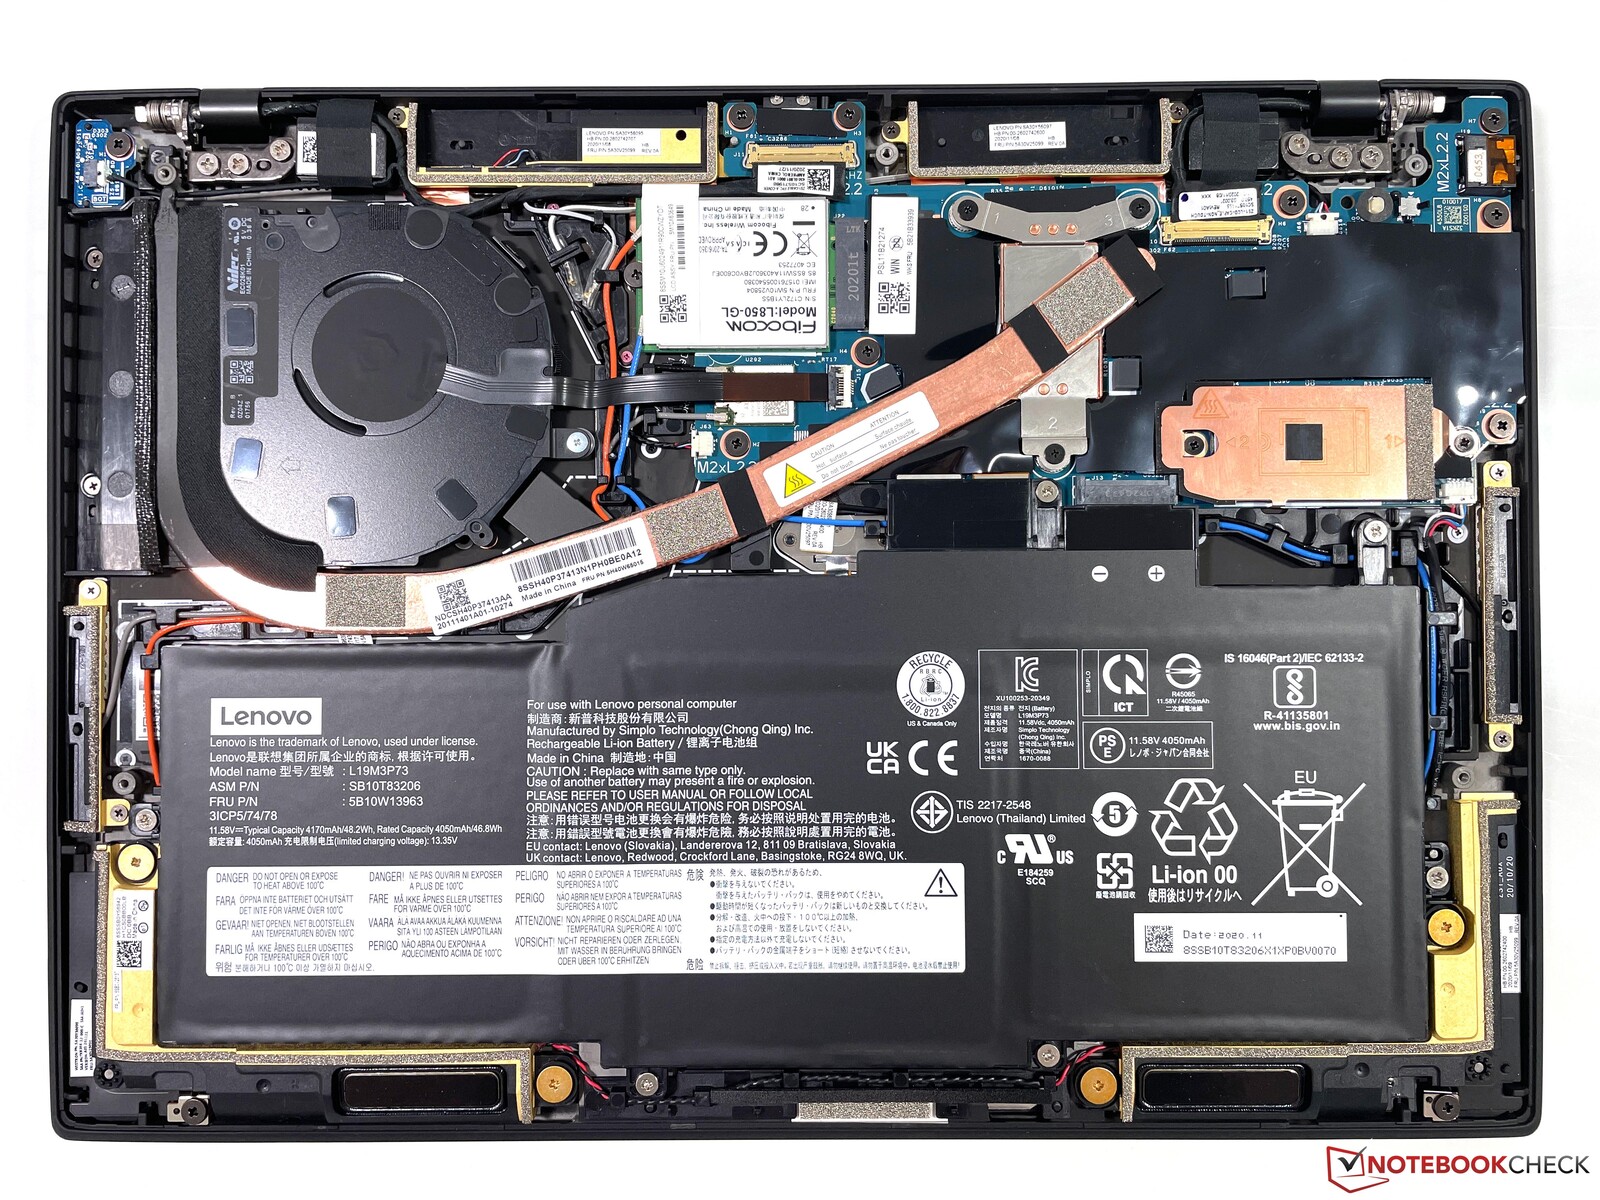
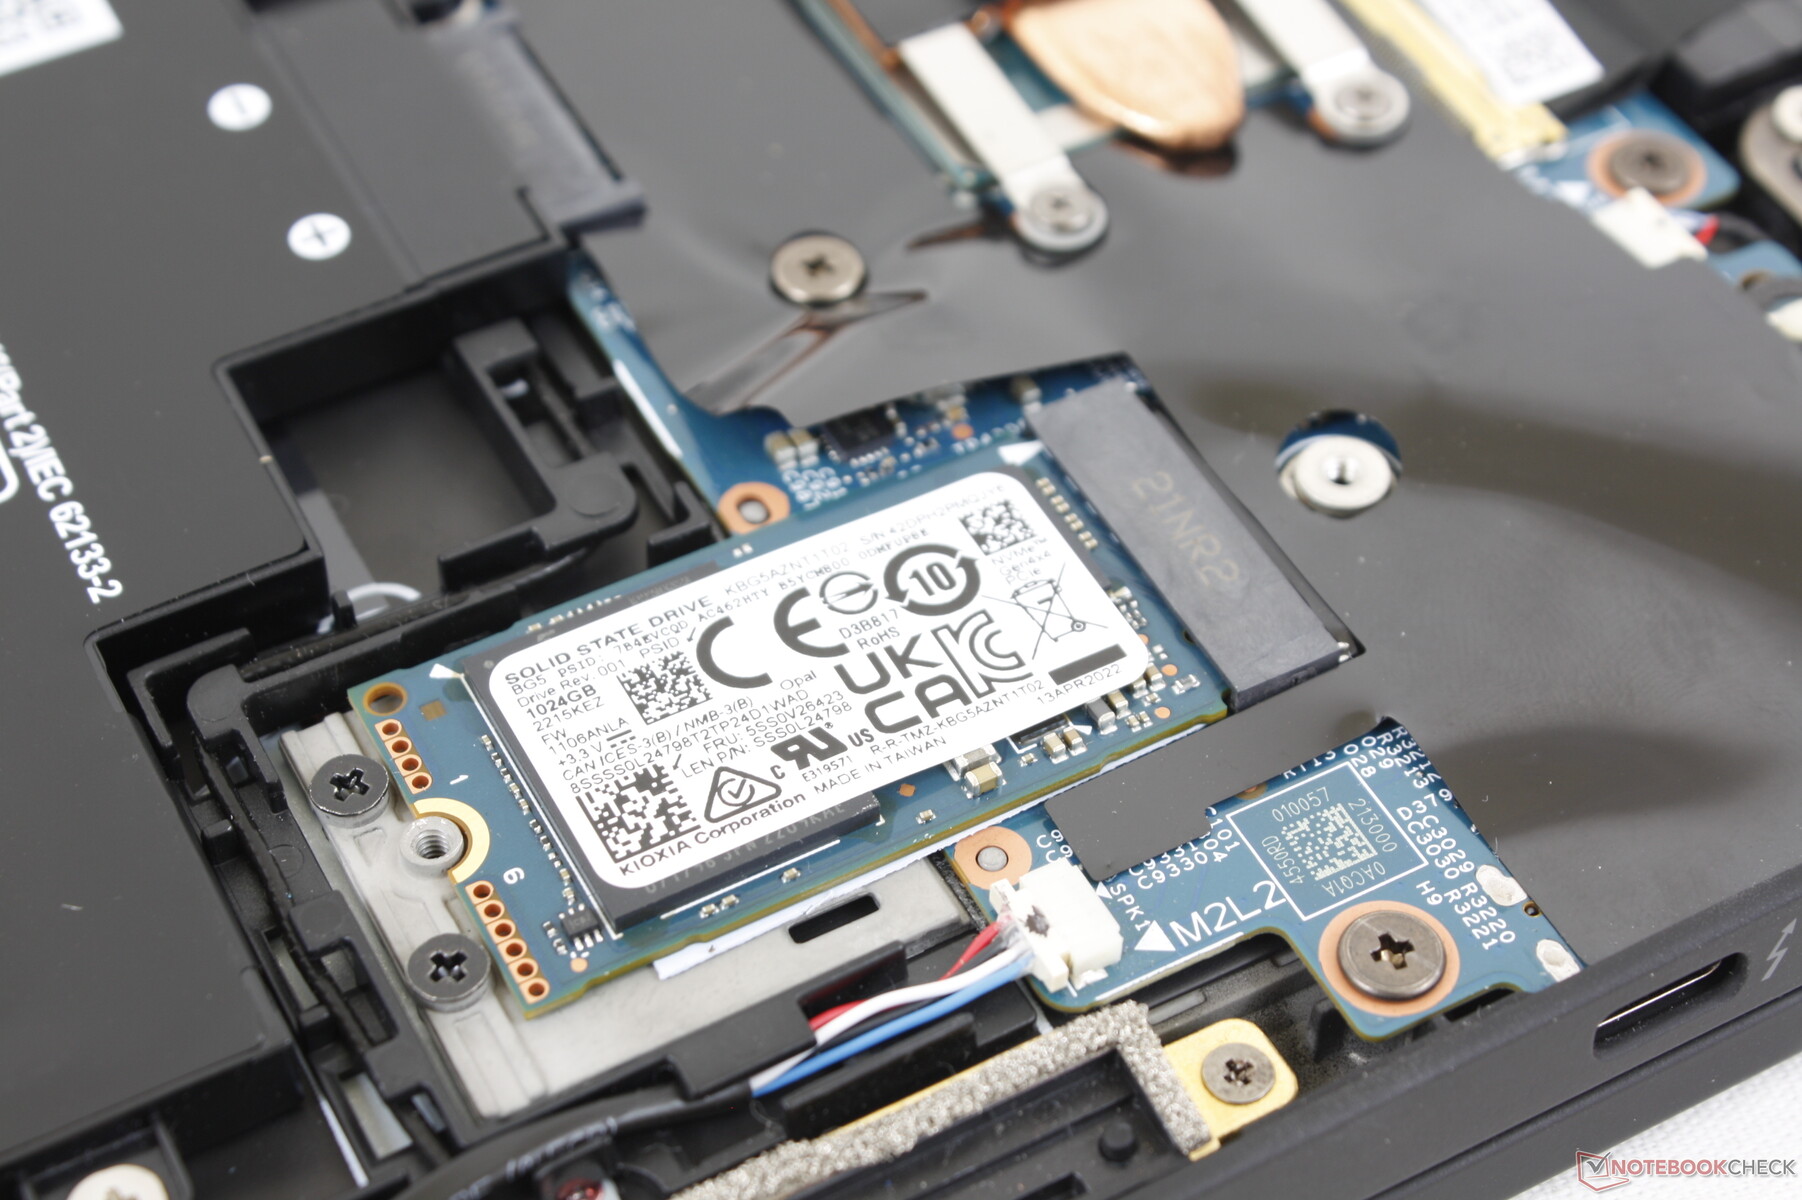
Das Entfernen der Bodenplatte erfordert lediglich einen Kreuzschraubenzieher. Abgesehen von der neuen Position der M.2-2242-SSD und anderen geringfügigen Änderungen, die auf den Bildern unten zu sehen sind, unterscheidet sich das Innenleben kaum.
Garantie und Zubehör
Bis auf das Netzteil und die üblichen Papiere befinden sich keine Extras im Lieferumfang. Die eingeschränkte Garantie gilt nur für ein Jahr, was in Anbetracht des hohen Basispreises enttäuschend ist. Hier sollte man mit standardmäßig 3 Jahren rechnen können.
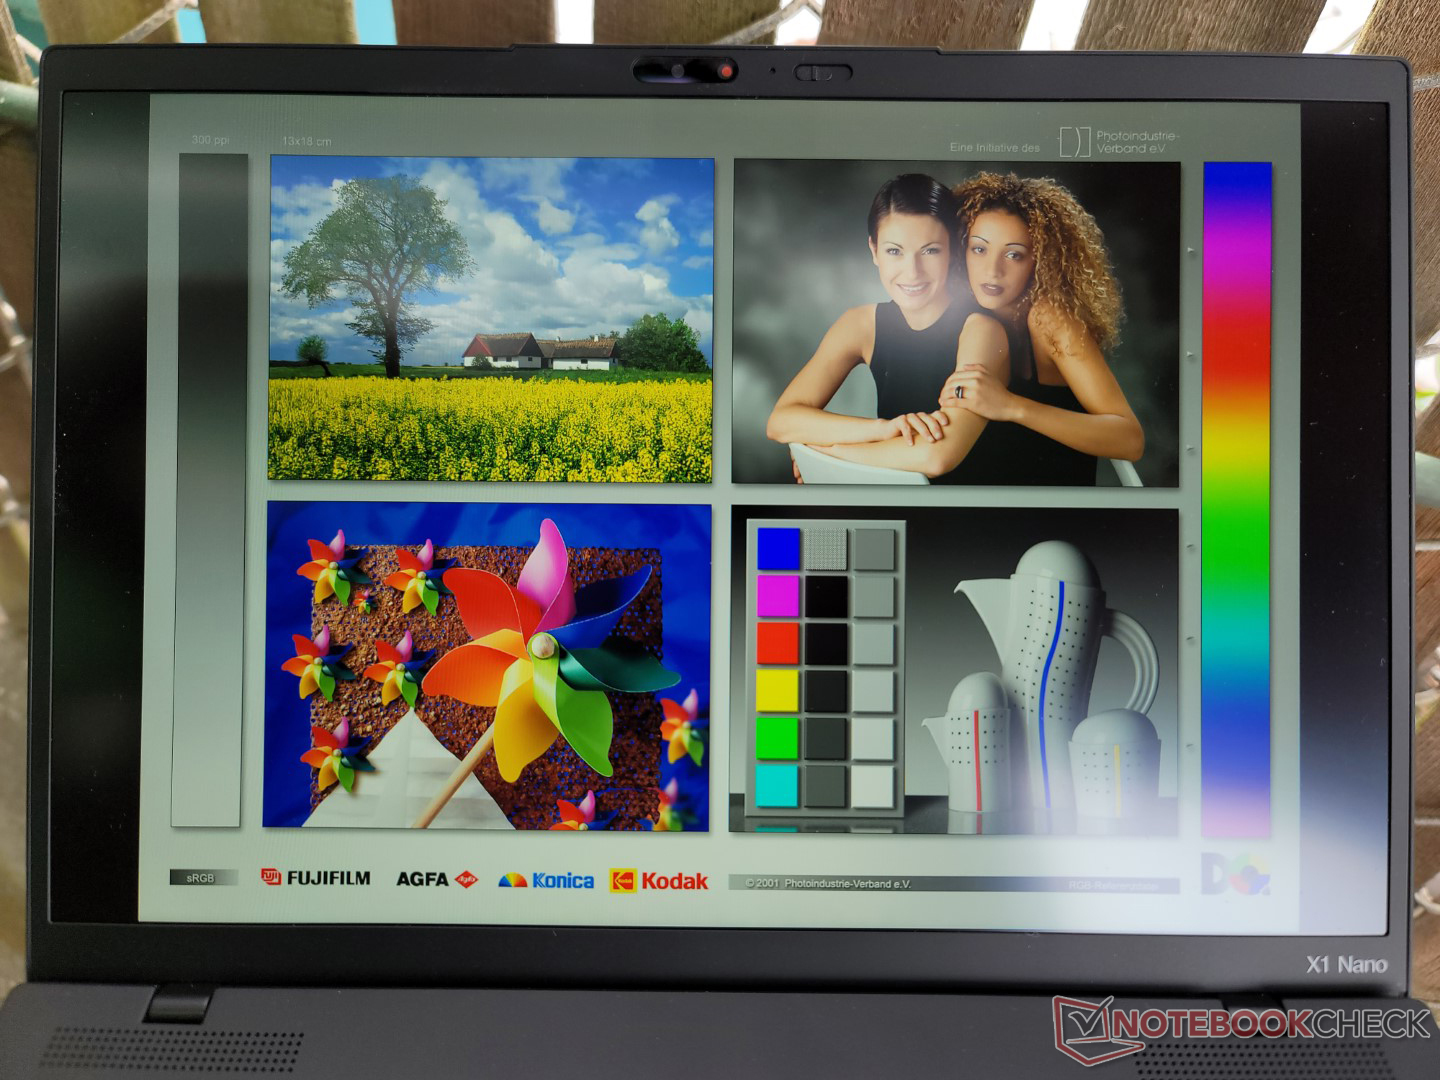
Display
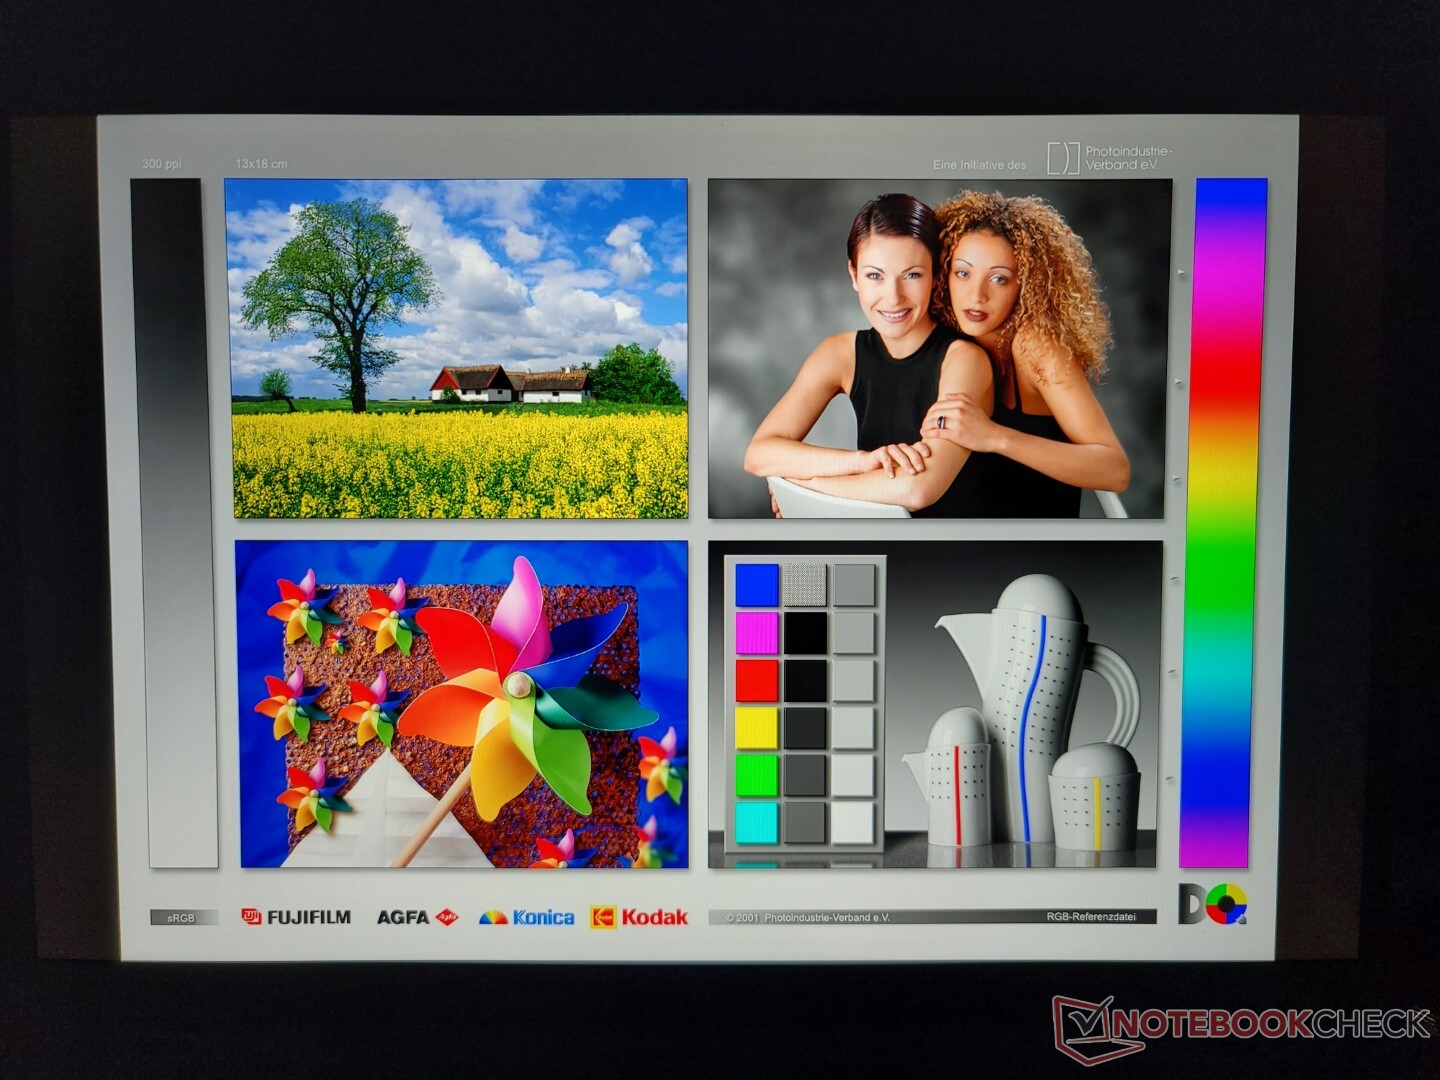
Bei unserem Testgerät aus der 2. Generation kommt ein anderes IPS-Panel zum Einsatz als beim Vorgänger (P101ZFZ-BH2 vs. MND007ZA1-2). Trotzdem bleiben die Eigenschaften im Wesentlichen identisch und die Darstellung damit praktisch unverändert. Auch weiterhin bekommt man hier ein 450-cd/m²-Panel mit einer vollständigen sRGB-Abdeckung und einem Kontrastverhältnis von über 1.000:1. Die Schwarz-zu-Weiß- und Grau-zu-Grau-Reaktionszeiten könnten besser sein, beim Surfen oder Büroaufgaben macht sich das jedoch nicht bemerkbar.


| |||||||||||||||||||||||||
Ausleuchtung: 94 %
Helligkeit Akku: 469.6 cd/m²
Kontrast: 1269:1 (Schwarzwert: 0.37 cd/m²)
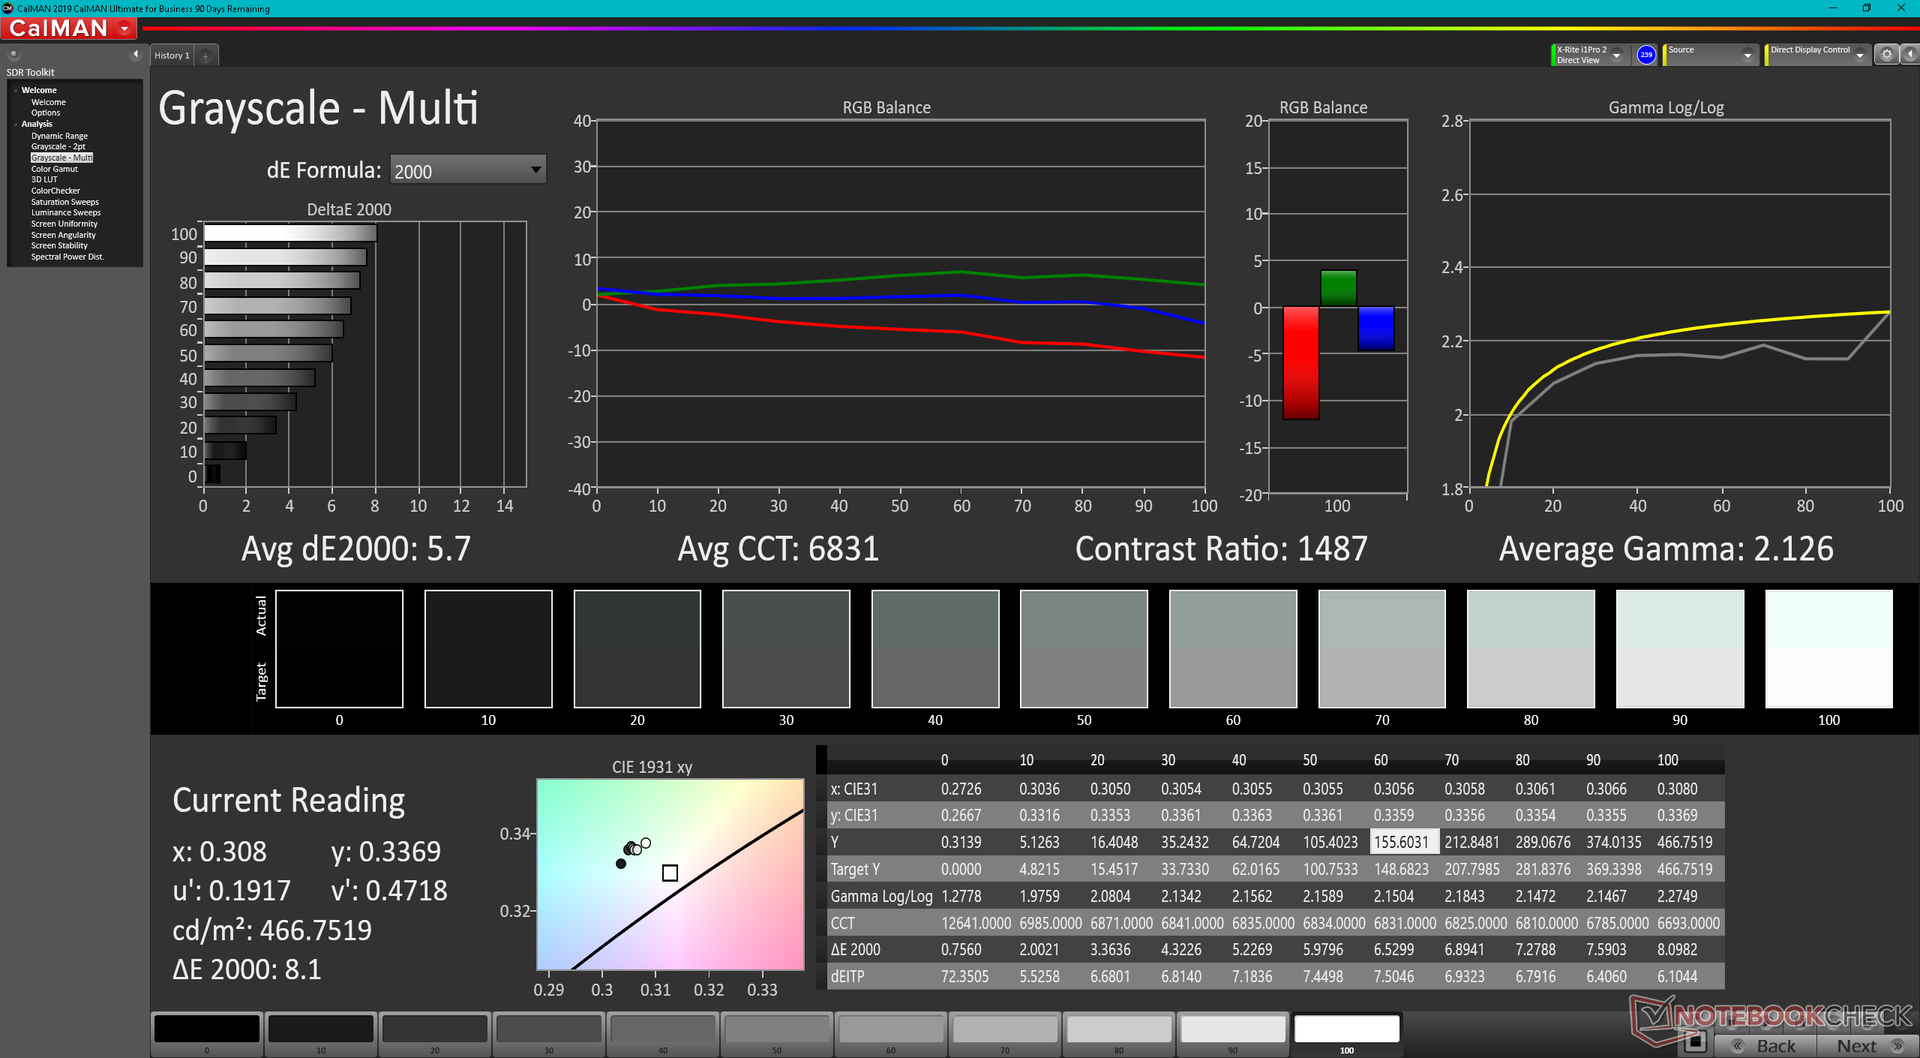
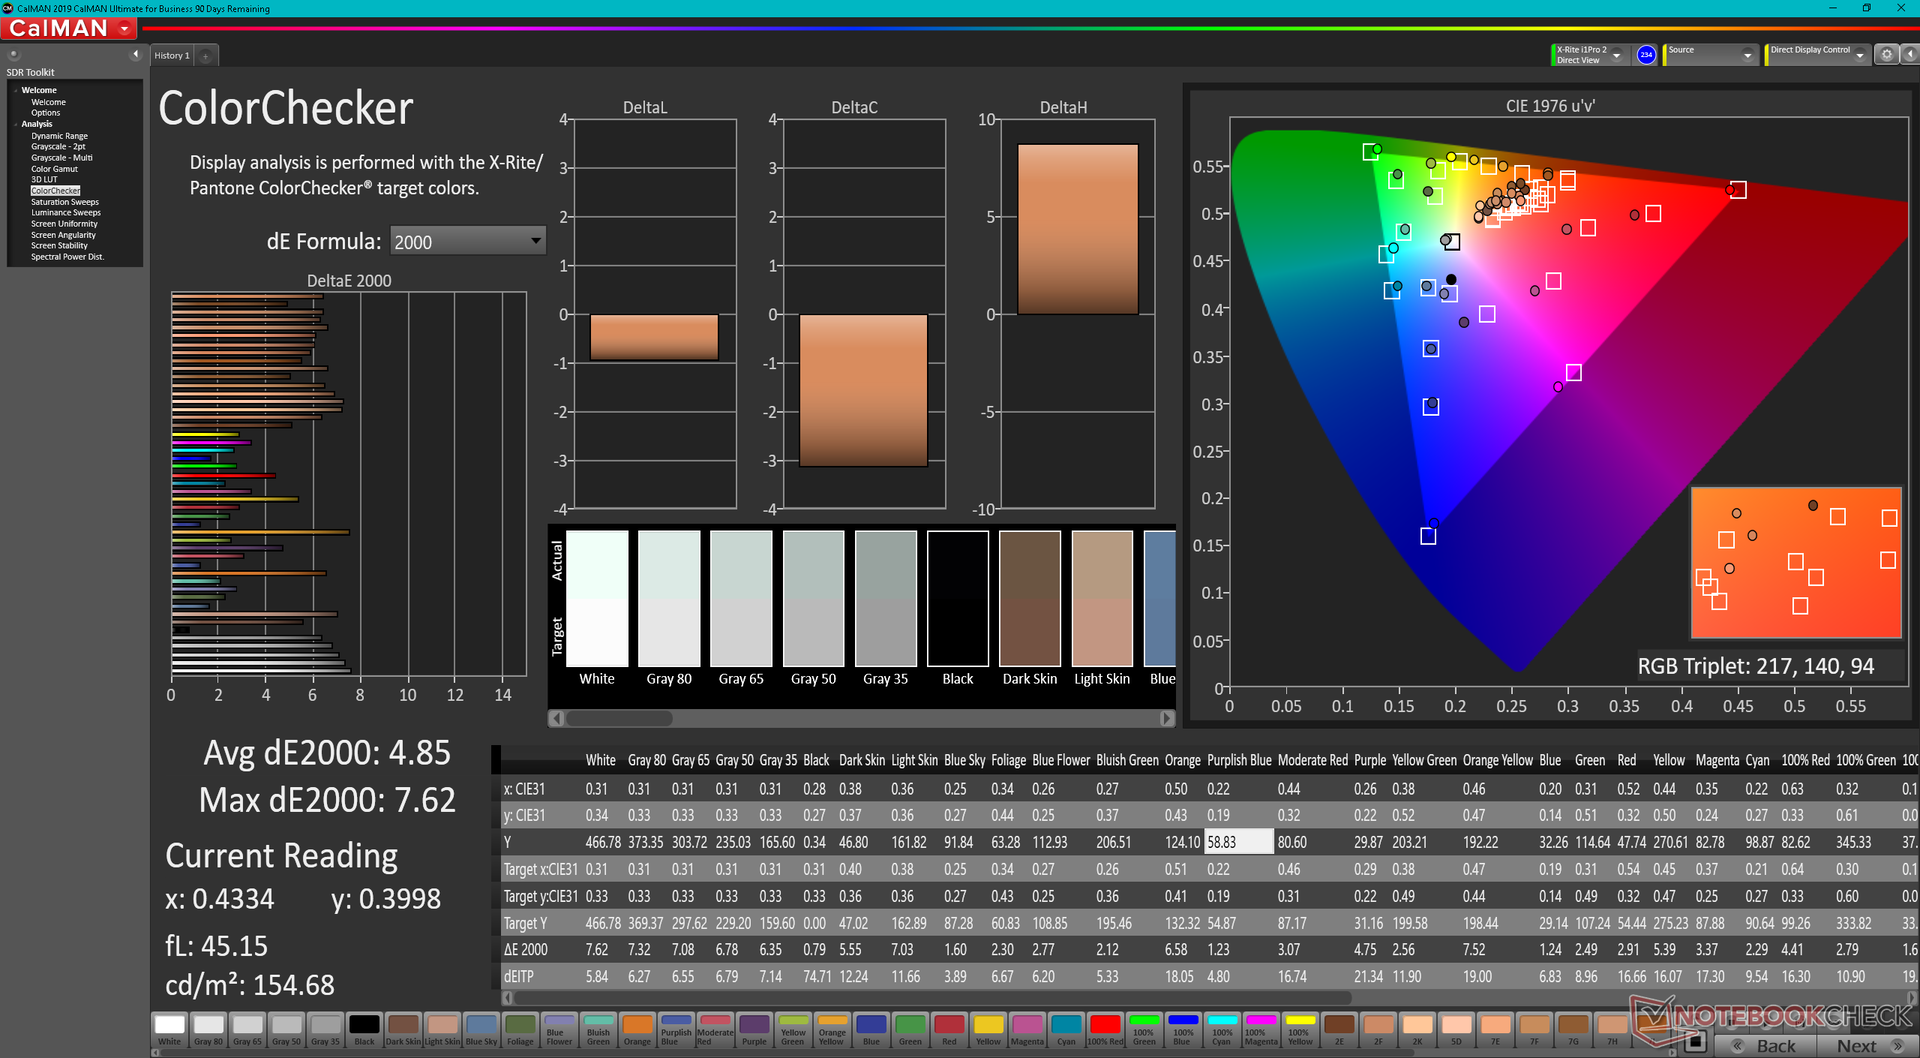
ΔE ColorChecker Calman: 4.85 | ∀{0.5-29.43 Ø4.73}
calibrated: 1.22
ΔE Greyscale Calman: 5.7 | ∀{0.09-98 Ø4.97}
68.3% AdobeRGB 1998 (Argyll 3D)
96.1% sRGB (Argyll 3D)
66.2% Display P3 (Argyll 3D)
Gamma: 2.13
CCT: 6931 K
| Lenovo ThinkPad X1 Nano Gen 2 Core i7-1280P P101ZFZ-BH2, IPS, 2160x1350, 13" | Lenovo ThinkPad X1 Nano-20UN002UGE MND007ZA1-2, IPS, 2160x1350, 13" | HP Elite Dragonfly G3 Chi Mei CMN13C0, IPS, 1920x1280, 13.5" | Dell Latitude 13 7330 LG Philips 133WF9, IPS, 1920x1080, 13.3" | Framework Laptop 13.5 12th Gen Intel BOE CQ NE135FBM-N41, IPS, 2256x1504, 13.5" | Huawei MateBook X Pro 2021 TIANMA XM, IPS, 3000x2000, 13.9" | |
|---|---|---|---|---|---|---|
| Display | 5% | 2% | -1% | 4% | -2% | |
| Display P3 Coverage (%) | 66.2 | 70.4 6% | 68 3% | 66.1 0% | 69.9 6% | 64.9 -2% |
| sRGB Coverage (%) | 96.1 | 99.9 4% | 98.3 2% | 93.5 -3% | 99.4 3% | 94.4 -2% |
| AdobeRGB 1998 Coverage (%) | 68.3 | 72 5% | 69.9 2% | 68.2 0% | 71.1 4% | 66.3 -3% |
| Response Times | -8% | -28% | -14% | 7% | 6% | |
| Response Time Grey 50% / Grey 80% * (ms) | 43.6 ? | 46.8 ? -7% | 50.8 ? -17% | 48.4 ? -11% | 34.7 ? 20% | 37.6 ? 14% |
| Response Time Black / White * (ms) | 25.6 ? | 28 ? -9% | 35.2 ? -38% | 29.6 ? -16% | 27.5 ? -7% | 26.4 ? -3% |
| PWM Frequency (Hz) | ||||||
| Bildschirm | 29% | 19% | 24% | 13% | 26% | |
| Helligkeit Bildmitte (cd/m²) | 469.6 | 460 -2% | 387.2 -18% | 460.1 -2% | 449.6 -4% | 502 7% |
| Brightness (cd/m²) | 460 | 434 -6% | 360 -22% | 445 -3% | 431 -6% | 474 3% |
| Brightness Distribution (%) | 94 | 92 -2% | 80 -15% | 89 -5% | 90 -4% | 89 -5% |
| Schwarzwert * (cd/m²) | 0.37 | 0.27 27% | 0.26 30% | 0.31 16% | 0.31 16% | 0.33 11% |
| Kontrast (:1) | 1269 | 1704 34% | 1489 17% | 1484 17% | 1450 14% | 1521 20% |
| Delta E Colorchecker * | 4.85 | 1.1 77% | 2.36 51% | 2.42 50% | 2.76 43% | 1.35 72% |
| Colorchecker dE 2000 max. * | 7.62 | 4.5 41% | 4.79 37% | 3.97 48% | 7.96 -4% | 3.67 52% |
| Colorchecker dE 2000 calibrated * | 1.22 | 1 18% | 0.63 48% | 0.77 37% | 0.58 52% | 1.2 2% |
| Delta E Graustufen * | 5.7 | 1.6 72% | 3 47% | 2.3 60% | 5.2 9% | 1.7 70% |
| Gamma | 2.13 103% | 2.2 100% | 2.17 101% | 2.23 99% | 2.23 99% | 2.24 98% |
| CCT | 6931 94% | 6475 100% | 6137 106% | 6262 104% | 6475 100% | 6440 101% |
| Farbraum (Prozent von AdobeRGB 1998) (%) | 65.7 | 61.1 | ||||
| Color Space (Percent of sRGB) (%) | 99.9 | 94.3 | ||||
| Durchschnitt gesamt (Programm / Settings) | 9% /
18% | -2% /
9% | 3% /
13% | 8% /
10% | 10% /
17% |
* ... kleinere Werte sind besser
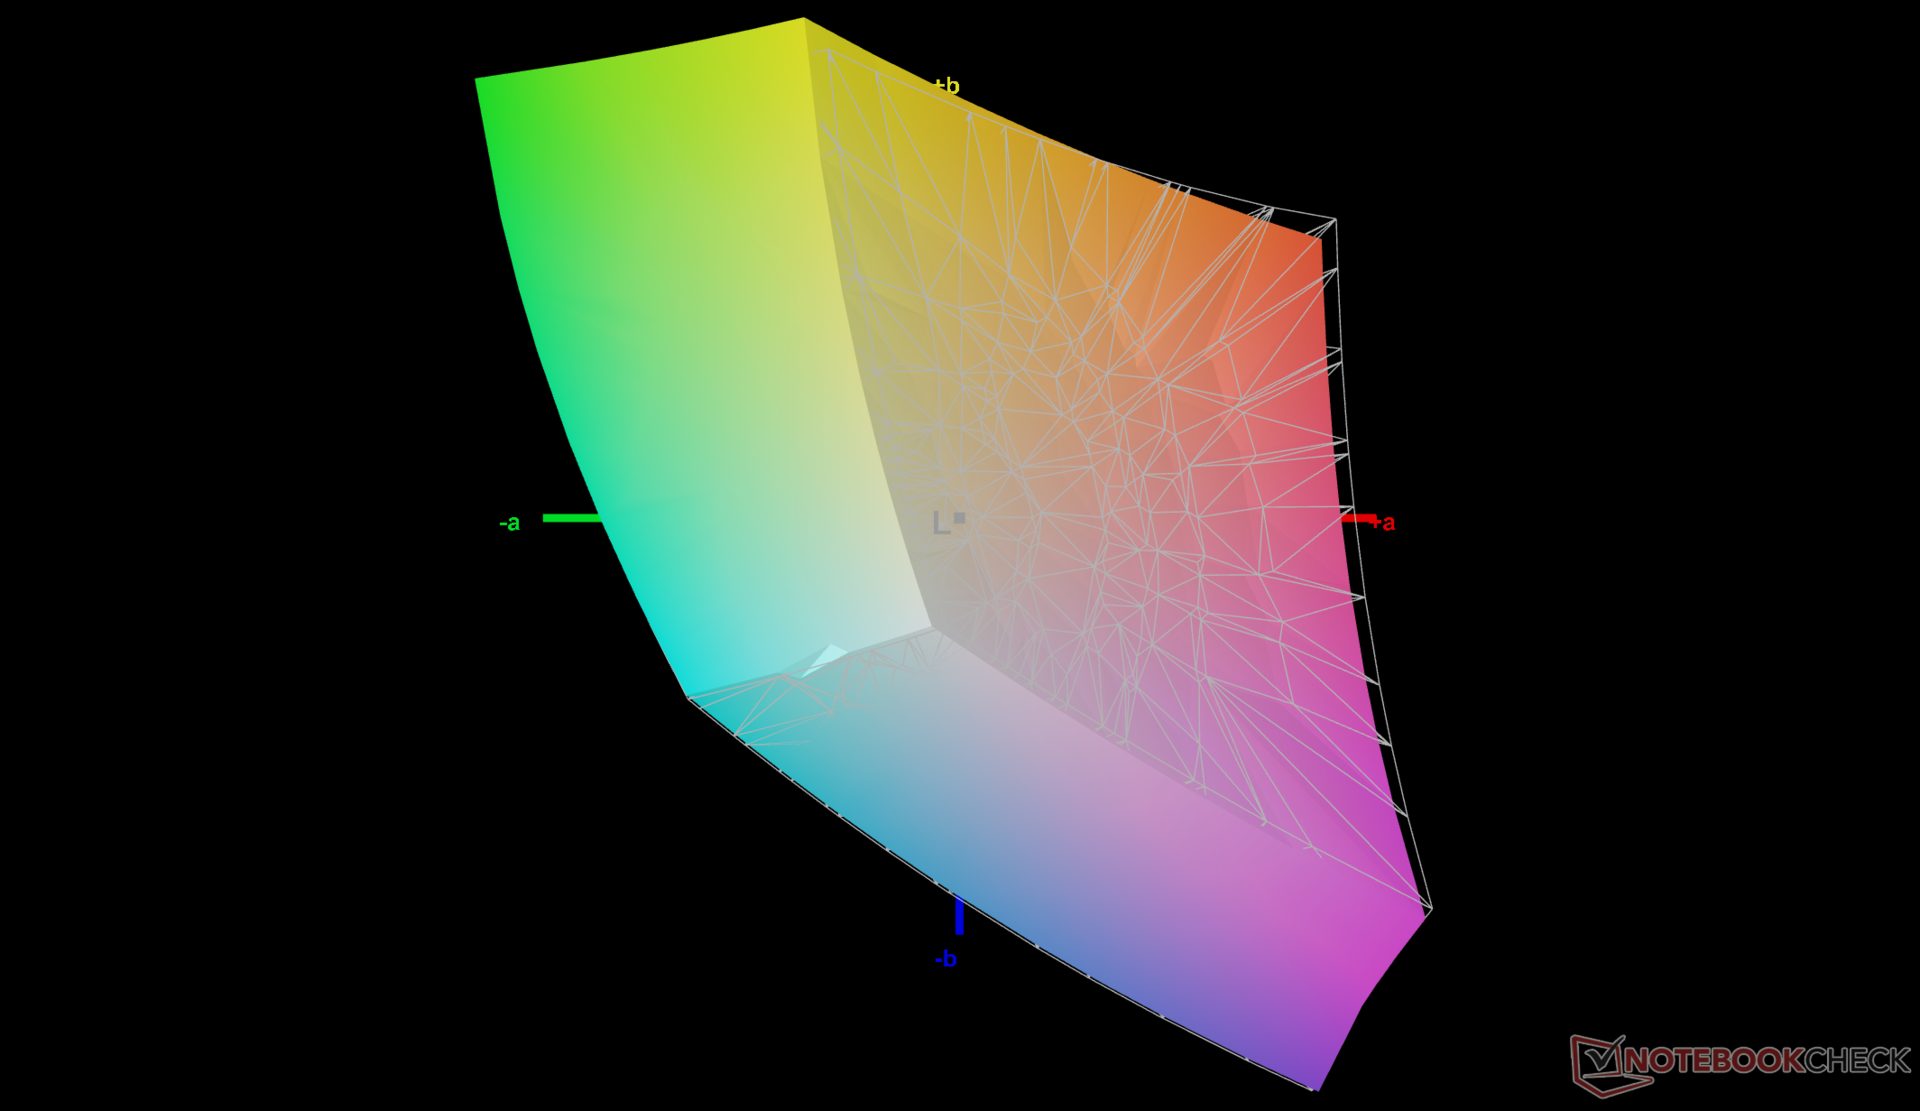
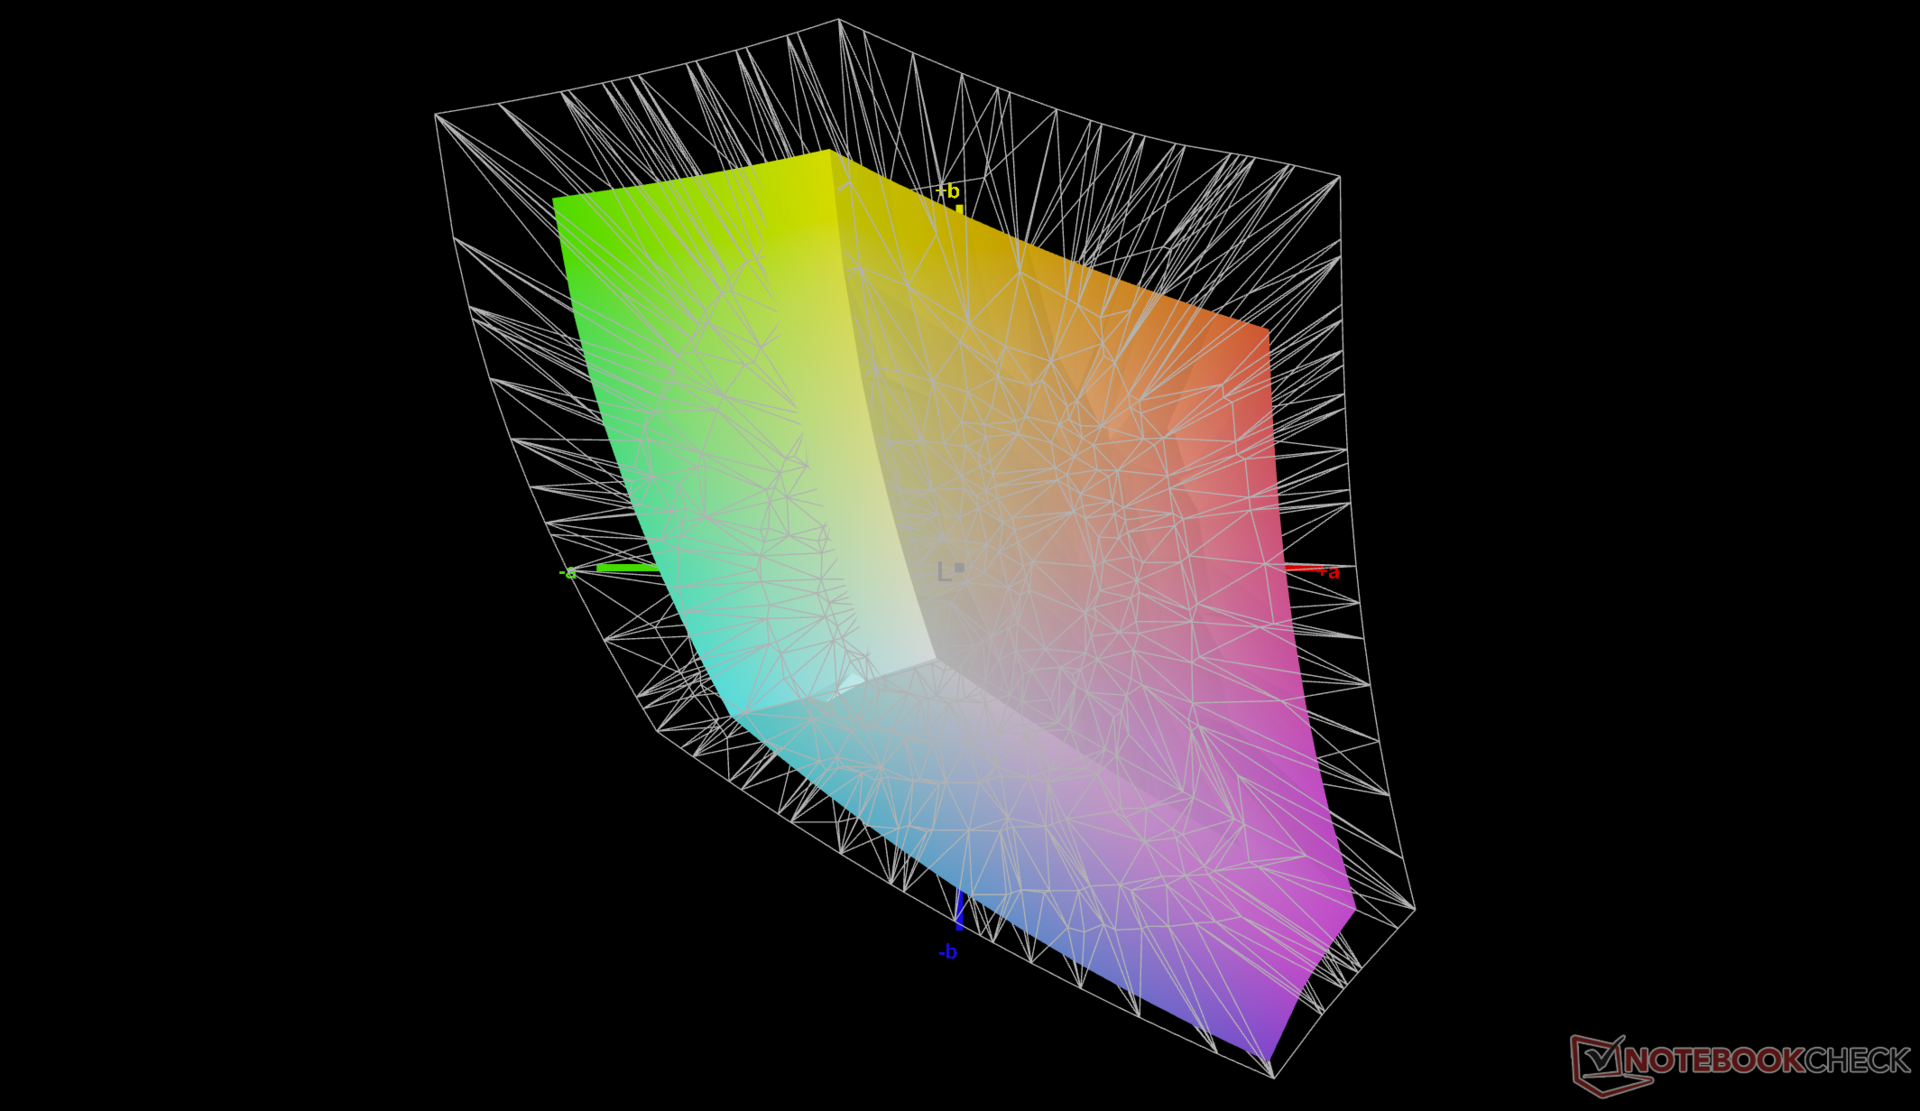
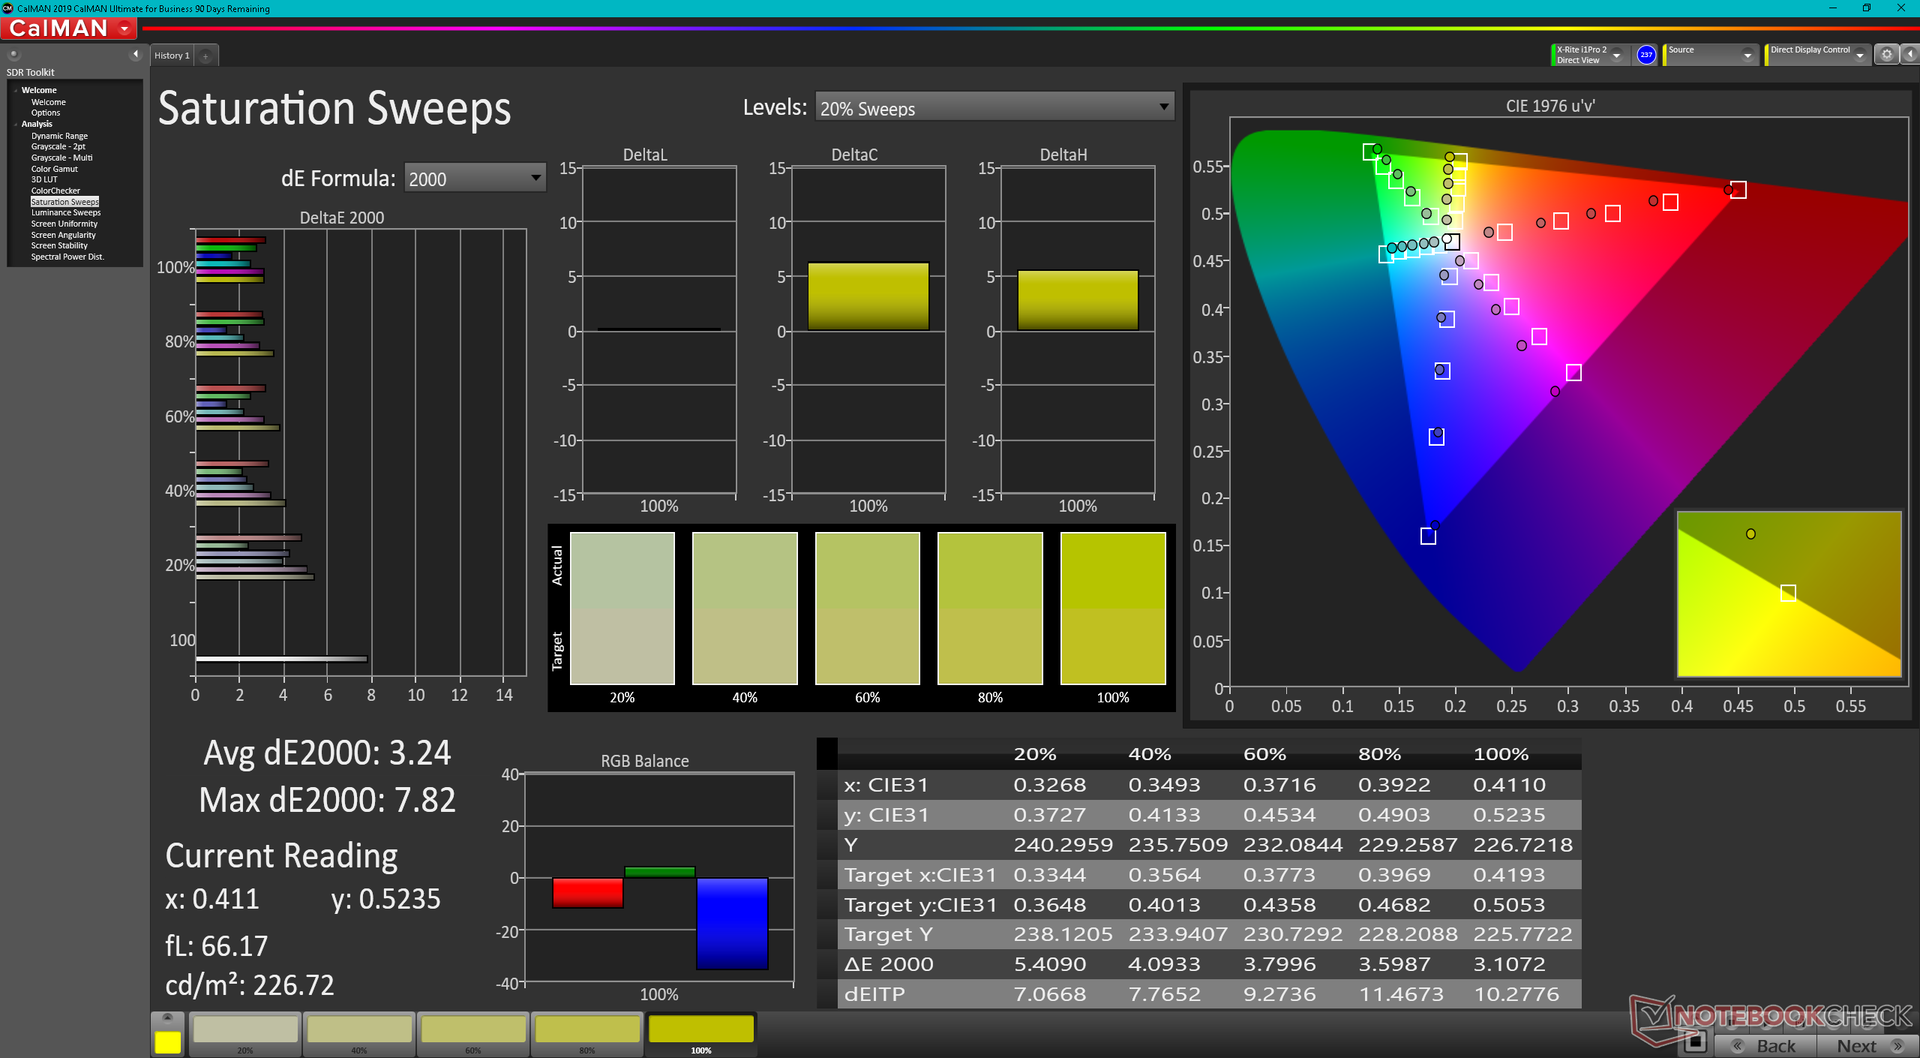
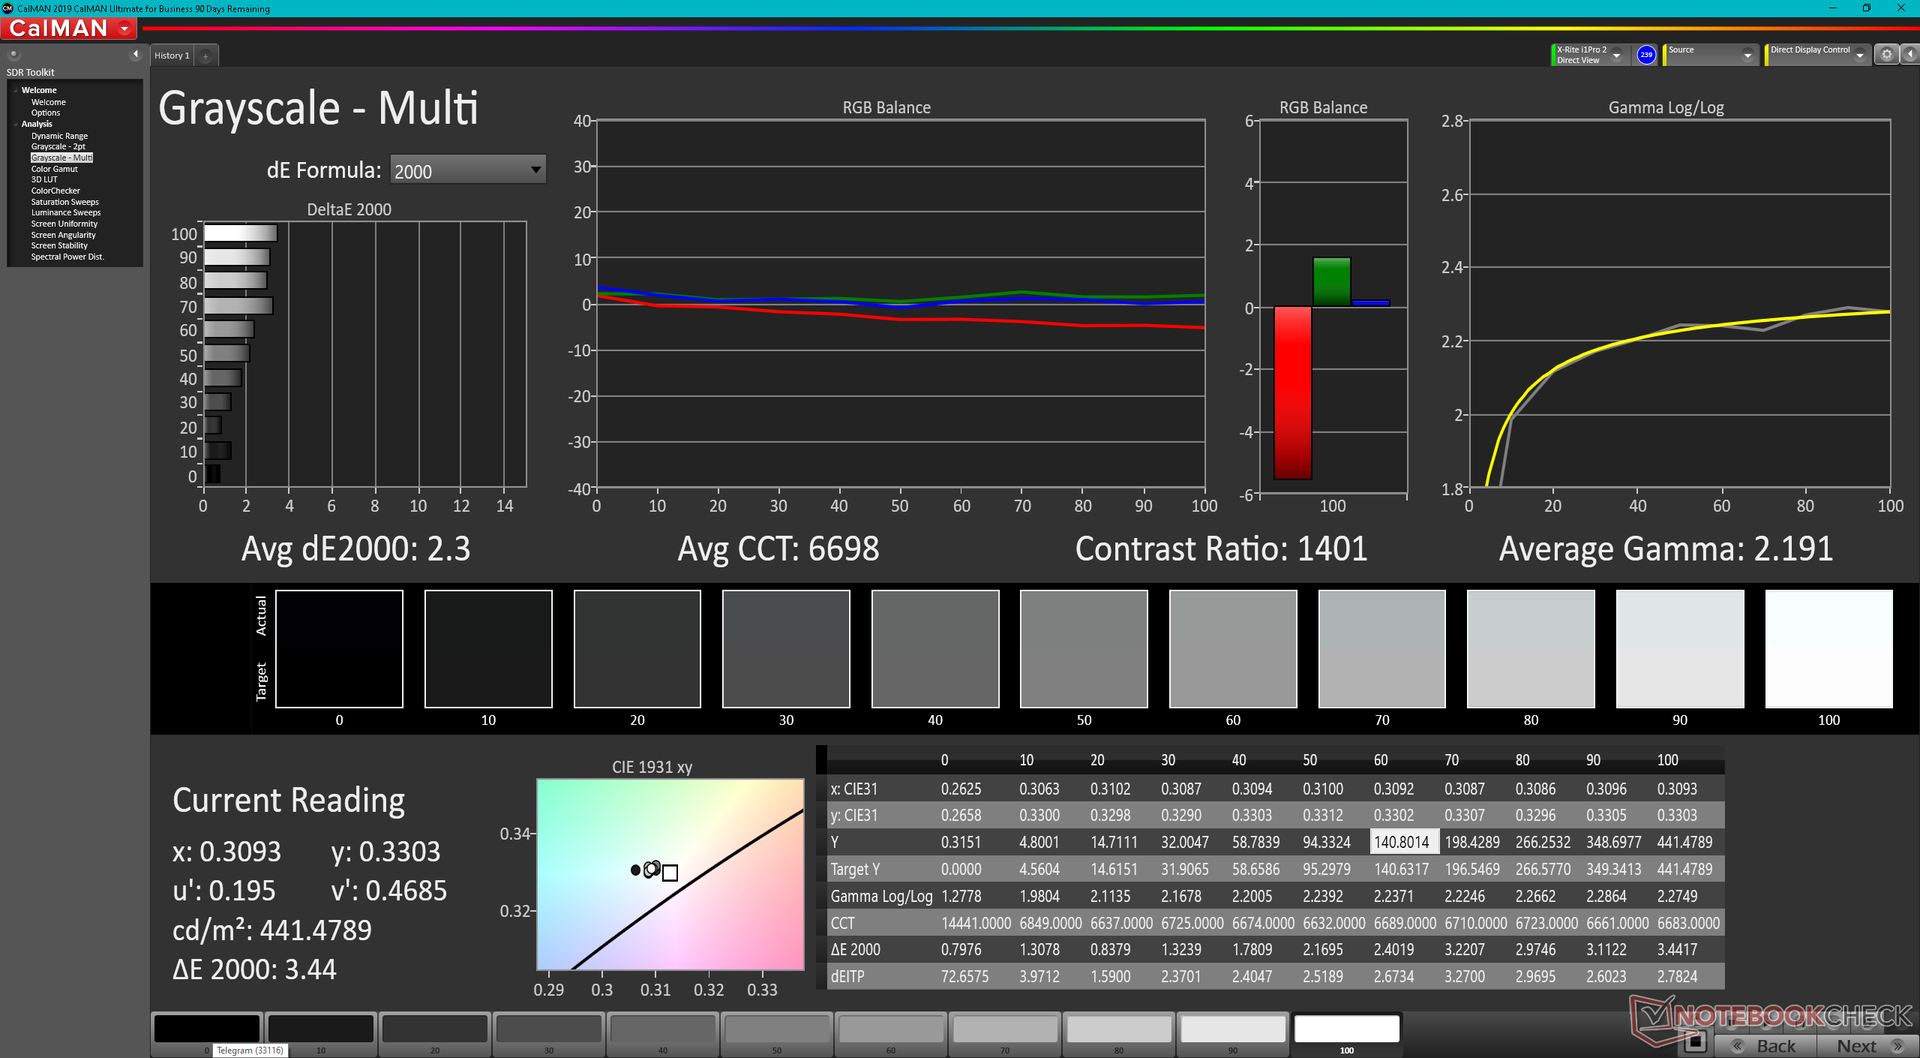
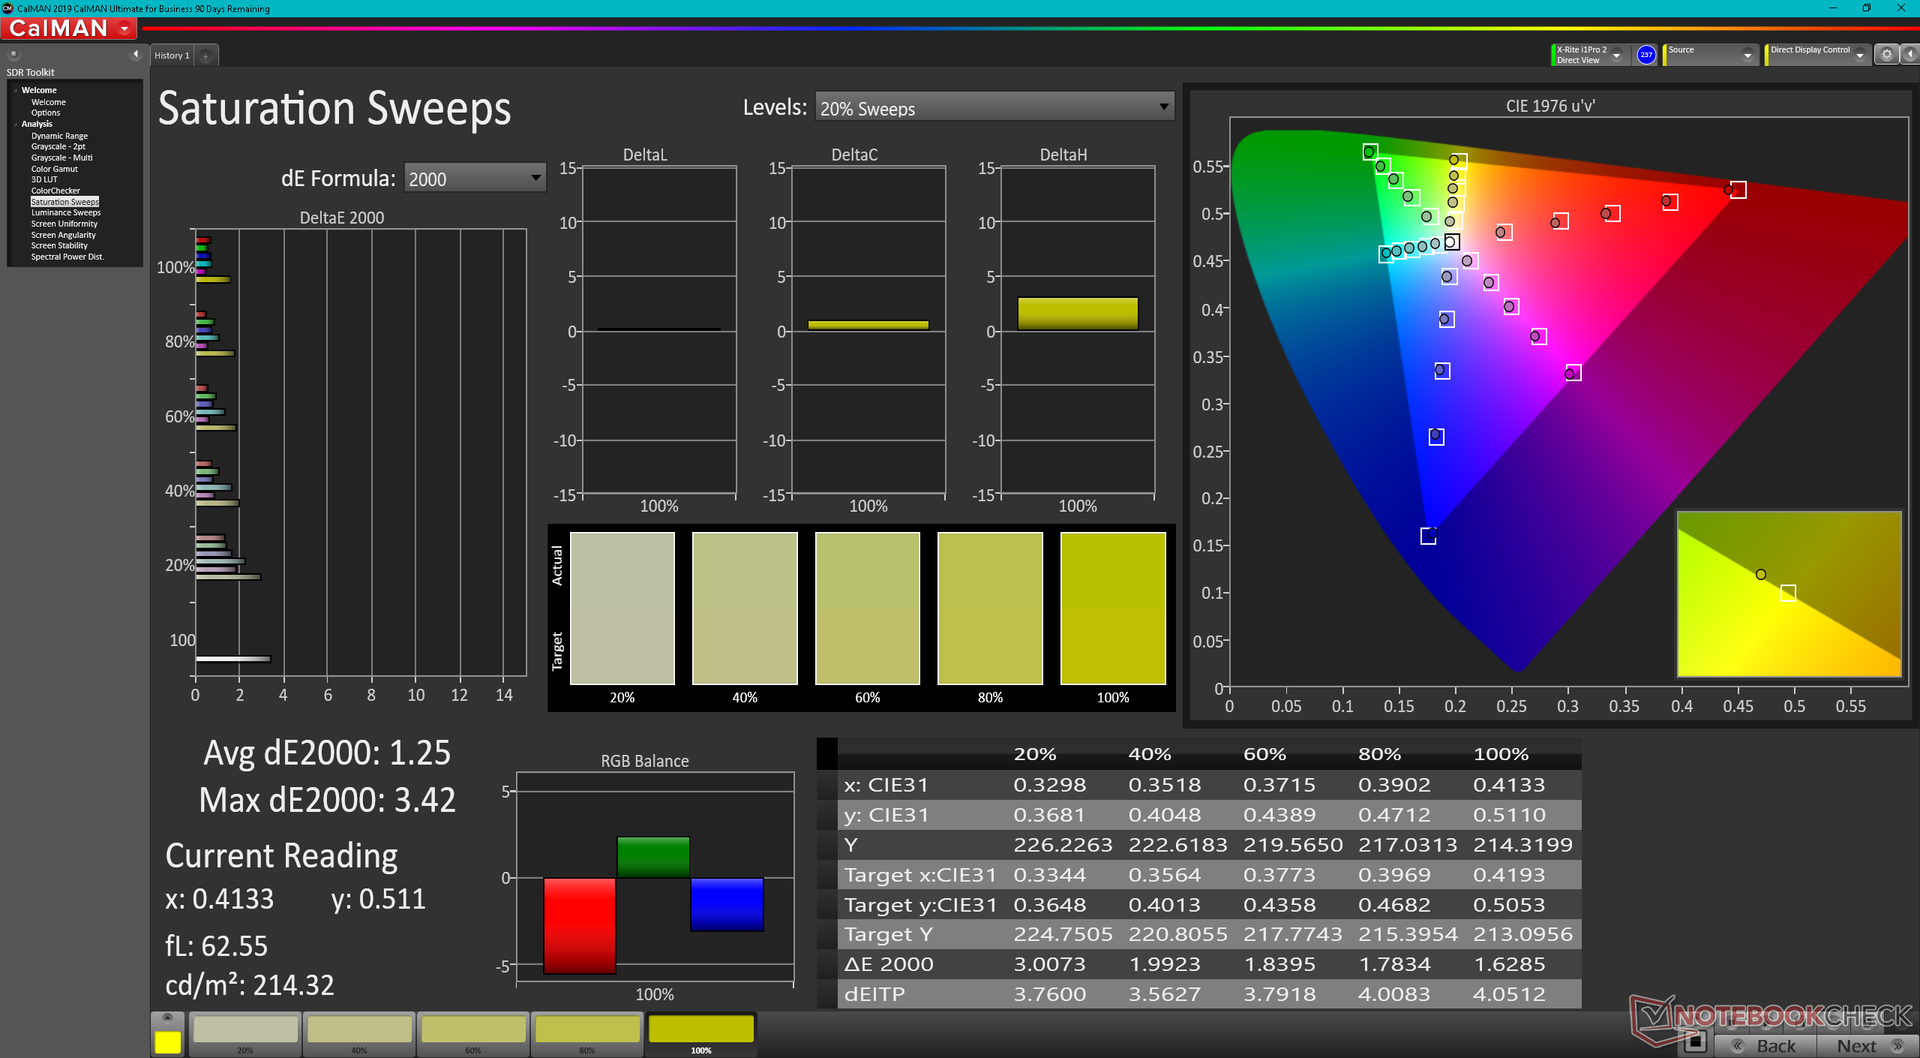
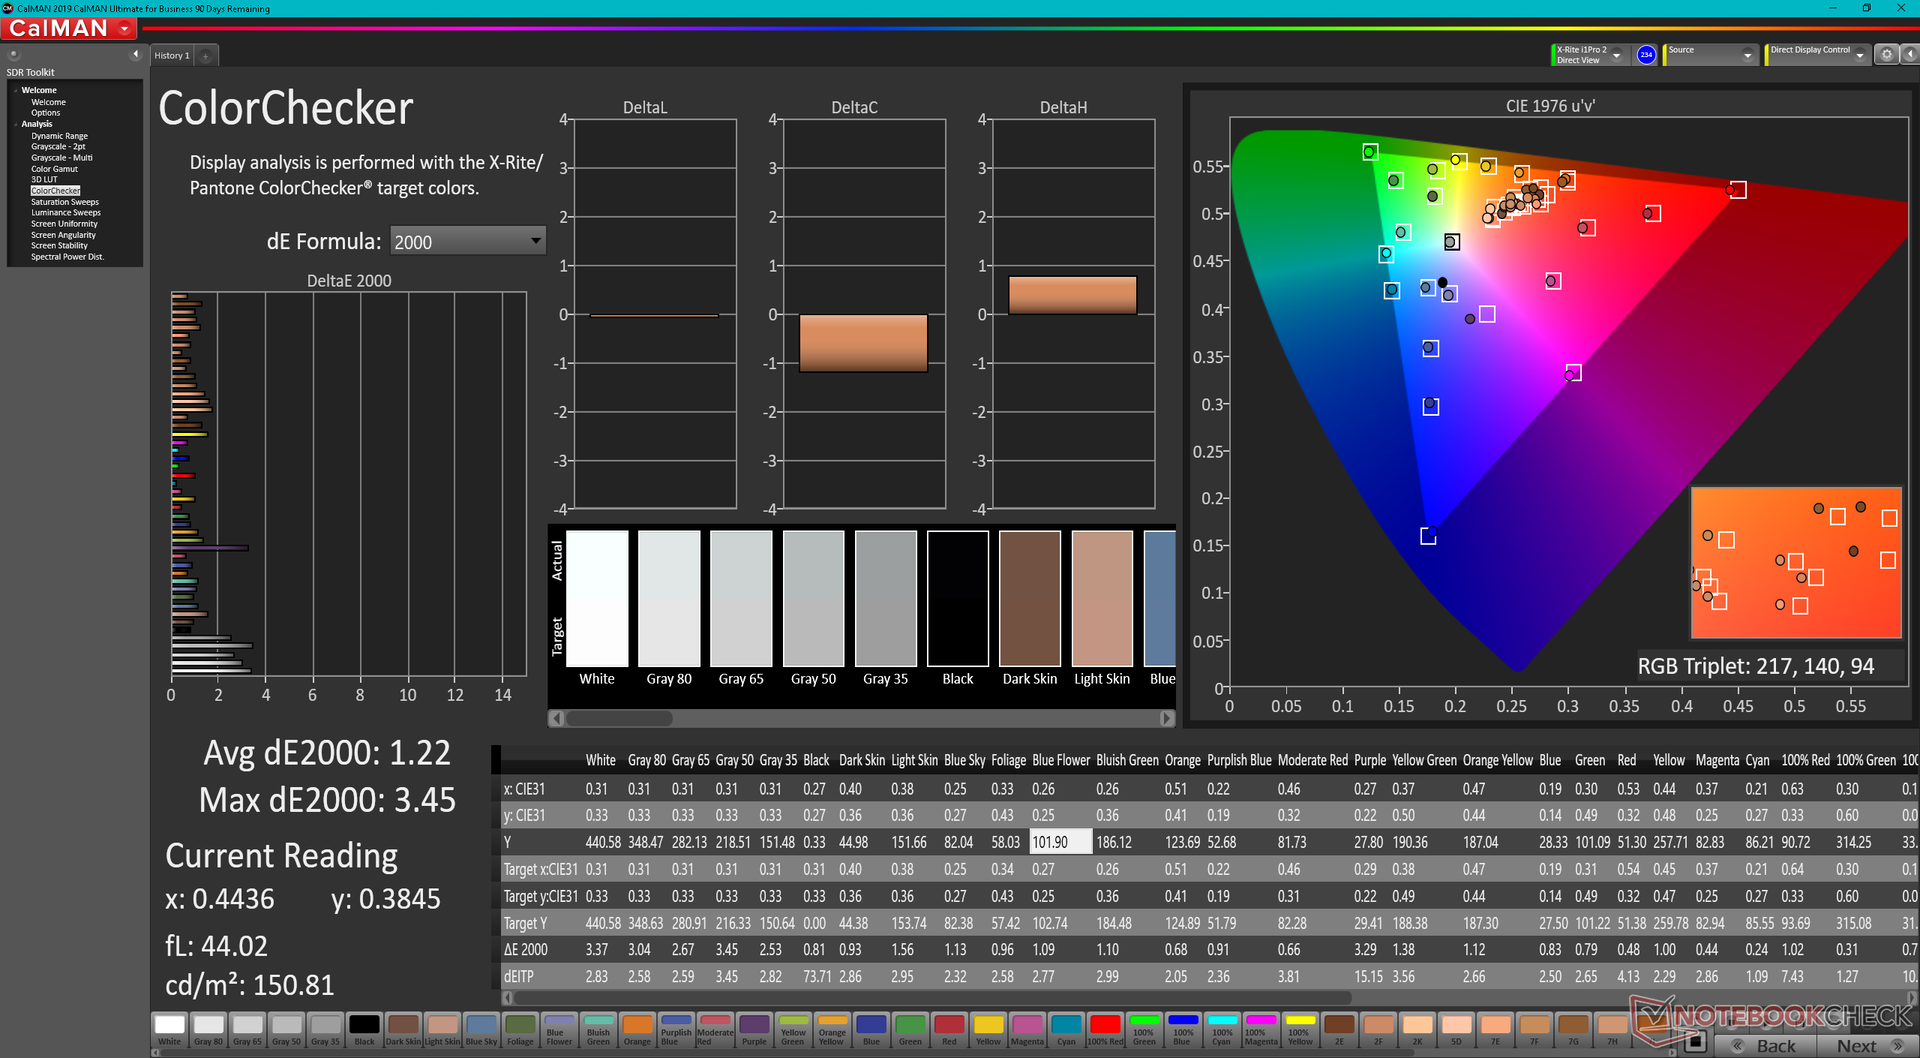
Die Darstellung lässt ab Werk zu wünschen übrig. Durch eine nachträgliche Kalibrierung konnten wir die durchschnittlichen Graustufen- und Farb-DeltaE-Werte von 5,7 auf 4,85 bzw. 2,3 auf 1,22 und damit erheblich verbessern. Daher raten wir Anwendern ebenfalls zu einer Kalibrierung, um die vollständige sRGB-Farbraumabdeckung des Panels bestmöglich nutzen zu können.
Reaktionszeiten (Response Times) des Displays
| ↔ Reaktionszeiten Schwarz zu Weiß | ||
|---|---|---|
| 25.6 ms ... steigend ↗ und fallend ↘ kombiniert | ↗ 13.2 ms steigend | 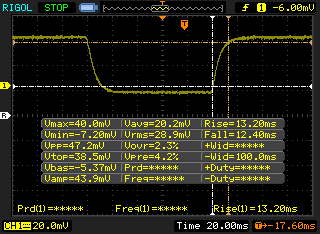 |
| ↘ 12.4 ms fallend | ||
| Die gemessenen Reaktionszeiten sind mittelmäßig und dadurch für Spieler eventuell zu langsam. Im Vergleich rangierten die bei uns getesteten Geräte von 0.1 (Minimum) zu 240 (Maximum) ms. » 61 % aller Screens waren schneller als der getestete. Daher sind die gemessenen Reaktionszeiten schlechter als der Durchschnitt aller vermessenen Geräte (19.9 ms). | ||
| ↔ Reaktionszeiten 50% Grau zu 80% Grau | ||
| 43.6 ms ... steigend ↗ und fallend ↘ kombiniert | ↗ 22 ms steigend | 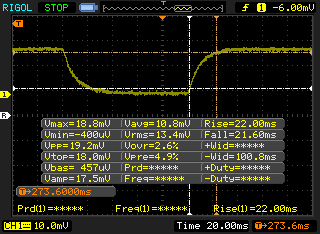 |
| ↘ 21.6 ms fallend | ||
| Die gemessenen Reaktionszeiten sind langsam und dadurch für viele Spieler wahrscheinlich zu langsam. Im Vergleich rangierten die bei uns getesteten Geräte von 0.165 (Minimum) zu 636 (Maximum) ms. » 73 % aller Screens waren schneller als der getestete. Daher sind die gemessenen Reaktionszeiten schlechter als der Durchschnitt aller vermessenen Geräte (31.1 ms). | ||
Bildschirm-Flackern / PWM (Pulse-Width Modulation)
| Flackern / PWM nicht festgestellt |  | ||
Im Vergleich: 52 % aller getesteten Geräte nutzten kein PWM um die Helligkeit zu reduzieren. Wenn PWM eingesetzt wurde, dann bei einer Frequenz von durchschnittlich 7798 (Minimum 5, Maximum 343500) Hz. | |||
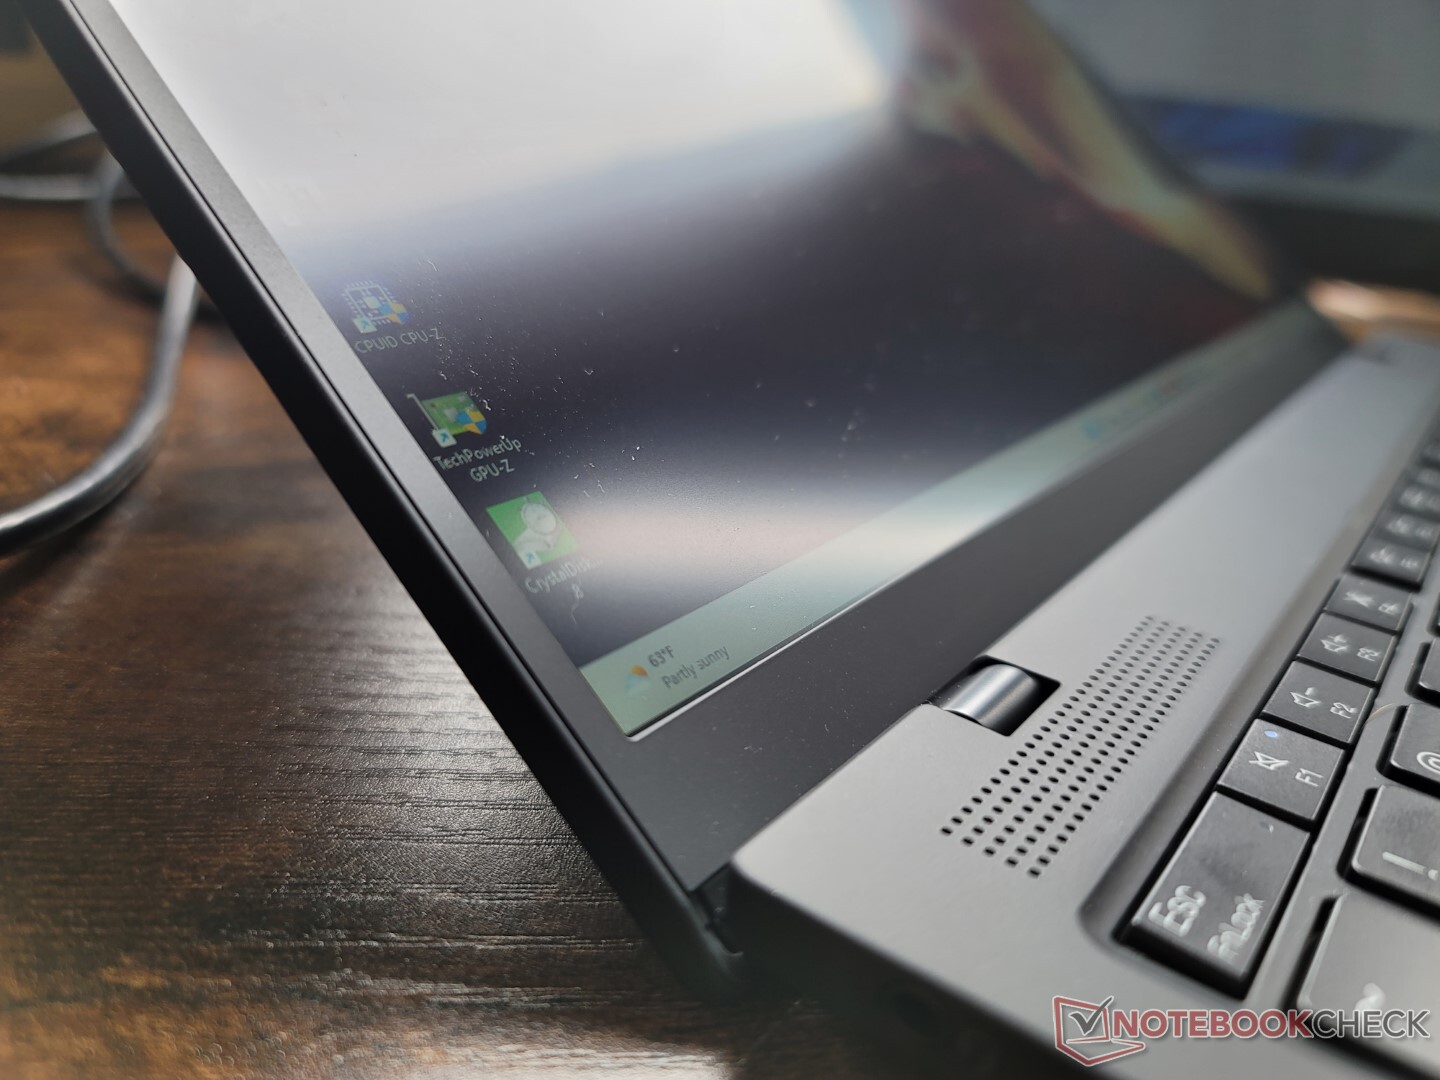
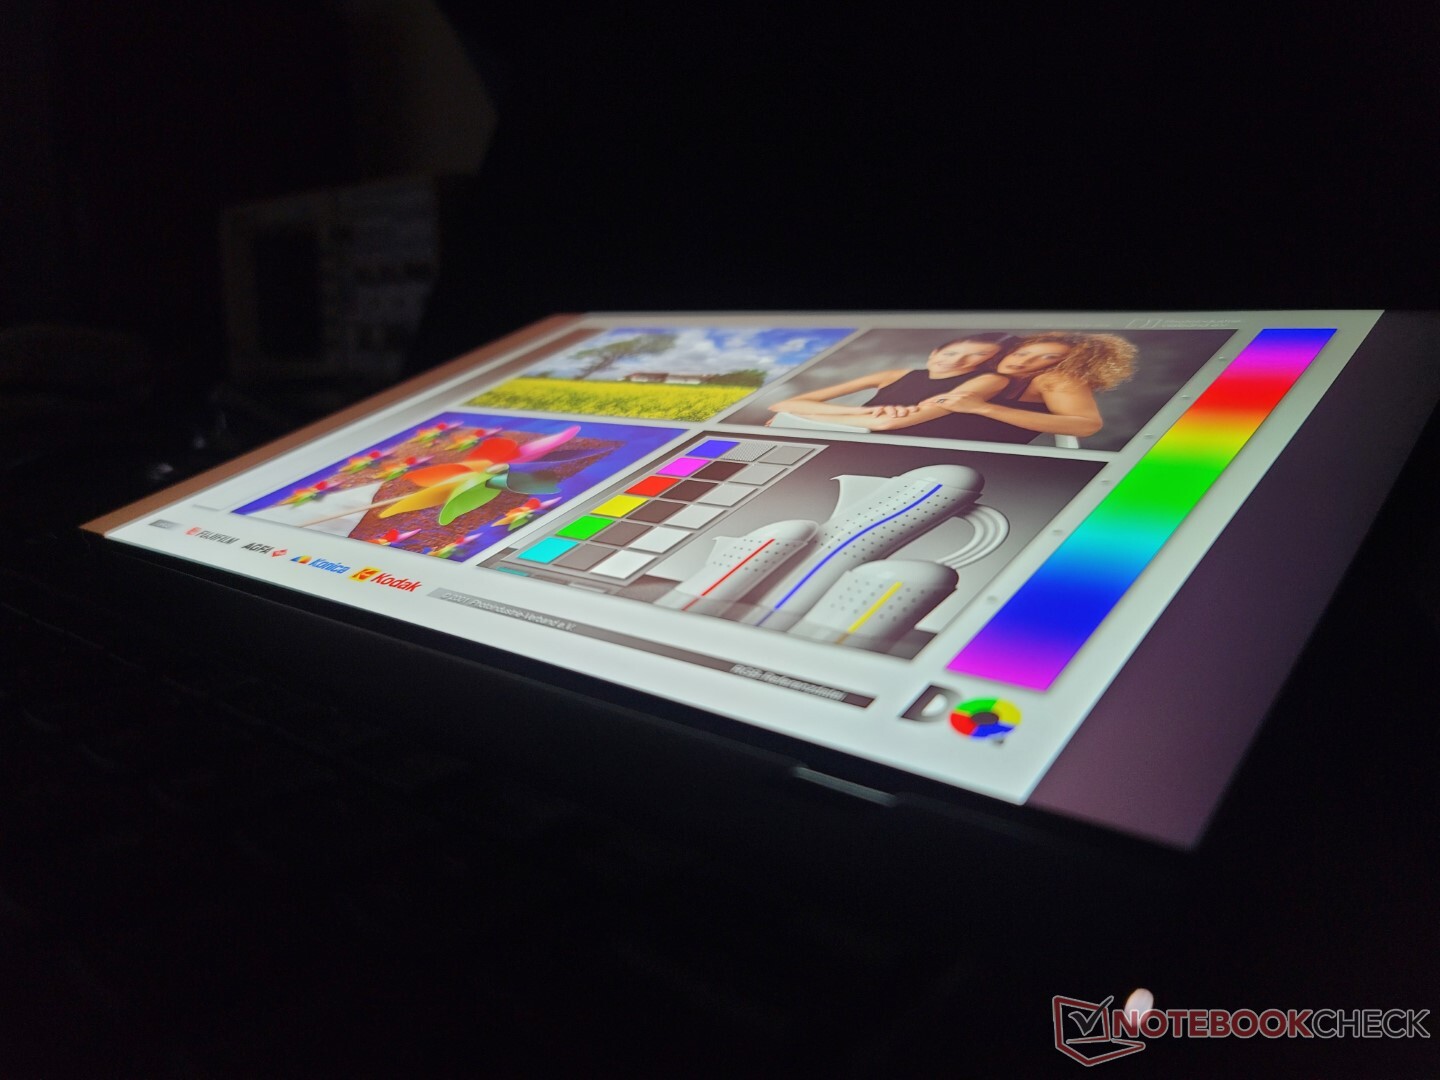
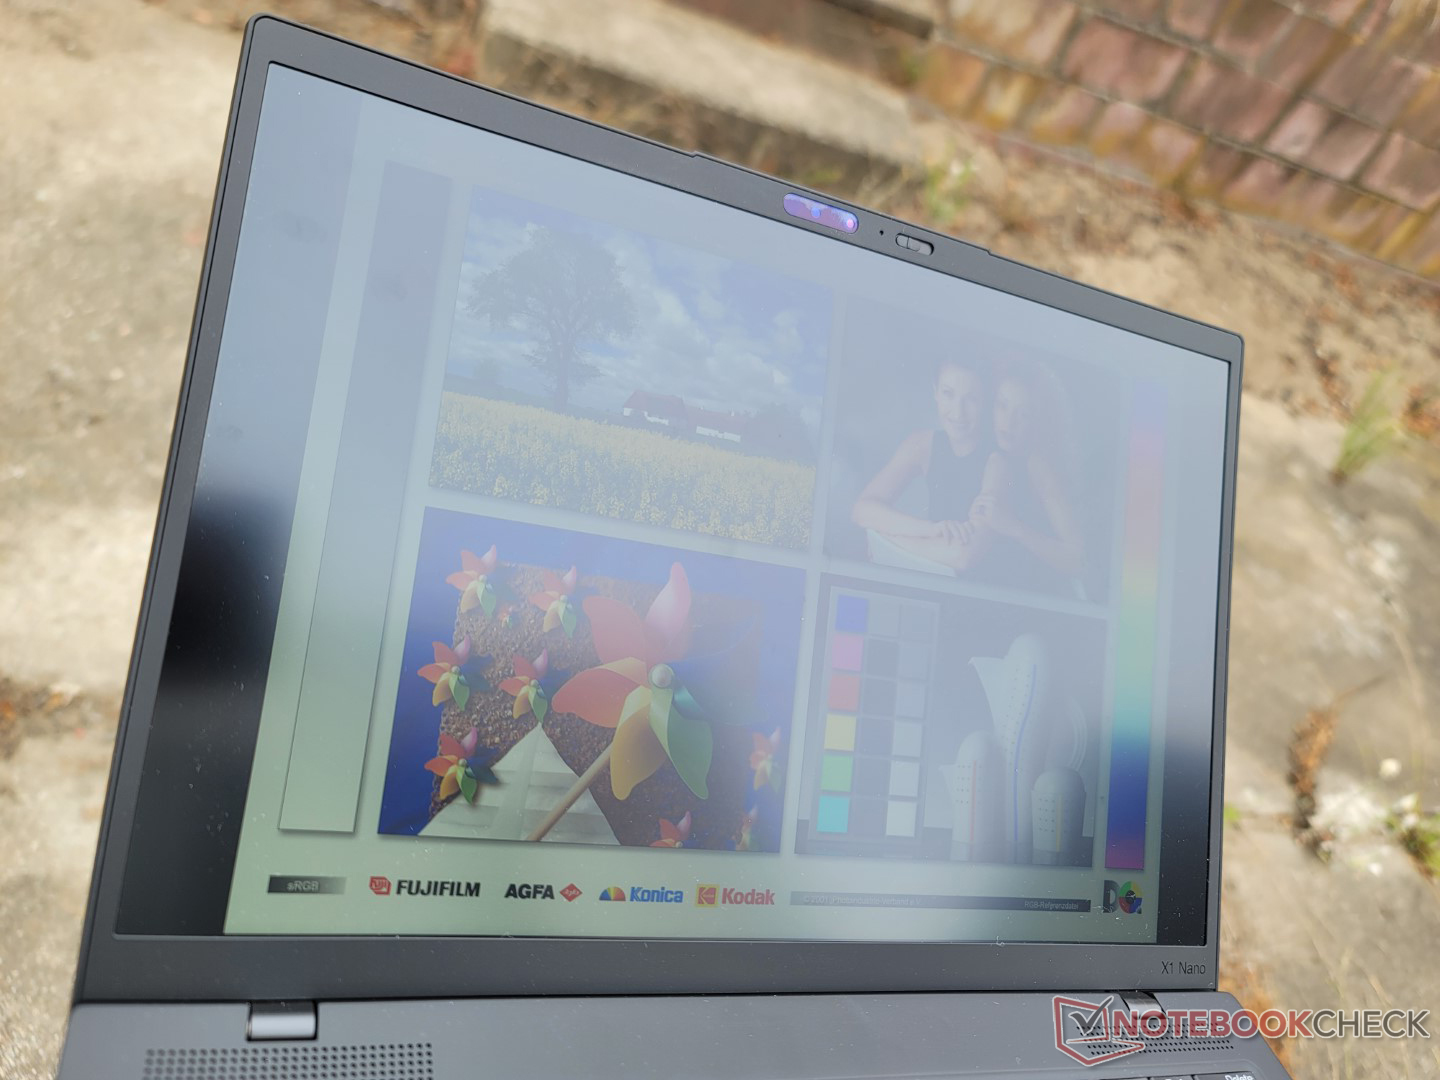
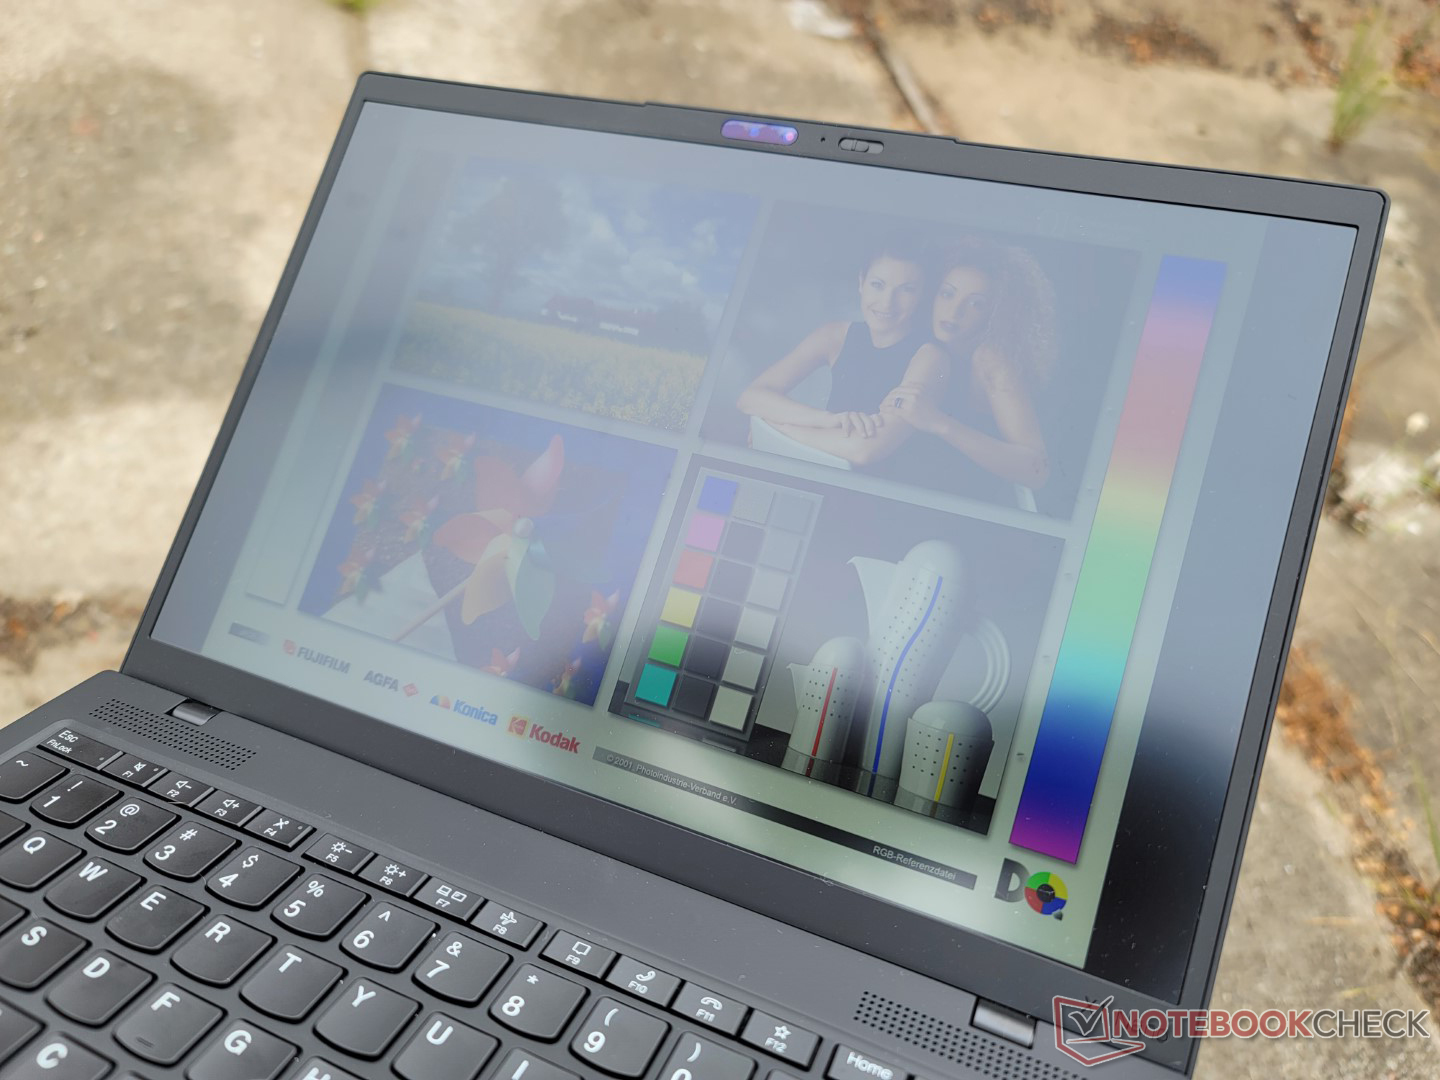
Die Lesbarkeit im Freien und die Blickwinkel bleiben im Vergleich zum Modell aus der 1. Generation im Prinzip unverändert, da Lenovo beim diesjährigen Modell weder die Helligkeit noch die Kontrast verbessert hat.

Leistung
Testbedingungen
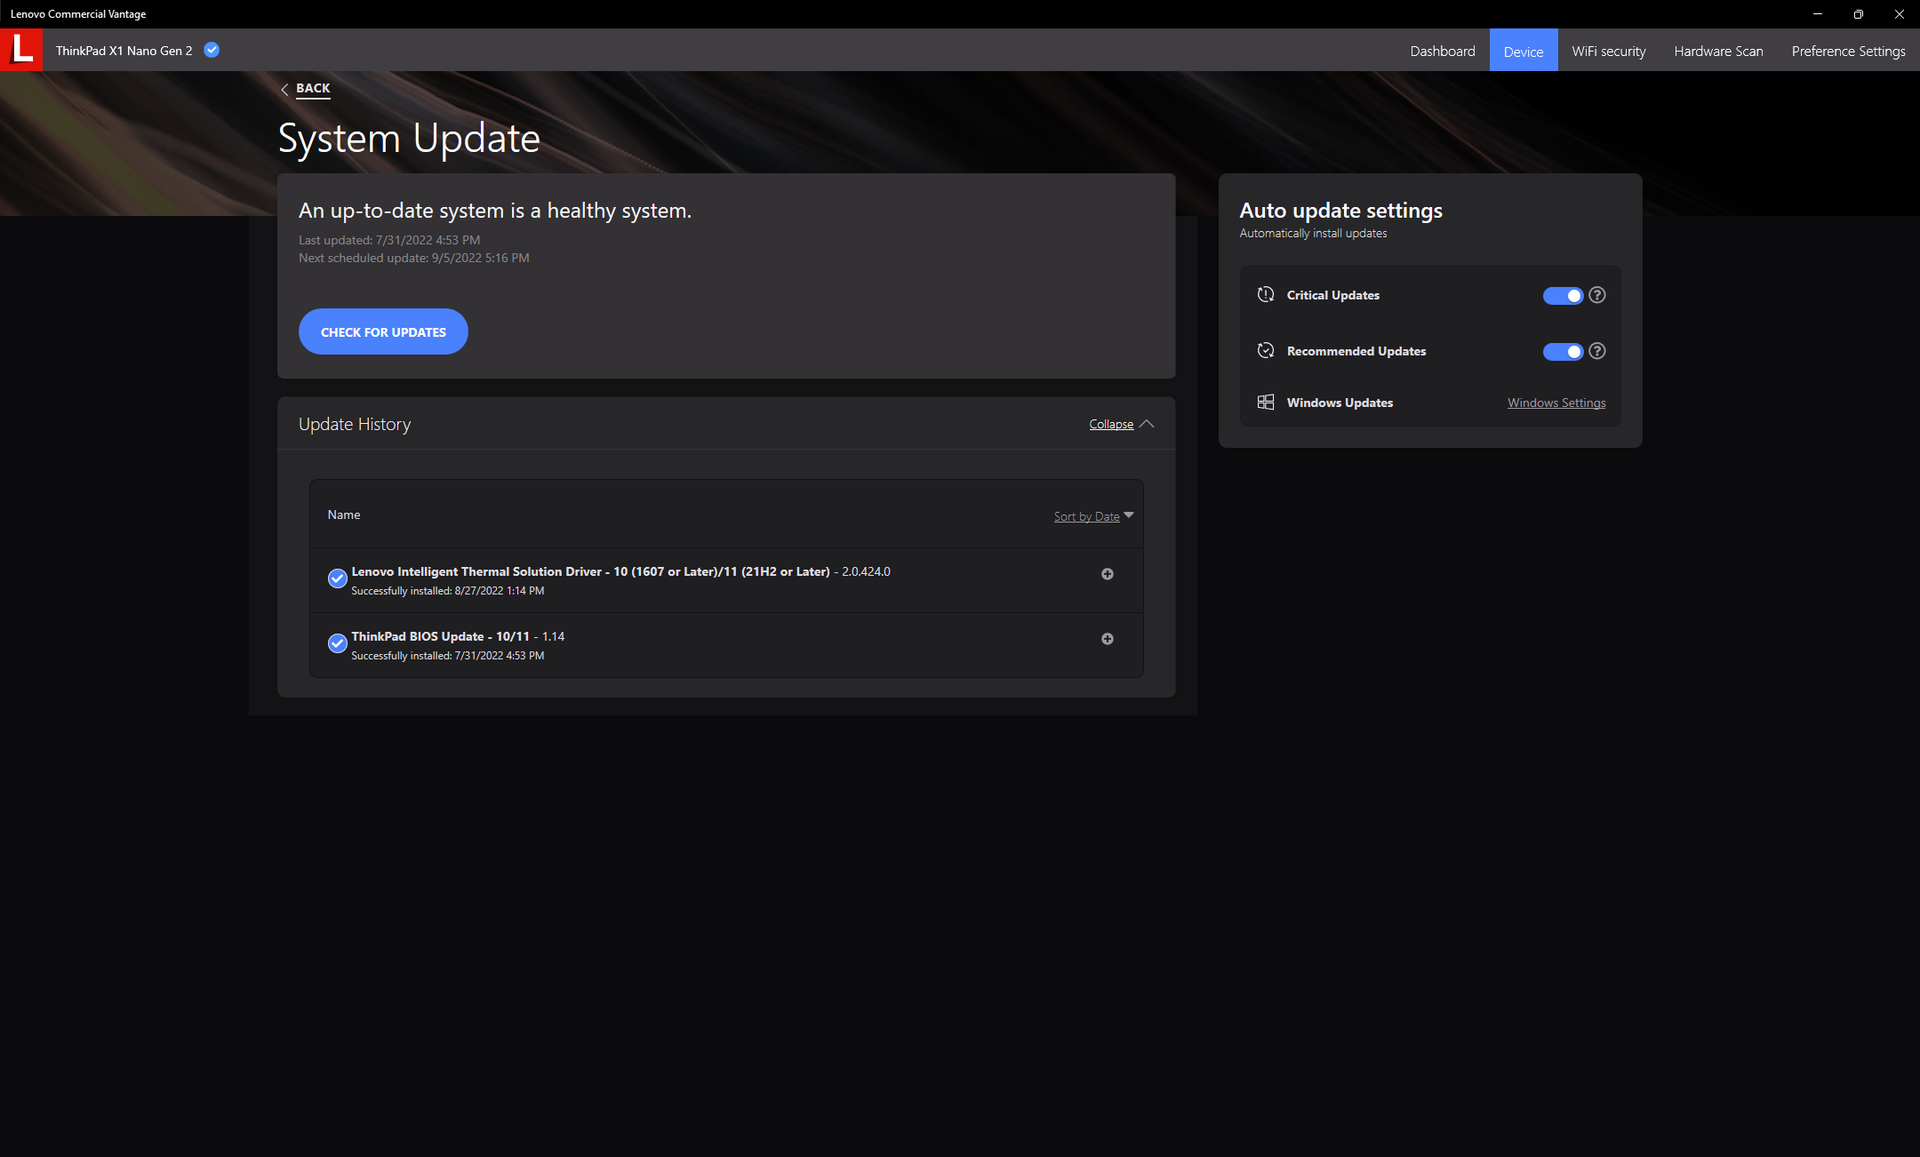
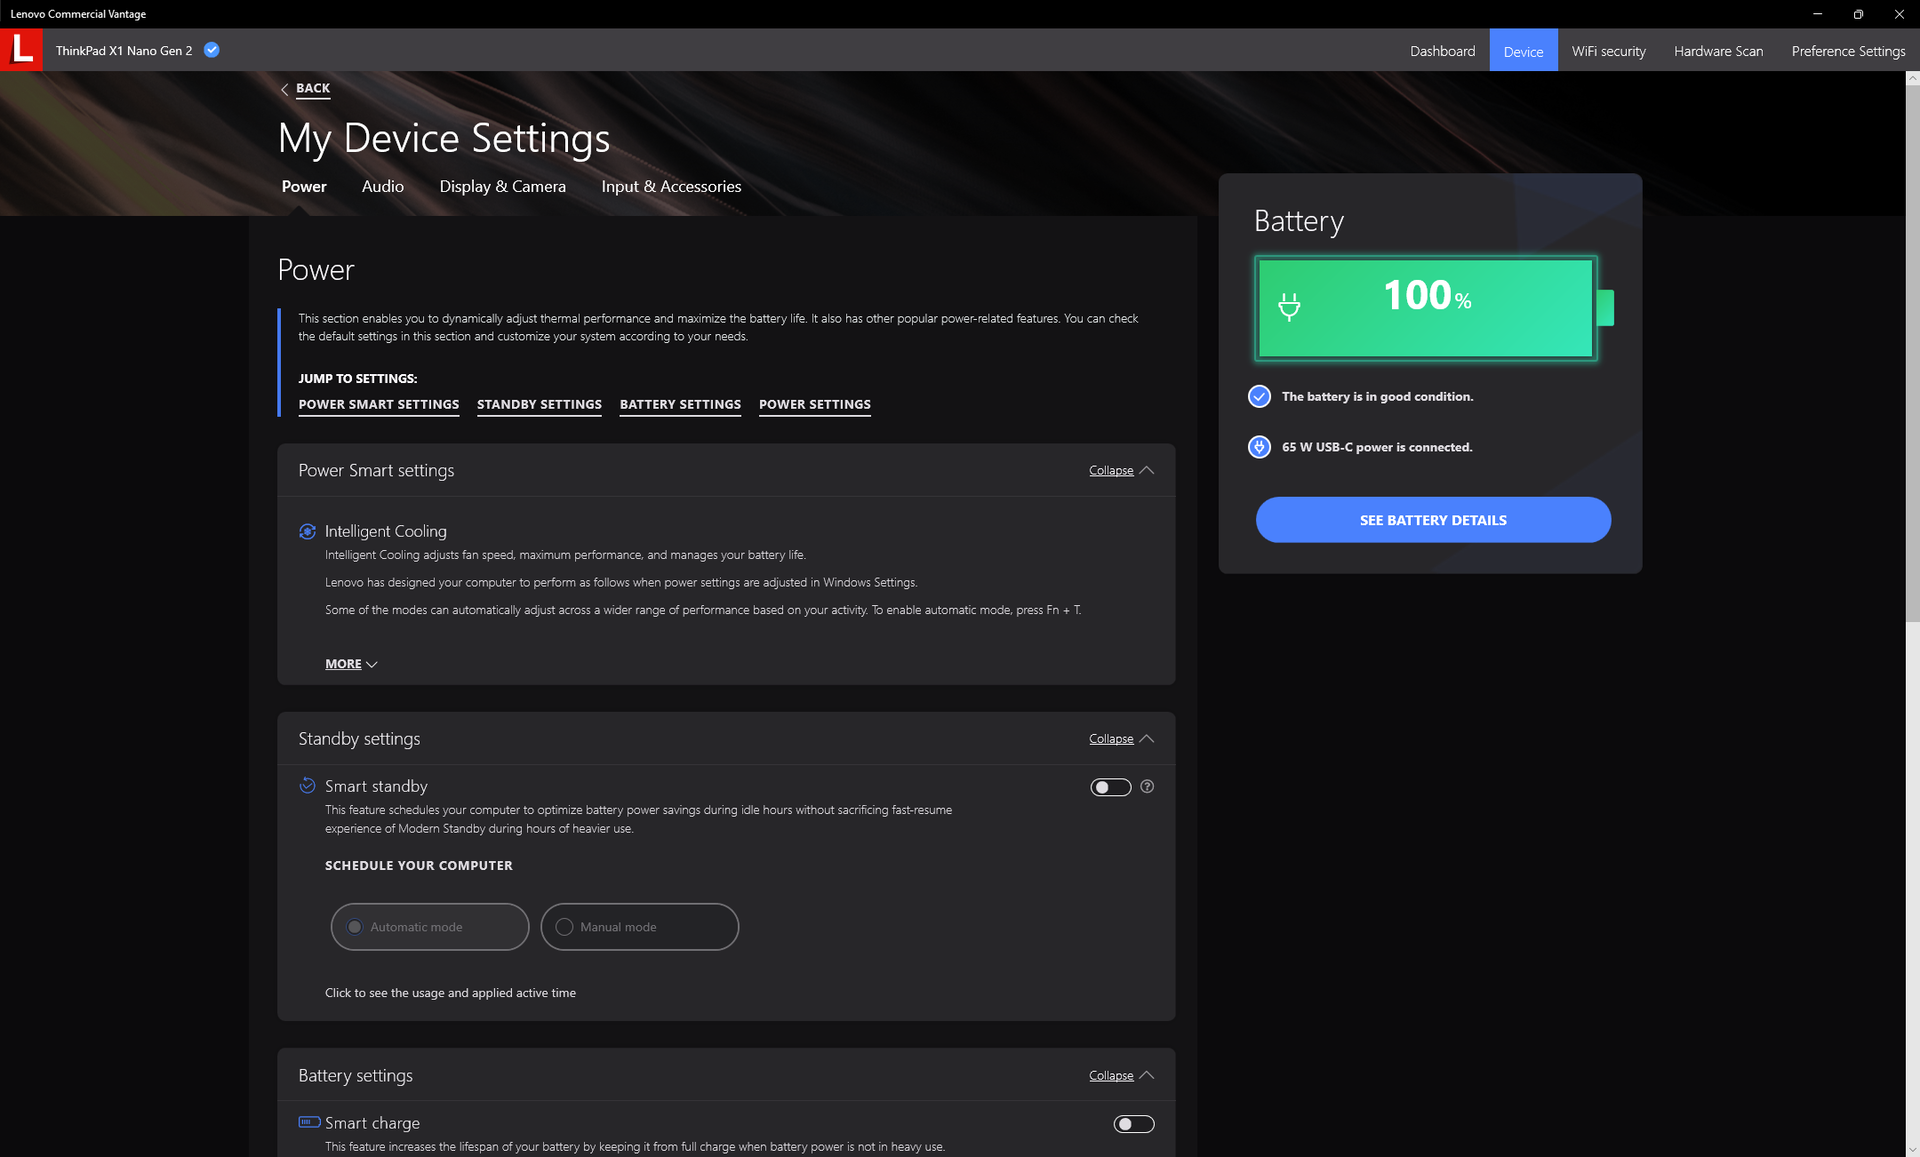
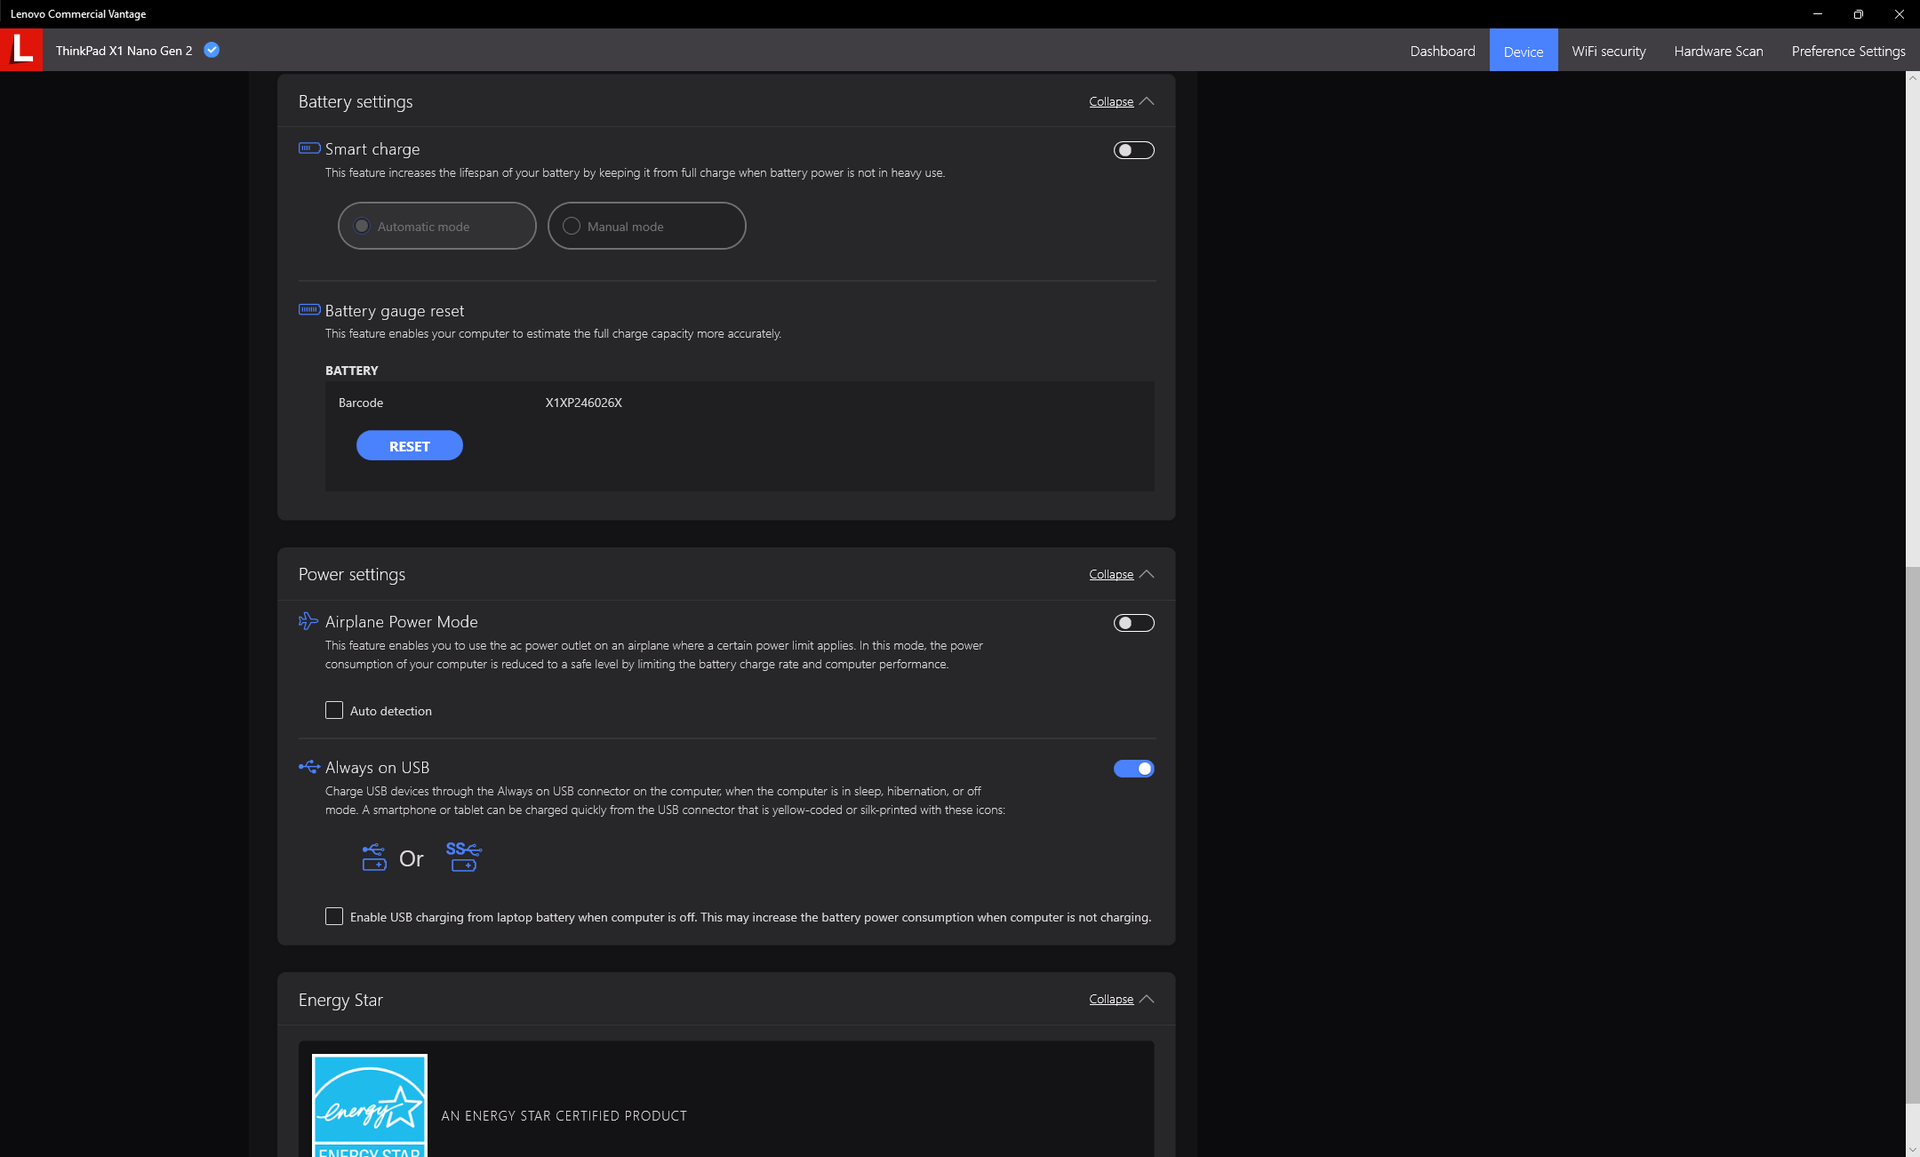
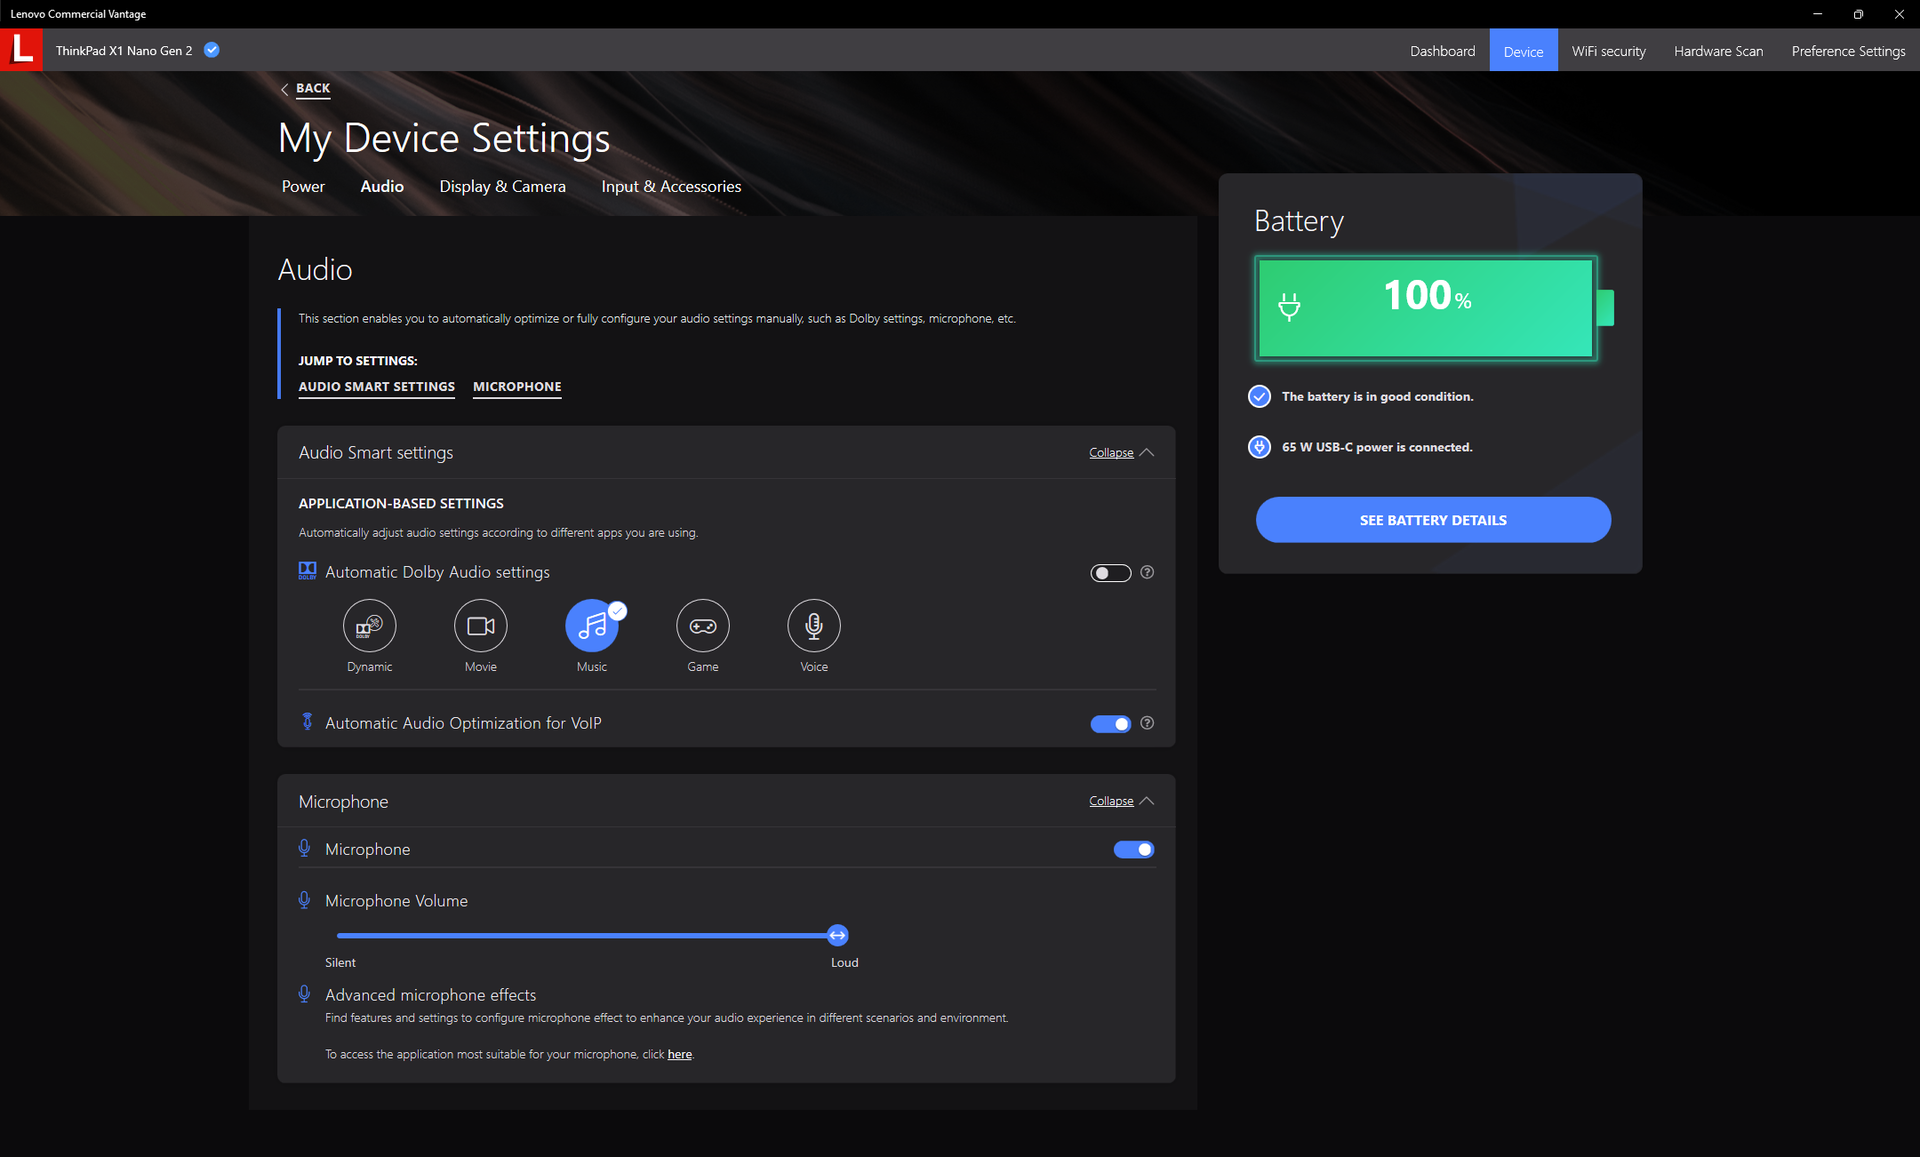
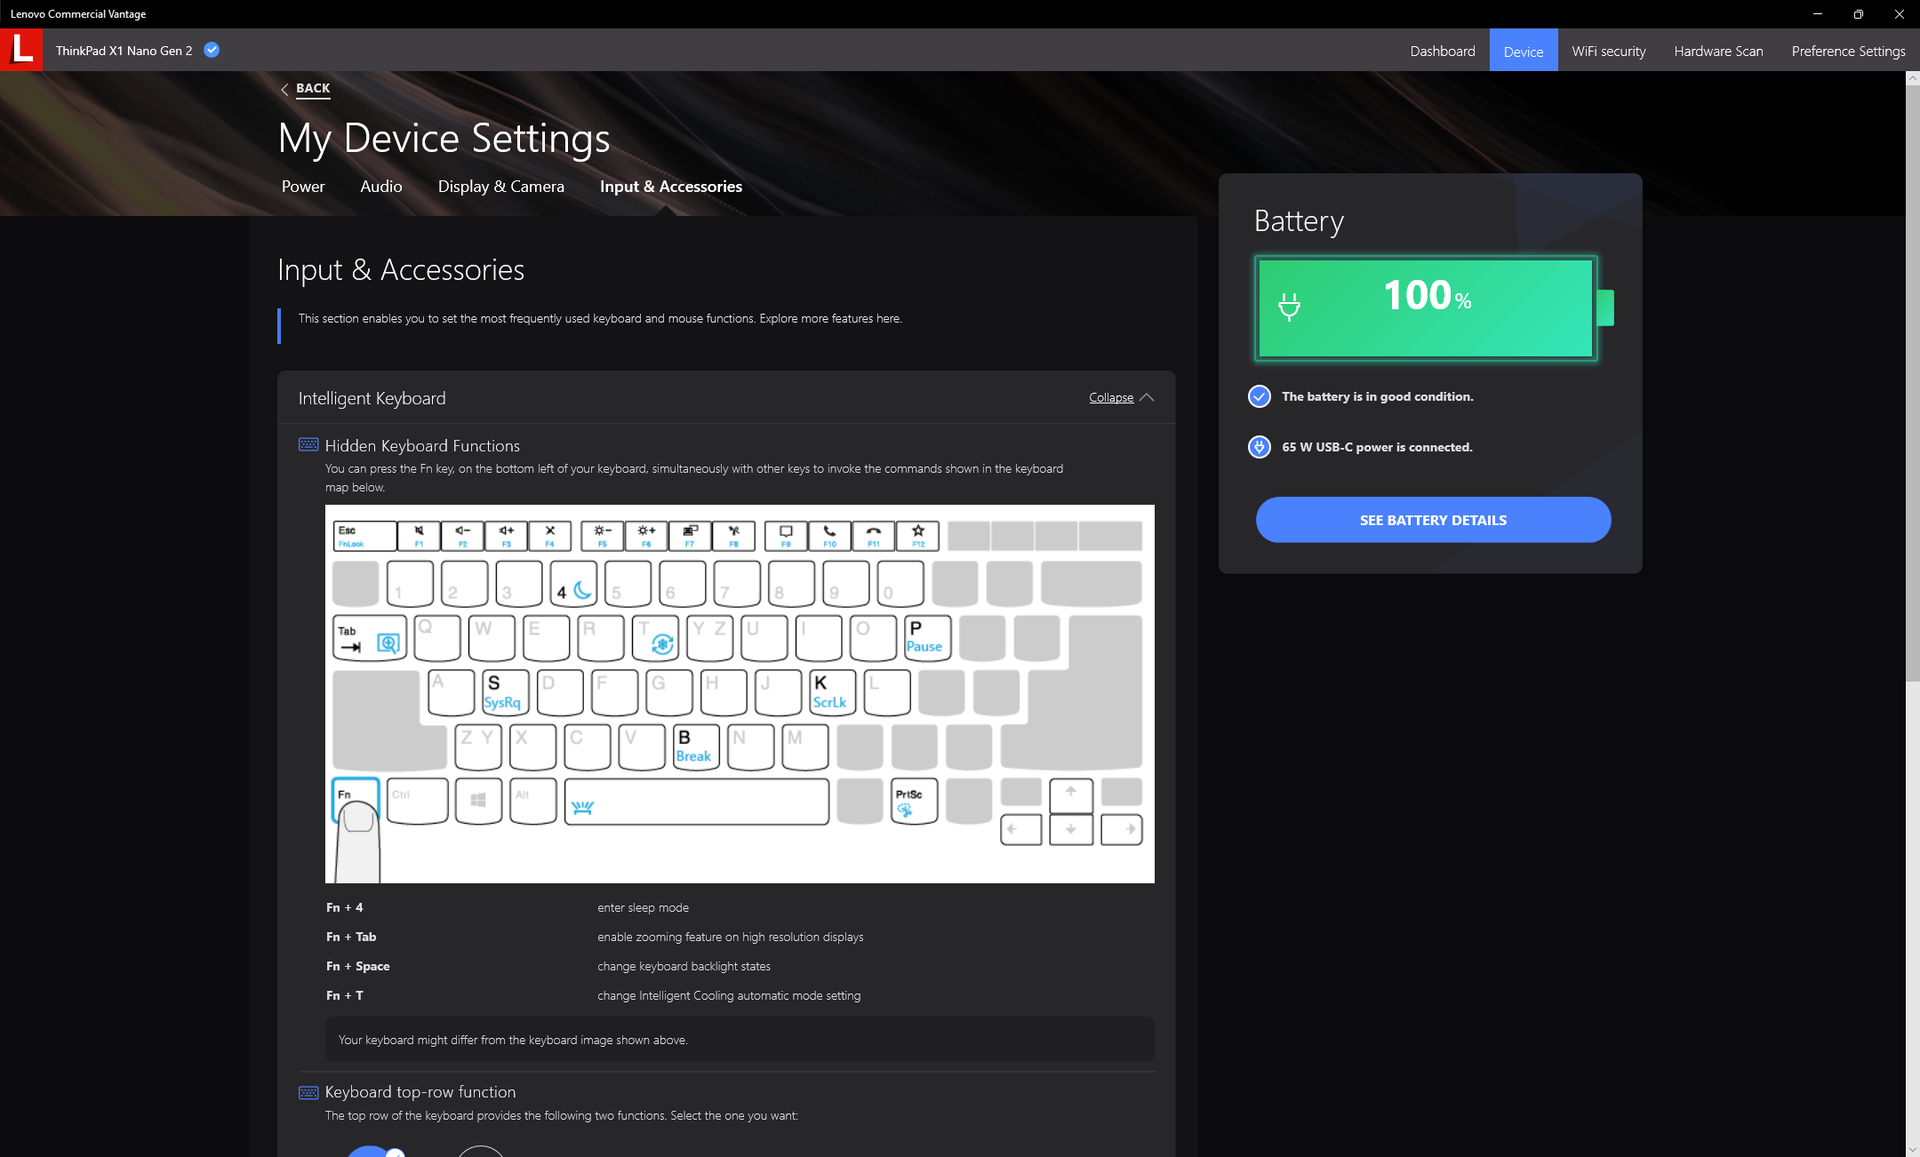
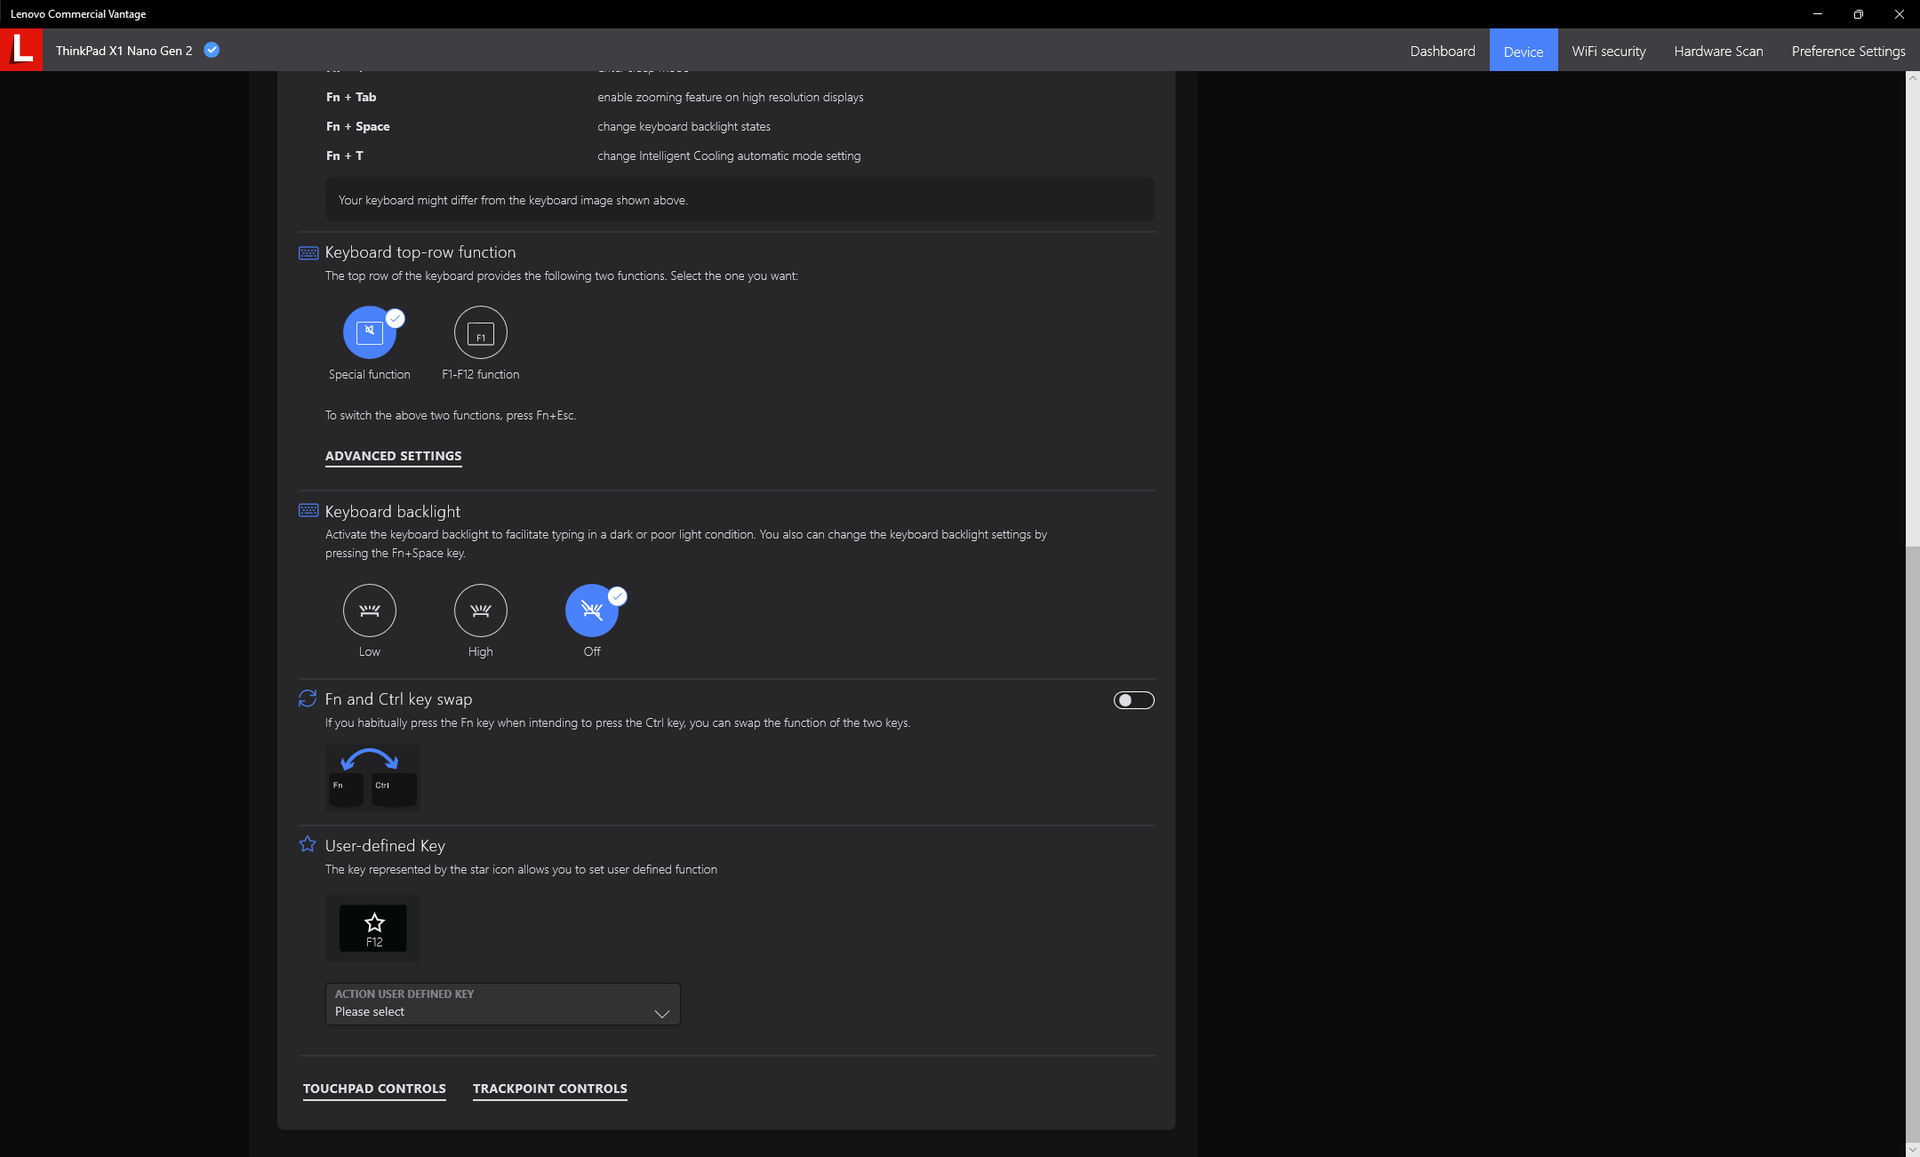
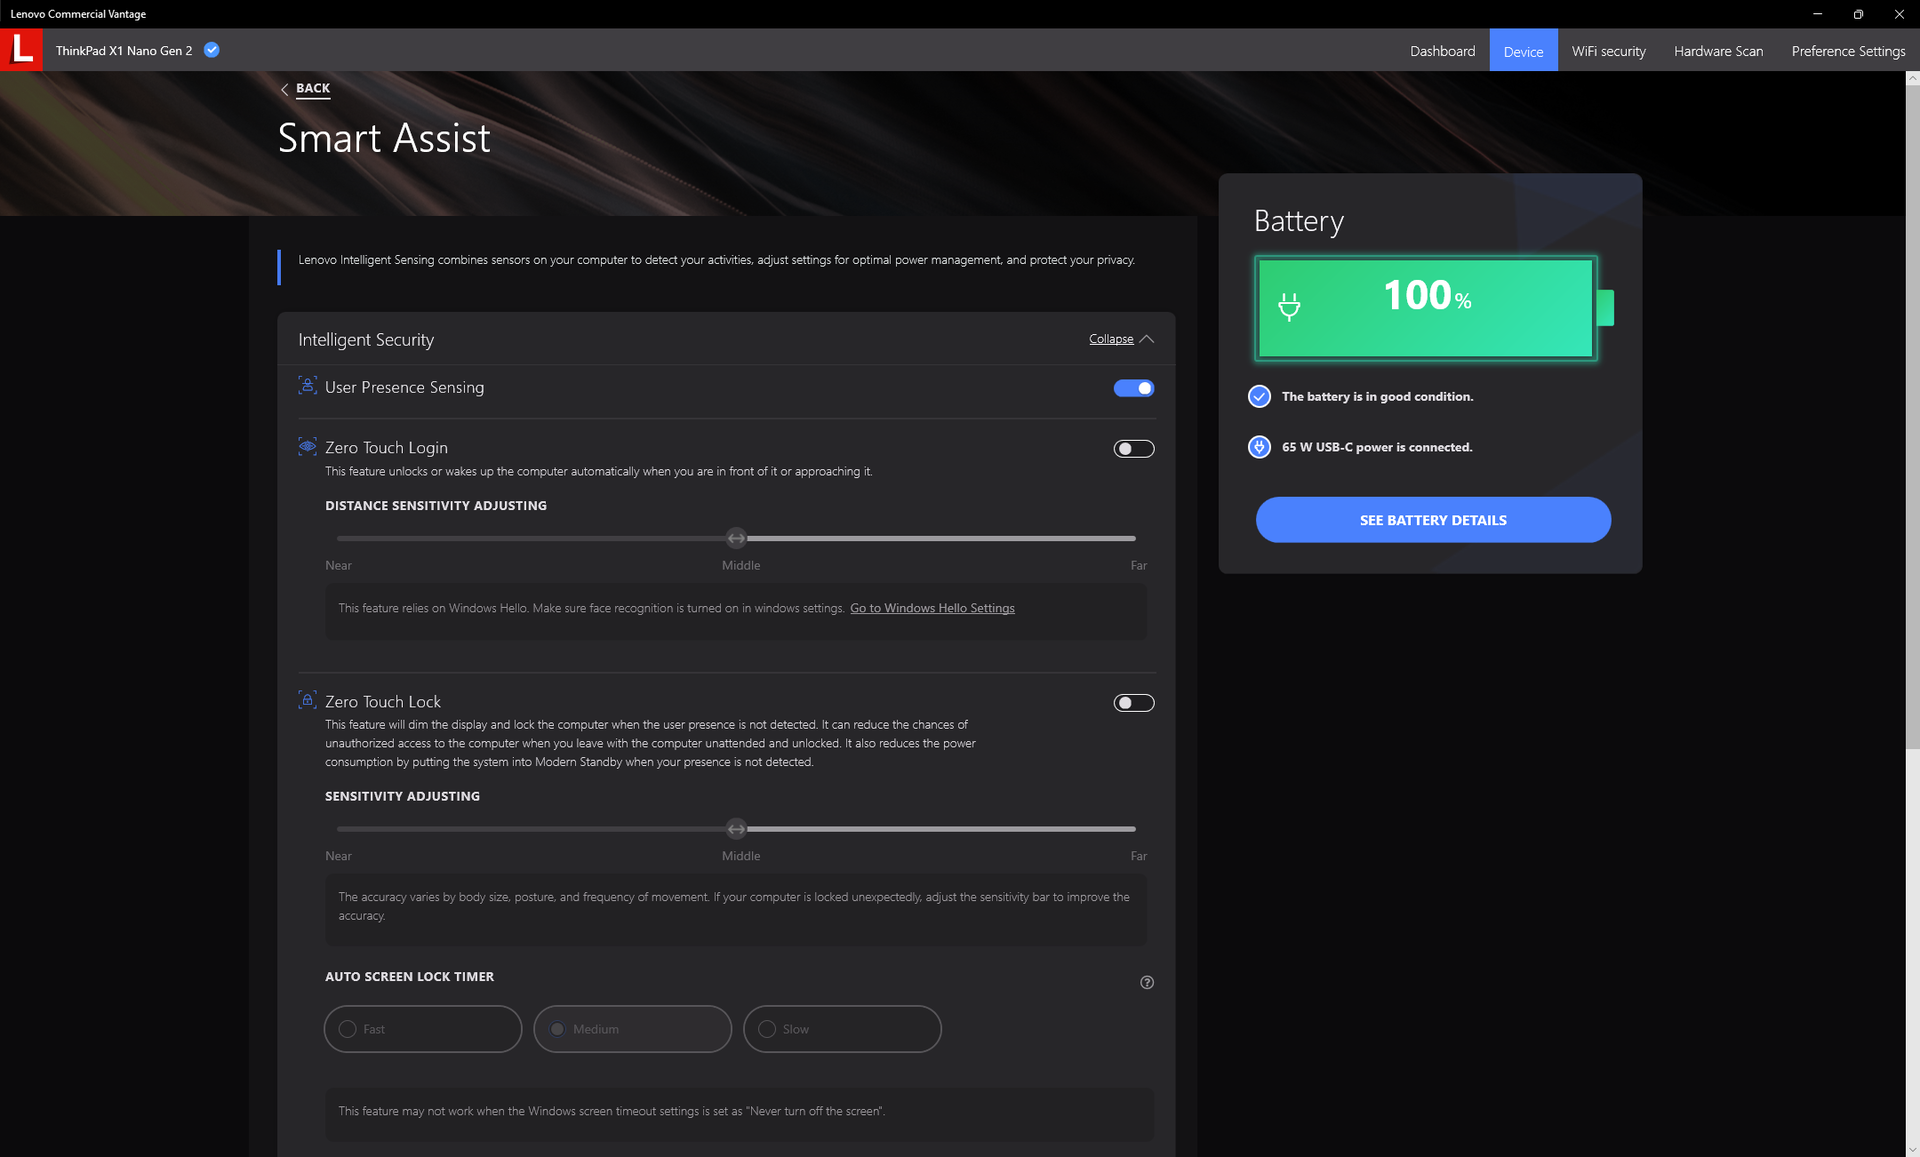
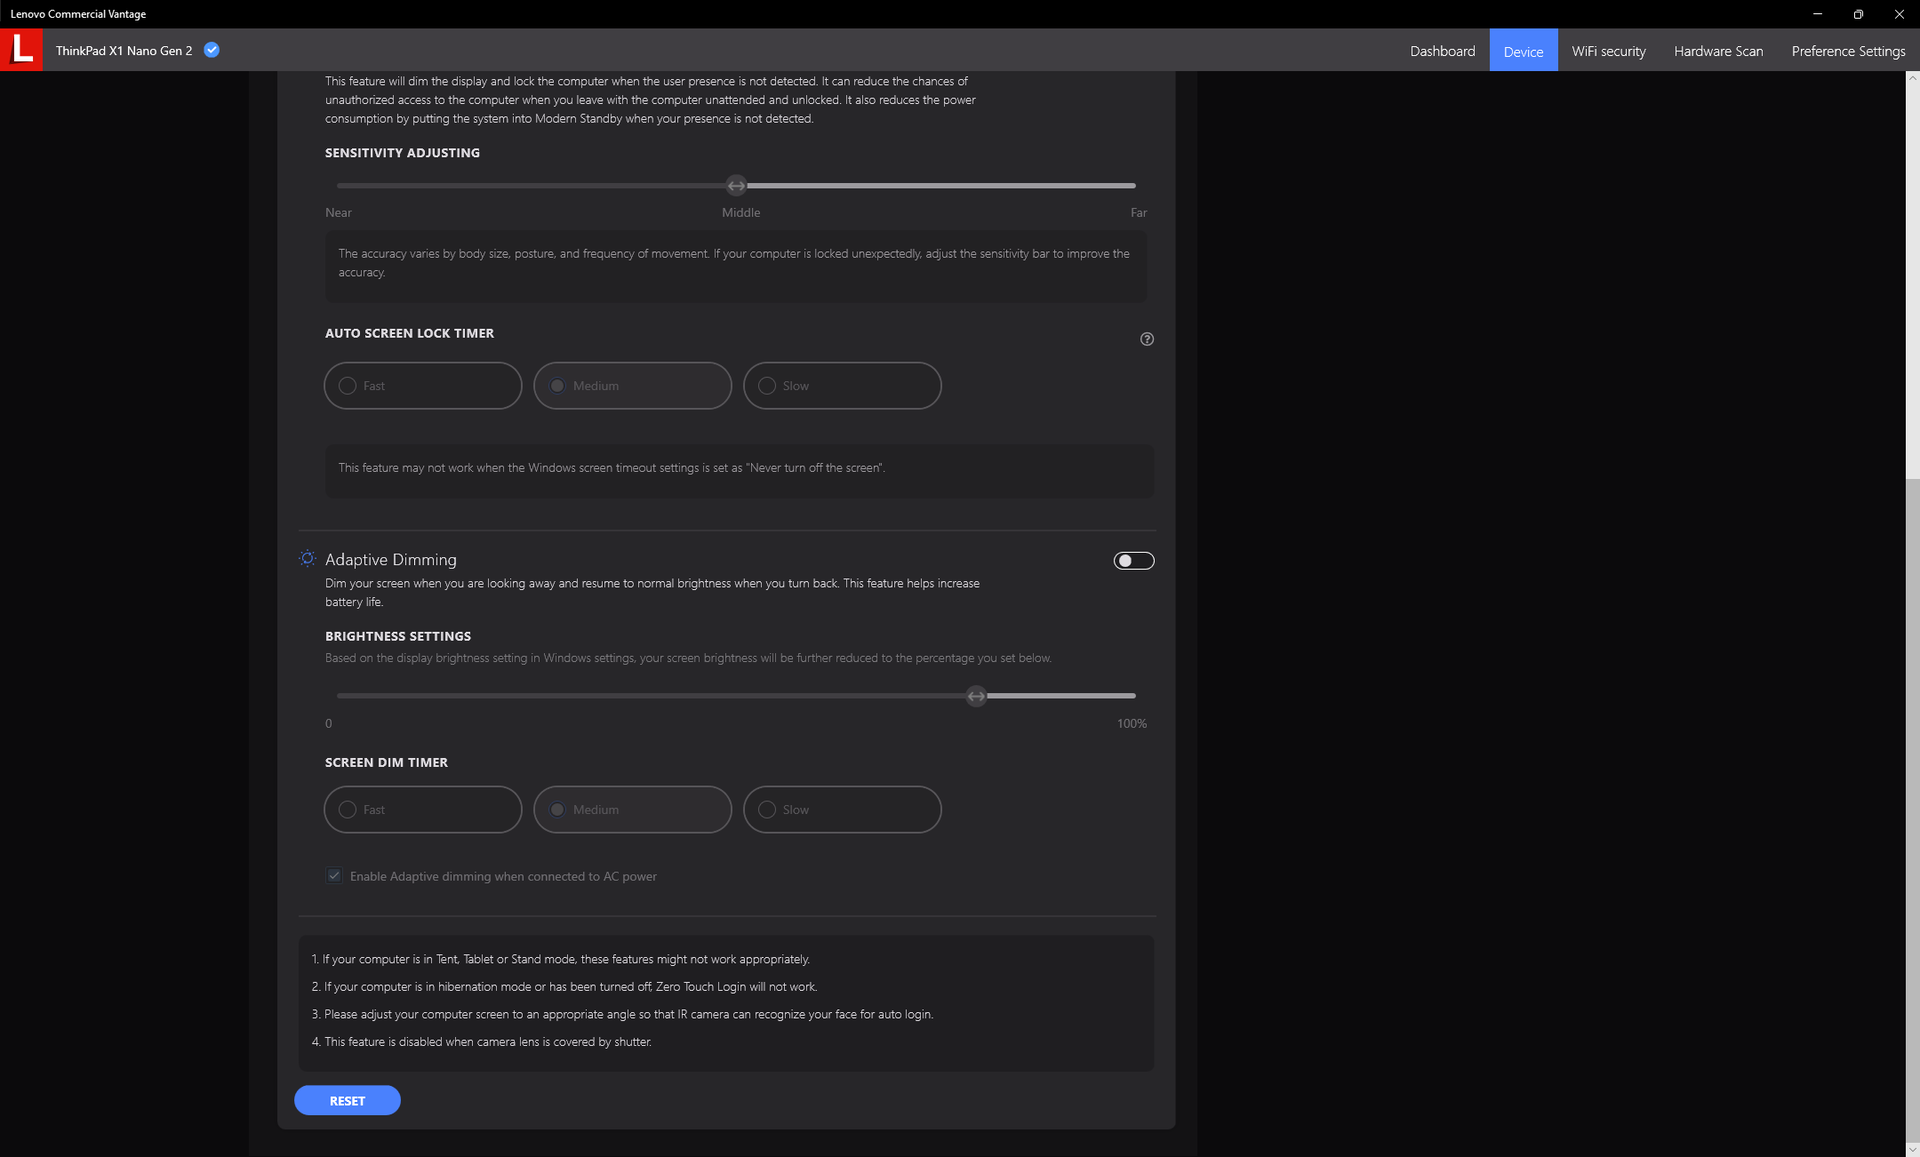
Wir haben in Windows vor dem Durchführen der folgenden Benchmarks den Modus "Beste Leistung" ausgewählt. Wir empfehlen Nutzern, sich mit der vorinstallierten Vantage-Software auseinanderzusetzen, da hier wichtige Lenovospezifische Softwareupdates und Funktionen wie die Anwesenheitserkennung durchgeführt bzw. aktiviert werden können, wie die Screenshots unten zeigen.
Prozessor
Die CPU-Leistung ist durchwachsen. Die hohe Cinebench-R15-Multi-Punktzahl von 2.118 Punkten ist einerseiits hervorragend, andererseits fällt sie schon im nächsten Durchlauf auf nur 1.485 Punkte, was auf eine schlechte Aufrechterhaltung des Turbo Boosts und deutlicheres Drosseln als bei den meisten Laptops hindeutet. Tatsächlich kann die Multi-Thread-Leistung unter dauerhafter Last um bis zu 48 % fallen, wie unser Cinebench-R15-xT-Schleifentest unten zeigt. Der Framework-Laptop mit dem nominell schwächeren Core i7-1260P schlägt unseren i7-1280P auf Dauer. Anders ausgedrückt kommt man beim Lenovo kurz in den Genuss der Spitzenleistung des i7-1280P und kann dann zusehen, wie das Leistungsniveau drastisch abfällt.
Trotz der etwas enttäuschenden Leistung ist der i7-1280P in unserem X1 Nano Gen. 2 auch unter Berücksichtigung des Drosselns um ca. 80 % und damit deutlich schneller als der Core i7-1160G7 im X1 Nano Gen. 1.
Dauerleistung: Cinebench R15 Multi
Cinebench R23: Multi Core | Single Core
Cinebench R15: CPU Multi 64Bit | CPU Single 64Bit
Blender: v2.79 BMW27 CPU
7-Zip 18.03: 7z b 4 | 7z b 4 -mmt1
Geekbench 5.5: Multi-Core | Single-Core
HWBOT x265 Benchmark v2.2: 4k Preset
LibreOffice : 20 Documents To PDF
R Benchmark 2.5: Overall mean
Cinebench R23: Multi Core | Single Core
Cinebench R15: CPU Multi 64Bit | CPU Single 64Bit
Blender: v2.79 BMW27 CPU
7-Zip 18.03: 7z b 4 | 7z b 4 -mmt1
Geekbench 5.5: Multi-Core | Single-Core
HWBOT x265 Benchmark v2.2: 4k Preset
LibreOffice : 20 Documents To PDF
R Benchmark 2.5: Overall mean
* ... kleinere Werte sind besser
AIDA64: FP32 Ray-Trace | FPU Julia | CPU SHA3 | CPU Queen | FPU SinJulia | FPU Mandel | CPU AES | CPU ZLib | FP64 Ray-Trace | CPU PhotoWorxx
| Performance Rating | |
| Durchschnittliche Intel Core i7-1280P | |
| Lenovo ThinkPad X1 Nano Gen 2 Core i7-1280P | |
| Framework Laptop 13.5 12th Gen Intel | |
| Lenovo ThinkPad X1 Nano-20UN002UGE | |
| Dell Latitude 13 7330 | |
| HP Elite Dragonfly G3 | |
| Huawei MateBook X Pro 2021 | |
| AIDA64 / FP32 Ray-Trace | |
| Durchschnittliche Intel Core i7-1280P (7466 - 13068, n=6) | |
| Lenovo ThinkPad X1 Nano Gen 2 Core i7-1280P | |
| Lenovo ThinkPad X1 Nano-20UN002UGE | |
| Dell Latitude 13 7330 | |
| HP Elite Dragonfly G3 | |
| Framework Laptop 13.5 12th Gen Intel | |
| Huawei MateBook X Pro 2021 | |
| AIDA64 / FPU Julia | |
| Durchschnittliche Intel Core i7-1280P (38904 - 66081, n=6) | |
| Lenovo ThinkPad X1 Nano Gen 2 Core i7-1280P | |
| Dell Latitude 13 7330 | |
| HP Elite Dragonfly G3 | |
| Lenovo ThinkPad X1 Nano-20UN002UGE | |
| Framework Laptop 13.5 12th Gen Intel | |
| Huawei MateBook X Pro 2021 | |
| AIDA64 / CPU SHA3 | |
| Durchschnittliche Intel Core i7-1280P (1826 - 2992, n=6) | |
| Dell Latitude 13 7330 | |
| Lenovo ThinkPad X1 Nano-20UN002UGE | |
| Framework Laptop 13.5 12th Gen Intel | |
| Lenovo ThinkPad X1 Nano Gen 2 Core i7-1280P | |
| HP Elite Dragonfly G3 | |
| Huawei MateBook X Pro 2021 | |
| AIDA64 / CPU Queen | |
| Lenovo ThinkPad X1 Nano Gen 2 Core i7-1280P | |
| Durchschnittliche Intel Core i7-1280P (80180 - 100358, n=6) | |
| Framework Laptop 13.5 12th Gen Intel | |
| Dell Latitude 13 7330 | |
| HP Elite Dragonfly G3 | |
| Huawei MateBook X Pro 2021 | |
| Lenovo ThinkPad X1 Nano-20UN002UGE | |
| AIDA64 / FPU SinJulia | |
| Durchschnittliche Intel Core i7-1280P (5880 - 8571, n=6) | |
| Framework Laptop 13.5 12th Gen Intel | |
| Lenovo ThinkPad X1 Nano Gen 2 Core i7-1280P | |
| Dell Latitude 13 7330 | |
| HP Elite Dragonfly G3 | |
| Lenovo ThinkPad X1 Nano-20UN002UGE | |
| Huawei MateBook X Pro 2021 | |
| AIDA64 / FPU Mandel | |
| Durchschnittliche Intel Core i7-1280P (18907 - 32766, n=6) | |
| Lenovo ThinkPad X1 Nano Gen 2 Core i7-1280P | |
| Lenovo ThinkPad X1 Nano-20UN002UGE | |
| Dell Latitude 13 7330 | |
| HP Elite Dragonfly G3 | |
| Framework Laptop 13.5 12th Gen Intel | |
| Huawei MateBook X Pro 2021 | |
| AIDA64 / CPU AES | |
| Lenovo ThinkPad X1 Nano-20UN002UGE | |
| Framework Laptop 13.5 12th Gen Intel | |
| Durchschnittliche Intel Core i7-1280P (40691 - 99367, n=6) | |
| Huawei MateBook X Pro 2021 | |
| Lenovo ThinkPad X1 Nano Gen 2 Core i7-1280P | |
| Dell Latitude 13 7330 | |
| HP Elite Dragonfly G3 | |
| AIDA64 / CPU ZLib | |
| Durchschnittliche Intel Core i7-1280P (540 - 880, n=6) | |
| Framework Laptop 13.5 12th Gen Intel | |
| Dell Latitude 13 7330 | |
| Lenovo ThinkPad X1 Nano Gen 2 Core i7-1280P | |
| HP Elite Dragonfly G3 | |
| Lenovo ThinkPad X1 Nano-20UN002UGE | |
| Huawei MateBook X Pro 2021 | |
| AIDA64 / FP64 Ray-Trace | |
| Durchschnittliche Intel Core i7-1280P (4006 - 7184, n=6) | |
| Lenovo ThinkPad X1 Nano Gen 2 Core i7-1280P | |
| Lenovo ThinkPad X1 Nano-20UN002UGE | |
| Dell Latitude 13 7330 | |
| HP Elite Dragonfly G3 | |
| Framework Laptop 13.5 12th Gen Intel | |
| Huawei MateBook X Pro 2021 | |
| AIDA64 / CPU PhotoWorxx | |
| Durchschnittliche Intel Core i7-1280P (36663 - 48416, n=6) | |
| Huawei MateBook X Pro 2021 | |
| Lenovo ThinkPad X1 Nano Gen 2 Core i7-1280P | |
| HP Elite Dragonfly G3 | |
| Lenovo ThinkPad X1 Nano-20UN002UGE | |
| Framework Laptop 13.5 12th Gen Intel | |
| Dell Latitude 13 7330 | |
Systemleistung
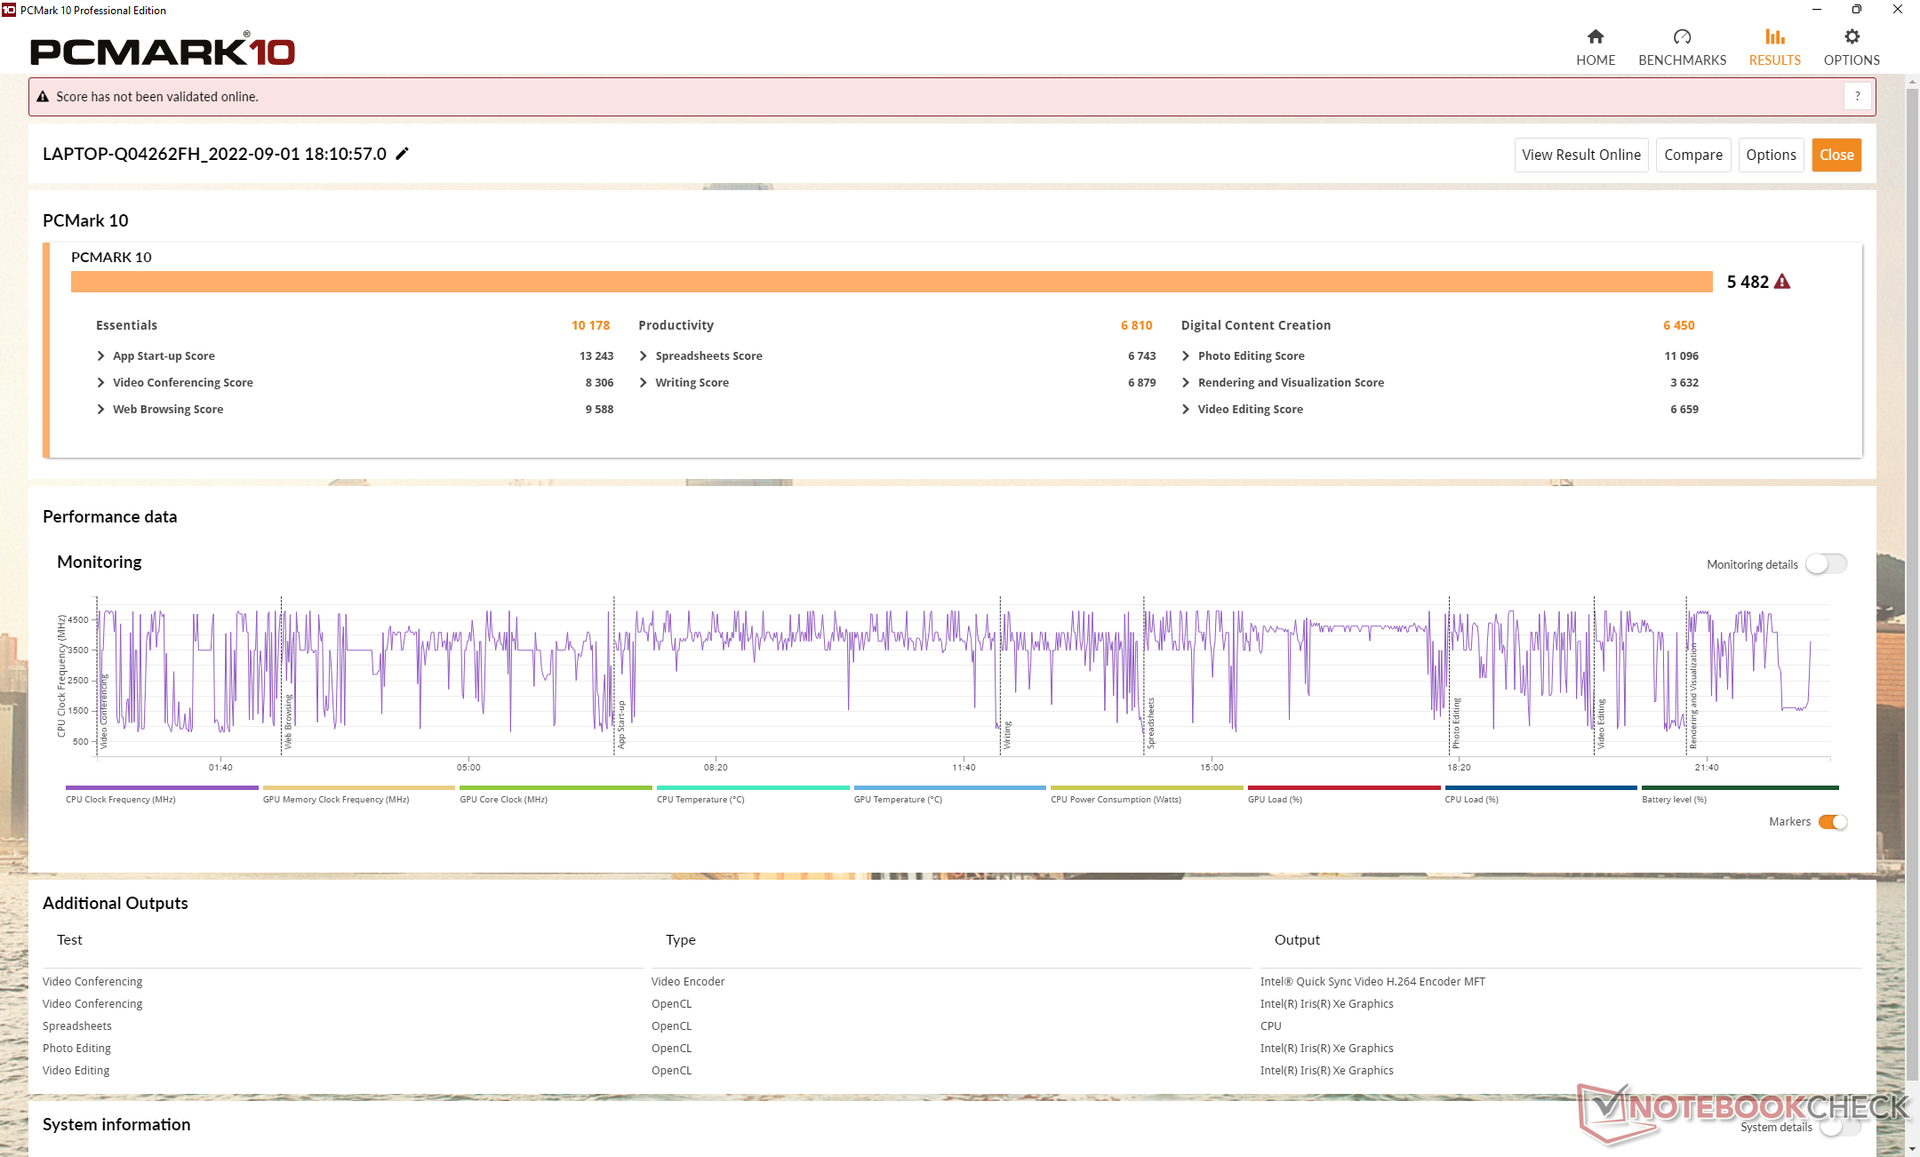
Die PCMark-10-Ergebnisse sind konstant höher als beim Modell aus der 1. Generation und aufgrund der Core-P-CPU auch höher als bei den meisten anderen 13-Zoll-Laptops. Am größten ist die Differenz im Digital-Content-Creation-Teil.
CrossMark: Overall | Productivity | Creativity | Responsiveness
| PCMark 10 / Score | |
| Framework Laptop 13.5 12th Gen Intel | |
| Durchschnittliche Intel Core i7-1280P, Intel Iris Xe Graphics G7 96EUs (5410 - 5994, n=4) | |
| Lenovo ThinkPad X1 Nano Gen 2 Core i7-1280P | |
| Dell Latitude 13 7330 | |
| Huawei MateBook X Pro 2021 | |
| HP Elite Dragonfly G3 | |
| Lenovo ThinkPad X1 Nano-20UN002UGE | |
| PCMark 10 / Essentials | |
| Framework Laptop 13.5 12th Gen Intel | |
| Dell Latitude 13 7330 | |
| Durchschnittliche Intel Core i7-1280P, Intel Iris Xe Graphics G7 96EUs (9719 - 10920, n=4) | |
| Huawei MateBook X Pro 2021 | |
| Lenovo ThinkPad X1 Nano Gen 2 Core i7-1280P | |
| Lenovo ThinkPad X1 Nano-20UN002UGE | |
| HP Elite Dragonfly G3 | |
| PCMark 10 / Productivity | |
| Framework Laptop 13.5 12th Gen Intel | |
| Dell Latitude 13 7330 | |
| Durchschnittliche Intel Core i7-1280P, Intel Iris Xe Graphics G7 96EUs (6301 - 7453, n=4) | |
| Lenovo ThinkPad X1 Nano Gen 2 Core i7-1280P | |
| Huawei MateBook X Pro 2021 | |
| Lenovo ThinkPad X1 Nano-20UN002UGE | |
| HP Elite Dragonfly G3 | |
| PCMark 10 / Digital Content Creation | |
| Durchschnittliche Intel Core i7-1280P, Intel Iris Xe Graphics G7 96EUs (6450 - 7180, n=4) | |
| Framework Laptop 13.5 12th Gen Intel | |
| Lenovo ThinkPad X1 Nano Gen 2 Core i7-1280P | |
| HP Elite Dragonfly G3 | |
| Dell Latitude 13 7330 | |
| Huawei MateBook X Pro 2021 | |
| Lenovo ThinkPad X1 Nano-20UN002UGE | |
| CrossMark / Overall | |
| Durchschnittliche Intel Core i7-1280P, Intel Iris Xe Graphics G7 96EUs (1677 - 1773, n=4) | |
| Lenovo ThinkPad X1 Nano Gen 2 Core i7-1280P | |
| Framework Laptop 13.5 12th Gen Intel | |
| Dell Latitude 13 7330 | |
| HP Elite Dragonfly G3 | |
| CrossMark / Productivity | |
| Durchschnittliche Intel Core i7-1280P, Intel Iris Xe Graphics G7 96EUs (1585 - 1709, n=4) | |
| Framework Laptop 13.5 12th Gen Intel | |
| Lenovo ThinkPad X1 Nano Gen 2 Core i7-1280P | |
| Dell Latitude 13 7330 | |
| HP Elite Dragonfly G3 | |
| CrossMark / Creativity | |
| Lenovo ThinkPad X1 Nano Gen 2 Core i7-1280P | |
| Durchschnittliche Intel Core i7-1280P, Intel Iris Xe Graphics G7 96EUs (1849 - 1928, n=4) | |
| Framework Laptop 13.5 12th Gen Intel | |
| HP Elite Dragonfly G3 | |
| Dell Latitude 13 7330 | |
| CrossMark / Responsiveness | |
| Durchschnittliche Intel Core i7-1280P, Intel Iris Xe Graphics G7 96EUs (1394 - 1746, n=4) | |
| Framework Laptop 13.5 12th Gen Intel | |
| Lenovo ThinkPad X1 Nano Gen 2 Core i7-1280P | |
| Dell Latitude 13 7330 | |
| HP Elite Dragonfly G3 | |
| PCMark 10 Score | 5482 Punkte | |
Hilfe | ||
| AIDA64 / Memory Copy | |
| Lenovo ThinkPad X1 Nano Gen 2 Core i7-1280P | |
| Durchschnittliche Intel Core i7-1280P (56337 - 73486, n=6) | |
| HP Elite Dragonfly G3 | |
| Huawei MateBook X Pro 2021 | |
| Lenovo ThinkPad X1 Nano-20UN002UGE | |
| Framework Laptop 13.5 12th Gen Intel | |
| Dell Latitude 13 7330 | |
| AIDA64 / Memory Read | |
| Lenovo ThinkPad X1 Nano Gen 2 Core i7-1280P | |
| Durchschnittliche Intel Core i7-1280P (63221 - 73719, n=6) | |
| Huawei MateBook X Pro 2021 | |
| HP Elite Dragonfly G3 | |
| Lenovo ThinkPad X1 Nano-20UN002UGE | |
| Framework Laptop 13.5 12th Gen Intel | |
| Dell Latitude 13 7330 | |
| AIDA64 / Memory Write | |
| Huawei MateBook X Pro 2021 | |
| Lenovo ThinkPad X1 Nano Gen 2 Core i7-1280P | |
| Durchschnittliche Intel Core i7-1280P (58729 - 68247, n=6) | |
| HP Elite Dragonfly G3 | |
| Lenovo ThinkPad X1 Nano-20UN002UGE | |
| Framework Laptop 13.5 12th Gen Intel | |
| Dell Latitude 13 7330 | |
| AIDA64 / Memory Latency | |
| Durchschnittliche Intel Core i7-1280P (93.1 - 153.3, n=6) | |
| HP Elite Dragonfly G3 | |
| Lenovo ThinkPad X1 Nano-20UN002UGE | |
| Lenovo ThinkPad X1 Nano Gen 2 Core i7-1280P | |
| Huawei MateBook X Pro 2021 | |
| Framework Laptop 13.5 12th Gen Intel | |
| Dell Latitude 13 7330 | |
* ... kleinere Werte sind besser
DPC-Latenzen
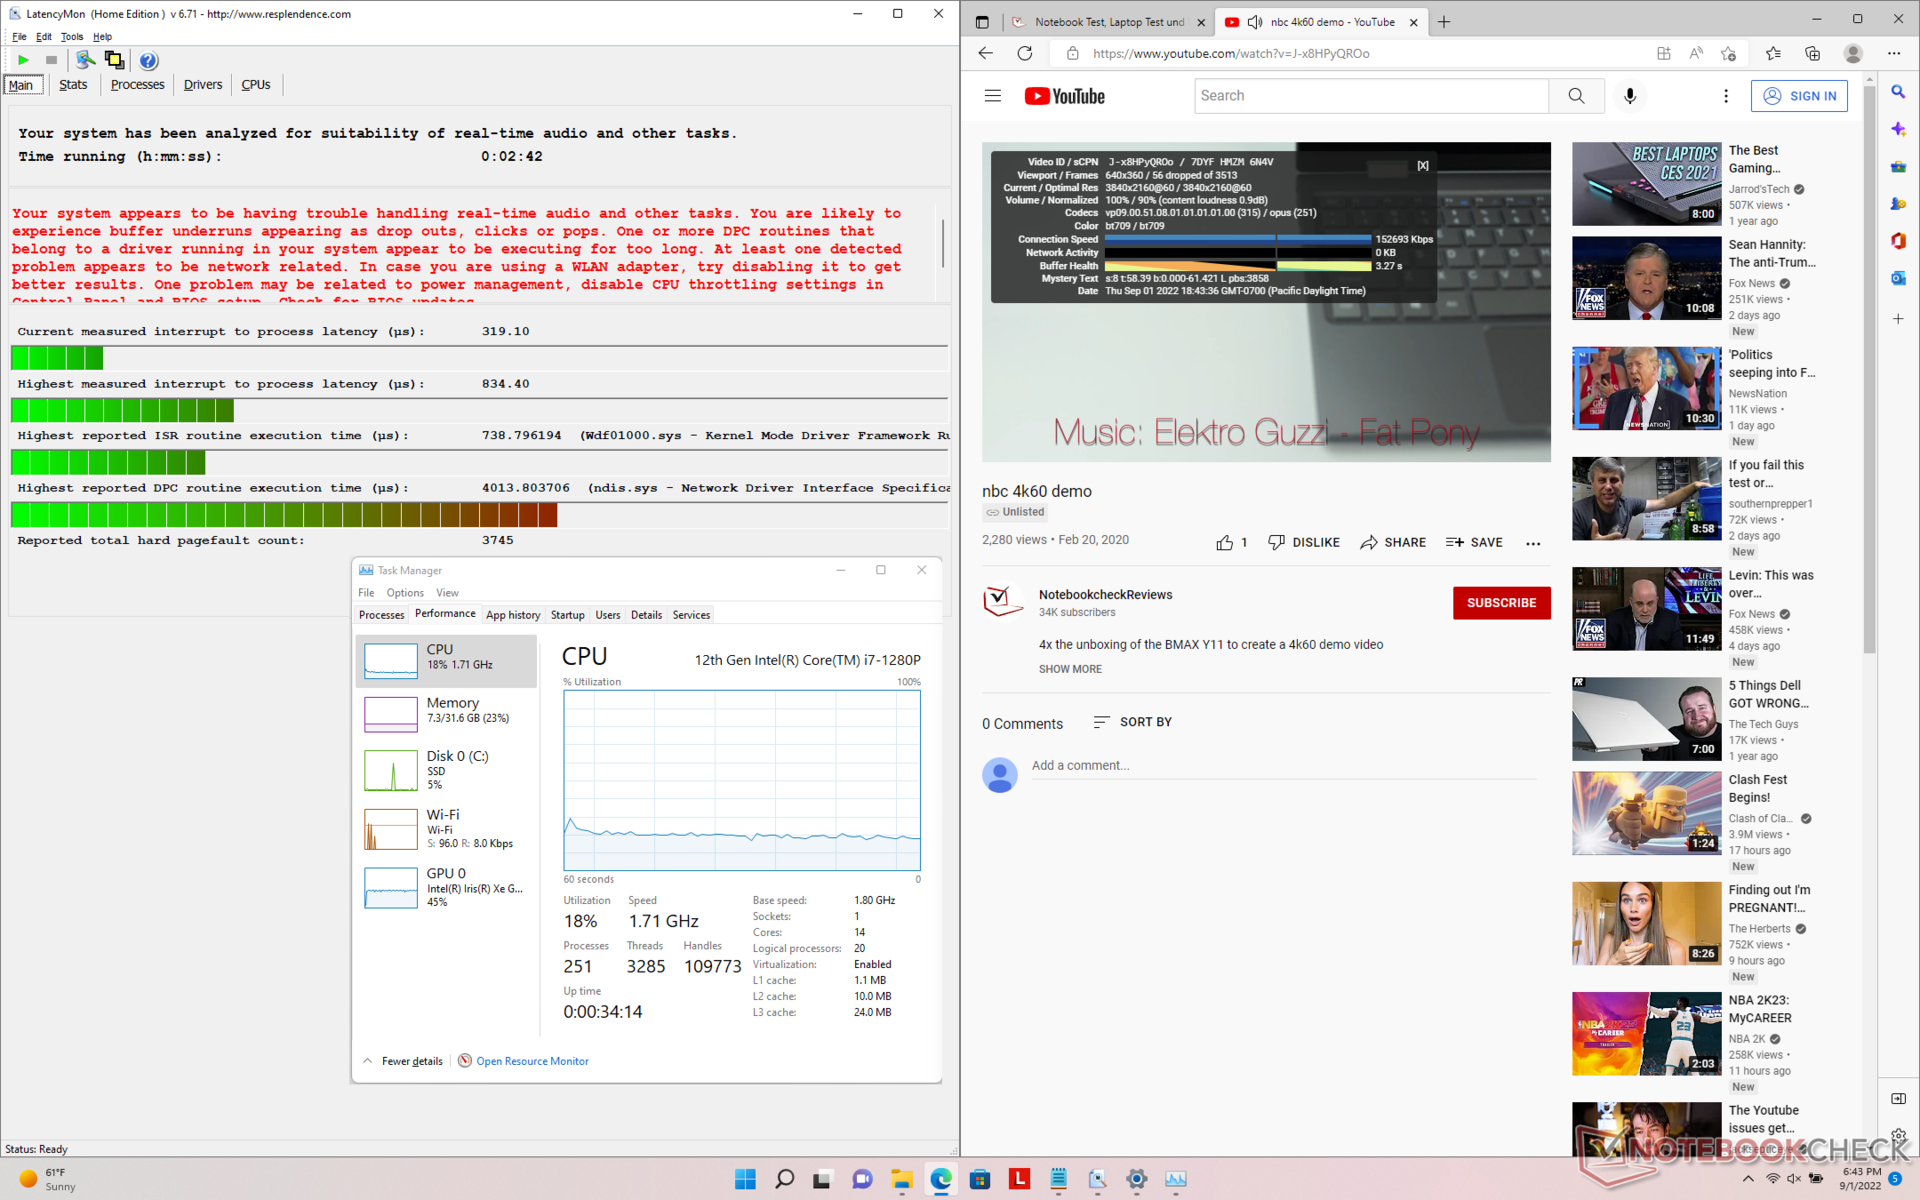
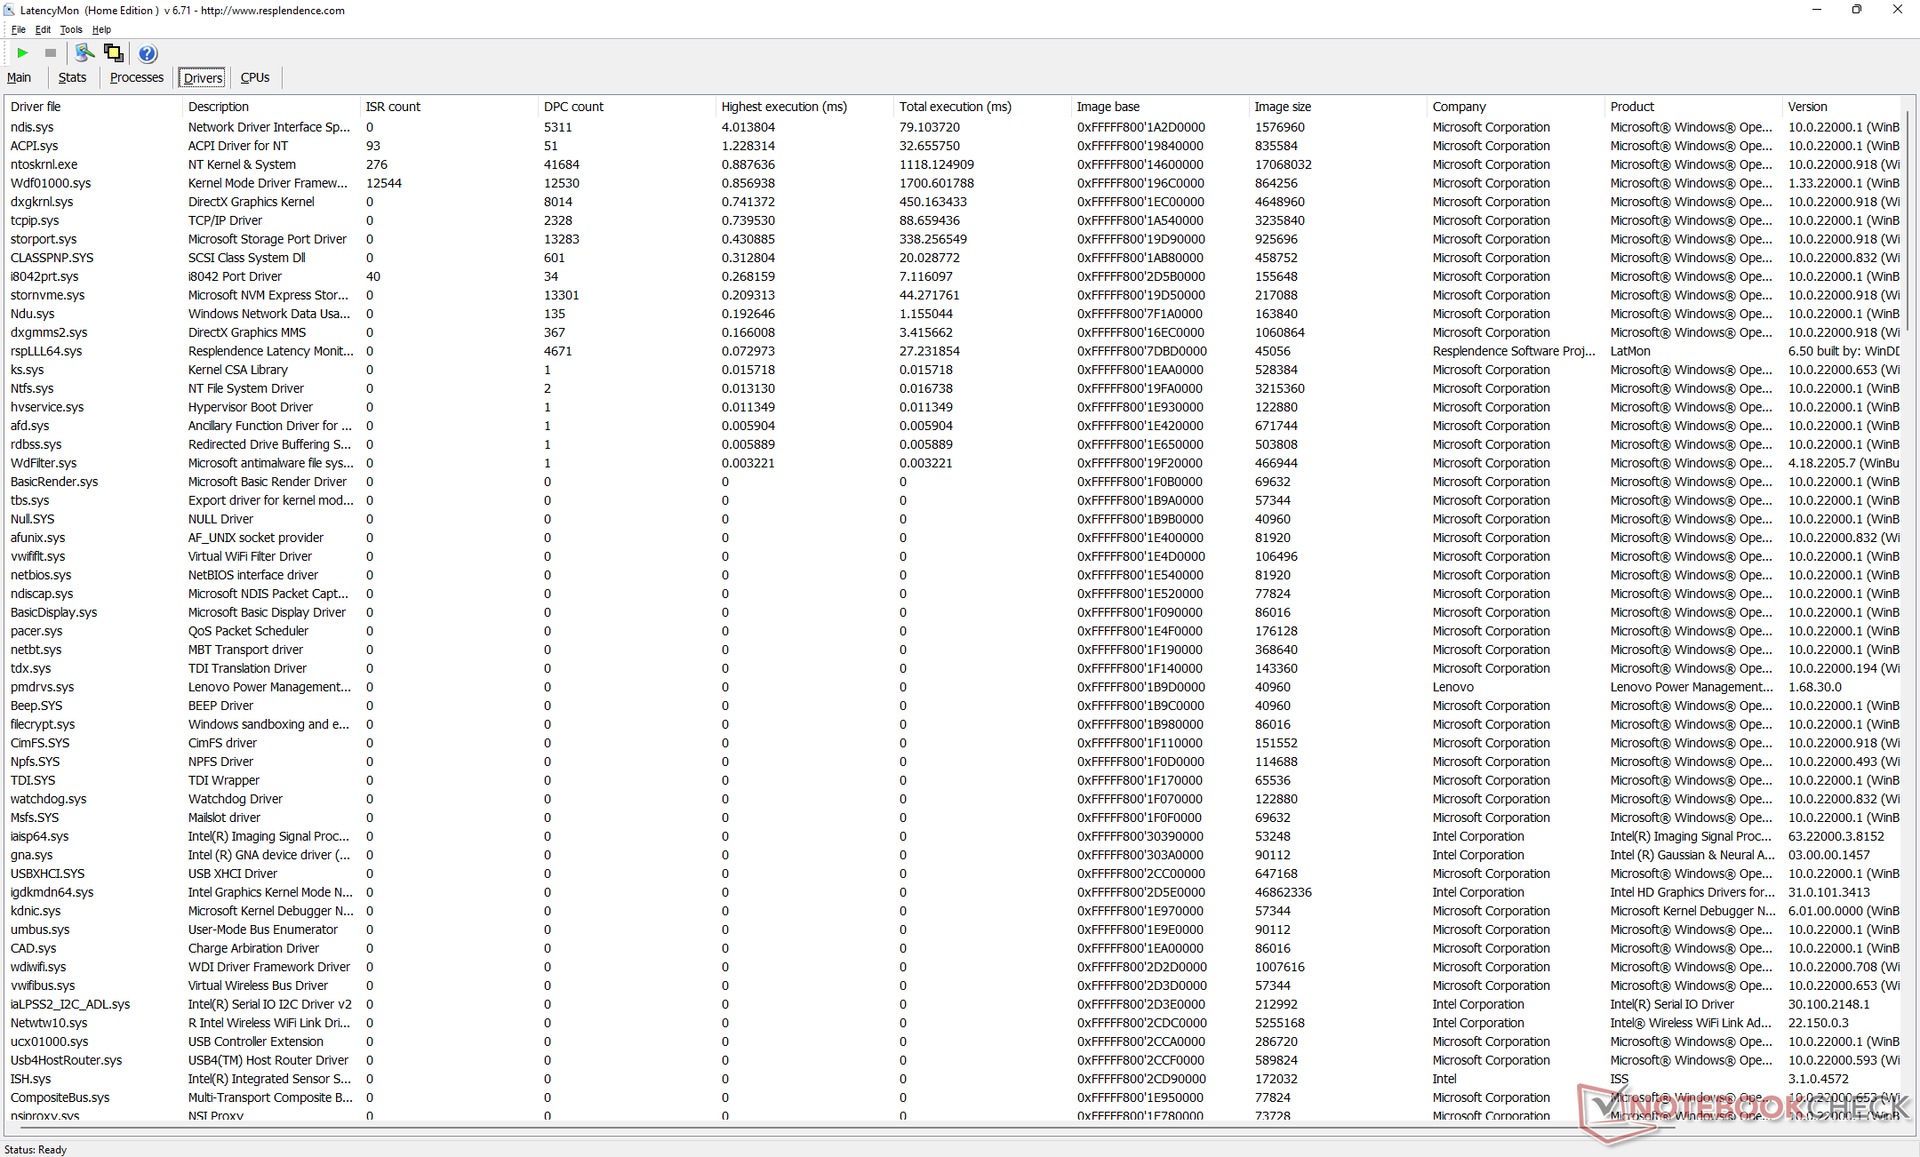
LatencyMon meldet beim Öffnen unserer Homepage in mehreren Tabs problematische DPC-Latenzen. Die 4K-Videowiedergabe mit 60 Fps geht nicht ganz reibungslos vonstatten, da im Verlauf unseres einminütigen Testvideos 56 Frames verloren gehen, obwohl die Grafiktreiber zum Zeitpunkt des Tests auf dem neuesten Stand waren.
| DPC Latencies / LatencyMon - interrupt to process latency (max), Web, Youtube, Prime95 | |
| Lenovo ThinkPad X1 Nano-20UN002UGE | |
| Huawei MateBook X Pro 2021 | |
| Framework Laptop 13.5 12th Gen Intel | |
| Lenovo ThinkPad X1 Nano Gen 2 Core i7-1280P | |
| Dell Latitude 13 7330 | |
| HP Elite Dragonfly G3 | |
* ... kleinere Werte sind besser
Massenspeicher
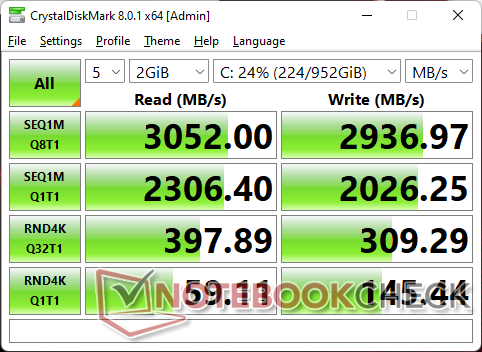
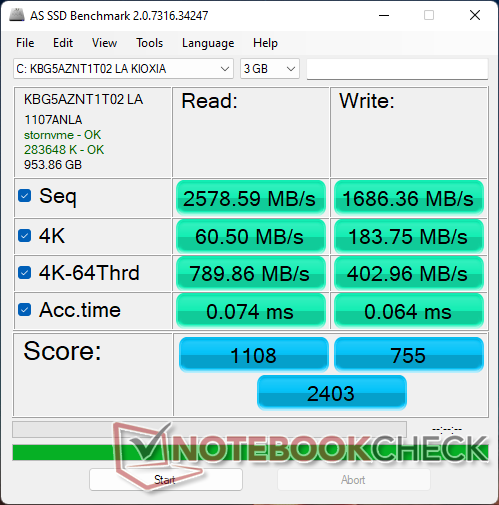
Unser Testgerät ist mit der PCIe3-NVMe-SSD Kioxia KBG5AZNT1T02 ausgestattet und erreicht maximale, konstante Lesegeschwindigkeiten von bis zu 2.700 MB/s. Derzeit können keine PCIe4-Optionen konfiguriert werden, was in Anbetracht des hohen Preises enttäuschend ist. Zumindest ist die SSD mit einem Kupferkühlkörper ausgestattet, wodurch die Abwärme besser abgeführt werden kann.
Man sollte beachten, dass die längeren 2280-M.2-Laufwerke hier nicht unterstützt werden.

* ... kleinere Werte sind besser
Laufwerksdrosseln: DiskSpd Leseschleife, Warteschlangentiefe 8
Grafikkarte
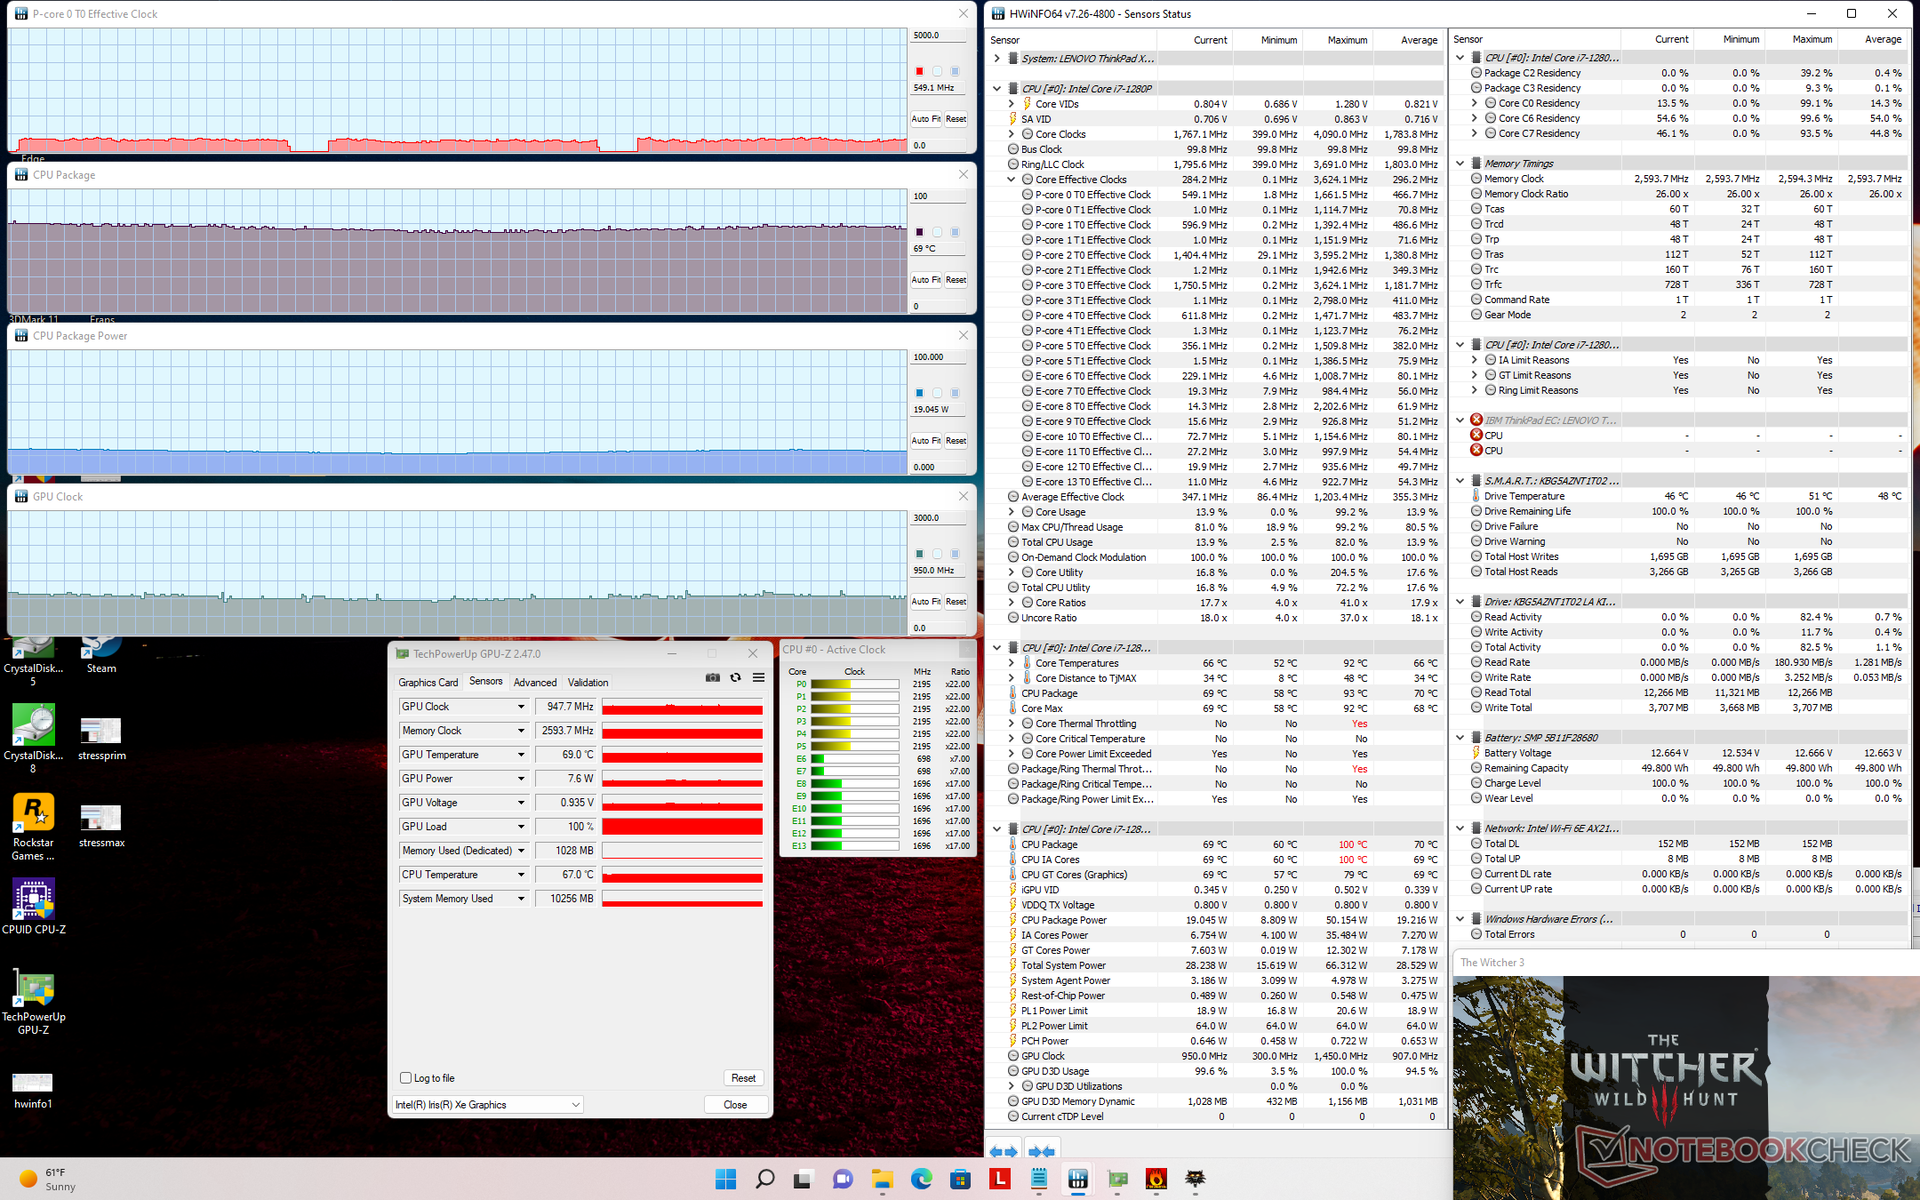
Obwohl die CPU wie oben erwähnt stark drosselt, ist die Grafikleistung relativ gut. Relativ zu anderen Laptops mit der Iris Xe 96 EUs entspricht die Leistung unseren Erwartungen, im Gaming-Betrieb zeigen sich jedoch die Effekte des Drosselns. Im Leerlauf in Witcher 3 auf den niedrigsten Einstellungen in 768p liegt die Framerate zu Beginn bei bis zu 106 Fps und fällt nach wenigen Minuten auf nur 80 Fps, wie unser Diagramm unten zeigt.
Die ungedrosselte Grafikleistung ist insgesamt dennoch um ca. 30 % höher als beim Modell aus der 1. Generation.
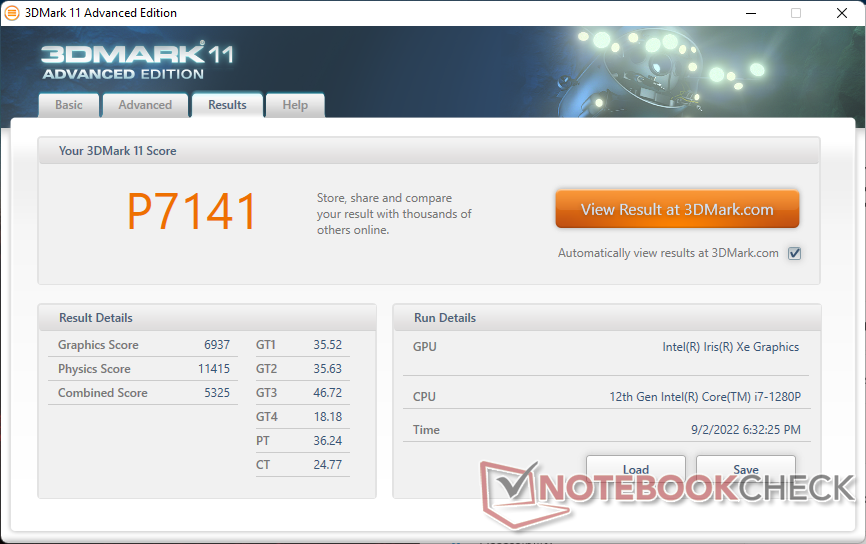
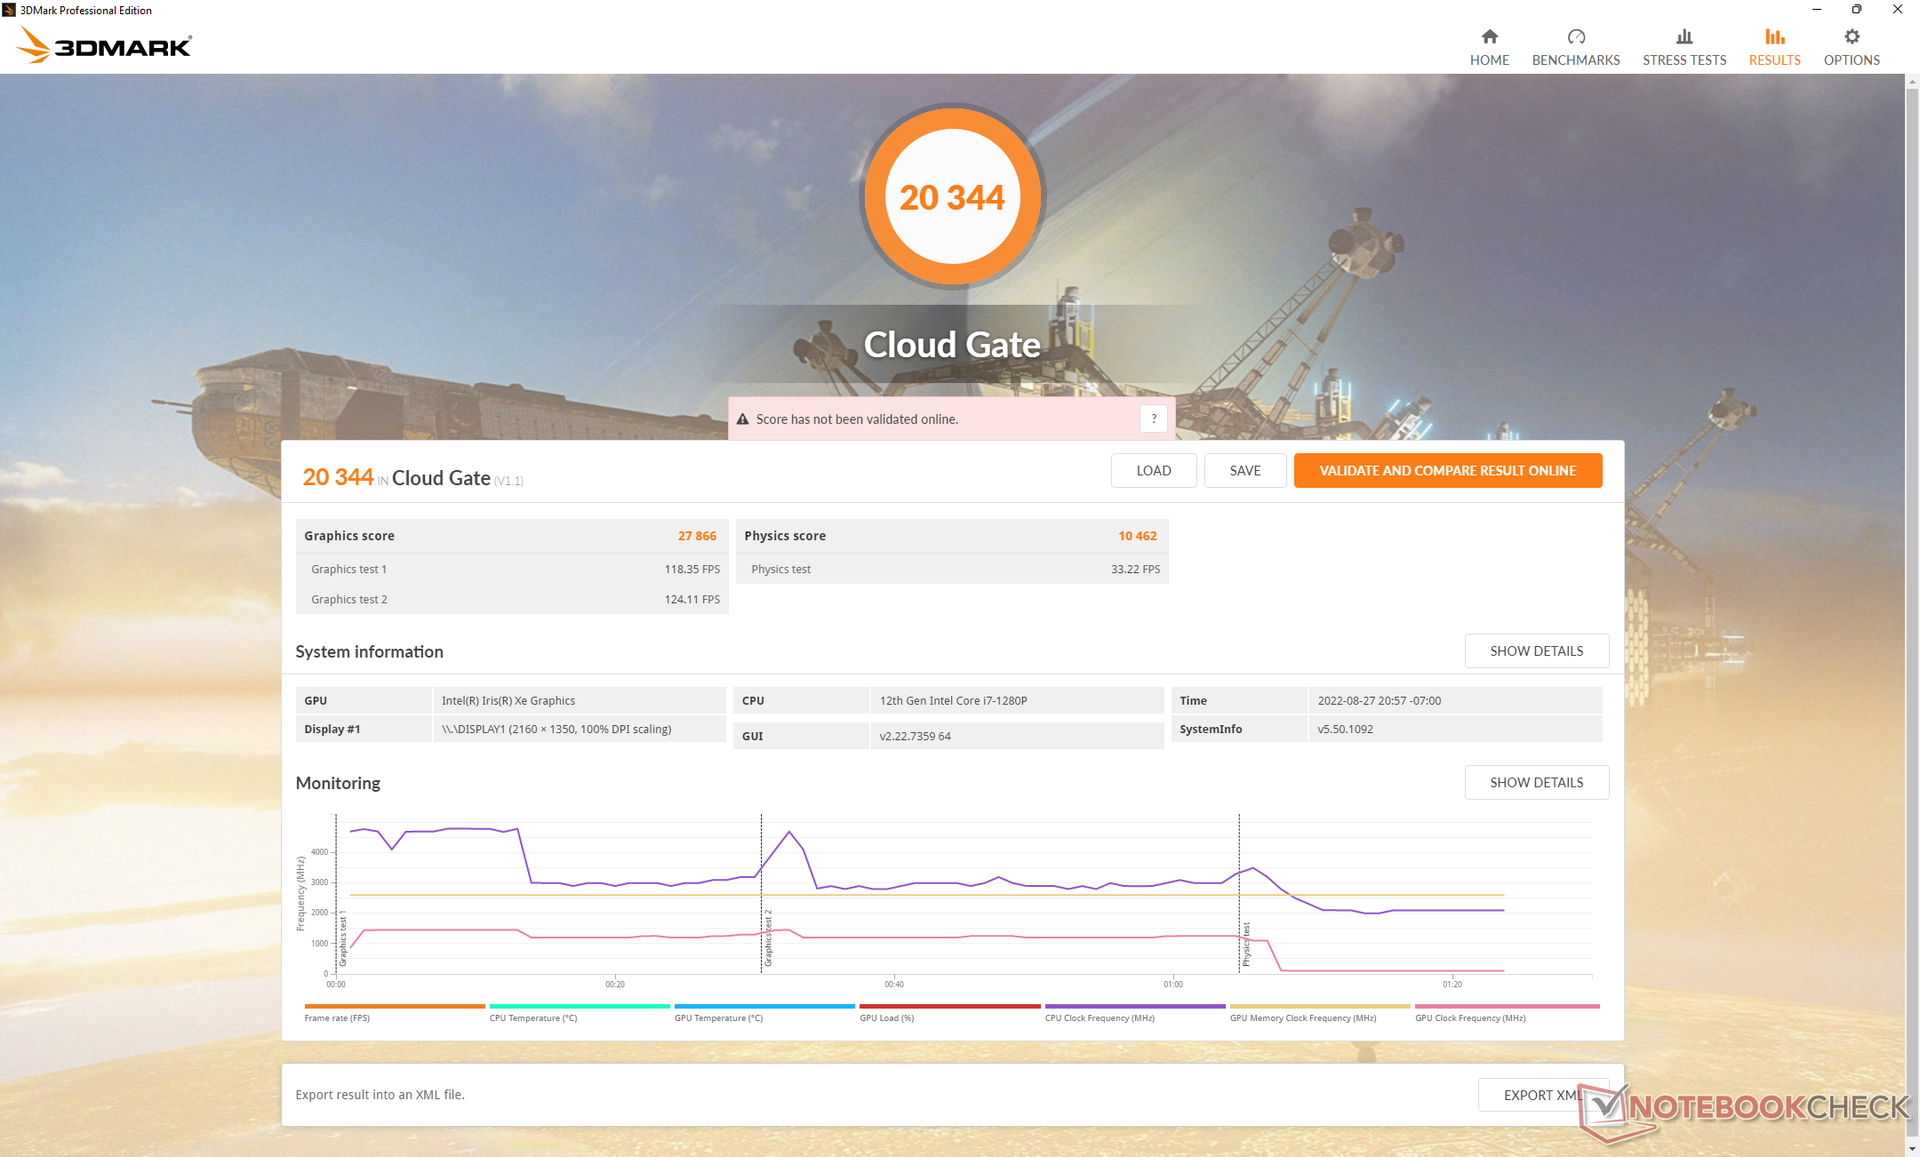
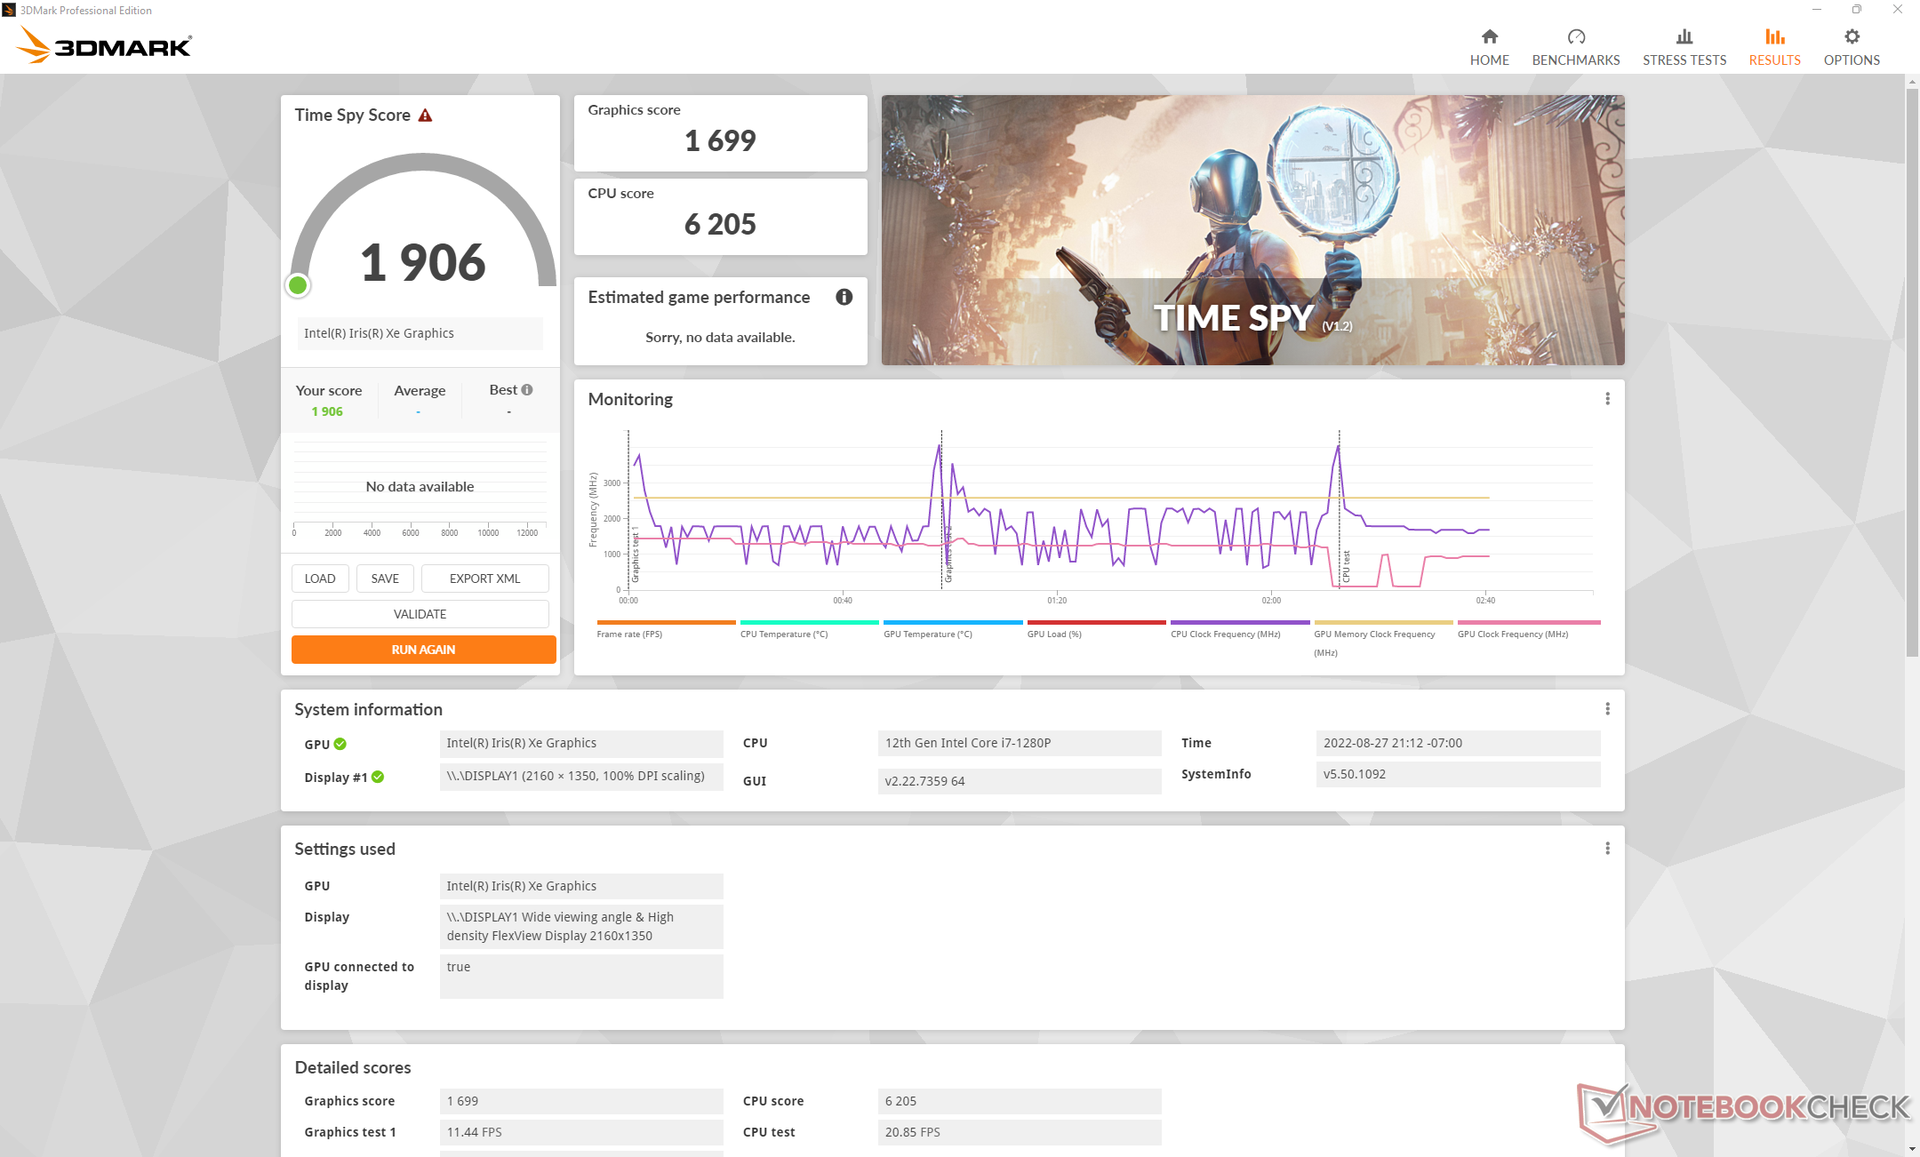
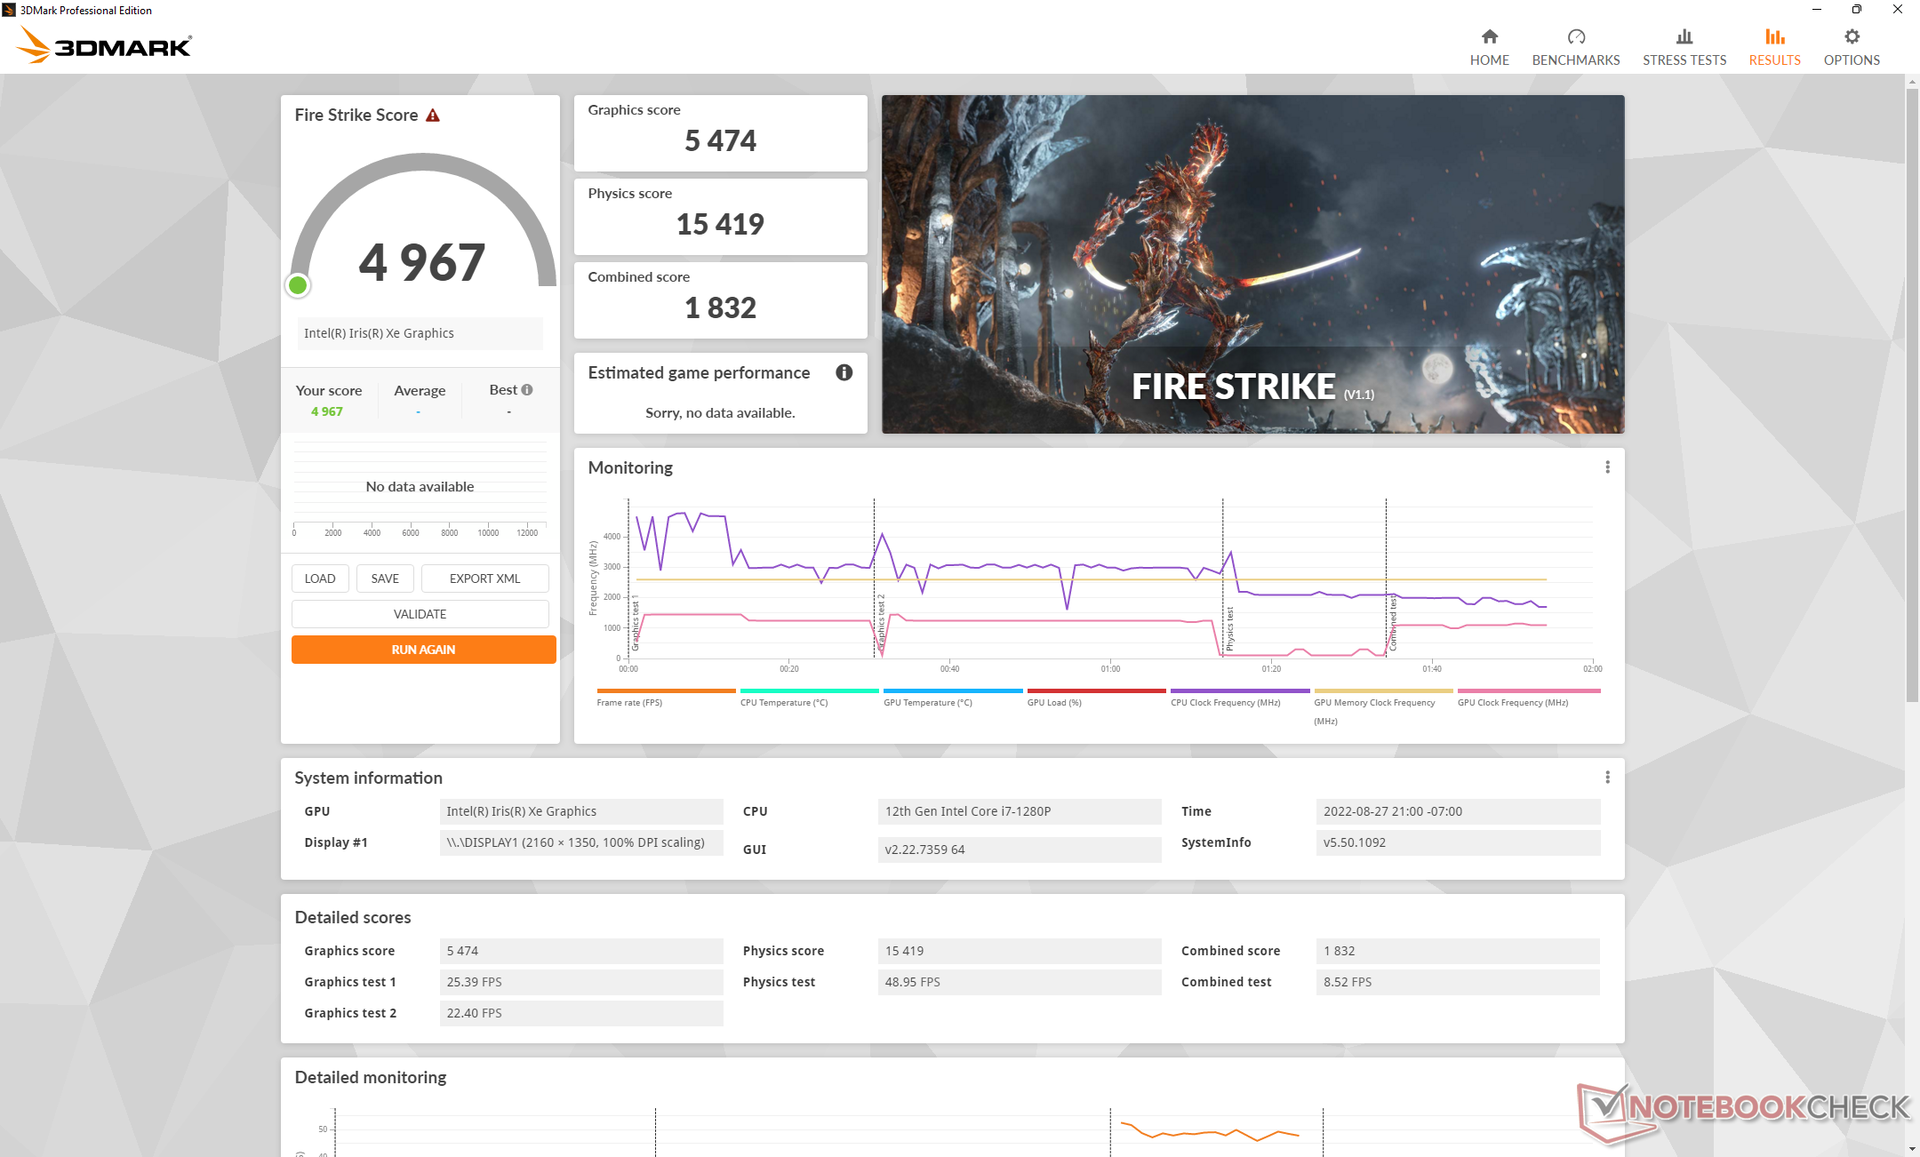
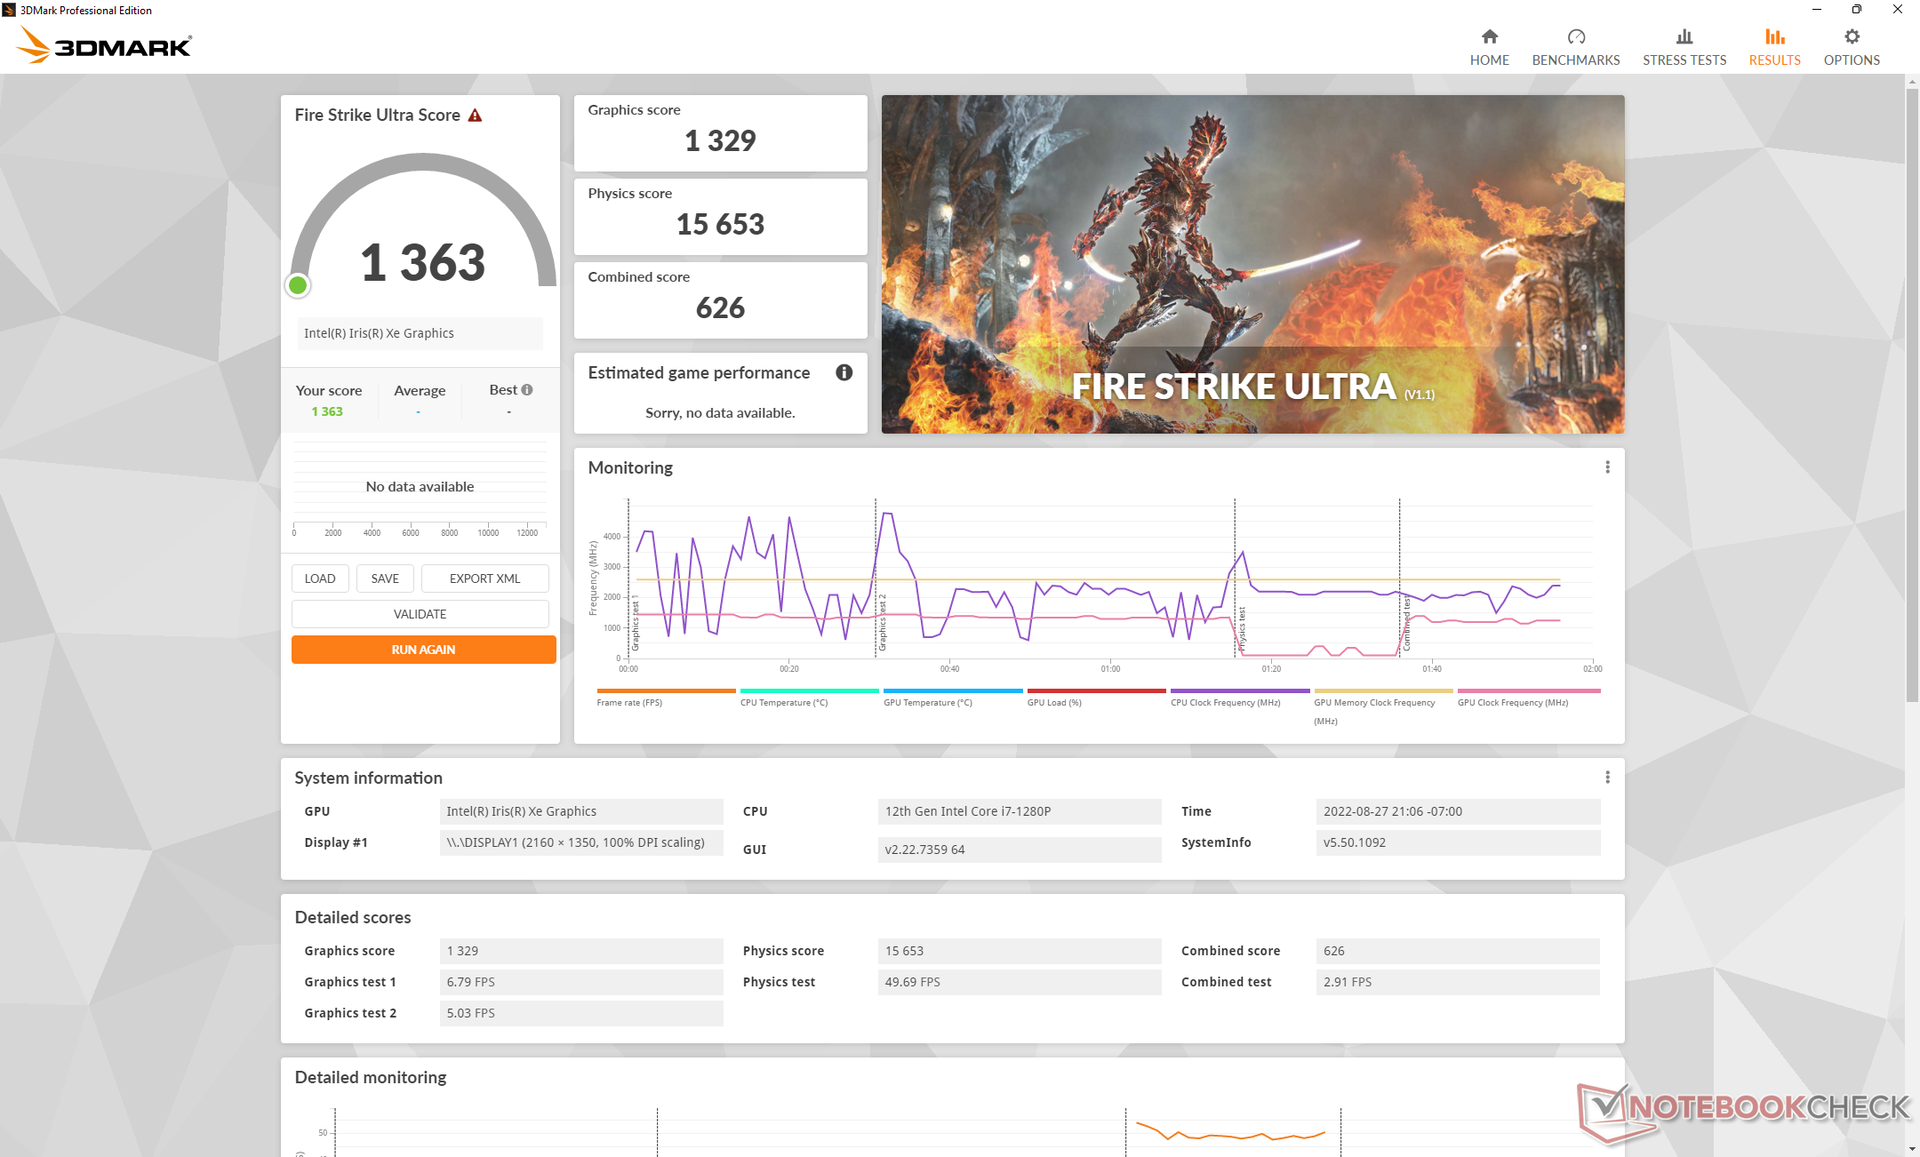
| 3DMark 11 Performance | 7141 Punkte | |
| 3DMark Cloud Gate Standard Score | 20344 Punkte | |
| 3DMark Fire Strike Score | 4967 Punkte | |
| 3DMark Time Spy Score | 1906 Punkte | |
Hilfe | ||
Witcher 3 FPS-Diagramm
| min. | mittel | hoch | max. | |
|---|---|---|---|---|
| GTA V (2015) | 97.2 | 82.3 | 21.9 | 9.84 |
| The Witcher 3 (2015) | 107.2 | 67.3 | 35 | 15.1 |
| Dota 2 Reborn (2015) | 106.1 | 76 | 55.6 | 49 |
| Final Fantasy XV Benchmark (2018) | 35.8 | 20.7 | 20.7 | |
| X-Plane 11.11 (2018) | 38.8 | 39.9 | 35.4 | |
| Strange Brigade (2018) | 88.1 | 41 | 32 | 25.1 |
| Cyberpunk 2077 1.6 (2022) | 18.3 | 16.1 | 12.3 | 9.5 |
Emissionen
Geräuschemissionen
Die drei Lenovo-Vantage-Leistungsprofile wirken sich stark auf das Lüftergeräuschniveau aus: Leise, ausbalanciert bzw. intelligente Kühlung und beste Leistung. Auch im Standardprofil "Intelligente Kühlung" bleibt der Laptop überraschend leise. In der ersten Benchmarkszene von 3DMark 06 bleibt der interne Lüfter beispielsweise wie beim Dragonfly G3 und dem MateBook X Pro über den gesamten Zeitraum sehr leise. Im Modus "Beste Leistung" pulsieren die Lüfter hingegen häufiger und erreichen unter hoher Last wie zum Beispiel im Gaming-Betrieb Spitzen von bis zu 40 dB(A). Wir empfehlen den Modus "Intelligente Kühlung" für die meisten Einsatzszenarien.
Wir können bei unserem Testgerät im Leerlauf elektronische Geräusche bzw. Spulenfiepen feststellen. Das Geräusch verschwindet temporär beim Ausführen von 3DMark 06, was erklärt, warum der Geräuschpegel während dem Benchmark niedriger ist als im Leerlauf (23,9 vs. 23,3 dB(A)).
Lautstärkediagramm
| Idle |
| 23.9 / 23.9 / 23.9 dB(A) |
| Last |
| 23.3 / 40.9 dB(A) |
 | ||
30 dB leise 40 dB(A) deutlich hörbar 50 dB(A) störend |
||
min: | ||
| Lenovo ThinkPad X1 Nano Gen 2 Core i7-1280P Iris Xe G7 96EUs, i7-1280P, Kioxia BG5 KBG5AZNT1T02 | Lenovo ThinkPad X1 Nano-20UN002UGE Iris Xe G7 96EUs, i7-1160G7, WDC PC SN530 SDBPNPZ-512G | HP Elite Dragonfly G3 Iris Xe G7 96EUs, i7-1265U, Micron 3400 MTFDKBA512TFH 512GB | Dell Latitude 13 7330 Iris Xe G7 96EUs, i7-1265U, Toshiba KBG40ZNS512G NVMe | Framework Laptop 13.5 12th Gen Intel Iris Xe G7 96EUs, i7-1260P, WDC PC SN730 SDBPNTY-512G | Huawei MateBook X Pro 2021 Iris Xe G7 96EUs, i7-1165G7, Samsung PM981a MZVLB1T0HBLR | |
|---|---|---|---|---|---|---|
| Geräuschentwicklung | -11% | 6% | -8% | -18% | -3% | |
| aus / Umgebung * (dB) | 23.3 | 24.9 -7% | 22.8 2% | 23.4 -0% | 22.8 2% | 25.4 -9% |
| Idle min * (dB) | 23.9 | 24.9 -4% | 23.2 3% | 23.4 2% | 23 4% | 25.6 -7% |
| Idle avg * (dB) | 23.9 | 26.3 -10% | 23.2 3% | 23.4 2% | 23 4% | 25.6 -7% |
| Idle max * (dB) | 23.9 | 31.8 -33% | 23.2 3% | 23.4 2% | 23 4% | 25.6 -7% |
| Last avg * (dB) | 23.3 | 34.3 -47% | 25.1 -8% | 37.8 -62% | 47.3 -103% | 28.7 -23% |
| Witcher 3 ultra * (dB) | 40.9 | 34.3 16% | 32 22% | 39.2 4% | 47.3 -16% | 32 22% |
| Last max * (dB) | 40.9 | 37.5 8% | 35.2 14% | 43 -5% | 49.8 -22% | 38.2 7% |
* ... kleinere Werte sind besser
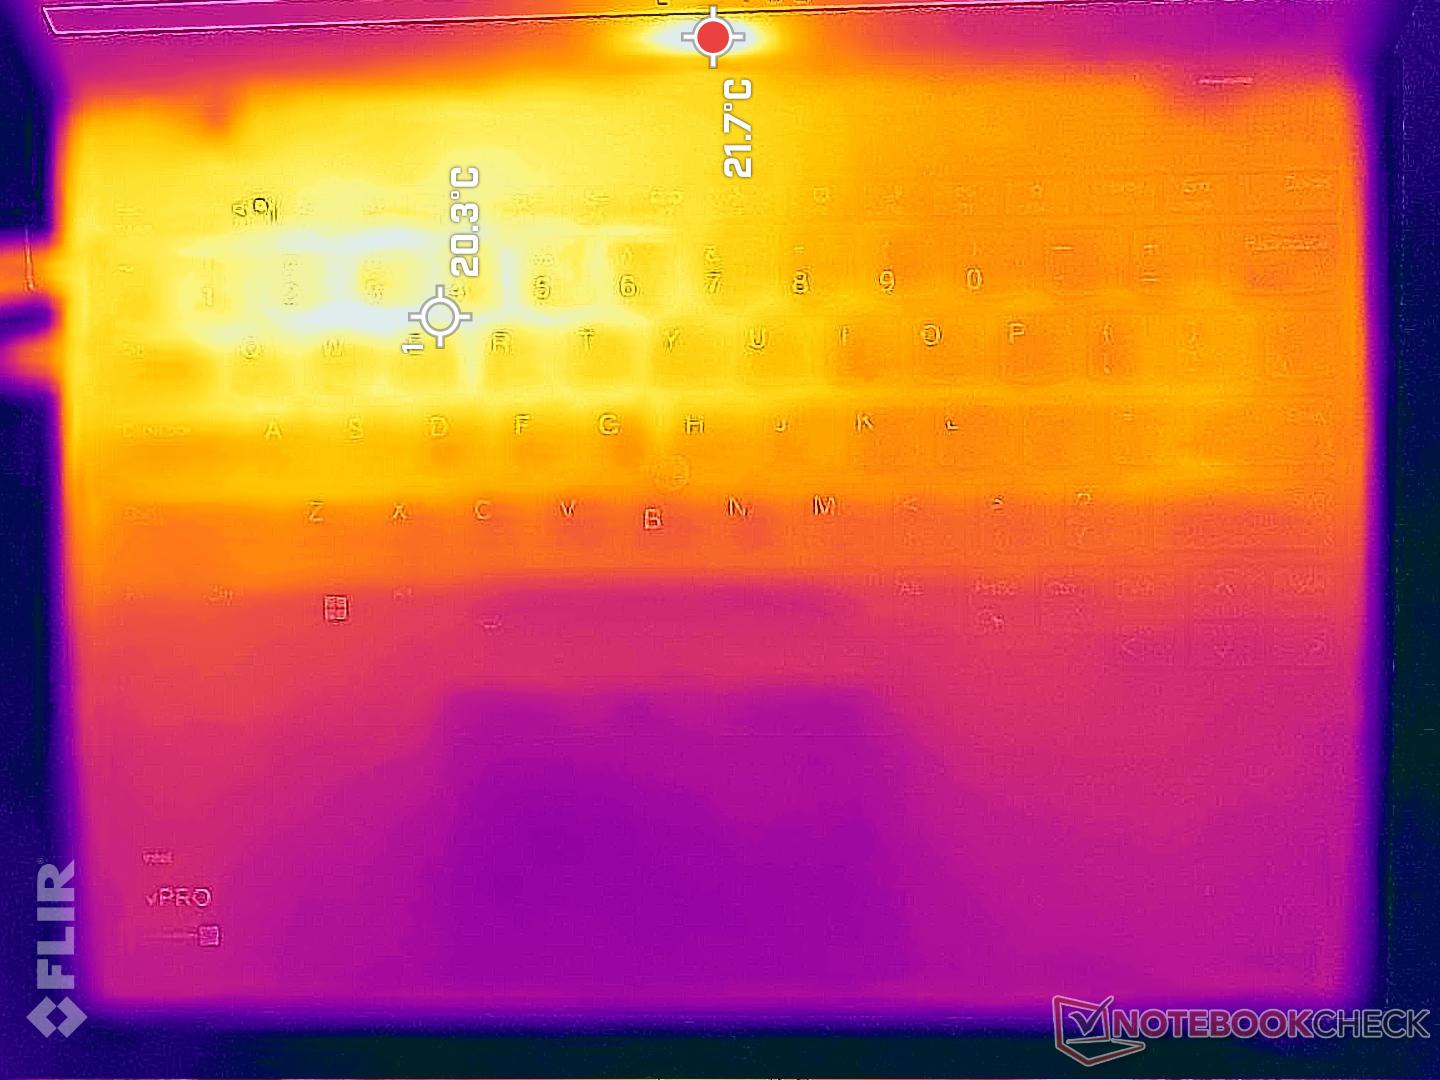
Temperatur
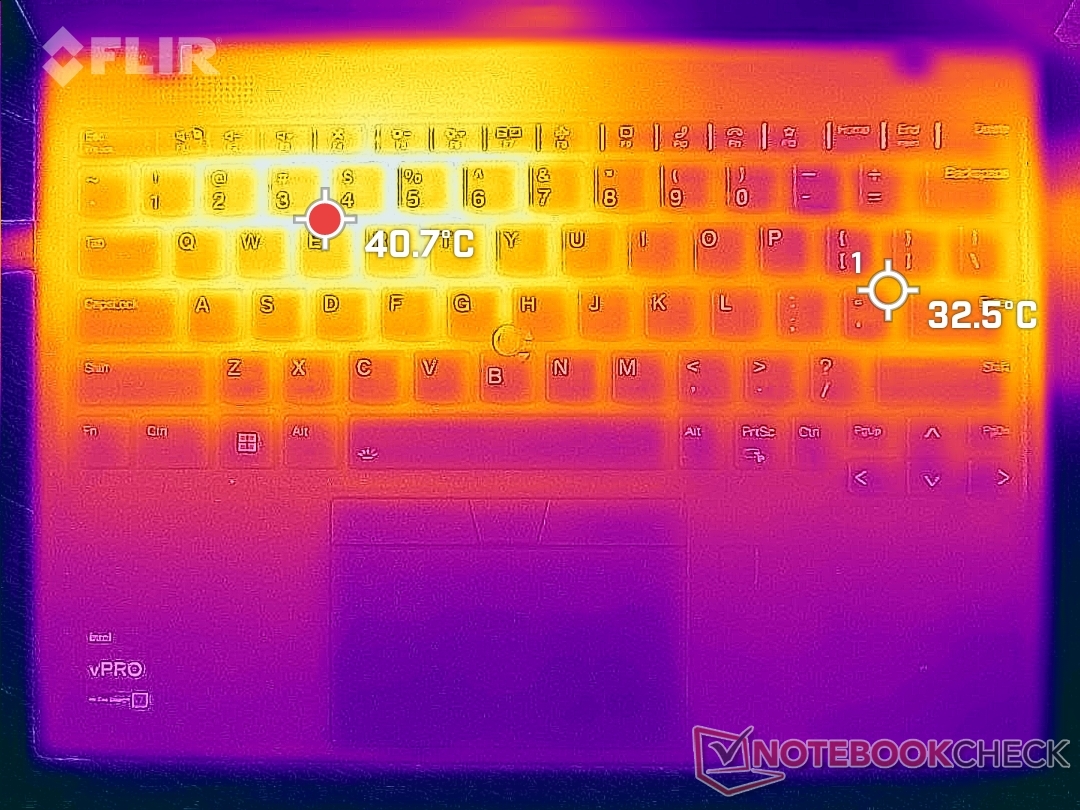
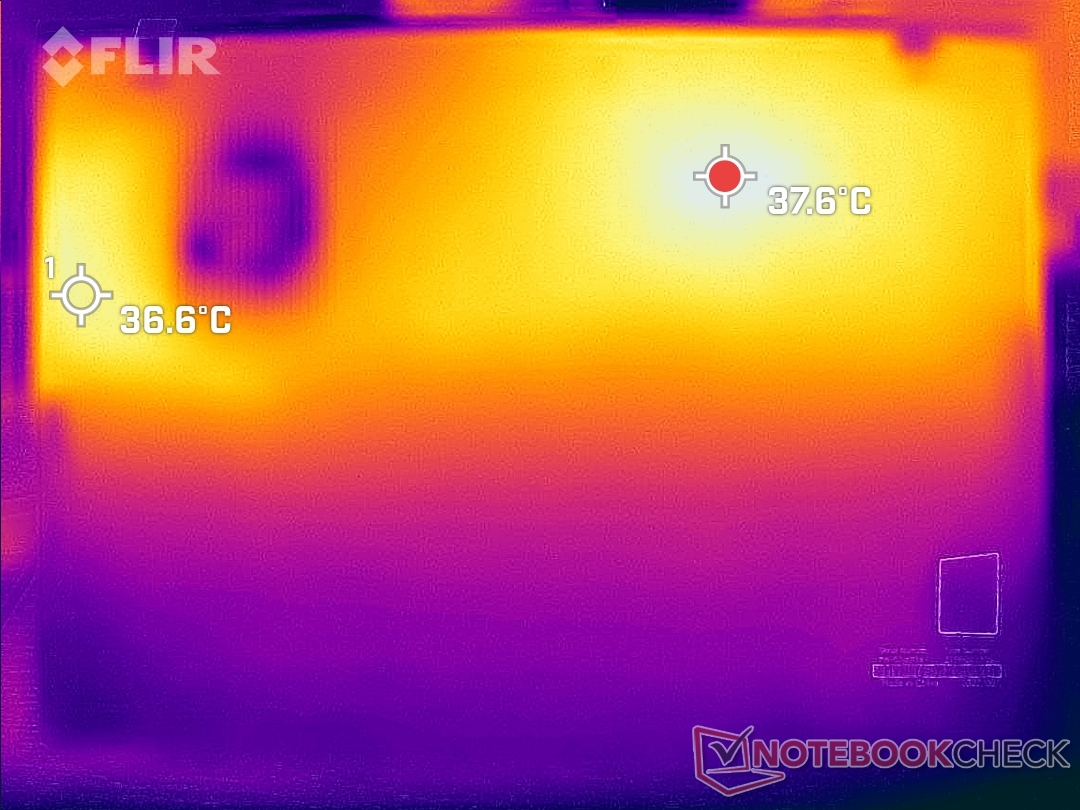
Die Oberflächentemperaturen sind bei unserem neuen Modell nicht höher als beim Vorgänger. Tatsächlich ist die wärmste Stelle auf der Unterseite mit 40 °C statt 48 °C sogar Kühler, was jedoch vermutlich auf das oben erwähnte, starke Drosseln zurückzuführen ist. Wie die Wärmebilder unten zeigen, ist die linke Hälfte der Tastatur ist immer etwas wärmer als die rechte, da sich die CPU in der linken Hälfte des Gehäuses befindet.
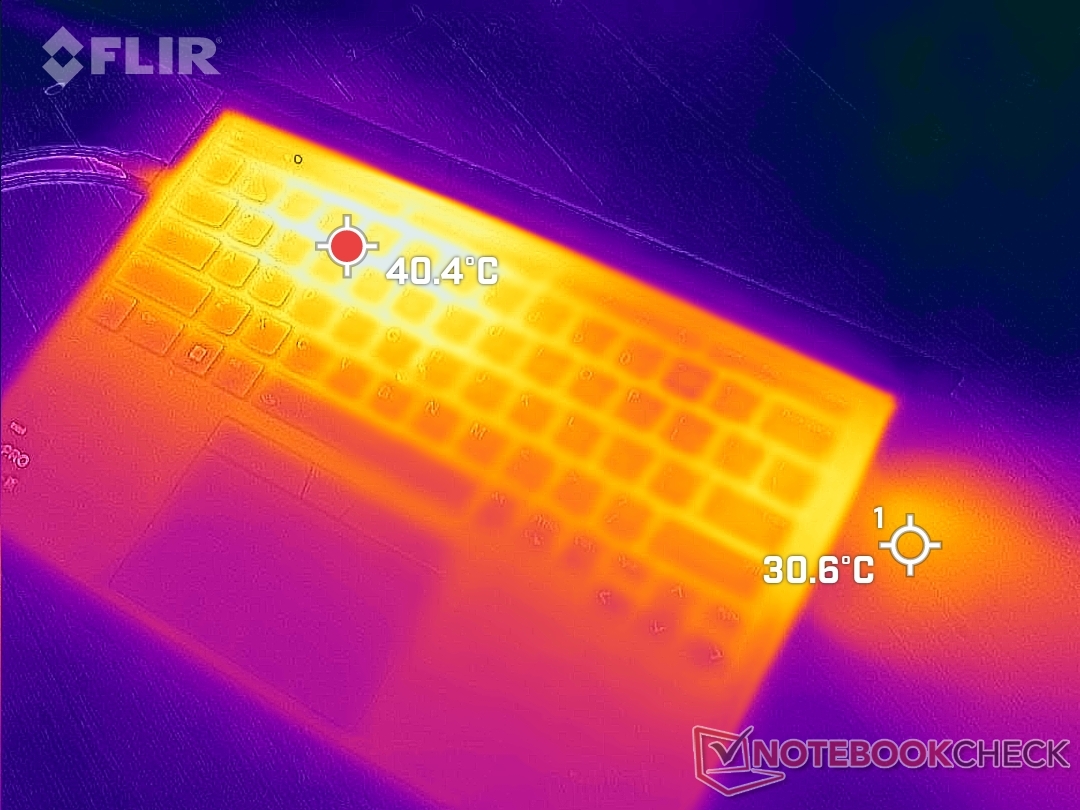
(±) Die maximale Temperatur auf der Oberseite ist 42.4 °C. Im Vergleich liegt der Klassendurchschnitt bei 35.9 °C (von 21.4 bis 59 °C für die Klasse Subnotebook).
(±) Auf der Unterseite messen wir eine maximalen Wert von 40.2 °C (im Vergleich zum Durchschnitt von 39.2 °C).
(+) Ohne Last messen wir eine durchschnittliche Temperatur von 25.3 °C auf der Oberseite. Der Klassendurchschnitt erreicht 30.8 °C.
(+) Die Handballen und der Touchpad-Bereich sind mit gemessenen 30.2 °C kühler als die typische Hauttemperatur und fühlen sich dadurch kühl an.
(±) Die durchschnittliche Handballen-Temperatur anderer getesteter Geräte war 28.2 °C (-2 °C).

| Lenovo ThinkPad X1 Nano Gen 2 Core i7-1280P Intel Core i7-1280P, Intel Iris Xe Graphics G7 96EUs | Lenovo ThinkPad X1 Nano-20UN002UGE Intel Core i7-1160G7, Intel Iris Xe Graphics G7 96EUs | HP Elite Dragonfly G3 Intel Core i7-1265U, Intel Iris Xe Graphics G7 96EUs | Dell Latitude 13 7330 Intel Core i7-1265U, Intel Iris Xe Graphics G7 96EUs | Framework Laptop 13.5 12th Gen Intel Intel Core i7-1260P, Intel Iris Xe Graphics G7 96EUs | Huawei MateBook X Pro 2021 Intel Core i7-1165G7, Intel Iris Xe Graphics G7 96EUs | |
|---|---|---|---|---|---|---|
| Hitze | 1% | 2% | 8% | 4% | -7% | |
| Last oben max * (°C) | 42.4 | 42.2 -0% | 39 8% | 38.6 9% | 36.8 13% | 42.2 -0% |
| Last unten max * (°C) | 40.2 | 47.5 -18% | 42.2 -5% | 42 -4% | 42.4 -5% | 40.4 -0% |
| Idle oben max * (°C) | 27.8 | 24.3 13% | 26.8 4% | 23.8 14% | 24.2 13% | 31.2 -12% |
| Idle unten max * (°C) | 27.8 | 25.3 9% | 28.2 -1% | 24.6 12% | 29 -4% | 32.2 -16% |
* ... kleinere Werte sind besser
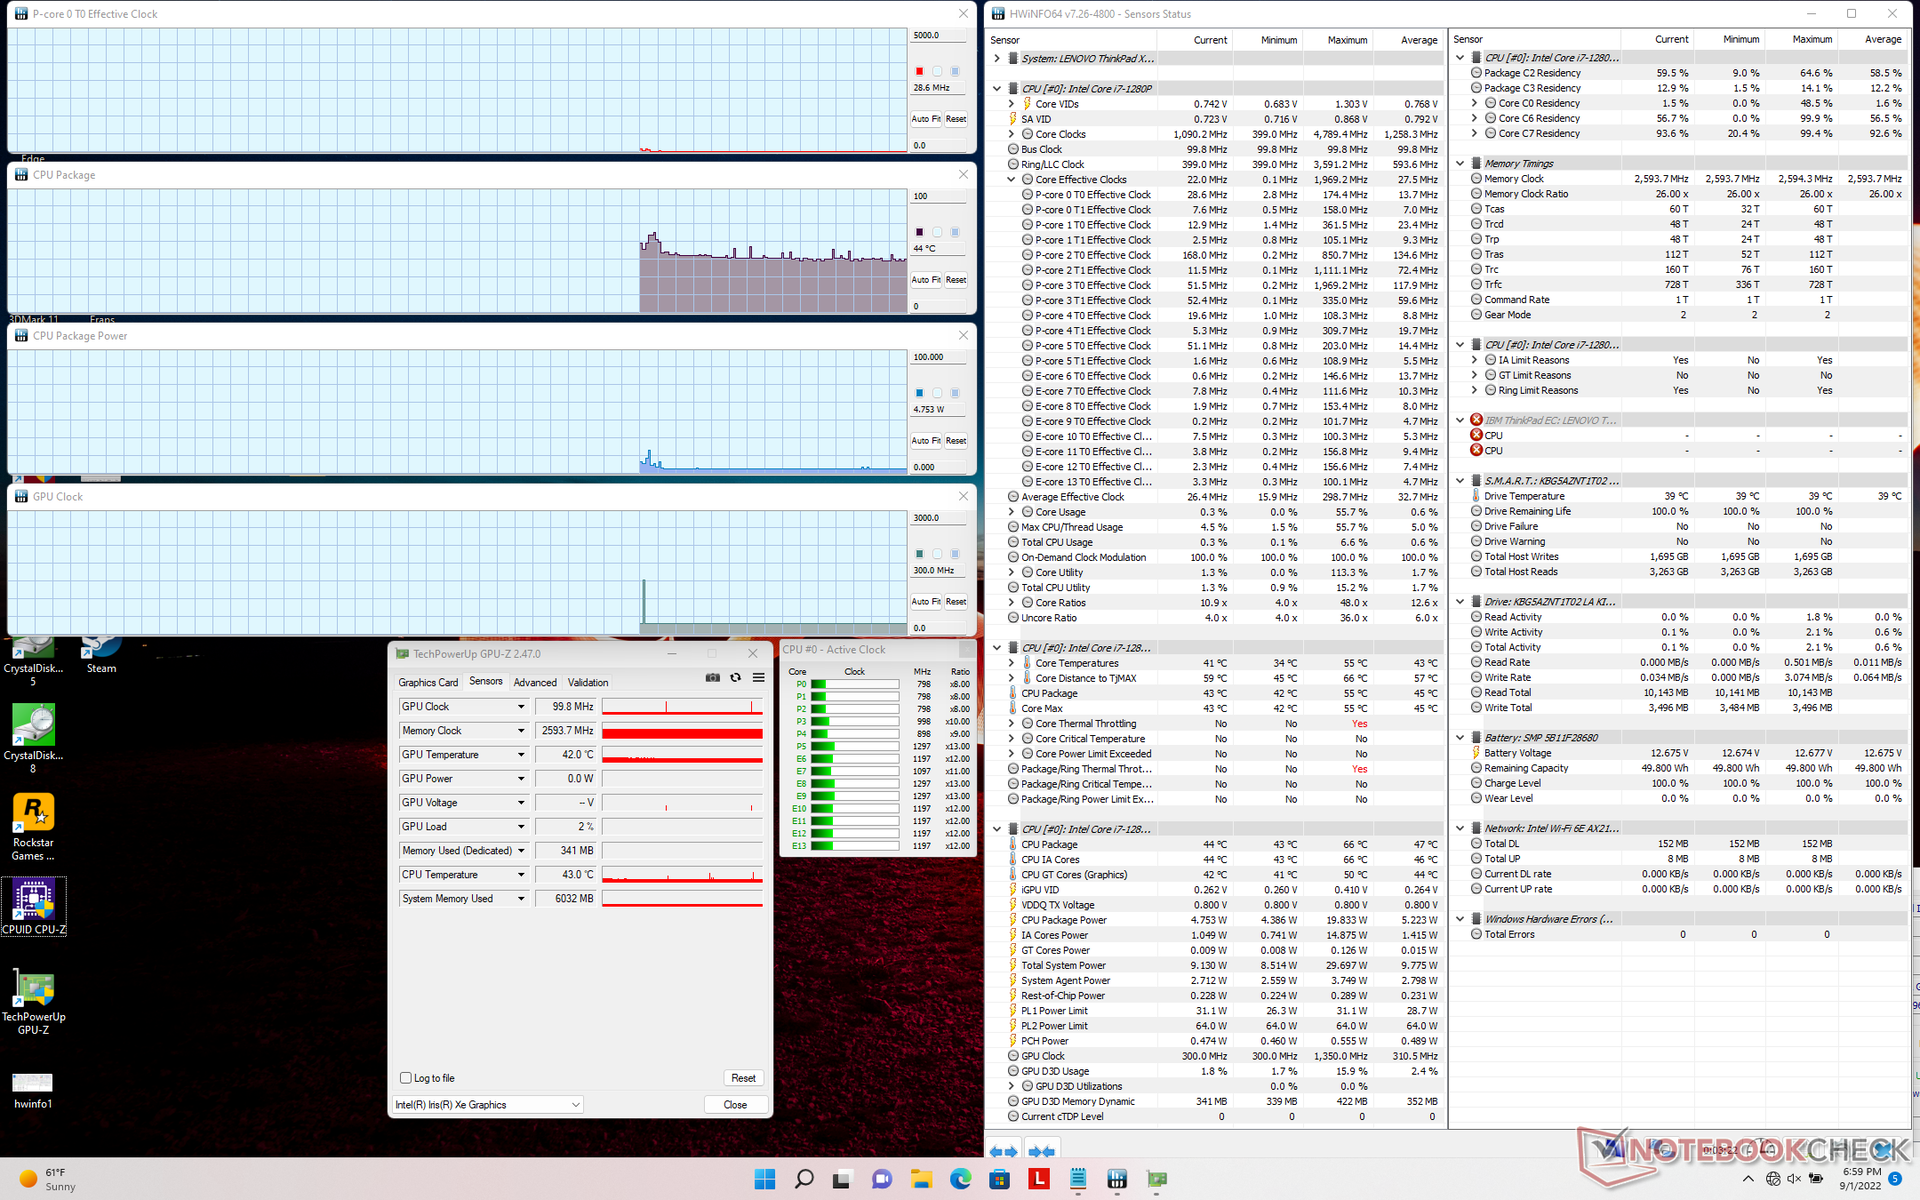
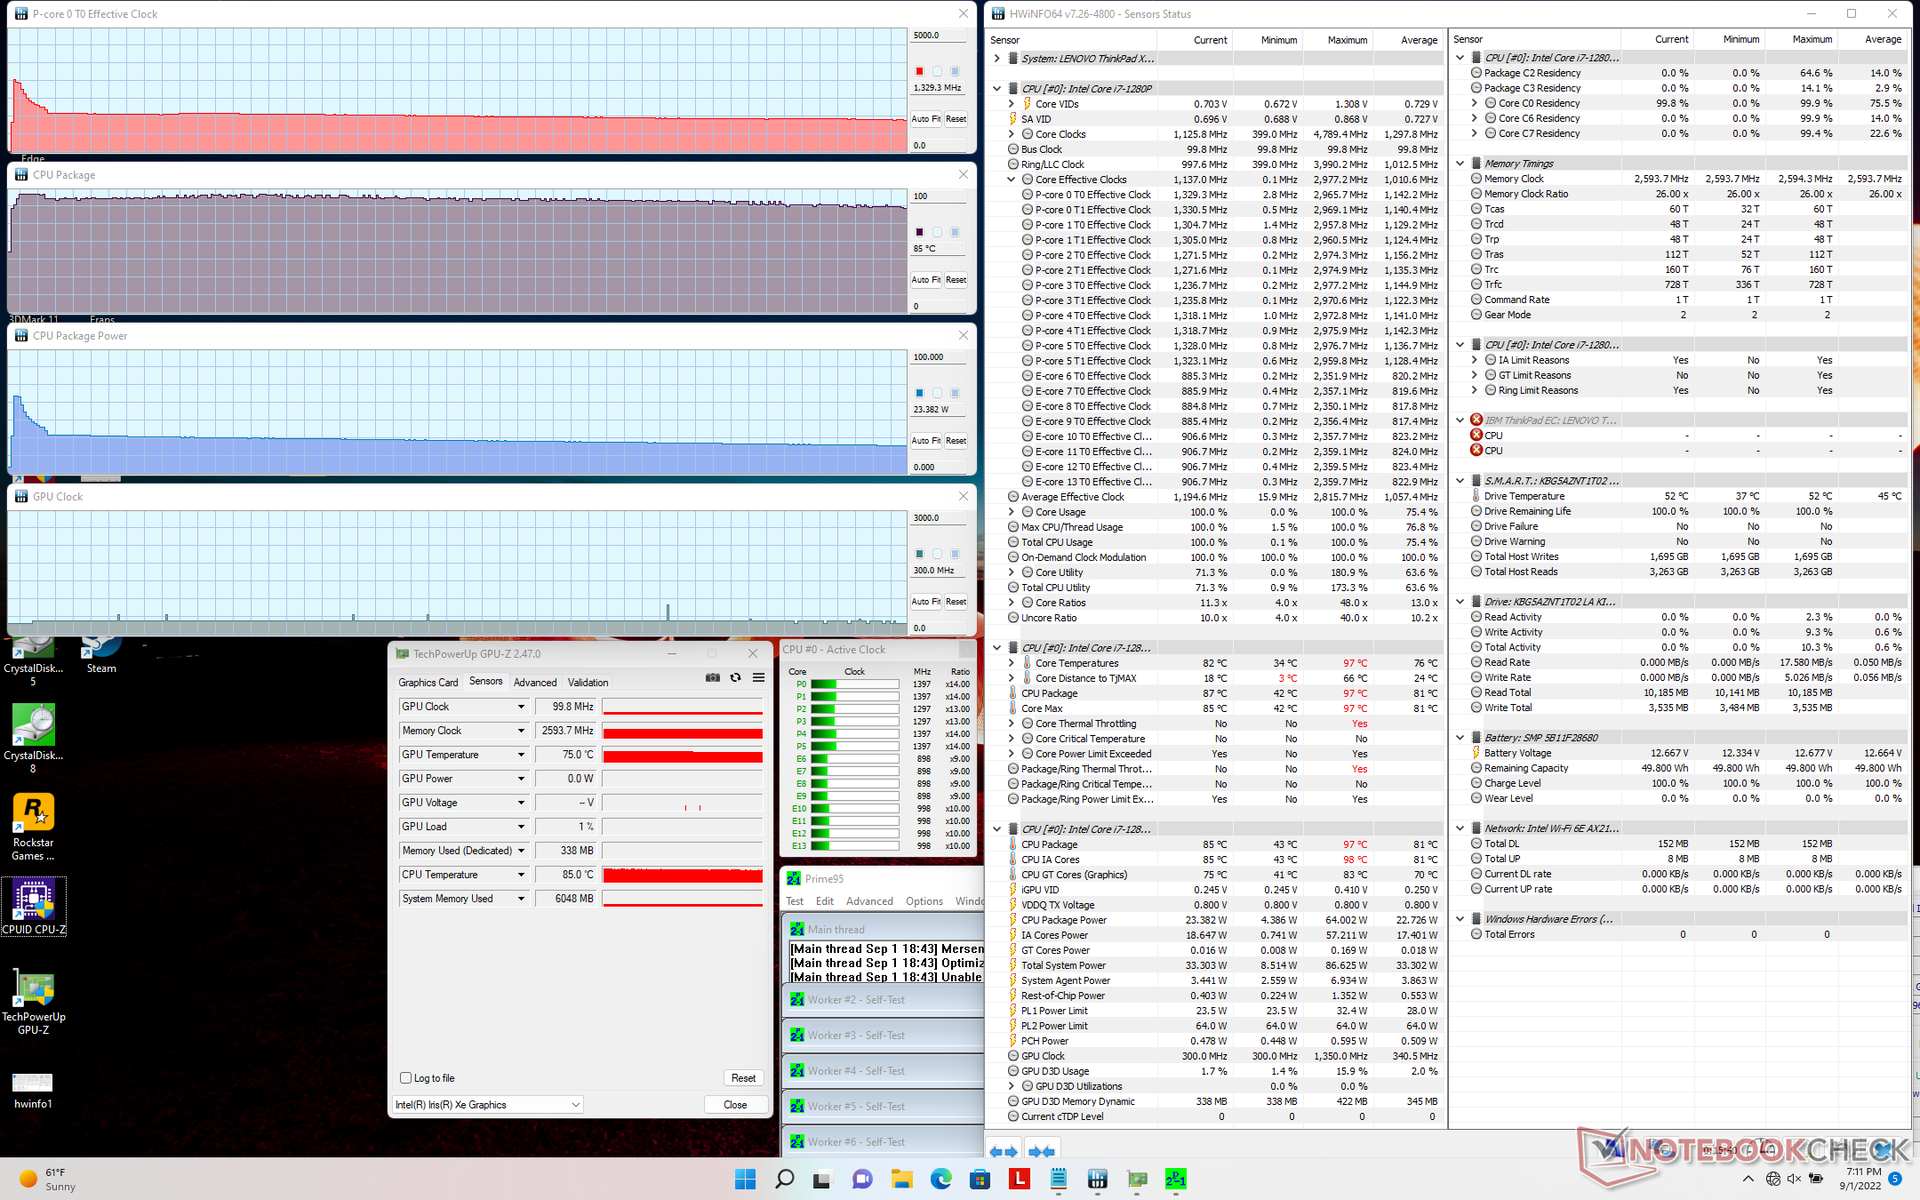
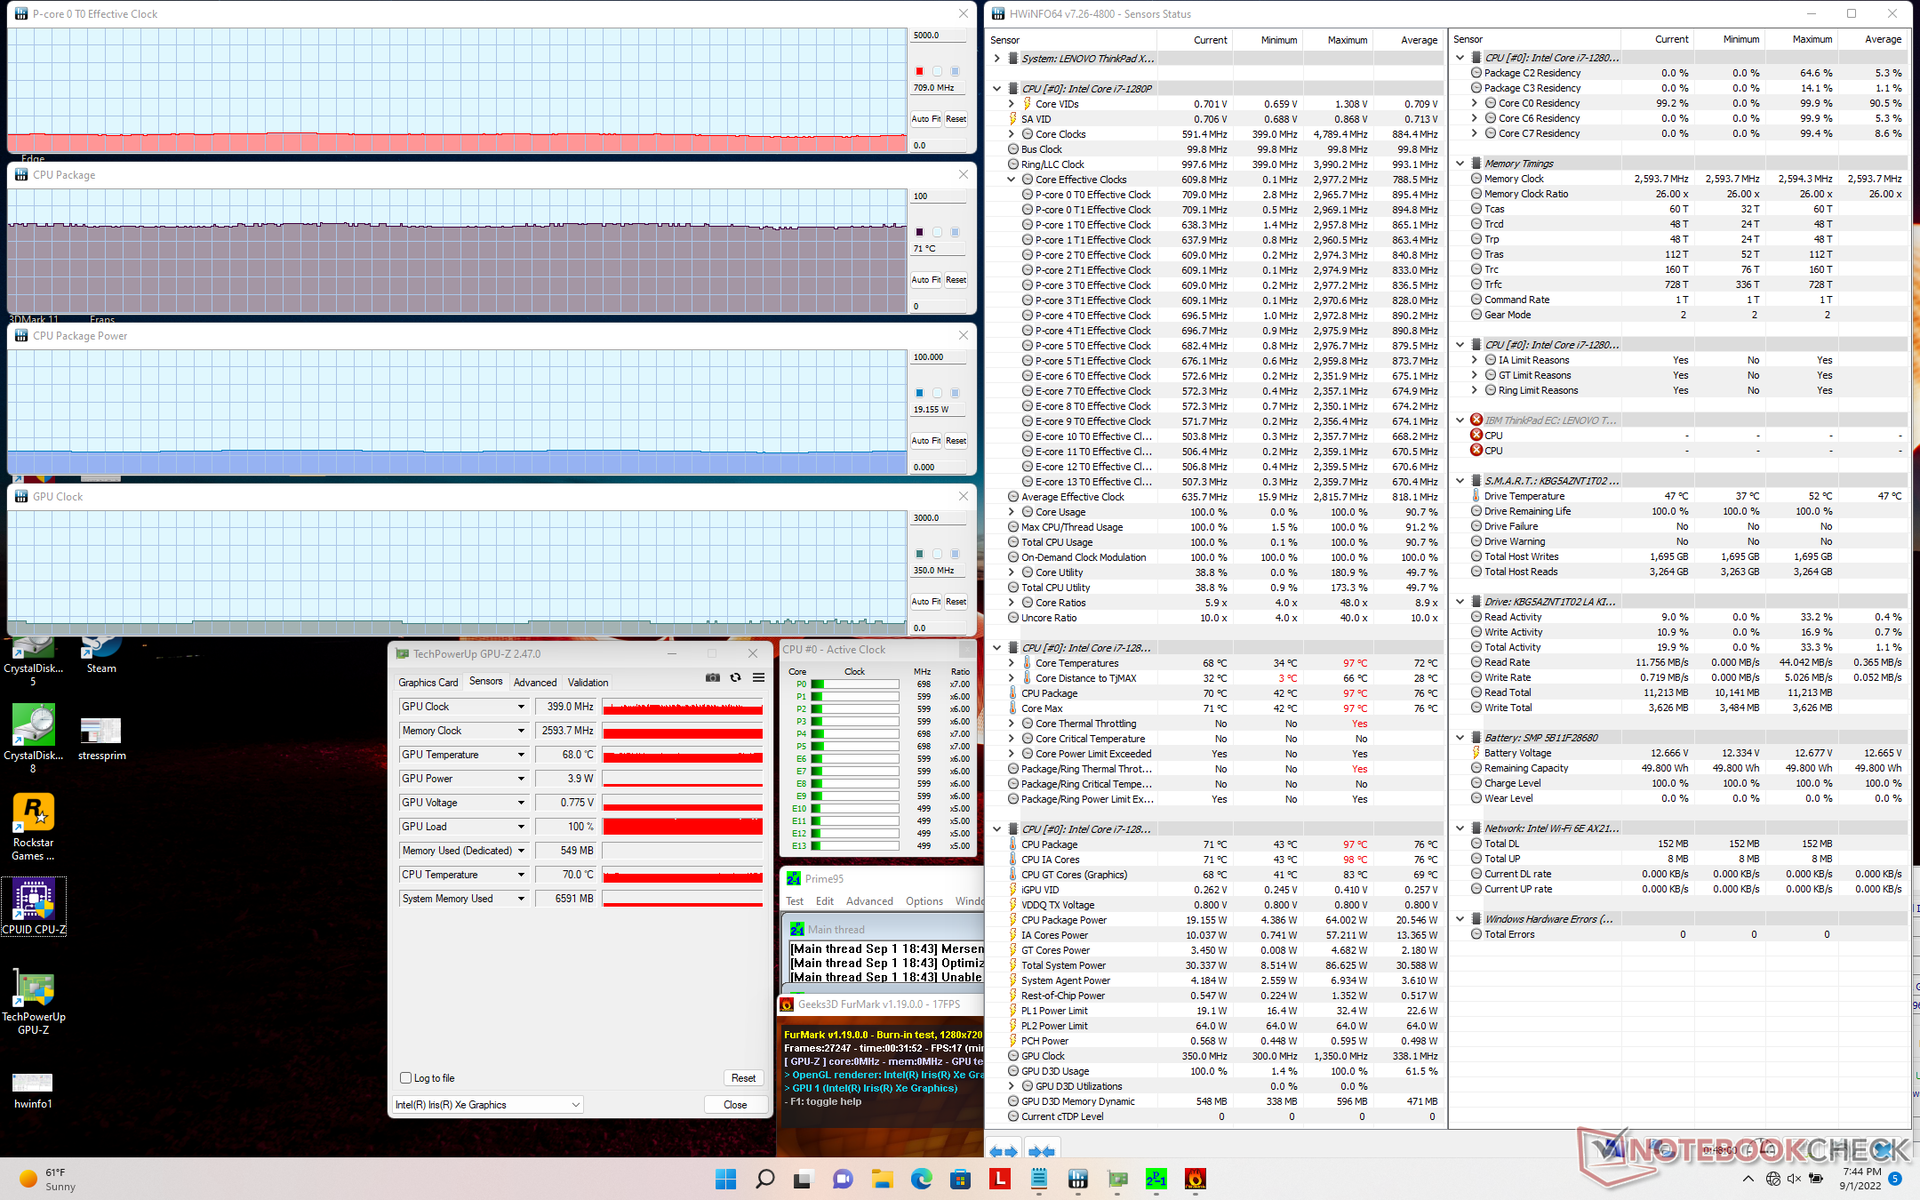
Stresstest
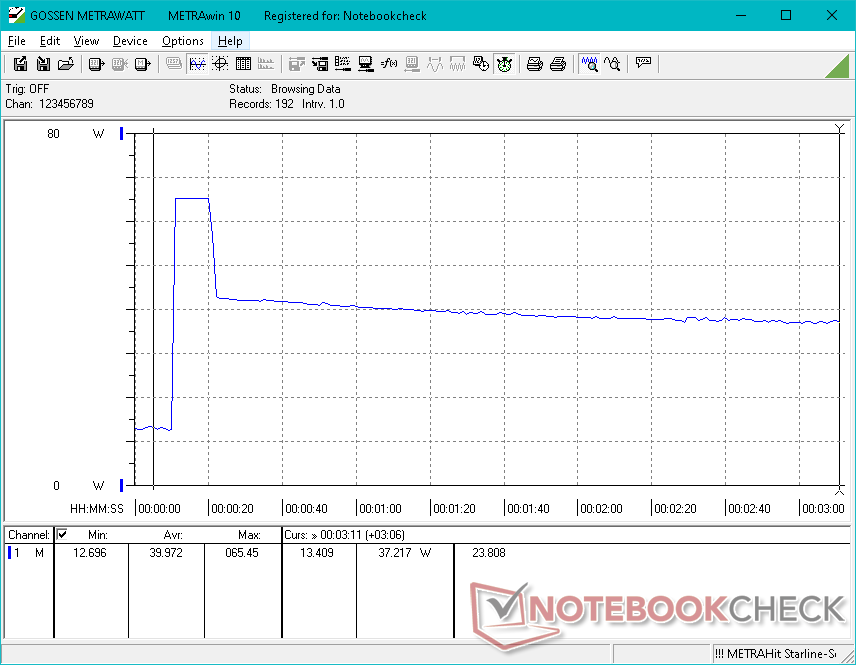
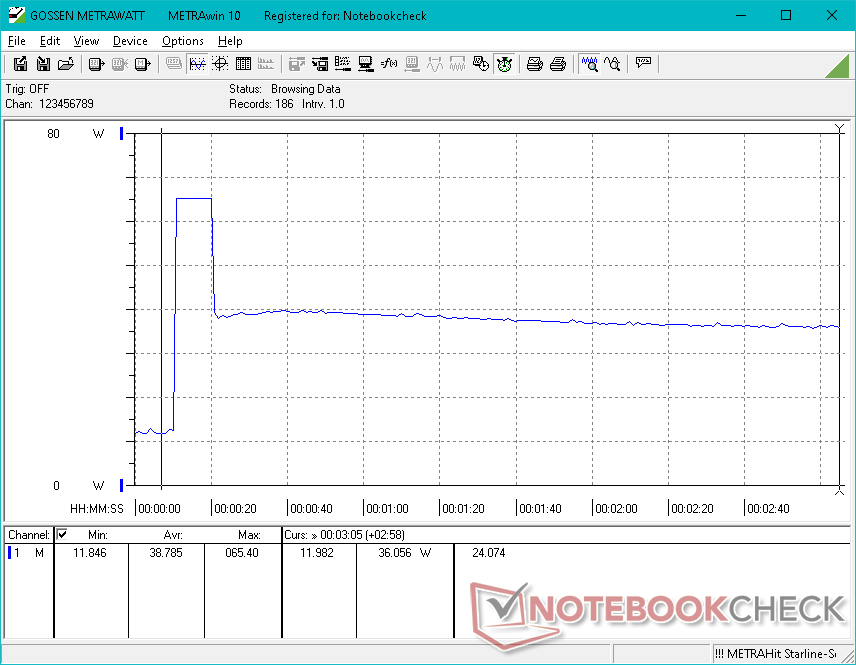
Beim Auslasten der CPU mithilfe von Prime95 steigen die CPU-Taktfrequenz und der Gesamtverbrauch (Board Power Draw) auf 3 GHz bzw. 64 W. Allerdings wird dabei auch eine kritische Temperatur von 97 °C erreicht, weshalb der maximale Turbo Boost nur wenige Sekunden lang anhält und die Taktfrequenzen und der Gesamtverbrauch (Board Power Draw) auf nur 1,3 GHz bzw. 23 W fallen, um eine etwas kühlere Kerntemperatur von 85 °C zu ermöglichen. Dagegen resultiert der gleiche Test beim größeren und schwereren Framework Laptop, der mit der i7-1260P-CPU ausgestattet ist, in höheren konstanten Taktfrequenzen von ca. 2,5 GHz.
Der GPU-Takt und die GPU-Temperatur stabilisieren sich beim ausführen von The Witcher 3 bei 948 MHz bzw. 69, beim zuvor erwähnten Framework-Gerät sind es 1.396 MHz bzw. 83 °C.
Im Akkumodus ist die Leistung nicht eingeschränkt. Ein 3DMark-11-Durchlauf liefert im Akkumodus Physik- und Grafikpunktzahlen von 13.122 bzw. 6.668 Punkten und im Netzbetrieb 11.415 bzw. 6.937 Punkte.
| CPU-Takt (GHz) | GPU-Takt (MHz) | Durchschnittliche CPU-Temperatur (°C) | |
| Leerlauf | -- | -- | 44 |
| Prime95-Stress | 1,3 | -- | 85 |
| Prime95-+FurMark-Stress | 0,7 | 399 | 71 |
| Witcher-3-Stress | ~0,5 | 948 | 69 |
Lautsprecher
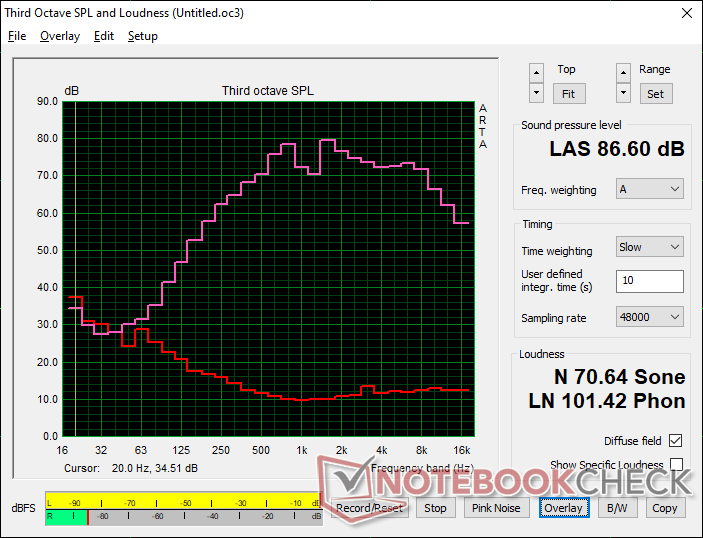
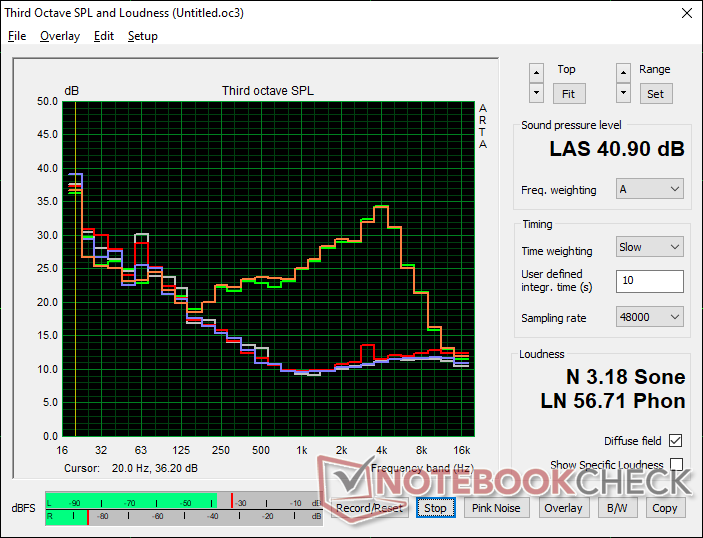
Lenovo ThinkPad X1 Nano Gen 2 Core i7-1280P Audio Analyse
(+) | Die Lautsprecher können relativ laut spielen (86.6 dB)
Bass 100 - 315 Hz
(-) | kaum Bass - 16.3% niedriger als der Median
(±) | durchschnittlich lineare Bass-Wiedergabe (8.4% Delta zum Vorgänger)
Mitteltöne 400 - 2000 Hz
(+) | ausgeglichene Mitten, vom Median nur 4% abweichend
(±) | Linearität der Mitten ist durchschnittlich (7.3% Delta zum Vorgänger)
Hochtöne 2 - 16 kHz
(+) | ausgeglichene Hochtöne, vom Median nur 2.7% abweichend
(+) | sehr lineare Hochtöne (3% Delta zum Vorgänger)
Gesamt im hörbaren Bereich 100 - 16.000 Hz
(+) | hörbarer Bereich ist sehr linear (12.8% Abstand zum Median
Im Vergleich zu allen Geräten derselben Klasse
» 19% aller getesteten Geräte dieser Klasse waren besser, 4% vergleichbar, 77% schlechter
» Das beste Gerät hat einen Delta-Wert von 5%, durchschnittlich ist 18%, das schlechteste Gerät hat 53%
Im Vergleich zu allen Geräten im Test
» 12% aller getesteten Geräte waren besser, 3% vergleichbar, 85% schlechter
» Das beste Gerät hat einen Delta-Wert von 4%, durchschnittlich ist 24%, das schlechteste Gerät hat 134%
Apple MacBook Pro 16 2021 M1 Pro Audio Analyse
(+) | Die Lautsprecher können relativ laut spielen (84.7 dB)
Bass 100 - 315 Hz
(+) | guter Bass - nur 3.8% Abweichung vom Median
(+) | lineare Bass-Wiedergabe (5.2% Delta zum Vorgänger)
Mitteltöne 400 - 2000 Hz
(+) | ausgeglichene Mitten, vom Median nur 1.3% abweichend
(+) | lineare Mitten (2.1% Delta zum Vorgänger)
Hochtöne 2 - 16 kHz
(+) | ausgeglichene Hochtöne, vom Median nur 1.9% abweichend
(+) | sehr lineare Hochtöne (2.7% Delta zum Vorgänger)
Gesamt im hörbaren Bereich 100 - 16.000 Hz
(+) | hörbarer Bereich ist sehr linear (4.6% Abstand zum Median
Im Vergleich zu allen Geräten derselben Klasse
» 0% aller getesteten Geräte dieser Klasse waren besser, 0% vergleichbar, 100% schlechter
» Das beste Gerät hat einen Delta-Wert von 5%, durchschnittlich ist 17%, das schlechteste Gerät hat 45%
Im Vergleich zu allen Geräten im Test
» 0% aller getesteten Geräte waren besser, 0% vergleichbar, 100% schlechter
» Das beste Gerät hat einen Delta-Wert von 4%, durchschnittlich ist 24%, das schlechteste Gerät hat 134%
Energieverwaltung
Energieaufnahme
Da es sich hierbei um eines der wenigen 13-Zoll-Subnotebooks mit einem Core-P-CPU handelt, ist der Verbrauch insgesamt höher. Im Leerlauf auf dem Desktop werden zwischen 3 und 15 W verbraucht, während das HP Dragonfly G3, Latitude 7330 und das ursprüngliche ThinkPad X1 Nano unter ähnlichen Bedingungen maximal 7-9 W benötigen.
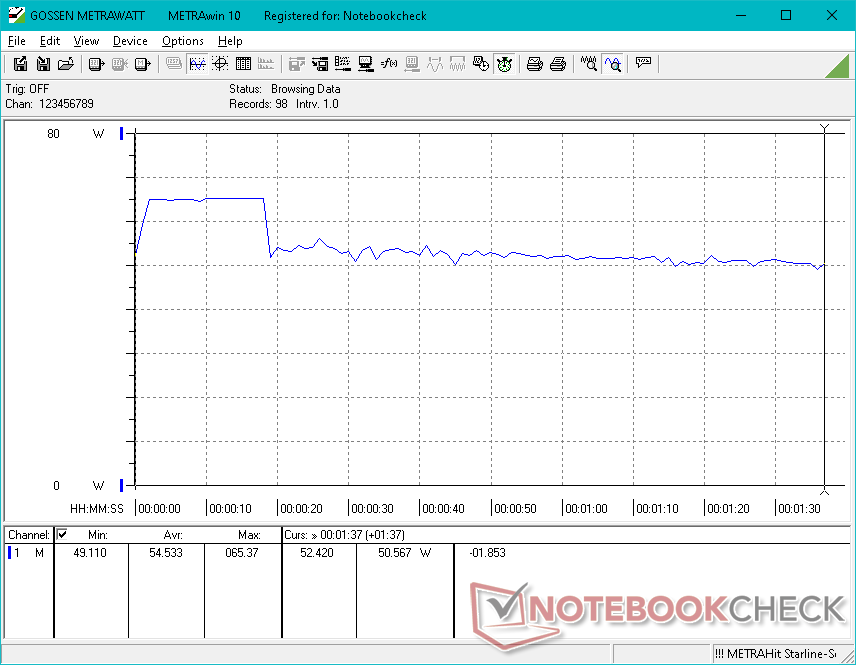
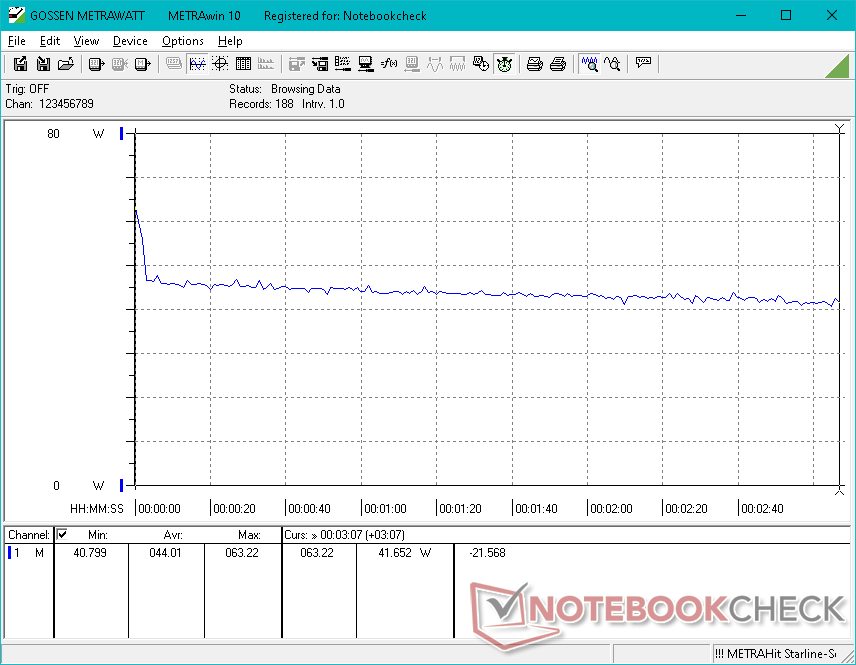
Die Verbrauchsdifferenz steigt unter hoher Last noch weiter. Beim Ausführen von 3DMark 06 und dem Spielen von The Witcher 3 werden beispielsweise zwischen 44 und 55 W und damit deutlich mehr als von den zuvor genannten HP-, Dell und X1-Nano-Geräten verbraucht. Der Core i7-1280P ist also schneller, die zusätzliche Leistung hat jedoch ihren Preis.
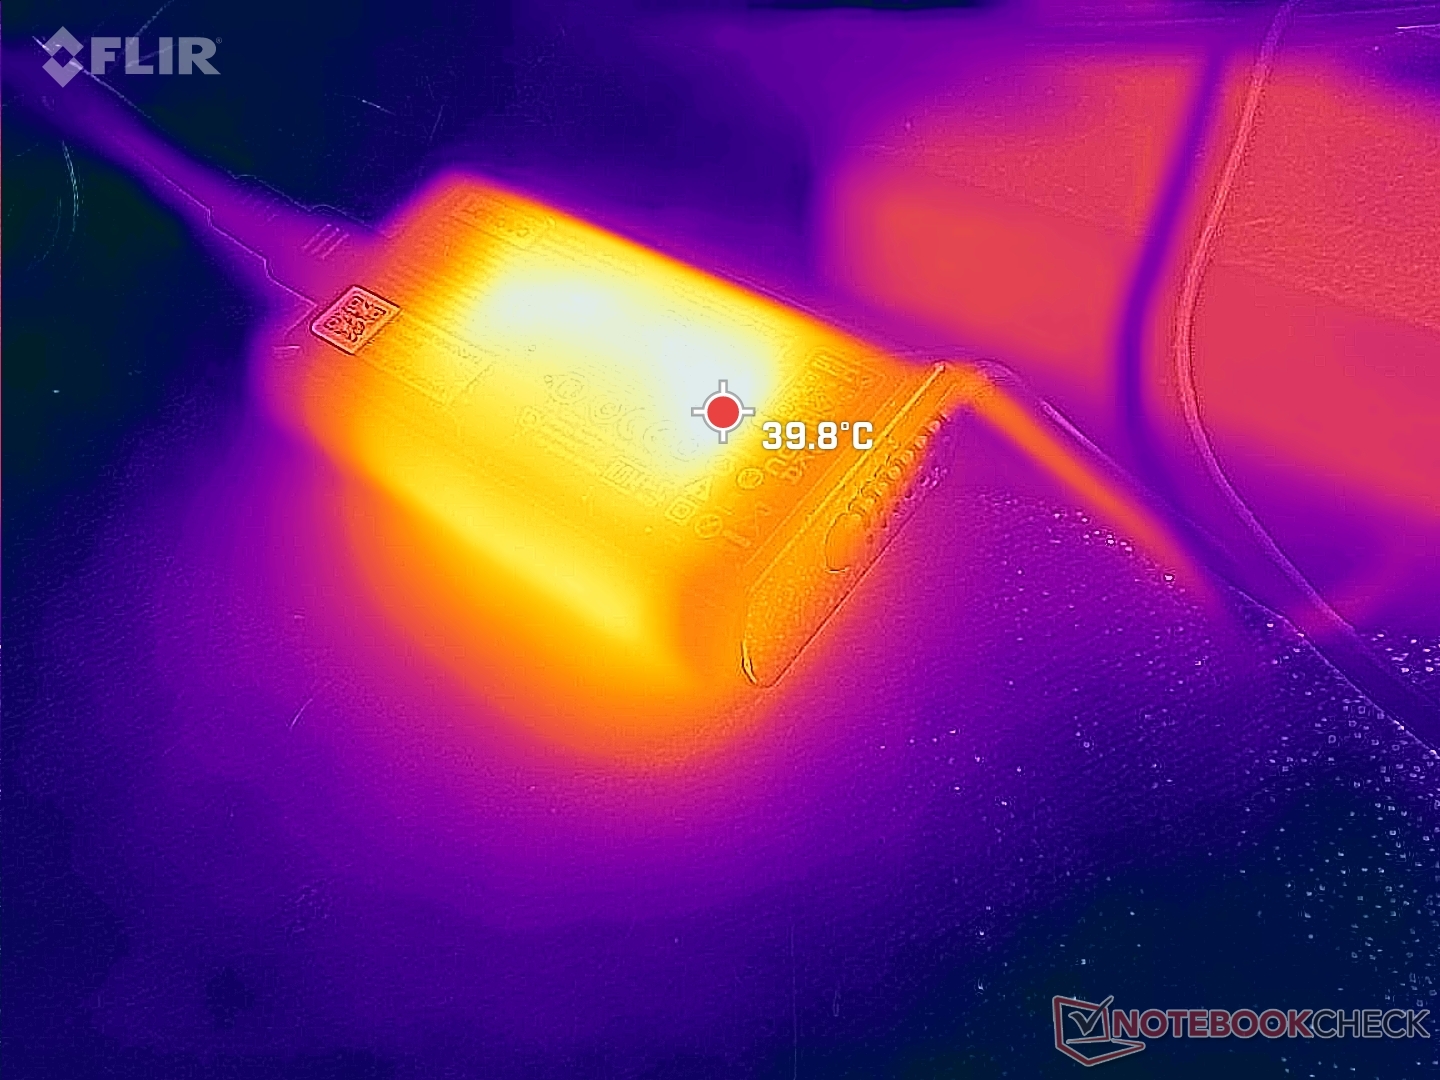
Wir konnten vor dem Drosseln einen maximalen verbrauch von 65,4 W an dem kleinen (~8,7 x 5,2 x 2,2 cm) 65-W-Netzteil messen, wie die Screenshots unten zeigen.
| Aus / Standby | |
| Idle | |
| Last |
|
Legende:
min: | |
| Lenovo ThinkPad X1 Nano Gen 2 Core i7-1280P i7-1280P, Iris Xe G7 96EUs, Kioxia BG5 KBG5AZNT1T02, IPS, 2160x1350, 13" | Lenovo ThinkPad X1 Nano-20UN002UGE i7-1160G7, Iris Xe G7 96EUs, WDC PC SN530 SDBPNPZ-512G, IPS, 2160x1350, 13" | HP Elite Dragonfly G3 i7-1265U, Iris Xe G7 96EUs, Micron 3400 MTFDKBA512TFH 512GB, IPS, 1920x1280, 13.5" | Dell Latitude 13 7330 i7-1265U, Iris Xe G7 96EUs, Toshiba KBG40ZNS512G NVMe, IPS, 1920x1080, 13.3" | Framework Laptop 13.5 12th Gen Intel i7-1260P, Iris Xe G7 96EUs, WDC PC SN730 SDBPNTY-512G, IPS, 2256x1504, 13.5" | Huawei MateBook X Pro 2021 i7-1165G7, Iris Xe G7 96EUs, Samsung PM981a MZVLB1T0HBLR, IPS, 3000x2000, 13.9" | |
|---|---|---|---|---|---|---|
| Stromverbrauch | 25% | 16% | 21% | -11% | -11% | |
| Idle min * (Watt) | 3.4 | 3.3 3% | 3.4 -0% | 2.8 18% | 5.3 -56% | 6.7 -97% |
| Idle avg * (Watt) | 6.5 | 5.7 12% | 5.6 14% | 4.8 26% | 8.4 -29% | 10 -54% |
| Idle max * (Watt) | 14.4 | 9.1 37% | 8.4 42% | 7.3 49% | 11.2 22% | 10.3 28% |
| Last avg * (Watt) | 54.5 | 29.6 46% | 40.8 25% | 48.1 12% | 57.4 -5% | 35.7 34% |
| Witcher 3 ultra * (Watt) | 44 | 27.7 37% | 35.5 19% | 35.4 20% | 46.7 -6% | 32.7 26% |
| Last max * (Watt) | 65.4 | 55.1 16% | 68.4 -5% | 63.6 3% | 61.2 6% | 67.6 -3% |
* ... kleinere Werte sind besser
Verbrauch Witcher 3 / Stresstest
Verbrauch externer Monitor
Akkulaufzeit
Die Laufzeiten fallen deutlich kürzer aus als beim Vorgänger und sind auch im ausbalancierten Leistungsprofil teilweise nur ungefähr halb (!) so hoch, was vermutlich auf die energiehungrige P-CPU zurückzuführen ist. Mit nur 5 Stunden praxisnaher WLAN-Laufzeit ist das X1 Nano Gen. 2 deutlich weniger ausdauernd als die meisten anderen Subnotebooks.
| Lenovo ThinkPad X1 Nano Gen 2 Core i7-1280P i7-1280P, Iris Xe G7 96EUs, 49.5 Wh | Lenovo ThinkPad X1 Nano-20UN002UGE i7-1160G7, Iris Xe G7 96EUs, 48.2 Wh | HP Elite Dragonfly G3 i7-1265U, Iris Xe G7 96EUs, 68 Wh | Dell Latitude 13 7330 i7-1265U, Iris Xe G7 96EUs, 41 Wh | Framework Laptop 13.5 12th Gen Intel i7-1260P, Iris Xe G7 96EUs, 55 Wh | Huawei MateBook X Pro 2021 i7-1165G7, Iris Xe G7 96EUs, 56 Wh | |
|---|---|---|---|---|---|---|
| Akkulaufzeit | 94% | 131% | 63% | 47% | 106% | |
| WLAN (h) | 5.1 | 9.9 94% | 11.8 131% | 8.3 63% | 7.5 47% | 10.5 106% |
| H.264 (h) | 15.4 | |||||
| Last (h) | 1.6 | 3.5 | 1.4 | 3 | ||
| Idle (h) | 37.8 | 21.9 | 19.5 |
Pro
Contra
Fazit — Ein leichter Sprinter, aber kein Marathonläufer
Das ThinkPad X1 Nano Gen. 2 ist das Paradebeispiel dafür, was passiert, wenn man eine 15-W-CPU in einem Laptop, der für eine 15-W-CPU konzipiert ist, durch eine 28-W-CPU ersetzt. Die Leistung ist zwar höher, sie kann jedoch aufgrund der begrenzten Möglichkeiten der Kühllösung nur kurzfristig aufrechterhalten werden. Daher spielt der Laptop seine Stärken am besten aus, wenn man einen kurzen Leistungsschub benötigt wie zum Beispiel beim Starten von Anwendungen, der gelegentlichen Bildbearbeitung und dem Entpacken von kleinen Dateien. Wer hingegen größere Aufgaben bewältigen möchte und den CPU-Turbo länger nutzen möchte, wird hier möglicherweise enttäuscht. Dieser Nachteil ist allerdings unter sehr leichten (<1 kg) Laptops wie unserem Testgerät, dem Dragonfly G3, Latitude 7330 und dem LG Gram keine Seltenheit.
Erwähnenswert ist außerdem, dass die Akkulaufzeit deutlich gesunken ist, da die Akkukapazität im Prinzip unverändert bleibt, obwohl neuere und energiehungrigere CPUs zum Einsatz kommen. Daher muss man auf Reisen sorgfältiger planen.
Dass das ThinkPad X1 Nano Gen. 2 schneller als sein Vorgänger ist, lässt sich nicht bestreiten. Die zusätzliche Leistung geht jedoch auf Kosten der Laufzeiten und mit möglichem Leistungsdrosseln einher.
Trotz des eingeschränkten Turbo-Boost-Potenzials der CPU ist das X1 Nano Gen. 2 ein deutlich schnellerer Laptop als sein Vorgänger und das ohne Änderungen am Gehäuse, Display oder dem Gewicht. Wer eine höhere Prozessorleistung benötigt, sollte jedoch einen schwereren Laptop mit einer besseren Kühllösung wie zum Beispiel ein ThinkPad T in Betracht ziehen.
Preis und Verfügbarkeit
Das ThinkPad X1 Nano Gen. 2 ist zum beispiel bei Lenovo direkt und Amazon.de verfügbar und kostet in der Variante mit dem Core i7 und dem 2K-Display rund 2.450 Euro.
Lenovo ThinkPad X1 Nano Gen 2 Core i7-1280P
- 04.09.2022 v7 (old)
Allen Ngo
Preisvergleich

