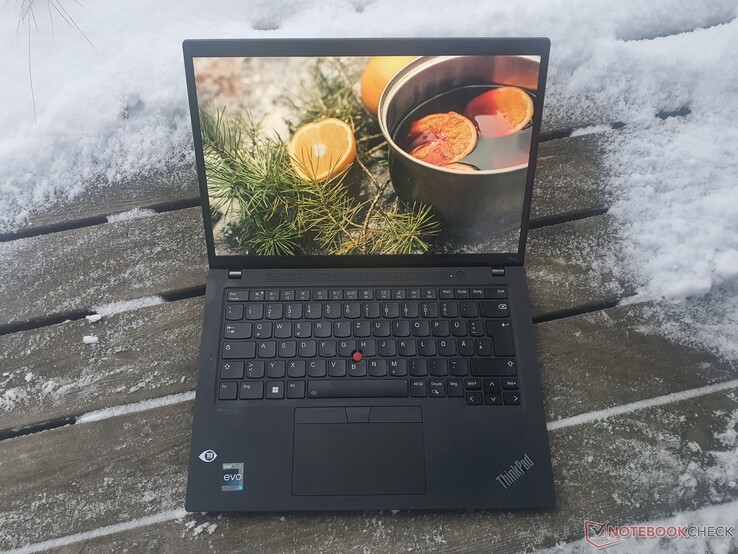
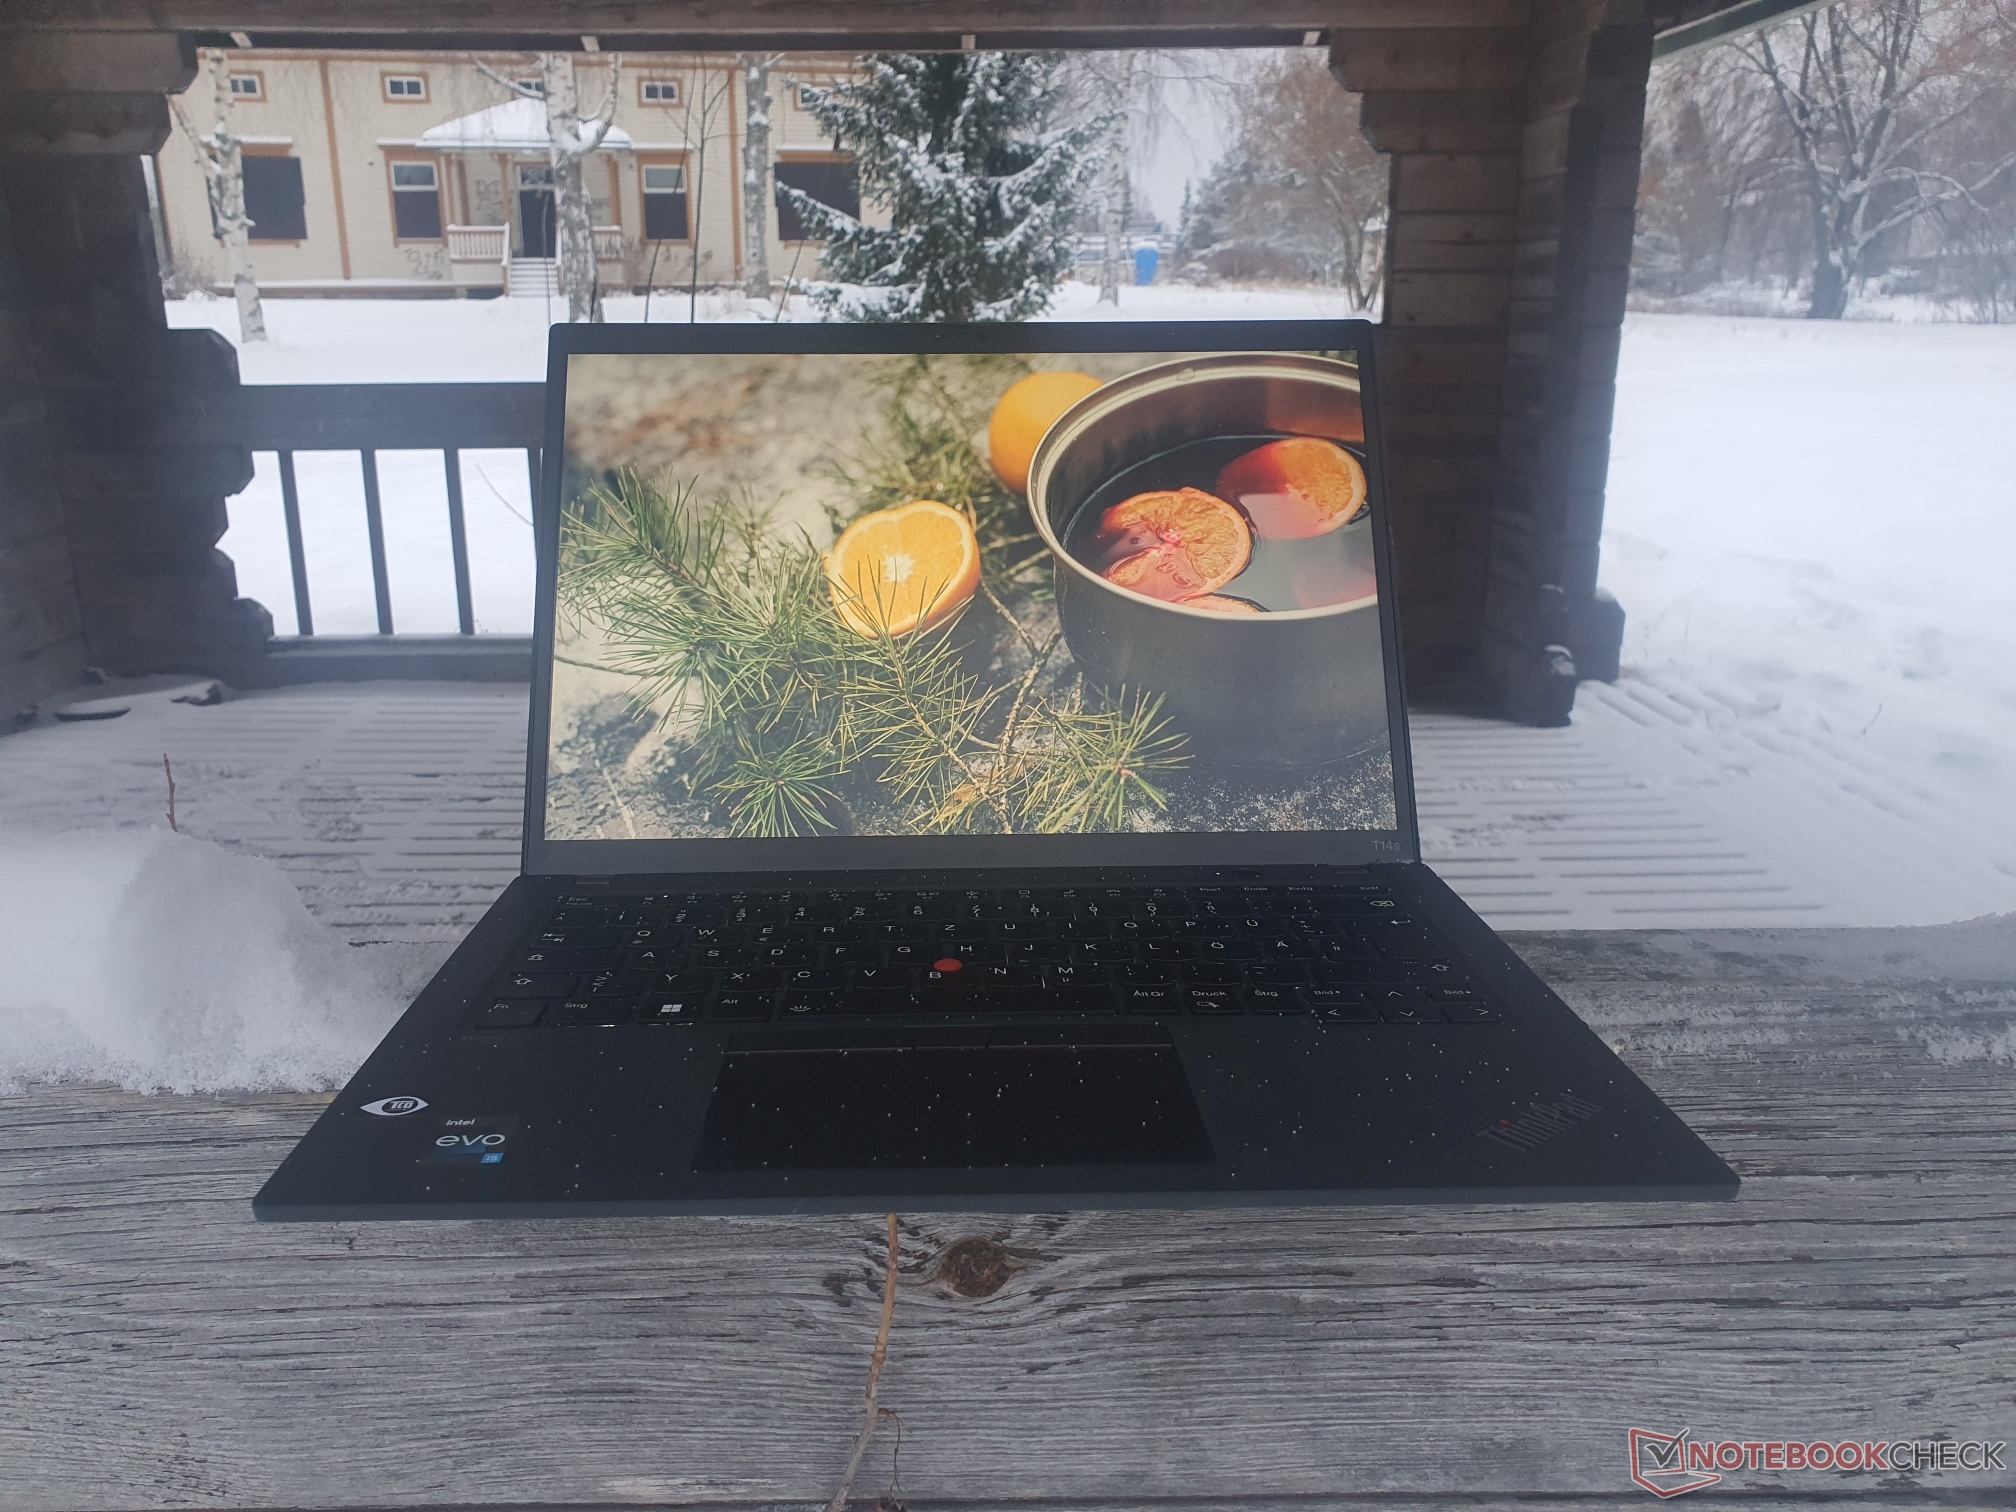
Lenovo ThinkPad T14s G3 Intel Laptop-Test: Leise, sparsam und schnell
Das neueste ThinkPad T14s G3 erhält im Zuge eines Redesigns durch Lenovo endlich ein 16:10-Display und sogar die heiß ersehnte 3K-OLED-Option, während Intel-CPUs mit einer 28-W-TDP anstelle von 15 W eingesetzt werden. All das in einem kompakteren, robusten und je nach Konfiguration leichterem Gehäuse. Insgesamt nähert es sich daher mehr dem ThinkPad X1 Carbon an, während das überarbeitete ThinkPad T14 ebenfalls kompakt daher kommt.
Unser Modell bietet den effizienten Core i5-1235U, schnellen 16 GB LPDDR5-RAM, eine 512 GB fassende PCIe-4.0-SSD und das FHD+-Low-Power-Display, was als Lenovo-Campus-Variante für 1.699 Euro erhältlich ist. Diese Komponenten lassen auf ein sparsames, zu AMD ebenbürtiges, System hoffen, was wir in diesem Testbericht klären.
Konkurrenz, außerhalb der eigenen Marke, ist für den High-End ThinkPad Laptop das HP EliteBook 845 G9, Dells Latitude 7420 und das Schenker Vision 14, bei denen sich im weiteren Testverlauf herausstellt, ob sie eine ThinkPad Alternative darstellen können.
mögliche Konkurrenten im Vergleich
Bew. | Datum | Modell | Gewicht | Dicke | Größe | Auflösung | Preis ab |
|---|---|---|---|---|---|---|---|
| 89.1 % v7 (old) | 12 / 2022 | Lenovo ThinkPad T14s G3 21BR00CDGE i5-1235U, Iris Xe G7 80EUs | 1.3 kg | 16.9 mm | 14.00" | 1920x1200 | |
| 89.4 % v7 (old) | 06 / 2021 | Lenovo ThinkPad T14s G2 20WM003TGE i7-1165G7, Iris Xe G7 96EUs | 1.3 kg | 16.14 mm | 14.00" | 1920x1080 | |
| 88.8 % v7 (old) | 09 / 2022 | Lenovo ThinkPad T14 G3-21CF004NGE R7 PRO 6850U, Radeon 680M | 1.4 kg | 17.9 mm | 14.00" | 1920x1200 | |
| 90.2 % v7 (old) | 06 / 2022 | Lenovo ThinkPad X1 Carbon G10 21CC001RGE i5-1250P, Iris Xe G7 80EUs | 1.2 kg | 15.36 mm | 14.00" | 1920x1200 | |
| 89.4 % v7 (old) | 11 / 2022 | Lenovo ThinkPad X13 G3 21BN0046GE i5-1235U, Iris Xe G7 80EUs | 1.3 kg | 18.9 mm | 13.30" | 1920x1200 | |
| 88.6 % v7 (old) | 11 / 2022 | HP EliteBook 845 G9 6F6H9EA R5 PRO 6650U, Radeon 660M | 1.4 kg | 19 mm | 14.00" | 1920x1200 | |
| 90.1 % v7 (old) | 04 / 2022 | Dell Latitude 7420 JW6MH i5-1145G7, Iris Xe G7 80EUs | 1.3 kg | 17.3 mm | 14.00" | 1920x1080 | |
| 88.8 % v7 (old) | 10 / 2022 | Schenker Vision 14 2022 RTX 3050 Ti i7-12700H, GeForce RTX 3050 Ti Laptop GPU | 1.3 kg | 16.6 mm | 14.00" | 2880x1800 |
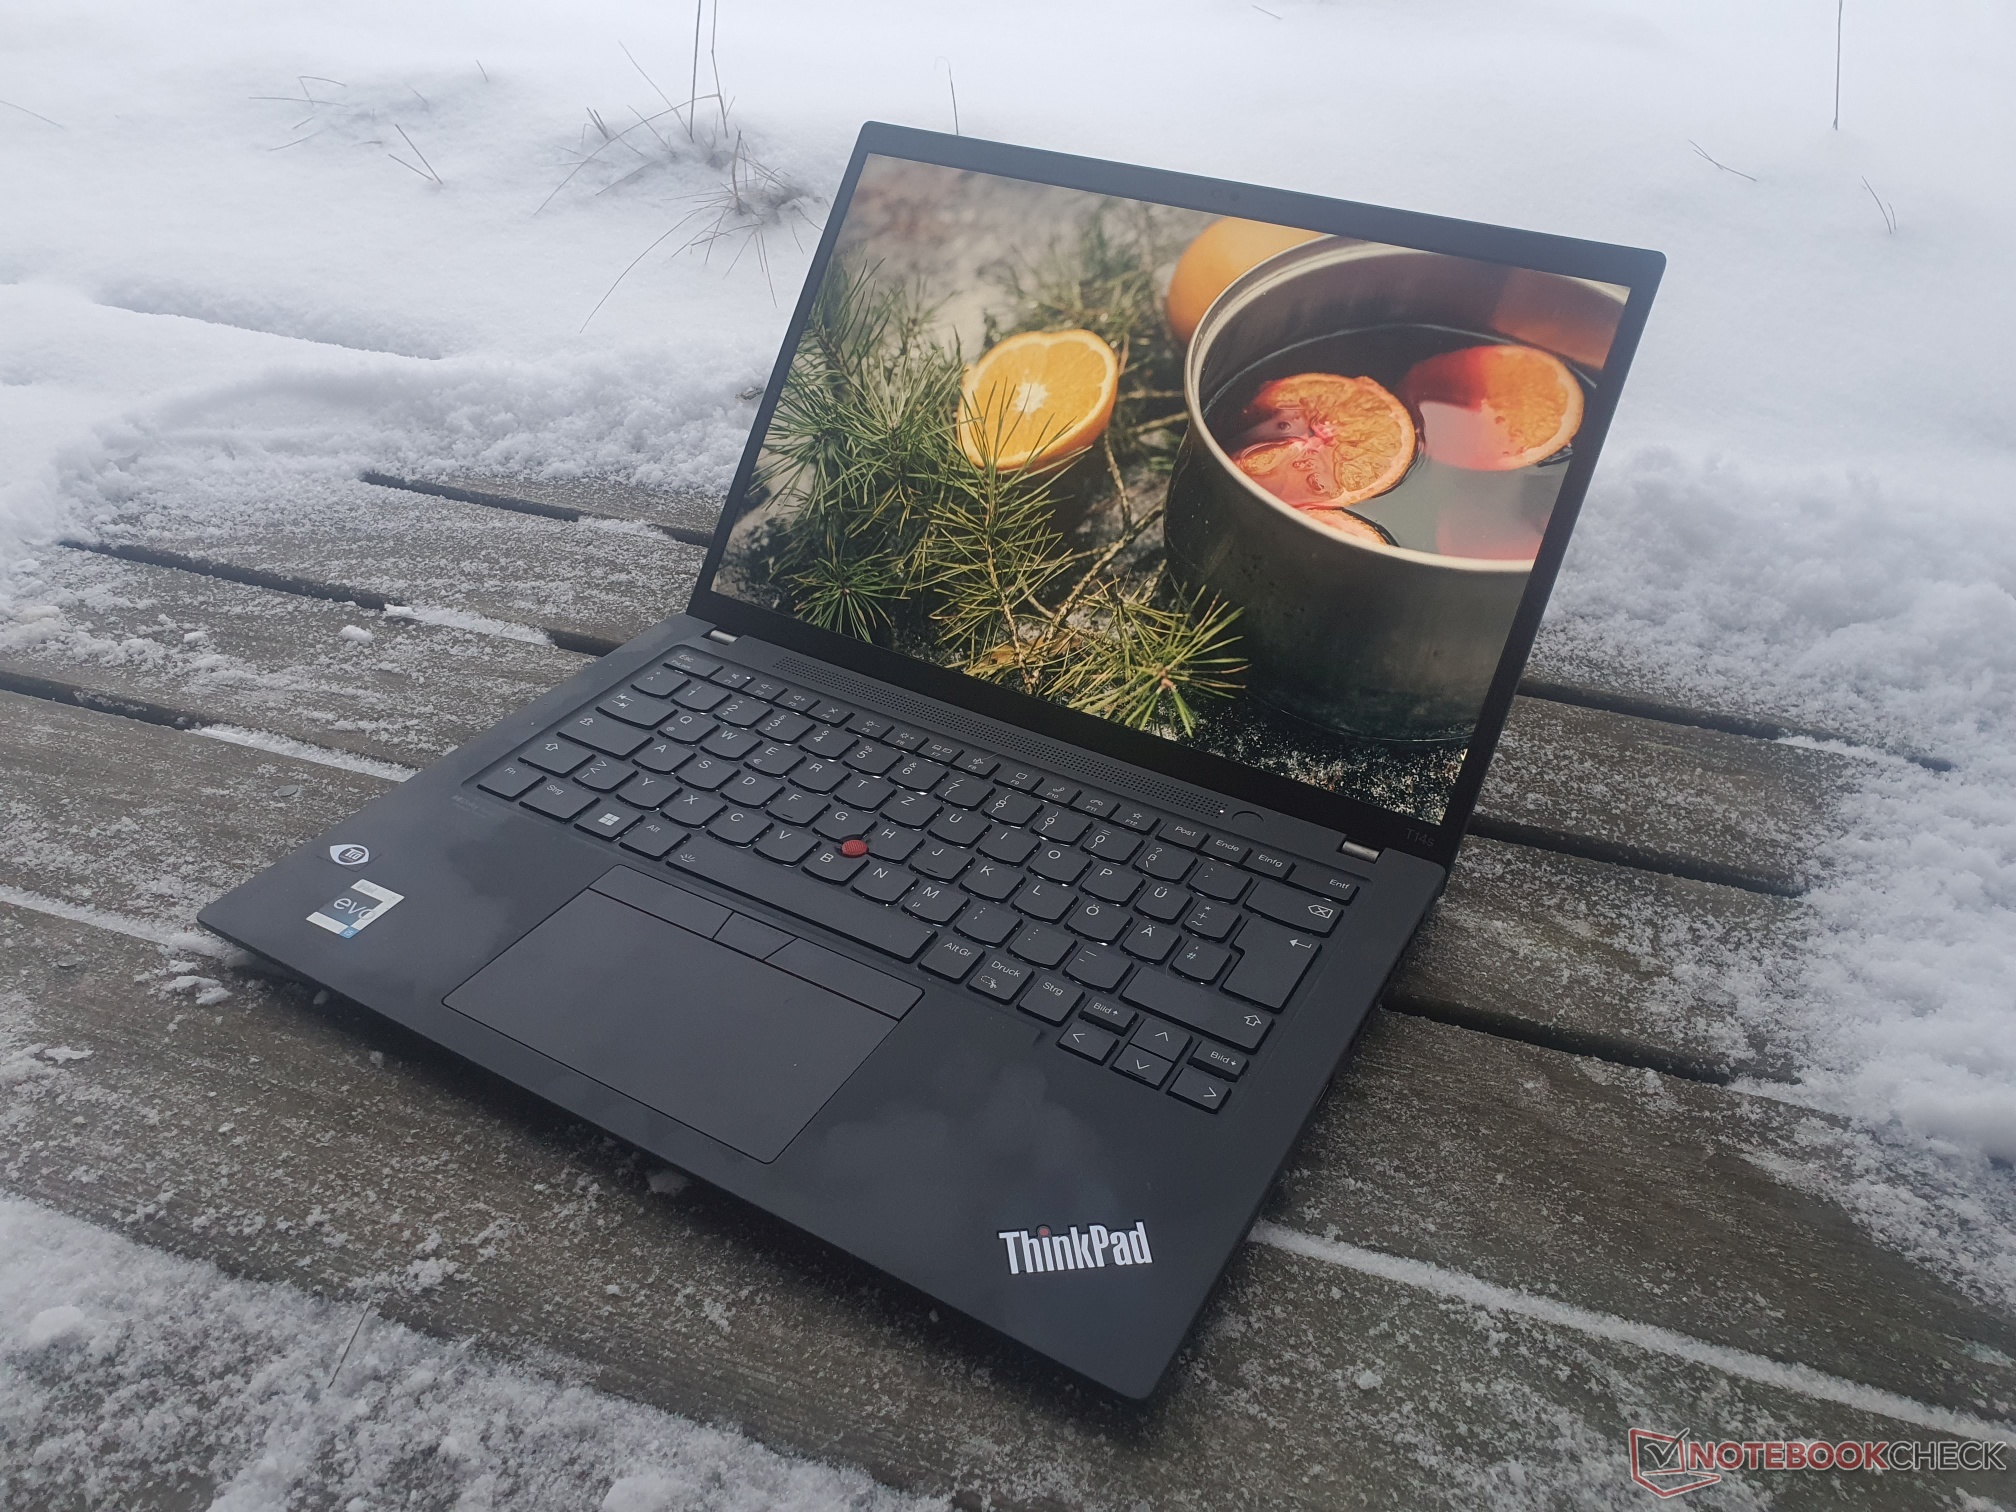
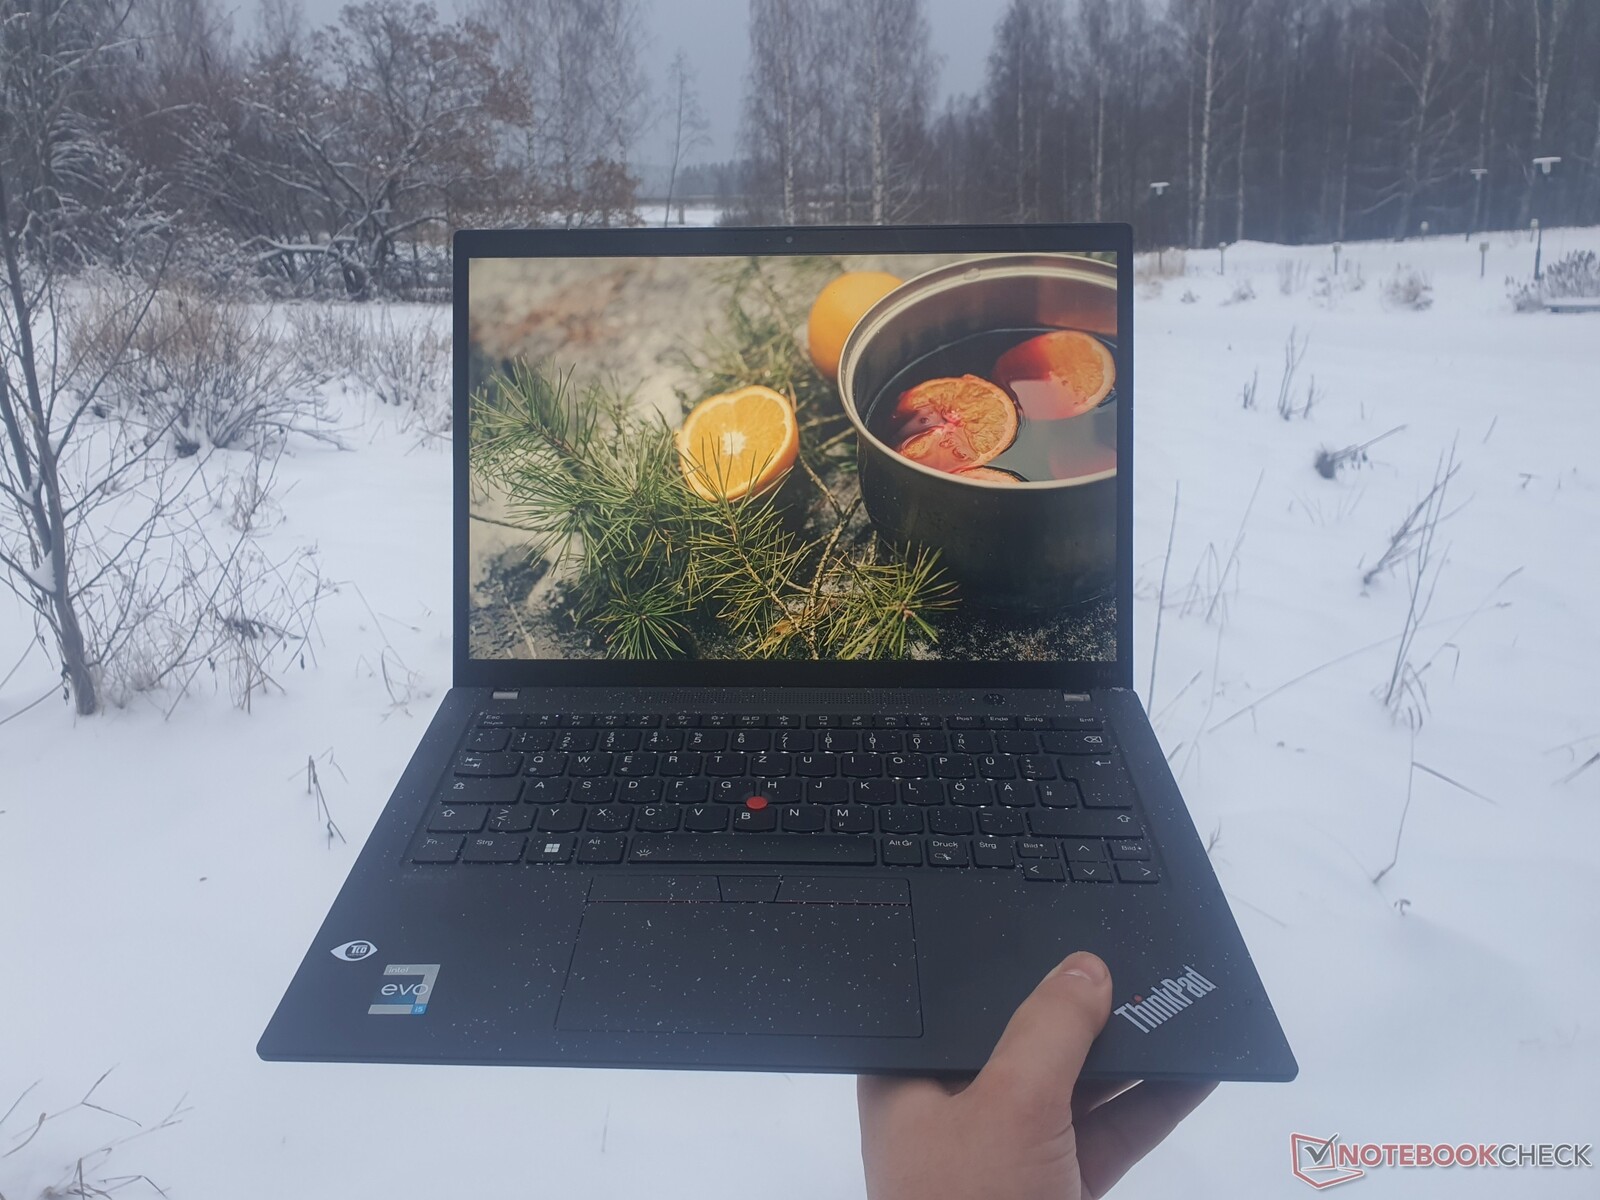
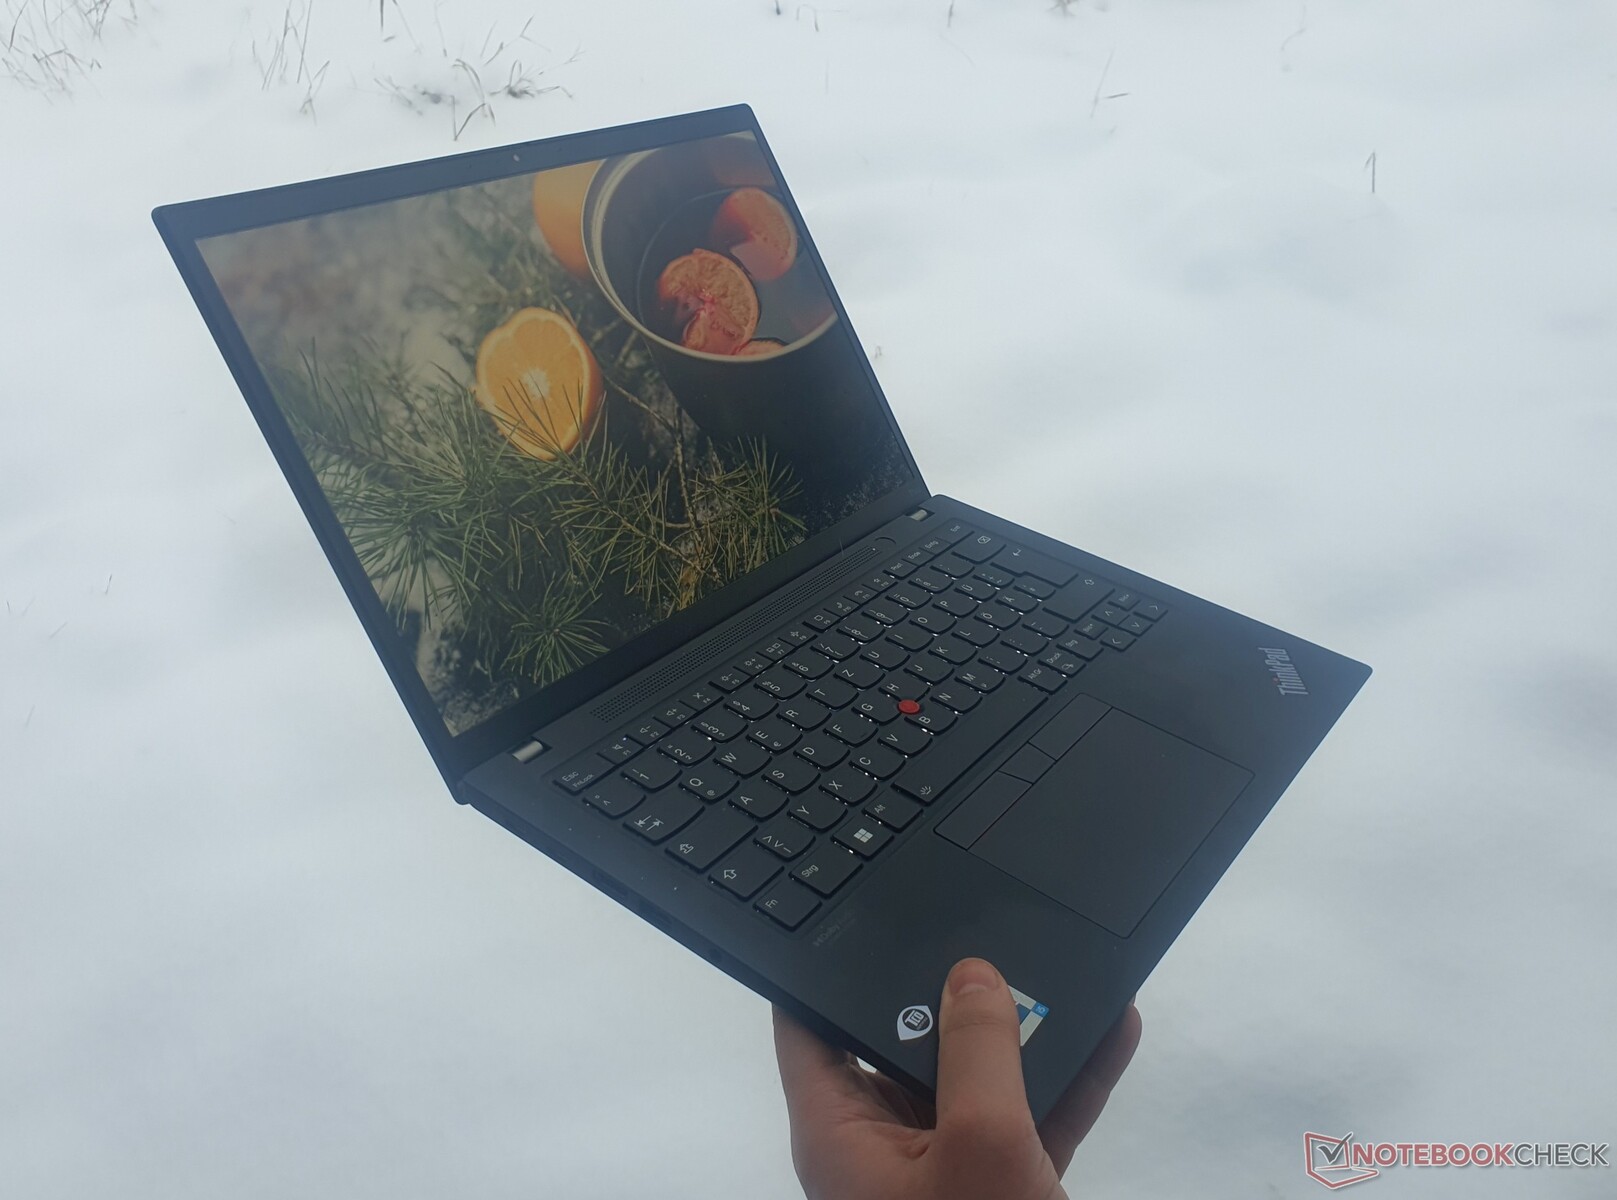
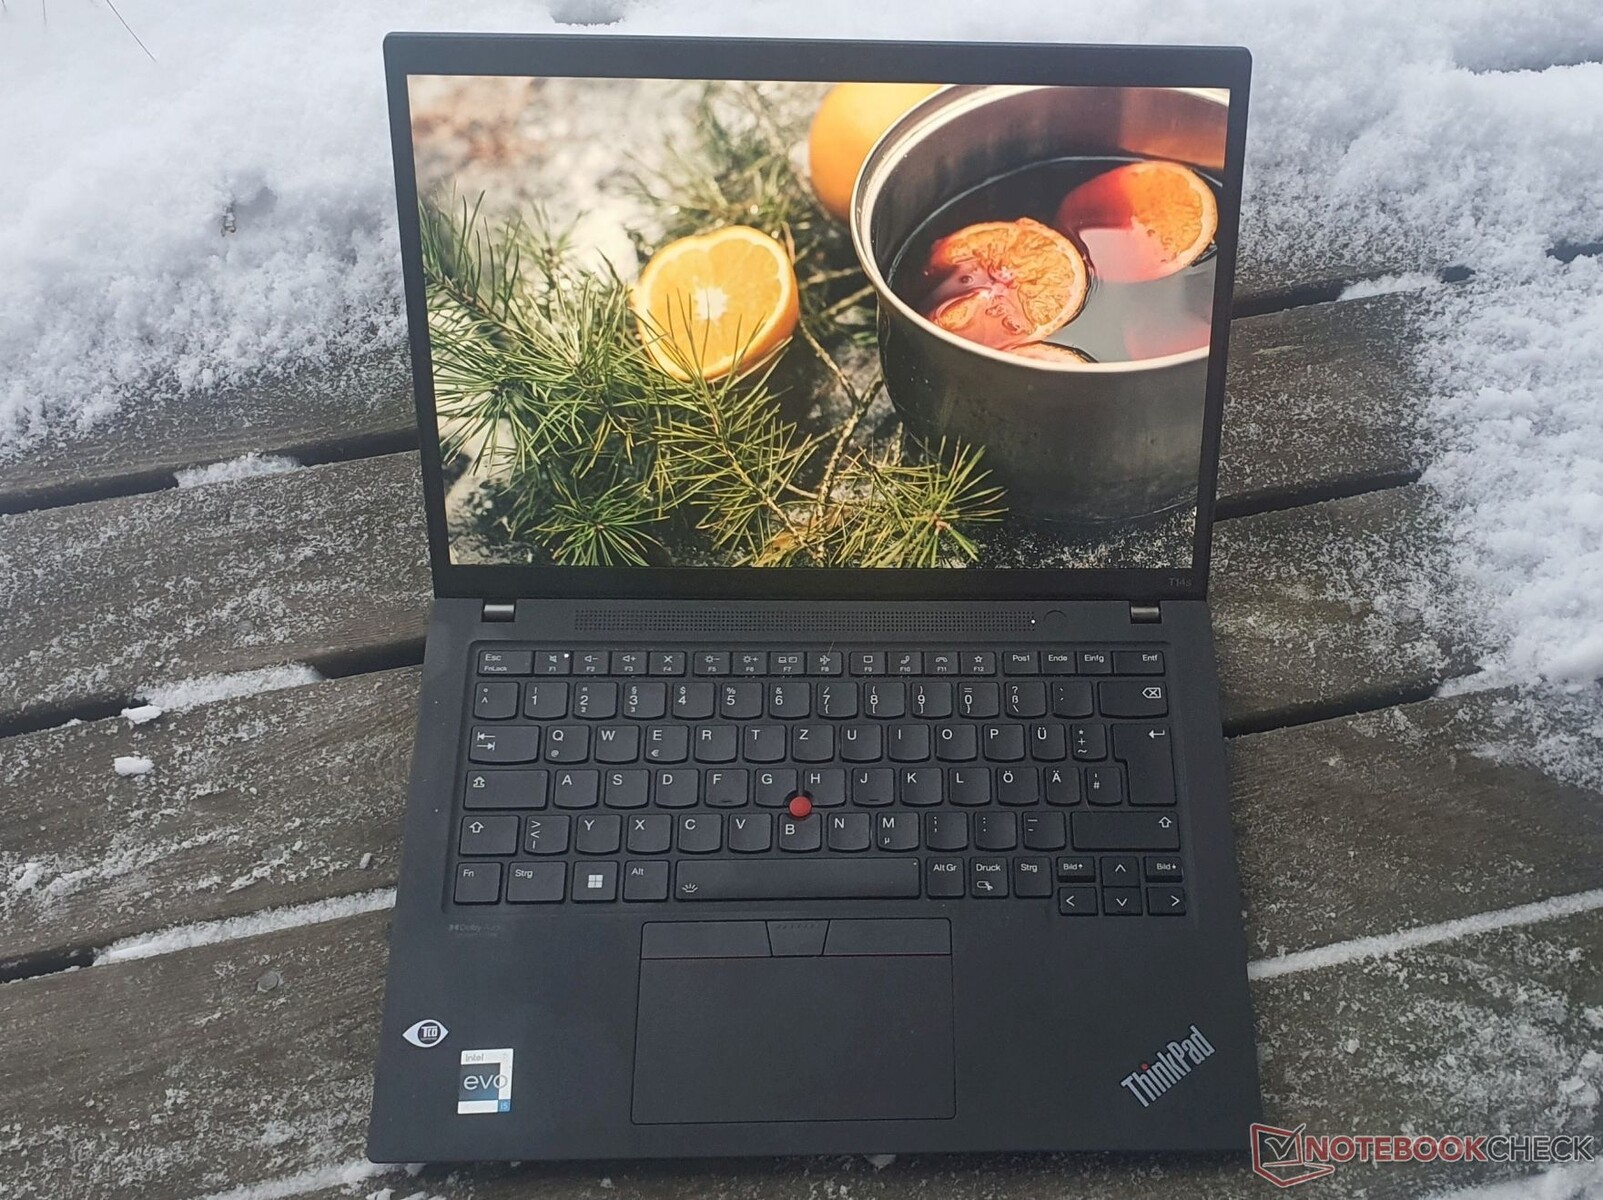
Gehäuse: ThinkPad ist kompakt und sehr robust dank Carbon & viel Metall
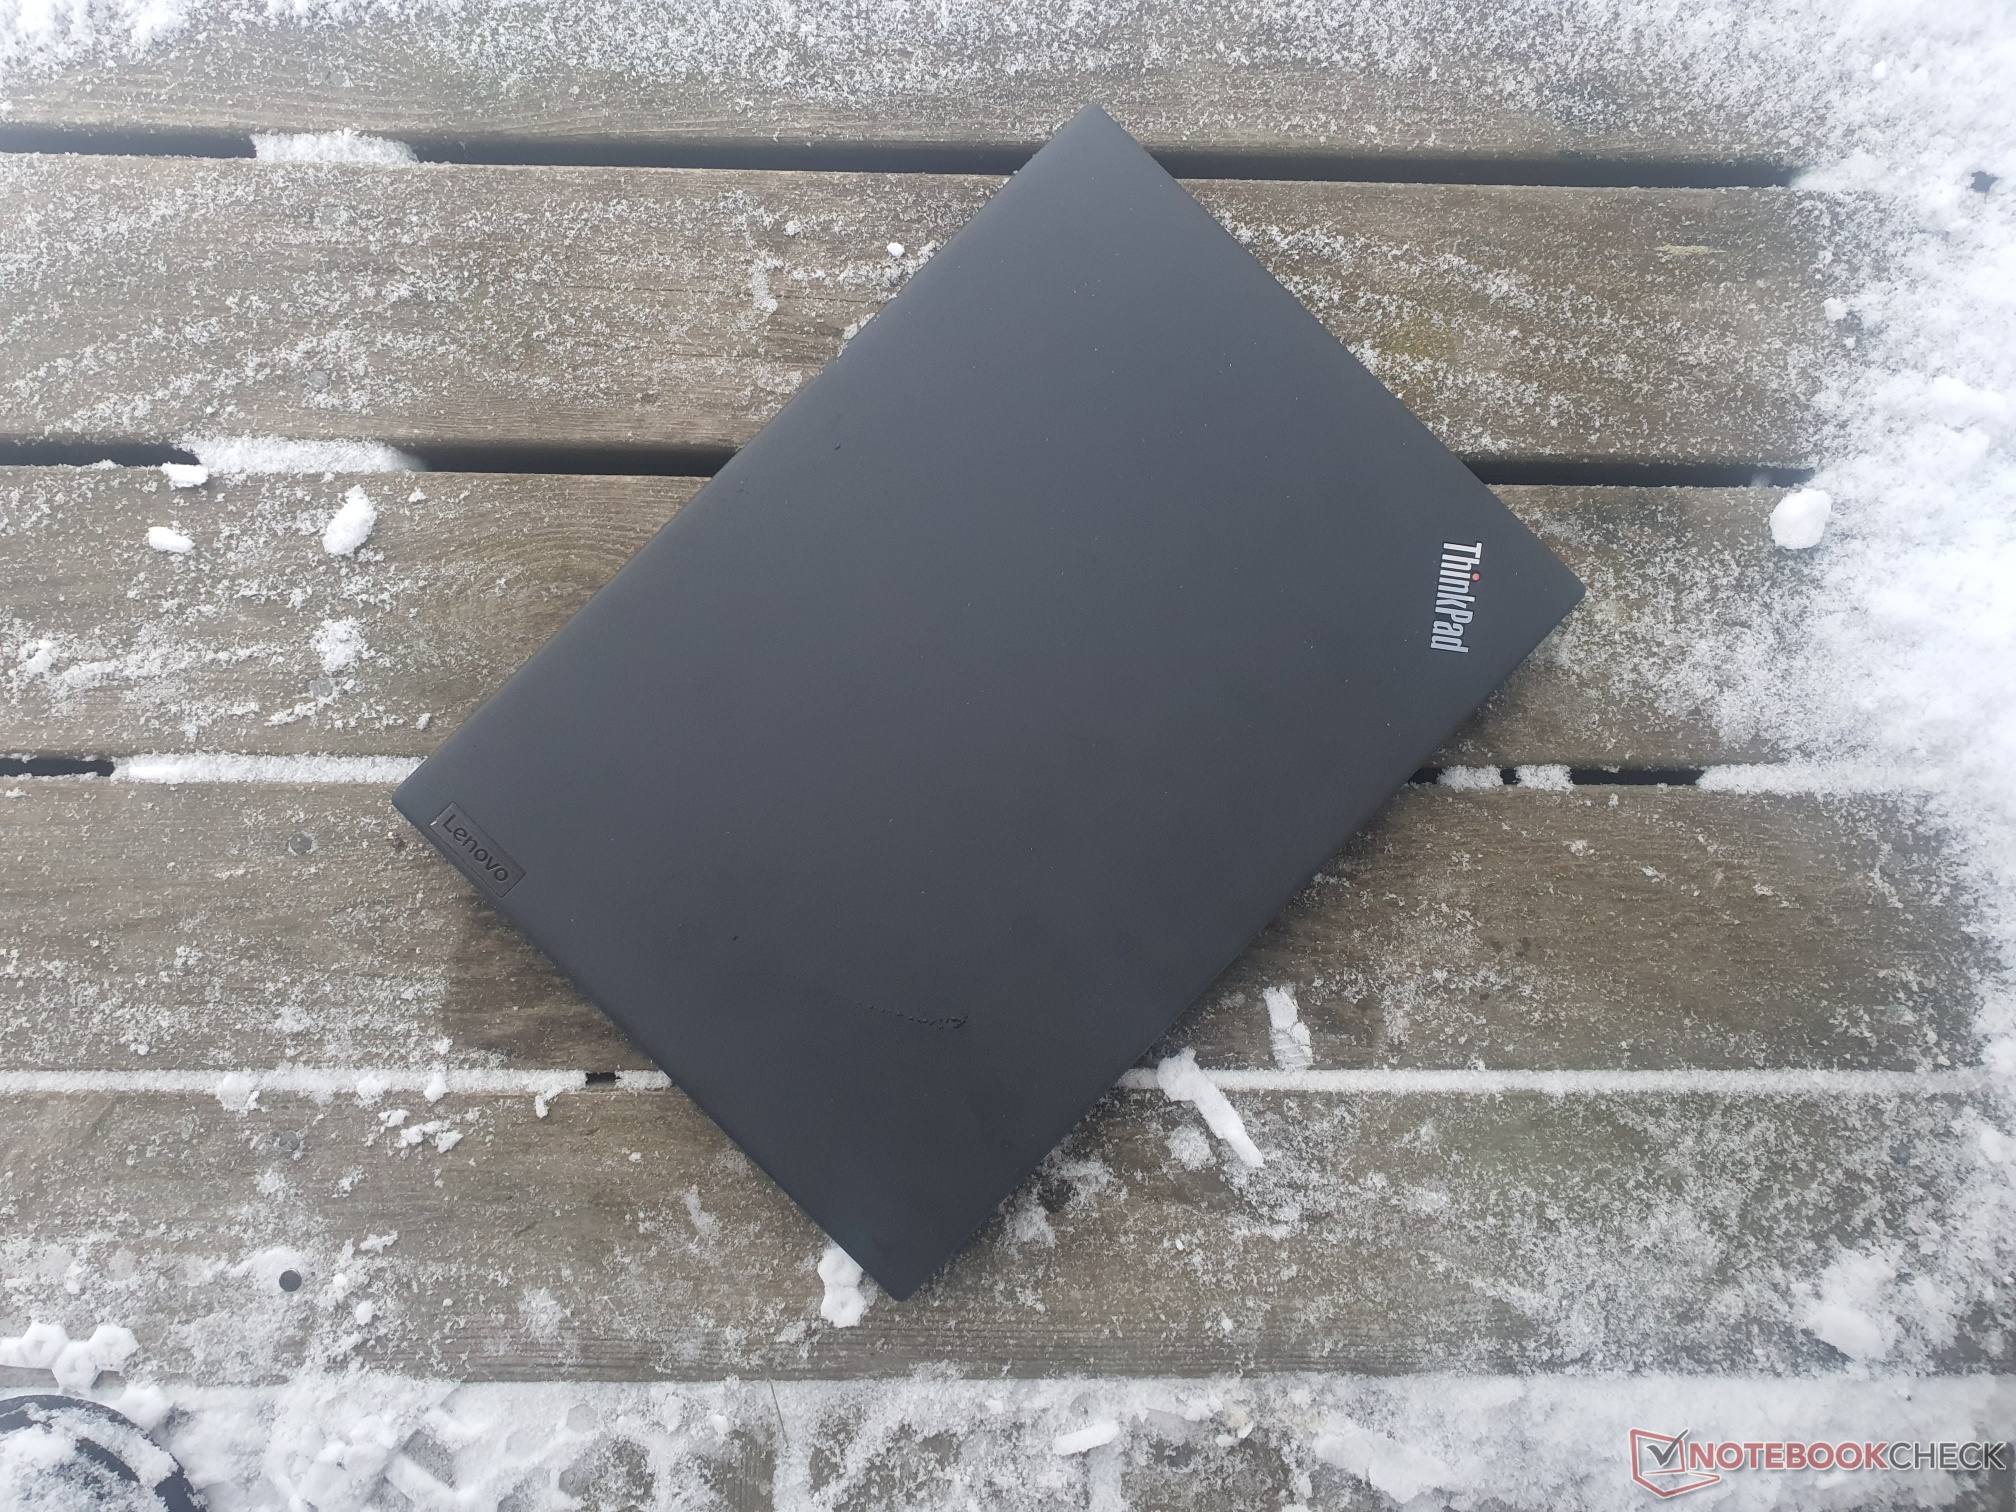
Das dunkelgraue ThinkPad T14s G3 ist durch das verwendete Carbon, Magnesium und Aluminium sehr stabil. Egal, an welcher Stelle wir versuchen den ThinkPad Laptop zu verwinden oder sonst wie zu beeinträchtigen, gibt er an keiner Stelle nach. Das Gehäuse kommt dank des 16:10-Formats in einem kleineren Formfaktor und mit schmaleren Bildschirmrändern als der Vorgänger.
Die Scharniere lassen eine Öffnung bis 180 Grad zu und sind straff eingestellt, was den Bildschirm gut in Position hält, der aber nicht einhändig geöffnet werden kann. Die Verarbeitung ist tadellos und die leicht angerauten Oberflächen sind angenehm, griffig und lassen nicht viele Fingerabdrücke zu.

Das ThinkPad T14s G3 ist mit 317,5 mm um 10 mm kürzer geworden sowie um 3 mm tiefer. Es startet ab 1,21 kg. Unser Modell ist mit 1,33 kg jedoch schwerer als das von uns getestete Vorgänger-Modell. Der Footprint entspricht fast dem X1 Carbon G10, während das Schenker Vision 14 trotz starker Hardware noch kompakter ist, ähnlich wie das ThinkPad X13 oder ein MacBook Air.
Ausstattung: Thunderbolt & 1080p-Cam, aber viel verlötet
Das ThinkPad T14s G3 Intel besitzt an der linken Seite zweimal Thunderbolt 4, HDMI 2.0b @4K60 und eine Klinkenbuchse. Hinzu kommen pro Seite je einmal USB-A 3.2 Gen 1. Rechts befindet sich ein optionaler Smart-Kartenleser und die Kensington-Vorrichtung. Auf der Rückseite versteckt sich zudem ein Nano-SIM-Einschub. Einen SD-Kartenleser vermissen wir, während RJ45 dem ThinkPad T14 vorbehalten bleibt.


Kommunikation
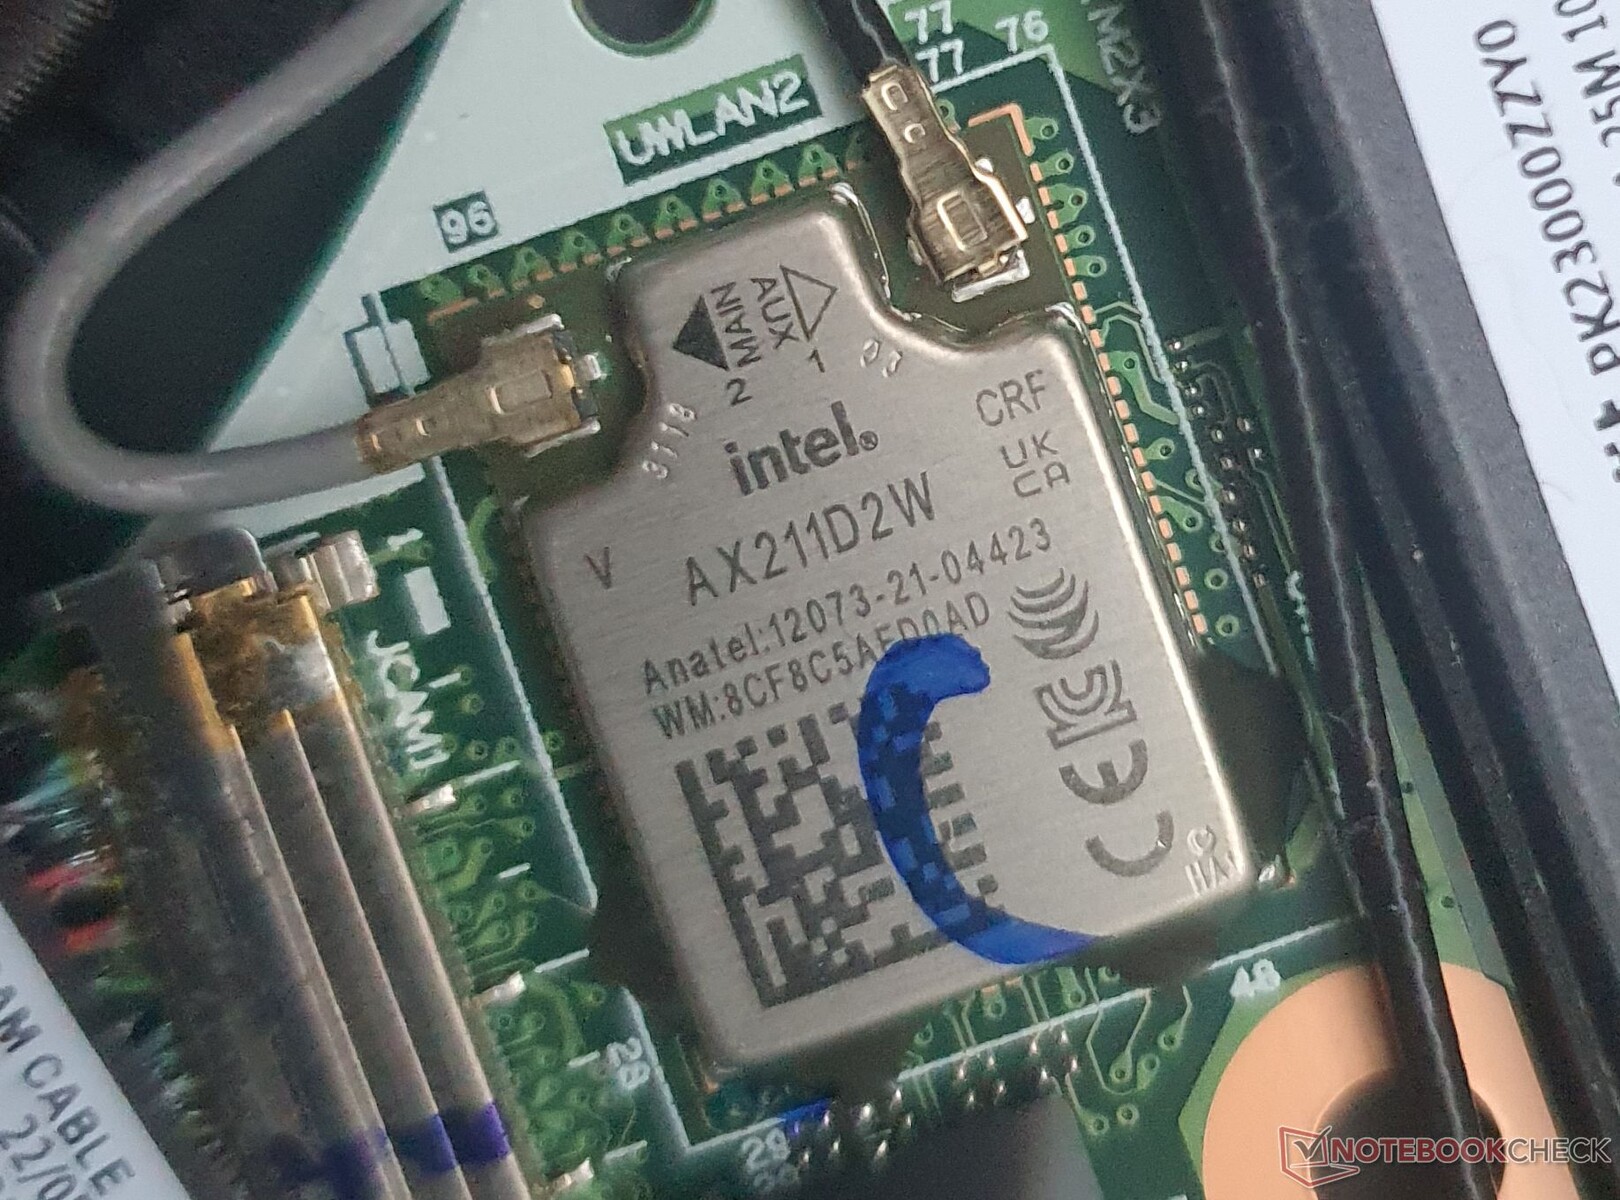
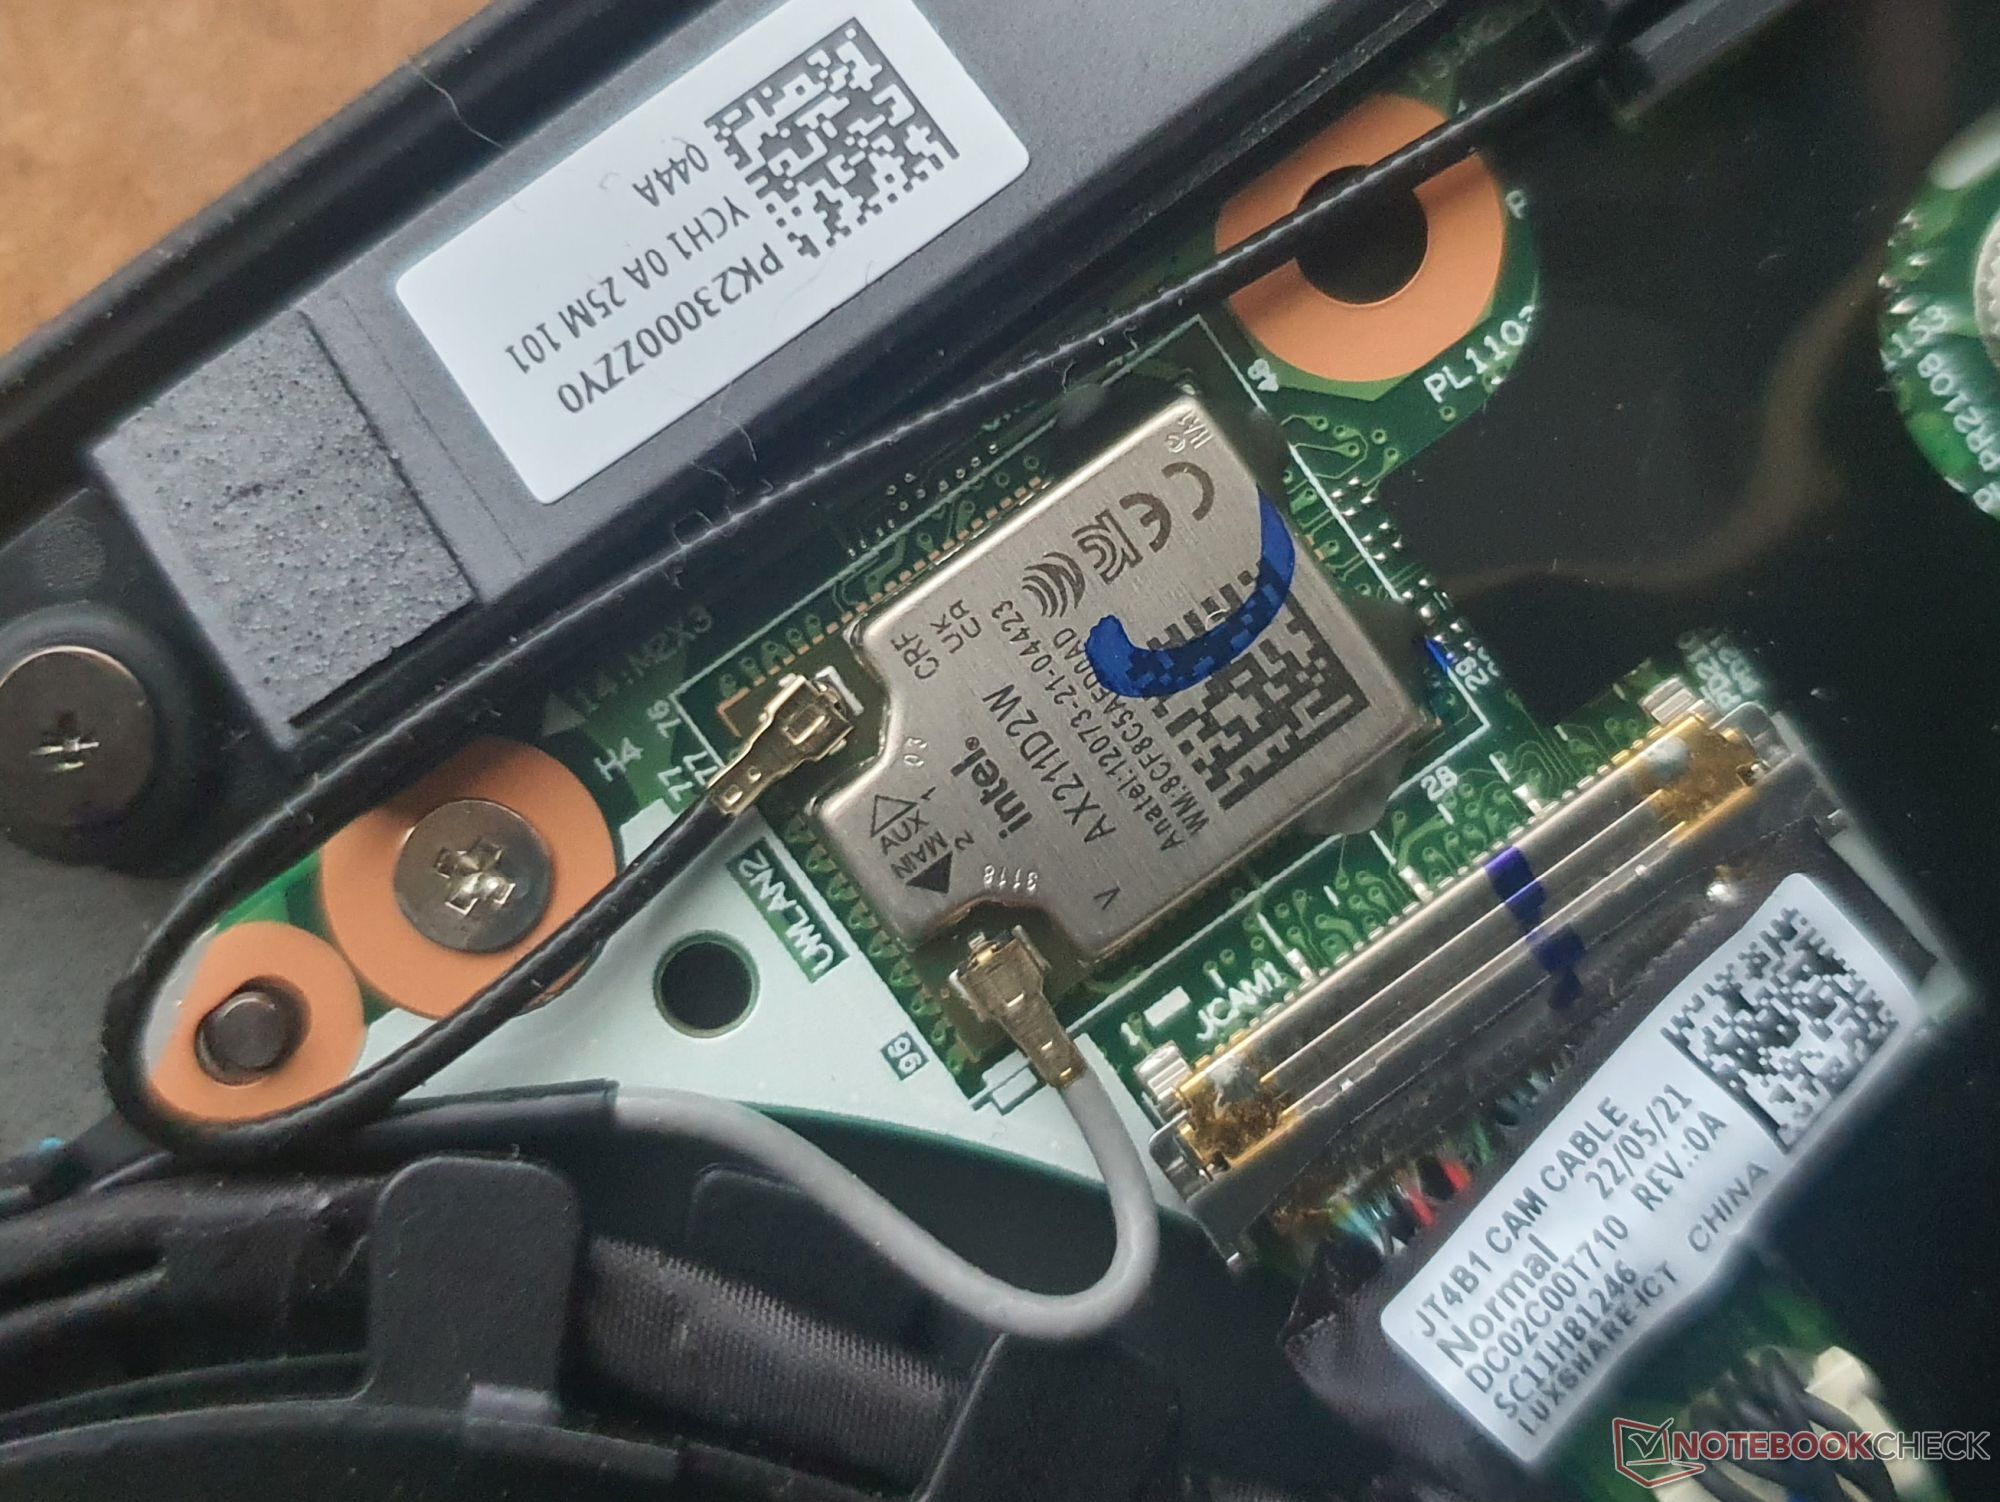
Das WiFi-6-E-Modul verlötet Lenovo beim ThinkPad T14s. Die Intel AX211 erreicht hohe Transferraten von etwa 1,6 bis 1,7 GBit/s, was dem Niveau des Vorgängers entspricht. Noch etwas schneller arbeitet der WiFi-Chip von Qualcomm im AMD-Modell des Lenovo T14. Bluetooth 5.2 ist mit an Bord, während WWAN mit 4G / 5G und NFC optional sind.
| Networking | |
| Lenovo ThinkPad T14s G3 21BR00CDGE | |
| iperf3 receive AXE11000 | |
| iperf3 transmit AXE11000 | |
| Lenovo ThinkPad T14s G2 20WM003TGE | |
| iperf3 transmit AX12 | |
| iperf3 receive AX12 | |
| Lenovo ThinkPad T14 G3-21CF004NGE | |
| iperf3 receive AXE11000 6GHz | |
| iperf3 transmit AXE11000 6GHz | |
| Lenovo ThinkPad X13 G3 21BN0046GE | |
| iperf3 receive AXE11000 | |
| iperf3 transmit AXE11000 | |
| Lenovo ThinkPad X1 Carbon G10 21CC001RGE | |
| iperf3 receive AXE11000 6GHz | |
| iperf3 transmit AXE11000 6GHz | |
| HP EliteBook 845 G9 6F6H9EA | |
| iperf3 receive AXE11000 | |
| Dell Latitude 7420 JW6MH | |
| iperf3 transmit AX12 | |
| iperf3 receive AX12 | |
| Schenker Vision 14 2022 RTX 3050 Ti | |
| iperf3 receive AXE11000 | |
| iperf3 transmit AXE11000 | |
Webcam
Die 1080p-Cam mit Dual-Array-Mikrofonen überzeugt zwar nicht, das Bild rauscht aber deutlich weniger als beim Vorgänger und sieht weniger verwaschen aus.


Sicherheit
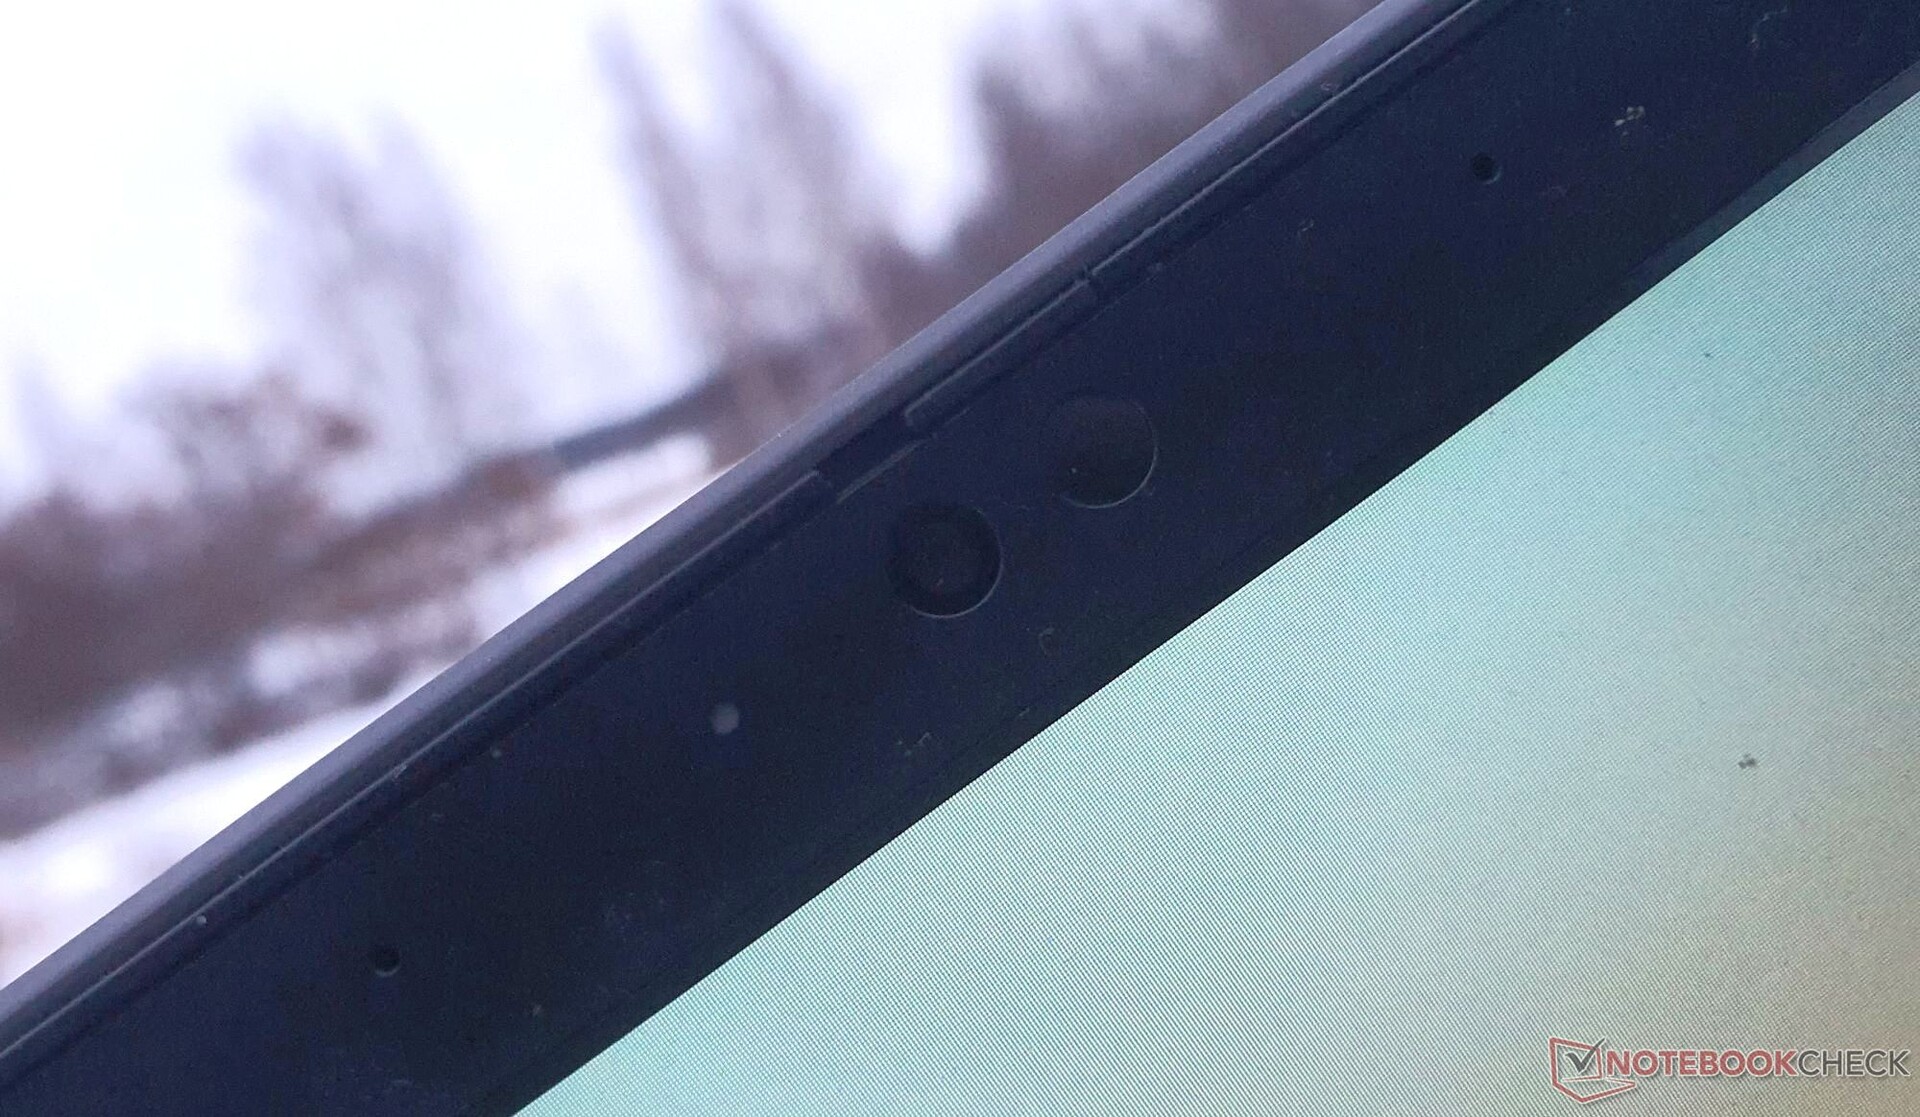
Das ThinkPad T14s Gen 3 bietet einen Smartkarten-Leser (optional), IR für die Gesichtserkennung und eine physische Kamerablende. TPM 2.0, eine Kensington-Vorrichtung und der optionale Fingerabdruckleser tragen ebenso zur Sicherheit bei. Human Presence Detection und Mirametrix Glance kommen Software-seitig hinzu.
Zubehör
Der Docking-Port fällt dieses Jahr auch bei der T-Serie weg, eine Thunderbolt- bzw. USB-C-Lenovo-Dockingstation (oder von Drittanbietern) lässt sich verwenden. Man erhält ein 65 W starkes USB-C-Netzteil, während die Verpackung selbst zu 90 % aus recyceltem Material besteht oder aus nachhaltiger Holzwirtschaft stammt.
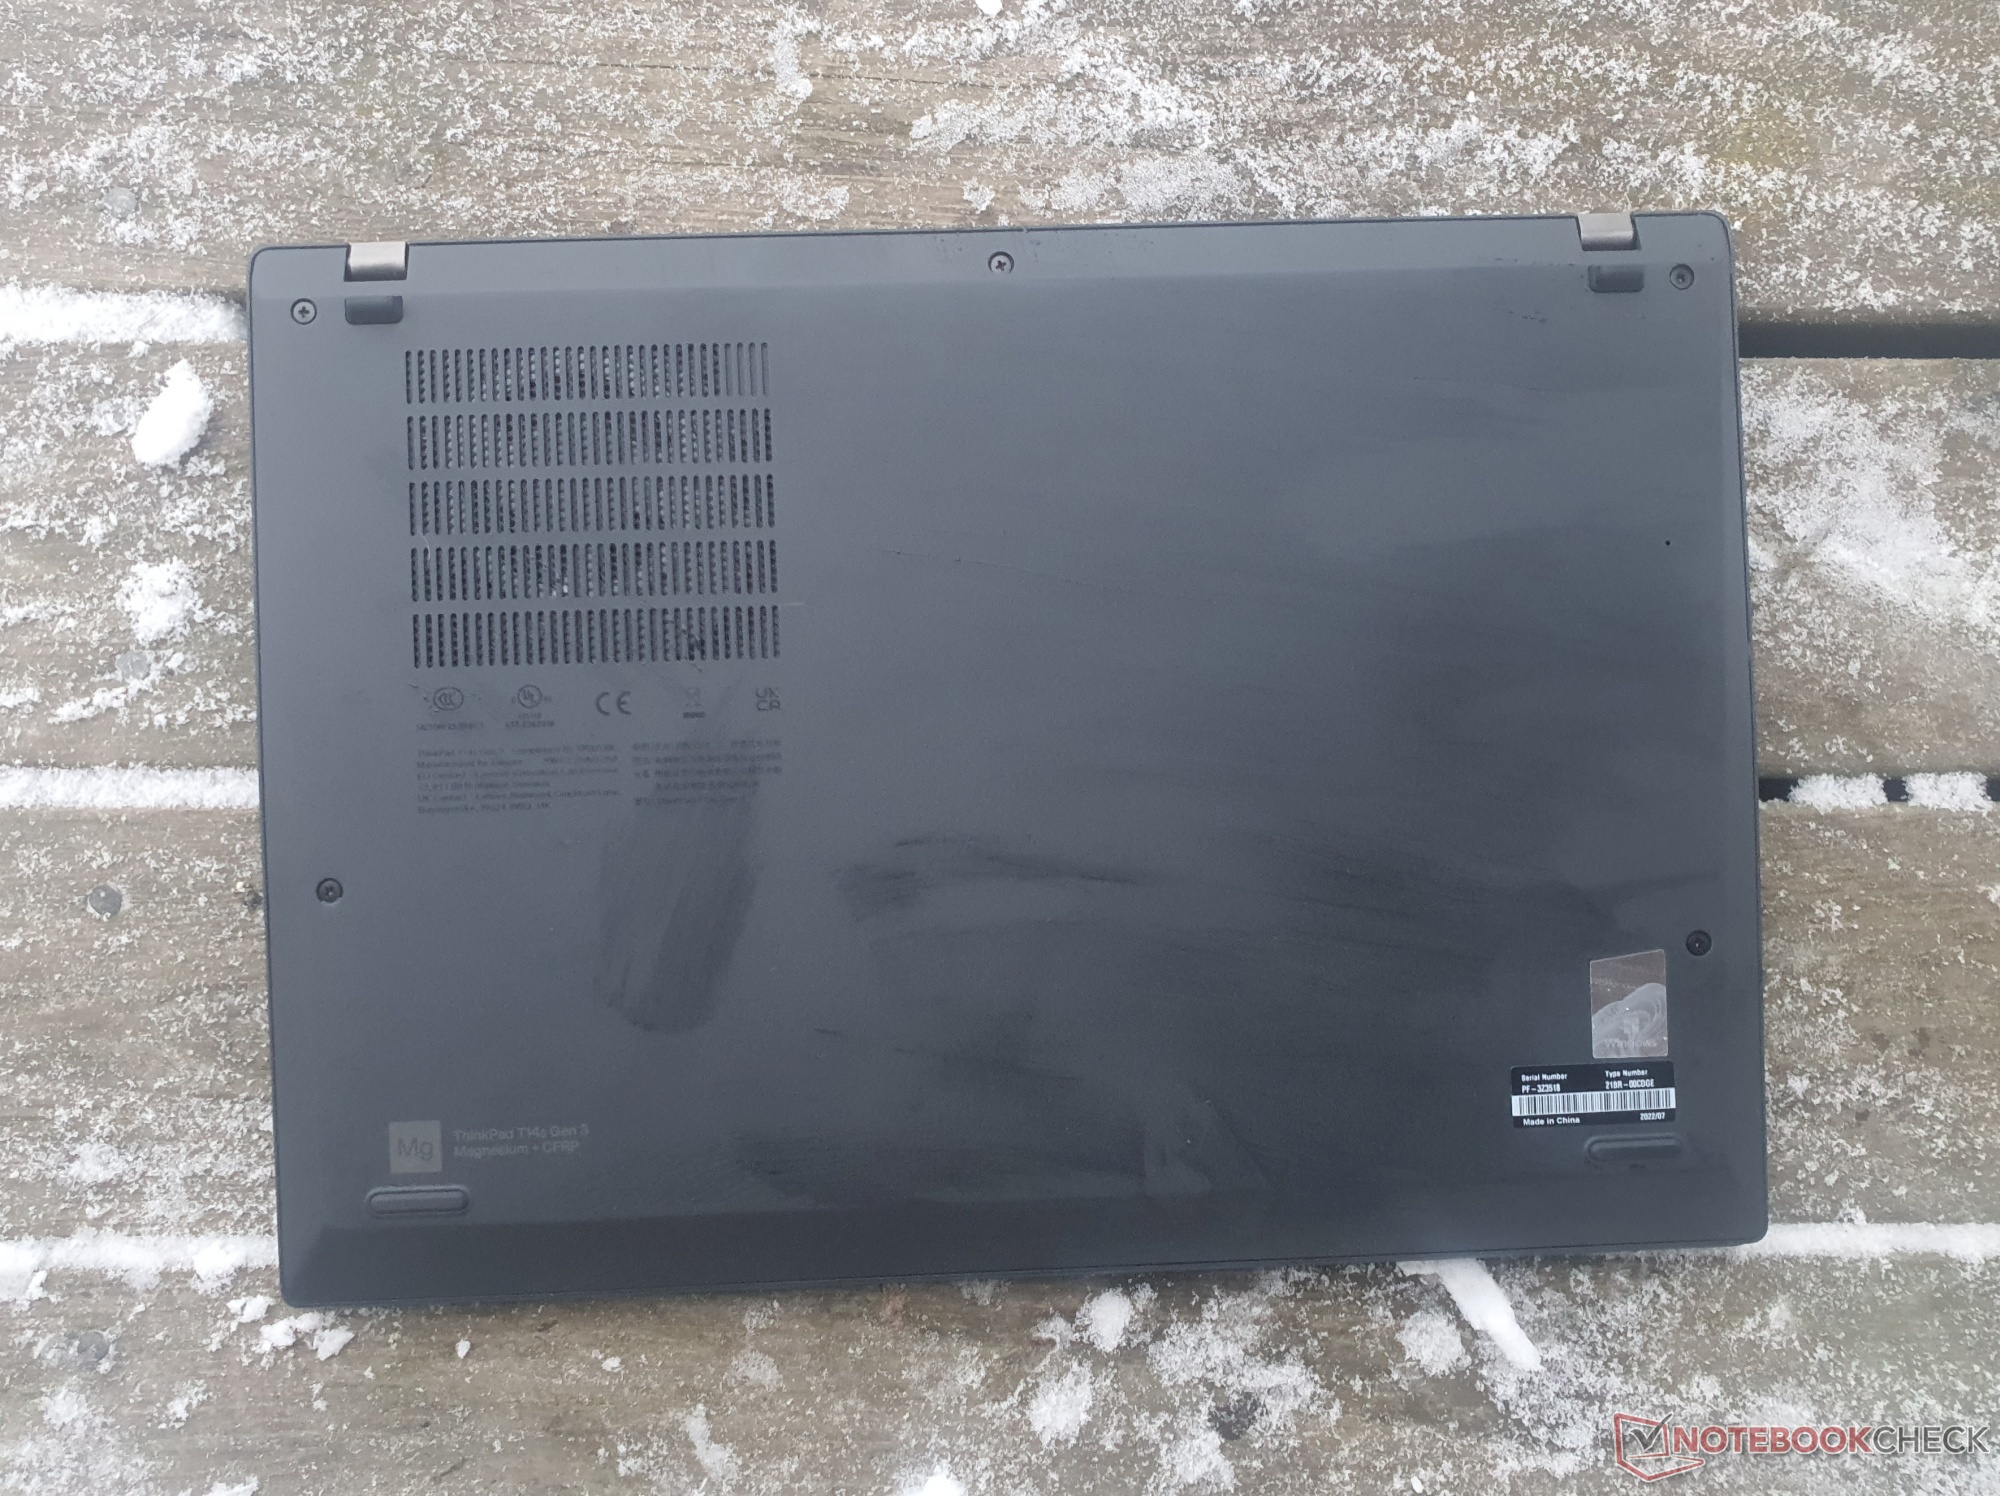
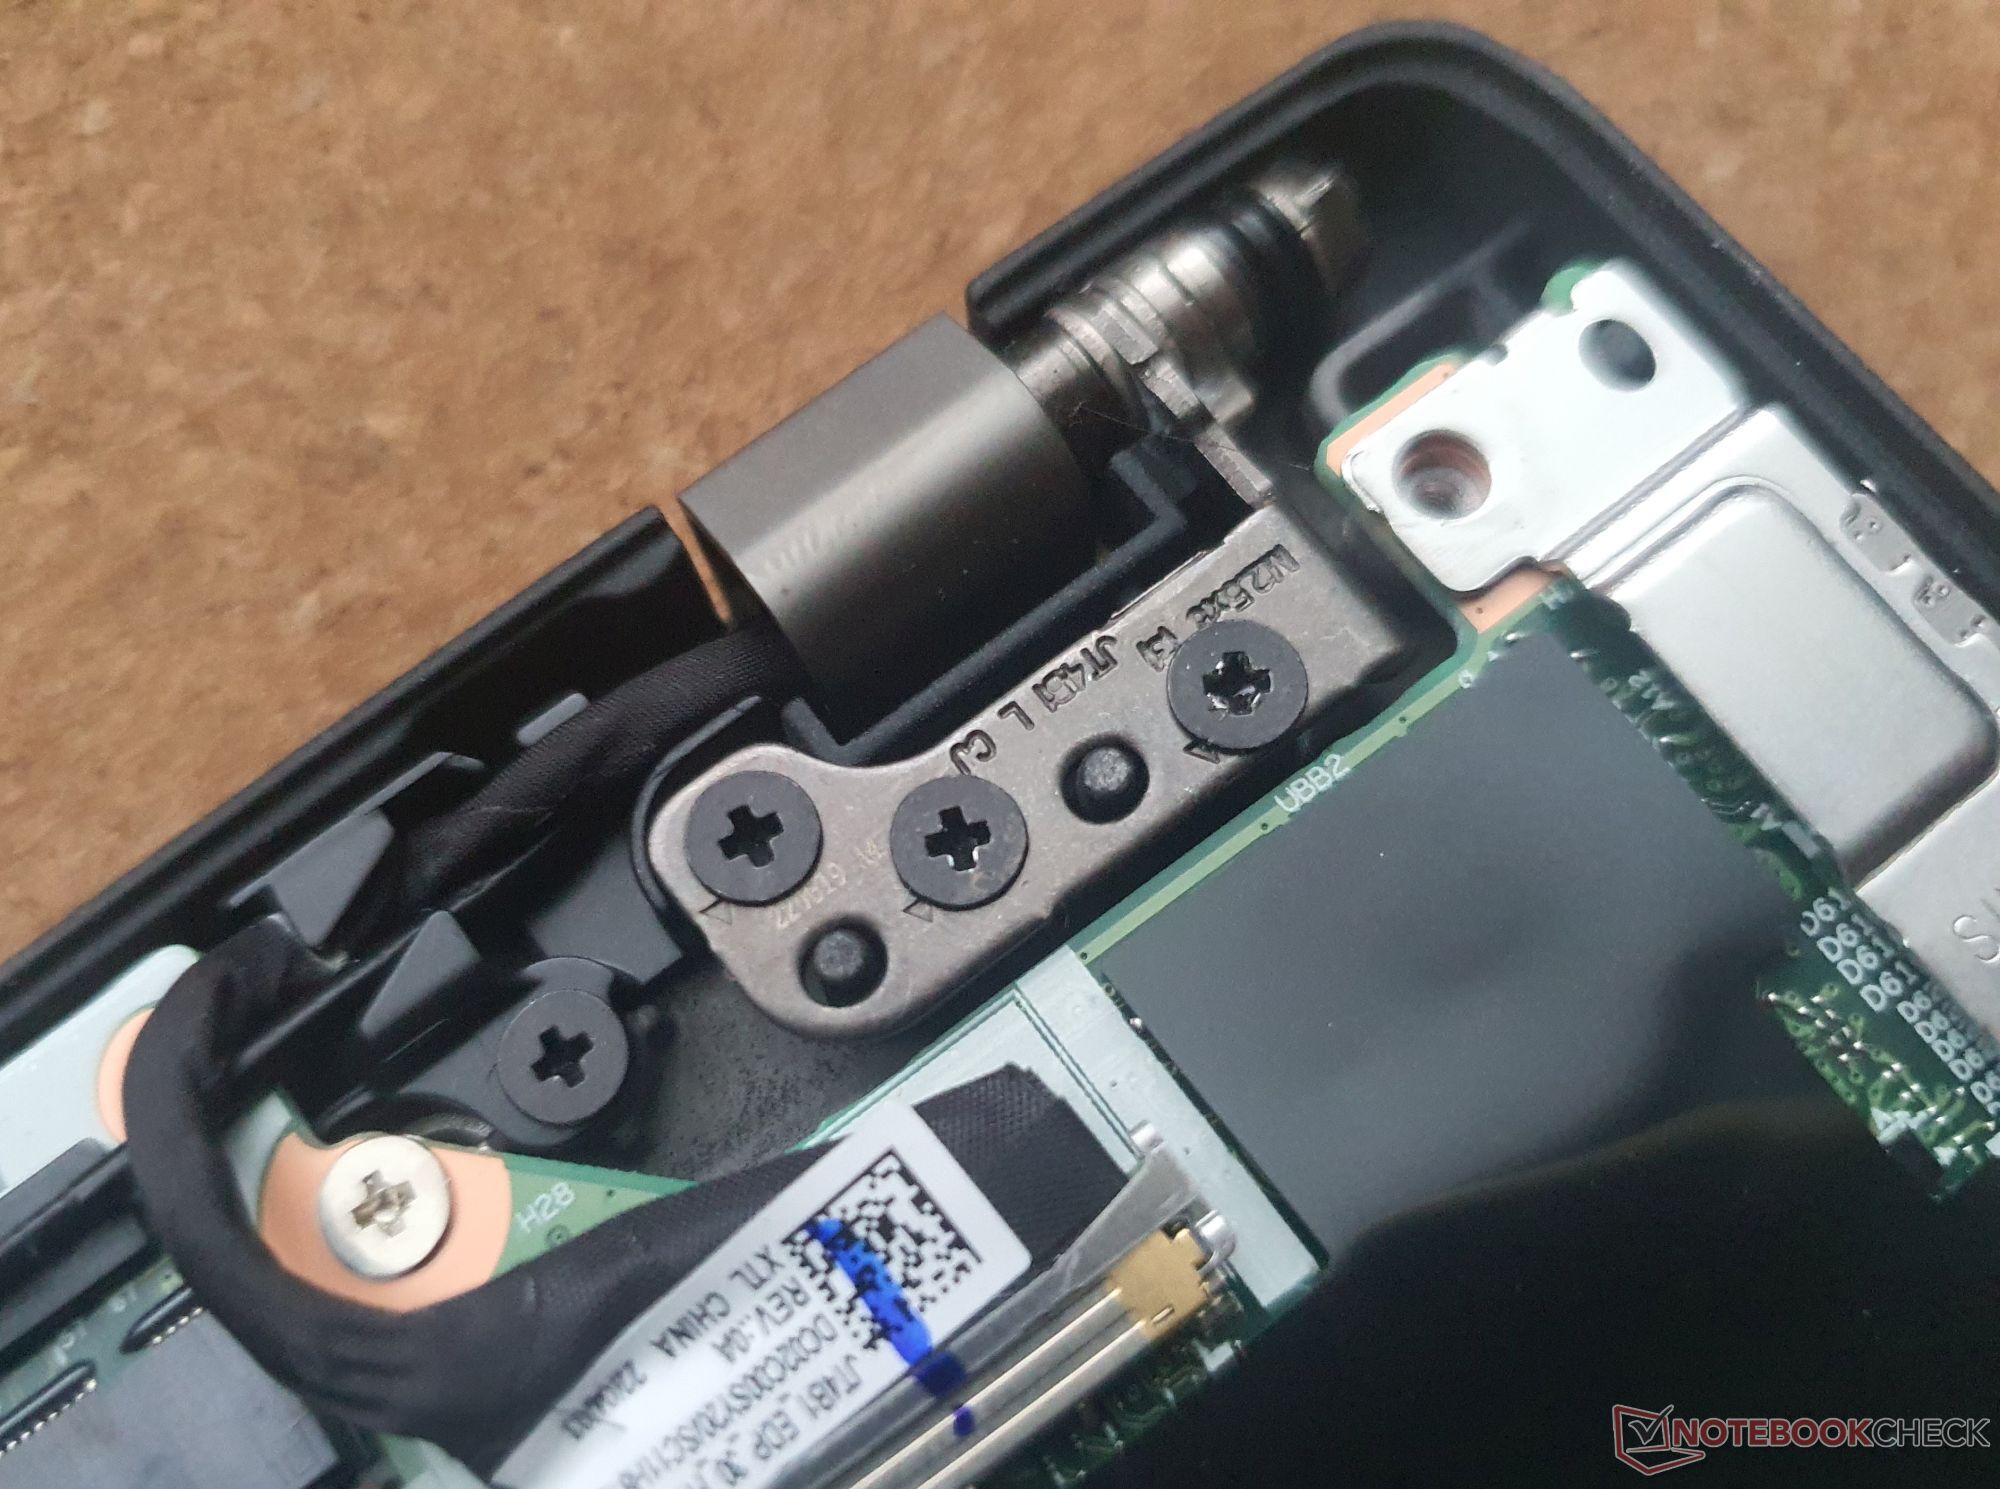
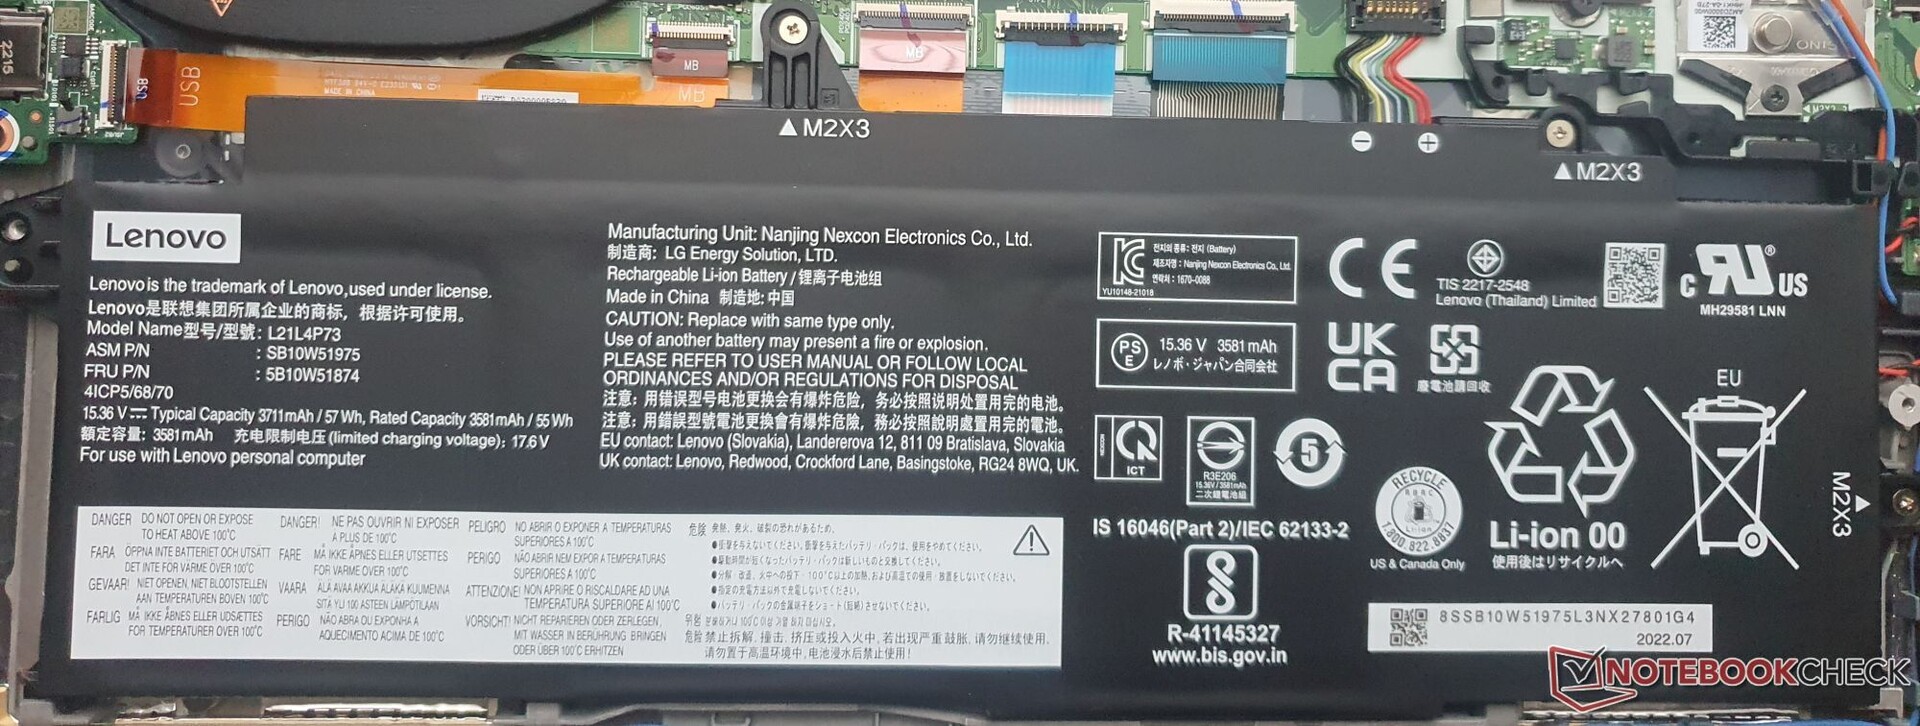
Wartung
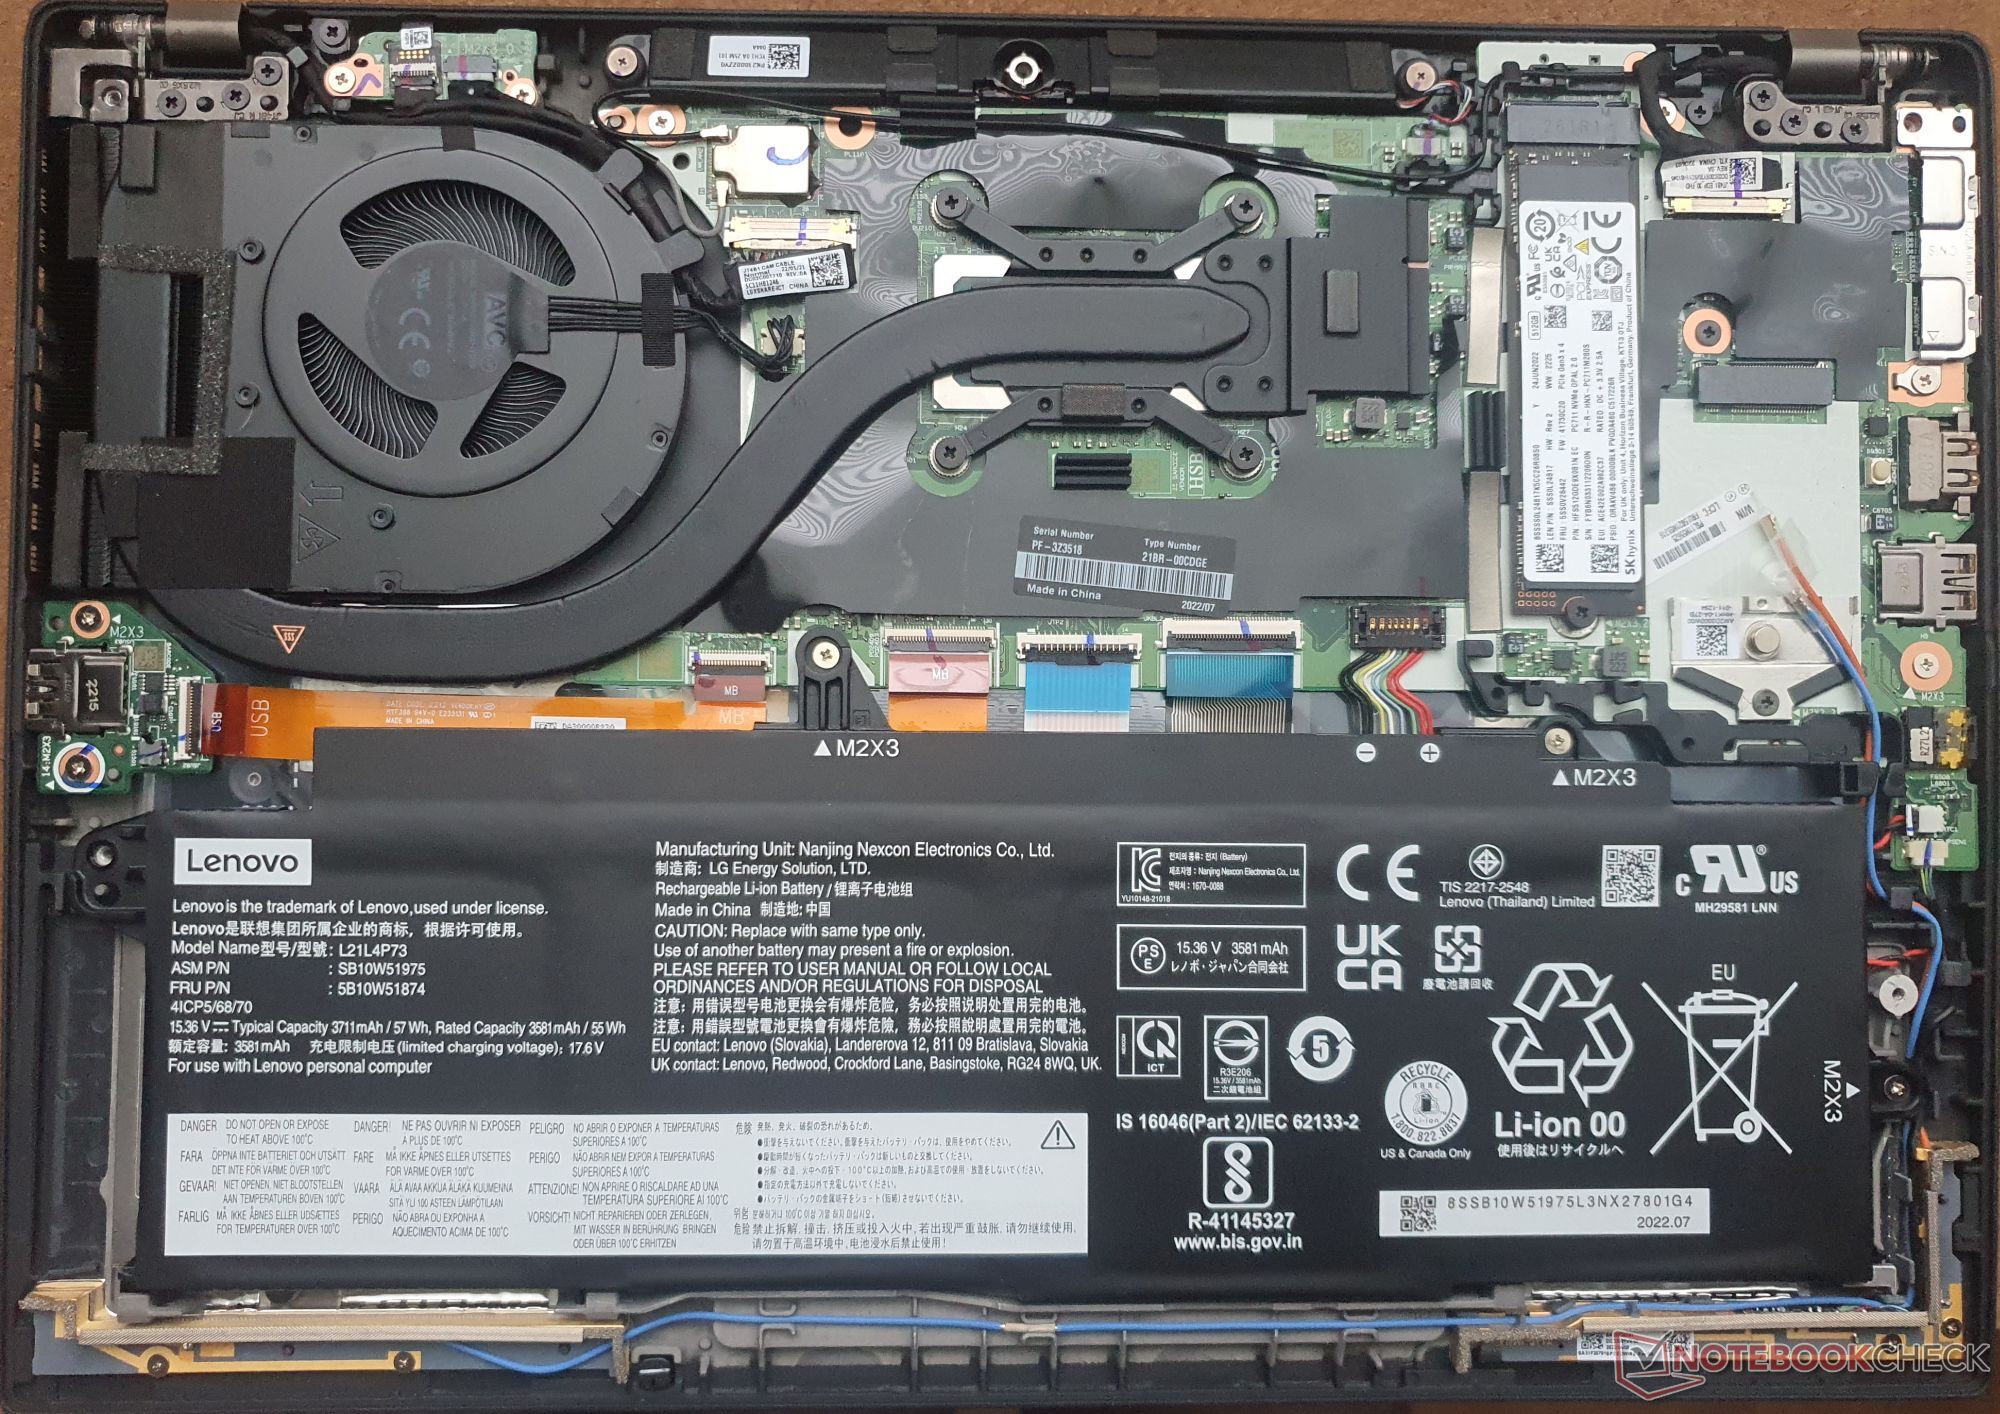
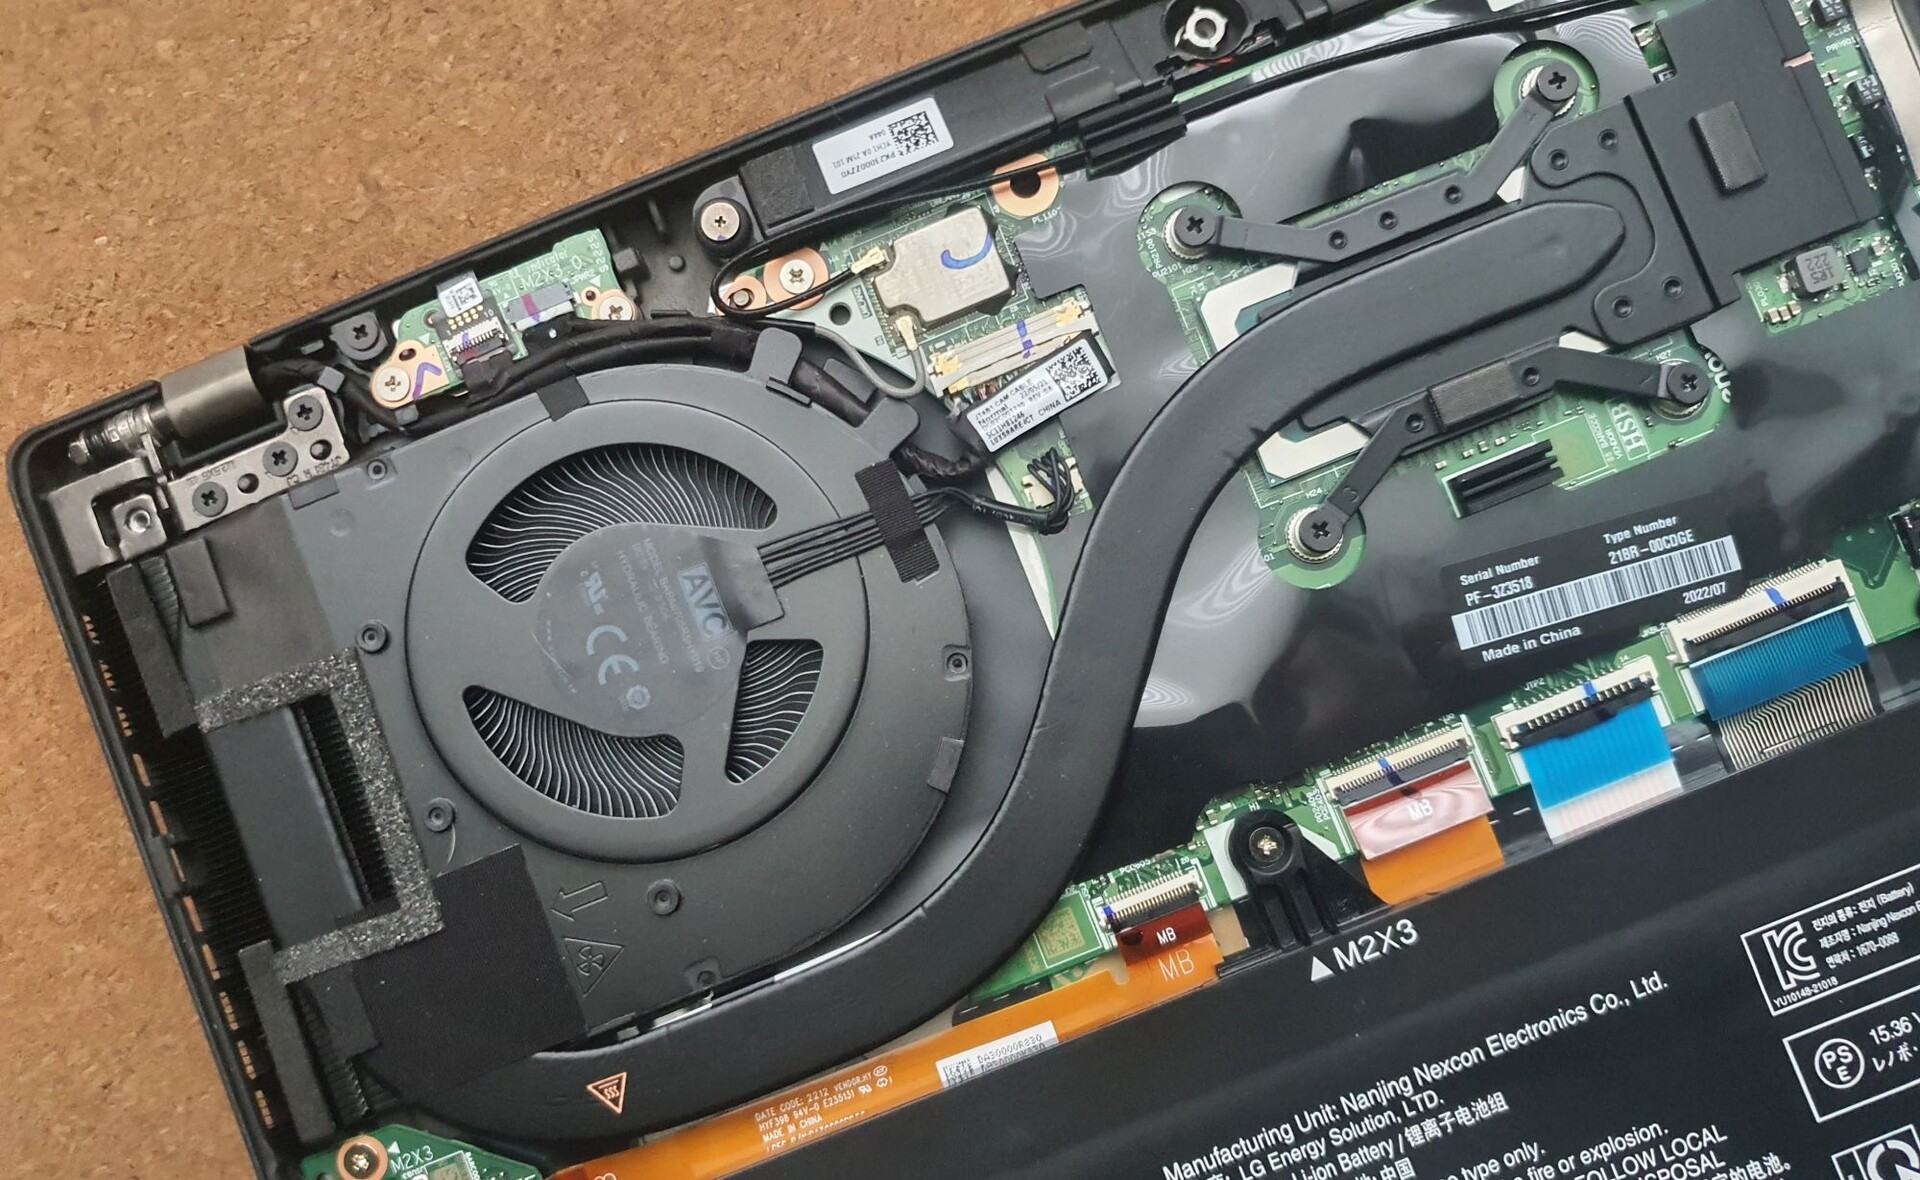
Bevor man das ThinkPad öffnet, sollte man im BIOS den internen Akku deaktivieren. Nachdem man nur fünf unverlierbare Kreuzschlitzschrauben gelöst hat, bedarf es eines Kunststoff-Spatels oder einer Plastikkarte, um einige Haken zu lösen.
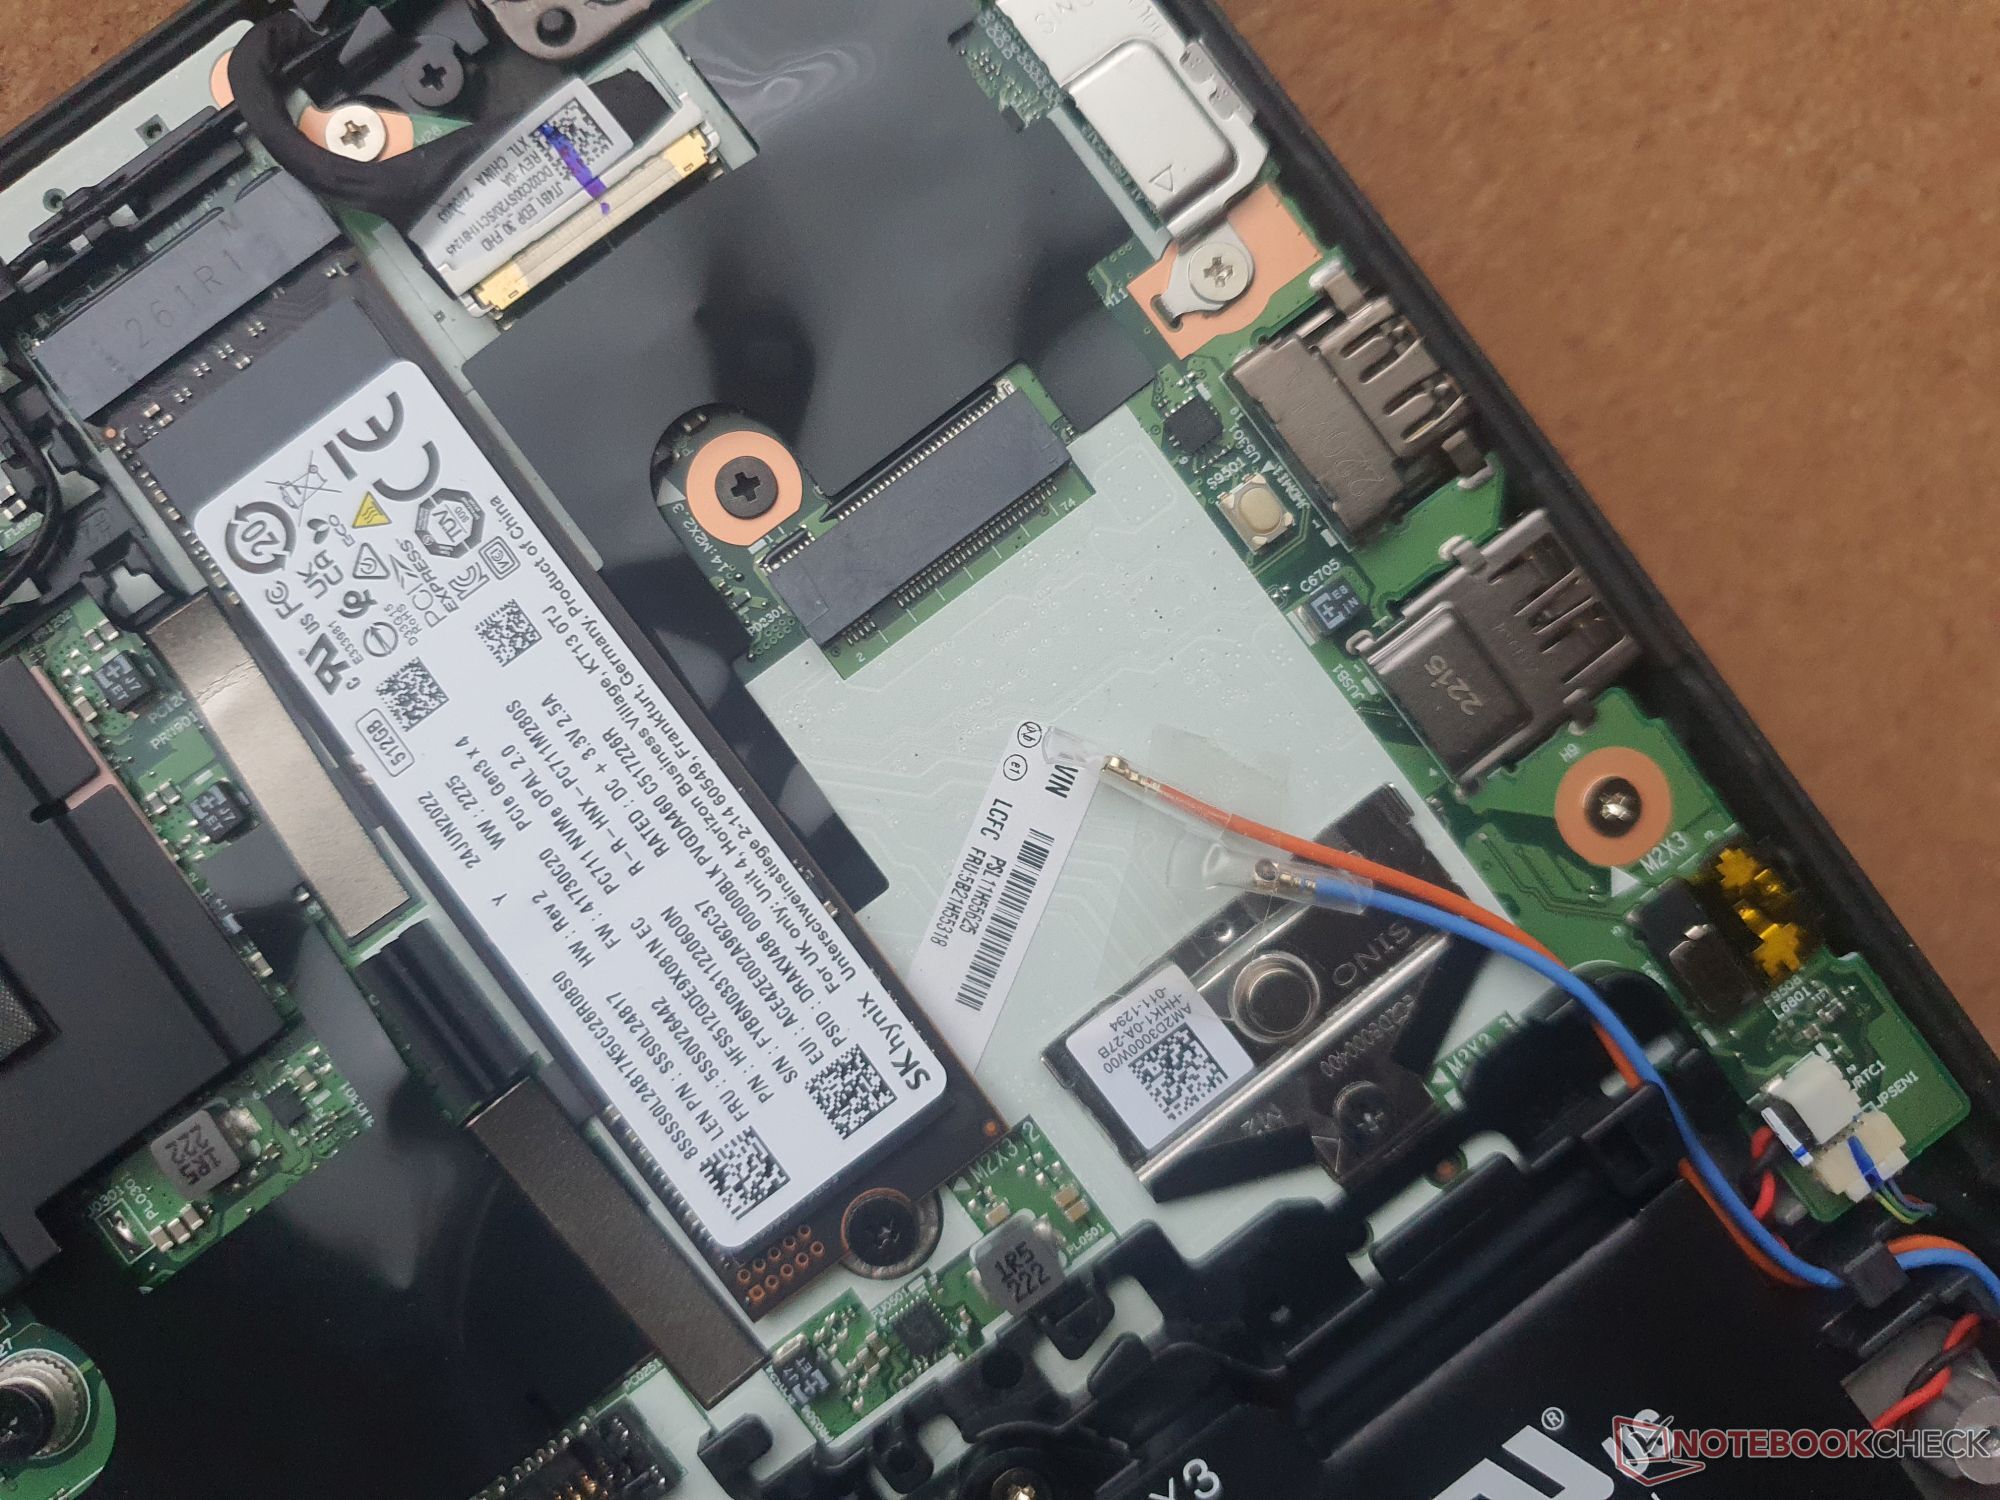
Danach erhält man Zugriff auf die M.2-2280-SSD, einen freien WWAN-Slot, den verschraubten 57-Wh-Akku und aufs Kühlsystem, das sich reinigen lässt. Verlötet sind leider das WiFi-Modul und der RAM.
Garantie
In Deutschland gewährt Lenovo eine Garantielaufzeit von drei Jahren bzw. ein Jahr auf den Akku. Unser Campus-Modell kommt mit 12 Monaten Premier-Support, welcher einen Vor-Ort-Service beinhaltet. Der Standard ist allerdings Kurier- oder Carry-in-Service. Ein Upgrade auf 36 Monate Premier-Support kostet 80 Euro, vier Jahre kosten 270 Euro, während fünf Jahre mit 382 Euro zu Buche schlagen.
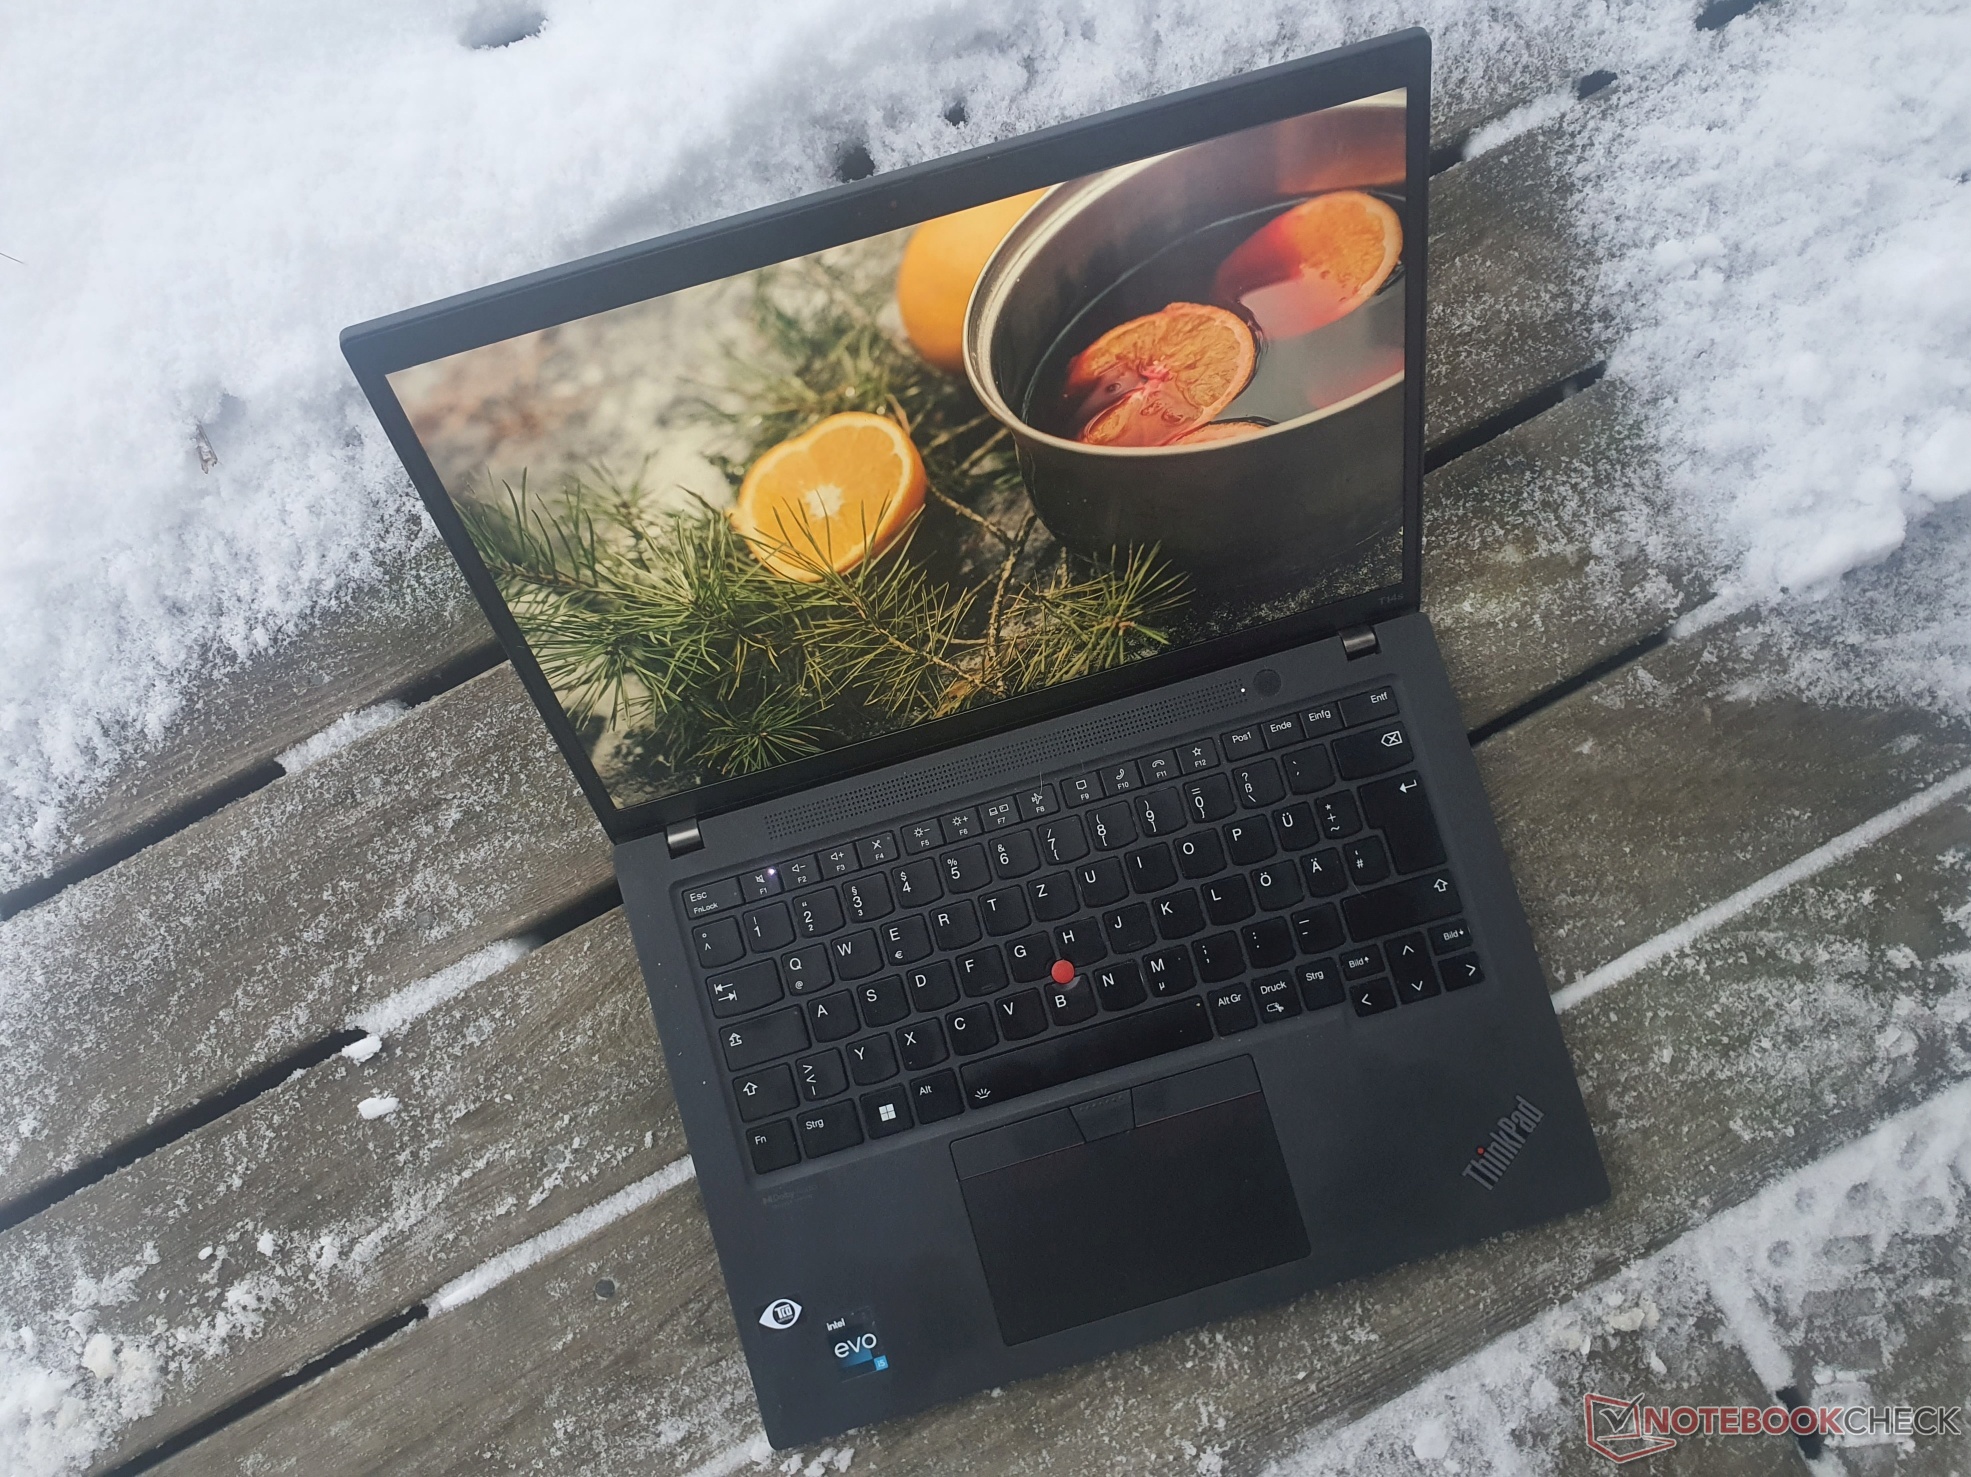
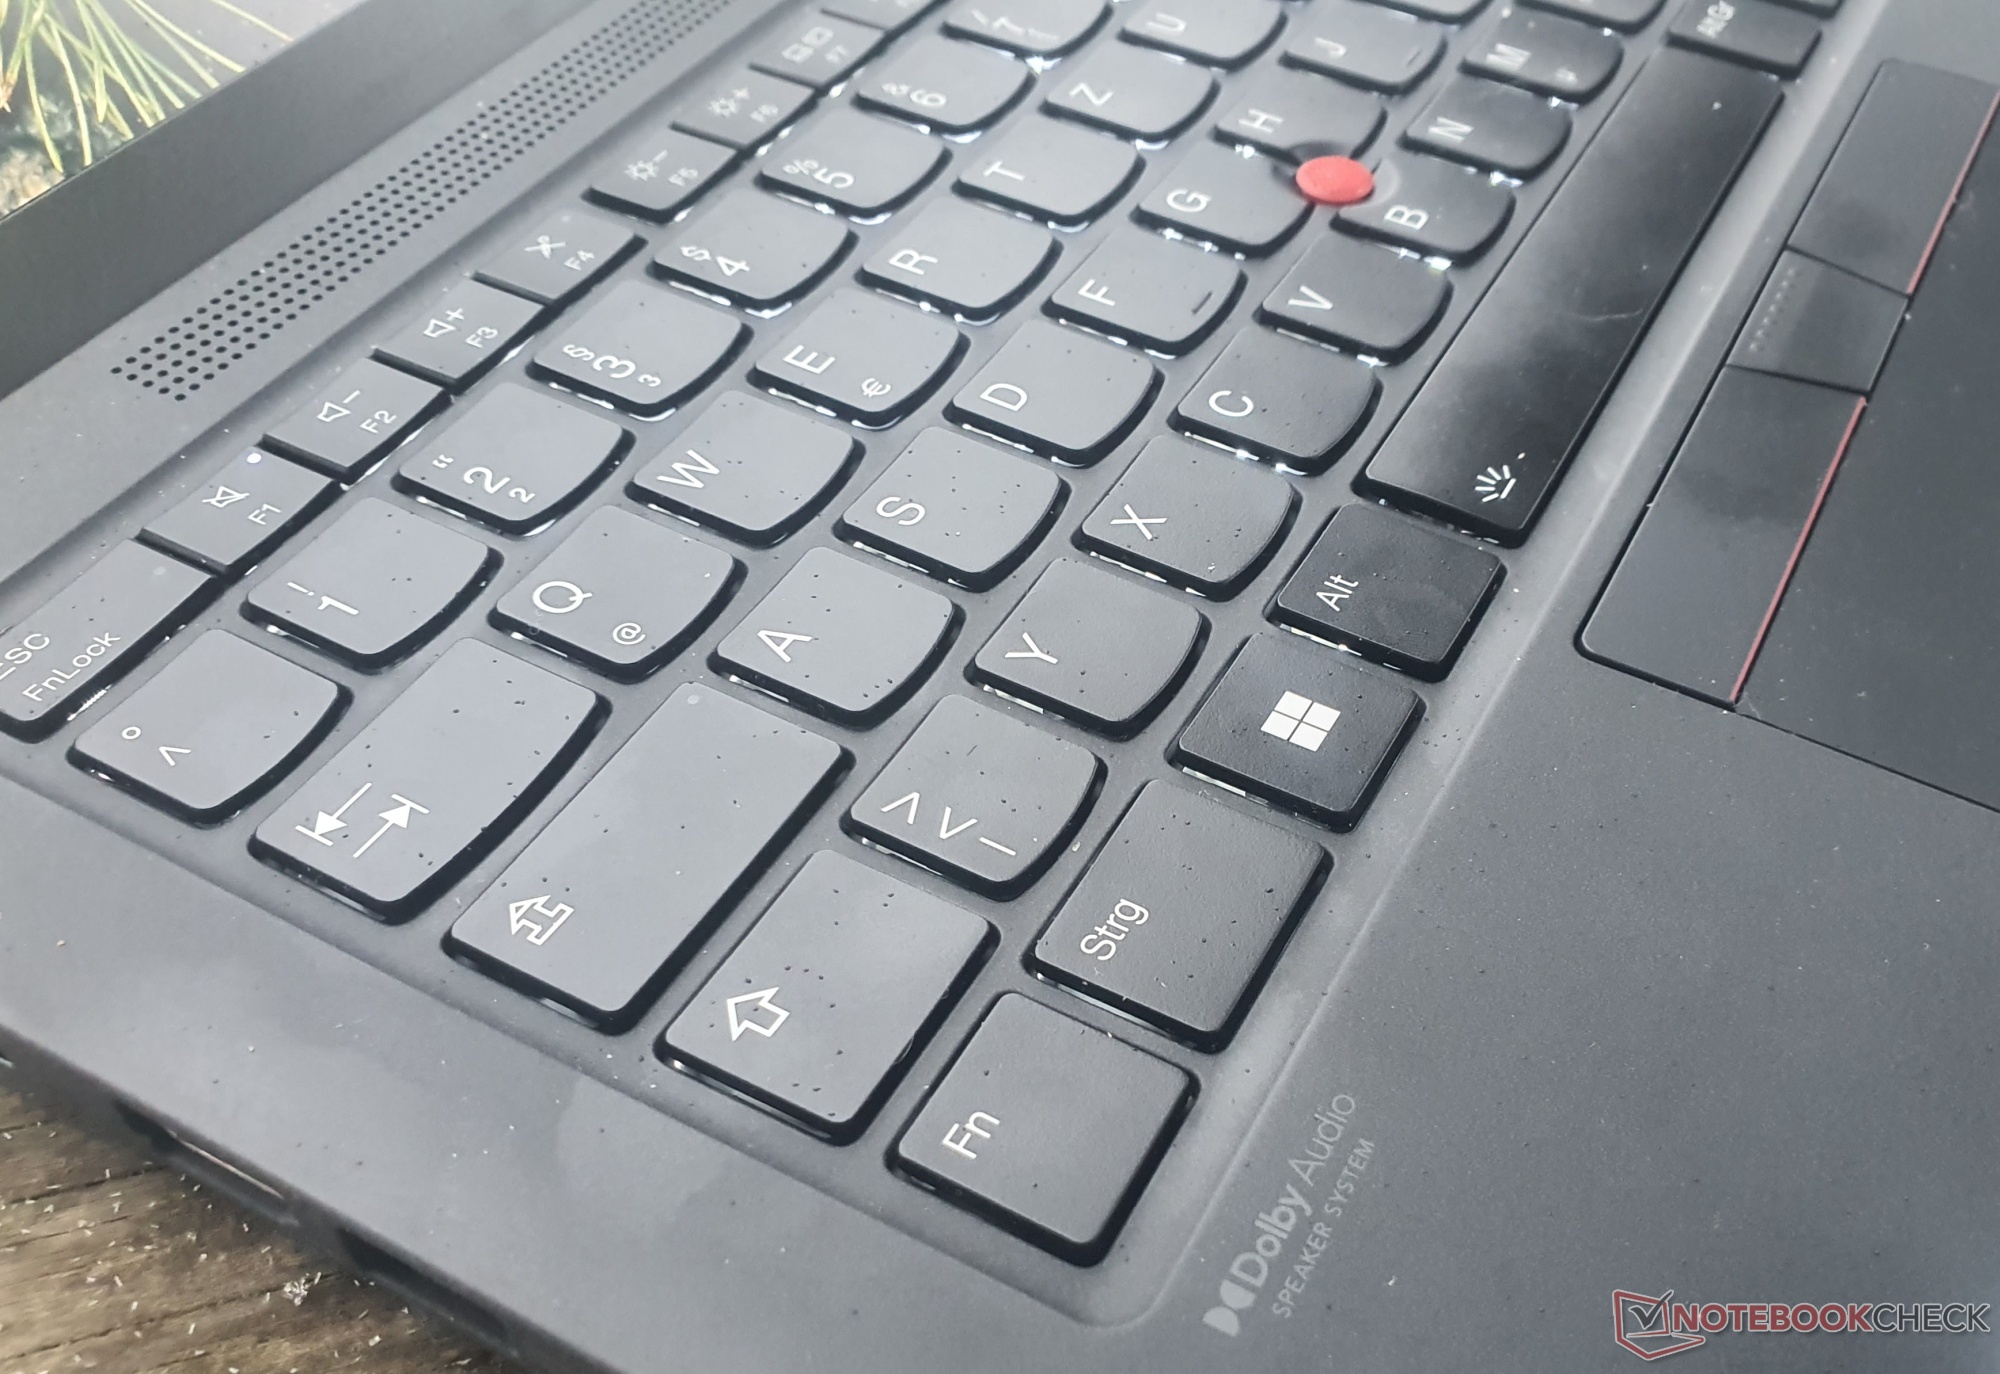
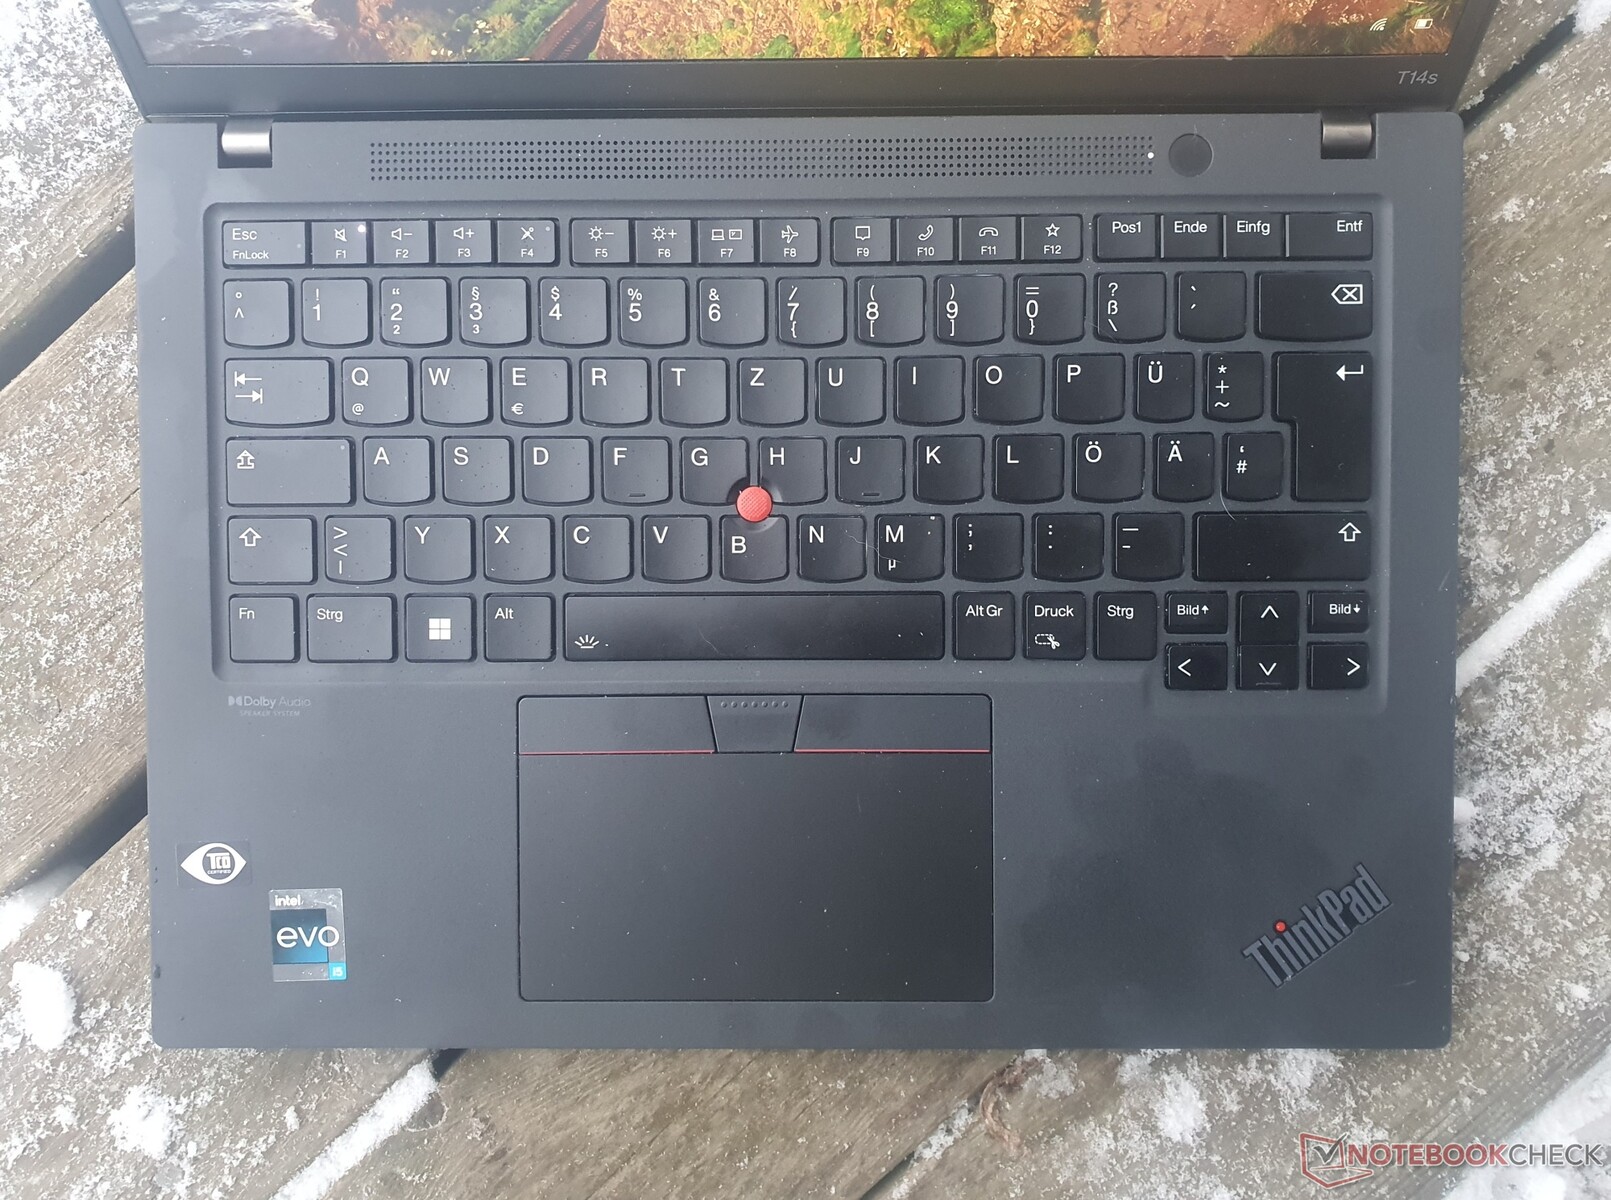
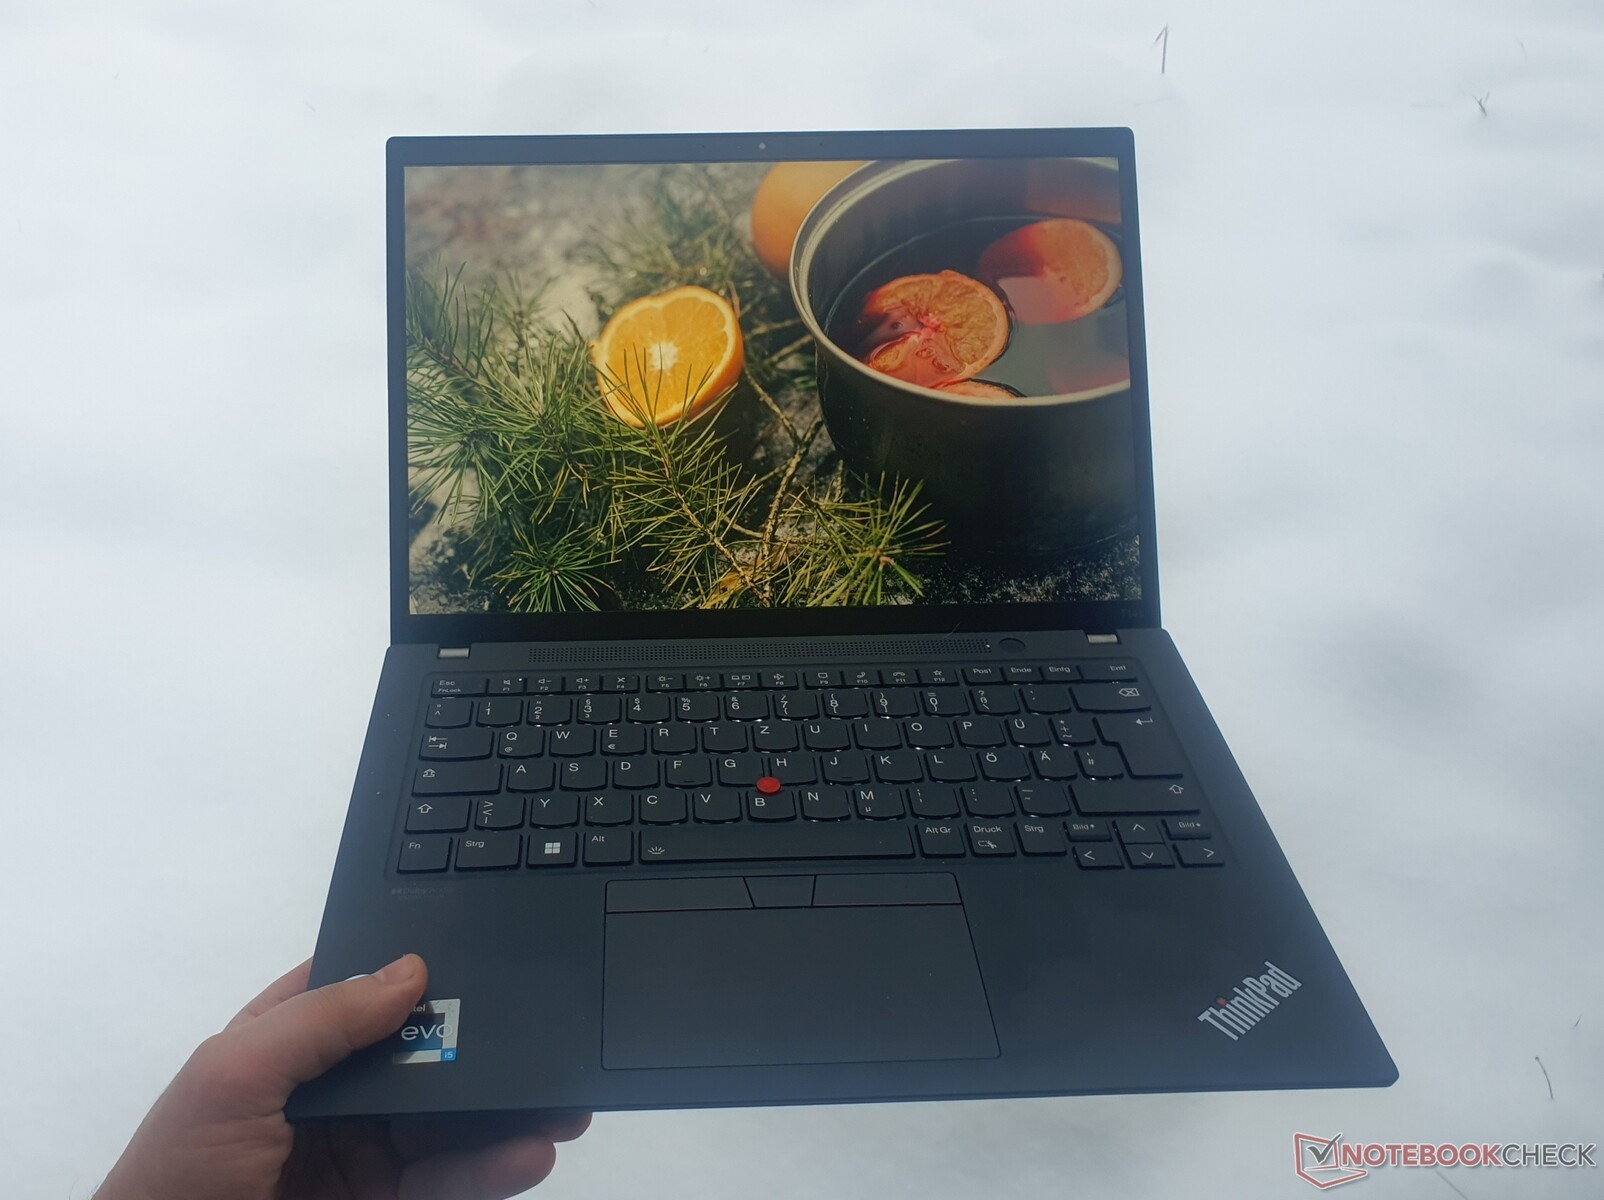
Eingabegeräte: Gute ThinkPad-Tastatur in voller Breite
Tastatur
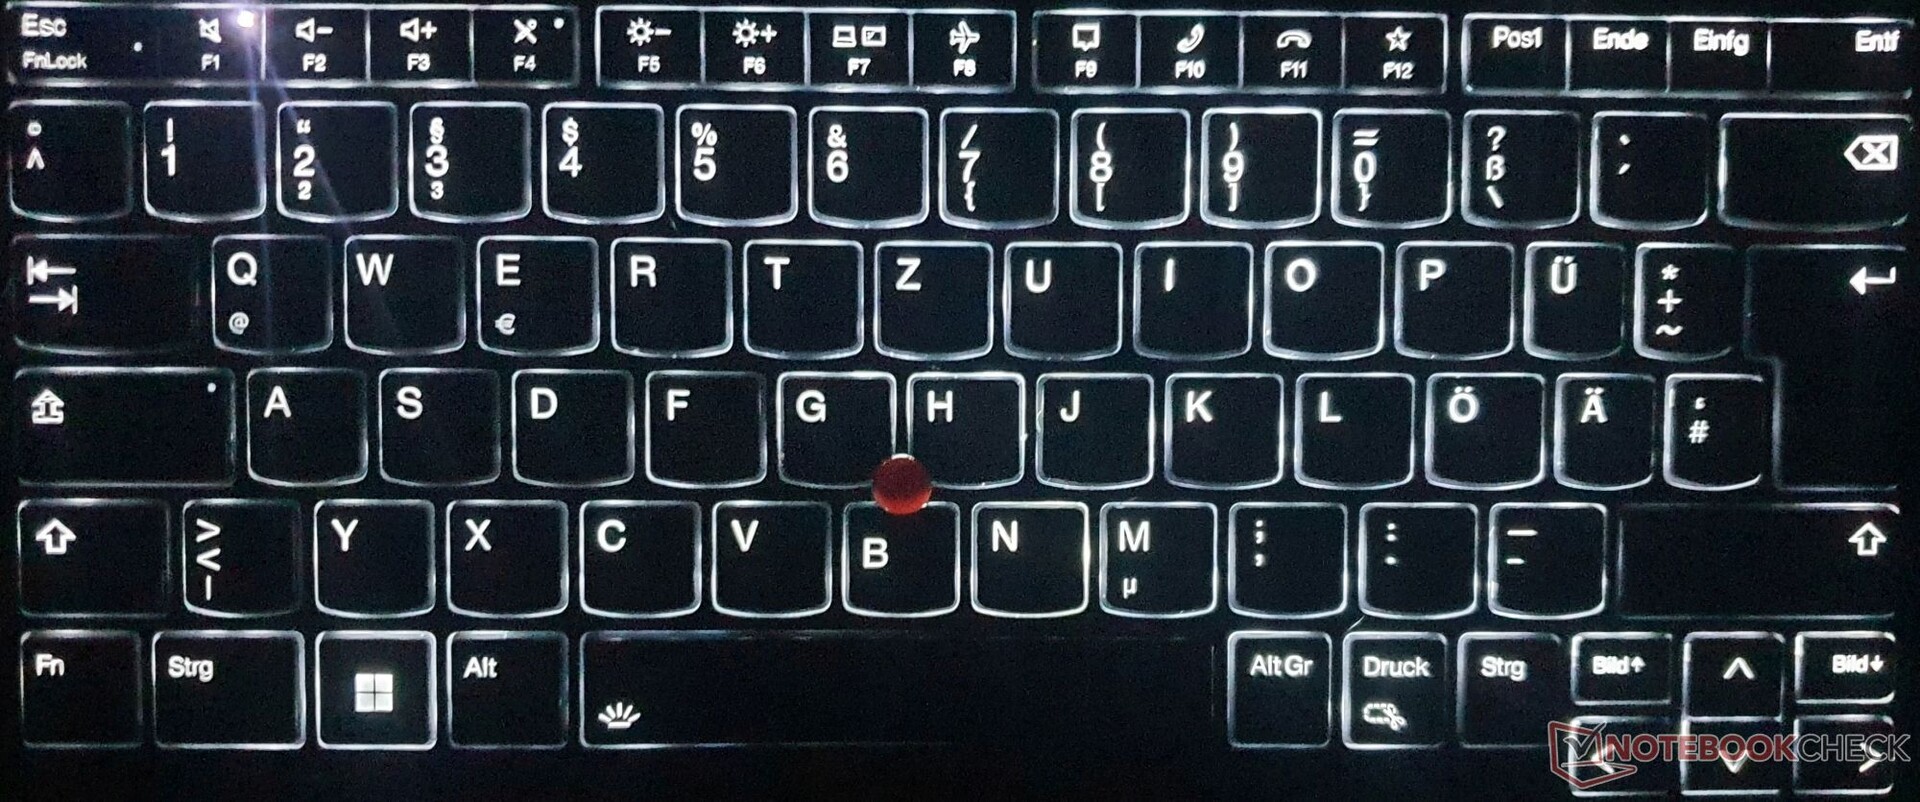
Die 6-reihige, spritzwassergeschützte Tastatur kommt mit 16x16 mm großen Tasten, bis auf die Umlaute, in voller Breite. Die Pfeiltasten etwa sind verkleinert, während alle wichtigen Tasten ohne Doppelbelegung auskommen.
Der Tastenhub wurde beim ThinkPad T14s bereits letztes Jahr auf 1,5 mm reduziert. Da Druckpunkt und Widerstand sehr spürbar sind, tippt es sich schneller und zielgenauer als auf den meisten Tastaturen. Zuträglich ist das stabile Tastaturen-Deck, das unter gezieltem Druck nicht nachgibt.
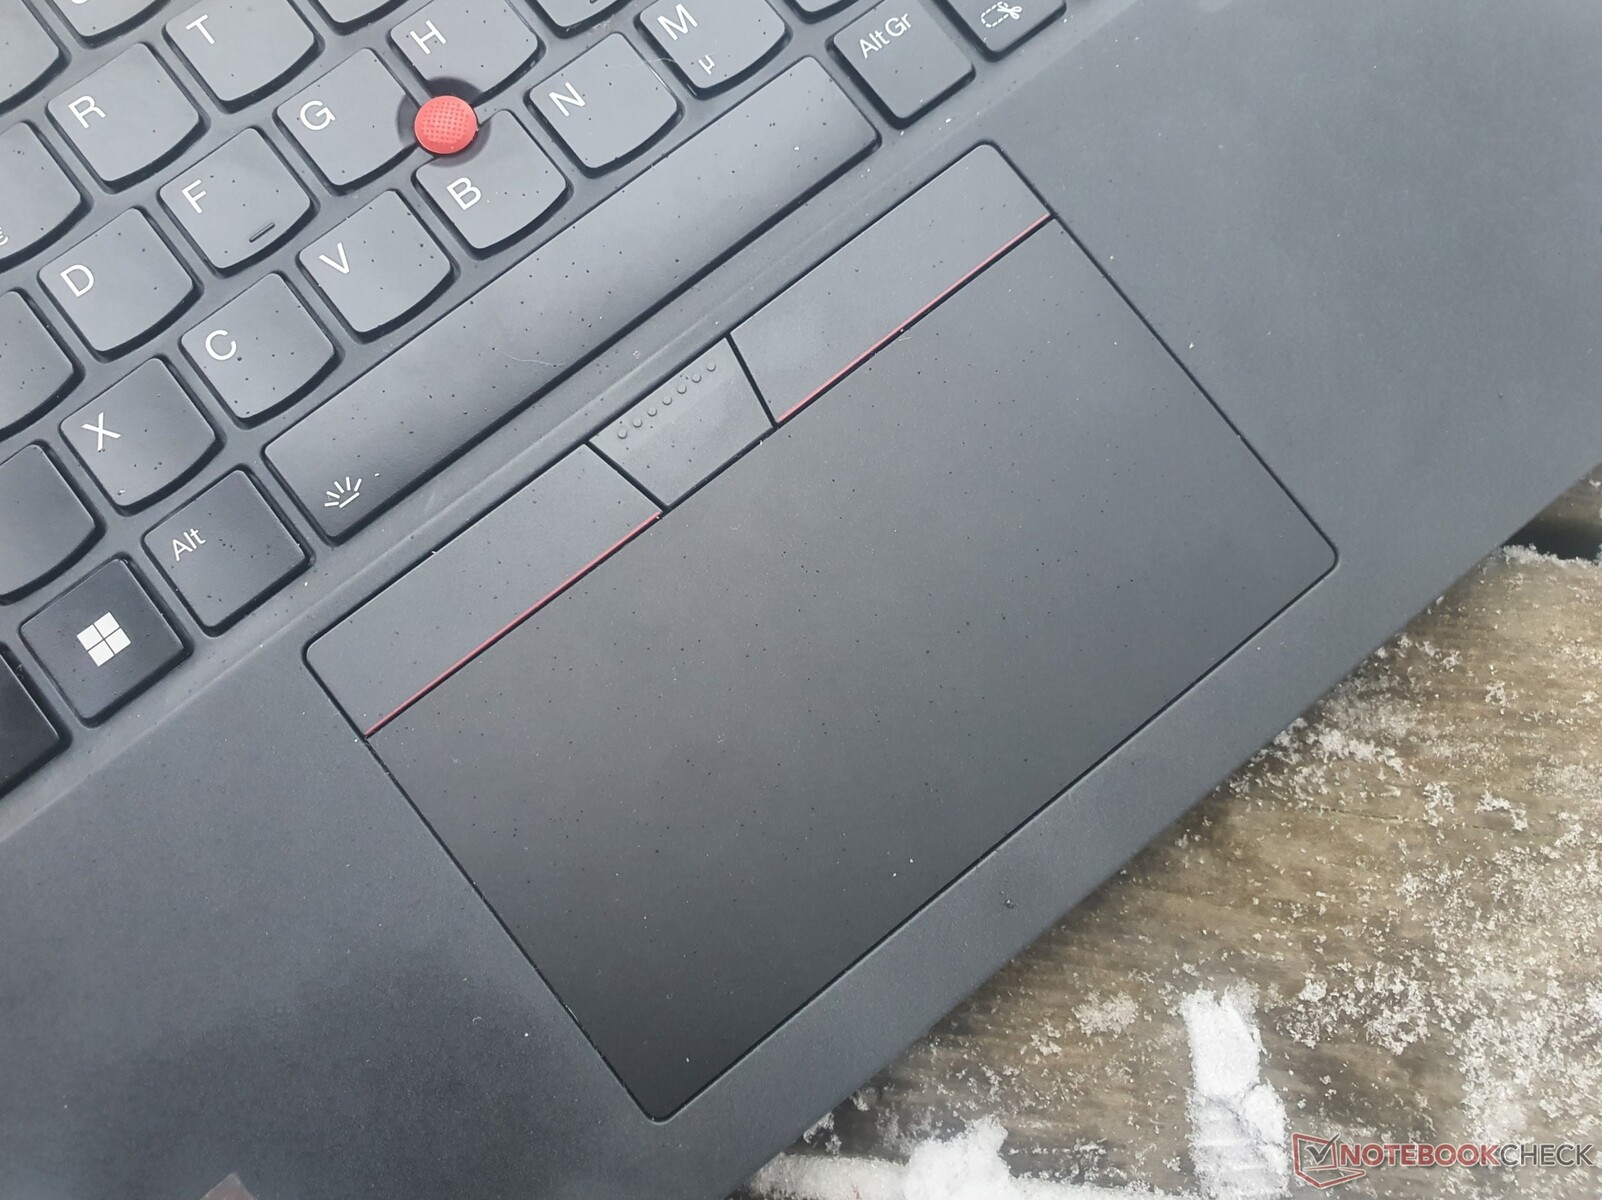
Touchpad & TrackPoint
Das Touchpad des ThinkPad T14s G3 misst 11,5x6,1 cm wie beim Vorgänger. Es erhält eine verbesserte Mylar-Oberfläche, die sich mehr wie Glas anfühlt und noch bessere Gleiteigenschaften bietet. Pinch-to-Zoom- und Drag-&-Drop-Gesten werden problemlos umgesetzt. Die integrierten Klicktasten bieten einen mittleren Hub sowie ein sattes Feedback. Unten links und rechts ist das Touchpad etwas klapprig.
Mit dem TrackPoint lässt sich der Mauszeiger schnell und präzise über den Bildschirm bewegen, während die Hand immer an der Tastatur bleibt. Die drei zugehörigen Tasten sind komplett flach, besitzen einen geringen Hub und lösen präzise aus.
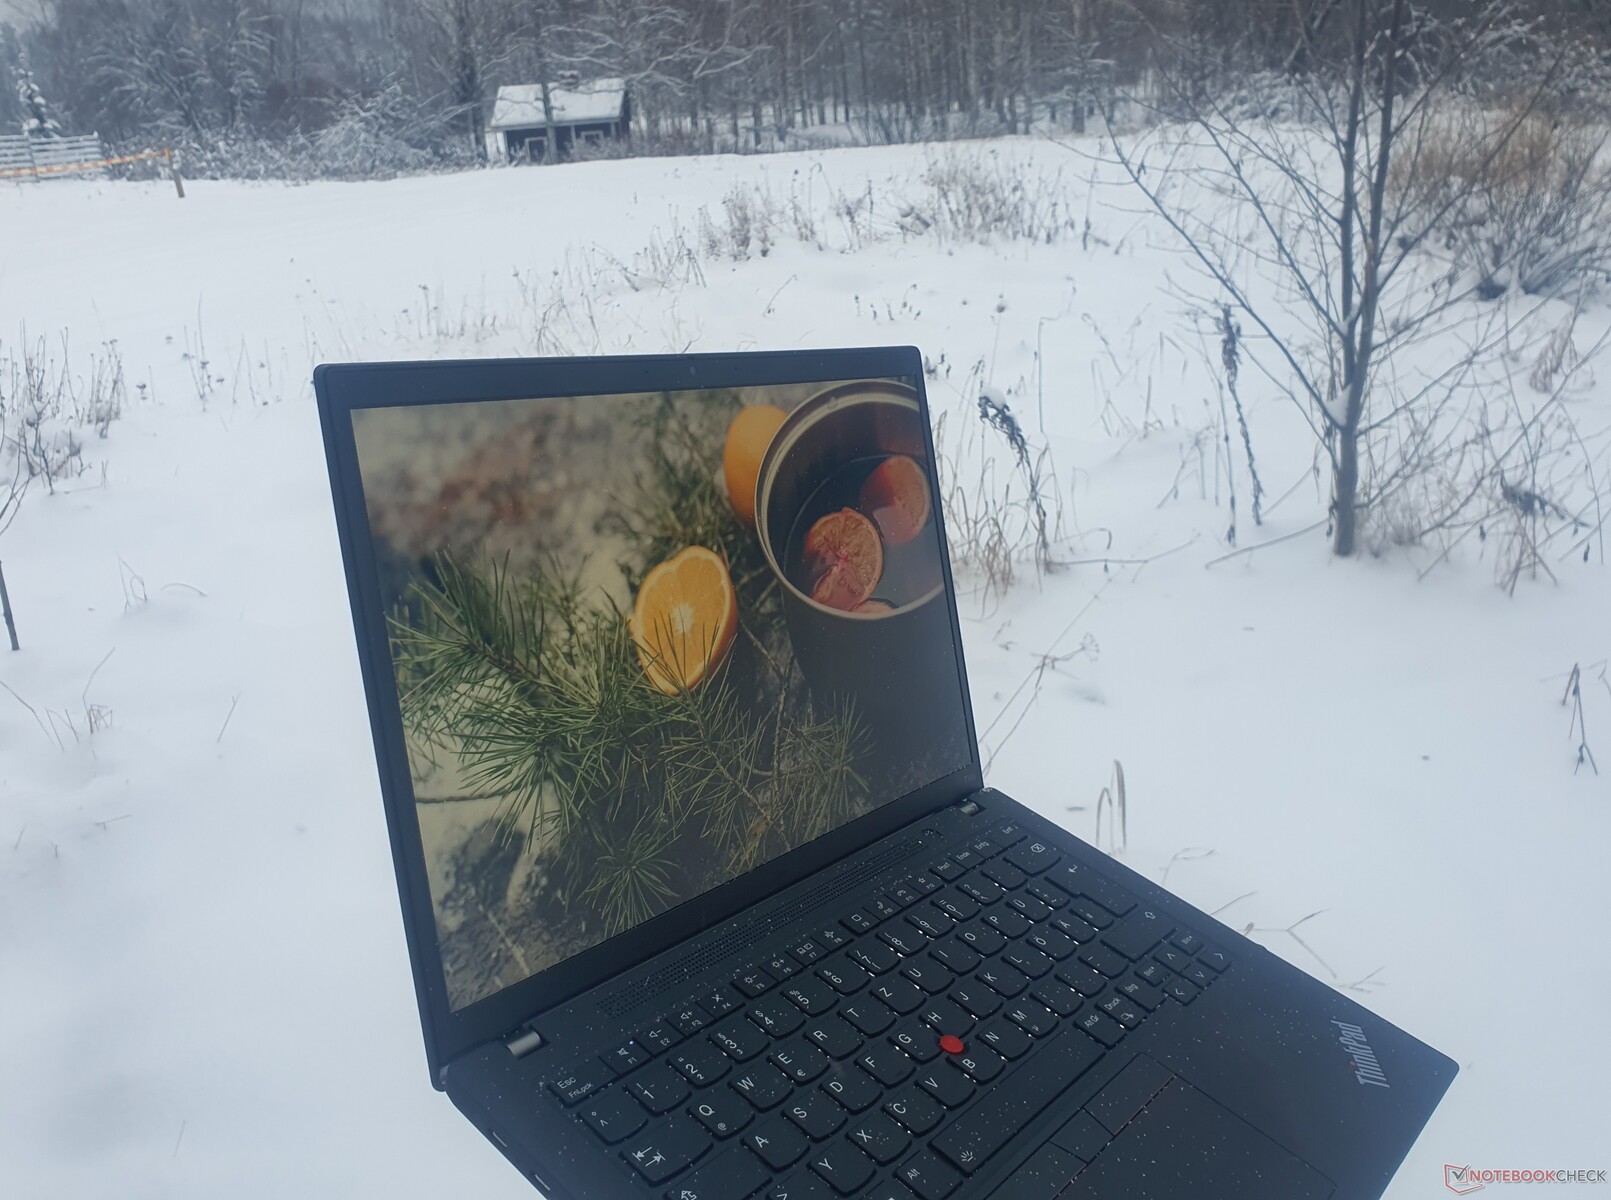
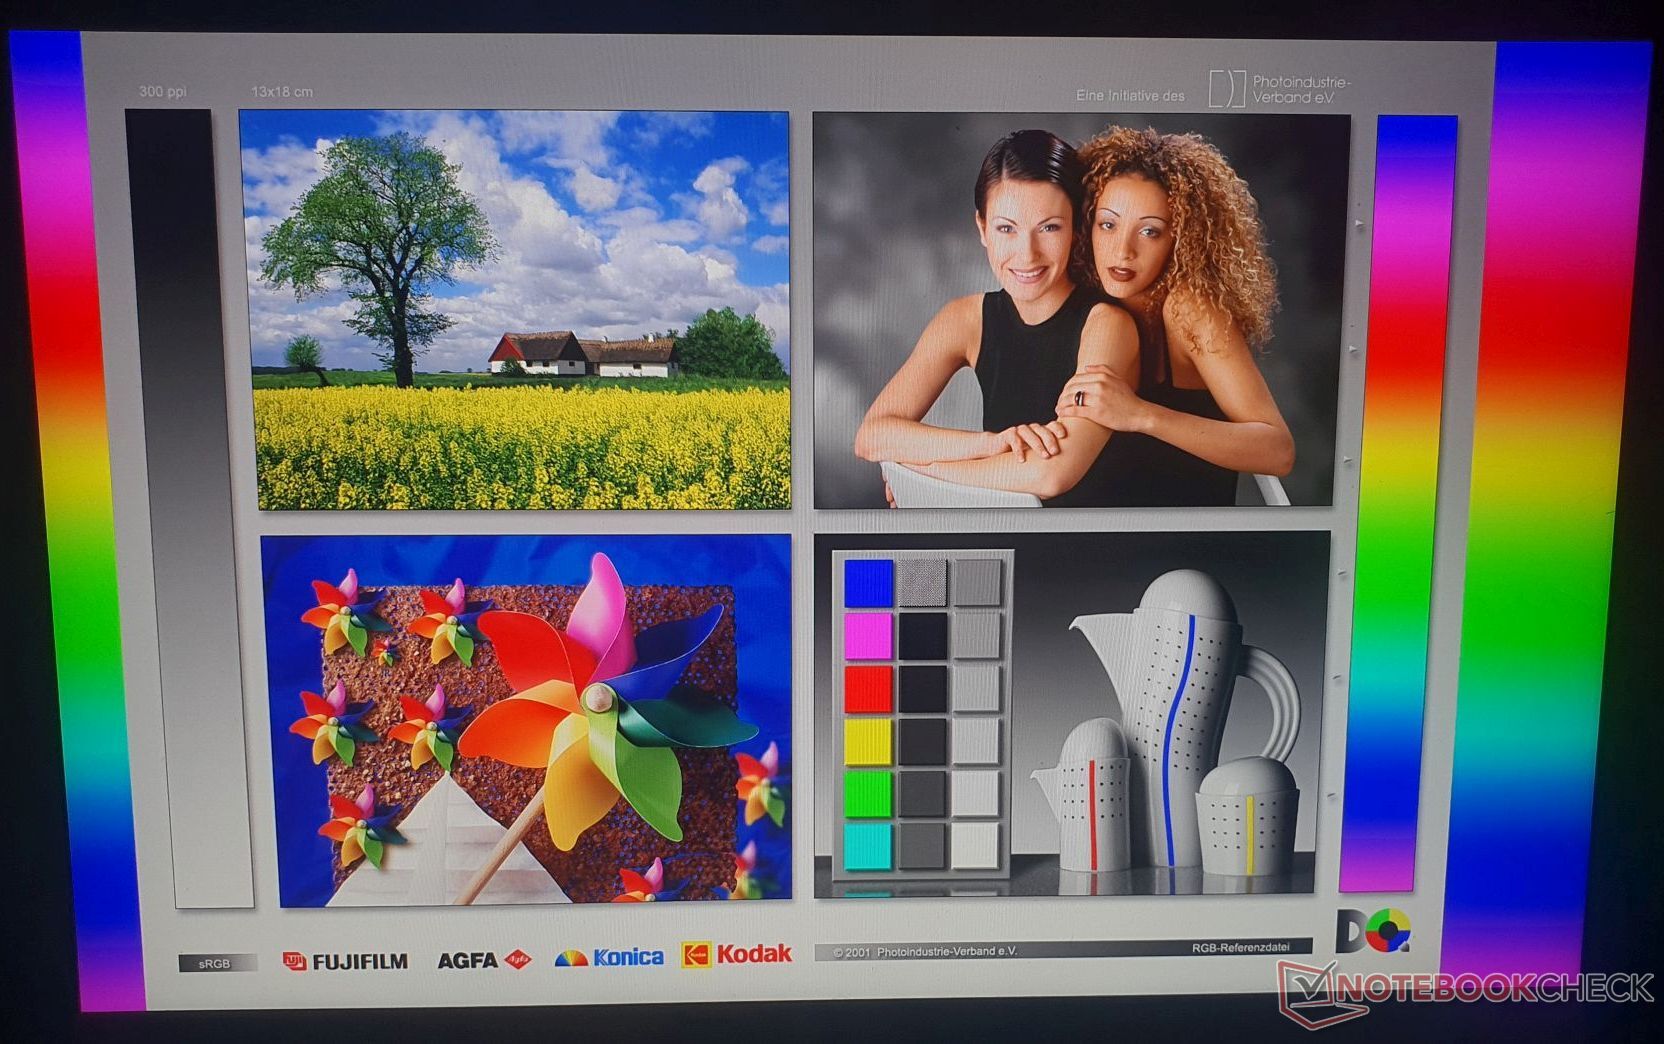
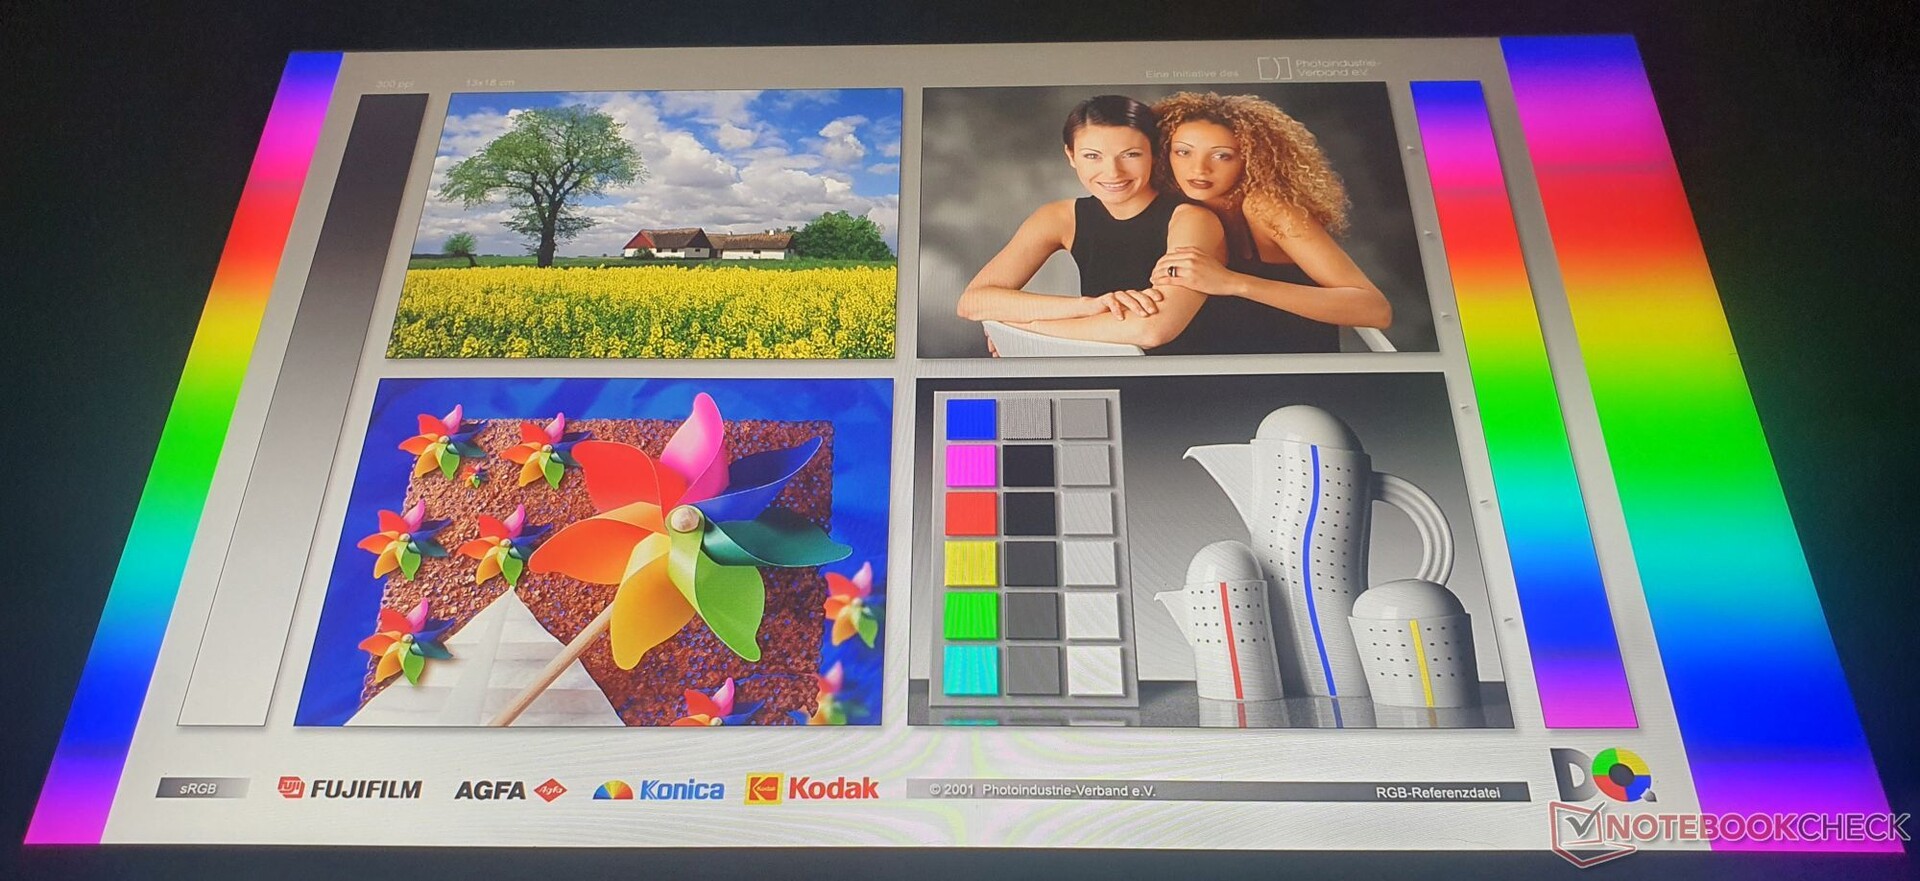
Low-Power-Display im ThinkPad T14s G3 wird nicht hell genug

Das Low-Power-Display im von uns getesteten Modell löst mit 1.920 x 1.200 Pixel (WUXGA/FHD+) auf und bietet ausreichend Schärfe auf 14 Zoll. Das 16:10-Format hat es endlich auch in die T-Serie geschafft, während das X13 etwa schon im Vorjahr darauf setzte.
Das matte Display erreicht nur 300 cd/m², statt den angegebenen 400 cd/m², was im Außeneinsatz problematisch werden kann. Das gleiche Panel testeten wir bereits im ThinkPad X1 Yoga G7, wo es mit 360 cd/m² ebenfalls nicht die Spezifikation erfüllt. Das Low-Power-Panel im ThinkPad T14 G3 etwa erreichte deutlich hellere 435 cd/m², was mal wieder ein Beispiel für die Displaylotterie mit verschiedenen Teile-Zulieferanten ist.
Für das T14s bietet Lenovo sechs Optionen an. Das 2,2K-Display schafft es aber nicht auf den europäischen Markt:
- FHD+, 300 cd/m², 45% NTSC
- FHD+, 400 cd/m², 800:1, Low-Power, 100% sRGB
- FHD+, 300 cd/m², Touch, 45% NTSC
- FHD+, 500 cd/m², Privacy Guard + Touch, 100% sRGB,
- 2.2K, 300 cd/m², Low Blue Light, 100% sRGB
- 2.8K, 400 cd/m², OLED, Anti-Glare, 100% DCI-P3, HDR 500, Eyesafe
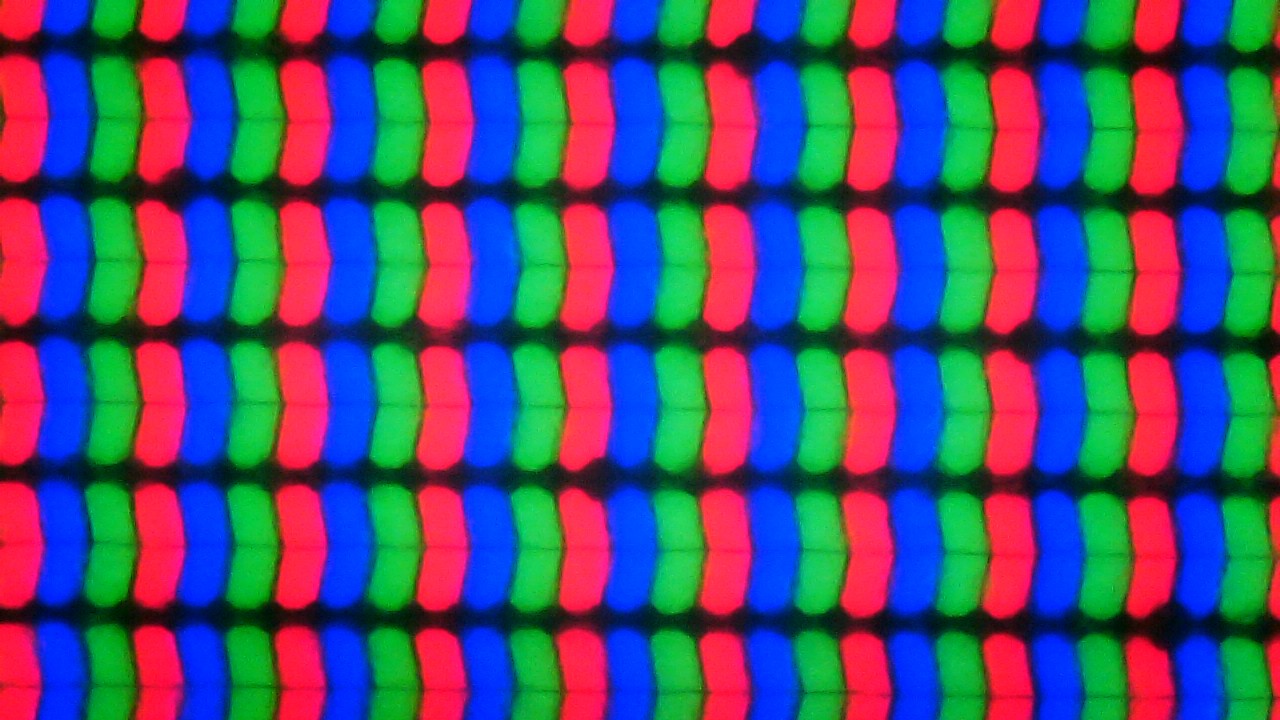
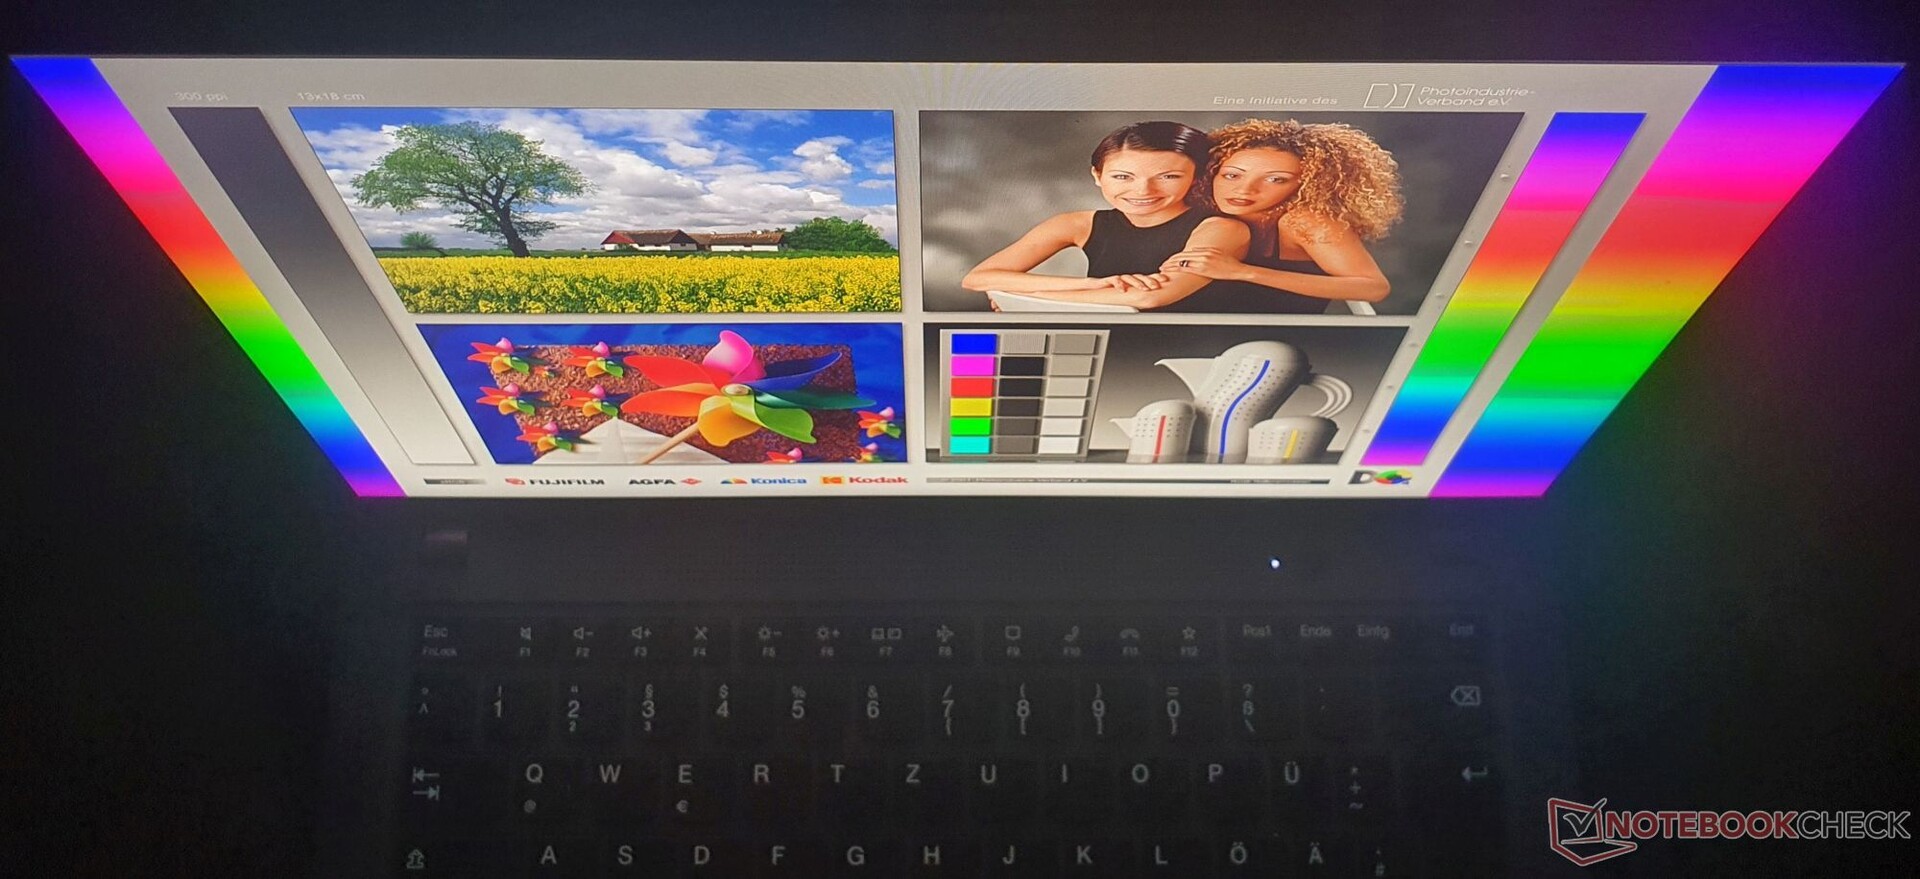
Das neue OLED-Display beim T14s ersetzt die 4K/UHD-Option. Der Kontrast von 1.950:1 und der Schwarzwert von 0,16 cd/m² befinden sich auf einem sehr guten Niveau für ein IPS-Display. Das Schwarz wirkt dadurch satt und tief. Der Weißpunkt liegt mit 6.196K ein wenig vom Optimum (6.500K) entfernt. Nachteilig ist das starke Clouding, das man bei dunklem Hintergrund deutlich wahrnimmt. Bei unserem Modell stellten wir zudem einen defekten Pixel fest, aber kein PWM-Flackern. Häufig sehen wir bei den Low-Power-Displays starkes Ghosting, wie auch bei diesem Panel.
| |||||||||||||||||||||||||
Ausleuchtung: 93 %
Helligkeit Akku: 312 cd/m²
Kontrast: 1950:1 (Schwarzwert: 0.16 cd/m²)
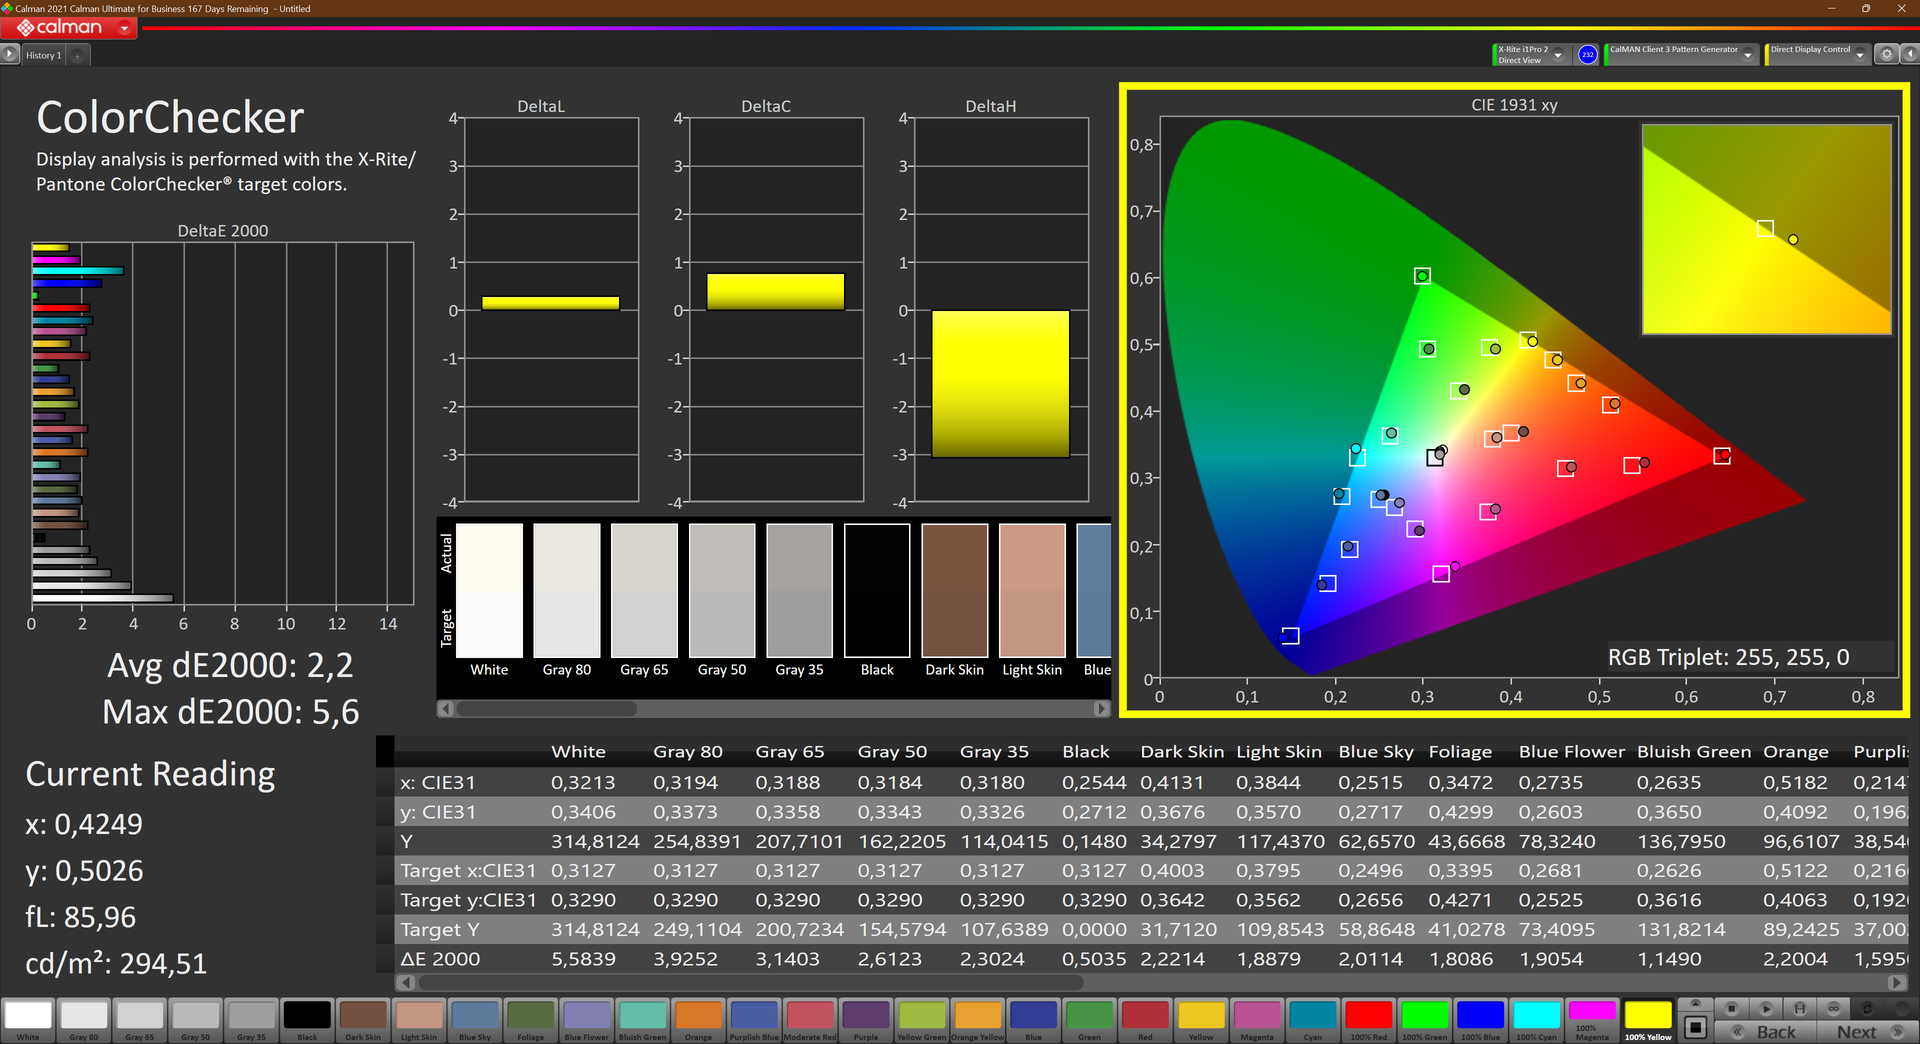
ΔE ColorChecker Calman: 2.2 | ∀{0.5-29.43 Ø4.72}
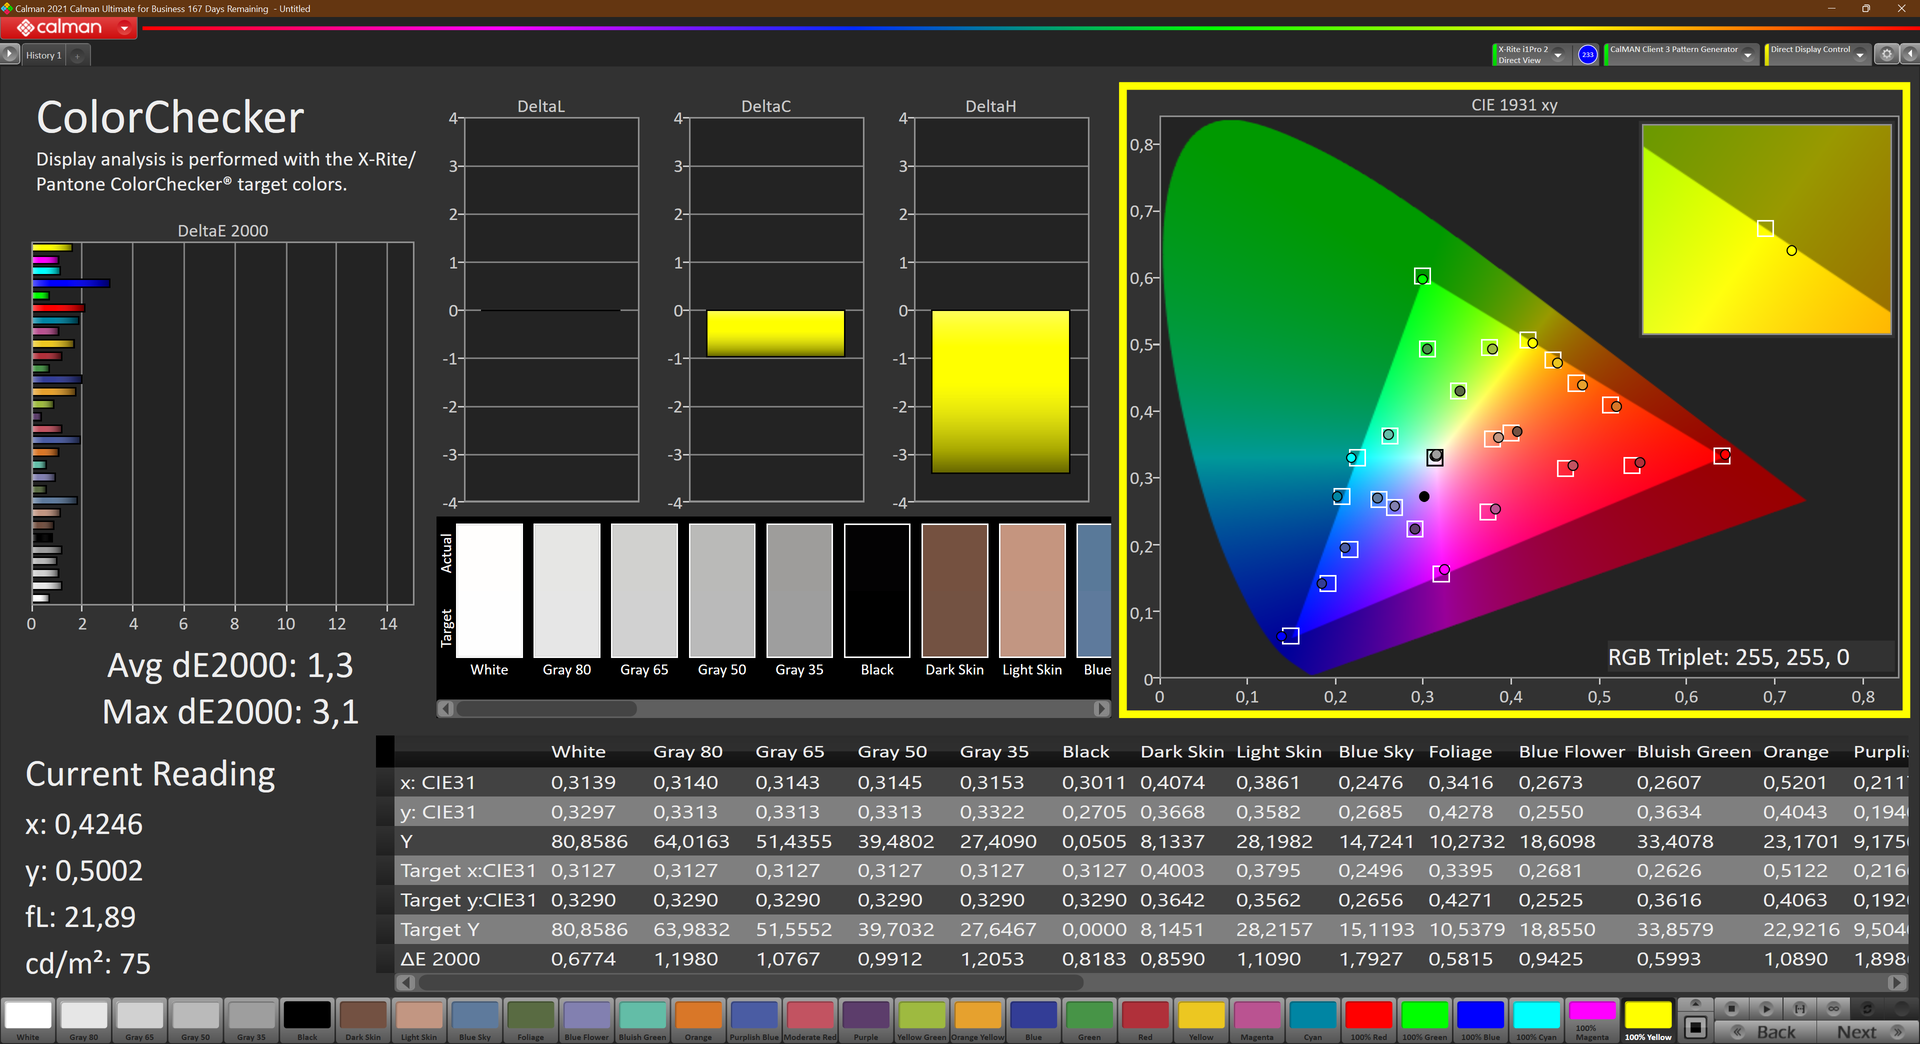
calibrated: 1.3
ΔE Greyscale Calman: 2.7 | ∀{0.09-98 Ø4.97}
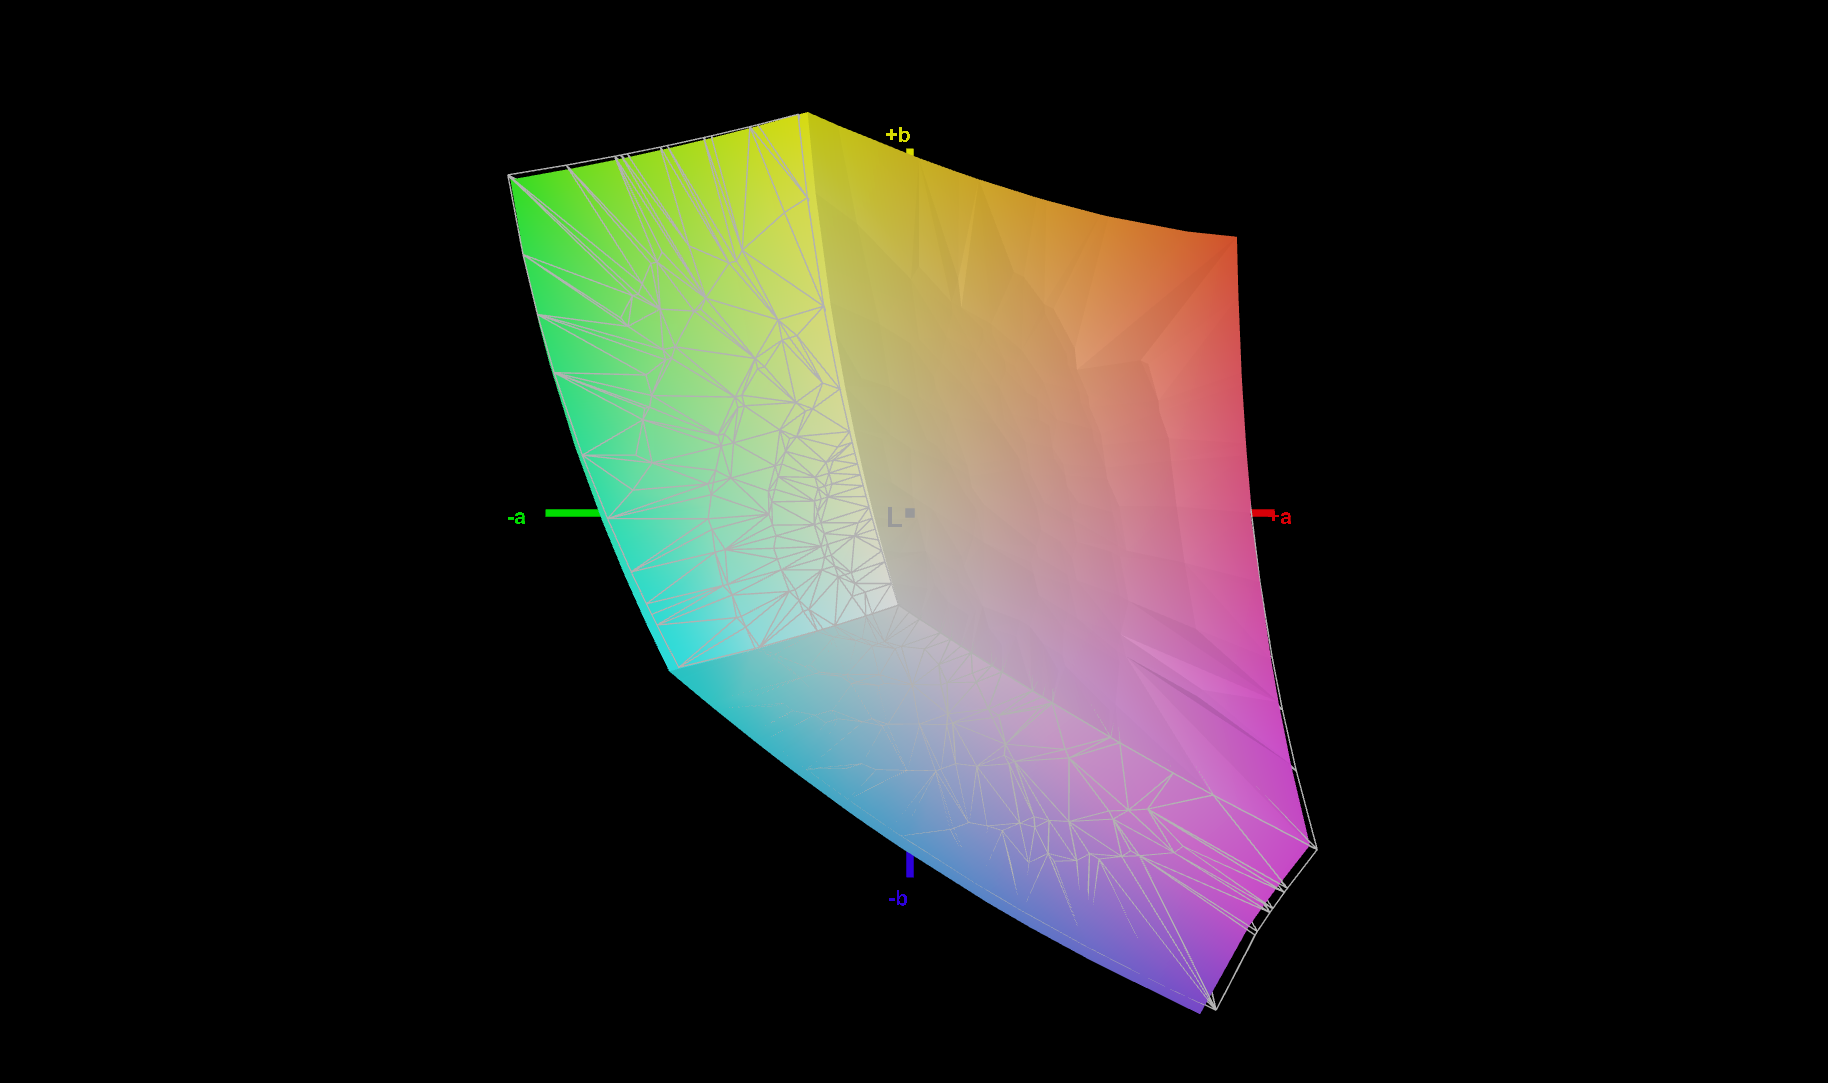
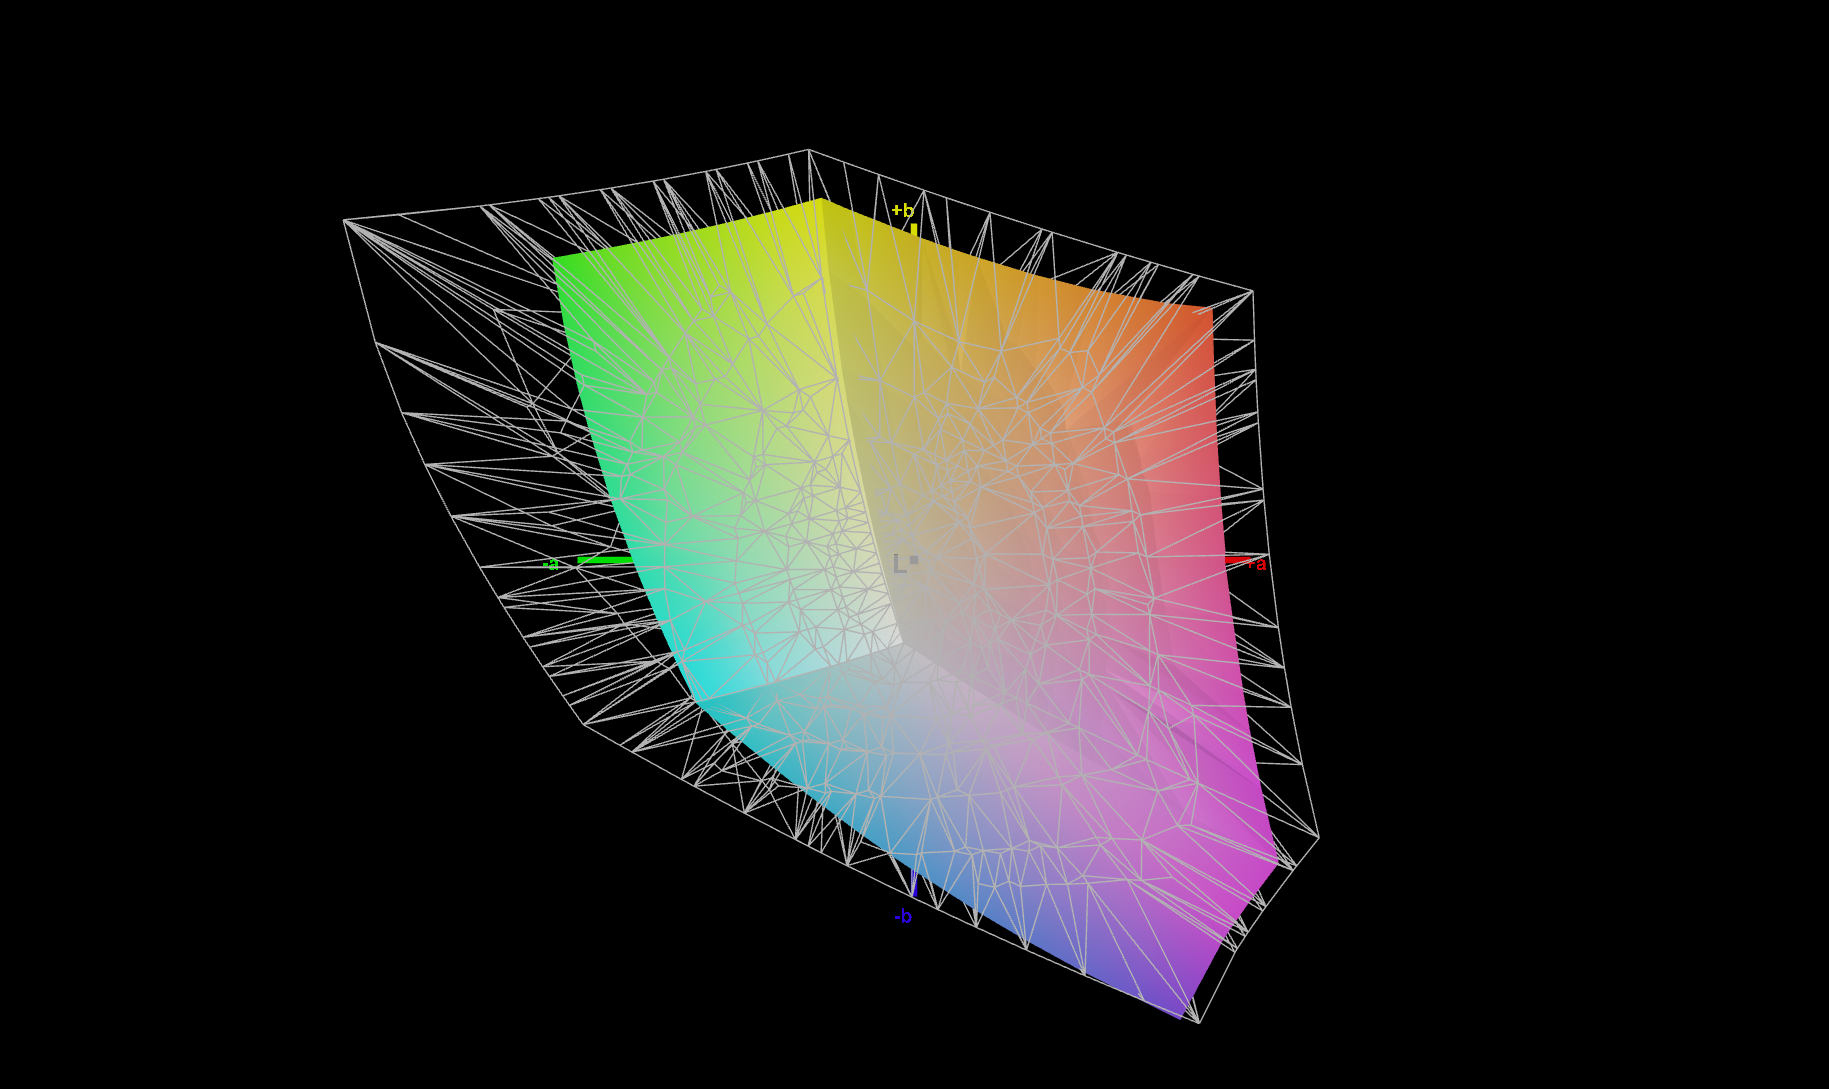
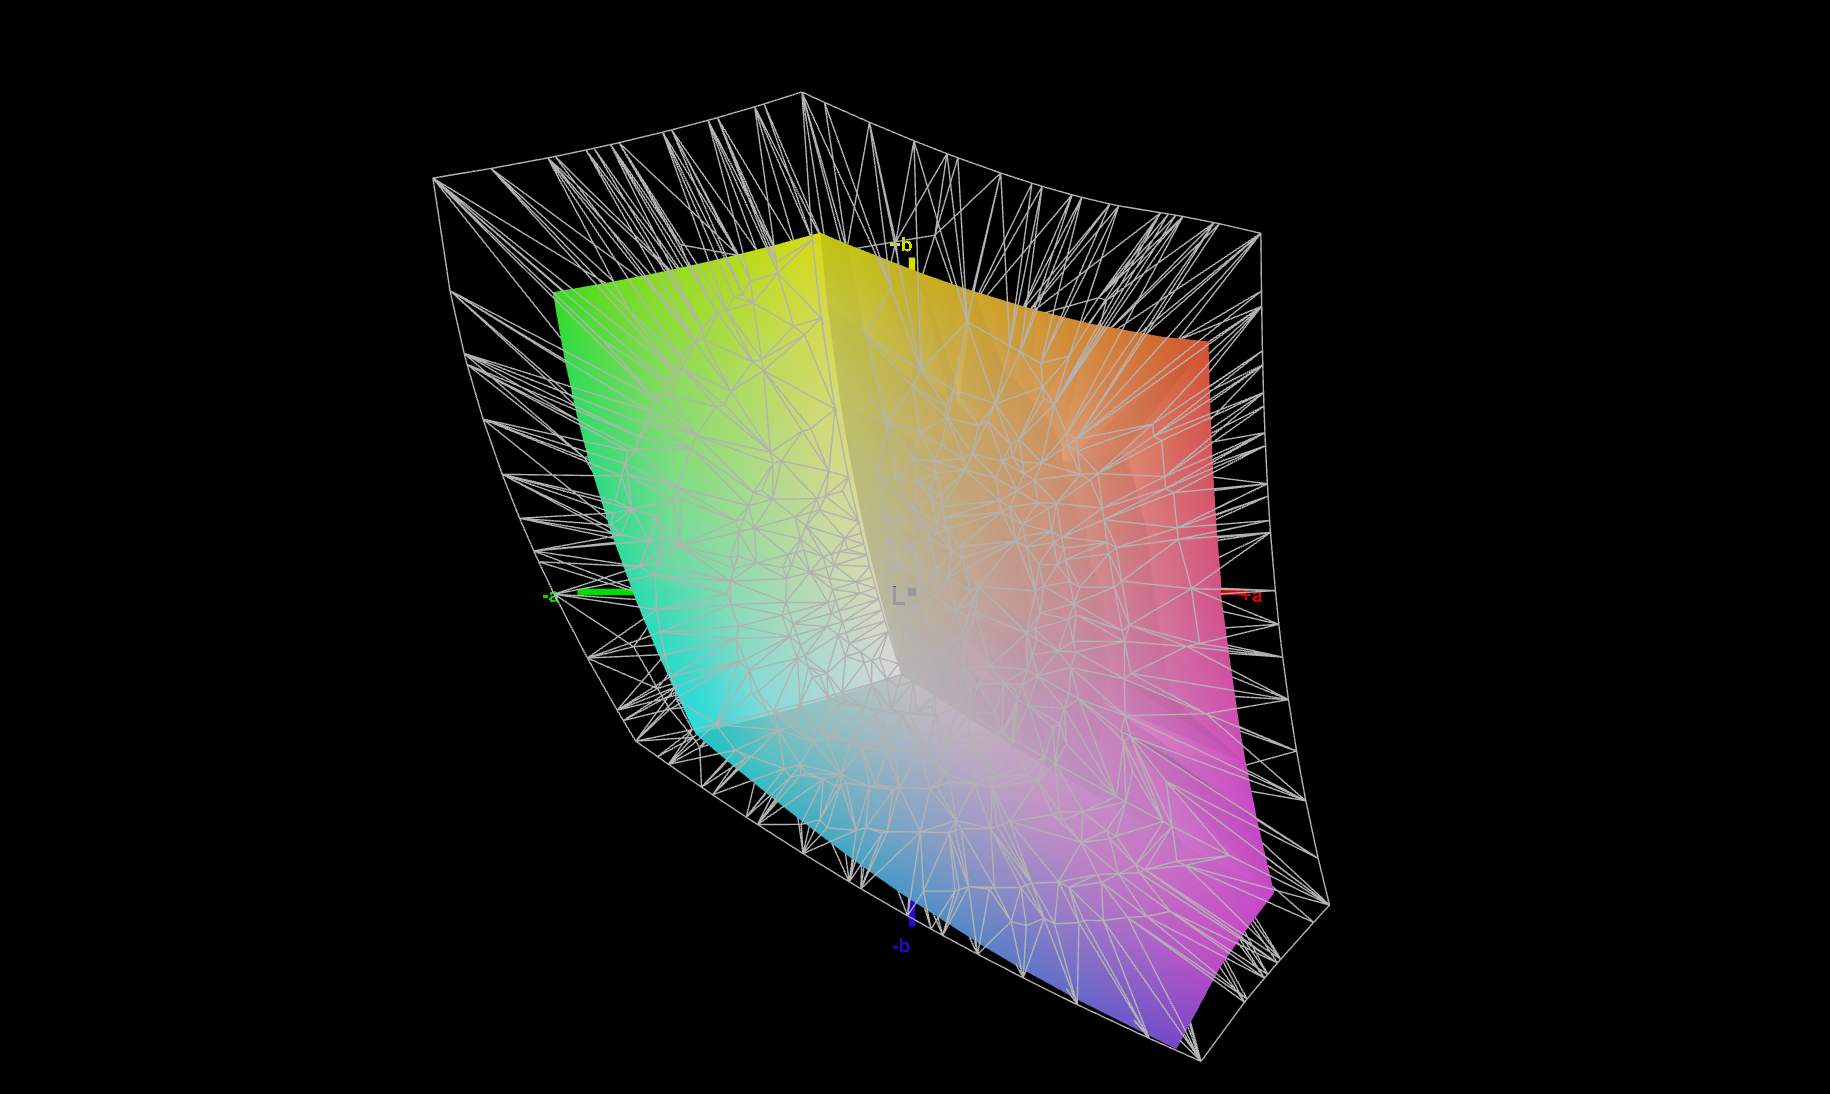
70.1% AdobeRGB 1998 (Argyll 3D)
98.6% sRGB (Argyll 3D)
67.8% Display P3 (Argyll 3D)
Gamma: 2.11
CCT: 6196 K
| Lenovo ThinkPad T14s G3 21BR00CDGE MNE007JA1-1, IPS LED, 1920x1200, 14" | Lenovo ThinkPad T14s G2 20WM003TGE NE140FHM-N61, IPS LED, 1920x1080, 14" | Lenovo ThinkPad T14 G3-21CF004NGE LP140WU1-SPB2, IPS, 1920x1200, 14" | Lenovo ThinkPad X1 Yoga G7 21CE002HGE MNE007JA1-1, IPS, 1920x1200, 14" | Lenovo ThinkPad X1 Carbon G10 21CC001RGE B140UAN02.1, IPS LED, 1920x1200, 14" | HP EliteBook 845 G9 6F6H9EA AUOA49A, IPS, 1920x1200, 14" | Dell Latitude 7420 JW6MH Chi Mei CMN1416 CHF07 140HCG, IPS, 1920x1080, 14" | Schenker Vision 14 2022 RTX 3050 Ti MNE007ZA1-1, IPS, 2880x1800, 14" | |
|---|---|---|---|---|---|---|---|---|
| Display | -4% | 1% | 2% | 6% | 7% | 0% | 5% | |
| Display P3 Coverage (%) | 67.8 | 68.1 0% | 69.2 2% | 69.3 2% | 74.6 10% | 75.4 11% | 68 0% | 74.1 9% |
| sRGB Coverage (%) | 98.6 | 91.7 -7% | 97.4 -1% | 99.7 1% | 98.6 0% | 100 1% | 99 0% | 97.4 -1% |
| AdobeRGB 1998 Coverage (%) | 70.1 | 67.1 -4% | 71.5 2% | 71.3 2% | 76.5 9% | 76.6 9% | 70 0% | 75.3 7% |
| Response Times | -45% | 15% | 9% | 1% | -20% | -15% | 36% | |
| Response Time Grey 50% / Grey 80% * (ms) | 41.4 ? | 68 ? -64% | 41.4 ? -0% | 42 ? -1% | 45.5 ? -10% | 58.8 ? -42% | 55 ? -33% | 31.5 ? 24% |
| Response Time Black / White * (ms) | 27.2 ? | 34 ? -25% | 19.2 ? 29% | 22.4 ? 18% | 24 ? 12% | 26.7 ? 2% | 26 ? 4% | 14.5 ? 47% |
| PWM Frequency (Hz) | 22730 ? | 53050 ? | ||||||
| Bildschirm | -46% | 7% | 17% | -15% | 4% | 15% | -21% | |
| Helligkeit Bildmitte (cd/m²) | 312 | 422.9 36% | 451 45% | 371 19% | 372 19% | 408 31% | 408 31% | 421 35% |
| Brightness (cd/m²) | 301 | 397 32% | 435 45% | 363 21% | 362 20% | 402 34% | 378 26% | 416 38% |
| Brightness Distribution (%) | 93 | 91 -2% | 94 1% | 92 -1% | 94 1% | 92 -1% | 86 -8% | 89 -4% |
| Schwarzwert * (cd/m²) | 0.16 | 0.32 -100% | 0.21 -31% | 0.21 -31% | 0.18 -13% | 0.24 -50% | 0.22 -38% | 0.28 -75% |
| Kontrast (:1) | 1950 | 1322 -32% | 2148 10% | 1767 -9% | 2067 6% | 1700 -13% | 1855 -5% | 1504 -23% |
| Delta E Colorchecker * | 2.2 | 4.8 -118% | 2.4 -9% | 1.3 41% | 3.4 -55% | 2.09 5% | 1.54 30% | 3.2 -45% |
| Colorchecker dE 2000 max. * | 5.6 | 8.7 -55% | 4.1 27% | 2.6 54% | 6.7 -20% | 5.09 9% | 2.72 51% | 5.5 2% |
| Colorchecker dE 2000 calibrated * | 1.3 | 1.9 -46% | 1.3 -0% | 0.8 38% | 1.8 -38% | 1.56 -20% | 1.08 17% | 2 -54% |
| Delta E Graustufen * | 2.7 | 6.1 -126% | 3.3 -22% | 2.1 22% | 4.3 -59% | 1.7 37% | 1.95 28% | 4.4 -63% |
| Gamma | 2.11 104% | 2.23 99% | 2.13 103% | 2.15 102% | 2.13 103% | 2.138 103% | 2.33 94% | 2.22 99% |
| CCT | 6196 105% | 7635 85% | 6848 95% | 6759 96% | 6158 106% | 6628 98% | 6806 96% | 6384 102% |
| Durchschnitt gesamt (Programm / Settings) | -32% /
-37% | 8% /
7% | 9% /
13% | -3% /
-8% | -3% /
1% | 0% /
7% | 7% /
-7% |
* ... kleinere Werte sind besser
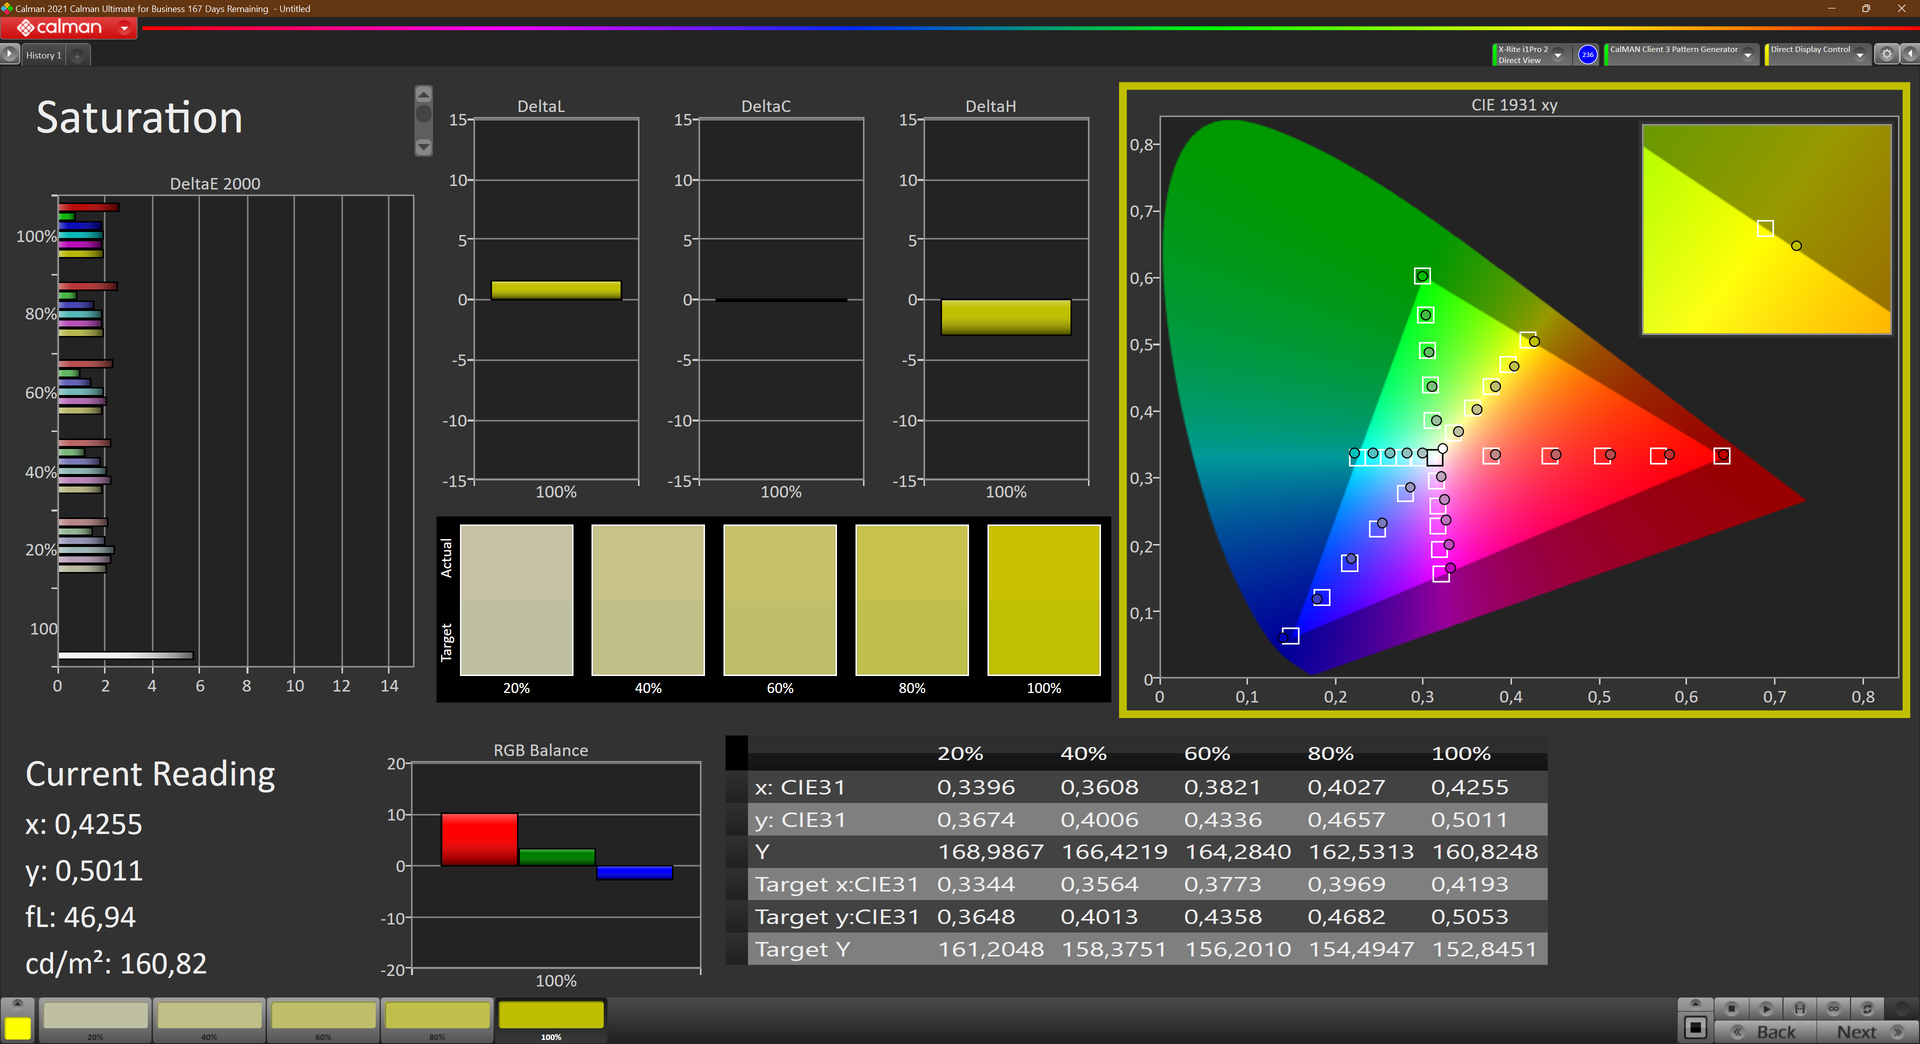
Der sRGB-Farbraum wird zu 99 % abgedeckt, was für eine professionelle Bildbearbeitungen geeignet ist. Unser Farbprofil kann hier heruntergeladen werden.
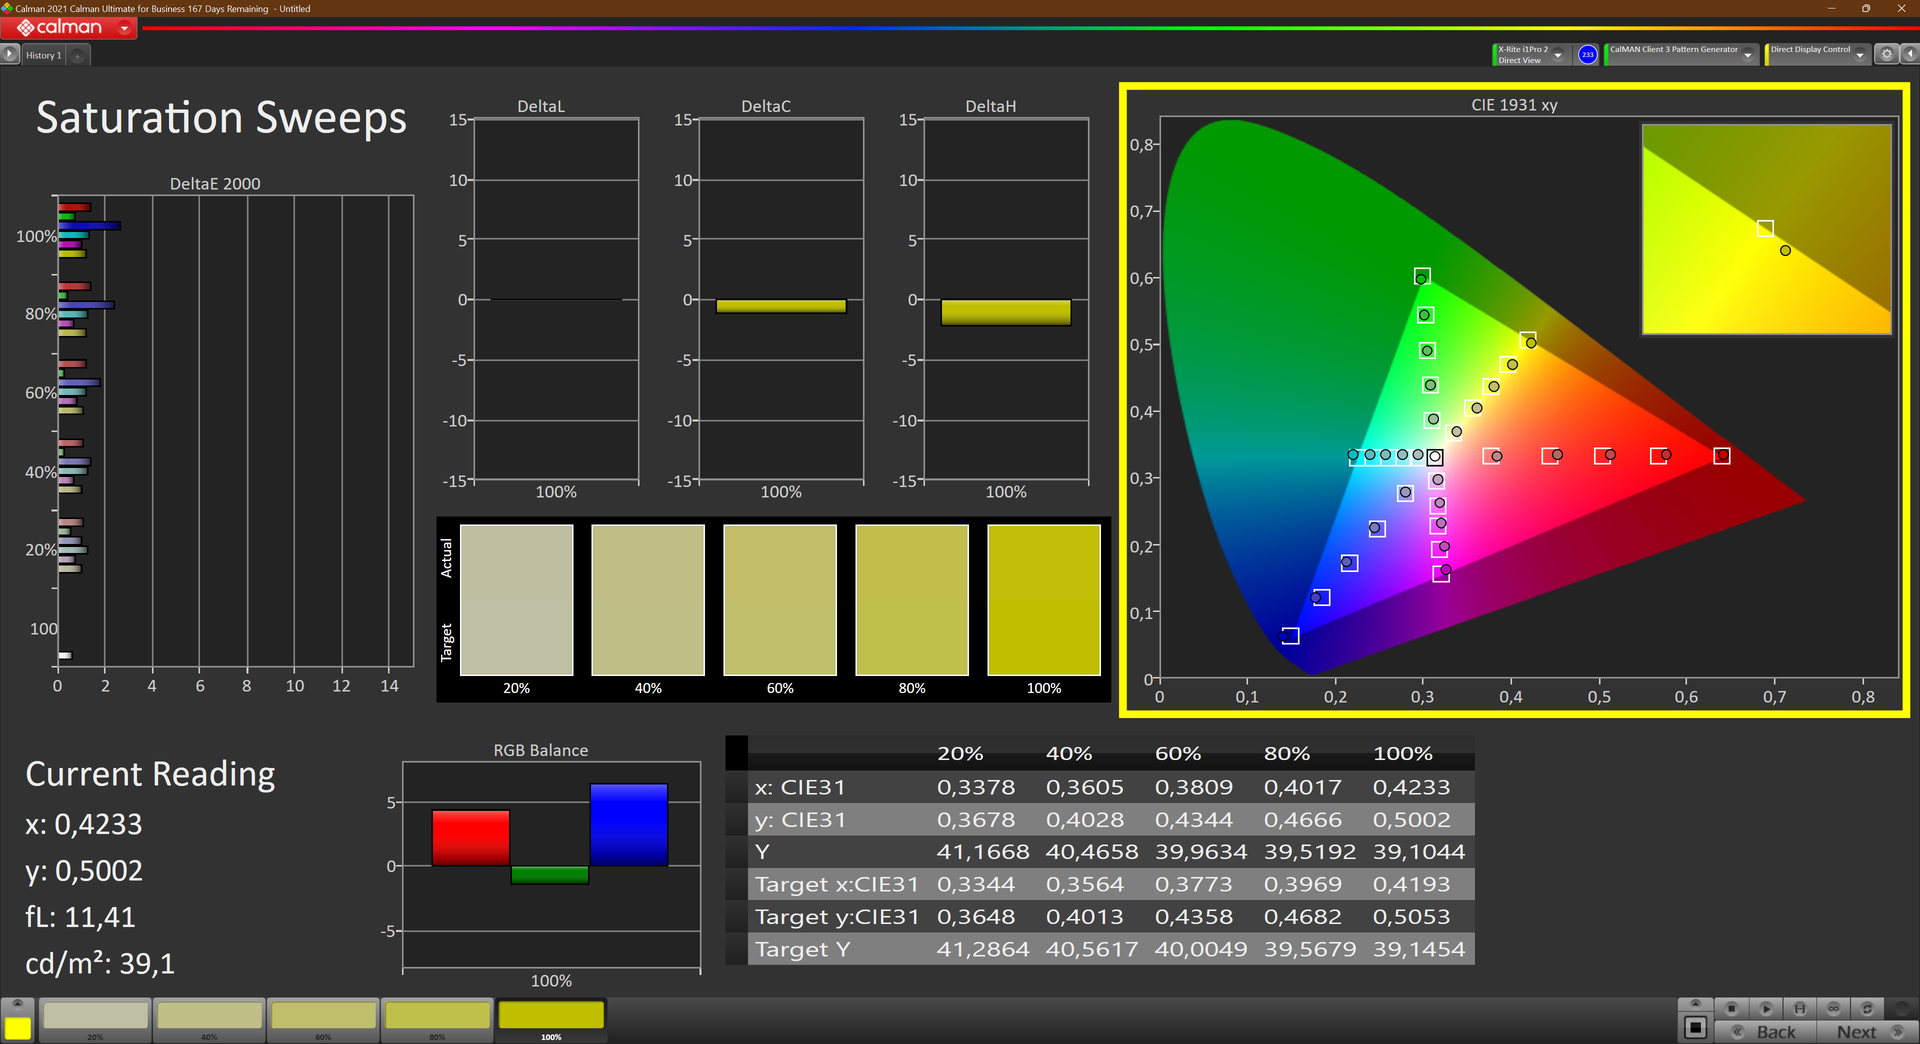
Bei Auslieferung besitzt das Panel einen leichten Rotstich, der nach unserer Kalibrierung passé ist. Die DeltaE-Farbwerte bleiben unter der wahrnehmbaren Schwelle von 2,5, nur Cyan weicht etwas ab, was unsere Kalibrierung ebenfalls behob. Blau weicht dann aber mit einem Wert von 3,1 ab. Die Delta-E-Werte der Graustufen weichen deutlich ab, konnten aber auch auf einen sehr guten Wert unter 1,5 kalibriert werden.
Reaktionszeiten (Response Times) des Displays
| ↔ Reaktionszeiten Schwarz zu Weiß | ||
|---|---|---|
| 27.2 ms ... steigend ↗ und fallend ↘ kombiniert | ↗ 14 ms steigend | 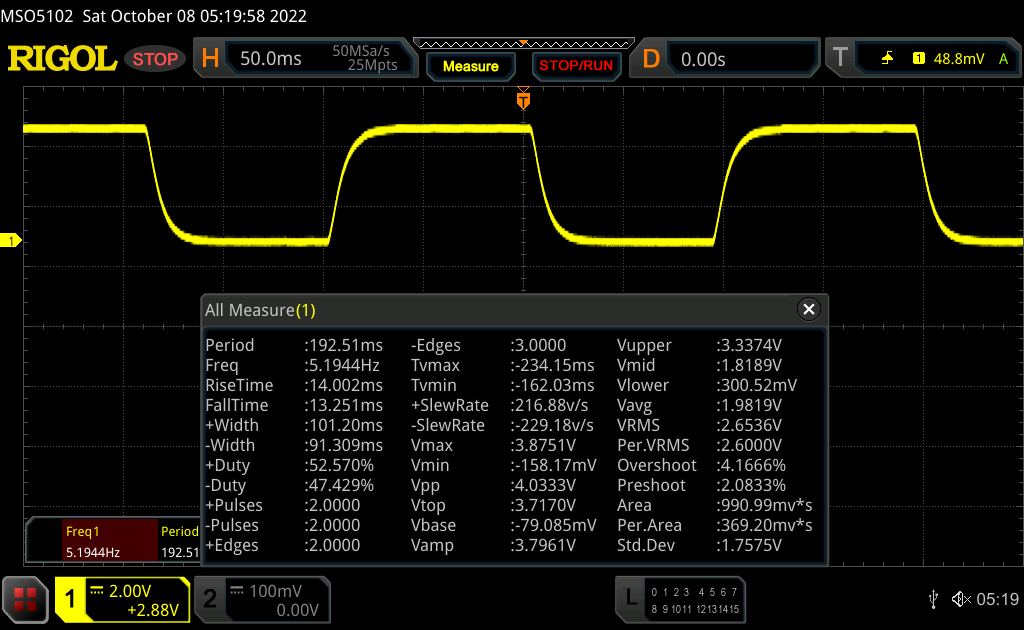 |
| ↘ 13.2 ms fallend | ||
| Die gemessenen Reaktionszeiten sind mittelmäßig und dadurch für Spieler eventuell zu langsam. Im Vergleich rangierten die bei uns getesteten Geräte von 0.1 (Minimum) zu 240 (Maximum) ms. » 69 % aller Screens waren schneller als der getestete. Daher sind die gemessenen Reaktionszeiten schlechter als der Durchschnitt aller vermessenen Geräte (19.8 ms). | ||
| ↔ Reaktionszeiten 50% Grau zu 80% Grau | ||
| 41.4 ms ... steigend ↗ und fallend ↘ kombiniert | ↗ 18.8 ms steigend |  |
| ↘ 22.6 ms fallend | ||
| Die gemessenen Reaktionszeiten sind langsam und dadurch für viele Spieler wahrscheinlich zu langsam. Im Vergleich rangierten die bei uns getesteten Geräte von 0.165 (Minimum) zu 636 (Maximum) ms. » 67 % aller Screens waren schneller als der getestete. Daher sind die gemessenen Reaktionszeiten schlechter als der Durchschnitt aller vermessenen Geräte (31 ms). | ||
Bildschirm-Flackern / PWM (Pulse-Width Modulation)
| Flackern / PWM nicht festgestellt |  | ||
Im Vergleich: 52 % aller getesteten Geräte nutzten kein PWM um die Helligkeit zu reduzieren. Wenn PWM eingesetzt wurde, dann bei einer Frequenz von durchschnittlich 7763 (Minimum 5, Maximum 343500) Hz. | |||
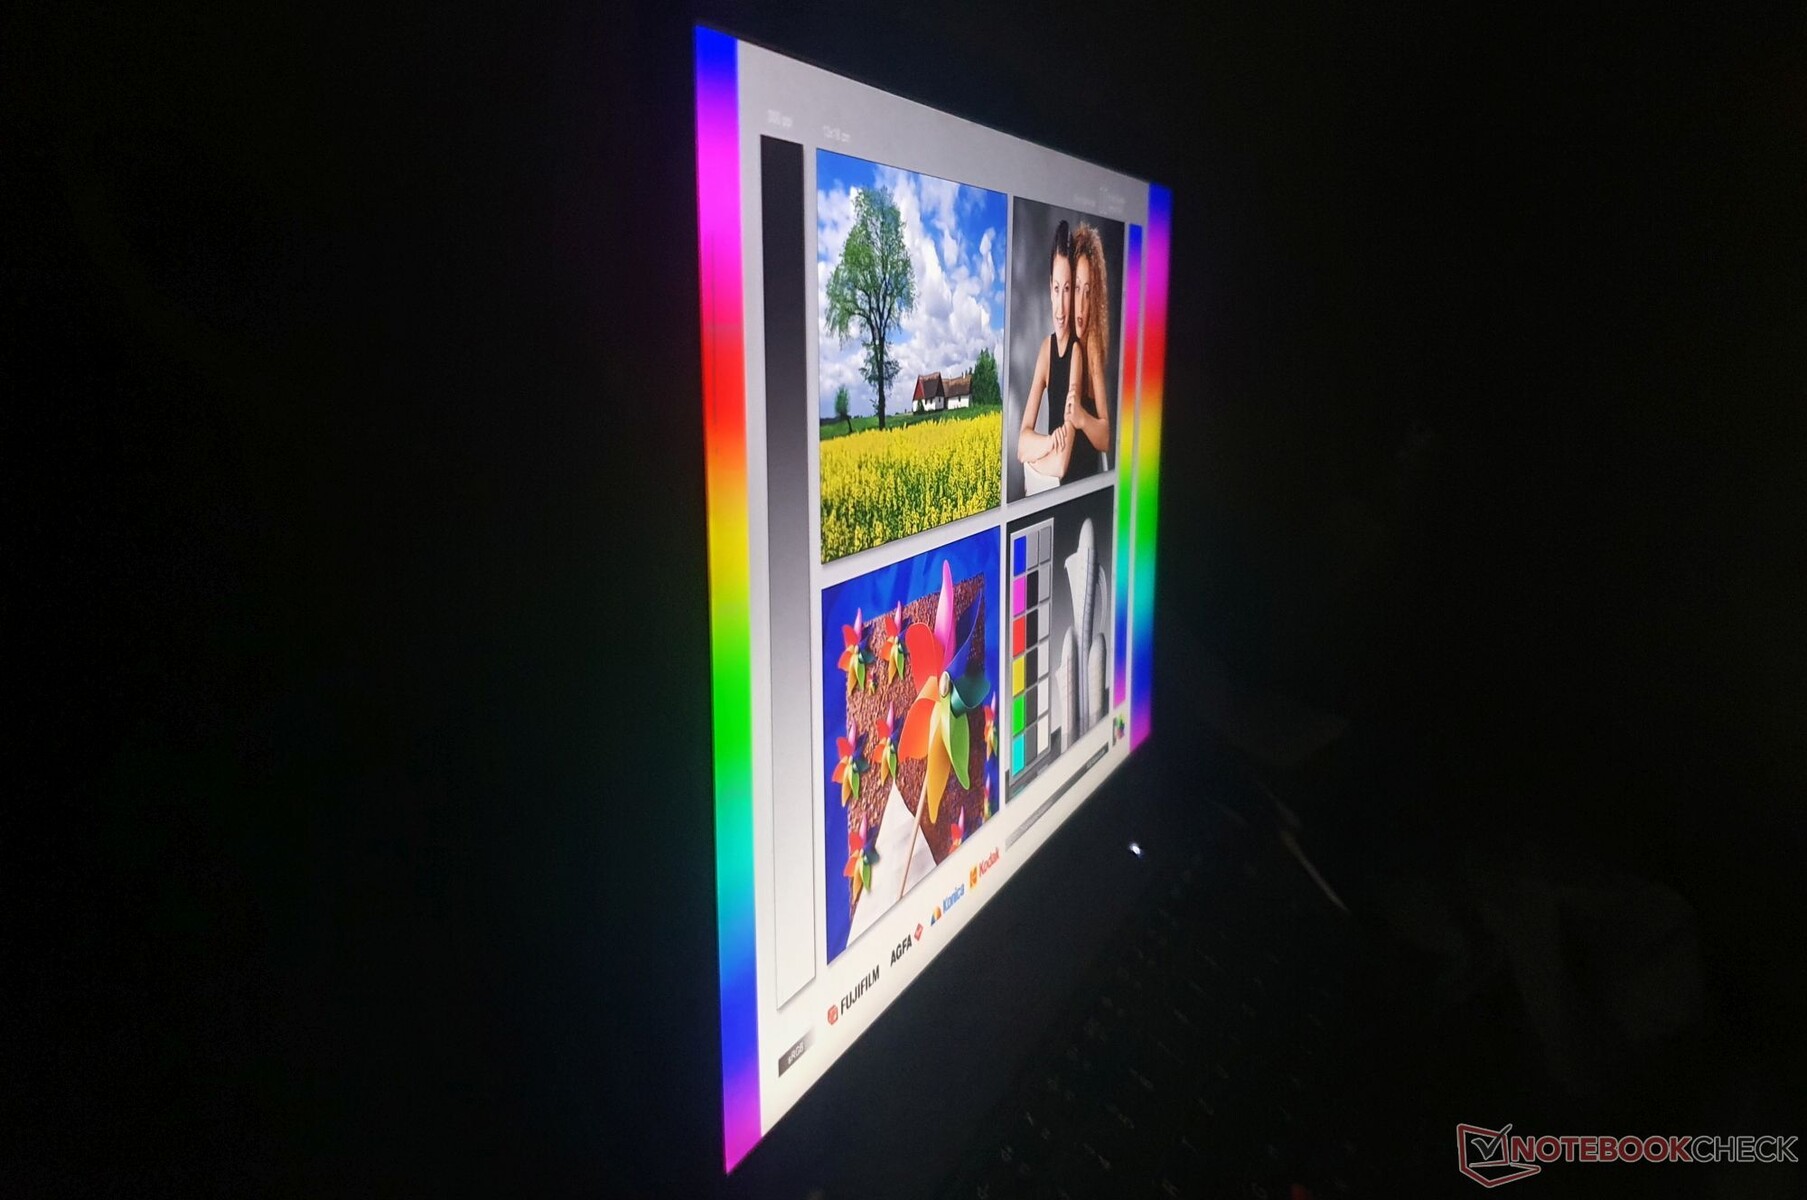
Aufgrund des matten Displays und den gerade noch ausreichenden 300 cd/m² kann man Bildschirminhalte auch draußen ablesen, sofern es bewölkt ist oder man schattige Plätze aufsucht. Direktes Sonnenlicht sollte man hingegen meiden.
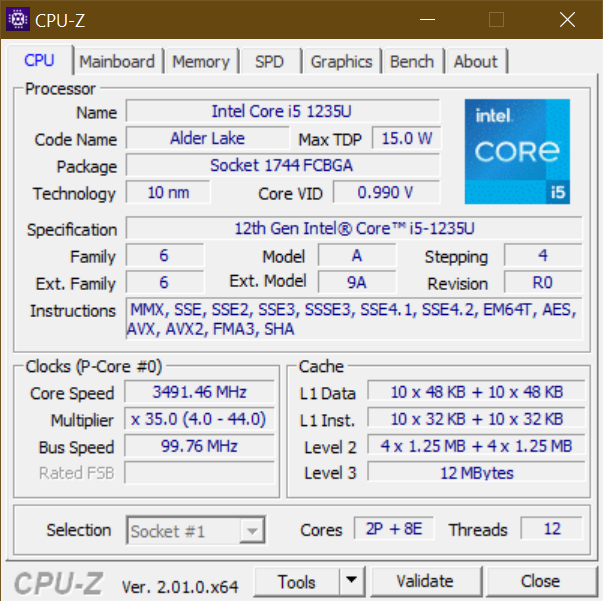
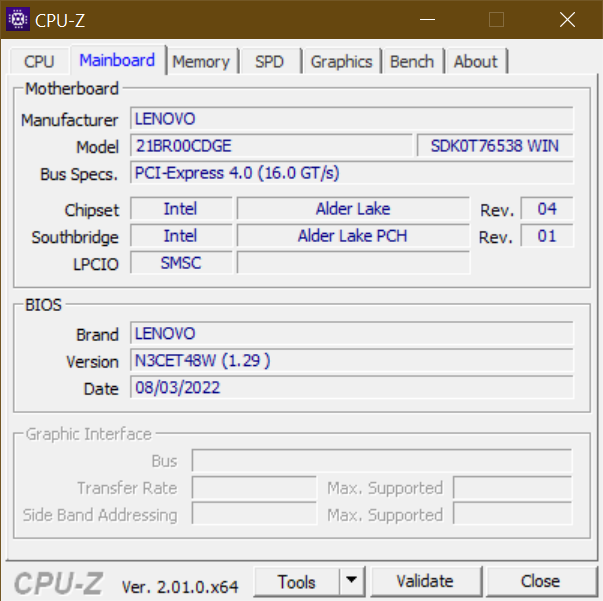
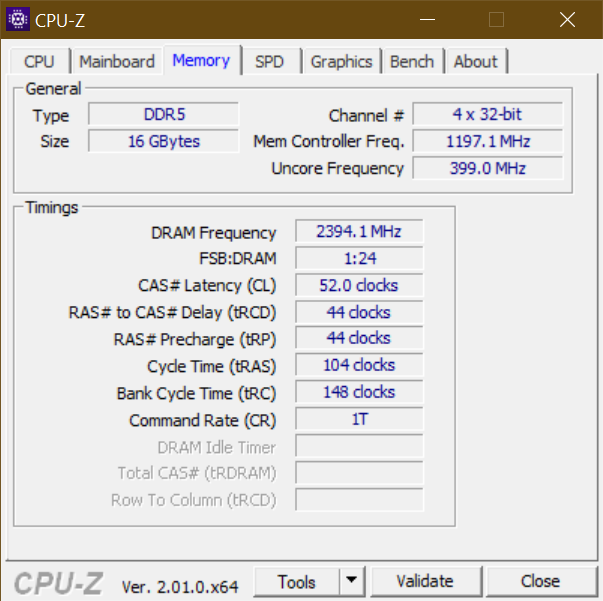
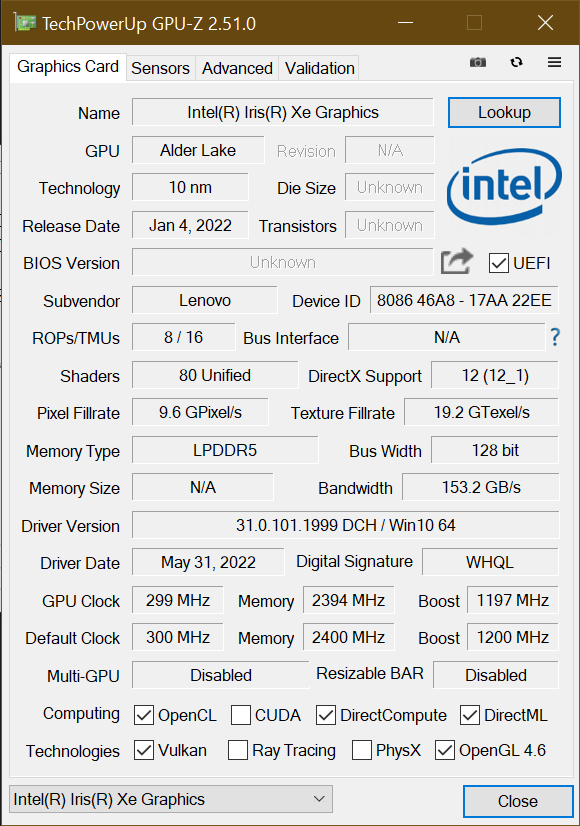
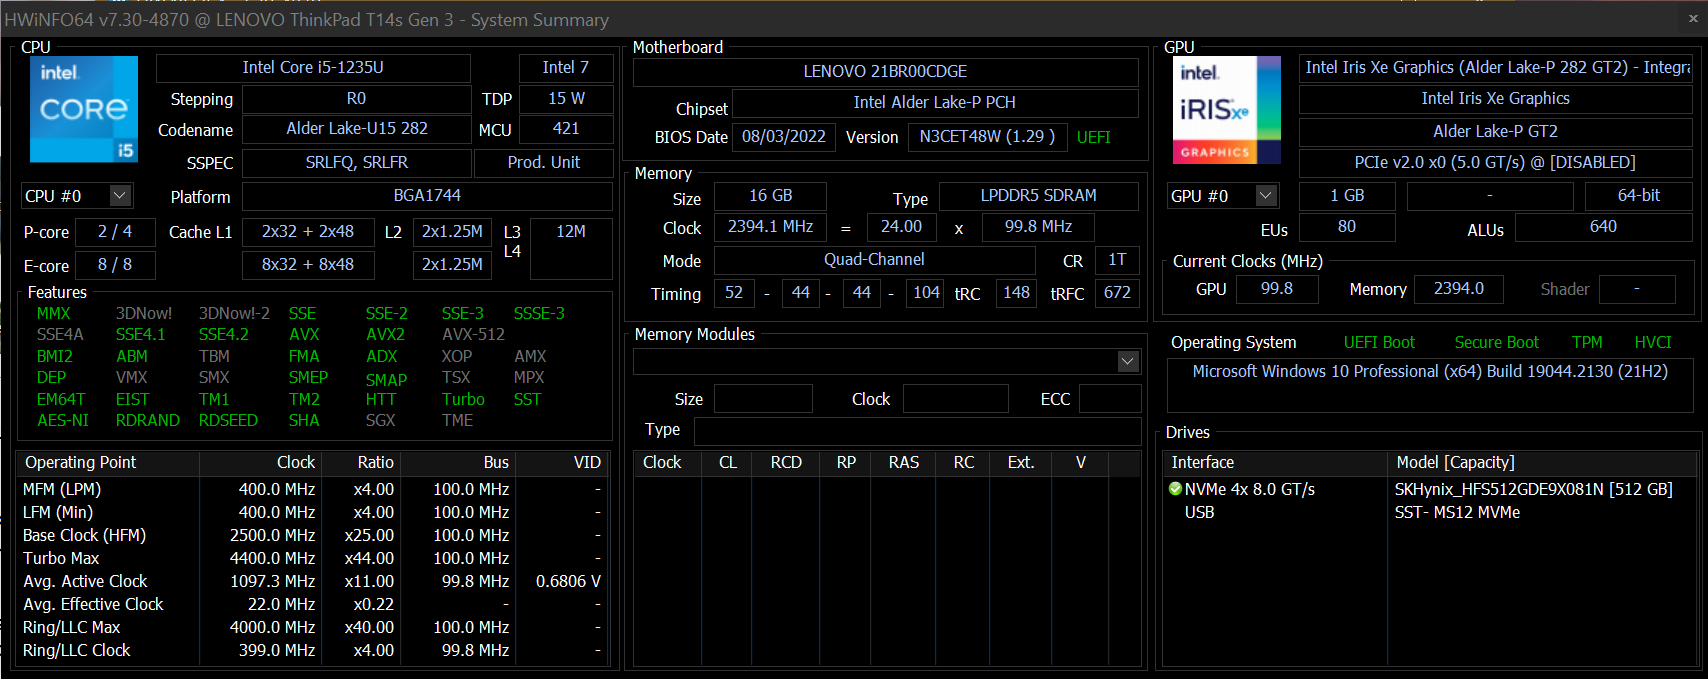
Leistung: Alder-Lake-U entfaltet sich im ThinkPad T14s
Das ThinkPad T14s kommt mit 16 GB verlötetem LPDDR5-4800-RAM (max. 32 GB). Der Intel Core i5-1235U bildet samt der Xe7-iGPU den Rechenkern. Maximal ausreizen lässt sich der Lenovo PC mit dem starken Core i7-1280P. Dazu gibts eine 512 GB fassende PCIe-4.0-SSD. Eingesetzt wird der ThinkPad Laptop vor allem für Büroaufgaben und Business-Anwendungen. Für Videobearbeitung und Spiele ist es nicht gedacht und bietet höchstens in der AMD-Variante mit integrierter Radeon 680M und Ryzen 7 PRO 6850U eine ausreichende Gesamtleistung.
Testbedingungen
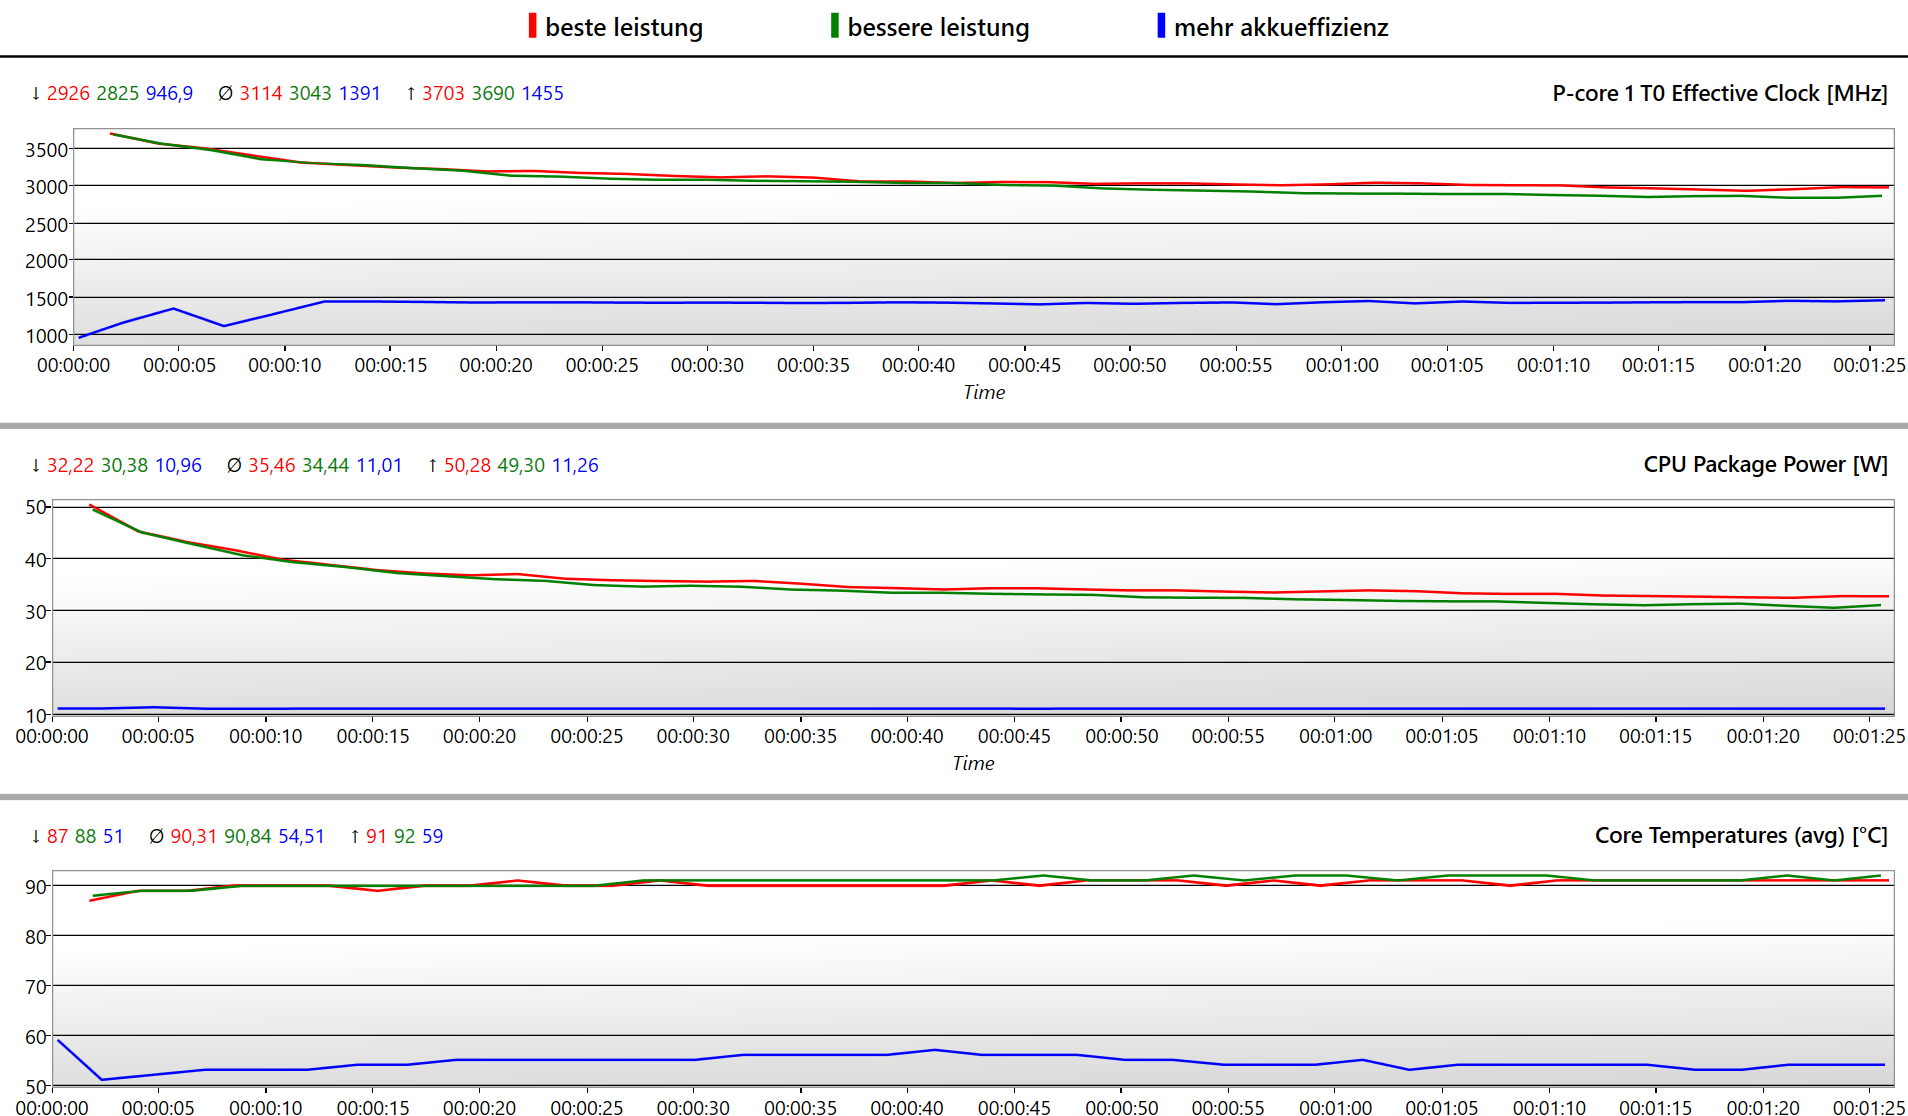
Lenovo bietet bei seinen ThinkPads keine eigenen Leistungsprofile, sondern integriert diese in die Windows-Energieeinstellungen. Die leistungsbezogenen Benchmarks liefen mit dem Höchstleistungsprofil bei ausgeschaltetem Auto-Modus der intelligenten Kühlung (Fn+T).
- Im Modus "Beste Leistung" messen wir Power-Limits von 52 W (Turbo) und ~33 W (Dauer).
- Der Modus "Bessere Leistung" wird das PL1 nur im Akkubetrieb auf 27,5 W begrenzt.
- Im Modus "Mehr Akkueffizienz" wird die Leistung auf 11 W gedrittelt.
Prozessor
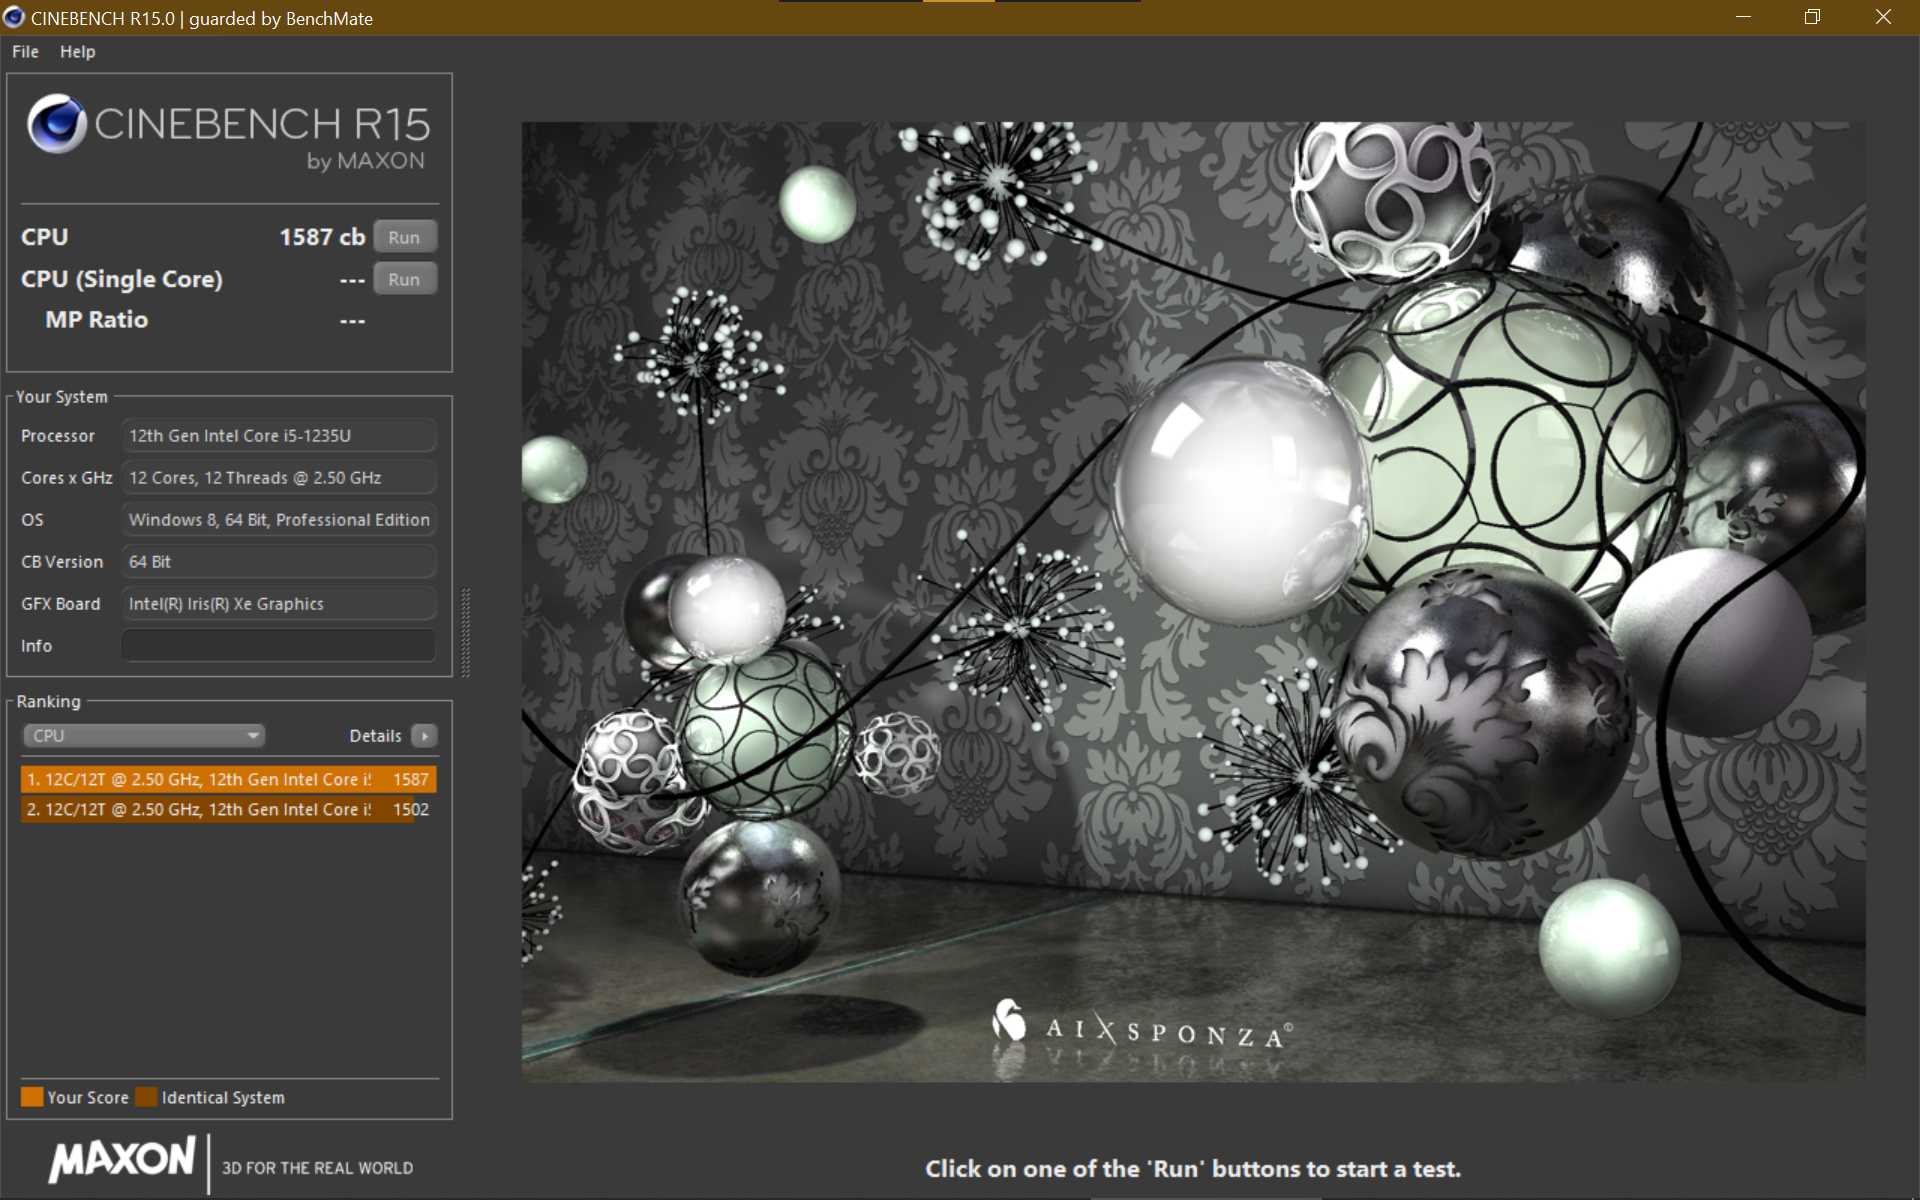
Der Intel Core i5-1235U besitzt zwar nur zwei P-Kerne und eine TDP von 15 W, die von Lenovo aber auf knapp über 30 W angehoben wurde. Unsere Cinebench-R15-Schleife offenbart eine hohe, dauerhafte Leistung, die nur knapp unterhalb eines Core i7-1270P im ThinkPad X1 Yoga G7 (28 W PL1) liegt bzw. ~10 % oberhalb im CB R20/R23
Der Core i5-1240P im ThinkPad T16 (20 W PL1) kann trotz doppelter P-Kerne um 25 % abgehängt werden bzw. um 40 % im CB R23. Bei gleicher Verlustleistung im ThinkPad T14, kann sich der AMD Ryzen 7 PRO 6850U allerdings um 33 % absetzen. Der Ryzen 5 PRO 6650U im EliteBook 845 G9 und ThinkPad Z13 liegt mit unserem Modell je nach Benchmark in etwa gleich auf.
Der Turbo entfaltet sich bei der U-Series-CPU besser als beim Core i5-1250P im ThinkPad X1 Carbon G10, während das T14s G2 mit Tiger Lake-U um ganze 50 % übertroffen wird – ein sehr guter Leistungszuwachs pro CPU-Generation. Sieger ist das Schenker Vision 14 mit seinem Core i7-12700H, der sechs P-Kerne mit einem 40-W-PL1 kombiniert, was grob 60 % Mehrleistung bedeutet. Ähnlich schnell ist ein Core i7-1280P, wie man am Lenovo Yoga Slim 9 mit 35-W-PL1 sieht. Diese CPU gibt es auch fürs Lenovo T14s, aber nicht für den EMEA-Markt.
Cinebench R15 Multi Dauertest
* ... kleinere Werte sind besser
AIDA64: FP32 Ray-Trace | FPU Julia | CPU SHA3 | CPU Queen | FPU SinJulia | FPU Mandel | CPU AES | CPU ZLib | FP64 Ray-Trace | CPU PhotoWorxx
System Performance
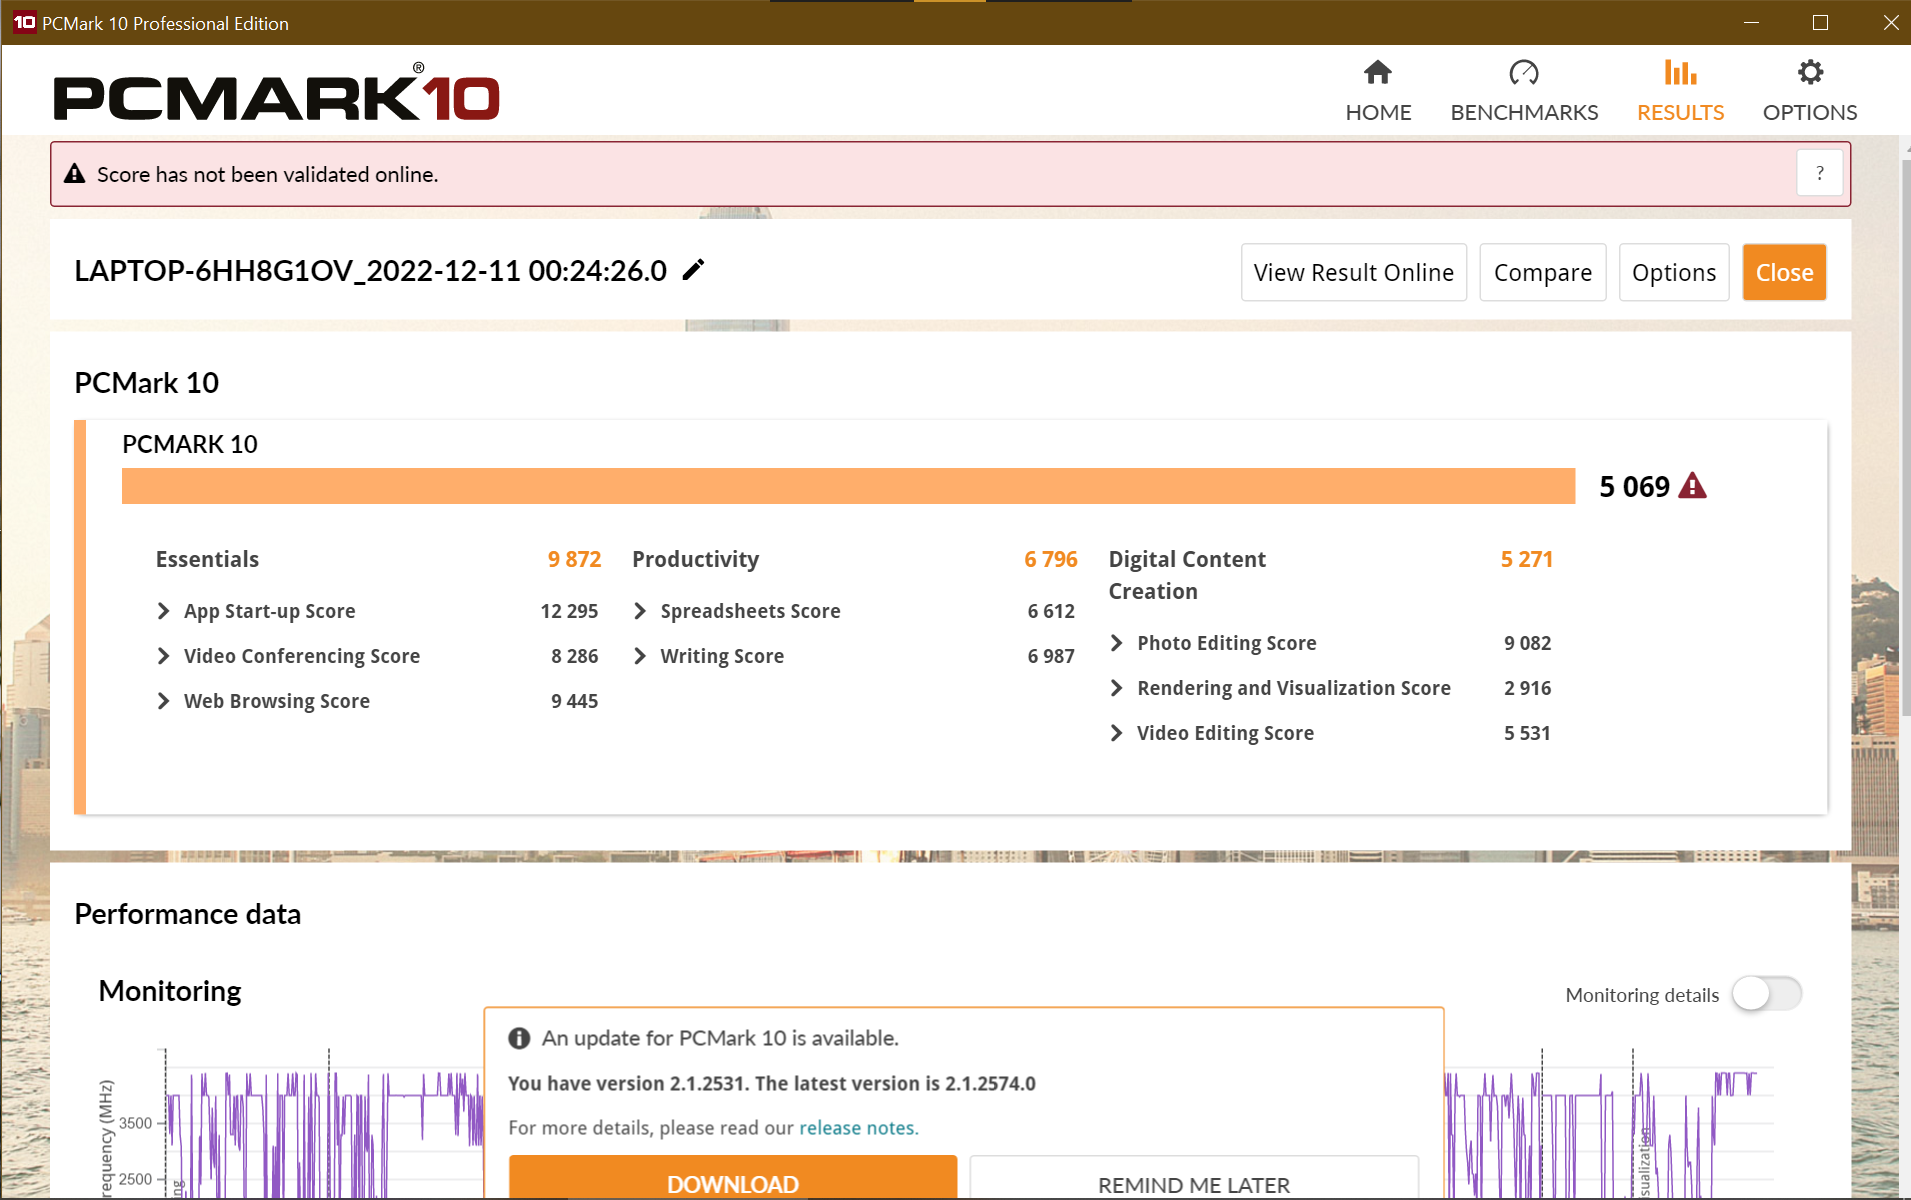
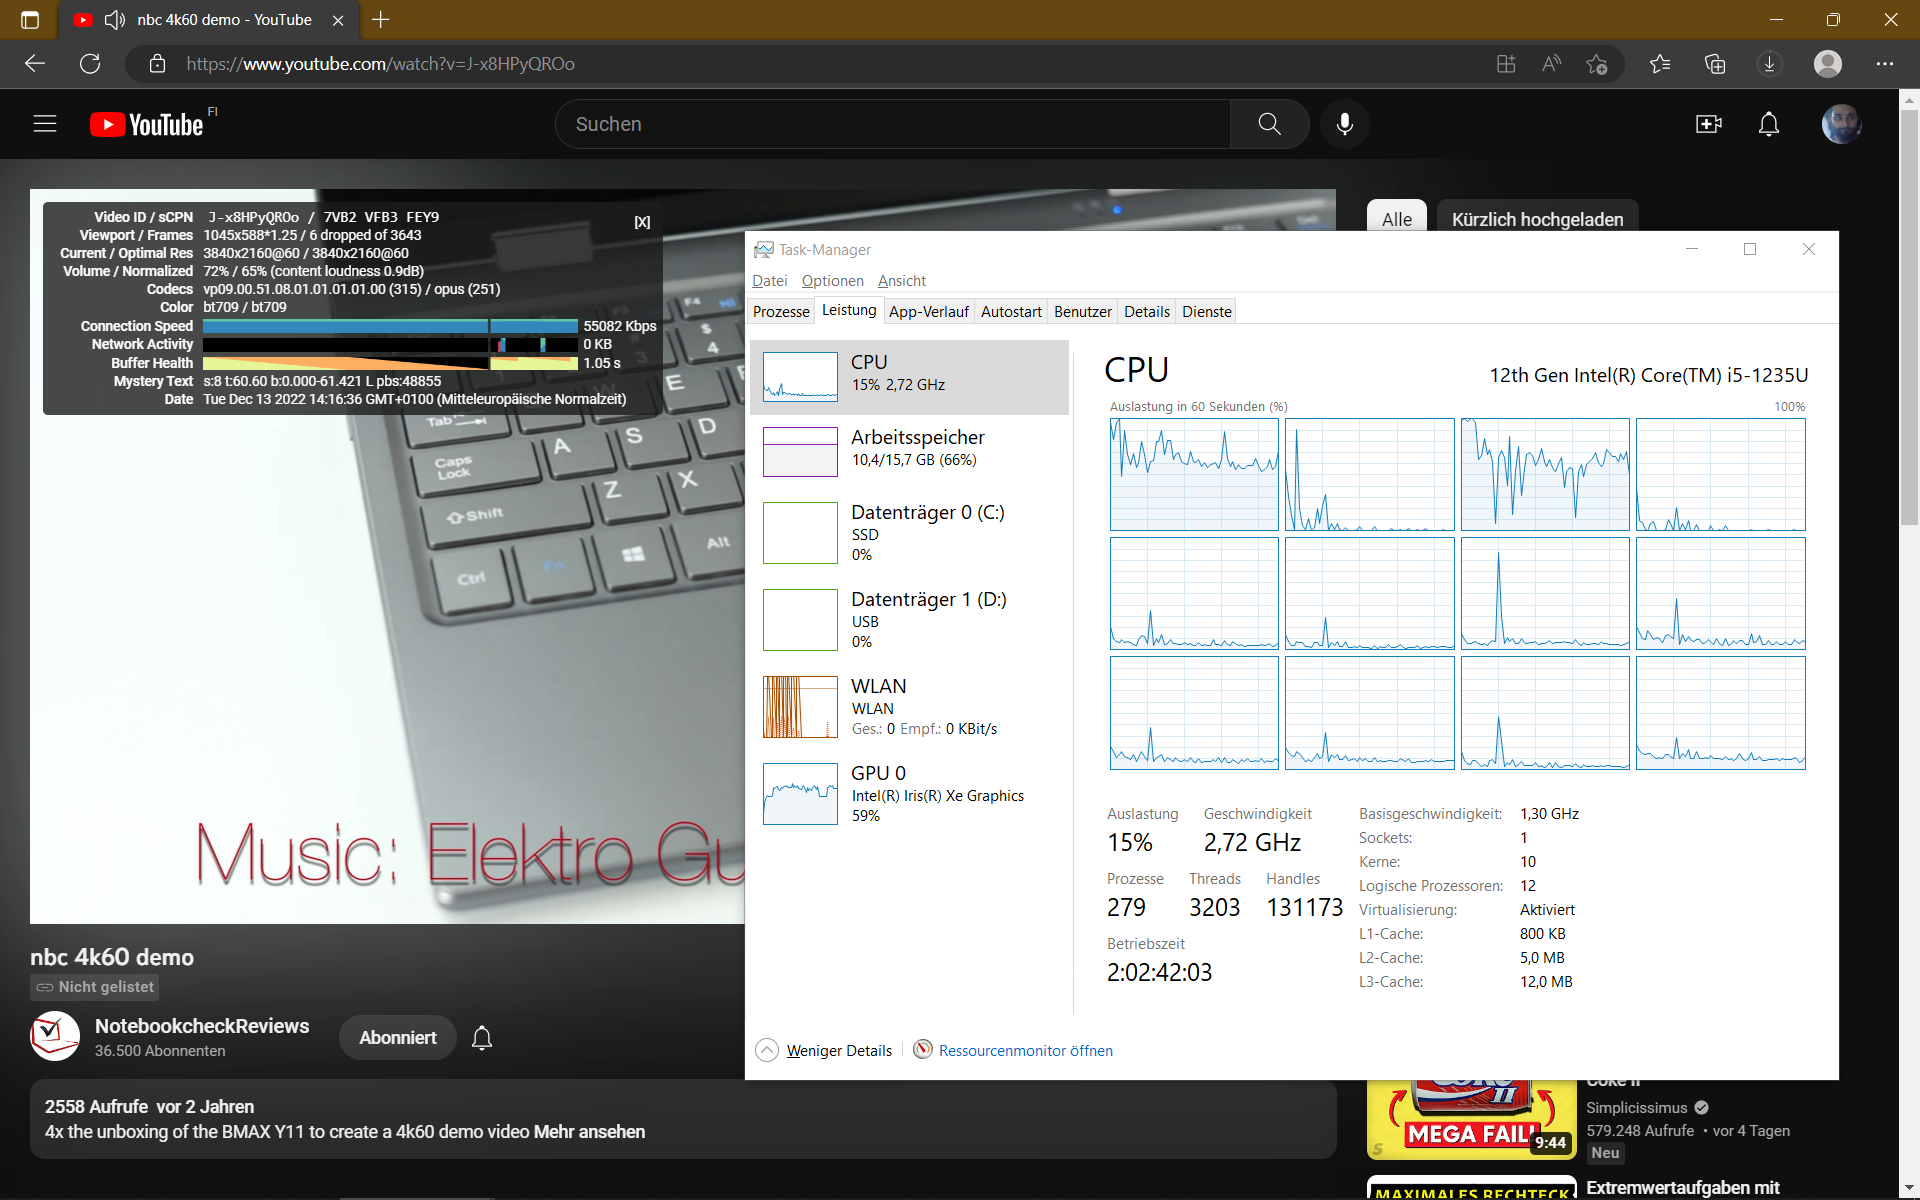
Aufgrund des starken Turbos und der hohen Single-Core-Leistung zeigt sich das System besonders beim Websurfing reaktionsfreudig, was sich auch während der gleichzeitigen Wiedergabe eines 4K-YouTube-Videos nicht verschlechtert. Im PCMark 10 besitzt das ThinkPad T14 G3 AMD einen Vorsprung von 20 %, während das Schenker Vision 14 ganz klar führt.
CrossMark: Overall | Productivity | Creativity | Responsiveness
Sunspider: 1.0 Total Score
Mozilla Kraken 1.1: Total
Speedometer 2.0: Result 2.0
Octane V2: Total Score
Jetstream 2: 2.0 Total
WebXPRT 3: Overall
WebXPRT 4: Overall
| PCMark 10 / Score | |
| Schenker Vision 14 2022 RTX 3050 Ti | |
| Durchschnitt der Klasse Office (2601 - 9298, n=65, der letzten 2 Jahre) | |
| Lenovo ThinkPad T14 G3-21CF004NGE | |
| HP EliteBook 845 G9 6F6H9EA | |
| Lenovo ThinkPad T14s G2 20WM003TGE | |
| Lenovo ThinkPad T14s G3 21BR00CDGE | |
| Lenovo ThinkPad X1 Carbon G10 21CC001RGE | |
| Lenovo ThinkPad T16 G1 21BWS00200 | |
| Durchschnittliche Intel Core i5-1235U, Intel Iris Xe Graphics G7 80EUs (4528 - 5543, n=8) | |
| Dell Latitude 7420 JW6MH | |
| Lenovo ThinkPad X13 G3 21BN0046GE | |
| PCMark 10 / Essentials | |
| Schenker Vision 14 2022 RTX 3050 Ti | |
| Lenovo ThinkPad T14s G2 20WM003TGE | |
| Lenovo ThinkPad X1 Carbon G10 21CC001RGE | |
| Durchschnitt der Klasse Office (3245 - 11594, n=65, der letzten 2 Jahre) | |
| Durchschnittliche Intel Core i5-1235U, Intel Iris Xe Graphics G7 80EUs (9143 - 11273, n=8) | |
| Lenovo ThinkPad T14s G3 21BR00CDGE | |
| Dell Latitude 7420 JW6MH | |
| Lenovo ThinkPad T14 G3-21CF004NGE | |
| HP EliteBook 845 G9 6F6H9EA | |
| Lenovo ThinkPad T16 G1 21BWS00200 | |
| Lenovo ThinkPad X13 G3 21BN0046GE | |
| PCMark 10 / Productivity | |
| Durchschnitt der Klasse Office (5336 - 17243, n=65, der letzten 2 Jahre) | |
| HP EliteBook 845 G9 6F6H9EA | |
| Schenker Vision 14 2022 RTX 3050 Ti | |
| Lenovo ThinkPad T14 G3-21CF004NGE | |
| Lenovo ThinkPad T14s G2 20WM003TGE | |
| Lenovo ThinkPad T14s G3 21BR00CDGE | |
| Durchschnittliche Intel Core i5-1235U, Intel Iris Xe Graphics G7 80EUs (6440 - 7354, n=8) | |
| Lenovo ThinkPad X1 Carbon G10 21CC001RGE | |
| Dell Latitude 7420 JW6MH | |
| Lenovo ThinkPad X13 G3 21BN0046GE | |
| Lenovo ThinkPad T16 G1 21BWS00200 | |
| PCMark 10 / Digital Content Creation | |
| Schenker Vision 14 2022 RTX 3050 Ti | |
| Durchschnitt der Klasse Office (2049 - 13541, n=65, der letzten 2 Jahre) | |
| Lenovo ThinkPad T14 G3-21CF004NGE | |
| HP EliteBook 845 G9 6F6H9EA | |
| Lenovo ThinkPad T16 G1 21BWS00200 | |
| Lenovo ThinkPad T14s G2 20WM003TGE | |
| Lenovo ThinkPad T14s G3 21BR00CDGE | |
| Lenovo ThinkPad X1 Carbon G10 21CC001RGE | |
| Dell Latitude 7420 JW6MH | |
| Durchschnittliche Intel Core i5-1235U, Intel Iris Xe Graphics G7 80EUs (4220 - 5839, n=8) | |
| Lenovo ThinkPad X13 G3 21BN0046GE | |
| CrossMark / Overall | |
| Schenker Vision 14 2022 RTX 3050 Ti | |
| Lenovo ThinkPad X1 Carbon G10 21CC001RGE | |
| Lenovo ThinkPad T14s G3 21BR00CDGE | |
| Apple MacBook Air M2 Entry | |
| Apple MacBook Pro 14 2021 M1 Pro Entry | |
| Durchschnitt der Klasse Office (381 - 2010, n=72, der letzten 2 Jahre) | |
| Lenovo ThinkPad T14 G3-21CF004NGE | |
| Lenovo ThinkPad X13 G3 21BN0046GE | |
| Lenovo ThinkPad T16 G1 21BWS00200 | |
| Durchschnittliche Intel Core i5-1235U, Intel Iris Xe Graphics G7 80EUs (983 - 1644, n=8) | |
| Dell Latitude 7420 JW6MH | |
| CrossMark / Productivity | |
| Schenker Vision 14 2022 RTX 3050 Ti | |
| Lenovo ThinkPad X1 Carbon G10 21CC001RGE | |
| Lenovo ThinkPad T14s G3 21BR00CDGE | |
| Durchschnitt der Klasse Office (464 - 1880, n=72, der letzten 2 Jahre) | |
| Lenovo ThinkPad T16 G1 21BWS00200 | |
| Lenovo ThinkPad T14 G3-21CF004NGE | |
| Durchschnittliche Intel Core i5-1235U, Intel Iris Xe Graphics G7 80EUs (1026 - 1676, n=8) | |
| Apple MacBook Air M2 Entry | |
| Lenovo ThinkPad X13 G3 21BN0046GE | |
| Dell Latitude 7420 JW6MH | |
| Apple MacBook Pro 14 2021 M1 Pro Entry | |
| CrossMark / Creativity | |
| Apple MacBook Pro 14 2021 M1 Pro Entry | |
| Apple MacBook Air M2 Entry | |
| Schenker Vision 14 2022 RTX 3050 Ti | |
| Lenovo ThinkPad X1 Carbon G10 21CC001RGE | |
| Durchschnitt der Klasse Office (319 - 2361, n=72, der letzten 2 Jahre) | |
| Lenovo ThinkPad T14s G3 21BR00CDGE | |
| Lenovo ThinkPad T14 G3-21CF004NGE | |
| Lenovo ThinkPad X13 G3 21BN0046GE | |
| Durchschnittliche Intel Core i5-1235U, Intel Iris Xe Graphics G7 80EUs (1032 - 1618, n=8) | |
| Lenovo ThinkPad T16 G1 21BWS00200 | |
| Dell Latitude 7420 JW6MH | |
| CrossMark / Responsiveness | |
| Schenker Vision 14 2022 RTX 3050 Ti | |
| Lenovo ThinkPad X1 Carbon G10 21CC001RGE | |
| Lenovo ThinkPad T14s G3 21BR00CDGE | |
| Lenovo ThinkPad X13 G3 21BN0046GE | |
| Lenovo ThinkPad T16 G1 21BWS00200 | |
| Durchschnitt der Klasse Office (360 - 1820, n=72, der letzten 2 Jahre) | |
| Durchschnittliche Intel Core i5-1235U, Intel Iris Xe Graphics G7 80EUs (746 - 1867, n=8) | |
| Dell Latitude 7420 JW6MH | |
| Lenovo ThinkPad T14 G3-21CF004NGE | |
| Apple MacBook Air M2 Entry | |
| Apple MacBook Pro 14 2021 M1 Pro Entry | |
| Sunspider / 1.0 Total Score | |
| Lenovo ThinkPad T16 G1 21BWS00200 | |
| Lenovo ThinkPad T14s G3 21BR00CDGE | |
| Durchschnittliche Intel Core i5-1235U, Intel Iris Xe Graphics G7 80EUs (n=1) | |
| Durchschnitt der Klasse Office (87.2 - 111.8, n=2, der letzten 2 Jahre) | |
| Apple MacBook Pro 14 2021 M1 Pro Entry | |
| Mozilla Kraken 1.1 / Total | |
| Lenovo ThinkPad X1 Carbon G10 21CC001RGE | |
| Dell Latitude 7420 JW6MH | |
| Lenovo ThinkPad T14s G2 20WM003TGE | |
| Lenovo ThinkPad X13 G3 21BN0046GE | |
| Lenovo ThinkPad X13 G3 21BN0046GE | |
| HP EliteBook 845 G9 6F6H9EA | |
| Lenovo ThinkPad T14 G3-21CF004NGE | |
| Lenovo ThinkPad T16 G1 21BWS00200 | |
| Durchschnittliche Intel Core i5-1235U, Intel Iris Xe Graphics G7 80EUs (486 - 634, n=11) | |
| Durchschnitt der Klasse Office (391 - 1297, n=75, der letzten 2 Jahre) | |
| Schenker Vision 14 2022 RTX 3050 Ti | |
| Lenovo ThinkPad T14s G3 21BR00CDGE | |
| Apple MacBook Air M2 Entry | |
| Apple MacBook Pro 14 2021 M1 Pro Entry | |
| Speedometer 2.0 / Result 2.0 | |
| Durchschnitt der Klasse Office (173 - 640, n=17, der letzten 2 Jahre) | |
| Apple MacBook Air M2 Entry | |
| Schenker Vision 14 2022 RTX 3050 Ti | |
| Durchschnittliche Intel Core i5-1235U, Intel Iris Xe Graphics G7 80EUs (235 - 292, n=5) | |
| Apple MacBook Pro 14 2021 M1 Pro Entry | |
| Lenovo ThinkPad T14s G3 21BR00CDGE | |
| Lenovo ThinkPad T16 G1 21BWS00200 | |
| Lenovo ThinkPad T14 G3-21CF004NGE | |
| Octane V2 / Total Score | |
| Durchschnitt der Klasse Office (49011 - 126830, n=19, der letzten 2 Jahre) | |
| Schenker Vision 14 2022 RTX 3050 Ti | |
| Lenovo ThinkPad T14s G3 21BR00CDGE | |
| Lenovo ThinkPad T16 G1 21BWS00200 | |
| Durchschnittliche Intel Core i5-1235U, Intel Iris Xe Graphics G7 80EUs (78578 - 83104, n=5) | |
| Apple MacBook Air M2 Entry | |
| Lenovo ThinkPad T14 G3-21CF004NGE | |
| Apple MacBook Pro 14 2021 M1 Pro Entry | |
| Lenovo ThinkPad T14s G2 20WM003TGE | |
| Jetstream 2 / 2.0 Total | |
| Durchschnitt der Klasse Office (126.6 - 483, n=20, der letzten 2 Jahre) | |
| Schenker Vision 14 2022 RTX 3050 Ti | |
| Lenovo ThinkPad T16 G1 21BWS00200 | |
| Durchschnittliche Intel Core i5-1235U, Intel Iris Xe Graphics G7 80EUs (191.9 - 254, n=7) | |
| Lenovo ThinkPad T14s G3 21BR00CDGE | |
| Apple MacBook Air M2 Entry | |
| Lenovo ThinkPad T14 G3-21CF004NGE | |
| Apple MacBook Pro 14 2021 M1 Pro Entry | |
| Lenovo ThinkPad T14s G2 20WM003TGE | |
| WebXPRT 3 / Overall | |
| Apple MacBook Air M2 Entry | |
| Apple MacBook Pro 14 2021 M1 Pro Entry | |
| Schenker Vision 14 2022 RTX 3050 Ti | |
| Durchschnitt der Klasse Office (129.9 - 444, n=74, der letzten 2 Jahre) | |
| Durchschnittliche Intel Core i5-1235U, Intel Iris Xe Graphics G7 80EUs (233 - 305, n=11) | |
| Lenovo ThinkPad T14s G2 20WM003TGE | |
| Lenovo ThinkPad X1 Carbon G10 21CC001RGE | |
| Lenovo ThinkPad T16 G1 21BWS00200 | |
| Lenovo ThinkPad T14s G3 21BR00CDGE | |
| Dell Latitude 7420 JW6MH | |
| Lenovo ThinkPad T14 G3-21CF004NGE | |
| Lenovo ThinkPad X13 G3 21BN0046GE | |
| Lenovo ThinkPad X13 G3 21BN0046GE | |
| HP EliteBook 845 G9 6F6H9EA | |
| WebXPRT 4 / Overall | |
| Schenker Vision 14 2022 RTX 3050 Ti | |
| Durchschnitt der Klasse Office (104.2 - 313, n=74, der letzten 2 Jahre) | |
| Lenovo ThinkPad T16 G1 21BWS00200 | |
| Apple MacBook Air M2 Entry | |
| Durchschnittliche Intel Core i5-1235U, Intel Iris Xe Graphics G7 80EUs (206 - 236, n=10) | |
| Lenovo ThinkPad T14s G3 21BR00CDGE | |
| Lenovo ThinkPad X13 G3 21BN0046GE | |
| Lenovo ThinkPad X13 G3 21BN0046GE | |
| Lenovo ThinkPad T14 G3-21CF004NGE | |
| HP EliteBook 845 G9 6F6H9EA | |
* ... kleinere Werte sind besser
| PCMark 10 Score | 5069 Punkte | |
Hilfe | ||
| AIDA64 / Memory Copy | |
| Durchschnitt der Klasse Office (20075 - 110930, n=76, der letzten 2 Jahre) | |
| Lenovo ThinkPad X13 G3 21BN0046GE | |
| Lenovo ThinkPad T14s G3 21BR00CDGE | |
| Dell Latitude 7420 JW6MH | |
| Lenovo ThinkPad T14s G2 20WM003TGE | |
| Durchschnittliche Intel Core i5-1235U (24653 - 61921, n=8) | |
| Lenovo ThinkPad T14 G3-21CF004NGE | |
| Schenker Vision 14 2022 RTX 3050 Ti | |
| HP EliteBook 845 G9 6F6H9EA | |
| Lenovo ThinkPad T16 G1 21BWS00200 | |
| AIDA64 / Memory Read | |
| Durchschnitt der Klasse Office (10084 - 128030, n=77, der letzten 2 Jahre) | |
| Lenovo ThinkPad X13 G3 21BN0046GE | |
| Lenovo ThinkPad T14s G3 21BR00CDGE | |
| Dell Latitude 7420 JW6MH | |
| Lenovo ThinkPad T14s G2 20WM003TGE | |
| Durchschnittliche Intel Core i5-1235U (24441 - 66108, n=8) | |
| Lenovo ThinkPad T14 G3-21CF004NGE | |
| Schenker Vision 14 2022 RTX 3050 Ti | |
| HP EliteBook 845 G9 6F6H9EA | |
| Lenovo ThinkPad T16 G1 21BWS00200 | |
| AIDA64 / Memory Write | |
| Durchschnitt der Klasse Office (20073 - 119858, n=77, der letzten 2 Jahre) | |
| Lenovo ThinkPad T14s G2 20WM003TGE | |
| Lenovo ThinkPad X13 G3 21BN0046GE | |
| Lenovo ThinkPad T14s G3 21BR00CDGE | |
| Dell Latitude 7420 JW6MH | |
| Durchschnittliche Intel Core i5-1235U (25156 - 75808, n=8) | |
| Lenovo ThinkPad T14 G3-21CF004NGE | |
| Schenker Vision 14 2022 RTX 3050 Ti | |
| HP EliteBook 845 G9 6F6H9EA | |
| Lenovo ThinkPad T16 G1 21BWS00200 | |
| AIDA64 / Memory Latency | |
| Lenovo ThinkPad T14 G3-21CF004NGE | |
| Durchschnitt der Klasse Office (7.6 - 162.9, n=72, der letzten 2 Jahre) | |
| Dell Latitude 7420 JW6MH | |
| Schenker Vision 14 2022 RTX 3050 Ti | |
| Lenovo ThinkPad T16 G1 21BWS00200 | |
| HP EliteBook 845 G9 6F6H9EA | |
| Lenovo ThinkPad T14s G3 21BR00CDGE | |
| Lenovo ThinkPad T14s G2 20WM003TGE | |
| Lenovo ThinkPad X13 G3 21BN0046GE | |
| Durchschnittliche Intel Core i5-1235U (76.3 - 119, n=8) | |
* ... kleinere Werte sind besser
DPC-Latenzen
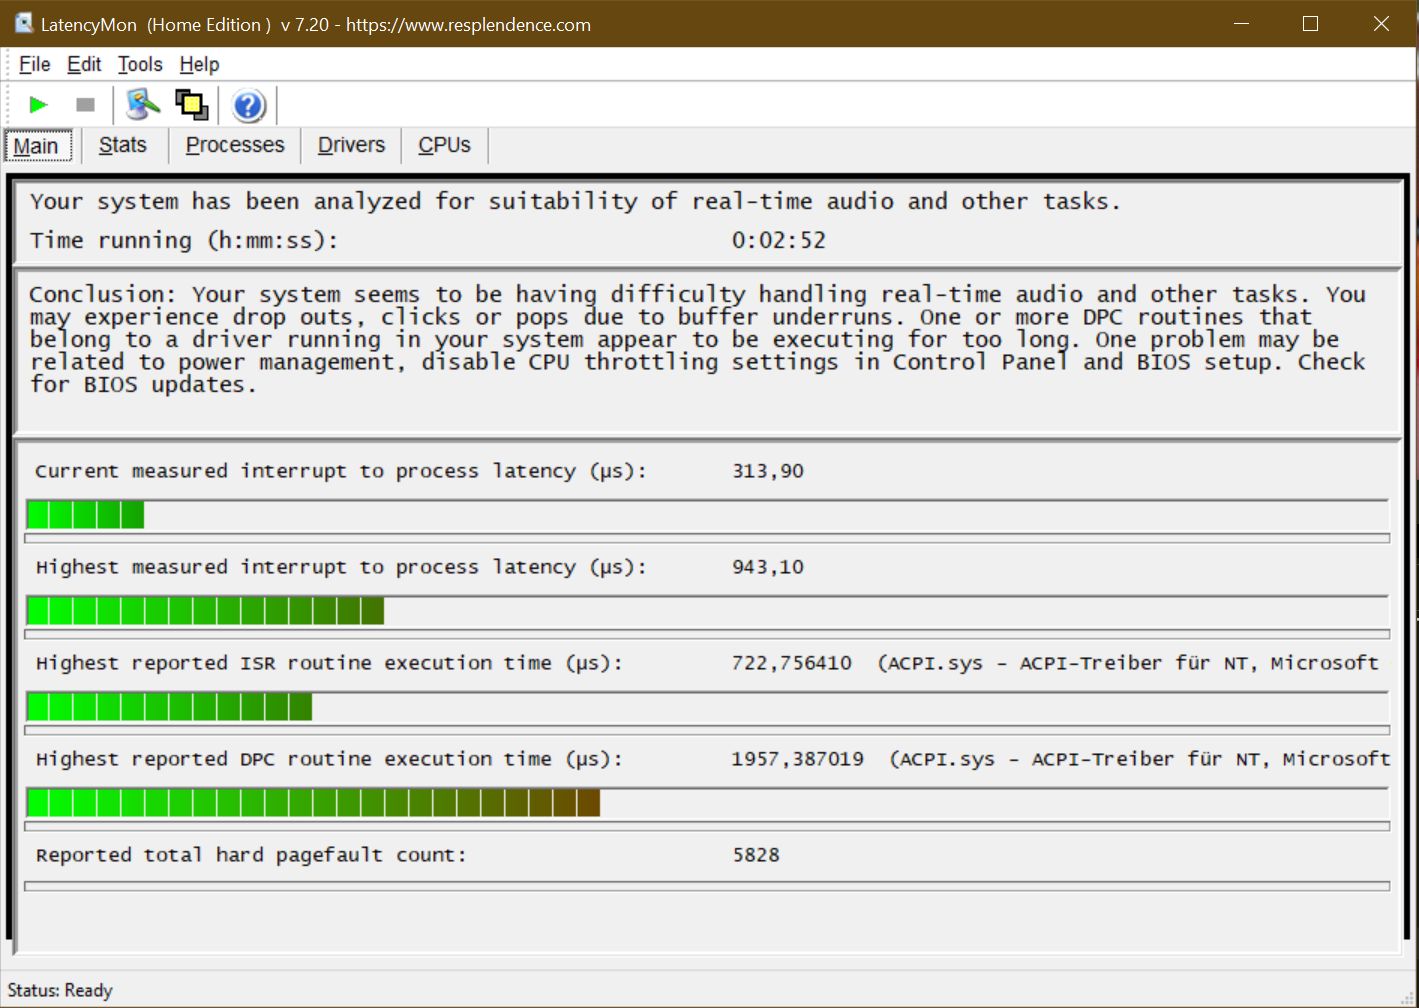
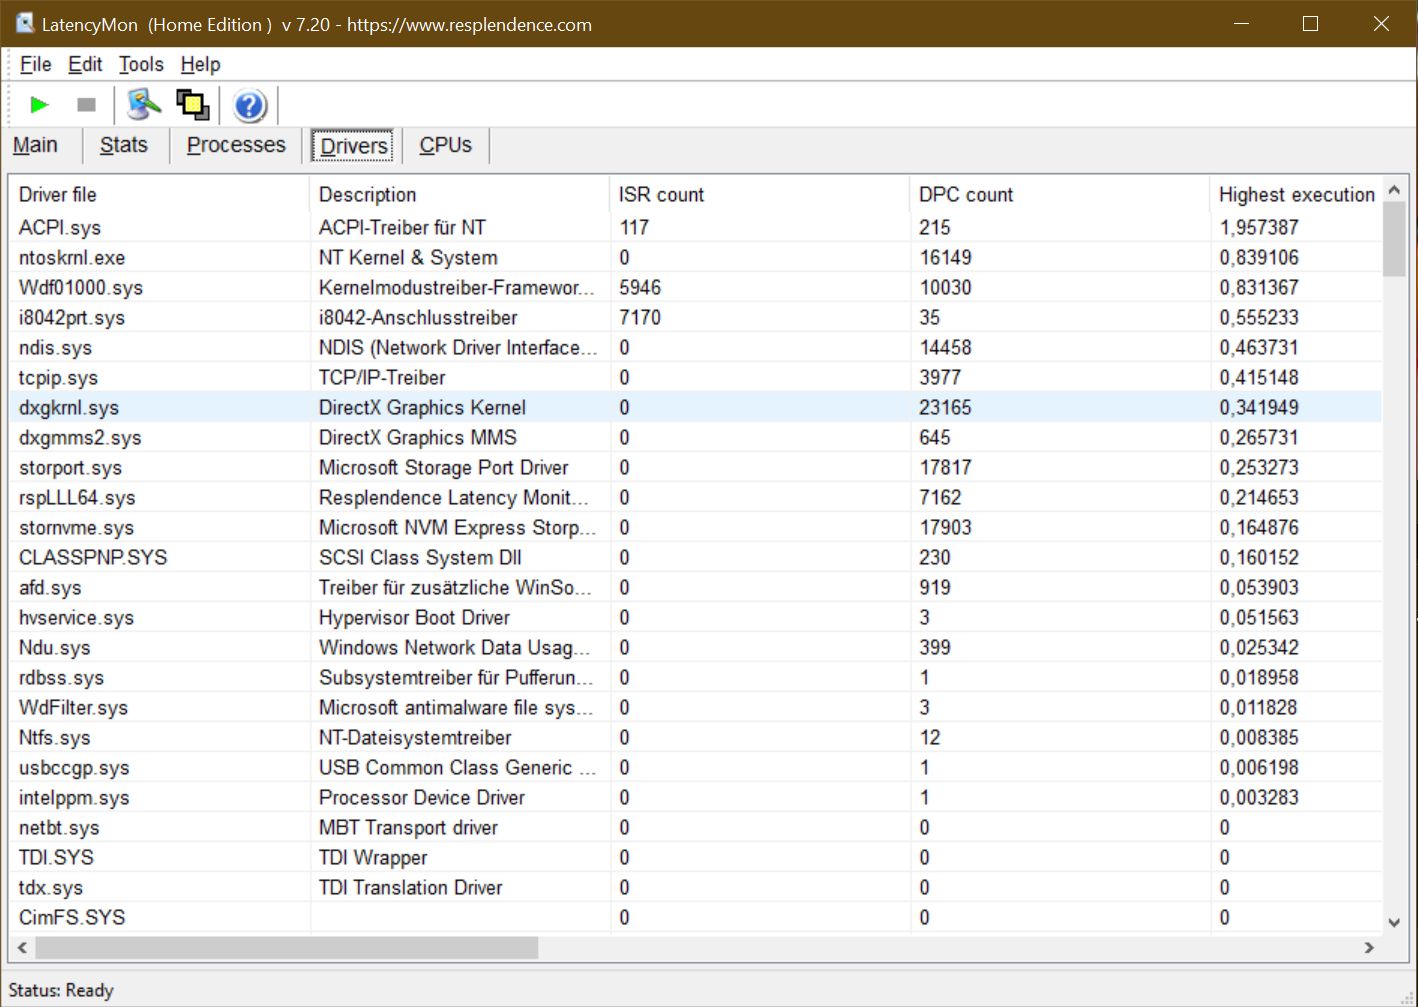
| DPC Latencies / LatencyMon - interrupt to process latency (max), Web, Youtube, Prime95 | |
| Lenovo ThinkPad T14s G2 20WM003TGE | |
| Lenovo ThinkPad X1 Carbon G10 21CC001RGE | |
| HP EliteBook 845 G9 6F6H9EA | |
| Dell Latitude 7420 JW6MH | |
| Lenovo ThinkPad T14s G3 21BR00CDGE | |
| Schenker Vision 14 2022 RTX 3050 Ti | |
* ... kleinere Werte sind besser
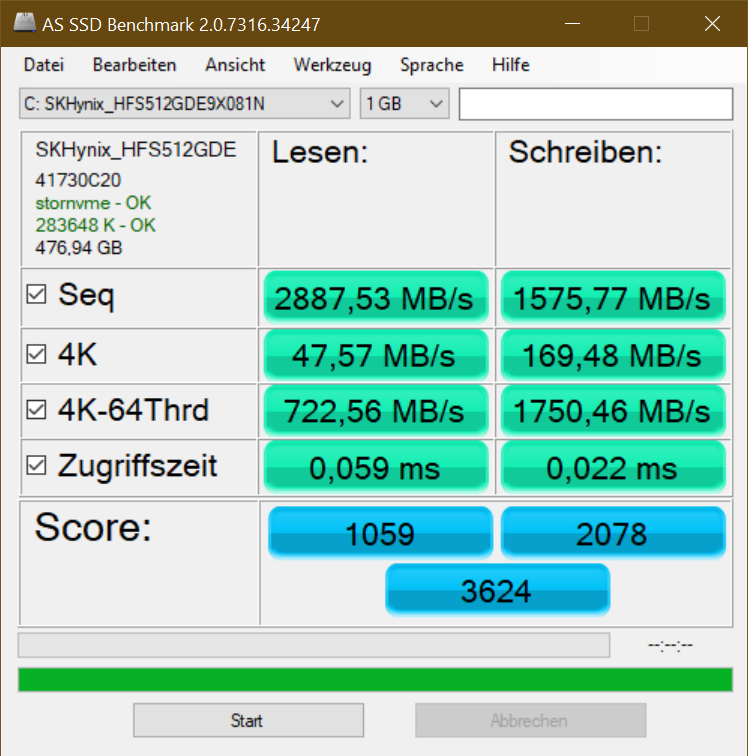
Massenspeicher
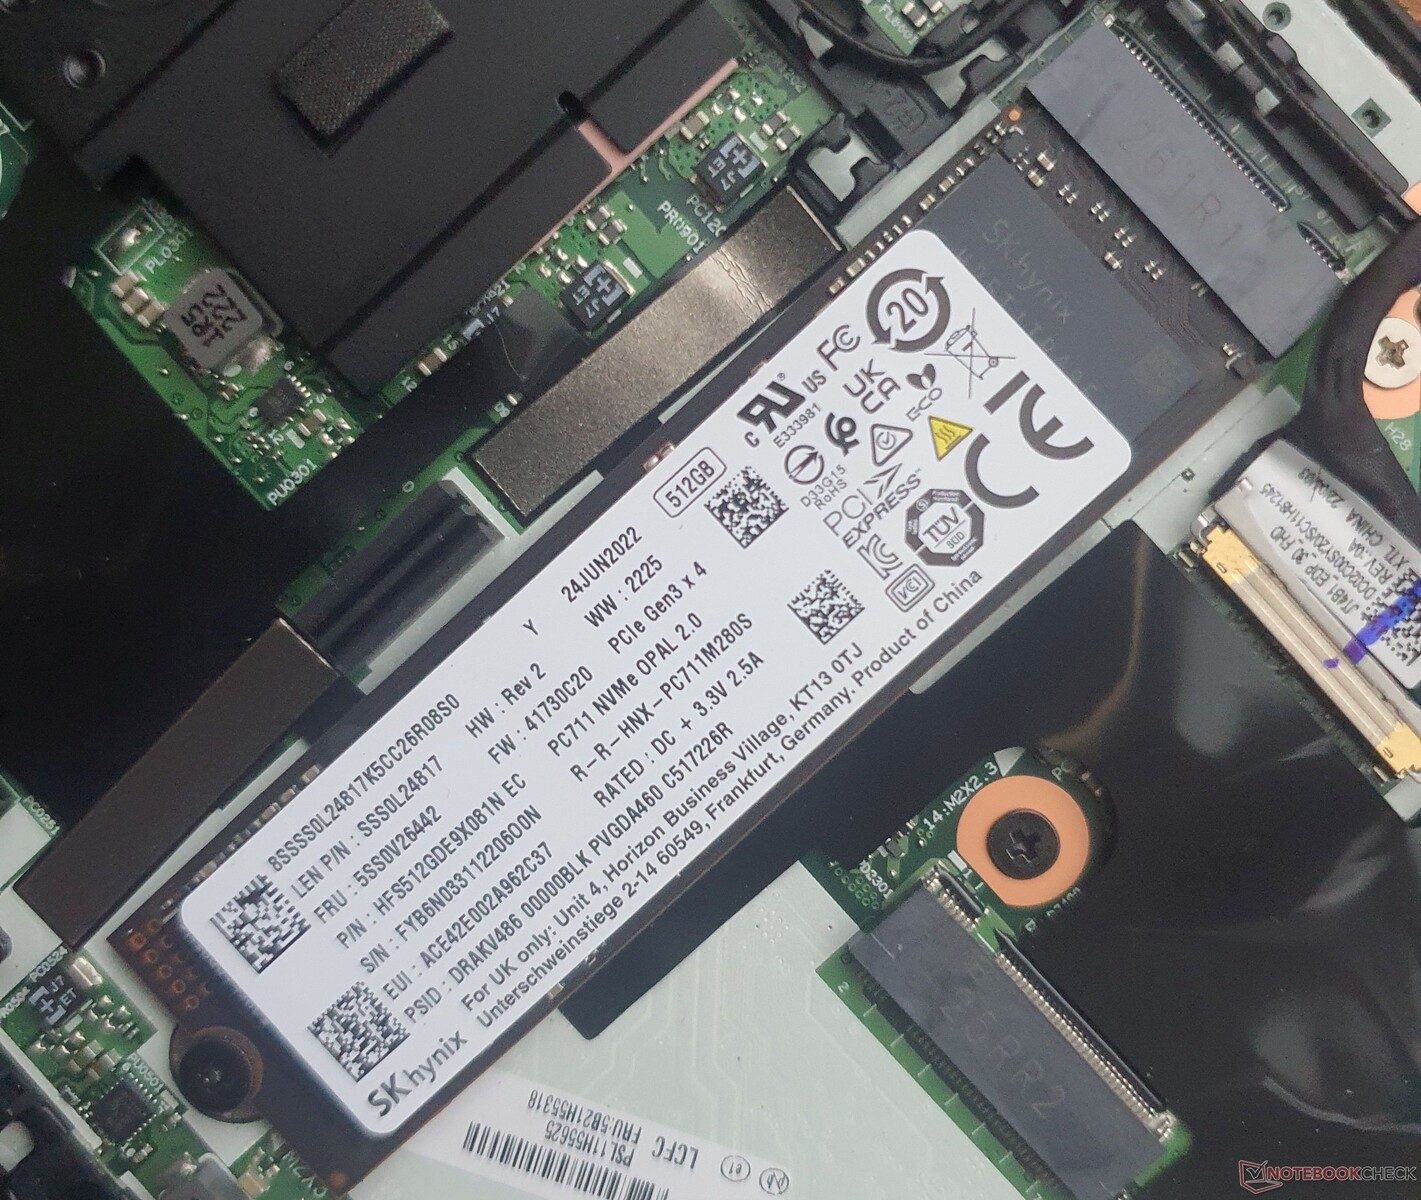
Die SK Hynix HFS512 stellt ca. 412 GB freien Speicher zur Verfügung, während die Transferraten der SSD auf PCIe-3.0-Niveau liegen. Unter Dauerlast bleiben die Geschwindigkeiten konstant. Probleme hat die SSD, wenn es um bis zu 32 4K-Lese-/Schreibprozesse etwa bei Servern geht.
Samsungs 980 Pro im Schenker Vision 14 arbeitet etwa doppelt so schnell, während die PM991 im HP EliteBook 845 G9 etwas langsamer läuft.
| Lenovo ThinkPad T14s G3 21BR00CDGE SK Hynix HFS512 GDE9X081N | Lenovo ThinkPad T14s G2 20WM003TGE Samsung PM981a MZVLB1T0HBLR | Lenovo ThinkPad T14 G3-21CF004NGE Kioxia BG5 KBG5AZNV512G | Lenovo ThinkPad X1 Carbon G10 21CC001RGE Samsung PM9A1 MZVL2512HCJQ | HP EliteBook 845 G9 6F6H9EA Samsung PM991 MZVLQ512HBLU | Dell Latitude 7420 JW6MH SK Hynix BC711 HFM512GD3HX015N | Schenker Vision 14 2022 RTX 3050 Ti Samsung SSD 980 Pro 1TB MZ-V8P1T0BW | |
|---|---|---|---|---|---|---|---|
| AS SSD | 15% | -28% | 17% | -28% | -12% | 100% | |
| Seq Read (MB/s) | 2888 | 2825 -2% | 2117 -27% | 3577.18 24% | 2472.02 -14% | 2674 -7% | 5315 84% |
| Seq Write (MB/s) | 1576 | 1288 -18% | 1059 -33% | 1503.79 -5% | 1309.38 -17% | 1311 -17% | 3766 139% |
| 4K Read (MB/s) | 48 | 61.2 28% | 51.29 7% | 52.64 10% | 44.98 -6% | 68.4 43% | 80.26 67% |
| 4K Write (MB/s) | 169 | 190.6 13% | 110.24 -35% | 182.62 8% | 118.54 -30% | 183.7 9% | 192.61 14% |
| 4K-64 Read (MB/s) | 723 | 1147 59% | 668.7 -8% | 1751.37 142% | 717.11 -1% | 924 28% | 2478.53 243% |
| 4K-64 Write (MB/s) | 1750 | 1827 4% | 332.54 -81% | 1492.76 -15% | 879.06 -50% | 809 -54% | 3195.52 83% |
| Access Time Read * (ms) | 0.059 | 0.055 7% | 0.067 -14% | 0.065 -10% | 0.093 -58% | 0.075 -27% | 0.022 63% |
| Access Time Write * (ms) | 0.022 | 0.019 14% | 0.035 -59% | 0.023 -5% | 0.033 -50% | 0.031 -41% | 0.022 -0% |
| Score Read (Points) | 1059 | 1491 41% | 932 -12% | 2162 104% | 1009 -5% | 1260 19% | 3090 192% |
| Score Write (Points) | 2078 | 2146 3% | 549 -74% | 1826 -12% | 1129 -46% | 1124 -46% | 3765 81% |
| Score Total (Points) | 3624 | 4336 20% | 1919 -47% | 4991 38% | 2607 -28% | 2980 -18% | 8363 131% |
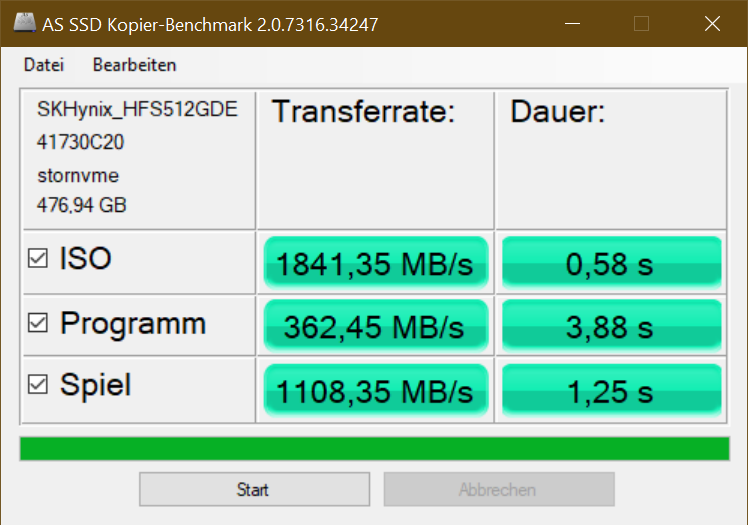
| Copy ISO MB/s (MB/s) | 1841 | 1682.54 -9% | 1375.59 -25% | 1611 -12% | |||
| Copy Program MB/s (MB/s) | 362 | 402.12 11% | 336.59 -7% | 327 -10% | |||
| Copy Game MB/s (MB/s) | 1108 | 967.5 -13% | 940.22 -15% | 698 -37% | |||
| DiskSpd | 27% | 8% | 172% | -11% | 10% | 217% | |
| seq read (MB/s) | 1889 | 2479 31% | 2449 30% | 4277 126% | 1698 -10% | 2253 19% | 3878 105% |
| seq write (MB/s) | 1875 | 1896 1% | 2052 9% | 3968 112% | 1513 -19% | 1791 -4% | 4000 113% |
| seq q8 t1 read (MB/s) | 3567 | 3555 0% | 2836 -20% | 6588 85% | 2955 -17% | 3547 -1% | 6876 93% |
| seq q8 t1 write (MB/s) | 3150 | 2965 -6% | 2752 -13% | 4805 53% | 1632 -48% | 2519 -20% | 4970 58% |
| 4k q1 t1 read (MB/s) | 53.9 | 65.1 21% | 54.1 0% | 71.2 32% | 44.9 -17% | 64 19% | 88.6 64% |
| 4k q1 t1 write (MB/s) | 138.5 | 151 9% | 134.4 -3% | 213 54% | 117.4 -15% | 162 17% | 224 62% |
| 4k q32 t16 read (MB/s) | 667 | 1140 71% | 839 26% | 3241 386% | 784 18% | 648 -3% | 3484 422% |
| 4k q32 t16 write (MB/s) | 278 | 528 90% | 377 36% | 1750 529% | 337 21% | 425 53% | 2554 819% |
| Durchschnitt gesamt (Programm / Settings) | 21% /
20% | -10% /
-15% | 95% /
73% | -20% /
-21% | -1% /
-4% | 159% /
149% |
* ... kleinere Werte sind besser
* ... kleinere Werte sind besser
Dauerleistung Lesen: DiskSpd Read Loop, Queue Depth 8
Grafikkarte
Die integrierte Intel Xe G7 (80 EUs) des Lenovo ThinkPad darf sich an Dual-Channel-RAM erfreuen und arbeitet dadurch 58 % schneller als die technisch gleiche UHD-iGPU im ThinkPad T16, die dort nur über Single-Channel-RAM verfügt. Ältere Spiele lassen sich somit immerhin bei mittleren Details spielen.
Da der ThinkPad Laptop aber nicht für Spiele konzipiert ist, ist es verkraftbar, dass neuere Spiele lediglich bei niedrigen Detailstufen flüssig darstellbar sind. Das Ziehen des Netzsteckers hat keinen negativen Einfluss auf die Grafikleistung. Eine dedizierte Grafiklösung wird beim ThinkPad T14 Intel und P14s Intel angeboten.
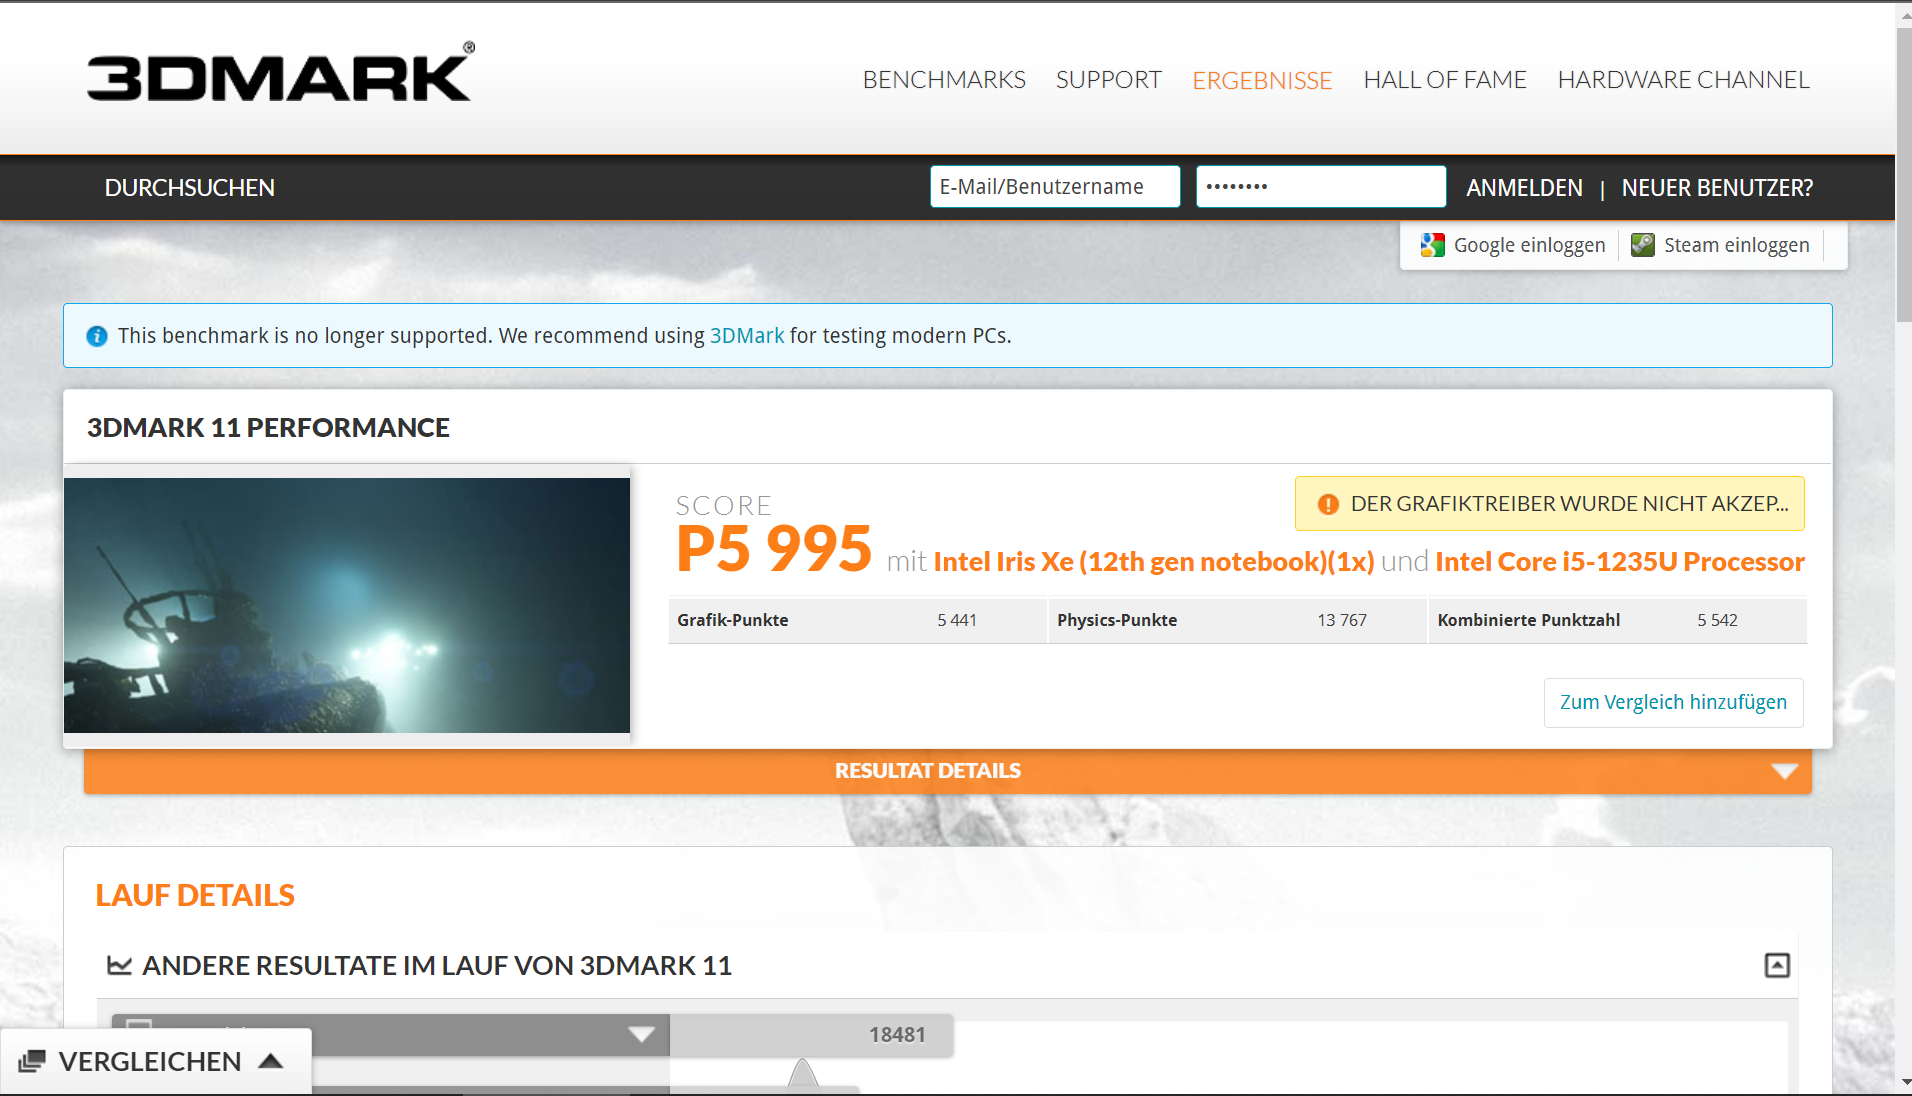
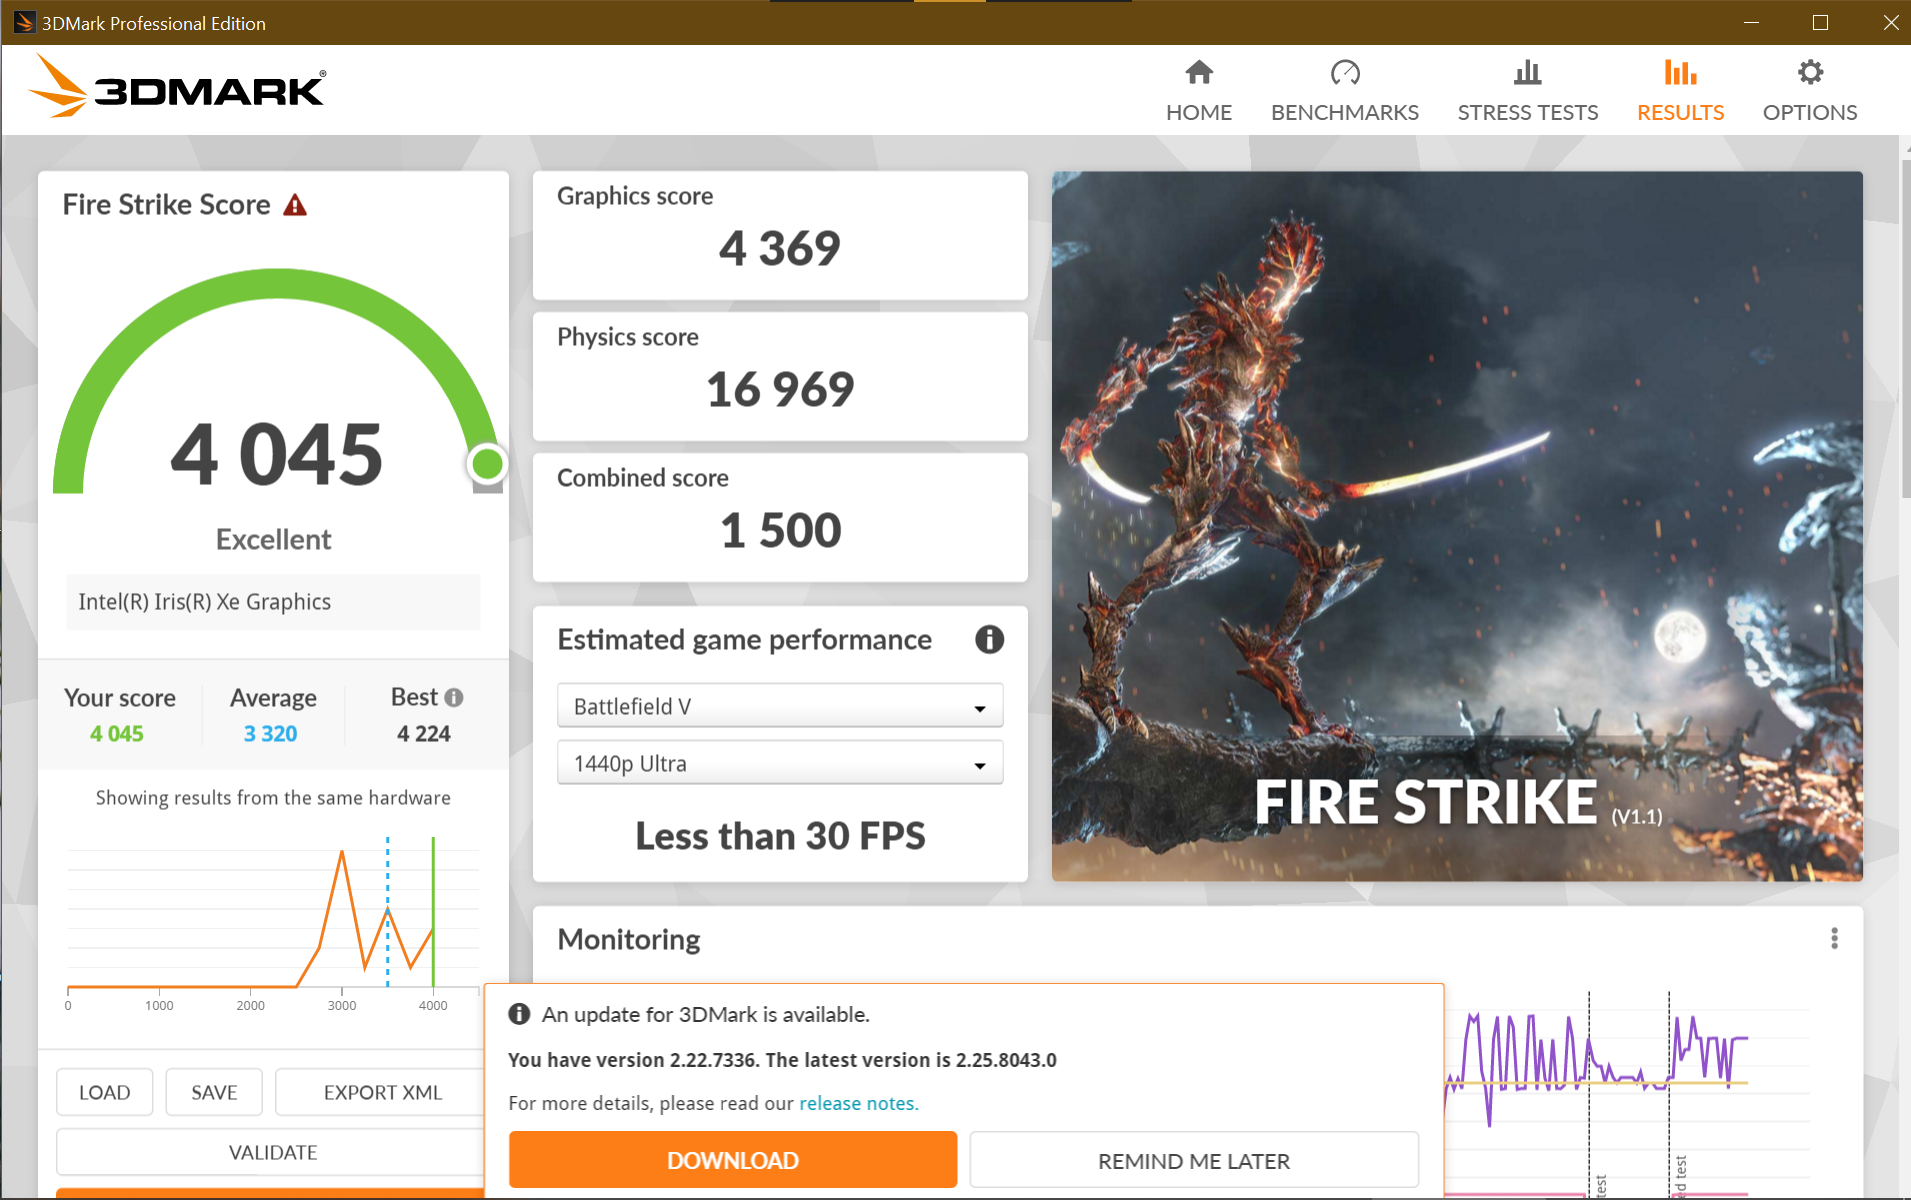
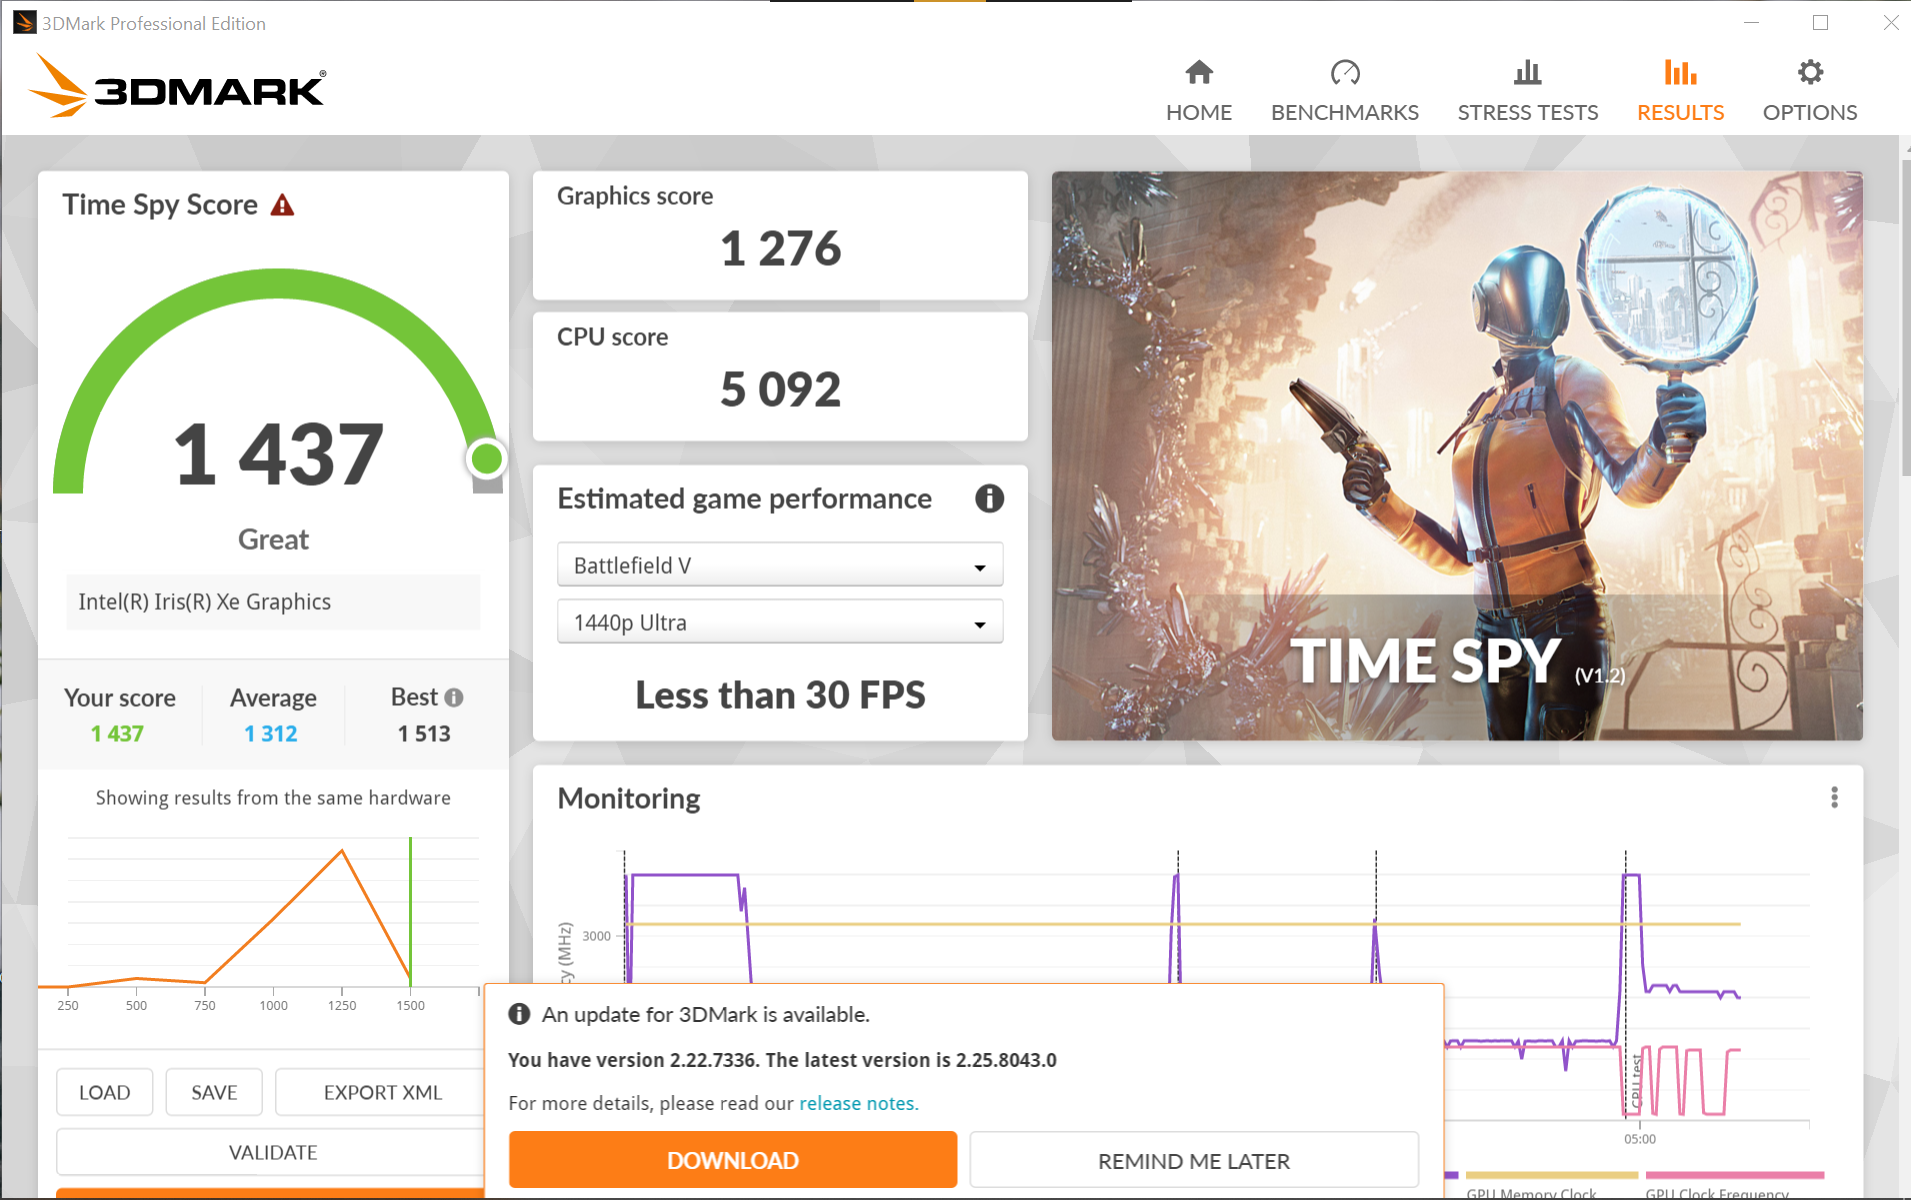
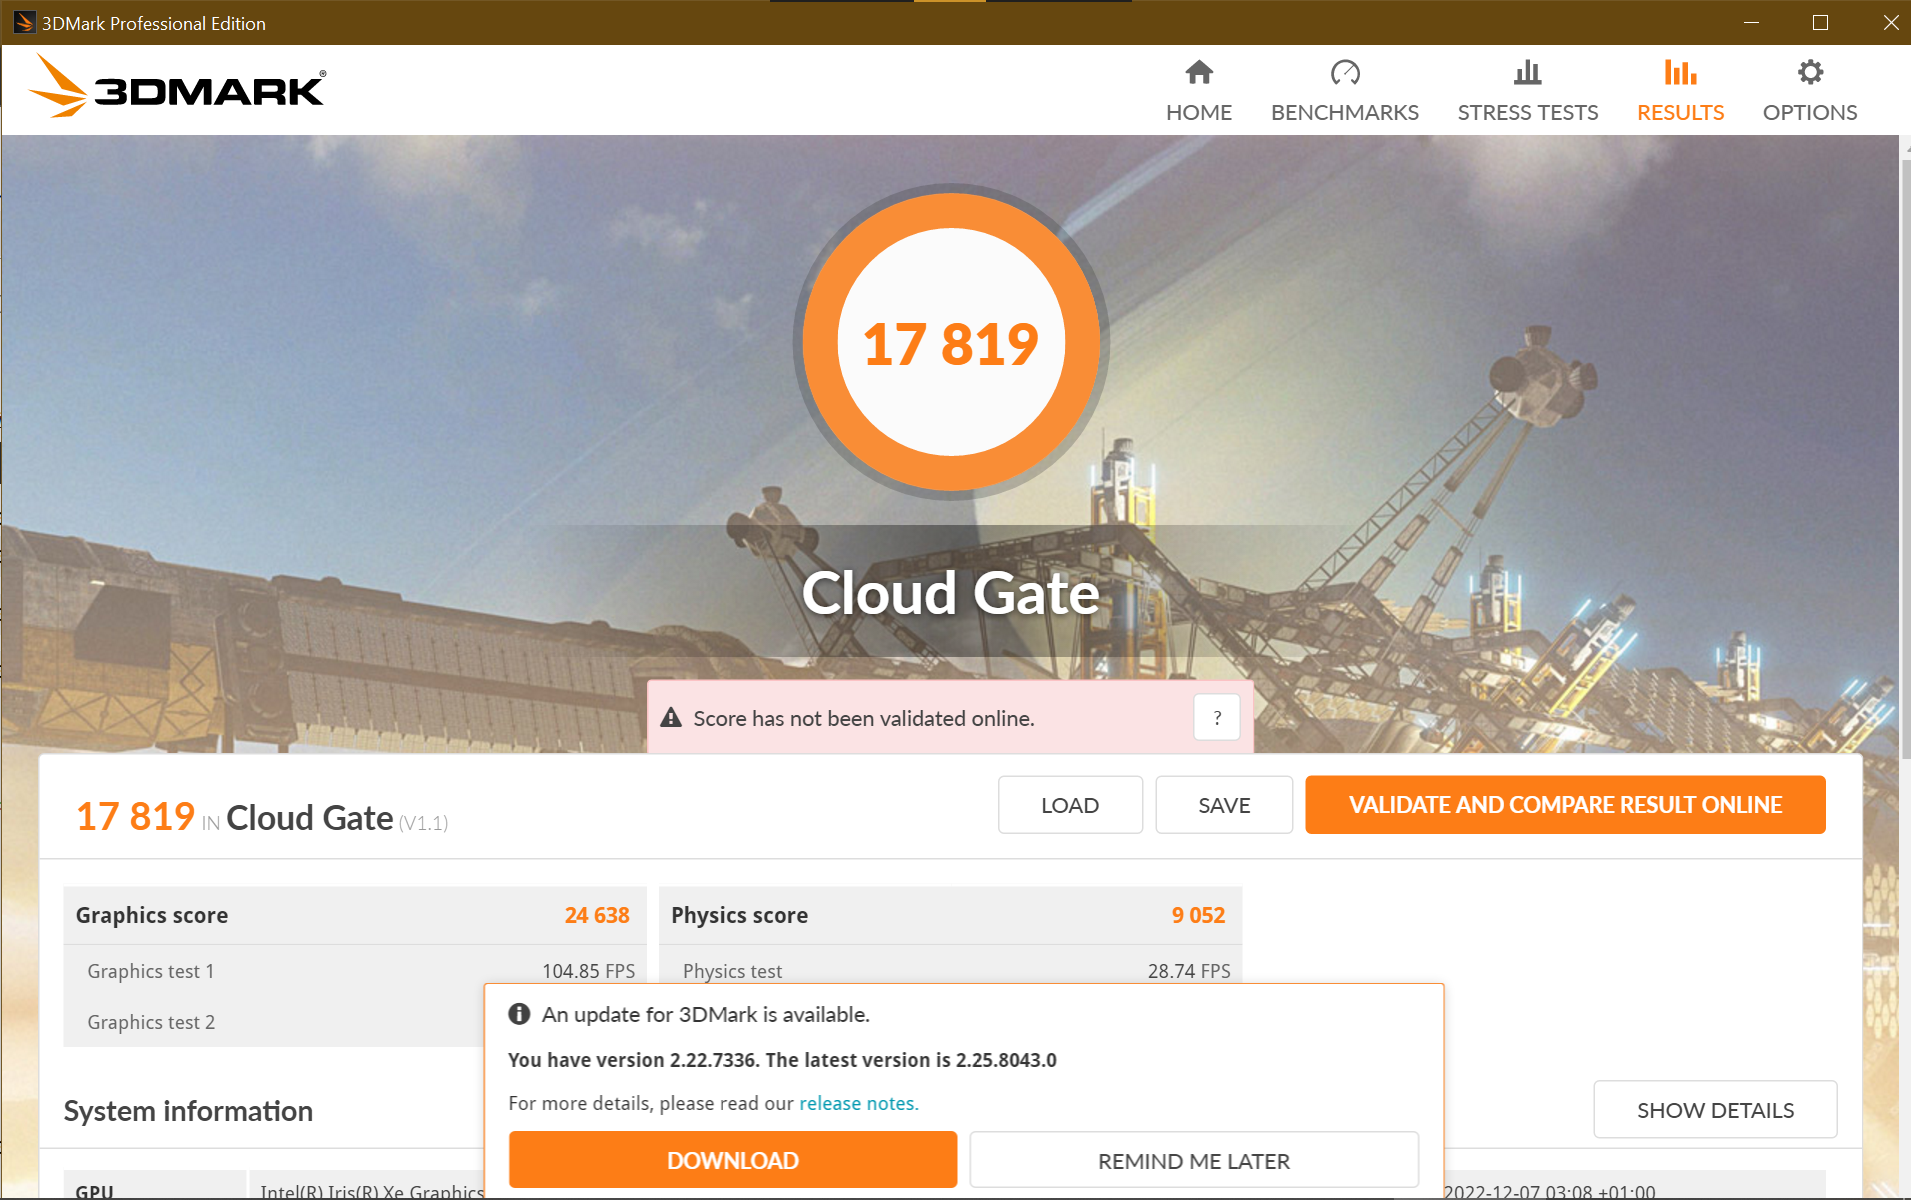
| 3DMark 11 Performance | 5995 Punkte | |
| 3DMark Cloud Gate Standard Score | 17819 Punkte | |
| 3DMark Fire Strike Score | 4045 Punkte | |
| 3DMark Time Spy Score | 1437 Punkte | |
Hilfe | ||
* ... kleinere Werte sind besser
Witcher 3 FPS-Diagramm
| min. | mittel | hoch | max. | |
|---|---|---|---|---|
| GTA V (2015) | 111.8 | 97 | 19.9 | 8.85 |
| The Witcher 3 (2015) | 74.9 | 48.6 | 26.2 | 12.5 |
| Dota 2 Reborn (2015) | 111.8 | 87.2 | 46.9 | 43.3 |
| Final Fantasy XV Benchmark (2018) | 39.5 | 20.7 | 14.6 | |
| X-Plane 11.11 (2018) | 51.2 | 34.6 | 30.8 | |
| Far Cry 5 (2018) | 43 | 25 | 23 | 21 |
| Strange Brigade (2018) | 70.3 | 30.7 | 24.1 | 19.7 |
| Shadow of the Tomb Raider (2018) | 42 | 21 | 21 | 18 |
| GRID Legends (2022) | 45 | 35.6 | 25.7 | 20 |
Geringe Emissionen beim Lenovo ThinkPad T14s
Geräuschemissionen
Der Lenovo Laptop bleibt im Leerlauf komplett lautlos, oft auch beim Websurfing mit mehreren Tabs sowie Multitasking, aber kann mit 26 dB(A) auch mal leise vor sich hin säuseln. Im Windows-Modus "Bessere Leistung" ist aber nichts mehr zu hören.
Selbst unter hoher CPU-Last bleibt das Notebook überraschend leise, während wir lediglich bei kombinierter Last, etwa beim Zocken, maximal 36 dB(A) messen. Das ist immer noch recht leise, wobei man dann höhere Frequenzen des Lüfters wahrnimmt, was etwas störend sein kann. Zu Spulenfiepen kam es bei unserem Modell nicht.
Lautstärkediagramm
| Idle |
| 24.6 / 24.6 / 24.6 dB(A) |
| Last |
| 26.1 / 36.3 dB(A) |
 | ||
30 dB leise 40 dB(A) deutlich hörbar 50 dB(A) störend |
||
min: | ||
| Lenovo ThinkPad T14s G3 21BR00CDGE Iris Xe G7 80EUs, i5-1235U, SK Hynix HFS512 GDE9X081N | Lenovo ThinkPad T14s G2 20WM003TGE Iris Xe G7 96EUs, i7-1165G7, Samsung PM981a MZVLB1T0HBLR | Lenovo ThinkPad T14 G3-21CF004NGE Radeon 680M, R7 PRO 6850U, Kioxia BG5 KBG5AZNV512G | Lenovo ThinkPad X13 G3 21BN0046GE Iris Xe G7 80EUs, i5-1235U, SK Hynix HFS512 GDE9X081N | Lenovo ThinkPad X1 Carbon G10 21CC001RGE Iris Xe G7 80EUs, i5-1250P, Samsung PM9A1 MZVL2512HCJQ | HP EliteBook 845 G9 6F6H9EA Radeon 660M, R5 PRO 6650U, Samsung PM991 MZVLQ512HBLU | Dell Latitude 7420 JW6MH Iris Xe G7 80EUs, i5-1145G7, SK Hynix BC711 HFM512GD3HX015N | Schenker Vision 14 2022 RTX 3050 Ti GeForce RTX 3050 Ti Laptop GPU, i7-12700H, Samsung SSD 980 Pro 1TB MZ-V8P1T0BW | |
|---|---|---|---|---|---|---|---|---|
| Geräuschentwicklung | -6% | -3% | -2% | 1% | -6% | -18% | -21% | |
| aus / Umgebung * (dB) | 24.6 | 24.81 -1% | 24.2 2% | 24.6 -0% | 22.81 7% | 24 2% | 25.3 -3% | 24.4 1% |
| Idle min * (dB) | 24.6 | 24.81 -1% | 24.2 2% | 24.6 -0% | 22.81 7% | 24 2% | 25.3 -3% | 24.4 1% |
| Idle avg * (dB) | 24.6 | 24.81 -1% | 24.2 2% | 24.6 -0% | 22.81 7% | 25 -2% | 25.3 -3% | 24.4 1% |
| Idle max * (dB) | 24.6 | 24.81 -1% | 25.8 -5% | 25.9 -5% | 22.81 7% | 26 -6% | 25.3 -3% | 27.8 -13% |
| Last avg * (dB) | 26.1 | 35.14 -35% | 32.2 -23% | 30.7 -18% | 31.59 -21% | 34 -30% | 44.9 -72% | 43.3 -66% |
| Witcher 3 ultra * (dB) | 35.9 | 34.1 5% | 34.6 4% | 35.59 1% | 38 -6% | 48.2 -34% | ||
| Last max * (dB) | 36.3 | 35.14 3% | 38.8 -7% | 34.6 5% | 35.47 2% | 38 -5% | 44.9 -24% | 48.8 -34% |
* ... kleinere Werte sind besser
Temperatur
Auch bei Maximallast bleibt der ThinkPad Laptop mit dem Intel Core i5-1235U sehr kühl. Das ThinkPad X13 G3 mit gleichem Mainboard erzielt ebenfalls ein gutes Ergebnis, während das dickere ThinkPad T14 G3 mit AMD Ryzen 7, trotz zweiter Heat-Pipe, um 10° C wärmer wird, mit bis zu 52,5 °C.
(±) Die maximale Temperatur auf der Oberseite ist 43.6 °C. Im Vergleich liegt der Klassendurchschnitt bei 34.3 °C (von 21.2 bis 62.5 °C für die Klasse Office).
(±) Auf der Unterseite messen wir eine maximalen Wert von 42 °C (im Vergleich zum Durchschnitt von 36.8 °C).
(+) Ohne Last messen wir eine durchschnittliche Temperatur von 26.4 °C auf der Oberseite. Der Klassendurchschnitt erreicht 29.5 °C.
(+) Beim längeren Spielen von The Witcher 3 erhitzt sich das Gerät durchschnittlich auf 28.9 °C. Der Durchschnitt der Klasse ist derzeit 29.5 °C.
(+) Die Handballen und der Touchpad-Bereich sind mit gemessenen 27.1 °C kühler als die typische Hauttemperatur und fühlen sich dadurch kühl an.
(±) Die durchschnittliche Handballen-Temperatur anderer getesteter Geräte war 27.5 °C (+0.4 °C).
| Lenovo ThinkPad T14s G3 21BR00CDGE Intel Core i5-1235U, Intel Iris Xe Graphics G7 80EUs | Lenovo ThinkPad T14s G2 20WM003TGE Intel Core i7-1165G7, Intel Iris Xe Graphics G7 96EUs | Lenovo ThinkPad T14 G3-21CF004NGE AMD Ryzen 7 PRO 6850U, AMD Radeon 680M | Lenovo ThinkPad X13 G3 21BN0046GE Intel Core i5-1235U, Intel Iris Xe Graphics G7 80EUs | Lenovo ThinkPad T16 G1 21BWS00200 Intel Core i5-1240P, Intel Iris Xe Graphics G7 80EUs | Lenovo ThinkPad X1 Carbon G10 21CC001RGE Intel Core i5-1250P, Intel Iris Xe Graphics G7 80EUs | HP EliteBook 845 G9 6F6H9EA AMD Ryzen 5 PRO 6650U, AMD Radeon 660M | Dell Latitude 7420 JW6MH Intel Core i5-1145G7, Intel Iris Xe Graphics G7 80EUs | Schenker Vision 14 2022 RTX 3050 Ti Intel Core i7-12700H, NVIDIA GeForce RTX 3050 Ti Laptop GPU | |
|---|---|---|---|---|---|---|---|---|---|
| Hitze | -3% | -2% | -7% | -10% | -9% | 1% | 7% | -12% | |
| Last oben max * (°C) | 43.6 | 47.5 -9% | 48.2 -11% | 45.3 -4% | 45 -3% | 45 -3% | 44 -1% | 37.1 15% | 48.4 -11% |
| Last unten max * (°C) | 42 | 43.4 -3% | 52.8 -26% | 41.8 -0% | 42.8 -2% | 44 -5% | 45 -7% | 38.7 8% | 57.1 -36% |
| Idle oben max * (°C) | 28.1 | 28.4 -1% | 24.4 13% | 31.6 -12% | 33 -17% | 31.2 -11% | 27 4% | 27.3 3% | 28.1 -0% |
| Idle unten max * (°C) | 28.9 | 28.3 2% | 24.5 15% | 32.6 -13% | 33.6 -16% | 33.2 -15% | 27 7% | 28.1 3% | 29 -0% |
* ... kleinere Werte sind besser
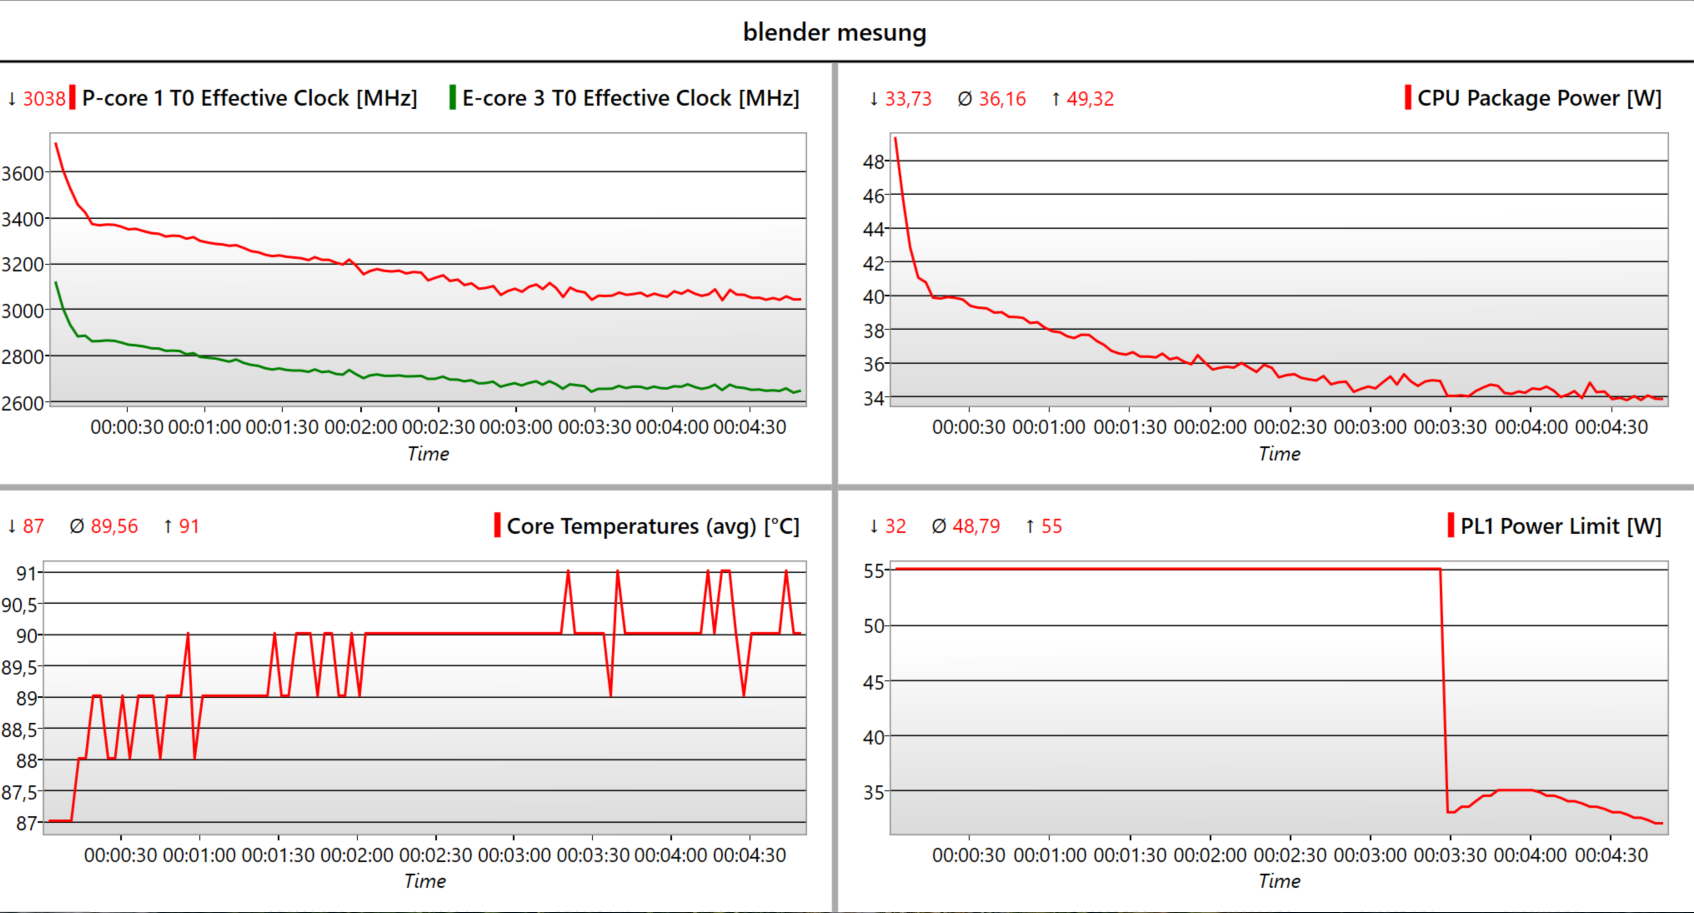
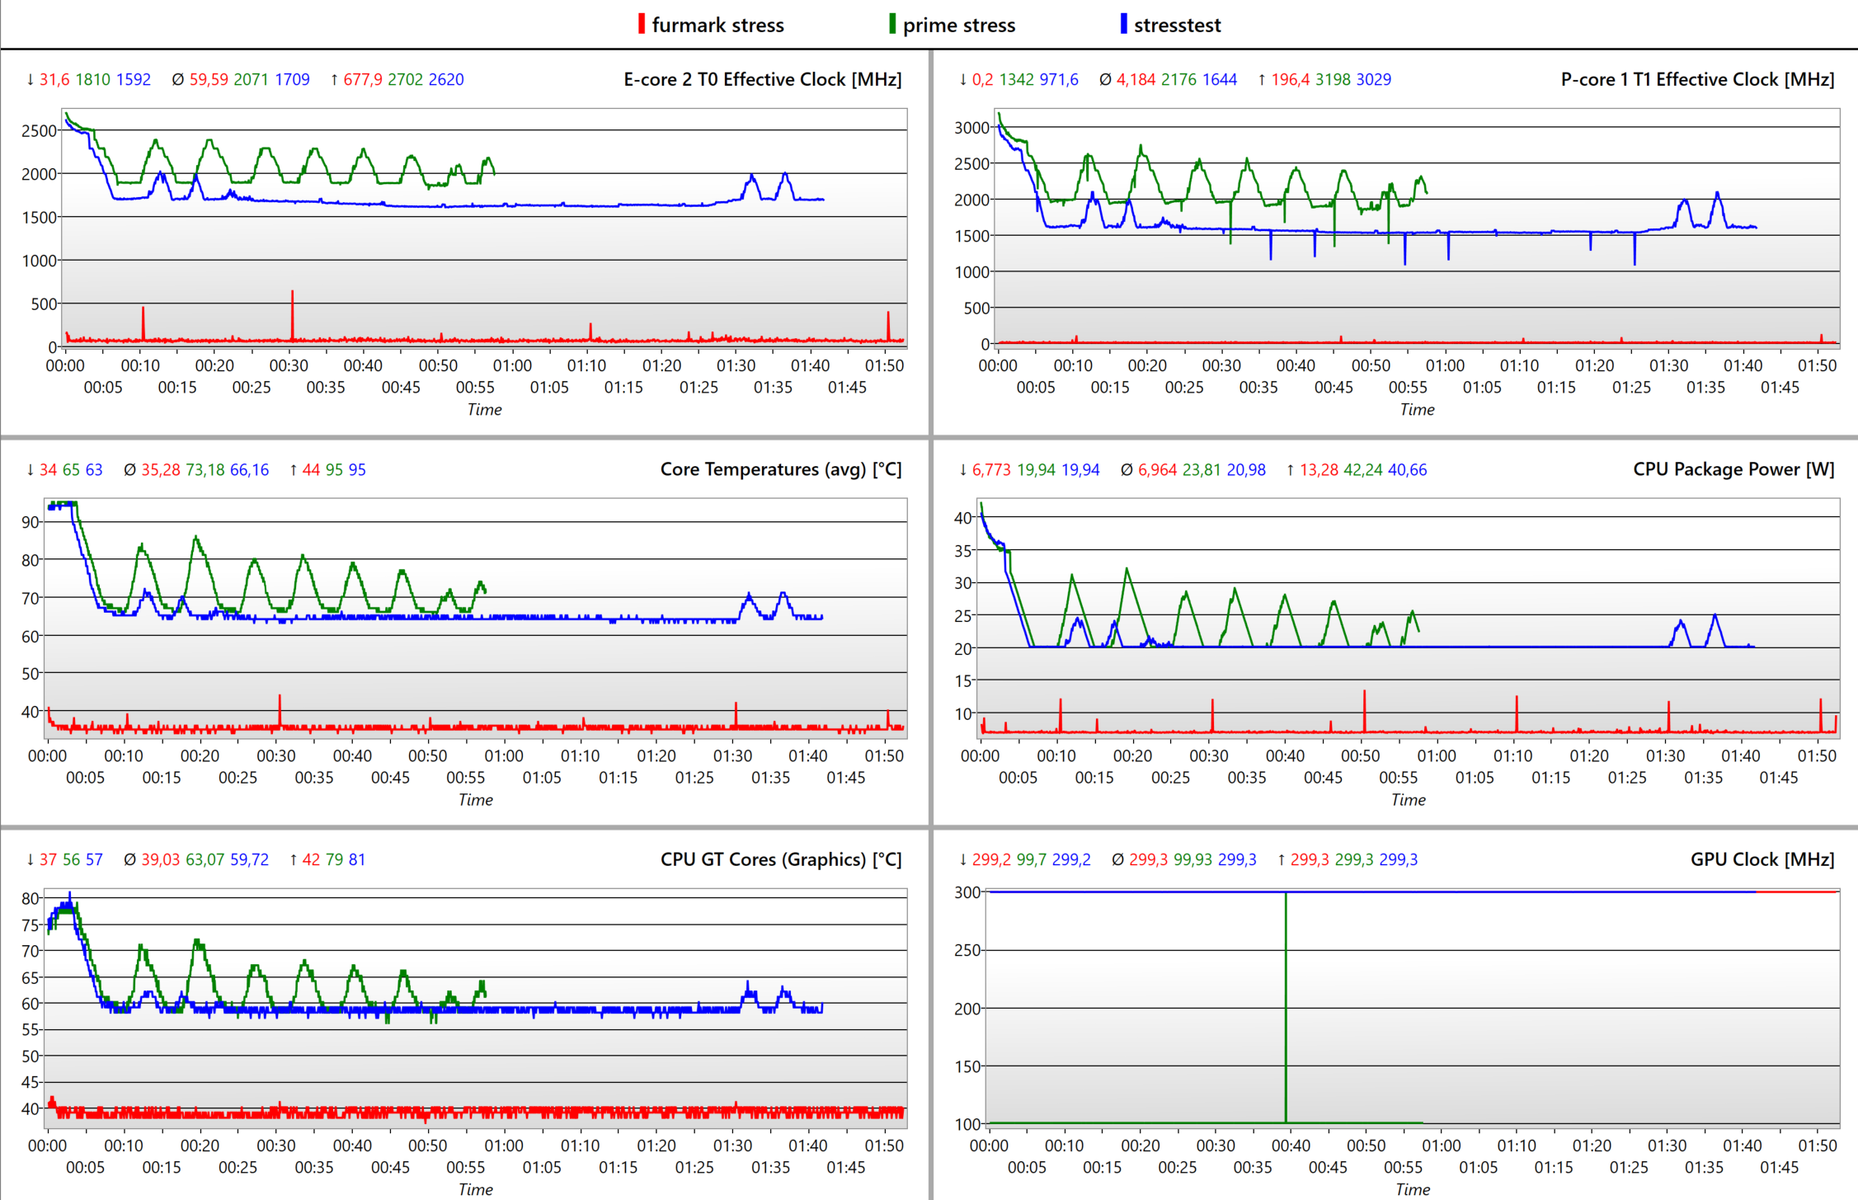
Stresstest
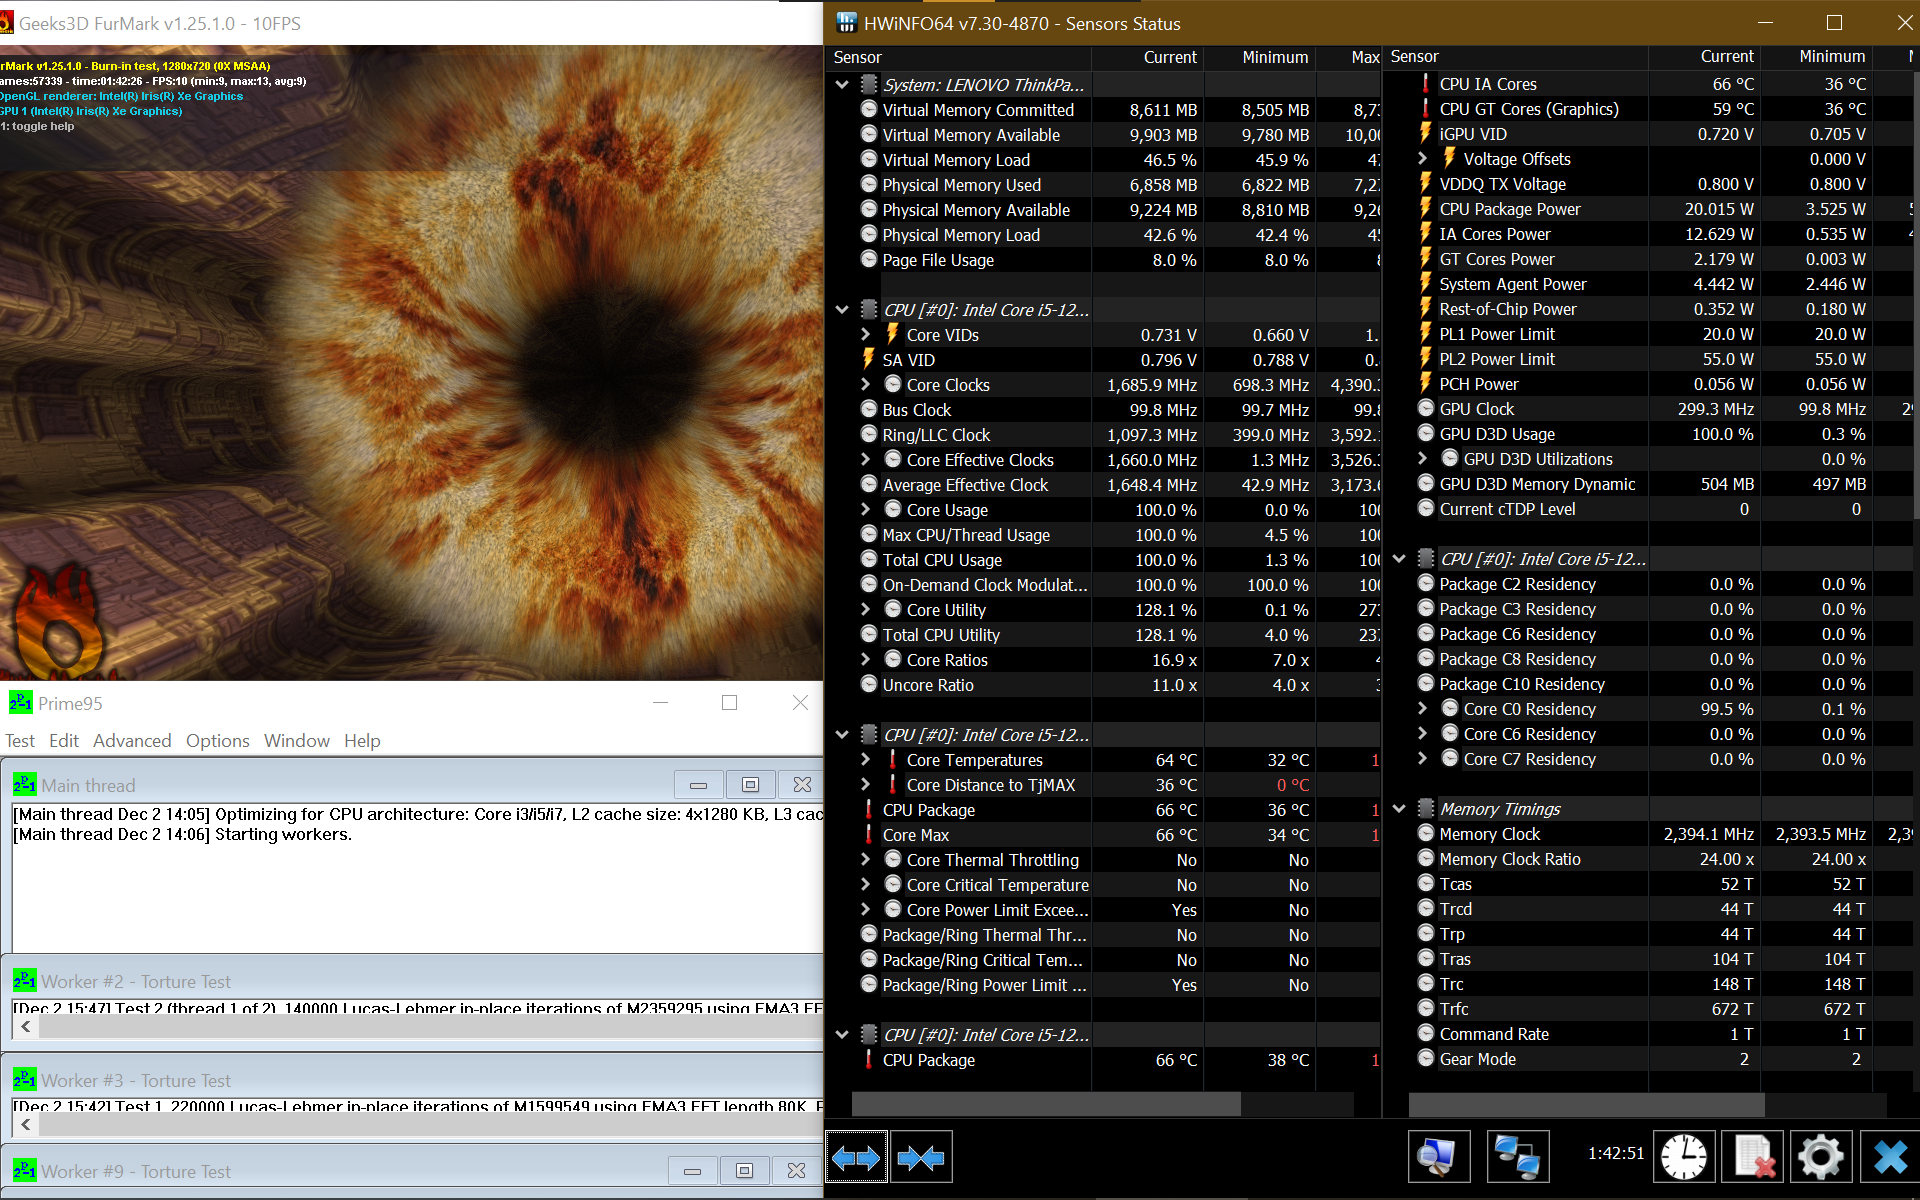
Bei kombinierter Last (Prime95+FurMark) takten die P-Kerne nach ca. 6 Minuten von 3 GHz auf ~1,5 GHz runter, was noch über dem Basistakt von 1,3 GHz liegt. Die Temperatur sinkt dann von 95 °C dauerhaft auf 64 °C. Die iGPU arbeitet statt mit den vollen 1.300 MHz nur bei 300 MHz und 58 °C.
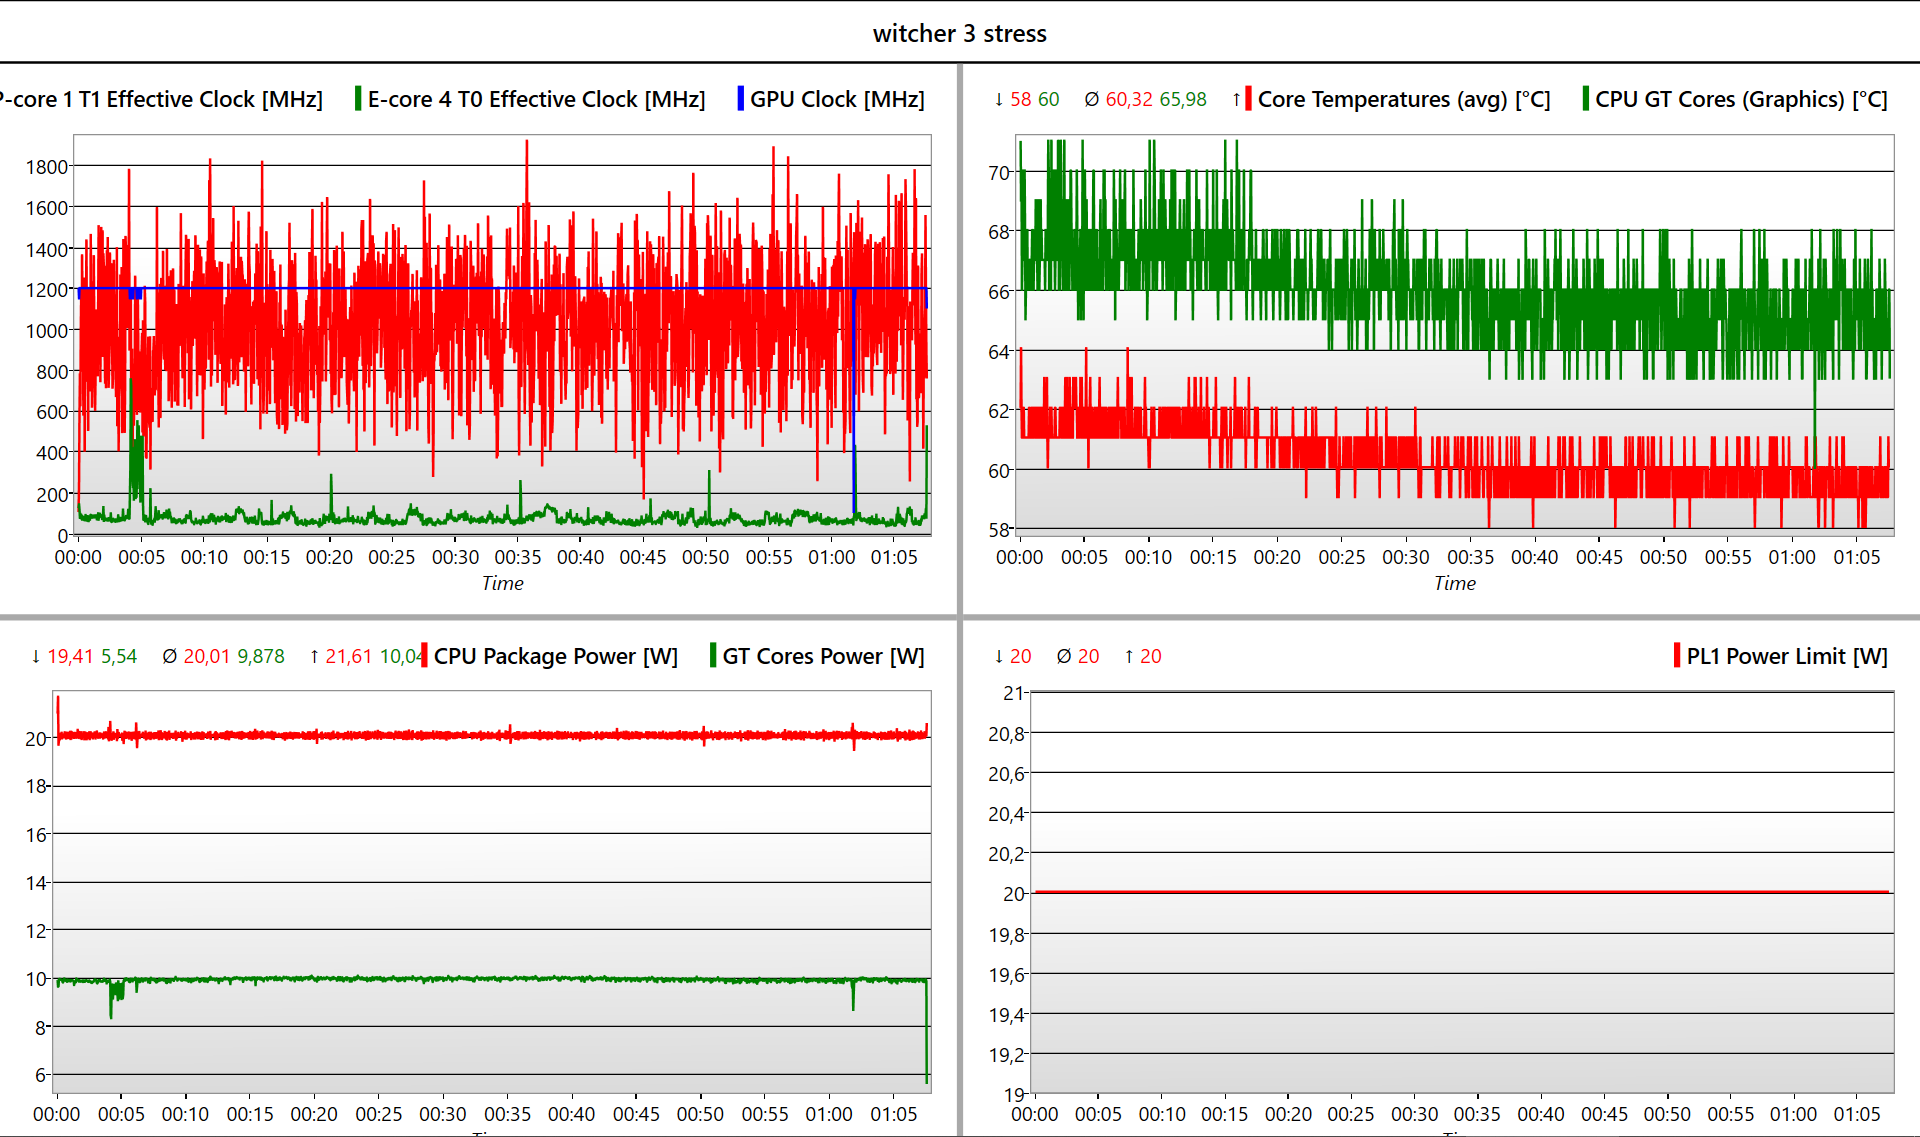
Bei reinem CPU-Stress pendeln die P-Kerne zwischen 2 GHz und 2,5 GHz. Wird allein die iGPU im Witcher 3 gestresst, bleibt sie mit 1.200 MHz nur 100 MHz unterm Maximaltakt und pendelt sich auf 65 °C ein.
| CPU Clock (GHz) | GPU Clock (MHz) | Average CPU Temperature (°C) | Average GPU Temperature (°C) | |
| System Idle | 0,04 | 100 | 27 | 31 |
| Prime95 Stress | 2 - 2,5 | 100 | 73 | 63 |
| Prime95 + FurMark Stress | 1,5 | 300 | 65 | 60 |
| Witcher 3 Stress | 0,9 | 1.200 | 60 | 65 |
Lautsprecher
Die Lautsprecher der gesamten T-Serie wurden verbessert und gehen beim T14s G3 schon in Richtung des ThinkPad X1 Carbon. Bass fehlt weiterhin, während Mitten und Höhen ausgeglichen und sehr linear wiedergegeben werden. Mit maximal 75 dB(A) lässt sich ein durchschnittlich großer Raum beschallen. Für den Musikgenuss sollte man dennoch auf ein externes Soundsystem oder Kopfhörer via Klinke oder Bluetooth setzen.
Lenovo ThinkPad T14s G3 21BR00CDGE Audio Analyse
(±) | Mittelmäßig laut spielende Lautsprecher (75.35 dB)
Bass 100 - 315 Hz
(-) | kaum Bass - 17.4% niedriger als der Median
(±) | durchschnittlich lineare Bass-Wiedergabe (12.2% Delta zum Vorgänger)
Mitteltöne 400 - 2000 Hz
(+) | ausgeglichene Mitten, vom Median nur 2.9% abweichend
(+) | lineare Mitten (5.5% Delta zum Vorgänger)
Hochtöne 2 - 16 kHz
(+) | ausgeglichene Hochtöne, vom Median nur 2.1% abweichend
(+) | sehr lineare Hochtöne (6.8% Delta zum Vorgänger)
Gesamt im hörbaren Bereich 100 - 16.000 Hz
(±) | hörbarer Bereich ist durchschnittlich linear (16% Abstand zum Median)
Im Vergleich zu allen Geräten derselben Klasse
» 18% aller getesteten Geräte dieser Klasse waren besser, 6% vergleichbar, 76% schlechter
» Das beste Gerät hat einen Delta-Wert von 7%, durchschnittlich ist 21%, das schlechteste Gerät hat 53%
Im Vergleich zu allen Geräten im Test
» 25% aller getesteten Geräte waren besser, 5% vergleichbar, 70% schlechter
» Das beste Gerät hat einen Delta-Wert von 4%, durchschnittlich ist 24%, das schlechteste Gerät hat 134%
Lenovo ThinkPad T14 G3-21CF004NGE Audio Analyse
(±) | Mittelmäßig laut spielende Lautsprecher (77.2 dB)
Bass 100 - 315 Hz
(-) | kaum Bass - 24.6% niedriger als der Median
(±) | durchschnittlich lineare Bass-Wiedergabe (10.1% Delta zum Vorgänger)
Mitteltöne 400 - 2000 Hz
(+) | ausgeglichene Mitten, vom Median nur 2.6% abweichend
(+) | lineare Mitten (4.6% Delta zum Vorgänger)
Hochtöne 2 - 16 kHz
(+) | ausgeglichene Hochtöne, vom Median nur 3.3% abweichend
(+) | sehr lineare Hochtöne (3.8% Delta zum Vorgänger)
Gesamt im hörbaren Bereich 100 - 16.000 Hz
(±) | hörbarer Bereich ist durchschnittlich linear (18.8% Abstand zum Median)
Im Vergleich zu allen Geräten derselben Klasse
» 35% aller getesteten Geräte dieser Klasse waren besser, 7% vergleichbar, 58% schlechter
» Das beste Gerät hat einen Delta-Wert von 7%, durchschnittlich ist 21%, das schlechteste Gerät hat 53%
Im Vergleich zu allen Geräten im Test
» 43% aller getesteten Geräte waren besser, 8% vergleichbar, 49% schlechter
» Das beste Gerät hat einen Delta-Wert von 4%, durchschnittlich ist 24%, das schlechteste Gerät hat 134%
Energieverwaltung: ThinkPad T14s G3 ist mit Intel sehr sparsam
Energieaufnahme
Beim ThinkPad T14s G3 mit Intel Core i5-1235U messen wir die geringste Aufnahme innerhalb unseres Vergleichsfeldes: 4,6 W im Mittel bzw. maximal 5,6 W. Das ThinkPad T14 AMD benötigt etwas mehr. Das 65-W-Netzteil kommt lediglich beim kombinierten Stress-Test als alltagsfernes Szenario an seine Grenzen, was an sich kein Problem darstellt.
| Aus / Standby | |
| Idle | |
| Last |
|
Legende:
min: | |
| Lenovo ThinkPad T14s G3 21BR00CDGE i5-1235U, Iris Xe G7 80EUs, SK Hynix HFS512 GDE9X081N, IPS LED, 1920x1200, 14" | Lenovo ThinkPad T14s G2 20WM003TGE i7-1165G7, Iris Xe G7 96EUs, Samsung PM981a MZVLB1T0HBLR, IPS LED, 1920x1080, 14" | Lenovo ThinkPad T14 G3-21CF004NGE R7 PRO 6850U, Radeon 680M, Kioxia BG5 KBG5AZNV512G, IPS, 1920x1200, 14" | Lenovo ThinkPad X13 G3 21BN0046GE i5-1235U, Iris Xe G7 80EUs, SK Hynix HFS512 GDE9X081N, IPS Grade, 1920x1200, 13.3" | Lenovo ThinkPad T16 G1 21BWS00200 i5-1240P, Iris Xe G7 80EUs, Samsung PM9A1 MZVL2512HCJQ, IPS, 1920x1200, 16" | Lenovo ThinkPad X1 Carbon G10 21CC001RGE i5-1250P, Iris Xe G7 80EUs, Samsung PM9A1 MZVL2512HCJQ, IPS LED, 1920x1200, 14" | HP EliteBook 845 G9 6F6H9EA R5 PRO 6650U, Radeon 660M, Samsung PM991 MZVLQ512HBLU, IPS, 1920x1200, 14" | Dell Latitude 7420 JW6MH i5-1145G7, Iris Xe G7 80EUs, SK Hynix BC711 HFM512GD3HX015N, IPS, 1920x1080, 14" | Schenker Vision 14 2022 RTX 3050 Ti i7-12700H, GeForce RTX 3050 Ti Laptop GPU, Samsung SSD 980 Pro 1TB MZ-V8P1T0BW, IPS, 2880x1800, 14" | |
|---|---|---|---|---|---|---|---|---|---|
| Stromverbrauch | -7% | -6% | -12% | -18% | -5% | -14% | -14% | -139% | |
| Idle min * (Watt) | 2.3 | 2.2 4% | 2.4 -4% | 2.7 -17% | 2.9 -26% | 2.9 -26% | 3 -30% | 2.7 -17% | 7.5 -226% |
| Idle avg * (Watt) | 4.6 | 5.5 -20% | 5.3 -15% | 5.2 -13% | 6 -30% | 4.9 -7% | 5 -9% | 6 -30% | 10.4 -126% |
| Idle max * (Watt) | 5.6 | 6.1 -9% | 5.6 -0% | 6.2 -11% | 6.9 -23% | 6 -7% | 9 -61% | 7.6 -36% | 11.4 -104% |
| Last avg * (Watt) | 37.1 | 41.3 -11% | 39.7 -7% | 38.4 -4% | 27.3 26% | 29.3 21% | 41 -11% | 37 -0% | 83.3 -125% |
| Witcher 3 ultra * (Watt) | 32.8 | 34.5 -5% | 42.8 -30% | 41.9 -28% | 42.6 -30% | 36.6 -12% | 32.6 1% | 33.2 -1% | 92.7 -183% |
| Last max * (Watt) | 65.8 | 67.3 -2% | 50.6 23% | 66.7 -1% | 81.53 -24% | 63.3 4% | 50 24% | 65 1% | 110.3 -68% |
* ... kleinere Werte sind besser
Energieaufnahme Witcher 3 / Stresstest
Energieaufnahme mit externem Monitor
Akkulaufzeit
Der 57-Wh-Akku hält mit 9:36 Stunden genauso lange durch wie der Vorgänger. Das Low-Power-Display in FHD+-Auflösung trägt zum Ergebnis bei, besonders bei der vollen Helligkeit von 300 cd/m², bei der das Lenovo ThinkPad immer noch über 8 Stunden erreicht. In knapp 90 Minuten ist der Akku wieder voll aufgeladen.
Das ThinkPad T14 G3 AMD hält, ähnlich wie das HP EliteBook 845, trotz der um 10 % geringeren Akkukapazität ganze 34 % länger durch. Die Laufzeit des T14s unter voller Last von 116 Minuten bedeutet, dass die volle CPU-Leistung auch im Akkubetrieb abgerufen wird.
| Lenovo ThinkPad T14s G3 21BR00CDGE i5-1235U, Iris Xe G7 80EUs, 57 Wh | Lenovo ThinkPad T14s G2 20WM003TGE i7-1165G7, Iris Xe G7 96EUs, 57 Wh | Lenovo ThinkPad T14 G3-21CF004NGE R7 PRO 6850U, Radeon 680M, 52.5 Wh | Lenovo ThinkPad X13 G3 21BN0046GE i5-1235U, Iris Xe G7 80EUs, 54.7 Wh | Lenovo ThinkPad X1 Yoga G7 21CE002HGE i7-1270P, Iris Xe G7 96EUs, 57 Wh | Lenovo ThinkPad X1 Carbon G10 21CC001RGE i5-1250P, Iris Xe G7 80EUs, 57 Wh | HP EliteBook 845 G9 6F6H9EA R5 PRO 6650U, Radeon 660M, 51 Wh | Dell Latitude 7420 JW6MH i5-1145G7, Iris Xe G7 80EUs, 63 Wh | Schenker Vision 14 2022 RTX 3050 Ti i7-12700H, GeForce RTX 3050 Ti Laptop GPU, 99.8 Wh | |
|---|---|---|---|---|---|---|---|---|---|
| Akkulaufzeit | 31% | 47% | 30% | 26% | 43% | 26% | 74% | 36% | |
| H.264 (h) | 7.9 | 14.6 85% | 16.4 108% | 12.2 54% | 10.9 38% | 11.1 41% | |||
| WLAN (h) | 9.6 | 9.7 1% | 12.9 34% | 10.2 6% | 8.9 -7% | 10.2 6% | 12.1 26% | 14.1 47% | 10.1 5% |
| Last (h) | 1.3 | 1.4 8% | 1.3 0% | 2 54% | 1.7 31% | 2.4 85% | 2.6 100% | 2.1 62% |
Pro
Contra
Fazit: Effizientes ThinkPad T14s G3 ist der ideale Business-Laptop

Mit dem T14s G3 Intel schafft Lenovo eines der besten, wenn nicht das beste ThinkPad, wenn es um den Mix aus Kompaktheit, möglichst geringen Emissionen und einer hoher Leistung geht, was etwa für Business-Anwender erstrebenswert ist. Man erhält ein robustes Gehäuse mit 16:10-Display und ein starkes CPU-Upgrade mit ~50 % Mehrleistung, während die Akkulaufzeit nicht darunter leidet.
Es ist das erste T-Serie ThinkPad mit OLED-Option - die wir hier aber nicht testen, und das im Testgerät verbaute Low-Power-Display leidet unglücklicherweise unter starkem Ghosting, Clouding und einer geringen Helligkeit. Der Kontrast und und die Farbwerte sind sehr gut, dennoch sollten anspruchsvollere Nutzer vermutlich zu der OLED-Option greifen.
Das ThinkPad T14s G3 Intel ist eine solide Entscheidung für diejenigen, die einen leisen wie schnellen Business-Laptop ohne größere Nachteile suchen und auf sehr gute Eingabegeräte, eine breite Ausstattung und den kompakten Formfaktor nicht verzichten wollen.
Beim RAM sollte man schauen, ob 16 GB langen oder man direkt 32 GB bestellt, da er im Gegensatz zum HP EliteBook 845 G9, Schenker Vision 14 und ThinkPad T14 nicht aufrüstbar ist.
Das T14s schließt noch mehr zum ThinkPad X1 Carbon auf, außer beim Gewicht. Die Dauer-Leistung ist beim T14s allerdings besser. Wer es noch kompakter braucht, schaut sich das ThinkPad X13 an, welches das gleiche Mainboard besitzt. Auch Schenkers Vision 14 ist kompakter als das T14s und bietet dabei eine höhere Leistung sowie eine RTX 3050 Ti. Anhand des ThinkPad T14 AMD erkennt man das Potenzial und die Effizienz von AMD, die das ThinkPad T14s G3 AMD in unserem bald erscheinenden Test noch beweisen muss.
Preis und Verfügbarkeit
Unser Modell 21BR00CDGE gibt es als Campus-Version für 1.699 Euro, während der Regulär-Preis 1.865 Euro beträgt. Eine AMD-Version mit schnellem Ryzen 7 PRO 6850U gibt es für knapp 50 Euro weniger. Campuspoint bietet sogar ein OLED-Modell an. Günstiger ist ein AMD-Modell mit 8 GB RAM für ~1.600 Euro.
Lenovo ThinkPad T14s G3 21BR00CDGE
- 16.12.2022 v7 (old)
Marvin Gollor
Preisvergleich
