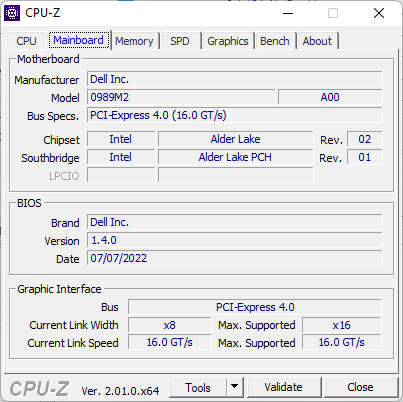
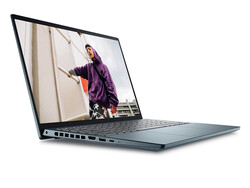
Dell Inspiron 14 Plus 7420 im Laptop-Test: Für preisbewusste Power-User
Für 2022 hat Dell gleich drei verschiedene Modelle des Inspiron 14 7420 mit 14 Zoll vorgestellt: Das Standardmodell Inspiron 14 7420, dann das Inspiron 14 7420 2-in-1 und schließlich das Inspiron 14 7420 Plus. Dieser Test konzentriert sich auf das Plus-Modell, welches mit deutlich schnelleren Core-H-Prozessoren sowie dedizierter RTX-Grafikkarte ausgestattet ist und sich somit an Power-Nutzer wendet, die mit den langsameren Core-U-Prozessoren in anderen Ultrabooks unzufrieden sind.
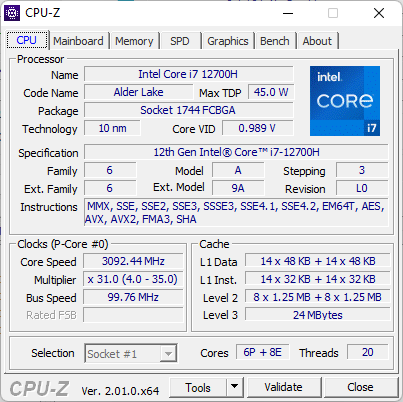
In unserem spezifischen Testmodell rechnet die Alder-Lake-H-CPU Core i7-12700H zusammen mit einer GeForce RTX 3050, das ganze kostet etwa 1.259 Euro im Dell-Shop. Andere Konfigurationen mit Core i5-12500H, RTX 3050 Ti, integrierter Xe-Grafik oder einem kleineren 54-Wh-Akku sind entweder geplant (Akku, RTX 3050 Ti) oder bereits erhältlich, aber alle Konfigurationen haben das gleiche 2,2K-Display mit einer Auflösung von 2.240 x 1.400 gemein.
Konkurrenz zum Vergleich findet sich in anderen hochperformanten 14-Zoll-Laptops wie dem Asus VivoBook Pro 14, dem HP Pavilion 14 Plus, dem Schenker Vision 14, dem HP Envy 14 oder dem Lenovo IdeaPad 5 Pro 14. Auch das Razer Blade 14 sowie das Asus Zephyrus G14 können als Alternativen in Betracht gezogen werden, sind jedoch deutlich teurer.
Weitere Dell-Tests:
Potentielle Konkurrenten im Vergleich
Bew. | Datum | Modell | Gewicht | Dicke | Größe | Auflösung | Preis ab |
|---|---|---|---|---|---|---|---|
| 87.2 % v7 (old) | 09 / 2022 | Dell Inspiron 14 Plus 7420 i7-12700H, GeForce RTX 3050 4GB Laptop GPU | 1.7 kg | 18.87 mm | 14.00" | 2240x1400 | |
| 86.3 % v7 (old) | 07 / 2022 | Asus Vivobook Pro 14 M3401QC-KM007T R5 5600H, GeForce RTX 3050 4GB Laptop GPU | 1.5 kg | 19 mm | 14.00" | 2880x1800 | |
| 83.7 % v7 (old) | 06 / 2022 | Dell Inspiron 14 7420 2-in-1 i7-1255U, Iris Xe G7 96EUs | 1.6 kg | 17.86 mm | 14.00" | 1920x1200 | |
| 87.7 % v7 (old) | 01 / 2022 | Schenker Vision 14 i7-11370H, GeForce RTX 3050 Ti Laptop GPU | 1.1 kg | 15.6 mm | 14.00" | 2880x1800 | |
v (old) | 10 / 2021 | Asus Zenbook 14X UX5400E i7-1165G7, GeForce MX450 | 1.4 kg | 16.9 mm | 14.00" | 2880x1800 | |
| 82.3 % v7 (old) | 08 / 2021 | MSI Summit E14 A11SCS i7-1185G7, GeForce GTX 1650 Ti Max-Q | 1.3 kg | 16 mm | 14.00" | 3840x2160 | |
| 86.5 % v7 (old) | 02 / 2021 | HP Envy 14-eb0010nr i5-1135G7, GeForce GTX 1650 Ti Max-Q | 1.6 kg | 17.9 mm | 14.00" | 1920x1200 |
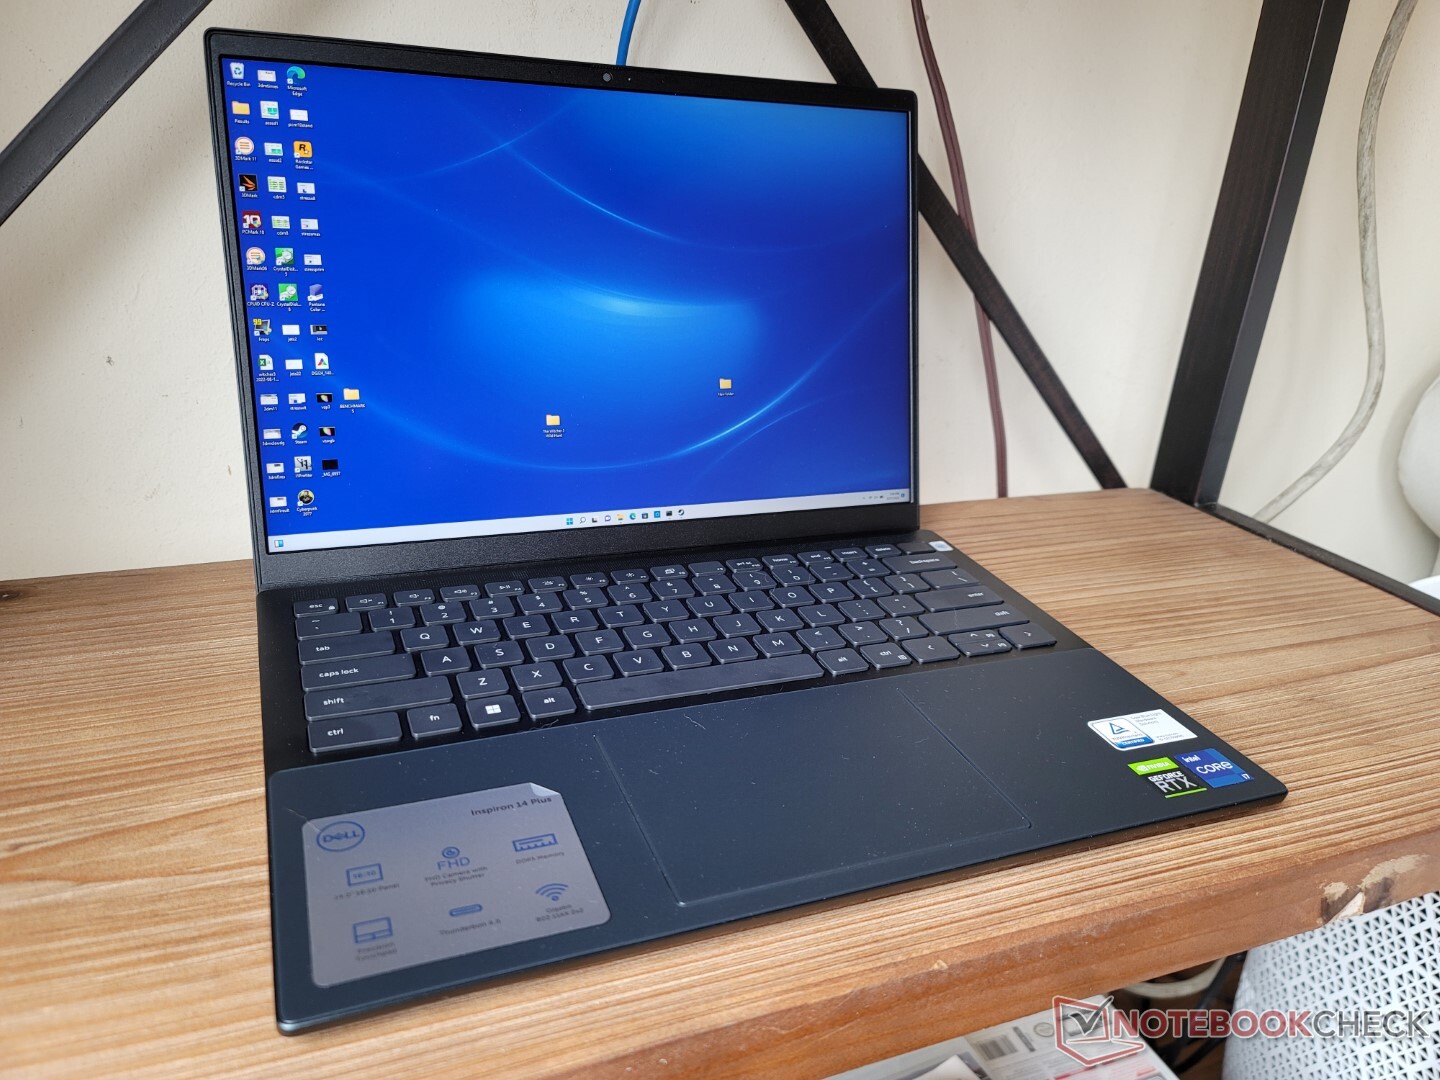
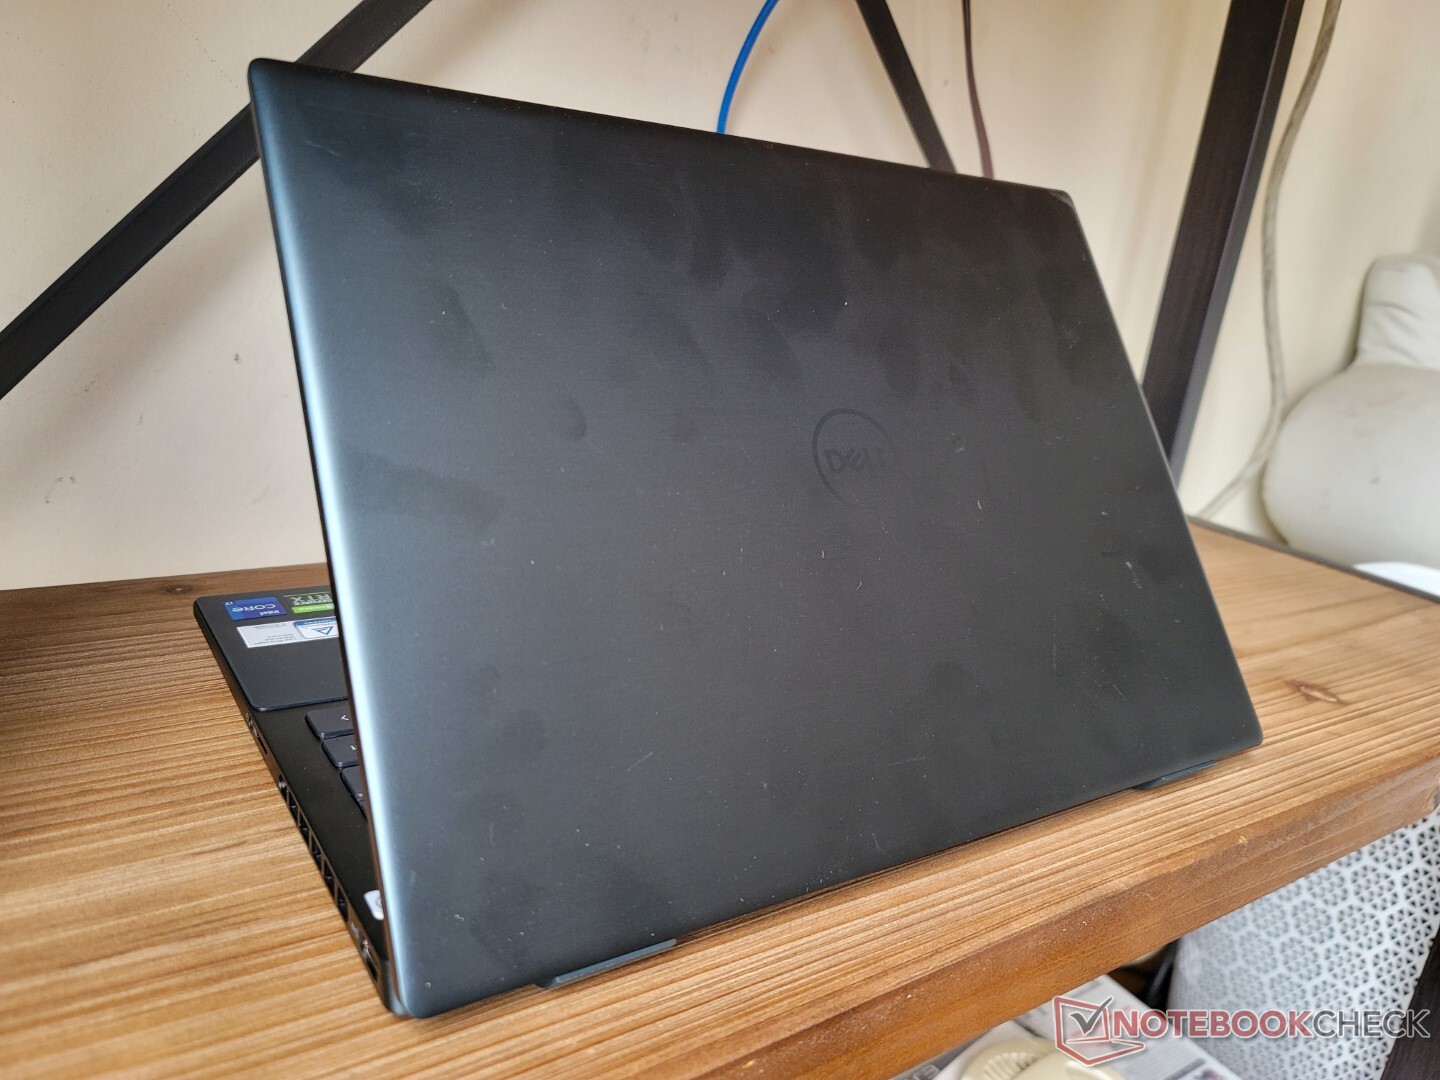
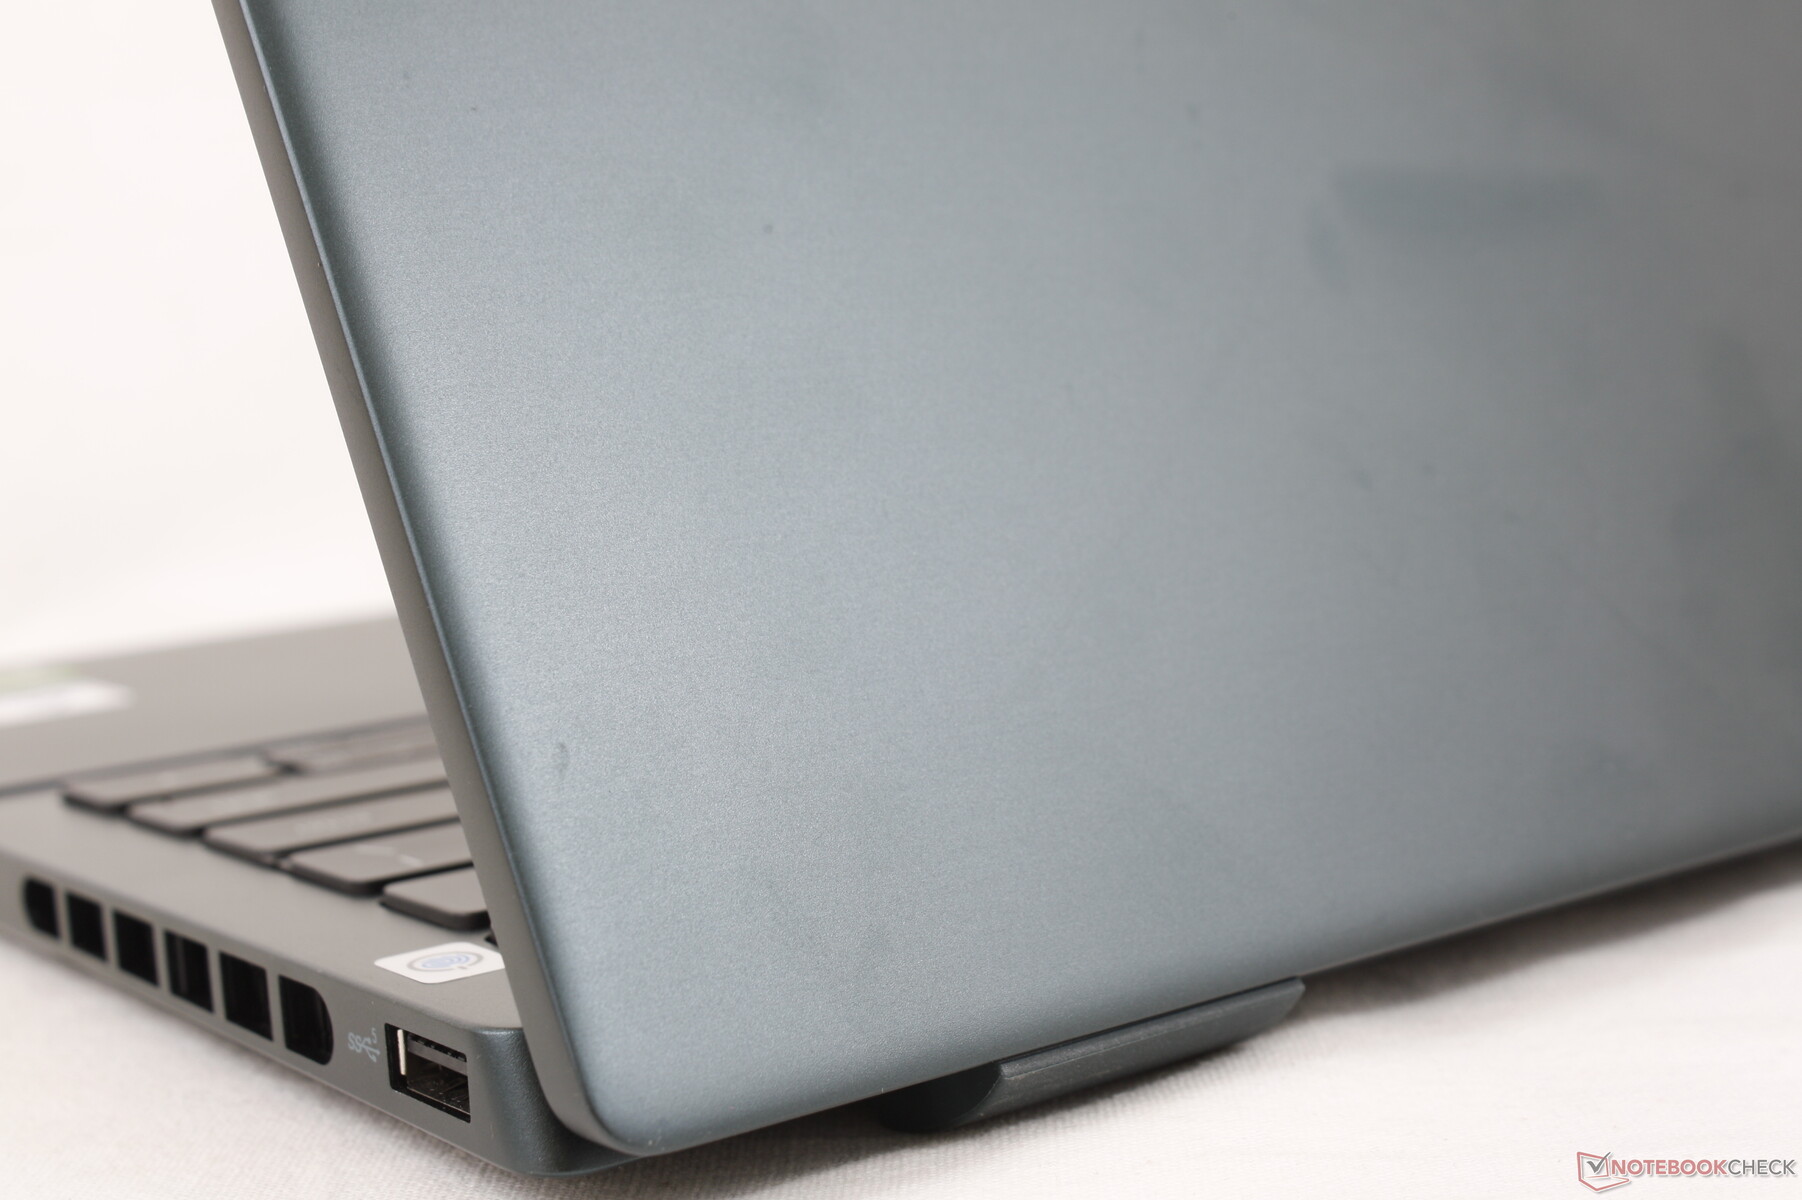
Gehäuse — Das Inspiron 16 7620 in Mini
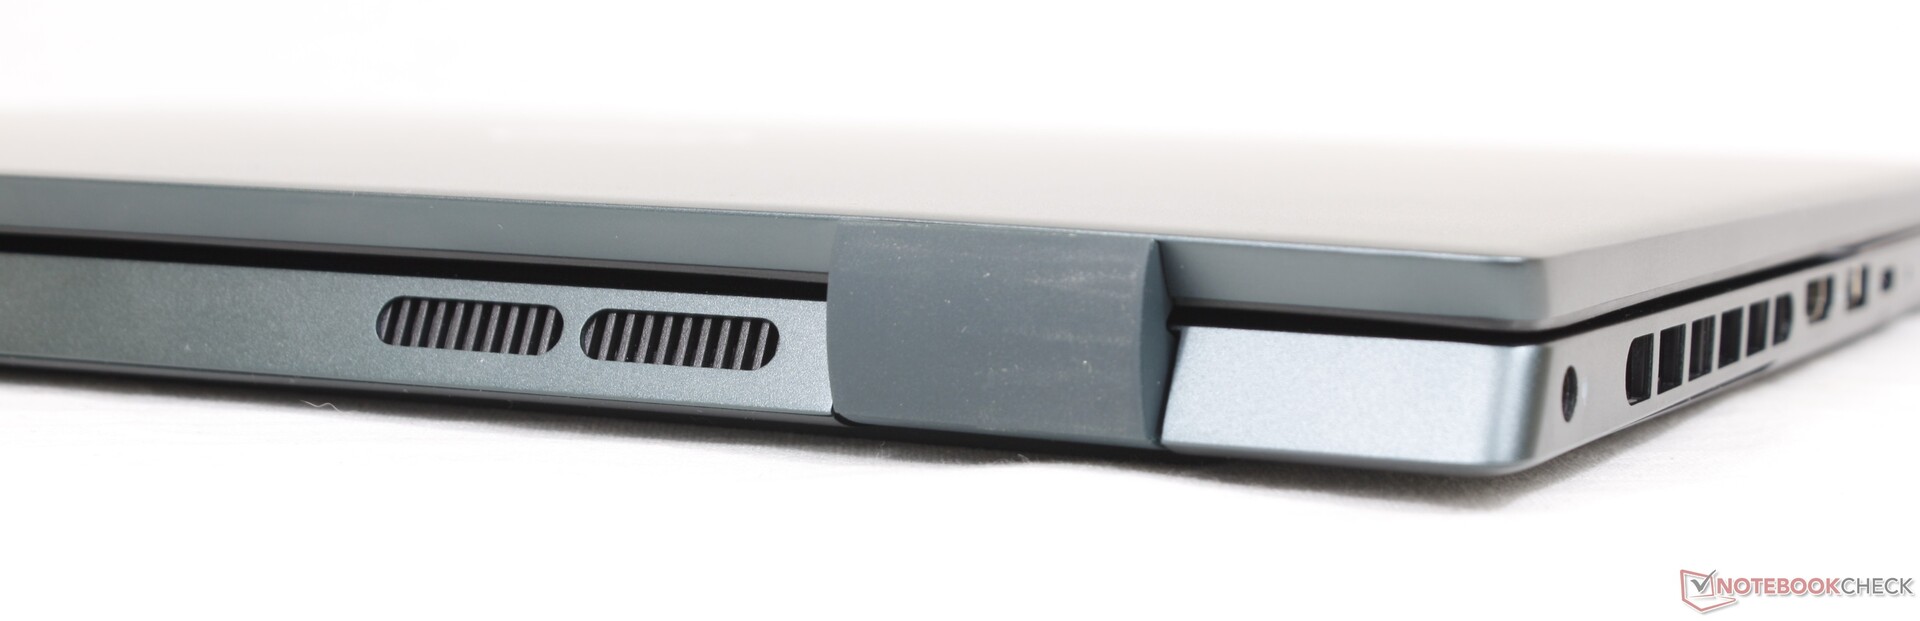
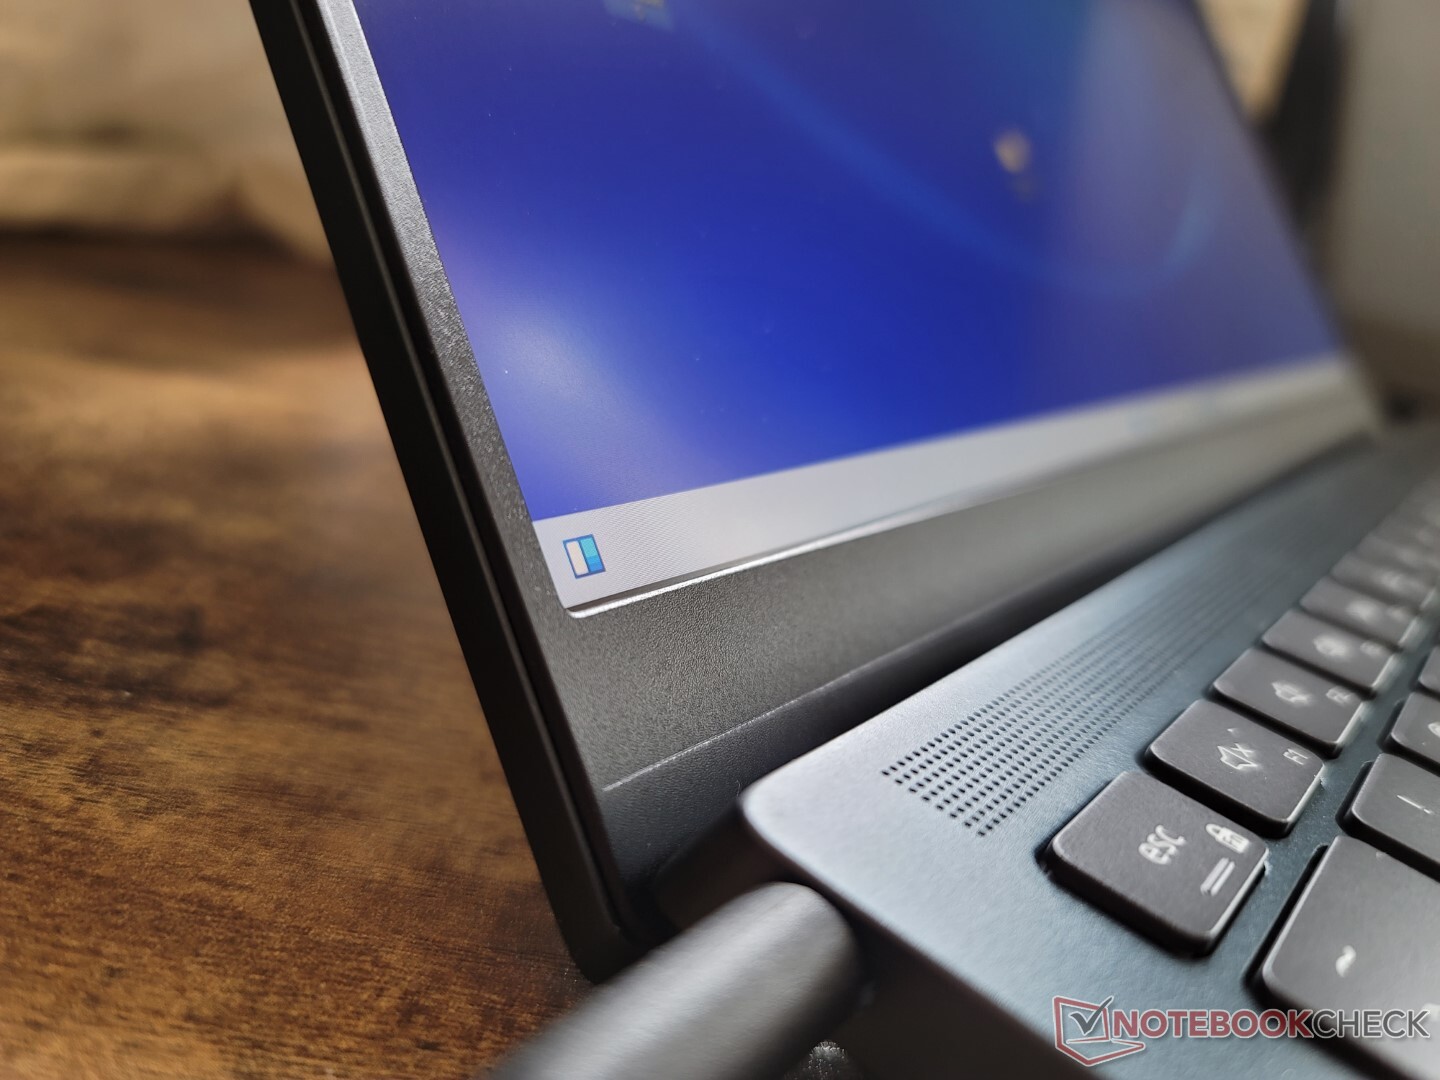
Das Gehäuse lässt sich am besten als eine kleinere Version des Inspiron 16 7620 Plus beschreiben, immerhin teilen sich beide die gleiche Designsprache. Die verwendeten Materialien für das Metallgehäuse, insbesondere auch die Mylar-Oberflächen des Touchpads sowie der Handballenauflagen, sind denen des größeren Inspiron sehr ähnlich. Der glatte, aber matte Look scheint sich dabei stark am glatten Metall-Design eines XPS 15 zu orientieren.
Als schwächsten Punkt des Gehäuses haben wir den Displaydeckel ausgemacht, welcher sich doch allzu leicht verformen lässt. Die Basis gibt beim Verbiegen leichte Knarzgeräusche und Druck auf die Tastaturmitte resultiert ebenfalls in Verwindungen. Obwohl das Modell also beinahe den Preis eines Dell XPS 15 erreicht, sollte man hier also nicht das gleiche Maß an Stabilität erwarten.
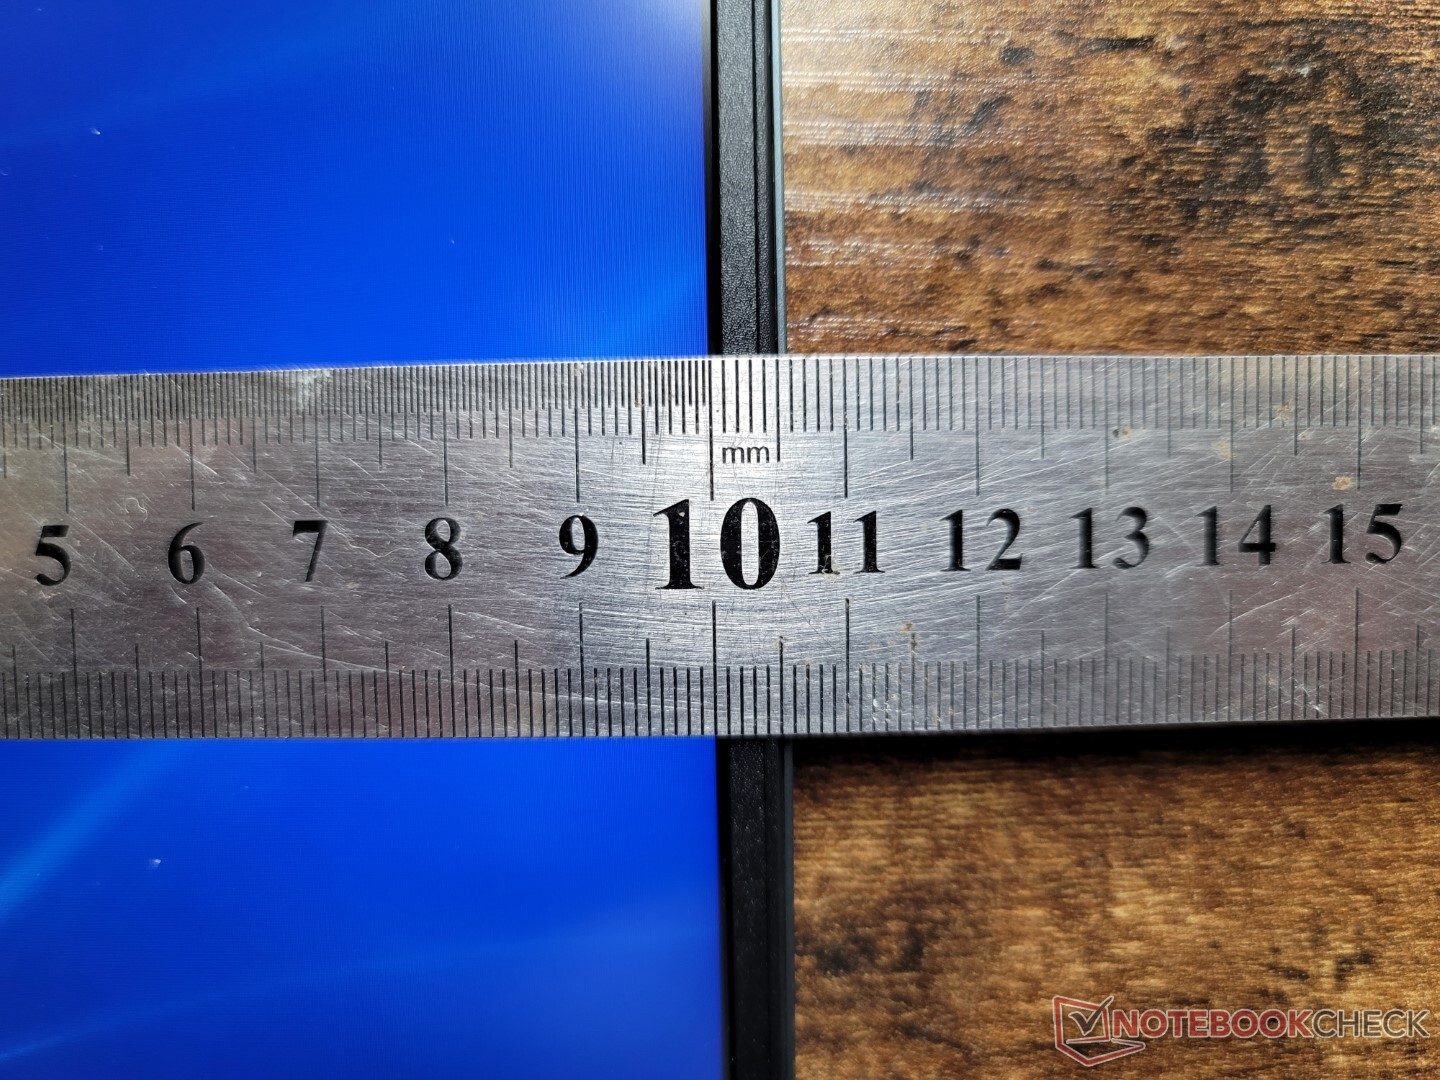
Man würde wohl erwarten, dass das Inspiron 14 Plus 7620 größer und schwerer wäre als das Inspiron 14 7620 2-in-1, das ist jedoch nicht unbedingt der Fall. Die Abmessungen sind größtenteils identisch zum 2-in-1, es ist nur einen Ticken dicker und schwerer, vor allem durch die potentere Hardware im Inneren. Es ist darüber hinaus auch größer und schwerer als die meisten anderen 14-Zoll-Laptops wie das HP Envy 14, das Asus Zenbook 14X oder das Schenker Vision 14, welche allesamt ebenfalls über eine dedizierte Nvidia-Grafikkarte verfügen.
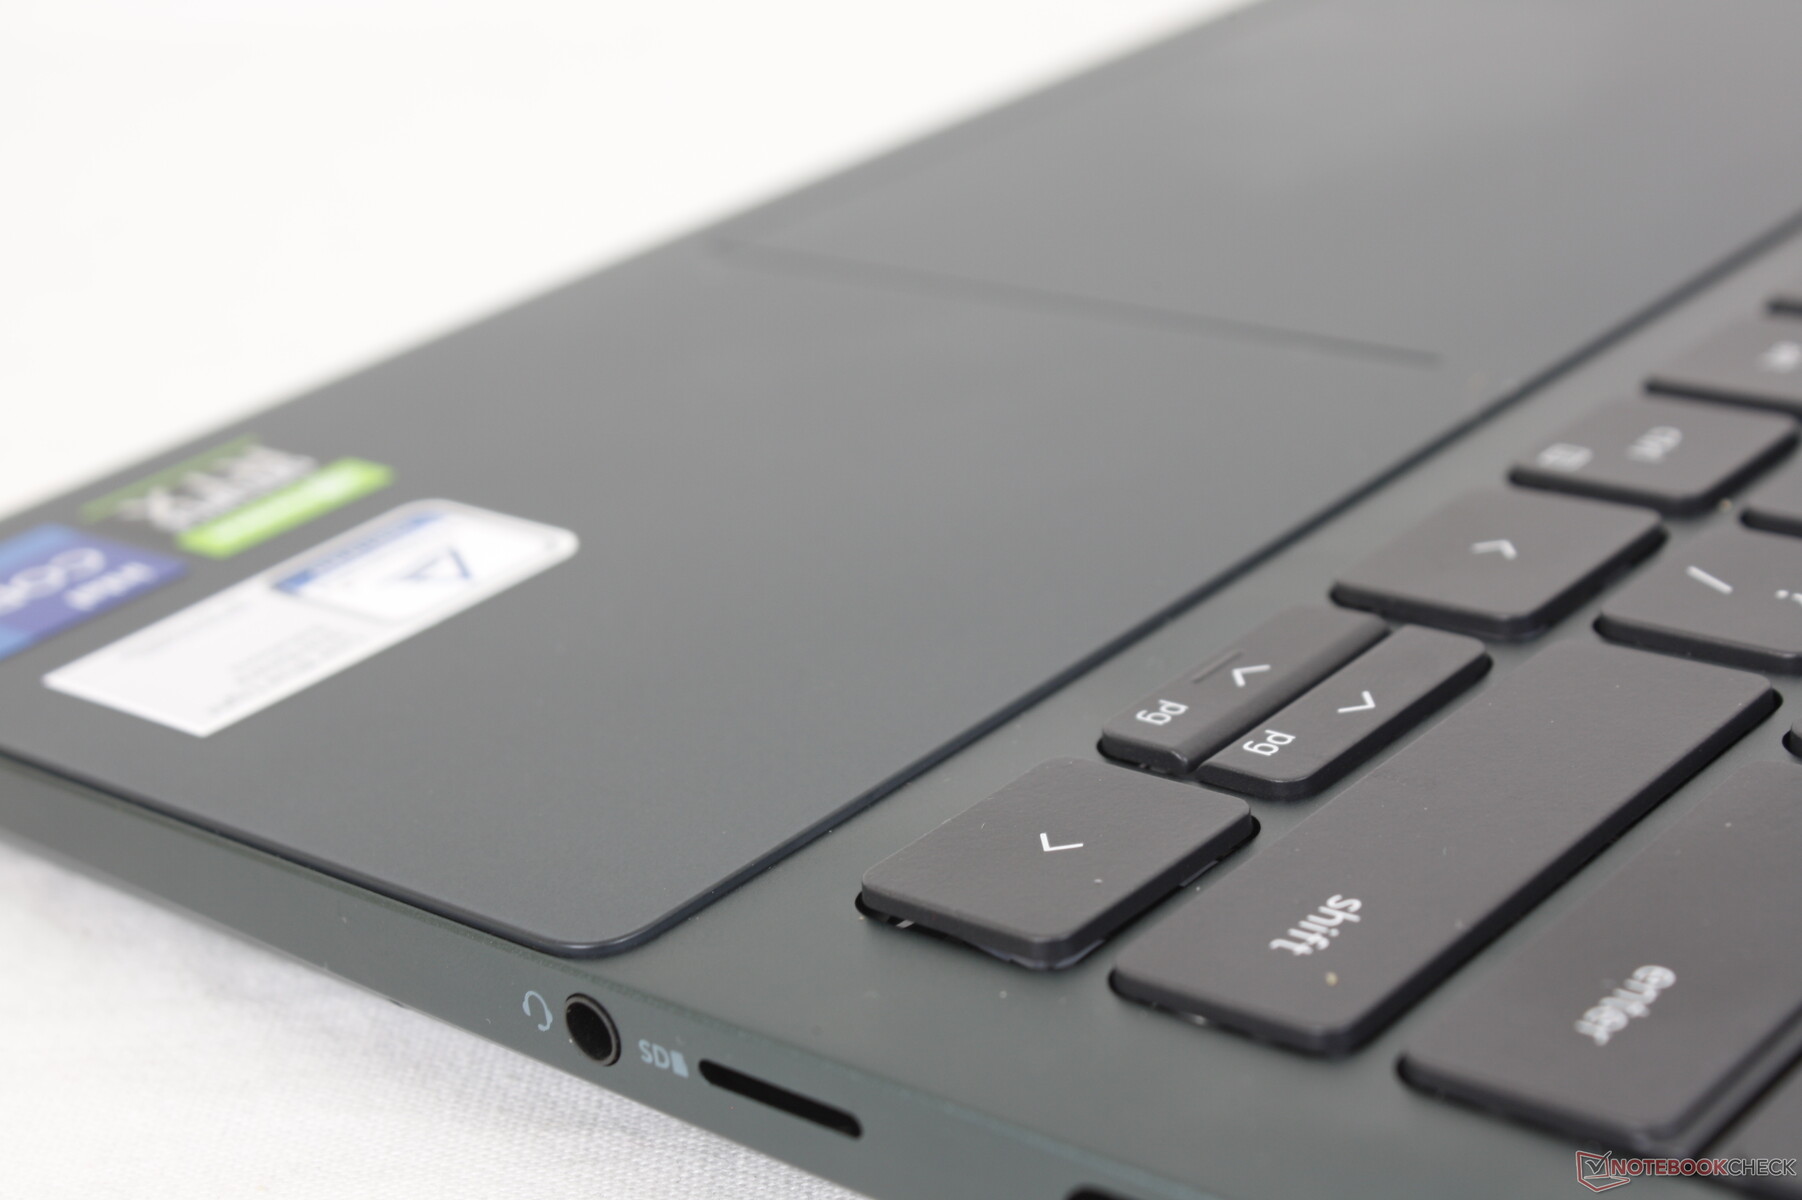

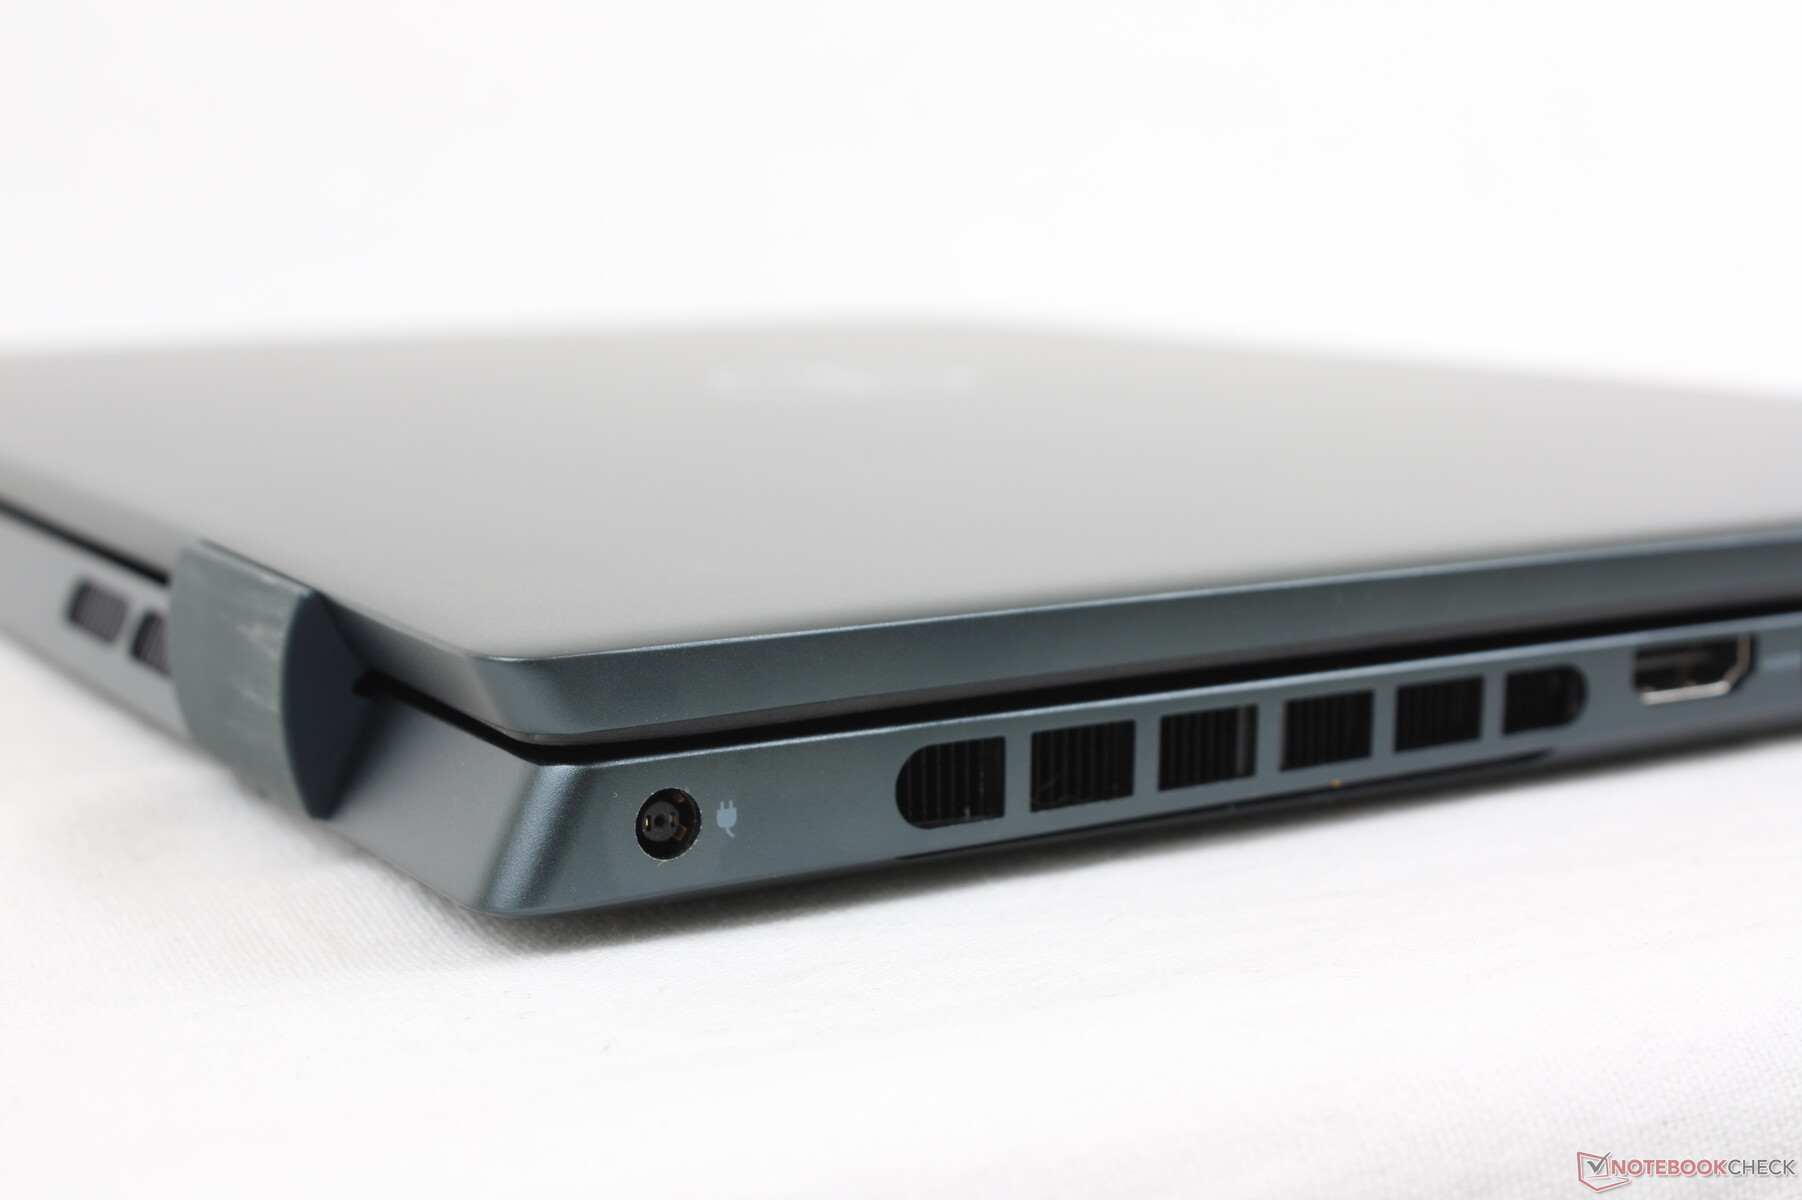
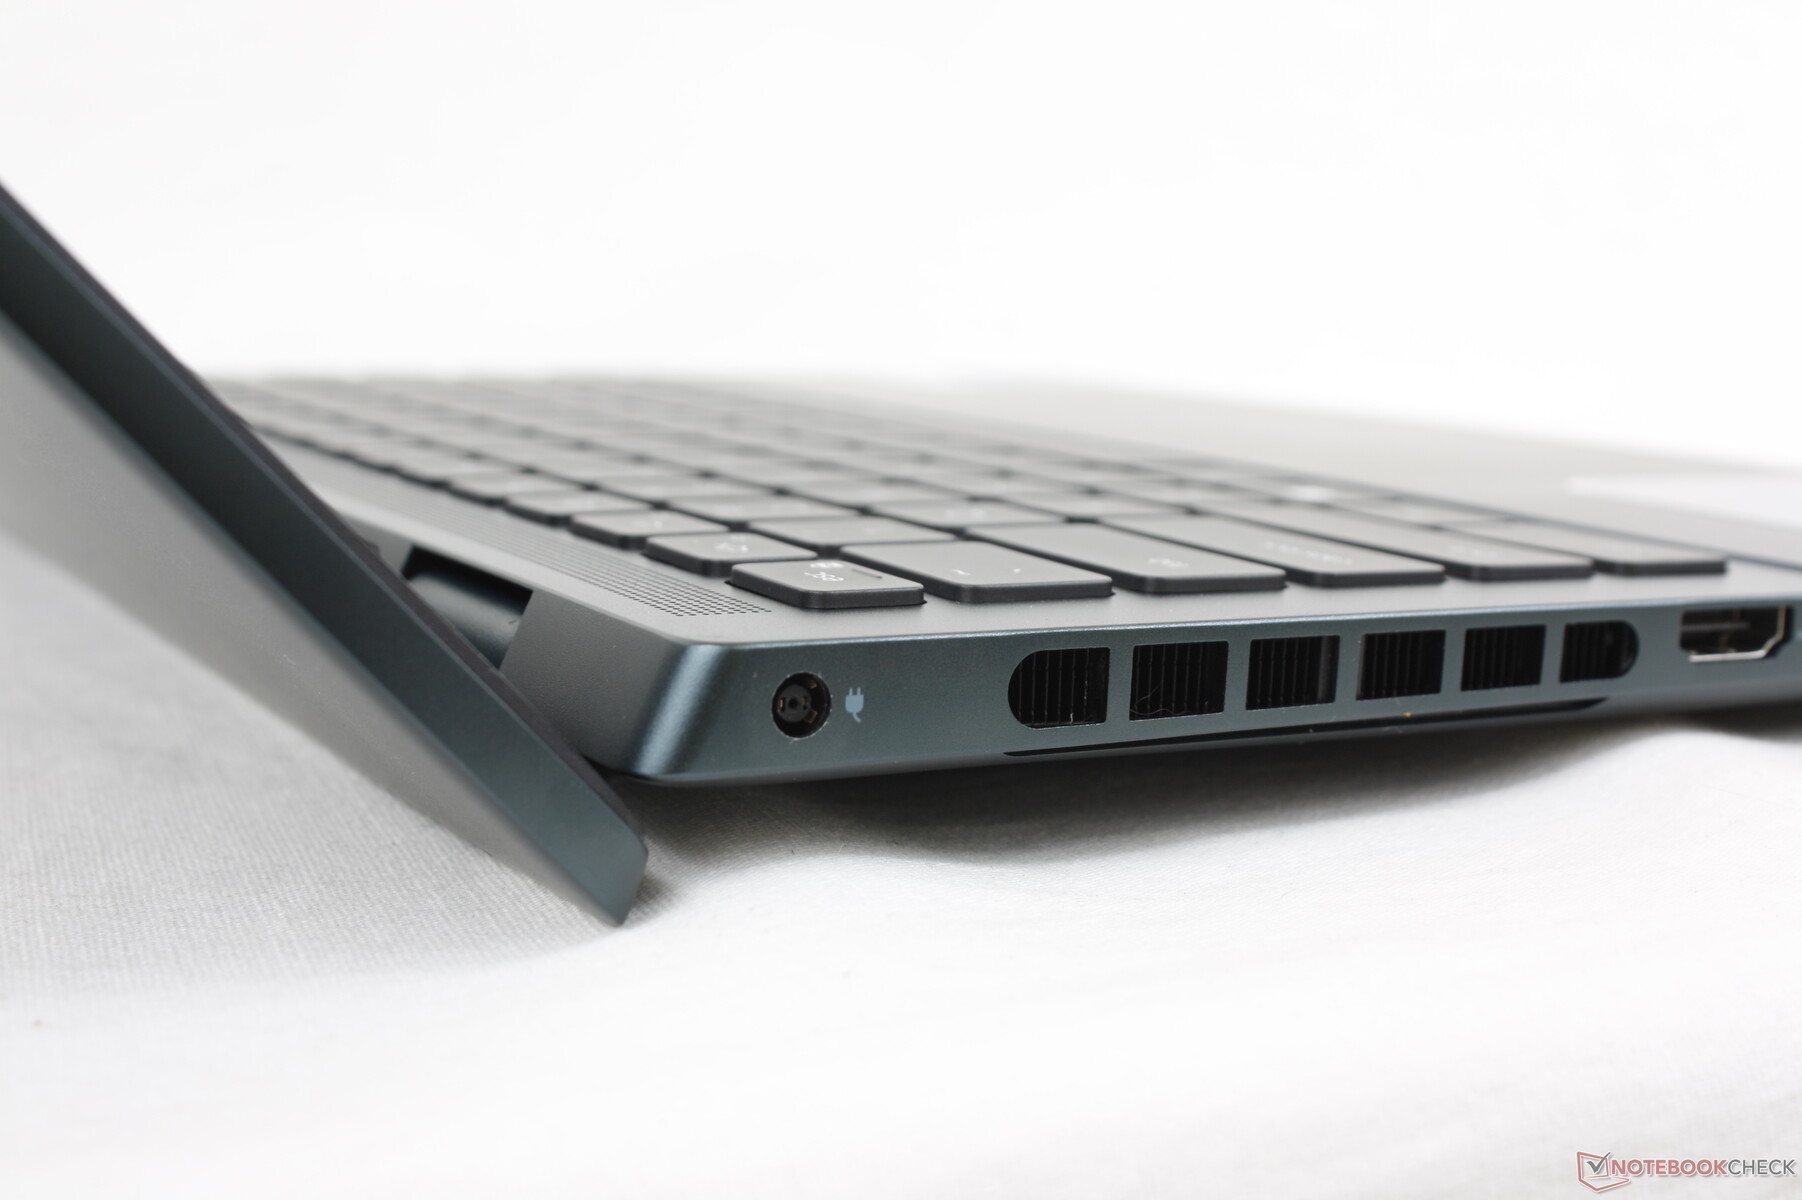
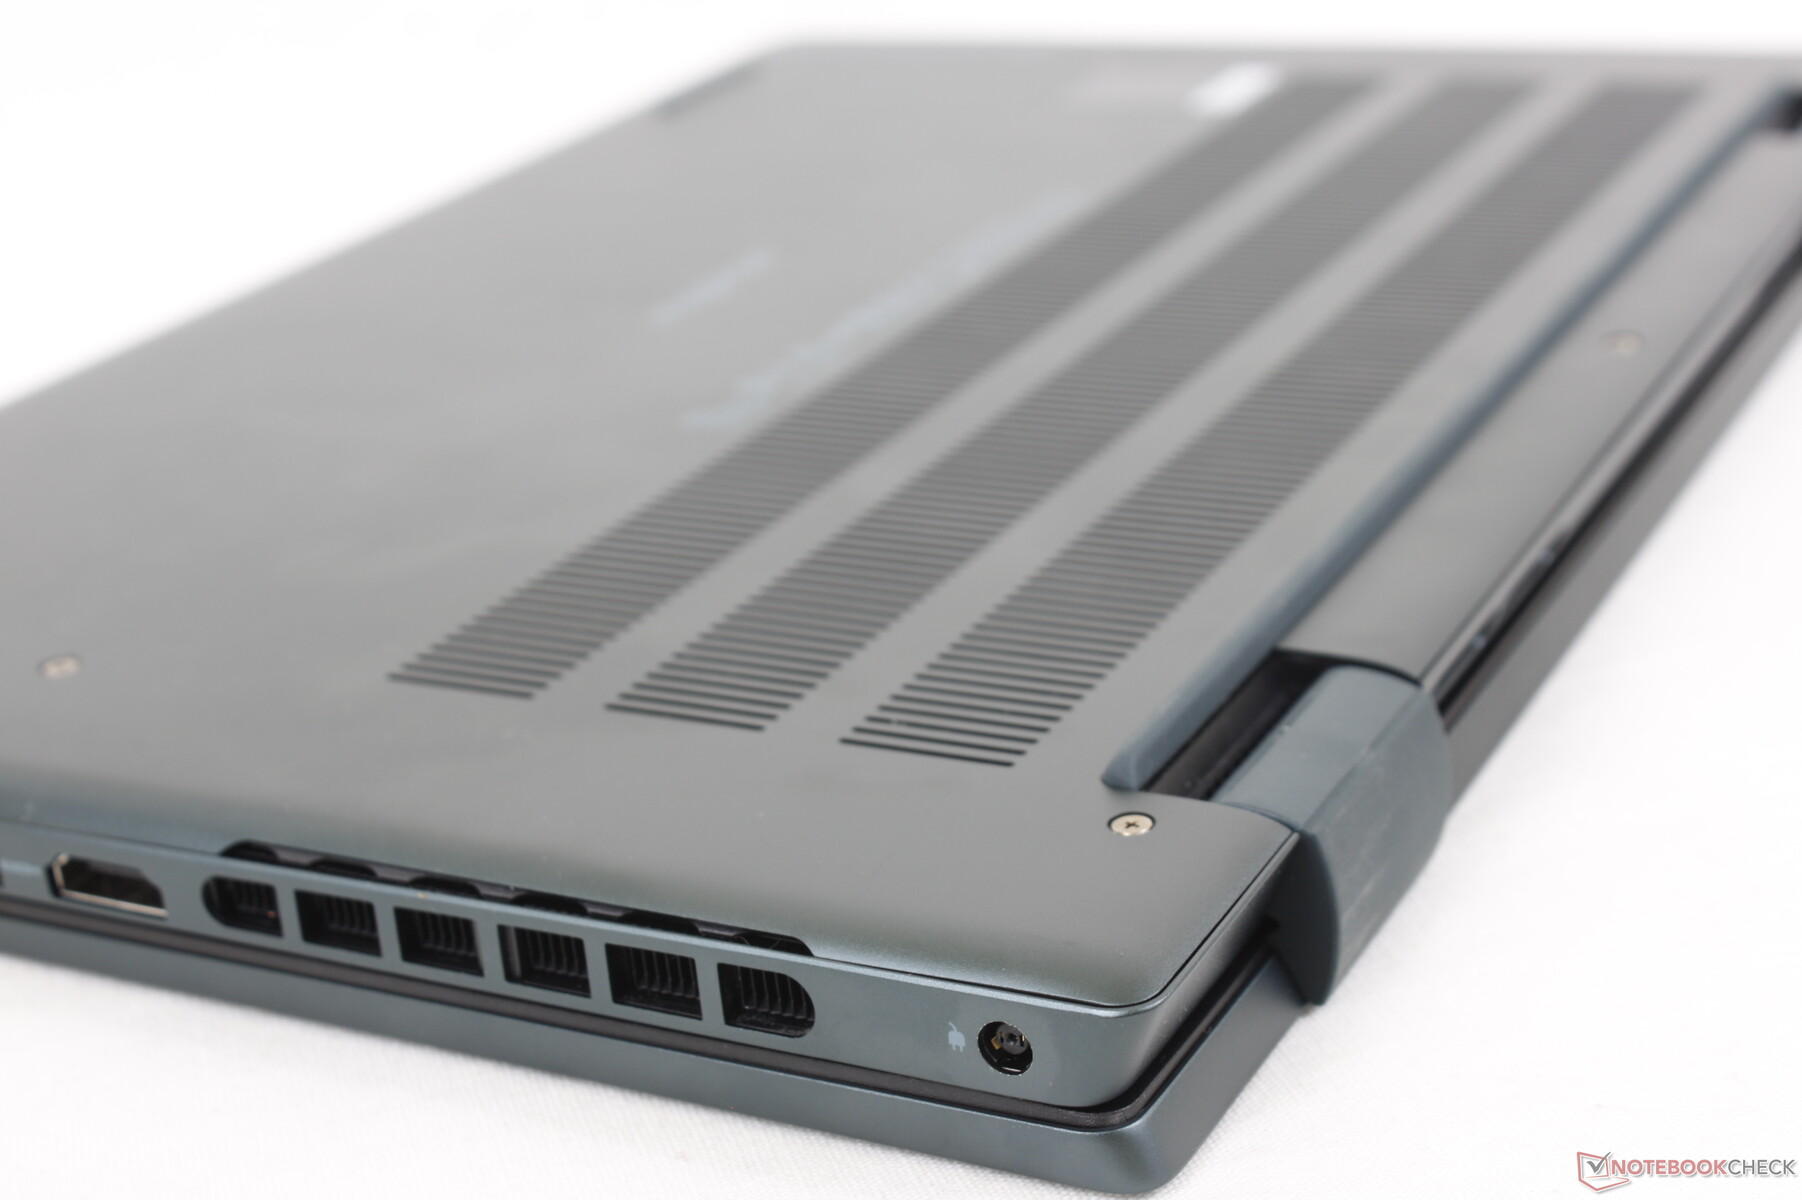
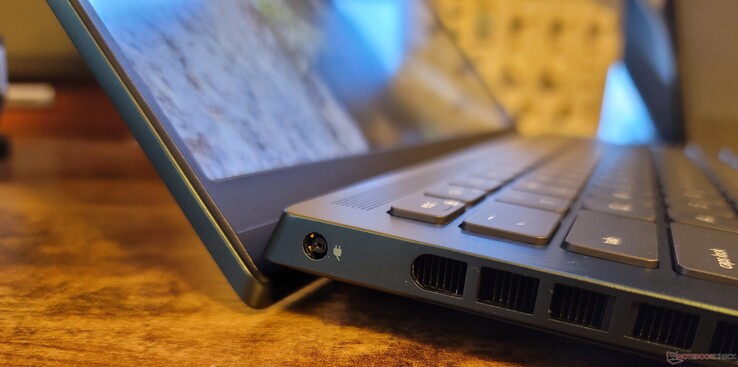
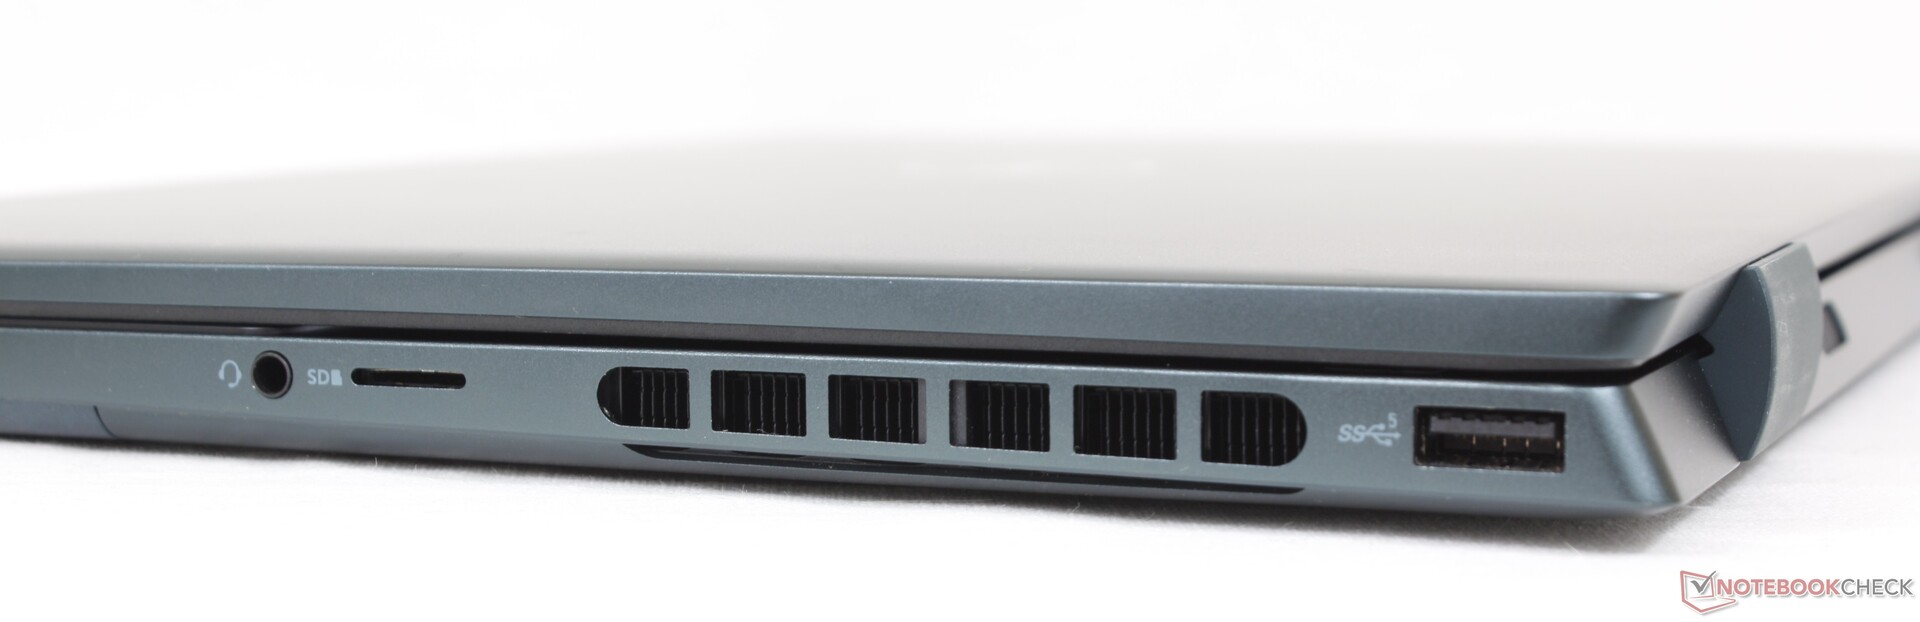
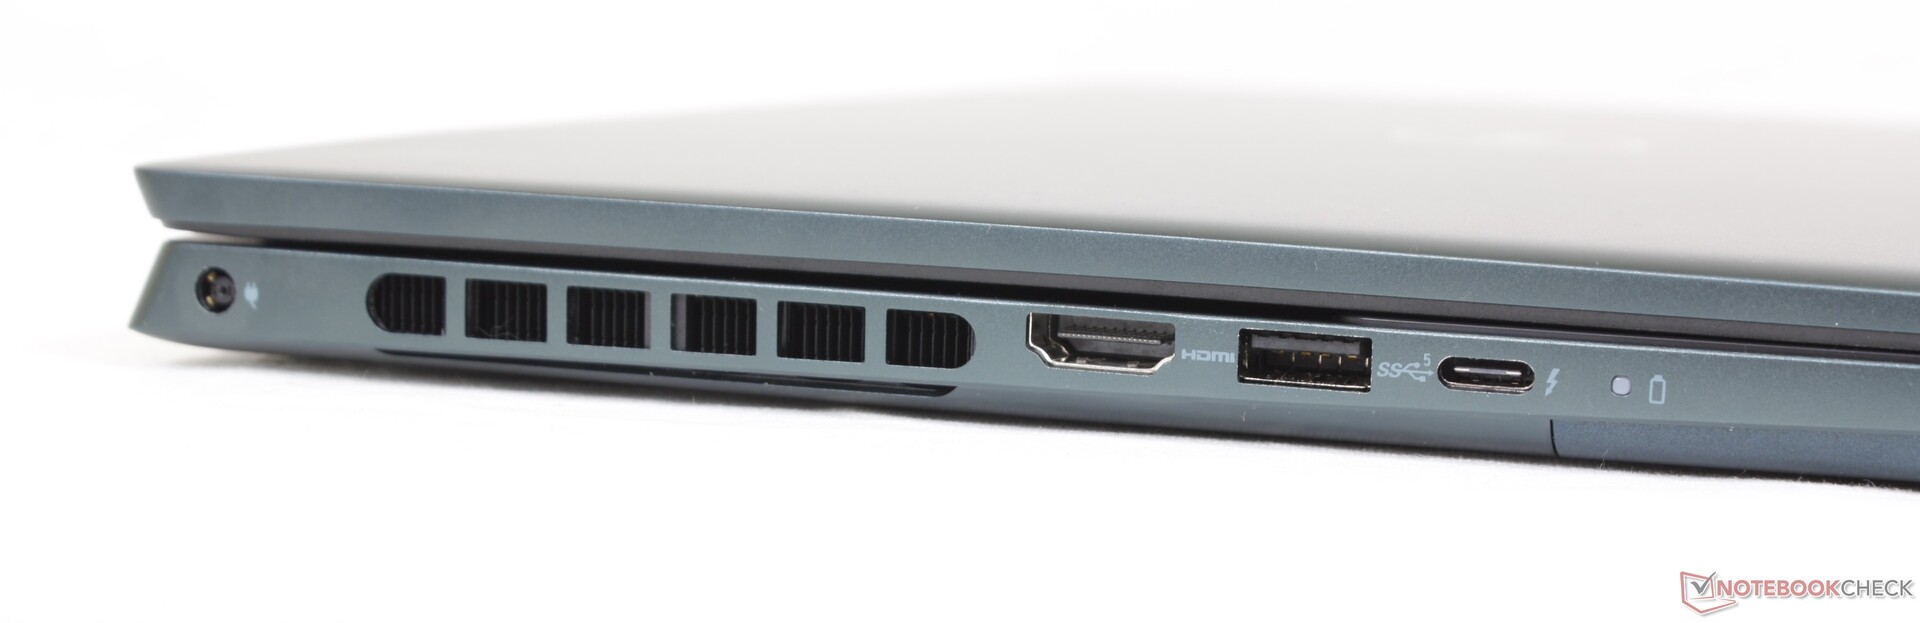
Anschlüsse — Thunderbolt-4-Support
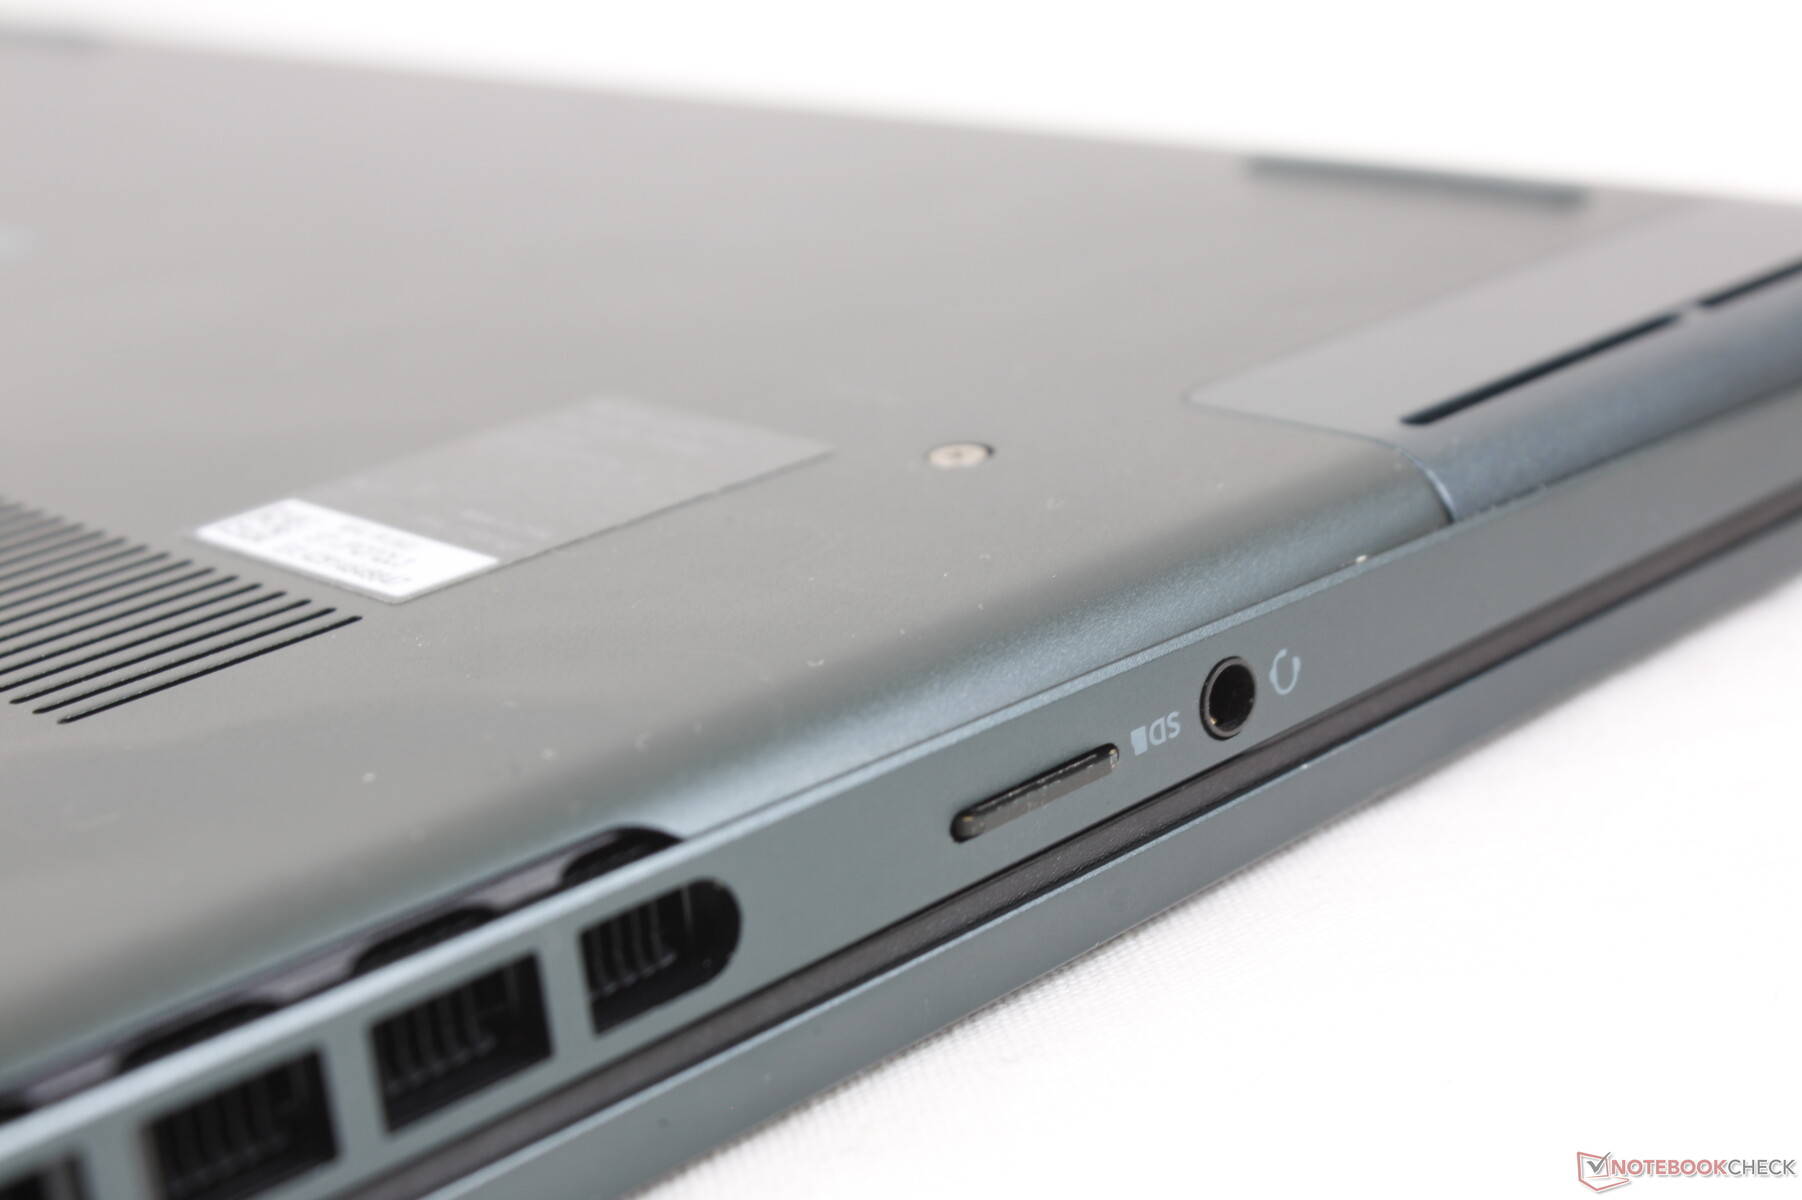
Die Anschlussmöglichkeiten entsprechen weitestgehend denen im Inspiron 16 Plus 7620, lediglich der vollwertige SD-Reader wurde gegen einen kleineren microSD-Reader getauscht. Wir freuen uns besonders über die Unterstützung von Thunderbolt 4, auch weil weder das HP Pavilion Plus 14 noch das Asus Vivobook Pro 14 OLED Thunderbolt unterstützen, obwohl sie über USB-C-Ports verfügen.

Kartenlesegerät
Die Transferraten des MicroSD-Readers mit Einrastmechanismus sind langsam und vergleichbar zu denen beim Inspiron 14 7420 2-in-1. Es dauert etwa 45 Sekunden, um 1 GB an Bildmaterial von unserer UHS-II-Testkarte auf den Rechner zu bekommen.
| SD Card Reader | |
| average JPG Copy Test (av. of 3 runs) | |
| MSI Summit E14 A11SCS (AV Pro V60) | |
| Schenker Vision 14 (Angelbird AV Pro V60) | |
| HP Envy 14-eb0010nr (Toshiba Exceria Pro M501 microSDXC 32GB) | |
| Asus Zenbook 14X UX5400E (AV Pro SD microSD 128 GB V60) | |
| Asus Vivobook Pro 14 M3401QC-KM007T (AV Pro SD microSD 128 GB V60) | |
| Dell Inspiron 14 Plus 7420 (AV PRO microSD 128 GB V60) | |
| Dell Inspiron 14 7420 2-in-1 (Toshiba Exceria Pro SDXC 64 GB UHS-II) | |
| maximum AS SSD Seq Read Test (1GB) | |
| MSI Summit E14 A11SCS (AV Pro V60) | |
| Schenker Vision 14 (Angelbird AV Pro V60) | |
| HP Envy 14-eb0010nr (Toshiba Exceria Pro M501 microSDXC 32GB) | |
| Asus Zenbook 14X UX5400E (AV Pro SD microSD 128 GB V60) | |
| Asus Vivobook Pro 14 M3401QC-KM007T (AV Pro SD microSD 128 GB V60) | |
| Dell Inspiron 14 Plus 7420 (AV PRO microSD 128 GB V60) | |
| Dell Inspiron 14 7420 2-in-1 (Toshiba Exceria Pro SDXC 64 GB UHS-II) | |
Kommunikation
Ein Intel-AX211-Modul sorgt für Wi-Fi 6E und Bluetooth 5.2. Obwohl beim Verbinden mit unserem 6-GHz-Netzwerk keinerlei Probleme auftraten, verhalten sich die Übertragungsraten instabiler als die Empfangsraten, wie der Graph unten zeigt.
| Networking | |
| iperf3 transmit AX12 | |
| Schenker Vision 14 | |
| HP Envy 14-eb0010nr | |
| MSI Summit E14 A11SCS | |
| Asus Zenbook 14X UX5400E | |
| iperf3 receive AX12 | |
| Schenker Vision 14 | |
| MSI Summit E14 A11SCS | |
| HP Envy 14-eb0010nr | |
| Asus Zenbook 14X UX5400E | |
| iperf3 receive AXE11000 6GHz | |
| Dell Inspiron 14 Plus 7420 | |
| Dell Inspiron 14 7420 2-in-1 | |
| Asus Vivobook Pro 14 M3401QC-KM007T | |
| iperf3 transmit AXE11000 6GHz | |
| Dell Inspiron 14 Plus 7420 | |
| Dell Inspiron 14 7420 2-in-1 | |
| Asus Vivobook Pro 14 M3401QC-KM007T | |
Webcam
Die Webcam mit 2 MP bietet eine vergleichbare Qualität zur 2-MP-Webcam im Inspiron 14 7420 2-in-1. Ein physischer Shutter ist mit an Bord, Windows Hello und IR werden jedoch nicht unterstützt.


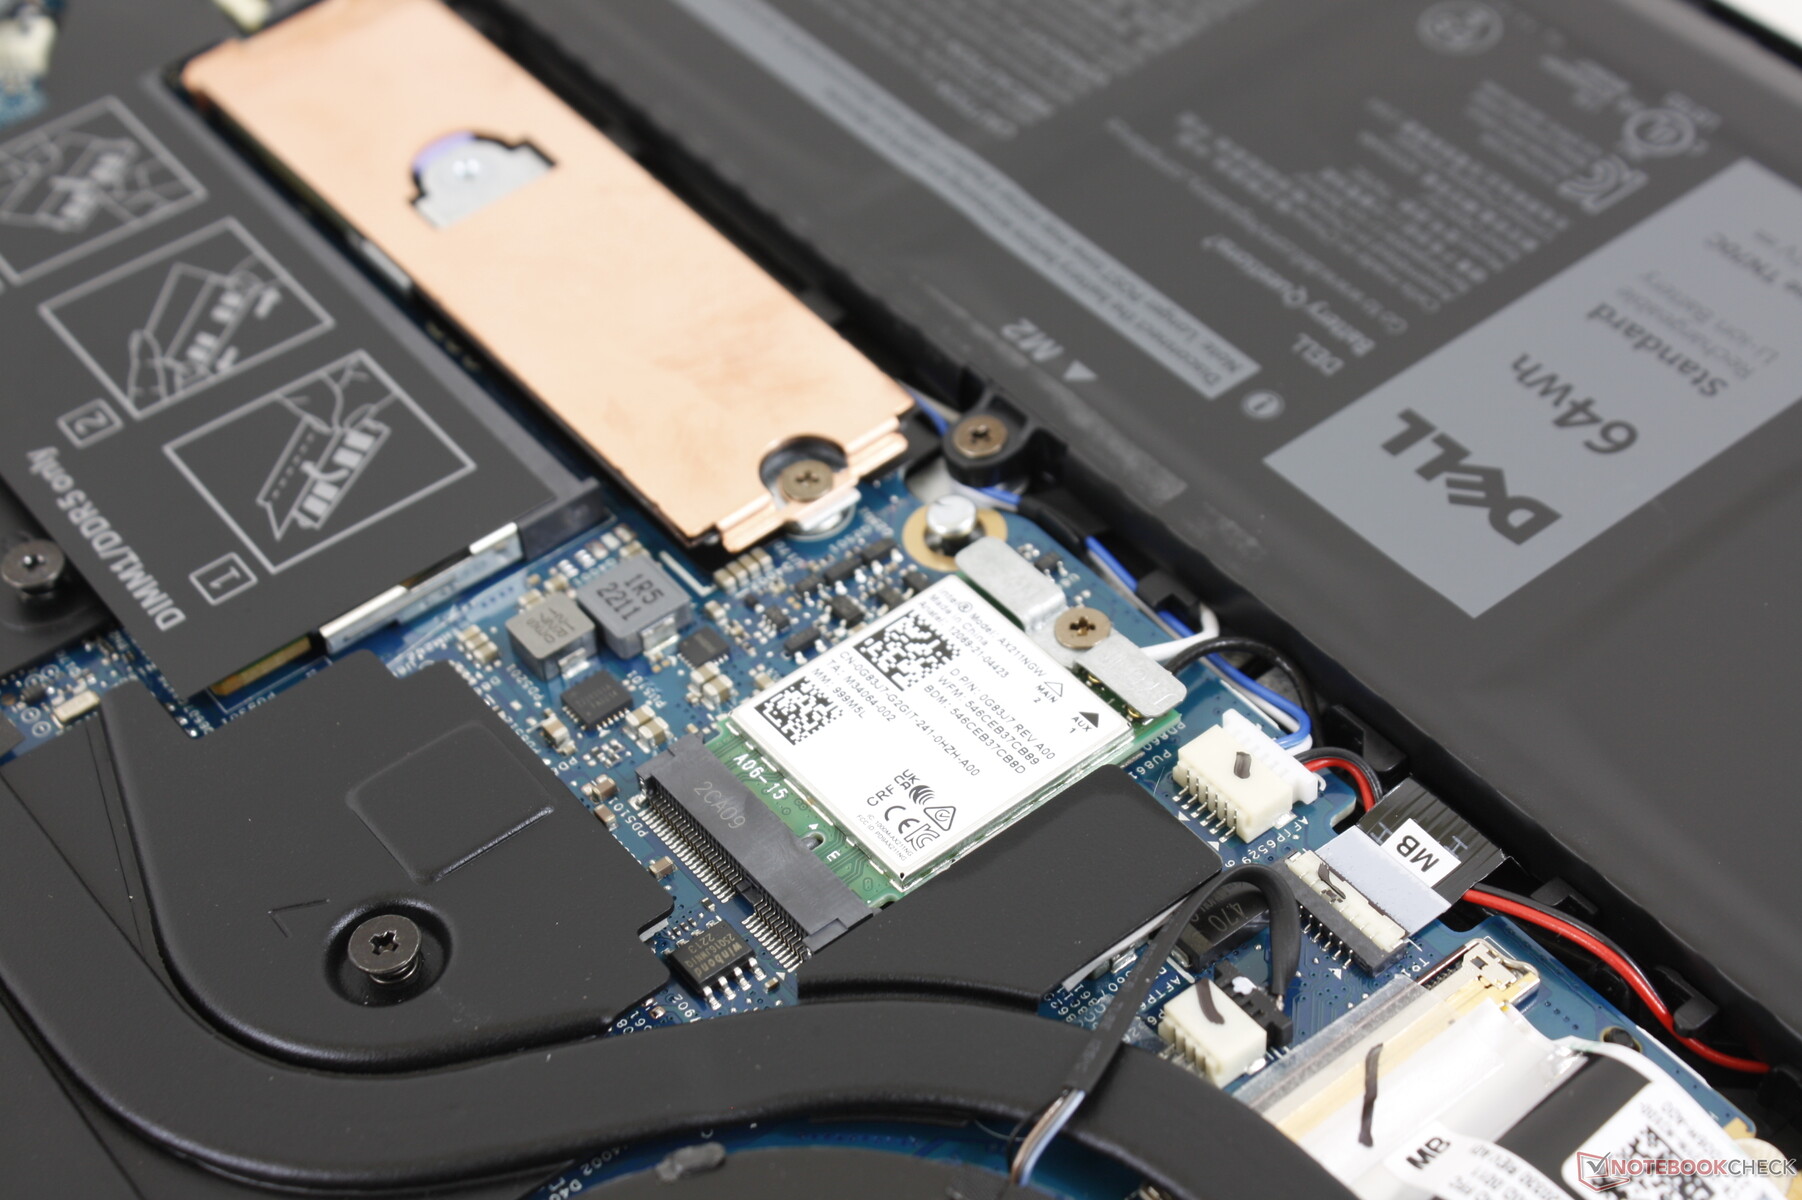
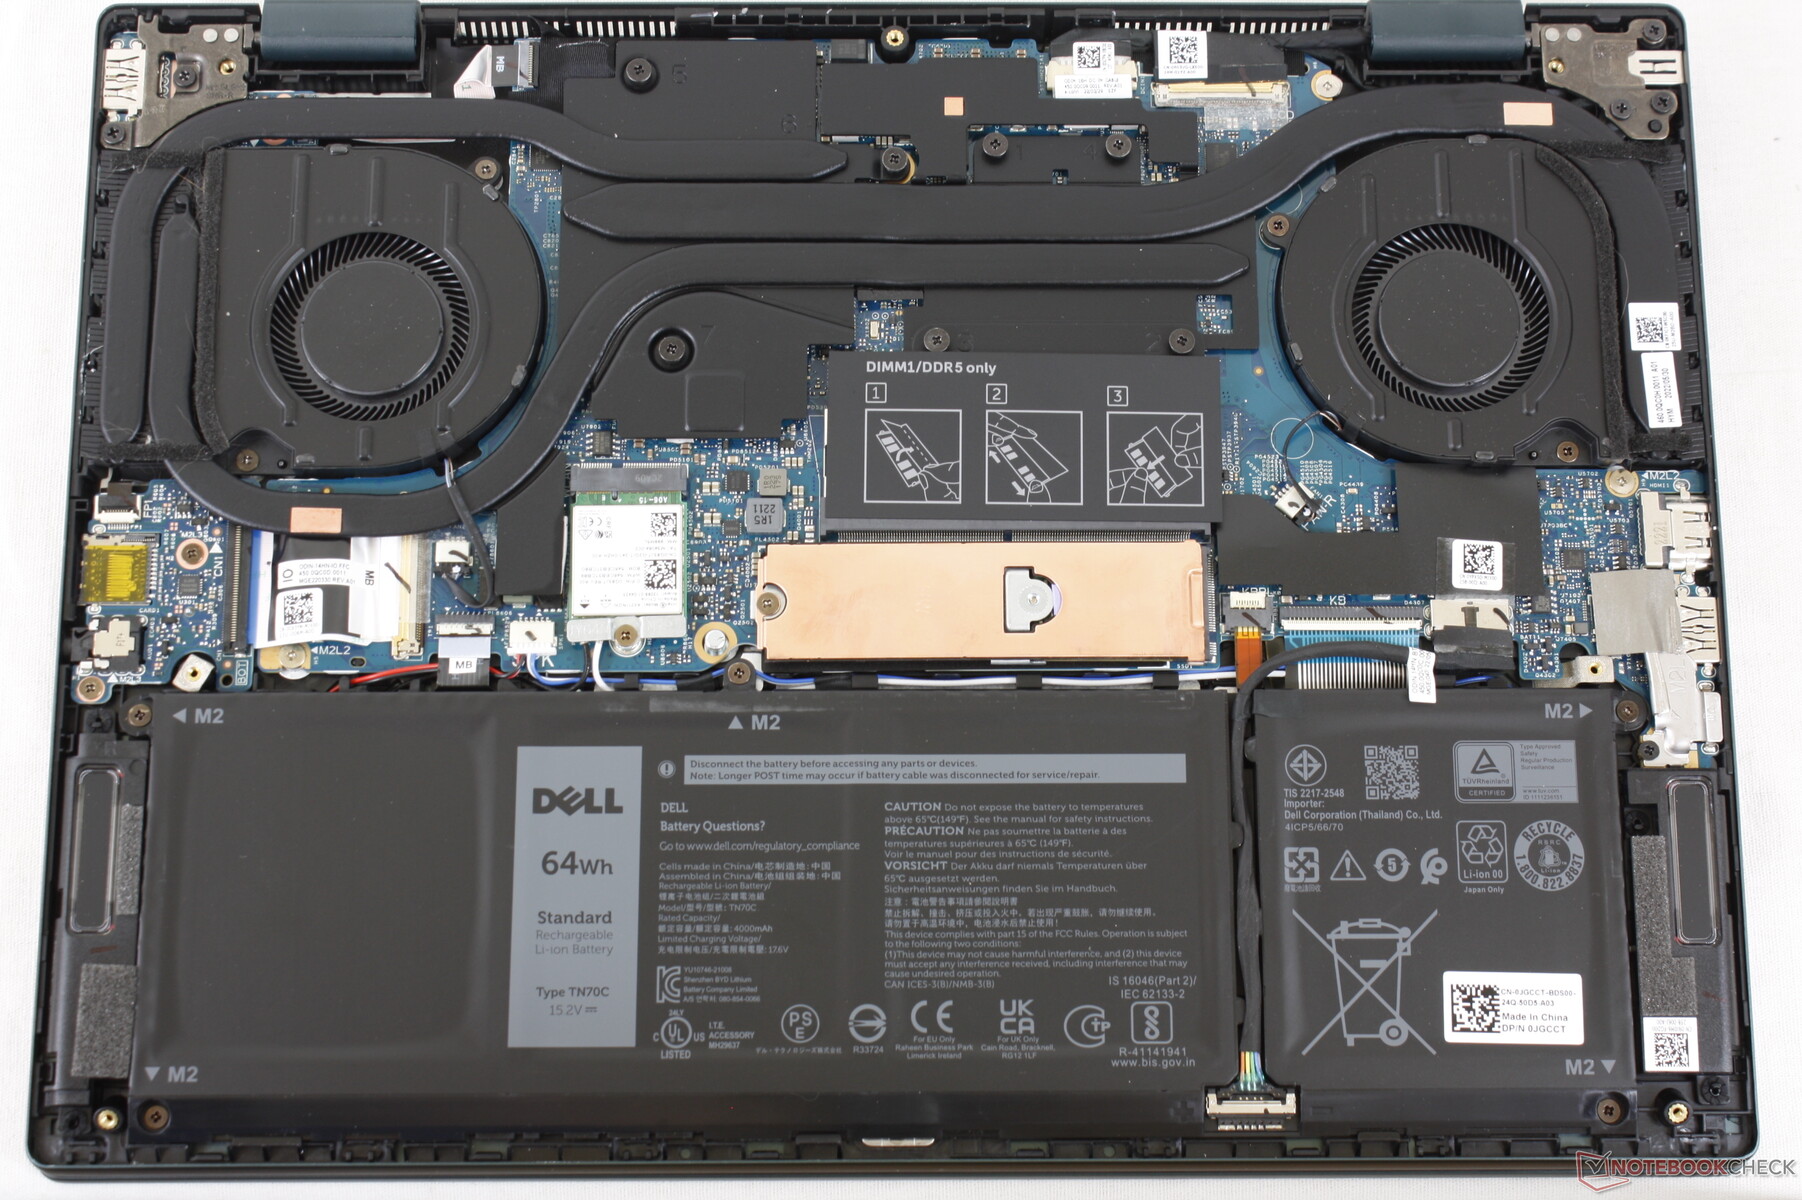
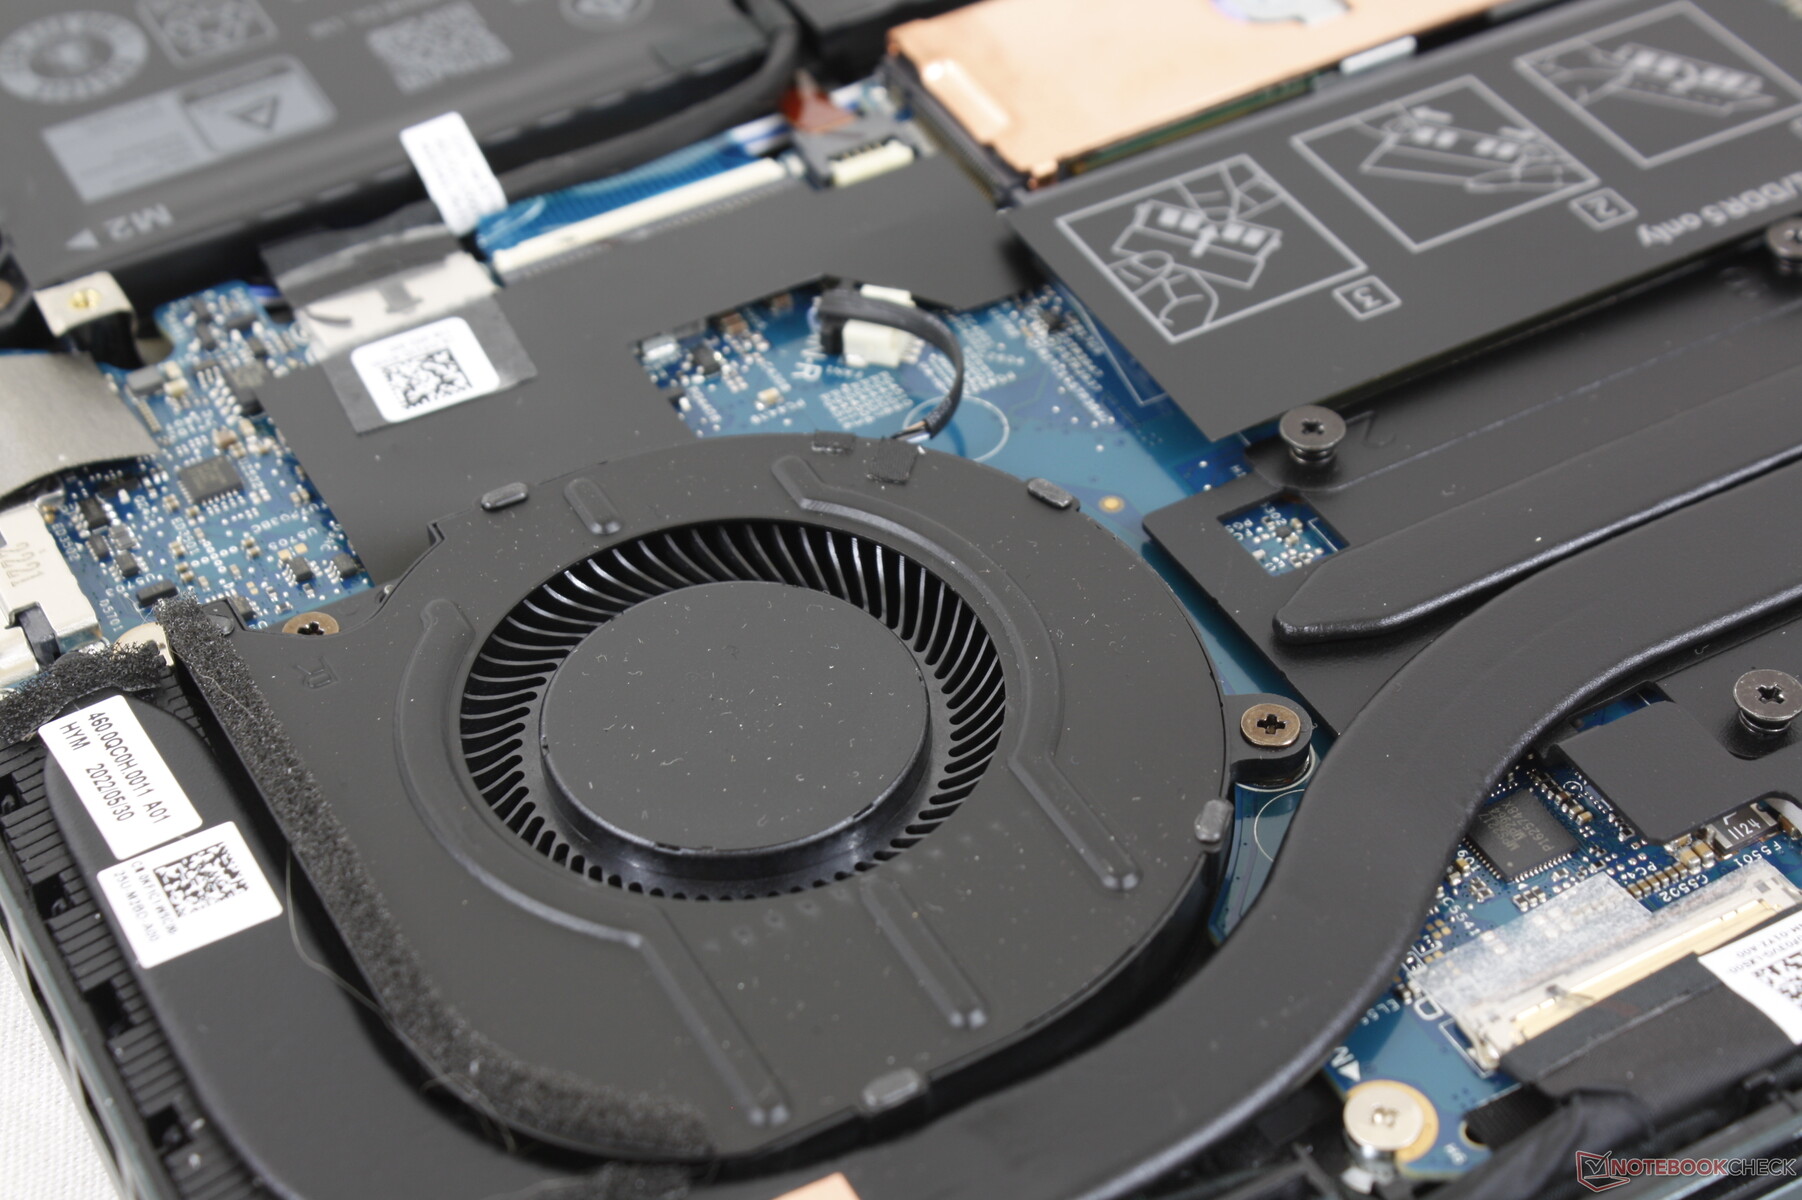
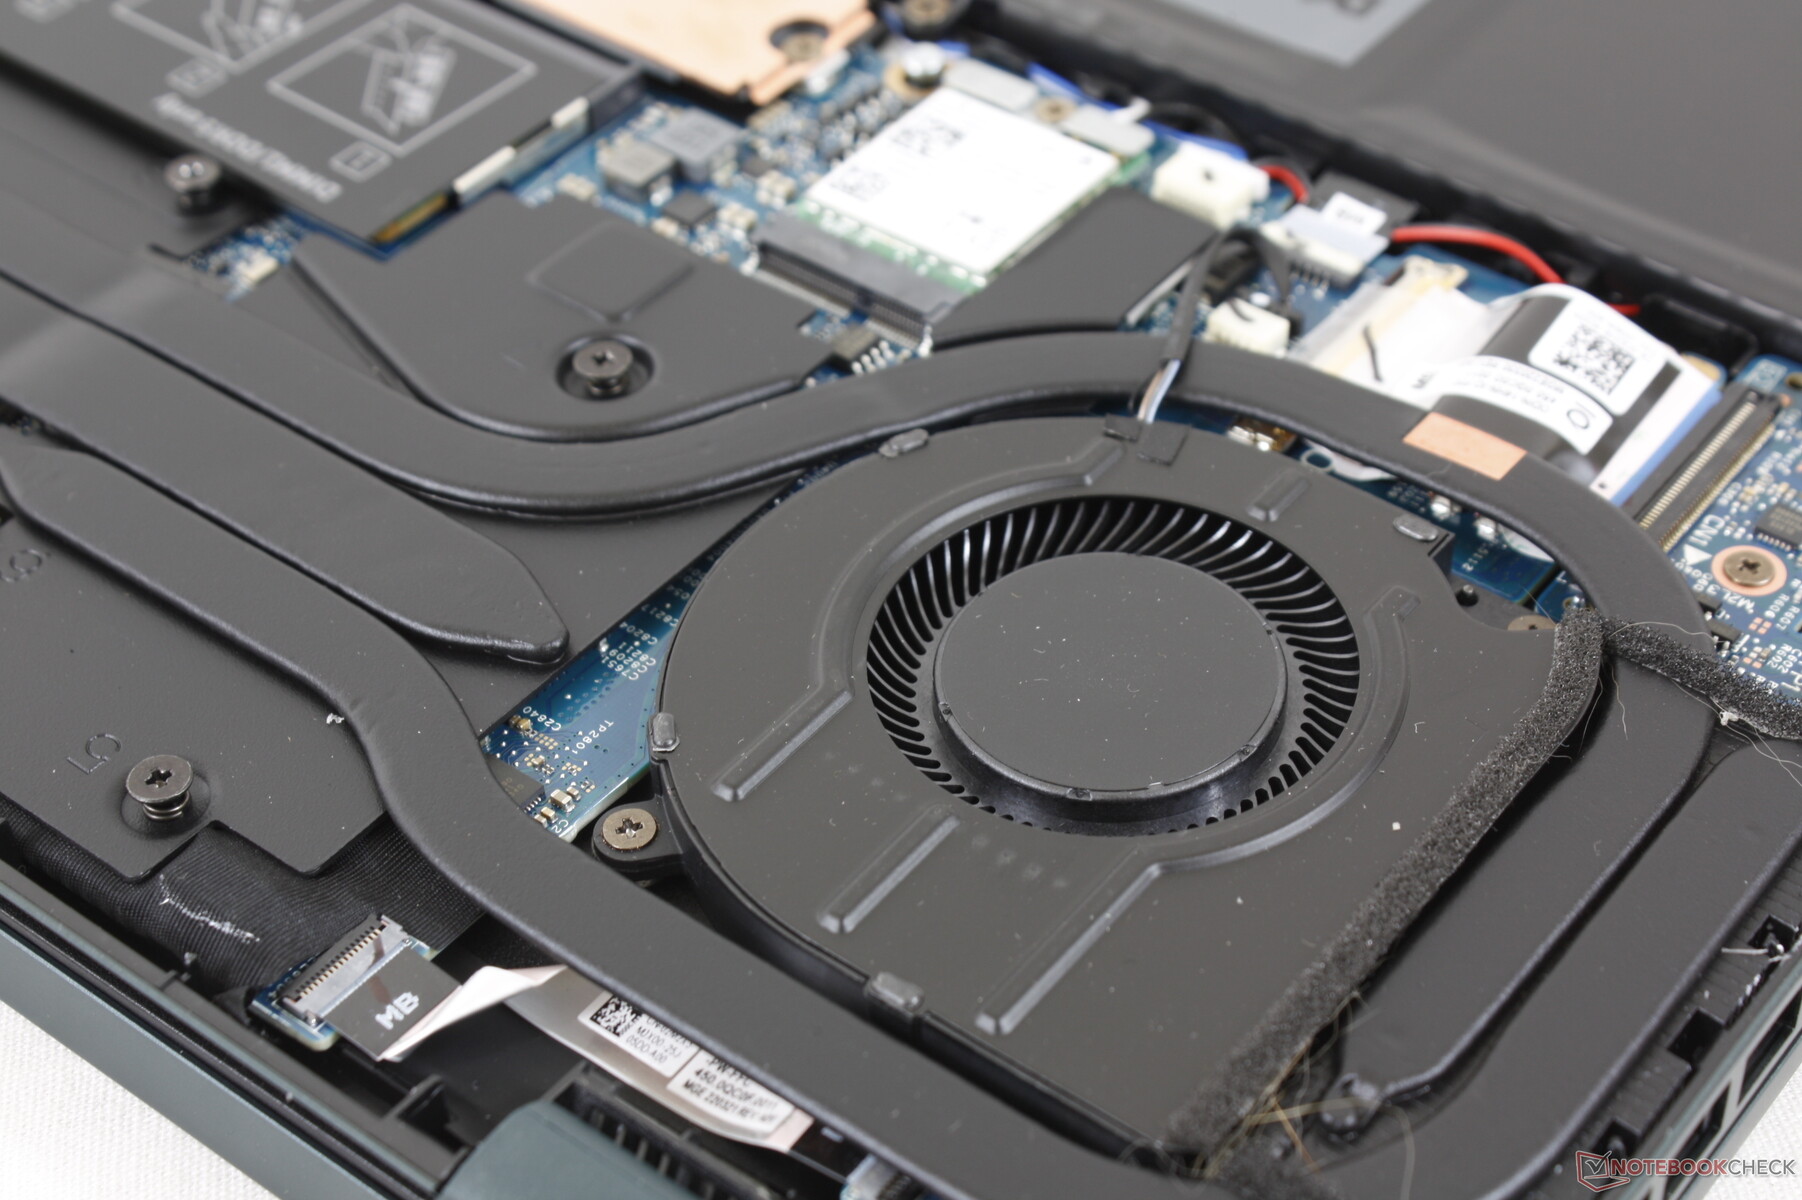
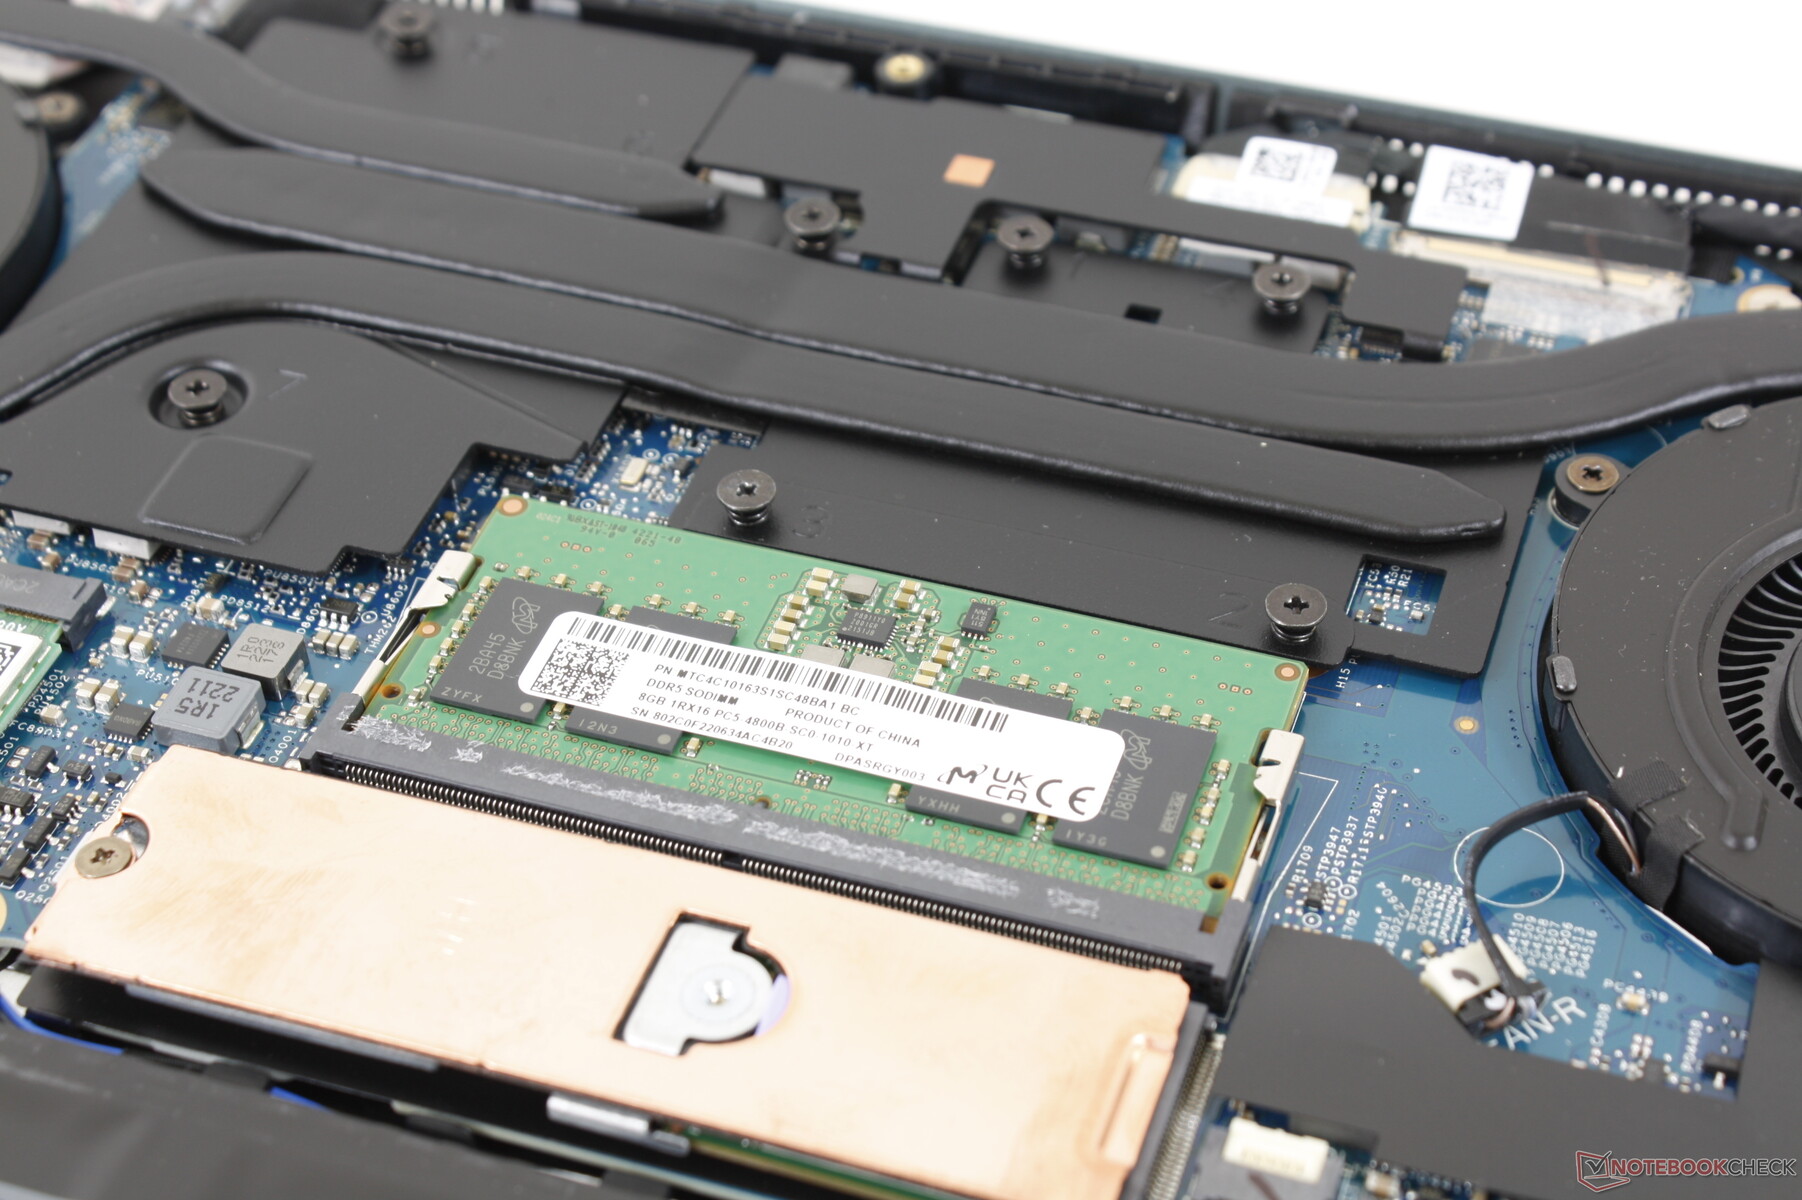
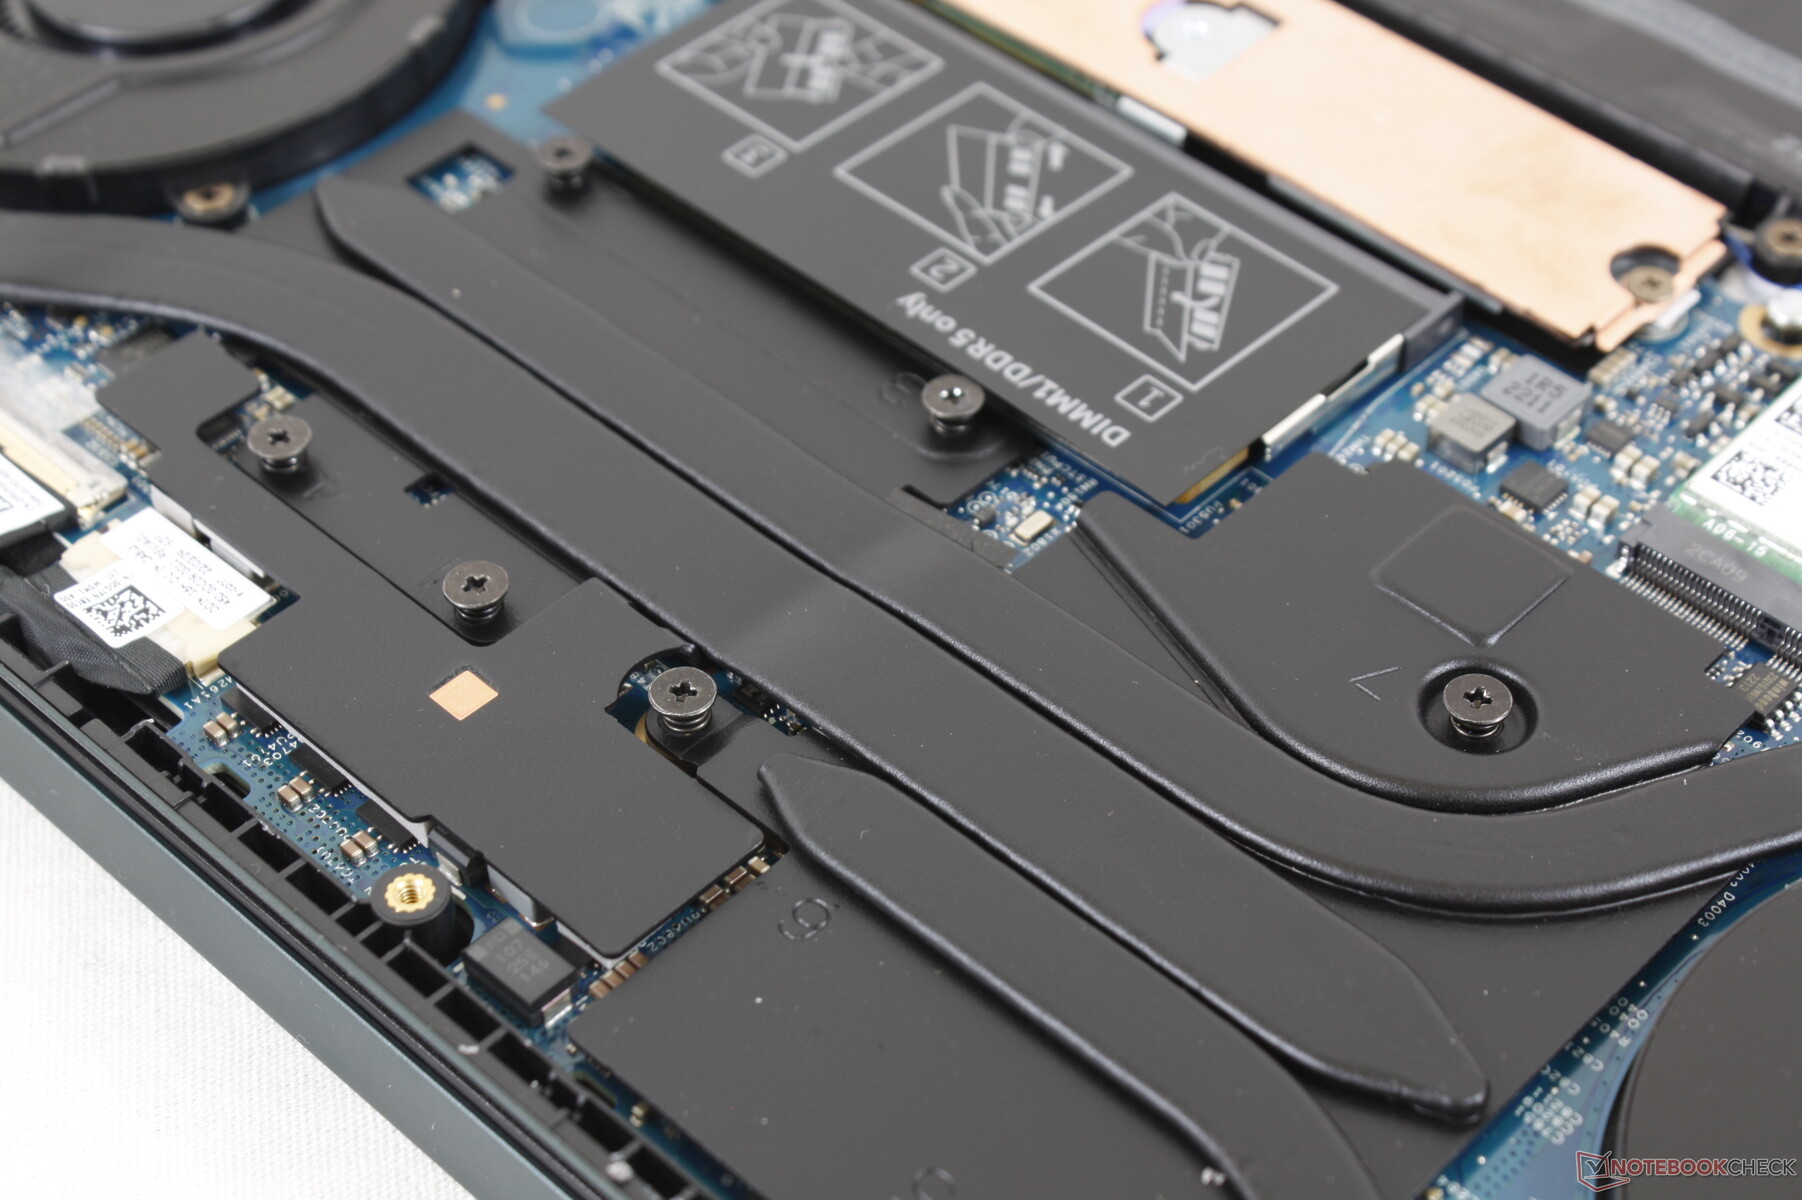
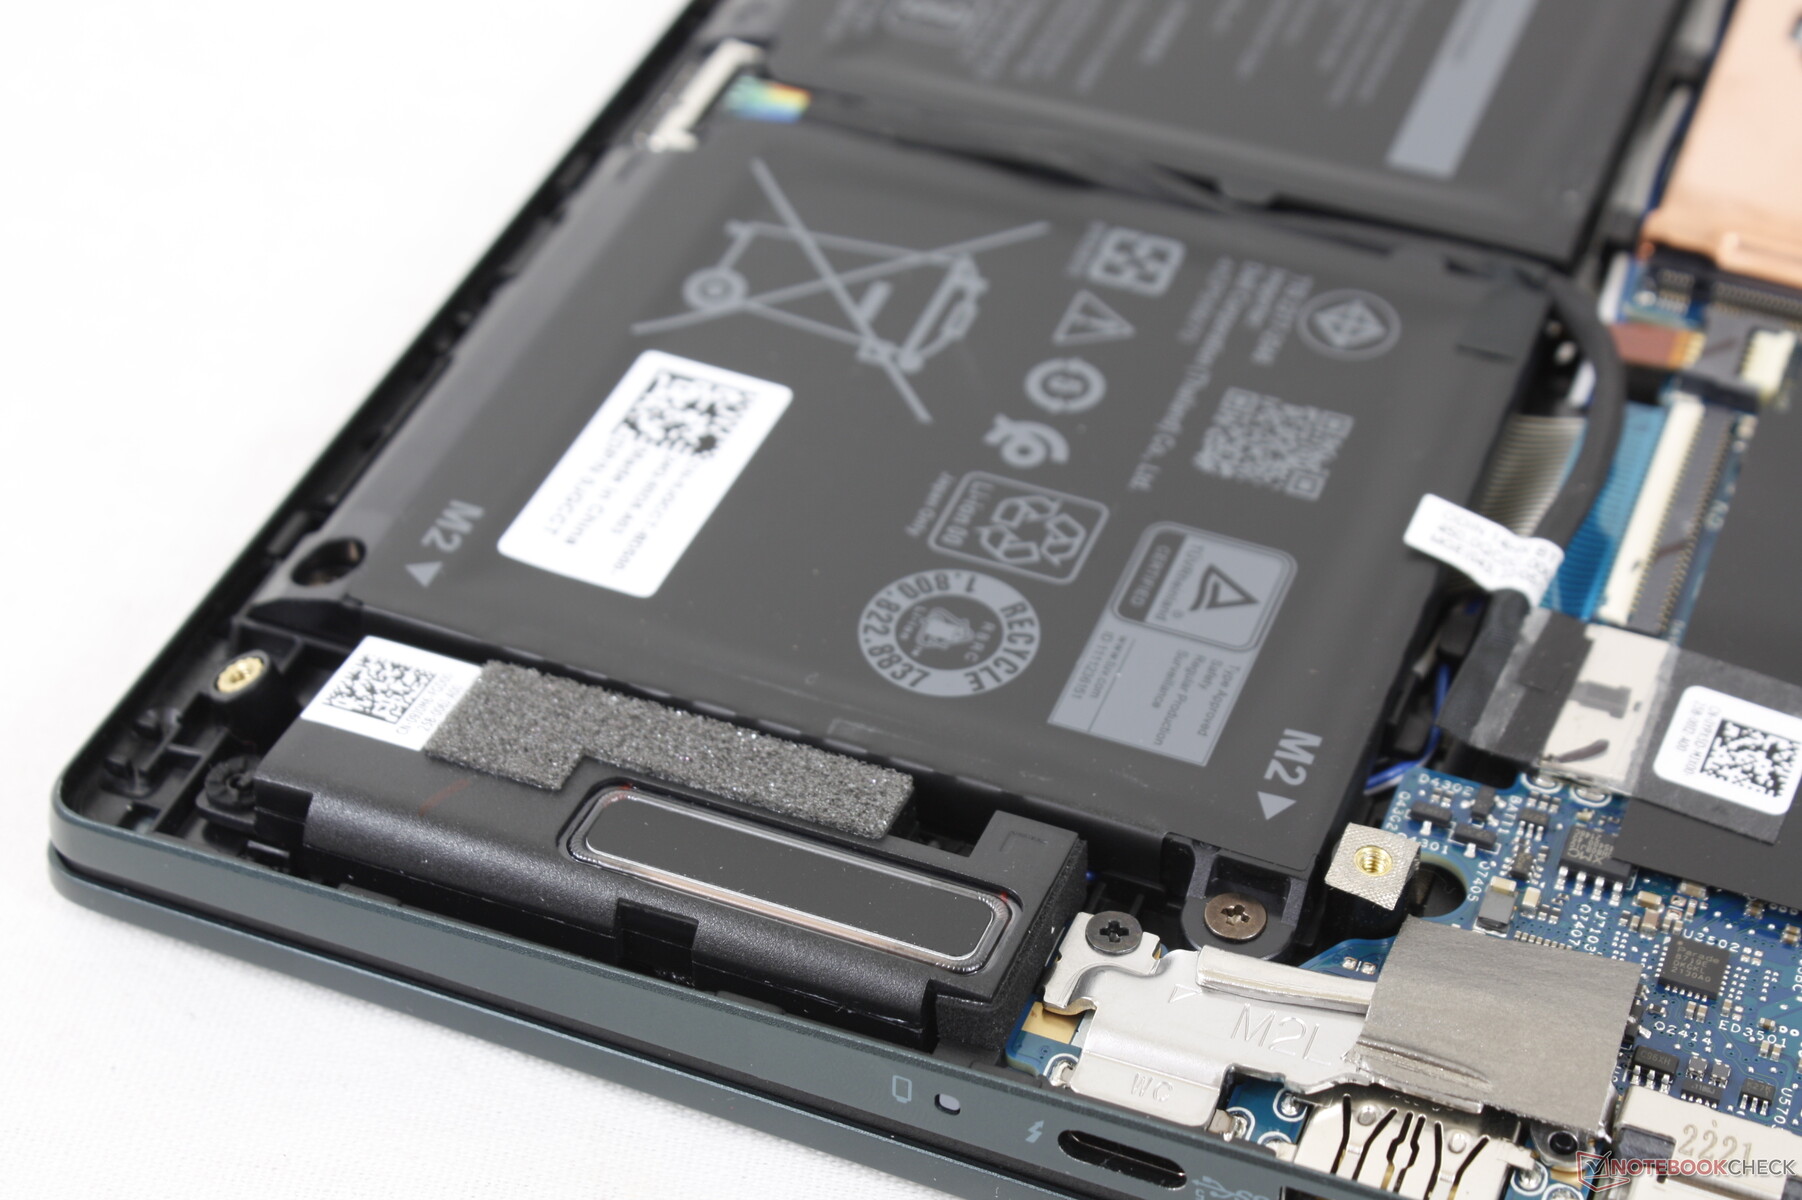
Wartung
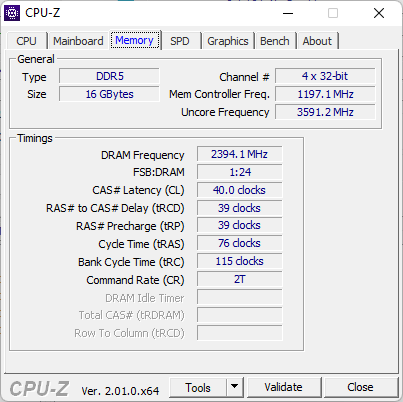
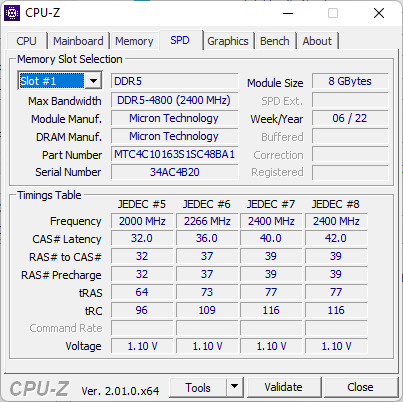
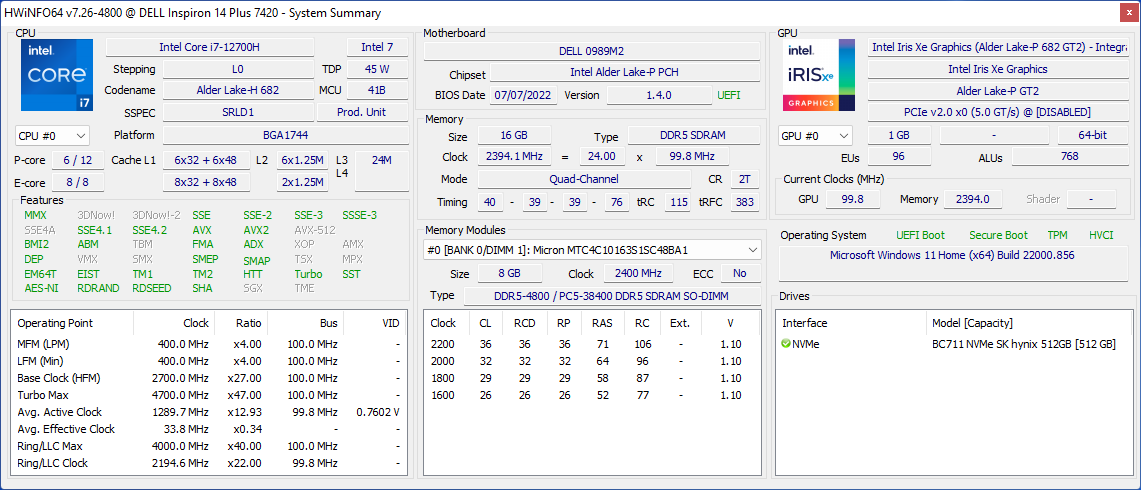
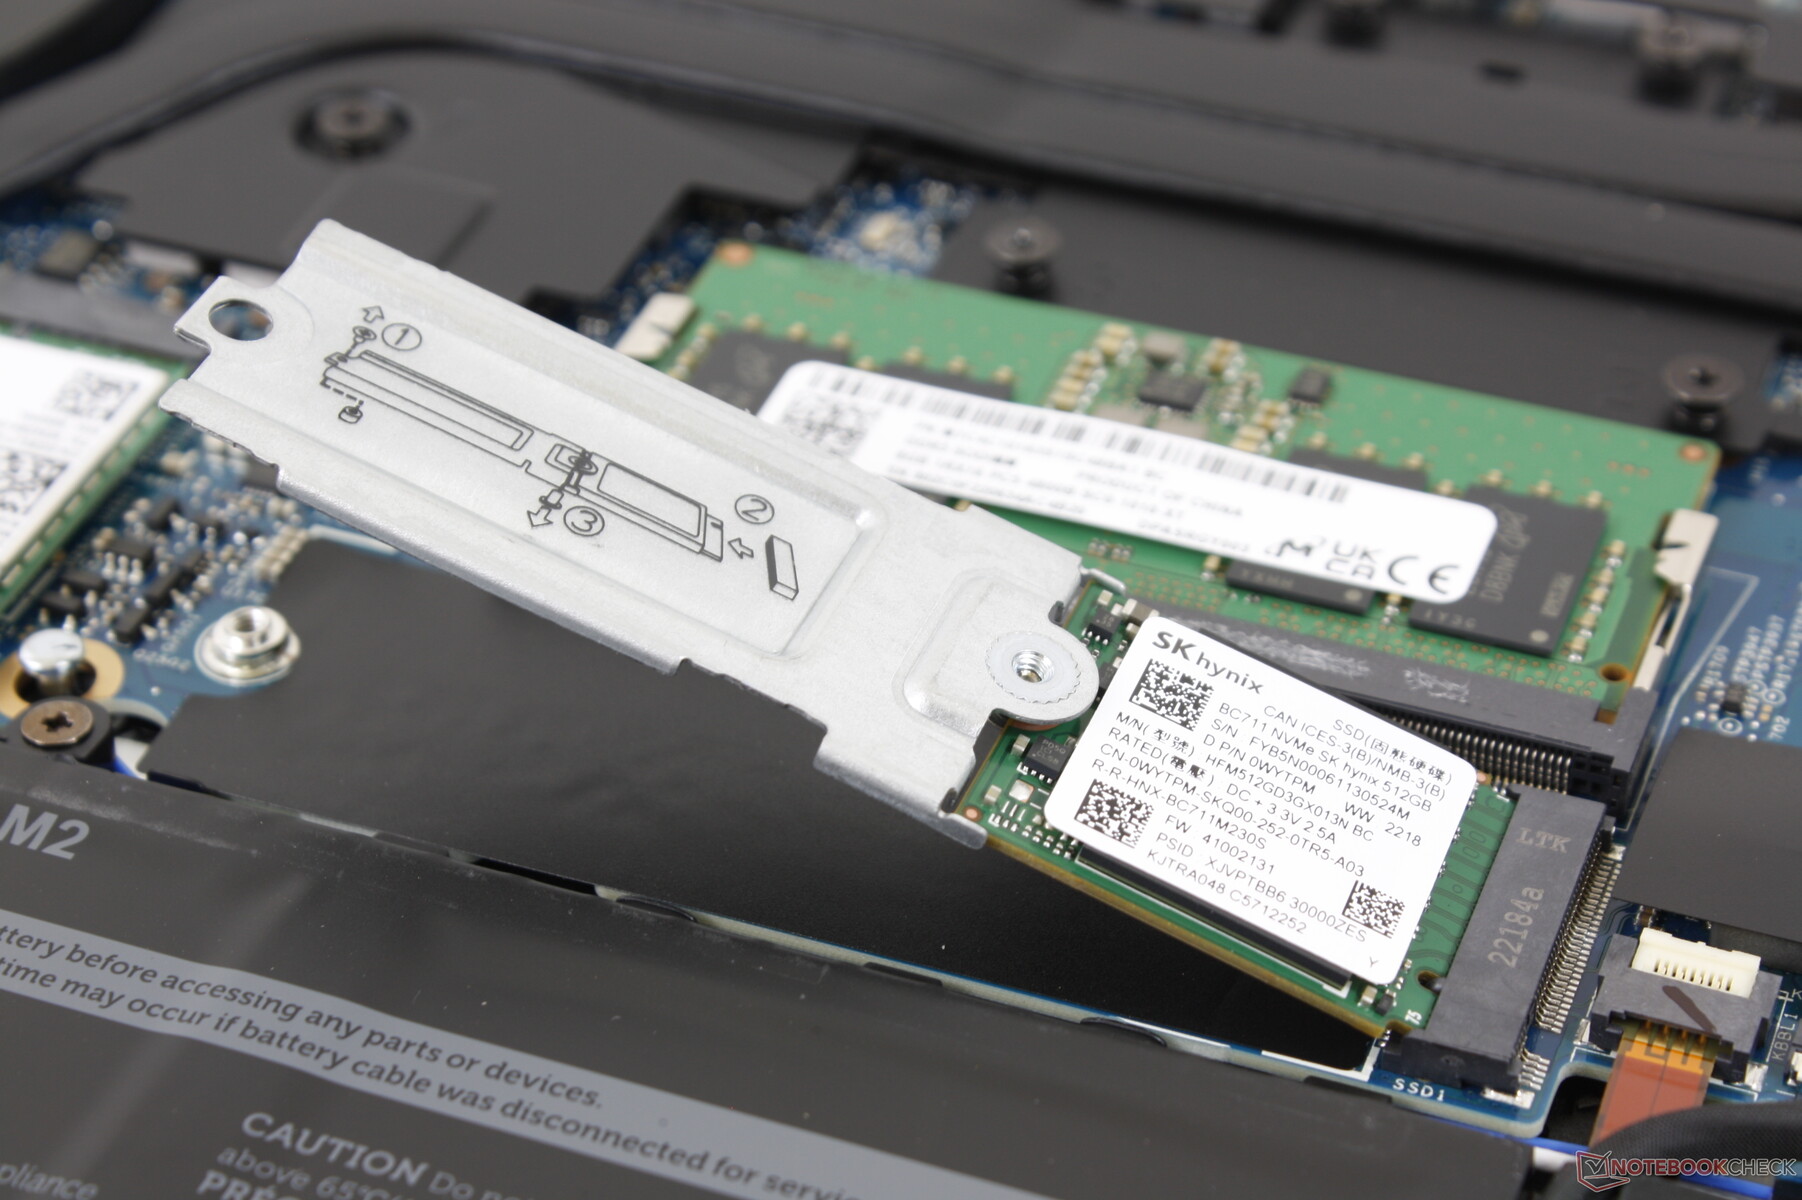
Mit einem Kreuzschraubendreher und einer dünnen Plastikkante stellt das Abnehmen der Unterseite kein Problem dar. Im Inneren erhalten Nutzer Zugang zum Akku, den 1x M.2-2280-Speicherslot, dem 1x DDR5-SODIMM-Slot sowie dem M.2-WLAN-Modul. Zu beachten ist, dass 8 GB RAM in jeder Konfiguration fest verlötet sind und man daher nur einen einzigen zusätzlichen RAM-Riegel für insgesamt 40 GB aufrüsten kann.
Zubehör uns Garantie
Außer dem Netzteil und einigem Papierkram befinden sich keine Extras in der Verpackung. In Deutschland greift die Standard-Garantie von einem Jahr mit Onsite Hardware Service.
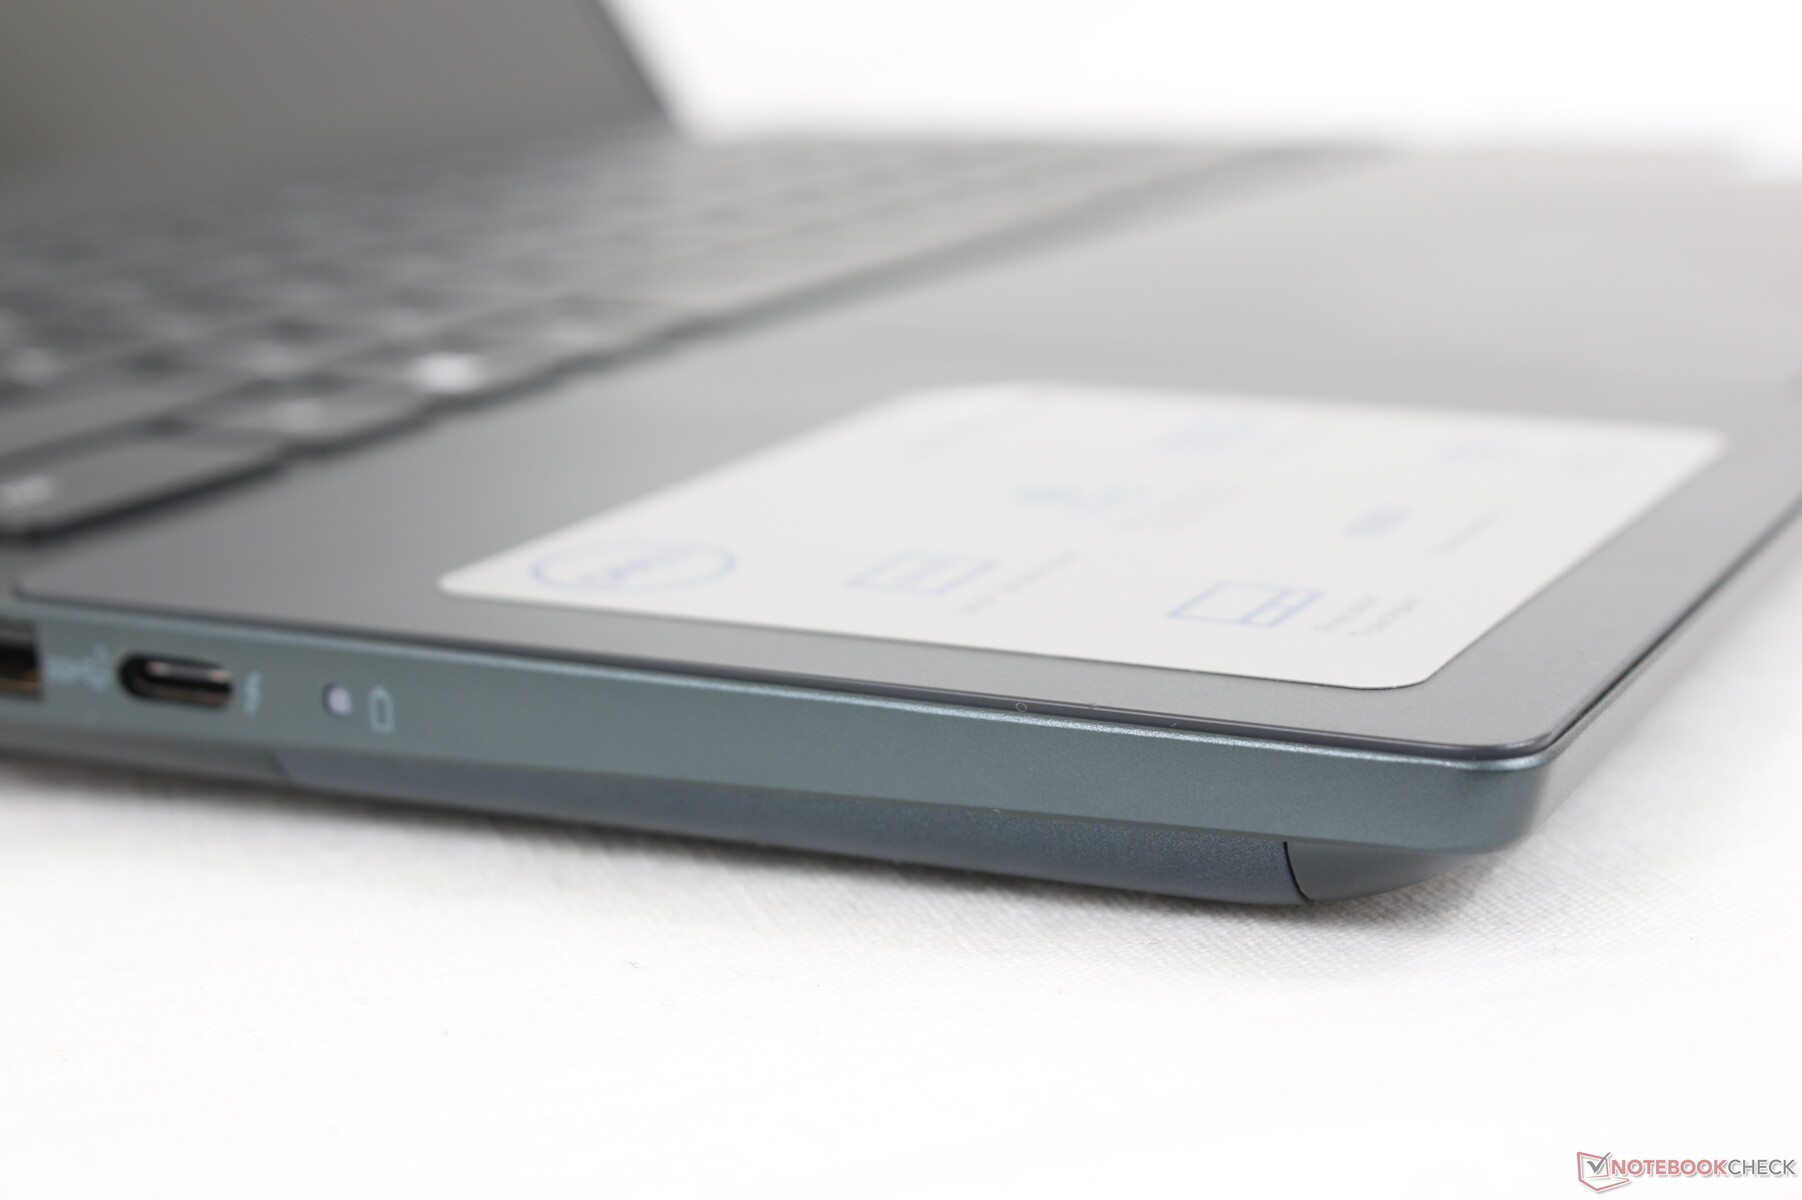
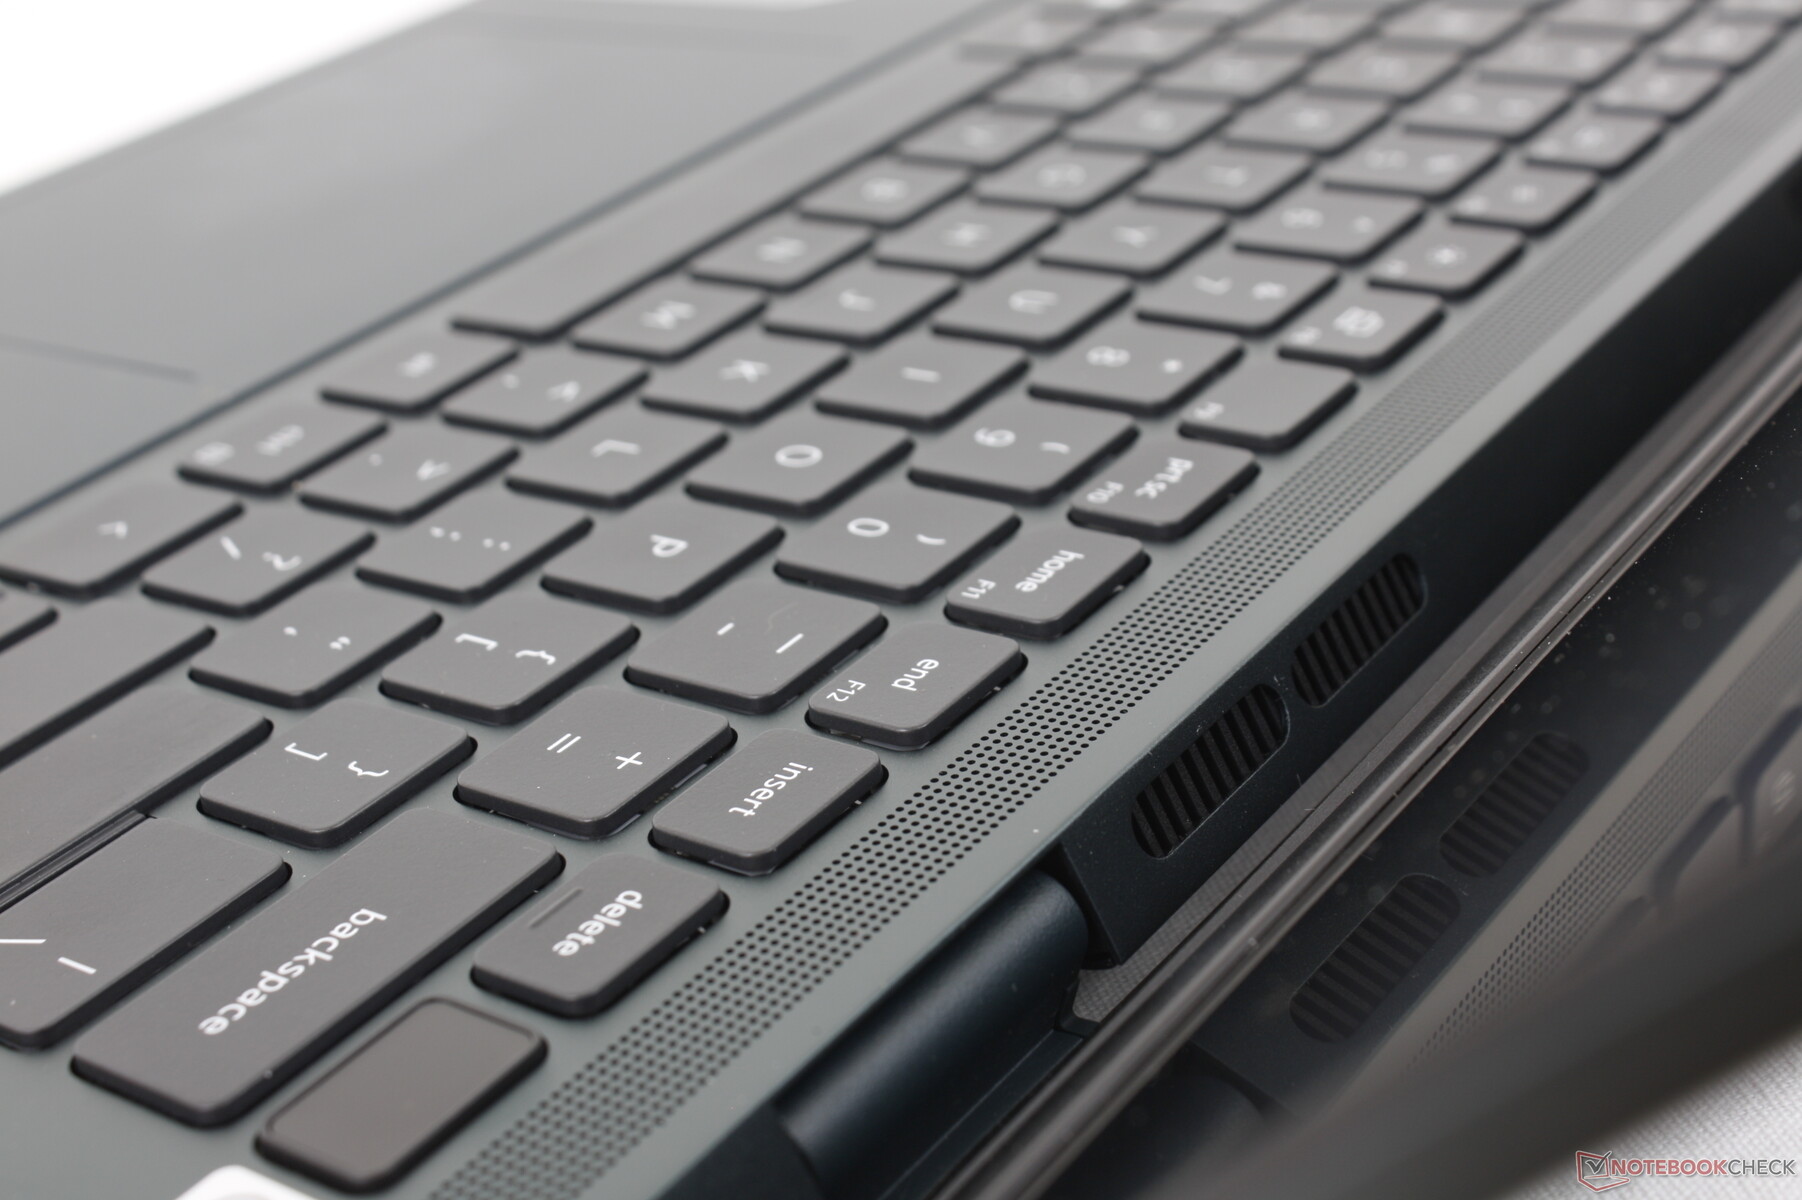
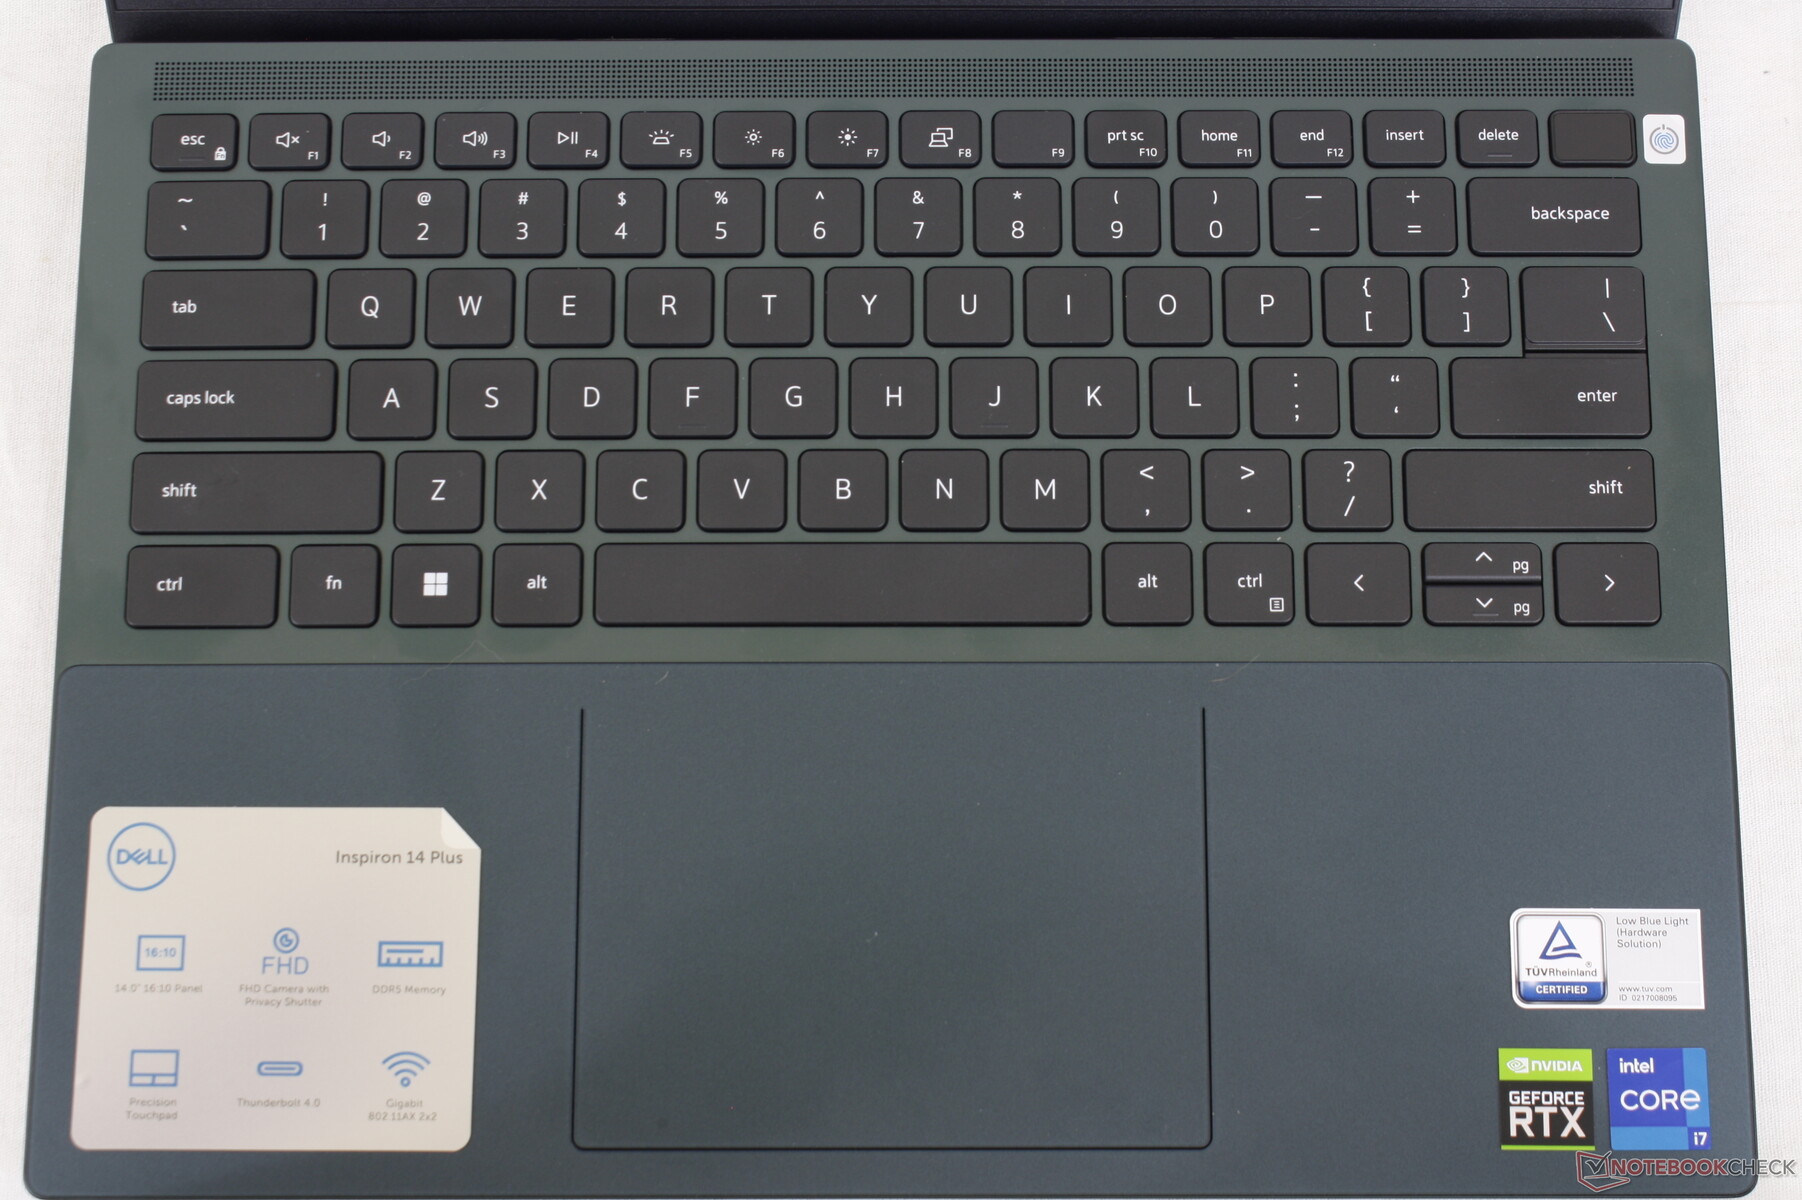
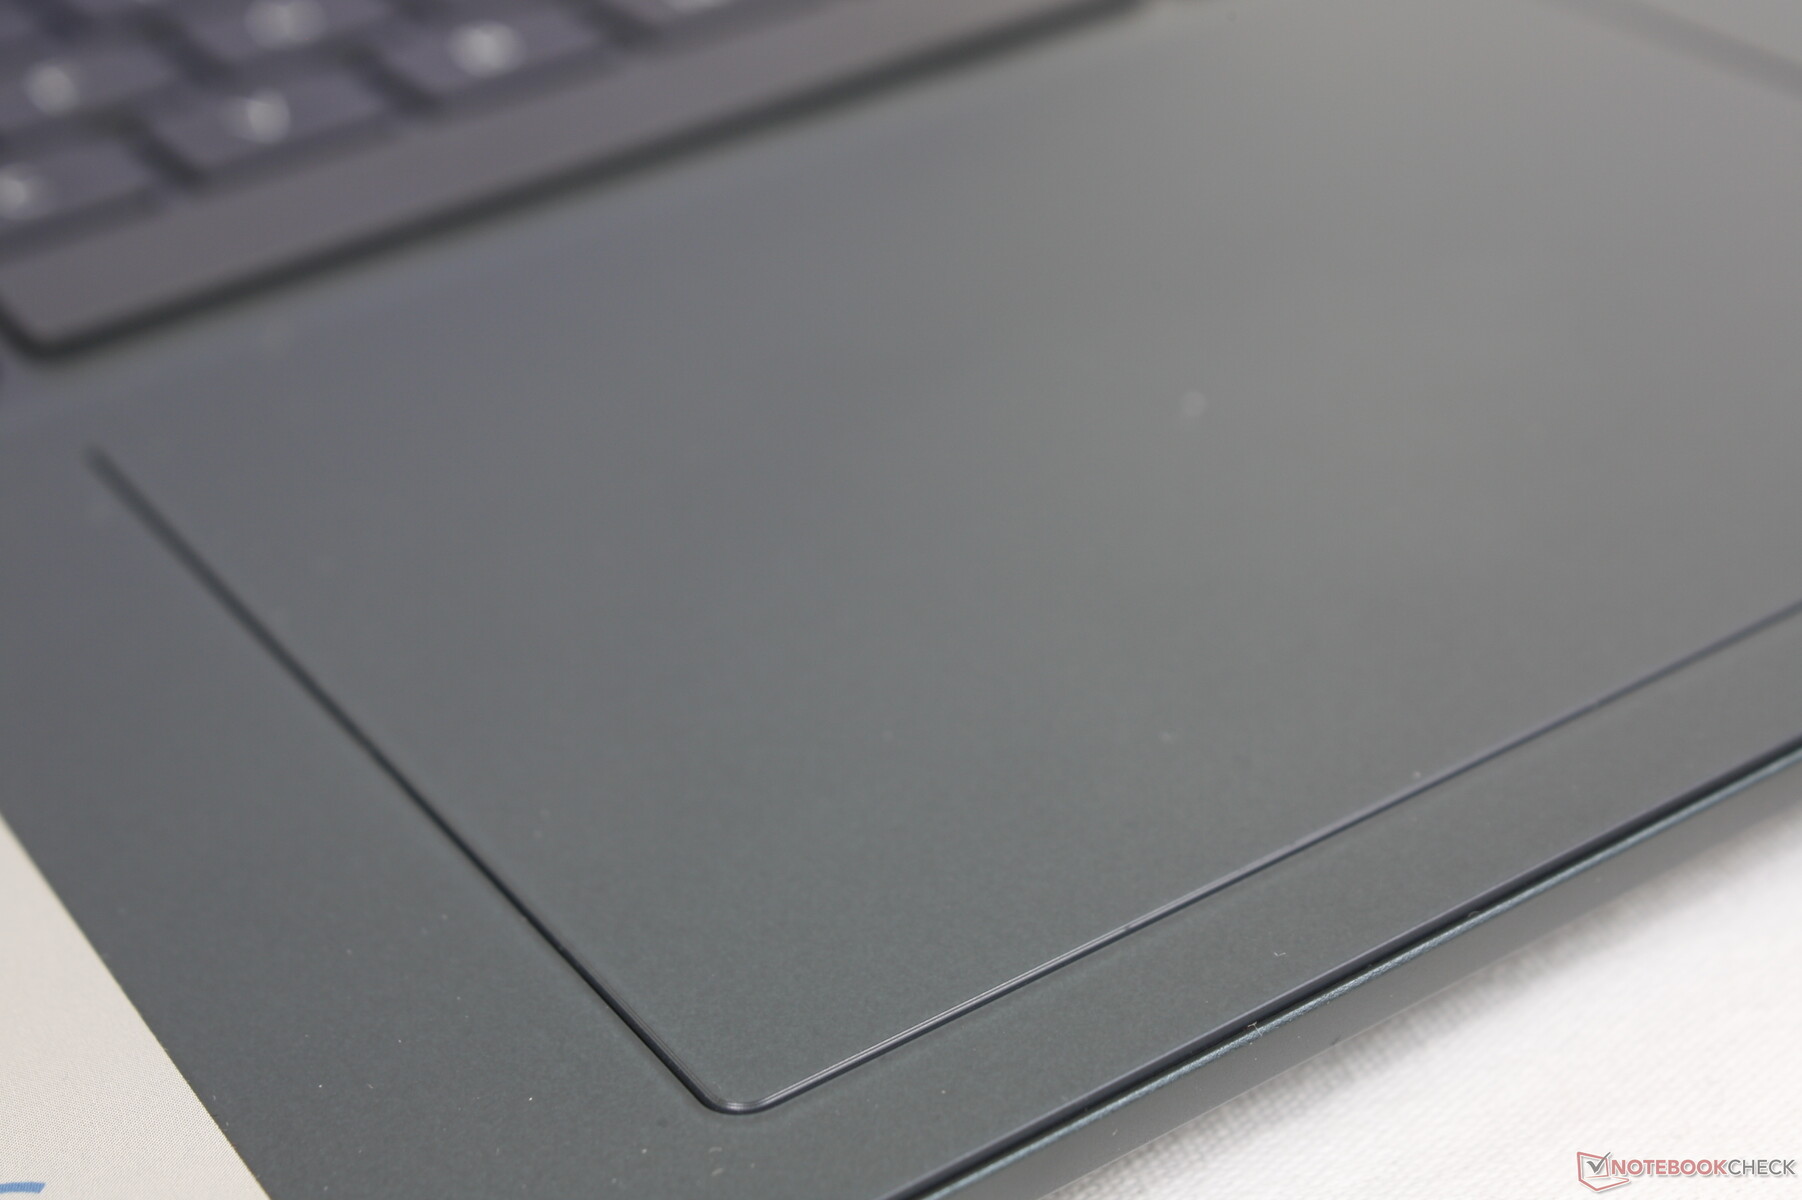
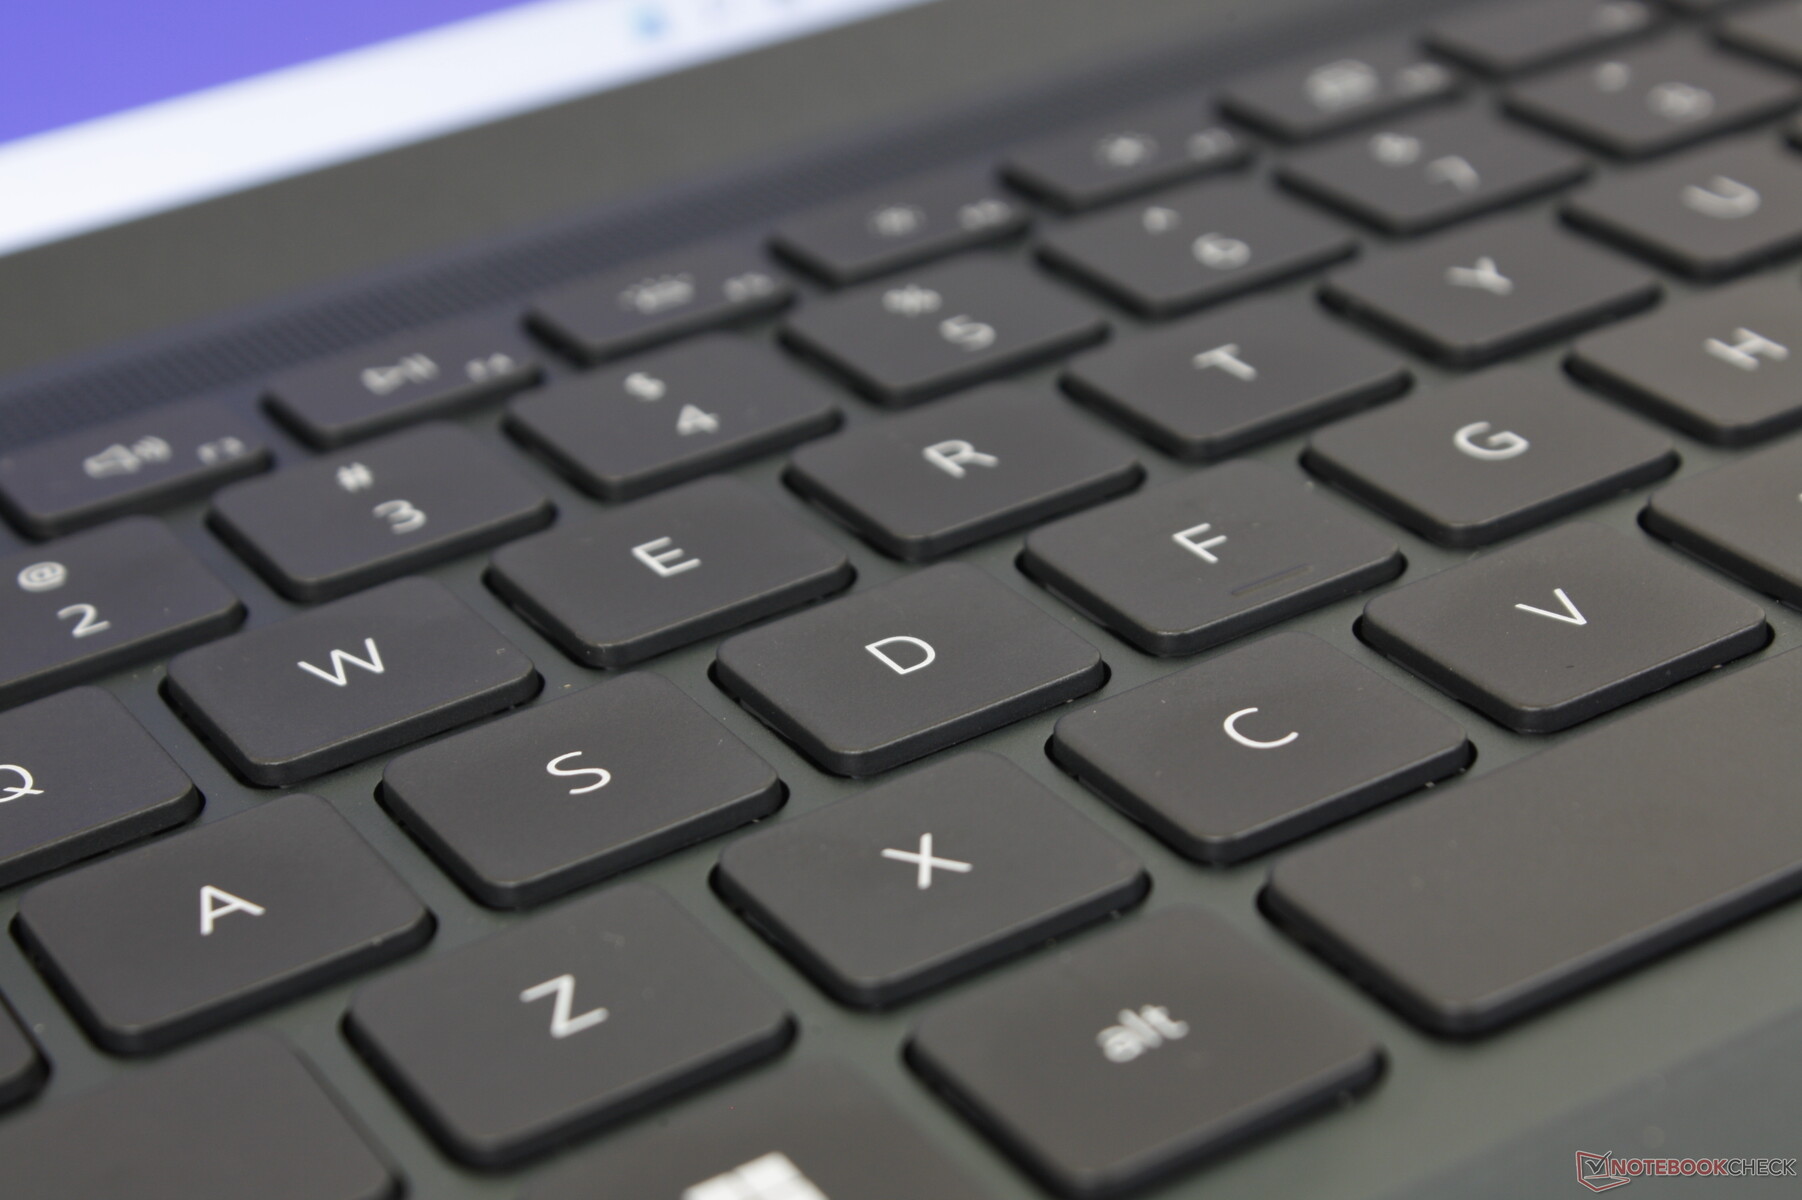
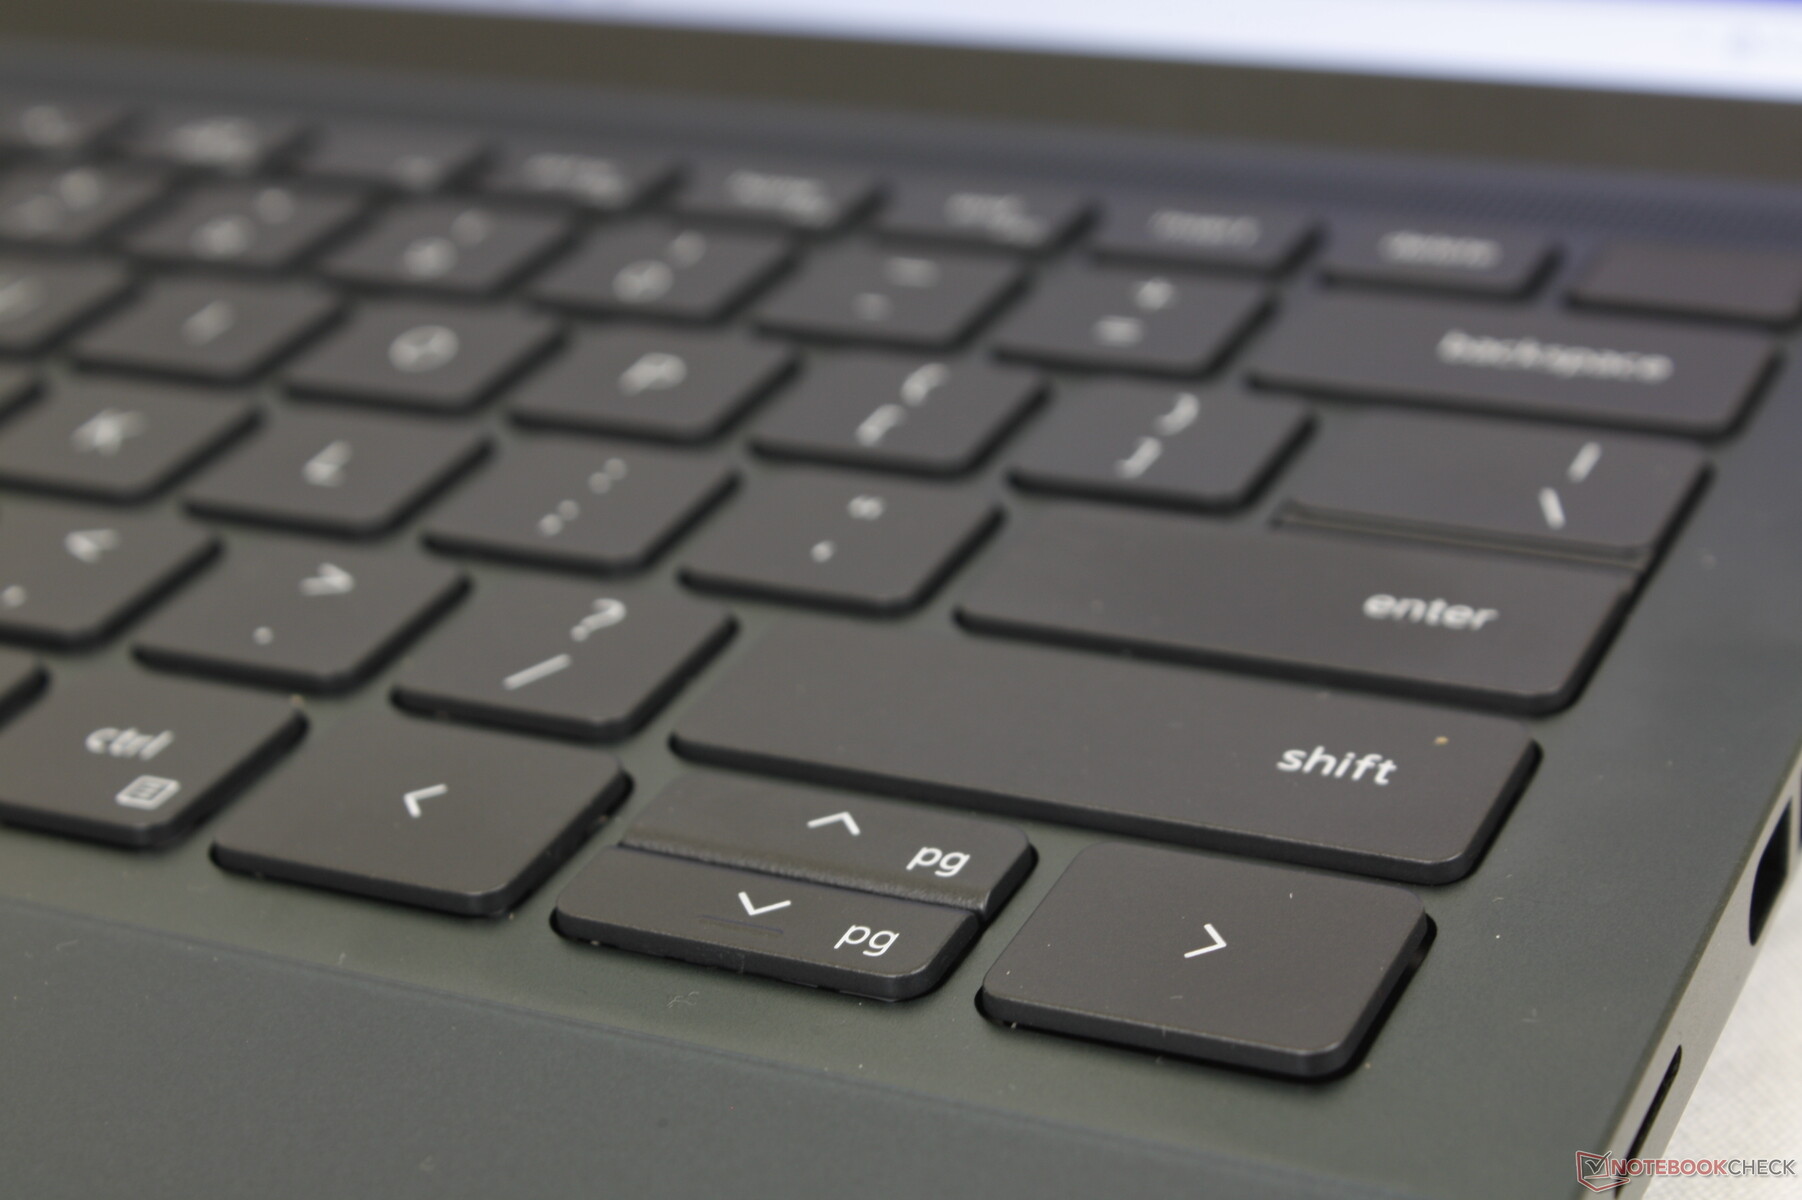
Eingabegeräte — Bestens bekannt, nichts Neues
Tastatur und Touchpad
Die Tipperfahrung ist die gleiche wie im Inspiron 16 Plus 7620, im Inspiron 16 7620 2-in-1 oder im Inspiron 14 7420 2-in-1, immerhin teilen sich alle Modelle die gleichen Tasten sowie das gleiche Mylar-Touchpad. Sogar die primäre und sekundäre Beschriftung aller Tasten sowie die Touchpadgröße (11.5 x 8 cm) ist über alle Modelle hinweg gleich, unabhängig von deren Laptop-Formfaktor. Zusammengefasst bieten die Tasten ein adäquates Feedback und klappern eher moderat, mit Ausnahme der Leertaste, welche sich auch zu seicht anfühlt. Ähnliches gilt für das Touchpad, dessen Oberfläche bei Alltagsaufgaben zwar zuverlässig funktioniert, dessen integrierten Tasten aber zu schwammig und seicht bei Drag-and-Drop-Aktionen rüberkommen.
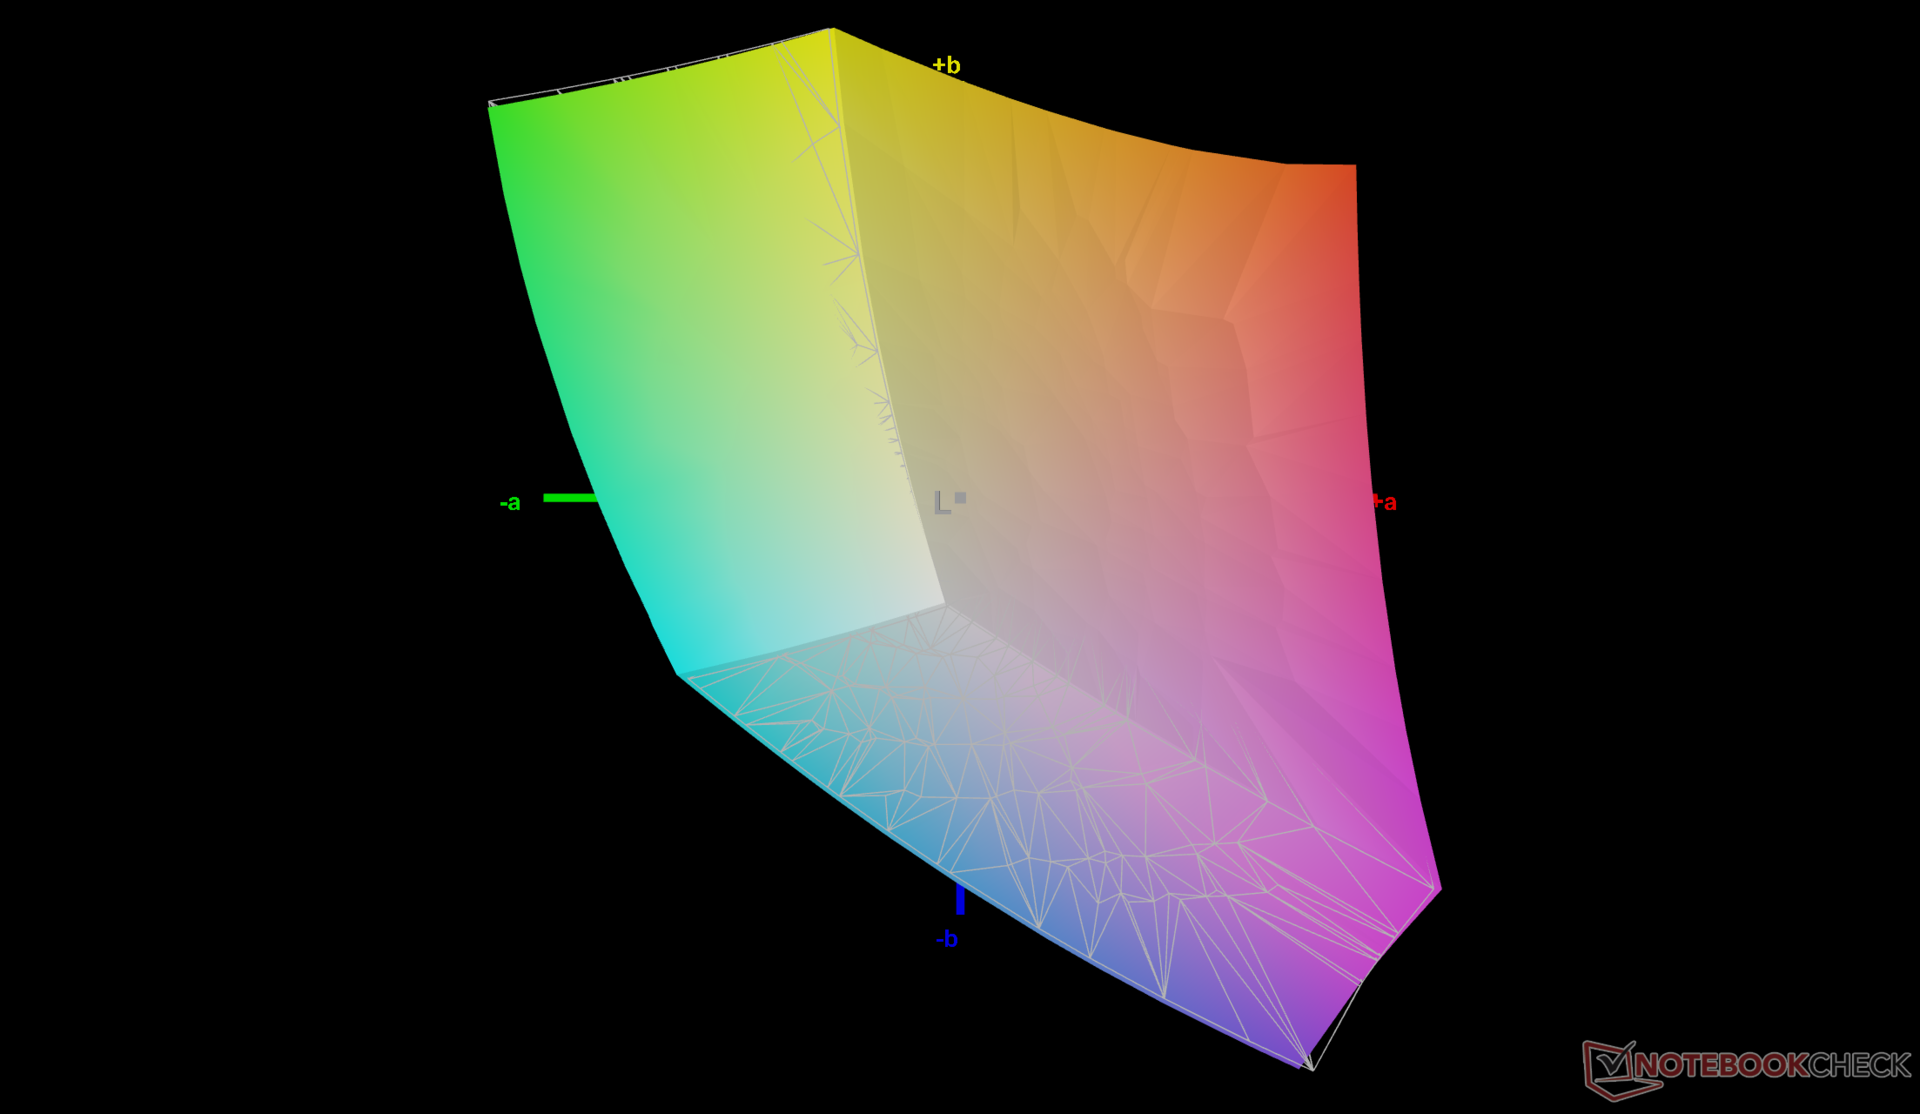
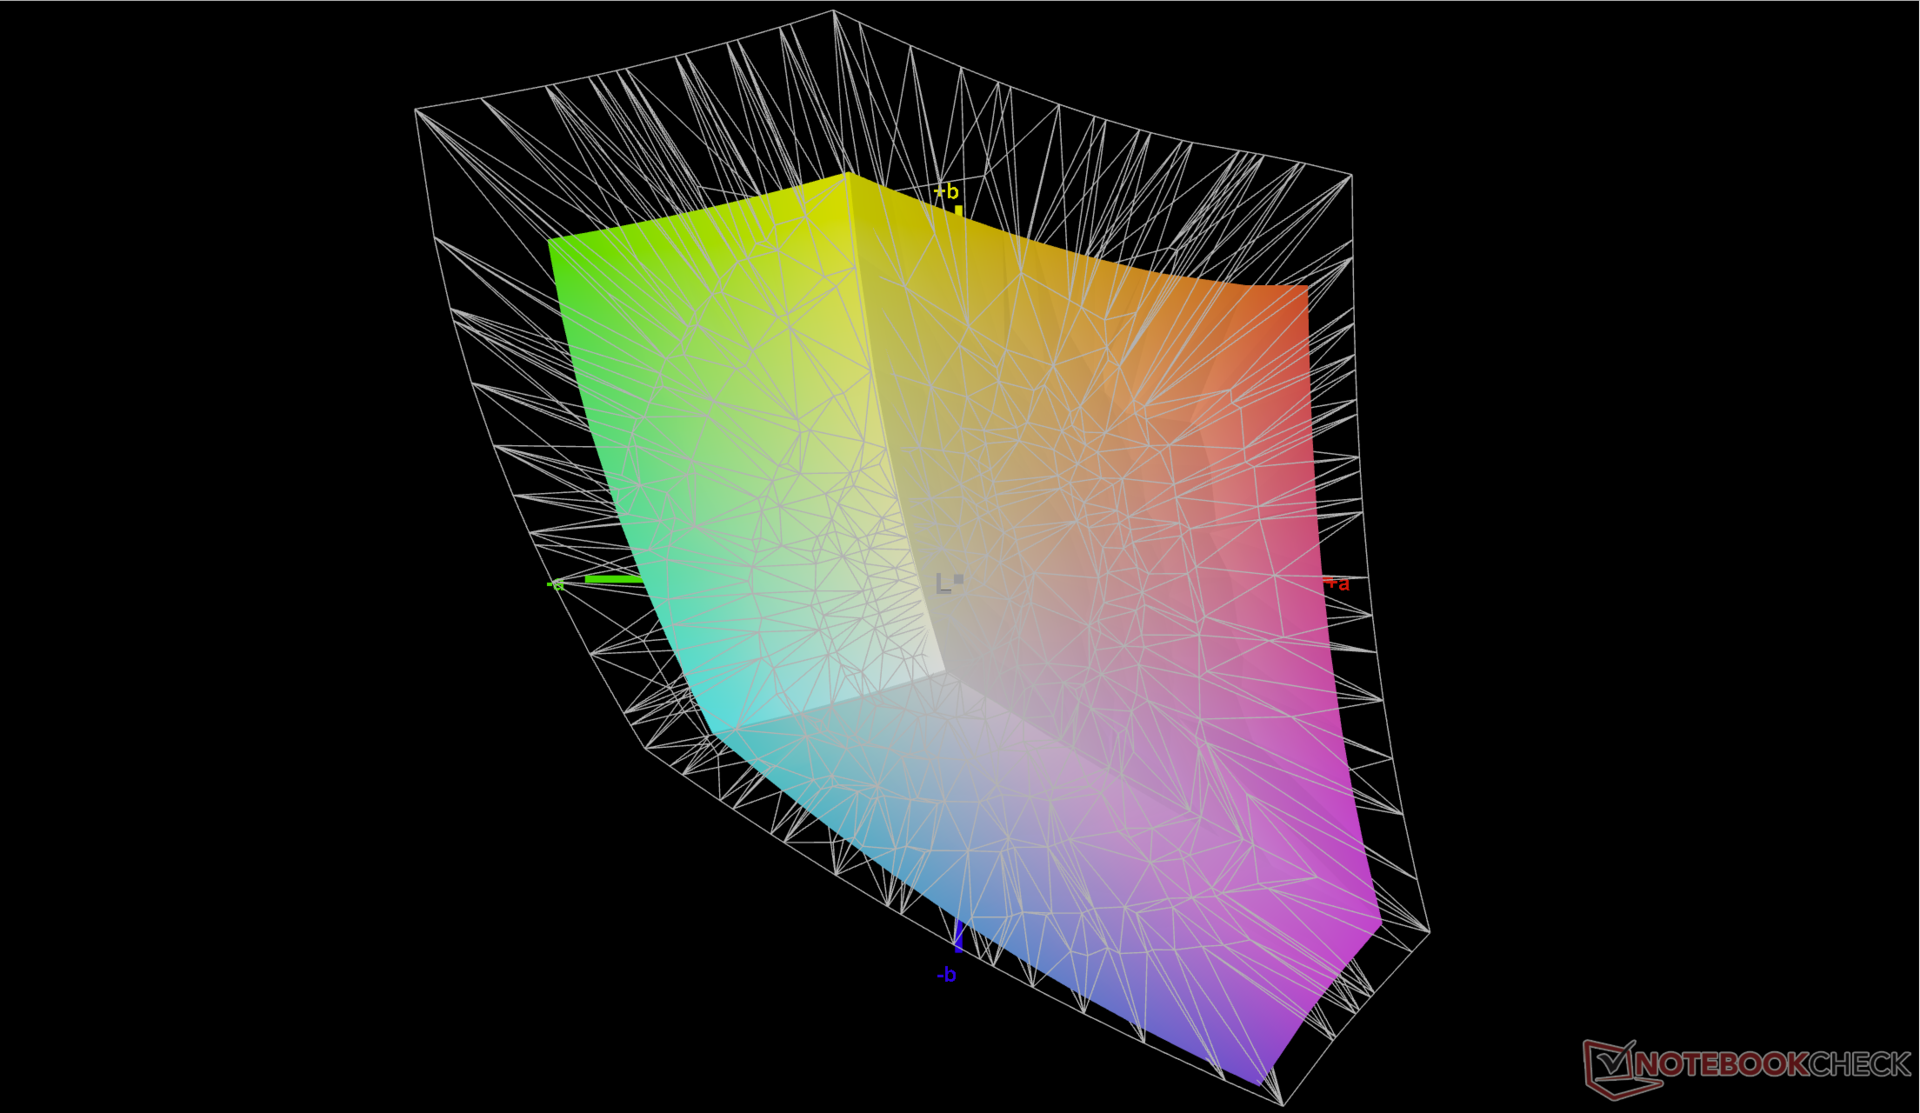
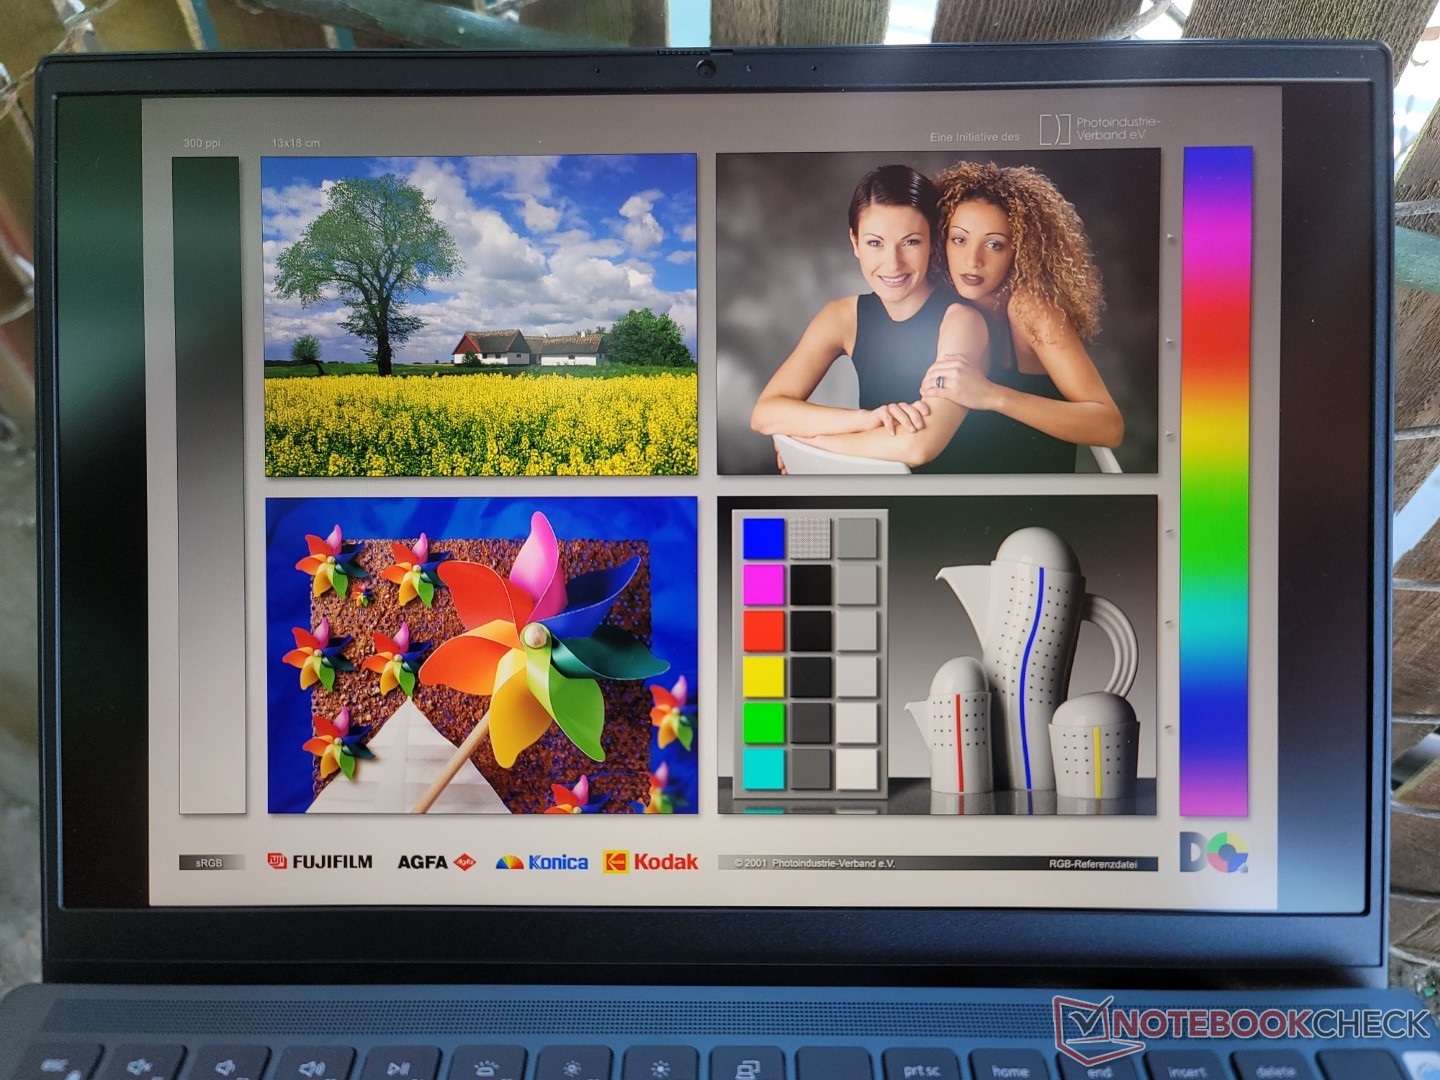
Display — Vollständige sRGB-Abdeckung und 60 Hz
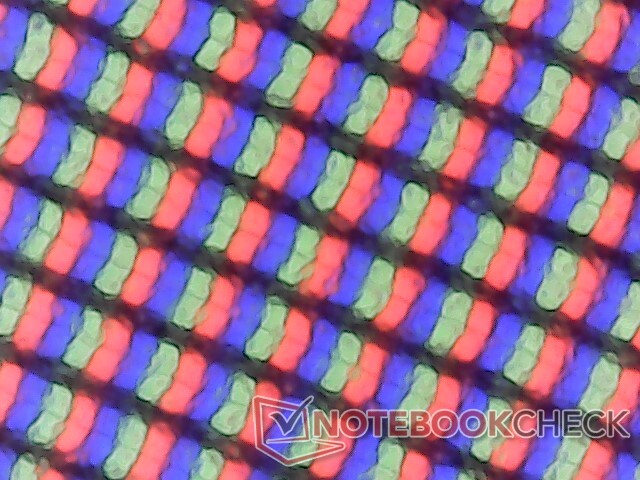
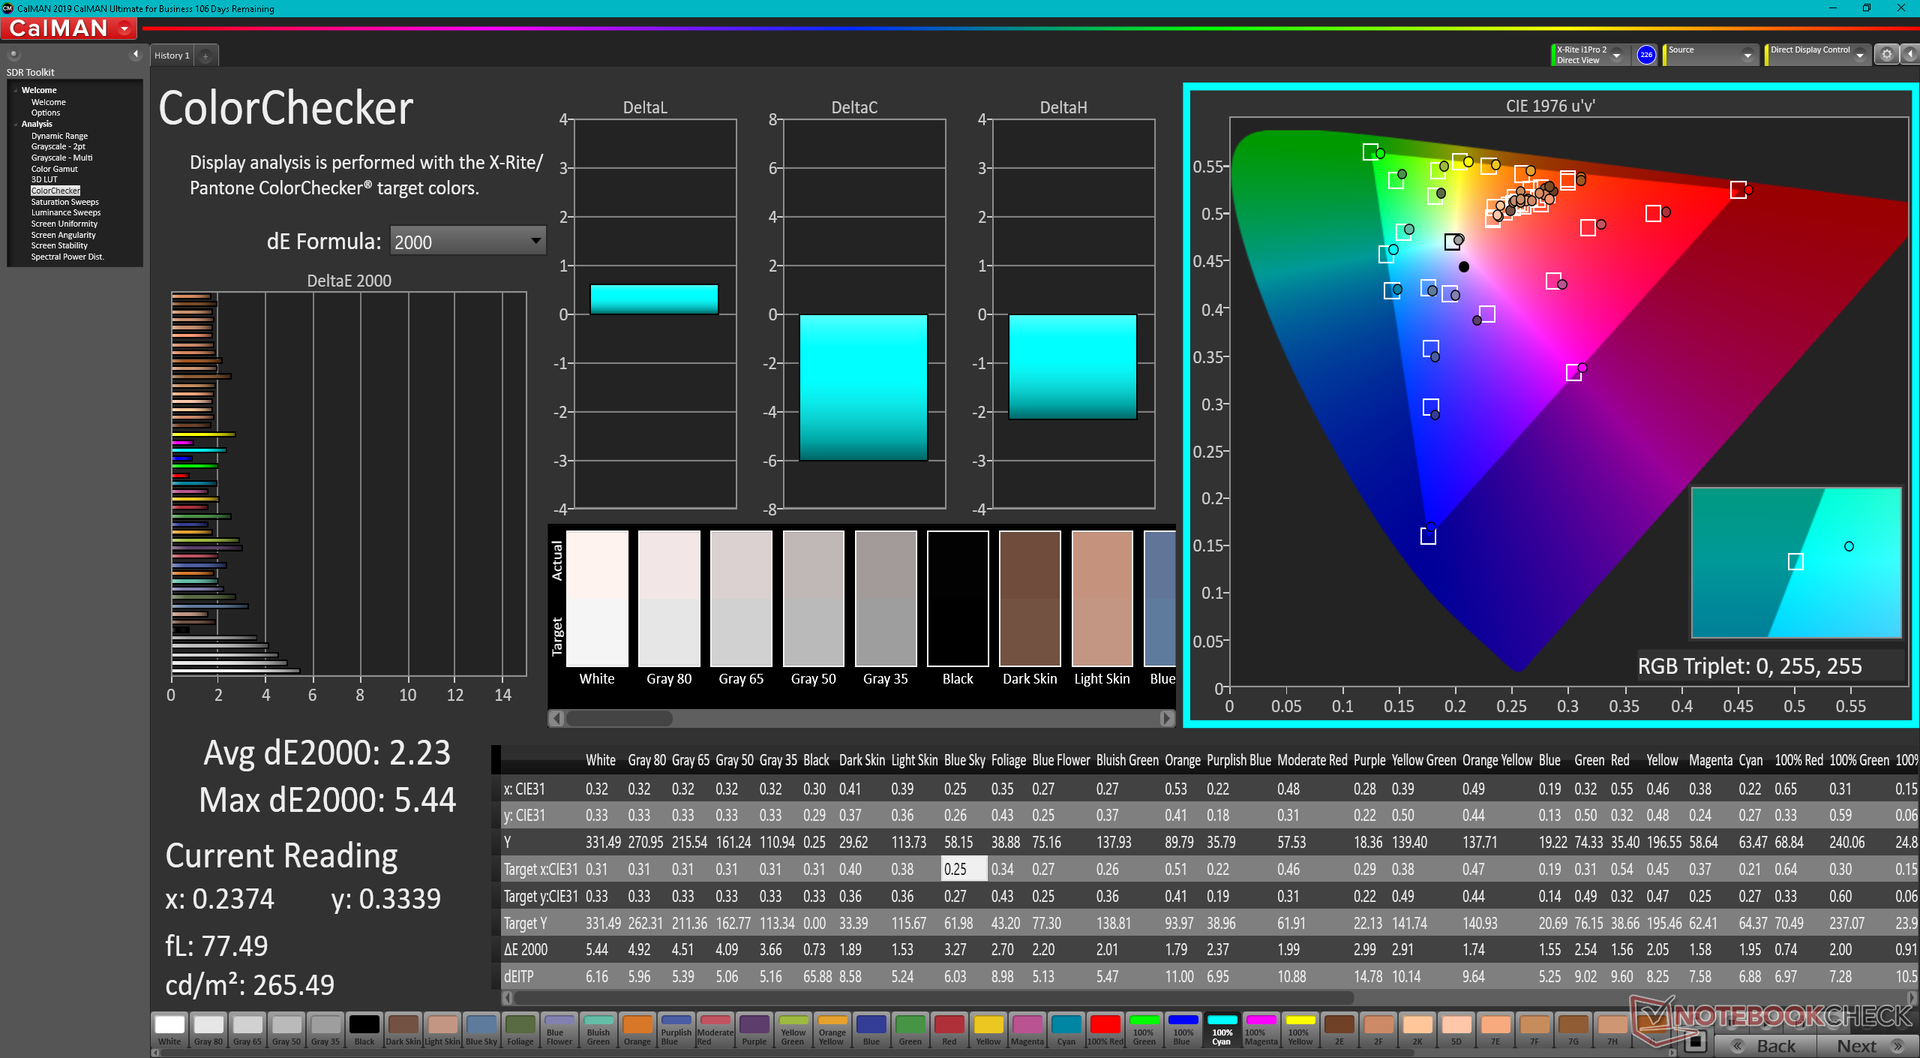
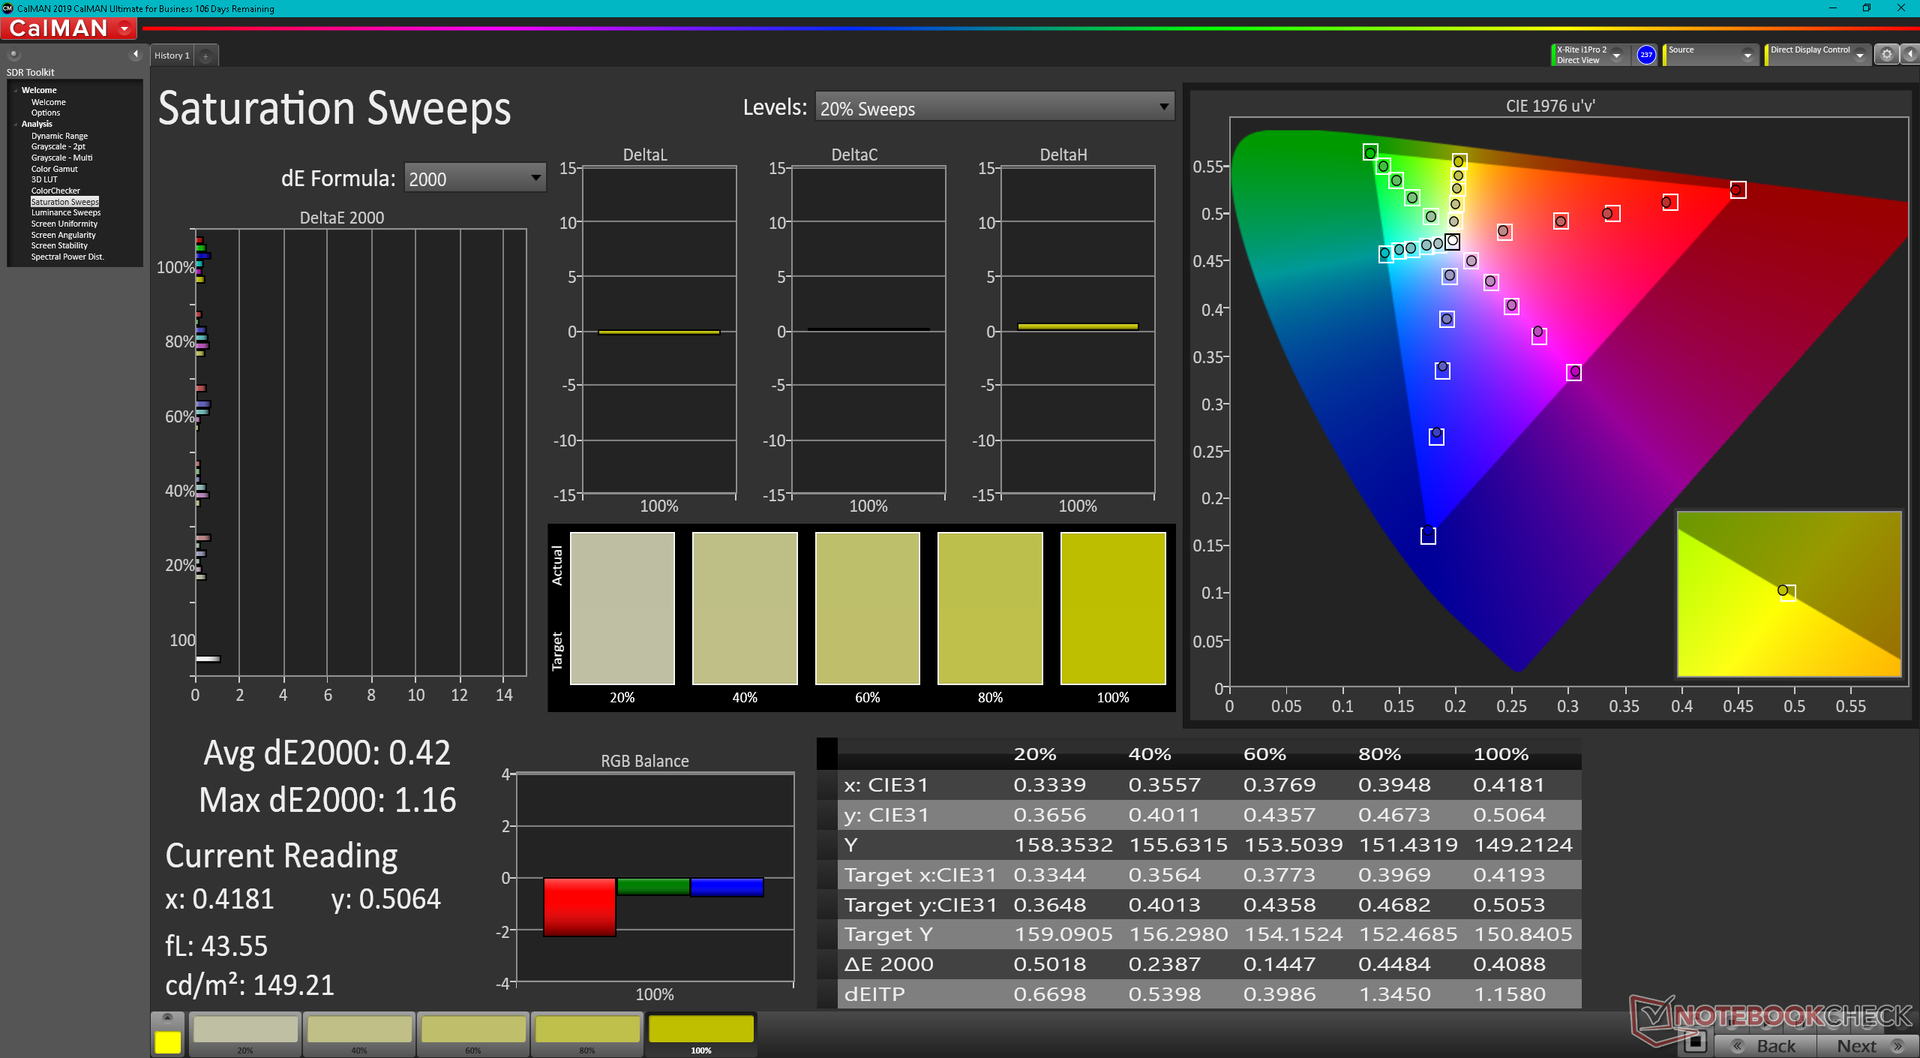
Während andere 14-Zoll-Laptops typischerweise auf 1200p-, 1800p- oder 2160p-Auflösungen setzen, überrascht das Inspiron 14 Plus 7420 mit einer eher untypischen 2.2K-Auflösung oder 2.240 x 1.400 Pixel. Alle anderen Kernwerte stimmen aber auch, inklusive der vollständigen sRGB-Abdeckung, einem Kontrastverhältnis von 1000:1 sowie ordentlichen Reaktionszeiten in dieser Größenklasse. Es ist wirklich schade, dass es keine OLED- oder Hochglanz-Alternativen angeboten werden, welche nochmals schärfere Farben bieten würden.
| |||||||||||||||||||||||||
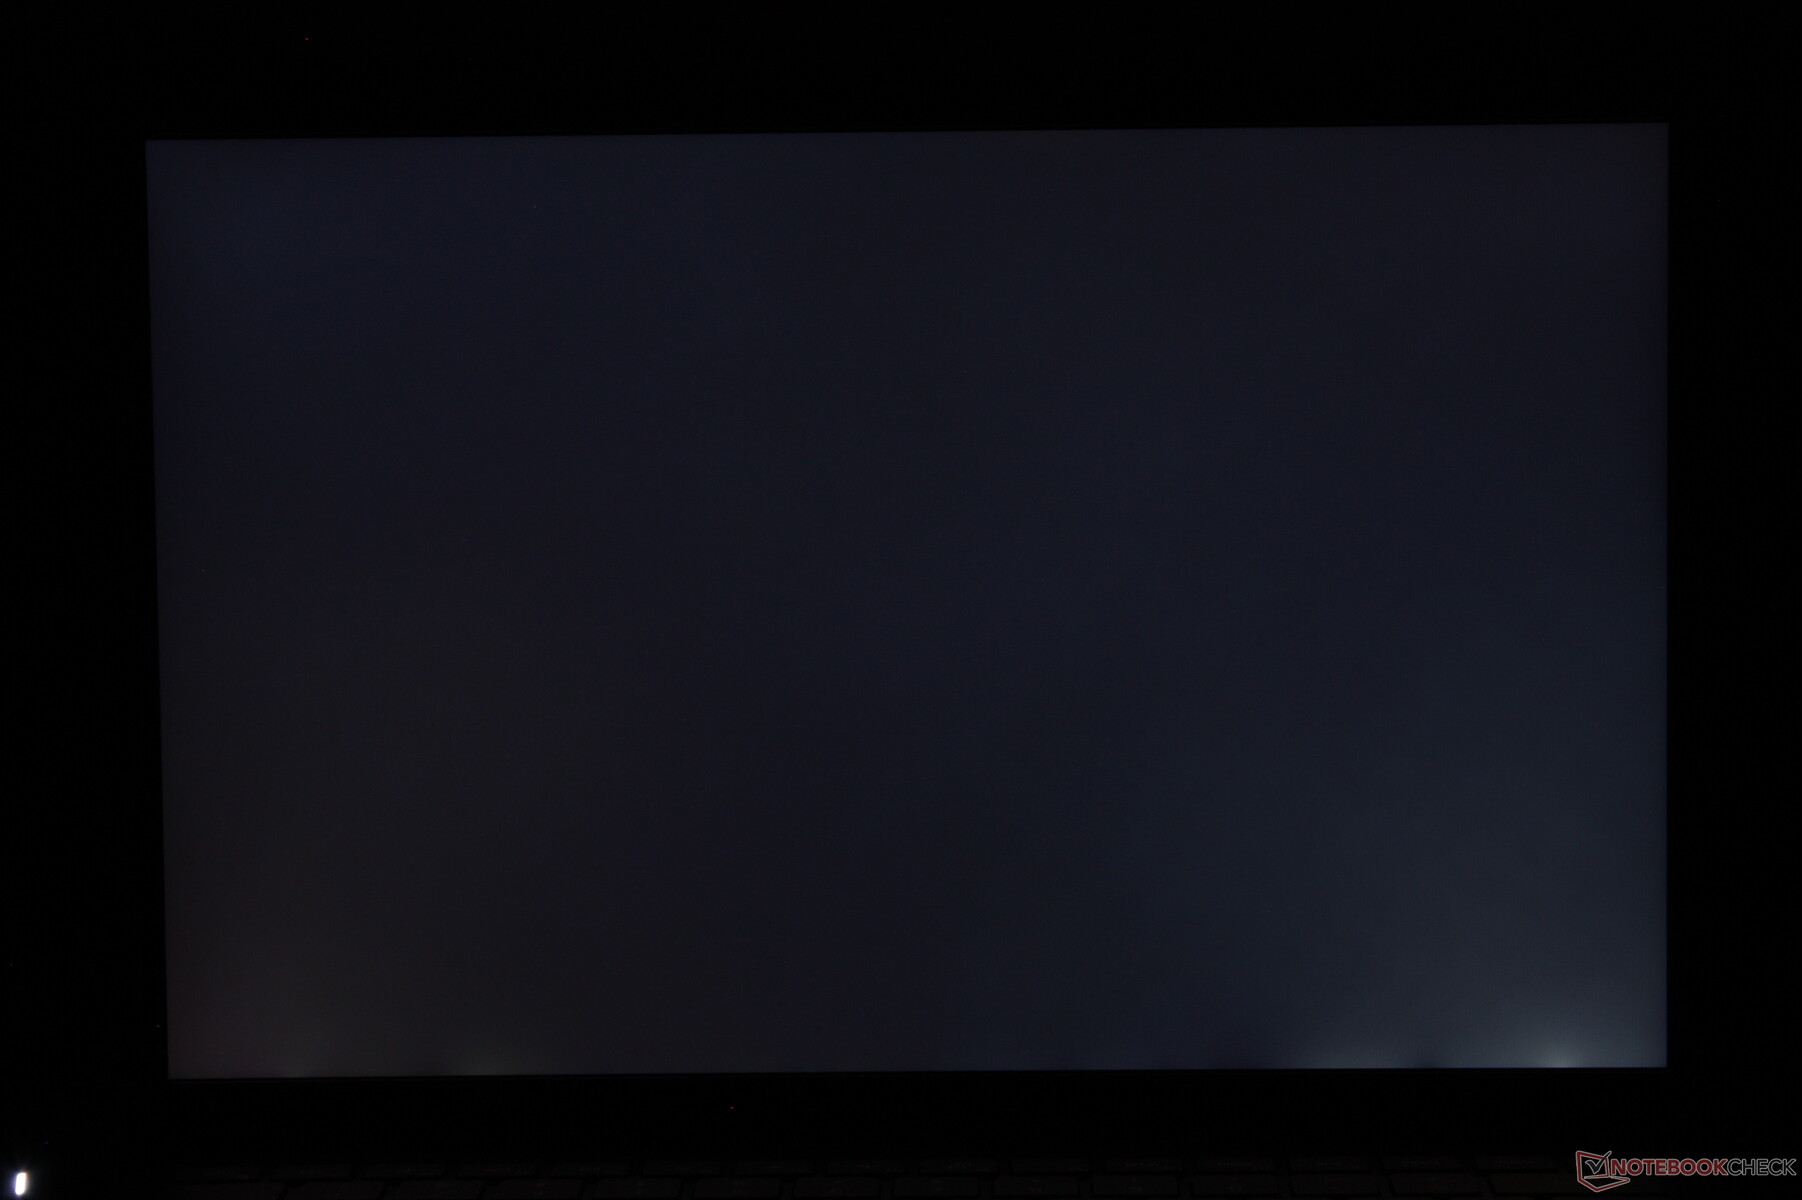
Ausleuchtung: 85 %
Helligkeit Akku: 331.1 cd/m²
Kontrast: 1142:1 (Schwarzwert: 0.29 cd/m²)
ΔE ColorChecker Calman: 2.23 | ∀{0.5-29.43 Ø4.73}
calibrated: 0.63
ΔE Greyscale Calman: 3.6 | ∀{0.09-98 Ø4.97}
69.5% AdobeRGB 1998 (Argyll 3D)
99.3% sRGB (Argyll 3D)
68.8% Display P3 (Argyll 3D)
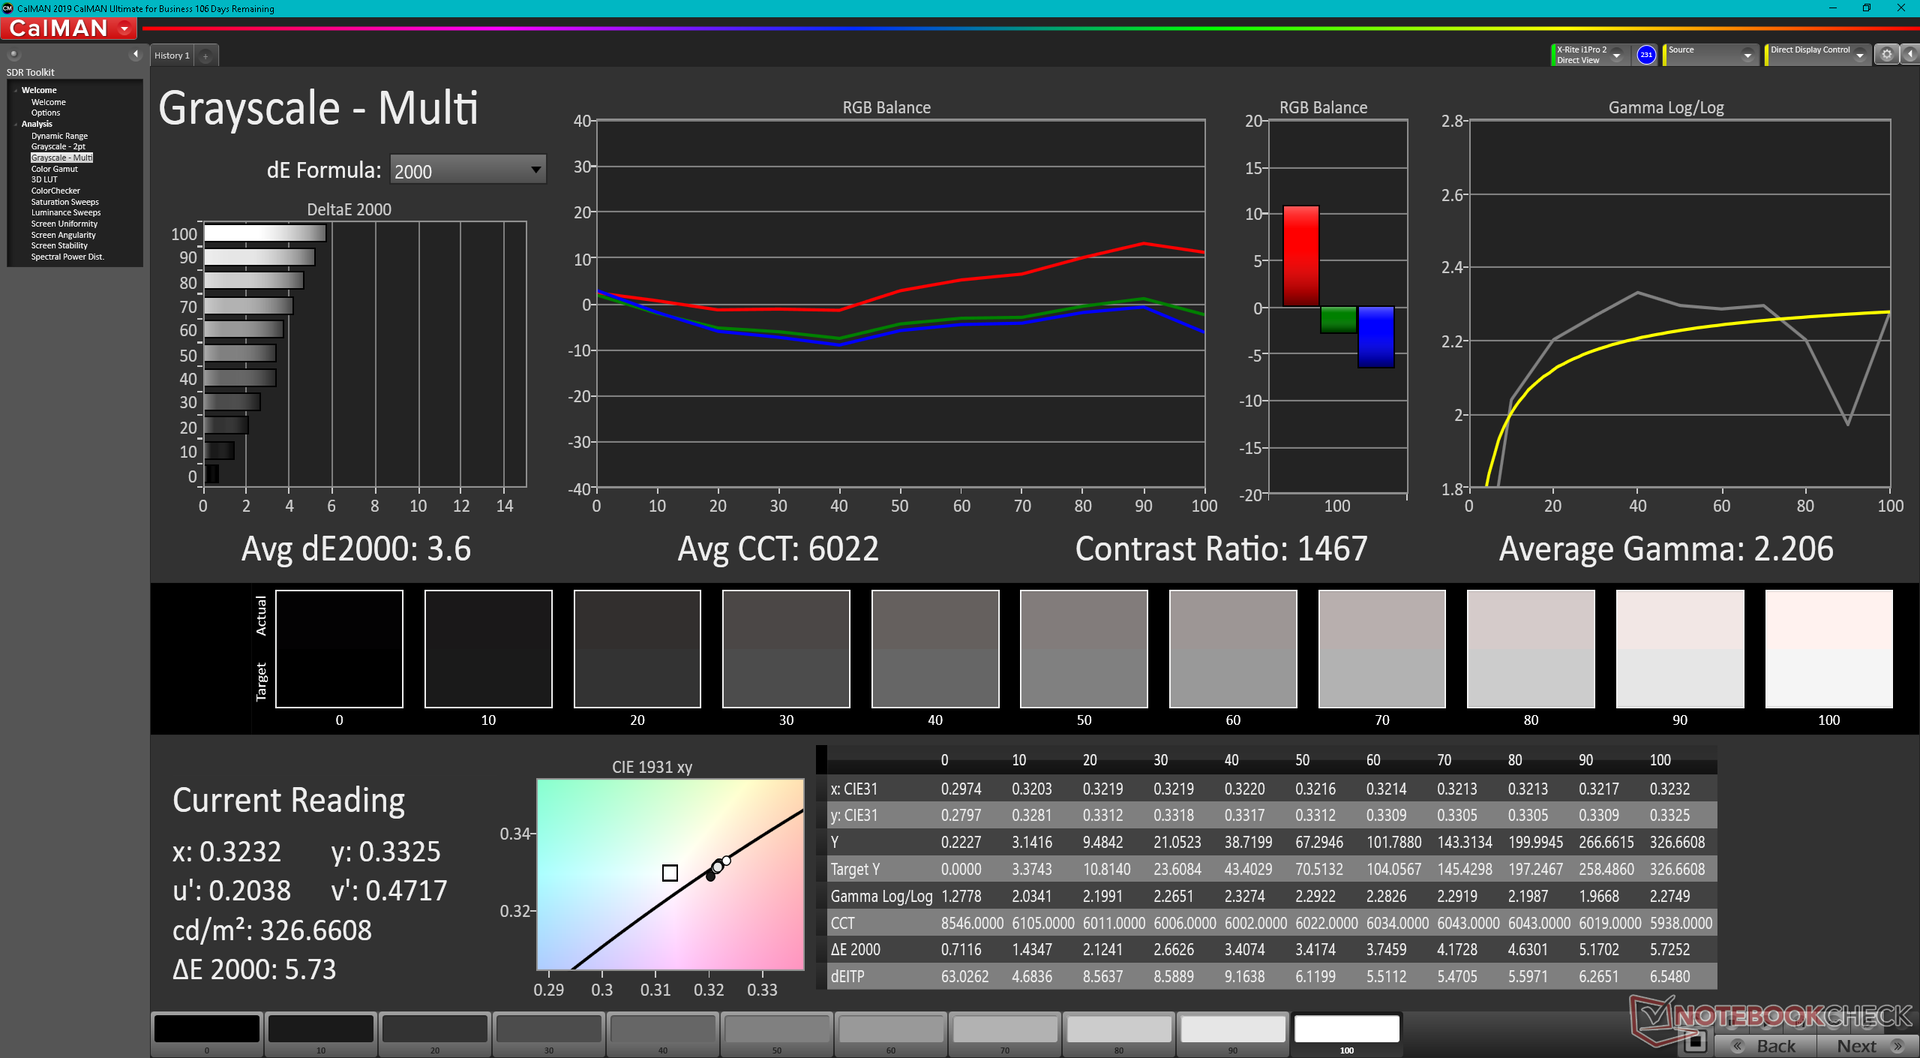
Gamma: 2.21
CCT: 6022 K
| Dell Inspiron 14 Plus 7420 InfoVision 140NWHE, IPS, 2240x1400, 14" | Asus Vivobook Pro 14 M3401QC-KM007T SAMSUNG: SDC4171, OLED, 2880x1800, 14" | Dell Inspiron 14 7420 2-in-1 BOE NV14N42, IPS, 1920x1200, 14" | Schenker Vision 14 MNE007ZA1, IPS, 2880x1800, 14" | Asus Zenbook 14X UX5400E Samsung SDC4154, OLED, 2880x1800, 14" | MSI Summit E14 A11SCS AU Optronics AUO123B, IPS, 3840x2160, 14" | HP Envy 14-eb0010nr AU Optronics AUOF392, IPS, 1920x1200, 14" | |
|---|---|---|---|---|---|---|---|
| Display | 27% | -43% | 5% | 28% | 24% | 8% | |
| Display P3 Coverage (%) | 68.8 | 99.41 44% | 38.6 -44% | 74.3 8% | 100 45% | 87.5 27% | 77.1 12% |
| sRGB Coverage (%) | 99.3 | 99.94 1% | 56.2 -43% | 97.6 -2% | 100 1% | 100 1% | 99.8 1% |
| AdobeRGB 1998 Coverage (%) | 69.5 | 94.79 36% | 39.9 -43% | 75.7 9% | 96 38% | 99.4 43% | 76.7 10% |
| Response Times | 89% | 13% | -2% | 93% | -47% | -95% | |
| Response Time Grey 50% / Grey 80% * (ms) | 32.8 ? | 3 ? 91% | 27.2 ? 17% | 40.4 ? -23% | 2 ? 94% | 52 ? -59% | 61.2 ? -87% |
| Response Time Black / White * (ms) | 22.8 ? | 3 ? 87% | 20.8 ? 9% | 18.4 ? 19% | 2 ? 91% | 30.8 ? -35% | 46 ? -102% |
| PWM Frequency (Hz) | 360 | ||||||
| Bildschirm | 41% | -113% | -8% | 13% | -70% | -8% | |
| Helligkeit Bildmitte (cd/m²) | 331.1 | 384 16% | 269.4 -19% | 407 23% | 379 14% | 593.3 79% | 412 24% |
| Brightness (cd/m²) | 326 | 385 18% | 260 -20% | 407 25% | 381 17% | 571 75% | 392 20% |
| Brightness Distribution (%) | 85 | 98 15% | 89 5% | 94 11% | 93 9% | 87 2% | 81 -5% |
| Schwarzwert * (cd/m²) | 0.29 | 0.07 76% | 0.41 -41% | 0.25 14% | 0.1 66% | 0.53 -83% | 0.32 -10% |
| Kontrast (:1) | 1142 | 5486 380% | 657 -42% | 1628 43% | 3790 232% | 1119 -2% | 1288 13% |
| Delta E Colorchecker * | 2.23 | 1.75 22% | 6.53 -193% | 2.6 -17% | 2.3 -3% | 4.42 -98% | 1.88 16% |
| Colorchecker dE 2000 max. * | 5.44 | 3.41 37% | 19.76 -263% | 4.4 19% | 4.16 24% | 7.16 -32% | 3.06 44% |
| Colorchecker dE 2000 calibrated * | 0.63 | 2.32 -268% | 3.13 -397% | 2 -217% | 2.42 -284% | 4.3 -583% | 1.96 -211% |
| Delta E Graustufen * | 3.6 | 1.06 71% | 5.4 -50% | 2.7 25% | 2.12 41% | 3.2 11% | 2.2 39% |
| Gamma | 2.21 100% | 2.39 92% | 2.05 107% | 2.18 101% | 2.42 91% | 2.04 108% | 2.1 105% |
| CCT | 6022 108% | 6440 101% | 6007 108% | 6316 103% | 6737 96% | 6650 98% | |
| Farbraum (Prozent von AdobeRGB 1998) (%) | 68.7 | ||||||
| Color Space (Percent of sRGB) (%) | 99.8 | ||||||
| Durchschnitt gesamt (Programm / Settings) | 52% /
45% | -48% /
-80% | -2% /
-5% | 45% /
28% | -31% /
-47% | -32% /
-17% |
* ... kleinere Werte sind besser
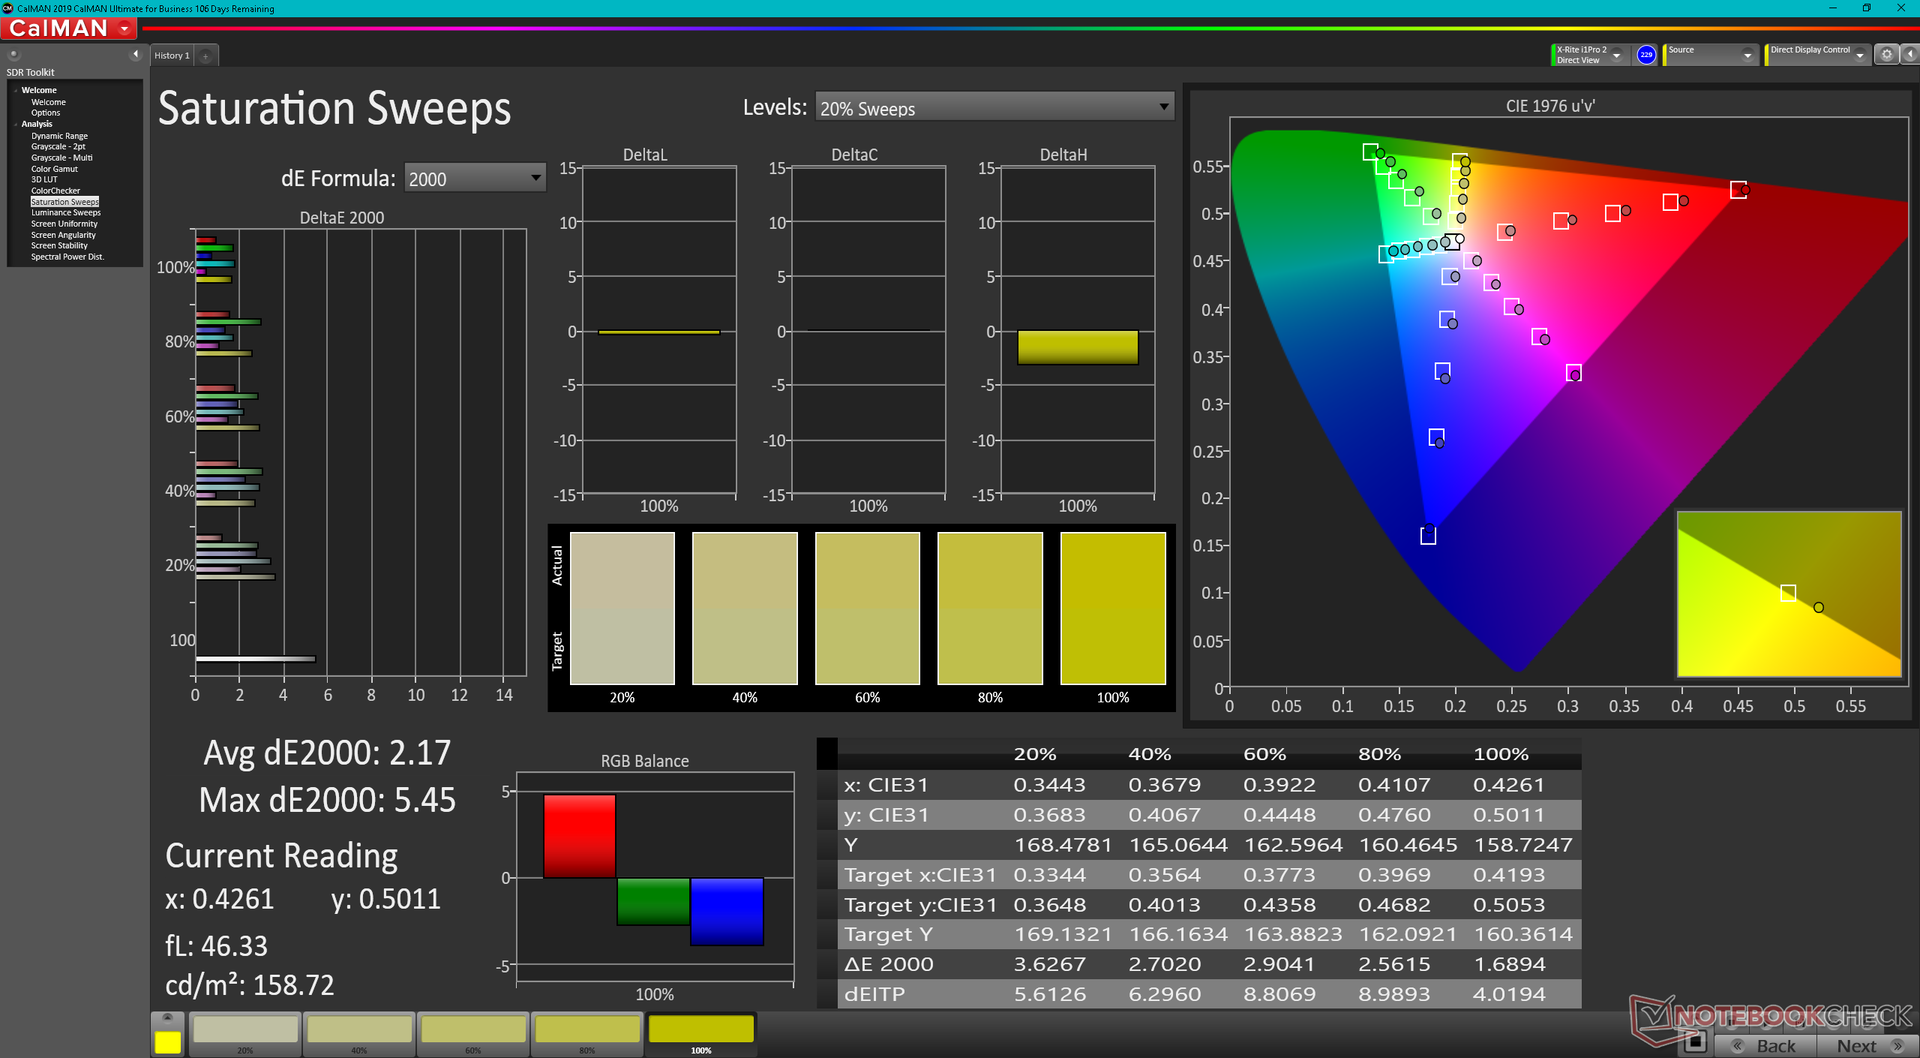
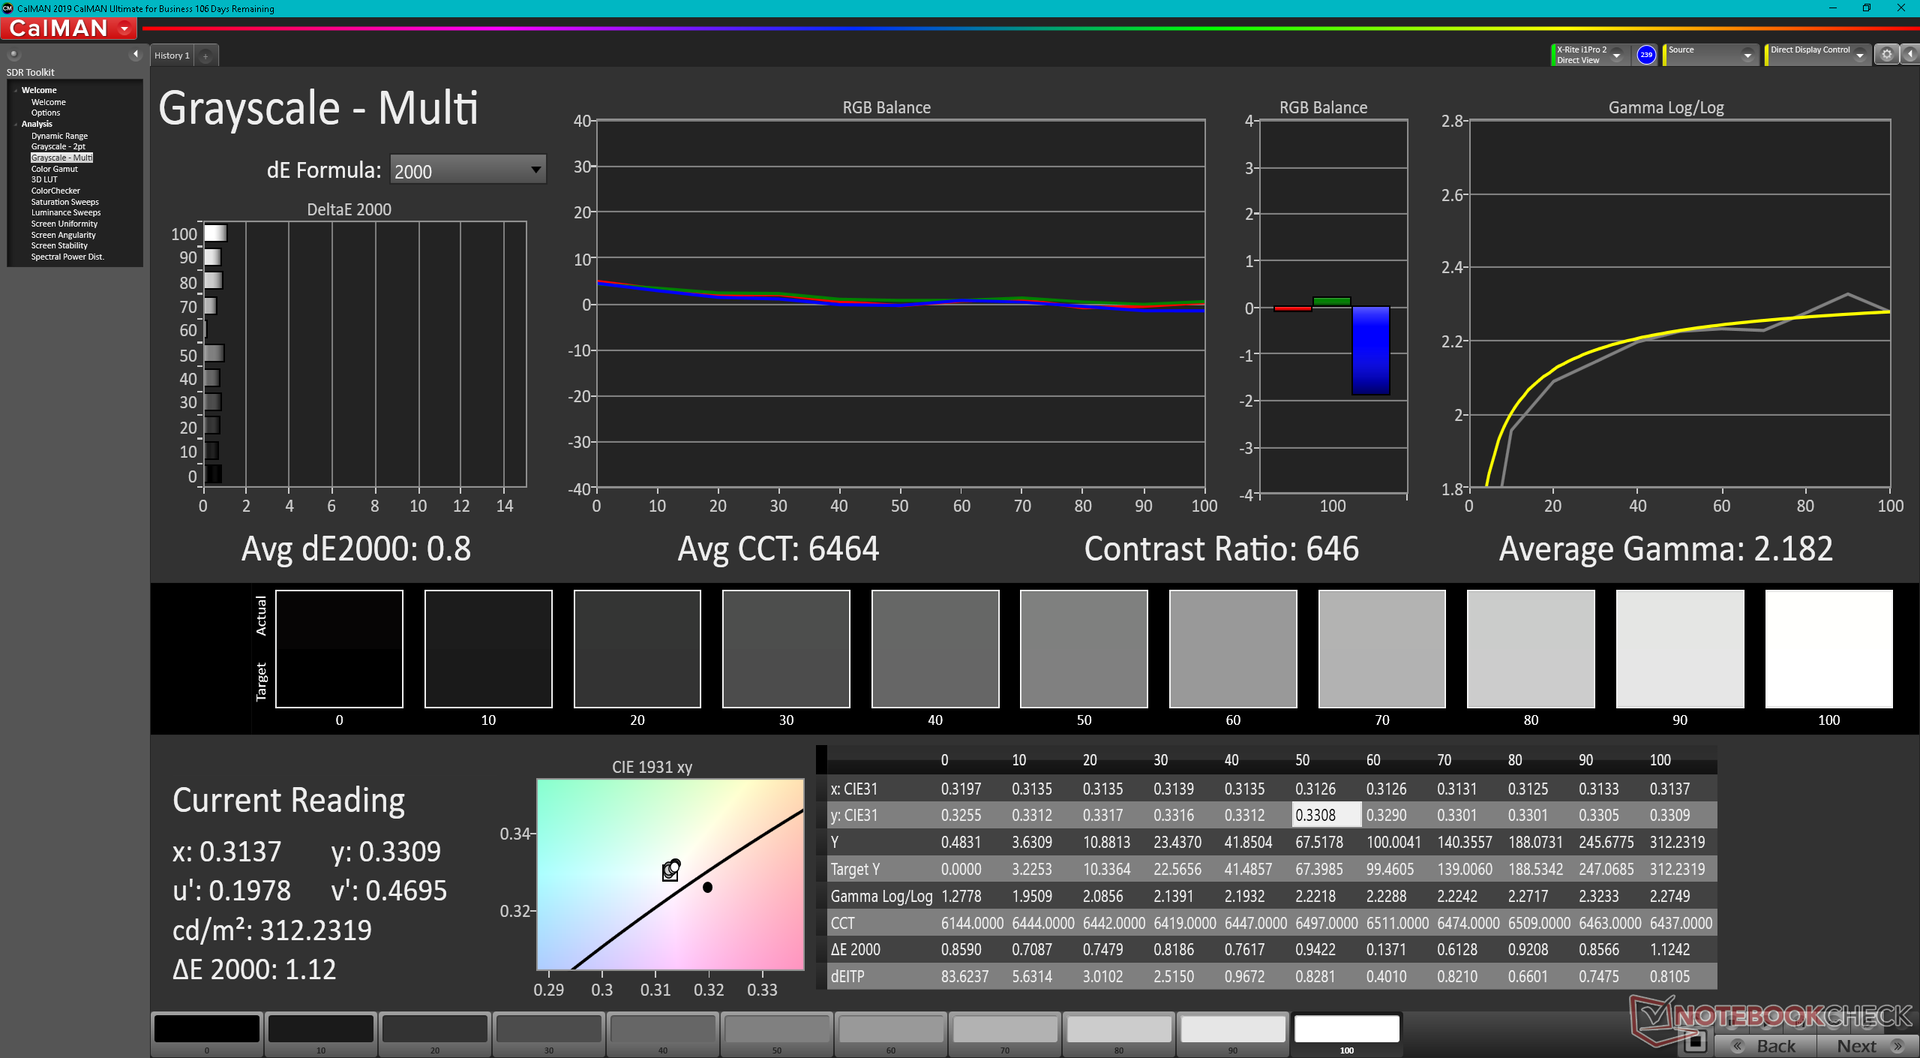
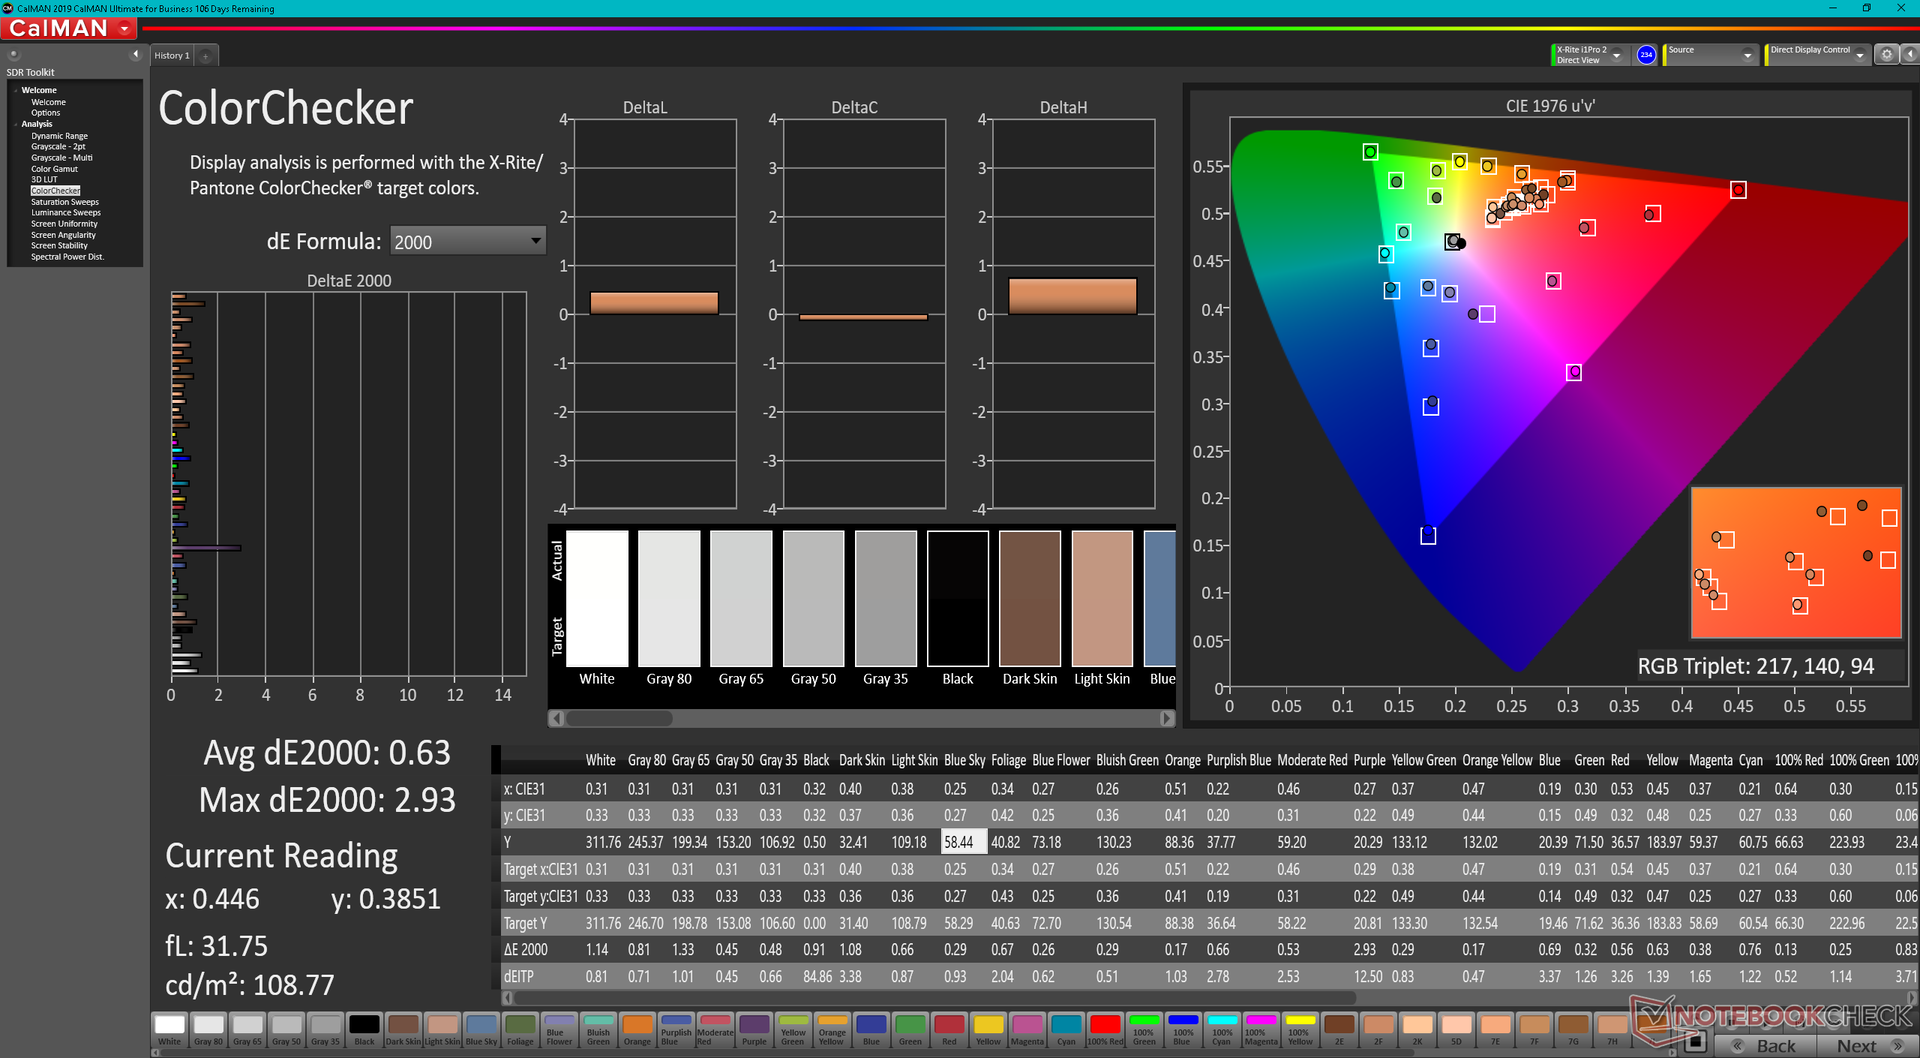
Ab Werk ist das Display nicht kalibriert, sodass die Farben weniger genau sind als möglich. Die Farbtemperatur fällt mit 6000 K zu warm aus, der sRGB-Standard zielt eher auf 6500 K ab. Nach einer ordentlichen Kalibrierung mittels unseres X-Rite-Farbmessgerätes verbessern sich die durchschnittlichen Graustufen- und DeltaE-Werte von 3,6 und 2,23 auf nur noch 0,8 und 0,63. Um die 100 Prozent sRGB-Abdeckung wirklich auszureizen empfehlen wir unbedingt eine Kalibrierung durch den Nutzer.
Reaktionszeiten (Response Times) des Displays
| ↔ Reaktionszeiten Schwarz zu Weiß | ||
|---|---|---|
| 22.8 ms ... steigend ↗ und fallend ↘ kombiniert | ↗ 12 ms steigend | 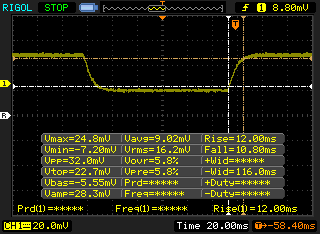 |
| ↘ 10.8 ms fallend | ||
| Die gemessenen Reaktionszeiten sind gut, für anspruchsvolle Spieler könnten der Bildschirm jedoch zu langsam sein. Im Vergleich rangierten die bei uns getesteten Geräte von 0.1 (Minimum) zu 240 (Maximum) ms. » 51 % aller Screens waren schneller als der getestete. Daher sind die gemessenen Reaktionszeiten schlechter als der Durchschnitt aller vermessenen Geräte (19.9 ms). | ||
| ↔ Reaktionszeiten 50% Grau zu 80% Grau | ||
| 32.8 ms ... steigend ↗ und fallend ↘ kombiniert | ↗ 16 ms steigend | 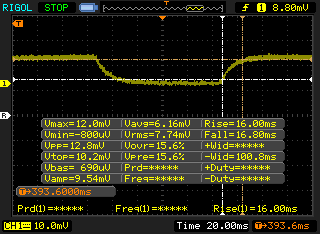 |
| ↘ 16.8 ms fallend | ||
| Die gemessenen Reaktionszeiten sind langsam und dadurch für viele Spieler wahrscheinlich zu langsam. Im Vergleich rangierten die bei uns getesteten Geräte von 0.165 (Minimum) zu 636 (Maximum) ms. » 44 % aller Screens waren schneller als der getestete. Daher sind die gemessenen Reaktionszeiten durchschnittlich (31.1 ms). | ||
Bildschirm-Flackern / PWM (Pulse-Width Modulation)
| Flackern / PWM nicht festgestellt | 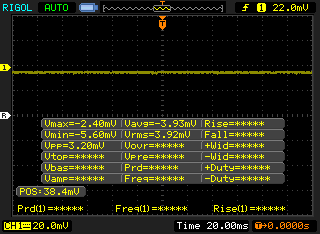 | ||
Im Vergleich: 52 % aller getesteten Geräte nutzten kein PWM um die Helligkeit zu reduzieren. Wenn PWM eingesetzt wurde, dann bei einer Frequenz von durchschnittlich 7798 (Minimum 5, Maximum 343500) Hz. | |||
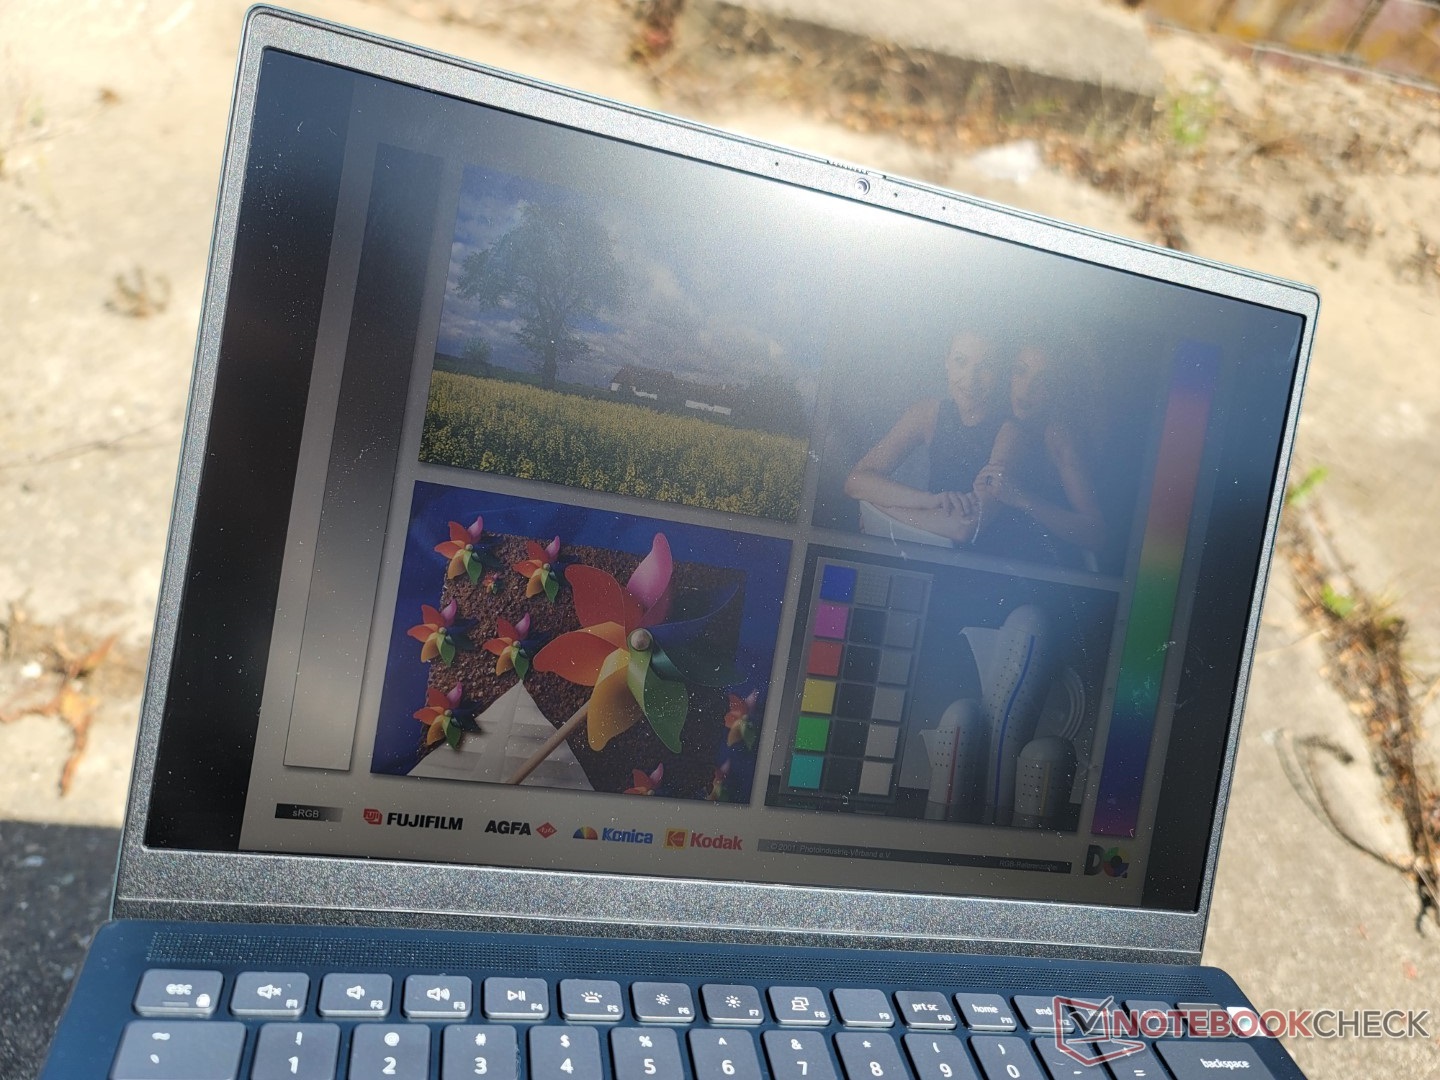
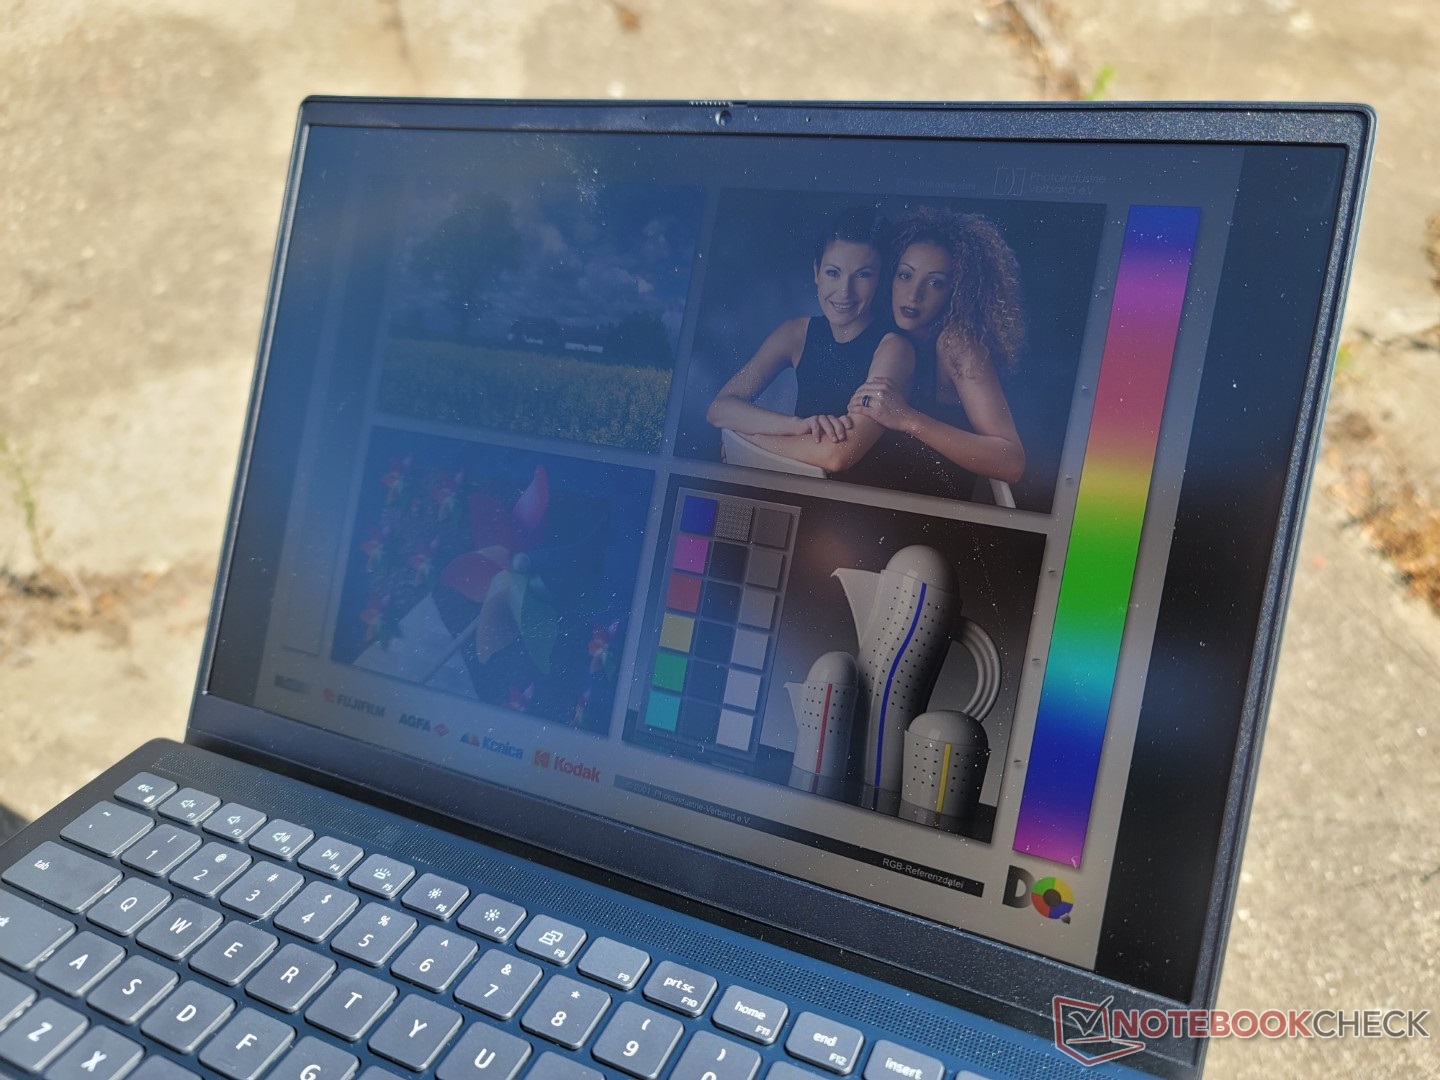
Im Freien ist die Sichtbarkeit eher enttäuschend, was an der Helligkeit von maximal 300 Nits liegt. Daher sollte man draußen eher im Schatten arbeiten, auch weil die Anzeige unter helleren Lichtbedingungen schnell ausgewaschen wirkt. Das MSI Summit E14 bietet hier einen deutlich helleren Bildschirm und hat ebenfalls Optionen für eine dedizierte GPU.
Leistung — Aufgeladener 14-Zoller
Testbedingungen
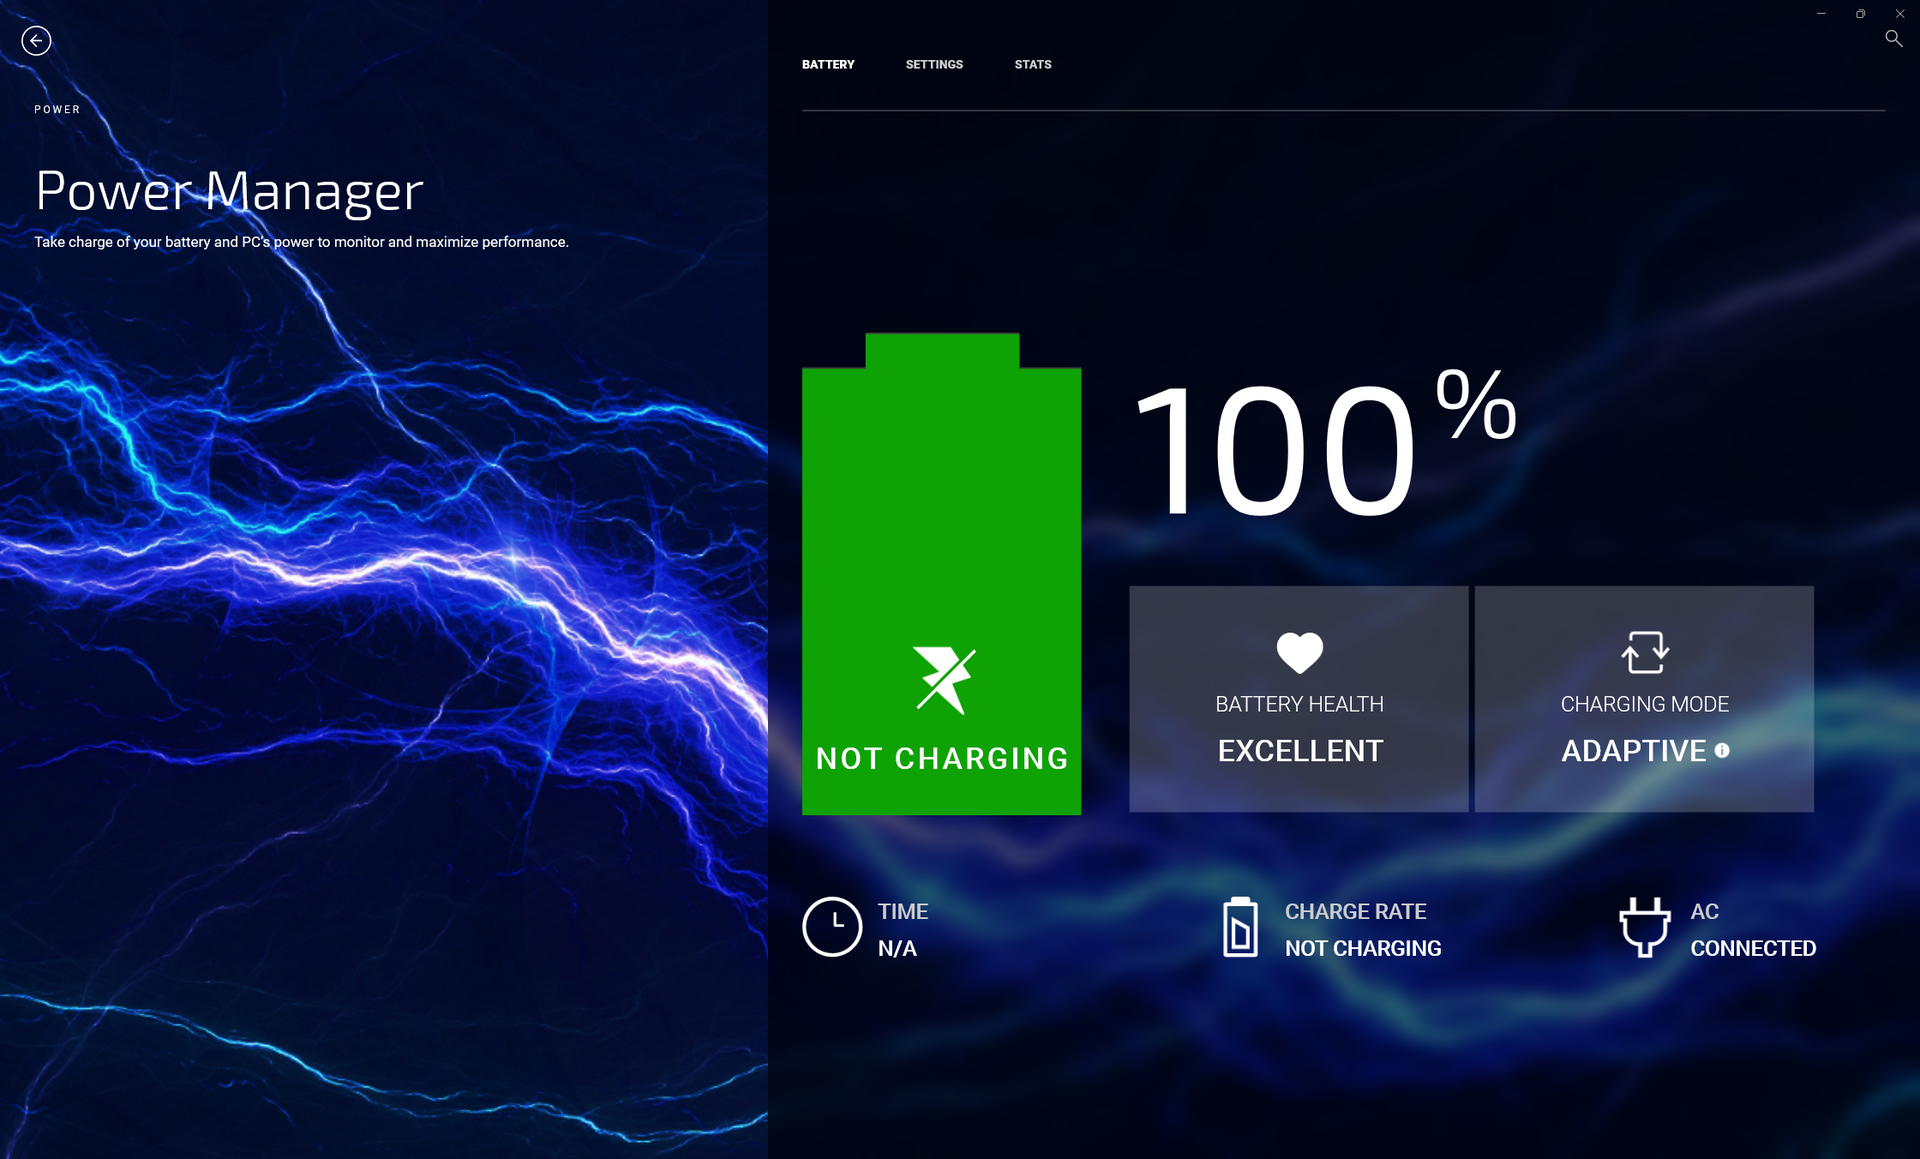
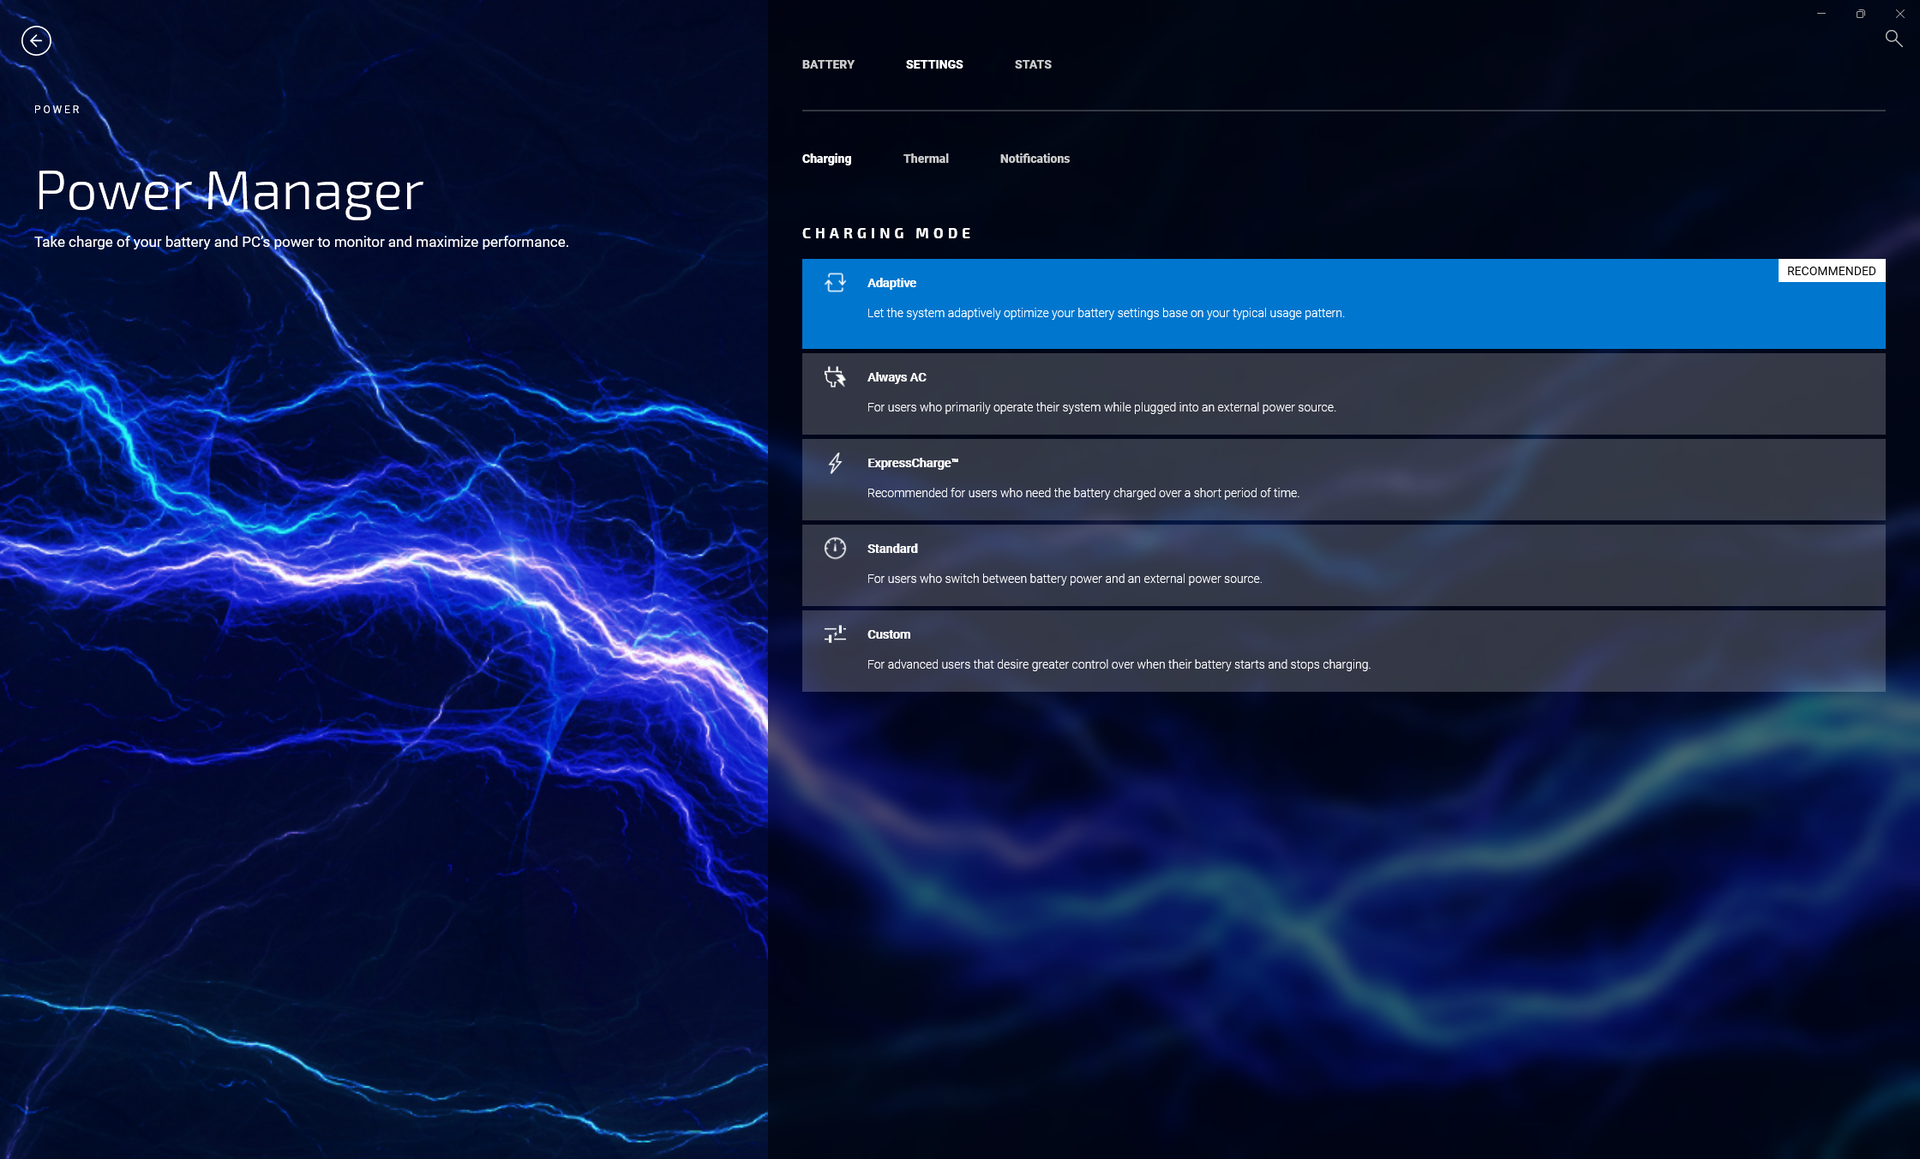
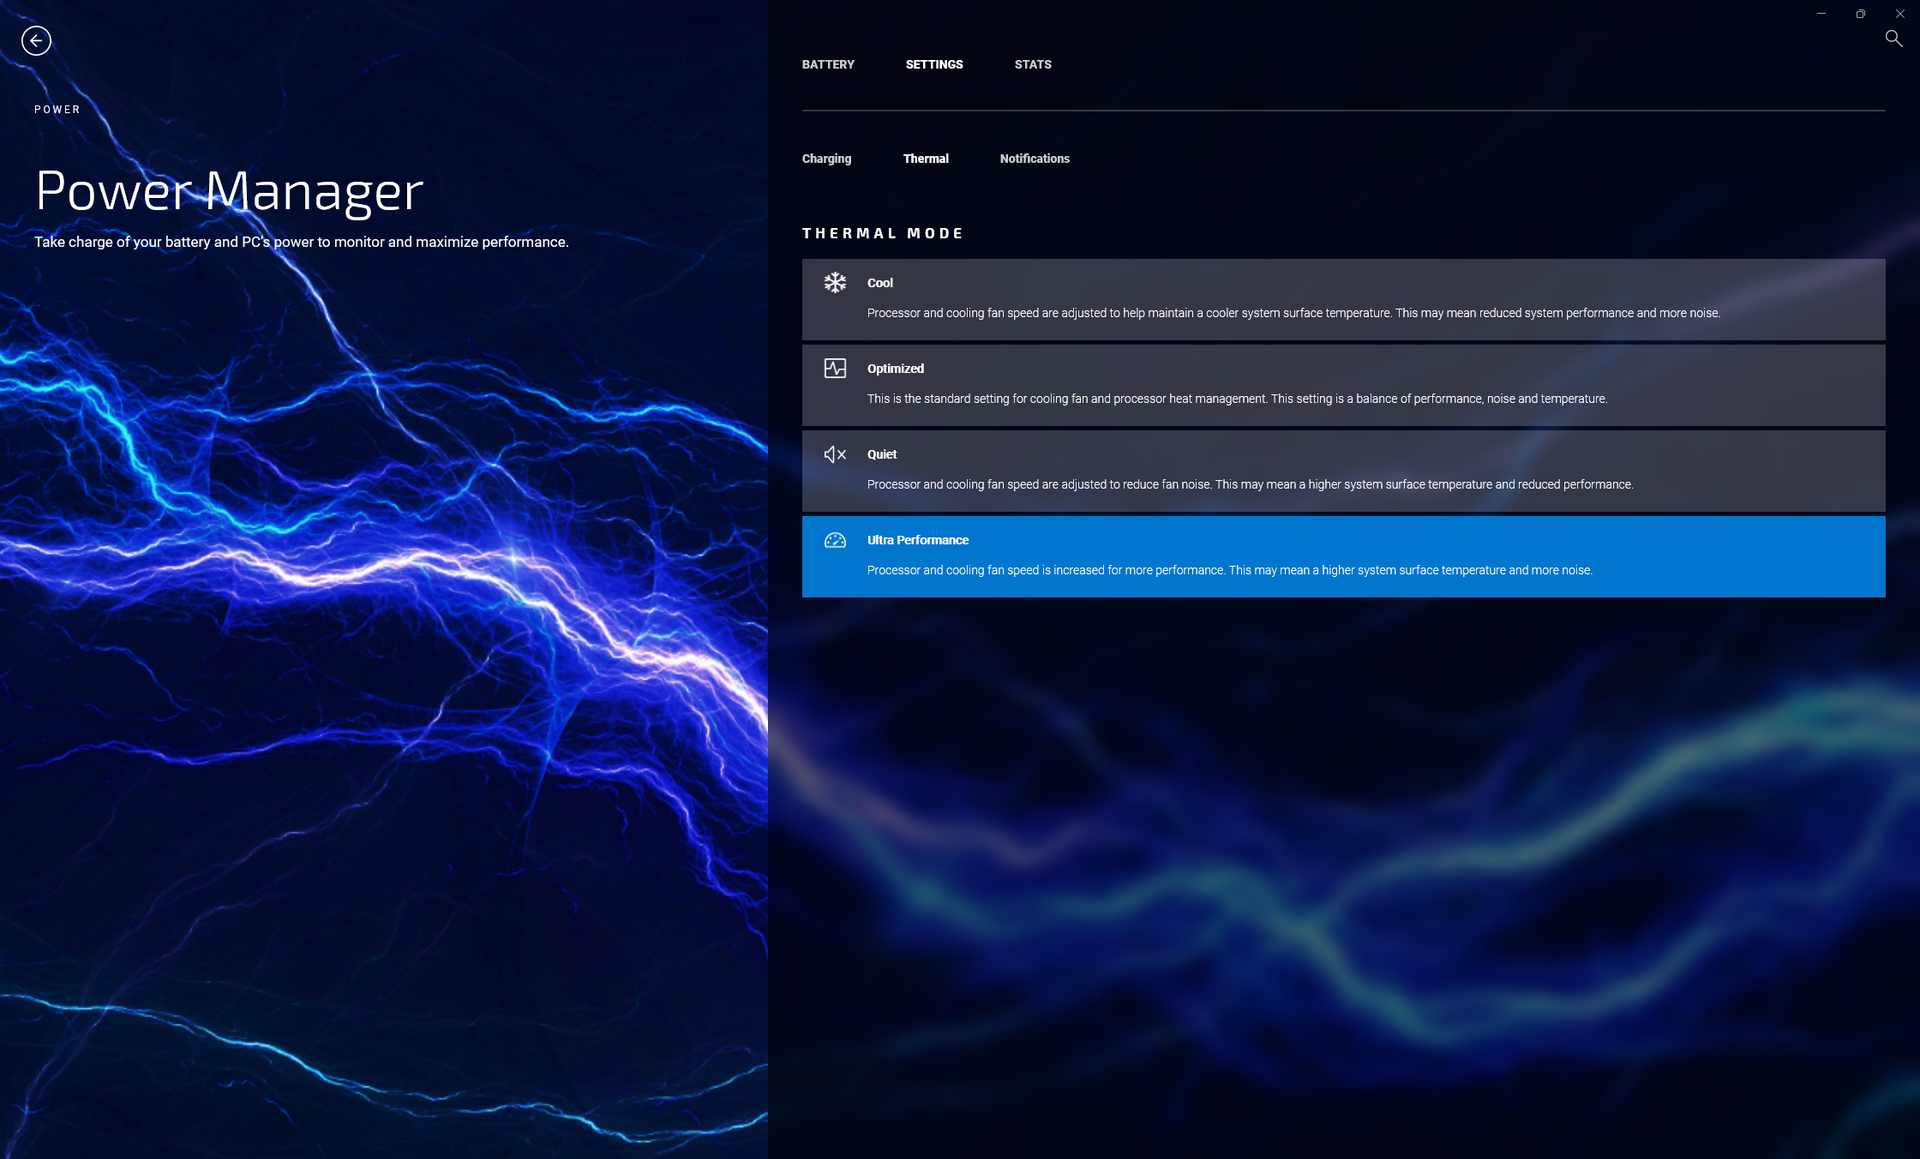
Vor unseren Benchmarks haben wir das Gerät über die Software My Dell in den Hochleistungsmodus versetzt. Wir empfehlen den Nutzern sich mit My Dell auseinanderzusetzen, da es das Portal zum Garantiesupport, dem Ladeverhalten des Akkus, der Systemleistung und mehr darstellt (siehe Screenshots).
Per Standard-Optimus lässt sich zwischen der integrierten und der dedizierten GeForce RTX 3050 wechseln. Advanced Optimus, MUX und WhisperMode werden nicht unterstützt.
Prozessor
Die CPU-Leistung kann man sowohl aus der "das Glas ist halb voll"- als auch der "das Glas ist halb leer"-Perspektive betrachten. Pessimistisch gesehen ist der Core i7-12700H mit 45 W im Dell eher enttäuschend, liegt seine Multi-Thread-Leistung doch etwa 10 Prozent unterhalb der anderer Laptops mit dem gleichen Prozessor. Optimistisch gesehen aber ist das Dell signifikant schneller als die meisten anderen 14-Zoll-Laptops, in denen 15-W-, 25-W- oder 35-W-CPUs vorherrschen. Und so ist das Inspiron 14 Plus einer der kleineren Laptops, welche man mit einem Core i7-12700H bekommen kann, mit der Kehrseite, dass sein Turbo Boost spürbar limitierter ist als bei größeren Laptops mit der gleichen CPU. Immerhin findet man den Core i7-12700H sonst häufig auch in vollwertigen Gaming-Laptops. Beispielsweise kommt das 16 Zoll große Lenovo Legion Slim 7 mit der gleichen CPU auf eine etwa 30 Prozent höhere Leistung als unser Inspiron 14 Plus.
Die eingeschränkte Turbo-Boost-Leistung zeigt sich ganz gut im CineBench-R15-xT-Loop: Wie man gut am Graph weiter unten erkennen kann, fiel der Score von 2.410 Punkten im ersten Durchgang um ganze 21 Prozent nach nur drei oder vier Durchläufen - ein mehr als signifikanter Leistungsverlust.
Cinebench R15 Multi Loop
Cinebench R23: Multi Core | Single Core
Cinebench R15: CPU Multi 64Bit | CPU Single 64Bit
Blender: v2.79 BMW27 CPU
7-Zip 18.03: 7z b 4 | 7z b 4 -mmt1
Geekbench 5.5: Multi-Core | Single-Core
HWBOT x265 Benchmark v2.2: 4k Preset
LibreOffice : 20 Documents To PDF
R Benchmark 2.5: Overall mean
| Cinebench R20 / CPU (Single Core) | |
| Asus ROG Flow Z13 GZ301ZE | |
| Razer Blade 15 2022 | |
| Dell Inspiron 14 7420 2-in-1 | |
| Dell Inspiron 14 Plus 7420 | |
| Durchschnittliche Intel Core i7-12700H (300 - 704, n=64) | |
| Schenker Vision 14 | |
| MSI Summit E14 A11SCS | |
| Lenovo Yoga Slim 7 Pro 14 OLED Ryzen 9 | |
| Asus Zenbook 14X UX5400E | |
| Asus ZenBook 14X UM5401QA-KN162 | |
| Asus Vivobook Pro 14 M3401QC-KM007T | |
| HP Envy 14-eb0010nr | |
| HWBOT x265 Benchmark v2.2 / 4k Preset | |
| Asus ROG Flow Z13 GZ301ZE | |
| Razer Blade 15 2022 | |
| Durchschnittliche Intel Core i7-12700H (4.67 - 21.8, n=64) | |
| Dell Inspiron 14 Plus 7420 | |
| Asus ZenBook 14X UM5401QA-KN162 | |
| Lenovo Yoga Slim 7 Pro 14 OLED Ryzen 9 | |
| Asus Vivobook Pro 14 M3401QC-KM007T | |
| Schenker Vision 14 | |
| Dell Inspiron 14 7420 2-in-1 | |
| HP Envy 14-eb0010nr | |
| Asus Zenbook 14X UX5400E | |
| MSI Summit E14 A11SCS | |
* ... kleinere Werte sind besser
AIDA64: FP32 Ray-Trace | FPU Julia | CPU SHA3 | CPU Queen | FPU SinJulia | FPU Mandel | CPU AES | CPU ZLib | FP64 Ray-Trace | CPU PhotoWorxx
| Performance Rating | |
| Durchschnittliche Intel Core i7-12700H | |
| Dell Inspiron 14 Plus 7420 | |
| Asus Vivobook Pro 14 M3401QC-KM007T | |
| Schenker Vision 14 | |
| Asus Zenbook 14X UX5400E | |
| MSI Summit E14 A11SCS | |
| Dell Inspiron 14 7420 2-in-1 | |
| AIDA64 / FP32 Ray-Trace | |
| Dell Inspiron 14 Plus 7420 | |
| Durchschnittliche Intel Core i7-12700H (2585 - 17957, n=64) | |
| Asus Vivobook Pro 14 M3401QC-KM007T | |
| Schenker Vision 14 | |
| Asus Zenbook 14X UX5400E | |
| MSI Summit E14 A11SCS | |
| Dell Inspiron 14 7420 2-in-1 | |
| AIDA64 / FPU Julia | |
| Asus Vivobook Pro 14 M3401QC-KM007T | |
| Dell Inspiron 14 Plus 7420 | |
| Durchschnittliche Intel Core i7-12700H (12439 - 90760, n=64) | |
| Schenker Vision 14 | |
| Asus Zenbook 14X UX5400E | |
| MSI Summit E14 A11SCS | |
| Dell Inspiron 14 7420 2-in-1 | |
| AIDA64 / CPU SHA3 | |
| Durchschnittliche Intel Core i7-12700H (833 - 4242, n=64) | |
| Dell Inspiron 14 Plus 7420 | |
| Schenker Vision 14 | |
| Asus Vivobook Pro 14 M3401QC-KM007T | |
| Asus Zenbook 14X UX5400E | |
| MSI Summit E14 A11SCS | |
| Dell Inspiron 14 7420 2-in-1 | |
| AIDA64 / CPU Queen | |
| Durchschnittliche Intel Core i7-12700H (57923 - 103202, n=63) | |
| Dell Inspiron 14 Plus 7420 | |
| Asus Vivobook Pro 14 M3401QC-KM007T | |
| Dell Inspiron 14 7420 2-in-1 | |
| Schenker Vision 14 | |
| Asus Zenbook 14X UX5400E | |
| MSI Summit E14 A11SCS | |
| AIDA64 / FPU SinJulia | |
| Durchschnittliche Intel Core i7-12700H (3249 - 9939, n=64) | |
| Asus Vivobook Pro 14 M3401QC-KM007T | |
| Dell Inspiron 14 Plus 7420 | |
| Schenker Vision 14 | |
| Asus Zenbook 14X UX5400E | |
| MSI Summit E14 A11SCS | |
| Dell Inspiron 14 7420 2-in-1 | |
| AIDA64 / FPU Mandel | |
| Asus Vivobook Pro 14 M3401QC-KM007T | |
| Dell Inspiron 14 Plus 7420 | |
| Durchschnittliche Intel Core i7-12700H (7135 - 44760, n=64) | |
| Schenker Vision 14 | |
| MSI Summit E14 A11SCS | |
| Asus Zenbook 14X UX5400E | |
| Dell Inspiron 14 7420 2-in-1 | |
| AIDA64 / CPU AES | |
| Asus Vivobook Pro 14 M3401QC-KM007T | |
| Durchschnittliche Intel Core i7-12700H (31839 - 144360, n=64) | |
| Schenker Vision 14 | |
| Asus Zenbook 14X UX5400E | |
| Dell Inspiron 14 Plus 7420 | |
| MSI Summit E14 A11SCS | |
| Dell Inspiron 14 7420 2-in-1 | |
| AIDA64 / CPU ZLib | |
| Durchschnittliche Intel Core i7-12700H (305 - 1171, n=64) | |
| Dell Inspiron 14 Plus 7420 | |
| Asus Vivobook Pro 14 M3401QC-KM007T | |
| Dell Inspiron 14 7420 2-in-1 | |
| Schenker Vision 14 | |
| Asus Zenbook 14X UX5400E | |
| MSI Summit E14 A11SCS | |
| AIDA64 / FP64 Ray-Trace | |
| Dell Inspiron 14 Plus 7420 | |
| Durchschnittliche Intel Core i7-12700H (1437 - 9692, n=64) | |
| Asus Vivobook Pro 14 M3401QC-KM007T | |
| Schenker Vision 14 | |
| Asus Zenbook 14X UX5400E | |
| MSI Summit E14 A11SCS | |
| Dell Inspiron 14 7420 2-in-1 | |
| AIDA64 / CPU PhotoWorxx | |
| MSI Summit E14 A11SCS | |
| Dell Inspiron 14 Plus 7420 | |
| Durchschnittliche Intel Core i7-12700H (12863 - 52207, n=64) | |
| Asus Zenbook 14X UX5400E | |
| Schenker Vision 14 | |
| Dell Inspiron 14 7420 2-in-1 | |
| Asus Vivobook Pro 14 M3401QC-KM007T | |
Systemleistung
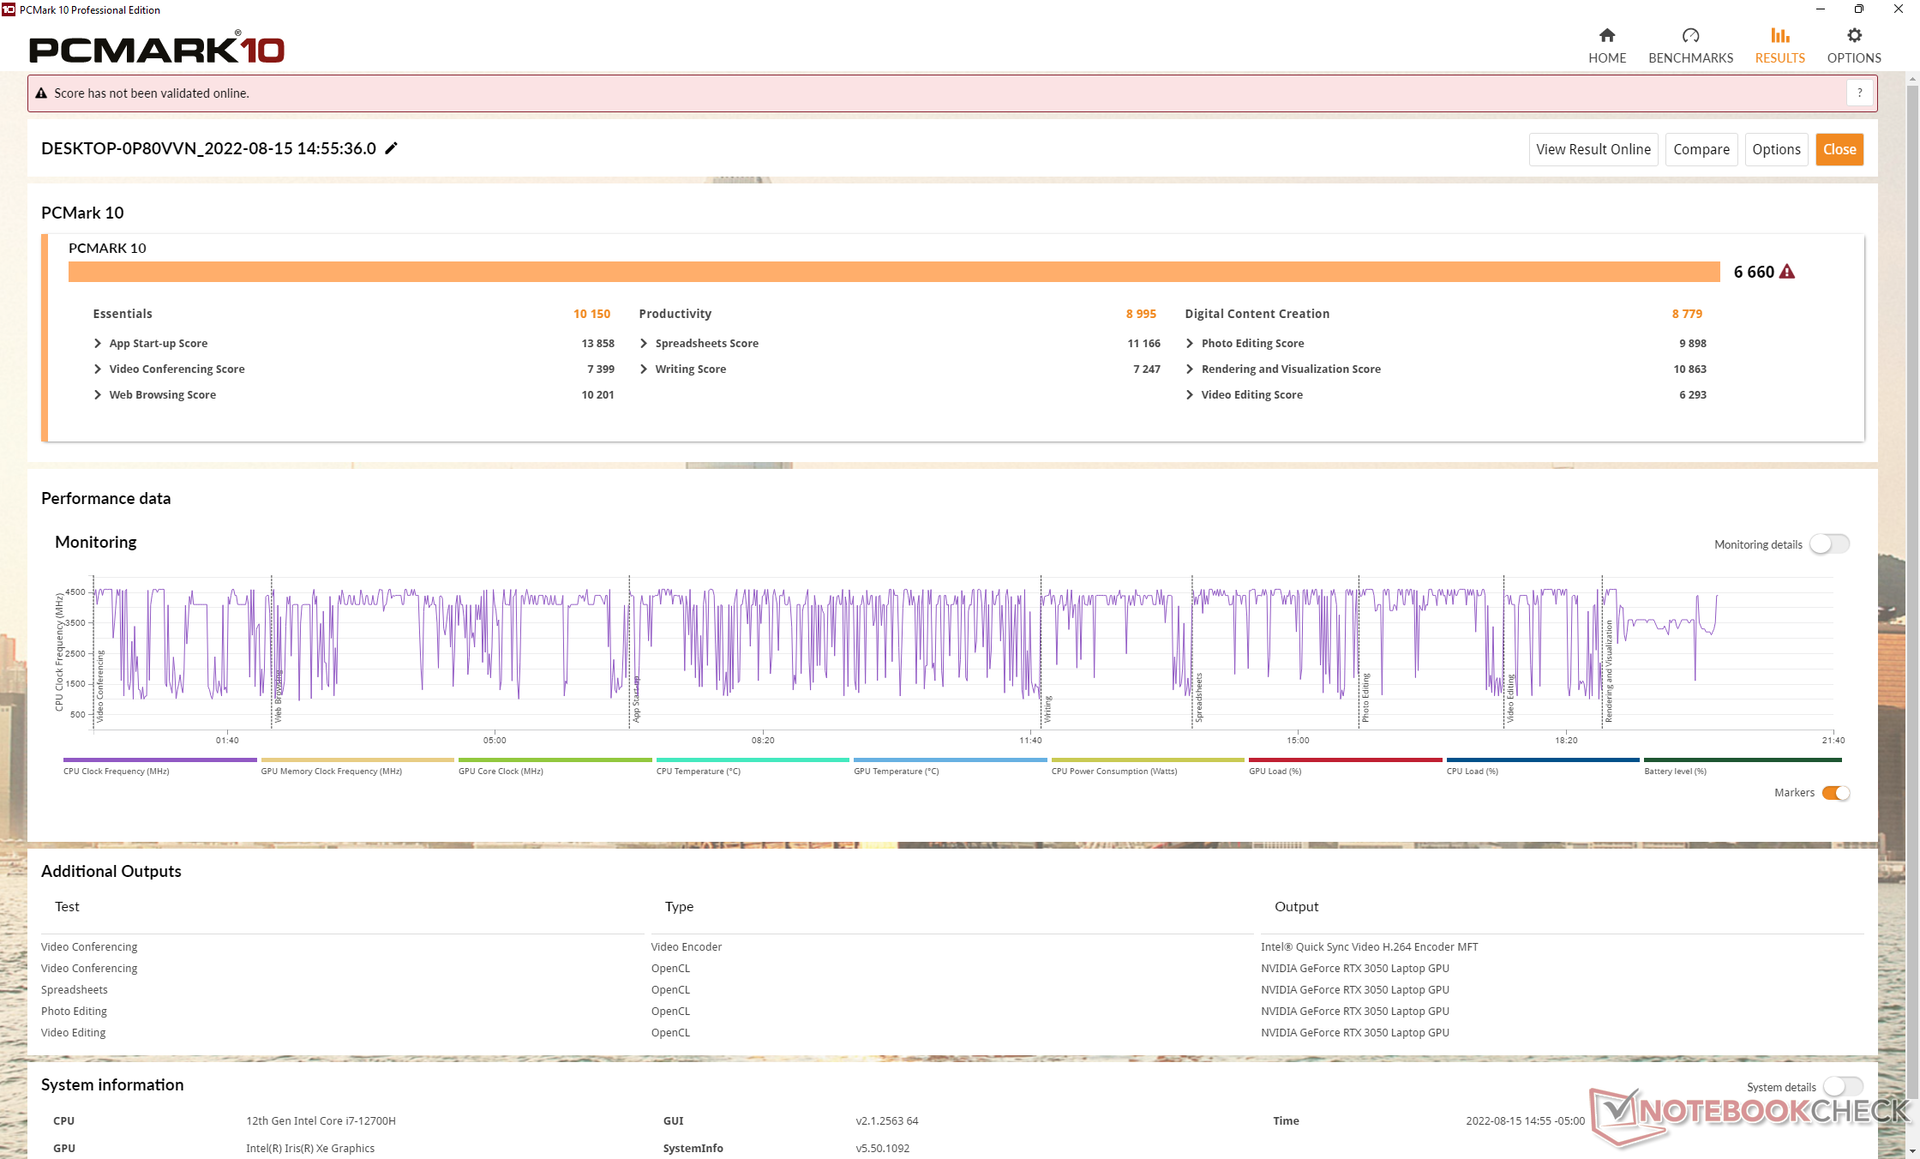
Die Ergebnisse im PCMark 10 sind ausgezeichnet und liegen gar höher als bei Konkurrenten wie dem Schenker Vision 14 mit schnellerer RTX 3050 Ti oder dem Asus Vivobook Pro 14 mit AMD Ryzen 5600H. Es gibt keinen Zweifel daran, dass der Core i7-12700H die allgemeine Leistung des Inspiron 14 Plus 7420 über die der meisten anderen 14-Zoll-Multimedia-Laptops anhebt.
CrossMark: Overall | Productivity | Creativity | Responsiveness
| PCMark 10 / Score | |
| Durchschnittliche Intel Core i7-12700H, NVIDIA GeForce RTX 3050 4GB Laptop GPU (6660 - 6879, n=3) | |
| Dell Inspiron 14 Plus 7420 | |
| Schenker Vision 14 | |
| Asus Vivobook Pro 14 M3401QC-KM007T | |
| HP Envy 14-eb0010nr | |
| MSI Summit E14 A11SCS | |
| Dell Inspiron 14 7420 2-in-1 | |
| Asus Zenbook 14X UX5400E | |
| PCMark 10 / Essentials | |
| Durchschnittliche Intel Core i7-12700H, NVIDIA GeForce RTX 3050 4GB Laptop GPU (10150 - 10369, n=3) | |
| Dell Inspiron 14 7420 2-in-1 | |
| Dell Inspiron 14 Plus 7420 | |
| Asus Vivobook Pro 14 M3401QC-KM007T | |
| Schenker Vision 14 | |
| HP Envy 14-eb0010nr | |
| MSI Summit E14 A11SCS | |
| Asus Zenbook 14X UX5400E | |
| PCMark 10 / Productivity | |
| Durchschnittliche Intel Core i7-12700H, NVIDIA GeForce RTX 3050 4GB Laptop GPU (8995 - 9397, n=3) | |
| Dell Inspiron 14 Plus 7420 | |
| Schenker Vision 14 | |
| Asus Zenbook 14X UX5400E | |
| HP Envy 14-eb0010nr | |
| MSI Summit E14 A11SCS | |
| Asus Vivobook Pro 14 M3401QC-KM007T | |
| Dell Inspiron 14 7420 2-in-1 | |
| PCMark 10 / Digital Content Creation | |
| Durchschnittliche Intel Core i7-12700H, NVIDIA GeForce RTX 3050 4GB Laptop GPU (8779 - 9203, n=3) | |
| Dell Inspiron 14 Plus 7420 | |
| Asus Vivobook Pro 14 M3401QC-KM007T | |
| Schenker Vision 14 | |
| Dell Inspiron 14 7420 2-in-1 | |
| HP Envy 14-eb0010nr | |
| MSI Summit E14 A11SCS | |
| Asus Zenbook 14X UX5400E | |
| CrossMark / Overall | |
| Durchschnittliche Intel Core i7-12700H, NVIDIA GeForce RTX 3050 4GB Laptop GPU (1717 - 1857, n=3) | |
| Dell Inspiron 14 Plus 7420 | |
| Schenker Vision 14 | |
| Dell Inspiron 14 7420 2-in-1 | |
| Asus Vivobook Pro 14 M3401QC-KM007T | |
| CrossMark / Productivity | |
| Durchschnittliche Intel Core i7-12700H, NVIDIA GeForce RTX 3050 4GB Laptop GPU (1620 - 1735, n=3) | |
| Dell Inspiron 14 Plus 7420 | |
| Schenker Vision 14 | |
| Dell Inspiron 14 7420 2-in-1 | |
| Asus Vivobook Pro 14 M3401QC-KM007T | |
| CrossMark / Creativity | |
| Durchschnittliche Intel Core i7-12700H, NVIDIA GeForce RTX 3050 4GB Laptop GPU (1911 - 2067, n=3) | |
| Dell Inspiron 14 Plus 7420 | |
| Dell Inspiron 14 7420 2-in-1 | |
| Schenker Vision 14 | |
| Asus Vivobook Pro 14 M3401QC-KM007T | |
| CrossMark / Responsiveness | |
| Durchschnittliche Intel Core i7-12700H, NVIDIA GeForce RTX 3050 4GB Laptop GPU (1481 - 1651, n=3) | |
| Schenker Vision 14 | |
| Dell Inspiron 14 Plus 7420 | |
| Dell Inspiron 14 7420 2-in-1 | |
| Asus Vivobook Pro 14 M3401QC-KM007T | |
| PCMark 10 Score | 6660 Punkte | |
Hilfe | ||
| AIDA64 / Memory Copy | |
| MSI Summit E14 A11SCS | |
| Asus Zenbook 14X UX5400E | |
| Dell Inspiron 14 Plus 7420 | |
| Durchschnittliche Intel Core i7-12700H (25615 - 80511, n=64) | |
| Schenker Vision 14 | |
| Dell Inspiron 14 7420 2-in-1 | |
| Asus Vivobook Pro 14 M3401QC-KM007T | |
| AIDA64 / Memory Read | |
| Dell Inspiron 14 Plus 7420 | |
| MSI Summit E14 A11SCS | |
| Asus Zenbook 14X UX5400E | |
| Durchschnittliche Intel Core i7-12700H (25586 - 79442, n=64) | |
| Schenker Vision 14 | |
| Asus Vivobook Pro 14 M3401QC-KM007T | |
| Dell Inspiron 14 7420 2-in-1 | |
| AIDA64 / Memory Write | |
| Asus Zenbook 14X UX5400E | |
| MSI Summit E14 A11SCS | |
| Dell Inspiron 14 Plus 7420 | |
| Durchschnittliche Intel Core i7-12700H (23679 - 88660, n=64) | |
| Schenker Vision 14 | |
| Dell Inspiron 14 7420 2-in-1 | |
| Asus Vivobook Pro 14 M3401QC-KM007T | |
| AIDA64 / Memory Latency | |
| Dell Inspiron 14 Plus 7420 | |
| Asus Zenbook 14X UX5400E | |
| MSI Summit E14 A11SCS | |
| Asus Vivobook Pro 14 M3401QC-KM007T | |
| Durchschnittliche Intel Core i7-12700H (76.2 - 133.9, n=62) | |
| Schenker Vision 14 | |
| Dell Inspiron 14 7420 2-in-1 | |
* ... kleinere Werte sind besser
DPC Latency
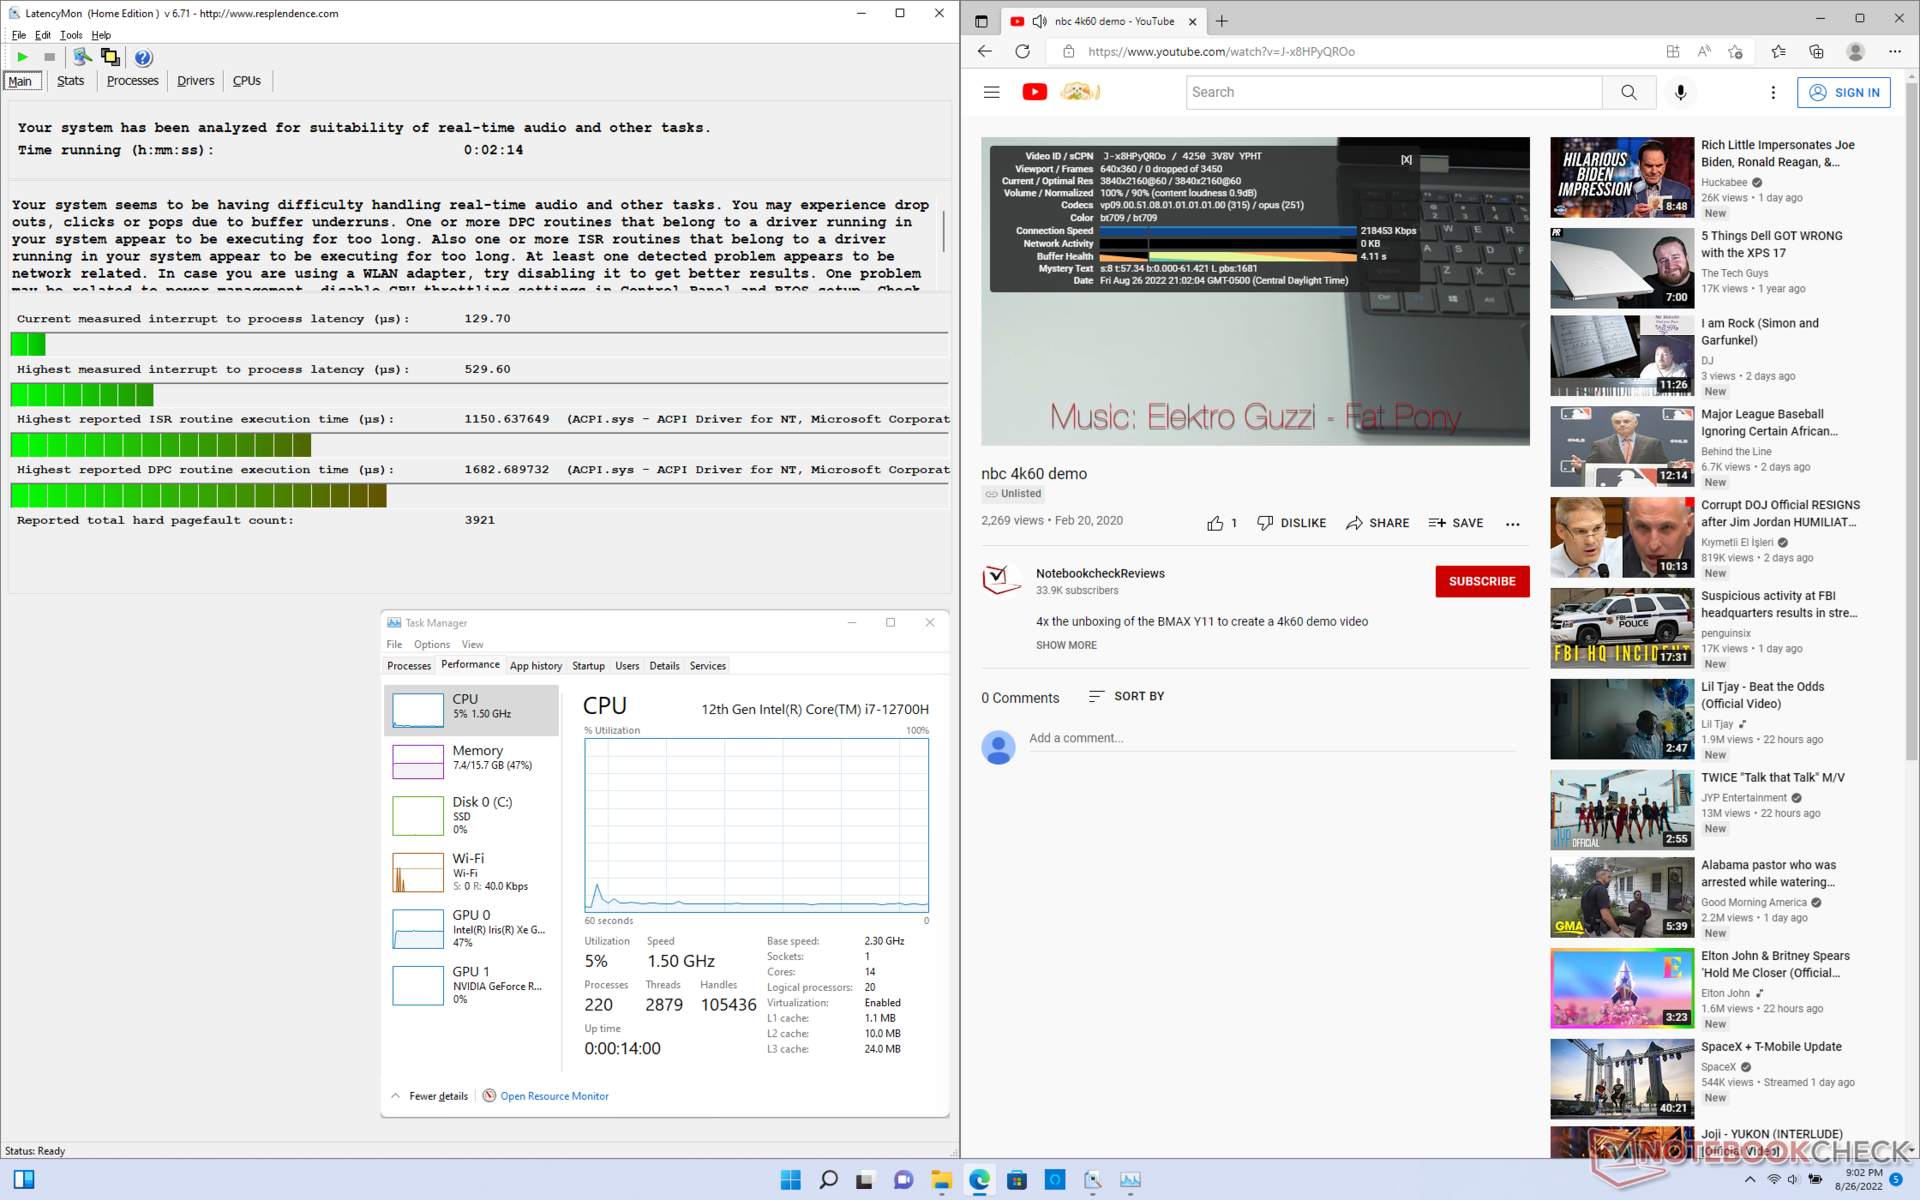
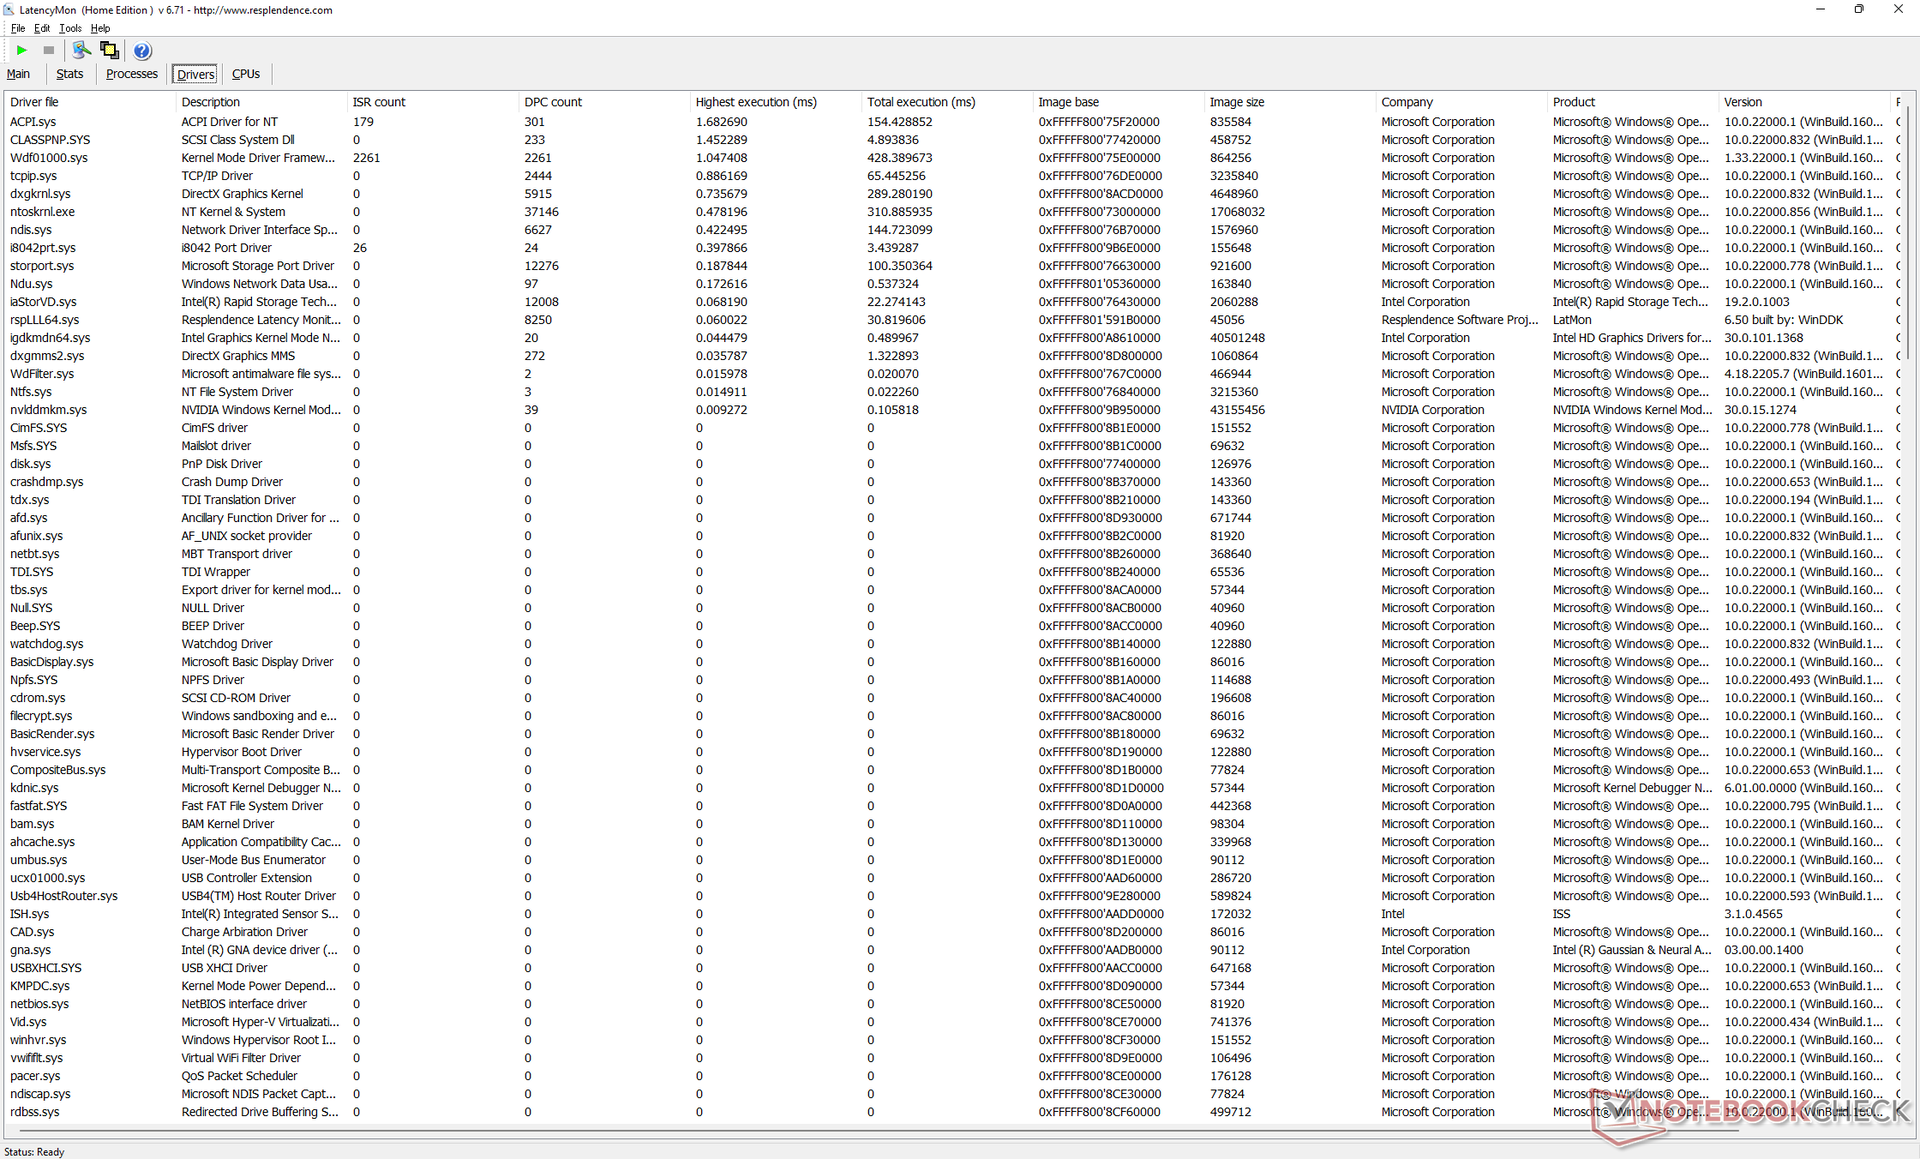
LatencyMon ermittelt geringe DPC-Probleme beim Öffnen mehrerer Browsertabs auf unserer Homepage. Die Wiedergabe unseres 4K/60-fps-Youtube-Testvideos läuft hingegen flüssig und gänzlich ohne Dropped Frames ab.
| DPC Latencies / LatencyMon - interrupt to process latency (max), Web, Youtube, Prime95 | |
| HP Envy 14-eb0010nr | |
| Schenker Vision 14 | |
| MSI Summit E14 A11SCS | |
| Asus Vivobook Pro 14 M3401QC-KM007T | |
| Asus Zenbook 14X UX5400E | |
| Dell Inspiron 14 7420 2-in-1 | |
| Dell Inspiron 14 Plus 7420 | |
* ... kleinere Werte sind besser
Massenspeicher — Inklusive Heat Spreader
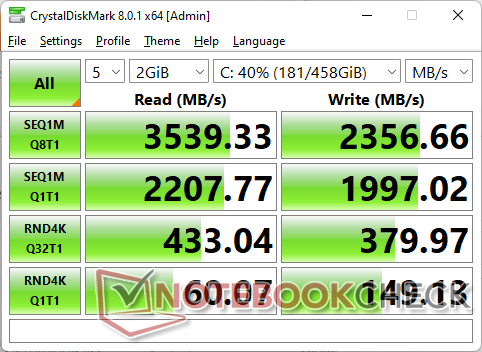
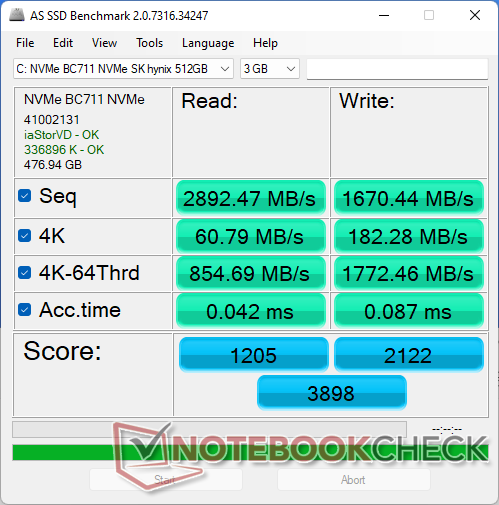
In unserer Testeinheit ist eine 512 GB große PCIe3-NVMe-SSD namens SK Hynix BC711 verbaut. Sie kommt auf Transferraten von bis zu 3.600 MB/s. Im DiskSpd-Loop stellt sich keine Leistungsdrosselung über die Zeit ein, was wohl am vorinstallierten Heat Spreader liegt, die meisten anderen OEMs statten ihre Budget- oder auch Mittelklasse-Laptops nicht damit aus. Wünschenswert wären allerdings schnellere PCIe4-Options im Inspiron 14 Plus 7420 gewesen.

* ... kleinere Werte sind besser
Disk Throttling: DiskSpd Read Loop, Queue Depth 8
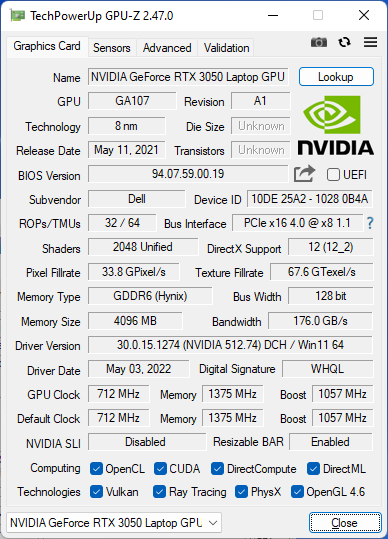
Grafikleistung — Schnell für die Größe und den Preis
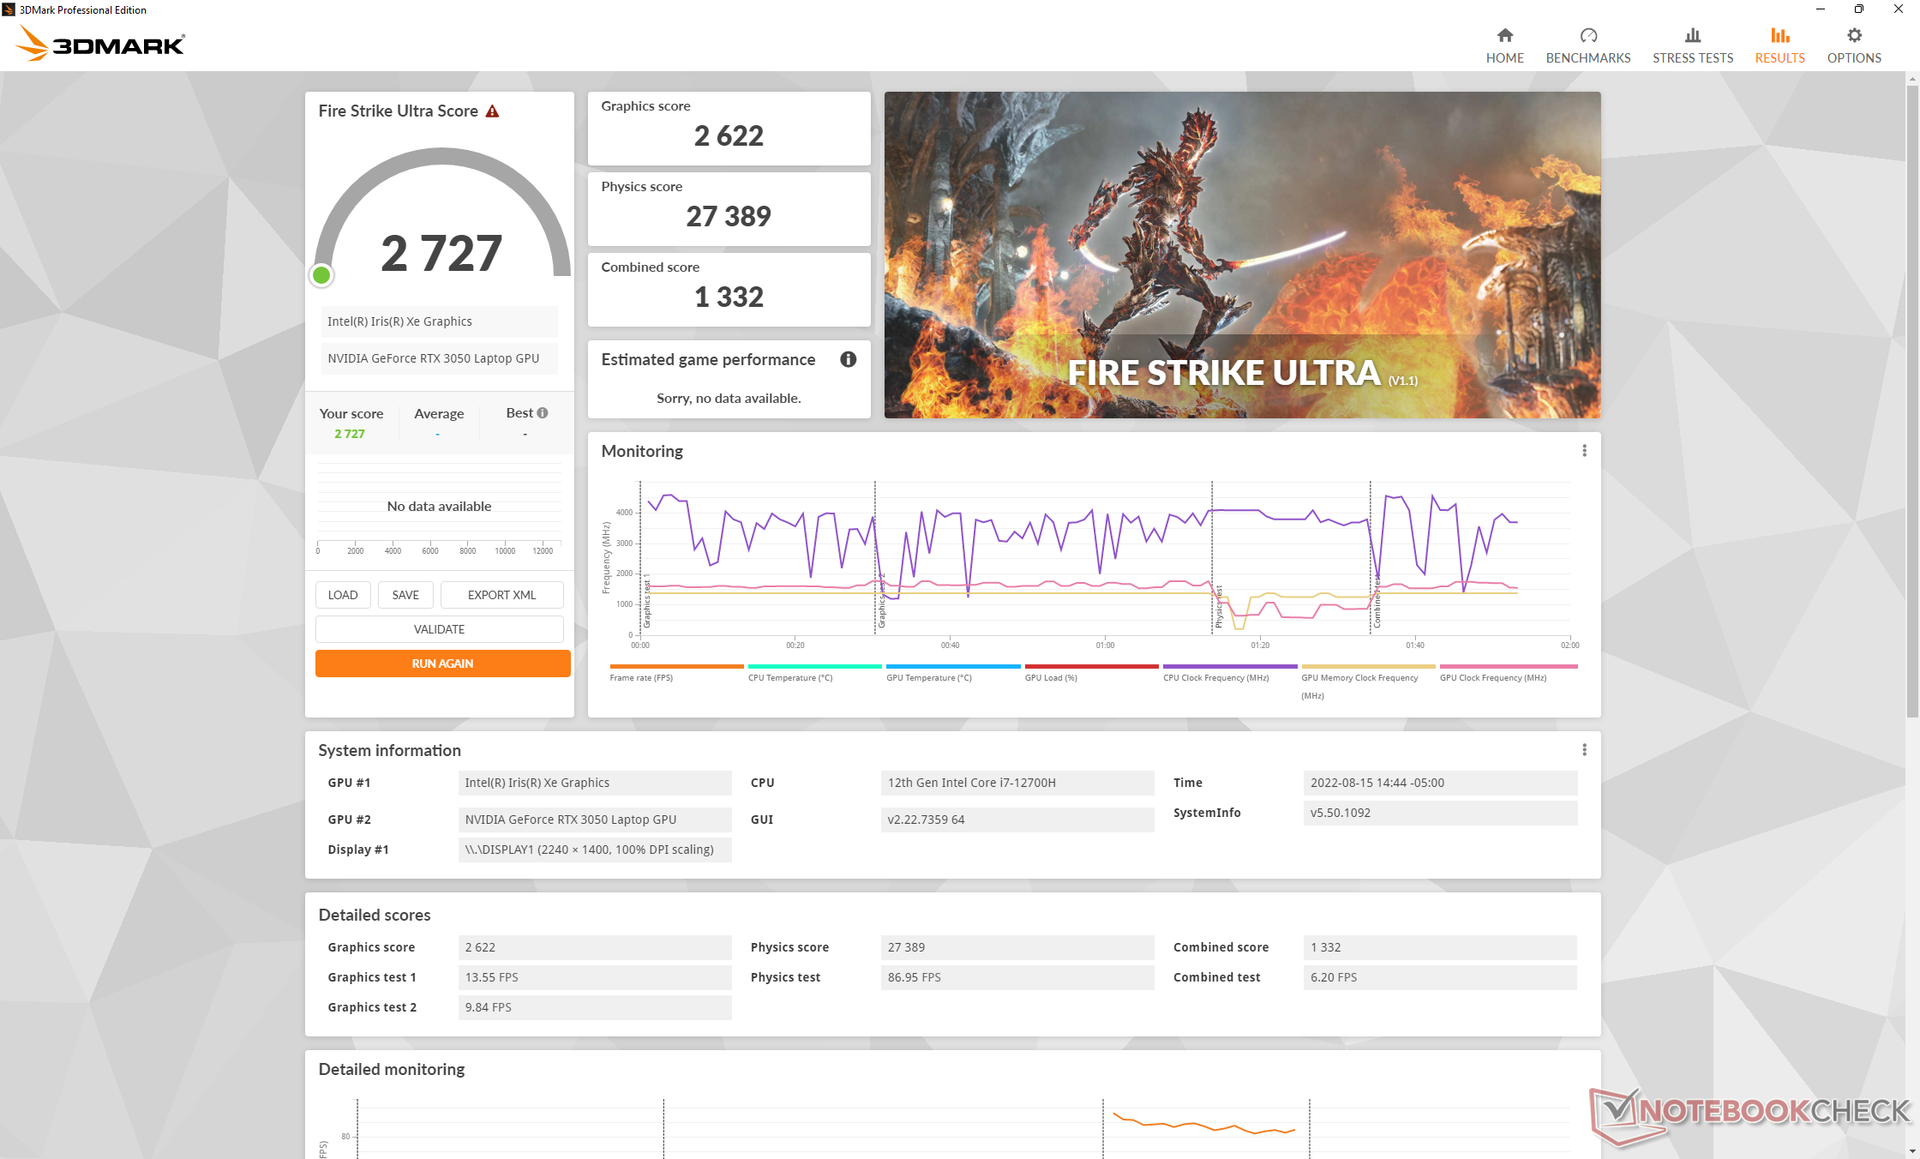
Die Grafikleistung liegt auf dem Niveau dessen, was wir von anderen Laptops mit der gleichen GeForce RTX 3050 kennen. Die Ergebnisse sind sogar fast gleichwertig mit denen einer RTX 3050 Ti, z.B. im Schenker Vision 14 oder im Asus ROG Flow Z13. Dell plant in der nahen Zukunft noch Konfigurationen mit einer RTX 3050 Ti, aber die können wir kaum empfehlen, schließlich dürfte diese bestenfalls marginal schneller sein als die RTX 3050 in unserer Testkonfiguration.
Wer von einer deutlich älteren GTX 1650 Ti Max-Q aufrüstet, darf sich über einen Leistungssprung von etwa 30 Prozent freuen.
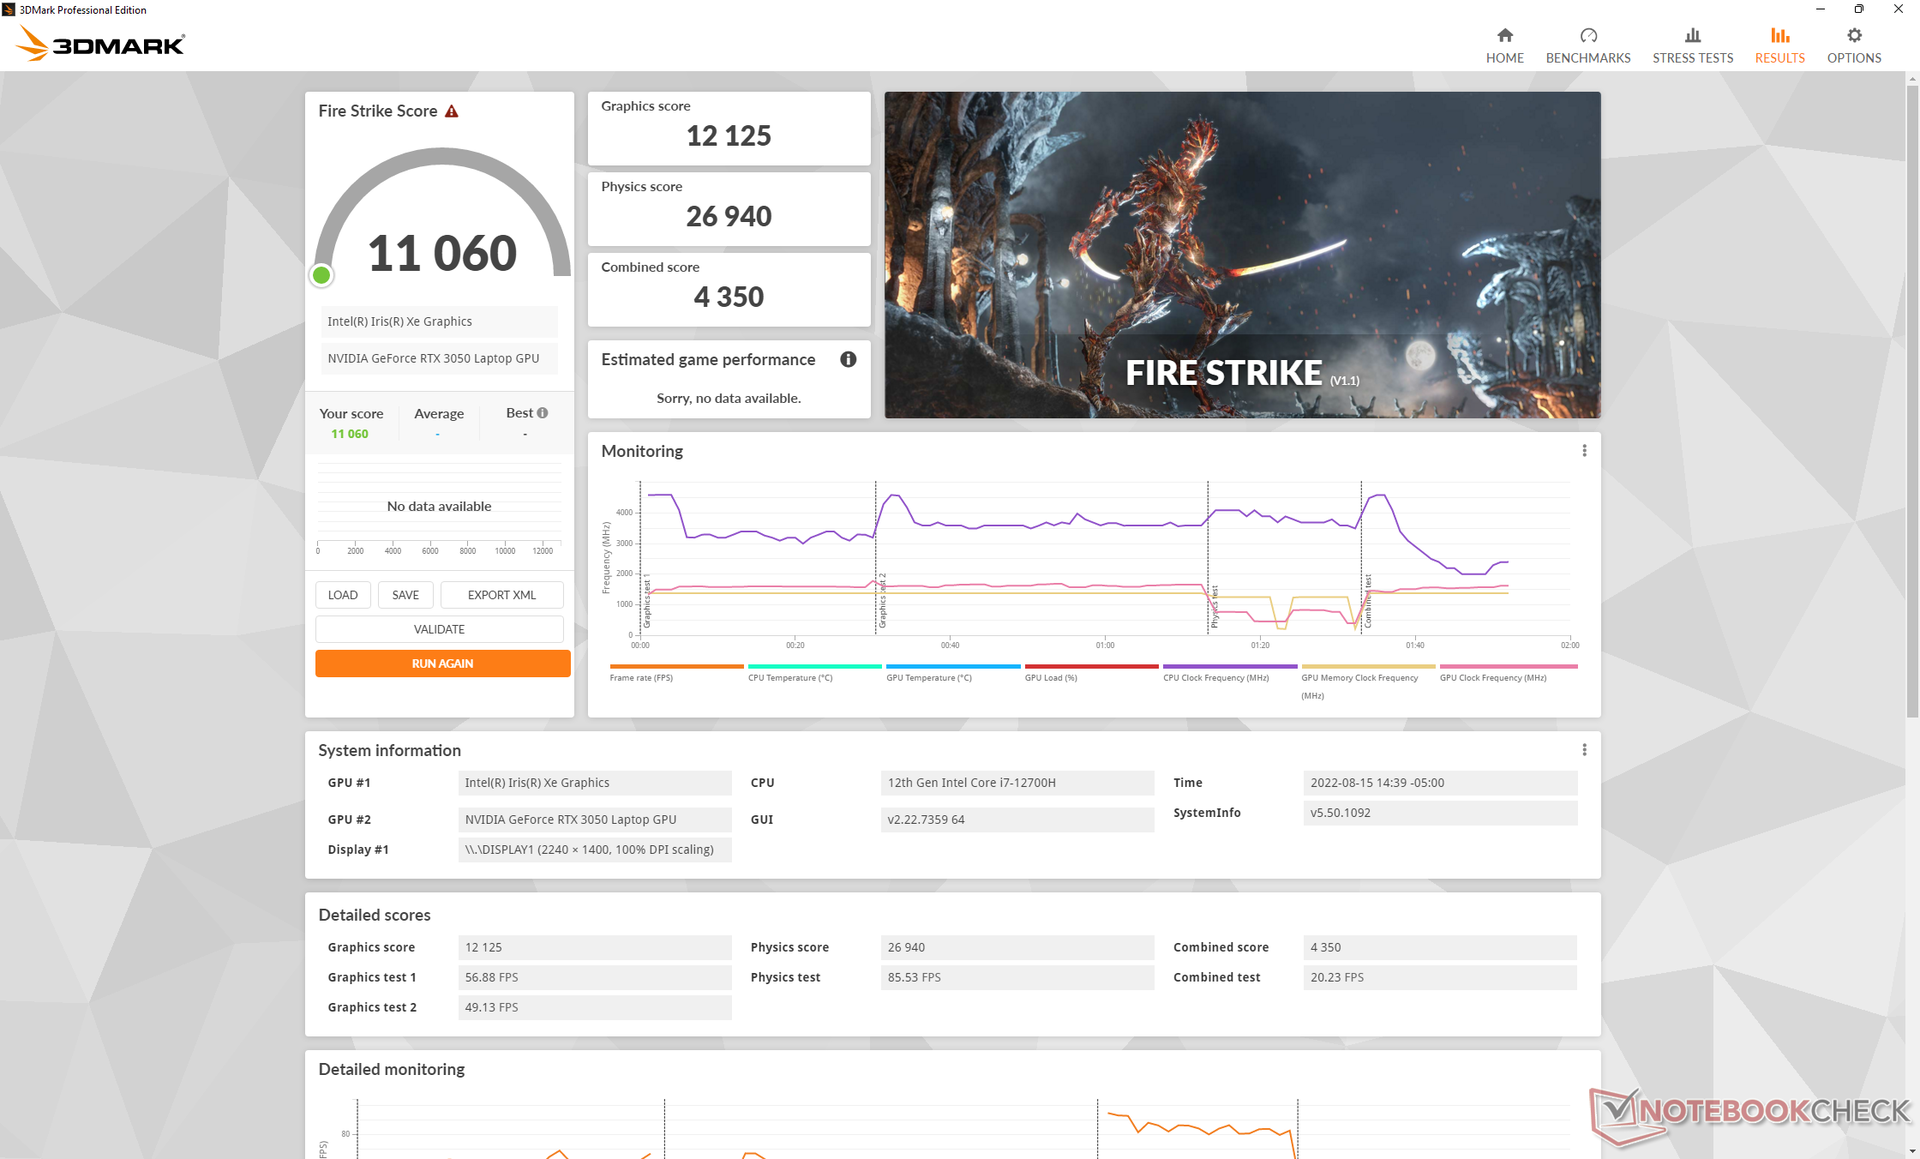
Zu beachten ist, dass die Grafikleistung im Dell Optimized Modus anstelle des Dell Hochleistungsmodus abnimmt. Ein Fire-Strike-Test im Optimized Modus generiert nur noch 10.966 Grafikpunkte anstelle von 12.125 Punkten im Hochleistungsmodus.
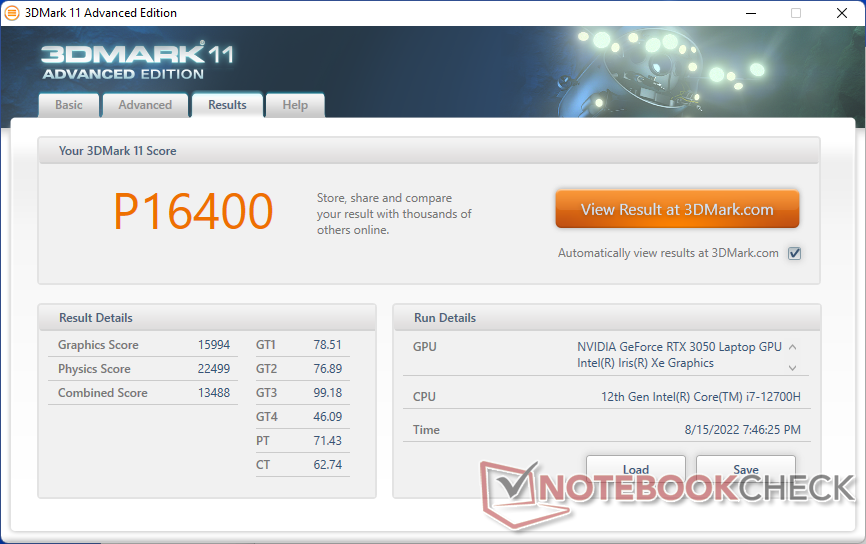

| 3DMark 11 Performance | 16400 Punkte | |
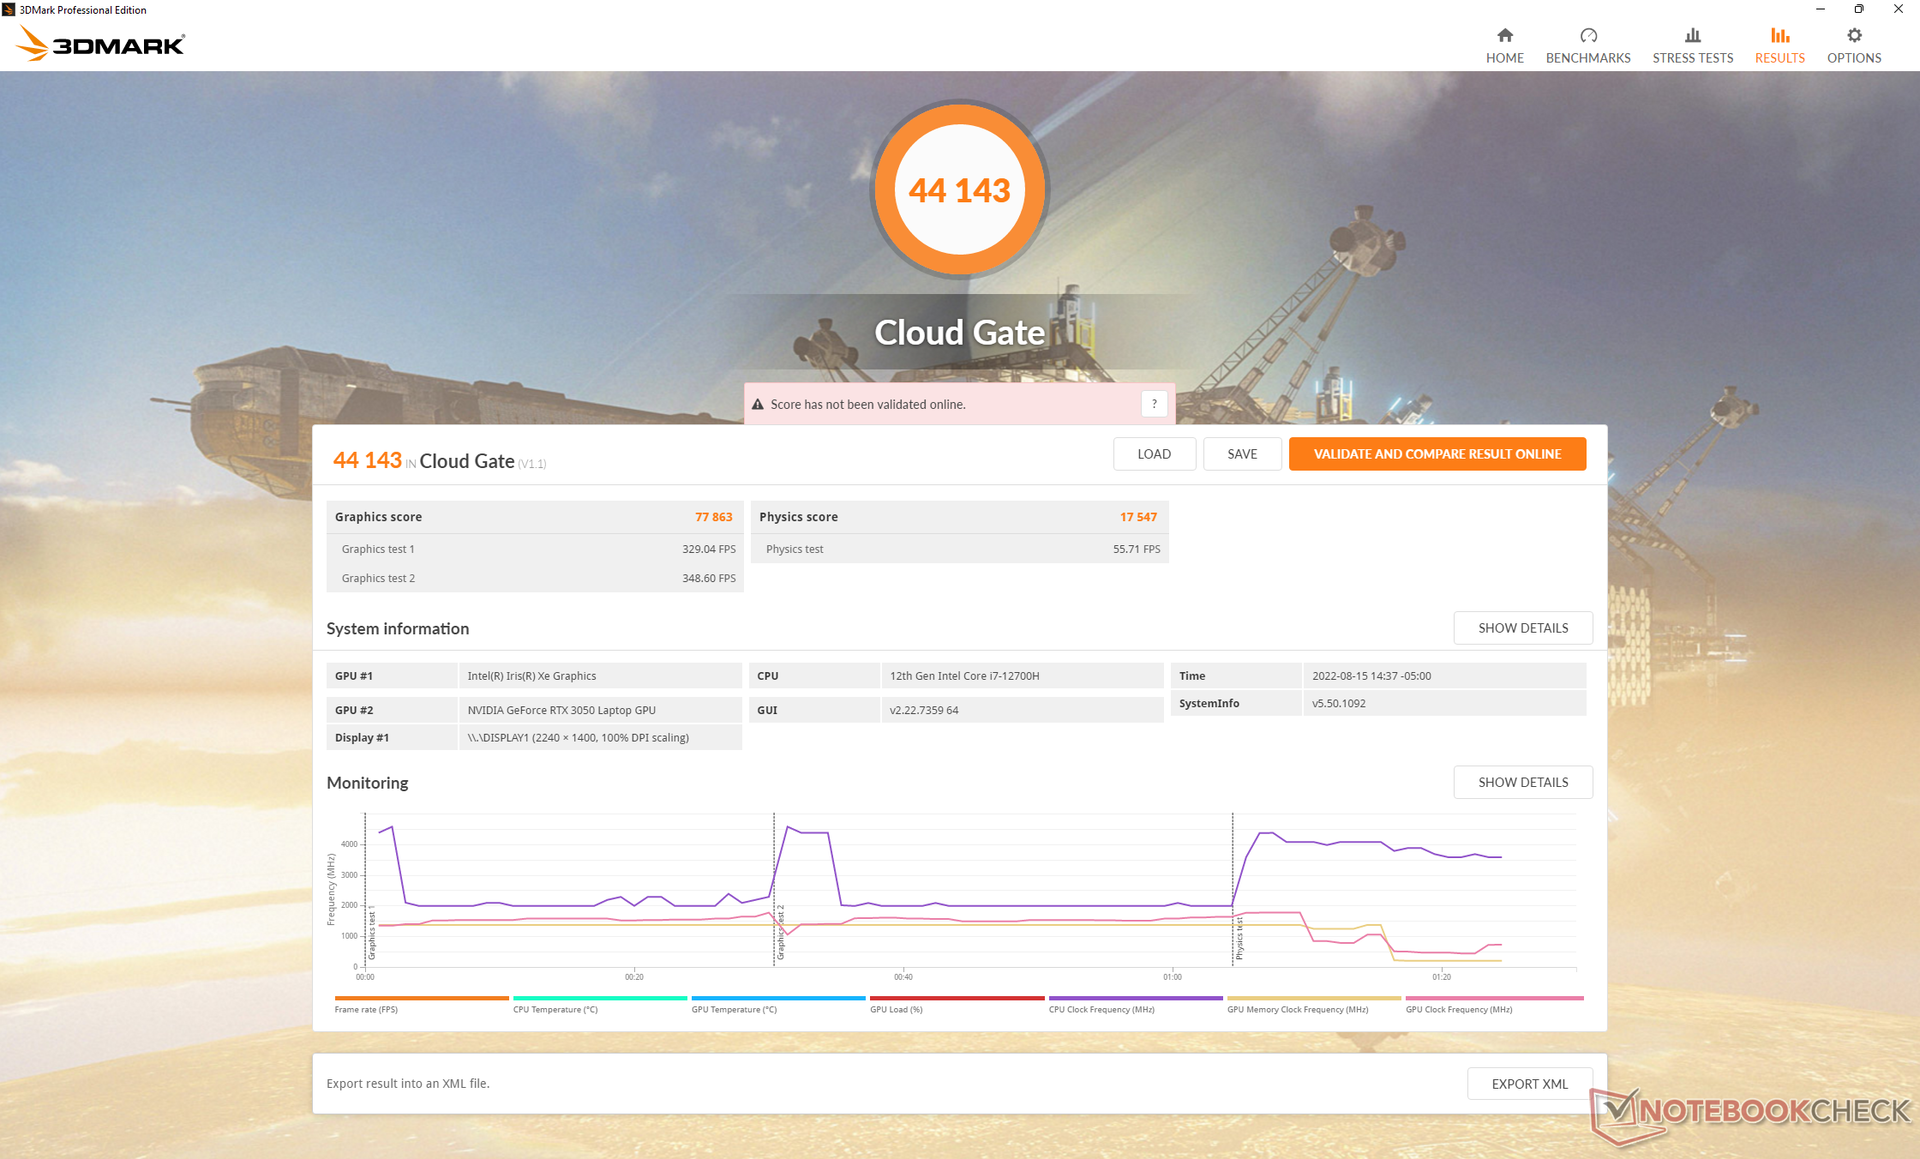
| 3DMark Cloud Gate Standard Score | 44143 Punkte | |
| 3DMark Fire Strike Score | 11060 Punkte | |
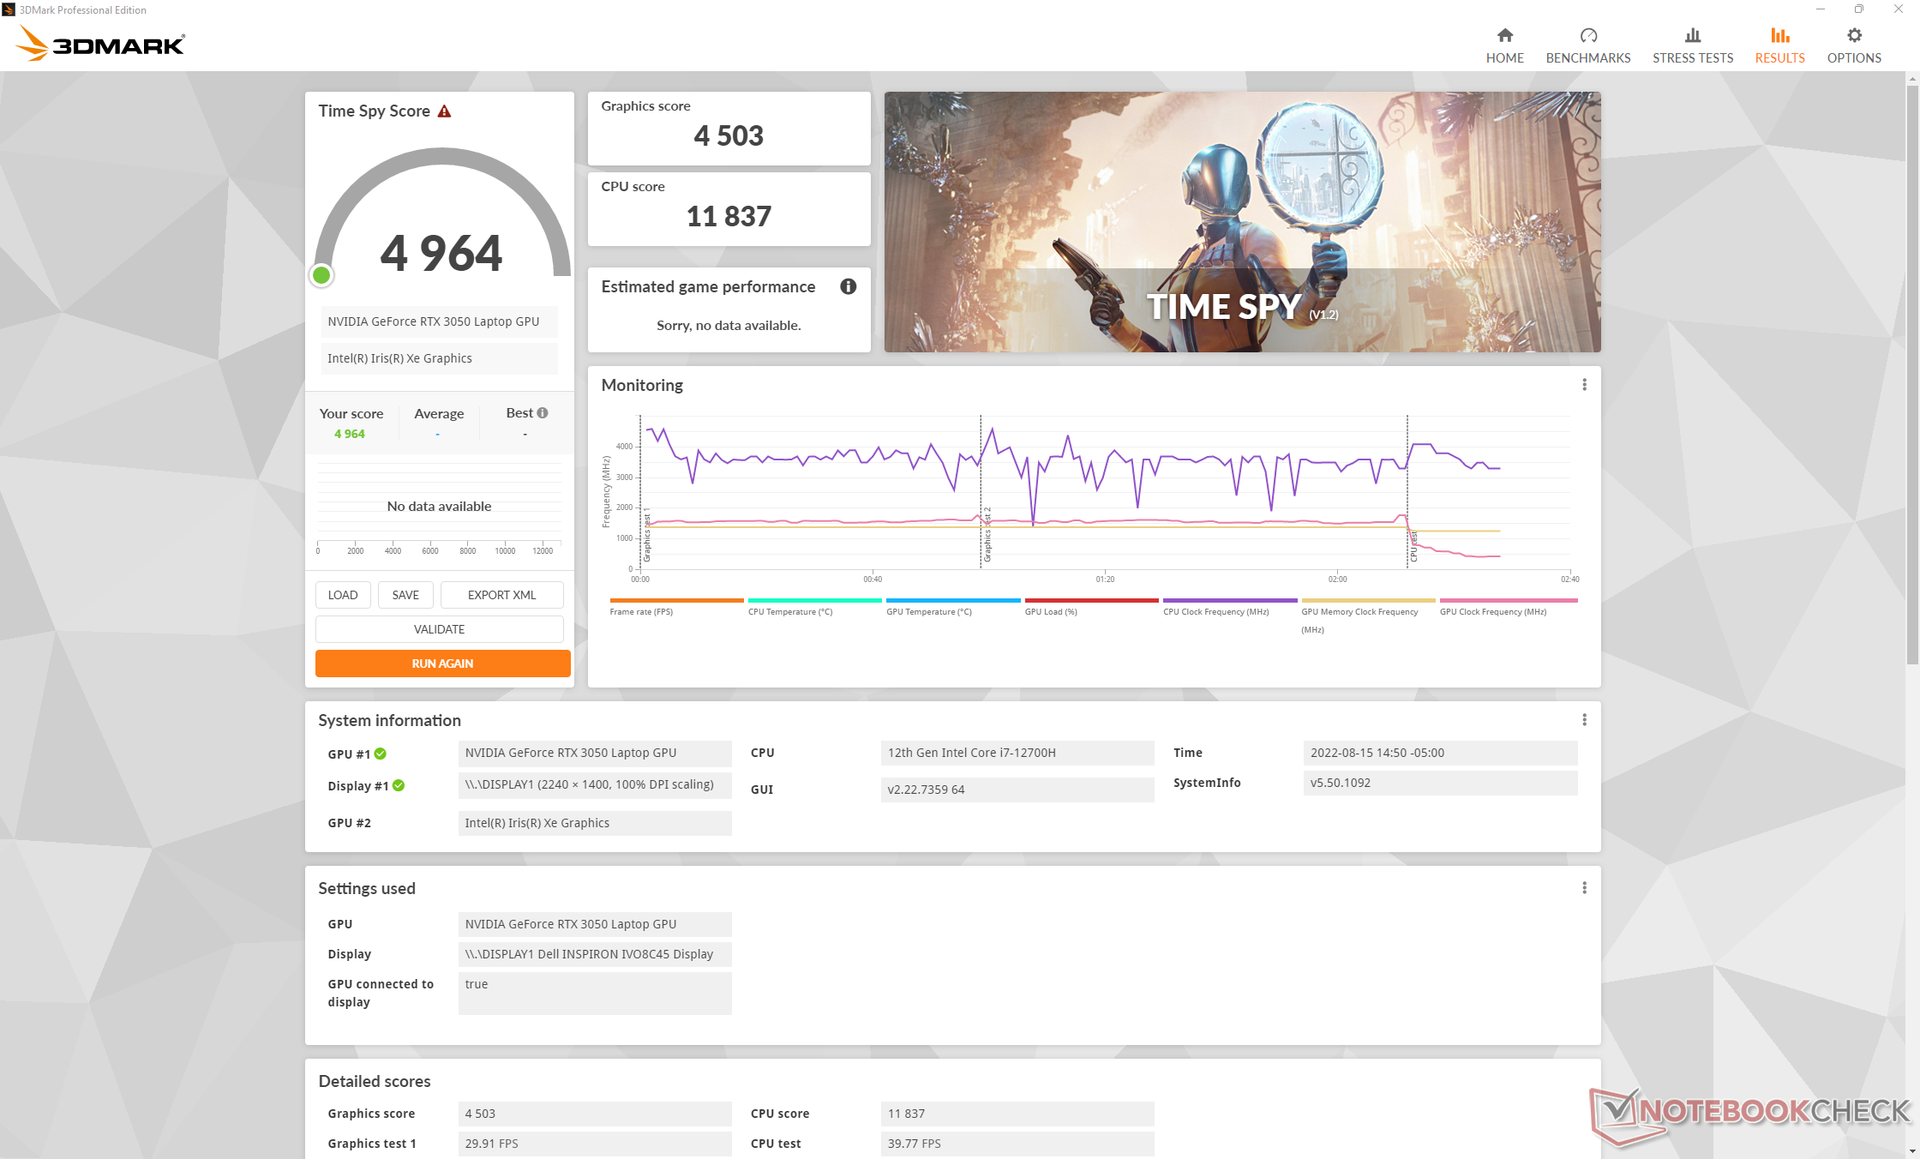
| 3DMark Time Spy Score | 4964 Punkte | |
Hilfe | ||
Witcher 3 FPS Chart
| min. | mittel | hoch | max. | |
|---|---|---|---|---|
| GTA V (2015) | 181.8 | 161.4 | 111.5 | 61.8 |
| The Witcher 3 (2015) | 222.2 | 150.4 | 83.5 | 46 |
| Dota 2 Reborn (2015) | 174.4 | 158.7 | 145 | 134.4 |
| Final Fantasy XV Benchmark (2018) | 113.5 | 66.1 | 47.4 | |
| X-Plane 11.11 (2018) | 137.8 | 117.2 | 94.4 | |
| Strange Brigade (2018) | 263 | 118.2 | 94.7 | 82.4 |
| Cyberpunk 2077 1.6 (2022) | 68.6 | 55 | 41 | 33.8 |
Emissionen — Laut wie ein Gamer
Systemlautstärke
Die verbauten Zwillingslüfter sind sehr sensibel, was hohe Lasten anbelangt. Deutlich wird das beispielsweise im 3DMark 06, hier fahren die Lüfter sehr schnell hoch und stabilisieren sich gegen Ende der ersten Benchmarkszene bei etwa 47 dB(A). Das ist recht laut, verglichen mit den 43 dB(A) beim Schenker Vision 14 oder gar den 35 dB(A) beim HP Envy 14, jeweils mit dedizierter Grafik.
Gaming im Hochleistungsmodus resultiert in einer Lüfterlautstärke von annähernd 52 dB(A), was sich leider schon mit vielen waschechten Gaming-Laptops vergleichen lässt. Im Optimized Modus geht das Gaming mit 48 dB(A) etwas ruhiger vonstatten, dafür verzichtet man auf Grafikleistung, wie oben erwähnt. Nutzer müssen sich also mit der maximalen Lüfterdrehzahl anfreunden, wenn sie der Geforce-GPU die vollen 50 W entlocken wollen.
Glücklicherweise bleiben die Lüfter bei Alltagsaufgaben wie Surfen oder Videostreaming mit 26,5 dB(A) recht ruhig (Hintergrund 23,2 dB(A)). Nur bei höheren Lasten werden sie sehr schnell laut.
Lautstärkediagramm
| Idle |
| 23.2 / 23.2 / 23.2 dB(A) |
| Last |
| 47.5 / 51.7 dB(A) |
 | ||
30 dB leise 40 dB(A) deutlich hörbar 50 dB(A) störend |
||
min: | ||
| Dell Inspiron 14 Plus 7420 GeForce RTX 3050 4GB Laptop GPU, i7-12700H, SK Hynix BC711 512GB HFM512GD3GX013N | Asus Vivobook Pro 14 M3401QC-KM007T GeForce RTX 3050 4GB Laptop GPU, R5 5600H, Intel SSD 670p SSDPEKNU512GZ | Dell Inspiron 14 7420 2-in-1 Iris Xe G7 96EUs, i7-1255U, WDC PC SN530 SDBPMPZ-512G | Schenker Vision 14 GeForce RTX 3050 Ti Laptop GPU, i7-11370H, Samsung SSD 980 Pro 1TB MZ-V8P1T0BW | Asus Zenbook 14X UX5400E GeForce MX450, i7-1165G7, SK Hynix HFM001TD3JX013N | HP Envy 14-eb0010nr GeForce GTX 1650 Ti Max-Q, i5-1135G7, Samsung SSD PM981a MZVLB256HBHQ | |
|---|---|---|---|---|---|---|
| Geräuschentwicklung | -14% | 7% | 0% | -0% | 3% | |
| aus / Umgebung * (dB) | 23.2 | 25.4 -9% | 23.1 -0% | 24.3 -5% | 26 -12% | 25.9 -12% |
| Idle min * (dB) | 23.2 | 25.4 -9% | 24.7 -6% | 24.3 -5% | 26 -12% | 26 -12% |
| Idle avg * (dB) | 23.2 | 25.4 -9% | 24.7 -6% | 24.3 -5% | 26 -12% | 26 -12% |
| Idle max * (dB) | 23.2 | 30.9 -33% | 24.7 -6% | 25.9 -12% | 26.3 -13% | 26 -12% |
| Last avg * (dB) | 47.5 | 56 -18% | 27.7 42% | 43.3 9% | 37.1 22% | 34.9 27% |
| Witcher 3 ultra * (dB) | 51.7 | 45.1 13% | 44.6 14% | 34.5 33% | ||
| Last max * (dB) | 51.7 | 56 -8% | 45.1 13% | 49.5 4% | 38 26% | 48.7 6% |
* ... kleinere Werte sind besser
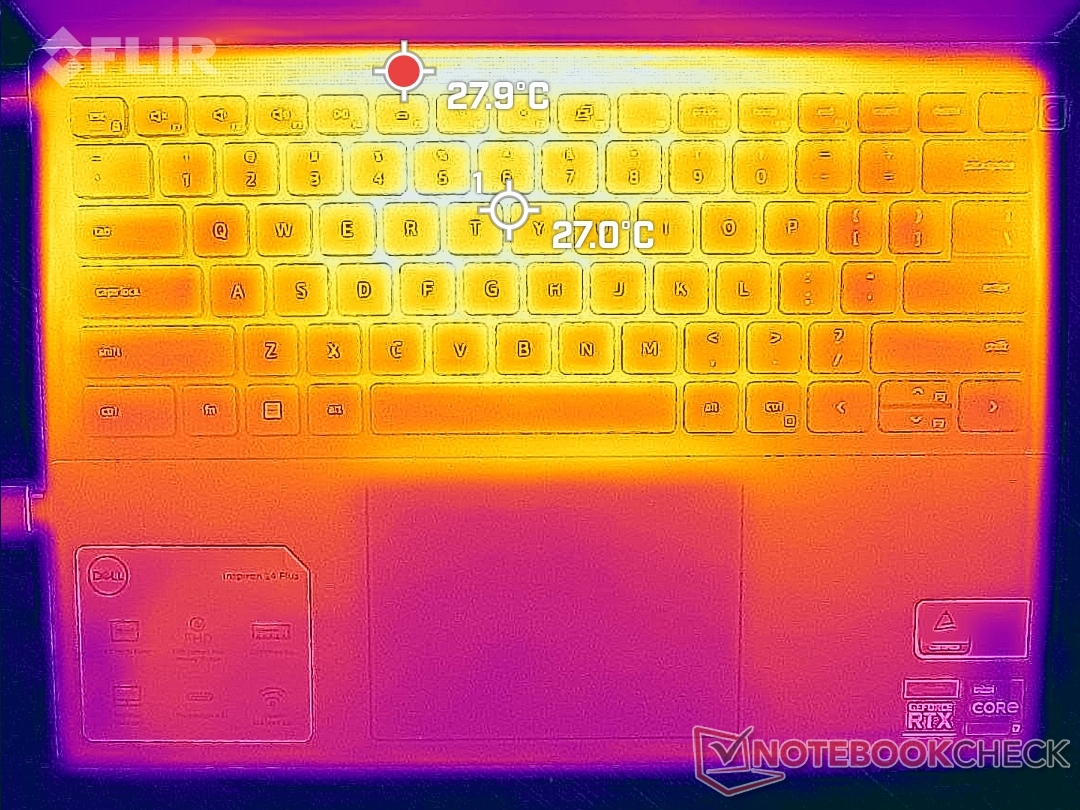
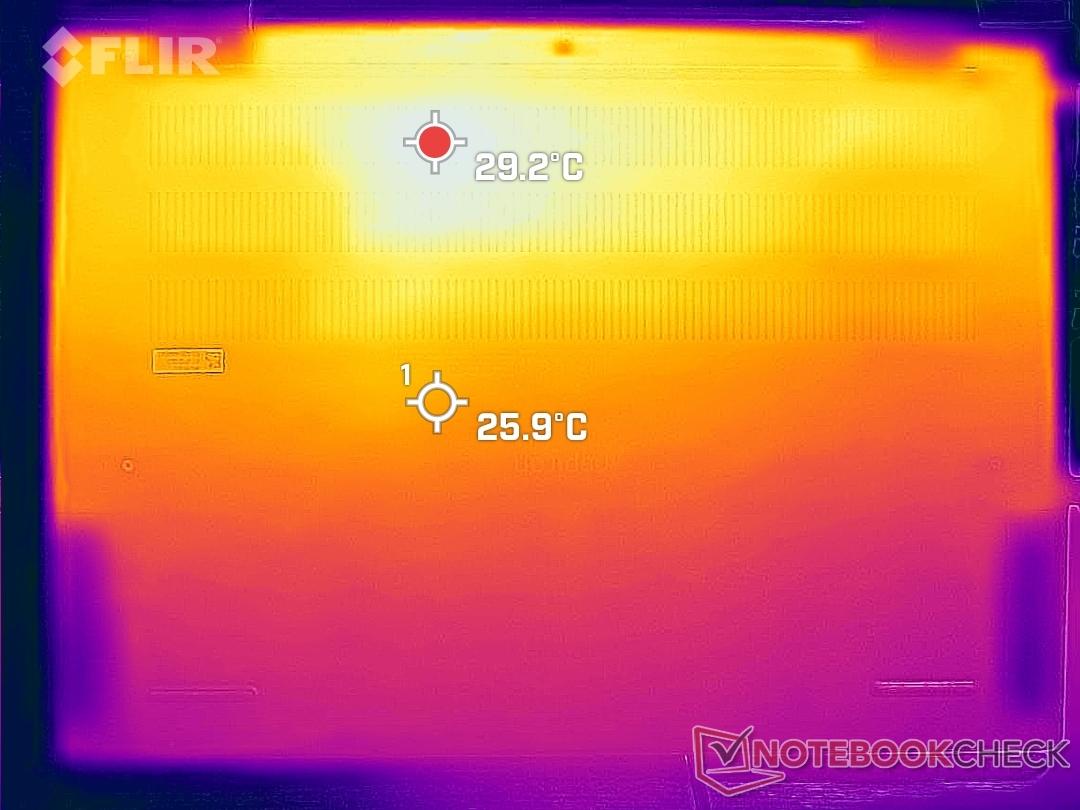
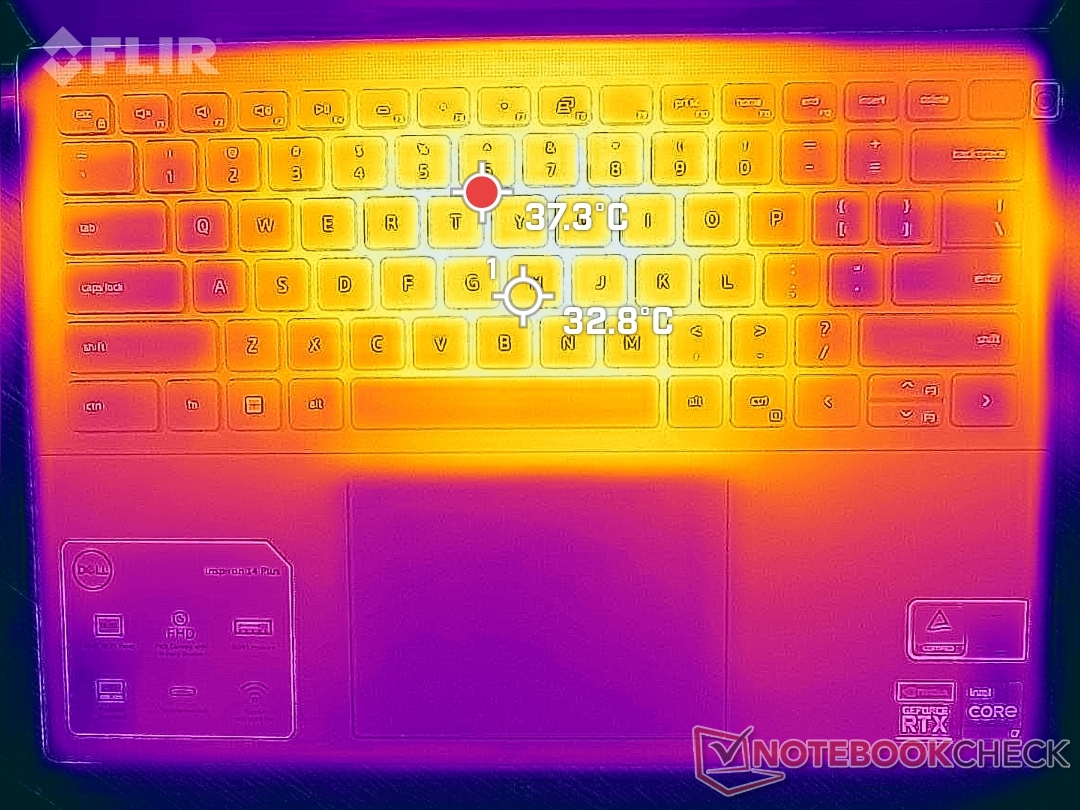
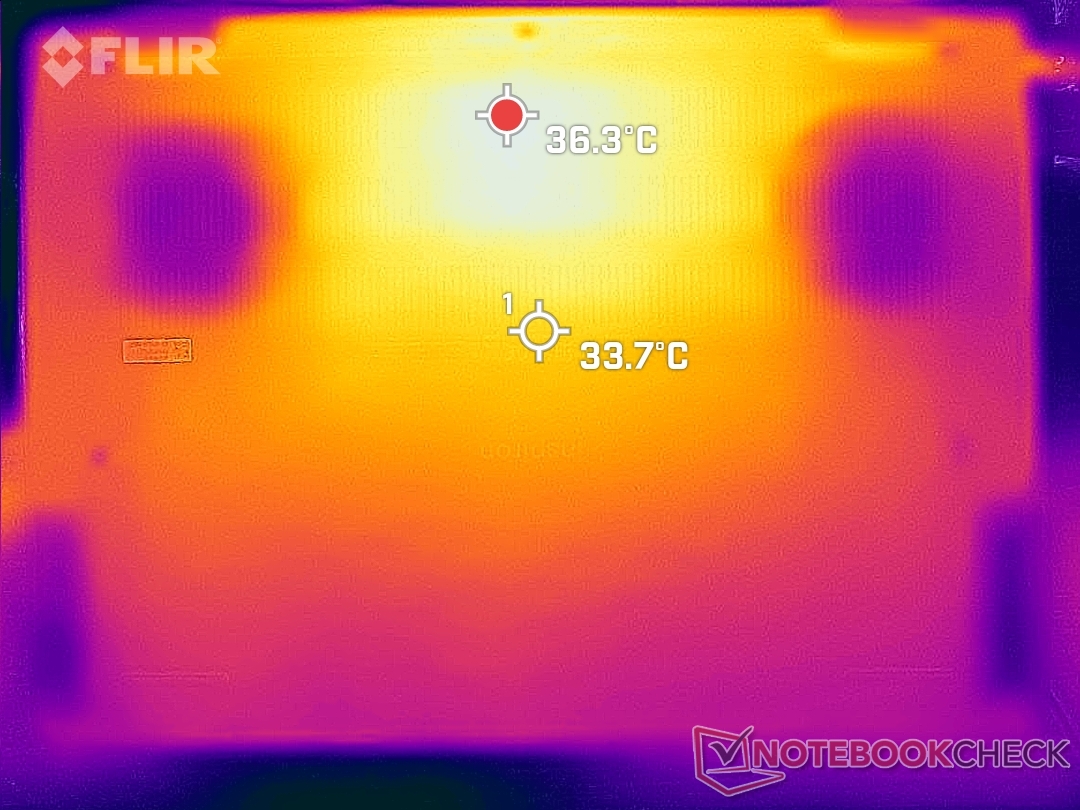
Temperatur
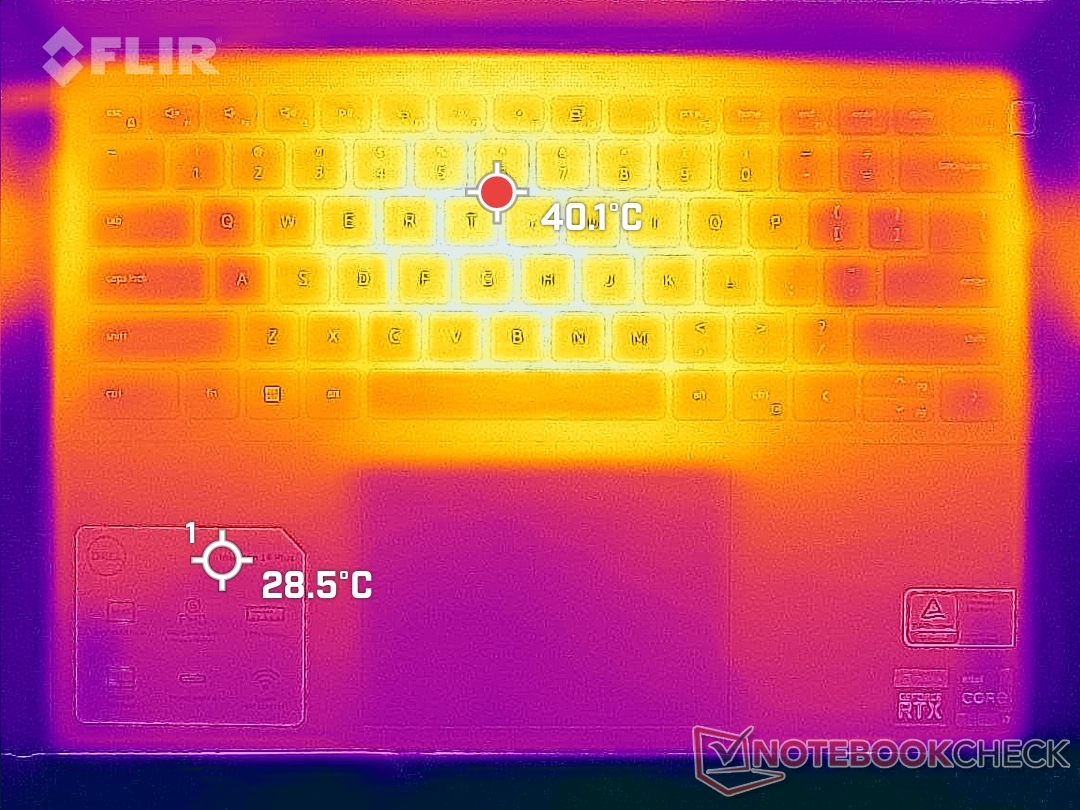
Die Oberflächentemperaturen sind mit 28 °C bereits im Idle warm, sowie wir es von anderen dünnen Multimedia-Laptops mit dedizierter Grafik wie dem Asus Vivobook Pro 14 oder dem Schenker Vision 14 gewohnt sind. Beim Gaming gibt es in der Tastaturmitte und der Rückseite Hot Spots von knapp über 40 °C, die Handballenauflagen bleiben jedoch unterhalb von 30 °C. Zudem sind selbst die Hot Spots allgemein kühler als bei den erwähnten Asus oder Schenker, welche 45 bis 55 °C.
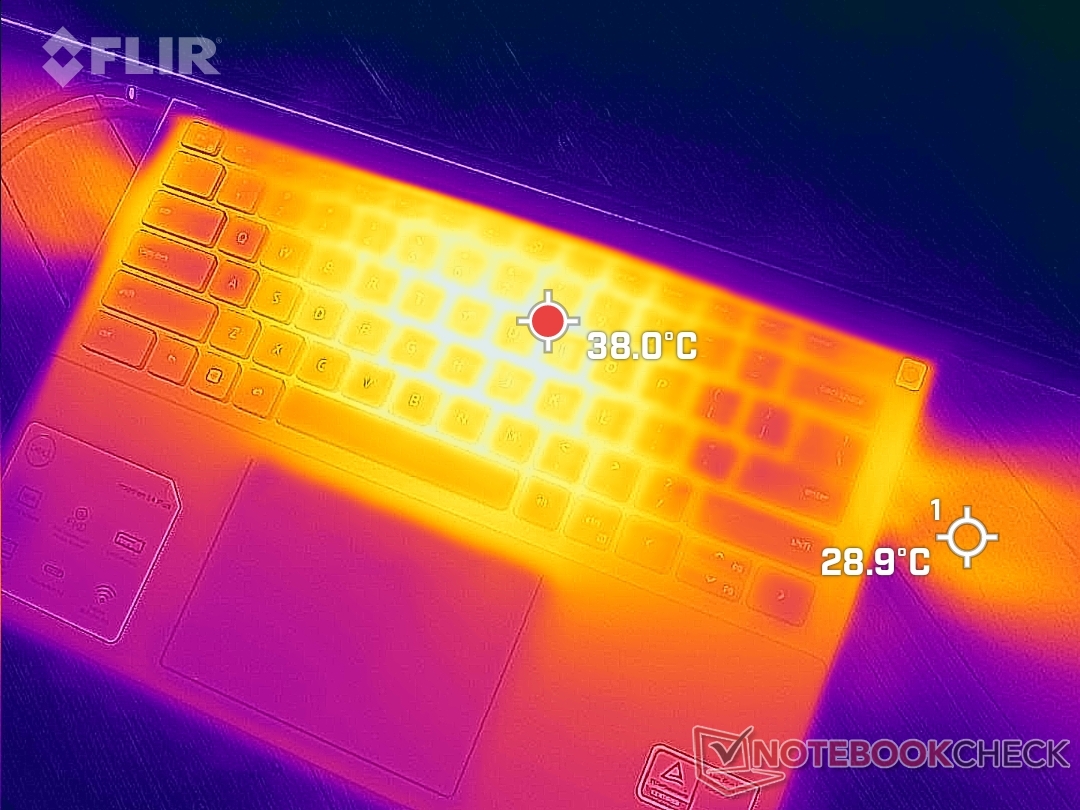
(±) Die maximale Temperatur auf der Oberseite ist 40 °C. Im Vergleich liegt der Klassendurchschnitt bei 36.8 °C (von 21 bis 71 °C für die Klasse Multimedia).
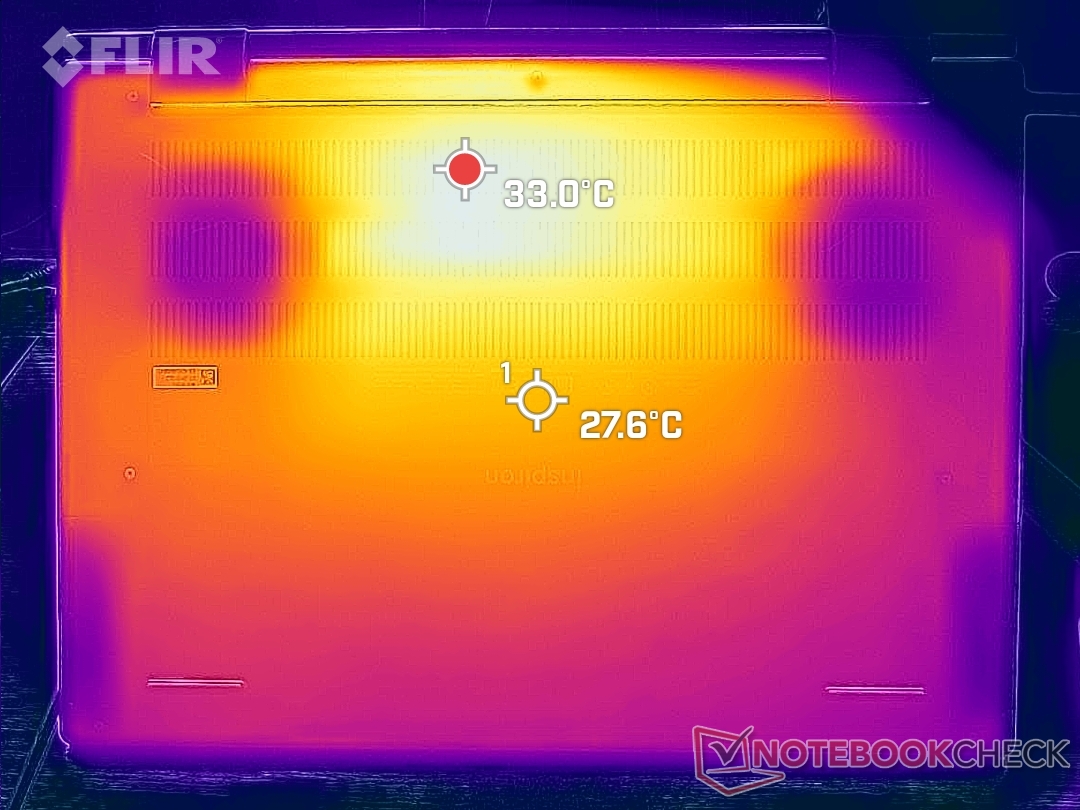
(+) Auf der Unterseite messen wir eine maximalen Wert von 36.4 °C (im Vergleich zum Durchschnitt von 39.1 °C).
(+) Ohne Last messen wir eine durchschnittliche Temperatur von 24.2 °C auf der Oberseite. Der Klassendurchschnitt erreicht 31.3 °C.
(+) Beim längeren Spielen von The Witcher 3 erhitzt sich das Gerät durchschnittlich auf 28.6 °C. Der Durchschnitt der Klasse ist derzeit 31.3 °C.
(+) Die Handballen und der Touchpad-Bereich sind mit gemessenen 29.4 °C kühler als die typische Hauttemperatur und fühlen sich dadurch kühl an.
(±) Die durchschnittliche Handballen-Temperatur anderer getesteter Geräte war 28.7 °C (-0.7 °C).
| Dell Inspiron 14 Plus 7420 Intel Core i7-12700H, NVIDIA GeForce RTX 3050 4GB Laptop GPU | Asus Vivobook Pro 14 M3401QC-KM007T AMD Ryzen 5 5600H, NVIDIA GeForce RTX 3050 4GB Laptop GPU | Dell Inspiron 14 7420 2-in-1 Intel Core i7-1255U, Intel Iris Xe Graphics G7 96EUs | Schenker Vision 14 Intel Core i7-11370H, NVIDIA GeForce RTX 3050 Ti Laptop GPU | Asus Zenbook 14X UX5400E Intel Core i7-1165G7, NVIDIA GeForce MX450 | MSI Summit E14 A11SCS Intel Core i7-1185G7, NVIDIA GeForce GTX 1650 Ti Max-Q | HP Envy 14-eb0010nr Intel Core i5-1135G7, NVIDIA GeForce GTX 1650 Ti Max-Q | |
|---|---|---|---|---|---|---|---|
| Hitze | -25% | -5% | -23% | -17% | -33% | -19% | |
| Last oben max * (°C) | 40 | 42.3 -6% | 38.2 4% | 49.7 -24% | 42.4 -6% | 49.4 -23% | 41.2 -3% |
| Last unten max * (°C) | 36.4 | 49.6 -36% | 45.6 -25% | 56 -54% | 47.7 -31% | 60.6 -66% | 45.6 -25% |
| Idle oben max * (°C) | 27 | 34.2 -27% | 27.4 -1% | 28.8 -7% | 32.3 -20% | 30.6 -13% | 31.8 -18% |
| Idle unten max * (°C) | 29.2 | 37.9 -30% | 28.4 3% | 30.6 -5% | 31.9 -9% | 37.4 -28% | 37.8 -29% |
* ... kleinere Werte sind besser
Stresstest
Läuft Prime95, um die CPU zu stressen, so maximieren sich die Taktraten, die Temperatur sowie der Energiebedarf für etwa 10 Sekunden auf 3,5 GHz, 100 °C und 80 W. Danach sinken diese Werte und stabilisieren sich letztlich bei 1,9 GHz, 80 °C und 38 W, um die Temperaturen konstant zu halten. Der thermisch bedingte Leistungsverlust ist recht hoch, verglichen mit dem HP Pavilion Plus 14, dessen identische CPU im gleichen Test stabil bei schnelleren 2,2 bis 2,9 GHz läuft.
Unter Witcher 3 stabilisiert sich die GeForce-GPU bei 1.590 MHz, 74 °C und 50 W. Die RTX 3050 Ti im größeren Inspiron 16 Plus stabilisiert sich hingegen bei 1.627 MHz, 84 °C und 63 W. Die Kerntemperaturen sind vergleichsweise hoch, da dies eines der wenigen 14-Zoll-Laptops mit sowohl Core-H-CPU und GeForce-RTX-GPU ist. Wechselt man auf den Optimized Modus, so zieht die GPU nur noch 45 W oder weniger aus dem Netzteil.
Im Akkumodus wird die 3D-Leistung weiter beschnitten. Bei einem erneuten Fire-Strike-Test abseits der Steckdose messen wir nur noch Physics- und Graphics-Scores von 9.493 und 7.637 Punkten, anstelle der 26.940 und 12.125 am Netz.
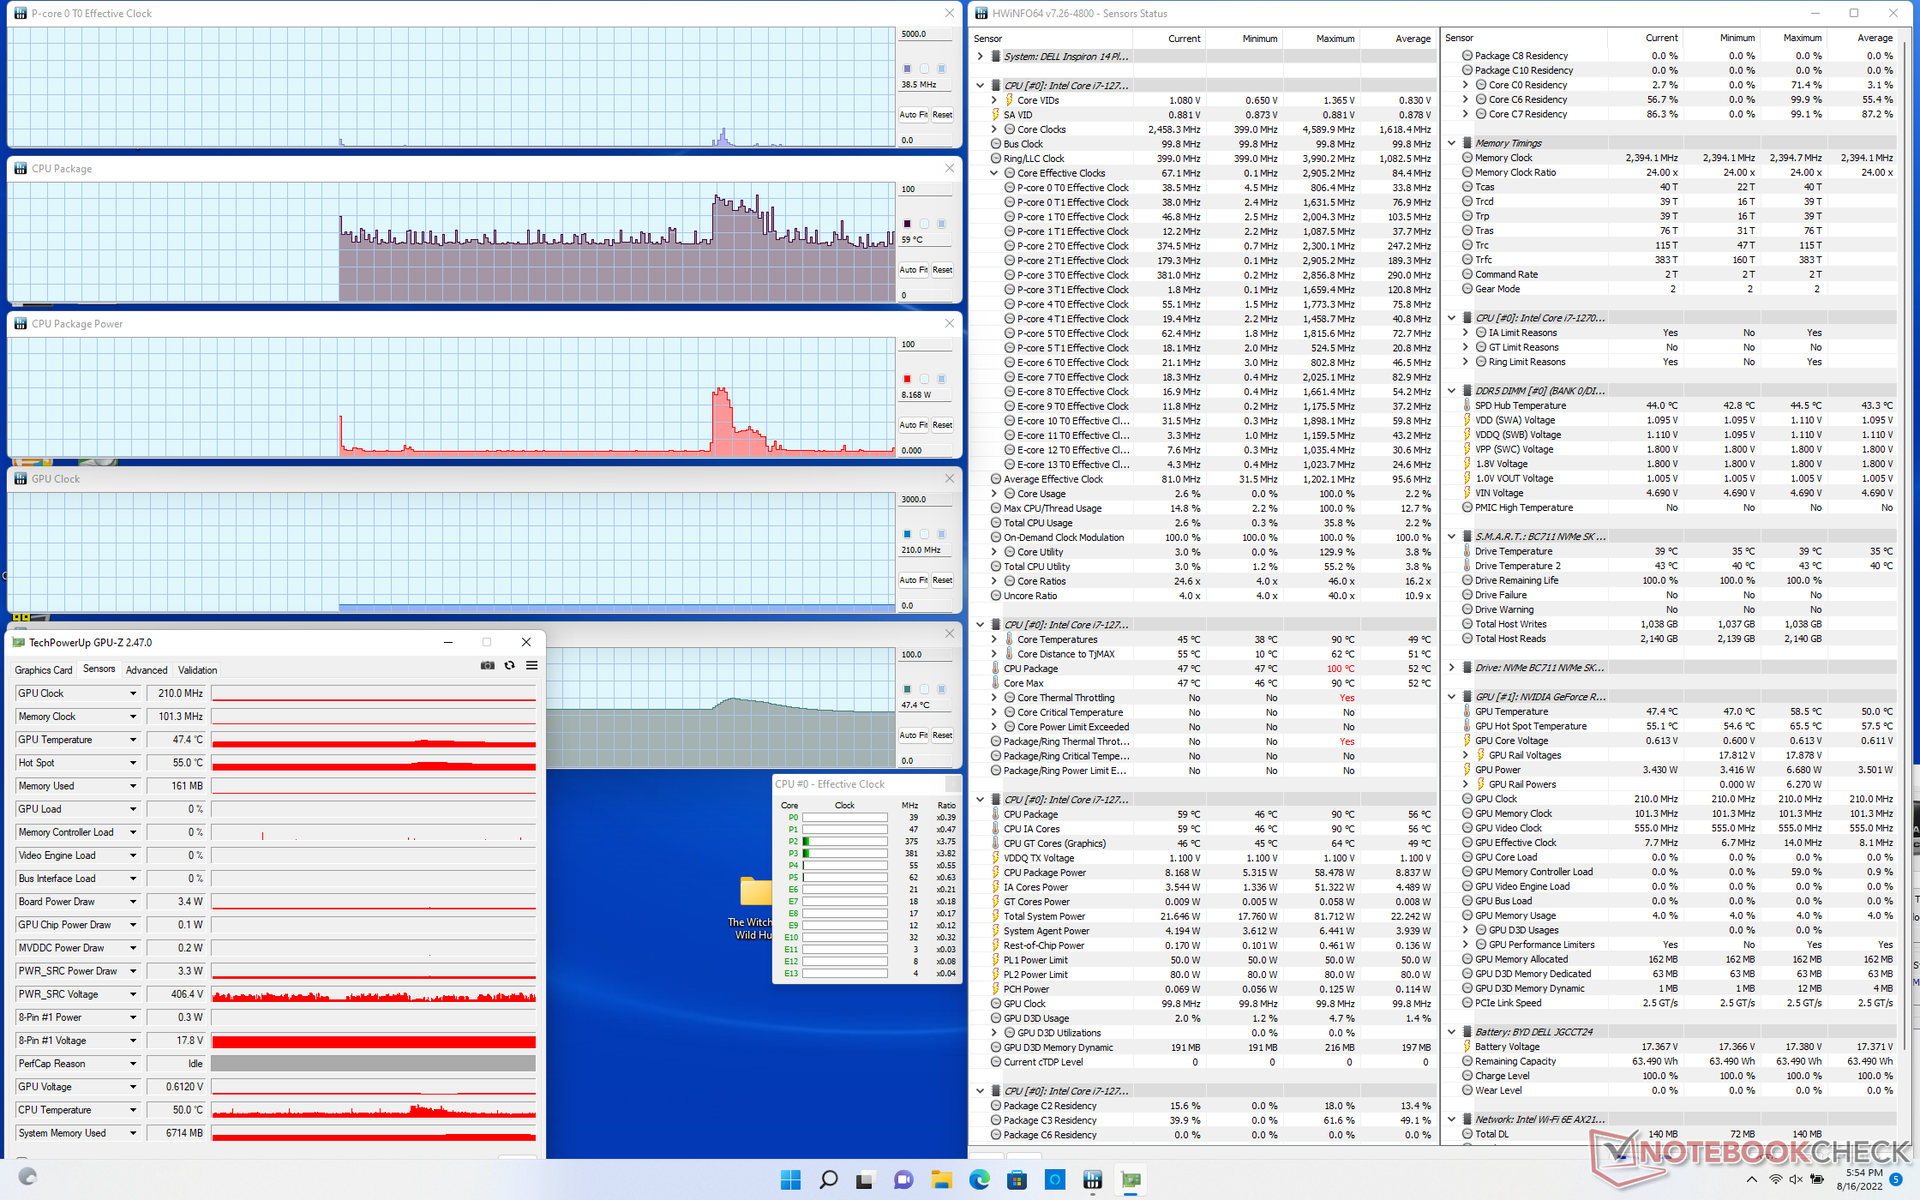
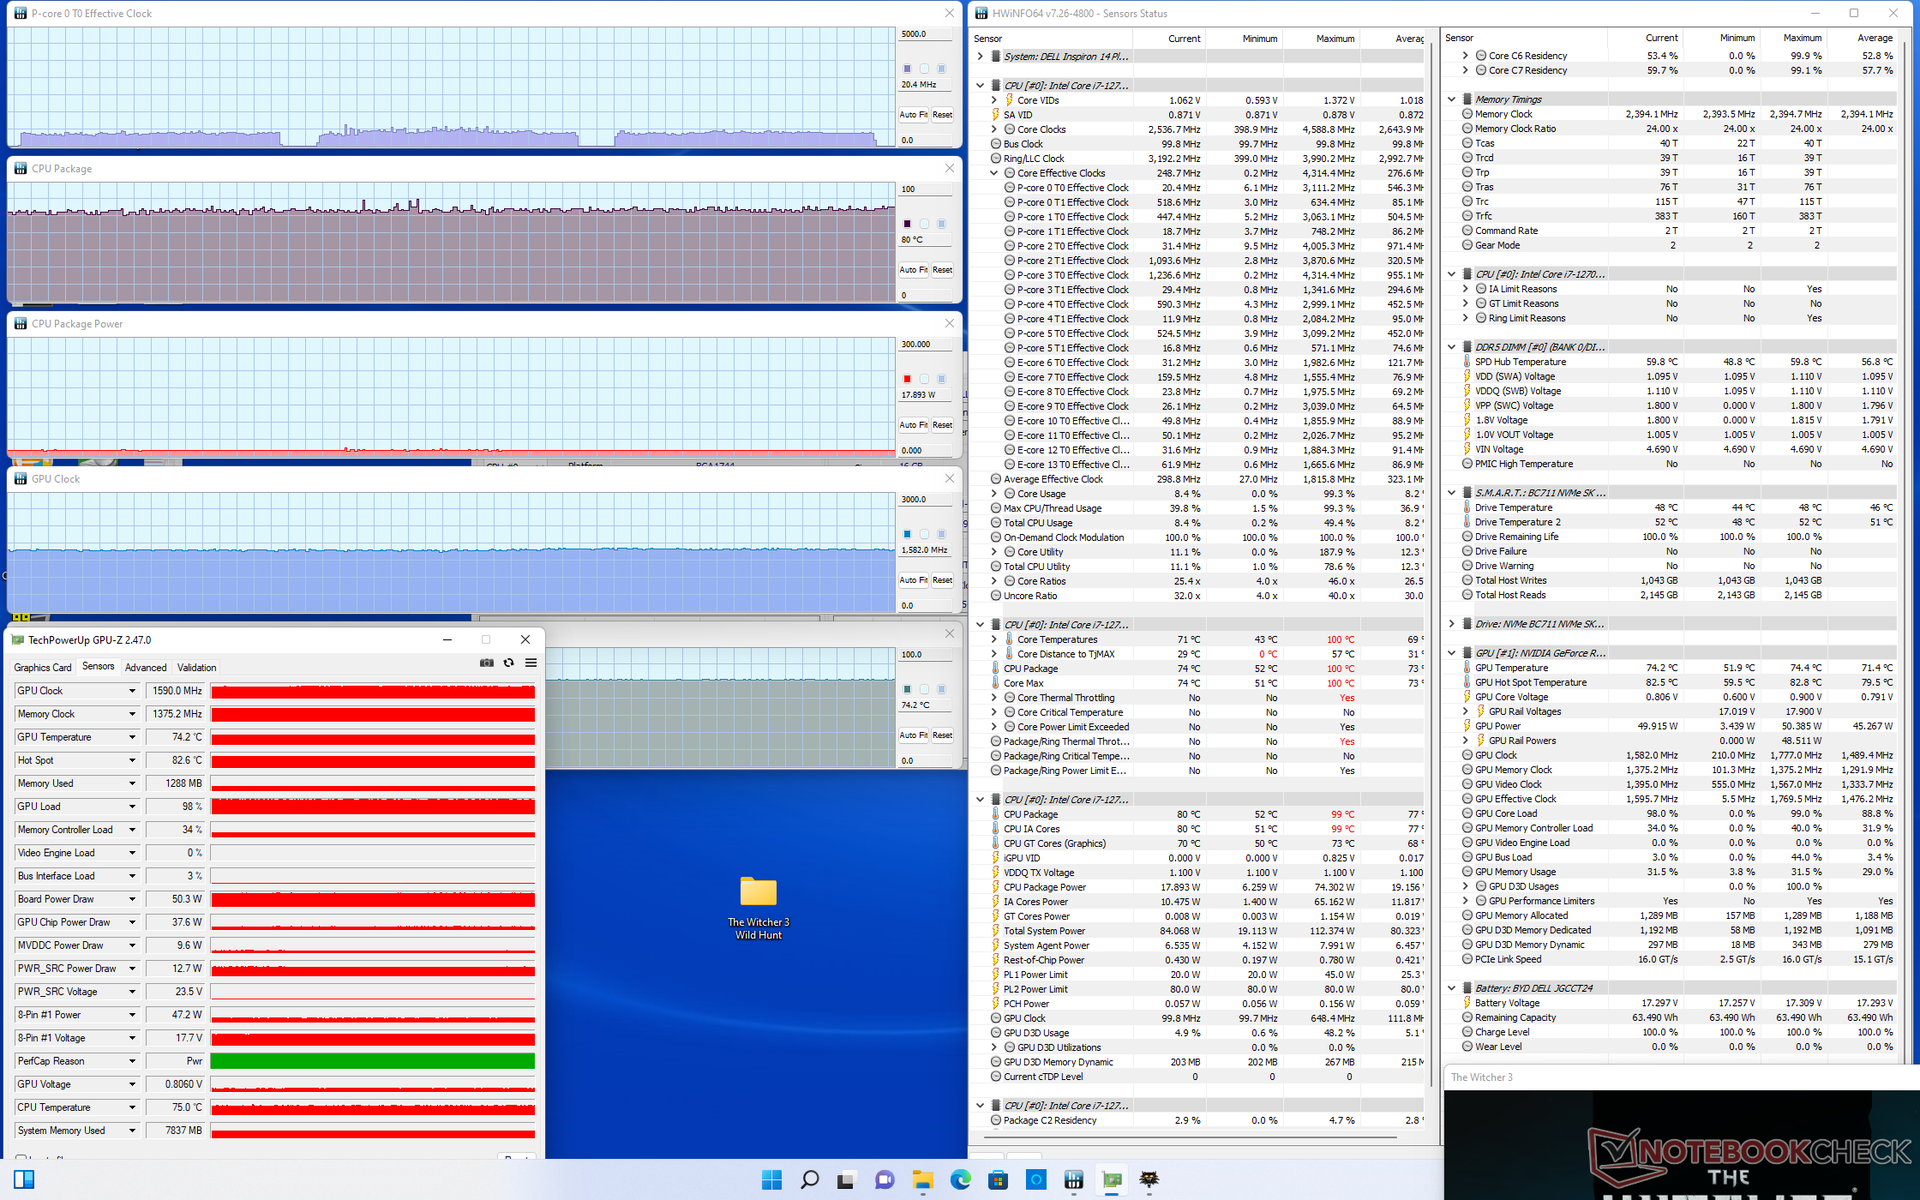
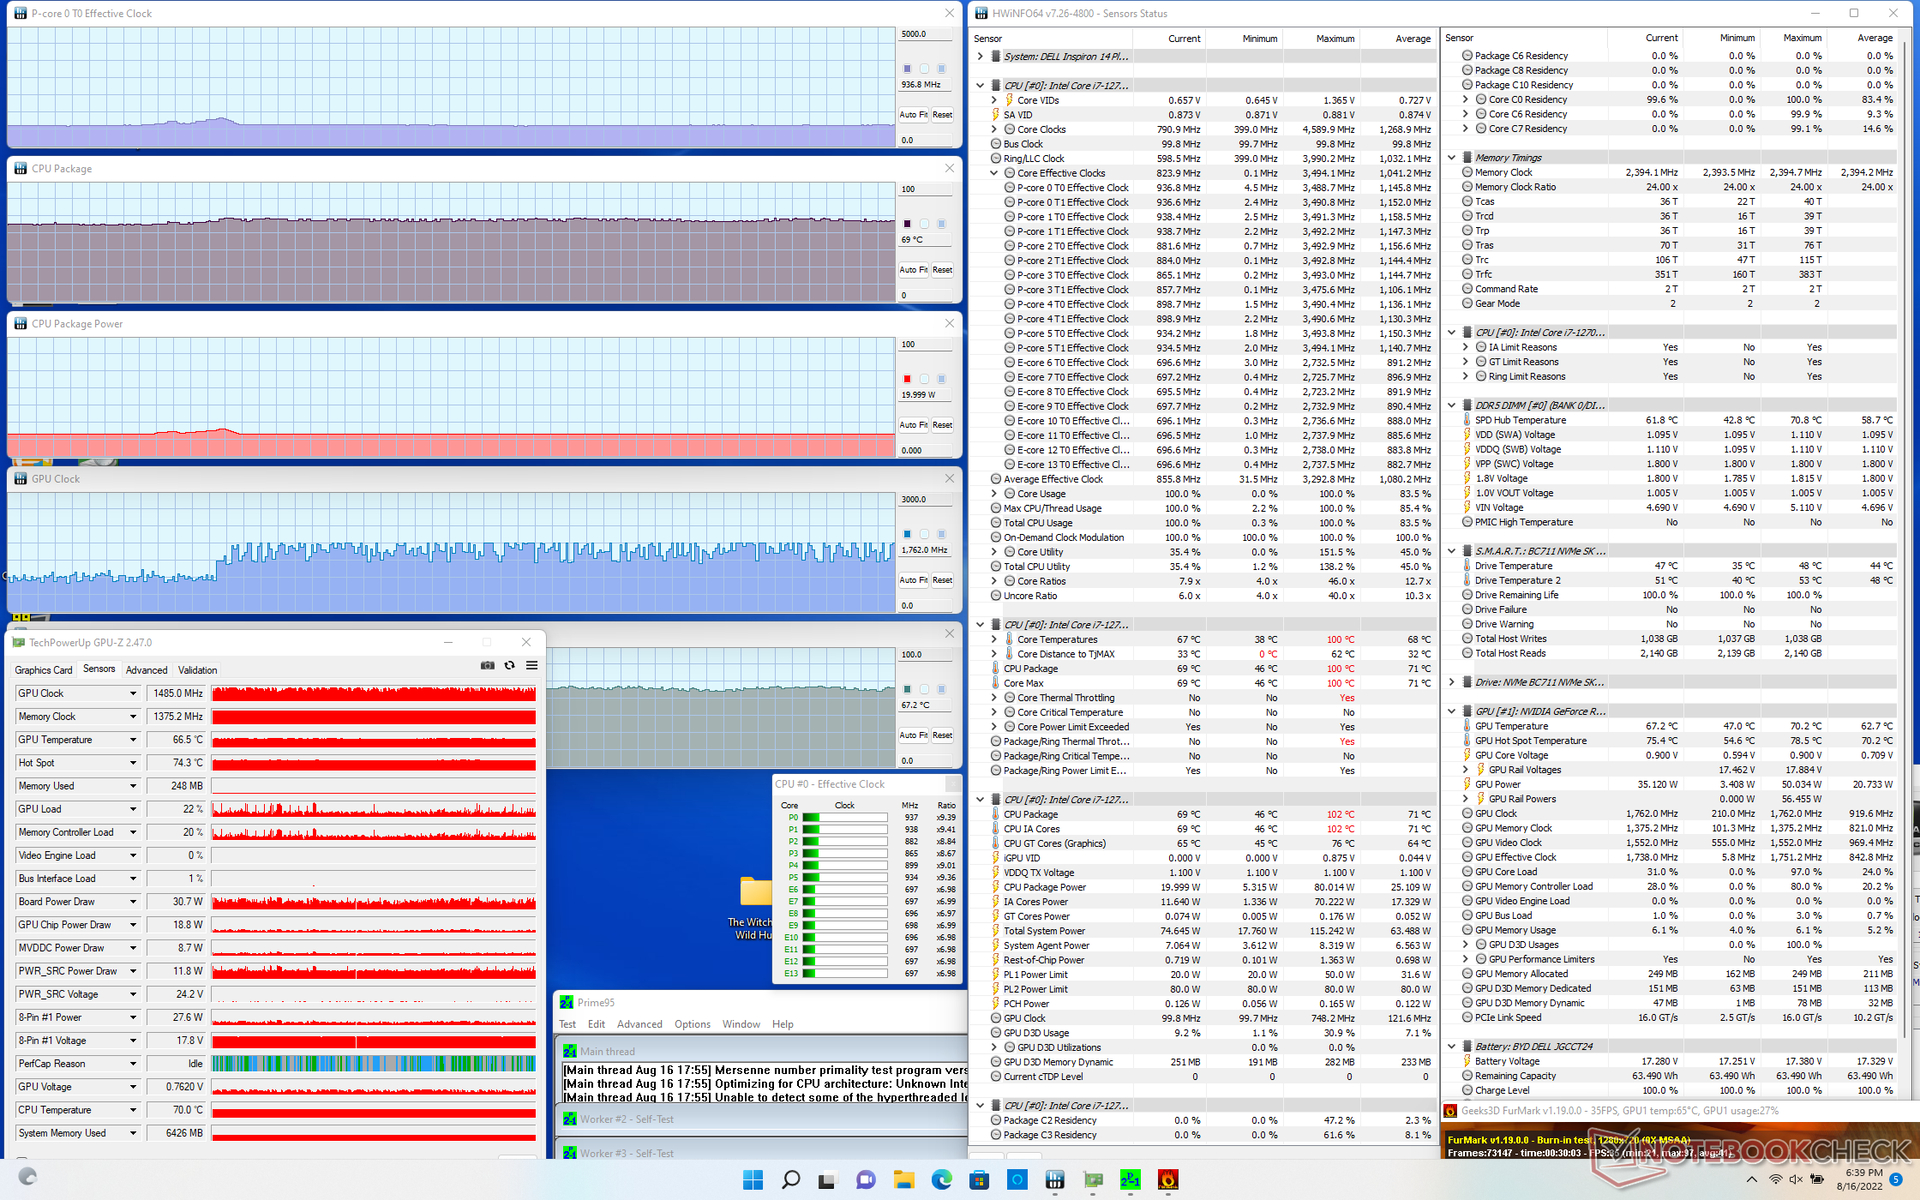
| CPU Clock (GHz) | GPU Clock (MHz) | Average CPU Temperature (°C) | Average GPU Temperature (°C) | |
| System Idle | -- | -- | 59 | 47 |
| Prime95 Stress | 1.9 | -- | 80 | 63 |
| Prime95 + FurMark Stress | 0.9 | ~1485 | 69 | 67 |
| Witcher 3 Stress | ~1.1 | 1590 | 80 | 74 |
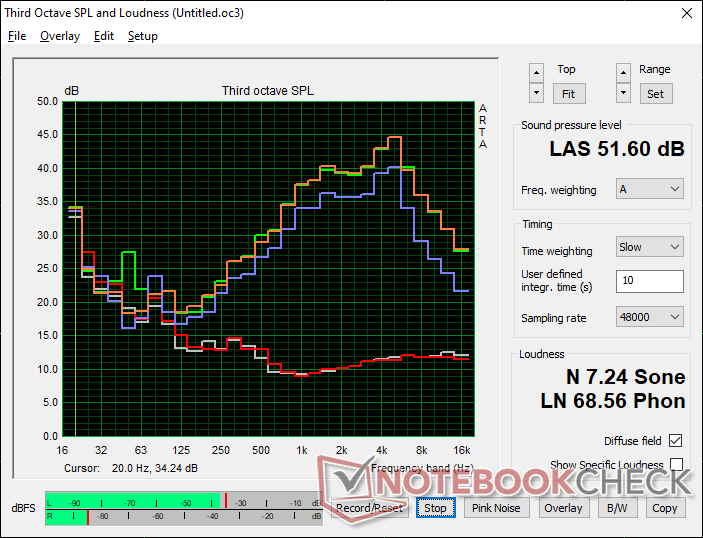
Lautsprecher
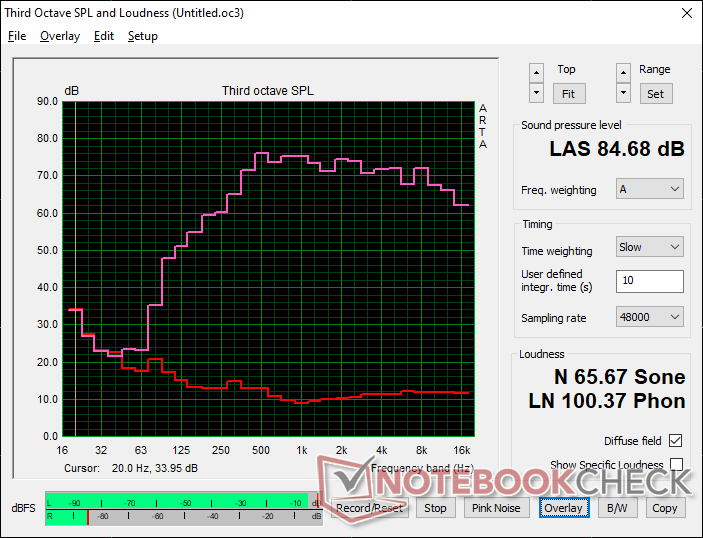
Dell Inspiron 14 Plus 7420 Audio Analyse
(+) | Die Lautsprecher können relativ laut spielen (84.7 dB)
Bass 100 - 315 Hz
(±) | abgesenkter Bass - 14.7% geringer als der Median
(±) | durchschnittlich lineare Bass-Wiedergabe (8.3% Delta zum Vorgänger)
Mitteltöne 400 - 2000 Hz
(+) | ausgeglichene Mitten, vom Median nur 2.6% abweichend
(+) | lineare Mitten (4.8% Delta zum Vorgänger)
Hochtöne 2 - 16 kHz
(+) | ausgeglichene Hochtöne, vom Median nur 1.8% abweichend
(+) | sehr lineare Hochtöne (4.4% Delta zum Vorgänger)
Gesamt im hörbaren Bereich 100 - 16.000 Hz
(+) | hörbarer Bereich ist sehr linear (10.4% Abstand zum Median
Im Vergleich zu allen Geräten derselben Klasse
» 15% aller getesteten Geräte dieser Klasse waren besser, 1% vergleichbar, 84% schlechter
» Das beste Gerät hat einen Delta-Wert von 5%, durchschnittlich ist 17%, das schlechteste Gerät hat 45%
Im Vergleich zu allen Geräten im Test
» 5% aller getesteten Geräte waren besser, 1% vergleichbar, 93% schlechter
» Das beste Gerät hat einen Delta-Wert von 4%, durchschnittlich ist 24%, das schlechteste Gerät hat 134%
Apple MacBook Pro 16 2021 M1 Pro Audio Analyse
(+) | Die Lautsprecher können relativ laut spielen (84.7 dB)
Bass 100 - 315 Hz
(+) | guter Bass - nur 3.8% Abweichung vom Median
(+) | lineare Bass-Wiedergabe (5.2% Delta zum Vorgänger)
Mitteltöne 400 - 2000 Hz
(+) | ausgeglichene Mitten, vom Median nur 1.3% abweichend
(+) | lineare Mitten (2.1% Delta zum Vorgänger)
Hochtöne 2 - 16 kHz
(+) | ausgeglichene Hochtöne, vom Median nur 1.9% abweichend
(+) | sehr lineare Hochtöne (2.7% Delta zum Vorgänger)
Gesamt im hörbaren Bereich 100 - 16.000 Hz
(+) | hörbarer Bereich ist sehr linear (4.6% Abstand zum Median
Im Vergleich zu allen Geräten derselben Klasse
» 0% aller getesteten Geräte dieser Klasse waren besser, 0% vergleichbar, 100% schlechter
» Das beste Gerät hat einen Delta-Wert von 5%, durchschnittlich ist 17%, das schlechteste Gerät hat 45%
Im Vergleich zu allen Geräten im Test
» 0% aller getesteten Geräte waren besser, 0% vergleichbar, 100% schlechter
» Das beste Gerät hat einen Delta-Wert von 4%, durchschnittlich ist 24%, das schlechteste Gerät hat 134%
Energiemanagement — Fordernde, kleine Maschine
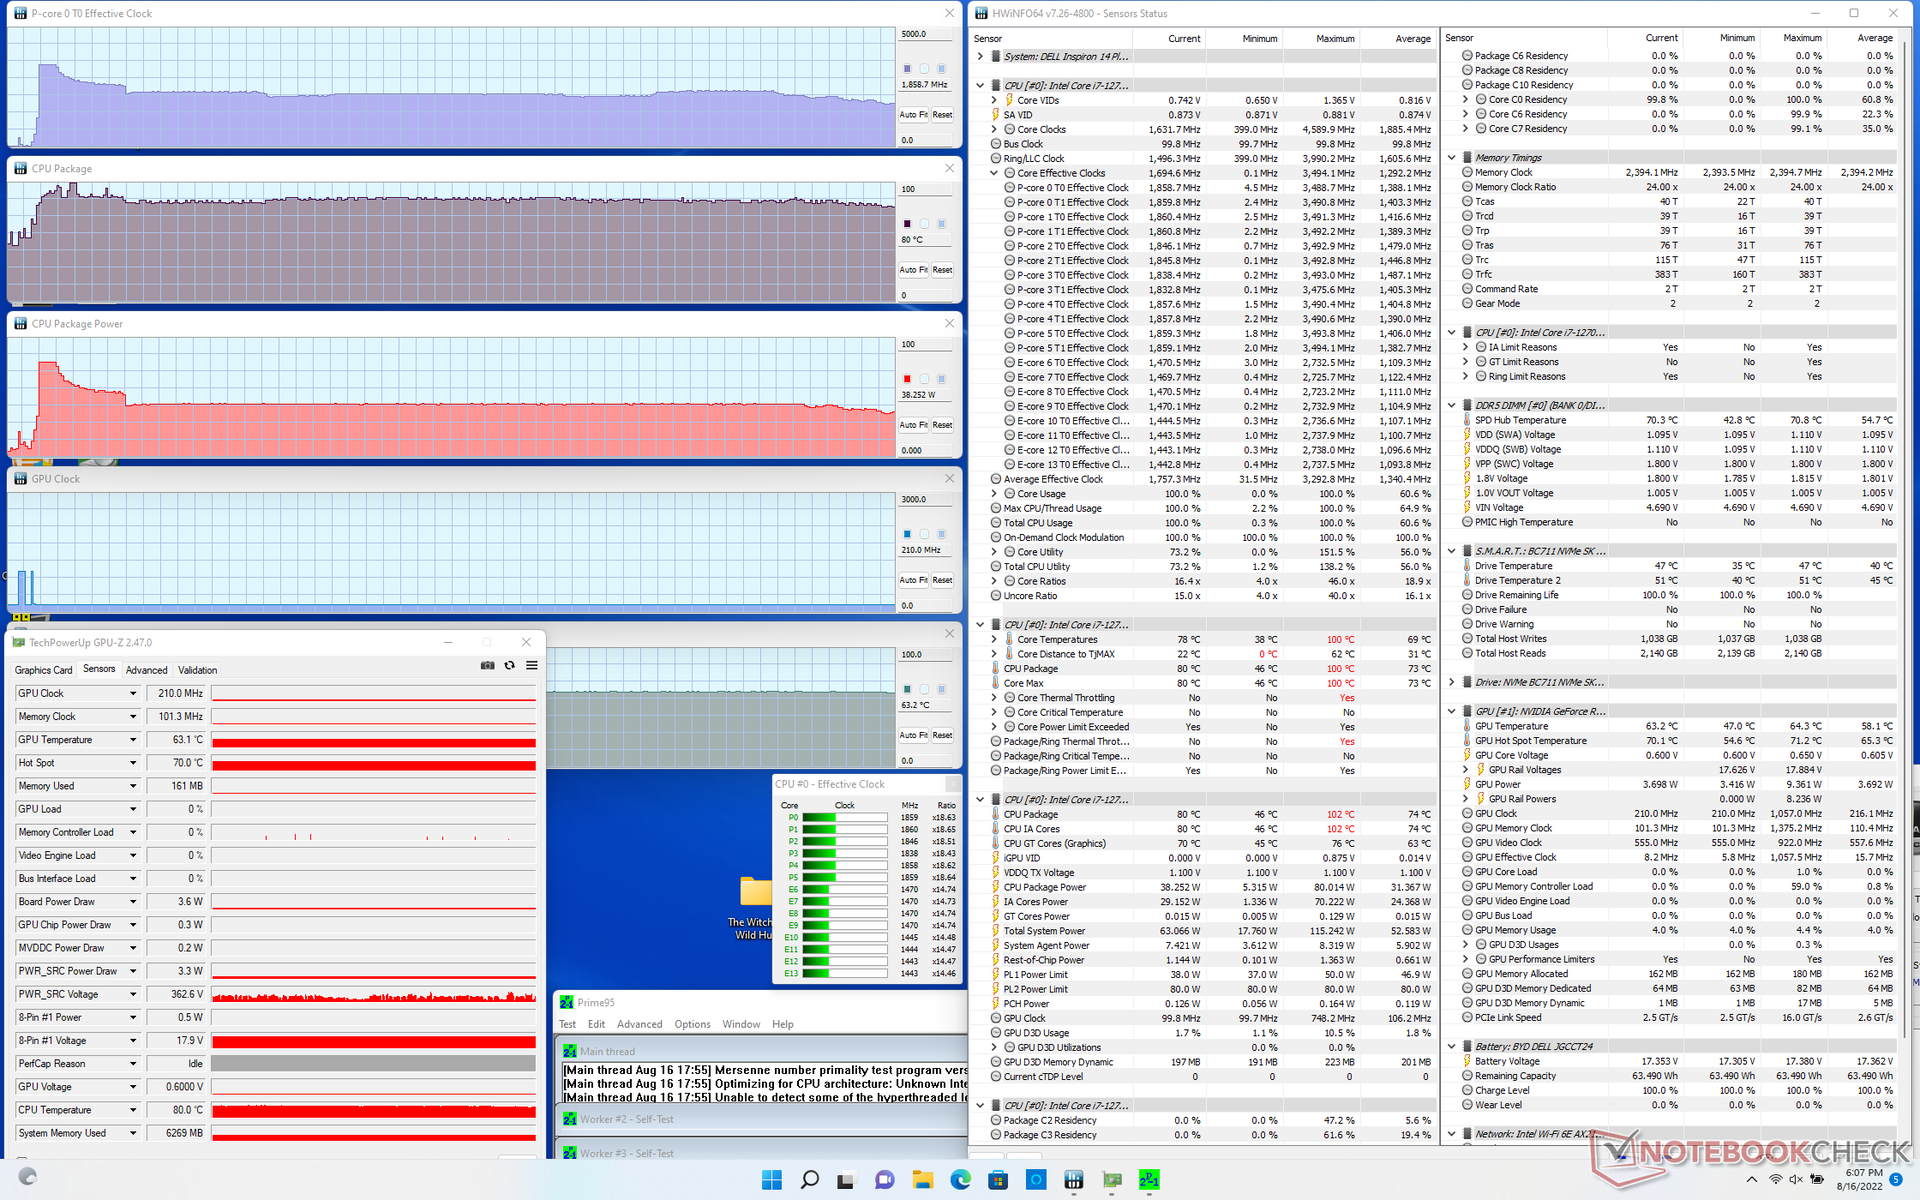
Energieverbrauch
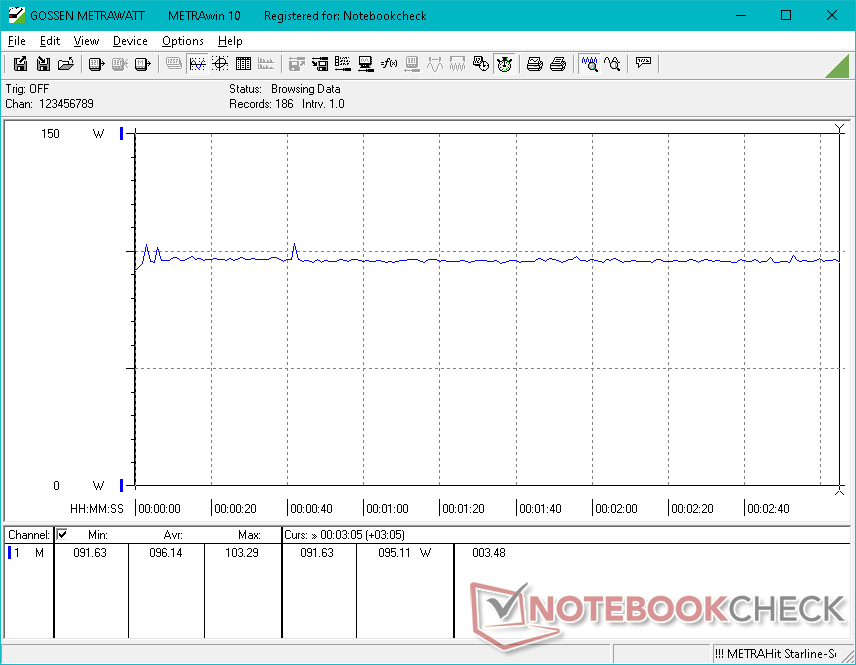
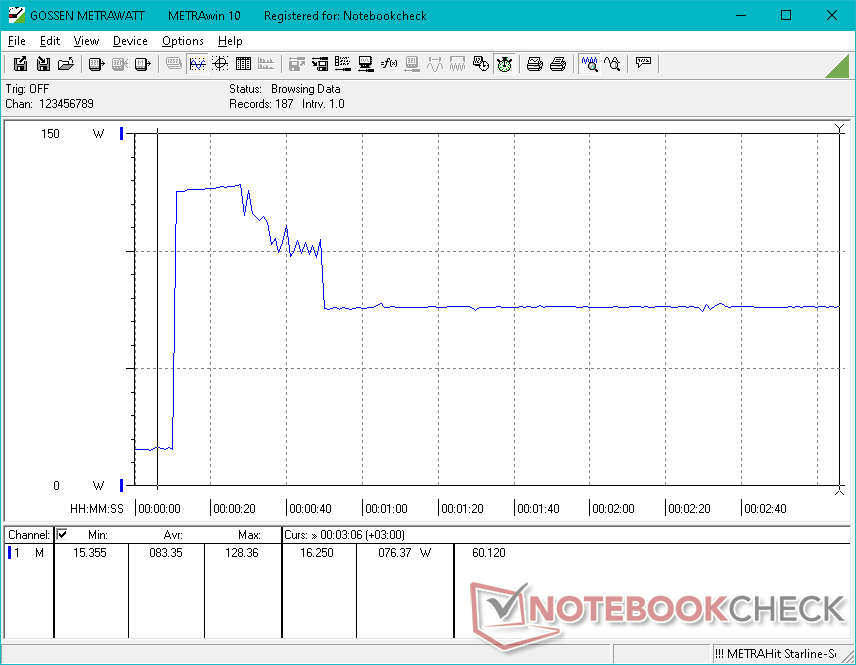
Im Energiesparmodus beträgt der Verbrauch im Idle zwischen 6 W bei minimaler und 10 W bei maximaler Helligkeit. Wechselt man zum Höchstleistungsmodus, so wird die dedizierte GPU aktiv und der Verbrauch steigt auf 20 W, was in etwa doppelt so viel ist wie bei den meisten langsameren 14-Zoll-Laptops mit Core-U-CPUs.
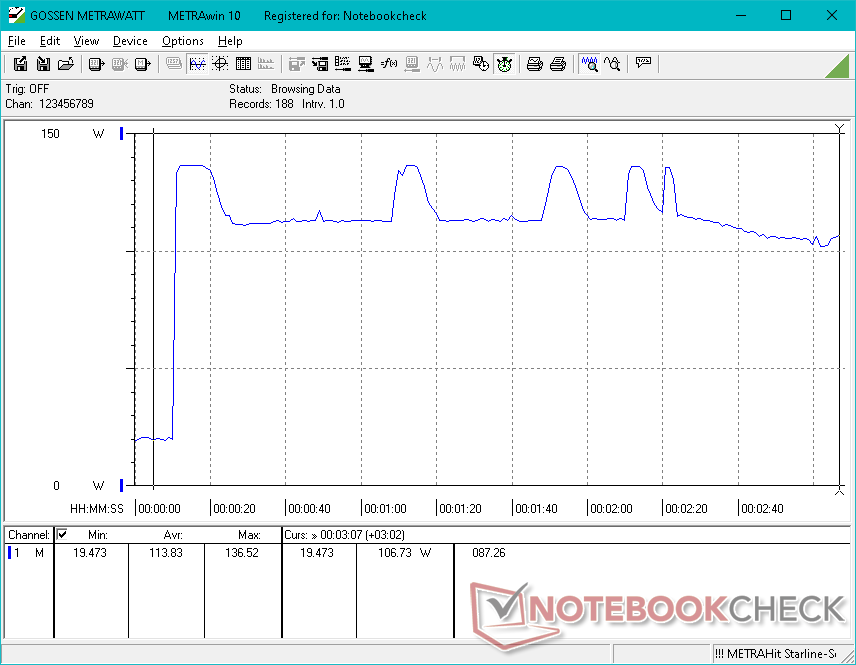
Gaming fordert zwischen 96 und 106 W, verglichen mit den 40 oder 50 W auf traditionellen Core-U-Alternativen. Die Gen12 H-Serie von Intel ist dafür bekannt viel Energie zu benötigen und die RTX 3050 kommt noch dazu. Daher ist es auch kein Wunder, dass das Inspiron 14 Plus sowohl lauter als auch wärmer wird als der durchschnittliche 14-Zoll-Laptop.
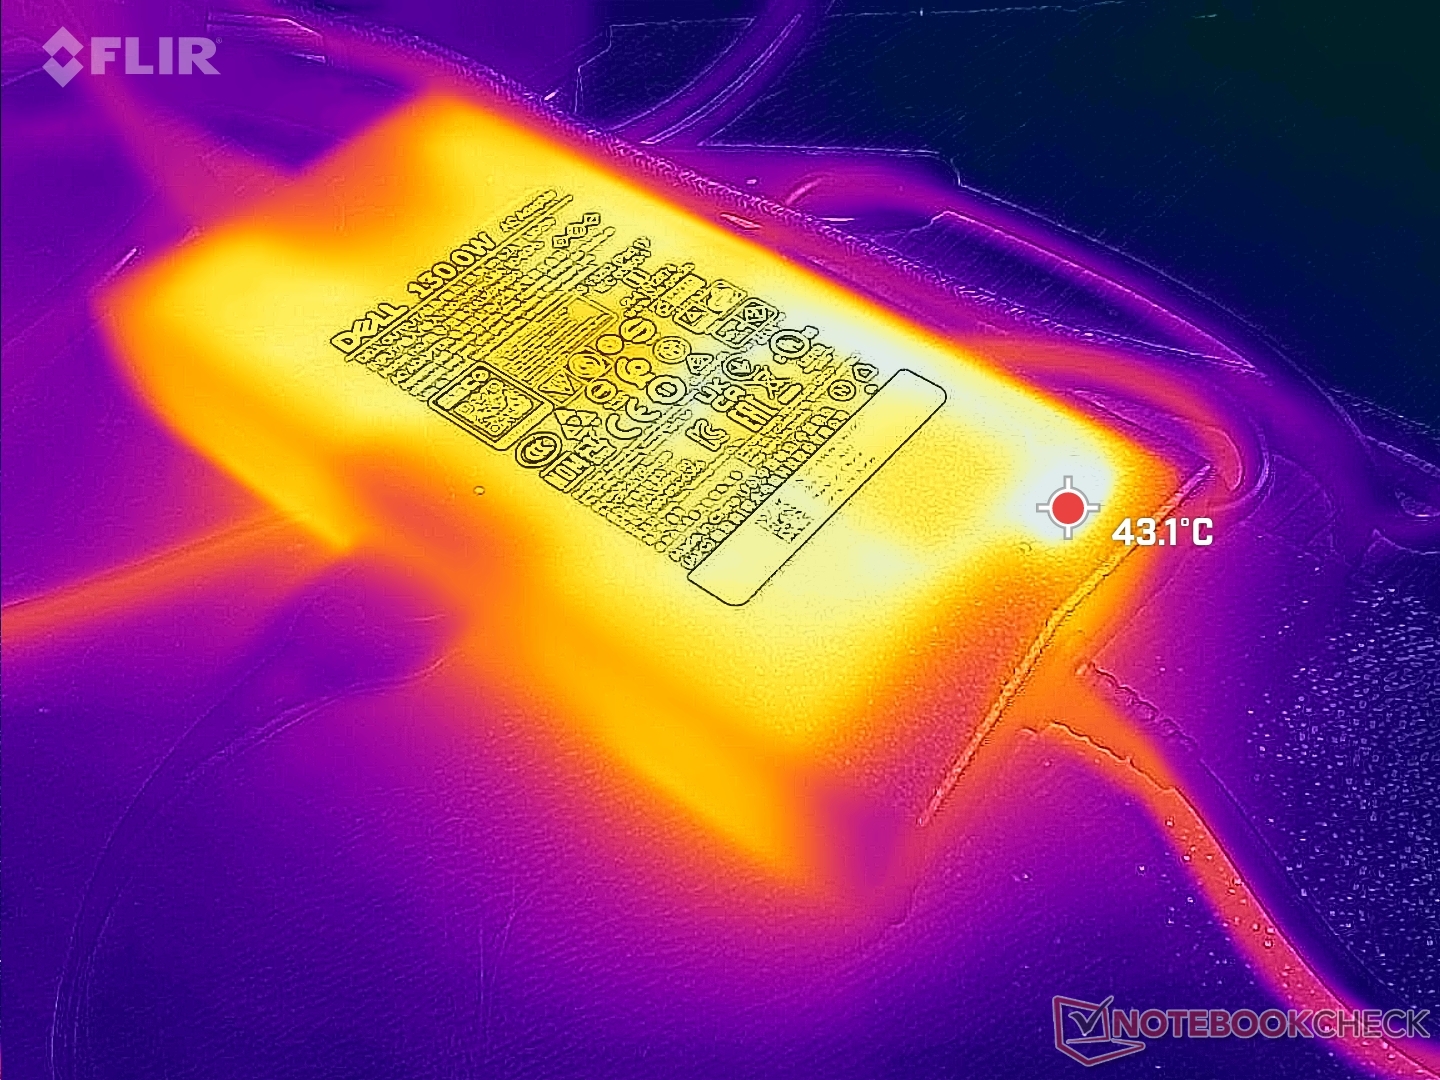
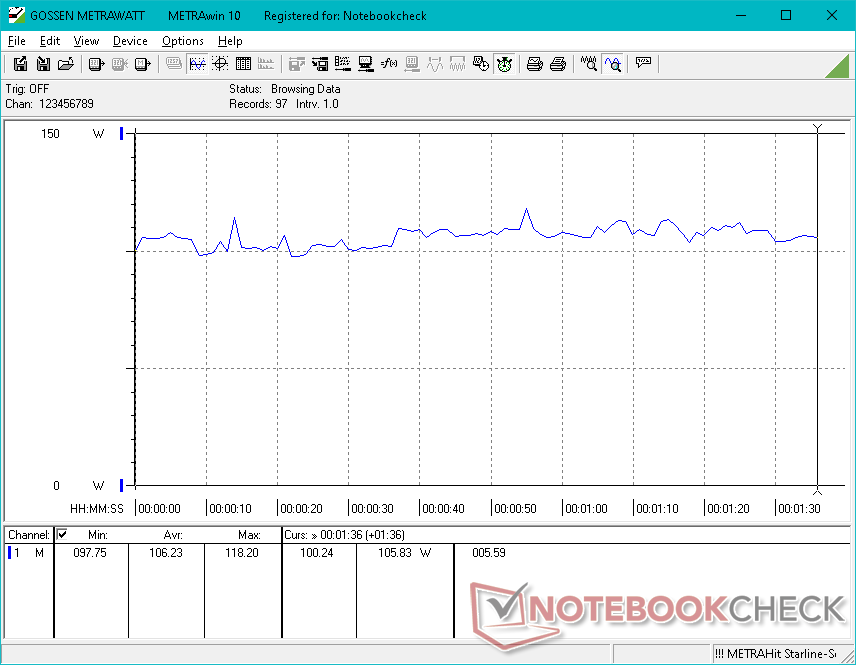
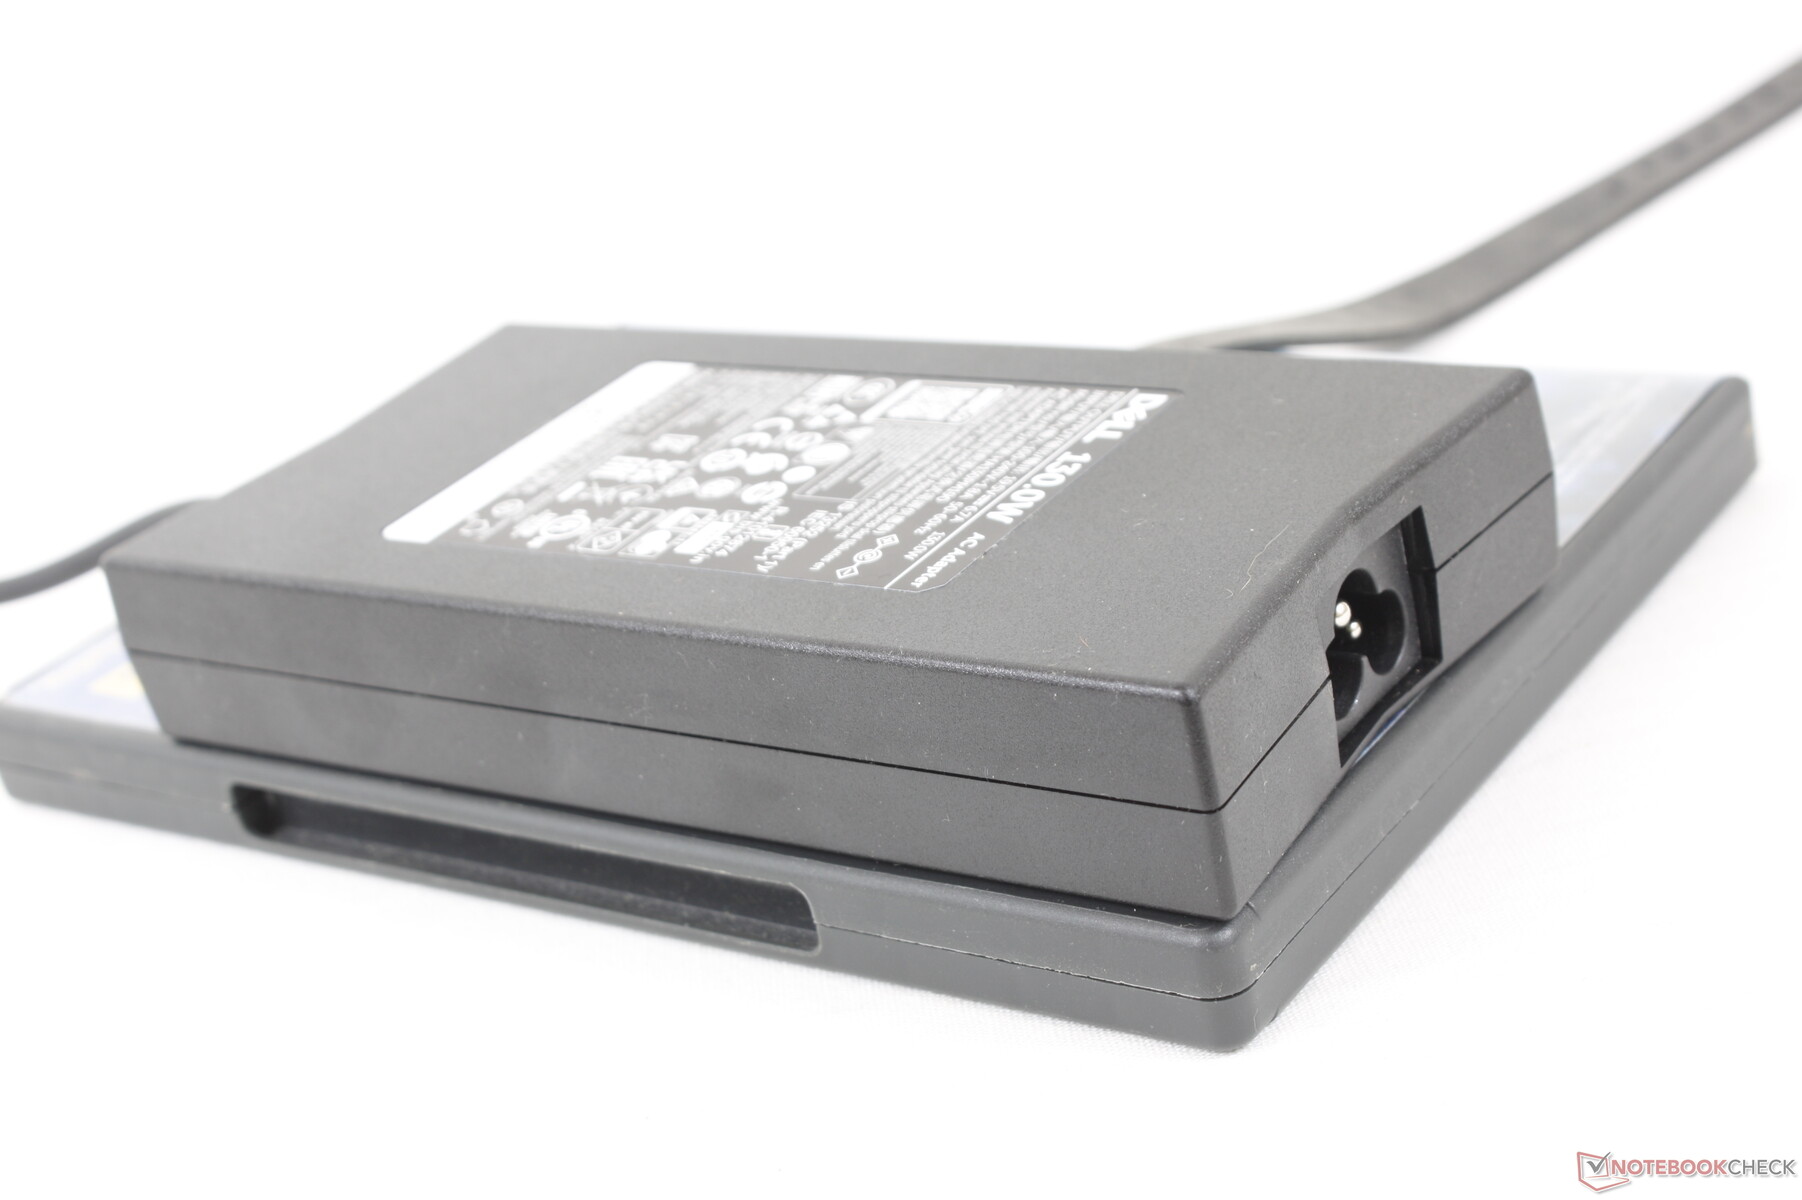
Wir messen unter Prime95 und FurMark gleichzeitig einen temporären Maximalverbrauch von 137 W am durchschnittlich großen (~15,3 x 7,5 x 2,6 cm) 130-W-Netzteil. Der Verbrauch pendelt typischerweise zwischen 110 und 137 W, wie auch der Screenshot unten zeigt. Bei solchen Lasten muss mit einer stark verlängerten Aufladezeit gerechnet werden.
| Aus / Standby | |
| Idle | |
| Last |
|
Legende:
min: | |
| Dell Inspiron 14 Plus 7420 i7-12700H, GeForce RTX 3050 4GB Laptop GPU, SK Hynix BC711 512GB HFM512GD3GX013N, IPS, 2240x1400, 14" | Asus Vivobook Pro 14 M3401QC-KM007T R5 5600H, GeForce RTX 3050 4GB Laptop GPU, Intel SSD 670p SSDPEKNU512GZ, OLED, 2880x1800, 14" | Dell Inspiron 14 7420 2-in-1 i7-1255U, Iris Xe G7 96EUs, WDC PC SN530 SDBPMPZ-512G, IPS, 1920x1200, 14" | Schenker Vision 14 i7-11370H, GeForce RTX 3050 Ti Laptop GPU, Samsung SSD 980 Pro 1TB MZ-V8P1T0BW, IPS, 2880x1800, 14" | Asus Zenbook 14X UX5400E i7-1165G7, GeForce MX450, SK Hynix HFM001TD3JX013N, OLED, 2880x1800, 14" | MSI Summit E14 A11SCS i7-1185G7, GeForce GTX 1650 Ti Max-Q, Phison 1TB SM2801T24GKBB4S-E162, IPS, 3840x2160, 14" | HP Envy 14-eb0010nr i5-1135G7, GeForce GTX 1650 Ti Max-Q, Samsung SSD PM981a MZVLB256HBHQ, IPS, 1920x1200, 14" | |
|---|---|---|---|---|---|---|---|
| Stromverbrauch | 22% | 44% | 8% | 24% | -10% | 5% | |
| Idle min * (Watt) | 6.3 | 6.6 -5% | 5.2 17% | 6.7 -6% | 7.2 -14% | 9.9 -57% | 4.2 33% |
| Idle avg * (Watt) | 10.3 | 9.6 7% | 8.2 20% | 12.6 -22% | 10.4 -1% | 17.4 -69% | 18.3 -78% |
| Idle max * (Watt) | 20 | 7.3 63% | 9.9 50% | 15.4 23% | 11 45% | 22.5 -13% | 19.2 4% |
| Last avg * (Watt) | 106.2 | 73 31% | 44.4 58% | 85.7 19% | 61.7 42% | 85.6 19% | 72.9 31% |
| Witcher 3 ultra * (Watt) | 96.1 | 74.4 23% | 35 64% | 83 14% | 53.6 44% | 70.9 26% | 61.5 36% |
| Last max * (Watt) | 136.5 | 119 13% | 62.5 54% | 110.9 19% | 96 30% | 91.1 33% | 127.8 6% |
* ... kleinere Werte sind besser
Energieverbrauch Witcher 3 / Stresstest
Energieverbrauch mit externem Monitor
Akkulaufzeit
Mit über 7 Stunden im WLAN-Test fällt die Laufzeit etwas höher aus als erwartet, denn dies ist nahe an dem was wir auf dem langsameren Inspiron 14 7420 2-in-1 ohne dedizierte Grafik gemessen haben. Doch Vorsicht: Unser Test zeigt die Ergebnisse mit dem größeren 64-Wh-Akku an, die Konfiguration mit dem kleineren 54-Wh-Akku dürfte spürbar weniger lange durchhalten.
Eine komplette Aufladung mit dem beiliegenden Netzteil dauert etwa 2 Stunden. Das Laden via USB-C-Netzteilen von Drittanbietern wird unterstützt.
| Dell Inspiron 14 Plus 7420 i7-12700H, GeForce RTX 3050 4GB Laptop GPU, 64 Wh | Asus Vivobook Pro 14 M3401QC-KM007T R5 5600H, GeForce RTX 3050 4GB Laptop GPU, 63 Wh | Dell Inspiron 14 7420 2-in-1 i7-1255U, Iris Xe G7 96EUs, 54 Wh | Schenker Vision 14 i7-11370H, GeForce RTX 3050 Ti Laptop GPU, 53 Wh | Asus Zenbook 14X UX5400E i7-1165G7, GeForce MX450, 63 Wh | MSI Summit E14 A11SCS i7-1185G7, GeForce GTX 1650 Ti Max-Q, 52 Wh | HP Envy 14-eb0010nr i5-1135G7, GeForce GTX 1650 Ti Max-Q, 63.3 Wh | |
|---|---|---|---|---|---|---|---|
| Akkulaufzeit | 47% | 58% | 16% | 65% | -24% | 83% | |
| Idle (h) | 11.9 | 11.5 -3% | 15.9 34% | 34 186% | 6.6 -45% | 27.7 133% | |
| WLAN (h) | 7.2 | 9.5 32% | 7.6 6% | 5.5 -24% | 5.4 -25% | 4.5 -37% | 10.8 50% |
| Last (h) | 0.9 | 1.9 111% | 2.1 133% | 1.4 56% | 1.2 33% | 1 11% | 1.5 67% |
| H.264 (h) | 6.8 |
Pro
Contra
Fazit — Plus-mäßige Leistung, Plus-mäßiges Gewicht
Wer nach der maximalen CPU- und GPU-Leistung in einem 14-Zoll-Laptop sucht, sollte die teureren Alternativen Razer Blade 14 oder Asus Zephyrus G14 in Betracht ziehen. Wer hingegen nach einem dünnen und leichten 14-Zoll-Ultrabook sucht, findet im Asus Zenbook 14 oder LG Gram 14 womöglich bessere Optionen. Für das beste aus beiden Welten jedoch wagt das Dell Inspiron 14 Plus 7420 den Ritt auf der schmalen Grenze zwischen extremer Leistung und Portabilität zu einem vernünftigen Preis. Wer viel unterwegs ist und eine Leistung oberhalb einer Core-U-CPU benötigt, könnte im Dell eine solide Lösung finden.
Natürlich ist es mit den üblichen Nachteilen verbunden derart performante Komponenten in ein kleines 14-Zoll-Gehäuse zu pressen: Das Dell wird wärmer, ist lauter, schwerer und hat einen höheren Energiebedarf als die meisten anderen 14-Zoll-Geräte. Beim Gewicht ließe sich hier, unserer Meinung nach, am ehesten ansetzen, schließlich ist das konkurrierende Asus Vivobook Pro 14 mit einer AMD-H-CPU und der gleichen GeForce RTX 3050 ausgestattet, wiegt aber gleich mehrere hundert Gramm weniger. Die Lüfter bleiben immerhin bei geringen Lasten vergleichsweise ruhig und sind somit nur unter hoher Beanspruchung laut.
Das Inspiron 14 Plus 7420 mag schwer sein, aber dafür löst es die Aufgaben deutlich schneller als ein typisches Ultrabook.
Weitere Nachteile sind das schwammige Klickpad und der sehr biegsame Displaydeckel. Gerade für einen so schweren 14-Zoll-Laptop wäre ein stabilerer Deckel wünschenswert gewesen. Die Leistungsvorteile gegenüber den meisten anderen 14-Zoll-Laptops dieser Preisklasse sind das Highlight dieses Systems.
Price and Availability
Unsere Testkonfiguration ist noch nicht flächendeckend in Deutschland verfügbar, kann aber bereits für 1.259 Euro auf der Dell-Produktseite erworben werden. Mit integrierter GPU statt RTX 3050 kostet er 200 Euro weniger. Wählt man statt des i7-12700H einen i5-12500H werden nochmals 100 Euro abgezogen.
Dell Inspiron 14 Plus 7420
- 30.08.2022 v7 (old)
Allen Ngo
Preisvergleich

