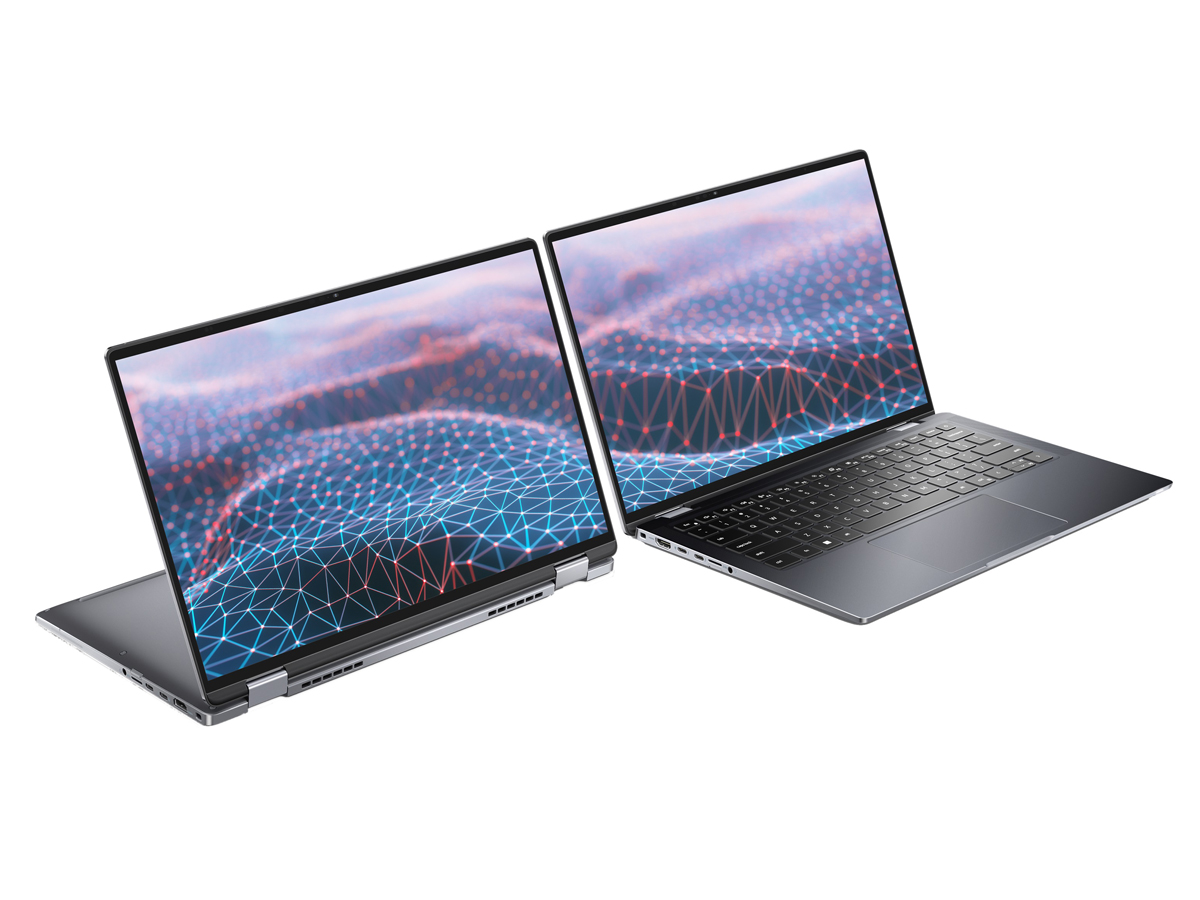
Test Dell Latitude 9430 2-in-1 Convertible: Auffrischung mit Intels 12. Generation
Nachdem dem die Latitude-Familie im letzten Jahr mit dem Latitude 9420 2-in-1 von Grund auf überarbeitet wurde, stellt das aktuelle Modell Latitude 9430 2-in-1 einen relativ kleinen Schritt für die Serie dar. Beim neuen Latitude kommen statt den Tiger-Lake-U-CPUs aus der 11. Generation Alder-Lake-U-CPUs aus Intels 12. Generation zum Einsatz. Darüber hinaus gibt es noch einige Änderungen im Detail, das Gehäuse bleibt jedoch unverändert, weshalb die meisten unserer Anmerkungen zum Latitude 9420 2-in-1 auch für das Latitude 9430 2-in-1 gelten.
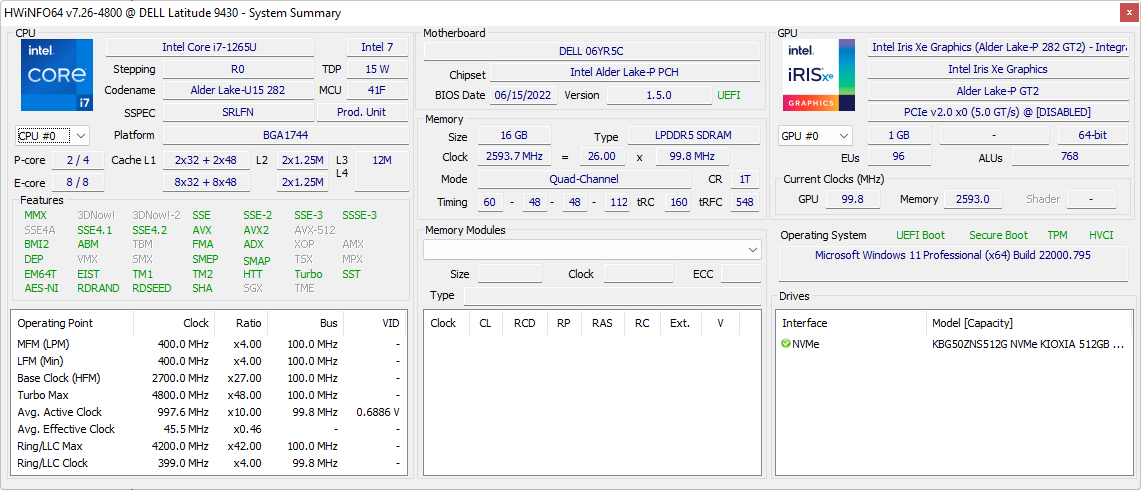
Unser Testgerät mit dem Core i7-1265U, 16 GB verlötetem RAM, einem QHD+-1.600p-Touchscreen und einer 512-GB-NVMe-SSD ist online für ca. 2.700 Euro erhältlich. Der Core i5-1245U steht ebenfalls zur Auswahl, das QHD+-Panel ist jedoch ein fester Bestandteil aller 2-in-1-Modelle. Zur Konkurrenz in dieser Kategorie zählen andere 14-Zoll-Bürolaptops wie das Lenovo ThinkPad X1 Yoga G7, HP EliteBook 840, MSI Summit E14 Flip, LG Gram 14T90P und das Huawei MateBook 14.
Weitere Dell-Tests:
Mögliche Konkurrenten im Vergleich
Bew. | Datum | Modell | Gewicht | Dicke | Größe | Auflösung | Preis ab |
|---|---|---|---|---|---|---|---|
| 89.8 % v7 (old) | 08 / 2022 | Dell Latitude 9430 2-in-1 i7-1265U, Iris Xe G7 96EUs | 1.5 kg | 13.94 mm | 14.00" | 2560x1600 | |
| 89 % v7 (old) | 07 / 2021 | Dell Latitude 9420 2-in-1 i7-1185G7, Iris Xe G7 96EUs | 1.5 kg | 13.94 mm | 14.00" | 2560x1600 | |
| 86.1 % v7 (old) | 07 / 2022 | MSI Summit E14 Flip Evo A12MT i7-1260P, Iris Xe G7 96EUs | 1.6 kg | 17.9 mm | 14.00" | 2880x1800 | |
| 87.5 % v7 (old) | 05 / 2022 | LG Gram 14T90P i5-1135G7, Iris Xe G7 80EUs | 1.2 kg | 17 mm | 14.00" | 1900x1200 | |
| 89.4 % v7 (old) | 05 / 2022 | Lenovo ThinkPad X1 Yoga G7 21CE002HGE i7-1270P, Iris Xe G7 96EUs | 1.5 kg | 15.53 mm | 14.00" | 1920x1200 | |
| 86.5 % v7 (old) | 05 / 2022 | Asus ZenBook Flip 14 UN5401QA-KN085W R7 5800H, Vega 8 | 1.4 kg | 15.9 mm | 14.00" | 2880x1800 |
Gehäuse
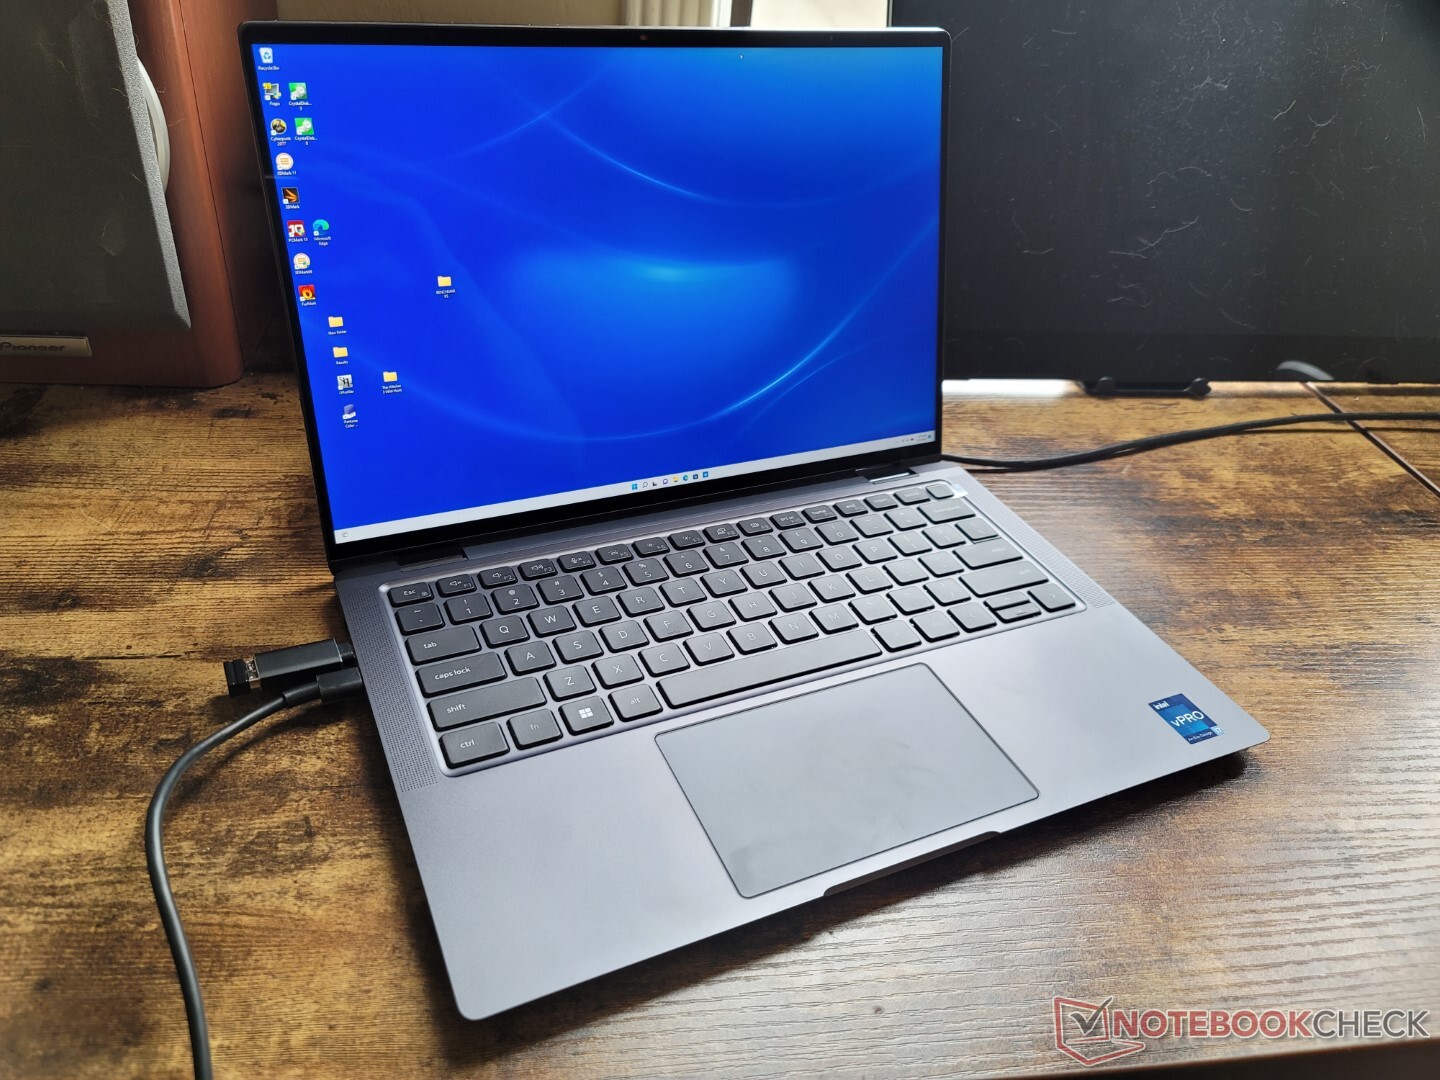
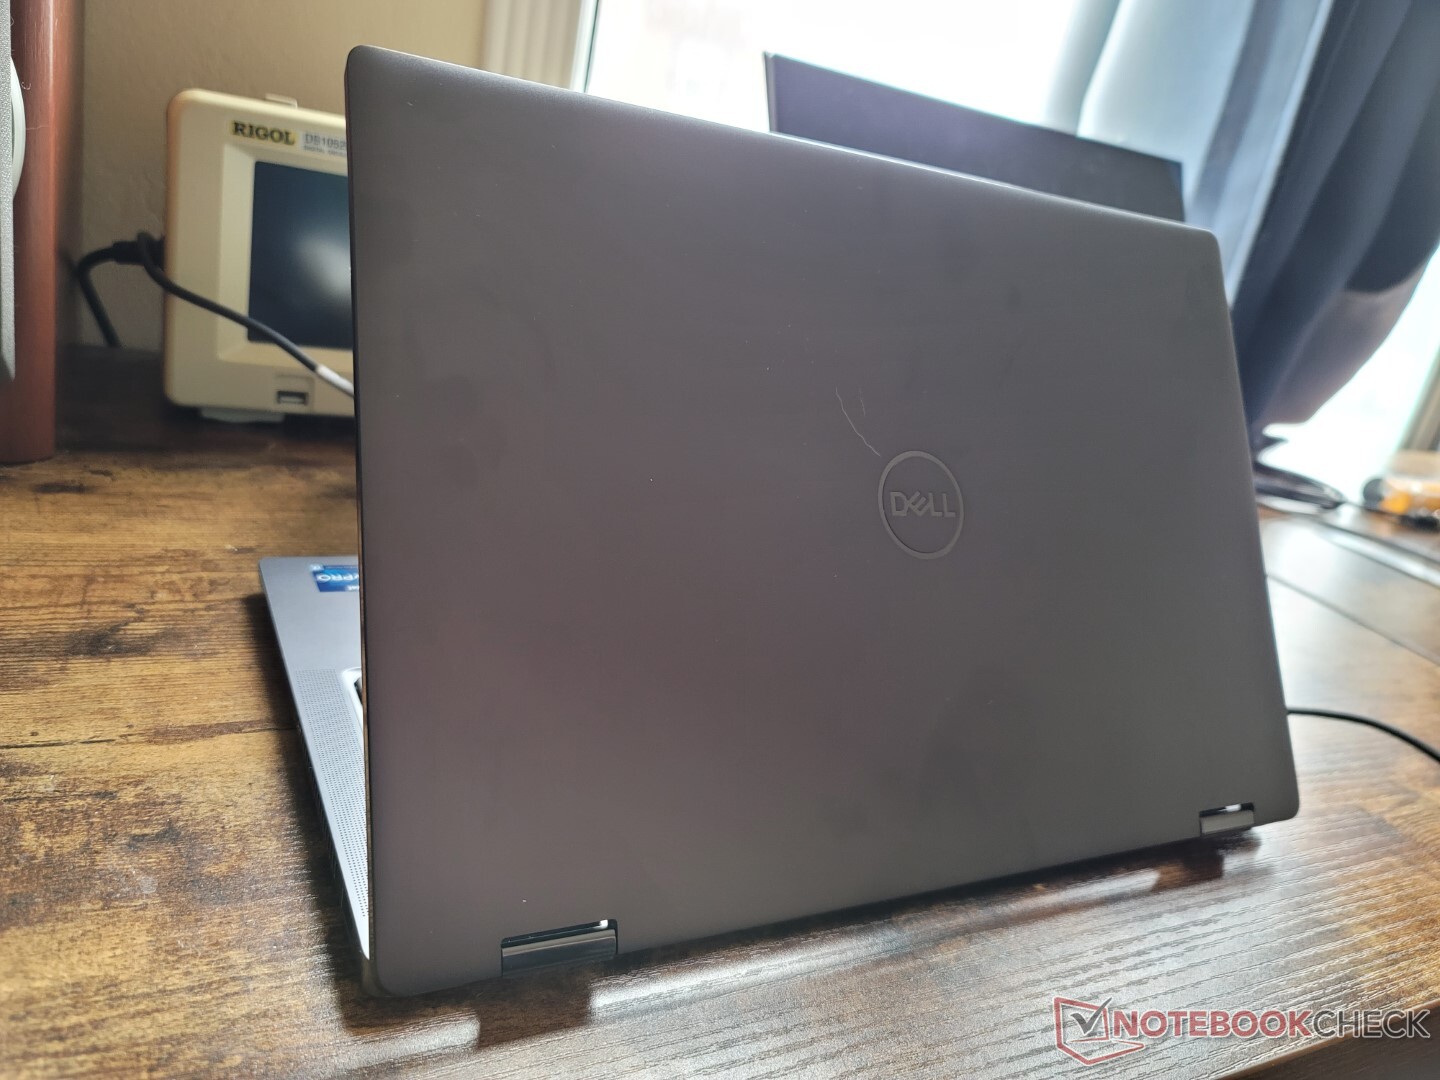
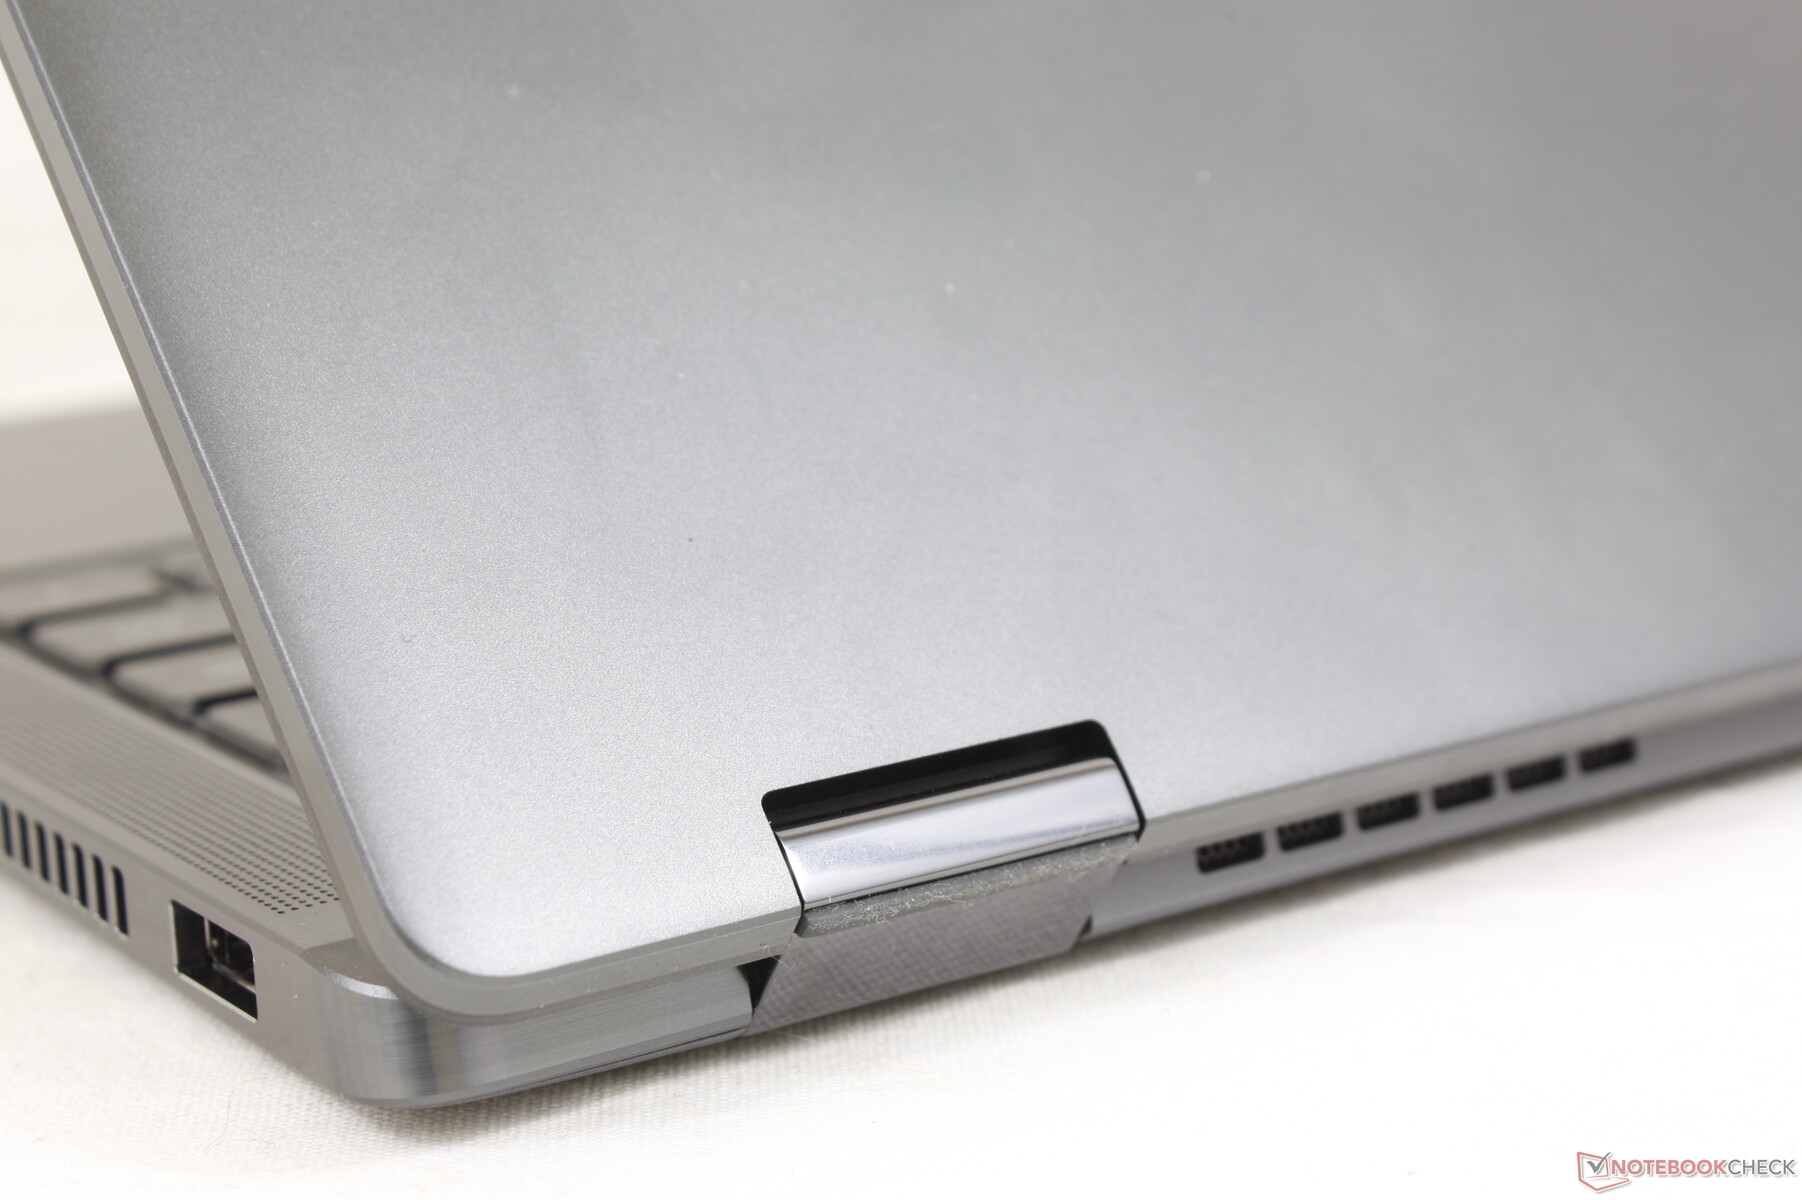
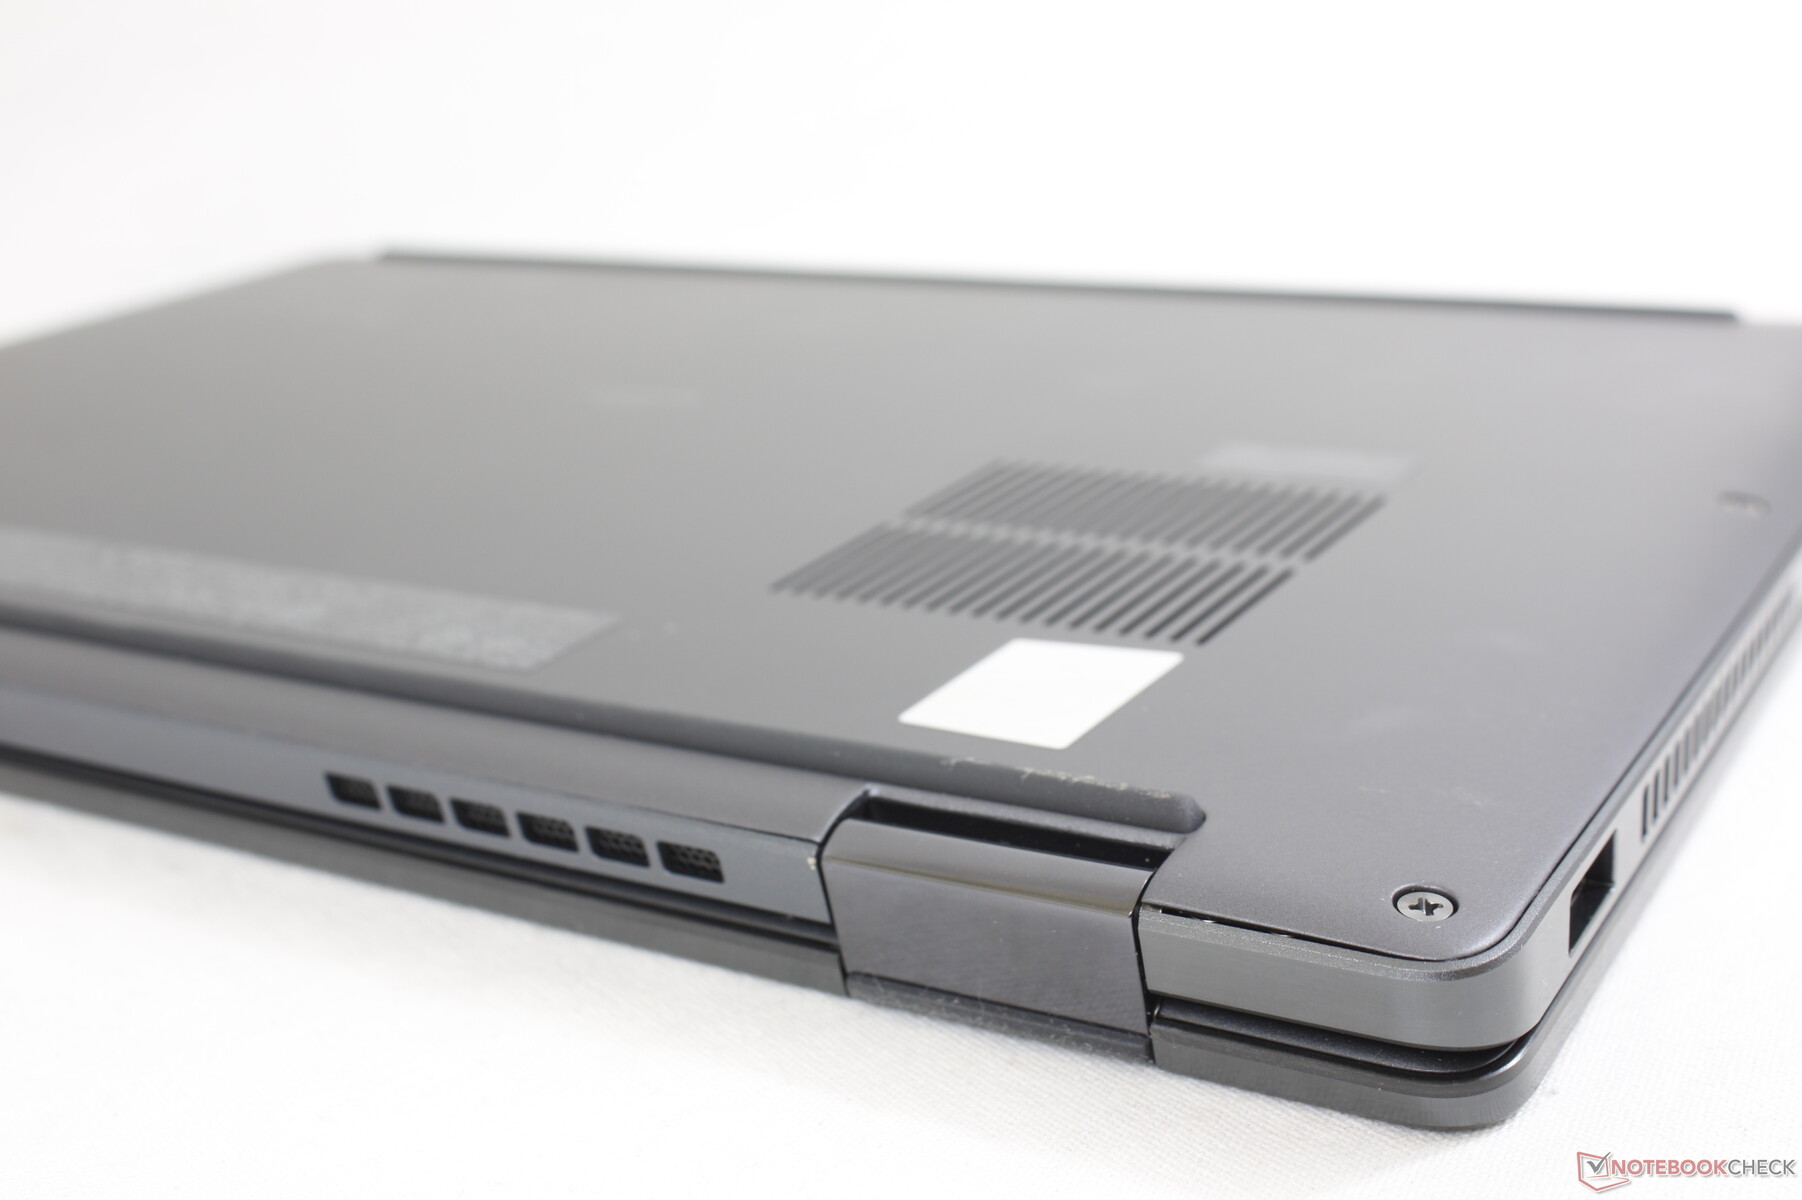
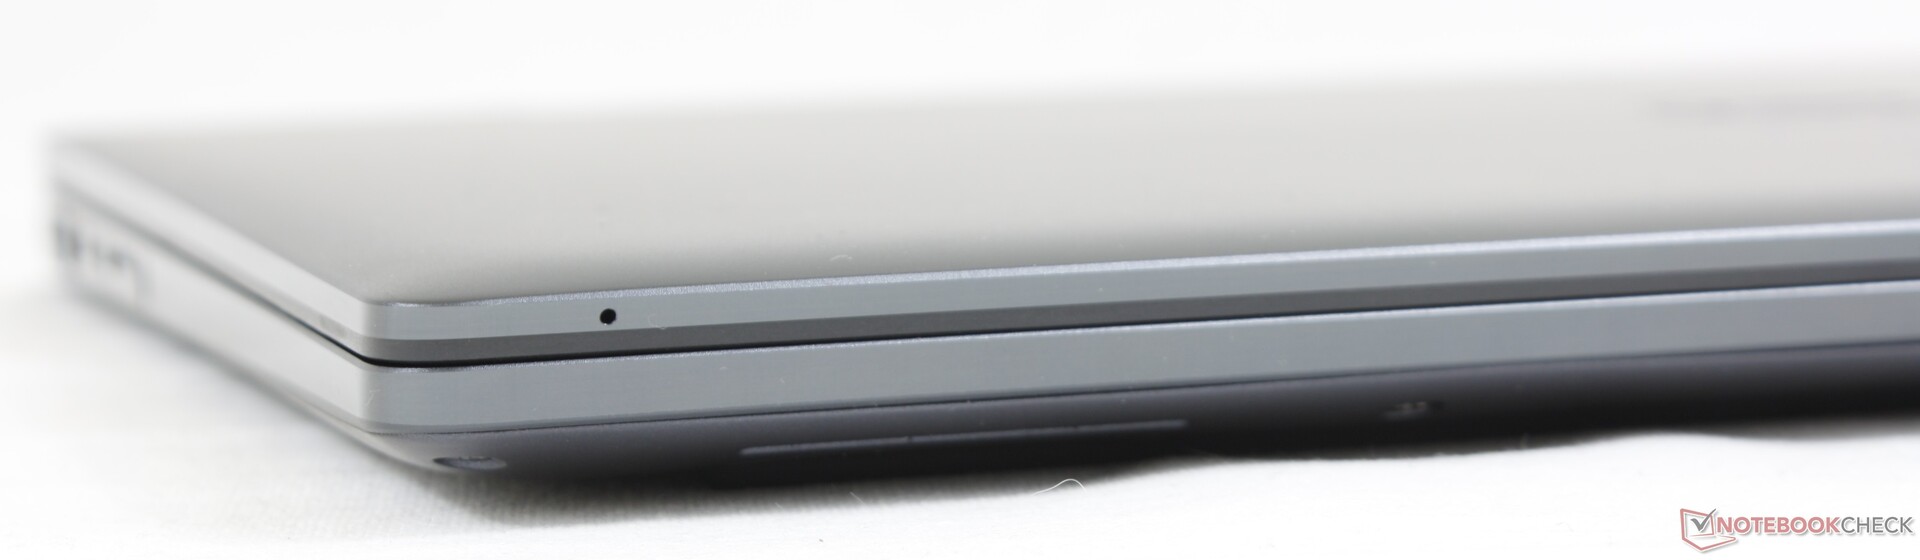
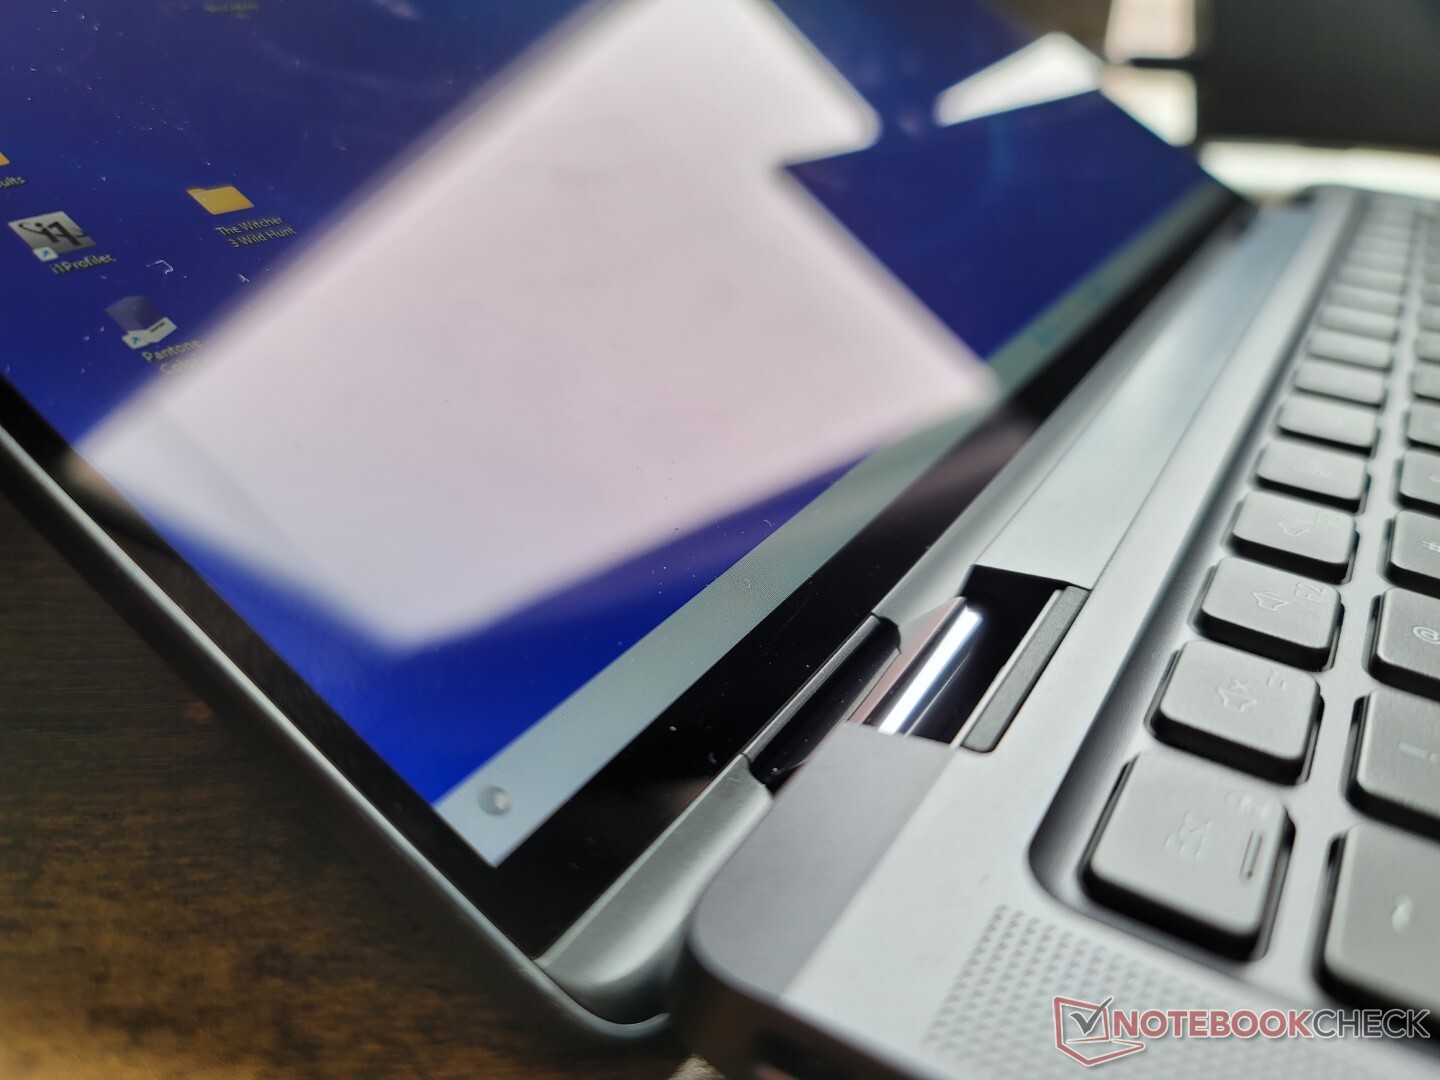
Dell scheint das hellgraue Farbschema des Latitude 9420 2-in-1 beim Latitude 9430 2-in-1 durch ein dunkleres Design ersetzt zu haben. Abgesehen von der markanten neuen Farbe gibt es keine wesentlichen optischen Änderungen.
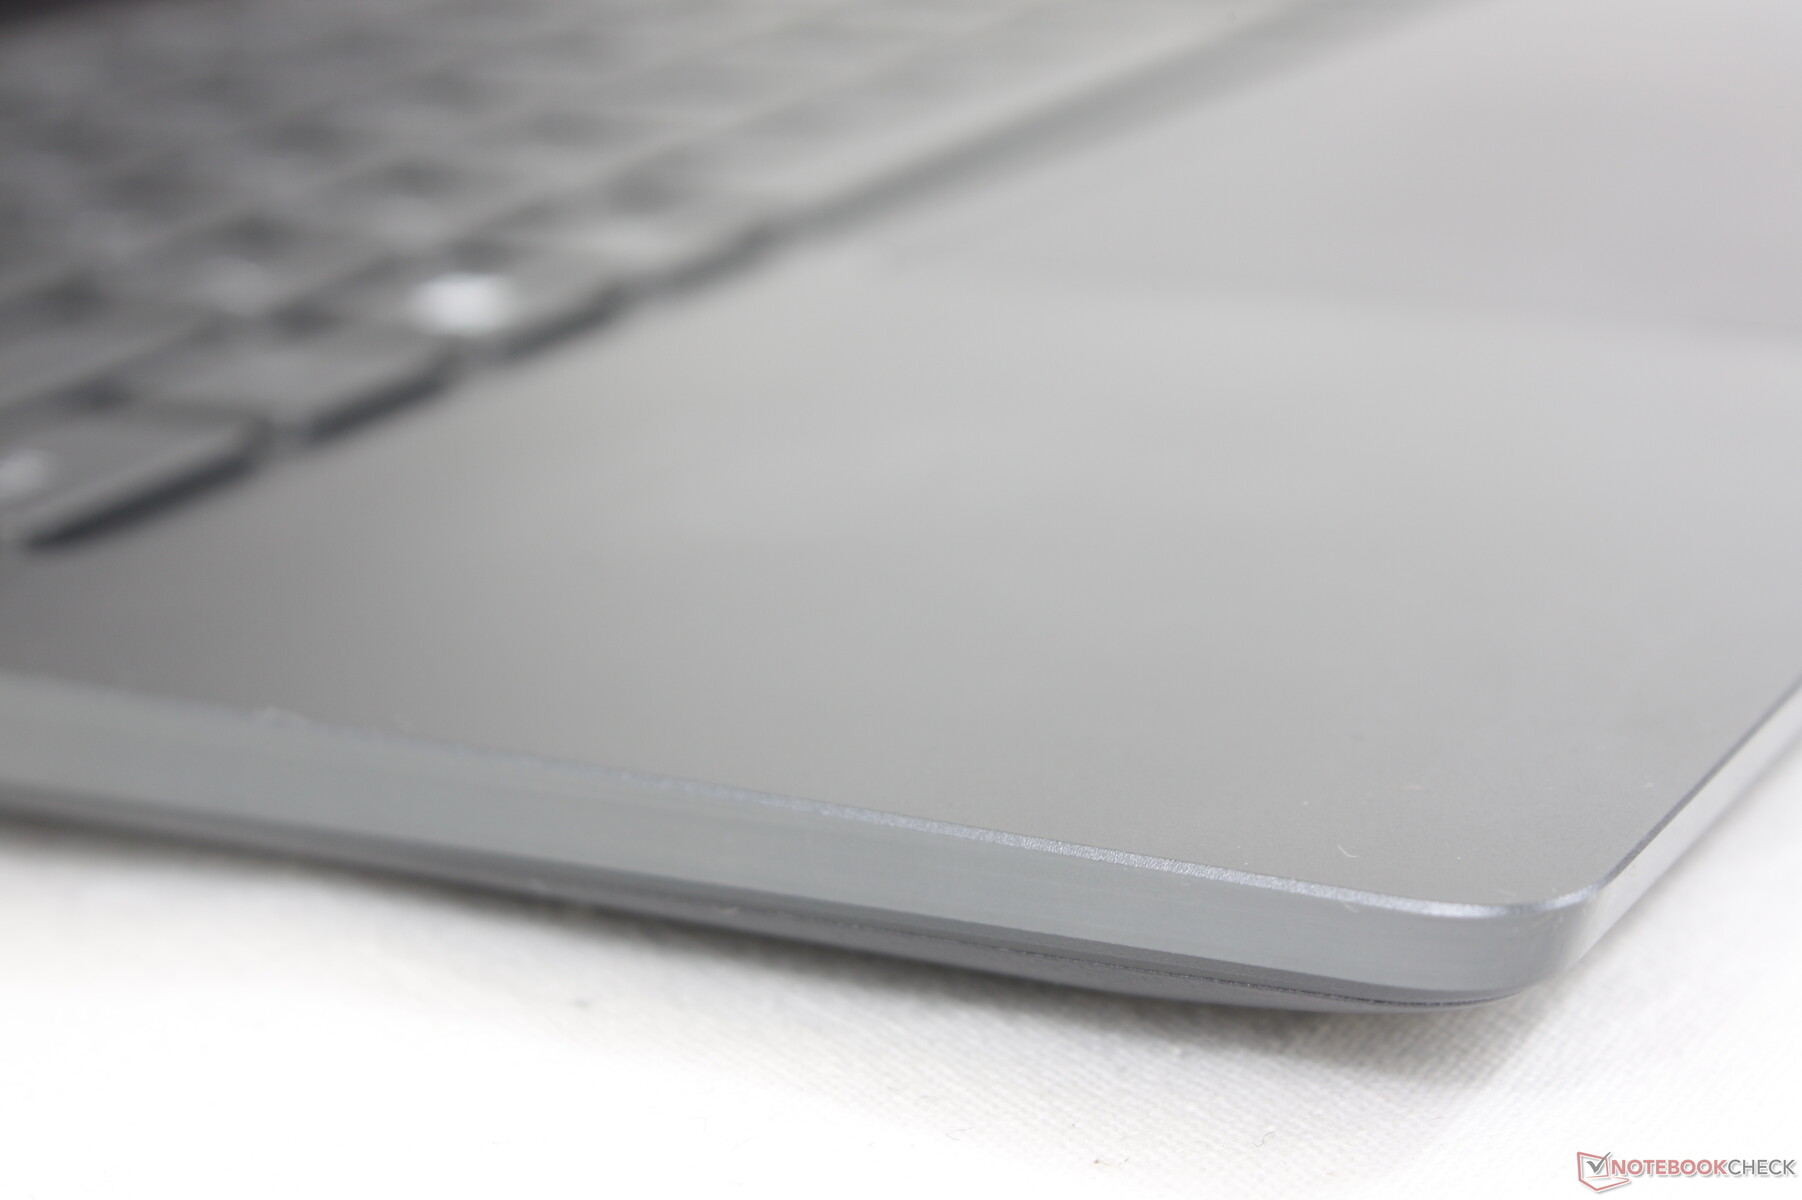
Die Konstruktion gehört auch ein Jahr nach der Markteinführung zur kleinsten und dünnsten in der 14-Zoll-Klasse. Da der Laptop insgesamt jedoch mehr Funktionsmerkmale inklusive optionaler 5G-Konnektivität bekommen hat, ist es jedoch nicht leichter geworden.
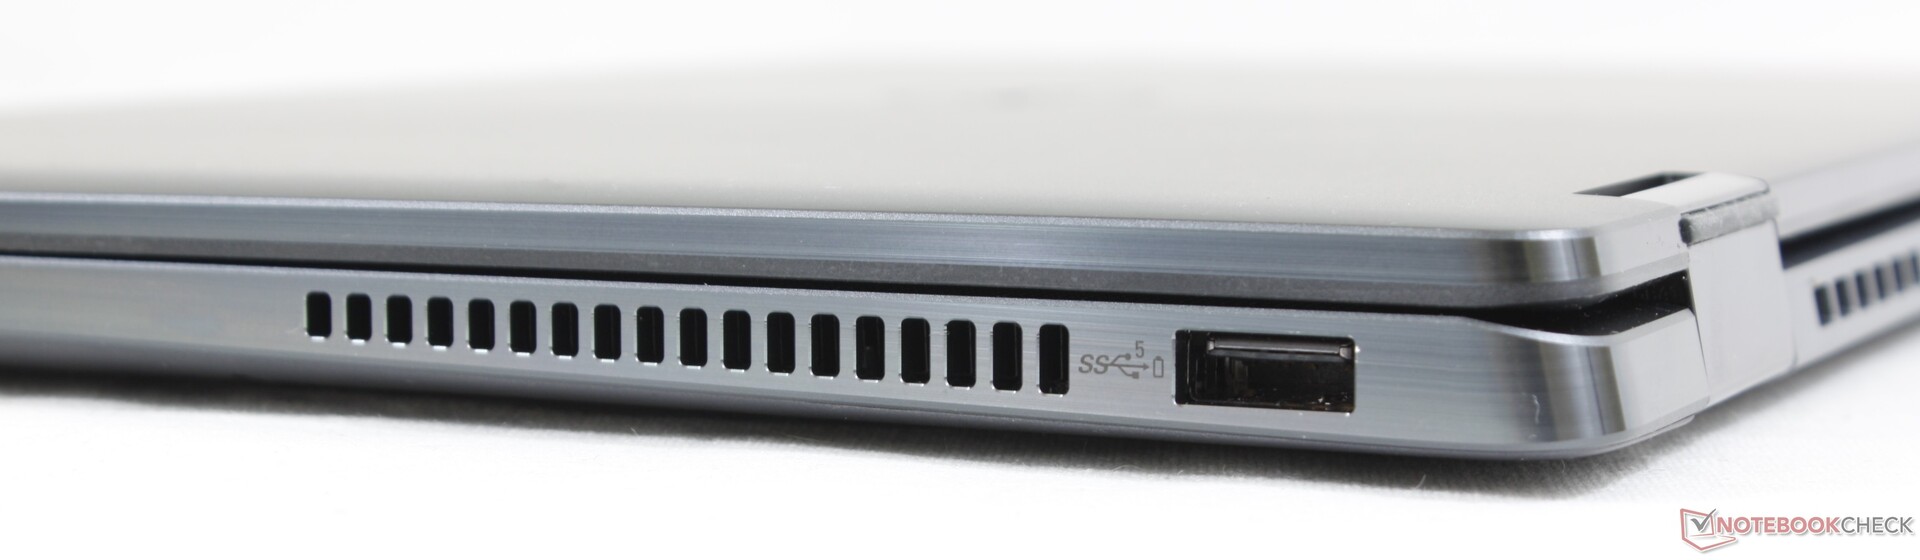
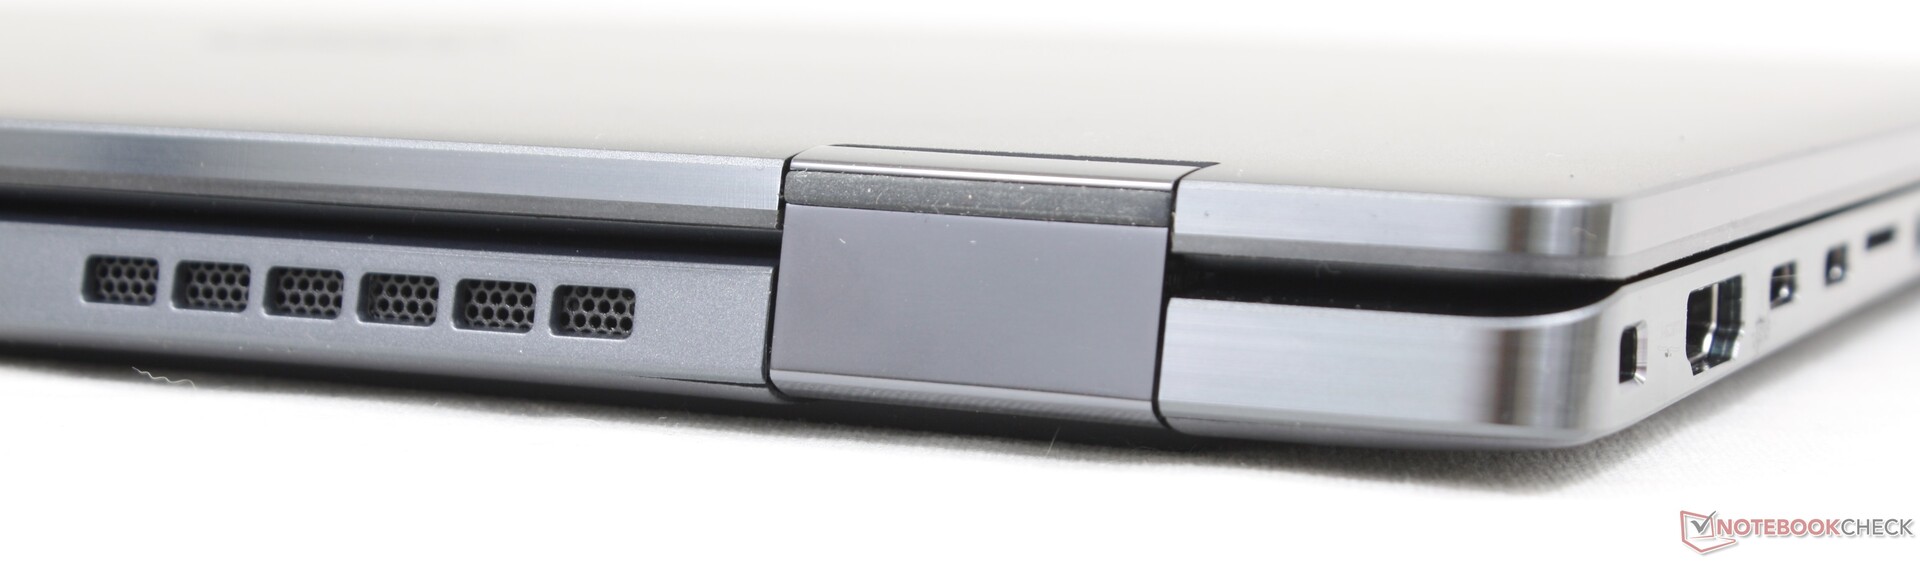
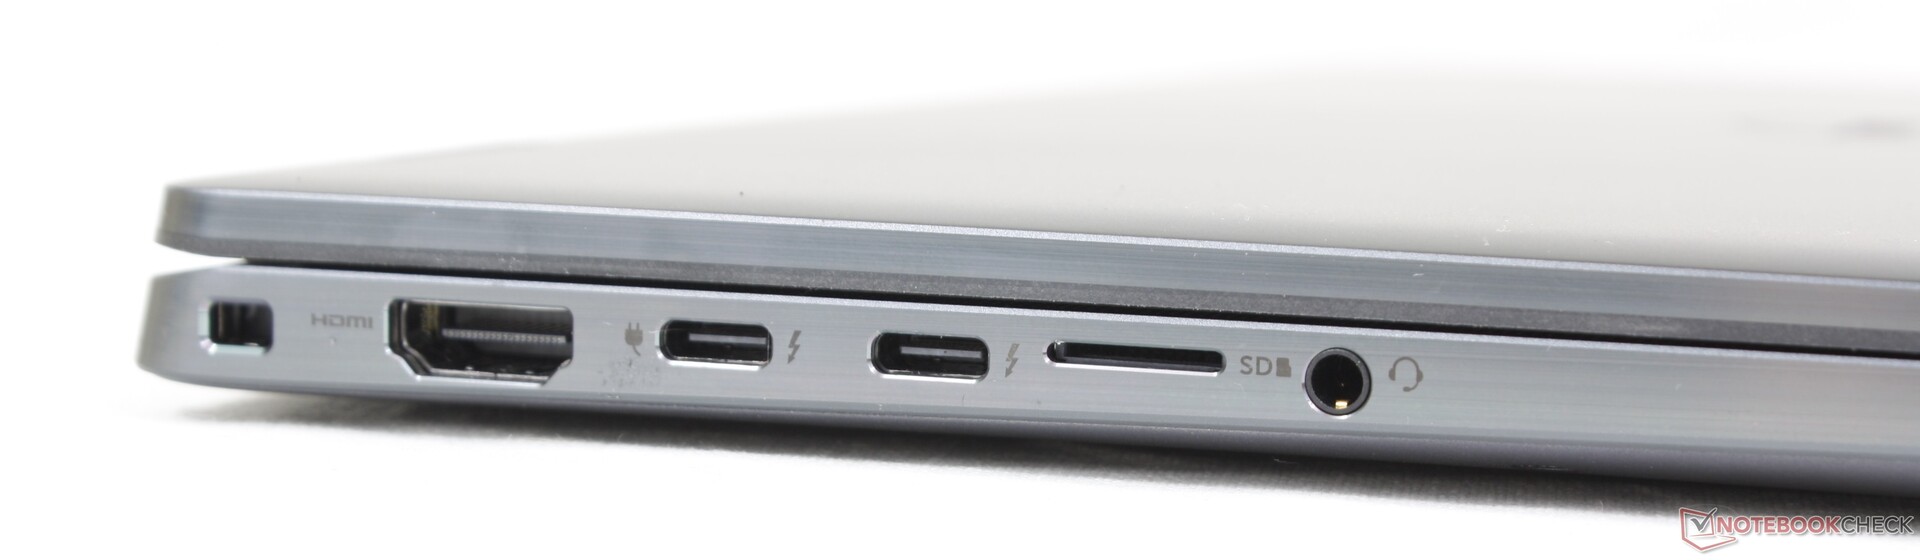
Ausstattung
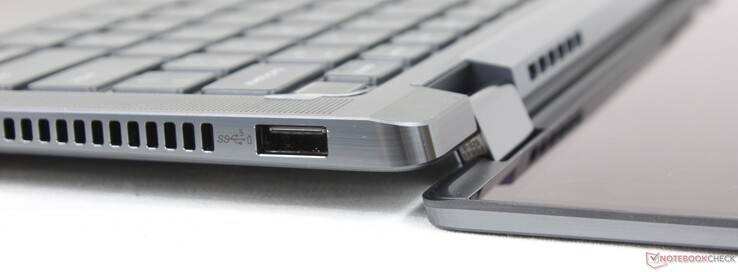
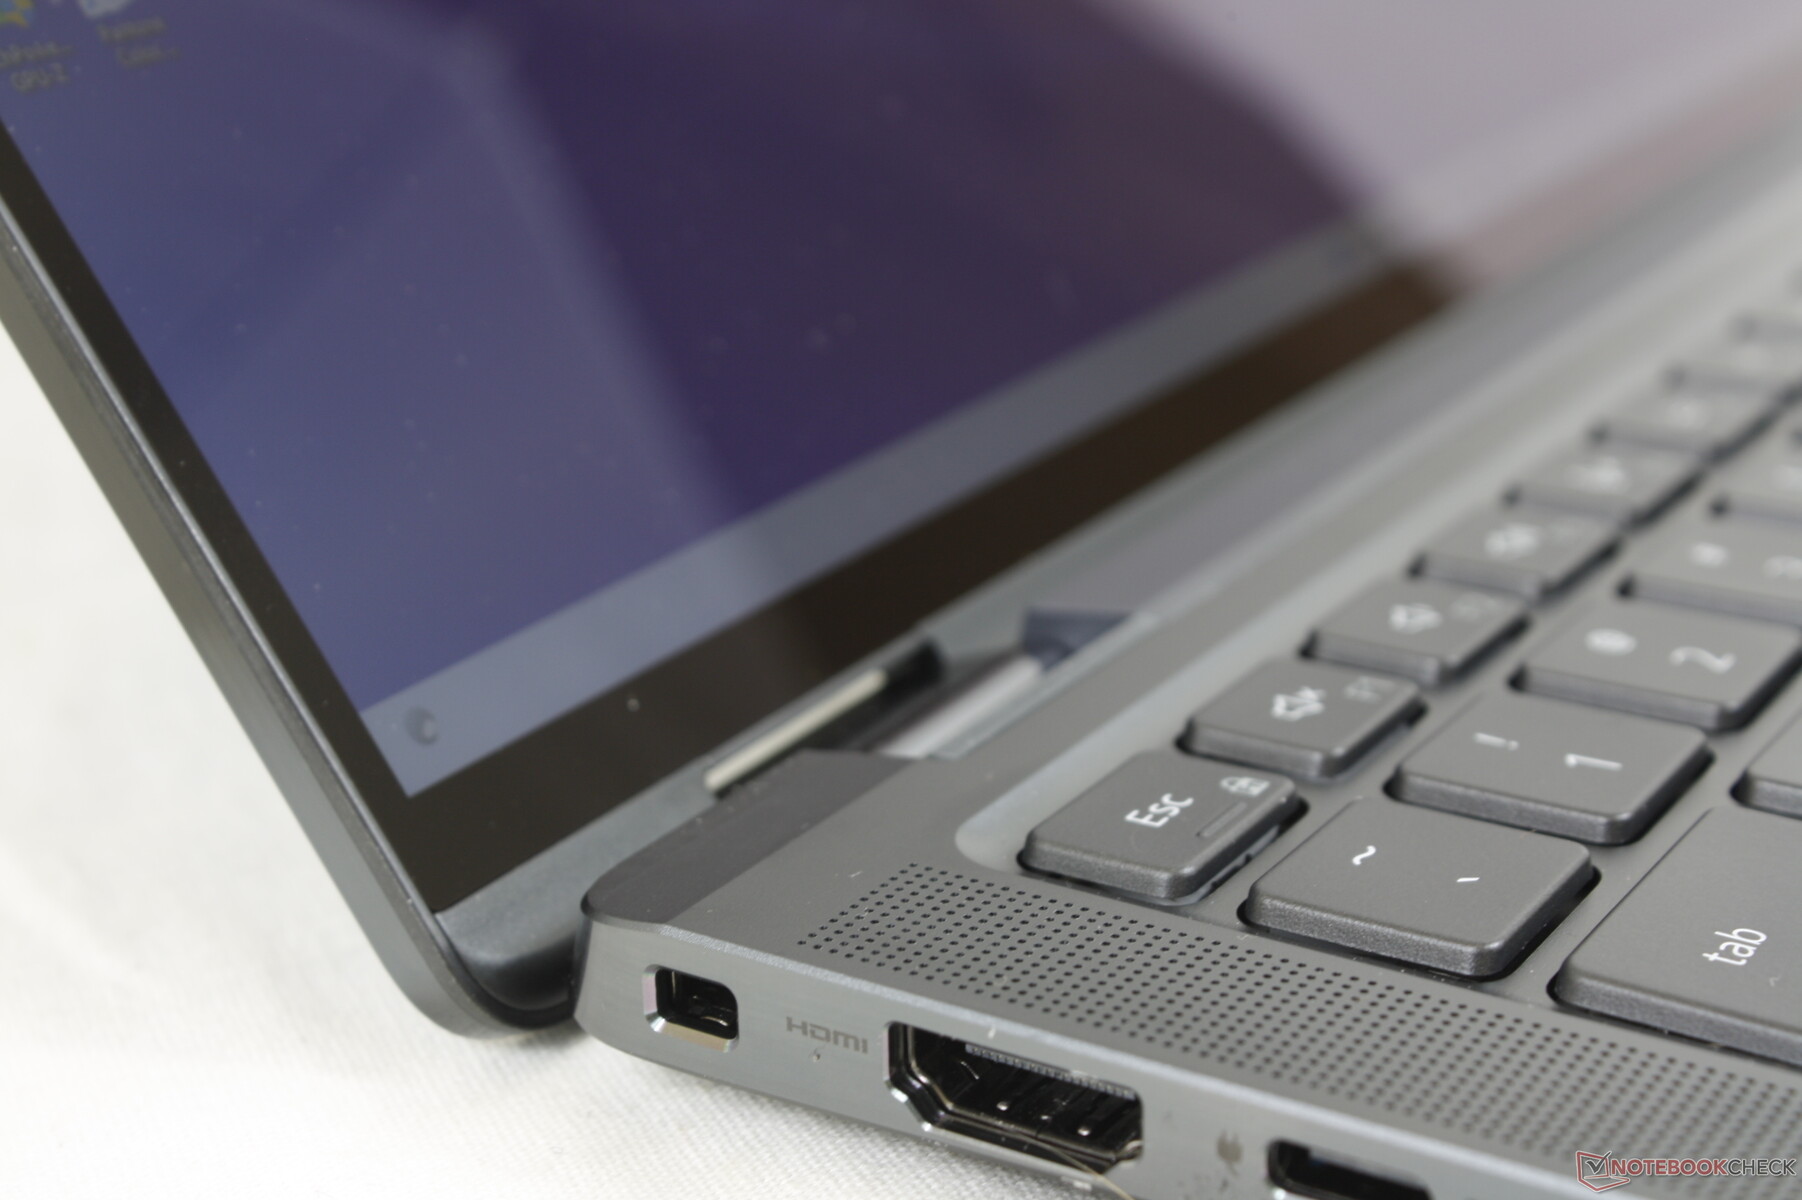
Die Anschlussausstattung hat sich gegenüber der des Latitude 9420 2-in-1 nicht verändert. USB-A 3.2-Gen.-2-Anschlüsse wären zwar nett, allerdings können ohnehin nicht viele Geräte die Gen.-2-Geschwindigkeiten nutzen.
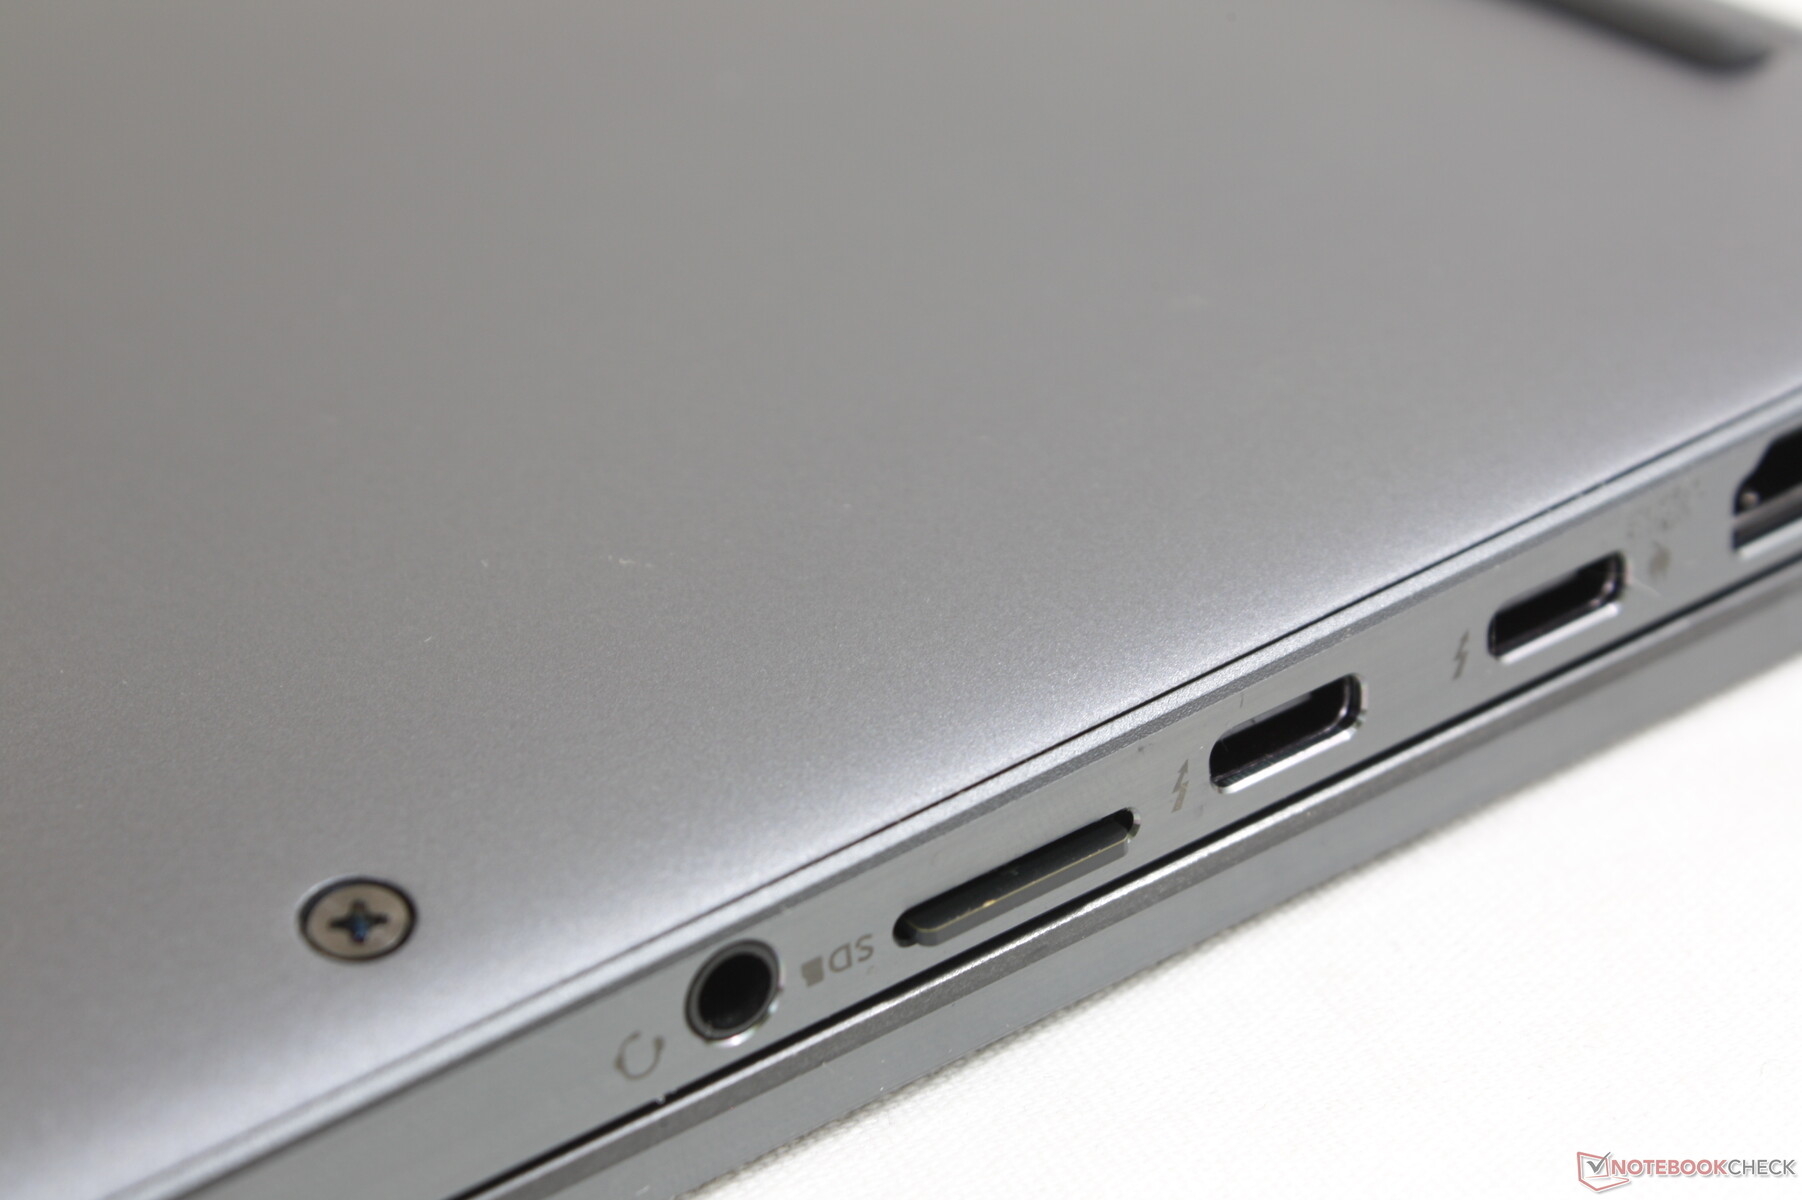
SD-Kartenleser
Die Übertragungsraten des microSD-Kartenlesers gehören in der Subnotebook-Klasse mit zu den schnellsten. Im Vergleich zum Asus ZenBook Flip 14 sind Dateiübertragungen mit unserem Dell beim Verwenden einer UHS-II-Karte ungefähr doppelt so schnell.
| SD Card Reader | |
| average JPG Copy Test (av. of 3 runs) | |
| Dell Latitude 9430 2-in-1 (AV Pro UHS-II V60) | |
| Dell Latitude 9420 2-in-1 (AV PRO microSD 128 GB V60) | |
| Asus ZenBook Flip 14 UN5401QA-KN085W (AV Pro SD microSD 128 GB V60) | |
| LG Gram 14T90P (AV Pro V60) | |
| MSI Summit E14 Flip Evo A12MT (AV Pro V60) | |
| maximum AS SSD Seq Read Test (1GB) | |
| Dell Latitude 9420 2-in-1 (AV PRO microSD 128 GB V60) | |
| Dell Latitude 9430 2-in-1 (AV Pro UHS-II V60) | |
| Asus ZenBook Flip 14 UN5401QA-KN085W (AV Pro SD microSD 128 GB V60) | |
| LG Gram 14T90P (AV Pro V60) | |
| MSI Summit E14 Flip Evo A12MT (AV Pro V60) | |
Kommunikation
5G ist innerhalb der Produktreihe ab sofort verfügbar. Diese Funktion muss jedoch im Konfigurationsprozess ausgewählt werden, da sonst keine Antennen vorinstalliert werden, um Käufer davon abzuhalten, ein eigenes 4G- oder 5G-Modul zu verbauen.
| Networking | |
| iperf3 transmit AX12 | |
| Asus ZenBook Flip 14 UN5401QA-KN085W | |
| Dell Latitude 9420 2-in-1 | |
| iperf3 receive AX12 | |
| Asus ZenBook Flip 14 UN5401QA-KN085W | |
| Dell Latitude 9420 2-in-1 | |
| iperf3 receive AXE11000 6GHz | |
| Lenovo ThinkPad X1 Yoga G7 21CE002HGE | |
| Dell Latitude 9430 2-in-1 | |
| MSI Summit E14 Flip Evo A12MT | |
| iperf3 transmit AXE11000 6GHz | |
| Lenovo ThinkPad X1 Yoga G7 21CE002HGE | |
| MSI Summit E14 Flip Evo A12MT | |
| Dell Latitude 9430 2-in-1 | |
Webcam
Dell hat die Webcamauflösung von 720p auf 1080p erhöht, was in einem schärferen Bild resultiert. In dieser Hinsicht ist HP der Konkurrenz einen Schritt voraus, da mehrere Spectre- und EliteBook-Modelle bereits mit 5-MP-Webcams ausgerüstet sind.


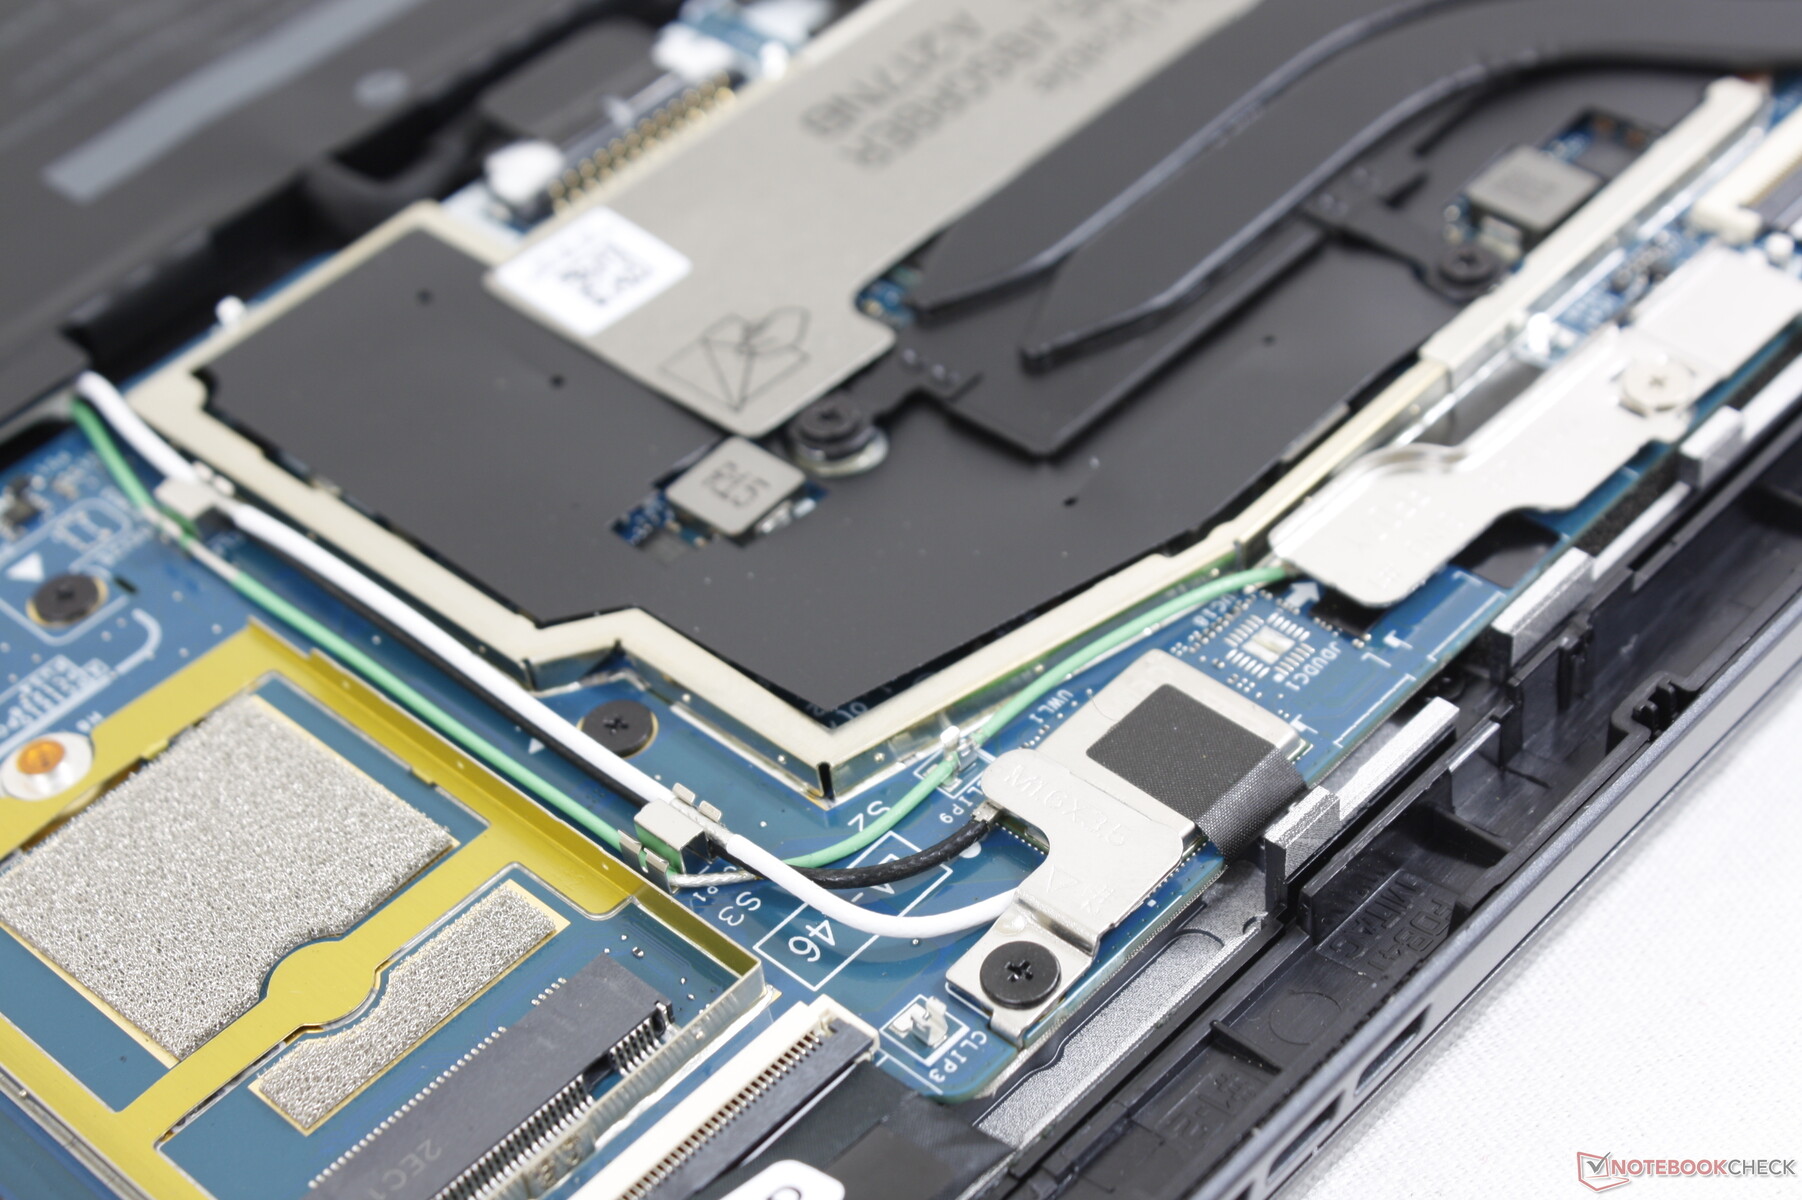
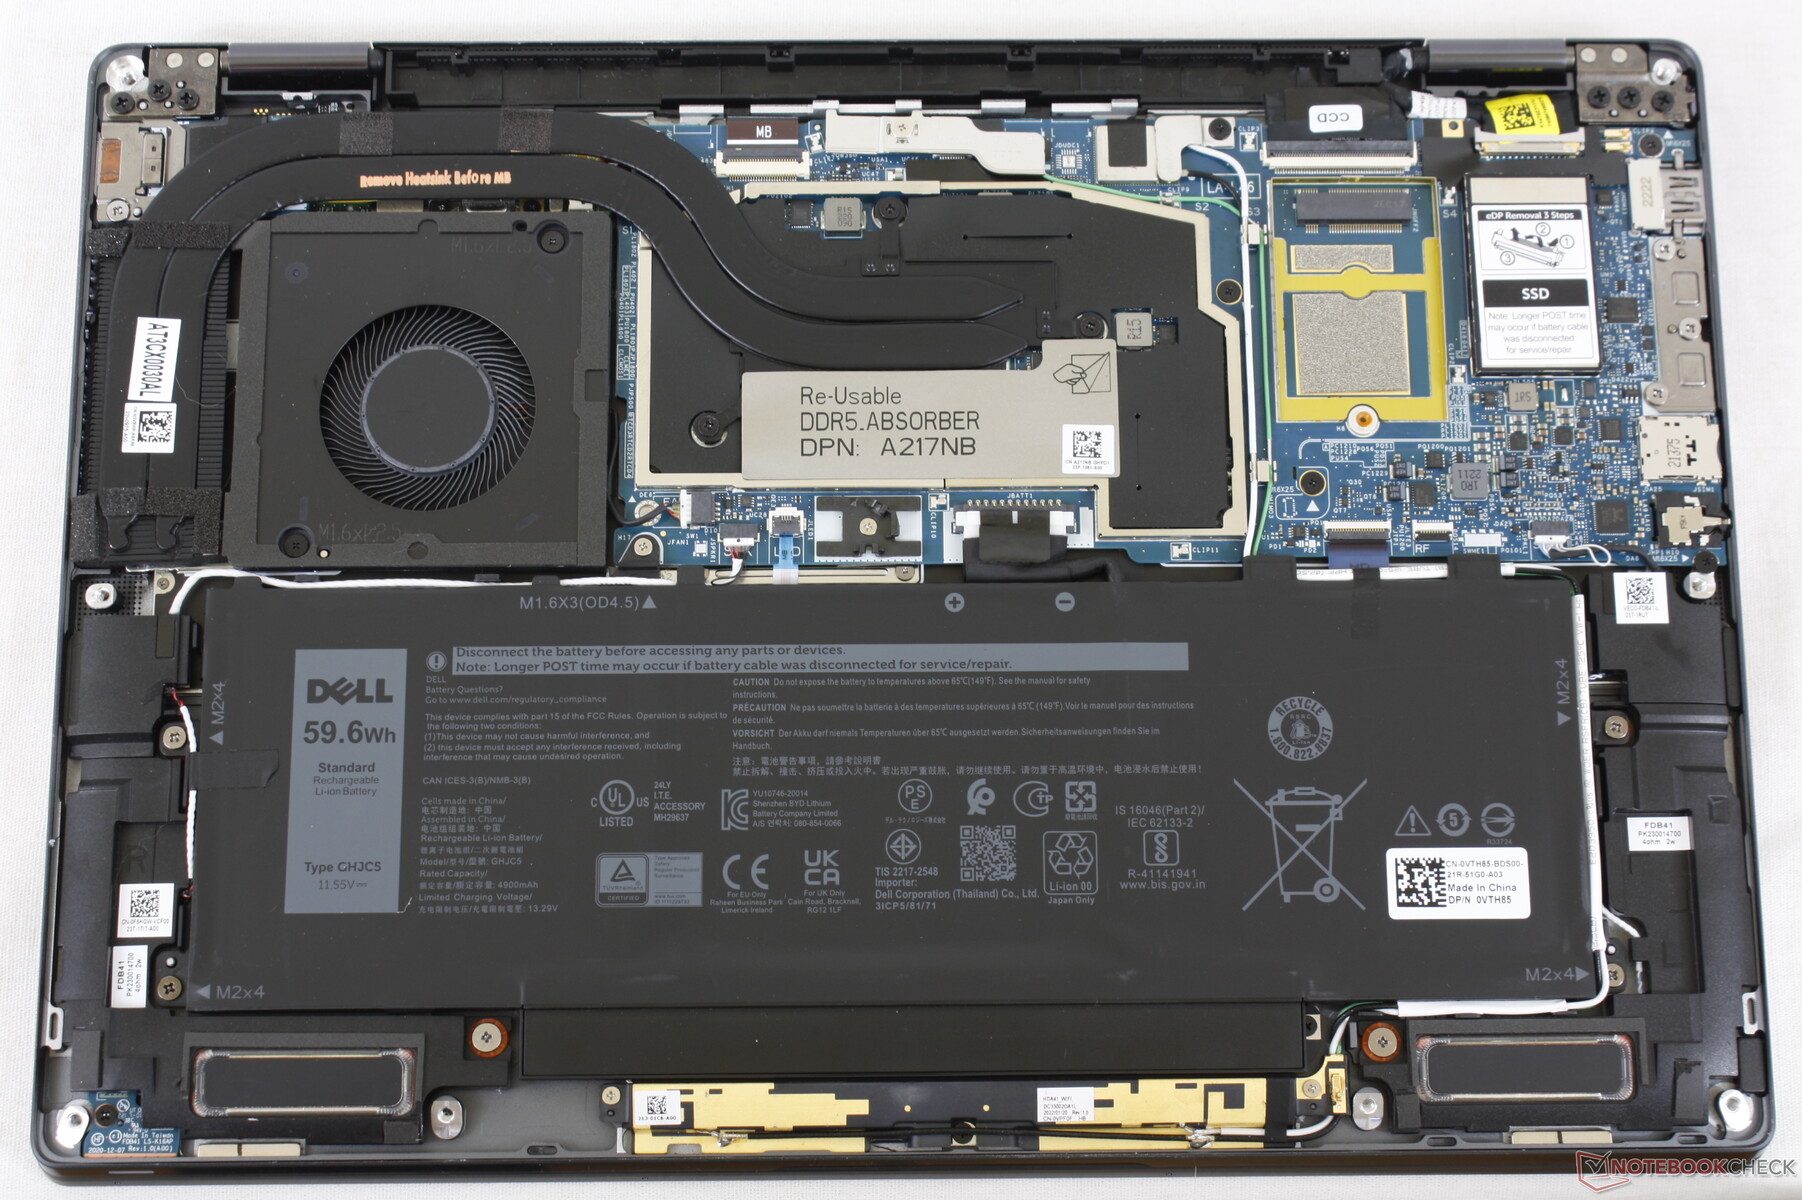
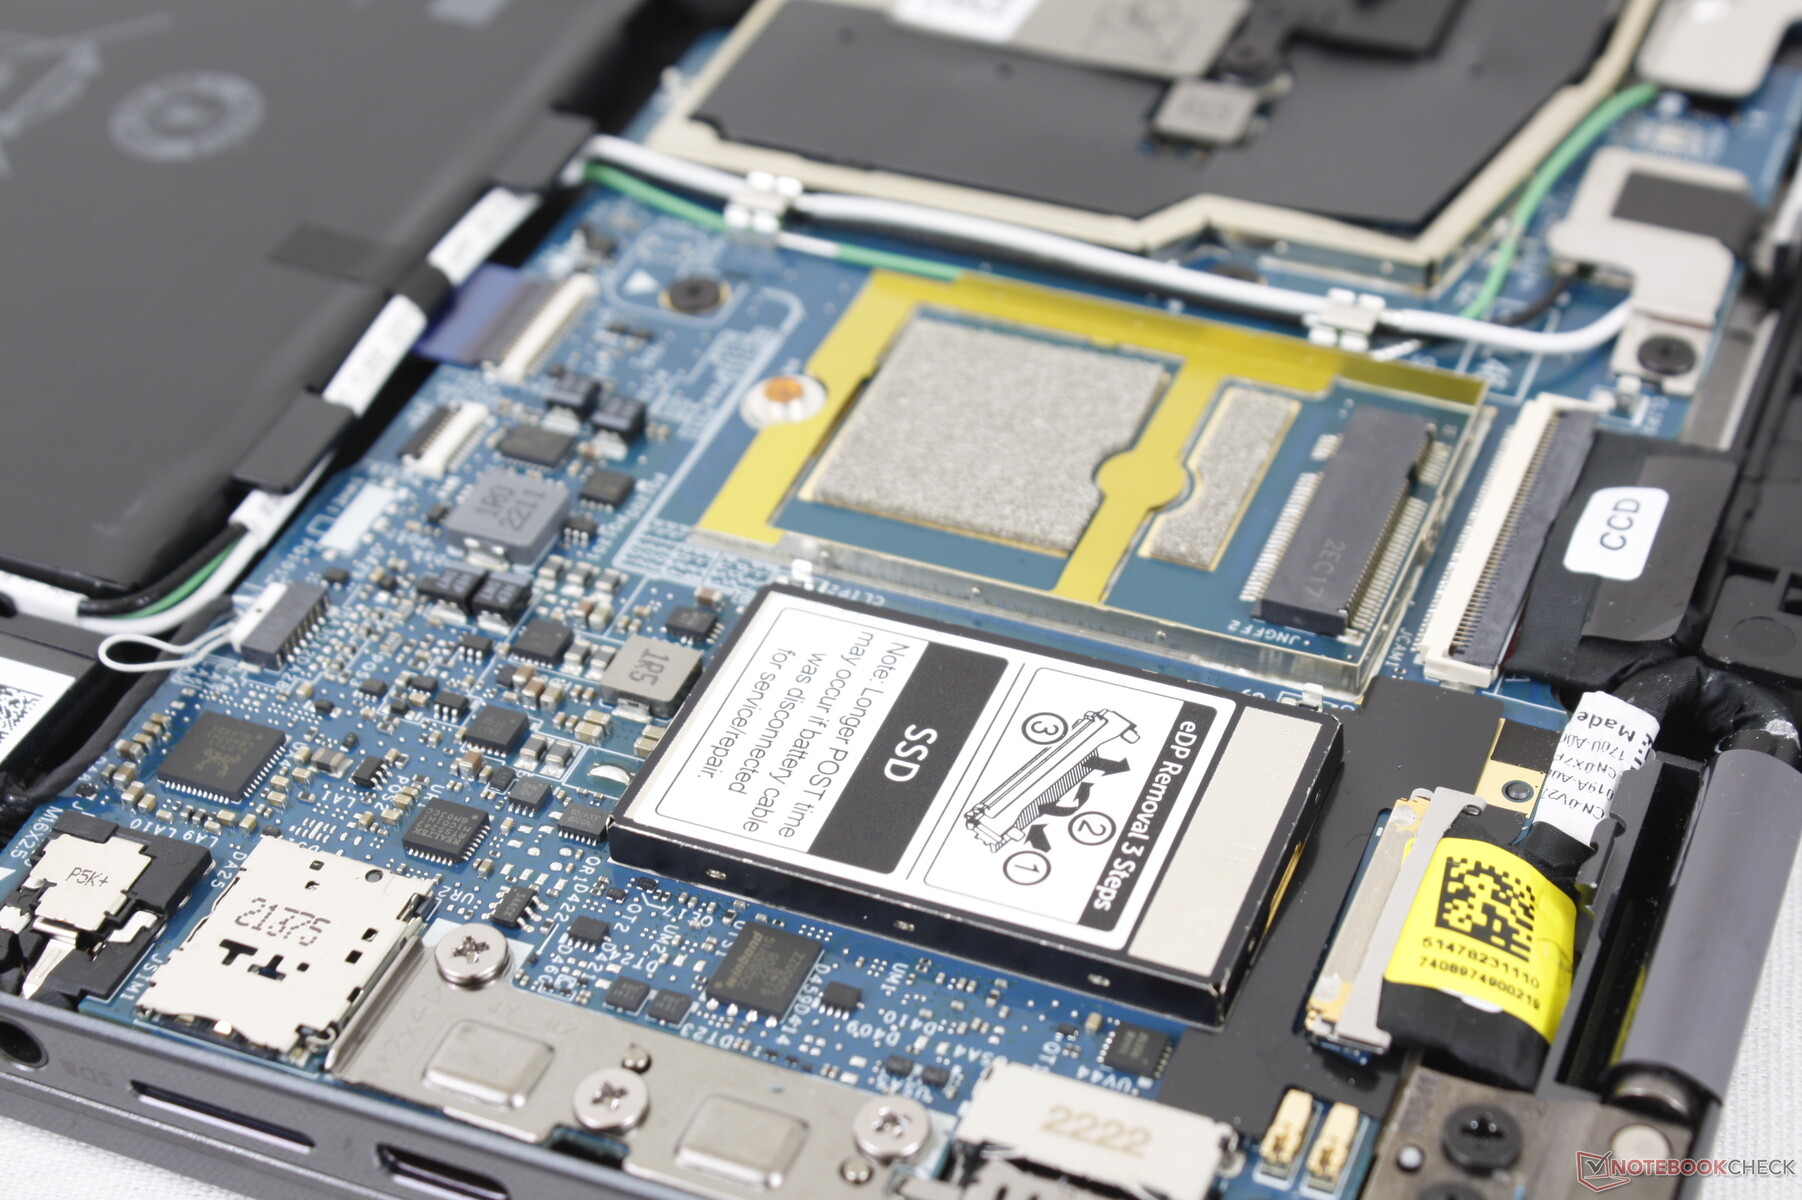
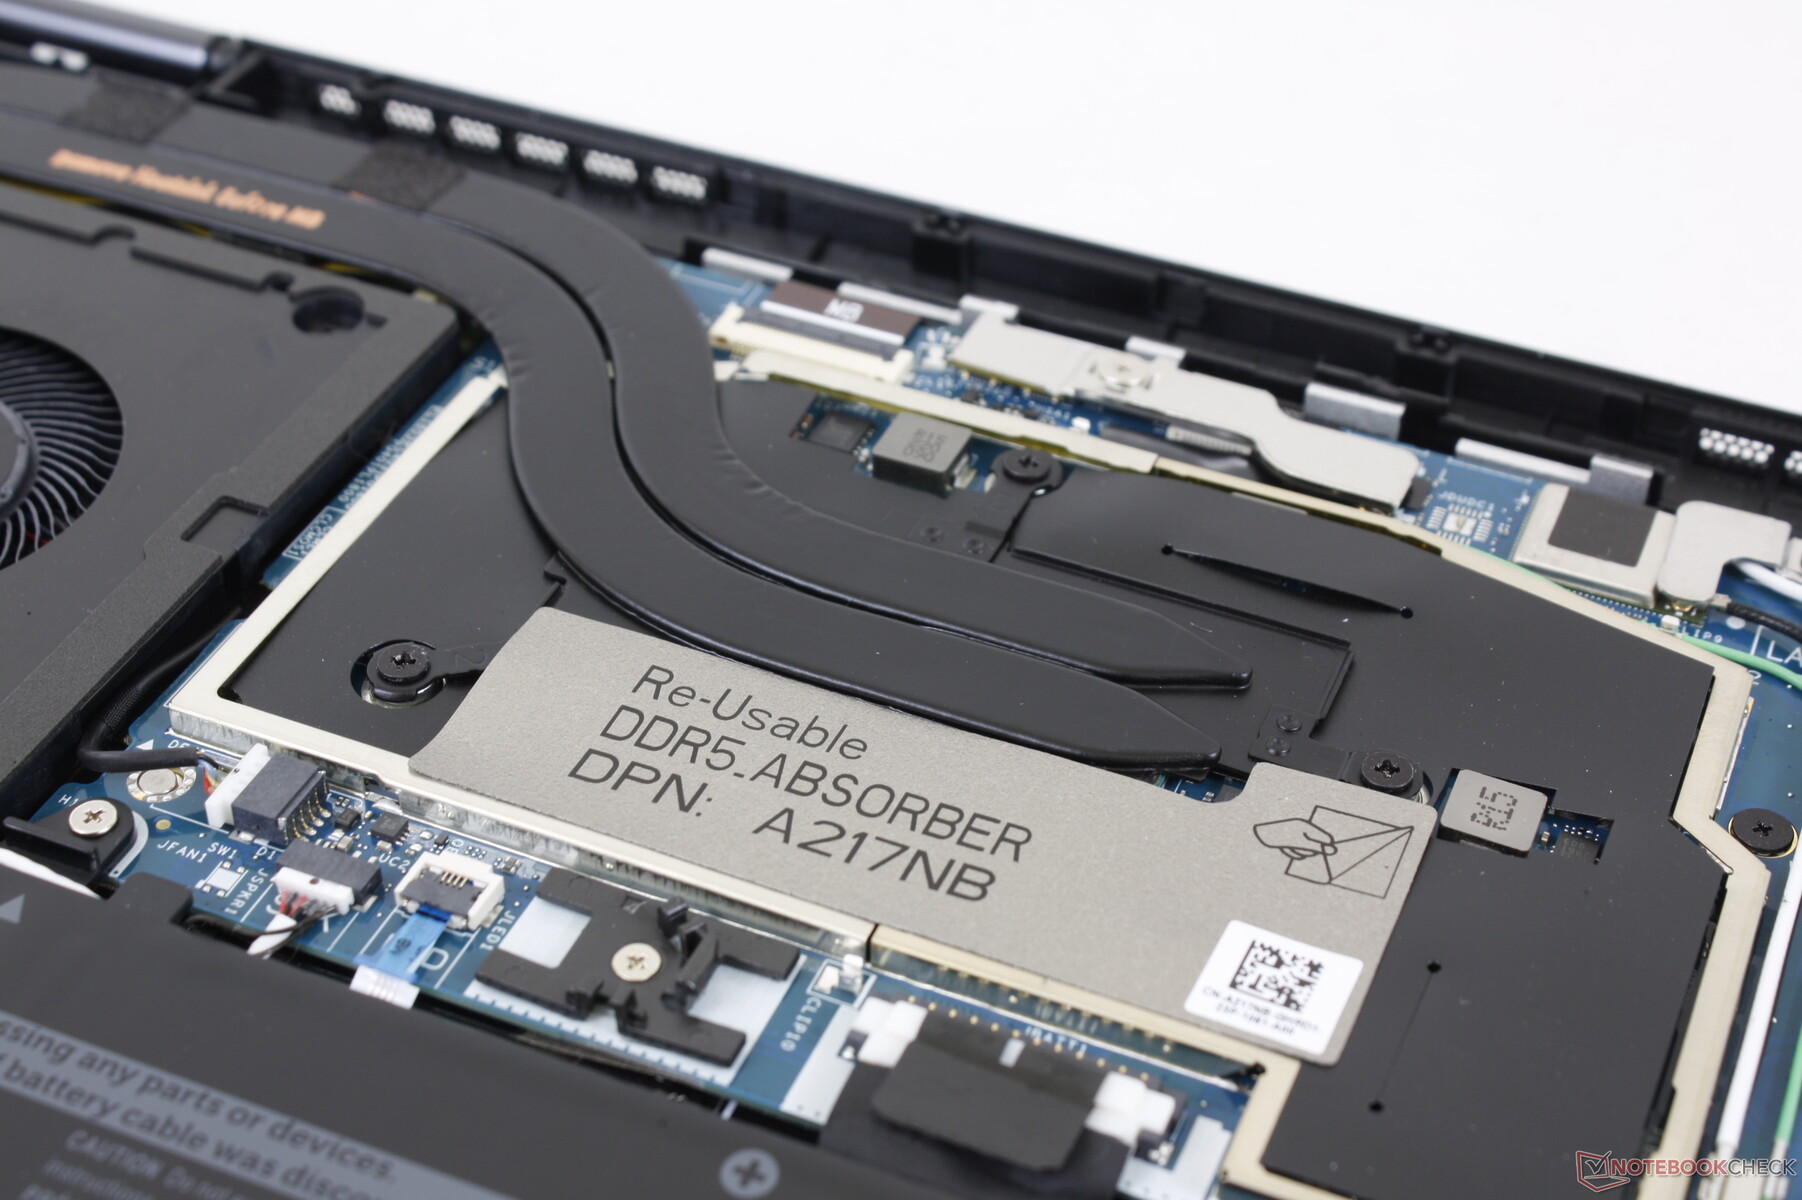
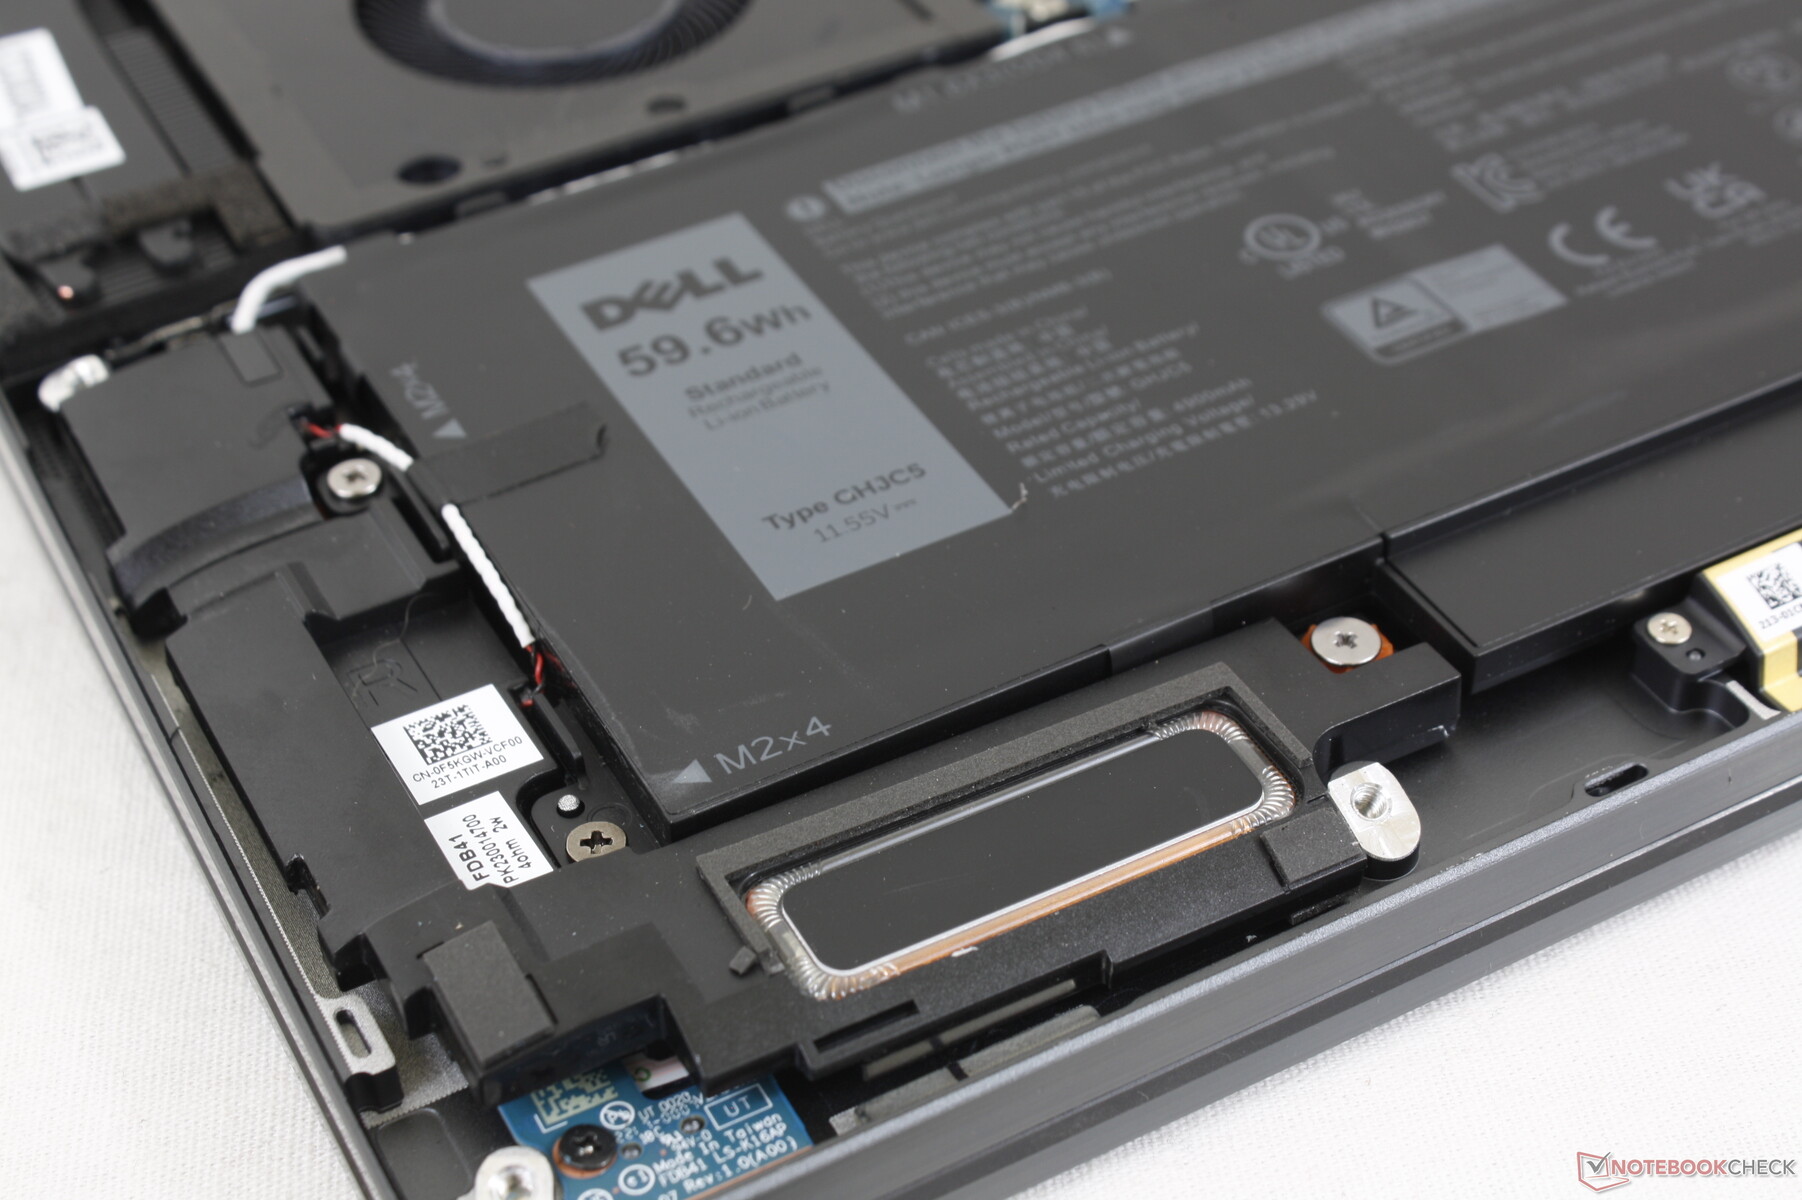
Wartung
Die Bodenplatte kann auch weiterhin einfach entfernt werden. Da das WLAN-Modul und der Arbeitsspeicher verlötet sind, gibt es abgesehen von der SSD und dem Akku im Inneren wenig zu tun.
Garantie und Zubehör
Bis auf das Netzteil und einige Papiere befinden sich im Lieferumfang keine Extras. Der PN7522W-Aktivstylus ist separat für rund 115 Euro erhältlich.
Eingabegeräte
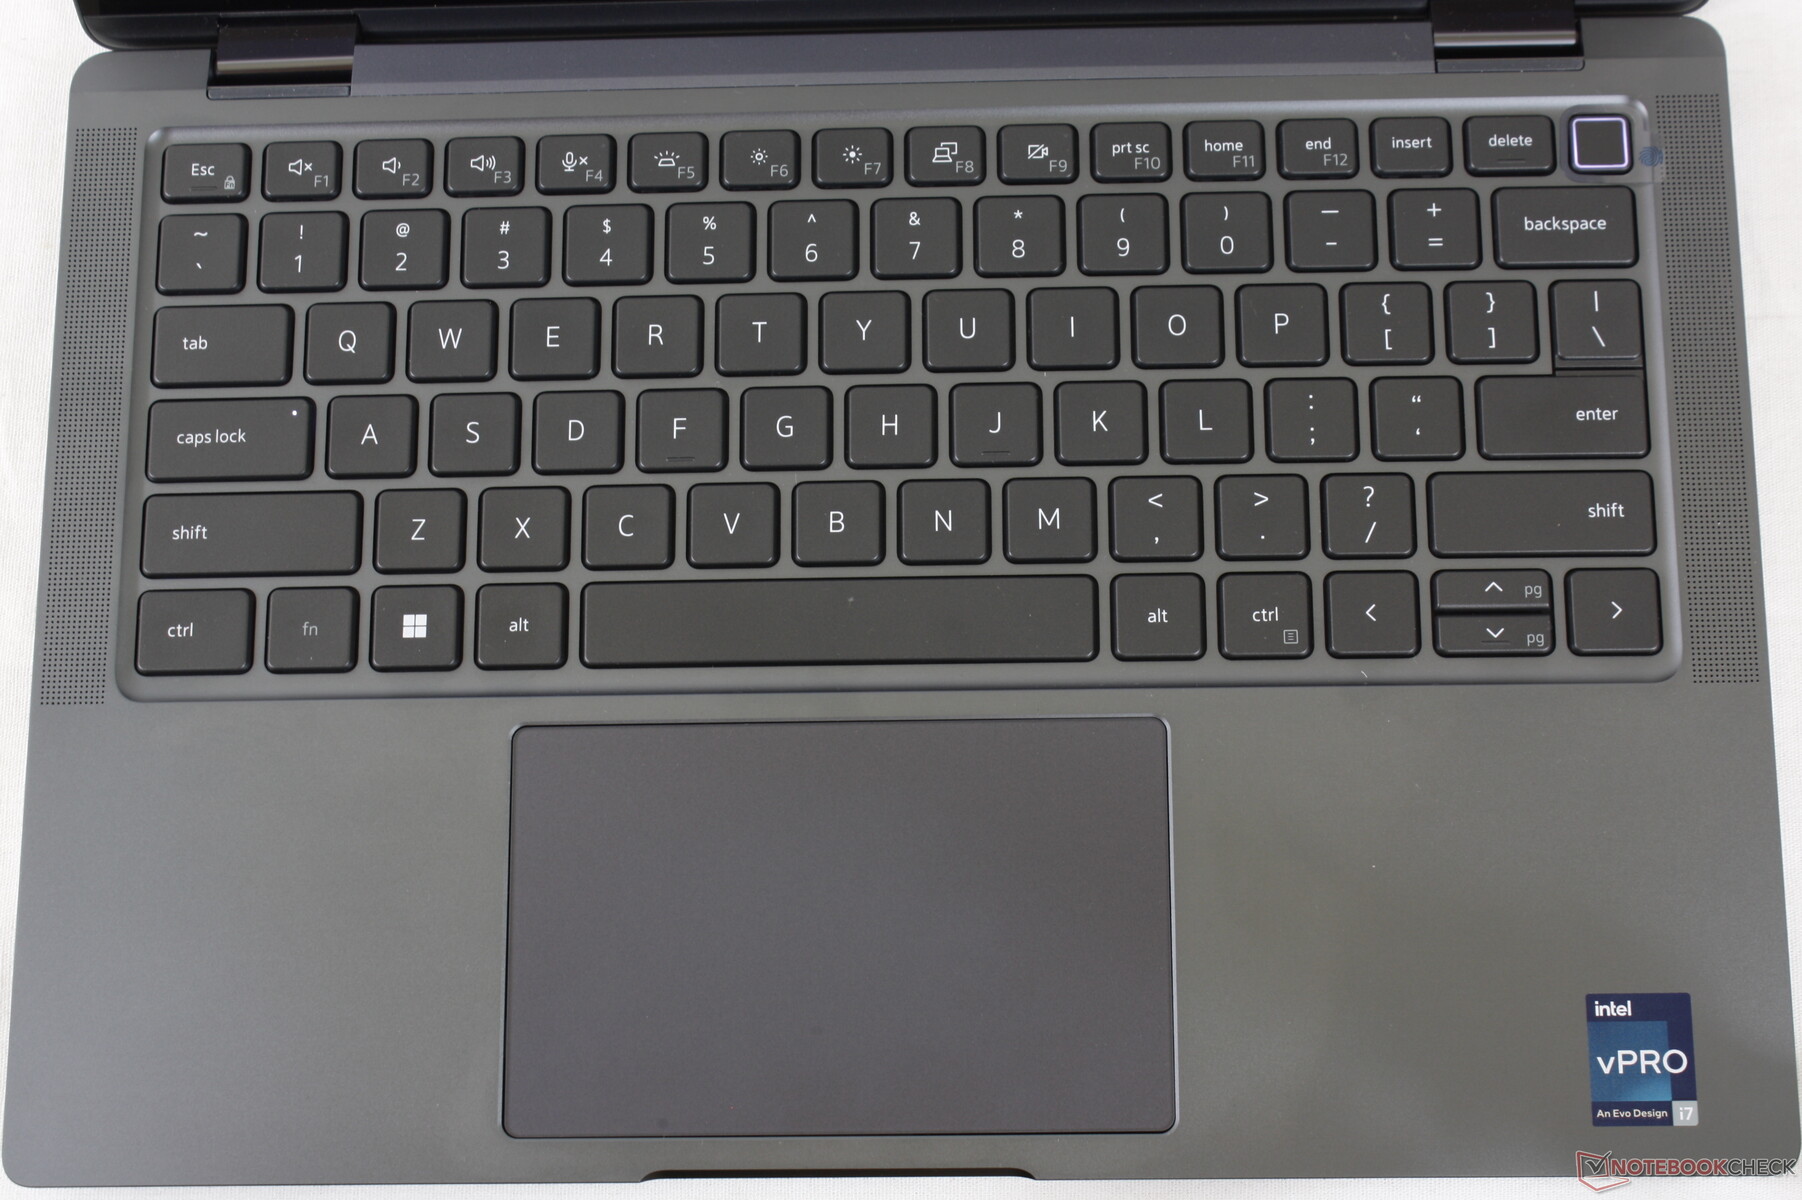
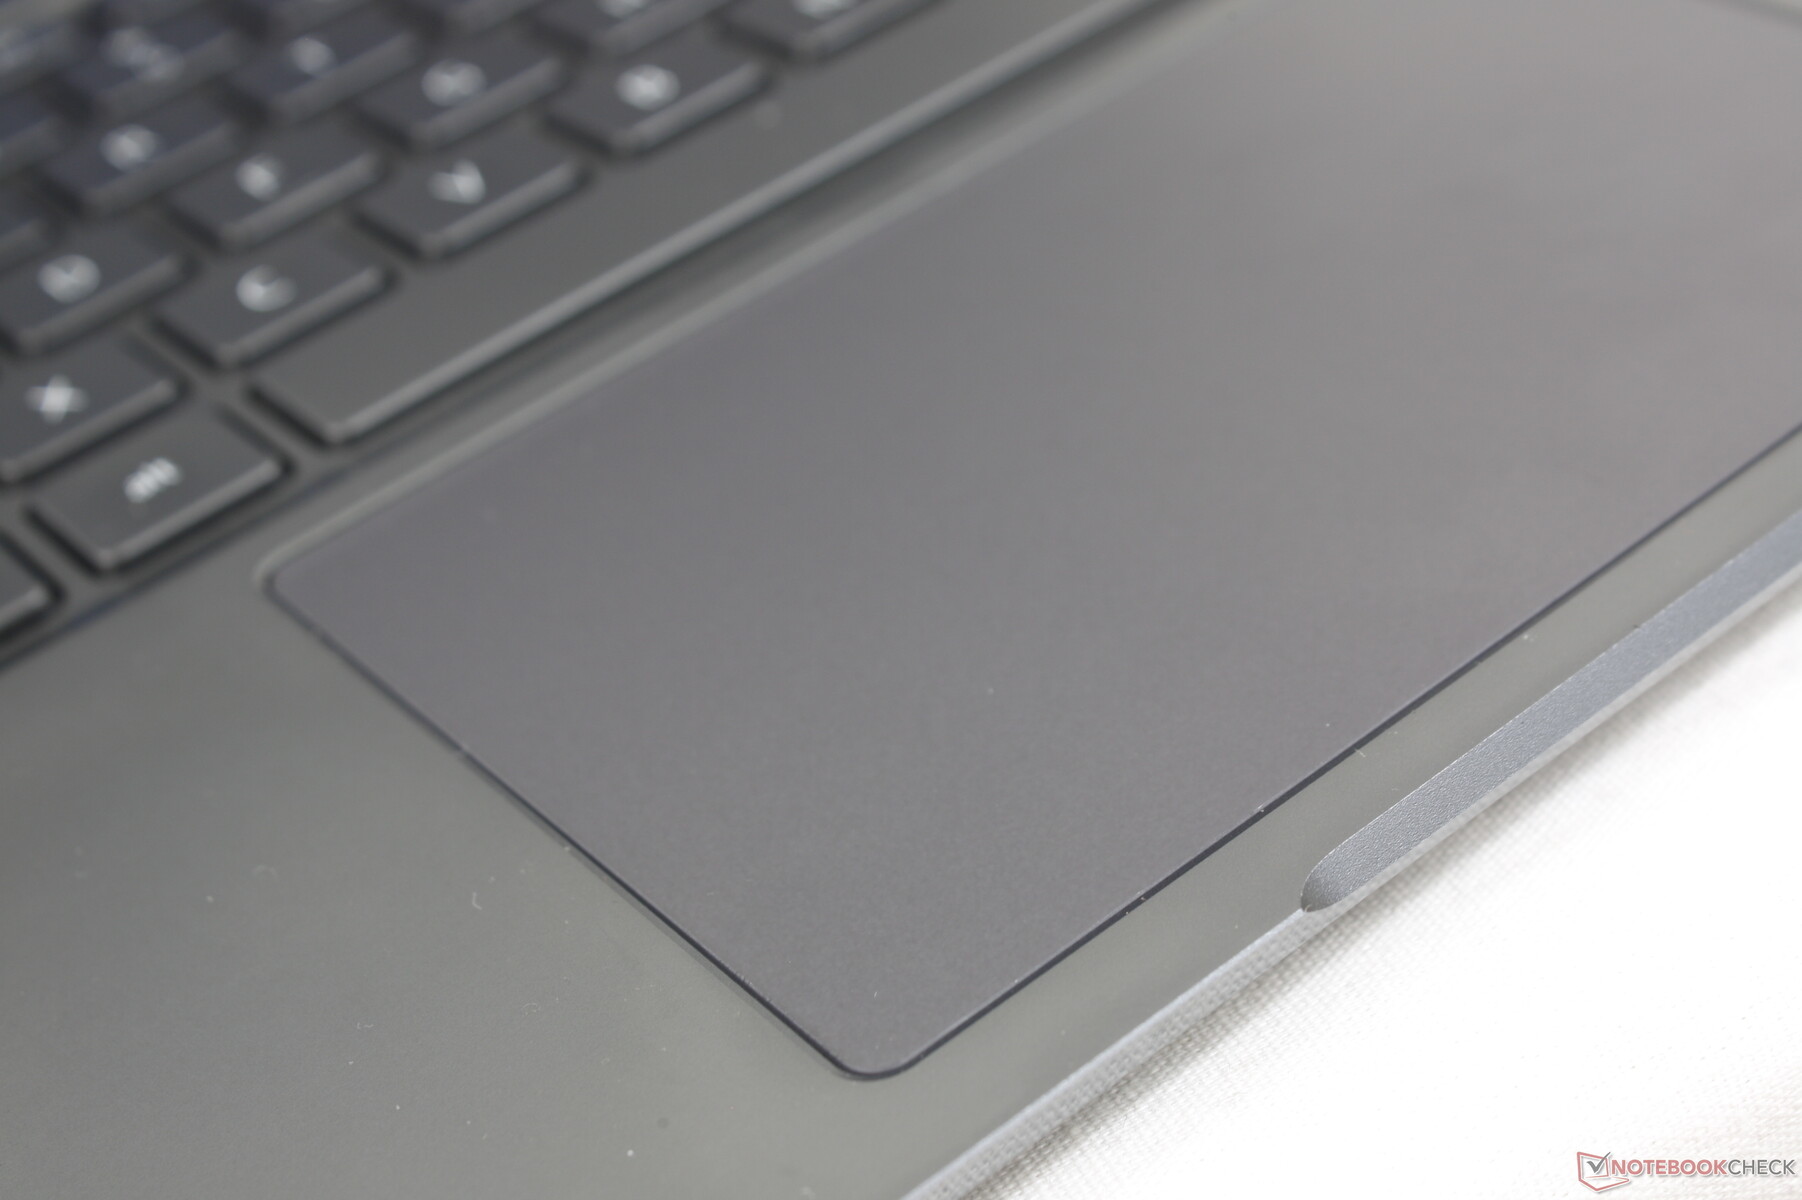
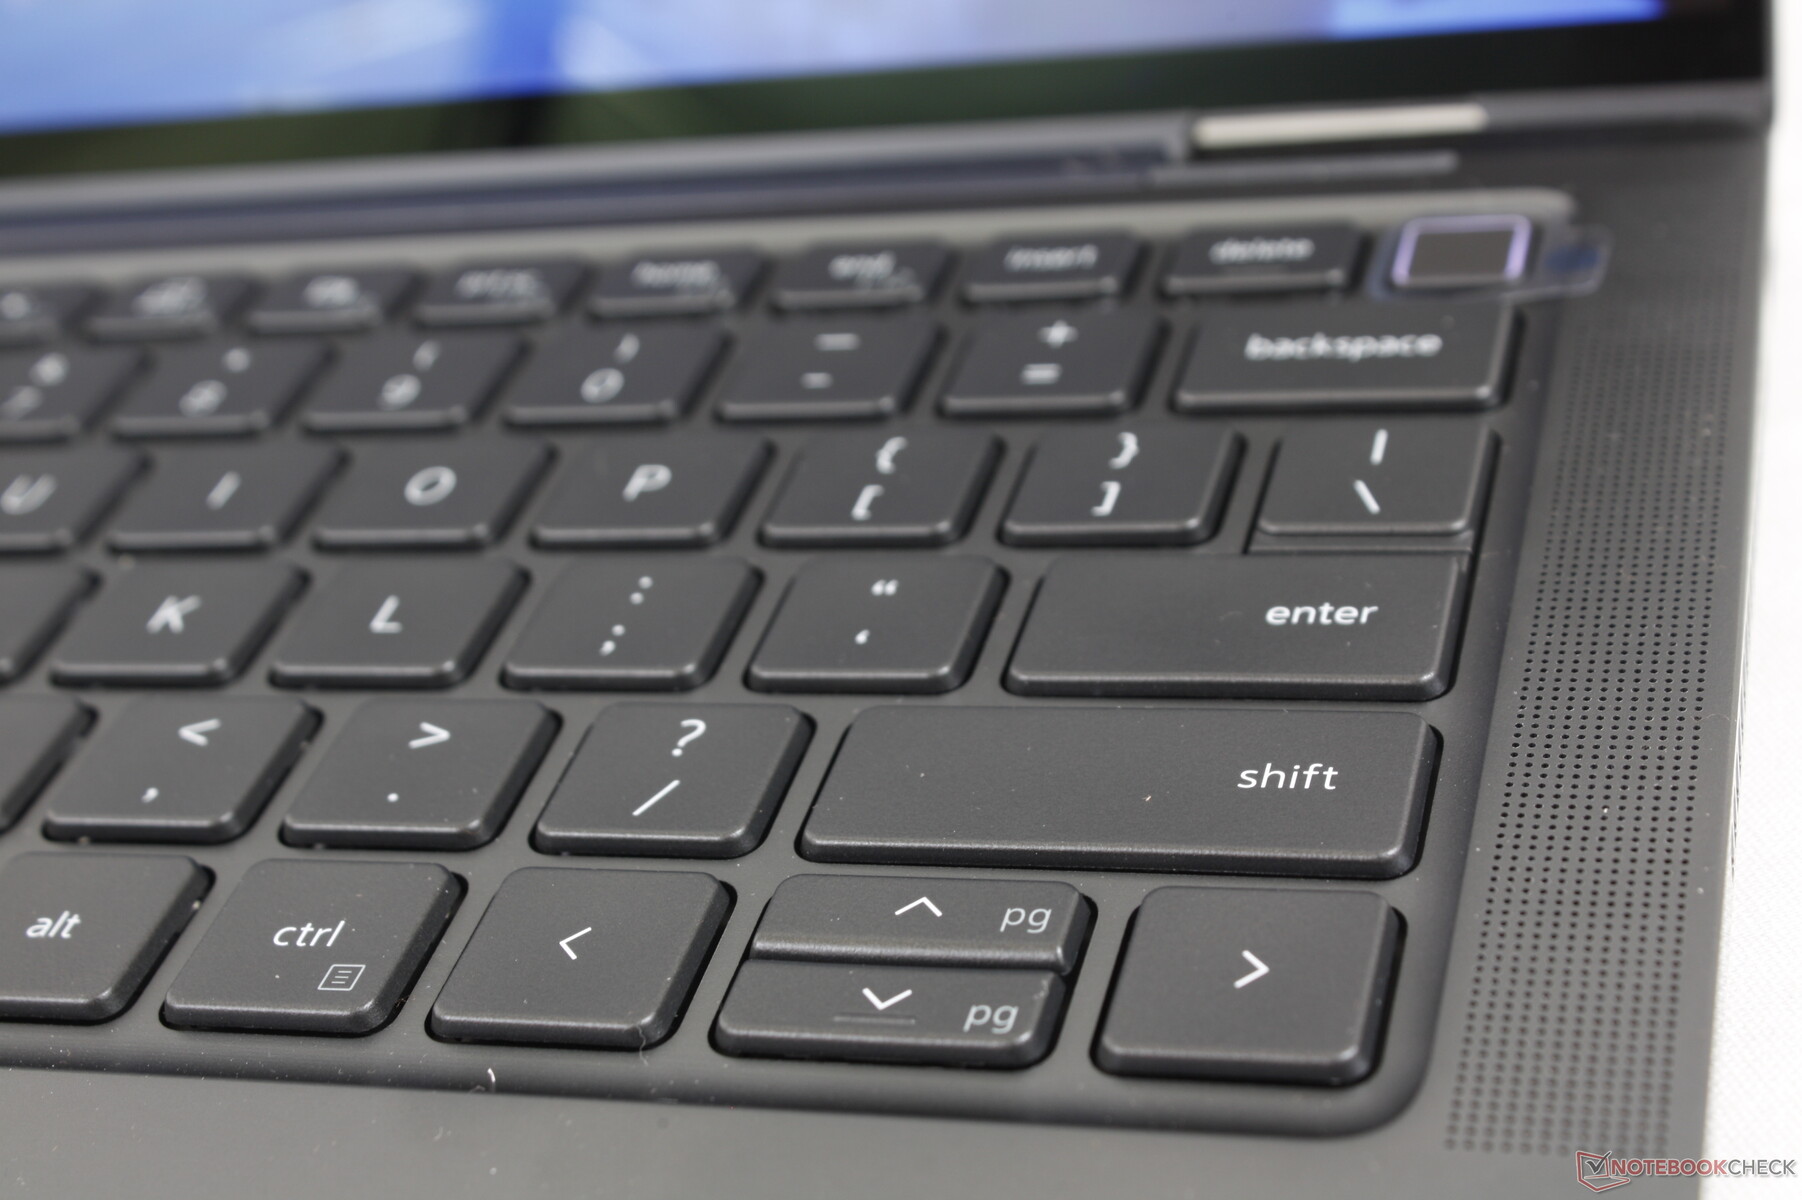
Tastatur und Touchpad
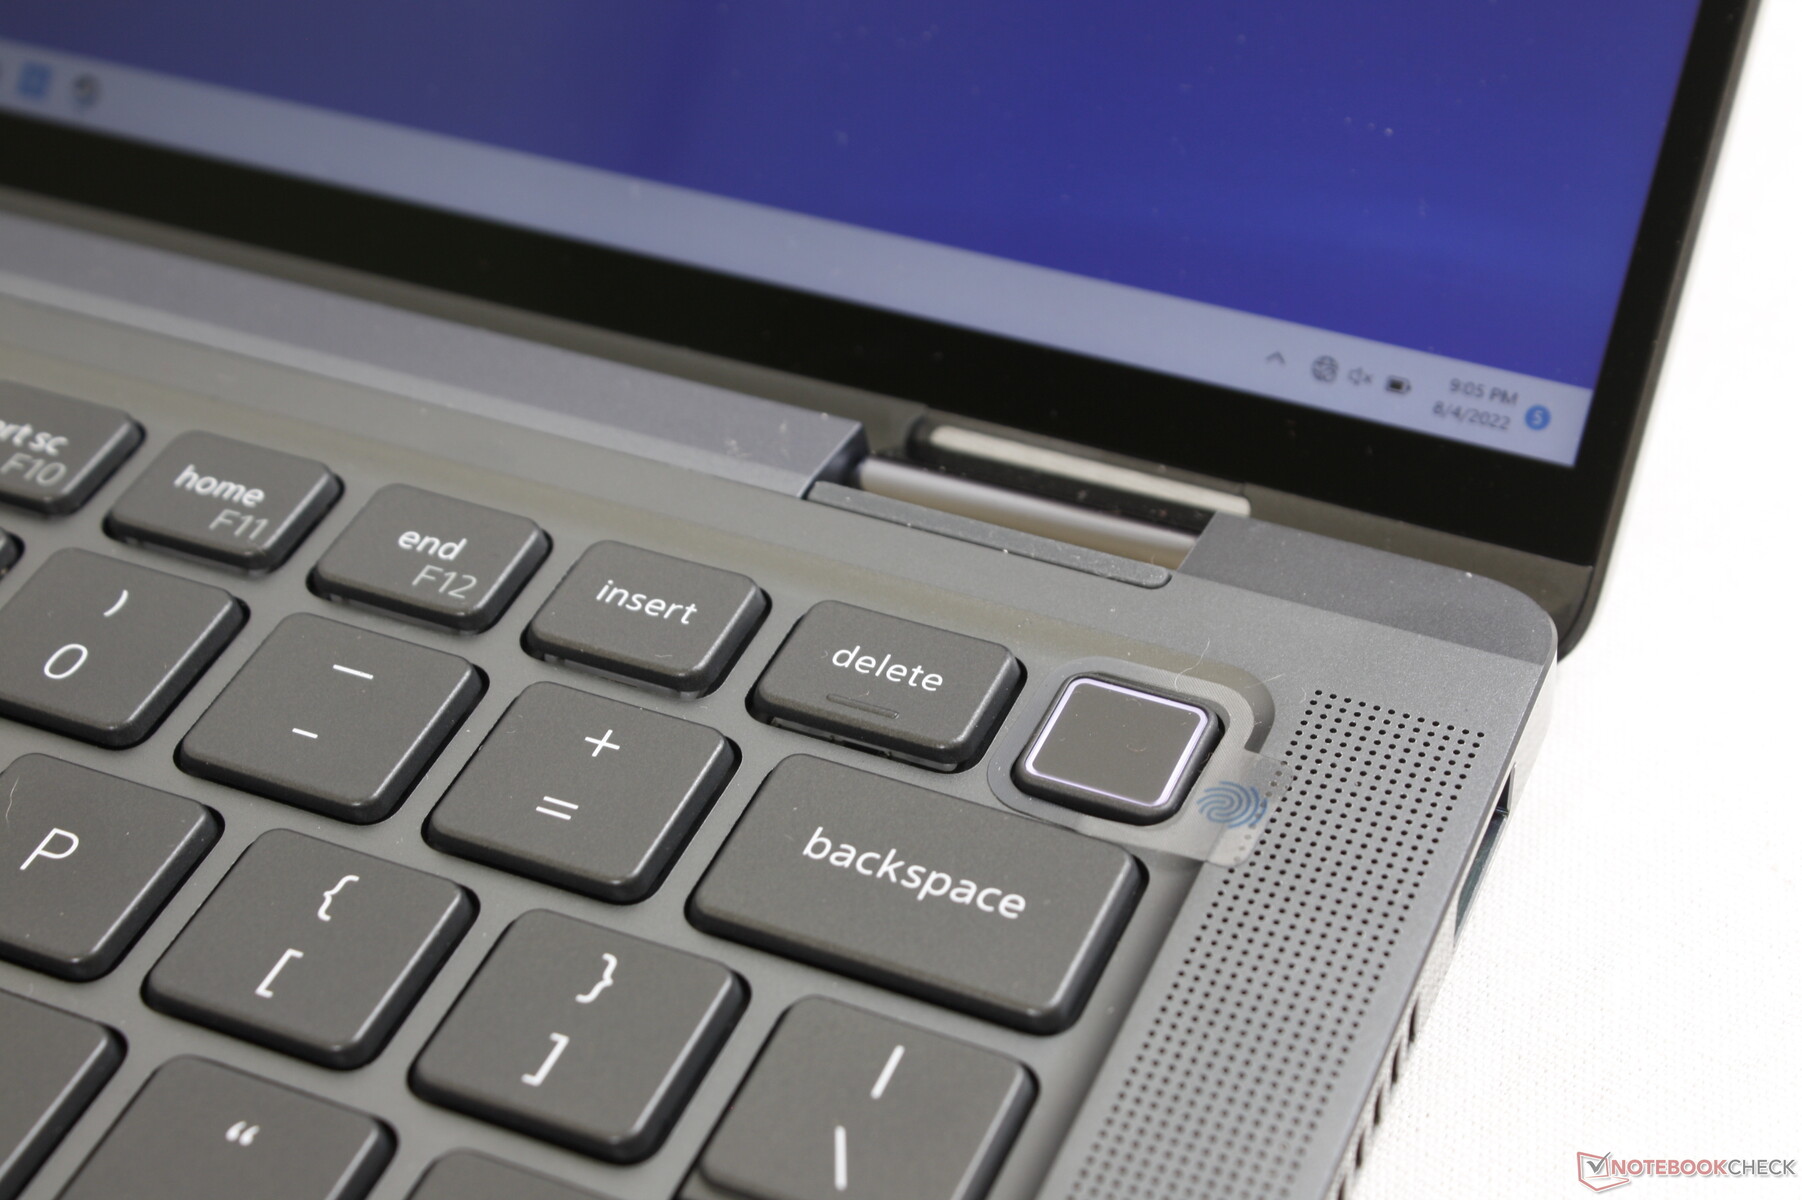
Im Vergleich zu den Tastaturen eines HP EliteBook oder Spectre ist das Tippen auf unserem Latitude etwas leiser und weicher. Weniger angenehm ist das Tippgefühl dadurch jedoch nicht, hier kommt es auf die individuellen Vorlieben an. Allerdings vergeben wir einen Bonuspunkt an die HP-Modelle, da sie eine eigene Taste zum Starten von HP-Systemprogrammen wie dem Command Center oder myHP besitzen. Eine solche Taste zum Starten von Optimizer oder der Power-Manager-Software wäre hier sehr hilfreich gewesen.

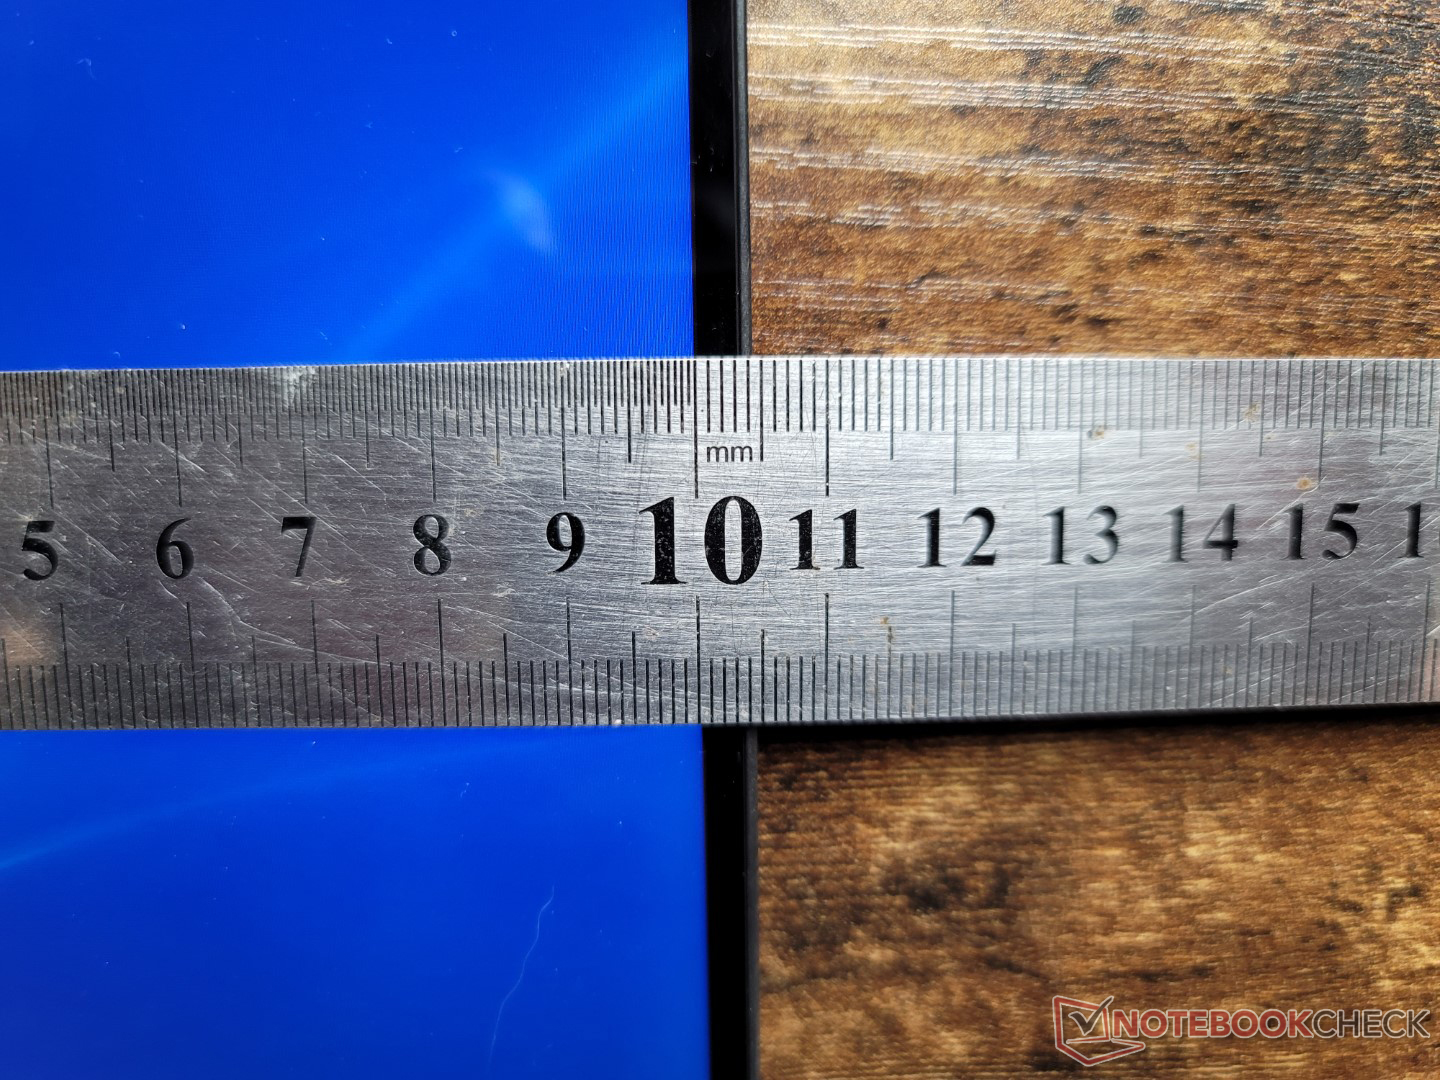
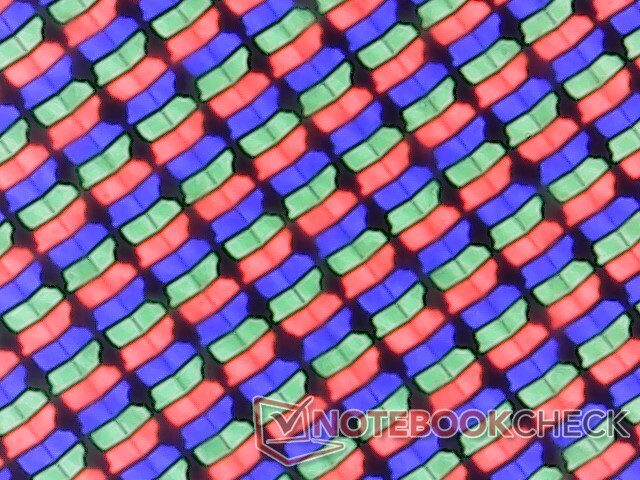
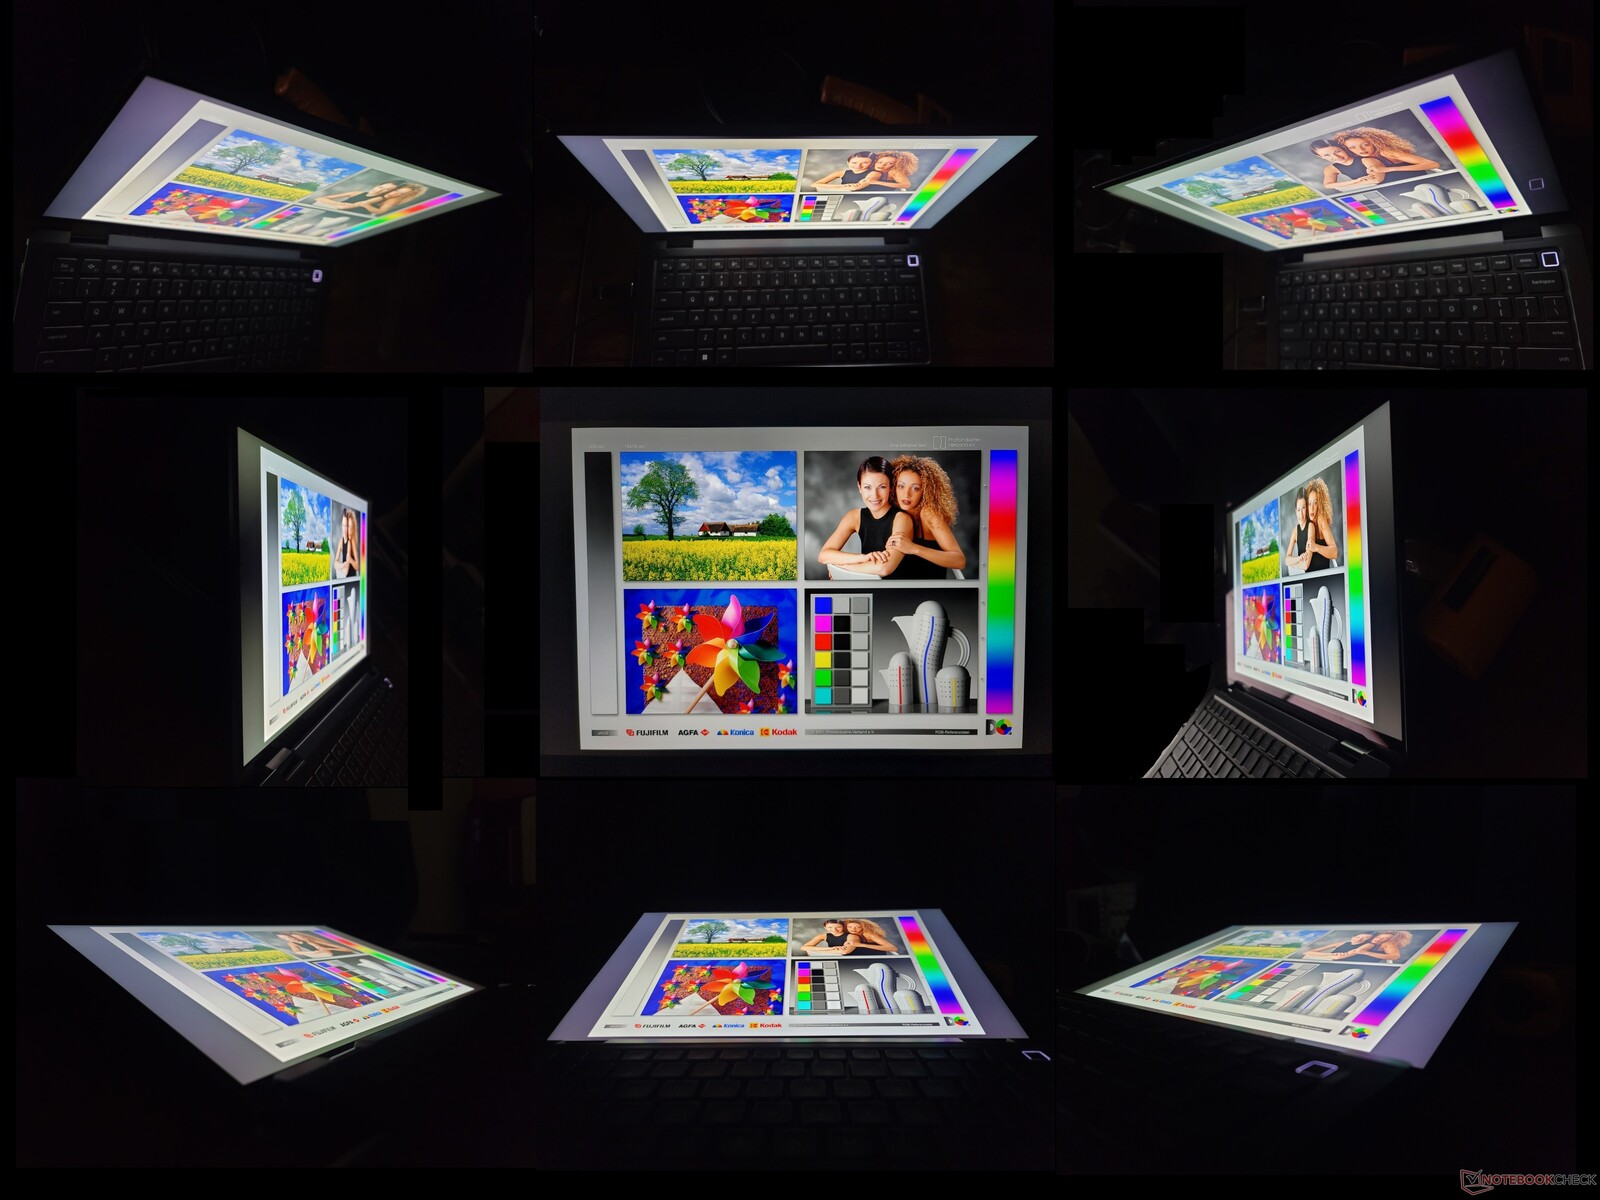
Display
Das IPS-Panel AU Optronics B140QAN kommt wie beim Modell aus dem Vorjahr auch hier wieder zum Einsatz, wodurch die visuellen Eigenschaften des Latitude 9420 2-in-1 und Latitude 9430 2-in-1 sehr ähnlich ausfallen. An dieser Stelle hätten wir uns über neue, schnellere Displayoptionen oder auch OLED-Panels wie beim neuen Asus ZenBook 14 bzw. HP Spectre gefreut. Stattdessen machen sich die sehr langen Schwarz-zu-Weiß- und Grau-zu-Grau-Reaktionszeiten weiterhin bemerkbar. Für Büroaufgaben, bei denen die Reaktionszeiten weniger stark ins Gewicht fallen, eignet sich das Panel dennoch hervorragend.
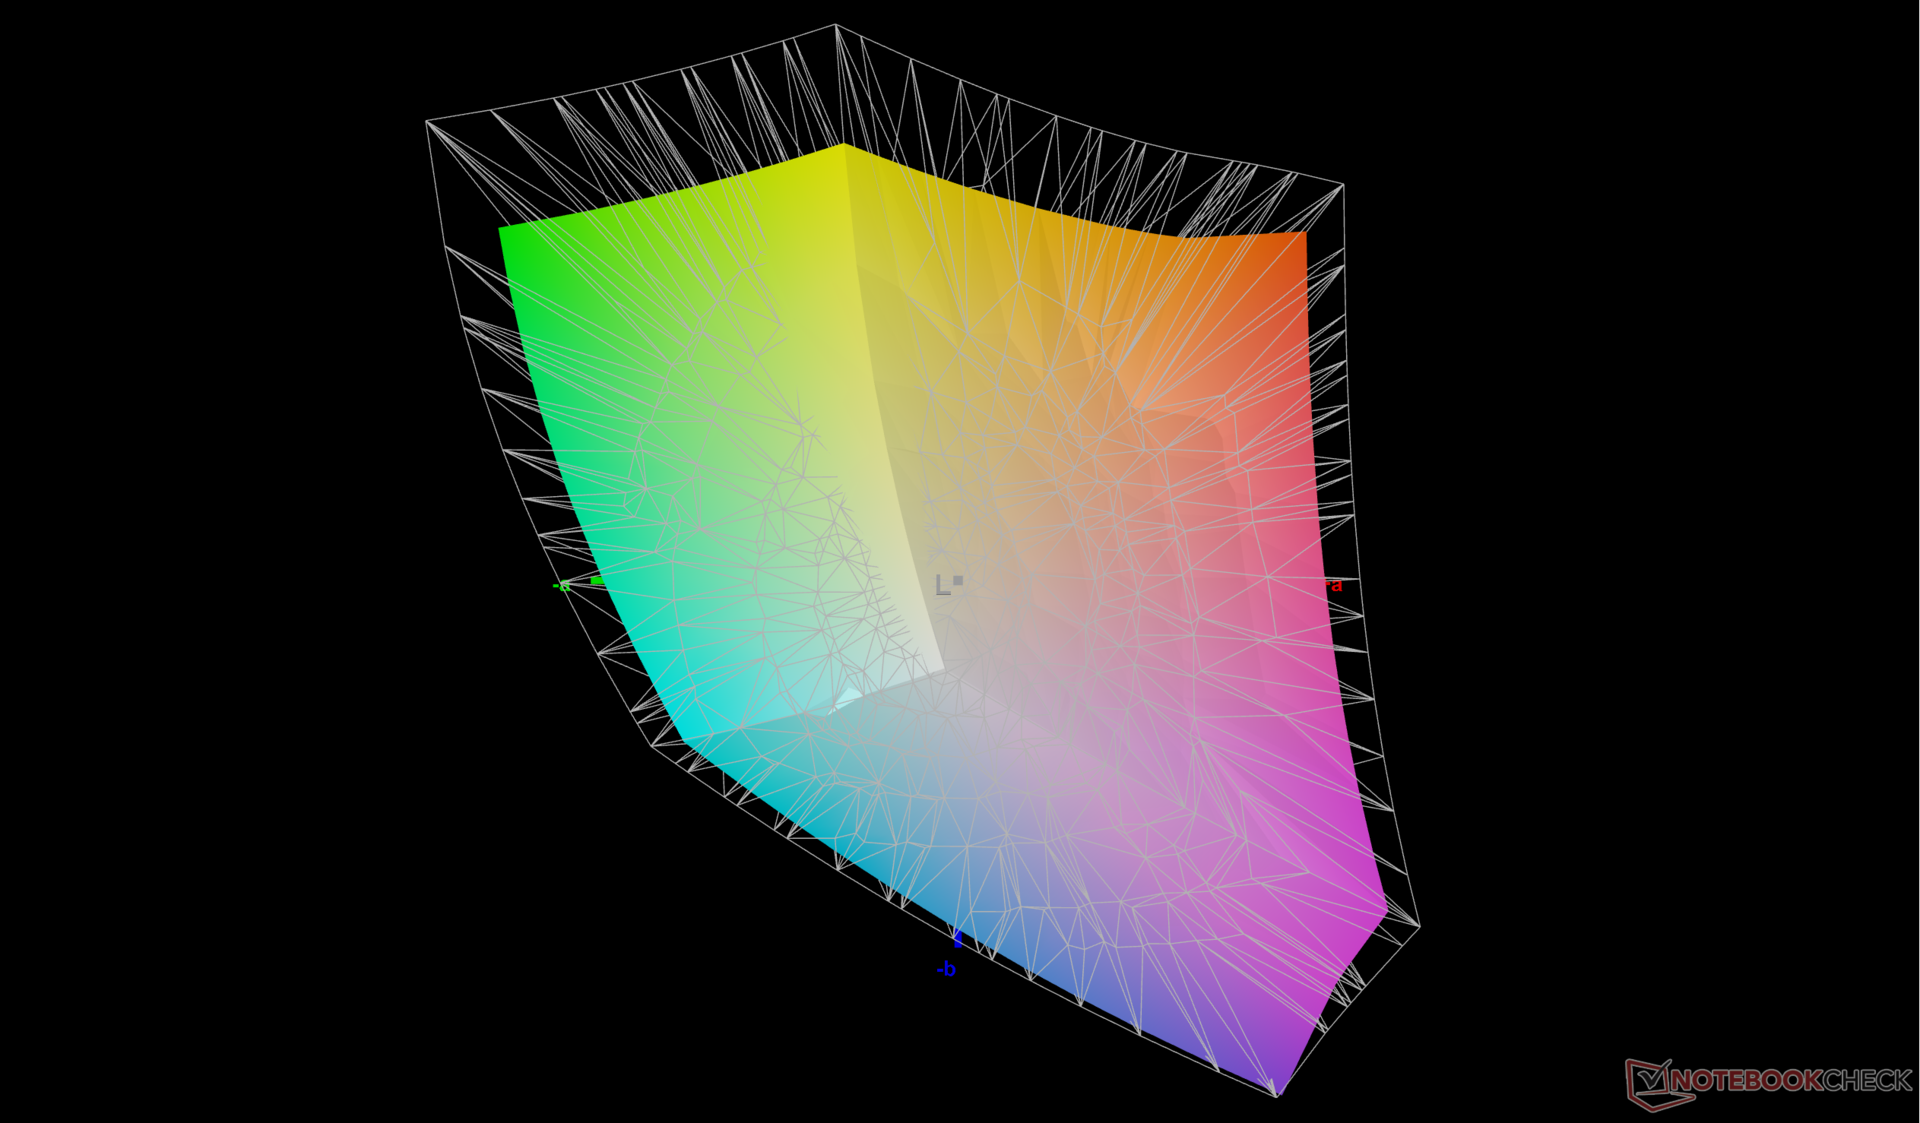
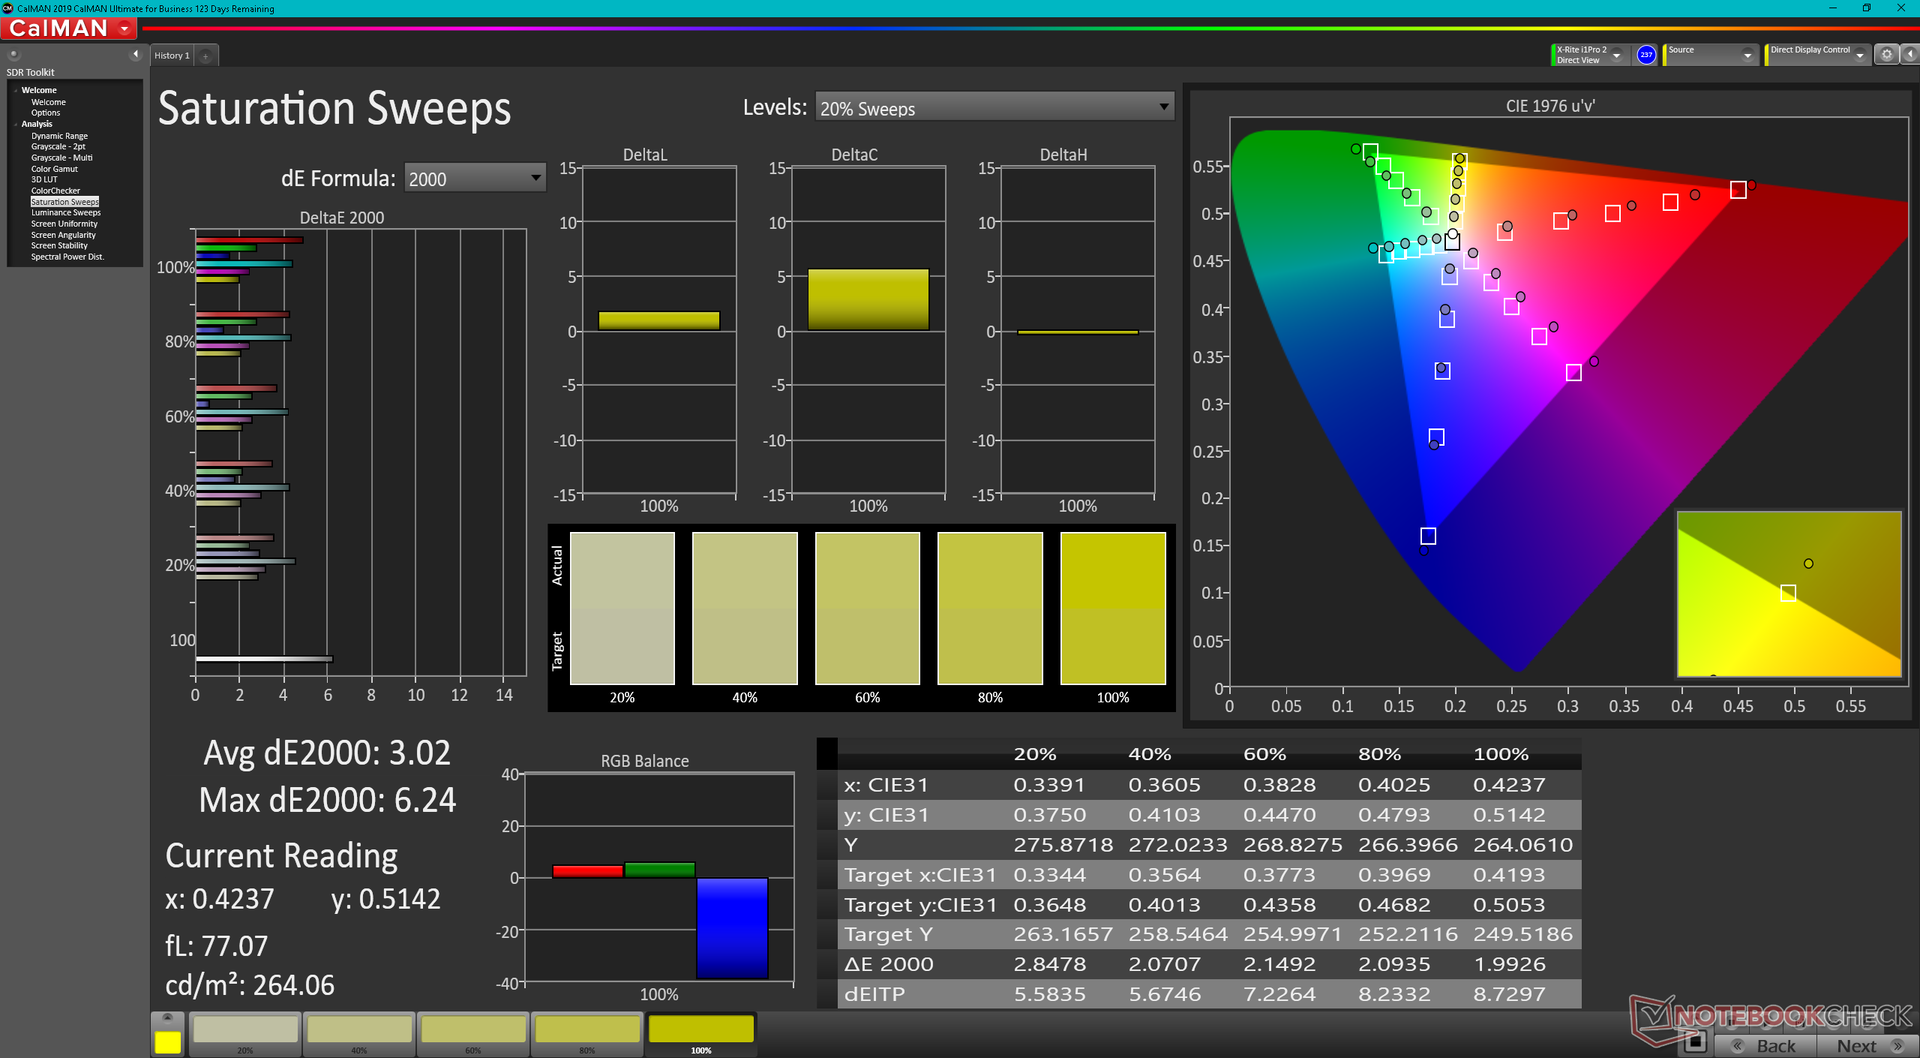
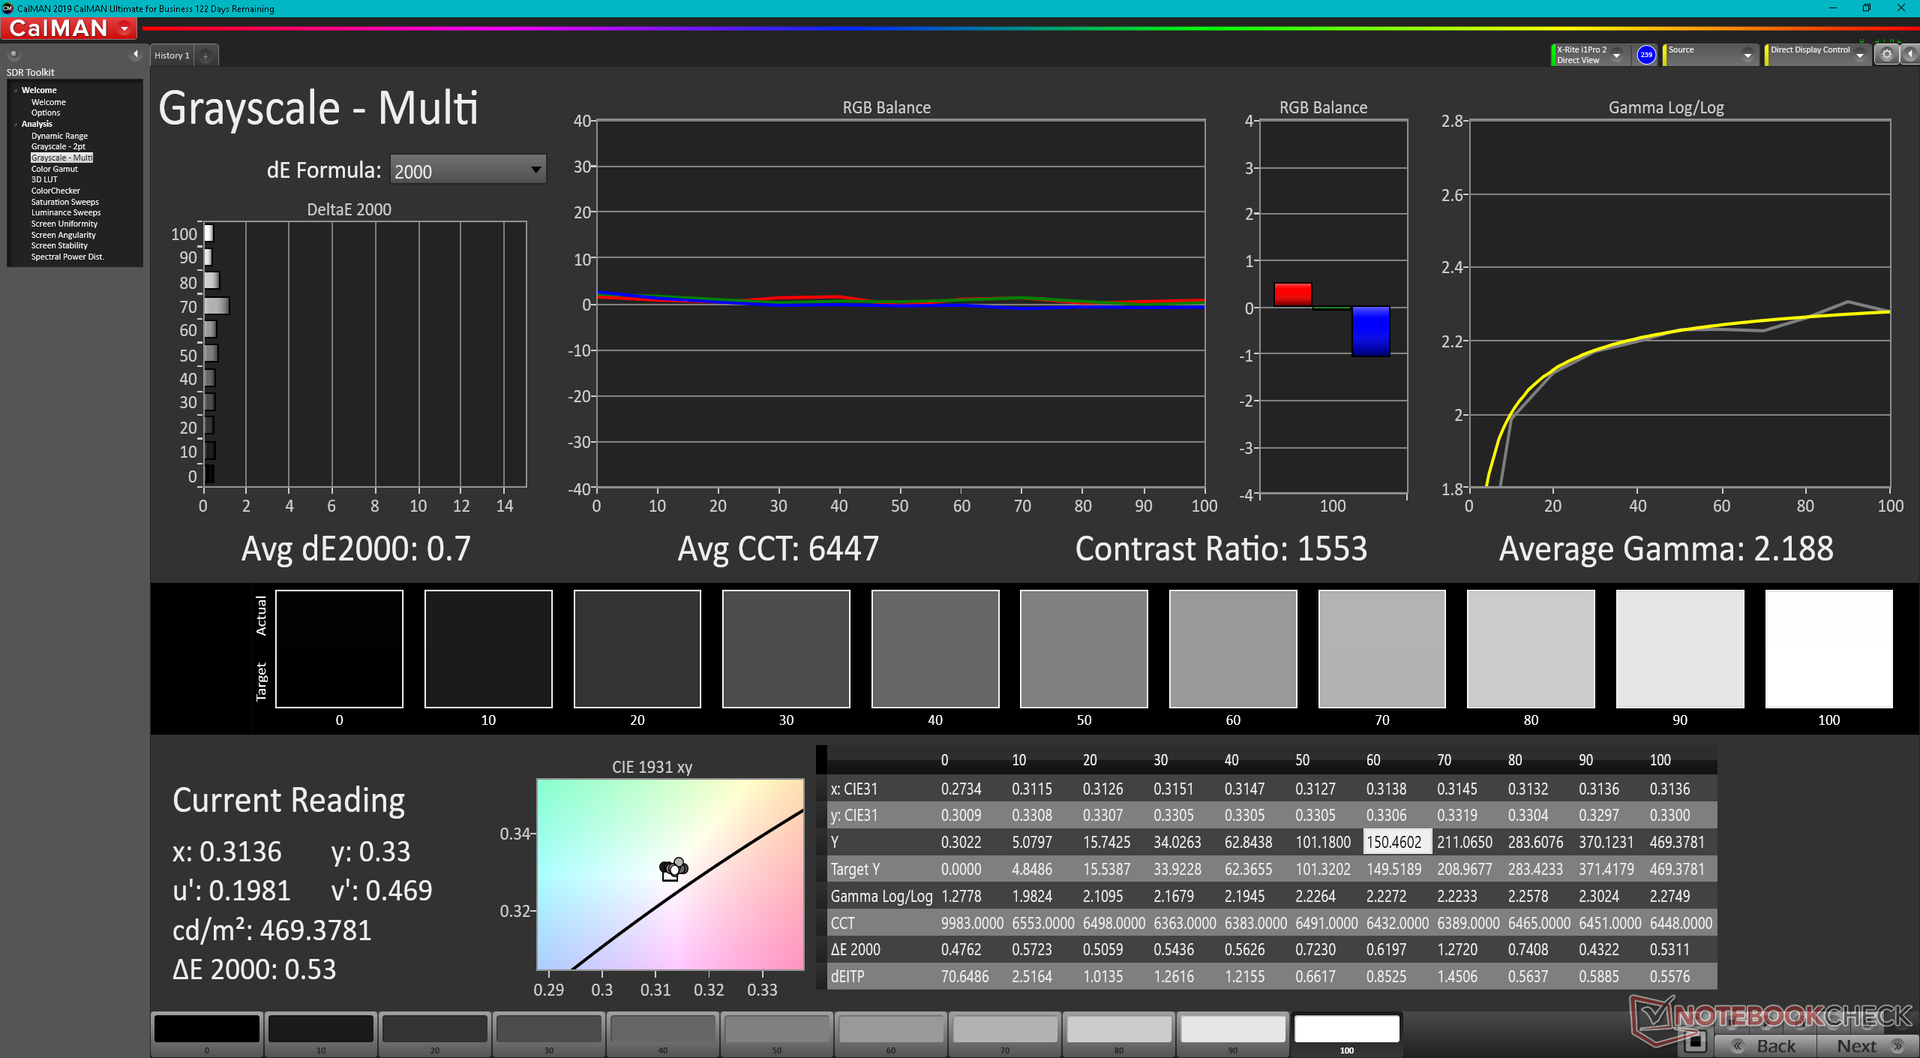
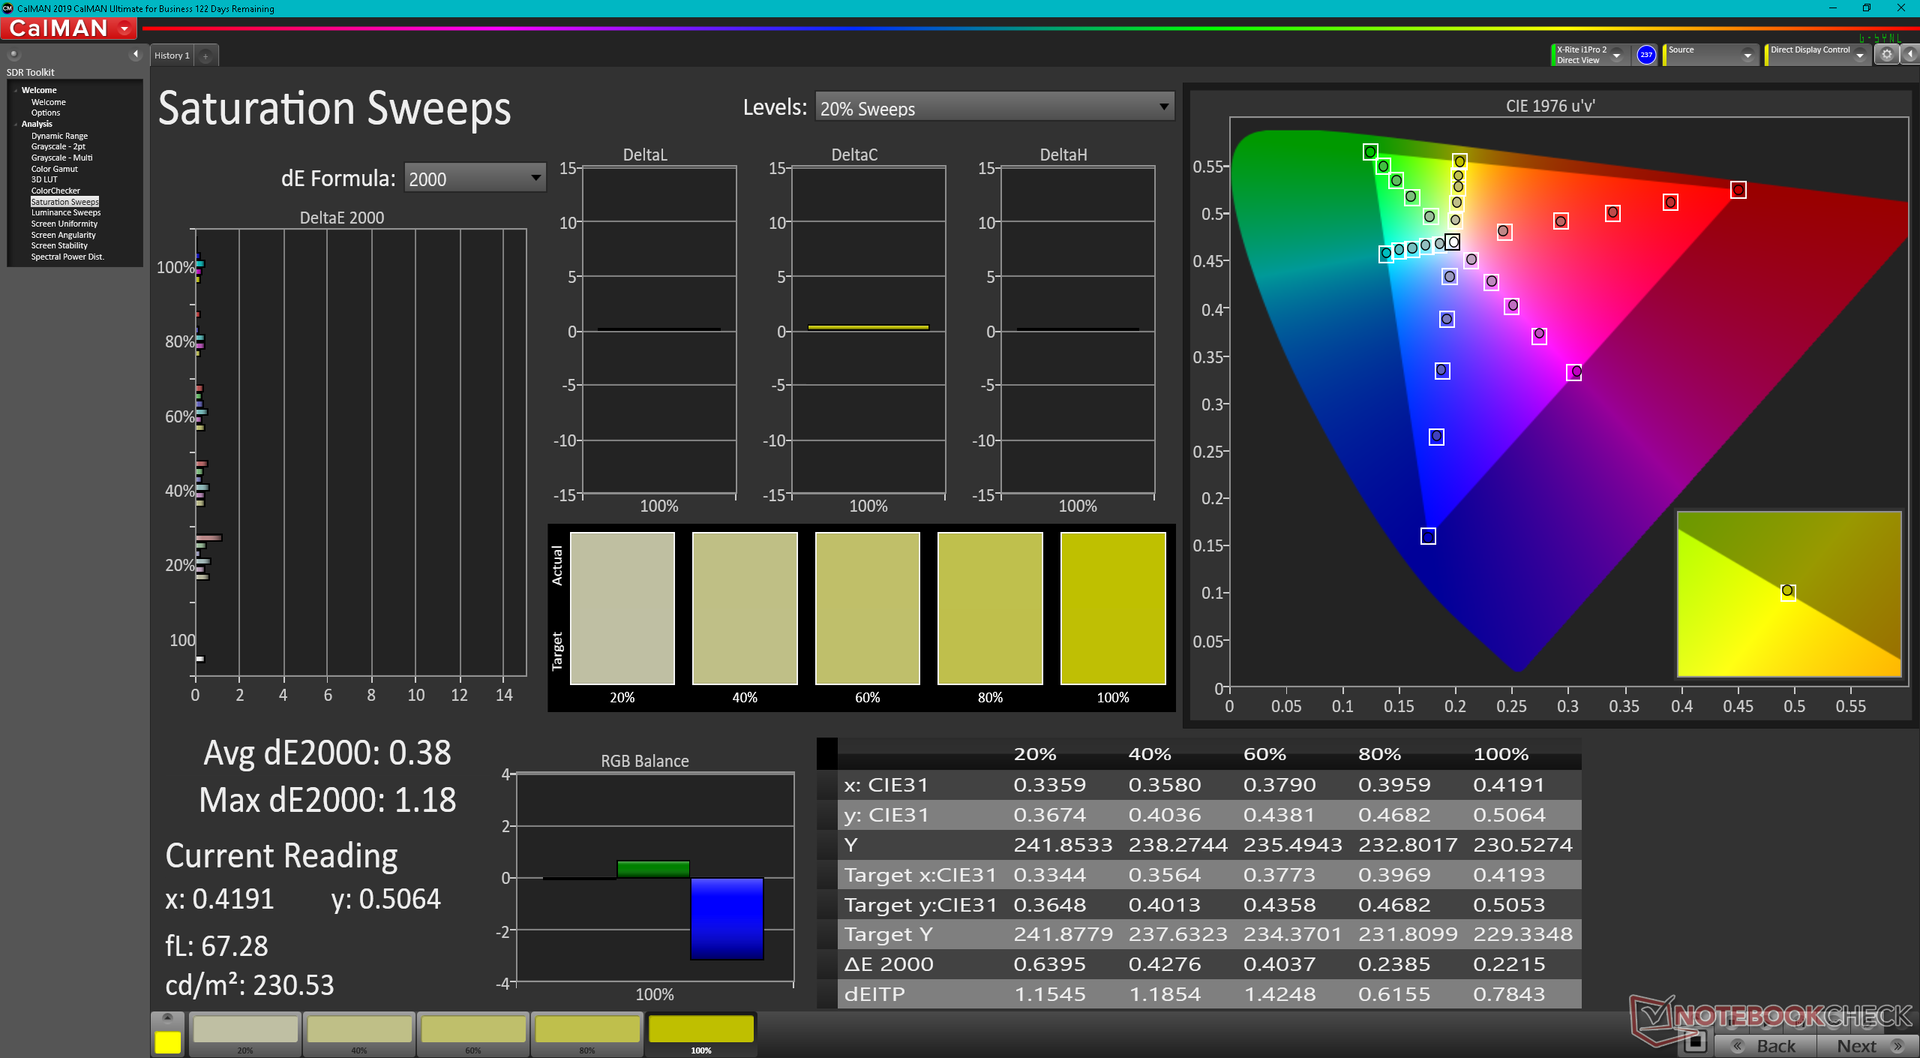
Dell wirbt mit einer vollständigen Abdeckung des sRGB-Farbraums, was wir durch unsere unabhängige Messung bestätigen können. Von einem High-End-Latitude-9000 hätten wir auch nichts geringeres erwartet.
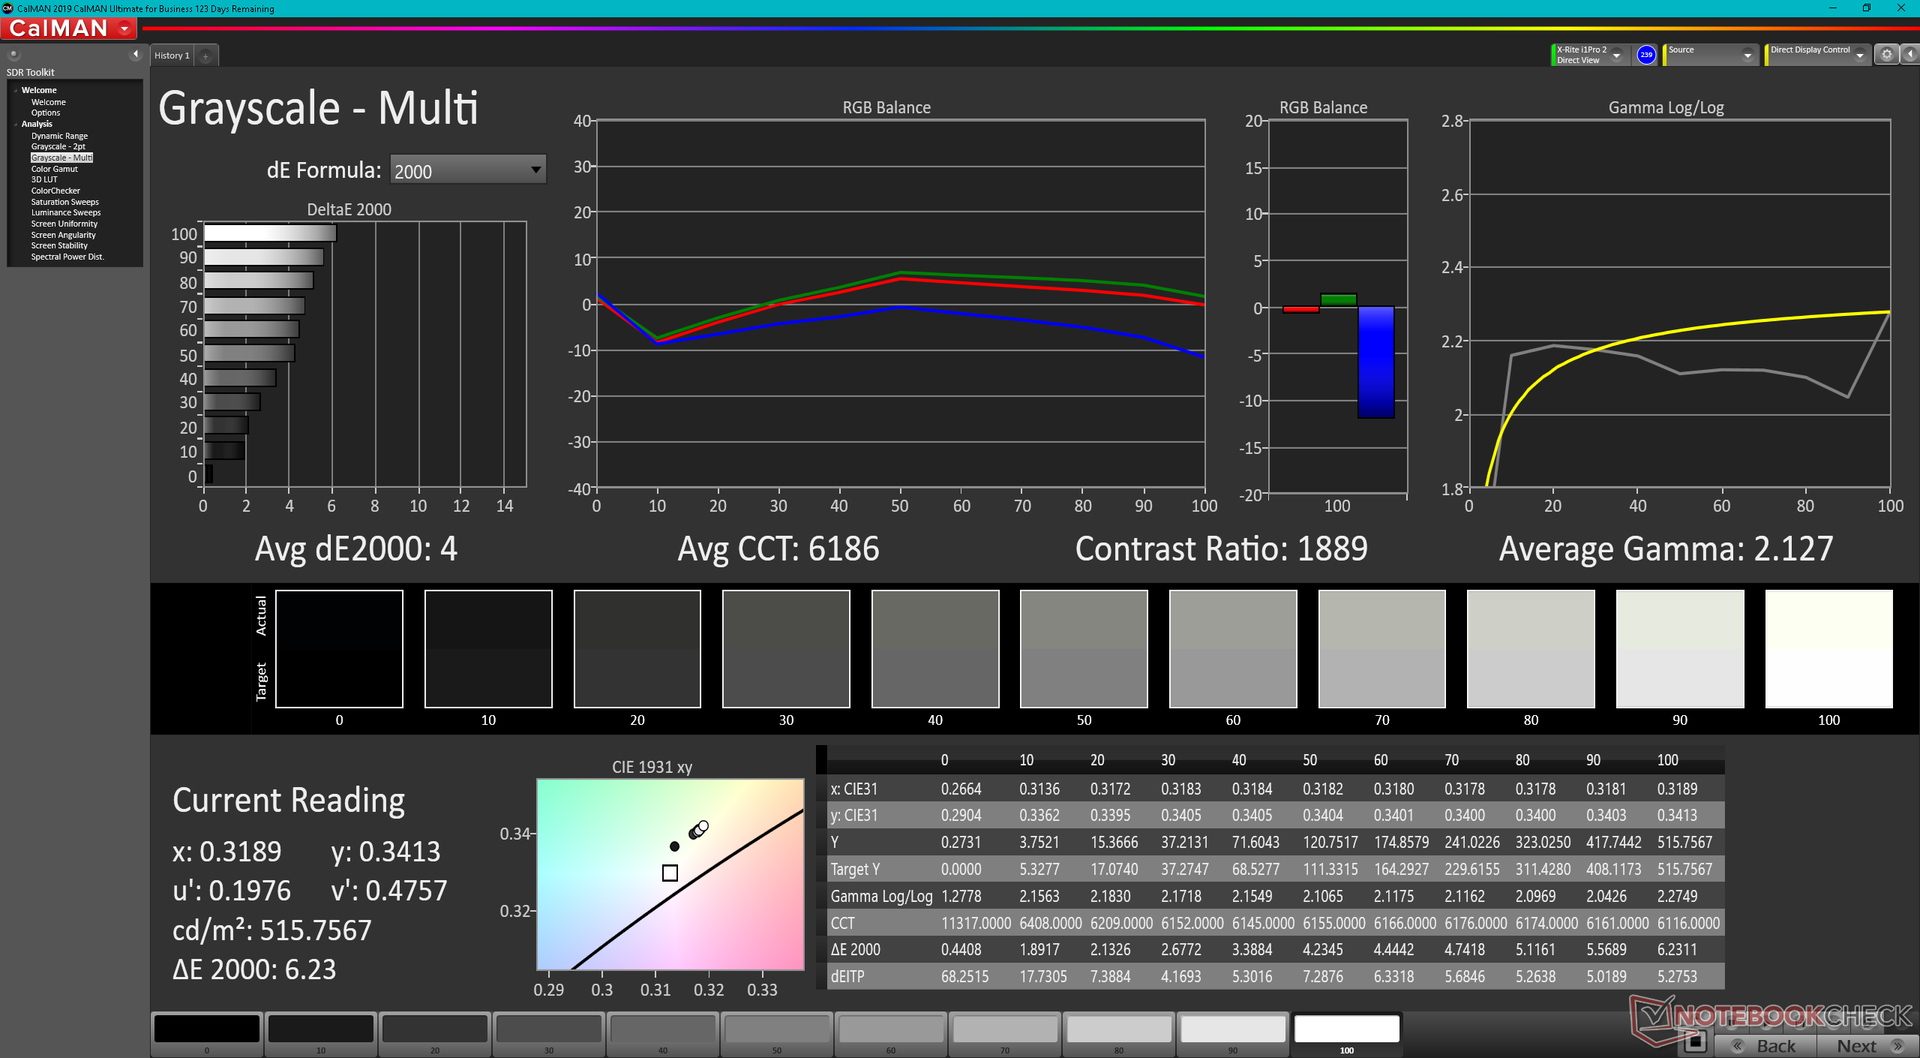
Wir sind bei unserem Testgerät auf einen Bug gestoßen, durch den sich die Helligkeit im Bereich von 0 bis 28 % nicht geändert hat. Die Helligkeit bleibt bis zu einer Einstellung von 29 % oder mehr auf 32 cd/m² fixiert. Dell ist das Problem bekannt.
| |||||||||||||||||||||||||
Ausleuchtung: 90 %
Helligkeit Akku: 517.7 cd/m²
Kontrast: 1569:1 (Schwarzwert: 0.33 cd/m²)
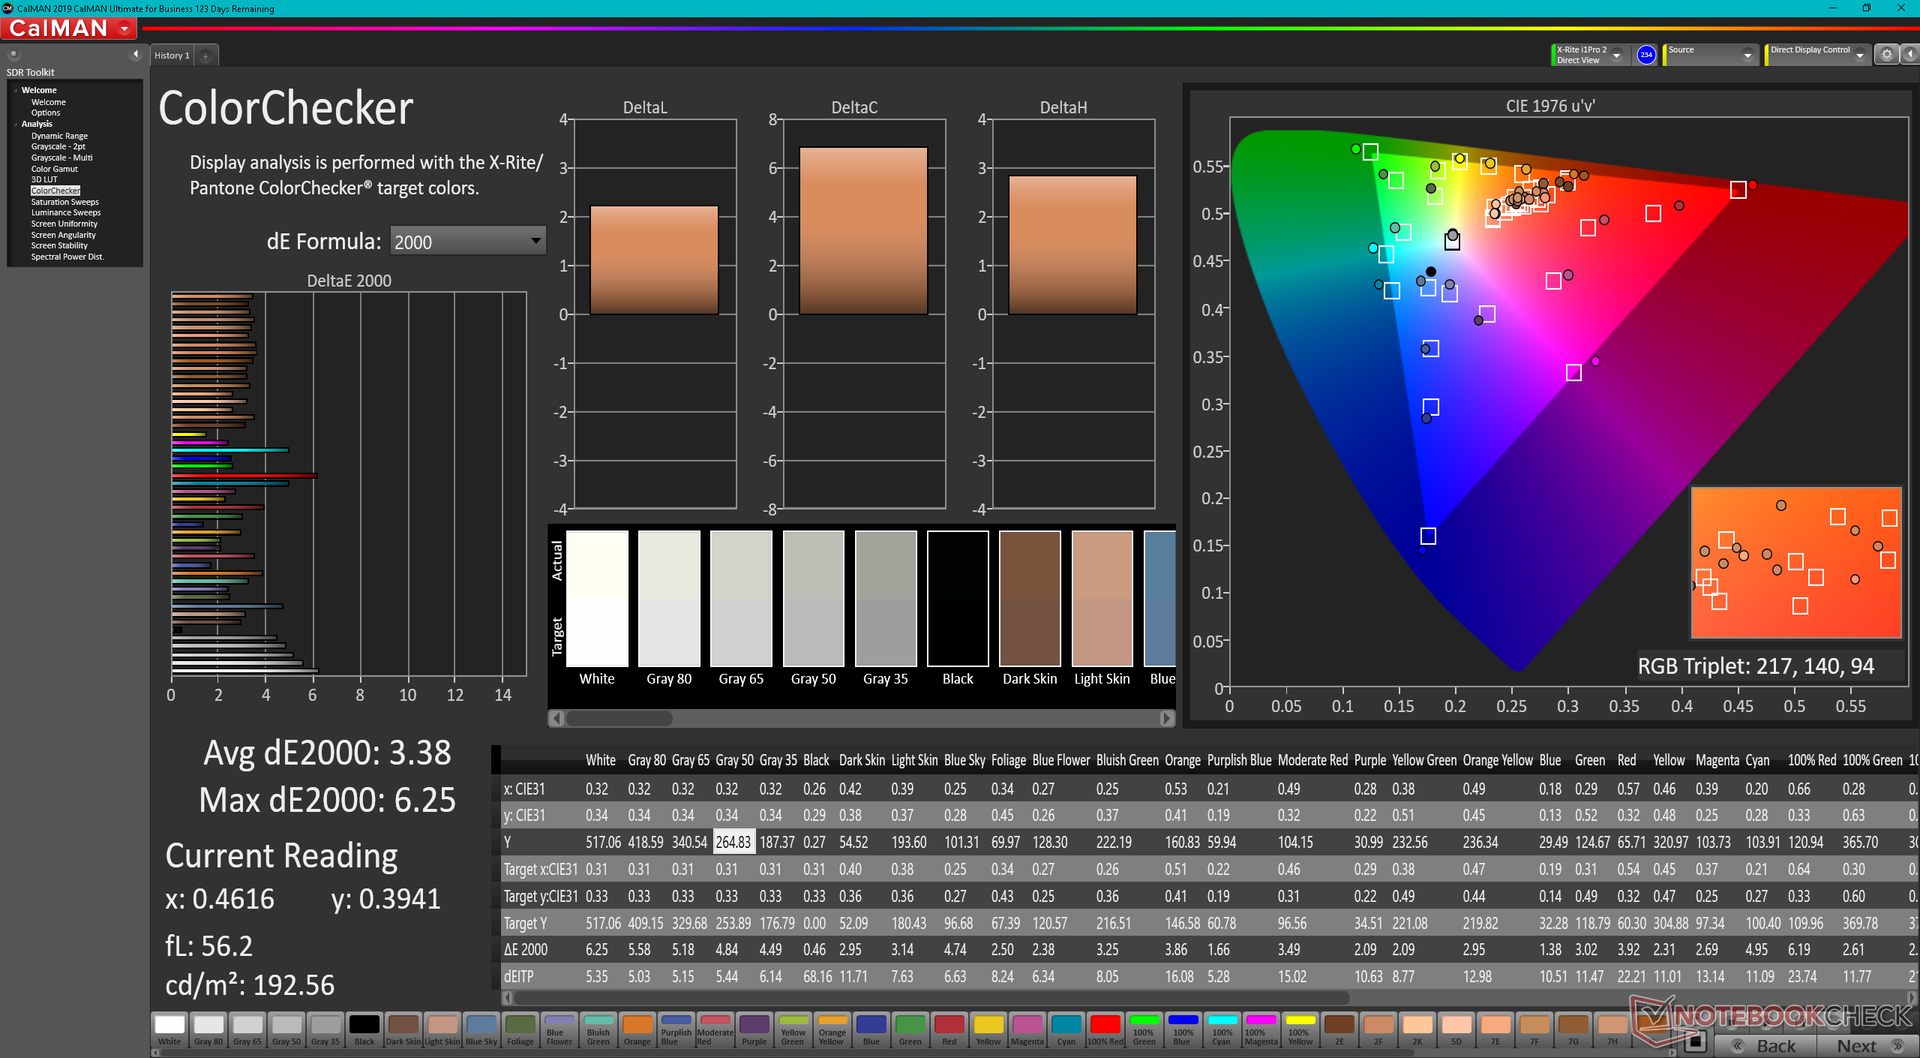
ΔE ColorChecker Calman: 3.38 | ∀{0.5-29.43 Ø4.73}
calibrated: 0.41
ΔE Greyscale Calman: 4 | ∀{0.09-98 Ø4.97}
79.4% AdobeRGB 1998 (Argyll 3D)
100% sRGB (Argyll 3D)
79.4% Display P3 (Argyll 3D)
Gamma: 2.13
CCT: 6186 K
| Dell Latitude 9430 2-in-1 AU Optronics B140QAN, IPS, 2560x1600, 14" | Dell Latitude 9420 2-in-1 AU Optronics B140QAN, IPS, 2560x1600, 14" | MSI Summit E14 Flip Evo A12MT AU Optronics B140QAN04.R, IPS, 2880x1800, 14" | LG Gram 14T90P LG Philips LP140WU1-SPA1, IPS, 1900x1200, 14" | Lenovo ThinkPad X1 Yoga G7 21CE002HGE MNE007JA1-1, IPS, 1920x1200, 14" | Asus ZenBook Flip 14 UN5401QA-KN085W SDC4154, OLED, 2880x1800, 14" | |
|---|---|---|---|---|---|---|
| Display | 1% | 10% | 12% | -8% | 17% | |
| Display P3 Coverage (%) | 79.4 | 80.7 2% | 97.8 23% | 98.8 24% | 69.3 -13% | 99.7 26% |
| sRGB Coverage (%) | 100 | 100 0% | 99.9 0% | 100 0% | 99.7 0% | 100 0% |
| AdobeRGB 1998 Coverage (%) | 79.4 | 79.7 0% | 85.9 8% | 71.3 -10% | 98.6 24% | |
| Response Times | 9% | 64% | 21% | 34% | 96% | |
| Response Time Grey 50% / Grey 80% * (ms) | 63.6 ? | 54 ? 15% | 16.9 ? 73% | 44 ? 31% | 42 ? 34% | 2 ? 97% |
| Response Time Black / White * (ms) | 33.6 ? | 32.8 ? 2% | 15.4 ? 54% | 30 ? 11% | 22.4 ? 33% | 2 ? 94% |
| PWM Frequency (Hz) | ||||||
| Bildschirm | -45% | -33% | -5% | 8% | -80% | |
| Helligkeit Bildmitte (cd/m²) | 517.7 | 483.6 -7% | 496.7 -4% | 305.5 -41% | 371 -28% | 366 -29% |
| Brightness (cd/m²) | 493 | 465 -6% | 468 -5% | 289 -41% | 363 -26% | 369 -25% |
| Brightness Distribution (%) | 90 | 92 2% | 87 -3% | 87 -3% | 92 2% | 96 7% |
| Schwarzwert * (cd/m²) | 0.33 | 0.32 3% | 0.3 9% | 0.27 18% | 0.21 36% | |
| Kontrast (:1) | 1569 | 1511 -4% | 1656 6% | 1131 -28% | 1767 13% | |
| Delta E Colorchecker * | 3.38 | 3.69 -9% | 3.93 -16% | 3.31 2% | 1.3 62% | 2.84 16% |
| Colorchecker dE 2000 max. * | 6.25 | 5.97 4% | 7.9 -26% | 6.12 2% | 2.6 58% | 5.29 15% |
| Colorchecker dE 2000 calibrated * | 0.41 | 2.05 -400% | 1.27 -210% | 0.8 -95% | 2.81 -585% | |
| Delta E Graustufen * | 4 | 3.5 12% | 5.9 -48% | 1.9 52% | 2.1 47% | 2.32 42% |
| Gamma | 2.13 103% | 2.04 108% | 2.04 108% | 2.04 108% | 2.15 102% | 2.44 90% |
| CCT | 6186 105% | 6158 106% | 7618 85% | 6706 97% | 6759 96% | 6170 105% |
| Durchschnitt gesamt (Programm / Settings) | -12% /
-28% | 14% /
-10% | 9% /
2% | 11% /
8% | 11% /
-27% |
* ... kleinere Werte sind besser
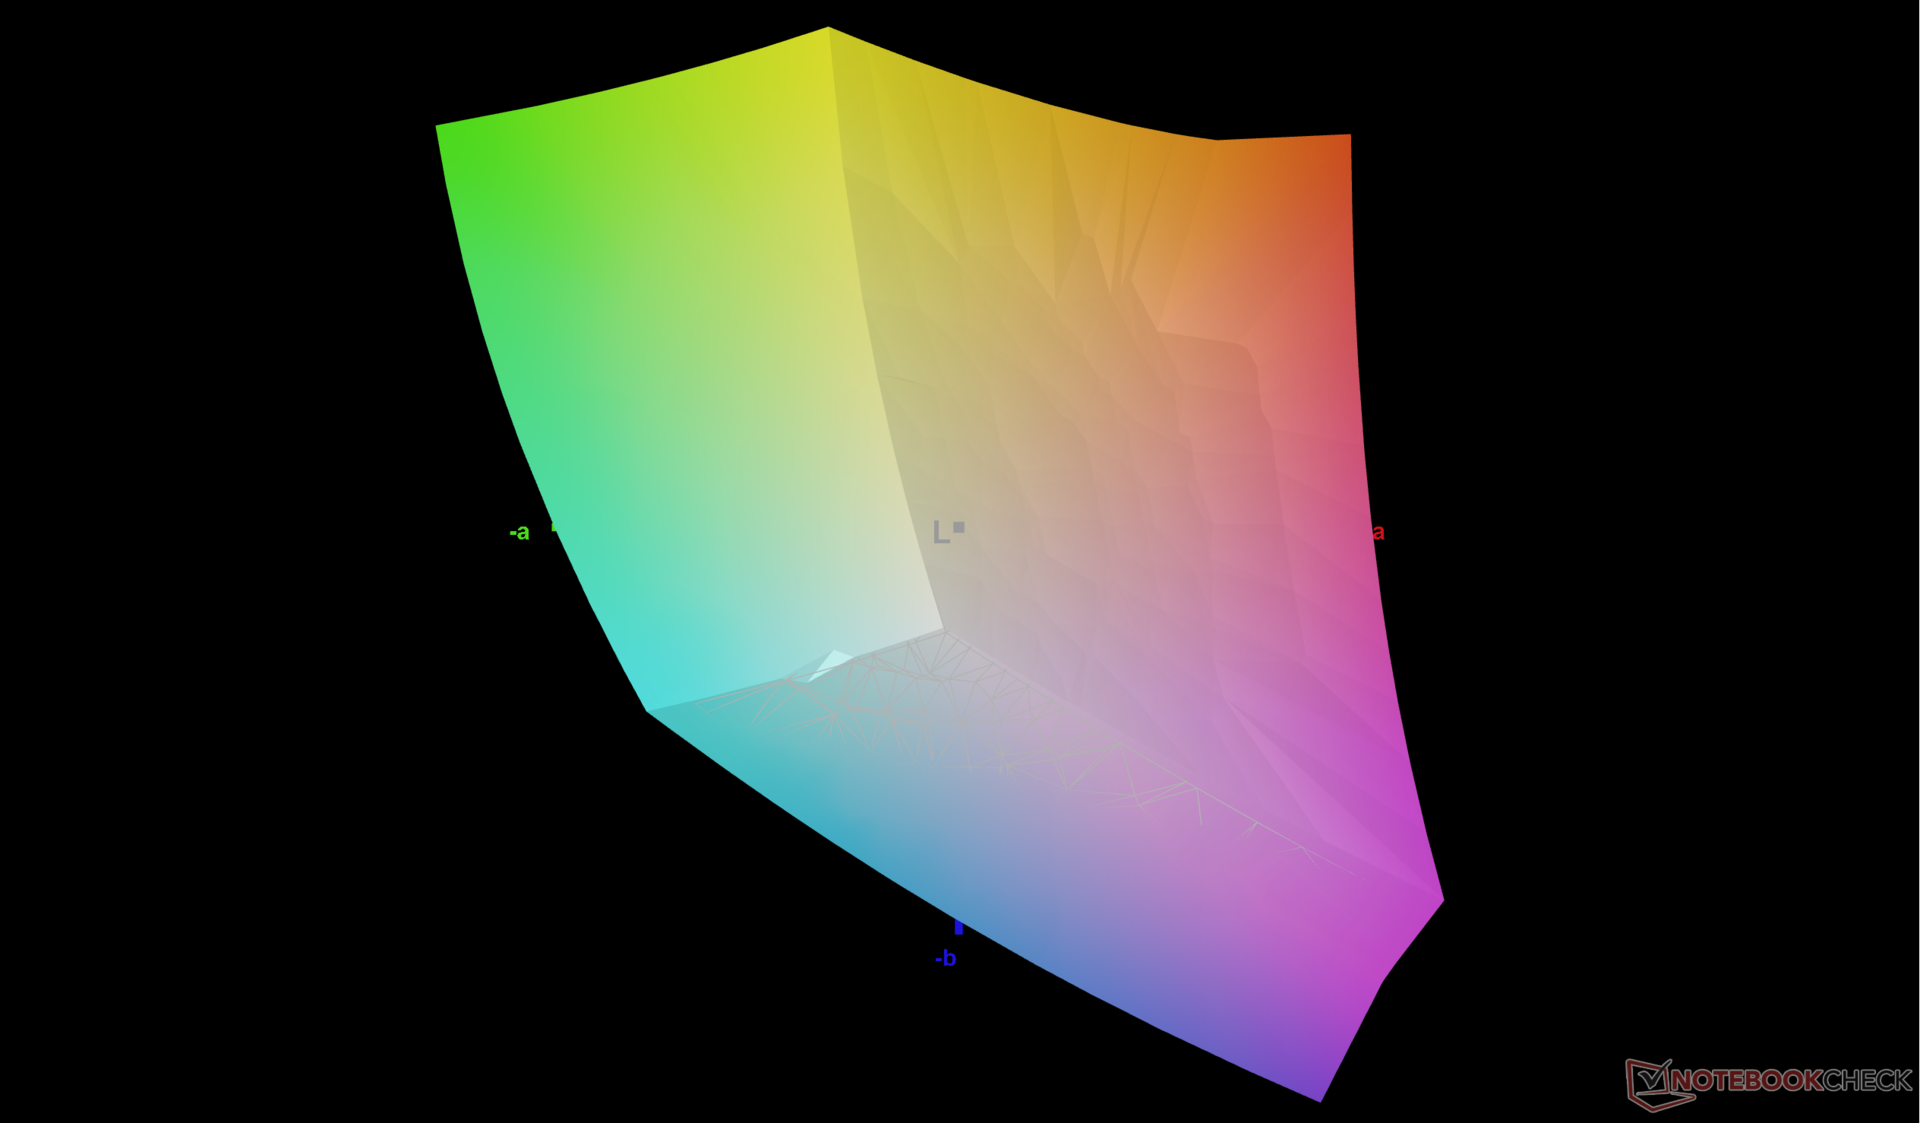
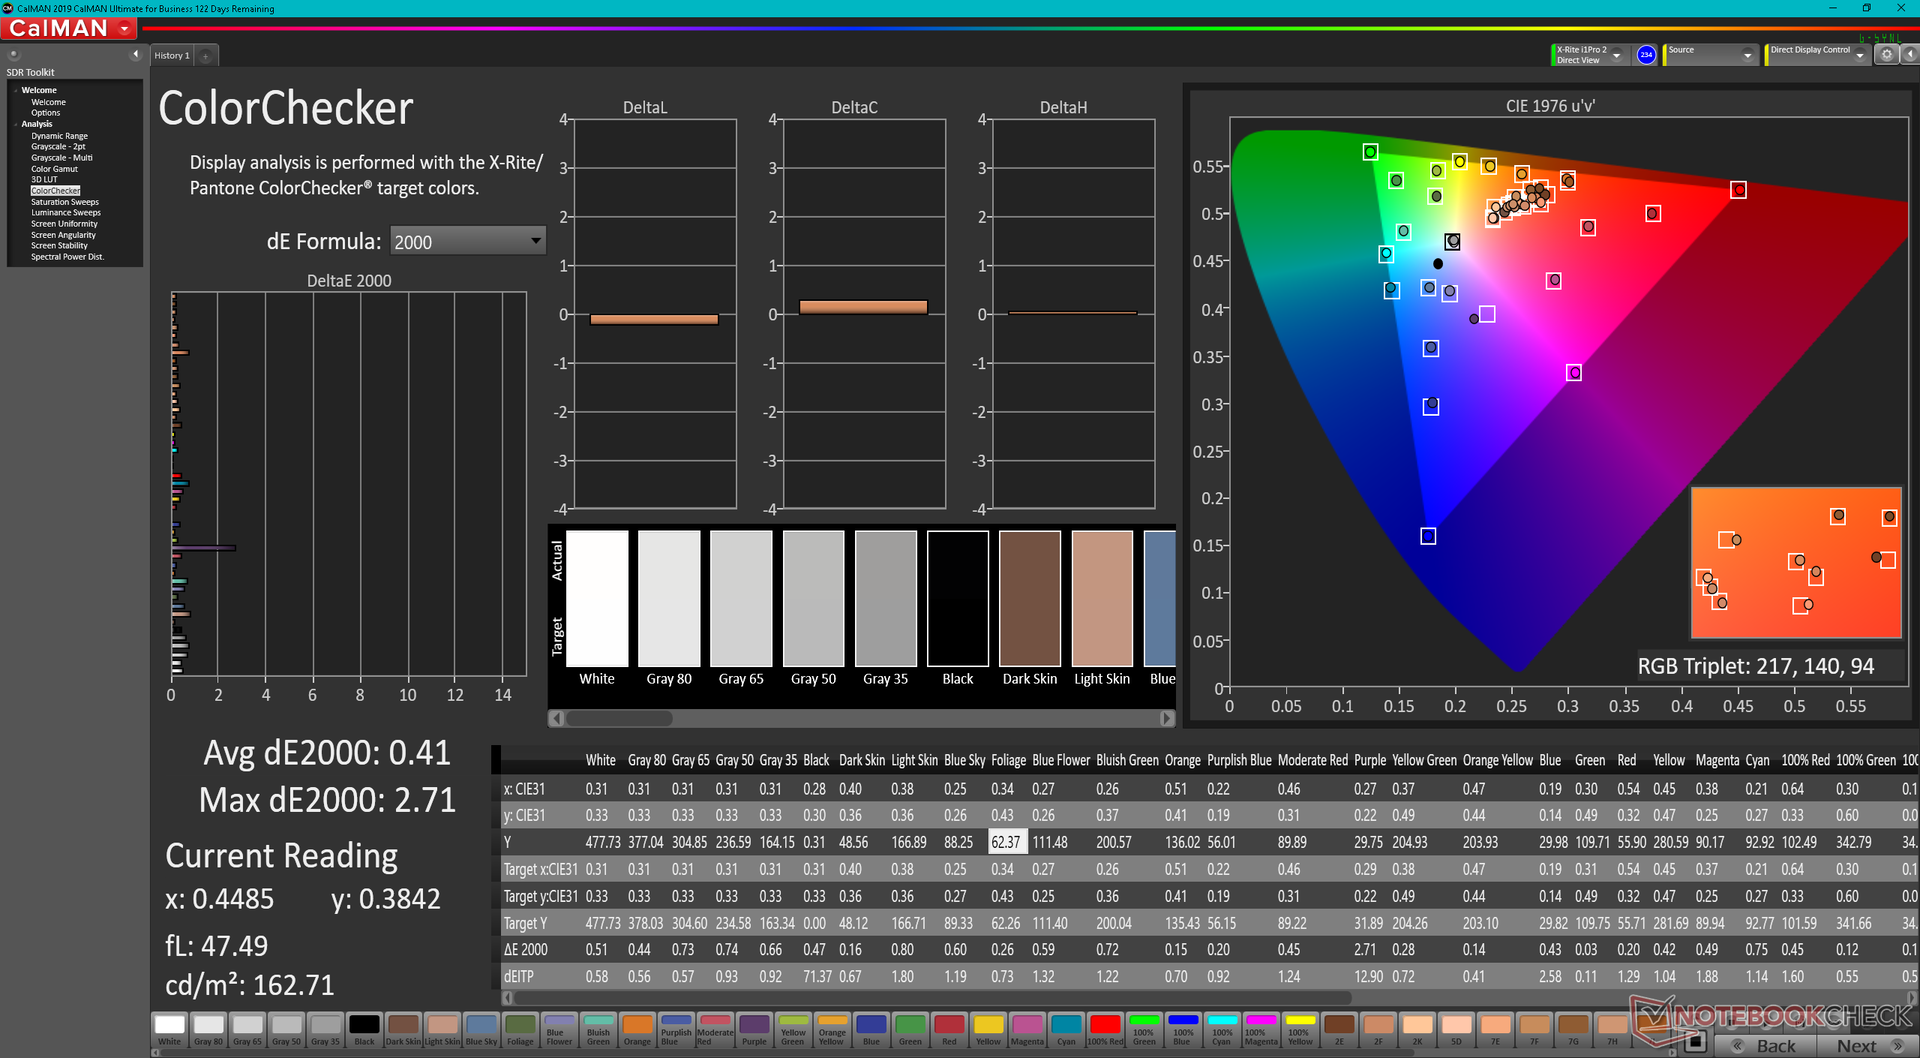
Die Darstellung des Displays ab Werk lässt mit durchschnittlichen Graustufen- und Farb-DeltaE-Werten von 4 bzw. 3,38 zu Wünschen übrig. Mithilfe unseres X-Rite-Farbmessgeräts konnten wir diese Werte auf nur 0,7 bzw. 0,41 senken. Um der vollständigen sRGB-Farbraumabdeckung des Panels besser gerecht zu werden, empfehlen wir die Installation unseres ICM-Profils (siehe oben).
Reaktionszeiten (Response Times) des Displays
| ↔ Reaktionszeiten Schwarz zu Weiß | ||
|---|---|---|
| 33.6 ms ... steigend ↗ und fallend ↘ kombiniert | ↗ 17.2 ms steigend | 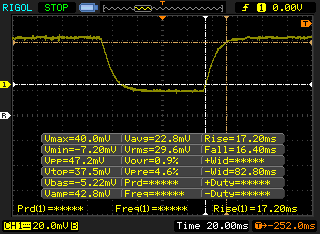 |
| ↘ 16.4 ms fallend | ||
| Die gemessenen Reaktionszeiten sind langsam und dadurch für viele Spieler wahrscheinlich zu langsam. Im Vergleich rangierten die bei uns getesteten Geräte von 0.1 (Minimum) zu 240 (Maximum) ms. » 90 % aller Screens waren schneller als der getestete. Daher sind die gemessenen Reaktionszeiten schlechter als der Durchschnitt aller vermessenen Geräte (19.9 ms). | ||
| ↔ Reaktionszeiten 50% Grau zu 80% Grau | ||
| 63.6 ms ... steigend ↗ und fallend ↘ kombiniert | ↗ 33.2 ms steigend |  |
| ↘ 30.4 ms fallend | ||
| Die gemessenen Reaktionszeiten sind langsam und dadurch für viele Spieler wahrscheinlich zu langsam. Im Vergleich rangierten die bei uns getesteten Geräte von 0.165 (Minimum) zu 636 (Maximum) ms. » 97 % aller Screens waren schneller als der getestete. Daher sind die gemessenen Reaktionszeiten schlechter als der Durchschnitt aller vermessenen Geräte (31.1 ms). | ||
Bildschirm-Flackern / PWM (Pulse-Width Modulation)
| Flackern / PWM nicht festgestellt |  | ||
Im Vergleich: 52 % aller getesteten Geräte nutzten kein PWM um die Helligkeit zu reduzieren. Wenn PWM eingesetzt wurde, dann bei einer Frequenz von durchschnittlich 7798 (Minimum 5, Maximum 343500) Hz. | |||
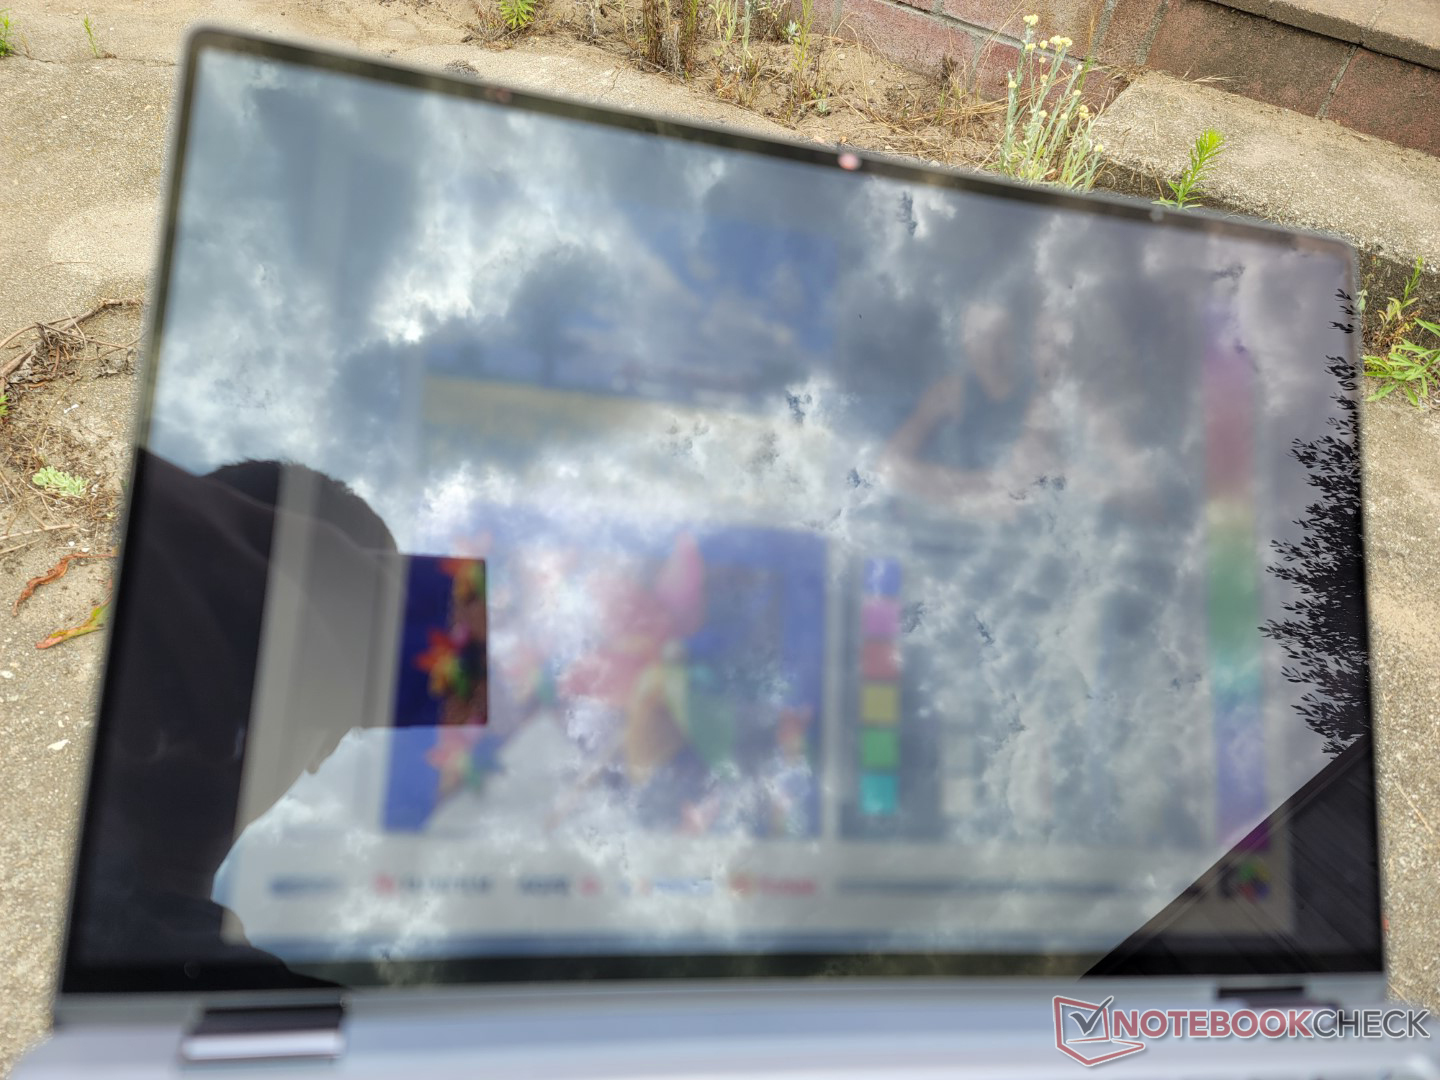
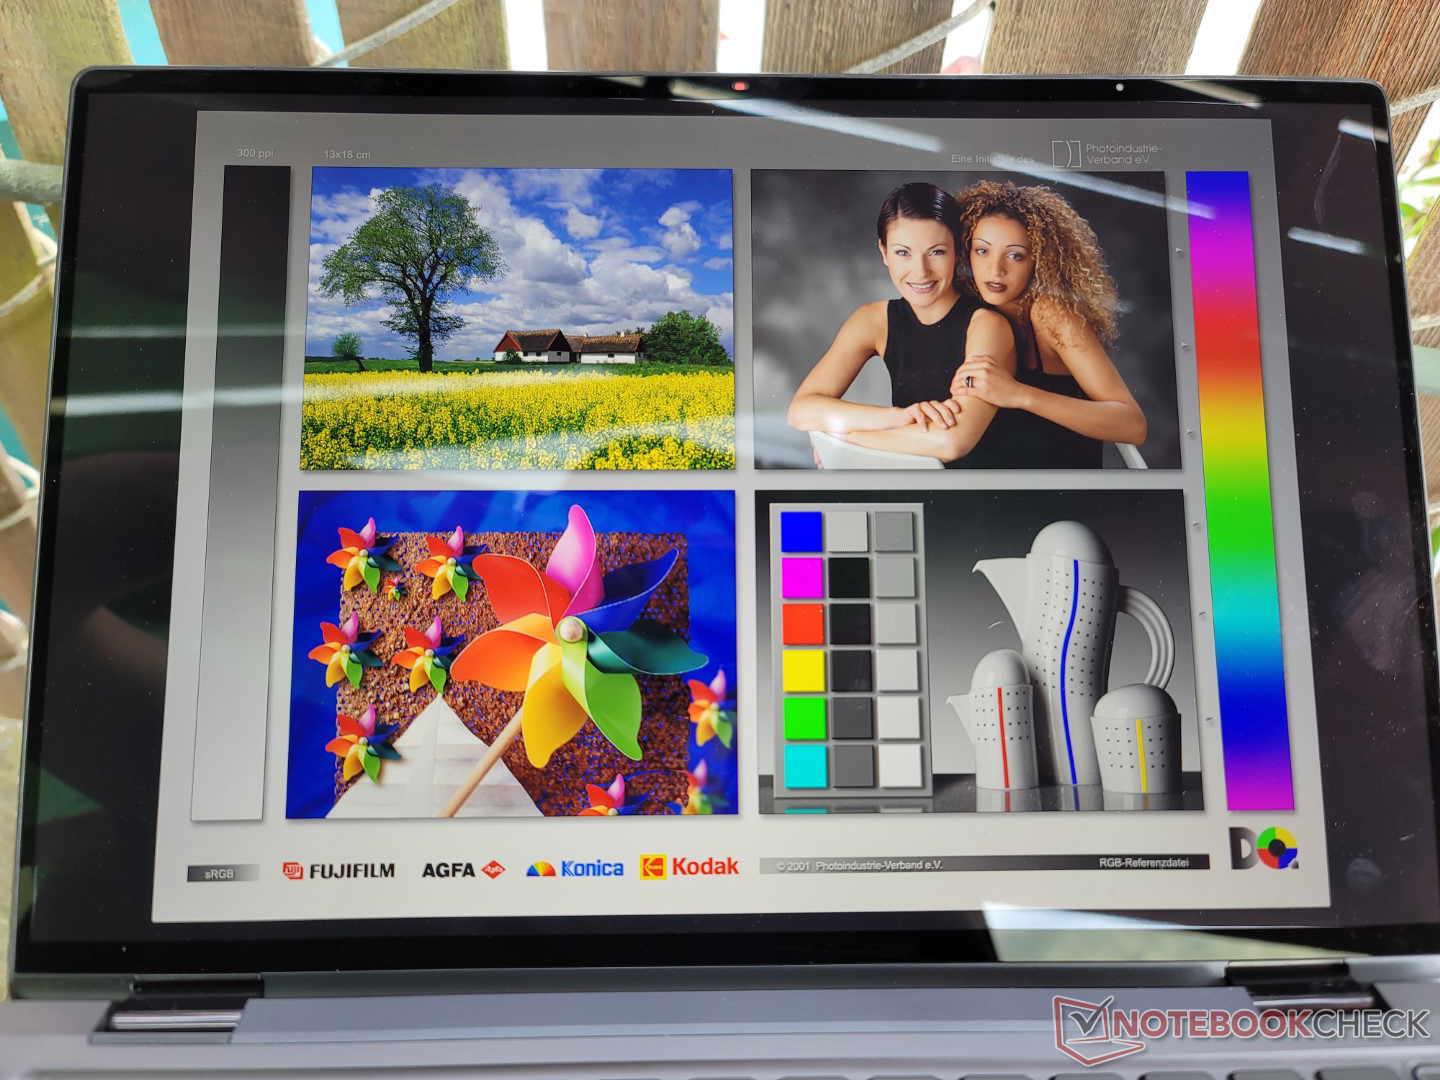
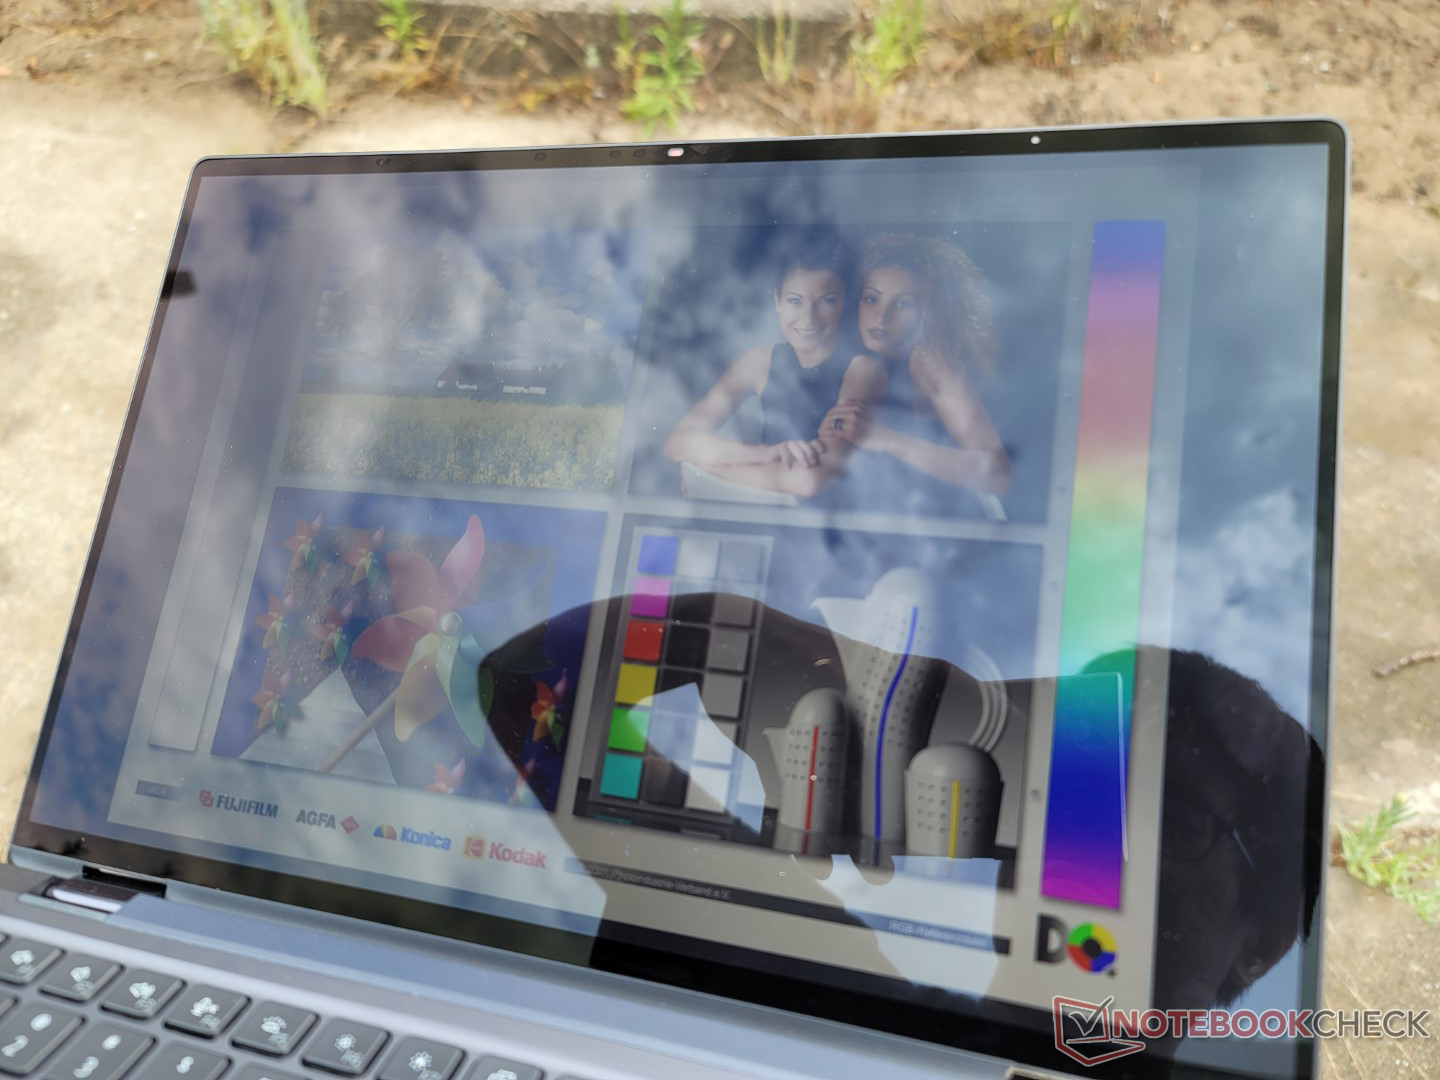
Mit 500 cd/m² ist das Display heller als bei den meisten anderen 14-Zoll-Laptops und dadurch besser für die Nutzung im Freien geeignet als das Lenovo ThinkPad X1 Yoga G7 und das LG Gram 16 2-in-1. Obwohl sich Reflexionen in den meisten Situationen dennoch nicht vermeiden lassen, bleiben Schrift und Bilder auf dem Bildschirm im Schatten scharf und kontrastreich.
Leistung
Testbedingungen
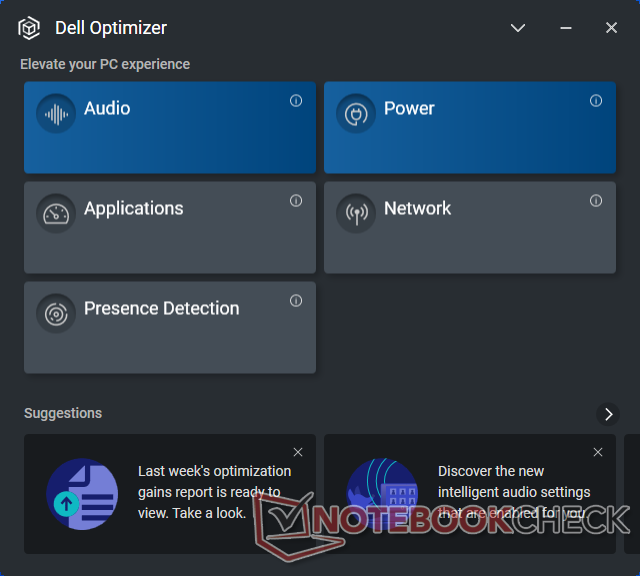
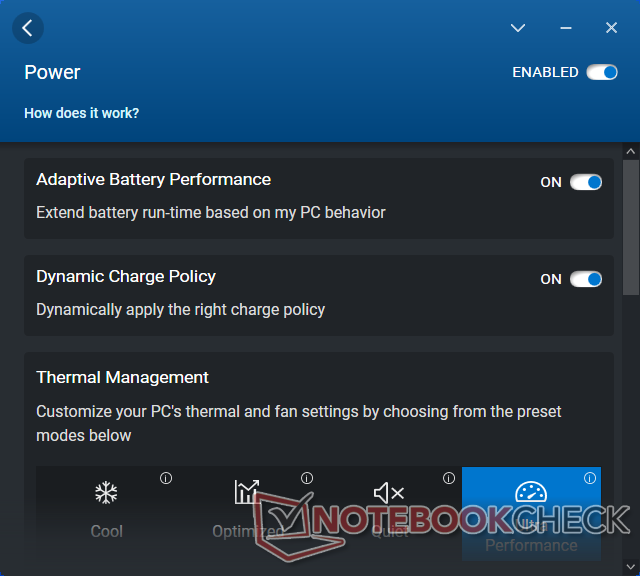
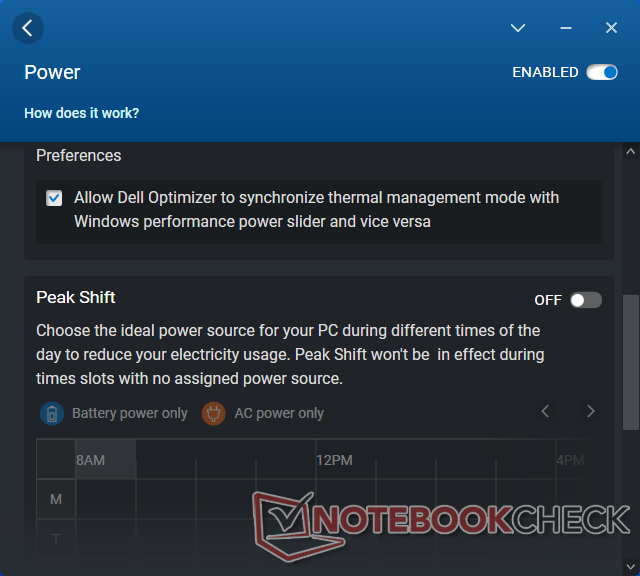
Wir haben unser Testgerät über die Dell-Optimizer-Software vor dem Ausführen der folgenden Benchmarks in den Ultraleistungsmodus versetzt. Besonders gefreut haben wir uns über die Optimizer-Option, die es Nutzern erlaubt, das Windows-Leistungsprofil mit dem aktuellen Optimizer-Leistungsprofil zu synchronisieren. Beispielsweise wechselt das Windows-Leistungsprofil beim Auswählen des leisen Modus in der Optimizer-Software automatisch in den Energiesparmodus. Das Optimizer-Preset Ultraleistungsmodus wählt zugleich den entsprechenden Windows-Leistungsmodus aus und so weiter. Damit ist das Problem widersprüchlicher Leistungseinstellungen in verschiedenen Anwendungen (z.B. Windows Energiesparmodus und Optimizer Ultraleistungsmodus) gelöst.
Etwas geärgert haben wir uns darüber, dass Optimizer nicht maximiert werden kann und man deshalb mit dem sehr kleinen Fenster vorlieb nehmen muss. In Anbetracht der vielen Schaltflächen und Optionen könnte die App definitiv von einer größeren Benutzeroberfläche profitieren.
Prozessor
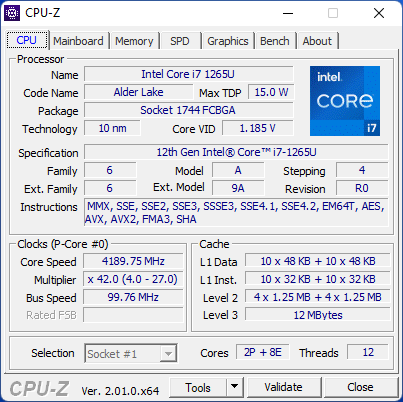
Die CPU-Leistungsvorteile gegenüber dem Core i7-1185G7 im Vorgänger fallen, besonders in Bezug auf die Multi-Thread-Leistung, beachtlich aus. Im Vergleich zu diesem bietet unser Core i7-1265U nämlich eine um 20 % bzw. 55 % höhere Single-Thread- bzw. Multi-Thread-Leistung. Obwohl der Core i7-1260P aus der Core-P-Reihe als schneller gilt, liefert sich die CPU in unserem Testgerät mit dieser ein Kopf-an-Kopf-Rennen. Da wir kürzlich erst die enttäuschende Leistung des Core i5-1235U bezeugen konnten, sind diese Ergebnisse besonders erfreulich.
Bei der Dauerleistung gibt es jedoch Luft nach oben. Während dem Cinebench-R15-xT-Schleifentest fällt die Punktzahl von ursprünglich 1.572 Punkten stetig ab und stabilisiert sich schließlich bei ungefähr 1.230 Punkten, was einem temperaturbedingten Leistungsabfall von rund 20 % Prozent entspricht.
Schleifentest Cinebench R15 Multi
Cinebench R23: Multi Core | Single Core
Cinebench R15: CPU Multi 64Bit | CPU Single 64Bit
Blender: v2.79 BMW27 CPU
7-Zip 18.03: 7z b 4 | 7z b 4 -mmt1
Geekbench 5.5: Multi-Core | Single-Core
HWBOT x265 Benchmark v2.2: 4k Preset
LibreOffice : 20 Documents To PDF
R Benchmark 2.5: Overall mean
Cinebench R23: Multi Core | Single Core
Cinebench R15: CPU Multi 64Bit | CPU Single 64Bit
Blender: v2.79 BMW27 CPU
7-Zip 18.03: 7z b 4 | 7z b 4 -mmt1
Geekbench 5.5: Multi-Core | Single-Core
HWBOT x265 Benchmark v2.2: 4k Preset
LibreOffice : 20 Documents To PDF
R Benchmark 2.5: Overall mean
* ... kleinere Werte sind besser
AIDA64: FP32 Ray-Trace | FPU Julia | CPU SHA3 | CPU Queen | FPU SinJulia | FPU Mandel | CPU AES | CPU ZLib | FP64 Ray-Trace | CPU PhotoWorxx
| Performance Rating | |
| Asus ZenBook Flip 14 UN5401QA-KN085W | |
| Dell Latitude 9430 2-in-1 | |
| Dell Latitude 9420 2-in-1 | |
| MSI Summit E14 Flip Evo A12MT | |
| LG Gram 14T90P | |
| Durchschnittliche Intel Core i7-1265U | |
| Lenovo ThinkPad X1 Yoga G7 21CE002HGE | |
| AIDA64 / FP32 Ray-Trace | |
| Asus ZenBook Flip 14 UN5401QA-KN085W | |
| Dell Latitude 9430 2-in-1 | |
| Dell Latitude 9420 2-in-1 | |
| LG Gram 14T90P | |
| Durchschnittliche Intel Core i7-1265U (2619 - 8178, n=10) | |
| MSI Summit E14 Flip Evo A12MT | |
| Lenovo ThinkPad X1 Yoga G7 21CE002HGE | |
| AIDA64 / FPU Julia | |
| Asus ZenBook Flip 14 UN5401QA-KN085W | |
| Dell Latitude 9430 2-in-1 | |
| Durchschnittliche Intel Core i7-1265U (12909 - 41649, n=10) | |
| Dell Latitude 9420 2-in-1 | |
| LG Gram 14T90P | |
| MSI Summit E14 Flip Evo A12MT | |
| Lenovo ThinkPad X1 Yoga G7 21CE002HGE | |
| AIDA64 / CPU SHA3 | |
| Asus ZenBook Flip 14 UN5401QA-KN085W | |
| Dell Latitude 9430 2-in-1 | |
| Dell Latitude 9420 2-in-1 | |
| LG Gram 14T90P | |
| MSI Summit E14 Flip Evo A12MT | |
| Durchschnittliche Intel Core i7-1265U (824 - 2183, n=10) | |
| Lenovo ThinkPad X1 Yoga G7 21CE002HGE | |
| AIDA64 / CPU Queen | |
| Asus ZenBook Flip 14 UN5401QA-KN085W | |
| MSI Summit E14 Flip Evo A12MT | |
| Dell Latitude 9430 2-in-1 | |
| Durchschnittliche Intel Core i7-1265U (63615 - 67065, n=10) | |
| Lenovo ThinkPad X1 Yoga G7 21CE002HGE | |
| Dell Latitude 9420 2-in-1 | |
| LG Gram 14T90P | |
| AIDA64 / FPU SinJulia | |
| Asus ZenBook Flip 14 UN5401QA-KN085W | |
| MSI Summit E14 Flip Evo A12MT | |
| Lenovo ThinkPad X1 Yoga G7 21CE002HGE | |
| Dell Latitude 9430 2-in-1 | |
| Dell Latitude 9420 2-in-1 | |
| LG Gram 14T90P | |
| Durchschnittliche Intel Core i7-1265U (3105 - 5135, n=10) | |
| AIDA64 / FPU Mandel | |
| Asus ZenBook Flip 14 UN5401QA-KN085W | |
| Dell Latitude 9430 2-in-1 | |
| Dell Latitude 9420 2-in-1 | |
| LG Gram 14T90P | |
| Durchschnittliche Intel Core i7-1265U (6967 - 20804, n=10) | |
| MSI Summit E14 Flip Evo A12MT | |
| Lenovo ThinkPad X1 Yoga G7 21CE002HGE | |
| AIDA64 / CPU AES | |
| Asus ZenBook Flip 14 UN5401QA-KN085W | |
| Dell Latitude 9420 2-in-1 | |
| LG Gram 14T90P | |
| Dell Latitude 9430 2-in-1 | |
| MSI Summit E14 Flip Evo A12MT | |
| Durchschnittliche Intel Core i7-1265U (19489 - 42966, n=10) | |
| Lenovo ThinkPad X1 Yoga G7 21CE002HGE | |
| AIDA64 / CPU ZLib | |
| Asus ZenBook Flip 14 UN5401QA-KN085W | |
| Dell Latitude 9430 2-in-1 | |
| MSI Summit E14 Flip Evo A12MT | |
| Lenovo ThinkPad X1 Yoga G7 21CE002HGE | |
| Durchschnittliche Intel Core i7-1265U (314 - 632, n=10) | |
| Dell Latitude 9420 2-in-1 | |
| LG Gram 14T90P | |
| AIDA64 / FP64 Ray-Trace | |
| Asus ZenBook Flip 14 UN5401QA-KN085W | |
| Dell Latitude 9430 2-in-1 | |
| Dell Latitude 9420 2-in-1 | |
| LG Gram 14T90P | |
| Durchschnittliche Intel Core i7-1265U (1473 - 4376, n=10) | |
| MSI Summit E14 Flip Evo A12MT | |
| Lenovo ThinkPad X1 Yoga G7 21CE002HGE | |
| AIDA64 / CPU PhotoWorxx | |
| Dell Latitude 9430 2-in-1 | |
| Dell Latitude 9420 2-in-1 | |
| LG Gram 14T90P | |
| MSI Summit E14 Flip Evo A12MT | |
| Durchschnittliche Intel Core i7-1265U (20213 - 47031, n=10) | |
| Lenovo ThinkPad X1 Yoga G7 21CE002HGE | |
| Asus ZenBook Flip 14 UN5401QA-KN085W | |
Systemleistung
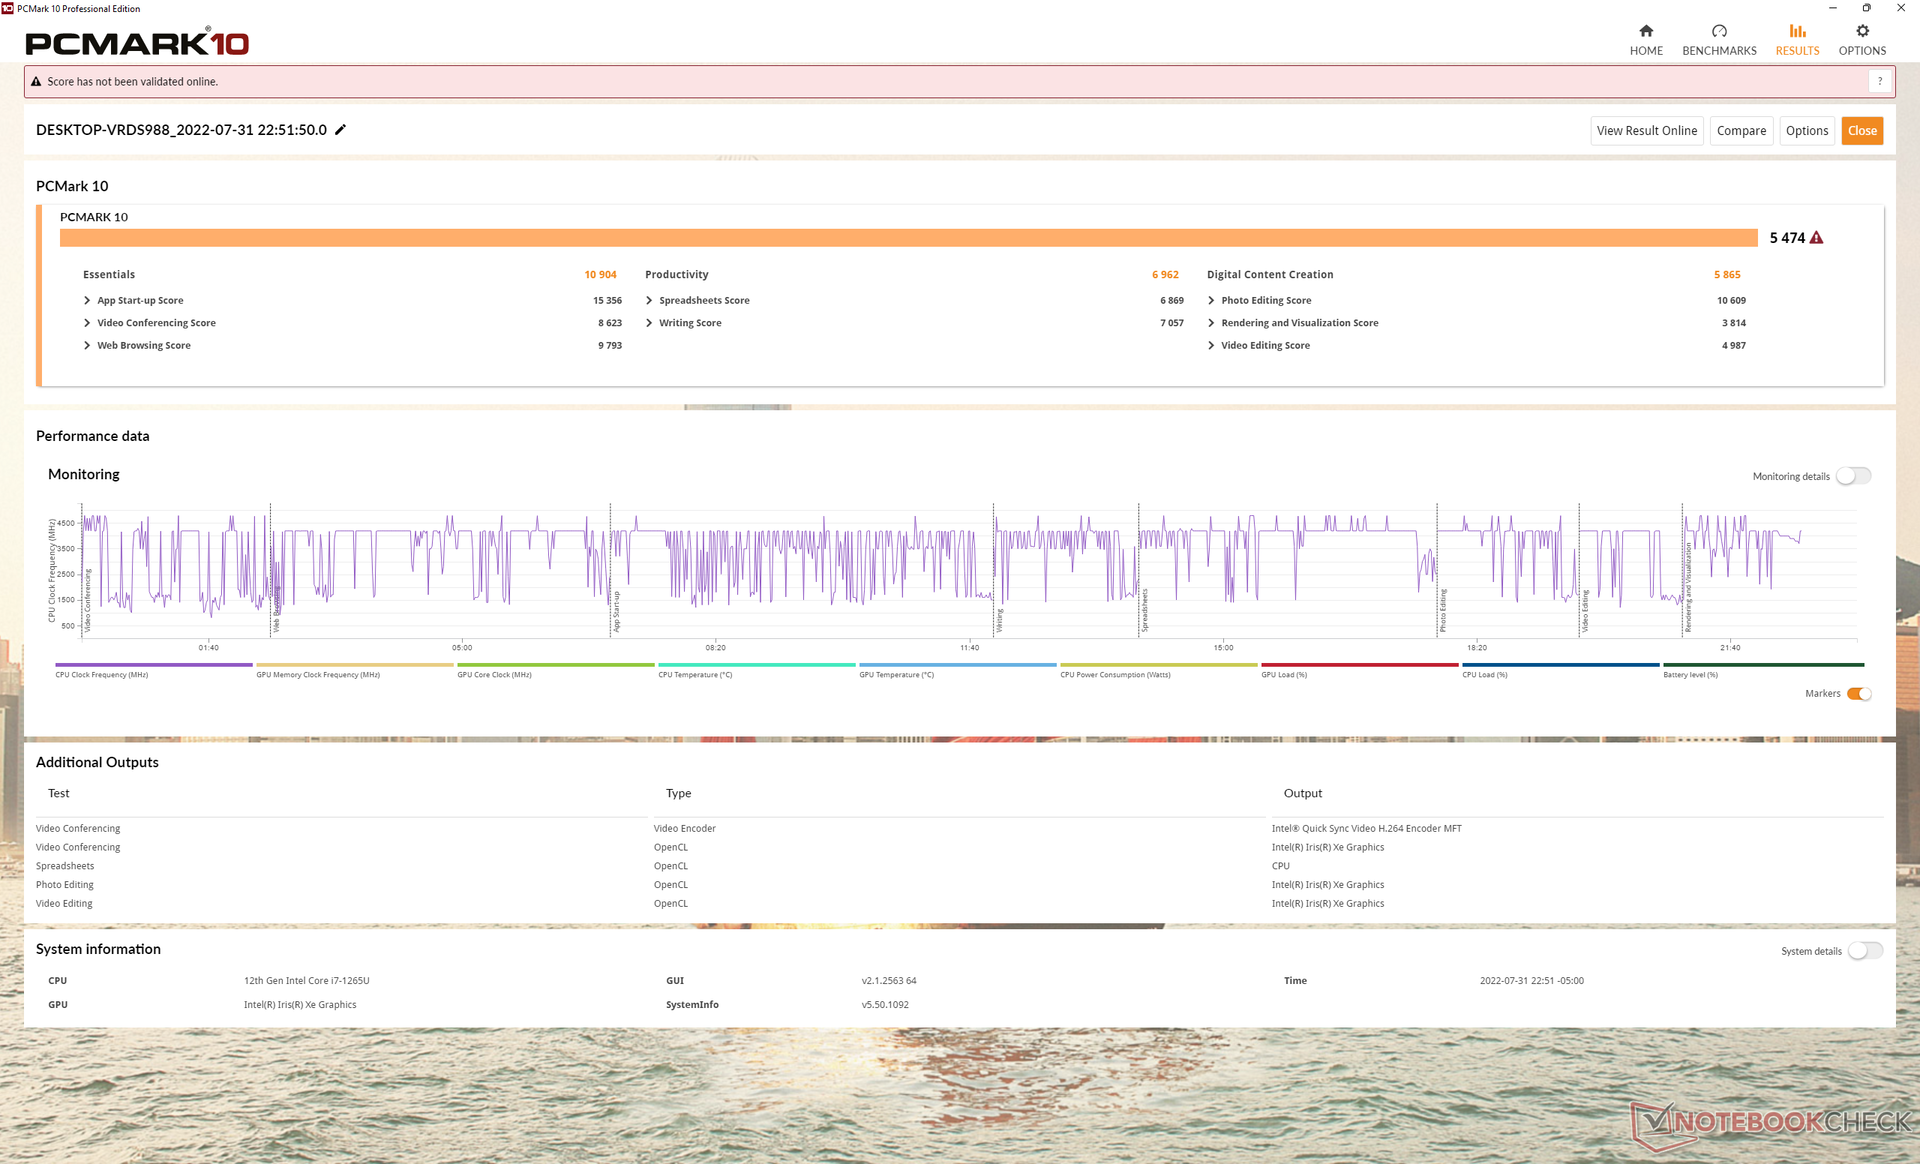
Obwohl die Unterschiede sich nur auf wenige Prozente belaufen, sind die PCMark-10-Punktzahlen konstant höher als beim alten Latitude 9420 2-in-1. Dadurch wird man beim Surfen, Videostreaming und bei kleineren Medienverarbeitungsaufgaben gegenüber den meisten Core-i7-1165G7-Laptops kaum einen Unterschied spüren.
CrossMark: Overall | Productivity | Creativity | Responsiveness
| PCMark 10 / Score | |
| Asus ZenBook Flip 14 UN5401QA-KN085W | |
| Lenovo ThinkPad X1 Yoga G7 21CE002HGE | |
| Dell Latitude 9430 2-in-1 | |
| MSI Summit E14 Flip Evo A12MT | |
| Durchschnittliche Intel Core i7-1265U, Intel Iris Xe Graphics G7 96EUs (4753 - 5766, n=7) | |
| Dell Latitude 9420 2-in-1 | |
| LG Gram 14T90P | |
| PCMark 10 / Essentials | |
| Lenovo ThinkPad X1 Yoga G7 21CE002HGE | |
| Dell Latitude 9430 2-in-1 | |
| MSI Summit E14 Flip Evo A12MT | |
| Durchschnittliche Intel Core i7-1265U, Intel Iris Xe Graphics G7 96EUs (9278 - 11418, n=7) | |
| Dell Latitude 9420 2-in-1 | |
| Asus ZenBook Flip 14 UN5401QA-KN085W | |
| LG Gram 14T90P | |
| PCMark 10 / Productivity | |
| Asus ZenBook Flip 14 UN5401QA-KN085W | |
| Dell Latitude 9430 2-in-1 | |
| Dell Latitude 9420 2-in-1 | |
| MSI Summit E14 Flip Evo A12MT | |
| Lenovo ThinkPad X1 Yoga G7 21CE002HGE | |
| Durchschnittliche Intel Core i7-1265U, Intel Iris Xe Graphics G7 96EUs (5828 - 7311, n=7) | |
| LG Gram 14T90P | |
| PCMark 10 / Digital Content Creation | |
| Lenovo ThinkPad X1 Yoga G7 21CE002HGE | |
| Asus ZenBook Flip 14 UN5401QA-KN085W | |
| Dell Latitude 9430 2-in-1 | |
| MSI Summit E14 Flip Evo A12MT | |
| Durchschnittliche Intel Core i7-1265U, Intel Iris Xe Graphics G7 96EUs (5127 - 6330, n=7) | |
| Dell Latitude 9420 2-in-1 | |
| LG Gram 14T90P | |
| CrossMark / Overall | |
| MSI Summit E14 Flip Evo A12MT | |
| Lenovo ThinkPad X1 Yoga G7 21CE002HGE | |
| Dell Latitude 9430 2-in-1 | |
| Durchschnittliche Intel Core i7-1265U, Intel Iris Xe Graphics G7 96EUs (1301 - 1615, n=7) | |
| LG Gram 14T90P | |
| CrossMark / Productivity | |
| MSI Summit E14 Flip Evo A12MT | |
| Lenovo ThinkPad X1 Yoga G7 21CE002HGE | |
| Dell Latitude 9430 2-in-1 | |
| Durchschnittliche Intel Core i7-1265U, Intel Iris Xe Graphics G7 96EUs (1230 - 1586, n=7) | |
| LG Gram 14T90P | |
| CrossMark / Creativity | |
| MSI Summit E14 Flip Evo A12MT | |
| Lenovo ThinkPad X1 Yoga G7 21CE002HGE | |
| Dell Latitude 9430 2-in-1 | |
| Durchschnittliche Intel Core i7-1265U, Intel Iris Xe Graphics G7 96EUs (1413 - 1706, n=7) | |
| LG Gram 14T90P | |
| CrossMark / Responsiveness | |
| MSI Summit E14 Flip Evo A12MT | |
| Lenovo ThinkPad X1 Yoga G7 21CE002HGE | |
| Dell Latitude 9430 2-in-1 | |
| Durchschnittliche Intel Core i7-1265U, Intel Iris Xe Graphics G7 96EUs (1193 - 1521, n=7) | |
| LG Gram 14T90P | |
| PCMark 10 Score | 5474 Punkte | |
Hilfe | ||
| AIDA64 / Memory Copy | |
| Dell Latitude 9430 2-in-1 | |
| MSI Summit E14 Flip Evo A12MT | |
| Dell Latitude 9420 2-in-1 | |
| LG Gram 14T90P | |
| Lenovo ThinkPad X1 Yoga G7 21CE002HGE | |
| Durchschnittliche Intel Core i7-1265U (40212 - 72204, n=10) | |
| Asus ZenBook Flip 14 UN5401QA-KN085W | |
| AIDA64 / Memory Read | |
| Lenovo ThinkPad X1 Yoga G7 21CE002HGE | |
| MSI Summit E14 Flip Evo A12MT | |
| Dell Latitude 9420 2-in-1 | |
| LG Gram 14T90P | |
| Durchschnittliche Intel Core i7-1265U (41808 - 69493, n=10) | |
| Dell Latitude 9430 2-in-1 | |
| Asus ZenBook Flip 14 UN5401QA-KN085W | |
| AIDA64 / Memory Write | |
| LG Gram 14T90P | |
| Dell Latitude 9420 2-in-1 | |
| Dell Latitude 9430 2-in-1 | |
| Lenovo ThinkPad X1 Yoga G7 21CE002HGE | |
| Durchschnittliche Intel Core i7-1265U (41382 - 76027, n=10) | |
| MSI Summit E14 Flip Evo A12MT | |
| Asus ZenBook Flip 14 UN5401QA-KN085W | |
| AIDA64 / Memory Latency | |
| Asus ZenBook Flip 14 UN5401QA-KN085W | |
| Dell Latitude 9430 2-in-1 | |
| Durchschnittliche Intel Core i7-1265U (74.6 - 112.4, n=10) | |
| Dell Latitude 9420 2-in-1 | |
| LG Gram 14T90P | |
| Lenovo ThinkPad X1 Yoga G7 21CE002HGE | |
| MSI Summit E14 Flip Evo A12MT | |
* ... kleinere Werte sind besser
DPC-Latenzen
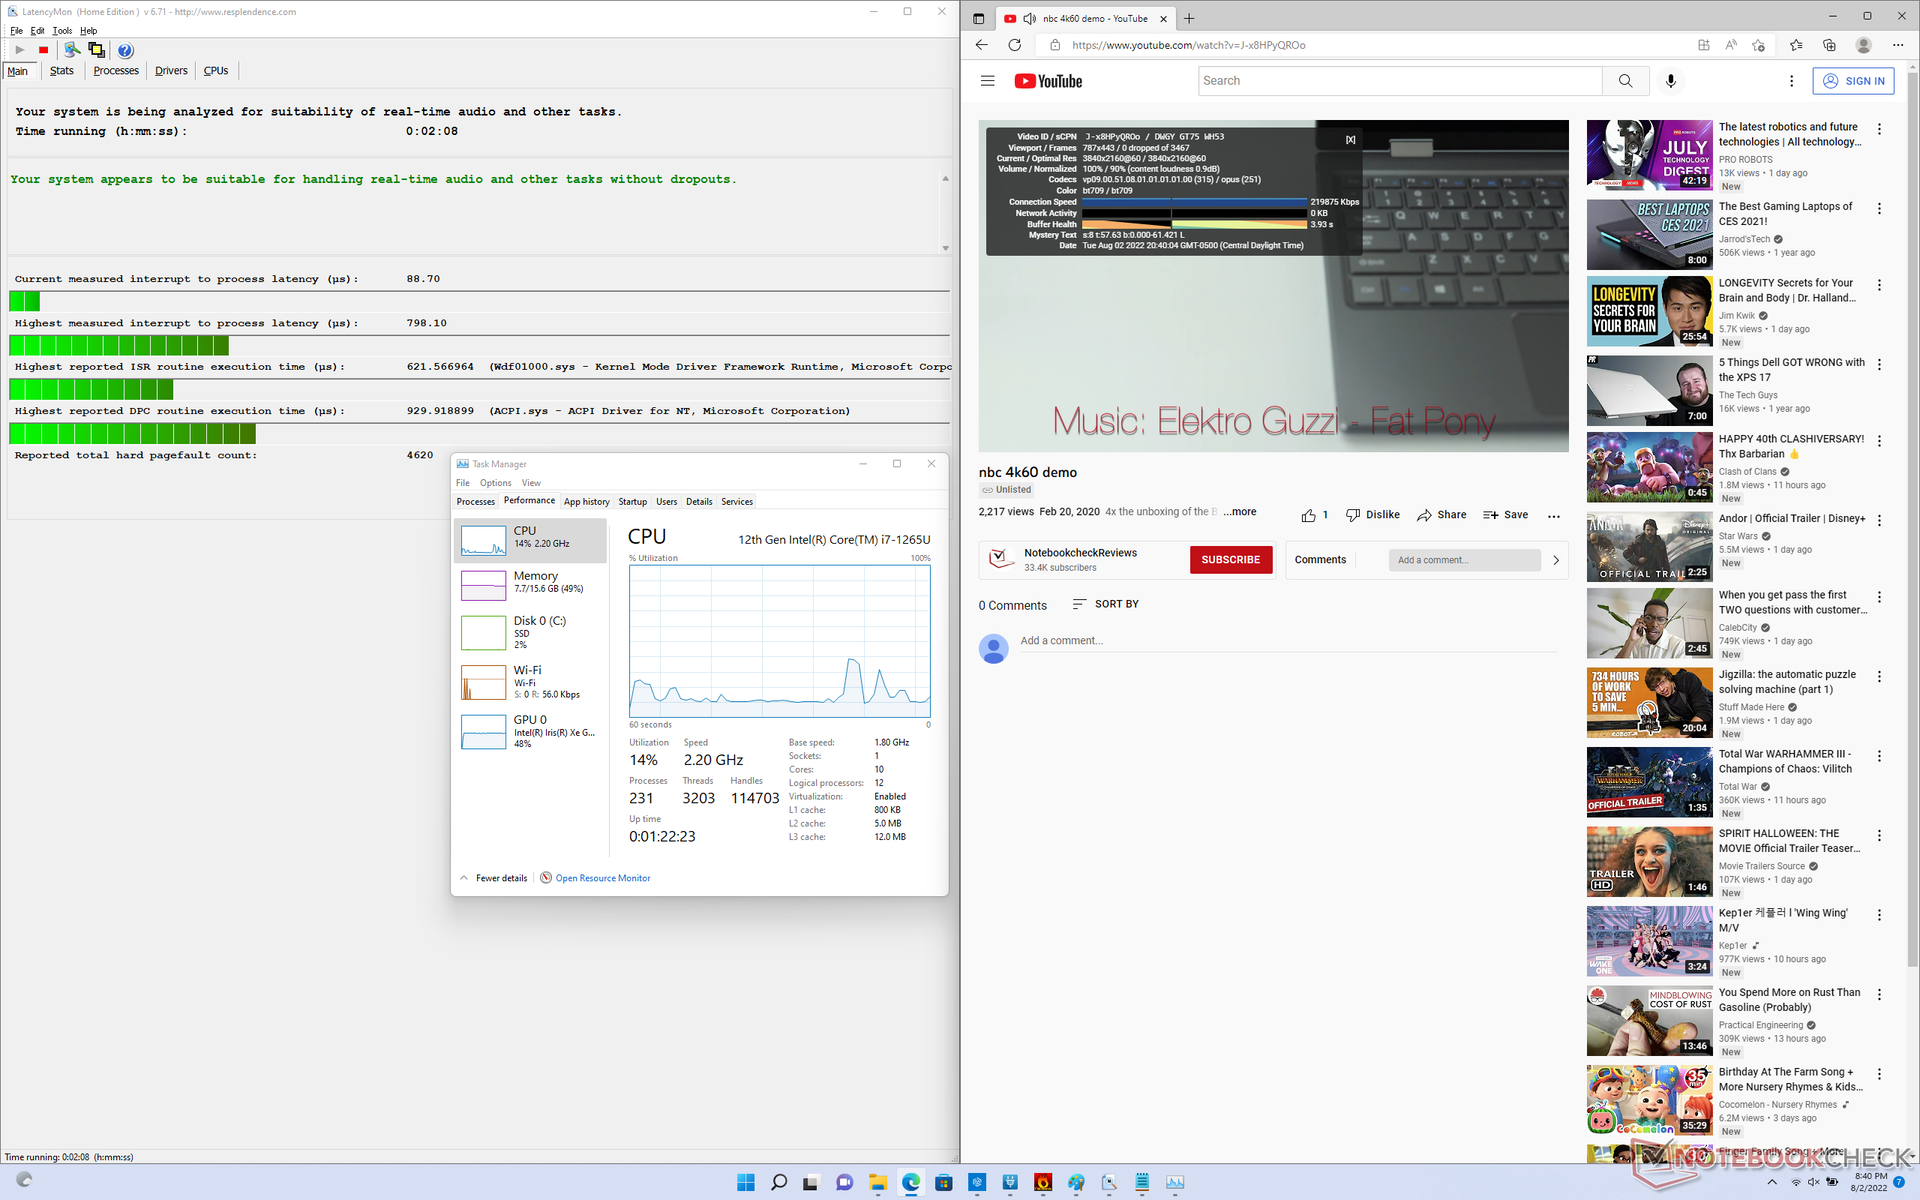
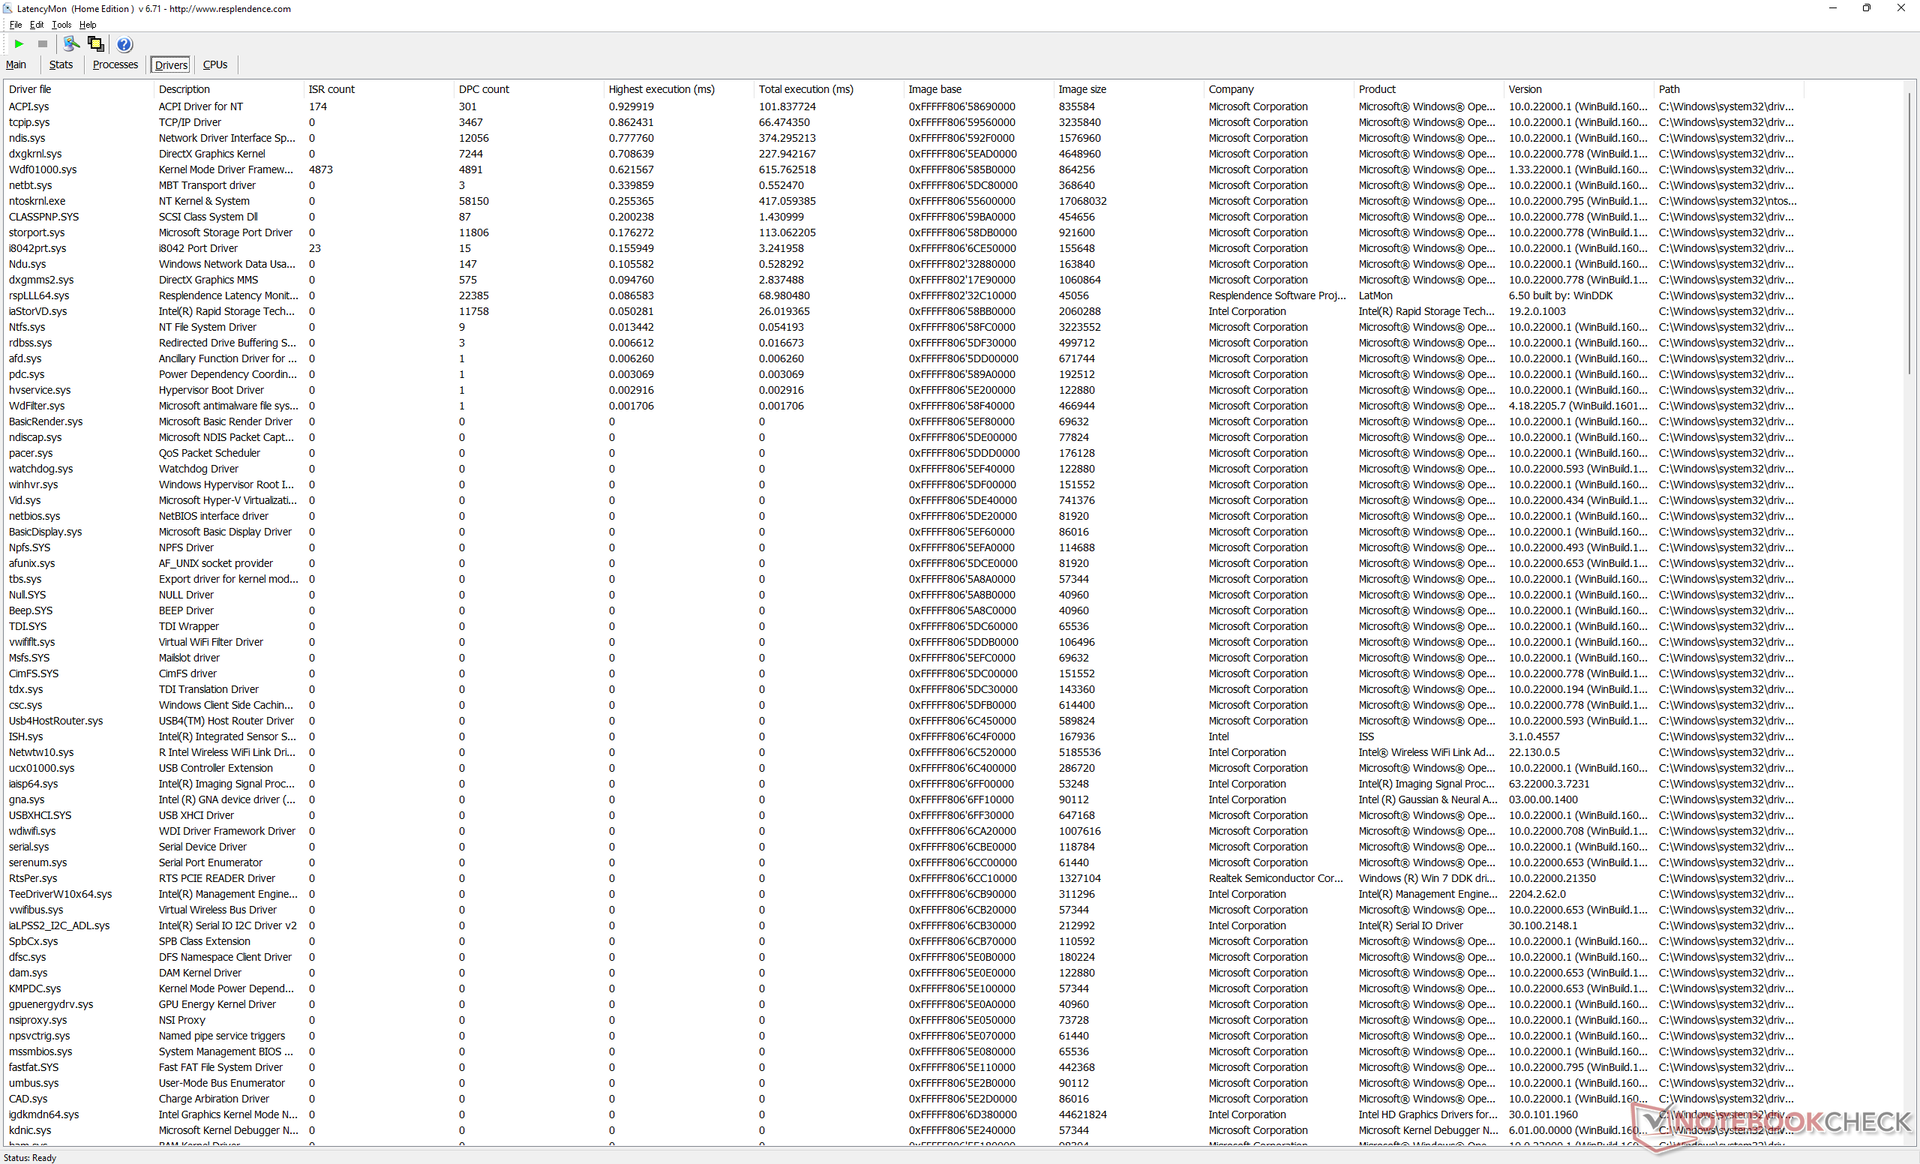
LatencyMon meldet keine schwerwiegenden DPC-Probleme beim Öffnen unserer Homepage in mehreren Tabs und der Auslastung des Systems mit Prime95. Die 4K-Videowiedergabe mit 60 Fps gelingt ebenfalls problemlos und es gehen keine Frames verloren.
| DPC Latencies / LatencyMon - interrupt to process latency (max), Web, Youtube, Prime95 | |
| MSI Summit E14 Flip Evo A12MT | |
| Lenovo ThinkPad X1 Yoga G7 21CE002HGE | |
| LG Gram 14T90P | |
| Asus ZenBook Flip 14 UN5401QA-KN085W | |
| Dell Latitude 9430 2-in-1 | |
| Dell Latitude 9420 2-in-1 | |
* ... kleinere Werte sind besser
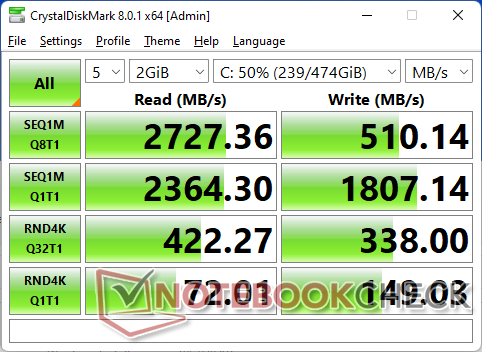
Massenspeicher
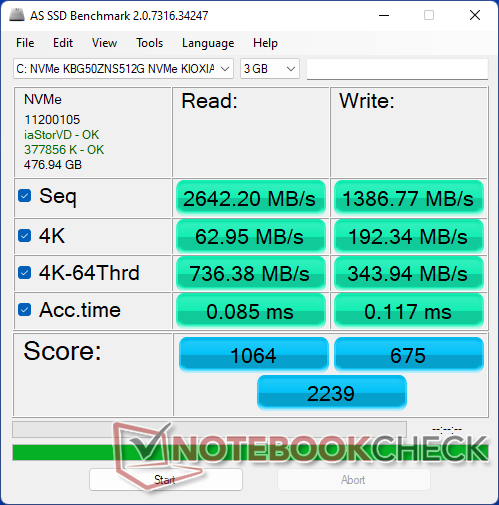
Unser Testgerät ist mit der 512 GB großen NVMe-SSD Toshiba Kioxia mit optionaler Opal-Verschlüsselung ausgestattet. Die Transferraten sind gut und relativ konstant, allerdings sind die Schreibgeschwindigkeiten deutlich langsamer als bei der Samsung PM981a, die häufig in Flaggschiff-Ultrabooks zum Einsatz kommt.

* ... kleinere Werte sind besser
Dauerleistung Lesen: DiskSpd-Leseschleife, Warteschlangentiefe 8
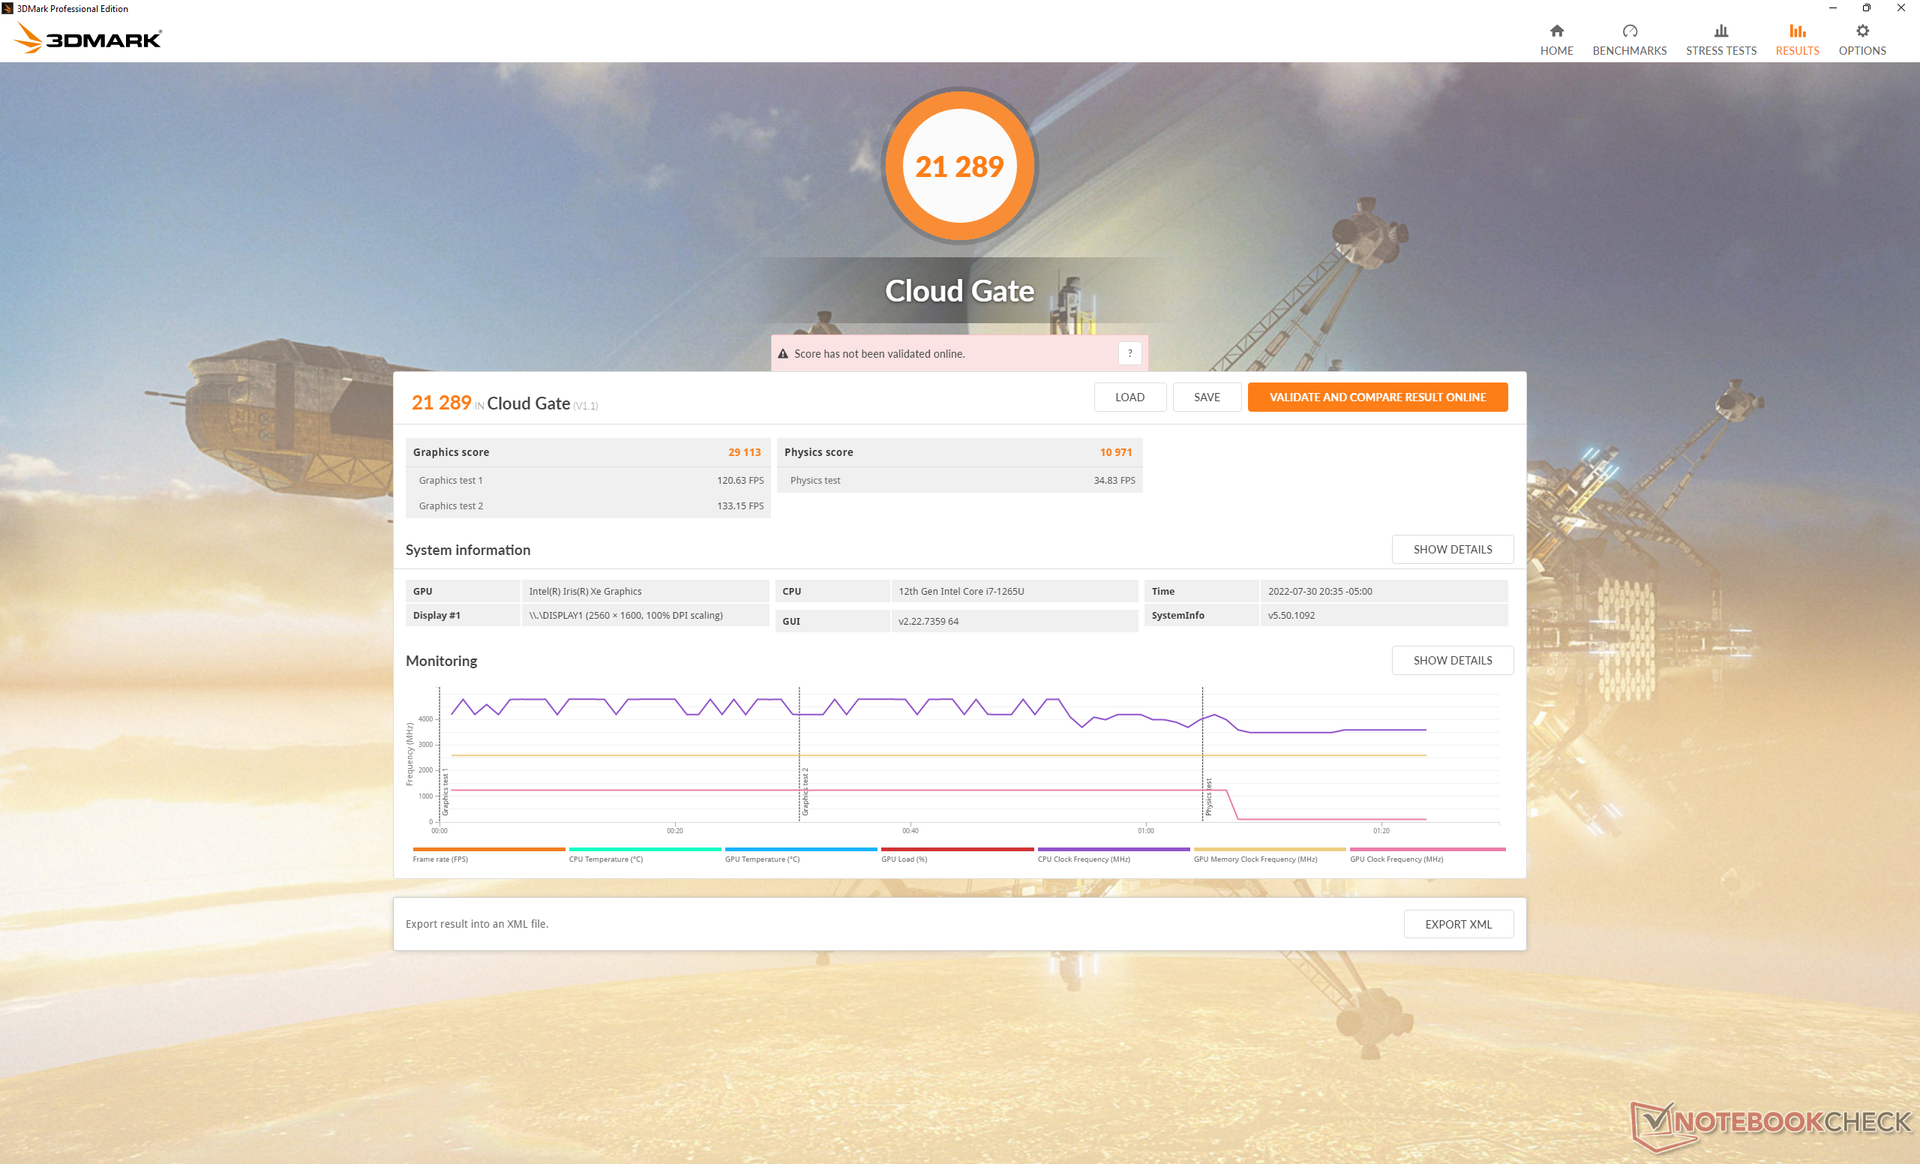
Grafikkarte
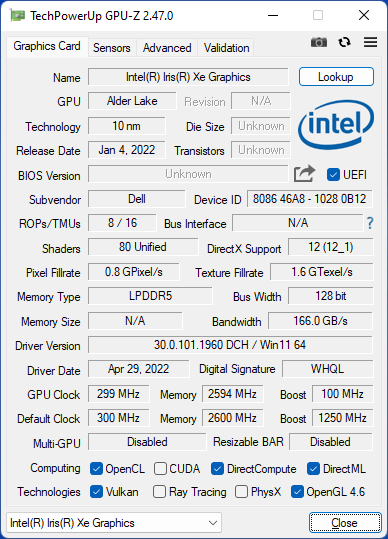
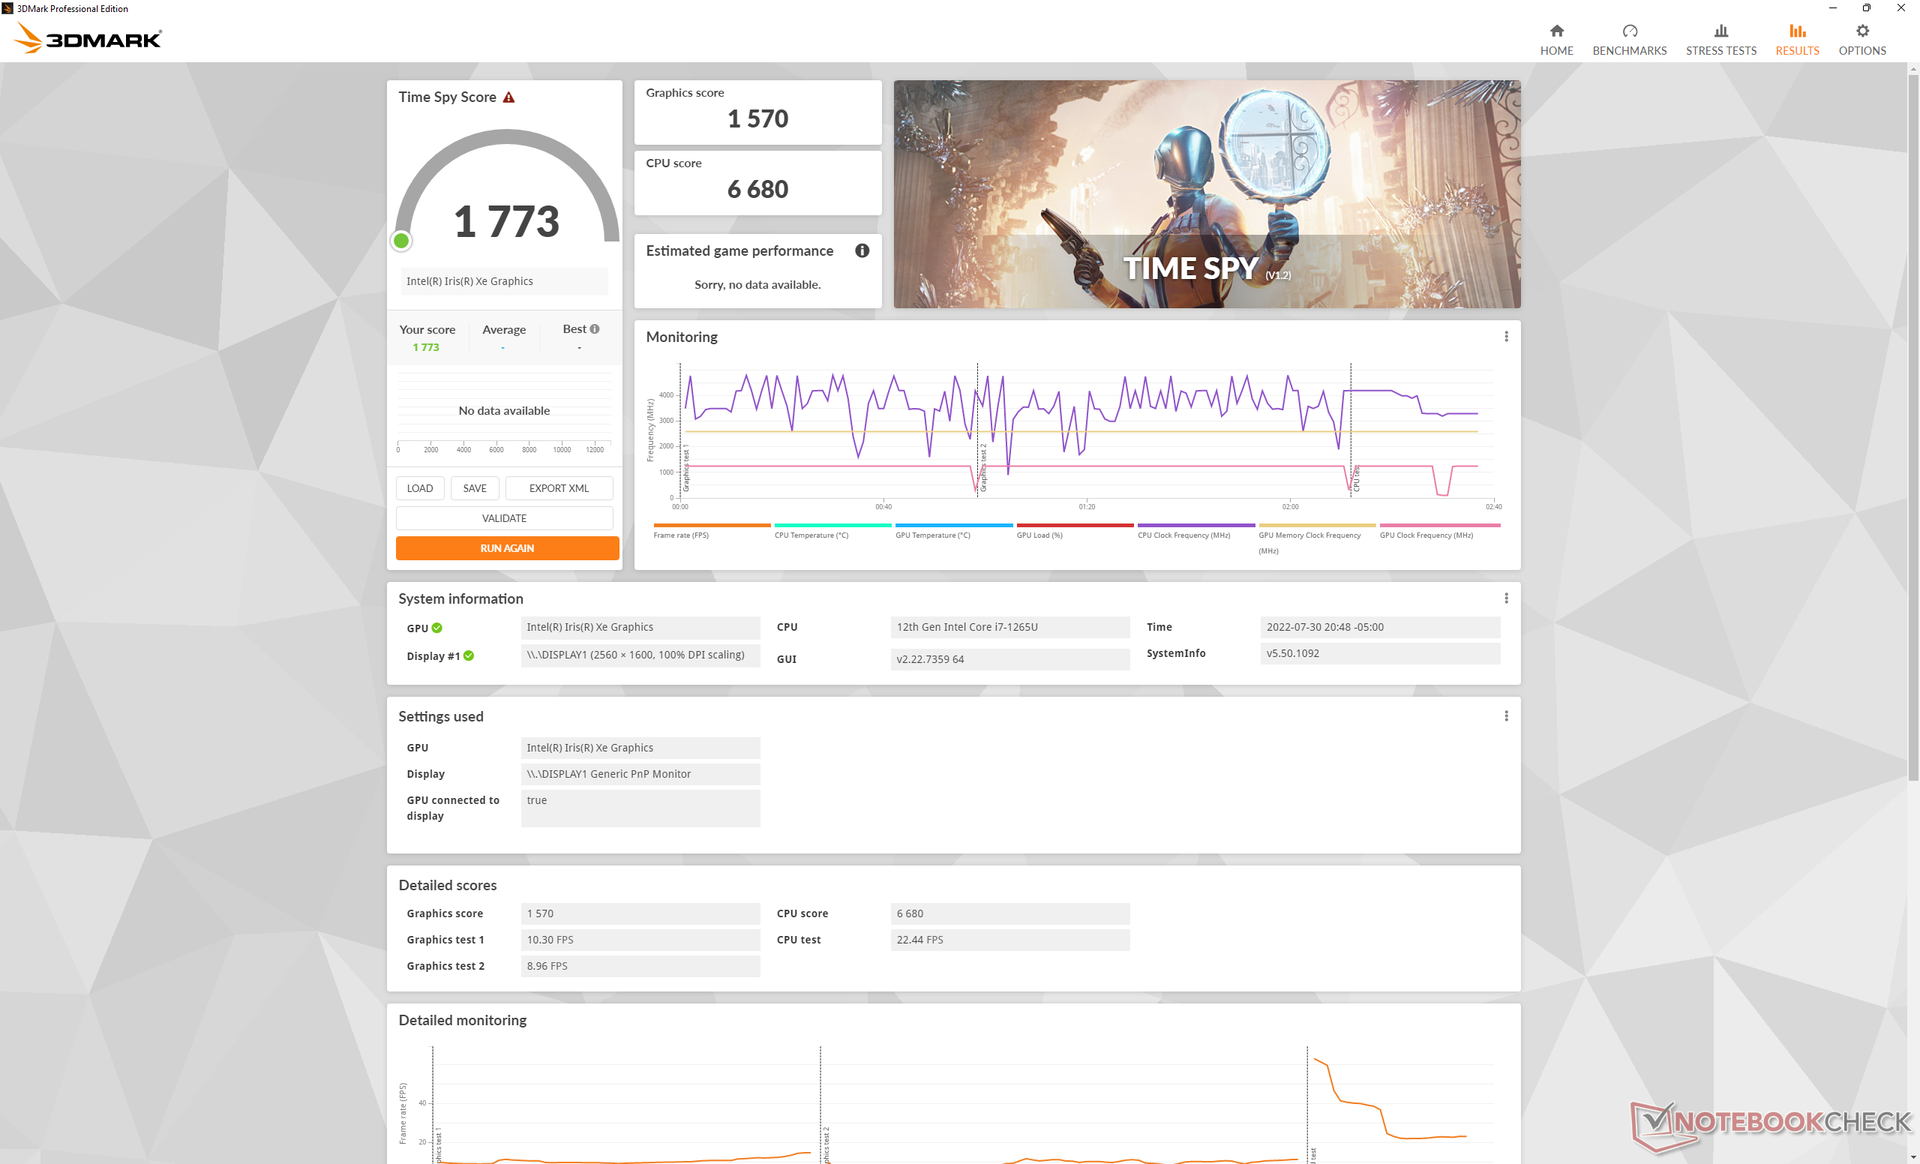
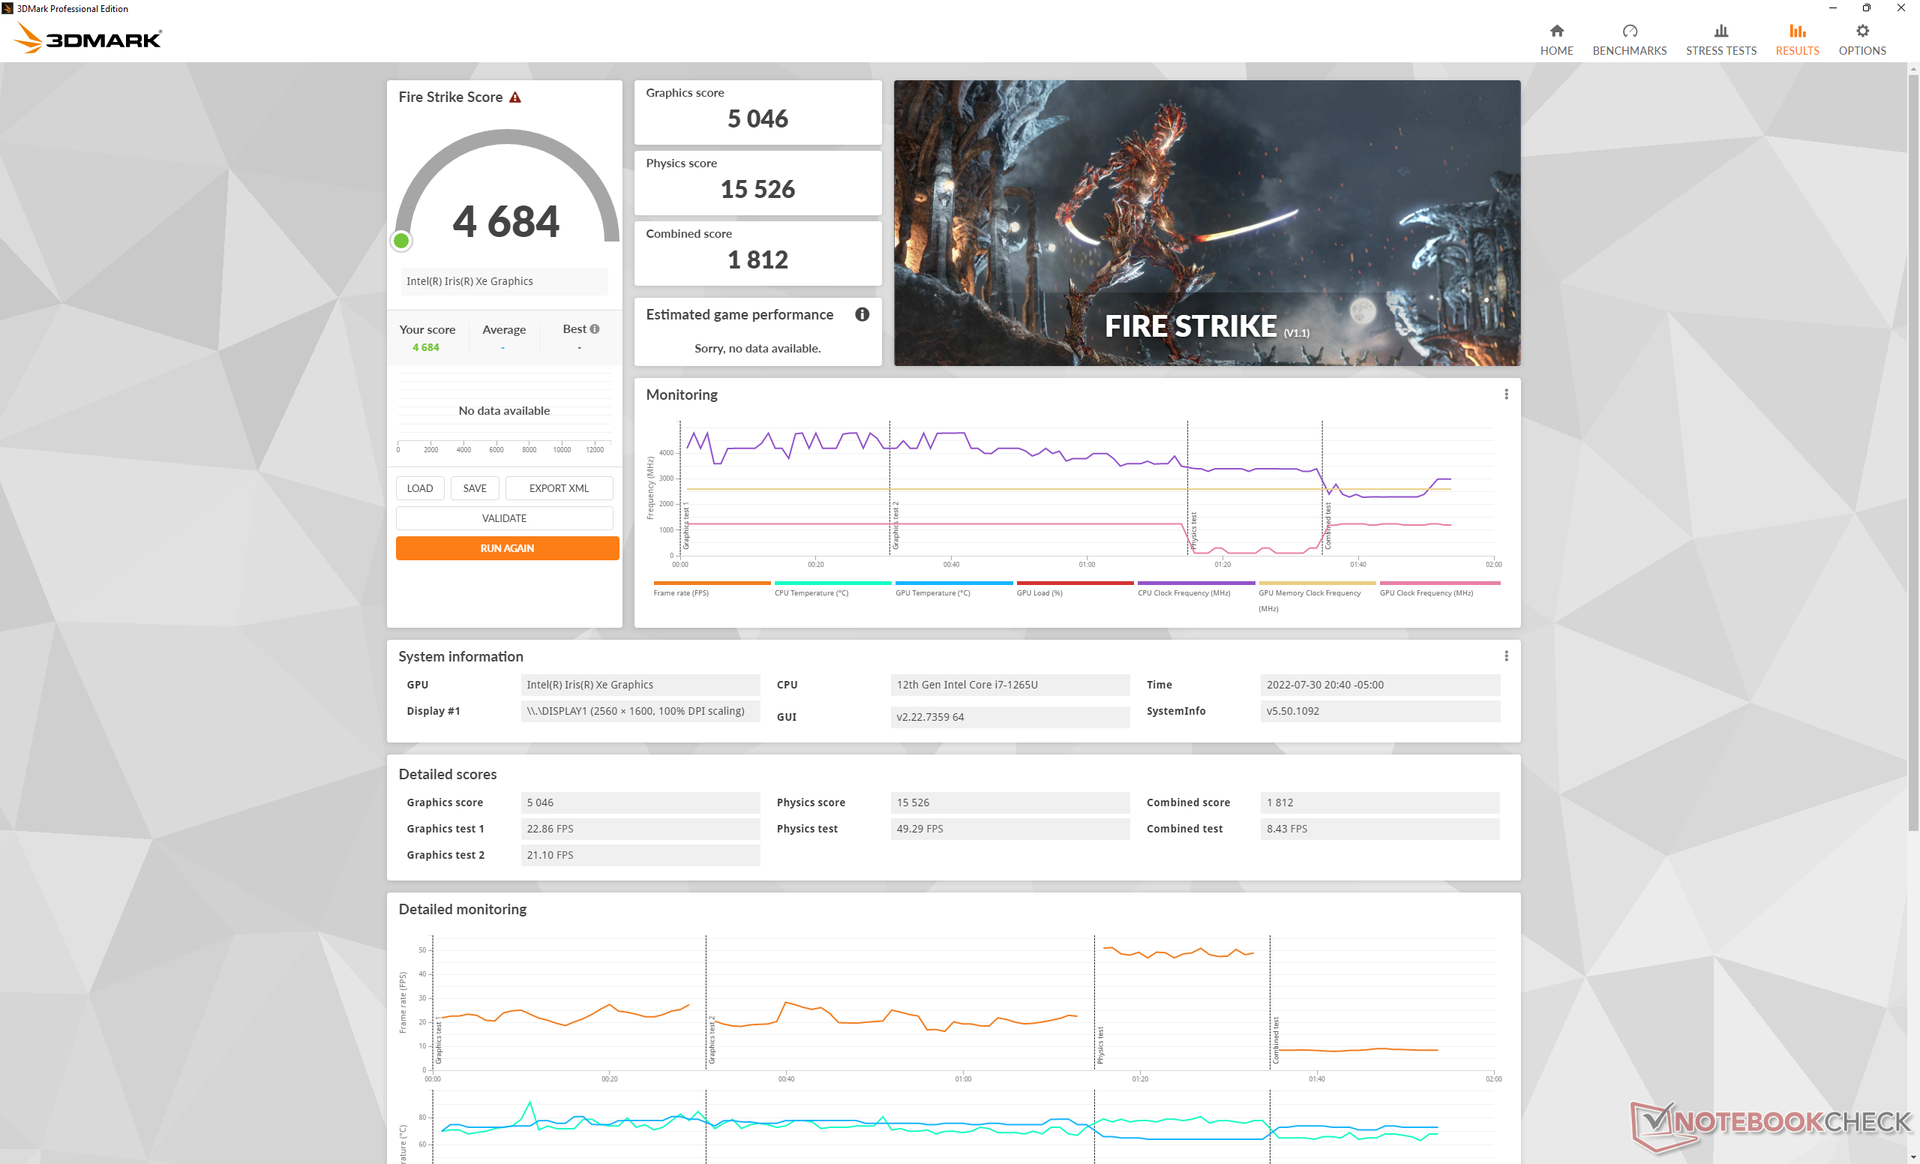
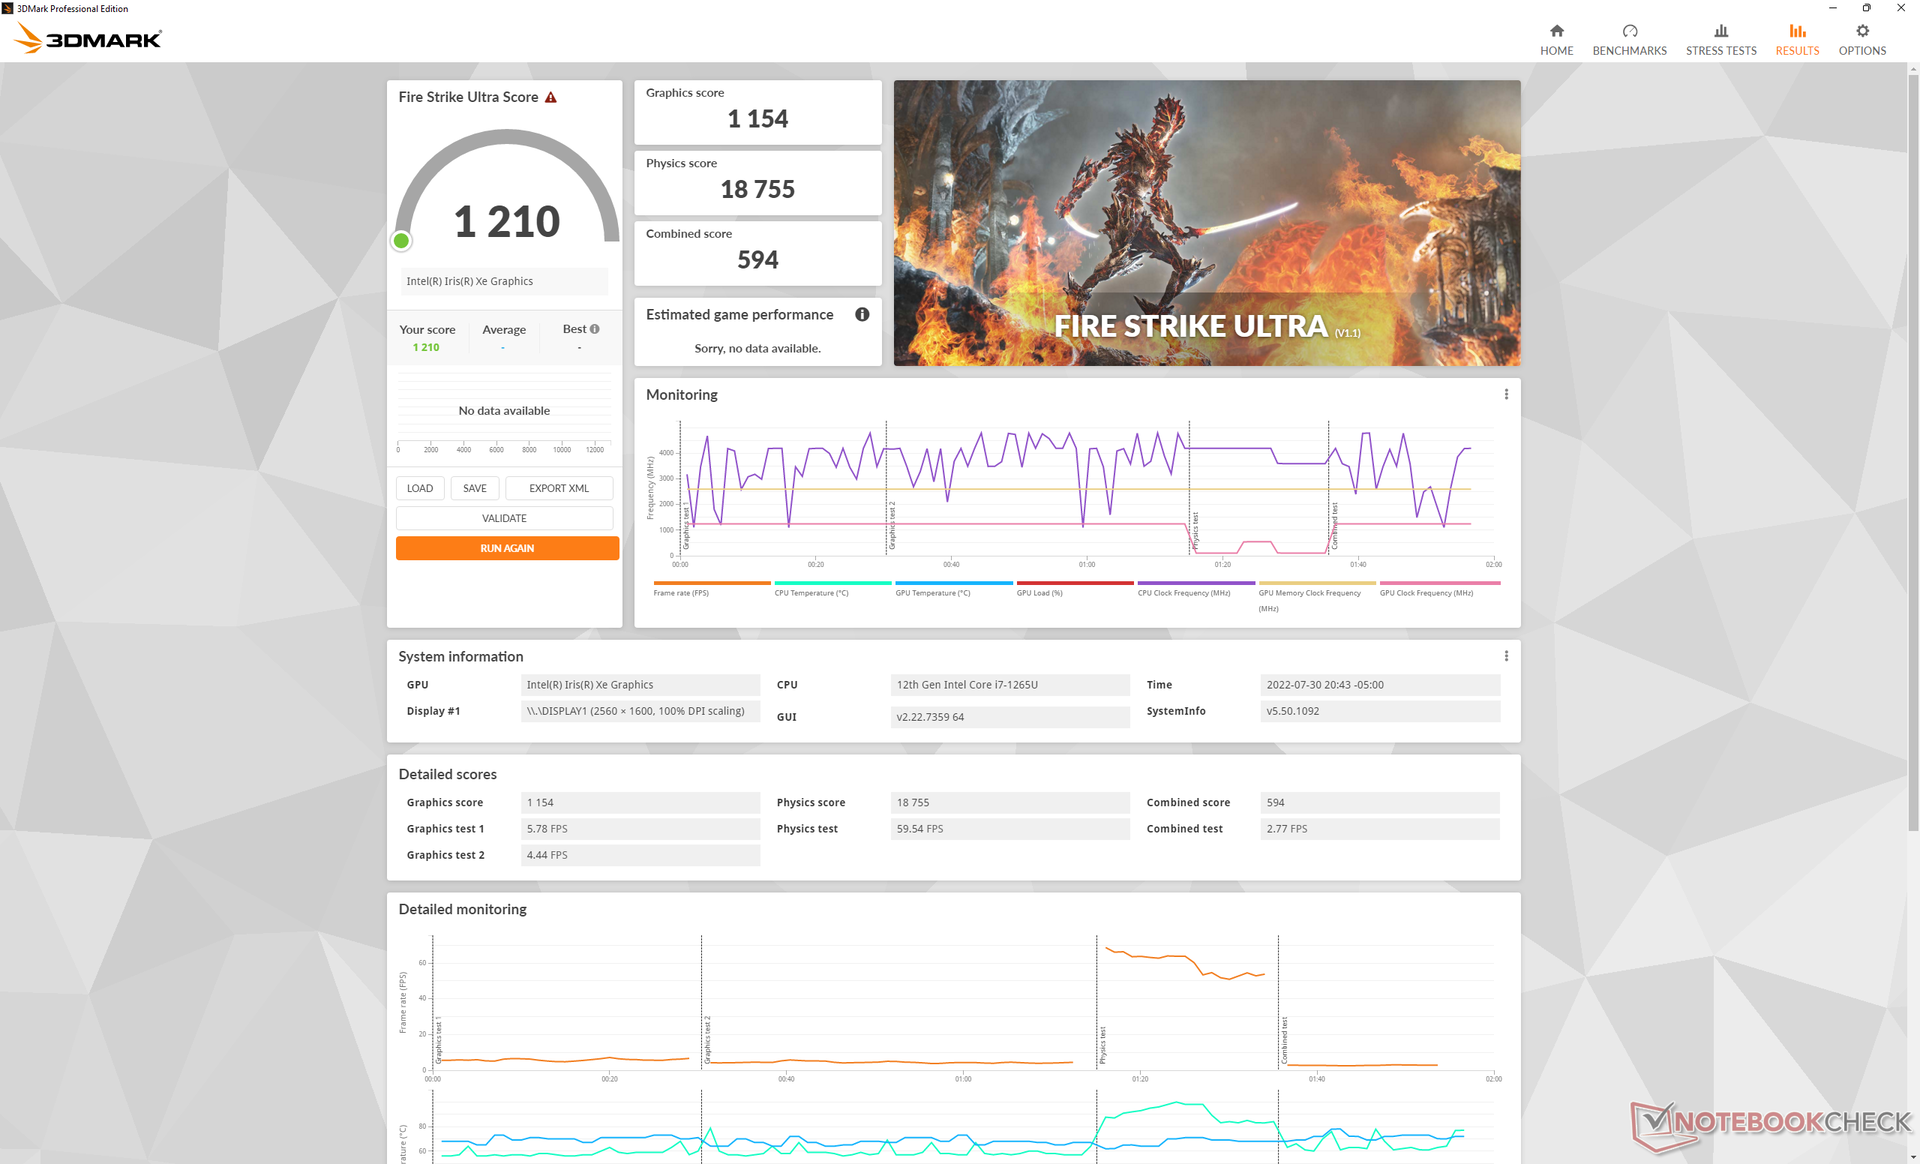
Obwohl das Latitude mit einer neuen Intel-CPU aus der 12. Generation ausgestattet ist, liegt die Grafikleistung auf einem ähnlichen Niveau wie bei anderen Laptops mit der integrierten Iris Xe mit 96 EUs. Daher kann man vom neuen Modell bestenfalls minimale GPU-Leistungssprünge erwarten. Die konkurrierende Radeon 680M bzw. GeForce MX450/550 bietet eine deutlich höhere Grafikleistung als die Iris Xe mit 96 EUs.
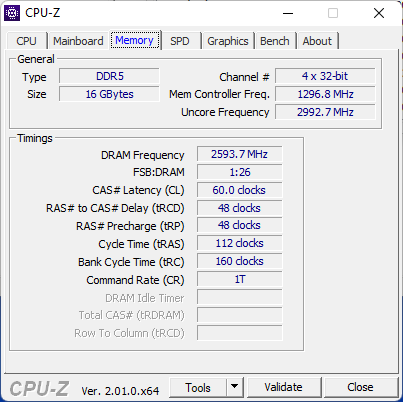
Hier kommt statt dem LPDDR4-RAM im Latitude 9420 2-in-1 schnellerer LPDDR5-RAM zum Einsatz, der daraus resultierende Leistungsvorteil fällt jedoch gering aus.
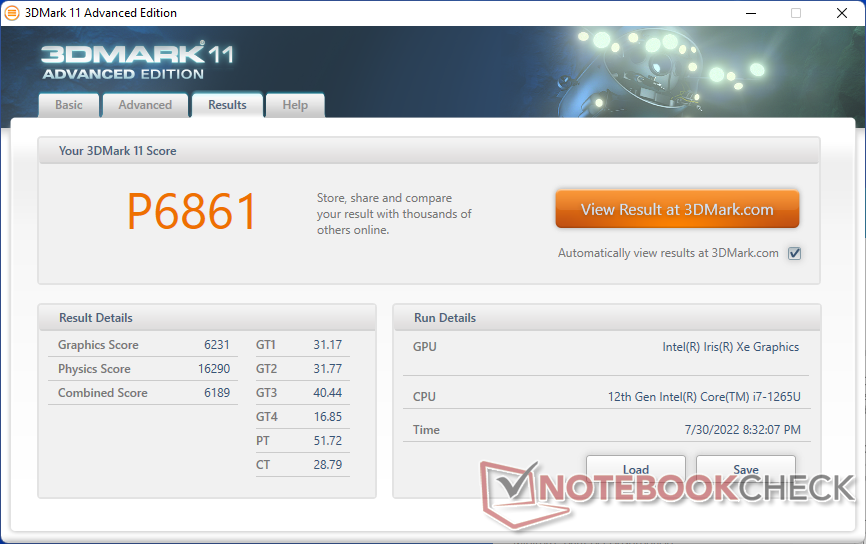
| 3DMark 11 Performance | 6861 Punkte | |
| 3DMark Cloud Gate Standard Score | 21289 Punkte | |
| 3DMark Fire Strike Score | 4684 Punkte | |
| 3DMark Time Spy Score | 1773 Punkte | |
Hilfe | ||
Witcher 3 FPS-Diagramm
| min. | mittel | hoch | max. | |
|---|---|---|---|---|
| GTA V (2015) | 111.6 | 93.9 | 24.8 | 10.7 |
| The Witcher 3 (2015) | 88 | 55.8 | 29.9 | 14.4 |
| Dota 2 Reborn (2015) | 114 | 87.9 | 67.6 | 57.4 |
| Final Fantasy XV Benchmark (2018) | 43.3 | 24.6 | 17 | |
| X-Plane 11.11 (2018) | 37.9 | 41.2 | 36.6 | |
| Strange Brigade (2018) | 89.6 | 41.7 | 32.5 | 26.4 |
| Cyberpunk 2077 1.6 (2022) | 22.2 | 18.8 | 14.1 | 11.3 |
Emissionen
Geräuschemissionen
Während dem Surfen oder Videostreaming bleibt der Laptop lautlos oder zumindest fast lautlos. Allerdings dreht der Lüfter schneller hoch als beim Latitude 9420 2-in-1. Der Lüfter des Latitude 9420 2-in-1 steht beispielsweise während der gesamten, 90-sekündigen Benchmarkszene von 3DMark 06 still. Beim Latitude 9430 2-in-1 erzeugt der Lüfter hier bei einem stillen Hintergrundgeräuschpegel von 23,7 dB(A) hörbare 35 dB(A).
Unter hoher Last wie zum Beispiel beim Spielen im Ultraleistungsmodus werden die Lüfter lauter als beim ThinkPad X1 Yoga G7 und dem LG Gram 14T90P.

Lautstärkediagramm
| Idle |
| 23.7 / 23.7 / 23.7 dB(A) |
| Last |
| 35.1 / 43 dB(A) |
 | ||
30 dB leise 40 dB(A) deutlich hörbar 50 dB(A) störend |
||
min: | ||
| Dell Latitude 9430 2-in-1 Iris Xe G7 96EUs, i7-1265U | Dell Latitude 9420 2-in-1 Iris Xe G7 96EUs, i7-1185G7, WDC PC SN530 SDBPNPZ-512G | MSI Summit E14 Flip Evo A12MT Iris Xe G7 96EUs, i7-1260P, Samsung PM9A1 MZVL21T0HCLR | LG Gram 14T90P Iris Xe G7 80EUs, i5-1135G7, Samsung SSD PM981a MZVLB512HBJQ | Lenovo ThinkPad X1 Yoga G7 21CE002HGE Iris Xe G7 96EUs, i7-1270P, Samsung PM9A1 MZVL2512HCJQ | Asus ZenBook Flip 14 UN5401QA-KN085W Vega 8, R7 5800H, Intel SSD 600p SSDPEKKW512G7 | |
|---|---|---|---|---|---|---|
| Geräuschentwicklung | 1% | 4% | 4% | 4% | -10% | |
| aus / Umgebung * (dB) | 23.7 | 25.4 -7% | 23.3 2% | 25.4 -7% | 22.7 4% | 26 -10% |
| Idle min * (dB) | 23.7 | 25.4 -7% | 23.3 2% | 25.5 -8% | 22.7 4% | 26 -10% |
| Idle avg * (dB) | 23.7 | 25.4 -7% | 23.3 2% | 25.5 -8% | 22.7 4% | 26 -10% |
| Idle max * (dB) | 23.7 | 25.4 -7% | 23.3 2% | 25.5 -8% | 27.1 -14% | 27.3 -15% |
| Last avg * (dB) | 35.1 | 25.4 28% | 24 32% | 28.3 19% | 34.5 2% | 39.8 -13% |
| Witcher 3 ultra * (dB) | 43.3 | 41.3 5% | 35.6 18% | 35 19% | 34.5 20% | |
| Last max * (dB) | 43 | 41.3 4% | 55.8 -30% | 35 19% | 38.7 10% | 42.4 1% |
* ... kleinere Werte sind besser
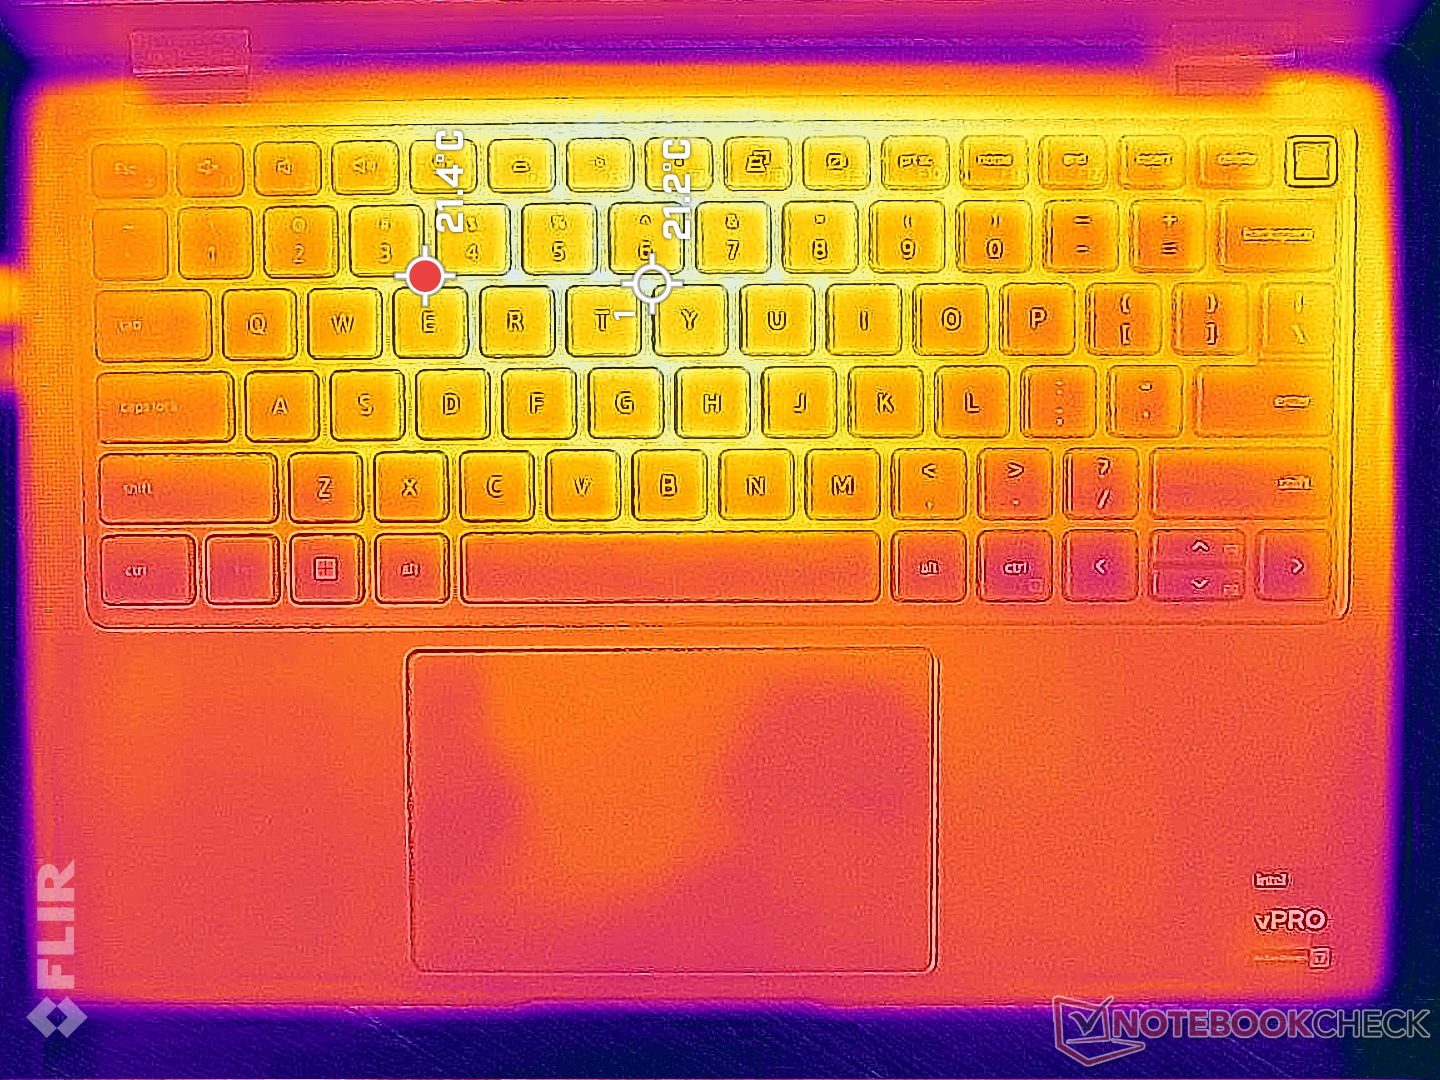
Temperatur
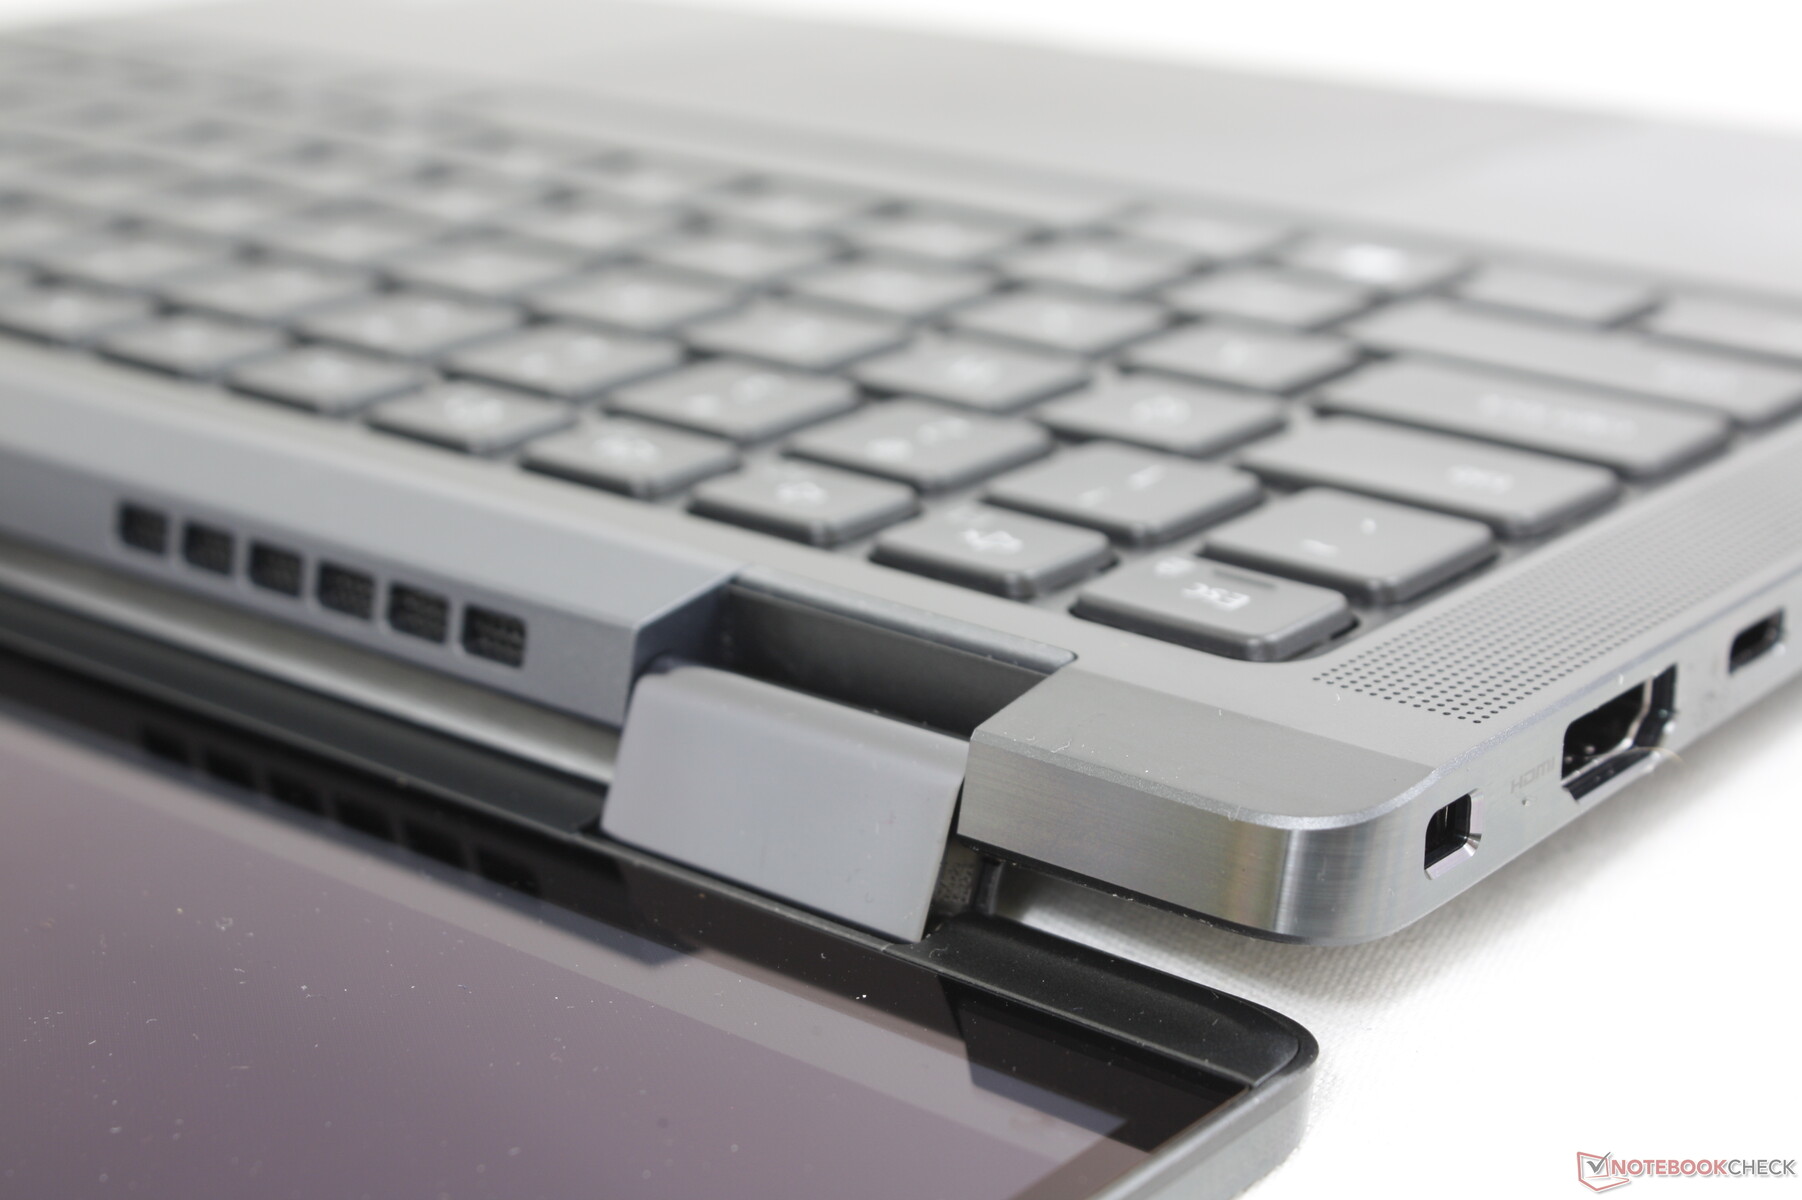
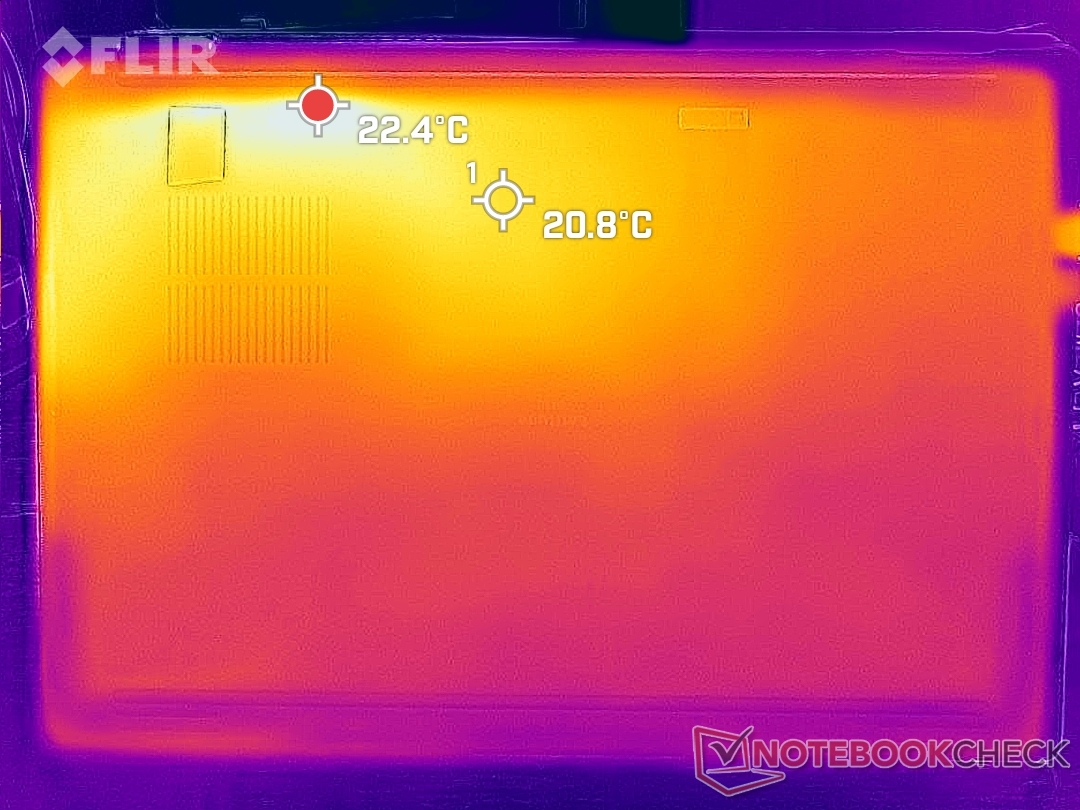
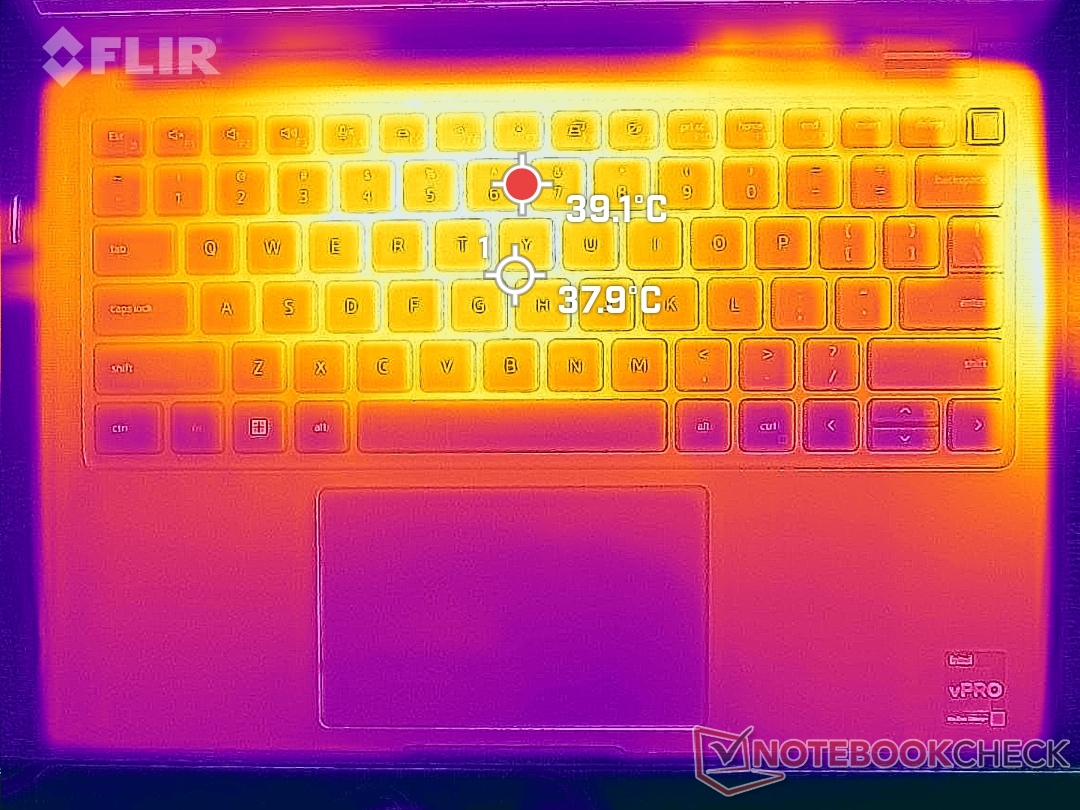
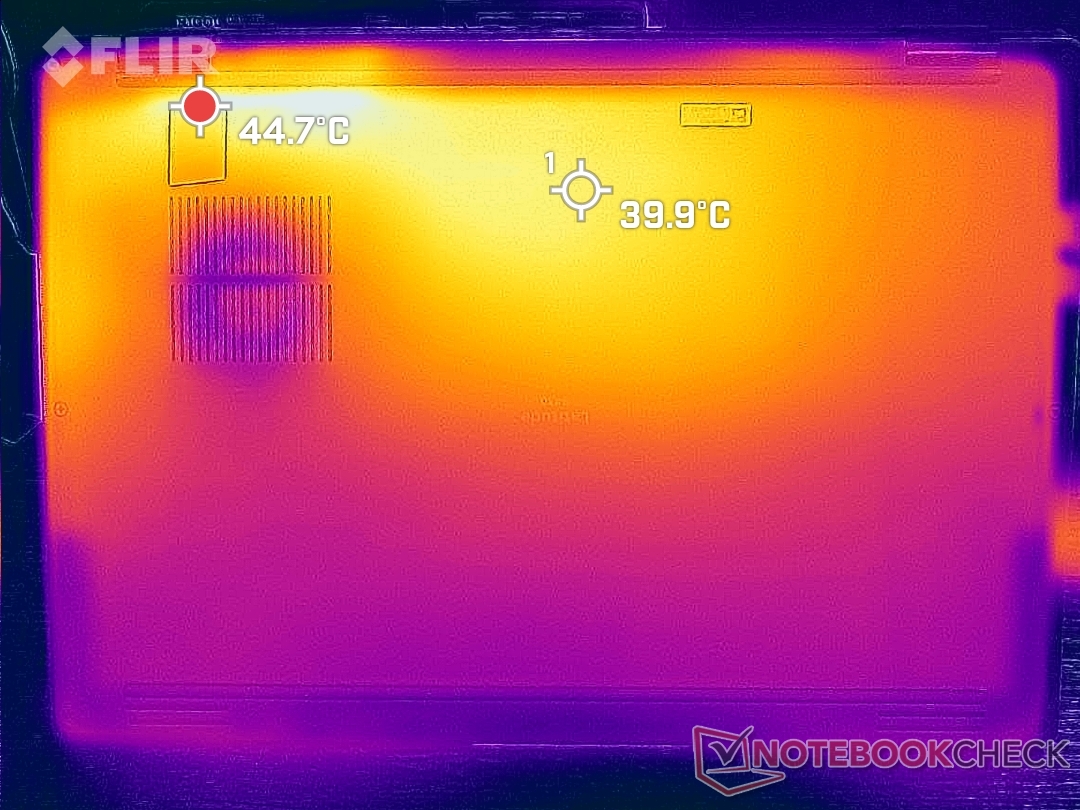
Die Oberflächentemperaturen sind in der Nähe der Tastaturmitte und in der hinteren Hälfte des Laptops am höchsten und erreichen dort in der Spitze bis zu 40 °C auf der Ober- und Unterseite. Damit bleiben die Oberflächen in diesem Szenario kühler als beim Latitude 9420 2-in-1 und erwärmen sich auf ein ähnliches Niveau wie beim MSI Summit E14 Flip. Abluft wird über die rechte Seite und die Rückseite des Gehäuses abgeführt.
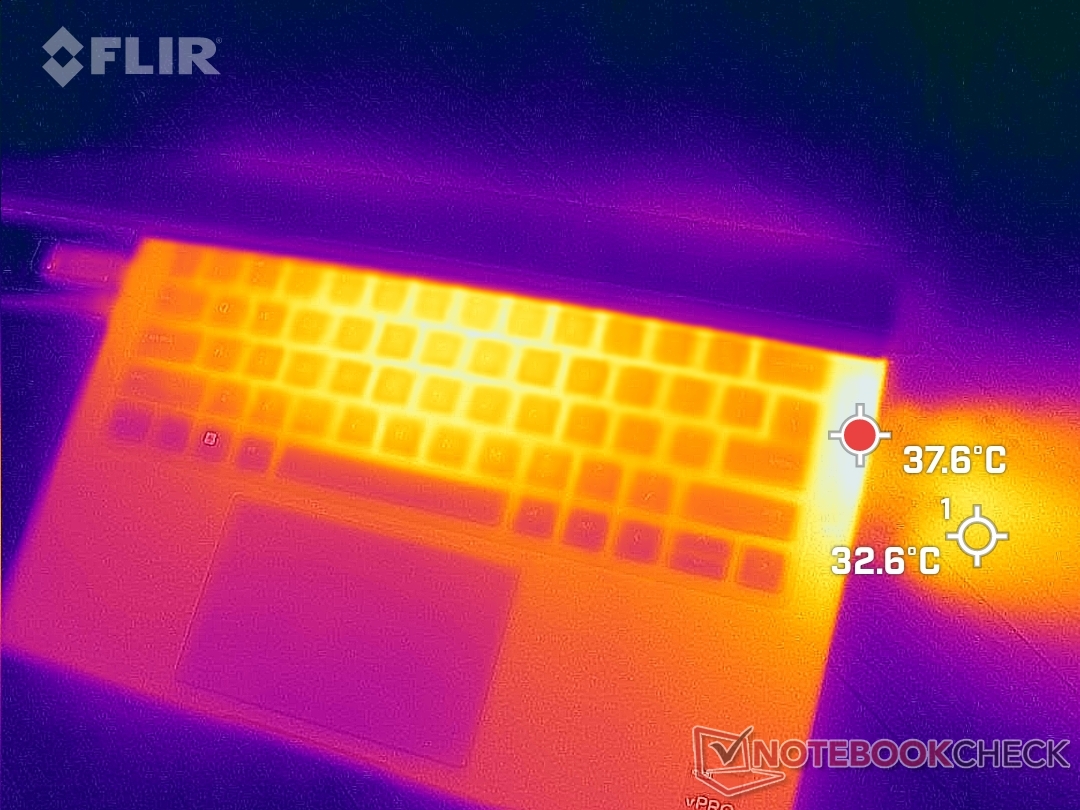
(+) Die maximale Temperatur auf der Oberseite ist 39.2 °C. Im Vergleich liegt der Klassendurchschnitt bei 35.4 °C (von 19.6 bis 60 °C für die Klasse Convertible).
(±) Auf der Unterseite messen wir eine maximalen Wert von 44.8 °C (im Vergleich zum Durchschnitt von 36.9 °C).
(+) Ohne Last messen wir eine durchschnittliche Temperatur von 19.7 °C auf der Oberseite. Der Klassendurchschnitt erreicht 30.3 °C.
(+) Die Handballen und der Touchpad-Bereich sind mit gemessenen 28.4 °C kühler als die typische Hauttemperatur und fühlen sich dadurch kühl an.
(±) Die durchschnittliche Handballen-Temperatur anderer getesteter Geräte war 28 °C (-0.4 °C).
| Dell Latitude 9430 2-in-1 Intel Core i7-1265U, Intel Iris Xe Graphics G7 96EUs | Dell Latitude 9420 2-in-1 Intel Core i7-1185G7, Intel Iris Xe Graphics G7 96EUs | MSI Summit E14 Flip Evo A12MT Intel Core i7-1260P, Intel Iris Xe Graphics G7 96EUs | LG Gram 14T90P Intel Core i5-1135G7, Intel Iris Xe Graphics G7 80EUs | Lenovo ThinkPad X1 Yoga G7 21CE002HGE Intel Core i7-1270P, Intel Iris Xe Graphics G7 96EUs | Asus ZenBook Flip 14 UN5401QA-KN085W AMD Ryzen 7 5800H, AMD Radeon RX Vega 8 (Ryzen 4000/5000) | |
|---|---|---|---|---|---|---|
| Hitze | -21% | -1% | -5% | -15% | -35% | |
| Last oben max * (°C) | 39.2 | 43.4 -11% | 44.2 -13% | 41.6 -6% | 43.3 -10% | 42.7 -9% |
| Last unten max * (°C) | 44.8 | 48 -7% | 45.8 -2% | 46.2 -3% | 45.1 -1% | 53.1 -19% |
| Idle oben max * (°C) | 21.4 | 29.8 -39% | 19.6 8% | 22.6 -6% | 26.5 -24% | 32.9 -54% |
| Idle unten max * (°C) | 22.4 | 28 -25% | 22 2% | 23.2 -4% | 27.6 -23% | 35.2 -57% |
* ... kleinere Werte sind besser
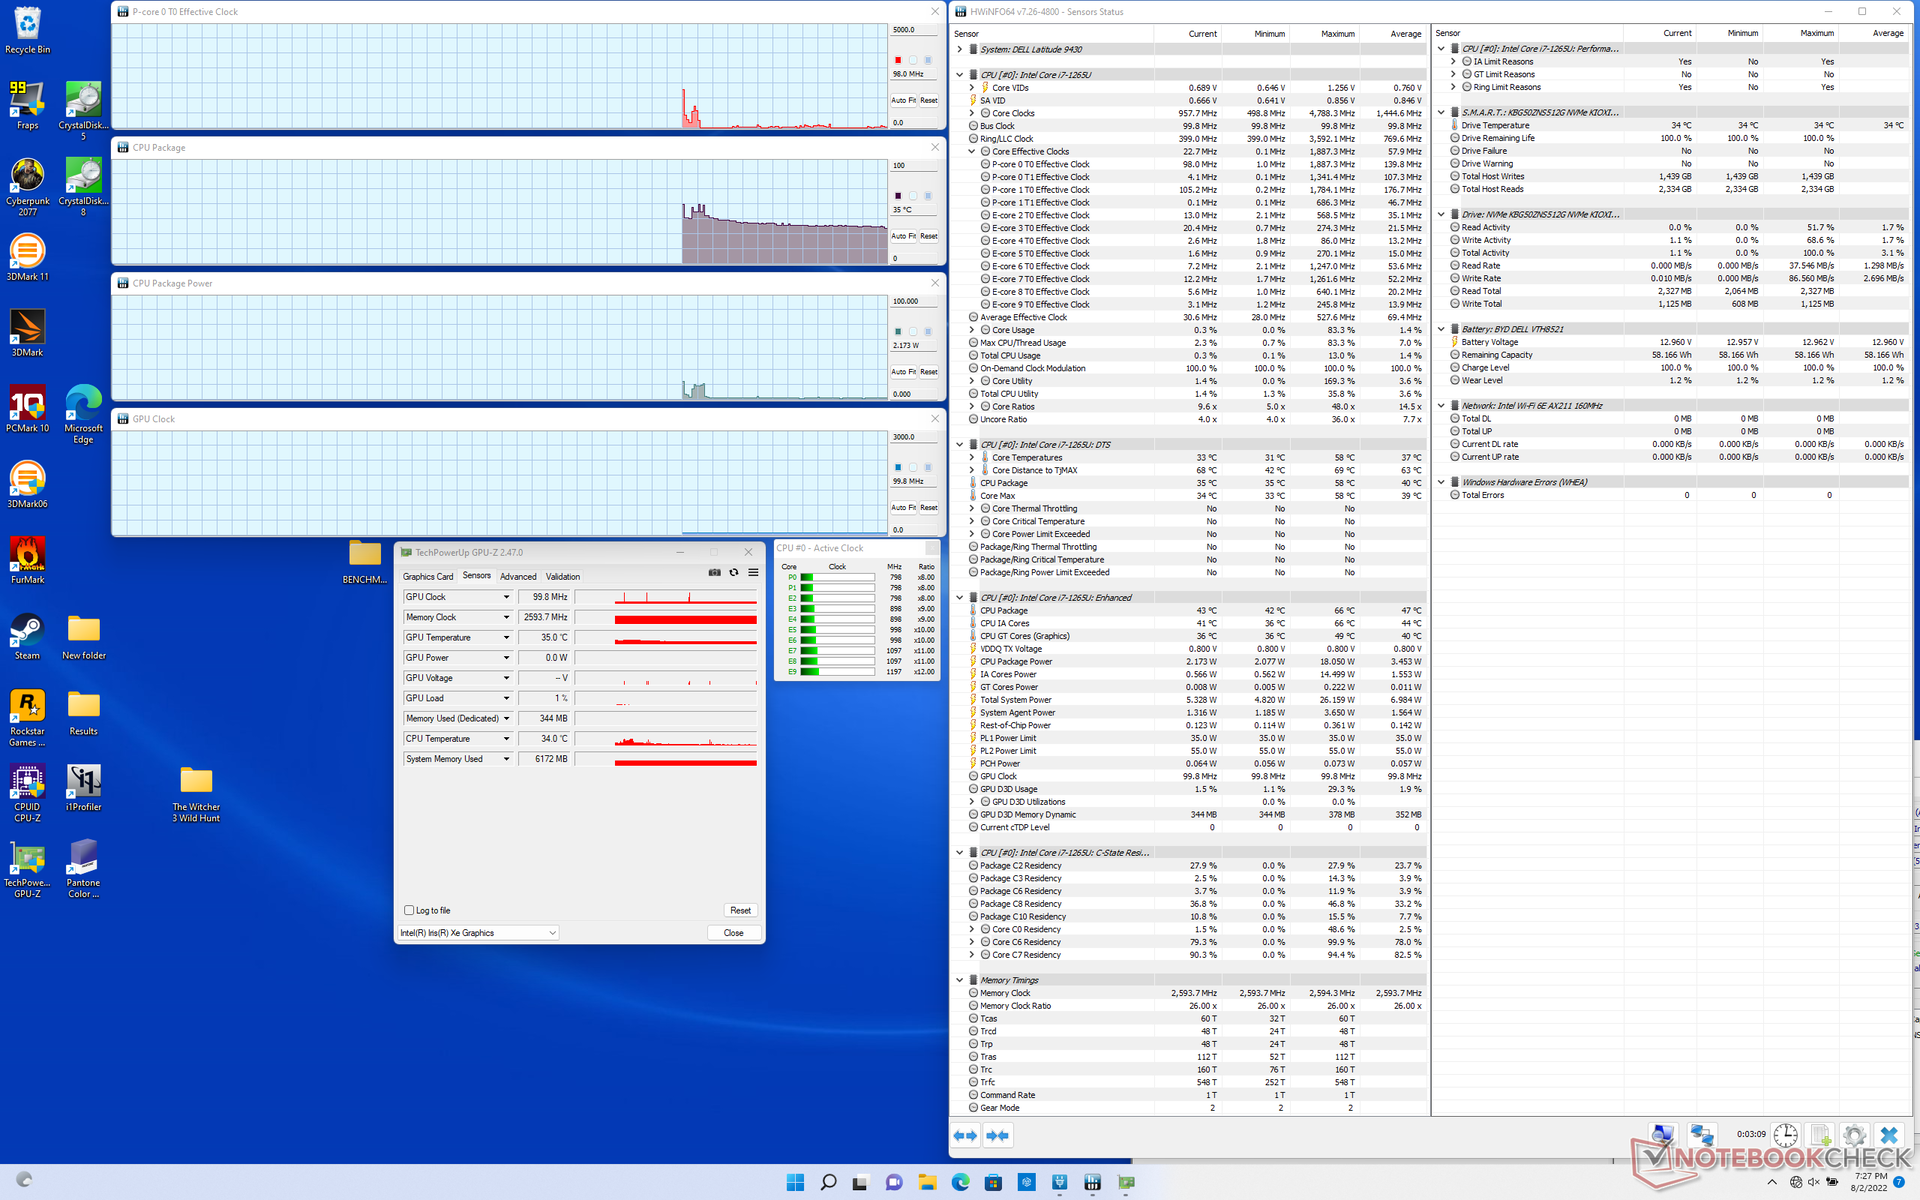
Stresstest
Nach dem Ausführen von Prime95 steigen der Takt, die Kerntemperatur und der Board Power Draw auf 3,6 GHz, 98 °C bzw. 48 W und fallen nach wenigen Sekunden ab. Die Taktfrequenz fällt darauf stetig und stabilisiert sich schließlich bei 2,4 GHz, um einen vernünftigeren Board Power Draw von 24 W und eine Kerntemperatur von 74 °C zu ermöglichen. Wir sind froh, dass Dell die in diesem Szenario stark schwankenden Taktfrequenzen des Latitude 9420 2-in-1 in den Griff bekommen hat und das Leistungsniveau konstant und vorhersehbarer ausfällt.
Beim Ausführen von The Witcher 3 stabilisieren sich die GPU-Taktfrequenz und -Temperatur bei 1.097 MHz bzw. 66 °C, beim Latitude 9420 2-in-1 waren es ~1.200 MHz bzw. 73 °C und beim MSI Summit E14 Flip 1.197 MHz bzw. 85 °C.
Im Akkumodus ist die Leistung eingeschränkt. Ein 3DMark-11-Durchlauf liefert im Akkumodus Physik- und Grafikpunktzahlen von 9.711 bzw. 5.679 Punkten, im Netzbetrieb sind es 16.290 bzw. 6.231 Punkte.
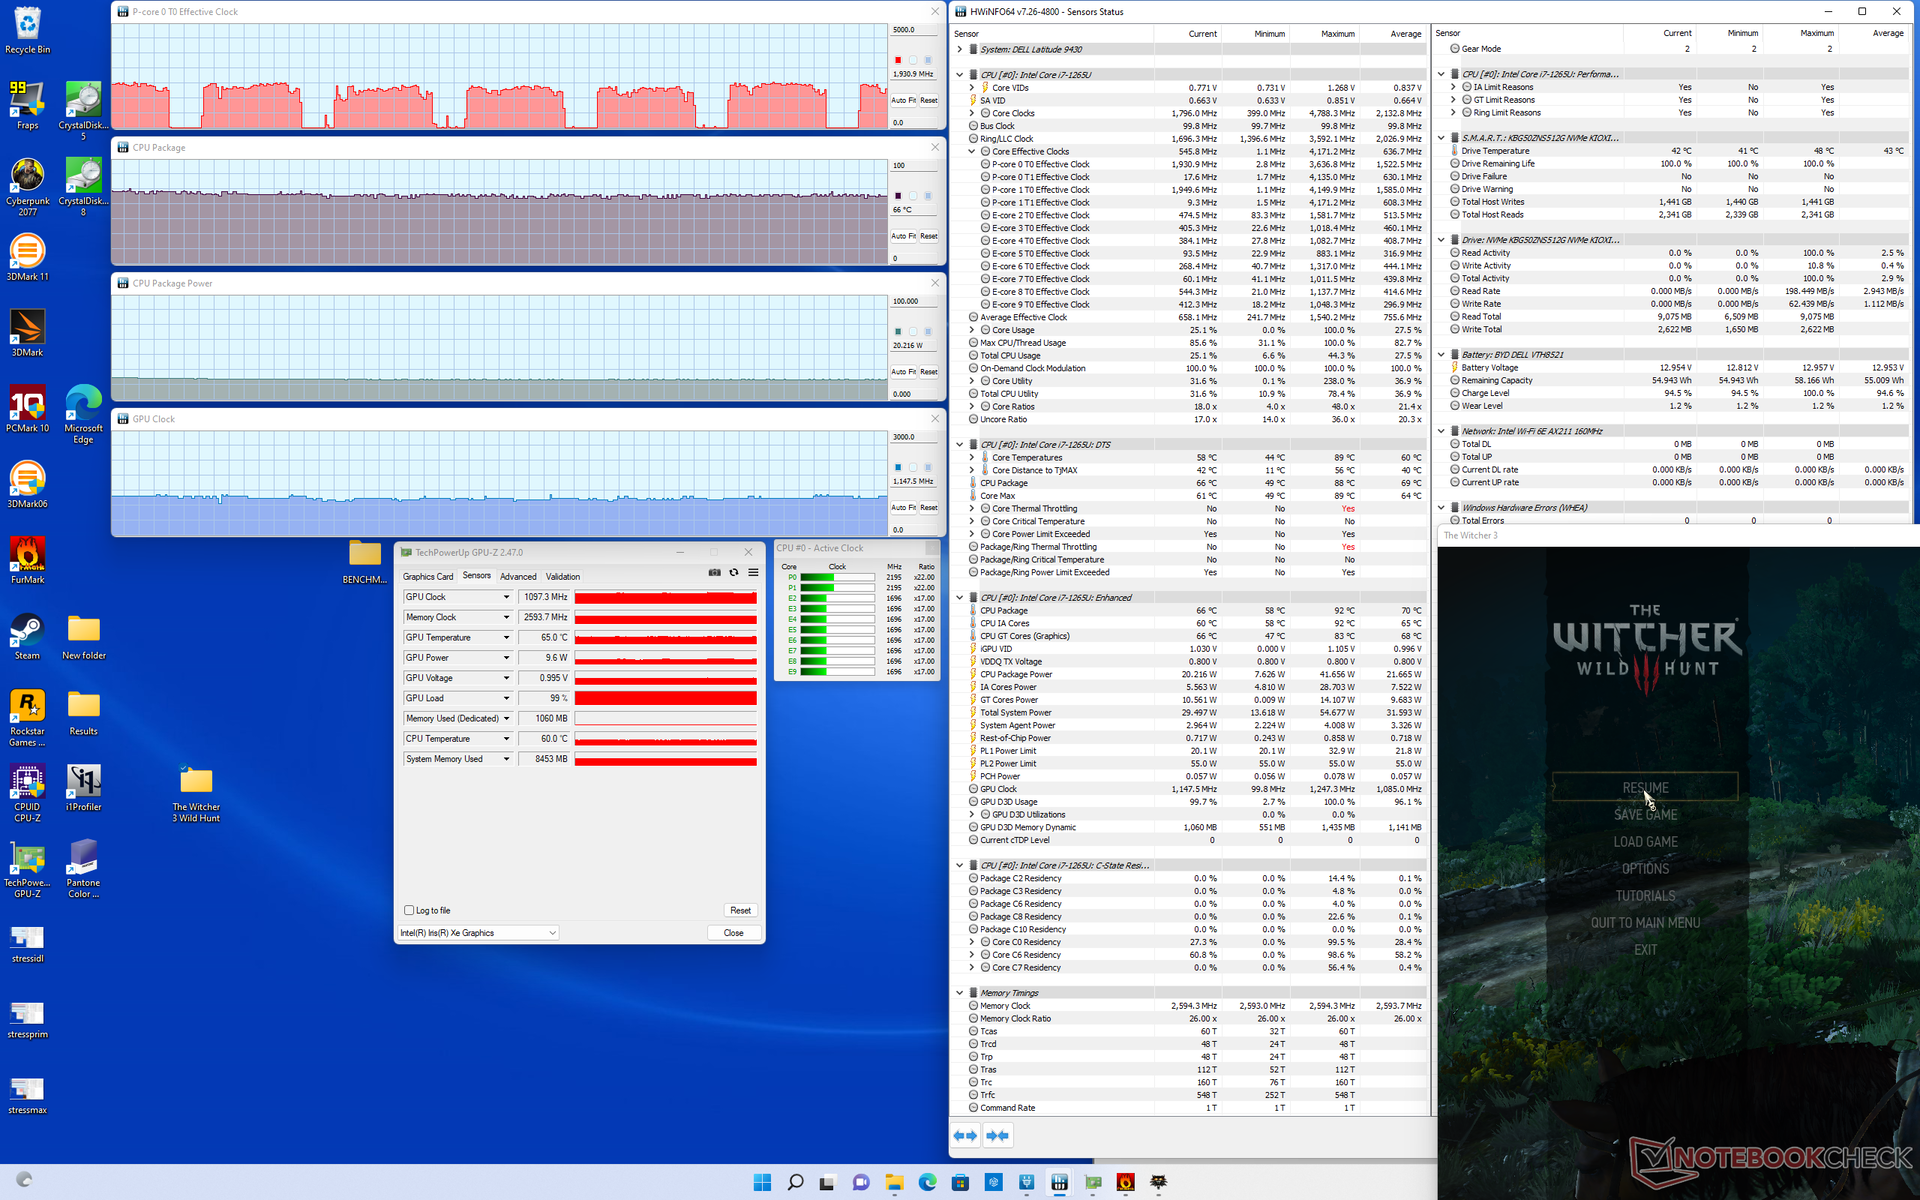
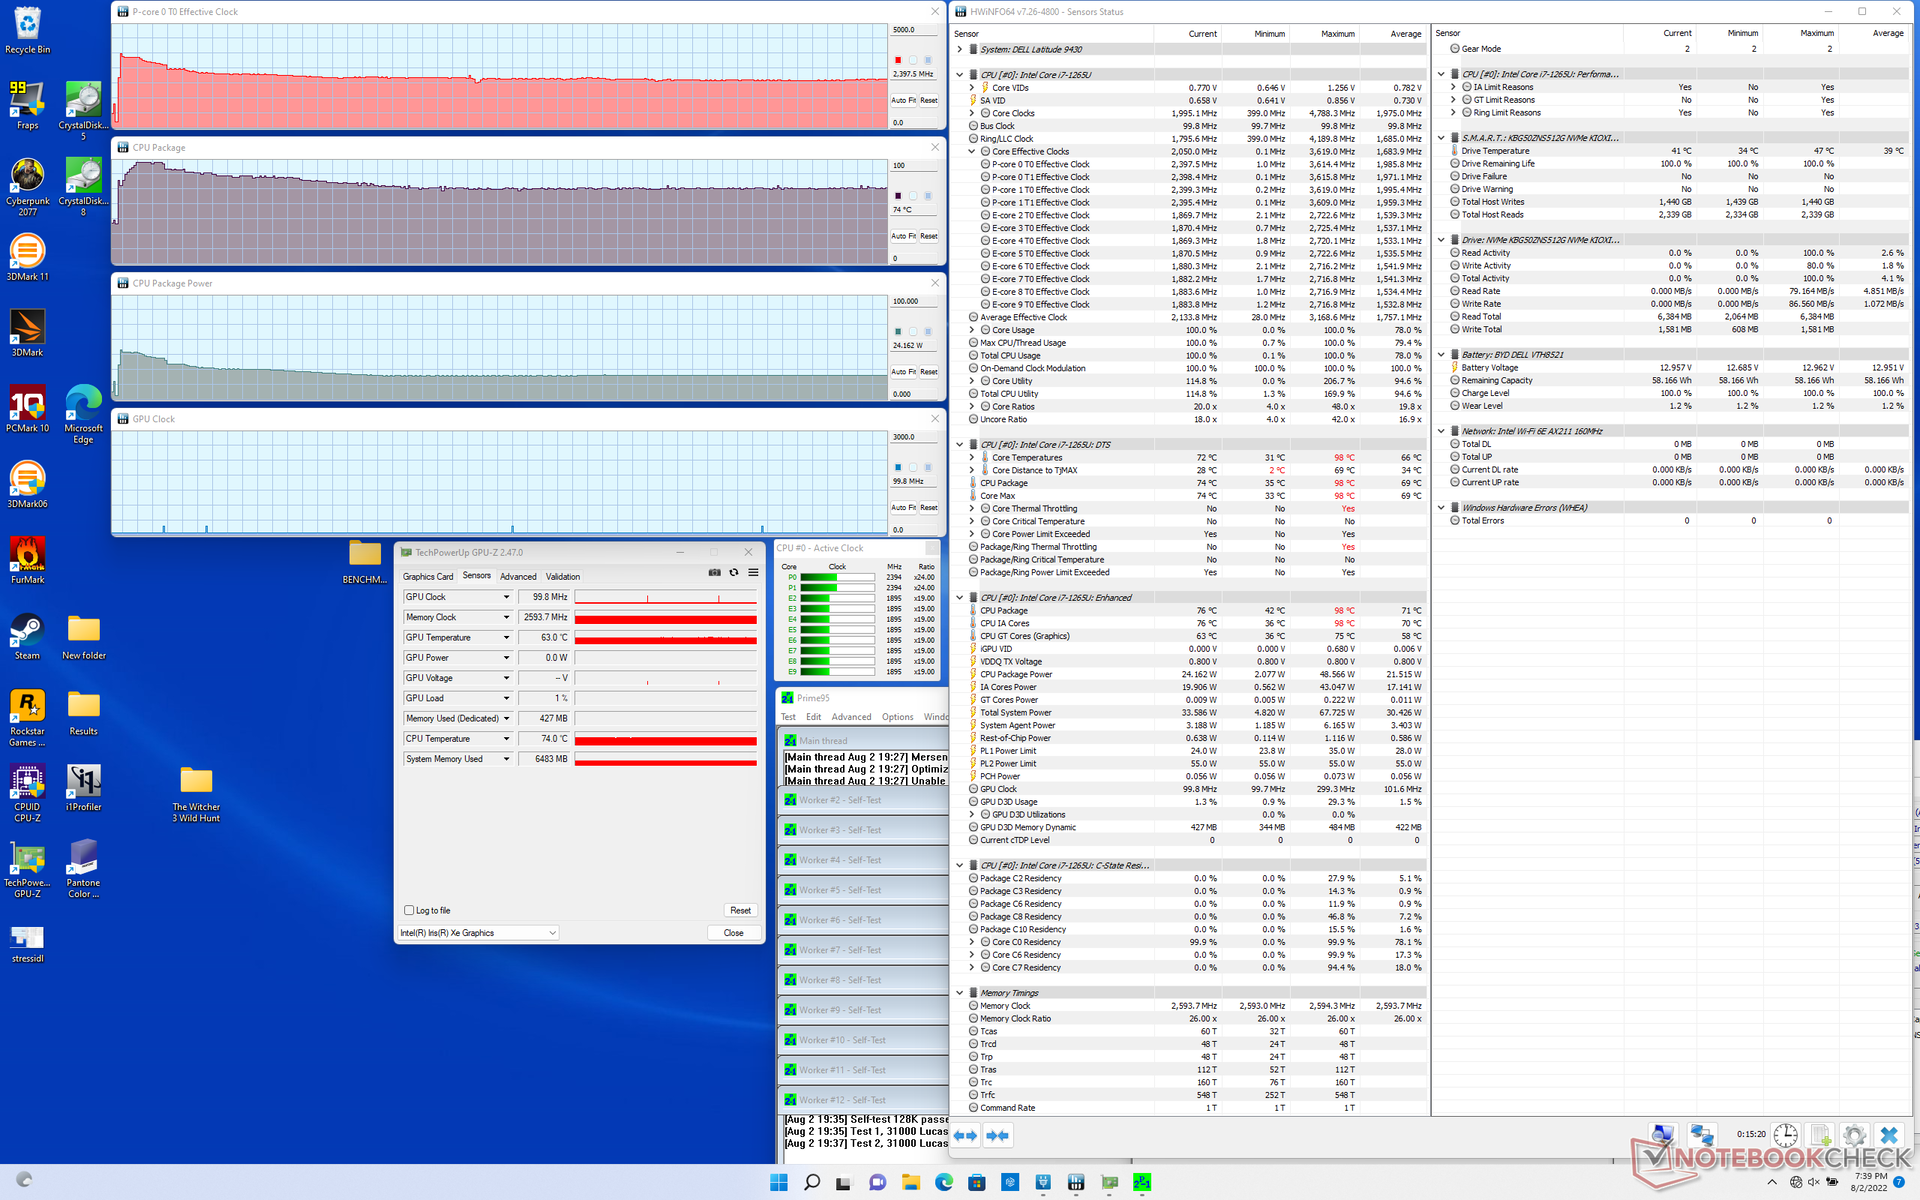
| CPU-Takt (GHz) | GPU-Takt (MHz) | Durchschnittliche CPU-Temperatur (°C) | |
| Leerlauf | -- | -- | 35 |
| Prime95-Stress | 2,4 | -- | 74 |
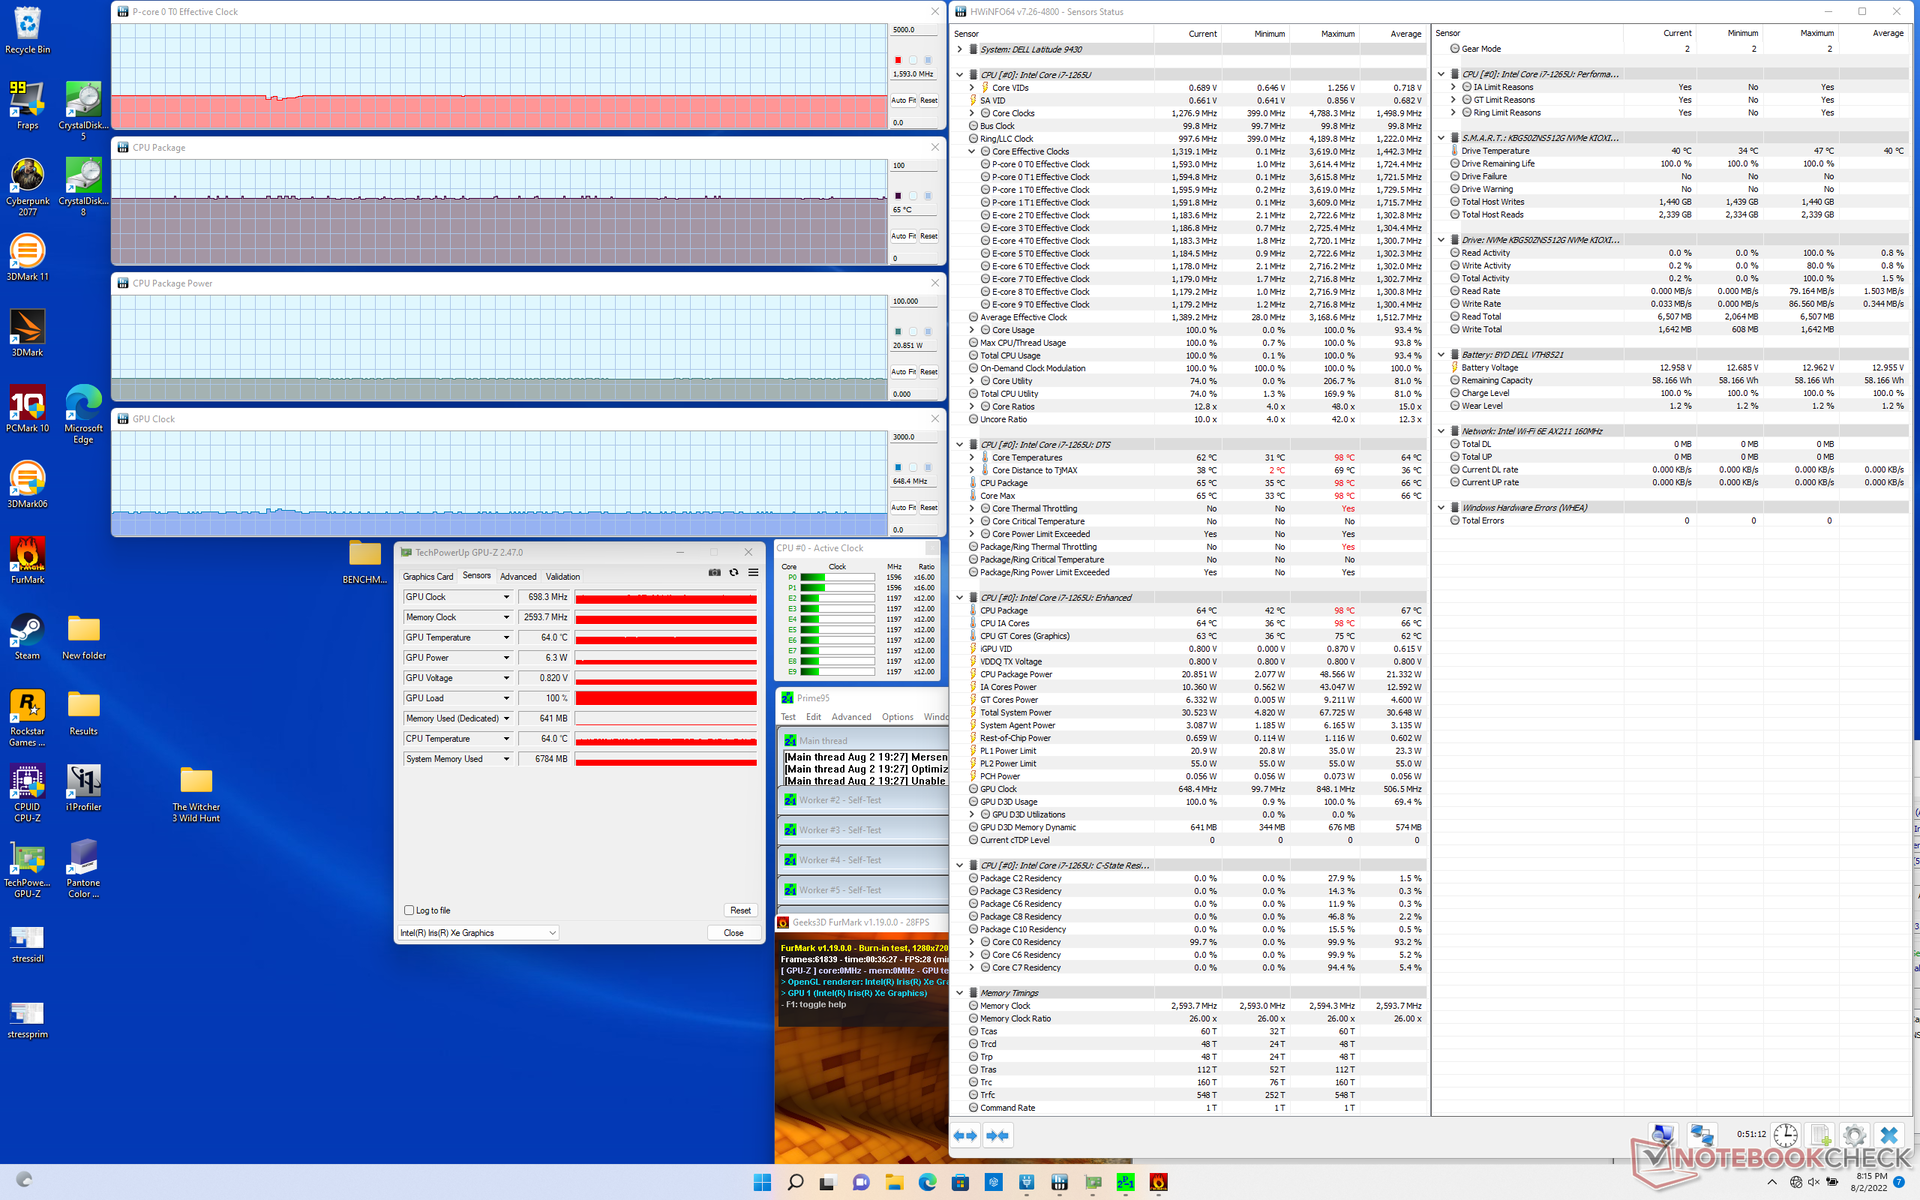
| Prime95-+FurMark-Stress | 1,6 | 698 | 65 |
| Witcher-3-Stress | ~2,0 | 1.097 | 66 |
Lautsprecher
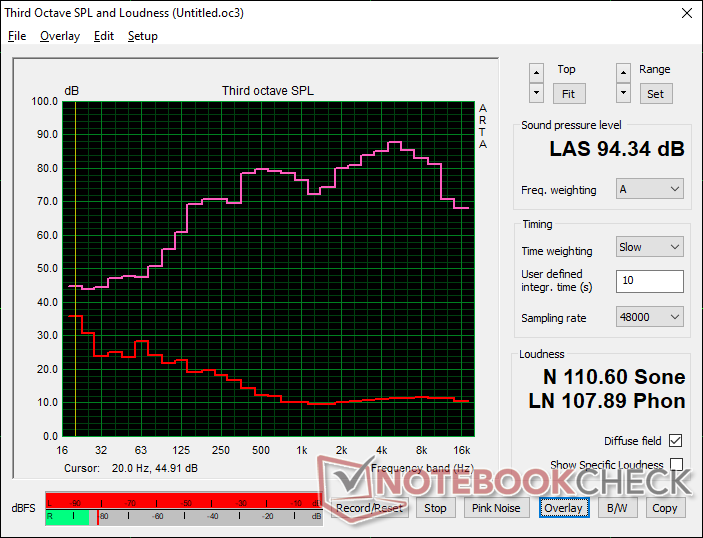
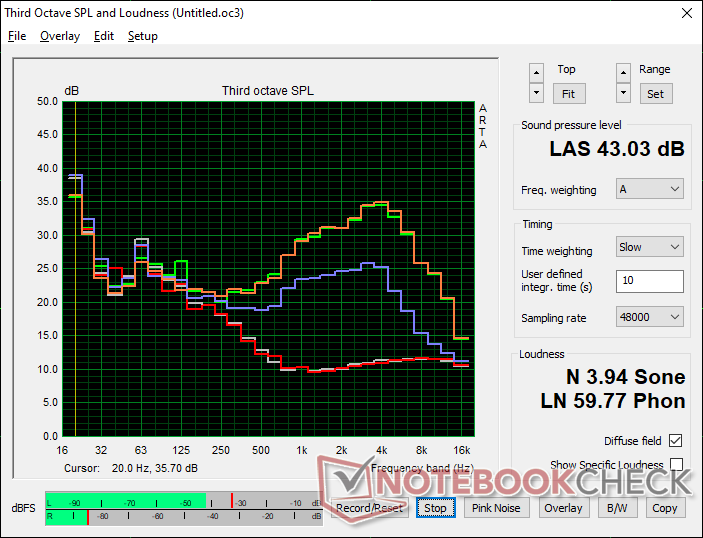
Dell Latitude 9430 2-in-1 Audio Analyse
(+) | Die Lautsprecher können relativ laut spielen (94.3 dB)
Bass 100 - 315 Hz
(±) | abgesenkter Bass - 12.3% geringer als der Median
(+) | lineare Bass-Wiedergabe (5.3% Delta zum Vorgänger)
Mitteltöne 400 - 2000 Hz
(+) | ausgeglichene Mitten, vom Median nur 2% abweichend
(+) | lineare Mitten (4.7% Delta zum Vorgänger)
Hochtöne 2 - 16 kHz
(±) | zu hohe Hochtöne, vom Median nur 5.4% abweichend
(+) | sehr lineare Hochtöne (3% Delta zum Vorgänger)
Gesamt im hörbaren Bereich 100 - 16.000 Hz
(+) | hörbarer Bereich ist sehr linear (11.6% Abstand zum Median
Im Vergleich zu allen Geräten derselben Klasse
» 10% aller getesteten Geräte dieser Klasse waren besser, 4% vergleichbar, 87% schlechter
» Das beste Gerät hat einen Delta-Wert von 6%, durchschnittlich ist 20%, das schlechteste Gerät hat 57%
Im Vergleich zu allen Geräten im Test
» 8% aller getesteten Geräte waren besser, 2% vergleichbar, 90% schlechter
» Das beste Gerät hat einen Delta-Wert von 4%, durchschnittlich ist 24%, das schlechteste Gerät hat 134%
Apple MacBook Pro 16 2021 M1 Pro Audio Analyse
(+) | Die Lautsprecher können relativ laut spielen (84.7 dB)
Bass 100 - 315 Hz
(+) | guter Bass - nur 3.8% Abweichung vom Median
(+) | lineare Bass-Wiedergabe (5.2% Delta zum Vorgänger)
Mitteltöne 400 - 2000 Hz
(+) | ausgeglichene Mitten, vom Median nur 1.3% abweichend
(+) | lineare Mitten (2.1% Delta zum Vorgänger)
Hochtöne 2 - 16 kHz
(+) | ausgeglichene Hochtöne, vom Median nur 1.9% abweichend
(+) | sehr lineare Hochtöne (2.7% Delta zum Vorgänger)
Gesamt im hörbaren Bereich 100 - 16.000 Hz
(+) | hörbarer Bereich ist sehr linear (4.6% Abstand zum Median
Im Vergleich zu allen Geräten derselben Klasse
» 0% aller getesteten Geräte dieser Klasse waren besser, 0% vergleichbar, 100% schlechter
» Das beste Gerät hat einen Delta-Wert von 5%, durchschnittlich ist 17%, das schlechteste Gerät hat 45%
Im Vergleich zu allen Geräten im Test
» 0% aller getesteten Geräte waren besser, 0% vergleichbar, 100% schlechter
» Das beste Gerät hat einen Delta-Wert von 4%, durchschnittlich ist 24%, das schlechteste Gerät hat 134%
Energieverwaltung
Energieaufnahme
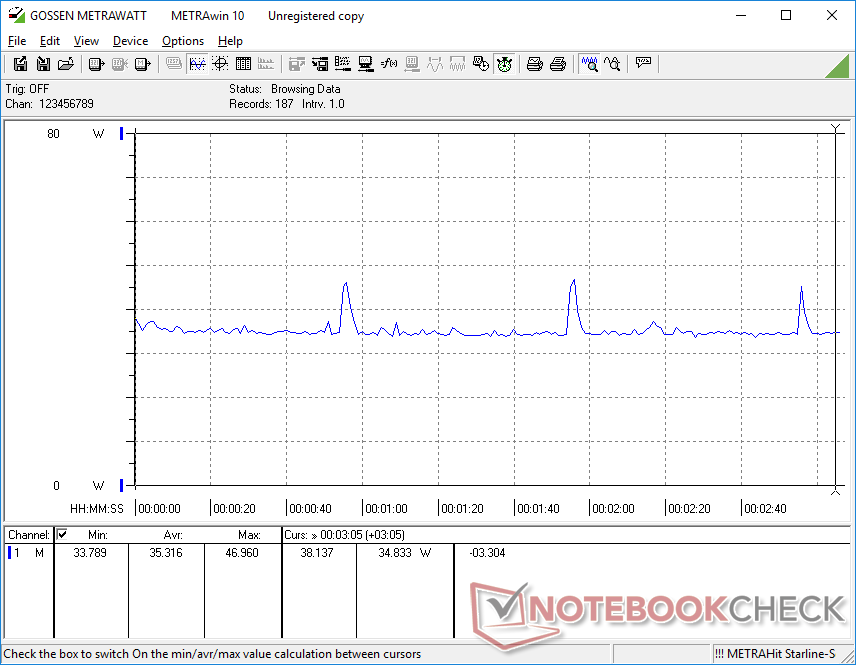
Im Leerlauf auf dem Desktop werden je nach Helligkeitsstufe und Leistungsprofil zwischen 3 und 7 W und damit etwas weniger Strom als beim Latitude 9420 2-in-1 verbraucht. Beim Ausführen von Prime95 werden statt nur 32 W beim Vorgänger ganze 62 W verbraucht, was während dem Auslasten der CPU einer 94-prozentigen Erhöhung des Verbrauchs entspricht. Das zeigt, dass die um 50 % höhere Multi-Thread-Leistung des Core i7-1265U gegenüber dem Core i7-1185G7 nicht von ungefähr kommt.
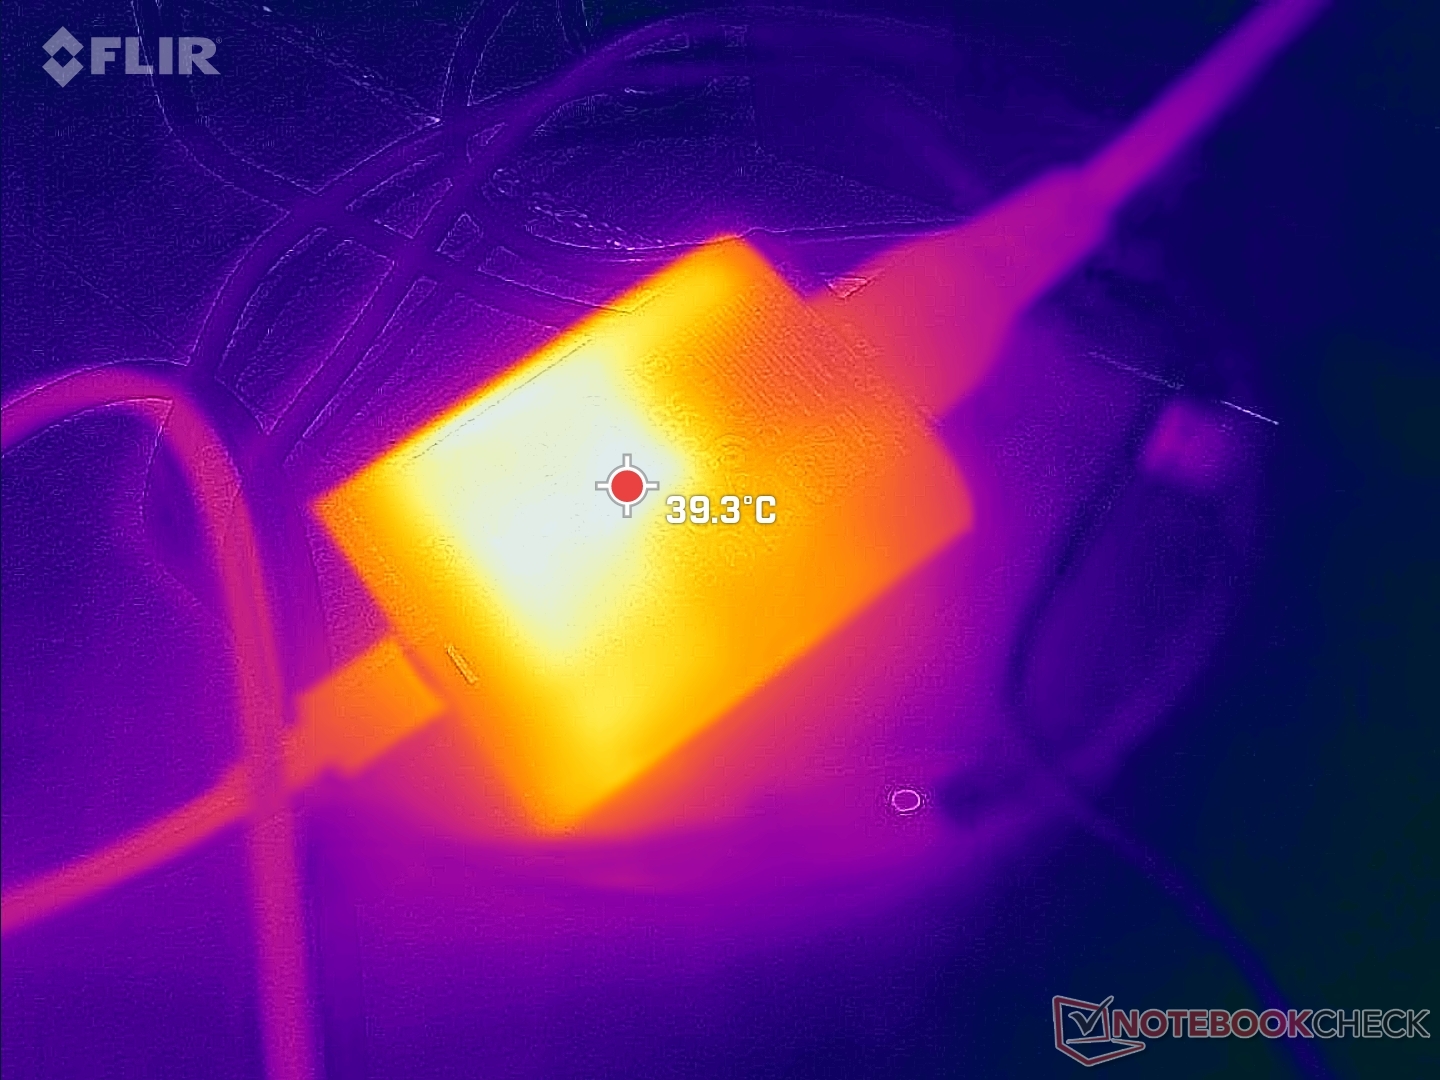
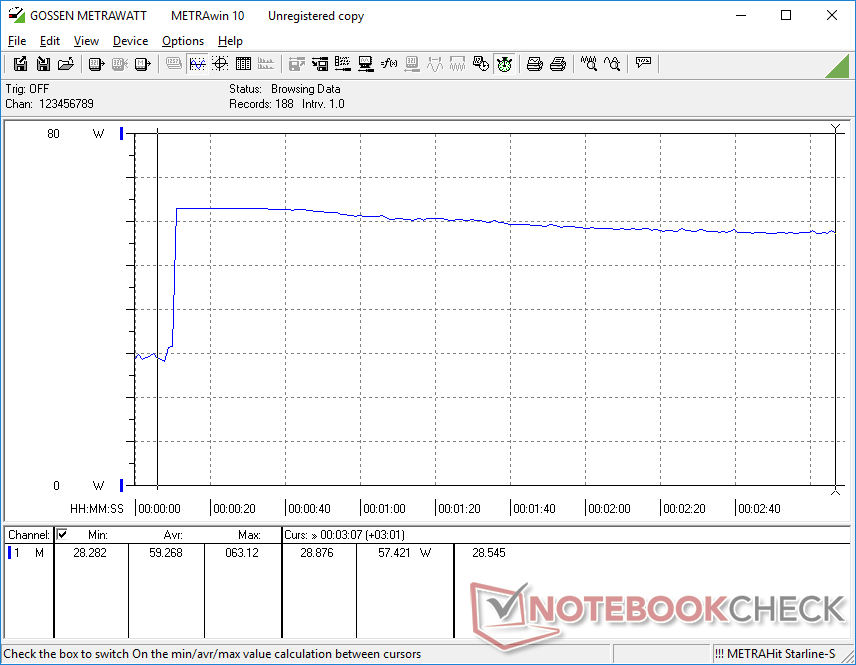
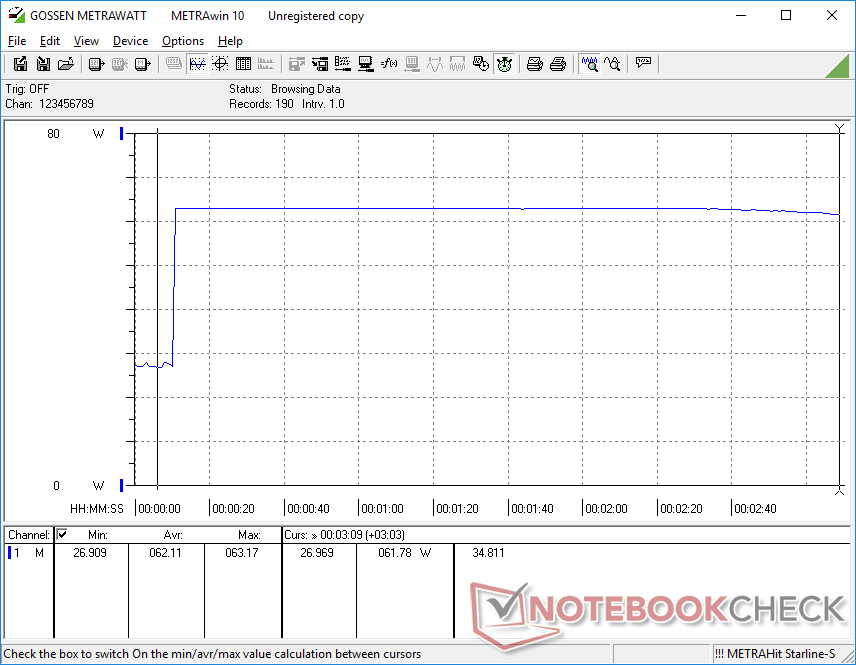
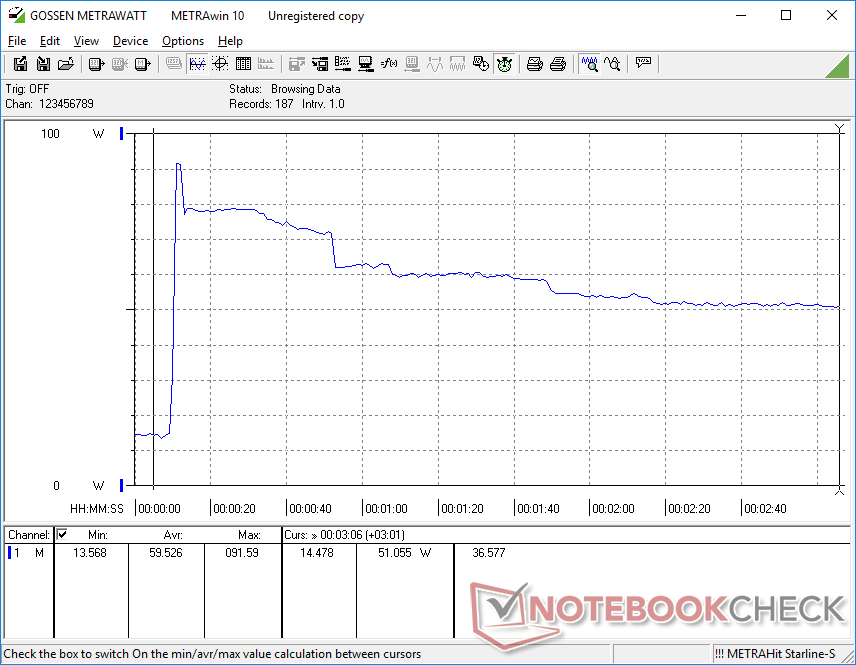
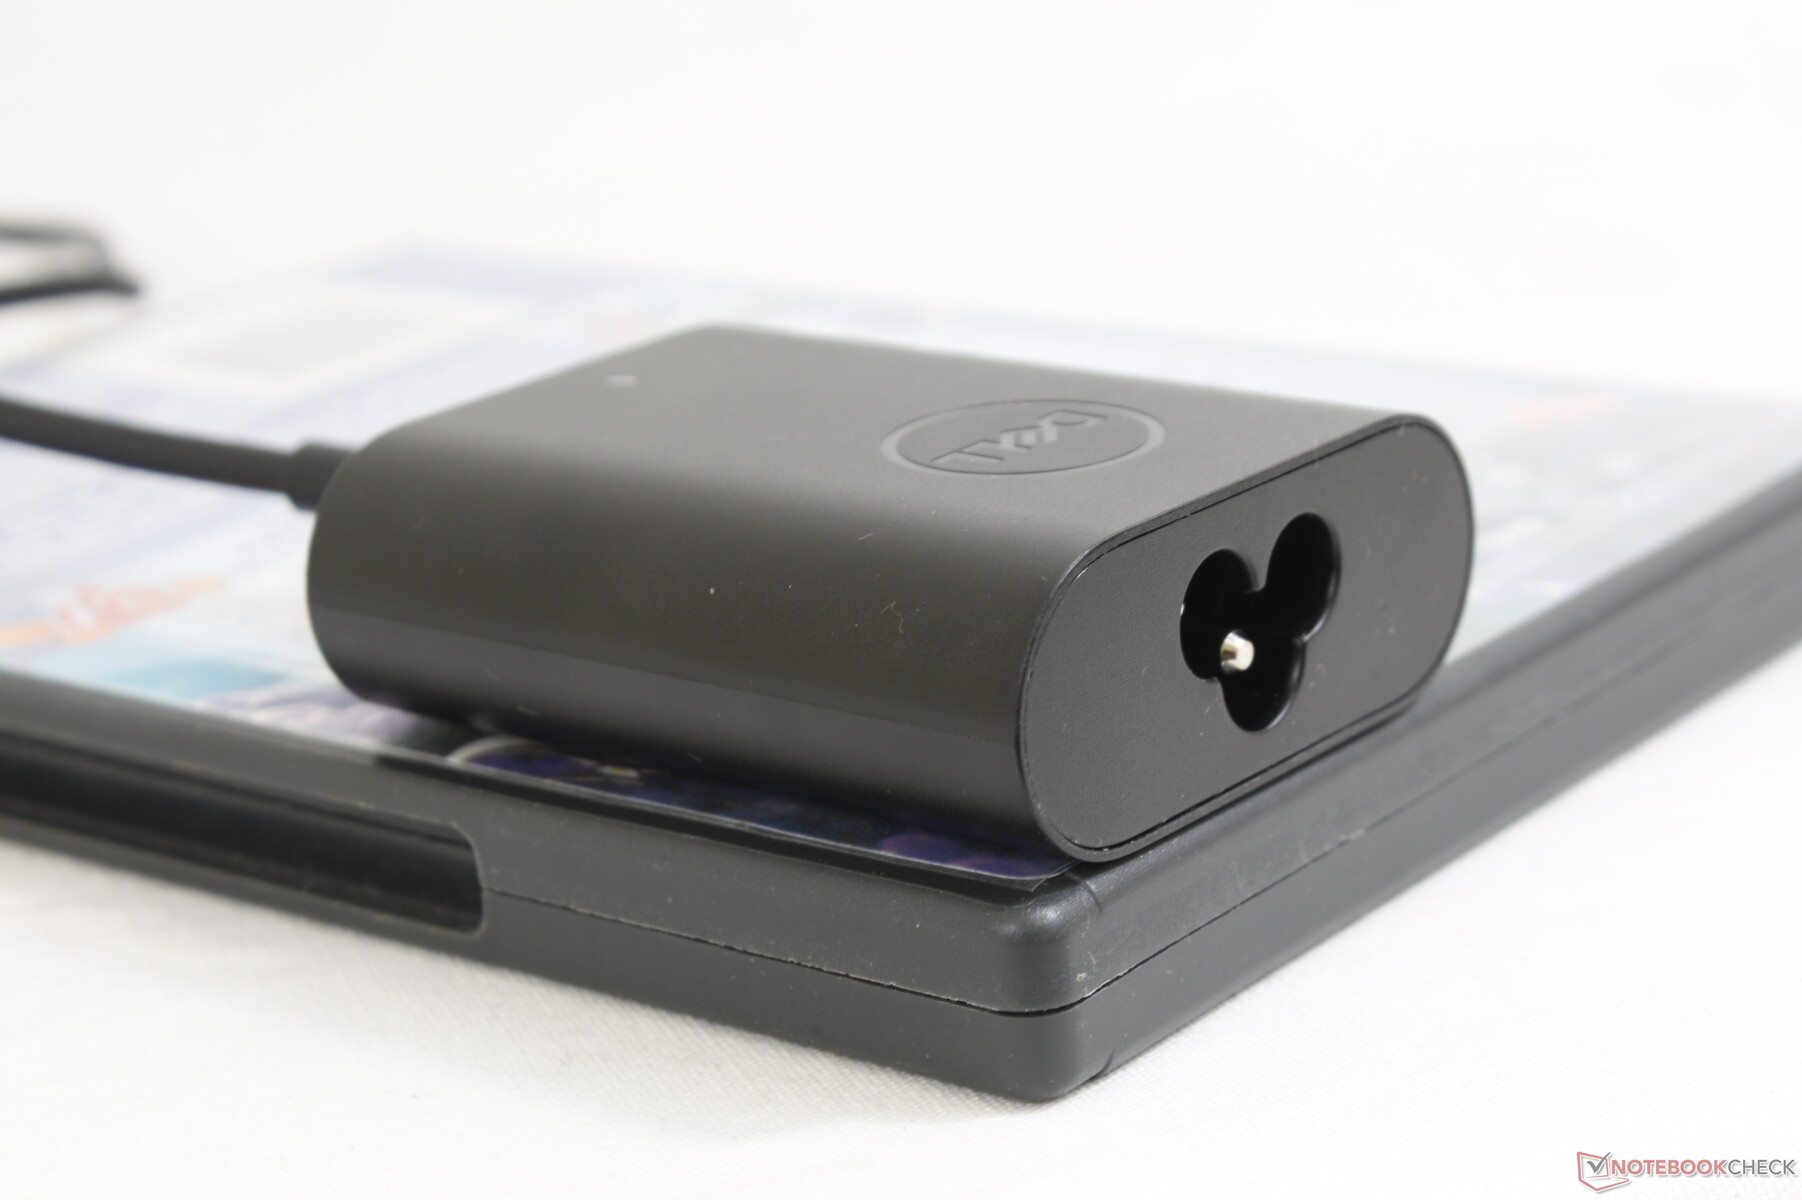
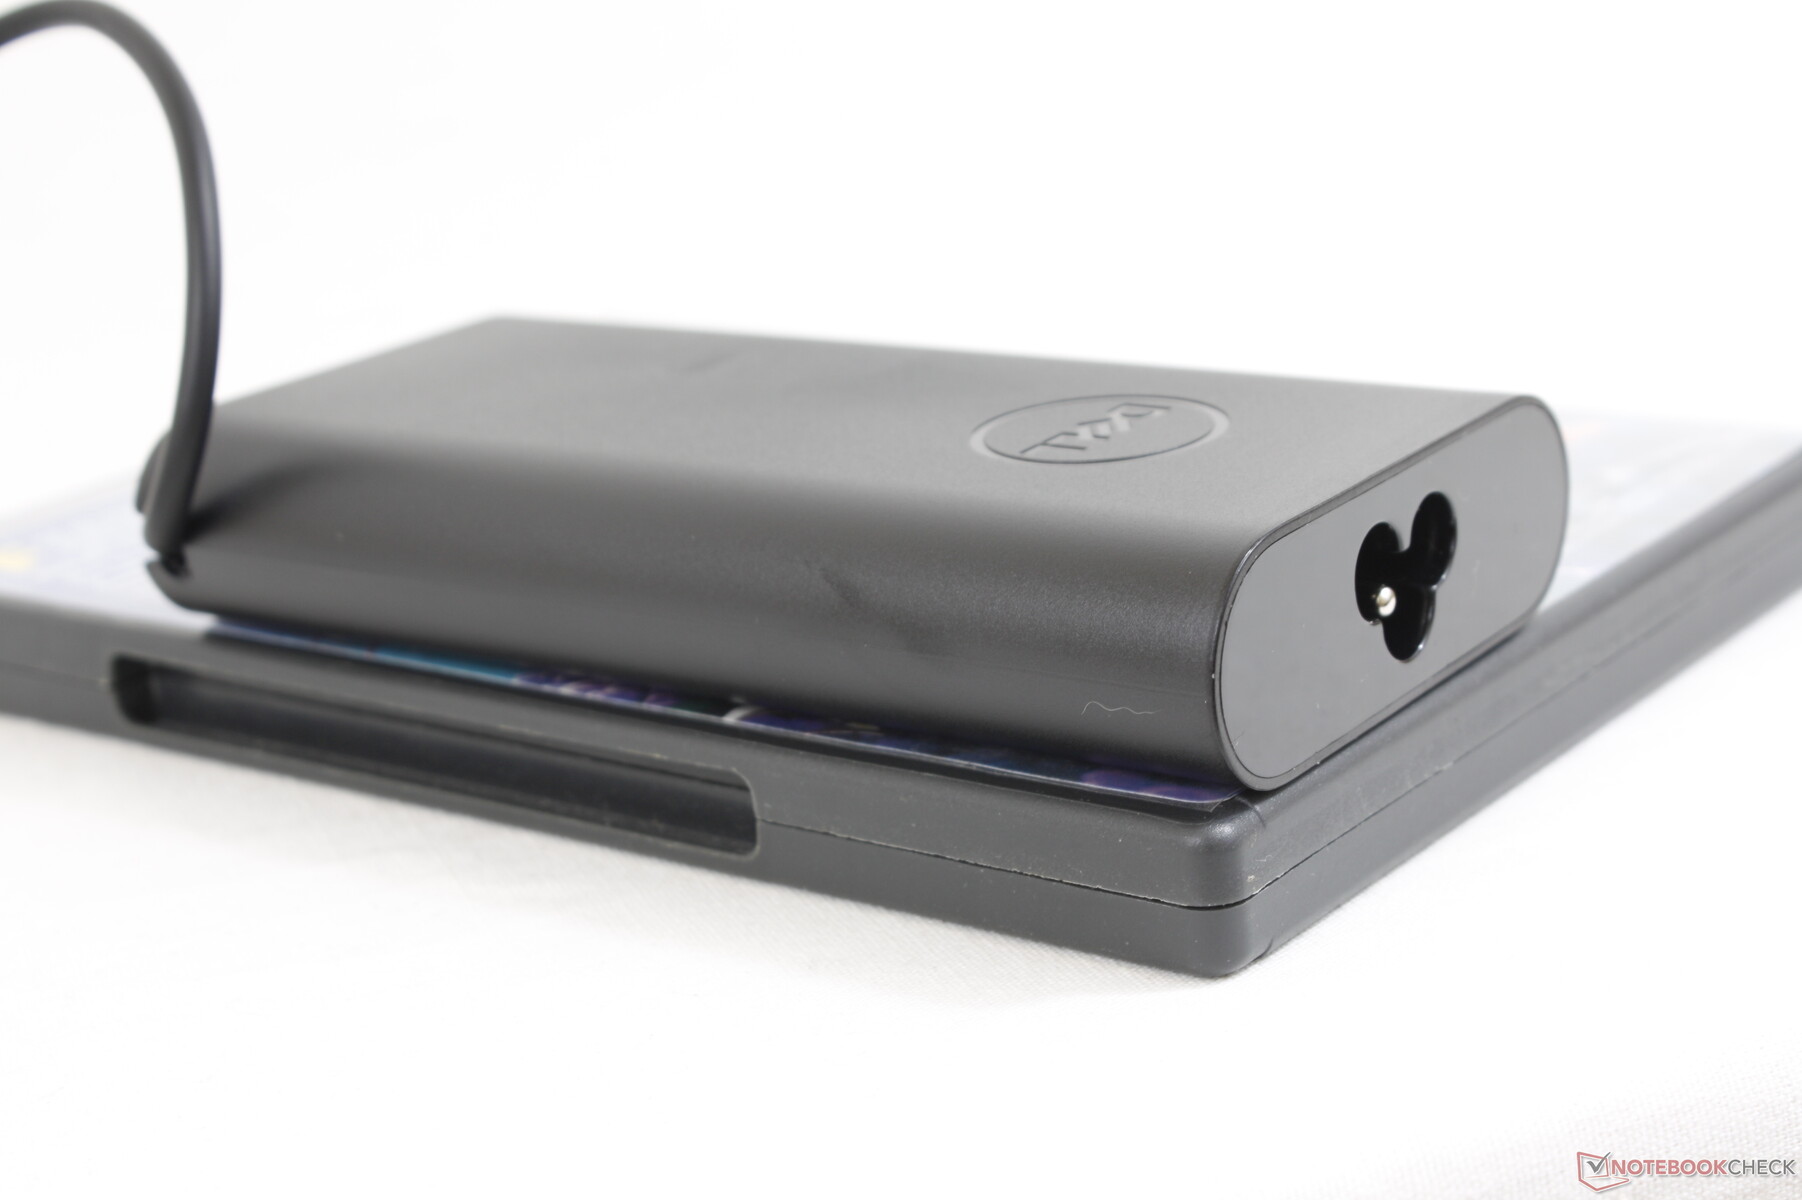
Im Gegensatz zu den meisten anderen Herstellern bietet Dell drei verschiedene Netzteile an: 60 W, 65 W und 90 W. Die 90-W-Option eignet sich für die Versorgung der CPU mit mehr Strom, wodurch ein höherer Turbo-Boost-Takt und damit eine höhere Gesamtleistung erzielt werden kann. Wie unser Stresstest jedoch zeigt, ist das System ohnehin nicht lange dazu in der Lage, hohe Turbo-Boost-Frequenzen aufrechtzuerhalten, was die theoretischen Vorteile des 90-W-Netzteils relativiert. Beim Ausführen von Prime95 stabilisiert sich der Verbrauch mit dem kleinen (~6,7 x 5,5 x 2,2 cm) 60-W-Netzteil bei 61 W. Bei der Wiederholung des Tests mit dem größeren (~13 x 6,5 x 2,3 cm) 90-W-Netzteil registrieren wir einen Spitzenverbrauch von 91,6 W zu Beginn des Tests, der sich jedoch nach ca. 90 Sekunden bei nur 51 W einpendelt, wie unsere Diagramme unten zeigen. Wer anspruchsvolle Programme ausführt, kann dennoch von der durch das 90-W-Netzteil kurzfristig erhöhten CPU-Leistung und den kürzeren Ladezeiten in Anwendungen oder bei der Bildverarbeitung profitieren.
| Aus / Standby | |
| Idle | |
| Last |
|
Legende:
min: | |
| Dell Latitude 9430 2-in-1 i7-1265U, Iris Xe G7 96EUs, , IPS, 2560x1600, 14" | Dell Latitude 9420 2-in-1 i7-1185G7, Iris Xe G7 96EUs, WDC PC SN530 SDBPNPZ-512G, IPS, 2560x1600, 14" | MSI Summit E14 Flip Evo A12MT i7-1260P, Iris Xe G7 96EUs, Samsung PM9A1 MZVL21T0HCLR, IPS, 2880x1800, 14" | LG Gram 14T90P i5-1135G7, Iris Xe G7 80EUs, Samsung SSD PM981a MZVLB512HBJQ, IPS, 1900x1200, 14" | Lenovo ThinkPad X1 Yoga G7 21CE002HGE i7-1270P, Iris Xe G7 96EUs, Samsung PM9A1 MZVL2512HCJQ, IPS, 1920x1200, 14" | Asus ZenBook Flip 14 UN5401QA-KN085W R7 5800H, Vega 8, Intel SSD 600p SSDPEKKW512G7, OLED, 2880x1800, 14" | |
|---|---|---|---|---|---|---|
| Stromverbrauch | -27% | -49% | 3% | -13% | -52% | |
| Idle min * (Watt) | 2.9 | 4.6 -59% | 5.4 -86% | 2.8 3% | 4.2 -45% | 6.4 -121% |
| Idle avg * (Watt) | 5.8 | 7.8 -34% | 9.5 -64% | 5.5 5% | 6.9 -19% | 9.4 -62% |
| Idle max * (Watt) | 6.6 | 8.2 -24% | 12.4 -88% | 6.4 3% | 7.6 -15% | 10.7 -62% |
| Last avg * (Watt) | 49.2 | 47.9 3% | 54.7 -11% | 45.4 8% | 36.2 26% | 52.2 -6% |
| Witcher 3 ultra * (Watt) | 35.3 | 38.8 -10% | 52 -47% | 34 4% | 43.2 -22% | 53 -50% |
| Last max * (Watt) | 63.1 | 87.1 -38% | 63.4 -0% | 65.9 -4% | 63.5 -1% | 69 -9% |
* ... kleinere Werte sind besser
Verbrauch Witcher 3 / Stresstest
Verbrauch externer Monitor
Akkulaufzeit
In der Praxis kann man mit einer WLAN-Laufzeit von mehr als 12 Stunden rechnen, worauf der 60-Wh-Akku wieder geladen werden muss. Alternativ gibt es eine 40-Wh-Konfiguration, die ein geringeres Gesamtgewicht und eine ca. 2/3 so hohe Laufzeit bietet.
Den leeren Akku mit dem mitgelieferten 60-W-Netzteil vollständig zu laden dauert knapp 2 Stunden.
| Dell Latitude 9430 2-in-1 i7-1265U, Iris Xe G7 96EUs, 60 Wh | Dell Latitude 9420 2-in-1 i7-1185G7, Iris Xe G7 96EUs, 60 Wh | MSI Summit E14 Flip Evo A12MT i7-1260P, Iris Xe G7 96EUs, 72 Wh | LG Gram 14T90P i5-1135G7, Iris Xe G7 80EUs, 72 Wh | Lenovo ThinkPad X1 Yoga G7 21CE002HGE i7-1270P, Iris Xe G7 96EUs, 57 Wh | Asus ZenBook Flip 14 UN5401QA-KN085W R7 5800H, Vega 8, 63 Wh | |
|---|---|---|---|---|---|---|
| Akkulaufzeit | -2% | -26% | -5% | -30% | -22% | |
| Idle (h) | 27.8 | 28.7 3% | 22.1 -21% | |||
| WLAN (h) | 12.8 | 11.7 -9% | 8.2 -36% | 12.1 -5% | 8.9 -30% | 8.7 -32% |
| Last (h) | 2.4 | 2.4 0% | 1.9 -21% | 2.3 -4% | 1.7 -29% | 2.1 -12% |
| H.264 (h) | 12.2 | 9 |
Pro
Contra
Fazit — Gleiche Hülle, neuer Name
Da die wichtigste Aktualisierung beim neuen Modell des Latitude 9420 2-in-1 der neue Prozessor ist, kommt man hier in den Genuss von allem, was uns am ursprünglichen Modell so gut gefallen hat. Ähnlich wie bei den meisten anderen Alder-Lake-Laptops bietet die CPU mehr Leistung, verbraucht jedoch auch mehr Strom. Wer auf die schnellere CPU, die 5G-Optionen und die 2-MP-Webcam im Alltag verzichten kann, bekommt beim Latitude 9420 2-in-1 fast das gleiche Benutzererlebnis für einen niedrigeren Preis.
Das Latitude 9430 2-in-1 ist ein Convertible für anspruchsvolle Anwender, die das Potenzial der Intel-12.-Gen.-CPU in einem geeigneten Szenario nutzen können. Für alle anderen bietet das nahezu identische Latitude 9420 2-in-1 als Bürolaptop ein besseres Preis-Leistungs-Verhältnis.
Ein kleines Ärgernis sind die fehlende Unterstützung für 80-mm-M.2-SSDs und die bei Modellen ohne WAN nicht vorhandenen, vorinstallierten WAN-Antennen. Der Turbo Boost der CPU kommt nur eingeschränkt zum Einsatz und die Leistung ist im Akkumodus eingeschränkt. Leider muss außerdem der Aktivstylus separat erworben werden, während ein entsprechender Stift bei Konkurrenten wie dem Lenovo ThinkPad X1 Yoga G7 direkt mitgeliefert wird. Die meisten Laptops unterstützen die üblicheren, 80 mm langen SSDs, dagegen gestaltet sich der SSD-Tausch bei unserem Dell etwas schwieriger. Das HP EliteBook 1040 besitzt einen deutlich helleren Touchscreen mit einer niedrigeren Auflösung von 1.200p. Um den obligatorischen Nachfolger attraktiver zu machen, könnte Dell in Zukunft das visuelle Erlebnis zum Beispiel mit einer 5-MP-Webcam und einem schnellen OLED-Display aufwerten.
Preis und Verfügbarkeit
Dell bietet derzeit klassische Laptopmodelle und 2-in-1-Konfigurationen des Latitude 9430 an. Unsere Konfiguration mit dem Core i7-1265U und 16 GB RAM kostet derzeit rund 2.700 Euro.
Dell Latitude 9430 2-in-1
- 05.08.2022 v7 (old)
Allen Ngo
Preisvergleich

