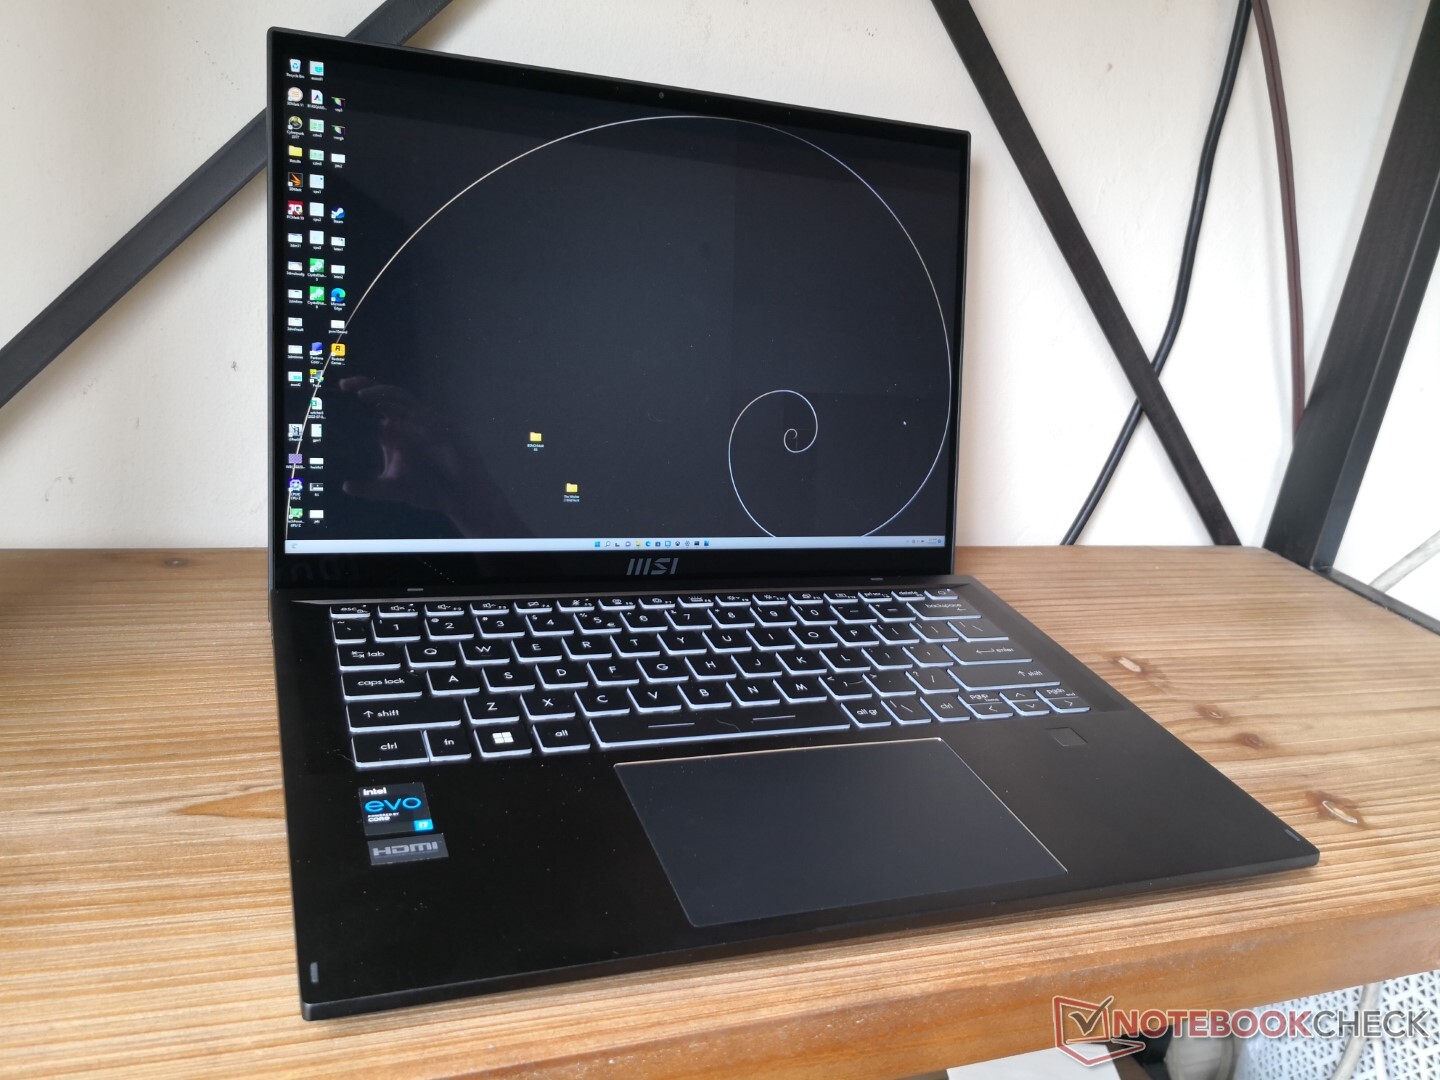
MSI Summit E14 Flip Evo A12M Convertible-Bewertung: Eine legitime Alternative zu HP, Dell oder Lenovo
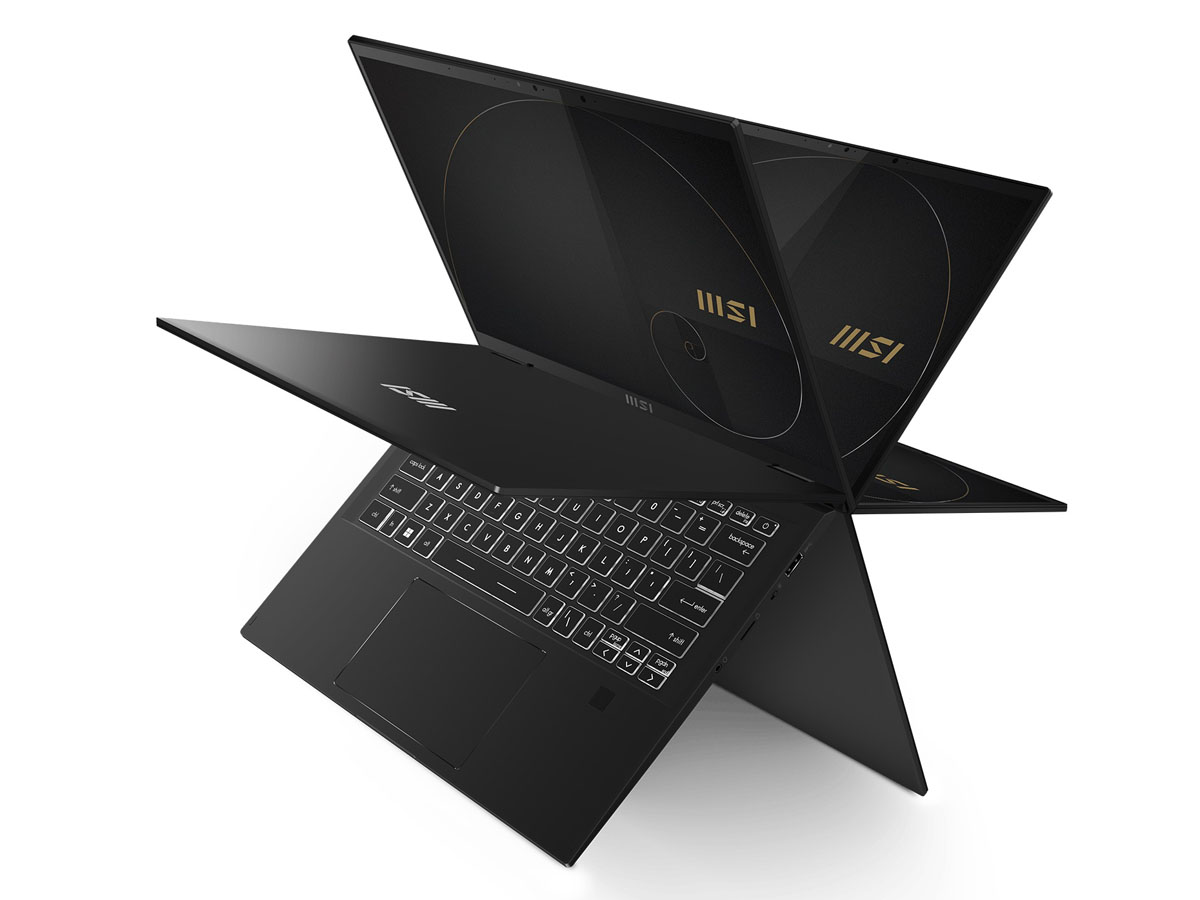
Nicht zu verwechseln mit der Summit E14 clamshell ist die Summit E14 Flip die Convertible-Version mit 360°-Scharnieren und einem insgesamt anderen Gehäusedesign. Das Modell debütierte im März neben dem kleineren und aufgefrischten 13-Zoll Summit E13 Flip.
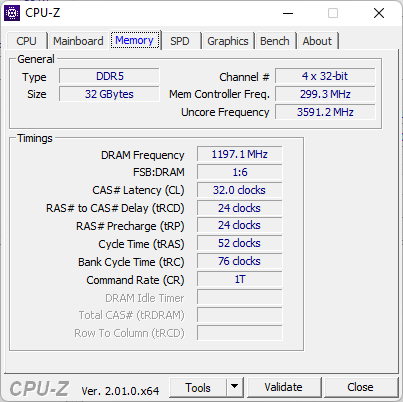
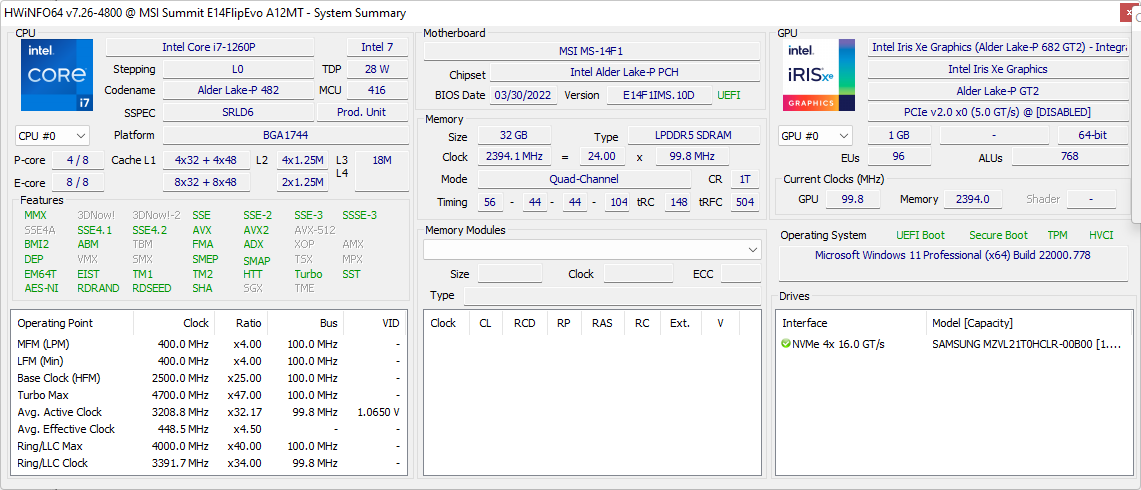
Unser Testgerät wird mit der Intel Alder Lake-P Core i7-1260P CPU, 32 GB LPDDR5 RAM, 16:10 QHD+ IPS Touchscreen und einer 1 TB NVMe SSD für ca. $ 1600 bis $ 1700 USD im Einzelhandel geliefert. Zusätzliche SKUs mit diskreten GeForce MX-Optionen sind für die nahe Zukunft geplant.
Der Summit E14 Flip konkurriert mit anderen High-End-Prosumer- oder geschäftsorientierten Convertibles wie dem Lenovo Yoga 9i 14, Dell Latitude 9420 2-in-1, LG Gram 14T90P, oder Asus ExpertBook B7 Flip.
Weitere MSI-Bewertungen:
Mögliche Konkurrenten im Vergleich
Bew | Datum | Modell | Gewicht | Dicke | Größe | Auflösung | Preis ab |
|---|---|---|---|---|---|---|---|
| 86.1 % v7 (old) | 07 / 2022 | MSI Summit E14 Flip Evo A12MT i7-1260P, Iris Xe G7 96EUs | 1.6 kg | 17.9 mm | 14.00" | 2880x1800 | |
| 82.3 % v7 (old) | 08 / 2021 | MSI Summit E14 A11SCS i7-1185G7, GeForce GTX 1650 Ti Max-Q | 1.3 kg | 16 mm | 14.00" | 3840x2160 | |
| 84.1 % v7 (old) | 07 / 2022 | Asus VivoBook S 14X S5402Z i7-12700H, Iris Xe G7 96EUs | 1.6 kg | 17.9 mm | 14.50" | 2880x1800 | |
| 87.5 % v7 (old) | 05 / 2022 | LG Gram 14T90P i5-1135G7, Iris Xe G7 80EUs | 1.2 kg | 17 mm | 14.00" | 1900x1200 | |
| 87.6 % v7 (old) | 06 / 2022 | Lenovo Yoga Slim 7i Pro 14IAP G7 i5-1240P, Iris Xe G7 80EUs | 1.3 kg | 14.6 mm | 14.00" | 2880x1800 | |
| 89 % v7 (old) | 07 / 2021 | Dell Latitude 9420 2-in-1 i7-1185G7, Iris Xe G7 96EUs | 1.5 kg | 13.94 mm | 14.00" | 2560x1600 |
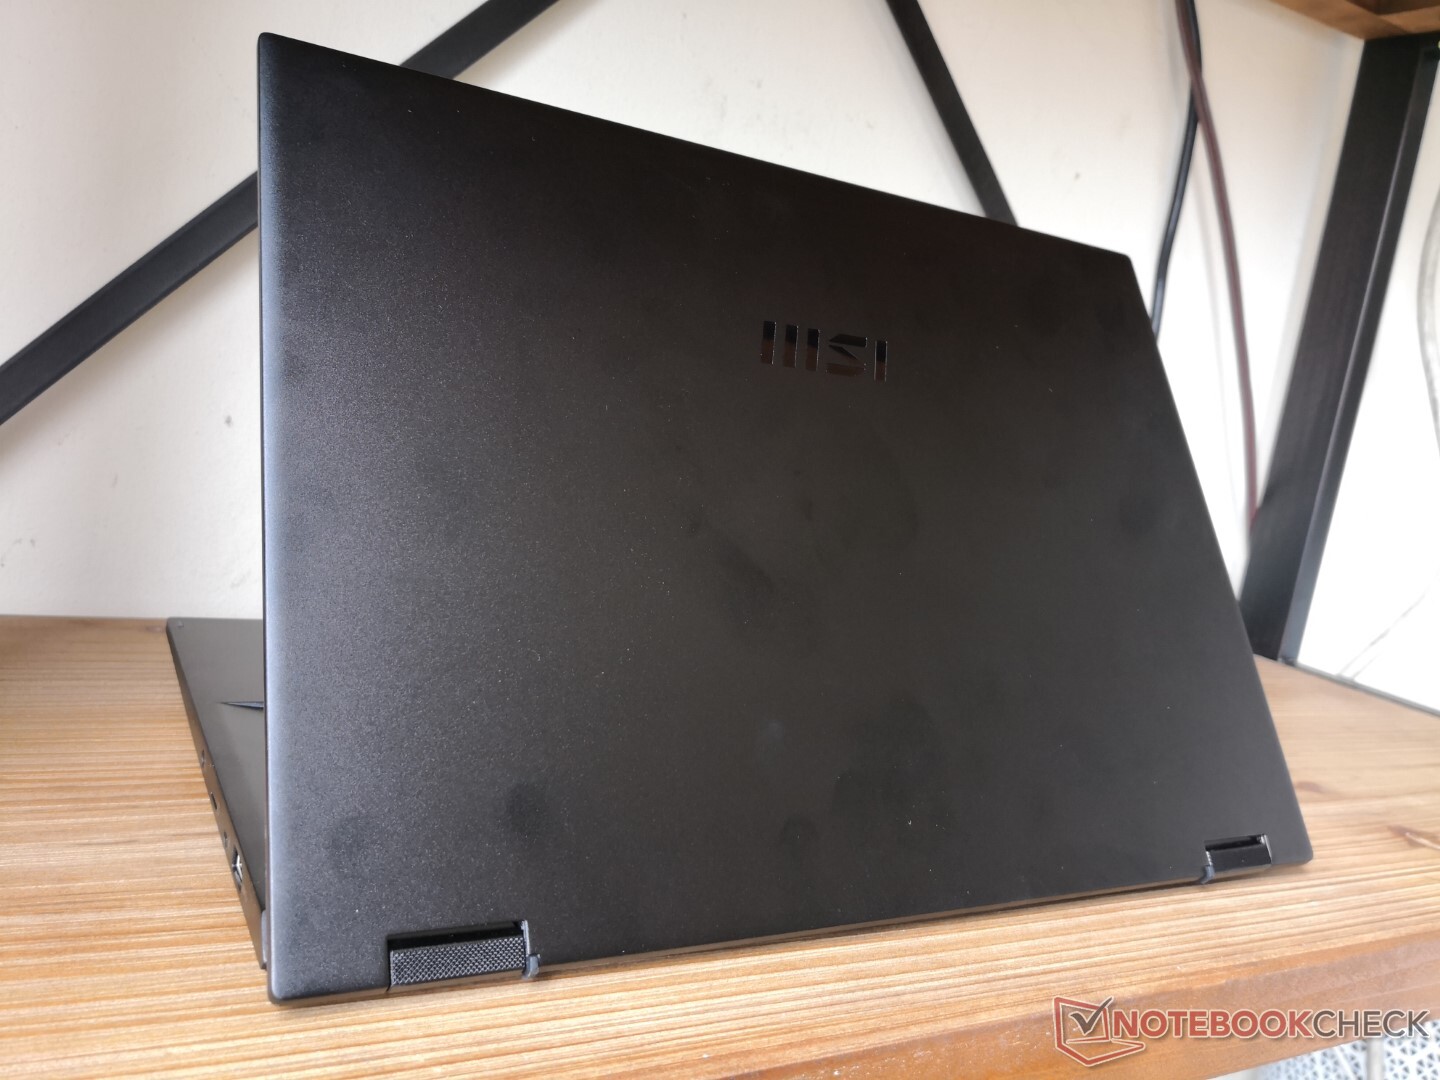
Gehäuse — Härter als vorher
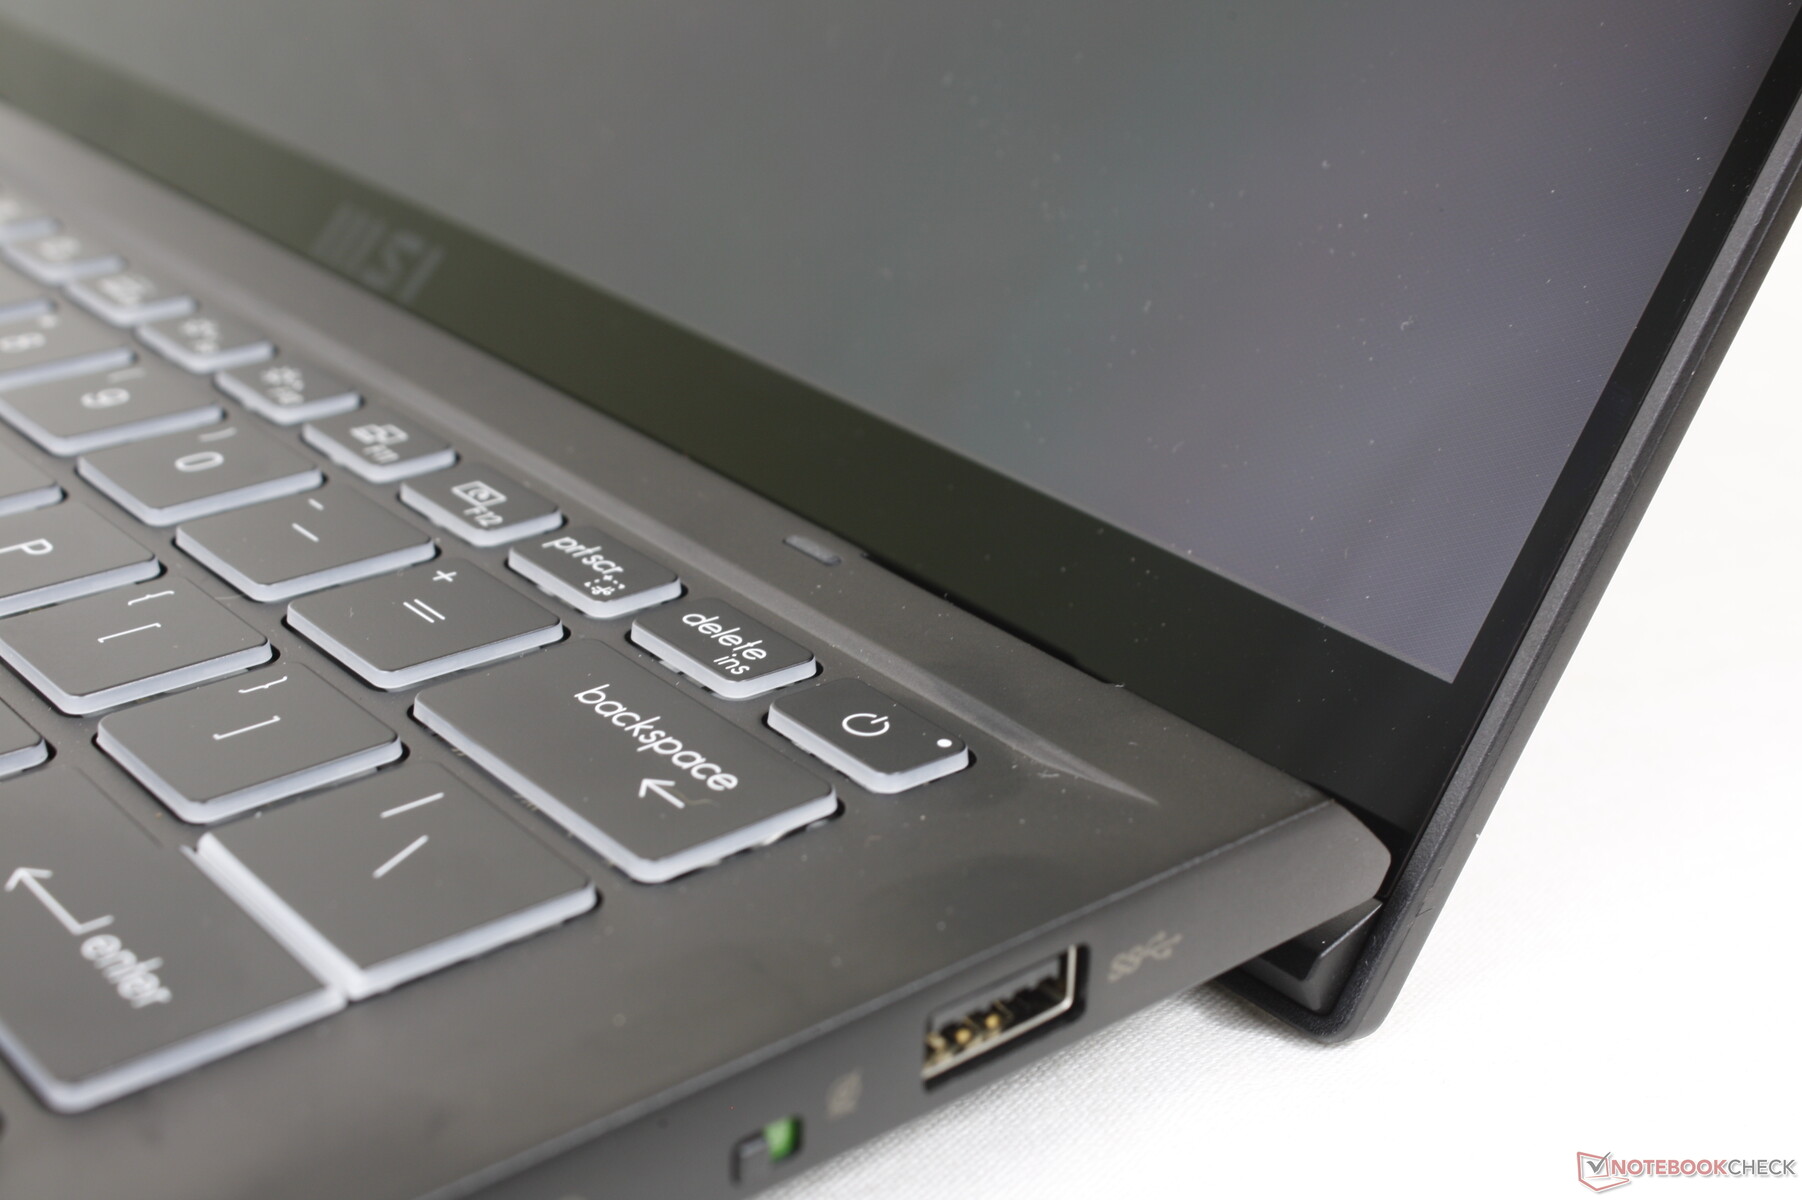
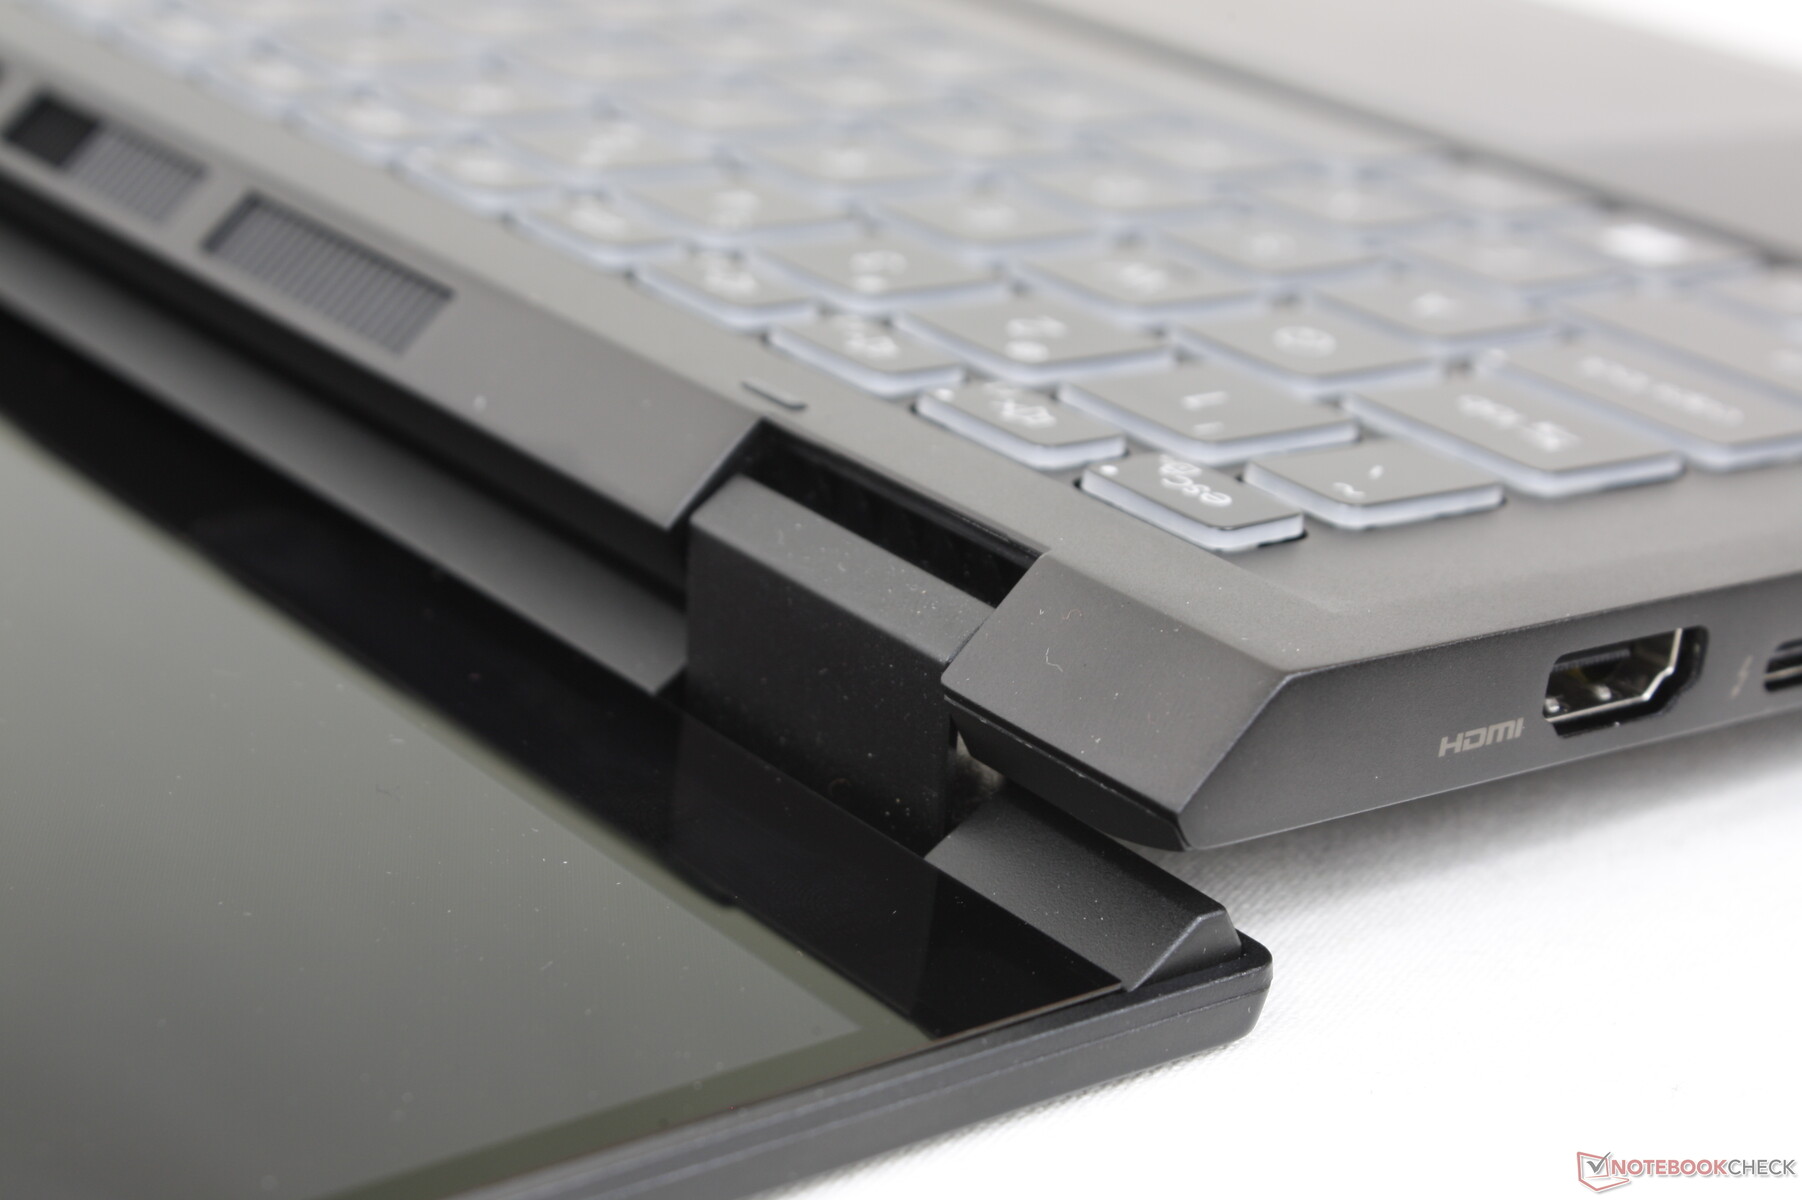
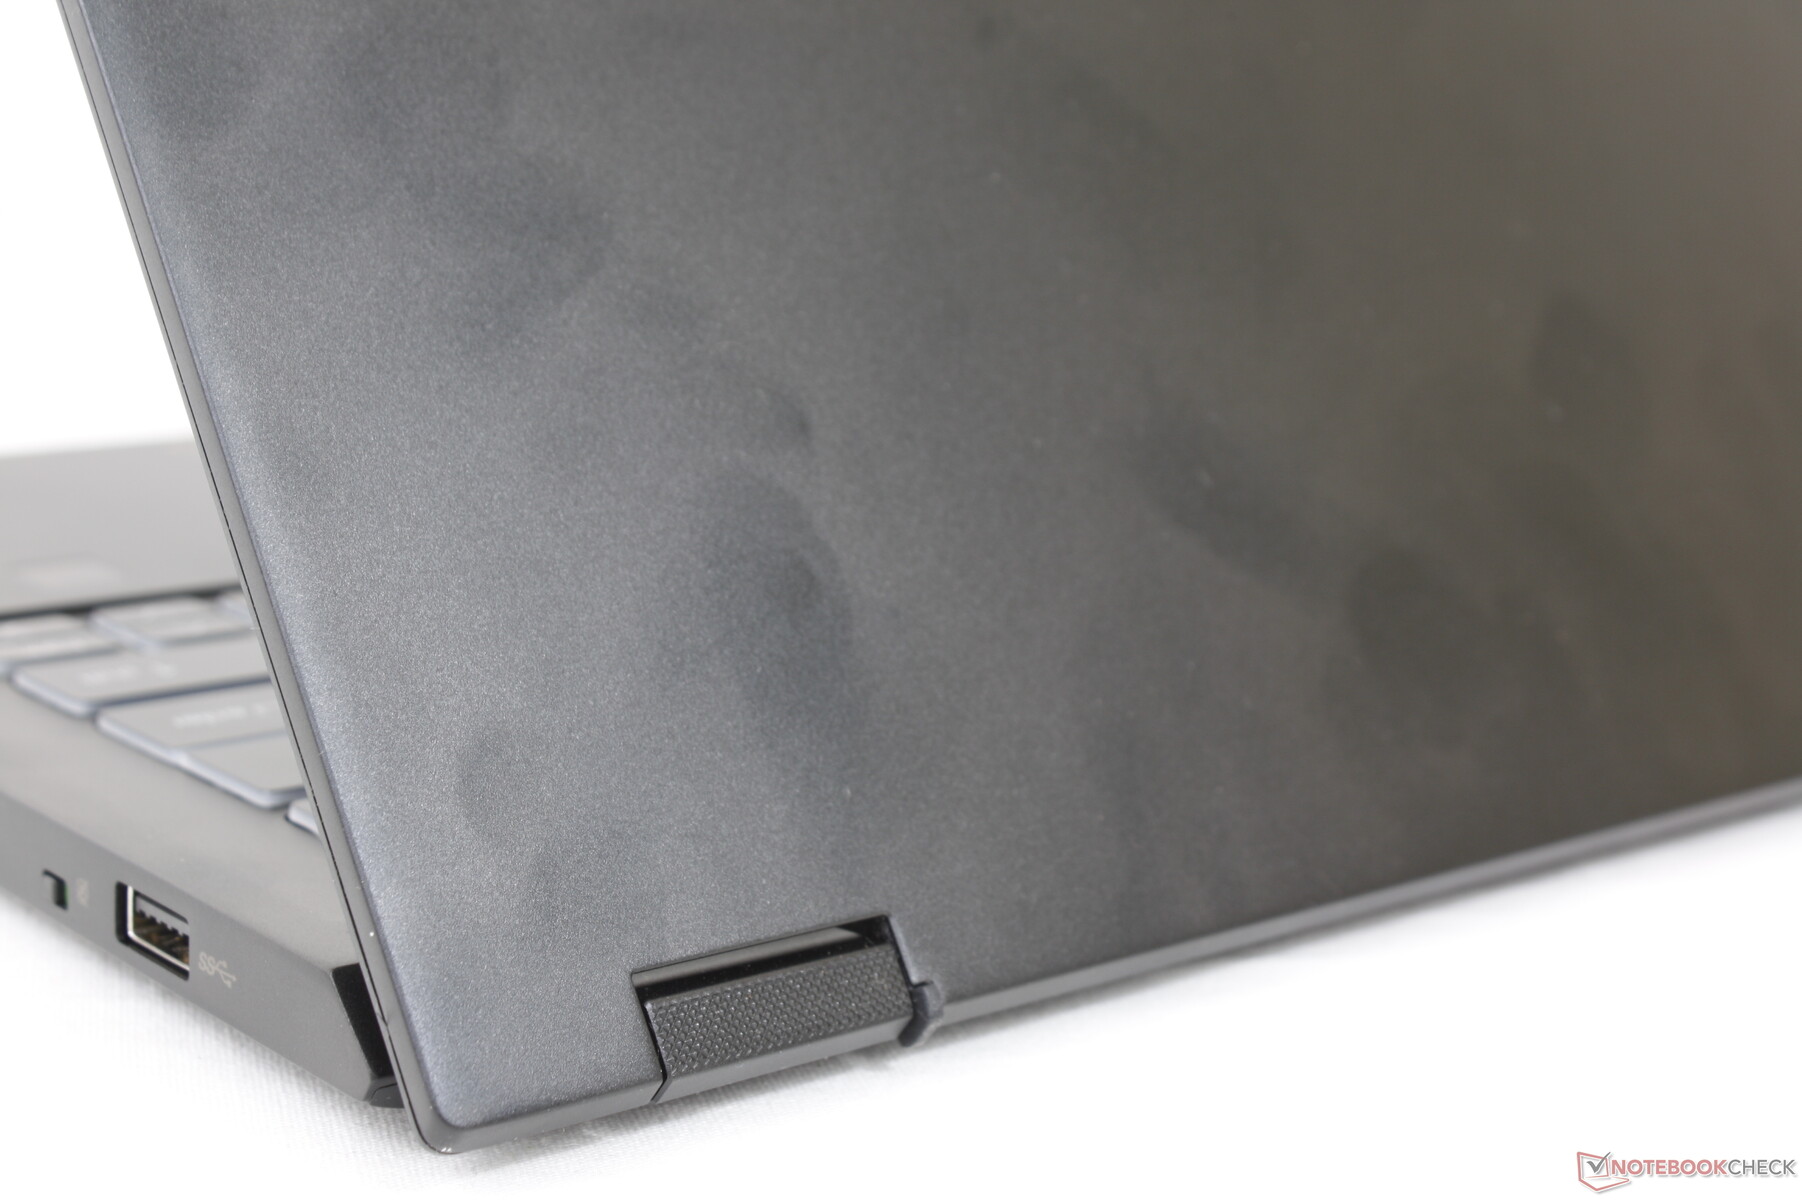
Obwohl das Summit E14 Flip Convertible auf den ersten Blick aufgrund seiner mattschwarzen Beschichtung wie das Summit E14 Clamshell aussehen mag, so sind die beiden innerlich und äußerlich tatsächlich recht unterschiedlich. Verschwunden sind das goldene Logo und die Einfassungen um das Clickpad für einen subtileren Look. Das Rundum-Glasdesign ist jetzt Standard, um sowohl die Festigkeit des Displaydeckels zu verstärken als auch um Touchscreen-/Stifteingaben zu ermöglichen. Die Scharniere, die beim Clamshell-Modell auf 180° begrenzt sind, wurden für die neue 360°-Bauform komplett umgestaltet, um größer und stärker zu sein. Wir denken jedoch immer noch, dass die Scharniere in einigen Winkeln steifer sein könnten, im Besonderen im Bereich zwischen 150° und 180°, für ein besseres Gefühl der Langlebigkeit.
Das Modell behält die MIL-STD-810G-Zertifizierung, die es mit der ursprünglichen Clamshell teilt. Die Basis ist hart und widerstandsfähig gegen Verdrehungen und Vertiefungen auf einem ähnlichen Level wie viele andere Prosumer Convertibles wie das Asus Zenbook Flip, XPS 13 2-in-1, oder das Lenovo Yoga 9i 14. Es handelt sich um eine wesentliche Verbesserung gegenüber den billigeren MSI Modern Laptops, die unserer Meinung nach im Vergleich zur Konkurrenz stets dünner waren.
In Bezug auf Größe und Gewicht ist das MSI-Modell sowohl größer als auch schwerer als viele andere 14-Zoll-Convertibles. LG Gram 14T90P und Latitude 9420 2-in-1 zum Beispiel sind beide leichter, kleiner und noch dünner als unser Summit E14 Flip. Das Lenovo Yoga 9i 14 Convertible ist etwas größer in der Grundfläche, aber es ist dennoch dünner und leichter, um ca. 3 mm bzw. 200 Gramm.
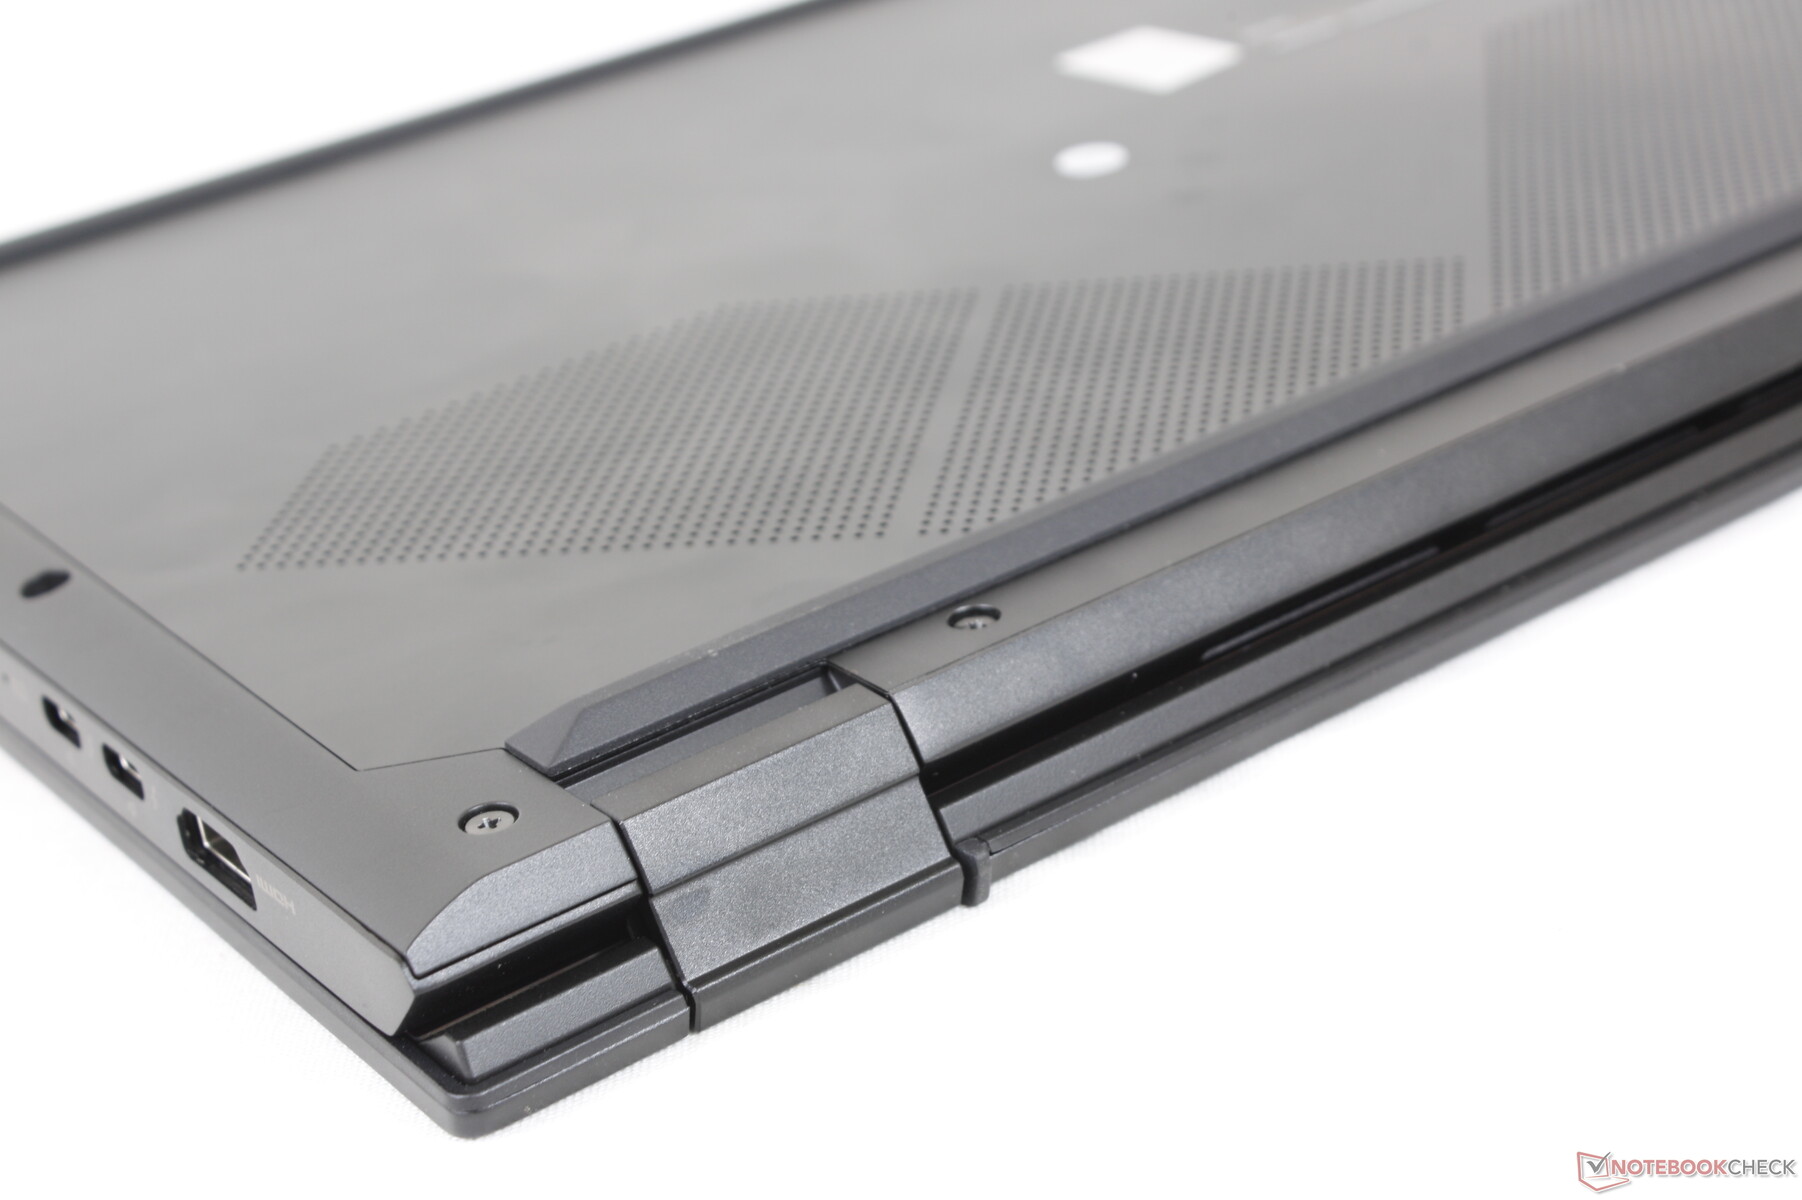
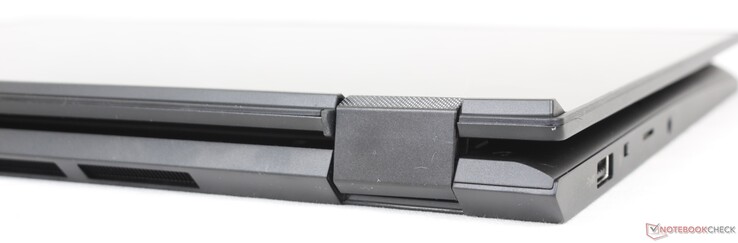
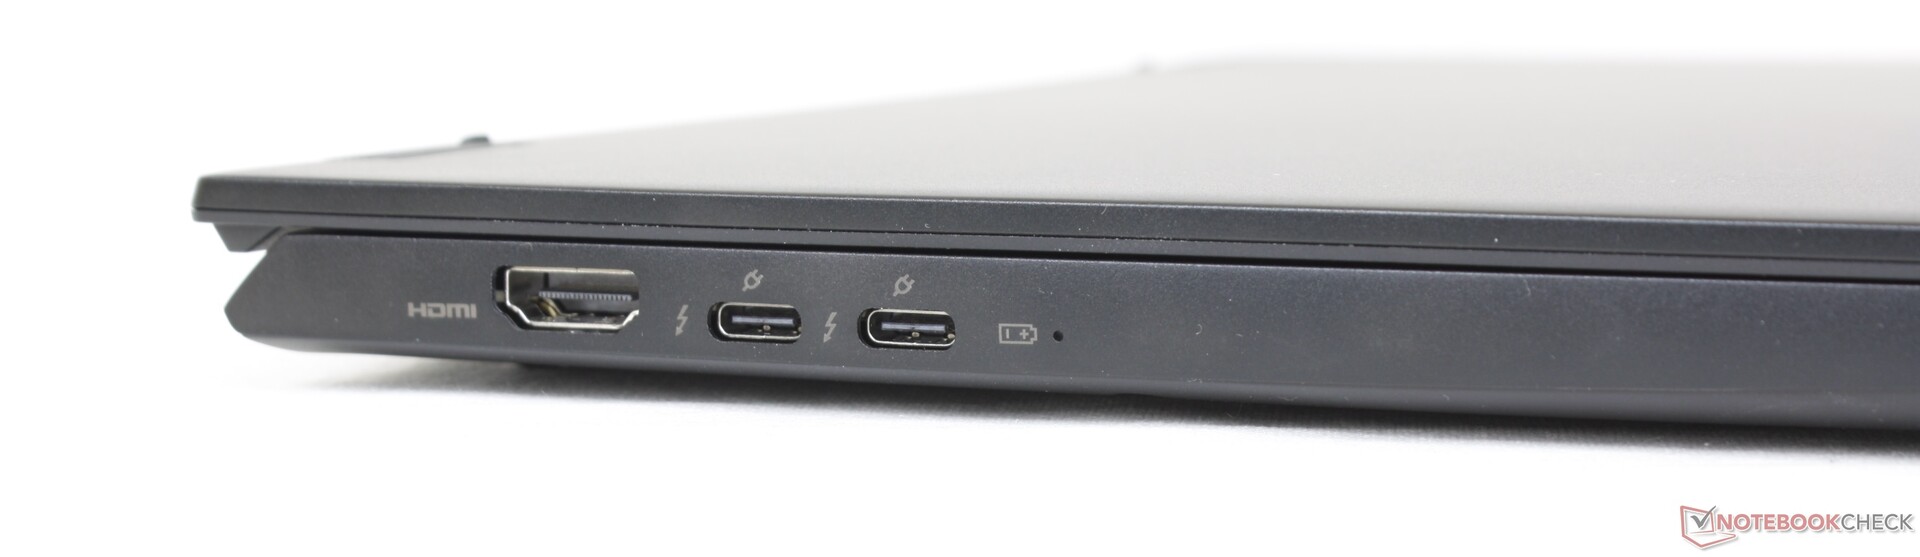
Konnektivität — Thunderbolt 4-Support
Dieses Convertible-Modell inkludiert alle Anschlussports der ursprünglichen Clamshell-Version sowie ein Full-Size-HDMI und einen Webcam-Switch. Es wäre jedoch toll gewesen, ein Kensington-Lock zu sehen, da die Summit-Serie professioneller ausgerichtet ist. Die Portpositionierung hätte am linken Rand besser sein können, wo die drei Ports etwas zu eng beieinanderliegen.
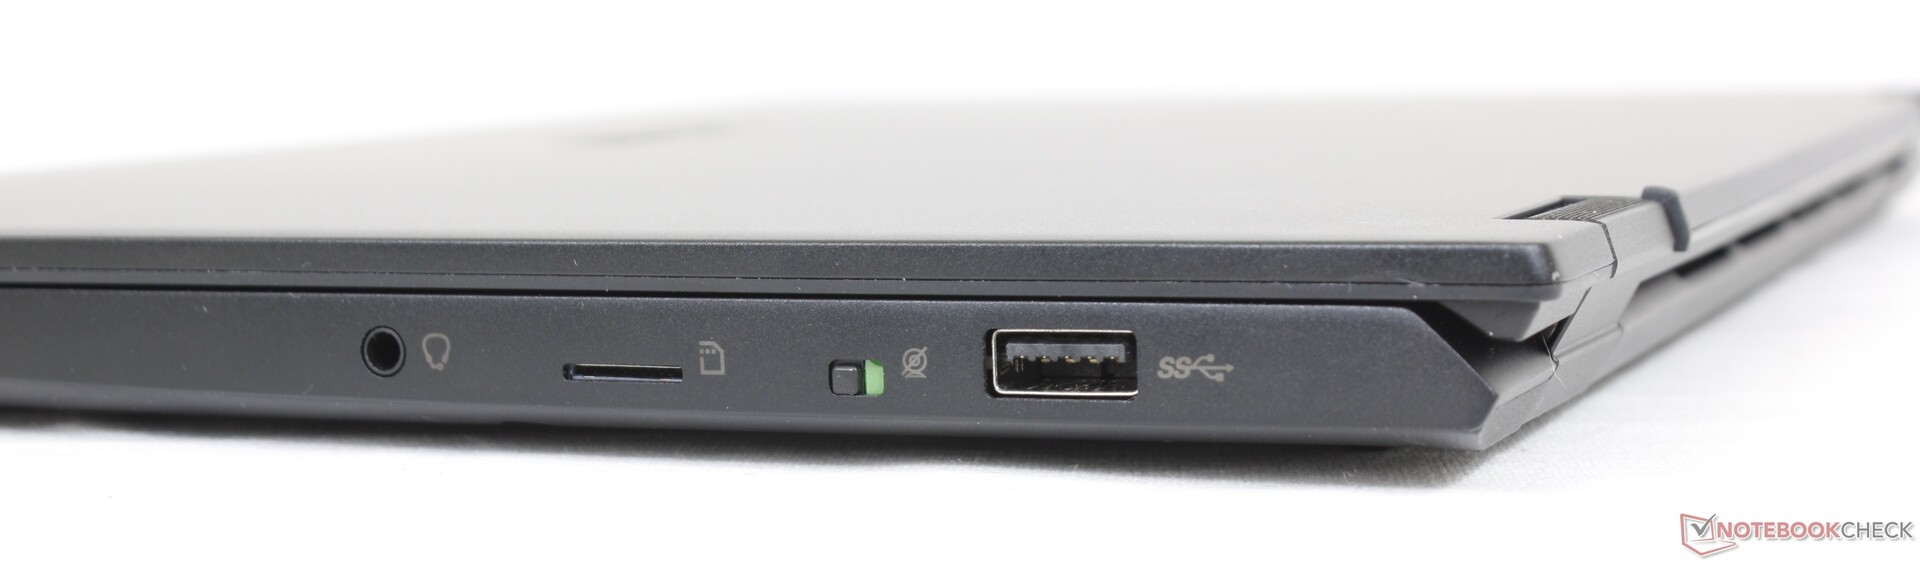

SD-Cardreader
Leider ist der integrierte federbelastete MicroSD-Leser langsamer als der auf der Summit E14 Clamshell. Das Verschieben von 1 GB an Bildern von unserem UHS-II-Testkarten-Top-Desktop dauert etwa 21 Sekunden im Vergleich zu nur 6 bis 7 Sekunden auf dem Summit E14.

| SD Card Reader | |
| average JPG Copy Test (av. of 3 runs) | |
| MSI Summit E14 A11SCS (AV Pro V60) | |
| Dell Latitude 9420 2-in-1 (AV PRO microSD 128 GB V60) | |
| LG Gram 14T90P (AV Pro V60) | |
| MSI Summit E14 Flip Evo A12MT (AV Pro V60) | |
| maximum AS SSD Seq Read Test (1GB) | |
| MSI Summit E14 A11SCS (AV Pro V60) | |
| Dell Latitude 9420 2-in-1 (AV PRO microSD 128 GB V60) | |
| LG Gram 14T90P (AV Pro V60) | |
| MSI Summit E14 Flip Evo A12MT (AV Pro V60) | |
Kommunikation
Ein Intel AX1675s ist standardmäßig für Wi-Fi 6E und Bluetooth 5.2 Konnektivität ausgestattet. Bei der Kopplung mit unserem 6-GHz-Netzwerk sind keine Probleme aufgetreten.
| Networking | |
| iperf3 transmit AX12 | |
| MSI Summit E14 A11SCS | |
| Dell Latitude 9420 2-in-1 | |
| iperf3 receive AX12 | |
| MSI Summit E14 A11SCS | |
| Dell Latitude 9420 2-in-1 | |
| iperf3 receive AXE11000 6GHz | |
| Asus VivoBook S 14X S5402Z | |
| MSI Summit E14 Flip Evo A12MT | |
| iperf3 transmit AXE11000 6GHz | |
| MSI Summit E14 Flip Evo A12MT | |
| Asus VivoBook S 14X S5402Z | |
Webcam
Bei der Webcam handelt es sich um eine 2 MP im Gegensatz zu den meisten anderen Laptops, wo noch 1 MP-Sensoren üblich sind. Windows Hello wird unterstützt.
Für die Privatsphäre setzt das Modell auf einen elektronischen Schalter anstelle eines echten Auslösers, um die Webcam zu deaktivieren.


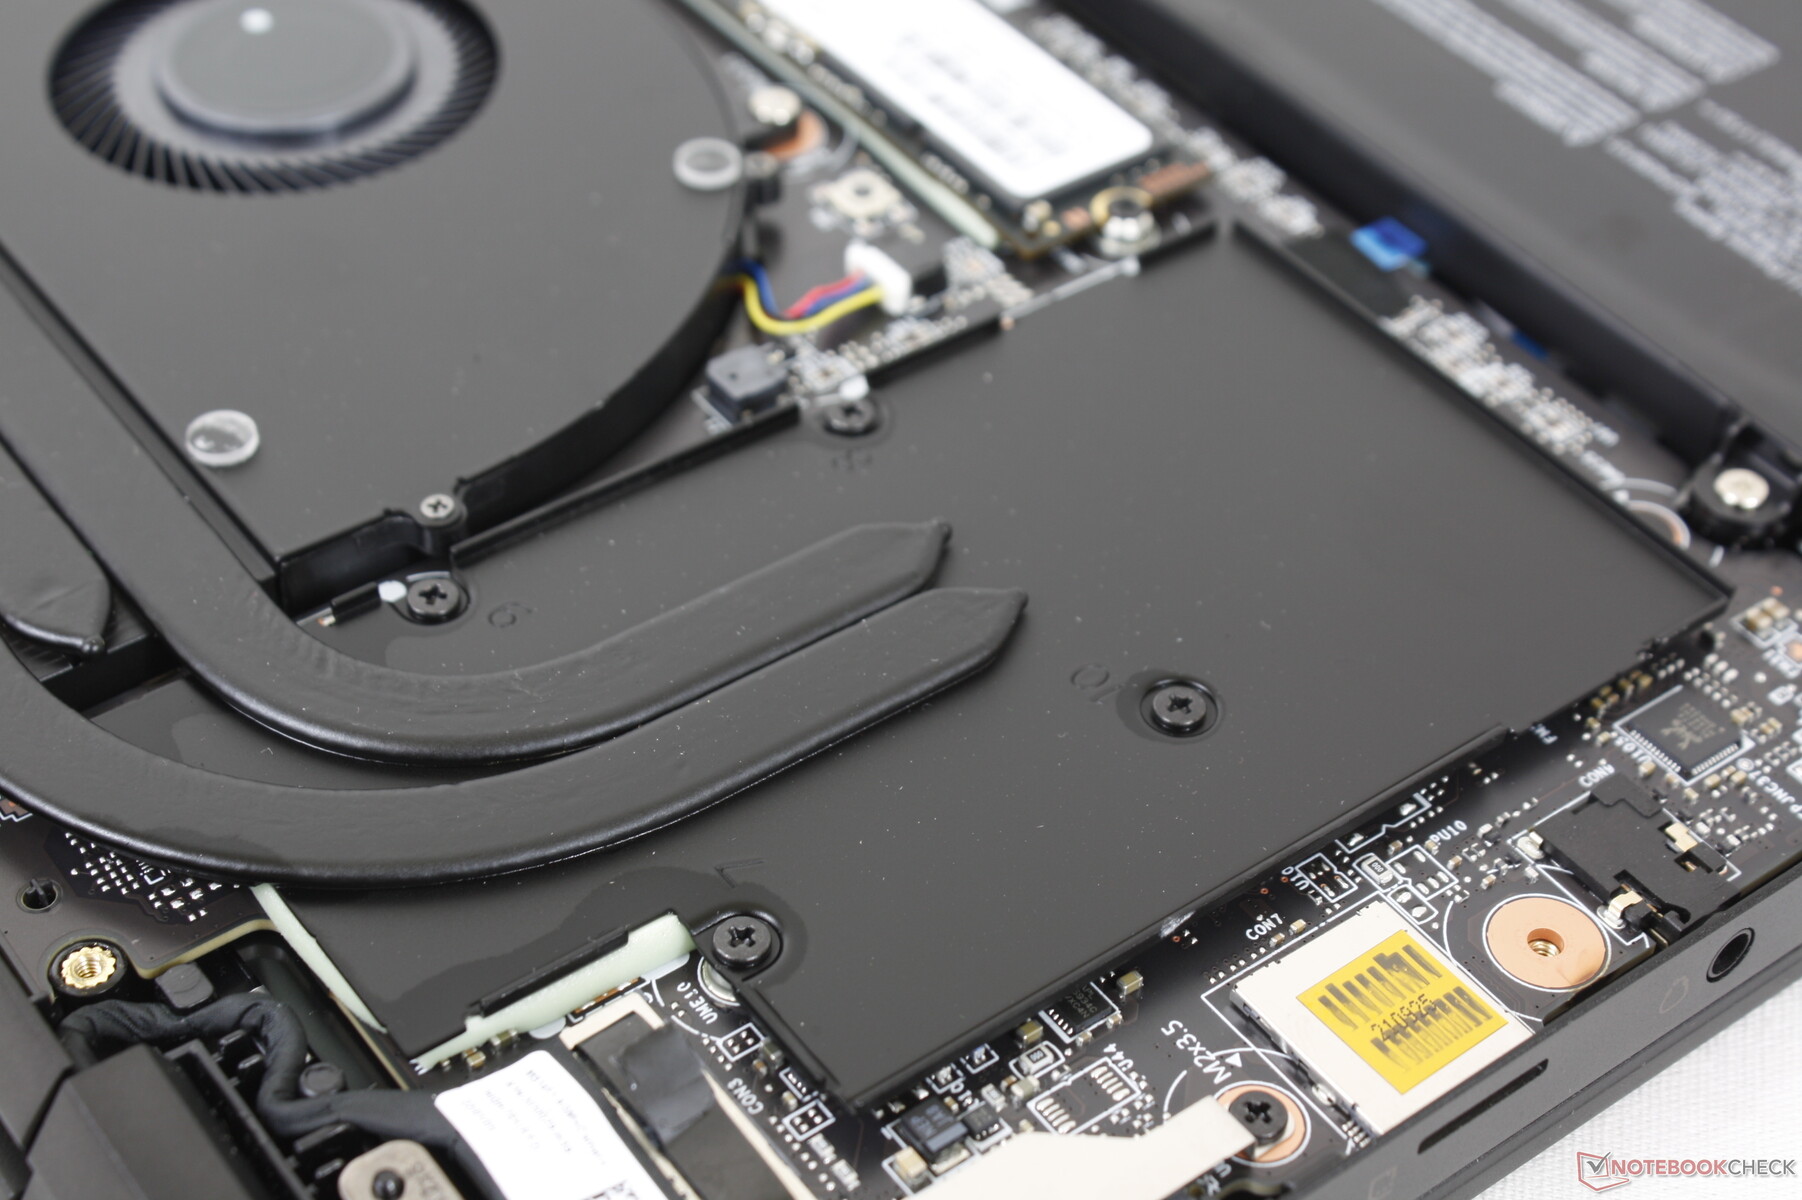
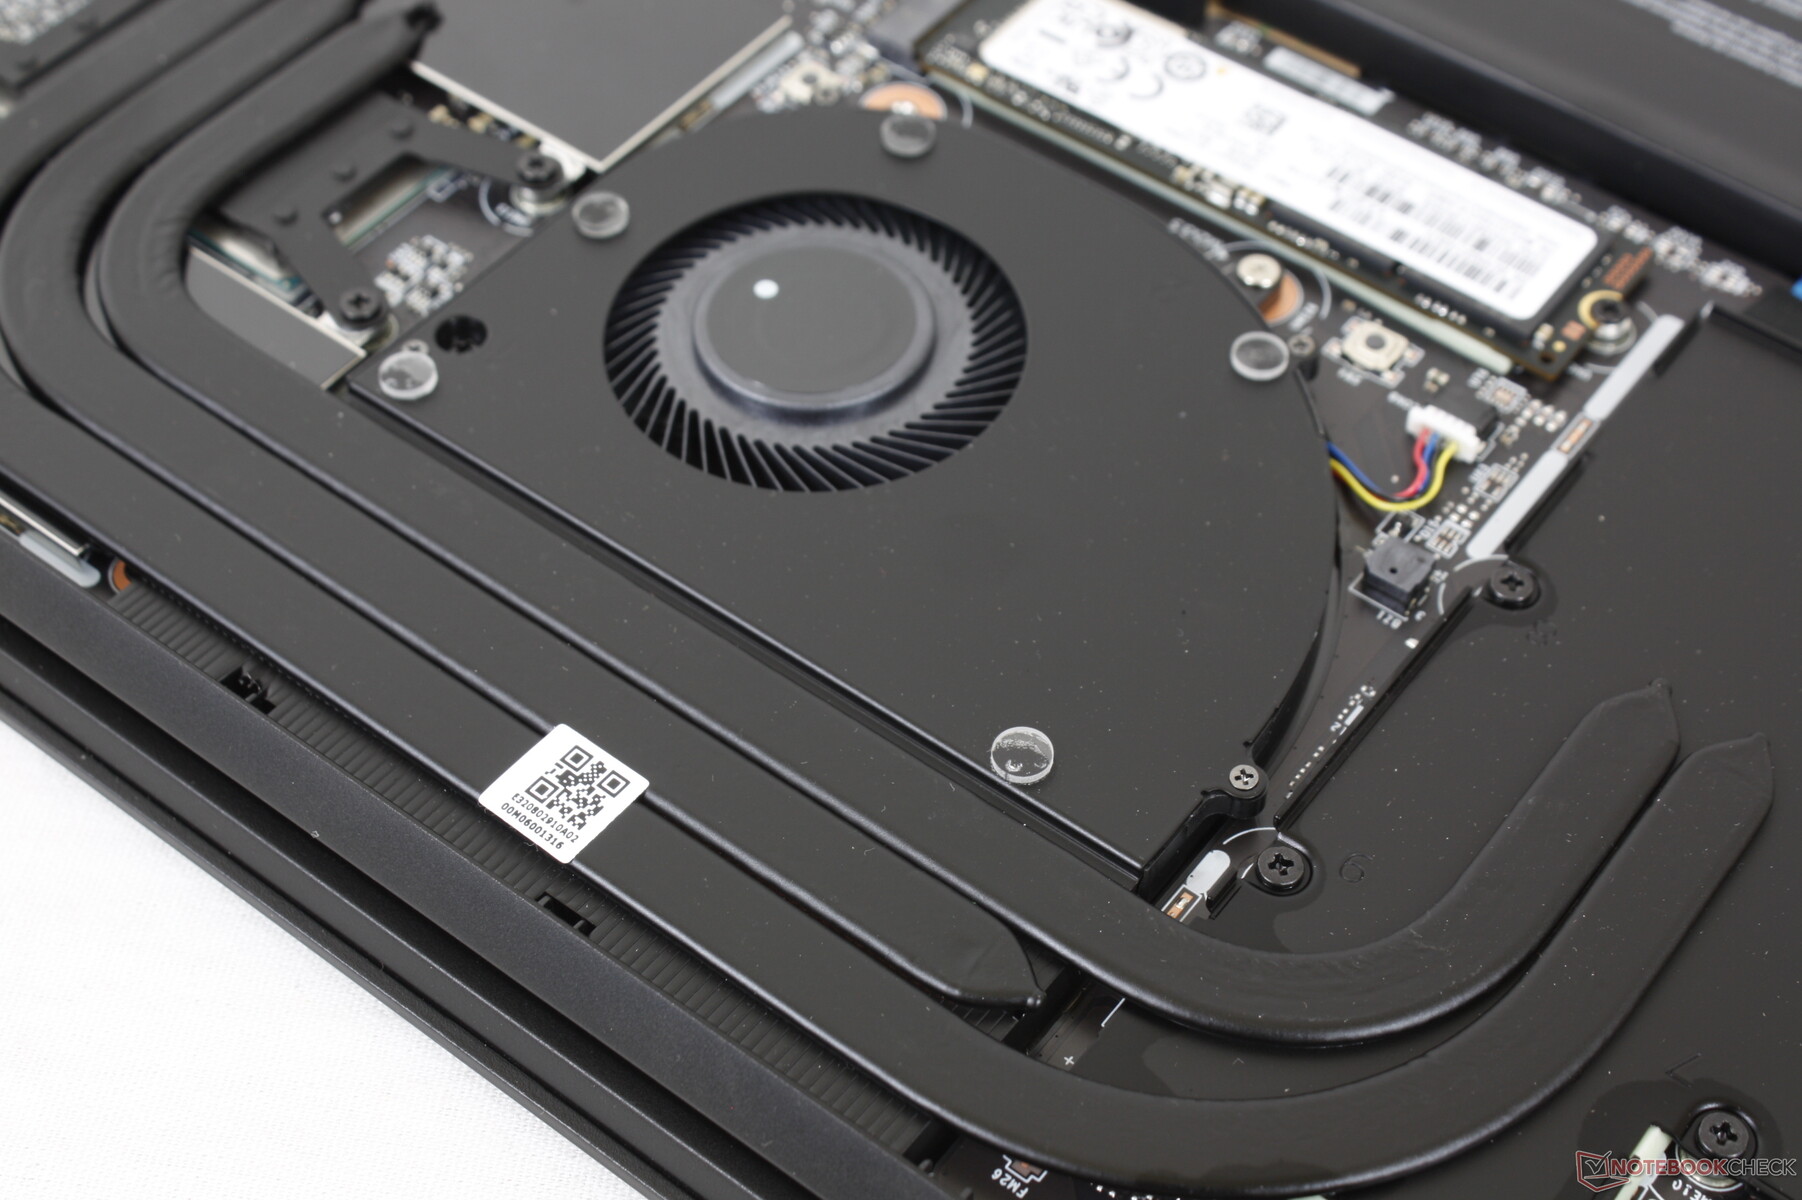
Instandhaltung
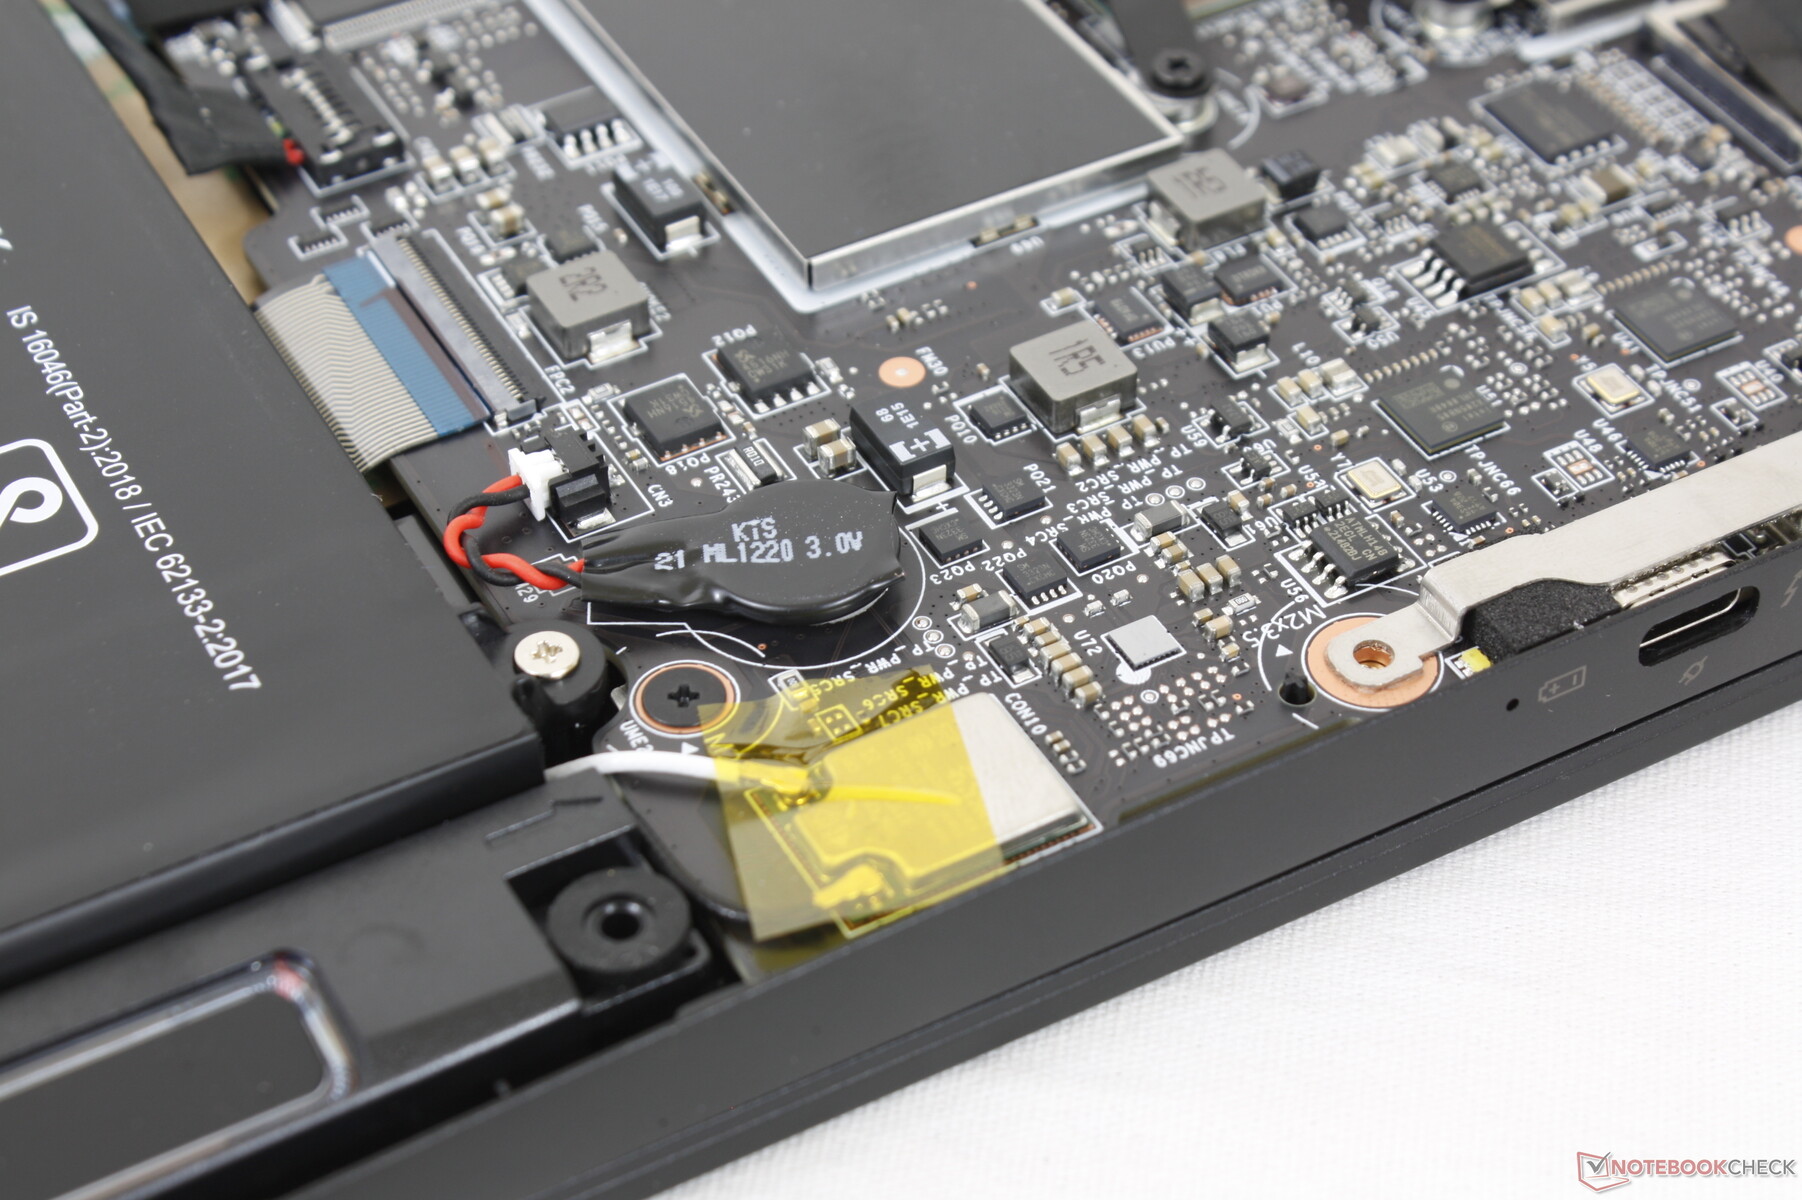
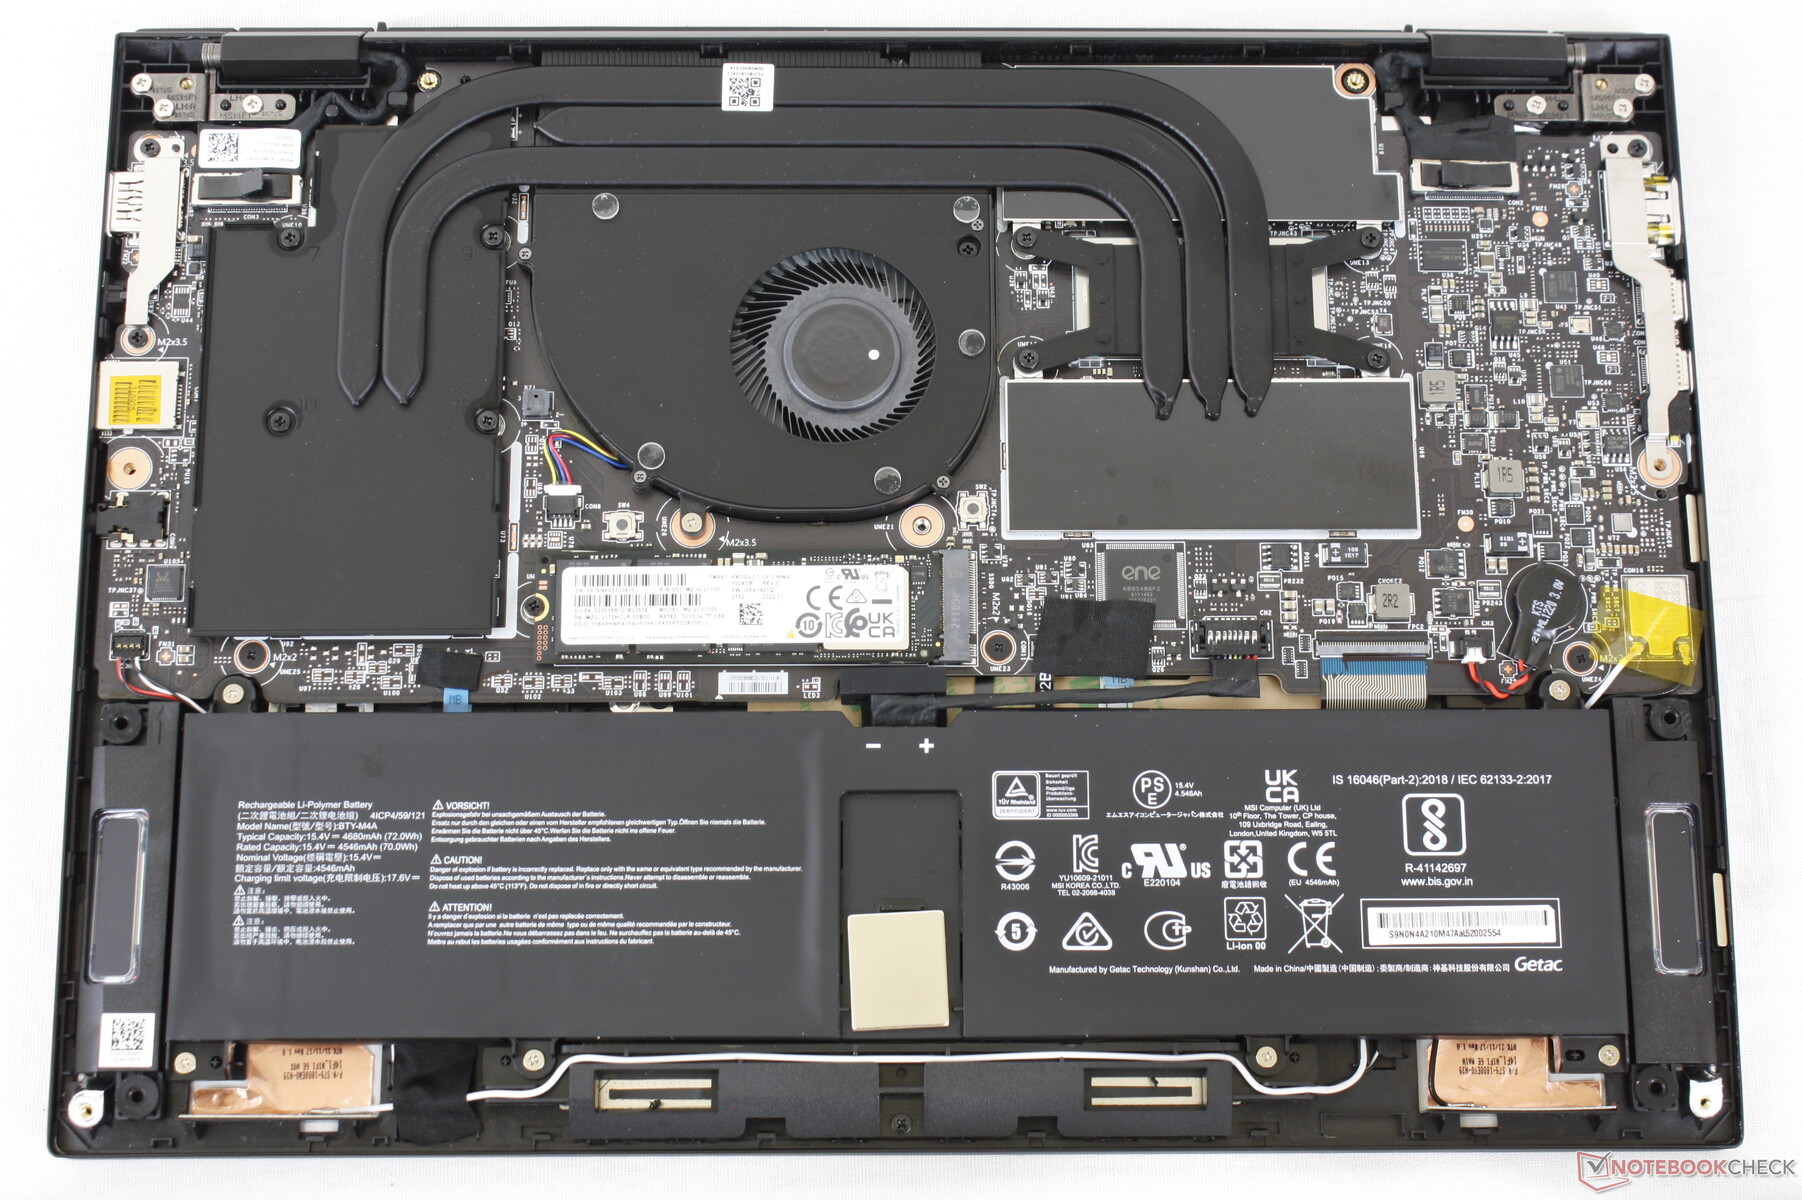
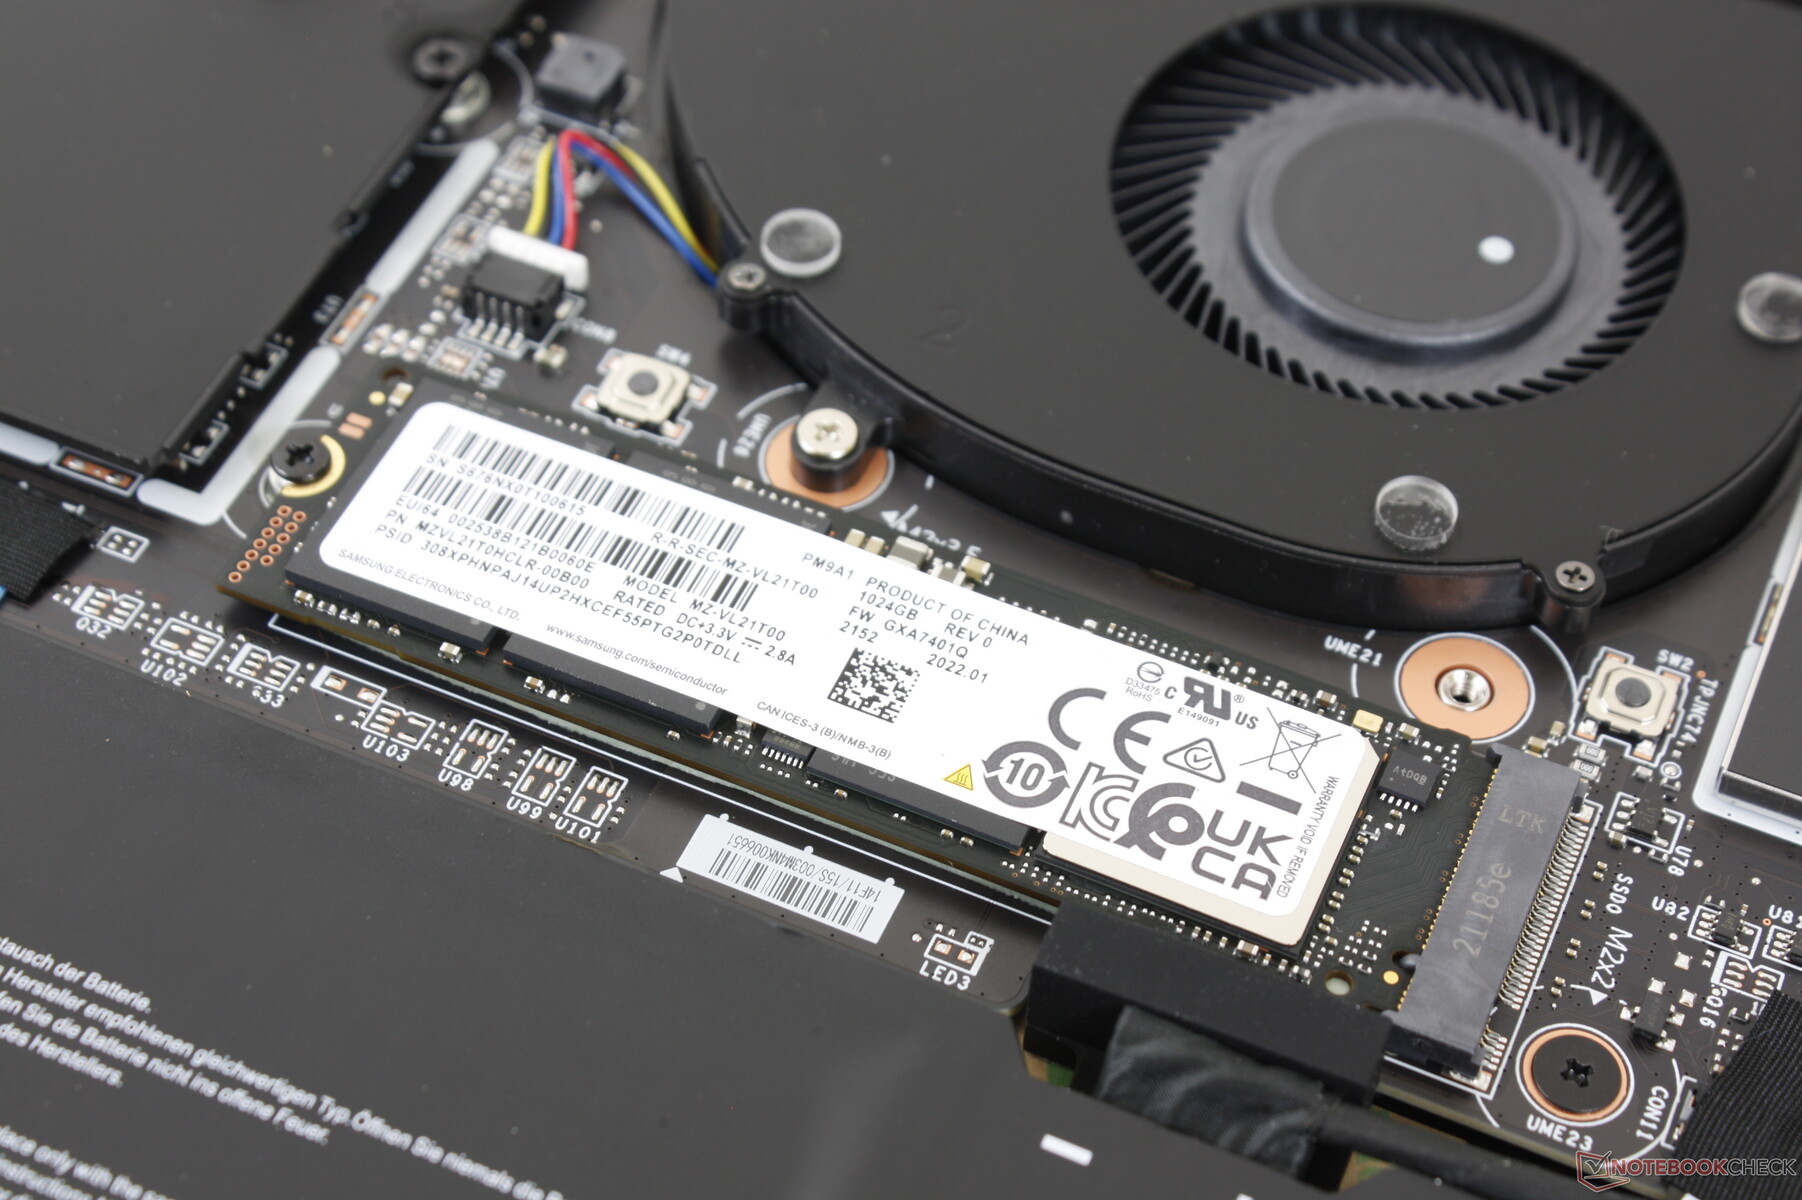
Die Bodenplatte ist mit nur 9 Philips-Schrauben gesichert, um eine einfache Demontage zu ermöglichen. Beachten Sie jedoch, dass Sie einen Versiegelungsaufkleber vom Hersteller durchtrennen müssen, um auf eine der Schrauben zugreifen zu können. Es gibt nicht viel zu aktualisieren, da es nur einen Speicherplatz gibt und sowohl das RAM- als auch das WLAN-Modul auf das Board gelötet sind.
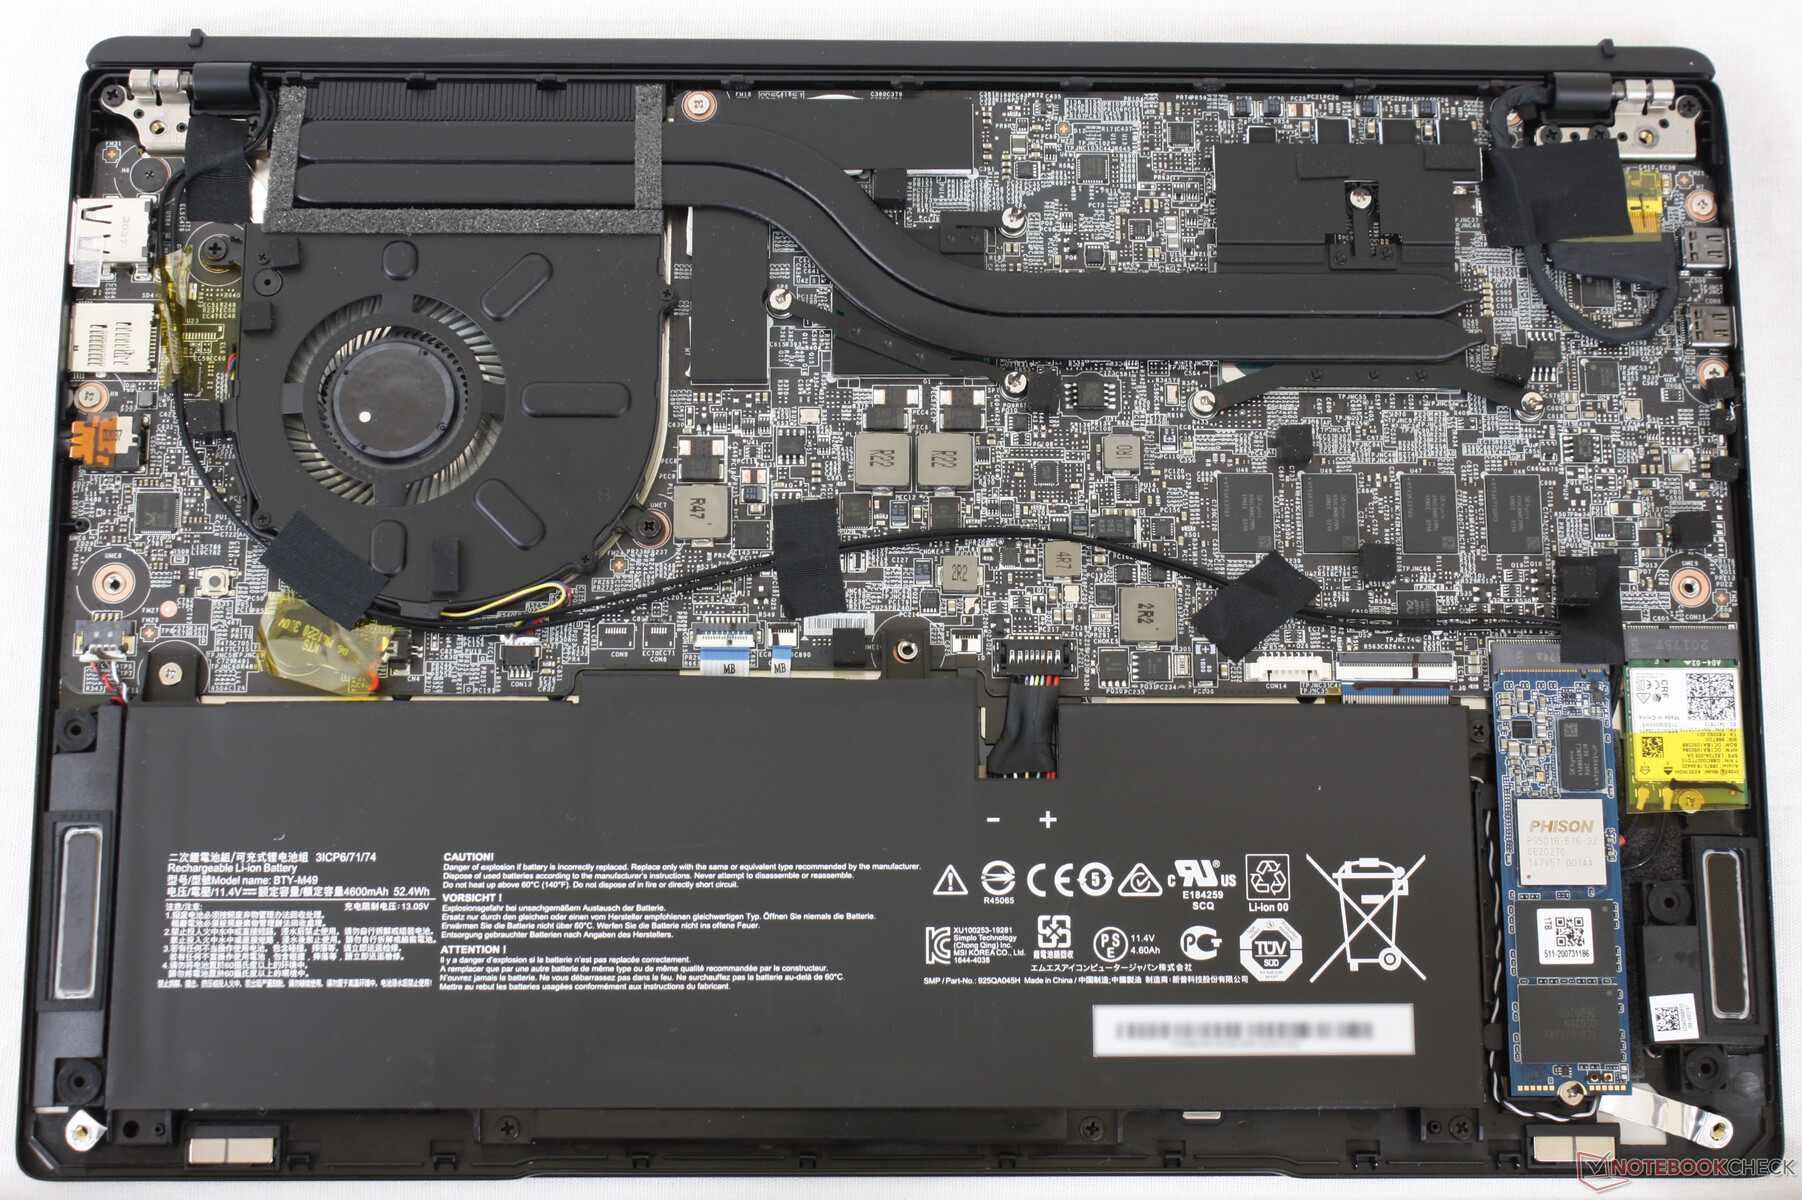
Das Layout und das Design des Motherboards unterscheiden sich völlig von der Summit E14 Clamshell, wie die Vergleichsbilder unten zeigen.
Zubehör und Garantie
Die Retail-Box enthält den aktiven MSI Stift, der derzeit für über $ 100 USD im Einzelhandel erhältlich ist. Es gilt die standardmäßige einjährige eingeschränkte Herstellergarantie.
Eingabegeräte — Keine größeren Änderungen
Tastatur
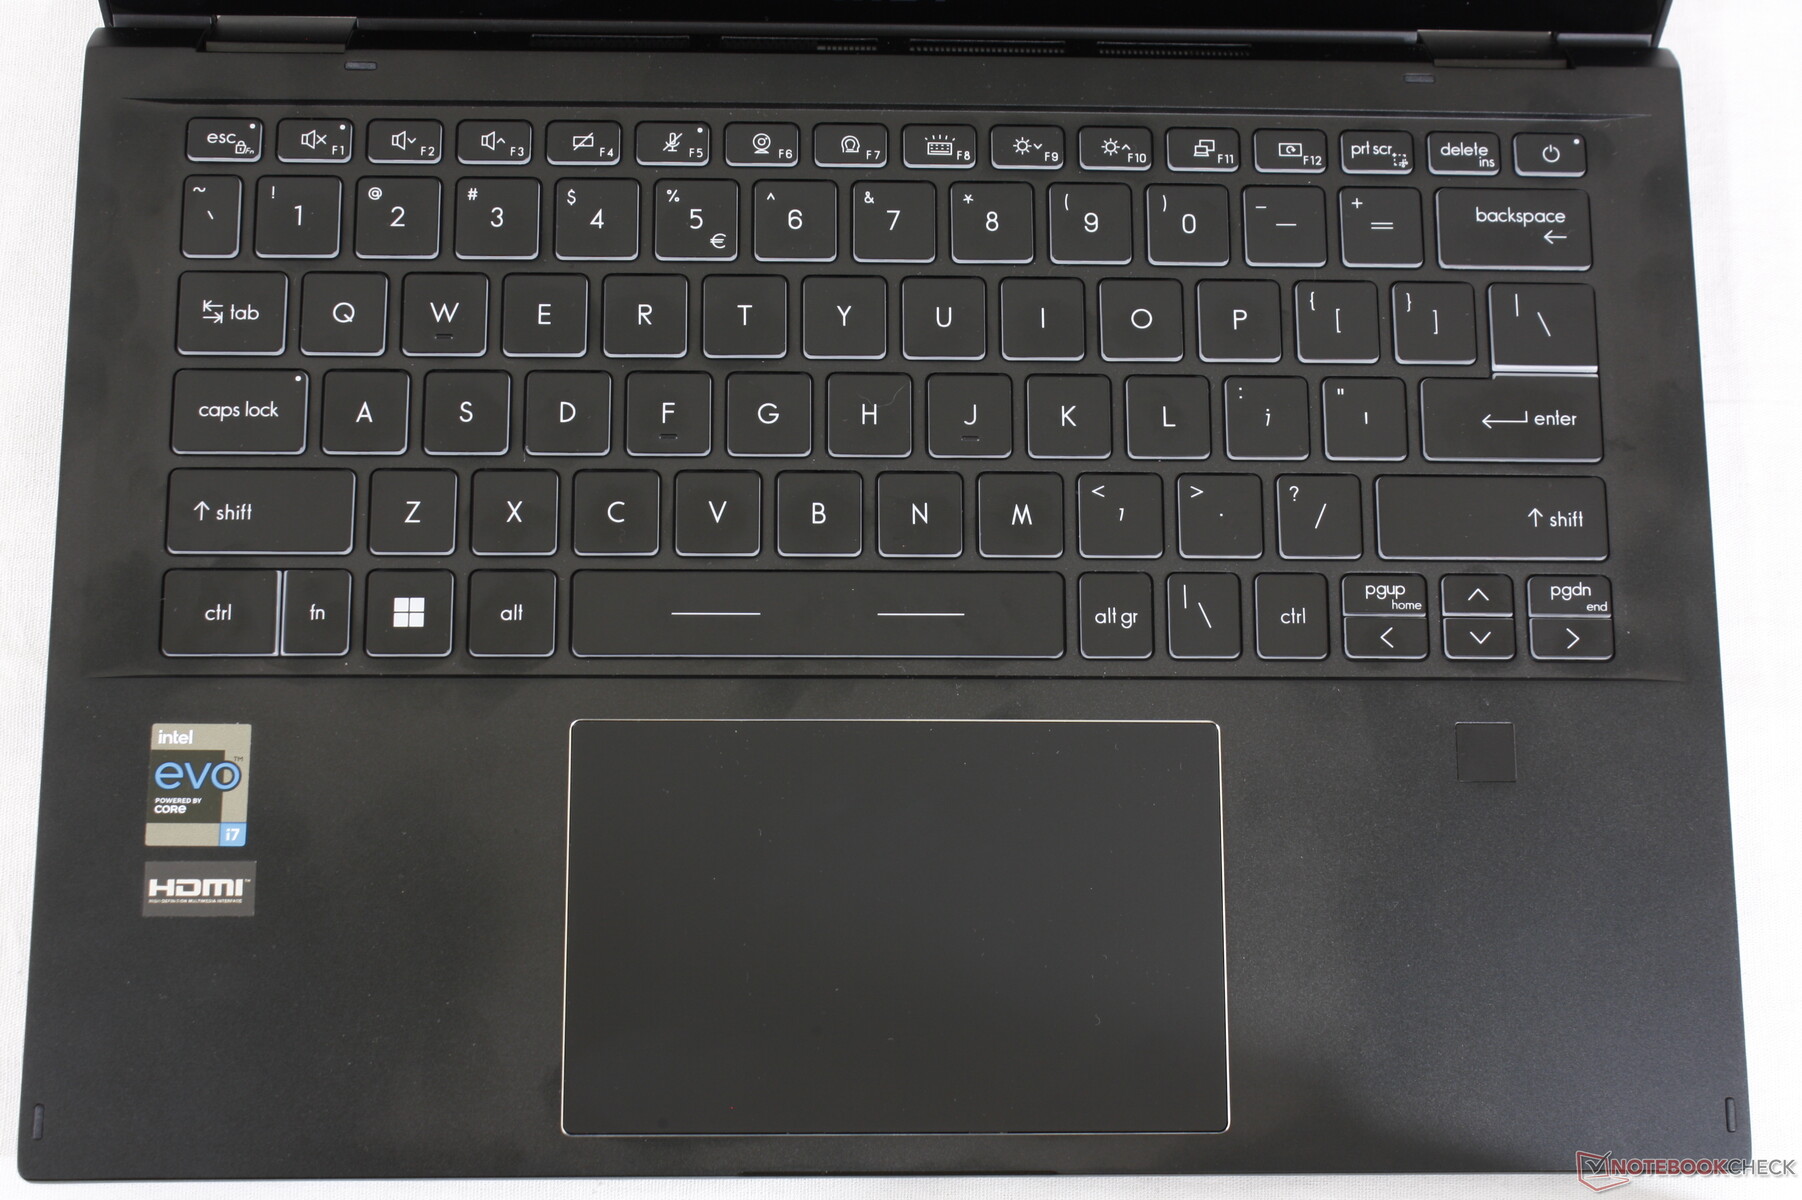
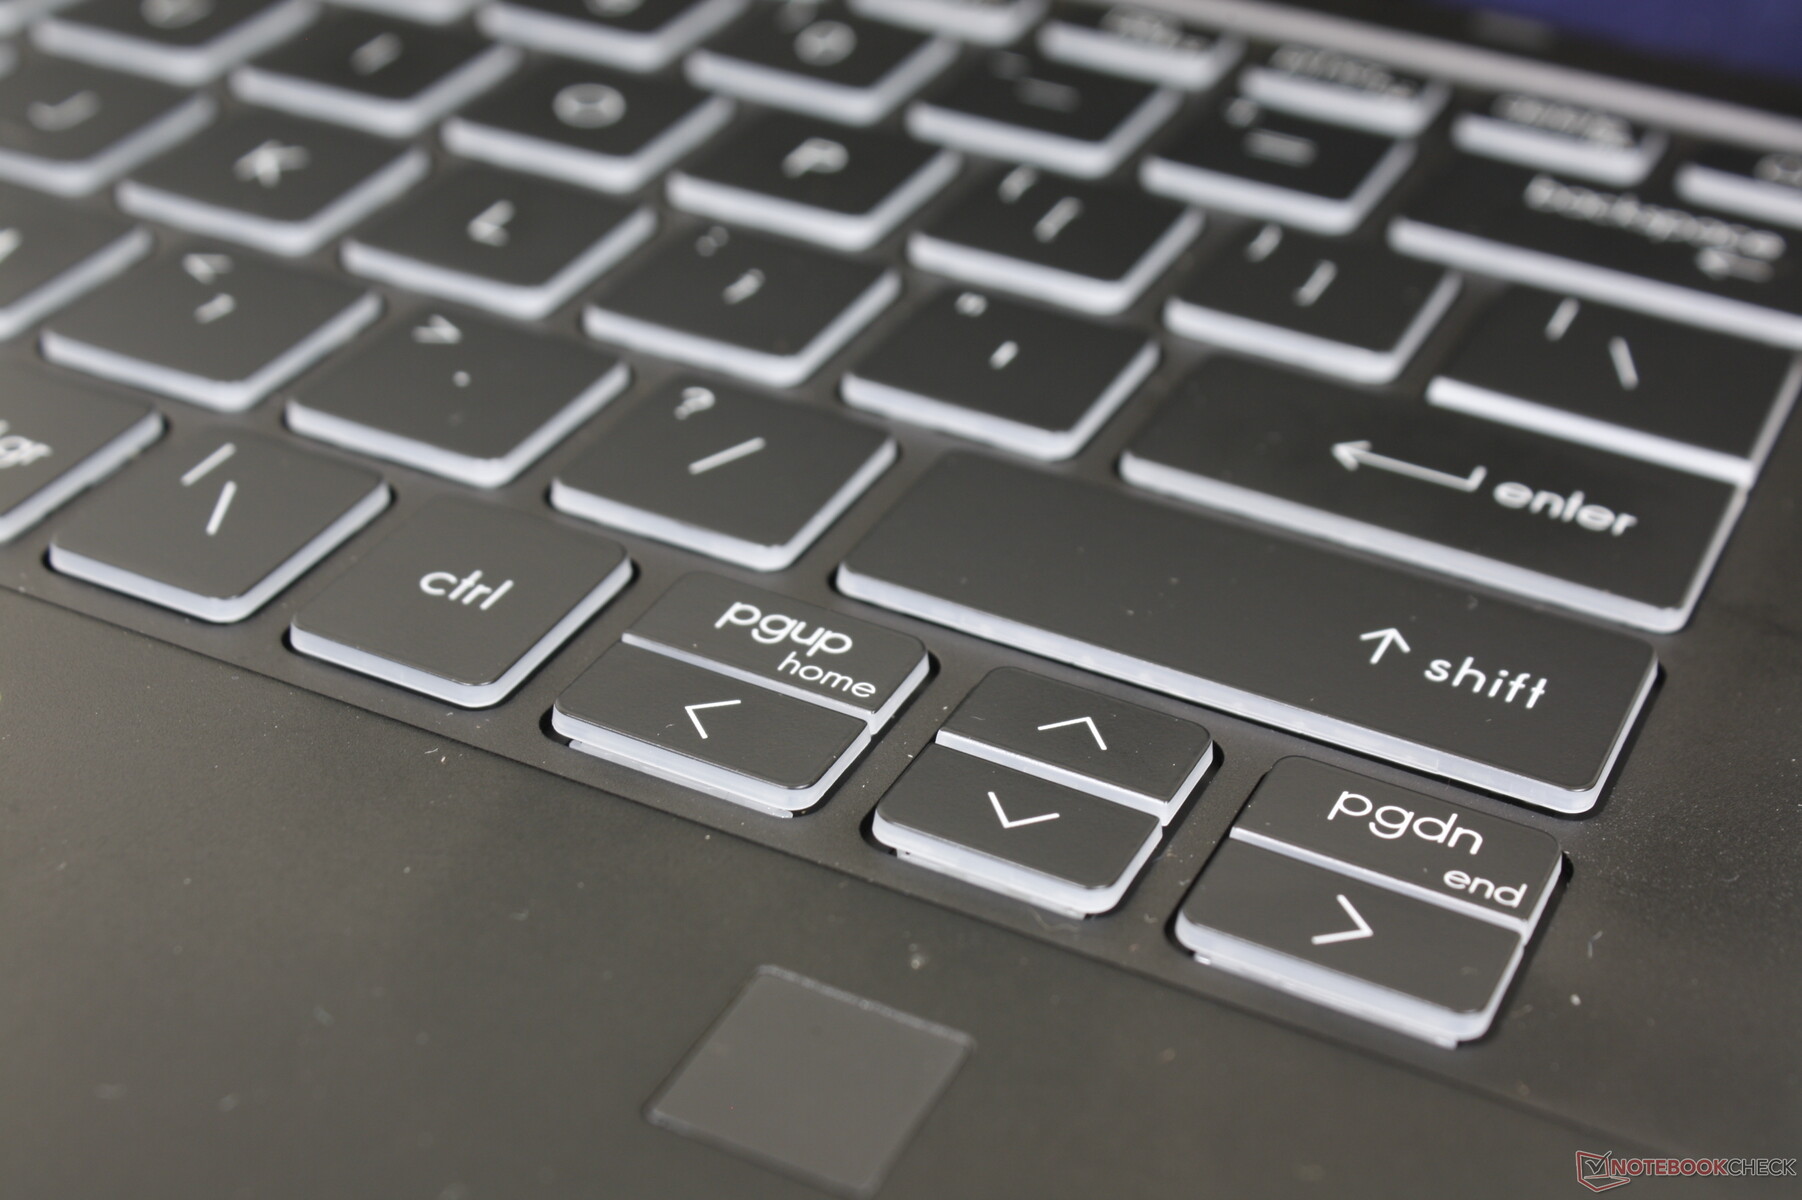
Das Tastaturlayout unterscheidet sich von der Summit E14 Clamshell. Die rechte Spalte der Del-, Insert-, PgDn- und PgUp-Tasten zum Beispiel ist nun für eine insgesamt kürzere Tastaturbreite verschwunden. Das Tipperlebnis bleibt mit einem überdurchschnittlich lauten Tastenklappern und einem etwas weicheren Feedbacks als bei den Tasten eines HP Spectre x360 14 zufriedenstellend.
Touchpad
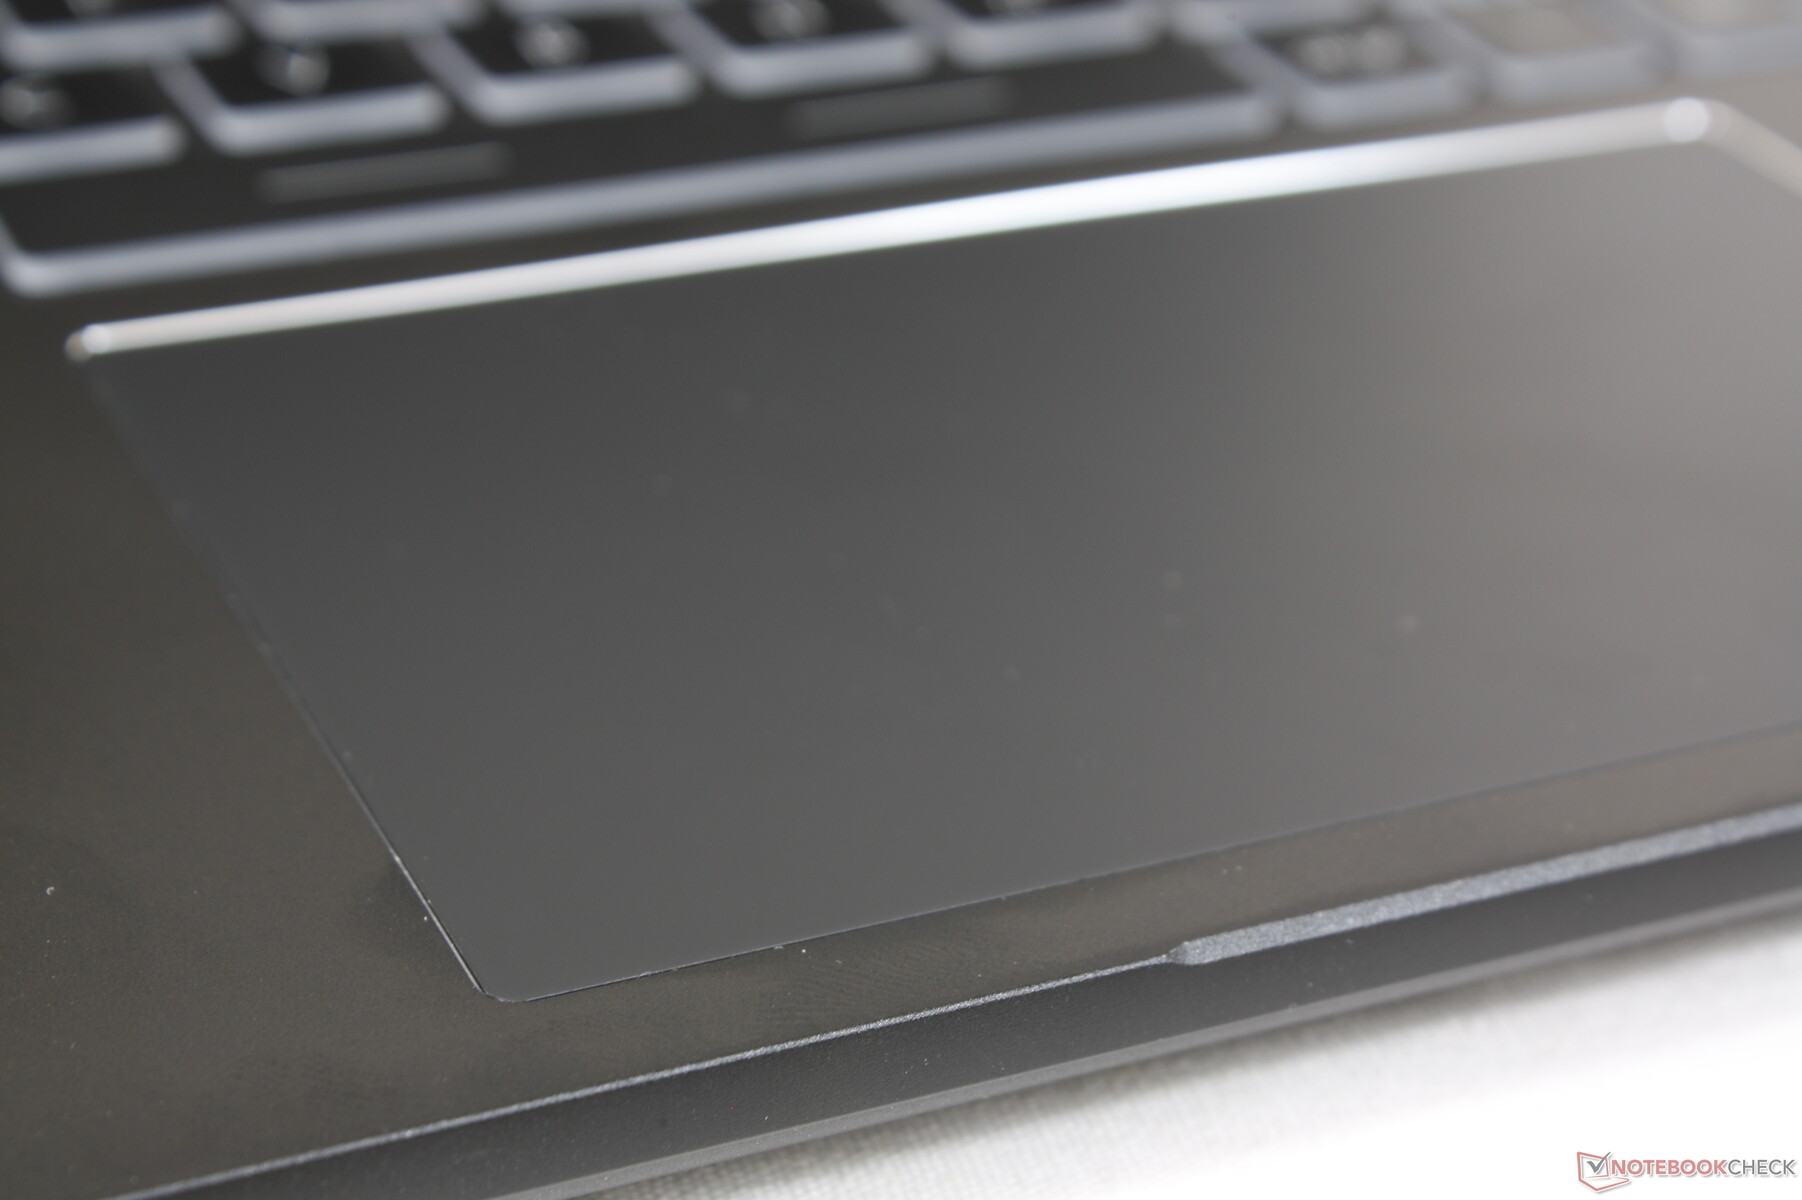
MSI hat die Größe des Clickpads von 10,5 x 6,5 cm bei der Summit E14 Clamshell auf 12 x 7,5 cm bei der Convertible-Version für komfortablere Multitouch-Eingaben erhöht. Seine Gleiteigenschaften sind auch bei langsamen Geschwindigkeiten extrem sanft, was feine Cursorklicks etwas erschweren kann. Gleichzeitig ist das Feedback, das durch Klicken auf das Klickpad entsteht, ausreichend und es kann leicht in schneller Folge gedrückt werden, ohne den Finger zu ermüden.

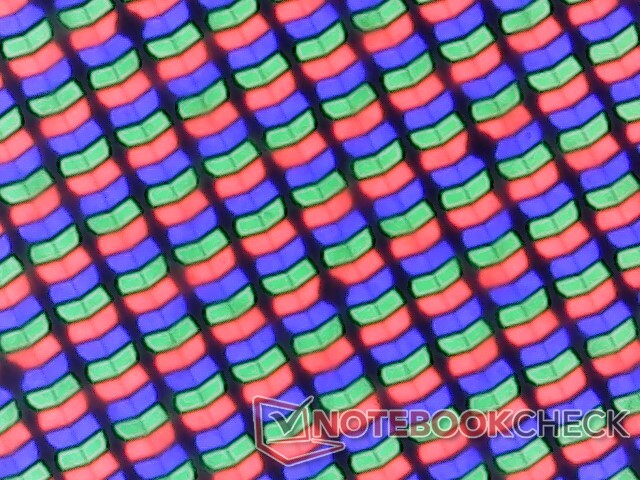
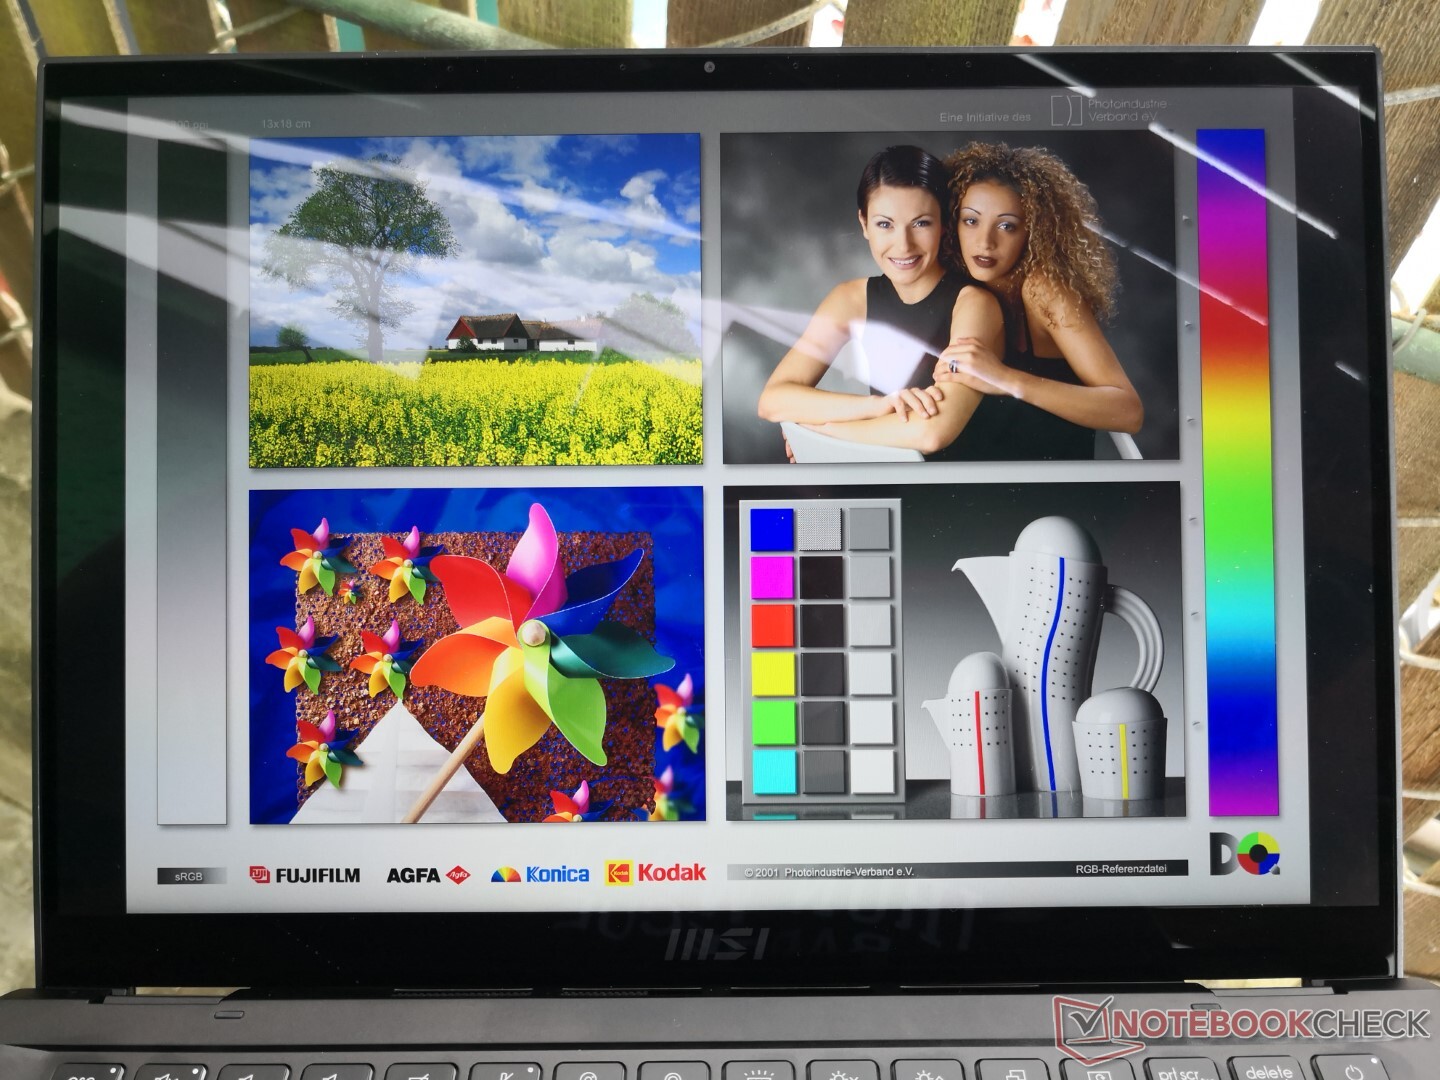
Display — Tolle Farben, aber bei 60 Hz hängen geblieben
Das Modell bietet die gleiche native Auflösung wie beim Lenovo Yoga Slim 7i Pro, aber mit breiterem Farbumfang, um den DCI-P3-Standard zu unterstützen. Schwarz-weiß und grau-grau Reaktionszeiten, wenn auch nicht so schnell wie OLED, sind immer noch schneller als auf dem LG Gram 14T90P oder Latitude 9420 2-in-1 für deutlich weniger Ghosting. Das Display funktioniert aufgrund seiner tiefen Farben, der hellen 500-Nit-Hintergrundbeleuchtung und der vernünftigen Reaktionszeiten sowohl für Gaming- als auch für Office-Tätigkeiten sehr gut.
Eine wichtige Einschränkung für das Display ist seine native 60 Hz Bildwiederholfrequenz, da bei anderen Subnotebooks bereits 90 Hz Bildwiederholfrequenzen oder höher angeboten werden. Alternativen wie das Lenovo IdeaPad Slim 7i Pro oder Asus VivoBook S 14X bieten mit ihren höheren Bildwiederholraten deutlich reinungslosere UI-Erlebnisse. Im Besonderen hätten Stift-Eingaben von einer höheren Bildwiederholfrequenz als die typischen 60 Hz profitiert.
| |||||||||||||||||||||||||
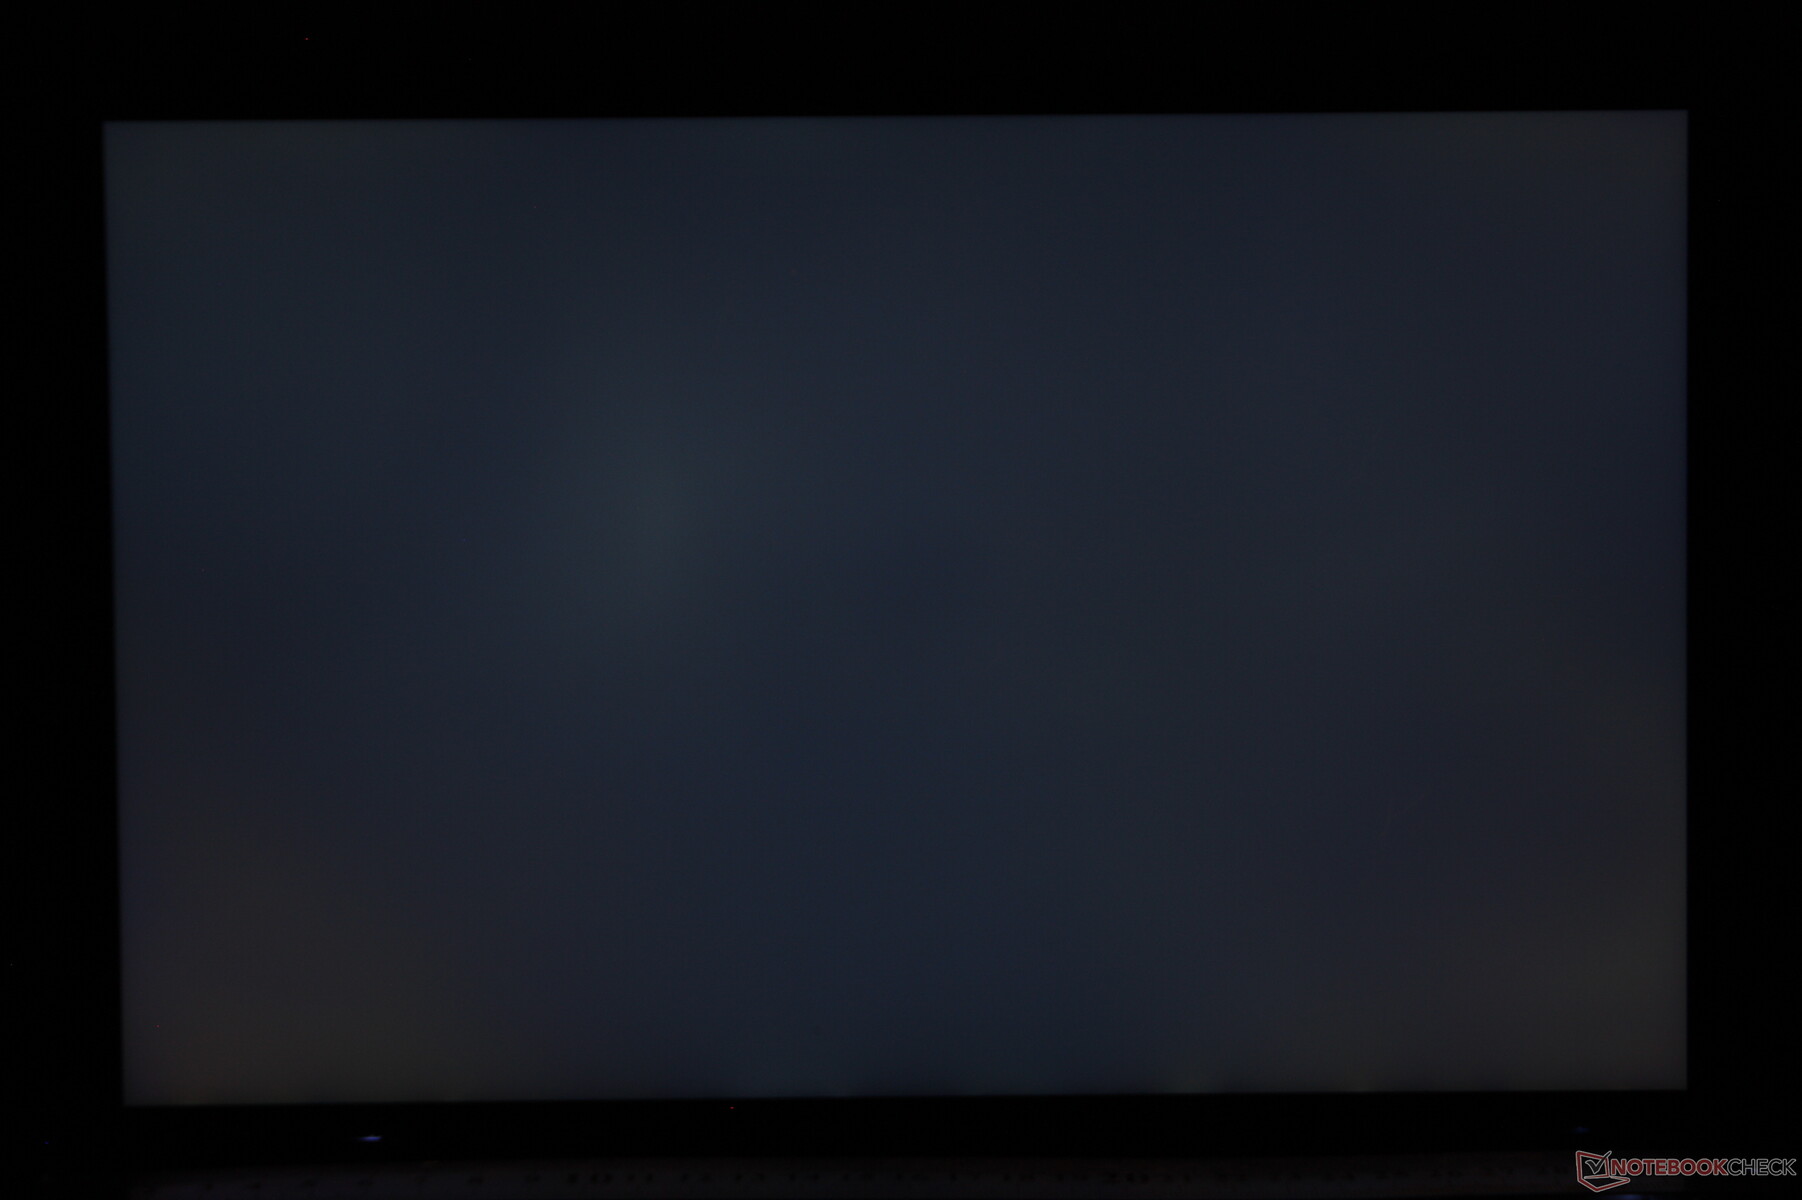
Ausleuchtung: 87 %
Helligkeit Akku: 496.7 cd/m²
Kontrast: 1656:1 (Schwarzwert: 0.3 cd/m²)
ΔE ColorChecker Calman: 3.93 | ∀{0.5-29.43 Ø4.72}
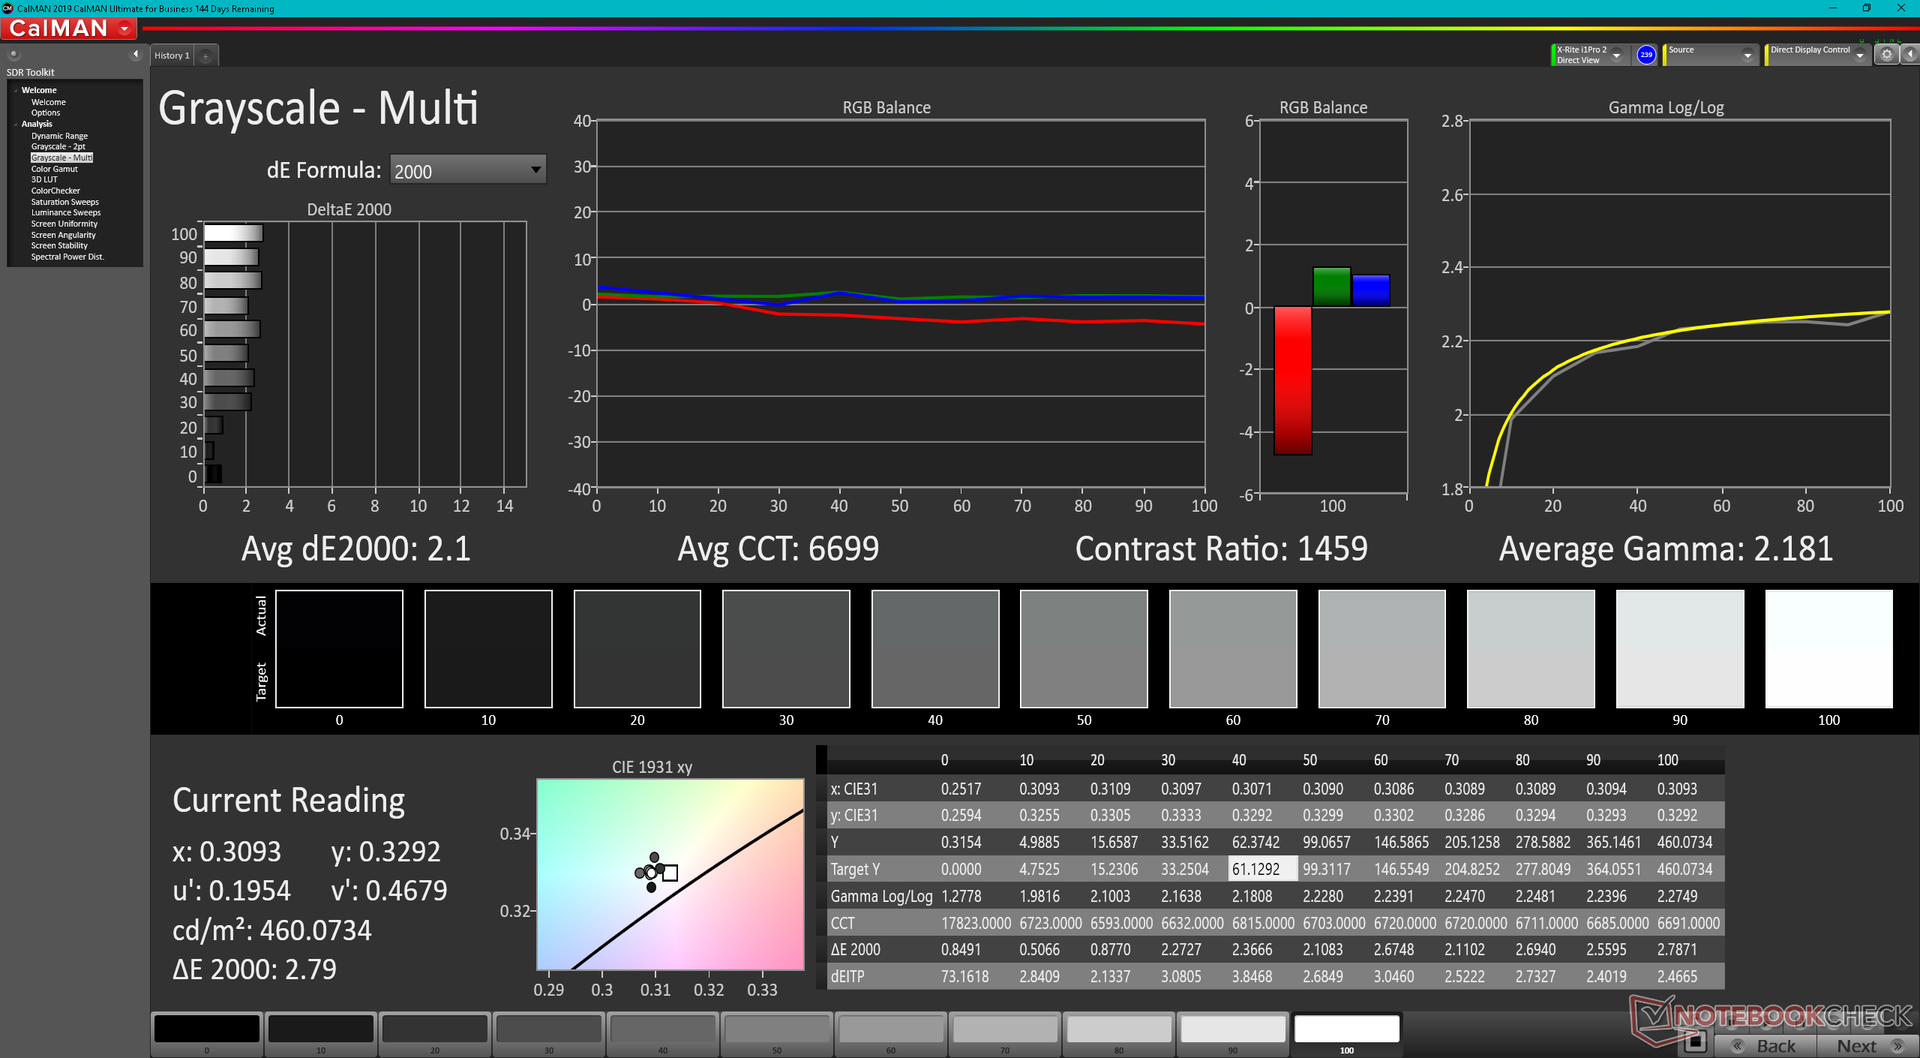
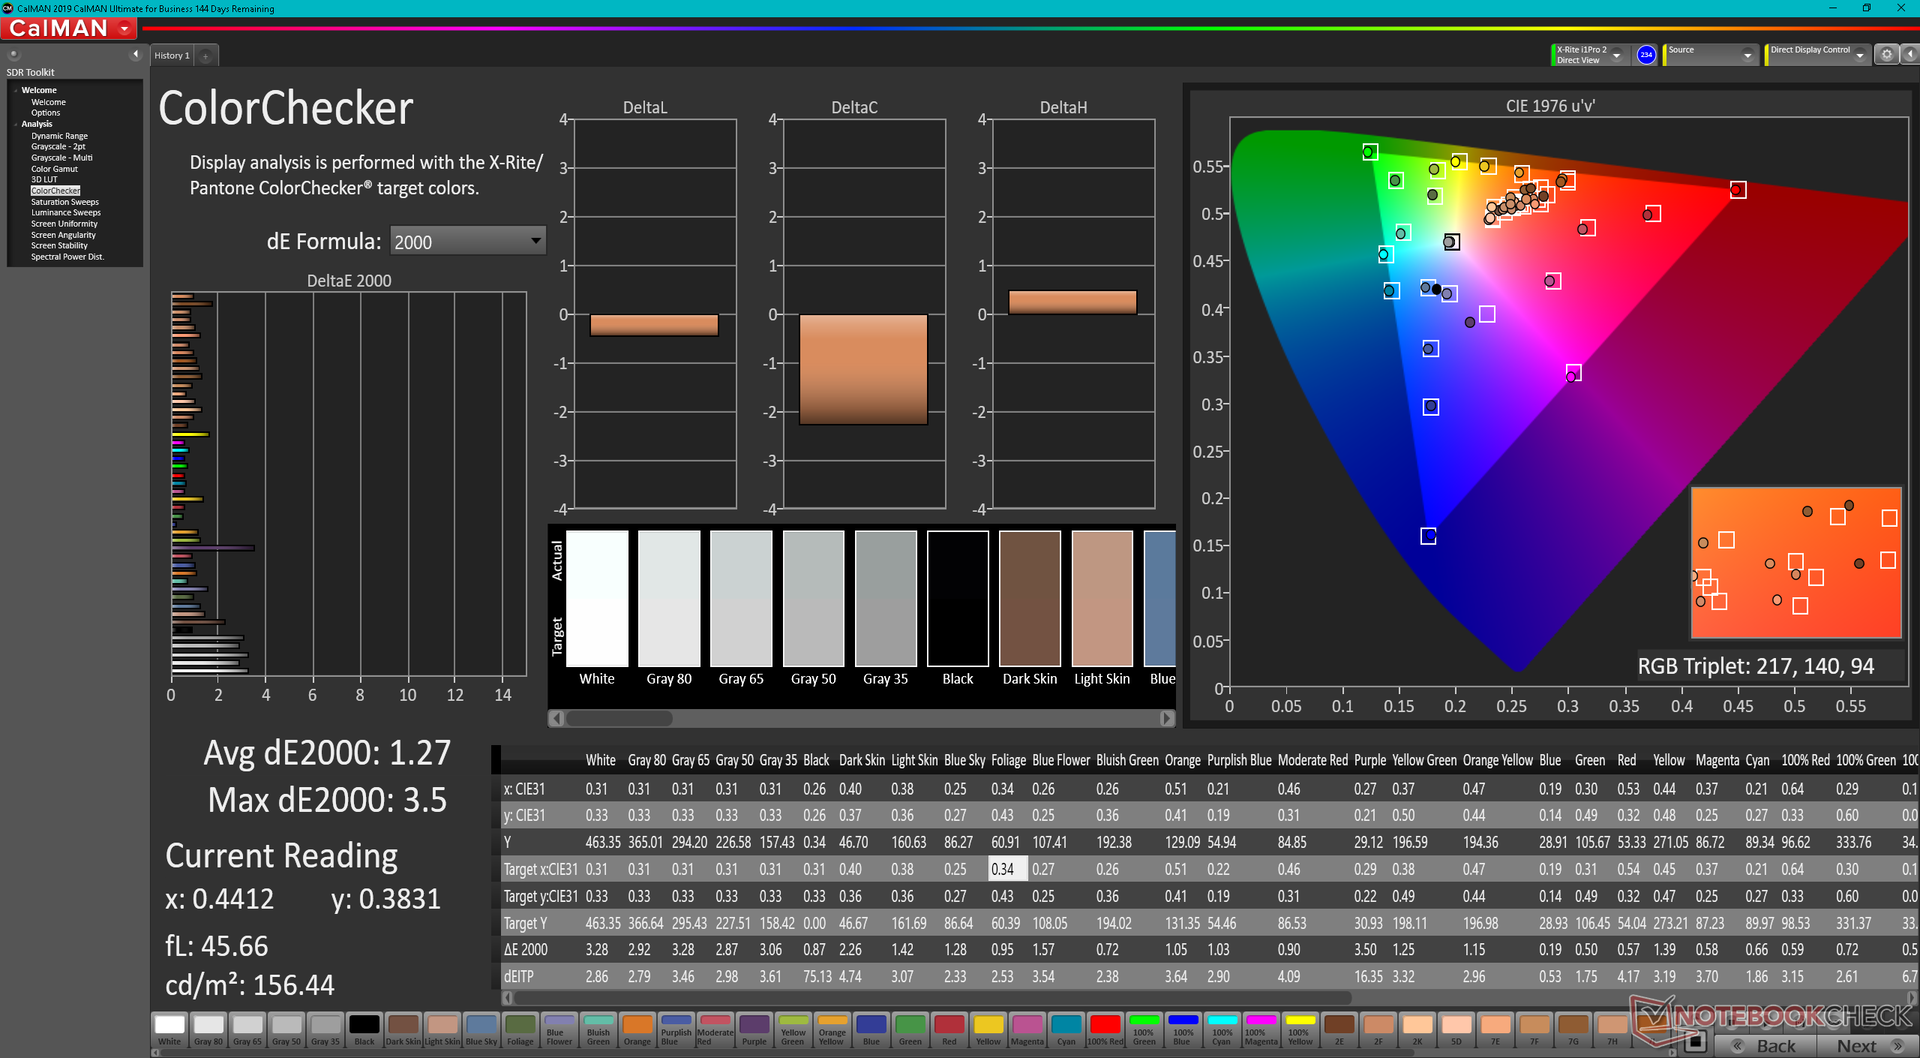
calibrated: 1.27
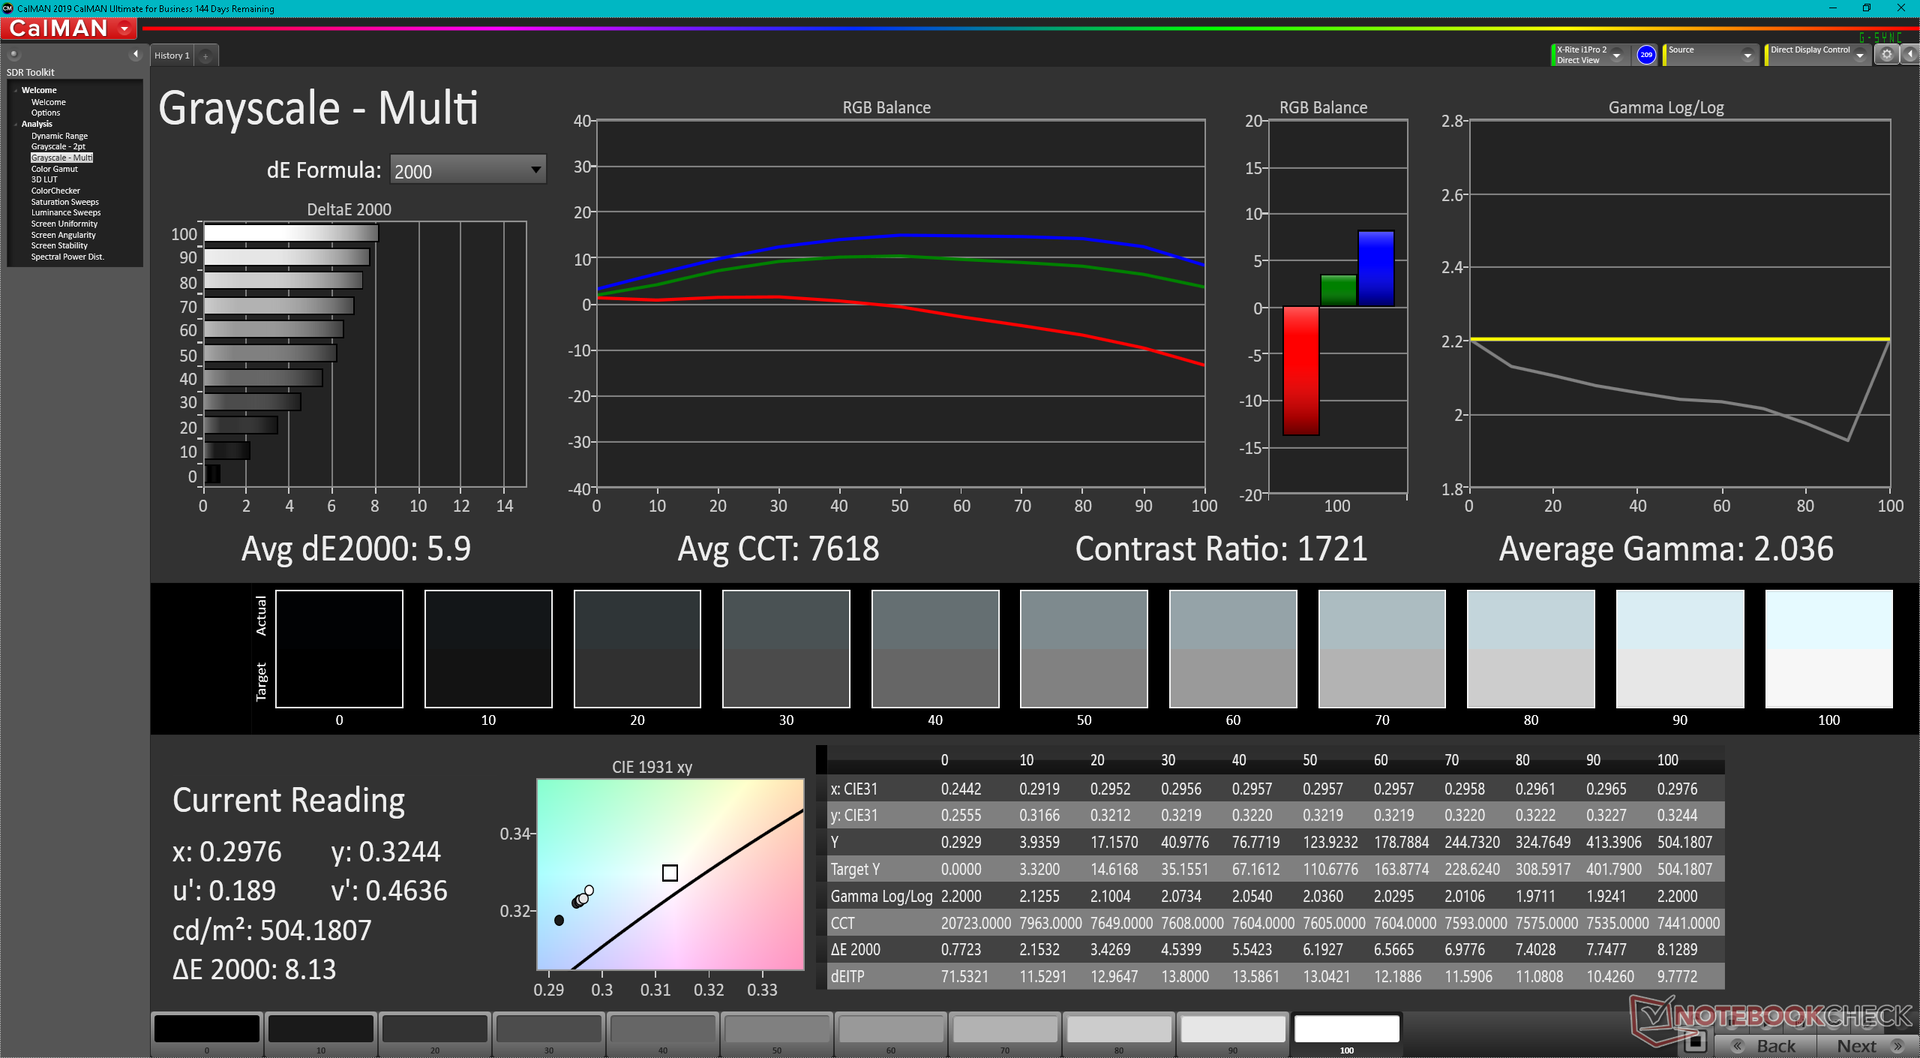
ΔE Greyscale Calman: 5.9 | ∀{0.09-98 Ø4.97}
85.9% AdobeRGB 1998 (Argyll 3D)
99.9% sRGB (Argyll 3D)
97.8% Display P3 (Argyll 3D)
Gamma: 2.04
CCT: 7618 K
| MSI Summit E14 Flip Evo A12MT AU Optronics B140QAN04.R, IPS, 2880x1800, 14" | MSI Summit E14 A11SCS AU Optronics AUO123B, IPS, 3840x2160, 14" | Asus VivoBook S 14X S5402Z Samsung ATNA45AF01-0, OLED, 2880x1800, 14.5" | LG Gram 14T90P LG Philips LP140WU1-SPA1, IPS, 1900x1200, 14" | Lenovo Yoga Slim 7i Pro 14IAP G7 LEN140WQ+, IPS, 2880x1800, 14" | Dell Latitude 9420 2-in-1 AU Optronics B140QAN, IPS, 2560x1600, 14" | |
|---|---|---|---|---|---|---|
| Display | 2% | 4% | 1% | -10% | -8% | |
| Display P3 Coverage (%) | 97.8 | 87.5 -11% | 99.9 2% | 98.8 1% | 77.7 -21% | 80.7 -17% |
| sRGB Coverage (%) | 99.9 | 100 0% | 100 0% | 100 0% | 100 0% | 100 0% |
| AdobeRGB 1998 Coverage (%) | 85.9 | 99.4 16% | 95.5 11% | 78.4 -9% | 79.7 -7% | |
| Response Times | -154% | 95% | -128% | -61% | -167% | |
| Response Time Grey 50% / Grey 80% * (ms) | 16.9 ? | 52 ? -208% | 0.73 ? 96% | 44 ? -160% | 35.2 ? -108% | 54 ? -220% |
| Response Time Black / White * (ms) | 15.4 ? | 30.8 ? -100% | 1 ? 94% | 30 ? -95% | 17.6 ? -14% | 32.8 ? -113% |
| PWM Frequency (Hz) | 240.4 ? | |||||
| Bildschirm | -29% | 18% | 1% | 7% | -0% | |
| Helligkeit Bildmitte (cd/m²) | 496.7 | 593.3 19% | 373 -25% | 305.5 -38% | 469 -6% | 483.6 -3% |
| Brightness (cd/m²) | 468 | 571 22% | 375 -20% | 289 -38% | 445 -5% | 465 -1% |
| Brightness Distribution (%) | 87 | 87 0% | 99 14% | 87 0% | 90 3% | 92 6% |
| Schwarzwert * (cd/m²) | 0.3 | 0.53 -77% | 0.27 10% | 0.32 -7% | ||
| Kontrast (:1) | 1656 | 1119 -32% | 1131 -32% | 1511 -9% | ||
| Delta E Colorchecker * | 3.93 | 4.42 -12% | 2.26 42% | 3.31 16% | 3.5 11% | 3.69 6% |
| Colorchecker dE 2000 max. * | 7.9 | 7.16 9% | 6.22 21% | 6.12 23% | 5.3 33% | 5.97 24% |
| Colorchecker dE 2000 calibrated * | 1.27 | 4.3 -239% | 1.7 -34% | 2.05 -61% | ||
| Delta E Graustufen * | 5.9 | 3.2 46% | 1.4 76% | 1.9 68% | 3.3 44% | 3.5 41% |
| Gamma | 2.04 108% | 2.04 108% | 2.22 99% | 2.04 108% | 1.97 112% | 2.04 108% |
| CCT | 7618 85% | 6737 96% | 6417 101% | 6706 97% | 6512 100% | 6158 106% |
| Durchschnitt gesamt (Programm / Settings) | -60% /
-41% | 39% /
28% | -42% /
-20% | -21% /
-9% | -58% /
-26% |
* ... kleinere Werte sind besser
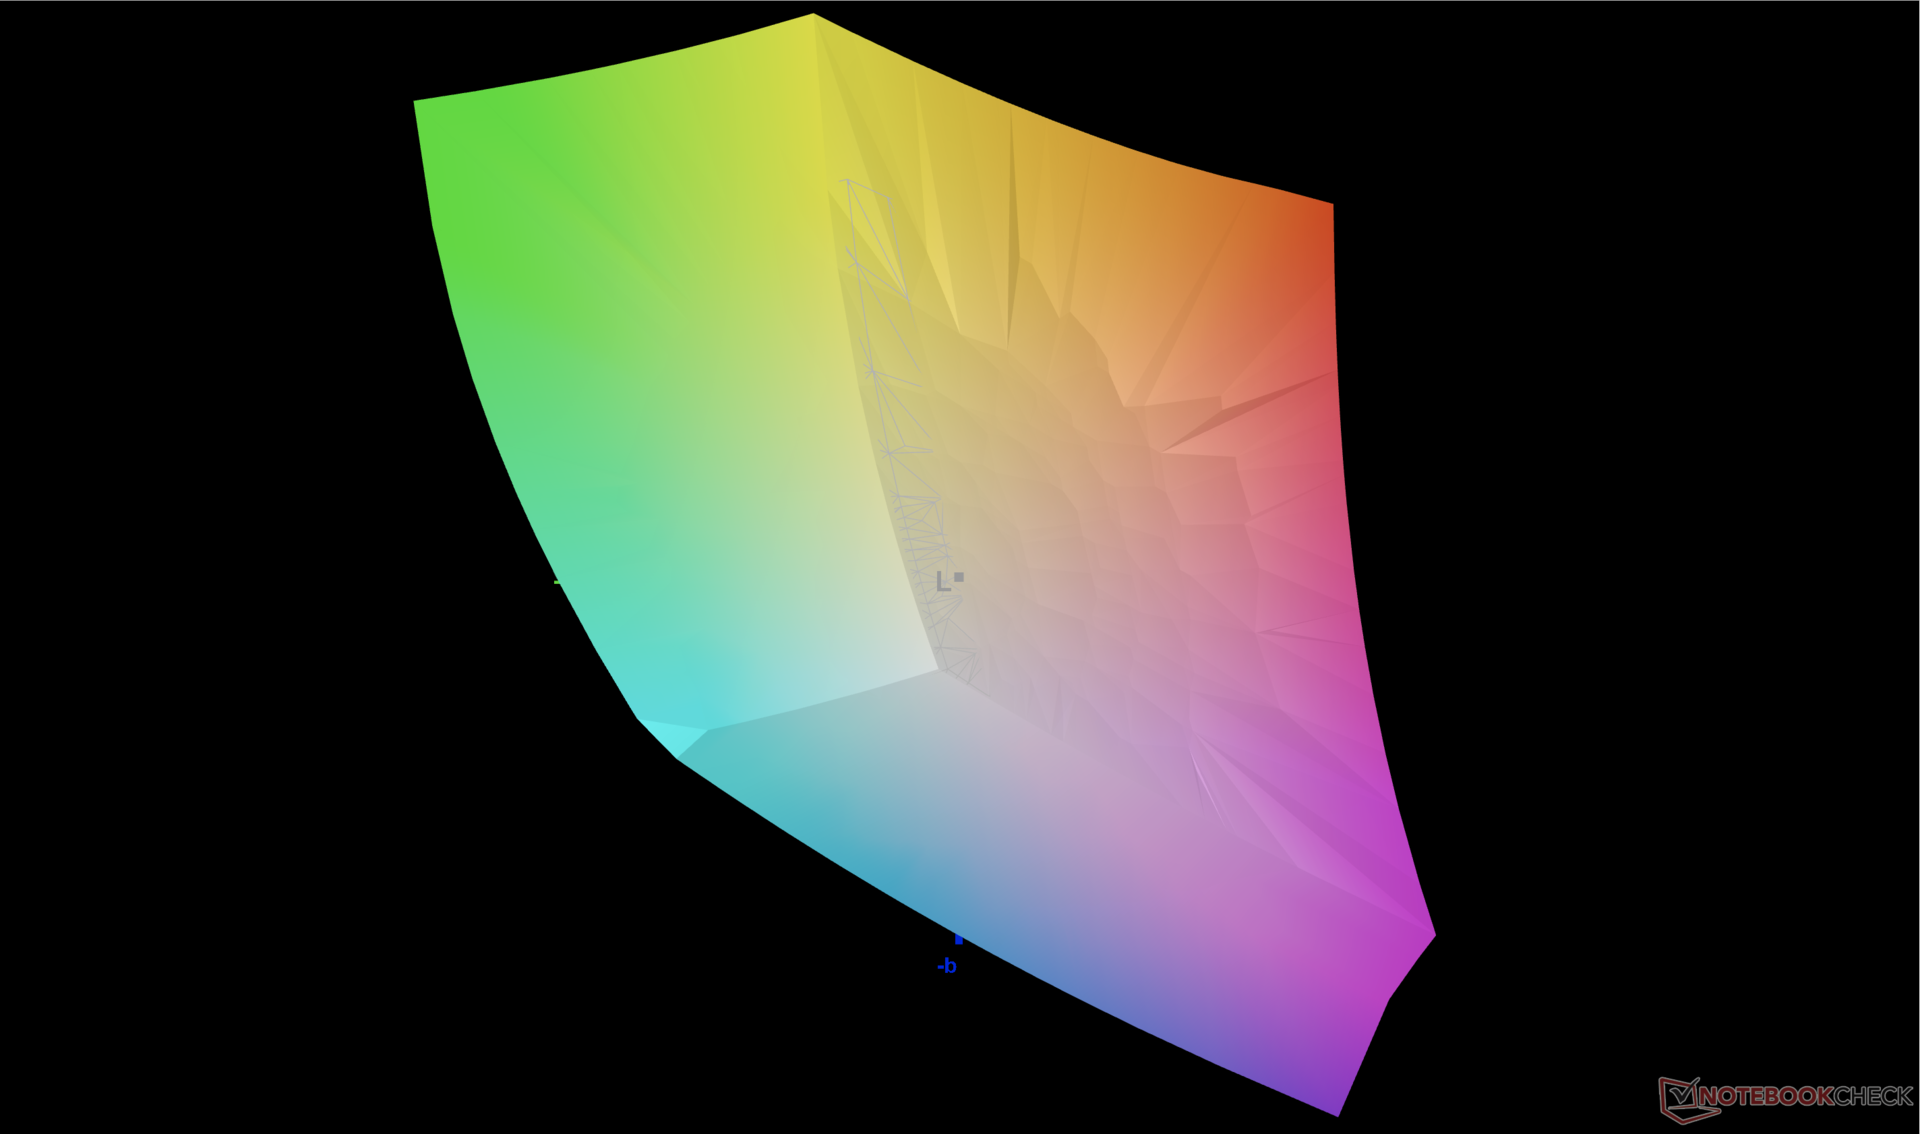
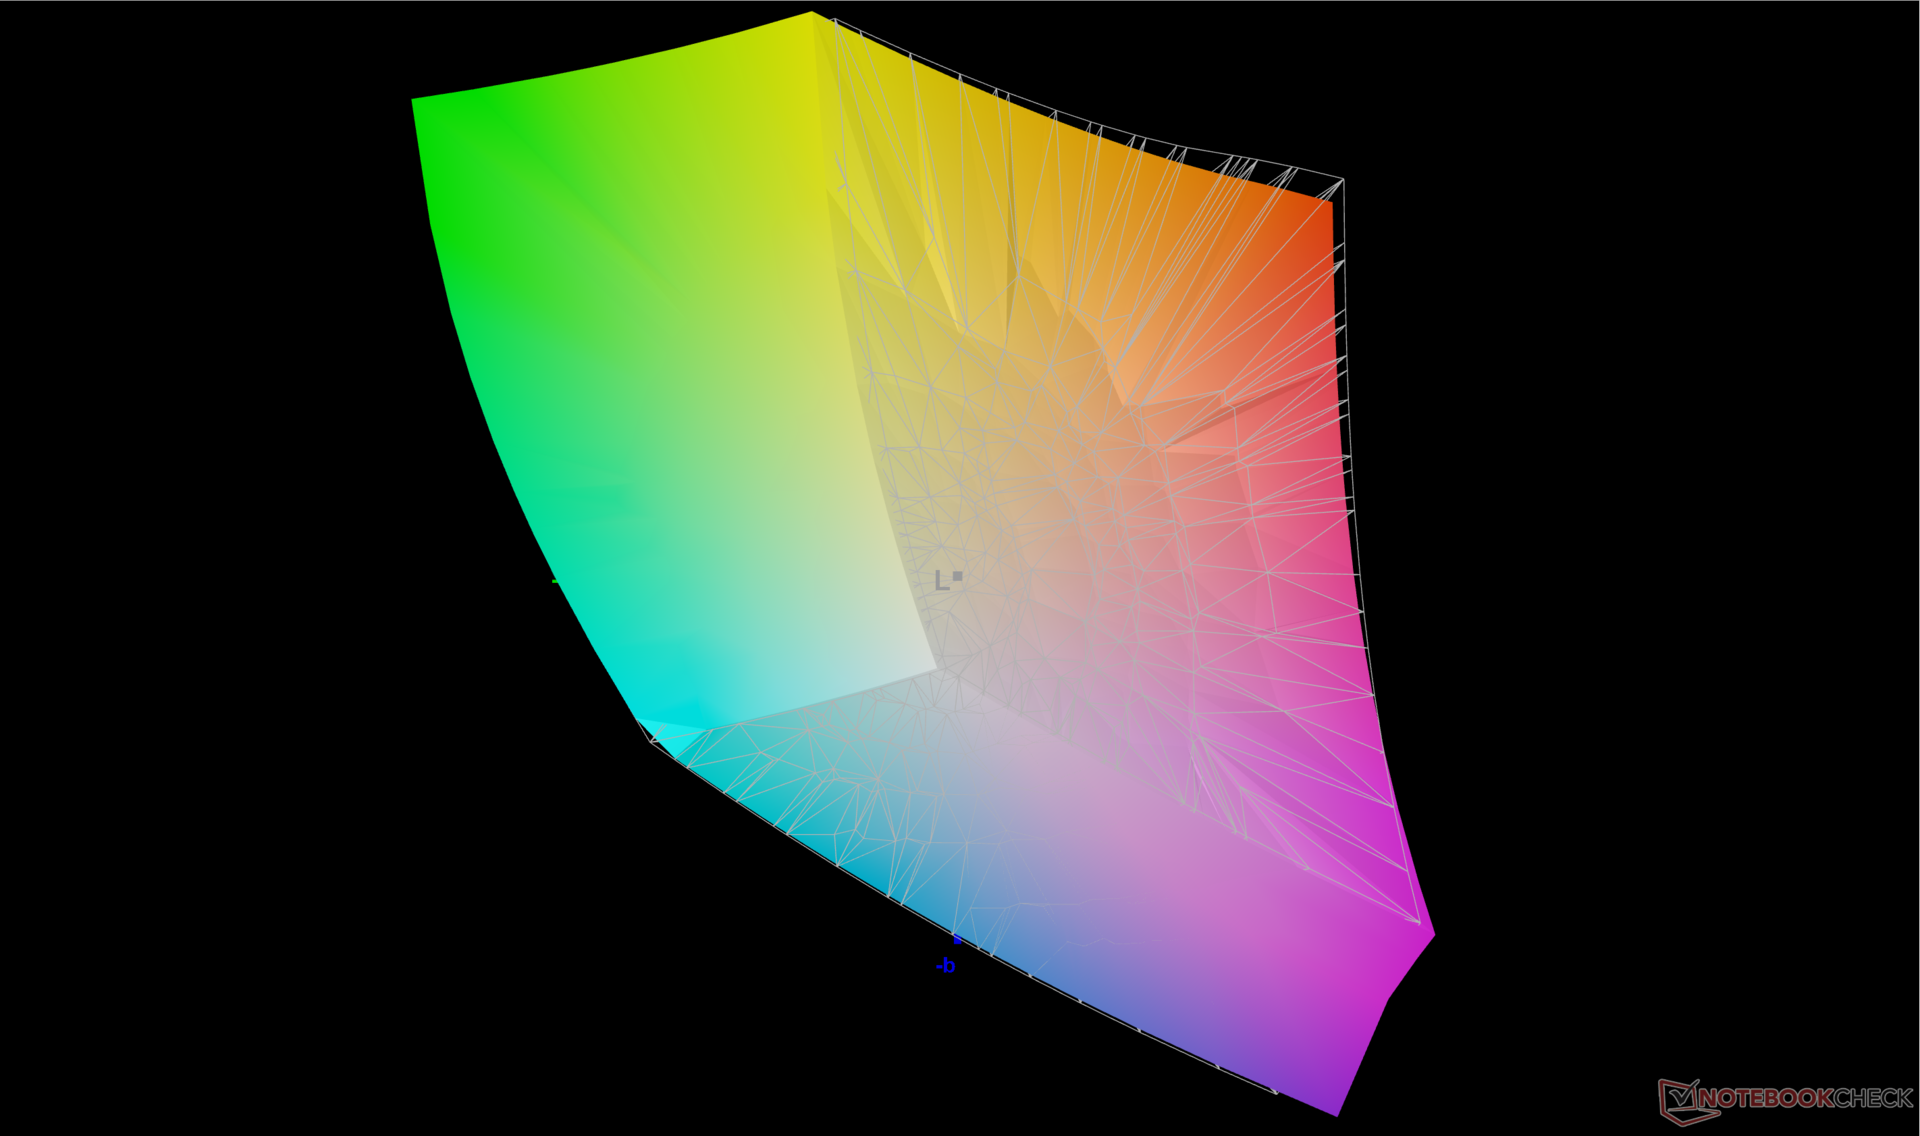
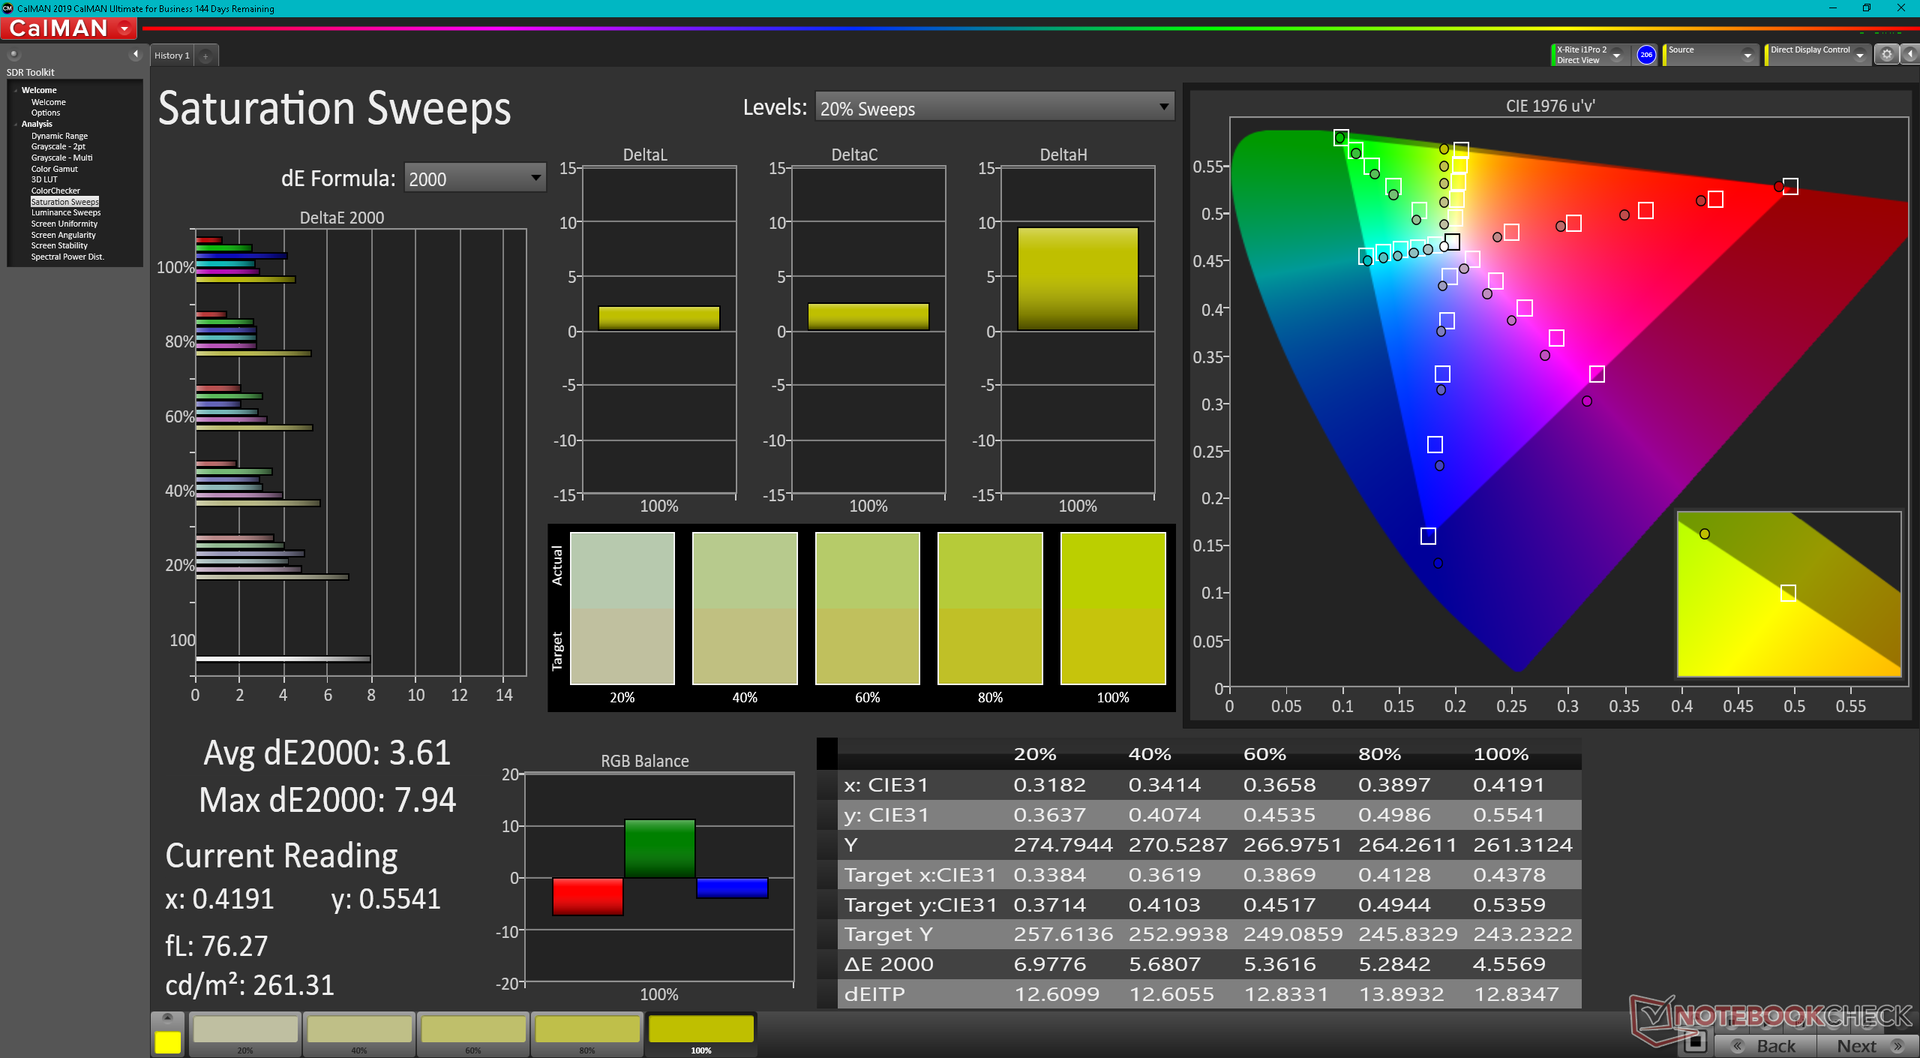
Das Display auf unserem Summit ist im Gegensatz zu vielen MSI Creator-Modellen nicht werkseitig kalibriert, obwohl das Panel eine vollständige Abdeckung des DCI-P3-Standards bietet. So sind die mittleren Graustufen- und Farb-DeltaE-Werte mit 5,9 bzw. 3,93 gegenüber dem P3-Standard als mittelmäßig zu betrachten. Im Besonderen ist die Farbtemperatur mit 7618 kühler als wir es uns wünschen. Benutzer müssen ihre Displays kalibrieren, um das Farbspektrum besser zu nutzen.


Reaktionszeiten (Response Times) des Displays
| ↔ Reaktionszeiten Schwarz zu Weiß | ||
|---|---|---|
| 15.4 ms ... steigend ↗ und fallend ↘ kombiniert | ↗ 7.3 ms steigend | 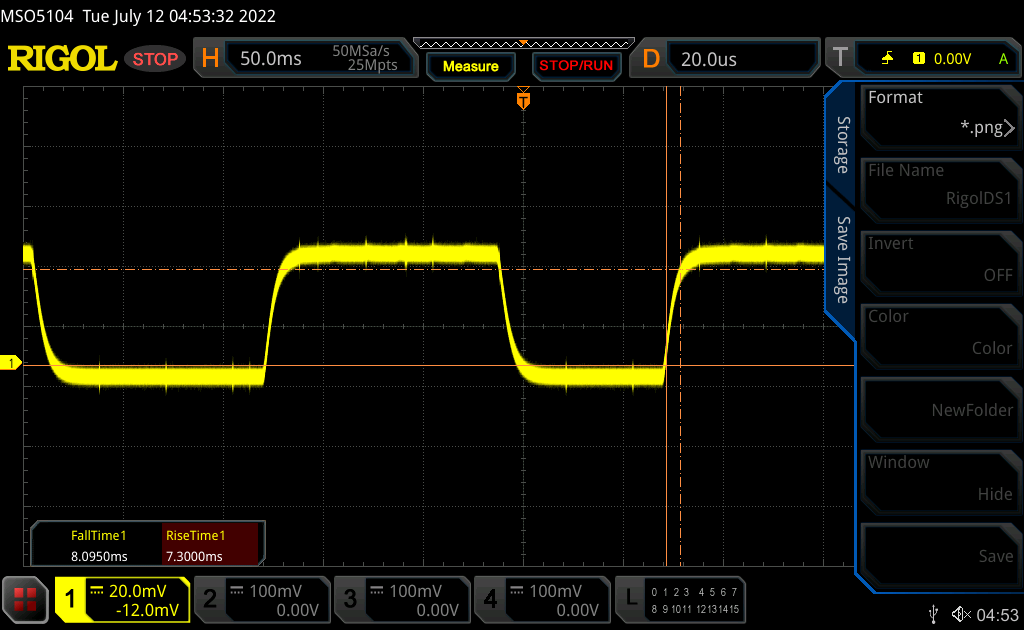 |
| ↘ 8.1 ms fallend | ||
| Die gemessenen Reaktionszeiten sind gut, für anspruchsvolle Spieler könnten der Bildschirm jedoch zu langsam sein. Im Vergleich rangierten die bei uns getesteten Geräte von 0.1 (Minimum) zu 240 (Maximum) ms. » 37 % aller Screens waren schneller als der getestete. Daher sind die gemessenen Reaktionszeiten besser als der Durchschnitt aller vermessenen Geräte (19.8 ms). | ||
| ↔ Reaktionszeiten 50% Grau zu 80% Grau | ||
| 16.9 ms ... steigend ↗ und fallend ↘ kombiniert | ↗ 7.3 ms steigend | 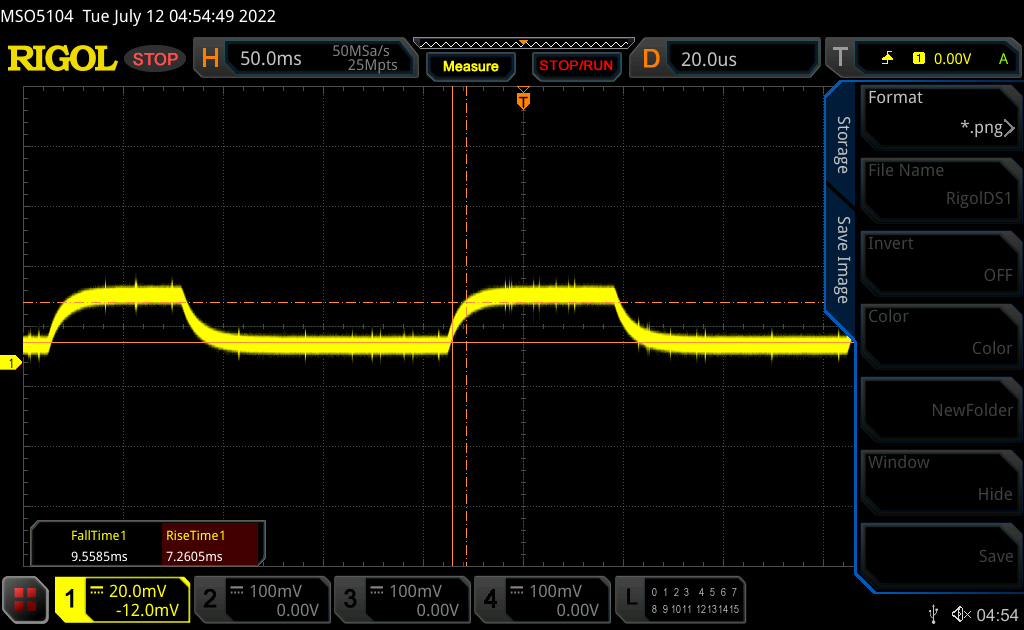 |
| ↘ 9.6 ms fallend | ||
| Die gemessenen Reaktionszeiten sind gut, für anspruchsvolle Spieler könnten der Bildschirm jedoch zu langsam sein. Im Vergleich rangierten die bei uns getesteten Geräte von 0.165 (Minimum) zu 636 (Maximum) ms. » 31 % aller Screens waren schneller als der getestete. Daher sind die gemessenen Reaktionszeiten besser als der Durchschnitt aller vermessenen Geräte (31 ms). | ||
Bildschirm-Flackern / PWM (Pulse-Width Modulation)
| Flackern / PWM nicht festgestellt | 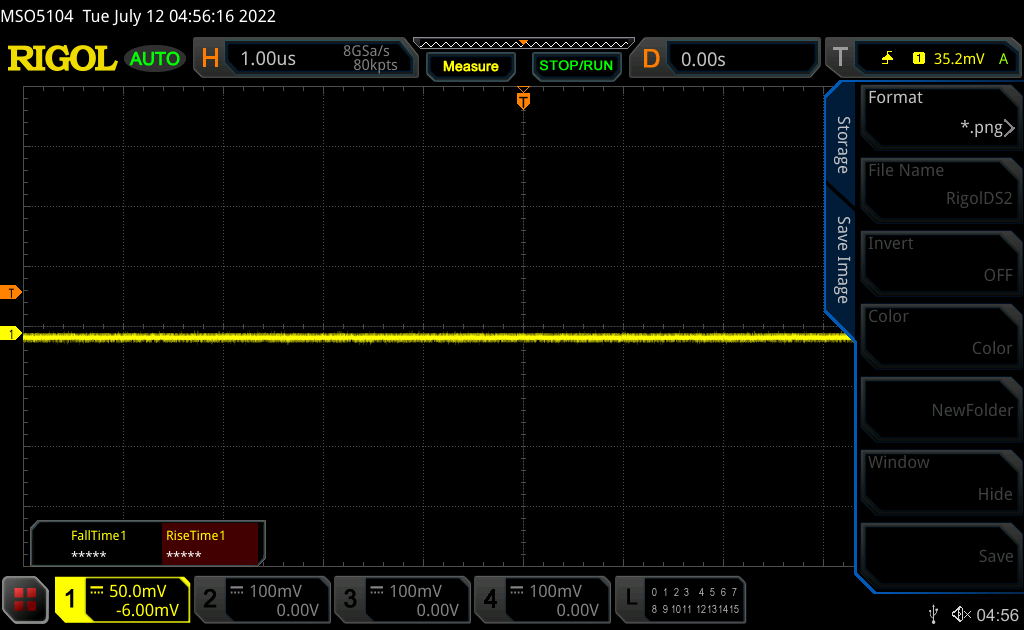 | ||
Im Vergleich: 52 % aller getesteten Geräte nutzten kein PWM um die Helligkeit zu reduzieren. Wenn PWM eingesetzt wurde, dann bei einer Frequenz von durchschnittlich 7769 (Minimum 5, Maximum 343500) Hz. | |||
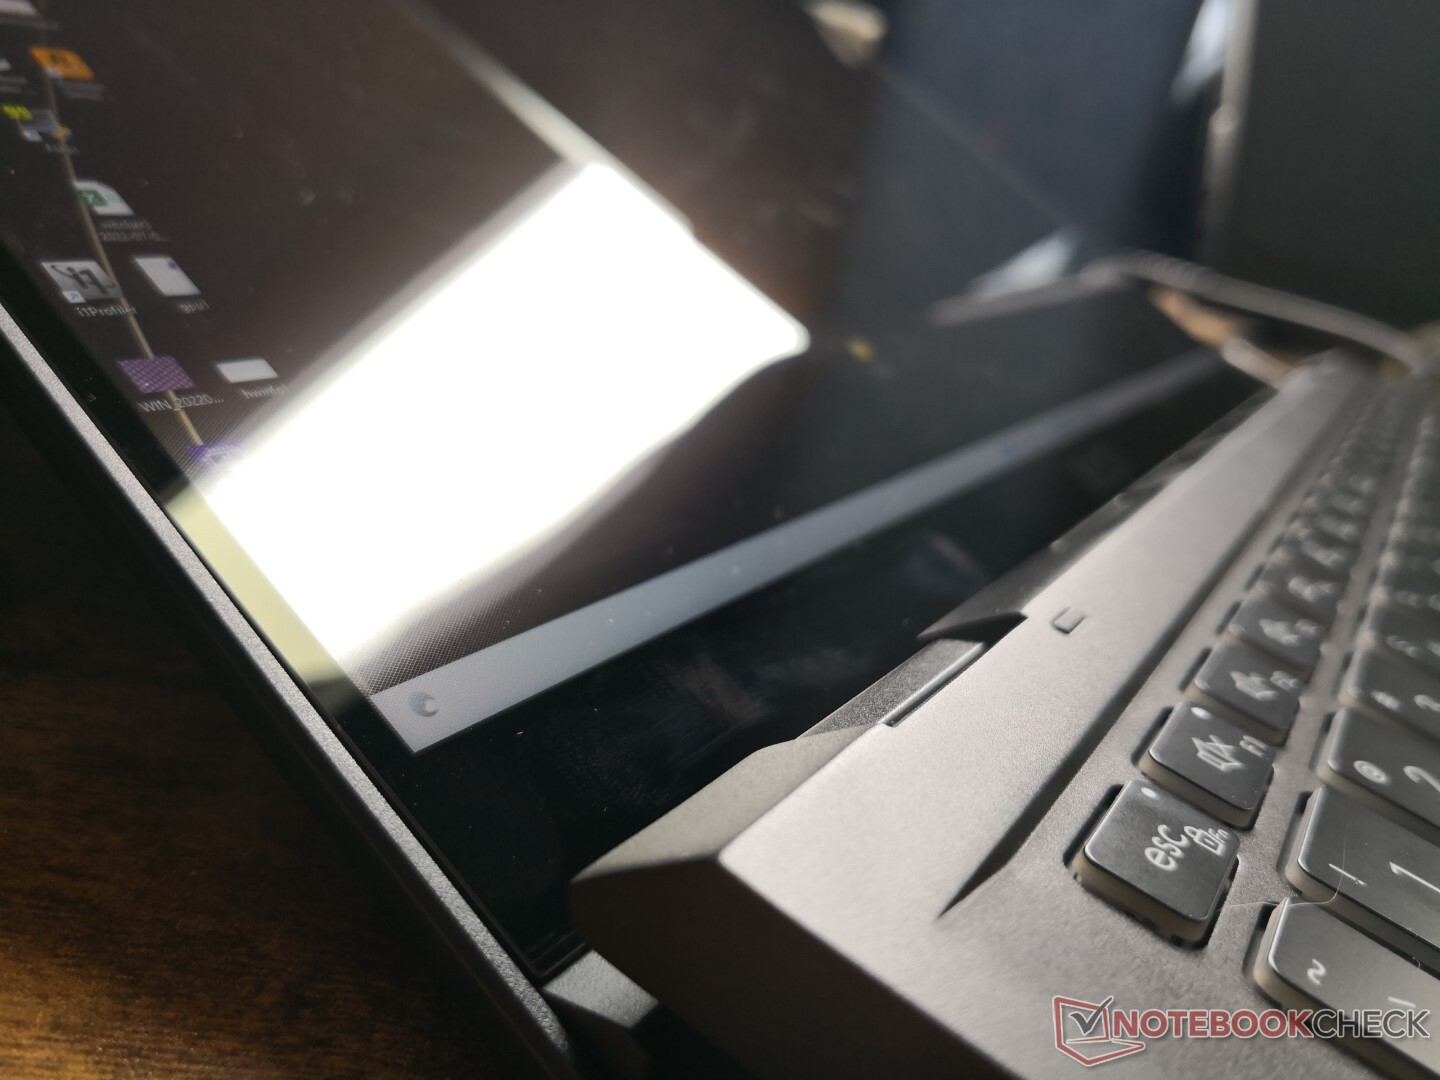
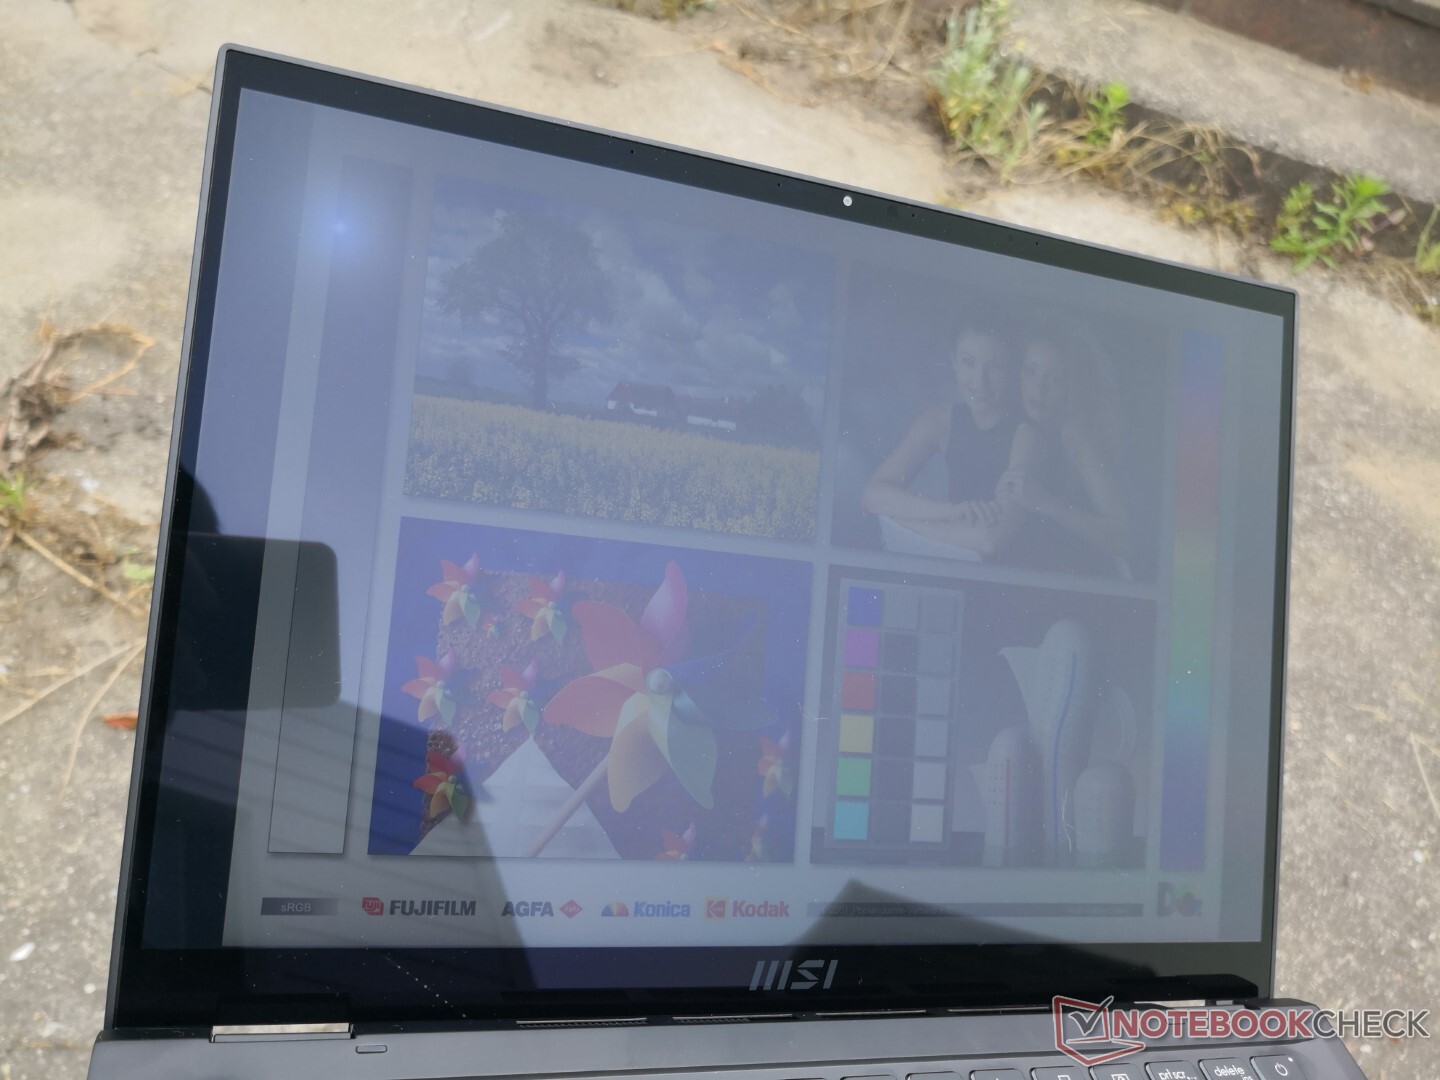
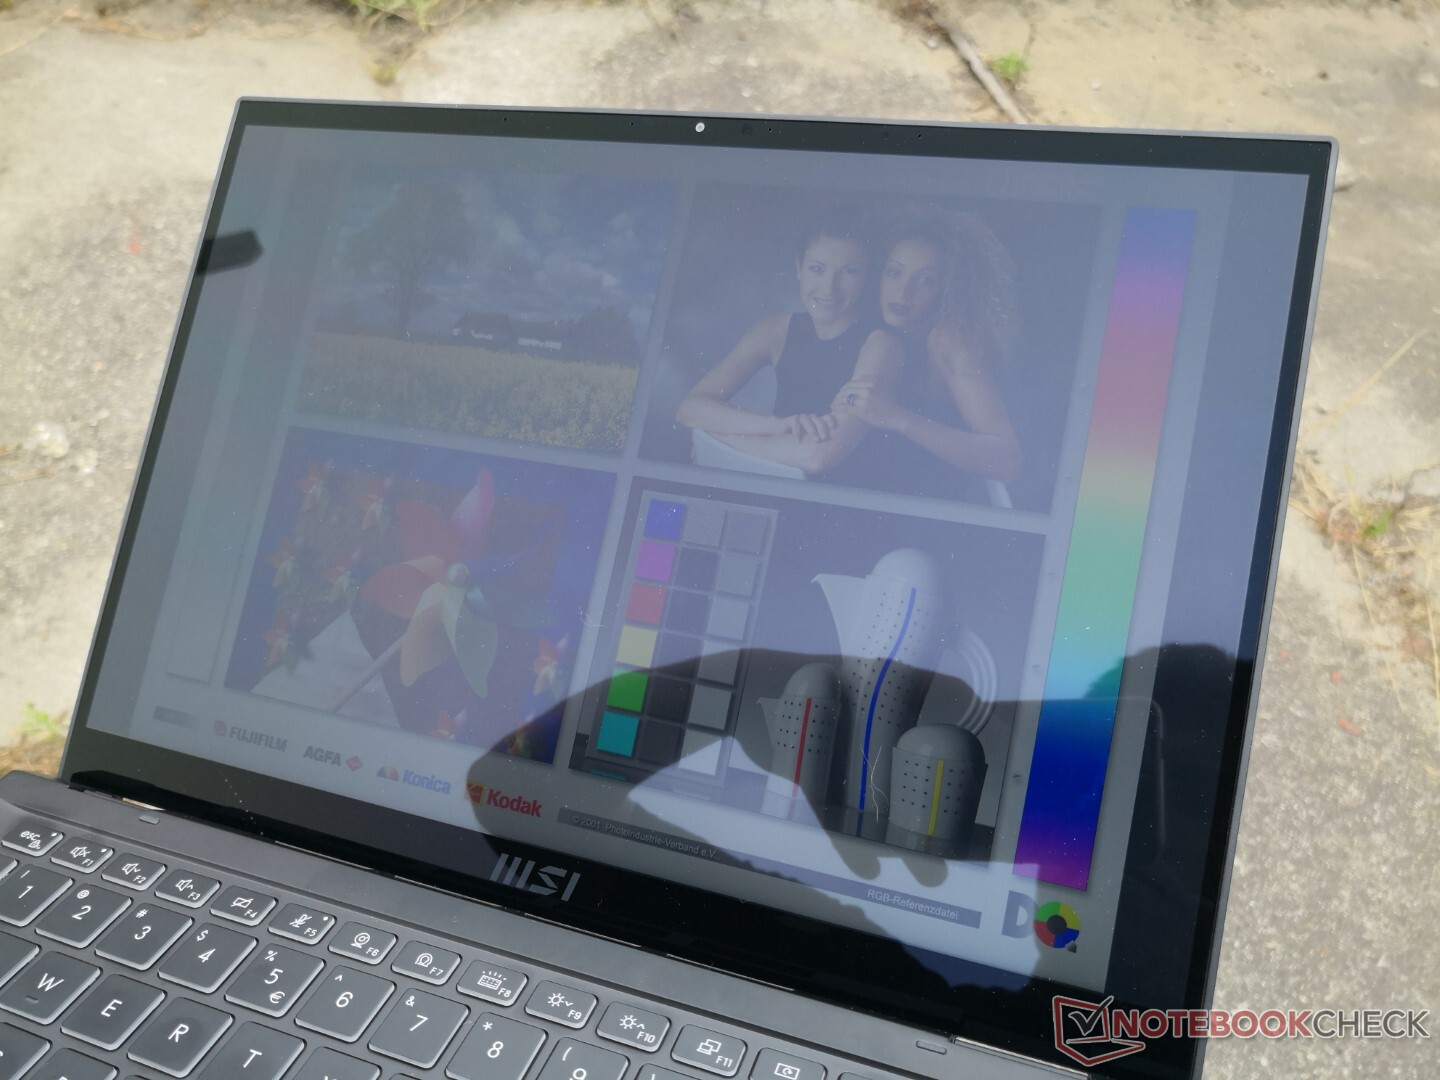
Blendung ist auf dem Hochglanzbildschirm unvermeidlich, aber die überdurchschnittlich helle 500-Nit-Hintergrundbeleuchtung hilft dabei, die Blendung auf ein erträglicheres Niveau zu minimieren. Es wird dennoch empfohlen, nicht unter direkter Sonneneinstrahlung zu arbeiten.
Leistung — Intel Core-P Serie beeindruckend

Testbedingungen
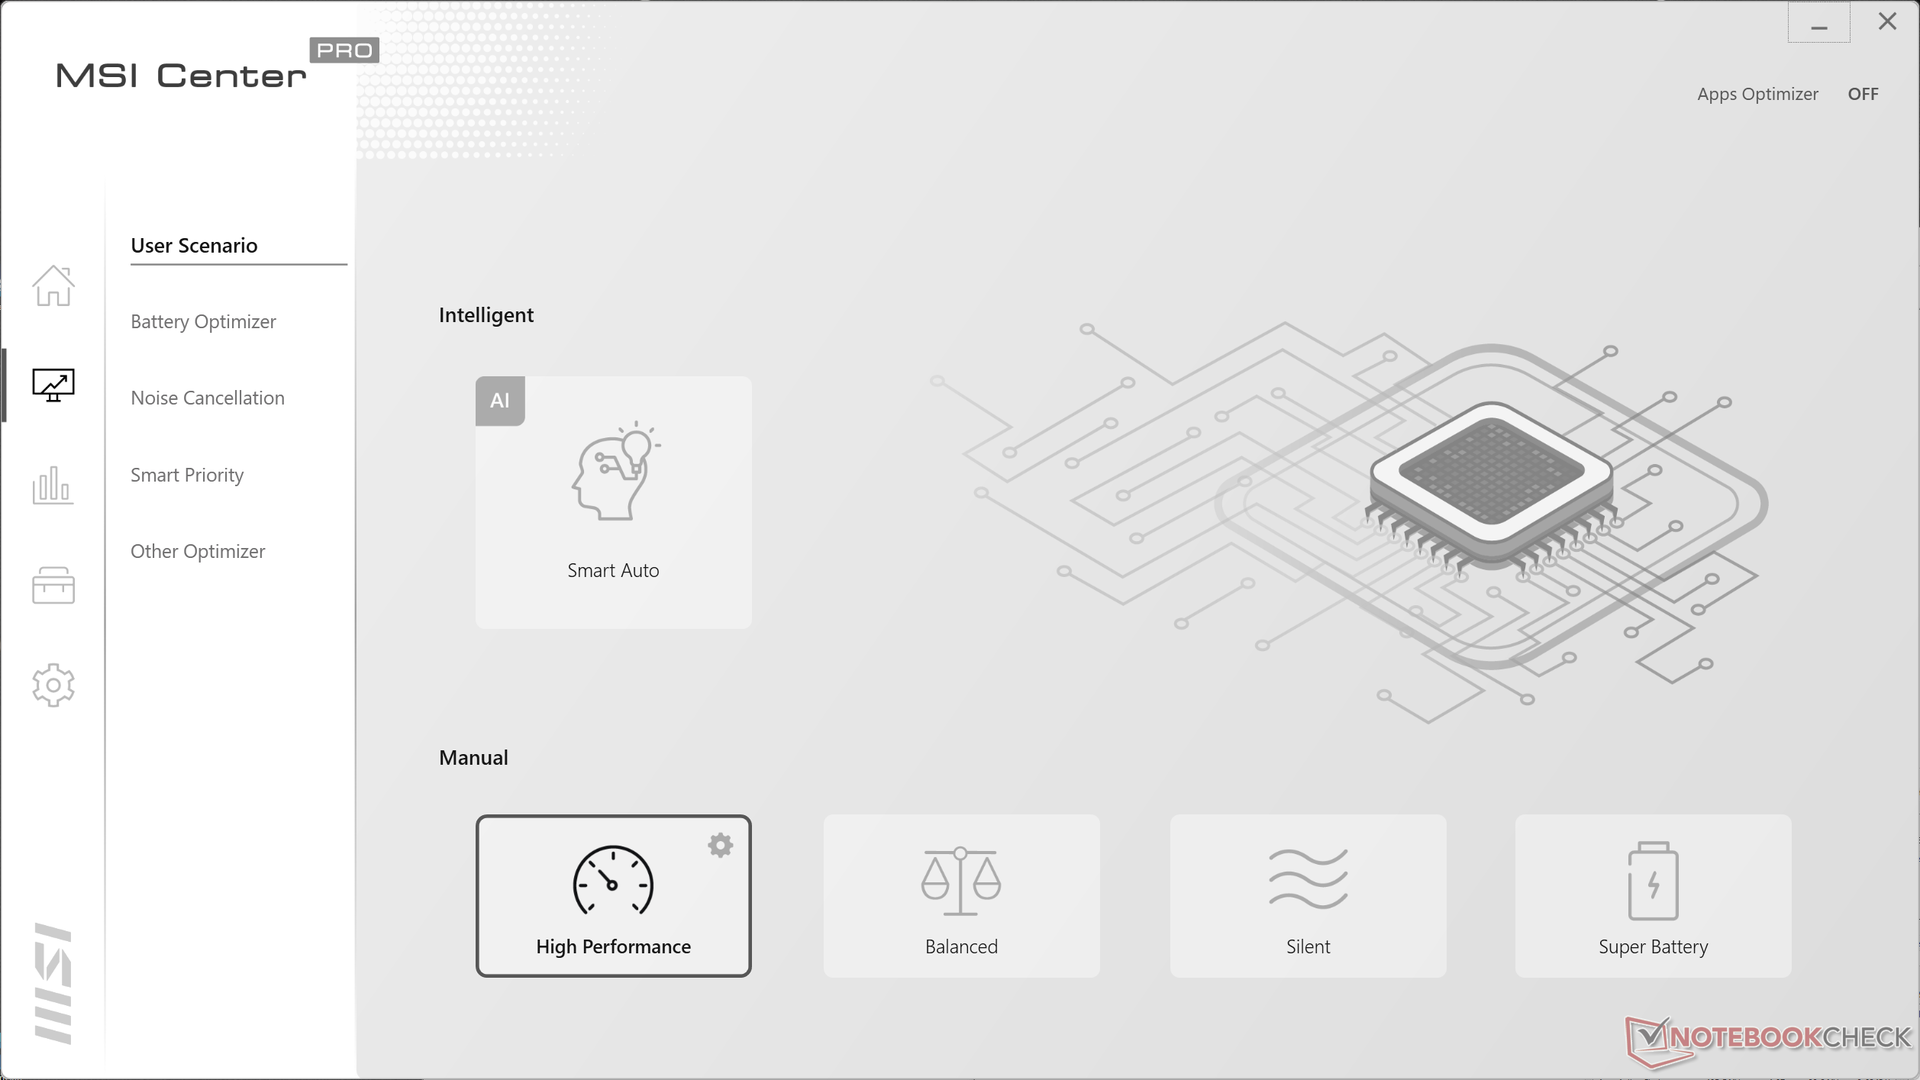
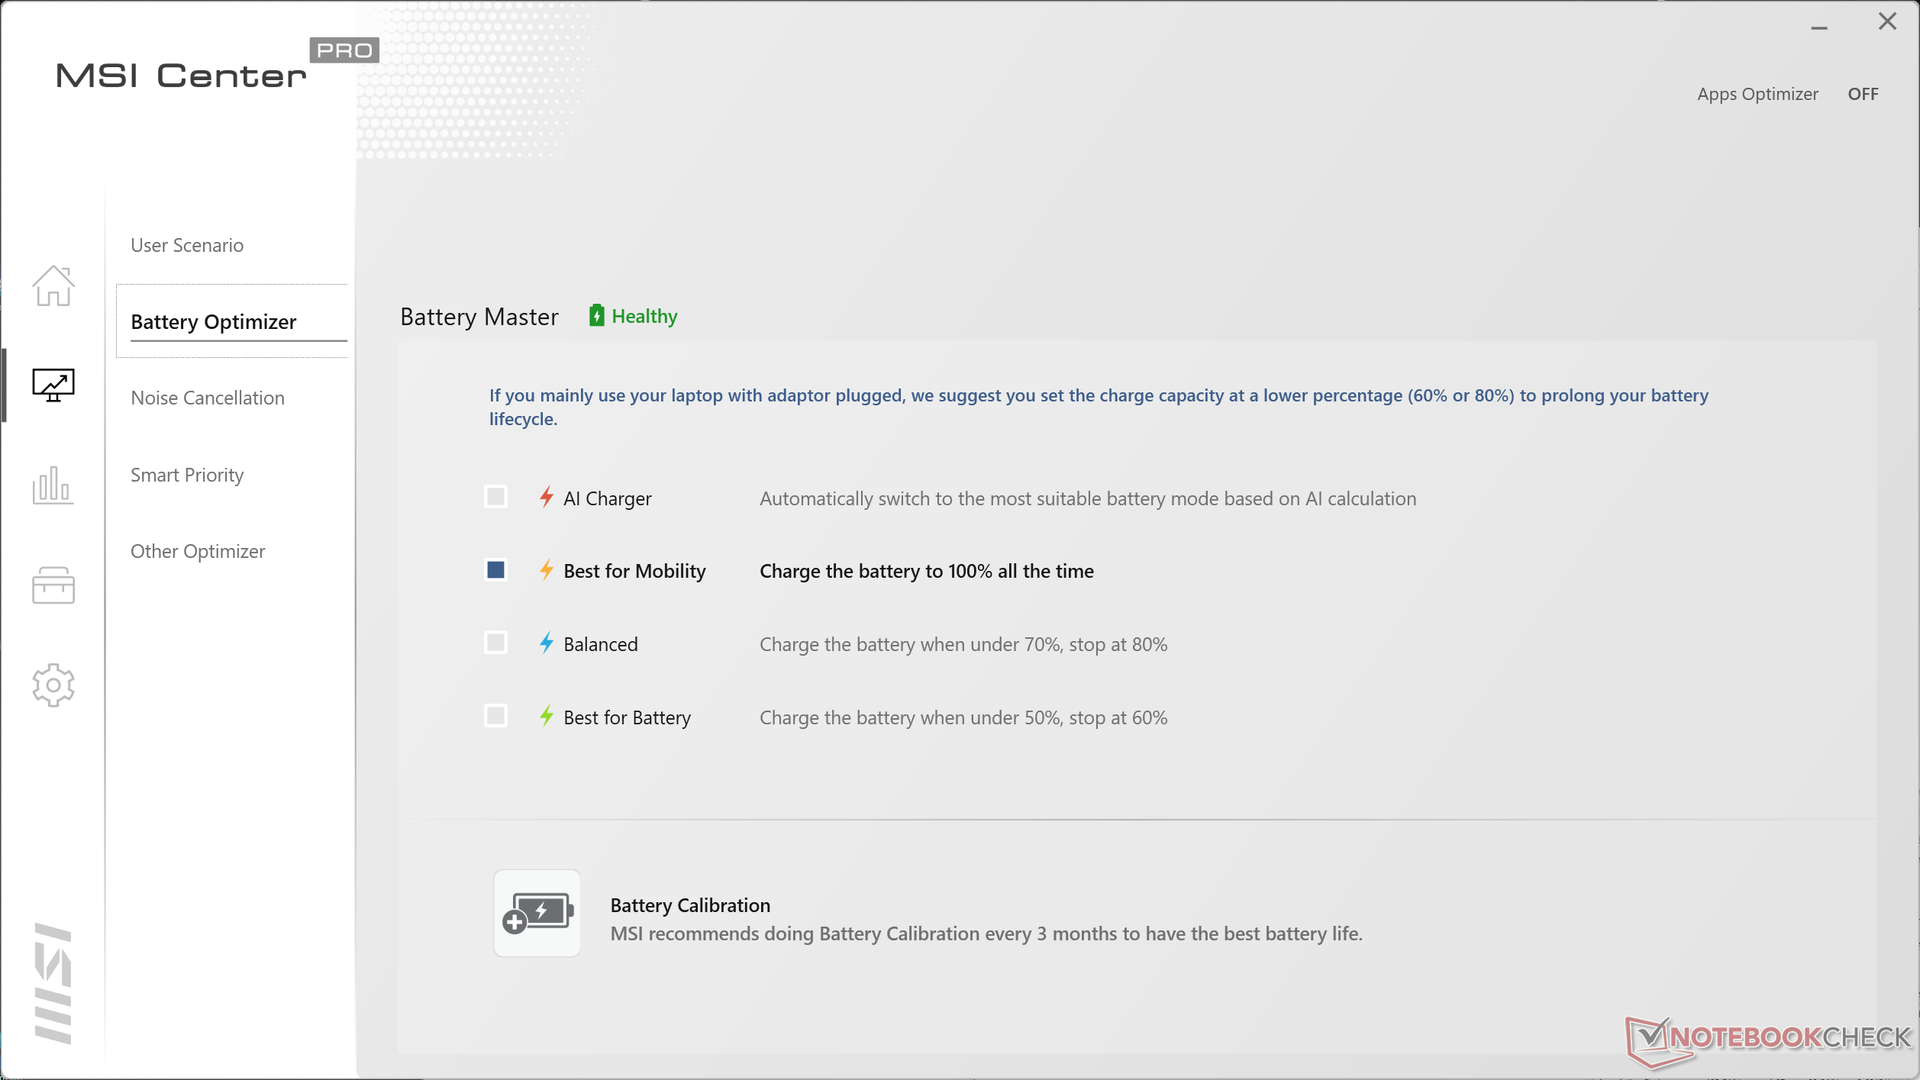
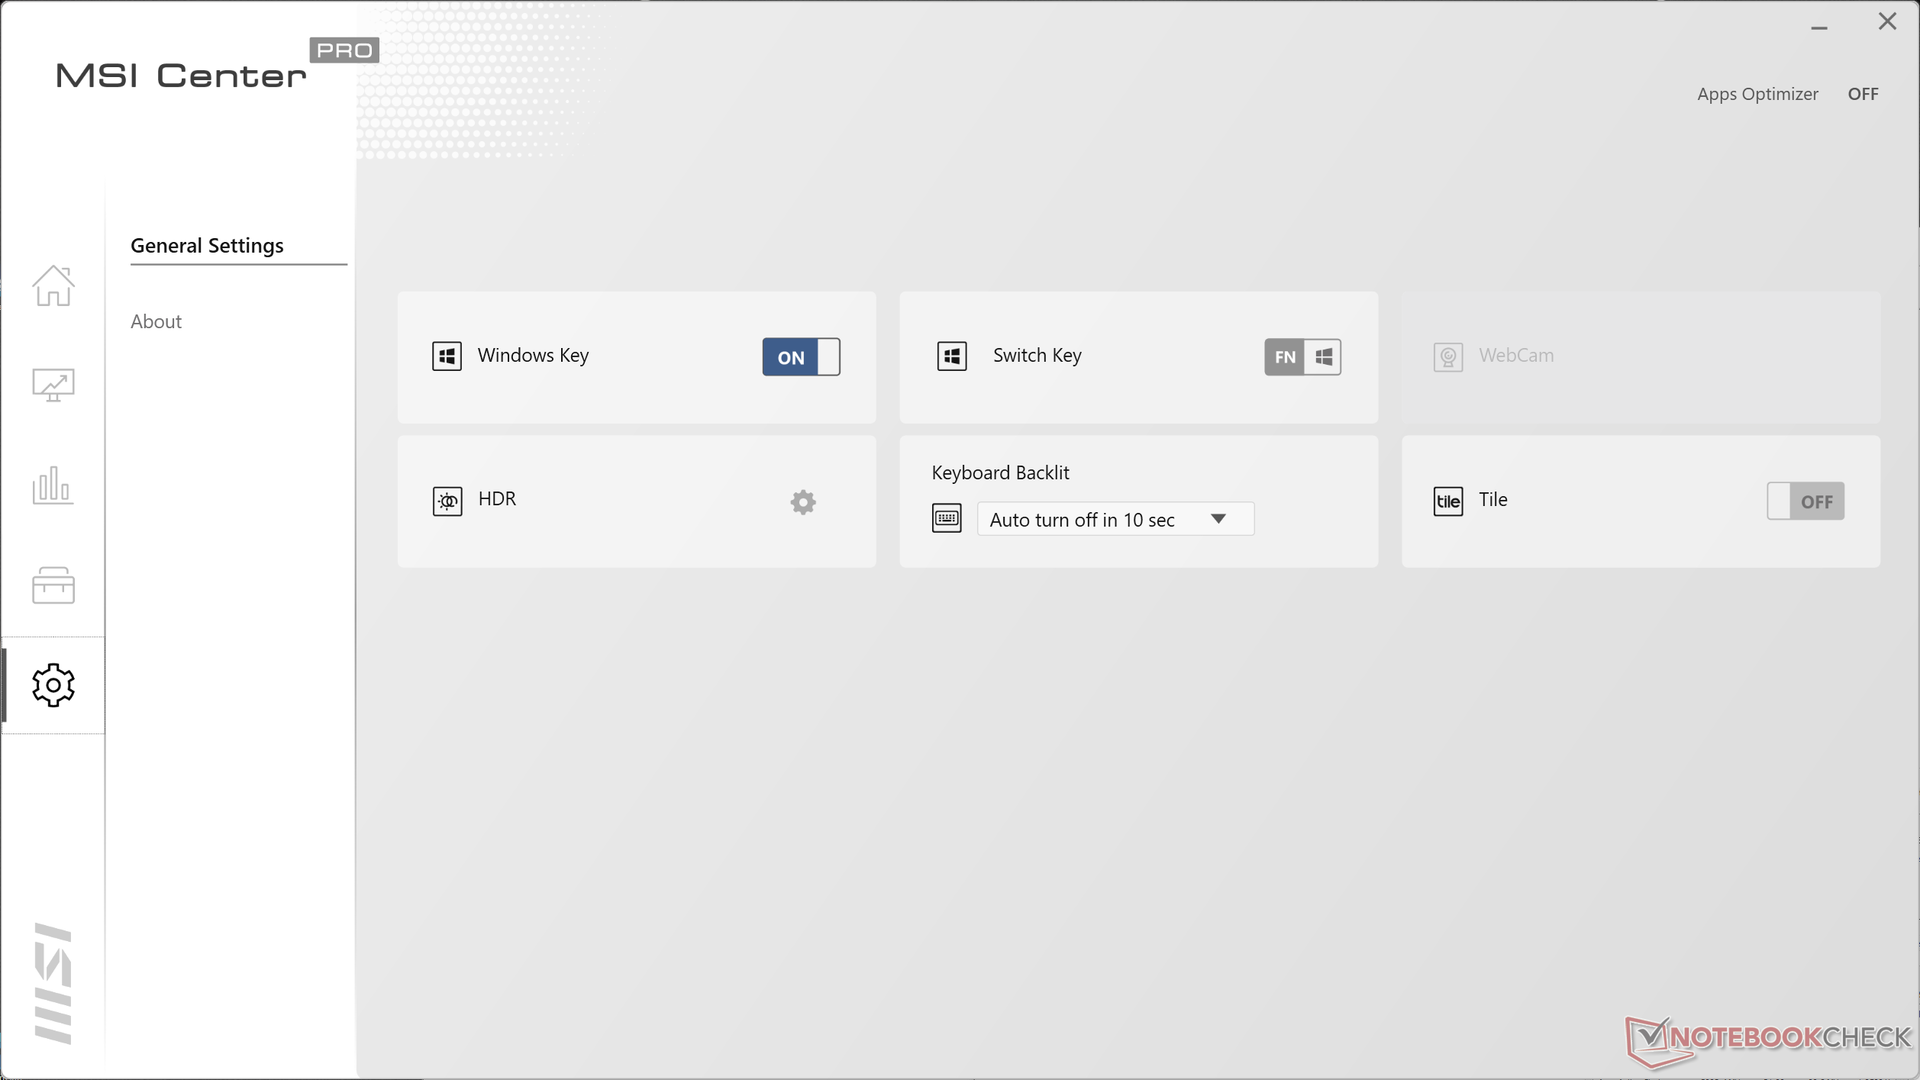
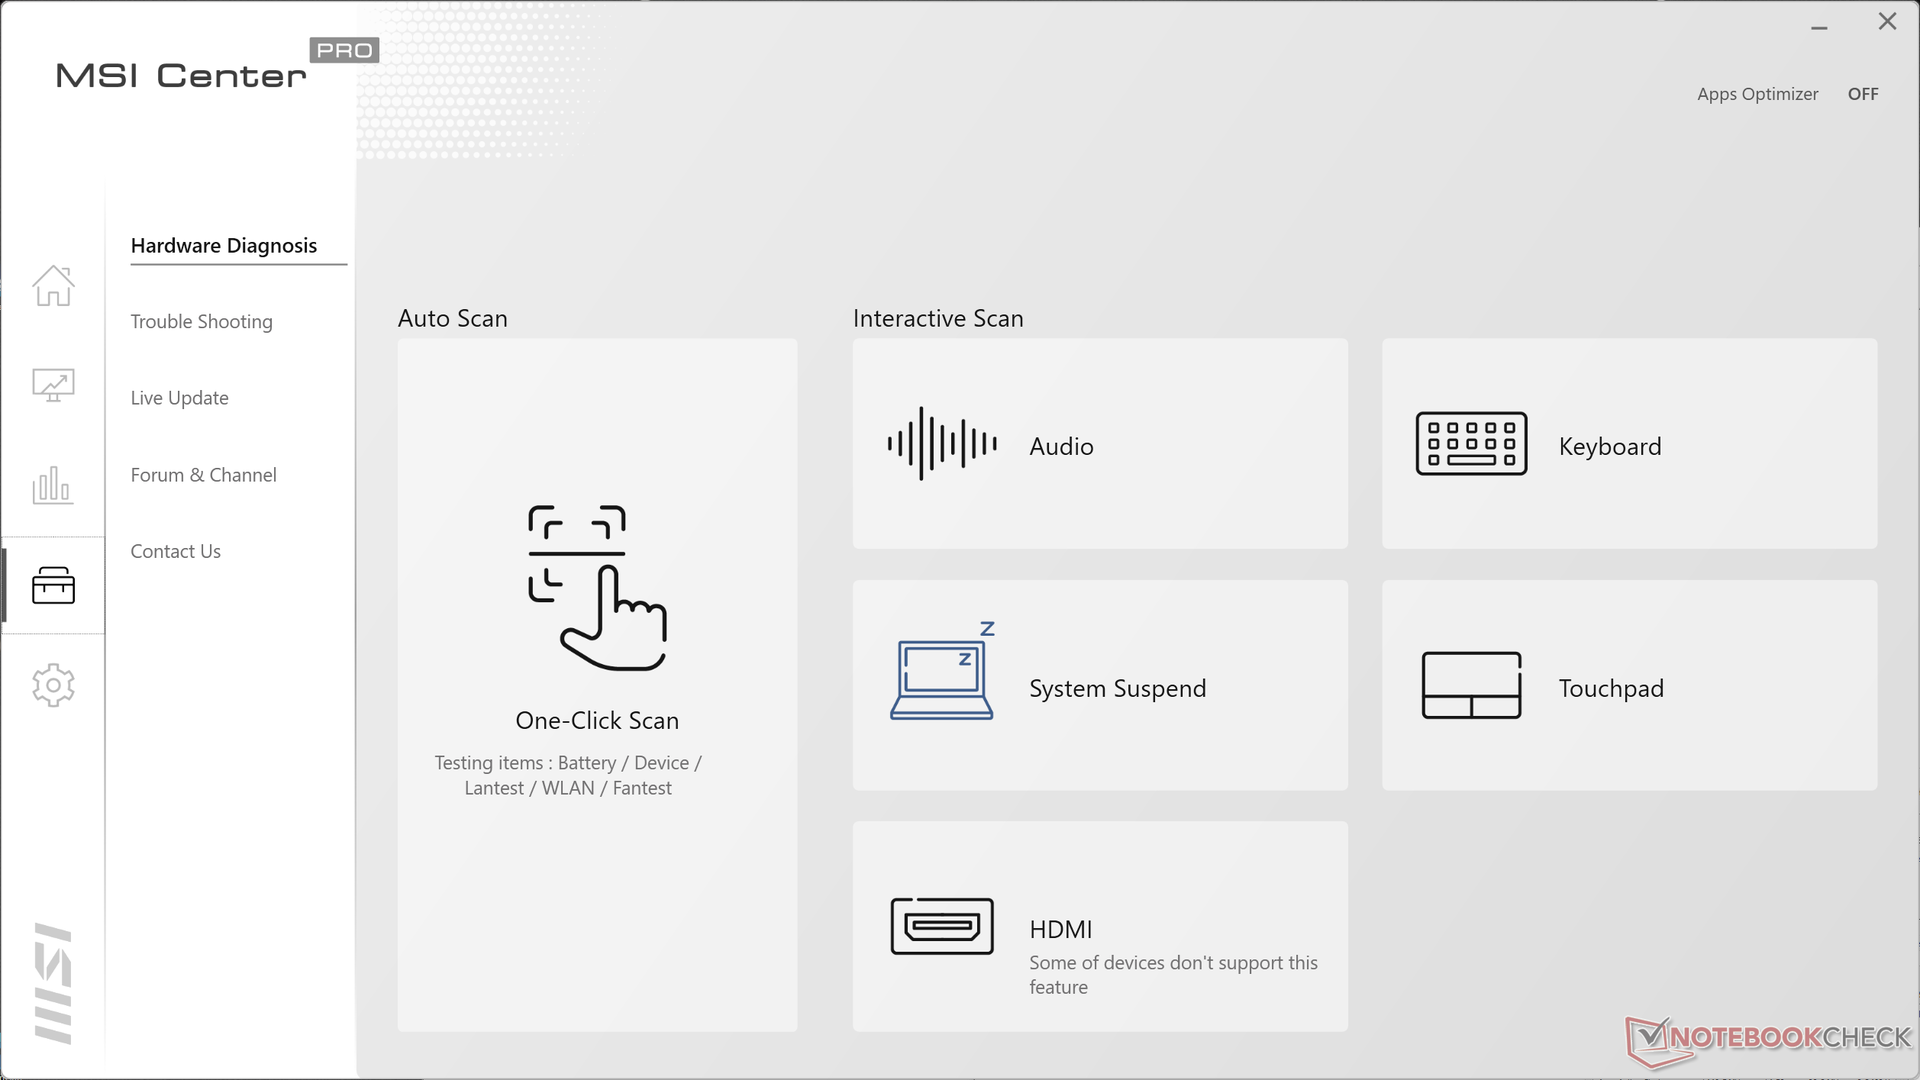
Wir stellen unser Gerät über die vorinstallierte MSI Center-Software in den Hochleistungsmodus, bevor wir die Leistungsbenchmarks unten ausführen. Es wird empfohlen, dass sich Besitzer mit dieser Software vertraut machen, da sie im Wesentlichen die Befehlszentrale zur Anpassung der meisten Systemeinstellungen, Updates und Leistungsprofile darstellt.
Prozessor
Die CPU-Leistung ist hervorragend mit Resultaten, die 5 bis 10 Prozent höher sind als der durchschnittliche Laptop in unserer Datenbank, der mit der gleichen Core i7-1260P CPU ausgestattet ist. Unsere Einheit schafft es sogar, den Core i7-1270P, wie er auf dem Lenovo ThinkPad X1 Yoga G7 zu finden ist, sowohl in ein- als auch mehrgängigen Workloads durchgängig zu übertreffen. Anwender, die von der letzten Generation Core i7-1165G7 aufrüsten, können bei Multithreading-Anwendungen mit einer deutlichen Steigerung von bis zu 80 Prozent rechnen.
Der konkurrierende Ryzen 7 6800U ist in der Lage, unseren Core i7-1260P bei Multithread-Workloads um bis zu 15 bis 20 Prozent zu übertreffen, während das Gegenteil bei Singlethread-Workloads der Fall ist.
Cinebench R15 Multi Loop
Cinebench R23: Multi Core | Single Core
Cinebench R15: CPU Multi 64Bit | CPU Single 64Bit
Blender: v2.79 BMW27 CPU
7-Zip 18.03: 7z b 4 | 7z b 4 -mmt1
Geekbench 5.5: Multi-Core | Single-Core
HWBOT x265 Benchmark v2.2: 4k Preset
LibreOffice : 20 Documents To PDF
R Benchmark 2.5: Overall mean
Cinebench R23: Multi Core | Single Core
Cinebench R15: CPU Multi 64Bit | CPU Single 64Bit
Blender: v2.79 BMW27 CPU
7-Zip 18.03: 7z b 4 | 7z b 4 -mmt1
Geekbench 5.5: Multi-Core | Single-Core
HWBOT x265 Benchmark v2.2: 4k Preset
LibreOffice : 20 Documents To PDF
R Benchmark 2.5: Overall mean
* ... kleinere Werte sind besser
AIDA64: FP32 Ray-Trace | FPU Julia | CPU SHA3 | CPU Queen | FPU SinJulia | FPU Mandel | CPU AES | CPU ZLib | FP64 Ray-Trace | CPU PhotoWorxx
| Performance Rating | |
| Asus VivoBook S 14X S5402Z | |
| Lenovo Yoga Slim 7i Pro 14IAP G7 | |
| Dell Latitude 9420 2-in-1 | |
| Durchschnittliche Intel Core i7-1260P | |
| MSI Summit E14 A11SCS | |
| LG Gram 14T90P | |
| MSI Summit E14 Flip Evo A12MT | |
| AIDA64 / FP32 Ray-Trace | |
| Dell Latitude 9420 2-in-1 | |
| MSI Summit E14 A11SCS | |
| LG Gram 14T90P | |
| Asus VivoBook S 14X S5402Z | |
| Durchschnittliche Intel Core i7-1260P (2176 - 10898, n=26) | |
| Lenovo Yoga Slim 7i Pro 14IAP G7 | |
| MSI Summit E14 Flip Evo A12MT | |
| AIDA64 / FPU Julia | |
| Asus VivoBook S 14X S5402Z | |
| Durchschnittliche Intel Core i7-1260P (11015 - 56906, n=26) | |
| Dell Latitude 9420 2-in-1 | |
| MSI Summit E14 A11SCS | |
| Lenovo Yoga Slim 7i Pro 14IAP G7 | |
| LG Gram 14T90P | |
| MSI Summit E14 Flip Evo A12MT | |
| AIDA64 / CPU SHA3 | |
| Asus VivoBook S 14X S5402Z | |
| Lenovo Yoga Slim 7i Pro 14IAP G7 | |
| Dell Latitude 9420 2-in-1 | |
| MSI Summit E14 A11SCS | |
| LG Gram 14T90P | |
| Durchschnittliche Intel Core i7-1260P (669 - 2709, n=26) | |
| MSI Summit E14 Flip Evo A12MT | |
| AIDA64 / CPU Queen | |
| Asus VivoBook S 14X S5402Z | |
| MSI Summit E14 Flip Evo A12MT | |
| Lenovo Yoga Slim 7i Pro 14IAP G7 | |
| Durchschnittliche Intel Core i7-1260P (42571 - 82493, n=26) | |
| Dell Latitude 9420 2-in-1 | |
| MSI Summit E14 A11SCS | |
| LG Gram 14T90P | |
| AIDA64 / FPU SinJulia | |
| Asus VivoBook S 14X S5402Z | |
| Lenovo Yoga Slim 7i Pro 14IAP G7 | |
| MSI Summit E14 Flip Evo A12MT | |
| Durchschnittliche Intel Core i7-1260P (2901 - 6975, n=26) | |
| Dell Latitude 9420 2-in-1 | |
| MSI Summit E14 A11SCS | |
| LG Gram 14T90P | |
| AIDA64 / FPU Mandel | |
| Asus VivoBook S 14X S5402Z | |
| MSI Summit E14 A11SCS | |
| Dell Latitude 9420 2-in-1 | |
| LG Gram 14T90P | |
| Durchschnittliche Intel Core i7-1260P (5950 - 26376, n=26) | |
| Lenovo Yoga Slim 7i Pro 14IAP G7 | |
| MSI Summit E14 Flip Evo A12MT | |
| AIDA64 / CPU AES | |
| Dell Latitude 9420 2-in-1 | |
| LG Gram 14T90P | |
| Asus VivoBook S 14X S5402Z | |
| Durchschnittliche Intel Core i7-1260P (16041 - 92356, n=26) | |
| Lenovo Yoga Slim 7i Pro 14IAP G7 | |
| MSI Summit E14 A11SCS | |
| MSI Summit E14 Flip Evo A12MT | |
| AIDA64 / CPU ZLib | |
| Asus VivoBook S 14X S5402Z | |
| Lenovo Yoga Slim 7i Pro 14IAP G7 | |
| MSI Summit E14 Flip Evo A12MT | |
| Durchschnittliche Intel Core i7-1260P (259 - 771, n=26) | |
| Dell Latitude 9420 2-in-1 | |
| MSI Summit E14 A11SCS | |
| LG Gram 14T90P | |
| AIDA64 / FP64 Ray-Trace | |
| Asus VivoBook S 14X S5402Z | |
| Dell Latitude 9420 2-in-1 | |
| MSI Summit E14 A11SCS | |
| LG Gram 14T90P | |
| Durchschnittliche Intel Core i7-1260P (1237 - 5858, n=26) | |
| Lenovo Yoga Slim 7i Pro 14IAP G7 | |
| MSI Summit E14 Flip Evo A12MT | |
| AIDA64 / CPU PhotoWorxx | |
| MSI Summit E14 A11SCS | |
| Dell Latitude 9420 2-in-1 | |
| LG Gram 14T90P | |
| MSI Summit E14 Flip Evo A12MT | |
| Lenovo Yoga Slim 7i Pro 14IAP G7 | |
| Durchschnittliche Intel Core i7-1260P (13261 - 43652, n=26) | |
| Asus VivoBook S 14X S5402Z | |
Systemleistung
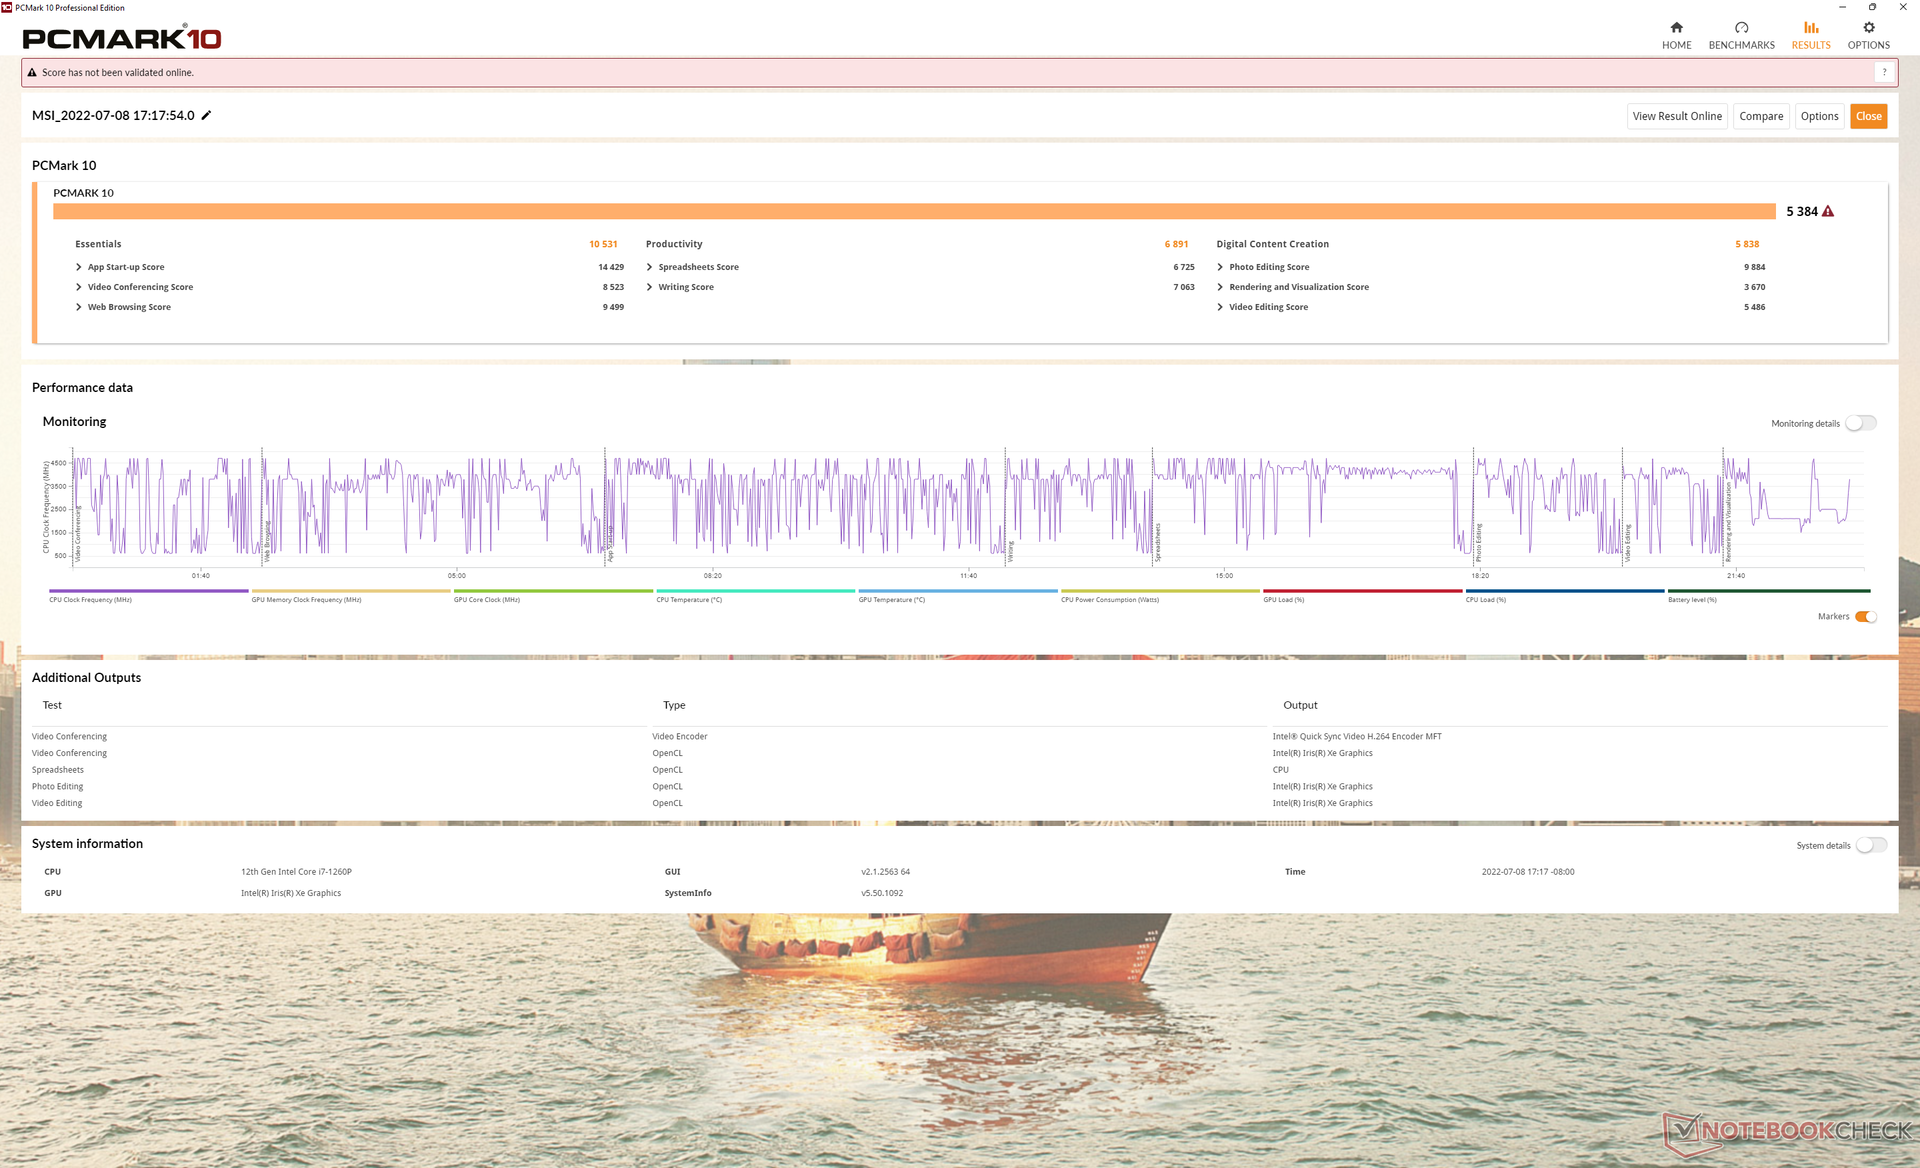
PCMark 10 Scores sind vergleichbar mit anderen Laptops, die auf derselben Core i7-1260P CPU laufen. Mittlerweile sind die CrossMark-Werte durchgehend höher als bei vielen anderen 14-Zoll-Alternativen, darunter auch das Core H-Serie-betriebene Asus VivoBook S 14.
CrossMark: Overall | Productivity | Creativity | Responsiveness
| PCMark 10 / Score | |
| Asus VivoBook S 14X S5402Z | |
| Durchschnittliche Intel Core i7-1260P, Intel Iris Xe Graphics G7 96EUs (4796 - 6068, n=17) | |
| MSI Summit E14 Flip Evo A12MT | |
| MSI Summit E14 A11SCS | |
| Dell Latitude 9420 2-in-1 | |
| Lenovo Yoga Slim 7i Pro 14IAP G7 | |
| LG Gram 14T90P | |
| PCMark 10 / Essentials | |
| Asus VivoBook S 14X S5402Z | |
| MSI Summit E14 Flip Evo A12MT | |
| Dell Latitude 9420 2-in-1 | |
| Durchschnittliche Intel Core i7-1260P, Intel Iris Xe Graphics G7 96EUs (9260 - 11251, n=17) | |
| Lenovo Yoga Slim 7i Pro 14IAP G7 | |
| LG Gram 14T90P | |
| MSI Summit E14 A11SCS | |
| PCMark 10 / Productivity | |
| MSI Summit E14 A11SCS | |
| Asus VivoBook S 14X S5402Z | |
| Durchschnittliche Intel Core i7-1260P, Intel Iris Xe Graphics G7 96EUs (6167 - 8629, n=17) | |
| Dell Latitude 9420 2-in-1 | |
| MSI Summit E14 Flip Evo A12MT | |
| LG Gram 14T90P | |
| Lenovo Yoga Slim 7i Pro 14IAP G7 | |
| PCMark 10 / Digital Content Creation | |
| Asus VivoBook S 14X S5402Z | |
| Durchschnittliche Intel Core i7-1260P, Intel Iris Xe Graphics G7 96EUs (5231 - 6908, n=17) | |
| Lenovo Yoga Slim 7i Pro 14IAP G7 | |
| MSI Summit E14 Flip Evo A12MT | |
| MSI Summit E14 A11SCS | |
| Dell Latitude 9420 2-in-1 | |
| LG Gram 14T90P | |
| CrossMark / Overall | |
| MSI Summit E14 Flip Evo A12MT | |
| Durchschnittliche Intel Core i7-1260P, Intel Iris Xe Graphics G7 96EUs (1484 - 1811, n=16) | |
| Lenovo Yoga Slim 7i Pro 14IAP G7 | |
| Asus VivoBook S 14X S5402Z | |
| LG Gram 14T90P | |
| CrossMark / Productivity | |
| MSI Summit E14 Flip Evo A12MT | |
| Durchschnittliche Intel Core i7-1260P, Intel Iris Xe Graphics G7 96EUs (1486 - 1755, n=16) | |
| Asus VivoBook S 14X S5402Z | |
| Lenovo Yoga Slim 7i Pro 14IAP G7 | |
| LG Gram 14T90P | |
| CrossMark / Creativity | |
| MSI Summit E14 Flip Evo A12MT | |
| Durchschnittliche Intel Core i7-1260P, Intel Iris Xe Graphics G7 96EUs (1451 - 1872, n=16) | |
| Lenovo Yoga Slim 7i Pro 14IAP G7 | |
| Asus VivoBook S 14X S5402Z | |
| LG Gram 14T90P | |
| CrossMark / Responsiveness | |
| MSI Summit E14 Flip Evo A12MT | |
| Durchschnittliche Intel Core i7-1260P, Intel Iris Xe Graphics G7 96EUs (1253 - 1807, n=16) | |
| Asus VivoBook S 14X S5402Z | |
| Lenovo Yoga Slim 7i Pro 14IAP G7 | |
| LG Gram 14T90P | |
| PCMark 10 Score | 5384 Punkte | |
Hilfe | ||
| AIDA64 / Memory Copy | |
| MSI Summit E14 Flip Evo A12MT | |
| Dell Latitude 9420 2-in-1 | |
| LG Gram 14T90P | |
| MSI Summit E14 A11SCS | |
| Lenovo Yoga Slim 7i Pro 14IAP G7 | |
| Durchschnittliche Intel Core i7-1260P (25125 - 71544, n=25) | |
| Asus VivoBook S 14X S5402Z | |
| AIDA64 / Memory Read | |
| MSI Summit E14 Flip Evo A12MT | |
| Dell Latitude 9420 2-in-1 | |
| Lenovo Yoga Slim 7i Pro 14IAP G7 | |
| LG Gram 14T90P | |
| MSI Summit E14 A11SCS | |
| Durchschnittliche Intel Core i7-1260P (24983 - 72065, n=25) | |
| Asus VivoBook S 14X S5402Z | |
| AIDA64 / Memory Write | |
| LG Gram 14T90P | |
| Dell Latitude 9420 2-in-1 | |
| MSI Summit E14 A11SCS | |
| MSI Summit E14 Flip Evo A12MT | |
| Lenovo Yoga Slim 7i Pro 14IAP G7 | |
| Durchschnittliche Intel Core i7-1260P (23512 - 66799, n=25) | |
| Asus VivoBook S 14X S5402Z | |
| AIDA64 / Memory Latency | |
| MSI Summit E14 A11SCS | |
| Dell Latitude 9420 2-in-1 | |
| LG Gram 14T90P | |
| Durchschnittliche Intel Core i7-1260P (77.9 - 118.4, n=21) | |
| Asus VivoBook S 14X S5402Z | |
| MSI Summit E14 Flip Evo A12MT | |
* ... kleinere Werte sind besser
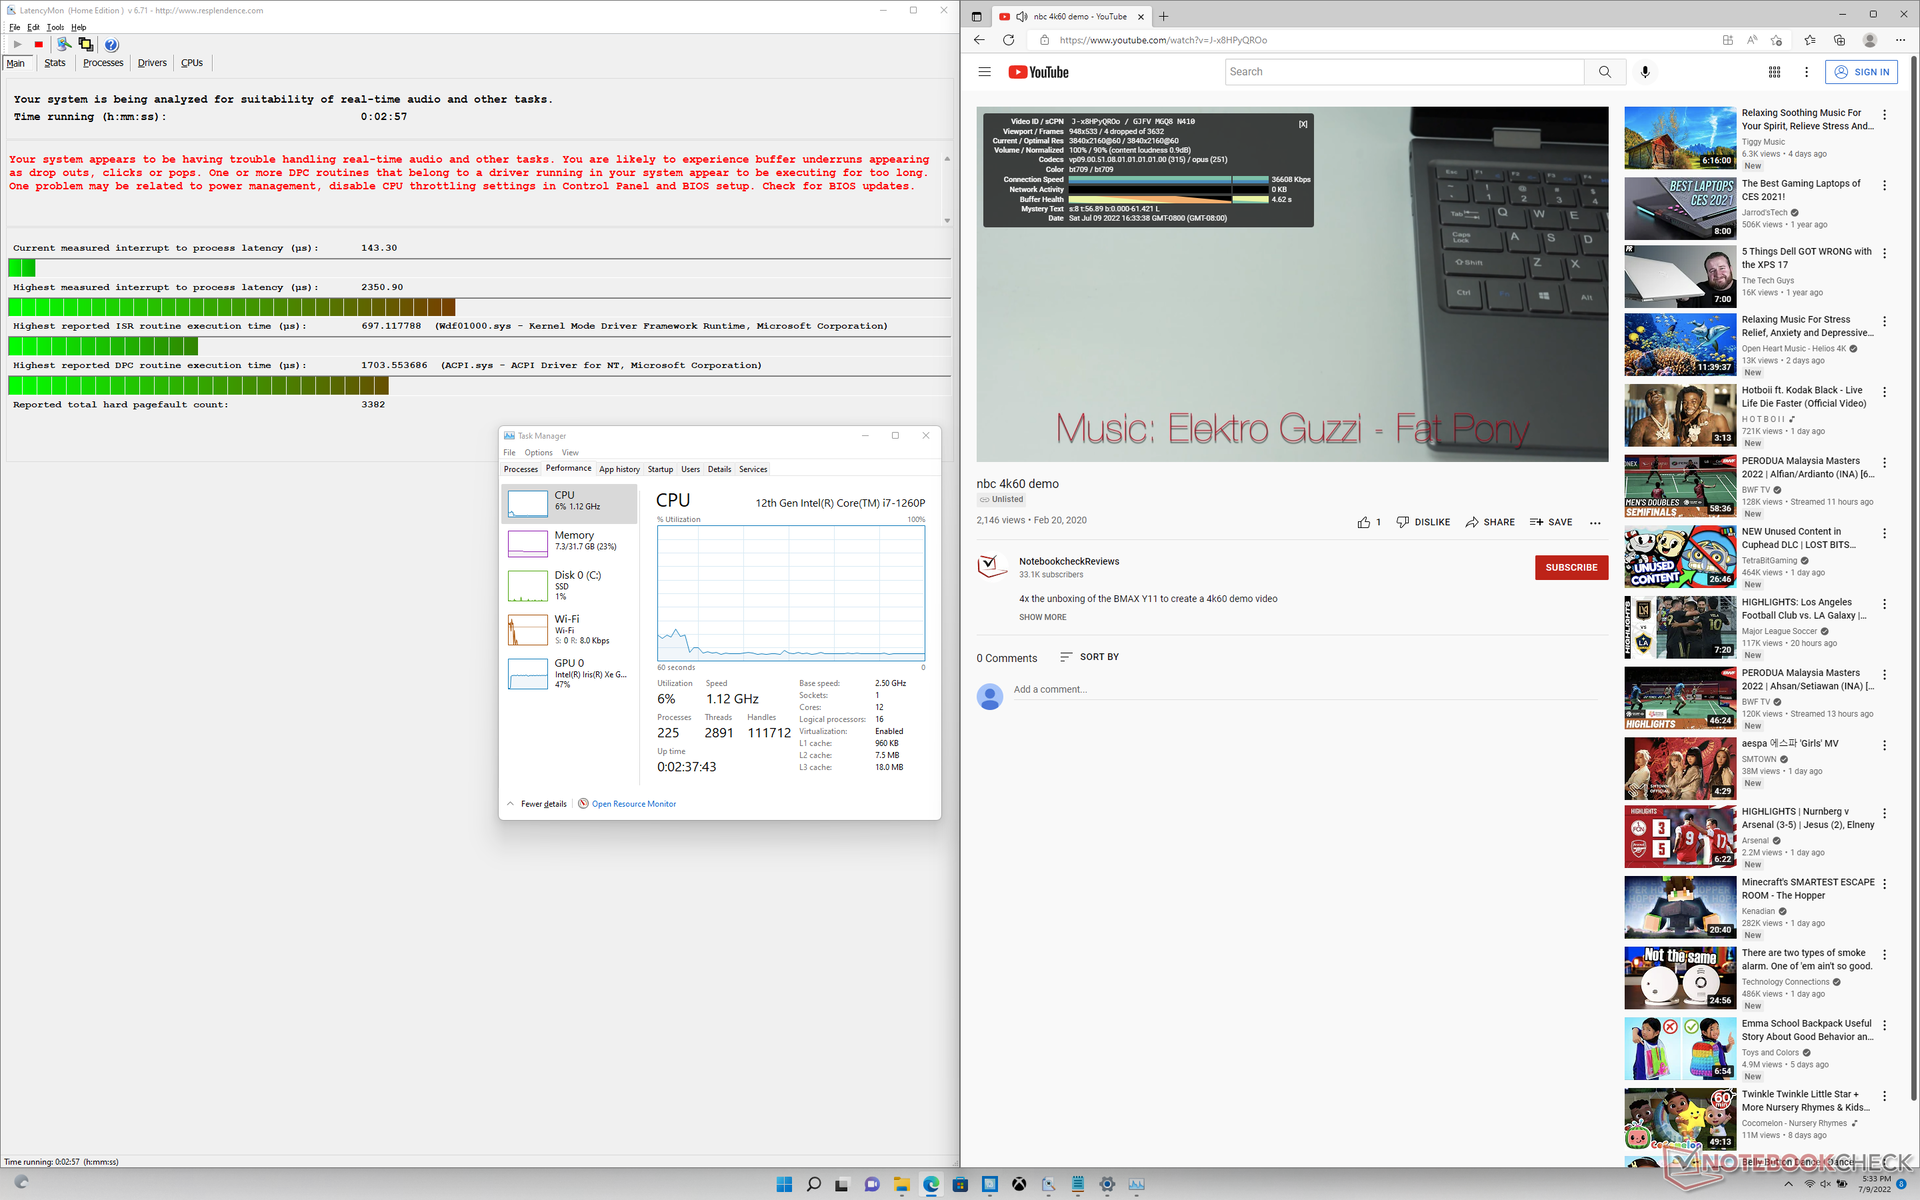
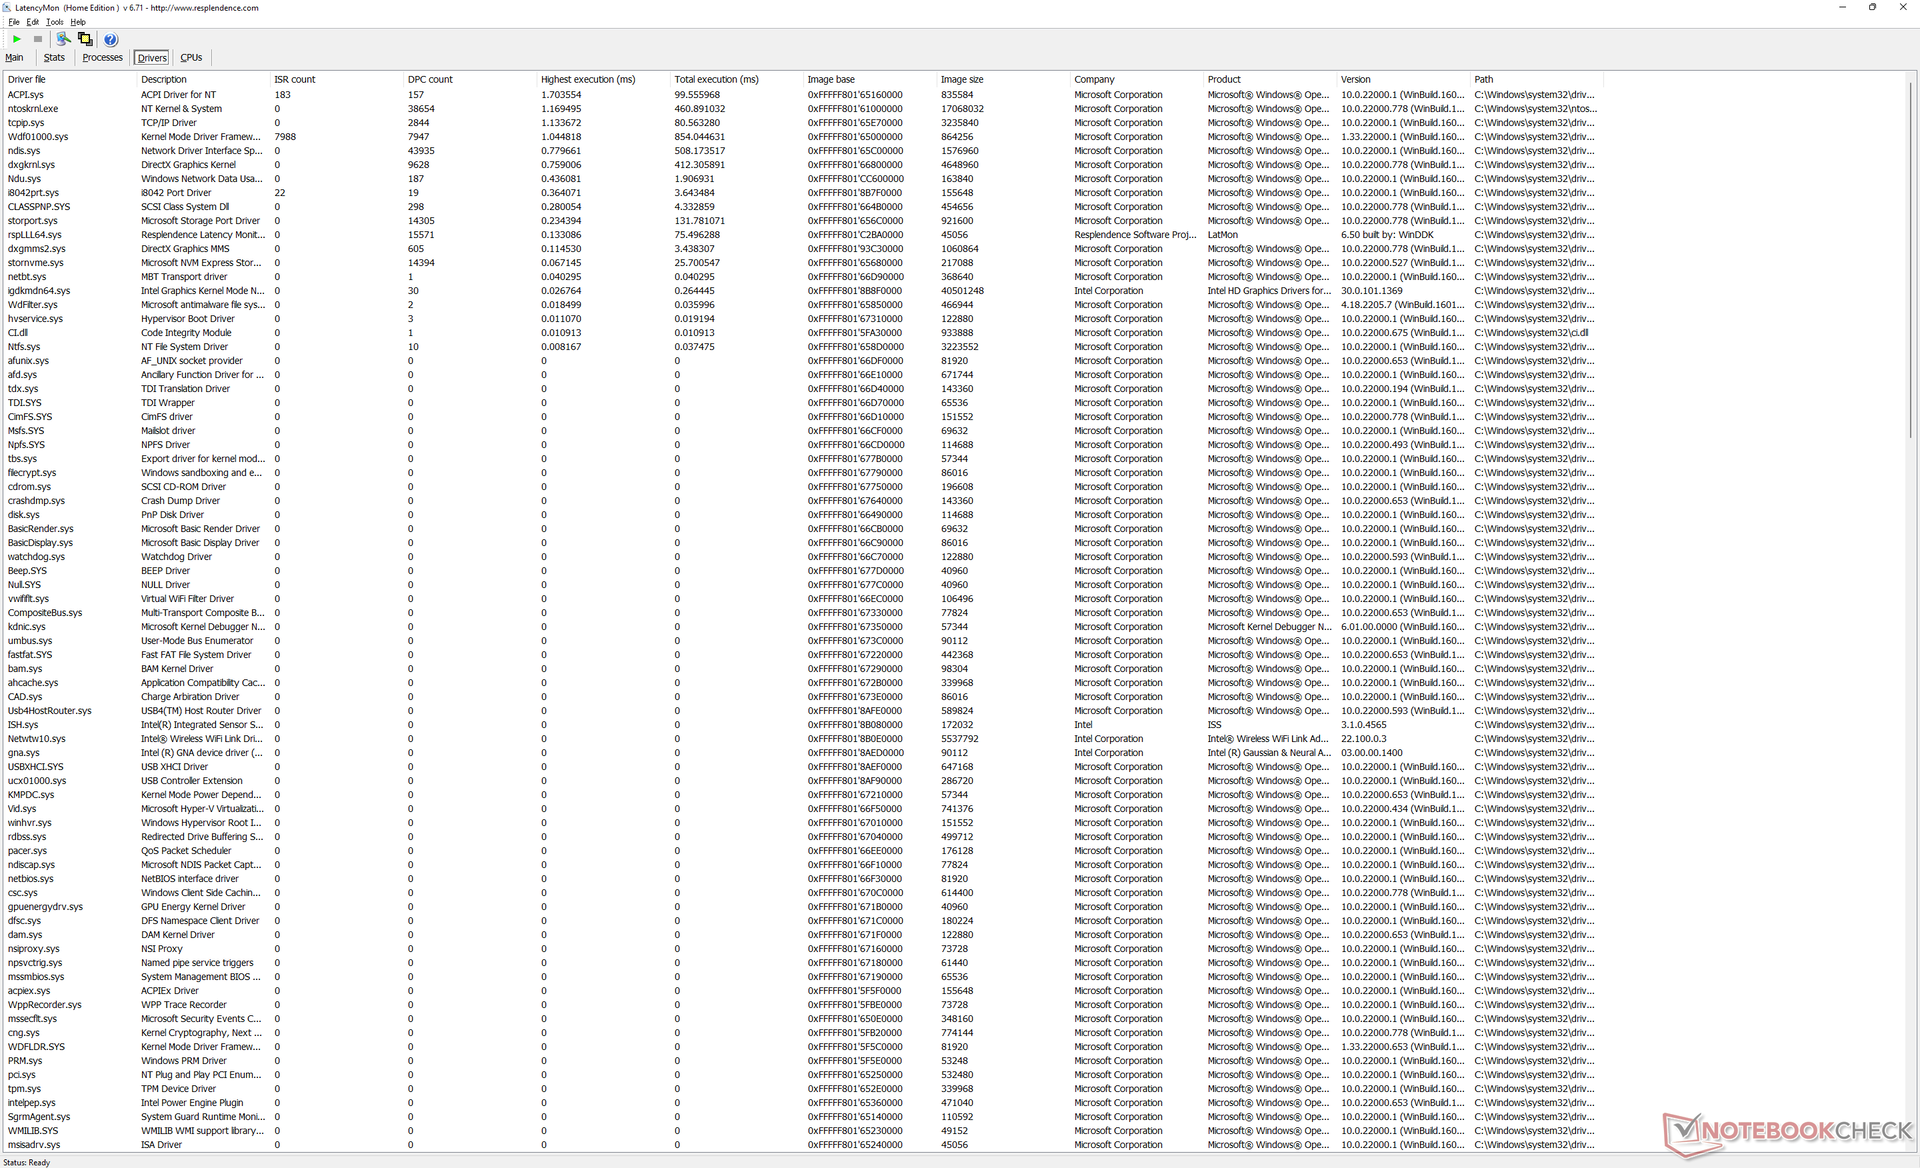
DPC Latenz
LatencyMon zeigt DPC-Probleme beim Öffnen mehrerer Browser-Tabs unserer Homepage. Die 4K-Videowiedergabe bei 60 FPS ist auch nicht perfekt mit 4 ausgelassenen Frames während unseres minutenlangen Videotests.
| DPC Latencies / LatencyMon - interrupt to process latency (max), Web, Youtube, Prime95 | |
| MSI Summit E14 Flip Evo A12MT | |
| Asus VivoBook S 14X S5402Z | |
| LG Gram 14T90P | |
| MSI Summit E14 A11SCS | |
| Lenovo Yoga Slim 7i Pro 14IAP G7 | |
| Dell Latitude 9420 2-in-1 | |
* ... kleinere Werte sind besser
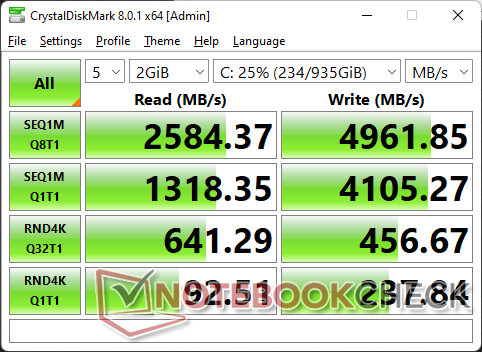
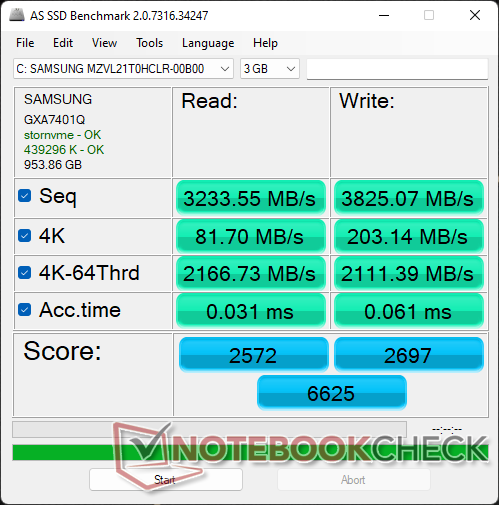
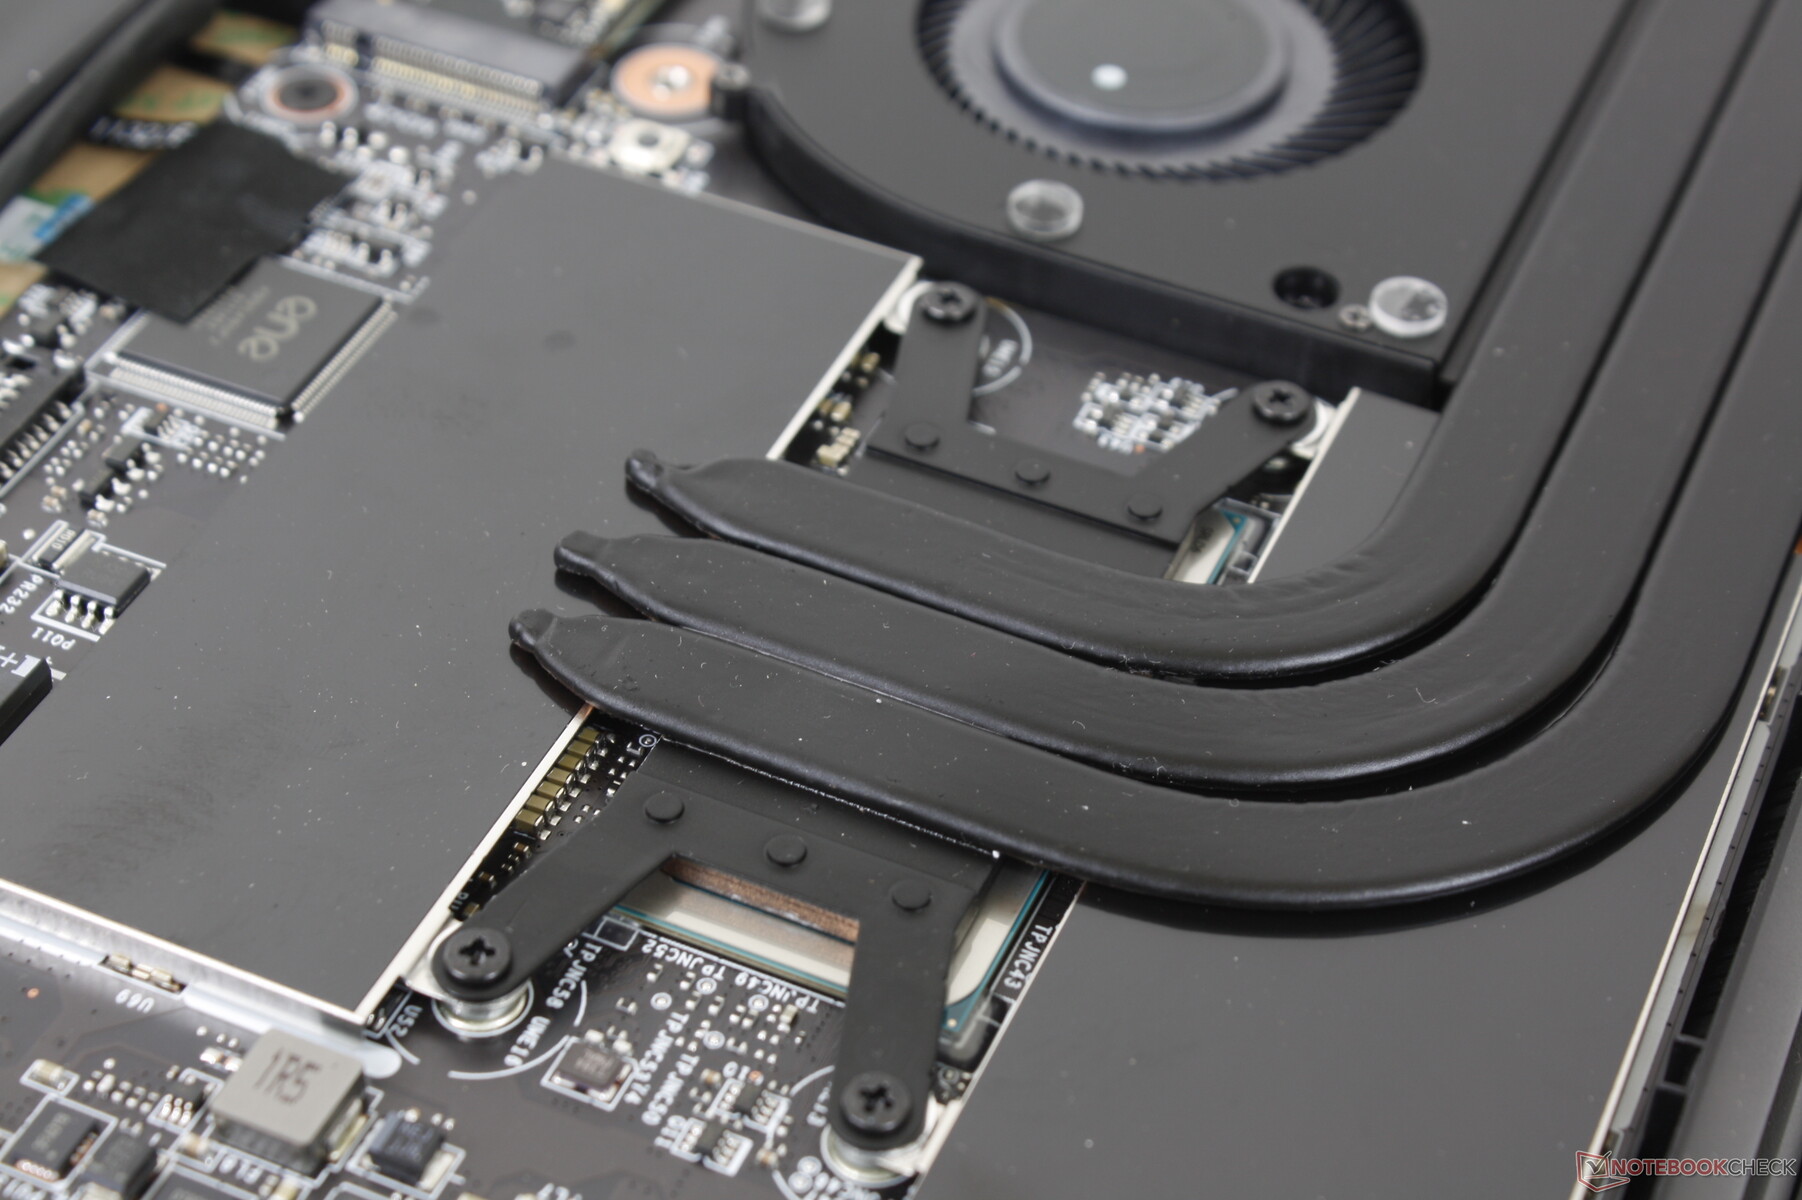
Speichergeräte — PCIe4 x4 Leistungsdrosselung
Unser Testgerät verfügt über eine 1 TB Samsung PM9A1 PCIe4 x4 NVMe SSD für sequentielle Lese- und Schreibraten von bis zu 7000 MB/s bzw. 5200 MB/s. Aufgrund der fehlenden Kühlung für die SSD im Summit E14 Flip sind die Übertragungsraten in den meisten realen Szenarien leider nicht annähernd hoch. Wenn DiskSpd in einer Schleife läuft, würden Übertragungsraten fast sofort auf nur 1700 MB/s fallen, was bereits langsamer ist als die meisten PCIe3 NVMe SSDs. Der gleiche Test auf dem Lenovo Yoga Slim 7i Pro, der mit einer ähnlichen Samsung PM9A1 SSD ausgestattet ist, würde ebenfalls ein leistungsdrosselndes Verhalten aufweisen, jedoch sind die durchschnittlichen Übertragungsraten immer noch schneller als auf dem MSI.

| Drive Performance Rating - Percent | |
| MSI Summit E14 Flip Evo A12MT | |
| MSI Summit E14 A11SCS | |
| Lenovo Yoga Slim 7i Pro 14IAP G7 | |
| LG Gram 14T90P | |
| Asus VivoBook S 14X S5402Z | |
| Dell Latitude 9420 2-in-1 | |
* ... kleinere Werte sind besser
Dauerleistung Lesen: DiskSpd Read Loop, Queue Depth 8
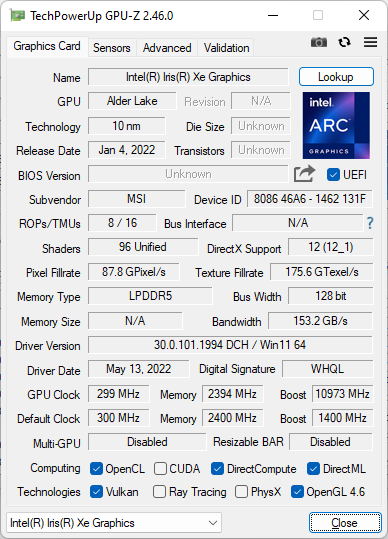
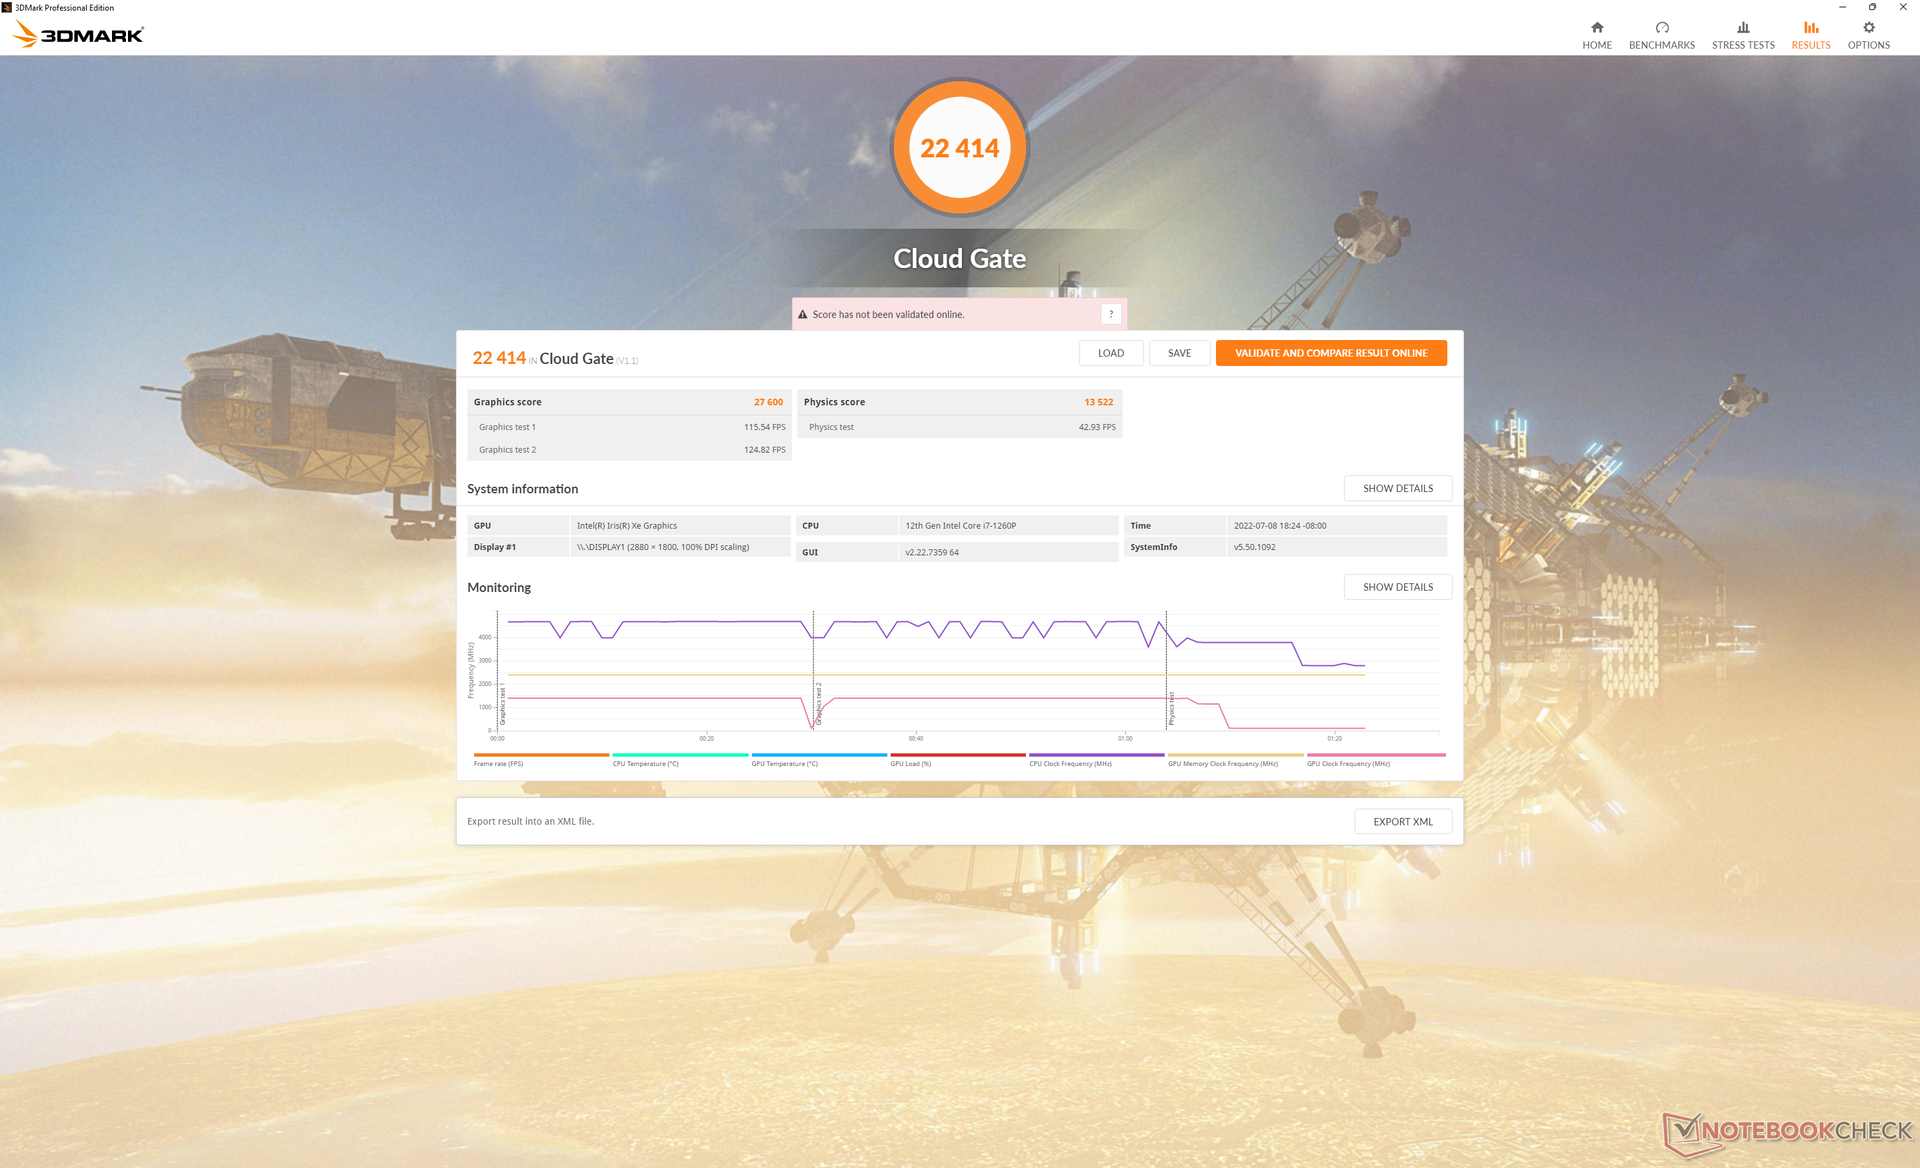
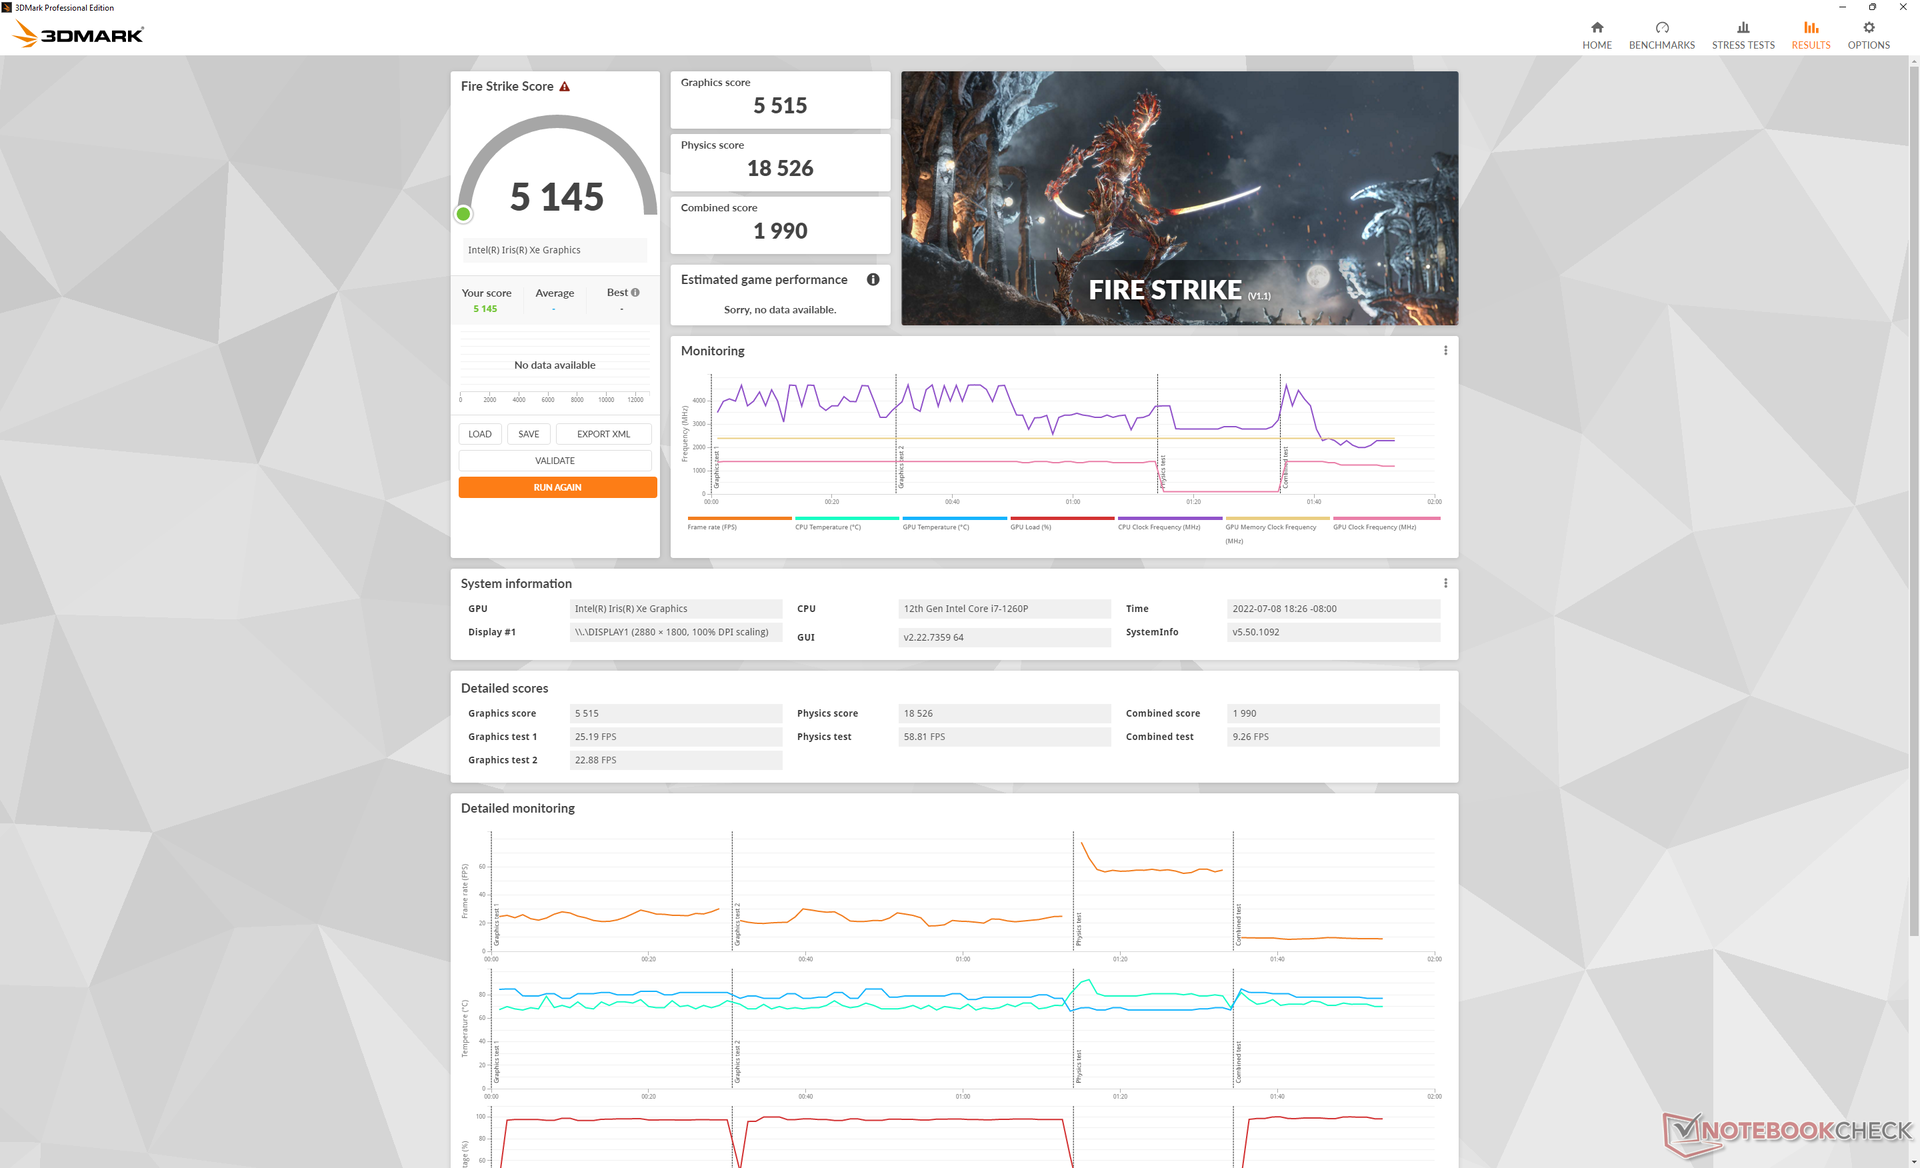
GPU-Leistung - Iris Xe ist immer noch sehr gut
Die Grafikleistung ist 15 bis 20 Prozent schneller als die durchschnittliche Iris Xe 96 EUs in unserer Datenbank, um eines der schnellsten 14-Zoll-Convertible-Geräte mit integrierter Grafik zu sein. Der leichte Boost ist teilweise auf den LPDDR5-RAM zurückzuführen, während bei den meisten anderen Ultrabooks noch DDR4 oder LPDDR4 eingesetzt werden. Die AMD Radeon 680M ist in den meisten Fällen immer noch schneller, aber eine solche Option steht nicht bei der Summit-Serie zur Verfügung. Das System ist dennoch schnell genug, um anspruchsvolle Spiele bei niedrigen 720p oder 900p Auflösungen oder weniger anspruchsvolle Spiele wie DOTA 2 bei 1080p zu spielen.
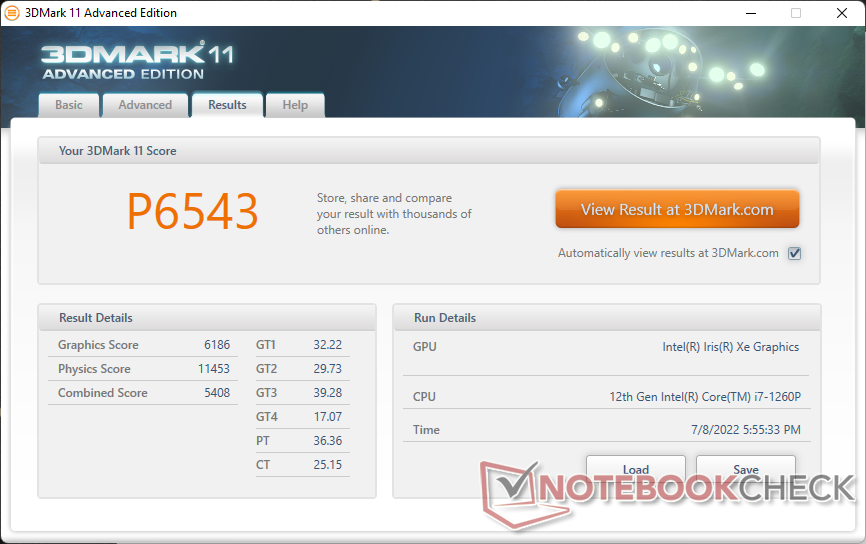

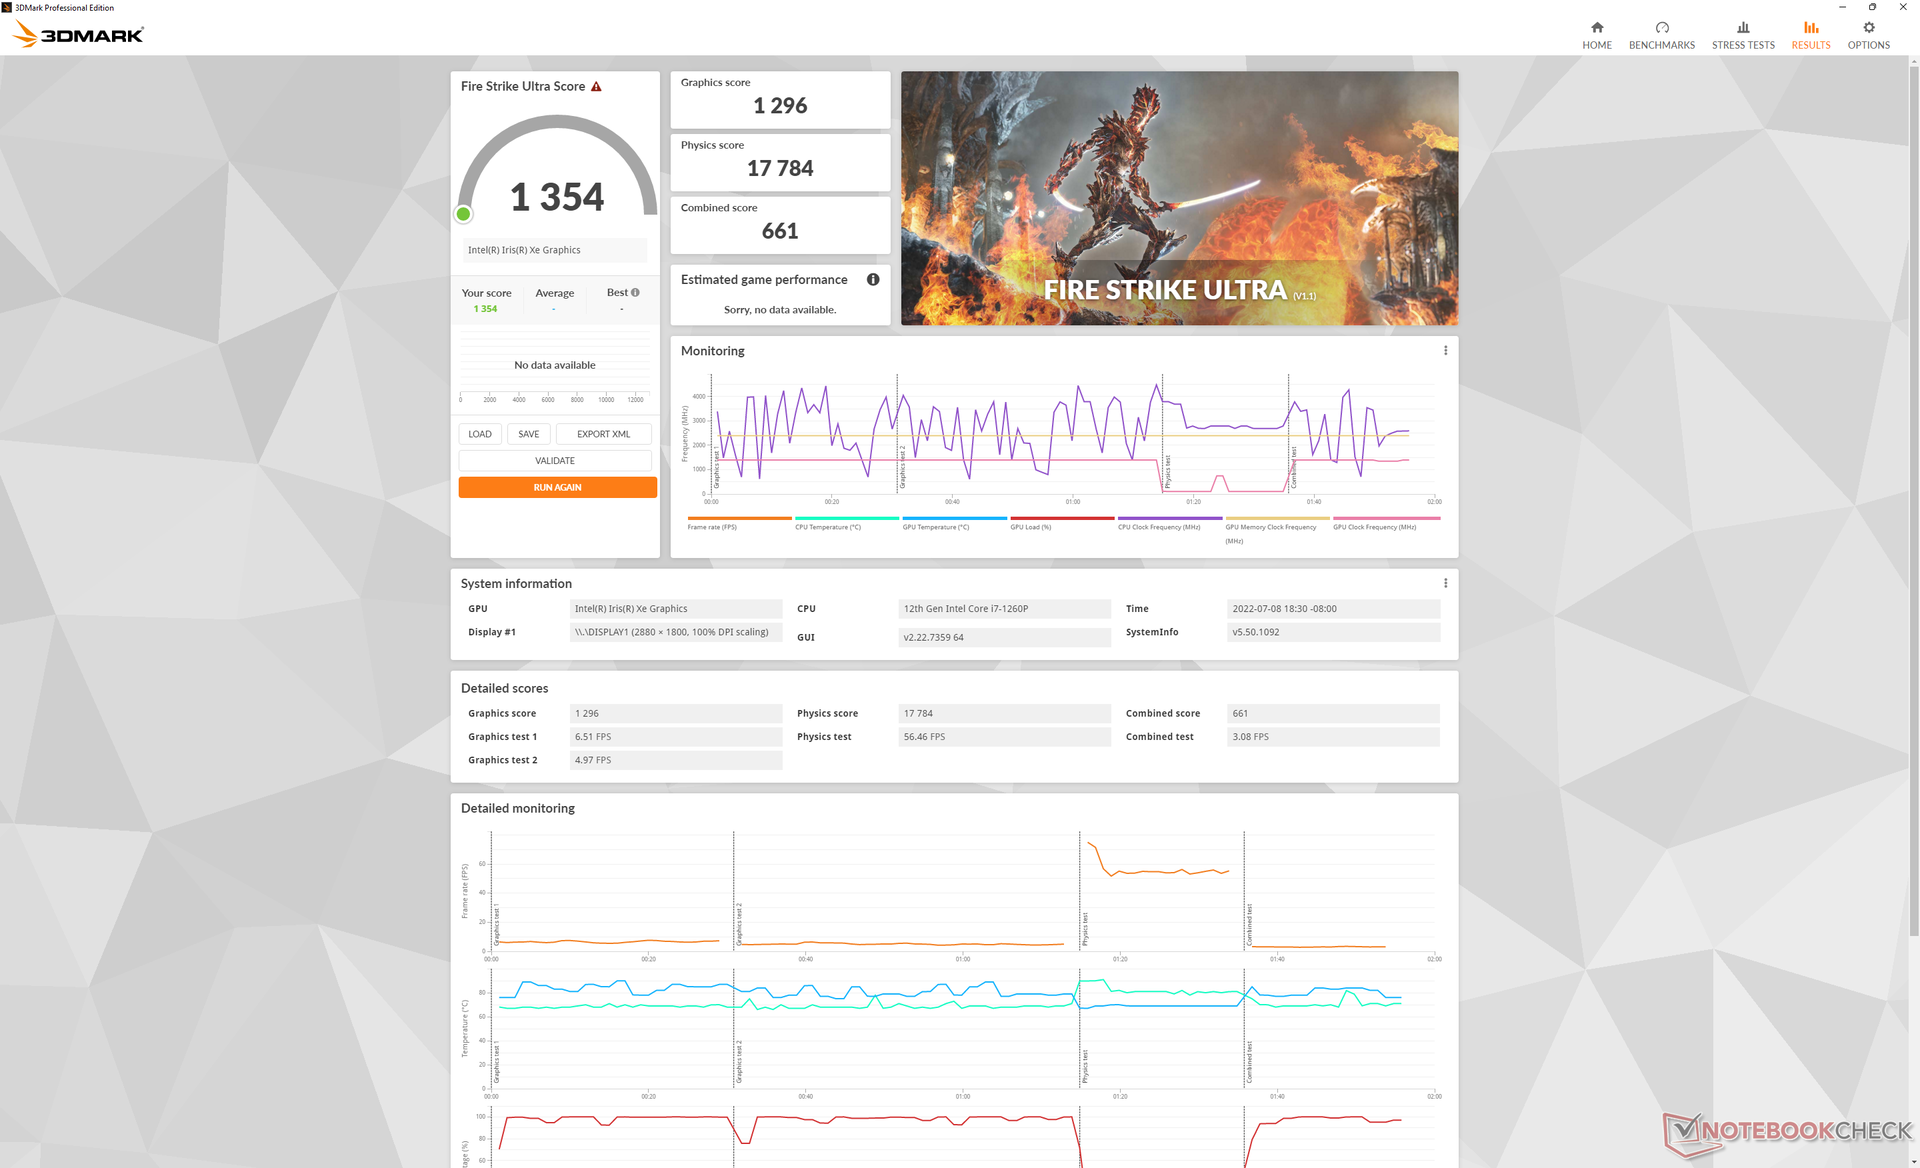
| 3DMark 11 Performance | 6543 Punkte | |
| 3DMark Cloud Gate Standard Score | 22414 Punkte | |
| 3DMark Fire Strike Score | 5145 Punkte | |
| 3DMark Time Spy Score | 1949 Punkte | |
Hilfe | ||
Witcher 3 FPS Chart
| min. | mittel | hoch | max. | |
|---|---|---|---|---|
| GTA V (2015) | 121.6 | 101.4 | 20.5 | 9.75 |
| The Witcher 3 (2015) | 96.9 | 62.9 | 34.7 | 15.8 |
| Dota 2 Reborn (2015) | 122.1 | 93.5 | 66.2 | 59.8 |
| Final Fantasy XV Benchmark (2018) | 44.4 | 24.8 | 24.8 | |
| X-Plane 11.11 (2018) | 47.8 | 34.9 | 32.1 | |
| Strange Brigade (2018) | 95.2 | 44.5 | 35.8 | 29 |
| Cyberpunk 2077 1.6 (2022) | 22.6 | 19.1 | 14.5 | 11.6 |
Emissionen
Systemrauschen — Leise bei den meisten Szenarien im mittleren und schwachen Bereich
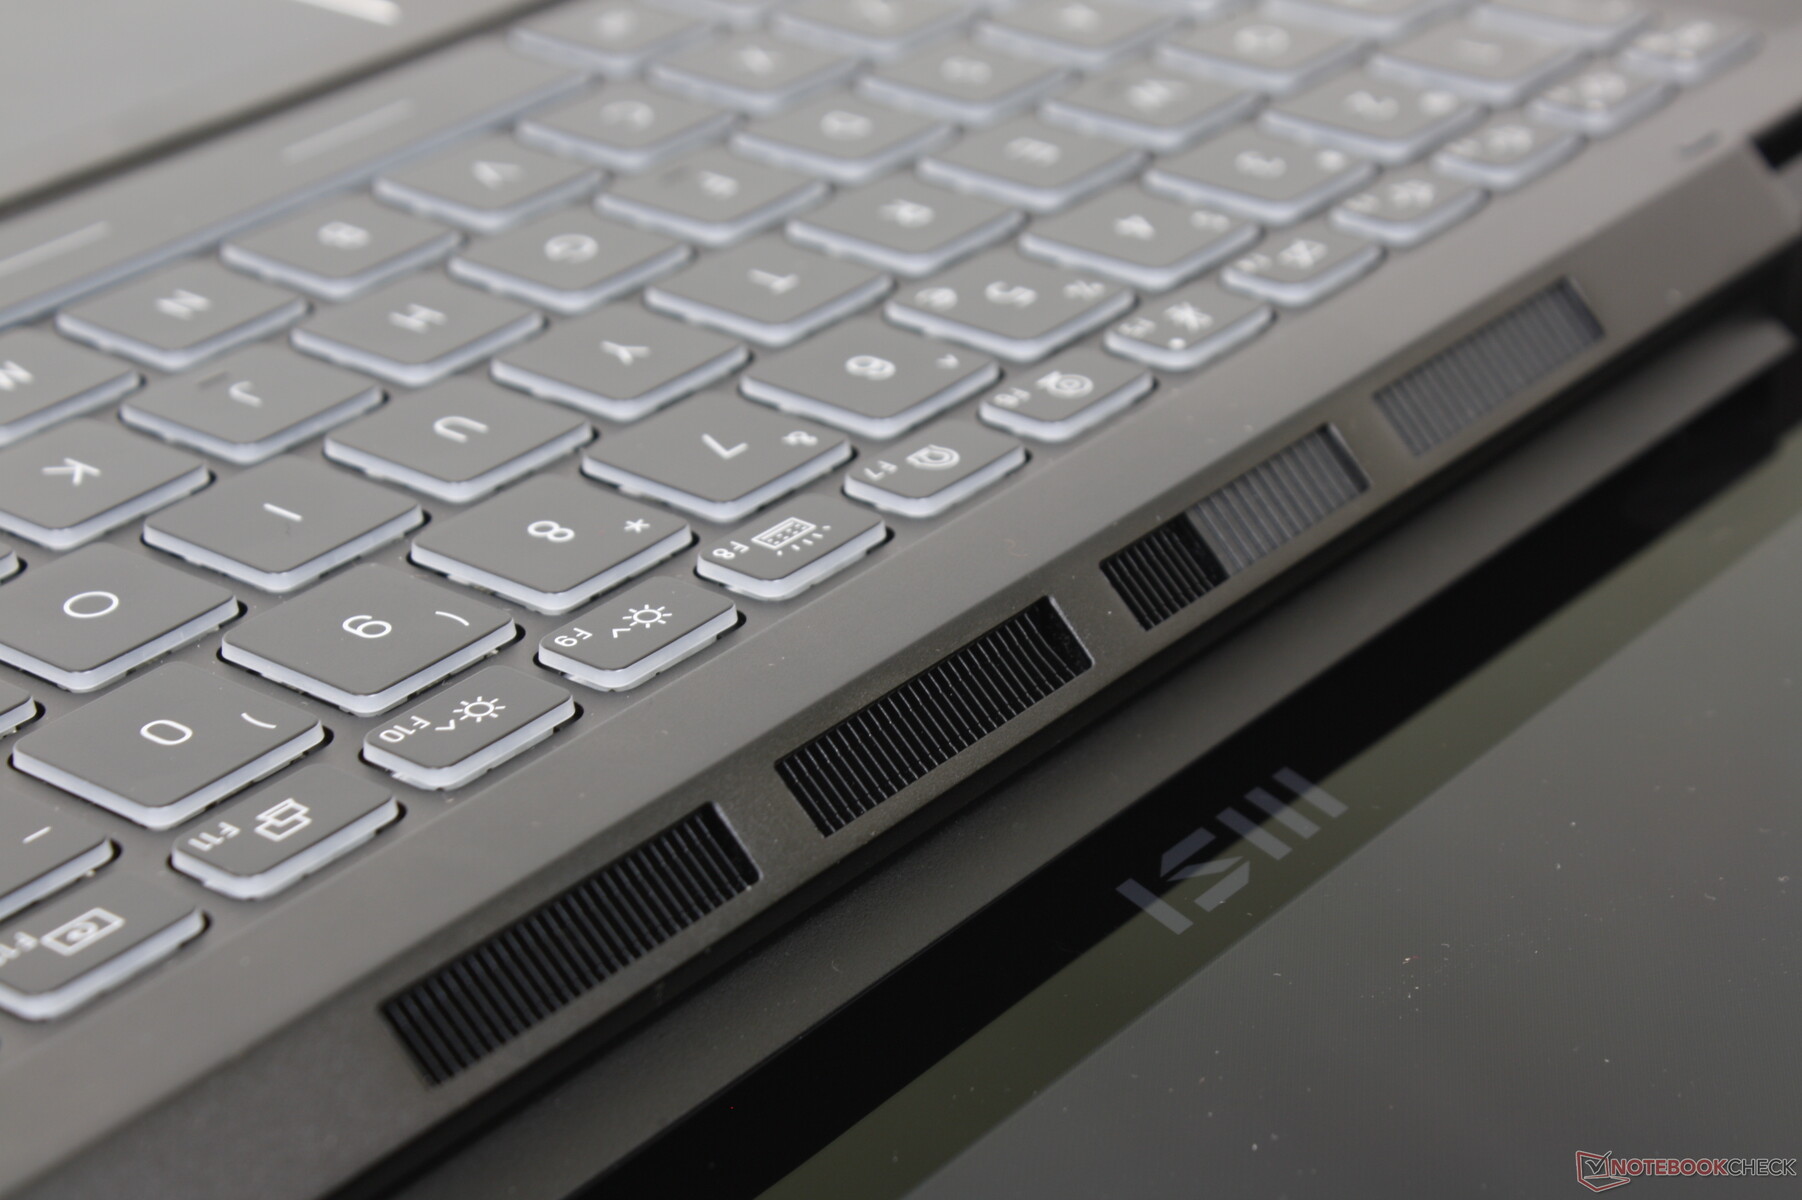
Das Gehäuse wurde entwickelt, um anspruchsvollere Core-H- und diskrete GeForce MX-Optionen zu unterstützen. Daher ist es keine Überraschung, dass unsere einzige Core-P CPU-Konfiguration relativ leise ist. Bei der ersten Benchmark-Szene von 3DMark 06 im Balanced Mode wäre beispielsweise das Lüftergeräusch bei nur 24 dB(A) und einem leisen Hintergrund von 23,3 dB(A) kaum hörbar. Bei typischen Browsing-Szenarien können die Benutzer damit rechnen, dass das Lüftergeräusch unter 24,7 dB(A) bleibt.
Wenn der Witcher 3 betrieben wird, um hohe Belastungen darzustellen, würde das Lüftergeräusch typischerweise zwischen 35 und 43 dB(A) liegen. Die Aktivierung des Cooler-Boost-Modus (d. h. des maximalen Lüftermodus) würde dazu führen, dass ein Lüftergeräusch von fast 56 dB(A) lauter ist als bei den meisten Subnotebooks. Ein solcher Modus ist zum Glück für unsere spezielle Konfiguration in den meisten Fällen nicht erforderlich.

Lautstärkediagramm
| Idle |
| 23.3 / 23.3 / 23.3 dB(A) |
| Last |
| 24 / 55.8 dB(A) |
 | ||
30 dB leise 40 dB(A) deutlich hörbar 50 dB(A) störend |
||
min: | ||
| MSI Summit E14 Flip Evo A12MT Iris Xe G7 96EUs, i7-1260P, Samsung PM9A1 MZVL21T0HCLR | MSI Summit E14 A11SCS GeForce GTX 1650 Ti Max-Q, i7-1185G7, Phison 1TB SM2801T24GKBB4S-E162 | Asus VivoBook S 14X S5402Z Iris Xe G7 96EUs, i7-12700H, Micron 2450 512GB MTFDKBA512TFK | LG Gram 14T90P Iris Xe G7 80EUs, i5-1135G7, Samsung SSD PM981a MZVLB512HBJQ | Lenovo Yoga Slim 7i Pro 14IAP G7 Iris Xe G7 80EUs, i5-1240P, Samsung PM9A1 MZVL2512HCJQ | Dell Latitude 9420 2-in-1 Iris Xe G7 96EUs, i7-1185G7, WDC PC SN530 SDBPNPZ-512G | |
|---|---|---|---|---|---|---|
| Geräuschentwicklung | -21% | -20% | -2% | -8% | -5% | |
| aus / Umgebung * (dB) | 23.3 | 23.9 -3% | 22.7 3% | 25.4 -9% | 23.7 -2% | 25.4 -9% |
| Idle min * (dB) | 23.3 | 24.2 -4% | 23.2 -0% | 25.5 -9% | 23.7 -2% | 25.4 -9% |
| Idle avg * (dB) | 23.3 | 24.2 -4% | 23.2 -0% | 25.5 -9% | 25.1 -8% | 25.4 -9% |
| Idle max * (dB) | 23.3 | 24.2 -4% | 27.2 -17% | 25.5 -9% | 25.1 -8% | 25.4 -9% |
| Last avg * (dB) | 24 | 50.2 -109% | 43.2 -80% | 28.3 -18% | 38.4 -60% | 25.4 -6% |
| Witcher 3 ultra * (dB) | 35.6 | 47 -32% | 52.8 -48% | 35 2% | 38.4 -8% | 41.3 -16% |
| Last max * (dB) | 55.8 | 51.7 7% | 52.8 5% | 35 37% | 39.4 29% | 41.3 26% |
* ... kleinere Werte sind besser
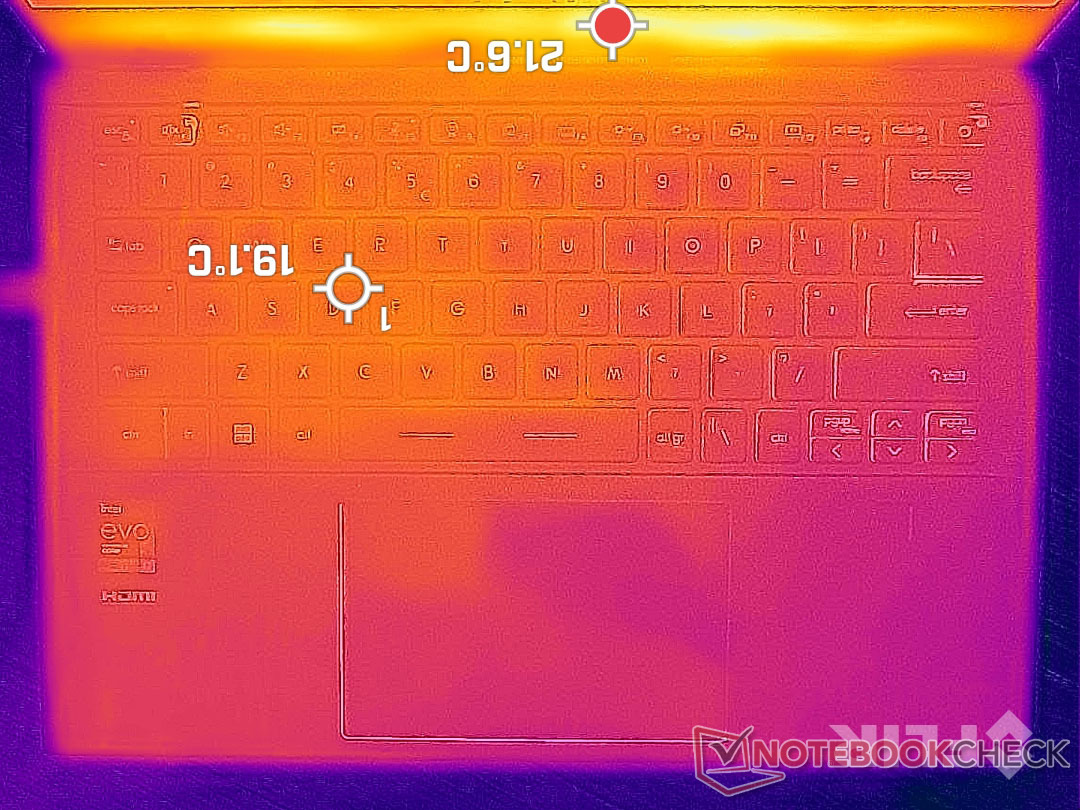
Temperatur
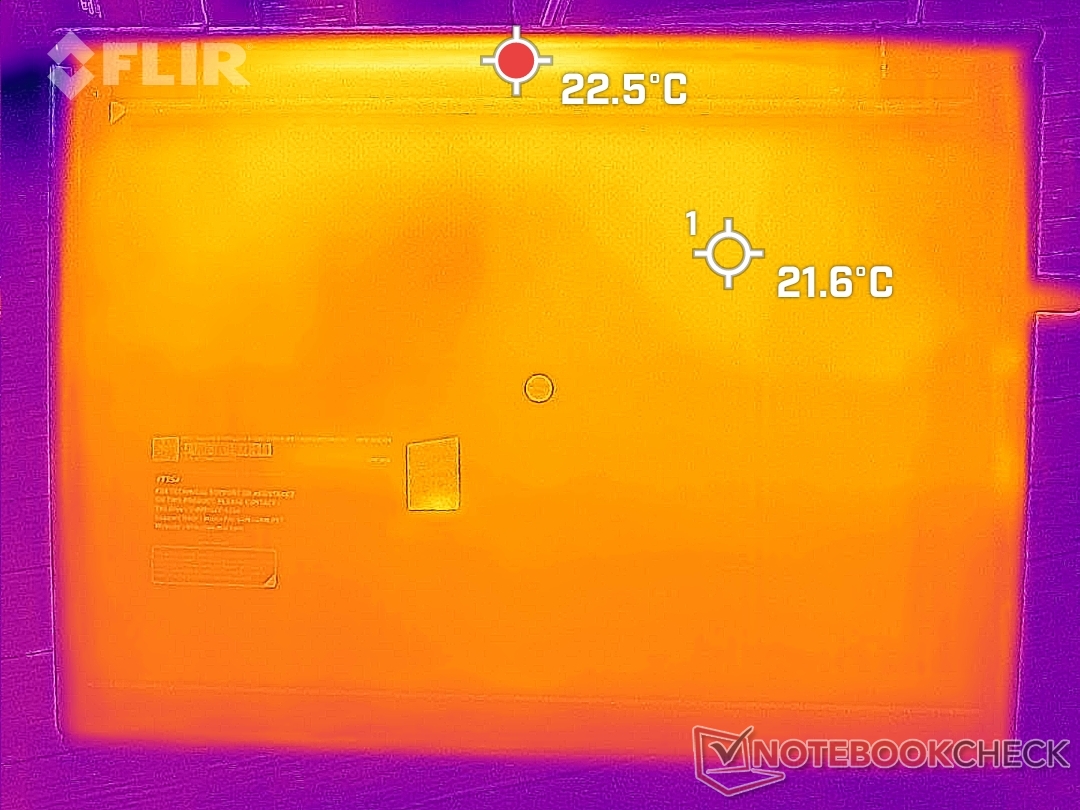
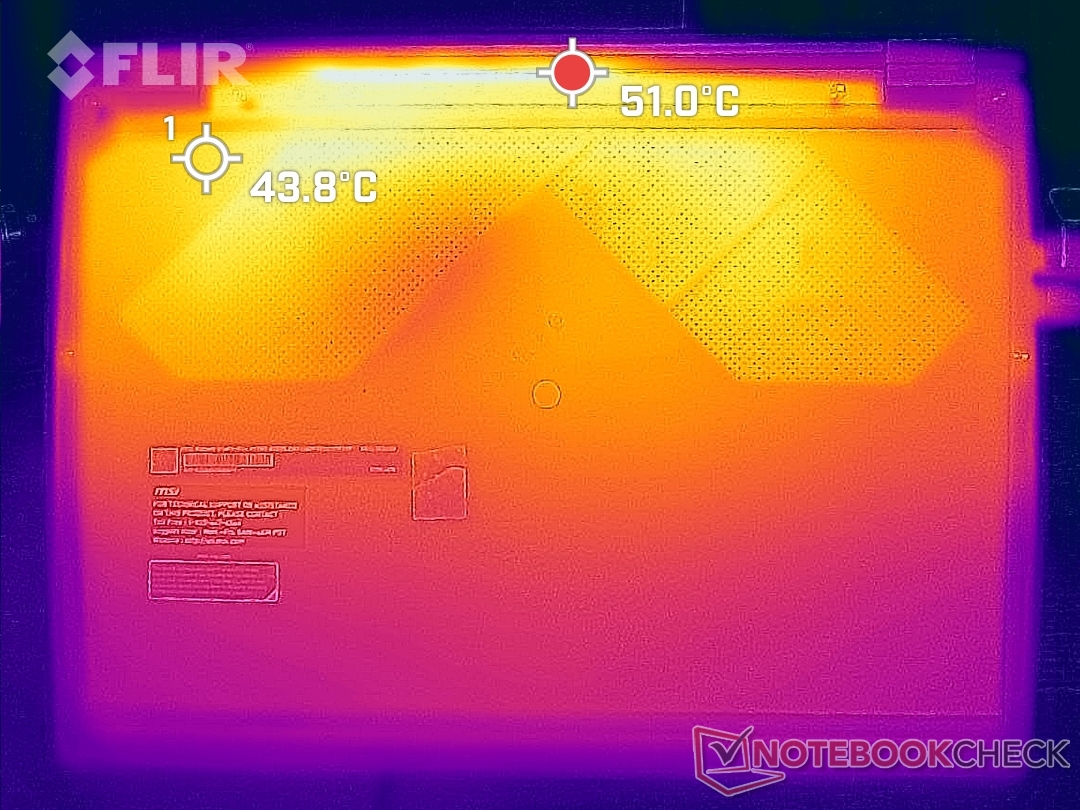
Die Oberflächentemperaturen im Leerlauf oder beim Surfen im Internet bleiben komfortabel und manchmal sogar kühl, da der Großteil des Gehäuses aus Metall besteht. Wenn anspruchsvollere Aufgaben wie Spiele ausgeführt werden, können die Hotspots auf der Ober- und Unterseite jedoch bis zu 52 °C in der Nähe der Lüftungsgitter erreichen. Die Handballenauflagen werden auch bei 27 °C wärmer, um auf den Handballen bemerkbar zu sein. Ähnliche Resultate lassen sich am metallgefassten Dell Latitude 9420 2-in-1 beobachten, so dass die sehr warmen Oberflächentemperaturen des MSI nicht ungewöhnlich sind.
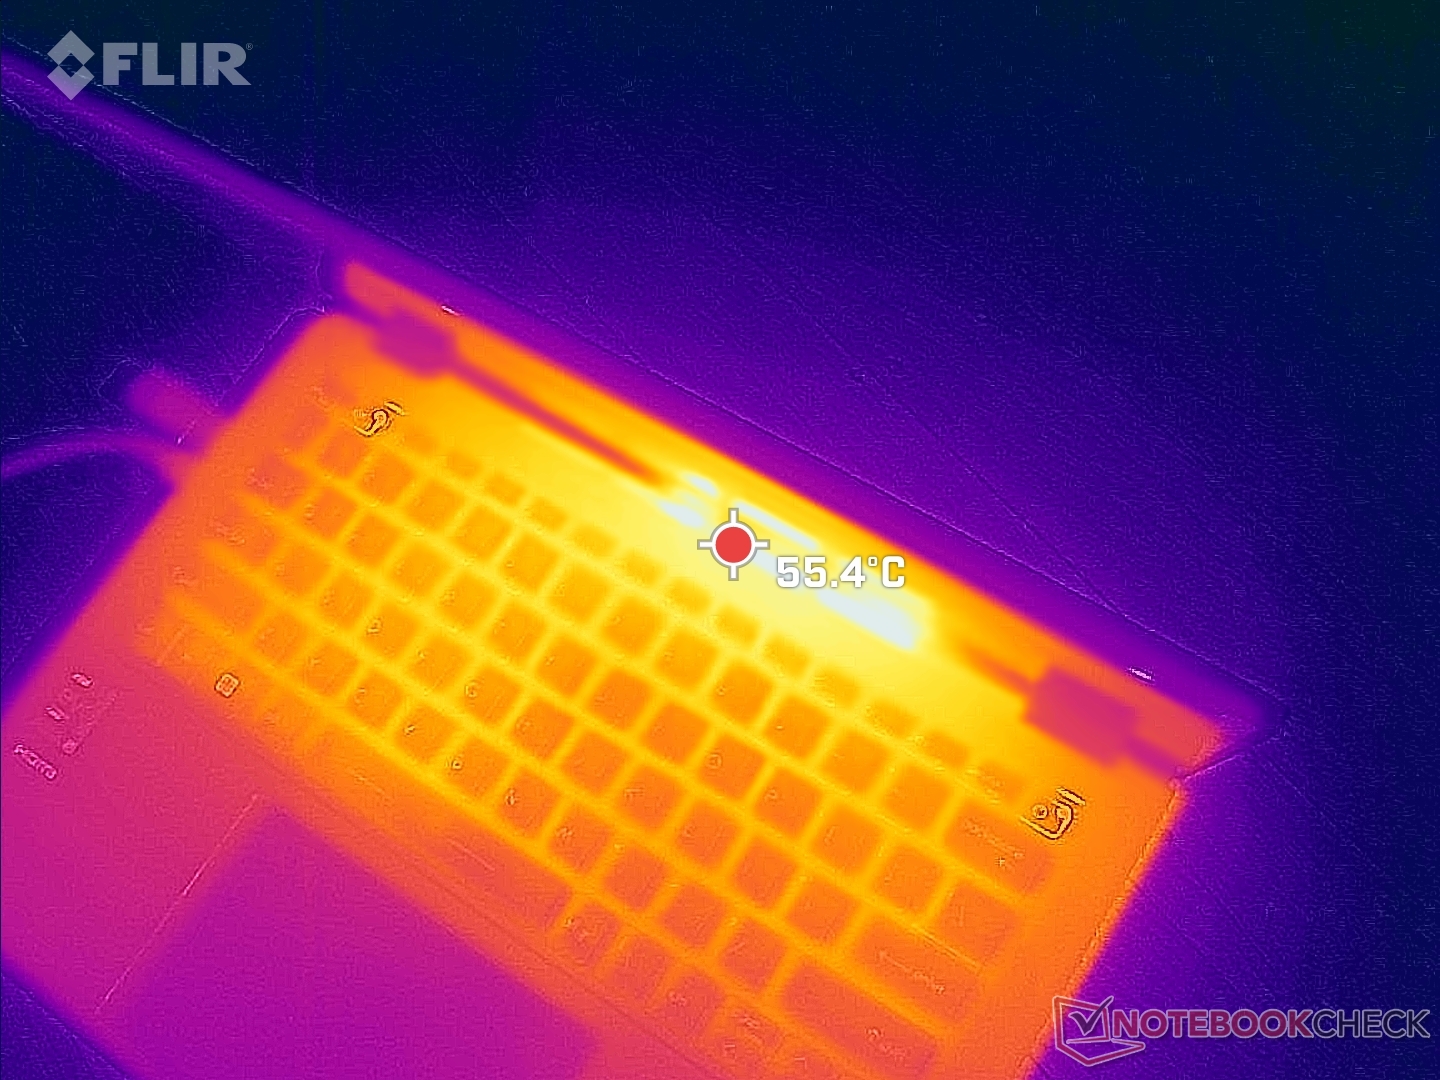
(±) Die maximale Temperatur auf der Oberseite ist 44.2 °C. Im Vergleich liegt der Klassendurchschnitt bei 35.4 °C (von 19.6 bis 60 °C für die Klasse Convertible).
(-) Auf der Unterseite messen wir eine maximalen Wert von 45.8 °C (im Vergleich zum Durchschnitt von 36.9 °C).
(+) Ohne Last messen wir eine durchschnittliche Temperatur von 19.2 °C auf der Oberseite. Der Klassendurchschnitt erreicht 30.3 °C.
(+) Die Handballen und der Touchpad-Bereich sind mit gemessenen 27.2 °C kühler als die typische Hauttemperatur und fühlen sich dadurch kühl an.
(±) Die durchschnittliche Handballen-Temperatur anderer getesteter Geräte war 28 °C (+0.8 °C).

| MSI Summit E14 Flip Evo A12MT Intel Core i7-1260P, Intel Iris Xe Graphics G7 96EUs | MSI Summit E14 A11SCS Intel Core i7-1185G7, NVIDIA GeForce GTX 1650 Ti Max-Q | Asus VivoBook S 14X S5402Z Intel Core i7-12700H, Intel Iris Xe Graphics G7 96EUs | LG Gram 14T90P Intel Core i5-1135G7, Intel Iris Xe Graphics G7 80EUs | Lenovo Yoga Slim 7i Pro 14IAP G7 Intel Core i5-1240P, Intel Iris Xe Graphics G7 80EUs | Dell Latitude 9420 2-in-1 Intel Core i7-1185G7, Intel Iris Xe Graphics G7 96EUs | |
|---|---|---|---|---|---|---|
| Hitze | -43% | -17% | -4% | -20% | -21% | |
| Last oben max * (°C) | 44.2 | 49.4 -12% | 37.2 16% | 41.6 6% | 42.3 4% | 43.4 2% |
| Last unten max * (°C) | 45.8 | 60.6 -32% | 39.2 14% | 46.2 -1% | 52.8 -15% | 48 -5% |
| Idle oben max * (°C) | 19.6 | 30.6 -56% | 30.4 -55% | 22.6 -15% | 27.1 -38% | 29.8 -52% |
| Idle unten max * (°C) | 22 | 37.4 -70% | 31.6 -44% | 23.2 -5% | 29.1 -32% | 28 -27% |
* ... kleinere Werte sind besser
Belastungstest — Hohe Kerntemperaturen
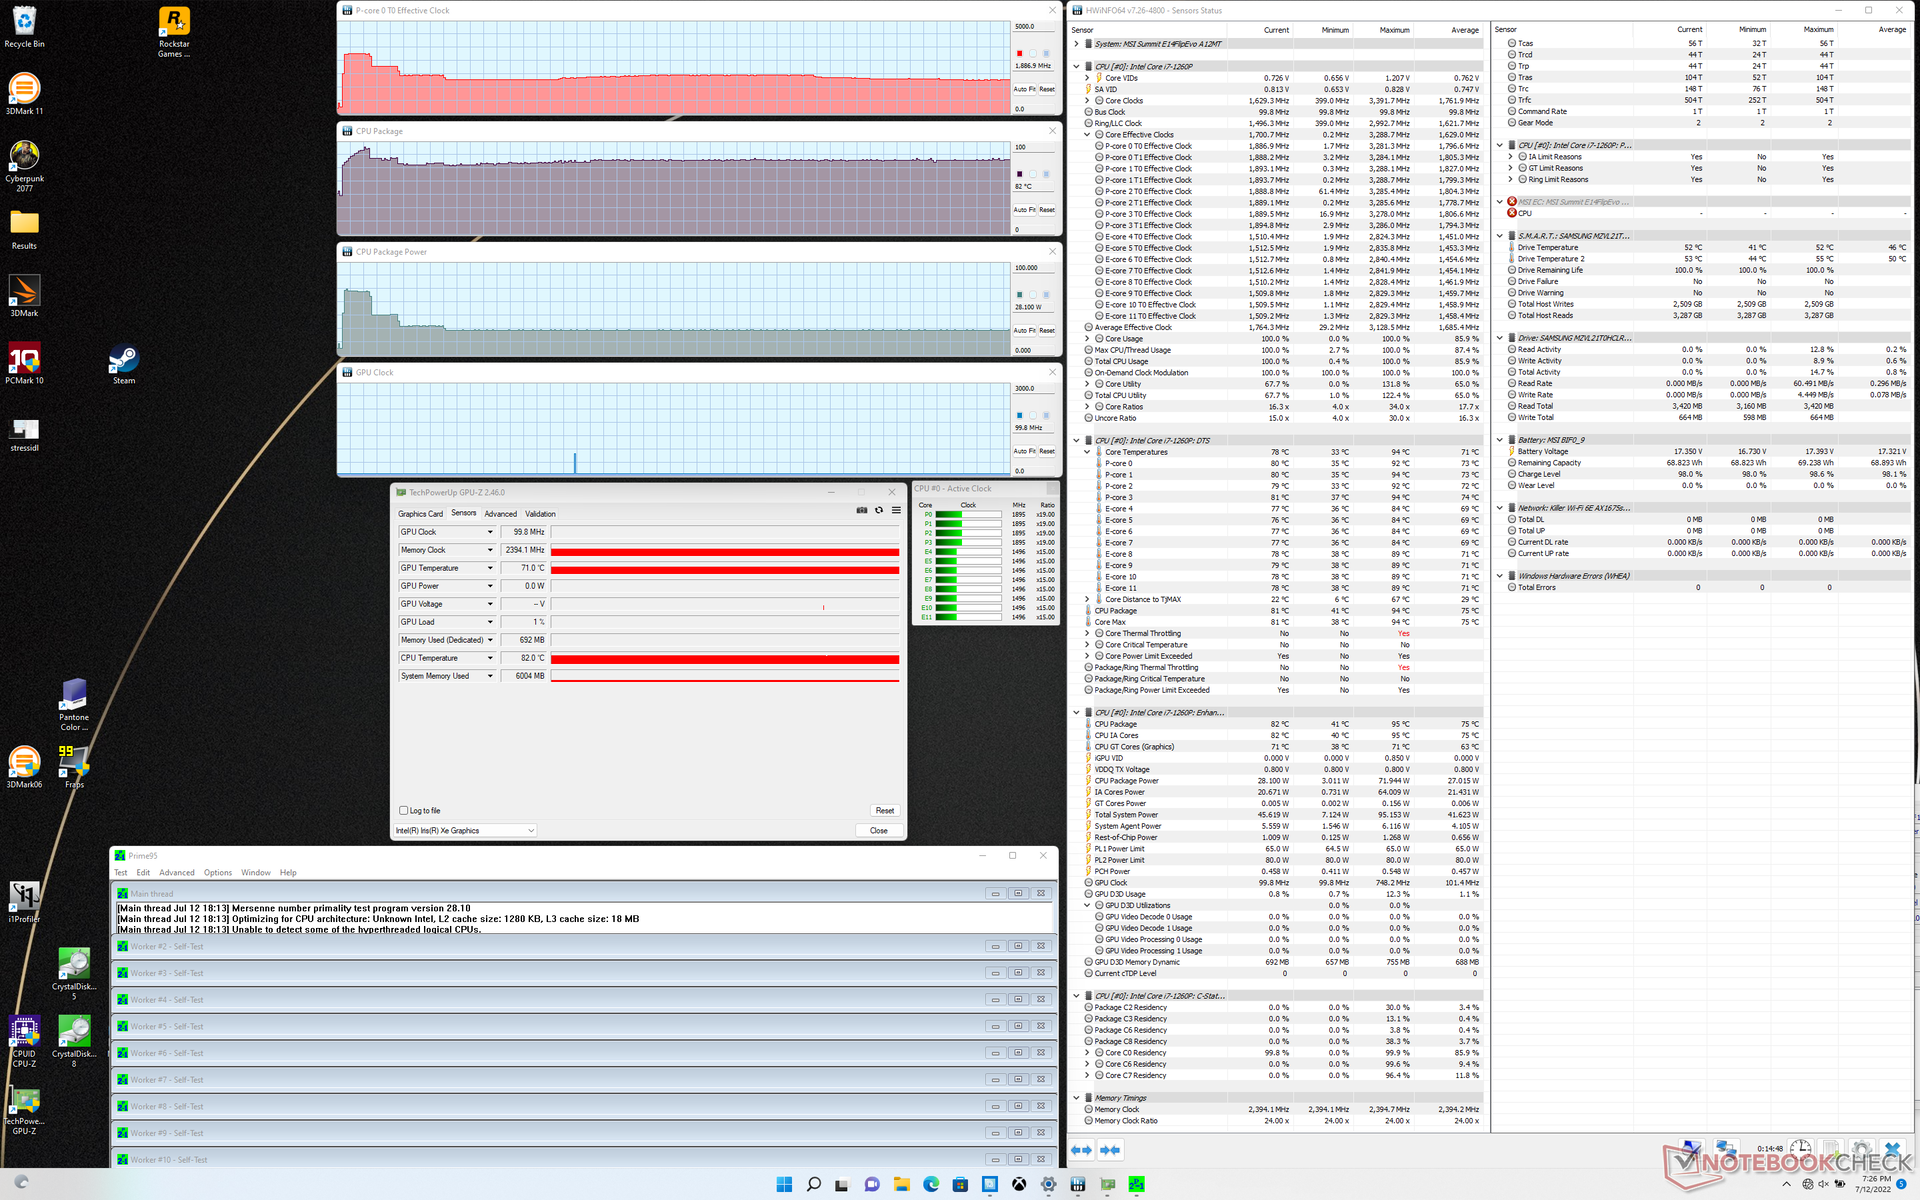
Beim Betrieb von Prime95 würden die CPU-Taktfrequenzen für weniger als eine Minute auf 3,3 GHz ansteigen, bevor sie eine Kerntemperatur von 95 °C erreichen. Danach würden die Taktfrequenzen auf 2,6 GHz absinken, bevor sie sich schließlich bei 1,9 GHz und einer Temperatur von 82 °C stabilisieren. Die CPU-Leistungsaufnahme würde zu Beginn des Tests bis zu 72 W betragen, bevor sie sich auf 28 W einpendelt. Wenn dieser gleiche Test auf dem Yoga 9 14 mit der gleichen CPU vorgenommen werden würde, würde dies zu ähnlichen stabilen Taktfrequenzen von 2,0 GHz und einer CPU-Leistungsaufnahme von 28 W führen, die Kerntemperatur wäre jedoch bei 66 °C kühler.
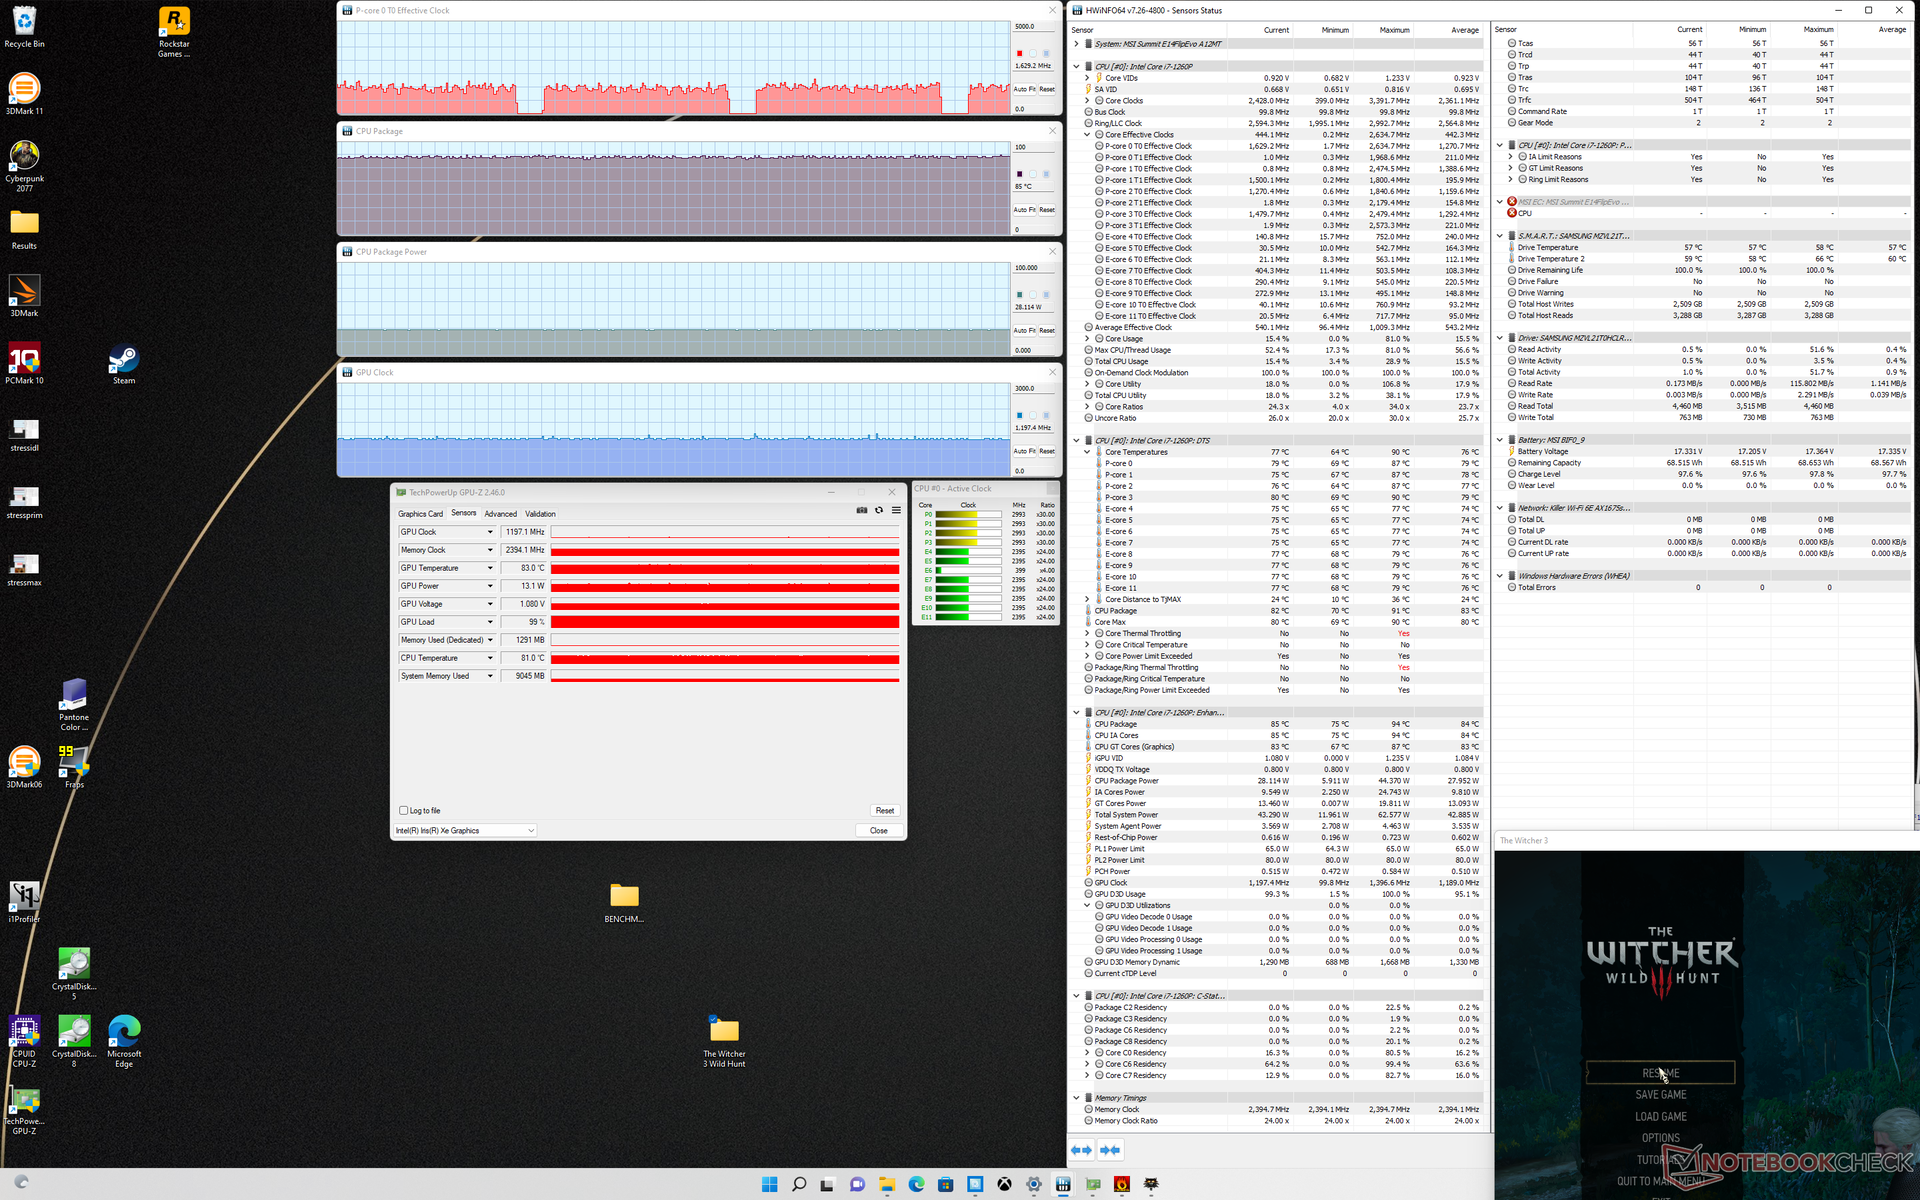
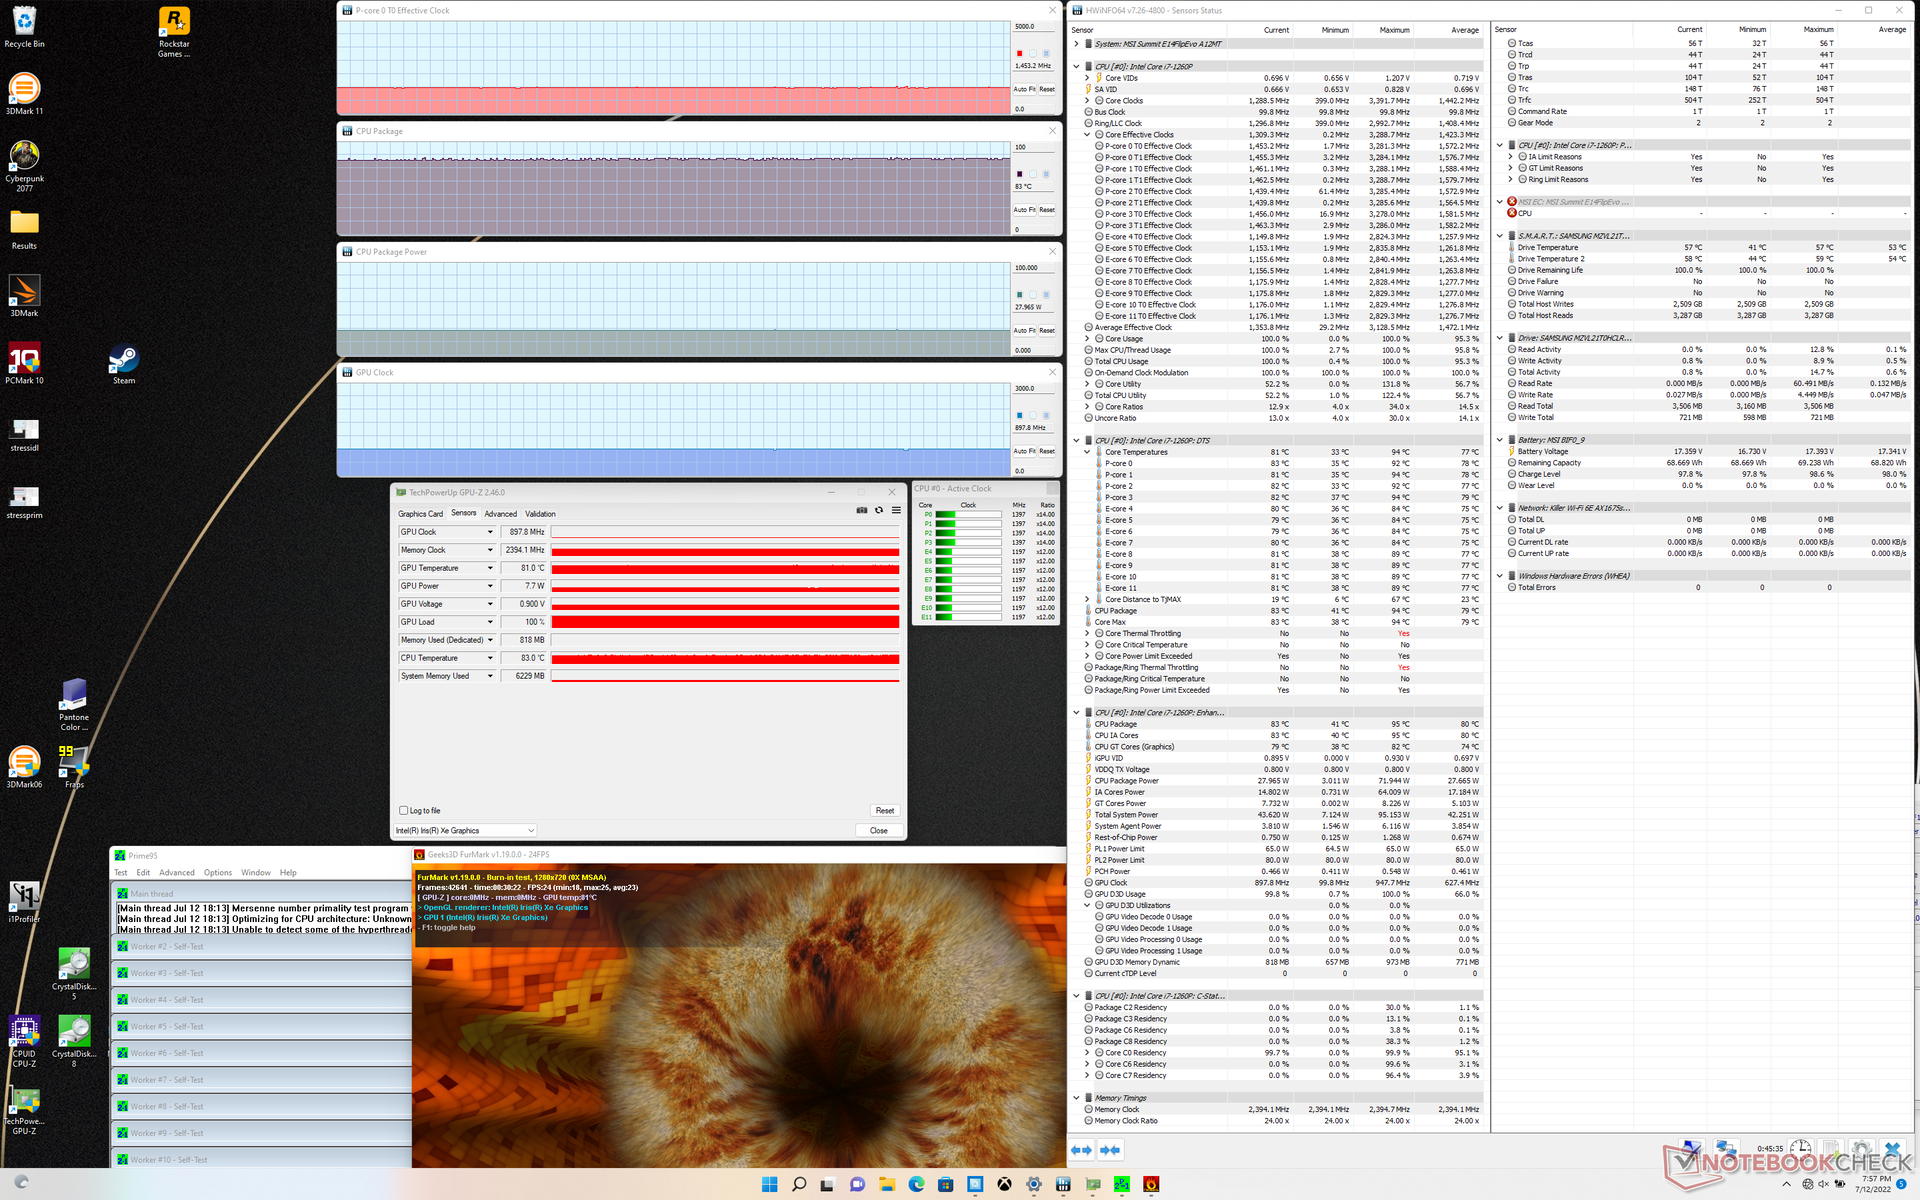
Der Betrieb des Witcher 3 würde zu einer durchschnittlichen Kerntemperatur von 85 °C führen, was bei einem 14-Zoll-Convertible auf der hohen Seite liegt. Der gleiche Test zum Beispiel auf dem Dell Latitude 9420 2-in-1 oder dem zuvor genannten Lenovo würde wiederum zu einer kühleren Kerntemperatur von ~73 bzw. 65 °C führen. Die Aktivierung des Kühler-Boost-Modus würde dazu beitragen, die Temperaturen auf den unteren 70 °C-Bereich zu reduzieren, wenn die hohen Temperaturen ein Problem darstellen.
Der Betrieb mit Akku schränkt die Leistung nicht ein. Ein 3DMark 11-Test an den Akkus würde ähnliche Werte wie die des Stromnetzes ergeben.
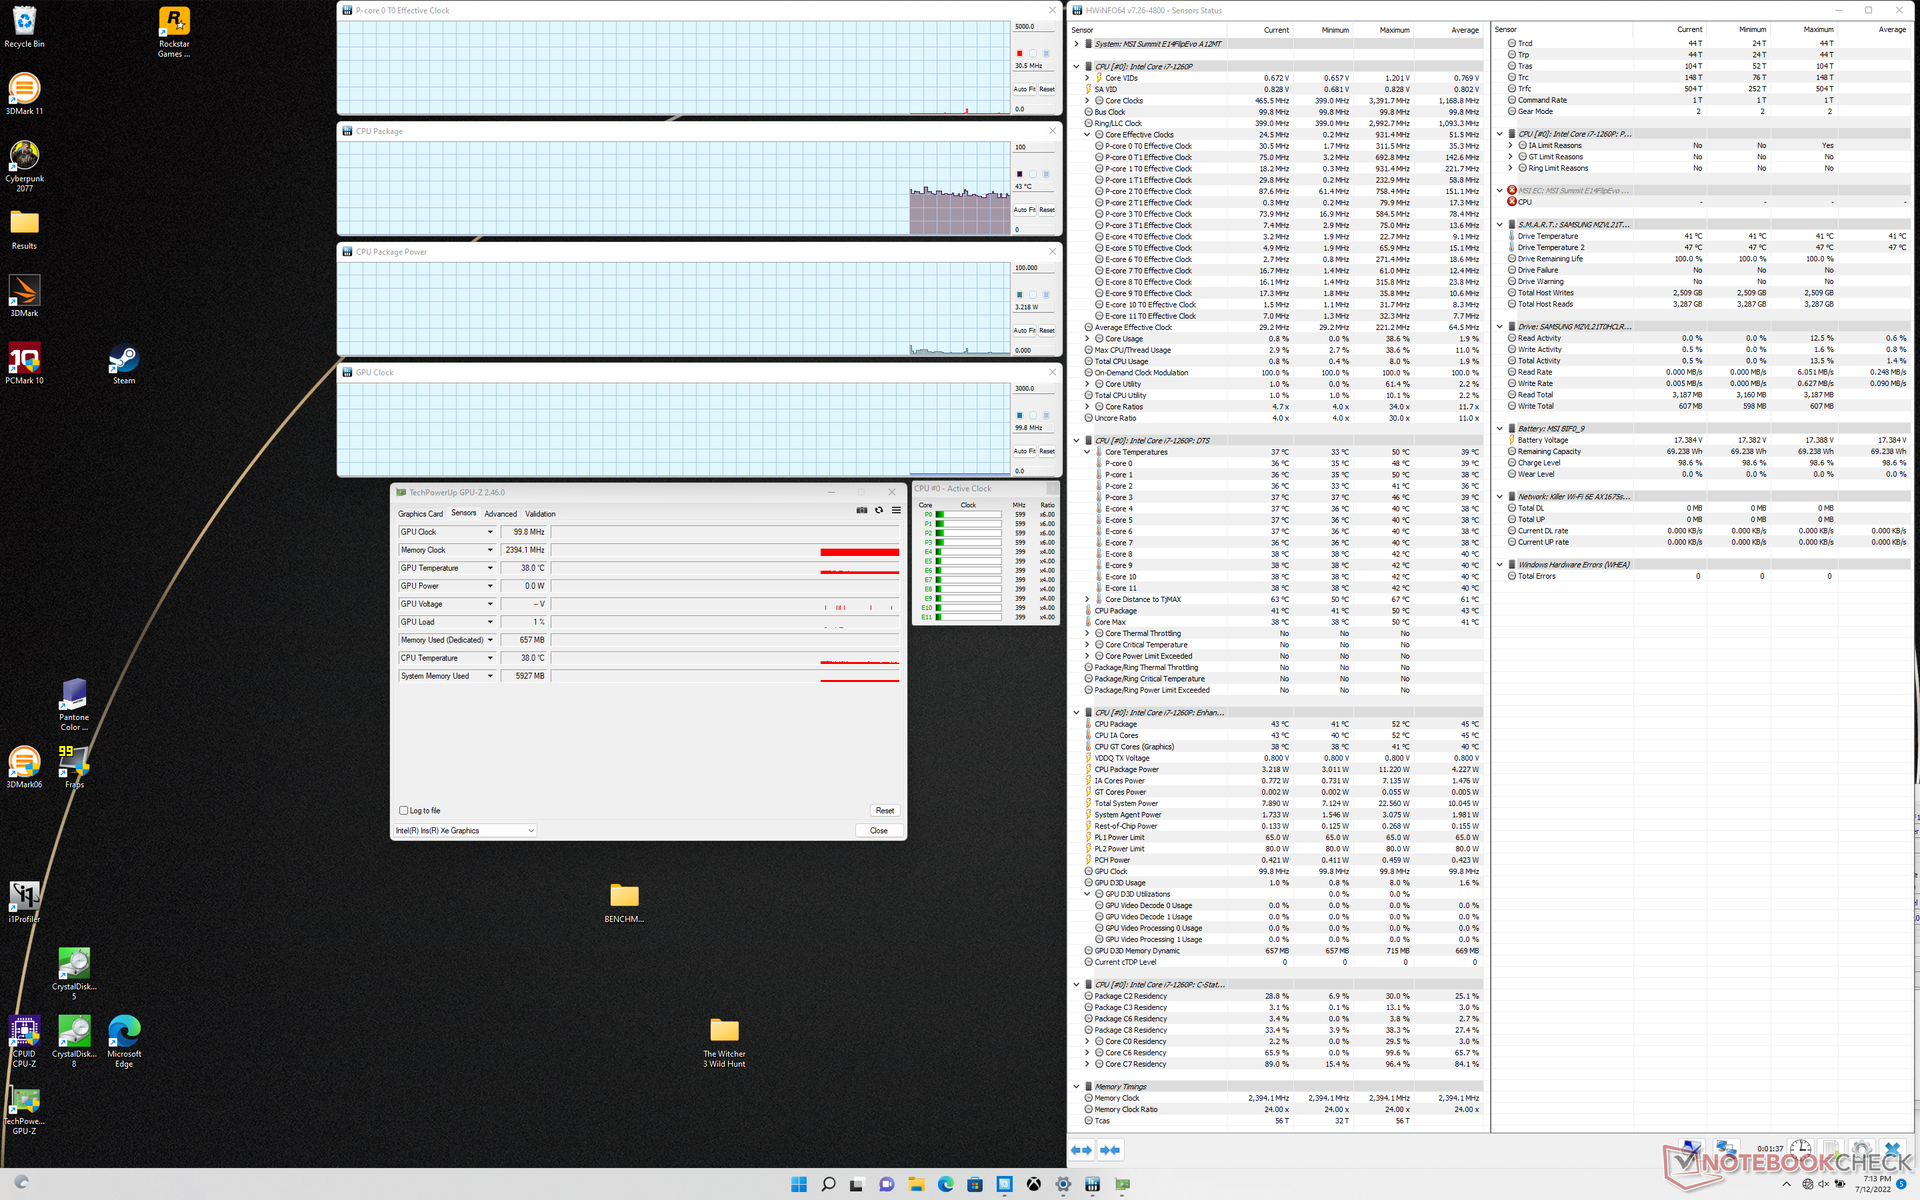
| CPU Clock (GHz) | GPU Clock (MHz) | Average CPU Temperature (°C) | |
| System Idle | -- | -- | 43 |
| Prime95 Stress | 1.9 - 2.0 | -- | 82 |
| Prime95 + FurMark Stress | 1.5 | 898 | 83 |
| Witcher 3 Stress | ~1.6 | 1197 | 85 |
Lautsprecher
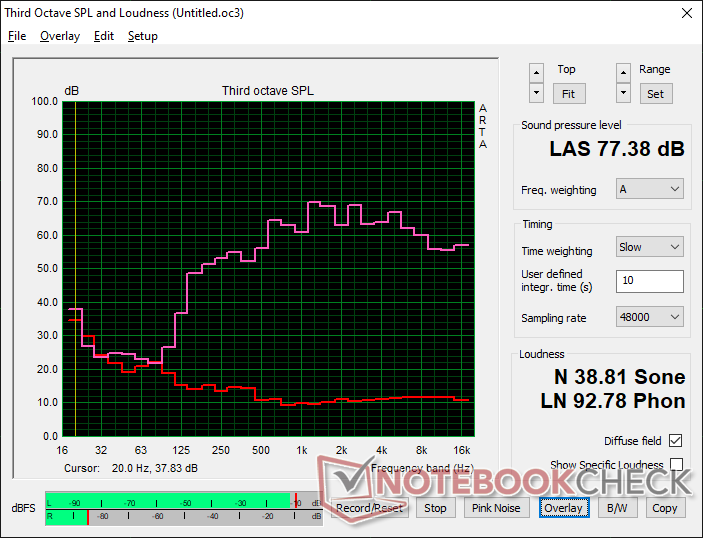
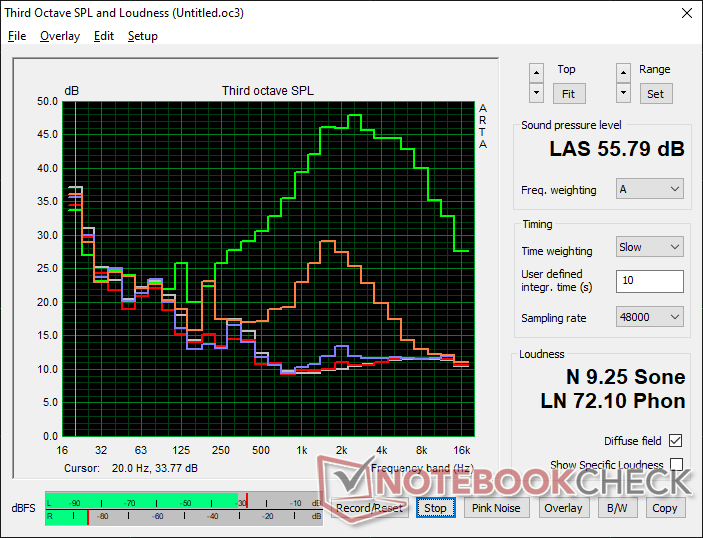
MSI Summit E14 Flip Evo A12MT Audio Analyse
(±) | Mittelmäßig laut spielende Lautsprecher (77.4 dB)
Bass 100 - 315 Hz
(±) | abgesenkter Bass - 14.7% geringer als der Median
(±) | durchschnittlich lineare Bass-Wiedergabe (11.4% Delta zum Vorgänger)
Mitteltöne 400 - 2000 Hz
(±) | zu hohe Mitten, vom Median 5.2% abweichend
(±) | Linearität der Mitten ist durchschnittlich (8.7% Delta zum Vorgänger)
Hochtöne 2 - 16 kHz
(+) | ausgeglichene Hochtöne, vom Median nur 4.3% abweichend
(±) | durchschnittlich lineare Hochtöne (7.7% Delta zum Vorgänger)
Gesamt im hörbaren Bereich 100 - 16.000 Hz
(±) | hörbarer Bereich ist durchschnittlich linear (17% Abstand zum Median)
Im Vergleich zu allen Geräten derselben Klasse
» 32% aller getesteten Geräte dieser Klasse waren besser, 8% vergleichbar, 61% schlechter
» Das beste Gerät hat einen Delta-Wert von 6%, durchschnittlich ist 20%, das schlechteste Gerät hat 57%
Im Vergleich zu allen Geräten im Test
» 30% aller getesteten Geräte waren besser, 8% vergleichbar, 62% schlechter
» Das beste Gerät hat einen Delta-Wert von 4%, durchschnittlich ist 24%, das schlechteste Gerät hat 134%
Apple MacBook Pro 16 2021 M1 Pro Audio Analyse
(+) | Die Lautsprecher können relativ laut spielen (84.7 dB)
Bass 100 - 315 Hz
(+) | guter Bass - nur 3.8% Abweichung vom Median
(+) | lineare Bass-Wiedergabe (5.2% Delta zum Vorgänger)
Mitteltöne 400 - 2000 Hz
(+) | ausgeglichene Mitten, vom Median nur 1.3% abweichend
(+) | lineare Mitten (2.1% Delta zum Vorgänger)
Hochtöne 2 - 16 kHz
(+) | ausgeglichene Hochtöne, vom Median nur 1.9% abweichend
(+) | sehr lineare Hochtöne (2.7% Delta zum Vorgänger)
Gesamt im hörbaren Bereich 100 - 16.000 Hz
(+) | hörbarer Bereich ist sehr linear (4.6% Abstand zum Median
Im Vergleich zu allen Geräten derselben Klasse
» 0% aller getesteten Geräte dieser Klasse waren besser, 0% vergleichbar, 100% schlechter
» Das beste Gerät hat einen Delta-Wert von 5%, durchschnittlich ist 17%, das schlechteste Gerät hat 45%
Im Vergleich zu allen Geräten im Test
» 0% aller getesteten Geräte waren besser, 0% vergleichbar, 100% schlechter
» Das beste Gerät hat einen Delta-Wert von 4%, durchschnittlich ist 24%, das schlechteste Gerät hat 134%
Energiemanagement
Stromverbrauch — Core-P ist sehr anspruchsvoll
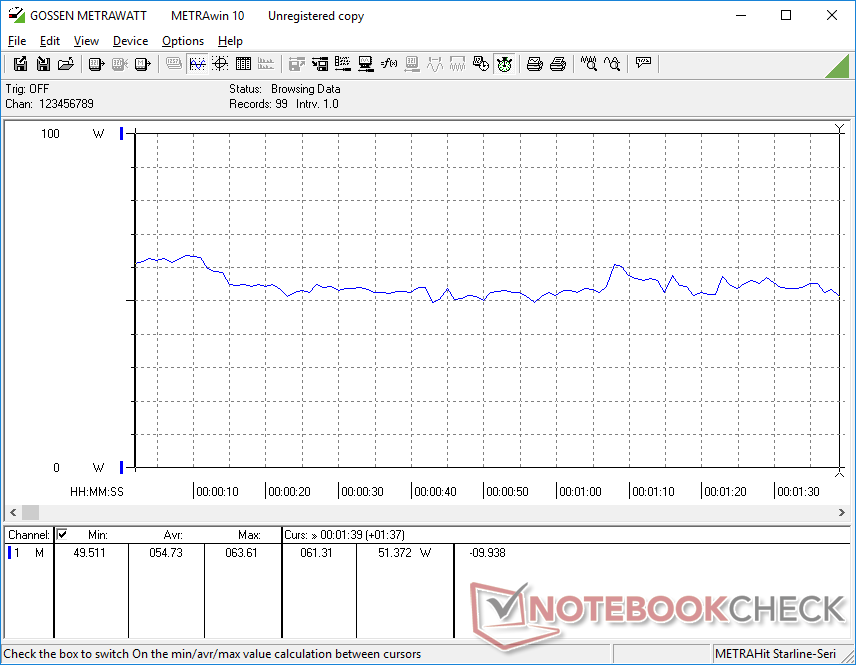
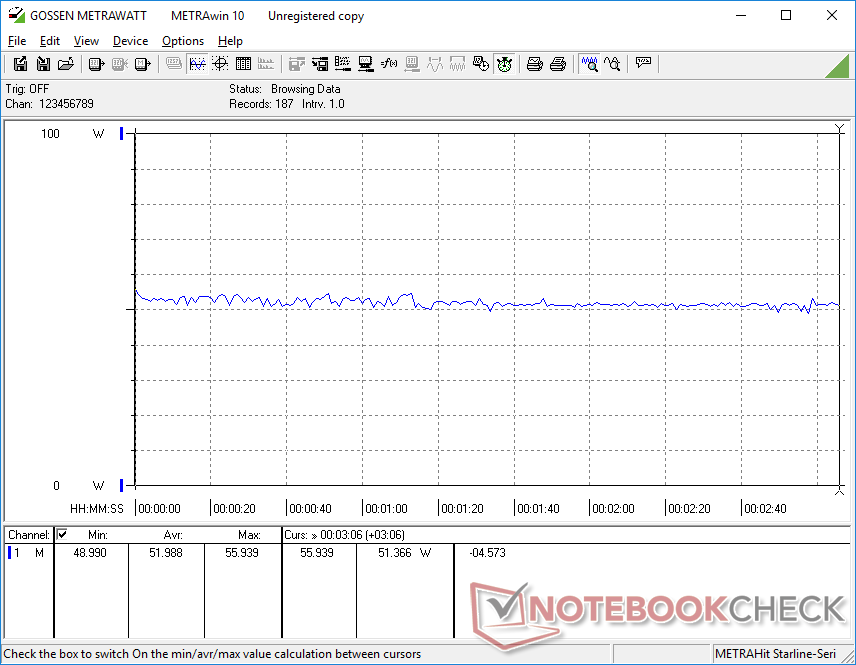
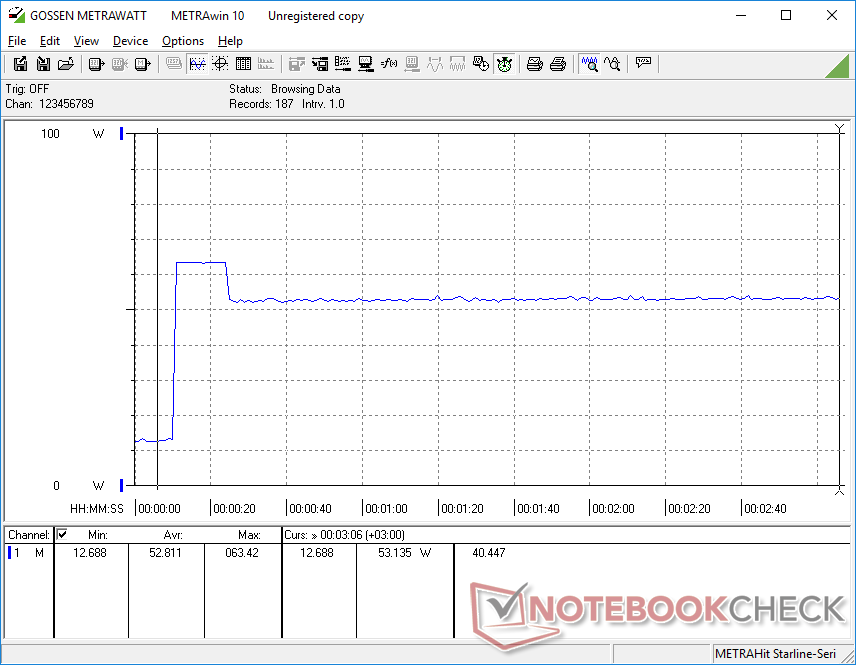
Der Stromverbrauch ist im Vergleich zu Systemen, die auf Intel Core U-Series-CPUs der 11. Generation wie dem LG Gram 14T90P oder Dell Latitude 9420 2-in-1 laufen, flächendeckend höher. Der Betrieb von Witcher 3 oder Prime95 auf unserem MSI zum Beispiel würde 37 Prozent bzw. 47 Prozent mehr Leistung verbrauchen, verglichen mit dem oben genannten Dell. Anders ausgedrückt, die oben genannten CPU- und GPU-Vorteile gegenüber Intel-CPUs der vorherigen Generation gehen auf Kosten spürbar höherer Leistungsanforderungen.
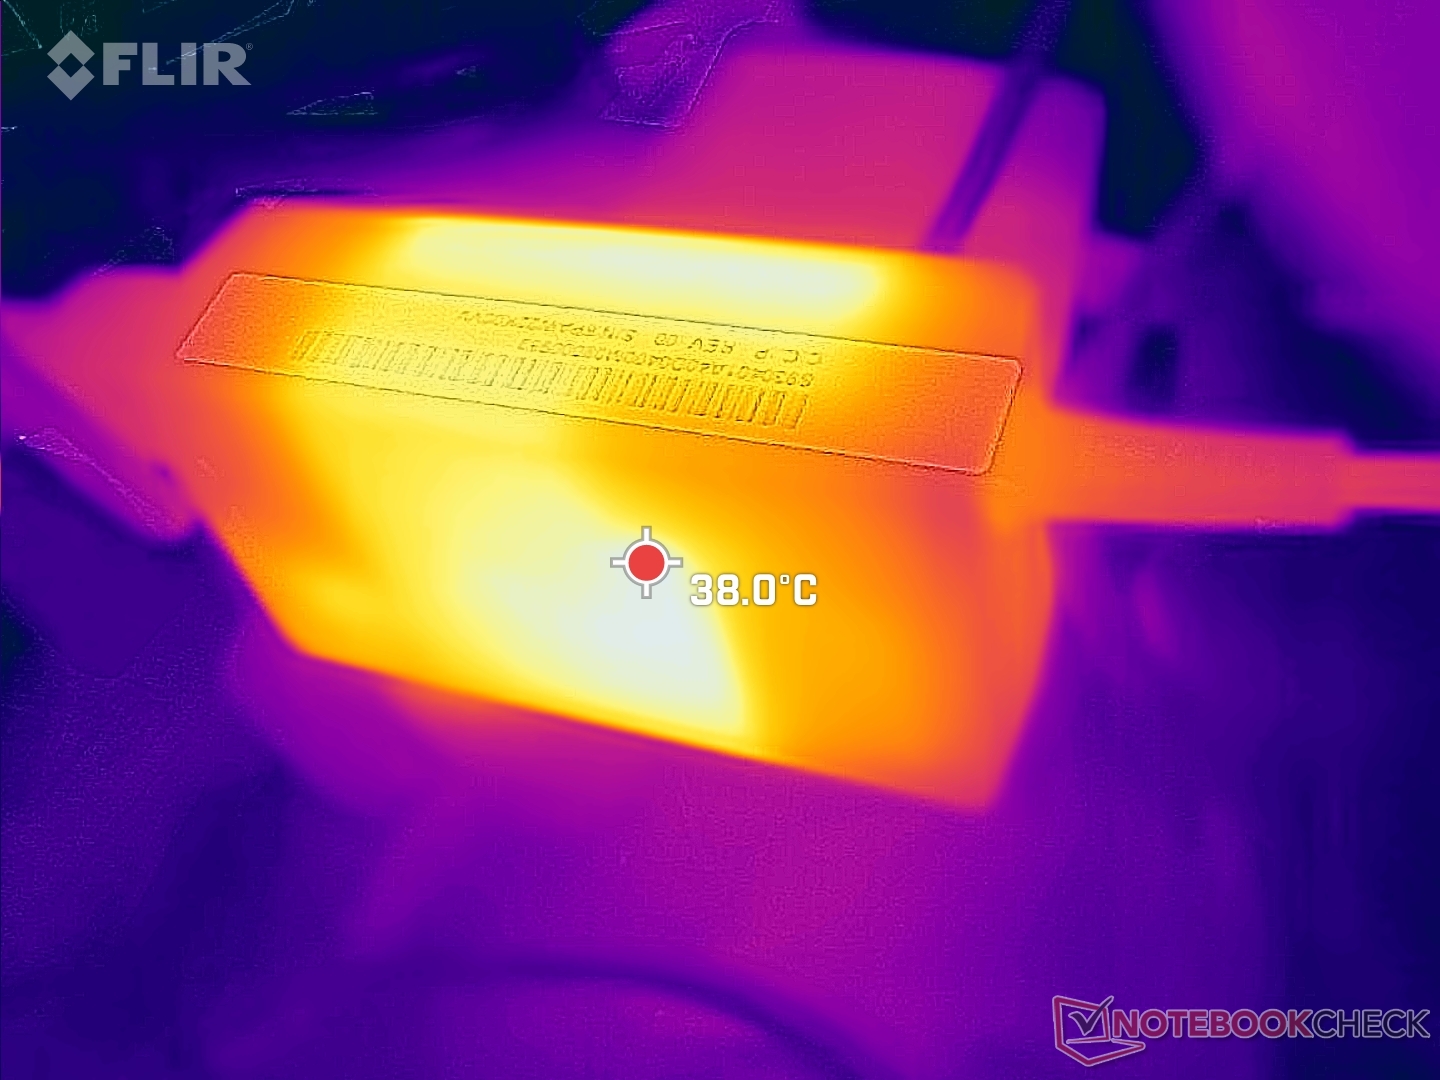
Mit dem kleinen (~ 8,8 x 4,9 x 3 cm) 65 W-Netzteil können wir eine maximale Auslastung von 63,4 W aufzeichnen. Tendenziell stabilisiert sich die Gesamtleistung bei 53 W, wenn die CPU voll ausgelastet ist und einen Spielraum von nur 12 W hinterlässt.

| Aus / Standby | |
| Idle | |
| Last |
|
Legende:
min: | |
| MSI Summit E14 Flip Evo A12MT i7-1260P, Iris Xe G7 96EUs, Samsung PM9A1 MZVL21T0HCLR, IPS, 2880x1800, 14" | MSI Summit E14 A11SCS i7-1185G7, GeForce GTX 1650 Ti Max-Q, Phison 1TB SM2801T24GKBB4S-E162, IPS, 3840x2160, 14" | Asus VivoBook S 14X S5402Z i7-12700H, Iris Xe G7 96EUs, Micron 2450 512GB MTFDKBA512TFK, OLED, 2880x1800, 14.5" | LG Gram 14T90P i5-1135G7, Iris Xe G7 80EUs, Samsung SSD PM981a MZVLB512HBJQ, IPS, 1900x1200, 14" | Lenovo Yoga Slim 7i Pro 14IAP G7 i5-1240P, Iris Xe G7 80EUs, Samsung PM9A1 MZVL2512HCJQ, IPS, 2880x1800, 14" | Dell Latitude 9420 2-in-1 i7-1185G7, Iris Xe G7 96EUs, WDC PC SN530 SDBPNPZ-512G, IPS, 2560x1600, 14" | |
|---|---|---|---|---|---|---|
| Stromverbrauch | -64% | -5% | 31% | 9% | 11% | |
| Idle min * (Watt) | 5.4 | 9.9 -83% | 5.1 6% | 2.8 48% | 5.6 -4% | 4.6 15% |
| Idle avg * (Watt) | 9.5 | 17.4 -83% | 7.7 19% | 5.5 42% | 9.3 2% | 7.8 18% |
| Idle max * (Watt) | 12.4 | 22.5 -81% | 11 11% | 6.4 48% | 9.6 23% | 8.2 34% |
| Last avg * (Watt) | 54.7 | 85.6 -56% | 73.9 -35% | 45.4 17% | 49 10% | 47.9 12% |
| Witcher 3 ultra * (Watt) | 52 | 70.9 -36% | 42.7 18% | 34 35% | 38.2 27% | 38.8 25% |
| Last max * (Watt) | 63.4 | 91.1 -44% | 93 -47% | 65.9 -4% | 65.2 -3% | 87.1 -37% |
* ... kleinere Werte sind besser
Energieverbrauch Witcher 3 / Stresstest
Stromverbrauch mit externem Monitor
Akkulaufzeit
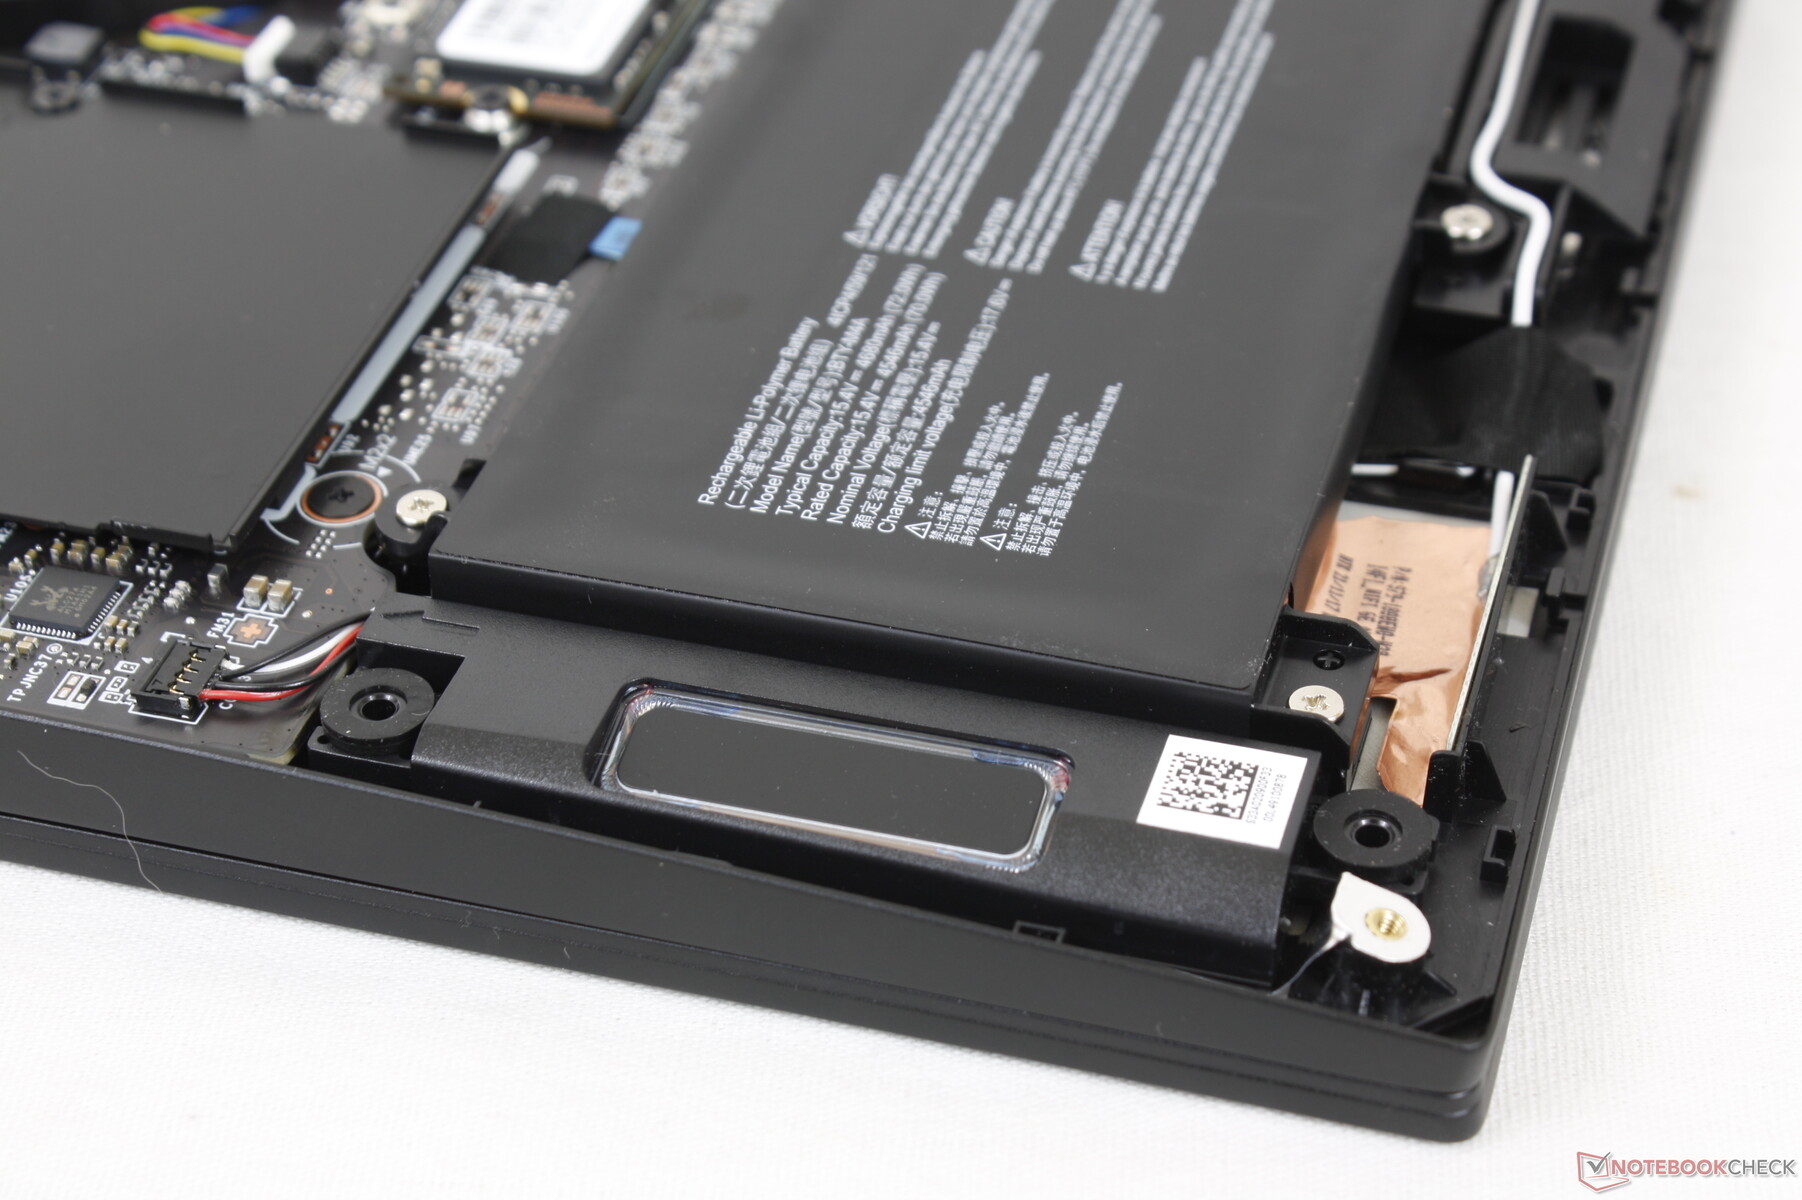
Die Akkukapazität ist ähnlich wie beim konkurrierenden Asus VivoBook S 14X oder LG Gram 14T90P mit 70 Wh. Die Benutzer können mit etwas mehr als 8 Stunden praxisnahen WLAN-Surfen rechnen, bevor sie erneut aufladen müssen.
Das Aufladen von leerer auf volle Kapazität mit dem mitgelieferten Adapter dauert knapp 90 Minuten, was mit den meisten Ultrabooks vergleichbar ist. Zum Aufladen des Systems können auch USB-C-Netzteile von Drittanbietern eingesetzt werden.
| MSI Summit E14 Flip Evo A12MT i7-1260P, Iris Xe G7 96EUs, 72 Wh | MSI Summit E14 A11SCS i7-1185G7, GeForce GTX 1650 Ti Max-Q, 52 Wh | Asus VivoBook S 14X S5402Z i7-12700H, Iris Xe G7 96EUs, 70 Wh | LG Gram 14T90P i5-1135G7, Iris Xe G7 80EUs, 72 Wh | Lenovo Yoga Slim 7i Pro 14IAP G7 i5-1240P, Iris Xe G7 80EUs, 61 Wh | Dell Latitude 9420 2-in-1 i7-1185G7, Iris Xe G7 96EUs, 60 Wh | |
|---|---|---|---|---|---|---|
| Akkulaufzeit | -54% | -27% | 35% | -21% | 33% | |
| Idle (h) | 22.1 | 6.6 -70% | 13.1 -41% | 28.7 30% | ||
| WLAN (h) | 8.2 | 4.5 -45% | 7.1 -13% | 12.1 48% | 8.6 5% | 11.7 43% |
| Last (h) | 1.9 | 1 -47% | 2.3 21% | 1 -47% | 2.4 26% | |
| H.264 (h) | 10.7 |
Pro
Contra
Fazit — Der bisher beste MSI-Summit
Anstatt den 13-Zoll Summit E13 Flip zu nehmen und ihn einfach um einen 14-Zoll-Formfaktor zu vergrößern, handelt es sich bei dem Summit E14 Flip um die vollständige Neugestaltung des Gehäuses, nach der wir gesucht haben. Er verliert einige der Pluspunkte seiner kleineren Schwestermodelle, aber aufgrund der Vorteile in Sachen Festigkeit und Bauqualität lohnt er sich wahrscheinlich, vor allem von einem professionellen Standpunkt aus gesehen, wo die Zuverlässigkeit Priorität hat. Er ist noch nicht ganz so stark wie der HP Spectre, aber er ist sicherlich nah dran.
Der Summit E14 Flip ist für Prosumenten und Studenten gedacht, die die Vielseitigkeit eines Convertible-Formfaktor-Subnotebooks wünschen, ohne dabei auf Leistung verzichten zu müssen.
Die Leistung ist erstklassig und es gibt keine großen CPU- oder GPU-Drosselungen im Gegensatz zu bestimmten HP EliteBook Dragonfly-Modellen. Mittlerweile steht das Display von Kopf bis Fuß mit den Displays anderer Prosumer-Subnotebooks von Dell, HP oder Asus im Einklang. Wir hoffen, in Zukunft OLED- oder 90+ Hz-Optionen zu sehen, die der aktuelle Trend zu sein scheinen.
Das Fehlen von WAN-Optionen bedeutet, dass einige Benutzer immer noch einen Grund dazu haben, sich für Modelle aus den Lenovo ThinkPad-, Dell Latitude- oder HP Spectre-Familien zu entscheiden. Außerdem ist die Leistung hervorragend und das Gehäuse robust, sie können auch sehr hohen Temperaturen standhalten und verfügen über ein größere Ausführung. Die Wahl des Summit E14 Flip bedeutet, ein wenig Portabilität für diese schnelle CPU zu opfern.
Preis und Verfügbarkeit
Amazon hat mehrere Konfigurationen auf Lager, die vom Core i5-1240P bis zum Core i7-1280P für 1.719 Euro reichen.
MSI Summit E14 Flip Evo A12MT
- 15.07.2022 v7 (old)
Allen Ngo
Preisvergleich

