MSI Summit B15 A11M Laptop im Test: Modern 15 mit Thunderbolt 4-, Prozessor- und Lüfter-Upgrade
MSI hat auf der CES 2021 seine Summit-Serie vorgestellt, die eine Reihe von Laptops umfasst, die für die verschiedensten semi-professionellen bis professionellen Arbeiten konzipiert sind. Zu den Spitzenmodellen gehören das 13,4 Zoll Summit E13 und 15,6 Zoll Summit E15, die jeweils um die 2.000 USD kosten.
Das Modell, das wir uns hier ansehen, ist ein Einsteigermodell der Serie namens Summit B15. Im Gegensatz zu den zuvor erwähnten Summit-E-Modellen fehlen beim B15 die goldenen Zierleisten und die eigenständigen GPU-Optionen, um ein geringeres Gewicht und einen günstigeren Preis zu erzielen. Ansonsten ist es mit ähnlichen Tiger-Lake-U-Prozessoroptionen der 11. Generation ausgestattet. Zu den direkten Konkurrenten zählen andere Prosumer-Notebooks der mittleren bis oberen Mittelklasse wie das HP Envy 15, das XPG Xenia Xe, das Lenovo ThinkBook 15, das Microsoft Surface Laptop 4 oder die LG-Gram-Serie.
Weitere MSI-Testberichte:
potential competitors in comparison
Bew. | Datum | Modell | Gewicht | Dicke | Größe | Auflösung | Preis ab |
|---|---|---|---|---|---|---|---|
| 81.2 % v7 (old) | 12 / 2021 | MSI Summit B15 A11M i7-1165G7, Iris Xe G7 96EUs | 1.5 kg | 16.9 mm | 15.60" | 1920x1080 | |
| 83.7 % v7 (old) | 01 / 2021 | MSI Summit E15 A11SCST i7-1185G7, GeForce GTX 1650 Ti Max-Q | 1.8 kg | 16.9 mm | 15.60" | 1920x1080 | |
| 86.8 % v7 (old) | 05 / 2020 | Dell XPS 15 9500 Core i5 i5-10300H, UHD Graphics 630 | 1.8 kg | 18 mm | 15.60" | 1920x1200 | |
| 85 % v7 (old) | 01 / 2020 | HP Spectre X360 15-5ZV31AV i7-10510U, GeForce MX250 | 2.1 kg | 19.3 mm | 15.60" | 3840x2160 | |
| 87.5 % v7 (old) | ADATA XPG Xenia Xe i7-1165G7, Iris Xe G7 96EUs | 1.7 kg | 14.9 mm | 15.60" | 1920x1080 | ||
| 85.2 % v7 (old) | 03 / 2020 | Asus ZenBook 15 UX534FTC-A8190T i7-10510U, GeForce GTX 1650 Max-Q | 1.6 kg | 18.9 mm | 15.60" | 1920x1080 |
Gehäuse
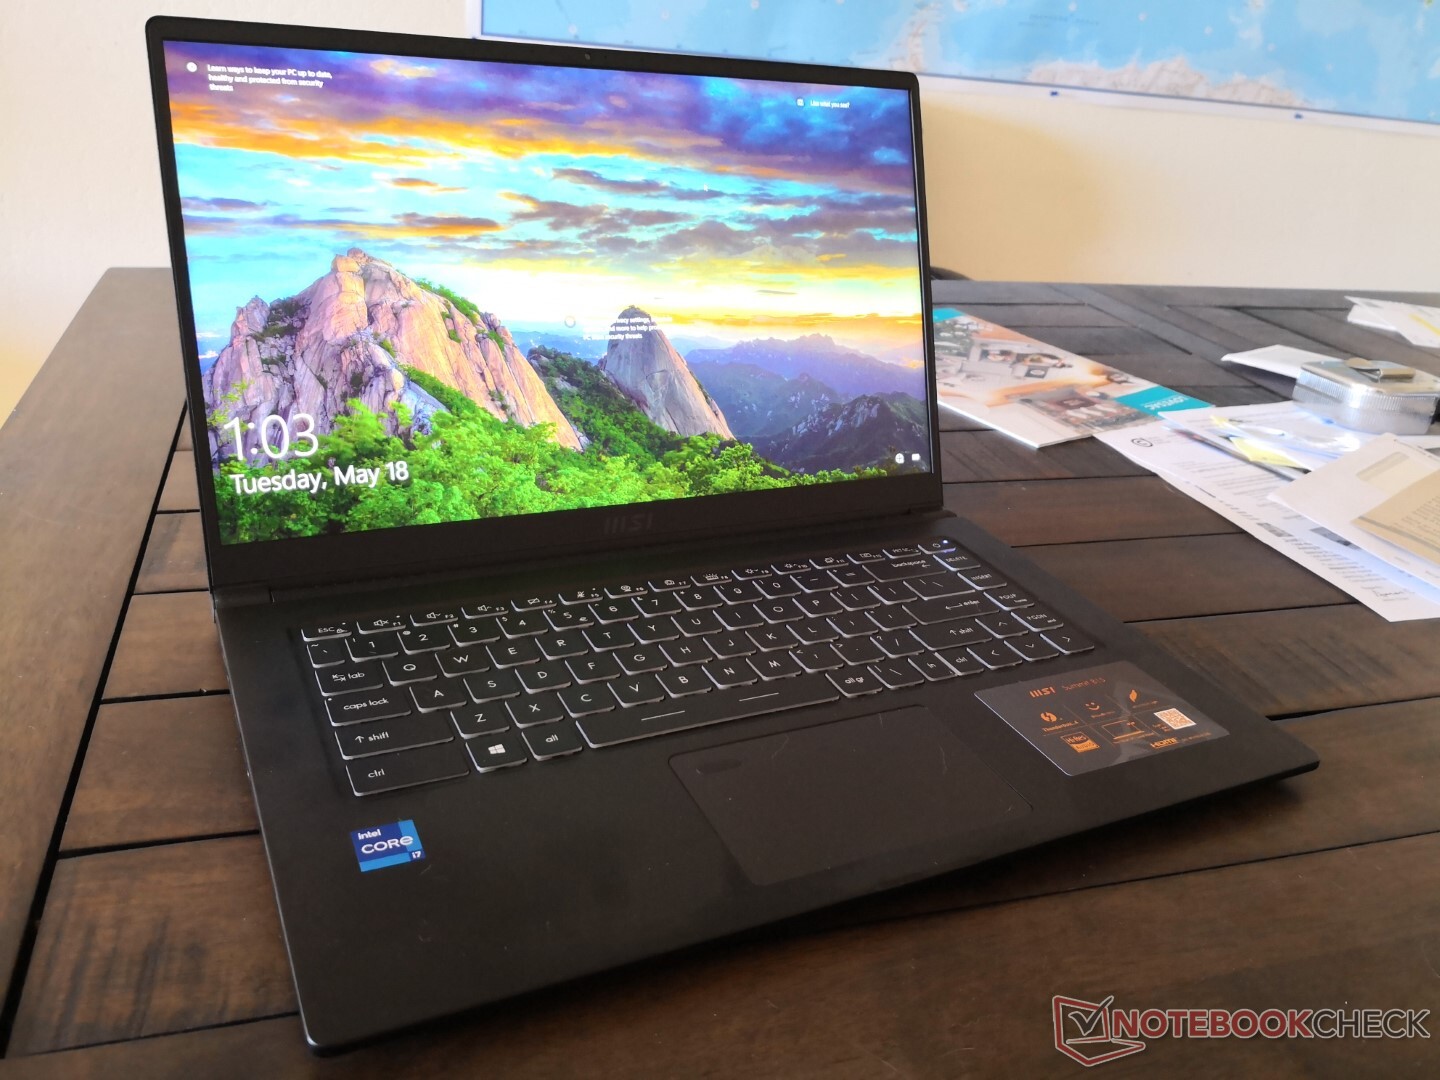
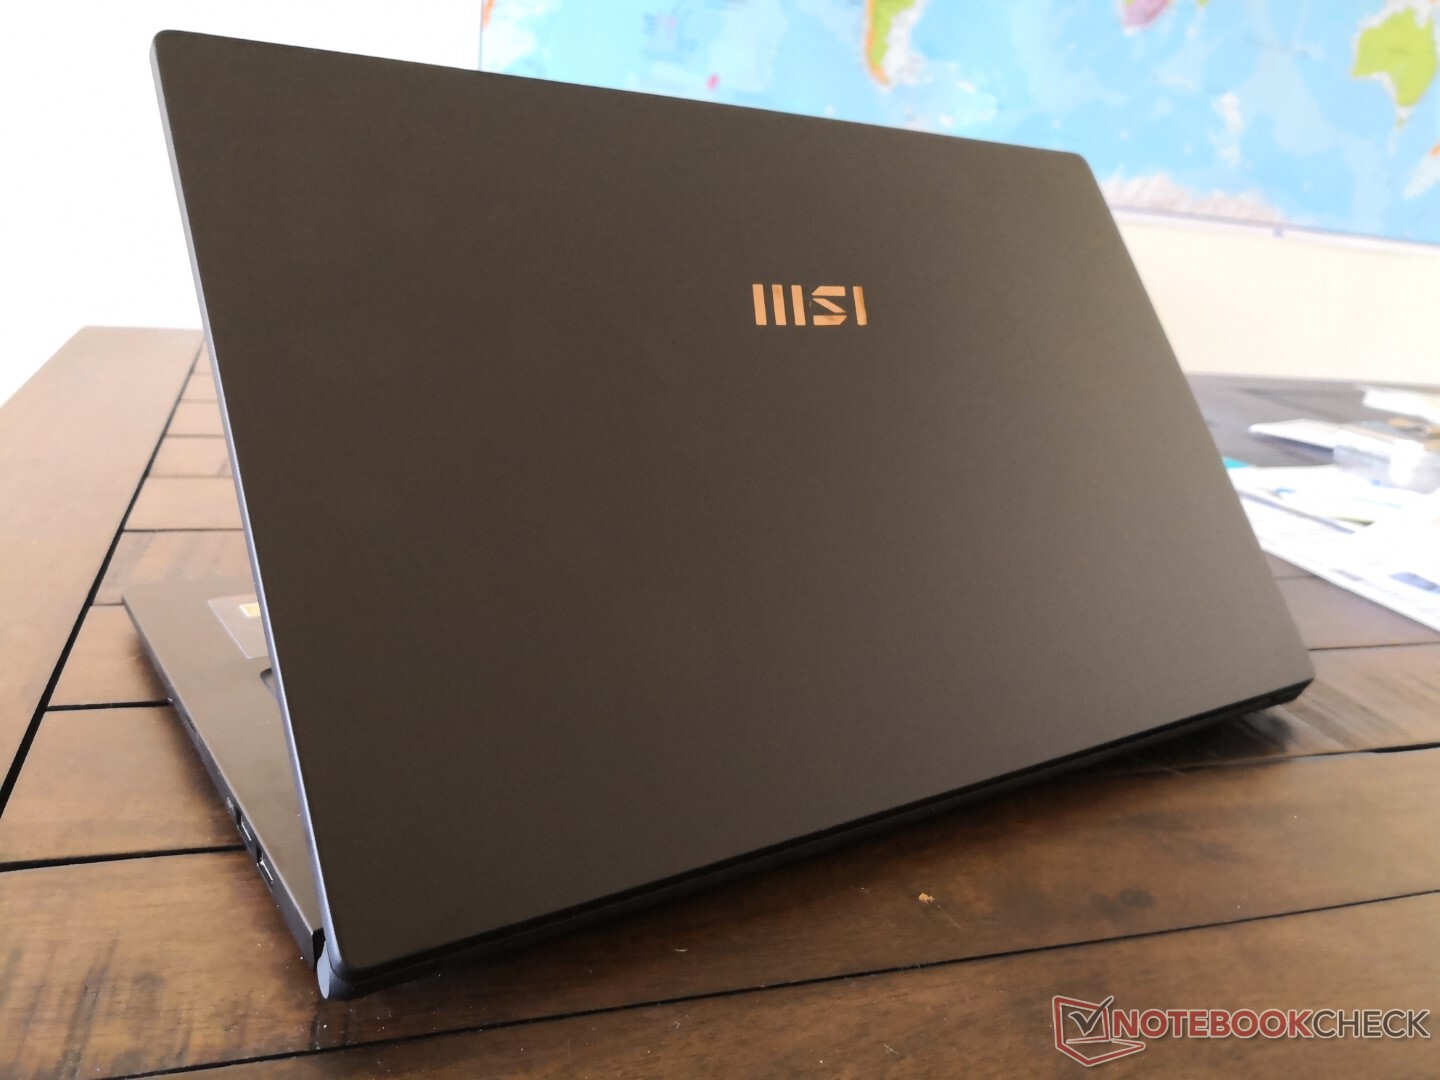
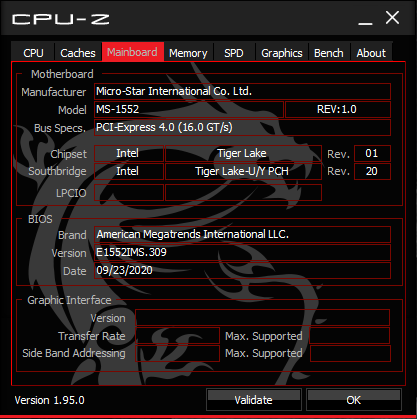
Wenn Ihnen das Summit B15 bekannt vorkommt, dann liegt das daran, dass es sich im Wesentlichen um einen neu gebrandeten 2020 Modern 15 mit einem neuen goldenen "MSI"-Logo auf dem Außendeckel handelt. Das Gehäuse und die Ausstattung sind nahezu identisch mit dem Modern 15, sogar das Mainboard im Inneren ist identisch. MSI ist gerade dabei, sein Notebook-Portfolio umzustrukturieren und so werden sowohl die alternde Modern- als auch die Prestige-Serie in naher Zukunft unter der neueren Summit-Serie konsolidiert. Dieser Schritt sollte es den Kunden erleichtern zwischen den verschiedenen MSI-Notebooks zu unterscheiden.
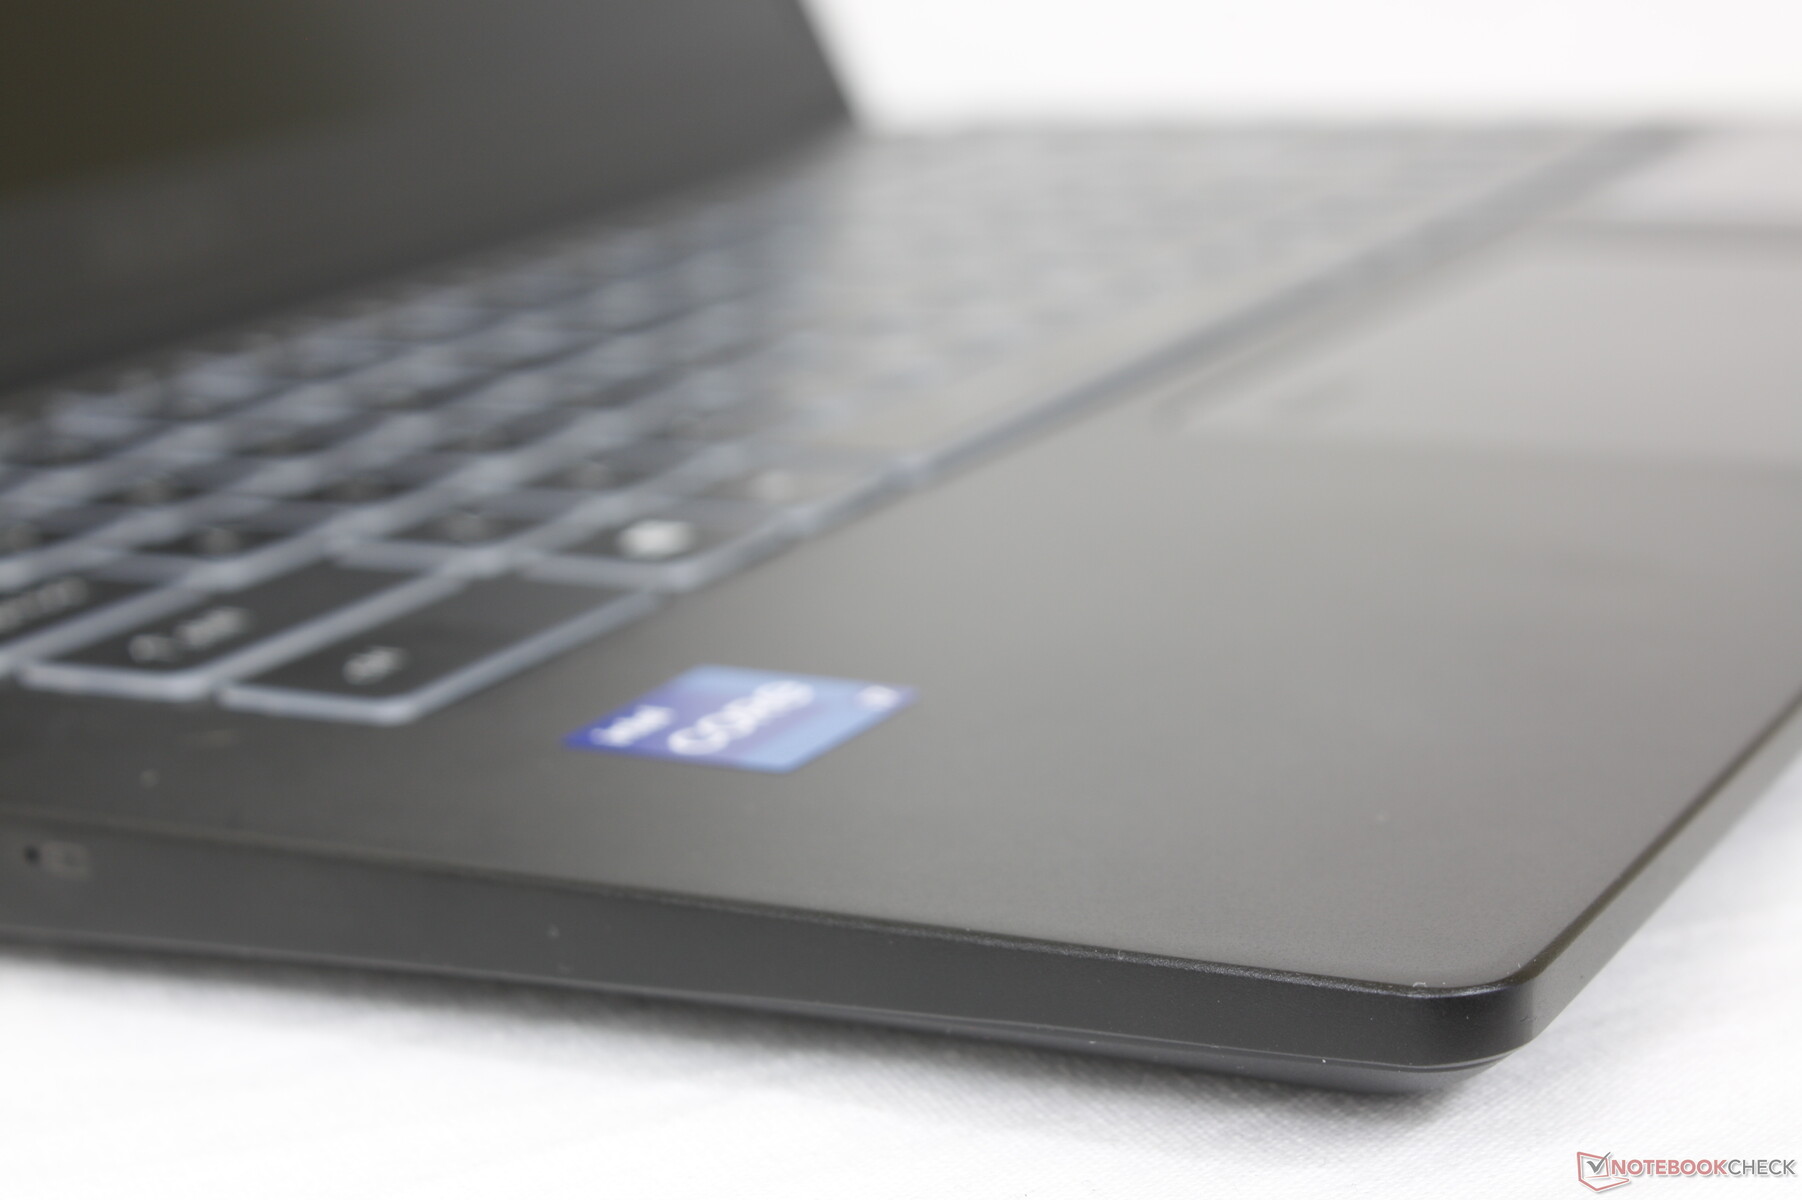
Unsere Eindrücke vom letztjährigen Modern 15 treffen auch auf das Summit B15 zu. Die Steifigkeit der Base ist immer noch ziemlich gut, während der Deckel immer noch ein wenig mehr nachgibt, als uns lieb ist. Vollwertige Business-Notebooks wie das Dell Latitude, das HP EliteBook oder das Lenovo ThinkPad sind definitiv teurer, aber von stärkerer Qualität.
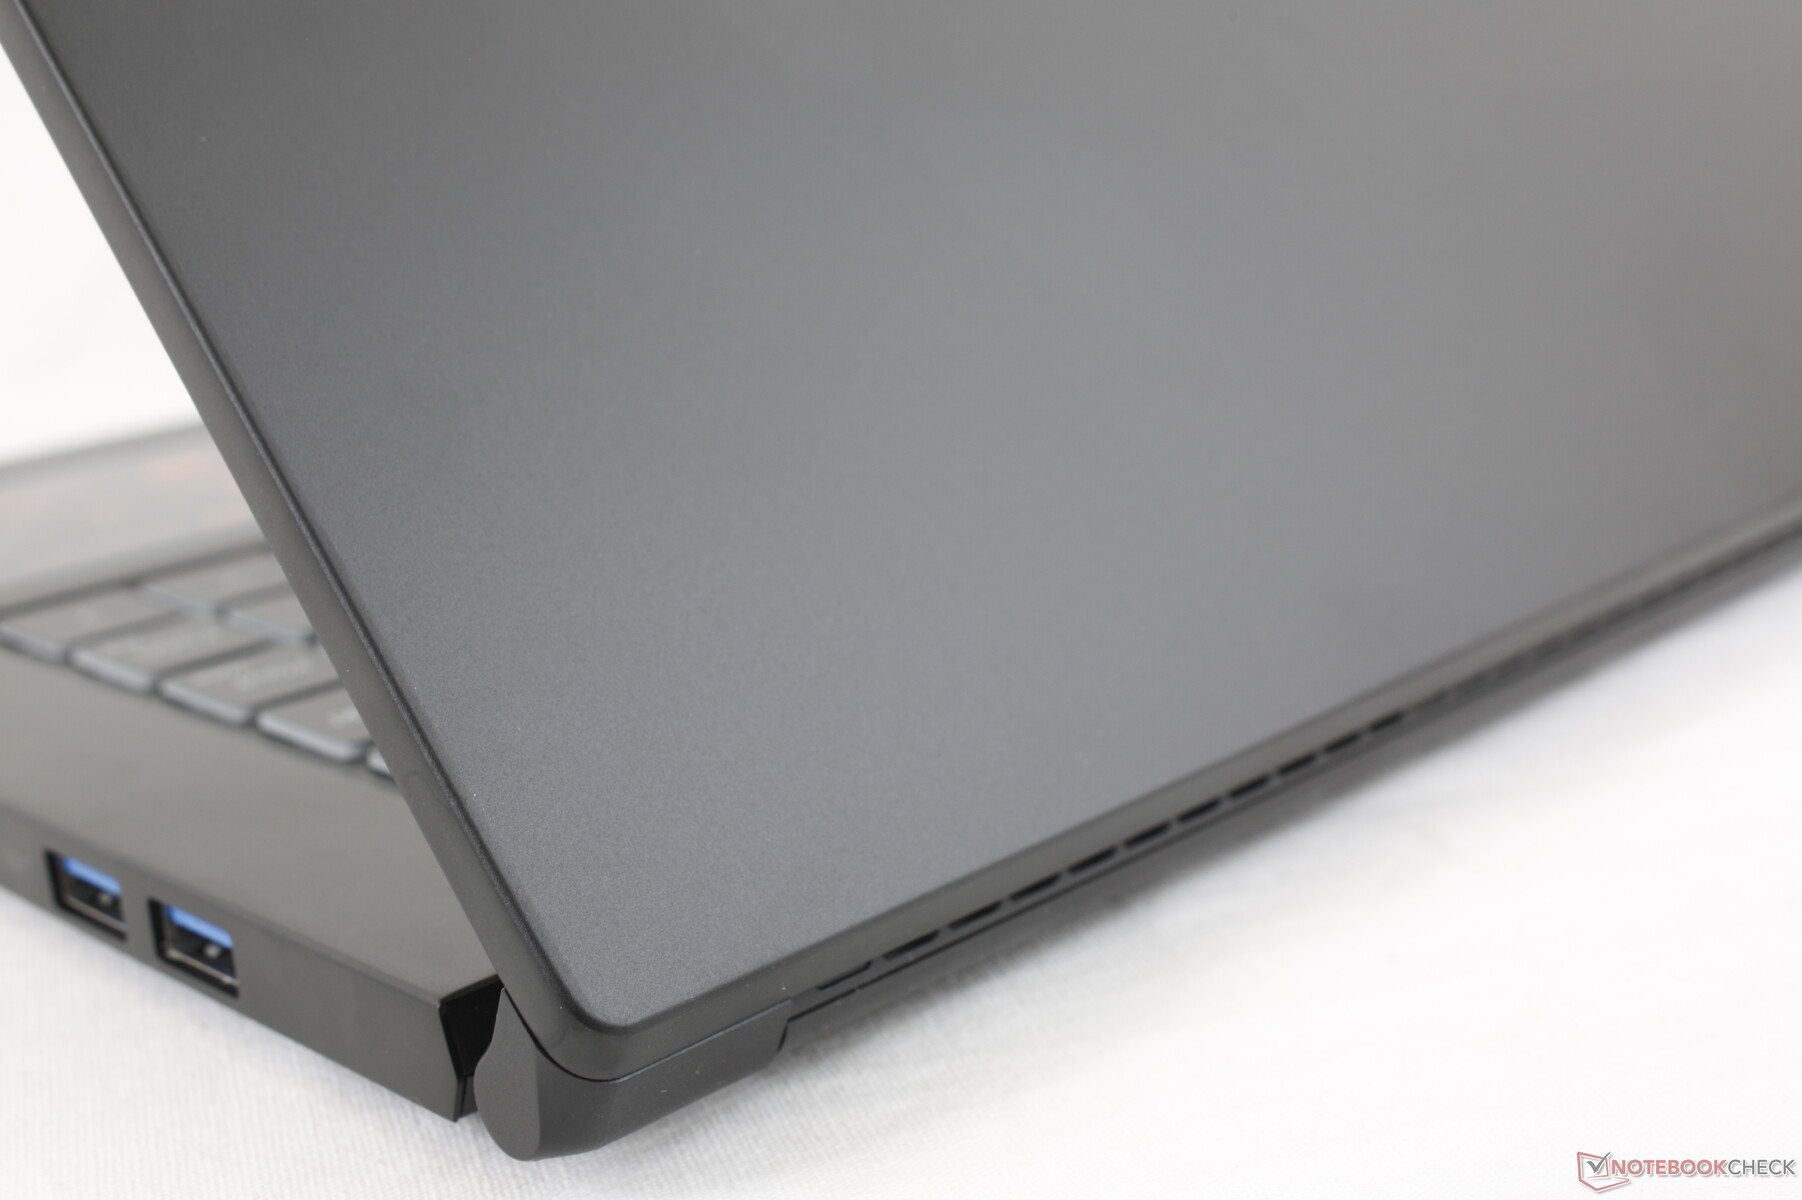
Ein wesentlicher Grund für die Wahl des Summit B15 (oder Modern 15) gegenüber Alternativen von Dell, HP oder anderen ist sein sehr geringes Gewicht von nur 1,5 kg. Die konkurrierende Lenovo ThinkBook 15 G2 oder ADATA XPG Xenia Xe sind im Vergleich jeweils etwa 200 Gramm schwerer, bei nahezu identischen Abmessungen.
Anschlussaustattung
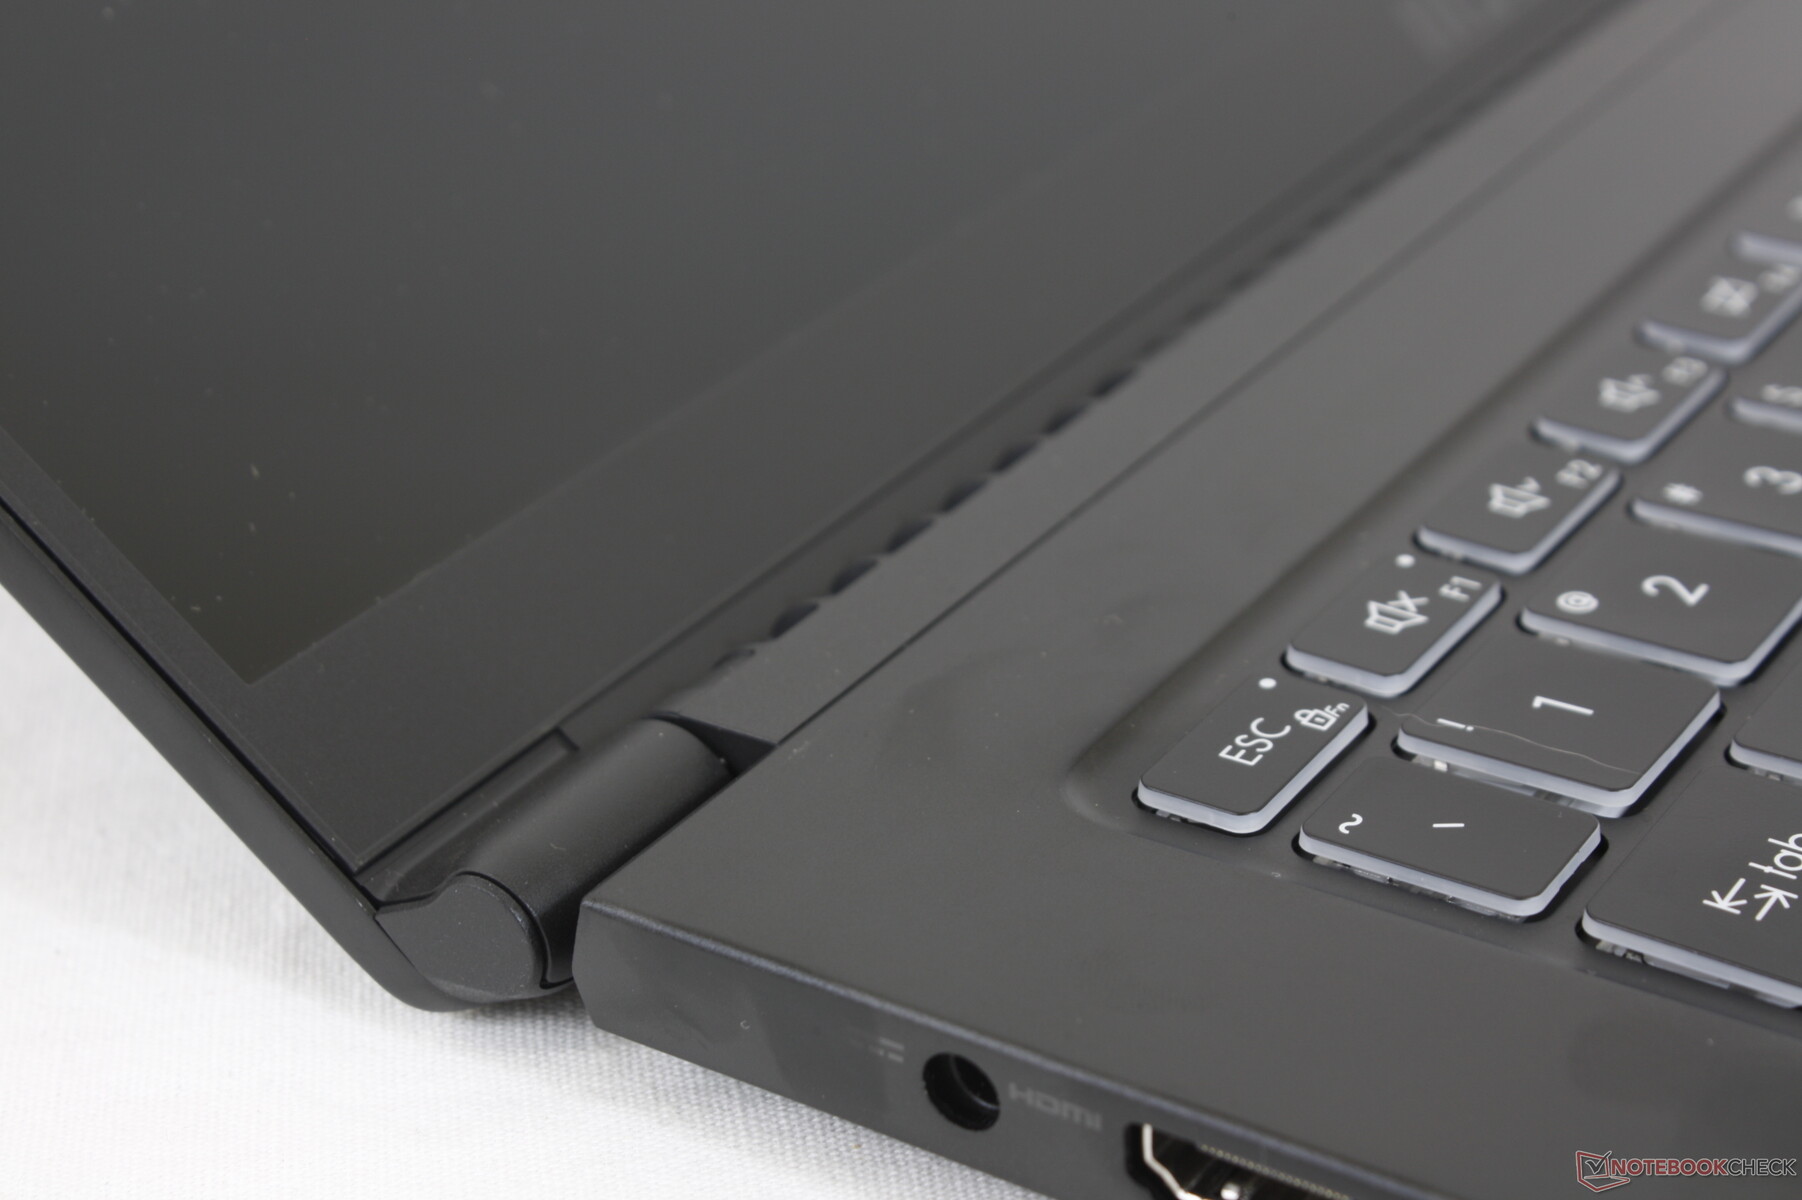
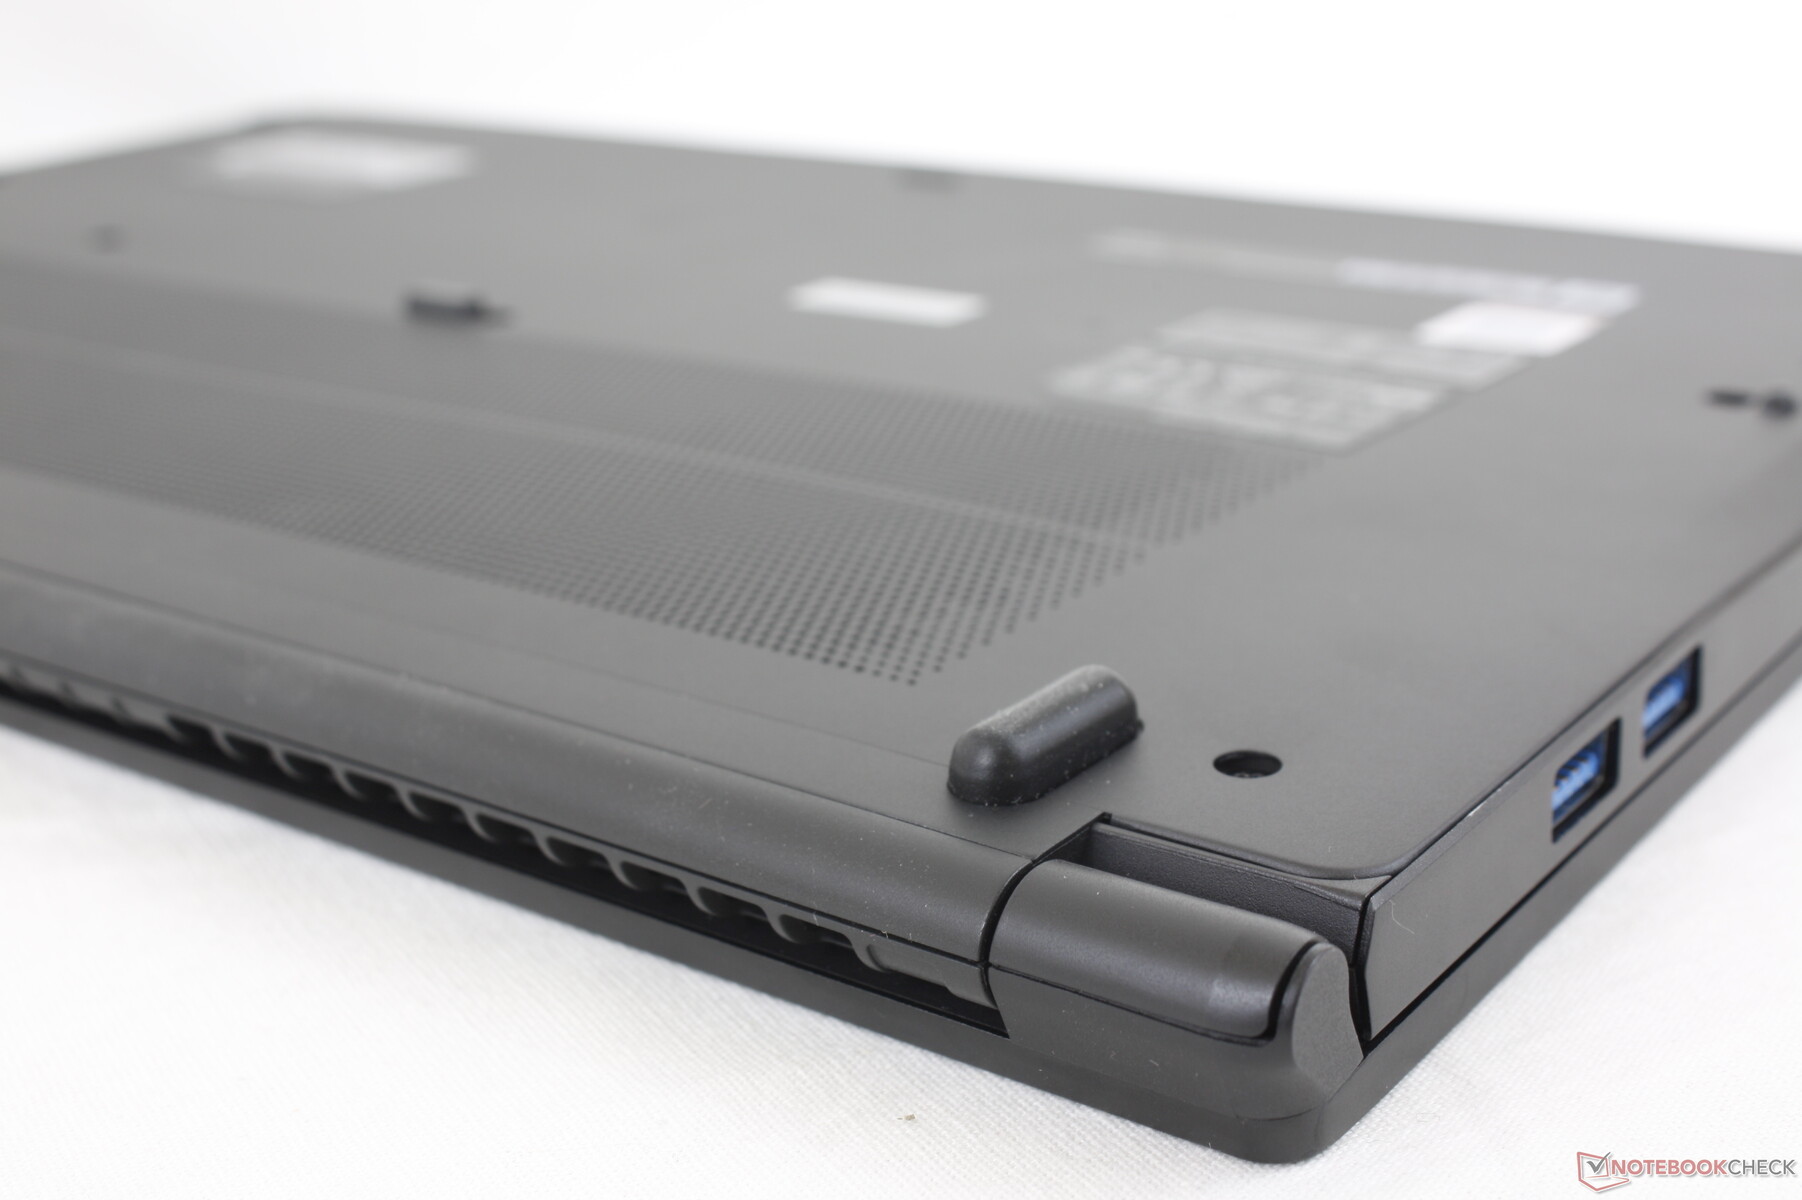
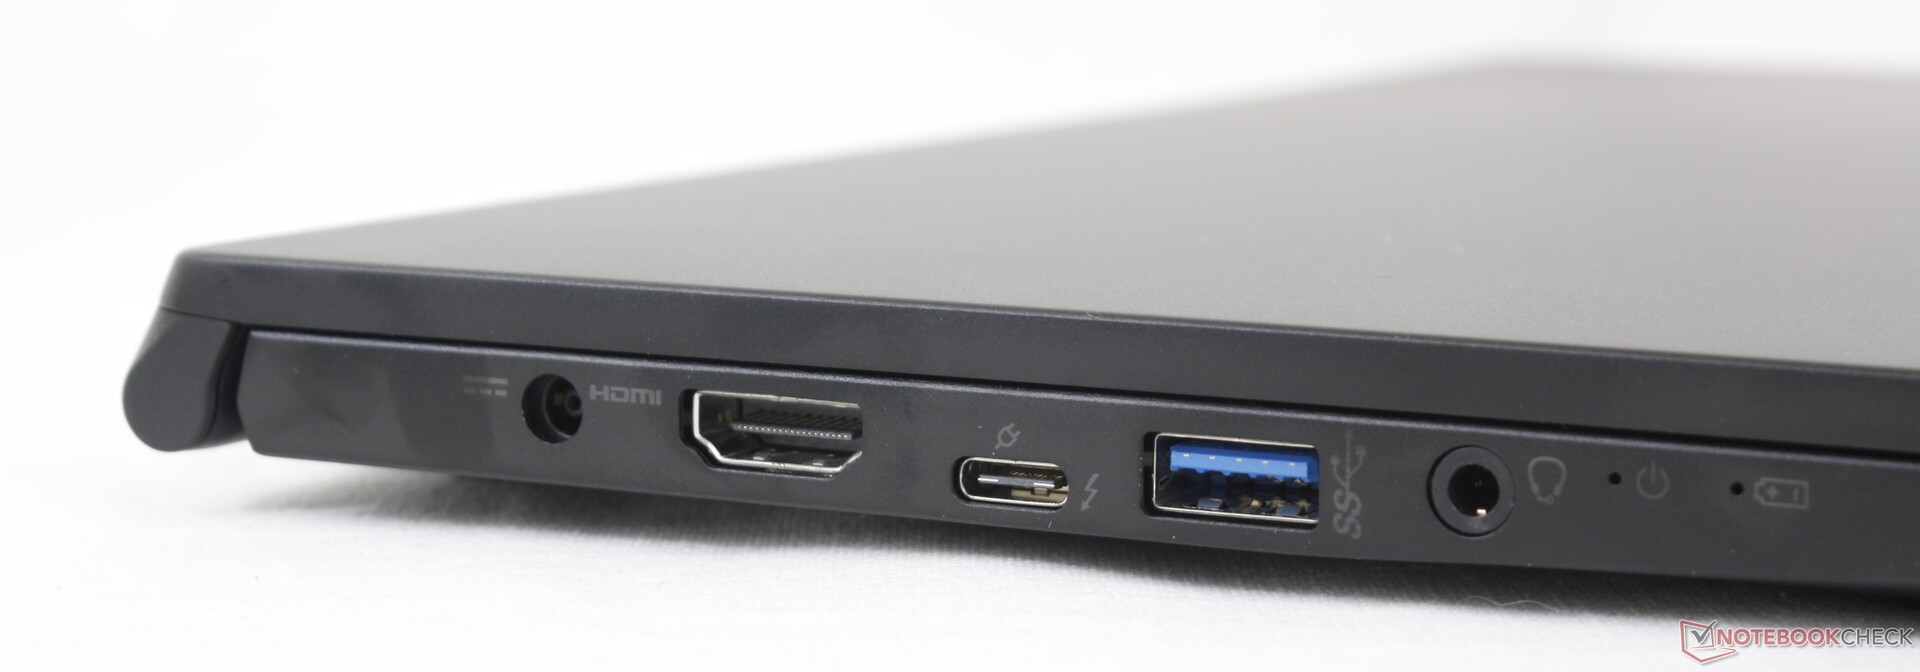
Die Anschlussoptionen bleiben im Vergleich zum Modern 15 unverändert, mit Ausnahme von zwei wichtigen Upgrades: Der HDMI-Anschluss unterstützt nun 4K60-Ausgabe, während der USB-C-Anschluss nun Thunderbolt-4-kompatibel ist. Nutzer können externe Grafikdocks an das Summit B15 anschließen, während dies beim Modern 15 nicht möglich war.
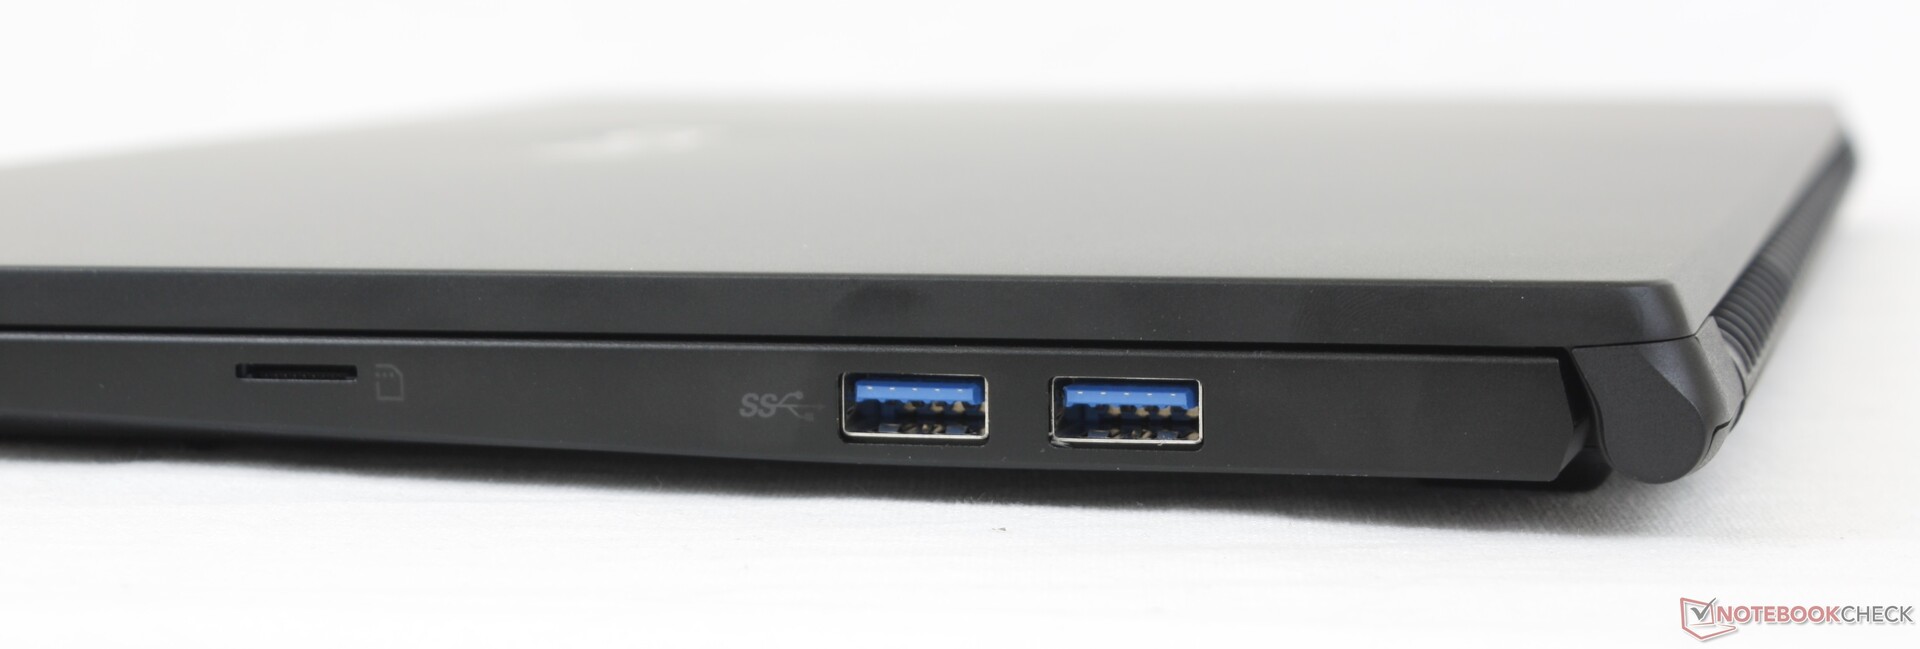
SD-Kartenleser
MSI hat den MicroSD-Steckplatz aufgerüstet, sodass er etwa 6x schneller ist als der gleiche MicroSD-Steckplatz des älteren Modern 15. Das Verschieben von 1 GB Bildern von unserer UHS-II-Testkarte auf den Desktop dauert etwa 7 Sekunden im Vergleich zu 40 Sekunden beim letztjährigen Modell.
| SD Card Reader | |
| average JPG Copy Test (av. of 3 runs) | |
| Dell XPS 15 9500 Core i5 (Toshiba Exceria Pro SDXC 64 GB UHS-II) | |
| HP Spectre X360 15-5ZV31AV (Toshiba Exceria Pro M501 UHS-II) | |
| MSI Summit B15 A11M (AV PRO microSD 128 GB V60) | |
| MSI Summit E13 Flip Evo A11MT (AV PRO microSD 128 GB V60) | |
| MSI Modern 15 A10RB (Toshiba Exceria Pro M501 UHS-II) | |
| maximum AS SSD Seq Read Test (1GB) | |
| Dell XPS 15 9500 Core i5 (Toshiba Exceria Pro SDXC 64 GB UHS-II) | |
| MSI Summit B15 A11M (AV PRO microSD 128 GB V60) | |
| HP Spectre X360 15-5ZV31AV (Toshiba Exceria Pro M501 UHS-II) | |
| MSI Summit E13 Flip Evo A11MT (AV PRO microSD 128 GB V60) | |
| MSI Modern 15 A10RB (Toshiba Exceria Pro M501 UHS-II) | |
Kommunikation
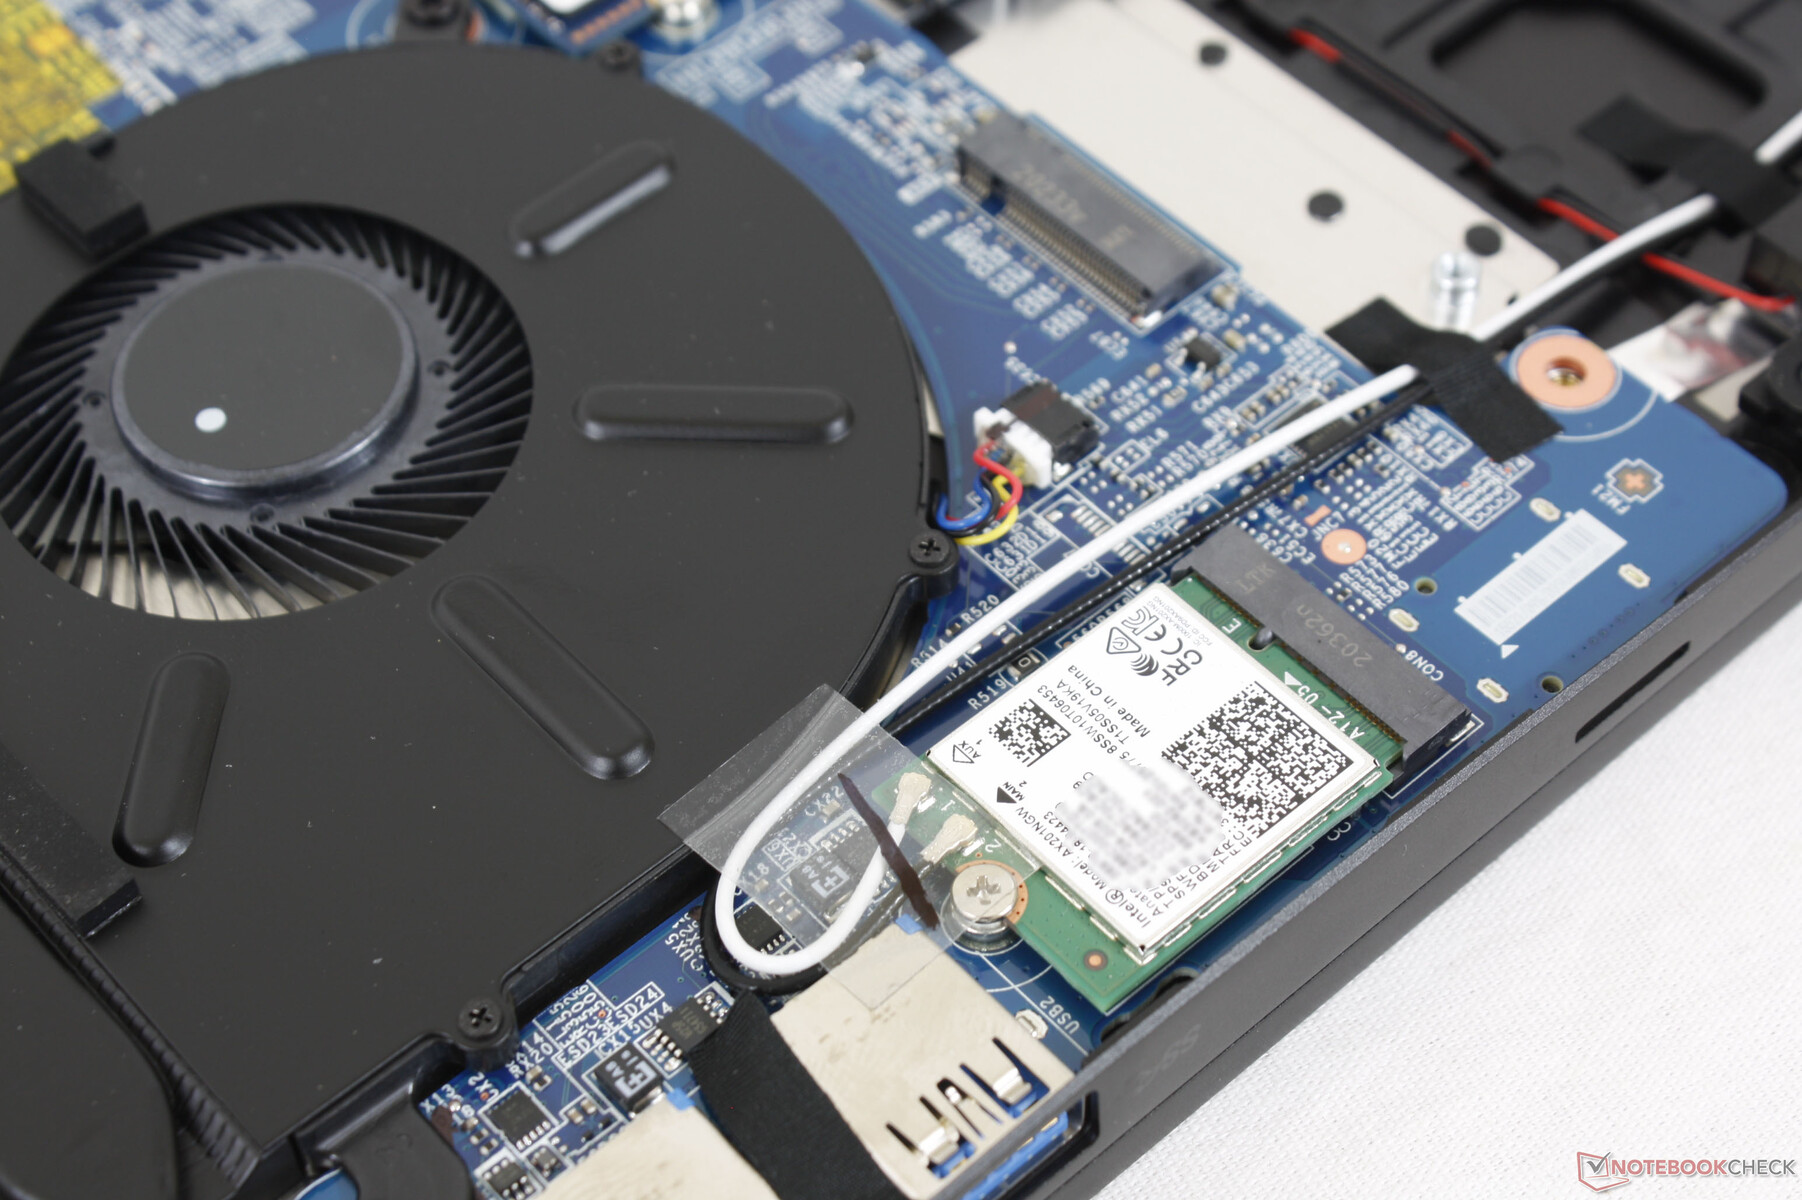
Das Intel AX201 ist standardmäßig mit Wi-Fi 6 und Bluetooth 5.1 ausgestattet. Bei der Kopplung mit unserem Netgear-RAX200-Router gab es keine Probleme.
| Networking | |
| iperf3 transmit AX12 | |
| ADATA XPG Xenia Xe | |
| MSI Summit E15 A11SCST | |
| Dell XPS 15 9500 Core i5 | |
| MSI Summit B15 A11M | |
| Asus ZenBook 15 UX534FTC-A8190T | |
| iperf3 receive AX12 | |
| ADATA XPG Xenia Xe | |
| Dell XPS 15 9500 Core i5 | |
| MSI Summit B15 A11M | |
| MSI Summit E15 A11SCST | |
| Asus ZenBook 15 UX534FTC-A8190T | |
Webcam


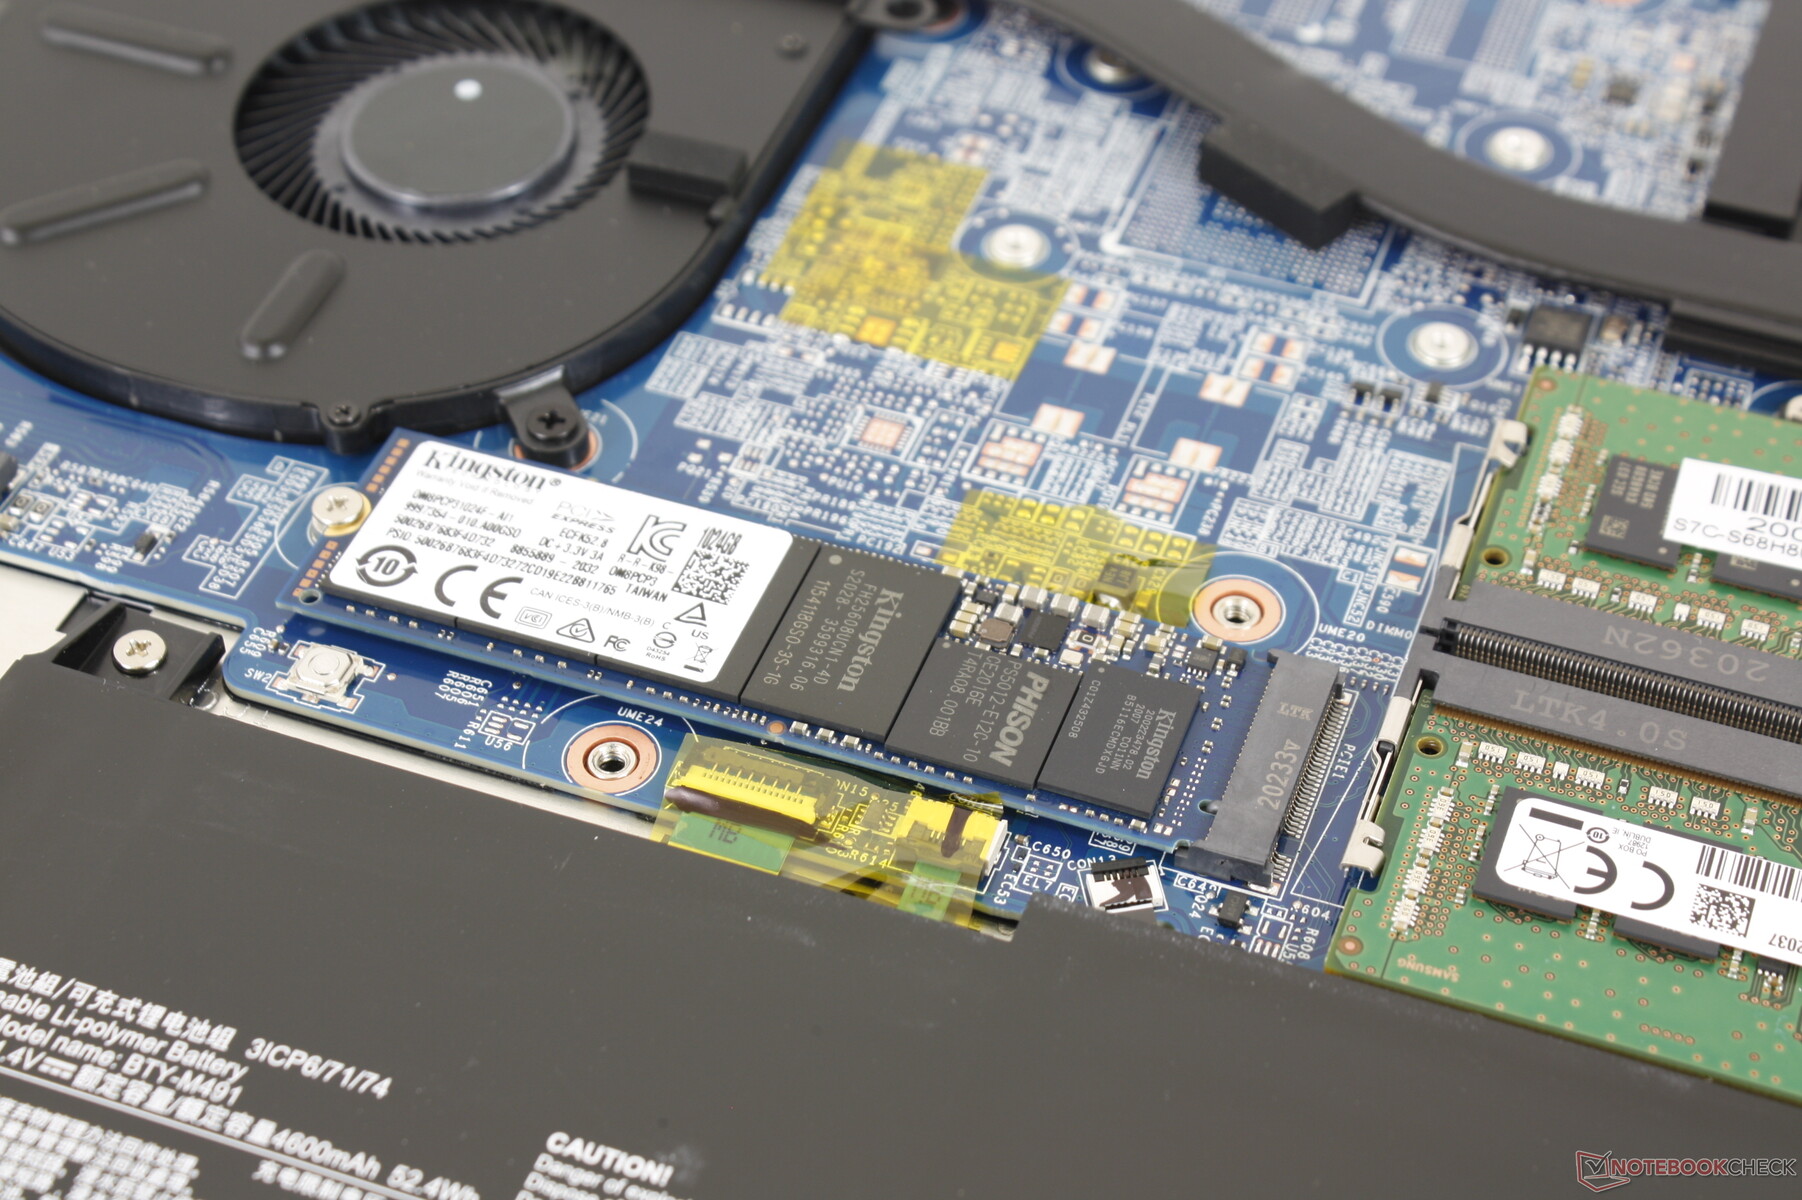
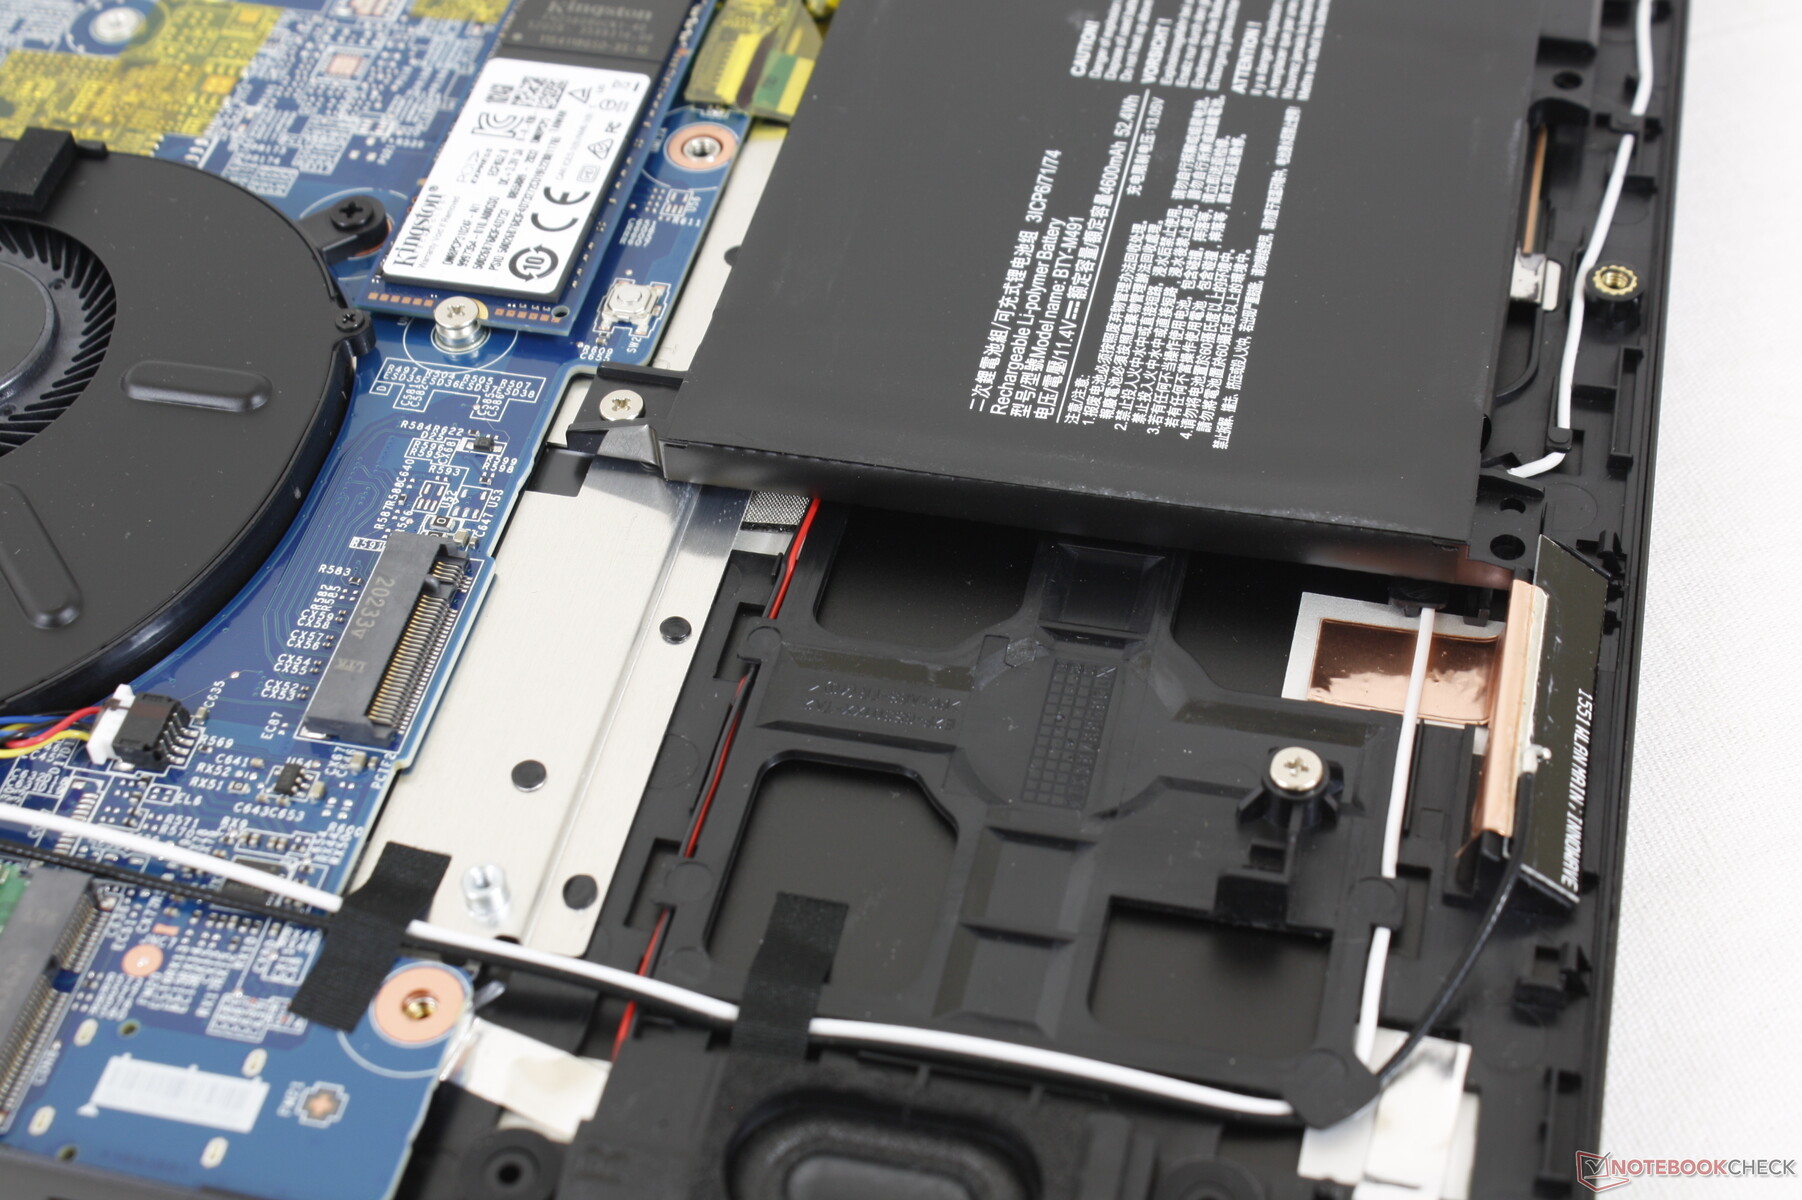
Wartung
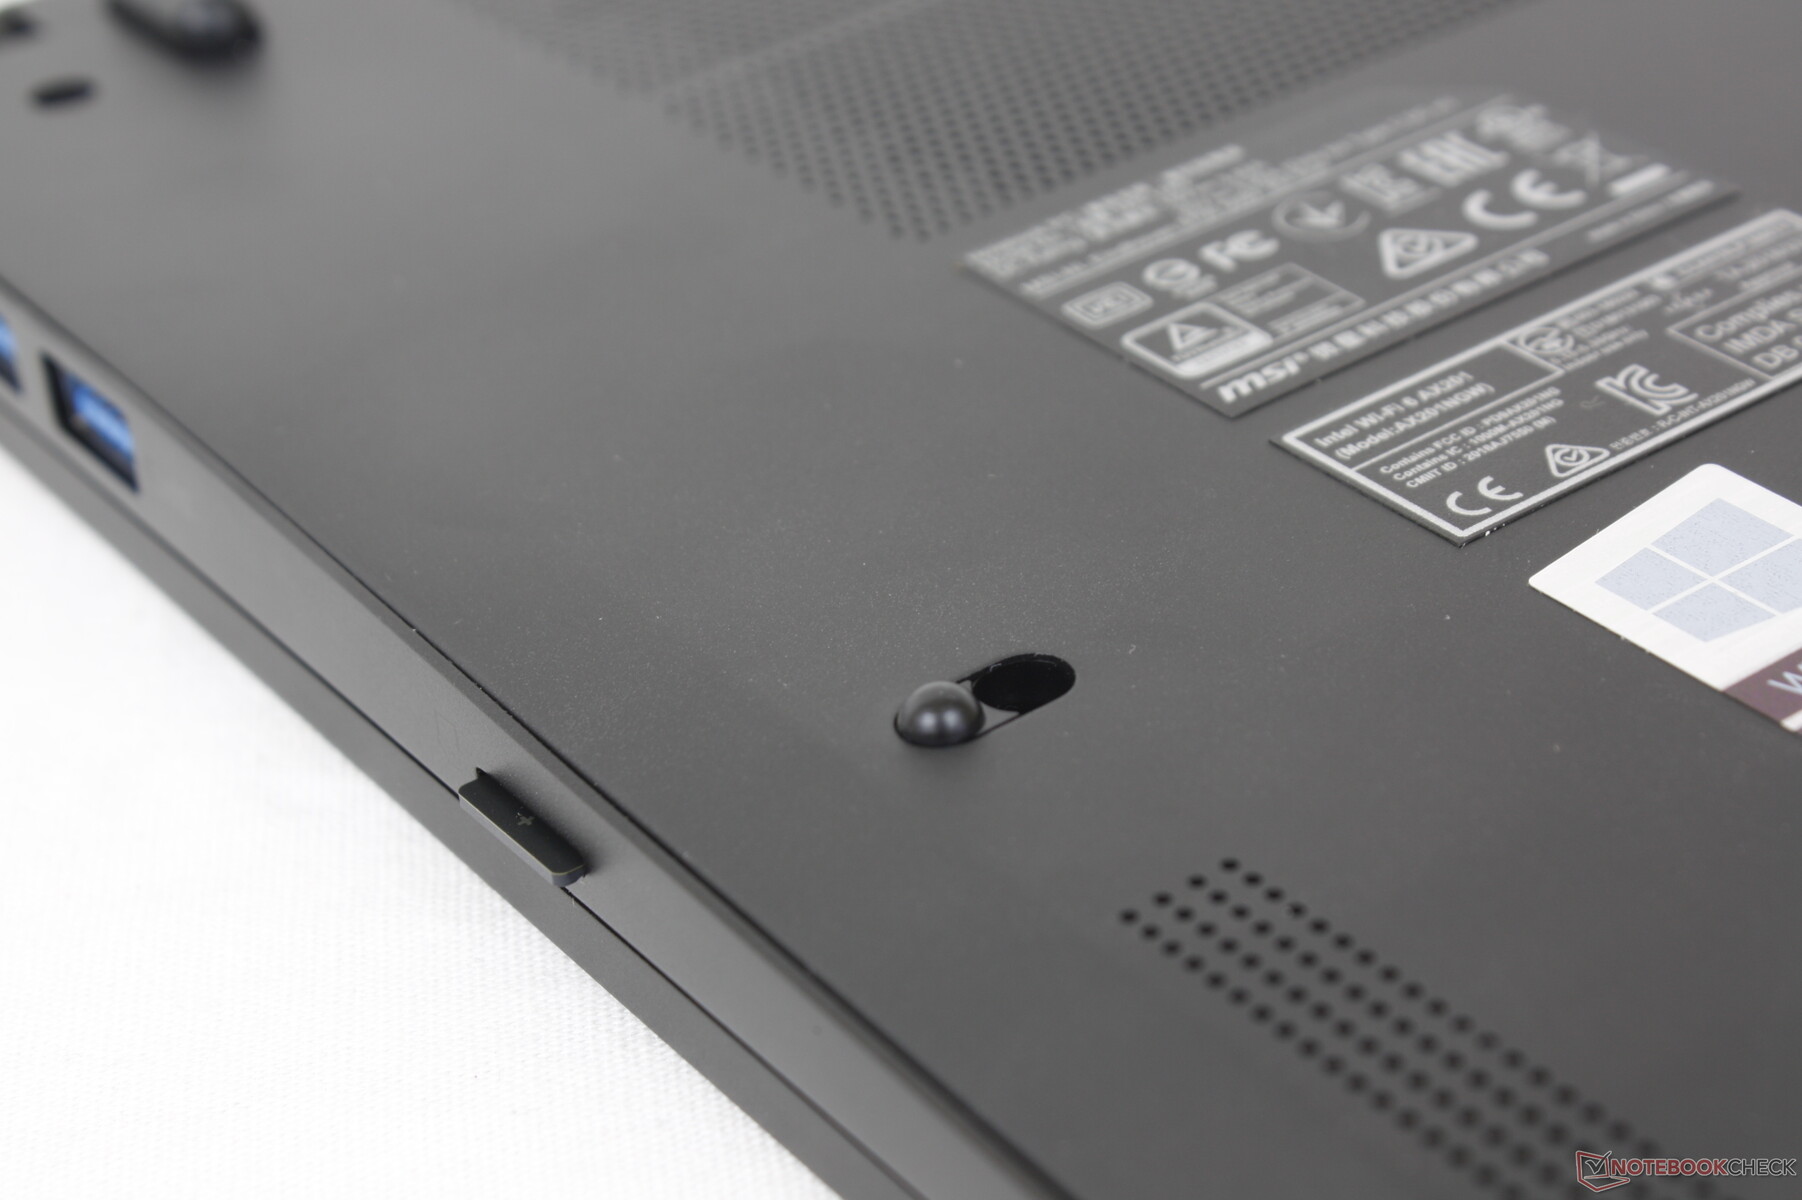
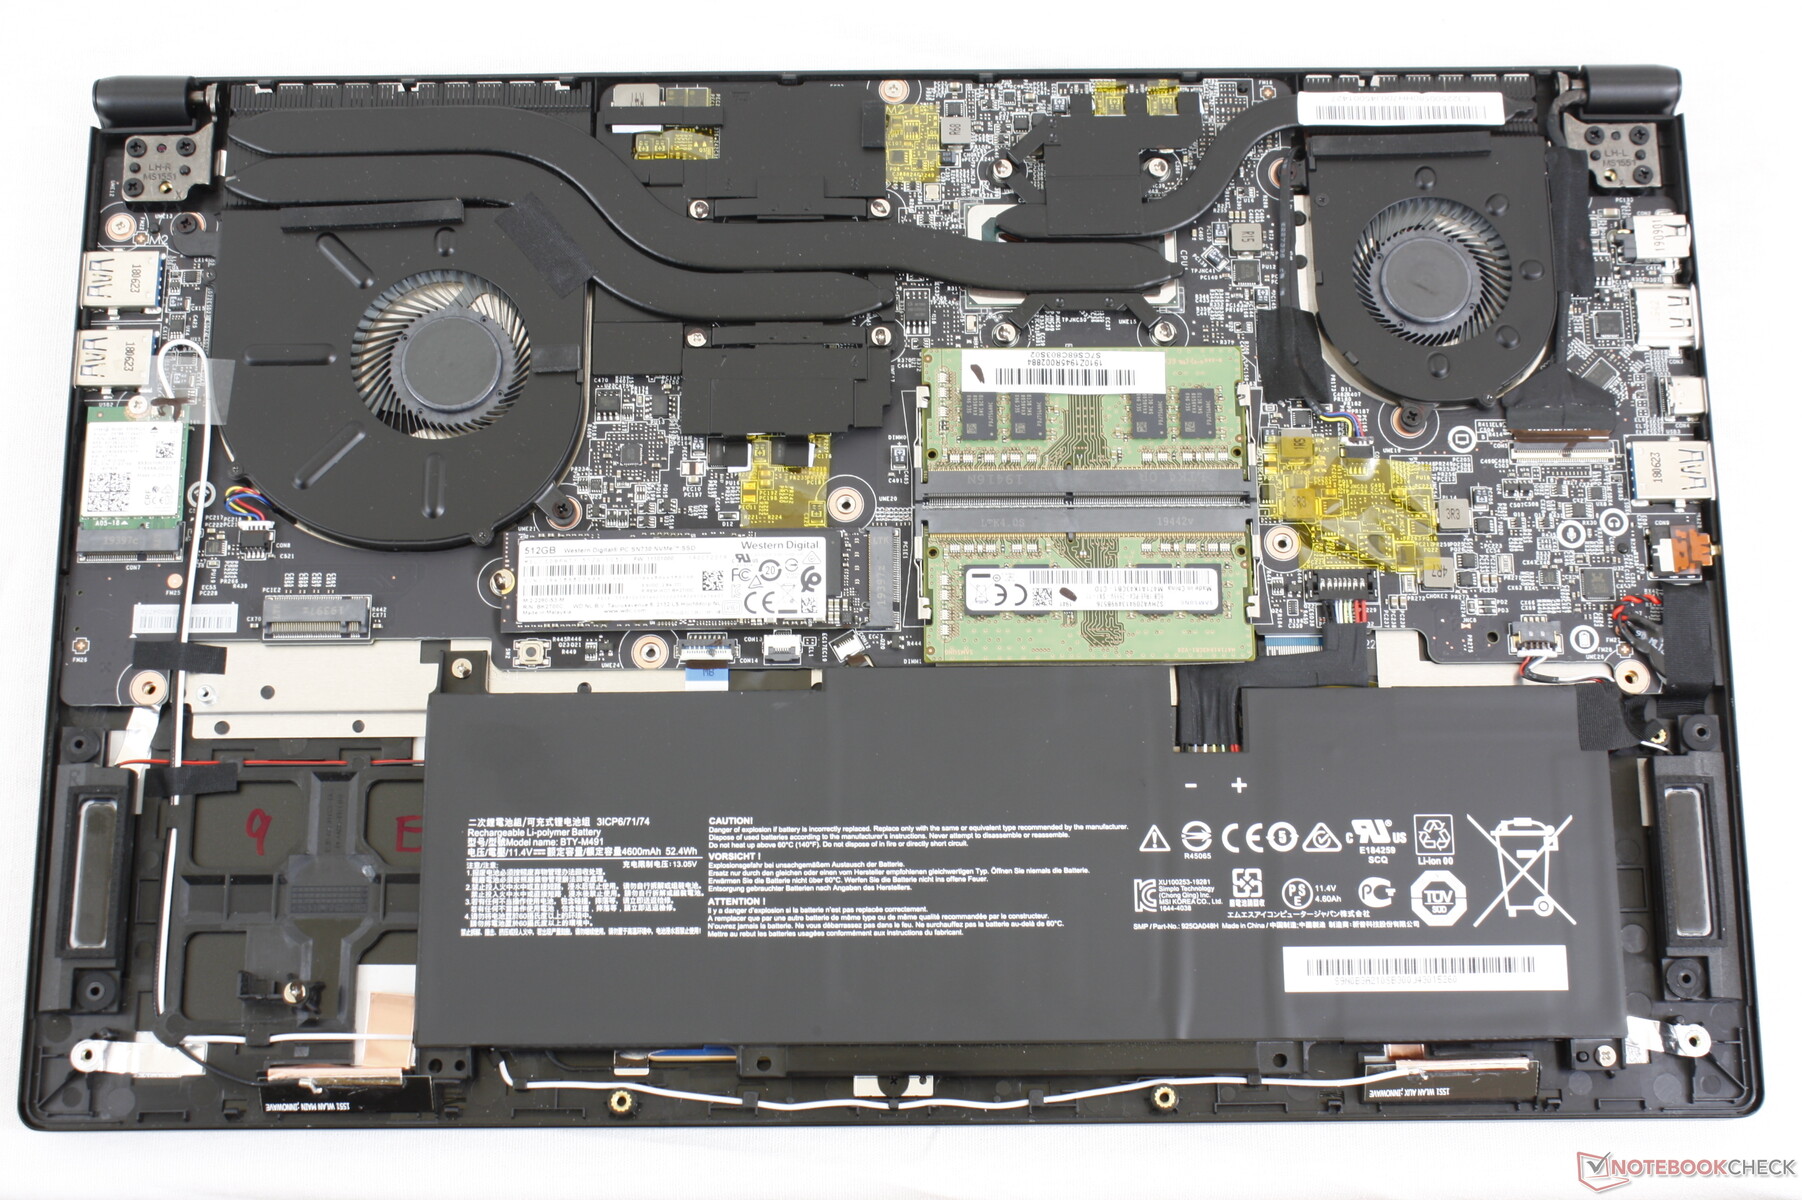
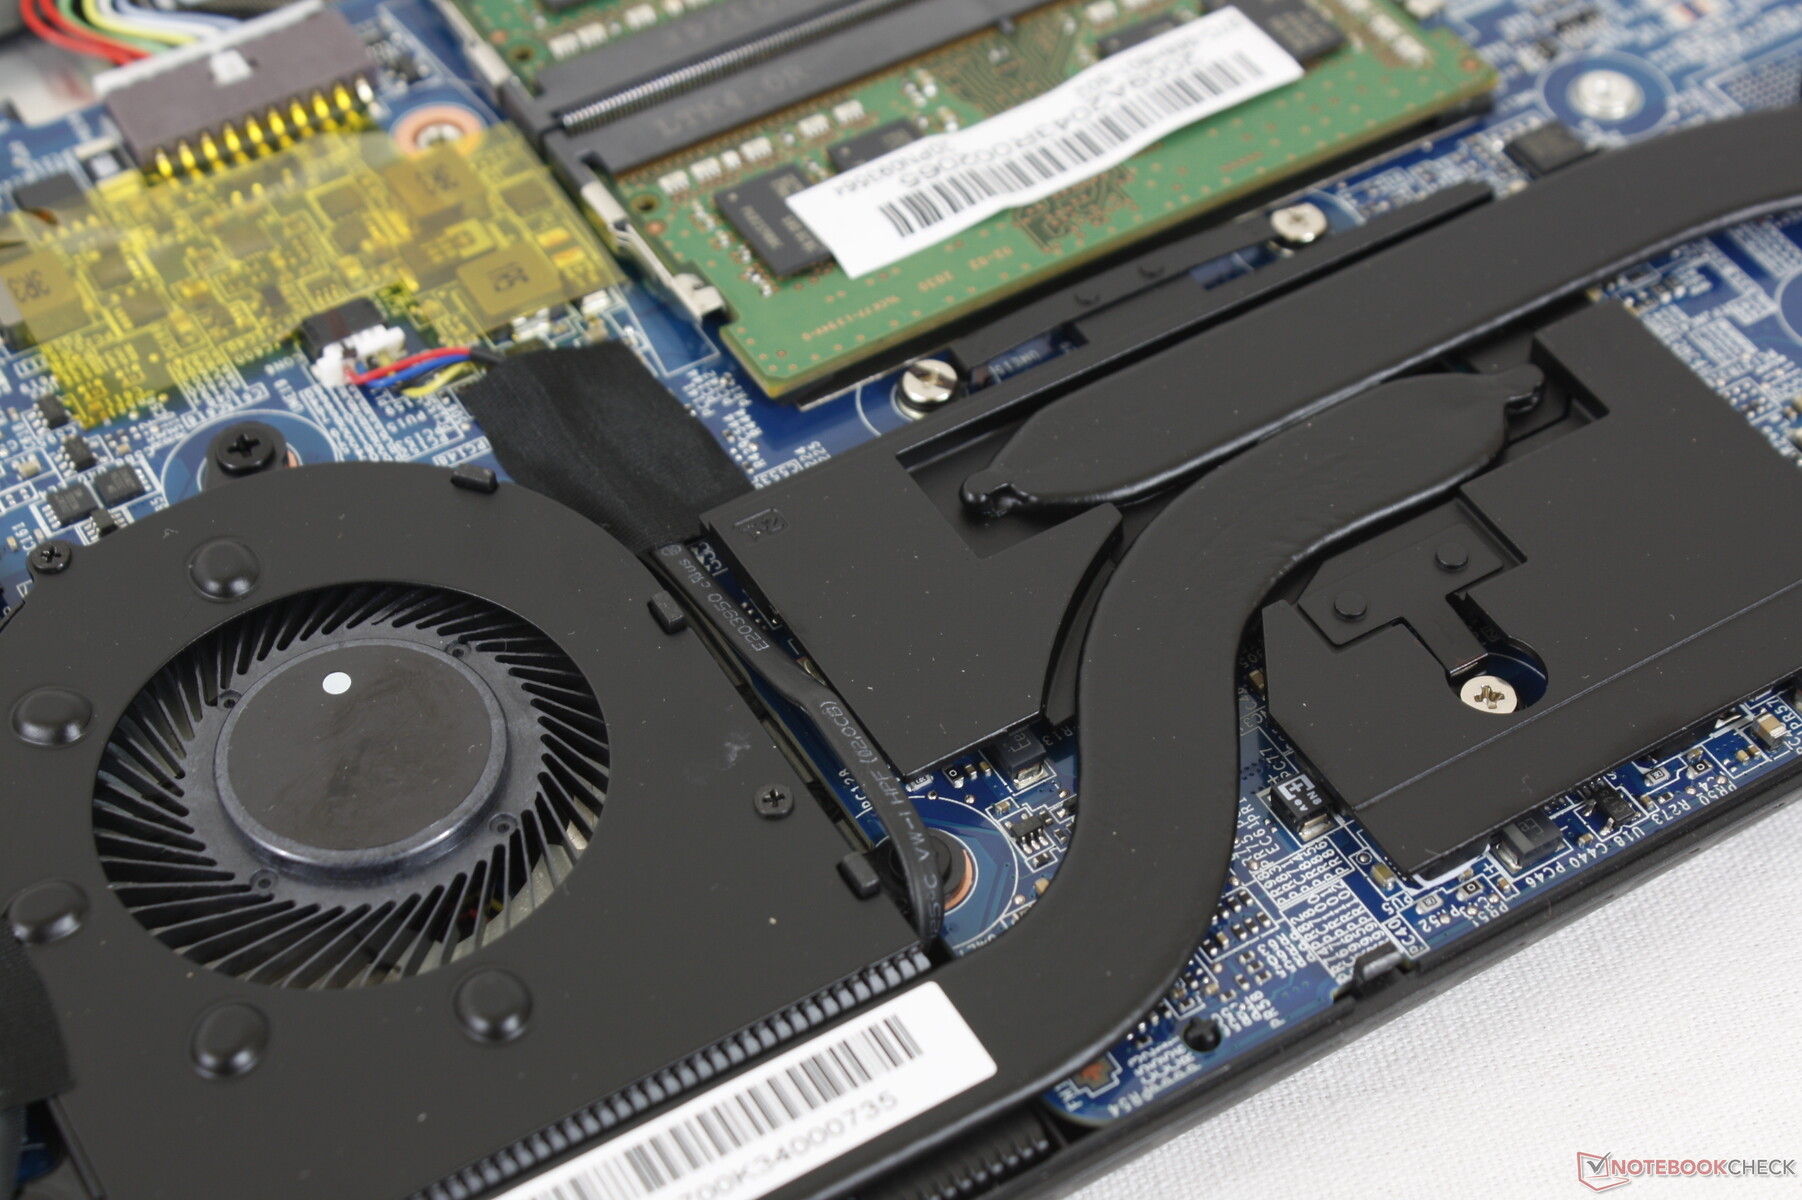
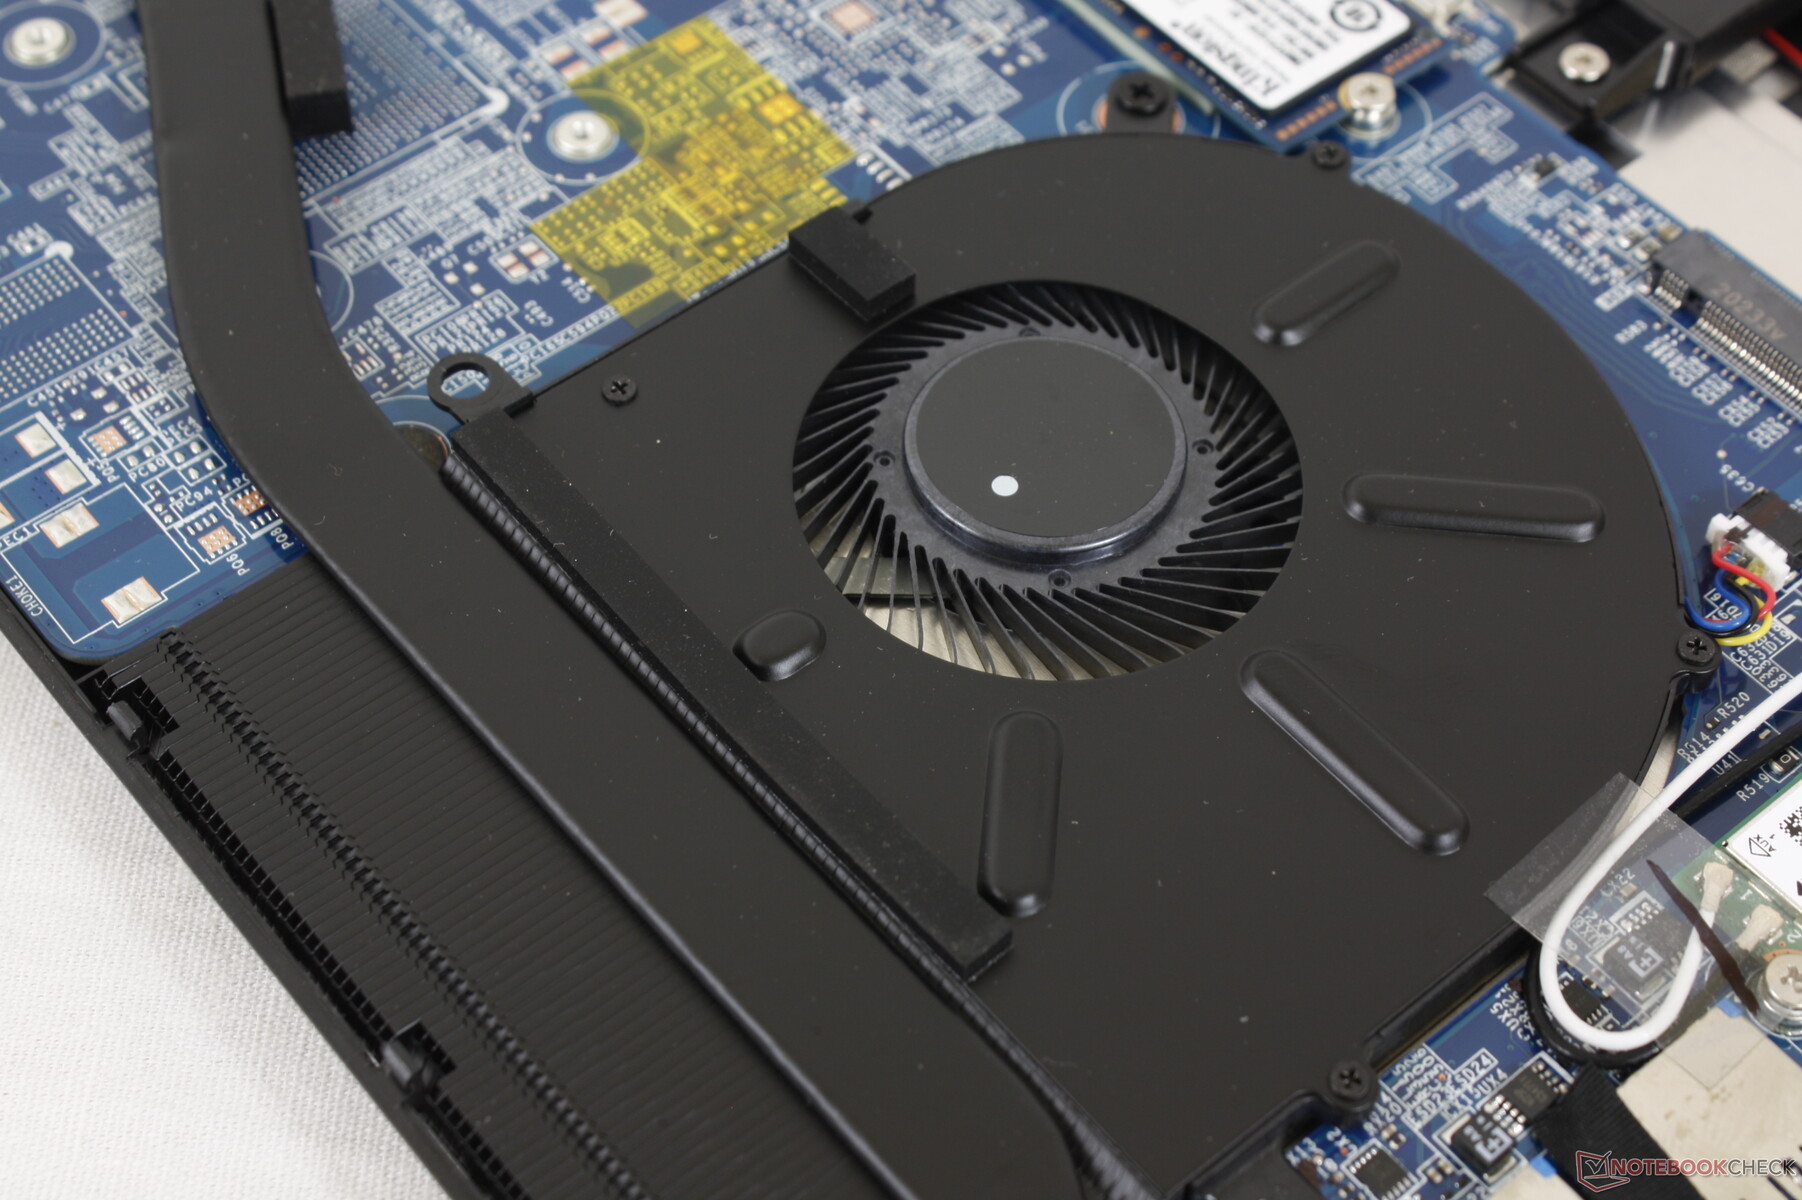
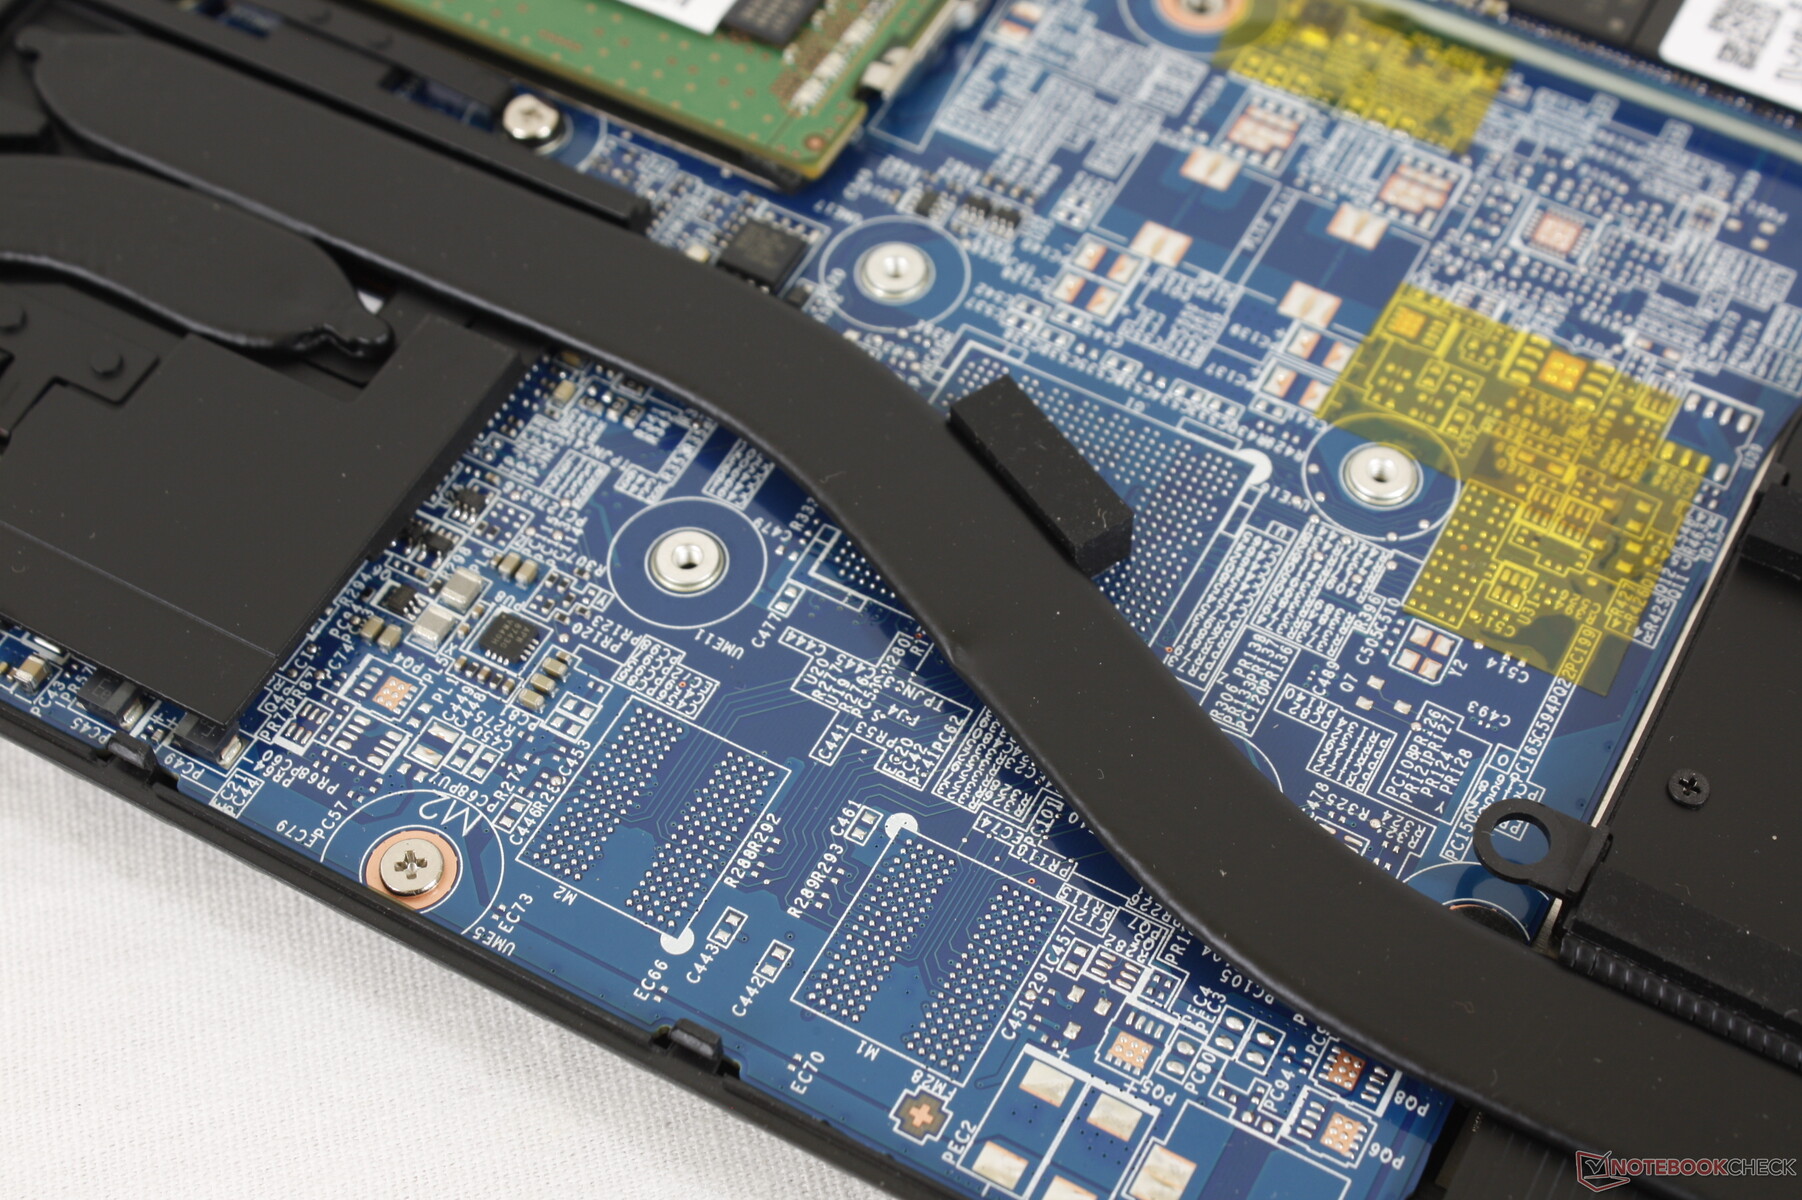
Die Bodenplatte lässt sich mit einem Schraubenzieher relativ leicht abnehmen, bedenken Sie jedoch den Aufkleber mit der Werksversiegelung. Im Inneren werden die Ähnlichkeiten zwischen dem Summit B15 und dem letztjährigen Modern 15 noch deutlicher, wie die Vergleichsbilder unten zeigen.
Zubehör und Garantie
Der Verkaufskarton enthält neben den Papieren und dem Netzteil auch einen USB-A-auf-RJ-45-Adapter. Es gilt die standardmäßige einjährige eingeschränkte Garantie mit Erweiterungsoptionen, wenn sie von Xotic PC erworben wurde.
Eingabegeräte
Tastatur
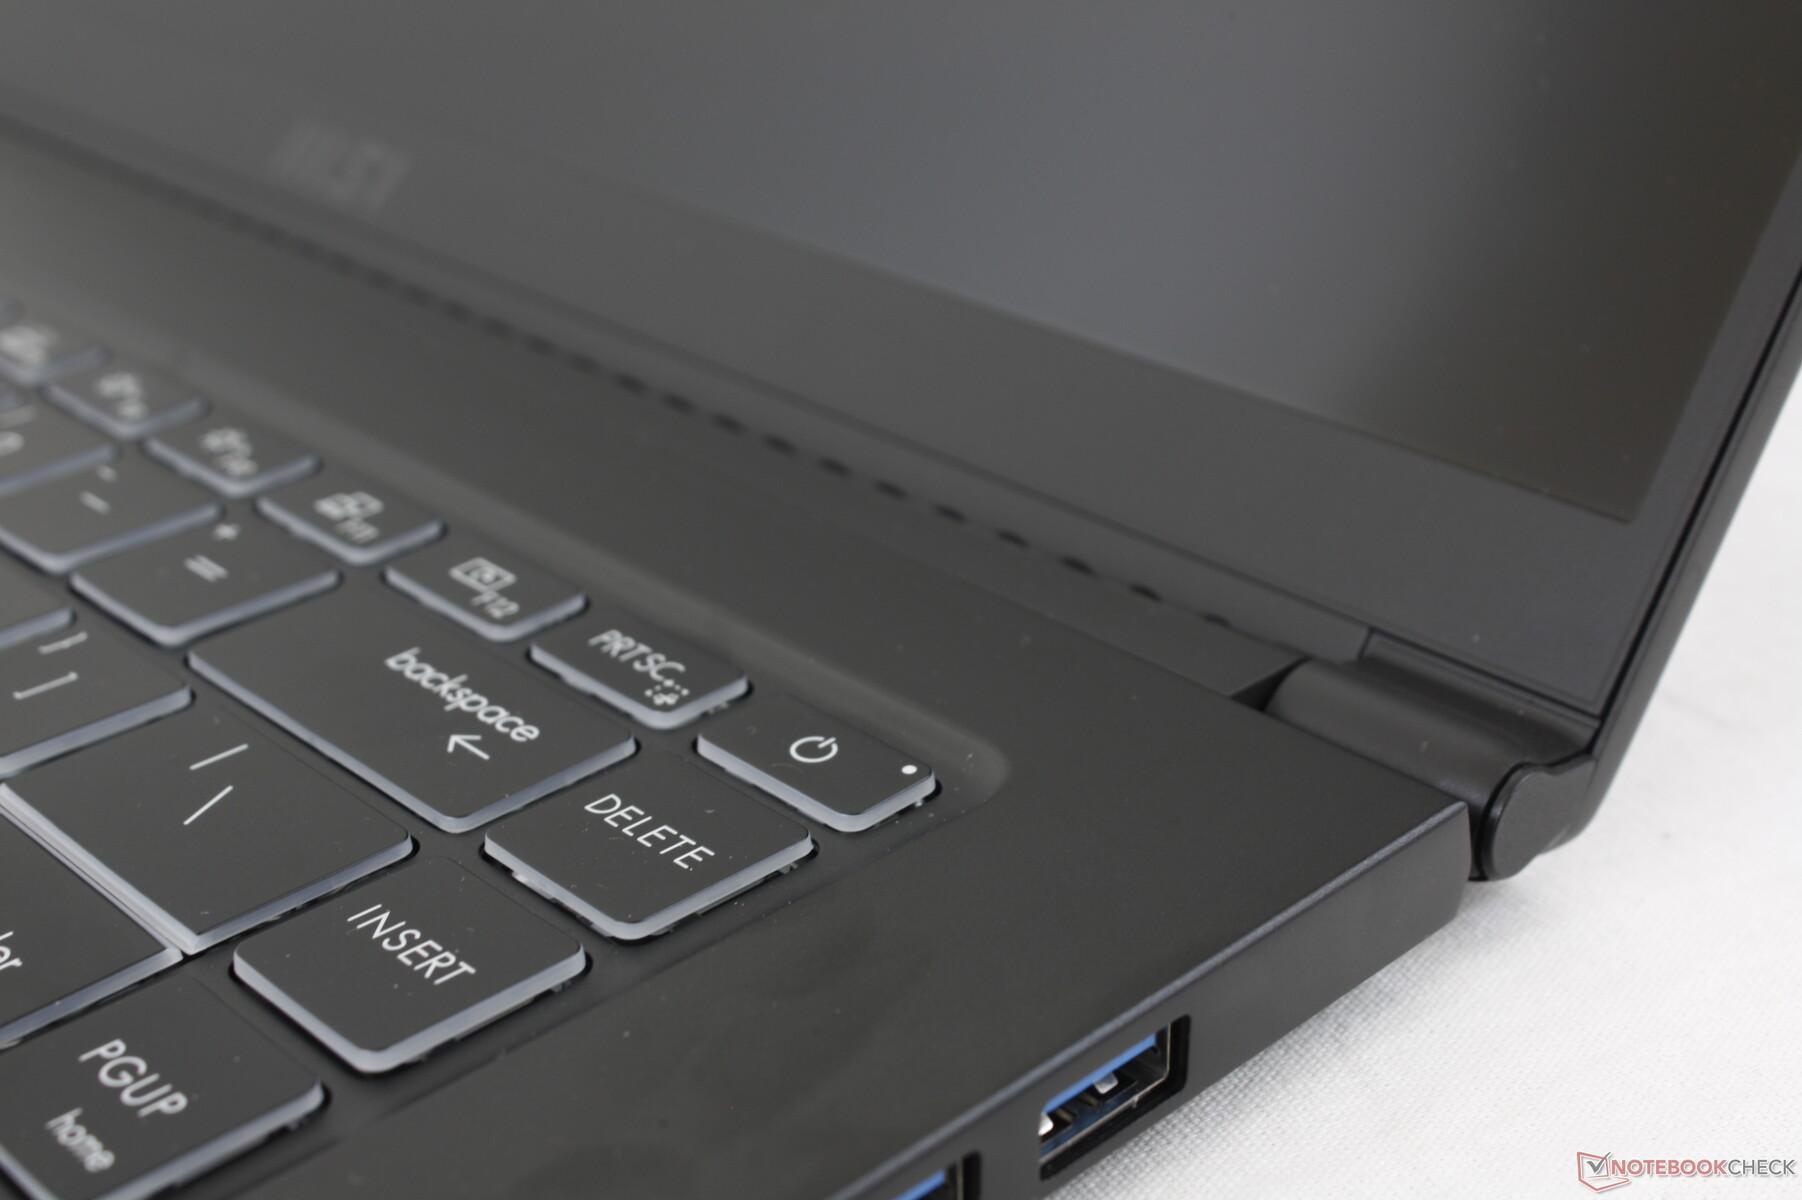
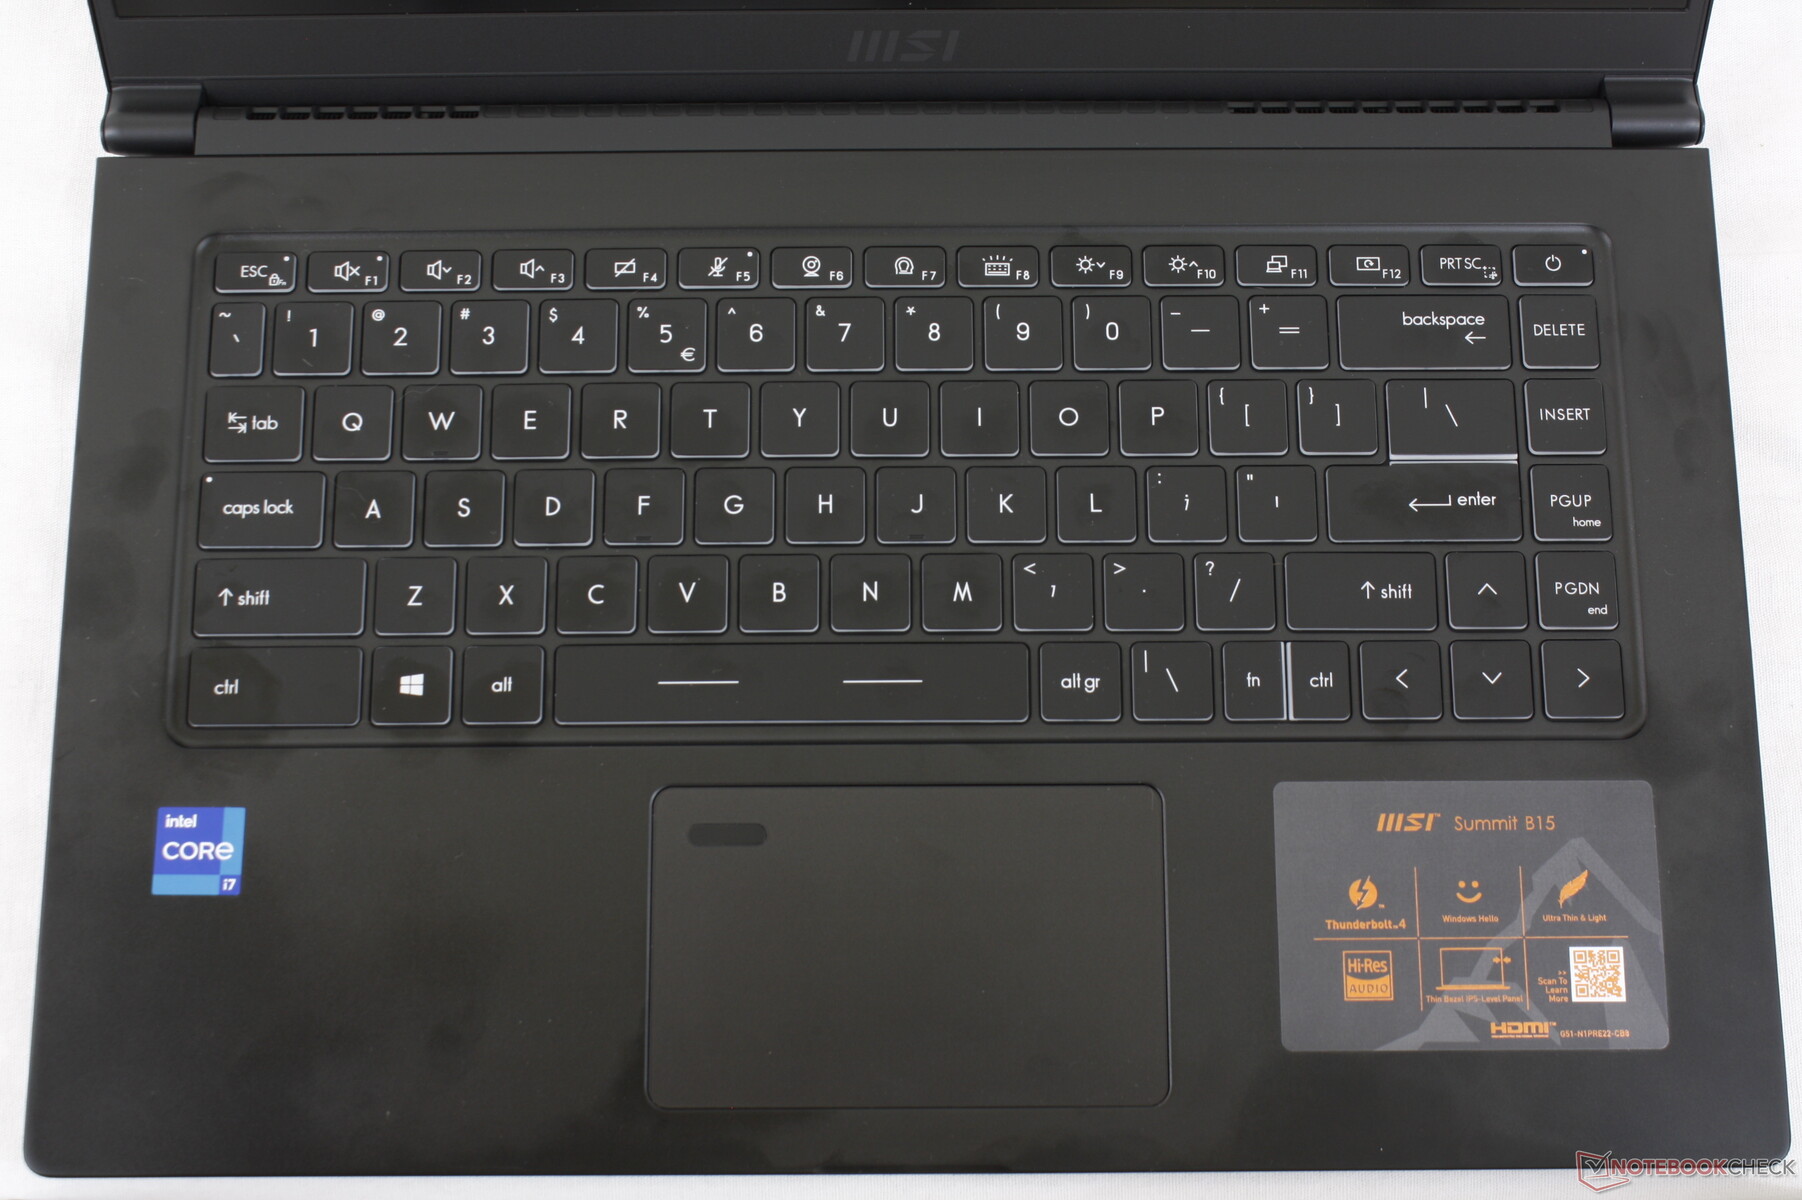
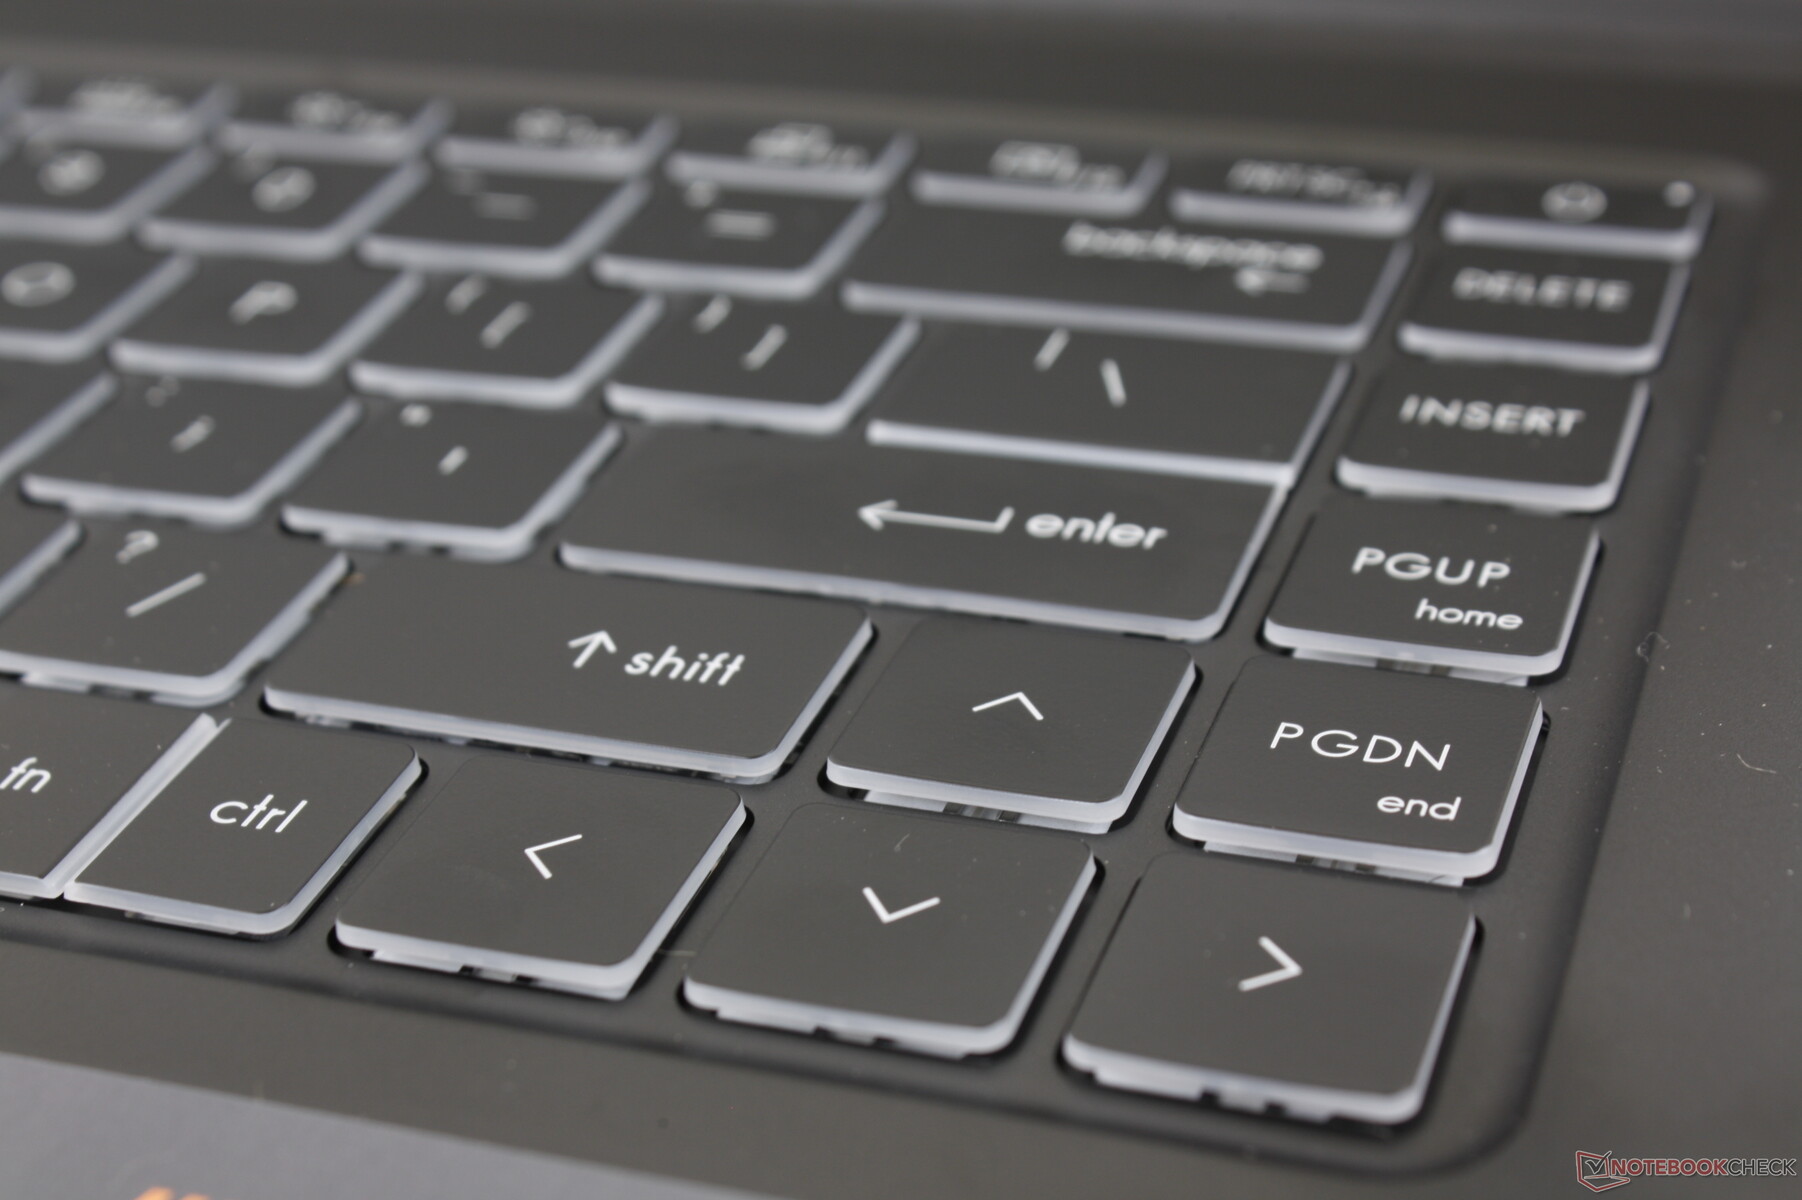
Die Schriftart der Tasten wurde gegenüber dem Modern 15 geändert und ist nun schärfer und nicht mehr so fett und kursiv. Ansonsten bleiben Tastenfeedback und Layout exakt gleich. Die Tasten fühlen sich fester und tiefer an als beim XPG Xenia Xe und beim Dell XPS 15, allerdings ist das Klappern dadurch auch etwas lauter. Wir schätzen die volle Größe der PgUp-, PgDn-, Entf- und Pfeiltasten, da diese bei den meisten anderen Laptops oft verkleinert sind.
Touchpad
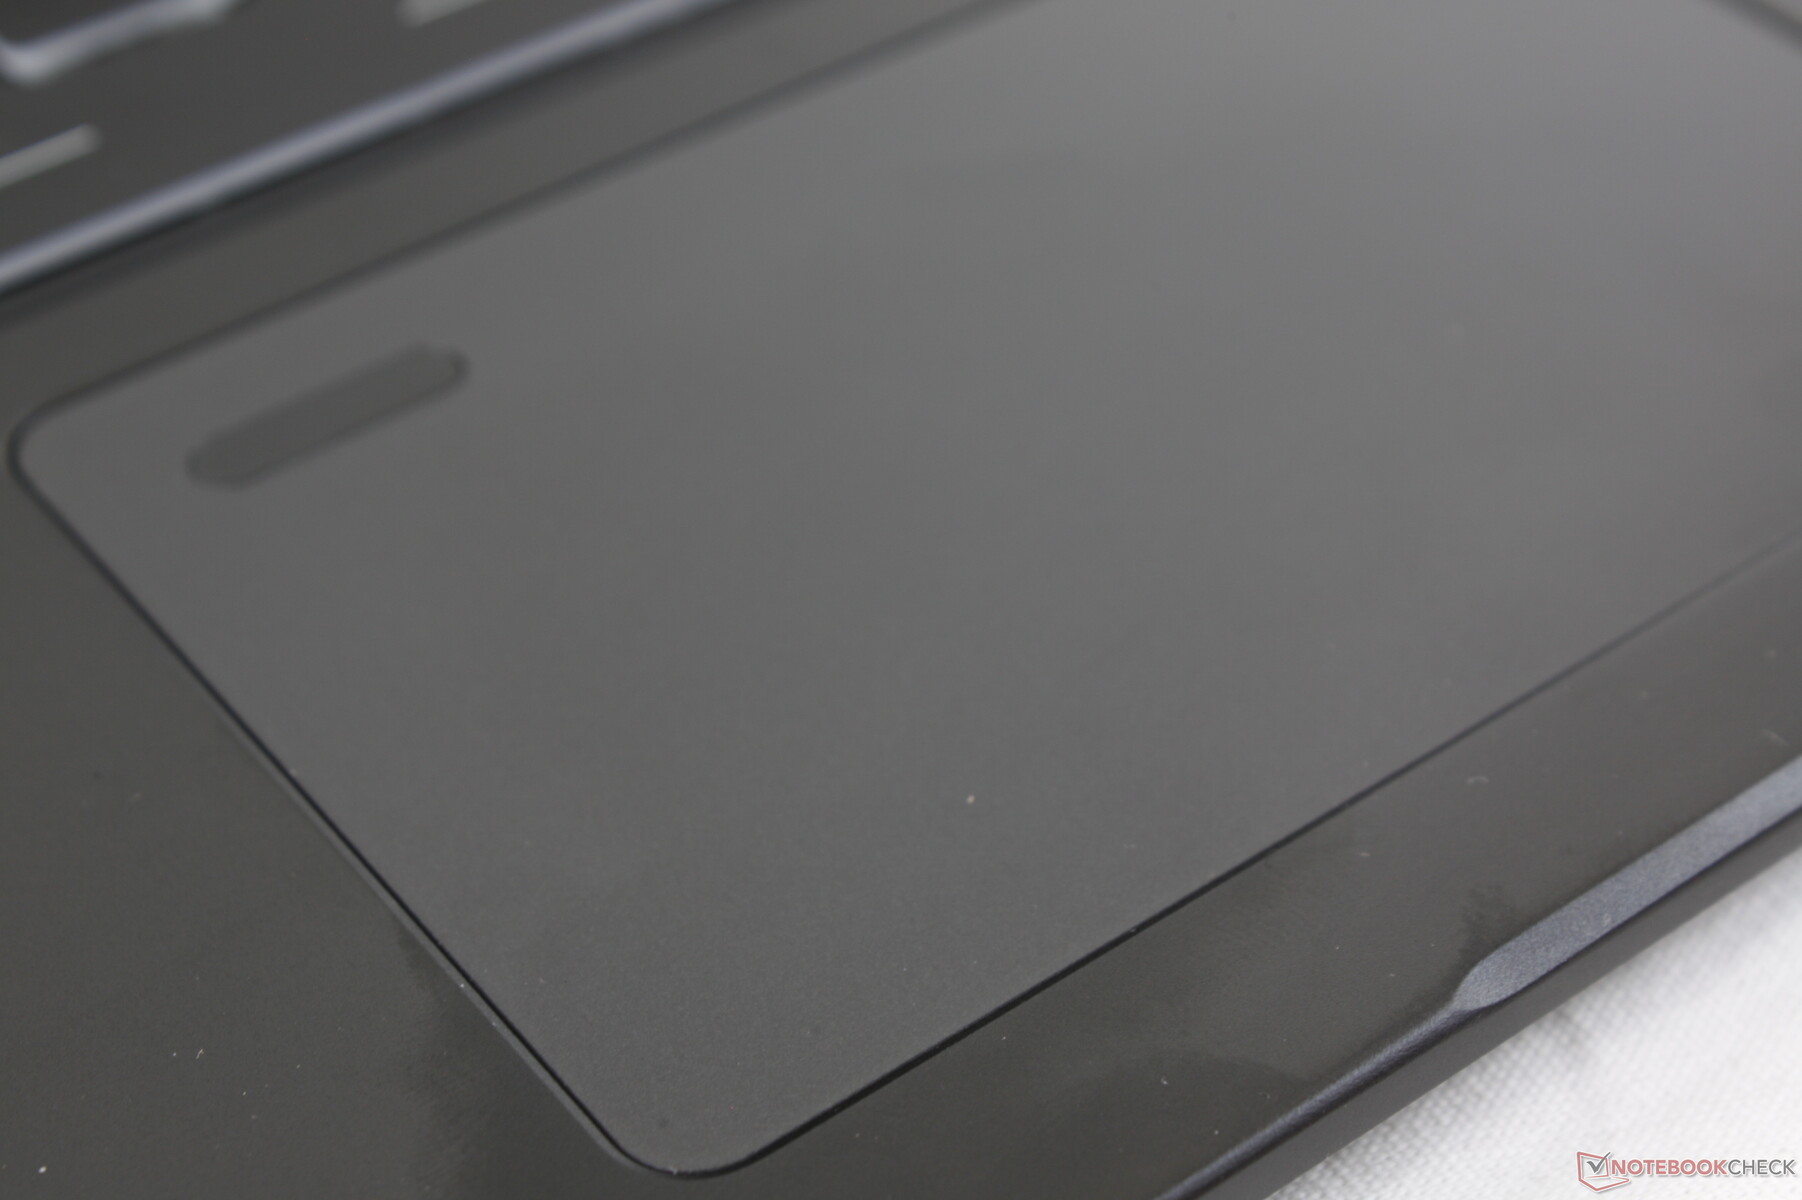
Das Clickpad hat die gleiche Größe wie das des Modern 15 (10,5 x 6,5 cm) mit der gleichen glatten Textur und schwammigem Feedback. Es ist nicht so weich wie das Clickpad des Xenia Xe, aber es hätte definitiv fester sein können.
Wir vermuten, dass MSI den Fingerabdruckleser irgendwann vom Clickpad nehmen wird, so wie wir das bereits von Dell, HP und anderen sehen.

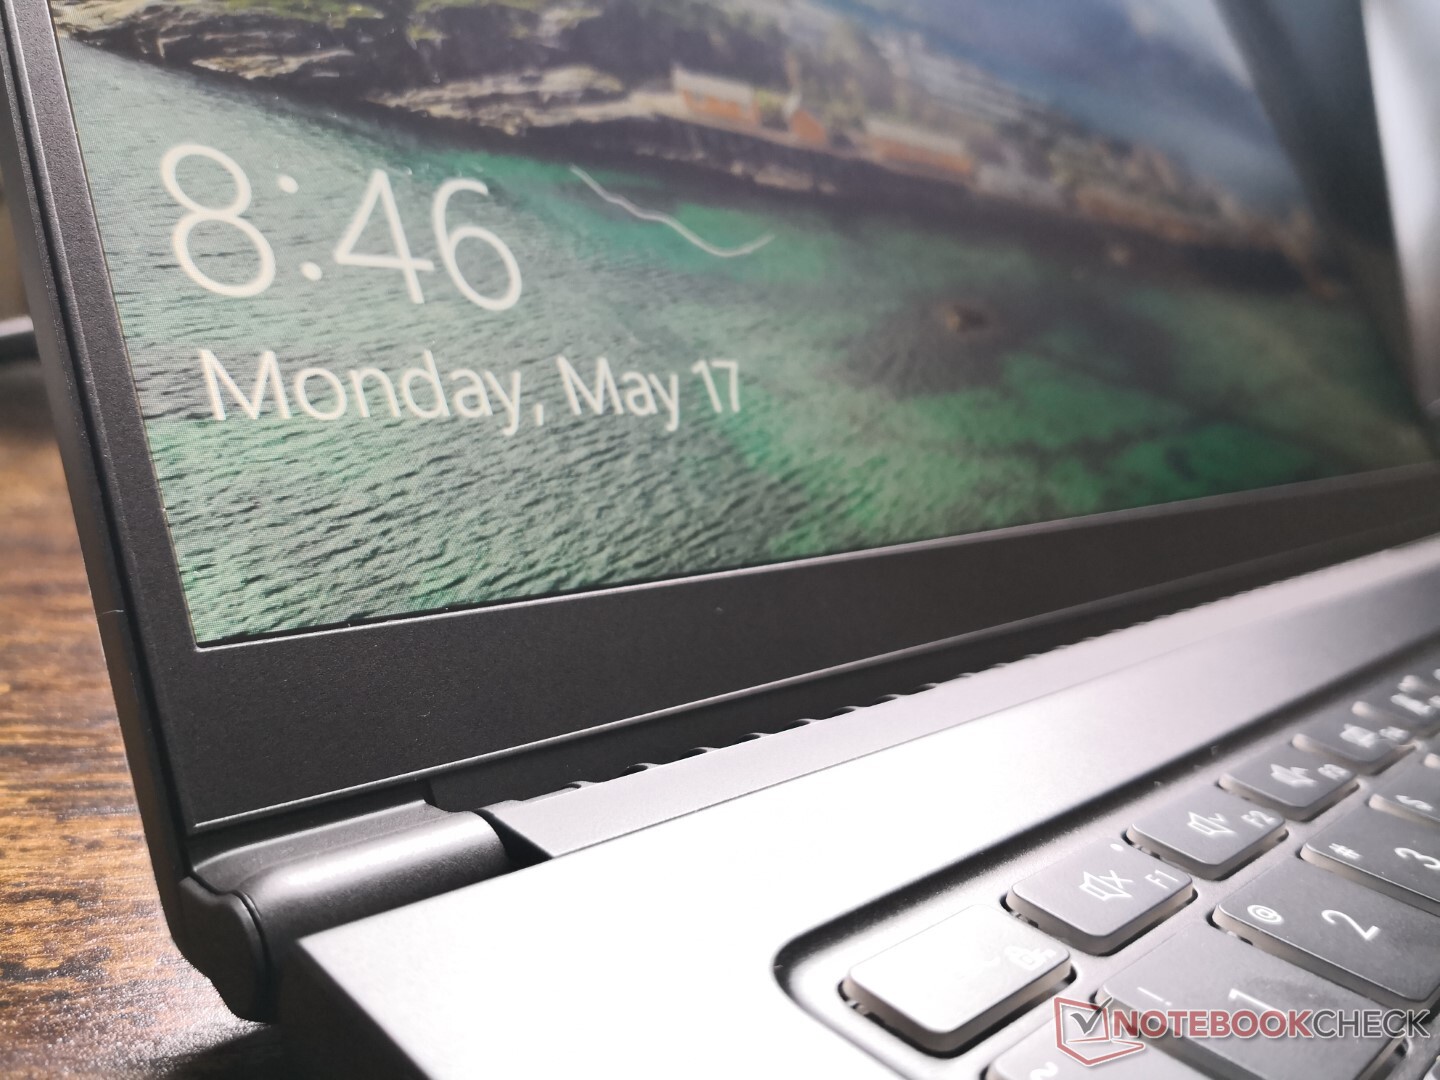
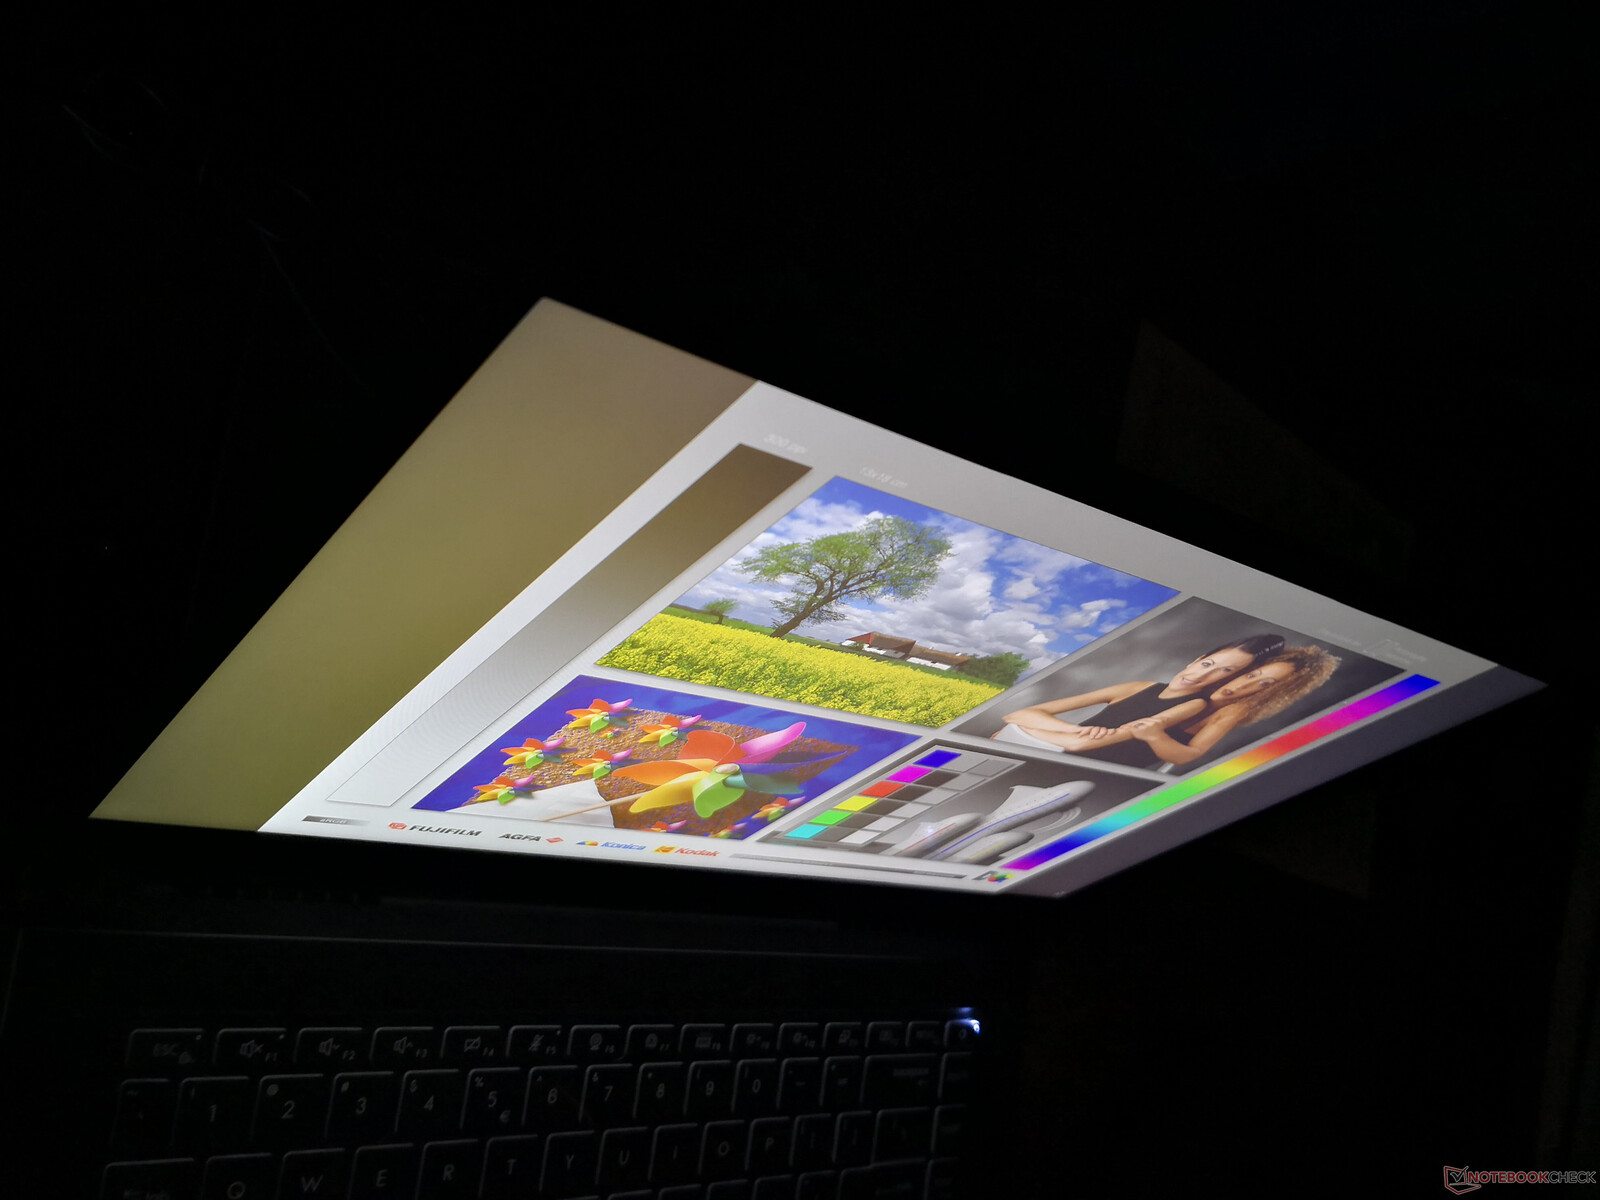
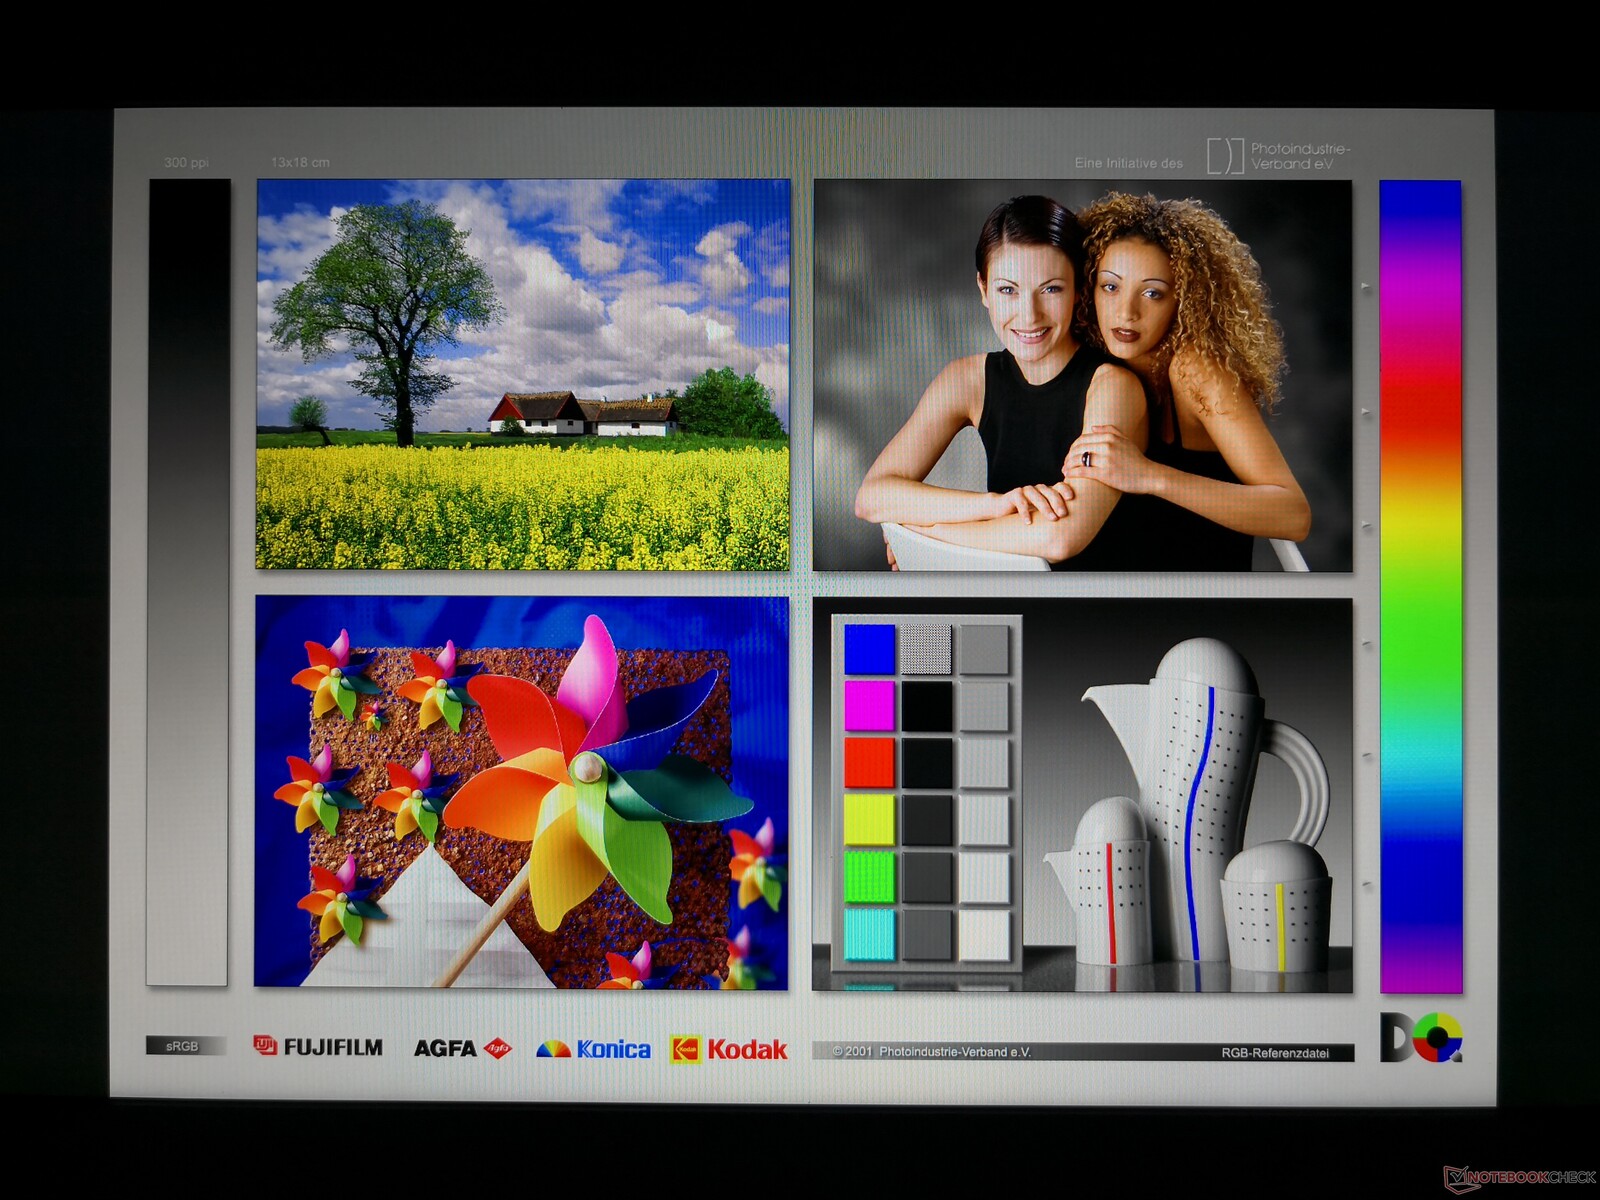
Display
Das Summit B15 verwendet das gleiche matte Chi Mei N156HCE-EN1 IPS-Panel, das auch beim 2019er MSI PS63 Modern eingesetzt wurde. In der Tat ist genau dieses Panel bei 15,6-Zoll-Notebooks der oberen Mittelklasse recht häufig zu finden, darunter im ThinkPad P52, ThinkPad X1 Extreme, Asus ZenBook Pro UX550 und sogar in MSIs eigenem Modern 15. Die Bildqualität ist daher bei all diesen Laptops ähnlich, einschließlich der durchschnittlichen Schwarz-Weiß-Reaktionszeiten und dem ordentlichen Kontrastverhältnis. Die Pulsweitenmodulation bei niedrigeren Helligkeitsstufen ist ebenfalls wieder vorhanden.


| |||||||||||||||||||||||||
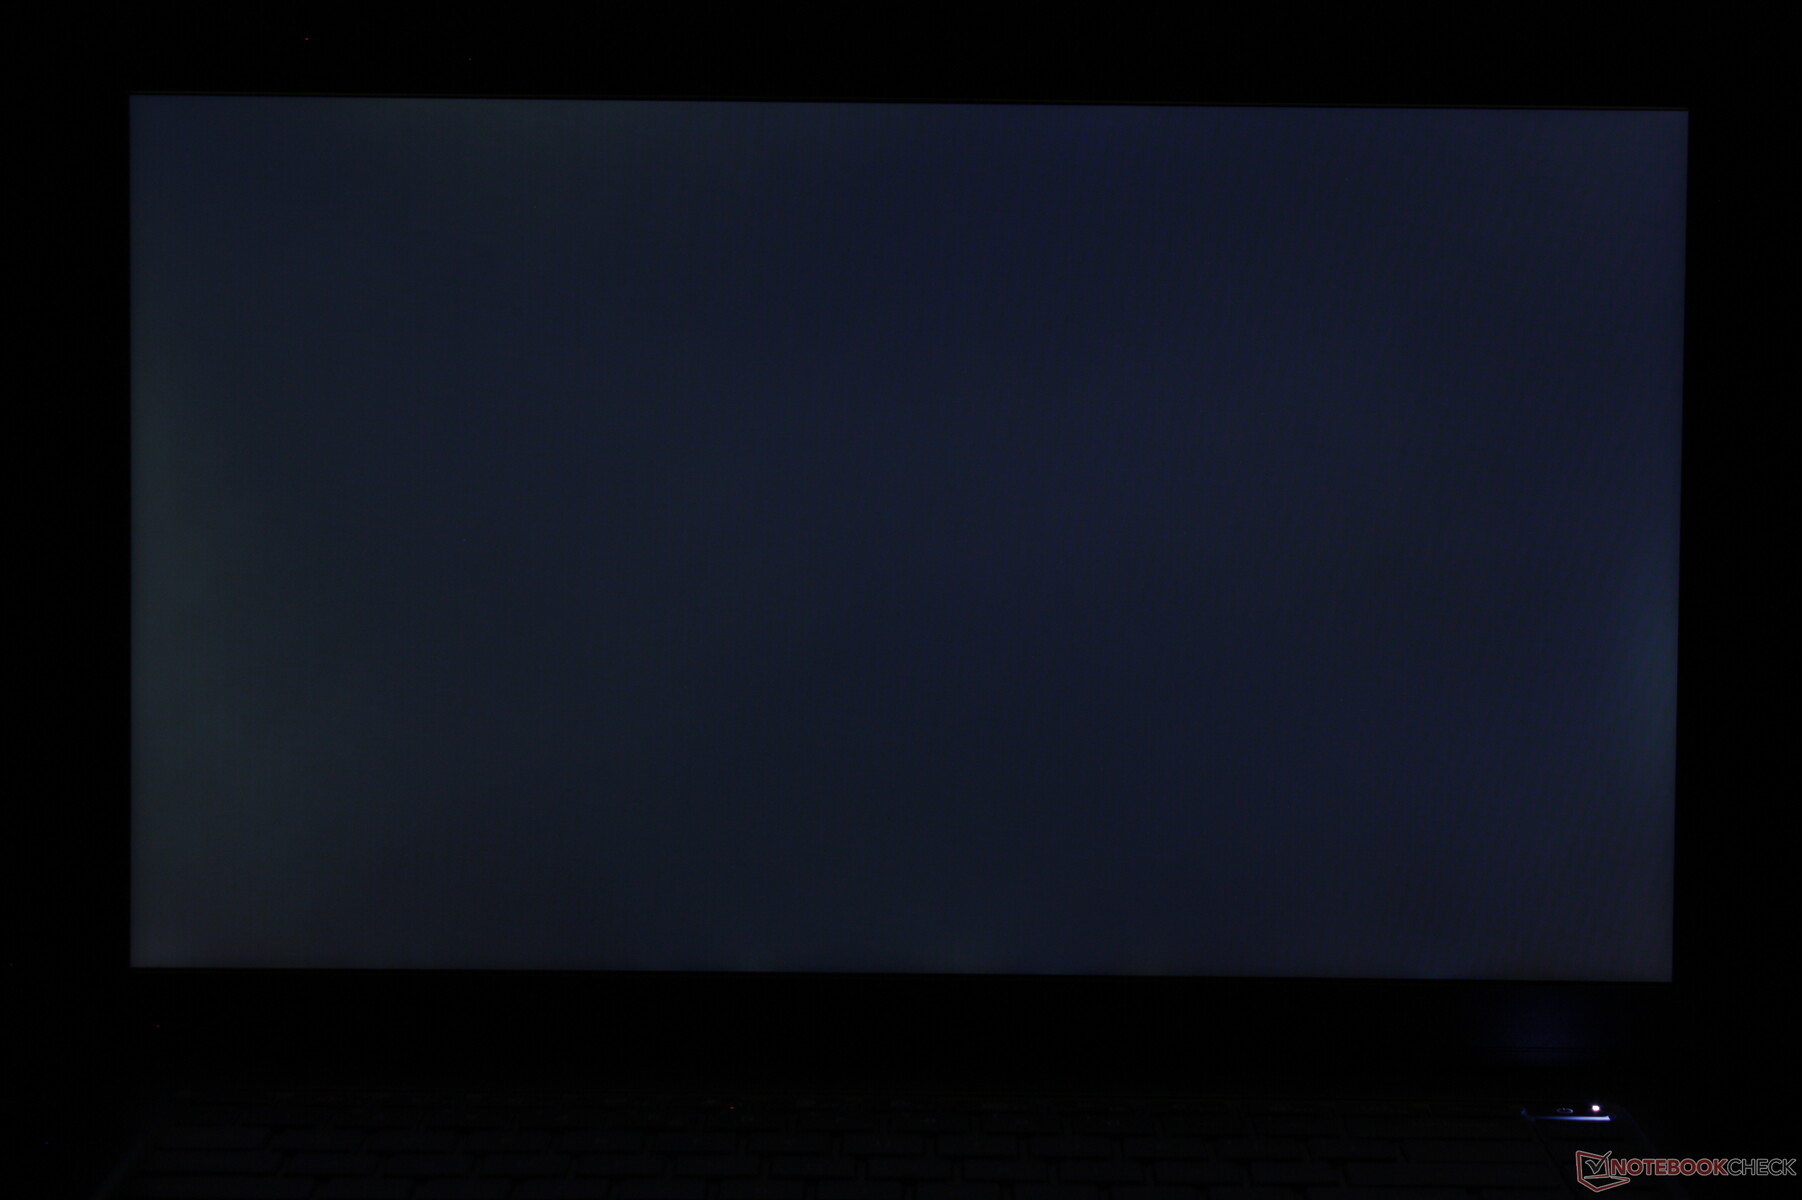
Ausleuchtung: 81 %
Helligkeit Akku: 341.3 cd/m²
Kontrast: 758:1 (Schwarzwert: 0.45 cd/m²)
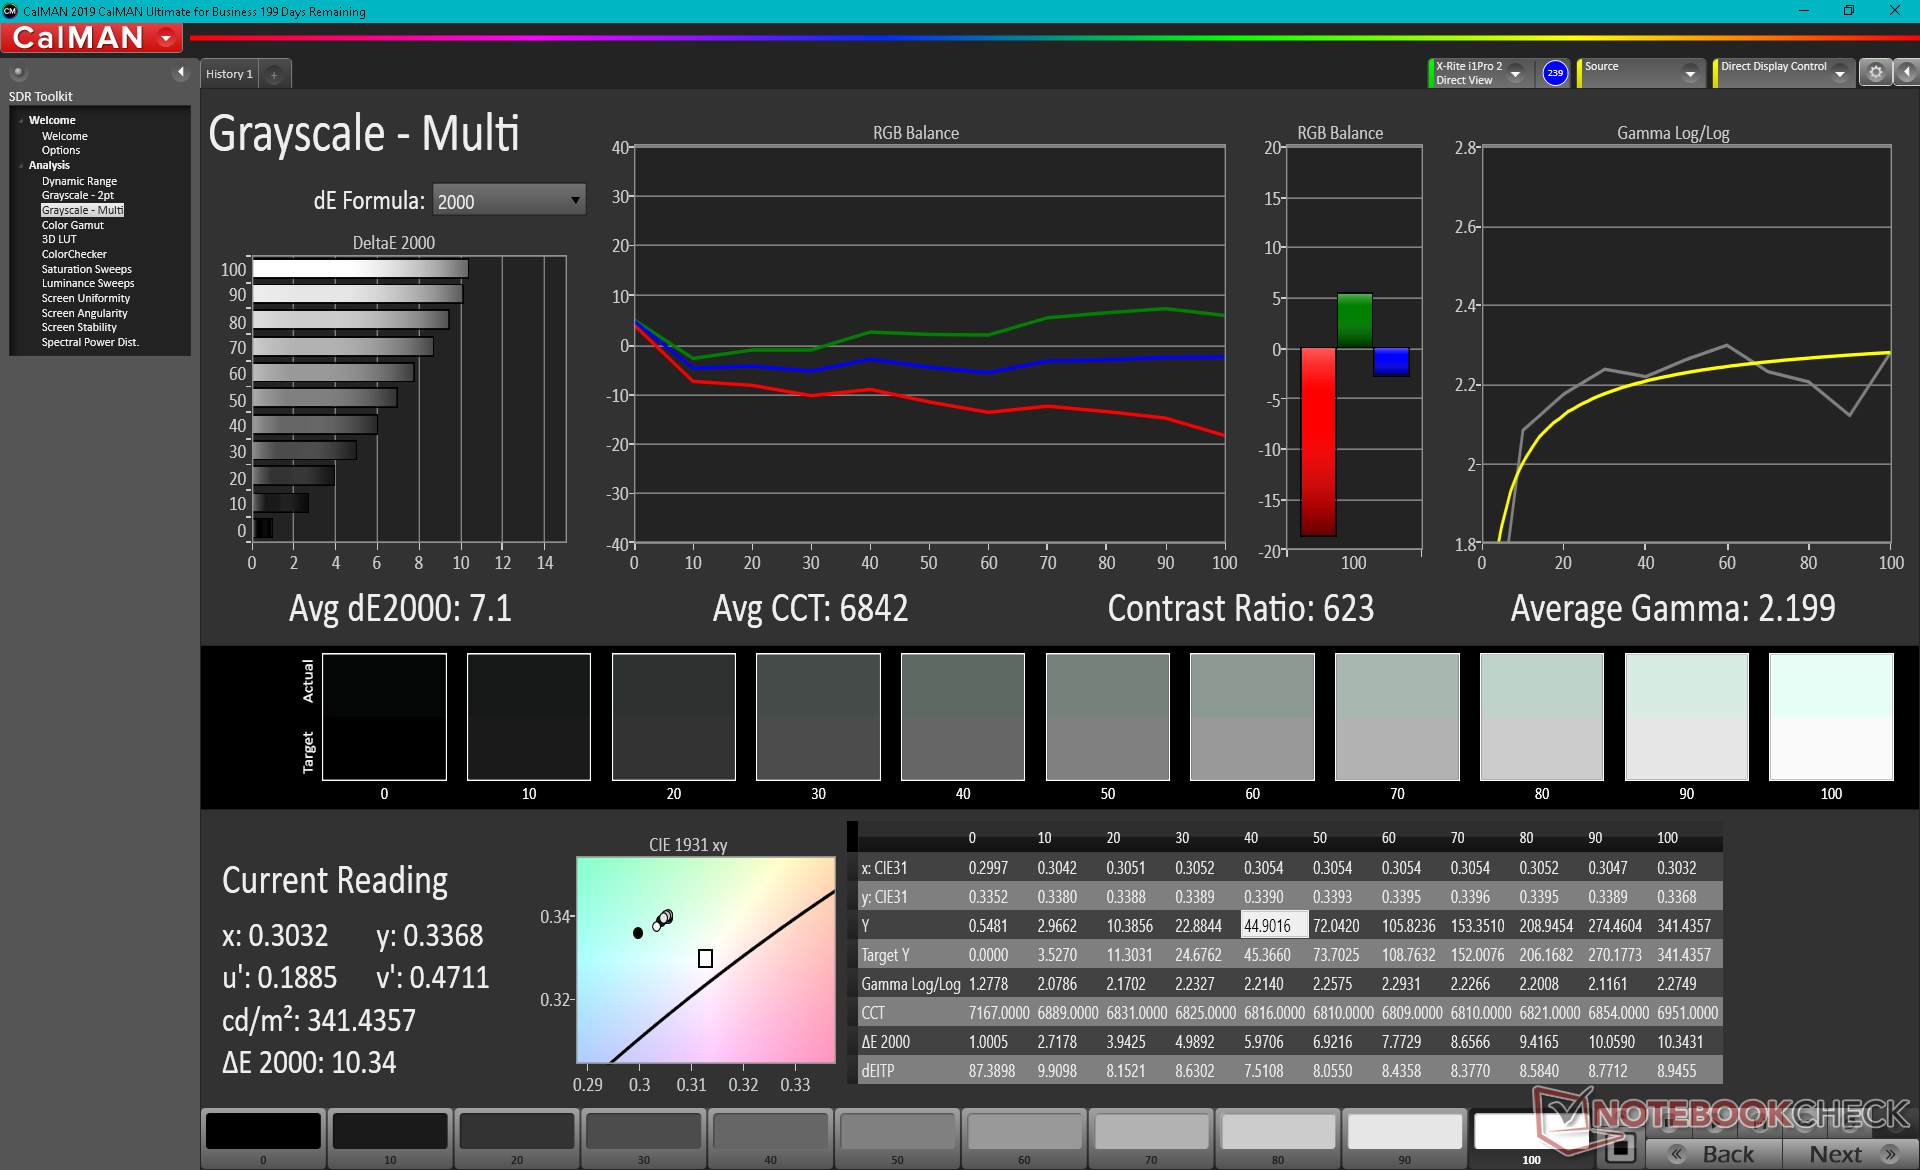
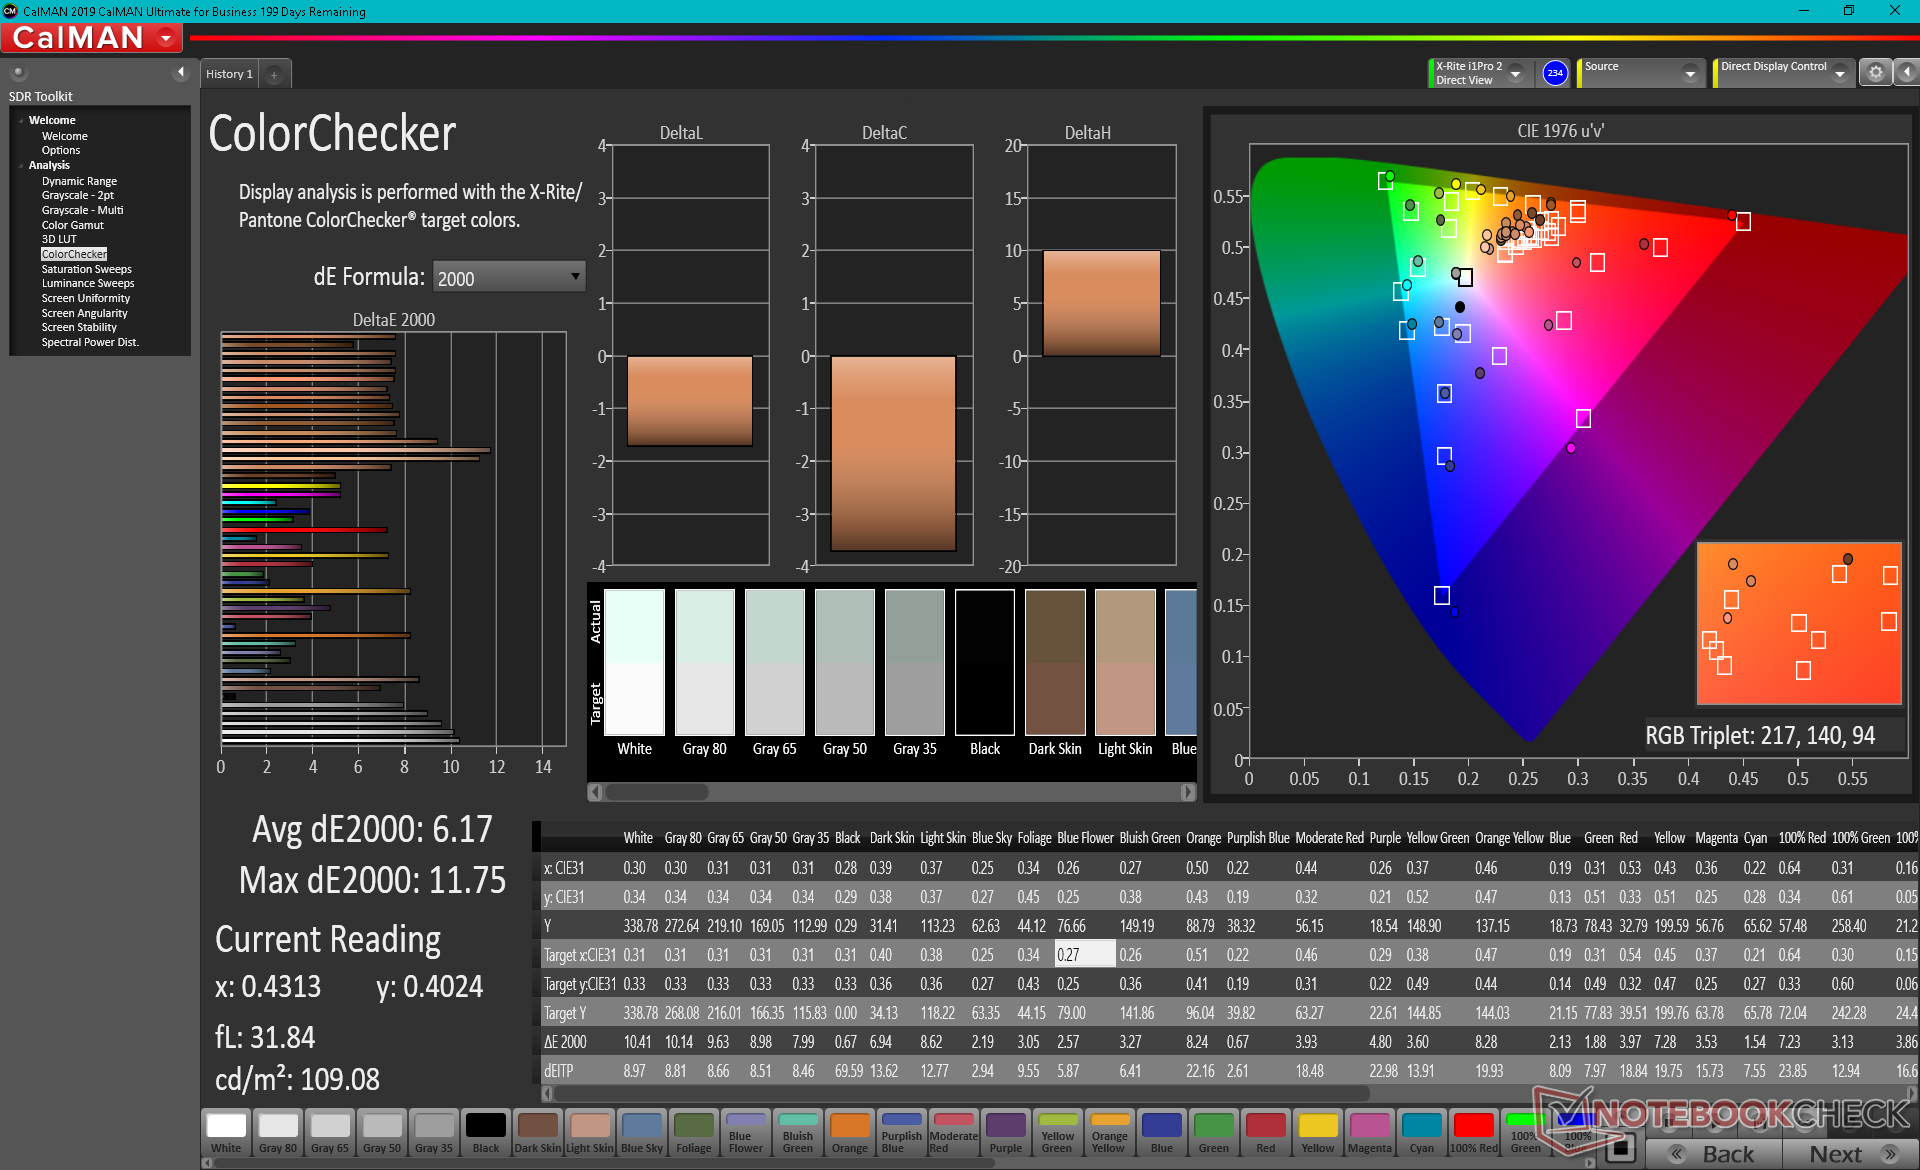
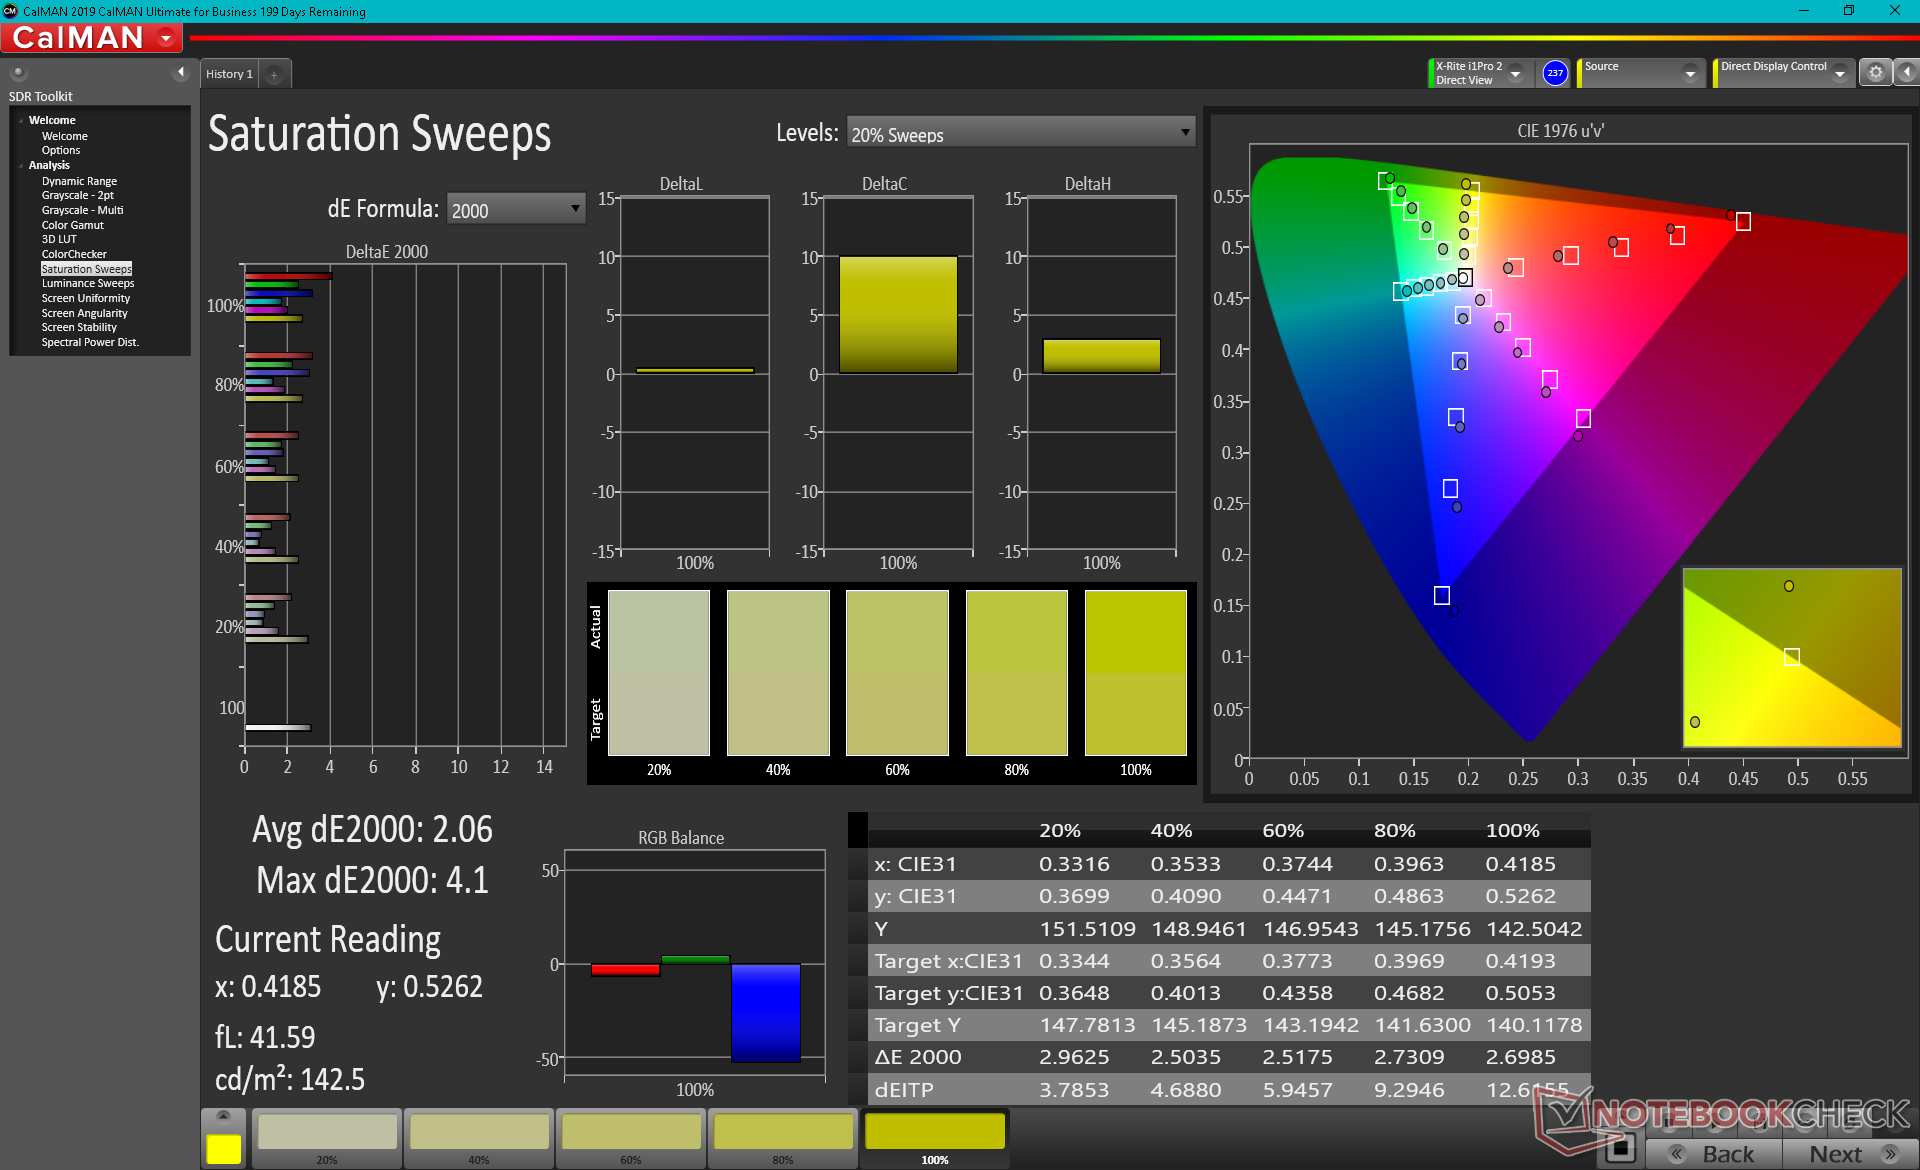
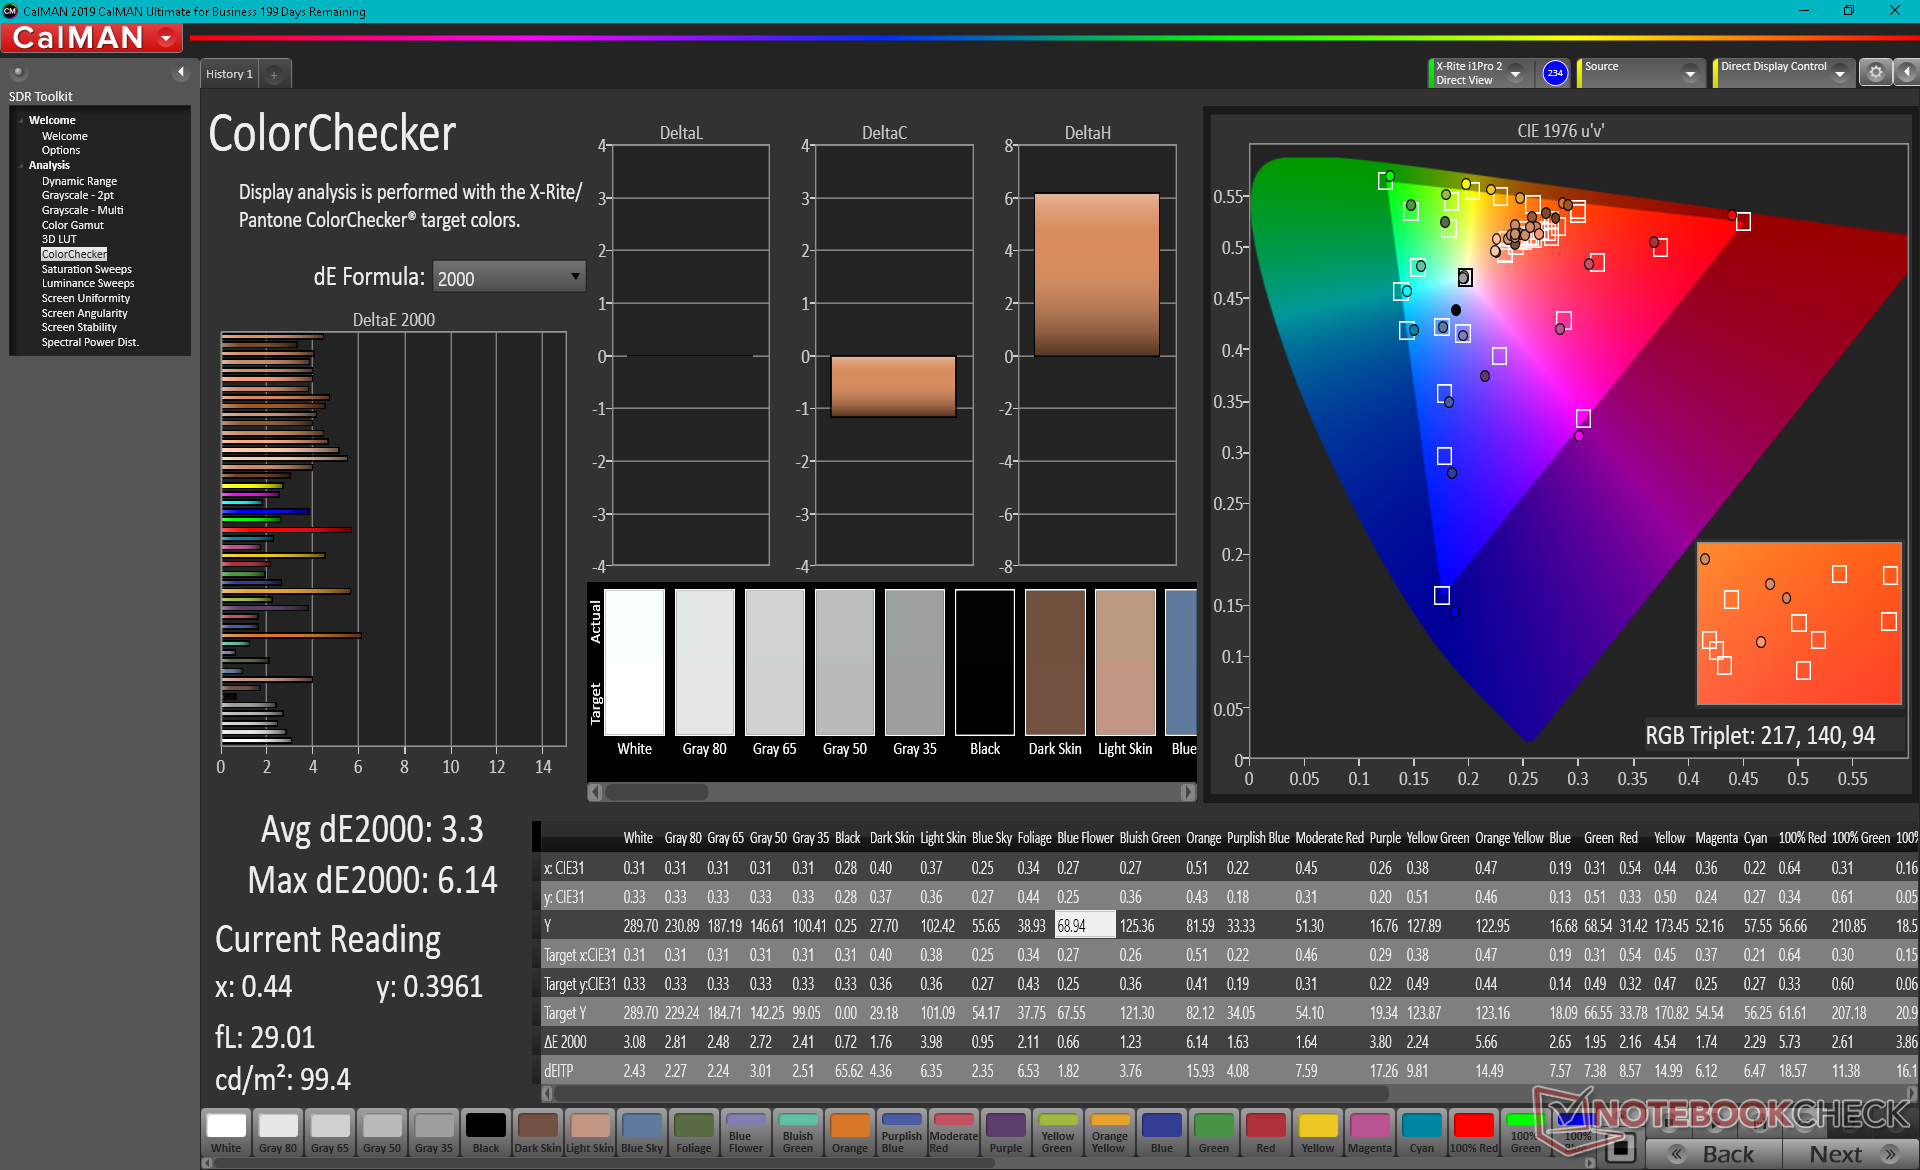
ΔE ColorChecker Calman: 6.17 | ∀{0.5-29.43 Ø4.72}
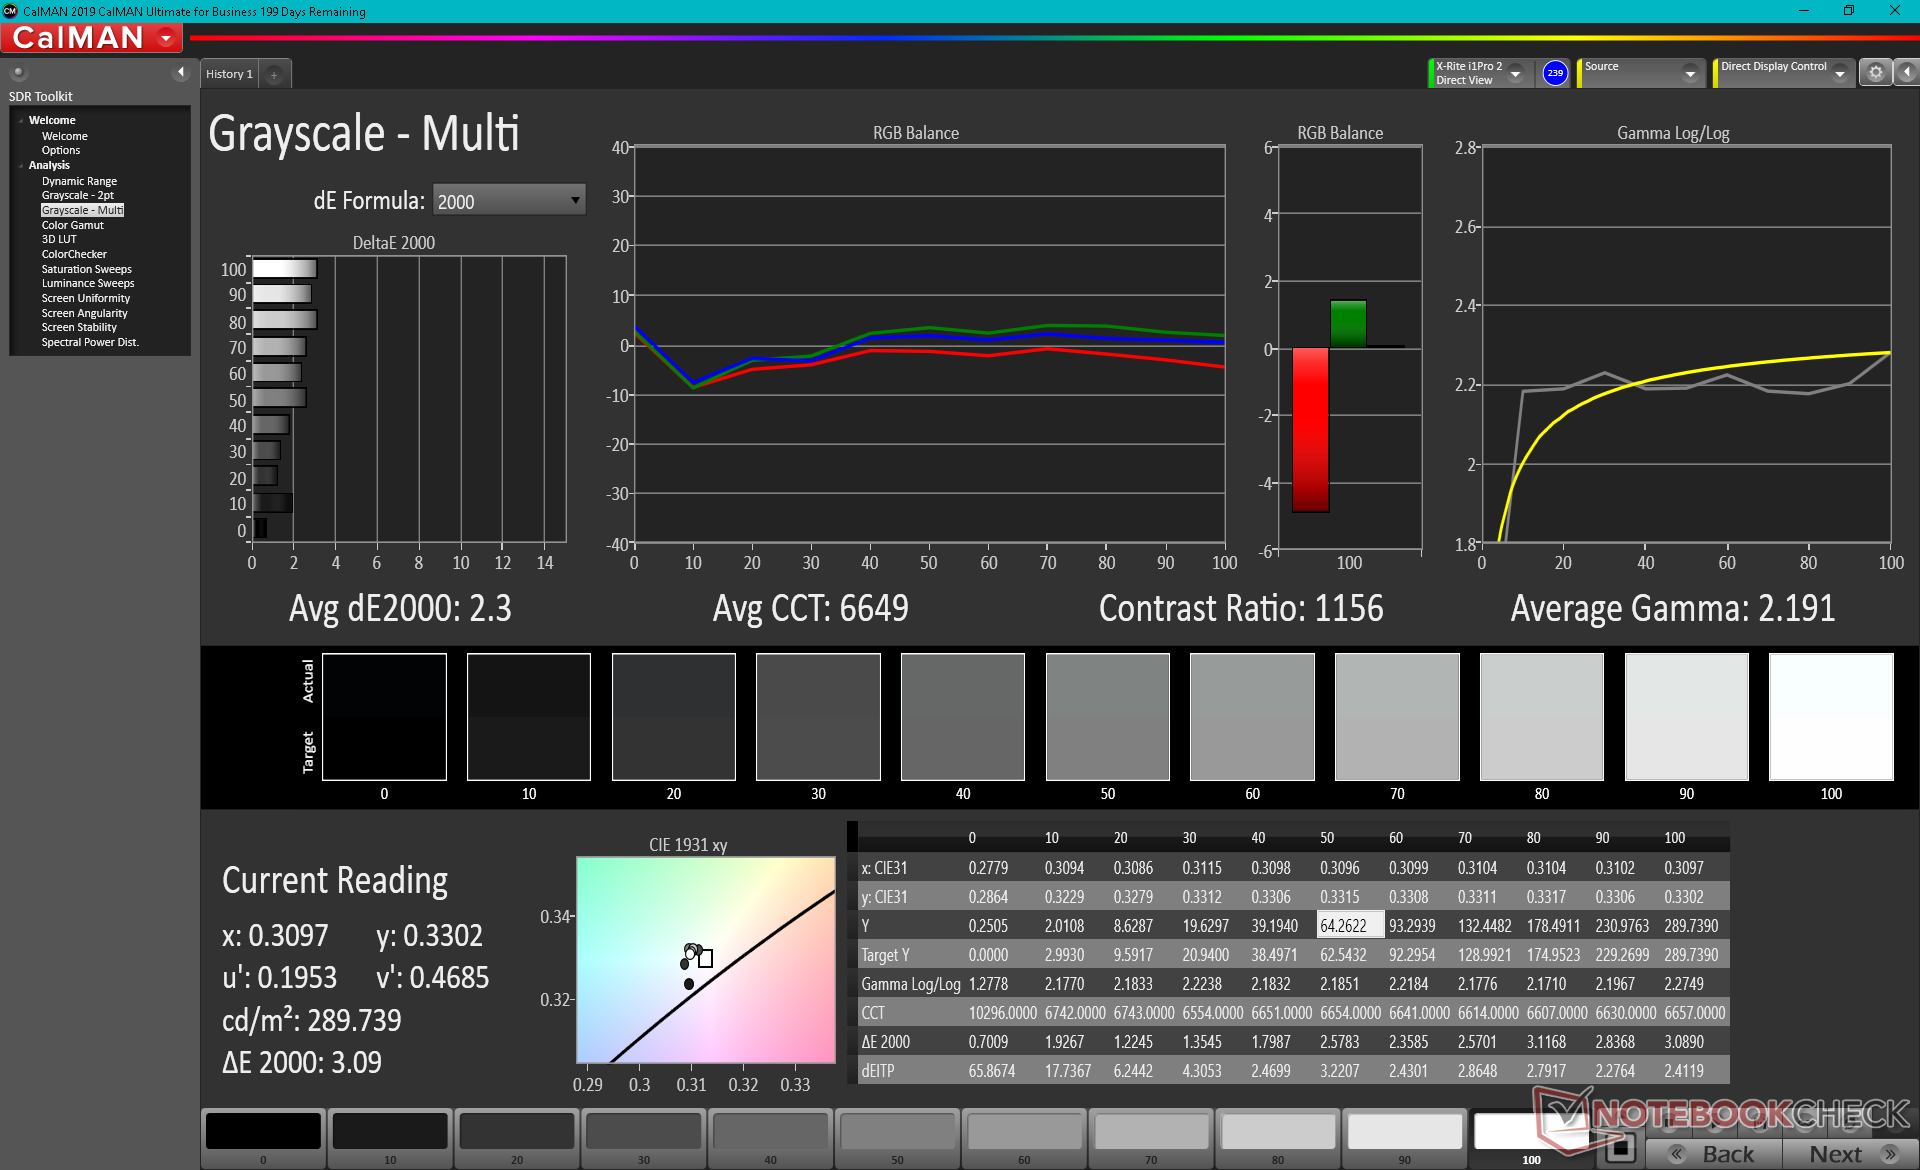
calibrated: 3.3
ΔE Greyscale Calman: 7.1 | ∀{0.09-98 Ø4.97}
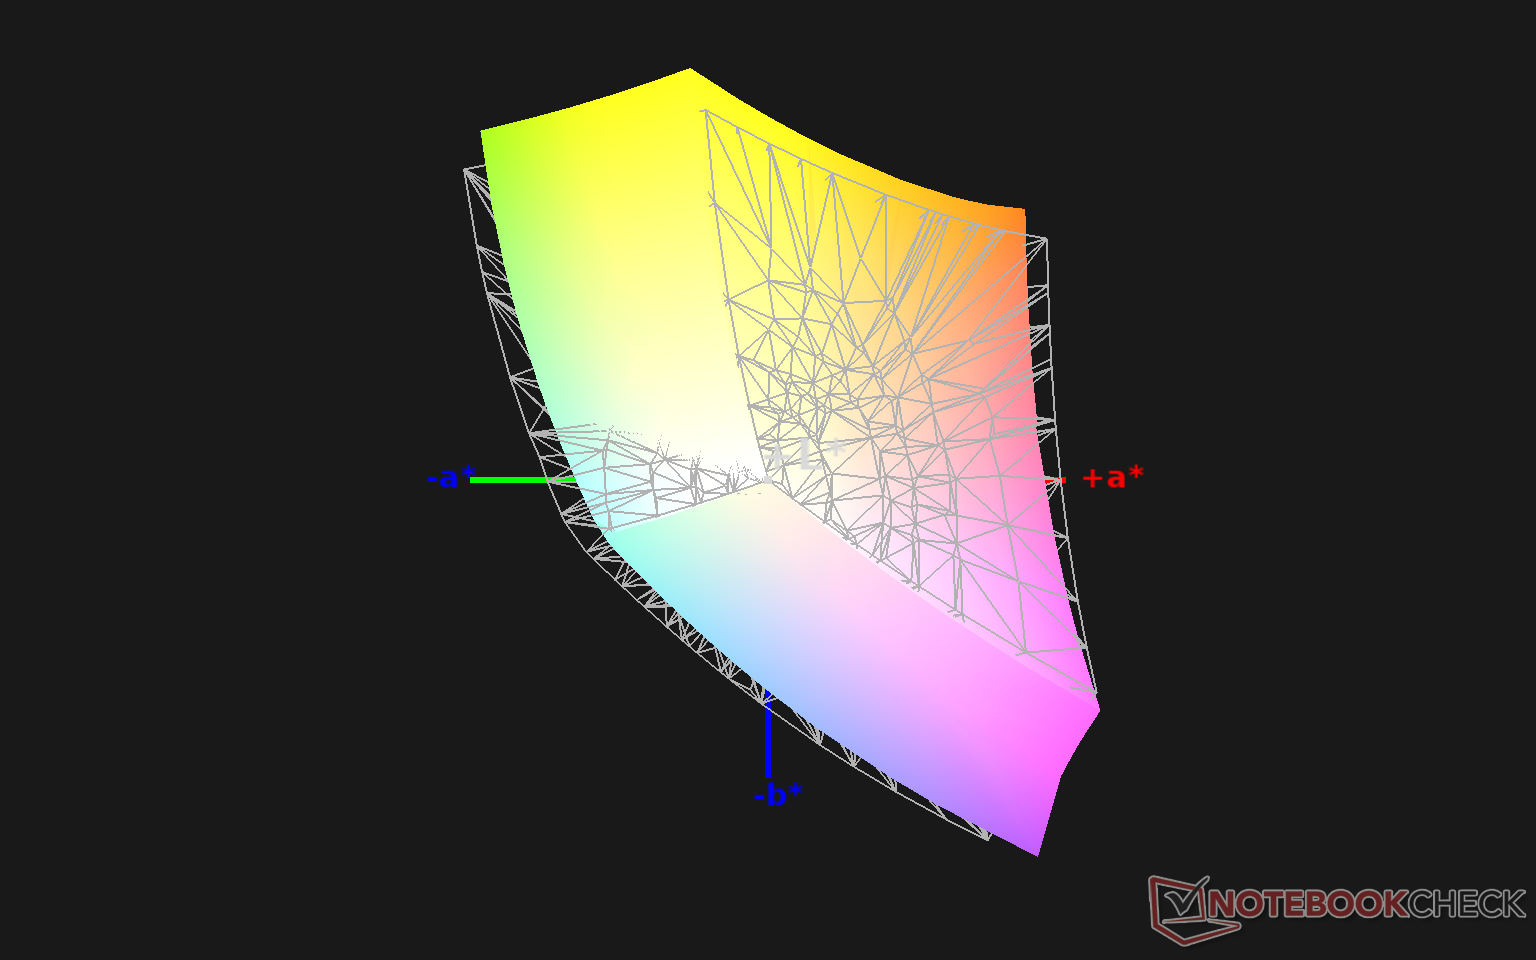
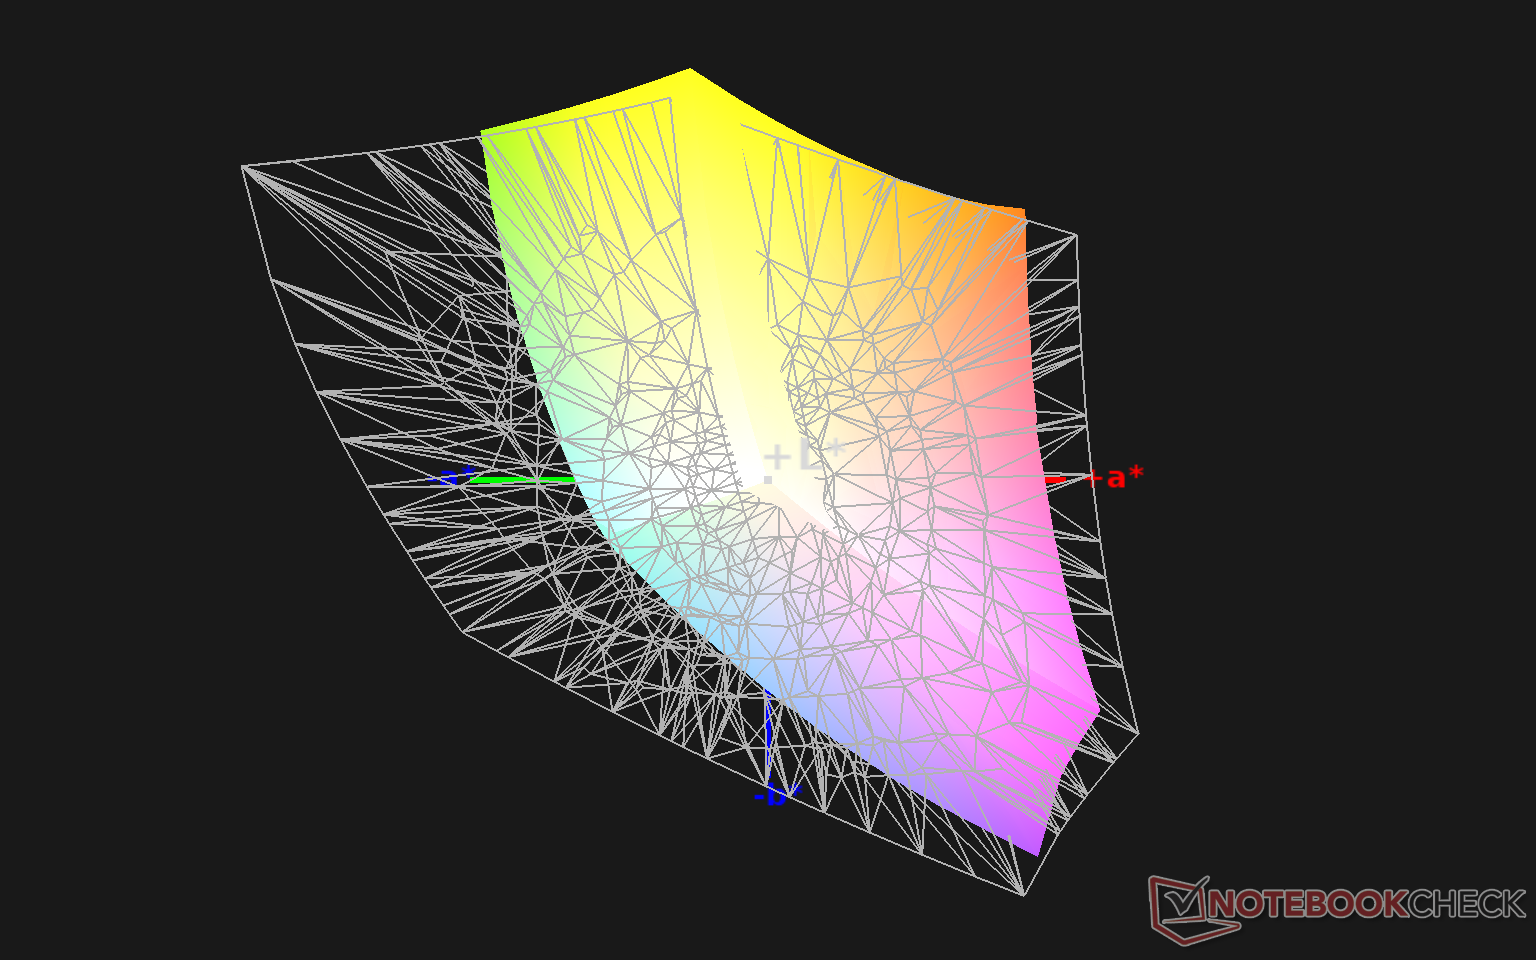
90.1% sRGB (Argyll 1.6.3 3D)
58.7% AdobeRGB 1998 (Argyll 1.6.3 3D)
66% AdobeRGB 1998 (Argyll 3D)
90.6% sRGB (Argyll 3D)
65.7% Display P3 (Argyll 3D)
Gamma: 2.2
CCT: 6842 K
| MSI Summit B15 A11M Chi Mei N156HCE-EN1, IPS, 15.6", 1920x1080 | MSI Summit E15 A11SCST AU Optronics B156HAB03.1, IPS, 15.6", 1920x1080 | Dell XPS 15 9500 Core i5 Sharp LQ156N1, IPS, 15.6", 1920x1200 | HP Spectre X360 15-5ZV31AV AU Optronics AUO30EB, IPS, 15.6", 3840x2160 | ADATA XPG Xenia Xe BOE08F5, IPS, 15.6", 1920x1080 | Asus ZenBook 15 UX534FTC-A8190T BOE CQ NV156FHM-N63, IPS, 15.6", 1920x1080 | |
|---|---|---|---|---|---|---|
| Display | -1% | 18% | 4% | 7% | -4% | |
| Display P3 Coverage (%) | 65.7 | 64.5 -2% | 81.5 24% | 68.3 4% | 70 7% | 65 -1% |
| sRGB Coverage (%) | 90.6 | 89.3 -1% | 100 10% | 94.3 4% | 95.2 5% | 86.2 -5% |
| AdobeRGB 1998 Coverage (%) | 66 | 65.3 -1% | 79.6 21% | 68.4 4% | 71.2 8% | 62.9 -5% |
| Response Times | -1% | 4% | -34% | -31% | -5% | |
| Response Time Grey 50% / Grey 80% * (ms) | 40.4 ? | 43.2 ? -7% | 42 ? -4% | 56.8 ? -41% | 56.8 ? -41% | 45 ? -11% |
| Response Time Black / White * (ms) | 32.4 ? | 30.8 ? 5% | 28.8 ? 11% | 40.8 ? -26% | 38.8 ? -20% | 32 ? 1% |
| PWM Frequency (Hz) | 25510 ? | |||||
| Bildschirm | 20% | 41% | 22% | 39% | 22% | |
| Helligkeit Bildmitte (cd/m²) | 341.3 | 298 -13% | 592 73% | 284.6 -17% | 480.4 41% | 299 -12% |
| Brightness (cd/m²) | 310 | 280 -10% | 565 82% | 285 -8% | 451 45% | 280 -10% |
| Brightness Distribution (%) | 81 | 90 11% | 85 5% | 85 5% | 88 9% | 89 10% |
| Schwarzwert * (cd/m²) | 0.45 | 0.22 51% | 0.46 -2% | 0.25 44% | 0.31 31% | 0.21 53% |
| Kontrast (:1) | 758 | 1355 79% | 1287 70% | 1138 50% | 1550 104% | 1424 88% |
| Delta E Colorchecker * | 6.17 | 5.41 12% | 3.19 48% | 3.52 43% | 2.53 59% | 4.76 23% |
| Colorchecker dE 2000 max. * | 11.75 | 8.59 27% | 5.45 54% | 5.56 53% | 7.28 38% | 9 23% |
| Colorchecker dE 2000 calibrated * | 3.3 | 2.97 10% | 2.03 38% | 3 9% | 1.69 49% | |
| Delta E Graustufen * | 7.1 | 4.1 42% | 3.9 45% | 3.2 55% | 3.8 46% | 3.53 50% |
| Gamma | 2.2 100% | 2.334 94% | 2.25 98% | 2.28 96% | 2.15 102% | 2.3 96% |
| CCT | 6842 95% | 7025 93% | 6522 100% | 7070 92% | 6760 96% | 7228 90% |
| Farbraum (Prozent von AdobeRGB 1998) (%) | 58.7 | 65 11% | 71.6 22% | 61.1 4% | 63 7% | 56 -5% |
| Color Space (Percent of sRGB) (%) | 90.1 | 90 0% | 100 11% | 93.8 4% | 94.9 5% | 86 -5% |
| Durchschnitt gesamt (Programm / Settings) | 6% /
13% | 21% /
32% | -3% /
12% | 5% /
25% | 4% /
13% |
* ... kleinere Werte sind besser
Der Farbraum deckt etwa 90 Prozent von sRGB ab und ist damit gut genug für Gelegenheitsgrafiken. Für alternative 4K- oder OLED-Modelle von Dell, HP oder anderen müssen Sie sicher mehr ausgeben, sollten Sie eine AdobeRGB-Abdeckung erreichen wollen.
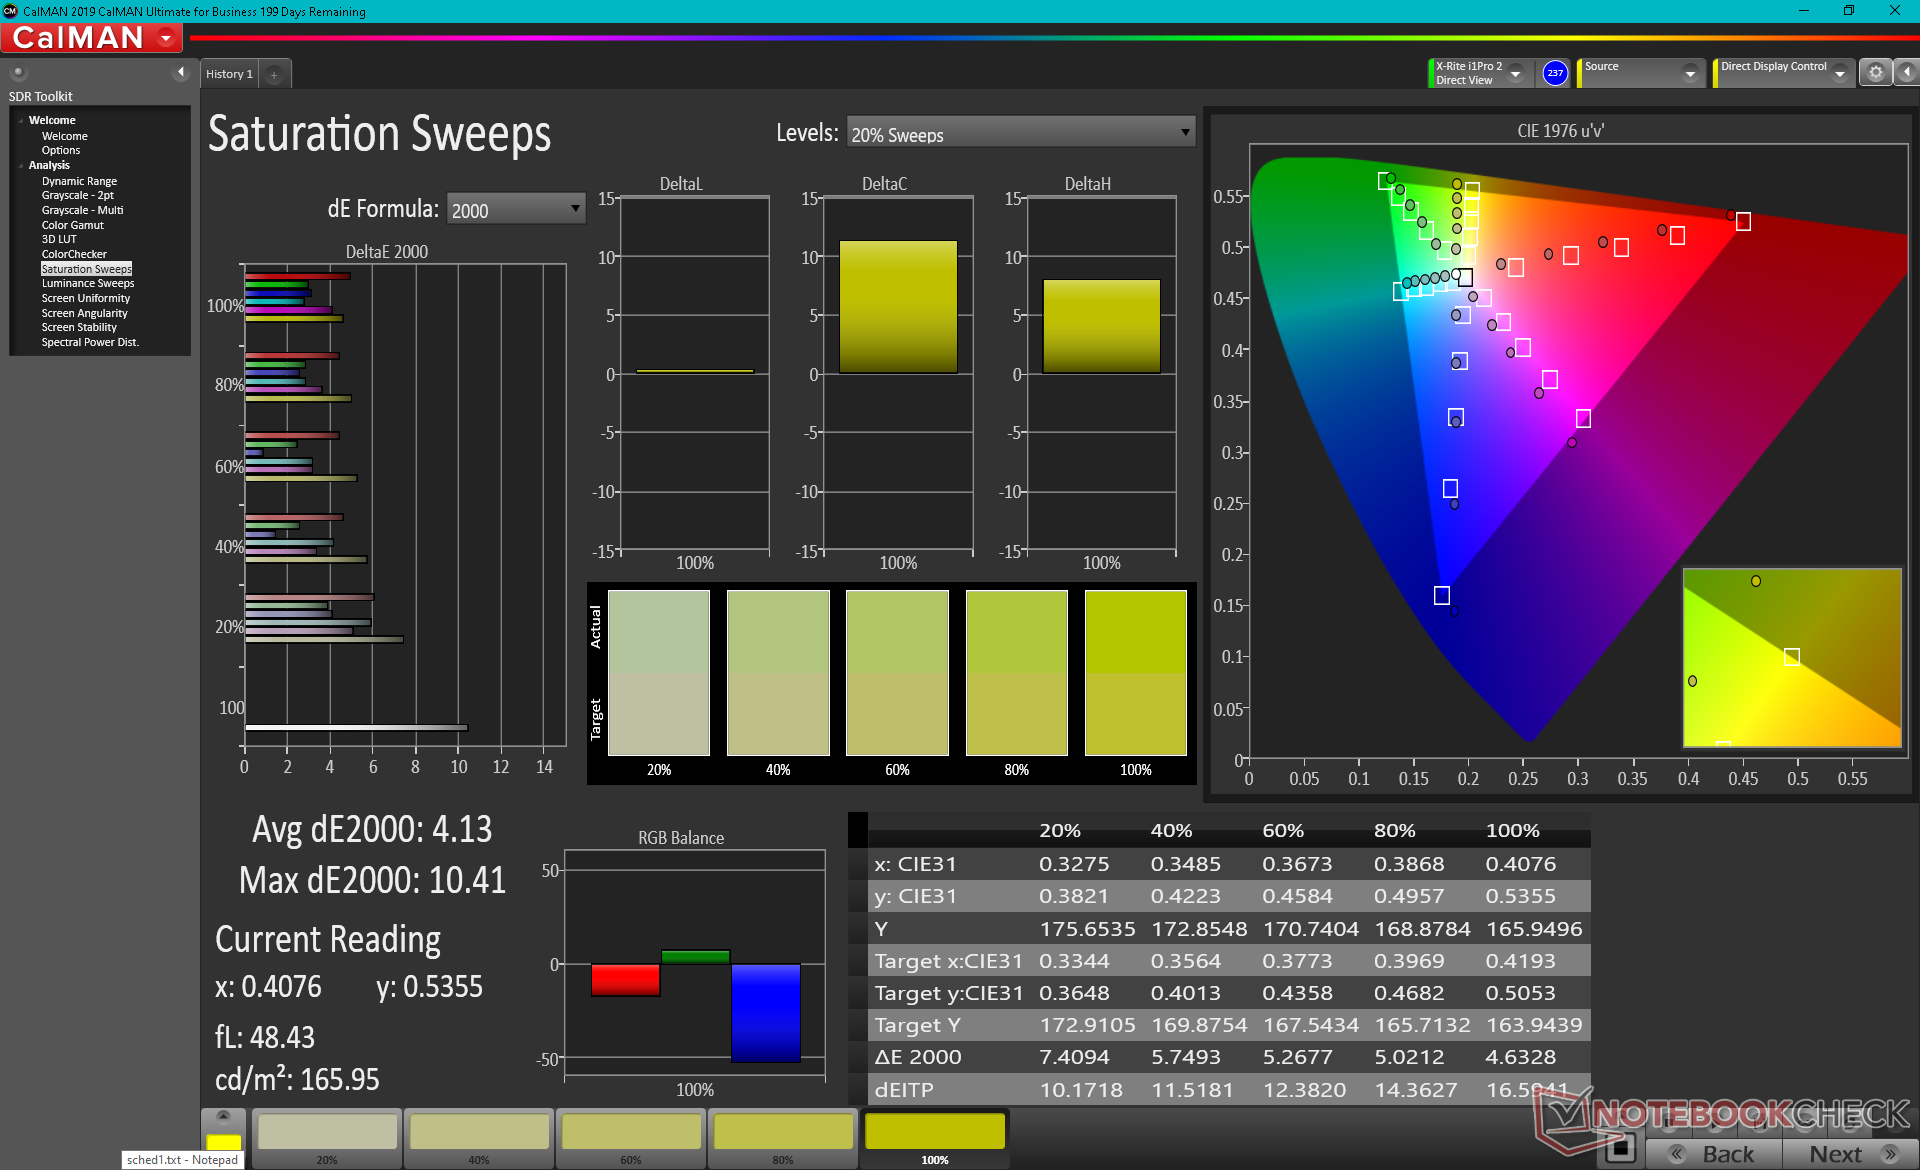
Die X-Rite-Colorimeter-Messungen offenbaren eine zu kühle Farbtemperatur im Auslieferungszustand für eine schlechte Graustufen- und Farbwiedergabe trotz der relativ hohen sRGB-Abdeckung von 90 Prozent. Die Daten machen Sinn, weil MSI die Summit-B15-Serie ab Werk nicht vorkalibriert. Farben und Graustufen verbessern sich nach der Kalibrierung deutlich, die durchschnittlichen DeltaE-Werte sind deutlich niedriger. Wir empfehlen die Anwendung unseres kalibrierten ICM-Profils für eine farbgenauere Darstellung.
Reaktionszeiten (Response Times) des Displays
| ↔ Reaktionszeiten Schwarz zu Weiß | ||
|---|---|---|
| 32.4 ms ... steigend ↗ und fallend ↘ kombiniert | ↗ 18.4 ms steigend | 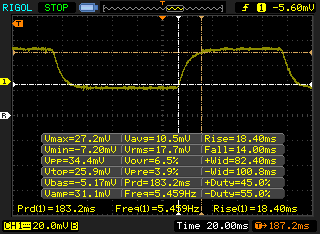 |
| ↘ 14 ms fallend | ||
| Die gemessenen Reaktionszeiten sind langsam und dadurch für viele Spieler wahrscheinlich zu langsam. Im Vergleich rangierten die bei uns getesteten Geräte von 0.1 (Minimum) zu 240 (Maximum) ms. » 88 % aller Screens waren schneller als der getestete. Daher sind die gemessenen Reaktionszeiten schlechter als der Durchschnitt aller vermessenen Geräte (19.8 ms). | ||
| ↔ Reaktionszeiten 50% Grau zu 80% Grau | ||
| 40.4 ms ... steigend ↗ und fallend ↘ kombiniert | ↗ 20.4 ms steigend | 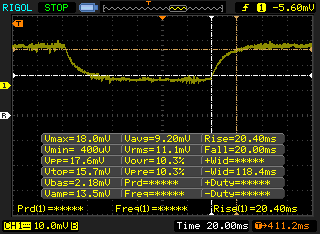 |
| ↘ 20 ms fallend | ||
| Die gemessenen Reaktionszeiten sind langsam und dadurch für viele Spieler wahrscheinlich zu langsam. Im Vergleich rangierten die bei uns getesteten Geräte von 0.165 (Minimum) zu 636 (Maximum) ms. » 63 % aller Screens waren schneller als der getestete. Daher sind die gemessenen Reaktionszeiten schlechter als der Durchschnitt aller vermessenen Geräte (31 ms). | ||
Bildschirm-Flackern / PWM (Pulse-Width Modulation)
| Flackern / PWM festgestellt | 25510 Hz | ≤ 25 % Helligkeit | 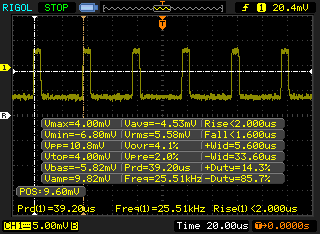 |
Das Display flackert mit 25510 Hz (im schlimmsten Fall, eventuell durch Pulsweitenmodulation PWM) bei einer eingestellten Helligkeit von 25 % und darunter. Darüber sollte es zu keinem Flackern kommen. Die Frequenz von 25510 Hz ist sehr hoch und sollte daher auch bei empfindlichen Personen zu keinen Problemen führen. Im Vergleich: 52 % aller getesteten Geräte nutzten kein PWM um die Helligkeit zu reduzieren. Wenn PWM eingesetzt wurde, dann bei einer Frequenz von durchschnittlich 7772 (Minimum 5, Maximum 343500) Hz. | |||
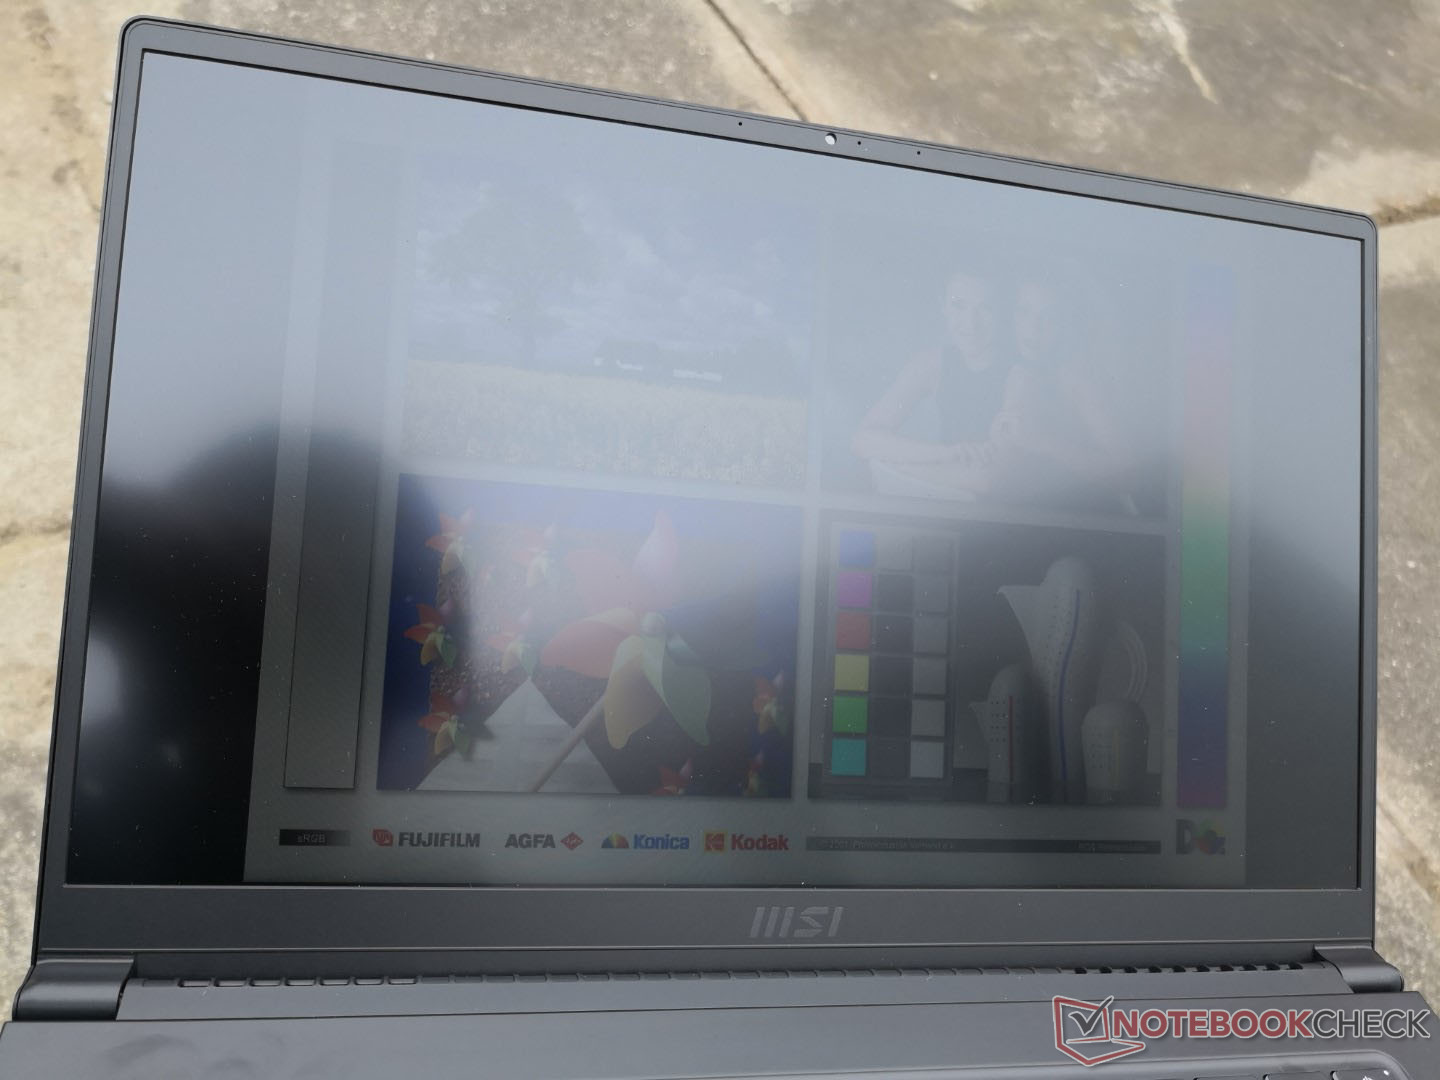
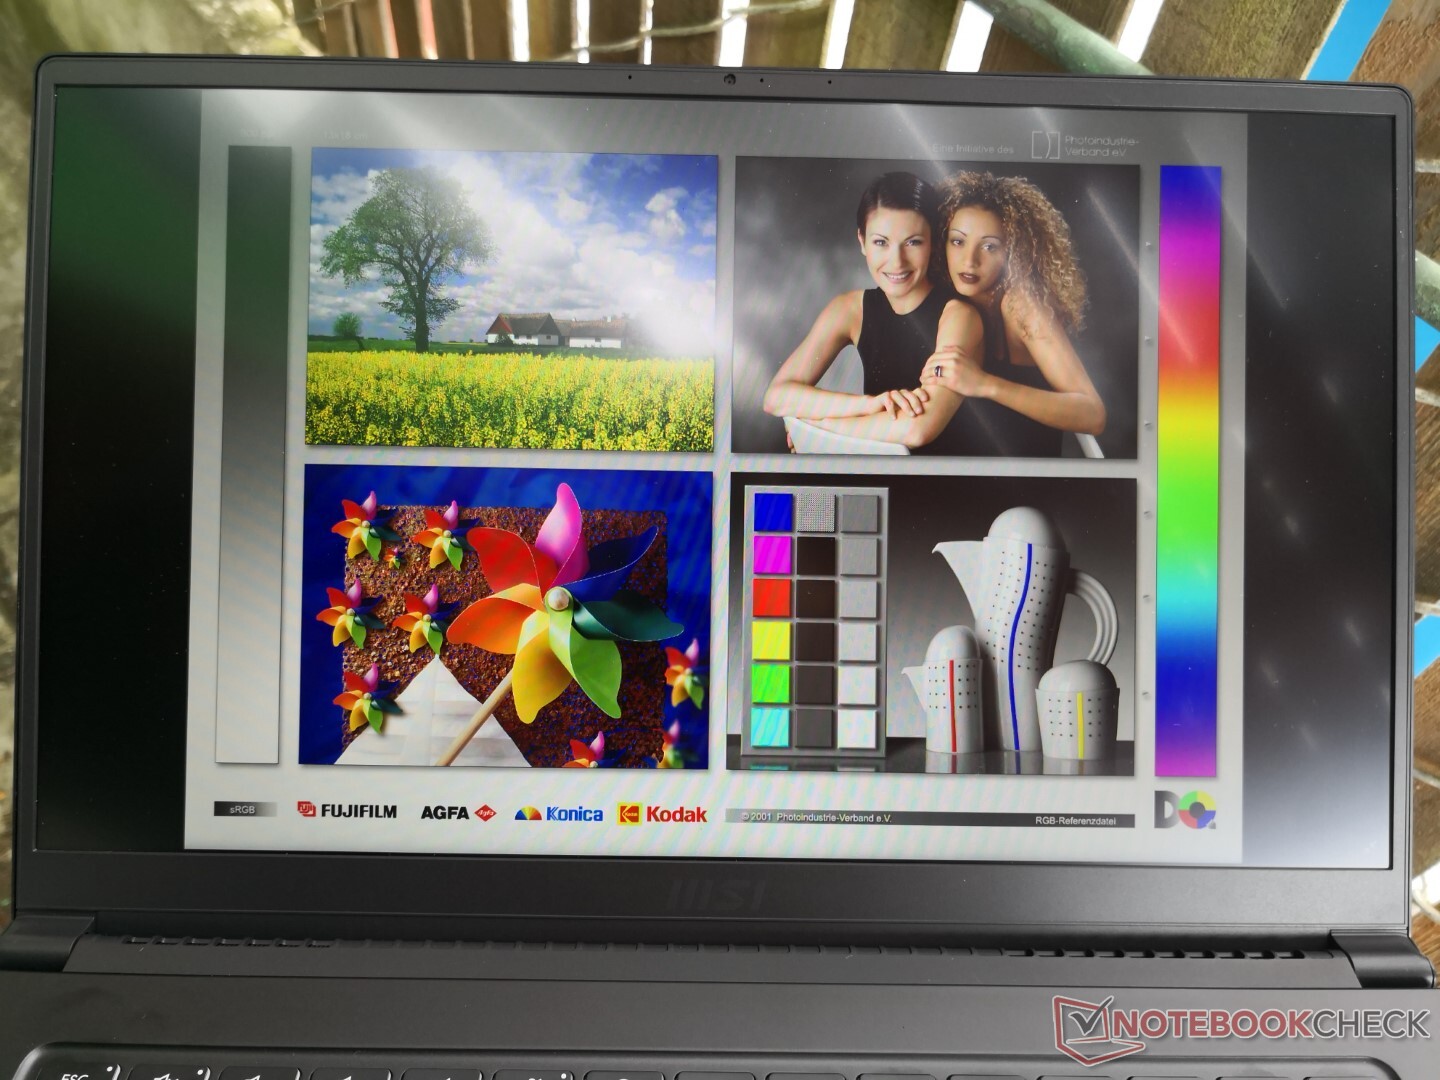
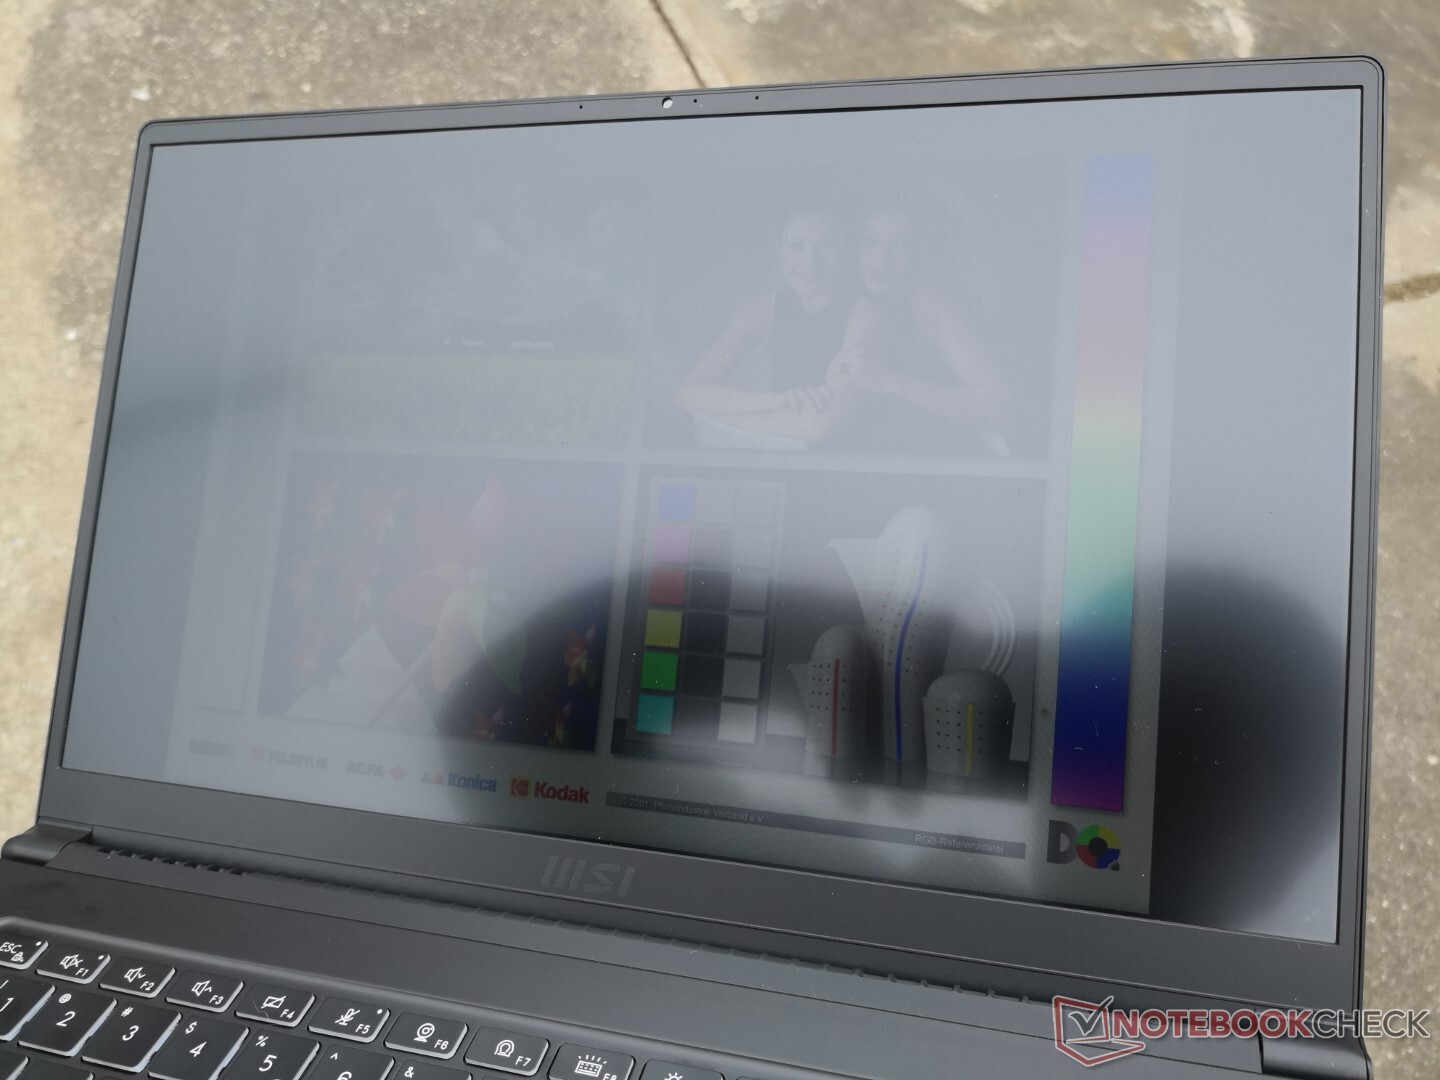
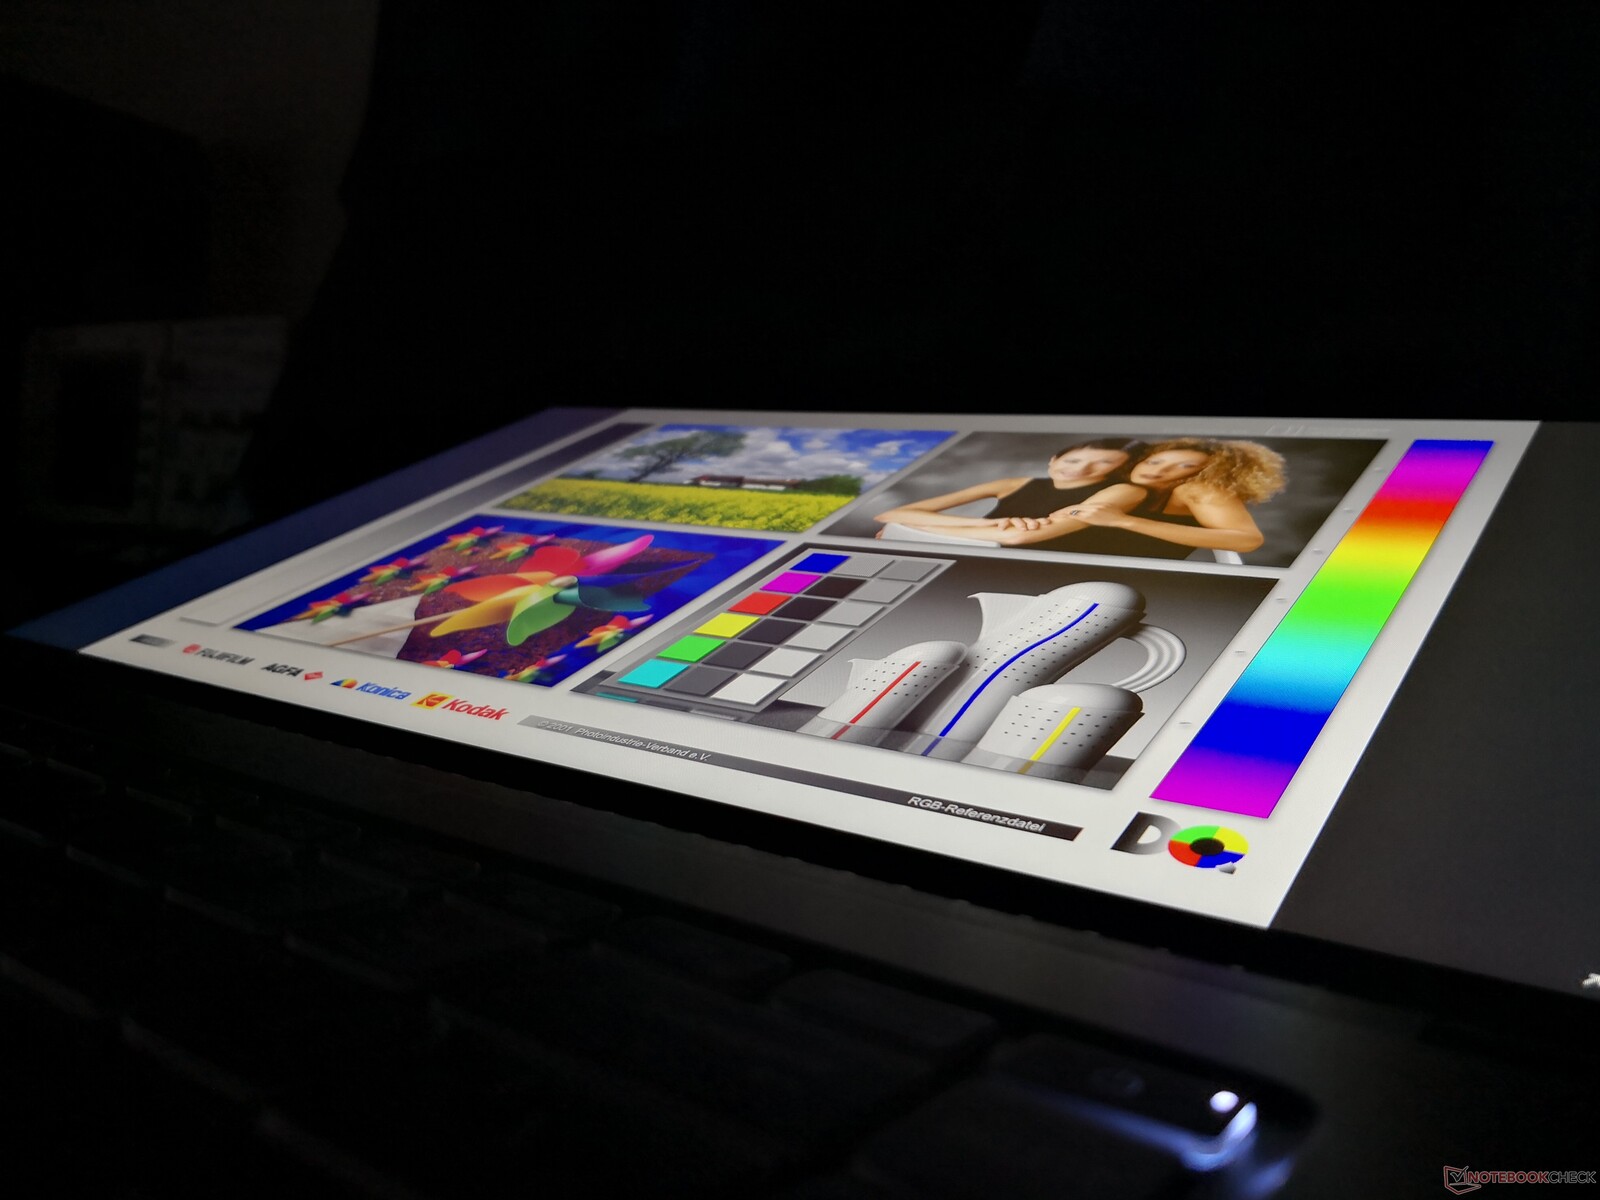
Die Sichtbarkeit im Freien ist nicht so gut wie die des Dell XPS 15 oder des MacBook Pro 15, die beide deutlich hellere Displays haben. Die Blendwirkung ist beim MSI aufgrund des matten Panels nicht so stark, aber das Display ist in den meisten Szenarien dennoch schwer zu erkennen.
Performance
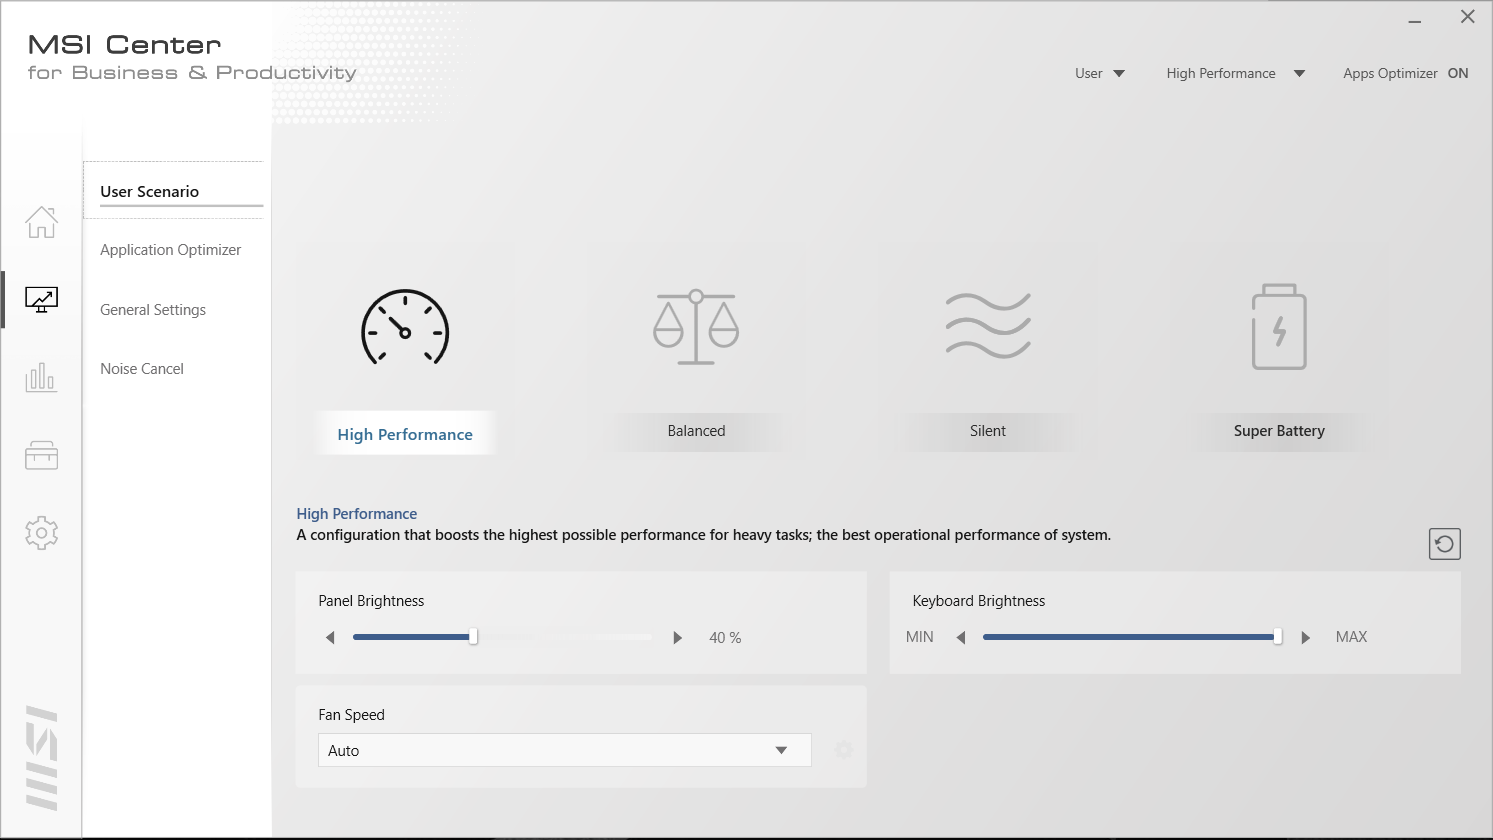
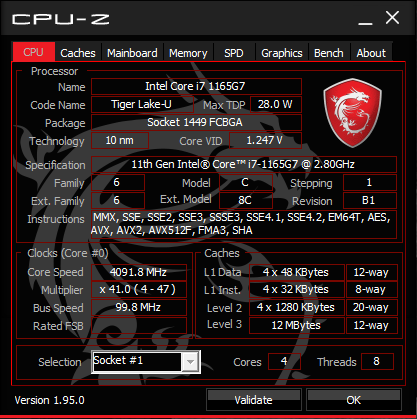
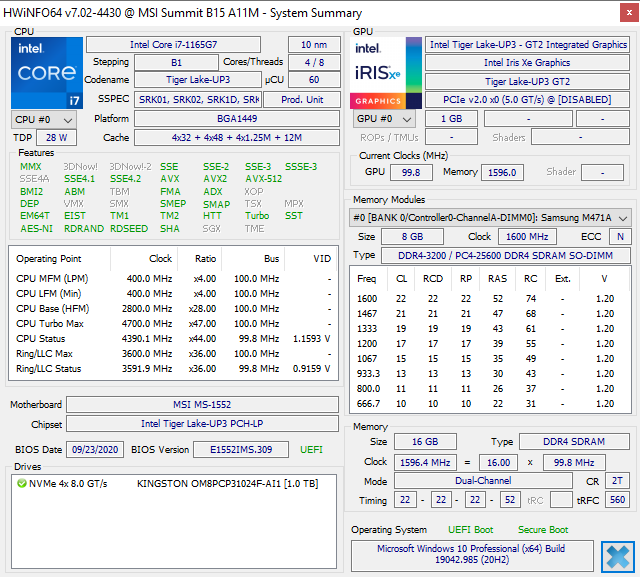
Zum jetzigen Zeitpunkt sind nur zwei SKUs verfügbar, entweder mit dem ULV Core i5-1135G7 oder Core i7-1165G7. Für schnellere Core-H-Optionen bietet MSI stattdessen die Creator-Z16-Serie an.
Unser Gerät wurde im MSI Center auf den Modus "High Performance" eingestellt, bevor wir die folgenden Leistungsbenchmarks durchführten, um die bestmöglichen Ergebnisse zu erzielen. Wir empfehlen Usern, sich mit dieser Software vertraut zu machen, da hier MSI-spezifische Updates und Funktionen zu finden sind.
Prozessor
Die CPU-Leistung ist mit CineBench R15 xT-Ergebnissen, die 12 % schneller sind als der durchschnittliche Laptop in unserer Datenbank, der mit der gleichen CPU ausgestattet ist, ausgezeichnet. Die CineBench-R20- und -R23-Scores sind mit 23 Prozent über dem Durchschnitt sogar noch besser, was auf eine bessere Turbo-Boost-Dauer als bei den meisten anderen Laptops hindeutet, da die R20- und R23-Benchmarks deutlich länger sind als die R15. Der Prozessor kann also sowohl den Core i7-10510U der 10. Generation als auch den Core i5-10300H im HP Spectre x360 15 bzw. im Dell XPS 15 übertreffen.
Wer sich für den günstigeren Core i5-1135G7 anstelle unseres Core i7-1165G7 entscheidet, verringert die Prozessorleistung lediglich um 7 bis 10 Prozent, basierend auf unserer Erfahrung mit anderen Core-i5-1135G7-Notebooks.
Cinebench R23: Multi Core | Single Core
Cinebench R15: CPU Multi 64Bit | CPU Single 64Bit
Blender: v2.79 BMW27 CPU
7-Zip 18.03: 7z b 4 -mmt1 | 7z b 4
Geekbench 5.5: Single-Core | Multi-Core
HWBOT x265 Benchmark v2.2: 4k Preset
LibreOffice : 20 Documents To PDF
R Benchmark 2.5: Overall mean
| Cinebench R23 / Multi Core | |
| Lenovo IdeaPad Flex 5 14ALC05 82HU002YUS | |
| Lenovo Yoga Slim 7-14ARE | |
| MSI Summit B15 A11M | |
| MSI Summit E15 A11SCST | |
| Durchschnittliche Intel Core i7-1165G7 (2525 - 6862, n=64) | |
| Cinebench R23 / Single Core | |
| MSI Summit B15 A11M | |
| MSI Summit E15 A11SCST | |
| Durchschnittliche Intel Core i7-1165G7 (1110 - 1539, n=59) | |
| Lenovo IdeaPad Flex 5 14ALC05 82HU002YUS | |
| Lenovo Yoga Slim 7-14ARE | |
| Blender / v2.79 BMW27 CPU | |
| Durchschnittliche Intel Core i7-1165G7 (468 - 1138, n=80) | |
| Lenovo IdeaPad 5 15IIL05 | |
| Lenovo ThinkBook 15 Gen2 ITL | |
| MSI Summit E15 A11SCST | |
| Dell XPS 15 9500 Core i5 | |
| MSI Summit B15 A11M | |
| Lenovo ThinkPad E15 Gen2-20T9S00K00 | |
| Dell XPS 15 9500 Core i7 4K UHD | |
| Lenovo Yoga Slim 7-14ARE | |
| Lenovo IdeaPad Flex 5 14ALC05 82HU002YUS | |
| 7-Zip 18.03 / 7z b 4 -mmt1 | |
| Dell XPS 15 9500 Core i7 4K UHD | |
| Durchschnittliche Intel Core i7-1165G7 (4478 - 5507, n=80) | |
| MSI Summit E15 A11SCST | |
| MSI Summit B15 A11M | |
| Dell XPS 15 9500 Core i5 | |
| Lenovo ThinkBook 15 Gen2 ITL | |
| Lenovo IdeaPad Flex 5 14ALC05 82HU002YUS | |
| Lenovo ThinkPad E15 Gen2-20T9S00K00 | |
| Lenovo Yoga Slim 7-14ARE | |
| Lenovo IdeaPad 5 15IIL05 | |
| HWBOT x265 Benchmark v2.2 / 4k Preset | |
| Lenovo Yoga Slim 7-14ARE | |
| Lenovo IdeaPad Flex 5 14ALC05 82HU002YUS | |
| Dell XPS 15 9500 Core i7 4K UHD | |
| Lenovo ThinkPad E15 Gen2-20T9S00K00 | |
| MSI Summit B15 A11M | |
| Dell XPS 15 9500 Core i5 | |
| Lenovo ThinkBook 15 Gen2 ITL | |
| MSI Summit E15 A11SCST | |
| Lenovo IdeaPad 5 15IIL05 | |
| Durchschnittliche Intel Core i7-1165G7 (1.39 - 8.47, n=80) | |
| LibreOffice / 20 Documents To PDF | |
| Dell XPS 15 9500 Core i5 | |
| MSI Summit E15 A11SCST | |
| Lenovo IdeaPad Flex 5 14ALC05 82HU002YUS | |
| Lenovo Yoga Slim 7-14ARE | |
| Lenovo ThinkPad E15 Gen2-20T9S00K00 | |
| Lenovo IdeaPad 5 15IIL05 | |
| MSI Summit B15 A11M | |
| Dell XPS 15 9500 Core i7 4K UHD | |
| Durchschnittliche Intel Core i7-1165G7 (21.5 - 88.1, n=78) | |
| Lenovo ThinkBook 15 Gen2 ITL | |
| R Benchmark 2.5 / Overall mean | |
| Lenovo IdeaPad 5 15IIL05 | |
| Dell XPS 15 9500 Core i5 | |
| Lenovo ThinkBook 15 Gen2 ITL | |
| MSI Summit E15 A11SCST | |
| Lenovo Yoga Slim 7-14ARE | |
| Lenovo ThinkPad E15 Gen2-20T9S00K00 | |
| Durchschnittliche Intel Core i7-1165G7 (0.552 - 1.002, n=80) | |
| Lenovo IdeaPad Flex 5 14ALC05 82HU002YUS | |
| Dell XPS 15 9500 Core i7 4K UHD | |
| MSI Summit B15 A11M | |
Cinebench R23: Multi Core | Single Core
Cinebench R15: CPU Multi 64Bit | CPU Single 64Bit
Blender: v2.79 BMW27 CPU
7-Zip 18.03: 7z b 4 -mmt1 | 7z b 4
Geekbench 5.5: Single-Core | Multi-Core
HWBOT x265 Benchmark v2.2: 4k Preset
LibreOffice : 20 Documents To PDF
R Benchmark 2.5: Overall mean
* ... kleinere Werte sind besser
System Performance
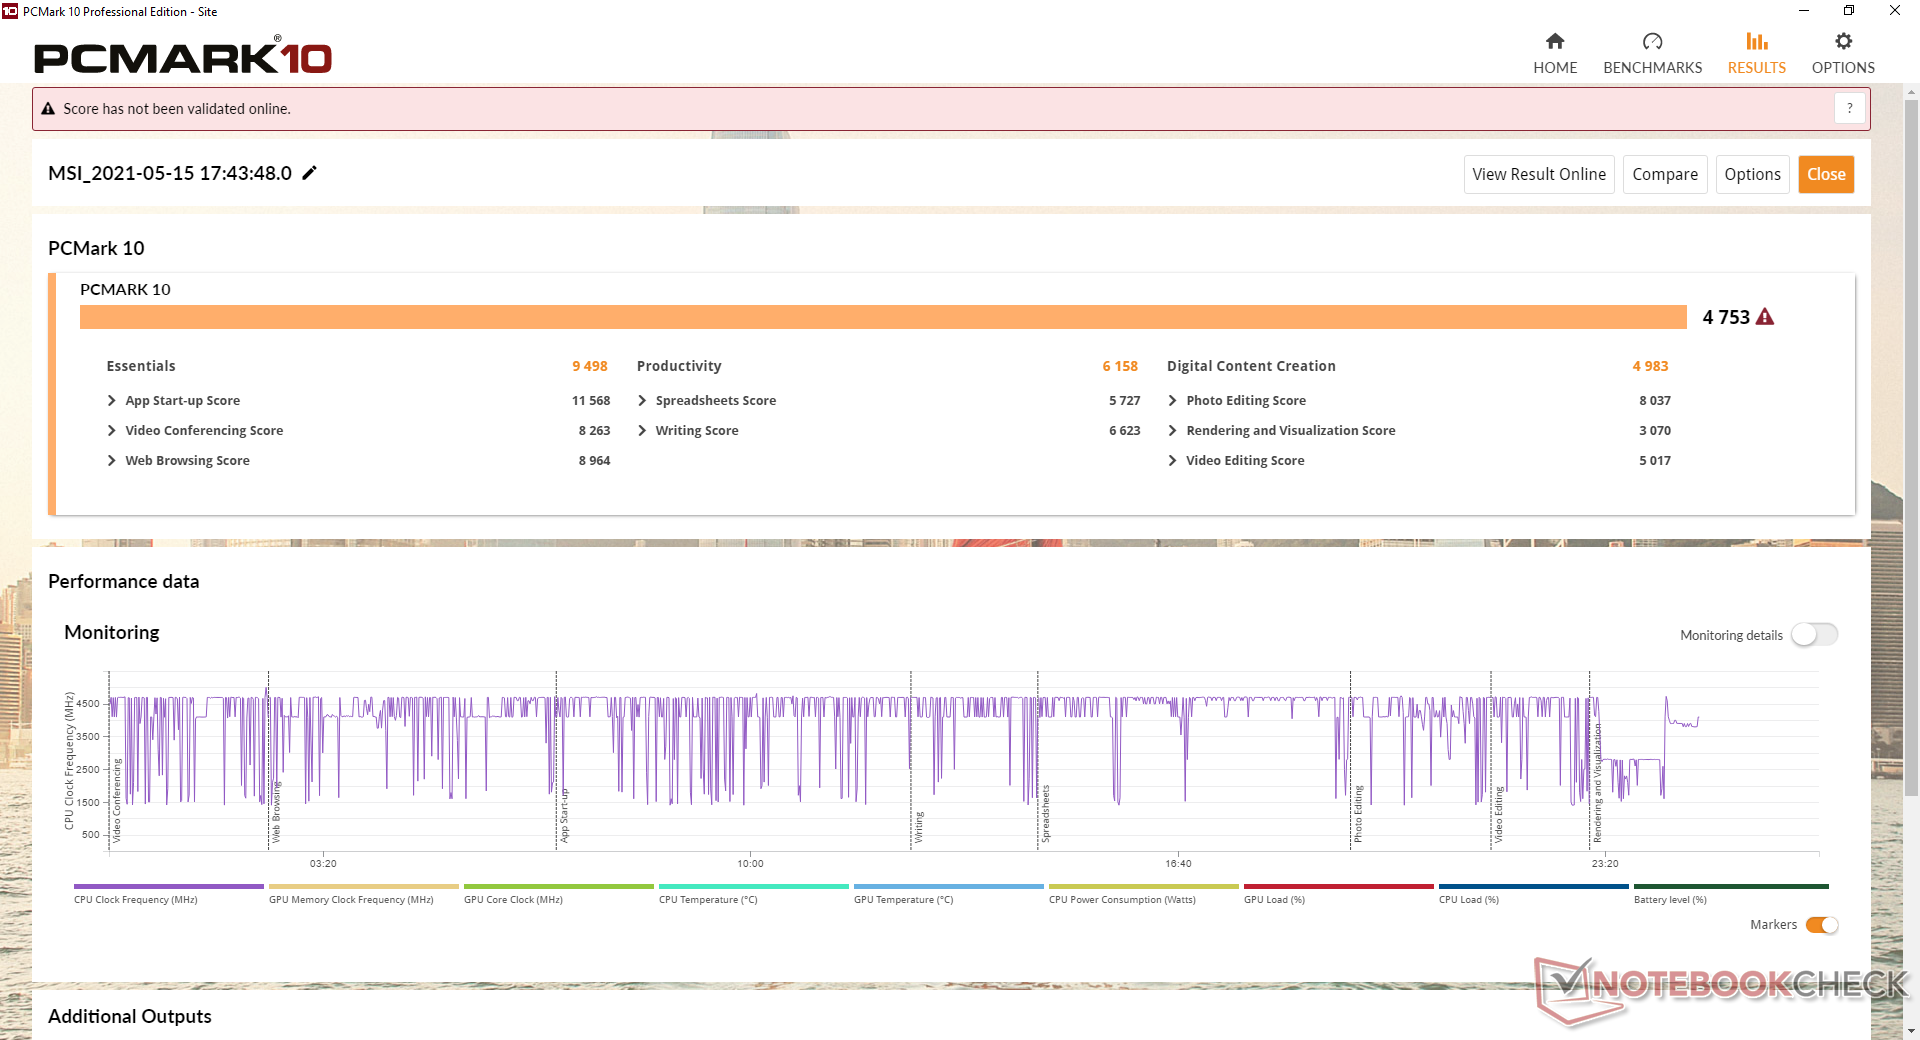
| PCMark 10 Score | 4753 Punkte | |
Hilfe | ||
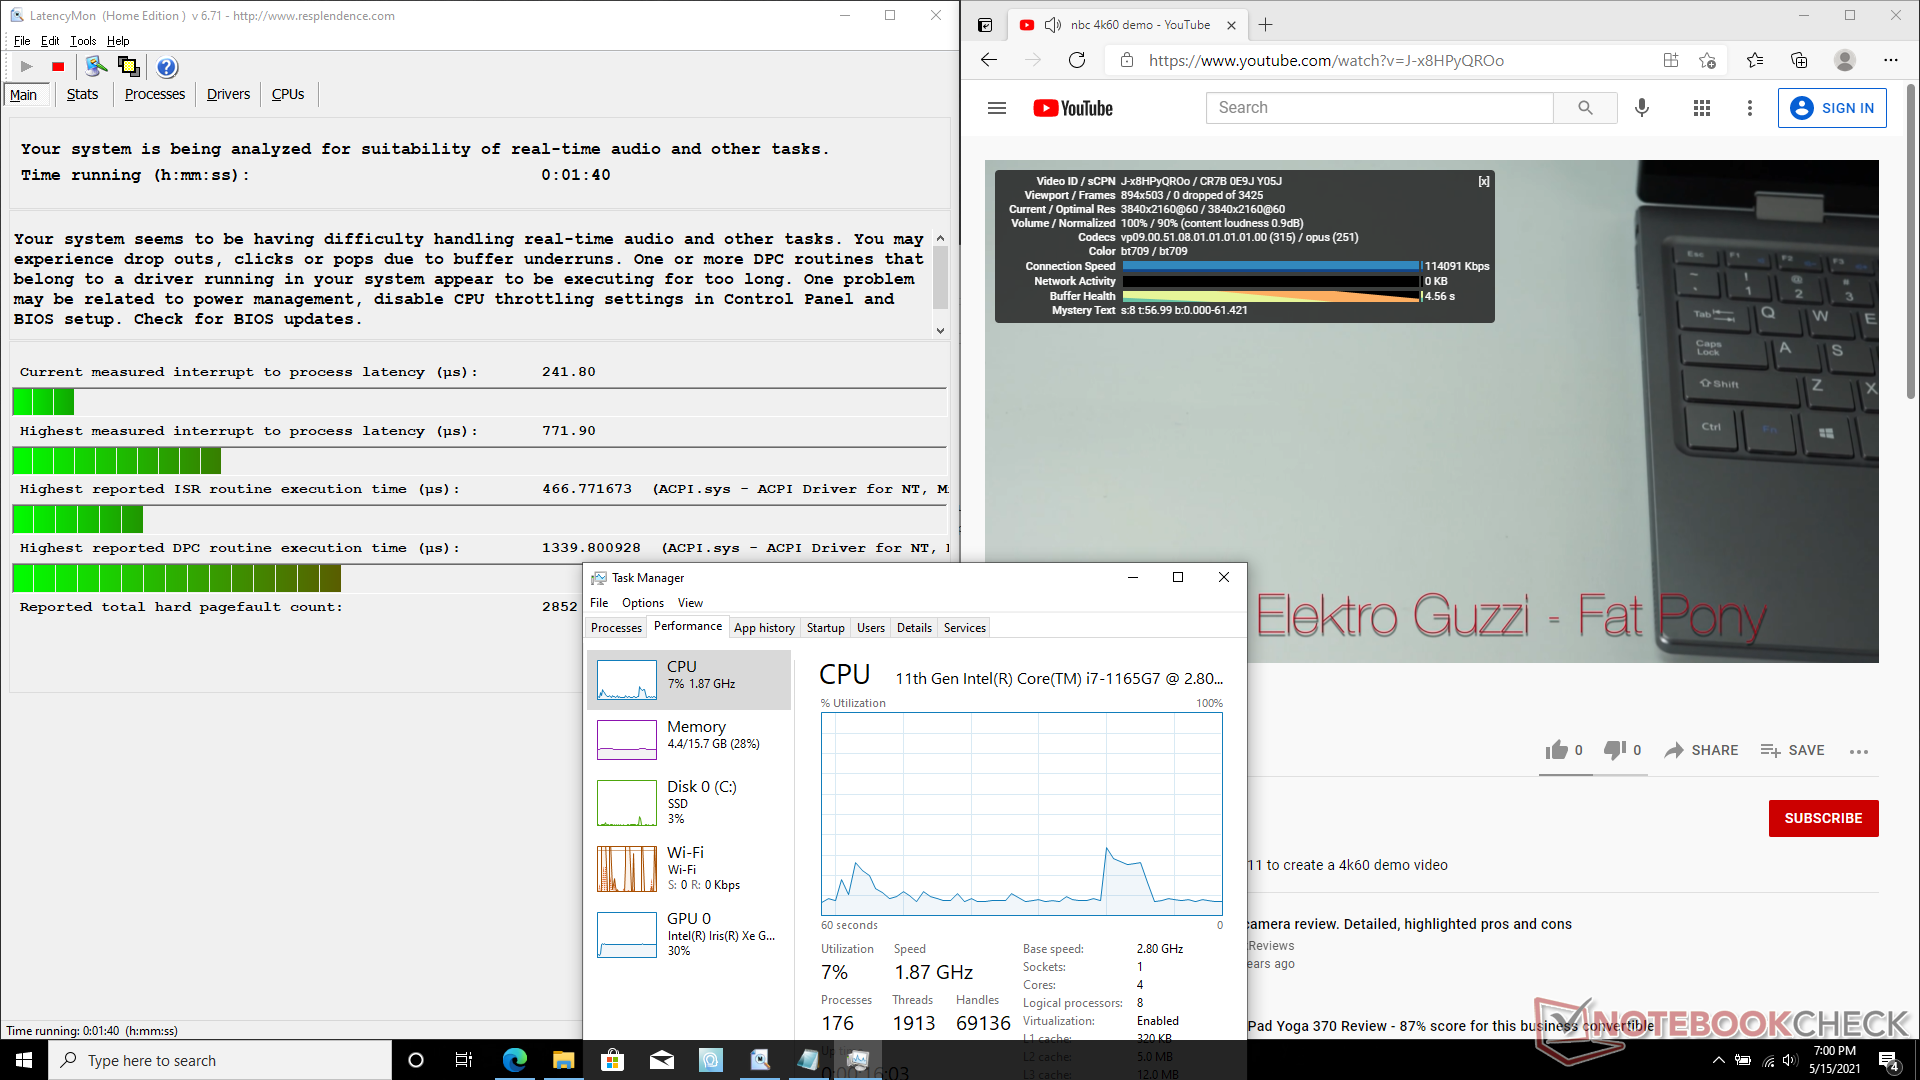
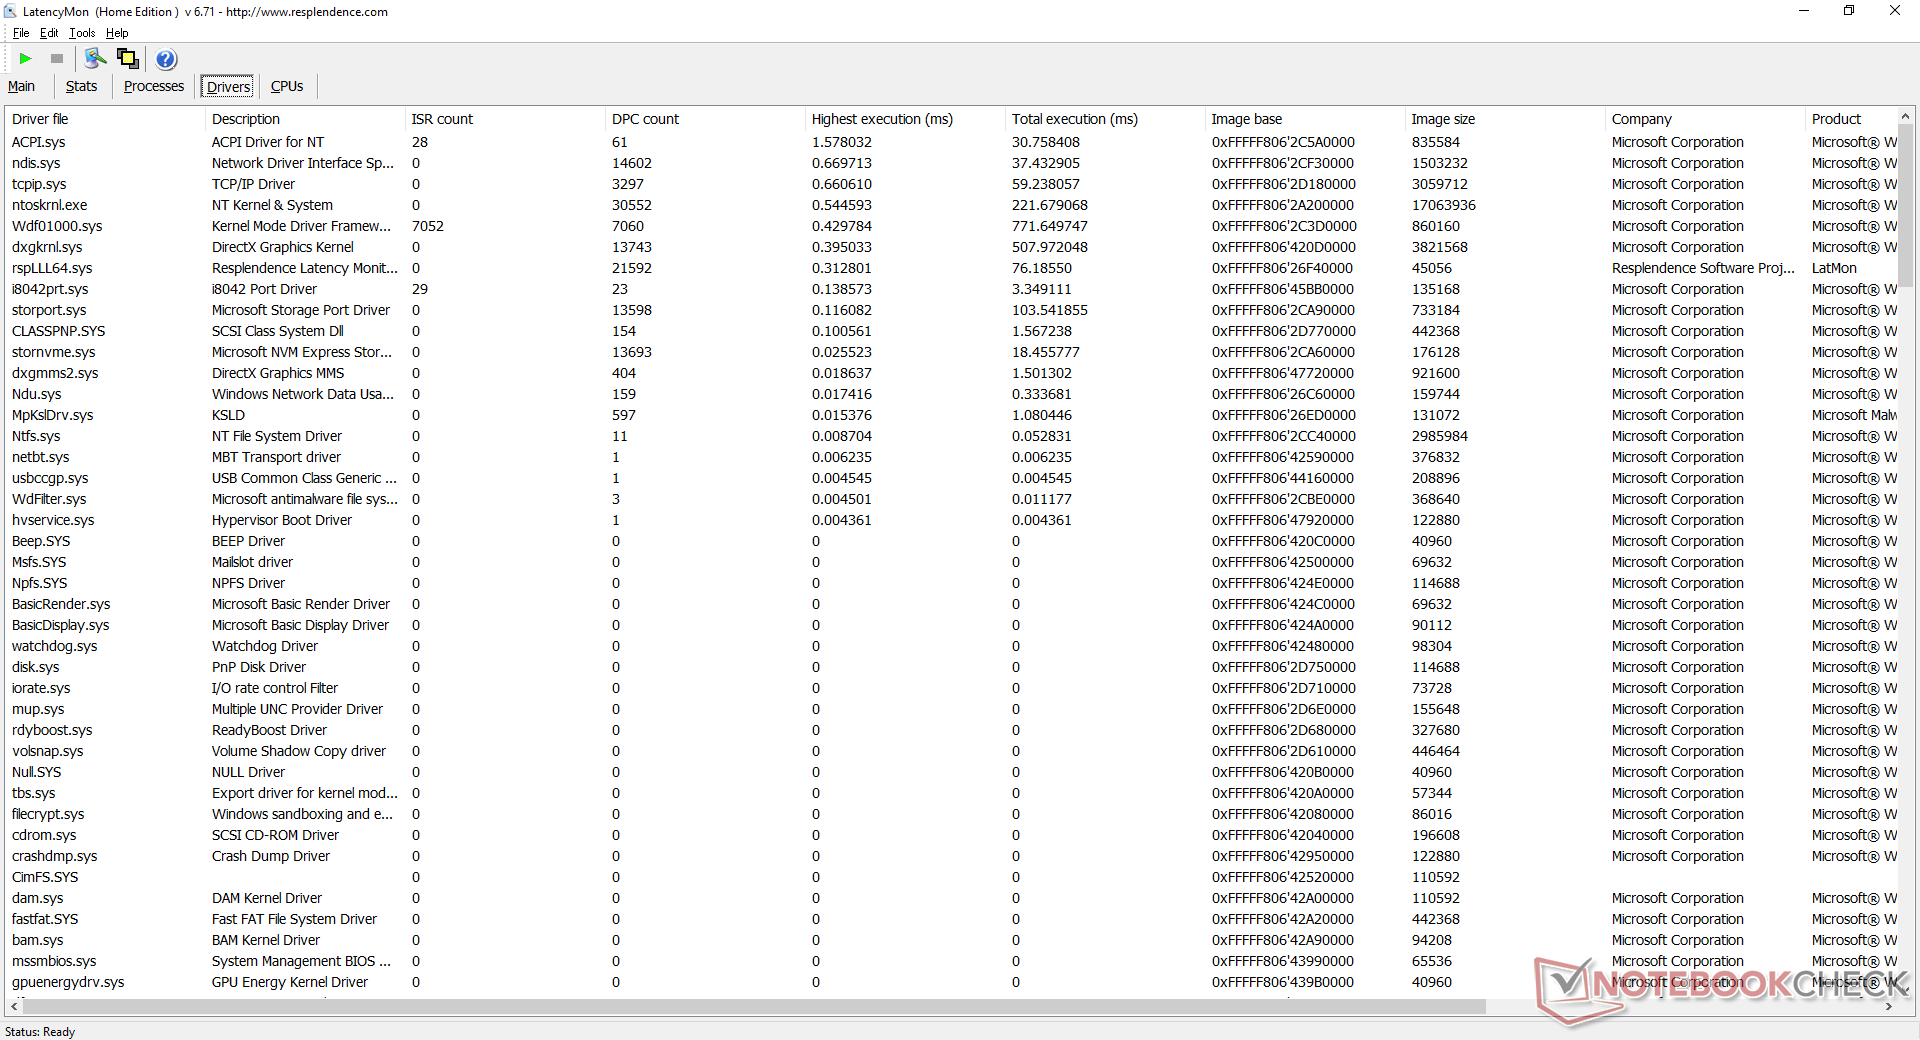
DPC-Latenzzeit
LatencyMon zeigt kleinere DPC-Latenzprobleme beim Öffnen mehrerer Browser-Tabs auf unserer Homepage. Die 4K-Videowiedergabe bei 60 FPS läuft ansonsten flüssig und ohne Bildaussetzer.
| DPC Latencies / LatencyMon - interrupt to process latency (max), Web, Youtube, Prime95 | |
| ADATA XPG Xenia Xe | |
| Dell XPS 15 9500 Core i5 | |
| MSI Summit E15 A11SCST | |
| MSI Summit B15 A11M | |
* ... kleinere Werte sind besser
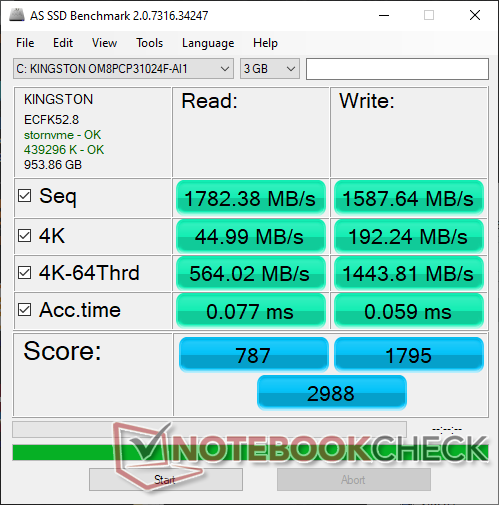
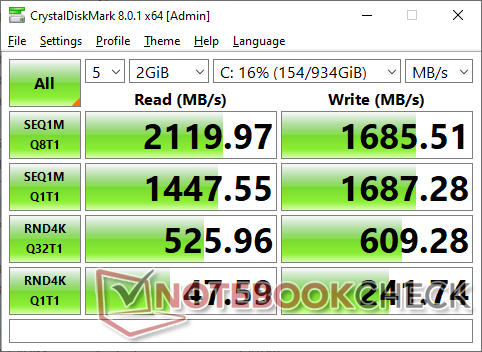
Speichergeräte
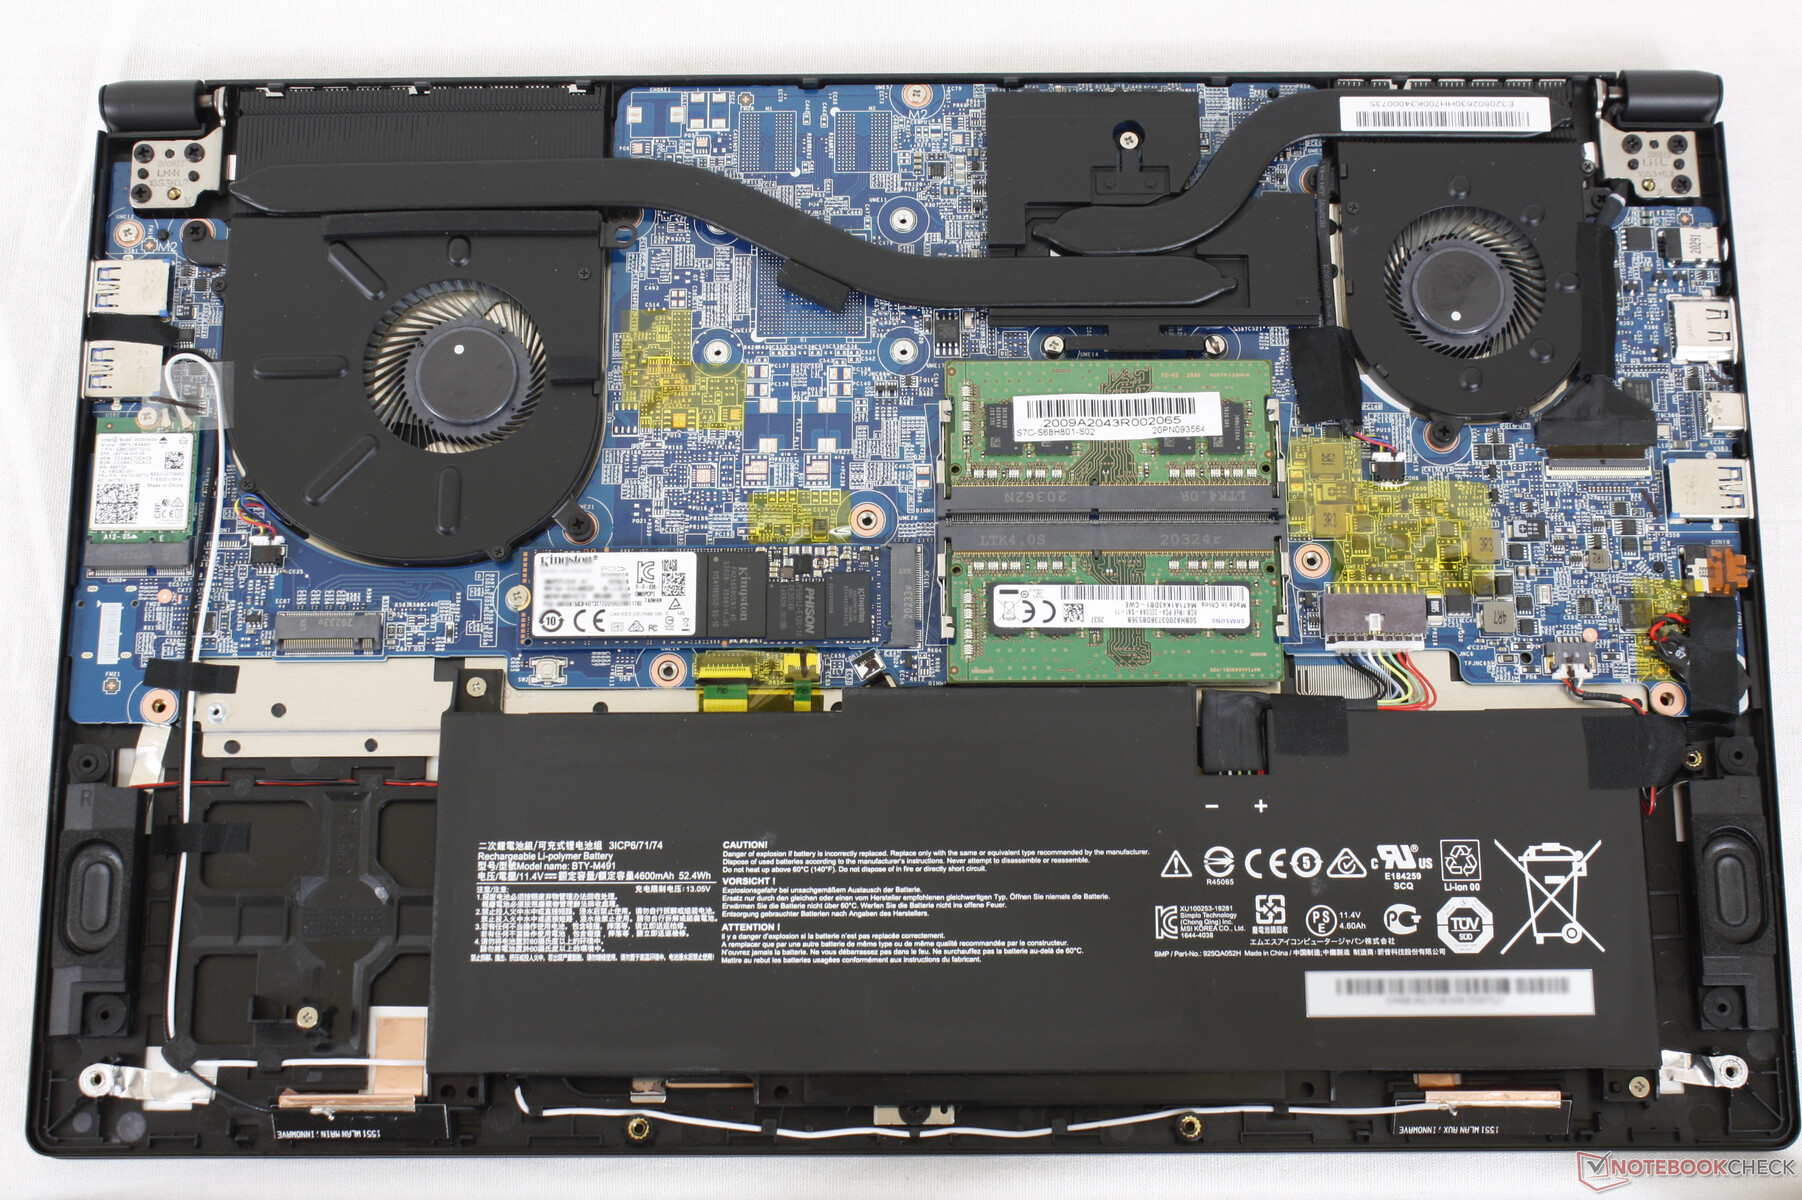
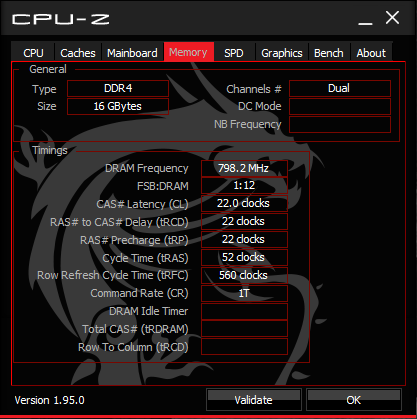
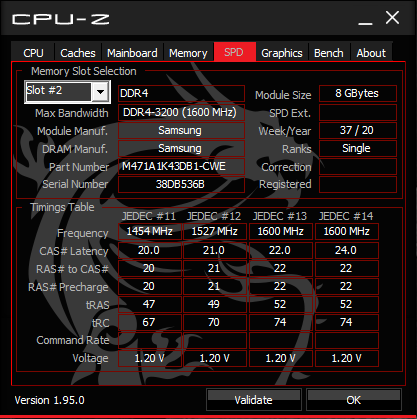
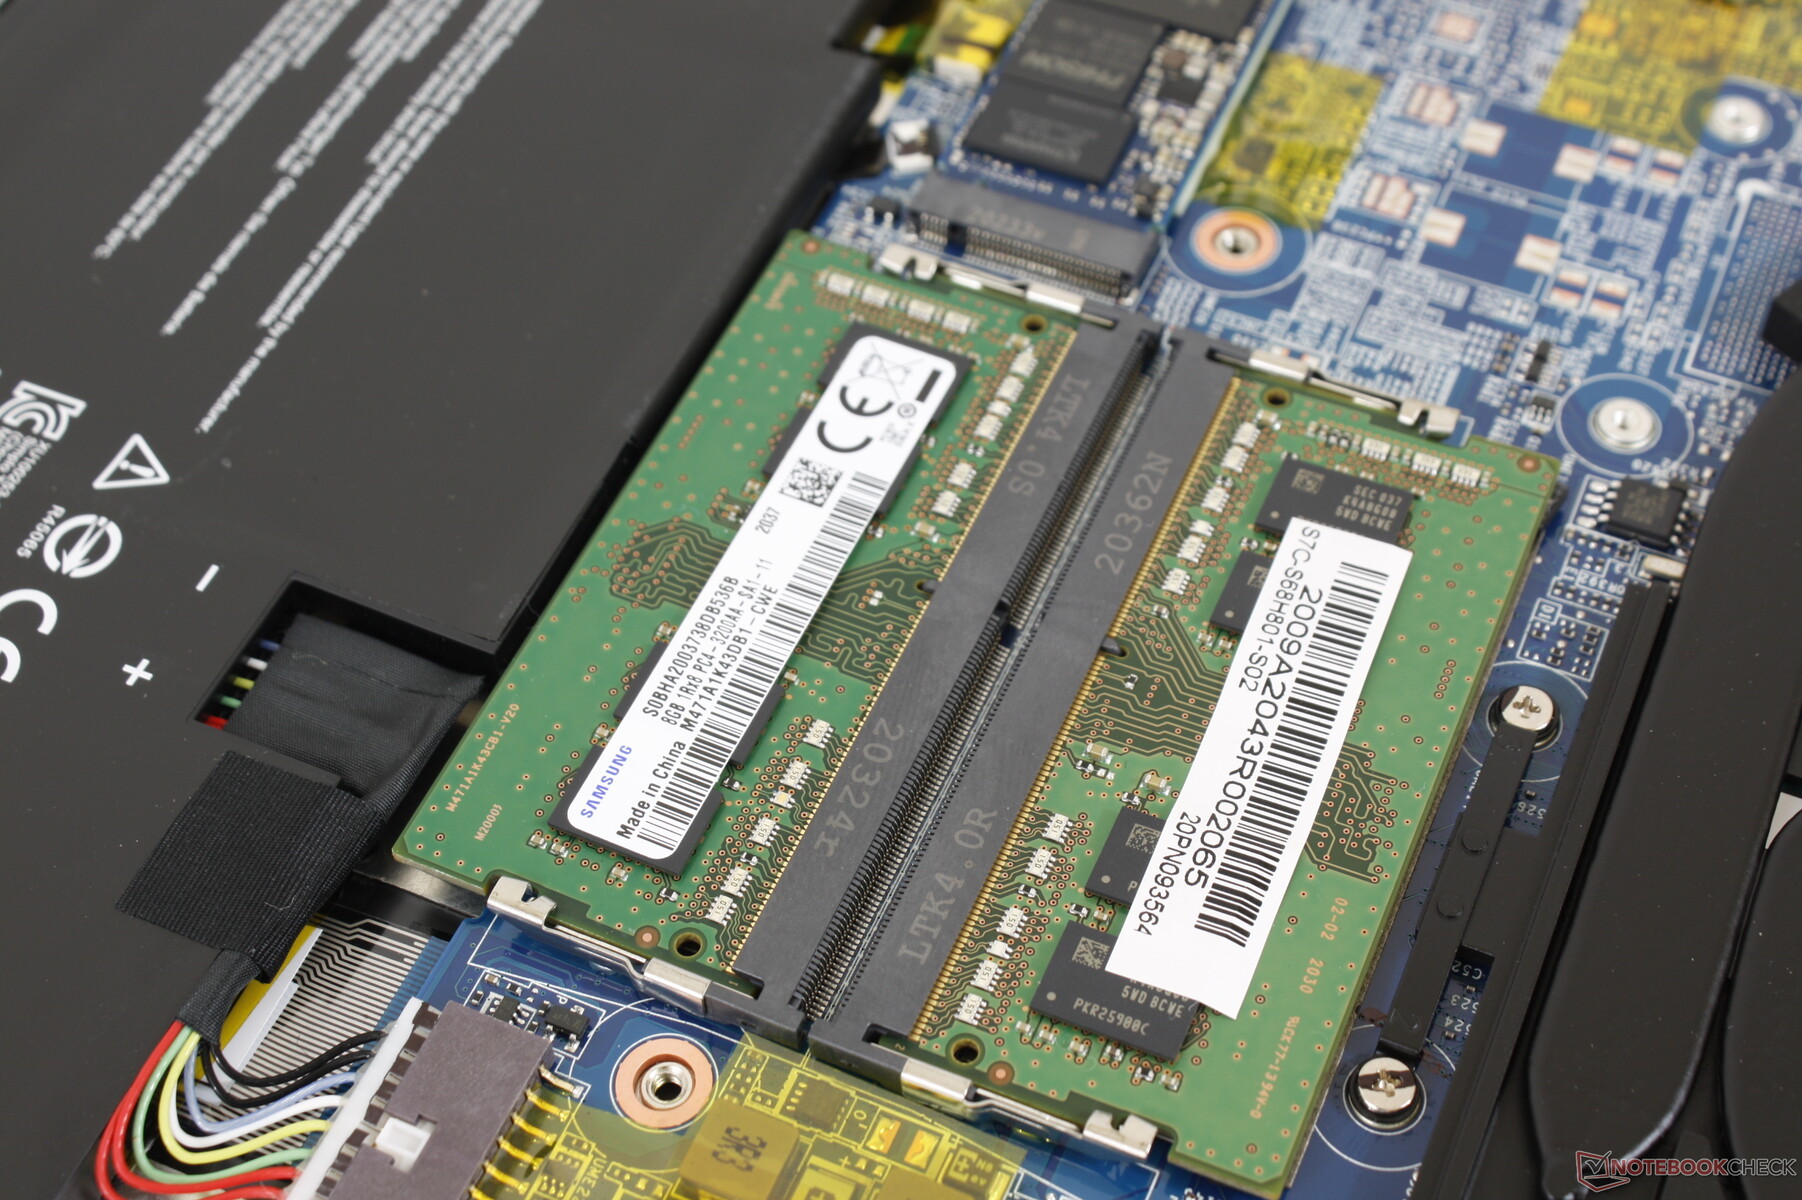
Es werden bis zu zwei interne M.2 2280 SSDs unterstützt, wobei einer dieser Steckplätze mit PCIe 4.0 kompatibel ist. Unser Testgerät wird mit der 1-TB-Kingston OM8PCP31024F ausgeliefert, einer recht günstigen PCIe-3.0-NVMe-SSD mit durchschnittlichen Transferraten von bis zu 2100 MB/s. Natürlich können Nutzer schnellere SSDs vor dem Kauf konfigurieren oder selbst einbauen.
| MSI Summit B15 A11M Kingston OM8PCP31024F | MSI Summit E15 A11SCST Phison 1TB SM2801T24GKBB4S-E162 | HP Spectre X360 15-5ZV31AV Intel SSD 660p 2TB SSDPEKNW020T8 | ADATA XPG Xenia Xe ADATA XPG Gammix S50 1TB | |
|---|---|---|---|---|
| AS SSD | 42% | -12% | 25% | |
| Seq Read (MB/s) | 1782 | 3597 102% | 1220 -32% | 3842 116% |
| Seq Write (MB/s) | 1588 | 2101 32% | 1152 -27% | 1601 1% |
| 4K Read (MB/s) | 44.99 | 62.5 39% | 52.3 16% | 51.2 14% |
| 4K Write (MB/s) | 192.2 | 208.9 9% | 146.6 -24% | 260.8 36% |
| 4K-64 Read (MB/s) | 564 | 1145 103% | 652 16% | 1222 117% |
| 4K-64 Write (MB/s) | 1444 | 1482 3% | 847 -41% | 1508 4% |
| Access Time Read * (ms) | 0.077 | 0.05 35% | 0.077 -0% | 0.065 16% |
| Access Time Write * (ms) | 0.059 | 0.019 68% | 0.106 -80% | 0.249 -322% |
| Score Read (Points) | 787 | 1567 99% | 826 5% | 1657 111% |
| Score Write (Points) | 1795 | 1901 6% | 1109 -38% | 1929 7% |
| Score Total (Points) | 2988 | 4207 41% | 2371 -21% | 4329 45% |
| Copy ISO MB/s (MB/s) | 1541 | 2209 43% | 2070 34% | 2166 41% |
| Copy Program MB/s (MB/s) | 641 | 455.2 -29% | 571 -11% | 995 55% |
| Copy Game MB/s (MB/s) | 908 | 1225 35% | 1219 34% | 1844 103% |
| CrystalDiskMark 5.2 / 6 | 42% | -6% | 47% | |
| Write 4K (MB/s) | 235.9 | 242.9 3% | 151.5 -36% | 159.6 -32% |
| Read 4K (MB/s) | 47.06 | 54.6 16% | 59.3 26% | 45.45 -3% |
| Write Seq (MB/s) | 1684 | 2420 44% | 1424 -15% | 2498 48% |
| Read Seq (MB/s) | 1333 | 2300 73% | 1609 21% | 2340 76% |
| Write 4K Q32T1 (MB/s) | 606 | 392.7 -35% | 393.6 -35% | 645 6% |
| Read 4K Q32T1 (MB/s) | 422.8 | 667 58% | 369.4 -13% | 439.4 4% |
| Write Seq Q32T1 (MB/s) | 1688 | 2424 44% | 1946 15% | 4057 140% |
| Read Seq Q32T1 (MB/s) | 2116 | 4944 134% | 1934 -9% | 4960 134% |
| Durchschnitt gesamt (Programm / Settings) | 42% /
42% | -9% /
-10% | 36% /
33% |
* ... kleinere Werte sind besser

Disk Throttling: DiskSpd Read Loop, Queue Depth 8
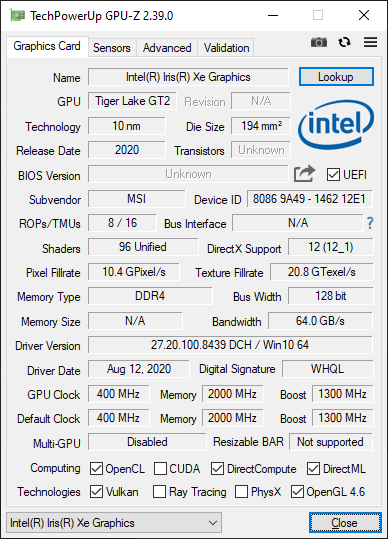
GPU Performance
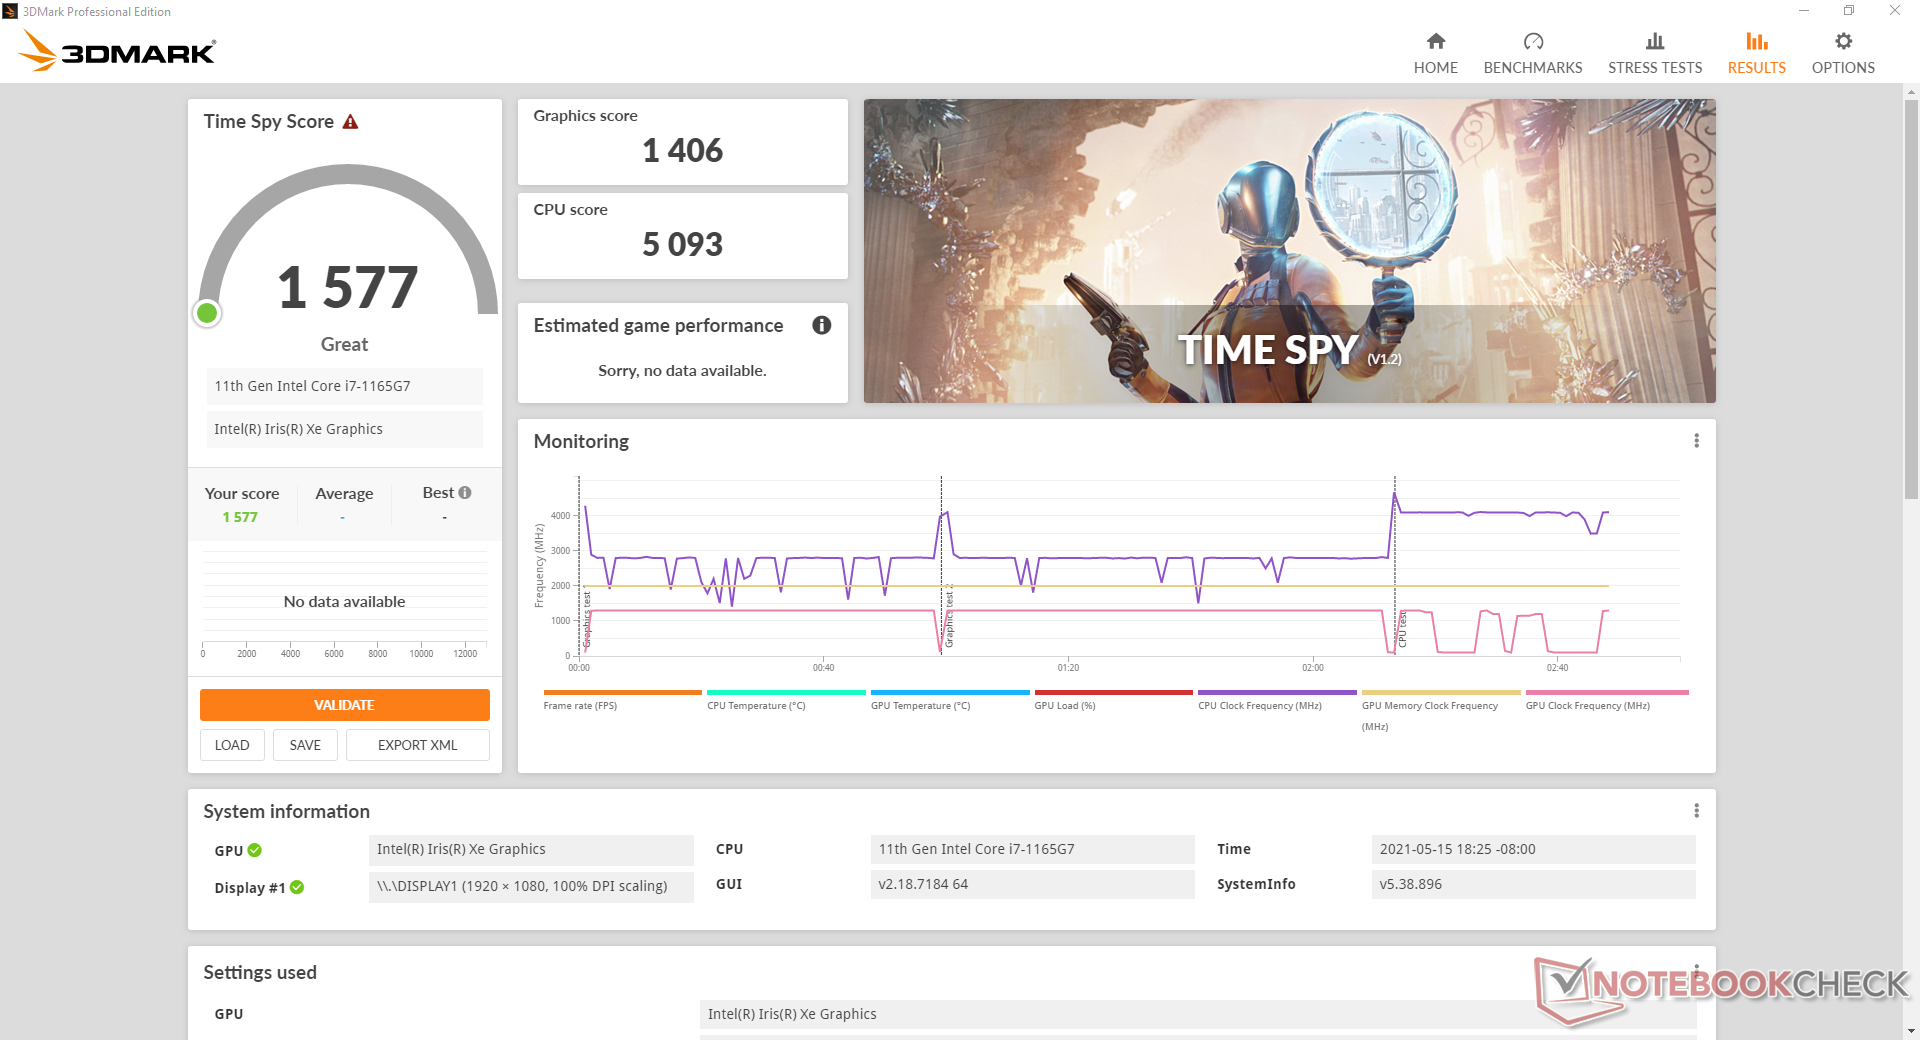
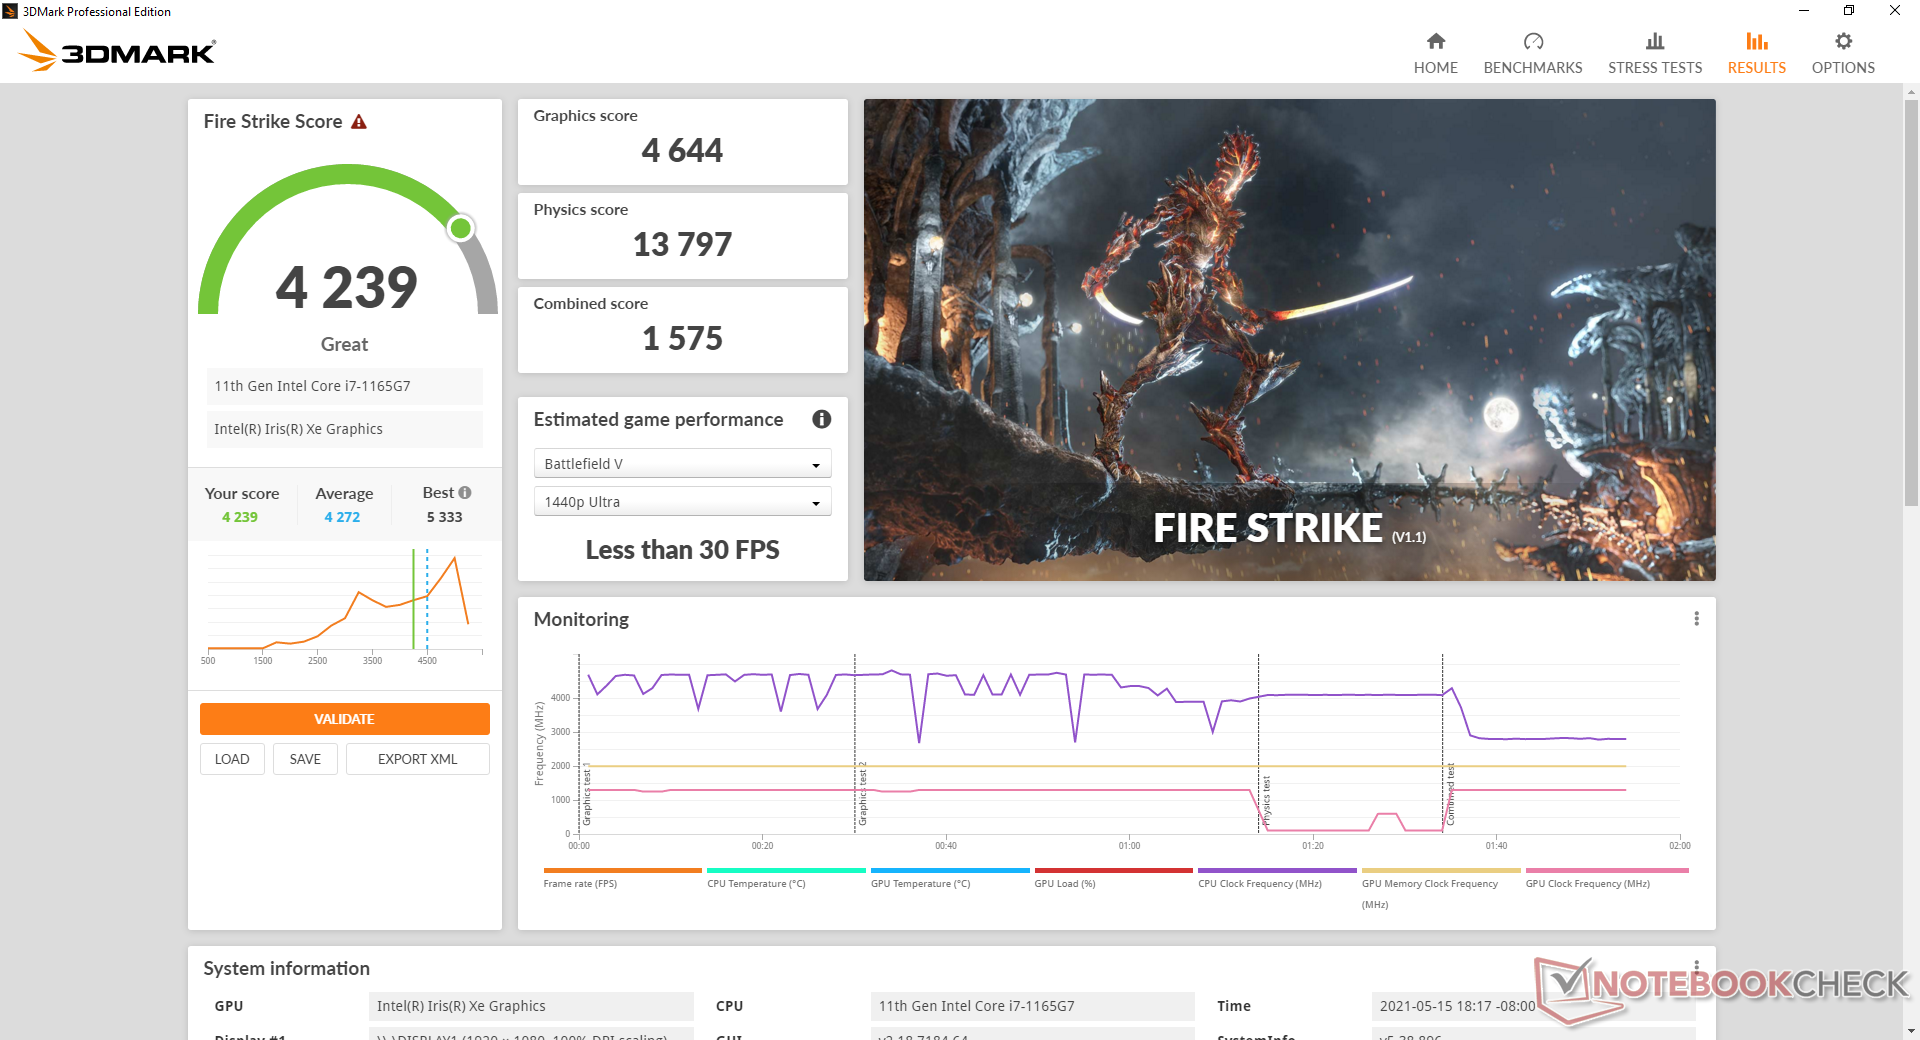
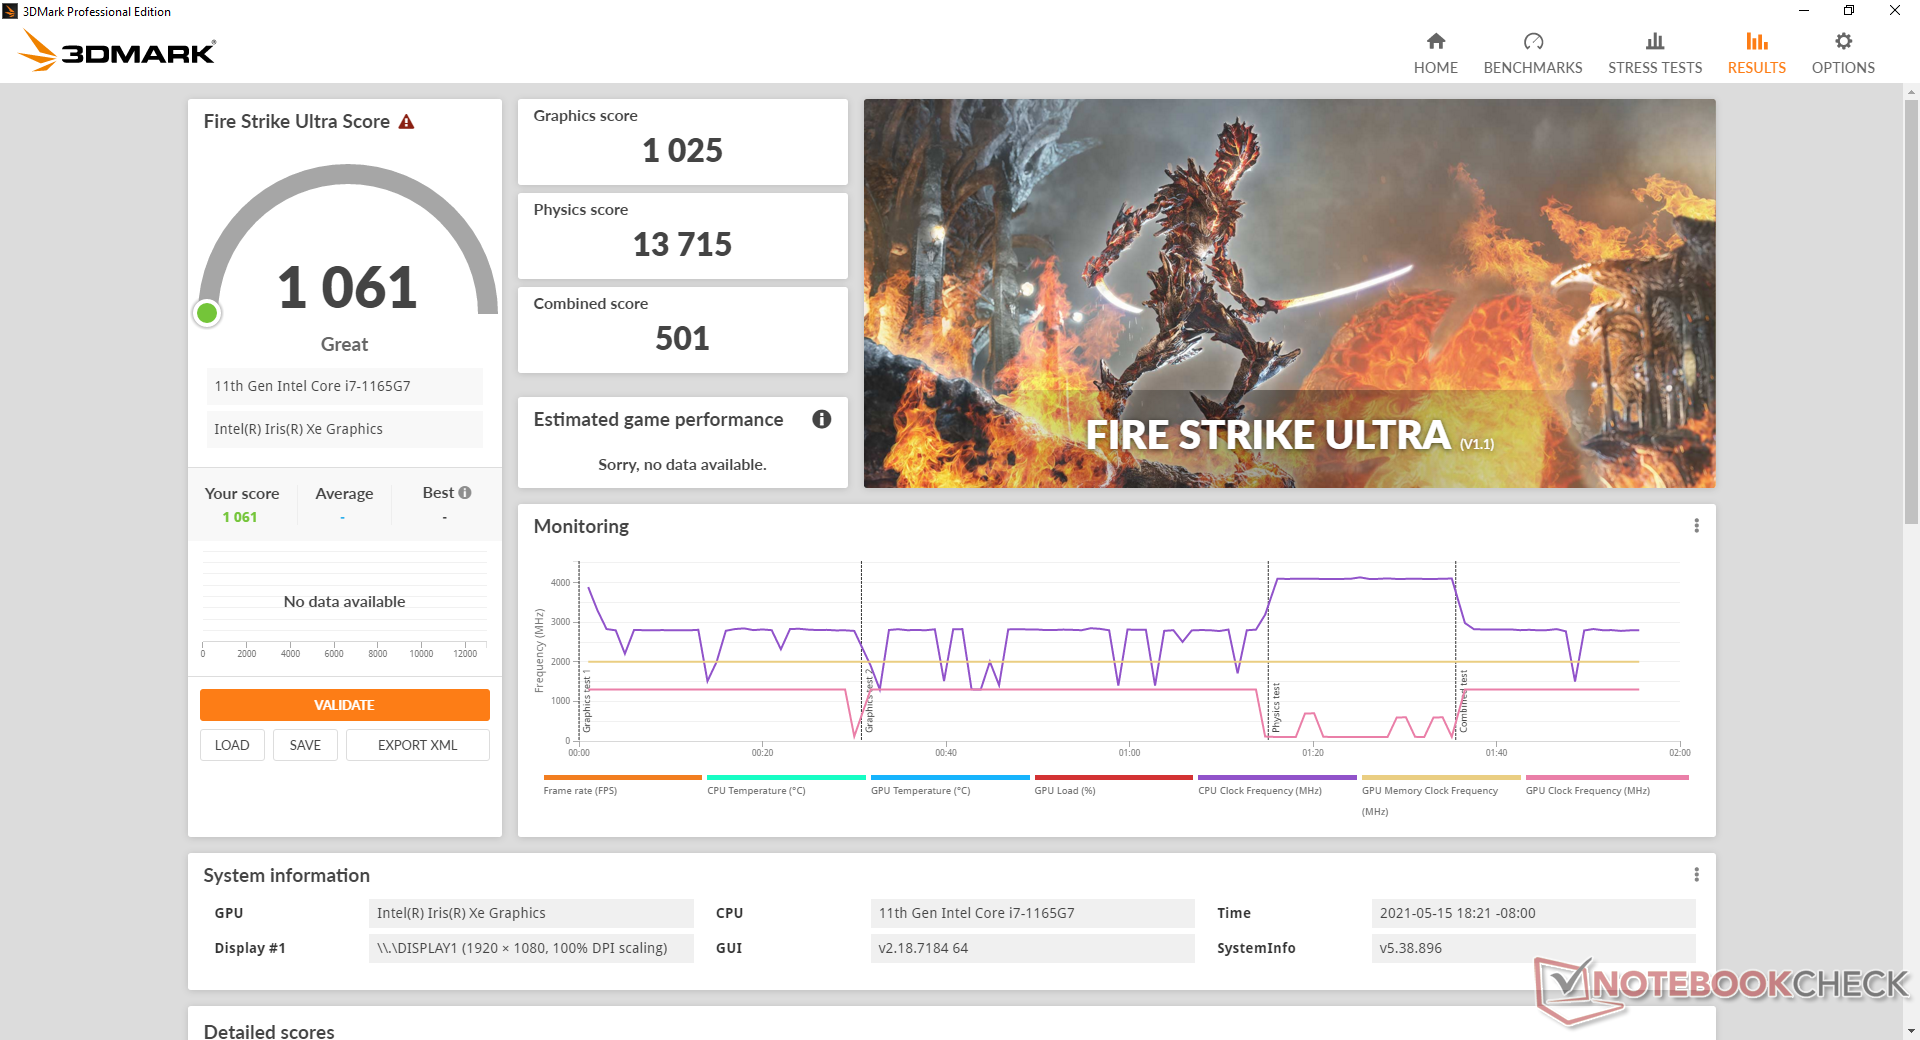
Die Grafikleistung liegt innerhalb weniger Prozentpunkte des durchschnittlichen Notebooks in unserer Datenbank, das mit der gleichen Iris Xe 96 EUs GPU ausgestattet ist. Obwohl 3DMark zeigt, dass die Iris Xe die GeForce MX250/350/450-Serie übertrifft, sind diese Nvidia-GPUs unter realen Spielbedingungen immer noch die bessere Wahl, was vor allem an den ausgereifteren Treibern von Nvidia und dem höheren Leistungsumfang liegt, der der CPU zur Verfügung steht, wenn eine diskrete GPU vorhanden ist. Was die integrierten GPUs betrifft, ist die Iris Xe jedoch die beste Wahl.
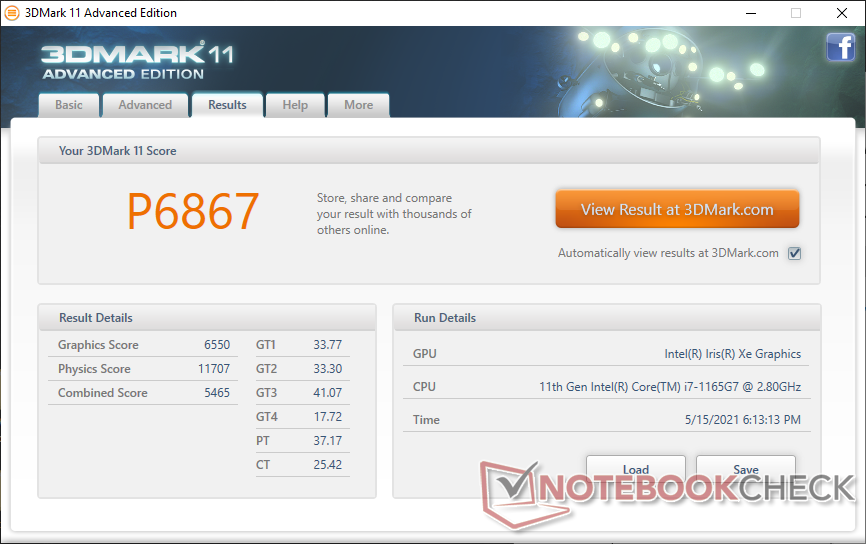
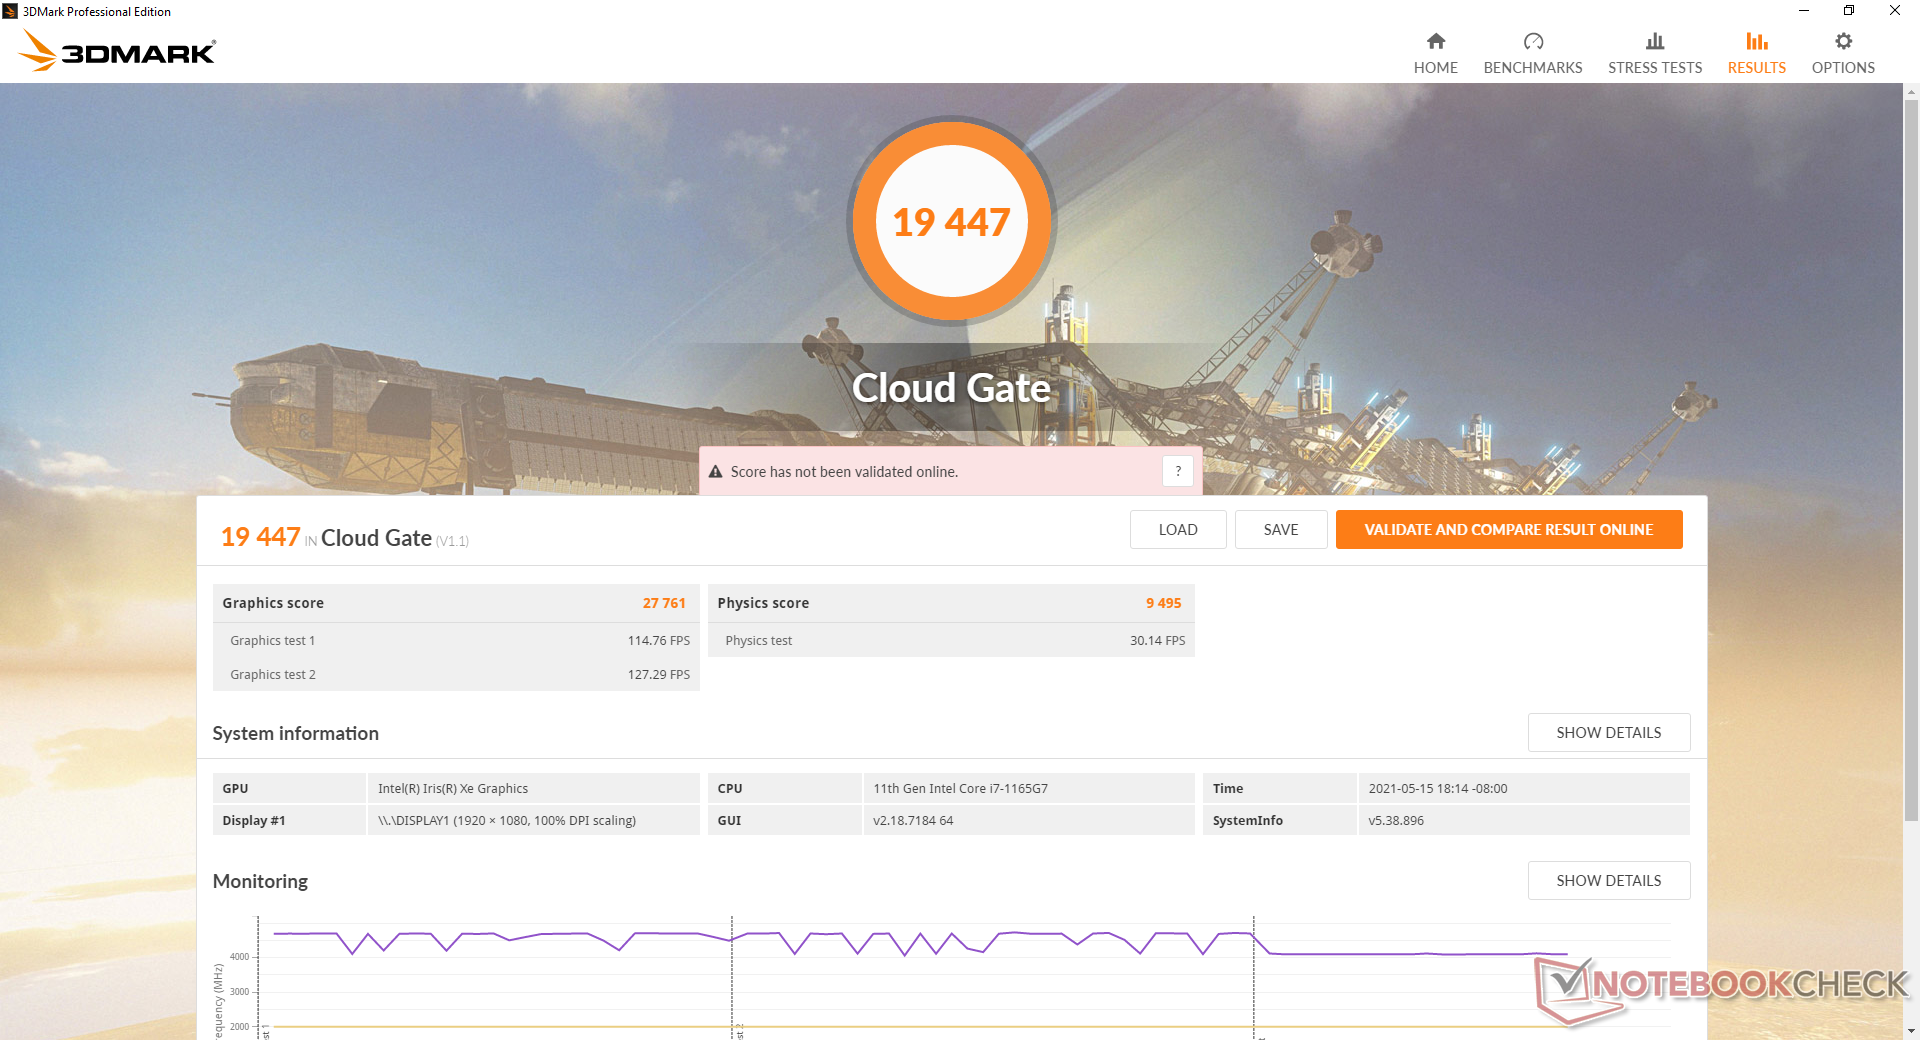
| 3DMark 11 Performance | 6867 Punkte | |
| 3DMark Cloud Gate Standard Score | 19447 Punkte | |
| 3DMark Fire Strike Score | 4239 Punkte | |
| 3DMark Time Spy Score | 1577 Punkte | |
Hilfe | ||
| Final Fantasy XV Benchmark | |
| 1280x720 Lite Quality | |
| ADATA XPG Xenia Xe | |
| Durchschnittliche Intel Iris Xe Graphics G7 96EUs (14.9 - 56.5, n=189) | |
| MSI Summit B15 A11M | |
| Lenovo Yoga Slim 7-14ARE | |
| Lenovo IdeaPad Flex 5 14ALC05 82HU002YUS | |
| 1920x1080 Standard Quality | |
| ADATA XPG Xenia Xe | |
| Durchschnittliche Intel Iris Xe Graphics G7 96EUs (10.5 - 31.2, n=185) | |
| MSI Summit B15 A11M | |
| Lenovo Yoga Slim 7-14ARE | |
| Lenovo IdeaPad Flex 5 14ALC05 82HU002YUS | |
| 1920x1080 High Quality | |
| ADATA XPG Xenia Xe | |
| Durchschnittliche Intel Iris Xe Graphics G7 96EUs (8.15 - 27.8, n=178) | |
| MSI Summit B15 A11M | |
| Lenovo Yoga Slim 7-14ARE | |
| Lenovo IdeaPad Flex 5 14ALC05 82HU002YUS | |
| min. | mittel | hoch | max. | |
|---|---|---|---|---|
| The Witcher 3 (2015) | 95.3 | 56.3 | 30.8 | 14.5 |
| Dota 2 Reborn (2015) | 81.5 | 67.3 | 45.4 | 42.3 |
| Final Fantasy XV Benchmark (2018) | 39.1 | 20.4 | 15.8 | |
| X-Plane 11.11 (2018) | 59.3 | 42.3 | 38.5 |
Emissionen
Systemrauschen
Das Lüftergeräusch ist nie wirklich leise, selbst wenn der Modus "Silent" im MSI Center eingestellt ist. Wir können ein sehr geringes Lüftergeräusch von 26,4 dB(A) vor einem Hintergrund von 25,2 dB(A) aufzeichnen, egal auf welche Einstellung das Notebook gesetzt ist.
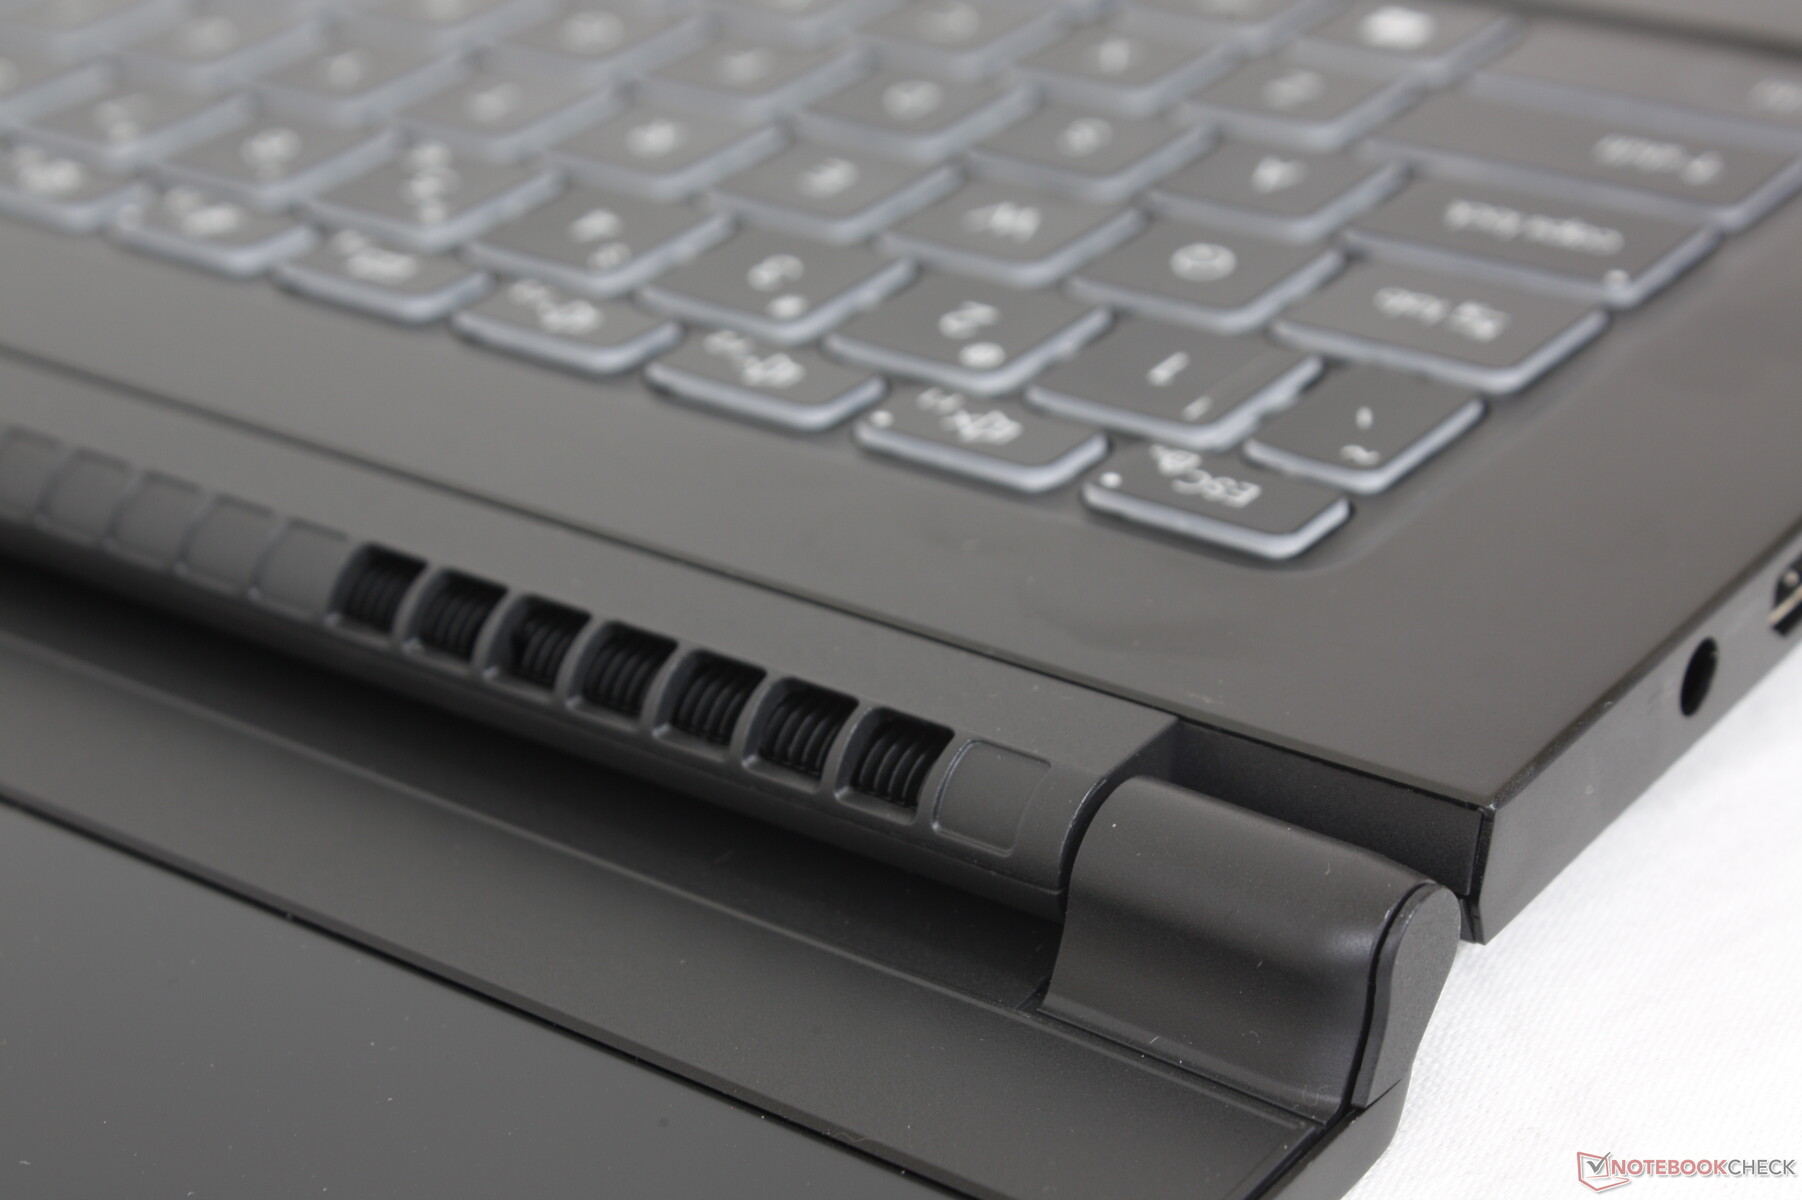
Erfreulicherweise bleiben die Lüfter auch nach dem Durchlaufen der ersten Benchmarkszene des 3DMark 06 mit 26,4 dB(A) leise. Das liegt daran, dass die Kühllösung so konzipiert wurde, dass sie sowohl eine CPU als auch eine diskrete GPU kühlt, wie die Bilder unten zeigen, obwohl unser Summit B15 keine diskrete GPU besitzt. Daher müssen die beiden internen Lüfter nicht immer aktiv sein, um das System so kühl zu halten.
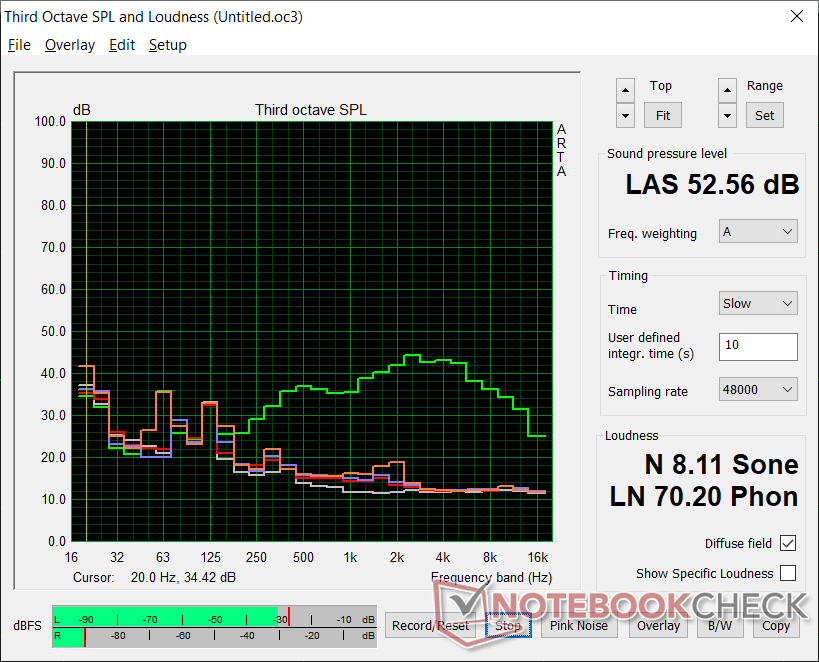
Natürlich kann das System trotzdem sehr laut werden, wenn Spiele mit hohen Frameraten laufen, bei denen die CPU belastet wird. In diesem Fall kann das Lüftergeräusch bis zu 40 dB(A) bzw. 52,6 dB(A) betragen, wenn Cooler Boost aus- bzw. eingeschaltet ist. Beachten Sie, dass Cooler Boost bei diesem ULV-Laptop größtenteils unnötig ist, wie der Abschnitt zum Stresstest unten zeigen wird.
Das Lüftergeräusch ist sehr gering, wenn Witcher 3 auf Ultra-Einstellungen läuft, da die Frameraten im einstelligen Bereich liegen. Bei niedrigen Grafikeinstellungen würde das Lüftergeräusch aufgrund der erhöhten CPU-Leistung fast sofort in den 40 dB(A)-Bereich ansteigen.
| MSI Summit B15 A11M Iris Xe G7 96EUs, i7-1165G7, Kingston OM8PCP31024F | MSI Summit E15 A11SCST GeForce GTX 1650 Ti Max-Q, i7-1185G7, Phison 1TB SM2801T24GKBB4S-E162 | Dell XPS 15 9500 Core i5 UHD Graphics 630, i5-10300H, Toshiba KBG40ZNS256G NVMe | HP Spectre X360 15-5ZV31AV GeForce MX250, i7-10510U, Intel SSD 660p 2TB SSDPEKNW020T8 | ADATA XPG Xenia Xe Iris Xe G7 96EUs, i7-1165G7, ADATA XPG Gammix S50 1TB | |
|---|---|---|---|---|---|
| Geräuschentwicklung | -17% | -2% | -14% | -7% | |
| aus / Umgebung * (dB) | 25.2 | 24 5% | 28 -11% | 30.1 -19% | 25.2 -0% |
| Idle min * (dB) | 26.4 | 28 -6% | 28 -6% | 30.1 -14% | 25.2 5% |
| Idle avg * (dB) | 26.4 | 29 -10% | 28 -6% | 30.1 -14% | 25.2 5% |
| Idle max * (dB) | 26.4 | 32 -21% | 28 -6% | 30.1 -14% | 25.2 5% |
| Last avg * (dB) | 26.8 | 43 -60% | 28 -4% | 30.1 -12% | 35.7 -33% |
| Witcher 3 ultra * (dB) | 28 | 41 -46% | 39.7 -42% | 39.7 -42% | |
| Last max * (dB) | 52.6 | 44 16% | 41.9 20% | 42 20% | 45.3 14% |
* ... kleinere Werte sind besser
Lautstärkediagramm
| Idle |
| 26.4 / 26.4 / 26.4 dB(A) |
| Last |
| 26.8 / 52.6 dB(A) |
 | ||
30 dB leise 40 dB(A) deutlich hörbar 50 dB(A) störend |
||
min: | ||
Temperatur
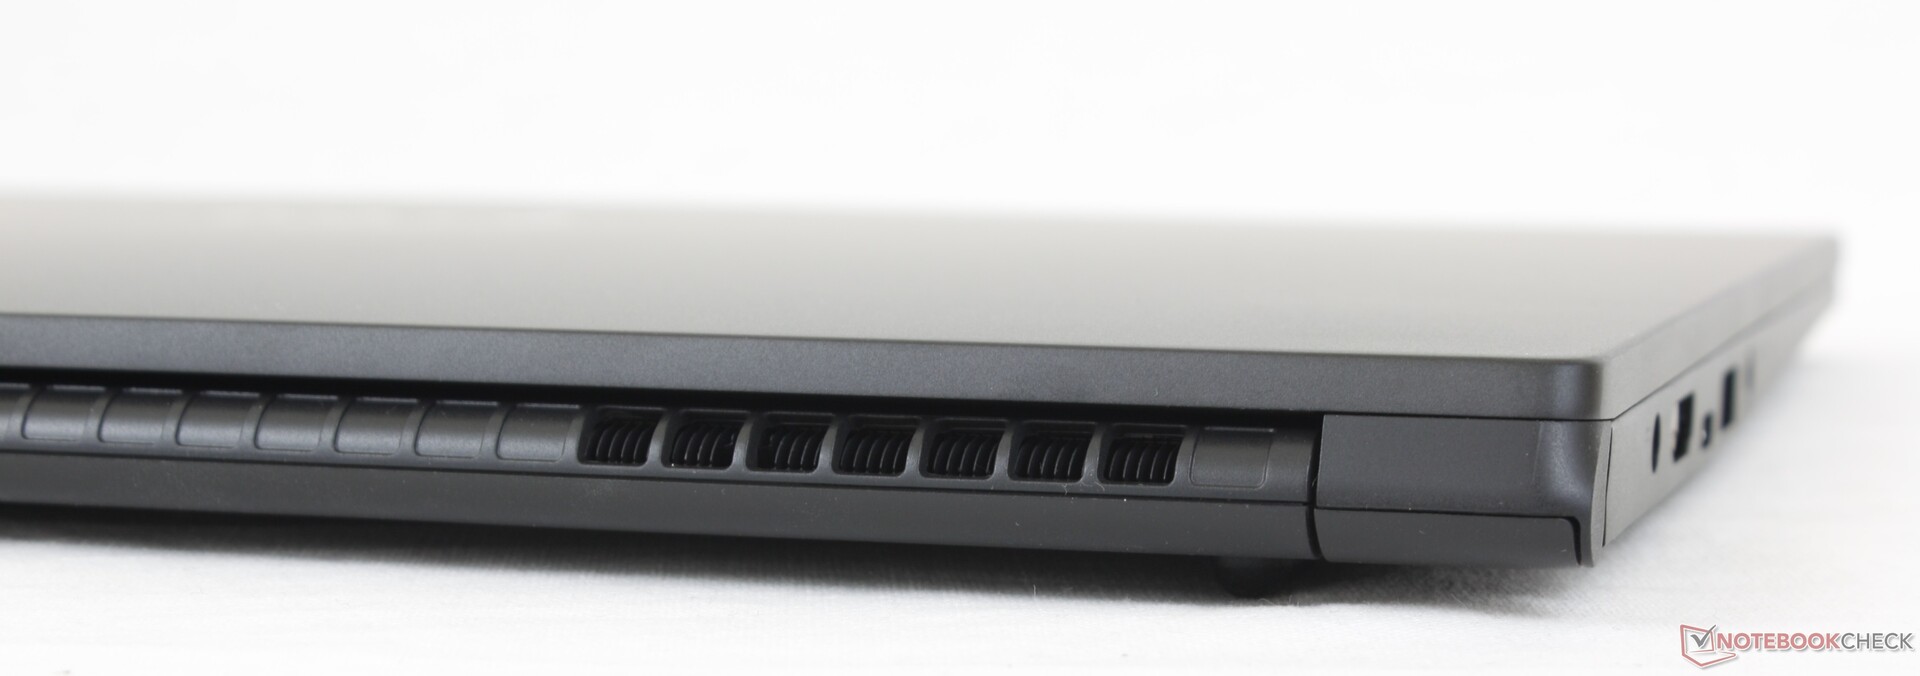
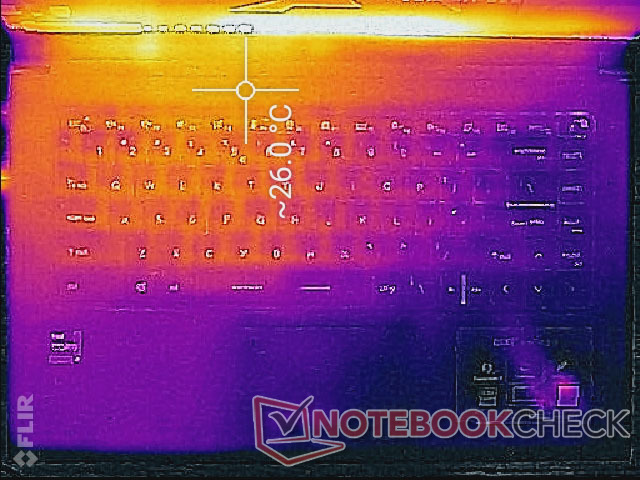
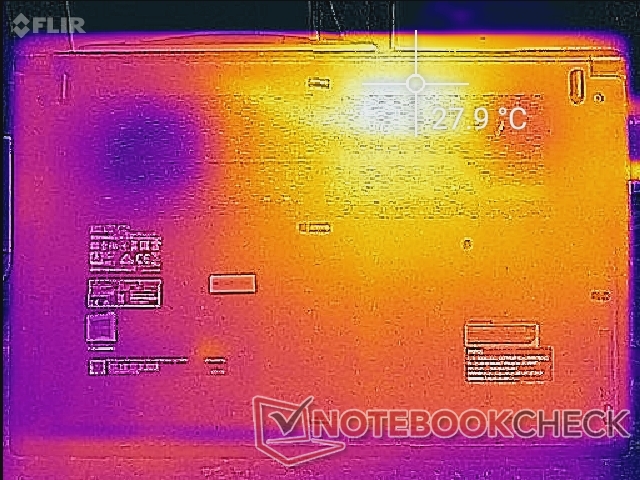
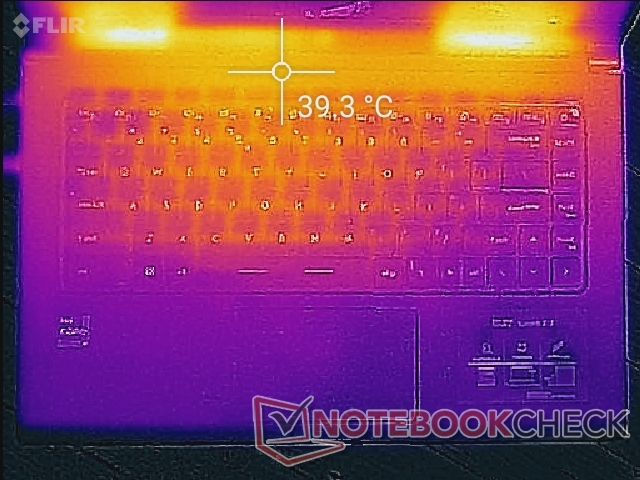
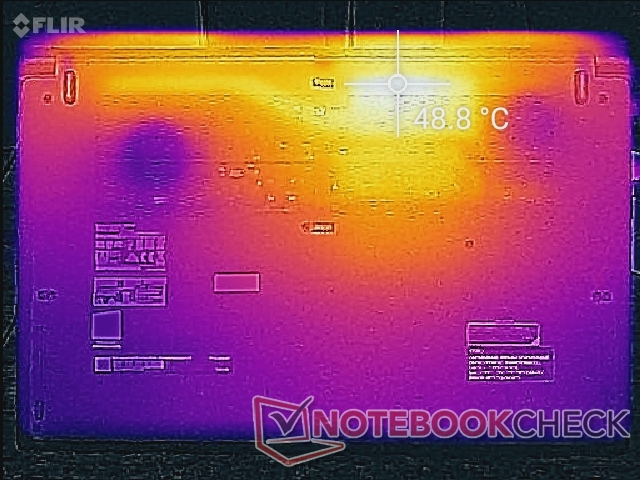
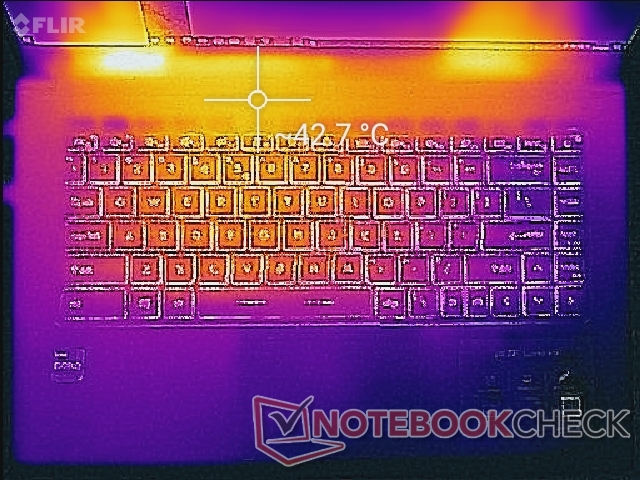
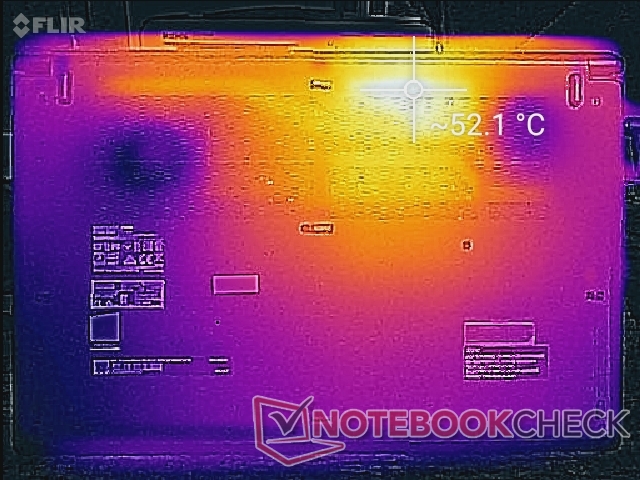
Die Oberflächentemperaturen sind merklich kühler als beim Modern 15, was wahrscheinlich daran liegt, dass unser Summit B15 nicht mit einer diskreten GPU ausgestattet ist. Zum Beispiel stabilisiert sich die Tastaturmitte bei hoher Rechenlast bei etwa 38 °C, verglichen mit 45 °C beim Modern 15. Auch die Hotspots auf der Unterseite sind diesmal ein paar Grad kühler. Im Gegensatz zu den winzigen Lüftungsgittern des Razer-Blade-Stealth- oder der Blade-15-Serie ist ein größerer Teil der Unterseite für die Belüftung vorgesehen.
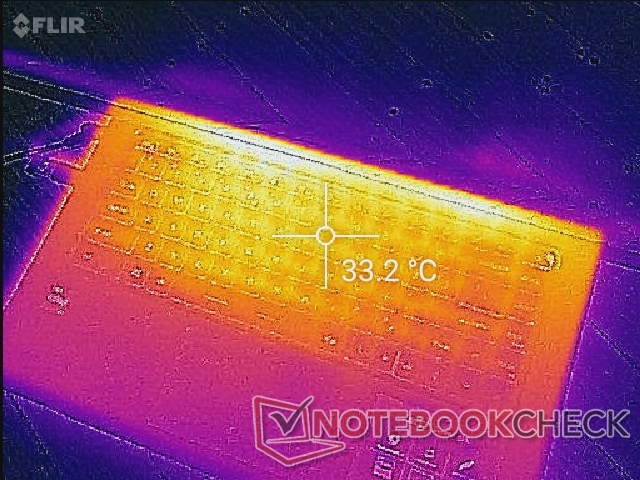
(±) Die maximale Temperatur auf der Oberseite ist 42.8 °C. Im Vergleich liegt der Klassendurchschnitt bei 34.3 °C (von 21.2 bis 62.5 °C für die Klasse Office).
(-) Auf der Unterseite messen wir eine maximalen Wert von 52.2 °C (im Vergleich zum Durchschnitt von 36.8 °C).
(+) Ohne Last messen wir eine durchschnittliche Temperatur von 24.2 °C auf der Oberseite. Der Klassendurchschnitt erreicht 29.5 °C.
(+) Beim längeren Spielen von The Witcher 3 erhitzt sich das Gerät durchschnittlich auf 31.9 °C. Der Durchschnitt der Klasse ist derzeit 29.5 °C.
(+) Die Handballen und der Touchpad-Bereich sind mit gemessenen 29.2 °C kühler als die typische Hauttemperatur und fühlen sich dadurch kühl an.
(±) Die durchschnittliche Handballen-Temperatur anderer getesteter Geräte war 27.5 °C (-1.7 °C).
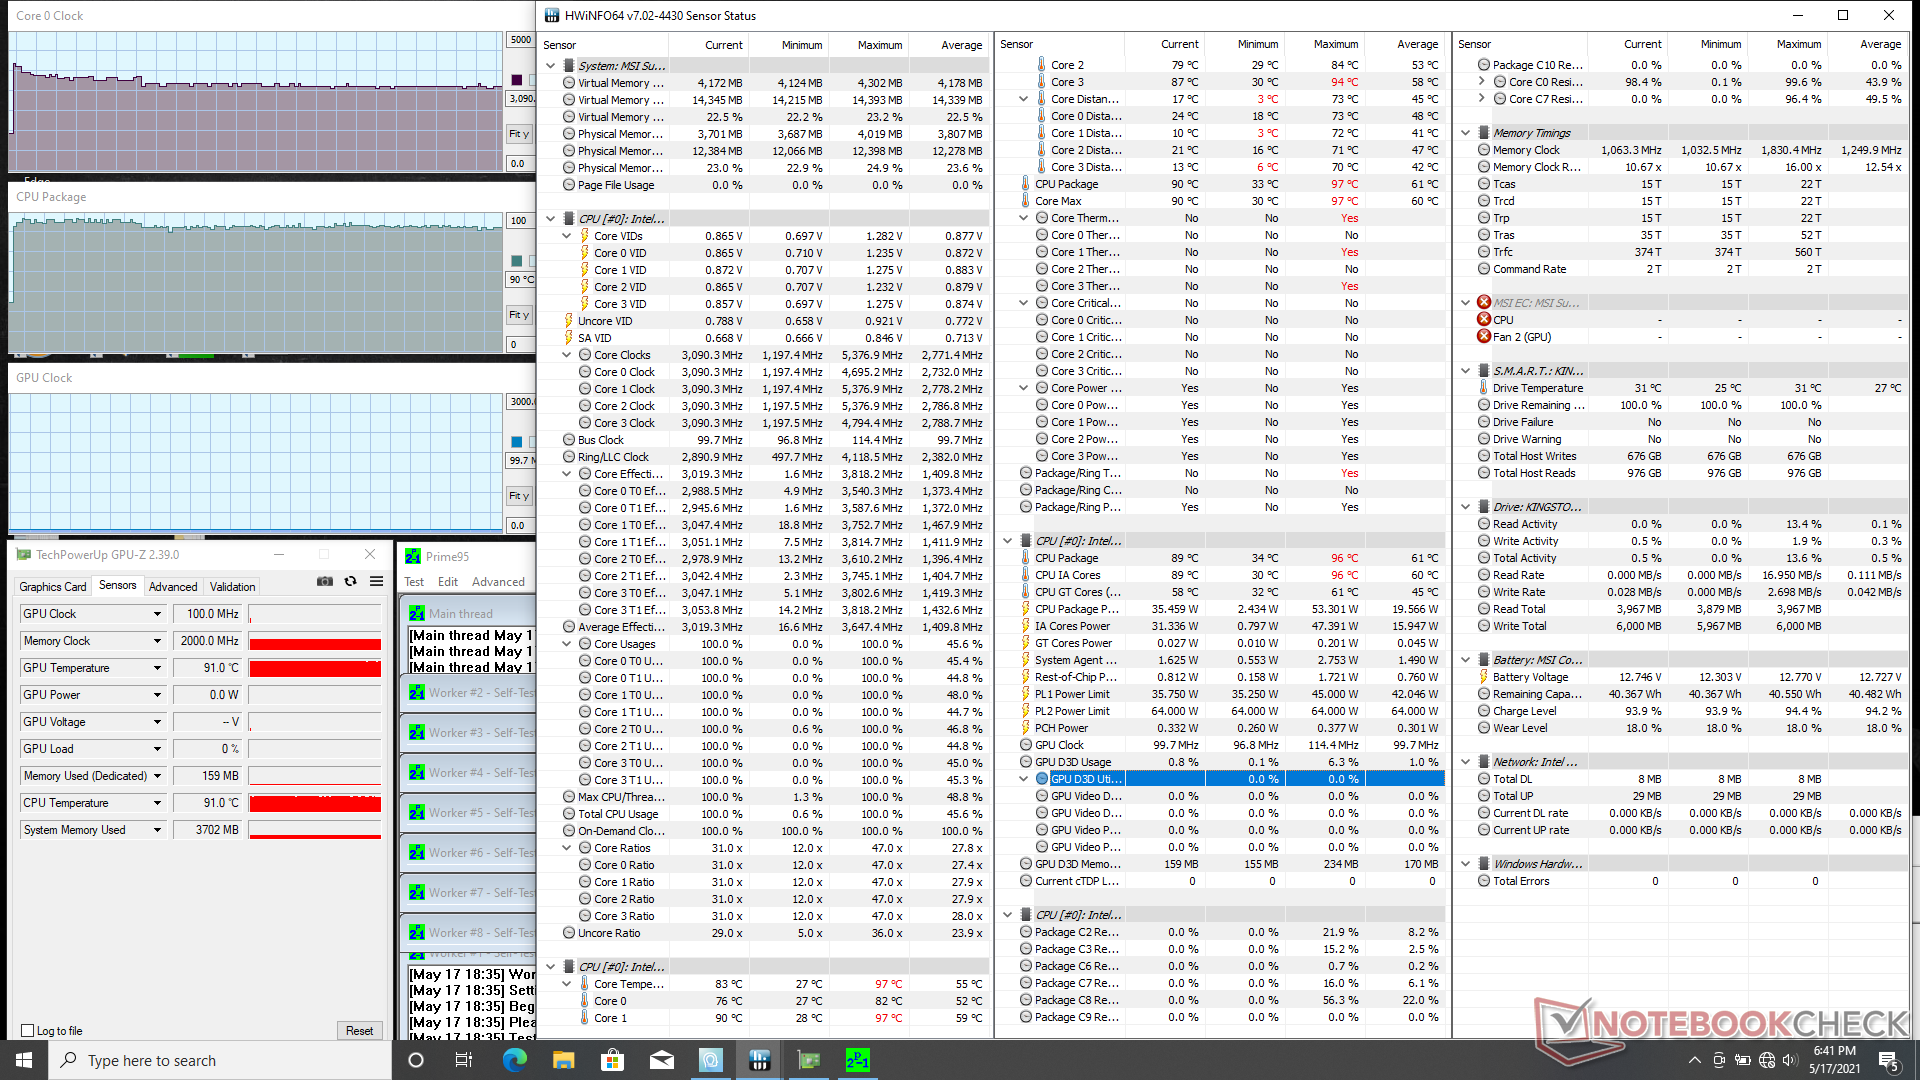
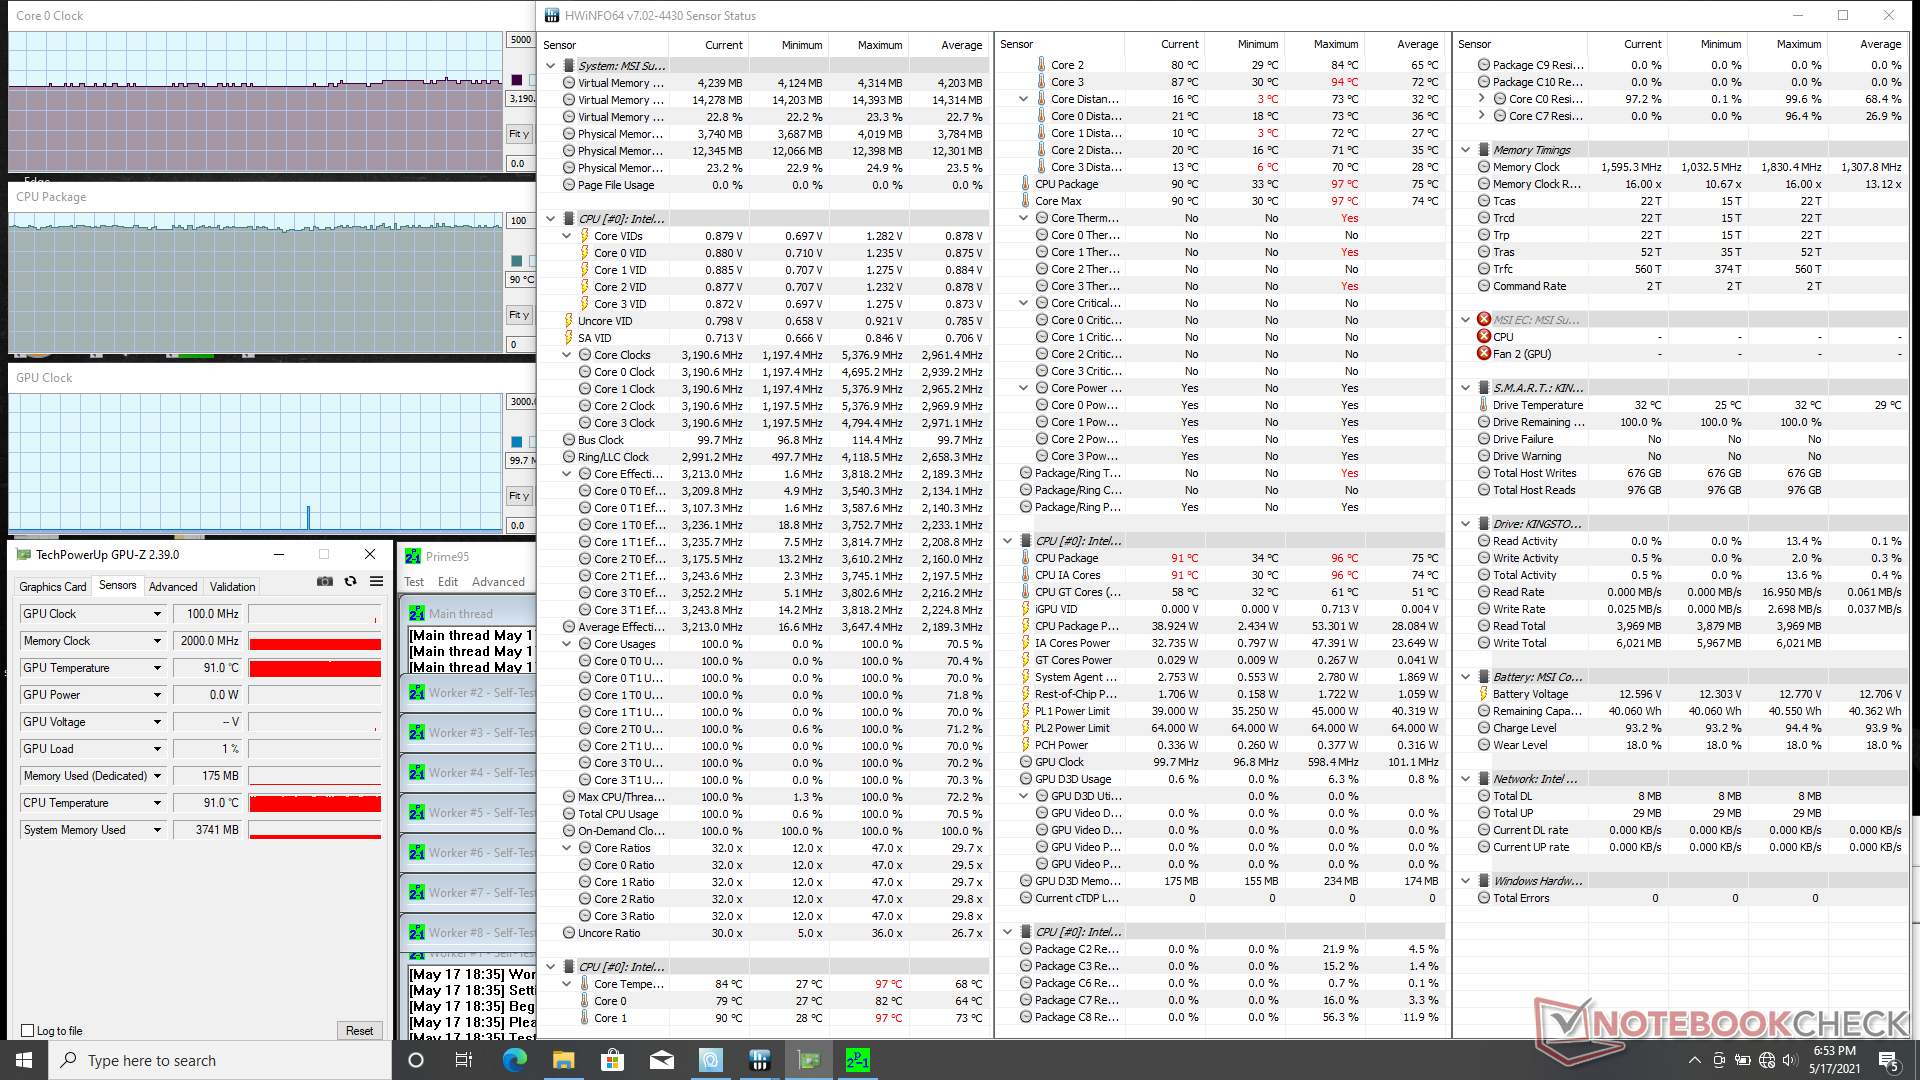
Stresstest
Bei Belastung mit Prime95 stieg die CPU in den ersten Sekunden auf 3,8 GHz, bevor sie stetig abfiel und sich schließlich im Bereich von 3,0 bis 3,1 GHz stabilisierte. Die Aktivierung des Cooler-Boost-Modus (d. h. maximaler Lüftermodus) führt dazu, dass die CPU mit 3,2 bis 3,3 GHz etwas schneller läuft, während die Kerntemperatur mit 90 °C gleich bleibt. Die CPU-Temperatur auf dem Modern 15 ist bei ähnlicher Belastung mit 73 °C viel kühler.
Bei der Ausführung von Witcher 3, was eine reale Belastung darstellt, stabilisiert sich die CPU bei nur 67 °C oder sogar 56 °C, wenn Cooler Boost aktiviert ist. Die Leistung bleibt jedoch unabhängig von der Cooler-Boost-Einstellung gleich, was bedeutet, dass die Funktion hauptsächlich für Temperaturzwecke genutzt wird.
Der Akkubetrieb kann die Grafikleistung beeinträchtigen. Ein 3DMark 11 Test im Akkubetrieb würde den gleichen Physik-Score wie im Netzbetrieb liefern, allerdings mit einem etwas niedrigeren Grafik-Score (6550 vs. 6232 Punkte).
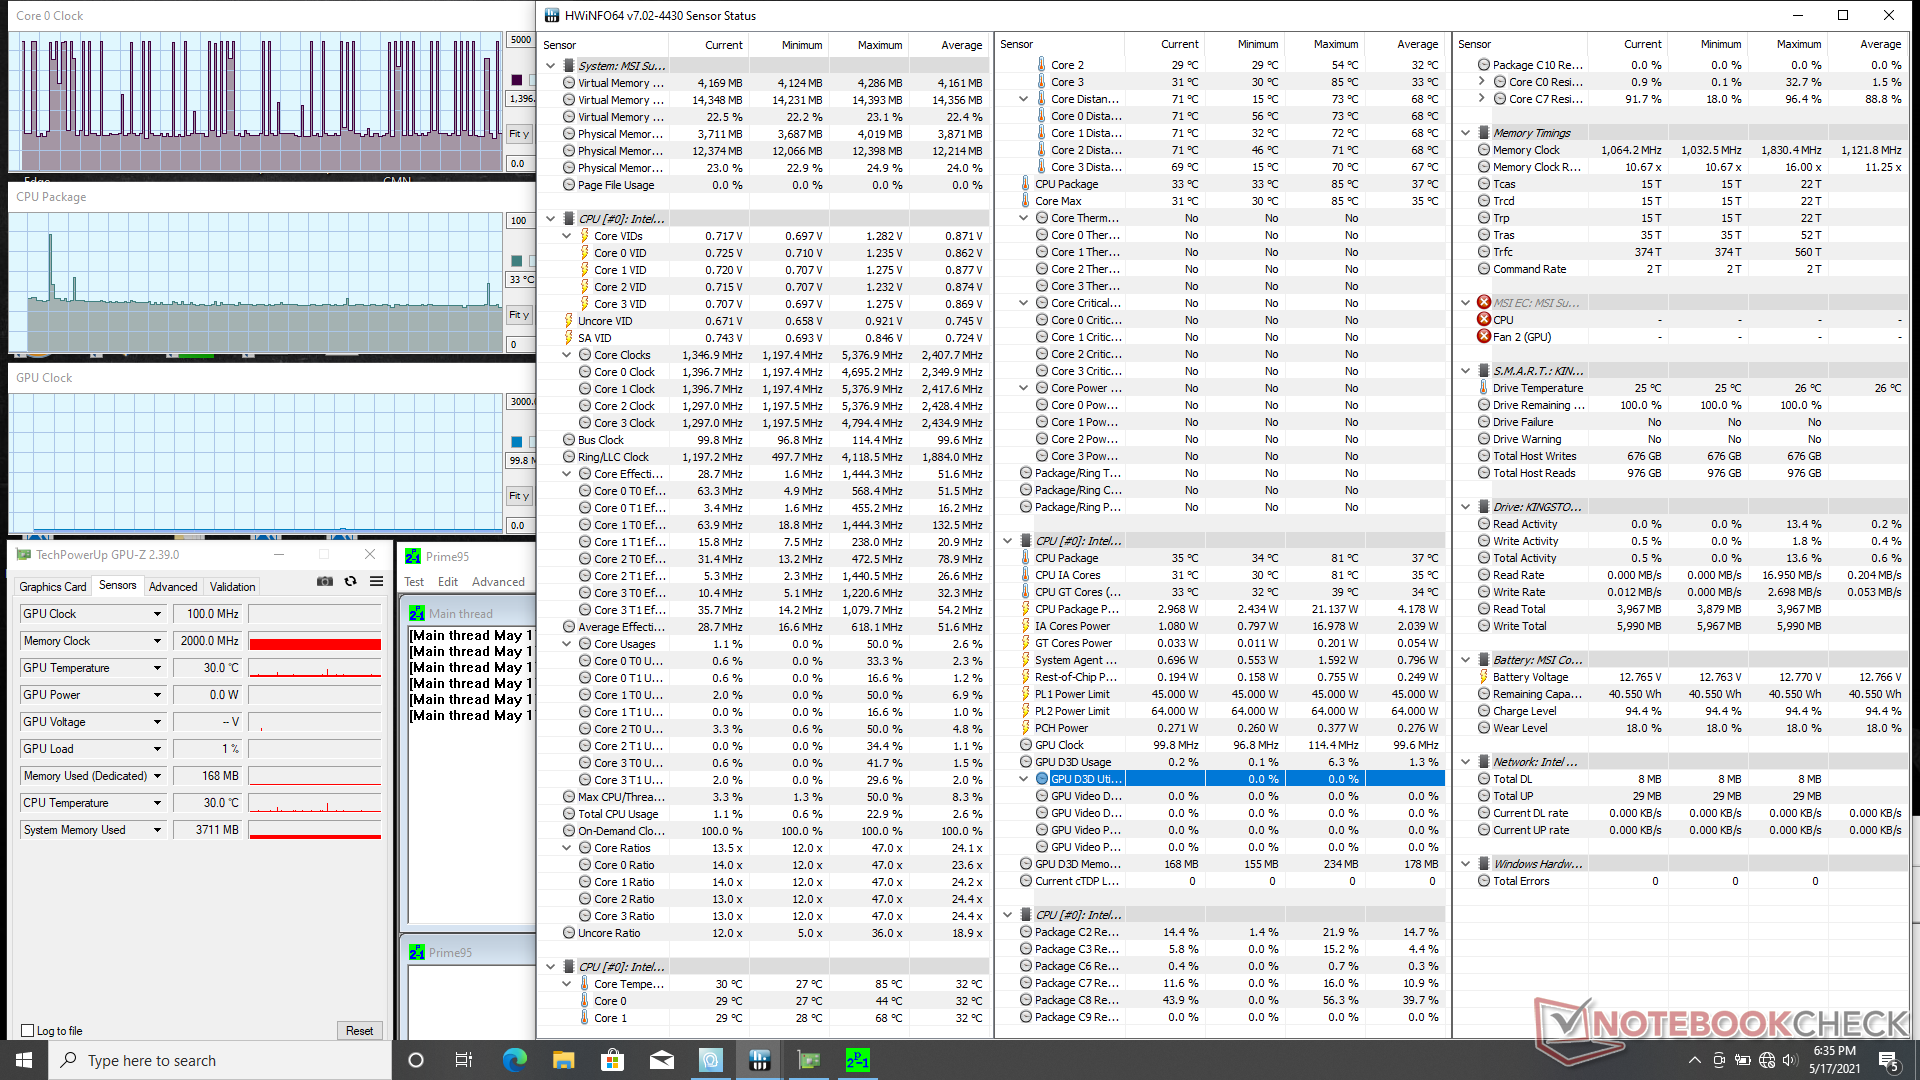
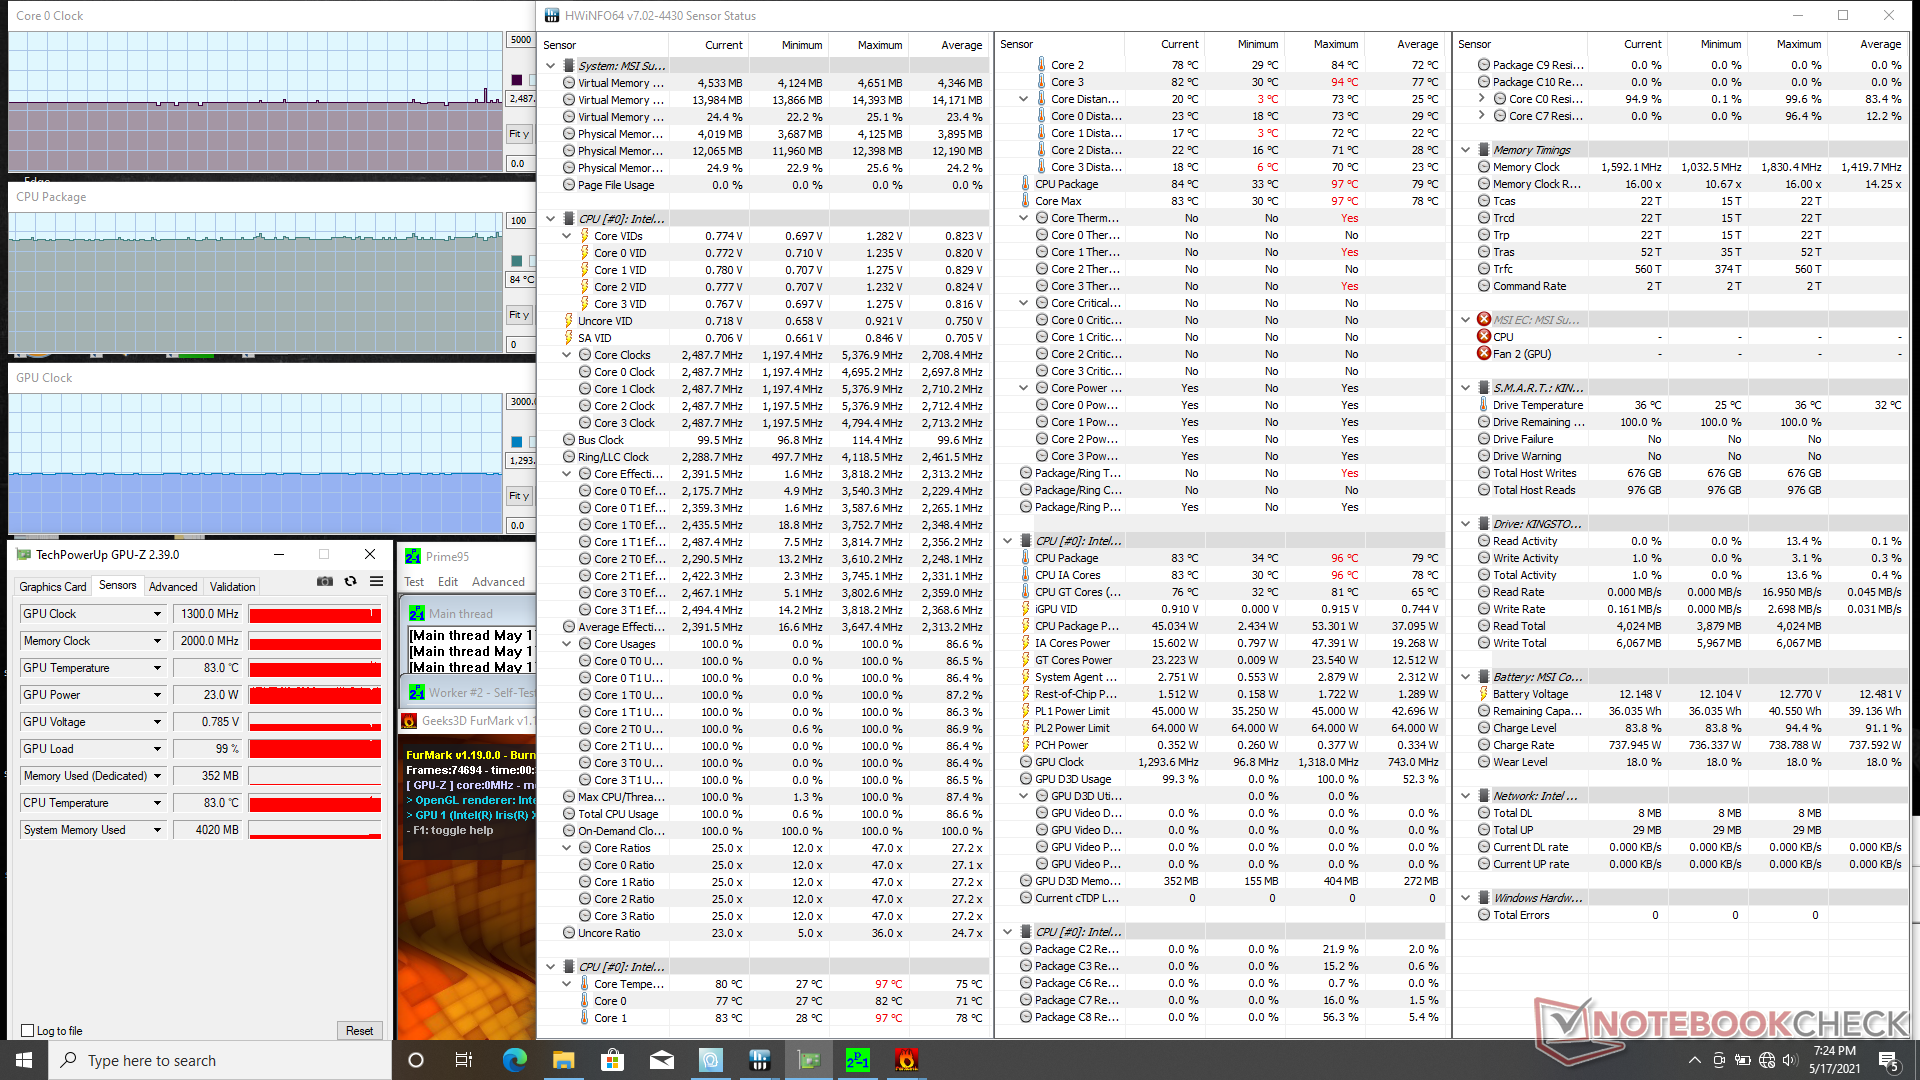
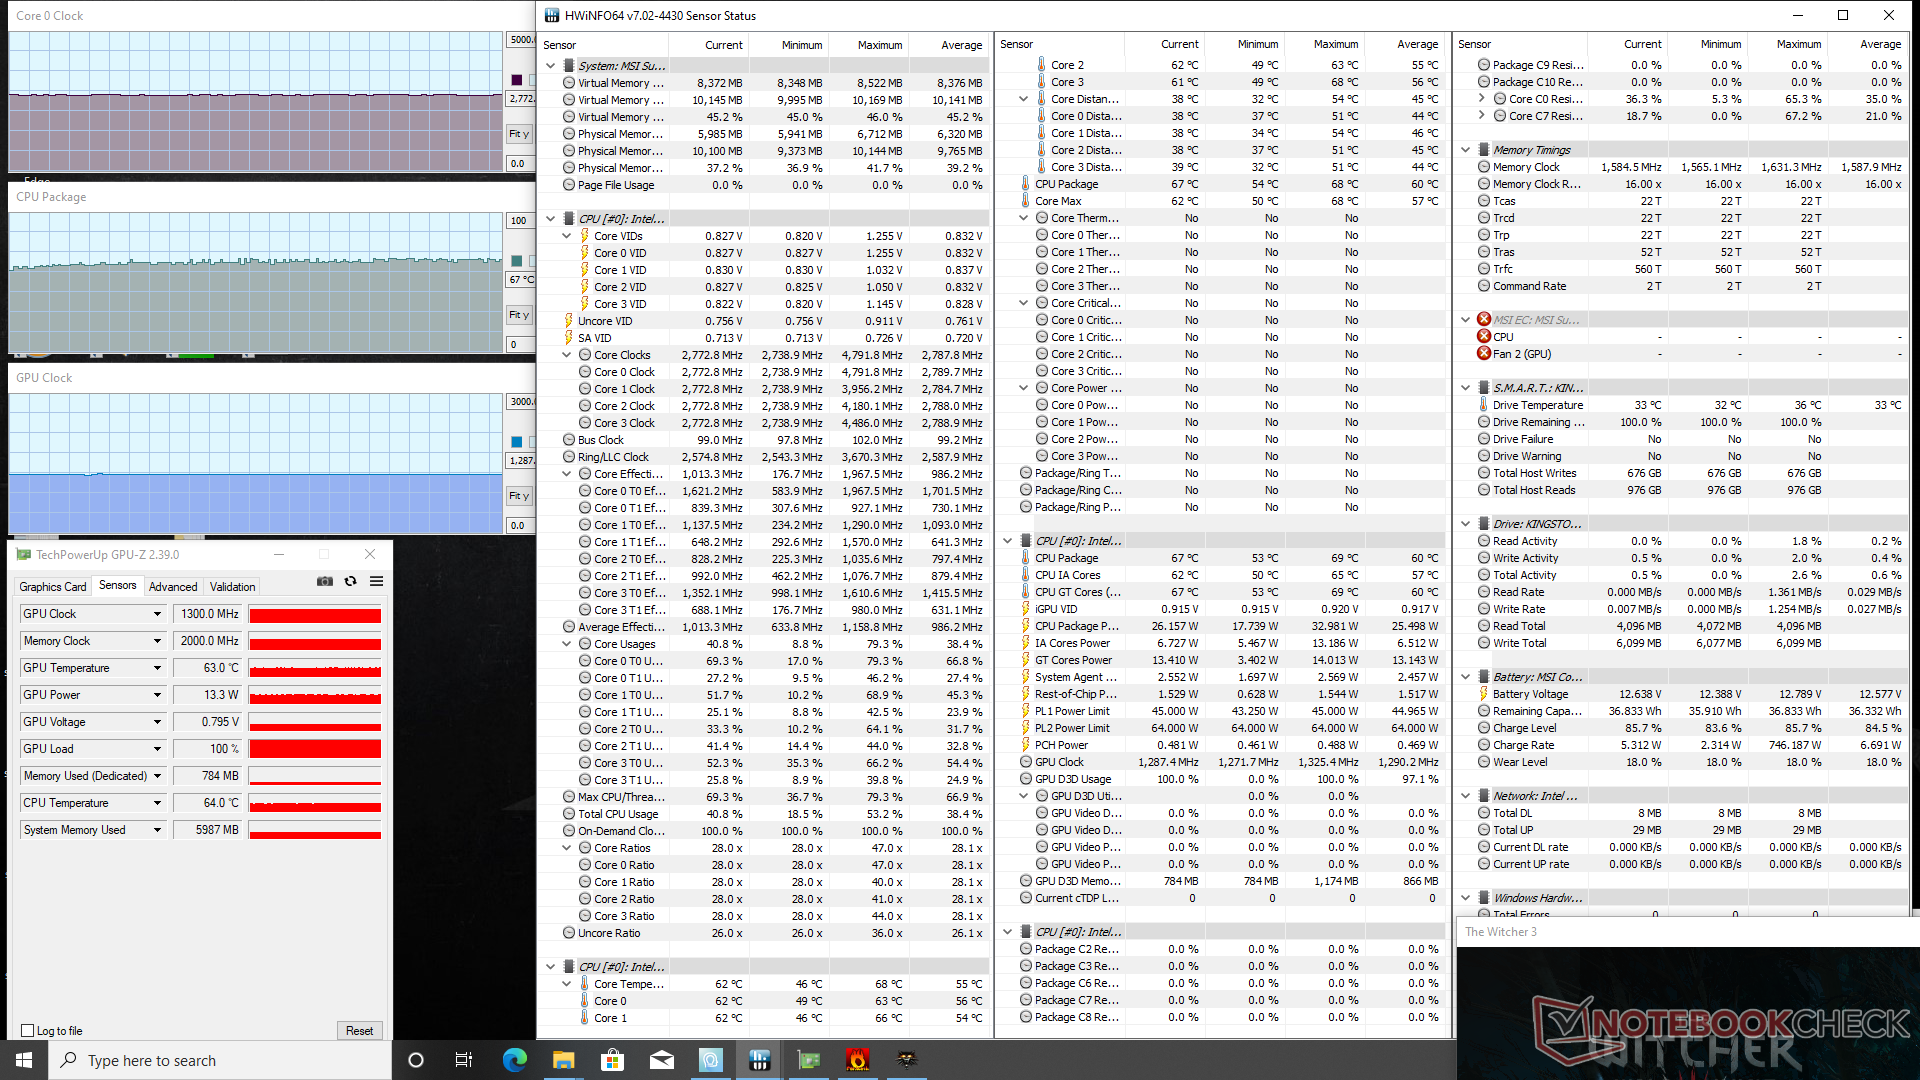

| CPU-Takt (GHz) | GPU-Takt (MHz) | DurchschnittlicheCPU-Temperatur (°C) | |
| System Leerlauf | -- | -- | 33 |
| Prime95 + FurMark Stress (Cooler Boost an) | 2.5 | 1300 | 84 |
| Prime95 Stress (Kühleranhebung aus) | 3.0 - 3.1 | -- | 90 |
| Prime95 Stress (Kühleranhebung ein) | 3.2 - 3.3 | -- | 90 |
| Witcher 3 Stress (Kühleranhebung aus) | 2.8 | 1300 | 67 |
| Witcher 3 Stress (Kühleranhebung ein) | 2.8 | 1300 | 56 |
Lautsprecher


MSI Summit B15 A11M Audio Analyse
(+) | Die Lautsprecher können relativ laut spielen (83.9 dB)
Bass 100 - 315 Hz
(-) | kaum Bass - 18.2% niedriger als der Median
(±) | durchschnittlich lineare Bass-Wiedergabe (12.2% Delta zum Vorgänger)
Mitteltöne 400 - 2000 Hz
(±) | zu hohe Mitten, vom Median 9.5% abweichend
(±) | Linearität der Mitten ist durchschnittlich (9.3% Delta zum Vorgänger)
Hochtöne 2 - 16 kHz
(±) | zu hohe Hochtöne, vom Median nur 7.5% abweichend
(±) | durchschnittlich lineare Hochtöne (7.1% Delta zum Vorgänger)
Gesamt im hörbaren Bereich 100 - 16.000 Hz
(±) | hörbarer Bereich ist durchschnittlich linear (25.6% Abstand zum Median)
Im Vergleich zu allen Geräten derselben Klasse
» 78% aller getesteten Geräte dieser Klasse waren besser, 6% vergleichbar, 16% schlechter
» Das beste Gerät hat einen Delta-Wert von 7%, durchschnittlich ist 21%, das schlechteste Gerät hat 53%
Im Vergleich zu allen Geräten im Test
» 79% aller getesteten Geräte waren besser, 4% vergleichbar, 17% schlechter
» Das beste Gerät hat einen Delta-Wert von 4%, durchschnittlich ist 24%, das schlechteste Gerät hat 134%
Apple MacBook 12 (Early 2016) 1.1 GHz Audio Analyse
(+) | Die Lautsprecher können relativ laut spielen (83.6 dB)
Bass 100 - 315 Hz
(±) | abgesenkter Bass - 11.3% geringer als der Median
(±) | durchschnittlich lineare Bass-Wiedergabe (14.2% Delta zum Vorgänger)
Mitteltöne 400 - 2000 Hz
(+) | ausgeglichene Mitten, vom Median nur 2.4% abweichend
(+) | lineare Mitten (5.5% Delta zum Vorgänger)
Hochtöne 2 - 16 kHz
(+) | ausgeglichene Hochtöne, vom Median nur 2% abweichend
(+) | sehr lineare Hochtöne (4.5% Delta zum Vorgänger)
Gesamt im hörbaren Bereich 100 - 16.000 Hz
(+) | hörbarer Bereich ist sehr linear (10.2% Abstand zum Median
Im Vergleich zu allen Geräten derselben Klasse
» 7% aller getesteten Geräte dieser Klasse waren besser, 2% vergleichbar, 91% schlechter
» Das beste Gerät hat einen Delta-Wert von 5%, durchschnittlich ist 18%, das schlechteste Gerät hat 53%
Im Vergleich zu allen Geräten im Test
» 5% aller getesteten Geräte waren besser, 1% vergleichbar, 94% schlechter
» Das beste Gerät hat einen Delta-Wert von 4%, durchschnittlich ist 24%, das schlechteste Gerät hat 134%
Energieverwaltung
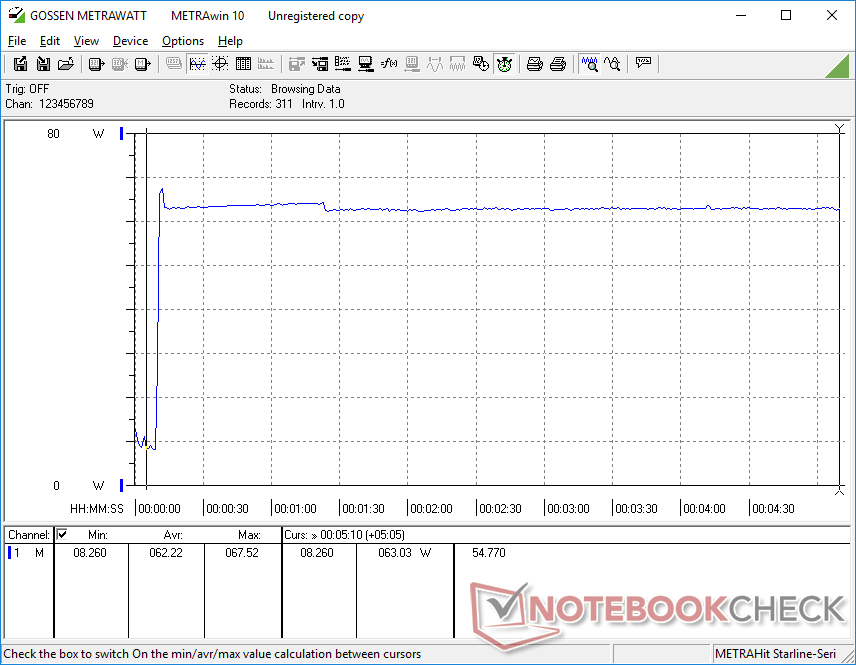
Leistungsaufnahme
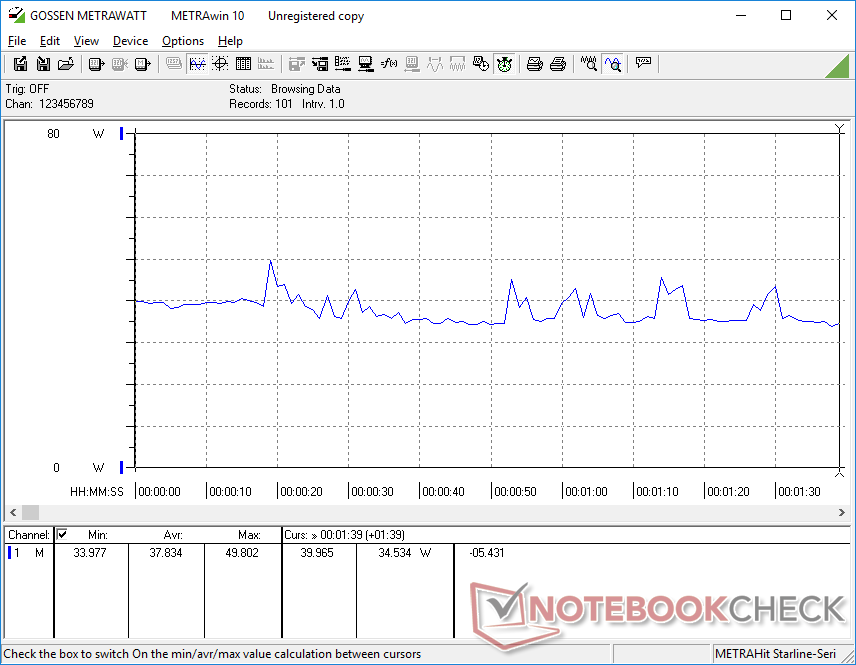
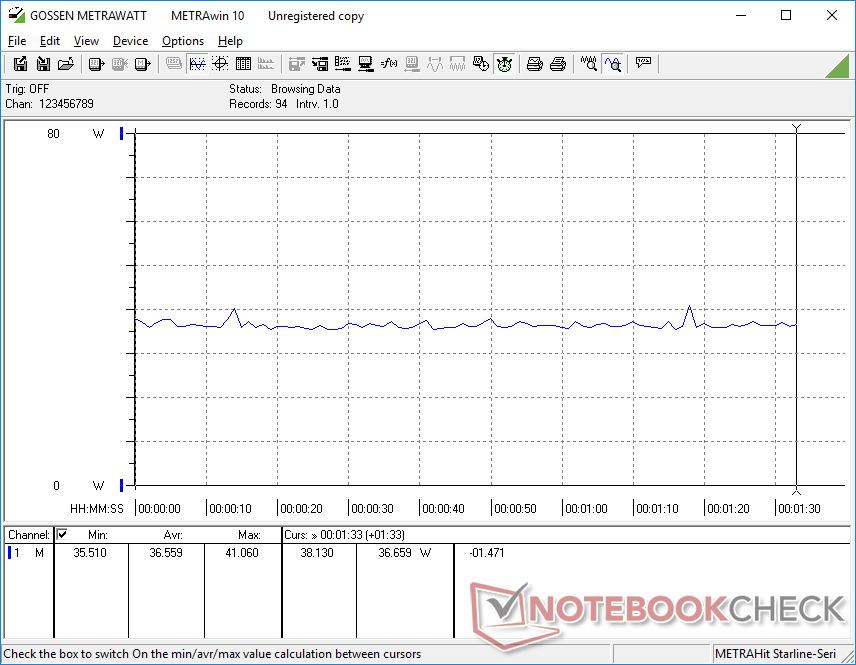
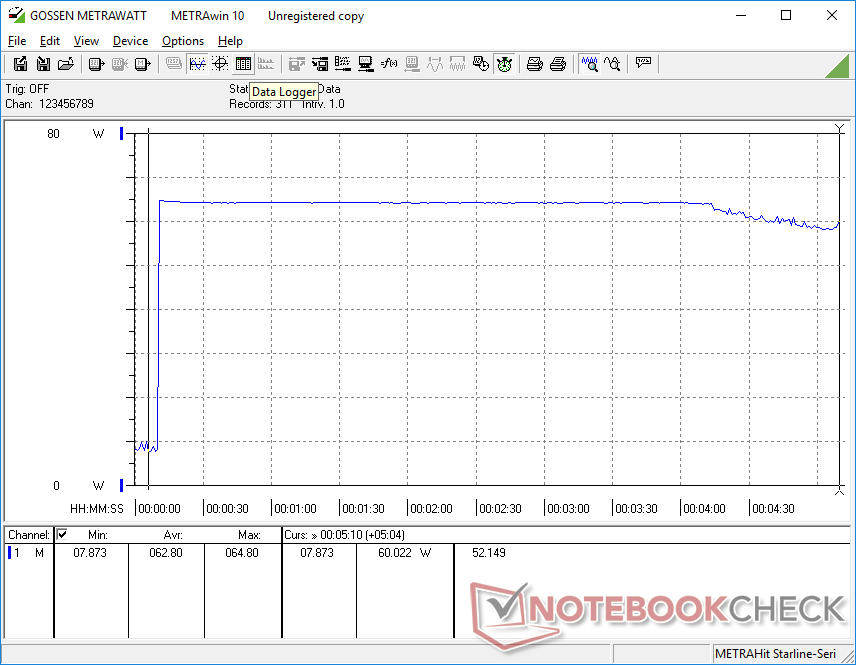
Der Stromverbrauch ist niedrig, vor allem im Vergleich zum Modern 15 aus dem letzten Jahr. Im Leerlauf auf dem Desktop verbraucht es je nach Helligkeitsstufe und Energieprofil zwischen 4 und 9 Watt, während das Modern 15 zwischen 6 und 15 Watt verbraucht. Im Spielbetrieb verbraucht das Summit B15 nur 38 Watt, während das Modern 15 zwischen 59 und 83 Watt verbraucht, obwohl unser Summit-System die 10th-Gen-CPU des Modern 15 übertrifft und in etwa gleichauf mit der GeForce MX250 ist.
Interessant ist, dass das XPG Xenia Xe mit der gleichen Core-i7-1165G7-CPU und Iris-Xe-GPU beim Spielen etwas mehr Energie verbraucht als unser Summit B15 (44 W vs. 38 W). Bei GPU-Benchmarks und Spielen schnitt das XPG-System jedoch ebenfalls durchweg besser ab als unser Summit.
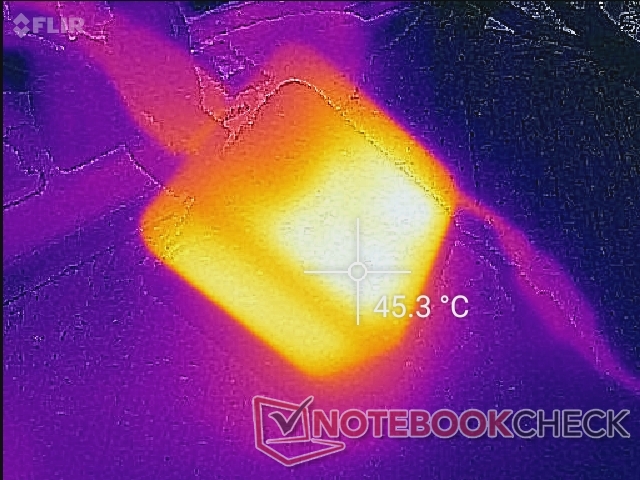
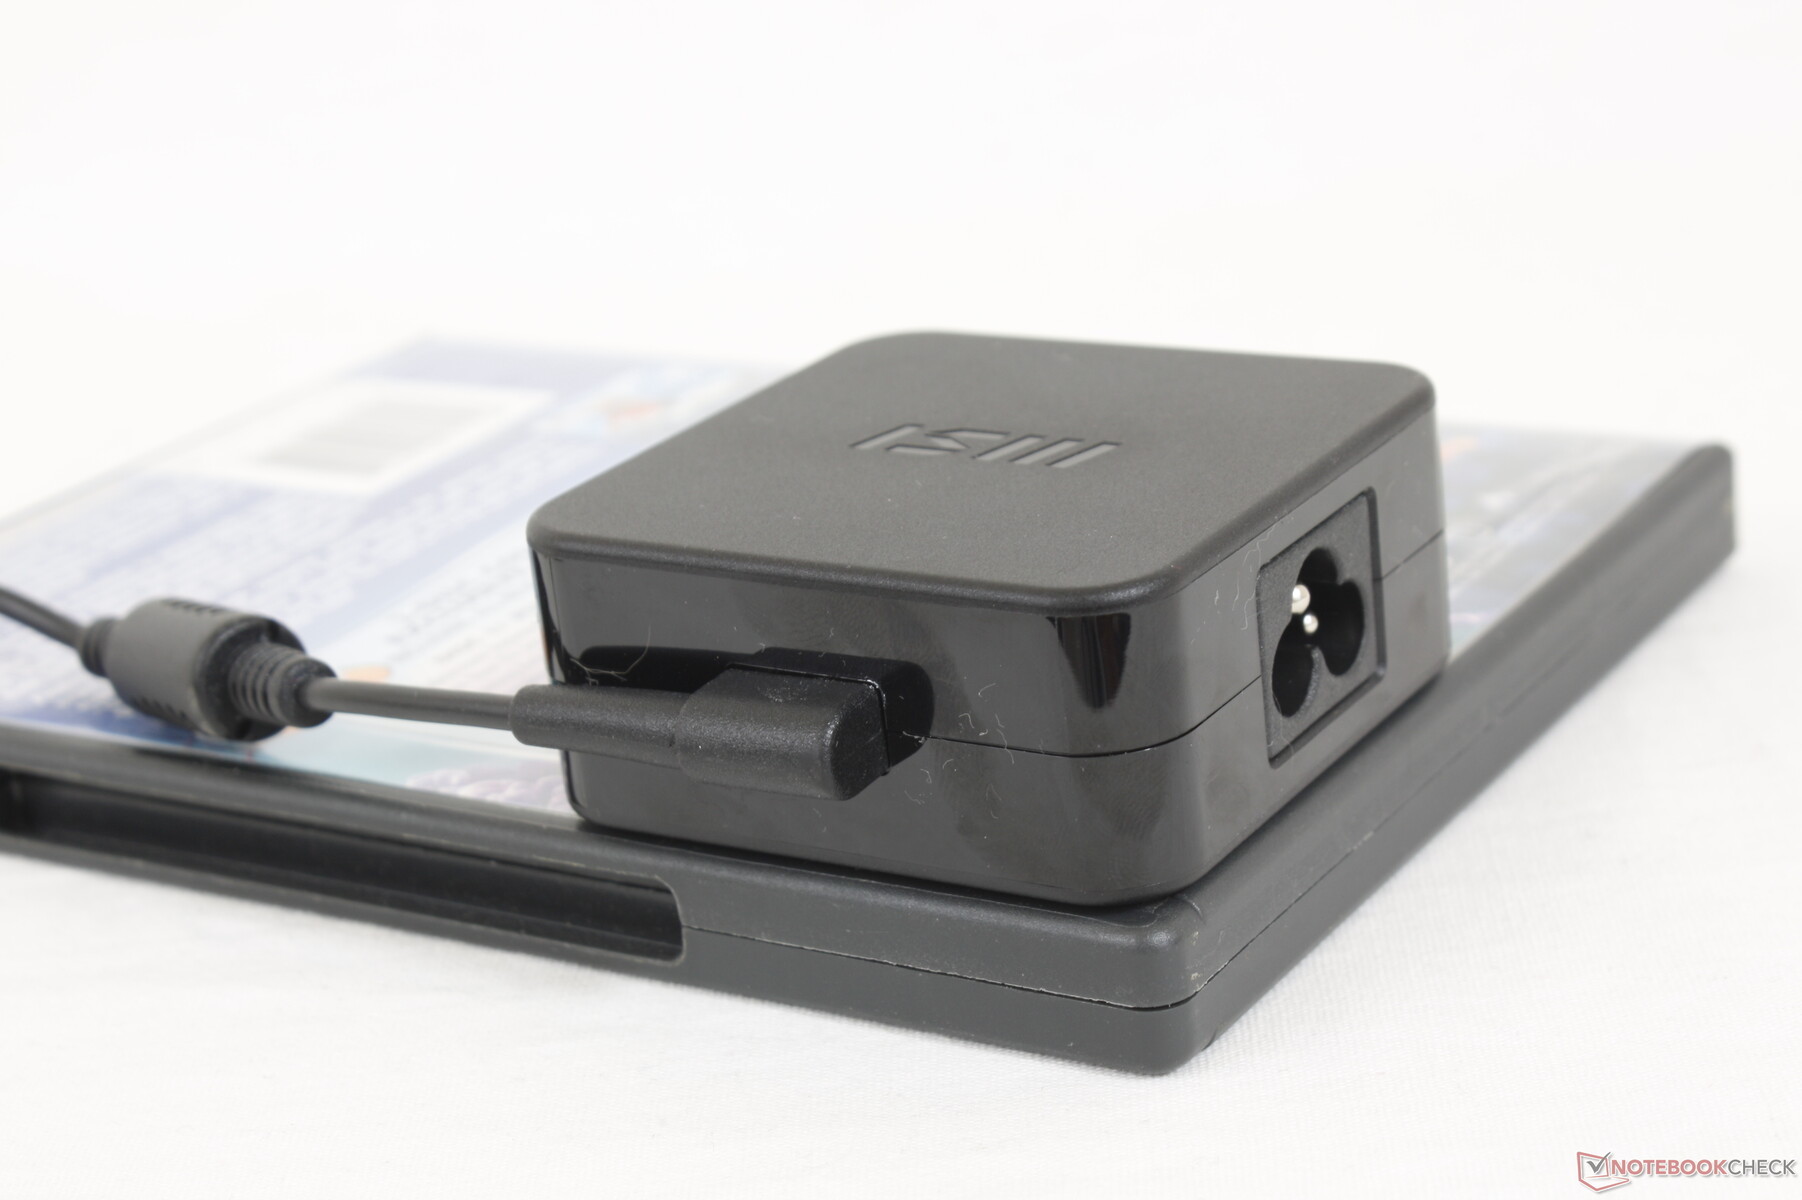
Mit dem kleinen (~6,5 x 6,5 x 2,8 cm) 65-Watt-Netzteil konnten wir eine maximale temporäre Leistungsaufnahme von 67,5 W messen. Unter extremer Belastung kann das System sogar über einen längeren Zeitraum eine grobe Leistungsaufnahme von 60 bis 63 W beibehalten, was zeigt, dass ein leistungsstärkeres Netzteil von Vorteil gewesen wäre.
| Aus / Standby | |
| Idle | |
| Last |
|
Legende:
min: | |
| MSI Summit B15 A11M i7-1165G7, Iris Xe G7 96EUs, Kingston OM8PCP31024F, IPS, 1920x1080, 15.6" | MSI Summit E15 A11SCST i7-1185G7, GeForce GTX 1650 Ti Max-Q, Phison 1TB SM2801T24GKBB4S-E162, IPS, 1920x1080, 15.6" | Dell XPS 15 9500 Core i5 i5-10300H, UHD Graphics 630, Toshiba KBG40ZNS256G NVMe, IPS, 1920x1200, 15.6" | HP Spectre X360 15-5ZV31AV i7-10510U, GeForce MX250, Intel SSD 660p 2TB SSDPEKNW020T8, IPS, 3840x2160, 15.6" | ADATA XPG Xenia Xe i7-1165G7, Iris Xe G7 96EUs, ADATA XPG Gammix S50 1TB, IPS, 1920x1080, 15.6" | Asus ZenBook 15 UX534FTC-A8190T i7-10510U, GeForce GTX 1650 Max-Q, Samsung SSD PM981 MZVLB1T0HALR, IPS, 1920x1080, 15.6" | |
|---|---|---|---|---|---|---|
| Stromverbrauch | -68% | -3% | -34% | 8% | -29% | |
| Idle min * (Watt) | 4.2 | 6 -43% | 2.9 31% | 5.2 -24% | 2.7 36% | 2.8 33% |
| Idle avg * (Watt) | 7.7 | 10 -30% | 7.6 1% | 8.5 -10% | 5.3 31% | 7.7 -0% |
| Idle max * (Watt) | 8.4 | 16 -90% | 8 5% | 8.7 -4% | 7.3 13% | 9.4 -12% |
| Last avg * (Watt) | 37.8 | 84 -122% | 41.7 -10% | 65.6 -74% | 43.6 -15% | 57 -51% |
| Witcher 3 ultra * (Watt) | 36.6 | 69 -89% | 56.5 -54% | 43.5 -19% | 62 -69% | |
| Last max * (Watt) | 67.5 | 90 -33% | 94.8 -40% | 92.4 -37% | 66.8 1% | 116 -72% |
* ... kleinere Werte sind besser
Lebensdauer der Batterie
Die Laufzeiten sind mit rund 6,5 Stunden realer WLAN-Nutzung ordentlich und damit einige Stunden kürzer als beim teureren Summit E15. Der Unterschied lässt sich auf die geringere Akkukapazität von nur 52 W im Vergleich zu 80 W beim vorgenannten Modell zurückführen.
Das Aufladen des Systems von leerer auf volle Kapazität mit dem AC-Fassadapter dauert etwa 2 Stunden. Das System kann auch über USB-C-Netzadapter von Drittanbietern aufgeladen werden. Wir vermuten, dass zukünftige Modelle den proprietären AC-Barrel-Anschluss ganz weglassen werden und nur noch über USB-C geladen werden.
| MSI Summit B15 A11M i7-1165G7, Iris Xe G7 96EUs, 52 Wh | MSI Summit E15 A11SCST i7-1185G7, GeForce GTX 1650 Ti Max-Q, 80.25 Wh | Dell XPS 15 9500 Core i5 i5-10300H, UHD Graphics 630, 56 Wh | HP Spectre X360 15-5ZV31AV i7-10510U, GeForce MX250, 84 Wh | ADATA XPG Xenia Xe i7-1165G7, Iris Xe G7 96EUs, 73.41 Wh | Asus ZenBook 15 UX534FTC-A8190T i7-10510U, GeForce GTX 1650 Max-Q, 71 Wh | |
|---|---|---|---|---|---|---|
| Akkulaufzeit | 41% | 48% | 92% | 77% | 92% | |
| Idle (h) | 18.4 | 19.5 6% | 26.4 43% | 22.6 23% | 27.2 48% | |
| WLAN (h) | 6.6 | 9.1 38% | 9.3 41% | 10.8 64% | 11.7 77% | 12.4 88% |
| Last (h) | 1 | 1.8 80% | 1.6 60% | 2.9 190% | 2.4 140% |
Pro
Contra
Fazit

Lohnt sich der Kauf des MSI Summit B15 gegenüber dem älteren Modern 15, obwohl beide sehr ähnliche Laptops sind? Wenn Sie Wert auf Thunderbolt 4, einen schnelleren Prozessor und generell leisere Lüftergeräusche legen, dann ist das neuere Summit B15 eine Überlegung wert. Seine rohe Leistung ist beeindruckend für einen so leichten 15,6-Zoller und Nutzer können jederzeit externe GPUs und Monitore für schnellere Grafiken bzw. bessere Farben anschließen.
Wer viel unterwegs ist und arbeitet wird das superleichte Gewicht, die leisen Lüfter und die hohe Leistung im Vergleich zu anderen beliebten 15,6-Zoll-Ultrabooks wie dem XPS 15, Spectre x360 15 oder Lenovo IdeaPad 15 schätzen. Für den Preis hätten wir uns aber eine bessere Gehäusesteifigkeit gewünscht.
Wenn Ihre Arbeitslast hauptsächlich aus einfachem Web-Browsing, Video-Streaming, leichtem Gaming oder minimaler Bearbeitung besteht, dann wird das günstigere Modern 15 mit GeForce MX-Grafik mehr als genug sein, denn die beiden Laptops bieten Ähnliches, wenn es um das Display, die Tastatur, das Clickpad und die Gehäusequalität geht.
Preis und Verfügbarkeit
Das MSI Summit B15 ist in Europa zur Zeit nur mit spiegelndem Touch-Display gelistet. Es ist ab 1.465 Euro zum Beispiel bei easynotebooks.de erhältlich.
MSI Summit B15 A11M
- 20.05.2021 v7 (old)
Allen Ngo
Preisvergleich

