MSI GF65 Thin 10UE Laptop Test: GeForce RTX 3060 zu einem günstigen Preis
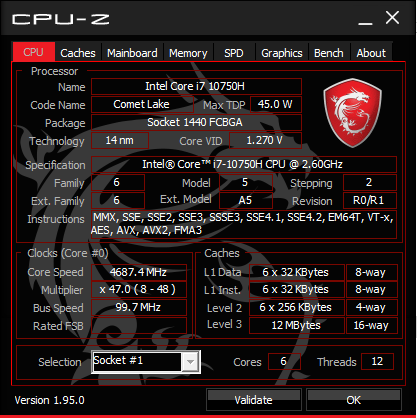
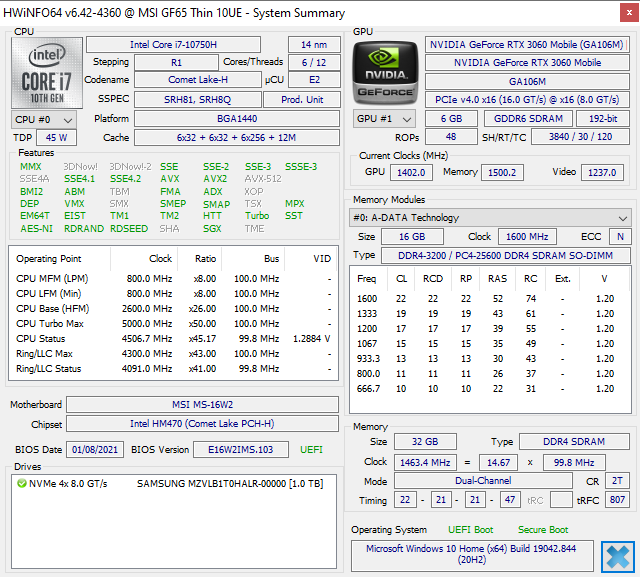
Das MSI GF65 ist einer der günstigsten 15,6-Zoll-Gaming-Laptops, den man mit GeForce RTX 3060 Grafik kaufen kann. Unsere Testkonfiguration wurde mit dem Core i7-10750H der 10. Generation, der erwähnten RTX-30-GPU, 32 GB RAM und einer 1-TB-Samsung-SSD für etwa 1650 US-Dollar von CUKUSA geliefert. Allerdings sind Optionen mit weniger RAM, Speicher und Core i5 für viel niedrigere Preise ab 999 US-Dollar erhältlich.
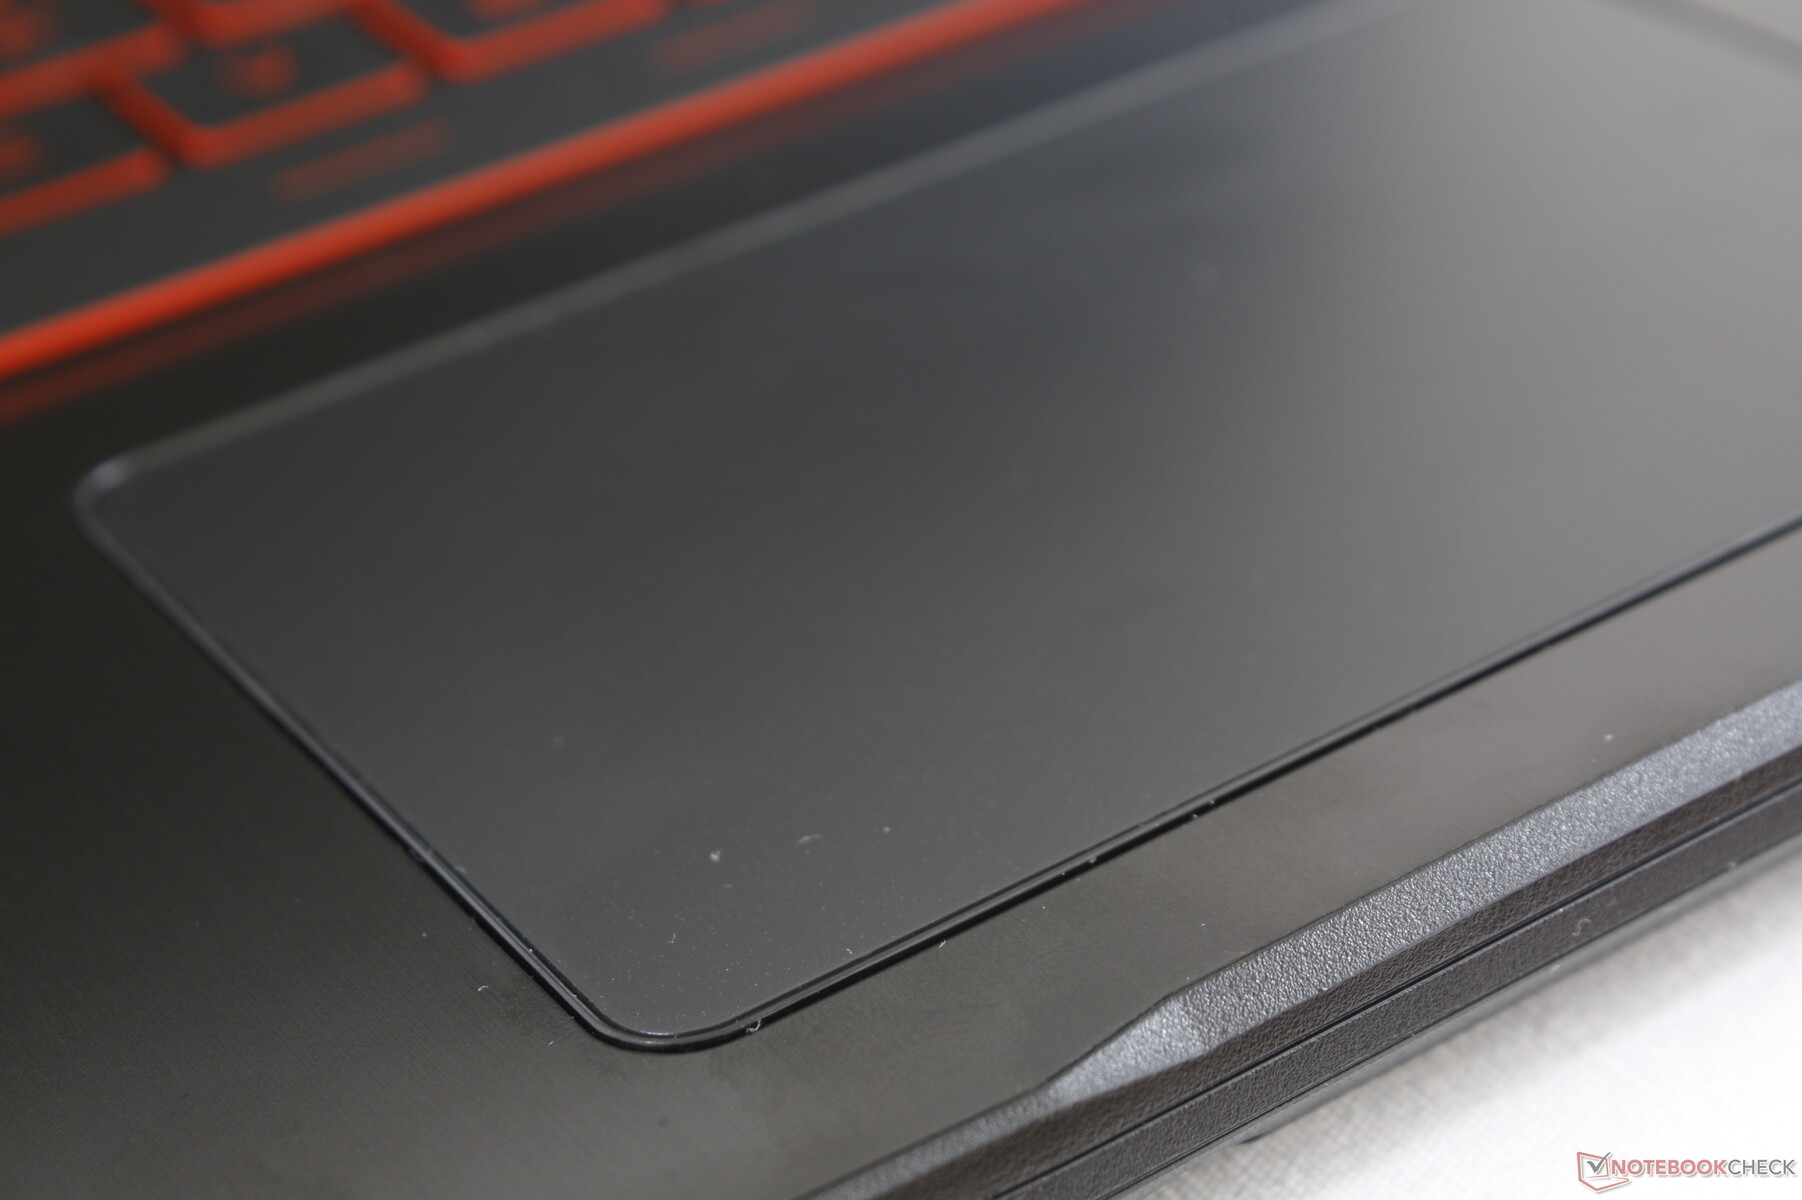
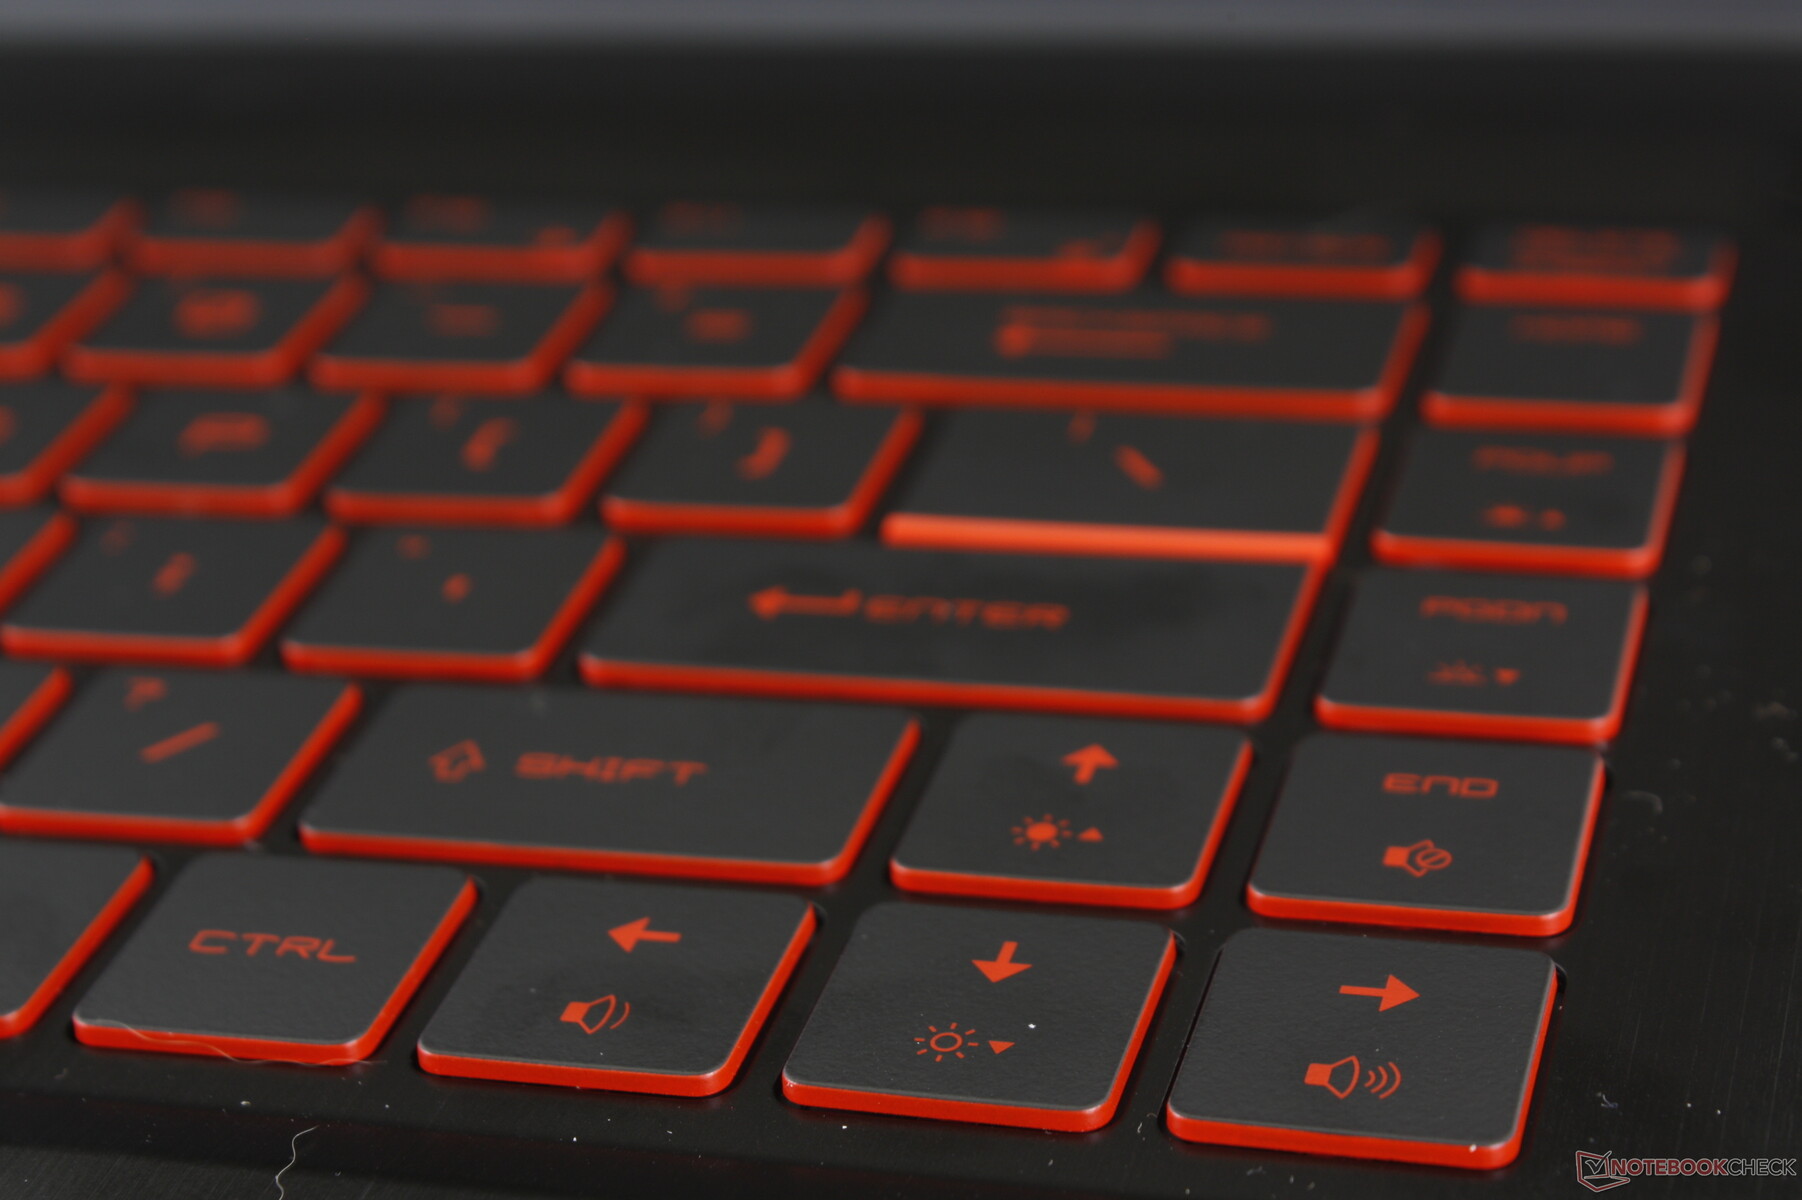
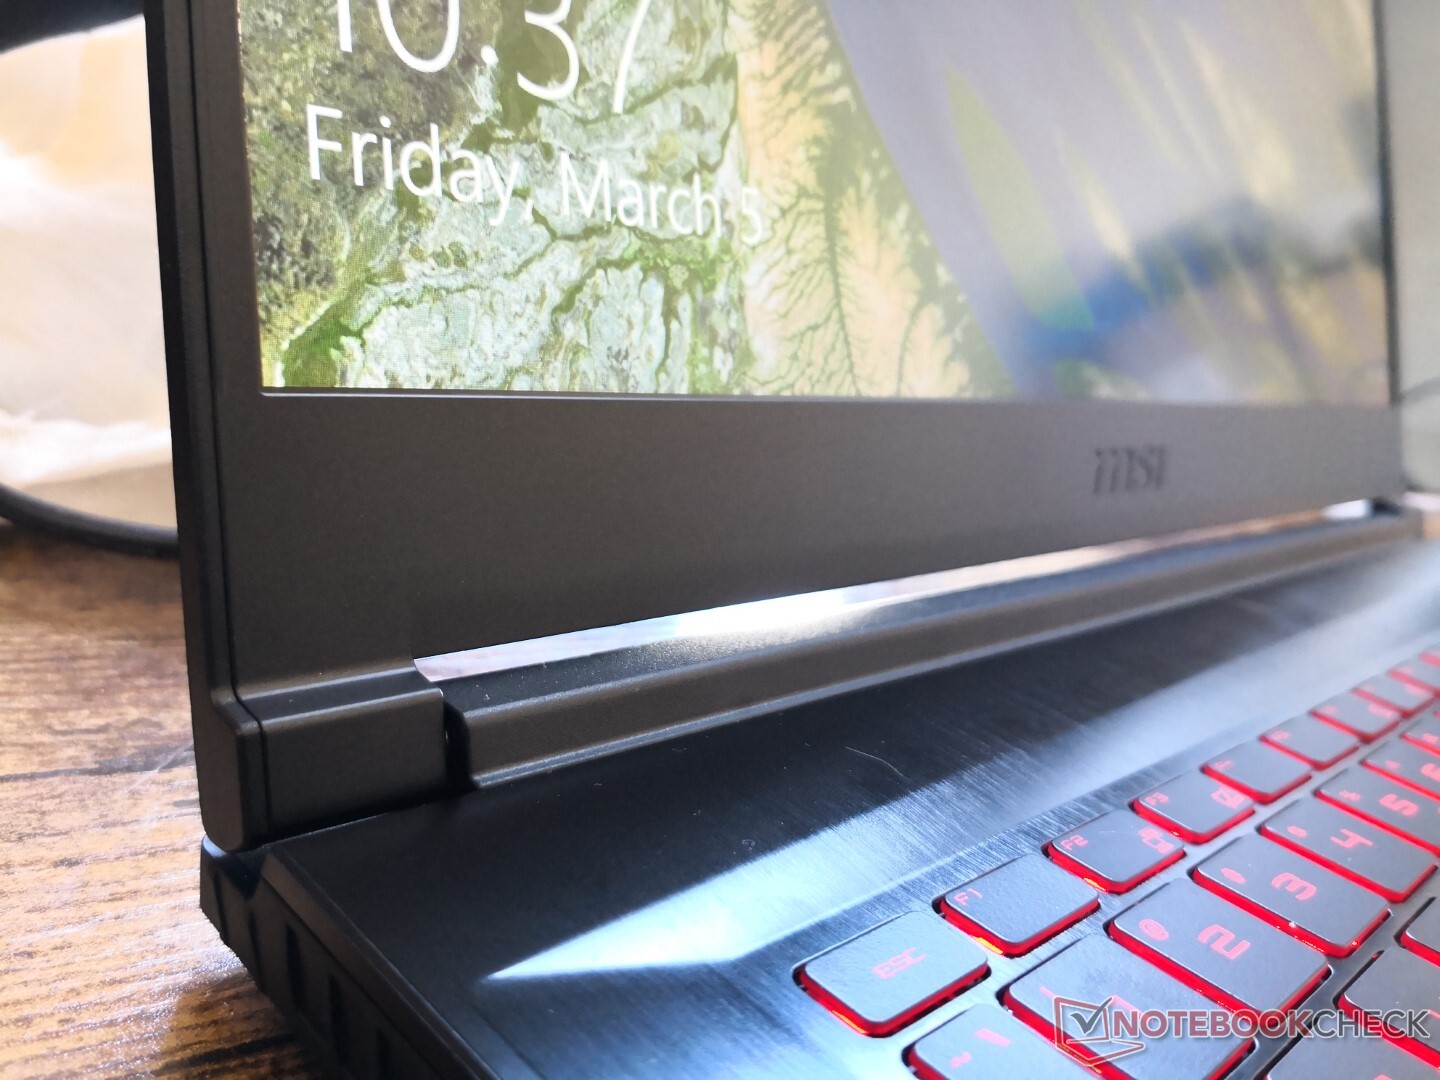
Das GF65 10UE hat das gleiche Gehäusedesign wie das 2020er GF65 9SD und so gelten viele unserer bisherigen Erfahrungen diesbezüglich weiterhin. Wir empfehlen einen Blick auf unseren Test der 2020-Version, um mehr über die physikalischen Eigenschaften des Notebooks herauszufinden.
Die MSI GF-Serie konkurriert mit anderen günstigen Gaming-Laptops wie dem Lenovo Legion 5, Dell G5, Acer Nitro 5 oder der Asus-TUF-Serie.
Weitere MSI-Tests:
potential competitors in comparison
Bew. | Datum | Modell | Gewicht | Dicke | Größe | Auflösung | Preis ab |
|---|---|---|---|---|---|---|---|
| 80.4 % v7 (old) | 03 / 2021 | MSI GF65 Thin 10UE i7-10750H, GeForce RTX 3060 Laptop GPU | 1.9 kg | 21.7 mm | 15.60" | 1920x1080 | |
| 85 % v7 (old) | 02 / 2021 | Asus ROG Strix G15 G513QR R9 5900HX, GeForce RTX 3070 Laptop GPU | 2.3 kg | 27.2 mm | 15.60" | 1920x1080 | |
| 84.9 % v7 (old) | 03 / 2021 | Schenker XMG Core 15 Ampere R7 4800H, GeForce RTX 3060 Laptop GPU | 2 kg | 22.9 mm | 15.60" | 2560x1440 | |
| 84 % v7 (old) | 02 / 2021 | MSI GS66 Stealth 10UG i7-10870H, GeForce RTX 3070 Laptop GPU | 2.1 kg | 19.8 mm | 15.60" | 1920x1080 | |
| 86.4 % v7 (old) | 02 / 2021 | Aorus 15G XC i7-10870H, GeForce RTX 3070 Laptop GPU | 2.1 kg | 23 mm | 15.60" | 1920x1080 | |
| 86.3 % v7 (old) | 12 / 2020 | Lenovo Legion 7 15IMH05-81YT001VGE i9-10980HK, GeForce RTX 2080 Super Max-Q | 2.4 kg | 19.9 mm | 15.60" | 1920x1080 |
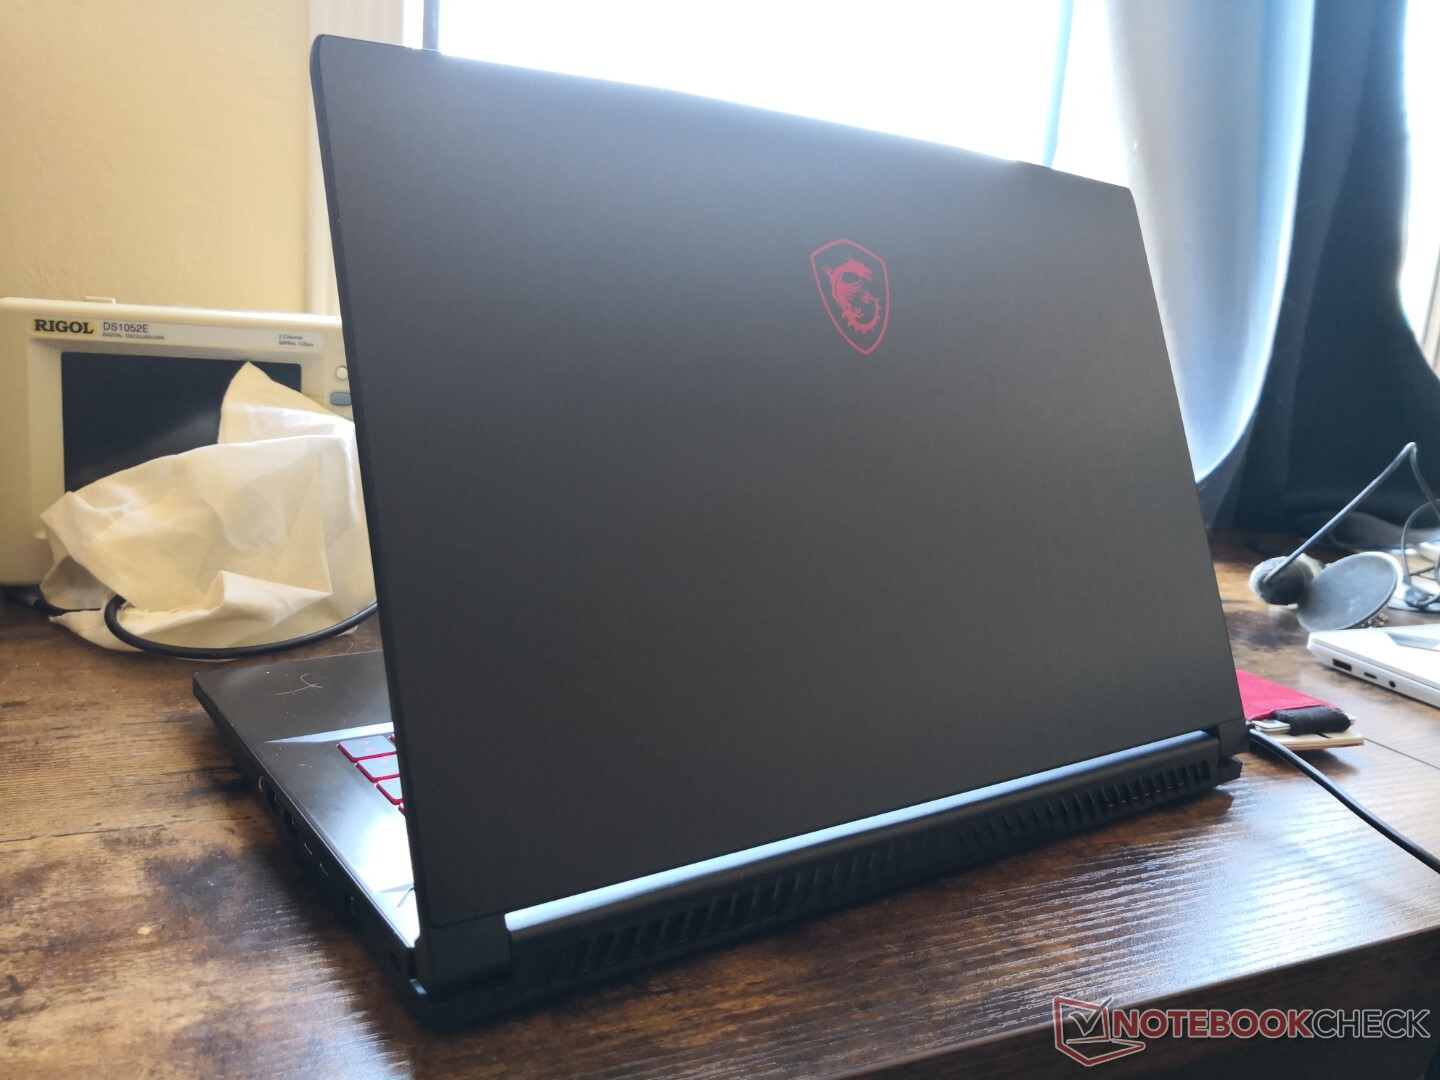
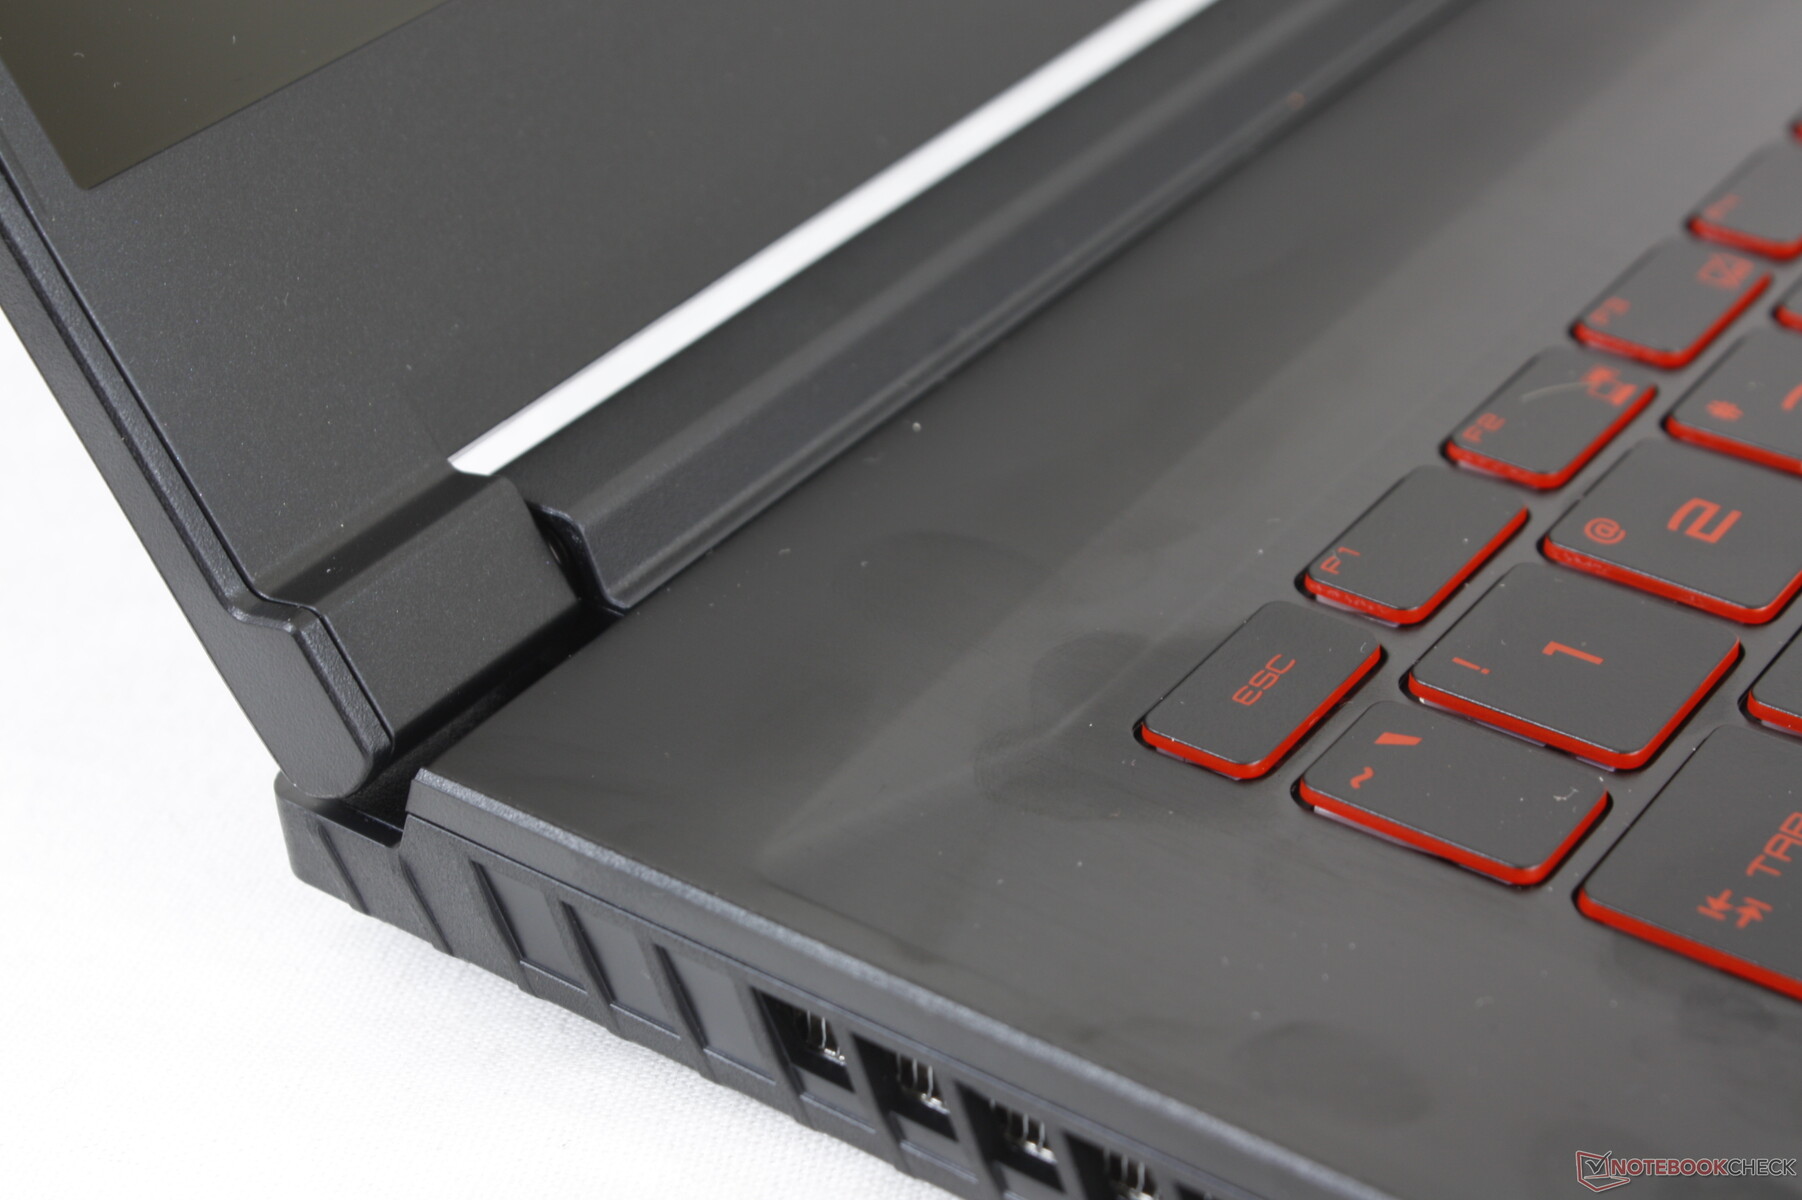
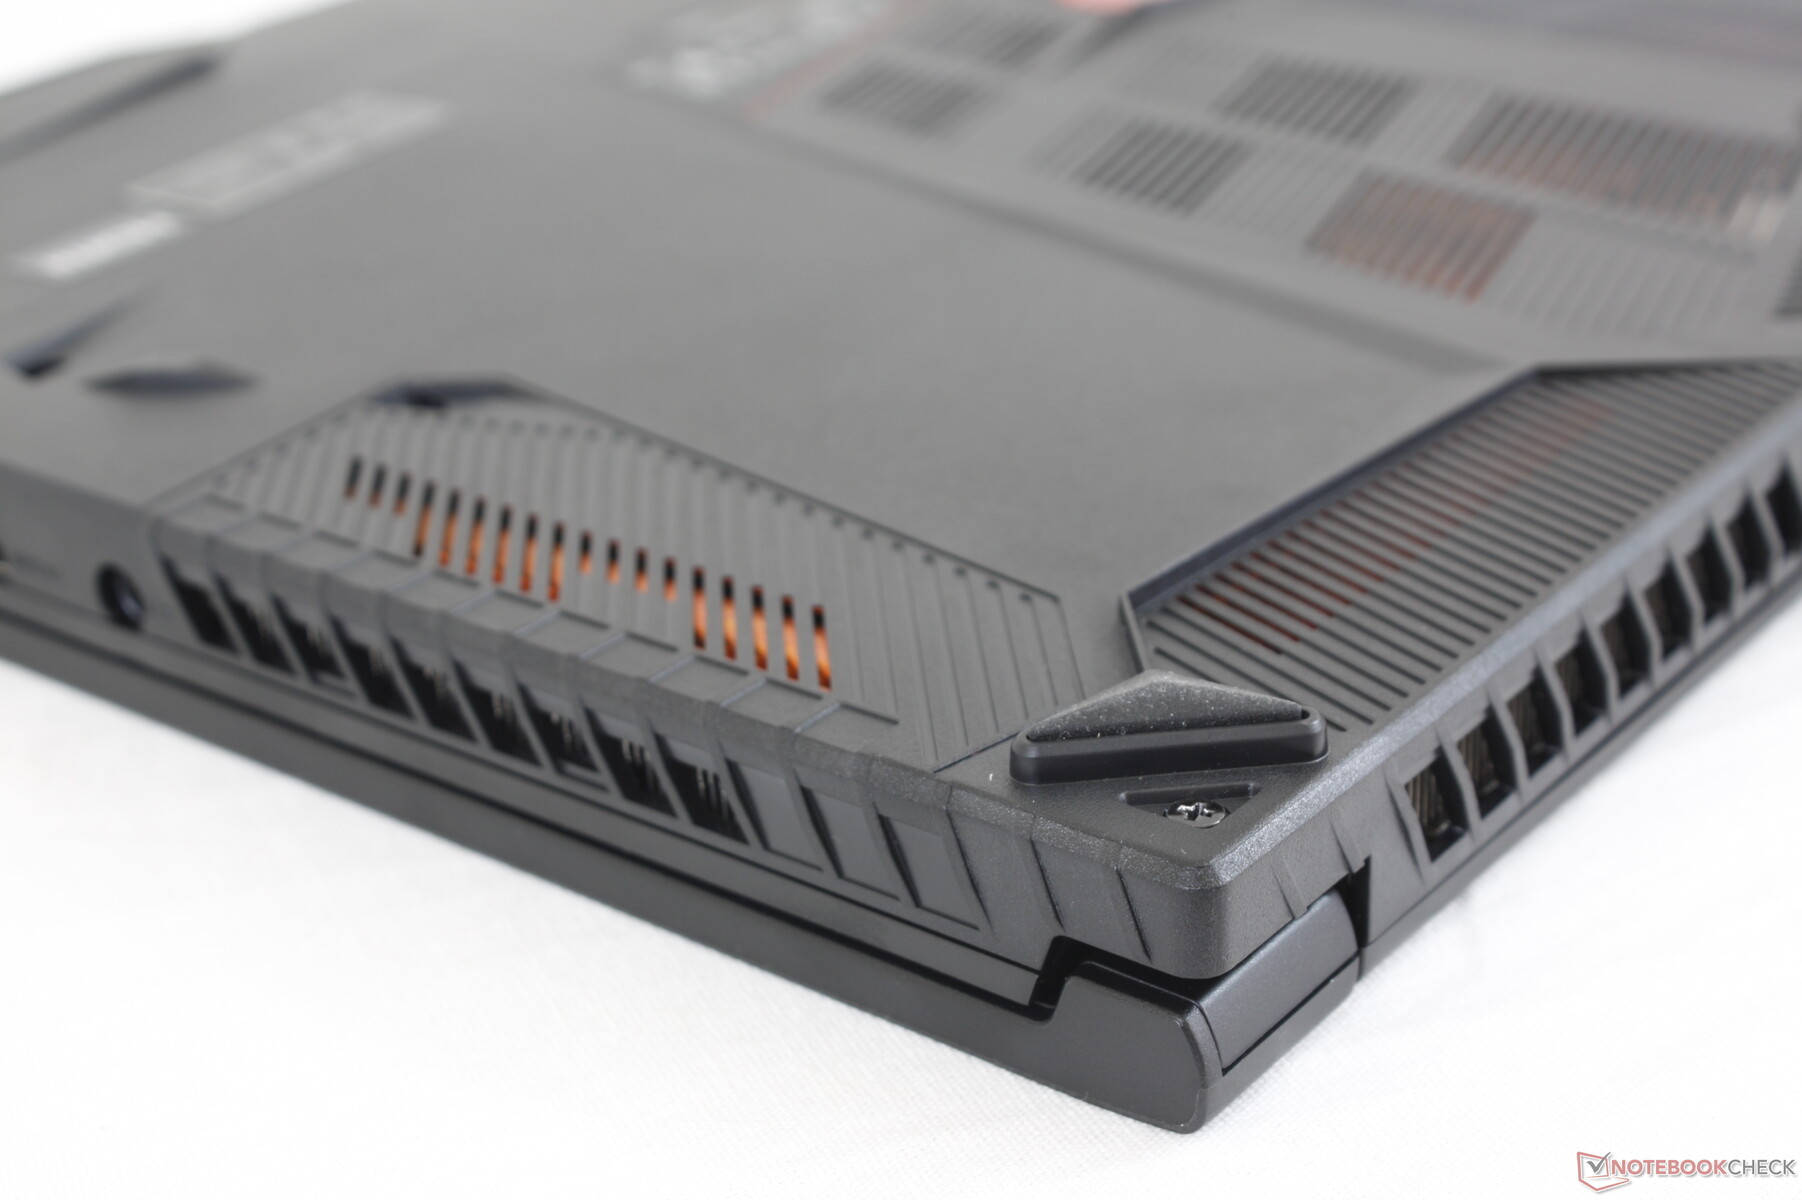
Gehäuse
Die Oberflächen fühlen sich dünn an und verziehen sich im Vergleich zu MSIs höherwertigen Modellen aus der GE- oder GT-Serie leichter. Das GF65 fühlt sich dadurch nicht so luxuriös an, was aber bei einem Einsteiger-Gaming-Laptop zu erwarten ist. Die konkurrierenden Asus-TUF-Modelle, die etwas schwerer sind, empfinden wir stabiler.
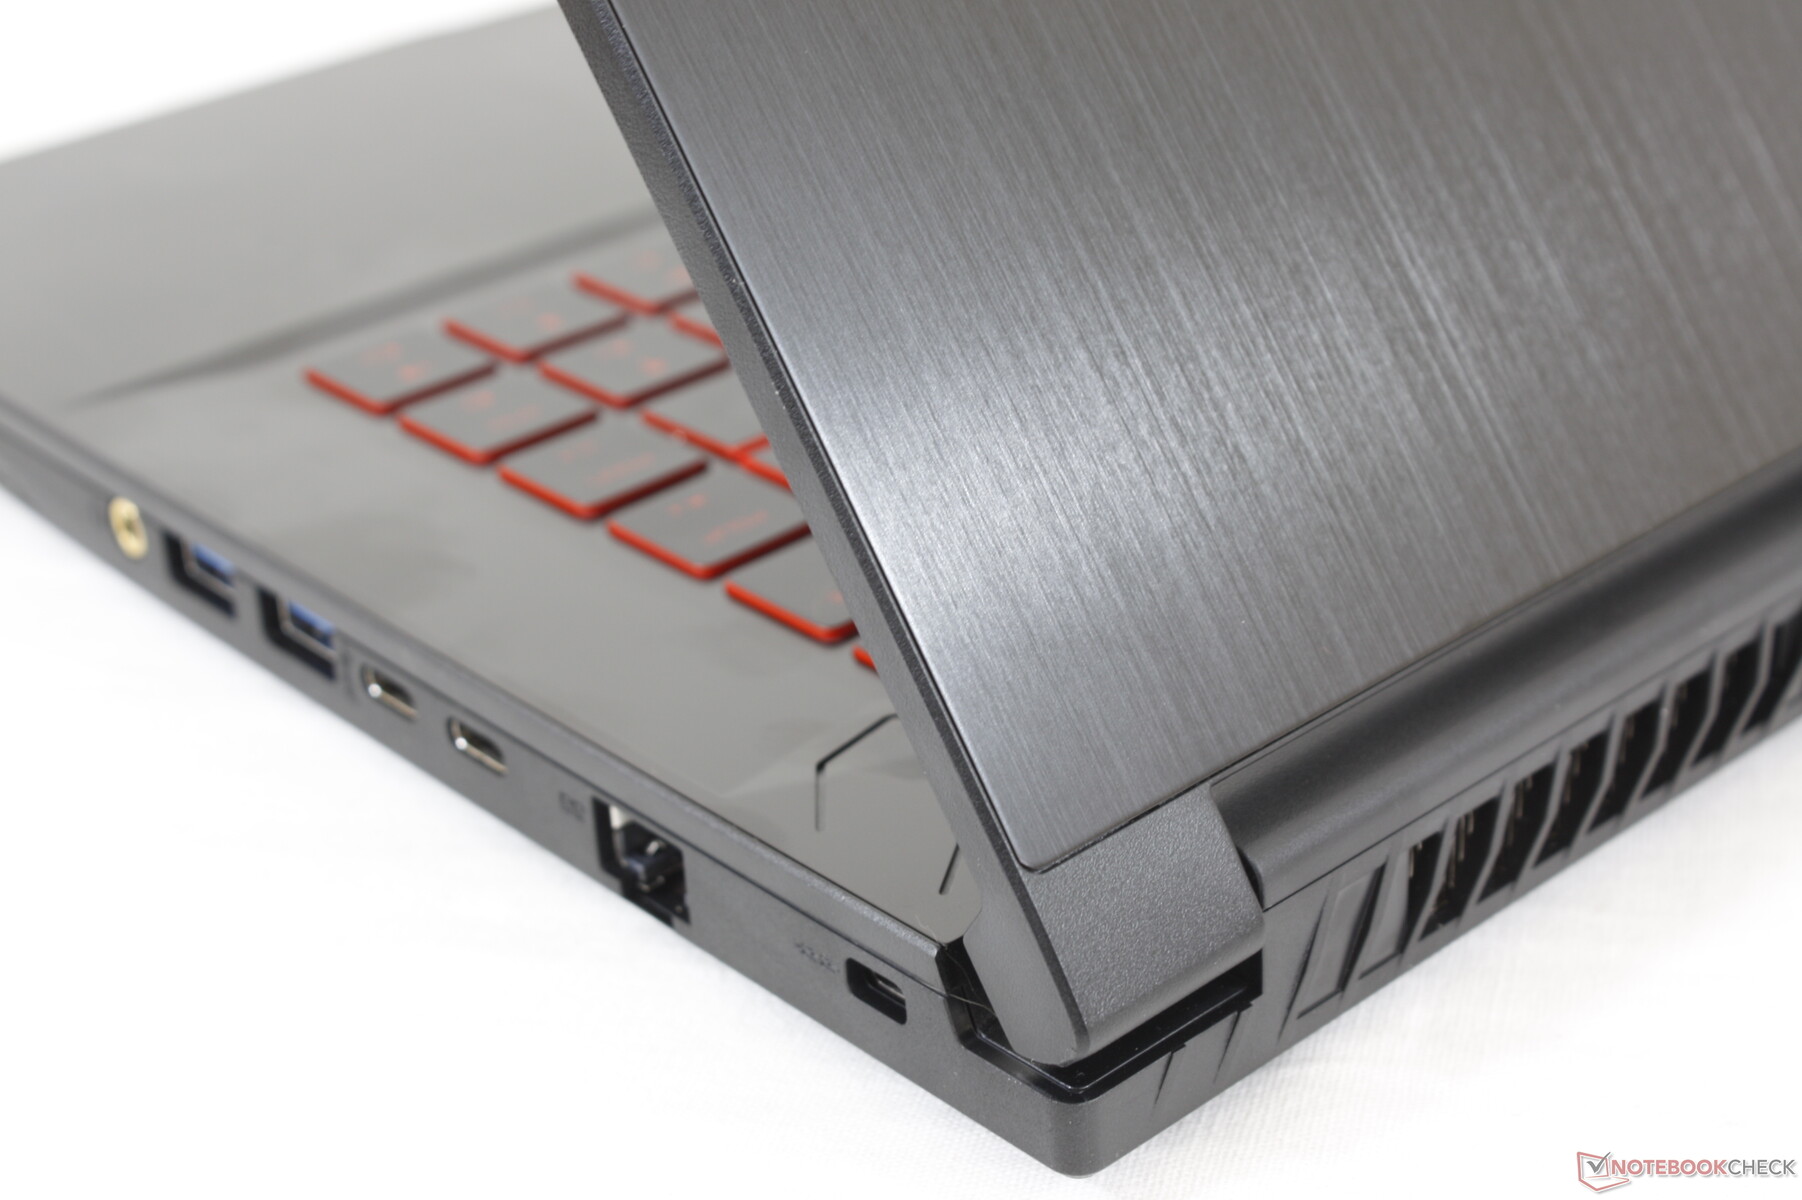
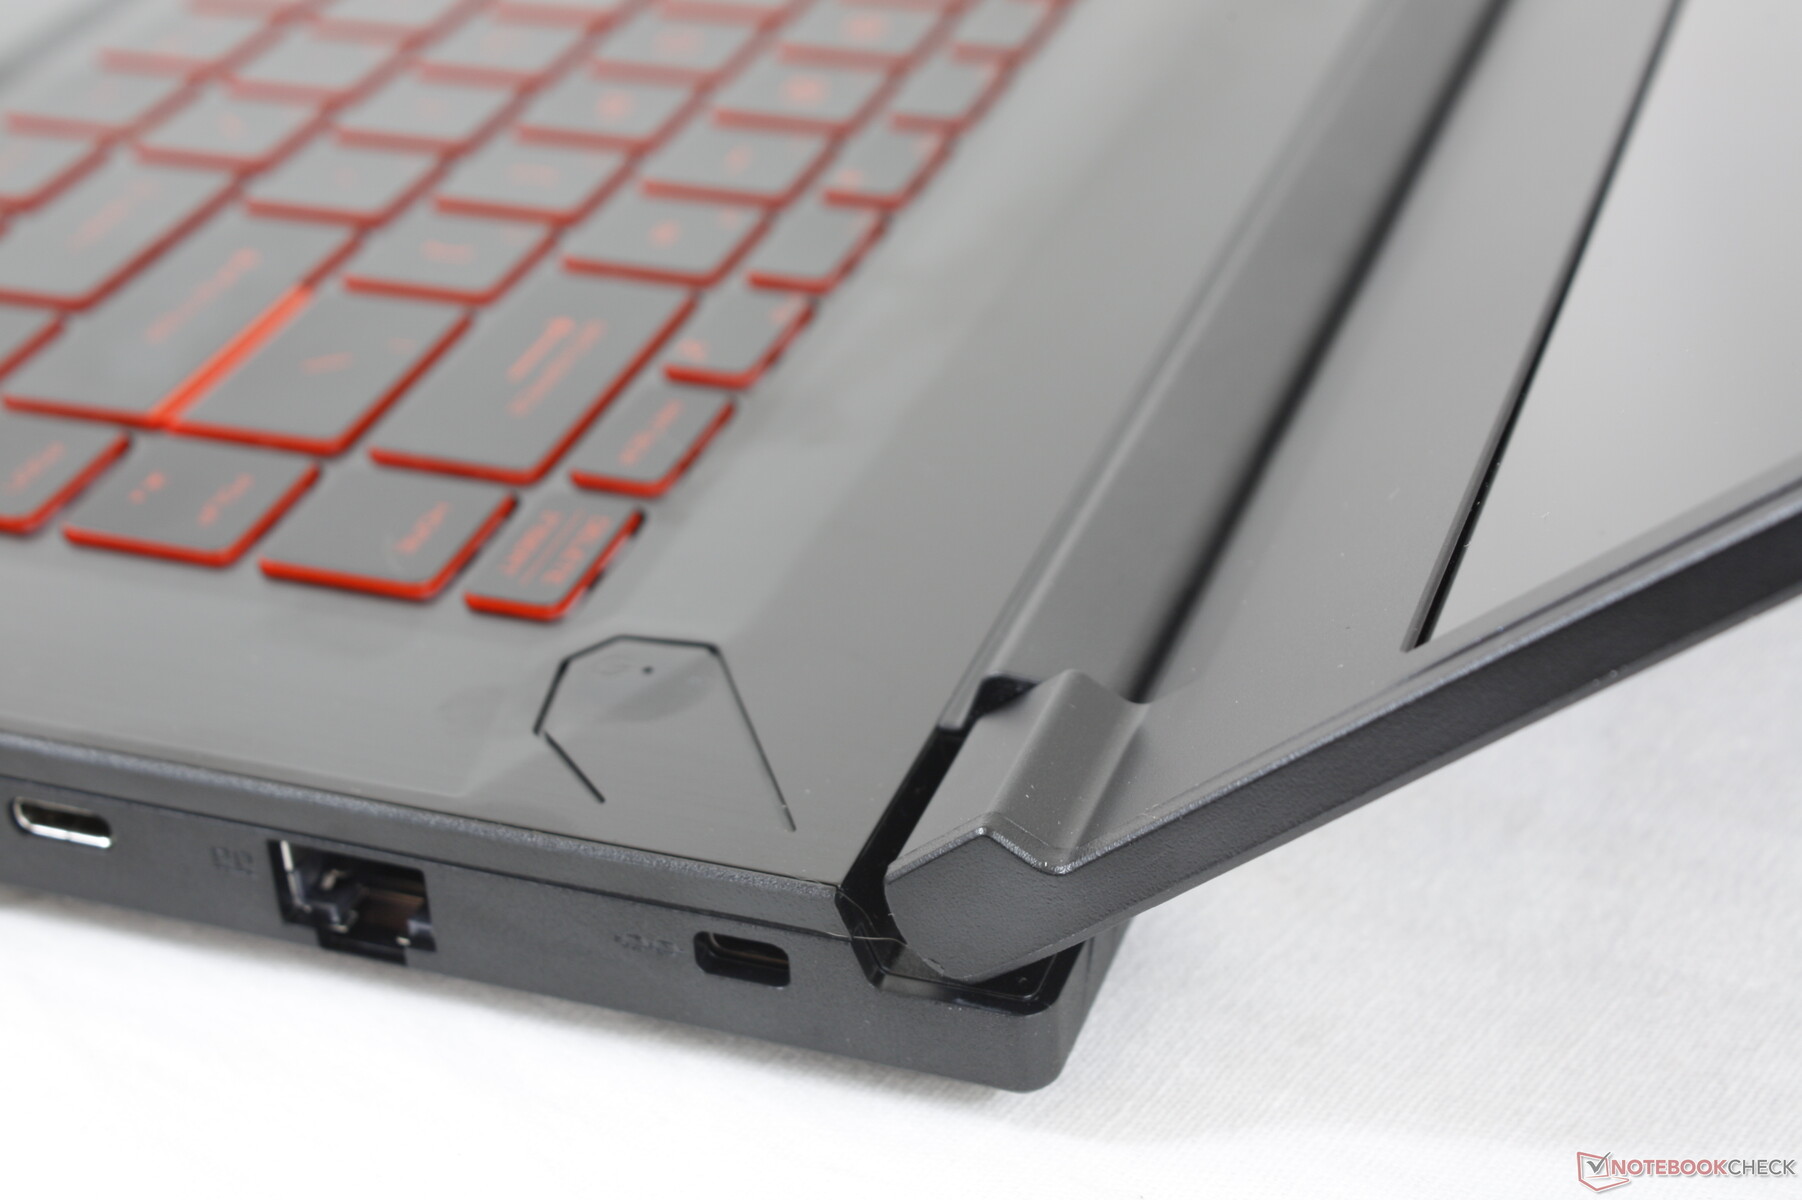
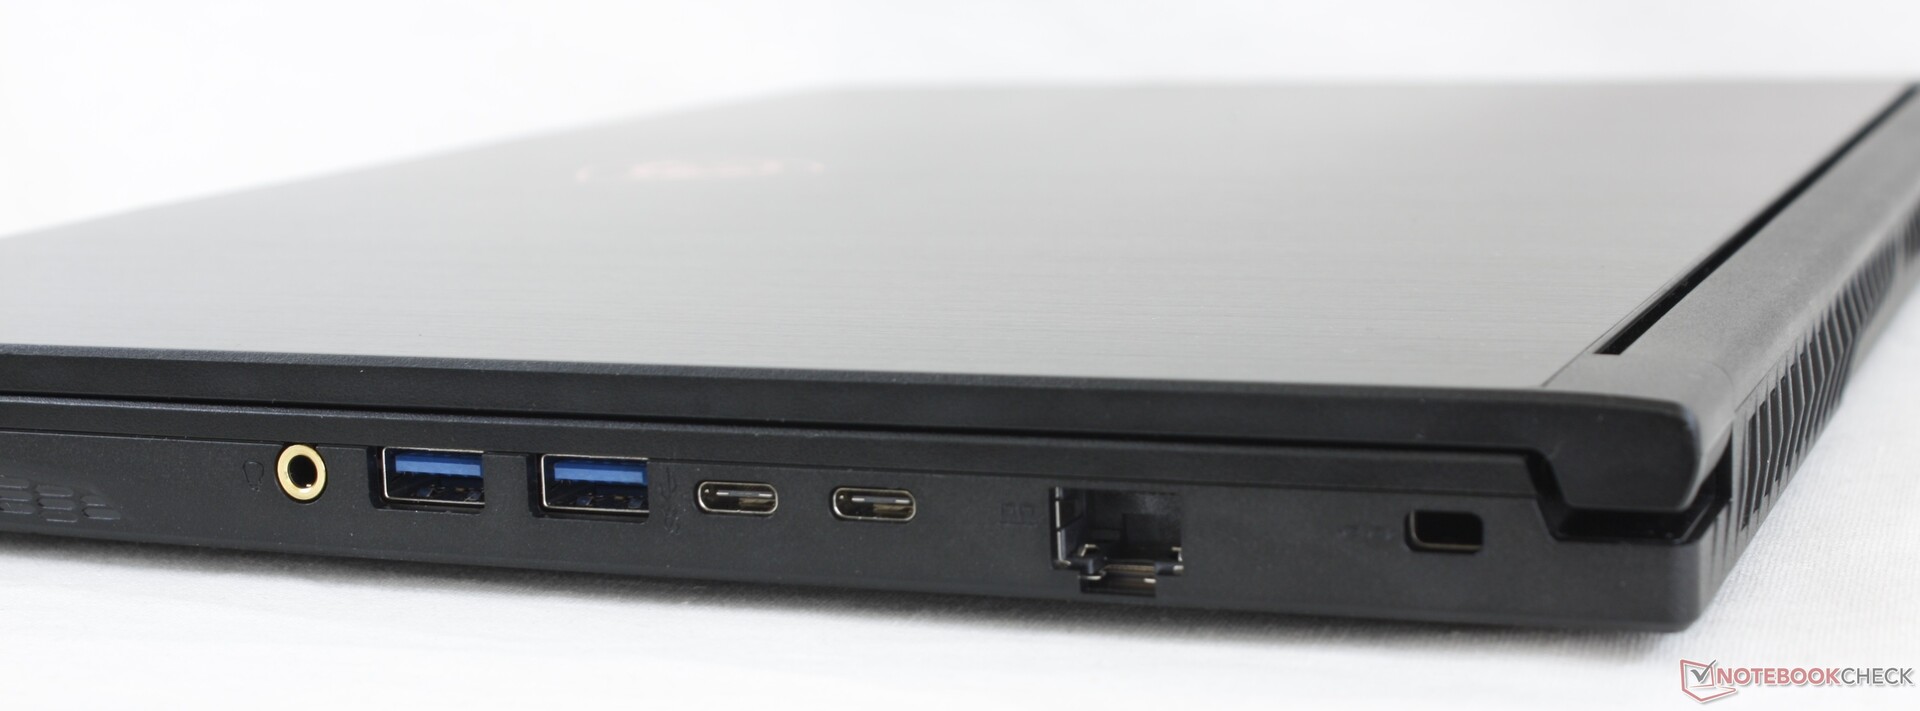
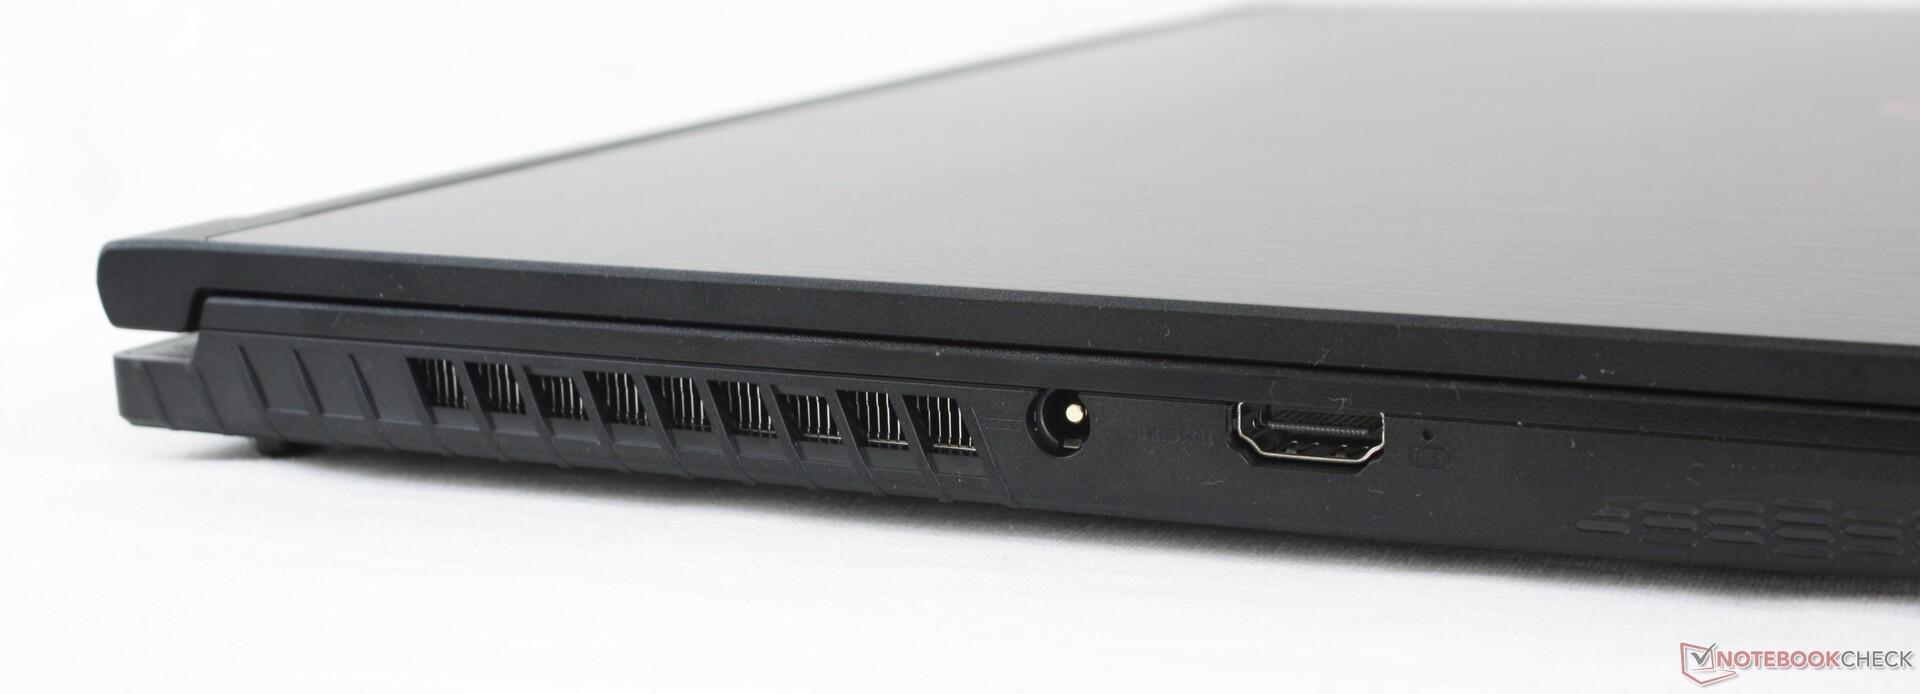
Anschlussausstattung
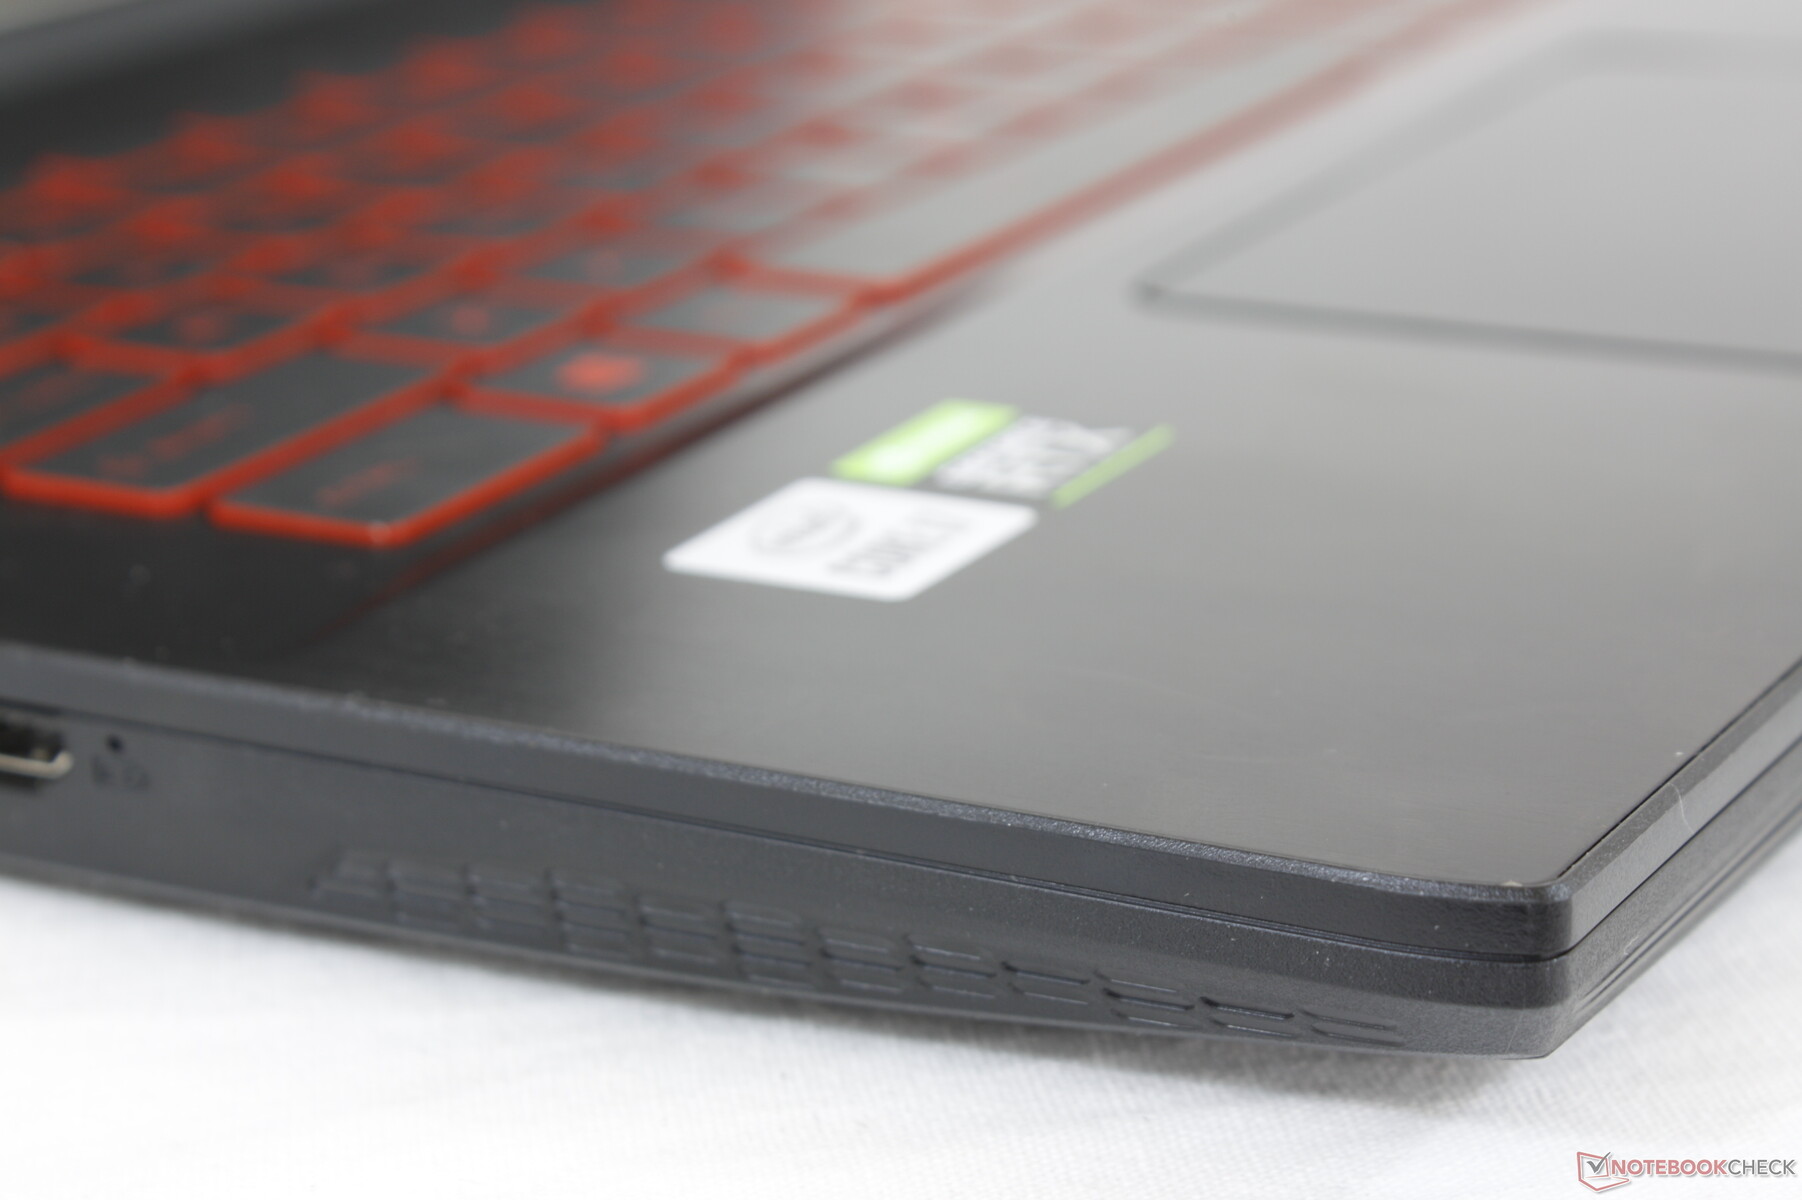
Die Anschlussoptionen bleiben bis auf eine bemerkenswerte Änderung identisch: Der HDMI-1.4-Anschluss des letztjährigen GF65 9SD wurde auf HDMI 2.0 aktualisiert und unterstützt nun externe Monitore mit 4K60 FPS. Die USB-C-Anschlüsse sind jedoch weiterhin nicht mit externen Monitoren kompatibel.
Kommunikation
Webcam


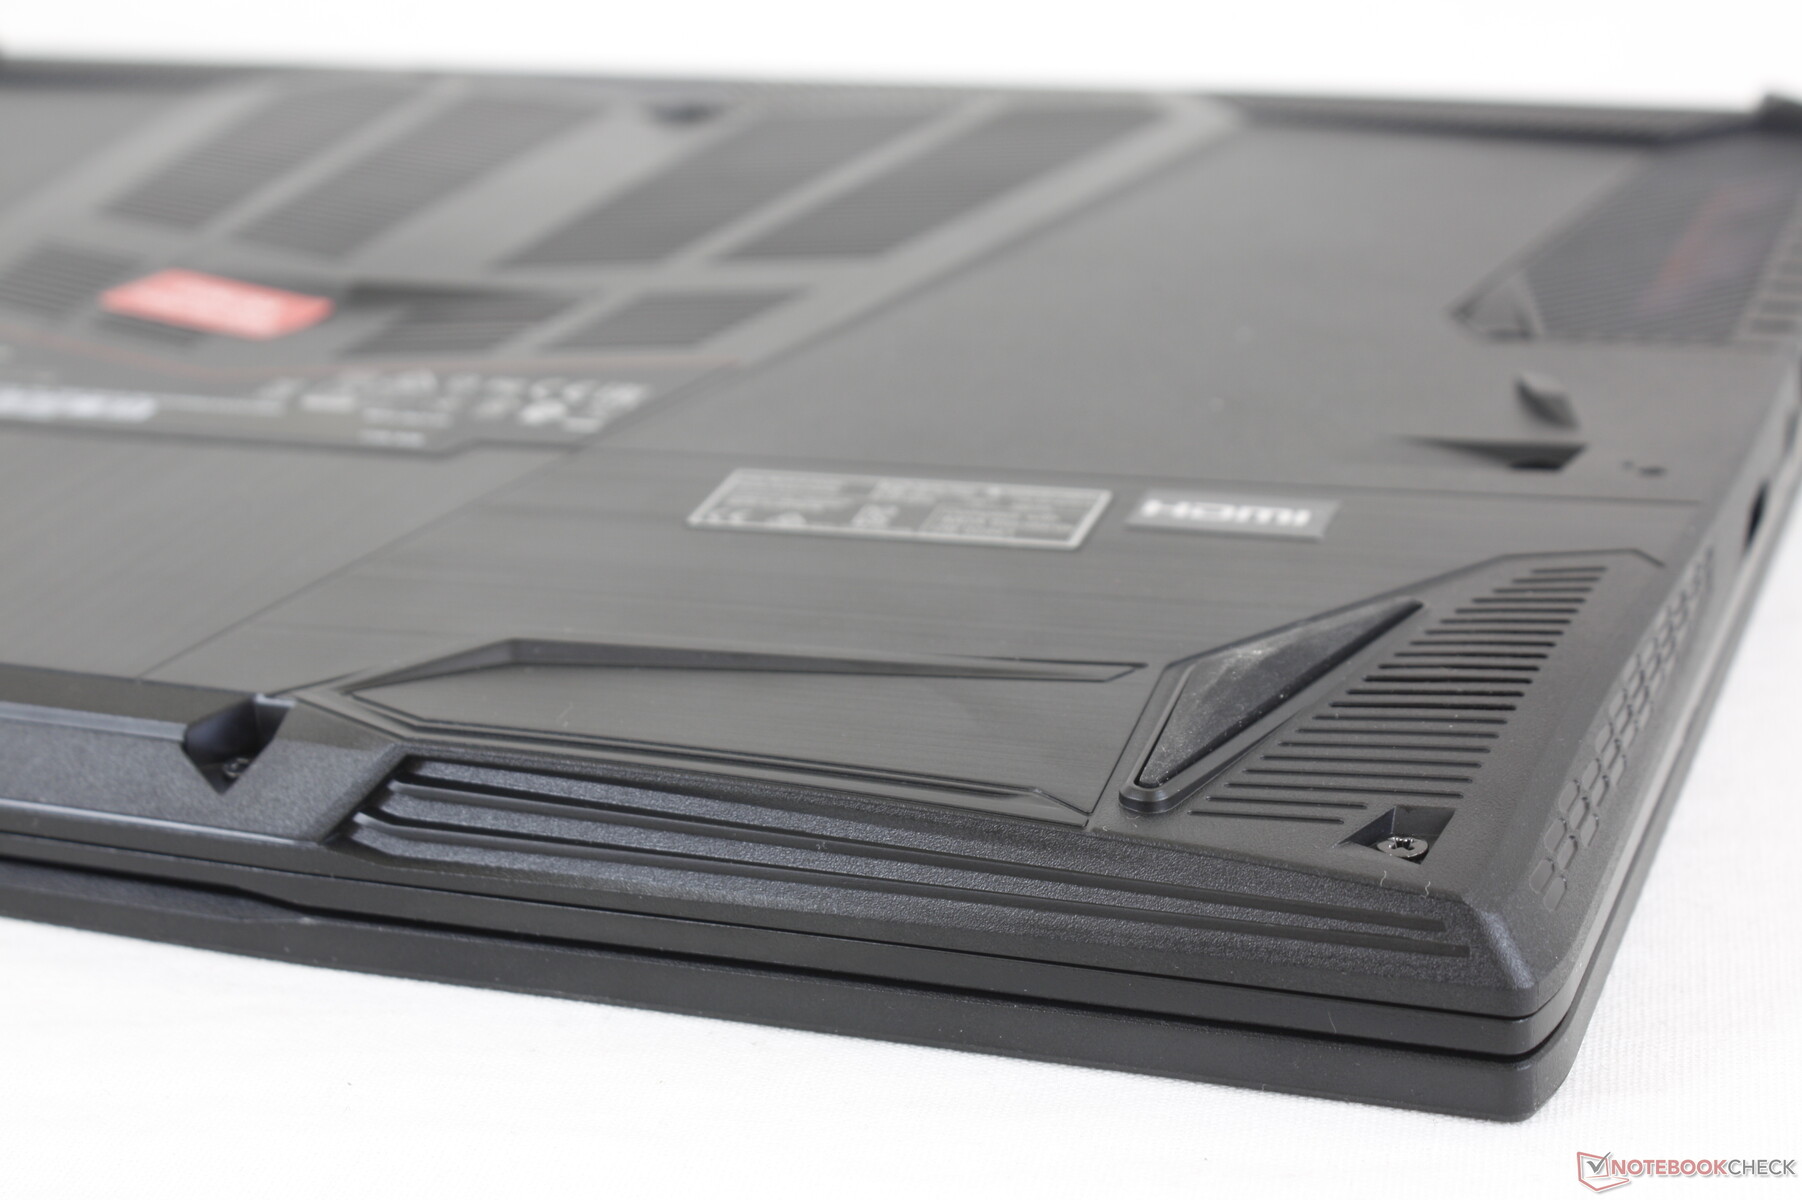
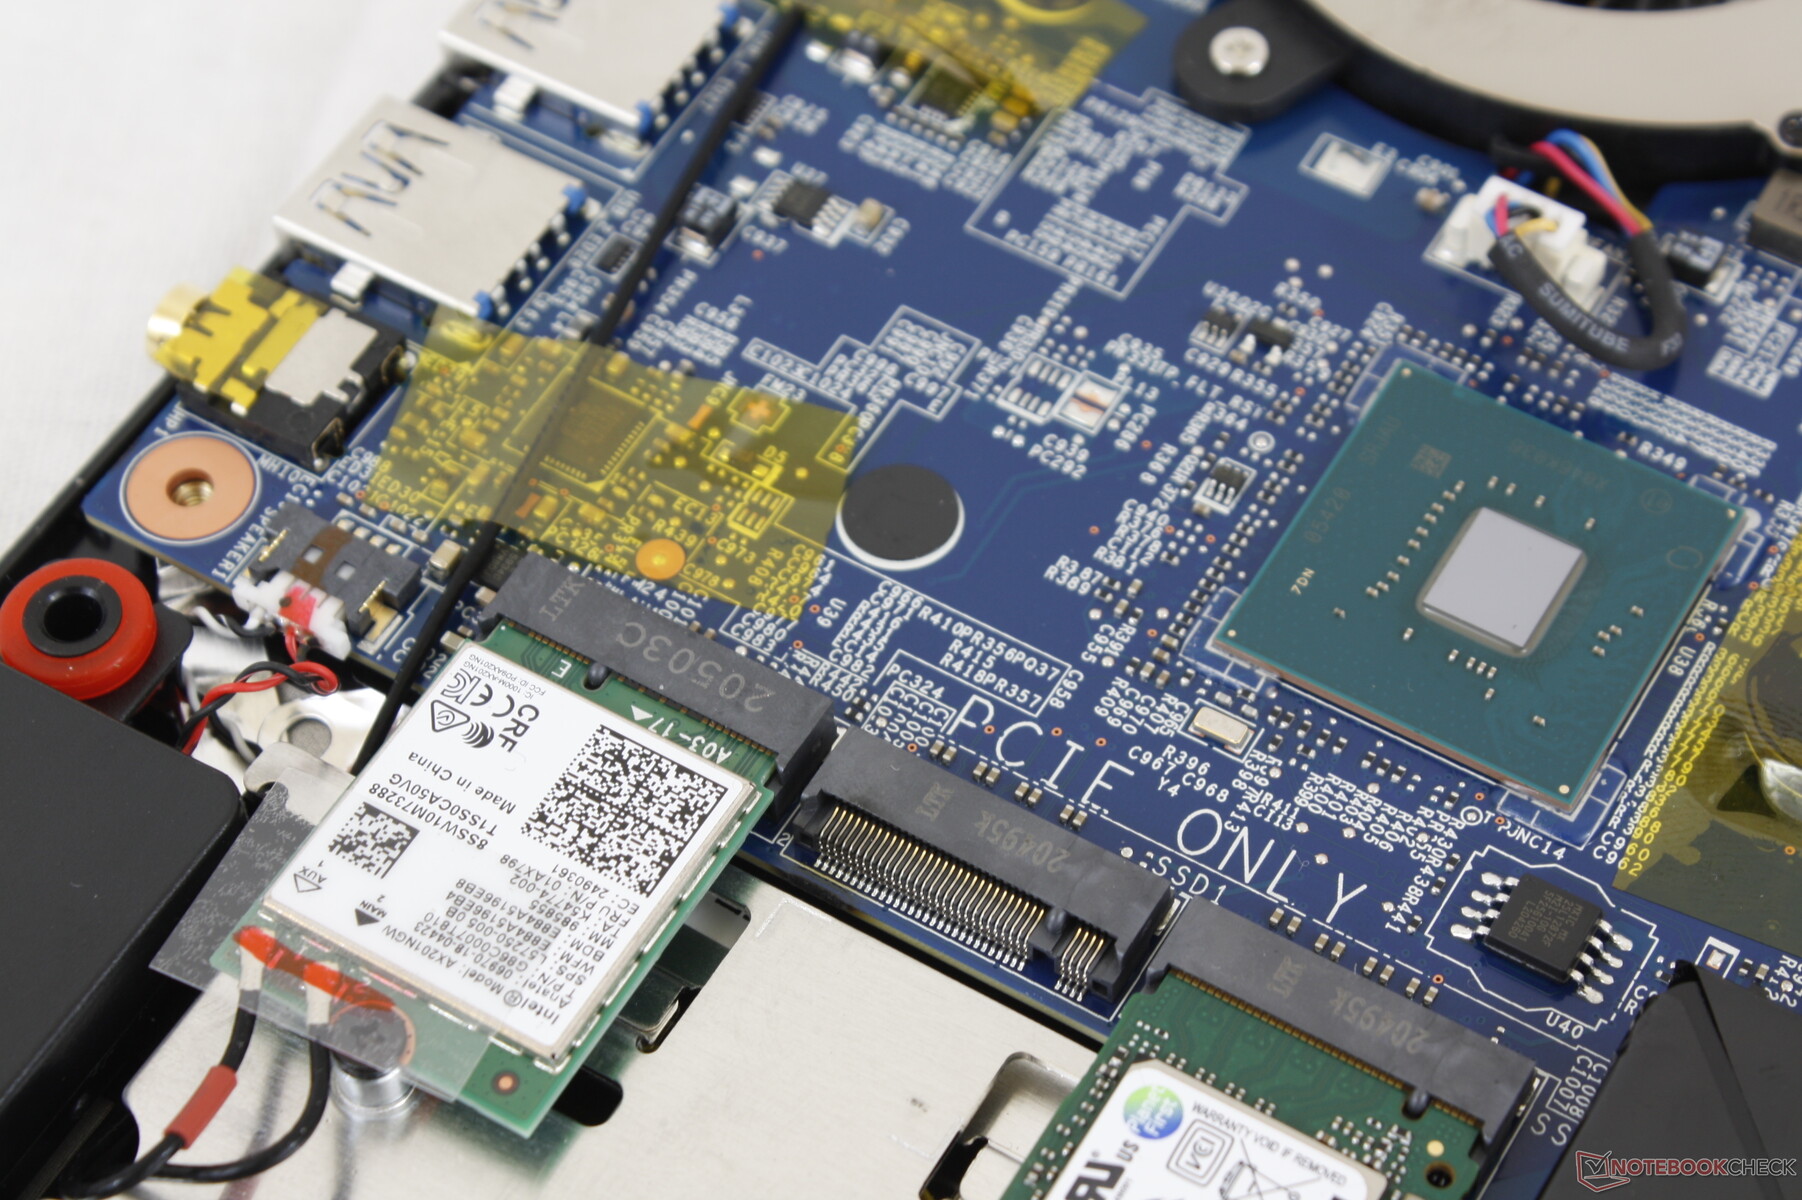
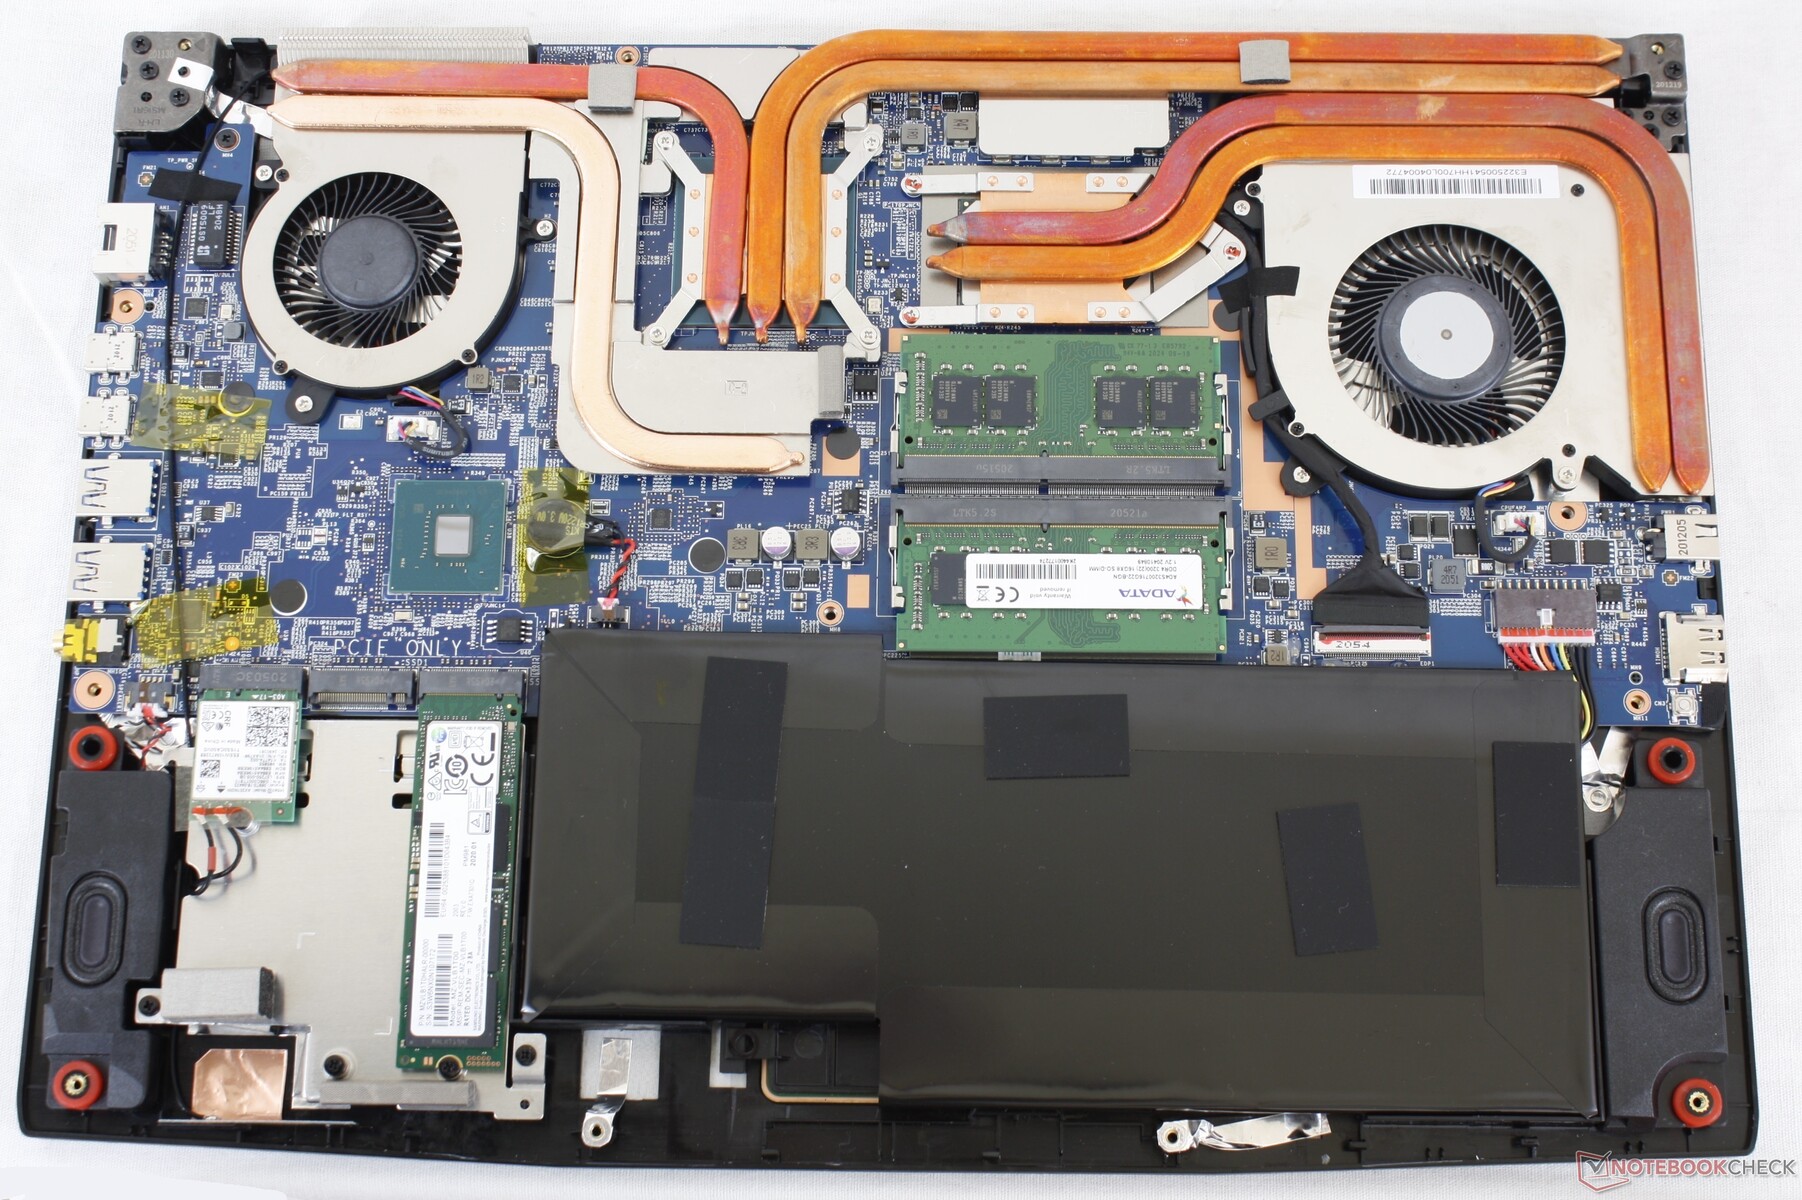
Wartung
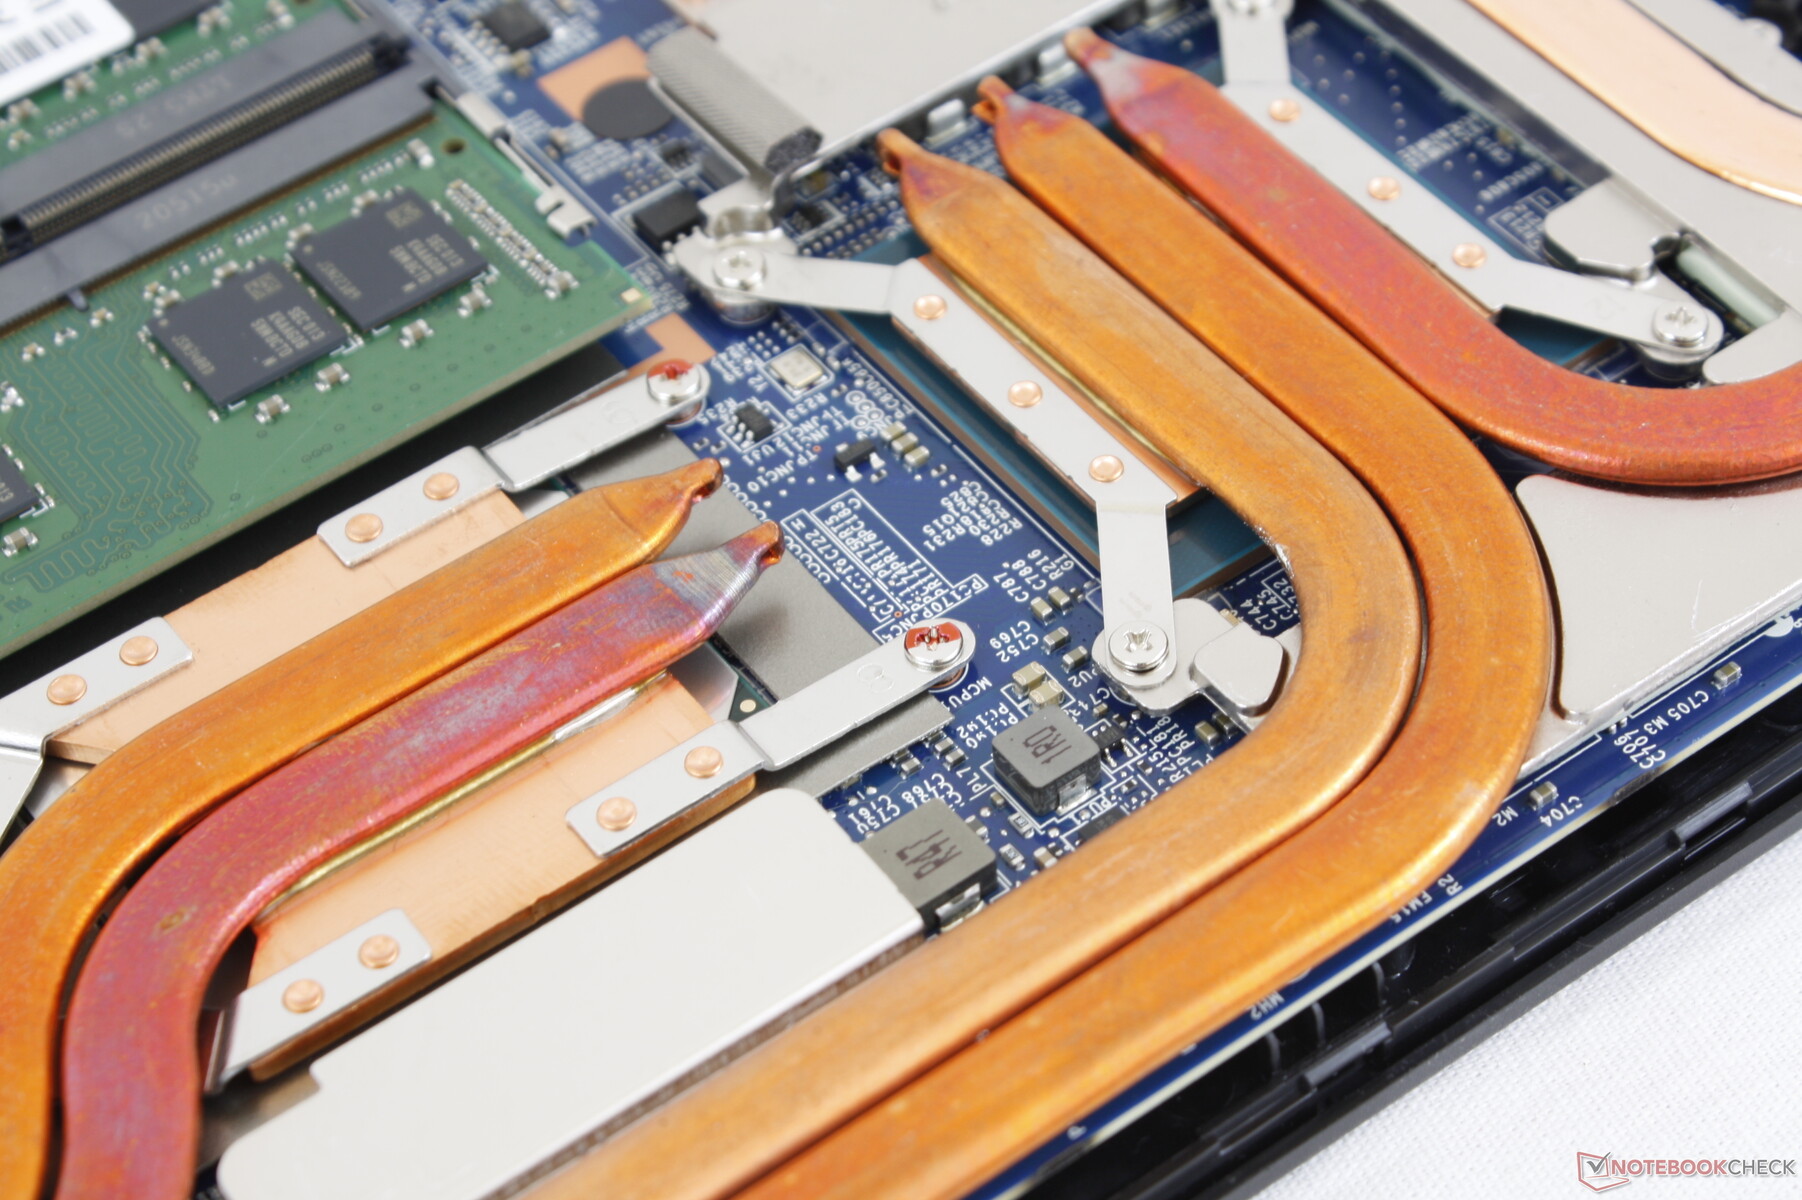
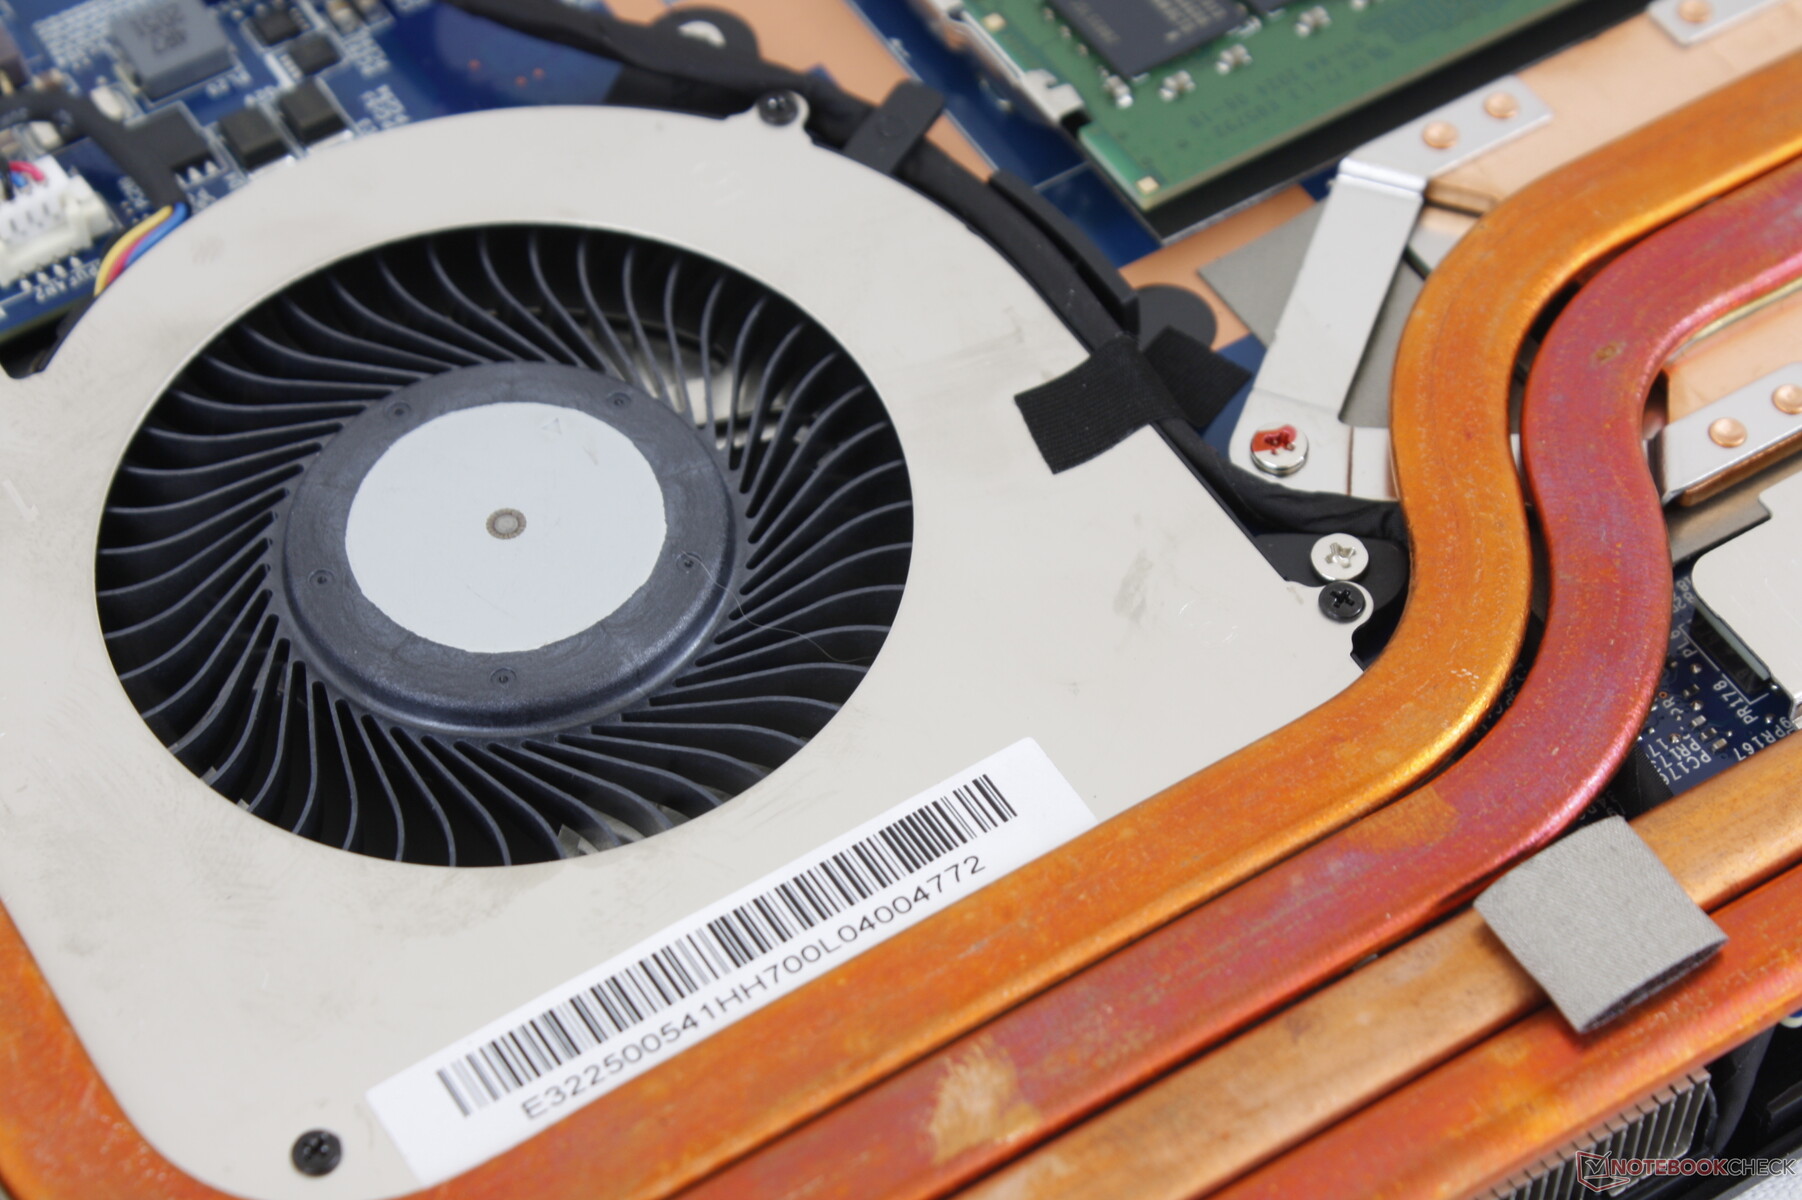
Die Wartung erfordert nur einen Kreuzschlitzschraubenzieher für relativ einfache Aufrüstungen. Besitzer sollten beim Entfernen der Bodenplatte vorsichtig sein, da die Audiobuchse an der Kante hängen bleiben kann.
Zubehör und Garantie
Im Karton befinden sich neben dem üblichen Netzteil und Papierkram keine weiteren Extras. Es gilt die Standard-Garantie von einem Jahr und auf alle von CUKUSA installierten Komponenten, wie RAM oder Speicher, eine dreijährige.
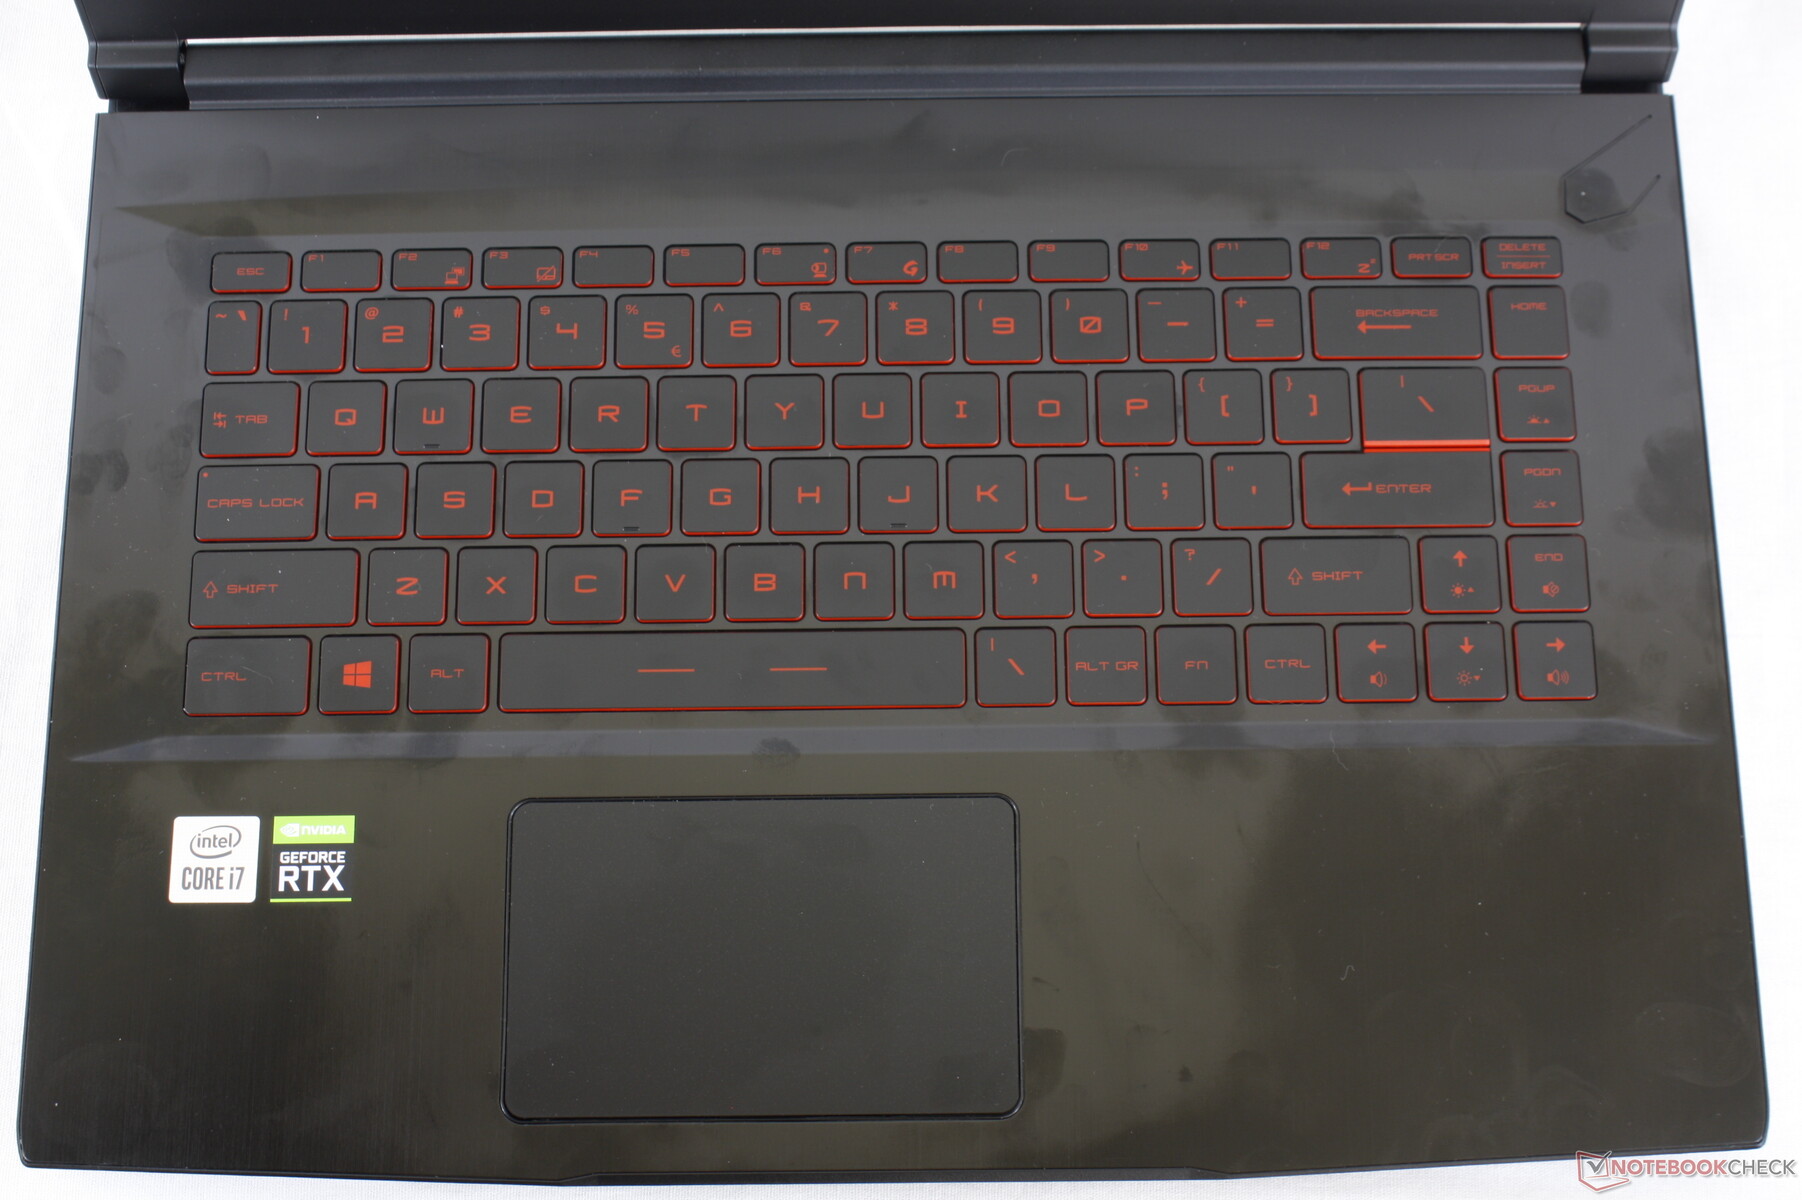
Eingabegeräte

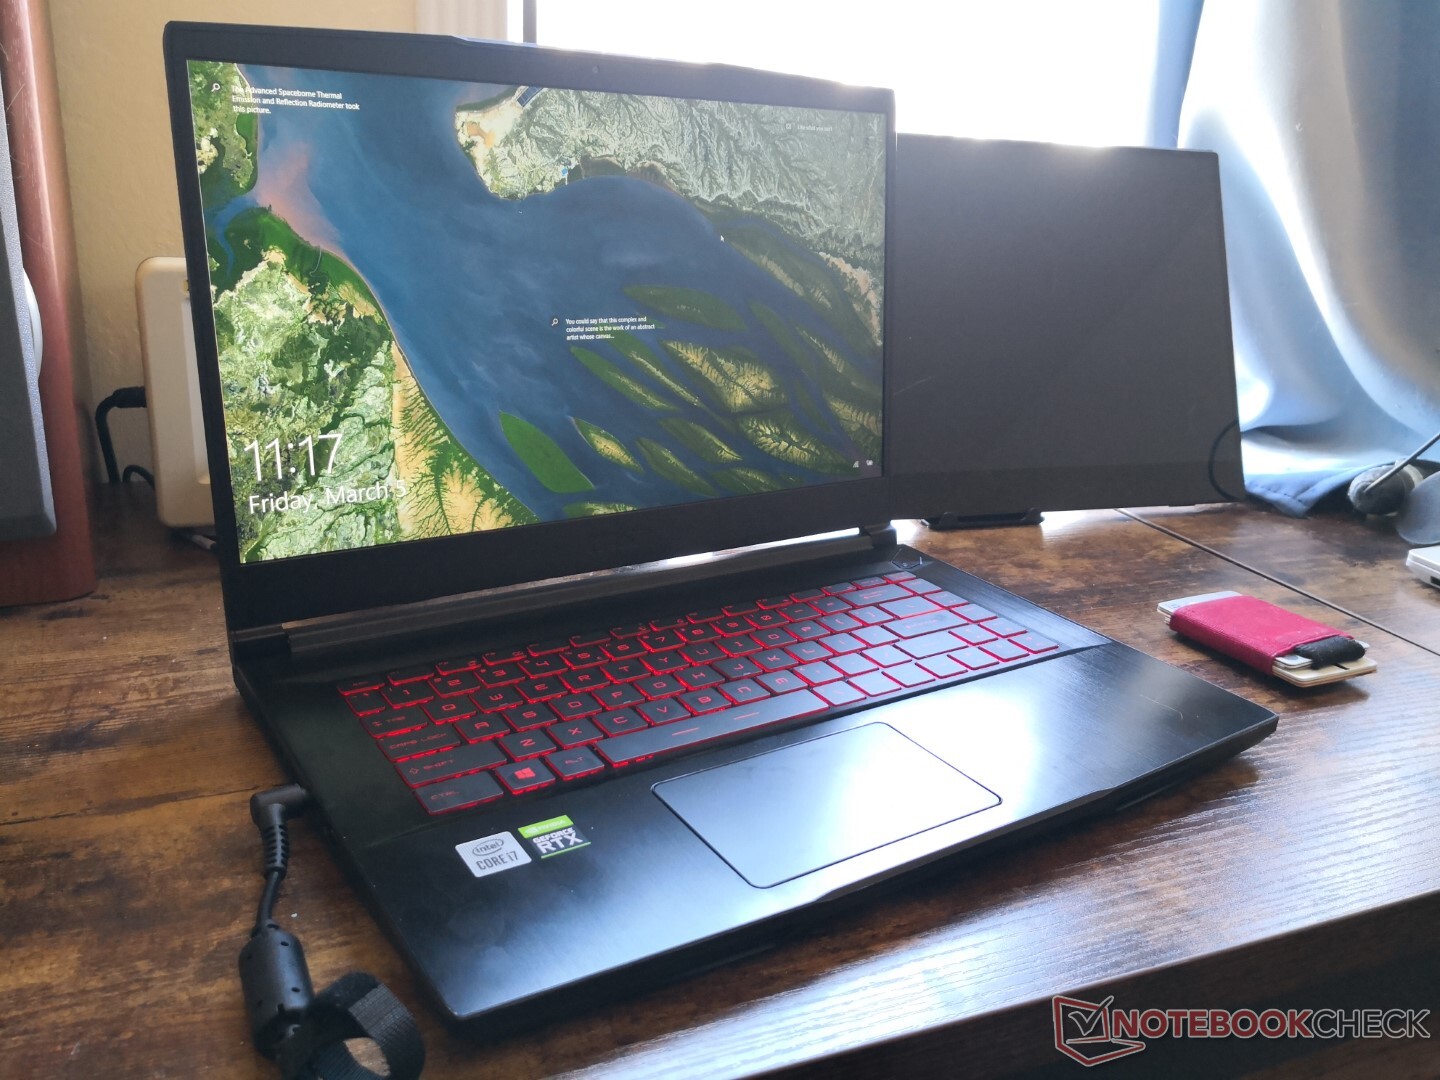
Display
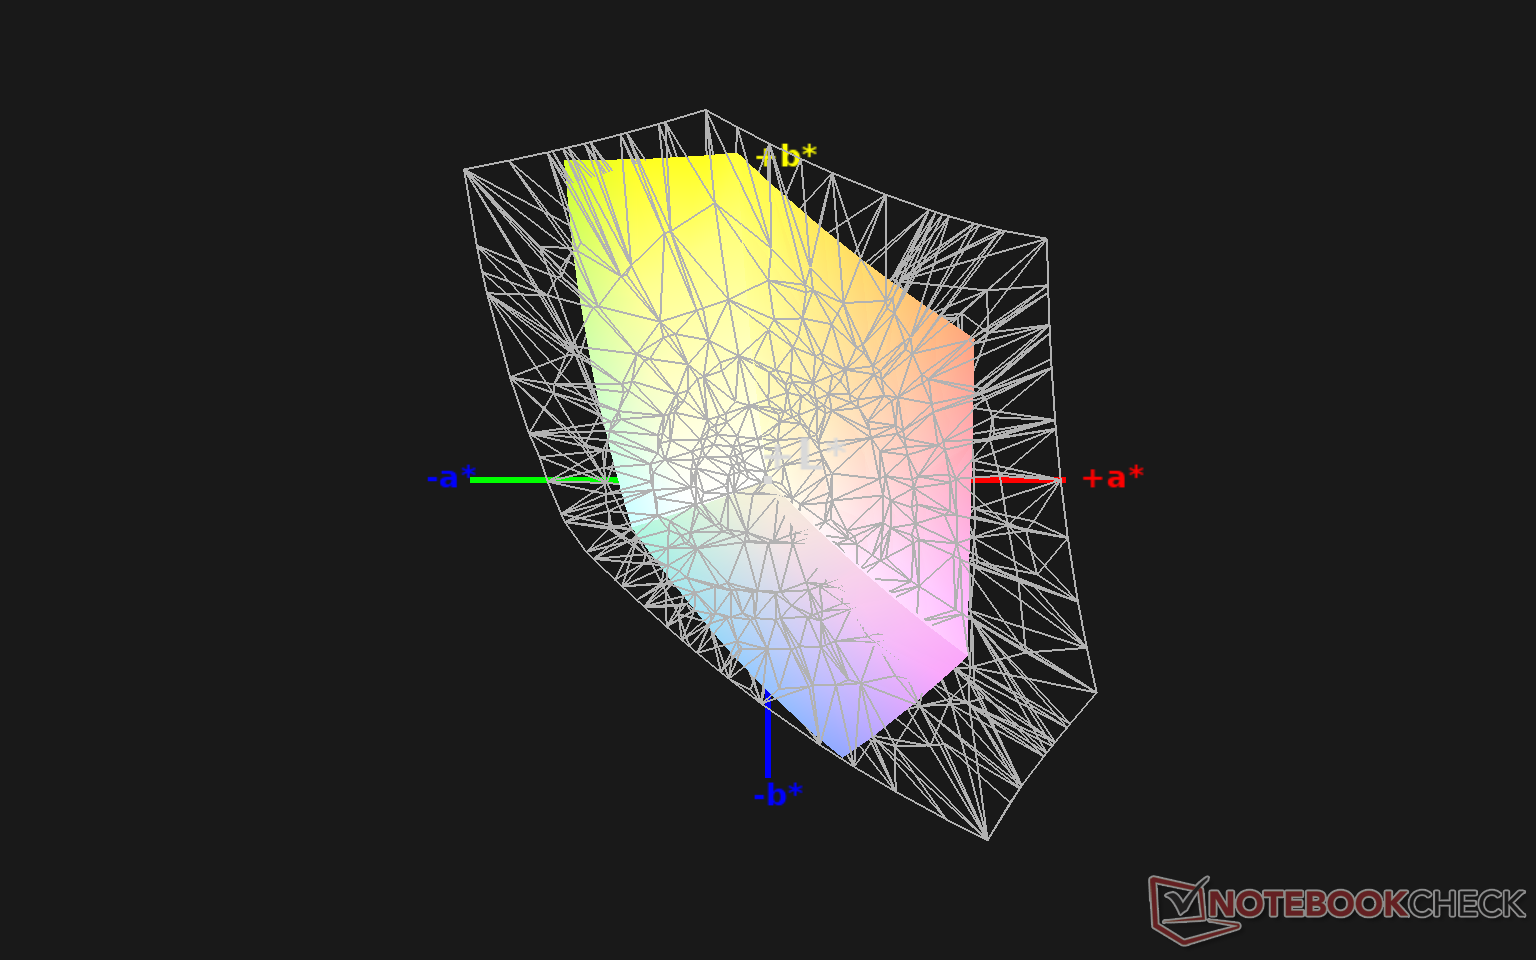
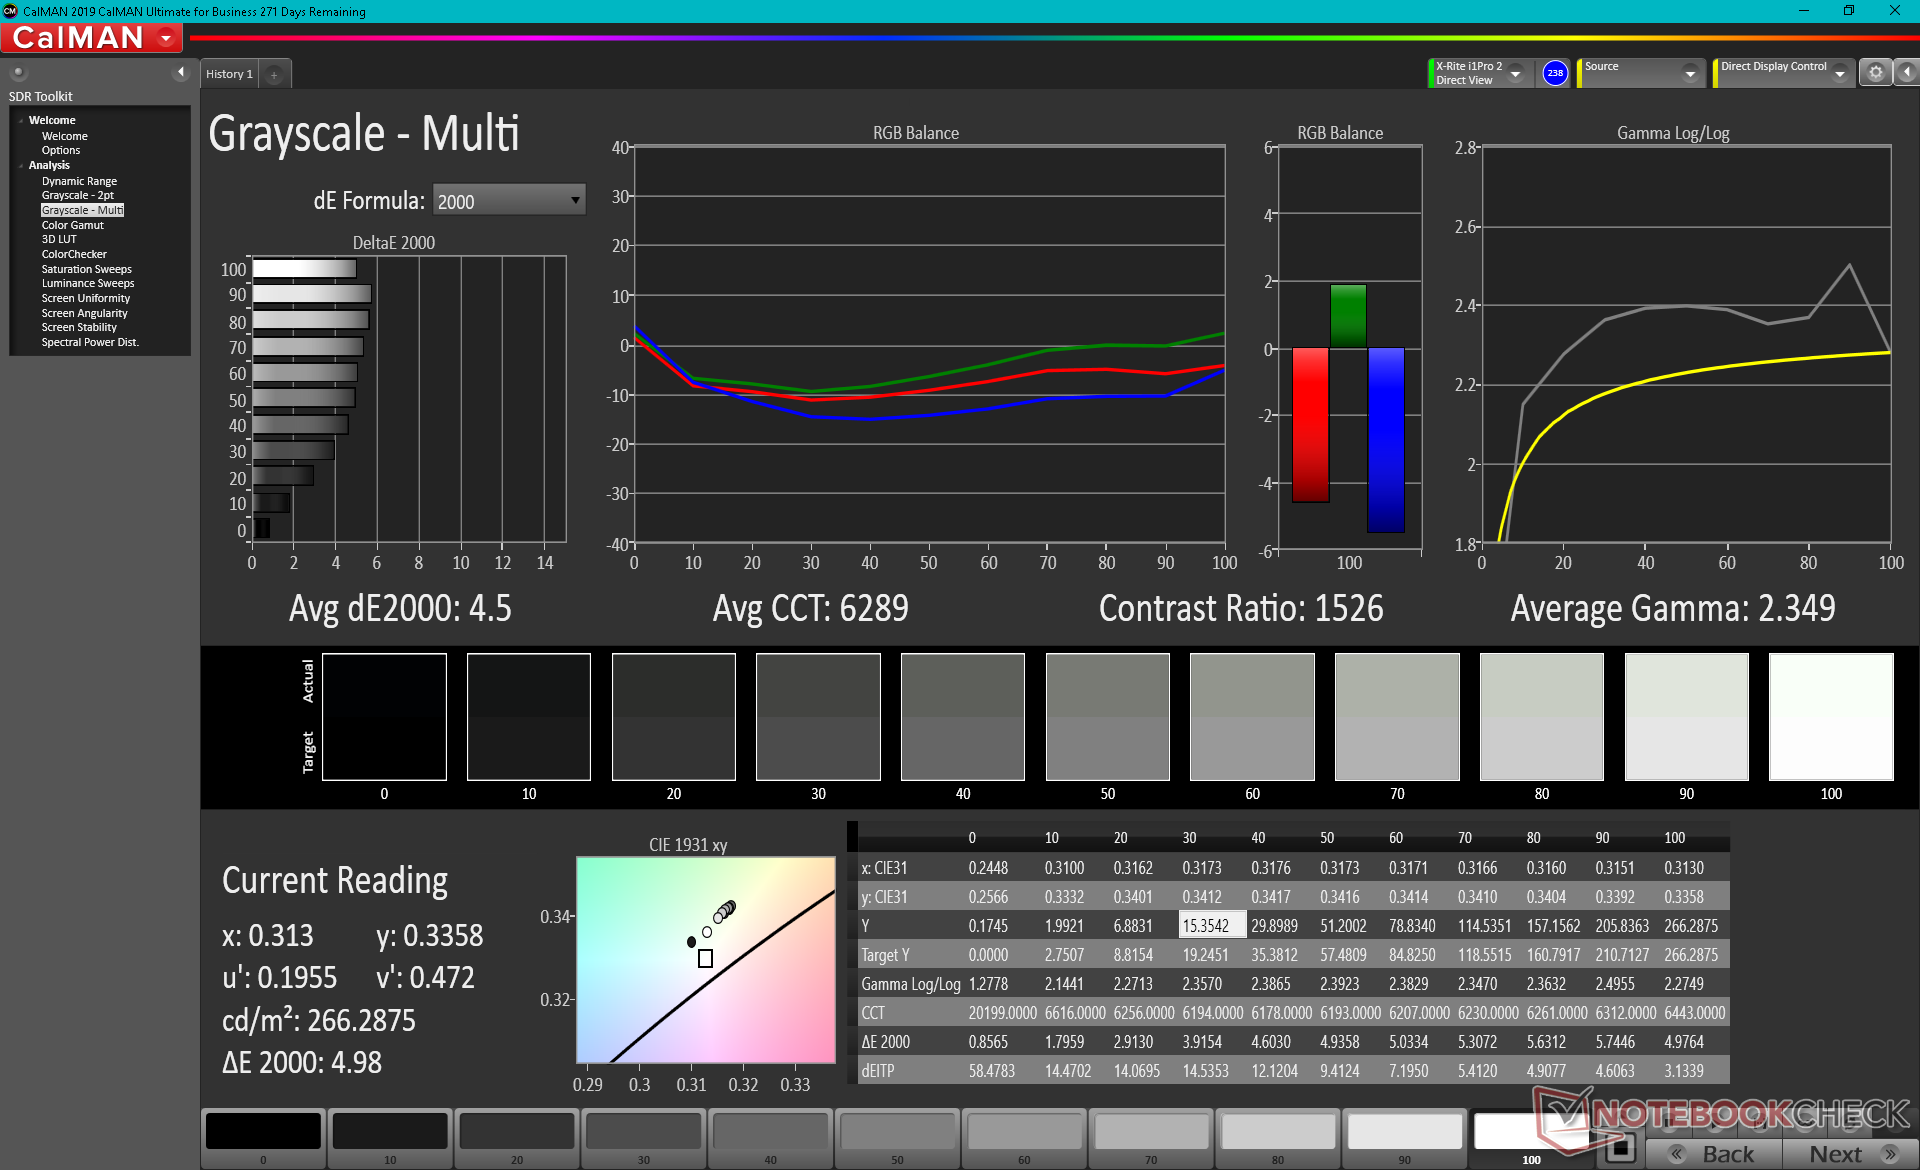
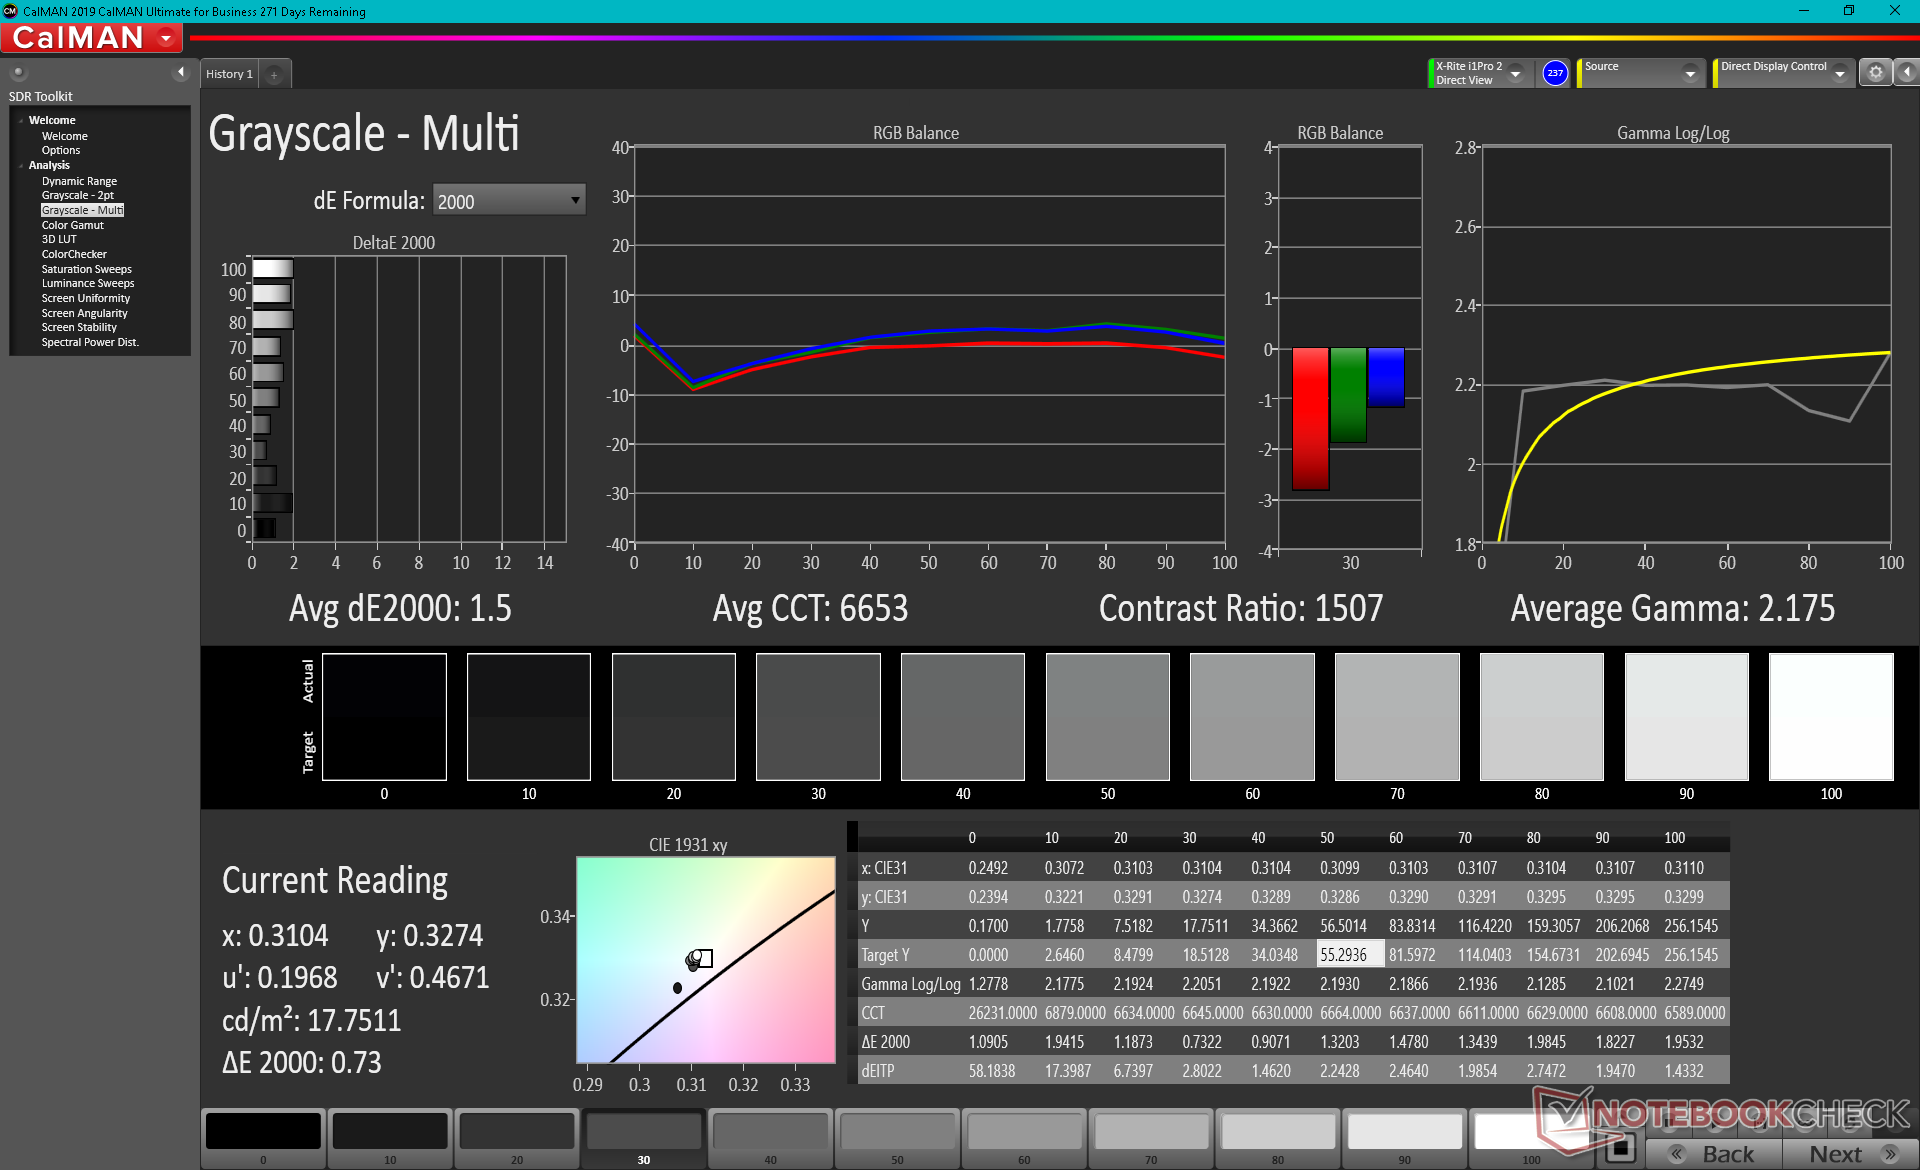
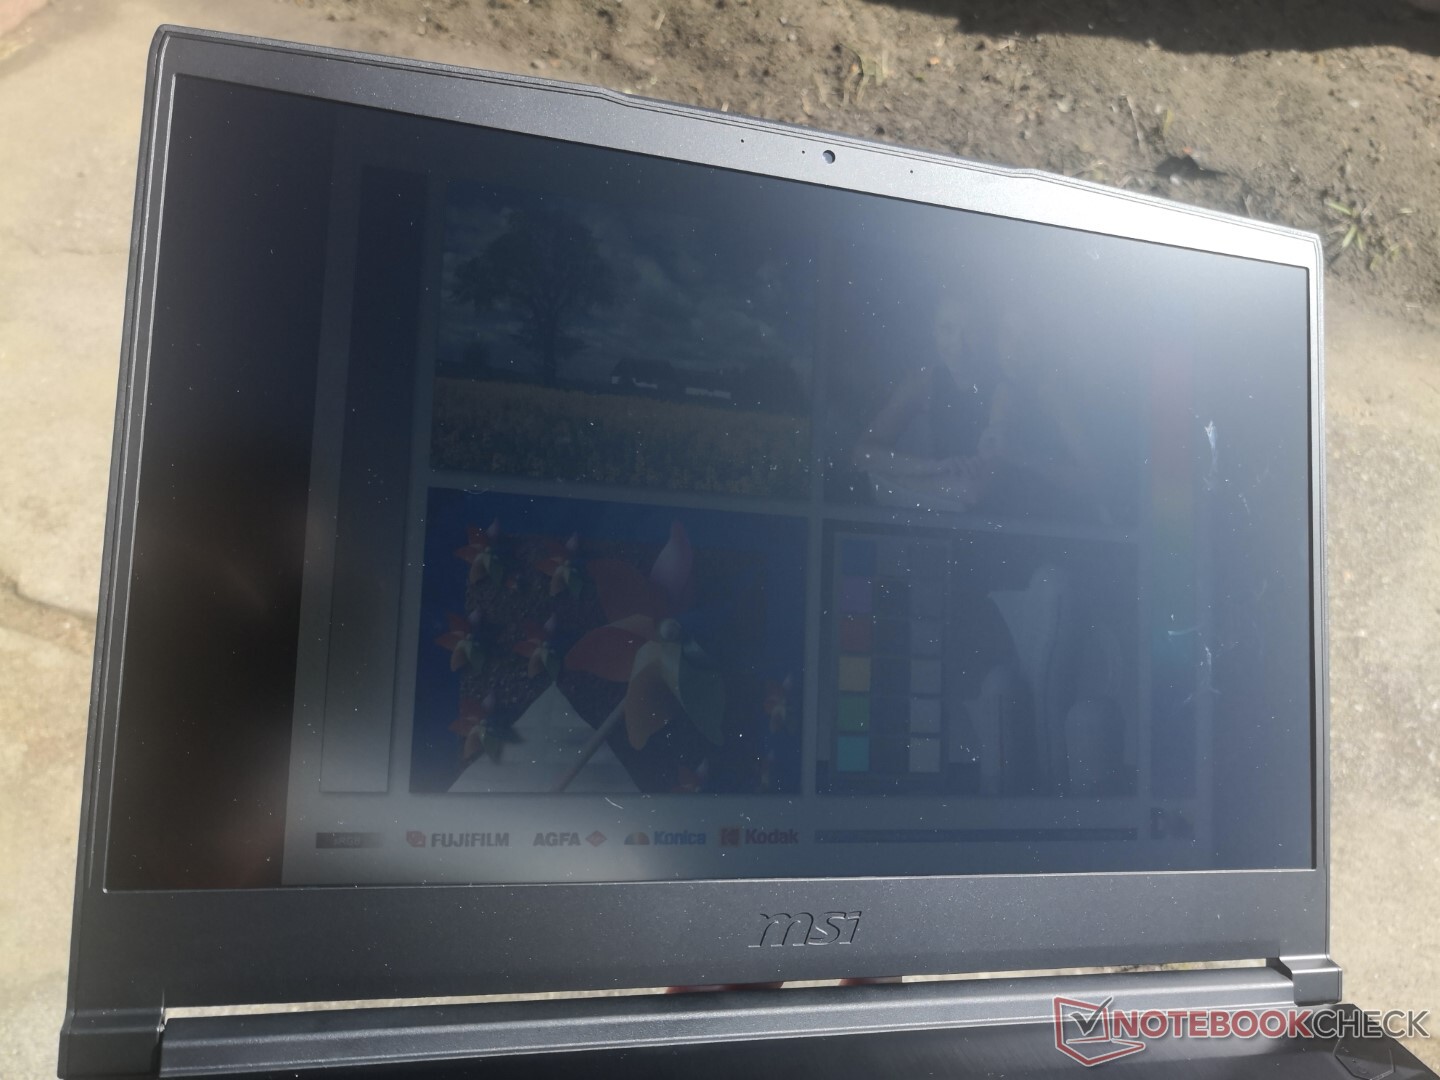
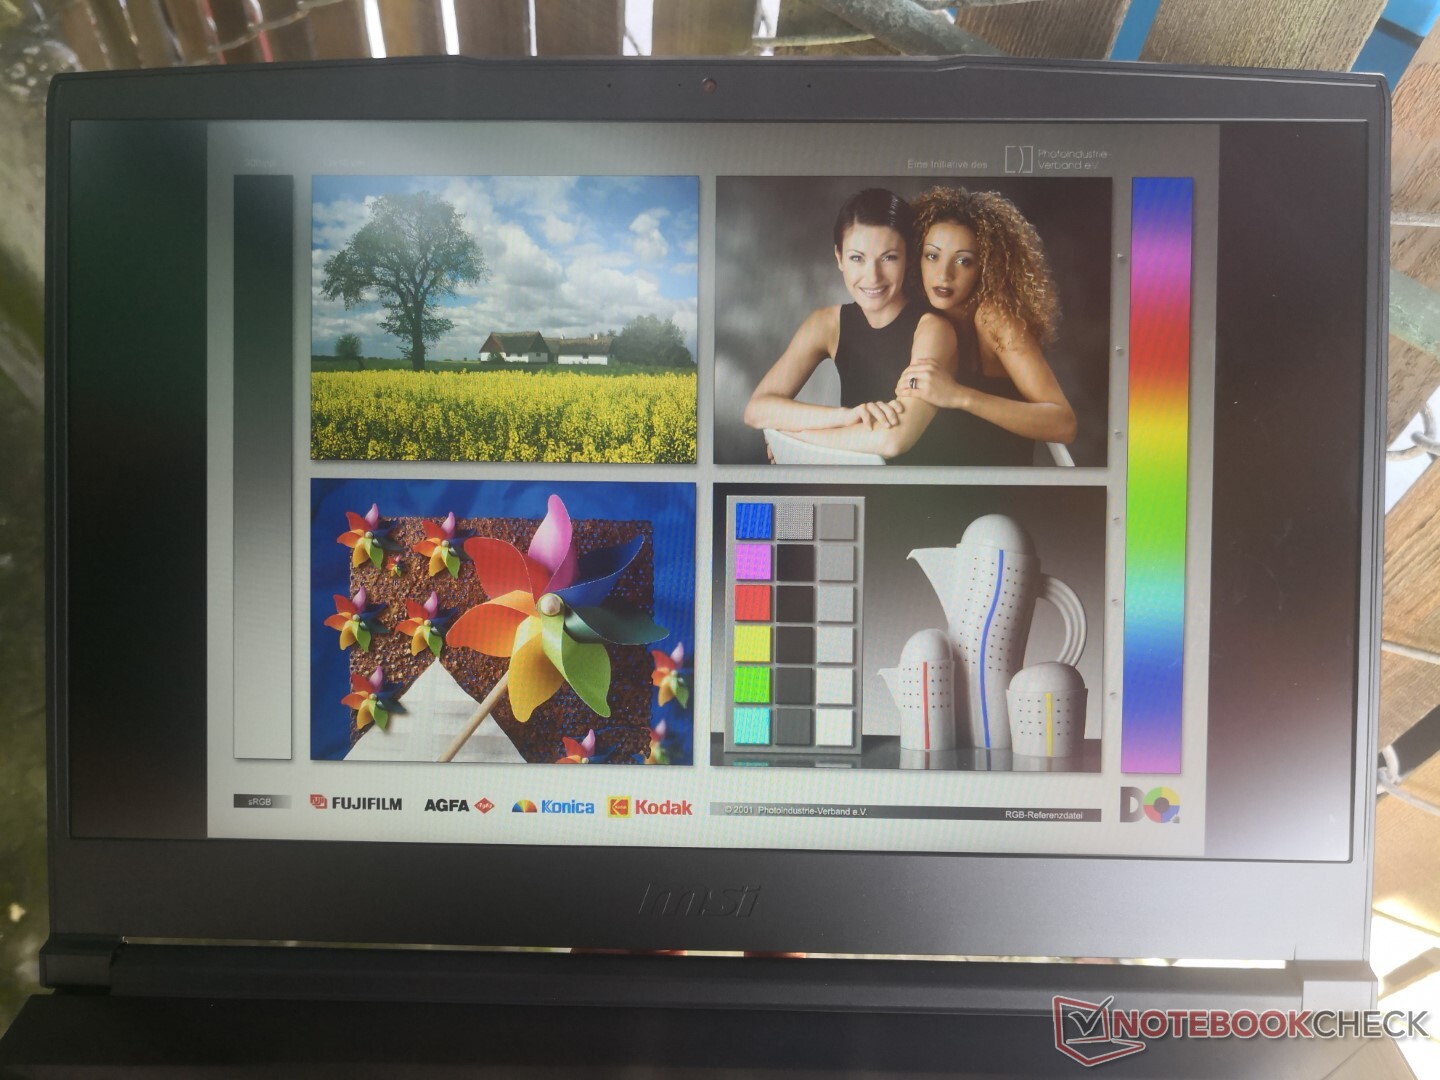
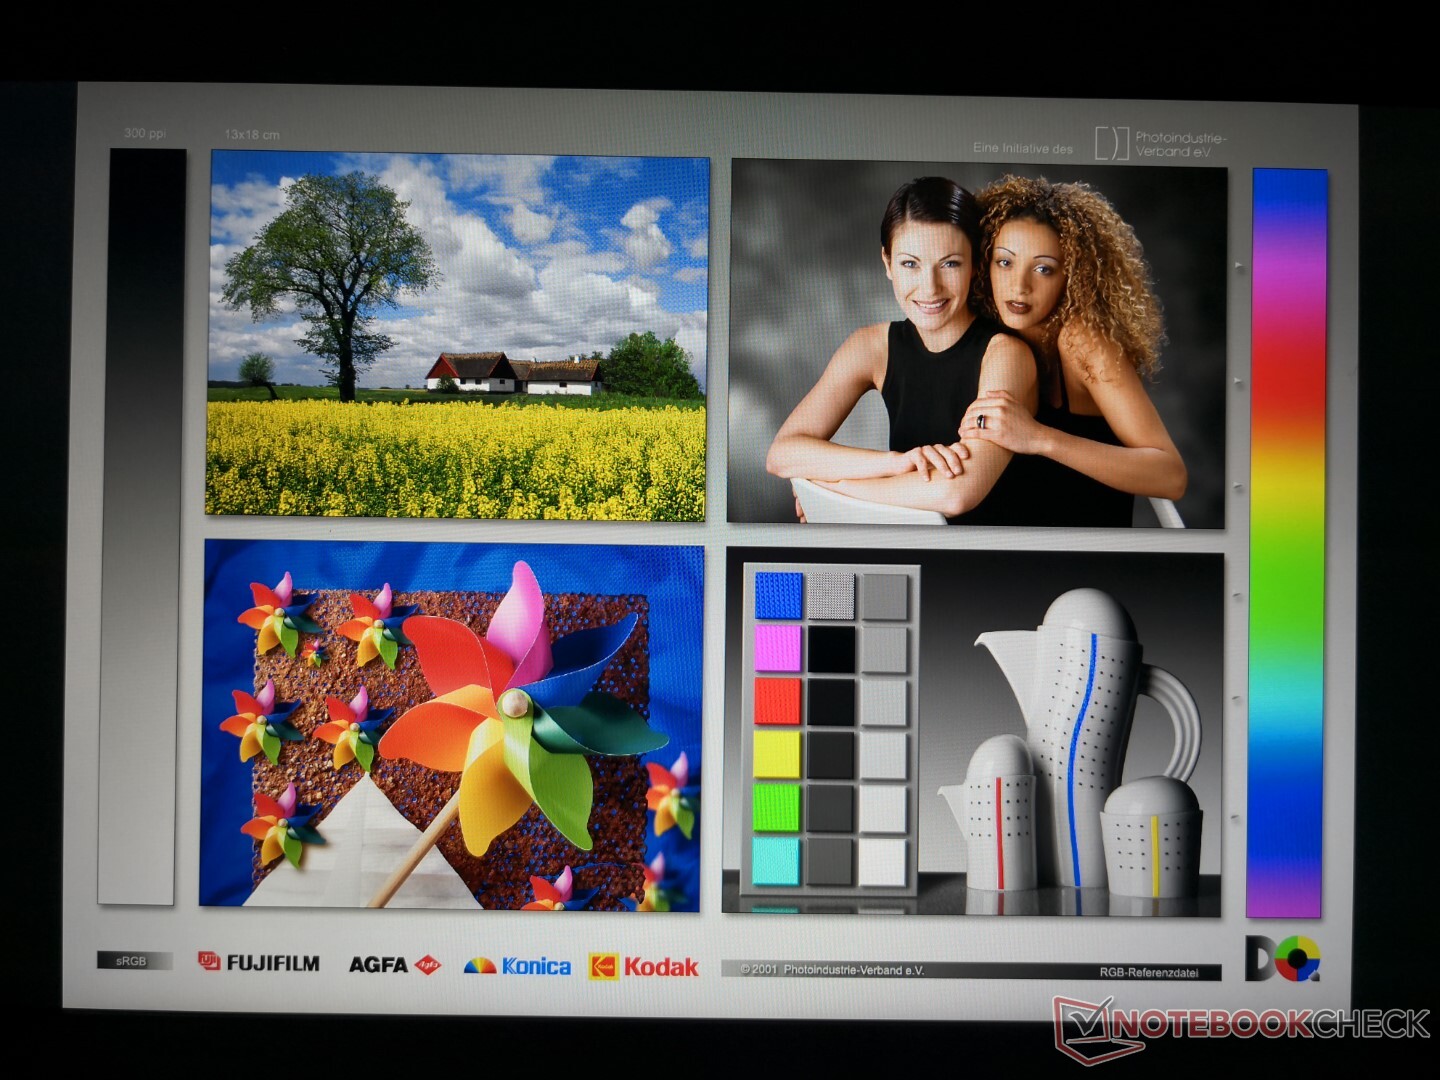
Der GF65 10UE verwendet ein anderes AU-Optronics-Panel als der ältere GF65 9SD (AUO B156HAN08.4 vs. AUO B156HAN13.0), wobei der Hauptunterschied in der Bildwiederholrate liegt (144 Hz vs. 120 Hz). Ansonsten sind die Panels fast identisch, inklusive der durchschnittlichen Schwarz-Weiß-Reaktionszeiten und dem unterdurchschnittlichen Farbraum. Der Kontrast ist mit über 1000:1 recht hoch, aber die eingeschränkte Farbwiedergabe schmälert diesen Vorteil.
Subjektiv ist das Display geeignet für Spiele und den allgemeinen Gebrauch - seien Sie nur auf ein wenig Ghosting vorbereitet und erwarten Sie keine knalligen Farben.


| |||||||||||||||||||||||||
Ausleuchtung: 91 %
Helligkeit Akku: 266.5 cd/m²
Kontrast: 1481:1 (Schwarzwert: 0.18 cd/m²)
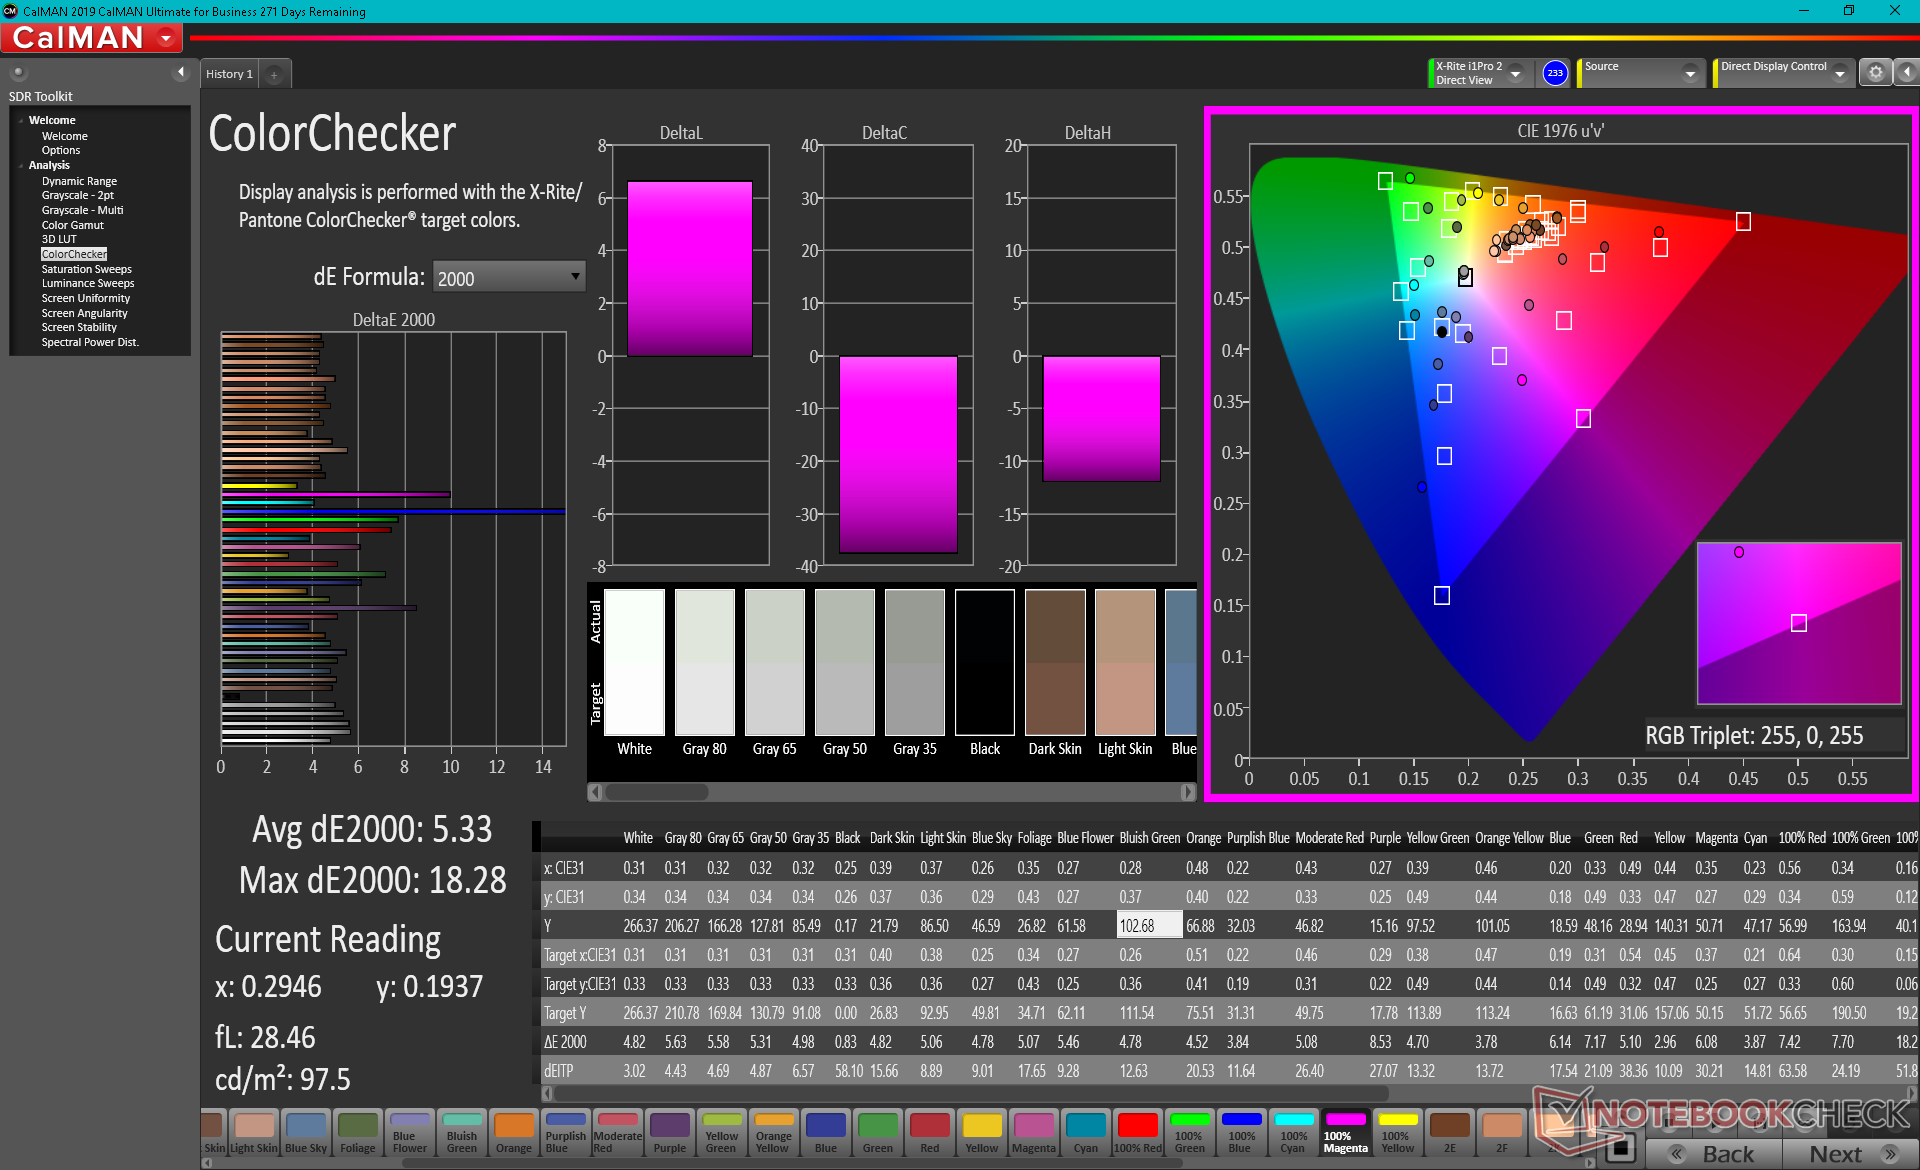
ΔE ColorChecker Calman: 5.33 | ∀{0.5-29.43 Ø4.73}
calibrated: 4.36
ΔE Greyscale Calman: 4.5 | ∀{0.09-98 Ø4.97}
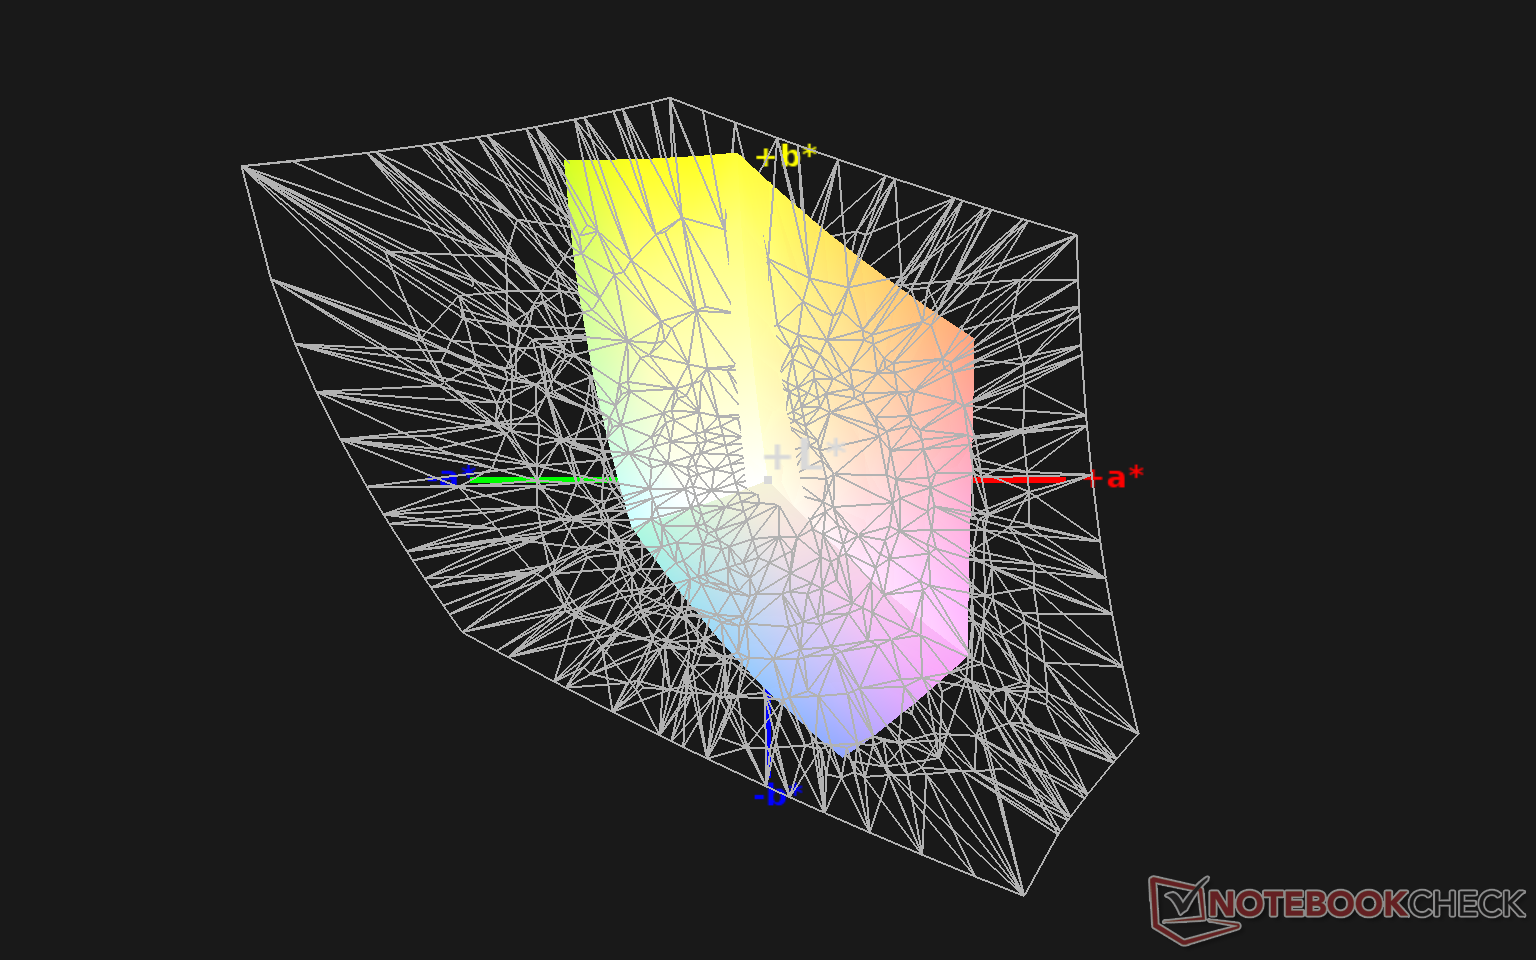
55.8% sRGB (Argyll 1.6.3 3D)
35.6% AdobeRGB 1998 (Argyll 1.6.3 3D)
38.9% AdobeRGB 1998 (Argyll 3D)
56.3% sRGB (Argyll 3D)
37.65% Display P3 (Argyll 3D)
Gamma: 2.35
CCT: 6289 K
| MSI GF65 Thin 10UE AU Optronics B156HAN08.4, IPS, 15.6", 1920x1080 | Asus ROG Strix G15 G513QR LQ156M1JW25, IPS, 15.6", 1920x1080 | Schenker XMG Core 15 Ampere BOE CQ NE156QHM-NY2, IPS, 15.6", 2560x1440 | MSI GS66 Stealth 10UG AU Optronics B156HAN12.0, IPS, 15.6", 1920x1080 | Aorus 15G XC Sharp LQ156M1JW03, IPS, 15.6", 1920x1080 | Lenovo Legion 7 15IMH05-81YT001VGE AUO048E, IPS, 15.6", 1920x1080 | |
|---|---|---|---|---|---|---|
| Display | 74% | 81% | 78% | 73% | 82% | |
| Display P3 Coverage (%) | 37.65 | 67.7 80% | 69.8 85% | 67.7 80% | 65.6 74% | 70.3 87% |
| sRGB Coverage (%) | 56.3 | 94.3 67% | 98.8 75% | 98.4 75% | 97.5 73% | 99.4 77% |
| AdobeRGB 1998 Coverage (%) | 38.9 | 68.2 75% | 70.7 82% | 69.1 78% | 67.1 72% | 71.3 83% |
| Response Times | 75% | 64% | 62% | 72% | 77% | |
| Response Time Grey 50% / Grey 80% * (ms) | 36.8 ? | 8.2 ? 78% | 14.8 ? 60% | 14.4 ? 61% | 9.6 ? 74% | 8 ? 78% |
| Response Time Black / White * (ms) | 31.6 ? | 9.2 ? 71% | 10.4 ? 67% | 11.6 ? 63% | 9.6 ? 70% | 8 ? 75% |
| PWM Frequency (Hz) | 24040 ? | |||||
| Bildschirm | 27% | 40% | 29% | 37% | 47% | |
| Helligkeit Bildmitte (cd/m²) | 266.5 | 308 16% | 347 30% | 259.5 -3% | 288 8% | 470 76% |
| Brightness (cd/m²) | 262 | 288 10% | 328 25% | 264 1% | 270 3% | 468 79% |
| Brightness Distribution (%) | 91 | 86 -5% | 89 -2% | 90 -1% | 89 -2% | 85 -7% |
| Schwarzwert * (cd/m²) | 0.18 | 0.23 -28% | 0.27 -50% | 0.25 -39% | 0.25 -39% | 0.21 -17% |
| Kontrast (:1) | 1481 | 1339 -10% | 1285 -13% | 1038 -30% | 1152 -22% | 2238 51% |
| Delta E Colorchecker * | 5.33 | 3.28 38% | 1.66 69% | 2.52 53% | 1.19 78% | 3.28 38% |
| Colorchecker dE 2000 max. * | 18.28 | 8.51 53% | 3.03 83% | 5.55 70% | 3.79 79% | 7.31 60% |
| Colorchecker dE 2000 calibrated * | 4.36 | 0.83 81% | 1.23 72% | 1.93 56% | 0.71 84% | 0.8 82% |
| Delta E Graustufen * | 4.5 | 5 -11% | 1.6 64% | 1.7 62% | 1.6 64% | 4.49 -0% |
| Gamma | 2.35 94% | 2.057 107% | 2.278 97% | 2.04 108% | 2.229 99% | 2.4 92% |
| CCT | 6289 103% | 7393 88% | 6430 101% | 6414 101% | 6539 99% | 7438 87% |
| Farbraum (Prozent von AdobeRGB 1998) (%) | 35.6 | 68 91% | 71 99% | 63.3 78% | 67 88% | 65 83% |
| Color Space (Percent of sRGB) (%) | 55.8 | 90 61% | 94 68% | 98.8 77% | 90 61% | 99 77% |
| Durchschnitt gesamt (Programm / Settings) | 59% /
42% | 62% /
51% | 56% /
43% | 61% /
48% | 69% /
58% |
* ... kleinere Werte sind besser
Der Farbraum deckt nur 56 Prozent von sRGB bzw. 36 Prozent von AdobeRGB ab, was trotz der hohen nativen Bildwiederholrate von 144 Hz auf ein Budget-Panel hindeutet. Die meisten Ultrabooks oder Gaming-Laptops der Mittelklasse oder besser decken mindestens 90 Prozent des sRGB-Farbraums ab und bieten damit tiefere Farben. Die eingeschränkte Farbdarstellung ist beim Gaming kein Problem, aber Grafikbearbeiter sollten den Einsatz dieses Panels vermeiden.
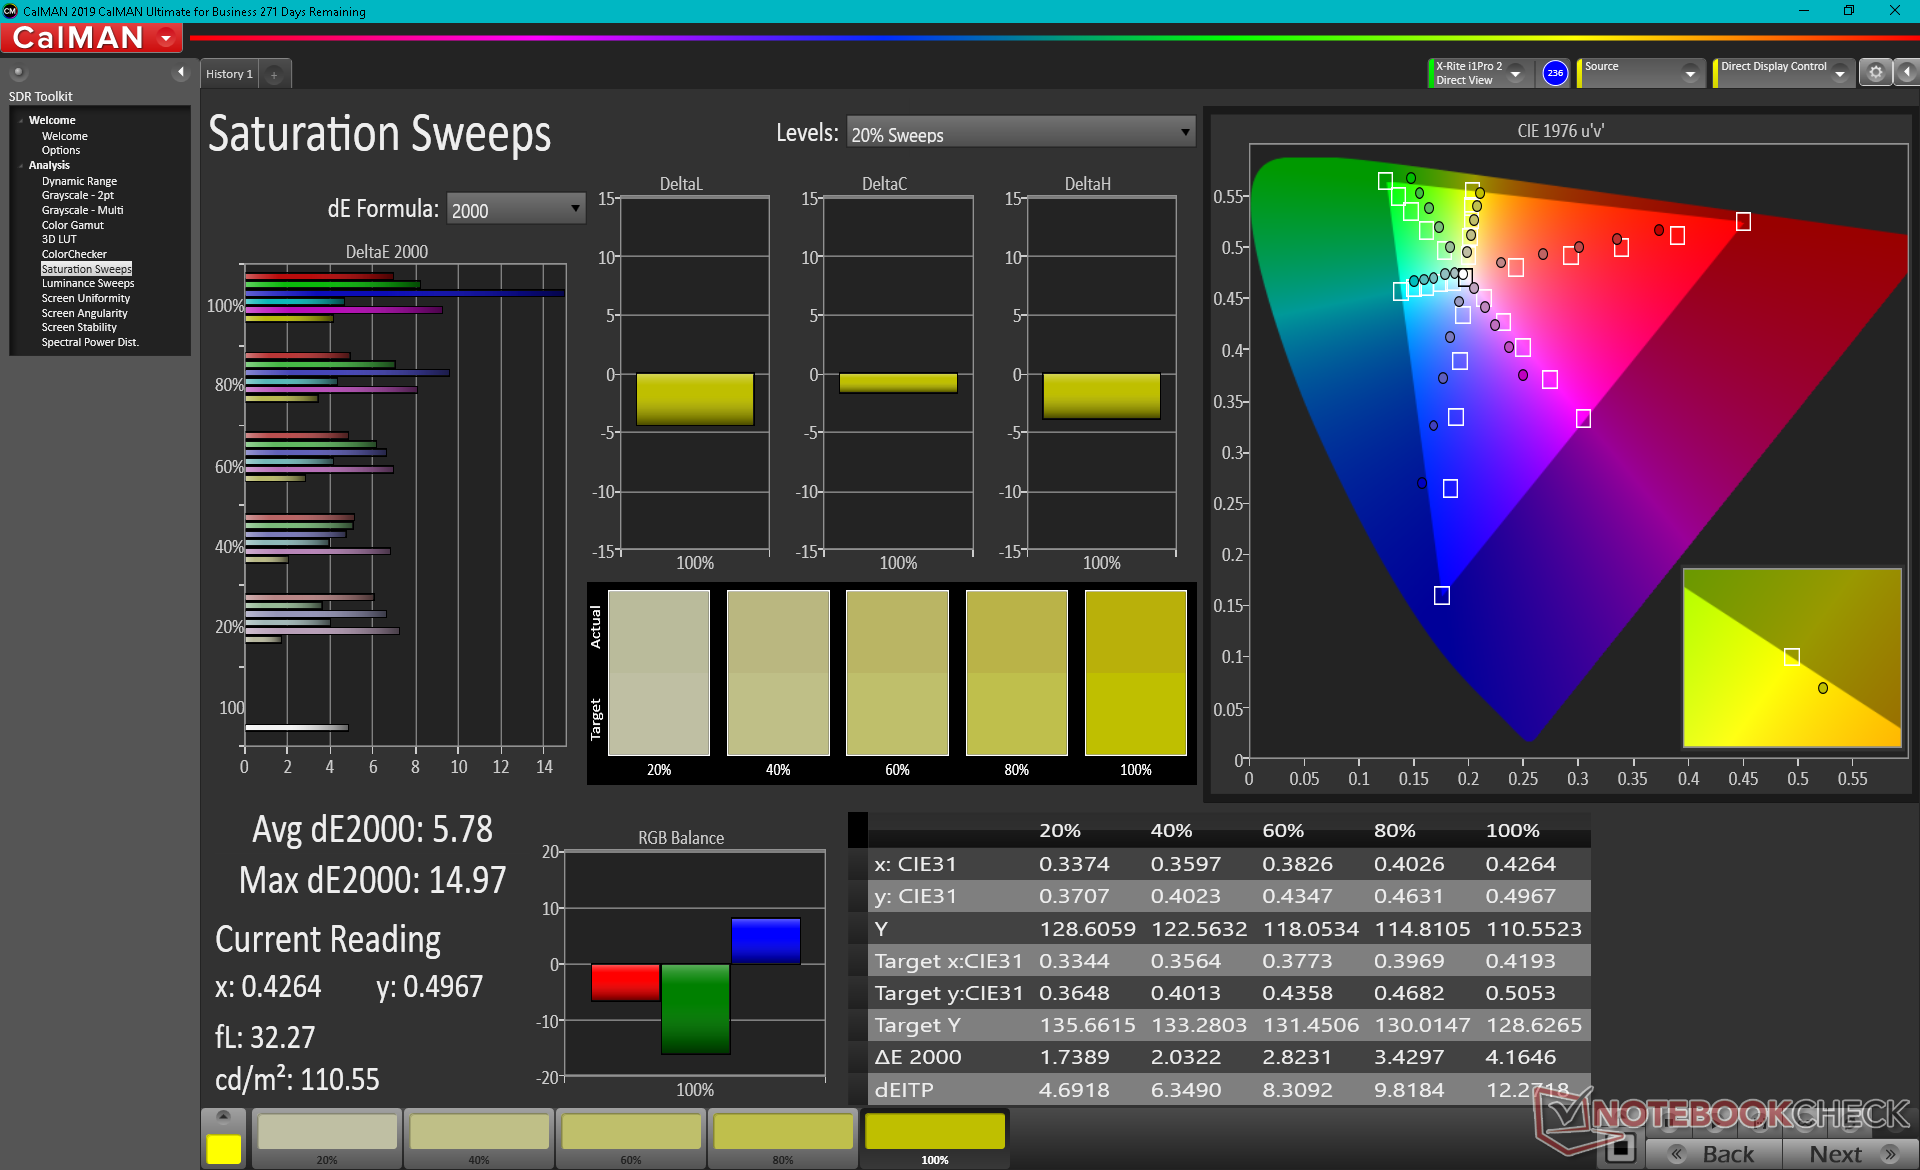
Die X-Rite-Kolorimeter-Messungen zeigen eine übermäßig warme Farbtemperatur im Auslieferungszustand, die eine Kalibrierung für genauere Graustufen beheben kann. Die Farbgenauigkeit bleibt jedoch unterdurchschnittlich, vor allem bei höheren Sättigungswerten, was auf den oben erwähnten engen Farbraum zurückzuführen ist. Insbesondere Blau wird mit deutlichem Abstand ungenauer dargestellt als jede andere getestete Farbe.
Reaktionszeiten (Response Times) des Displays
| ↔ Reaktionszeiten Schwarz zu Weiß | ||
|---|---|---|
| 31.6 ms ... steigend ↗ und fallend ↘ kombiniert | ↗ 18.4 ms steigend | 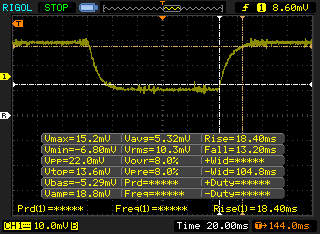 |
| ↘ 13.2 ms fallend | ||
| Die gemessenen Reaktionszeiten sind langsam und dadurch für viele Spieler wahrscheinlich zu langsam. Im Vergleich rangierten die bei uns getesteten Geräte von 0.1 (Minimum) zu 240 (Maximum) ms. » 85 % aller Screens waren schneller als der getestete. Daher sind die gemessenen Reaktionszeiten schlechter als der Durchschnitt aller vermessenen Geräte (19.9 ms). | ||
| ↔ Reaktionszeiten 50% Grau zu 80% Grau | ||
| 36.8 ms ... steigend ↗ und fallend ↘ kombiniert | ↗ 19.2 ms steigend | 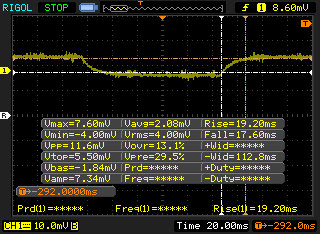 |
| ↘ 17.6 ms fallend | ||
| Die gemessenen Reaktionszeiten sind langsam und dadurch für viele Spieler wahrscheinlich zu langsam. Im Vergleich rangierten die bei uns getesteten Geräte von 0.165 (Minimum) zu 636 (Maximum) ms. » 53 % aller Screens waren schneller als der getestete. Daher sind die gemessenen Reaktionszeiten schlechter als der Durchschnitt aller vermessenen Geräte (31.1 ms). | ||
Bildschirm-Flackern / PWM (Pulse-Width Modulation)
| Flackern / PWM nicht festgestellt | 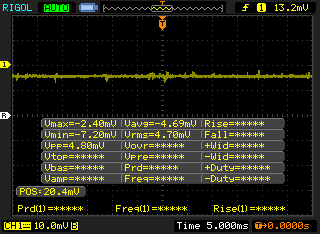 | ||
Im Vergleich: 52 % aller getesteten Geräte nutzten kein PWM um die Helligkeit zu reduzieren. Wenn PWM eingesetzt wurde, dann bei einer Frequenz von durchschnittlich 7798 (Minimum 5, Maximum 343500) Hz. | |||
Die Sichtbarkeit im Freien ist unterdurchschnittlich, da der Bildschirm nicht heller oder dunkler ist als der des bisherigen GF65 9SD. Die maximale Helligkeit ist etwas geringer als bei den meisten Gaming-Laptops, wo 300 nits oder mehr üblich sind.

Performance
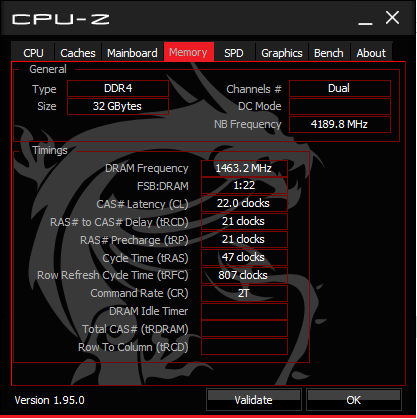
MSI hat das Display (120 Hz auf 144 Hz) und den Arbeitsspeicher (2666 MHz auf 3200 MHz) vom älteren GF65 9SD aktualisiert. Die CPU und GPU wurden von Coffee Lake-H auf Comet Lake-H bzw. Nvidia Turing auf Ampere aktualisiert.
Kleinere Core i5-10200H- und i5-10500H-SKUs sind ebenfalls verfügbar, aber das 144-Hz-IPS-Display und die GeForce RTX 3060 bleiben bei allen Konfigurationen zum jetzigen Zeitpunkt fix.
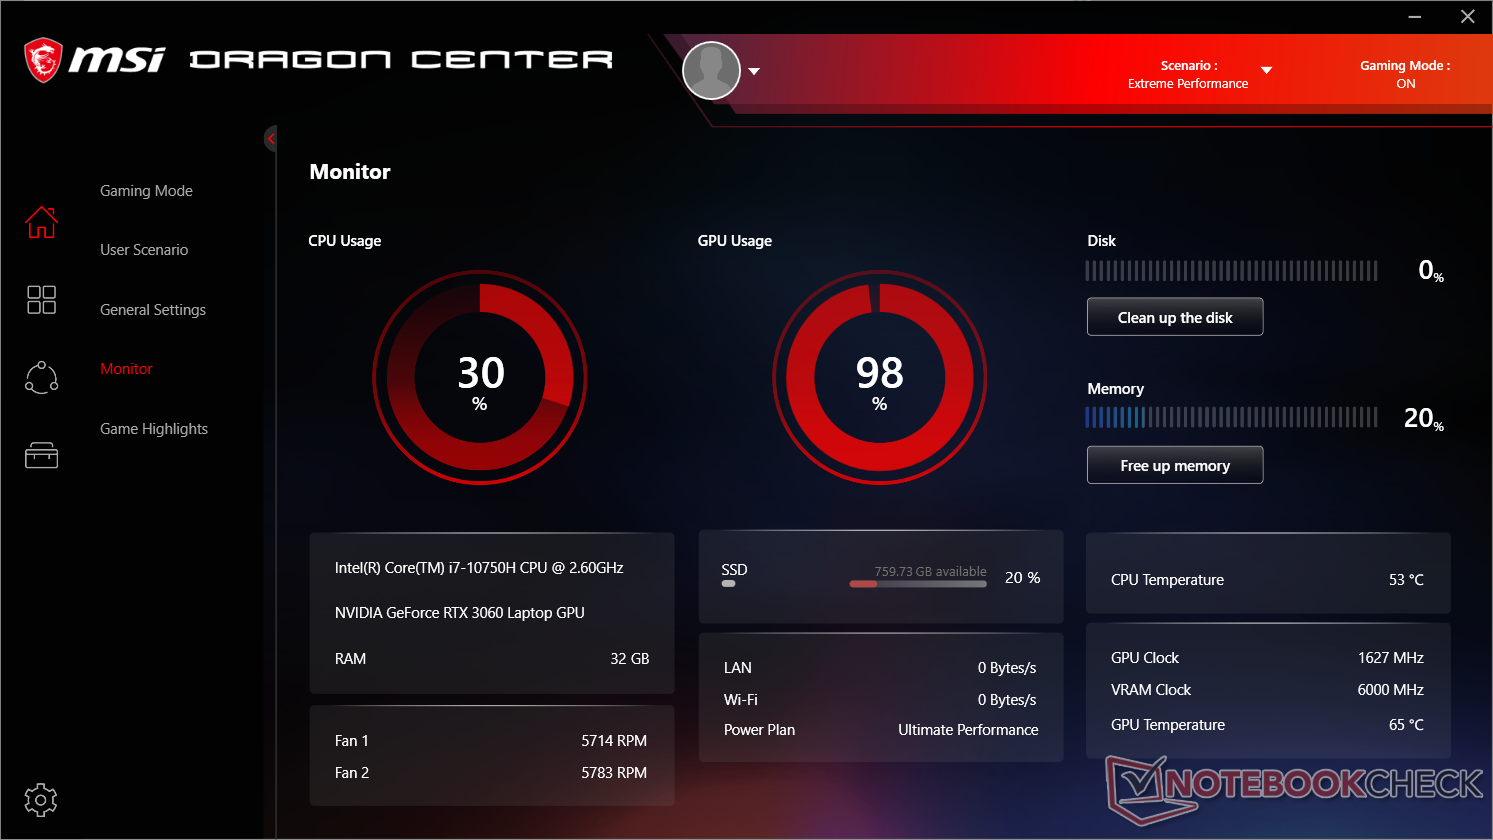
Wir haben unser System auf den MSI Extreme Performance Modus eingestellt, bevor wir die folgenden Leistungsbenchmarks durchgeführt haben.
Prozessor
Die Multi-Thread-CPU-Leistung ist um etwa 10 bis 15 Prozent langsamer als der durchschnittliche Core i7-10750H in unserer Datenbank. Tatsächlich ist der ältere Core i7-9750H im Maingear Vector 15 in der Lage, unser MSI bei Multi-Thread-Lasten durchweg um einige Prozentpunkte zu übertreffen. Für eine höhere Leistung sollten Nutzer den Cooler-Boost-Modus (oder den maximalen Lüftermodus) aktivieren, wie in unserem Stresstest-Abschnitt unten beschrieben.
Cinebench R15: CPU Multi 64Bit | CPU Single 64Bit
Blender: v2.79 BMW27 CPU
7-Zip 18.03: 7z b 4 -mmt1 | 7z b 4
Geekbench 5.5: Single-Core | Multi-Core
HWBOT x265 Benchmark v2.2: 4k Preset
LibreOffice : 20 Documents To PDF
R Benchmark 2.5: Overall mean
| Cinebench R20 / CPU (Multi Core) | |
| Schenker XMG Core 15 Ampere | |
| Asus Zephyrus G14 GA401IV | |
| Asus ROG Strix Scar 15 G532LWS | |
| Aorus 15P XC | |
| MSI GE65 Raider 9SF-049US | |
| HP Pavilion Gaming 15-ec1206ng | |
| Durchschnittliche Intel Core i7-10750H (1749 - 3325, n=43) | |
| Maingear Vector 15 | |
| MSI GF65 Thin 10UE | |
| Gateway Creator Series 15.6 GWTN156-3BK | |
| MSI GF63 Thin 9SC | |
| Cinebench R20 / CPU (Single Core) | |
| Asus Zephyrus G14 GA401IV | |
| Asus ROG Strix Scar 15 G532LWS | |
| Schenker XMG Core 15 Ampere | |
| MSI GF65 Thin 10UE | |
| MSI GE65 Raider 9SF-049US | |
| Aorus 15P XC | |
| Durchschnittliche Intel Core i7-10750H (431 - 504, n=43) | |
| Gateway Creator Series 15.6 GWTN156-3BK | |
| HP Pavilion Gaming 15-ec1206ng | |
| Maingear Vector 15 | |
| MSI GF63 Thin 9SC | |
| Cinebench R15 / CPU Multi 64Bit | |
| Schenker XMG Core 15 Ampere | |
| Asus Zephyrus G14 GA401IV | |
| Asus ROG Strix Scar 15 G532LWS | |
| Aorus 15P XC | |
| MSI GE65 Raider 9SF-049US | |
| HP Pavilion Gaming 15-ec1206ng | |
| Maingear Vector 15 | |
| Durchschnittliche Intel Core i7-10750H (804 - 1418, n=50) | |
| MSI GF65 Thin 10UE | |
| Gateway Creator Series 15.6 GWTN156-3BK | |
| MSI GF63 Thin 9SC | |
| Cinebench R15 / CPU Single 64Bit | |
| Asus ROG Strix Scar 15 G532LWS | |
| MSI GF65 Thin 10UE | |
| Aorus 15P XC | |
| MSI GE65 Raider 9SF-049US | |
| Durchschnittliche Intel Core i7-10750H (184 - 213, n=45) | |
| Asus Zephyrus G14 GA401IV | |
| Schenker XMG Core 15 Ampere | |
| Maingear Vector 15 | |
| Gateway Creator Series 15.6 GWTN156-3BK | |
| HP Pavilion Gaming 15-ec1206ng | |
| MSI GF63 Thin 9SC | |
| Blender / v2.79 BMW27 CPU | |
| Gateway Creator Series 15.6 GWTN156-3BK | |
| MSI GF65 Thin 10UE | |
| Durchschnittliche Intel Core i7-10750H (322 - 587, n=43) | |
| HP Pavilion Gaming 15-ec1206ng | |
| Asus Zephyrus G14 GA401IV | |
| Aorus 15P XC | |
| Asus ROG Strix Scar 15 G532LWS | |
| Schenker XMG Core 15 Ampere | |
| 7-Zip 18.03 / 7z b 4 -mmt1 | |
| Asus ROG Strix Scar 15 G532LWS | |
| Aorus 15P XC | |
| MSI GF65 Thin 10UE | |
| Durchschnittliche Intel Core i7-10750H (4504 - 5470, n=43) | |
| Schenker XMG Core 15 Ampere | |
| Asus Zephyrus G14 GA401IV | |
| Gateway Creator Series 15.6 GWTN156-3BK | |
| HP Pavilion Gaming 15-ec1206ng | |
| 7-Zip 18.03 / 7z b 4 | |
| Schenker XMG Core 15 Ampere | |
| Asus Zephyrus G14 GA401IV | |
| Asus ROG Strix Scar 15 G532LWS | |
| Aorus 15P XC | |
| HP Pavilion Gaming 15-ec1206ng | |
| Durchschnittliche Intel Core i7-10750H (26040 - 37345, n=43) | |
| MSI GF65 Thin 10UE | |
| Gateway Creator Series 15.6 GWTN156-3BK | |
| Geekbench 5.5 / Single-Core | |
| Asus ROG Strix Scar 15 G532LWS | |
| MSI GF65 Thin 10UE | |
| Aorus 15P XC | |
| Durchschnittliche Intel Core i7-10750H (1114 - 1333, n=43) | |
| Asus Zephyrus G14 GA401IV | |
| Schenker XMG Core 15 Ampere | |
| HP Pavilion Gaming 15-ec1206ng | |
| Gateway Creator Series 15.6 GWTN156-3BK | |
| Geekbench 5.5 / Multi-Core | |
| Asus ROG Strix Scar 15 G532LWS | |
| Schenker XMG Core 15 Ampere | |
| Aorus 15P XC | |
| Asus Zephyrus G14 GA401IV | |
| MSI GF65 Thin 10UE | |
| Durchschnittliche Intel Core i7-10750H (4443 - 6674, n=43) | |
| HP Pavilion Gaming 15-ec1206ng | |
| Gateway Creator Series 15.6 GWTN156-3BK | |
| HWBOT x265 Benchmark v2.2 / 4k Preset | |
| Schenker XMG Core 15 Ampere | |
| Asus ROG Strix Scar 15 G532LWS | |
| Aorus 15P XC | |
| Asus Zephyrus G14 GA401IV | |
| HP Pavilion Gaming 15-ec1206ng | |
| Durchschnittliche Intel Core i7-10750H (5.54 - 11.6, n=43) | |
| MSI GF65 Thin 10UE | |
| Gateway Creator Series 15.6 GWTN156-3BK | |
| LibreOffice / 20 Documents To PDF | |
| HP Pavilion Gaming 15-ec1206ng | |
| Schenker XMG Core 15 Ampere | |
| Gateway Creator Series 15.6 GWTN156-3BK | |
| Aorus 15P XC | |
| Durchschnittliche Intel Core i7-10750H (43.1 - 99.2, n=43) | |
| Asus ROG Strix Scar 15 G532LWS | |
| MSI GF65 Thin 10UE | |
| R Benchmark 2.5 / Overall mean | |
| Gateway Creator Series 15.6 GWTN156-3BK | |
| Durchschnittliche Intel Core i7-10750H (0.578 - 0.708, n=42) | |
| HP Pavilion Gaming 15-ec1206ng | |
| MSI GF65 Thin 10UE | |
| Aorus 15P XC | |
| Schenker XMG Core 15 Ampere | |
| Asus ROG Strix Scar 15 G532LWS | |
* ... kleinere Werte sind besser
System Performance
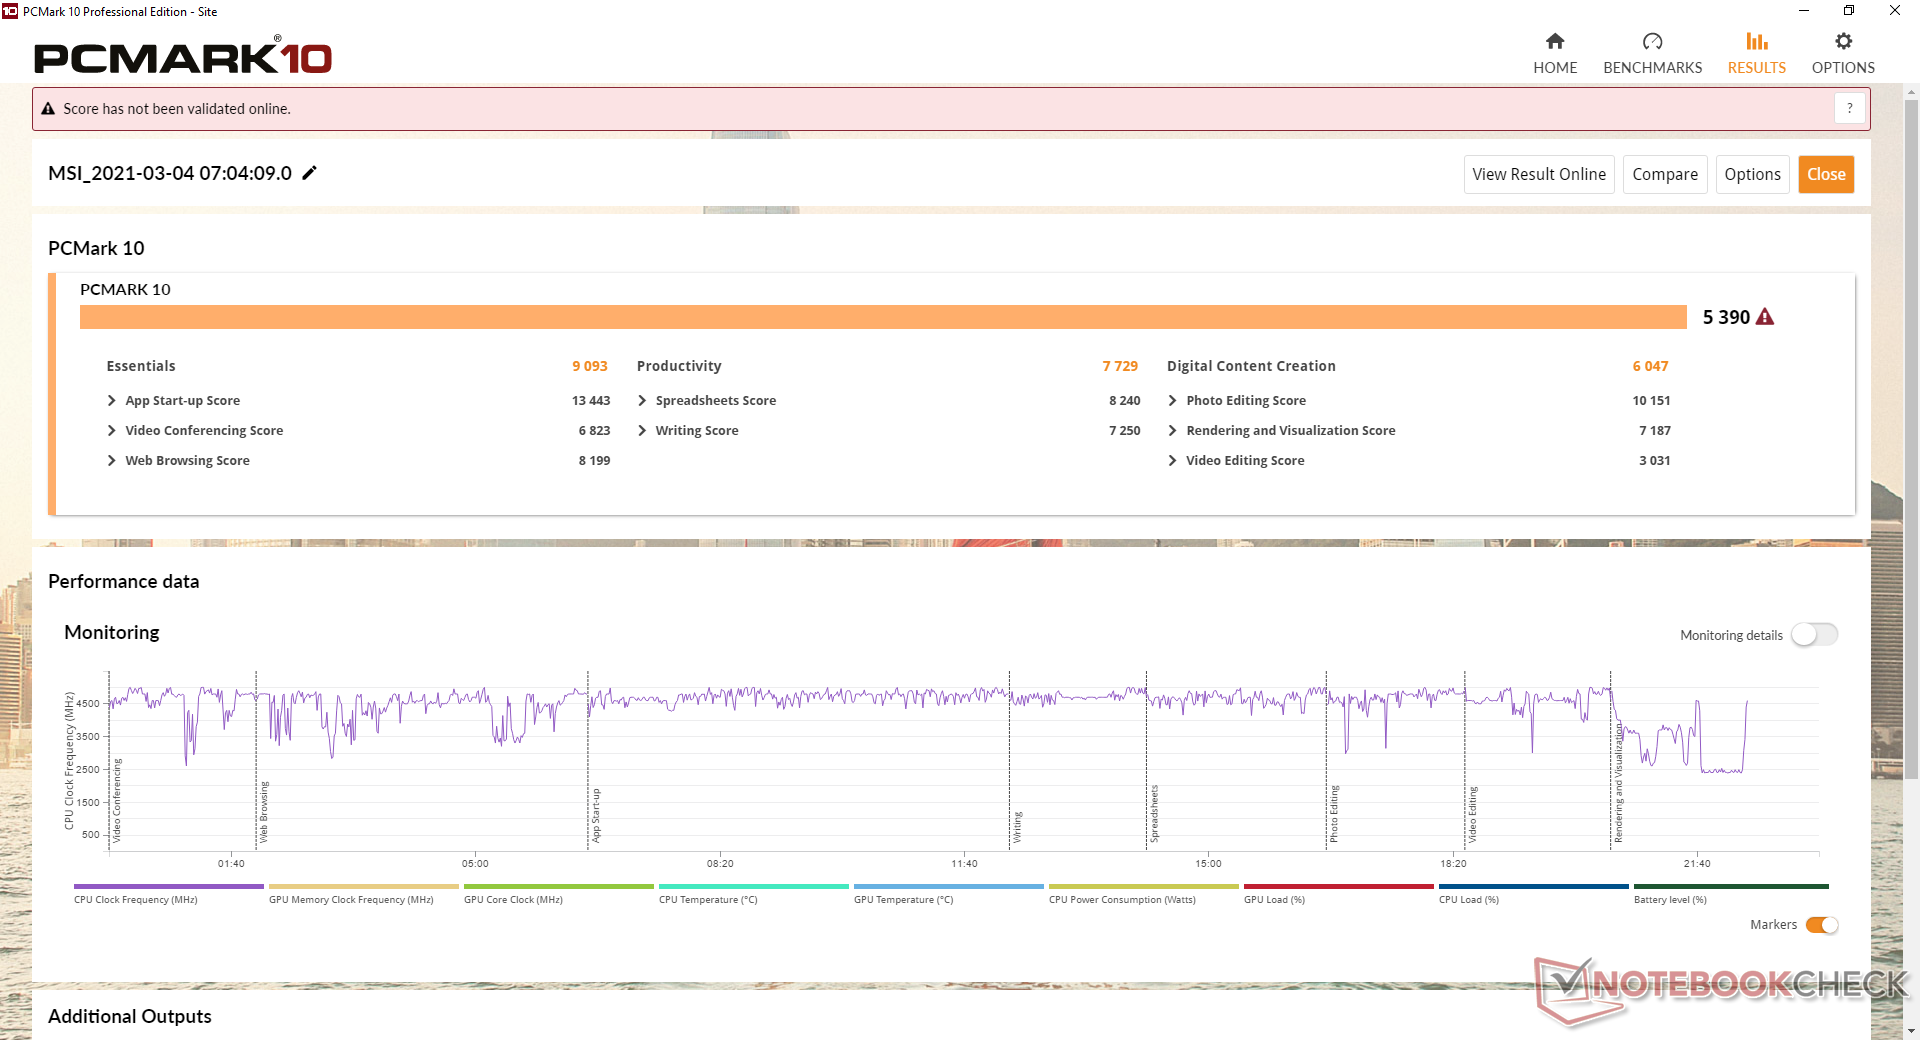
| PCMark 10 Score | 5390 Punkte | |
Hilfe | ||
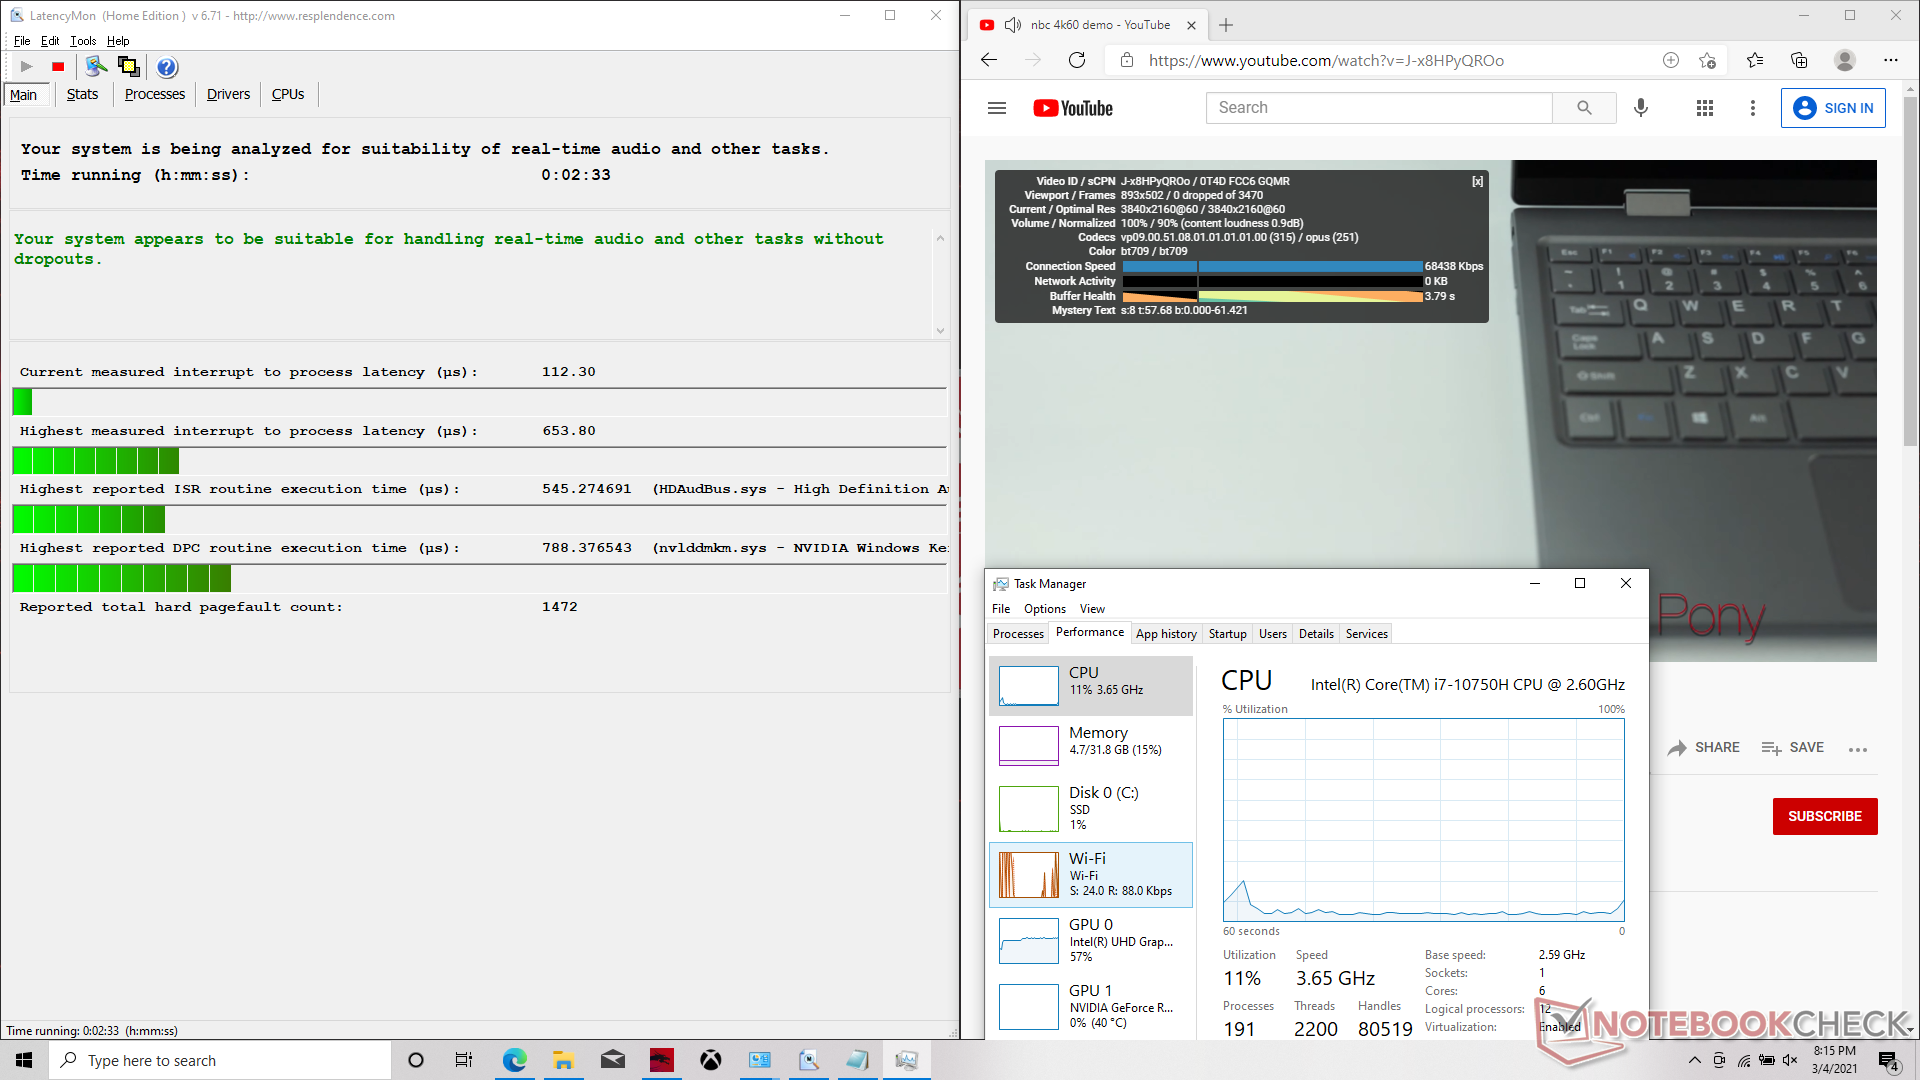
DPC-Latenzzeit
LatencyMon zeigt keine DPC-Latenzprobleme beim Öffnen mehrerer Browser-Tabs auf unserer Homepage und auch keine dropped frames bei der Wiedergabe von 4K60-Inhalten auf YouTube.
| DPC Latencies / LatencyMon - interrupt to process latency (max), Web, Youtube, Prime95 | |
| Aorus 15G XC | |
| Lenovo Legion 7 15IMH05-81YT001VGE | |
| MSI GF65 Thin 10UE | |
| MSI GS66 Stealth 10UG | |
| Schenker XMG Core 15 Ampere | |
| Asus ROG Strix G15 G513QR | |
* ... kleinere Werte sind besser
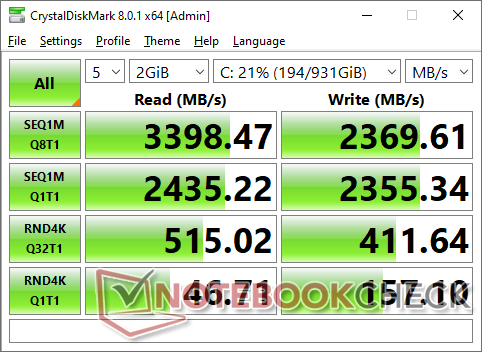
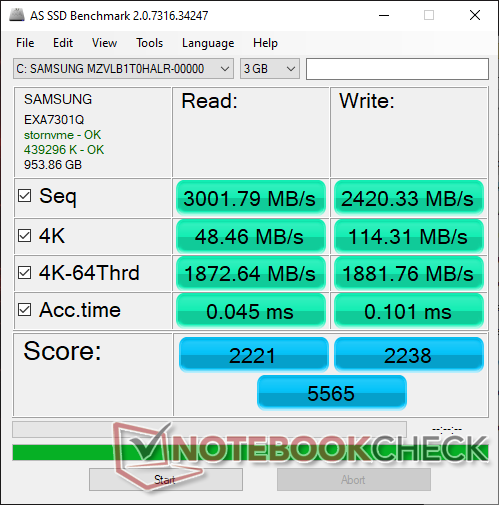
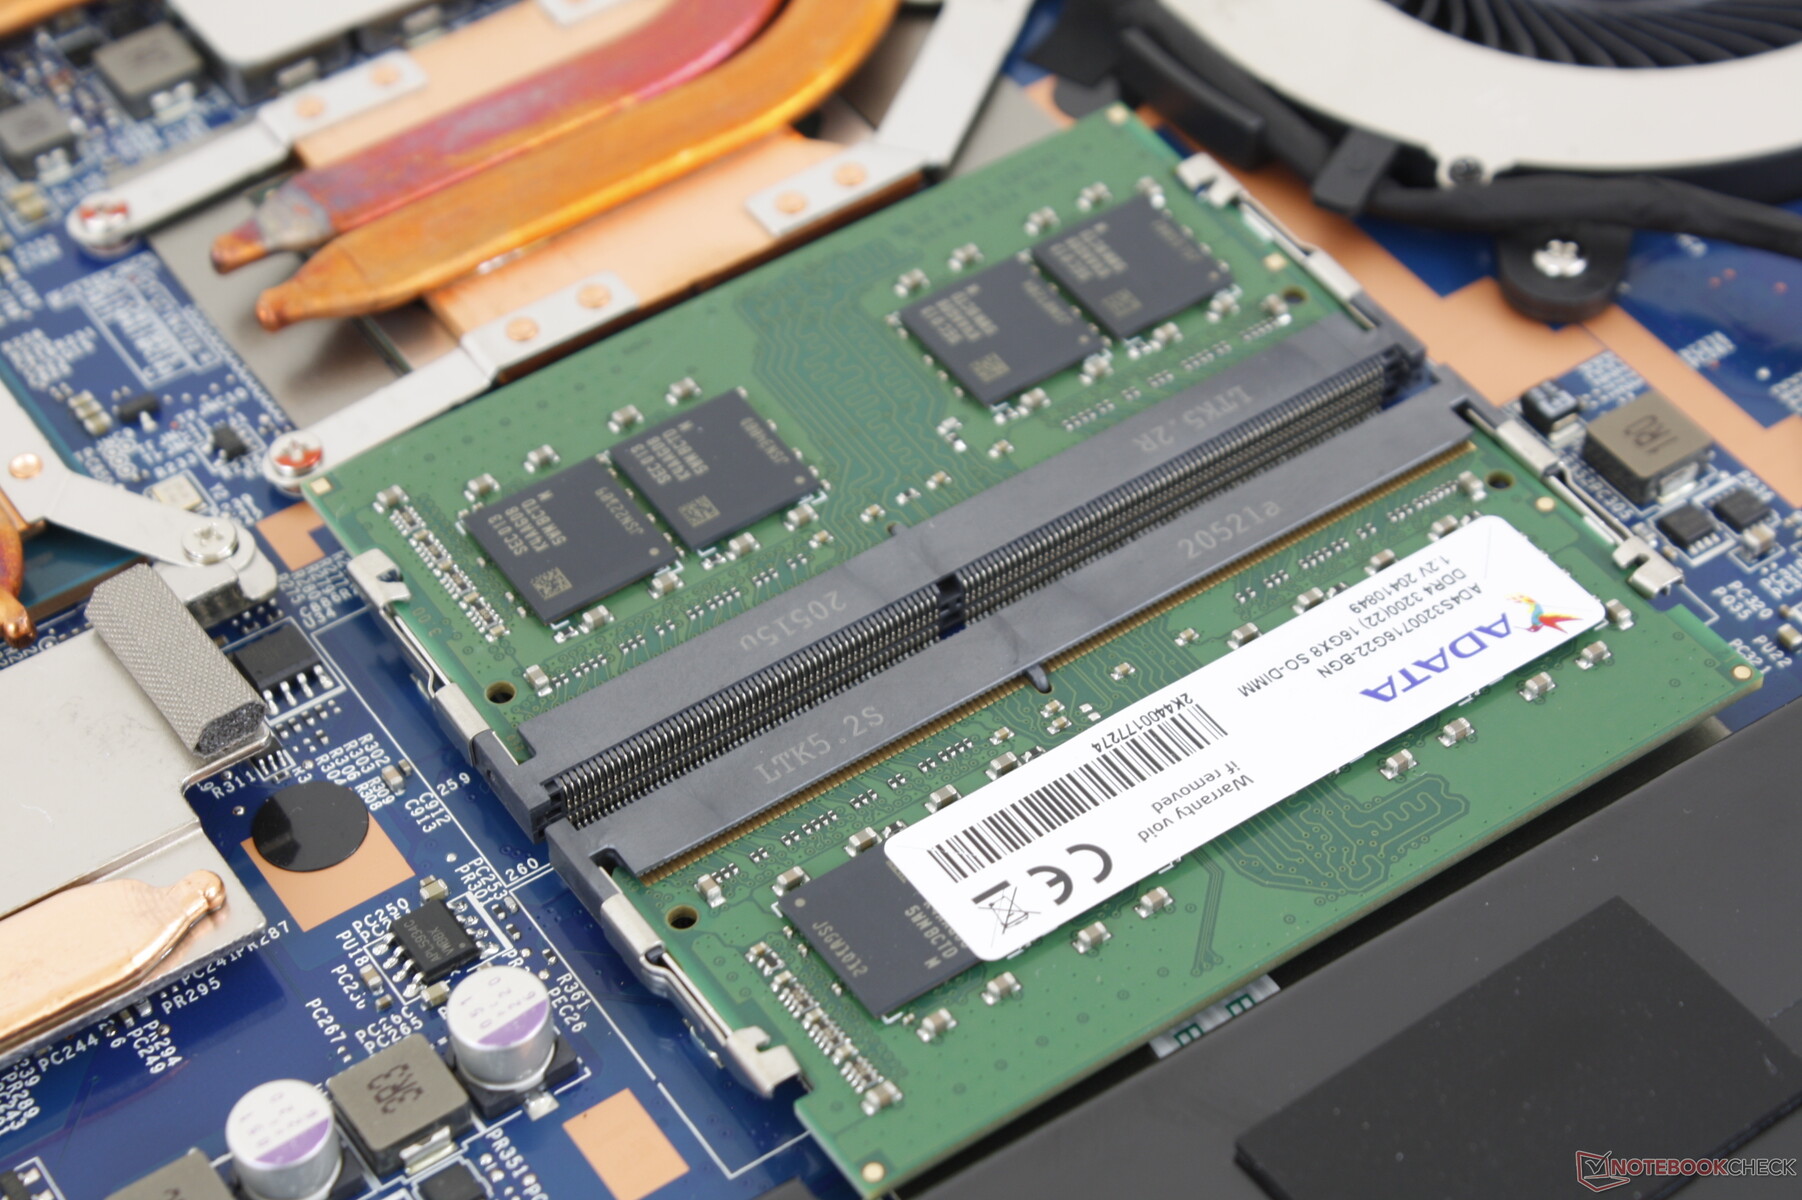
Speichergeräte
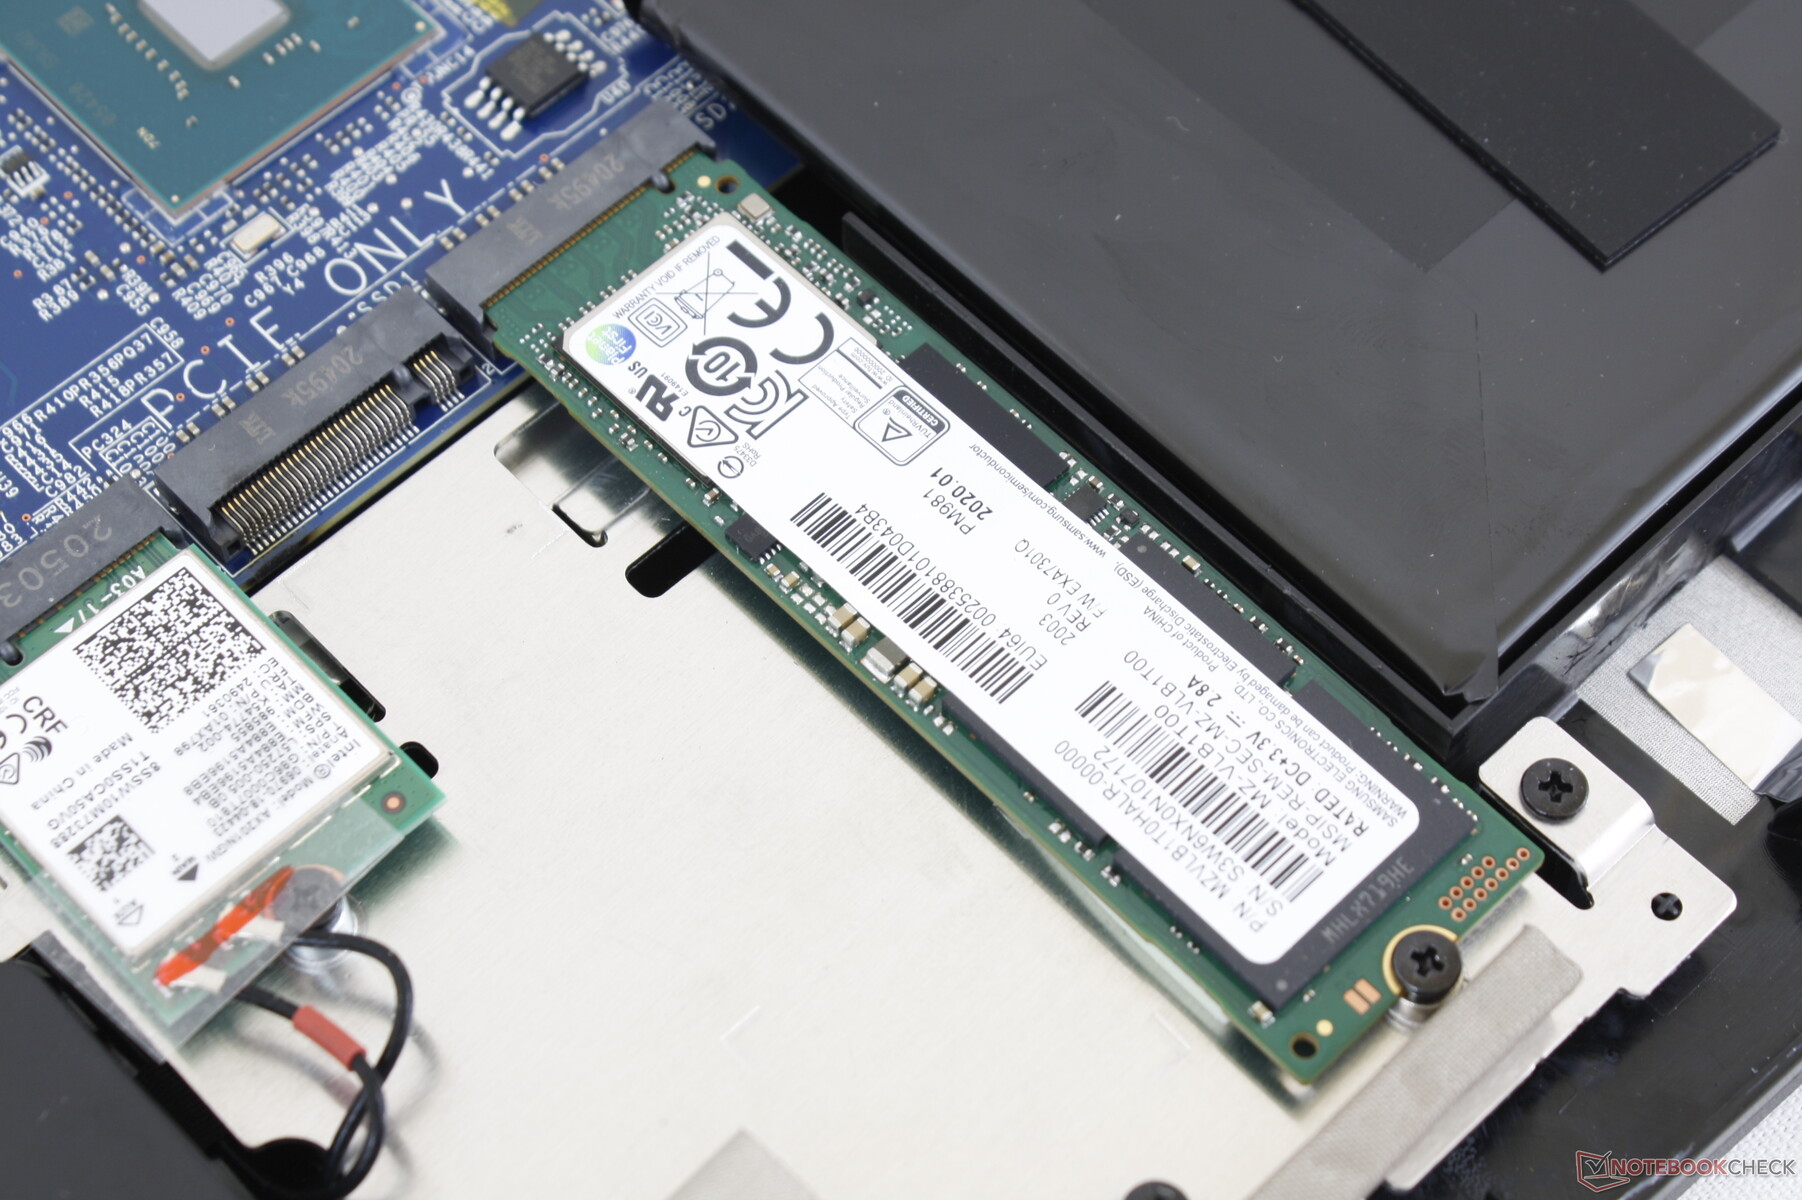
Unser Gerät wird mit einer 1-TB-Samsung-PM981-NVMe-SSD ausgeliefert, aber das ändert sich nach gewünschter Kapazität und Preis. Wir können die theoretische sequenzielle Lesegeschwindigkeit des Laufwerks von 3200 MB/s sowohl erreichen als auch zu halten, wie unser DiskSpd-Schleifentest unten zeigt.
| MSI GF65 Thin 10UE Samsung SSD PM981 MZVLB1T0HALR | Asus ROG Strix G15 G513QR SK Hynix HFM001TD3JX013N | Schenker XMG Core 15 Ampere Samsung SSD 970 EVO Plus 1TB | MSI GS66 Stealth 10UG WDC PC SN730 SDBPNTY-1T00 | Lenovo Legion 7 15IMH05-81YT001VGE 2x Samsung PM981a MZVLB1T0HBLR (RAID 0) | |
|---|---|---|---|---|---|
| AS SSD | -7% | 10% | -4% | -7% | |
| Seq Read (MB/s) | 3002 | 2881 -4% | 2829 -6% | 2198 -27% | 3088 3% |
| Seq Write (MB/s) | 2420 | 1570 -35% | 2646 9% | 2596 7% | 2561 6% |
| 4K Read (MB/s) | 48.46 | 52.4 8% | 54.8 13% | 43.81 -10% | 43.01 -11% |
| 4K Write (MB/s) | 114.3 | 124 8% | 179.1 57% | 115.5 1% | 102 -11% |
| 4K-64 Read (MB/s) | 1873 | 1334 -29% | 1734 -7% | 1692 -10% | 1549 -17% |
| 4K-64 Write (MB/s) | 1882 | 2189 16% | 2396 27% | 2162 15% | 1378 -27% |
| Access Time Read * (ms) | 0.045 | 0.055 -22% | 0.033 27% | 0.056 -24% | 0.051 -13% |
| Access Time Write * (ms) | 0.101 | 0.03 70% | 0.021 79% | 0.098 3% | 0.037 63% |
| Score Read (Points) | 2221 | 1675 -25% | 2072 -7% | 1956 -12% | 1901 -14% |
| Score Write (Points) | 2238 | 2470 10% | 2839 27% | 2537 13% | 1737 -22% |
| Score Total (Points) | 5565 | 4943 -11% | 5965 7% | 5513 -1% | 4583 -18% |
| Copy ISO MB/s (MB/s) | 2421 | 1277 -47% | 2119 -12% | 2236 -8% | 2684 11% |
| Copy Program MB/s (MB/s) | 705 | 575 -18% | 406.1 -42% | 690 -2% | 544 -23% |
| Copy Game MB/s (MB/s) | 1490 | 1272 -15% | 1086 -27% | 1546 4% | 1116 -25% |
| CrystalDiskMark 5.2 / 6 | 14% | 4% | 8% | ||
| Write 4K (MB/s) | 157.3 | 139.1 -12% | 163.1 4% | 110.4 -30% | |
| Read 4K (MB/s) | 46.69 | 47.59 2% | 48.97 5% | 55.1 18% | |
| Write Seq (MB/s) | 2389 | 2917 22% | 2607 9% | ||
| Read Seq (MB/s) | 2196 | 2586 18% | 2316 5% | ||
| Write 4K Q32T1 (MB/s) | 407.6 | 511 25% | 338 -17% | 466.6 14% | |
| Read 4K Q32T1 (MB/s) | 519 | 571 10% | 475.6 -8% | 517 0% | |
| Write Seq Q32T1 (MB/s) | 2401 | 3263 36% | 3090 29% | 3424 43% | |
| Read Seq Q32T1 (MB/s) | 3344 | 3567 7% | 3421 2% | 3519 5% | |
| Write 4K Q8T8 (MB/s) | 1496 | ||||
| Read 4K Q8T8 (MB/s) | 1597 | ||||
| Durchschnitt gesamt (Programm / Settings) | -7% /
-7% | 12% /
12% | 0% /
-1% | 1% /
-2% |
* ... kleinere Werte sind besser

Disk Throttling: DiskSpd Read Loop, Queue Depth 8
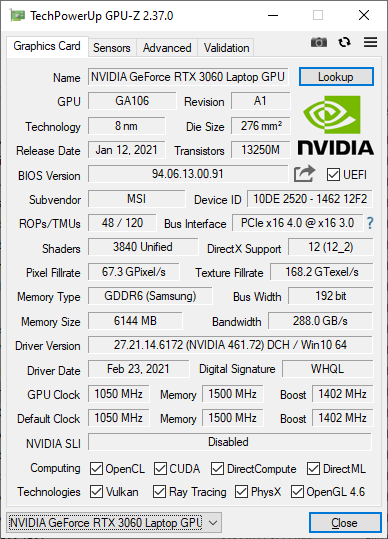
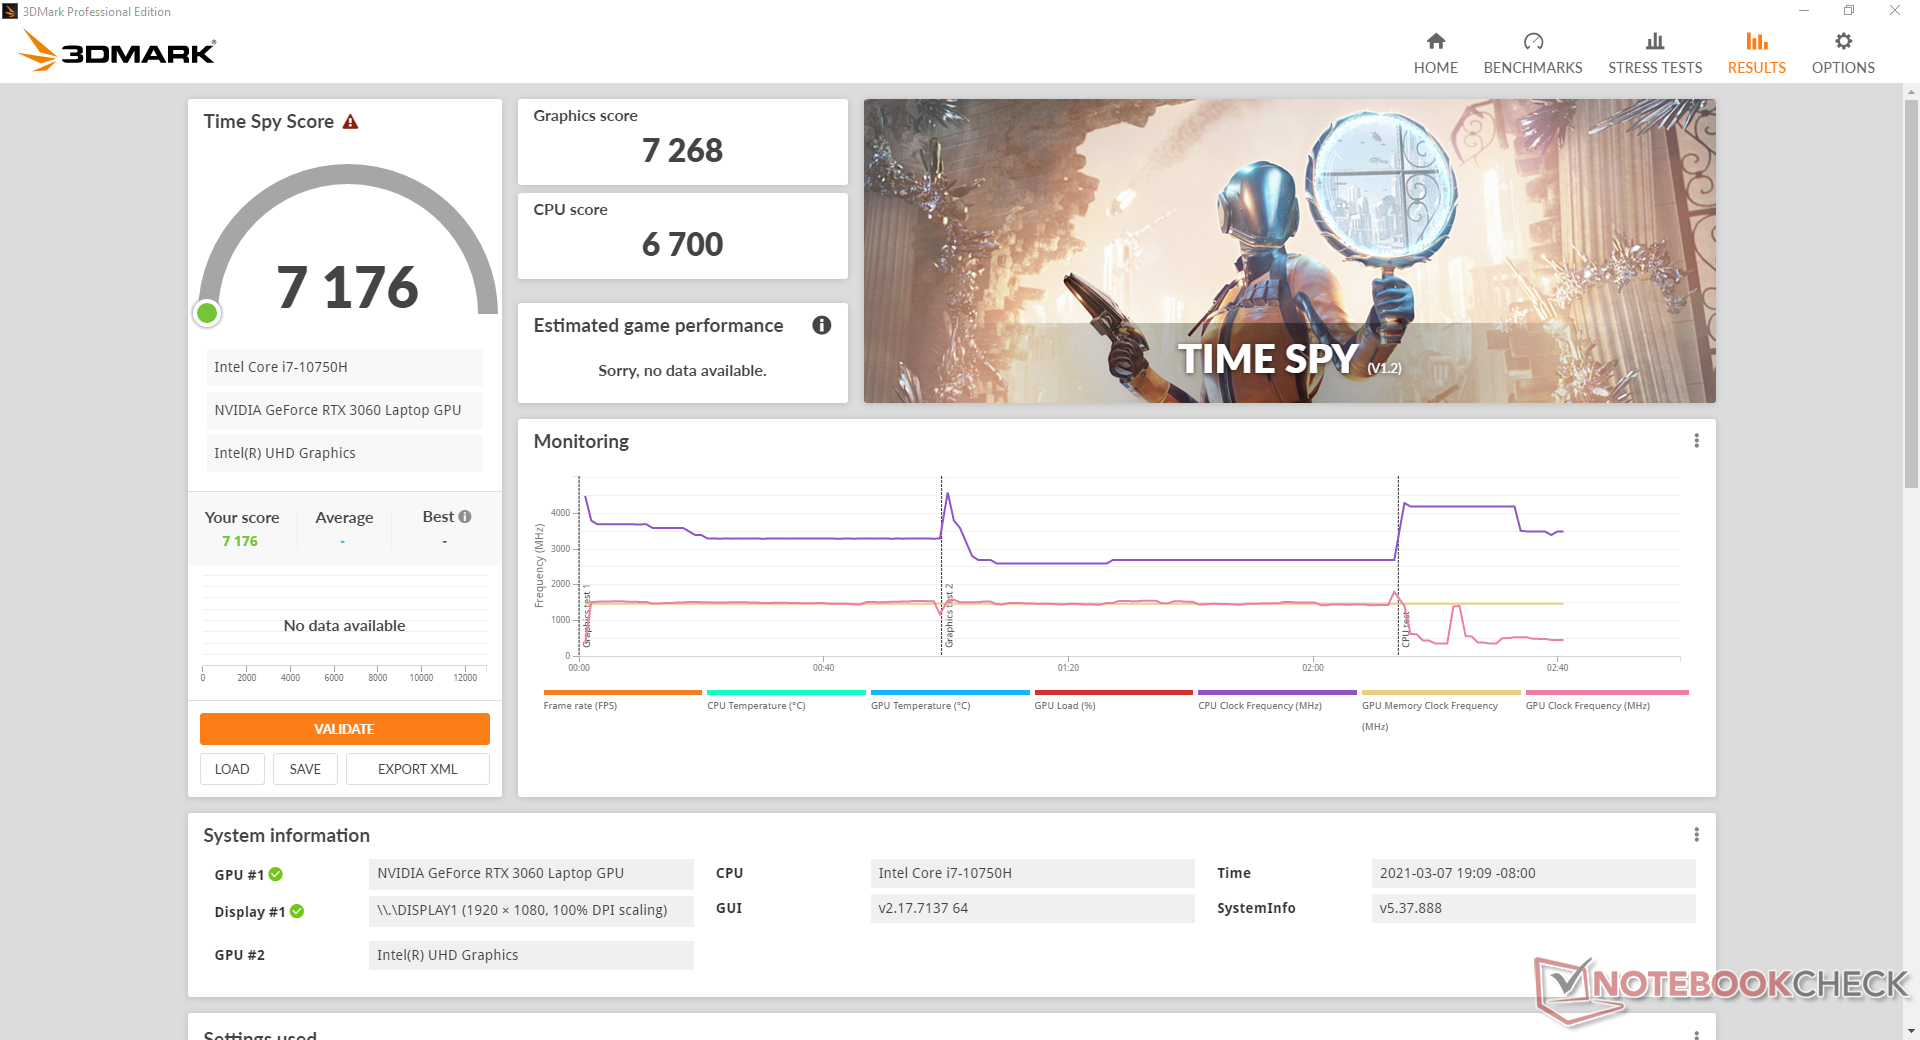
GPU Performance
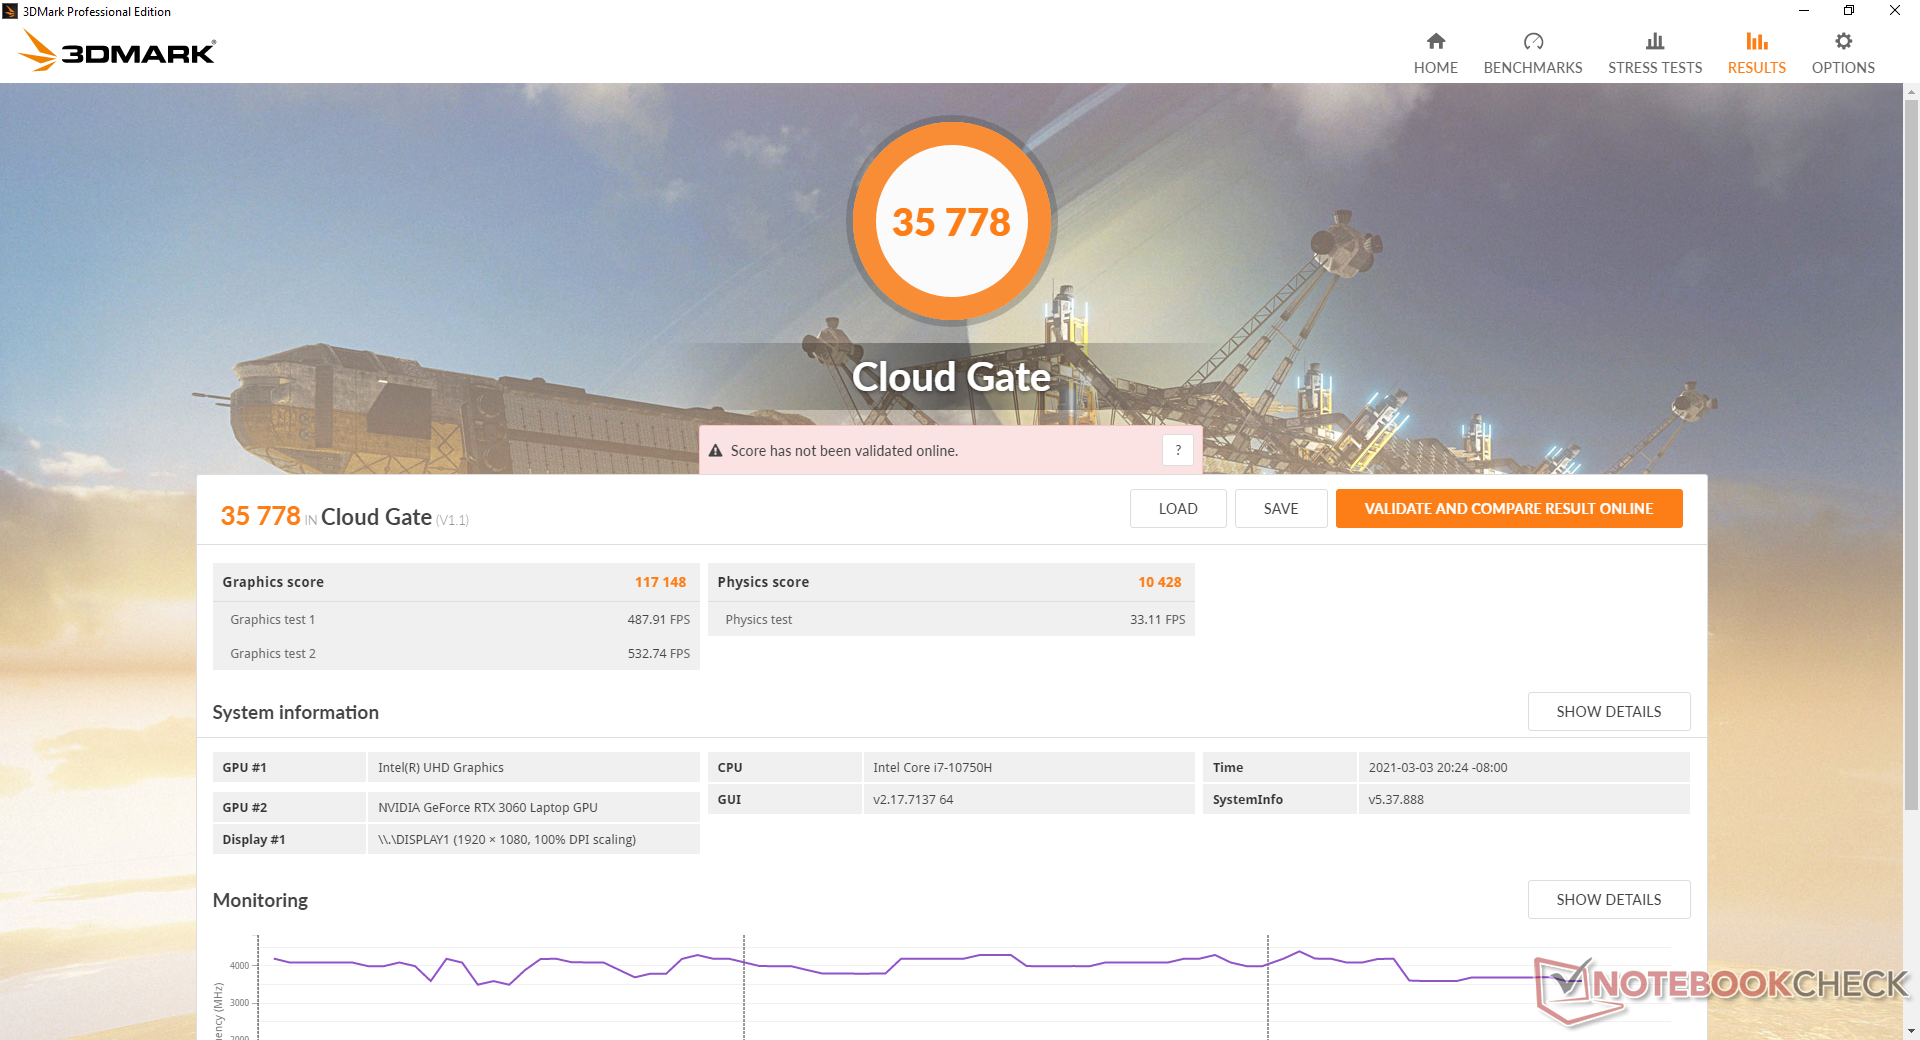
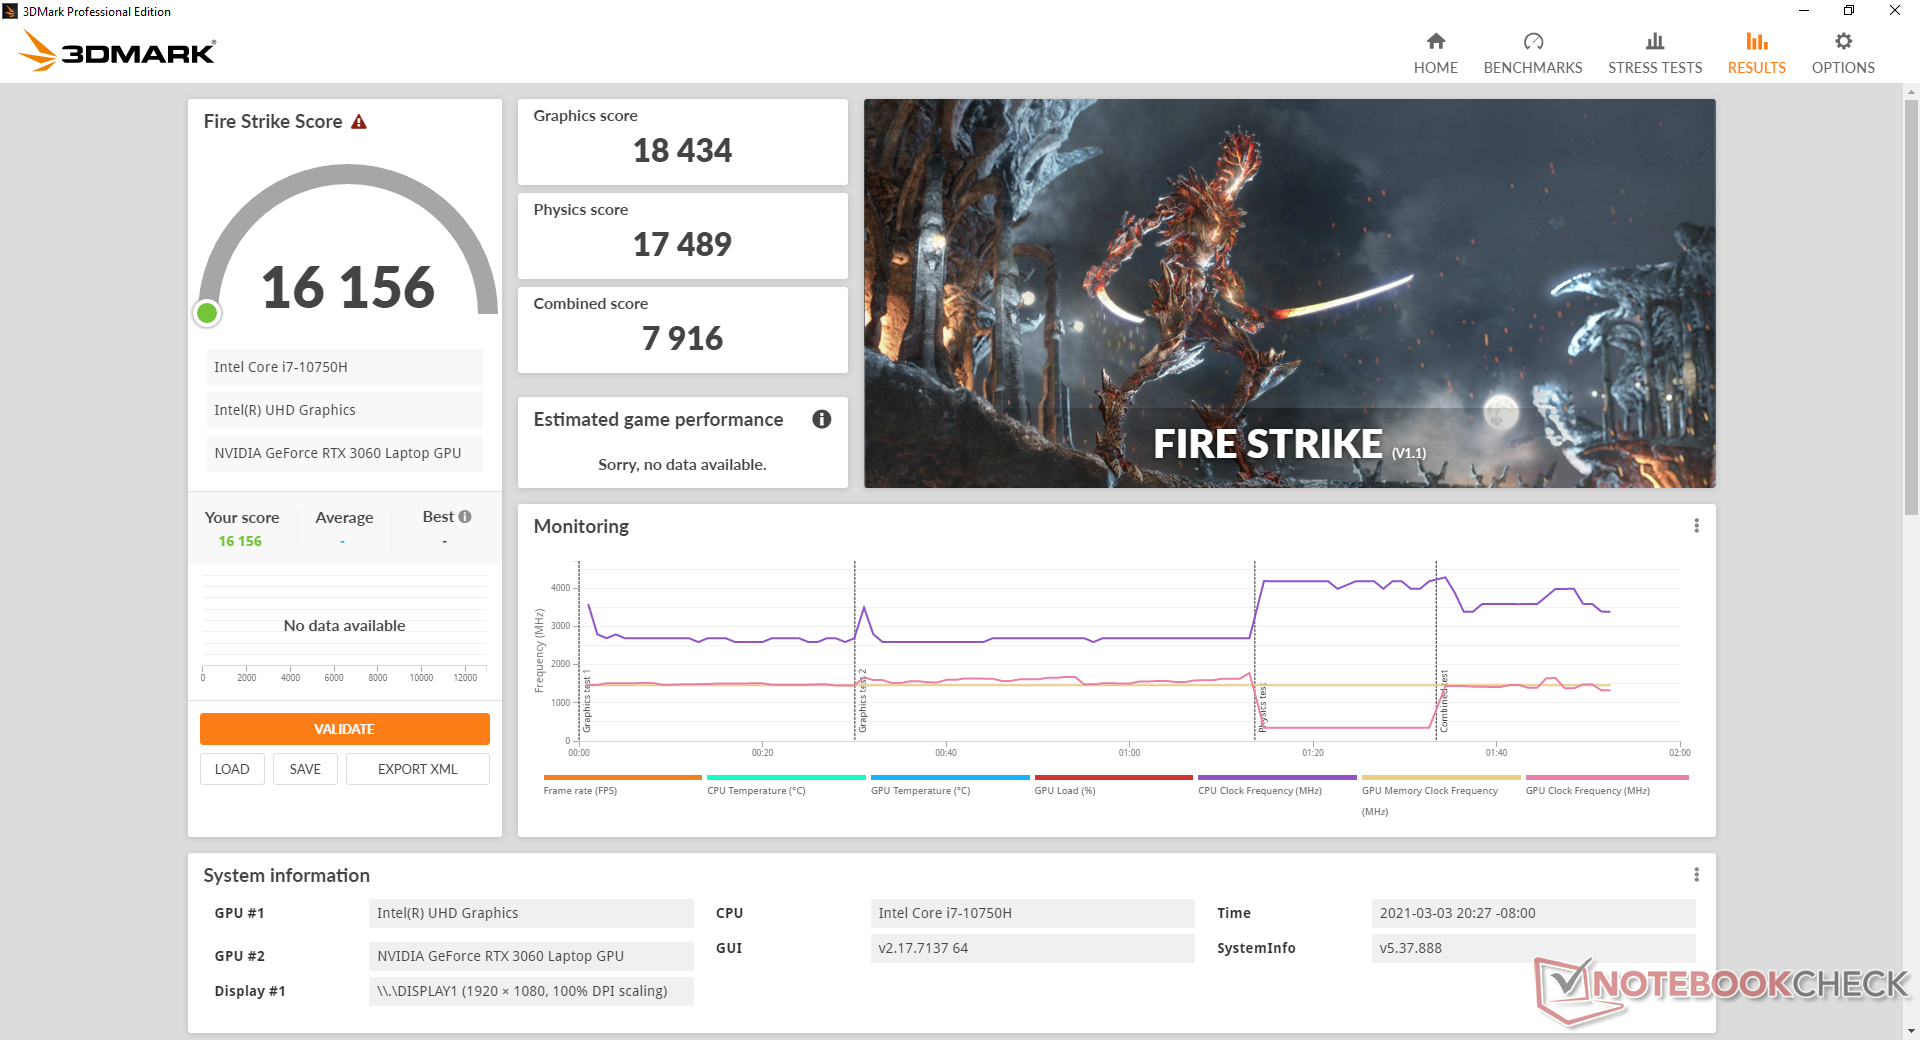
Von den vier Laptops, die wir bisher mit der mobilen GeForce RTX 3060 getestet haben, ist unser MSI GF65 laut 3DMark-Benchmarks mit etwa 15 Prozent das langsamste aus dem Pulk. Die Rohleistung liegt immer noch über der mobilen RTX 2060, wenn auch nur um etwa 15 Prozent. Besitzer von GeForce RTX 2070 Laptops werden immer noch eine etwas schnellere Grafikleistung genießen.
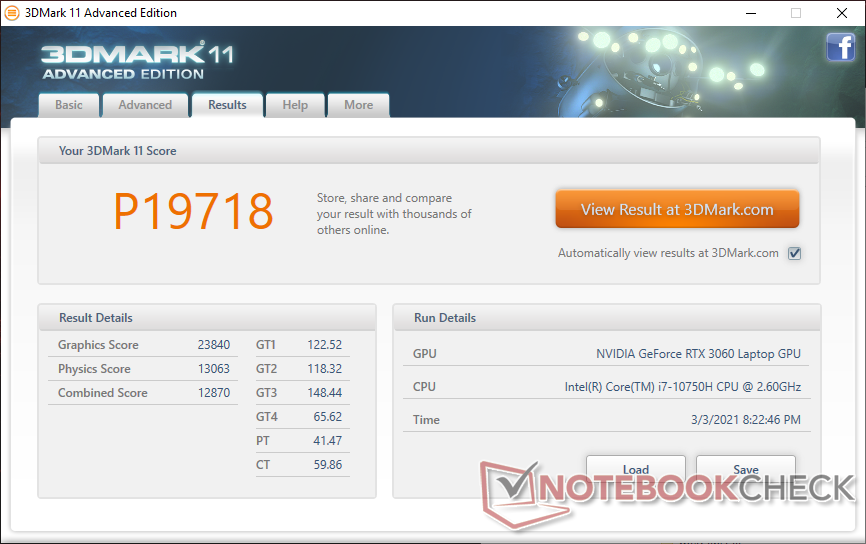
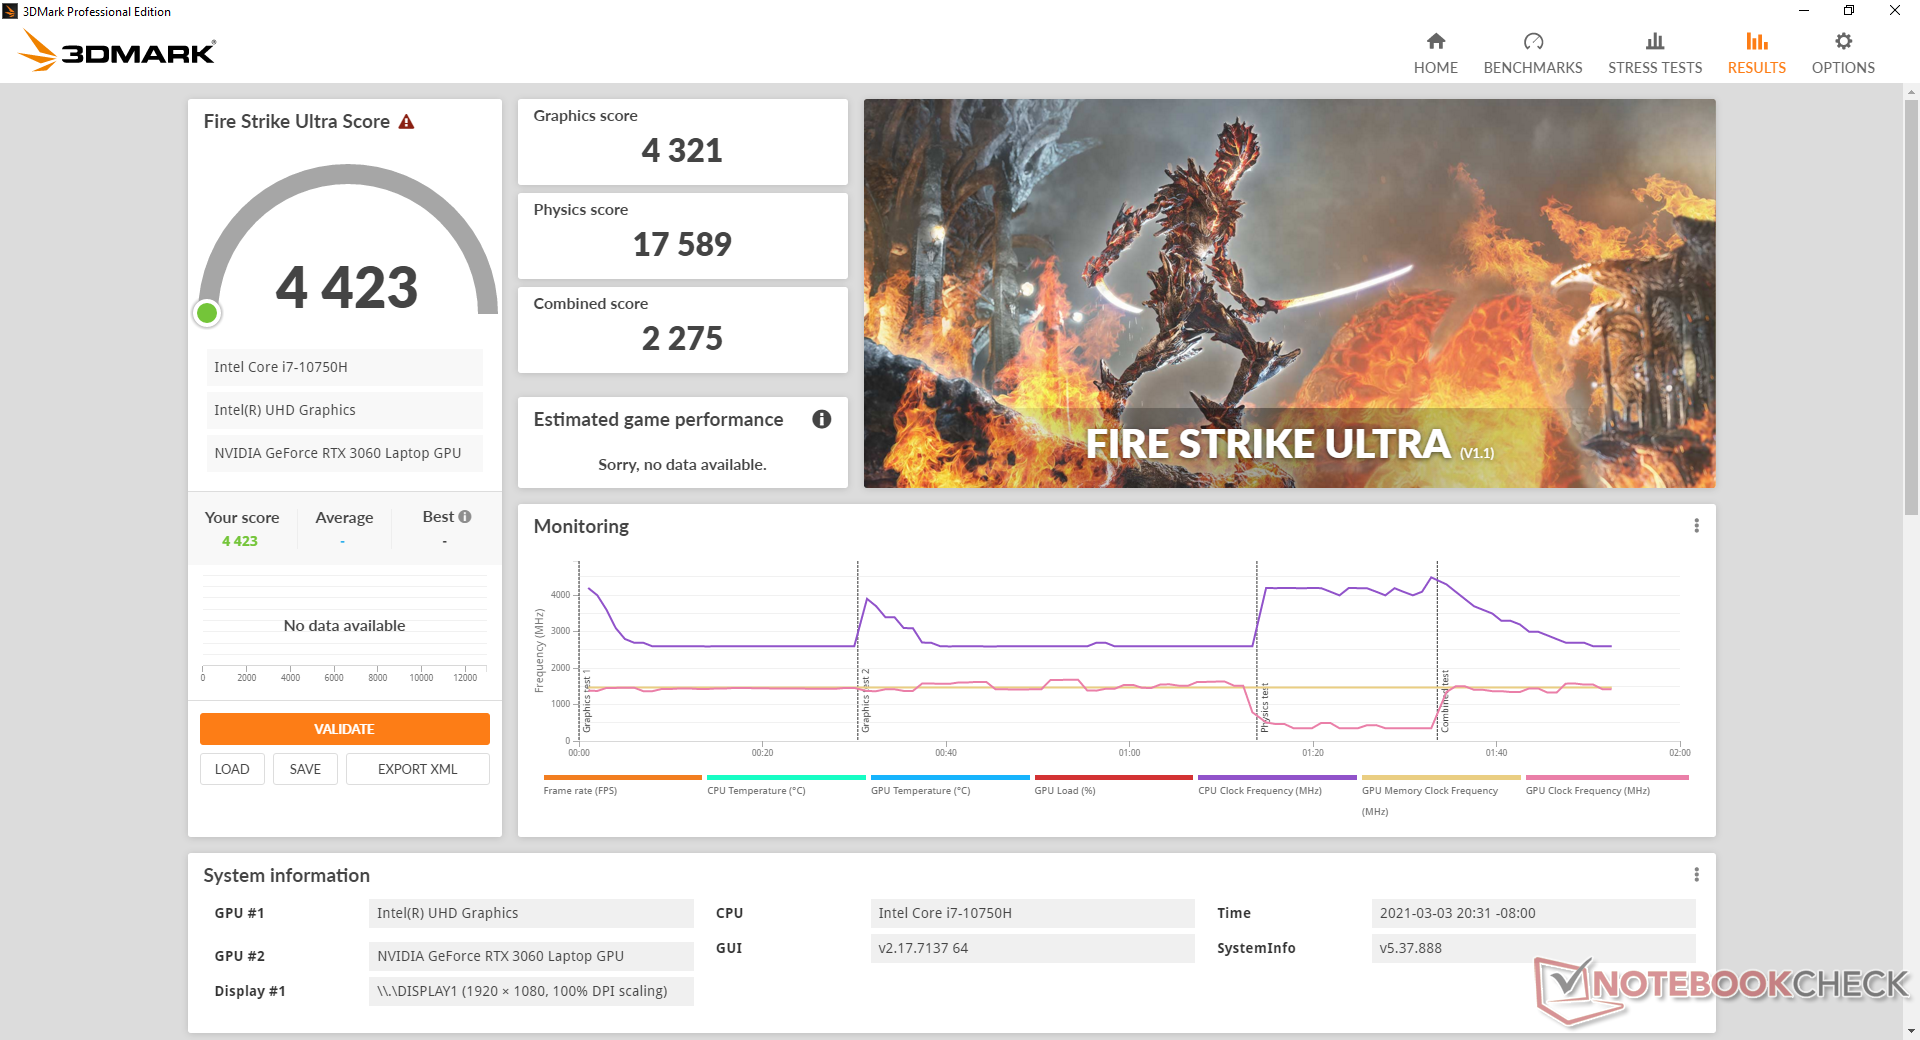
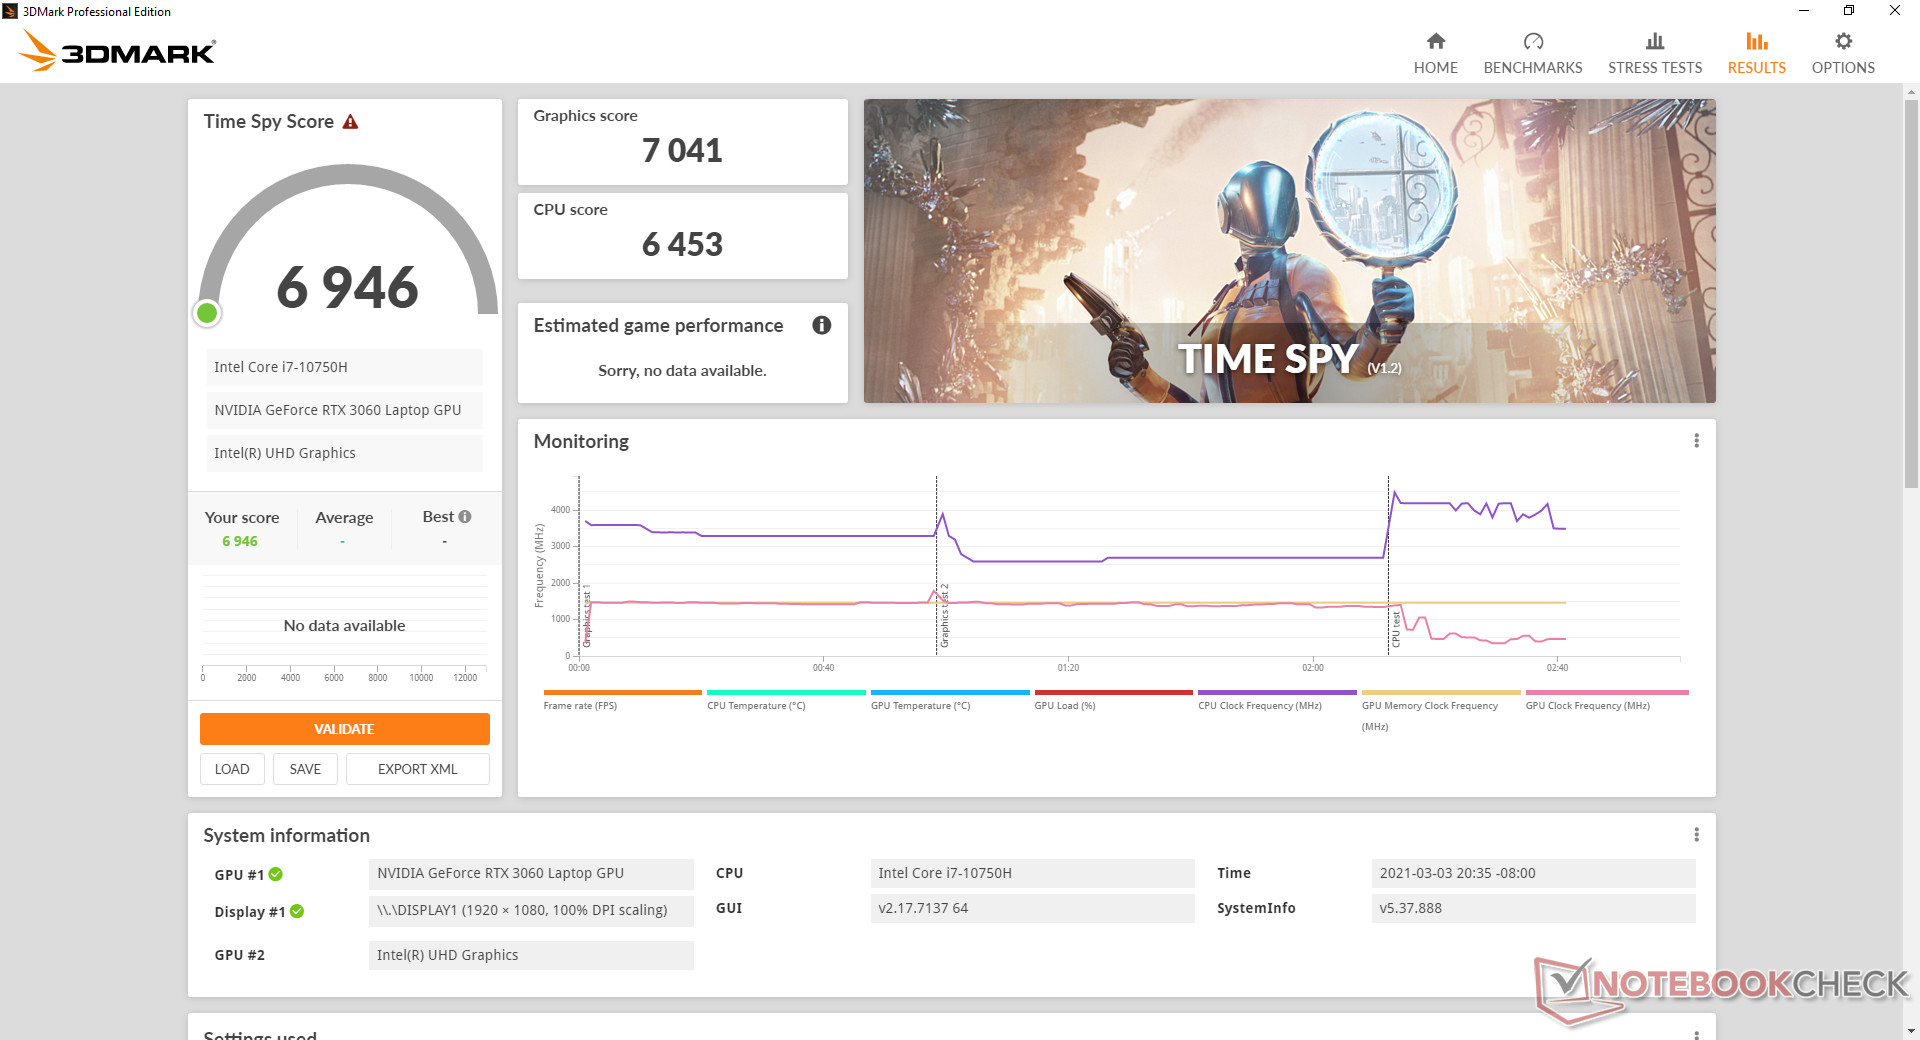
| 3DMark 11 Performance | 19718 Punkte | |
| 3DMark Cloud Gate Standard Score | 35778 Punkte | |
| 3DMark Fire Strike Score | 16156 Punkte | |
| 3DMark Time Spy Score | 6946 Punkte | |
Hilfe | ||
| Dota 2 Reborn - 3840x2160 ultra (3/3) best looking | |
| MSI GF65 Thin 10UE | |
| Durchschnittliche NVIDIA GeForce RTX 3060 Laptop GPU (46.9 - 107, n=11) | |
| min. | mittel | hoch | max. | QHD | 4K | |
|---|---|---|---|---|---|---|
| GTA V (2015) | 164 | 152 | 120 | 69.2 | ||
| The Witcher 3 (2015) | 294 | 223.2 | 134.2 | 68.7 | ||
| Dota 2 Reborn (2015) | 125 | 116 | 109 | 90.7 | 94.9 | |
| Final Fantasy XV Benchmark (2018) | 124 | 89.8 | 70.3 | 53.6 | 30.7 | |
| X-Plane 11.11 (2018) | 83.6 | 73 | 62.2 | 62.3 | ||
| Far Cry 5 (2018) | 131 | 108 | 103 | 97 | ||
| Strange Brigade (2018) | 269 | 172 | 138 | 121 |
Emissionen
Systemrauschen
Wenn das Gerät an eine Steckdose angeschlossen ist, ist das Lüftergeräusch unabhängig von der Einstellung immer vorhanden, selbst wenn der MSI "Silent"-Modus eingestellt ist. Die Lüfter werden nur dann wirklich leise, wenn sie im Akkubetrieb laufen. Ansonsten sind die Lüfter bei stromsparenden Aktivitäten wie Webbrowsing oder Videostreaming immer mit 33 dB(A) hörbar, was etwas störend sein kann.
Das Lüftergeräusch beim Spielen im Extreme Performance Modus bewegt sich im niedrigen 40-dB(A)-Bereich und ist damit leiser als das, was wir beim GF65 9SD beobachtet haben. Allerdings kann es während des Spielens je nach CPU-Last höher werden. Aktiviert man den Cooler-Boost-Modus, steigt das Lüftergeräusch auf ohrenbetäubende 59 dB(A) an.
| MSI GF65 Thin 10UE GeForce RTX 3060 Laptop GPU, i7-10750H, Samsung SSD PM981 MZVLB1T0HALR | Asus ROG Strix G15 G513QR GeForce RTX 3070 Laptop GPU, R9 5900HX, SK Hynix HFM001TD3JX013N | Schenker XMG Core 15 Ampere GeForce RTX 3060 Laptop GPU, R7 4800H, Samsung SSD 970 EVO Plus 1TB | MSI GS66 Stealth 10UG GeForce RTX 3070 Laptop GPU, i7-10870H, WDC PC SN730 SDBPNTY-1T00 | Aorus 15G XC GeForce RTX 3070 Laptop GPU, i7-10870H, ESR512GTLCG-EAC-4 | Lenovo Legion 7 15IMH05-81YT001VGE GeForce RTX 2080 Super Max-Q, i9-10980HK, 2x Samsung PM981a MZVLB1T0HBLR (RAID 0) | MSI GF65 9SD GeForce GTX 1660 Ti Mobile, i7-9750H, Kingston RBUSNS8154P3512GJ | |
|---|---|---|---|---|---|---|---|
| Geräuschentwicklung | 4% | 6% | -5% | 4% | 8% | -6% | |
| aus / Umgebung * (dB) | 24.7 | 24 3% | 24 3% | 26.2 -6% | 25 -1% | 24.4 1% | 28.7 -16% |
| Idle min * (dB) | 33.1 | 25 24% | 26 21% | 34 -3% | 29 12% | 24.4 26% | 33.3 -1% |
| Idle avg * (dB) | 33.1 | 31 6% | 28 15% | 34 -3% | 30 9% | 24.4 26% | 33.9 -2% |
| Idle max * (dB) | 33.1 | 33 -0% | 30 9% | 34 -3% | 31 6% | 24.4 26% | 33.9 -2% |
| Last avg * (dB) | 42.7 | 45 -5% | 42 2% | 47.2 -11% | 41 4% | 49.3 -15% | 41 4% |
| Witcher 3 ultra * (dB) | 40.6 | 48 -18% | 50 -23% | 46.3 -14% | 47 -16% | 54 -33% | 49.5 -22% |
| Last max * (dB) | 59.4 | 50 16% | 52 12% | 58.2 2% | 51 14% | 46.6 22% | 59.5 -0% |
* ... kleinere Werte sind besser
Lautstärkediagramm
| Idle |
| 33.1 / 33.1 / 33.1 dB(A) |
| Last |
| 42.7 / 59.4 dB(A) |
 | ||
30 dB leise 40 dB(A) deutlich hörbar 50 dB(A) störend |
||
min: | ||
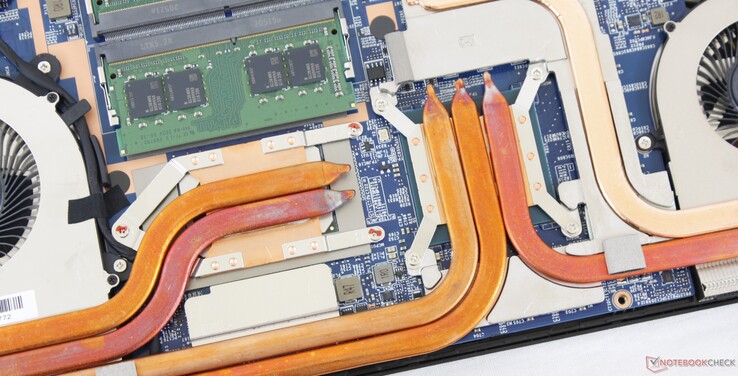
Temperatur
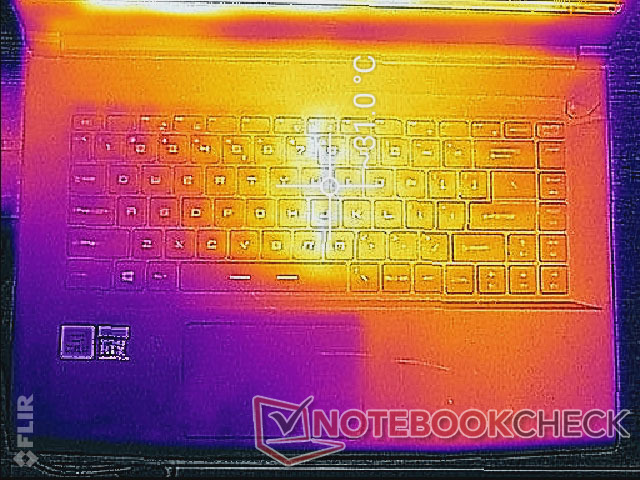
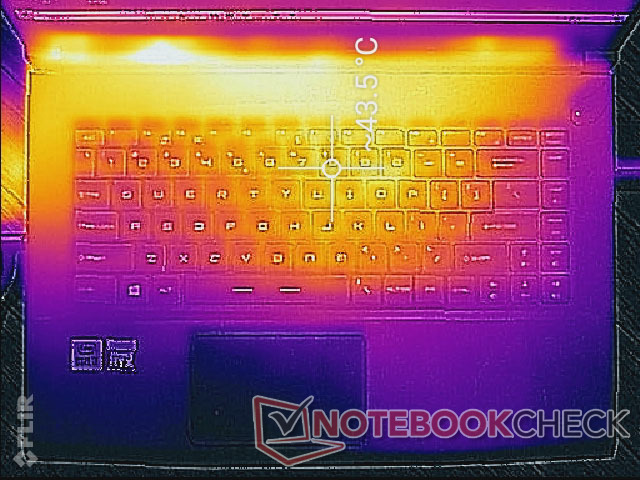
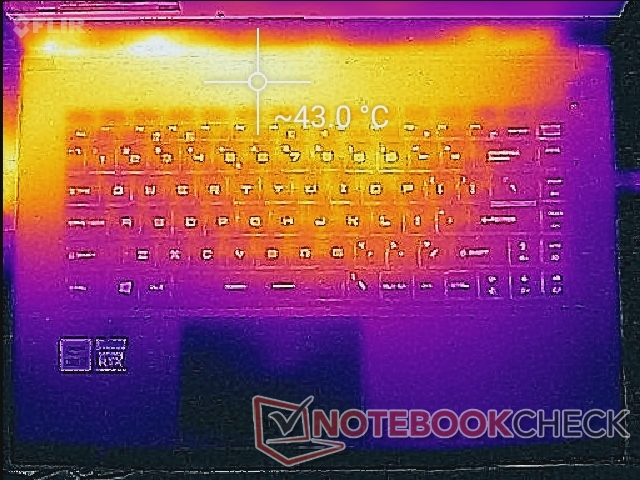
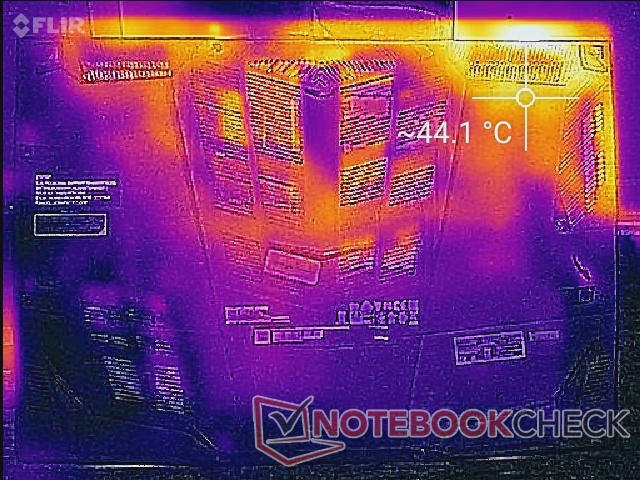
Die Oberflächentemperaturen sind zu den hinteren Quadranten hin am wärmsten, weg von den WASD- und den Pfeiltasten. Hotspots können beim Spielen bis zu 44 °C warm werden, was sehr nahe an den Werten liegt, die wir mit dem älteren GF65 9SD gemessen haben. Der Großteil der Unterseite bleibt beim Spielen relativ kühl.
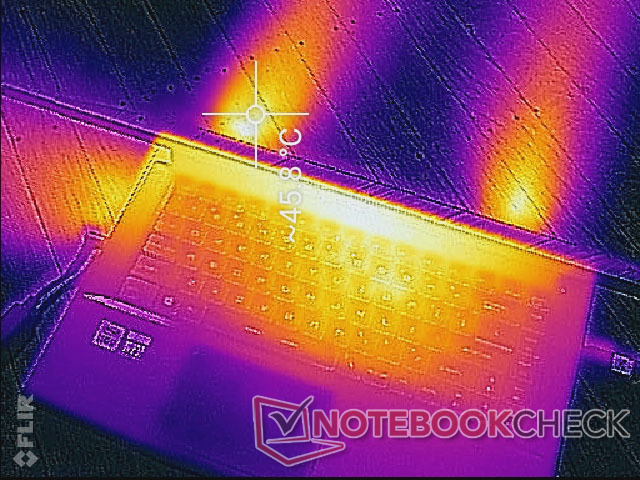
(±) Die maximale Temperatur auf der Oberseite ist 43.4 °C. Im Vergleich liegt der Klassendurchschnitt bei 40.4 °C (von 21.2 bis 68.8 °C für die Klasse Gaming).
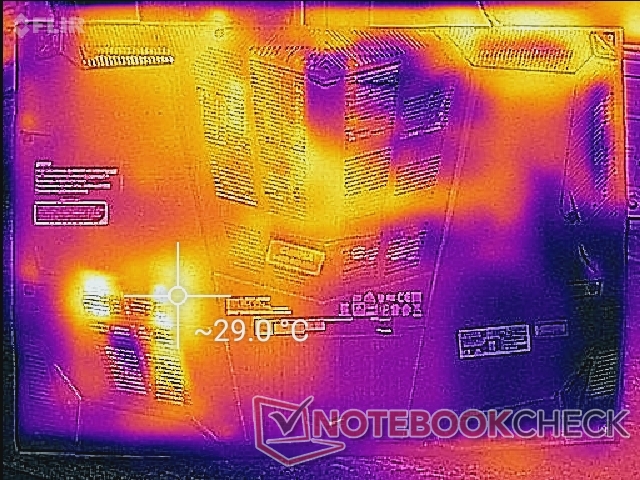
(±) Auf der Unterseite messen wir eine maximalen Wert von 41.8 °C (im Vergleich zum Durchschnitt von 43.2 °C).
(+) Ohne Last messen wir eine durchschnittliche Temperatur von 27.6 °C auf der Oberseite. Der Klassendurchschnitt erreicht 33.9 °C.
(±) Beim längeren Spielen von The Witcher 3 erhitzt sich das Gerät durchschnittlich auf 33.9 °C. Der Durchschnitt der Klasse ist derzeit 33.9 °C.
(+) Die Handballen und der Touchpad-Bereich sind mit gemessenen 27.4 °C kühler als die typische Hauttemperatur und fühlen sich dadurch kühl an.
(±) Die durchschnittliche Handballen-Temperatur anderer getesteter Geräte war 28.8 °C (+1.4 °C).

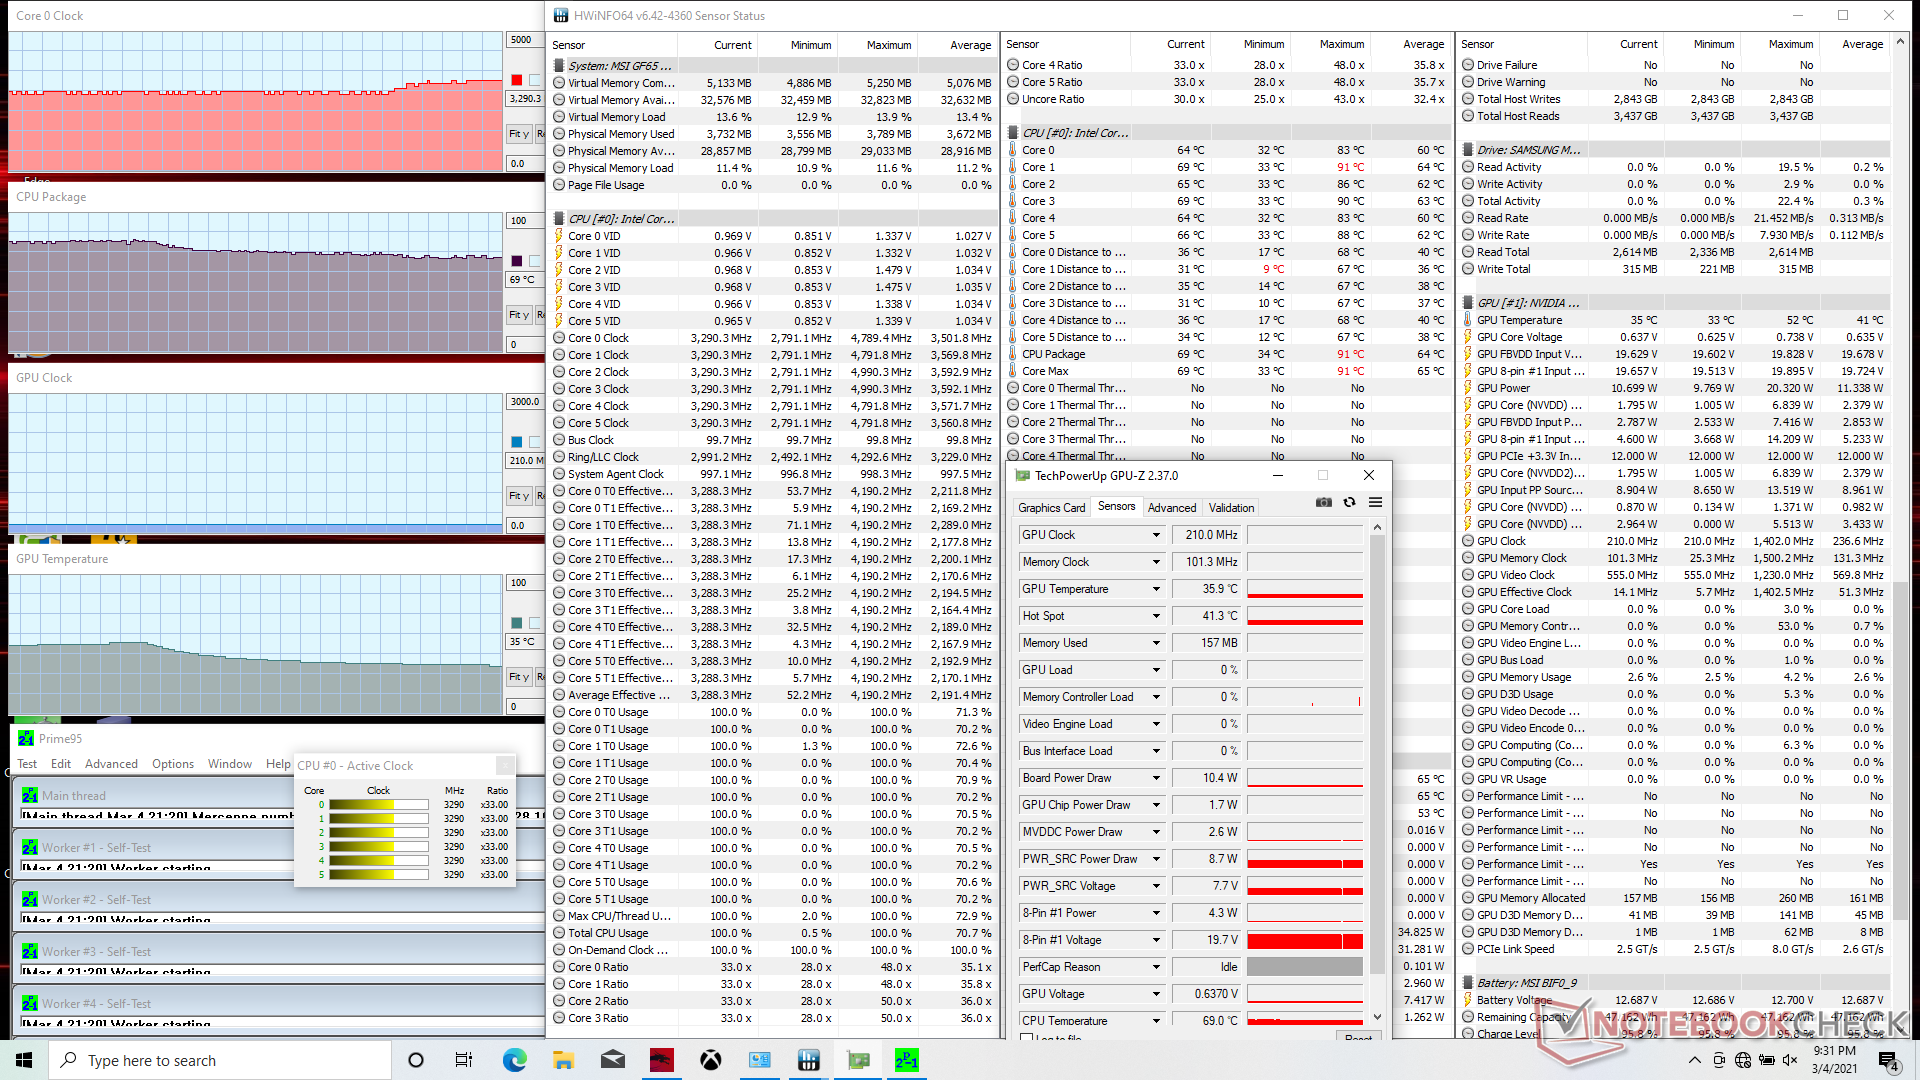
Stresstest
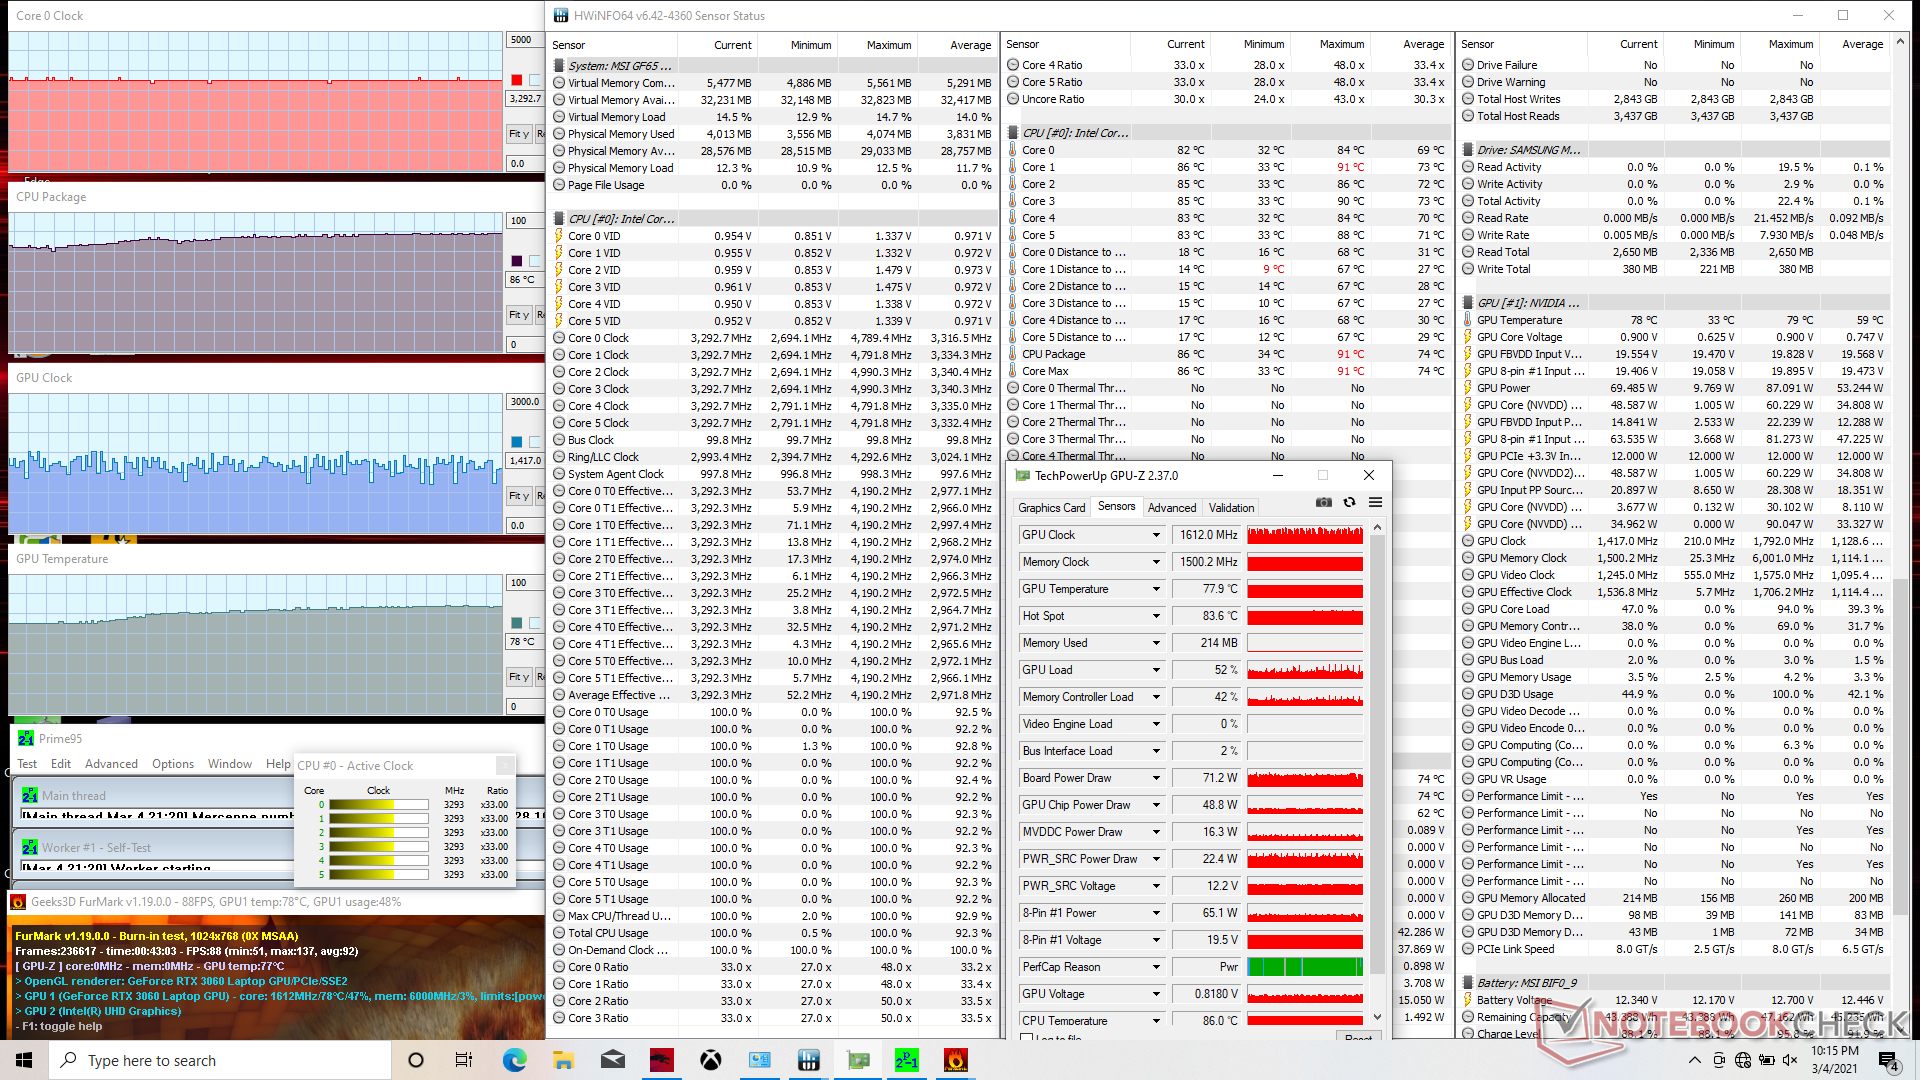
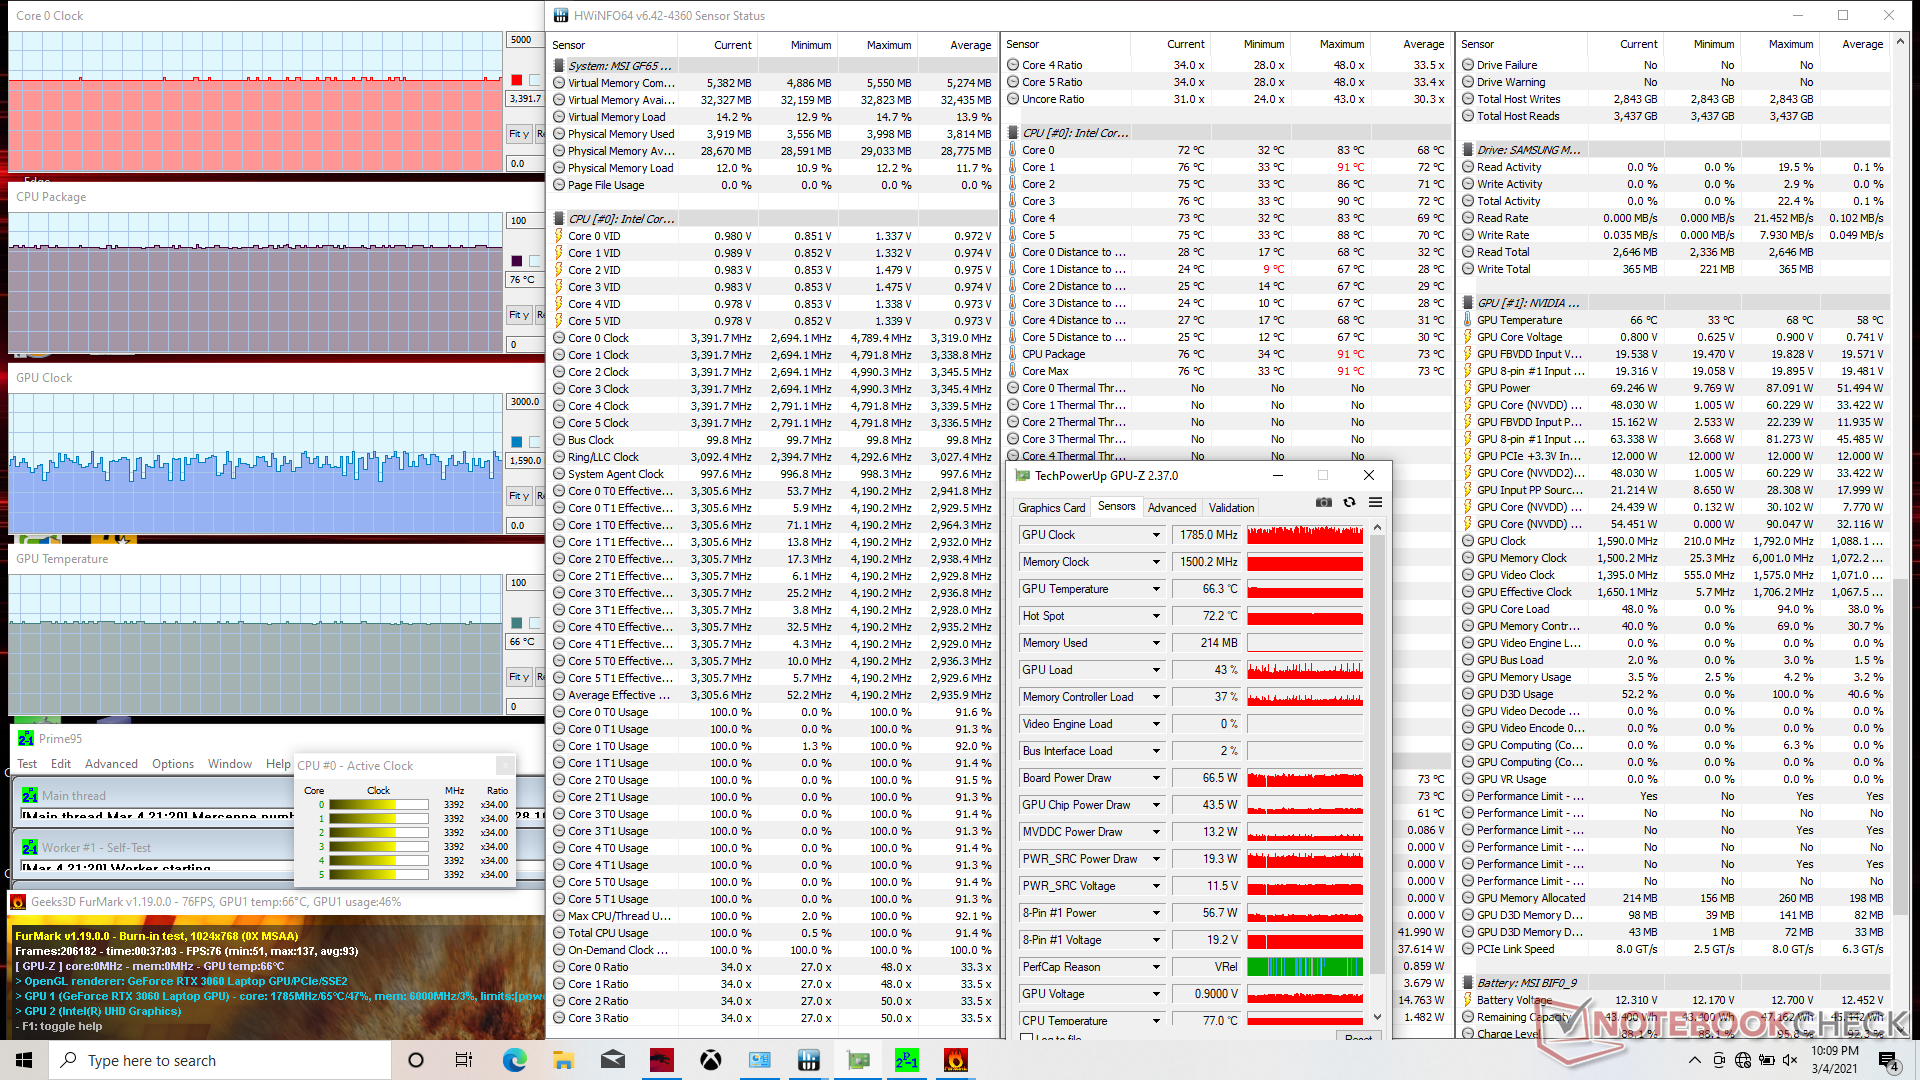
Wenn Prime95 im Extreme Performance Modus läuft, erreicht die CPU Taktraten von 4,2 GHz für die ersten paar Sekunden, bis eine Kerntemperatur von 91 °C erreicht wird. Die Taktraten und die Temperatur fallen dann stetig und stabilisieren sich bei 2,8 GHz bzw. 72 °C. Wenn Cooler Boost aktiviert ist, steigen die Taktraten und die Temperatur auf 3,3 GHz bzw. sinken auf 69 °C.
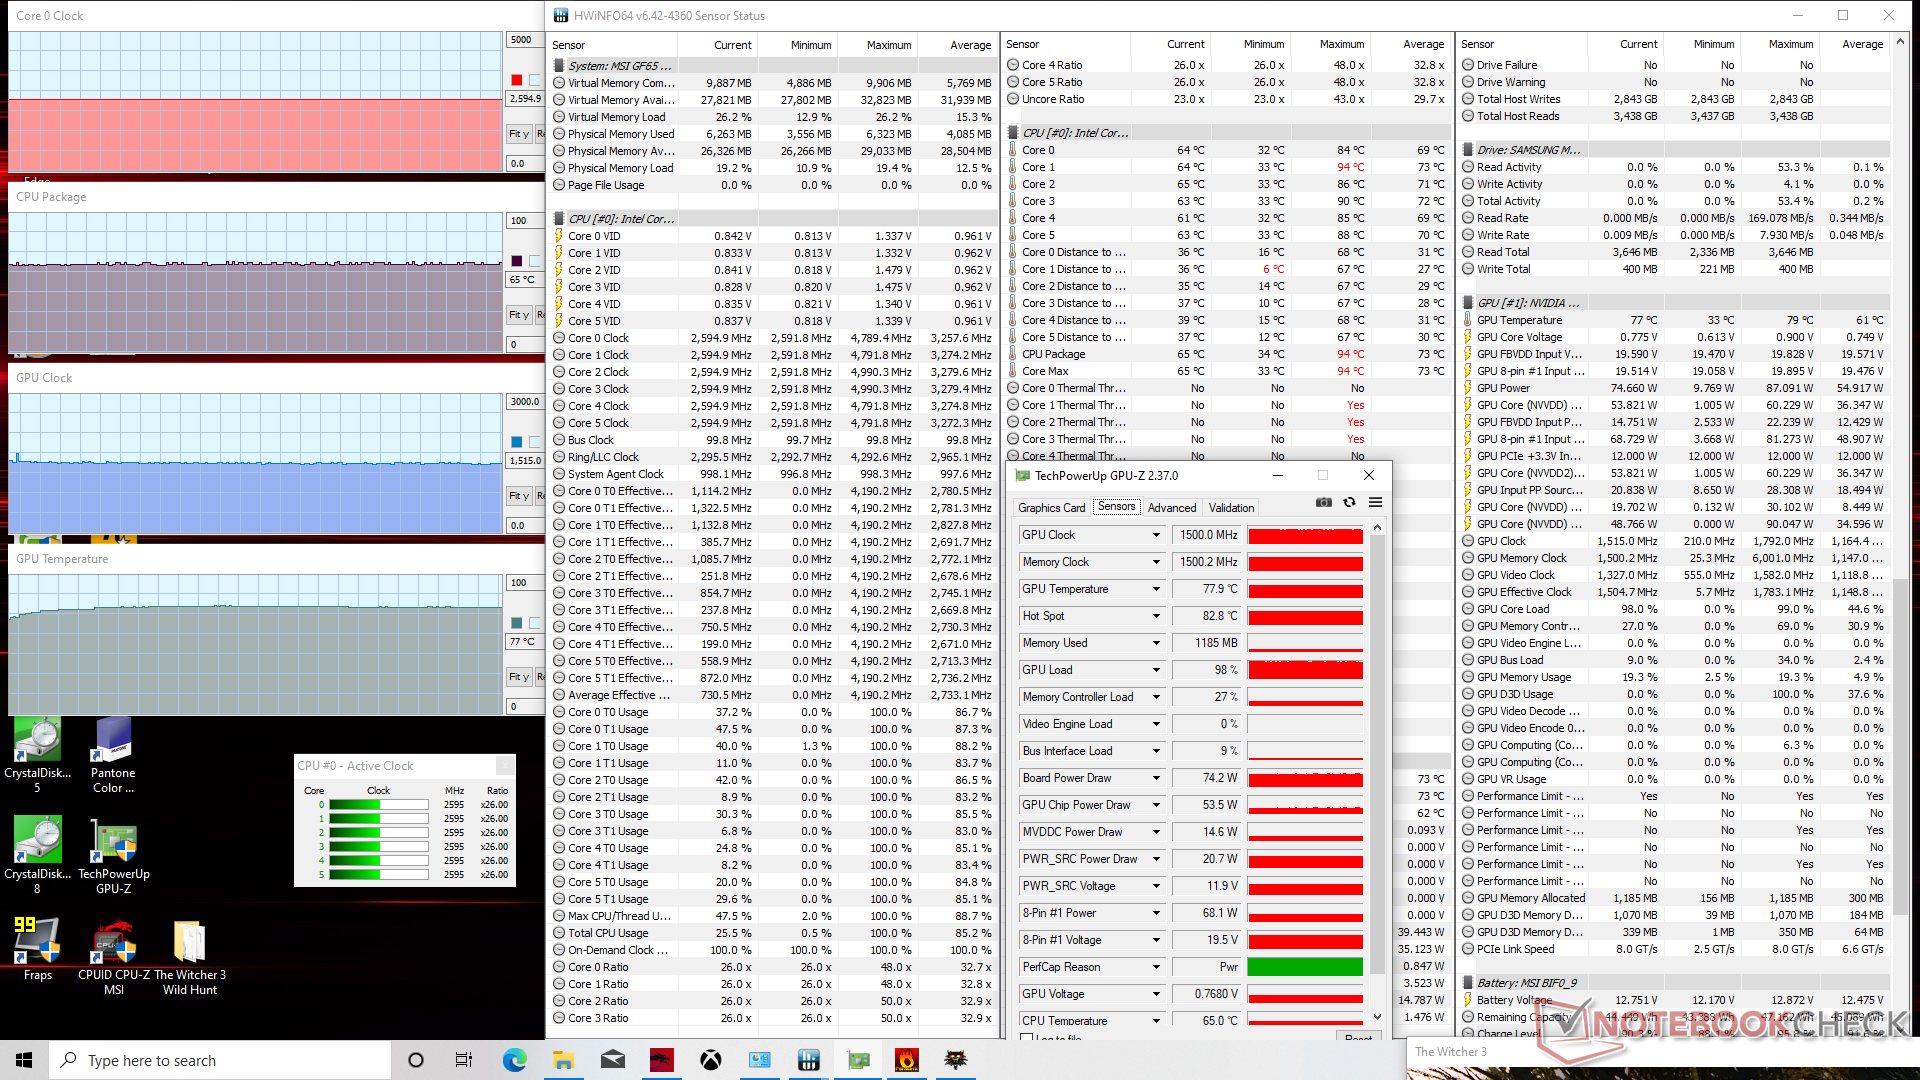
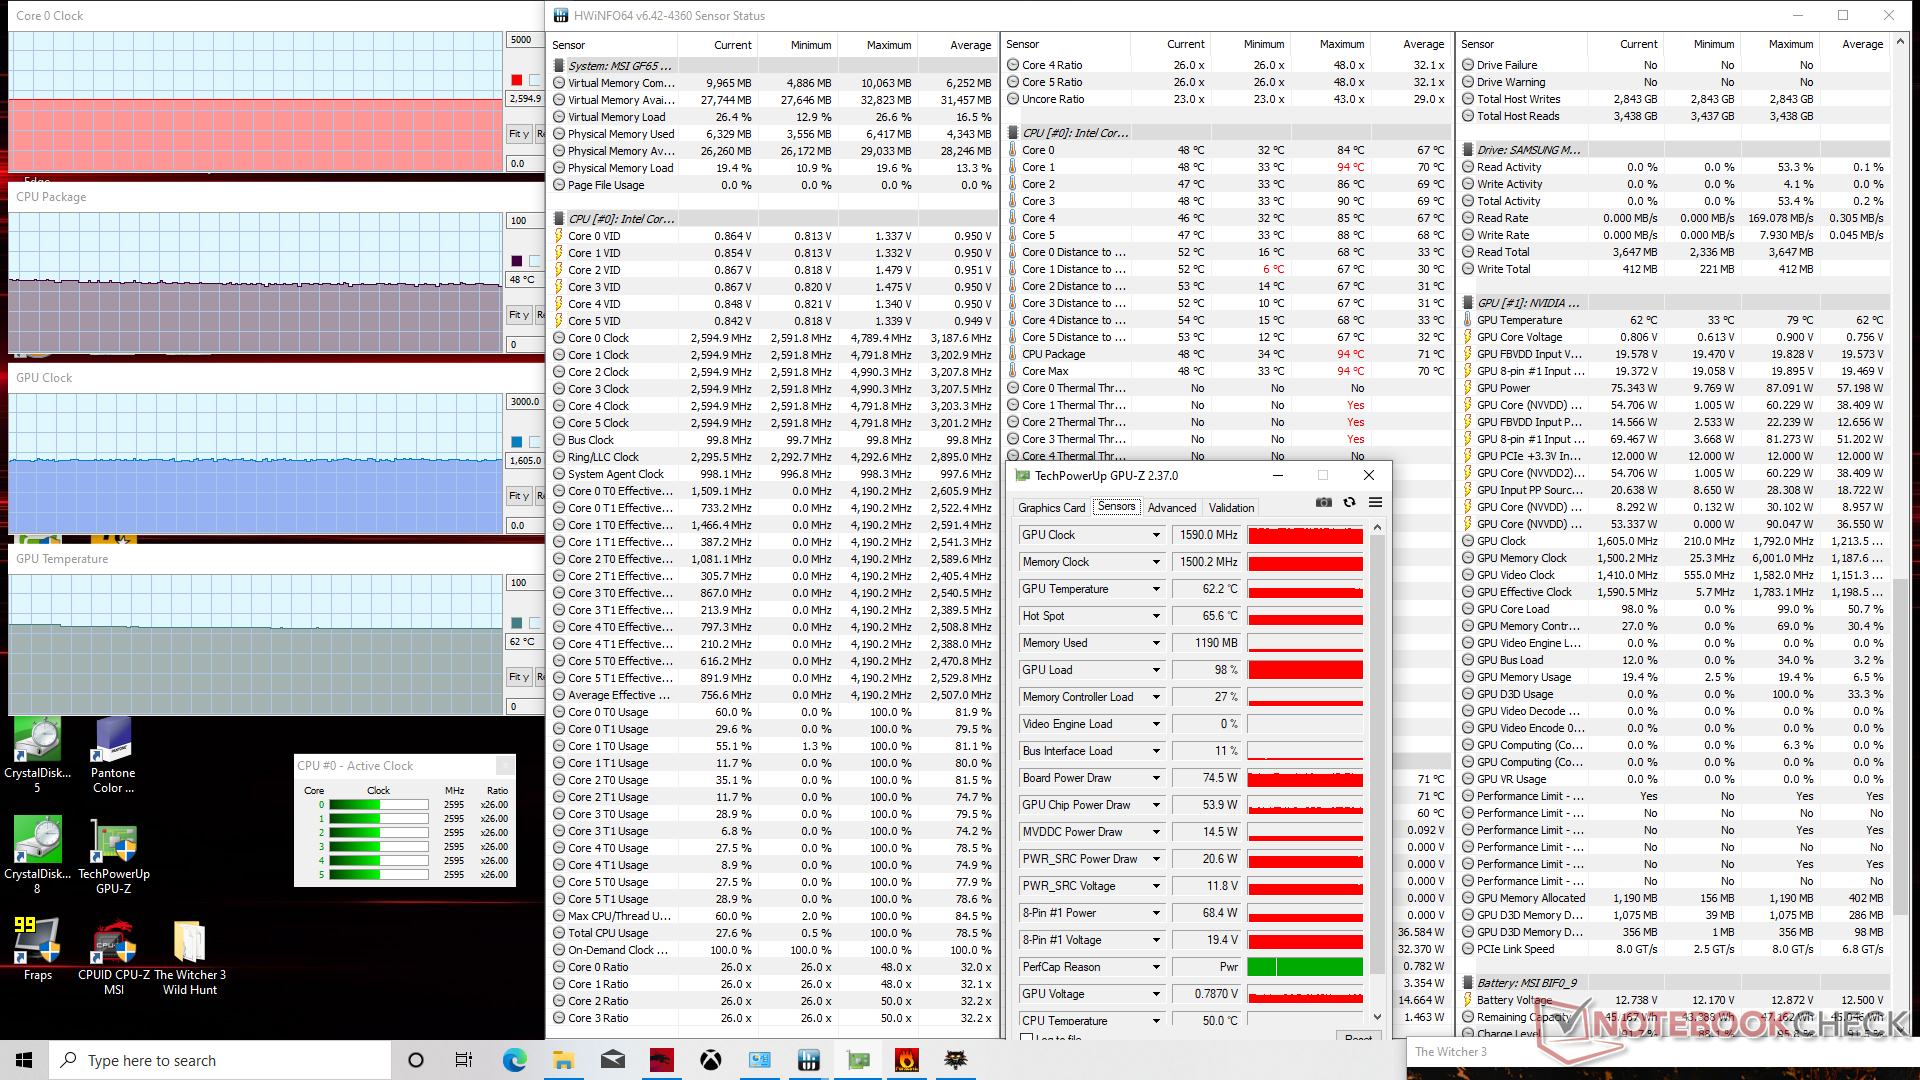
Beim Ausführen von Witcher 3 stabilisieren sich CPU und GPU bei 65 C bzw. 77 °C, was für ein Gaming-Notebook relativ kühle Bereiche sind. Die Aktivierung von Cooler Boost würde die CPU- und GPU-Temperaturen sogar noch weiter auf nur 48 °C bzw. 62 °C senken, während die durchschnittlichen GPU-Taktraten nur leicht von 1515 MHz auf 1590 MHz steigen. Das Cooler-Boost-Feature ist also nicht unbedingt notwendig für Spiele, aber es kann für diejenigen nützlich sein, die maximale CPU-Turbo-Boost-Leistung aus ihrem GF65-System herausholen wollen.
Im Akkubetrieb wird die Leistung eingeschränkt. Ein Fire Strike Durchauf im Akkubetrieb liefert Physik- und Grafik-Scores von 10559 bzw. 12438 Punkten, verglichen mit 17489 und 18434 Punkten im Netzbetrieb.
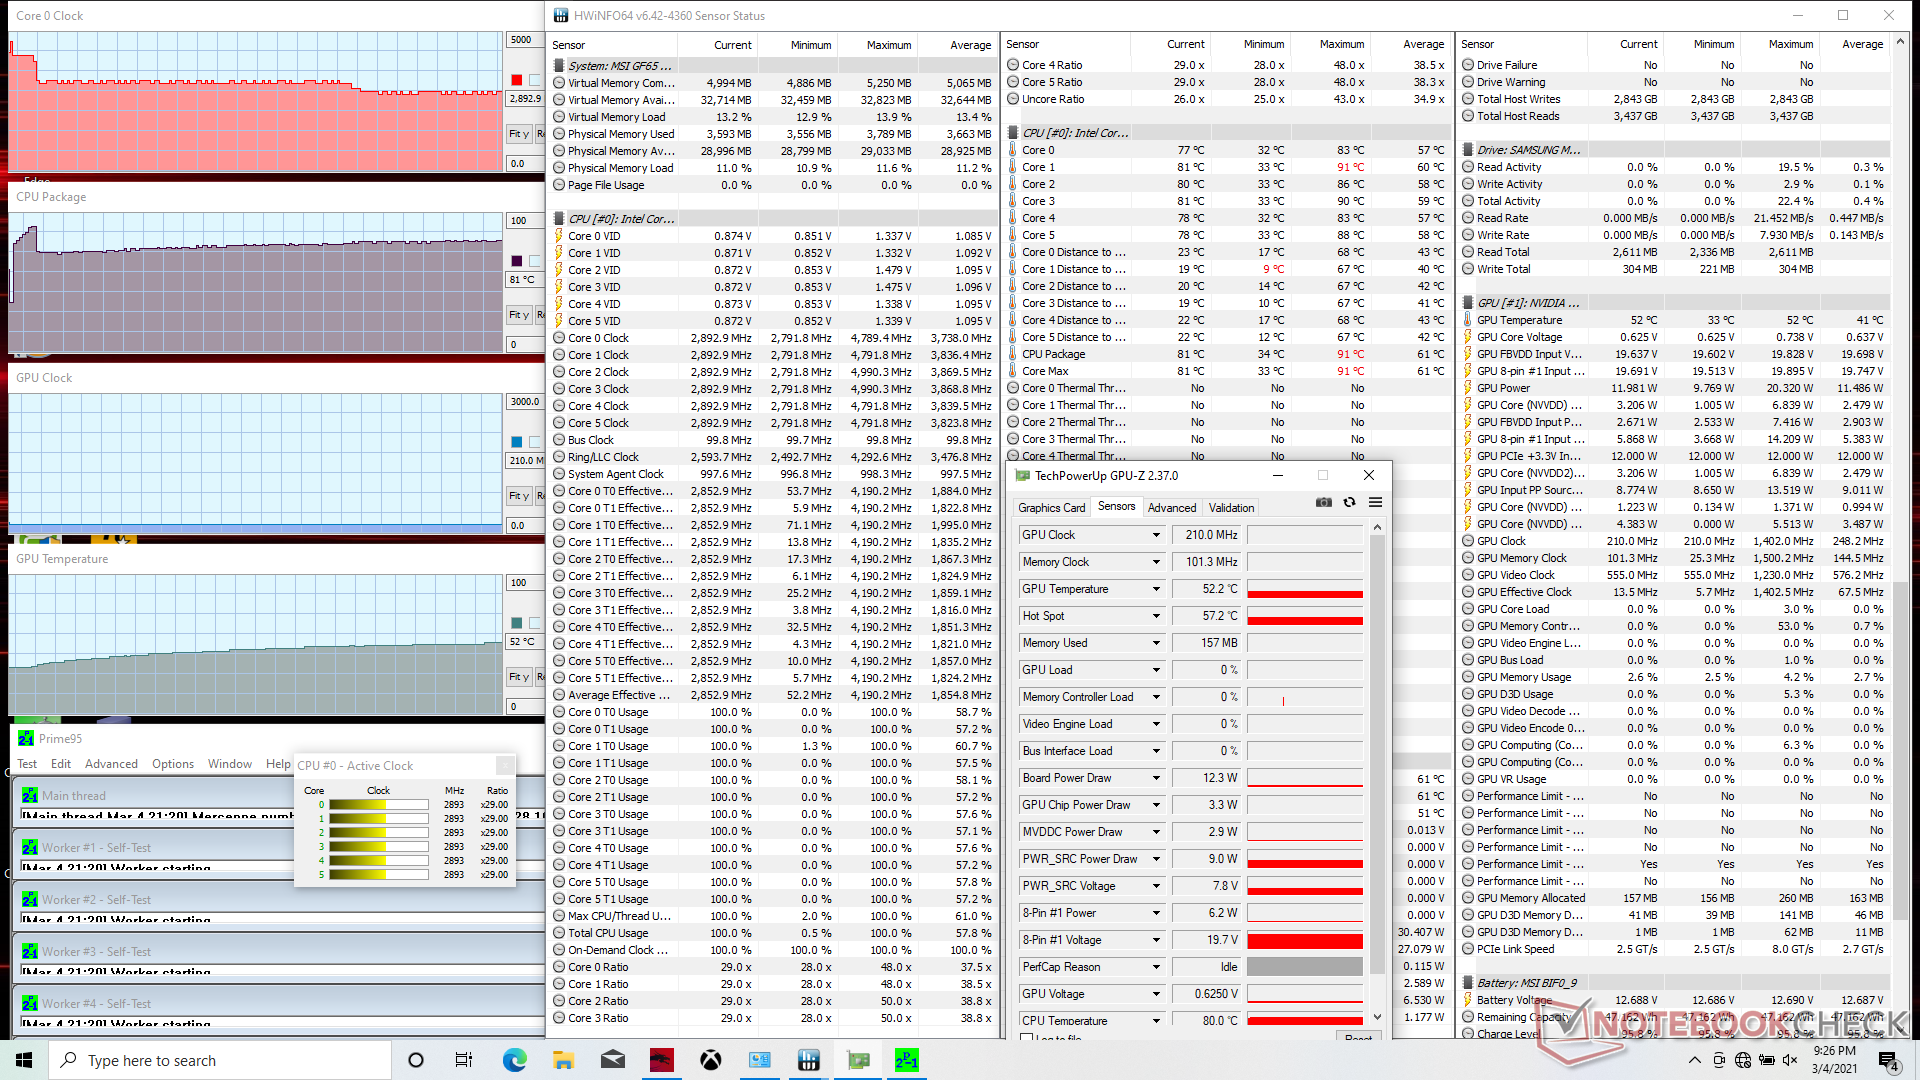

| CPU-Takt (GHz) | GPU-Takt (MHz) | DurchschnittlicheCPU-Temperatur (°C) | DurchschnittlicheGPU-Temperatur (°C) | |
| System Leerlauf | -- | -- | 34 | 33 |
| Prime95 Stress (Cooler Boost aus) | 2.8 - 2.9 | -- | 81 | 52 |
| Prime95 Stress (Kühleranhebung ein) | 3,3 | -- | 69 | 35 |
| Witcher 3 Stress (Kühleranhebung aus) | 2.6 | 1515 | 65 | 77 |
| Witcher 3 Stress (Kühlerboost ein) | 2.6 | 1590 | 48 | 62 |
| Prime95 + FurMark Stress (Kühleranhebung aus) | 3.3 | 1612 | 86 | 78 |
| Prime95+ FurMark Stress (Kühleranhebung ein) | 3.3 | 1785 | 76 | 66 |
Lautsprecher


MSI GF65 Thin 10UE Audio Analyse
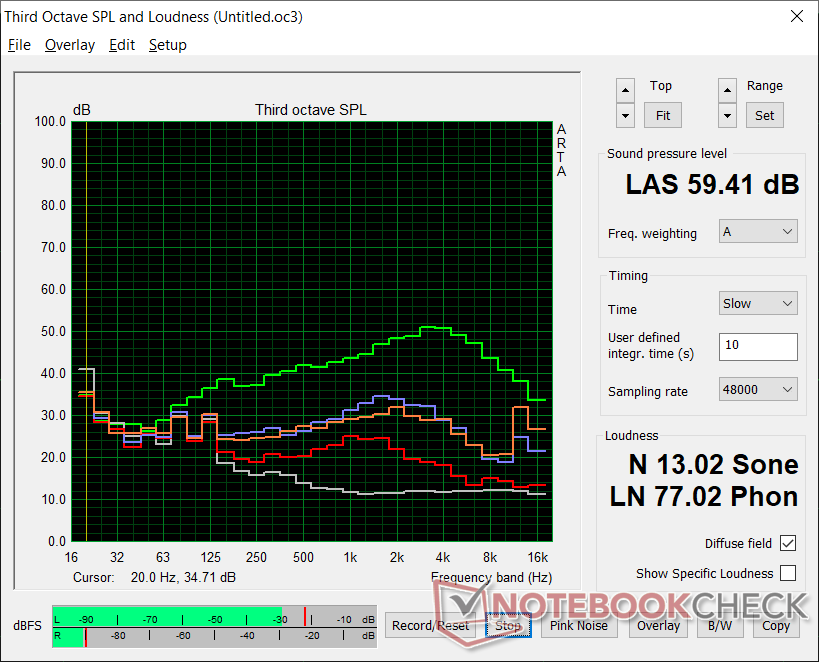
(±) | Mittelmäßig laut spielende Lautsprecher (80.7 dB)
Bass 100 - 315 Hz
(-) | kaum Bass - 19.6% niedriger als der Median
(-) | keine lineare Bass-Wiedergabe (16.1% Delta zum Vorgänger)
Mitteltöne 400 - 2000 Hz
(+) | ausgeglichene Mitten, vom Median nur 3.2% abweichend
(±) | Linearität der Mitten ist durchschnittlich (7.6% Delta zum Vorgänger)
Hochtöne 2 - 16 kHz
(+) | ausgeglichene Hochtöne, vom Median nur 3.6% abweichend
(±) | durchschnittlich lineare Hochtöne (8.6% Delta zum Vorgänger)
Gesamt im hörbaren Bereich 100 - 16.000 Hz
(±) | hörbarer Bereich ist durchschnittlich linear (17.9% Abstand zum Median)
Im Vergleich zu allen Geräten derselben Klasse
» 54% aller getesteten Geräte dieser Klasse waren besser, 9% vergleichbar, 37% schlechter
» Das beste Gerät hat einen Delta-Wert von 6%, durchschnittlich ist 18%, das schlechteste Gerät hat 132%
Im Vergleich zu allen Geräten im Test
» 37% aller getesteten Geräte waren besser, 8% vergleichbar, 55% schlechter
» Das beste Gerät hat einen Delta-Wert von 4%, durchschnittlich ist 24%, das schlechteste Gerät hat 134%
Apple MacBook 12 (Early 2016) 1.1 GHz Audio Analyse
(+) | Die Lautsprecher können relativ laut spielen (83.6 dB)
Bass 100 - 315 Hz
(±) | abgesenkter Bass - 11.3% geringer als der Median
(±) | durchschnittlich lineare Bass-Wiedergabe (14.2% Delta zum Vorgänger)
Mitteltöne 400 - 2000 Hz
(+) | ausgeglichene Mitten, vom Median nur 2.4% abweichend
(+) | lineare Mitten (5.5% Delta zum Vorgänger)
Hochtöne 2 - 16 kHz
(+) | ausgeglichene Hochtöne, vom Median nur 2% abweichend
(+) | sehr lineare Hochtöne (4.5% Delta zum Vorgänger)
Gesamt im hörbaren Bereich 100 - 16.000 Hz
(+) | hörbarer Bereich ist sehr linear (10.2% Abstand zum Median
Im Vergleich zu allen Geräten derselben Klasse
» 7% aller getesteten Geräte dieser Klasse waren besser, 2% vergleichbar, 91% schlechter
» Das beste Gerät hat einen Delta-Wert von 5%, durchschnittlich ist 18%, das schlechteste Gerät hat 53%
Im Vergleich zu allen Geräten im Test
» 5% aller getesteten Geräte waren besser, 1% vergleichbar, 94% schlechter
» Das beste Gerät hat einen Delta-Wert von 4%, durchschnittlich ist 24%, das schlechteste Gerät hat 134%
Energieverwaltung
Leistungsaufnahme
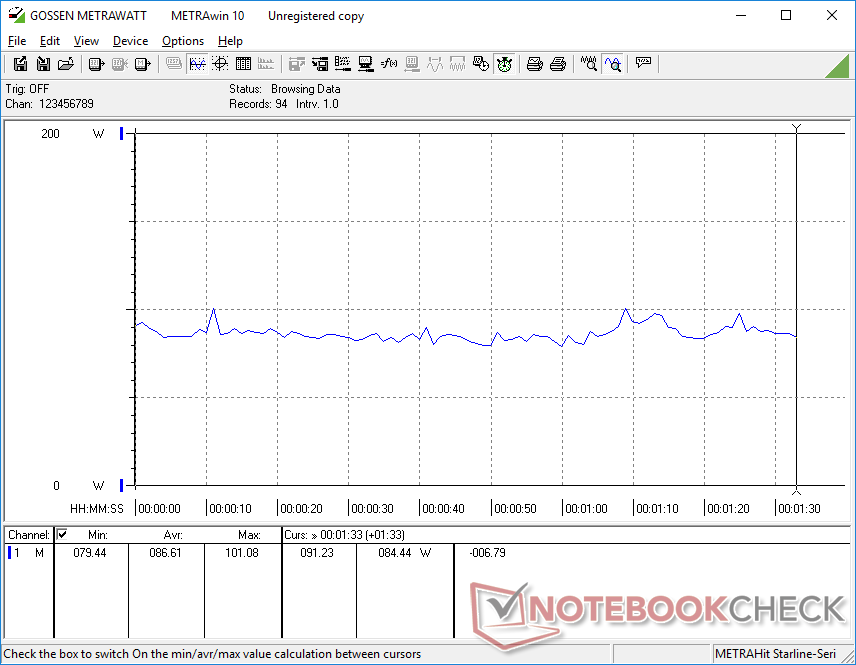
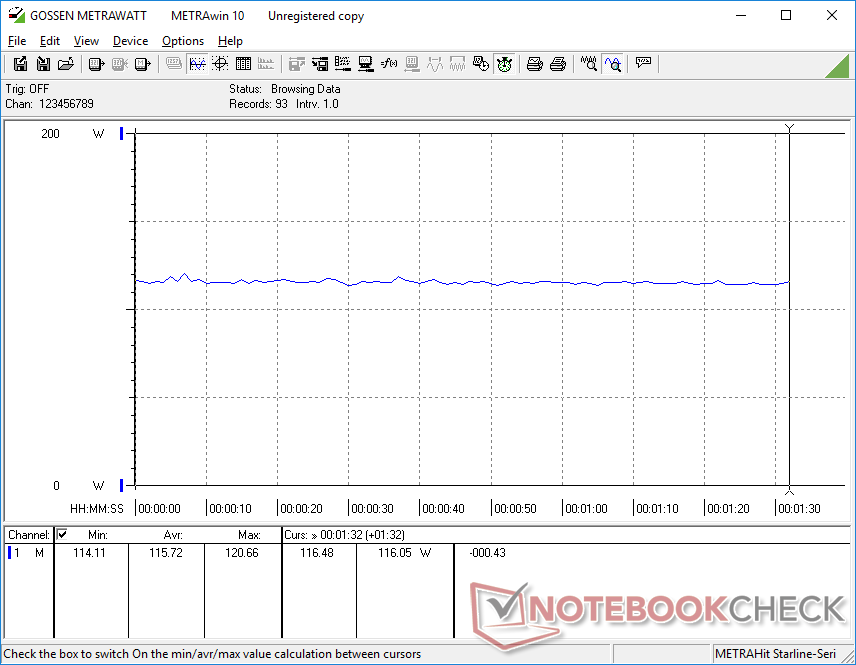
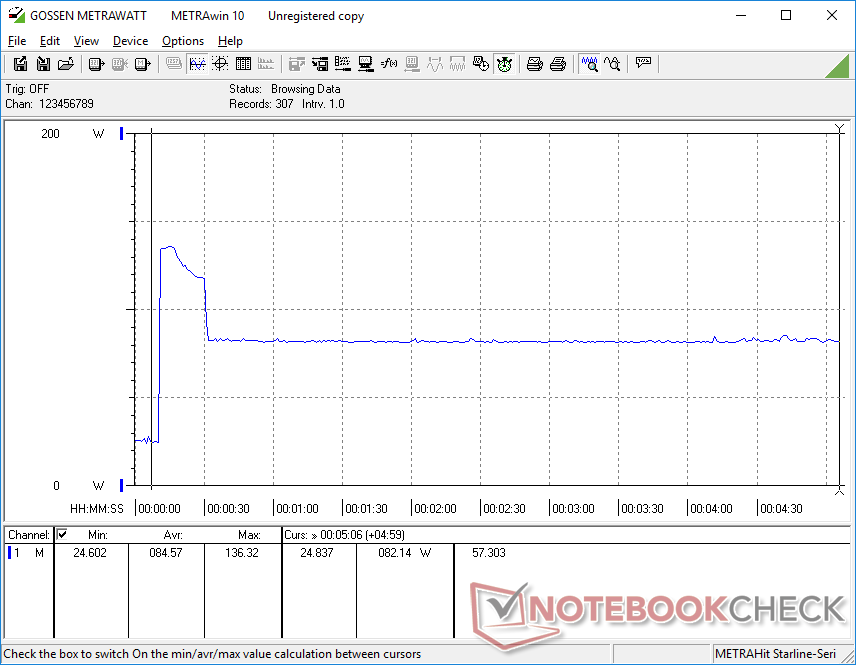
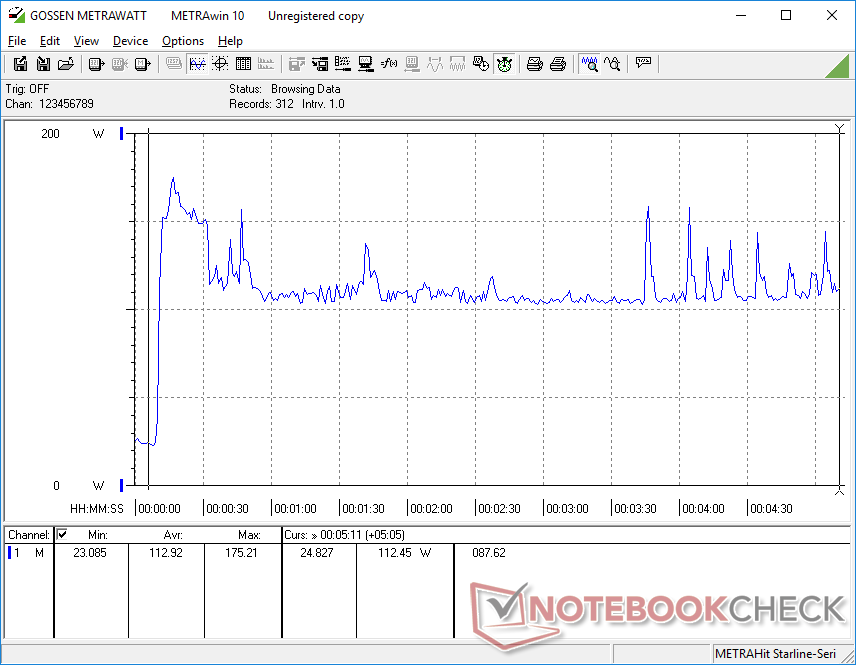
Das System verbraucht etwas weniger Strom als beim älteren GF65 9SD, unter Witcher 3 etwa 116 W im Vergleich zu 134 W beim älteren Modell, obwohl unsere RTX 3060 eine 15-prozentige Steigerung der rohen Grafikleistung gegenüber der GTX 1660 Ti liefern kann. Das Schenker XMG Core 15 mit der gleichen RTX 3060 GPU verbraucht deutlich mehr Strom als unser MSI, wahrscheinlich weil es auf höhere TGP-Werte und andere Prozessorunterschiede abzielt.
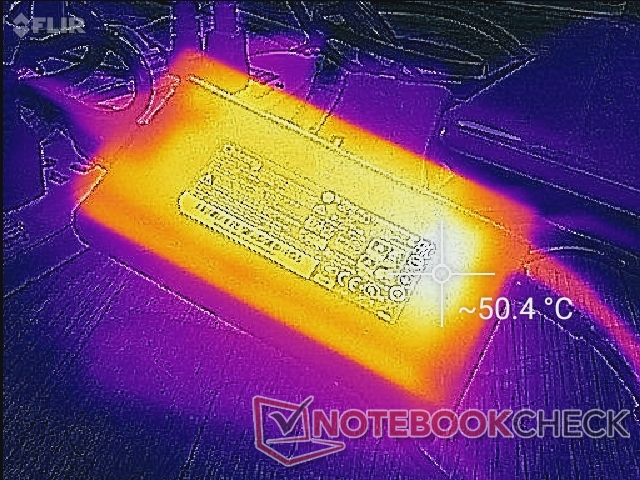
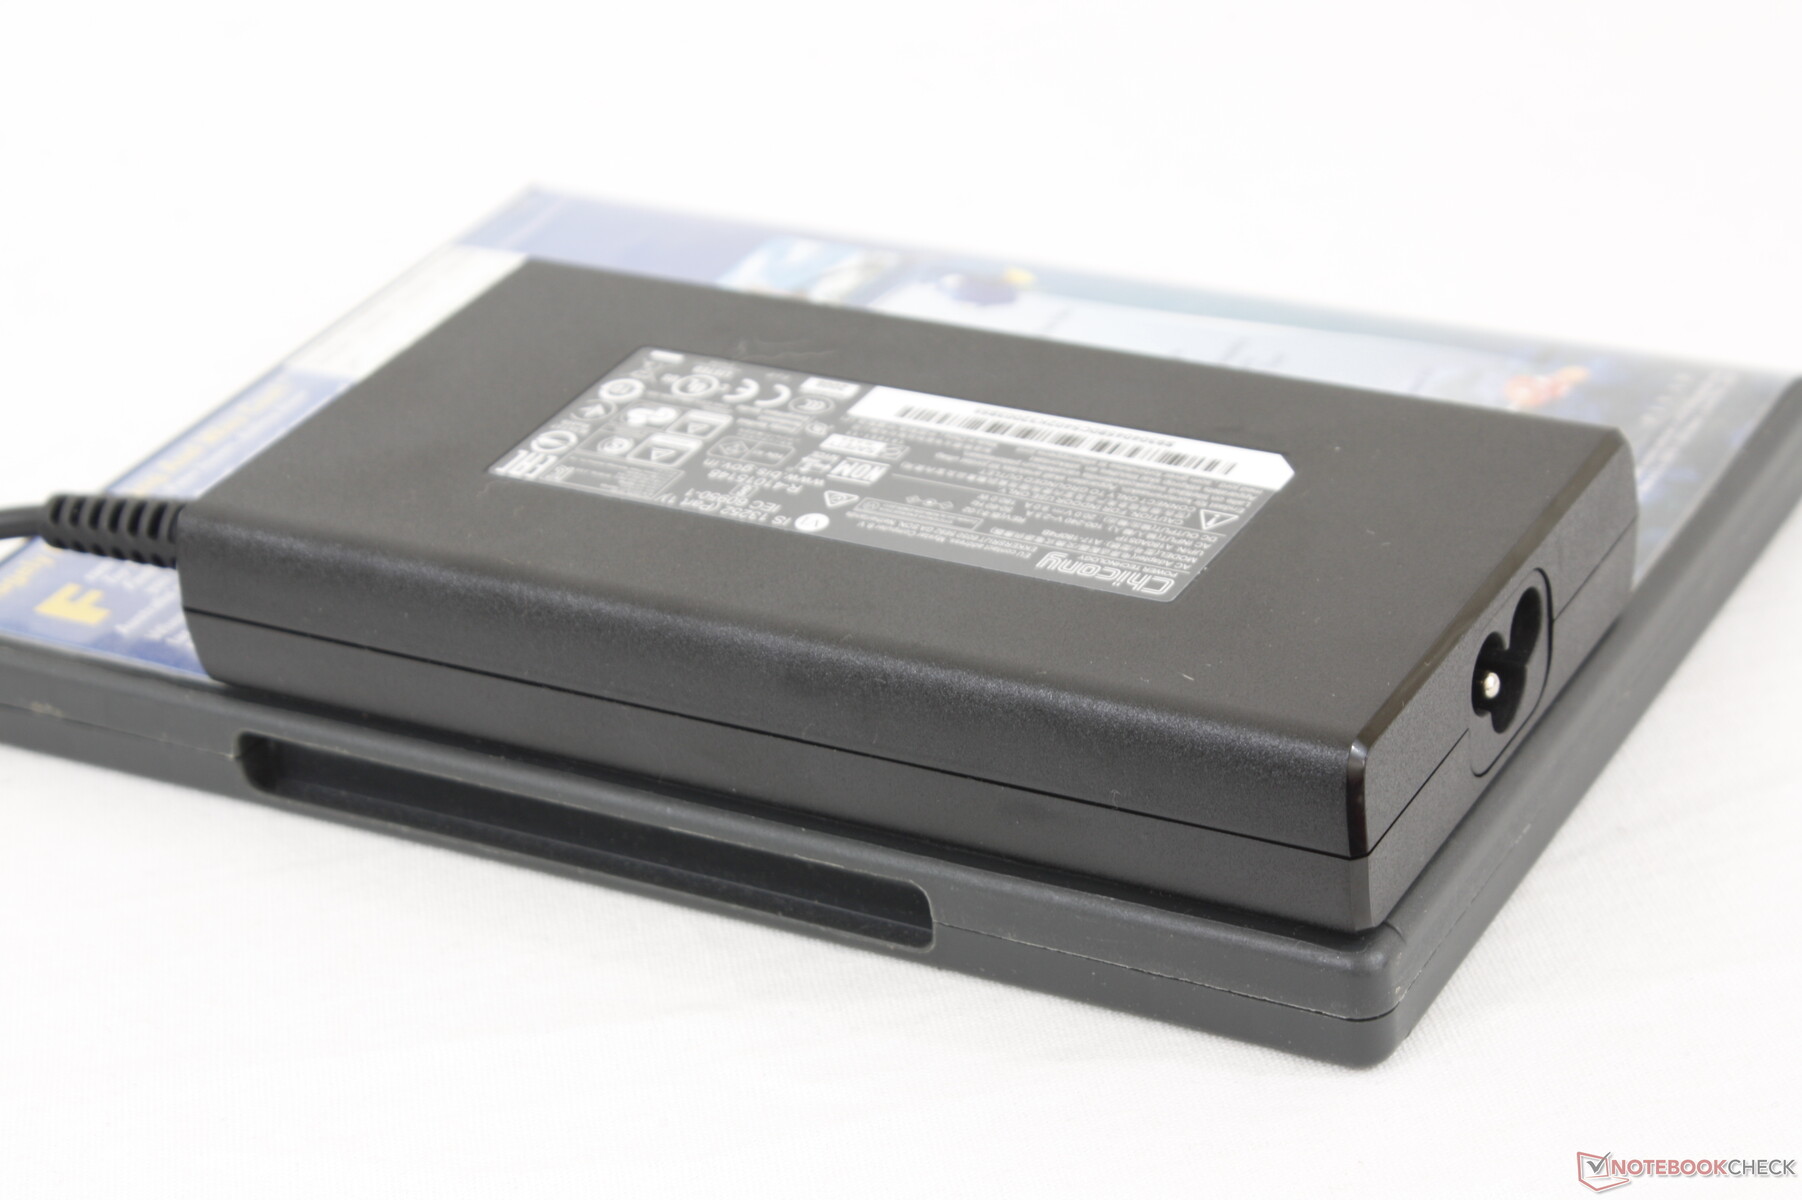
Wir können einen maximalen Verbrauch von 175,2 W aus dem kleinen (~14,4 x 7,5 x 2,3 cm) 180-Watt-Netzteil messen, wenn Prime95 und FurMark gleichzeitig laufen. Die Akkuladung verlangsamt sich bei extremer Last deutlich und kann sogar zum Stillstand kommen, was wir bei unserem obigen Stresstest beobachtet haben.
| Aus / Standby | |
| Idle | |
| Last |
|
Legende:
min: | |
| MSI GF65 Thin 10UE i7-10750H, GeForce RTX 3060 Laptop GPU, Samsung SSD PM981 MZVLB1T0HALR, IPS, 1920x1080, 15.6" | Asus ROG Strix G15 G513QR R9 5900HX, GeForce RTX 3070 Laptop GPU, SK Hynix HFM001TD3JX013N, IPS, 1920x1080, 15.6" | Schenker XMG Core 15 Ampere R7 4800H, GeForce RTX 3060 Laptop GPU, Samsung SSD 970 EVO Plus 1TB, IPS, 2560x1440, 15.6" | Aorus 15G XC i7-10870H, GeForce RTX 3070 Laptop GPU, ESR512GTLCG-EAC-4, IPS, 1920x1080, 15.6" | Lenovo Legion 7 15IMH05-81YT001VGE i9-10980HK, GeForce RTX 2080 Super Max-Q, 2x Samsung PM981a MZVLB1T0HBLR (RAID 0), IPS, 1920x1080, 15.6" | MSI GF65 9SD i7-9750H, GeForce GTX 1660 Ti Mobile, Kingston RBUSNS8154P3512GJ, IPS, 1920x1080, 15.6" | |
|---|---|---|---|---|---|---|
| Stromverbrauch | -27% | -35% | -48% | -24% | -17% | |
| Idle min * (Watt) | 5.4 | 4 26% | 11 -104% | 13 -141% | 9 -67% | 9.5 -76% |
| Idle avg * (Watt) | 12.8 | 9 30% | 14 -9% | 16 -25% | 12.6 2% | 12.4 3% |
| Idle max * (Watt) | 19.5 | 36 -85% | 20 -3% | 30 -54% | 17 13% | 22 -13% |
| Last avg * (Watt) | 86.6 | 130 -50% | 94 -9% | 92 -6% | 115 -33% | 80.8 7% |
| Witcher 3 ultra * (Watt) | 115.7 | 174 -50% | 167 -44% | 154 -33% | 159 -37% | 133.9 -16% |
| Last max * (Watt) | 175.2 | 227 -30% | 251 -43% | 223 -27% | 216 -23% | 187.1 -7% |
* ... kleinere Werte sind besser
Akkulaufzeit
Die Laufzeiten liegen im Durchschnitt bei etwa 4,5 Stunden realer WLAN-Nutzung mit dem Energieprofil "Ausbalanciert". Die Ergebnisse unterscheiden sich nicht allzu sehr vom letztjährigen GF65, da sich die Akkukapazität nicht verändert hat.
Das Aufladen von leerer auf volle Kapazität dauert etwas mehr als zwei Stunden. Das System kann nicht über USB-C aufgeladen werden.
| MSI GF65 Thin 10UE i7-10750H, GeForce RTX 3060 Laptop GPU, 51 Wh | Asus ROG Strix G15 G513QR R9 5900HX, GeForce RTX 3070 Laptop GPU, 90 Wh | Schenker XMG Core 15 Ampere R7 4800H, GeForce RTX 3060 Laptop GPU, 62 Wh | MSI GS66 Stealth 10UG i7-10870H, GeForce RTX 3070 Laptop GPU, 99.9 Wh | Aorus 15G XC i7-10870H, GeForce RTX 3070 Laptop GPU, 99 Wh | Lenovo Legion 7 15IMH05-81YT001VGE i9-10980HK, GeForce RTX 2080 Super Max-Q, 80 Wh | MSI GF65 9SD i7-9750H, GeForce GTX 1660 Ti Mobile, 51 Wh | |
|---|---|---|---|---|---|---|---|
| Akkulaufzeit | 58% | 2% | 50% | 44% | 1% | 11% | |
| Idle (h) | 11.1 | 7.8 -30% | 10.8 -3% | 9.6 -14% | |||
| WLAN (h) | 4.6 | 7.4 61% | 5.8 26% | 7.1 54% | 6.3 37% | 3.4 -26% | 5.1 11% |
| Last (h) | 1.1 | 1.7 55% | 1.2 9% | 2.2 100% | 2.3 109% | 1.4 27% |
Pro
Contra
Fazit


Die mobile GeForce RTX 3060 arbeitet in einem TGP-Bereich zwischen 60 W und 115 W. Laptop-Hersteller können innerhalb dieses Bereichs beliebige TGP-Werte anpeilen, was bedeutet, dass höhere TGP-Ziele zu einer höheren Leistung führen. Das bedeutet auch, dass einige Laptops möglicherweise etwas langsamer sind als andere, selbst wenn sie mit der gleichen GPU ausgestattet sind.
Das MSI GF65 10UE ist ein relativ günstiges RTX 3060 Notebook und, vielleicht nicht zufällig, kommt es auch mit einer langsameren RTX 3060 GPU als der Durchschnitt. Andere Laptops, die wir bisher mit der gleichen GPU getestet haben, sind etwa 10 bis 15 Prozent schneller. Die CPU-Leistung ist ebenfalls etwas langsamer als der Durchschnitt, es sei denn, Nutzer entscheiden sich, den Cooler-Boost-Modus zu aktivieren. Farben, Schwarz-Weiß-Reaktionszeiten, Thunderbolt und DisplayPort sind entweder durchschnittlich oder fallen überhaupt weg.
Gamer, für die das Preis-Leistungs-Verhältnis im Vordergrund steht und dabei nicht auf RAM- oder SSD-Aufrüstbarkeit verzichten wollen, werden das leichte MSI GF65 attraktiv finden.
Die einfache Wartbarkeit, die hohe Display-Refresh-Rate und die relativ kühlen Kerntemperaturen beim Spielen sind immer noch einige unserer Lieblingsaspekte des GF65. Dennoch sollten sich potenzielle Käufer bewusst sein, auf welche Features sie verzichten müssen.
Preis und Verfügbarkeit
Unsere Konfiguration ist derzeit in Deutschland noch nicht erhältlich.
MSI GF65 Thin 10UE
- 08.03.2021 v7 (old)
Allen Ngo
Preisvergleich

