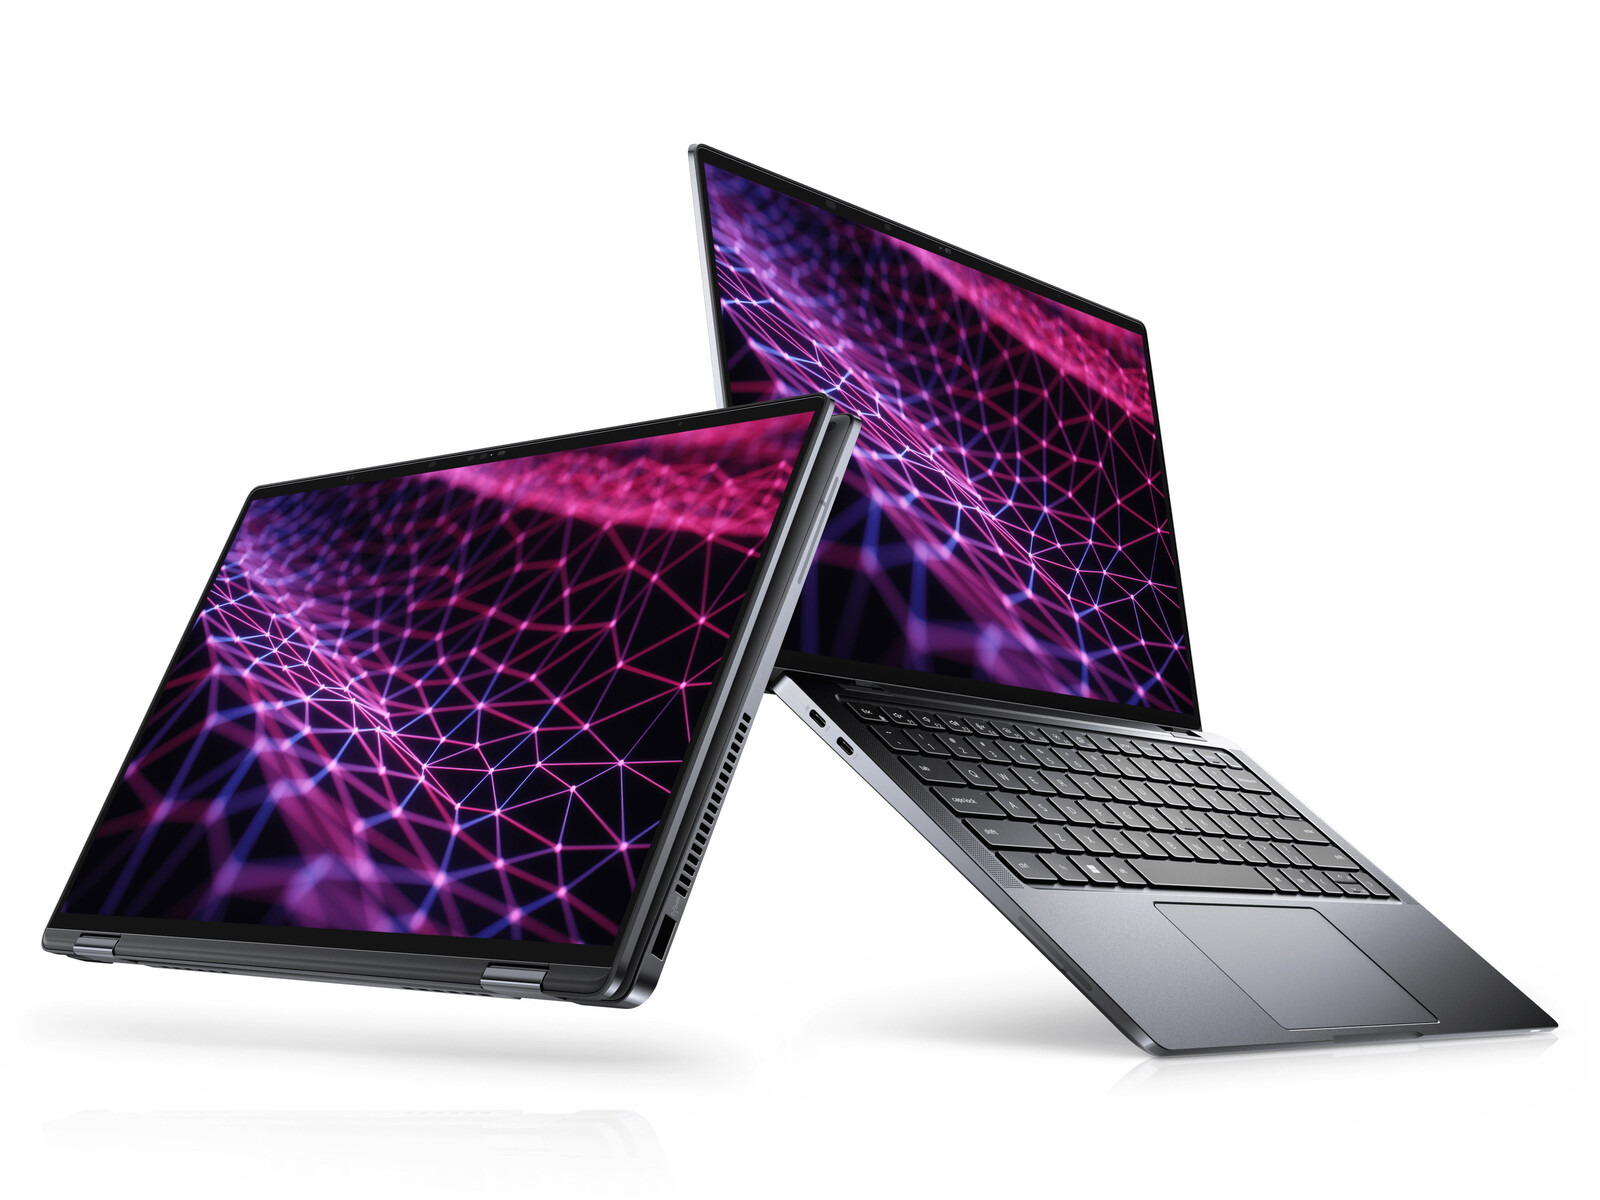
Dell Latitude 13 9330 2-in-1-Convertible im Test: Debüt des Core i7-1260U
Die Latitude-9000-Serie fungiert als Flaggschiff unter den Dell-Business-Laptops und grenzt sich von der Latitude-7000-Serie der oberen Mittelklasse ab, ebenso von der Mid-Tier-Latitude-5000-Reihe und der Einstiegsserie bestehend aus Latitude-3000-Modellen. Das von uns getestete Modell hört auf den Namen Latitude 9330 und ist das erste 13,3-Zoll-Convertible der Latitude-9000-Familie.
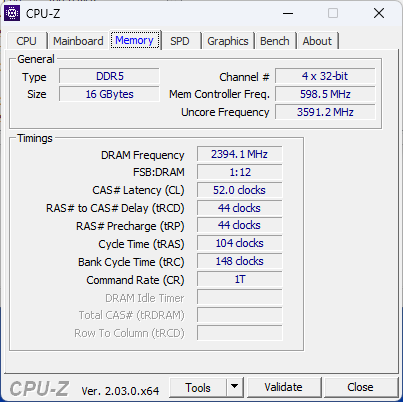
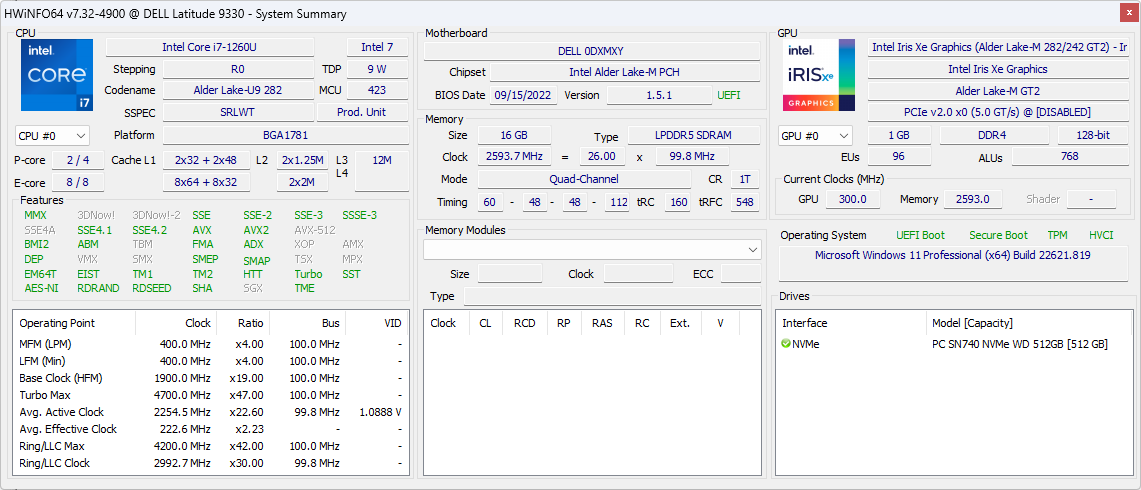
Wir testen das Modell mit der bestmöglichen Ausstattung mit einem Intel Core i7-1260U der 12. Generation, 16-GB-LPDDR5-RAM und einer 512-GB-NVMe-SSD, erhältlich für einen Preis von etwa 2.500 Euro. Weitere Konfigurationen, etwa mit langsamerer Core-i5-1230U-CPU und einer 256-GB-SSD starten ab 1.600 Euro, während alle Optionen mit einer integrierten Grafiklösung und dem gleichen QHD+-IPS-Touchscreen (2.560 x 1.600 Pixel) ausgestattet sind. Testlink DE. Testlink EN.
Konkurrierende 13 Zoll große High-End-Business-Convertibles sind etwa das Lenovo ThinkPad X1 Titanium Yoga, das MSI Summit E13 Flip sowie das HP Elite Dragonfly Max.
Weitere Dell Testberichte:
mögliche Konkurrenten im Vergleich
Bew. | Datum | Modell | Gewicht | Dicke | Größe | Auflösung | Preis ab |
|---|---|---|---|---|---|---|---|
| 89 % v7 (old) | 11 / 2022 | Dell Latitude 9330 i7-1260U, Iris Xe G7 96EUs | 1.2 kg | 14.1 mm | 13.30" | 2560x1600 | |
| 88.5 % v7 (old) | 03 / 2022 | Lenovo ThinkPad X1 Titanium Yoga G1 20QB0016GE i5-1140G7, Iris Xe G7 80EUs | 1.2 kg | 11.5 mm | 13.50" | 2256x1504 | |
| 86.9 % v7 (old) | 04 / 2021 | MSI Summit E13 Flip Evo A11MT i7-1185G7, Iris Xe G7 96EUs | 1.4 kg | 14.9 mm | 13.40" | 1920x1200 | |
| 90 % v7 (old) | 11 / 2020 | HP EliteBook x360 1030 G7 i7-10810U, UHD Graphics 620 | 1.2 kg | 16 mm | 13.30" | 1920x1080 | |
| 90.8 % v7 (old) | 06 / 2021 | HP Elite Dragonfly Max i7-1185G7, Iris Xe G7 96EUs | 1.2 kg | 16 mm | 13.30" | 1920x1080 | |
| 87.2 % v7 (old) | 12 / 2020 | Dell Latitude 5310-23VP6 i5-10310U, UHD Graphics 620 | 1.3 kg | 19.7 mm | 13.30" | 1920x1080 |
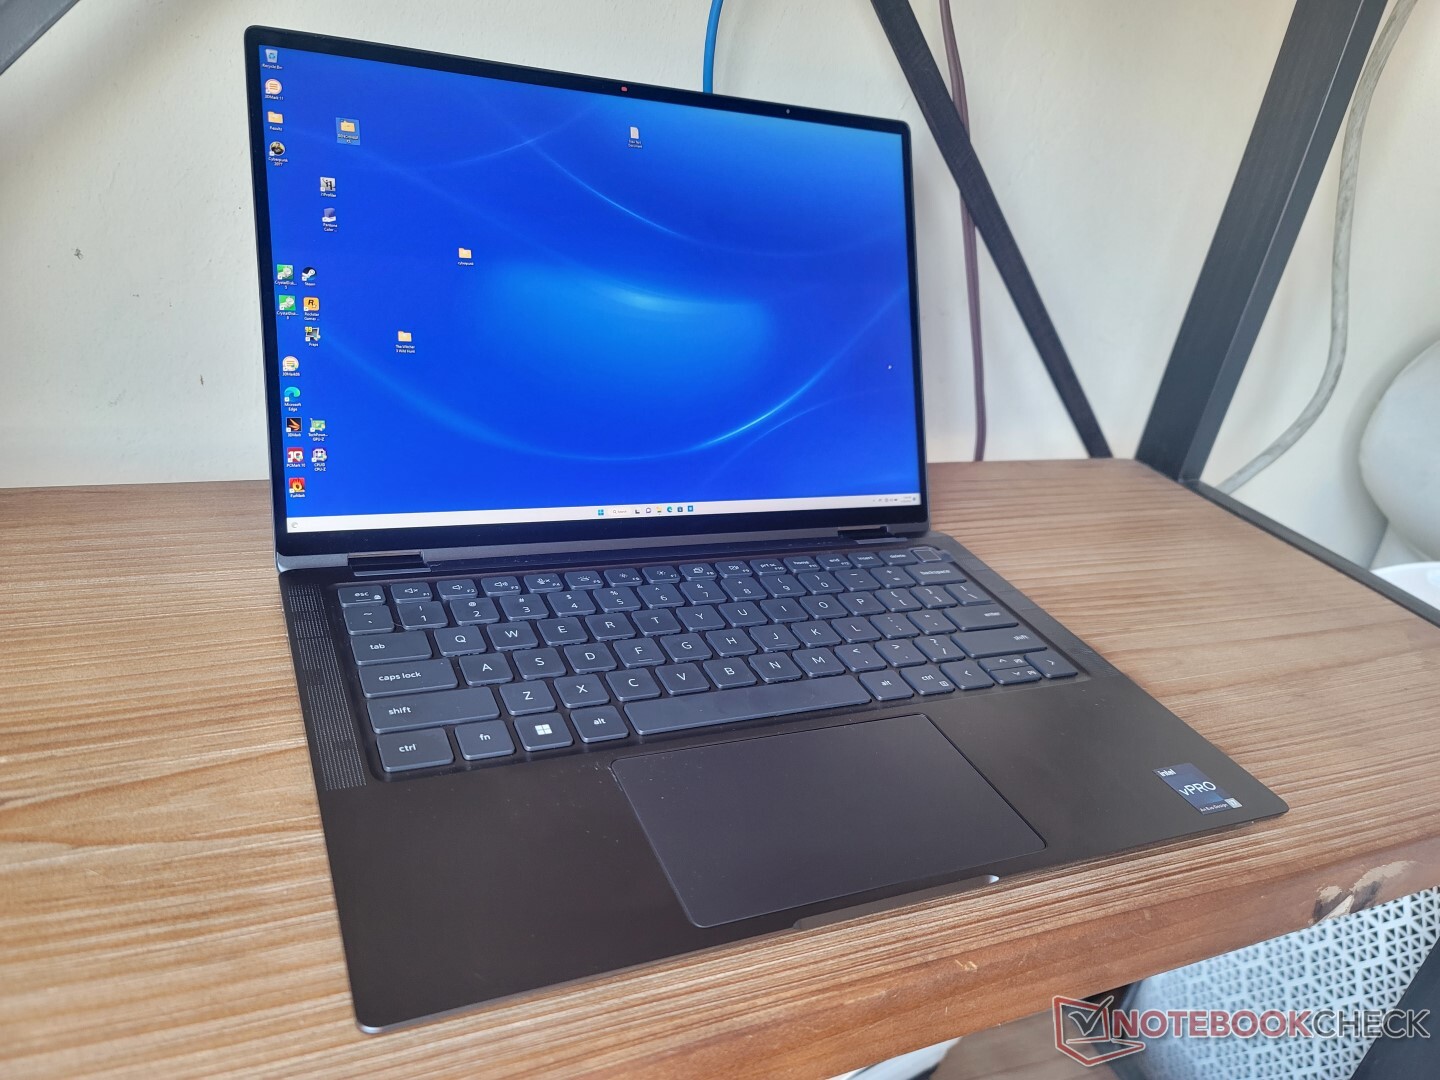
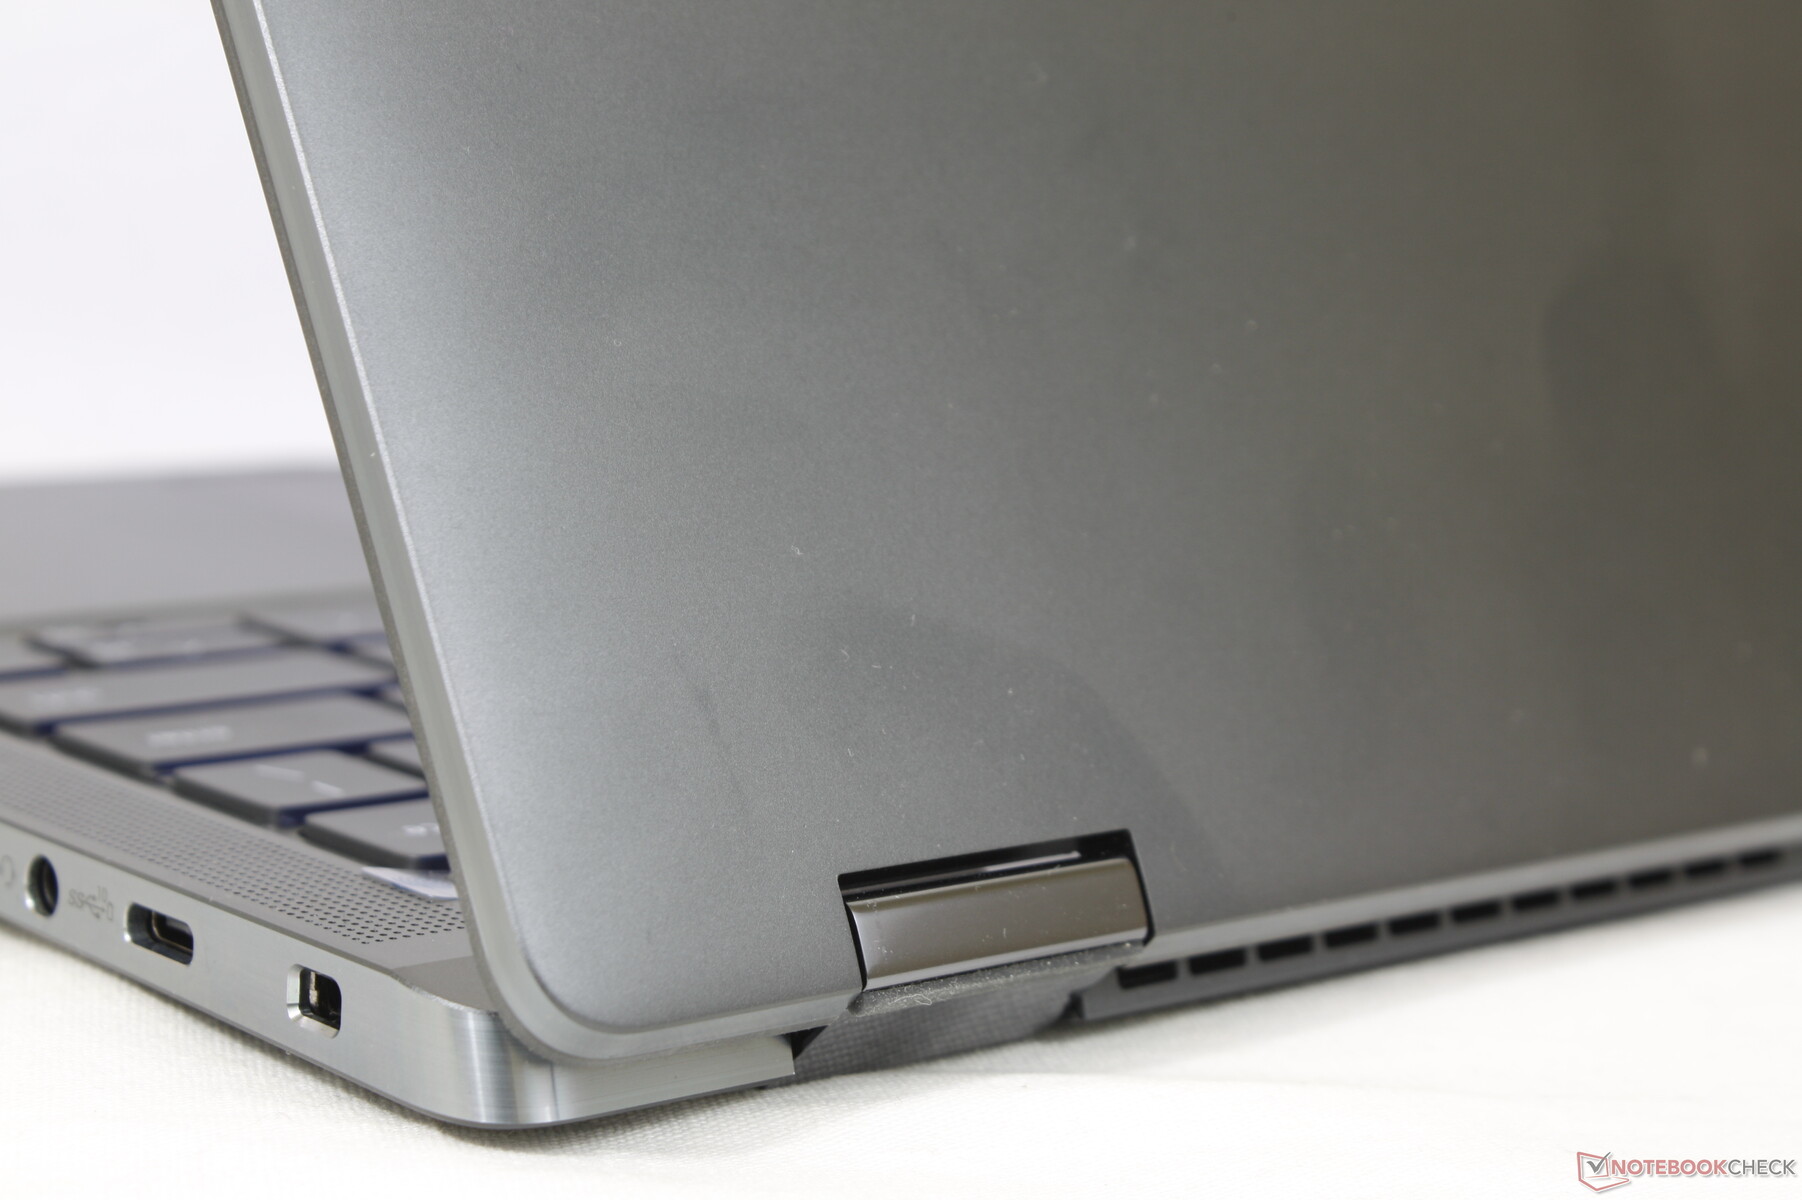
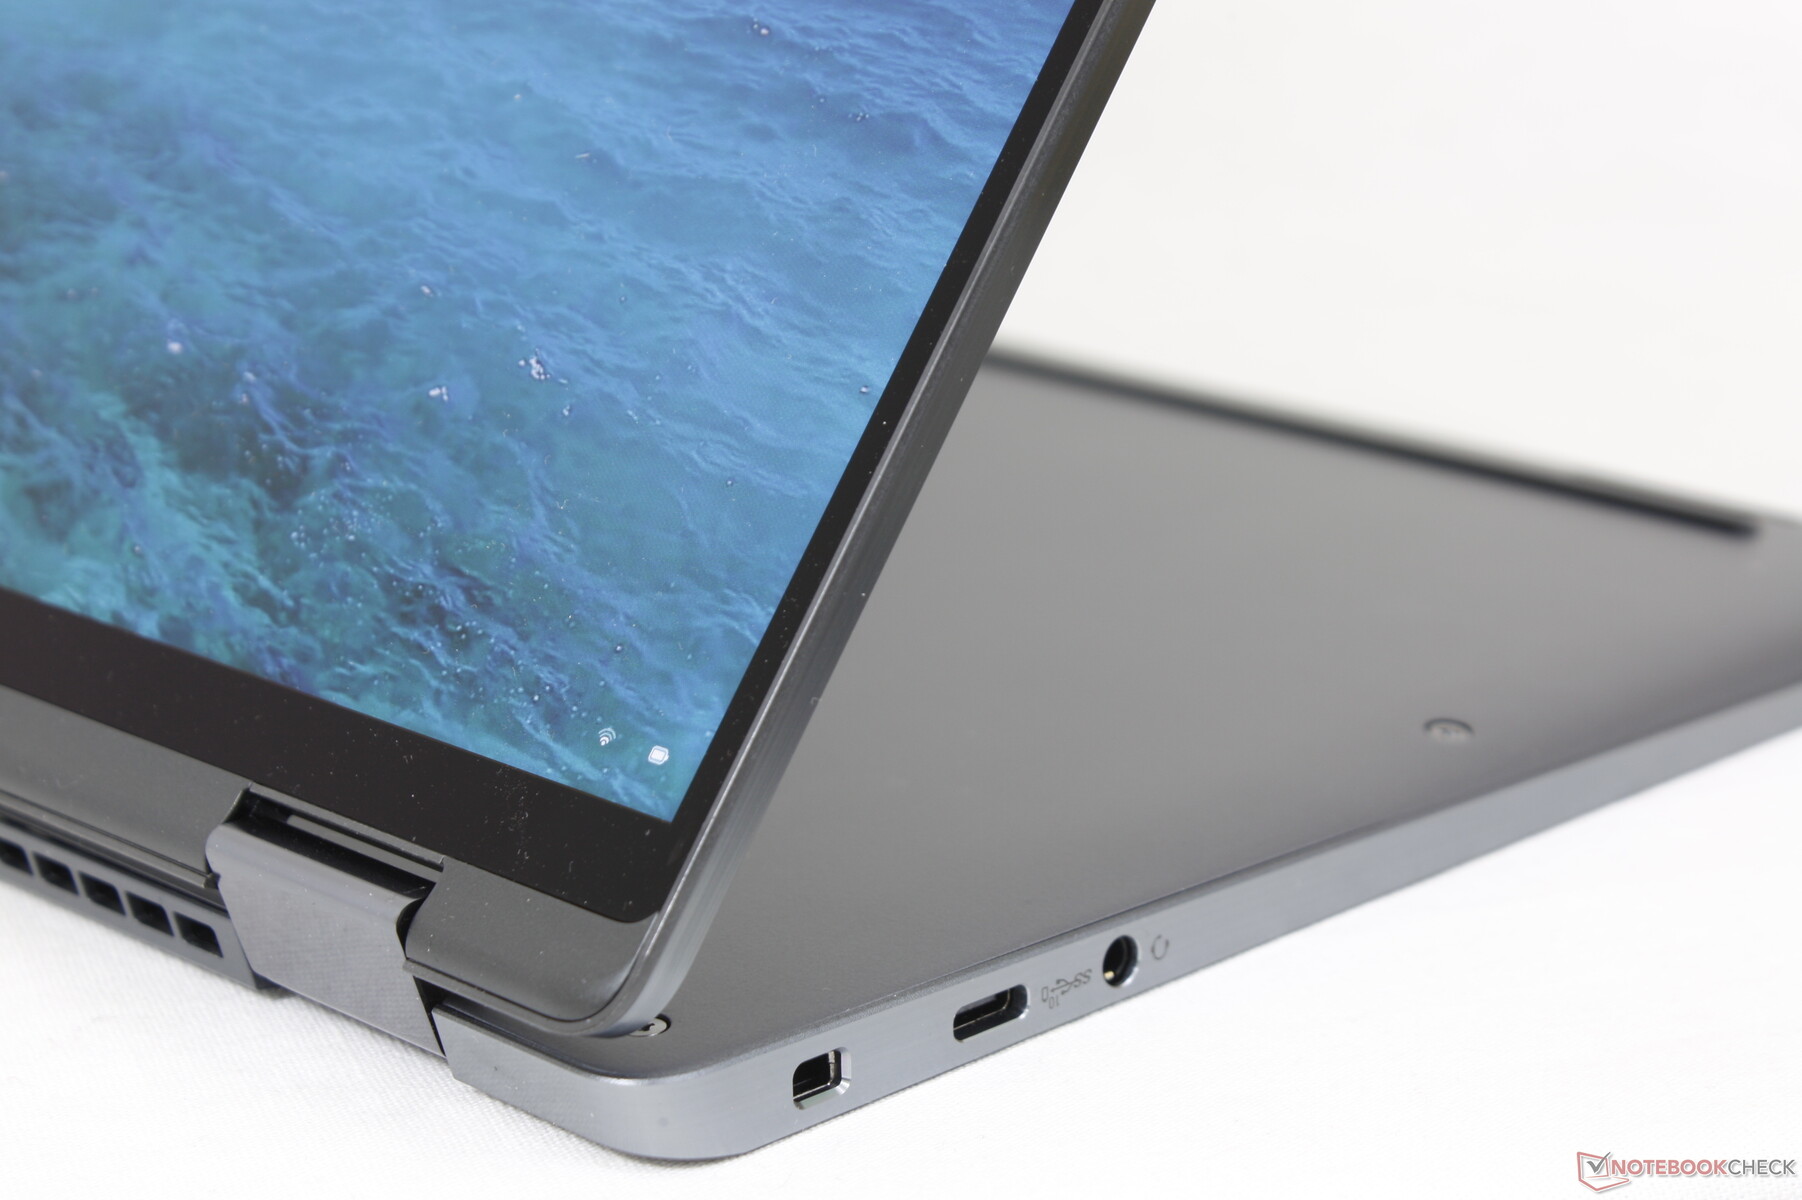
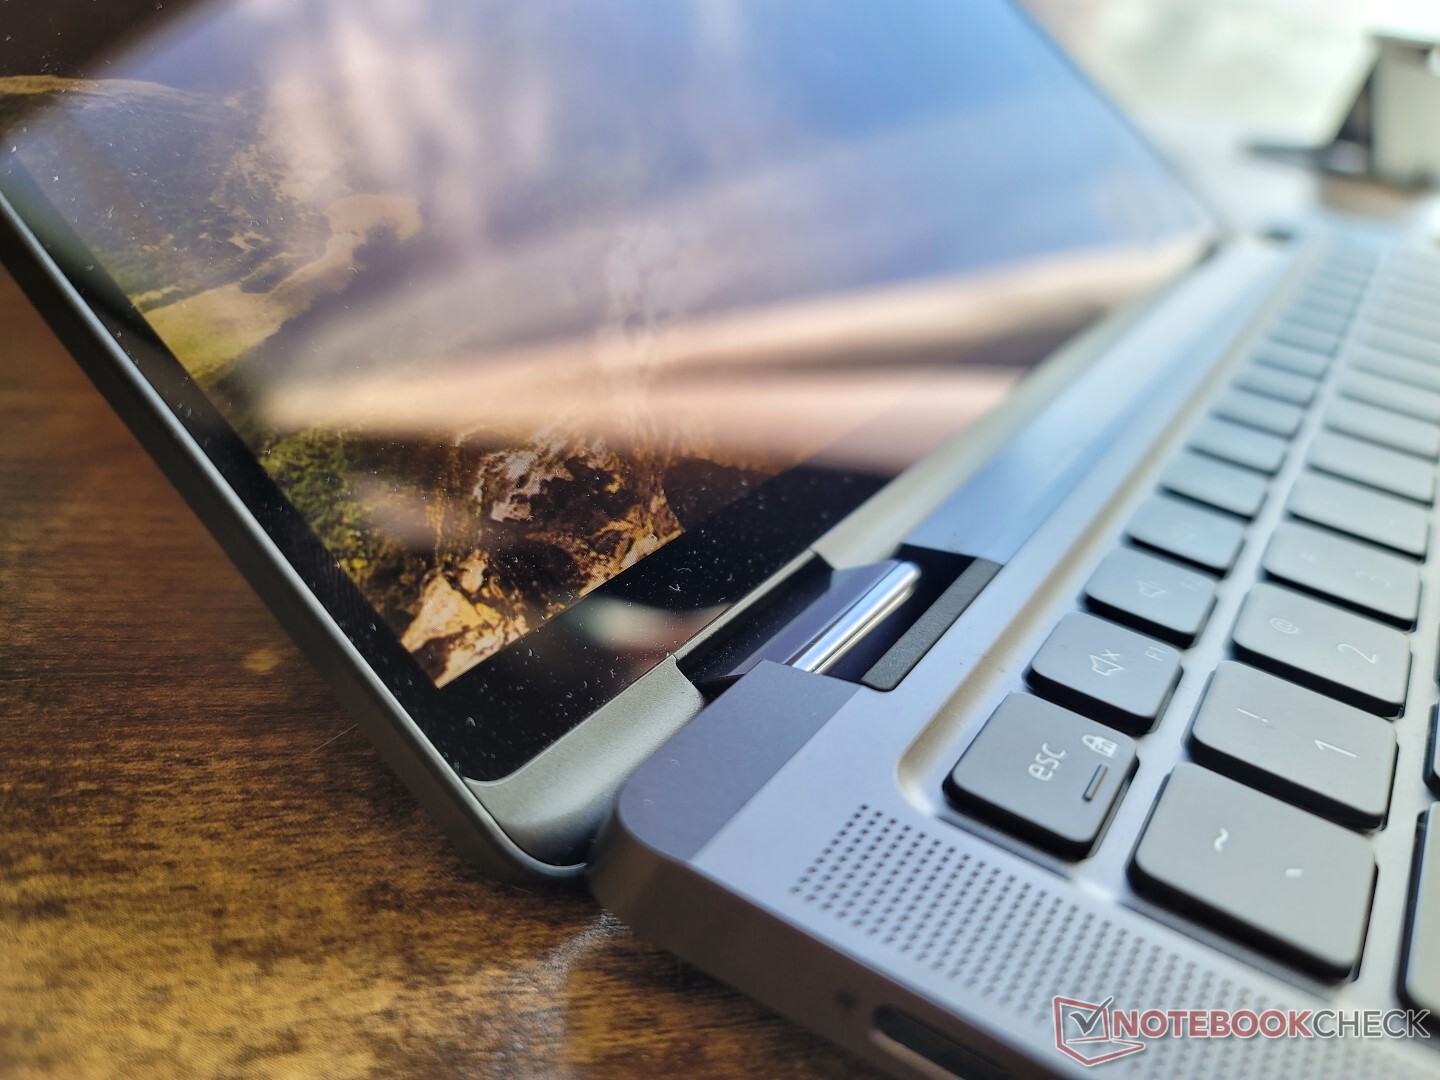
Gehäuse — robust mit schlichtem Aussehen
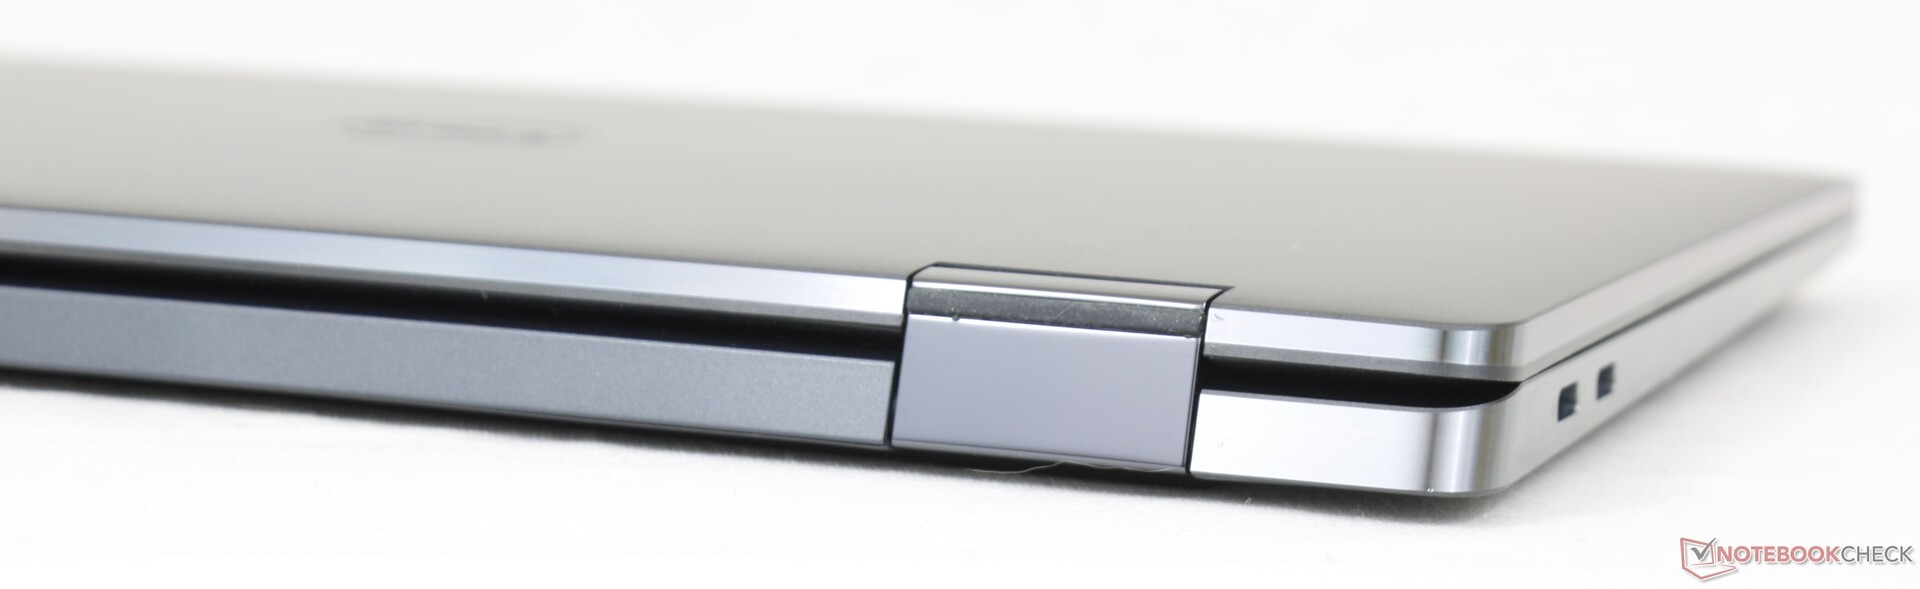
Das graue Gehäuse aus Metall mag nicht viel hermachen, besonders wenn man es mit dem schicken, goldfarbenen MSI Summit E13 Flip oder der HP-Spectre-Reihe vergleicht. Dennoch ist es mindestens genauso robust. Die Basiseinheit lässt sich nur minimal verwinden, und auch das Tastaturen-Deck erlaubt nur ein geringfügiges Eindrücken, was einen ordentlichen ersten Eindruck hinterlässt. Auch der Bildschirm ist resistent gegen Verwindungen. Die generelle Stabilität ist so gut, wie wir sie selten bei einem ultradünnen Subnotebook-Convertible erleben.
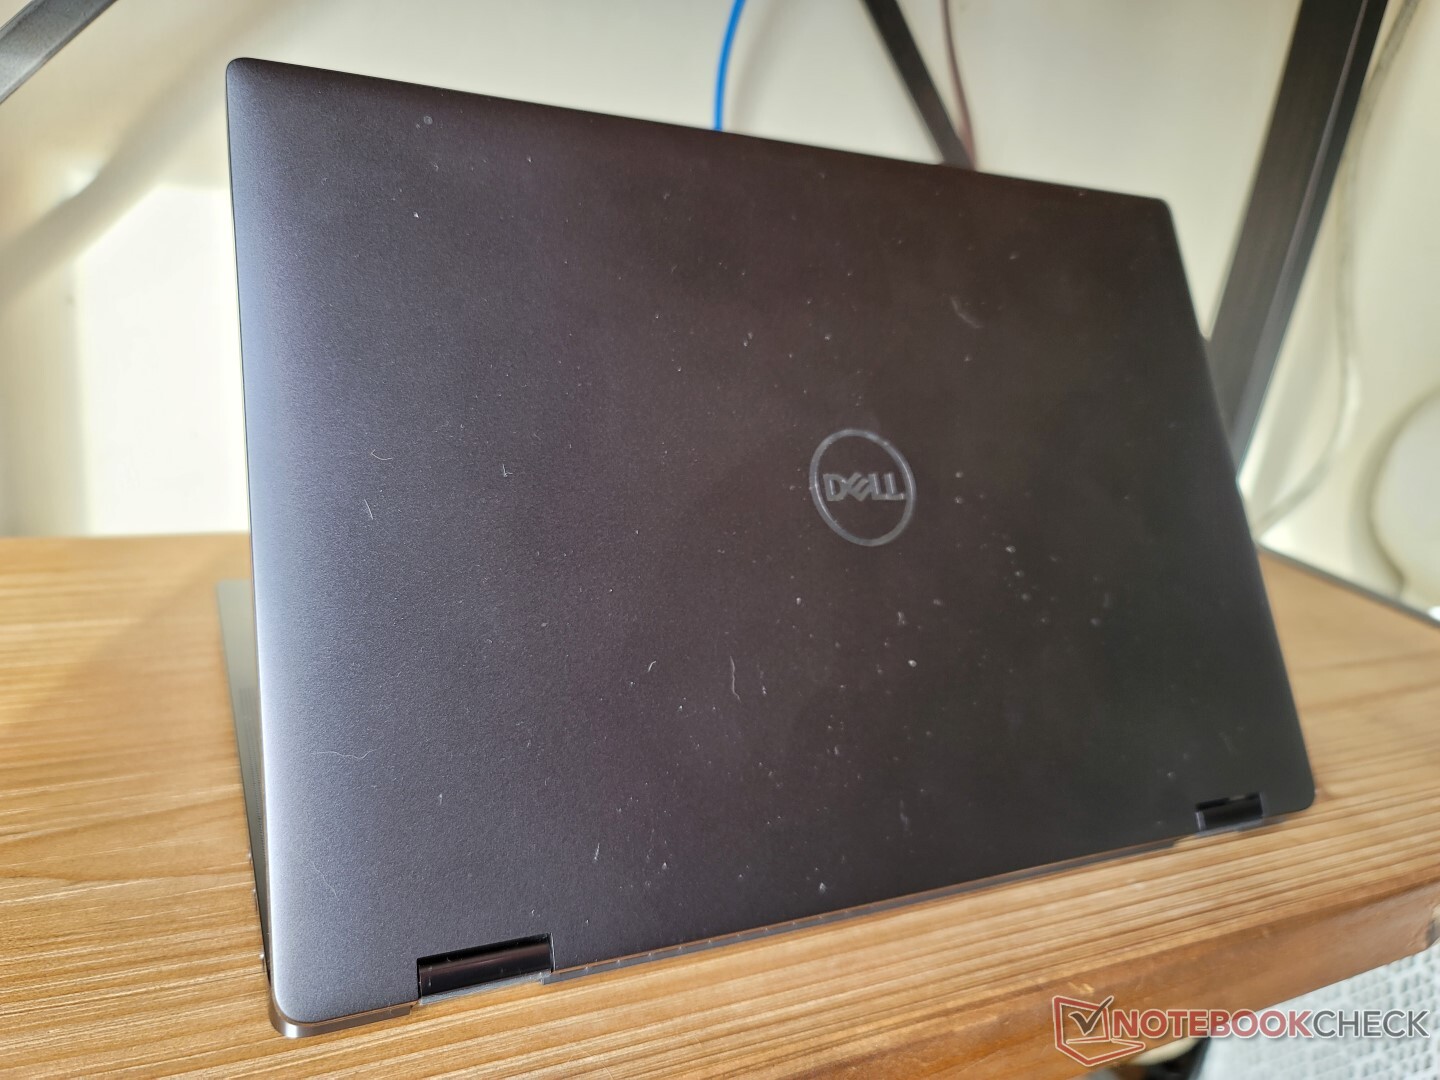
Die Abmaße und das Gewicht sind ähnlich zum HP Elite Dragonfly Max. Der Dell Laptop ist etwas länger aufgrund des höheren 16:10-Displays im Gegensatz zum HP Laptop im 16:9-Format. Das Dell Latitude 9330 besitzt hingegen die schmaleren Bildschirmränder und ein dünneres Design, während das MSI Summit E13 Flip ein 13-Zoll-Convertible mit einem höheren Gewicht und größeren Abmaßen ist.
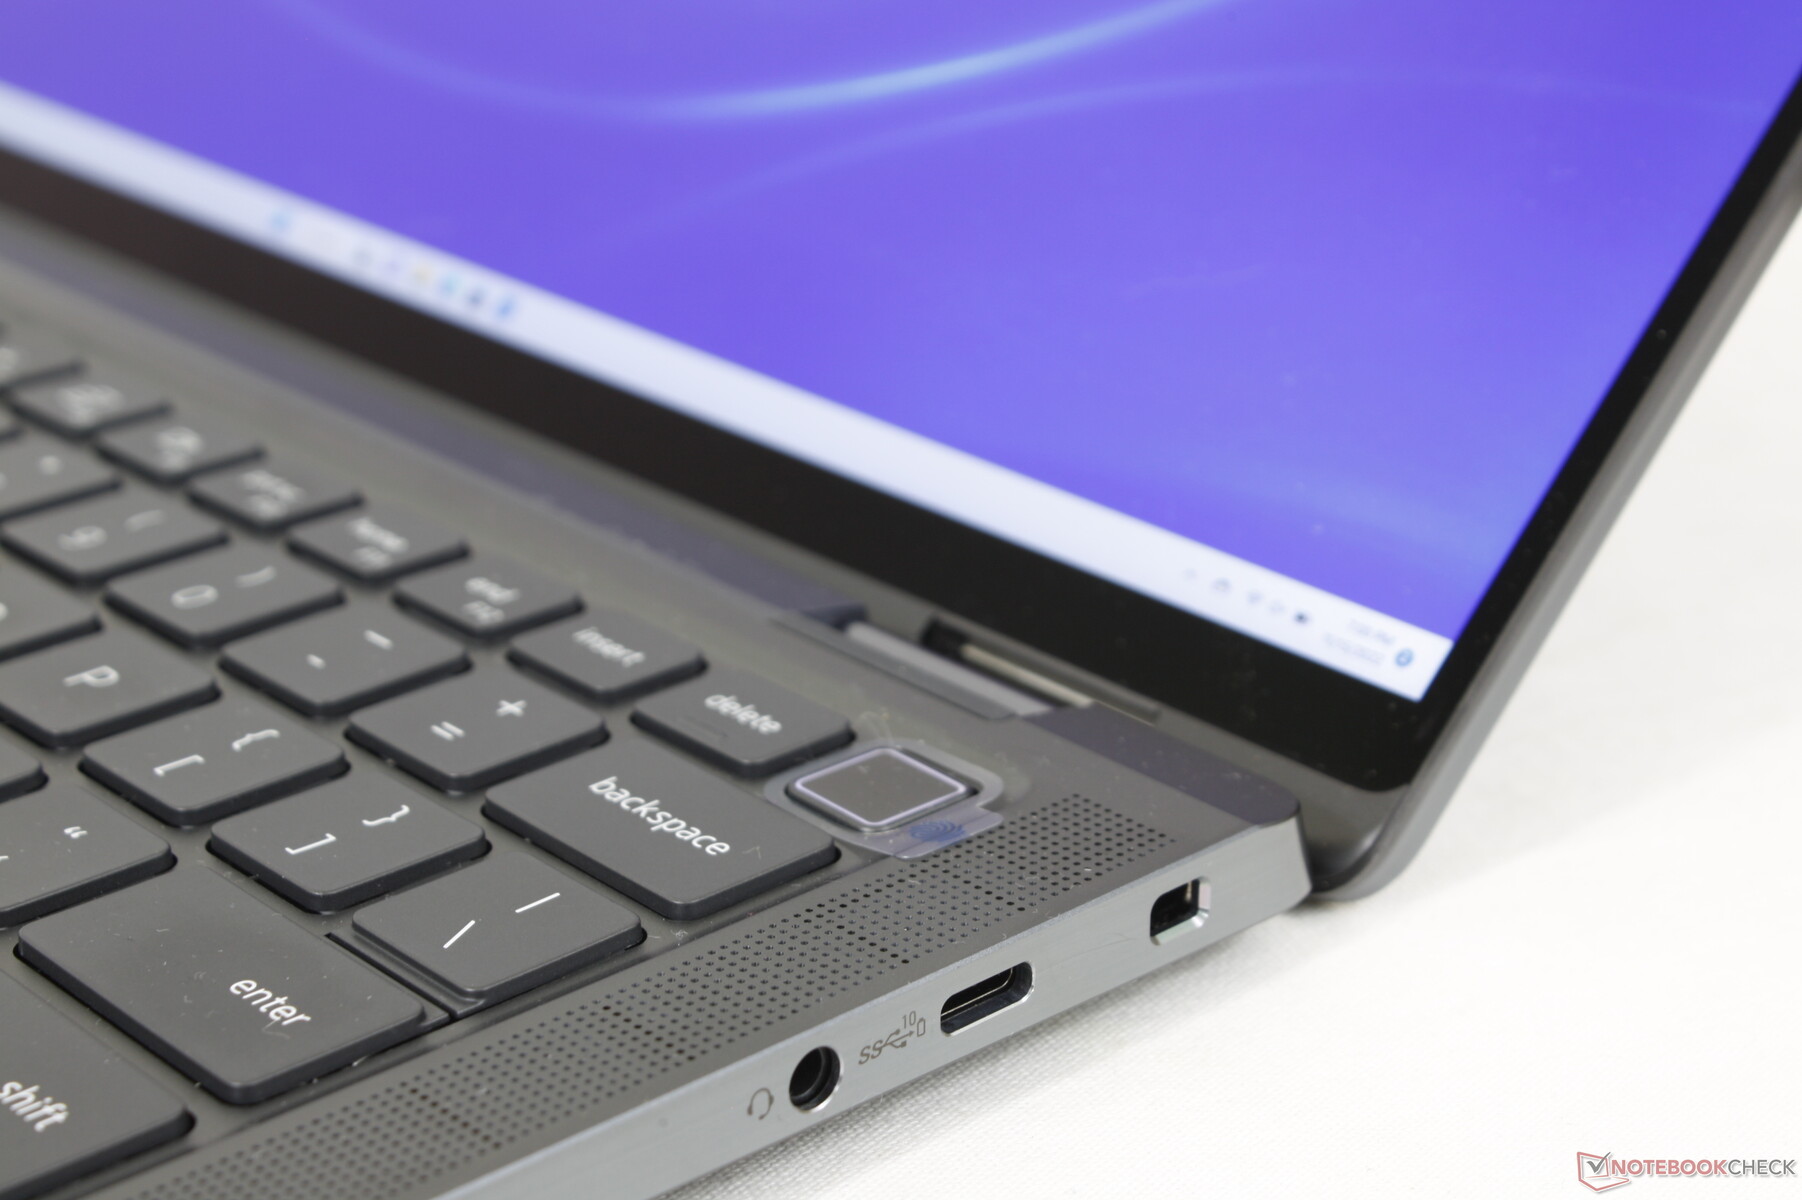
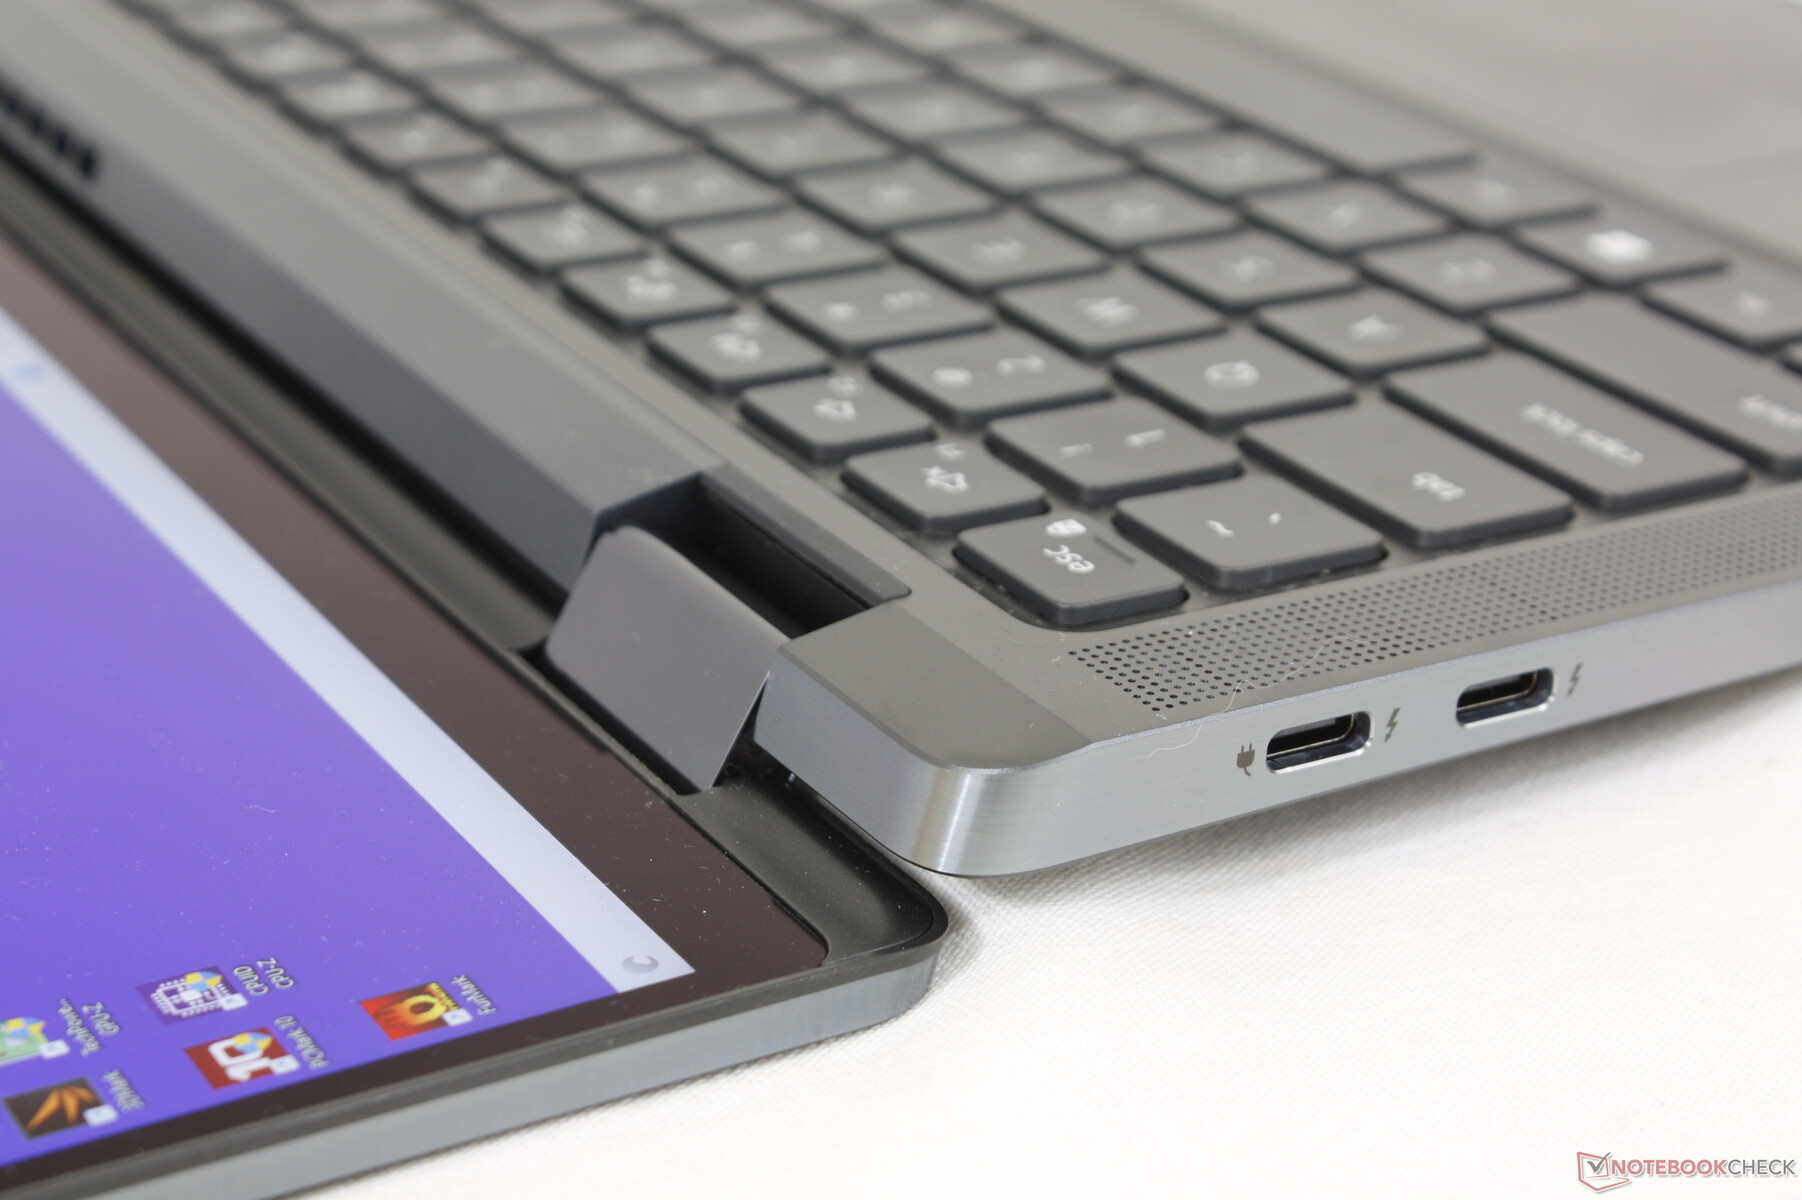
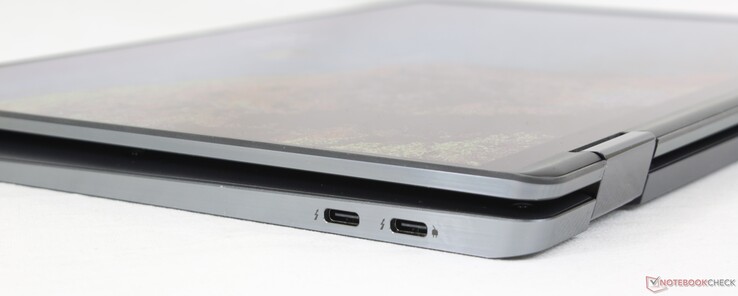
Konnektivität — ausschließlich USB-C
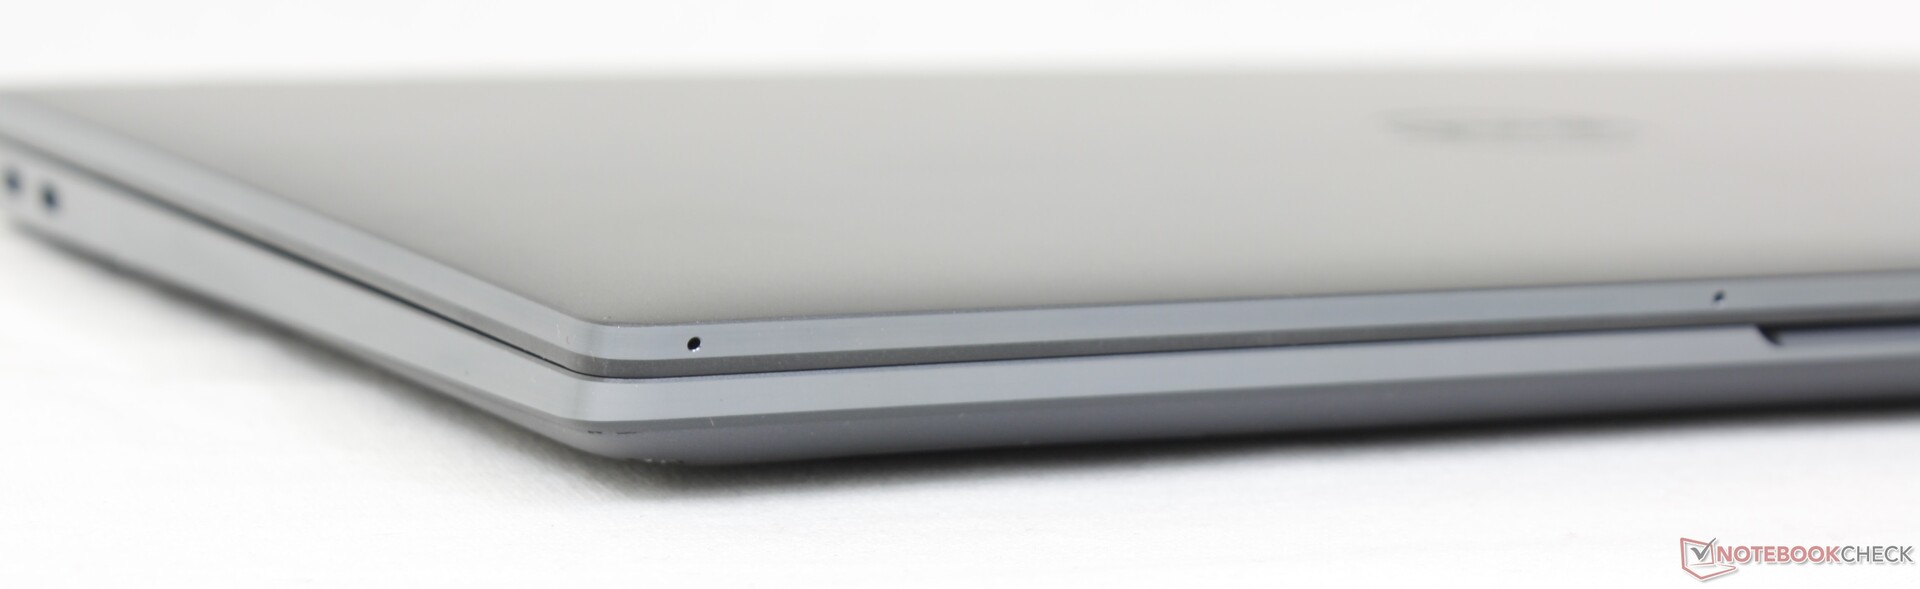
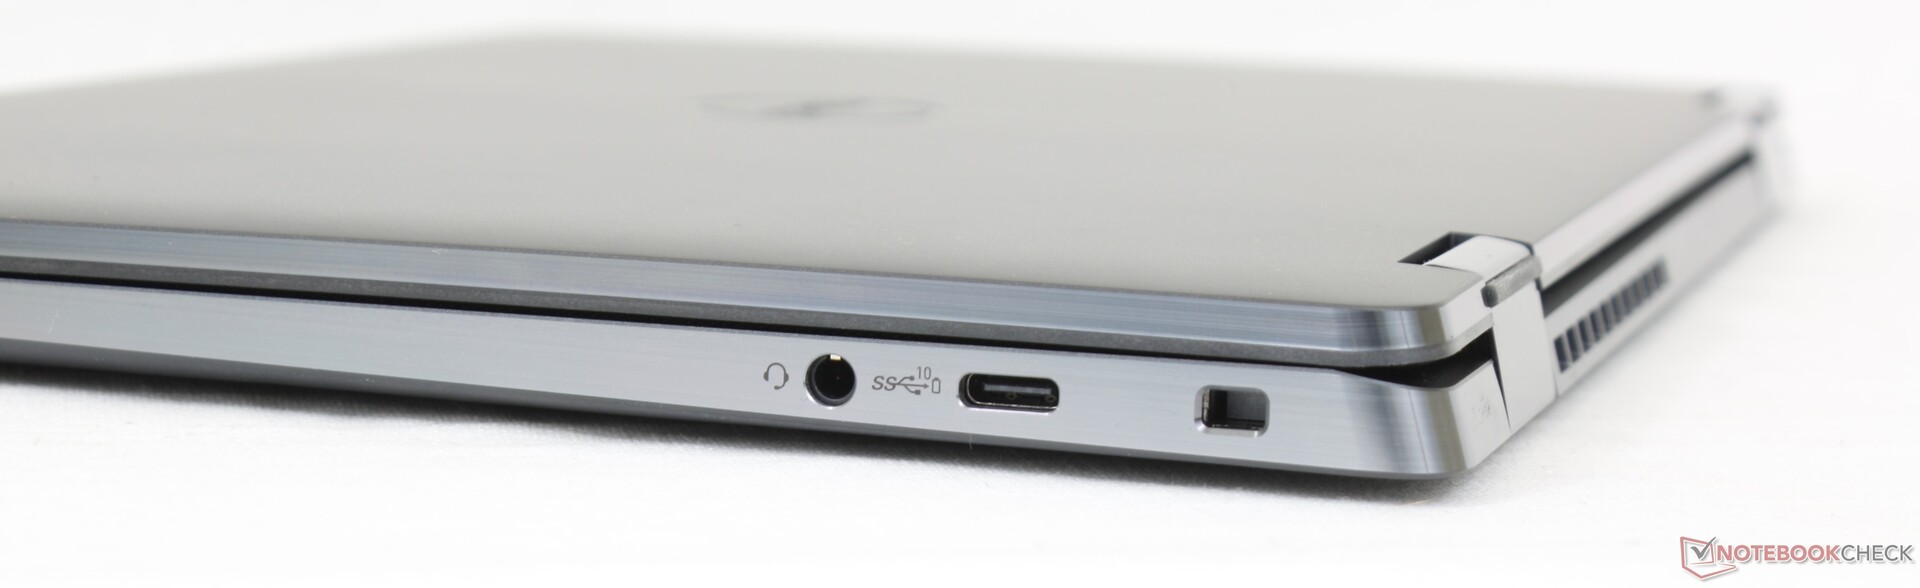
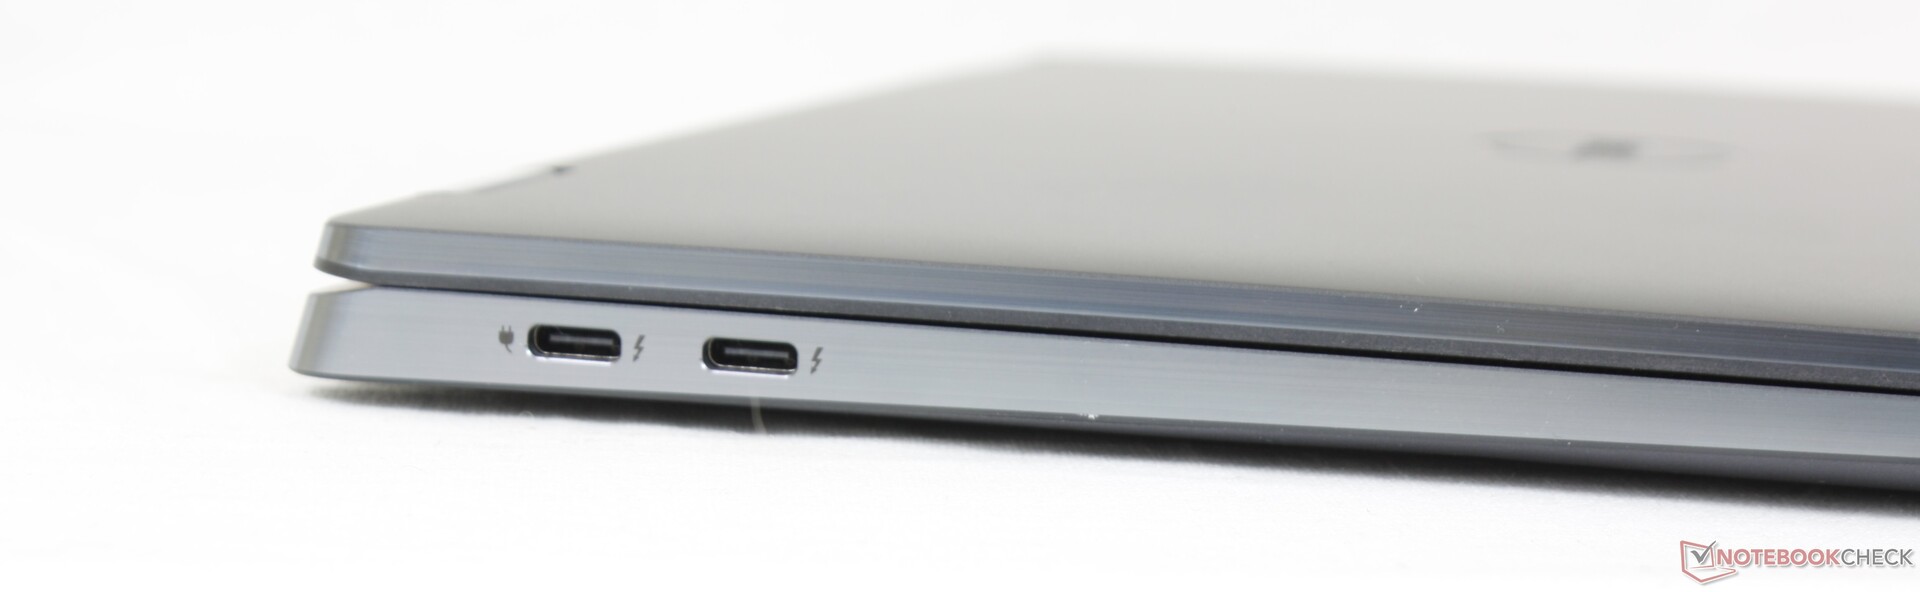
Da weder USB-A noch HDMI mit an Bord sind, sollte man sich auf den ständigen Gebrauch von USB-C-Adaptern einstellen. Falls man diese Anschlüsse dringend benötigt, sollte man sich das Dragonfly Max oder das Summit E13 Flip näher anschauen.
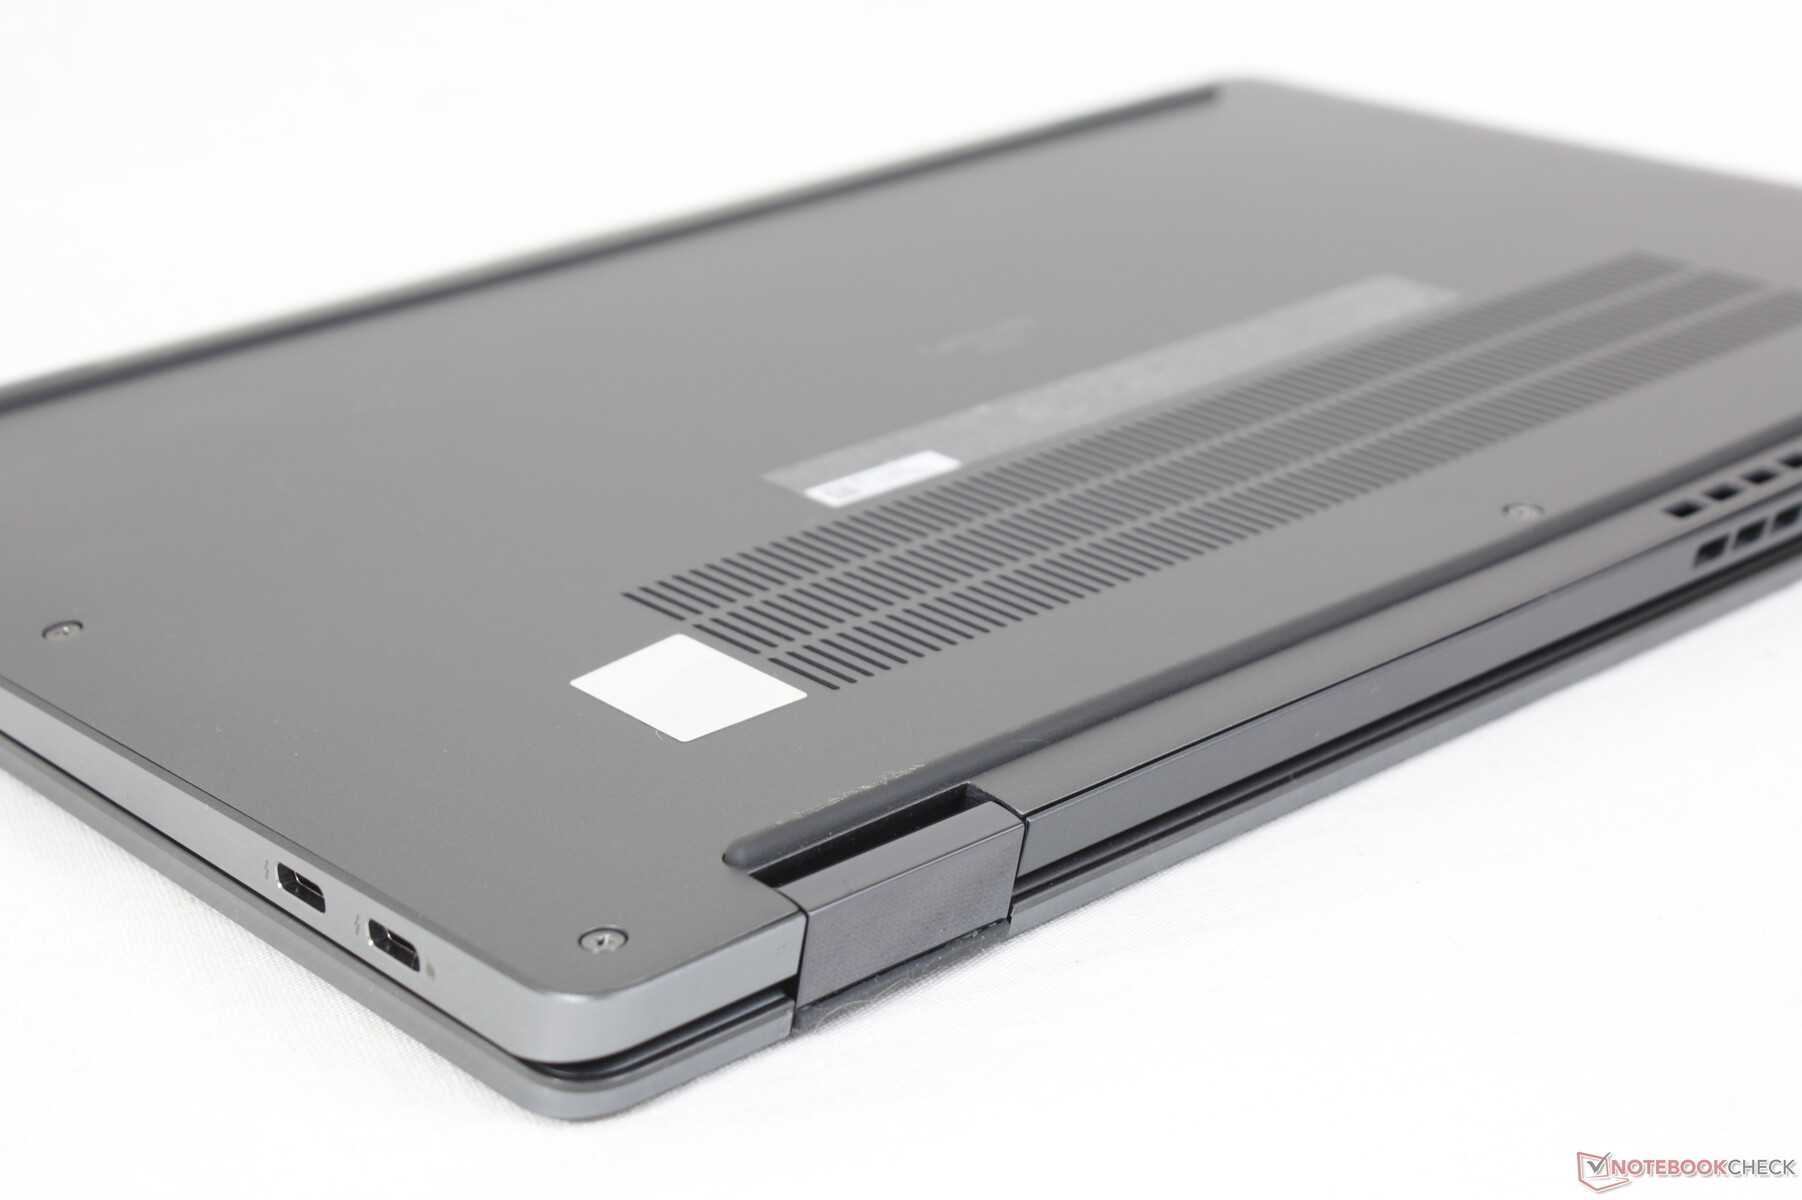
Nur die beiden USB-C-Ports auf der linken Geräteseite unterstützen Thunderbolt 4, während alle USB-C-Anschlüsse dennoch externe Monitore und Power Delivery unterstützen. Schade ist das Ausbleiben eines SD-Kartenlesers, besonderns da das günstigere Latitude 5310 2-in-1 einen besitzt.
Kommunikation
Die Intel AX211 sorgt für schnelles Wi-Fi 6E und Bluetooth 5.2. Mit einem 6-GHz-Router fallen die Transferraten etwas höher aus als bei 5 GHz, während der Unterschied nicht so gravierend ist, wie man zunächst annehmen mag.
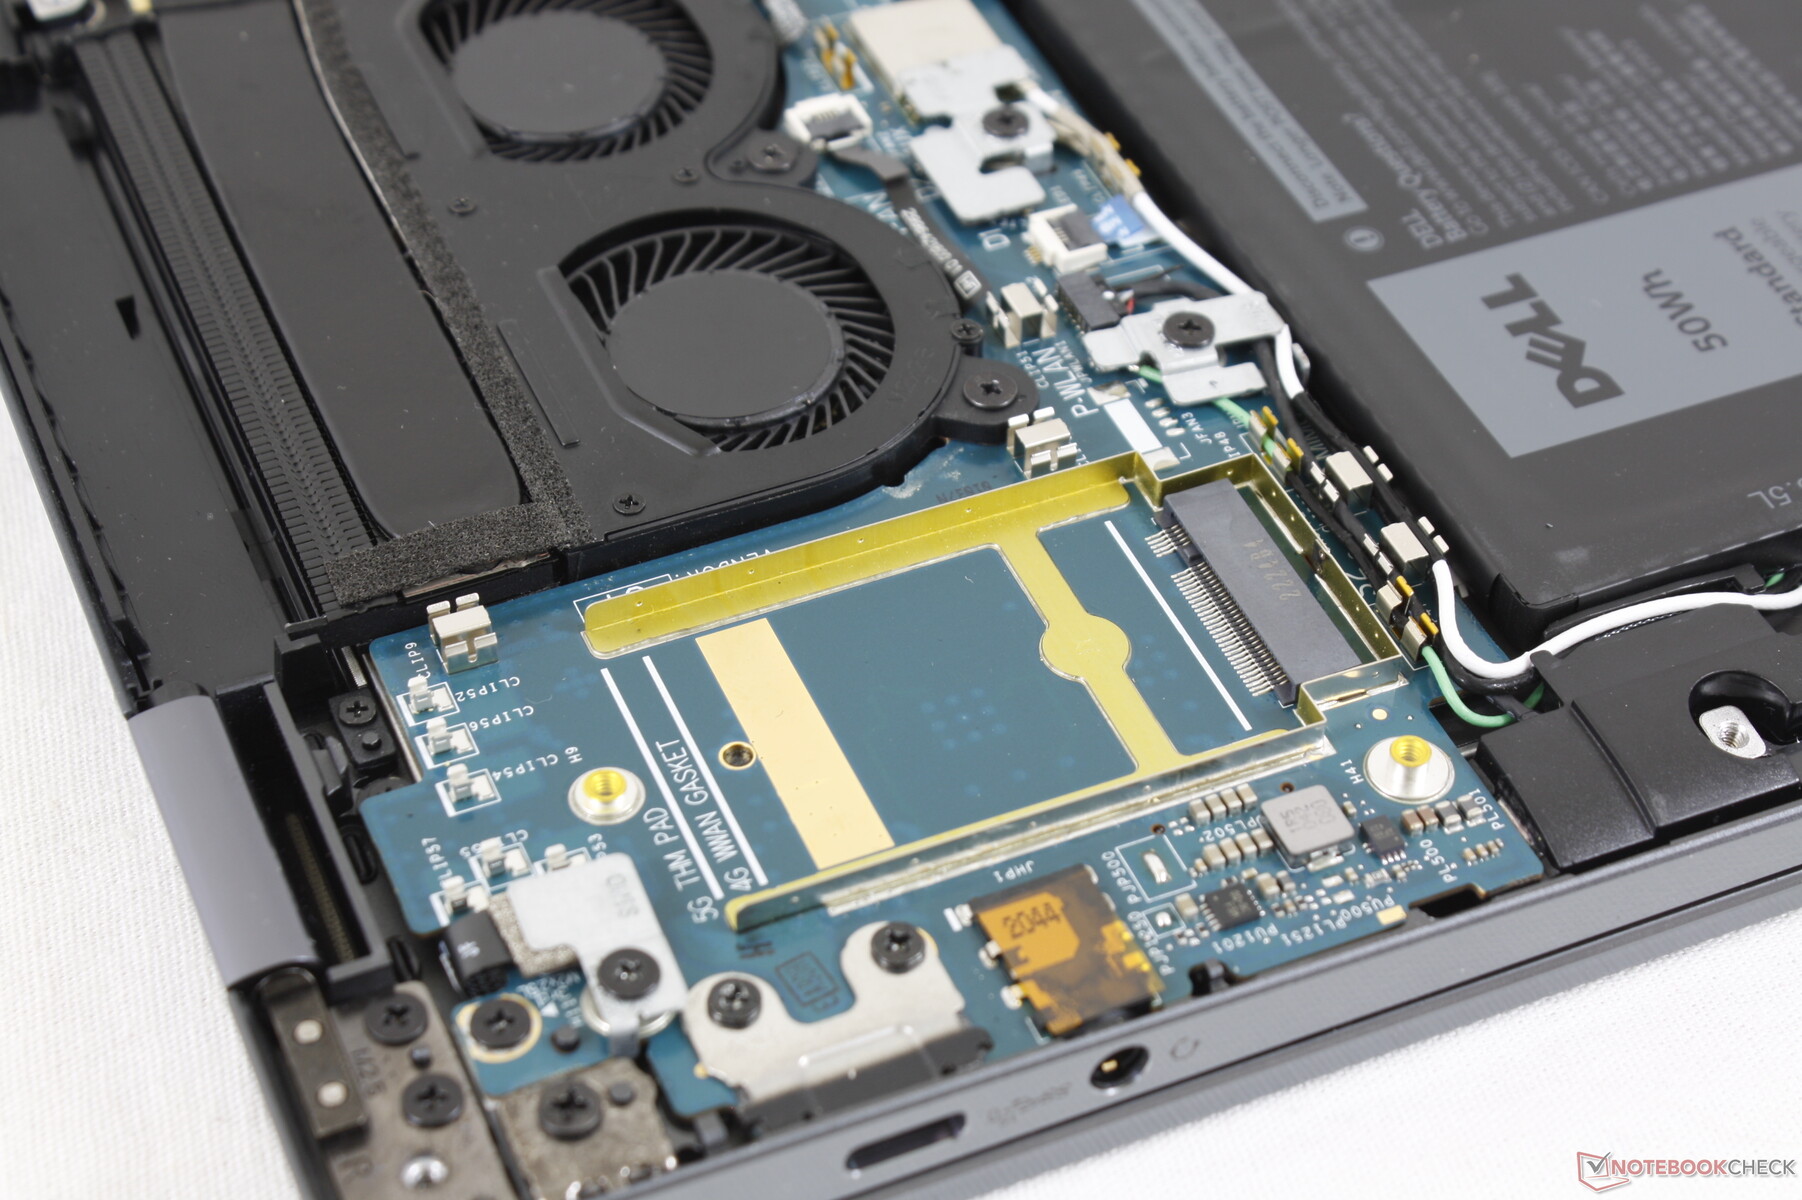
Der Snapdragon X20 LTE-A oder Intel 5000 5G sind optional für uSIM WWAN. Die Modelle ohne WWAN kommen leider ohne vorverlegte Antennenkabel, sodass das Nachrüsten eines WWAN-Moduls nicht möglich ist.
| Networking | |
| iperf3 transmit AX12 | |
| Dell Latitude 5310-23VP6 | |
| HP Elite Dragonfly Max | |
| HP EliteBook x360 1030 G7 | |
| MSI Summit E13 Flip Evo A11MT | |
| iperf3 receive AX12 | |
| HP EliteBook x360 1030 G7 | |
| HP Elite Dragonfly Max | |
| MSI Summit E13 Flip Evo A11MT | |
| Dell Latitude 5310-23VP6 | |
| iperf3 receive AXE11000 6GHz | |
| Dell Latitude 9330 | |
| iperf3 receive AXE11000 | |
| Dell Latitude 9330 | |
| iperf3 transmit AXE11000 | |
| Dell Latitude 9330 | |
| iperf3 transmit AXE11000 6GHz | |
| Dell Latitude 9330 | |
Webcam
Verbaut wird eine 2-MP-Webcam mit IR für Windows Hello. HP Elite and Spectre Laptops kommen hingegen mit 5-MP-Sensoren für eine schärfere Bildqualität. Alle Dell-Latitude- und Lenovo--ThinkPad-Laptop-Webcams besitzen bisher ausschließlich 2-MP-Sensoren.


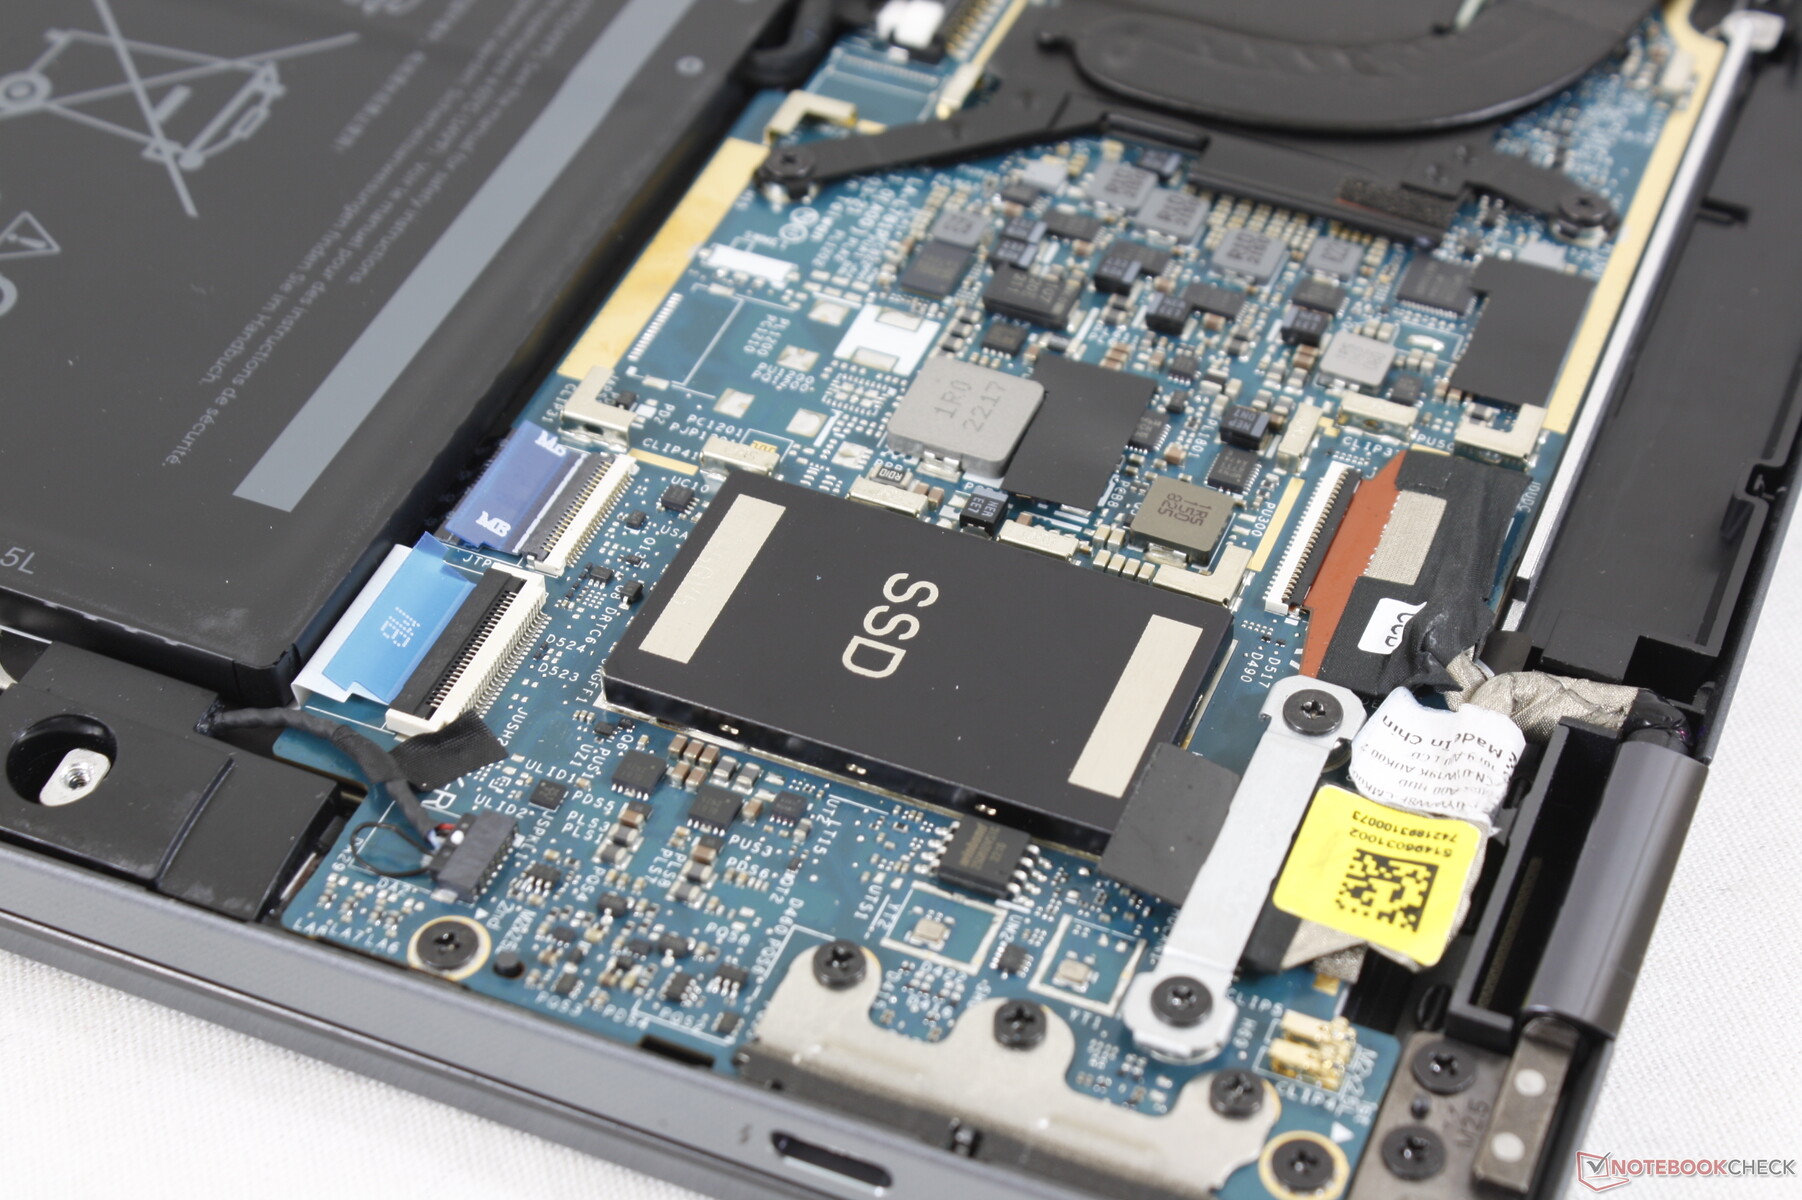
Wartung
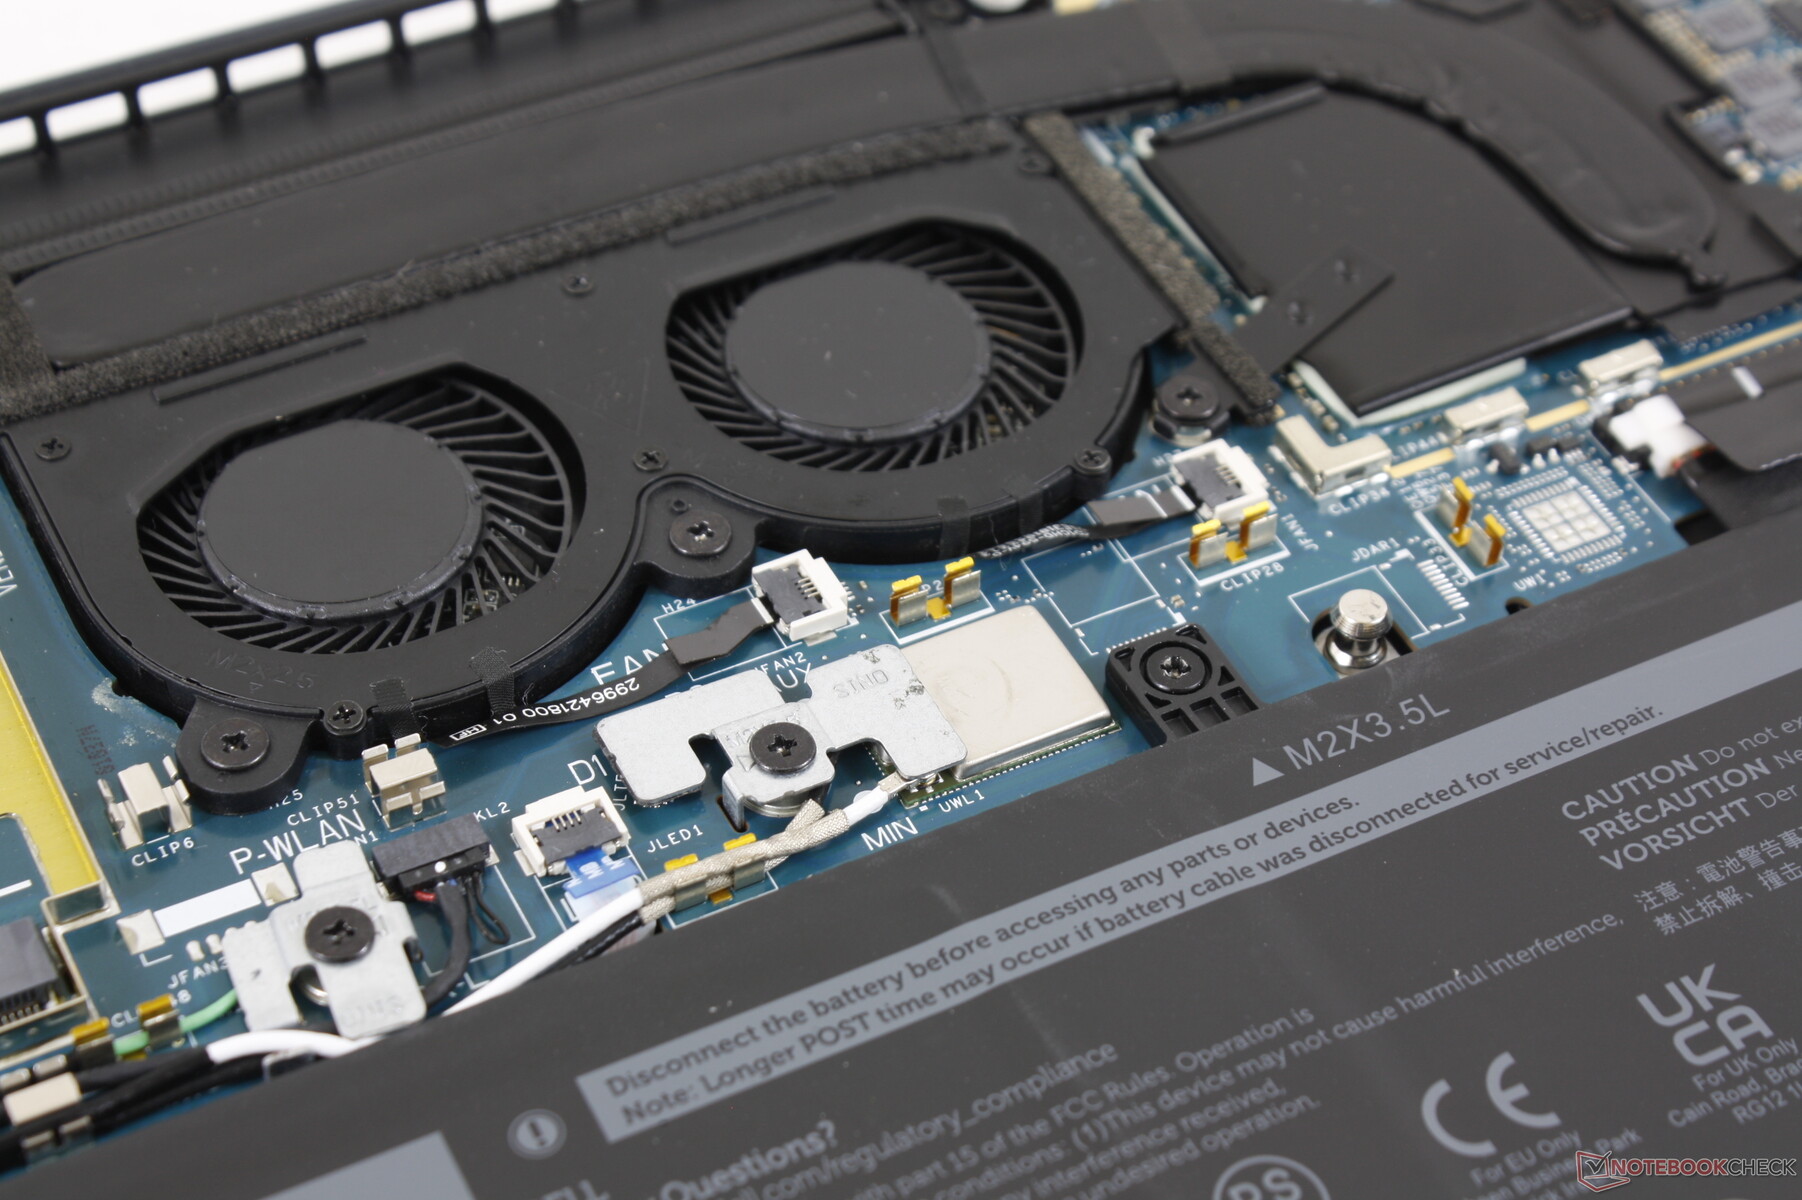
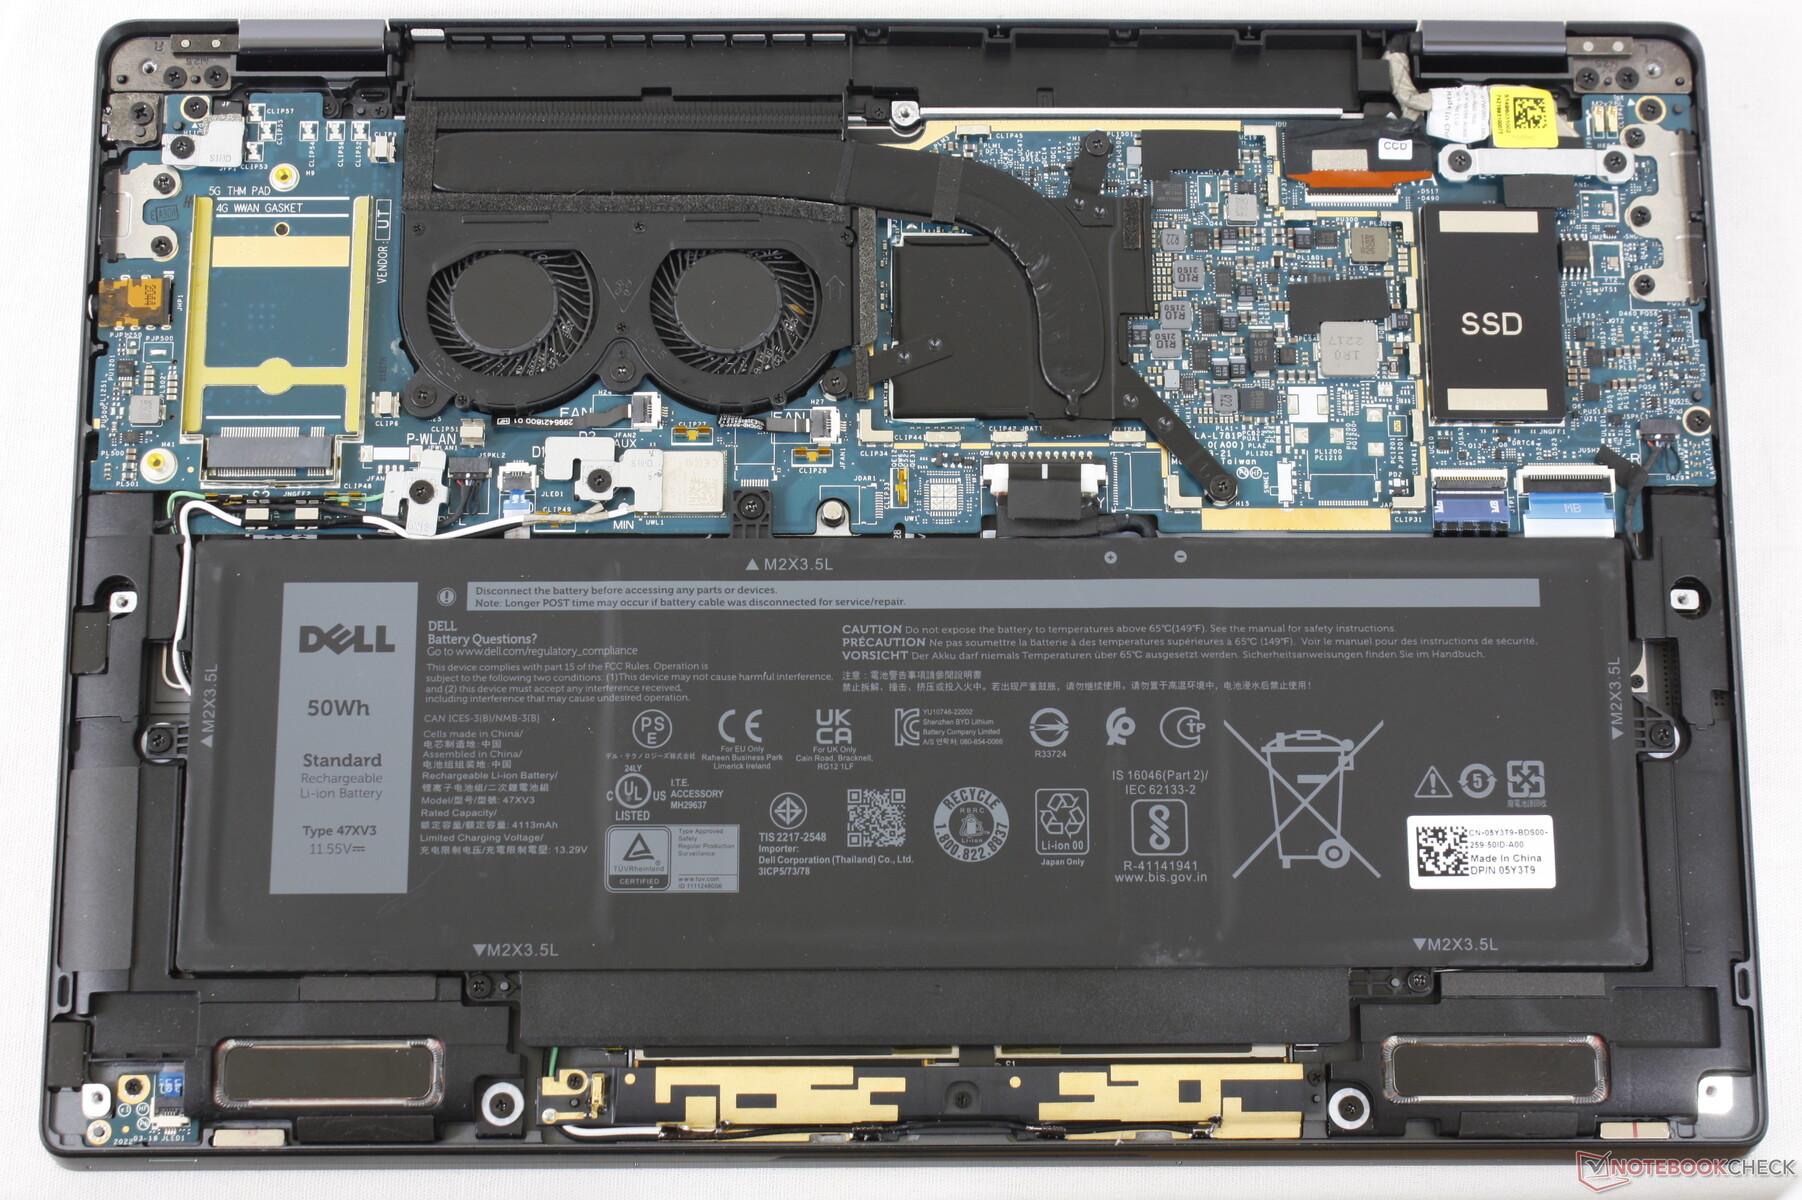
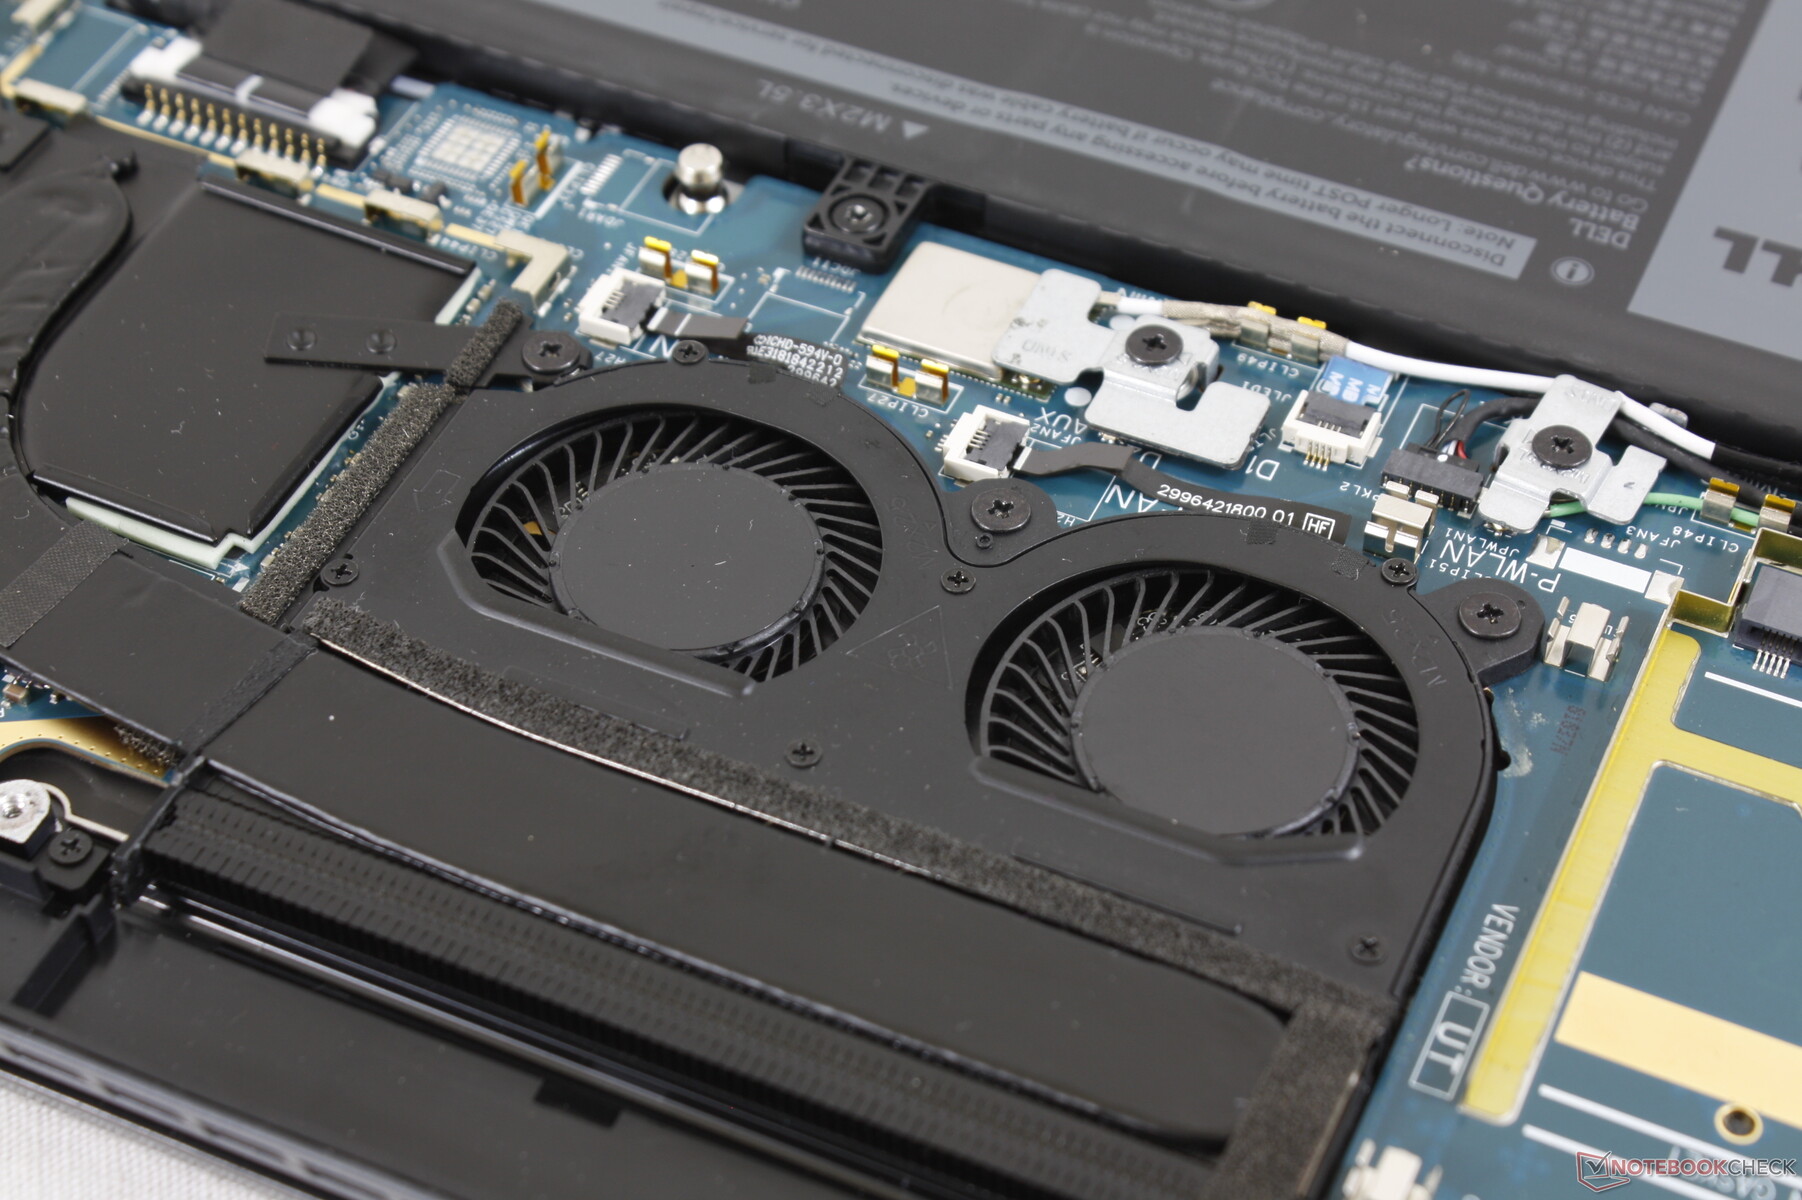
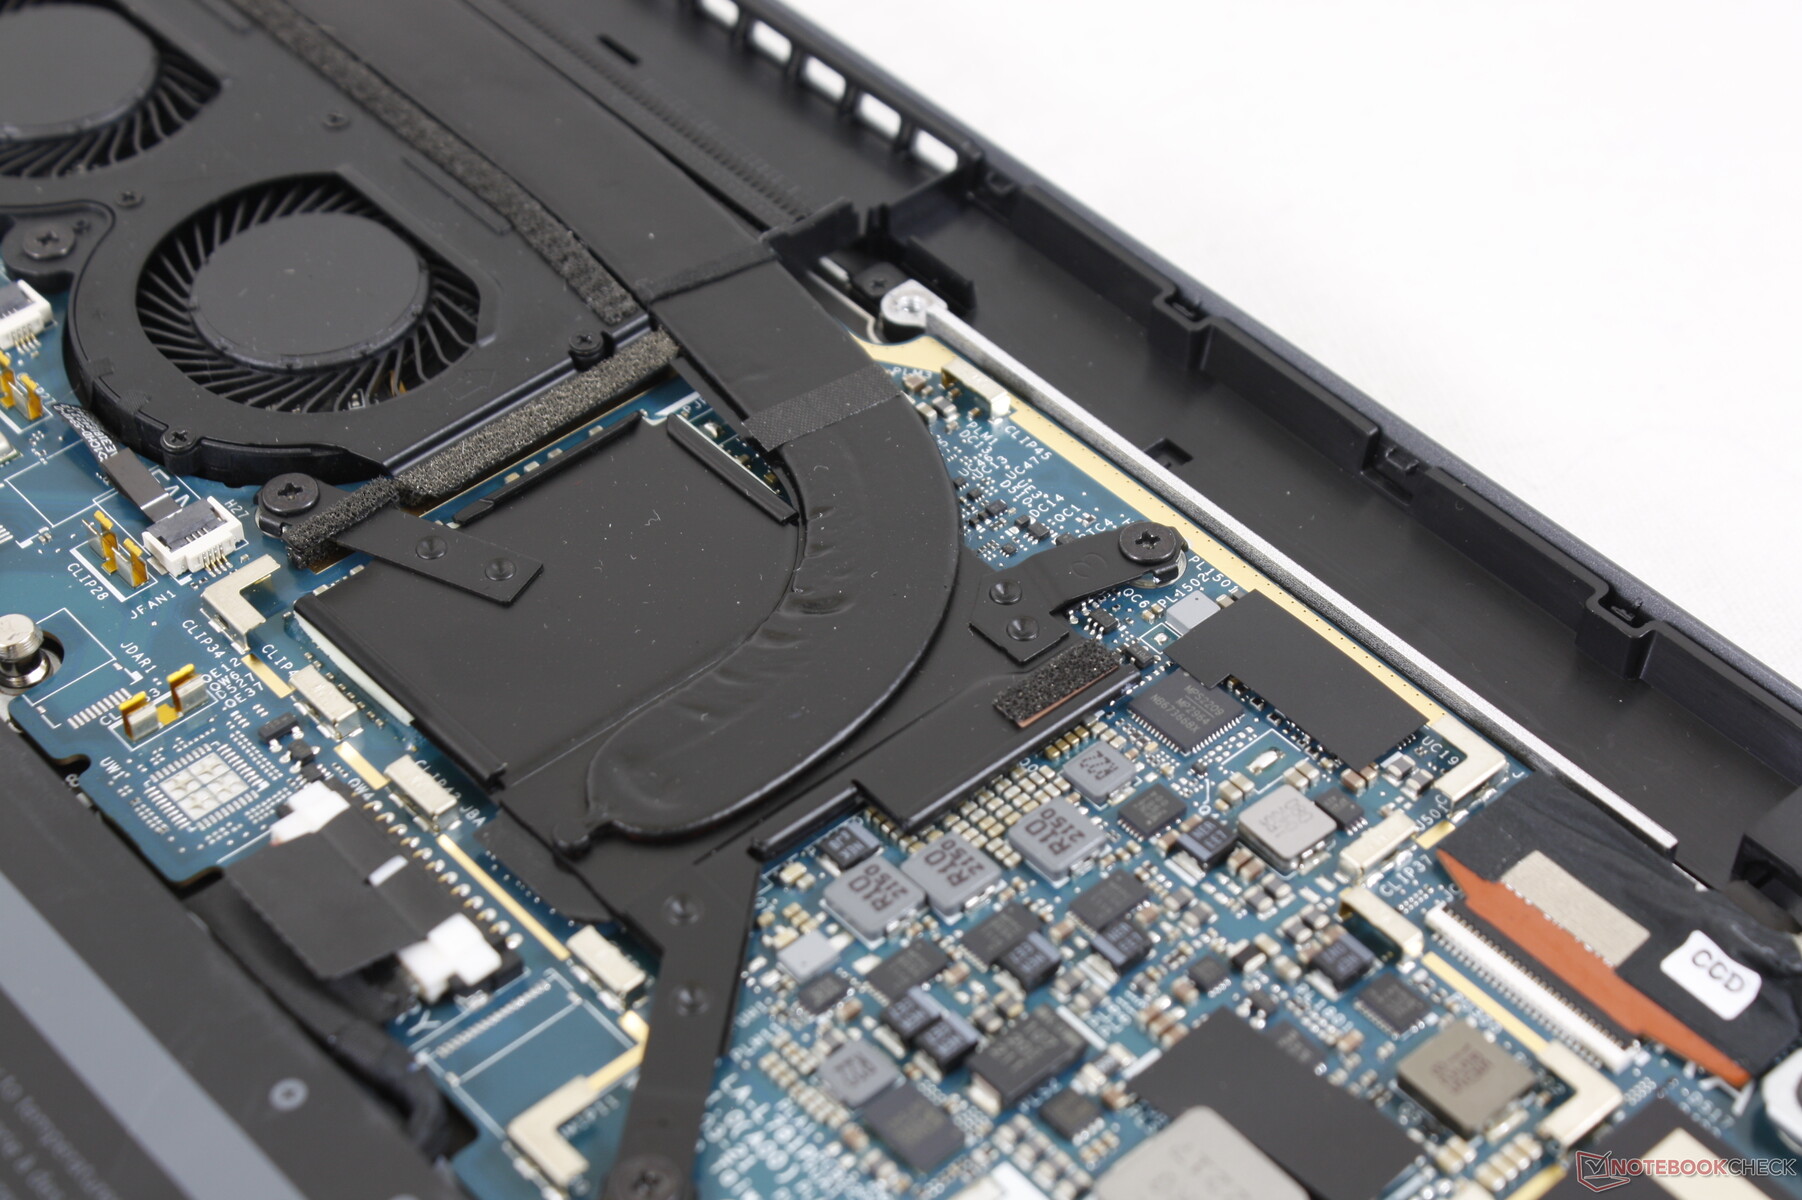
Die Bodenplatte ist lediglich mit sechs Kreuzschlitzschrauben versehen, um eine einfache Wartung zu ermöglichen. Nutzer können Akku, WWAN- und SSD-Module austauschen, während das WLAN-Modul und die RAM-Bausteine verlötet sind. Das ist die gängige Praxis bei 13-Zoll-Subnotebooks.
Zubehör und Garantie
Die Verpackung beinhaltet einen USB-C- zu USB-A-Adapter, um eine gewisse Abhilfe für die fehlenden USB-A-Ports des Latitude 9330 zu schaffen. Üblich für High-End-Business Laptops von Dell oder HP ist eine Herstellergarantie von drei Jahren, die auch für das Latitude 9330 greift.
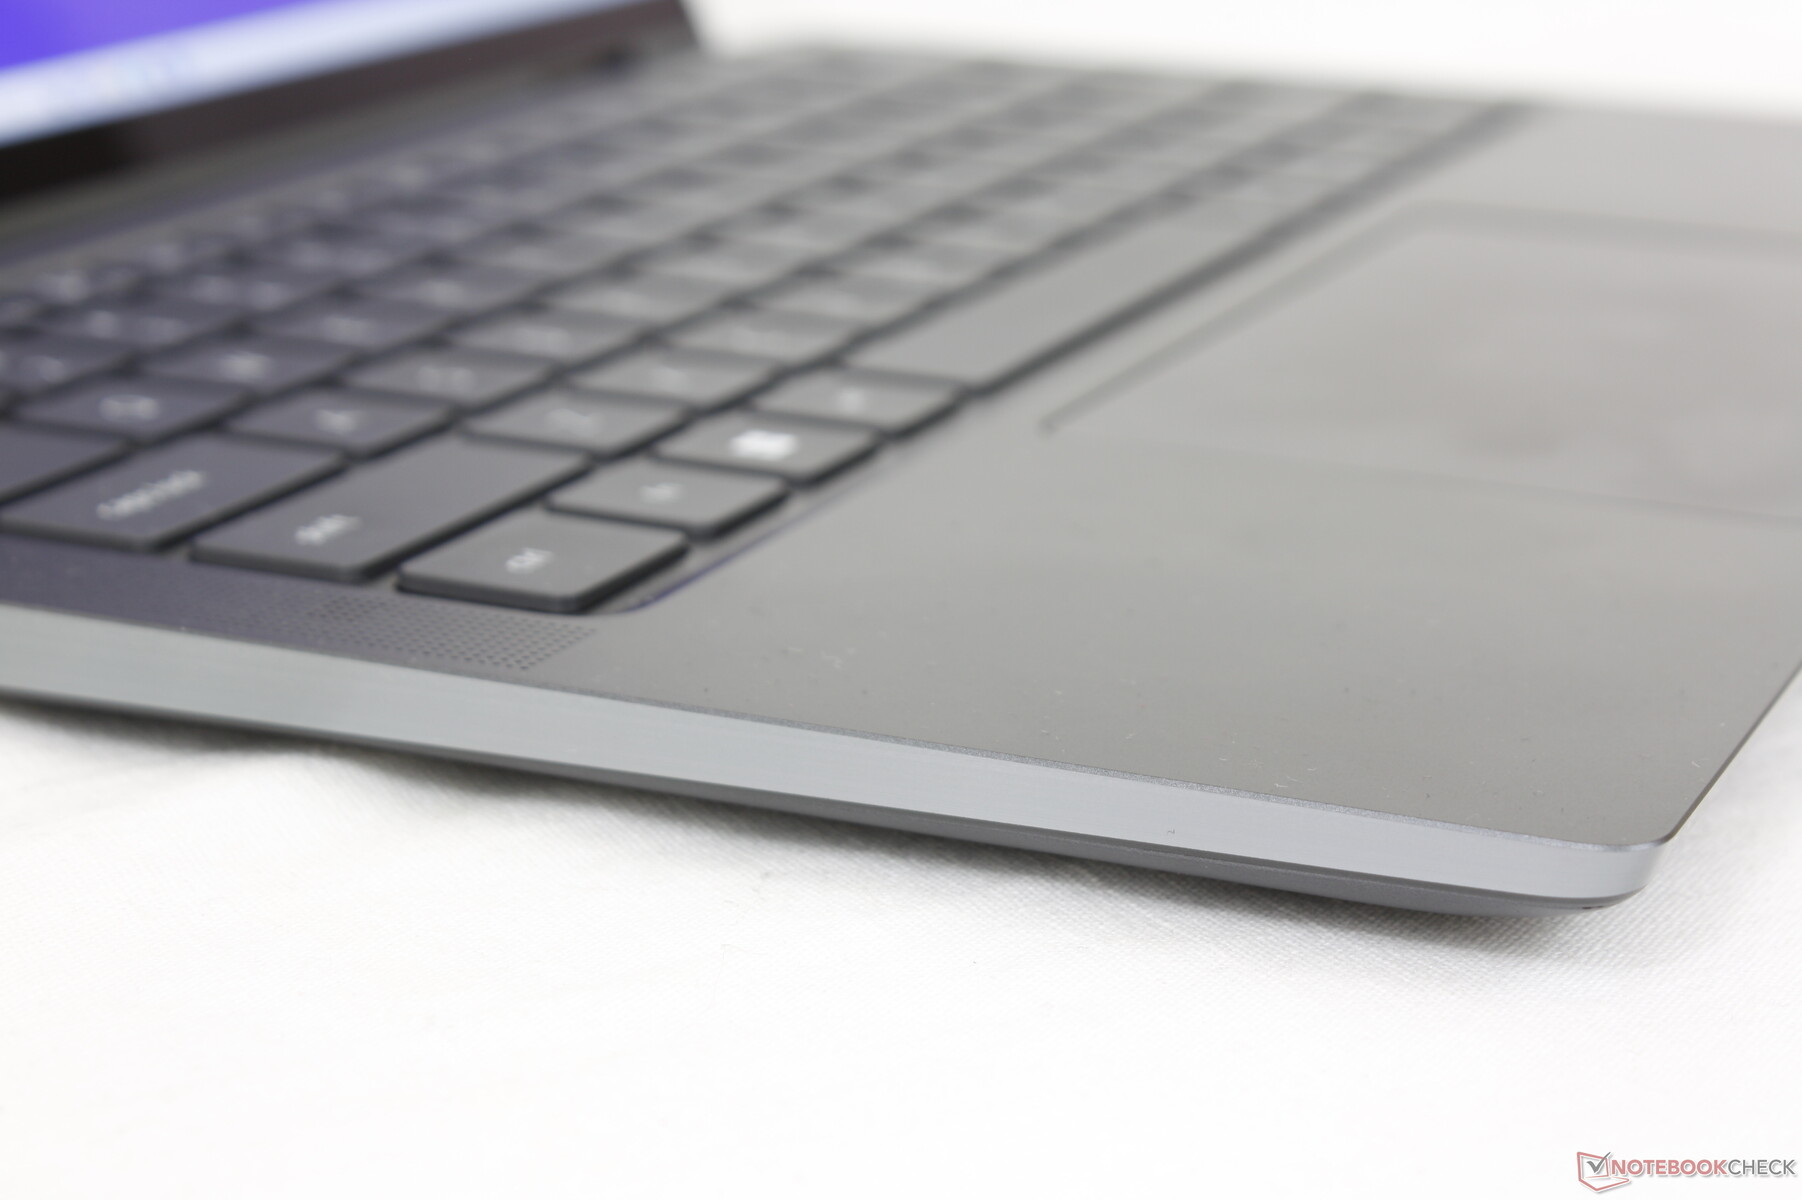
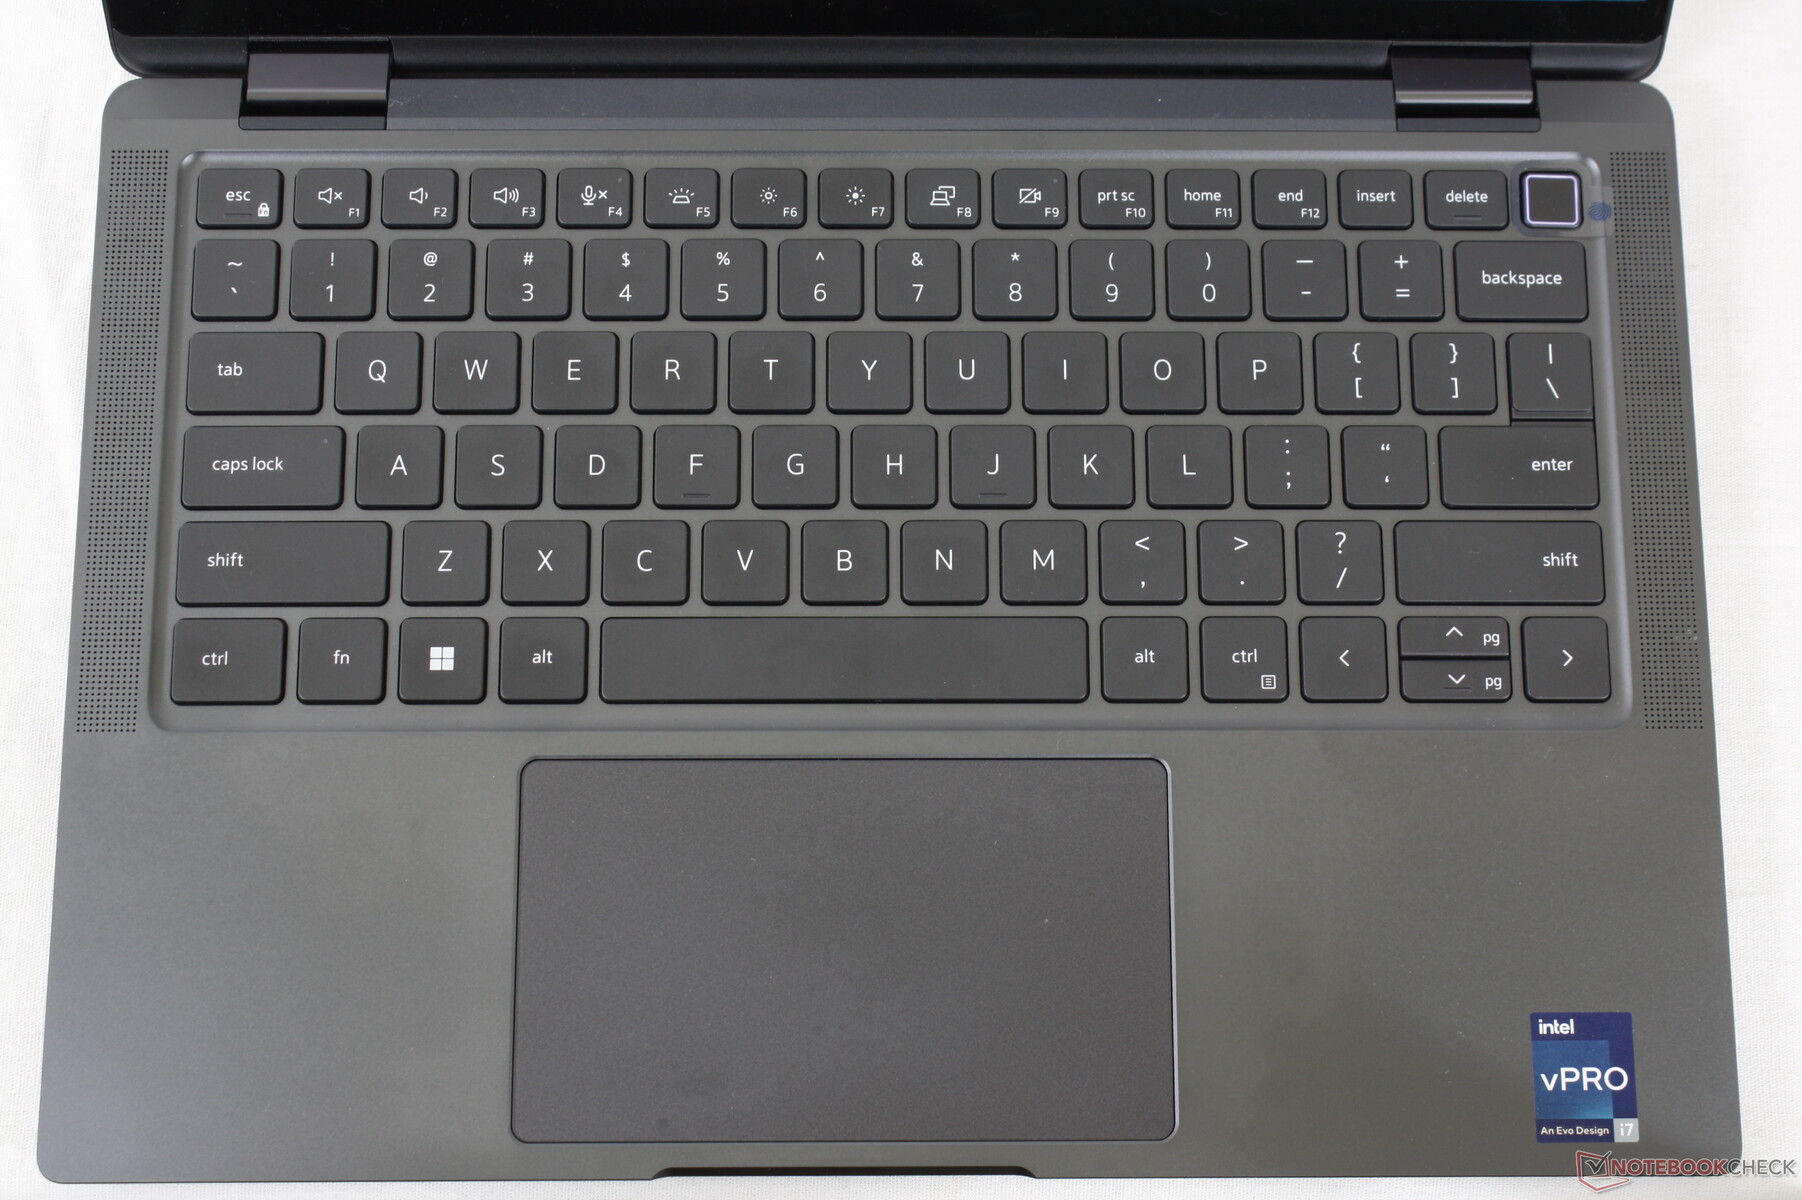
Eingabegeräte — angenehme Tastatur, schwammiges Touchpad
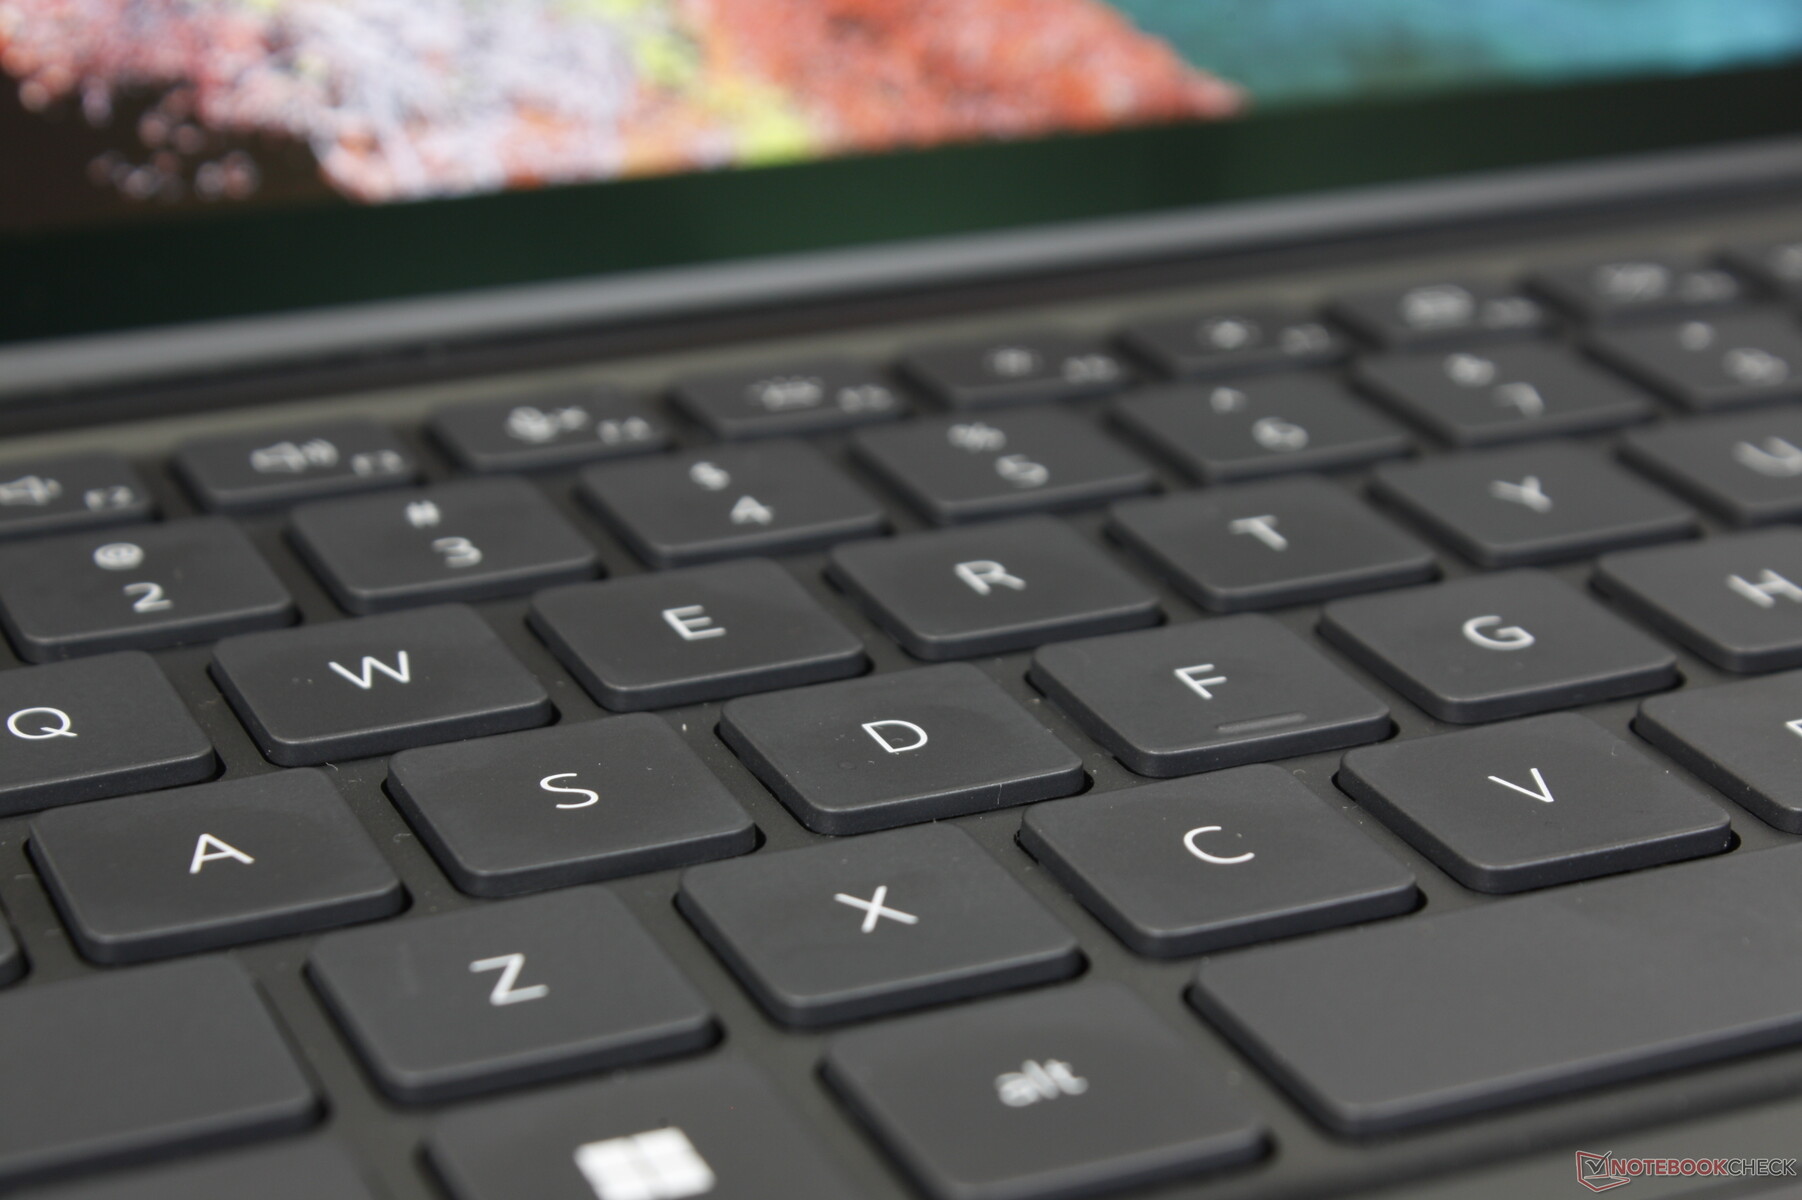
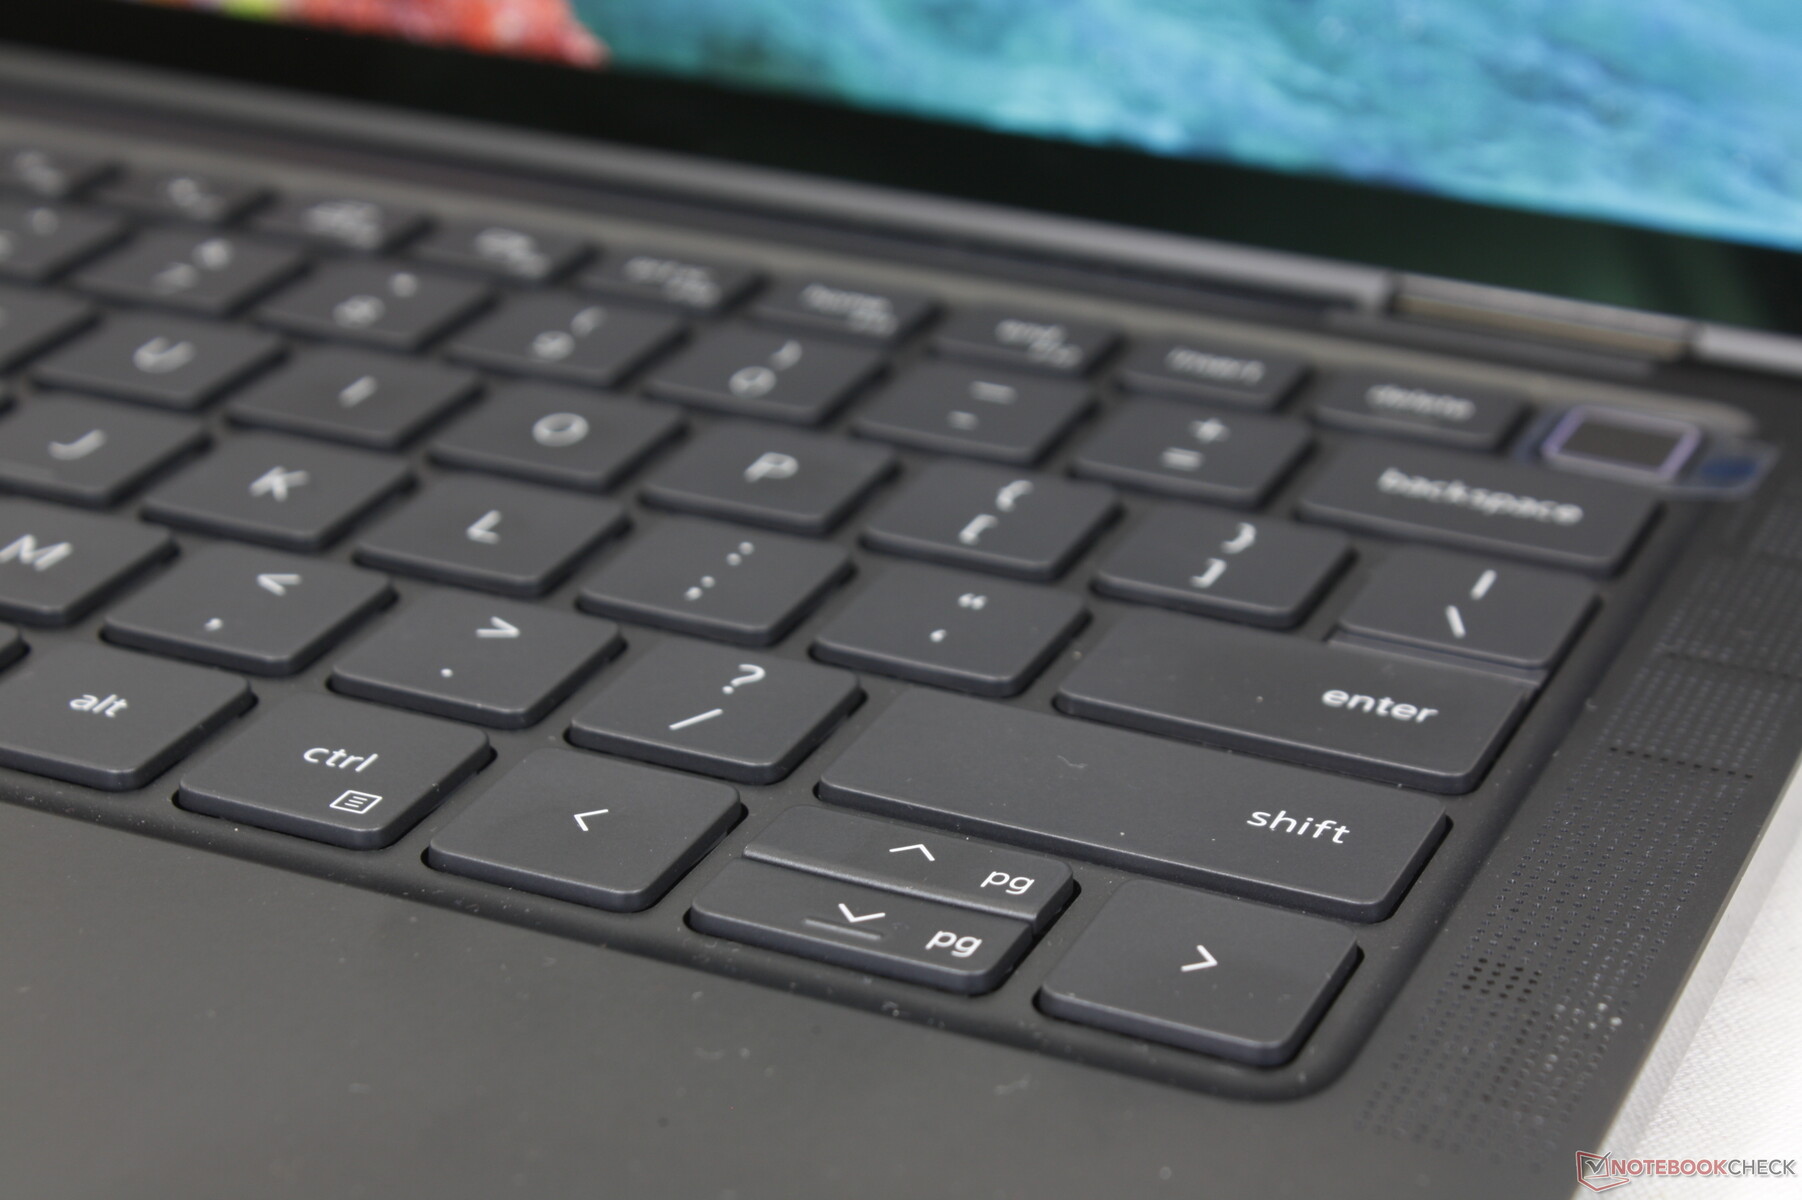
Tastatur
Die Tasten des Latitude 9330 weisen ein festeres und insgesamt deutlicheres Feedback auf als die Tastatur des XPS 13 9315, was das Tippen angenehmer gestaltet. Sie liegt deutlich näher an den Tastaturen der HP-Spectre- oder EliteBook Serie als an günstigeren Consumer-orientierten Subnotebooks. Das Tippen gestaltet sich mäßig laut und ist eine Folge des knackigen Feedbacks.
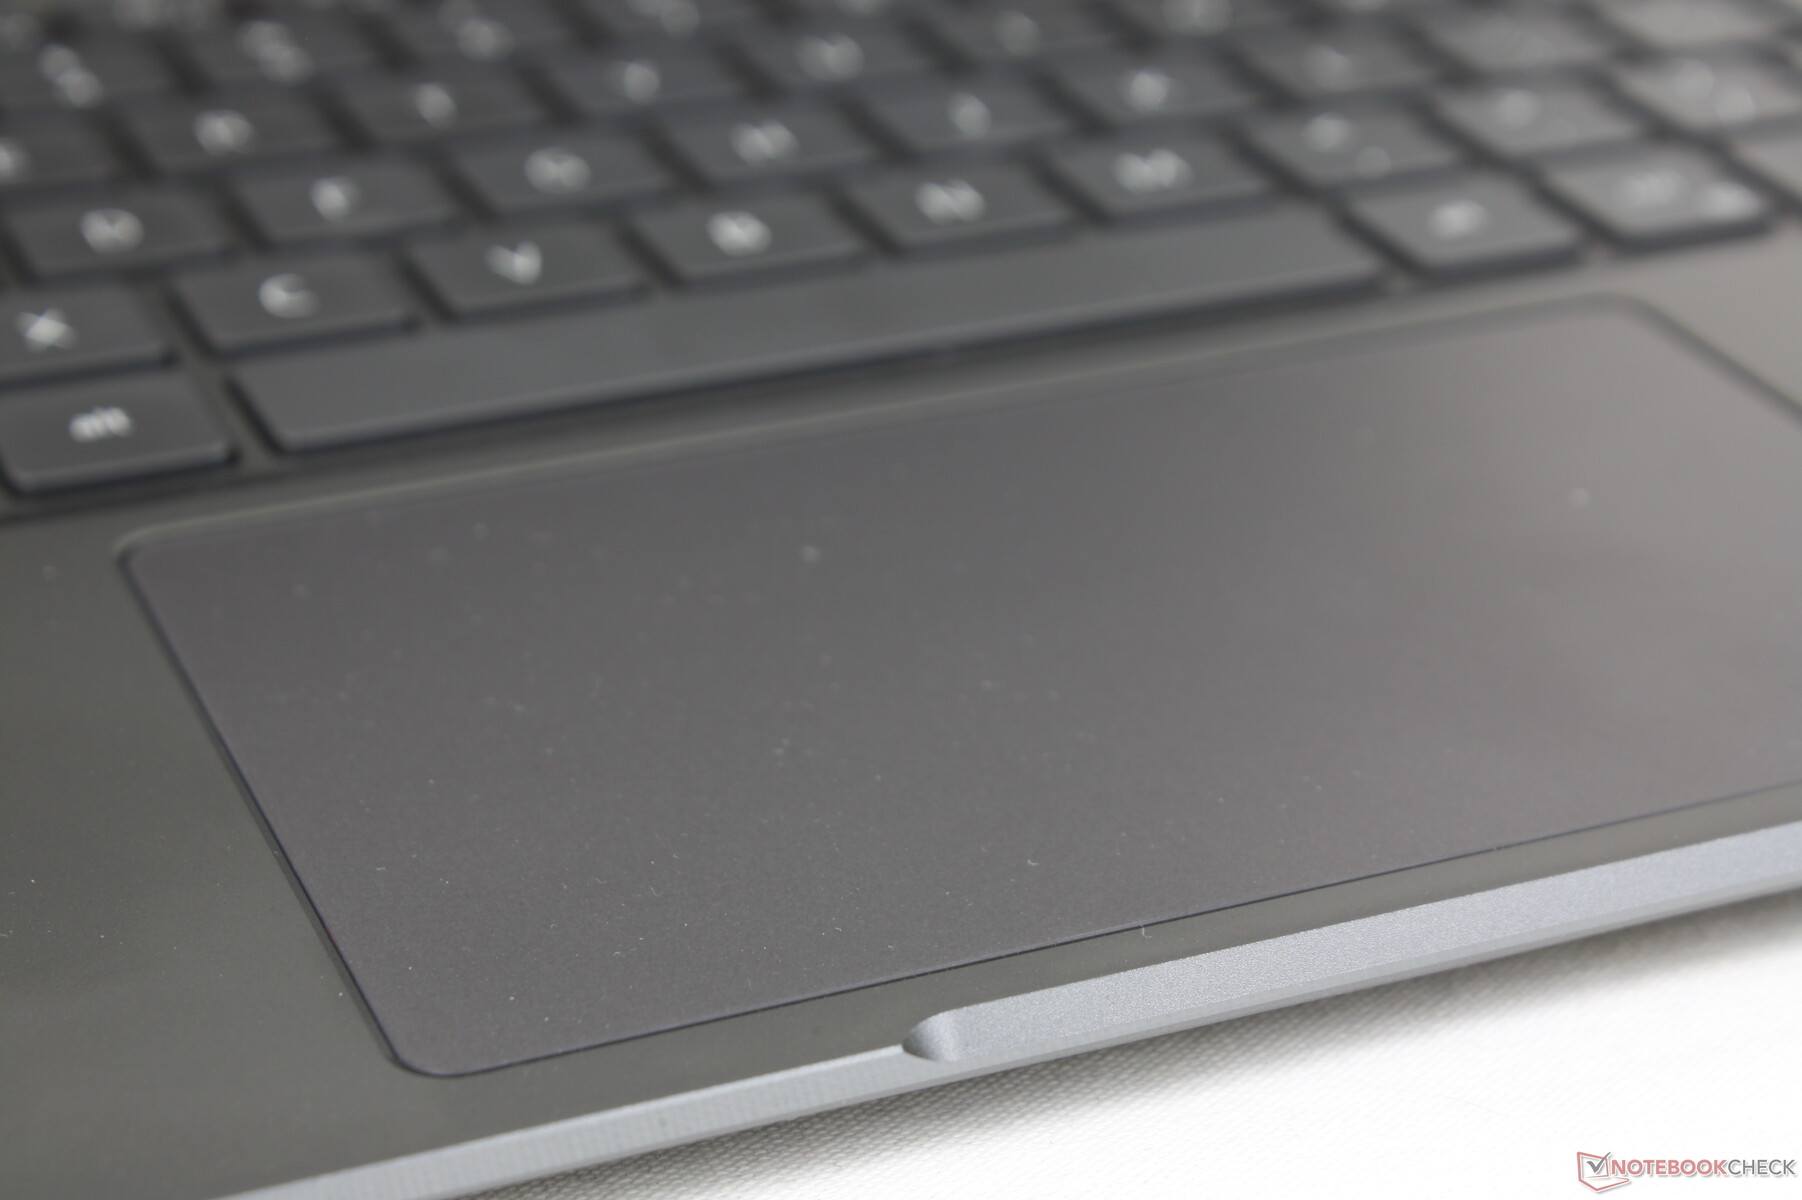
Touchpad
Das Clickpad ist größer als beim ThinkPad X1 Titanium Yoga (11,5x6,8 cm vs. 9x6,5 cm), sodass Multi-Touch-Gesten trotz kleinerem 13-Zoll-Formfaktor einfacher von der Hand gehen. Auf der anderen Seite besitzt das Latitude keine dedizierten Maustasten, sodass Drag-and-Drop-Aktionen schwieriger umzusetzen sind. Die komplett glatte Oberfläche bietet beim langsamen Gleiten dennoch genug Halt für ein akkurates Klicken.
Das Feedback der integrierten Klick-Tasten ist weicher und leiser als bei den meisten Laptops. Während einigen Nutzern das leise Klickgeräusch gefallen wird, besitzt das schwammige Feedback jedoch nichts Erfreuliches.
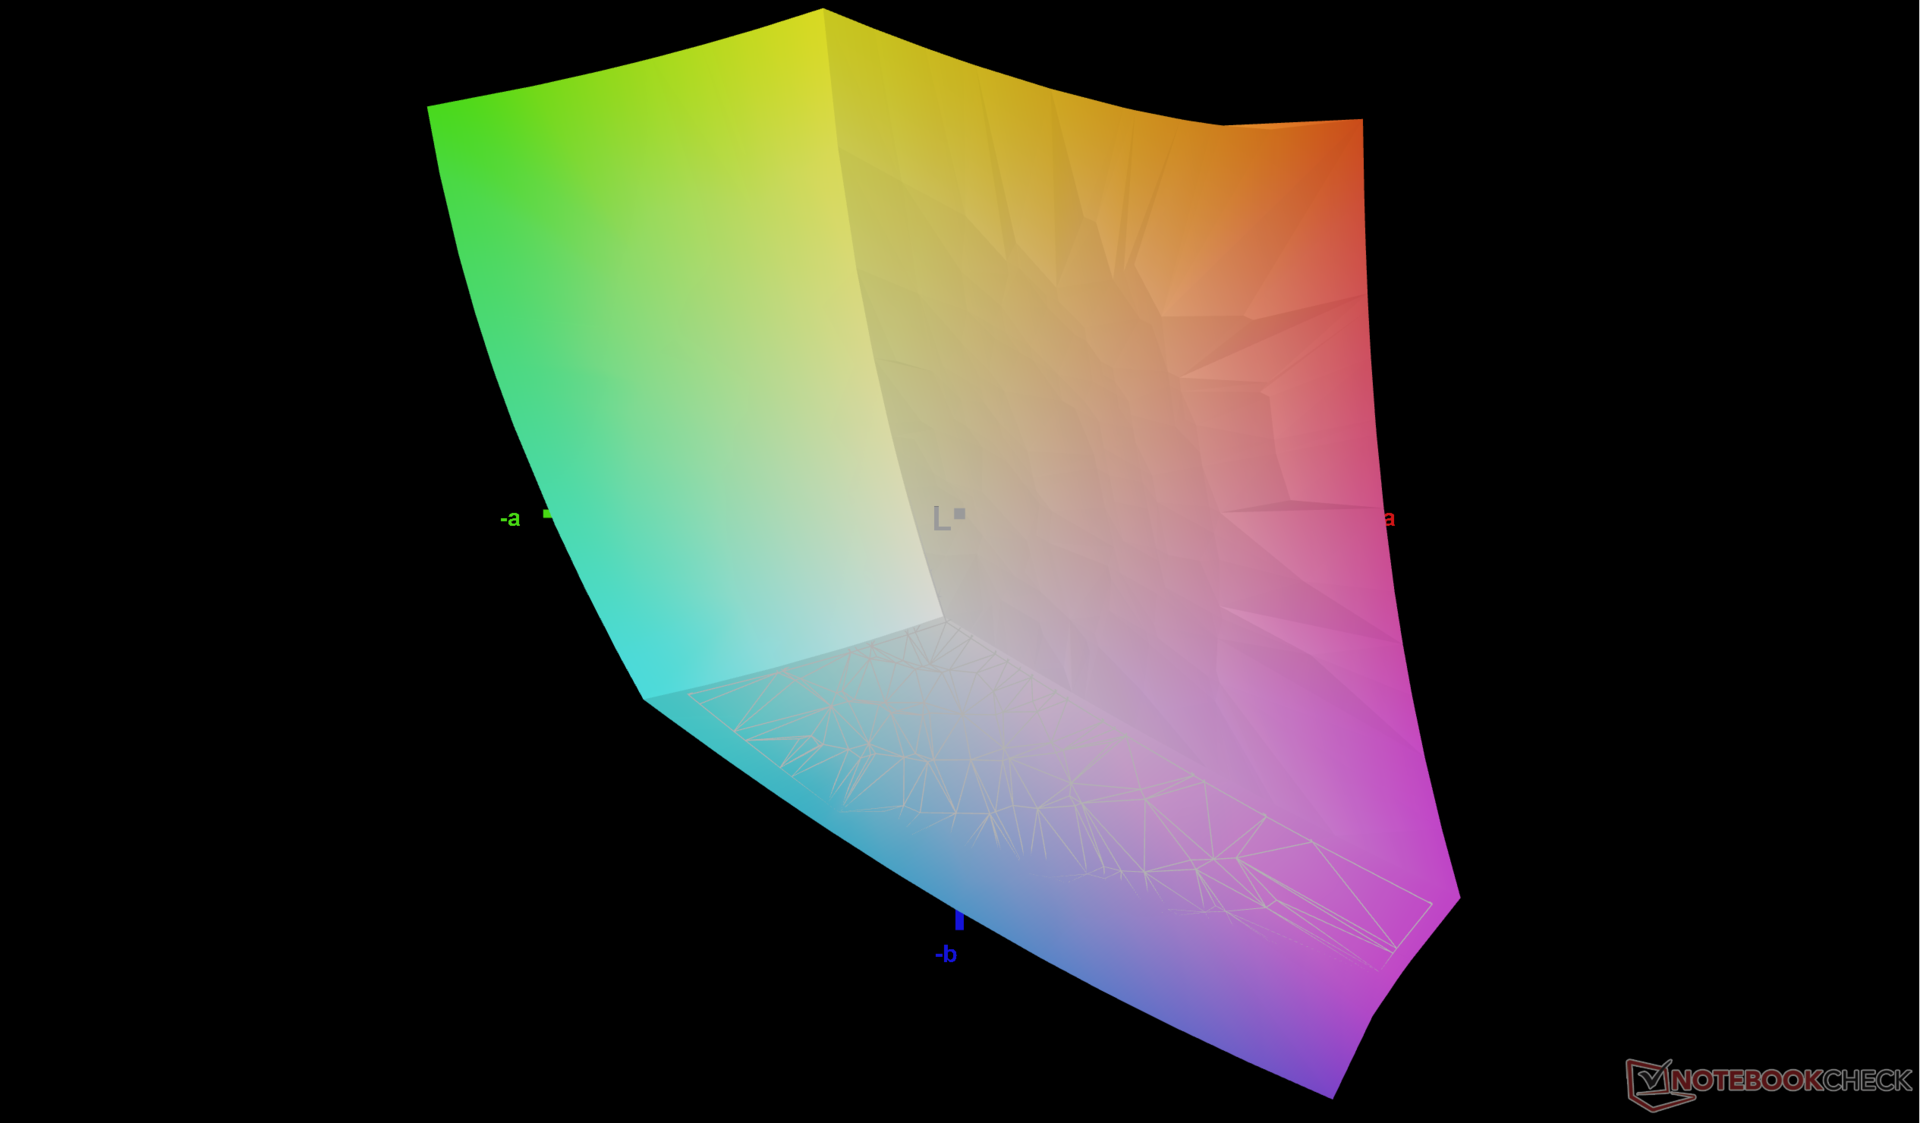
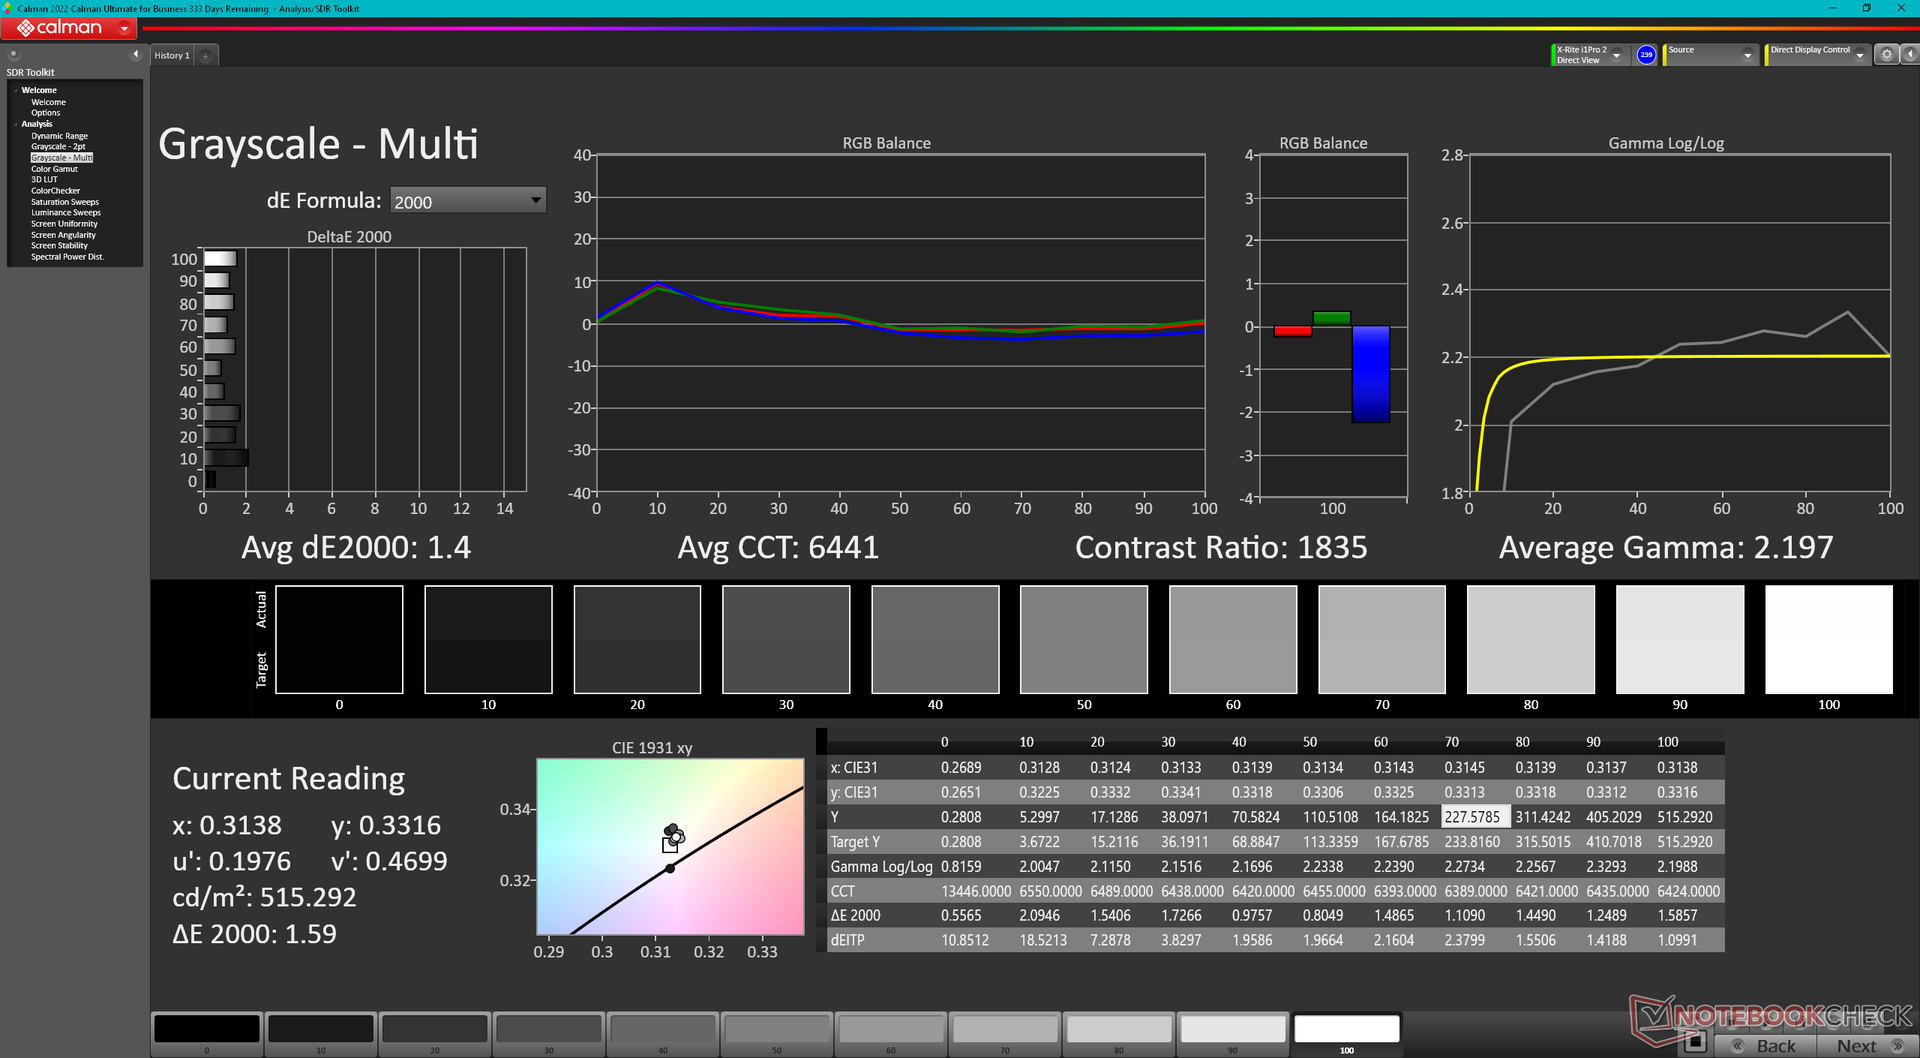
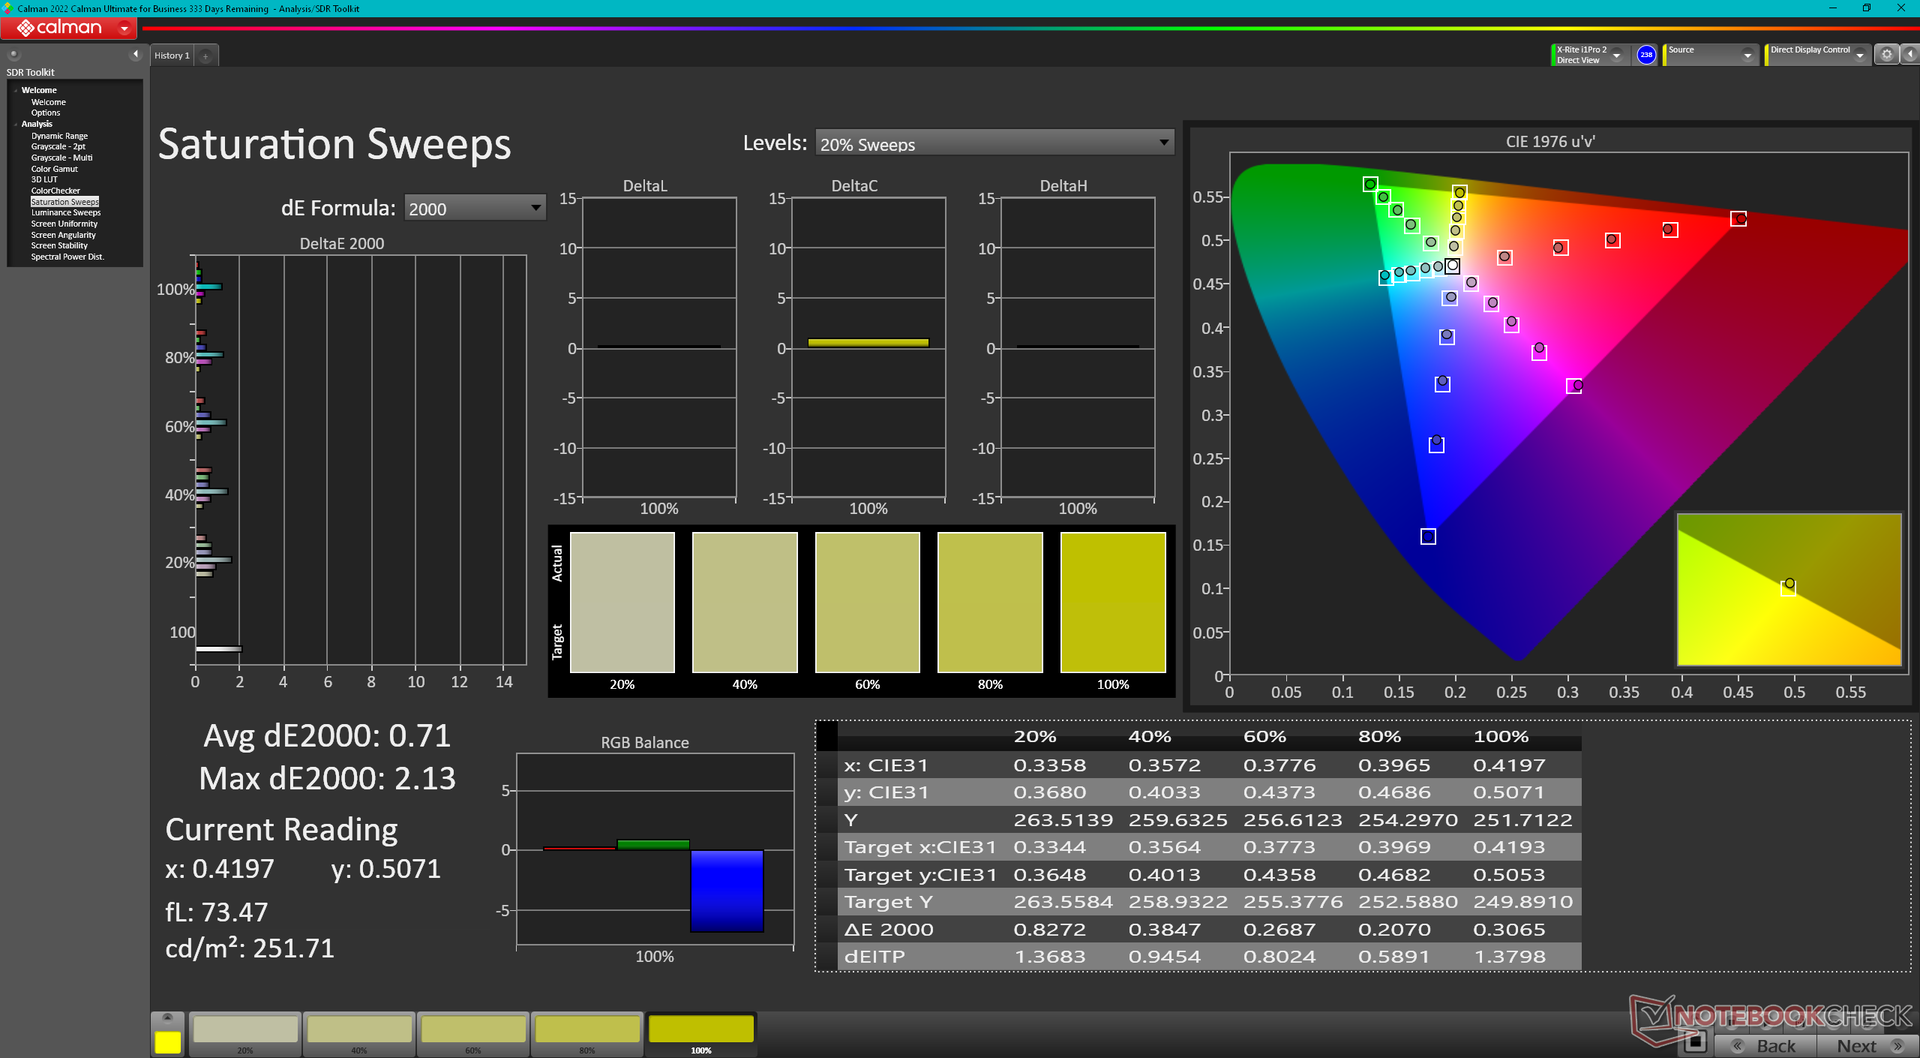
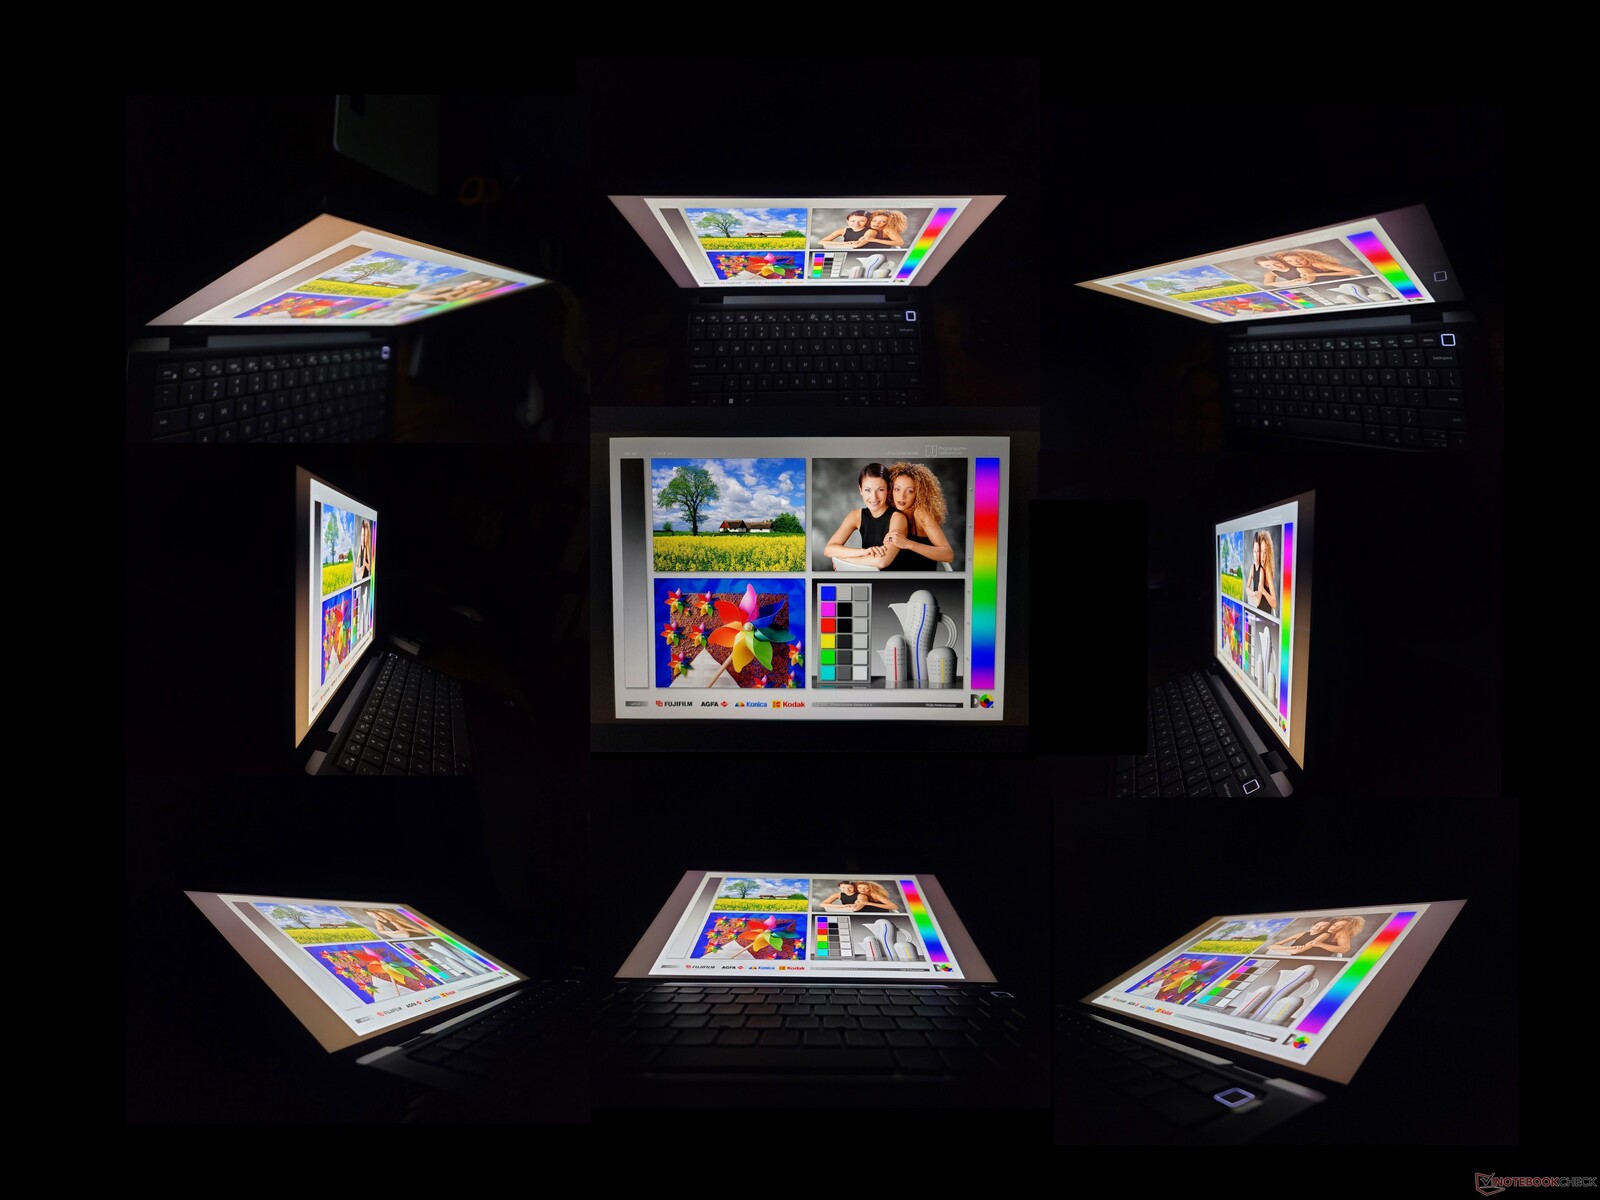
Bildschirm— 100% sRGB beim 500-Nits-IPS-Touchscreen
Dell verspricht einen 500 Nits hellen Touchscreen mit voller sRGB-Abdeckung, was unsere unabhängigen Messungen bestätigen. Es handelt sich um ein High-End-Display mit ähnlichen Helligkeits- und Kontrastwerten wie das Display im MSI Summit E13 Flip.
Die zwei größten Nachteile des Panels sind die sehr langsame Schwarz-zu-Weiß-Reaktionszeit und eine Bildwiederholrate von nur 60 Hz. Auch wenn es sich um keinen Gaming-Laptop handelt, ist das Ghosting schwer zu ignorieren. Selbst beim Web Browsing merkt man, dass 60 Hz nicht mehr die aktuelle Tech ist. Eine höhere Bildwiederholrate würde zudem das Ansprechverhalten des Touchscreens verbessern.
Hellere Display-Optionen werden nicht angeboten, auch keine, die den DCI-P3-Farbraum abdecken würden. Bei allen Latitude-9330-Modellen ist derzeit das gleiche Panel von AU Optronics verbaut.

| |||||||||||||||||||||||||
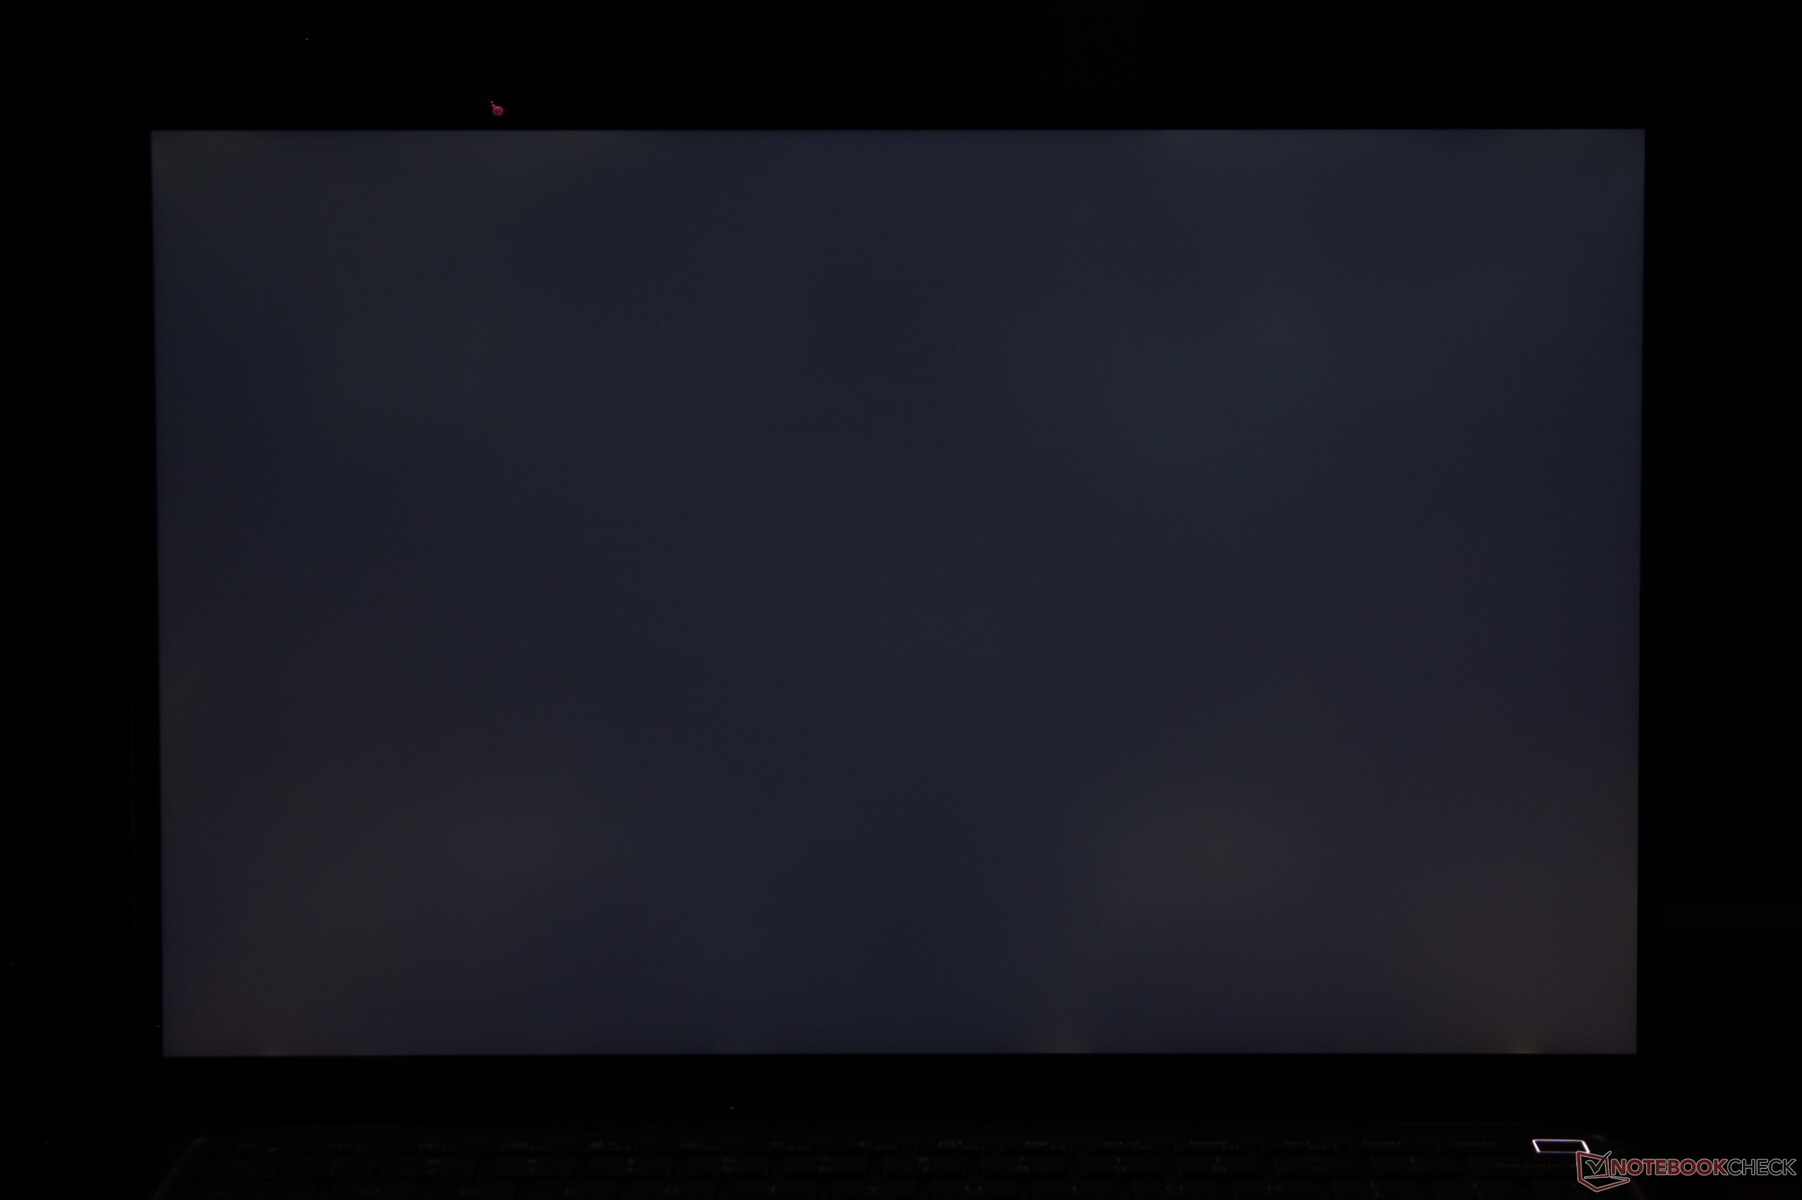
Ausleuchtung: 85 %
Helligkeit Akku: 542.3 cd/m²
Kontrast: 1427:1 (Schwarzwert: 0.38 cd/m²)
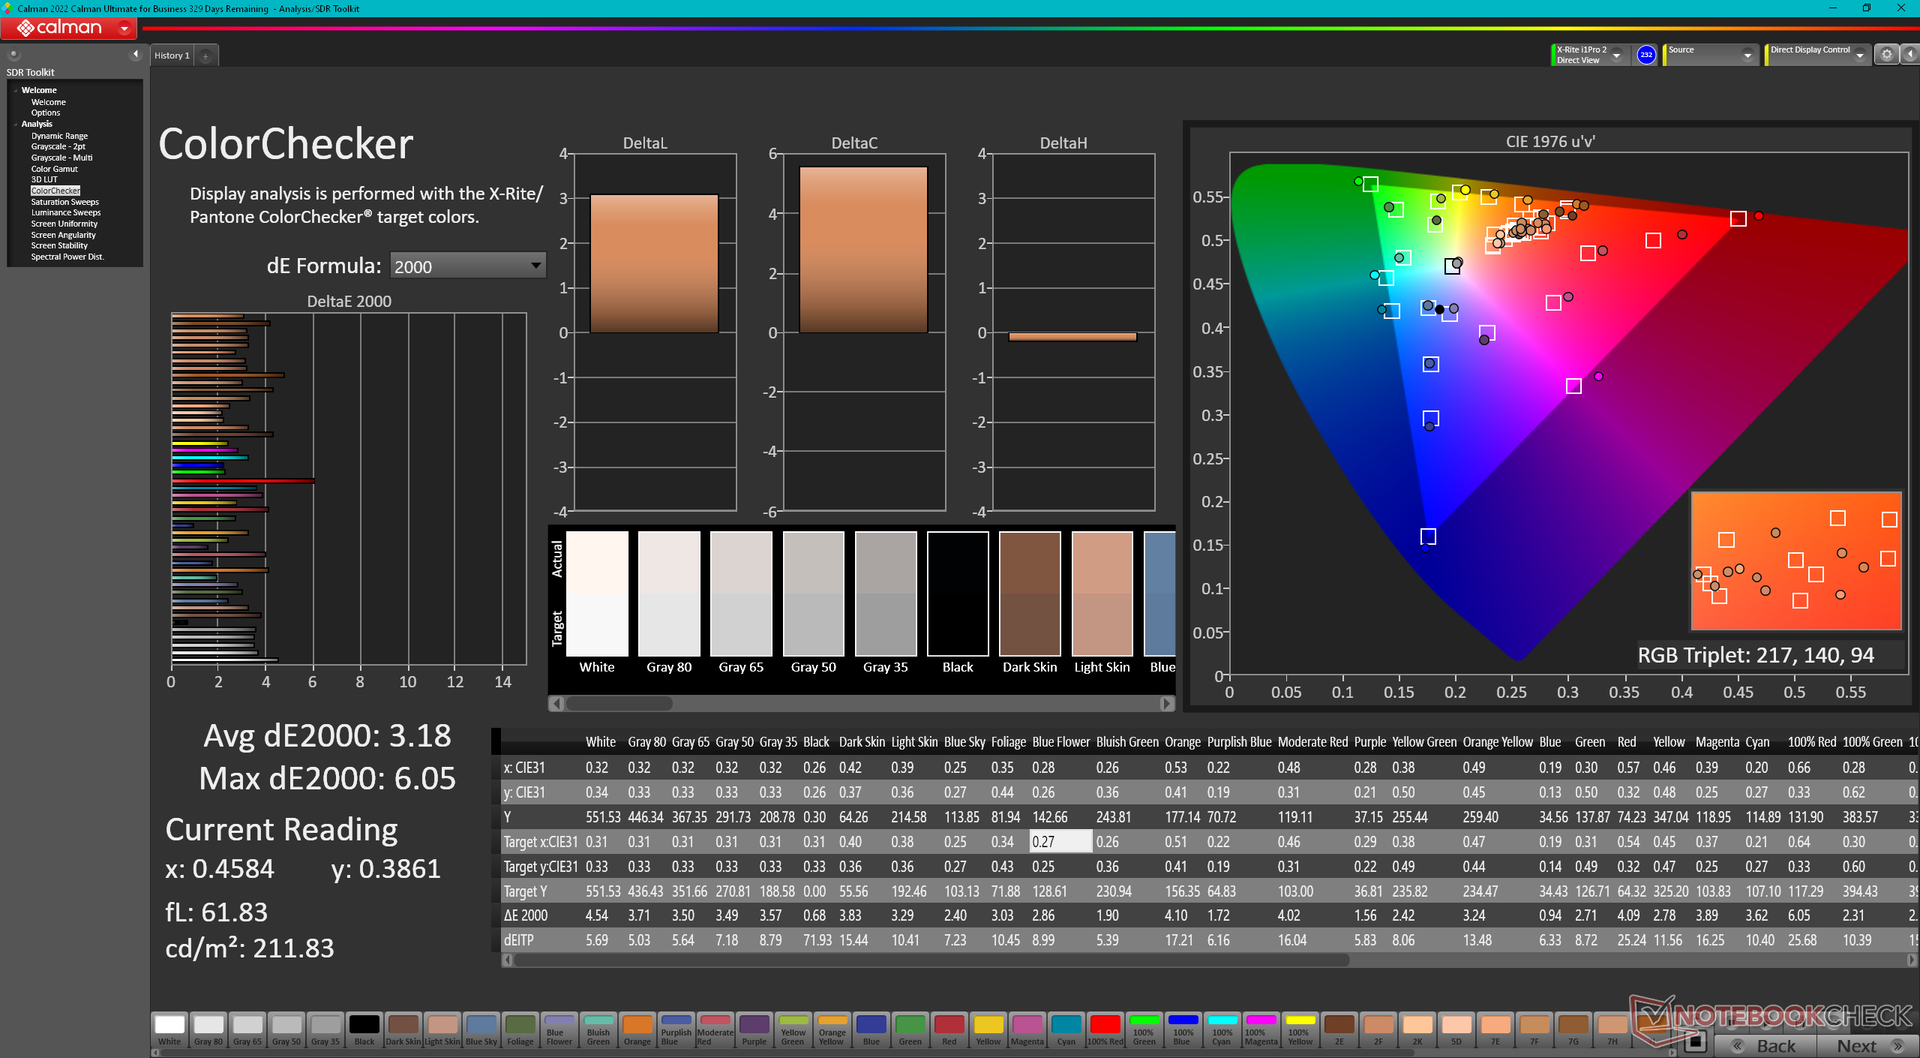
ΔE ColorChecker Calman: 3.18 | ∀{0.5-29.43 Ø4.72}
calibrated: 0.67
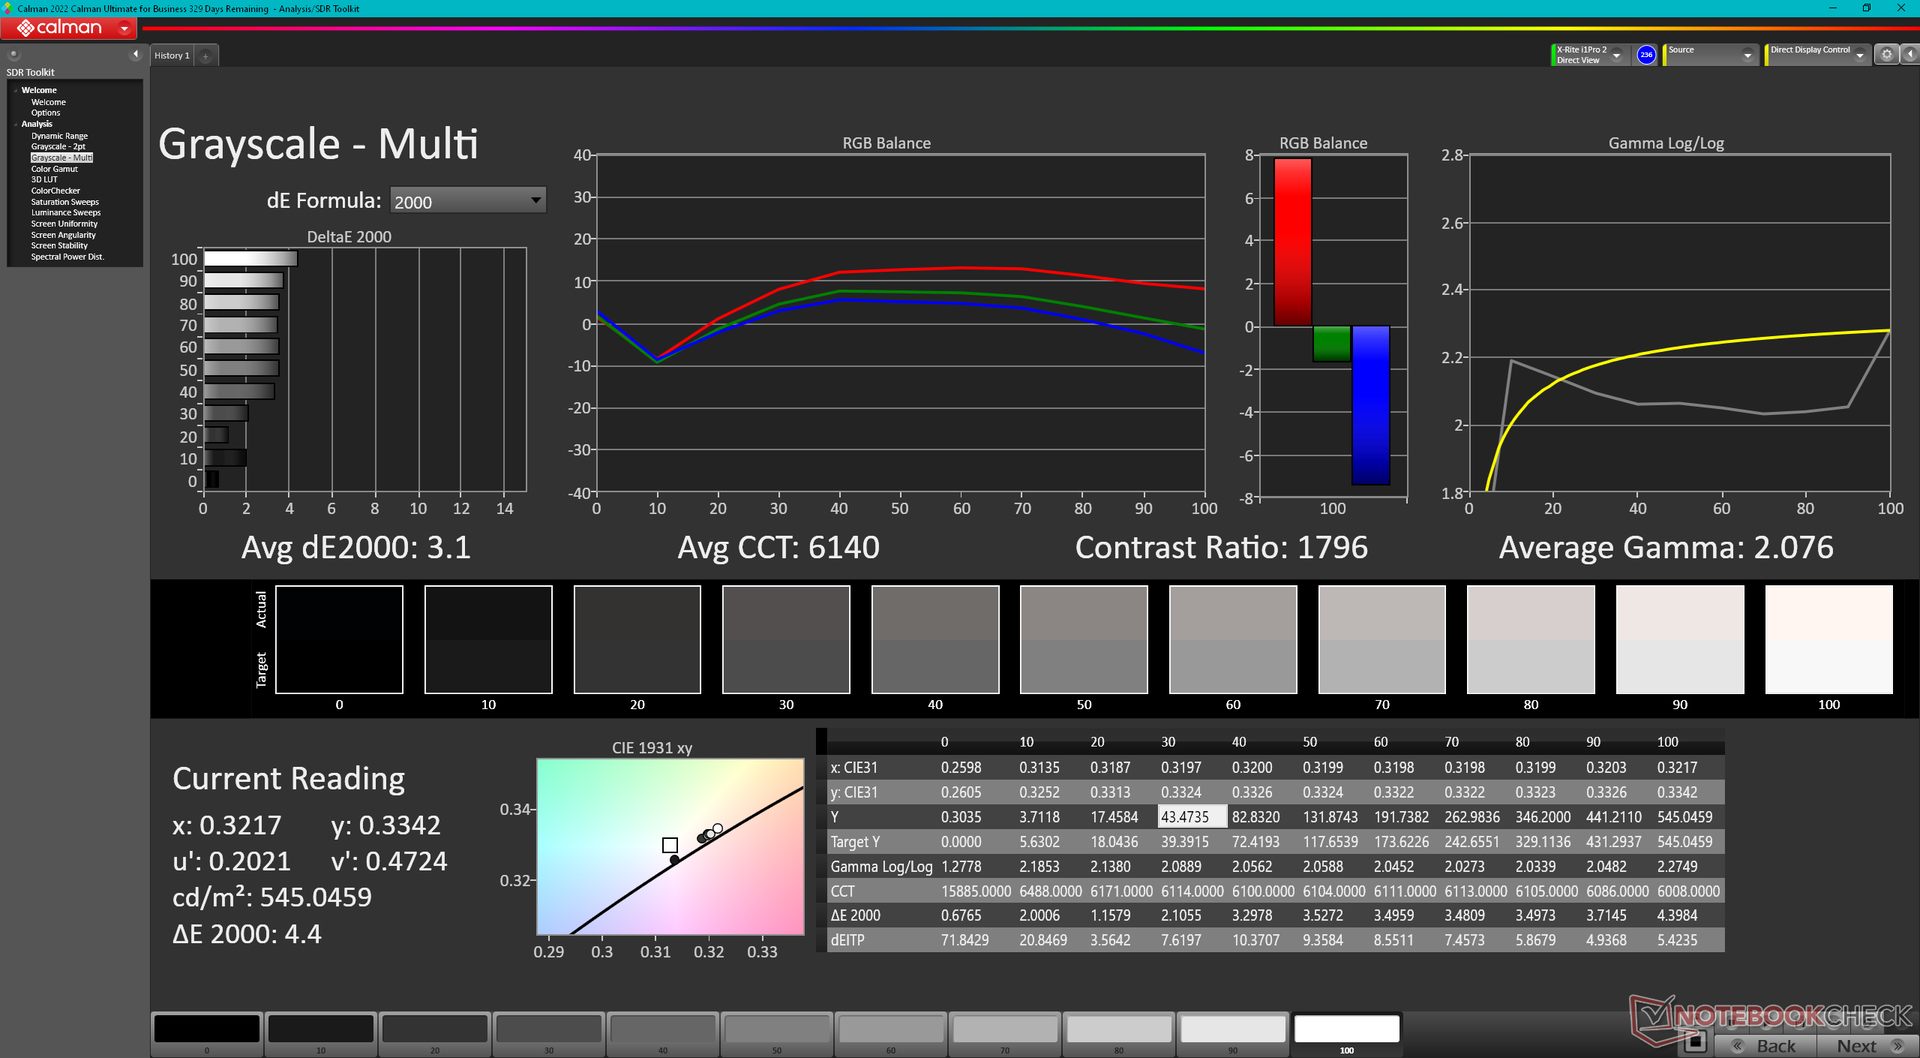
ΔE Greyscale Calman: 3.1 | ∀{0.09-98 Ø4.97}
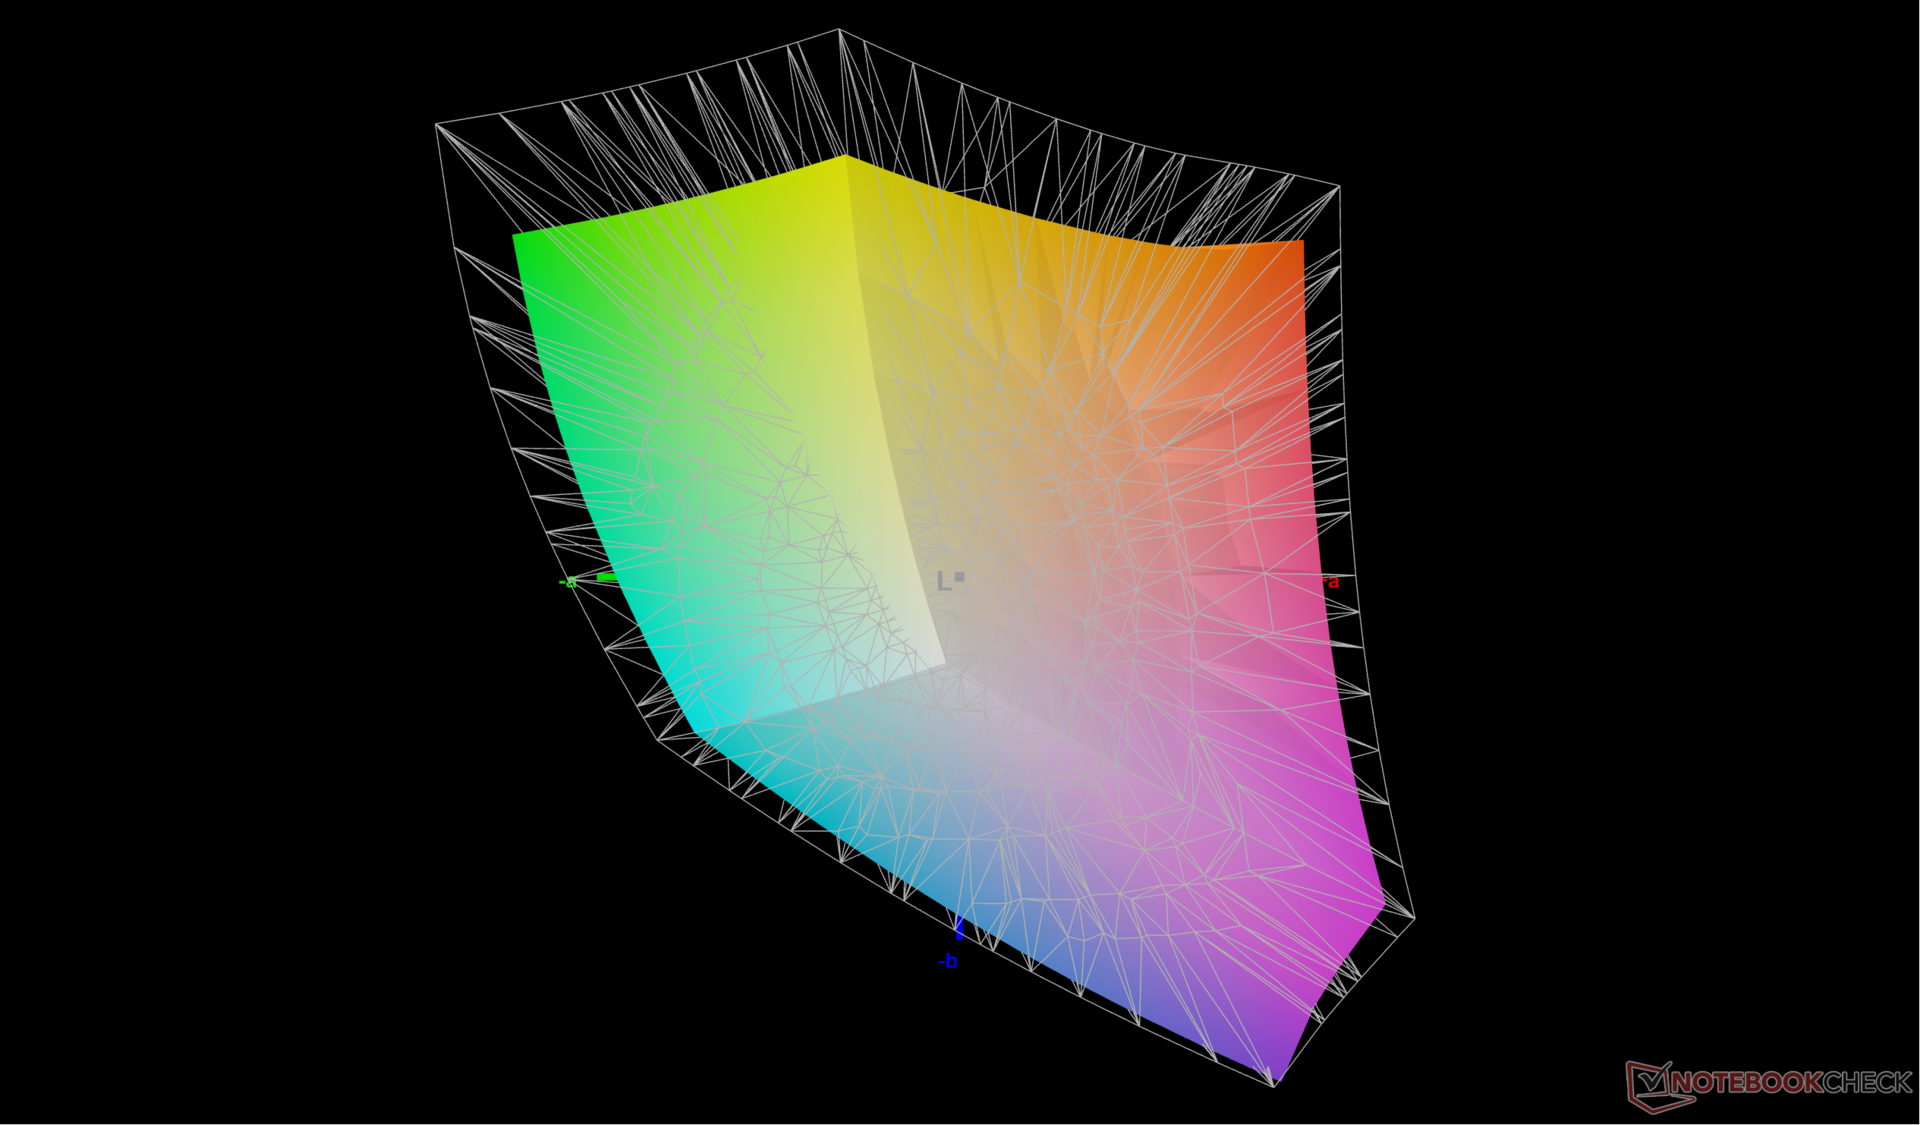
77.5% AdobeRGB 1998 (Argyll 3D)
99.9% sRGB (Argyll 3D)
77.8% Display P3 (Argyll 3D)
Gamma: 2.08
CCT: 6140 K
| Dell Latitude 9330 AU Optronics B133QAA, IPS, 2560x1600, 13.3" | Lenovo ThinkPad X1 Titanium Yoga G1 20QB0016GE LPM135M467, IPS LED, 2256x1504, 13.5" | MSI Summit E13 Flip Evo A11MT Sharp LQ134N1JW53, IPS, 1920x1200, 13.4" | HP EliteBook x360 1030 G7 Chi Mei CMN13A9, IPS, 1920x1080, 13.3" | HP Elite Dragonfly Max InfoVision X133NVFL R0, IPS, 1920x1080, 13.3" | Dell Latitude 5310-23VP6 Chi Mei CMN1382, IPS, 1920x1080, 13.3" | |
|---|---|---|---|---|---|---|
| Display | -9% | -7% | -10% | -8% | ||
| Display P3 Coverage (%) | 77.8 | 66.8 -14% | 69.8 -10% | 66.1 -15% | 67.5 -13% | |
| sRGB Coverage (%) | 99.9 | 98 -2% | 98.8 -1% | 97 -3% | 99 -1% | |
| AdobeRGB 1998 Coverage (%) | 77.5 | 68.6 -11% | 70.6 -9% | 67.7 -13% | 69.2 -11% | |
| Response Times | 9% | 9% | 25% | 36% | 50% | |
| Response Time Grey 50% / Grey 80% * (ms) | 67.6 ? | 64 ? 5% | 64 ? 5% | 56.4 ? 17% | 44.8 ? 34% | 36 ? 47% |
| Response Time Black / White * (ms) | 50.4 ? | 44 ? 13% | 44 ? 13% | 34.4 ? 32% | 32 ? 37% | 24 ? 52% |
| PWM Frequency (Hz) | 26040 ? | 2500 ? | ||||
| Bildschirm | 9% | 3% | -25% | 10% | 2% | |
| Helligkeit Bildmitte (cd/m²) | 542.3 | 465 -14% | 551.3 2% | 425.4 -22% | 777.5 43% | 383 -29% |
| Brightness (cd/m²) | 516 | 451 -13% | 517 0% | 407 -21% | 727 41% | 364 -29% |
| Brightness Distribution (%) | 85 | 92 8% | 91 7% | 89 5% | 75 -12% | 84 -1% |
| Schwarzwert * (cd/m²) | 0.38 | 0.28 26% | 0.37 3% | 0.28 26% | 0.44 -16% | 0.34 11% |
| Kontrast (:1) | 1427 | 1661 16% | 1490 4% | 1519 6% | 1767 24% | 1126 -21% |
| Delta E Colorchecker * | 3.18 | 2 37% | 1.45 54% | 4.39 -38% | 1.62 49% | 2.24 30% |
| Colorchecker dE 2000 max. * | 6.05 | 4.7 22% | 2.86 53% | 6.73 -11% | 5.26 13% | 3.32 45% |
| Colorchecker dE 2000 calibrated * | 0.67 | 0.7 -4% | 1.7 -154% | 1.65 -146% | 1.32 -97% | 0.72 -7% |
| Delta E Graustufen * | 3.1 | 2.9 6% | 1.3 58% | 3.9 -26% | 1.6 48% | 2.42 22% |
| Gamma | 2.08 106% | 2.09 105% | 2.14 103% | 1.87 118% | 2.2 100% | 2.65 83% |
| CCT | 6140 106% | 6181 105% | 6580 99% | 6758 96% | 6538 99% | 6776 96% |
| Farbraum (Prozent von AdobeRGB 1998) (%) | 65 | 61.7 | 72.3 | 56 | ||
| Color Space (Percent of sRGB) (%) | 99 | 96.6 | 94.8 | 99 | ||
| Durchschnitt gesamt (Programm / Settings) | 3% /
5% | 2% /
2% | -3% /
-15% | 23% /
15% | 15% /
7% |
* ... kleinere Werte sind besser
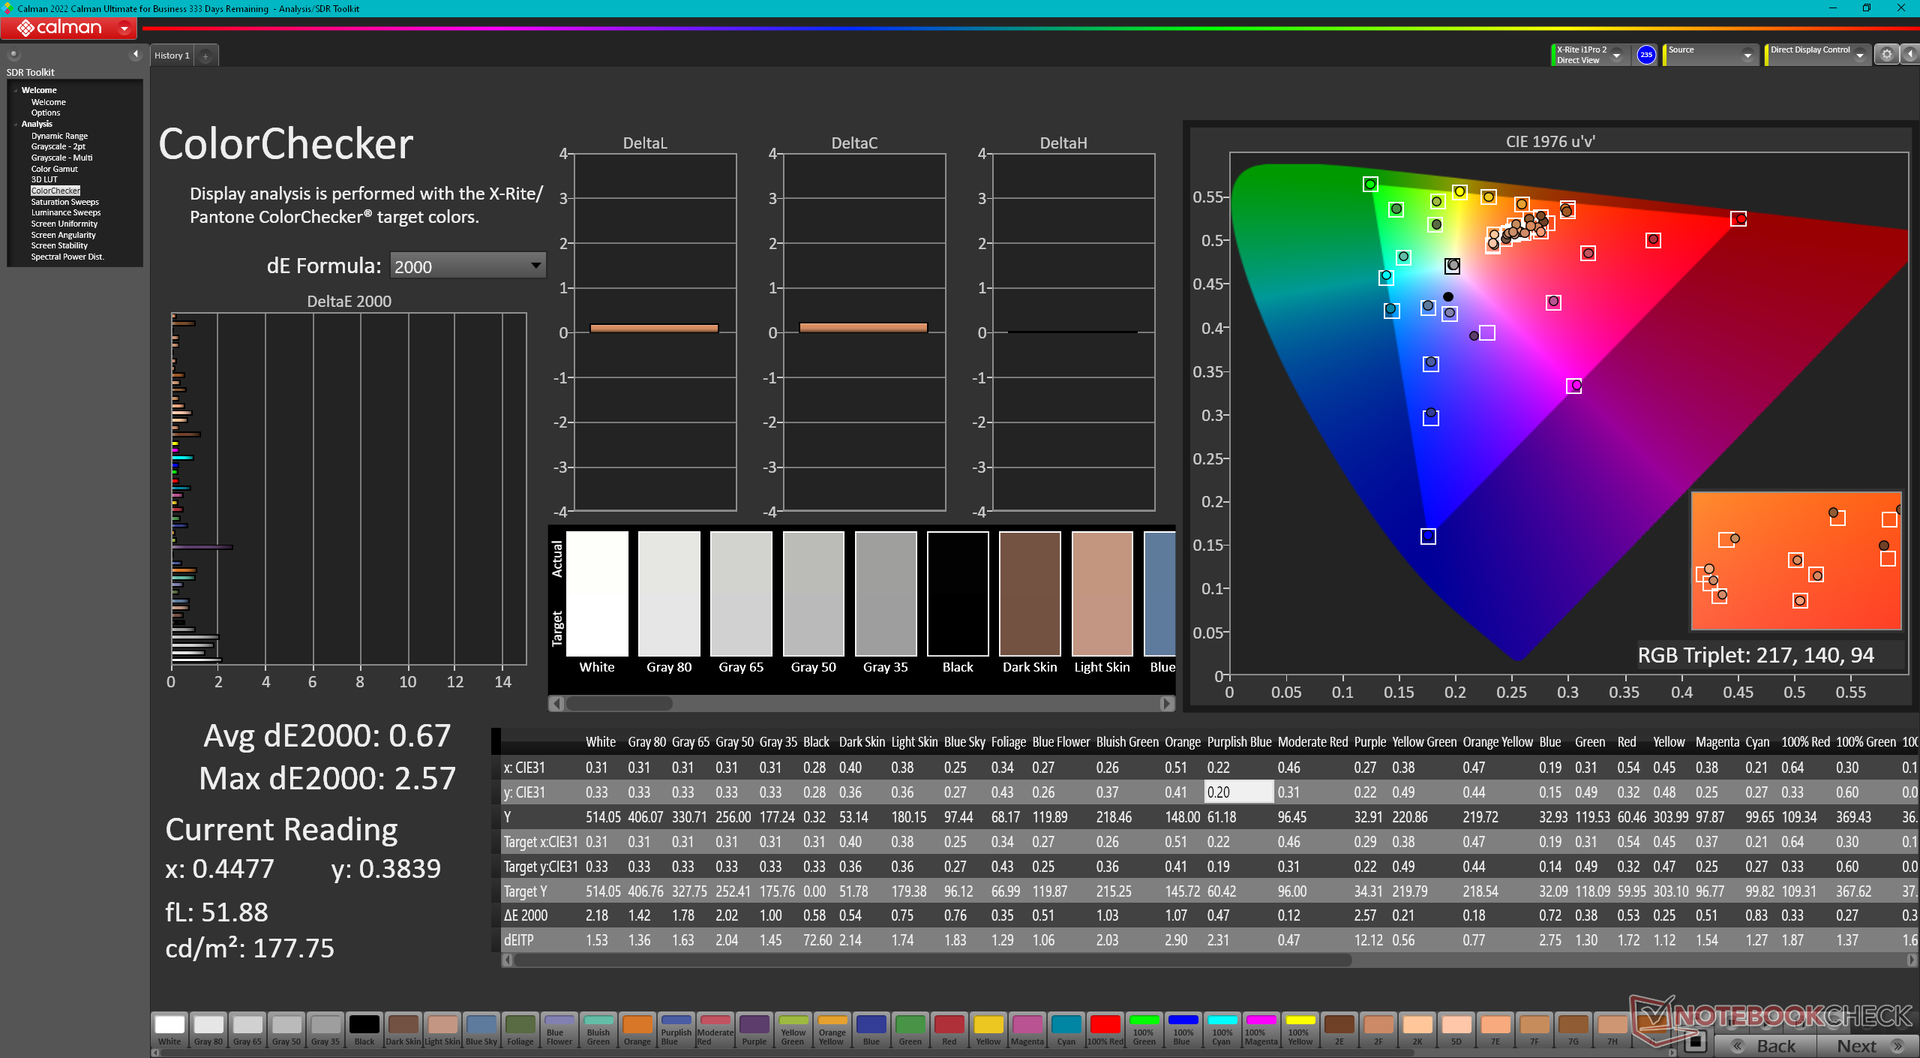
Das Display wird in einem unkalibrierten Zustand ausgeliefert, das für den Preis von über 2.000 Euro enttäuschend ist. Unsere Kalibrierung mit einem X-Rite Colorimeter verbesserte die durchschnittlichen DeltaE-Werte für Graustufen und Farben von 3,1 und 3,18 zu guten 1,4 respektive 0,67. Unser ICM-Profil neben der Ausleuchtungsgrafik kann für eine bessere Anzeige der sRGB-Farben genutzt werden.
Reaktionszeiten (Response Times) des Displays
| ↔ Reaktionszeiten Schwarz zu Weiß | ||
|---|---|---|
| 50.4 ms ... steigend ↗ und fallend ↘ kombiniert | ↗ 26.8 ms steigend | 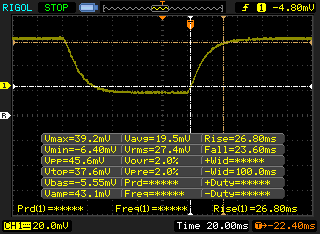 |
| ↘ 23.6 ms fallend | ||
| Die gemessenen Reaktionszeiten sind langsam und dadurch für viele Spieler wahrscheinlich zu langsam. Im Vergleich rangierten die bei uns getesteten Geräte von 0.1 (Minimum) zu 240 (Maximum) ms. » 99 % aller Screens waren schneller als der getestete. Daher sind die gemessenen Reaktionszeiten schlechter als der Durchschnitt aller vermessenen Geräte (19.8 ms). | ||
| ↔ Reaktionszeiten 50% Grau zu 80% Grau | ||
| 67.6 ms ... steigend ↗ und fallend ↘ kombiniert | ↗ 34.8 ms steigend |  |
| ↘ 32.8 ms fallend | ||
| Die gemessenen Reaktionszeiten sind langsam und dadurch für viele Spieler wahrscheinlich zu langsam. Im Vergleich rangierten die bei uns getesteten Geräte von 0.165 (Minimum) zu 636 (Maximum) ms. » 98 % aller Screens waren schneller als der getestete. Daher sind die gemessenen Reaktionszeiten schlechter als der Durchschnitt aller vermessenen Geräte (31 ms). | ||
Bildschirm-Flackern / PWM (Pulse-Width Modulation)
| Flackern / PWM nicht festgestellt |  | ||
Im Vergleich: 52 % aller getesteten Geräte nutzten kein PWM um die Helligkeit zu reduzieren. Wenn PWM eingesetzt wurde, dann bei einer Frequenz von durchschnittlich 7772 (Minimum 5, Maximum 343500) Hz. | |||
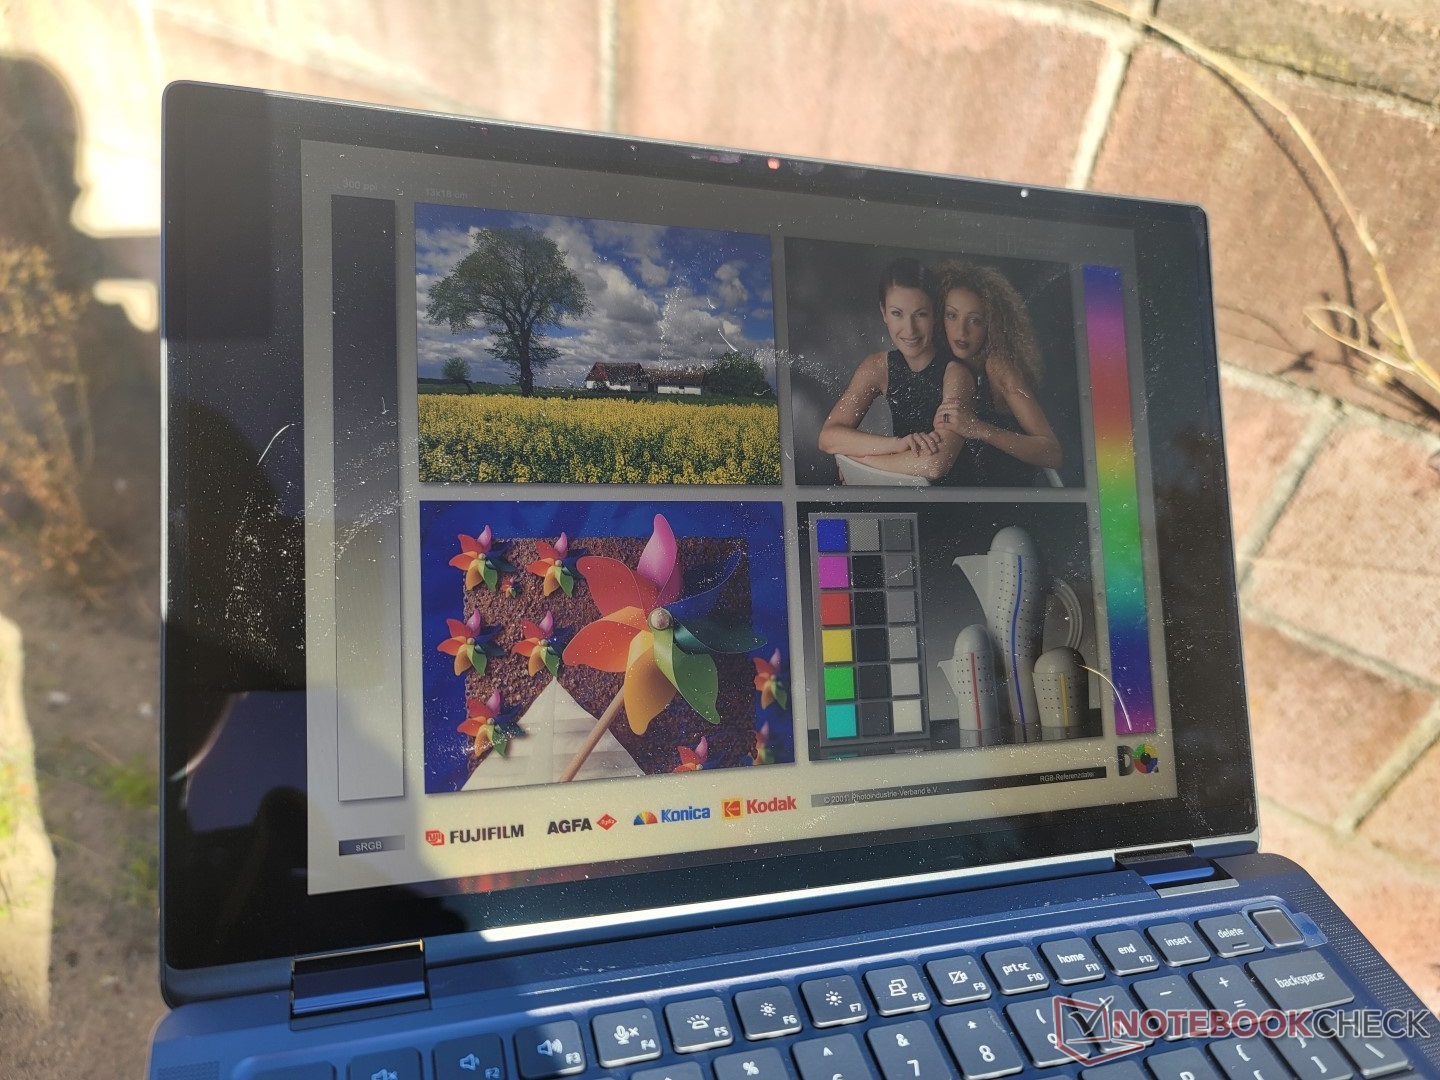
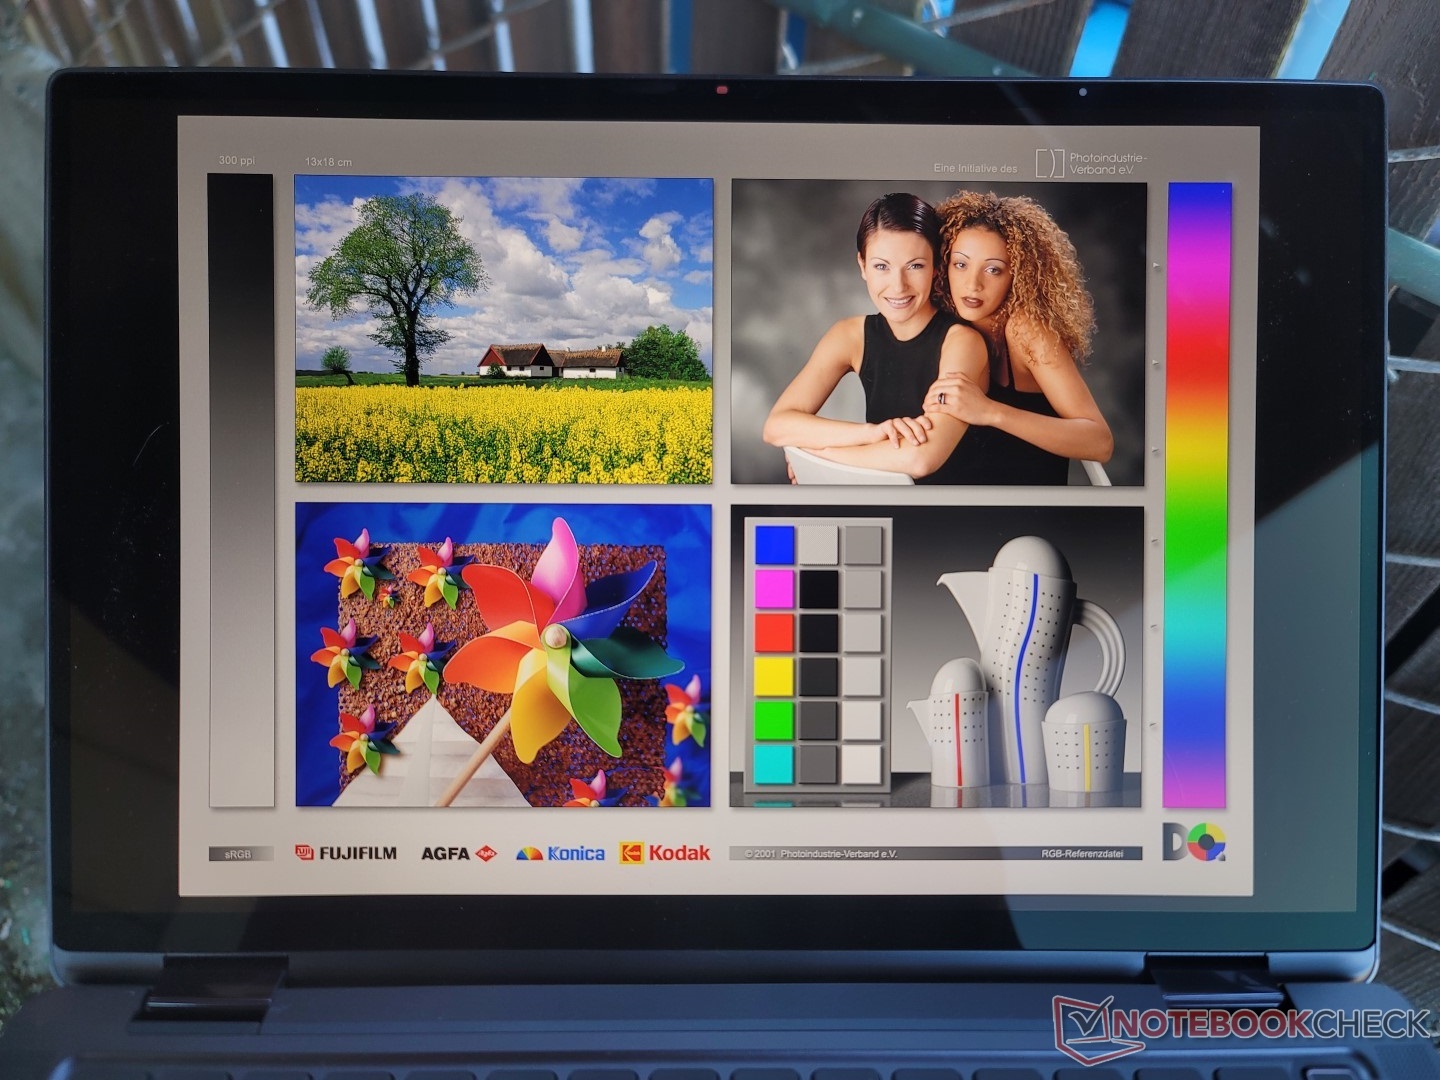
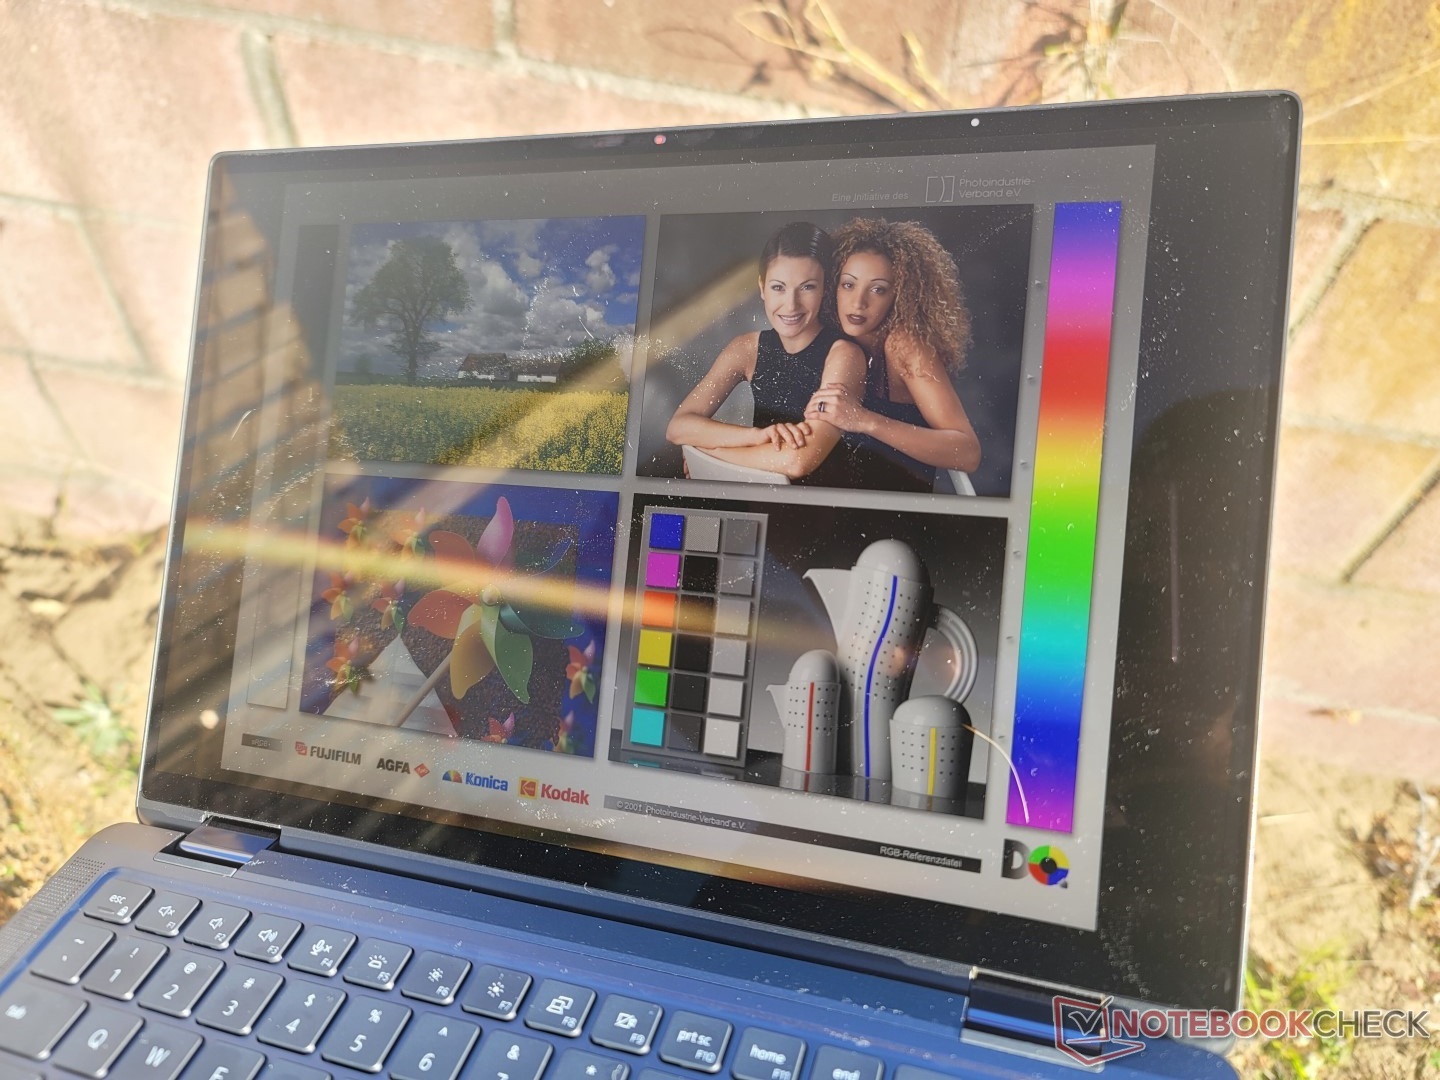
Die Bildschirm-Ablesbarkeit unter freiem Himmel ist angemessen, wenn man sich im Schatten befindet, da das Display hell genug leuchtet, um geringe bis moderate Reflexionen zu kompensieren. Direktes Sonnenlicht sollte dennoch gemieden werden. Das konkurrierende Dragonfly Max bietet ein noch helleres Display als das des Latitude 9330, mit dem das Ablesen des Displays in freien Umgebungen noch besser funktioniert.
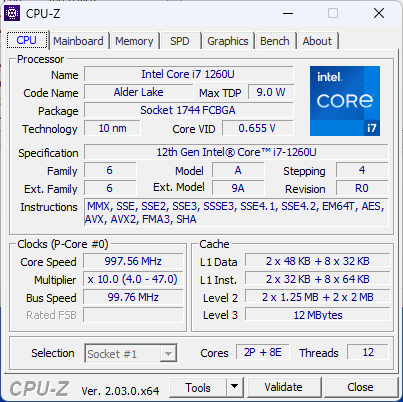
Leistung— 12. Gen Alder Lake Core i7-1260U

Testbedingungen
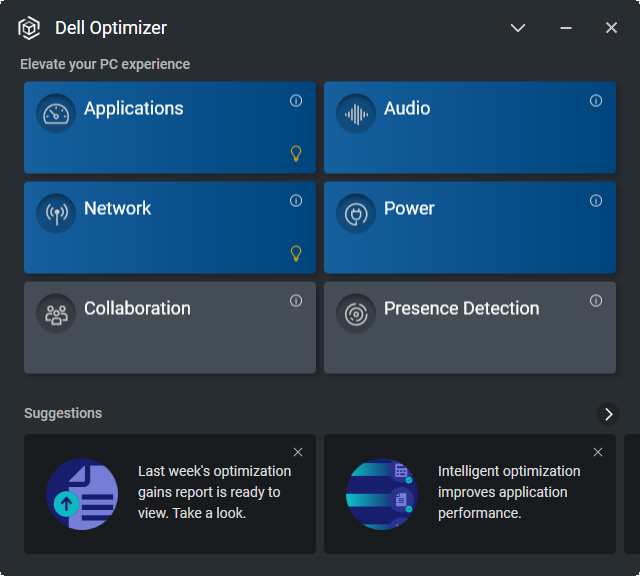
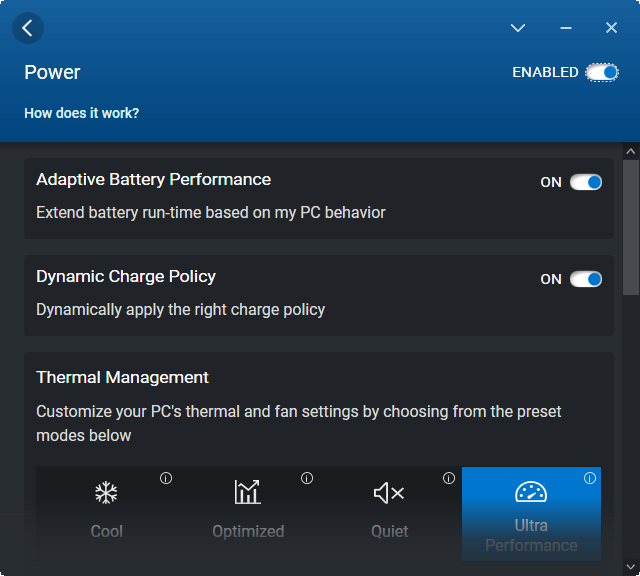
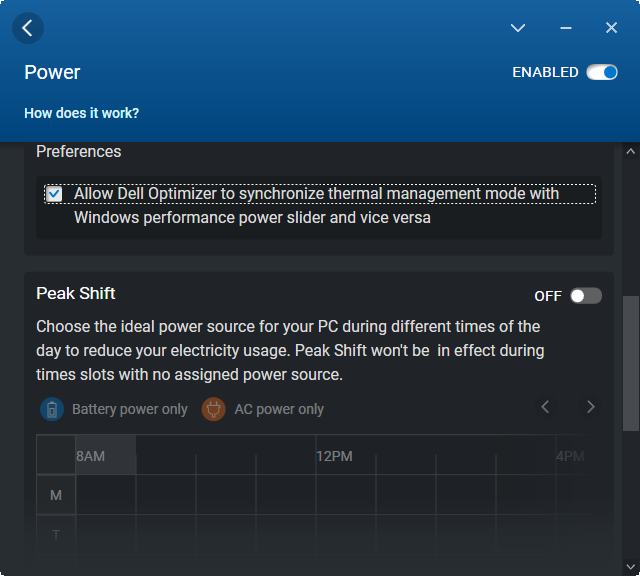
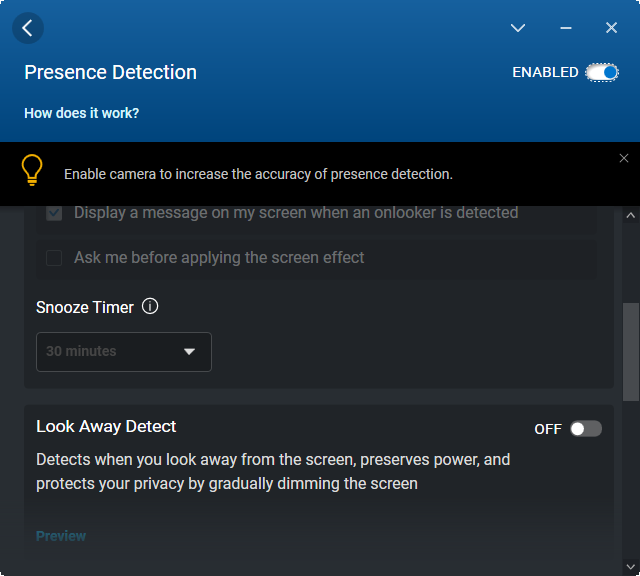
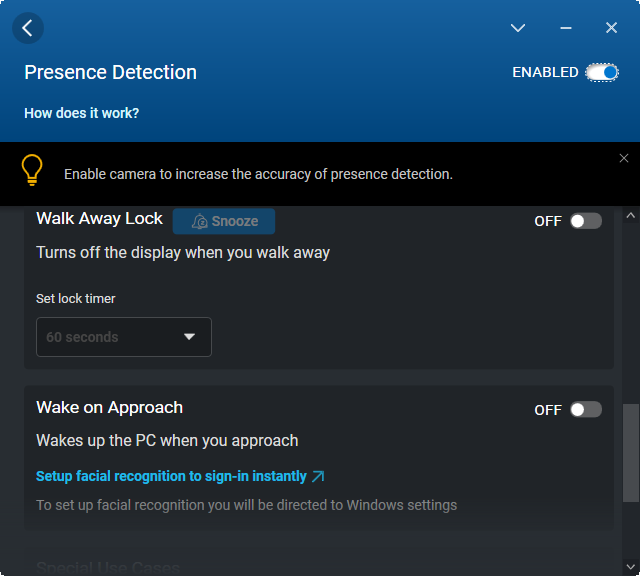
Wir haben unser Testgerät in den Ultra-Performance-Modus in Windows und der Dell Optimizer Software versetzt. Es wird empfohlen, dass Nutzer mit dem Optimizer umzugehen lernen, da es das Hub für Latitude spezifische Funktionen ist, wie etwa Presence Detection für einen automatischen Login oder für zusätzliche touch-sensitive Tasten fürs Clickpad. Die Performance-Profile können anhand folgender Screenshots einfach gefunden werden.

Prozessor
Die CPU-Leistung ist hervorragend, grenzt sich aber nur um circa 5 bis 10 Prozent vom günstigeren Core i5-1235U im IdeaPad Flex 5i ab, und der Core i7-1255U ist sogar um circa 10 bis 15 Prozent schneller als der Core i7-1260U des Latitudes, aufgrund von höheren Power-Limits. Der Leistungszuwachs in Multi-Core-Anwendungen gegenüber dem Core i7-1165G7 der 11. Gen beträgt dennoch beachtliche ~35 Prozent, auch wenn es zum i5-1235U und i5-1255U der 12. Gen keine wirklichen Unterschiede gibt.
Die Langzeitleistung ist konstant, was sich Dell durch sehr hohe Kerntemperaturen erkauft, wie im Abschnitt "Stresstest" gut dargestellt. Das konkurrierende ThinkPad X1 Nano Gen 2 bricht bei der Leistung auf Dauer jedoch ein, wie der folgende Graph zeigt.
Cinebench R15 Multi Dauertest
Cinebench R23: Multi Core | Single Core
Cinebench R15: CPU Multi 64Bit | CPU Single 64Bit
Blender: v2.79 BMW27 CPU
7-Zip 18.03: 7z b 4 | 7z b 4 -mmt1
Geekbench 5.5: Multi-Core | Single-Core
HWBOT x265 Benchmark v2.2: 4k Preset
LibreOffice : 20 Documents To PDF
R Benchmark 2.5: Overall mean
Cinebench R23: Multi Core | Single Core
Cinebench R15: CPU Multi 64Bit | CPU Single 64Bit
Blender: v2.79 BMW27 CPU
7-Zip 18.03: 7z b 4 | 7z b 4 -mmt1
Geekbench 5.5: Multi-Core | Single-Core
HWBOT x265 Benchmark v2.2: 4k Preset
LibreOffice : 20 Documents To PDF
R Benchmark 2.5: Overall mean
* ... kleinere Werte sind besser
AIDA64: FP32 Ray-Trace | FPU Julia | CPU SHA3 | CPU Queen | FPU SinJulia | FPU Mandel | CPU AES | CPU ZLib | FP64 Ray-Trace | CPU PhotoWorxx
| Performance Rating | |
| MSI Summit E13 Flip Evo A11MT | |
| Durchschnittliche Intel Core i7-1260U | |
| Dell Latitude 9330 | |
| HP Elite Dragonfly Max | |
| Lenovo ThinkPad X1 Titanium Yoga G1 20QB0016GE | |
| Dell Latitude 5310-23VP6 | |
| AIDA64 / FP32 Ray-Trace | |
| MSI Summit E13 Flip Evo A11MT | |
| Durchschnittliche Intel Core i7-1260U (6694 - 7261, n=2) | |
| Dell Latitude 9330 | |
| HP Elite Dragonfly Max | |
| Dell Latitude 5310-23VP6 | |
| Lenovo ThinkPad X1 Titanium Yoga G1 20QB0016GE | |
| AIDA64 / FPU Julia | |
| Durchschnittliche Intel Core i7-1260U (33823 - 37371, n=2) | |
| Dell Latitude 9330 | |
| MSI Summit E13 Flip Evo A11MT | |
| Dell Latitude 5310-23VP6 | |
| HP Elite Dragonfly Max | |
| Lenovo ThinkPad X1 Titanium Yoga G1 20QB0016GE | |
| AIDA64 / CPU SHA3 | |
| MSI Summit E13 Flip Evo A11MT | |
| Durchschnittliche Intel Core i7-1260U (1816 - 1949, n=2) | |
| Dell Latitude 9330 | |
| HP Elite Dragonfly Max | |
| Lenovo ThinkPad X1 Titanium Yoga G1 20QB0016GE | |
| Dell Latitude 5310-23VP6 | |
| AIDA64 / CPU Queen | |
| MSI Summit E13 Flip Evo A11MT | |
| Durchschnittliche Intel Core i7-1260U (50854 - 53090, n=2) | |
| Dell Latitude 9330 | |
| HP Elite Dragonfly Max | |
| Dell Latitude 5310-23VP6 | |
| Lenovo ThinkPad X1 Titanium Yoga G1 20QB0016GE | |
| AIDA64 / FPU SinJulia | |
| MSI Summit E13 Flip Evo A11MT | |
| Dell Latitude 5310-23VP6 | |
| Durchschnittliche Intel Core i7-1260U (4067 - 4155, n=2) | |
| Dell Latitude 9330 | |
| HP Elite Dragonfly Max | |
| Lenovo ThinkPad X1 Titanium Yoga G1 20QB0016GE | |
| AIDA64 / FPU Mandel | |
| MSI Summit E13 Flip Evo A11MT | |
| Durchschnittliche Intel Core i7-1260U (16988 - 17918, n=2) | |
| Dell Latitude 9330 | |
| HP Elite Dragonfly Max | |
| Dell Latitude 5310-23VP6 | |
| Lenovo ThinkPad X1 Titanium Yoga G1 20QB0016GE | |
| AIDA64 / CPU AES | |
| MSI Summit E13 Flip Evo A11MT | |
| HP Elite Dragonfly Max | |
| Lenovo ThinkPad X1 Titanium Yoga G1 20QB0016GE | |
| Durchschnittliche Intel Core i7-1260U (33289 - 35061, n=2) | |
| Dell Latitude 9330 | |
| Dell Latitude 5310-23VP6 | |
| AIDA64 / CPU ZLib | |
| Durchschnittliche Intel Core i7-1260U (506 - 586, n=2) | |
| Dell Latitude 9330 | |
| MSI Summit E13 Flip Evo A11MT | |
| Dell Latitude 5310-23VP6 | |
| HP Elite Dragonfly Max | |
| Lenovo ThinkPad X1 Titanium Yoga G1 20QB0016GE | |
| AIDA64 / FP64 Ray-Trace | |
| MSI Summit E13 Flip Evo A11MT | |
| Durchschnittliche Intel Core i7-1260U (3666 - 3854, n=2) | |
| Dell Latitude 9330 | |
| HP Elite Dragonfly Max | |
| Dell Latitude 5310-23VP6 | |
| Lenovo ThinkPad X1 Titanium Yoga G1 20QB0016GE | |
| AIDA64 / CPU PhotoWorxx | |
| MSI Summit E13 Flip Evo A11MT | |
| HP Elite Dragonfly Max | |
| Durchschnittliche Intel Core i7-1260U (37448 - 37790, n=2) | |
| Dell Latitude 9330 | |
| Lenovo ThinkPad X1 Titanium Yoga G1 20QB0016GE | |
| Dell Latitude 5310-23VP6 | |
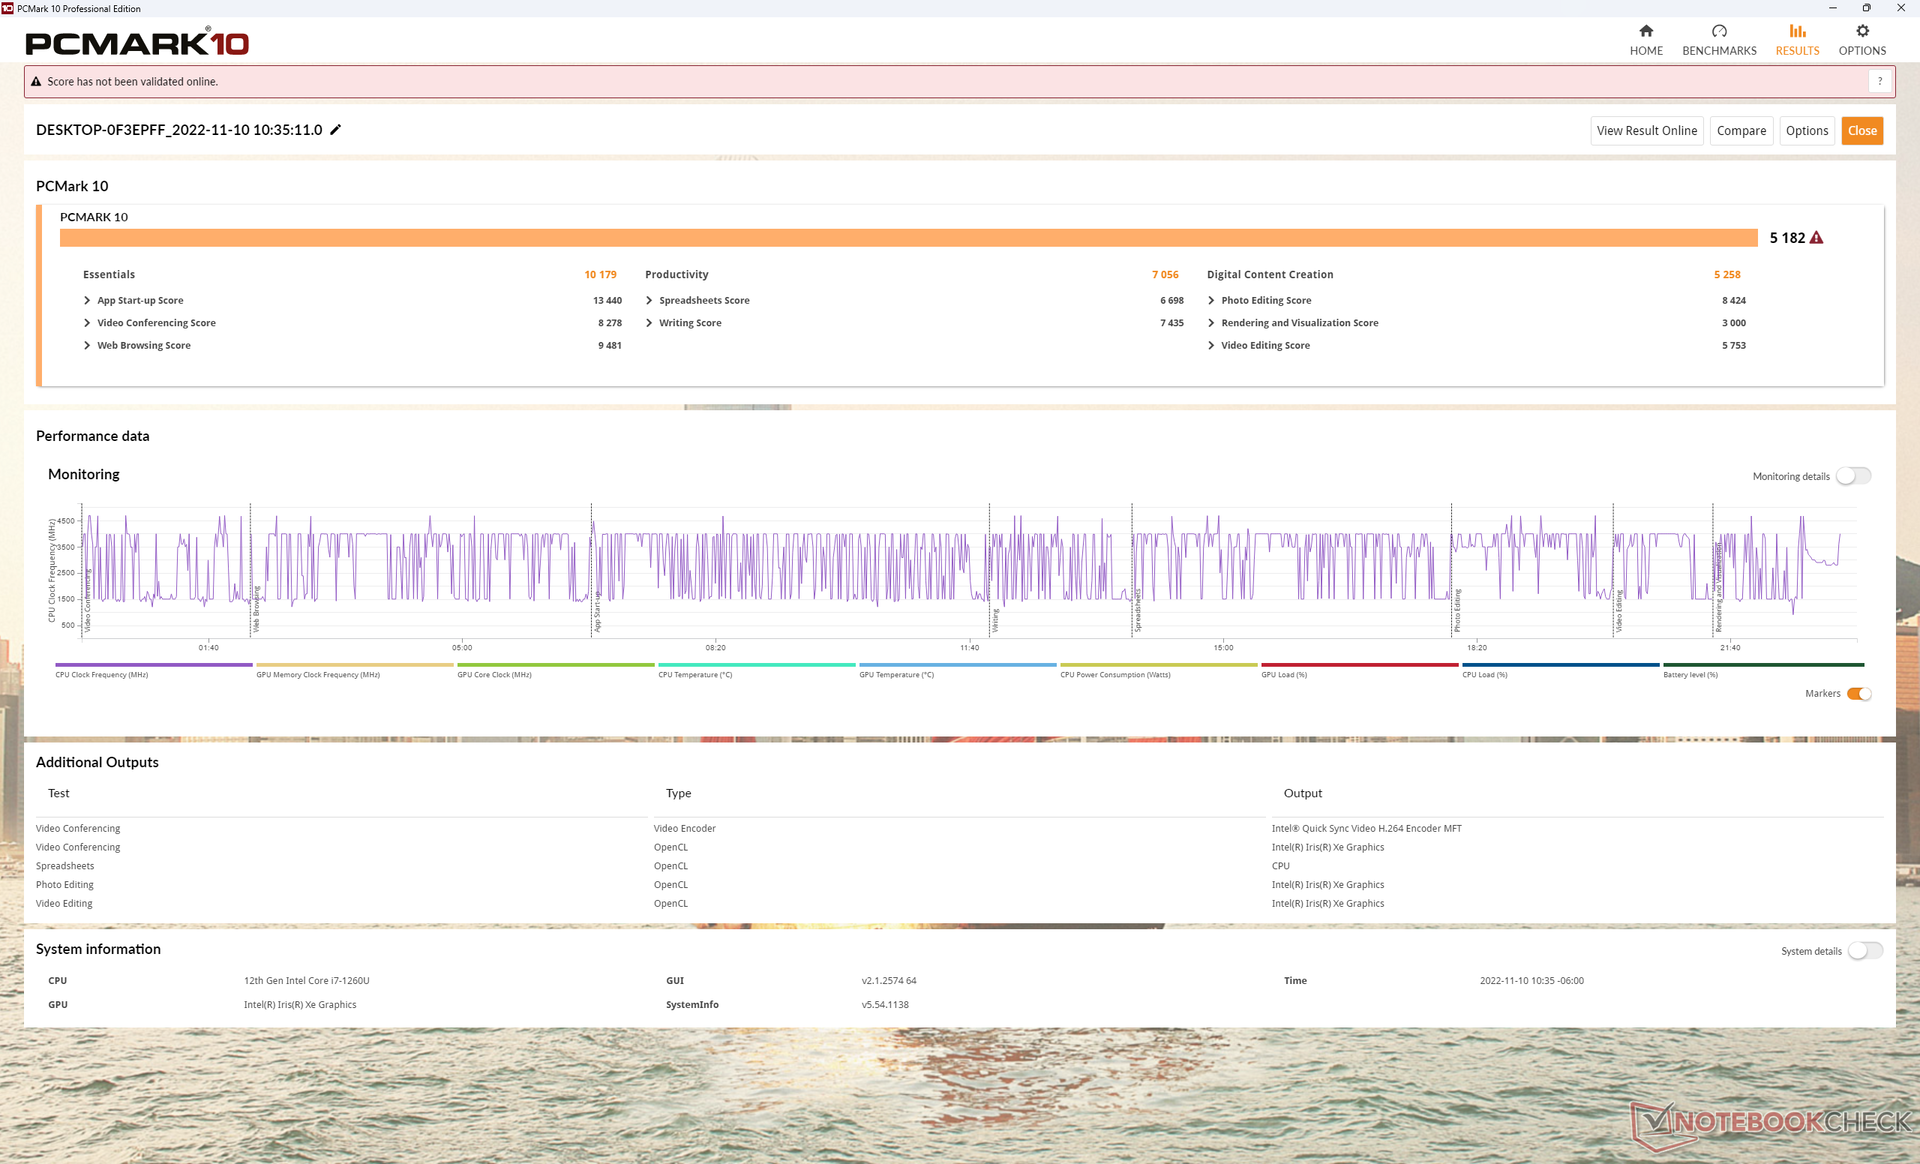
System Performance
Das PCMark-10-Ergebnis fällt höher aus als bei den meisten 13-Zoll-Subnotebooks und ist eines der besten in dieser Kategorie. Viele Laptops in dieser Größenordnung fahren niedrigere TDP-Limits, etwa auch das ThinkPad X1 Titanium Yoga, was letztlich eine geringere Leistung bedeutet.
| PCMark 10 / Score | |
| Durchschnittliche Intel Core i7-1260U, Intel Iris Xe Graphics G7 96EUs (5182 - 5300, n=2) | |
| Dell Latitude 9330 | |
| HP Elite Dragonfly Max | |
| MSI Summit E13 Flip Evo A11MT | |
| Lenovo ThinkPad X1 Titanium Yoga G1 20QB0016GE | |
| HP EliteBook x360 1030 G7 | |
| Dell Latitude 5310-23VP6 | |
| PCMark 10 / Essentials | |
| HP Elite Dragonfly Max | |
| Dell Latitude 9330 | |
| Durchschnittliche Intel Core i7-1260U, Intel Iris Xe Graphics G7 96EUs (9929 - 10179, n=2) | |
| Lenovo ThinkPad X1 Titanium Yoga G1 20QB0016GE | |
| HP EliteBook x360 1030 G7 | |
| Dell Latitude 5310-23VP6 | |
| MSI Summit E13 Flip Evo A11MT | |
| PCMark 10 / Productivity | |
| Durchschnittliche Intel Core i7-1260U, Intel Iris Xe Graphics G7 96EUs (7056 - 7287, n=2) | |
| Dell Latitude 9330 | |
| MSI Summit E13 Flip Evo A11MT | |
| HP Elite Dragonfly Max | |
| Dell Latitude 5310-23VP6 | |
| HP EliteBook x360 1030 G7 | |
| Lenovo ThinkPad X1 Titanium Yoga G1 20QB0016GE | |
| PCMark 10 / Digital Content Creation | |
| Durchschnittliche Intel Core i7-1260U, Intel Iris Xe Graphics G7 96EUs (5258 - 5584, n=2) | |
| Dell Latitude 9330 | |
| MSI Summit E13 Flip Evo A11MT | |
| HP Elite Dragonfly Max | |
| Lenovo ThinkPad X1 Titanium Yoga G1 20QB0016GE | |
| HP EliteBook x360 1030 G7 | |
| Dell Latitude 5310-23VP6 | |
| PCMark 10 Score | 5182 Punkte | |
Hilfe | ||
| AIDA64 / Memory Copy | |
| Dell Latitude 9330 | |
| Durchschnittliche Intel Core i7-1260U (68849 - 69994, n=2) | |
| HP Elite Dragonfly Max | |
| MSI Summit E13 Flip Evo A11MT | |
| Lenovo ThinkPad X1 Titanium Yoga G1 20QB0016GE | |
| Dell Latitude 5310-23VP6 | |
| AIDA64 / Memory Read | |
| HP Elite Dragonfly Max | |
| Dell Latitude 9330 | |
| Durchschnittliche Intel Core i7-1260U (59219 - 60804, n=2) | |
| MSI Summit E13 Flip Evo A11MT | |
| Lenovo ThinkPad X1 Titanium Yoga G1 20QB0016GE | |
| Dell Latitude 5310-23VP6 | |
| AIDA64 / Memory Write | |
| HP Elite Dragonfly Max | |
| Dell Latitude 9330 | |
| Durchschnittliche Intel Core i7-1260U (62367 - 63786, n=2) | |
| Lenovo ThinkPad X1 Titanium Yoga G1 20QB0016GE | |
| MSI Summit E13 Flip Evo A11MT | |
| Dell Latitude 5310-23VP6 | |
| AIDA64 / Memory Latency | |
| Dell Latitude 9330 | |
| Durchschnittliche Intel Core i7-1260U (107.2 - 107.7, n=2) | |
| HP Elite Dragonfly Max | |
| Dell Latitude 5310-23VP6 | |
| MSI Summit E13 Flip Evo A11MT | |
| Lenovo ThinkPad X1 Titanium Yoga G1 20QB0016GE | |
* ... kleinere Werte sind besser
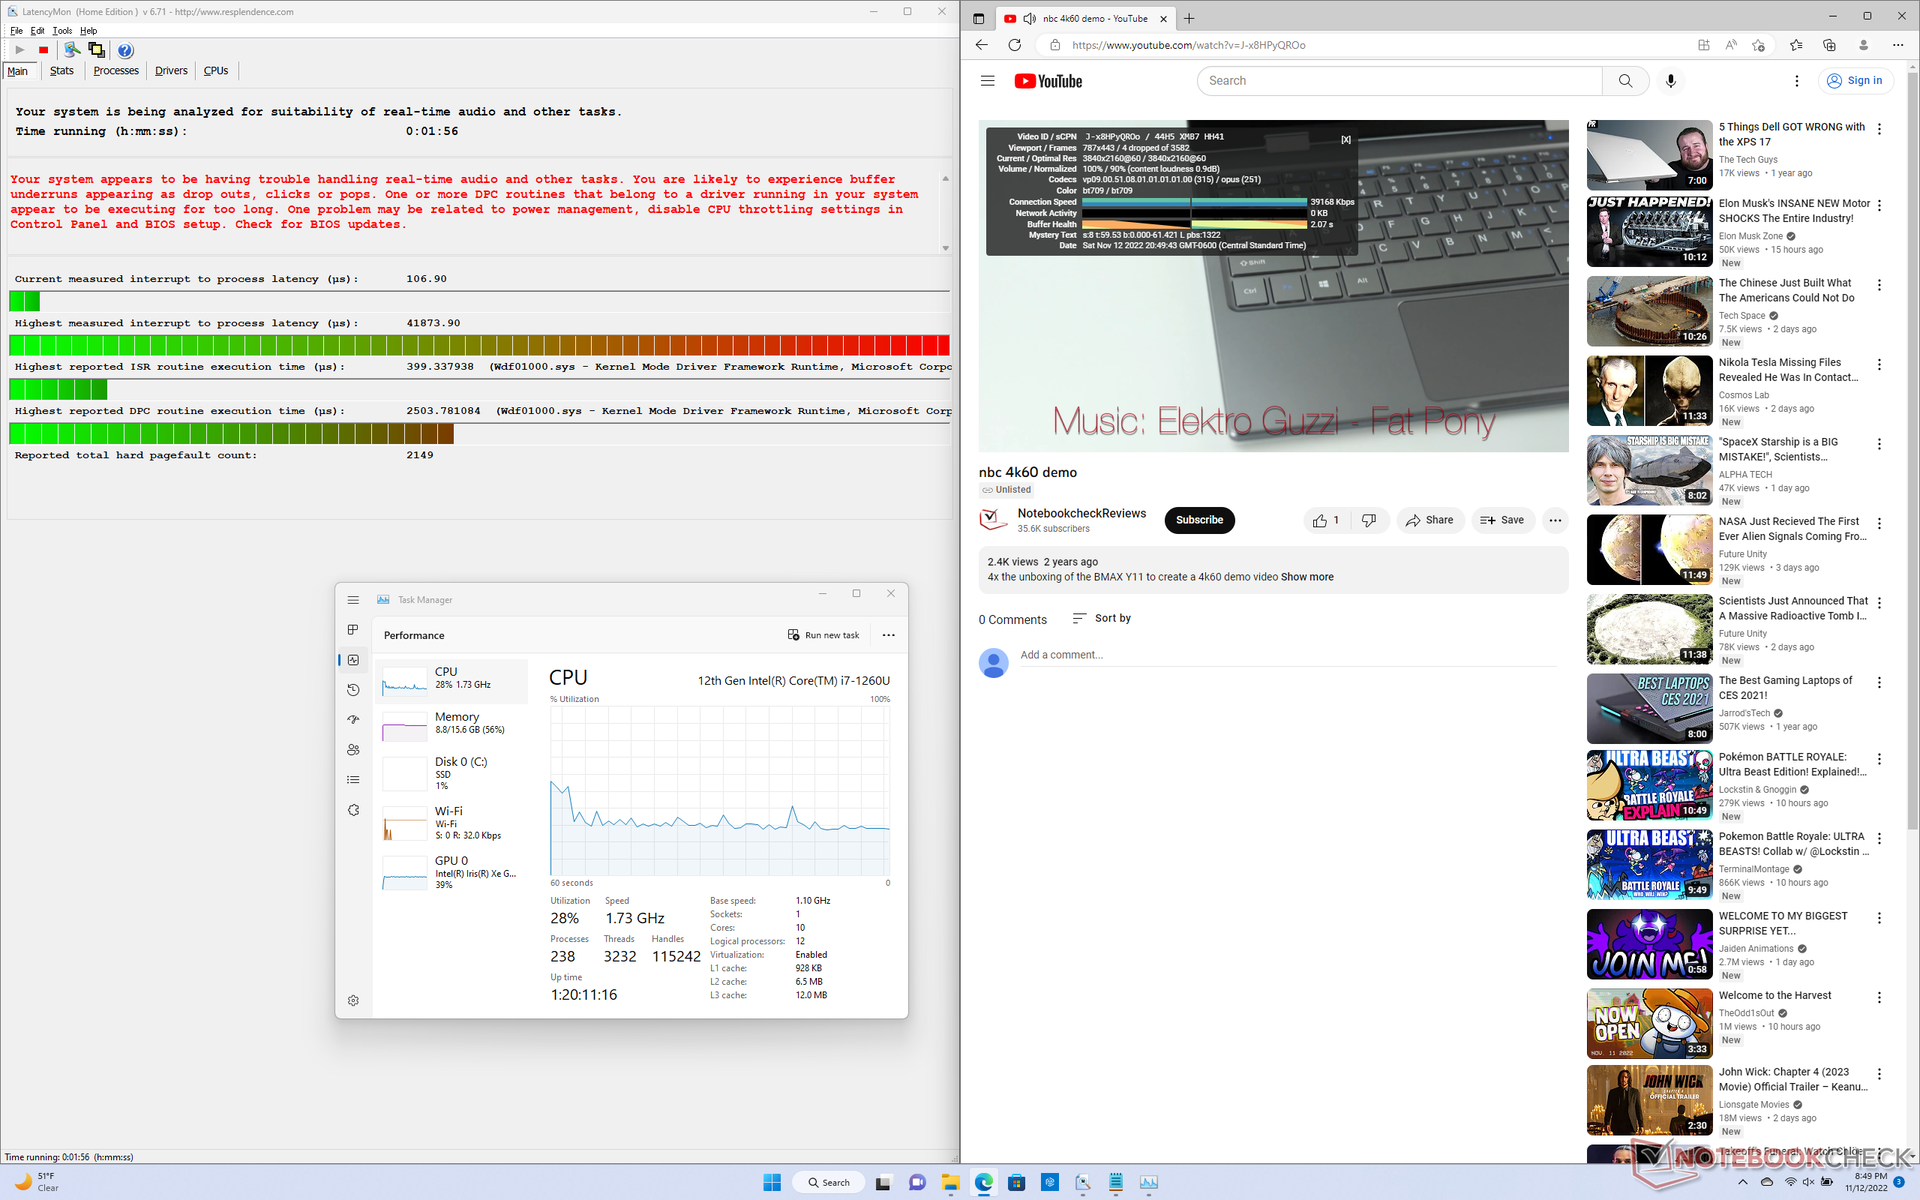
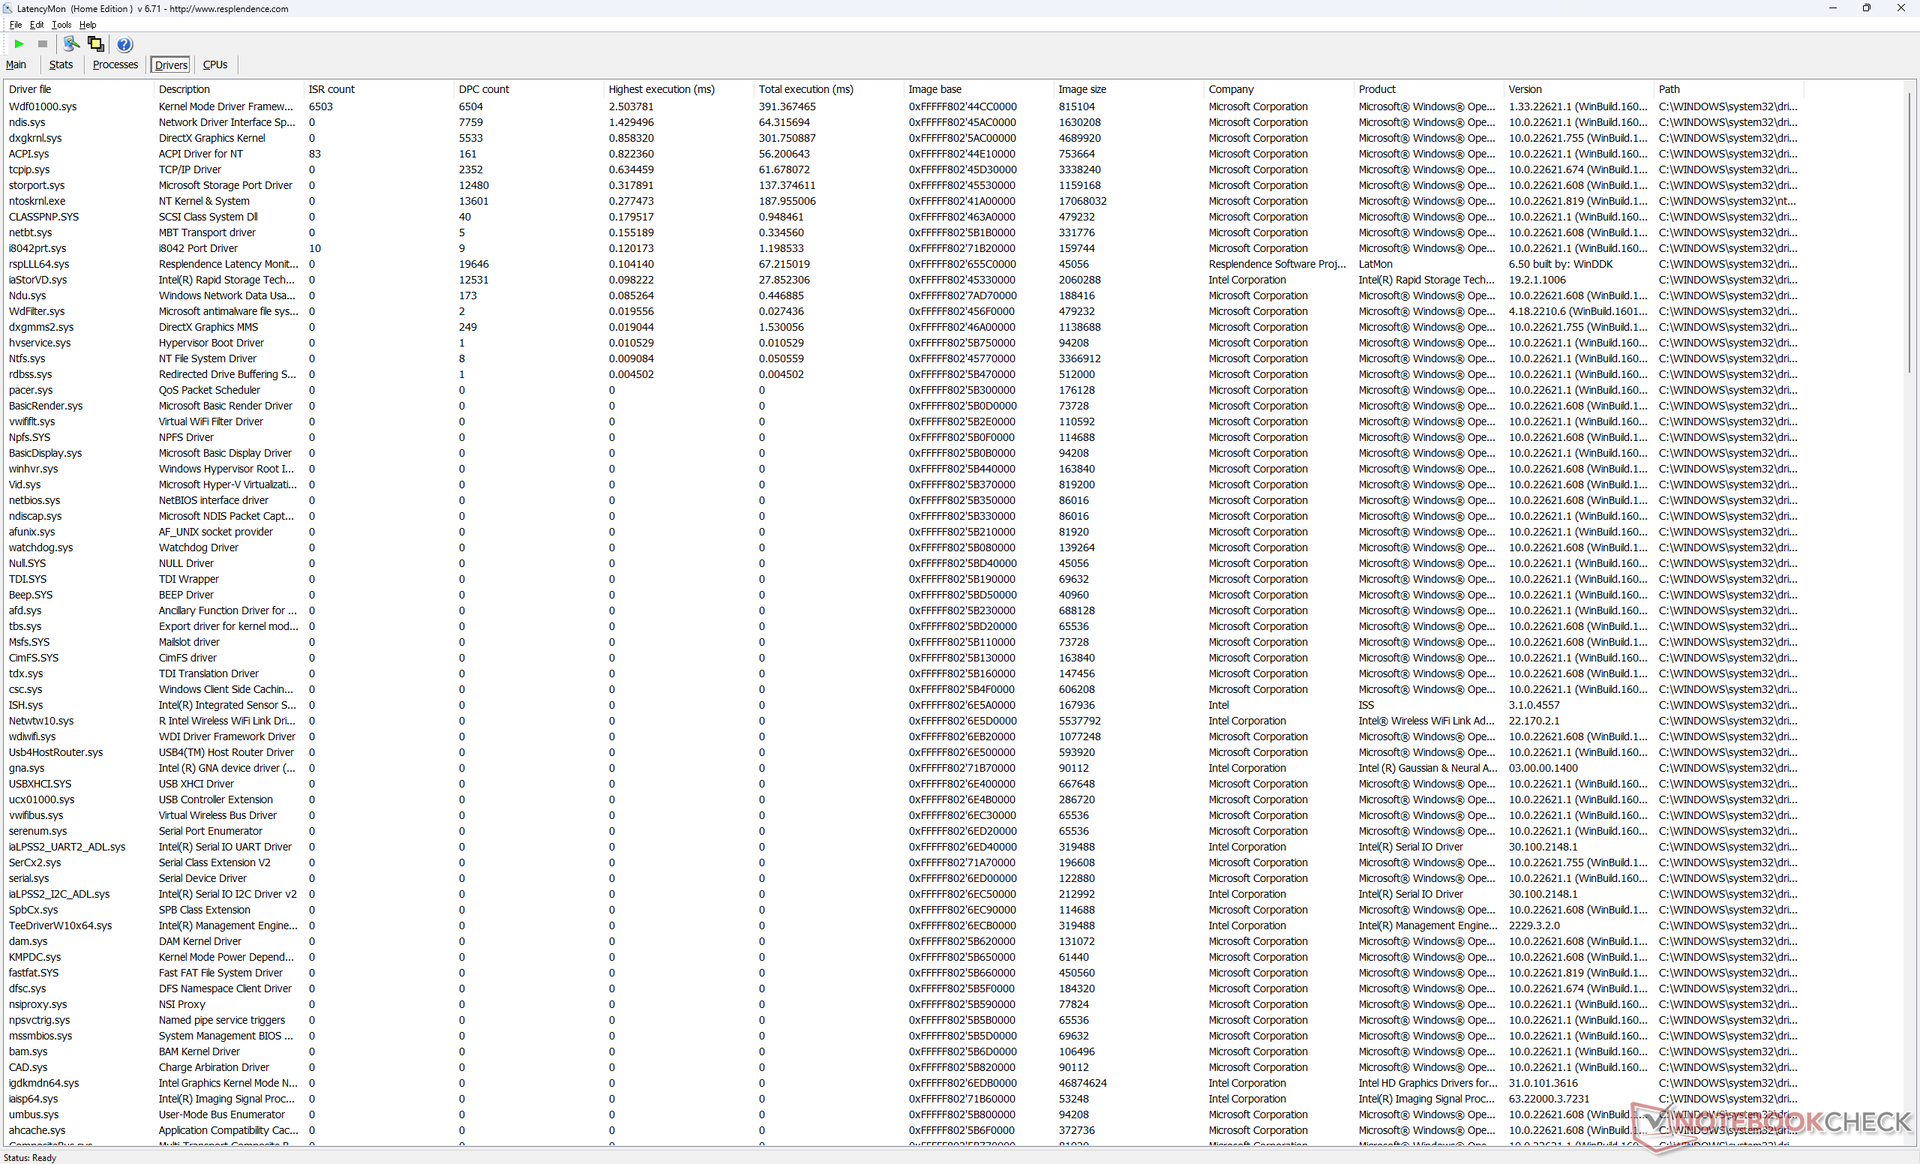
DPC-Latenzen
Das von uns getestete Modell wies auch nach mehreren Testläufen starke DPC-Probleme auf, während wir multiple Browser-Fenster auf unserer Homepage öffneten. Die mehrminütige 4K-YouTube-Wiedergabe bei 60 fps ist mit vier ausgelassenen Bildern auch nicht perfekt. Für ein High-End-Business-Laptop, bei dem eine durchgängig abrufbare Performance wichtig ist, ist das enttäuschend.
| DPC Latencies / LatencyMon - interrupt to process latency (max), Web, Youtube, Prime95 | |
| Dell Latitude 9330 | |
| HP EliteBook x360 1030 G7 | |
| HP Elite Dragonfly Max | |
| MSI Summit E13 Flip Evo A11MT | |
| Lenovo ThinkPad X1 Titanium Yoga G1 20QB0016GE | |
| Dell Latitude 5310-23VP6 | |
* ... kleinere Werte sind besser
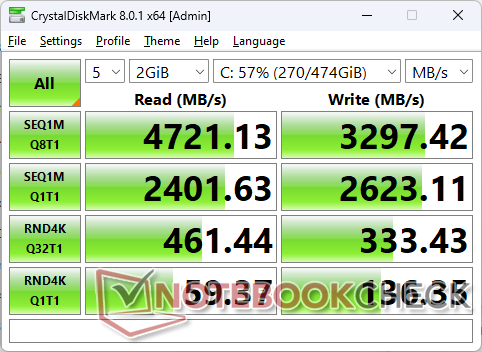
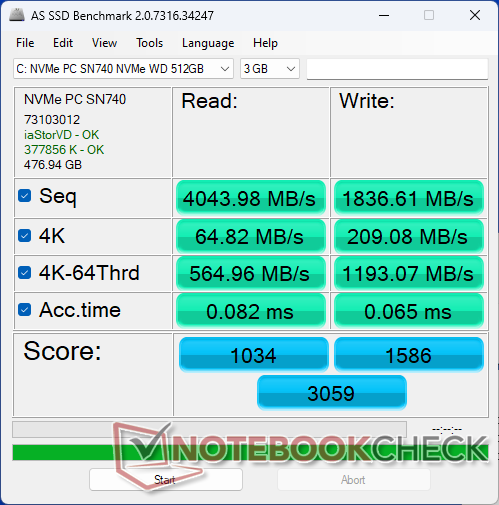
Massenspeicher— lediglich PCIe-4-x4-2230
Unser Testgerät kommt mit einer 512-GB-WD-SN740-PCIe4-x4-NVMe-SSD, die beständige sequentielle Lese- und Schreibraten von bis zu 4.700 MB/s respektive 3.300 MB/s bietet. Die Performance ist dem Mittelfeld zuzuordnen, da die neuesten PCIe4-x4-SSDs von Samsung über 7.000 MB/s erreichen. Der Dell Laptop unterstützt nur eine interne SSD.

| Drive Performance Rating - Percent | |
| MSI Summit E13 Flip Evo A11MT | |
| Dell Latitude 9330 | |
| HP EliteBook x360 1030 G7 | |
| HP Elite Dragonfly Max | |
| Lenovo ThinkPad X1 Titanium Yoga G1 20QB0016GE | |
| Dell Latitude 5310-23VP6 | |
* ... kleinere Werte sind besser
Dauerleistung Lesen: DiskSpd Read Loop, Queue Depth 8
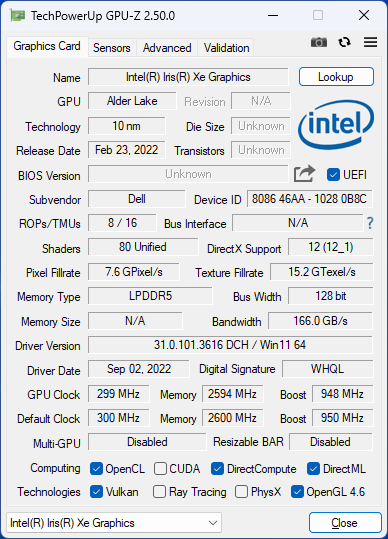
Grafikleistung — gut, aber nicht herausragend
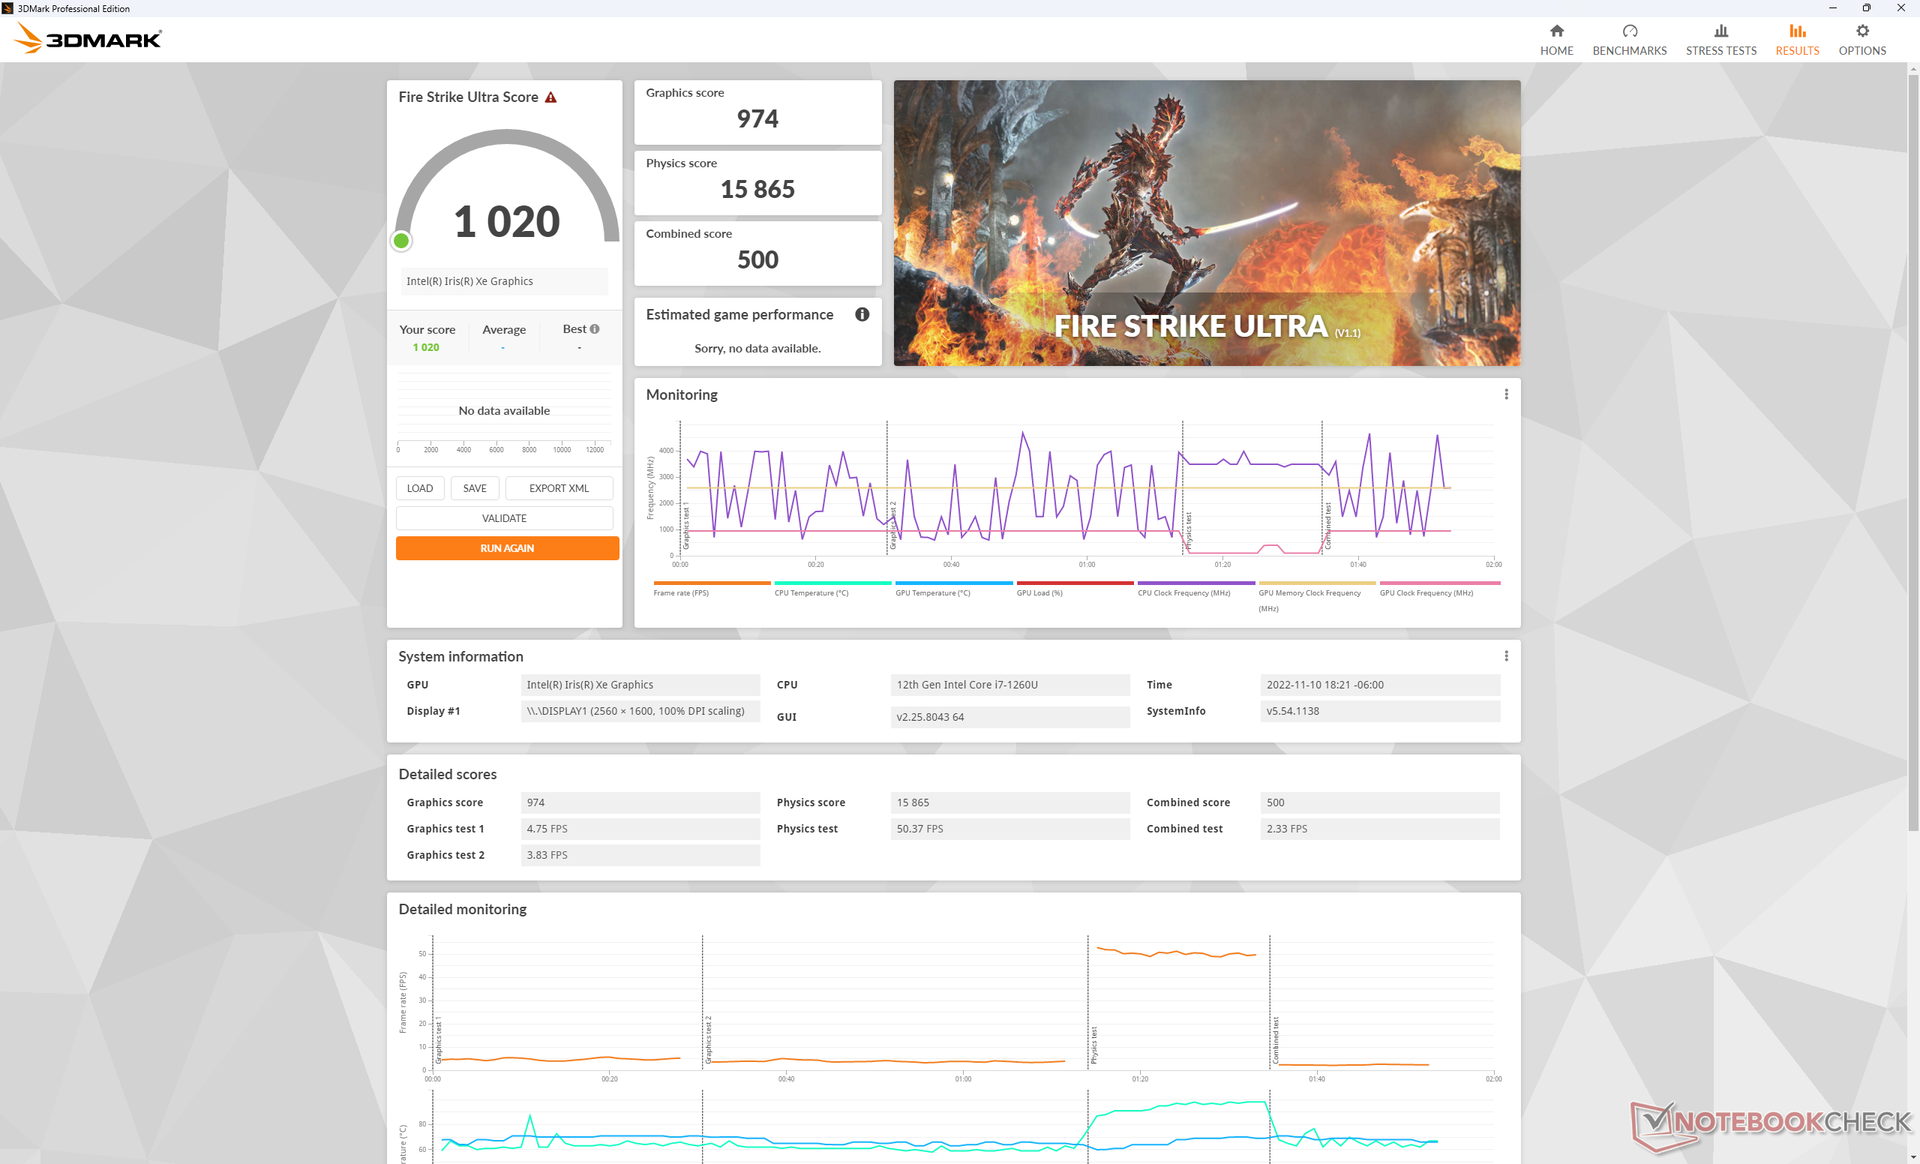
Die Grafikleistung ist laut unserer Datenbank um 15 Prozent schwächer als der Durchschnitt einer Iris-Xe-GPU 96 EUs, obwohl ein schneller LPDDR5-5200-RAM zum Einsatz kommt. Die Latitude Serie ist jedoch nicht für Gaming konzipiert, sodass es kein großes Problem darstellen dürfte. Die Leistung nähert sich generell die einer Iris Xe 80 EUs an, die bei vielen Core-i5-CPUs vorzufinden ist.
Dennoch sind viele Games bei niedrigen Detailstufen auf dem Latitude 9330 spielbar.
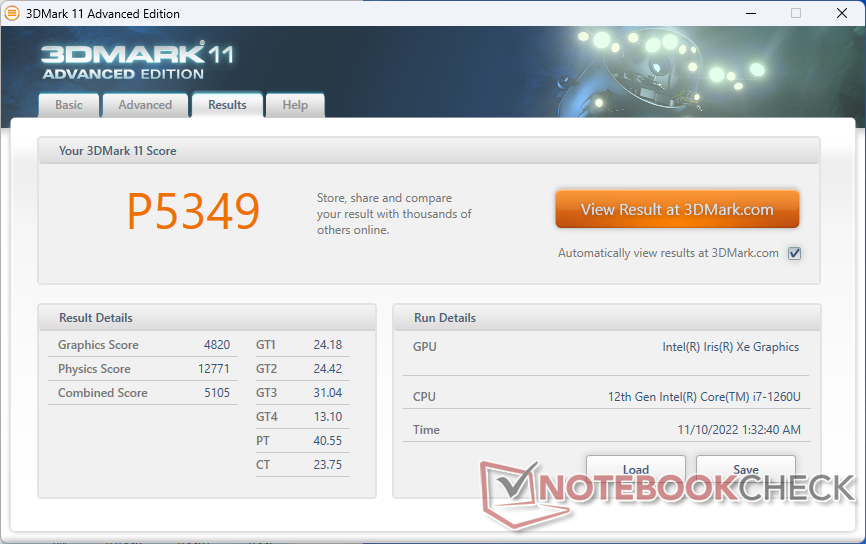
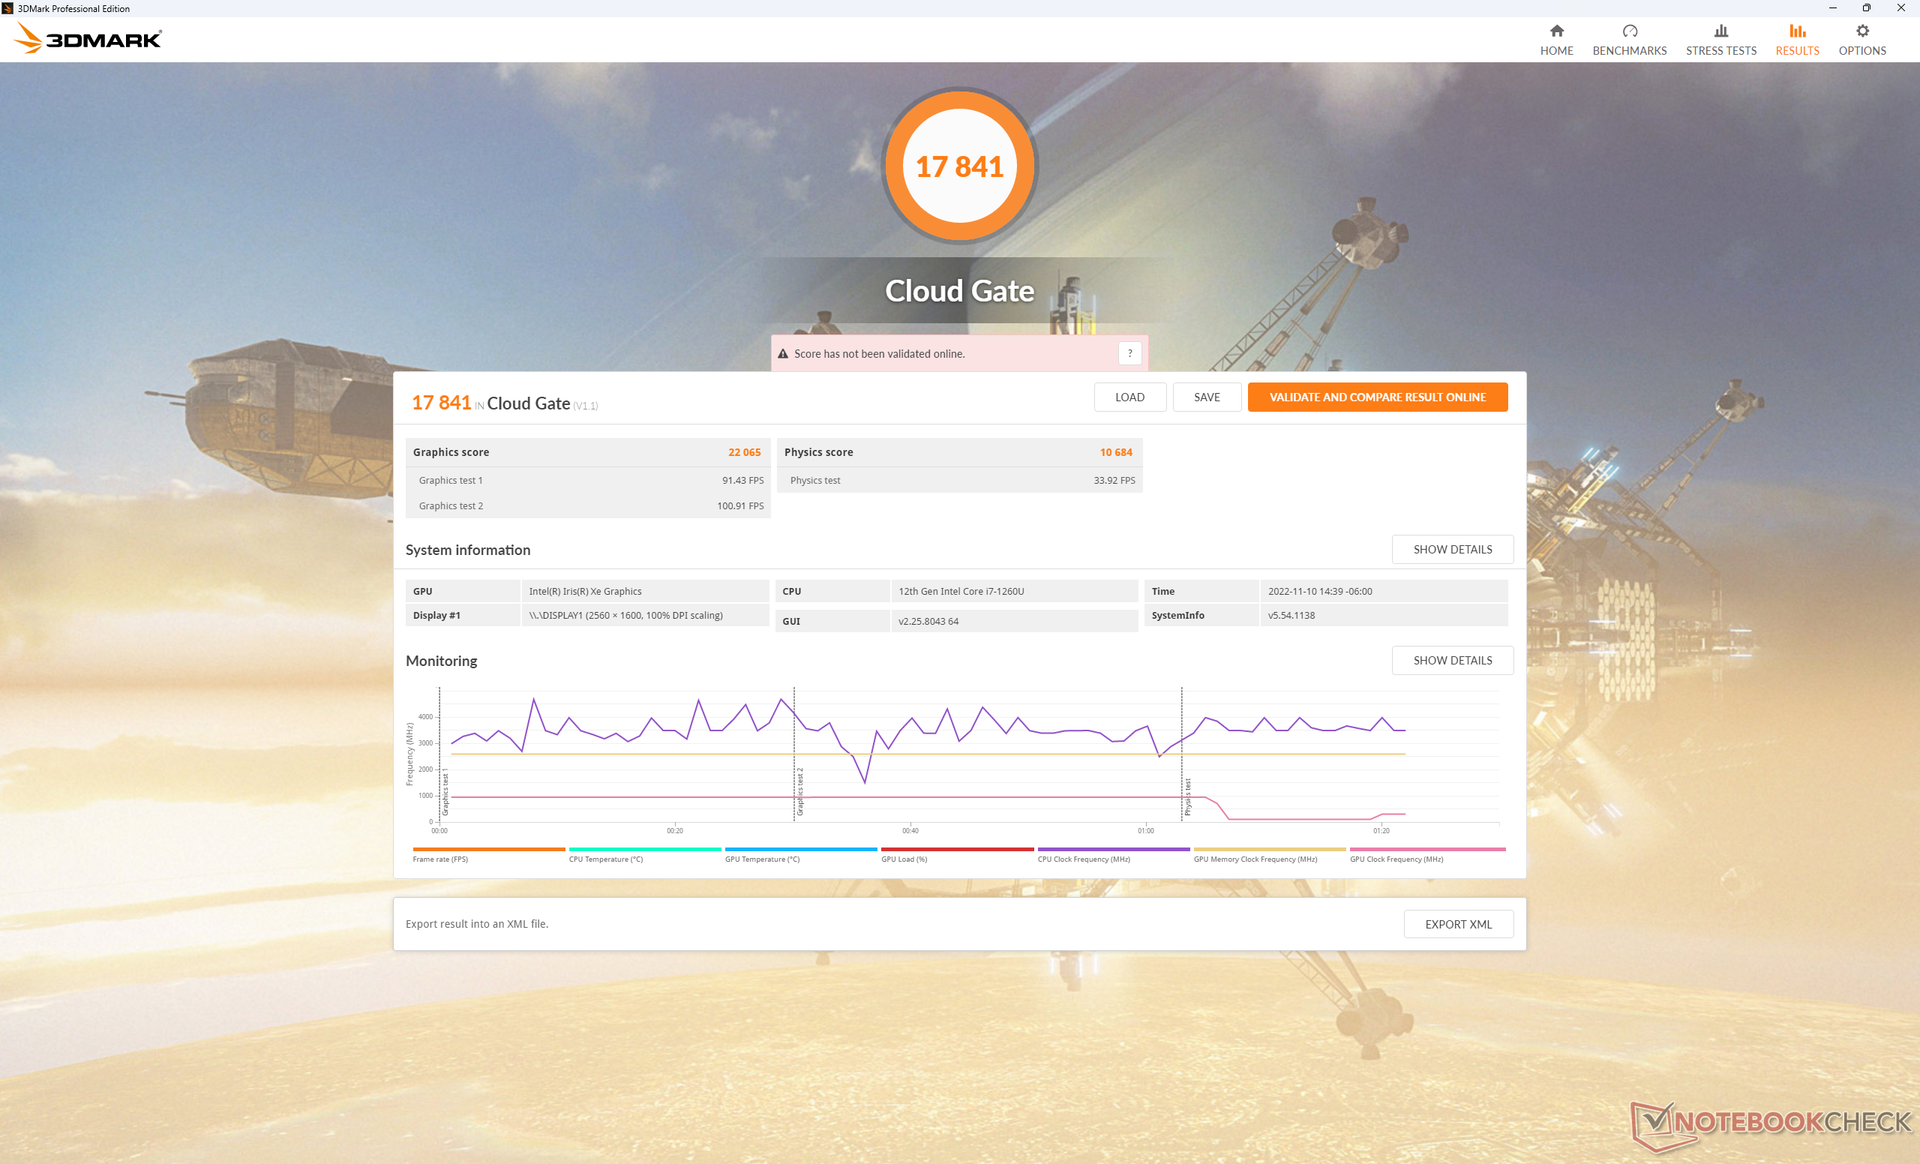
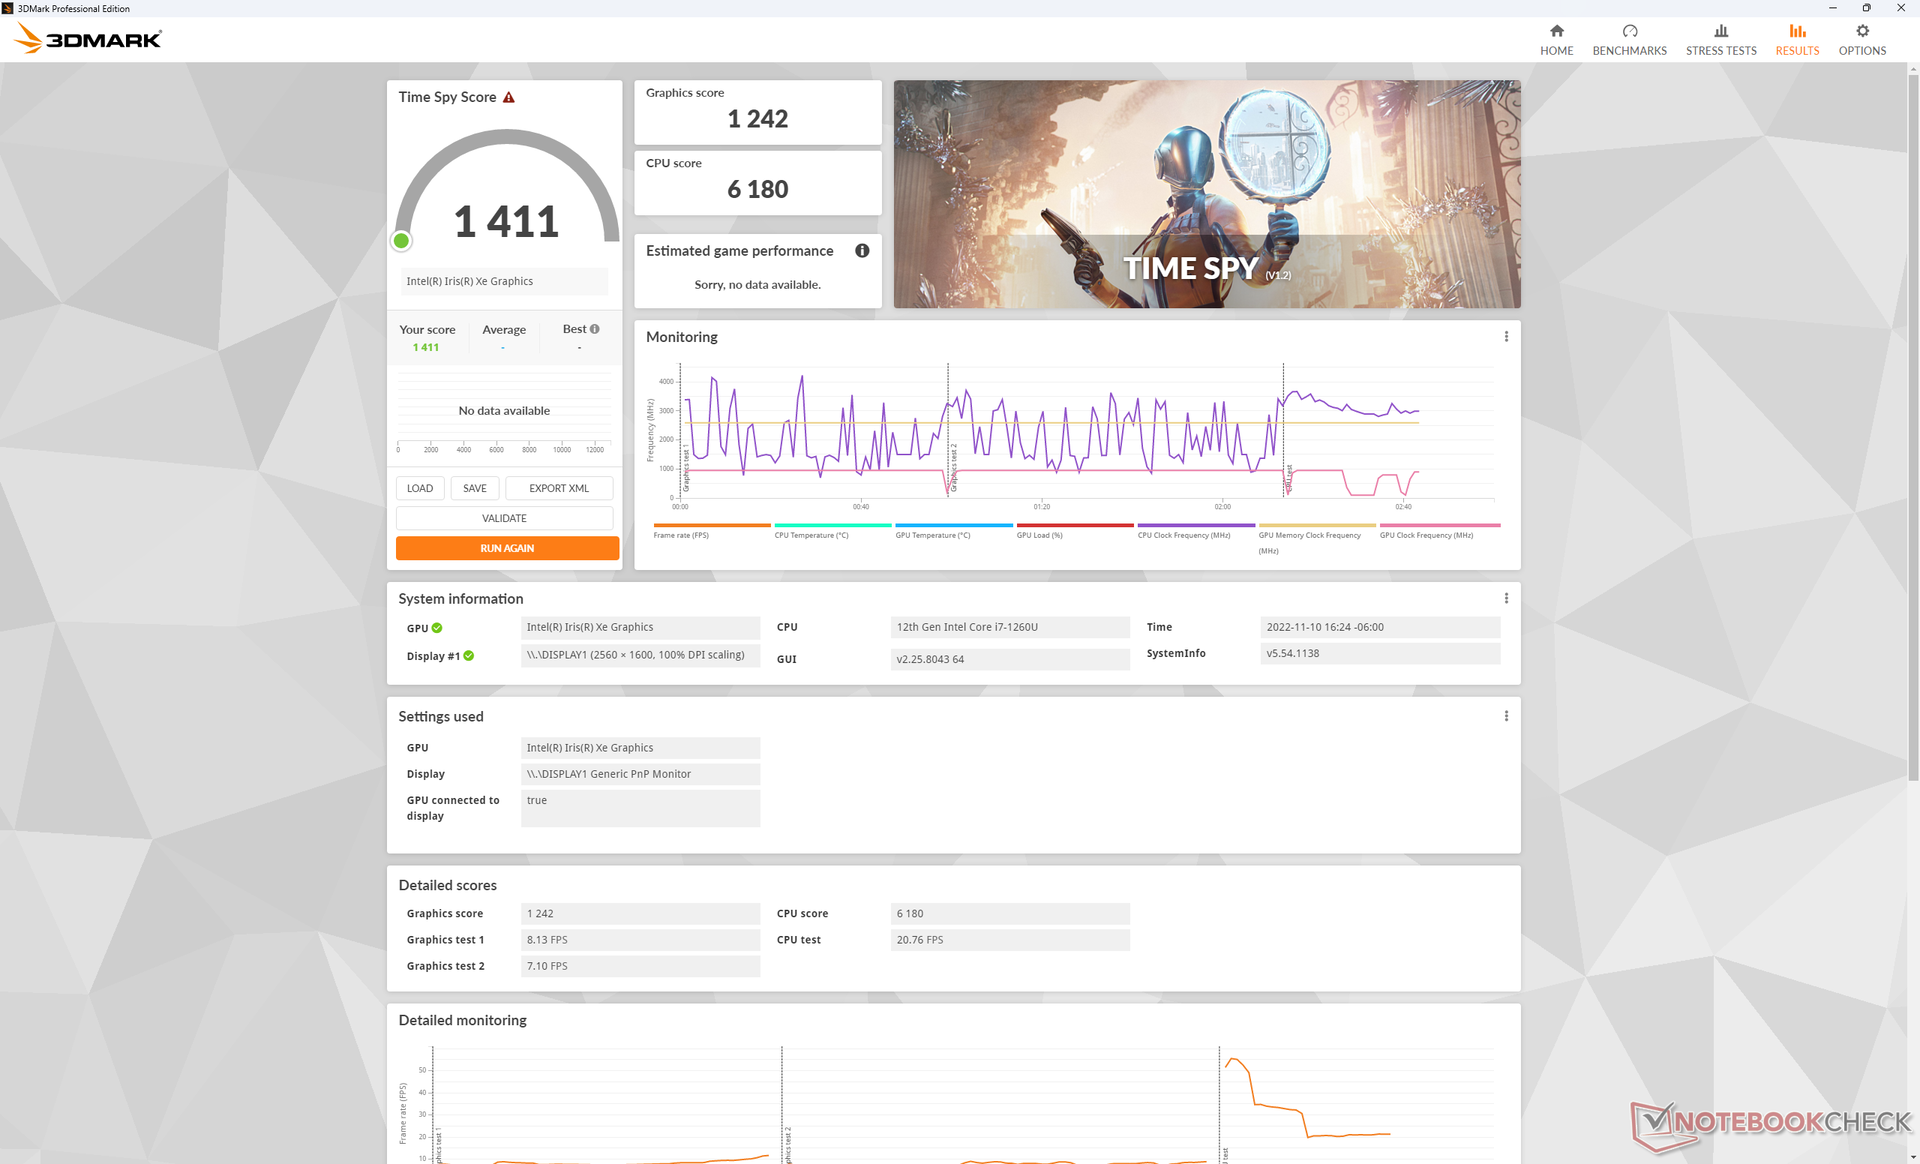
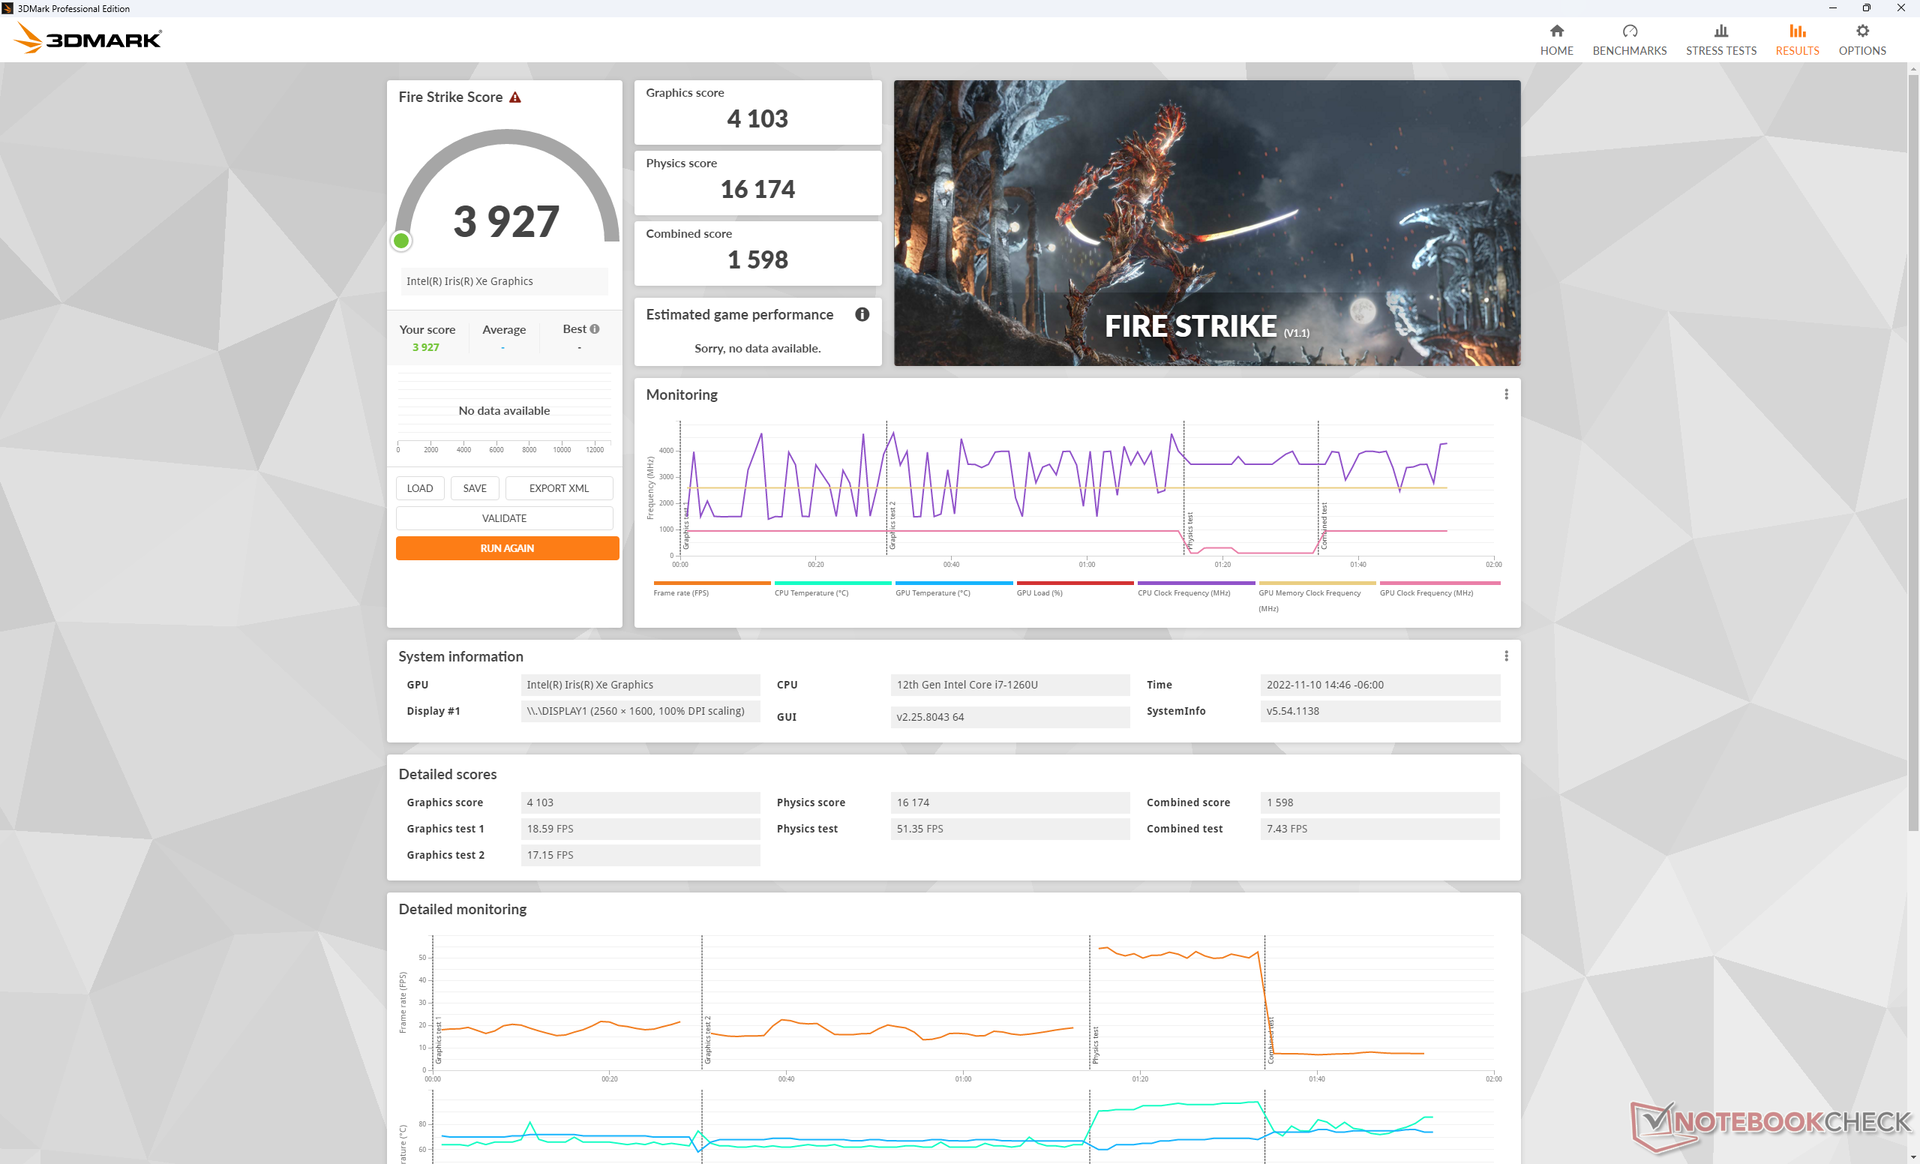
| 3DMark 11 Performance | 5349 Punkte | |
| 3DMark Cloud Gate Standard Score | 17841 Punkte | |
| 3DMark Fire Strike Score | 3927 Punkte | |
| 3DMark Time Spy Score | 1411 Punkte | |
Hilfe | ||
| Blender - v3.3 Classroom CPU | |
| Dell Latitude 9330 | |
| Durchschnittliche Intel Iris Xe Graphics G7 96EUs (336 - 1259, n=109) | |
* ... kleinere Werte sind besser
| Performance Rating - Percent | |
| MSI Summit E13 Flip Evo A11MT | |
| Dell Latitude 9330 | |
| HP Elite Dragonfly Max -1! | |
| Lenovo ThinkPad X1 Titanium Yoga G1 20QB0016GE -3! | |
| HP EliteBook x360 1030 G7 -3! | |
| Dell Latitude 5310-23VP6 -4! | |
| The Witcher 3 - 1920x1080 Ultra Graphics & Postprocessing (HBAO+) | |
| MSI Summit E13 Flip Evo A11MT | |
| HP Elite Dragonfly Max | |
| Dell Latitude 9330 | |
| Lenovo ThinkPad X1 Titanium Yoga G1 20QB0016GE | |
| GTA V - 1920x1080 Highest AA:4xMSAA + FX AF:16x | |
| MSI Summit E13 Flip Evo A11MT | |
| Dell Latitude 9330 | |
| Final Fantasy XV Benchmark - 1920x1080 High Quality | |
| MSI Summit E13 Flip Evo A11MT | |
| Dell Latitude 9330 | |
| HP Elite Dragonfly Max | |
| HP EliteBook x360 1030 G7 | |
| Strange Brigade - 1920x1080 ultra AA:ultra AF:16 | |
| MSI Summit E13 Flip Evo A11MT | |
| Dell Latitude 9330 | |
| HP Elite Dragonfly Max | |
| Dota 2 Reborn - 1920x1080 ultra (3/3) best looking | |
| Dell Latitude 9330 | |
| MSI Summit E13 Flip Evo A11MT | |
| Lenovo ThinkPad X1 Titanium Yoga G1 20QB0016GE | |
| HP Elite Dragonfly Max | |
| HP EliteBook x360 1030 G7 | |
| Dell Latitude 5310-23VP6 | |
| X-Plane 11.11 - 1920x1080 high (fps_test=3) | |
| MSI Summit E13 Flip Evo A11MT | |
| Dell Latitude 9330 | |
| HP Elite Dragonfly Max | |
| Lenovo ThinkPad X1 Titanium Yoga G1 20QB0016GE | |
| HP EliteBook x360 1030 G7 | |
| Dell Latitude 5310-23VP6 | |
Witcher 3 FPS-Diagramm
| min. | mittel | hoch | max. | |
|---|---|---|---|---|
| GTA V (2015) | 102.1 | 91.1 | 21.7 | 8.94 |
| The Witcher 3 (2015) | 75.8 | 47.2 | 25.9 | 11.4 |
| Dota 2 Reborn (2015) | 100.3 | 80.1 | 58.6 | 53.4 |
| Final Fantasy XV Benchmark (2018) | 37.3 | 21 | 14.6 | |
| X-Plane 11.11 (2018) | 37.1 | 34.4 | 30.8 | |
| Strange Brigade (2018) | 69.1 | 32.4 | 25 | 20.4 |
| Cyberpunk 2077 1.6 (2022) | 17.5 | 14.5 | 11.2 | 8.9 |
Emissionen — Hochfrequente Lüfter im Latitude 9330
Geräuschemissionen — Hochfrequente Lüfter
Die zwei Lüfter sind mit ihren 30 mm recht klein, im Vergleich zu den 40 mm oder gar größeren Lüftern in den meisten anderen Laptops. Das Hauptproblem von kleineren Lüftern ist, dass sie in der Regel hochfrequenter laufen als größere, sodass sie deutlich wahrnehmbarer sind.
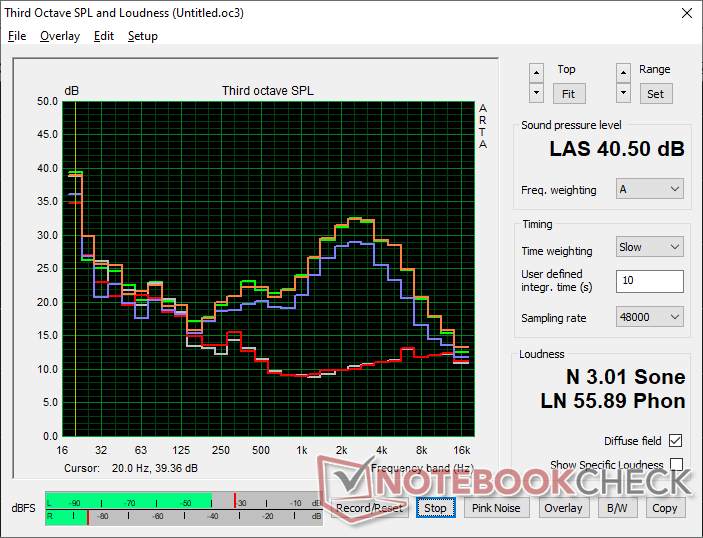
Unsere Messungen bestätigen das mit einer ziemlich deutlichen Spitze von circa 3 kHz im Vergleich zu den deutlich breiter gestreuten Messwerten der hohen Frequenzen in anderen 13-Zoll-Subnotebooks, etwa beim XPS 13 Plus 9320. Anders ausgedrückt können die Lüfter im Latitude 9330 beim Web-Browsing und Video-Streaming schon störender werden.
Beim 3DMark 06 drehen die Lüfter ab der Hälfte der ersten Benchmark-Szene mit 37dB(A) deutlich auf. Damit wird das Dell eindeutig lauter als das HP Dragonfly Max, während das Summit E13 Flip in etwa gleichauf liegt. Wir empfehlen den Quiet- oder Balanced-Modus zu verwenden, um das Pulsieren der Lüfter auf ein Minimum zu begrenzen.
Lautstärkediagramm
| Idle |
| 23 / 23.1 / 23.1 dB(A) |
| Last |
| 37.1 / 40.5 dB(A) |
 | ||
30 dB leise 40 dB(A) deutlich hörbar 50 dB(A) störend |
||
min: | ||
| Dell Latitude 9330 Iris Xe G7 96EUs, i7-1260U | Lenovo ThinkPad X1 Titanium Yoga G1 20QB0016GE Iris Xe G7 80EUs, i5-1140G7, Lenovo UMIS RPJTJ256MEE1OWX | MSI Summit E13 Flip Evo A11MT Iris Xe G7 96EUs, i7-1185G7, Phison 1TB SM2801T24GKBB4S-E162 | HP EliteBook x360 1030 G7 UHD Graphics 620, i7-10810U, Samsung SSD PM981a MZVLB512HBJQ | HP Elite Dragonfly Max Iris Xe G7 96EUs, i7-1185G7, Toshiba XG6 KXG60ZNV512G | Dell Latitude 5310-23VP6 UHD Graphics 620, i5-10310U, SK hynix BC511 HFM512GDHTNI-87A0B | |
|---|---|---|---|---|---|---|
| Geräuschentwicklung | -9% | -8% | -13% | 5% | 1% | |
| aus / Umgebung * (dB) | 23 | 25.61 -11% | 24.5 -7% | 28.1 -22% | 24.9 -8% | 24.9 -8% |
| Idle min * (dB) | 23 | 25.61 -11% | 24.7 -7% | 28.1 -22% | 24.9 -8% | 24.9 -8% |
| Idle avg * (dB) | 23.1 | 25.61 -11% | 24.7 -7% | 28.1 -22% | 24.9 -8% | 24.9 -8% |
| Idle max * (dB) | 23.1 | 25.61 -11% | 26.4 -14% | 28.1 -22% | 24.9 -8% | 24.9 -8% |
| Last avg * (dB) | 37.1 | 40.14 -8% | 37.8 -2% | 35.1 5% | 29.7 20% | 30 19% |
| Witcher 3 ultra * (dB) | 40.6 | 41.4 -2% | 31.3 23% | 36 11% | ||
| Last max * (dB) | 40.5 | 40.14 1% | 48.8 -20% | 37.6 7% | 31.3 23% | 36.3 10% |
* ... kleinere Werte sind besser
Temperatur
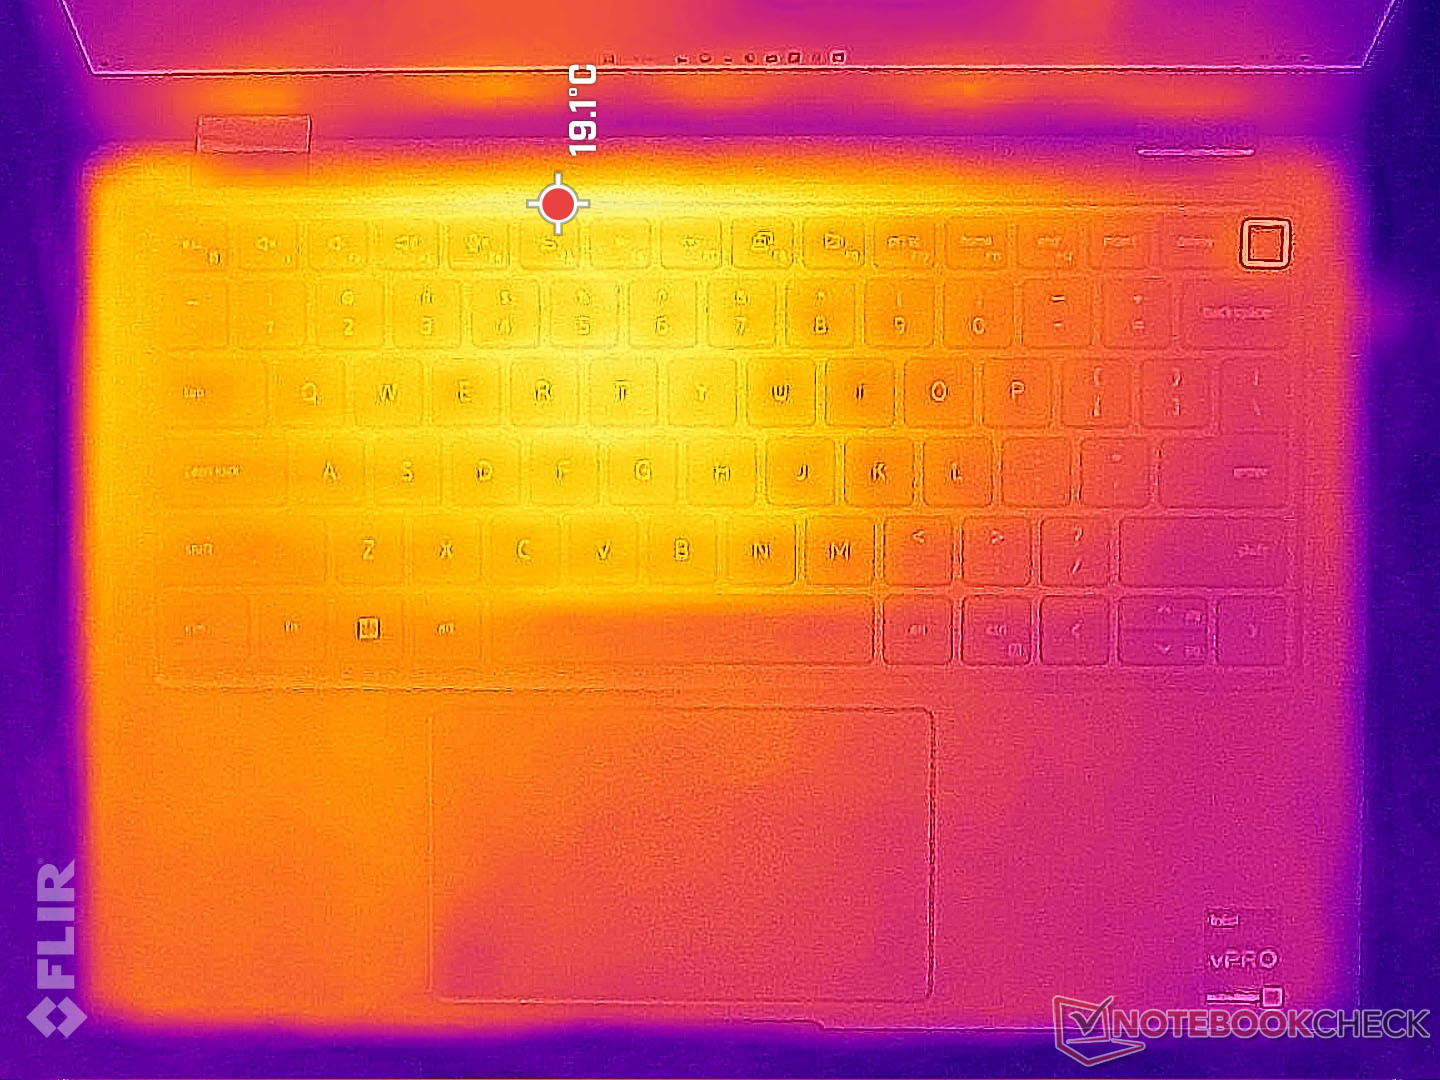
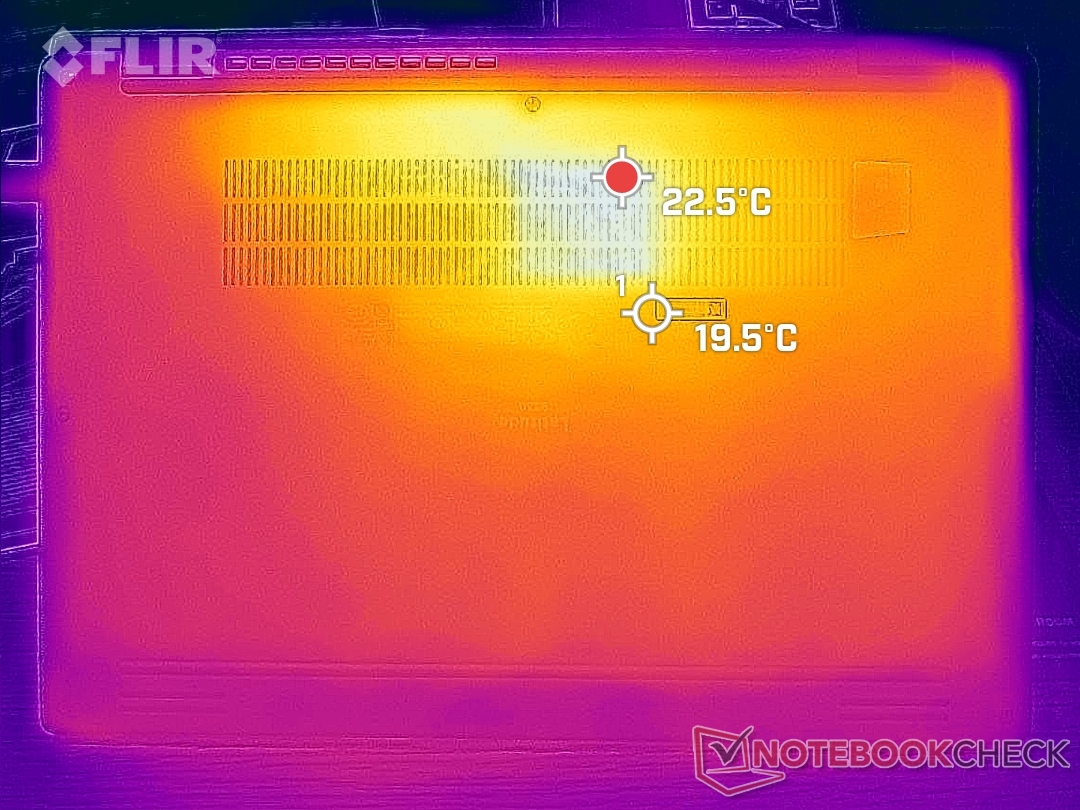
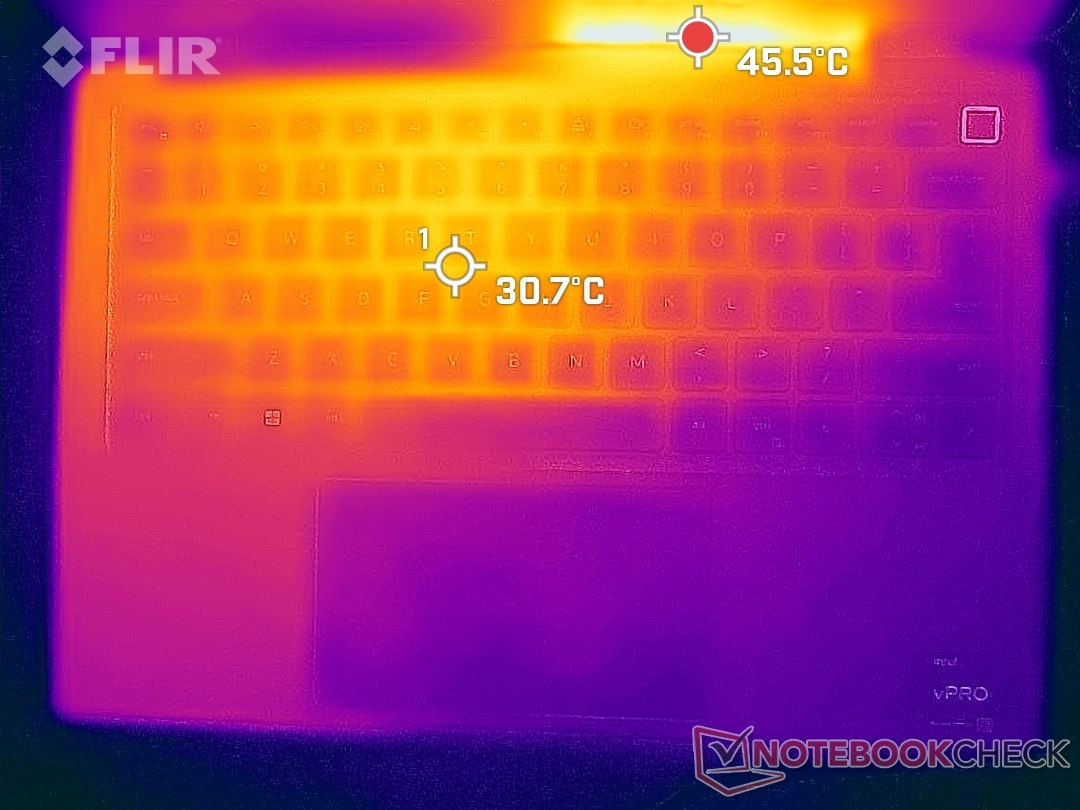
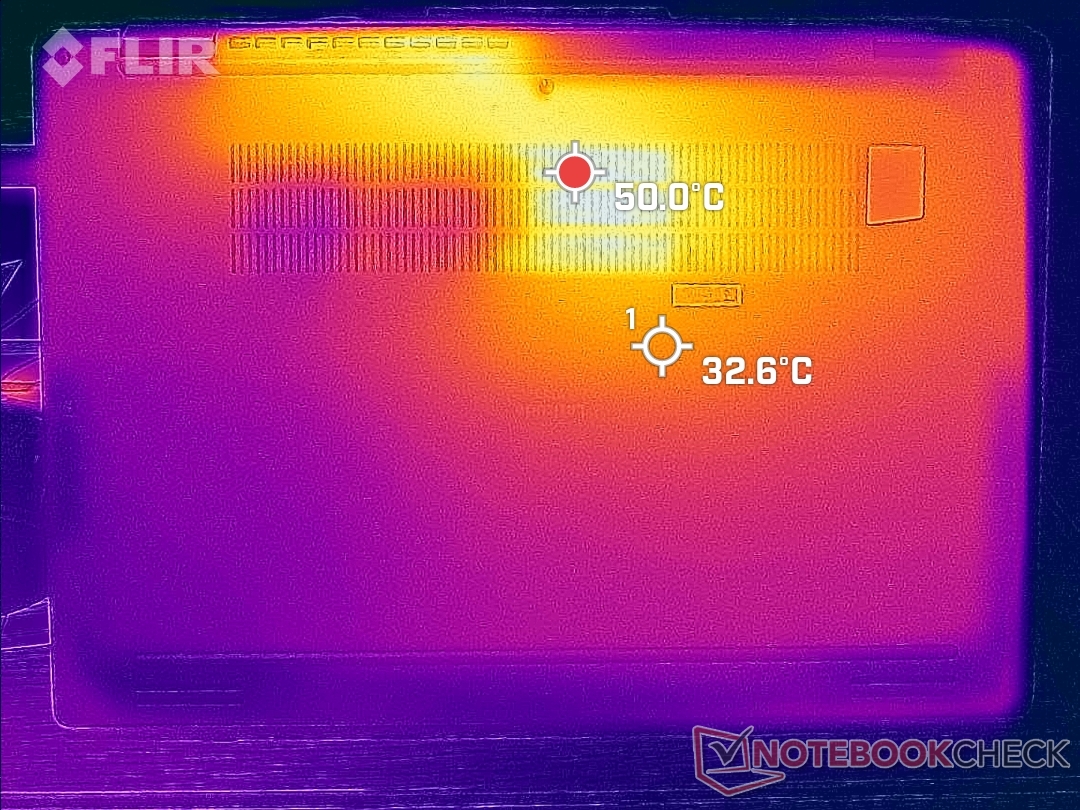
Die Oberflächen-Temperaturen bleiben bei geringen Lasten sehr kühl, da das Gehäuse größtenteils aus Metall besteht. Bei höheren Lasten kommt es jedoch zu Hotspots, mit 41 °C auf der Oberseite und 50 °C an der Unterseite. Sie befinden sich je an der Hinterseite des Gehäuses, sodass Tastatur und Handballenauflage kühl bleiben und ein komfortables Tippen gewährleistet bleibt. Das konkurrierende Dragonfly Max erreicht ähnliche Maxima, während das Summit E13 Flip mit bis zu 57 °C sogar wärmer werden kann.
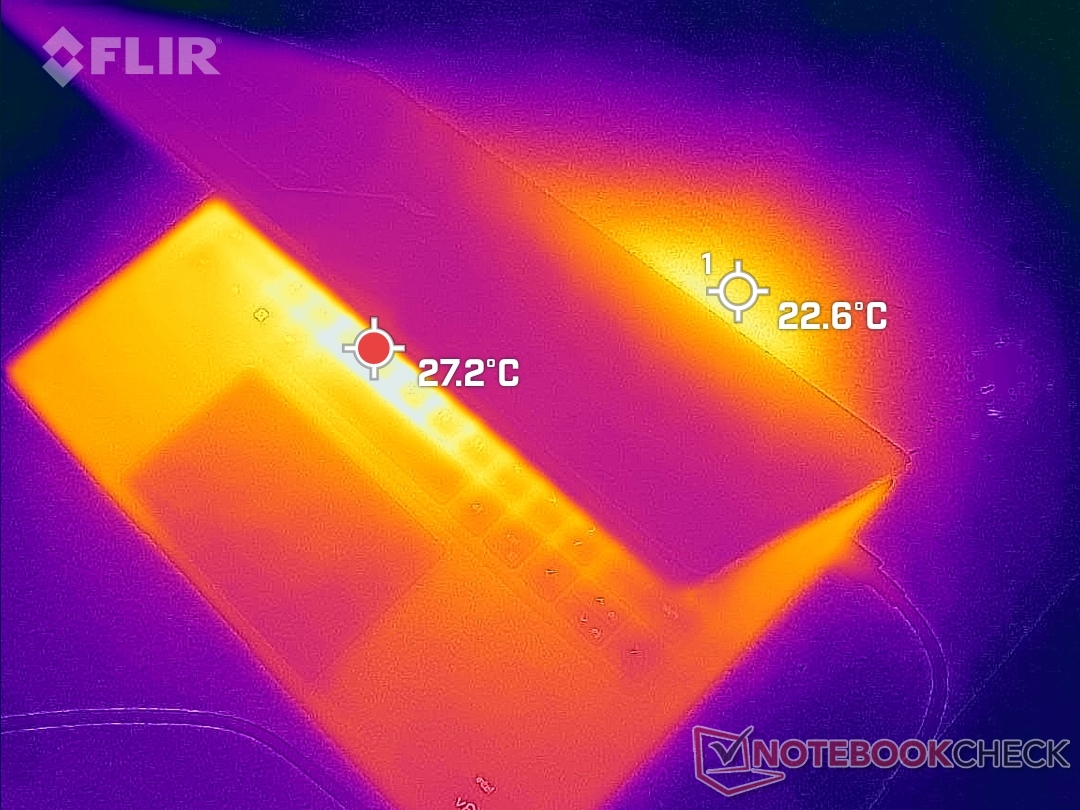
(±) Die maximale Temperatur auf der Oberseite ist 40.6 °C. Im Vergleich liegt der Klassendurchschnitt bei 35.4 °C (von 19.6 bis 60 °C für die Klasse Convertible).
(-) Auf der Unterseite messen wir eine maximalen Wert von 50.2 °C (im Vergleich zum Durchschnitt von 36.9 °C).
(+) Ohne Last messen wir eine durchschnittliche Temperatur von 23.5 °C auf der Oberseite. Der Klassendurchschnitt erreicht 30.3 °C.
(+) Die Handballen und der Touchpad-Bereich sind mit gemessenen 28 °C kühler als die typische Hauttemperatur und fühlen sich dadurch kühl an.
(±) Die durchschnittliche Handballen-Temperatur anderer getesteter Geräte war 28 °C (0 °C).
| Dell Latitude 9330 Intel Core i7-1260U, Intel Iris Xe Graphics G7 96EUs | Lenovo ThinkPad X1 Titanium Yoga G1 20QB0016GE Intel Core i5-1140G7, Intel Iris Xe Graphics G7 80EUs | MSI Summit E13 Flip Evo A11MT Intel Core i7-1185G7, Intel Iris Xe Graphics G7 96EUs | HP EliteBook x360 1030 G7 Intel Core i7-10810U, Intel UHD Graphics 620 | HP Elite Dragonfly Max Intel Core i7-1185G7, Intel Iris Xe Graphics G7 96EUs | Dell Latitude 5310-23VP6 Intel Core i5-10310U, Intel UHD Graphics 620 | |
|---|---|---|---|---|---|---|
| Hitze | -3% | -22% | -2% | -11% | 6% | |
| Last oben max * (°C) | 40.6 | 46.3 -14% | 52 -28% | 37 9% | 39.4 3% | 39 4% |
| Last unten max * (°C) | 50.2 | 43.3 14% | 57.4 -14% | 47.2 6% | 50 -0% | 44.8 11% |
| Idle oben max * (°C) | 25 | 26.8 -7% | 30.4 -22% | 25.8 -3% | 31.6 -26% | 24.3 3% |
| Idle unten max * (°C) | 27.6 | 28.3 -3% | 34.2 -24% | 32.6 -18% | 33.4 -21% | 25.6 7% |
* ... kleinere Werte sind besser
Stresstest
Die CPU-Temperatur erreicht unter Last regelmäßig 90 °C oder mehr. Als wir etwa Prime95 initiierten, schoss die CPU fast sofort auf 99 °C, bei 2,8 GHz und 29 W, und fällt dann schnell auf stabil bleibende 2,4 GHz bei 25 W, um Kern-Temperaturen von ~98 °C beizubehalten. Das Dragonfly Max mit Core i7-1185G7 erreicht beim gleichen Stresstest deutlich geringere Taktraten und Temperaturen von 1,5 GHz bei nur 71 °C. Dell scheut sich demnach nicht, den Prozessor heißer laufen zu lassen als bei den meisten anderen Geräten, um eine bessere Leistung zu erzielen.
GPU-Takt und -Temperatur beim Witcher-3-Stresstest stabilisieren sich bei 948 MHz, respektive bei 91 °C, im Vergleich zu nur 700 MHz und 61 °C beim erwähnten HP Dragonfly Max.
Im Akkubetrieb verringert sich die Leistung: Ein 3DMark-11-Test erzielte dann Physics- und Graphics-Scores von 7.531 bzw. 4.193 Punkte, im Vergleich zu 12.771 und 4.820 Punkte während des Netzbetriebs.
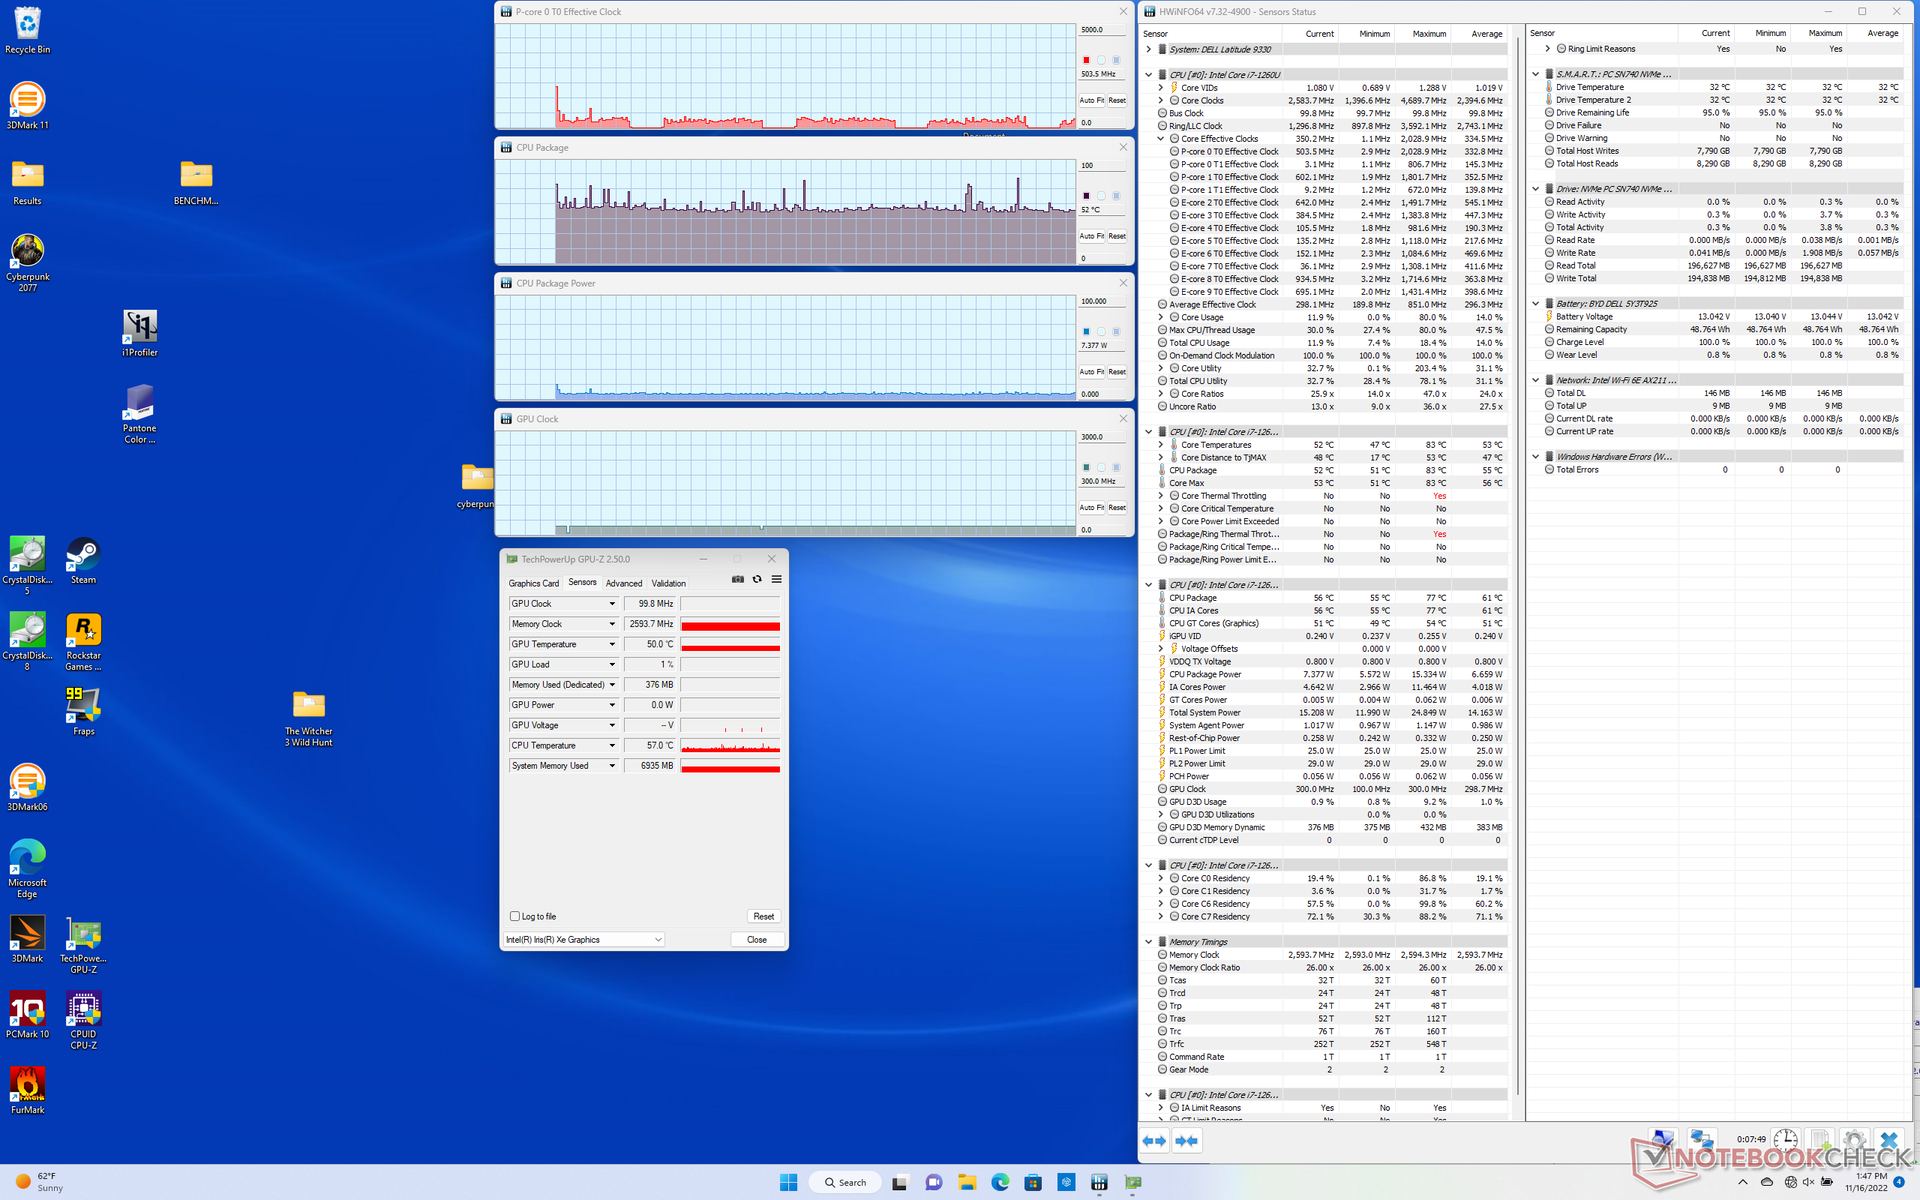
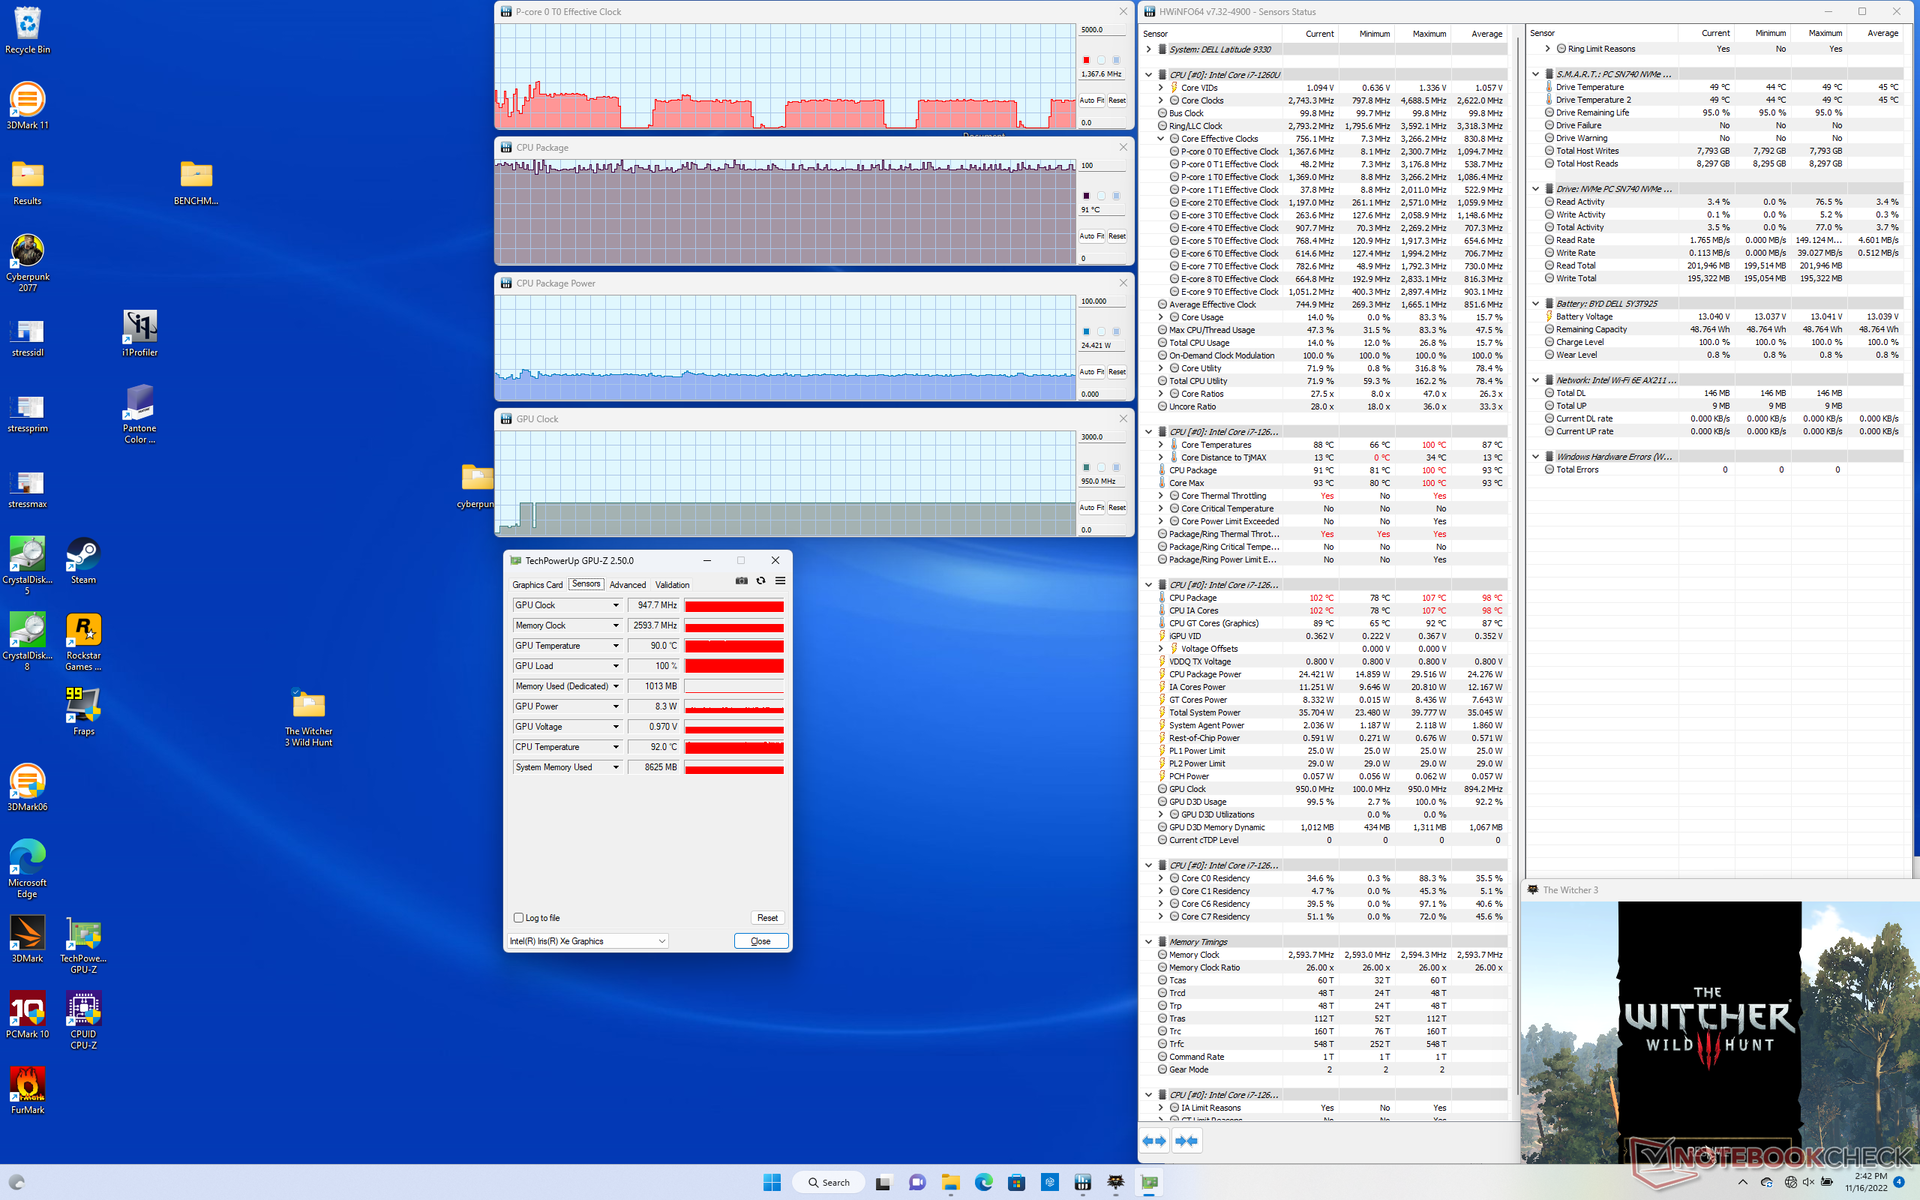
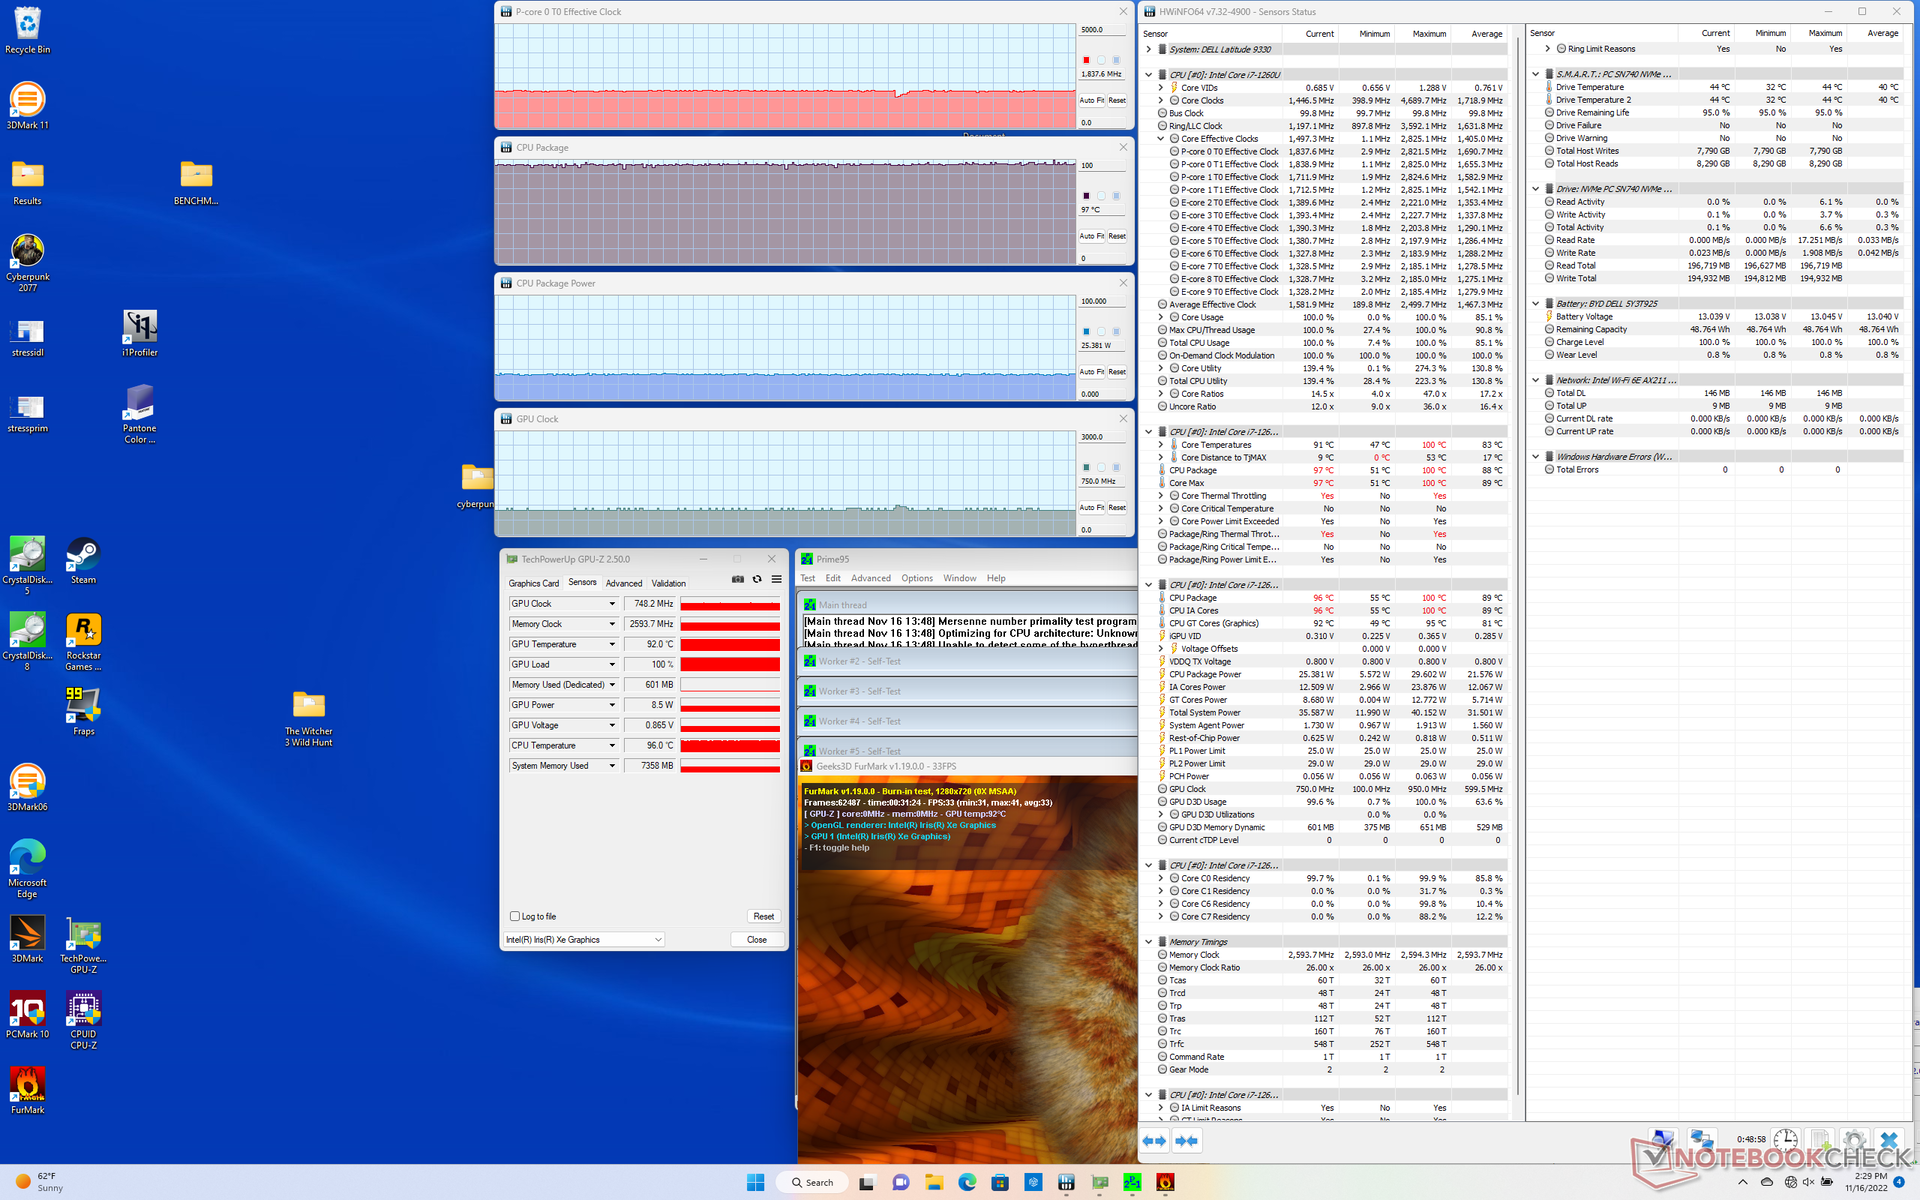
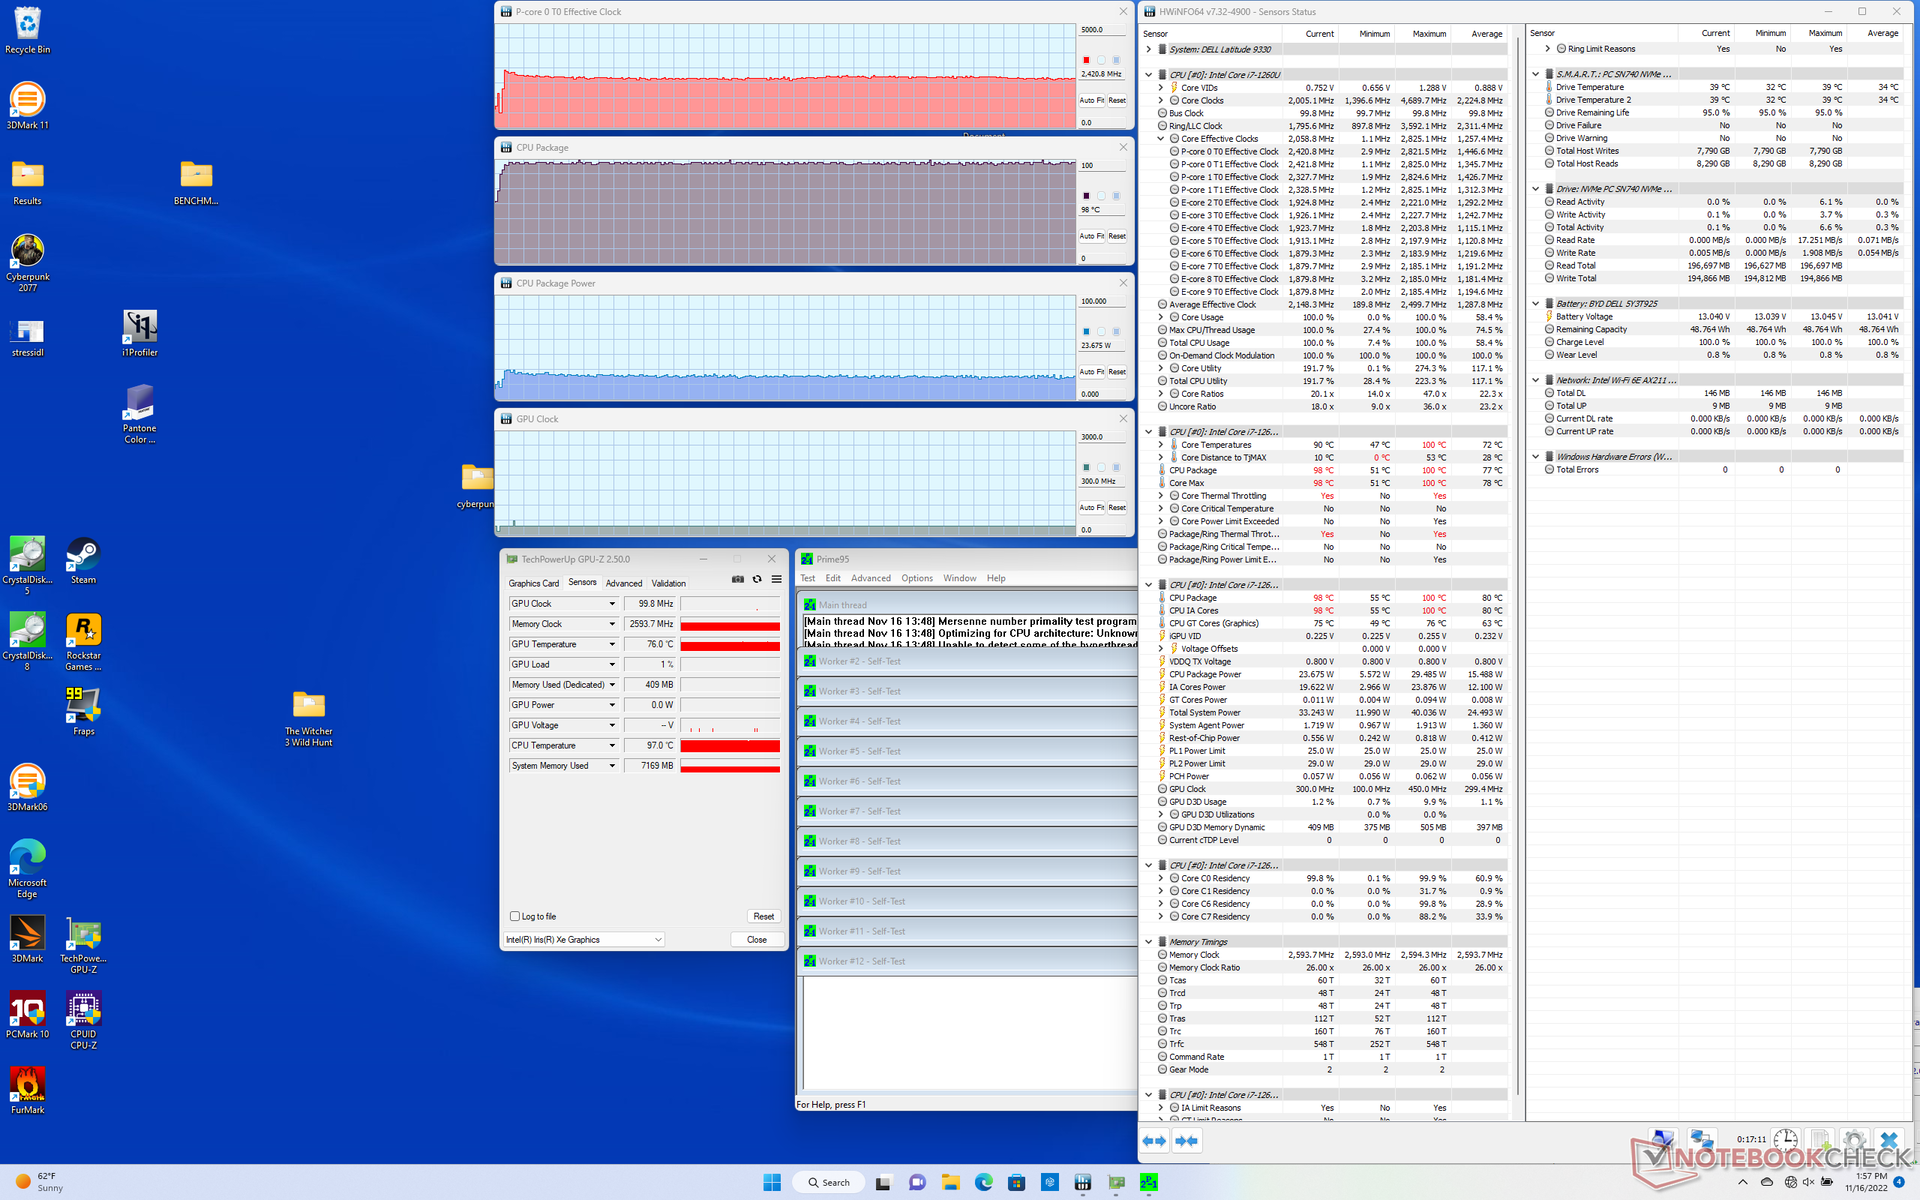
| CPU Clock (GHz) | GPU Clock (MHz) | Average CPU Temperature (°C) | |
| System Idle | -- | -- | 52 |
| Prime95 Stress | 2,4 | -- | 98 |
| Prime95 + FurMark, Stress | 1,8 | 748 | 97 |
| Witcher 3, Stress | 1,4 | 948 | 91 |
Lautsprecher
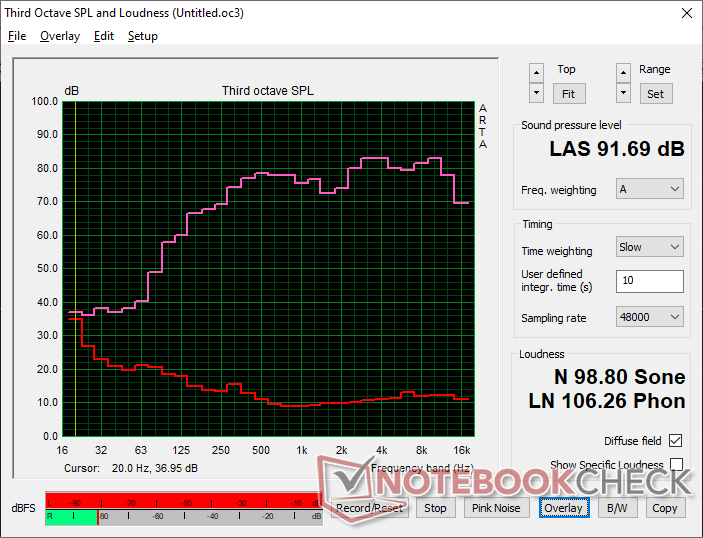
Dell hat es geschafft, vier Lautsprecher ins Gehäuse zu quetschen, mit einer ausgezeichneten Audioqualität trotz dem kleinen Formfaktor. Sie werden mit 91 dB(A) zudem ausgesprochen laut und bleiben dabei sehr klar ohne zu rauschen. Man muss nicht erwähnen, dass die Lautsprecher für Audio- und Video-Konferenzen mehr als geeignet sind.
Dell Latitude 9330 Audio Analyse
(+) | Die Lautsprecher können relativ laut spielen (91.7 dB)
Bass 100 - 315 Hz
(±) | abgesenkter Bass - 11.9% geringer als der Median
(+) | lineare Bass-Wiedergabe (6.3% Delta zum Vorgänger)
Mitteltöne 400 - 2000 Hz
(+) | ausgeglichene Mitten, vom Median nur 1.9% abweichend
(+) | lineare Mitten (2.7% Delta zum Vorgänger)
Hochtöne 2 - 16 kHz
(+) | ausgeglichene Hochtöne, vom Median nur 3.4% abweichend
(+) | sehr lineare Hochtöne (3.5% Delta zum Vorgänger)
Gesamt im hörbaren Bereich 100 - 16.000 Hz
(+) | hörbarer Bereich ist sehr linear (9.2% Abstand zum Median
Im Vergleich zu allen Geräten derselben Klasse
» 4% aller getesteten Geräte dieser Klasse waren besser, 1% vergleichbar, 95% schlechter
» Das beste Gerät hat einen Delta-Wert von 6%, durchschnittlich ist 20%, das schlechteste Gerät hat 57%
Im Vergleich zu allen Geräten im Test
» 3% aller getesteten Geräte waren besser, 1% vergleichbar, 96% schlechter
» Das beste Gerät hat einen Delta-Wert von 4%, durchschnittlich ist 24%, das schlechteste Gerät hat 134%
Apple MacBook Pro 16 2021 M1 Pro Audio Analyse
(+) | Die Lautsprecher können relativ laut spielen (84.7 dB)
Bass 100 - 315 Hz
(+) | guter Bass - nur 3.8% Abweichung vom Median
(+) | lineare Bass-Wiedergabe (5.2% Delta zum Vorgänger)
Mitteltöne 400 - 2000 Hz
(+) | ausgeglichene Mitten, vom Median nur 1.3% abweichend
(+) | lineare Mitten (2.1% Delta zum Vorgänger)
Hochtöne 2 - 16 kHz
(+) | ausgeglichene Hochtöne, vom Median nur 1.9% abweichend
(+) | sehr lineare Hochtöne (2.7% Delta zum Vorgänger)
Gesamt im hörbaren Bereich 100 - 16.000 Hz
(+) | hörbarer Bereich ist sehr linear (4.6% Abstand zum Median
Im Vergleich zu allen Geräten derselben Klasse
» 0% aller getesteten Geräte dieser Klasse waren besser, 0% vergleichbar, 100% schlechter
» Das beste Gerät hat einen Delta-Wert von 5%, durchschnittlich ist 17%, das schlechteste Gerät hat 45%
Im Vergleich zu allen Geräten im Test
» 0% aller getesteten Geräte waren besser, 0% vergleichbar, 100% schlechter
» Das beste Gerät hat einen Delta-Wert von 4%, durchschnittlich ist 24%, das schlechteste Gerät hat 134%
Energieverwaltung
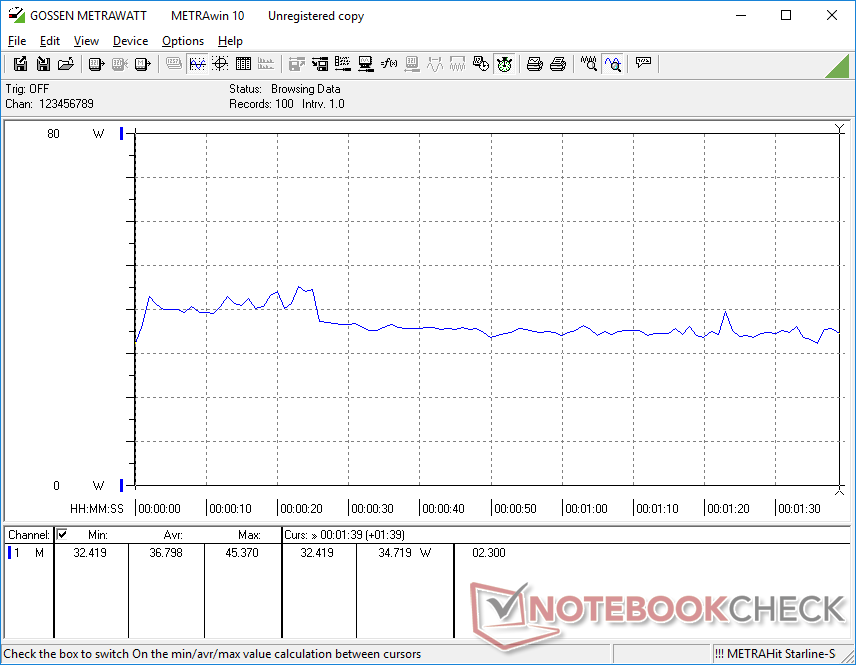
Energieaufnahme — starke Leistung pro Watt
Das System arbeitet sehr energieeffizient, wie man es von einem Laptop mit einer U-Serie-CPU auch erwarten würde. Interessant ist, dass das Latitude 9330 circa 23 Prozent weniger Strom in GPU-intensiven Szenarien zieht als das ältere Latitude 5310, während eine zwei- bis dreifache Grafikleistung erzielt wird. Nutzer, die von Geräten mit Intels 10.-Gen- oder älteren CPUs aufrüsten, werden eine herausragende Effizienzsteigerung bemerken.
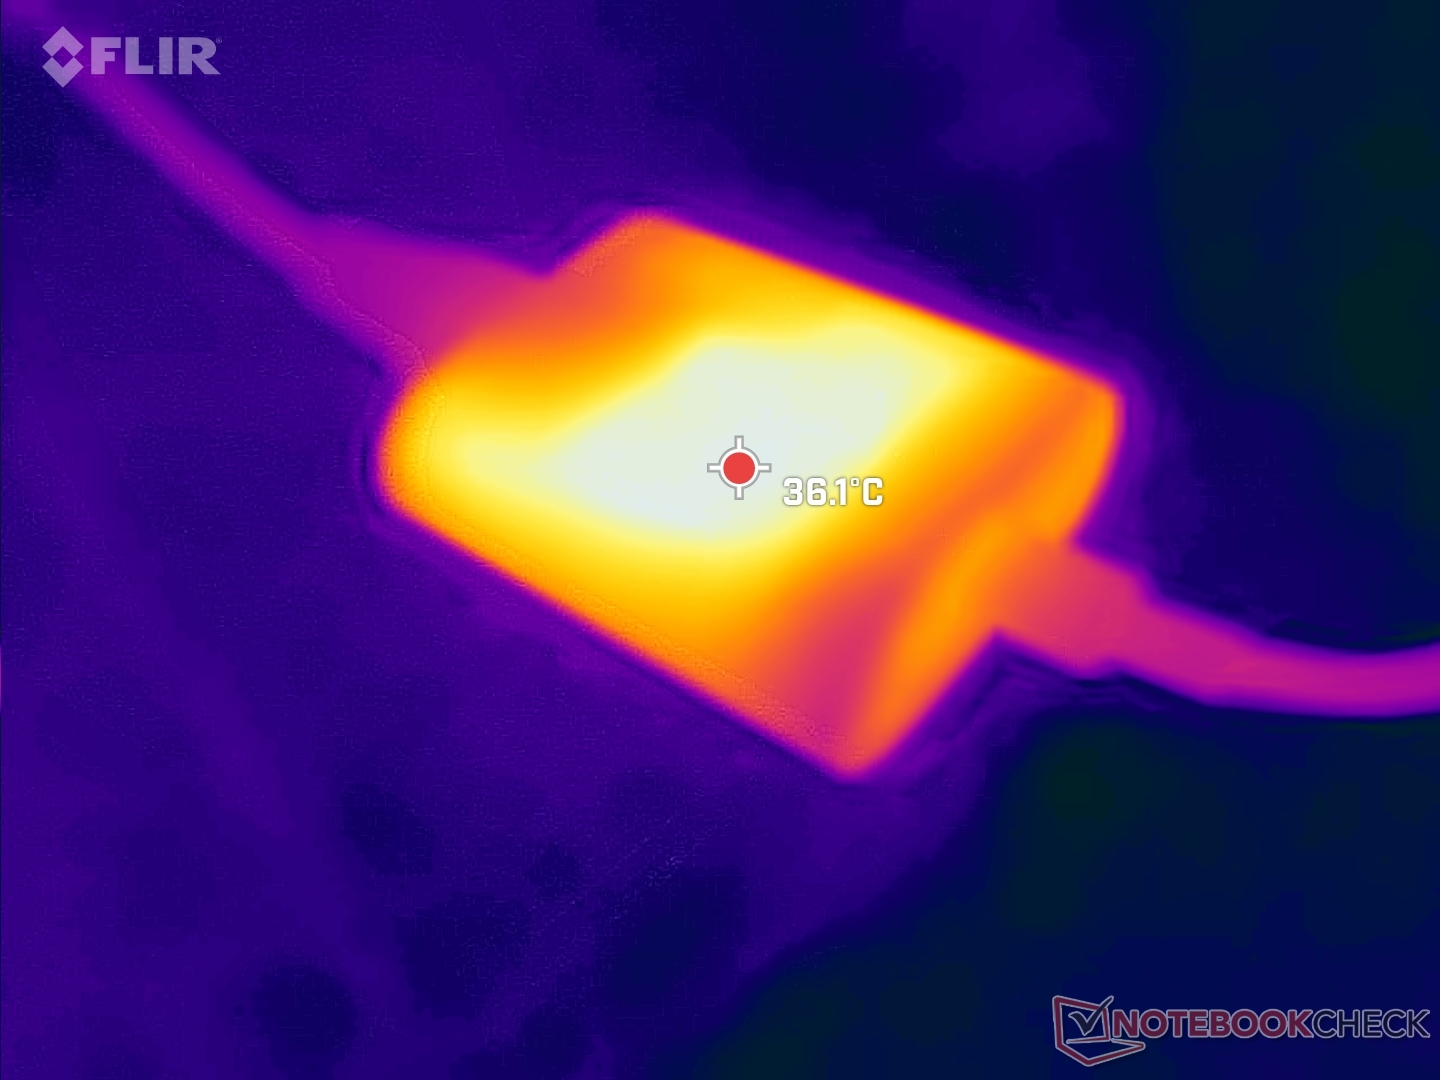
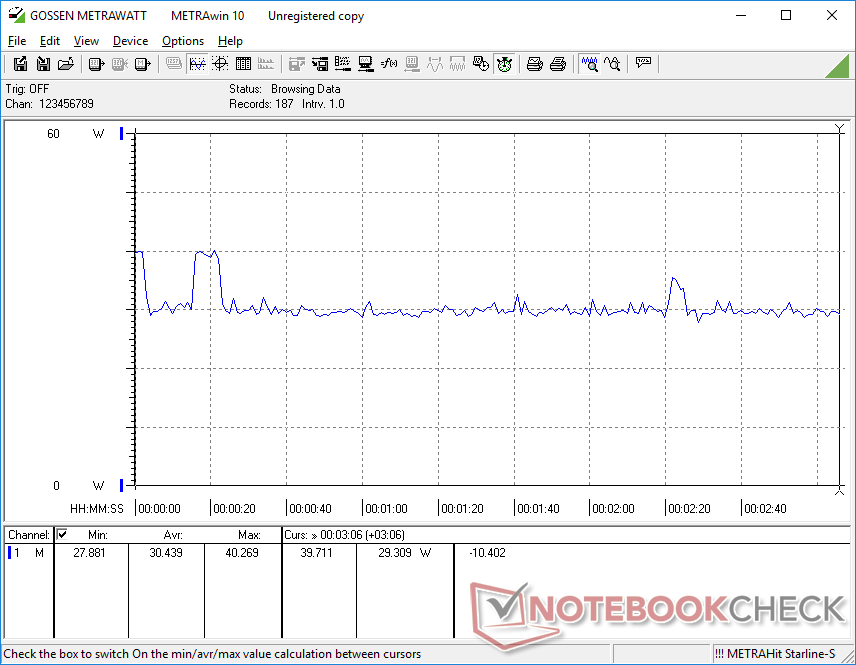
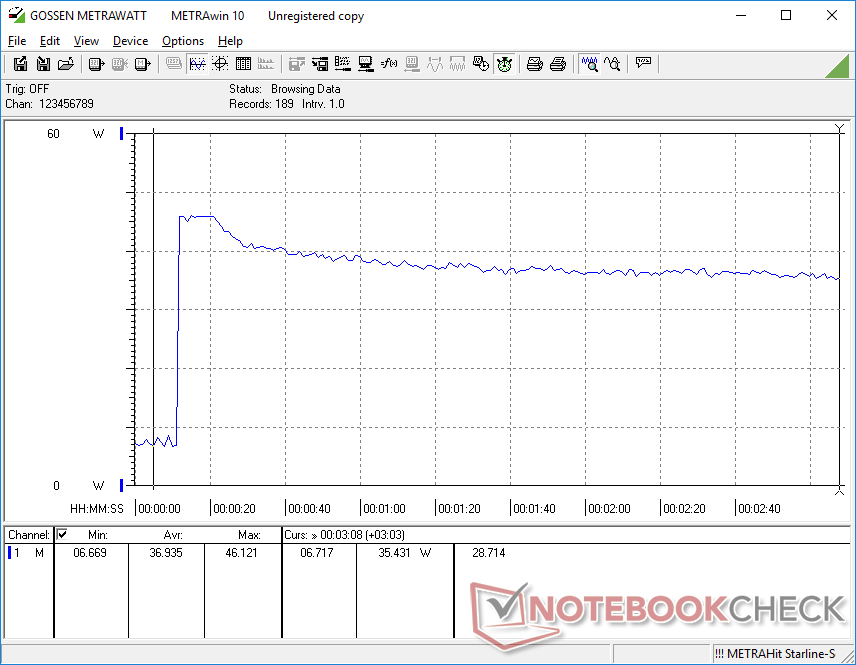
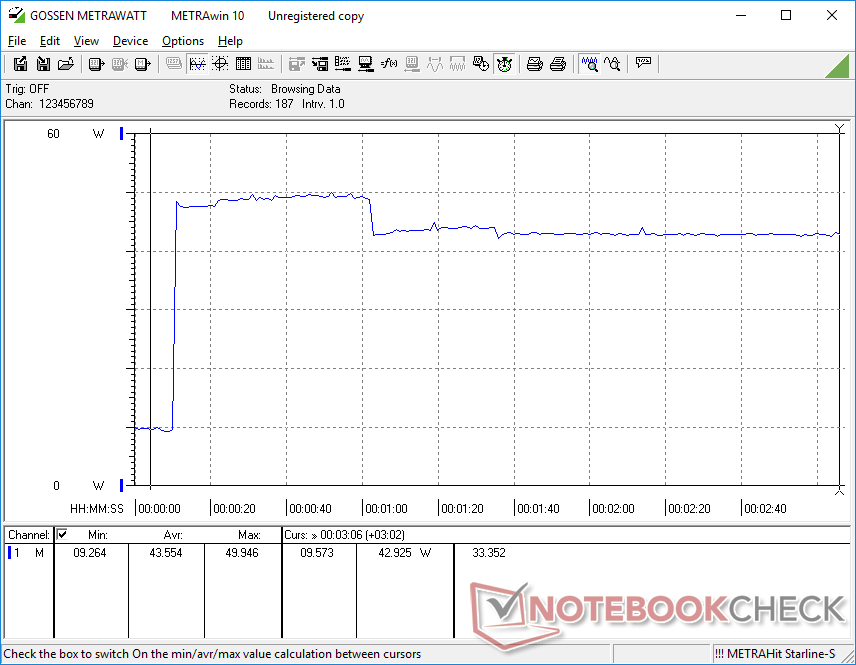
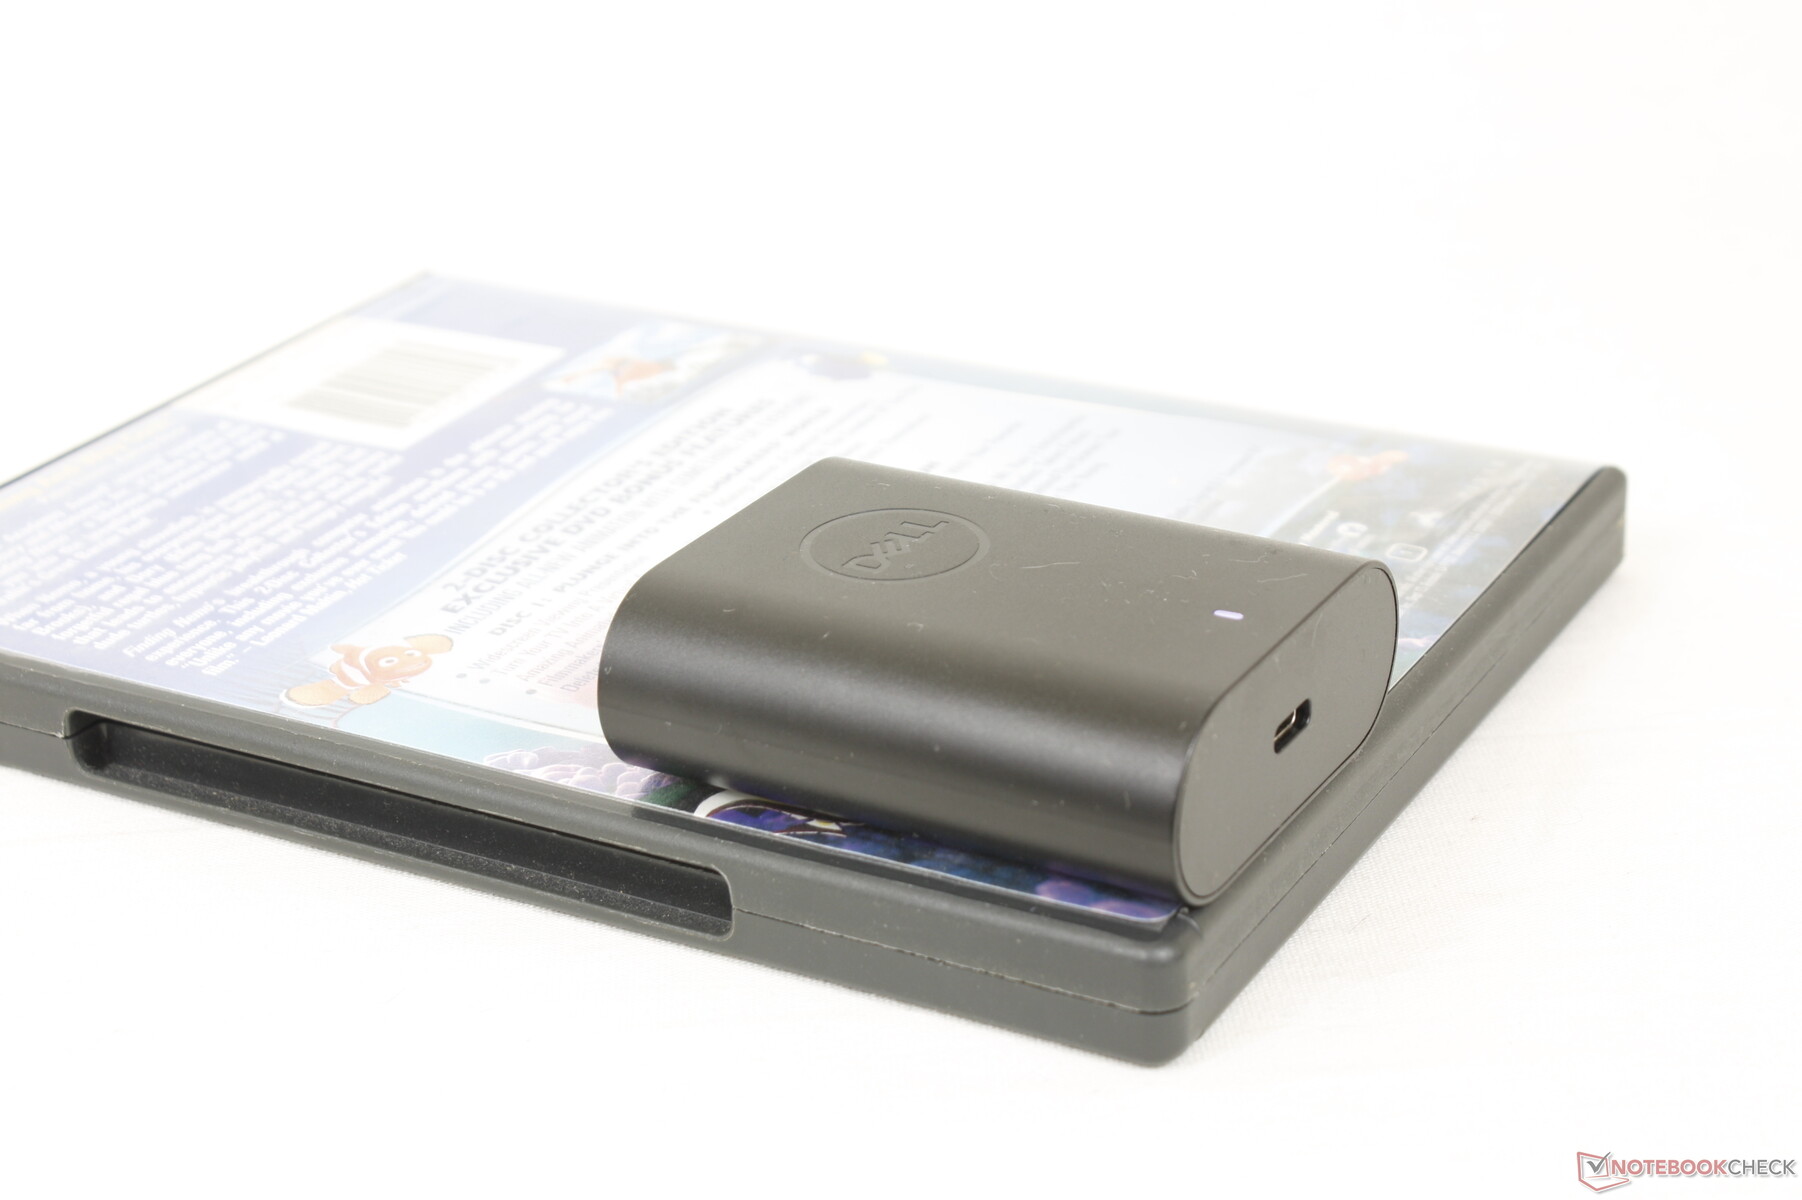
Die Energieaufnahme während des Prime95-Stresstests liegt etwa 27 Prozent unterhalb der des Spectre x360 13.5 mit Core i7-1255U. Wir messen ein kurzes Maximum von 50 W, die das 60 W starke USB-C-Netzteil (~67×5,3×2,3 cm) bei einer CPU-Auslastung von 100 Prozent liefert. Da der Turbo-Boost nicht unendlich lange währt, nimmt die Energieaufnahme mit der Zeit ab, wie die folgenden Graphen zeigen.
| Aus / Standby | |
| Idle | |
| Last |
|
Legende:
min: | |
| Dell Latitude 9330 i7-1260U, Iris Xe G7 96EUs, , IPS, 2560x1600, 13.3" | Lenovo ThinkPad X1 Titanium Yoga G1 20QB0016GE i5-1140G7, Iris Xe G7 80EUs, Lenovo UMIS RPJTJ256MEE1OWX, IPS LED, 2256x1504, 13.5" | MSI Summit E13 Flip Evo A11MT i7-1185G7, Iris Xe G7 96EUs, Phison 1TB SM2801T24GKBB4S-E162, IPS, 1920x1200, 13.4" | HP Elite Dragonfly Max i7-1185G7, Iris Xe G7 96EUs, Toshiba XG6 KXG60ZNV512G, IPS, 1920x1080, 13.3" | Dell Latitude 5310-23VP6 i5-10310U, UHD Graphics 620, SK hynix BC511 HFM512GDHTNI-87A0B, IPS, 1920x1080, 13.3" | Lenovo Yoga Slim 9 14IAP7 i7-1280P, Iris Xe G7 96EUs, Samsung PM9B1 1024GB MZAL41T0HBLB, OLED, 2880x1800, 14" | |
|---|---|---|---|---|---|---|
| Stromverbrauch | 11% | -23% | -5% | 5% | -98% | |
| Idle min * (Watt) | 4.7 | 3.75 20% | 4.8 -2% | 2.9 38% | 2.9 38% | 11.8 -151% |
| Idle avg * (Watt) | 8.2 | 7.75 5% | 8.4 -2% | 9.9 -21% | 5.9 28% | 17.4 -112% |
| Idle max * (Watt) | 8.4 | 8.69 -3% | 8.6 -2% | 10.4 -24% | 6.7 20% | 22.4 -167% |
| Last avg * (Watt) | 36.8 | 33.12 10% | 47.1 -28% | 37.1 -1% | 42 -14% | 53 -44% |
| Witcher 3 ultra * (Watt) | 30.4 | 28.7 6% | 51.6 -70% | 31.5 -4% | 43 -41% | 52.6 -73% |
| Last max * (Watt) | 49.9 | 35.19 29% | 65.9 -32% | 58.8 -18% | 50 -0% | 71 -42% |
* ... kleinere Werte sind besser
Energieaufnahme Witcher 3 / Stresstest
Energieaufnahme mit externem Monitor
Akkulaufzeit — Latitude 9330 schafft es über den Arbeitstag
Die Akkukapazität von 50 Wh ist Durchschnitt für ein Subnotebook. Die Laufzeiten sind mit 9,5 Stunden im praxisnahen WLAN-Test gut, aber etwas kürzer als beim HP Dragonfly Max oder MSI Summit E13 Flip. Bis zum vollständigen Aufladen des Akkus vergehen circa 90 Minuten.
| Dell Latitude 9330 i7-1260U, Iris Xe G7 96EUs, 50 Wh | Lenovo ThinkPad X1 Titanium Yoga G1 20QA001RGE i7-1160G7, Iris Xe G7 96EUs, 44.5 Wh | MSI Summit E13 Flip Evo A11MT i7-1185G7, Iris Xe G7 96EUs, 70 Wh | HP EliteBook x360 1030 G7 i7-10810U, UHD Graphics 620, 54 Wh | HP Elite Dragonfly Max i7-1185G7, Iris Xe G7 96EUs, 56 Wh | Dell Latitude 5310-23VP6 i5-10310U, UHD Graphics 620, 60 Wh | |
|---|---|---|---|---|---|---|
| Akkulaufzeit | -14% | 11% | 37% | 43% | 18% | |
| Idle (h) | 15.4 | 21.1 37% | 30.9 101% | 28.7 86% | ||
| WLAN (h) | 9.4 | 8.4 -11% | 11.2 19% | 10.3 10% | 11 17% | 11.1 18% |
| Last (h) | 2.3 | 1.9 -17% | 1.8 -22% | 2.3 0% | 2.9 26% | |
| H.264 (h) | 11.4 |
Pro
Contra
Fazit — hervorragend bei den wichtigen Aspekten
Das Latitude 9330 2-in-1 ist für Office-Umgebungen sehr gut optimiert mit Features, welche die meisten Consumer-Laptops nicht bieten, das XPS 13 eingeschlossen. Die Verarbeitung und Stabilität befinden sich auf bestem Niveau unter den 13-Zoll-Convertibles, was einen langlebigen sowie verlässlichen Eindruck bei uns hinterließ. Wenn man sich für das Latitude 9330 entscheidet, wird es einen sehr wahrscheinlich für mehrere Jahre begleiten.
Auch wenn der Dell Laptop in den meisten Bereichen gut bis sehr gut abschneidet, fällt er in einigen Bereichen doch etwas hinter die Konkurrenz zurück. Einige HP Modelle etwa werden mit 1000-Nits-Displays und 5-MP-Webcams geliefert, während das Latitude 9330 auf 500 Nits und 2 MP begrenzt ist. Auch das Fehlen von USB-A und HDMI wird einige Nutzer stören. Abgesehen davon sollte man auf ein lauteres Lüfteraufkommen gefasst sein, sobald man das Dell mit hohen Lasten fährt.
Trotz einiger durchschnittlicher Merkmale ist das Dell Latitude 9330 2-in-1 unsere Top-Empfehlung unter den Business-Convertibles, das sicher für mehrere Jahre hält.
Nachteile wie die verminderte Grafikleistung, die hohen Kerntemperaturen und die fehlende Unterstützung für M.2-2280-SSDs fallen relativ gering ins Gewicht, wenn man die Zielgruppe von Business-Usern und Unternehmern bedenkt. Dennoch wünschen wir uns für die Zukunft eine höhere Refreshrate beim Display samt schnelleren Schwarz-zu-Weiß-Reaktionszeiten, was beides die Touchscreen-Bedienung deutlich verbessern würde.
Preis und Verfügbarkeit
Dell bietet das Latitude 9330 2-in-1 ab circa 2.045 Euro an oder für 2.500 Euro in unserer getesteten Konfiguration. Bei Notebooksbilliger ist die von uns getestete Konfiguration schon ab 2.429 Euro erhältlich.
Dell Latitude 9330
- 18.11.2022 v7 (old)
Allen Ngo
Preisvergleich

