Dell Precision 7670 im Workstation-Test: Erstauftritt für den Core i7-12850HX und für CAMM-RAM

Die Precision-7000-Serie stellt die Flaggschiff-Modelle von Dells mobilen Workstations auf, im Vergleich zur Mittelklasse Precision 5000 und den Einsteiger-Workstations Precision 3000. Das Precision 7670 ist das erste 16-Zoll-Modell der Serie und reiht sich zwischen der 15,6-Zoll großen Precision 7560 und der 17,3-Zoll großen Precision 7760 ein. Etwas verwirrend ist, dass Dell gleich zwei Varianten der Precision 7670 anbietet, nämlich "Performance Base" und "Thin Base", sie zeichnen sich auch durch eine unterschiedliche Gehäusedicke aus. Hier handelt es sich um die "Thin Base"-Variante, der Test der "Performance Base" kommt zu einem späteren Zeitpunkt.
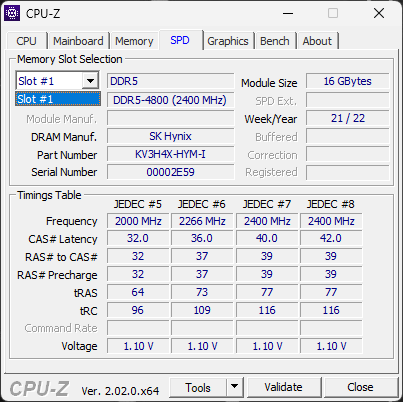
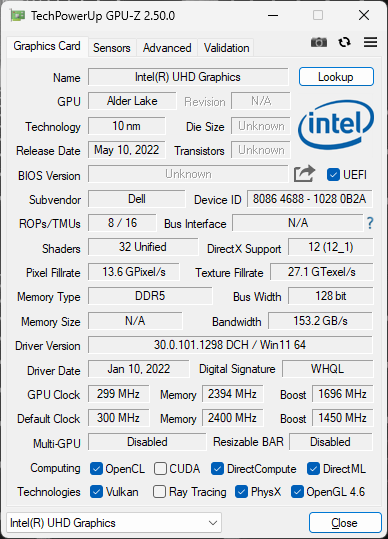
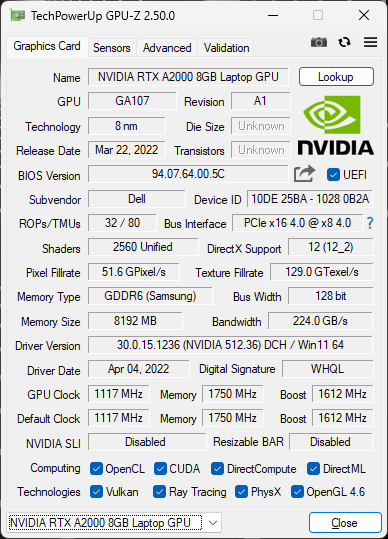
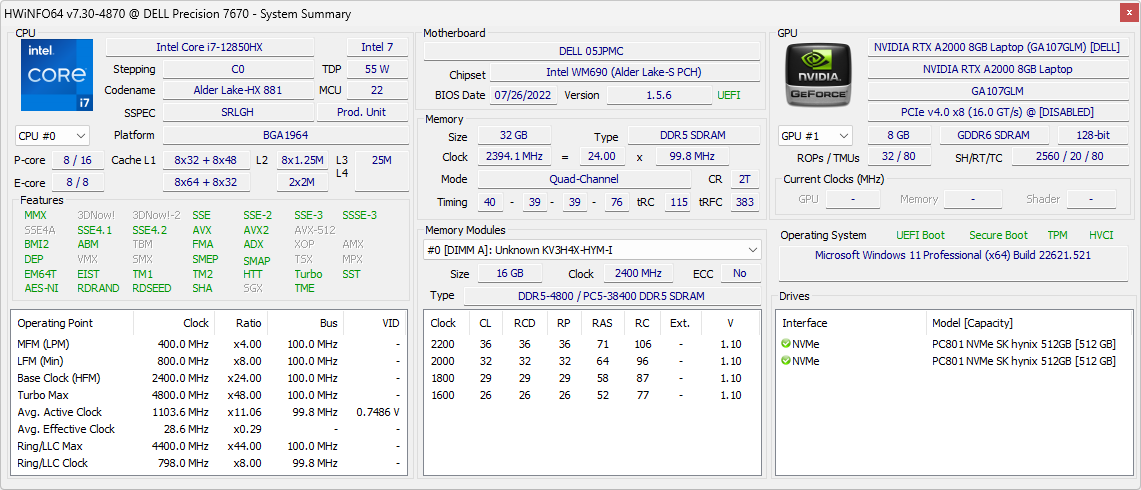
Die Konfigurationsmöglichkeiten sind vielfältig, die CPU rangiert von einem Core i5-12600HX bis zum i9-12950HX, die GPU von einer Iris Xe Graphics bis hin zur dedizierten Nvidia RTX A5500, das Display von einem FHD-IPS-Modell bis hin zu einer 4K-OLED-Option und sogar beim Arbeitsspeicher hat man die Wahl zwischen SODIMM und CAMM-RAM bis zu 128 GB. Unser Testmodell stellt die mittlere Ausstattungsvariante dar und kommt mit einem i7-12850HX, einer RTX A2000 mit 95 W und einem 4K-OLED-Touchscreen. Das Paket kostet 4.335 Euro.
Leider gibt es aktuell keine Xeon- oder ECC-RAM-Optionen für das Precision 7670, vPro wird hingegen von allen SKUs unterstützt.
Es gibt zur Zeit nur wenige direkte Konkurrenten in unserer Datenbank, da 16-Zoll-Workstations noch recht neu sind. Aktuelle Alternativen finden sich im Asus ProArt StudioBook Pro 16, dem Lenovo ThinkPad P1 G4 sowie dem HP ZBook Fury 16.
Weitere Dell-Tests:
Potentielle Konkurrenten im Vergleich
Bew. | Datum | Modell | Gewicht | Dicke | Größe | Auflösung | Preis ab |
|---|---|---|---|---|---|---|---|
| 88.4 % v7 (old) | 10 / 2022 | Dell Precision 7670 i7-12850HX, RTX A2000 Laptop GPU | 2.7 kg | 24.7 mm | 16.00" | 3840x2400 | |
| 89.3 % v7 (old) | 02 / 2022 | Lenovo ThinkPad P1 G4-20Y4Z9DVUS i7-11800H, T1200 Laptop GPU | 1.8 kg | 17.7 mm | 16.00" | 2560x1600 | |
v (old) | 11 / 2021 | Asus ProArt StudioBook 16 W7600H5A-2BL2 W-11955M, RTX A5000 Laptop GPU | 2.4 kg | 21.4 mm | 16.00" | 3840x2400 | |
| 88.3 % v7 (old) | 10 / 2021 | Dell Precision 5000 5560 i7-11850H, RTX A2000 Laptop GPU | 2 kg | 18 mm | 15.60" | 3840x2400 | |
| 87.8 % v7 (old) | 08 / 2020 | Dell Precision 7550 W-10885M, Quadro RTX 5000 Max-Q | 2.8 kg | 27.36 mm | 15.60" | 3840x2160 | |
| 90.3 % v7 (old) | 10 / 2021 | HP ZBook Fury 15 G8 i9-11950H, RTX A5000 Laptop GPU | 2.5 kg | 25.9 mm | 15.60" | 3840x2160 |
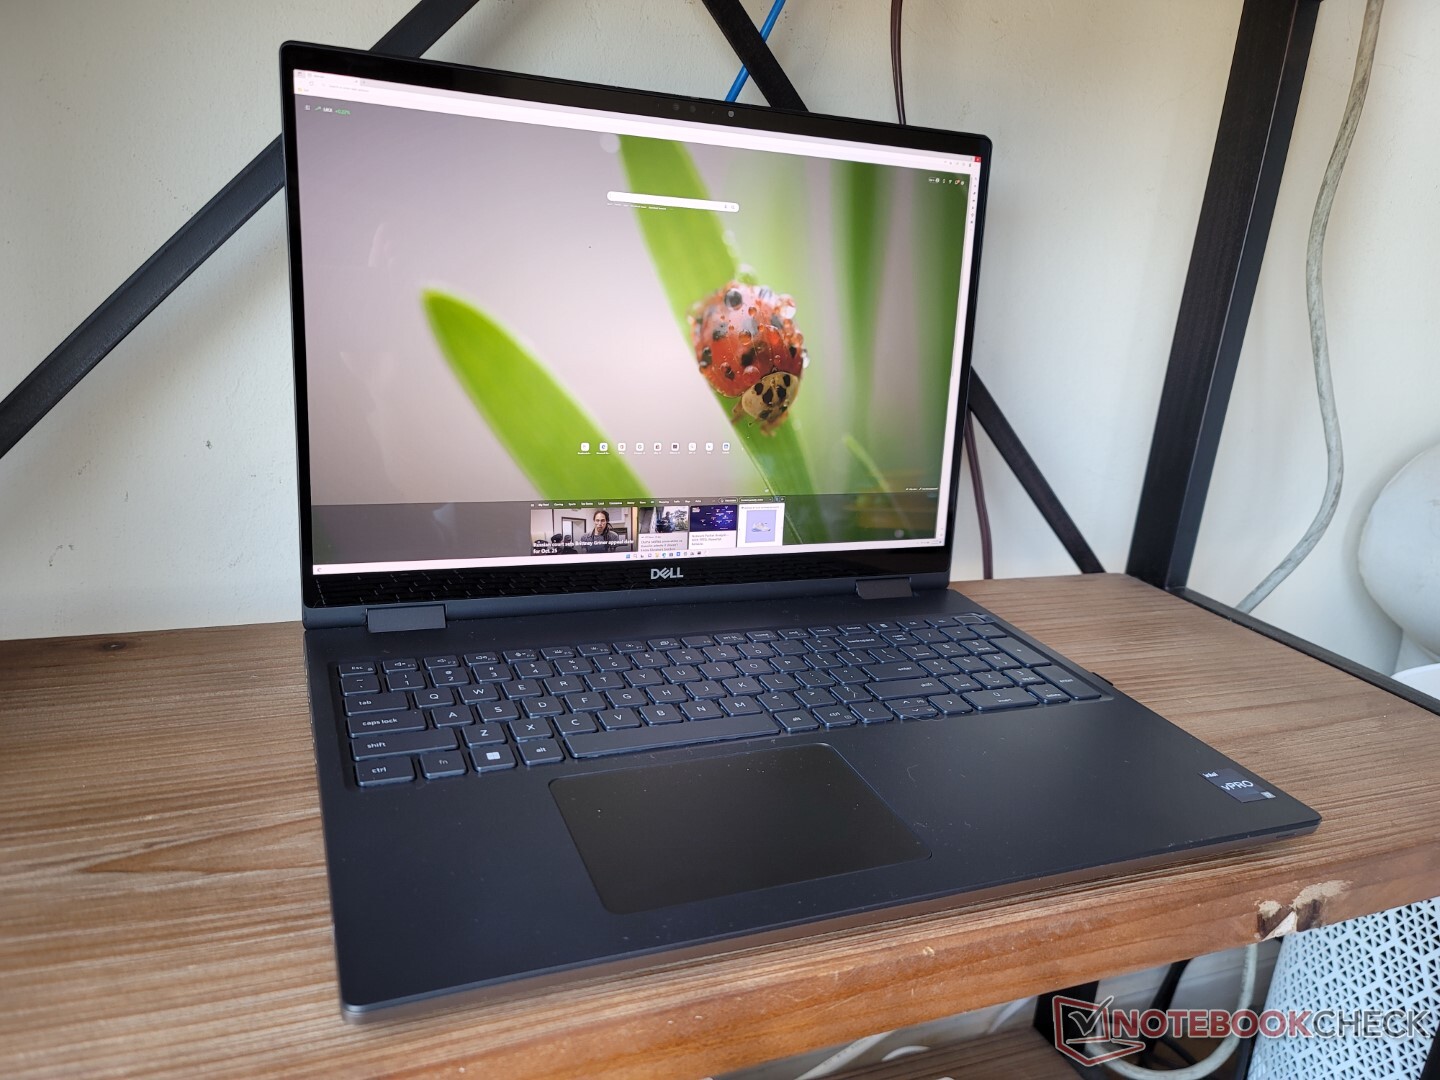
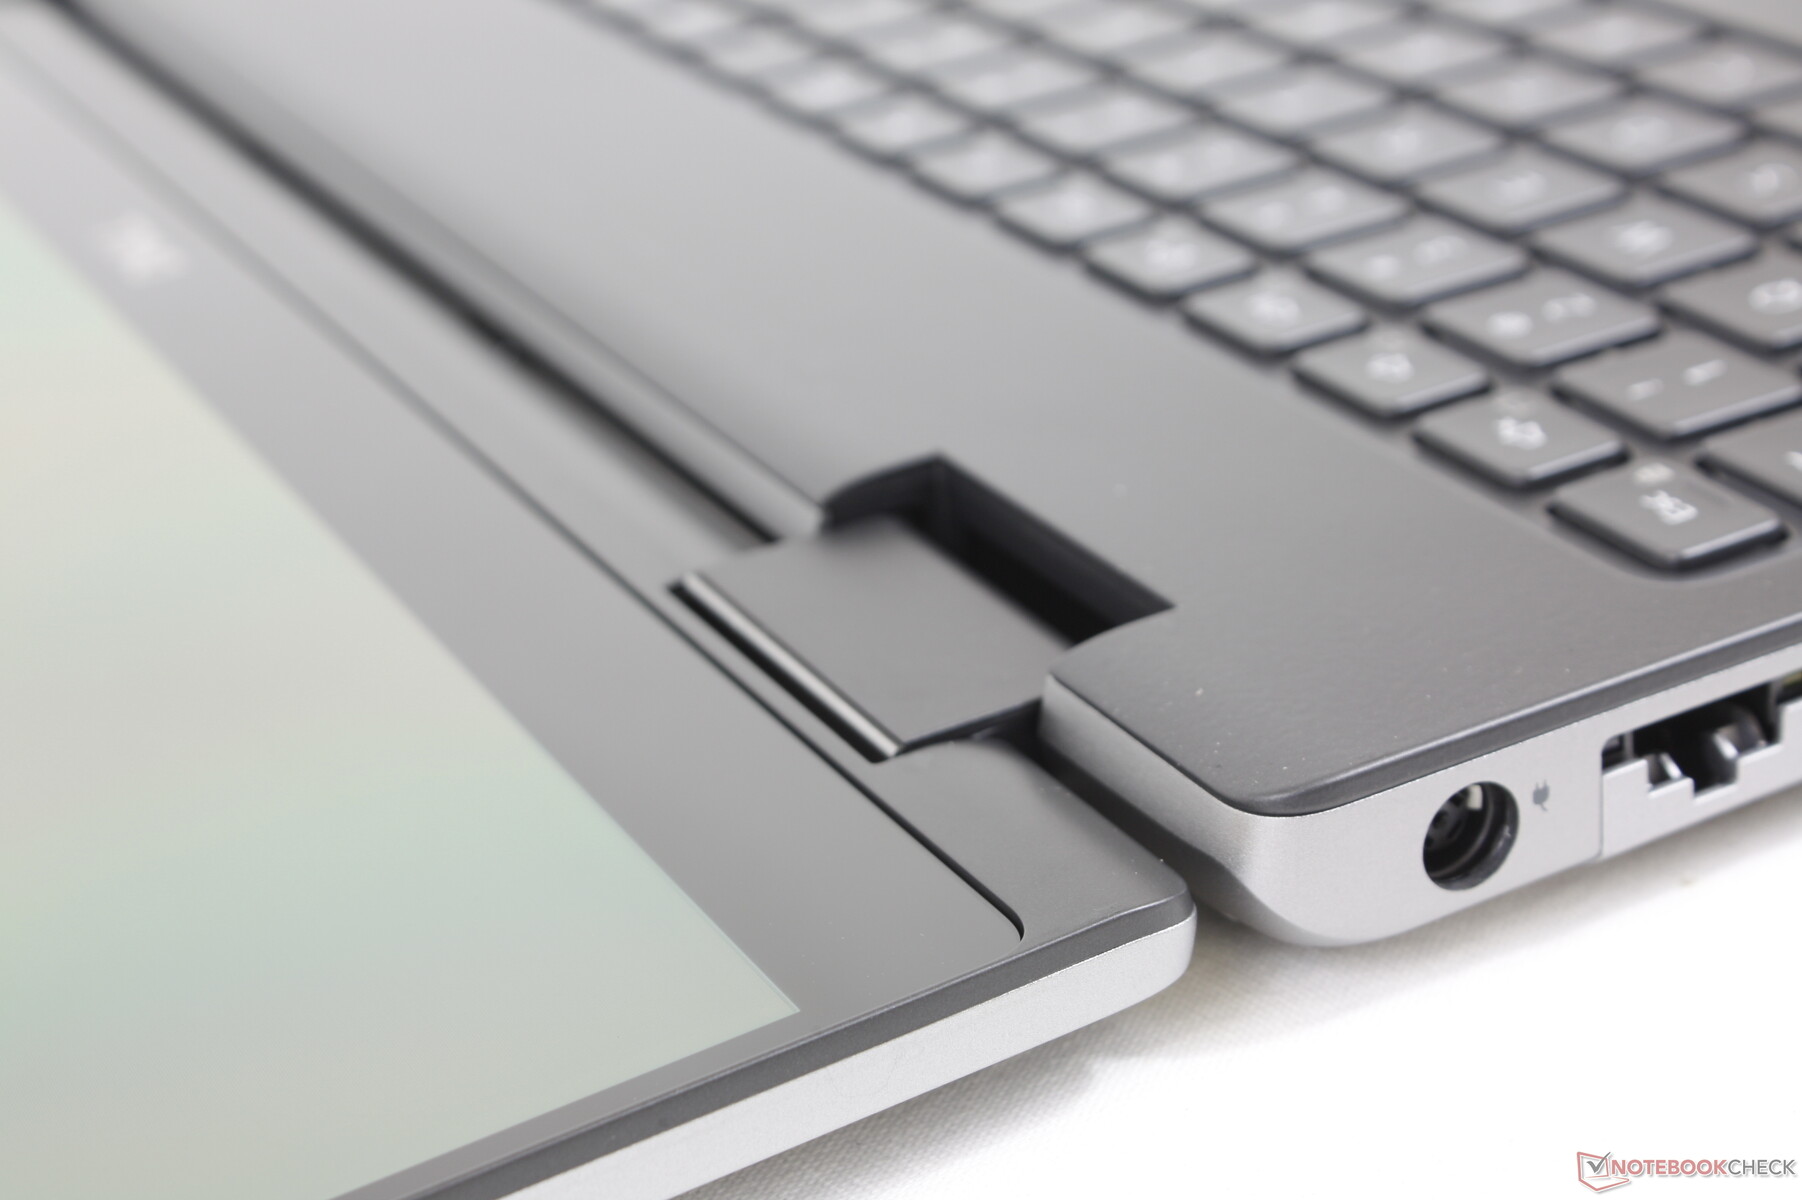
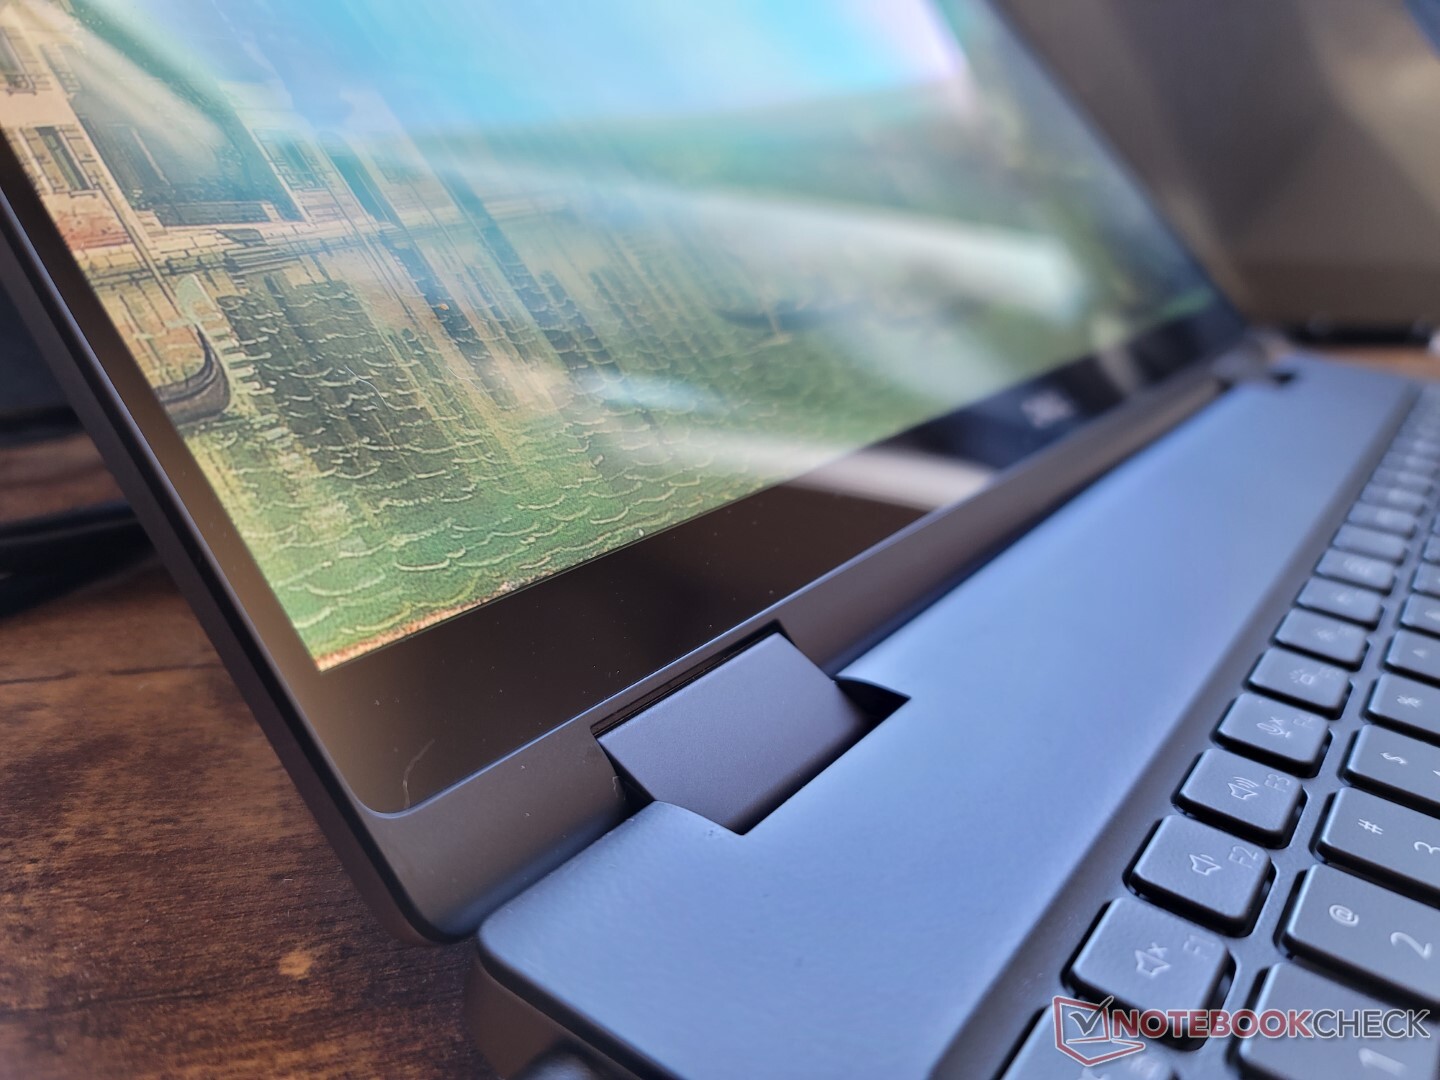
Gehäuse — Klassischer Precision-Look
Das Gehäusedesign und die Materialien erinnern stark an das 2020er Precision 7550. Beispielsweise ist das schwarze Tastendeck ebenfalls leicht gummiert und lässt Premium-Gefühl aufkommen, während das äußere Skelett recht dick ist und dadurch einen stabileren Ersteindruck vermittelt als das ThinkPad P1 G4 oder das Asus ProArt StudioBook. Etwas Druck auf die Tastaturmitte oder den Displaydeckel biegt die Oberflächen allerdings minimal stärker durch als bei einem HP ZBook Studio, aber Knacken, Knarzen oder irgendwelche Schwachstellen haben wir nicht entdeckt.
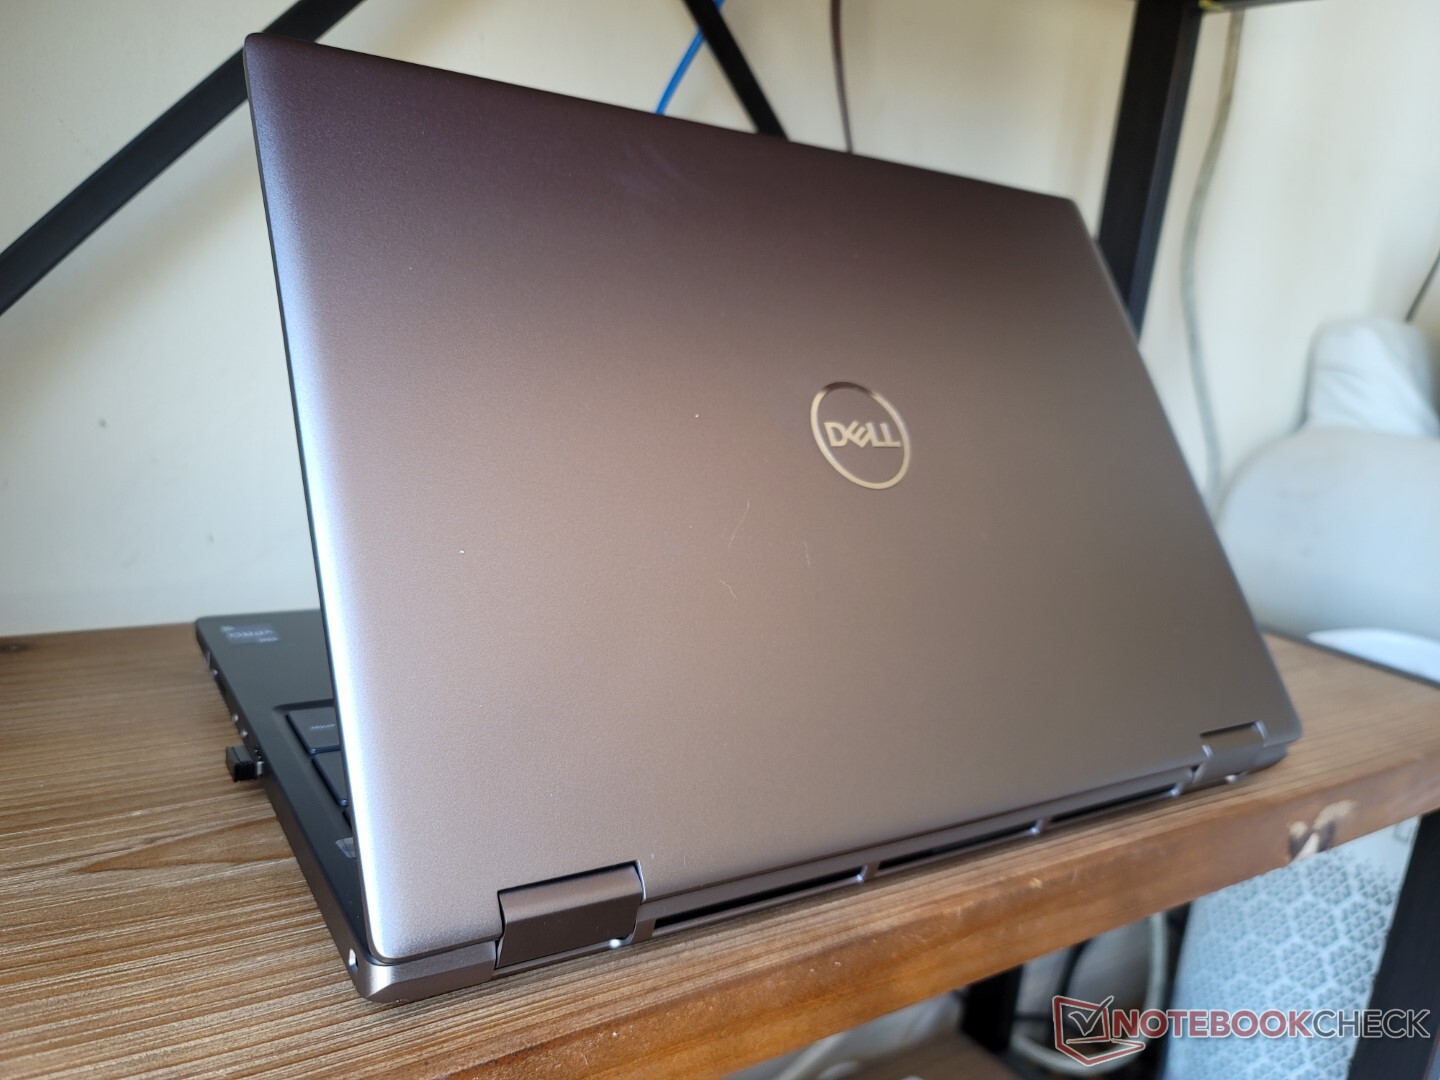
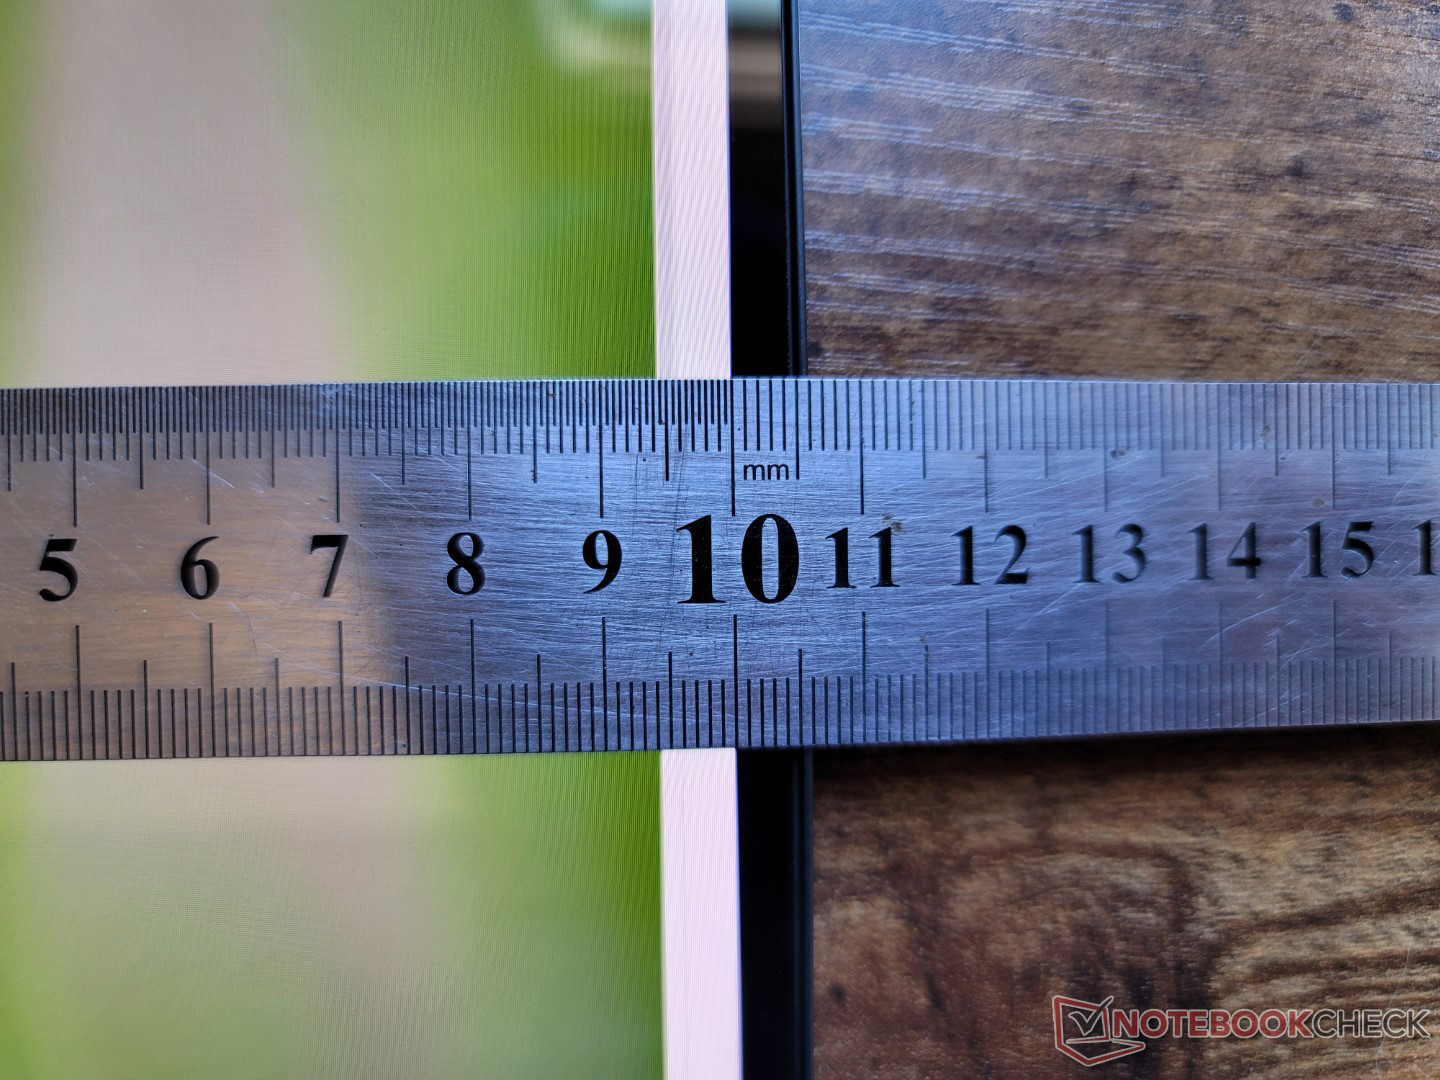
Trotz der "Thin Base"-Version bleibt das Precision 7670 relativ groß und schwer. Mit 24,7 mm ist das System dicker als ein Asus ProArt StudioBook 16 und nur um Haaresbreite dünner als ein HP ZBook Fury 15 G8. Die Workstation ist außerdem mehrere hundert Gramm schwerer, was teilweise an dem größeren 16-Zoll-16:10-Formfaktor liegt.
Die "Performance Base"-Version ist nochmals 3 mm dicker und mindestens 70 g schwerer als die "Thin Base", je nach Konfiguration.
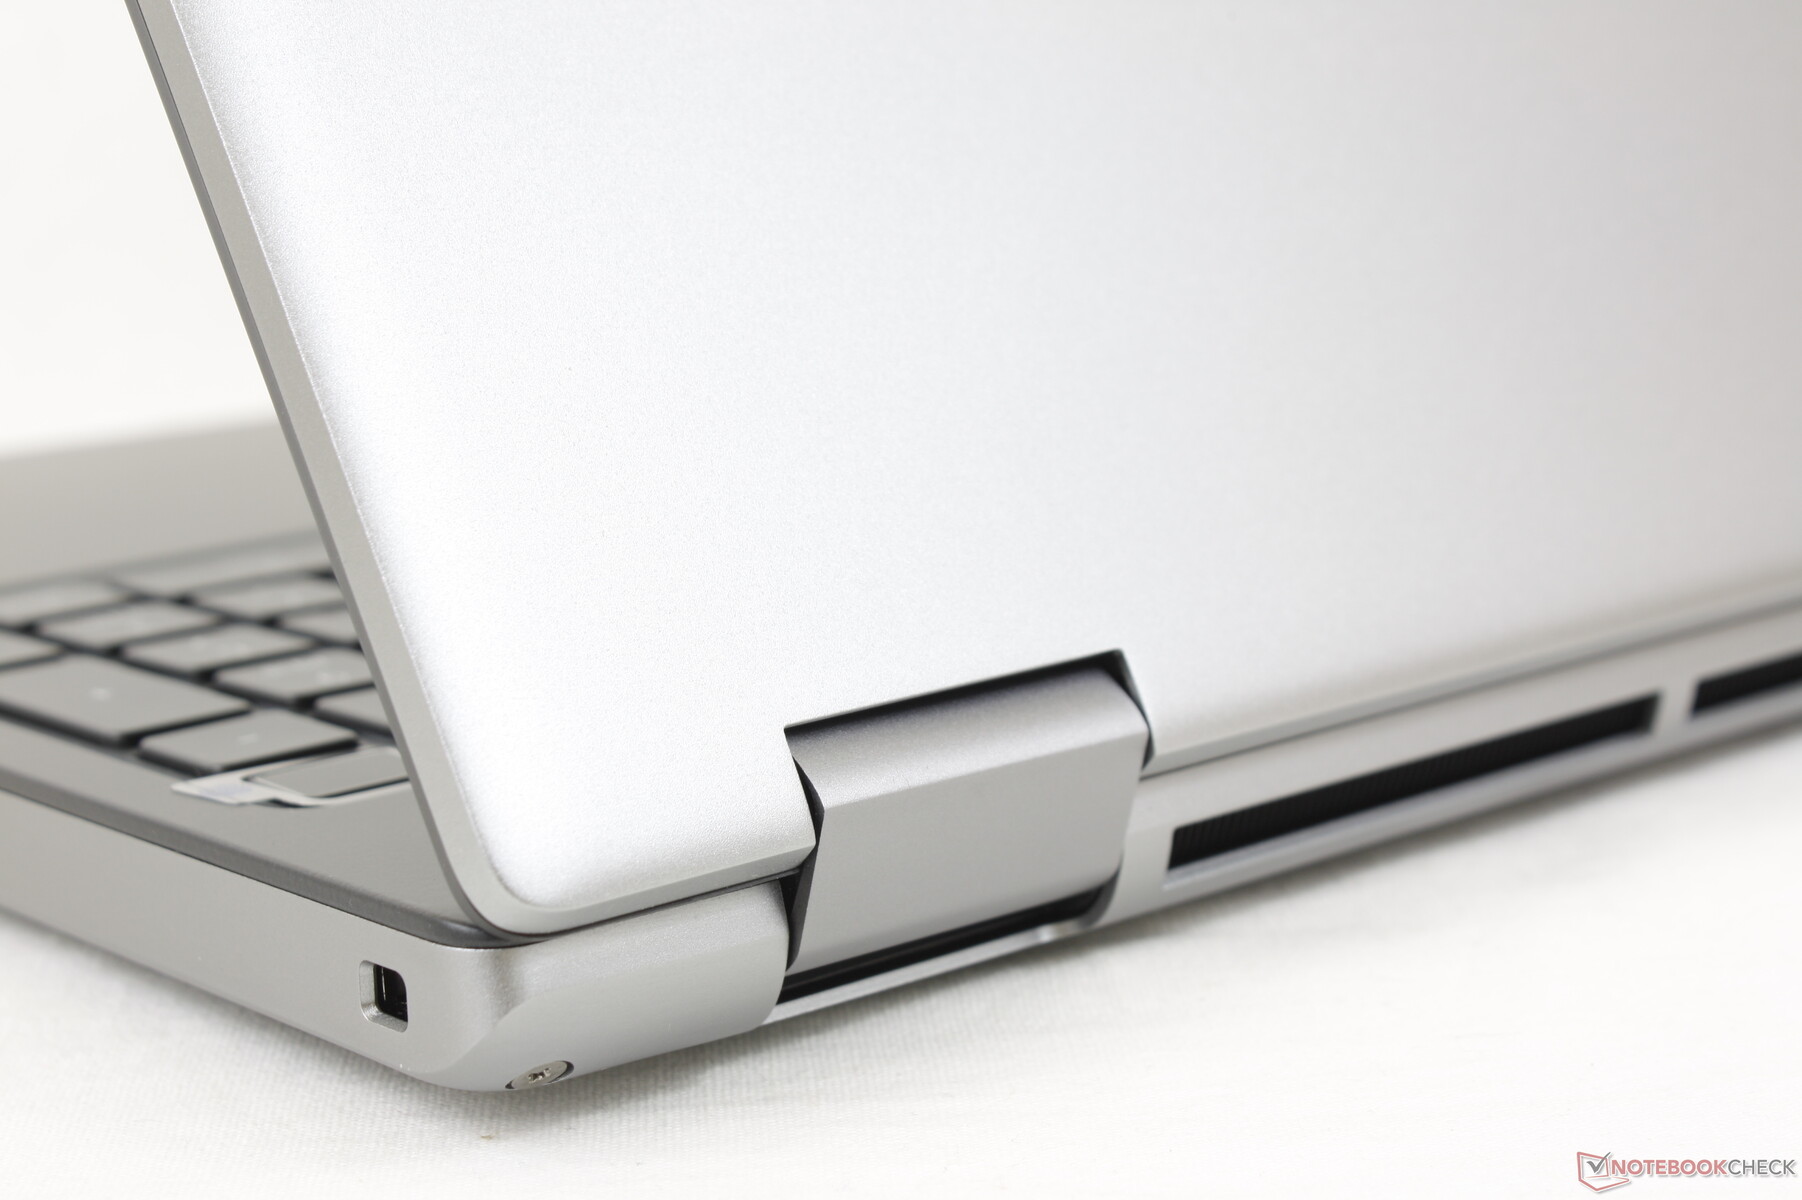
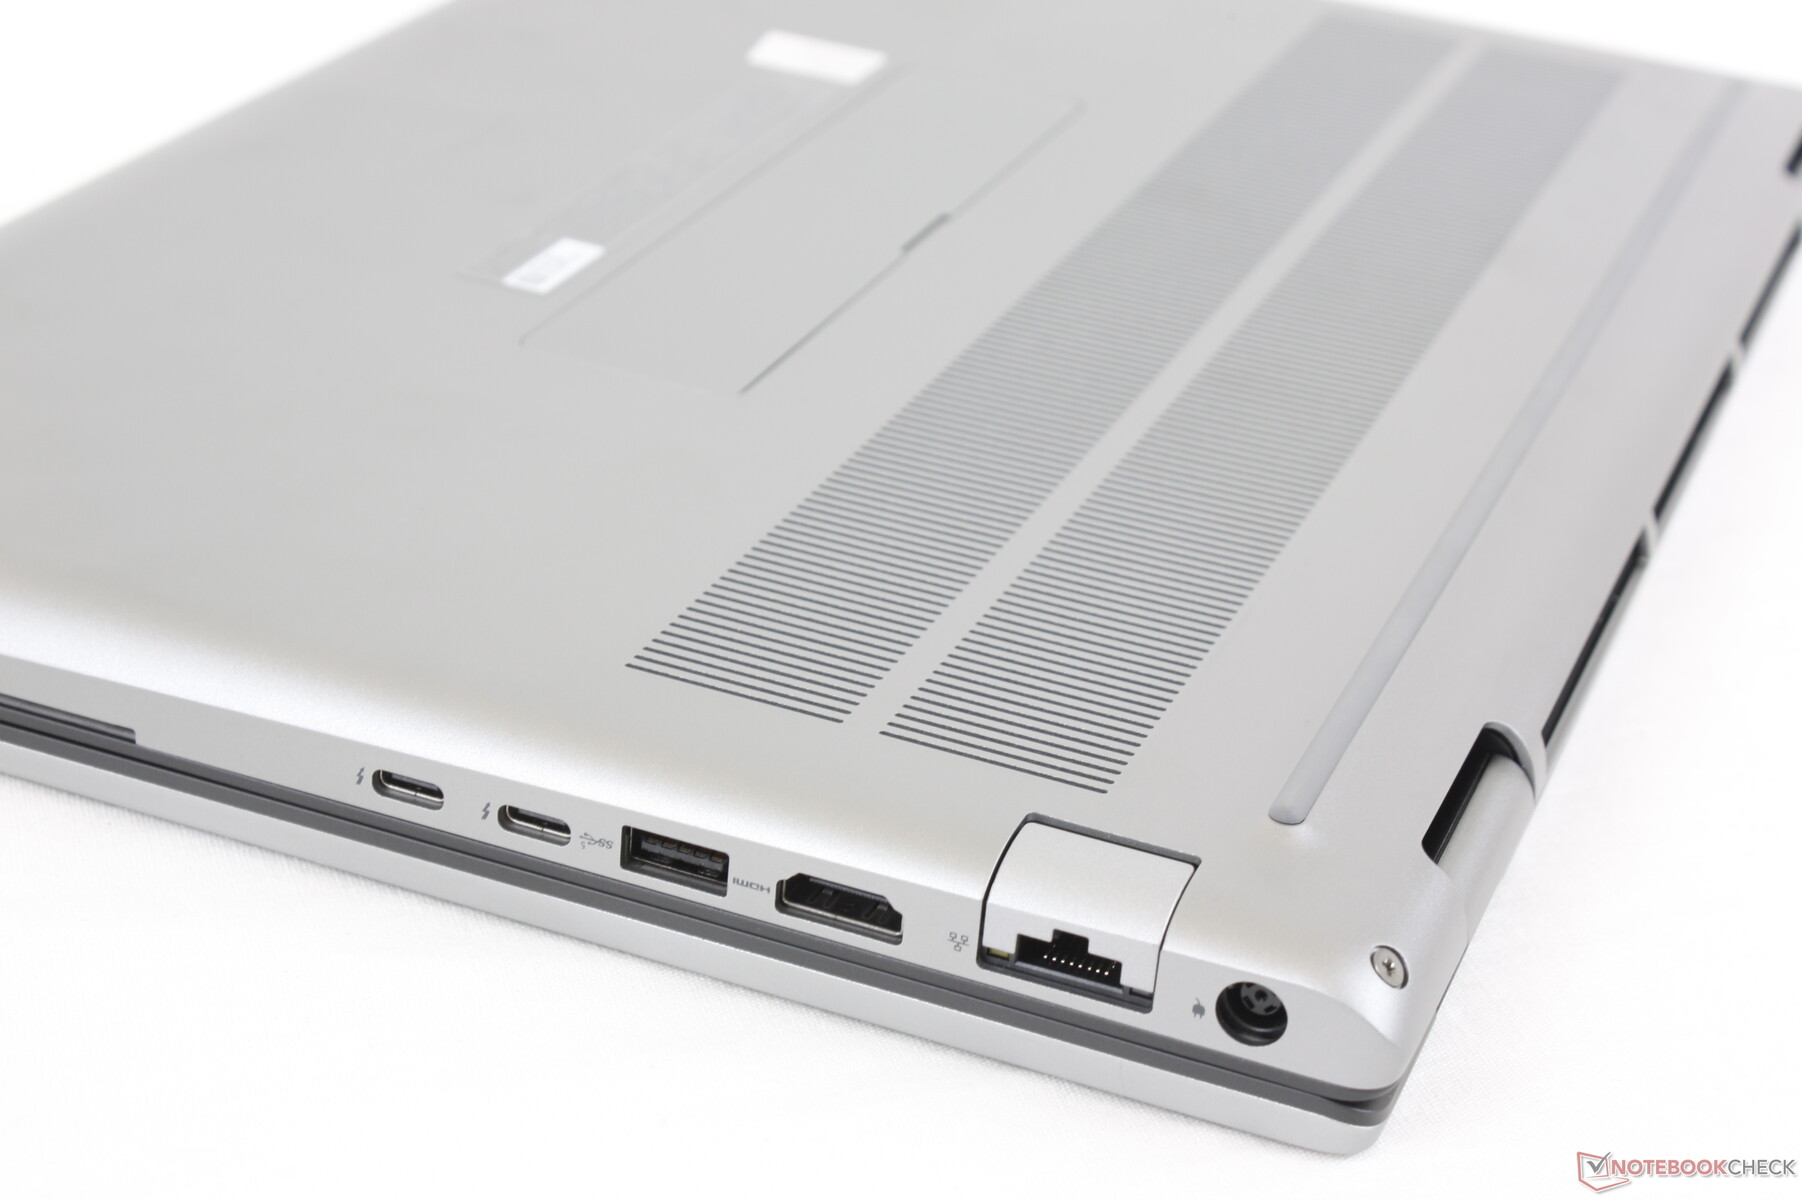
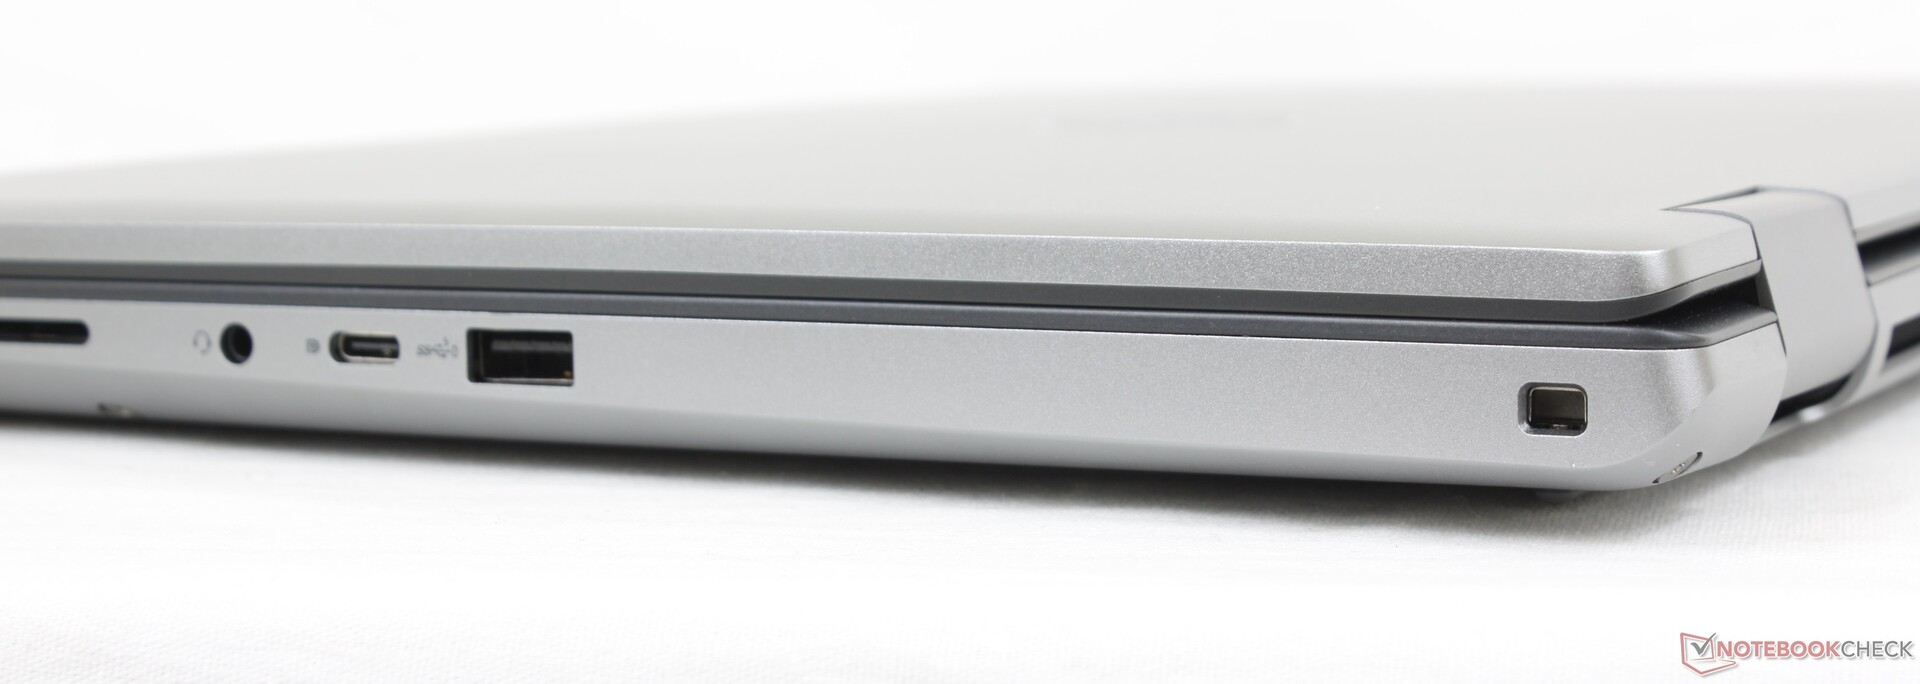
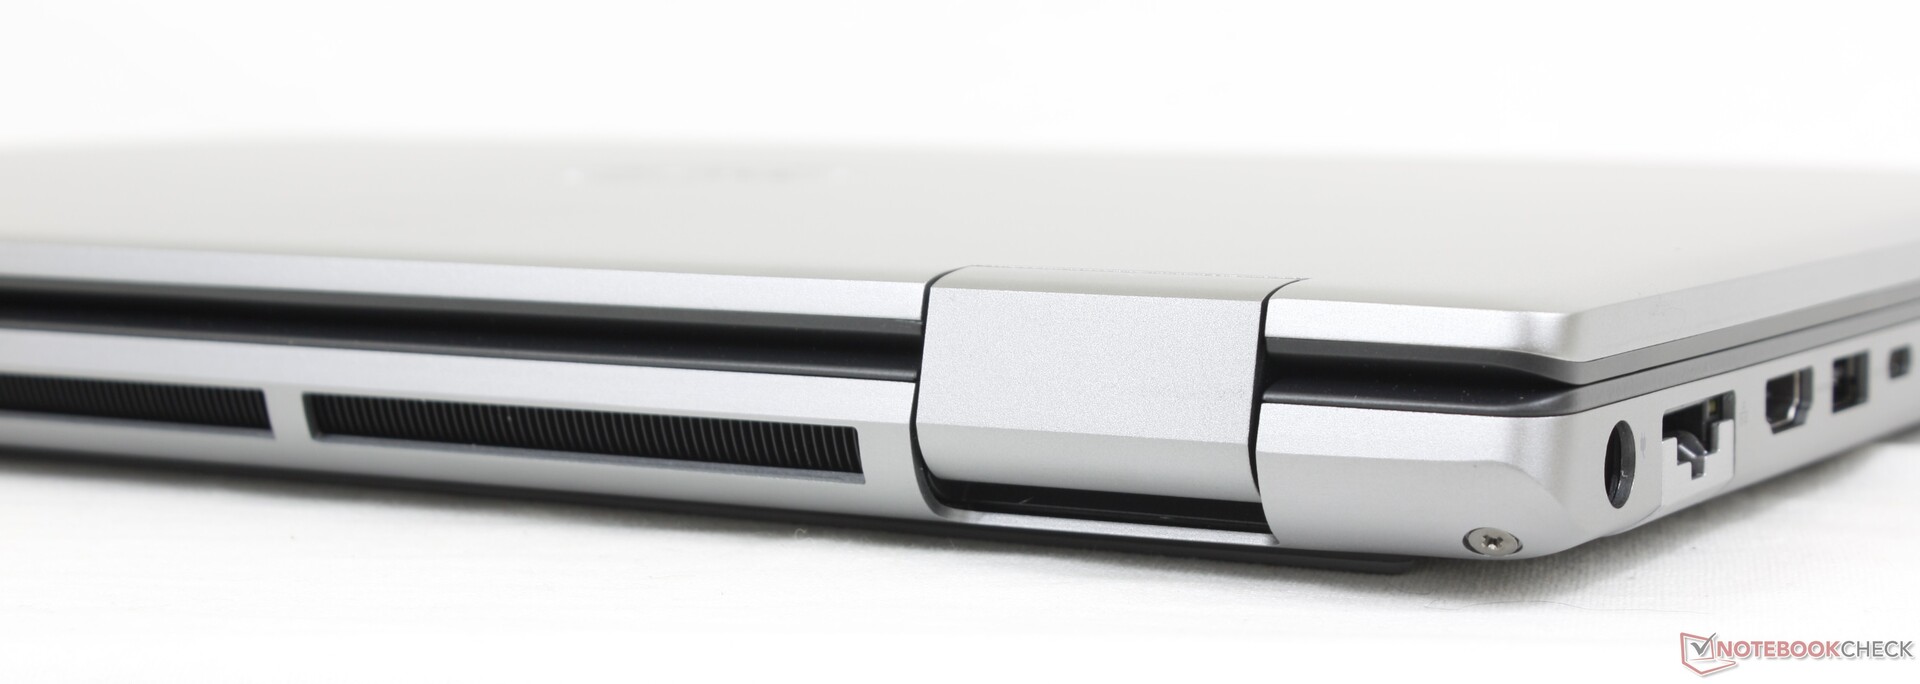
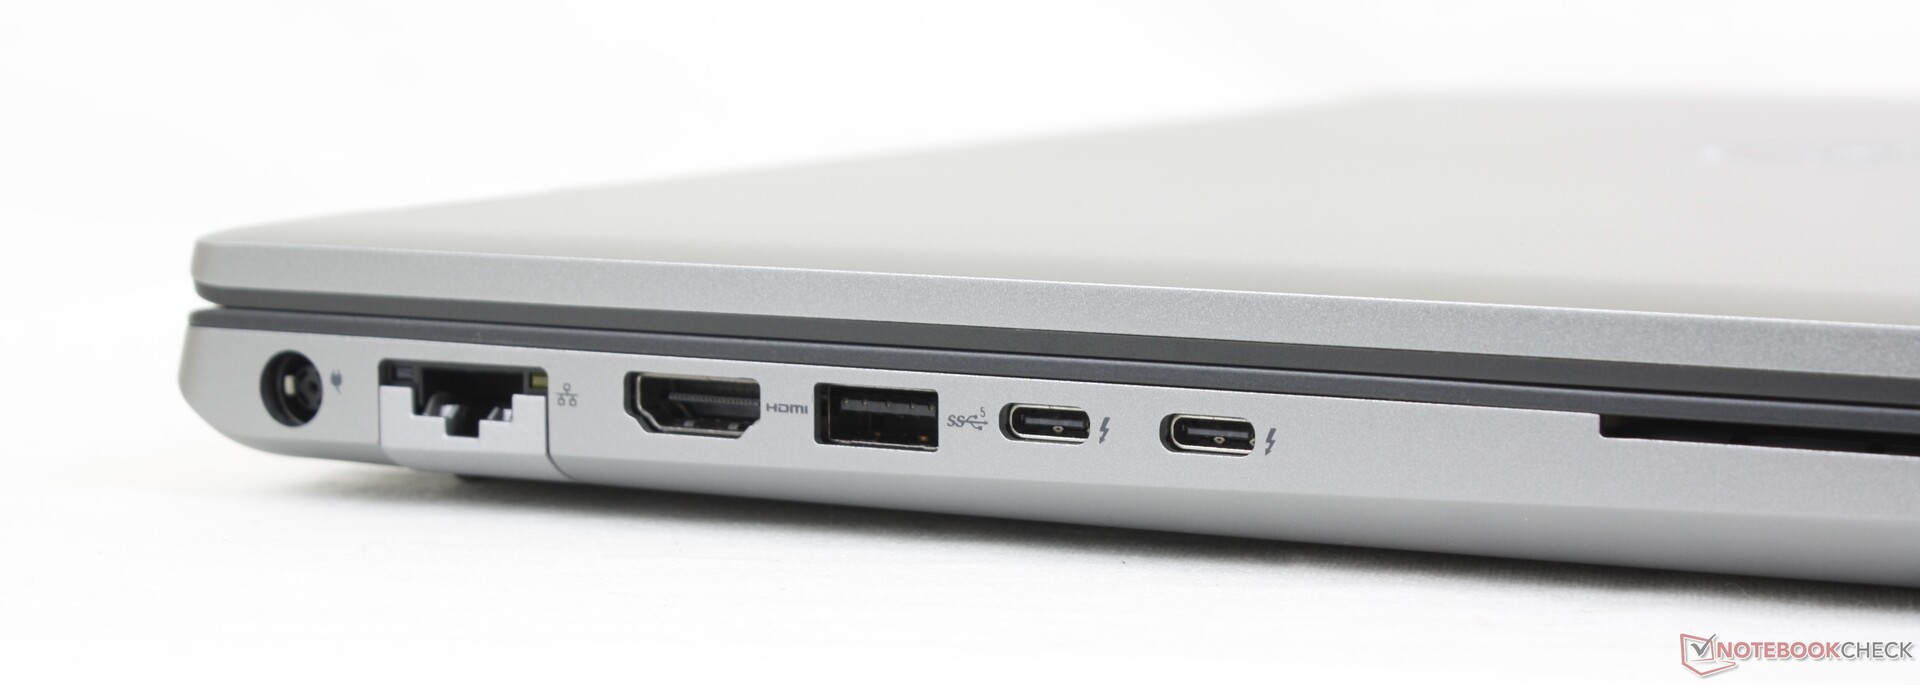
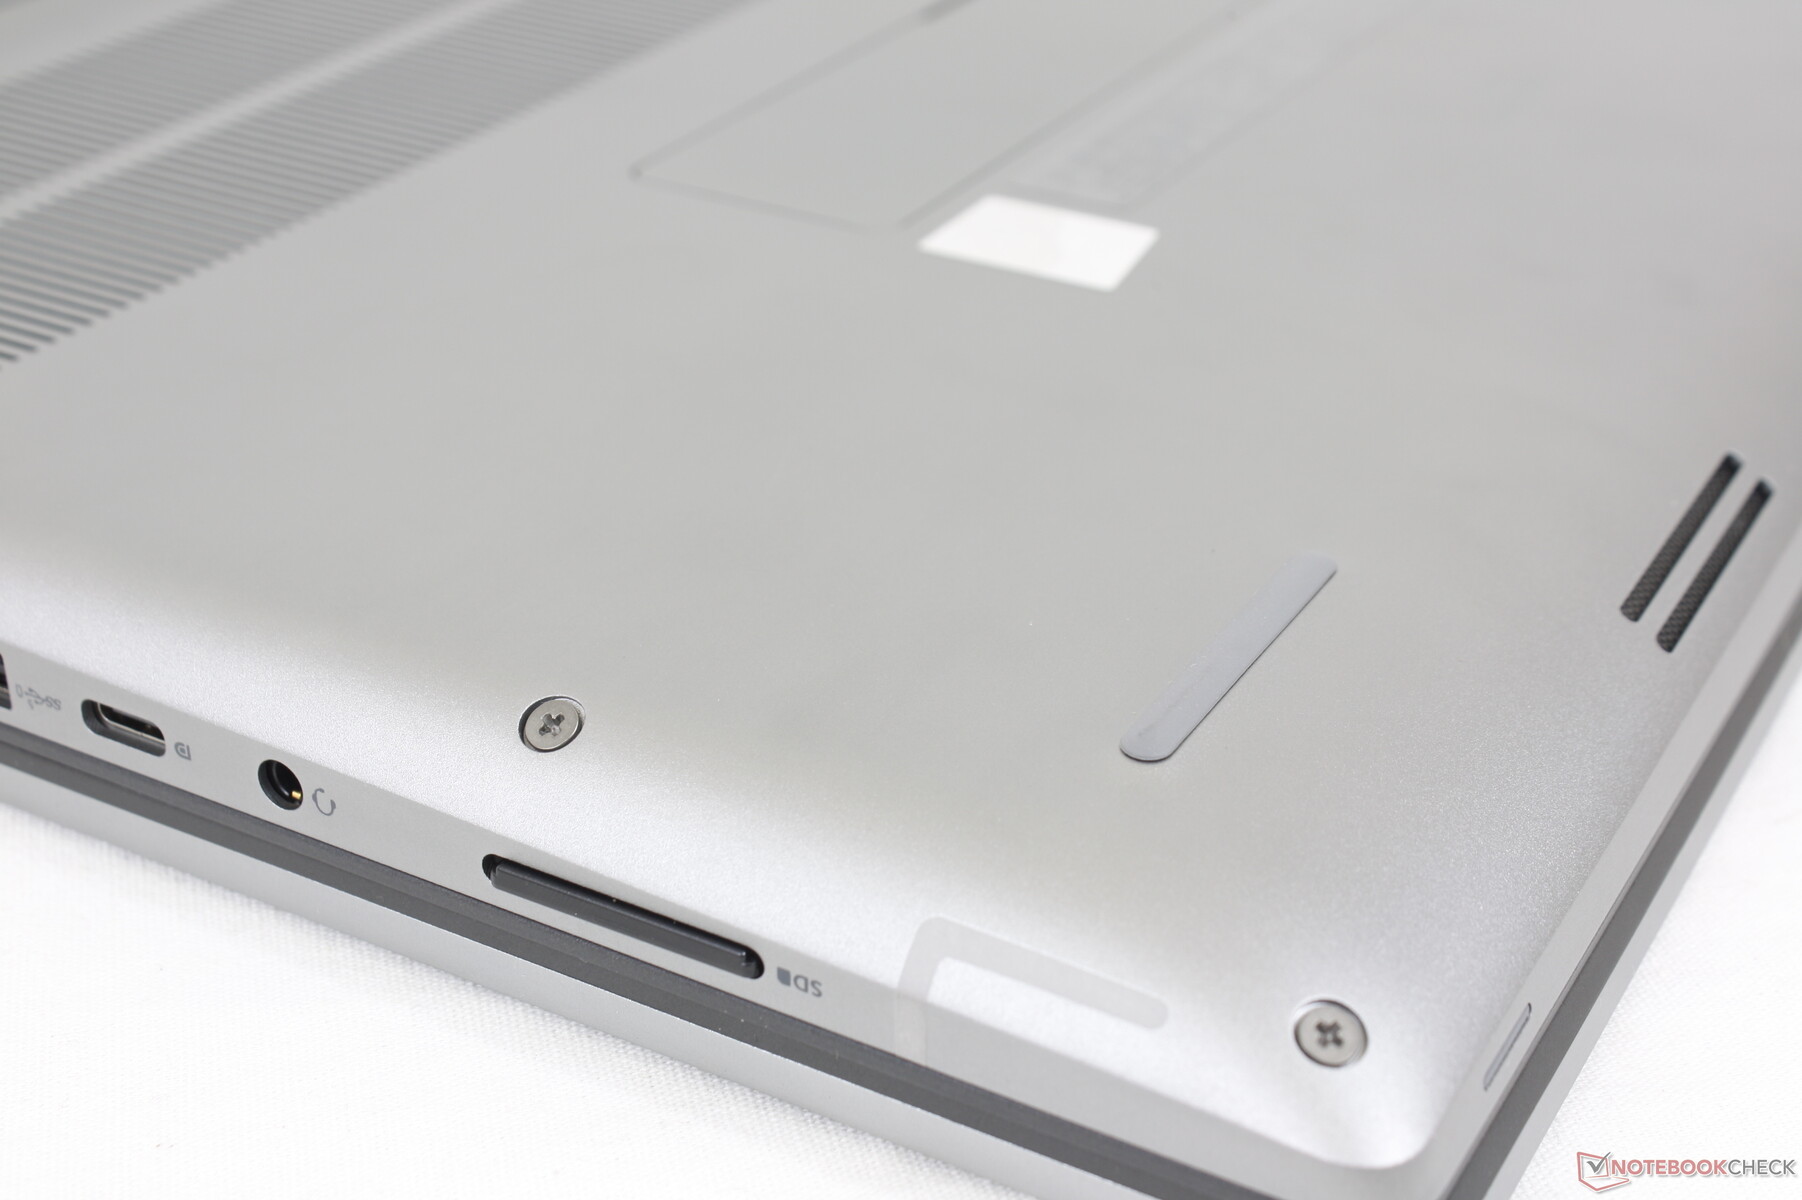
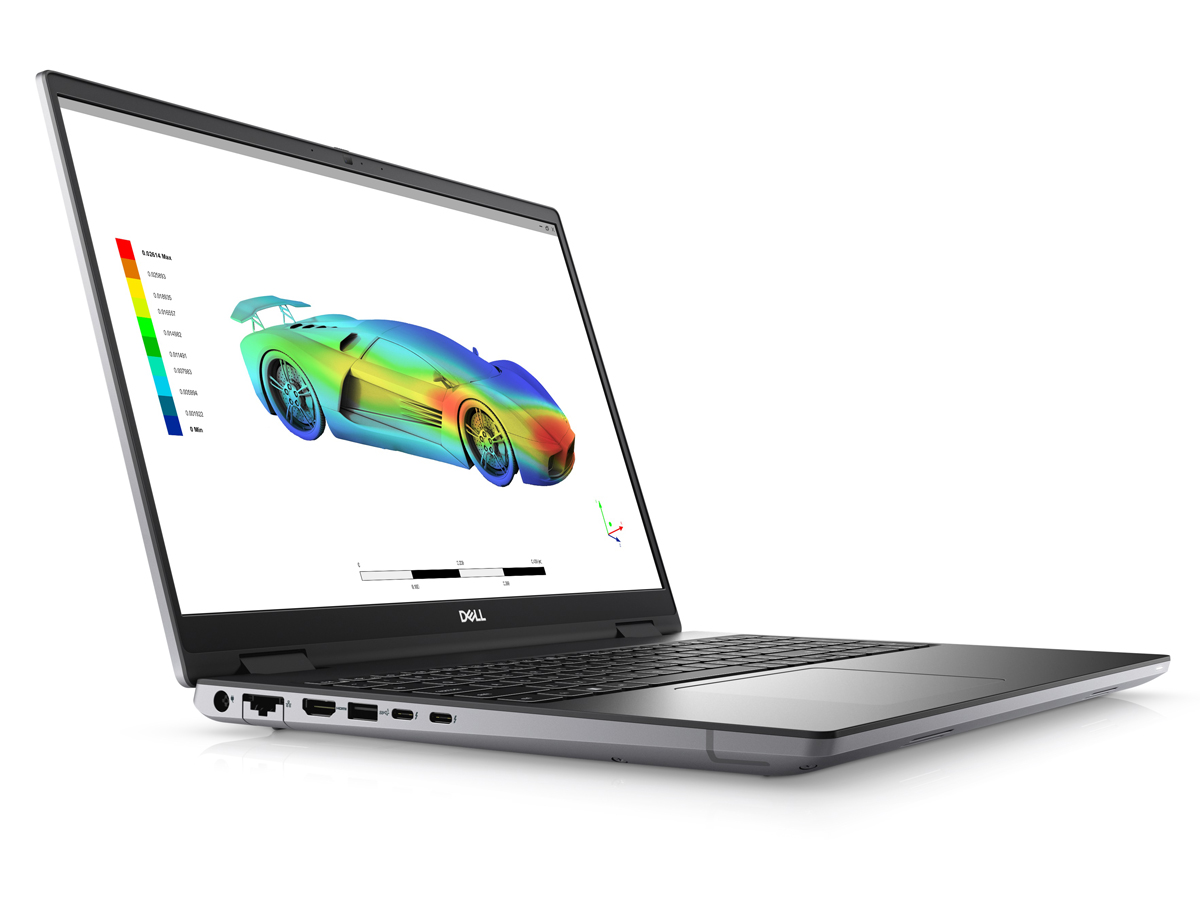
Anschlüsse — Thunderbolt 4, aber kein PD
Die Anschlussvielfalt ist ausgezeichnet, insbesondere da hier mehr USB-Optionen vorhanden sind als auf vielen anderen Workstations. Viele Ports verteilen sich auf die linke Seite, während die Anschlüsse rechts sehr nahe an die Vorderseite heranrücken. Achtung: Der RJ-45-LAN-Port unterstützt nur Geschwindigkeiten von bis zu 1 Gbps anstelle von schnelleren 10 Gbps oder zumindest 2,5 Gbps.
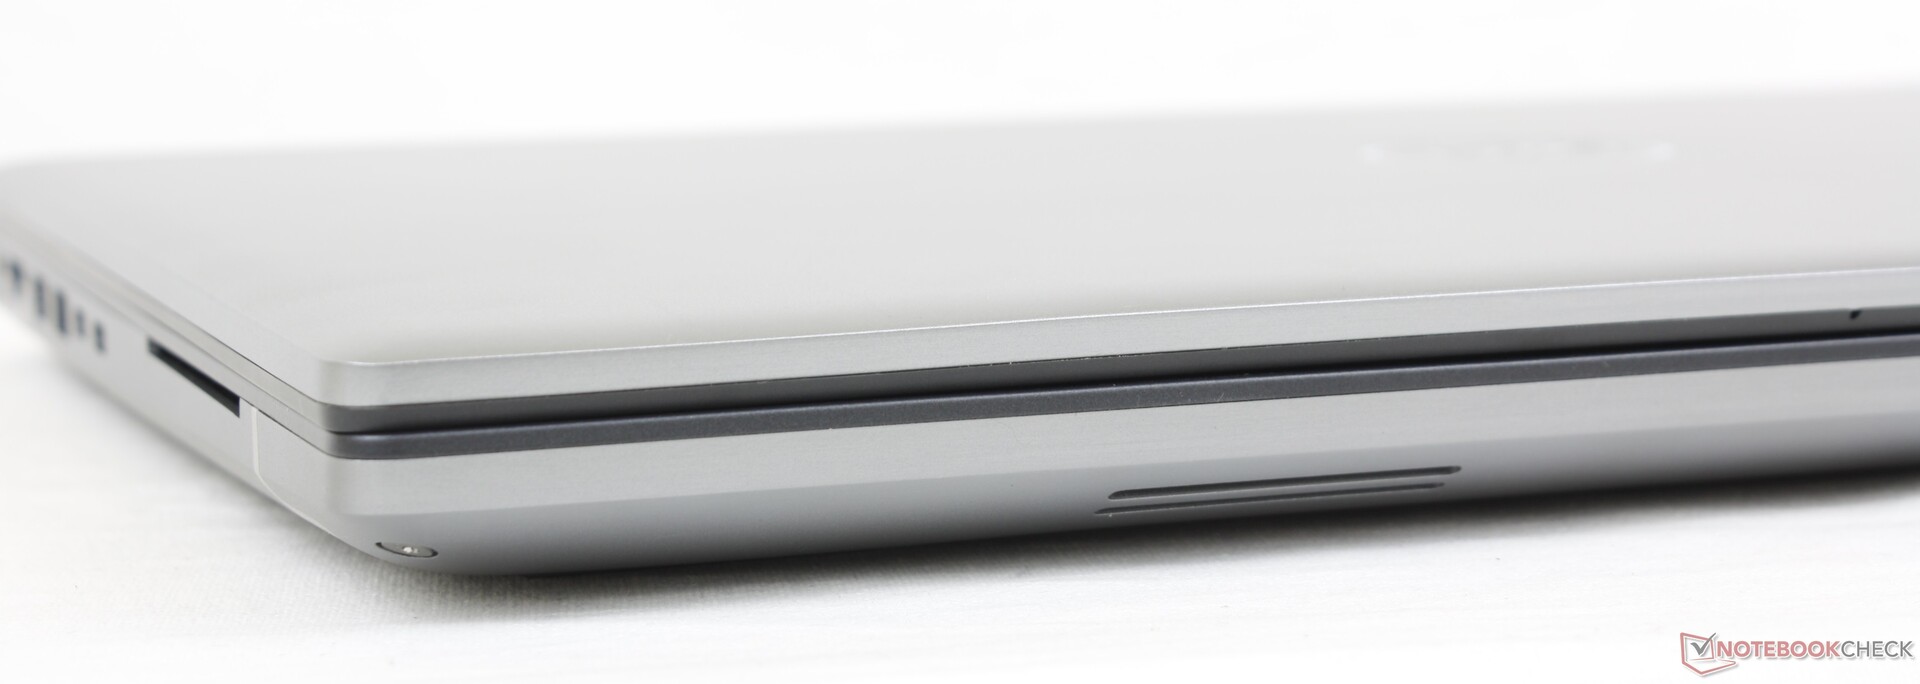
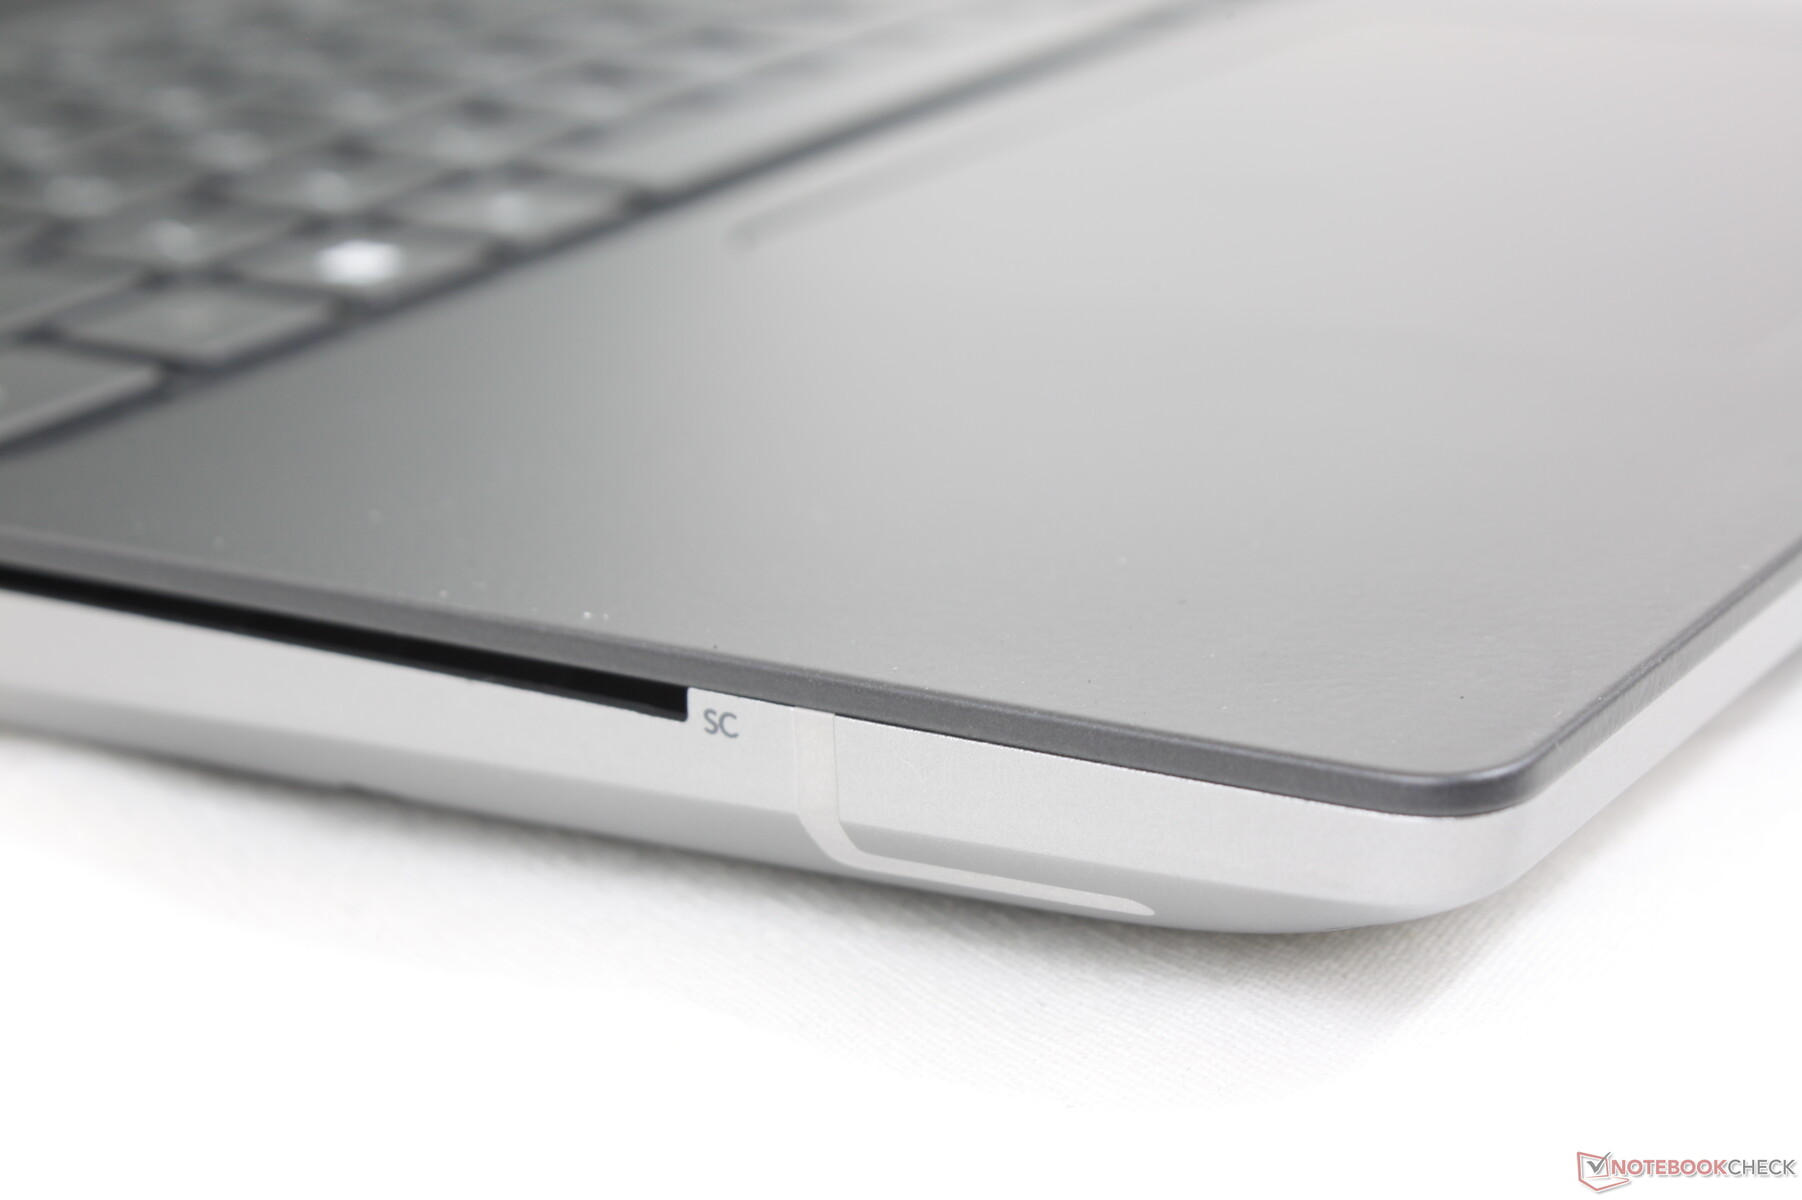
SD Card Reader
Die Transferraten des SD-Readers mit Einrastfunktion entsprechen denen beim Precision 7550 und sind mehr als doppelt so schnell wie beim HP ZBook Fury G8. Das Verschieben von 1 GB an Bildern von unserer UHS-II-Testkarte dauert nur 5 bis 6 Sekunden.
| SD Card Reader | |
| average JPG Copy Test (av. of 3 runs) | |
| Lenovo ThinkPad P1 G4-20Y4Z9DVUS (Angelbird AV Pro V60) | |
| Dell Precision 5000 5560 (AV Pro V60) | |
| Dell Precision 7670 (Toshiba Exceria Pro SDXC 64 GB UHS-II) | |
| Dell Precision 7550 (Toshiba Exceria Pro SDXC 64 GB UHS-II) | |
| HP ZBook Fury 15 G8 (AV Pro V60) | |
| Asus ProArt StudioBook 16 W7600H5A-2BL2 (AV Pro SD microSD 128 GB V60) | |
| maximum AS SSD Seq Read Test (1GB) | |
| Dell Precision 5000 5560 (AV Pro V60) | |
| Dell Precision 7550 (Toshiba Exceria Pro SDXC 64 GB UHS-II) | |
| Dell Precision 7670 (Toshiba Exceria Pro SDXC 64 GB UHS-II) | |
| Lenovo ThinkPad P1 G4-20Y4Z9DVUS (Angelbird AV Pro V60) | |
| HP ZBook Fury 15 G8 (AV Pro V60) | |
| Asus ProArt StudioBook 16 W7600H5A-2BL2 (AV Pro SD microSD 128 GB V60) | |
Kommunikation
Standardmäßig verbaut Dell das Wi-Fi-6E-Modul Intel AX211 in zwei Varianten, denn Bluetooth ist optional. Leider erweist sich Wi-Fi 6E in vielen Situationen nicht notwendigerweise als schneller als Wi-Fi 6. Im Gegensatz zu vielen anderen Workstations variieren die Transferraten bei der Precision 7670 deutlich stärker, selbst bei einer Entfernung von nur 1 - 2 m von unserem 6-GHz-Router.

| Networking | |
| iperf3 transmit AX12 | |
| Lenovo ThinkPad P1 G4-20Y4Z9DVUS | |
| HP ZBook Fury 15 G8 | |
| Dell Precision 7550 | |
| Dell Precision 5000 5560 | |
| Asus ProArt StudioBook 16 W7600H5A-2BL2 | |
| iperf3 receive AX12 | |
| Dell Precision 5000 5560 | |
| Lenovo ThinkPad P1 G4-20Y4Z9DVUS | |
| Dell Precision 7550 | |
| HP ZBook Fury 15 G8 | |
| Asus ProArt StudioBook 16 W7600H5A-2BL2 | |
| iperf3 receive AXE11000 6GHz | |
| Dell Precision 7670 | |
| iperf3 transmit AXE11000 6GHz | |
| Dell Precision 7670 | |
Webcam
Verglichen mit der alten 1-MP-Webcam in den meisten XPS-Modellen stellt die neue 2-MP-Webcam eine Verbesserung dar. Allerdings verblasst auch sie verglichen mit den 5-MP-Kameras auf den meisten, aktuellen HP-Laptops.
Sowohl IR als auch ein Shutter sind für Windows Hello und mehr Privatsphäre mit an Bord.


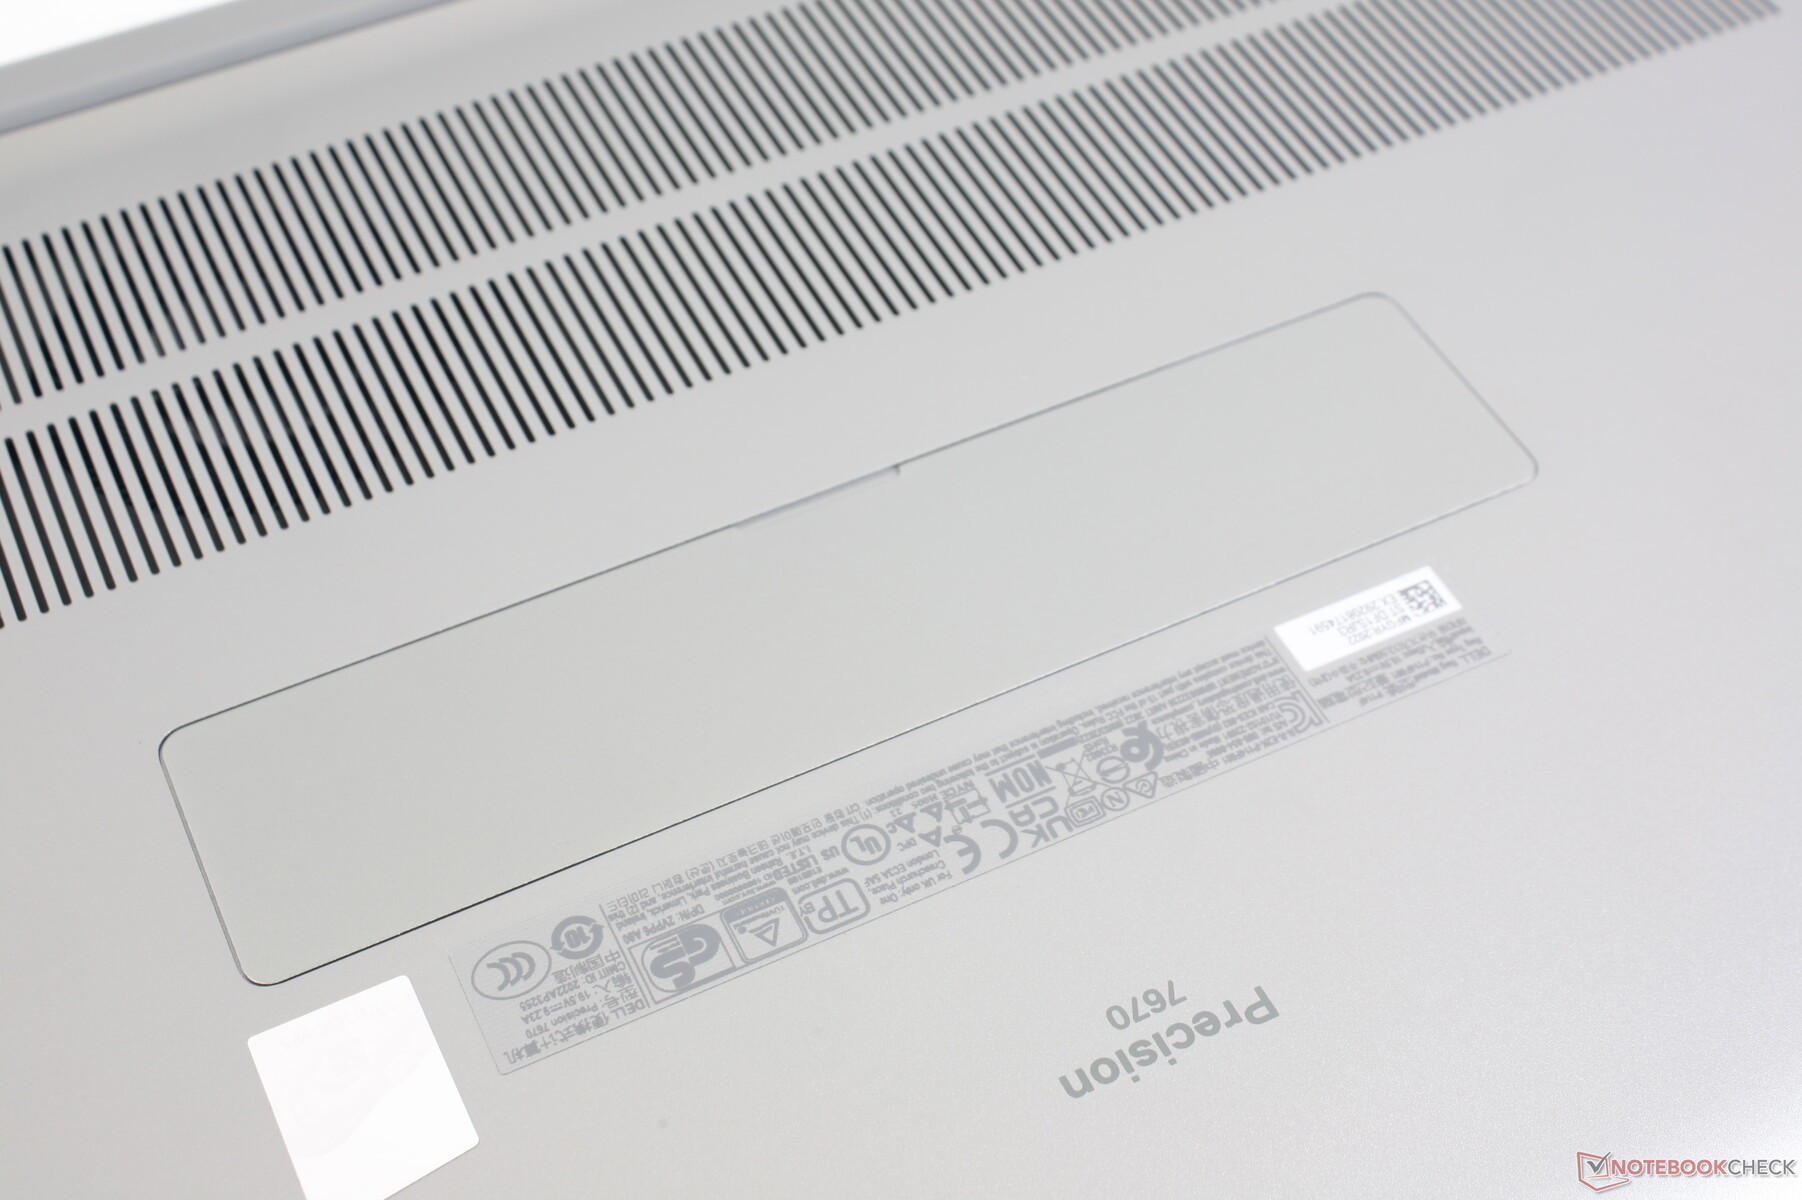
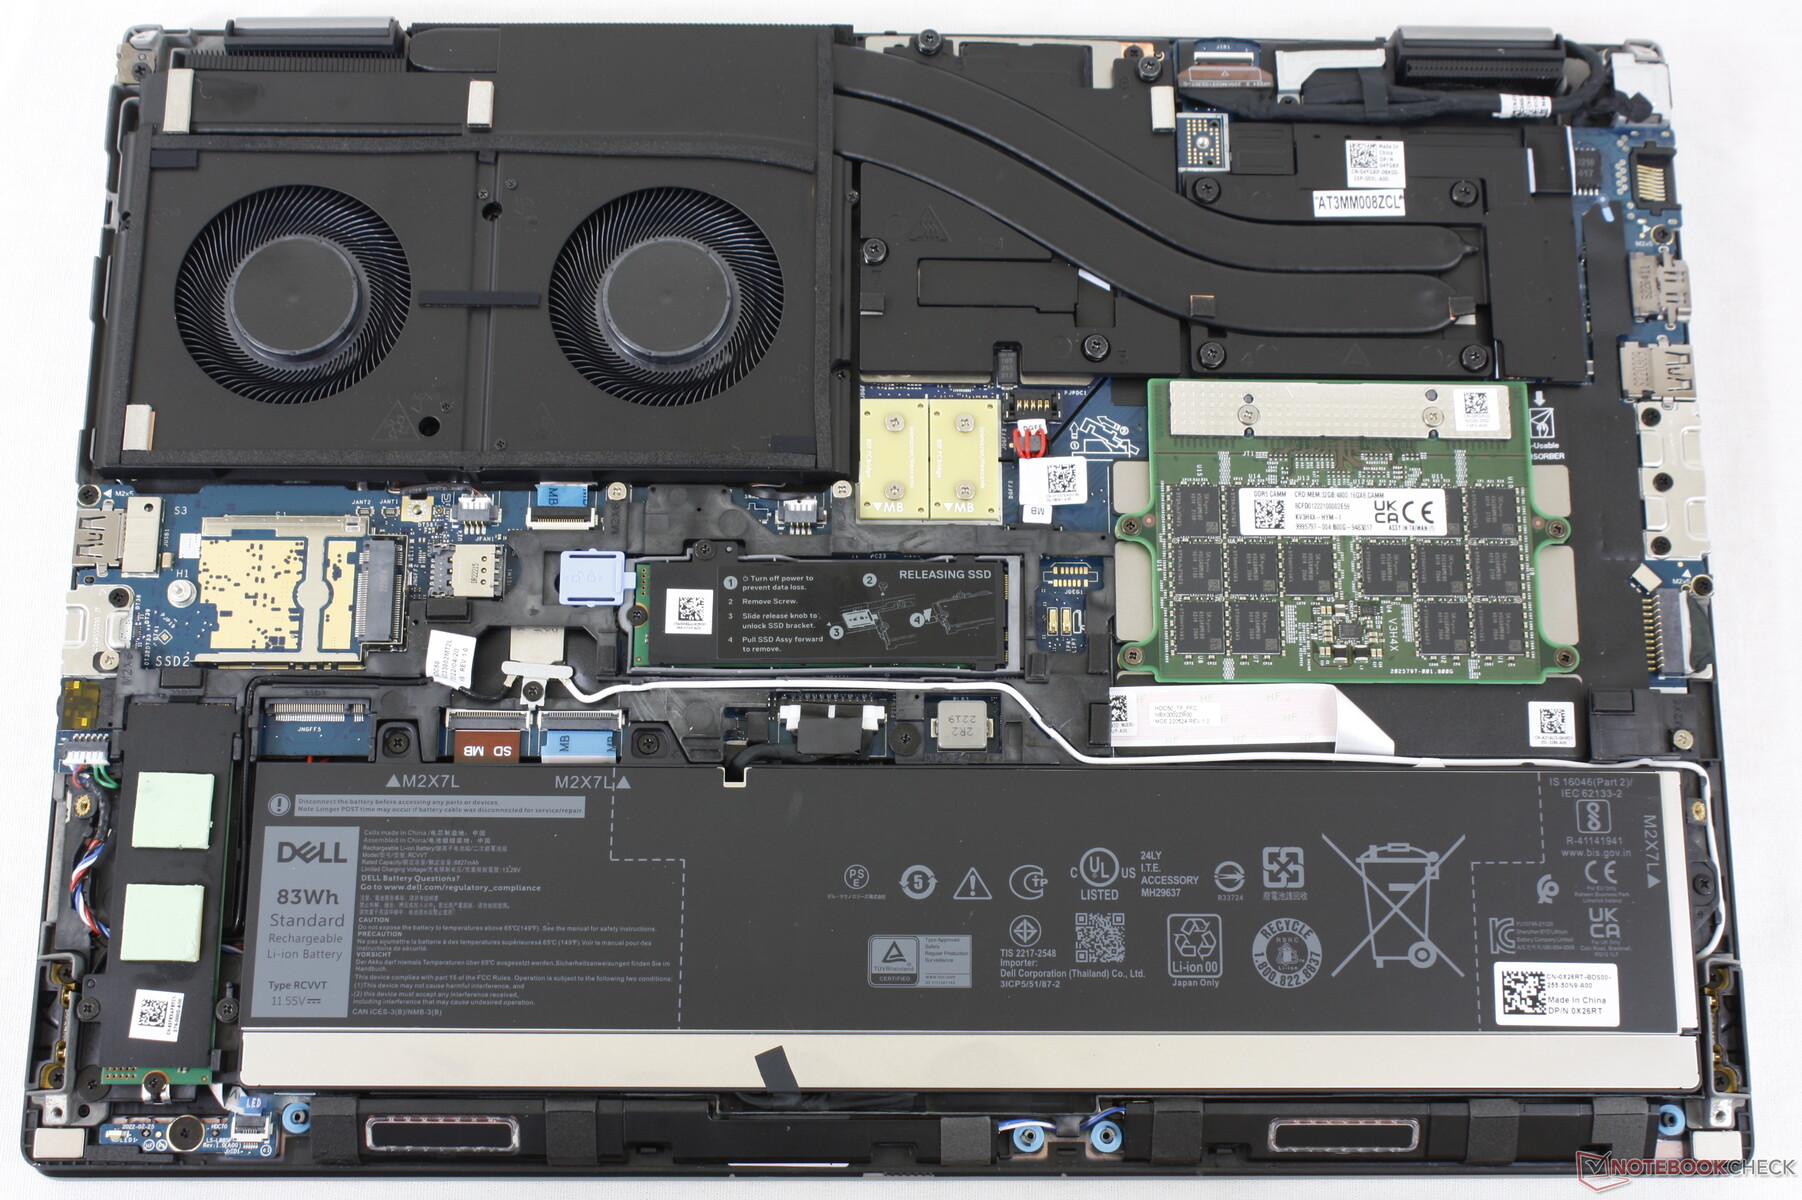
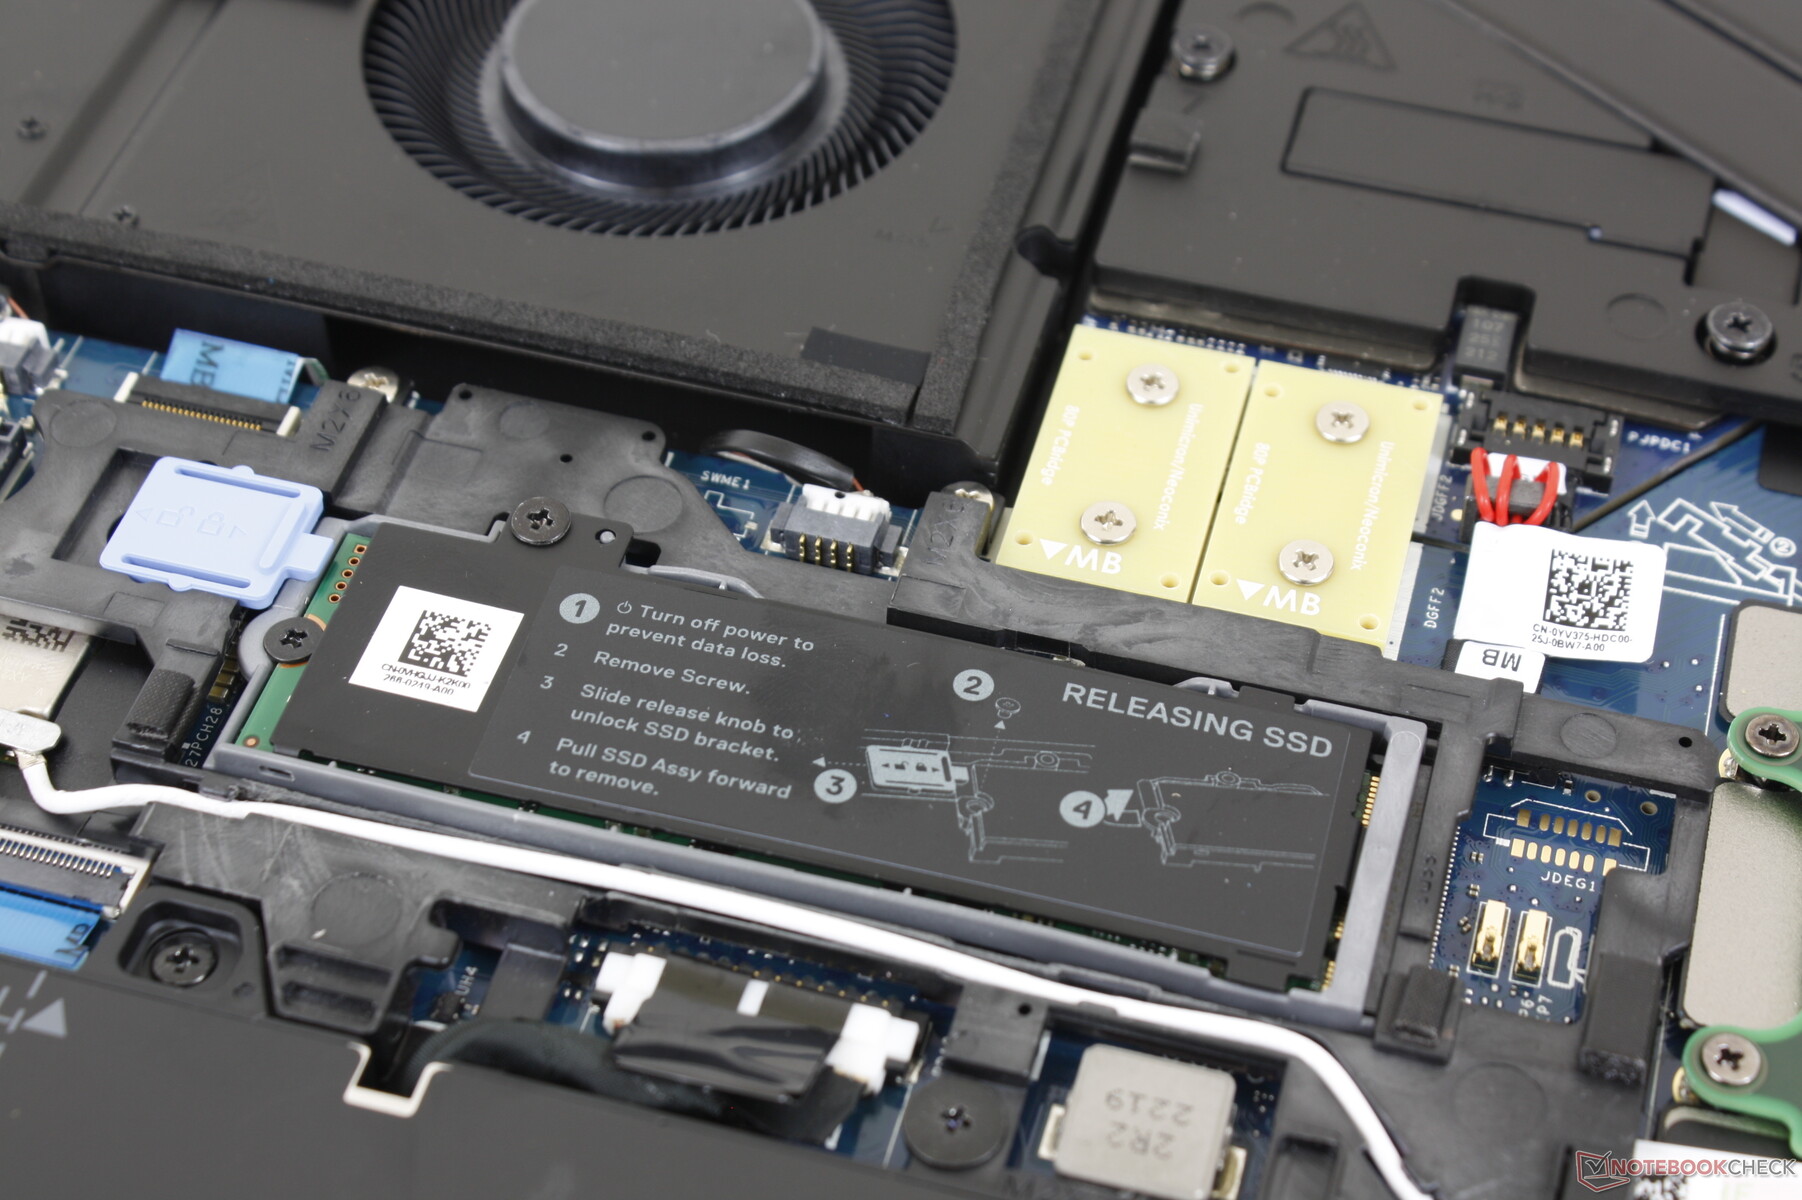
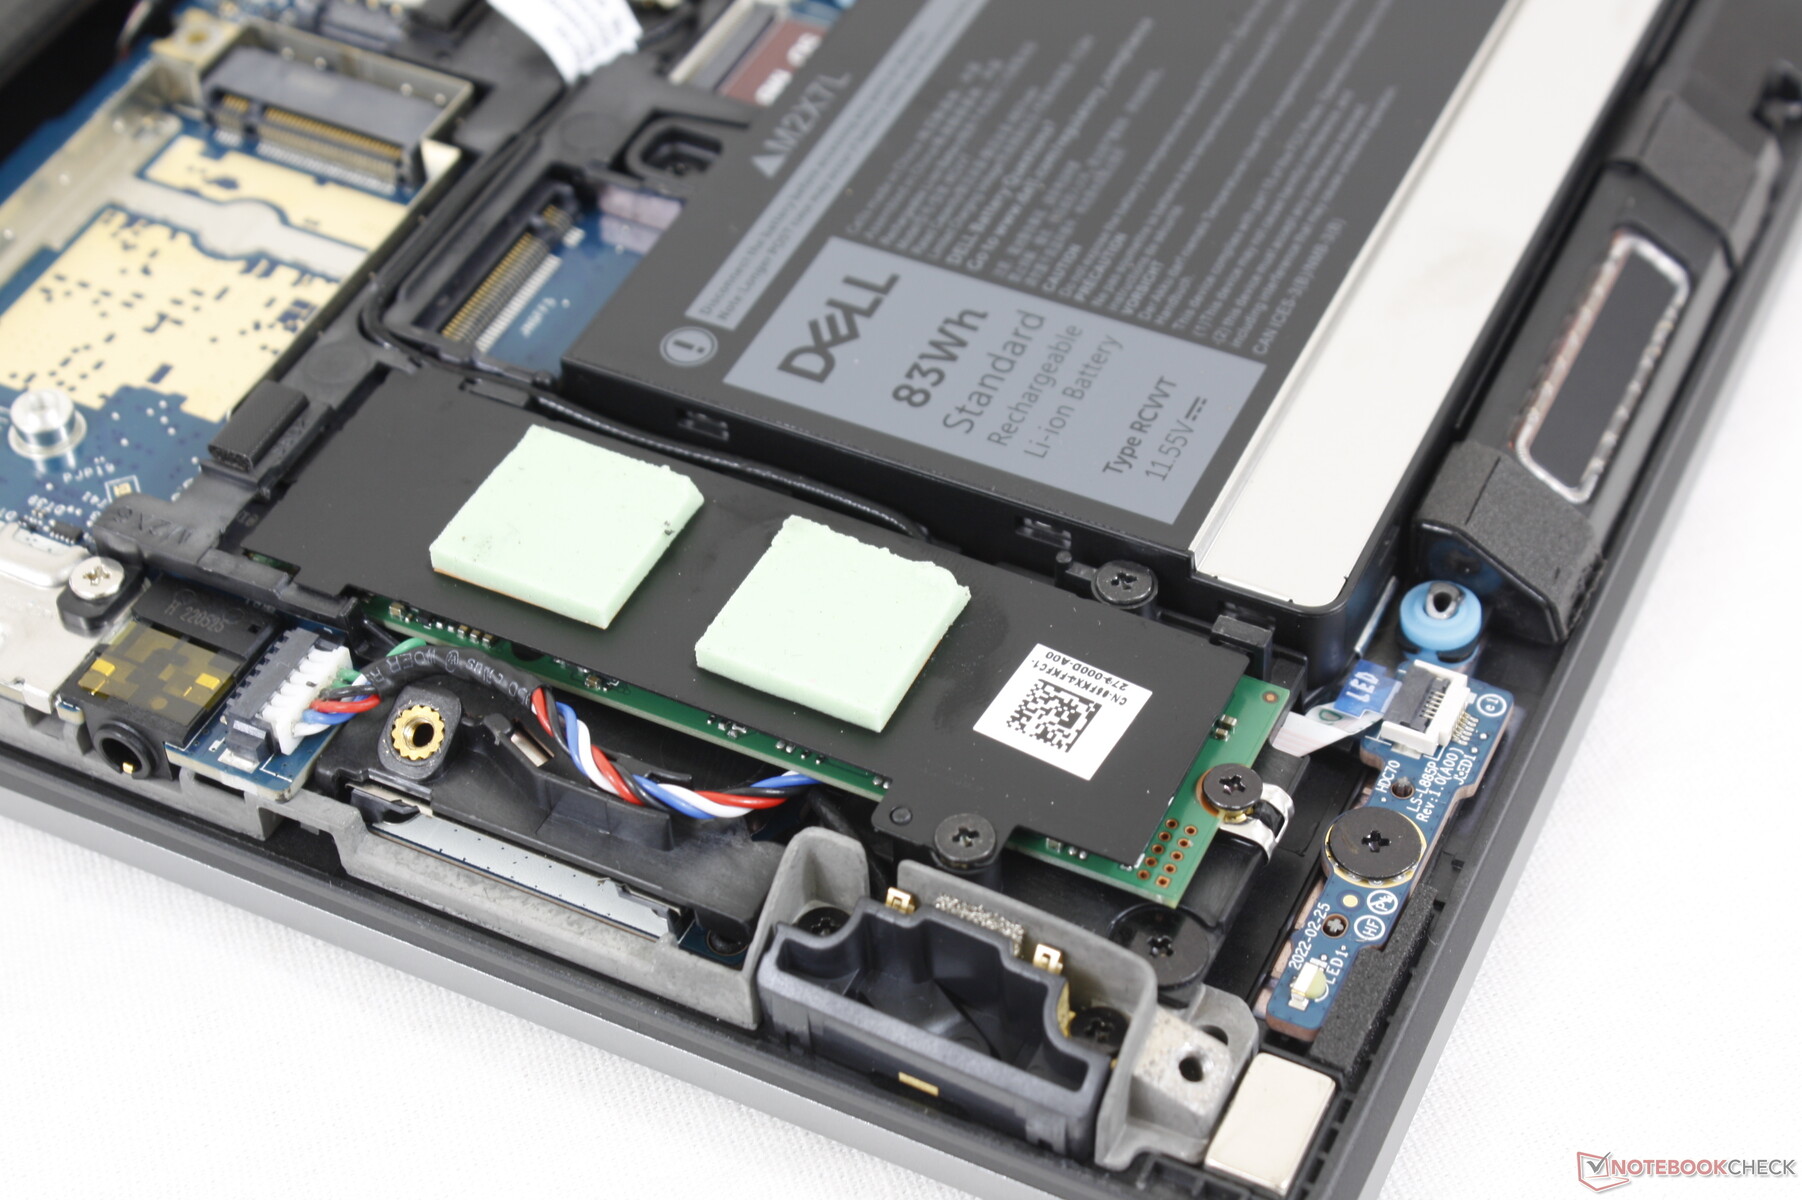
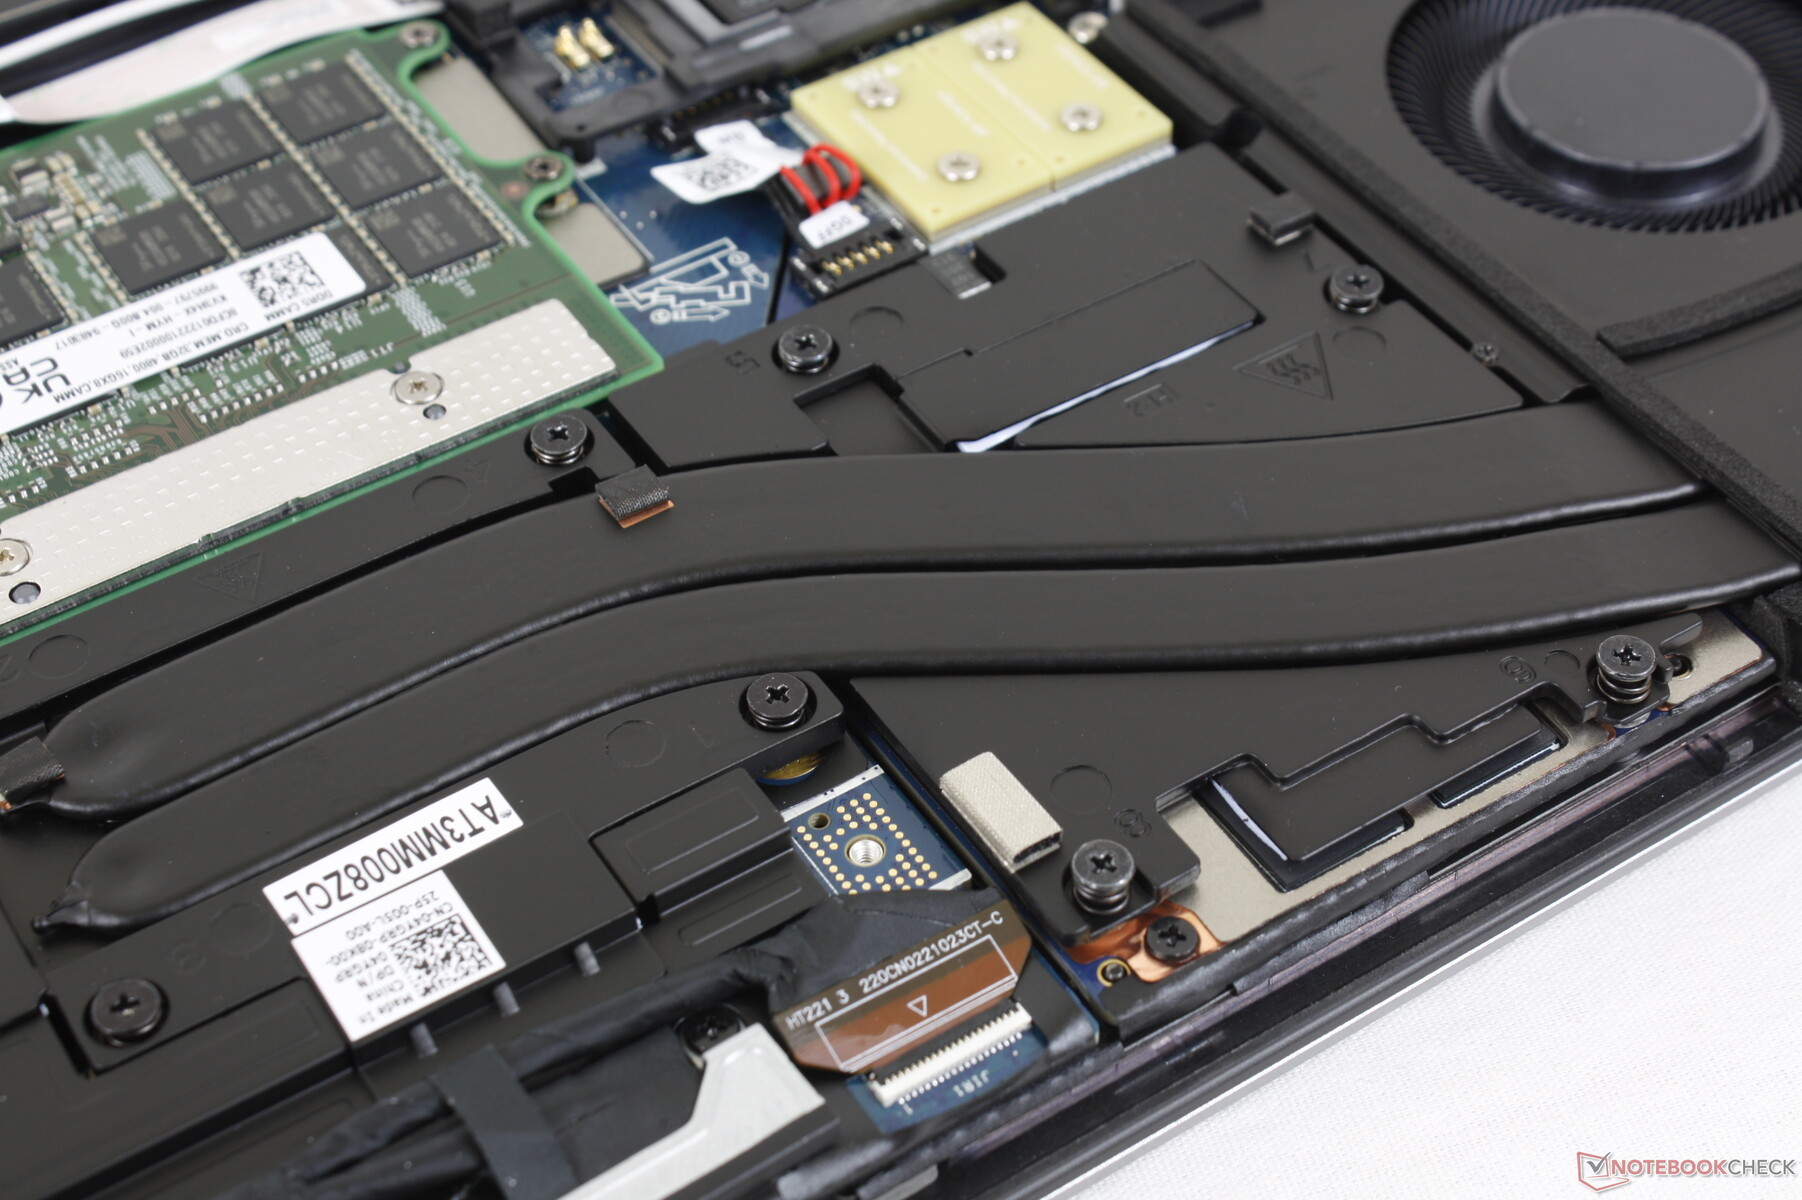
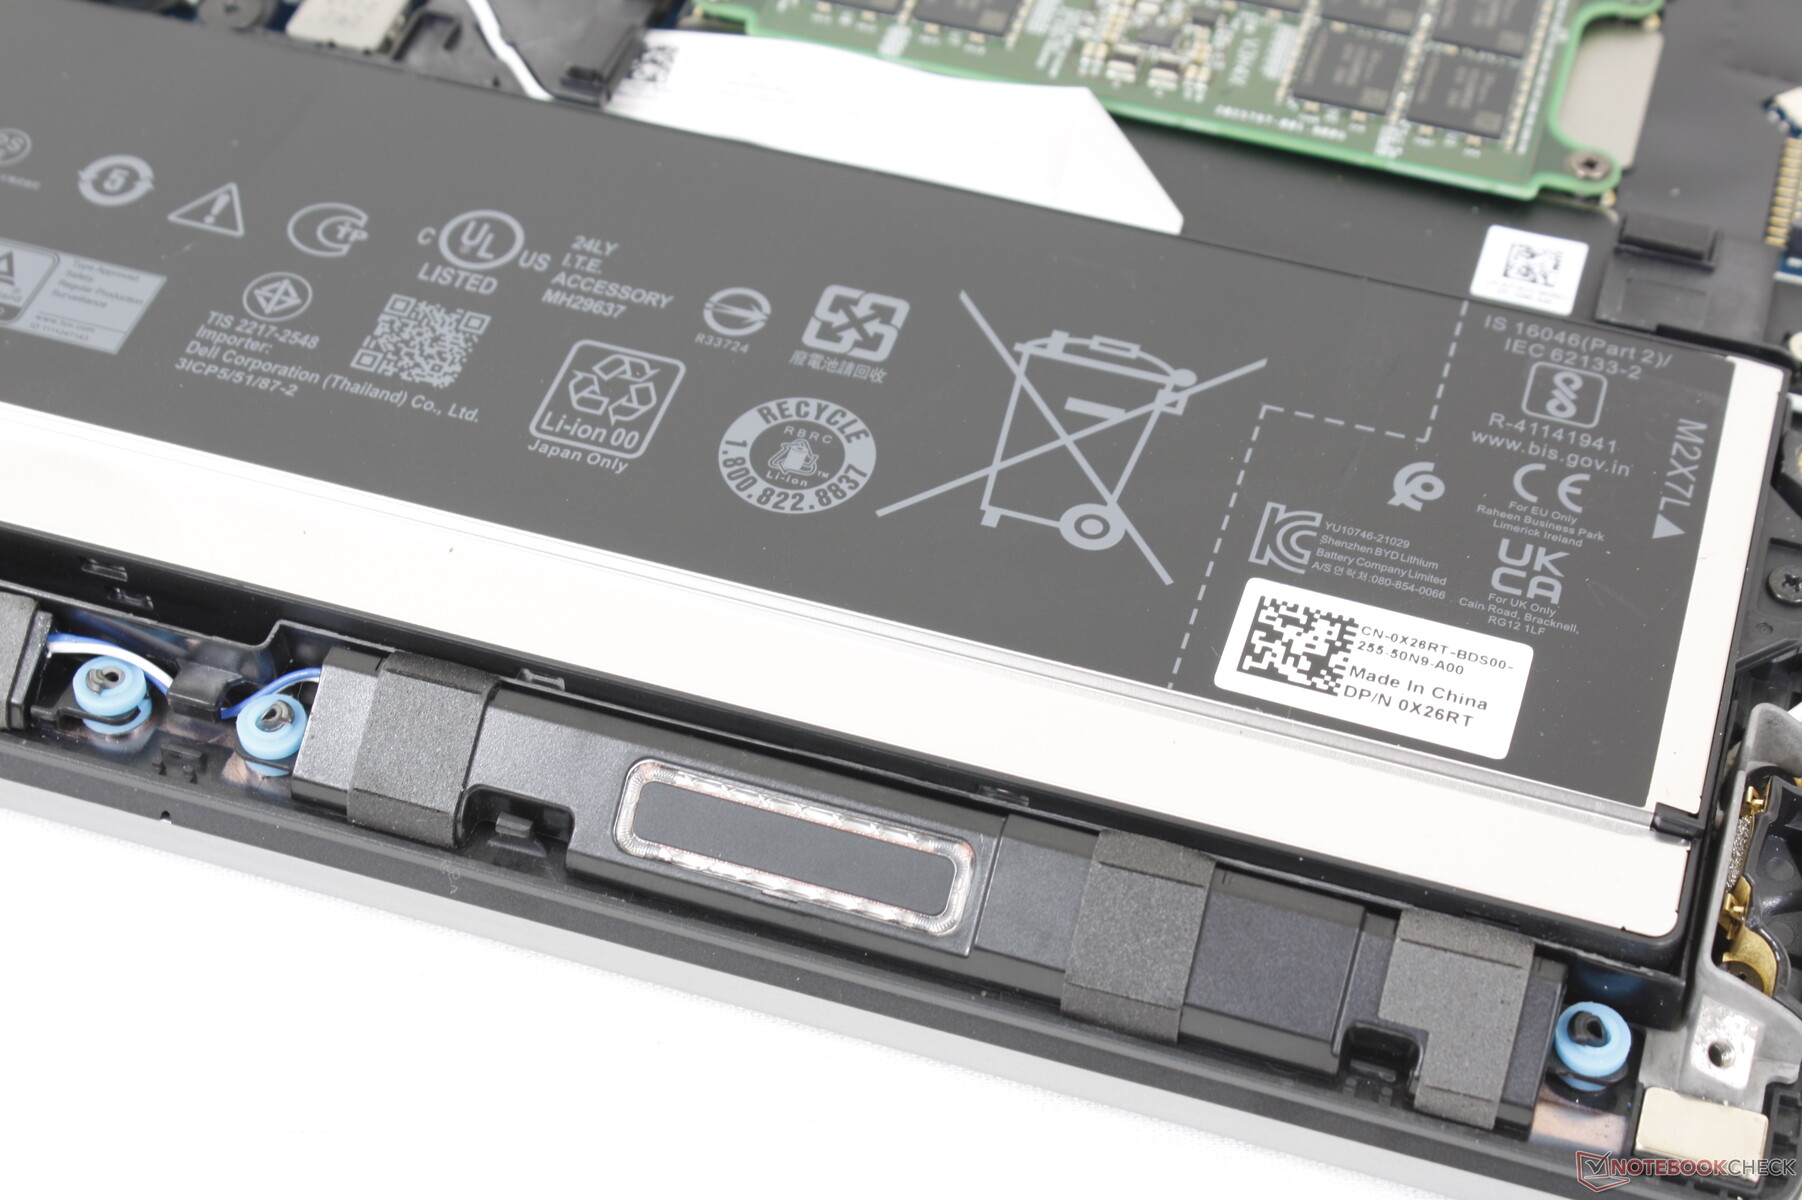
Wartung — Einfacher Zugang
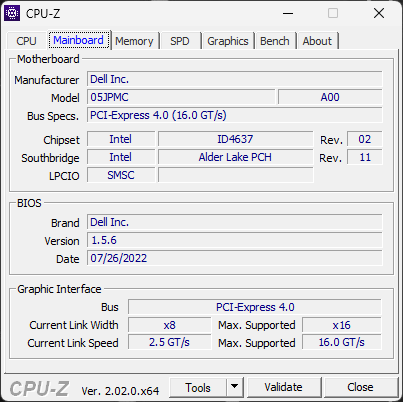
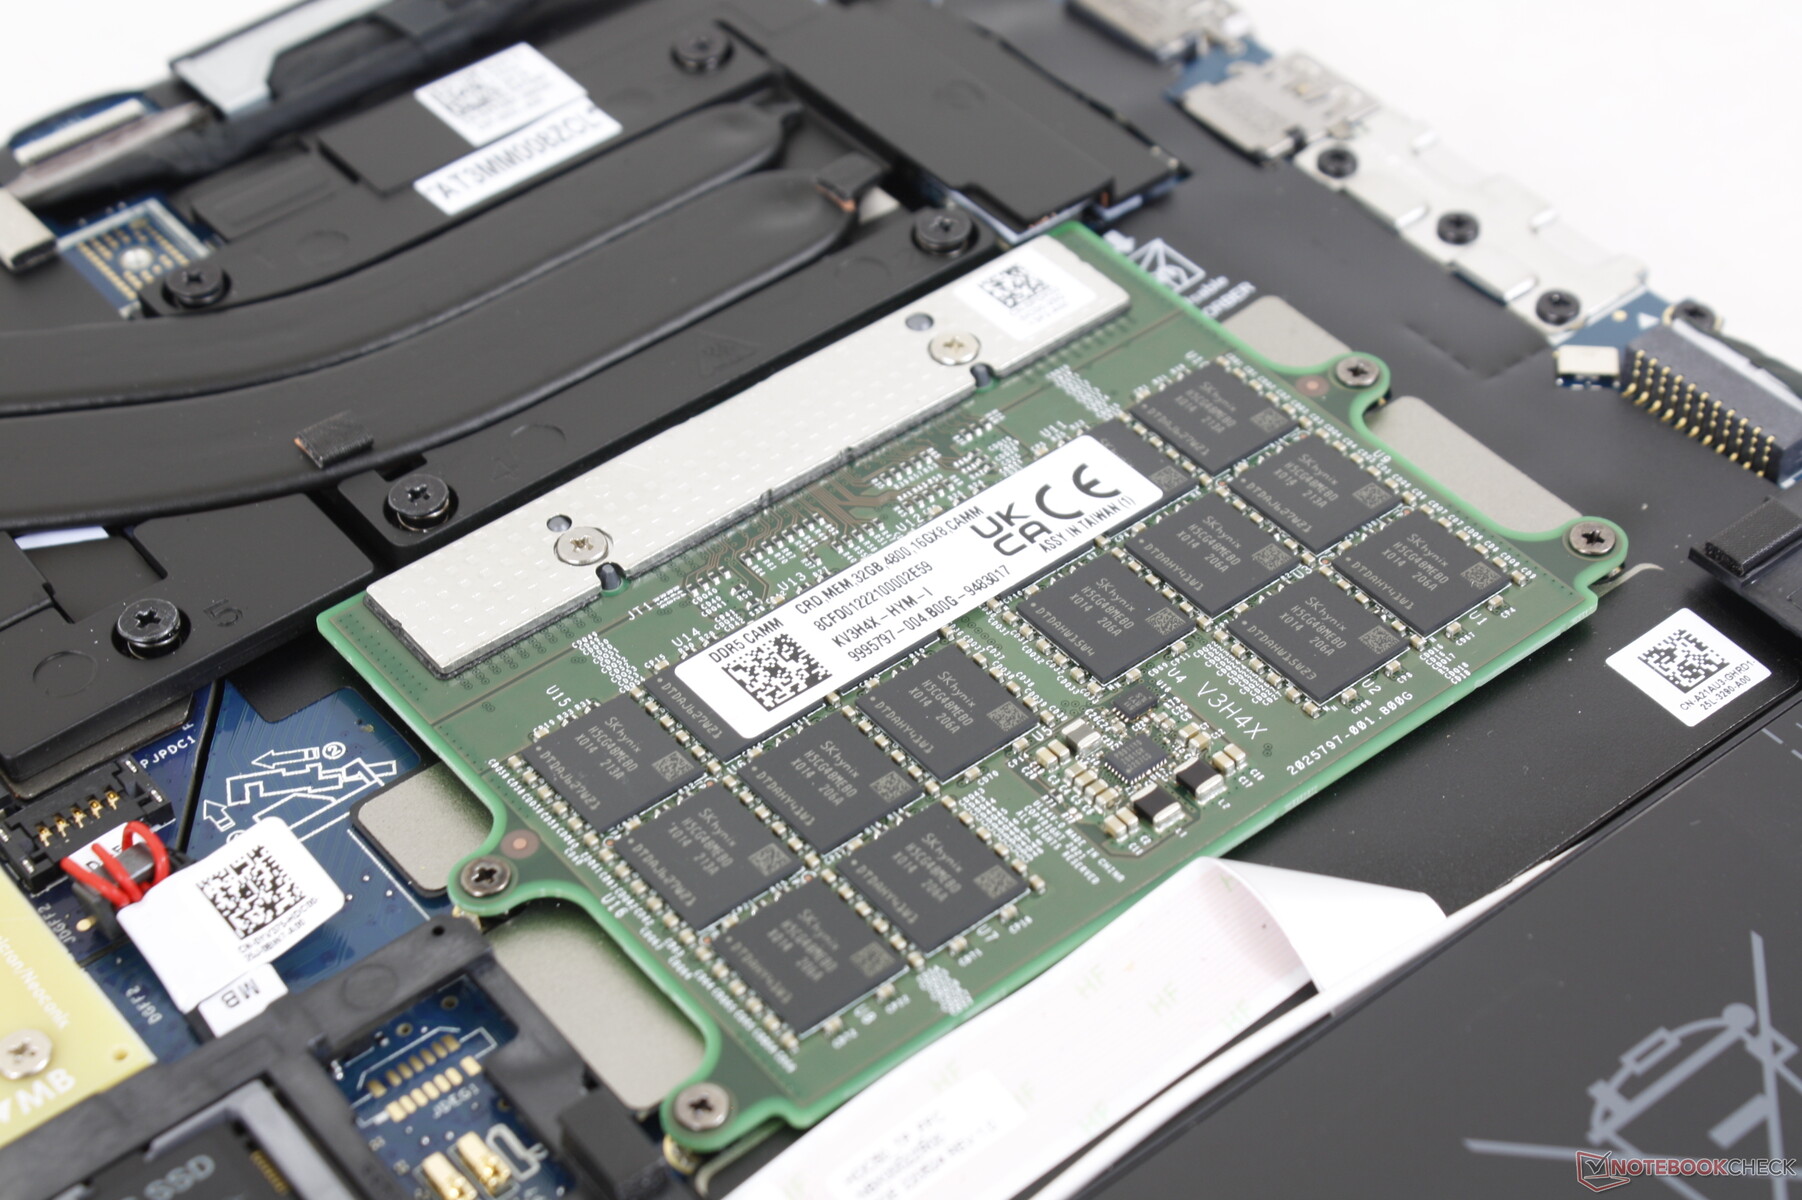
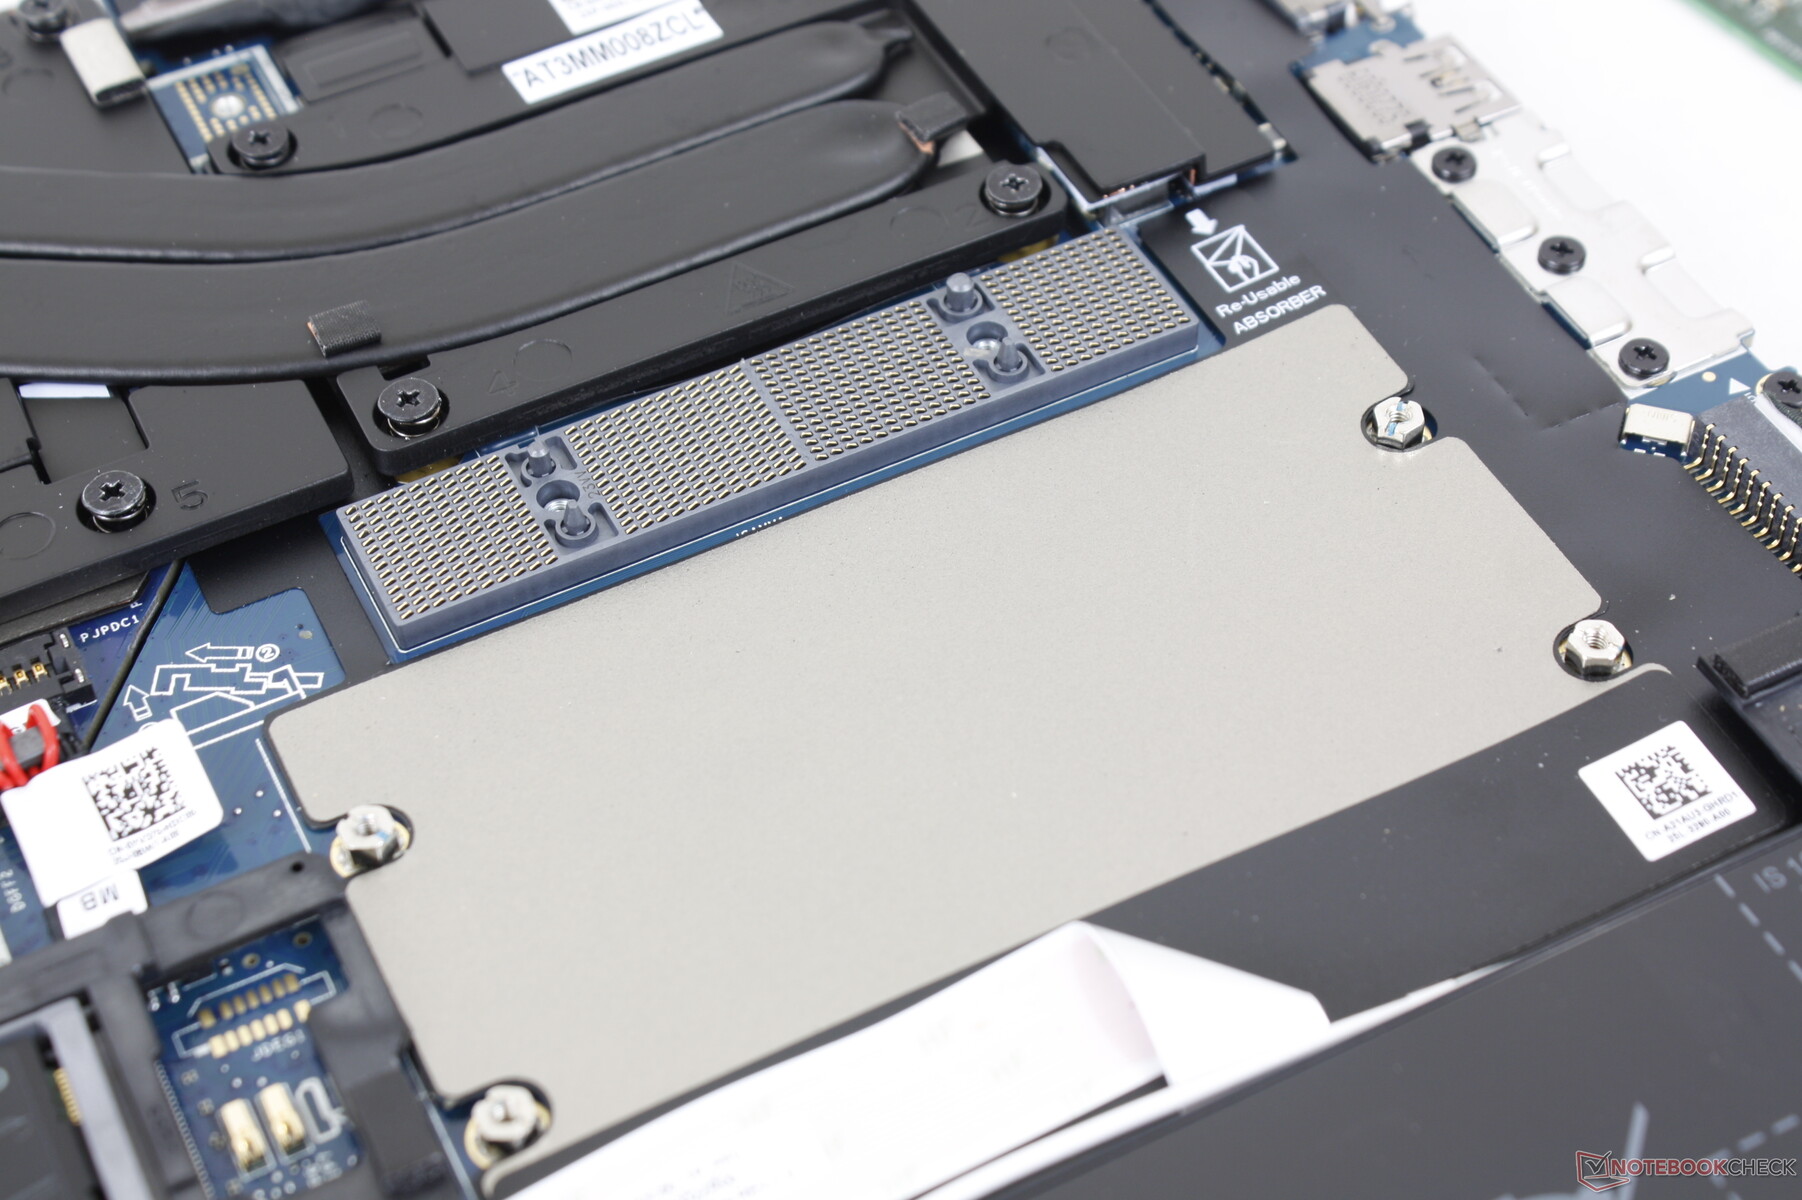
Die Unterseite wird durch nur 6 Philips-Schrauben gesichert, sodass das Öffnen leicht gelingt. Nutzer haben Zugang zu den beiden M.2-PCIe4-x4-2280-Slots, dem WAN-Slot, dem Nano-SIM-Slot und den SODIMM- oder CAMM-Slots, je nach Ausstattungsvariante. Das WLAN-Modul ist hingegen nicht austauschbar.
Einige Konfigurationen beherbergen bis zu drei M.2-SSDs, wie der dritte M.2-Slot in der Nähe des Akkus verdeutlicht.
Mehr Details und Informationen zum CAMM-RAM bietet unsere Vorschauseite.
Zubehör und Garantie
Außer dem Netzteil und etwas Papierkram liegt nichts in der Verpackung bei. In Deutschland greift eine 3-Jahres-Garantie, sofern man direkt bei Dell bestellt. Für 47 Euro zusätzlich erhält man für diese Zeit einen Vor-Ort-Diagnose-Service am nächsten Werktag.
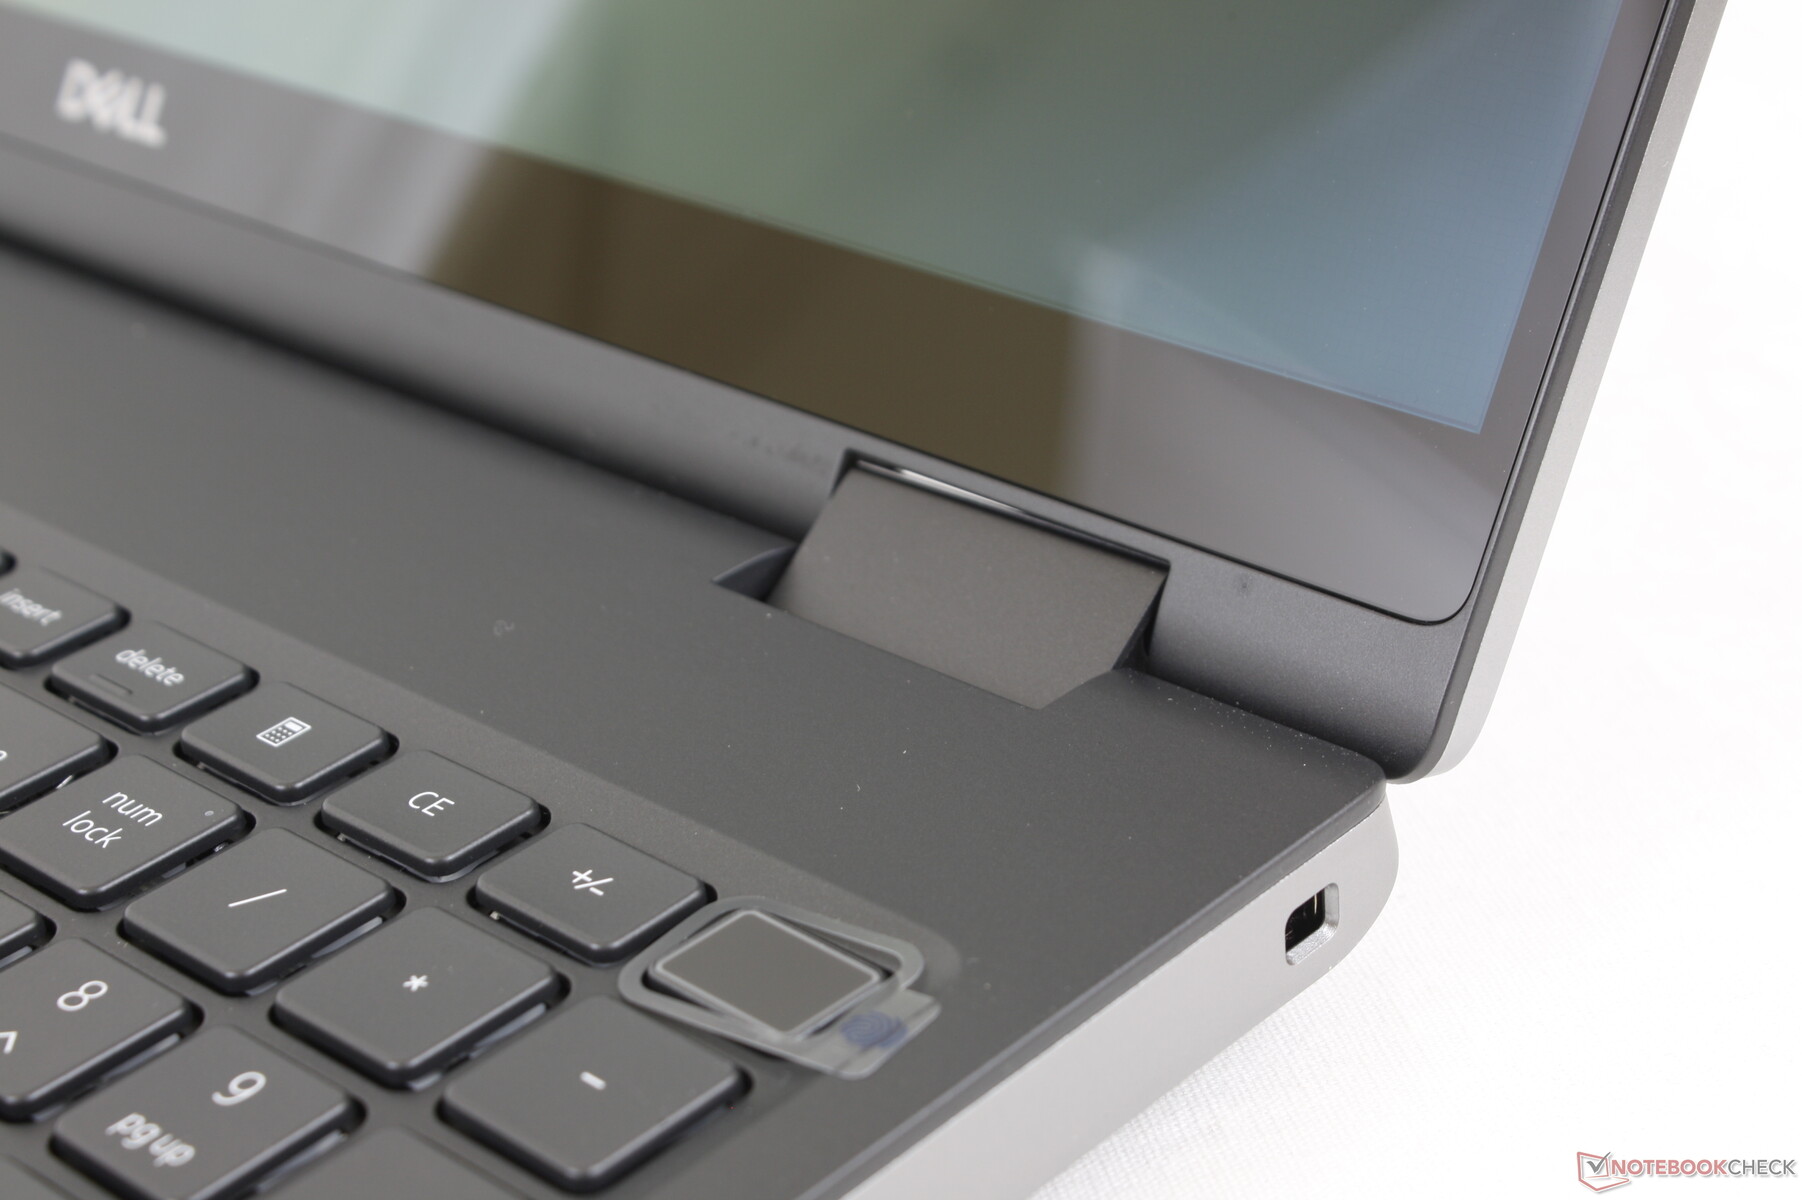
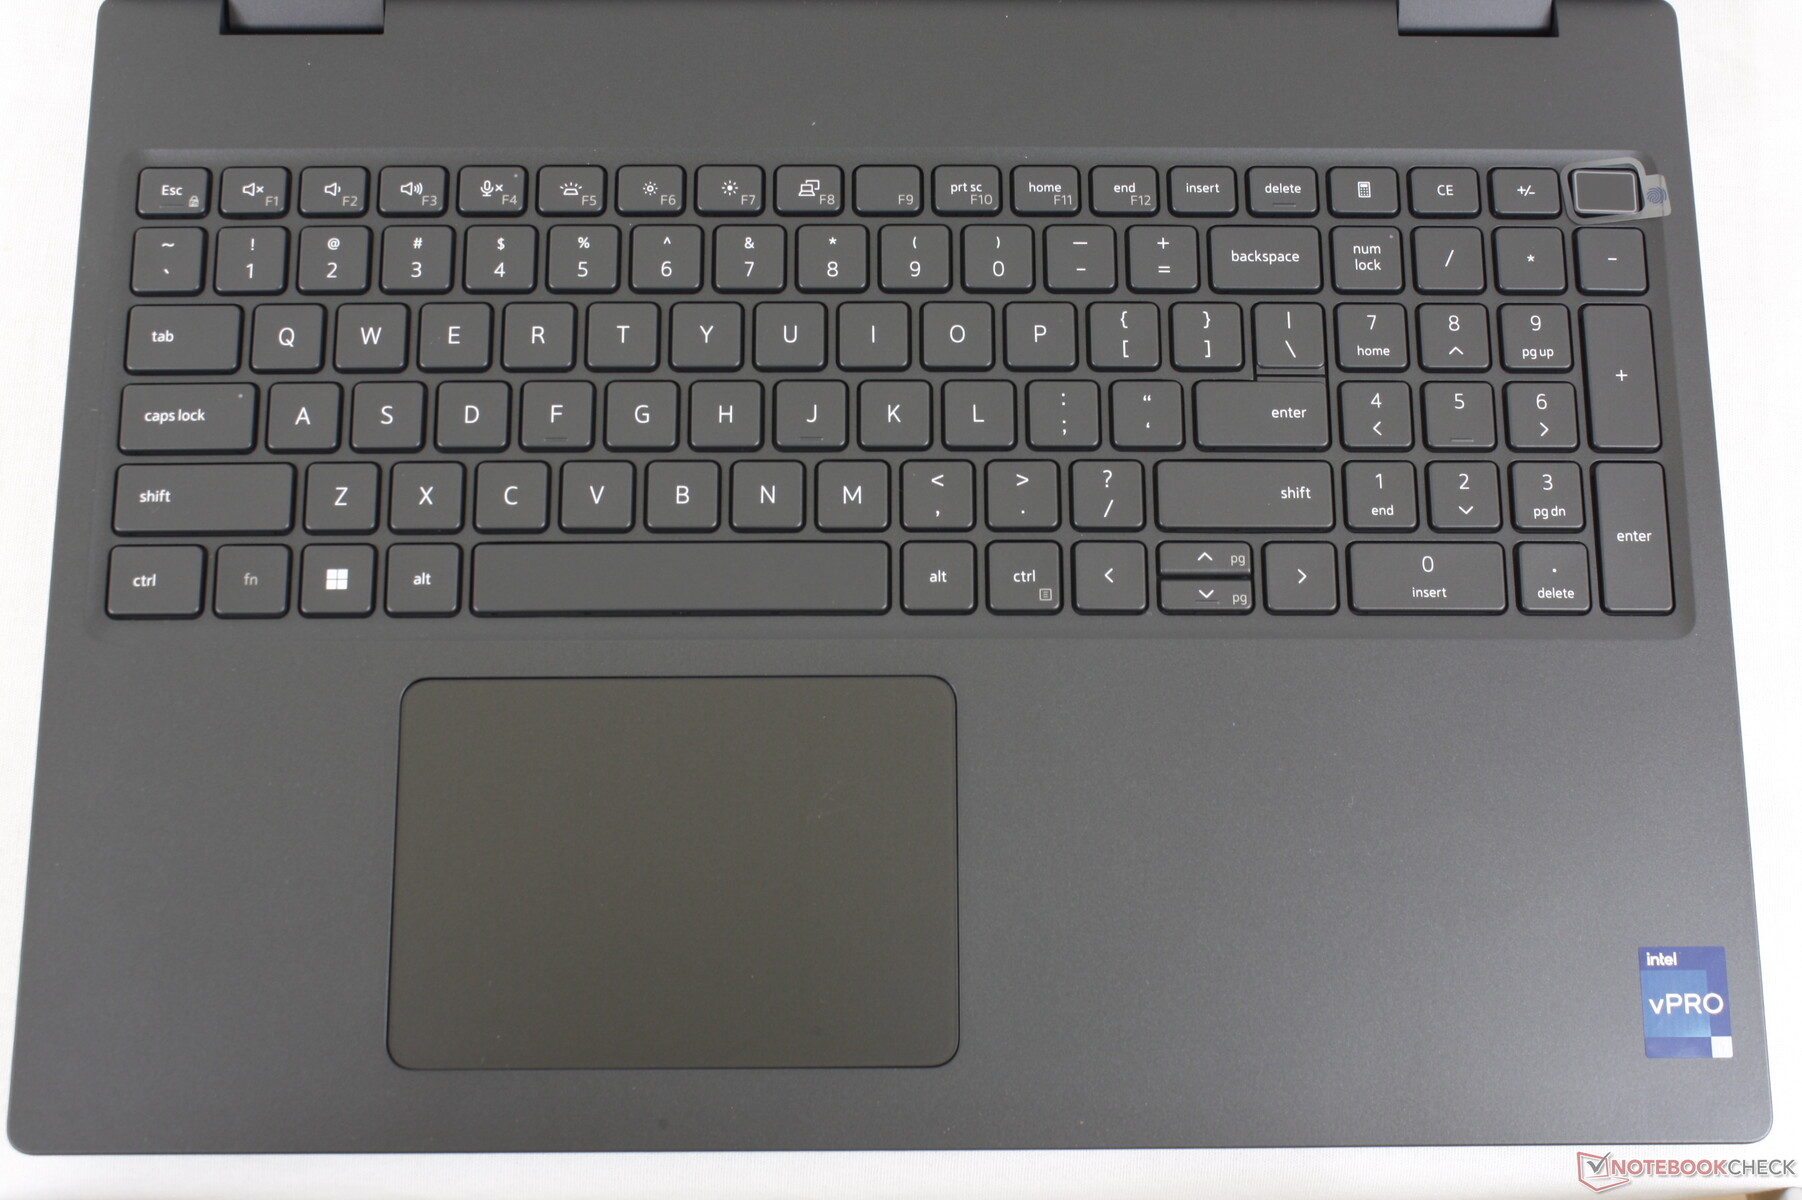
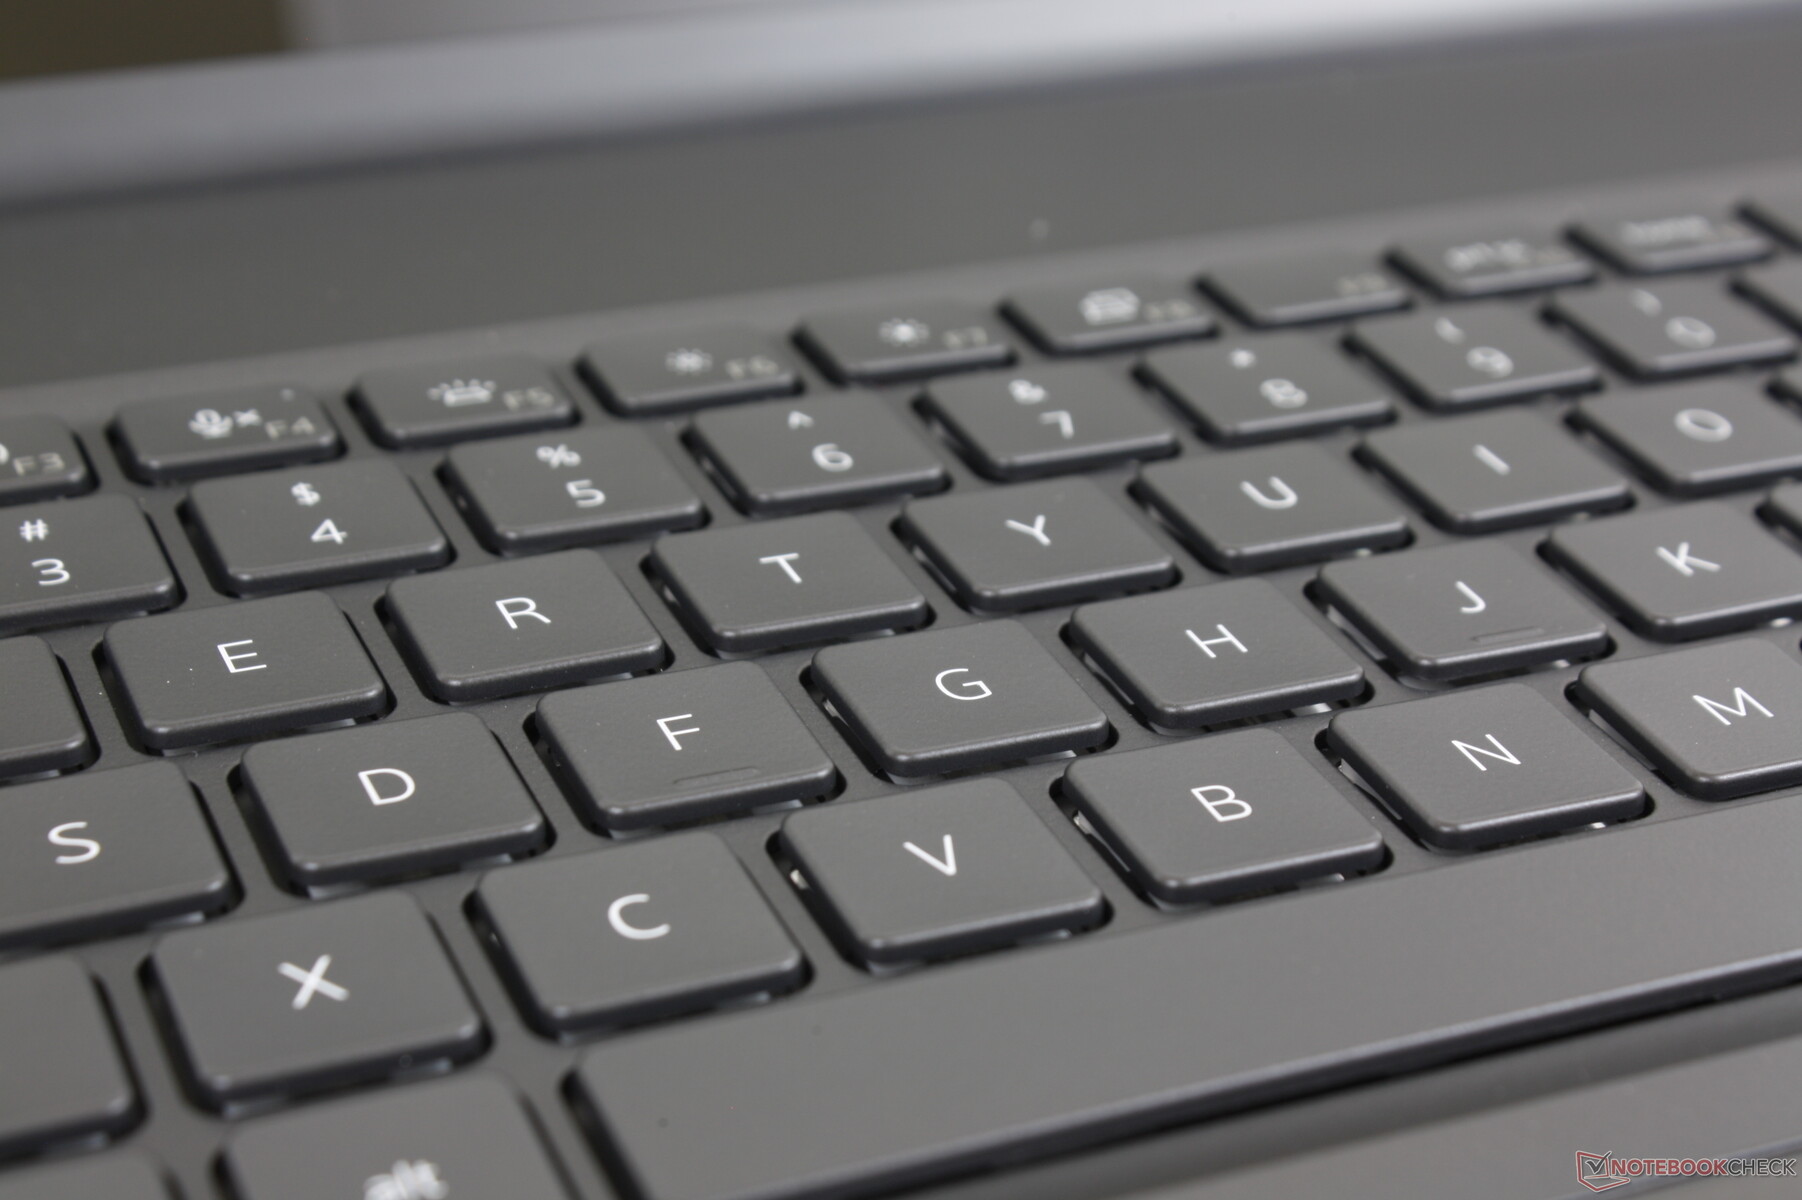
Eingabegeräte — Großes Touchpad und eine angenehme Tastatur
Tastatur
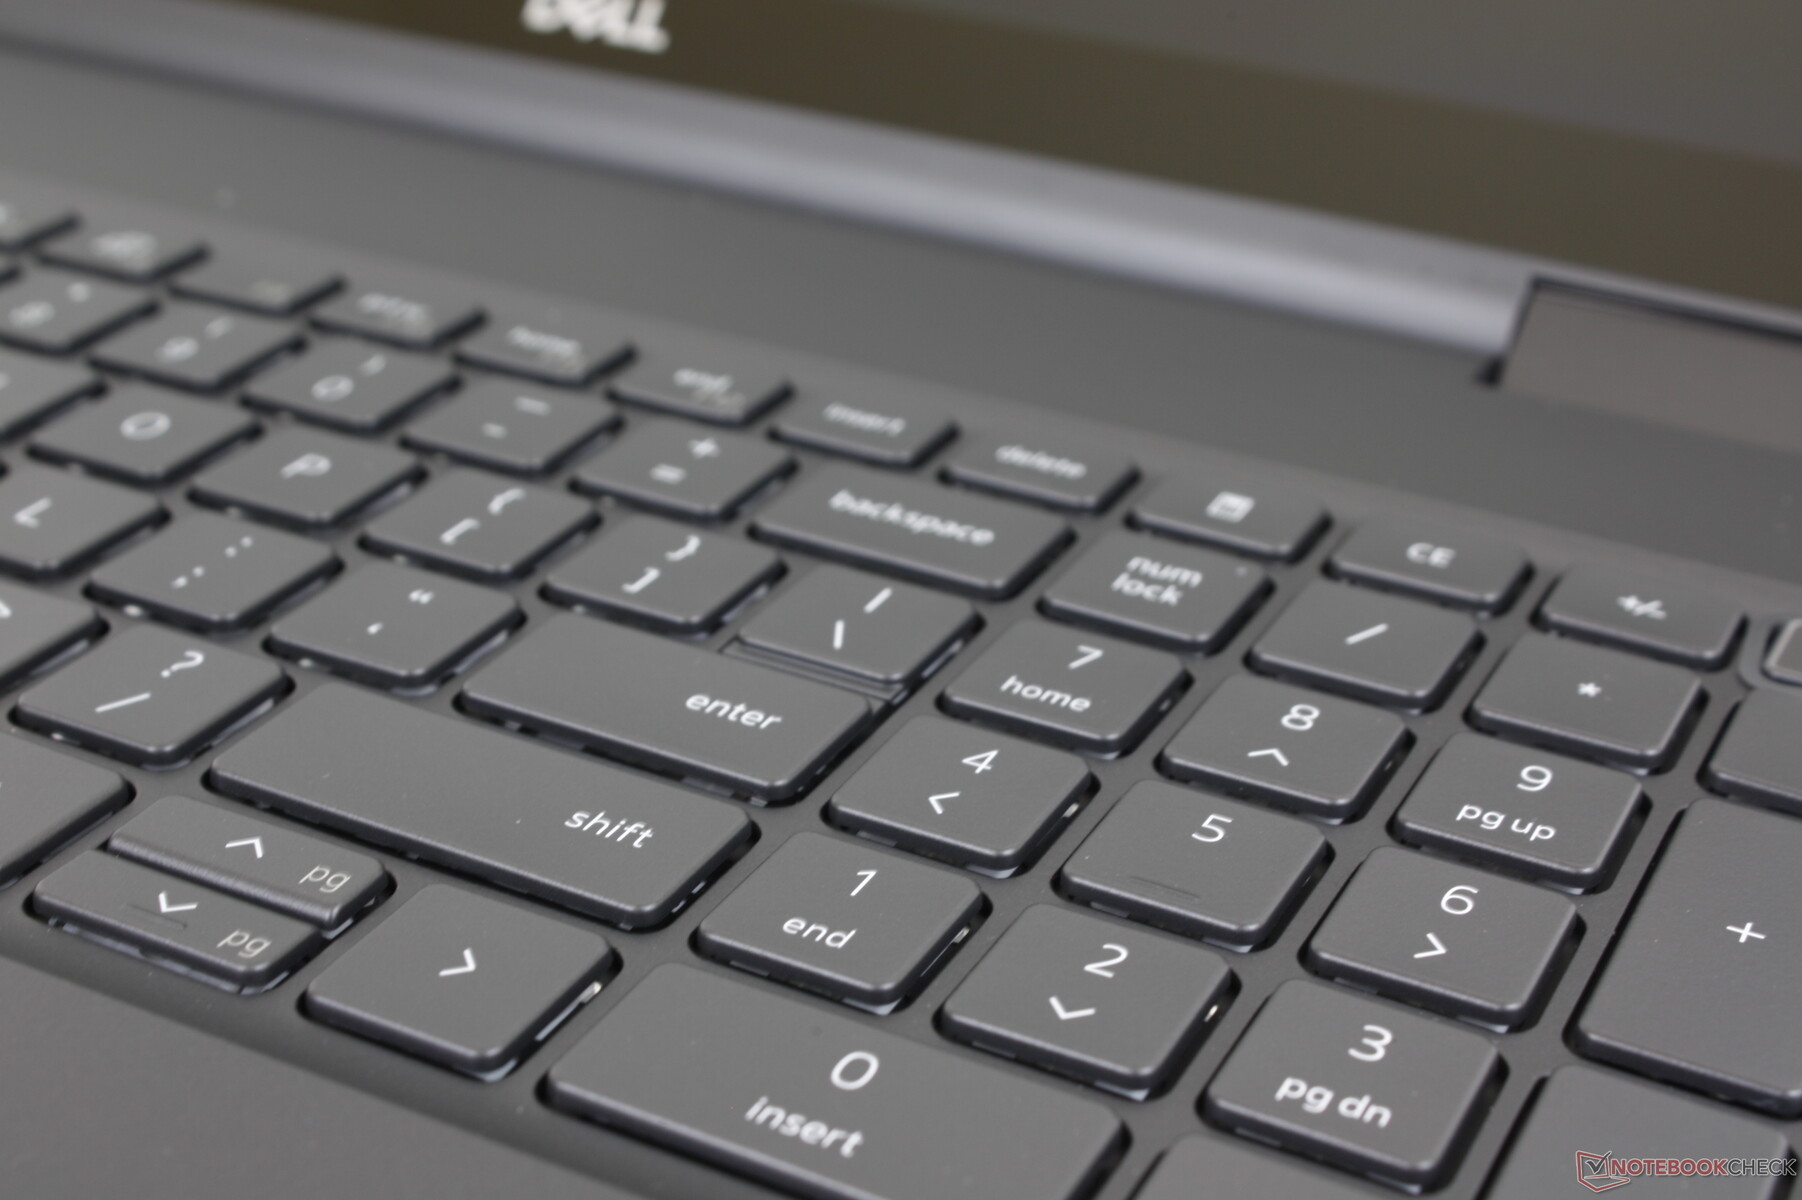
Das Tastenlayout und das Feedback haben sich seit dem Precision 7550 nicht verändert. Wir finden die Tasten etwas lauter als auf der XPS-Serie, dafür aber ist das Feedback deutlicher und der Hubweg länger. Leider sind die Pfeiltasten noch immer dahin-gequetscht, anders als die angenehm großen Pfeiltasten eines ThinkPad P1 G4 oder Asus ProArt StudioBook.
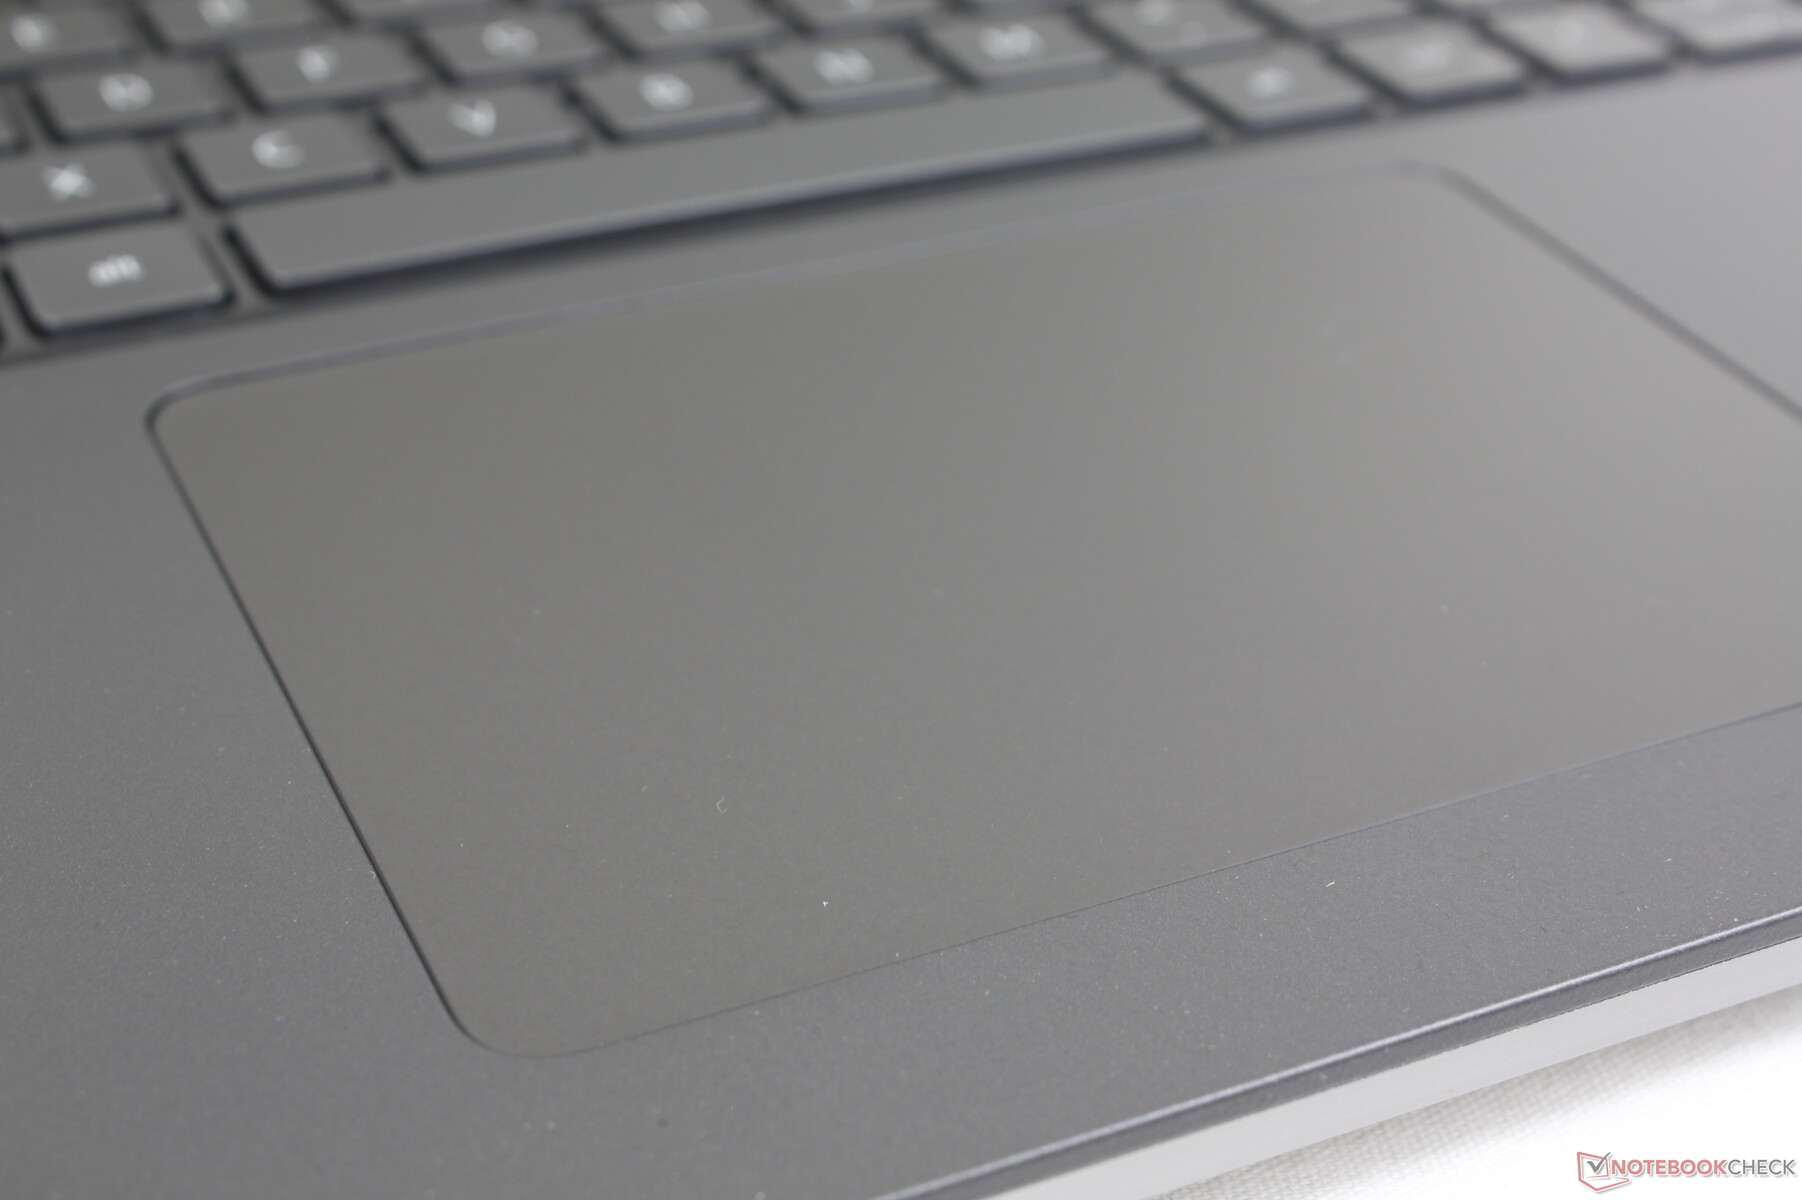
Touchpad
Das Touchpad ist größer als das auf dem Precision 7550 (11,5 x 8 cm vs. 10 x 6,5 cm). Es gibt allerdings keine dedizierten Maustasten mehr, sodass die Erfahrung eher an der eines Ultrabooks angelehnt ist als an der eines business-fokussierten ThinkPad oder ZBook, bei denen die Extra-Maustasten noch immer vorhanden sind. Persönlich bevorzugen wir richtige Maustasten, auch weil dadurch Drag-and-Drop-Aktionen leichter vonstatten gehen. Aber immerhin führt der Verzicht auf die Maustasten zu einem größeren Clickpad, was einige Anwender womöglich bevorzugen.
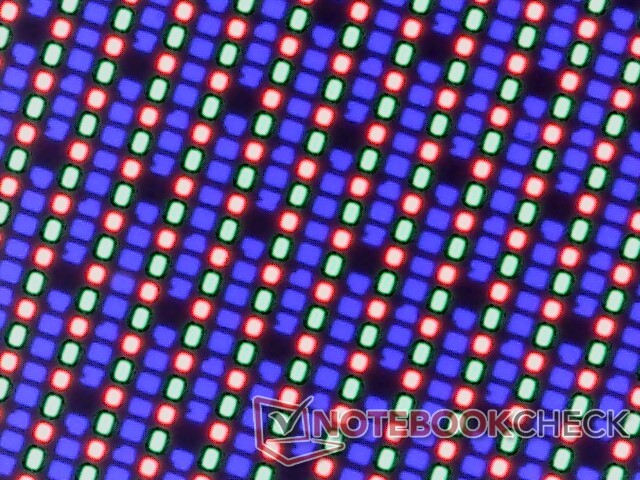
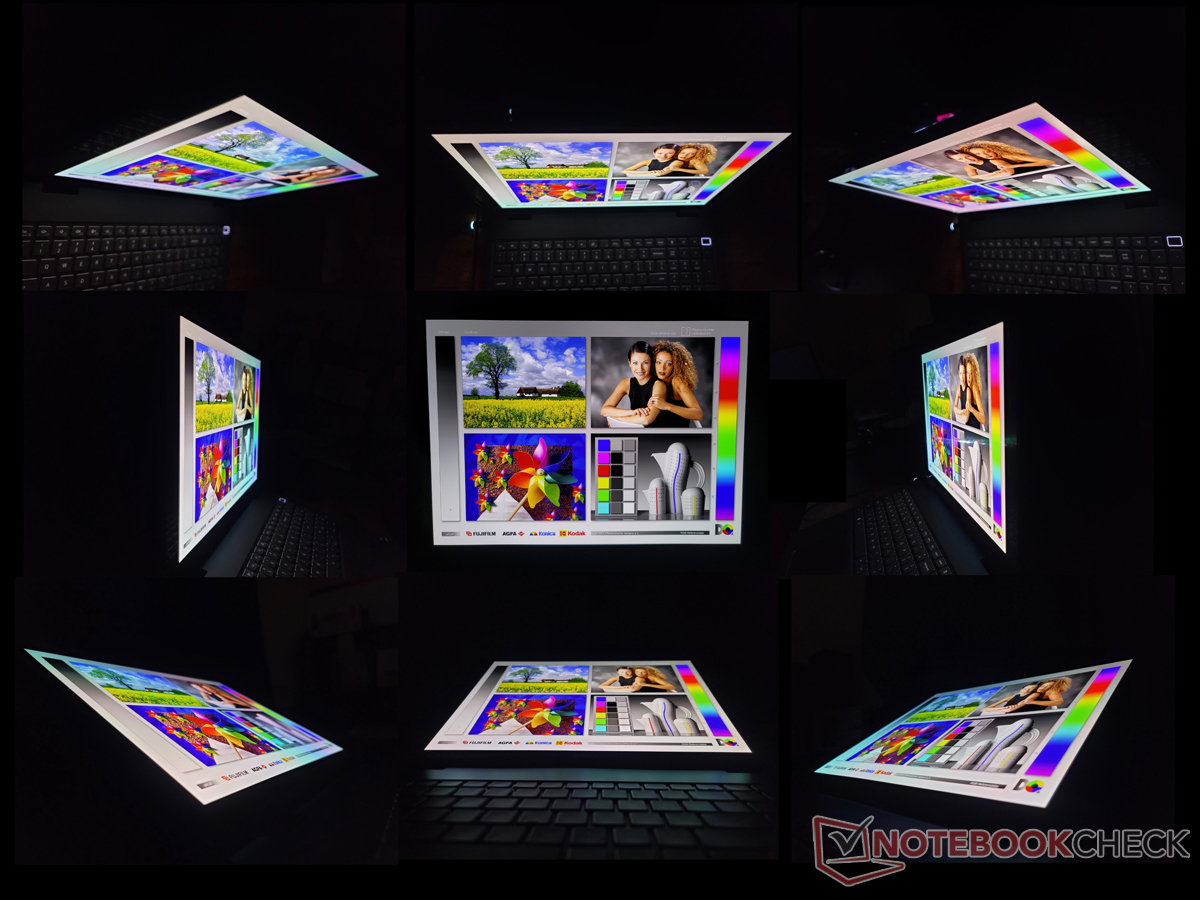
Display — Keine Option mit 120 Hz
Aktuell bietet Dell drei Displayoptionen an:
- 1200p, 60 Hz, 60 Prozent sRGB, 250 Nits, Non-Touch
- 1200p, 60 Hz, 99 Prozent DCI-P3, 500 Nits, Non-Touch, IPS
- 2400p, 60 Hz, 100 Prozent DCI-P3, 400 Nits, Touch, OLED
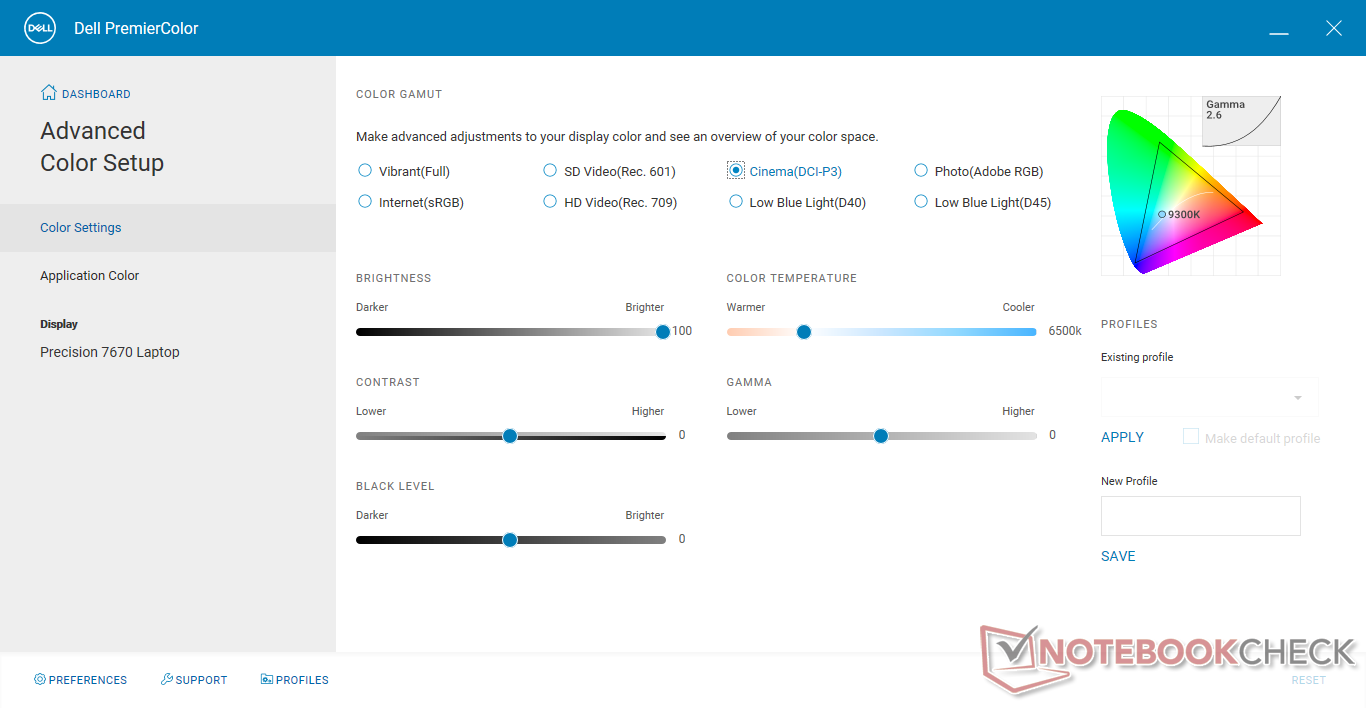
Unsere unabhängigen Messungen weiter unten beziehen sich nur auf die fettgedruckte Option. Wer akkurate Farben benötigt, sollte unbedingt auf die 250-Nits-Option verzichten, denn deren Farbdarstellung ist genauso schwach wie die vieler Budget-Laptops im Consumerbereich. Nutzer sollten sich mit der Software Dell PremierColor vertraut machen, hier wird das Farbprofil des Displays angepasst.
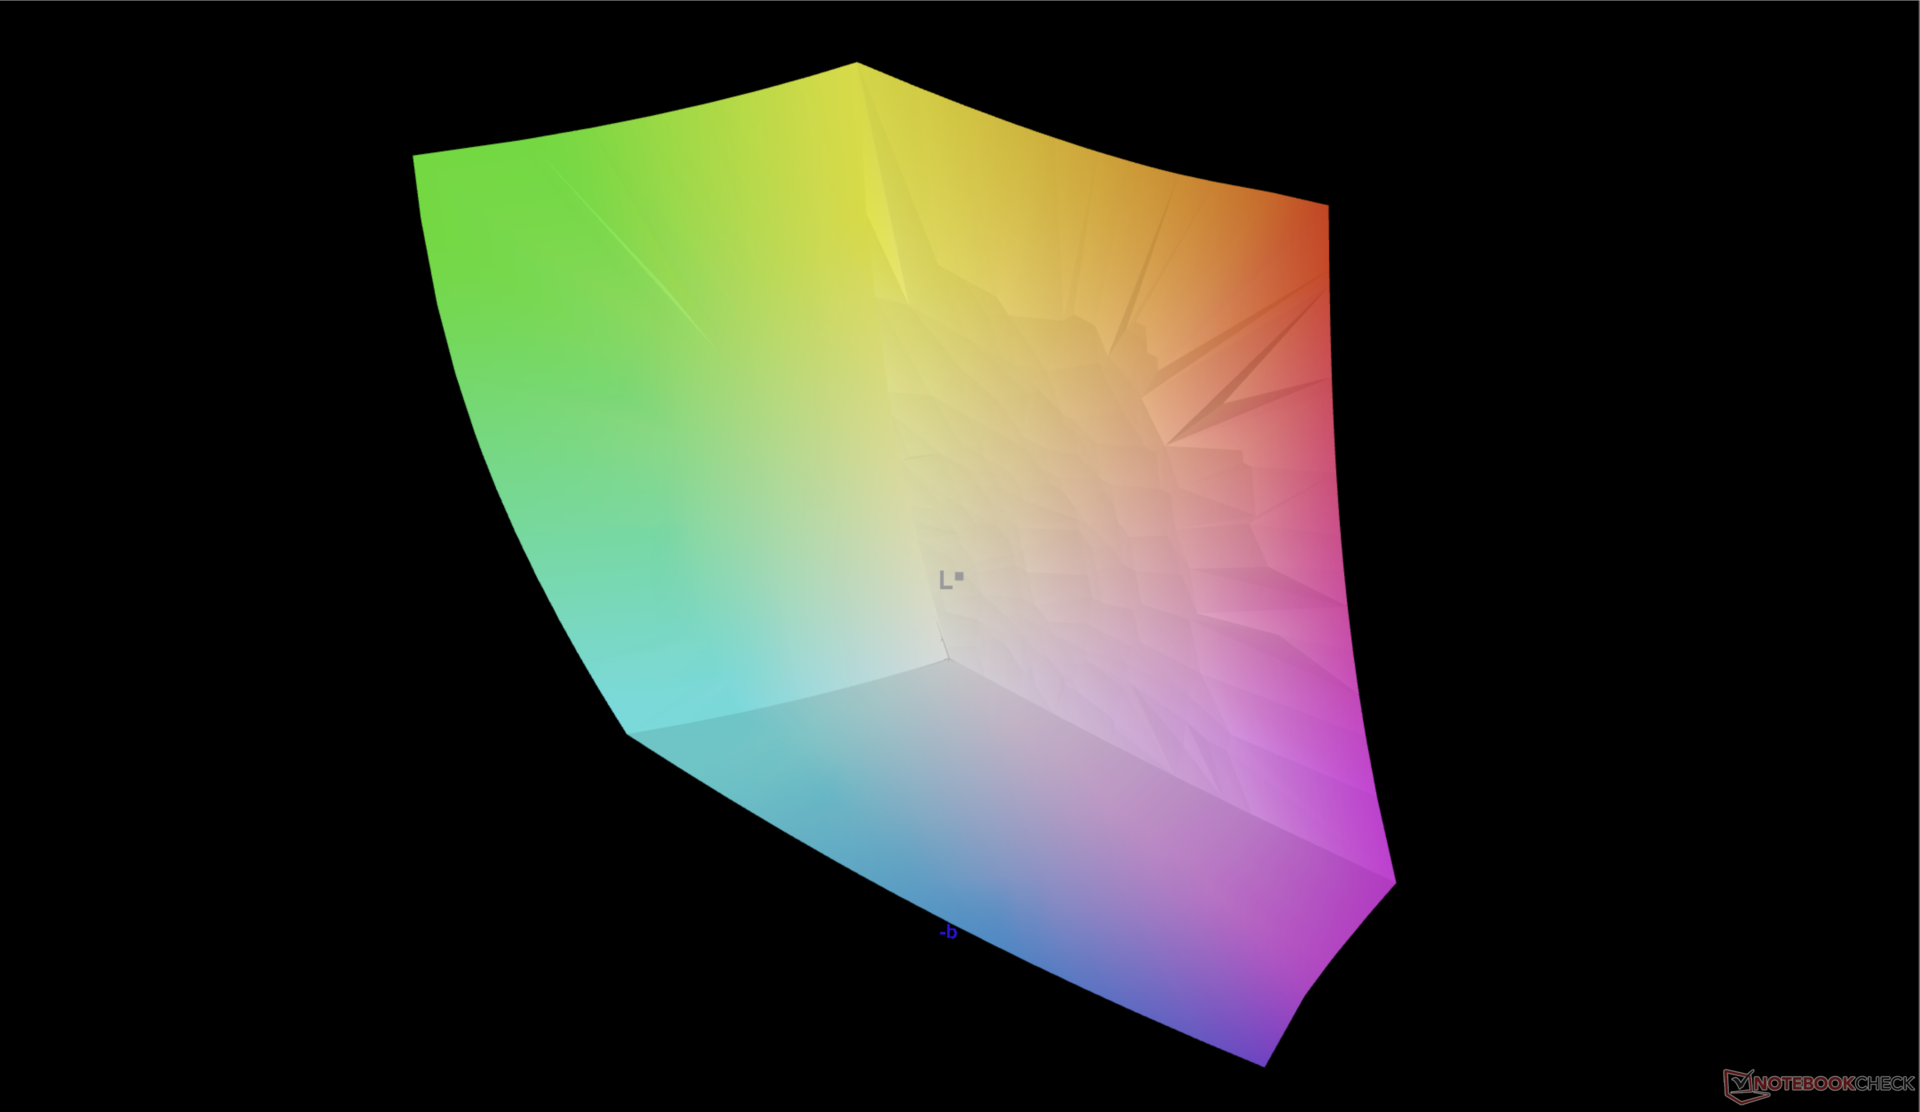
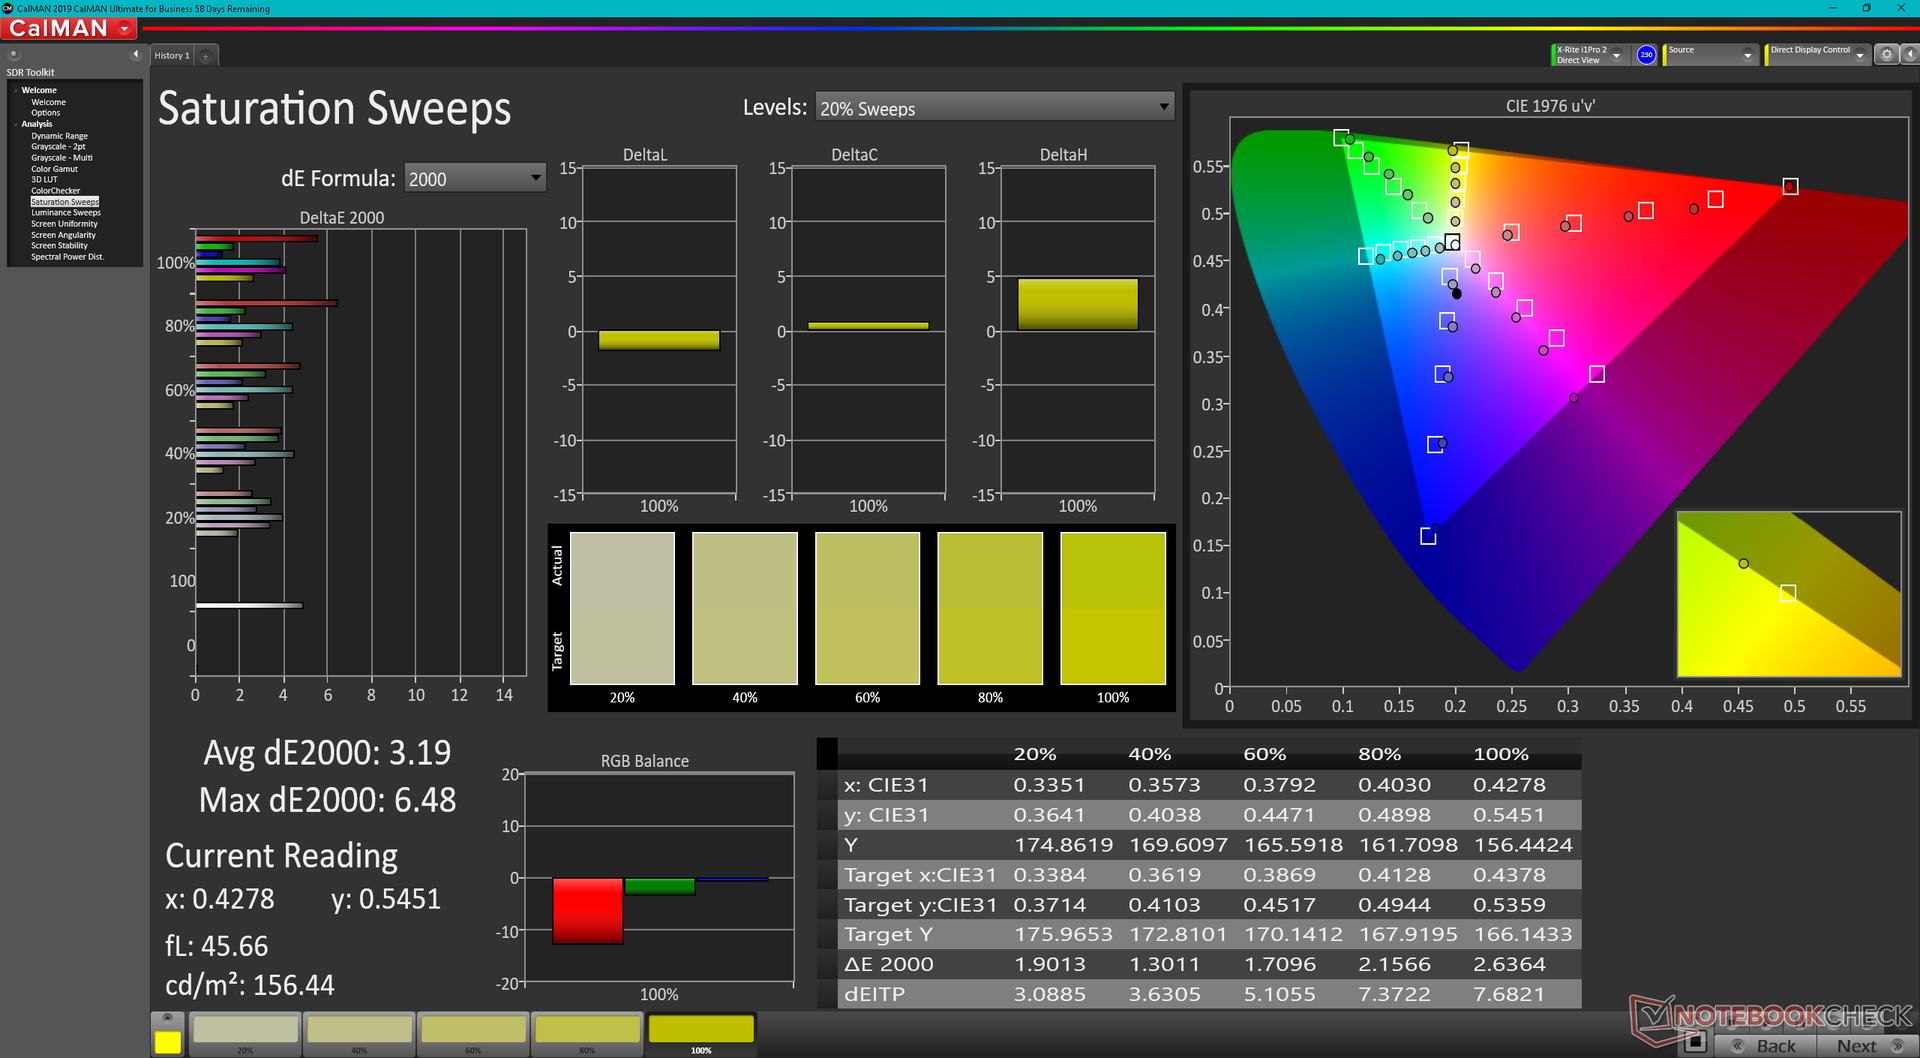
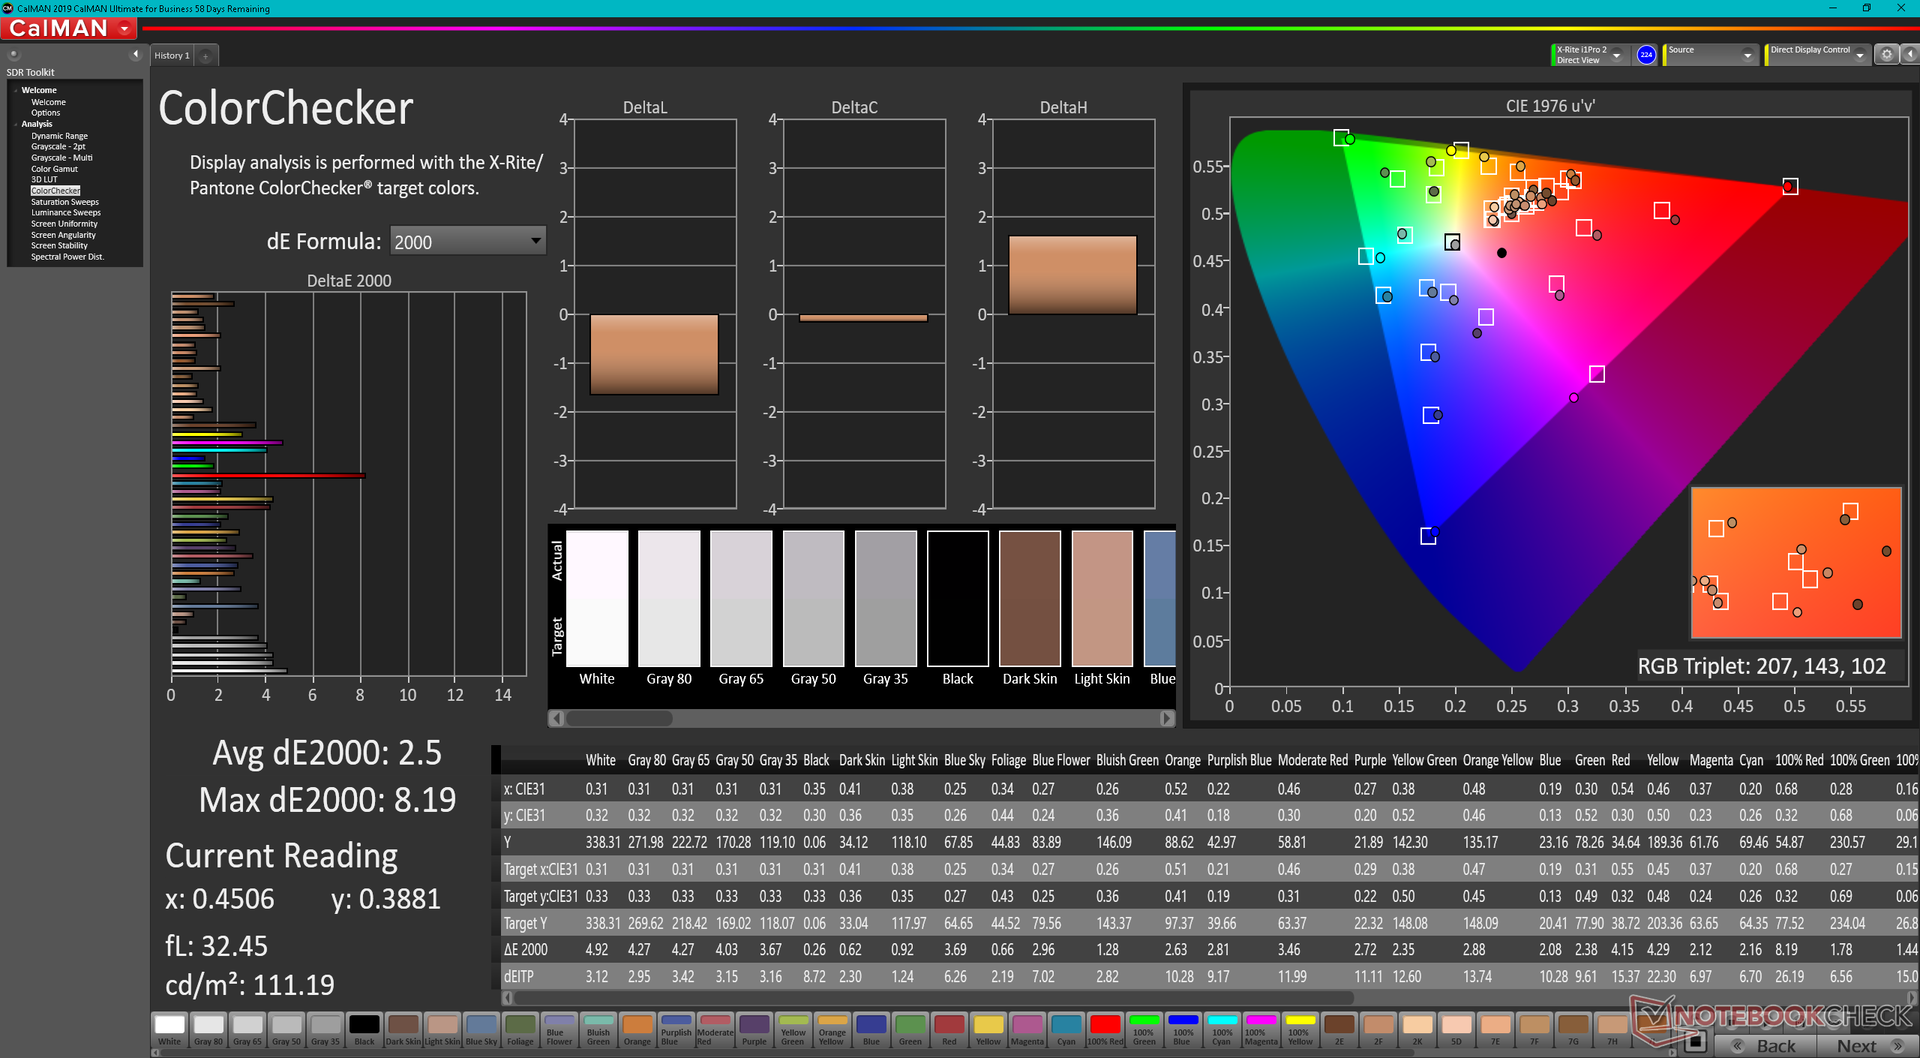
Wir können zwar die vollständige DCI-P3-Abdeckung des OLED-Panels bestätigen, unser X-Rite-Farbmessgerät misst jedoch nur eine Helligkeit von durchschnittlich 340 Nits anstelle der beworbenen 400 Nits, und das auch nach der Deaktivierung der automatischen Helligkeitssteuerung. Das bedeutet gleichzeitig, dass das Display dunkler ist als auf den meisten anderen Workstations, bei denen 450 Nit und mehr Normalität darstellt.
| |||||||||||||||||||||||||
Ausleuchtung: 98 %
Helligkeit Akku: 340.1 cd/m²
Kontrast: ∞:1 (Schwarzwert: 0 cd/m²)
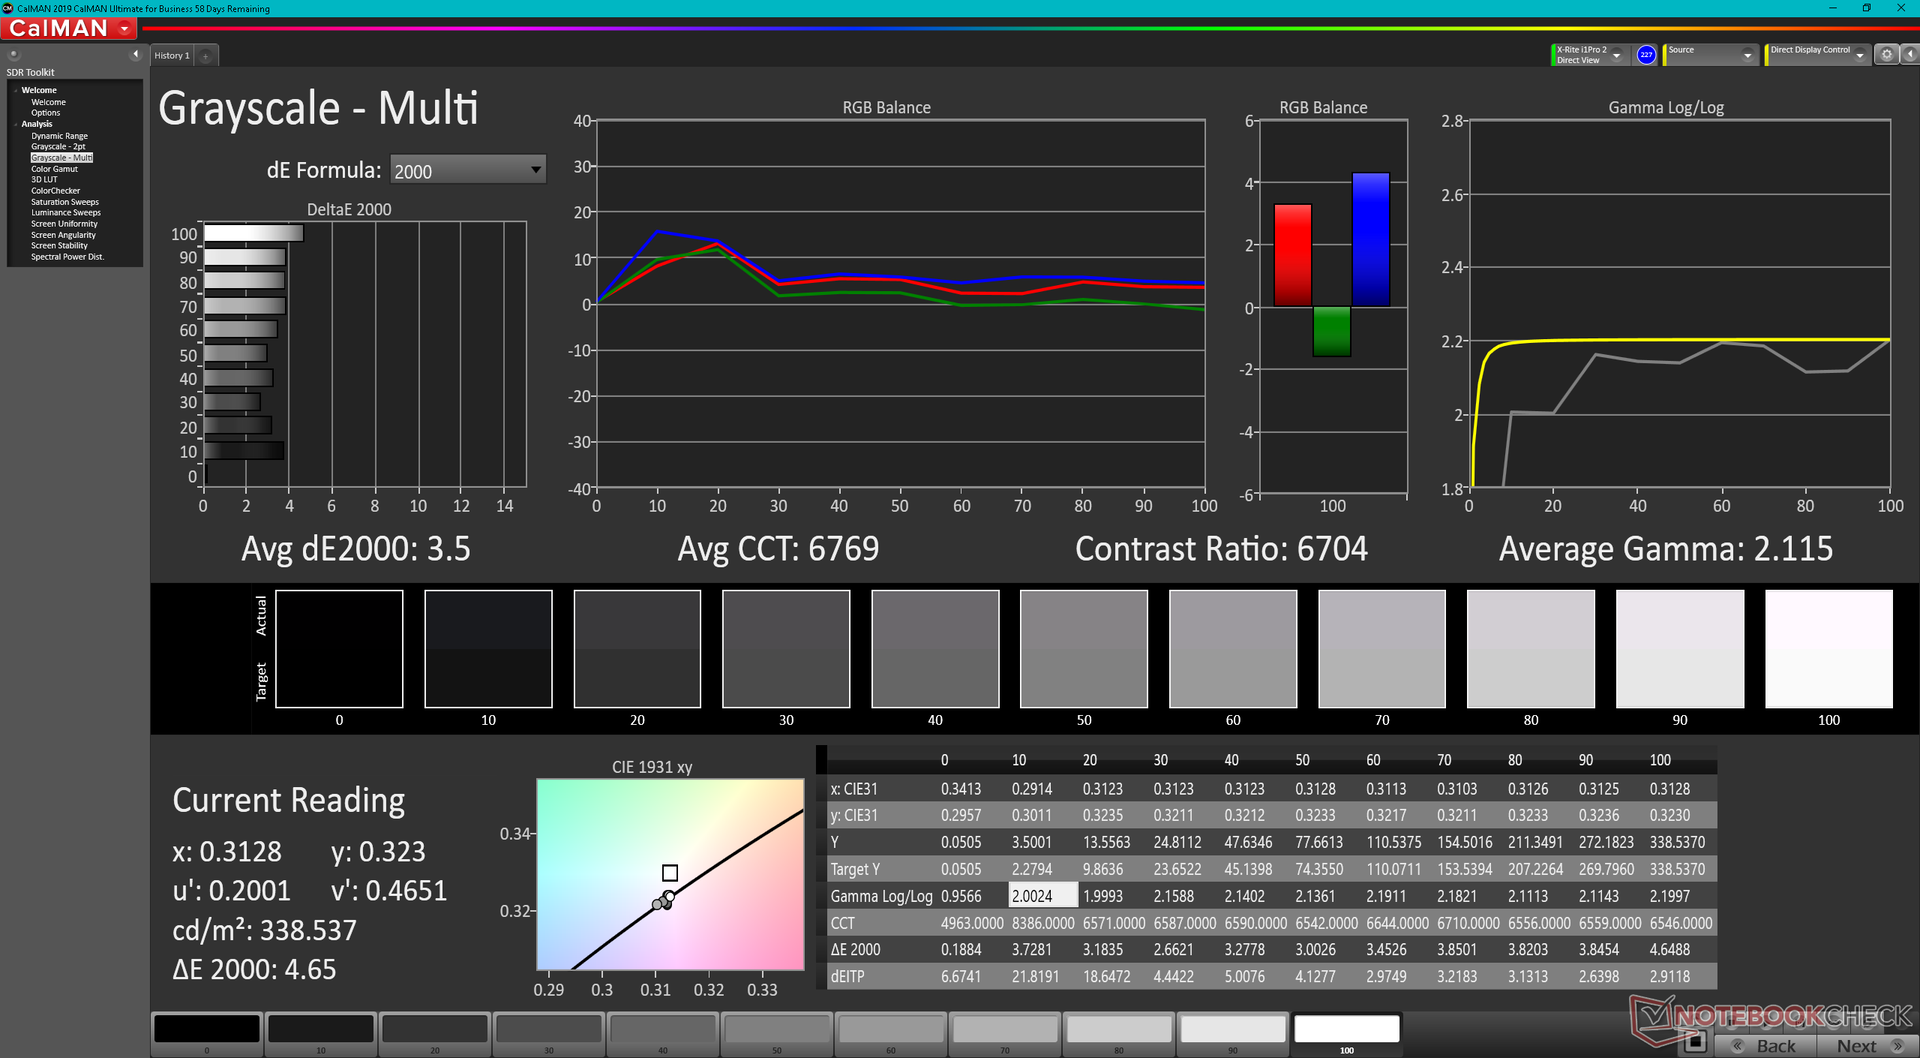
ΔE ColorChecker Calman: 2.5 | ∀{0.5-29.43 Ø4.72}
ΔE Greyscale Calman: 3.5 | ∀{0.09-98 Ø4.97}
97.5% AdobeRGB 1998 (Argyll 3D)
100% sRGB (Argyll 3D)
99.9% Display P3 (Argyll 3D)
Gamma: 2.12
CCT: 6704 K
| Dell Precision 7670 Samsung 160YV03, OLED, 3840x2400, 16" | Lenovo ThinkPad P1 G4-20Y4Z9DVUS NE160QDM-N63, IPS, 2560x1600, 16" | Asus ProArt StudioBook 16 W7600H5A-2BL2 ATNA60YV02-0, OLED, 3840x2400, 16" | Dell Precision 5000 5560 Sharp LQ156R1, IPS, 3840x2400, 15.6" | Dell Precision 7550 AU Optronics B156ZAN, IPS, 3840x2160, 15.6" | HP ZBook Fury 15 G8 BOE0969, IPS, 3840x2160, 15.6" | |
|---|---|---|---|---|---|---|
| Display | -17% | 0% | -1% | -6% | -5% | |
| Display P3 Coverage (%) | 99.9 | 72.7 -27% | 99.9 0% | 94.9 -5% | 82.1 -18% | 95.9 -4% |
| sRGB Coverage (%) | 100 | 99.3 -1% | 100 0% | 100 0% | 99.6 0% | 100 0% |
| AdobeRGB 1998 Coverage (%) | 97.5 | 74.7 -23% | 98.6 1% | 100 3% | 96.8 -1% | 87.3 -10% |
| Response Times | -1494% | -3% | -1902% | -2098% | -565% | |
| Response Time Grey 50% / Grey 80% * (ms) | 1.9 ? | 40.8 -2047% | 2 ? -5% | 47.2 ? -2384% | 51.2 ? -2595% | 14.8 ? -679% |
| Response Time Black / White * (ms) | 2 ? | 20.8 -940% | 2 ? -0% | 30.4 ? -1420% | 34 ? -1600% | 11 ? -450% |
| PWM Frequency (Hz) | 59.5 ? | 240 ? | ||||
| Bildschirm | 7% | 18% | -4% | -16% | -10% | |
| Helligkeit Bildmitte (cd/m²) | 340.1 | 441 30% | 353 4% | 501.5 47% | 473.5 39% | 626 84% |
| Brightness (cd/m²) | 342 | 420 23% | 360 5% | 467 37% | 461 35% | 589 72% |
| Brightness Distribution (%) | 98 | 90 -8% | 96 -2% | 83 -15% | 90 -8% | 87 -11% |
| Schwarzwert * (cd/m²) | 0.27 | 0.44 | 0.55 | 0.58 | ||
| Delta E Colorchecker * | 2.5 | 2.6 -4% | 2.45 2% | 4.73 -89% | 4.8 -92% | 5.41 -116% |
| Colorchecker dE 2000 max. * | 8.19 | 6 27% | 3.75 54% | 8.45 -3% | 8.73 -7% | 9.05 -11% |
| Delta E Graustufen * | 3.5 | 4.5 -29% | 1.88 46% | 3.6 -3% | 5.6 -60% | 6.2 -77% |
| Gamma | 2.12 104% | 2.18 101% | 2.31 95% | 2.08 106% | 2.34 94% | 2.66 83% |
| CCT | 6704 97% | 6623 98% | 6441 101% | 6447 101% | 7549 86% | 6101 107% |
| Kontrast (:1) | 1633 | 1140 | 861 | 1079 | ||
| Colorchecker dE 2000 calibrated * | 1.2 | 2.77 | 0.51 | 3.08 | 0.6 | |
| Farbraum (Prozent von AdobeRGB 1998) (%) | 86.4 | |||||
| Color Space (Percent of sRGB) (%) | 99.7 | |||||
| Durchschnitt gesamt (Programm / Settings) | -501% /
-273% | 5% /
10% | -636% /
-348% | -707% /
-392% | -193% /
-109% |
* ... kleinere Werte sind besser

Eine Werkskalibrierung erwähnt Dell nirgends. Dennoch fallen die Graustufen und Farben auf unserem OLED-Panel recht gut aus, die DeltaE-Werte liegen nur bei 3,5 und 2,5.
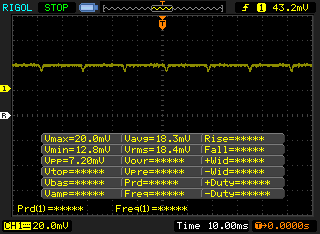
Reaktionszeiten (Response Times) des Displays
| ↔ Reaktionszeiten Schwarz zu Weiß | ||
|---|---|---|
| 2 ms ... steigend ↗ und fallend ↘ kombiniert | ↗ 0.8 ms steigend | 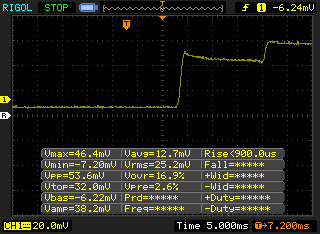 |
| ↘ 1.2 ms fallend | ||
| Die gemessenen Reaktionszeiten sind sehr kurz, wodurch sich der Bildschirm auch für schnelle 3D Spiele eignen sollte. Im Vergleich rangierten die bei uns getesteten Geräte von 0.1 (Minimum) zu 240 (Maximum) ms. » 11 % aller Screens waren schneller als der getestete. Daher sind die gemessenen Reaktionszeiten besser als der Durchschnitt aller vermessenen Geräte (19.8 ms). | ||
| ↔ Reaktionszeiten 50% Grau zu 80% Grau | ||
| 1.9 ms ... steigend ↗ und fallend ↘ kombiniert | ↗ 1.1 ms steigend | 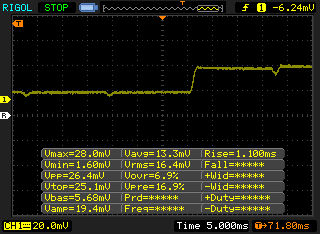 |
| ↘ 0.8 ms fallend | ||
| Die gemessenen Reaktionszeiten sind sehr kurz, wodurch sich der Bildschirm auch für schnelle 3D Spiele eignen sollte. Im Vergleich rangierten die bei uns getesteten Geräte von 0.165 (Minimum) zu 636 (Maximum) ms. » 9 % aller Screens waren schneller als der getestete. Daher sind die gemessenen Reaktionszeiten besser als der Durchschnitt aller vermessenen Geräte (31 ms). | ||
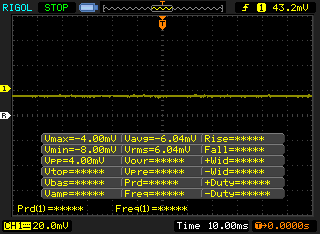
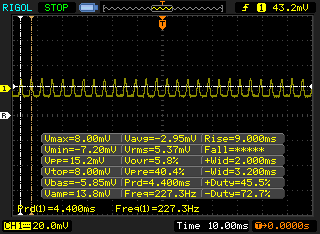
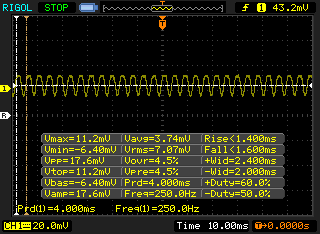
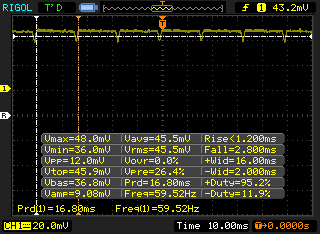
Bildschirm-Flackern / PWM (Pulse-Width Modulation)
| Flackern / PWM festgestellt | 59.5 Hz | ≤ 100 % Helligkeit |  |
Das Display flackert mit 59.5 Hz (im schlimmsten Fall, eventuell durch Pulsweitenmodulation PWM) bei einer eingestellten Helligkeit von 100 % und darunter. Darüber sollte es zu keinem Flackern kommen. Die Frequenz von 59.5 Hz ist sehr gering und daher kann es bei allen Usern zu sichtbaren Flackern, brennenden Augen oder Kopfweh kommen. Im Vergleich: 52 % aller getesteten Geräte nutzten kein PWM um die Helligkeit zu reduzieren. Wenn PWM eingesetzt wurde, dann bei einer Frequenz von durchschnittlich 7763 (Minimum 5, Maximum 343500) Hz. | |||
Wie bei den meisten anderen OLED-Panels liegt auch hier Flimmern quasi bei jeder Helligkeitsstufe an. Wir messen eine Frequenz von 250 Hz bei einer Helligkeit zwischen 1 bis 56 Prozent und 59,5 Hz bei einer Helligkeit von 57 Prozent und darüber.
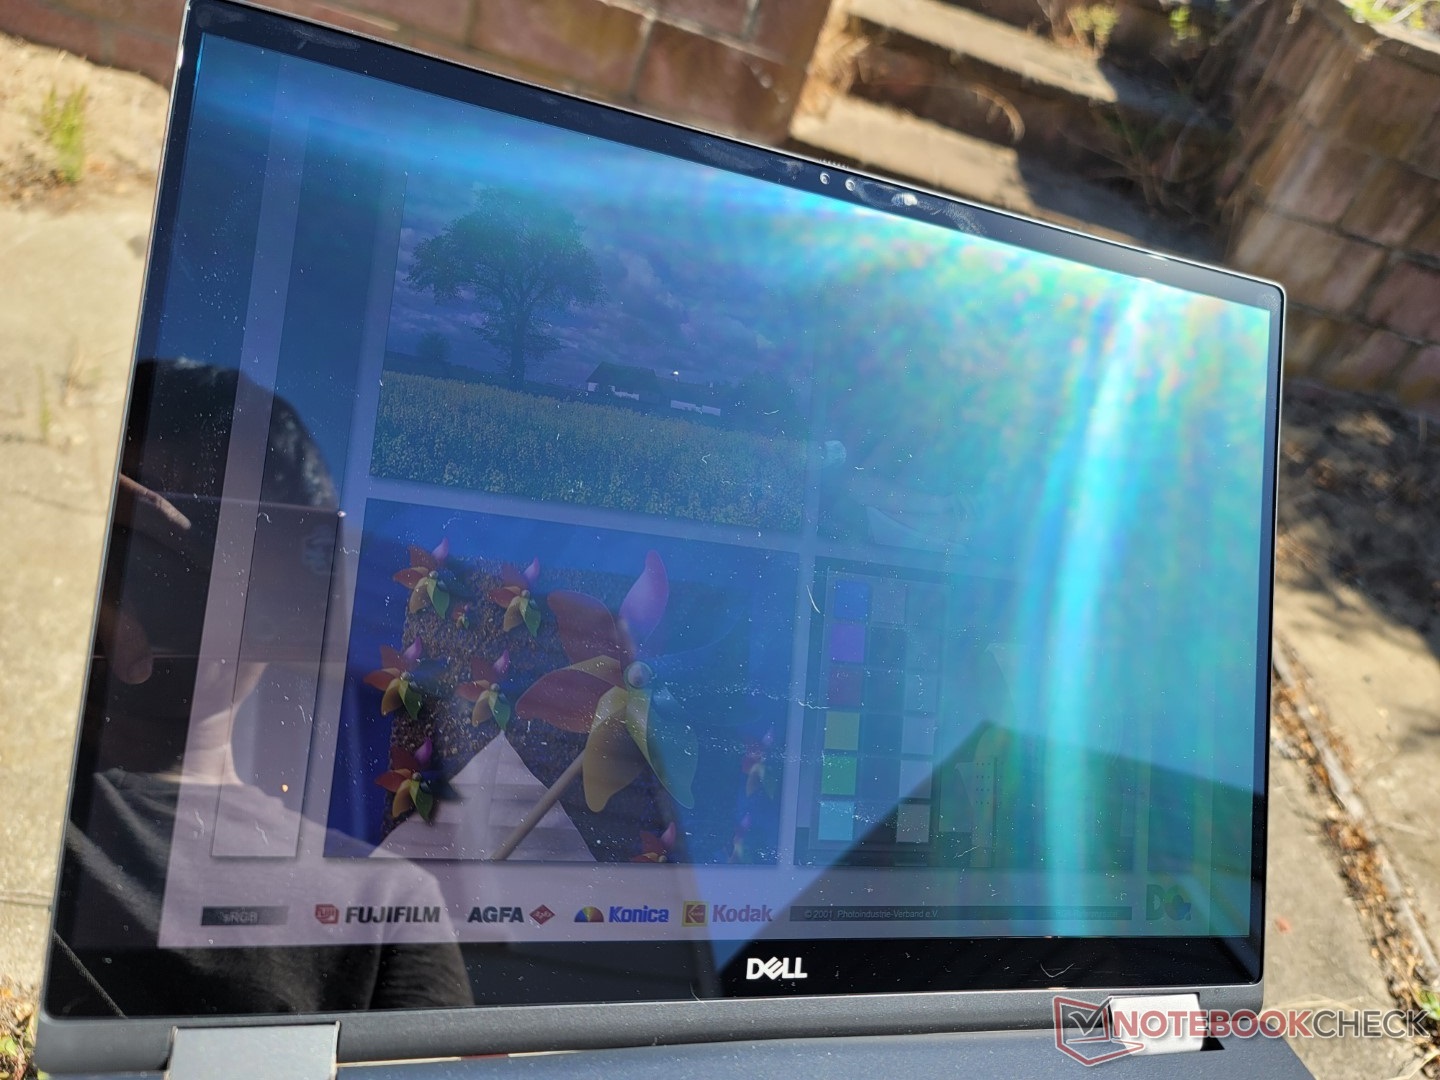
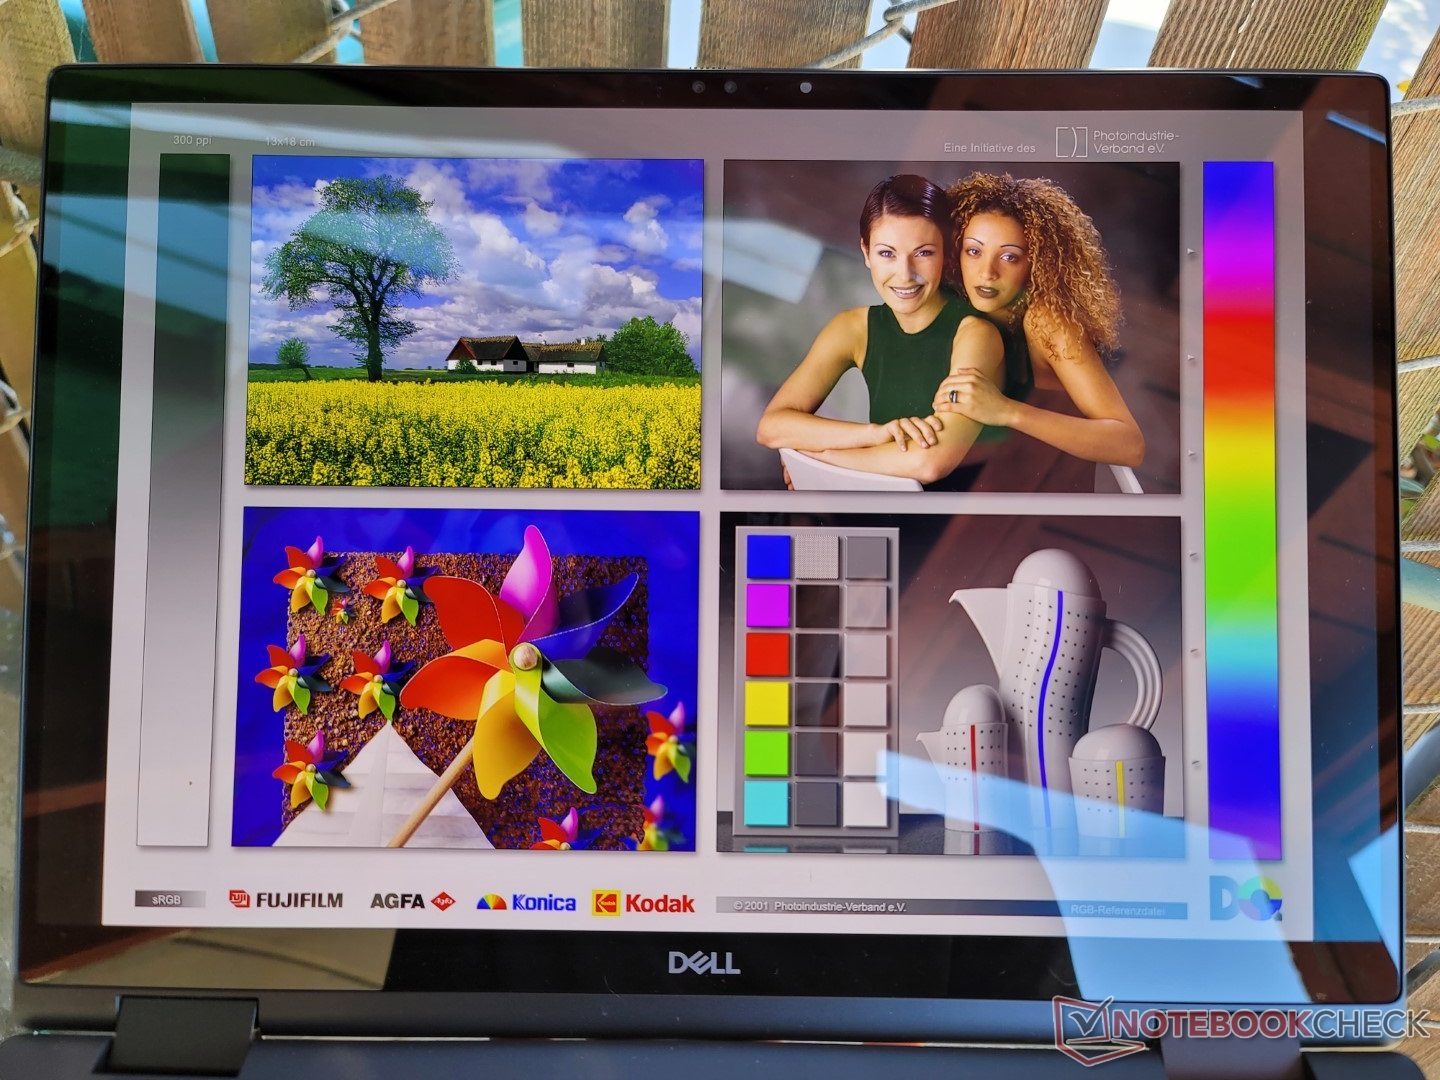
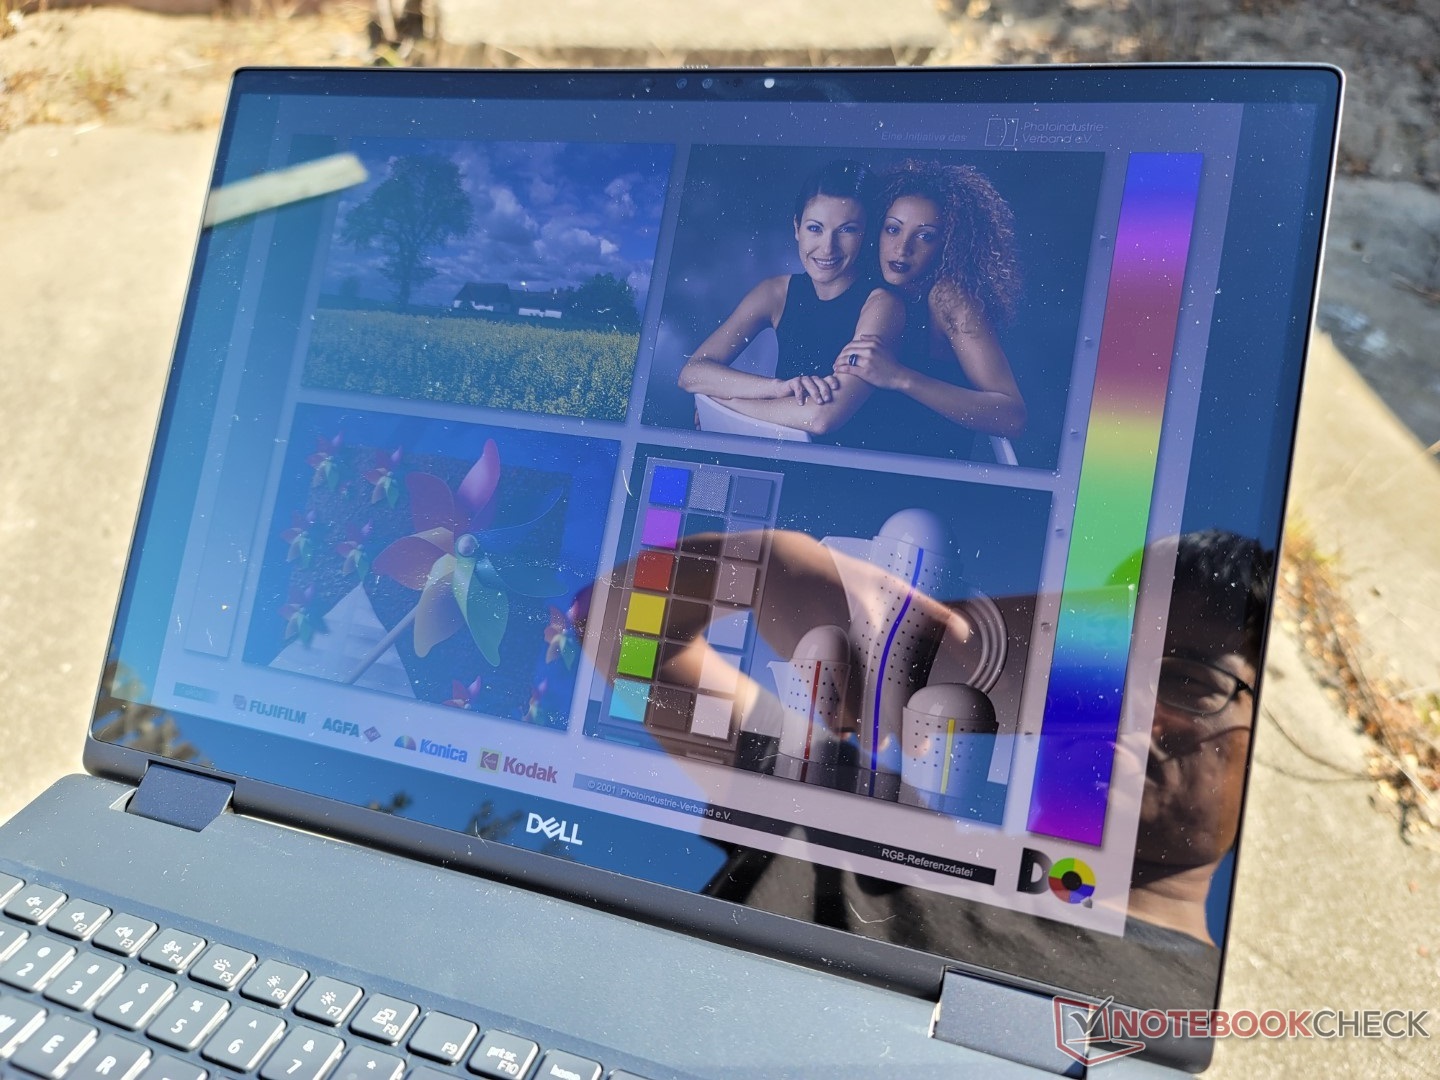
Obwohl es sich technisch um ein "Anti-Glare"-Display handelt, leidet das Panel im Freien unter starken Spiegelungen. Die Helligkeit ist zudem nicht ausreichend, um abseits des Schattens für eine angenehme Sicht im Freien zu sorgen. Wenn die Sichtbarkeit im Freien ein entscheidendes Kriterium darstellt, sollte man sich eher das HP ZBook Fury 15 G8 anschauen, dessen Display ist beinahe doppelt so hell wie das unseres Precision-Laptops.
Leistung — Intel vPro für alle
Testbedingungen
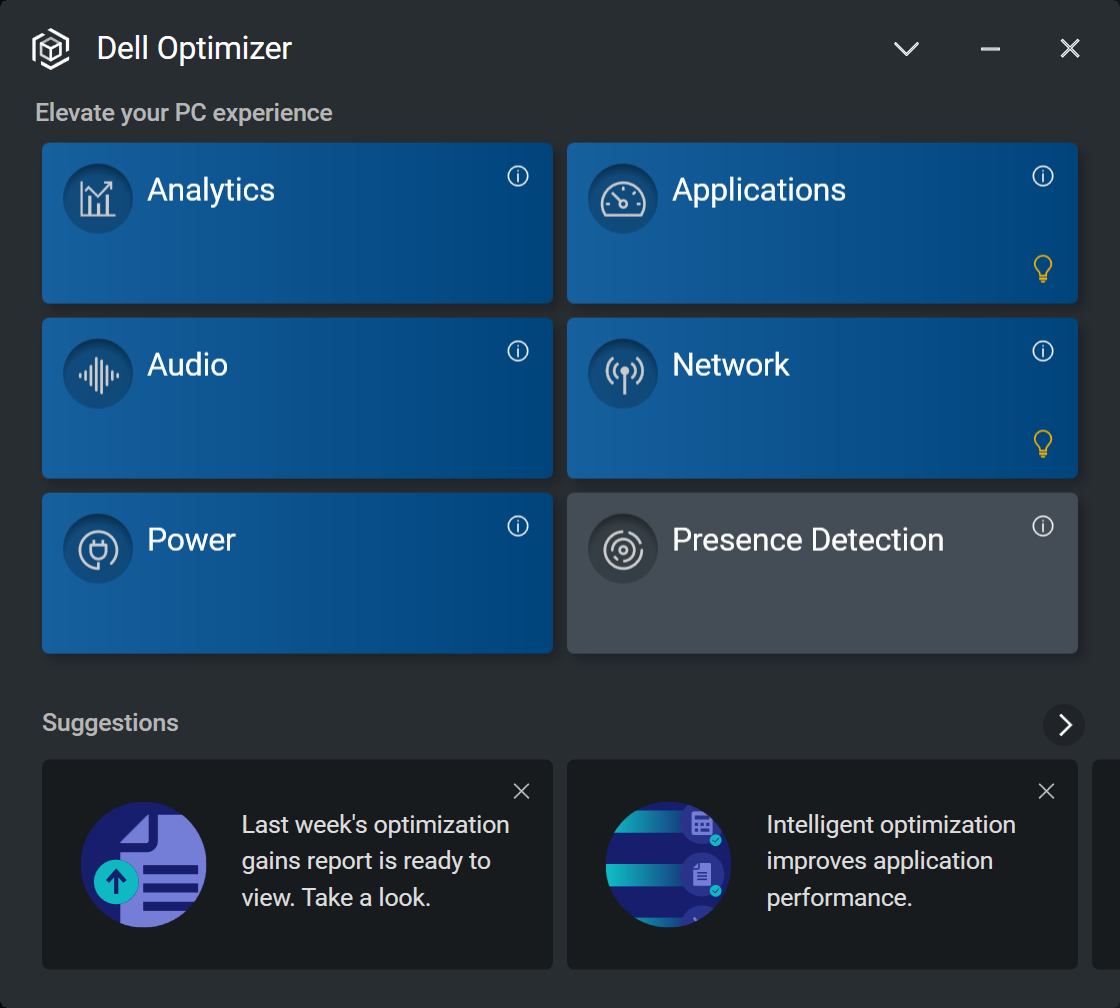
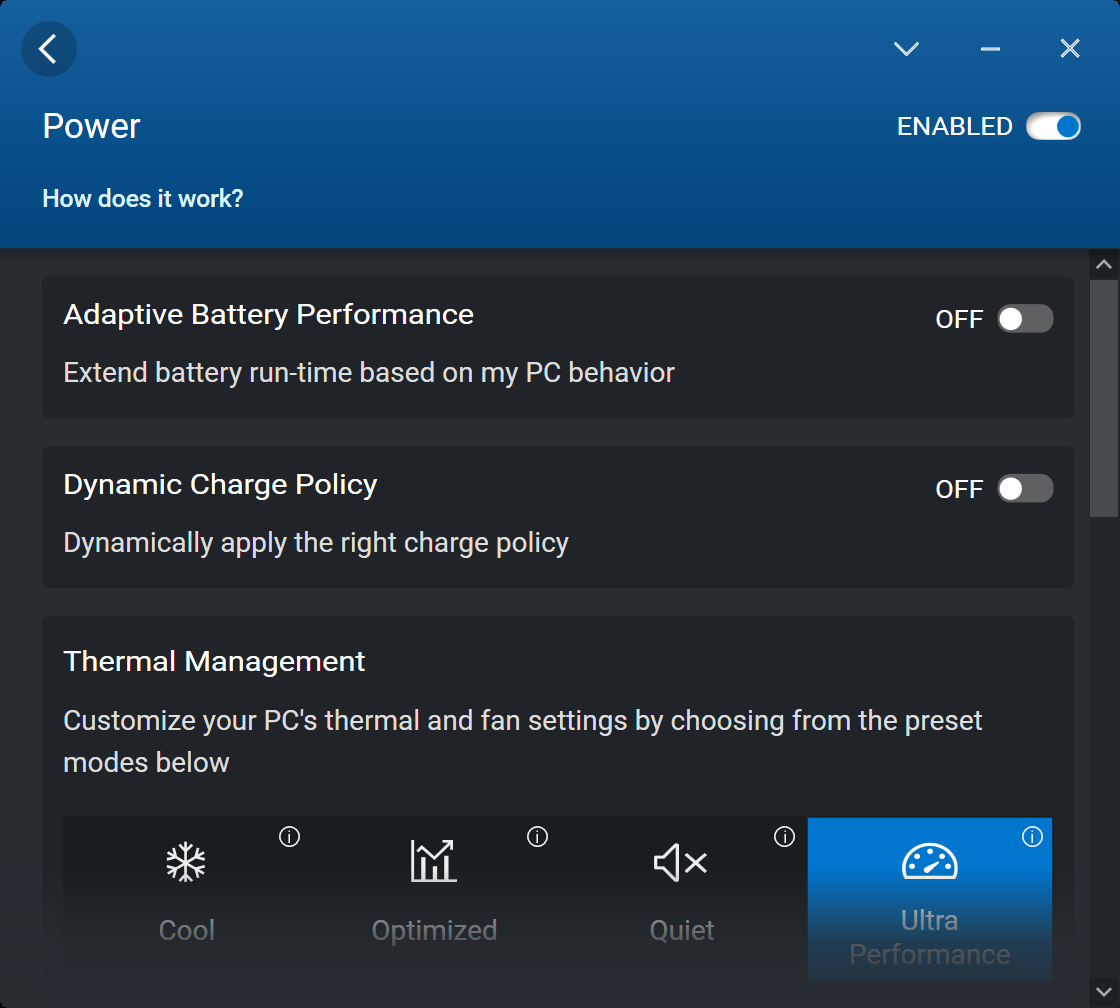
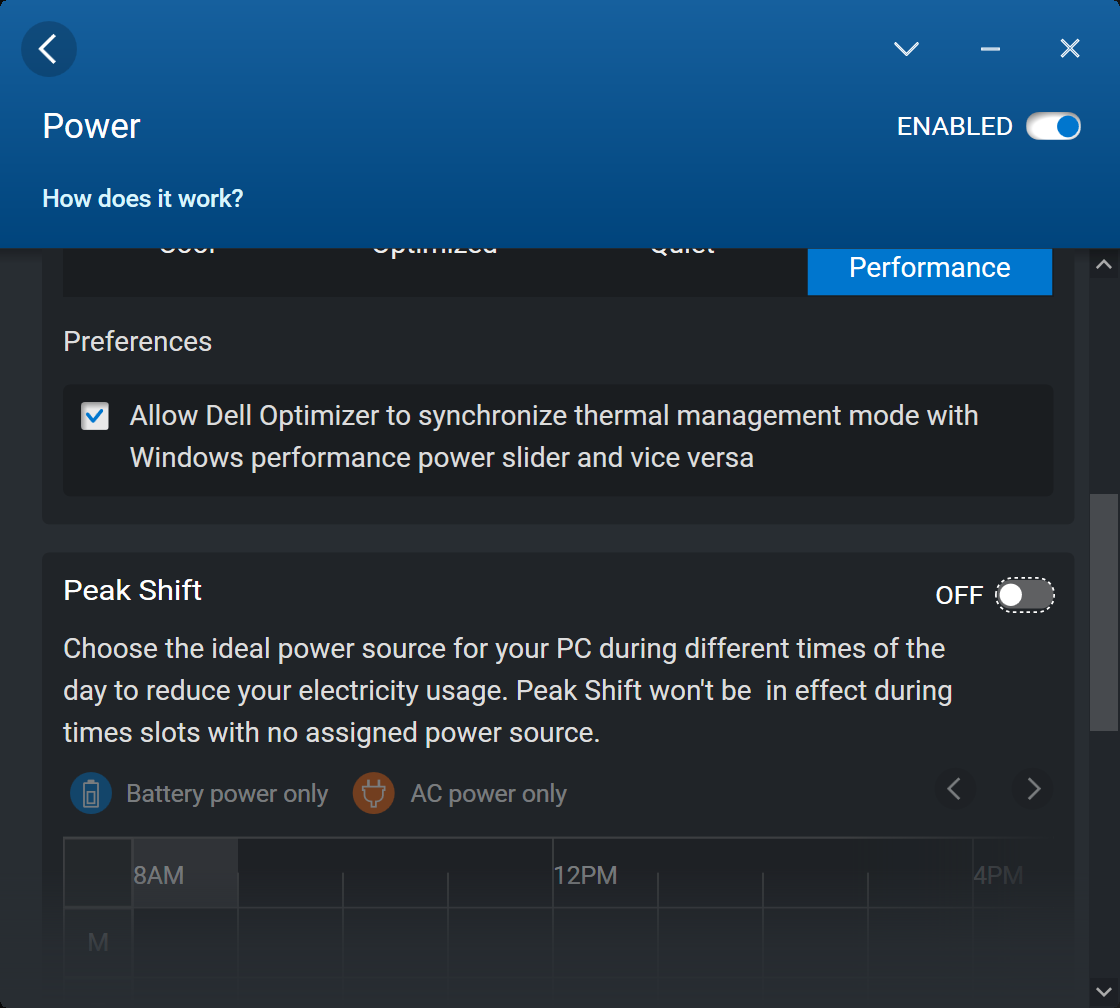
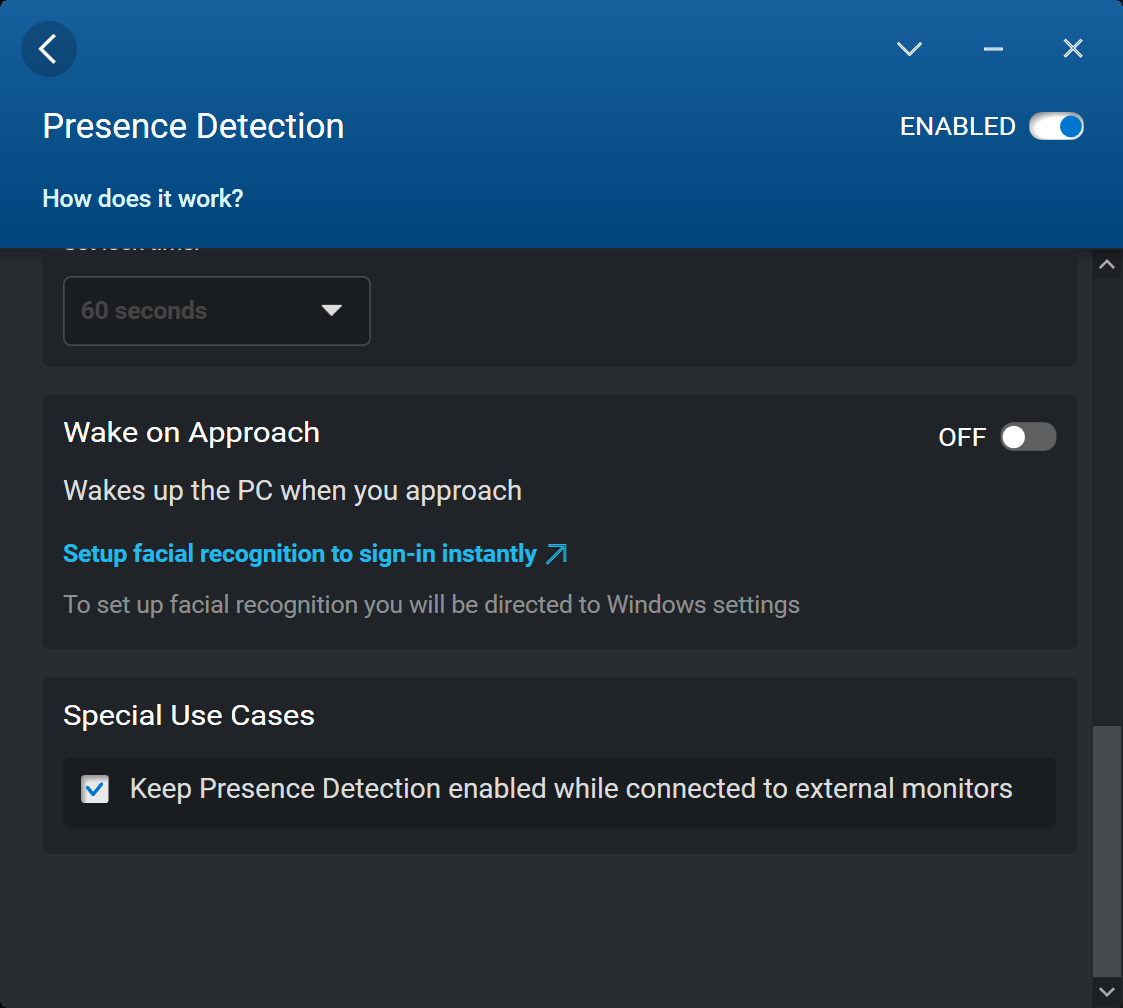
Vor den Benchmarktests haben wir die Leistung über den Dell Optimizer auf den Ultra Performance Modus gestellt sowie die GPU über das Nvidia Control Panel in den diskreten Modus versetzt. Ärgerlich ist, dass wir die Leistungsmodi über gleich drei Kanäle steuern können, nämlich über Windows, den Dell Optimizer oder den Dell Power Manager, was sehr verwirrend sein kann und nicht klar ist, welcher bei verschiedenen Einstellungen denn nun aktiv ist. Wir empfehlen unbedingt die Profil-Synchronisation über den Optimizer zu aktivieren, unser Screenshot weiter unten zeigt die Option.
Prozessor
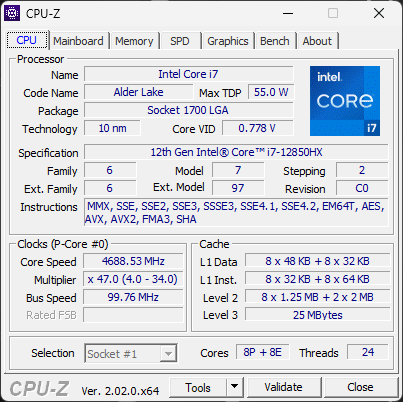
Auf dem Papier hat der Core i7-12850HX ähnliche Taktraten, Kernanzahl und Cache-Größe wie der i7-12800HX, allerdings mit zusätzlichem vPro-Support. In Wirklichkeit kann sich die Leistung beider Modelle aber sehr wohl stark unterscheiden.
Die CPU-Leistung liegt eher auf dem Niveau eines Core i7-12800H als auf dem eines Core i7-12800HX. Tatsächlich fällt die Multi-Thread-Leistung 30 Prozent langsamer aus als auf einem i7-12800HX, beispielsweise dem im MSI GE67 HX mit besserer Kühllösung. Dennoch bleibt die Leistung eine der schnellsten im Vergleich mit anderen Workstations, auch weil viele noch auf einem Intel-Core der 11. Generation laufen.
Die Turbo-Boost-Konstanz könnte besser ausfallen. Im CineBench-R15-xT-Loop fällt die Leistung nach den ersten zwei bis drei Durchgängen um ganze 25 Prozent, was auch dabei helfen könnte das große Leistungsdefizit zum Core i7-12800HX zu erklären.
Cinebench R15 Multi Loop
Cinebench R23: Multi Core | Single Core
Cinebench R15: CPU Multi 64Bit | CPU Single 64Bit
Blender: v2.79 BMW27 CPU
7-Zip 18.03: 7z b 4 | 7z b 4 -mmt1
Geekbench 5.5: Multi-Core | Single-Core
HWBOT x265 Benchmark v2.2: 4k Preset
LibreOffice : 20 Documents To PDF
R Benchmark 2.5: Overall mean
| Geekbench 5.5 / Multi-Core | |
| MSI GE67 HX 12UGS | |
| Razer Blade 17 RTX 3080 Ti | |
| HP Envy 16 h0112nr | |
| Durchschnittliche Intel Core i7-12850HX (11509 - 13095, n=2) | |
| Dell Precision 5000 5470 | |
| Dell Precision 7670 | |
| Lenovo Legion 7 16ARHA7 | |
| Asus Zenbook Pro 15 OLED UM535Q | |
| Dell Precision 7550 | |
| Asus ProArt StudioBook 16 W7600H5A-2BL2 | |
| Lenovo ThinkPad P1 G4-20Y4Z9DVUS | |
| Geekbench 5.5 / Single-Core | |
| Dell Precision 5000 5470 | |
| Durchschnittliche Intel Core i7-12850HX (1777 - 1787, n=2) | |
| Dell Precision 7670 | |
| HP Envy 16 h0112nr | |
| MSI GE67 HX 12UGS | |
| Razer Blade 17 RTX 3080 Ti | |
| Lenovo Legion 7 16ARHA7 | |
| Lenovo ThinkPad P1 G4-20Y4Z9DVUS | |
| Asus Zenbook Pro 15 OLED UM535Q | |
| Asus ProArt StudioBook 16 W7600H5A-2BL2 | |
| Dell Precision 7550 | |
| HWBOT x265 Benchmark v2.2 / 4k Preset | |
| MSI GE67 HX 12UGS | |
| Lenovo Legion 7 16ARHA7 | |
| Dell Precision 7670 | |
| Durchschnittliche Intel Core i7-12850HX (17.2 - 17.3, n=2) | |
| Razer Blade 17 RTX 3080 Ti | |
| Asus Zenbook Pro 15 OLED UM535Q | |
| HP Envy 16 h0112nr | |
| HP ZBook Fury 15 G8 | |
| Lenovo ThinkPad P1 G4-20Y4Z9DVUS | |
| Asus ProArt StudioBook 16 W7600H5A-2BL2 | |
| Dell Precision 5000 5470 | |
| Dell Precision 7550 | |
| Dell Precision 5000 5560 | |
Cinebench R23: Multi Core | Single Core
Cinebench R15: CPU Multi 64Bit | CPU Single 64Bit
Blender: v2.79 BMW27 CPU
7-Zip 18.03: 7z b 4 | 7z b 4 -mmt1
Geekbench 5.5: Multi-Core | Single-Core
HWBOT x265 Benchmark v2.2: 4k Preset
LibreOffice : 20 Documents To PDF
R Benchmark 2.5: Overall mean
* ... kleinere Werte sind besser
AIDA64: FP32 Ray-Trace | FPU Julia | CPU SHA3 | CPU Queen | FPU SinJulia | FPU Mandel | CPU AES | CPU ZLib | FP64 Ray-Trace | CPU PhotoWorxx
| Performance Rating | |
| Durchschnittliche Intel Core i7-12850HX | |
| HP ZBook Fury 15 G8 | |
| Lenovo ThinkPad P1 G4-20Y4Z9DVUS | |
| Dell Precision 7670 | |
| Asus ProArt StudioBook 16 W7600H5A-2BL2 -9! | |
| Dell Precision 5000 5560 -9! | |
| AIDA64 / FP32 Ray-Trace | |
| Lenovo ThinkPad P1 G4-20Y4Z9DVUS | |
| Durchschnittliche Intel Core i7-12850HX (12983 - 16752, n=2) | |
| HP ZBook Fury 15 G8 | |
| Dell Precision 7670 | |
| AIDA64 / FPU Julia | |
| Durchschnittliche Intel Core i7-12850HX (68219 - 87231, n=2) | |
| Dell Precision 7670 | |
| Lenovo ThinkPad P1 G4-20Y4Z9DVUS | |
| HP ZBook Fury 15 G8 | |
| AIDA64 / CPU SHA3 | |
| Lenovo ThinkPad P1 G4-20Y4Z9DVUS | |
| HP ZBook Fury 15 G8 | |
| Durchschnittliche Intel Core i7-12850HX (3098 - 3818, n=2) | |
| Dell Precision 7670 | |
| AIDA64 / CPU Queen | |
| HP ZBook Fury 15 G8 | |
| Lenovo ThinkPad P1 G4-20Y4Z9DVUS | |
| Durchschnittliche Intel Core i7-12850HX (26716 - 95664, n=2) | |
| Dell Precision 7670 | |
| AIDA64 / FPU SinJulia | |
| Durchschnittliche Intel Core i7-12850HX (9869 - 11286, n=2) | |
| HP ZBook Fury 15 G8 | |
| Dell Precision 7670 | |
| Lenovo ThinkPad P1 G4-20Y4Z9DVUS | |
| AIDA64 / FPU Mandel | |
| Durchschnittliche Intel Core i7-12850HX (34218 - 42580, n=2) | |
| Lenovo ThinkPad P1 G4-20Y4Z9DVUS | |
| HP ZBook Fury 15 G8 | |
| Dell Precision 7670 | |
| AIDA64 / CPU AES | |
| Lenovo ThinkPad P1 G4-20Y4Z9DVUS | |
| HP ZBook Fury 15 G8 | |
| Durchschnittliche Intel Core i7-12850HX (63362 - 80775, n=2) | |
| Dell Precision 7670 | |
| AIDA64 / CPU ZLib | |
| Durchschnittliche Intel Core i7-12850HX (817 - 1102, n=2) | |
| Dell Precision 7670 | |
| Lenovo ThinkPad P1 G4-20Y4Z9DVUS | |
| HP ZBook Fury 15 G8 | |
| Asus ProArt StudioBook 16 W7600H5A-2BL2 | |
| Asus ProArt StudioBook 16 W7600H5A-2BL2 | |
| Dell Precision 5000 5560 | |
| AIDA64 / FP64 Ray-Trace | |
| Durchschnittliche Intel Core i7-12850HX (7671 - 9145, n=2) | |
| Lenovo ThinkPad P1 G4-20Y4Z9DVUS | |
| HP ZBook Fury 15 G8 | |
| Dell Precision 7670 | |
| AIDA64 / CPU PhotoWorxx | |
| Dell Precision 7670 | |
| Durchschnittliche Intel Core i7-12850HX (33415 - 42035, n=2) | |
| HP ZBook Fury 15 G8 | |
| Lenovo ThinkPad P1 G4-20Y4Z9DVUS | |
Systemleistung
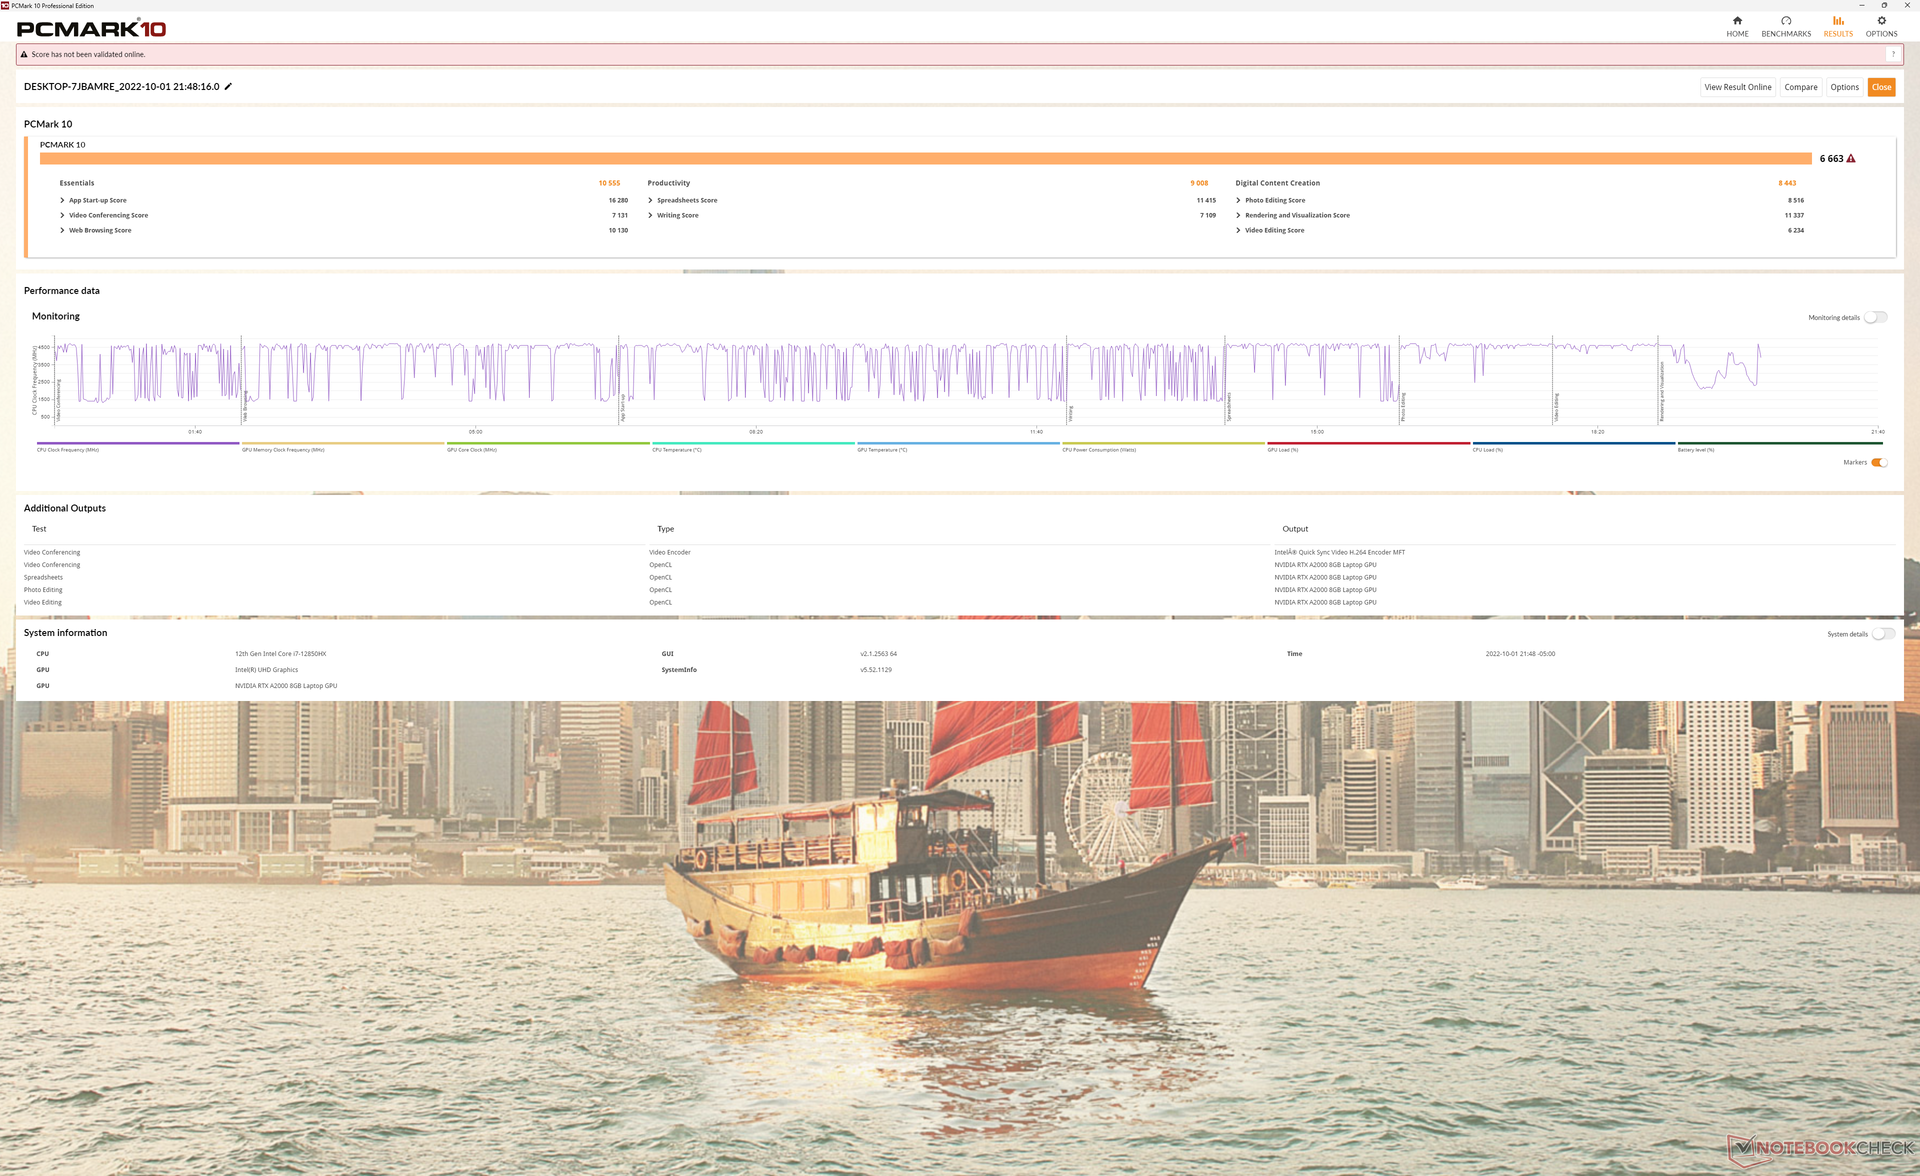
Die Ergebnisse im PCMark 10 sind auf einem ähnlichen Niveau wie das von anderen Workstations mit Core-H-CPU und Nvidia Quadro. Modelle mit schnellerer RTX A5000, wie das HP ZBook Fury 15 G8, ziehen aber vor allem in GPU-lastigen Benchmarks wie Digital Content Creation schnell an unserer Precision 7670 vorbei.
CrossMark: Overall | Productivity | Creativity | Responsiveness
| PCMark 10 / Score | |
| Asus ProArt StudioBook 16 W7600H5A-2BL2 | |
| HP ZBook Fury 15 G8 | |
| Dell Precision 5000 5560 | |
| Dell Precision 7670 | |
| Lenovo ThinkPad P1 G4-20Y4Z9DVUS | |
| Dell Precision 7550 | |
| PCMark 10 / Essentials | |
| Dell Precision 5000 5560 | |
| Dell Precision 7670 | |
| Asus ProArt StudioBook 16 W7600H5A-2BL2 | |
| HP ZBook Fury 15 G8 | |
| Lenovo ThinkPad P1 G4-20Y4Z9DVUS | |
| Dell Precision 7550 | |
| PCMark 10 / Productivity | |
| Dell Precision 7670 | |
| Dell Precision 5000 5560 | |
| Asus ProArt StudioBook 16 W7600H5A-2BL2 | |
| HP ZBook Fury 15 G8 | |
| Lenovo ThinkPad P1 G4-20Y4Z9DVUS | |
| Dell Precision 7550 | |
| PCMark 10 / Digital Content Creation | |
| Asus ProArt StudioBook 16 W7600H5A-2BL2 | |
| HP ZBook Fury 15 G8 | |
| Dell Precision 5000 5560 | |
| Dell Precision 7670 | |
| Lenovo ThinkPad P1 G4-20Y4Z9DVUS | |
| Dell Precision 7550 | |
| CrossMark / Overall | |
| Lenovo ThinkPad P1 G4-20Y4Z9DVUS | |
| Dell Precision 7670 | |
| CrossMark / Productivity | |
| Lenovo ThinkPad P1 G4-20Y4Z9DVUS | |
| Dell Precision 7670 | |
| CrossMark / Creativity | |
| Dell Precision 7670 | |
| Lenovo ThinkPad P1 G4-20Y4Z9DVUS | |
| CrossMark / Responsiveness | |
| Lenovo ThinkPad P1 G4-20Y4Z9DVUS | |
| Dell Precision 7670 | |
| PCMark 10 Score | 6663 Punkte | |
Hilfe | ||
| AIDA64 / Memory Copy | |
| Dell Precision 7670 | |
| HP ZBook Fury 15 G8 | |
| Lenovo ThinkPad P1 G4-20Y4Z9DVUS | |
| AIDA64 / Memory Read | |
| Dell Precision 7670 | |
| HP ZBook Fury 15 G8 | |
| Lenovo ThinkPad P1 G4-20Y4Z9DVUS | |
| AIDA64 / Memory Write | |
| Dell Precision 7670 | |
| HP ZBook Fury 15 G8 | |
| Lenovo ThinkPad P1 G4-20Y4Z9DVUS | |
| AIDA64 / Memory Latency | |
| HP ZBook Fury 15 G8 | |
| Dell Precision 7670 | |
| Lenovo ThinkPad P1 G4-20Y4Z9DVUS | |
| Asus ProArt StudioBook 16 W7600H5A-2BL2 | |
| Asus ProArt StudioBook 16 W7600H5A-2BL2 | |
* ... kleinere Werte sind besser
DPC Latency
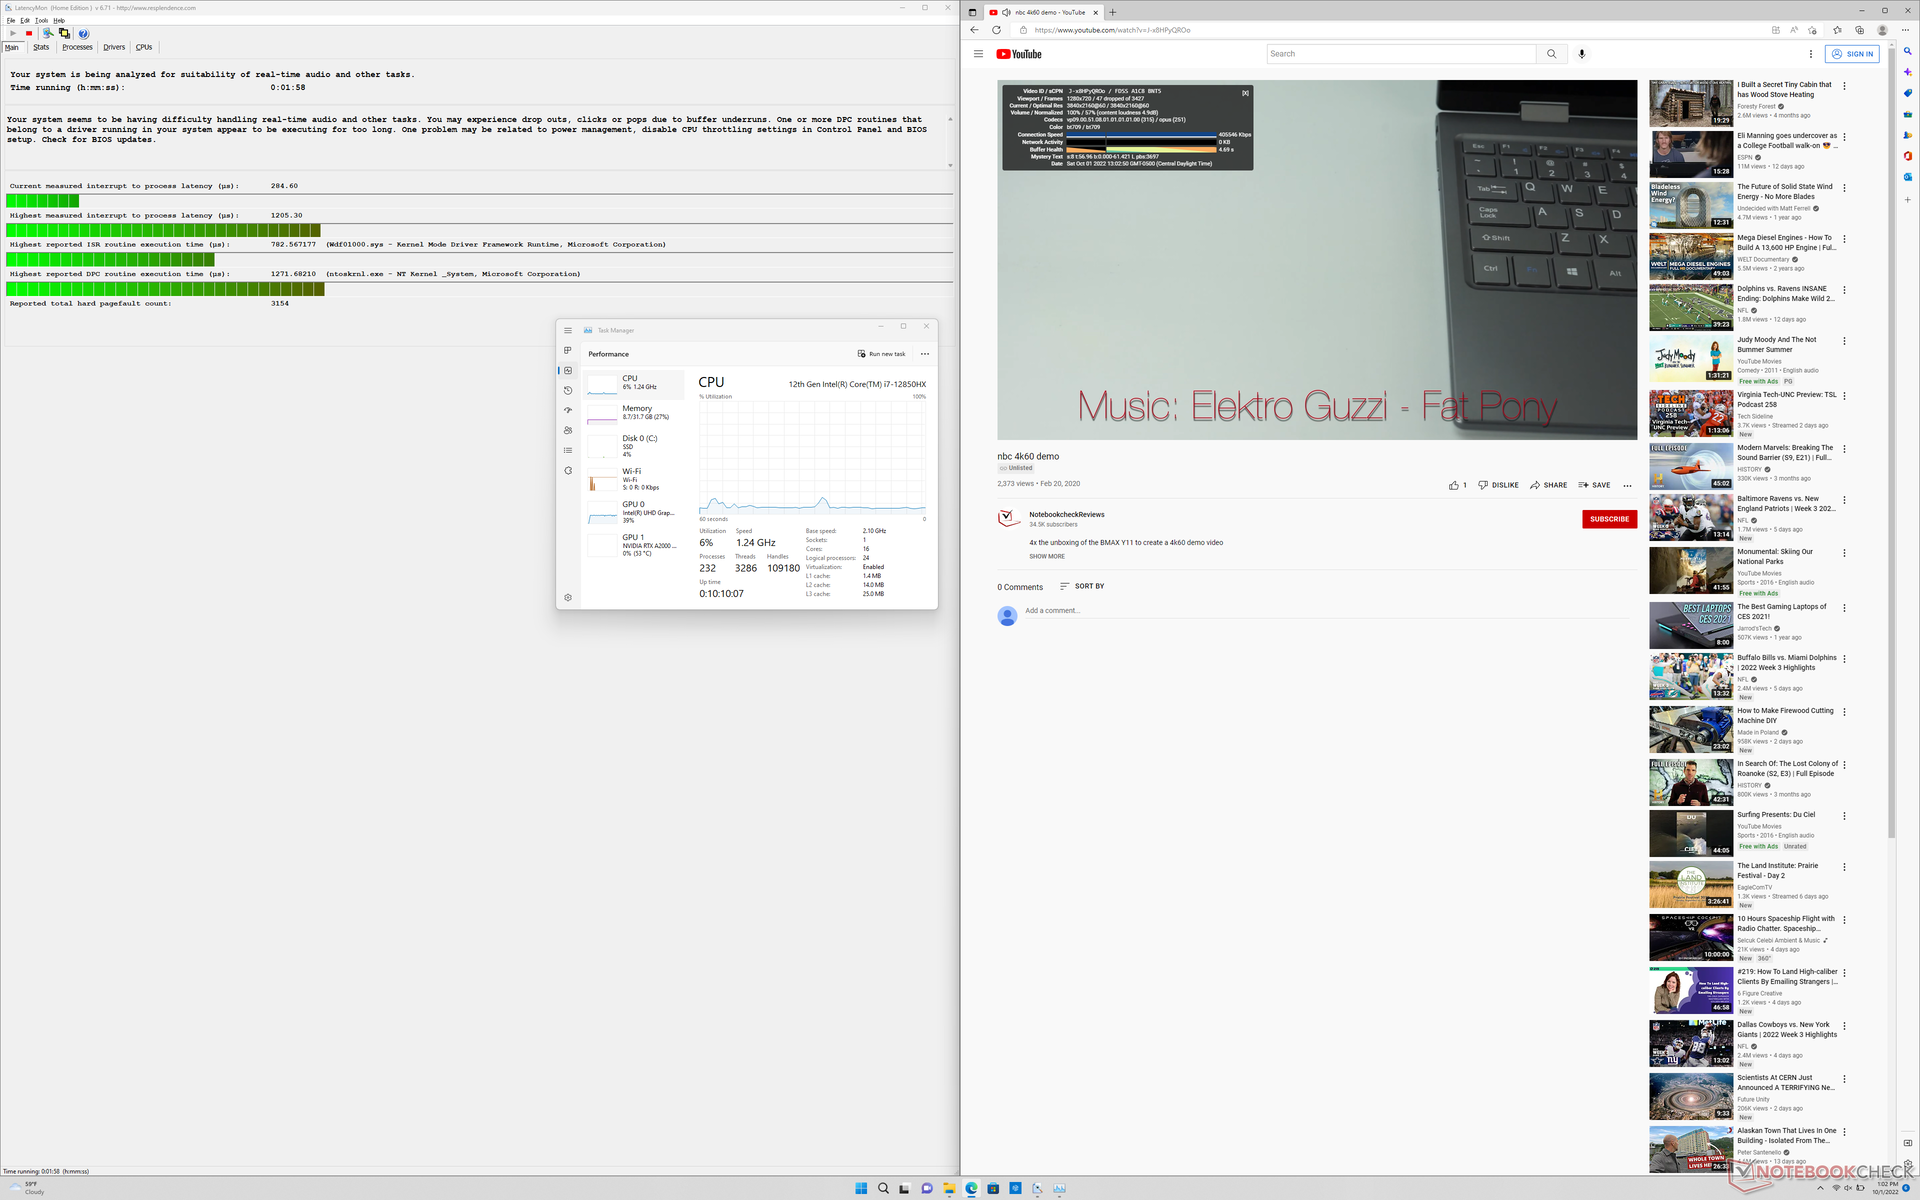
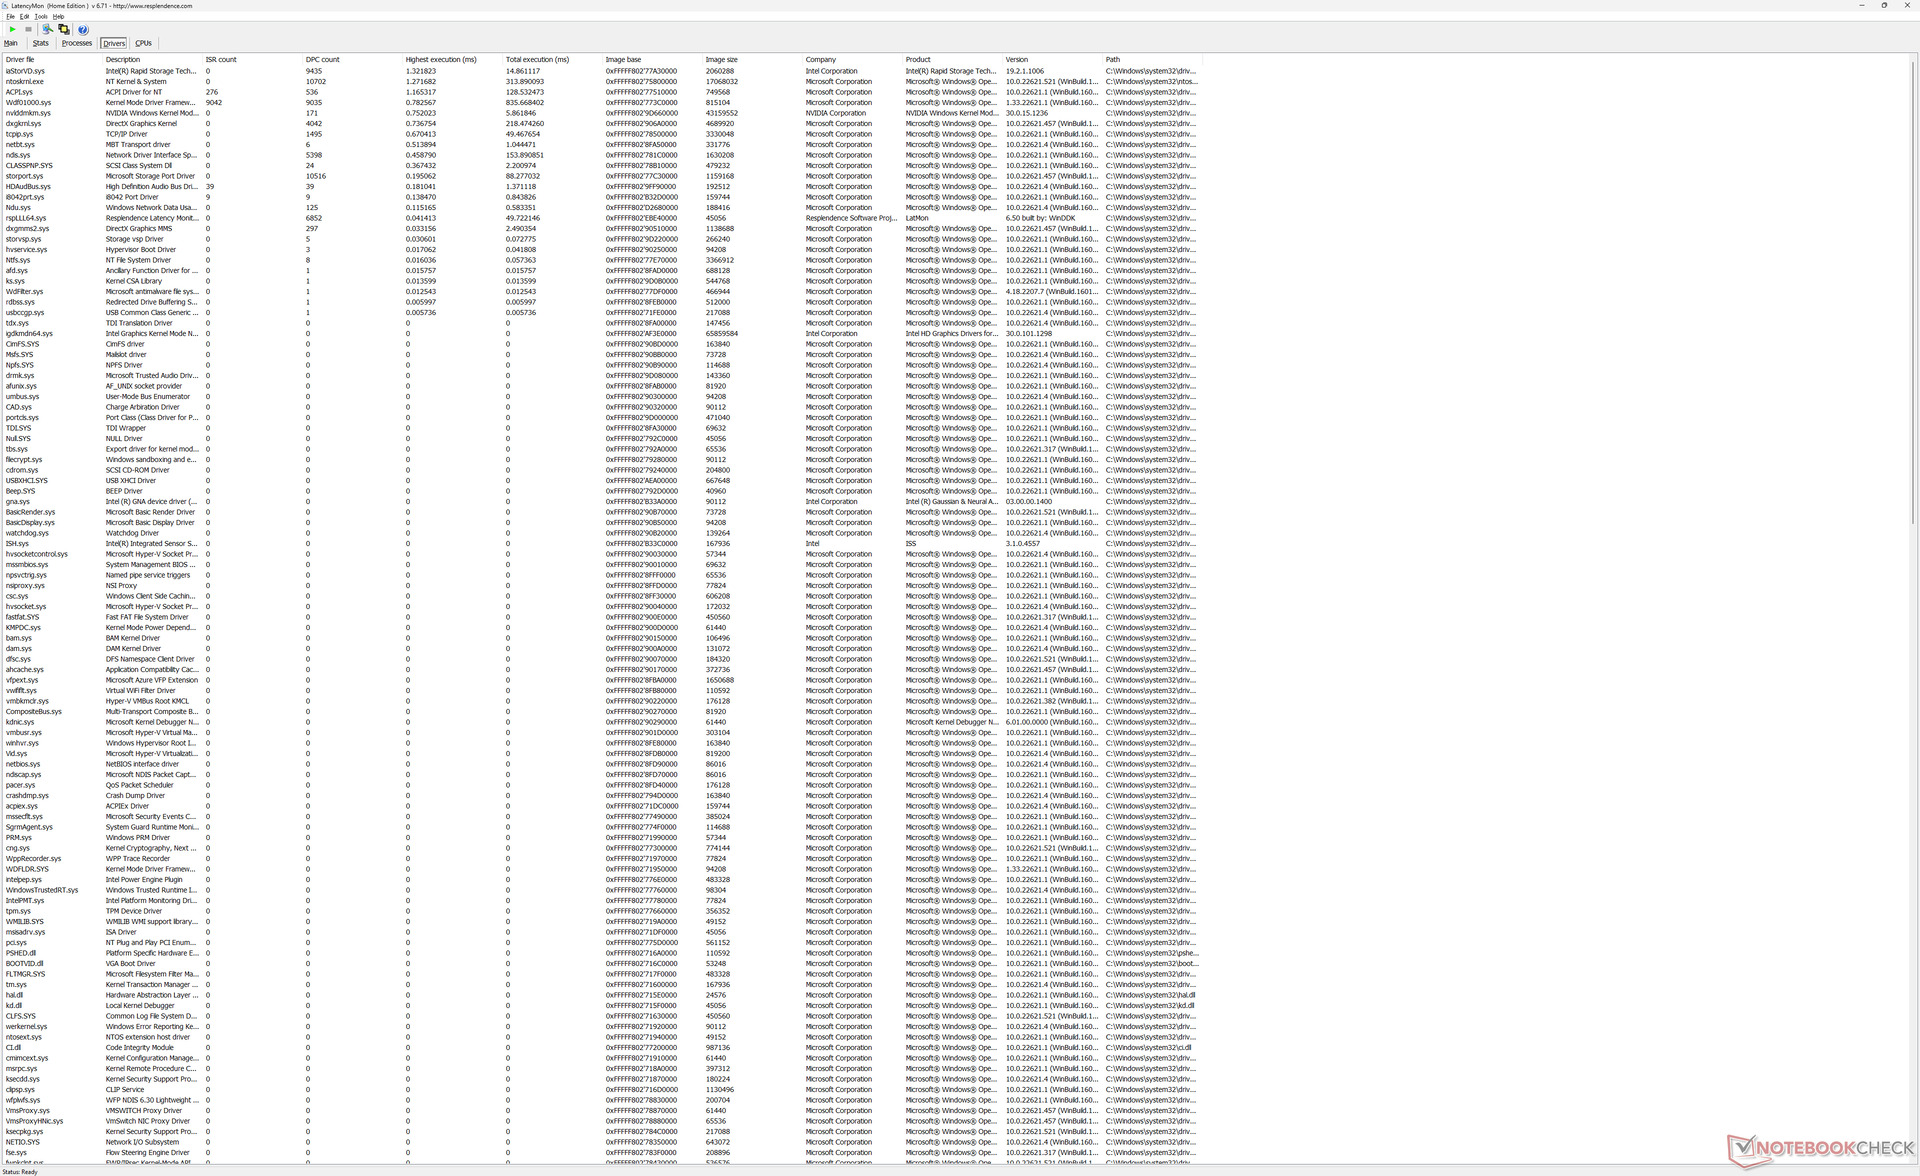
LatencyMon weist uns auf leichte DPC-Probleme beim Öffnen mehrerer Browsertabs hin. Dazu gesellt sich leider eine suboptimale Leistung bei der Wiedergabe unseres 4K/60-fps-YouTubevideos, welches ganze 47 Dropped Frames innerhalb einer Minute aufweist.
| DPC Latencies / LatencyMon - interrupt to process latency (max), Web, Youtube, Prime95 | |
| Dell Precision 7550 | |
| Asus ProArt StudioBook 16 W7600H5A-2BL2 | |
| Lenovo ThinkPad P1 G4-20Y4Z9DVUS | |
| Dell Precision 7670 | |
| Dell Precision 5000 5560 | |
| HP ZBook Fury 15 G8 | |
* ... kleinere Werte sind besser
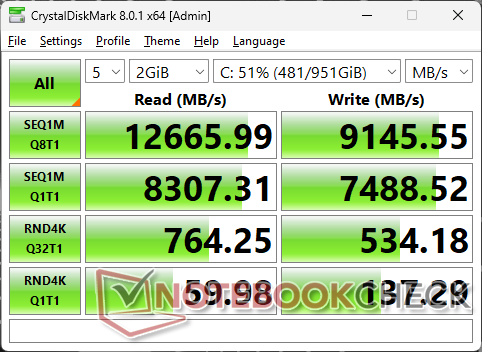
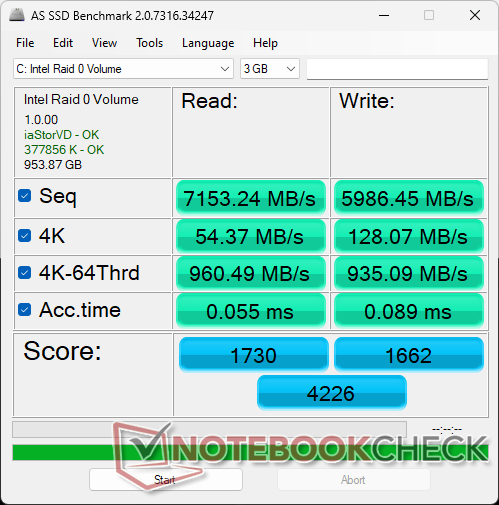
Massenspeicher — Wahnsinnig schnell mit PCIe4 x4 und RAID 0
Alle Konfigurationen unterstützen mindestens zwei M.2-SSDs, einige sogar drei. Unser testmodell ist mit zwei PCIe4-x4-NVMe-SSDs SK Hynix PC801 mit jeweils 512 GB bestückt, welche im RAID-0-Verbund laufen und zusammen auf sequentielle Lese- und Schreibraten von beinahe 13,000 MB/s und 9.200 MB/s kommen. Auch unter anhaltendem Stress mit DiskSpd zeigen die Speichermedien keine Zeichen einer Drosselung. Jede SSD verfügt über vorinstallierte Heat Spreader oder Thermalpads, die bei der Hitzeverteilung helfen.

| Drive Performance Rating - Percent | |
| Dell Precision 5000 5560 | |
| Dell Precision 7670 | |
| Lenovo ThinkPad P1 G4-20Y4Z9DVUS | |
| Asus ProArt StudioBook 16 W7600H5A-2BL2 | |
| HP ZBook Fury 15 G8 | |
| Dell Precision 7550 | |
* ... kleinere Werte sind besser
Disk Throttling: DiskSpd Read Loop, Queue Depth 8
Grafikleistung — Grafik mit 95 W TGP
Die RTX A2000 ist aus der GeForce RTX 3050 Ti hervorgegangen, sodass beide Karten ähnliche Leistungswerte aufweisen. Rüstet man auf eine RTX A3000 oder RTX A5500 um, so kann man eine Leistungssteigerung von 15 bis 20 Prozent beziehungsweise 70 bis 90 Prozent erwarten.
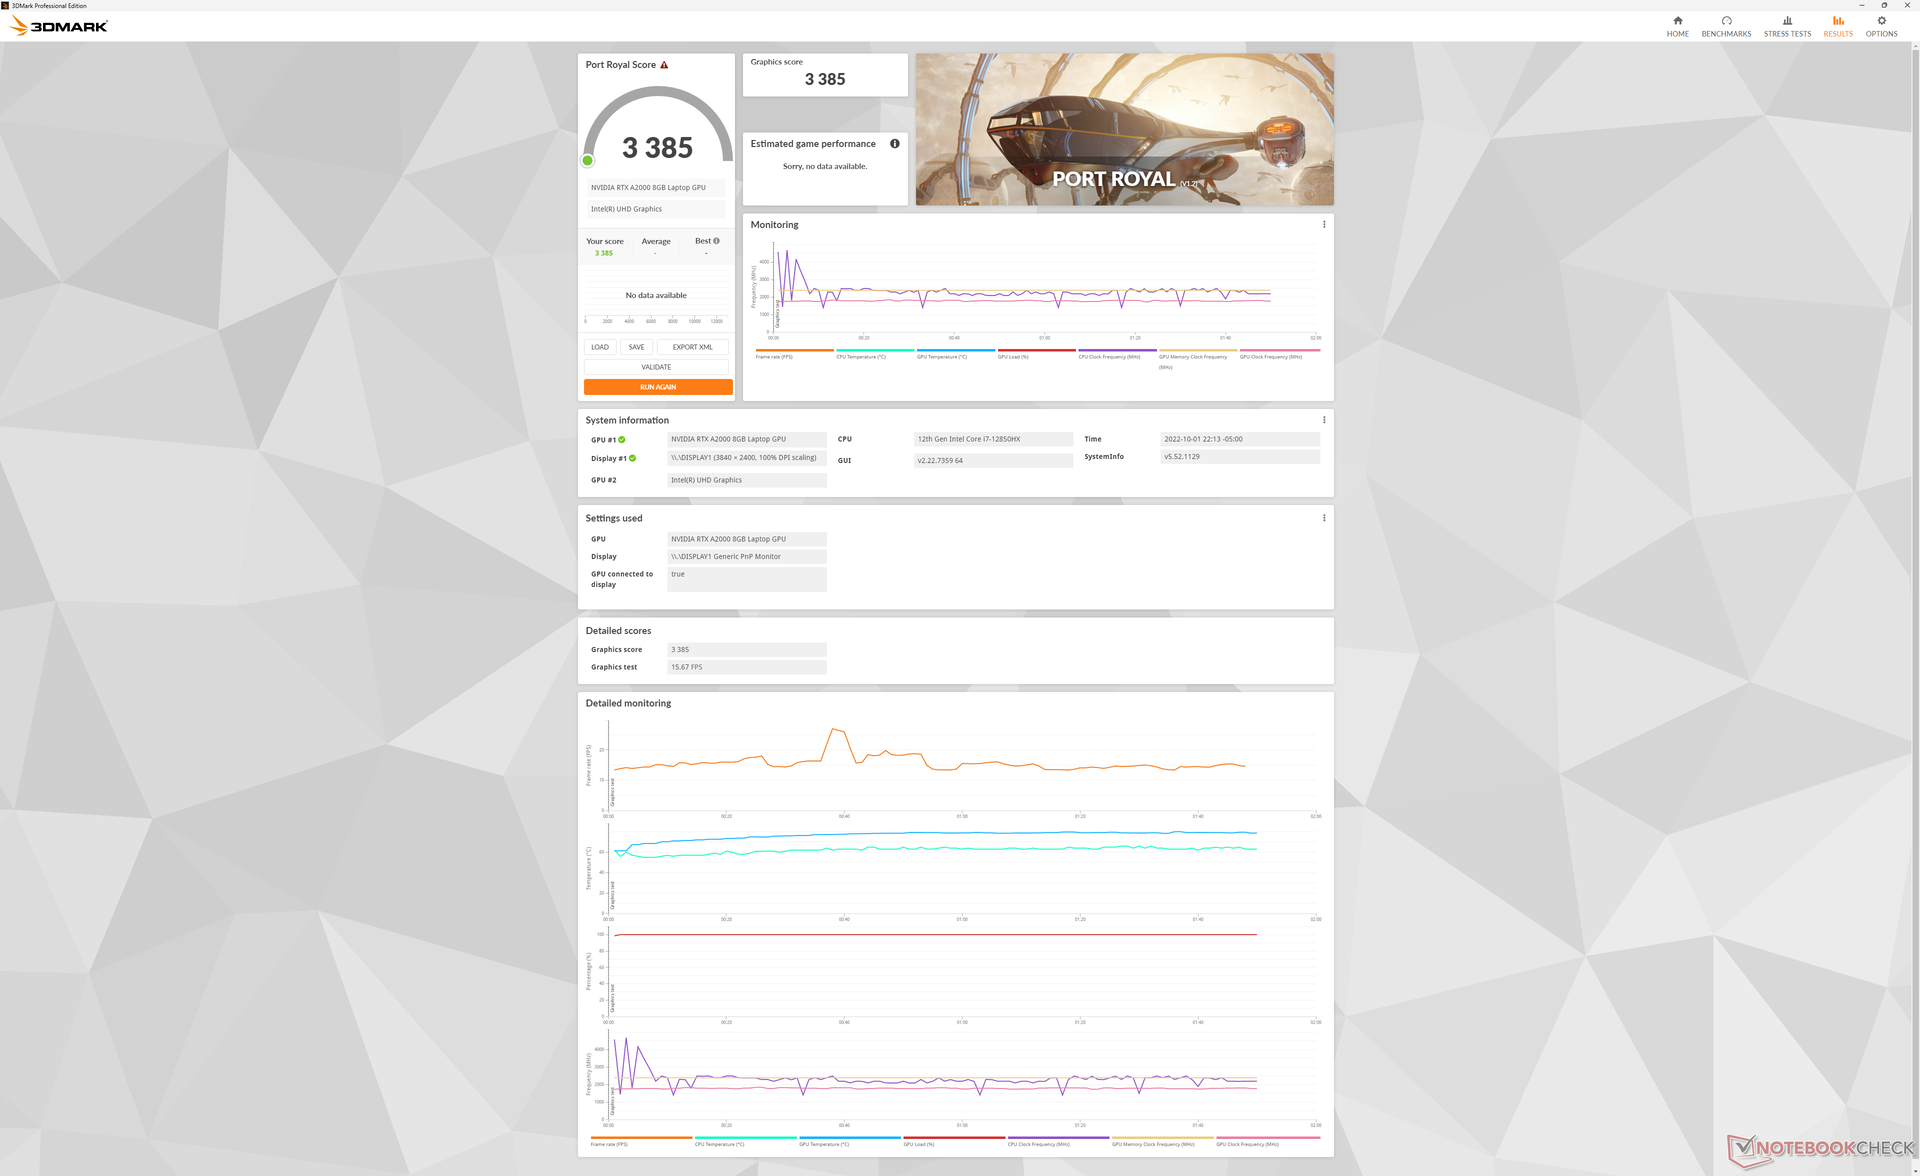
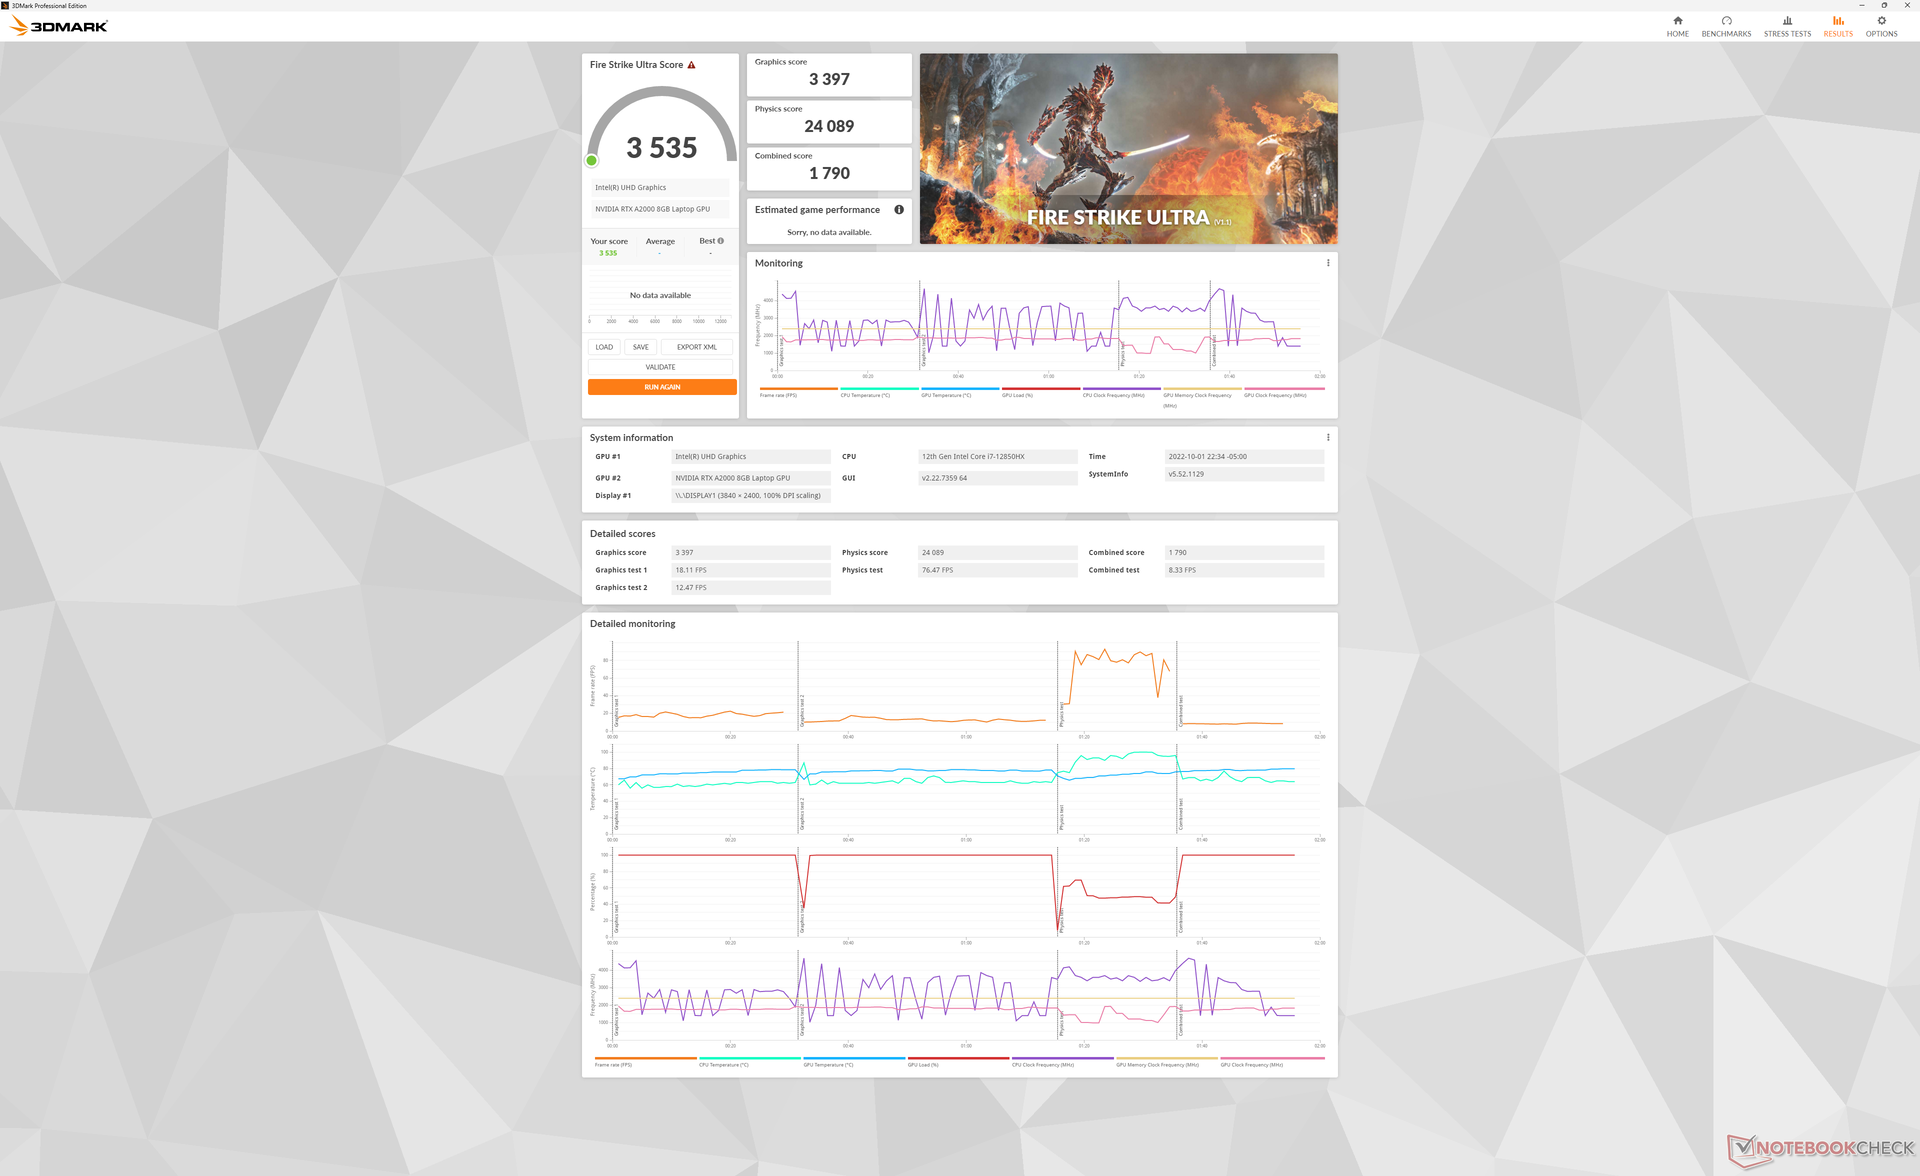
Interessanterweise fällt die Ray-Tracing-Leistung unter Port Royal signifikant besser aus als noch auf dem älteren Precision 5560, obwohl beide über die gleiche RTX A2000 verfügen. Wir gehen davon aus, dass dies sowohl an der deutlich gestiegenen TGP (95 W vs. 45 W) sowie an den neueren Nvidia-Treibern (512.36 vs. 472.12) unseres Precision 7670 liegt.
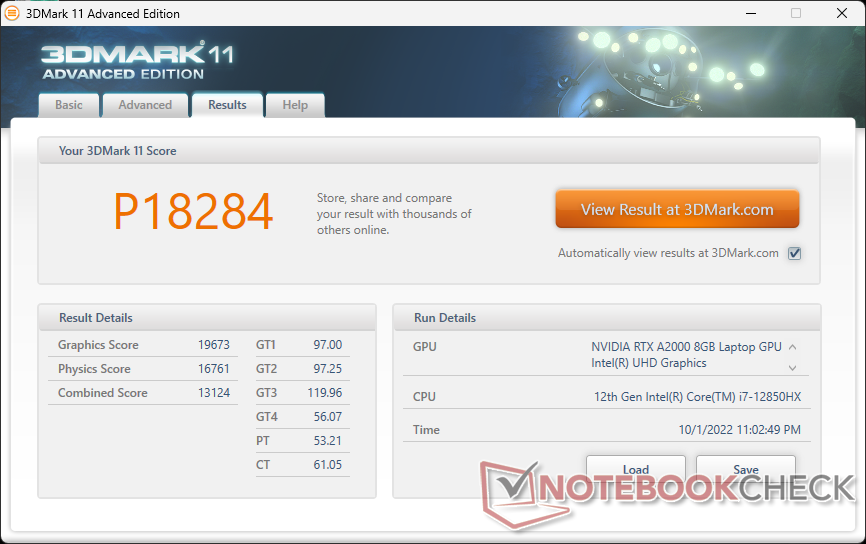
| 3DMark 11 Performance | 18284 Punkte | |
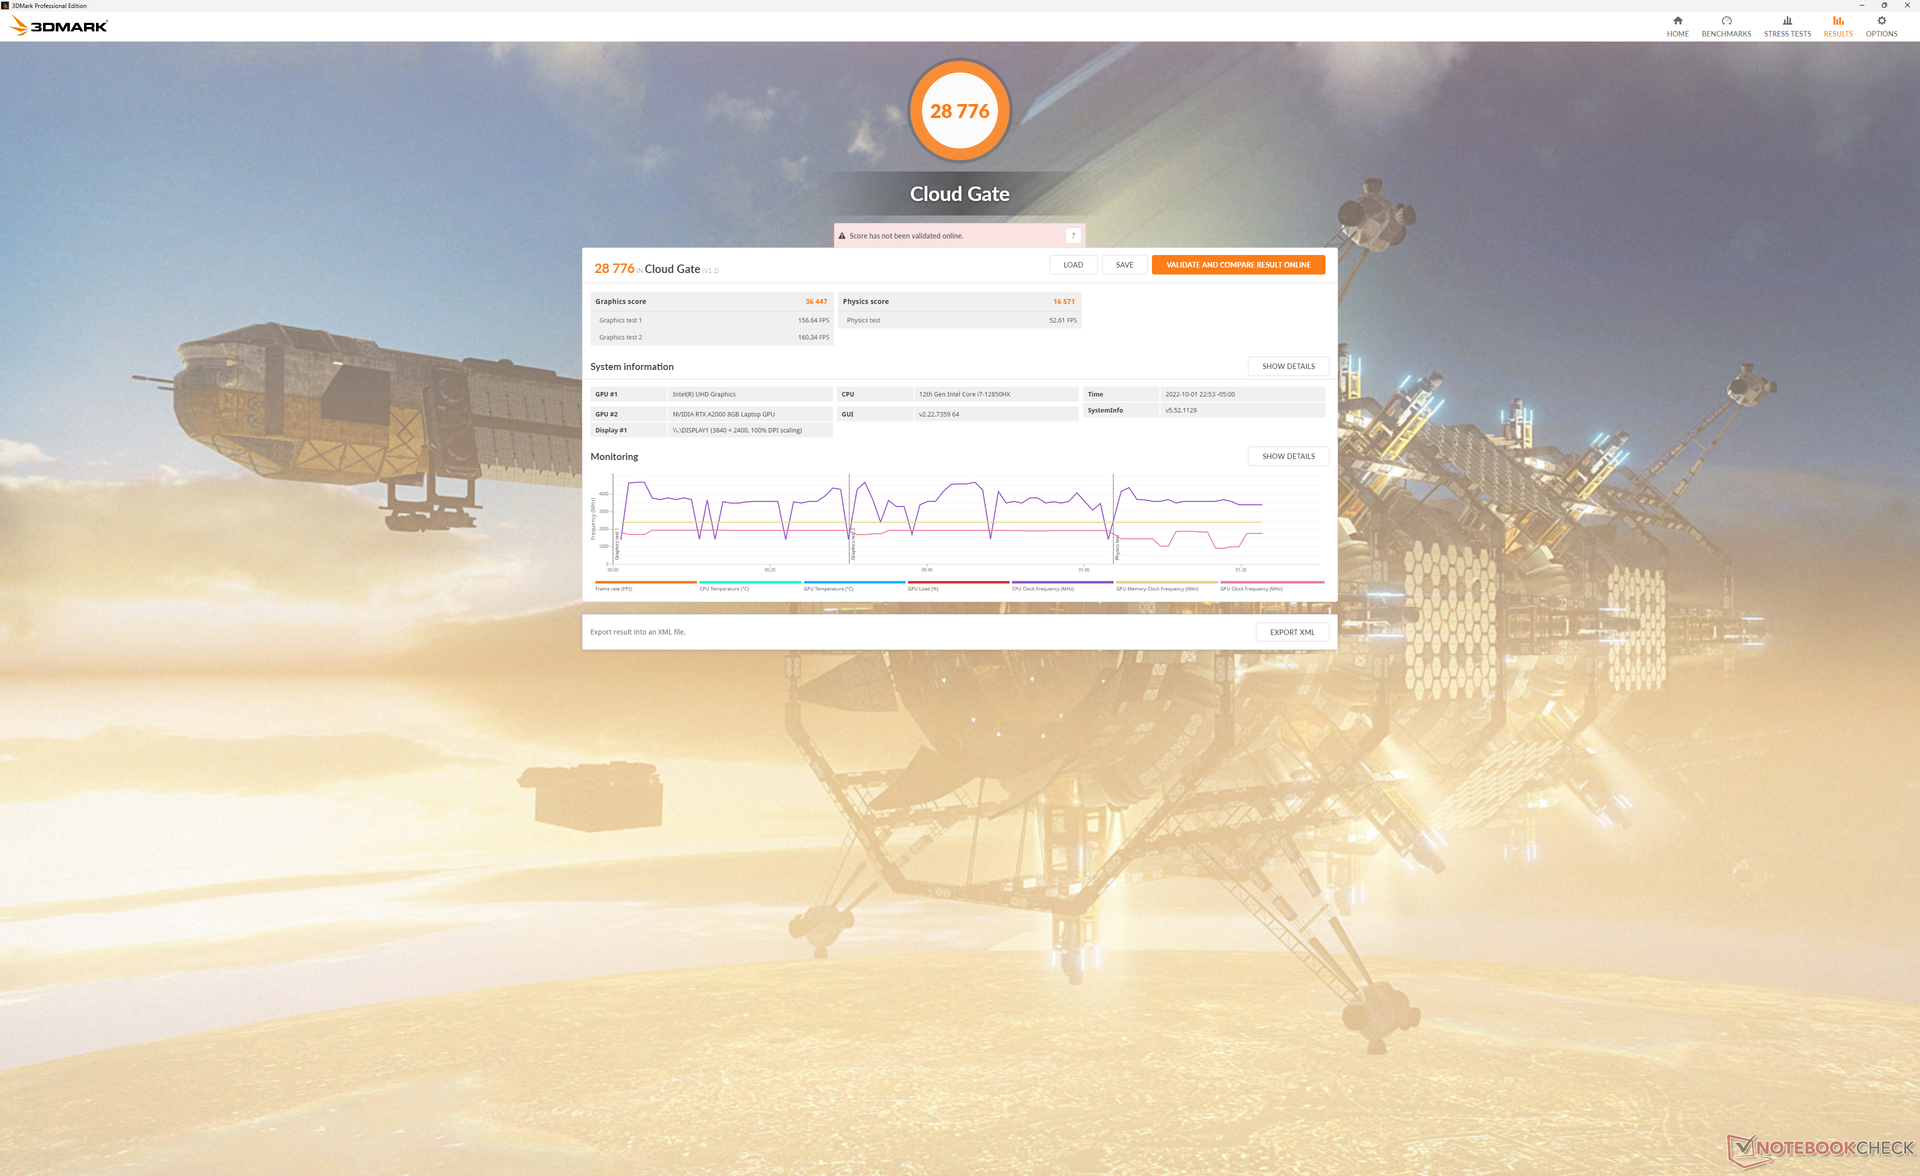
| 3DMark Cloud Gate Standard Score | 28776 Punkte | |
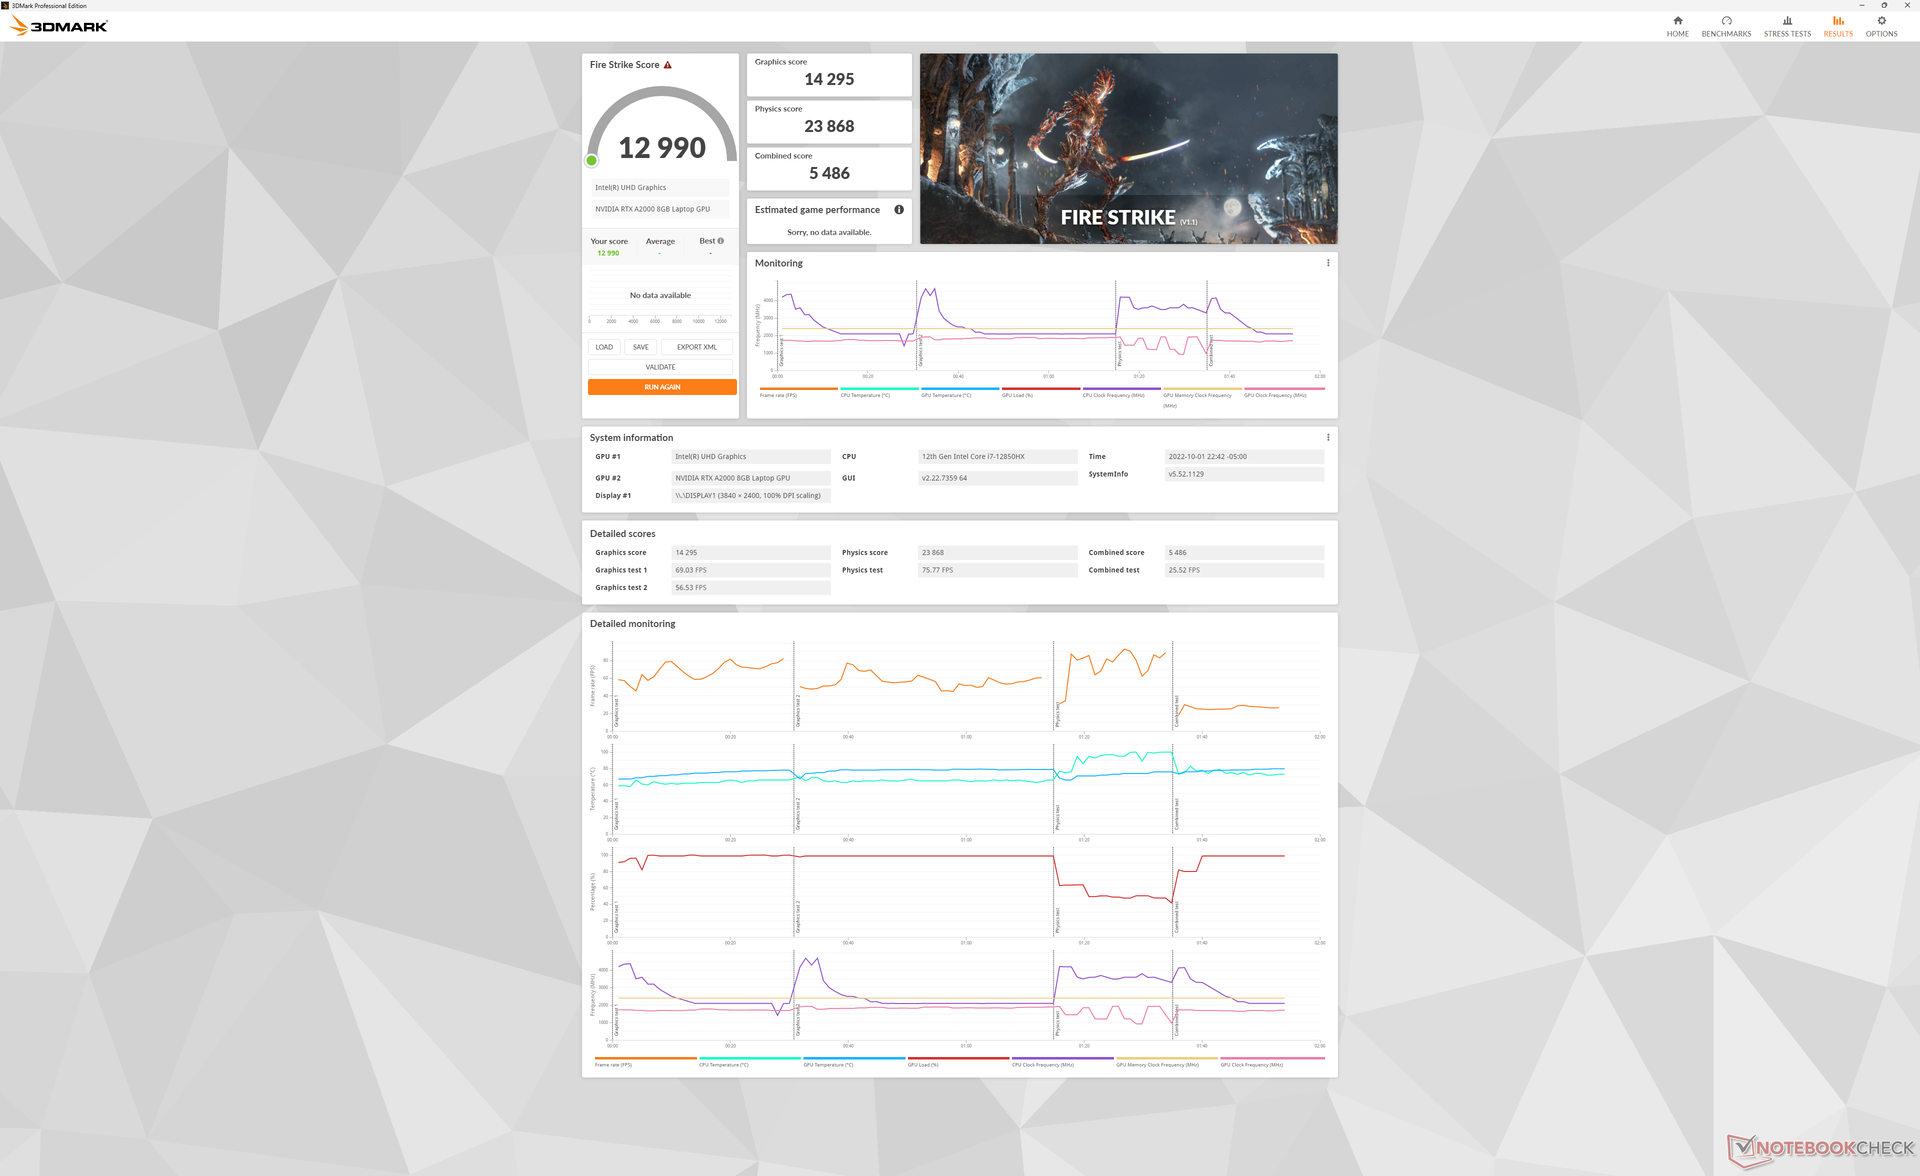
| 3DMark Fire Strike Score | 12990 Punkte | |
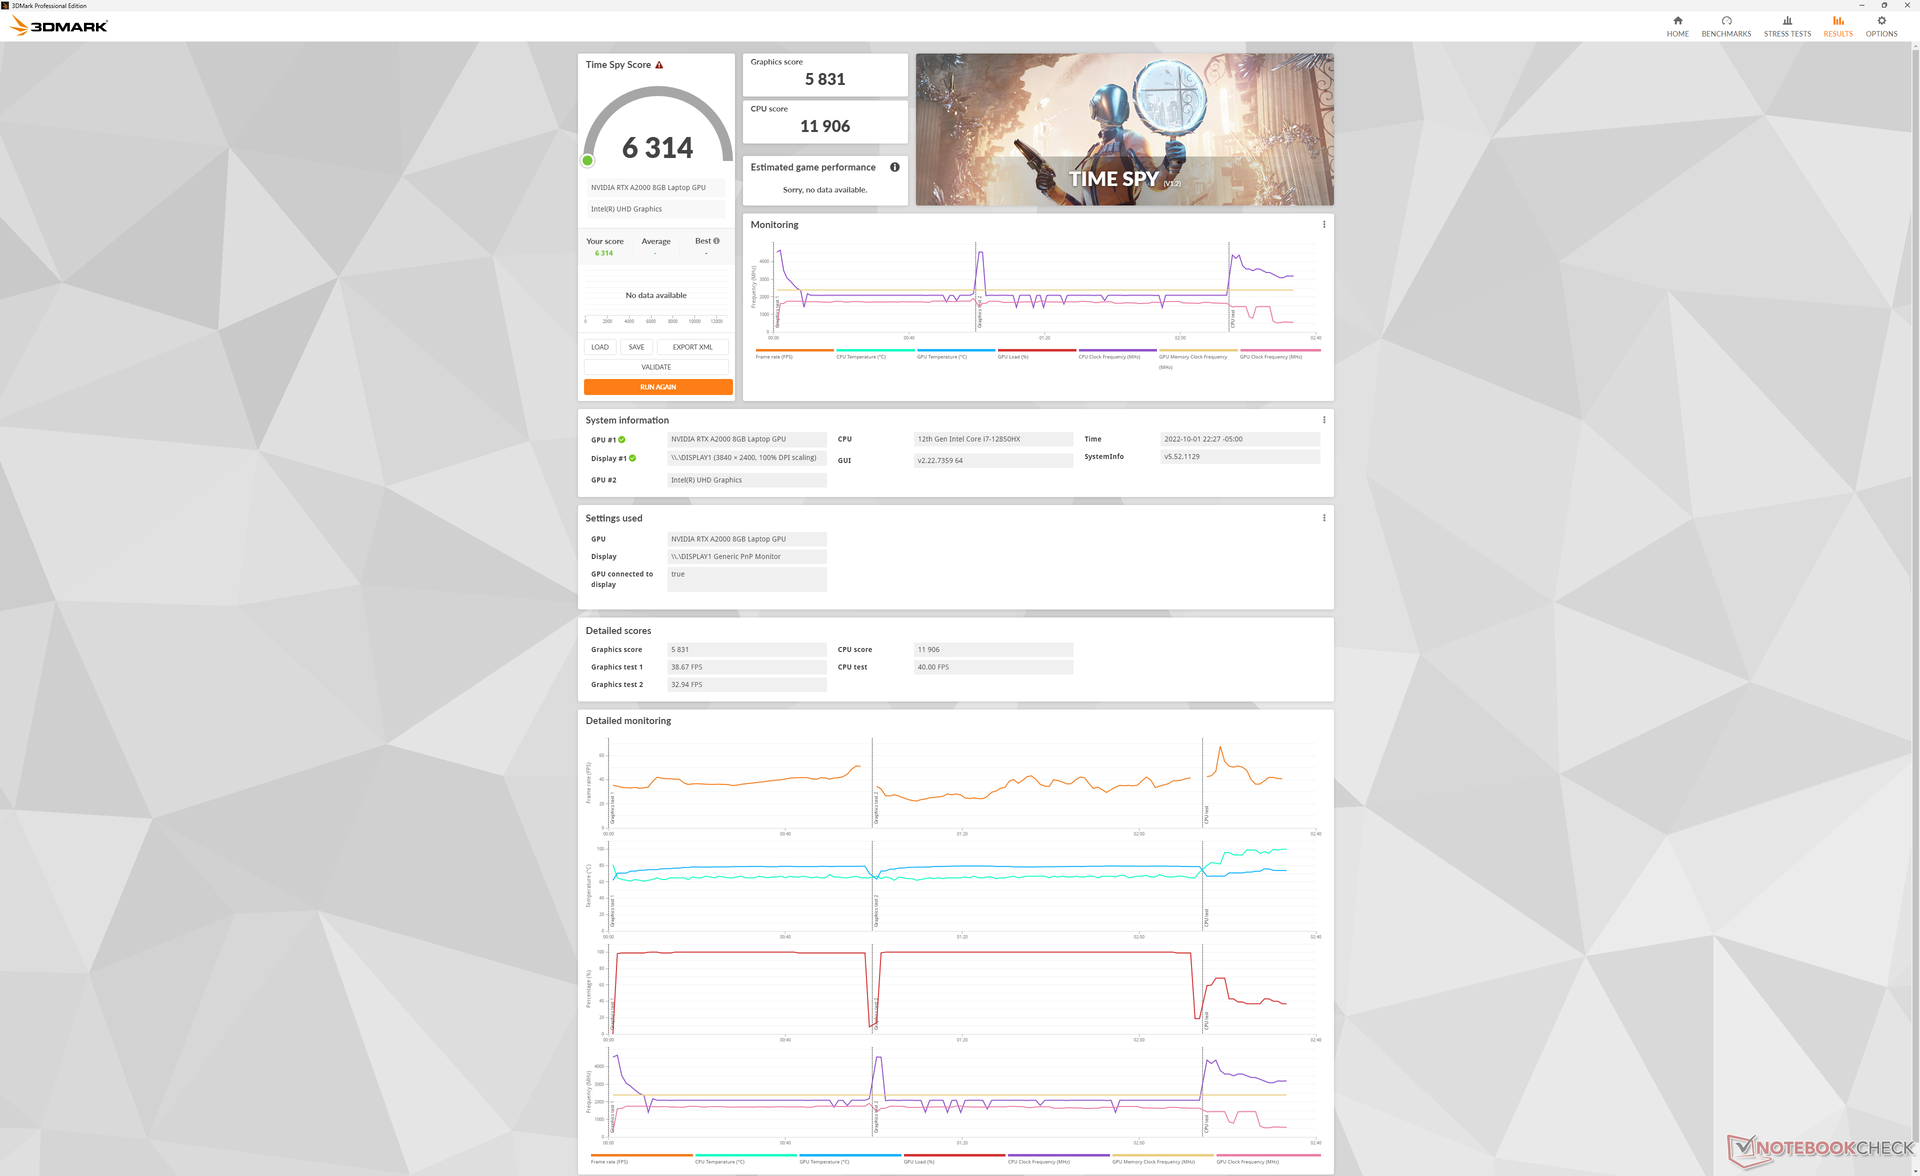
| 3DMark Time Spy Score | 6314 Punkte | |
Hilfe | ||
| Blender | |
| v3.3 Classroom HIP/AMD | |
| Lenovo Legion 7 16ARHA7 | |
| v3.3 Classroom OPTIX/RTX | |
| Dell Precision 5000 5470 | |
| HP Envy 16 h0112nr | |
| Dell Precision 7670 | |
| v3.3 Classroom CUDA | |
| Dell Precision 5000 5470 | |
| HP Envy 16 h0112nr | |
| Dell Precision 7670 | |
| v3.3 Classroom CPU | |
| HP Envy 16 h0112nr | |
| Dell Precision 5000 5470 | |
| Lenovo Legion 7 16ARHA7 | |
| Dell Precision 7670 | |
* ... kleinere Werte sind besser
Witcher 3 FPS Chart
| min. | mittel | hoch | max. | QHD | 4K | |
|---|---|---|---|---|---|---|
| GTA V (2015) | 181.7 | 177.6 | 155.1 | 79.1 | 57.1 | |
| The Witcher 3 (2015) | 297.1 | 181.7 | 108.6 | 57.4 | ||
| Dota 2 Reborn (2015) | 180.8 | 159.3 | 145.1 | 128.8 | 78.5 | |
| Final Fantasy XV Benchmark (2018) | 129.5 | 80.4 | 60.6 | 44.4 | 26 | |
| X-Plane 11.11 (2018) | 135.2 | 104.1 | 85.5 | 55.1 | ||
| Strange Brigade (2018) | 325 | 151.2 | 120.9 | 103.5 | 76.8 | |
| Cyberpunk 2077 1.6 (2022) | 78.5 | 65.1 | 55 | 44.3 | 27.4 |
Emissionen
Systemlautstärke
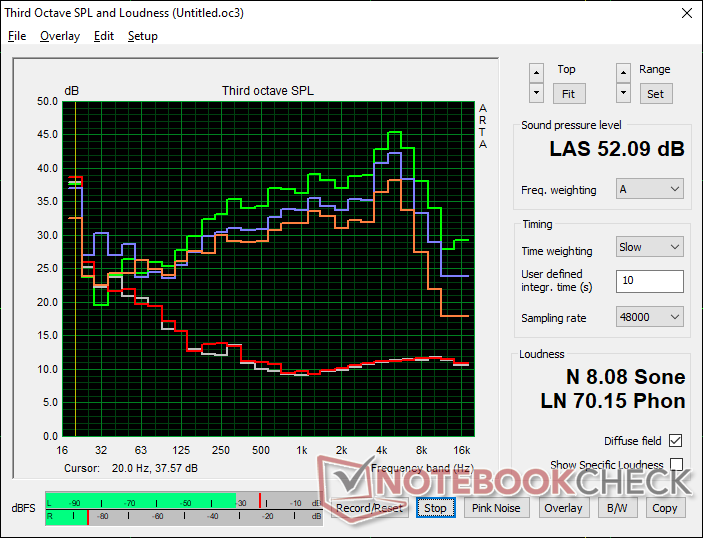
Die Lüfter stehen auch beim Leerlauf quasi fast nie still, bleiben unter geringen Lasten aber dennoch ruhig und kaum wahrnehmbar. Bei der Videowiedergabe kann man von etwa 28 dB(A) gegen eine Hintergrundlautstärke von 22,7 dB(A) ausgehen. Mit nur 24,5 dB(A) ist die Workstation beim Surfen oder in Word sogar noch leiser und damit ähnlich ruhig wie das ZBook Fury 15 G8 oder das Precision 5560.
Natürlich steigt der Pegel schnell unter anspruchsvollen Lasten. Selbst im Balanced-Profil steigt die Lüfterlautstärke in der ersten Szene des 3DMark 06 schnell auf 49 dB(A). Das Lüfter-Maximum liegt bei etwa 52 dB(A) und wird unter extremen Lasten wie Prime95 und FurMark erreicht, ähnlich wie beim Precision 5560. In anderen Worten, das Precision 7670 bleibt in vielen Bedingungen recht ruhig, wird aber schnell laut wenn etwas Stress anliegt.
Lautstärkediagramm
| Idle |
| 22.9 / 22.9 / 24.5 dB(A) |
| Last |
| 48.7 / 52.1 dB(A) |
 | ||
30 dB leise 40 dB(A) deutlich hörbar 50 dB(A) störend |
||
min: | ||
| Dell Precision 7670 RTX A2000 Laptop GPU, i7-12850HX, SK Hynix HFS001TEJ9X115N | Lenovo ThinkPad P1 G4-20Y4Z9DVUS T1200 Laptop GPU, i7-11800H, Samsung PM9A1 MZVL2512HCJQ | Asus ProArt StudioBook 16 W7600H5A-2BL2 RTX A5000 Laptop GPU, W-11955M, 2x Micron 2300 2TB MTFDHBA2T0TDV (RAID 0) | Dell Precision 5000 5560 RTX A2000 Laptop GPU, i7-11850H, Samsung PM9A1 MZVL22T0HBLB | Dell Precision 7550 Quadro RTX 5000 Max-Q, W-10885M, SK Hynix PC601A NVMe 1TB | HP ZBook Fury 15 G8 RTX A5000 Laptop GPU, i9-11950H, Samsung PM981a MZVLB1T0HBLR | |
|---|---|---|---|---|---|---|
| Geräuschentwicklung | -3% | -3% | 11% | -9% | 3% | |
| aus / Umgebung * (dB) | 22.7 | 24.3 -7% | 26 -15% | 23.4 -3% | 25.8 -14% | 24.1 -6% |
| Idle min * (dB) | 22.9 | 24.3 -6% | 26 -14% | 23.6 -3% | 25.8 -13% | 24.1 -5% |
| Idle avg * (dB) | 22.9 | 24.3 -6% | 26 -14% | 23.6 -3% | 25.8 -13% | 24.1 -5% |
| Idle max * (dB) | 24.5 | 26.6 -9% | 26.5 -8% | 23.6 4% | 25.9 -6% | 24.8 -1% |
| Last avg * (dB) | 48.7 | 46.8 4% | 42 14% | 25.8 47% | 51.2 -5% | 37.8 22% |
| Witcher 3 ultra * (dB) | 45.2 | 46.8 -4% | 40.1 11% | 51.9 -15% | 44.2 2% | |
| Last max * (dB) | 52.1 | 46.8 10% | 43 17% | 41.4 21% | 51.9 -0% | 44.2 15% |
* ... kleinere Werte sind besser
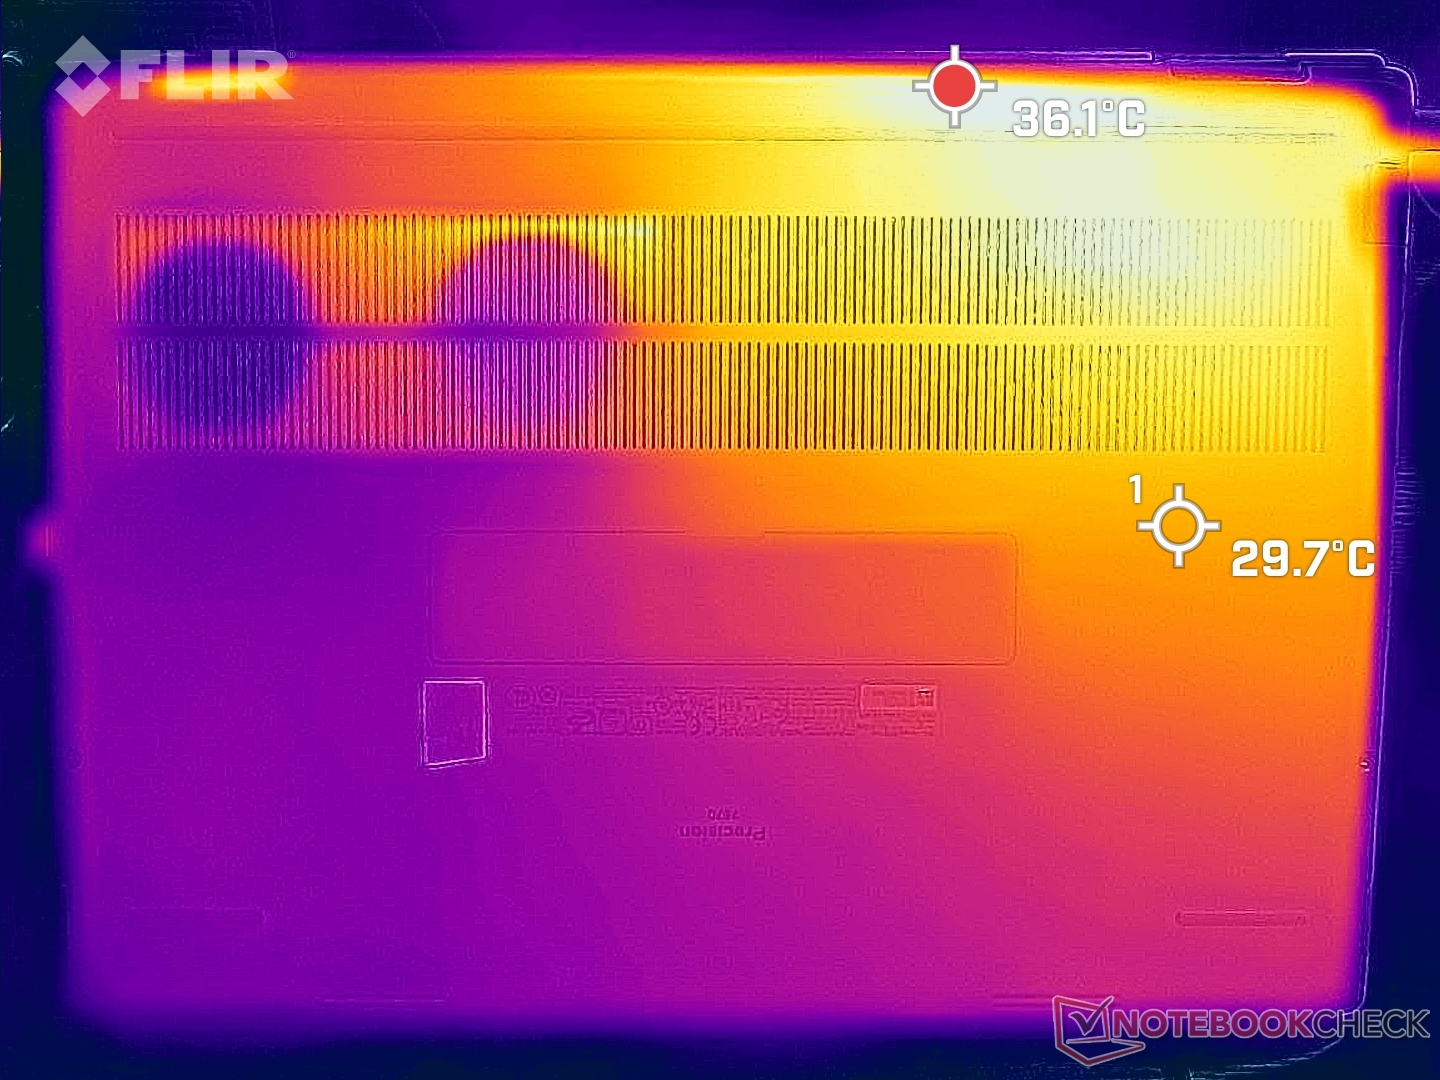
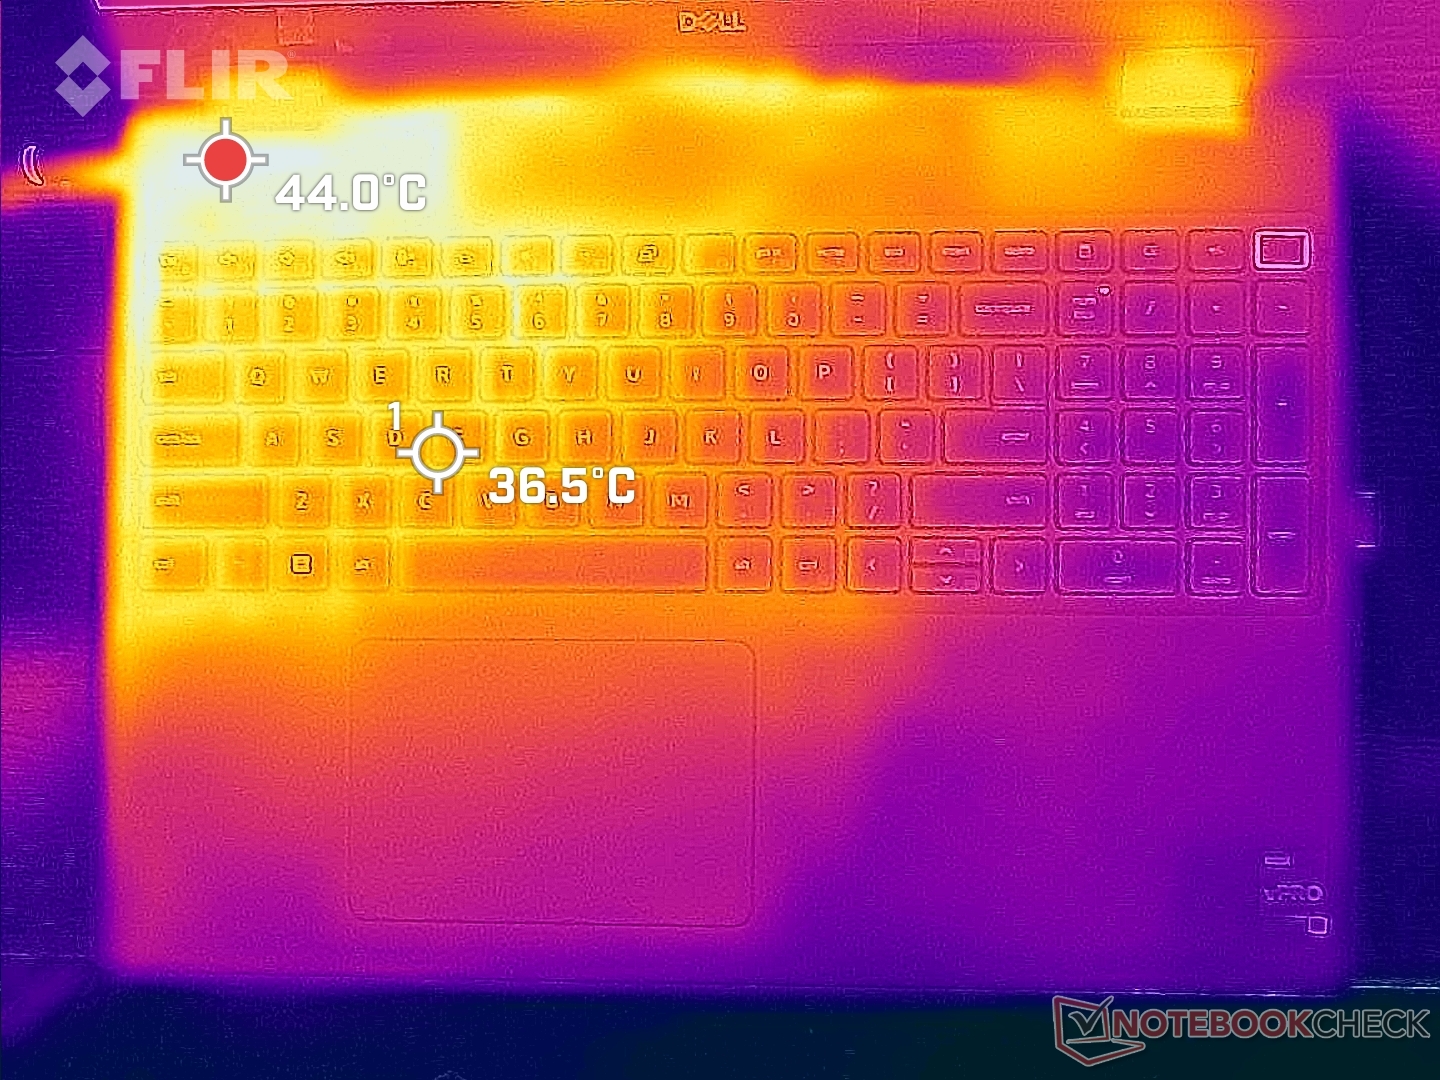
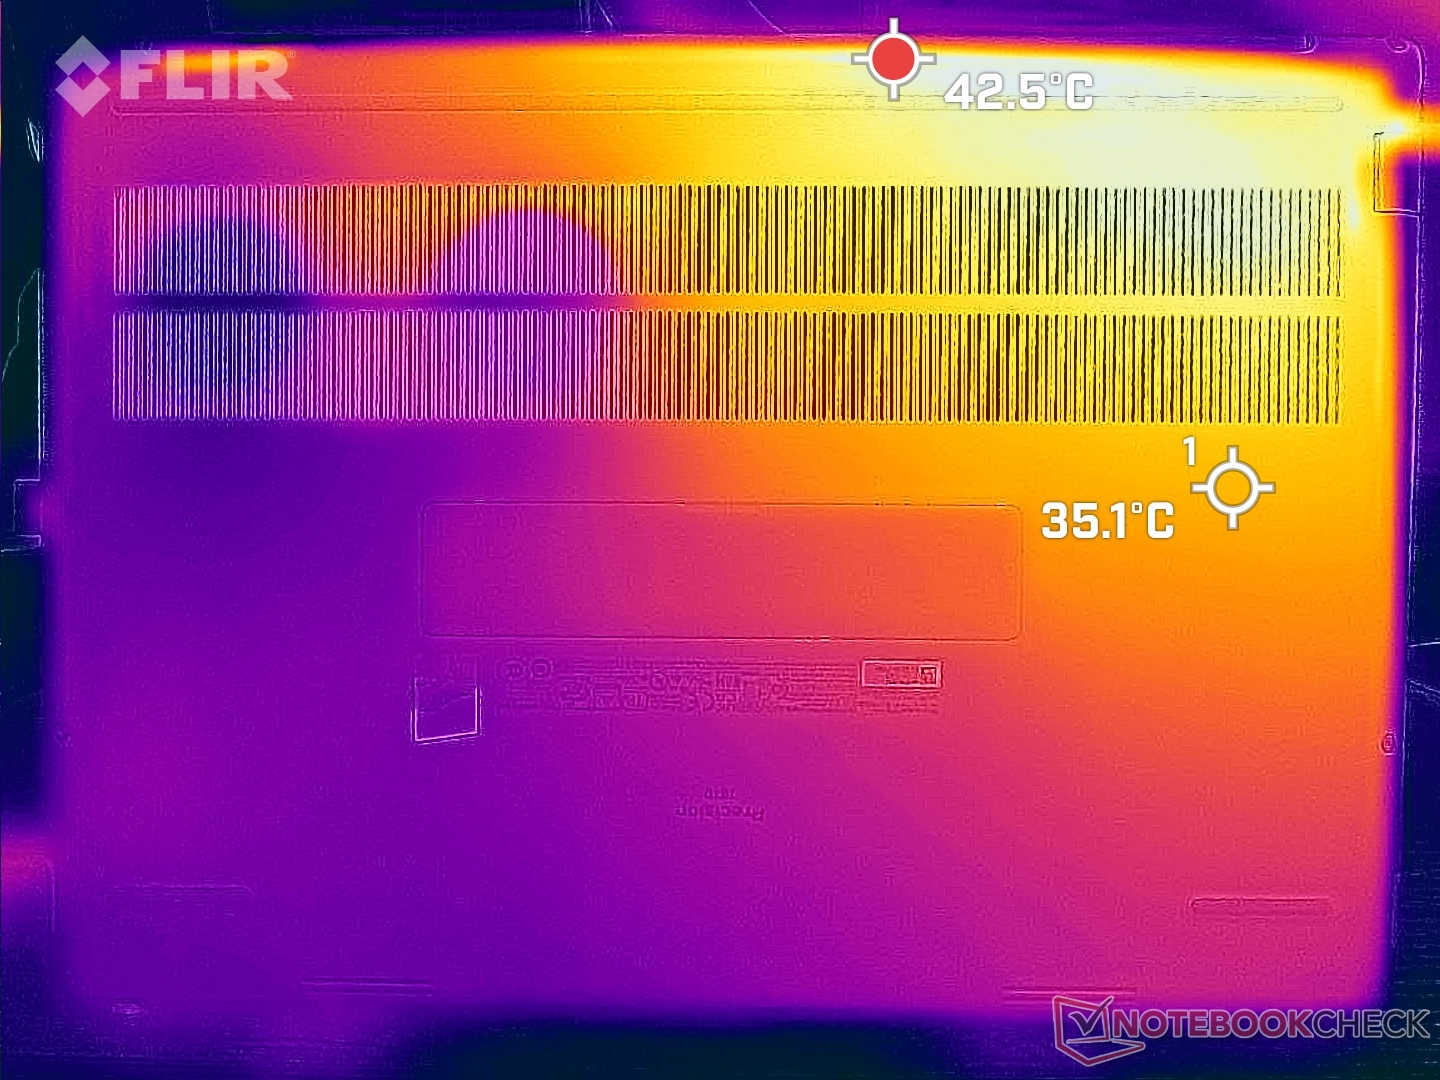
Temperatur
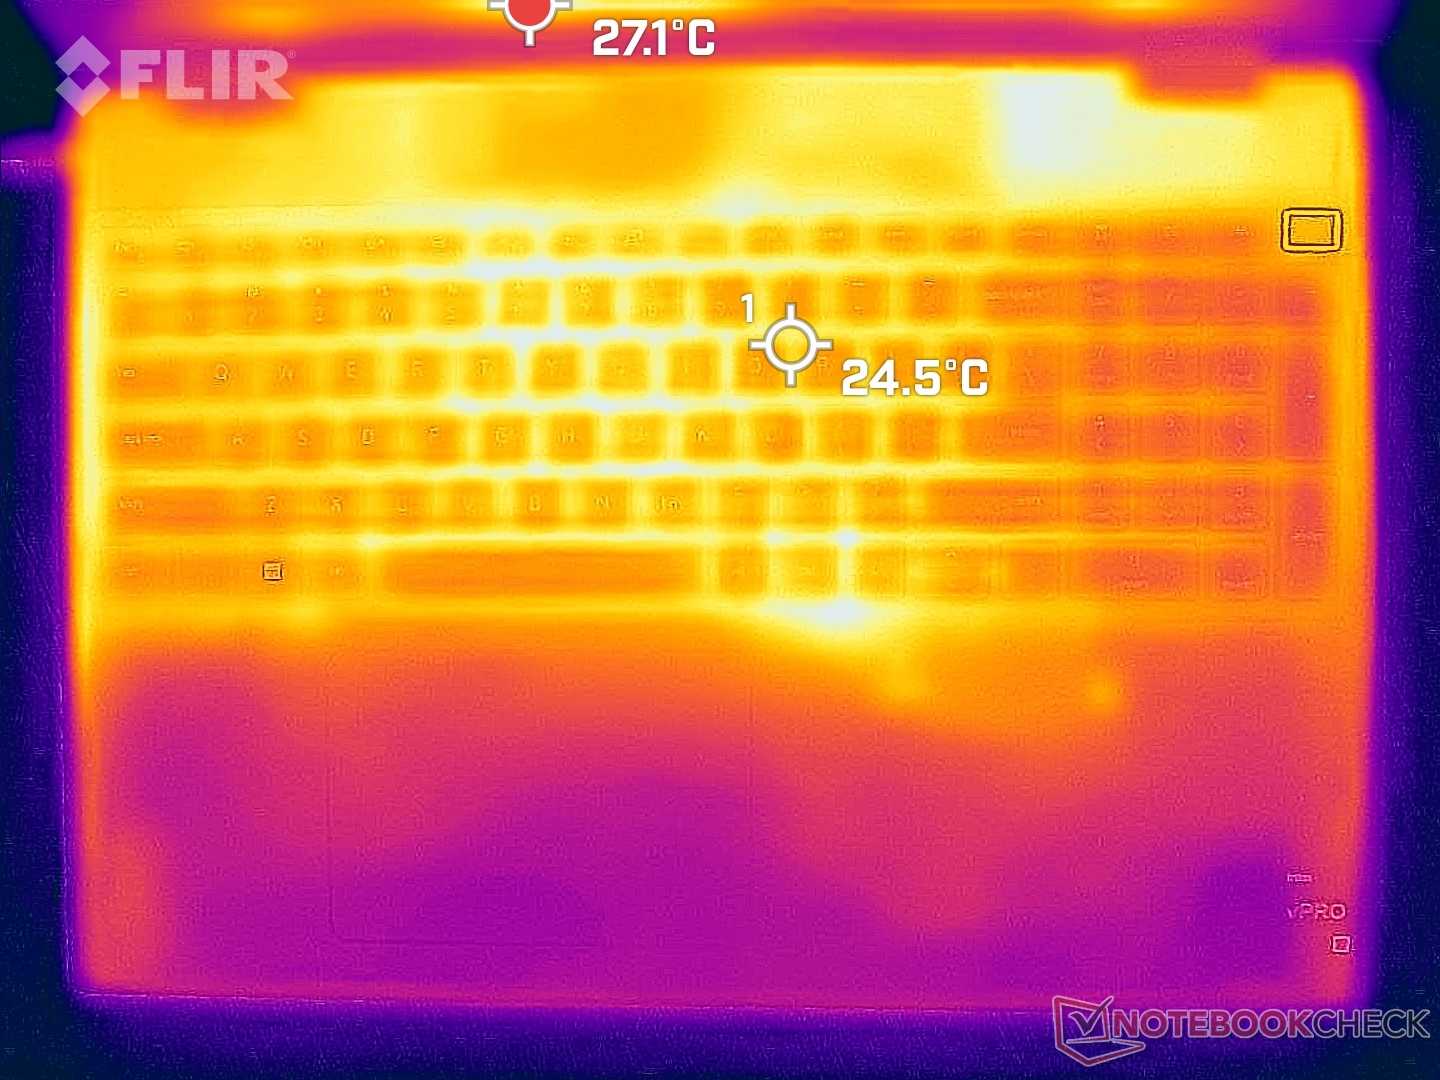
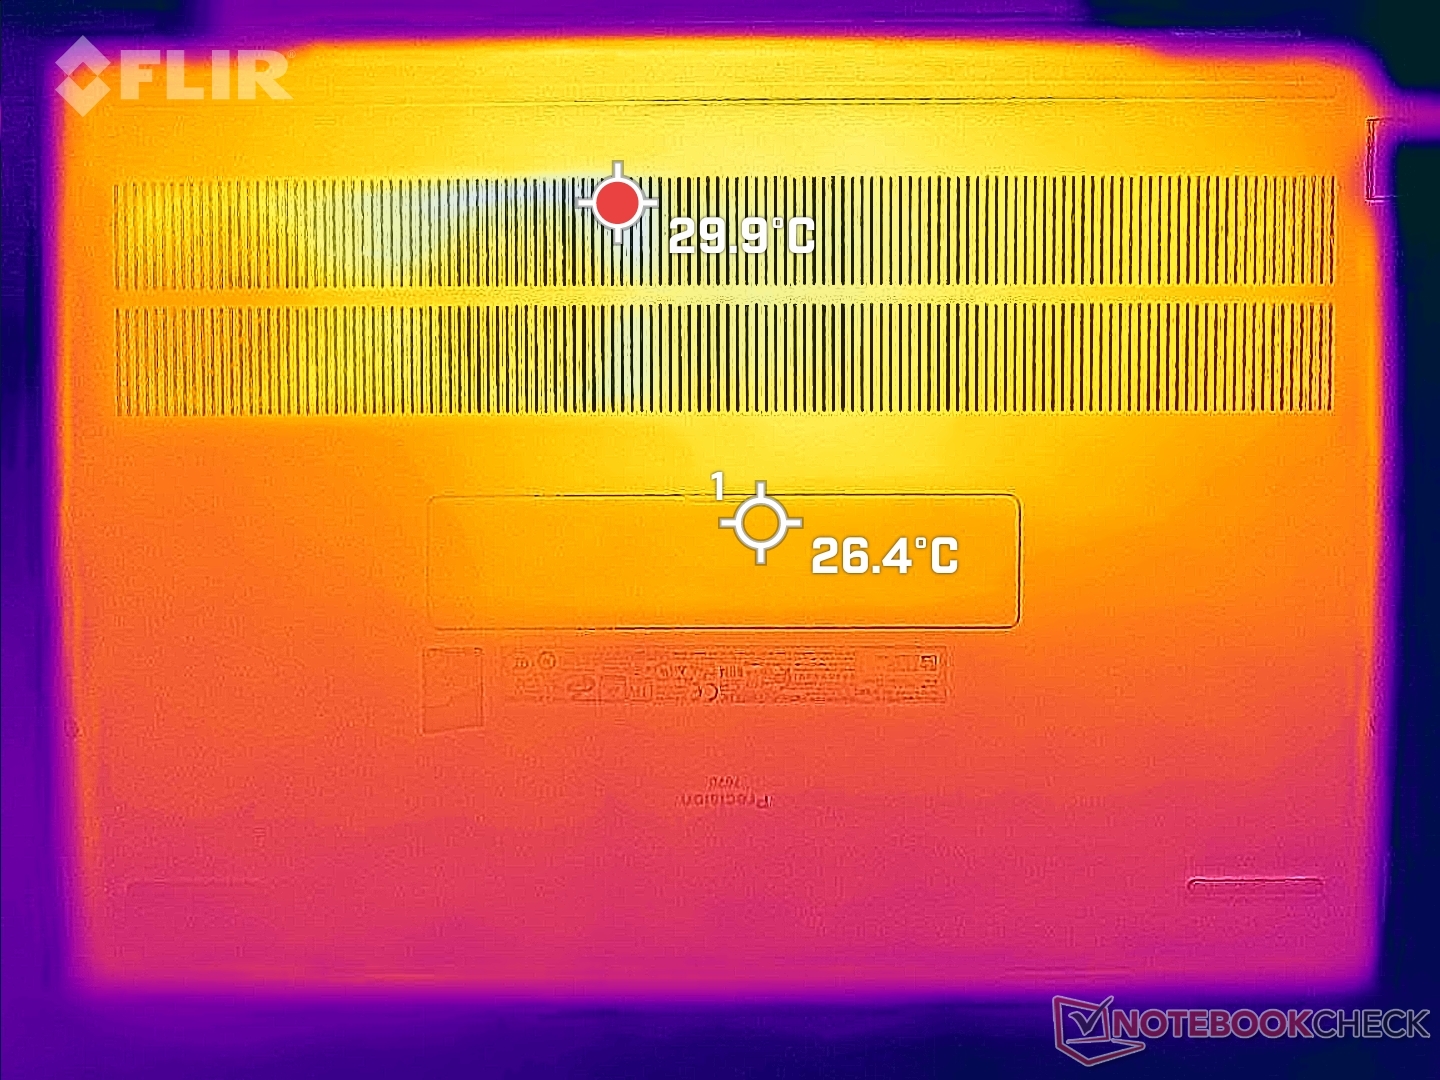
Die Oberflächentemperaturen sind immer warm, unabhängig von der Last. Beispielsweise werden das Tastendeck und die Unterseite im Leerlauf selbst im Energiesparmodus jeweils 30 °C warm, verglichen mit den 26 °C im Lenovo ThinkPad P1 G4. Das Asus ProArt StudioBook Pro 16 kann mit beinahe 35 °C unter ähnlichen Bedingungen allerdings noch wärmer werden.
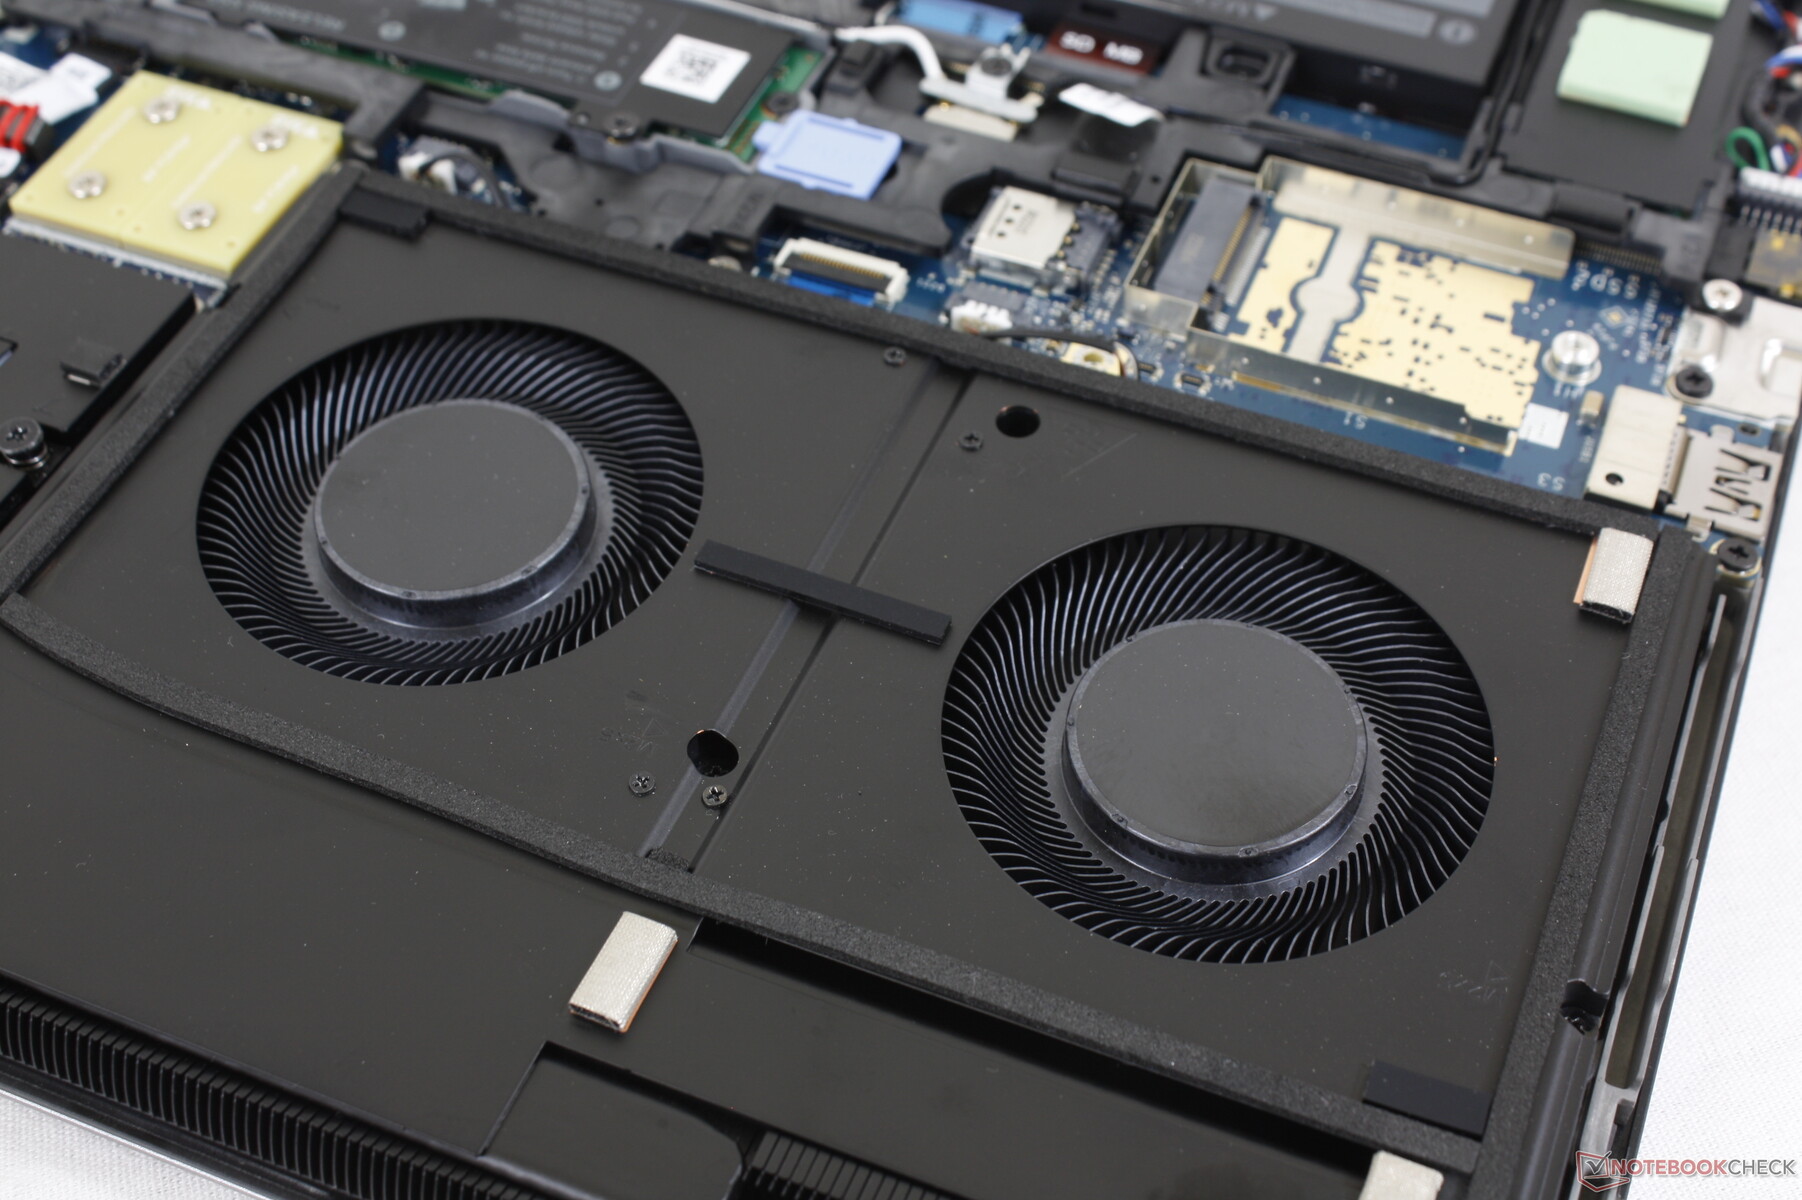
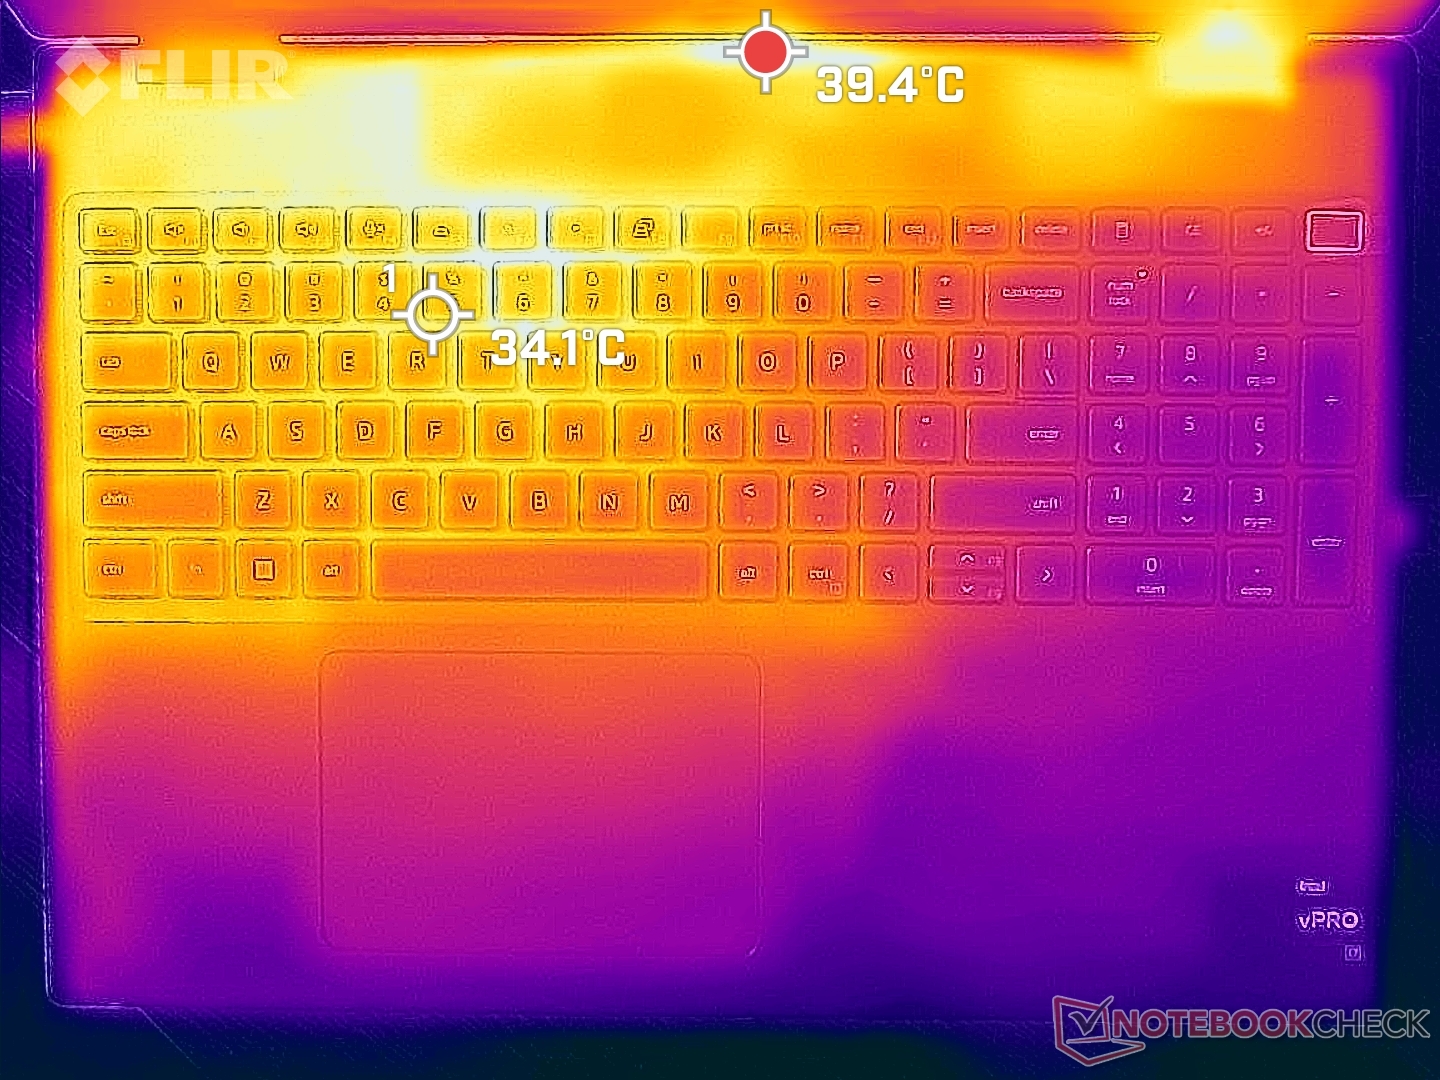
Unter extremer Last messen wir Hot Spots von 51 °C auf der Ober- und 46 °C auf der Unterseite. Die linke Gehäuseseite ist stets wärmer als die rechte, was an der Kühllösung und der Lage des Prozessors liegt.
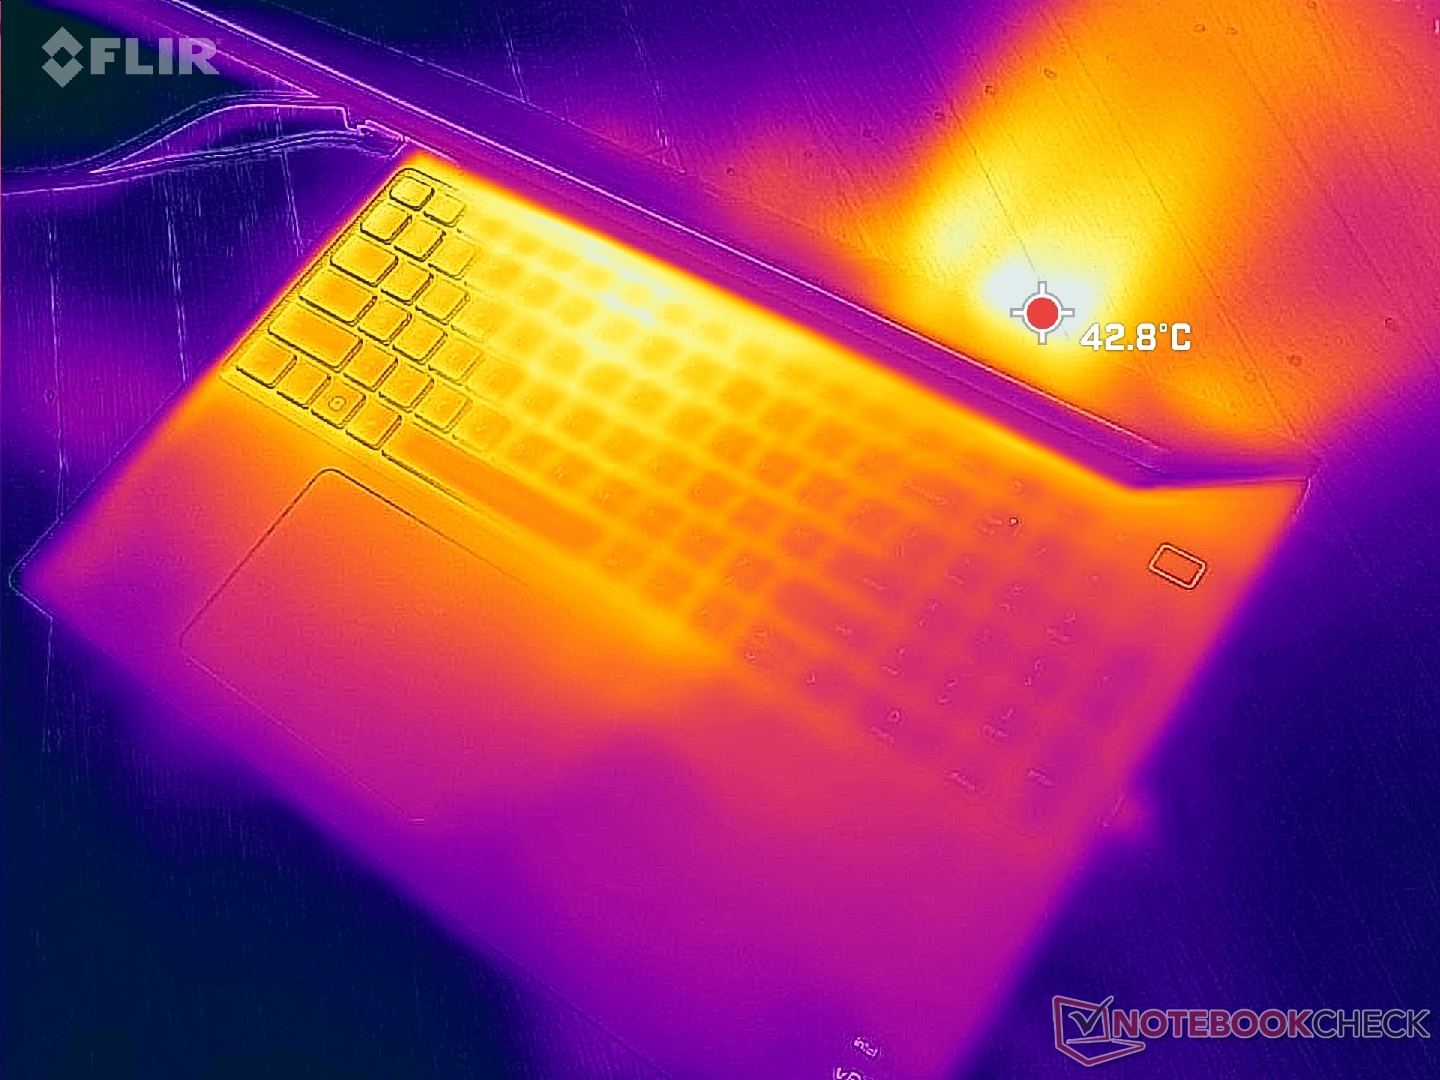
(-) Die maximale Temperatur auf der Oberseite ist 51 °C. Im Vergleich liegt der Klassendurchschnitt bei 38.2 °C (von 22.2 bis 69.8 °C für die Klasse Workstation).
(-) Auf der Unterseite messen wir eine maximalen Wert von 45.8 °C (im Vergleich zum Durchschnitt von 41.1 °C).
(+) Ohne Last messen wir eine durchschnittliche Temperatur von 29.8 °C auf der Oberseite. Der Klassendurchschnitt erreicht 32 °C.
(±) Beim längeren Spielen von The Witcher 3 erhitzt sich das Gerät durchschnittlich auf 37.1 °C. Der Durchschnitt der Klasse ist derzeit 32 °C.
(+) Die Handballen und der Touchpad-Bereich erreichen maximal 34.2 °C und damit die typische Hauttemperatur und fühlen sich daher nicht heiß an.
(-) Die durchschnittliche Handballen-Temperatur anderer getesteter Geräte war 27.8 °C (-6.4 °C).
| Dell Precision 7670 Intel Core i7-12850HX, NVIDIA RTX A2000 Laptop GPU | Lenovo ThinkPad P1 G4-20Y4Z9DVUS Intel Core i7-11800H, NVIDIA T1200 Laptop GPU | Asus ProArt StudioBook 16 W7600H5A-2BL2 Intel Xeon W-11955M, NVIDIA RTX A5000 Laptop GPU | Dell Precision 5000 5560 Intel Core i7-11850H, NVIDIA RTX A2000 Laptop GPU | Dell Precision 7550 Intel Xeon W-10885M, NVIDIA Quadro RTX 5000 Max-Q | HP ZBook Fury 15 G8 Intel Core i9-11950H, NVIDIA RTX A5000 Laptop GPU | |
|---|---|---|---|---|---|---|
| Hitze | 5% | -3% | -1% | 2% | 4% | |
| Last oben max * (°C) | 51 | 49.9 2% | 45.7 10% | 48.2 5% | 49 4% | 45.6 11% |
| Last unten max * (°C) | 45.8 | 56.7 -24% | 48.3 -5% | 42.6 7% | 51 -11% | 57.6 -26% |
| Idle oben max * (°C) | 31.8 | 25.5 20% | 35.3 -11% | 34.8 -9% | 28.2 11% | 26 18% |
| Idle unten max * (°C) | 32.6 | 26.2 20% | 34.4 -6% | 35.2 -8% | 32 2% | 28.8 12% |
* ... kleinere Werte sind besser
Stresstest
Beim Stressen mit Prime95 steigen die CPU-Taktraten und die Leistungsaufnahme innerhalb der ersten Sekunden auf 3,5 GHz und 153 W. In dieser kurzen Zeit erhöhen sich die Kerntemperaturen auf 100 °C. Danach fallen die Werte und stabilisieren sich schließlich bei 2,2 bis 2,4 GHz und 73 W, dabei wird eine eher zu tolerierende Kerntemperatur von 85 °C gehalten. Die Turbo-Boost-Leistung ist dementsprechend weniger gut, als wir es uns von einer Workstation dieser Größe erhofft haben.
Unter Witcher 3 stabilisieren sich die GPU-Taktraten,Temperatur und Leistungsaufnahme bei 1.777 MHz, 80 °C und 80 W. Zum Vergleich: Das Precision 5560 mit der gleichen RTX A2000 kommt hier auf 1.462 MHz, 75 °C und 45 W.
Im Akkumodus leidet die Leistung. Ein erneuter Fire-Strike-Test lieferte nur noch Physics- und Graphics-Scores von 9.820 und 6.911 Punkten, anstelle der 23.868 und 14.295 Punkte an der Steckdose.
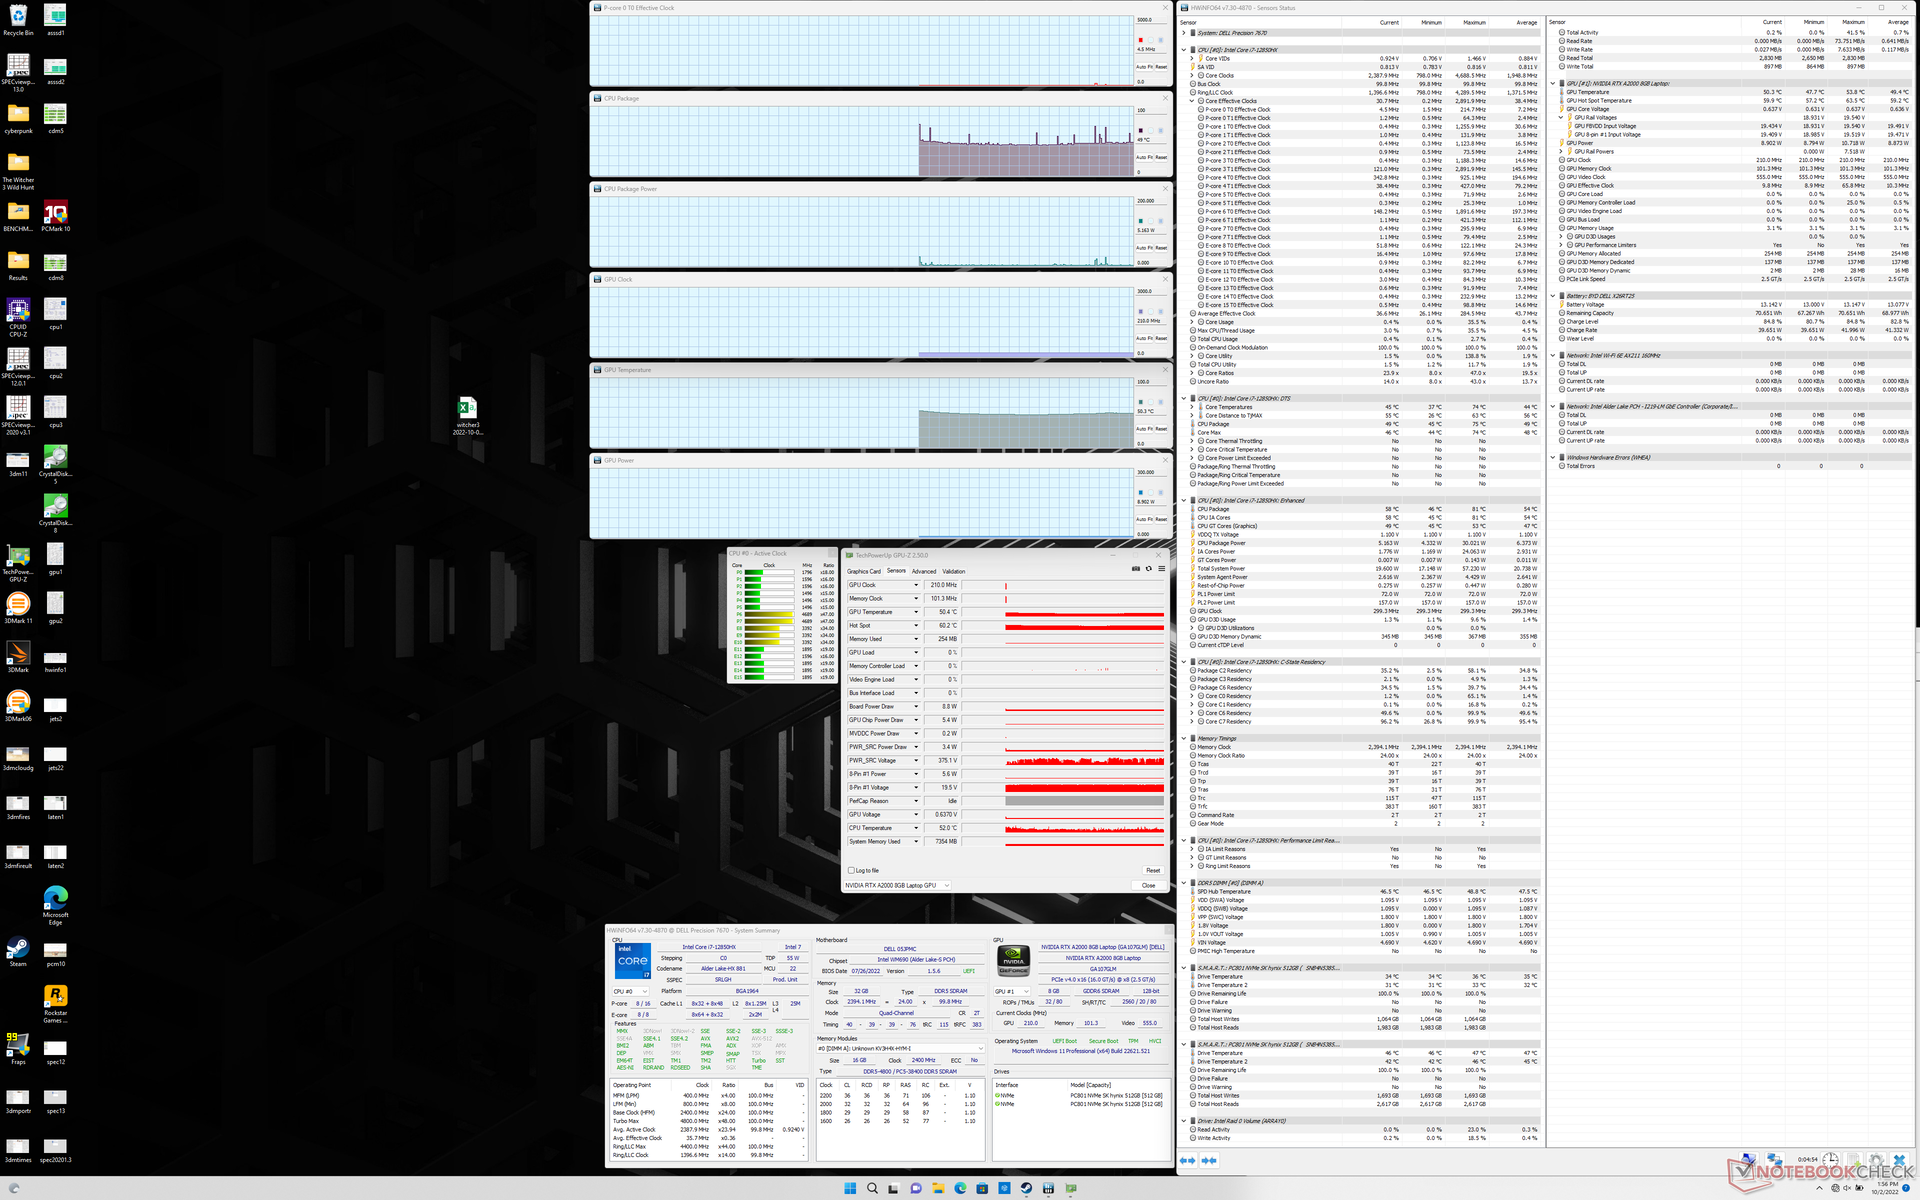
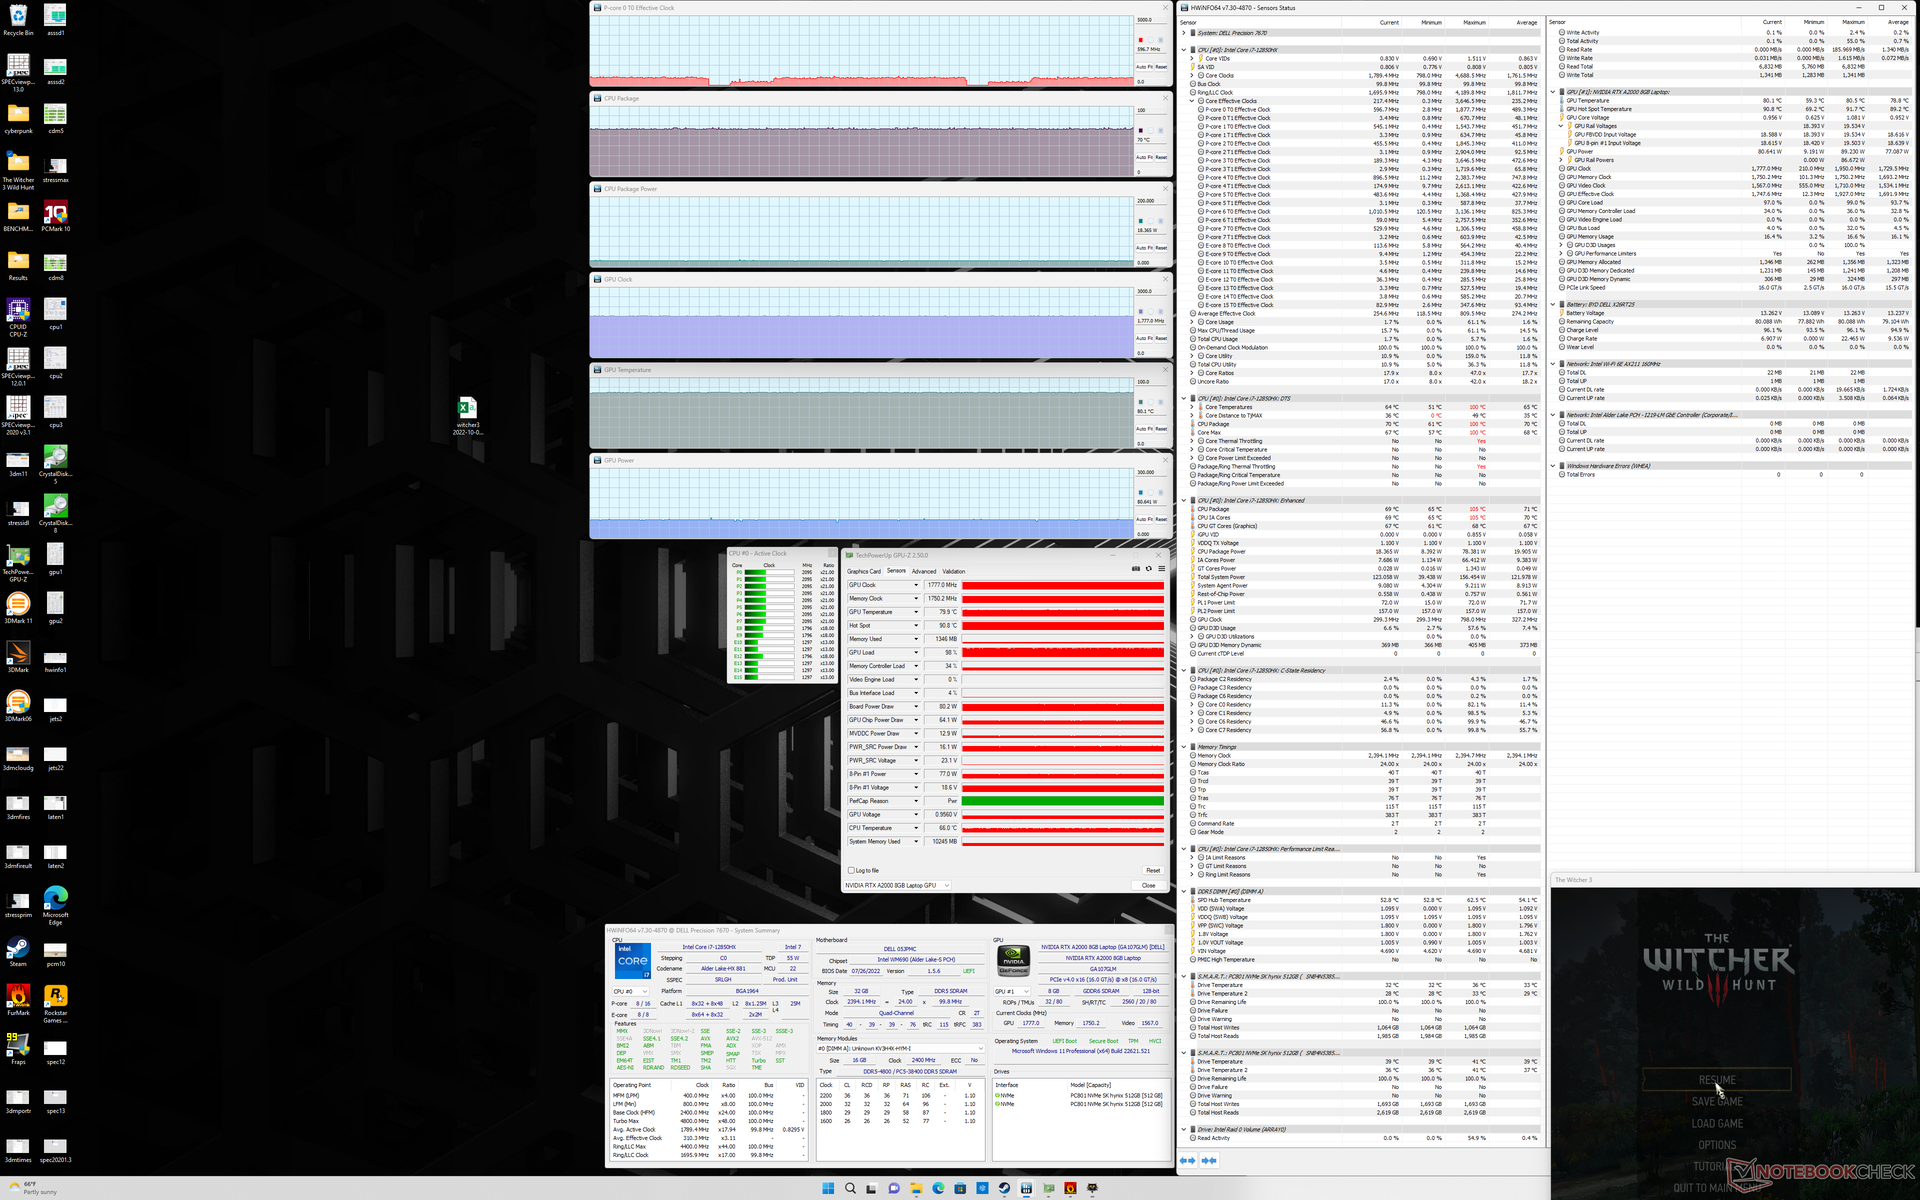
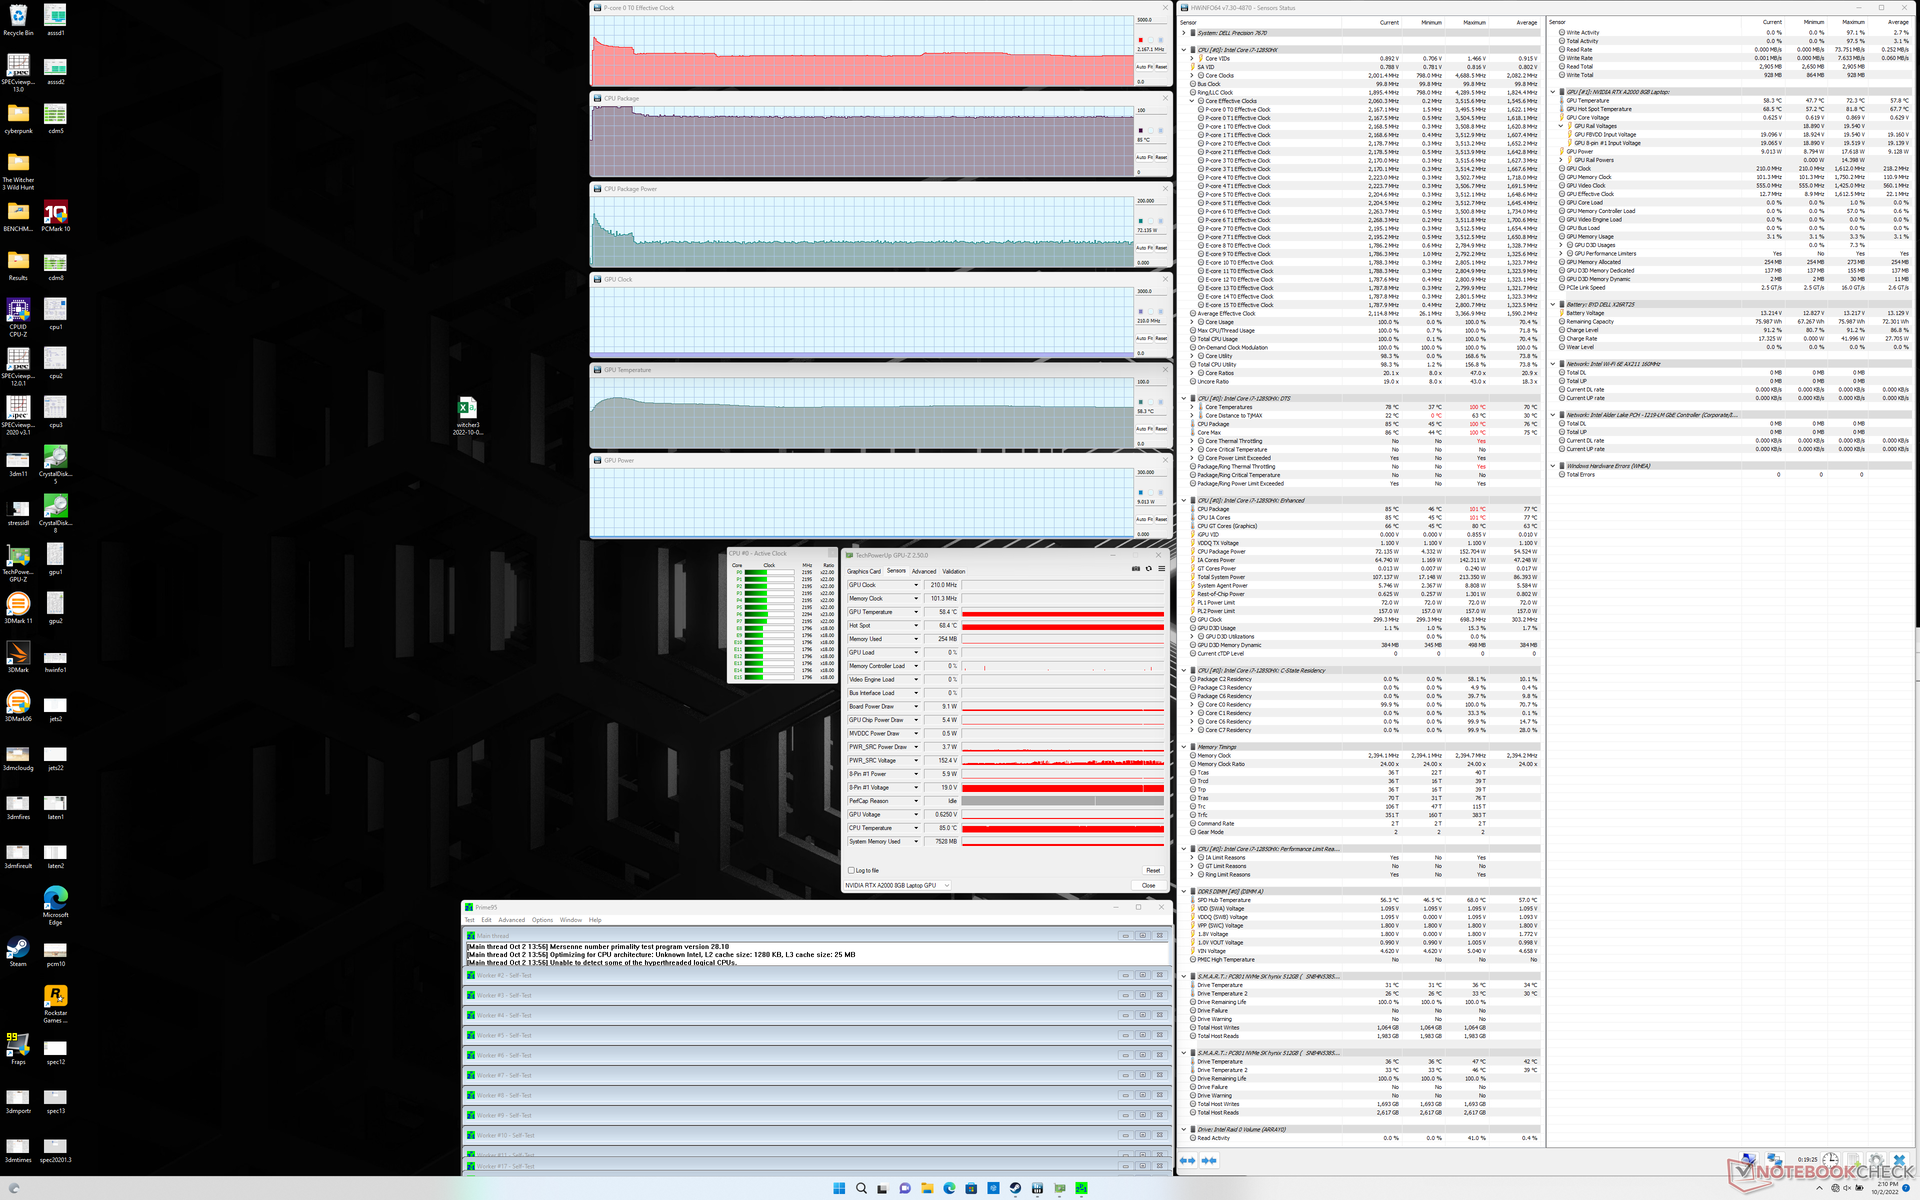
| CPU Clock (GHz) | GPU Clock (MHz) | Average CPU Temperature (°C) | Average GPU Temperature (°C) | |
| System Idle | -- | -- | 49 | 50 |
| Prime95 Stress | 2.2 | -- | 85 | 58 |
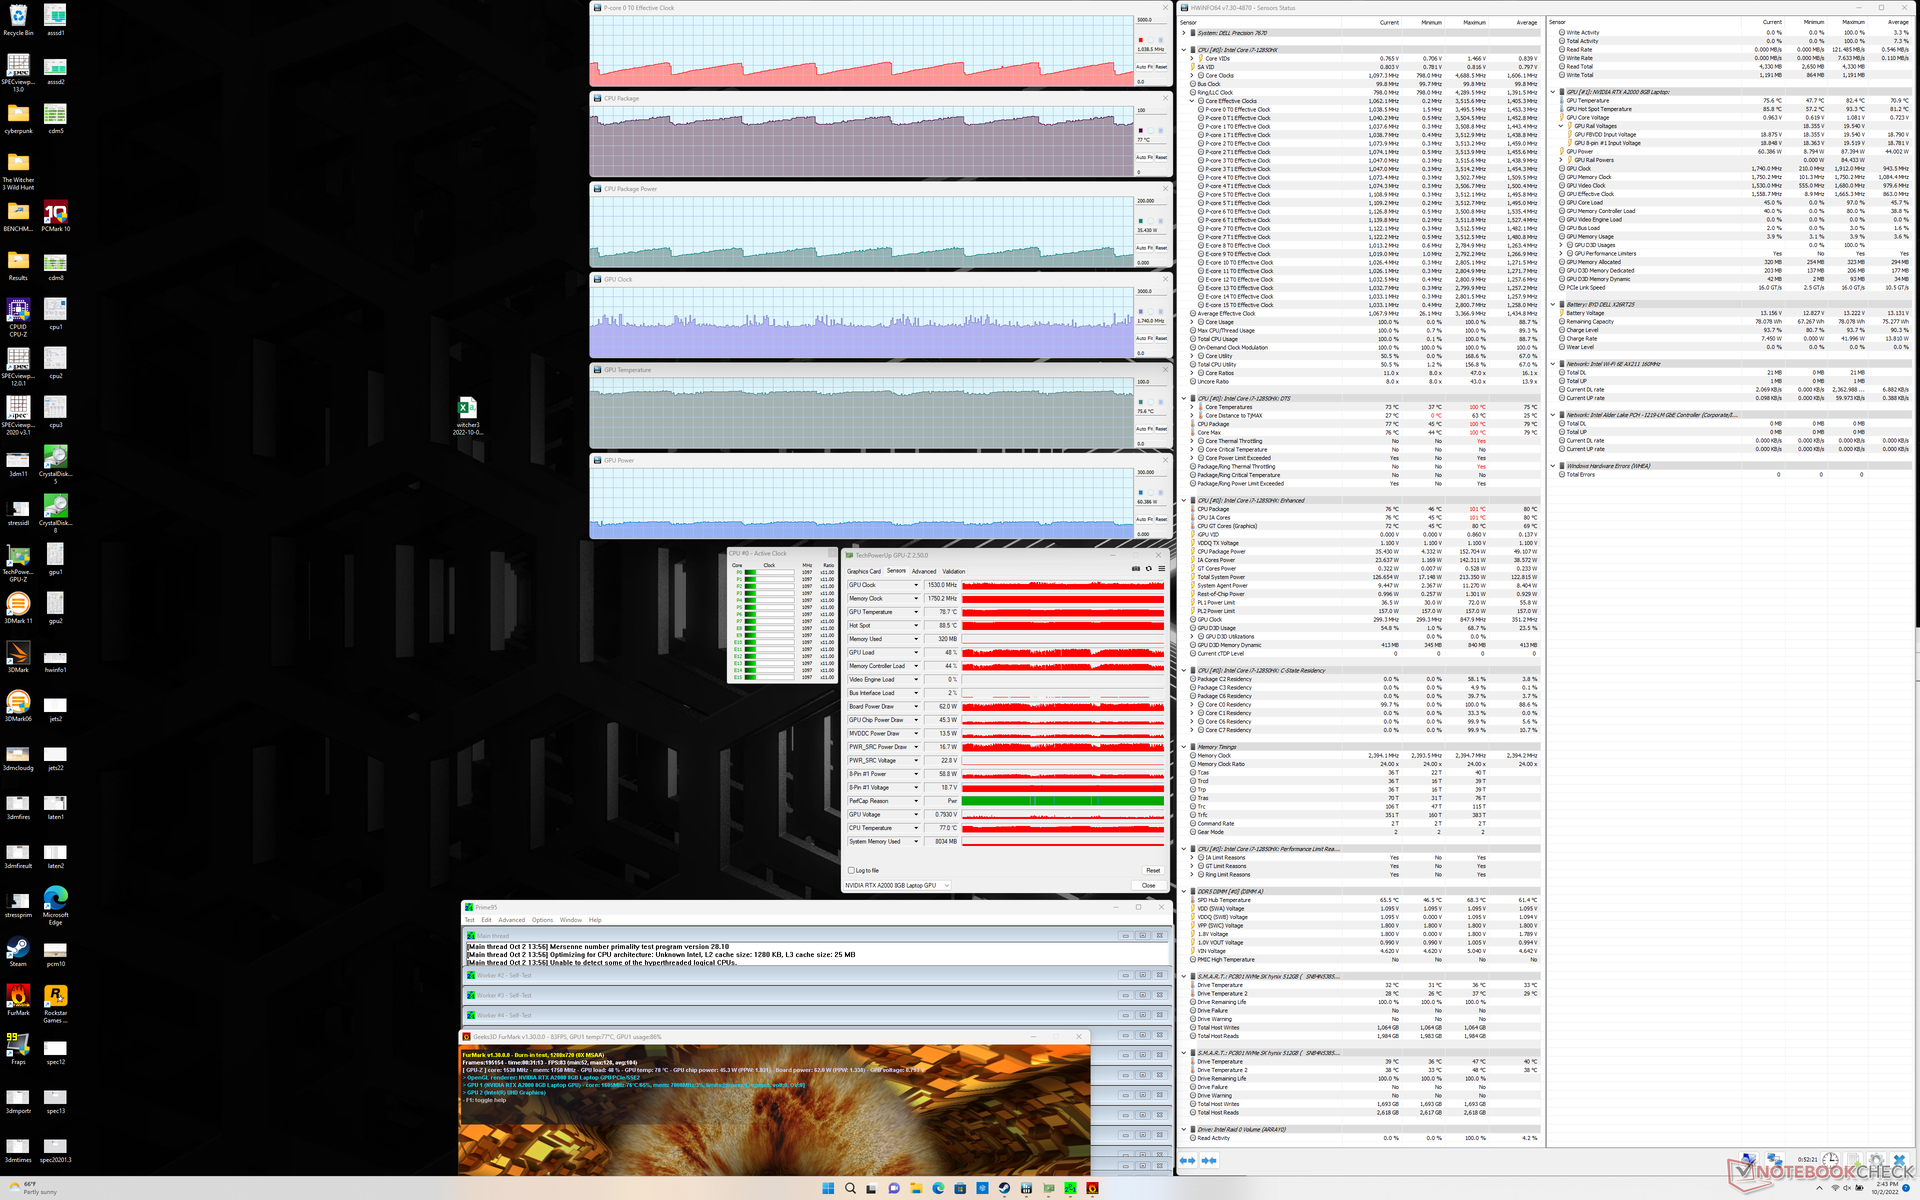
| Prime95 + FurMark Stress | 0.8 - 1.3 | ~1450 | 76 - 86 | 62 - 72 |
| Witcher 3 Stress | 0.6 | 1777 | 70 | 80 |
Lautsprecher
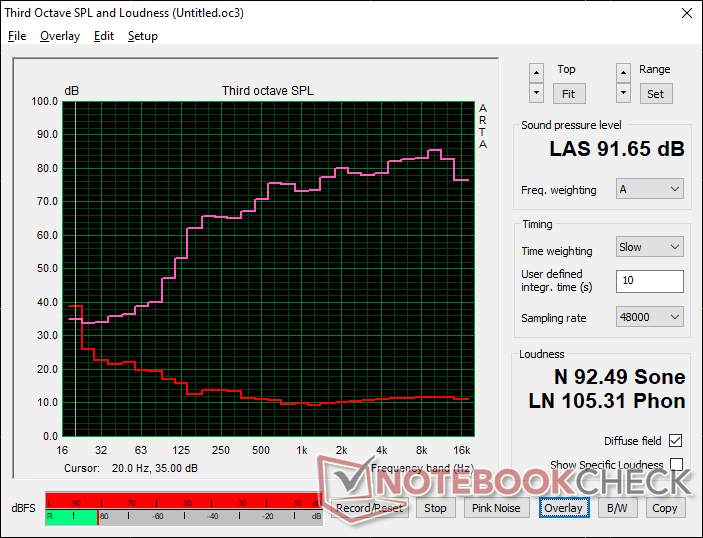
Dell Precision 7670 Audio Analyse
(+) | Die Lautsprecher können relativ laut spielen (91.7 dB)
Bass 100 - 315 Hz
(-) | kaum Bass - 16.8% niedriger als der Median
(+) | lineare Bass-Wiedergabe (6.7% Delta zum Vorgänger)
Mitteltöne 400 - 2000 Hz
(+) | ausgeglichene Mitten, vom Median nur 3.5% abweichend
(+) | lineare Mitten (3.9% Delta zum Vorgänger)
Hochtöne 2 - 16 kHz
(+) | ausgeglichene Hochtöne, vom Median nur 4.6% abweichend
(+) | sehr lineare Hochtöne (2% Delta zum Vorgänger)
Gesamt im hörbaren Bereich 100 - 16.000 Hz
(+) | hörbarer Bereich ist sehr linear (12.2% Abstand zum Median
Im Vergleich zu allen Geräten derselben Klasse
» 18% aller getesteten Geräte dieser Klasse waren besser, 3% vergleichbar, 79% schlechter
» Das beste Gerät hat einen Delta-Wert von 7%, durchschnittlich ist 17%, das schlechteste Gerät hat 35%
Im Vergleich zu allen Geräten im Test
» 10% aller getesteten Geräte waren besser, 2% vergleichbar, 88% schlechter
» Das beste Gerät hat einen Delta-Wert von 4%, durchschnittlich ist 23%, das schlechteste Gerät hat 134%
Apple MacBook Pro 16 2021 M1 Pro Audio Analyse
(+) | Die Lautsprecher können relativ laut spielen (84.7 dB)
Bass 100 - 315 Hz
(+) | guter Bass - nur 3.8% Abweichung vom Median
(+) | lineare Bass-Wiedergabe (5.2% Delta zum Vorgänger)
Mitteltöne 400 - 2000 Hz
(+) | ausgeglichene Mitten, vom Median nur 1.3% abweichend
(+) | lineare Mitten (2.1% Delta zum Vorgänger)
Hochtöne 2 - 16 kHz
(+) | ausgeglichene Hochtöne, vom Median nur 1.9% abweichend
(+) | sehr lineare Hochtöne (2.7% Delta zum Vorgänger)
Gesamt im hörbaren Bereich 100 - 16.000 Hz
(+) | hörbarer Bereich ist sehr linear (4.6% Abstand zum Median
Im Vergleich zu allen Geräten derselben Klasse
» 0% aller getesteten Geräte dieser Klasse waren besser, 0% vergleichbar, 100% schlechter
» Das beste Gerät hat einen Delta-Wert von 5%, durchschnittlich ist 17%, das schlechteste Gerät hat 45%
Im Vergleich zu allen Geräten im Test
» 0% aller getesteten Geräte waren besser, 0% vergleichbar, 100% schlechter
» Das beste Gerät hat einen Delta-Wert von 4%, durchschnittlich ist 23%, das schlechteste Gerät hat 134%
Energiemanagement — Precision 7670 ist sehr fordernd
Energieverbrauch
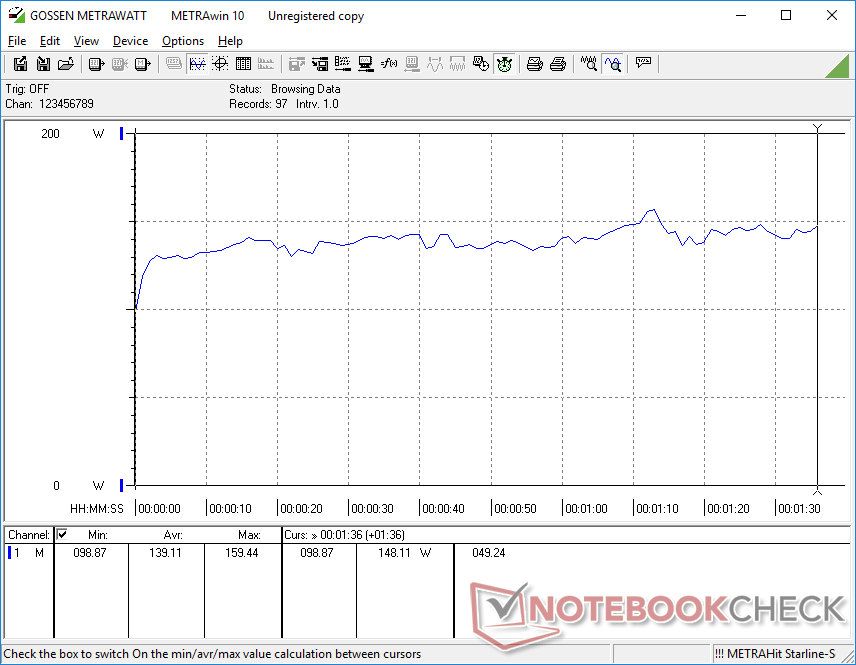
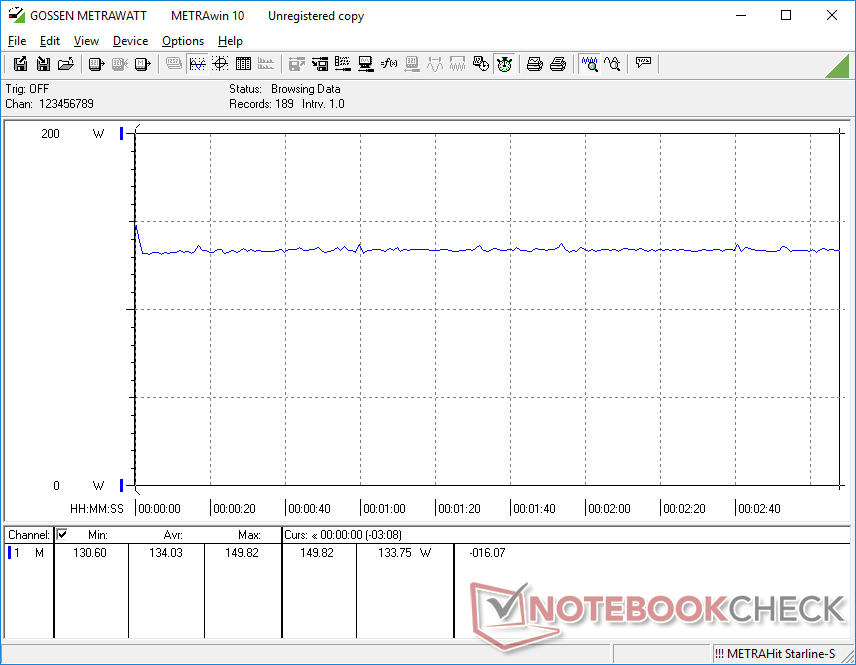
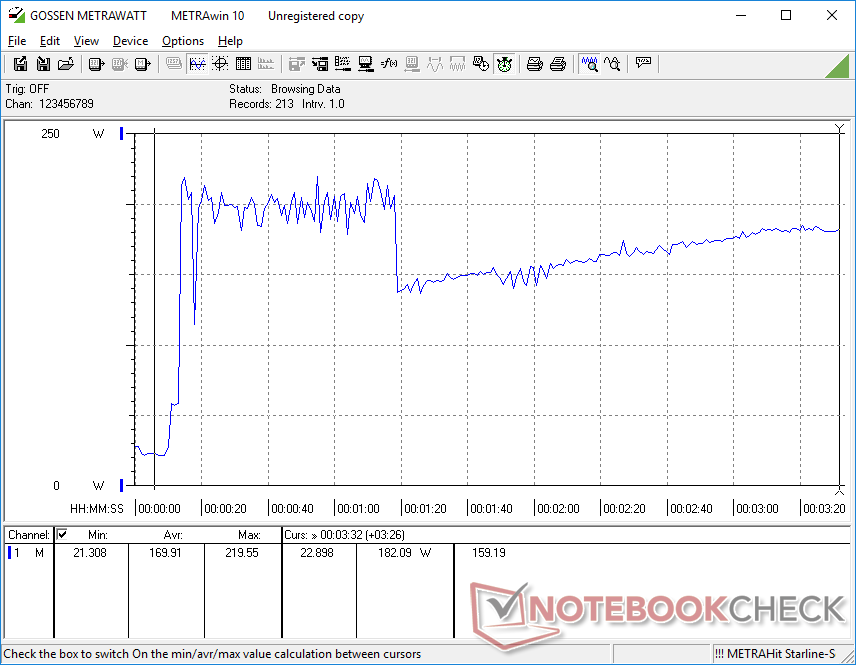
Das System zeigt sich unter den meisten Bedingungen als recht anspruchsvoll. Der Verbrauch rangiert im Leerlauf zwischen 7 und 25 W, größere Lasten wie 3DMark 06 oder Witcher 3 ziehen jeweils 140 W aus dem Netzteil. Das Asus ProArt StudioBook 16 oder das Precision 5560 ziehen unter ähnlichen Bedingungen nur 132 bzw. 96 W.
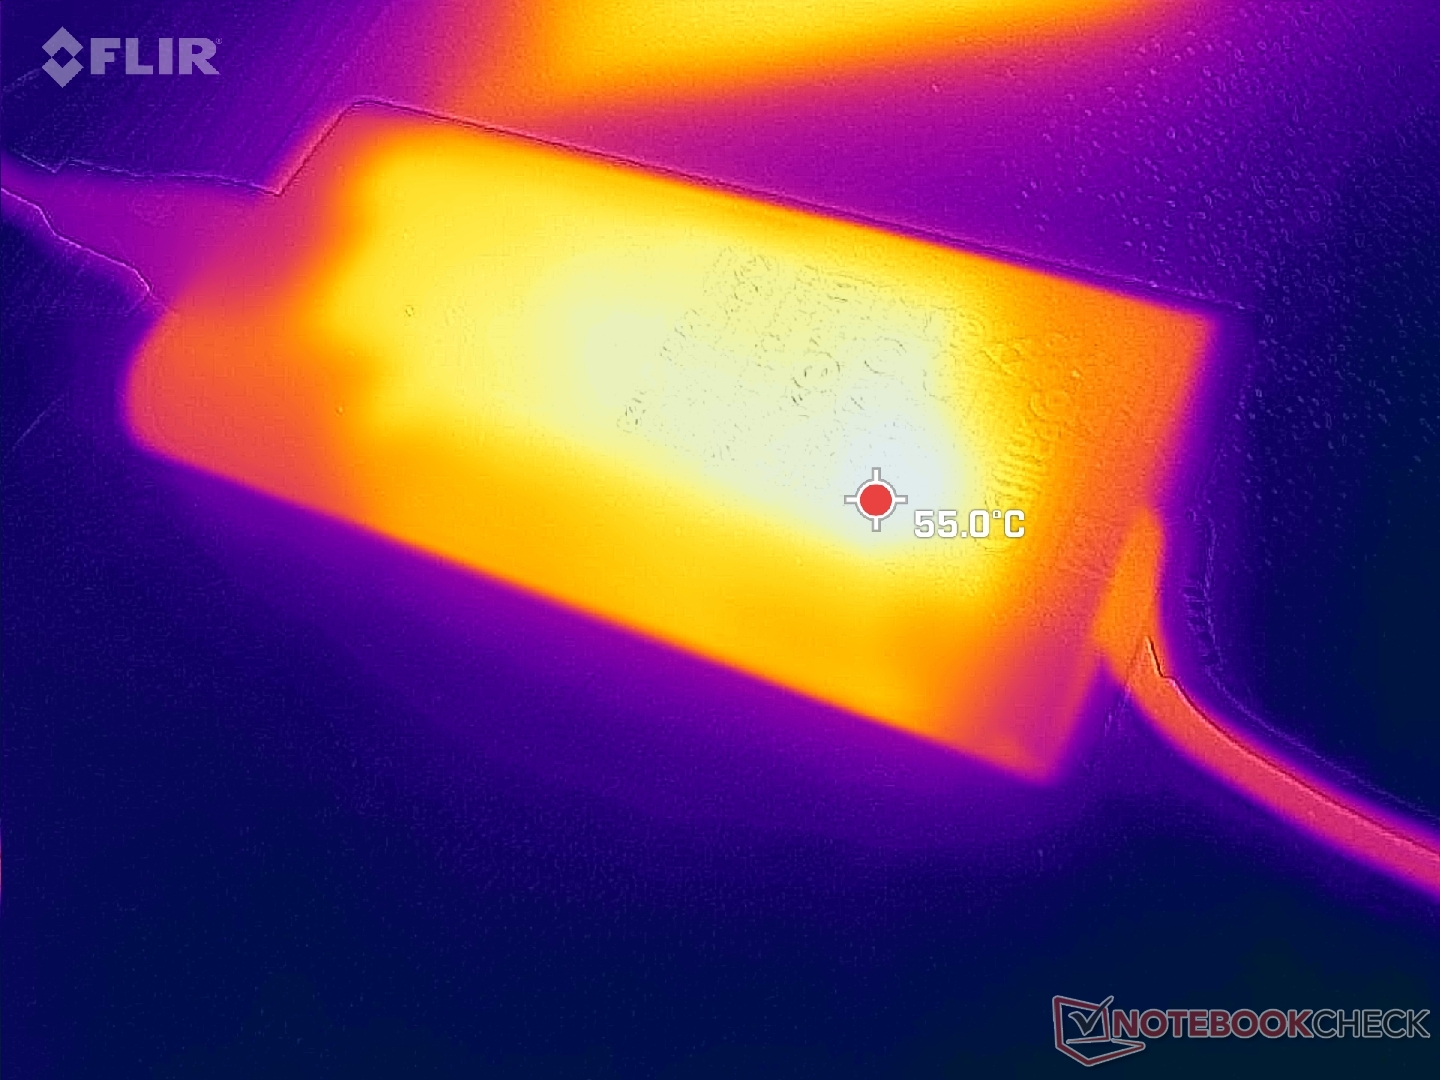
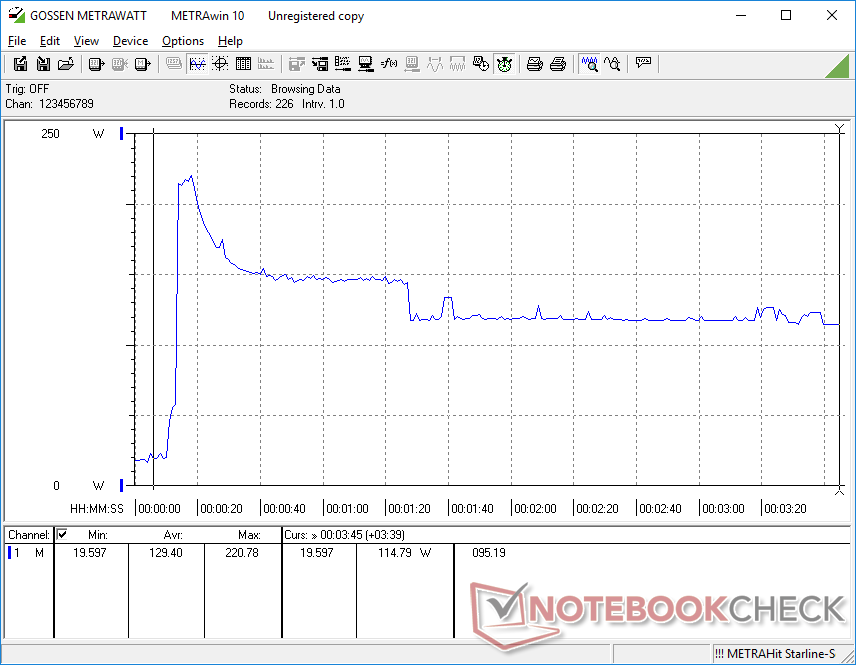
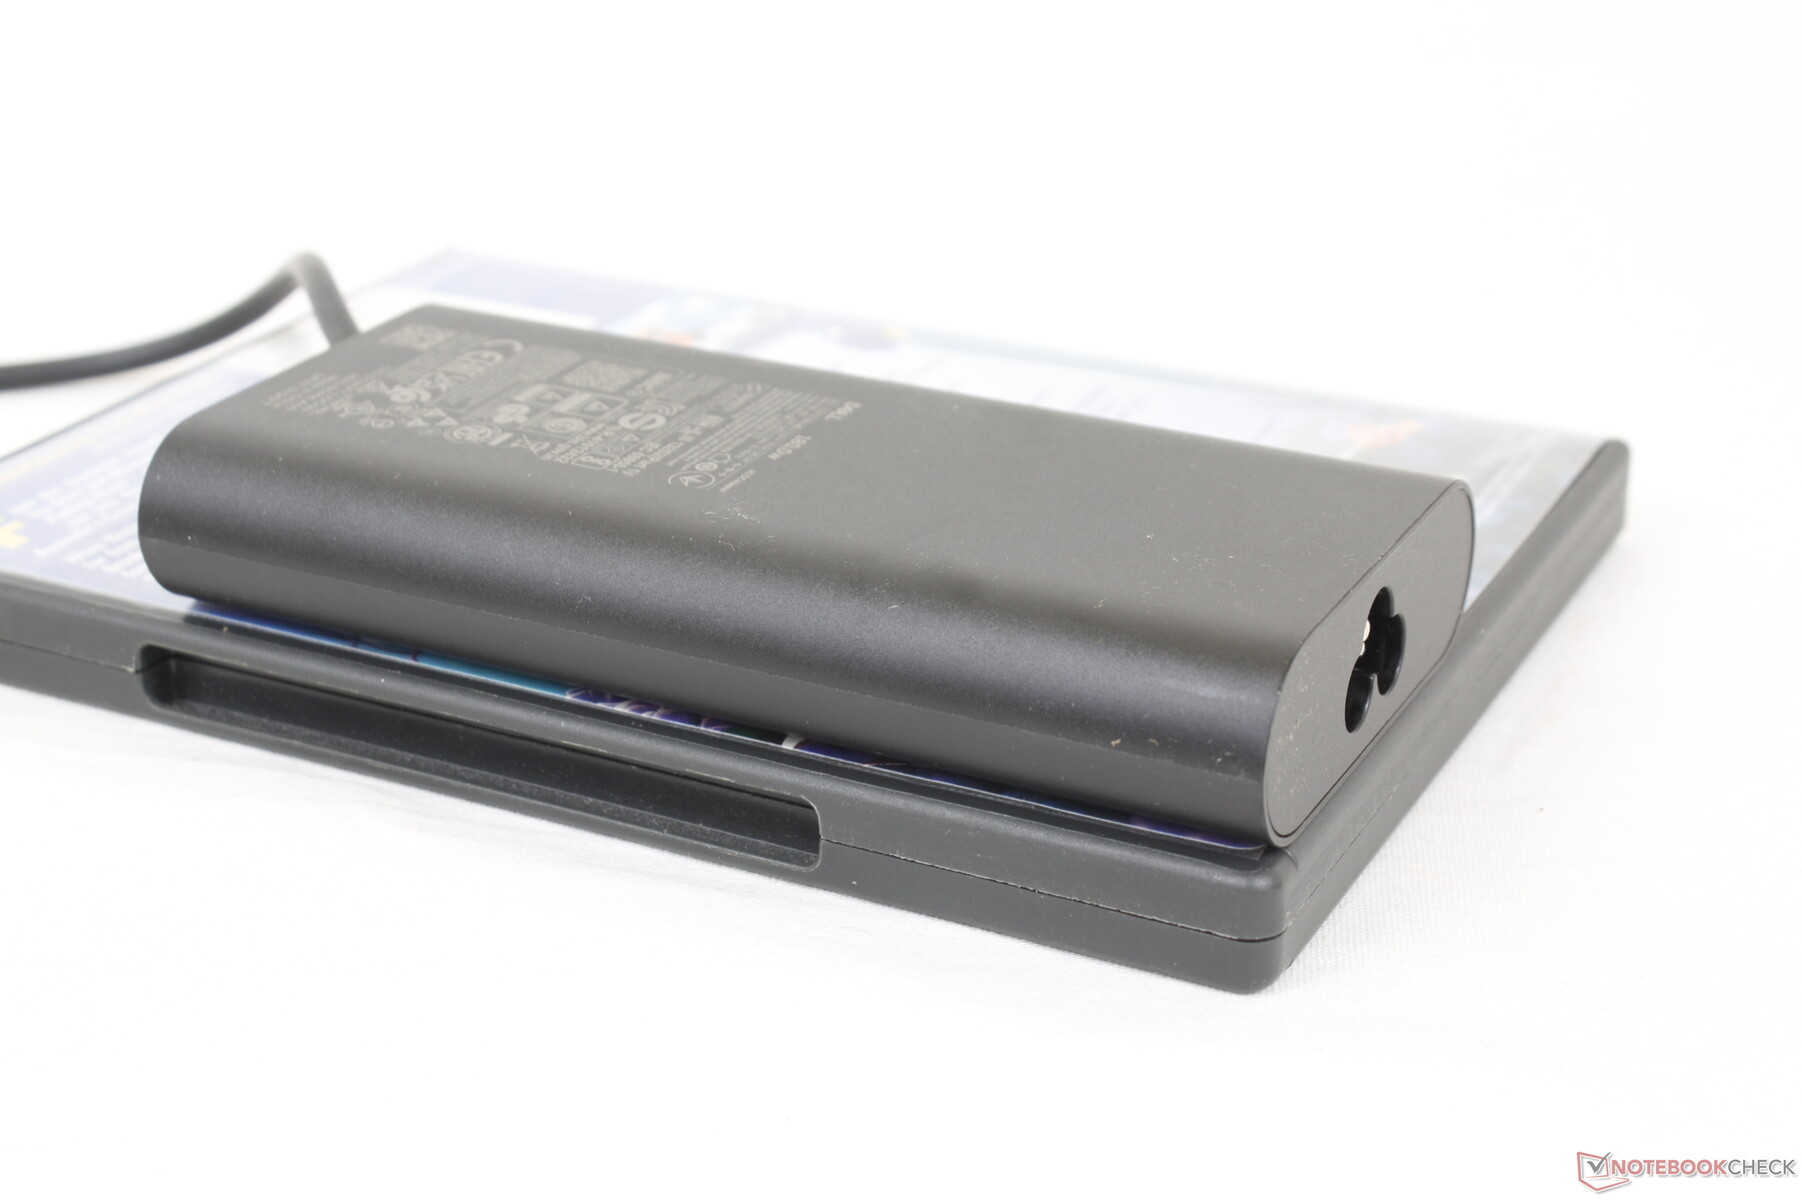
Das Verbrauchsmaximum liegt bei hohen 221 W wenn sowohl CPU als auch GPU maximal ausgelastet werden, dabei liegt das Rating für das beiliegende, mittelgroße Netzteil (~13,7 x 6,6 x 2,3 cm) bei nur 180 W. Dieser Maximalwert liegt höchstens für eine Minute an und fällt anschließend auf 114 W wenn nur die CPU gestresst wird oder auf 180 W wenn sowohl CPU als auch GPU gleichzeitig beansprucht werden. Die Aufladerate dürfte unter solch extremen Bedingungen allerdings stark einbrechen oder gar zum Erliegen kommen.
Dell bietet daher automatisch auch ein stärkeres 240-W-Netzteil an, wenn man das Precision 7670 mit eine der schnelleren GPUs konfiguriert. Ausgehend von unseren Erfahrungen mit dem 180-W-Netzteil sollte womöglich die 240-W-Option bei allen Nvidia-RTX-Konfigurationen zum Einsatz kommen.
| Aus / Standby | |
| Idle | |
| Last |
|
Legende:
min: | |
| Dell Precision 7670 i7-12850HX, RTX A2000 Laptop GPU, SK Hynix HFS001TEJ9X115N, OLED, 3840x2400, 16" | Lenovo ThinkPad P1 G4-20Y4Z9DVUS i7-11800H, T1200 Laptop GPU, Samsung PM9A1 MZVL2512HCJQ, IPS, 2560x1600, 16" | Asus ProArt StudioBook 16 W7600H5A-2BL2 W-11955M, RTX A5000 Laptop GPU, 2x Micron 2300 2TB MTFDHBA2T0TDV (RAID 0), OLED, 3840x2400, 16" | Dell Precision 5000 5560 i7-11850H, RTX A2000 Laptop GPU, Samsung PM9A1 MZVL22T0HBLB, IPS, 3840x2400, 15.6" | Dell Precision 7550 W-10885M, Quadro RTX 5000 Max-Q, SK Hynix PC601A NVMe 1TB, IPS, 3840x2160, 15.6" | HP ZBook Fury 15 G8 i9-11950H, RTX A5000 Laptop GPU, Samsung PM981a MZVLB1T0HBLR, IPS, 3840x2160, 15.6" | |
|---|---|---|---|---|---|---|
| Stromverbrauch | 9% | -14% | 16% | -12% | -13% | |
| Idle min * (Watt) | 7.5 | 9.9 -32% | 12.4 -65% | 6.2 17% | 8.2 -9% | 8.3 -11% |
| Idle avg * (Watt) | 9.5 | 13.9 -46% | 16.5 -74% | 13.9 -46% | 16.8 -77% | 19.9 -109% |
| Idle max * (Watt) | 28.4 | 14.6 49% | 25 12% | 23.8 16% | 24.4 14% | 21.8 23% |
| Last avg * (Watt) | 139.1 | 95 32% | 132 5% | 95.7 31% | 131 6% | 110.9 20% |
| Witcher 3 ultra * (Watt) | 134 | 98.9 26% | 132 1% | 87 35% | 156.6 -17% | 165 -23% |
| Last max * (Watt) | 220.8 | 170.8 23% | 134 39% | 132.6 40% | 201.8 9% | 171.8 22% |
* ... kleinere Werte sind besser
Energieverbrauch Witcher 3 / Stresstest
Energieverbrauch mit externem Monitor
Akkulaufzeit
Die WLAN-Laufzeit liegt unterhalb von 6 Stunden und ist so kürzer als beim Precision 5560 oder Precision 7550. Das dürfte vor allem am OLED-Panel liegen, welches bei der Anzeige weißer Farbbereiche mehr verbraucht als ein IPS-Display. Da auf den meisten Webseiten Weiß die vorherrschende Farbe darstellt, kommt die kürzere Laufzeit wenig überraschend.
Eine Aufladung dauert etwa zwei Stunden. Ein Aufladen via USB-C ist durch den fehlenden PD-Support leider nicht möglich.
| Dell Precision 7670 i7-12850HX, RTX A2000 Laptop GPU, 83 Wh | Lenovo ThinkPad P1 G4-20Y4Z9DVUS i7-11800H, T1200 Laptop GPU, 90 Wh | Asus ProArt StudioBook 16 W7600H5A-2BL2 W-11955M, RTX A5000 Laptop GPU, 90 Wh | Dell Precision 5000 5560 i7-11850H, RTX A2000 Laptop GPU, 86 Wh | Dell Precision 7550 W-10885M, Quadro RTX 5000 Max-Q, 95 Wh | HP ZBook Fury 15 G8 i9-11950H, RTX A5000 Laptop GPU, 94 Wh | |
|---|---|---|---|---|---|---|
| Akkulaufzeit | 49% | -15% | 32% | 23% | 5% | |
| Idle (h) | 7.9 | 12 52% | 11.1 41% | |||
| WLAN (h) | 5.9 | 8.8 49% | 5 -15% | 6.3 7% | 8.9 51% | 6.2 5% |
| Last (h) | 1.3 | 1.8 38% | 1 -23% | |||
| H.264 (h) | 1.8 | |||||
| Witcher 3 ultra (h) | 1.6 |
Pro
Contra
Fazit — Kraftvoll ohne zu groß zu sein
Das Precision 7670 tritt direkt gegen das HP ZBook Fury 16 G9 an. Bis auch dieser Test steht, können wir unser Precision nur mit dem 16-Zöllern Lenovo ThinkPad P1 G4 und Asus ProArt StudioBook Pro 16 W7600 vergleichen. Die Dell-Workstation bietet dabei eine signifikant höhere CPU-Leistung als beide Konkurrenten und gefällt außerdem durch zusätzliche Funktionen wie der leichten Wartbarkeit, der WAN-Option und mehr Speicheroptionen.
Das Precision 7670 läuft zur Hochform auf, wenn es mit Higher-End-CPUs und -GPUs konfiguriert wird. Bei den schwächeren Konfigurationen gibt es allerdings dünnere und leichtere Alternativen, welche die gleiche Leistung bieten können.
Das Gewicht ist eines der Nachteile des Precision 7670, immerhin ist das System fast so schwer wie das 17,3-Zoll große Precision 7550. Zudem ist es etwas enttäuschend, dass der Core i7-12850HX seine Turbo-Boost-Taktraten trotz des hohen Gewichtes nicht für längere Zeit aufrecht erhalten kann. Es ist noch immer schnell, aber das verantwortliche Kühlsystem limitiert aktuell das volle Potential. Das Fehlen von Xeon-CPU-Optionen lässt das Precision 7670 eher wie einen Studio-Laptop als eine vollwertige Workstation erscheinen.
Das Precision 7670 eignet sich dennoch gut für Power Users, welche von der geballten Kraft der energiehungrigen Gen12-Intel-Cores und High-End-Karten wie der RTX A5500 profitieren können. Bei niedrigeren Konfigurationen empfehlen sich allerdings eher dünnere und leichtere 16-Zoll-Modelle wie die zuvor erwähnten Lenovo- oder Asus-Versionen.
Preise und Verfügbarkeit
Momentan ist das Dell Precision 7670 noch nicht wirklich verfügbar und wird von Vergleichsportalen noch nicht aufgeführt. Allerdings kann man es bereits auf der deutschen Seite von Dell direkt bestellen, dort kostet unsere Konfiguration etwa 4.335 Euro.
Dell Precision 7670
- 06.10.2022 v7 (old)
Allen Ngo
Preisvergleich

