Lenovo ThinkPad P1 G4 Laptop im Test: BIOS-Update sorgt für mehr CPU-Leistung

Die aktuellen Versionen des ThinkPad P1 G4 und dem baugleichen ThinkPad X1 Extreme G4 sind mit zwei verschiedenen Kühllösungen verfügbar. Bei Konfigurationen mit schnelleren Grafikkarten (ab RTX 3060 bzw. RTX A3000) verwenden eine leistungsfähigere Vapor-Chamber-Kühlung. Bei unserem ersten Testgerät des ThinkPad P1 G4 mit der konventionellen Kühlung waren wir von der CPU-Leistung enttäuscht. Wir haben die Konfiguration nun erneut in der Redaktion und wollen mit dem aktuellen BIOS (Version 1.13) überprüfen, ob sich die CPU-Leistung mittlerweile verbessert hat.
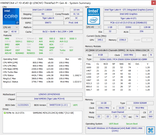
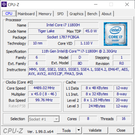
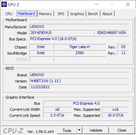
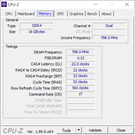
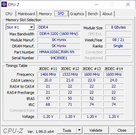
Abgesehen von der Konfiguration des Arbeitsspeichers (jetzt Dual-Channel) unterscheiden sich die Spezifikationen des heutigen Testgerätes nicht vom ersten Modell des ThinkPad P1 G4, wir sehen uns also erneut die Kombination aus Intel Core i7-11800H sowie der Nvidia T1200 an. Auch beim standardmäßigen WQHD-Bildschirm kommt ein Panel von einem Zulieferer zum Einsatz, wo wir uns ebenfalls die Messwerte anschauen, prinzipiell konzentrieren wir uns aber auf die CPU-Leistung. Für alle weiteren Informationen zum ThinkPad P1 G4 sowie dem baugleichen ThinkPad X1 Extreme G4 verweisen wir auf unsere bisherigen Testberichte:
mögliche Konkurrenten im Vergleich
Bew. | Datum | Modell | Gewicht | Dicke | Größe | Auflösung | Preis ab |
|---|---|---|---|---|---|---|---|
| 89.3 % v7 (old) | 02 / 2022 | Lenovo ThinkPad P1 G4-20Y4Z9DVUS i7-11800H, T1200 Laptop GPU | 1.8 kg | 17.7 mm | 16.00" | 2560x1600 | |
| 89.4 % v7 (old) | 10 / 2021 | Lenovo ThinkPad P1 G4-20Y30017GE i7-11800H, T1200 Laptop GPU | 1.8 kg | 17.7 mm | 16.00" | 2560x1600 | |
| 89.8 % v7 (old) | 10 / 2021 | Lenovo ThinkPad P1 G4-20Y4S0KS00 i7-11850H, GeForce RTX 3070 Laptop GPU | 2 kg | 17.7 mm | 16.00" | 3840x2400 | |
| 89 % v7 (old) | 11 / 2021 | Lenovo ThinkPad X1 Extreme G4-20Y5CTO1WW (3050 Ti) i7-11800H, GeForce RTX 3050 Ti Laptop GPU | 2 kg | 18.2 mm | 16.00" | 3840x2400 | |
| 88.3 % v7 (old) | 12 / 2021 | Lenovo ThinkPad X1 Extreme G4-20Y50040GE i9-11950H, GeForce RTX 3080 Laptop GPU | 1.9 kg | 18.2 mm | 16.00" | 3840x2400 |
Gehäuse & Ausstattung
| SD Card Reader | |
| average JPG Copy Test (av. of 3 runs) | |
| Lenovo ThinkPad P1 G4-20Y4Z9DVUS (Angelbird AV Pro V60) | |
| Lenovo ThinkPad P1 G4-20Y30017GE (AV PRO V60) | |
| Lenovo ThinkPad X1 Extreme G4-20Y5CTO1WW (3050 Ti) (AV Pro V60) | |
| Durchschnitt der Klasse Workstation (49.6 - 681, n=13, der letzten 2 Jahre) | |
| maximum AS SSD Seq Read Test (1GB) | |
| Durchschnitt der Klasse Workstation (87.6 - 1455, n=13, der letzten 2 Jahre) | |
| Lenovo ThinkPad P1 G4-20Y30017GE (AV PRO V60) | |
| Lenovo ThinkPad P1 G4-20Y4Z9DVUS (Angelbird AV Pro V60) | |
| Lenovo ThinkPad X1 Extreme G4-20Y5CTO1WW (3050 Ti) (AV Pro V60) | |

Display - WQHD-Panel von mindestens zwei Zulieferern
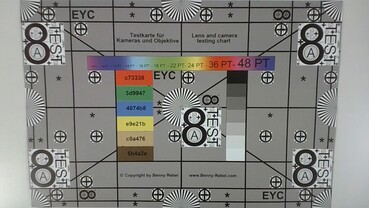
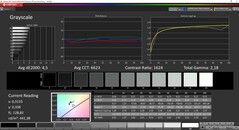
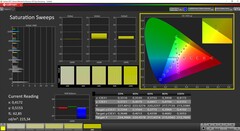
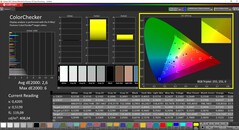
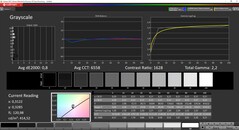
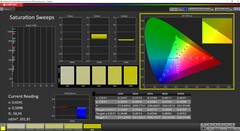
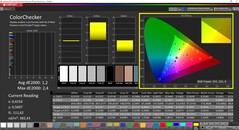
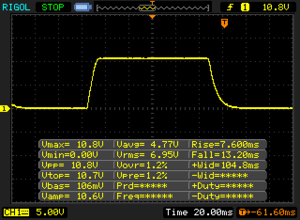
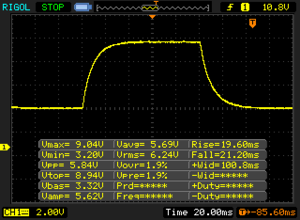
Das Testgerät des ThinkPad P1 G4 ist erneut mit dem standardmäßigen WQHD-Panel (2.560 x 1.600 Pixel, 16:10, matt) ausgestattet, allerdings unterscheidet sich die Panel ID und damit auch der Zulieferer. Das BOE-Panel schneidet bei den Messwerten auch minimal besser ab (etwas heller, leicht höherer Kontrast), aber grundsätzlich sind die Werte sehr vergleichbar. Beide Panels bieten eine sehr gute Bildqualität ohne PWM-Flackern und es gibt auch keine Probleme mit zu langsamen Reaktionszeiten.
Das Panel deckt den sRGB-Farbraum vollständig ab, für die bestmögliche Darstellungsqualität sollte der Bildschirm aber kalibriert werden (unser kalibriertes Profil steht in der nachfolgenden Box zum kostenlosen Download zur Verfügung). Die beiden optionalen 4K-Displays bieten eine größere Farbraumabdeckung (AdobeRGB), aber für den normalen Einsatz ist das standardmäßige WQHD-Panel hervorragend geeignet.
| |||||||||||||||||||||||||
Ausleuchtung: 90 %
Helligkeit Akku: 443 cd/m²
Kontrast: 1633:1 (Schwarzwert: 0.27 cd/m²)
ΔE ColorChecker Calman: 2.6 | ∀{0.5-29.43 Ø4.76}
calibrated: 1.2
ΔE Greyscale Calman: 4.5 | ∀{0.09-98 Ø5}
74.7% AdobeRGB 1998 (Argyll 3D)
99.3% sRGB (Argyll 3D)
72.7% Display P3 (Argyll 3D)
Gamma: 2.18
CCT: 6623 K
| Lenovo ThinkPad P1 G4-20Y4Z9DVUS NE160QDM-N63, IPS, 2560x1600, 16" | Lenovo ThinkPad P1 G4-20Y30017GE B160QAN02.M, IPS, 2560x1600, 16" | Lenovo ThinkPad P1 G4-20Y4S0KS00 LP160UQ1-SPB1, IPS LED, 3840x2400, 16" | Lenovo ThinkPad X1 Extreme G4-20Y5CTO1WW (3050 Ti) LP160UQ1-SPB1, IPS LED, 3840x2400, 16" | |
|---|---|---|---|---|
| Display | 4% | 17% | 15% | |
| Display P3 Coverage (%) | 72.7 | 77.3 6% | 85.7 18% | 84.3 16% |
| sRGB Coverage (%) | 99.3 | 99.9 1% | 99.4 0% | 98.3 -1% |
| AdobeRGB 1998 Coverage (%) | 74.7 | 78.1 5% | 98.9 32% | 97.8 31% |
| Response Times | -14% | -43% | -75% | |
| Response Time Grey 50% / Grey 80% * (ms) | 40.8 | 40.8 ? -0% | 55.2 ? -35% | 60 ? -47% |
| Response Time Black / White * (ms) | 20.8 | 26.4 ? -27% | 31.2 ? -50% | 42 ? -102% |
| PWM Frequency (Hz) | ||||
| Bildschirm | -2% | 14% | 7% | |
| Helligkeit Bildmitte (cd/m²) | 441 | 420 -5% | 630 43% | 639 45% |
| Brightness (cd/m²) | 420 | 401 -5% | 622 48% | 612 46% |
| Brightness Distribution (%) | 90 | 90 0% | 90 0% | 84 -7% |
| Schwarzwert * (cd/m²) | 0.27 | 0.3 -11% | 0.41 -52% | 0.47 -74% |
| Kontrast (:1) | 1633 | 1400 -14% | 1537 -6% | 1360 -17% |
| Delta E Colorchecker * | 2.6 | 2.5 4% | 2.2 15% | 2.2 15% |
| Colorchecker dE 2000 max. * | 6 | 4.9 18% | 5 17% | 5.3 12% |
| Colorchecker dE 2000 calibrated * | 1.2 | 1.6 -33% | 1 17% | 1.4 -17% |
| Delta E Graustufen * | 4.5 | 3.4 24% | 2.7 40% | 1.7 62% |
| Gamma | 2.18 101% | 2.24 98% | 2.26 97% | 2.31 95% |
| CCT | 6623 98% | 6479 100% | 6886 94% | 6390 102% |
| Durchschnitt gesamt (Programm / Settings) | -4% /
-3% | -4% /
6% | -18% /
-3% |
* ... kleinere Werte sind besser
Reaktionszeiten (Response Times) des Displays
| ↔ Reaktionszeiten Schwarz zu Weiß | ||
|---|---|---|
| 20.8 ms ... steigend ↗ und fallend ↘ kombiniert | ↗ ms steigend | |
| ↘ ms fallend | ||
| Die gemessenen Reaktionszeiten sind gut, für anspruchsvolle Spieler könnten der Bildschirm jedoch zu langsam sein. Im Vergleich rangierten die bei uns getesteten Geräte von 0.1 (Minimum) zu 240 (Maximum) ms. » 45 % aller Screens waren schneller als der getestete. Daher sind die gemessenen Reaktionszeiten durchschnittlich (20.1 ms). | ||
| ↔ Reaktionszeiten 50% Grau zu 80% Grau | ||
| 40.8 ms ... steigend ↗ und fallend ↘ kombiniert | ↗ ms steigend | |
| ↘ ms fallend | ||
| Die gemessenen Reaktionszeiten sind langsam und dadurch für viele Spieler wahrscheinlich zu langsam. Im Vergleich rangierten die bei uns getesteten Geräte von 0.165 (Minimum) zu 636 (Maximum) ms. » 63 % aller Screens waren schneller als der getestete. Daher sind die gemessenen Reaktionszeiten schlechter als der Durchschnitt aller vermessenen Geräte (31.4 ms). | ||
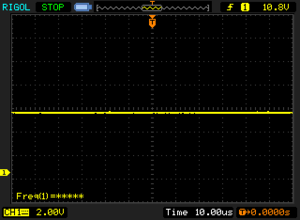
Bildschirm-Flackern / PWM (Pulse-Width Modulation)
| Flackern / PWM nicht festgestellt | |||
Im Vergleich: 53 % aller getesteten Geräte nutzten kein PWM um die Helligkeit zu reduzieren. Wenn PWM eingesetzt wurde, dann bei einer Frequenz von durchschnittlich 8016 (Minimum 5, Maximum 343500) Hz. | |||
Leistung - ThinkPad P1 G4 endlich ohne angezogene Handbremse
Prozessor - Core i7-11800H
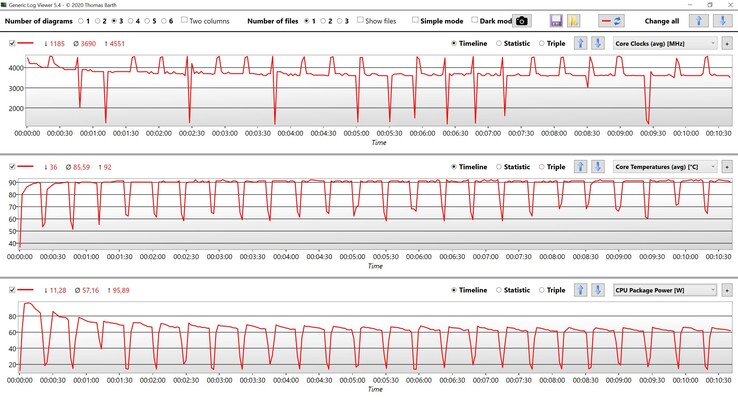
Wir haben mittlerweile mehrere Versionen des ThinkPad P1 G4 bzw. des X1 Extreme G4 getestet und mit jeder neuen BIOS-Version wurde die CPU-Leistung gesteigert. Bei unserem ersten Test waren wir noch enttäuscht, denn die CPU hat sich nach kurzer Zeit bei 40 Watt eingependelt und war damit deutlich langsamer als ein durchschnittlicher Core i7-11800H. Mit der aktuellen BIOS-Version 1.13 gehören diese Einschränkungen aber der Vergangenheit an und der Core i7-11800H schneidet jetzt sehr gut ab. Die CPU-Leistung ist jetzt vergleichbar mit den Vapor-Chamber-Modellen und identisch mit dem eigentlich schnelleren Core i9-11950H, was wiederum zeigt, dass der optionale Core-i9-Prozessor nur in den Single-Core-Tests einen minimalen Leistungsvorteil bietet.
Im Akkubetrieb ist der Stromverbrauch des Prozessors auf 70 Watt begrenzt, was nur zu einem geringen Leistungsverlust von rund 15 Prozent führt. Weitere CPU-Benchmarks sind in unserer Techniksektion verfügbar.
Cinebench R15 Multi Dauertest
Cinebench R23: Multi Core | Single Core
Cinebench R20: CPU (Multi Core) | CPU (Single Core)
Cinebench R15: CPU Multi 64Bit | CPU Single 64Bit
Blender: v2.79 BMW27 CPU
7-Zip 18.03: 7z b 4 | 7z b 4 -mmt1
Geekbench 5.5: Multi-Core | Single-Core
HWBOT x265 Benchmark v2.2: 4k Preset
LibreOffice : 20 Documents To PDF
R Benchmark 2.5: Overall mean
| CPU Performance Rating | |
| Durchschnitt der Klasse Workstation | |
| Lenovo ThinkPad P1 G4-20Y4S0KS00 | |
| Lenovo ThinkPad X1 Extreme G4-20Y50040GE -3! | |
| Lenovo ThinkPad X1 Extreme G4-20Y5CTO1WW (3050 Ti) | |
| Lenovo ThinkPad P1 G4-20Y4Z9DVUS | |
| Durchschnittliche Intel Core i7-11800H | |
| Lenovo ThinkPad P1 G4-20Y30017GE | |
| Cinebench R23 / Multi Core | |
| Durchschnitt der Klasse Workstation (14055 - 38520, n=28, der letzten 2 Jahre) | |
| Lenovo ThinkPad X1 Extreme G4-20Y5CTO1WW (3050 Ti) | |
| Lenovo ThinkPad P1 G4-20Y4Z9DVUS | |
| Lenovo ThinkPad X1 Extreme G4-20Y50040GE | |
| Lenovo ThinkPad P1 G4-20Y4S0KS00 | |
| Durchschnittliche Intel Core i7-11800H (6508 - 14088, n=48) | |
| Lenovo ThinkPad P1 G4-20Y30017GE | |
| Cinebench R23 / Single Core | |
| Durchschnitt der Klasse Workstation (1712 - 2228, n=28, der letzten 2 Jahre) | |
| Lenovo ThinkPad X1 Extreme G4-20Y50040GE | |
| Lenovo ThinkPad P1 G4-20Y4S0KS00 | |
| Lenovo ThinkPad X1 Extreme G4-20Y5CTO1WW (3050 Ti) | |
| Lenovo ThinkPad P1 G4-20Y4Z9DVUS | |
| Durchschnittliche Intel Core i7-11800H (1386 - 1522, n=45) | |
| Lenovo ThinkPad P1 G4-20Y30017GE | |
| Cinebench R20 / CPU (Multi Core) | |
| Durchschnitt der Klasse Workstation (5471 - 15043, n=28, der letzten 2 Jahre) | |
| Lenovo ThinkPad P1 G4-20Y4Z9DVUS | |
| Lenovo ThinkPad X1 Extreme G4-20Y5CTO1WW (3050 Ti) | |
| Lenovo ThinkPad P1 G4-20Y4S0KS00 | |
| Lenovo ThinkPad X1 Extreme G4-20Y50040GE | |
| Durchschnittliche Intel Core i7-11800H (2498 - 5408, n=50) | |
| Lenovo ThinkPad P1 G4-20Y30017GE | |
| Cinebench R20 / CPU (Single Core) | |
| Durchschnitt der Klasse Workstation (671 - 857, n=28, der letzten 2 Jahre) | |
| Lenovo ThinkPad X1 Extreme G4-20Y50040GE | |
| Lenovo ThinkPad P1 G4-20Y4S0KS00 | |
| Lenovo ThinkPad X1 Extreme G4-20Y5CTO1WW (3050 Ti) | |
| Lenovo ThinkPad P1 G4-20Y4Z9DVUS | |
| Durchschnittliche Intel Core i7-11800H (520 - 586, n=47) | |
| Lenovo ThinkPad P1 G4-20Y30017GE | |
| Cinebench R15 / CPU Multi 64Bit | |
| Durchschnitt der Klasse Workstation (2404 - 5810, n=28, der letzten 2 Jahre) | |
| Lenovo ThinkPad P1 G4-20Y4Z9DVUS | |
| Lenovo ThinkPad X1 Extreme G4-20Y50040GE | |
| Lenovo ThinkPad X1 Extreme G4-20Y50040GE | |
| Lenovo ThinkPad X1 Extreme G4-20Y5CTO1WW (3050 Ti) | |
| Lenovo ThinkPad P1 G4-20Y4S0KS00 | |
| Durchschnittliche Intel Core i7-11800H (1342 - 2173, n=50) | |
| Lenovo ThinkPad P1 G4-20Y30017GE | |
| Cinebench R15 / CPU Single 64Bit | |
| Durchschnitt der Klasse Workstation (191.4 - 328, n=28, der letzten 2 Jahre) | |
| Lenovo ThinkPad X1 Extreme G4-20Y50040GE | |
| Lenovo ThinkPad P1 G4-20Y4S0KS00 | |
| Lenovo ThinkPad P1 G4-20Y4Z9DVUS | |
| Lenovo ThinkPad X1 Extreme G4-20Y5CTO1WW (3050 Ti) | |
| Durchschnittliche Intel Core i7-11800H (201 - 231, n=46) | |
| Lenovo ThinkPad P1 G4-20Y30017GE | |
| Blender / v2.79 BMW27 CPU | |
| Lenovo ThinkPad P1 G4-20Y30017GE | |
| Durchschnittliche Intel Core i7-11800H (217 - 454, n=46) | |
| Lenovo ThinkPad P1 G4-20Y4S0KS00 | |
| Lenovo ThinkPad X1 Extreme G4-20Y5CTO1WW (3050 Ti) | |
| Lenovo ThinkPad P1 G4-20Y4Z9DVUS | |
| Durchschnitt der Klasse Workstation (91 - 261, n=28, der letzten 2 Jahre) | |
| 7-Zip 18.03 / 7z b 4 | |
| Durchschnitt der Klasse Workstation (53407 - 116969, n=28, der letzten 2 Jahre) | |
| Lenovo ThinkPad P1 G4-20Y4S0KS00 | |
| Lenovo ThinkPad P1 G4-20Y4Z9DVUS | |
| Lenovo ThinkPad X1 Extreme G4-20Y5CTO1WW (3050 Ti) | |
| Durchschnittliche Intel Core i7-11800H (33718 - 56758, n=46) | |
| Lenovo ThinkPad P1 G4-20Y30017GE | |
| 7-Zip 18.03 / 7z b 4 -mmt1 | |
| Durchschnitt der Klasse Workstation (4981 - 6960, n=28, der letzten 2 Jahre) | |
| Lenovo ThinkPad P1 G4-20Y4S0KS00 | |
| Lenovo ThinkPad X1 Extreme G4-20Y5CTO1WW (3050 Ti) | |
| Lenovo ThinkPad P1 G4-20Y4Z9DVUS | |
| Lenovo ThinkPad P1 G4-20Y30017GE | |
| Durchschnittliche Intel Core i7-11800H (5138 - 5732, n=46) | |
| Geekbench 5.5 / Multi-Core | |
| Durchschnitt der Klasse Workstation (11542 - 25554, n=28, der letzten 2 Jahre) | |
| Lenovo ThinkPad P1 G4-20Y4S0KS00 | |
| Durchschnittliche Intel Core i7-11800H (4655 - 9851, n=40) | |
| Lenovo ThinkPad P1 G4-20Y4Z9DVUS | |
| Lenovo ThinkPad X1 Extreme G4-20Y5CTO1WW (3050 Ti) | |
| Lenovo ThinkPad X1 Extreme G4-20Y50040GE | |
| Lenovo ThinkPad P1 G4-20Y30017GE | |
| Geekbench 5.5 / Single-Core | |
| Durchschnitt der Klasse Workstation (1759 - 2183, n=28, der letzten 2 Jahre) | |
| Lenovo ThinkPad P1 G4-20Y4S0KS00 | |
| Lenovo ThinkPad X1 Extreme G4-20Y50040GE | |
| Lenovo ThinkPad X1 Extreme G4-20Y5CTO1WW (3050 Ti) | |
| Lenovo ThinkPad P1 G4-20Y4Z9DVUS | |
| Durchschnittliche Intel Core i7-11800H (1429 - 1625, n=40) | |
| Lenovo ThinkPad P1 G4-20Y30017GE | |
| HWBOT x265 Benchmark v2.2 / 4k Preset | |
| Durchschnitt der Klasse Workstation (14.4 - 40.5, n=28, der letzten 2 Jahre) | |
| Lenovo ThinkPad P1 G4-20Y4S0KS00 | |
| Lenovo ThinkPad P1 G4-20Y4Z9DVUS | |
| Lenovo ThinkPad X1 Extreme G4-20Y50040GE | |
| Durchschnittliche Intel Core i7-11800H (7.38 - 17.4, n=46) | |
| Lenovo ThinkPad X1 Extreme G4-20Y5CTO1WW (3050 Ti) | |
| Lenovo ThinkPad P1 G4-20Y30017GE | |
| LibreOffice / 20 Documents To PDF | |
| Lenovo ThinkPad P1 G4-20Y4Z9DVUS | |
| Lenovo ThinkPad P1 G4-20Y30017GE | |
| Durchschnitt der Klasse Workstation (37.1 - 74.7, n=28, der letzten 2 Jahre) | |
| Durchschnittliche Intel Core i7-11800H (38.6 - 59.9, n=45) | |
| Lenovo ThinkPad P1 G4-20Y4S0KS00 | |
| Lenovo ThinkPad X1 Extreme G4-20Y5CTO1WW (3050 Ti) | |
| Lenovo ThinkPad X1 Extreme G4-20Y50040GE | |
| R Benchmark 2.5 / Overall mean | |
| Lenovo ThinkPad P1 G4-20Y30017GE | |
| Durchschnittliche Intel Core i7-11800H (0.548 - 0.615, n=46) | |
| Lenovo ThinkPad P1 G4-20Y4Z9DVUS | |
| Lenovo ThinkPad X1 Extreme G4-20Y5CTO1WW (3050 Ti) | |
| Lenovo ThinkPad X1 Extreme G4-20Y50040GE | |
| Lenovo ThinkPad P1 G4-20Y4S0KS00 | |
| Durchschnitt der Klasse Workstation (0.3825 - 0.603, n=28, der letzten 2 Jahre) | |
* ... kleinere Werte sind besser
AIDA64: FP32 Ray-Trace | FPU Julia | CPU SHA3 | CPU Queen | FPU SinJulia | FPU Mandel | CPU AES | CPU ZLib | FP64 Ray-Trace | CPU PhotoWorxx
| Performance Rating | |
| Durchschnitt der Klasse Workstation | |
| Lenovo ThinkPad X1 Extreme G4-20Y50040GE | |
| Lenovo ThinkPad X1 Extreme G4-20Y5CTO1WW (3050 Ti) | |
| Lenovo ThinkPad P1 G4-20Y4Z9DVUS | |
| Durchschnittliche Intel Core i7-11800H | |
| Lenovo ThinkPad P1 G4-20Y30017GE -9! | |
| Lenovo ThinkPad P1 G4-20Y4S0KS00 -9! | |
| AIDA64 / FP32 Ray-Trace | |
| Durchschnitt der Klasse Workstation (10658 - 61611, n=28, der letzten 2 Jahre) | |
| Lenovo ThinkPad X1 Extreme G4-20Y50040GE | |
| Lenovo ThinkPad P1 G4-20Y4Z9DVUS | |
| Lenovo ThinkPad X1 Extreme G4-20Y5CTO1WW (3050 Ti) | |
| Durchschnittliche Intel Core i7-11800H (8772 - 15961, n=20) | |
| AIDA64 / FPU Julia | |
| Durchschnitt der Klasse Workstation (56664 - 186971, n=28, der letzten 2 Jahre) | |
| Lenovo ThinkPad P1 G4-20Y4Z9DVUS | |
| Lenovo ThinkPad X1 Extreme G4-20Y50040GE | |
| Lenovo ThinkPad X1 Extreme G4-20Y5CTO1WW (3050 Ti) | |
| Durchschnittliche Intel Core i7-11800H (39404 - 65636, n=20) | |
| AIDA64 / CPU SHA3 | |
| Durchschnitt der Klasse Workstation (2608 - 8975, n=28, der letzten 2 Jahre) | |
| Lenovo ThinkPad X1 Extreme G4-20Y50040GE | |
| Lenovo ThinkPad P1 G4-20Y4Z9DVUS | |
| Lenovo ThinkPad X1 Extreme G4-20Y5CTO1WW (3050 Ti) | |
| Durchschnittliche Intel Core i7-11800H (2599 - 4439, n=20) | |
| AIDA64 / CPU Queen | |
| Durchschnitt der Klasse Workstation (60778 - 144411, n=28, der letzten 2 Jahre) | |
| Lenovo ThinkPad X1 Extreme G4-20Y50040GE | |
| Lenovo ThinkPad X1 Extreme G4-20Y5CTO1WW (3050 Ti) | |
| Lenovo ThinkPad P1 G4-20Y4Z9DVUS | |
| Durchschnittliche Intel Core i7-11800H (85233 - 91941, n=20) | |
| AIDA64 / FPU SinJulia | |
| Durchschnitt der Klasse Workstation (7906 - 29343, n=28, der letzten 2 Jahre) | |
| Lenovo ThinkPad X1 Extreme G4-20Y50040GE | |
| Lenovo ThinkPad X1 Extreme G4-20Y5CTO1WW (3050 Ti) | |
| Lenovo ThinkPad P1 G4-20Y4Z9DVUS | |
| Durchschnittliche Intel Core i7-11800H (6420 - 9792, n=20) | |
| AIDA64 / FPU Mandel | |
| Durchschnitt der Klasse Workstation (27301 - 98153, n=28, der letzten 2 Jahre) | |
| Lenovo ThinkPad X1 Extreme G4-20Y50040GE | |
| Lenovo ThinkPad P1 G4-20Y4Z9DVUS | |
| Lenovo ThinkPad X1 Extreme G4-20Y5CTO1WW (3050 Ti) | |
| Durchschnittliche Intel Core i7-11800H (23365 - 39464, n=20) | |
| AIDA64 / CPU AES | |
| Lenovo ThinkPad X1 Extreme G4-20Y50040GE | |
| Lenovo ThinkPad X1 Extreme G4-20Y5CTO1WW (3050 Ti) | |
| Durchschnittliche Intel Core i7-11800H (74617 - 149388, n=20) | |
| Durchschnitt der Klasse Workstation (56077 - 187841, n=28, der letzten 2 Jahre) | |
| Lenovo ThinkPad P1 G4-20Y4Z9DVUS | |
| AIDA64 / CPU ZLib | |
| Durchschnitt der Klasse Workstation (742 - 2148, n=28, der letzten 2 Jahre) | |
| Lenovo ThinkPad X1 Extreme G4-20Y50040GE | |
| Lenovo ThinkPad P1 G4-20Y4Z9DVUS | |
| Lenovo ThinkPad X1 Extreme G4-20Y5CTO1WW (3050 Ti) | |
| Durchschnittliche Intel Core i7-11800H (461 - 830, n=43) | |
| Lenovo ThinkPad P1 G4-20Y30017GE | |
| Lenovo ThinkPad P1 G4-20Y4S0KS00 | |
| AIDA64 / FP64 Ray-Trace | |
| Durchschnitt der Klasse Workstation (5580 - 32891, n=28, der letzten 2 Jahre) | |
| Lenovo ThinkPad X1 Extreme G4-20Y50040GE | |
| Lenovo ThinkPad P1 G4-20Y4Z9DVUS | |
| Lenovo ThinkPad X1 Extreme G4-20Y5CTO1WW (3050 Ti) | |
| Durchschnittliche Intel Core i7-11800H (4545 - 8717, n=21) | |
| AIDA64 / CPU PhotoWorxx | |
| Durchschnitt der Klasse Workstation (37151 - 93684, n=28, der letzten 2 Jahre) | |
| Durchschnittliche Intel Core i7-11800H (11898 - 26757, n=21) | |
| Lenovo ThinkPad X1 Extreme G4-20Y5CTO1WW (3050 Ti) | |
| Lenovo ThinkPad P1 G4-20Y4Z9DVUS | |
| Lenovo ThinkPad X1 Extreme G4-20Y50040GE | |
CrossMark: Overall | Productivity | Creativity | Responsiveness
| PCMark 10 / Score | |
| Durchschnitt der Klasse Workstation (6436 - 10409, n=23, der letzten 2 Jahre) | |
| Lenovo ThinkPad P1 G4-20Y4S0KS00 | |
| Lenovo ThinkPad X1 Extreme G4-20Y50040GE | |
| Lenovo ThinkPad X1 Extreme G4-20Y5CTO1WW (3050 Ti) | |
| Lenovo ThinkPad P1 G4-20Y4Z9DVUS | |
| Durchschnittliche Intel Core i7-11800H, NVIDIA T1200 Laptop GPU (5889 - 6147, n=3) | |
| Lenovo ThinkPad P1 G4-20Y30017GE | |
| PCMark 10 / Essentials | |
| Lenovo ThinkPad P1 G4-20Y4S0KS00 | |
| Lenovo ThinkPad X1 Extreme G4-20Y5CTO1WW (3050 Ti) | |
| Durchschnitt der Klasse Workstation (9622 - 11157, n=23, der letzten 2 Jahre) | |
| Lenovo ThinkPad X1 Extreme G4-20Y50040GE | |
| Lenovo ThinkPad P1 G4-20Y4Z9DVUS | |
| Durchschnittliche Intel Core i7-11800H, NVIDIA T1200 Laptop GPU (9776 - 9956, n=3) | |
| Lenovo ThinkPad P1 G4-20Y30017GE | |
| PCMark 10 / Productivity | |
| Durchschnitt der Klasse Workstation (8789 - 20616, n=23, der letzten 2 Jahre) | |
| Lenovo ThinkPad P1 G4-20Y4S0KS00 | |
| Lenovo ThinkPad X1 Extreme G4-20Y50040GE | |
| Lenovo ThinkPad X1 Extreme G4-20Y5CTO1WW (3050 Ti) | |
| Lenovo ThinkPad P1 G4-20Y30017GE | |
| Durchschnittliche Intel Core i7-11800H, NVIDIA T1200 Laptop GPU (8276 - 8445, n=3) | |
| Lenovo ThinkPad P1 G4-20Y4Z9DVUS | |
| PCMark 10 / Digital Content Creation | |
| Durchschnitt der Klasse Workstation (7744 - 15631, n=23, der letzten 2 Jahre) | |
| Lenovo ThinkPad P1 G4-20Y4S0KS00 | |
| Lenovo ThinkPad X1 Extreme G4-20Y50040GE | |
| Lenovo ThinkPad X1 Extreme G4-20Y5CTO1WW (3050 Ti) | |
| Lenovo ThinkPad P1 G4-20Y4Z9DVUS | |
| Durchschnittliche Intel Core i7-11800H, NVIDIA T1200 Laptop GPU (6851 - 7581, n=3) | |
| Lenovo ThinkPad P1 G4-20Y30017GE | |
| CrossMark / Overall | |
| Durchschnitt der Klasse Workstation (1307 - 2267, n=27, der letzten 2 Jahre) | |
| Lenovo ThinkPad X1 Extreme G4-20Y50040GE | |
| Lenovo ThinkPad P1 G4-20Y4S0KS00 | |
| Lenovo ThinkPad P1 G4-20Y4Z9DVUS | |
| Durchschnittliche Intel Core i7-11800H, NVIDIA T1200 Laptop GPU (1367 - 1526, n=2) | |
| CrossMark / Productivity | |
| Durchschnitt der Klasse Workstation (1130 - 2122, n=27, der letzten 2 Jahre) | |
| Lenovo ThinkPad X1 Extreme G4-20Y50040GE | |
| Lenovo ThinkPad P1 G4-20Y4S0KS00 | |
| Lenovo ThinkPad P1 G4-20Y4Z9DVUS | |
| Durchschnittliche Intel Core i7-11800H, NVIDIA T1200 Laptop GPU (1389 - 1521, n=2) | |
| CrossMark / Creativity | |
| Durchschnitt der Klasse Workstation (1657 - 2725, n=27, der letzten 2 Jahre) | |
| Lenovo ThinkPad P1 G4-20Y4S0KS00 | |
| Lenovo ThinkPad X1 Extreme G4-20Y50040GE | |
| Lenovo ThinkPad P1 G4-20Y4Z9DVUS | |
| Durchschnittliche Intel Core i7-11800H, NVIDIA T1200 Laptop GPU (1430 - 1606, n=2) | |
| CrossMark / Responsiveness | |
| Durchschnitt der Klasse Workstation (993 - 2096, n=27, der letzten 2 Jahre) | |
| Lenovo ThinkPad X1 Extreme G4-20Y50040GE | |
| Lenovo ThinkPad P1 G4-20Y4S0KS00 | |
| Lenovo ThinkPad P1 G4-20Y4Z9DVUS | |
| Durchschnittliche Intel Core i7-11800H, NVIDIA T1200 Laptop GPU (1137 - 1323, n=2) | |
| PCMark 10 Score | 6147 Punkte | |
Hilfe | ||
| AIDA64 / Memory Copy | |
| Durchschnitt der Klasse Workstation (56003 - 164795, n=28, der letzten 2 Jahre) | |
| Durchschnittliche Intel Core i7-11800H (24508 - 48144, n=21) | |
| Lenovo ThinkPad P1 G4-20Y4Z9DVUS | |
| Lenovo ThinkPad X1 Extreme G4-20Y5CTO1WW (3050 Ti) | |
| Lenovo ThinkPad X1 Extreme G4-20Y50040GE | |
| AIDA64 / Memory Read | |
| Durchschnitt der Klasse Workstation (55795 - 121563, n=28, der letzten 2 Jahre) | |
| Durchschnittliche Intel Core i7-11800H (25882 - 50365, n=20) | |
| Lenovo ThinkPad X1 Extreme G4-20Y5CTO1WW (3050 Ti) | |
| Lenovo ThinkPad P1 G4-20Y4Z9DVUS | |
| Lenovo ThinkPad X1 Extreme G4-20Y50040GE | |
| AIDA64 / Memory Write | |
| Durchschnitt der Klasse Workstation (55663 - 214520, n=28, der letzten 2 Jahre) | |
| Durchschnittliche Intel Core i7-11800H (22240 - 46214, n=20) | |
| Lenovo ThinkPad X1 Extreme G4-20Y5CTO1WW (3050 Ti) | |
| Lenovo ThinkPad P1 G4-20Y4Z9DVUS | |
| Lenovo ThinkPad X1 Extreme G4-20Y50040GE | |
| AIDA64 / Memory Latency | |
| Durchschnitt der Klasse Workstation (84.5 - 165.2, n=28, der letzten 2 Jahre) | |
| Lenovo ThinkPad X1 Extreme G4-20Y50040GE | |
| Lenovo ThinkPad X1 Extreme G4-20Y5CTO1WW (3050 Ti) | |
| Lenovo ThinkPad P1 G4-20Y4Z9DVUS | |
| Durchschnittliche Intel Core i7-11800H (71.9 - 104.1, n=44) | |
| Lenovo ThinkPad P1 G4-20Y30017GE | |
| Lenovo ThinkPad P1 G4-20Y4S0KS00 | |
* ... kleinere Werte sind besser
| DPC Latencies / LatencyMon - interrupt to process latency (max), Web, Youtube, Prime95 | |
| Lenovo ThinkPad P1 G4-20Y30017GE | |
| Lenovo ThinkPad X1 Extreme G4-20Y50040GE | |
| Lenovo ThinkPad P1 G4-20Y4Z9DVUS | |
| Lenovo ThinkPad X1 Extreme G4-20Y5CTO1WW (3050 Ti) | |
| Lenovo ThinkPad P1 G4-20Y4S0KS00 | |
* ... kleinere Werte sind besser
Grafikkarte - Nvidia T1200 mit 60 Watt
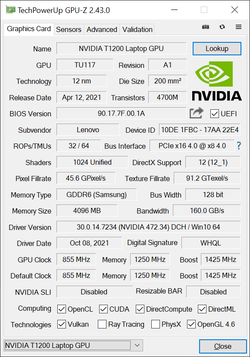
Die Leistung der Grafikkarte hat sich durch die BIOS-Updates nicht verändert. Nvidias professionelle T1200-GPU (basiert auf dem TU117-Chip der Consumer GeForce GTX 1650 Ti) darf nach wie vor maximal 60 Watt verbrauchen und die Ergebnisse in den Benchmarks sind wenig überraschend auf dem gleichen Niveau wie zuvor. In den professionellen Benchmarks sieht man teilweise noch den Vorteil der professionellen Treiber, da hier in manchen Szenarios die RTX 3070 überholt werden kann.
Die Leistung bleibt auch bei längerer Belastung stabil und der anspruchsvolle Time-Spy-Stresstest wir mit 99,2% problemlos bestanden. Das gilt auch für unseren Gaming-Test mit Witcher 3, in dem die Leistung vollkommen stabil bleibt. Im Akkubetrieb darf die GPU maximal 35 Watt verbrauchen, weshalb die Grafikleistung um rund 15% abfällt. Weitere GPU-Benchmarks sind hier verfügbar.
| 3DMark 11 Performance | 14344 Punkte | |
| 3DMark Fire Strike Score | 9310 Punkte | |
| 3DMark Time Spy Score | 3937 Punkte | |
Hilfe | ||
Witcher 3 FPS-Diagramm
| min. | mittel | hoch | max. | QHD | |
|---|---|---|---|---|---|
| The Witcher 3 (2015) | 198 | 125 | 71 | 36.7 | |
| Dota 2 Reborn (2015) | 157 | 138 | 128 | 116 | |
| Final Fantasy XV Benchmark (2018) | 102 | 56.5 | 39 | 26.6 | |
| X-Plane 11.11 (2018) | 109 | 94 | 75.6 |
Emissionen & Energie
Geräuschemissionen
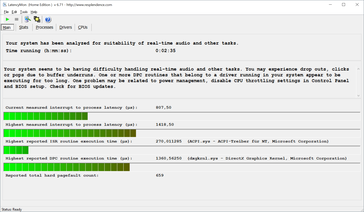
Die Lüftercharakteristik hat sich nicht verändert, unter Last erreichen die beiden Lüfter weiterhin schnell ihre maximale Geschwindigkeit, was einem Geräuschniveau von ~47 dB(A) entspricht. Störende elektronische Geräusche oder Spulenfiepen konnten wir auch bei diesem Testgerät nicht erkennen.
| Lenovo ThinkPad P1 G4-20Y4Z9DVUS T1200 Laptop GPU, i7-11800H, Samsung PM9A1 MZVL2512HCJQ | Lenovo ThinkPad P1 G4-20Y30017GE T1200 Laptop GPU, i7-11800H, Samsung PM9A1 MZVL2512HCJQ | Lenovo ThinkPad P1 G4-20Y4S0KS00 GeForce RTX 3070 Laptop GPU, i7-11850H, Samsung PM9A1 MZVL21T0HCLR | Lenovo ThinkPad X1 Extreme G4-20Y5CTO1WW (3050 Ti) GeForce RTX 3050 Ti Laptop GPU, i7-11800H, Samsung PM9A1 MZVL21T0HCLR | Lenovo ThinkPad X1 Extreme G4-20Y50040GE GeForce RTX 3080 Laptop GPU, i9-11950H, Kioxia XG7 KXG7AZNV1T02 | |
|---|---|---|---|---|---|
| Geräuschentwicklung | 0% | 2% | 1% | -2% | |
| aus / Umgebung * (dB) | 24.3 | 24.3 -0% | 23.8 2% | 23.52 3% | 24.7 -2% |
| Idle min * (dB) | 24.3 | 24.3 -0% | 23.8 2% | 23.52 3% | 24.7 -2% |
| Idle avg * (dB) | 24.3 | 24.3 -0% | 23.8 2% | 23.52 3% | 24.7 -2% |
| Idle max * (dB) | 26.6 | 26.6 -0% | 28.3 -6% | 23.52 12% | 28.1 -6% |
| Last avg * (dB) | 46.8 | 46.8 -0% | 38.6 18% | 42.9 8% | 42.5 9% |
| Witcher 3 ultra * (dB) | 46.8 | 46.8 -0% | 47.4 -1% | 52.5 -12% | 46.4 1% |
| Last max * (dB) | 46.8 | 46.8 -0% | 47.4 -1% | 52.45 -12% | 52.1 -11% |
* ... kleinere Werte sind besser
Temperatur
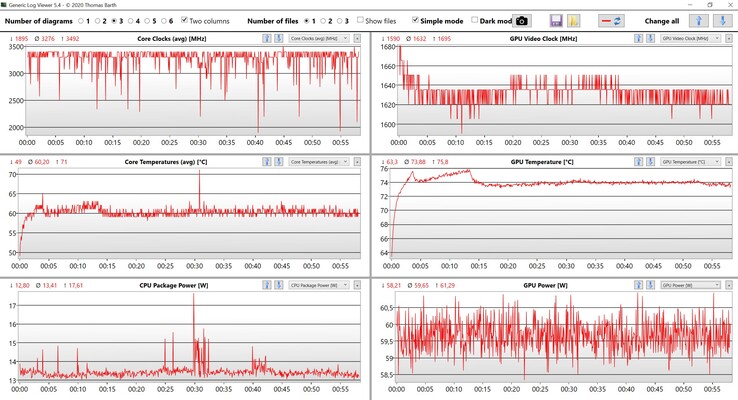
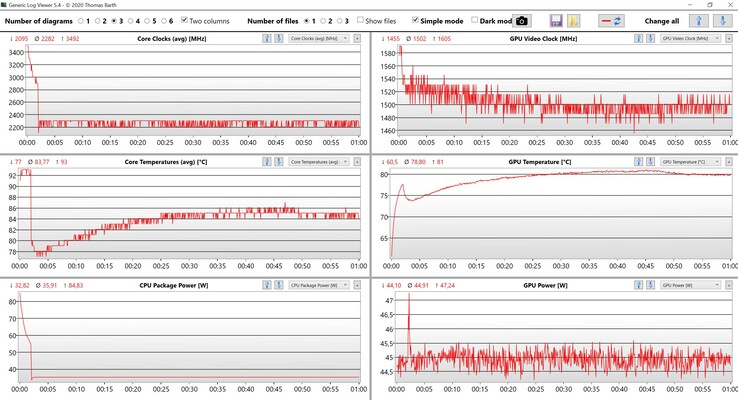
Die Oberflächentemperaturen unter Last sind nun etwas höher als zuvor, denn der Stromverbrauch der Komponenten bei kombinierter Last hat sich etwas verschoben. In unserem ersten Test wurde ganz klar die dedizierte GPU priorisiert und weiterhin mit 60 Watt betrieben, weshalb der Prozessor auf lediglich 20 Watt gedrosselt wurde. Mit dem aktuellen BIOS 1.13 hat sich dieses Verhältnis nun verschoben und der Prozessor pendelt sich nach wenigen Minuten bei 35 Watt ein, während die Nvidia T1200 nun mit 45 Watt läuft.
(-) Die maximale Temperatur auf der Oberseite ist 49.9 °C. Im Vergleich liegt der Klassendurchschnitt bei 38.2 °C (von 22.2 bis 69.8 °C für die Klasse Workstation).
(-) Auf der Unterseite messen wir eine maximalen Wert von 56.7 °C (im Vergleich zum Durchschnitt von 41.1 °C).
(+) Ohne Last messen wir eine durchschnittliche Temperatur von 24.9 °C auf der Oberseite. Der Klassendurchschnitt erreicht 32 °C.
(+) Die Handballen und der Touchpad-Bereich erreichen maximal 33.9 °C und damit die typische Hauttemperatur und fühlen sich daher nicht heiß an.
(-) Die durchschnittliche Handballen-Temperatur anderer getesteter Geräte war 27.8 °C (-6.1 °C).
| Lenovo ThinkPad P1 G4-20Y4Z9DVUS Intel Core i7-11800H, NVIDIA T1200 Laptop GPU | Lenovo ThinkPad X1 Extreme G4-20Y5CTO1WW (3050 Ti) Intel Core i7-11800H, NVIDIA GeForce RTX 3050 Ti Laptop GPU | Lenovo ThinkPad X1 Extreme G4-20Y50040GE Intel Core i9-11950H, NVIDIA GeForce RTX 3080 Laptop GPU | Lenovo ThinkPad P1 G4-20Y30017GE Intel Core i7-11800H, NVIDIA T1200 Laptop GPU | Lenovo ThinkPad P1 G4-20Y4S0KS00 Intel Core i7-11850H, NVIDIA GeForce RTX 3070 Laptop GPU | |
|---|---|---|---|---|---|
| Hitze | -4% | -5% | 2% | -5% | |
| Last oben max * (°C) | 49.9 | 49 2% | 51.4 -3% | 50.6 -1% | 51 -2% |
| Last unten max * (°C) | 56.7 | 44.4 22% | 55.9 1% | 53.6 5% | 53.5 6% |
| Idle oben max * (°C) | 25.5 | 32.1 -26% | 27.2 -7% | 25 2% | 28.8 -13% |
| Idle unten max * (°C) | 26.2 | 29.8 -14% | 28.8 -10% | 25.7 2% | 29.3 -12% |
* ... kleinere Werte sind besser
Lautsprecher
Lenovo ThinkPad P1 G4-20Y4Z9DVUS Audio Analyse
(+) | Die Lautsprecher können relativ laut spielen (84.3 dB)
Bass 100 - 315 Hz
(±) | abgesenkter Bass - 12.2% geringer als der Median
(±) | durchschnittlich lineare Bass-Wiedergabe (9.8% Delta zum Vorgänger)
Mitteltöne 400 - 2000 Hz
(+) | ausgeglichene Mitten, vom Median nur 3.4% abweichend
(+) | lineare Mitten (3.4% Delta zum Vorgänger)
Hochtöne 2 - 16 kHz
(+) | ausgeglichene Hochtöne, vom Median nur 2.9% abweichend
(+) | sehr lineare Hochtöne (5% Delta zum Vorgänger)
Gesamt im hörbaren Bereich 100 - 16.000 Hz
(+) | hörbarer Bereich ist sehr linear (11.8% Abstand zum Median
Im Vergleich zu allen Geräten derselben Klasse
» 16% aller getesteten Geräte dieser Klasse waren besser, 3% vergleichbar, 81% schlechter
» Das beste Gerät hat einen Delta-Wert von 7%, durchschnittlich ist 17%, das schlechteste Gerät hat 35%
Im Vergleich zu allen Geräten im Test
» 8% aller getesteten Geräte waren besser, 2% vergleichbar, 89% schlechter
» Das beste Gerät hat einen Delta-Wert von 4%, durchschnittlich ist 24%, das schlechteste Gerät hat 134%
Energieaufnahme
Der Stromverbrauch unter Last ist jetzt deutlich höher, wenn man die CPU stärker fordert. Im Stresstest ermitteln wir maximal 170,8 Watt zu Beginn des Tests, allerdings pendelt sich der Wert zunächst für einige Minuten bei 122 Watt und dann bei 111 Watt ein, was sich mit der fallenden TDP des Prozessors deckt. Der Standby-Verbrauch ist mit etwas mehr als 2 Watt aber immer noch zu hoch.
| Aus / Standby | |
| Idle | |
| Last |
|
Legende:
min: | |
Energieaufnahme Witcher 3 / Stresstest
Energieaufnahme mit externem Monitor
Akkulaufzeit
Die Akkulaufzeit ist praktisch identisch zum ersten Testgerät des ThinkPad P1 G4. Bei einer Helligkeit von 150 cd/m² (entspricht in diesem Fall 68% der maximalen Helligkeit) läuft unser WLAN-Test für knapp 9 Stunden und bei der maximalen Helligkeit für etwas mehr als 6 Stunden. Damit bleibt das standardmäßige WQHD-Panel die deutlich bessere Wahl gegenüber den optionalen 4K-Panels, wenn es um die Ausdauer geht.
Pro
Contra
Fazit - ThinkPad P1 G4 jetzt mit mehr CPU-Leistung
Mit der aktuellen BIOS-Version hat Lenovo die CPU-Leistung nun spürbar verbessert und es spielt nun keine Rolle mehr, ob man sich für eine Konfiguration mit der konventionellen Kühlung oder aber einem Modell mit einer stärkeren GPU und der Vapor-Chamber-Kühlung entscheidet. Bei kombinierter Last wird bei beiden Versionen die Grafikkarte bevorzugt, wobei der Prozessor mit der konventionellen Kühlung sogar einen leichten Vorteil hat (35 vs. 30 Watt im Stresstest). Zudem zeigen unsere Benchmarks auch ganz klar, dass die optionalen CPUs keine Mehrleistung gegenüber dem standardmäßigen Core i7-11800H bringen. Der einzige Grund für ein Upgrade liegt in unserem Augen in dem vPro-Support, den die optionalen Chips bieten.
Mit dem aktuellen BIOS 1.13 spielt es keine Rolle mehr, ob man sich für eine Konfiguration mit konventioneller oder Vapor-Chamber-Kühlung entscheidet, die CPU-Leistung ist jetzt auf dem gleichen Niveau.
Dass Lenovo bei dem standardmäßig verbauten WQHD-Panel auf mehrere Zulieferer setzt ist für den Kunden in diesem Fall kein großes Problem, da die Leistung der beiden Panels sehr vergleichbar ist und man in der Praxis keinen Unterschied erkennen wird. Von einer Panel-Lotterie wie bei einigen älteren ThinkPad-Modellen kann man hier also nicht sprechen.
Preis und Verfügbarkeit
Das Testgerät ist beispielsweise bei Campuspoint für 2.419 Euro sofort verfügbar, we Zugang zu Lenovos Campus-Programm hat bekommt diese Konfiguration schon für 2.279 Euro.
Lenovo ThinkPad P1 G4-20Y4Z9DVUS
- 01.02.2022 v7 (old)
Andreas Osthoff


