Nvidia RTX 3000 Ada Leistungsdebüt: Dell Precision 5480 Workstation im Test

Das Precision 5480 ist der direkte Nachfolger des Precision 5470 aus dem letzten Jahr und aktualisiert die Alder Lake-H-CPU der 12. Generation sowie die Nvidia Ampere-GPU mit Raptor Lake-H- bzw. Ada Lovelace-Optionen der 13. Außerdem eine der ersten mobilen Workstations, die mit der RTX 3000 Ada ausgestattet ist. Das Gehäuse bzw. der Rahmen bleibt im Grunde gleich wie bei der Precision 5470. Um mehr über die Eigenschaften des Precision 5480 zu erfahren, empfehlen wir Ihnen, unseren Test des letzten Modells zu lesen.
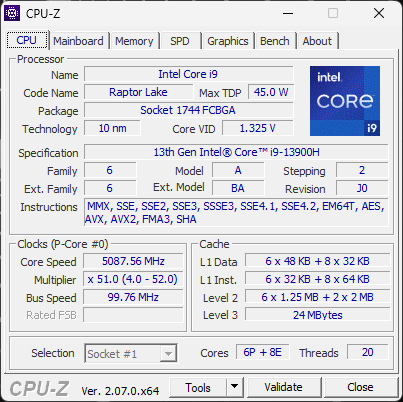
Bei unserem Testgerät handelt es sich um eine High-End-Konfiguration mit Core i9-13900H-CPU, RTX 3000 Ada-GPU und QHD+-Touchscreen für etwa 4.122 Euro. Geringere SKUs mit Core i5-13500H, integrierter Iris Xe-Grafik und FHD+-Display ohne Touchscreen sind ebenfalls ab 2.155 Euro erhältlich.
Der Markt für 14-Zoll-Subnotebooks ist relativ begrenzt, aber es gibt dennoch einige Alternativen, darunter das Lenovo ThinkPad P14s und die HP ZBook Firefly 14-Serie.
Weitere Dell Bewertungen:
Potential Competitors in Comparison
Bew. | Datum | Modell | Gewicht | Dicke | Größe | Auflösung | Preis ab |
|---|---|---|---|---|---|---|---|
| 89.6 % v7 (old) | 09 / 2023 | Dell Precision 5480 i9-13900H, RTX 3000 Ada Generation Laptop | 1.6 kg | 18.95 mm | 14.00" | 2560x1600 | |
| 87.6 % v7 (old) | 09 / 2022 | Dell Precision 5000 5470 i9-12900H, RTX A1000 Laptop GPU | 1.6 kg | 18.95 mm | 14.00" | 2560x1600 | |
| 88.3 % v7 (old) | 10 / 2021 | Dell Precision 5000 5560 i7-11850H, RTX A2000 Laptop GPU | 2 kg | 18 mm | 15.60" | 3840x2400 | |
| 86.9 % v7 (old) | 04 / 2023 | Lenovo ThinkPad P14s G3 AMD 21J6S05000 R7 PRO 6850U, Radeon 680M | 1.5 kg | 17.9 mm | 14.00" | 1920x1200 | |
| 87.4 % v7 (old) | 01 / 2023 | HP ZBook Firefly 14 G9-6B8A2EA i7-1265U, T550 Laptop GPU | 1.5 kg | 19.9 mm | 14.00" | 1920x1200 | |
| 87.8 % v7 (old) | 04 / 2023 | Lenovo ThinkPad P15v G3 21EM001AGE R7 PRO 6850H, RTX A2000 Laptop GPU | 2.2 kg | 22.7 mm | 15.60" | 3840x2160 |
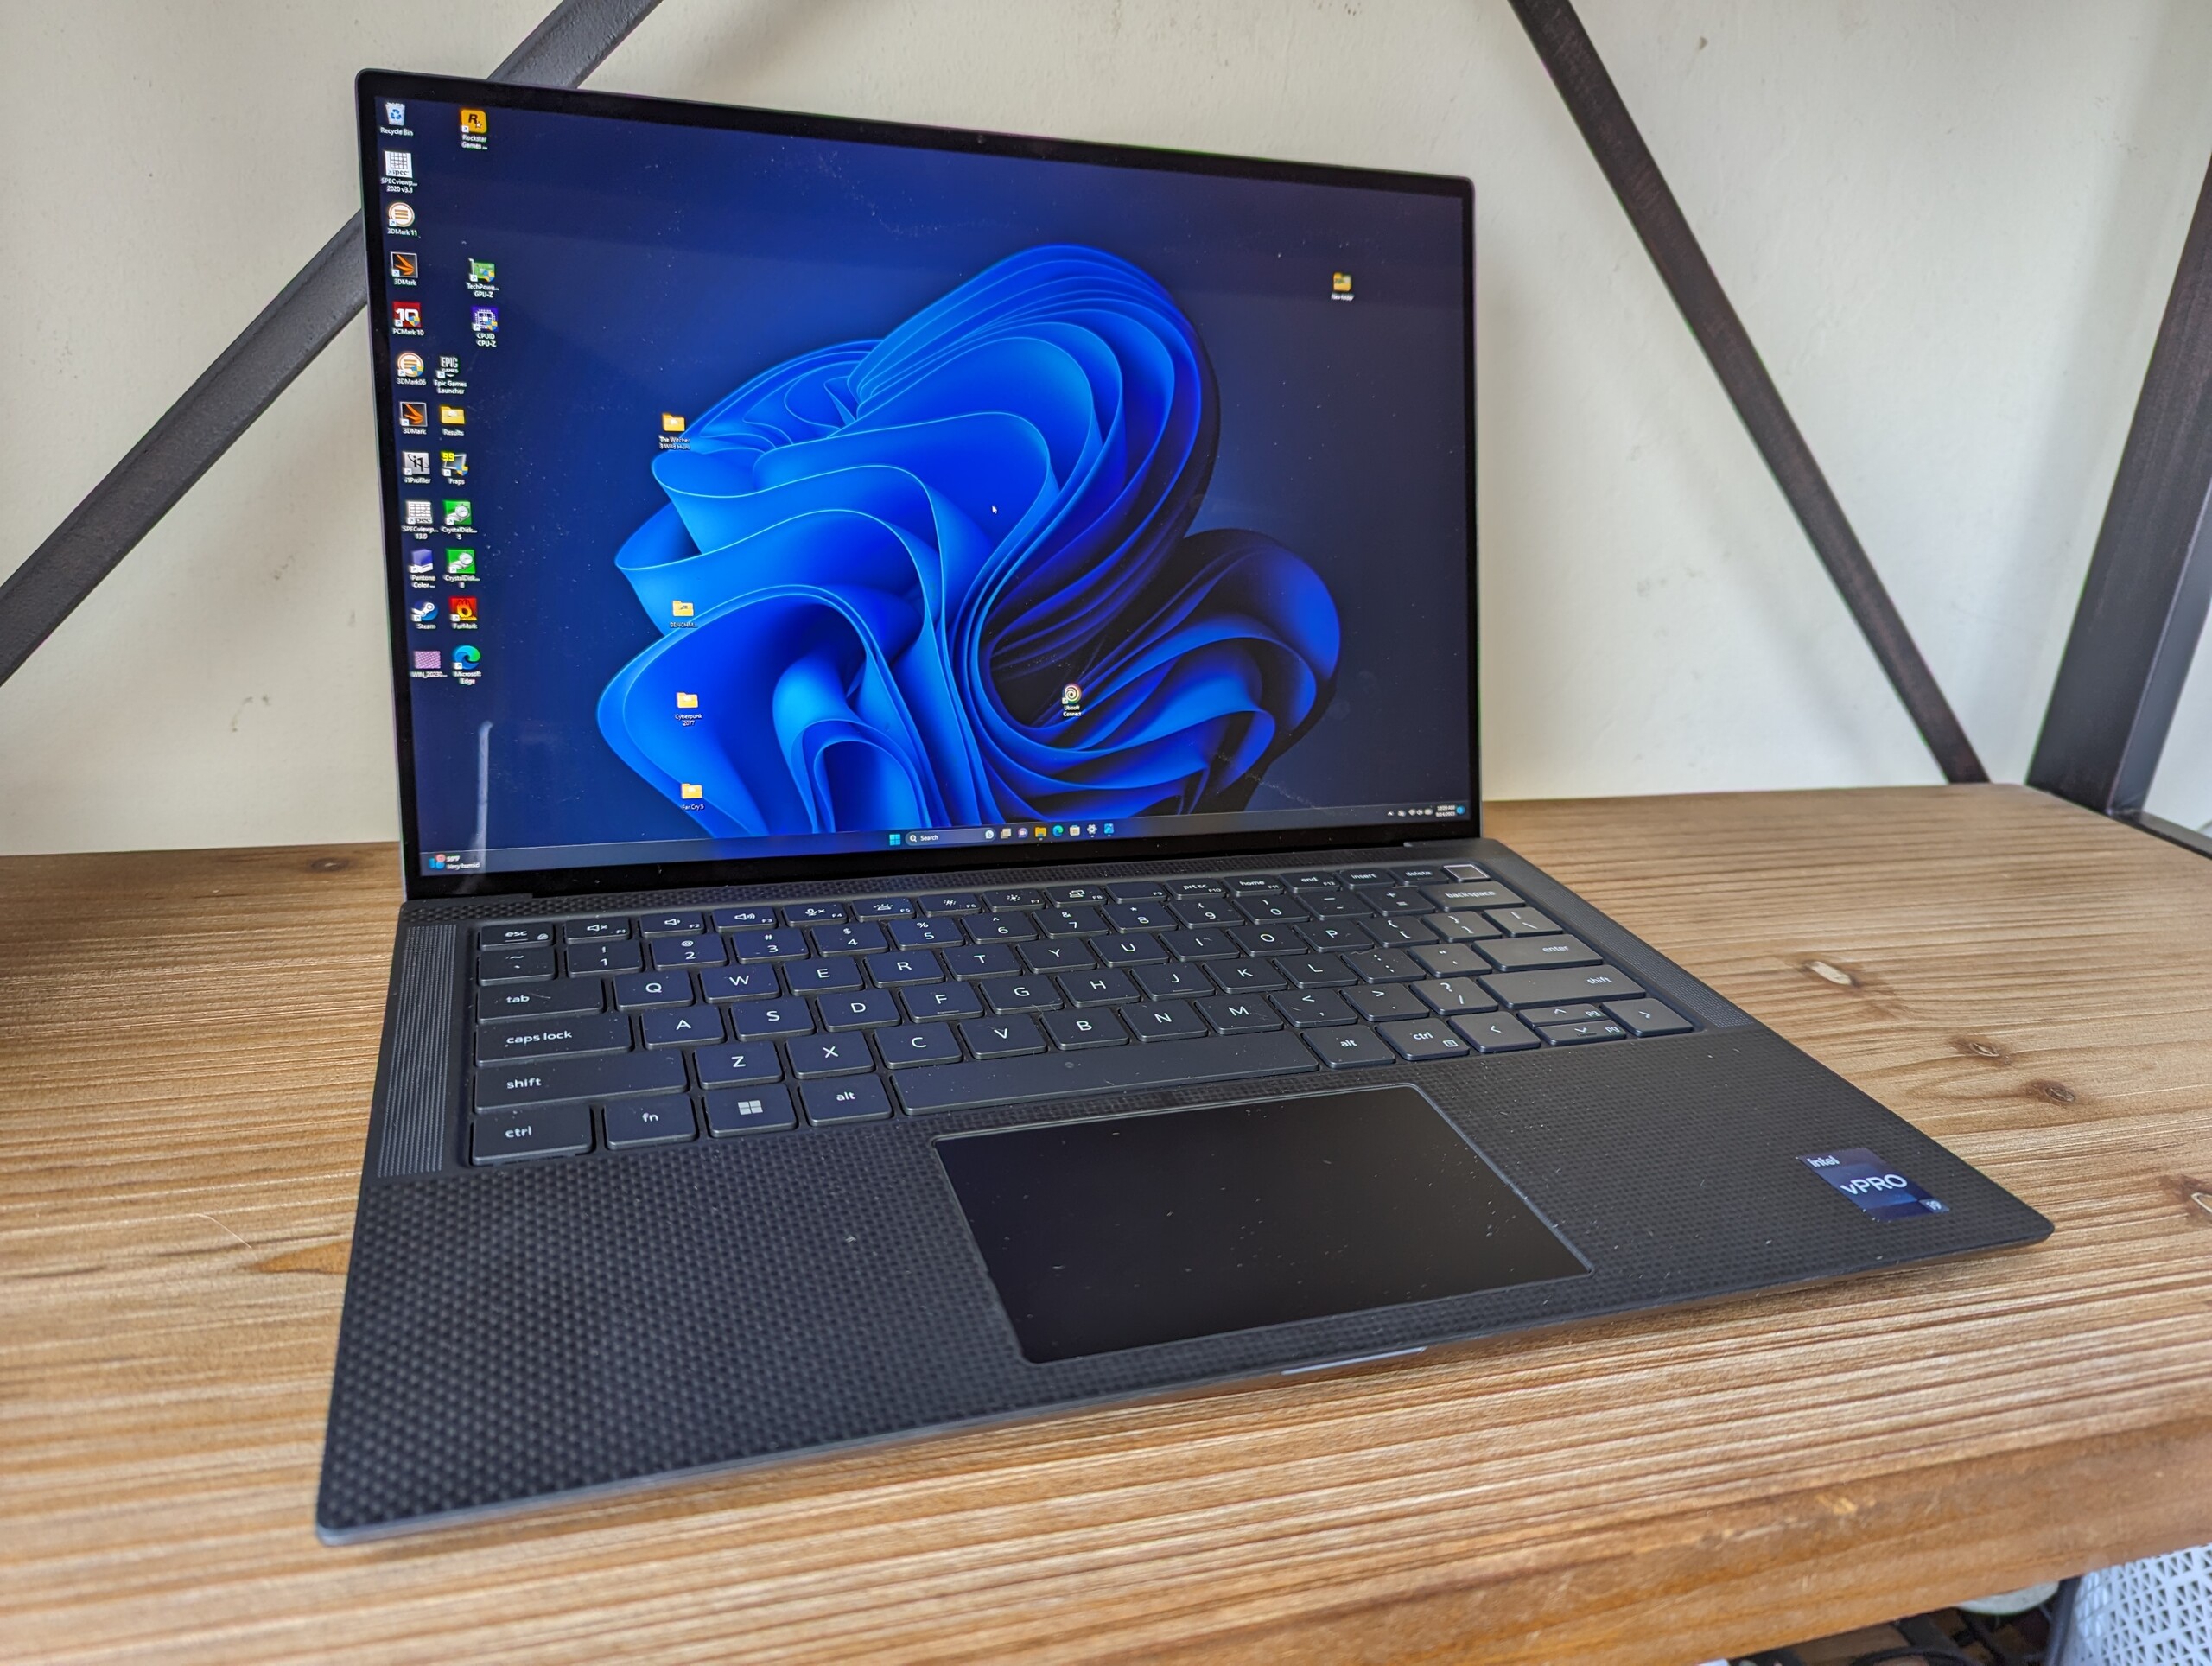
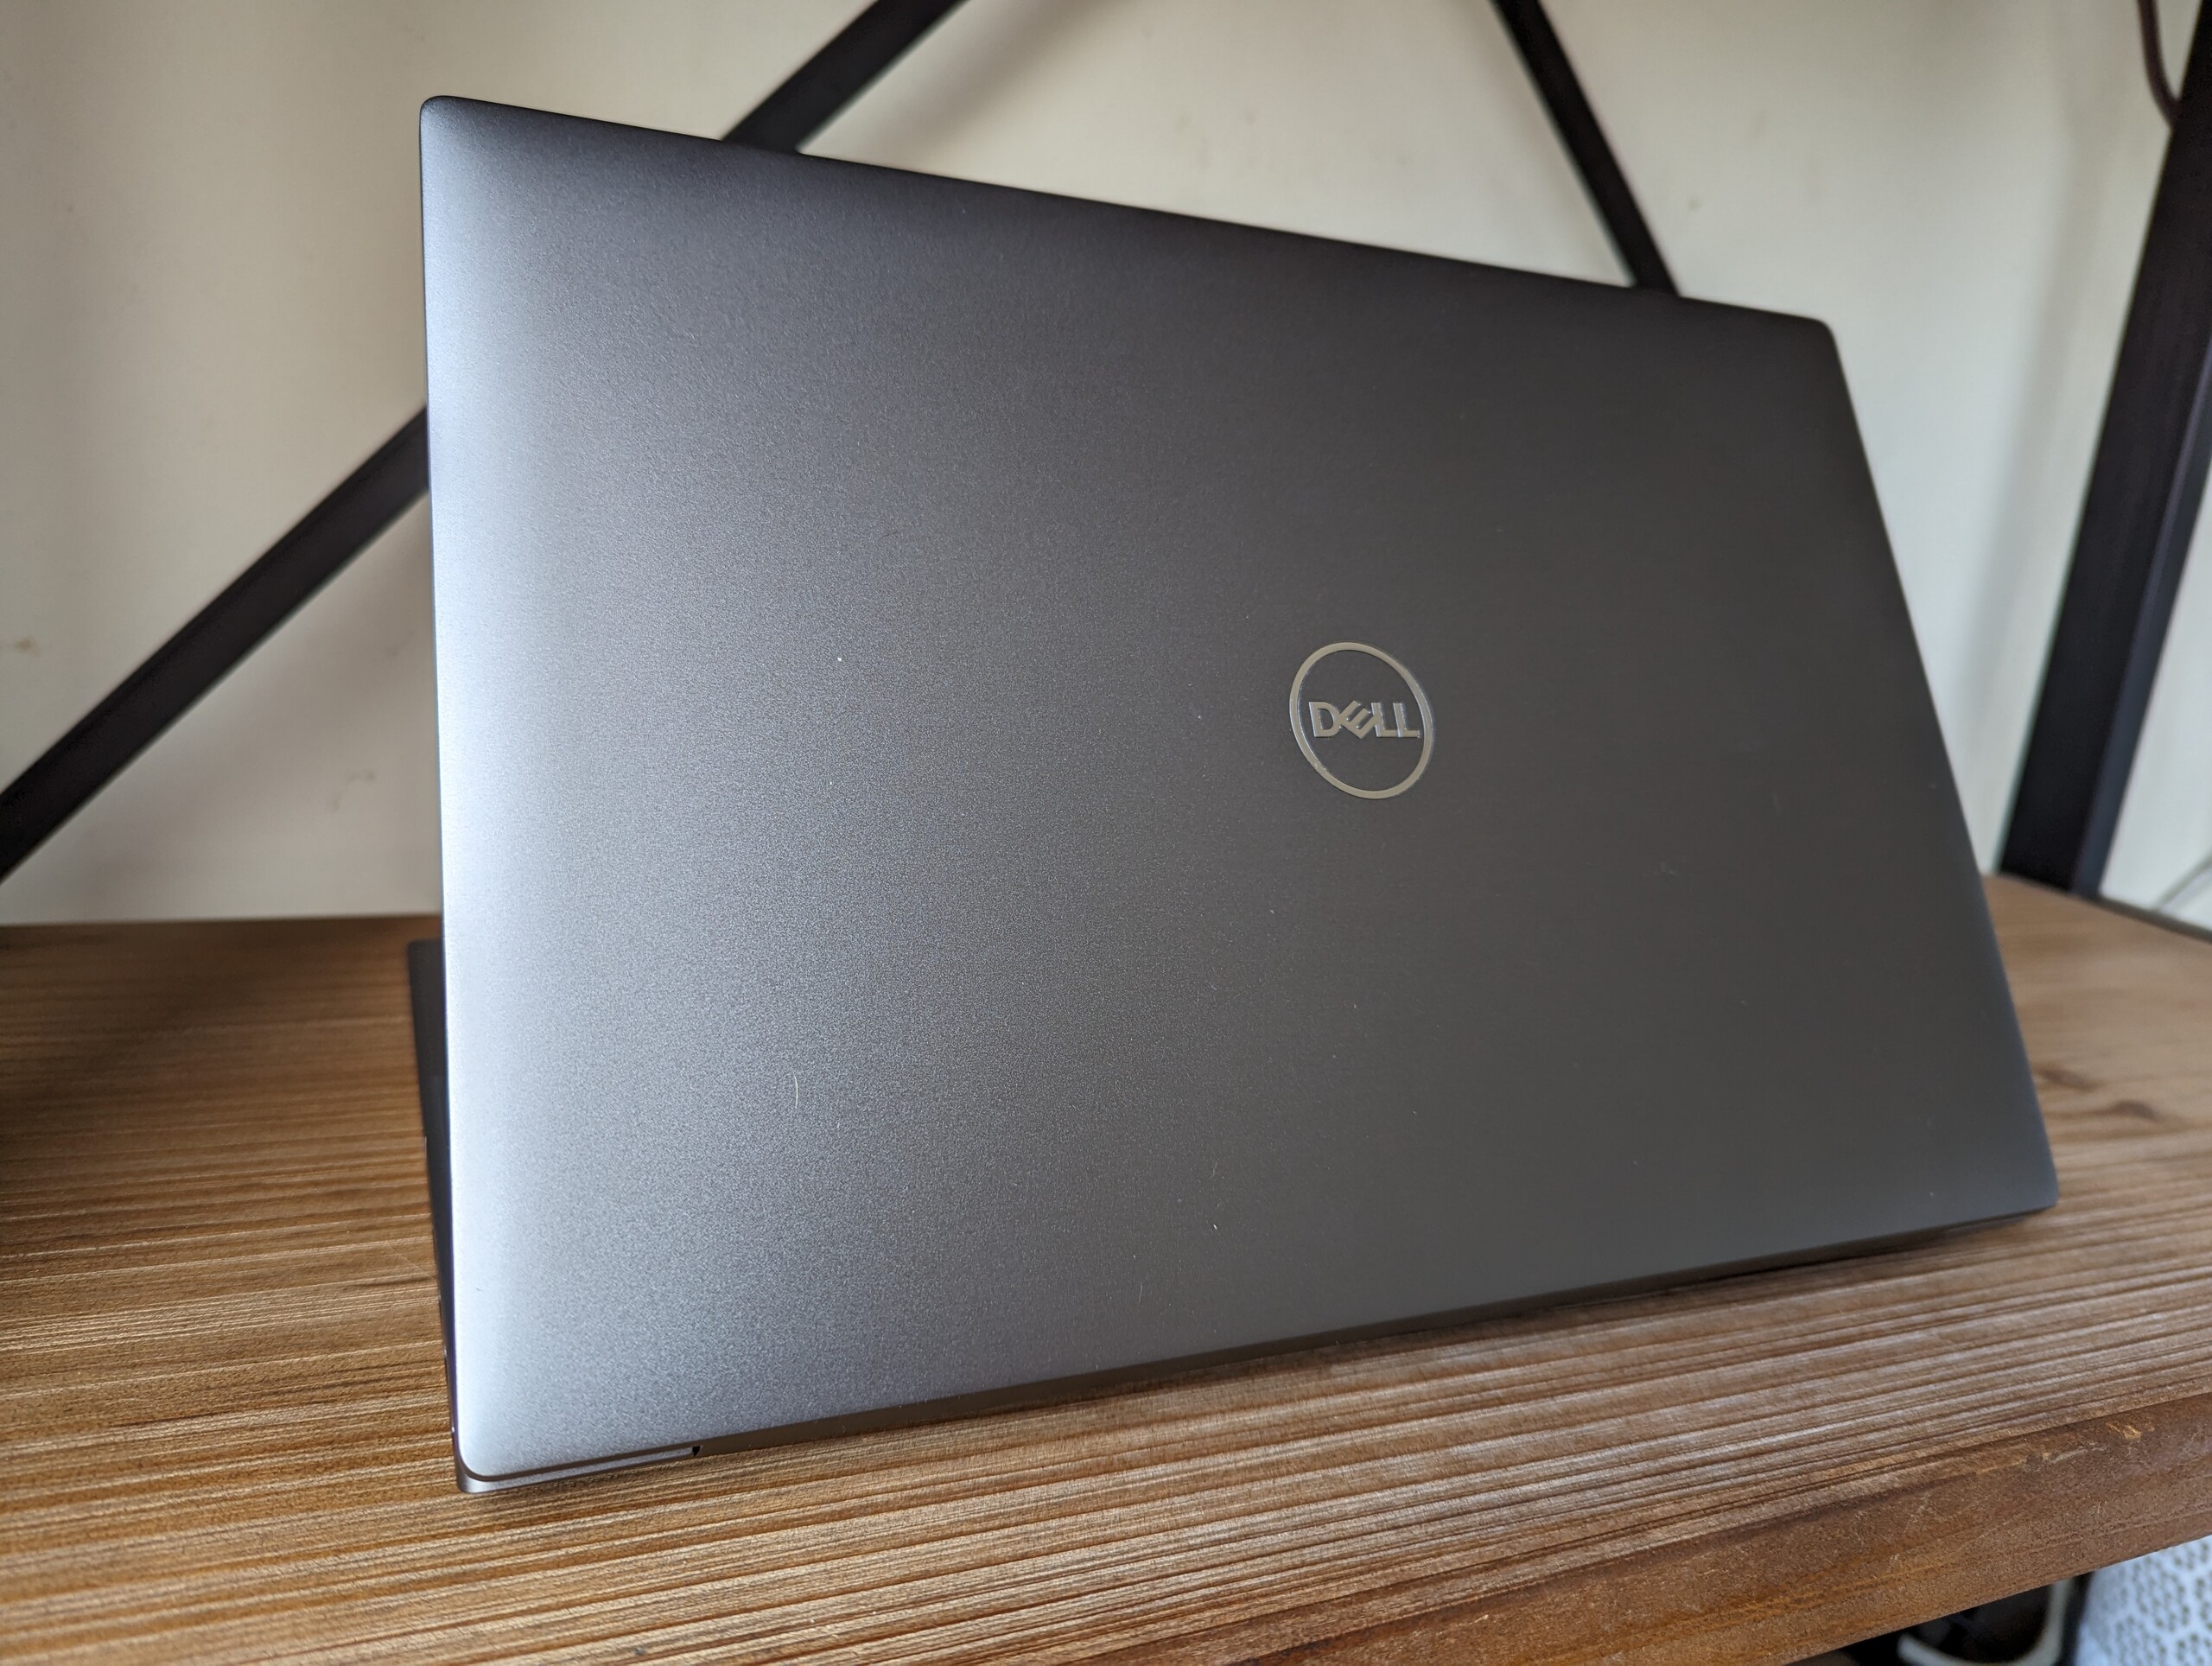
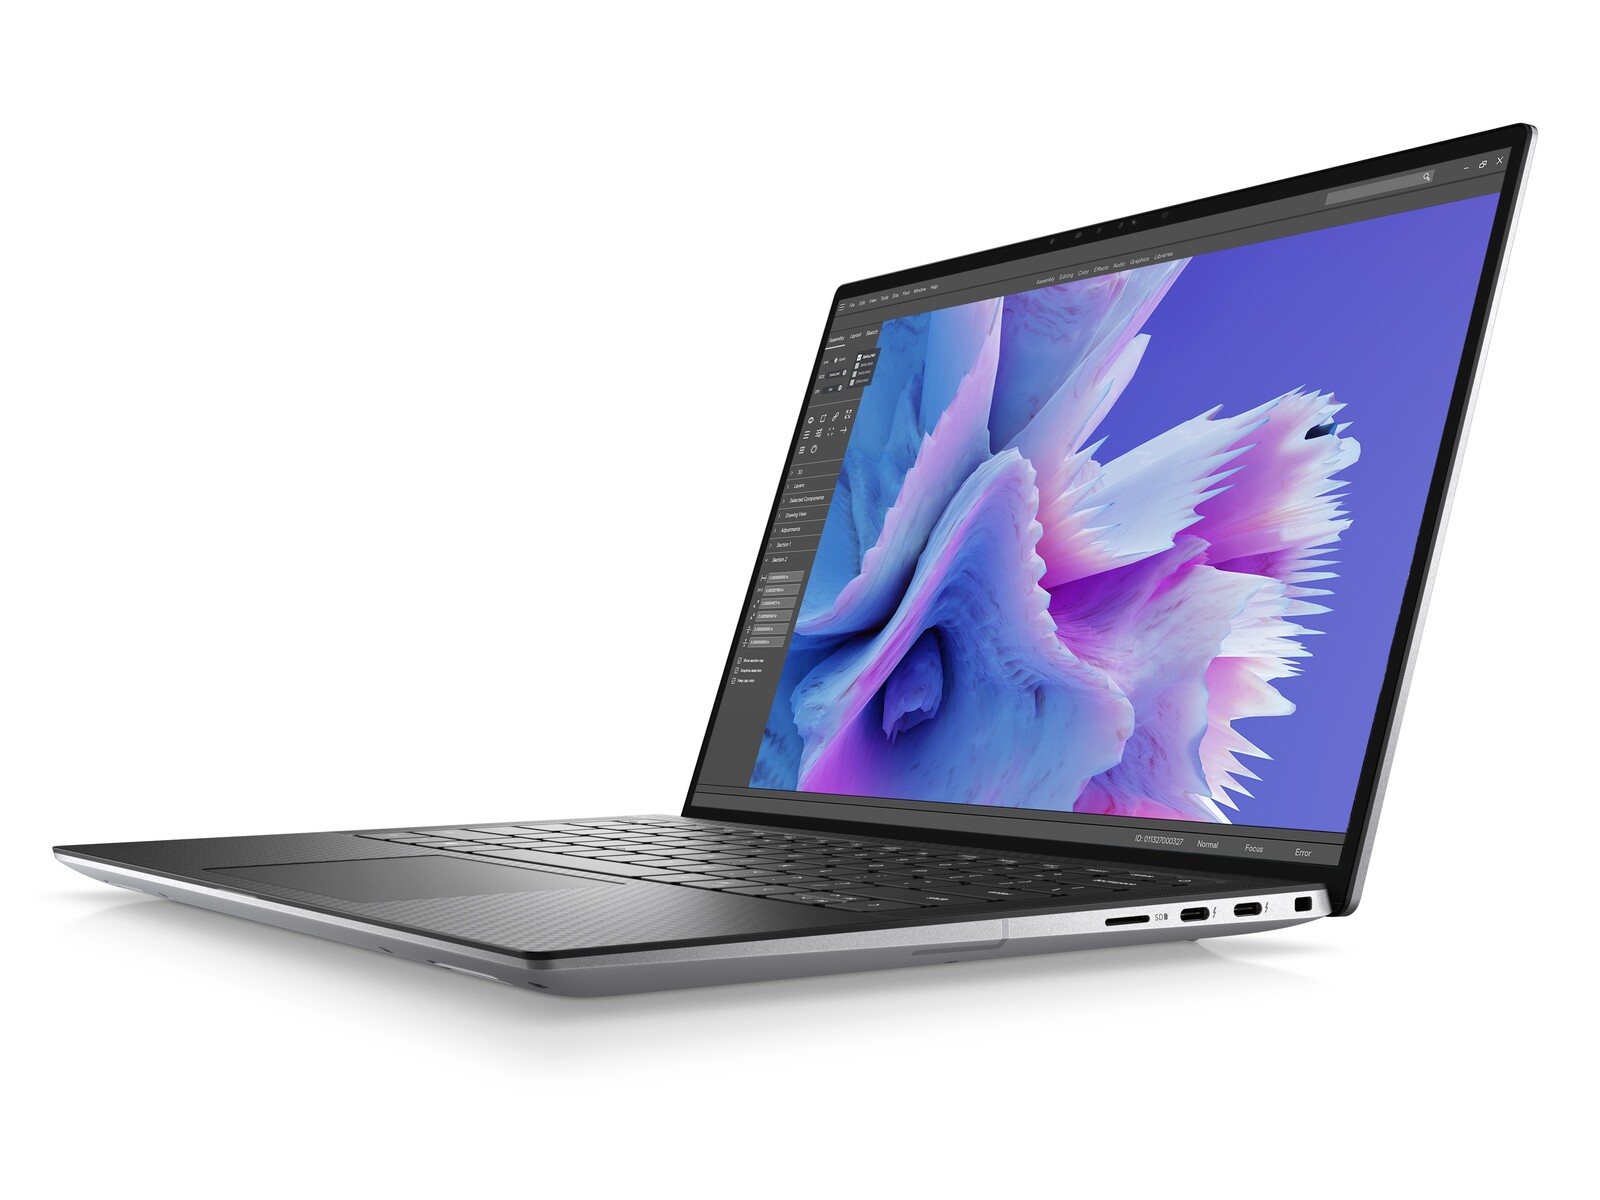
Gehäuse - vom XPS beeinflusst
SD Card Reader
| SD Card Reader | |
| average JPG Copy Test (av. of 3 runs) | |
| Dell Precision 5000 5560 (AV Pro V60) | |
| Lenovo ThinkPad P15v G3 21EM001AGE (AV Pro V60) | |
| Dell Precision 5000 5470 (AV Pro V60) | |
| Dell Precision 5480 (AV Pro V60) | |
| maximum AS SSD Seq Read Test (1GB) | |
| Dell Precision 5000 5470 (AV Pro V60) | |
| Lenovo ThinkPad P15v G3 21EM001AGE (AV Pro V60) | |
| Dell Precision 5000 5560 (AV Pro V60) | |
| Dell Precision 5480 (AV Pro V60) | |
Kommunikation
| Networking | |
| iperf3 transmit AX12 | |
| Dell Precision 5000 5560 | |
| iperf3 receive AX12 | |
| Dell Precision 5000 5560 | |
| iperf3 transmit AXE11000 | |
| Dell Precision 5480 | |
| Lenovo ThinkPad P14s G3 AMD 21J6S05000 | |
| Lenovo ThinkPad P15v G3 21EM001AGE | |
| iperf3 receive AXE11000 | |
| Lenovo ThinkPad P14s G3 AMD 21J6S05000 | |
| Lenovo ThinkPad P15v G3 21EM001AGE | |
| Dell Precision 5480 | |
| iperf3 transmit AXE11000 6GHz | |
| Dell Precision 5480 | |
| Lenovo ThinkPad P14s G3 AMD 21J6S05000 | |
| Dell Precision 5000 5470 | |
| Lenovo ThinkPad P15v G3 21EM001AGE | |
| iperf3 receive AXE11000 6GHz | |
| Lenovo ThinkPad P14s G3 AMD 21J6S05000 | |
| Lenovo ThinkPad P15v G3 21EM001AGE | |
| Dell Precision 5480 | |
| Dell Precision 5000 5470 | |
Webcam
Dell liefert immer noch 720p-Webcams in vielen seiner Spitzenprodukte aus, darunter die XPS-Serie und Precision-Notebooks, die auf dem XPS-Design basieren. Andere Hersteller haben bereits auf 2-MP- oder 5-MP-Sensoren umgestellt, und wir gehen davon aus, dass Dell bei künftigen Neuentwicklungen das Gleiche tun wird.


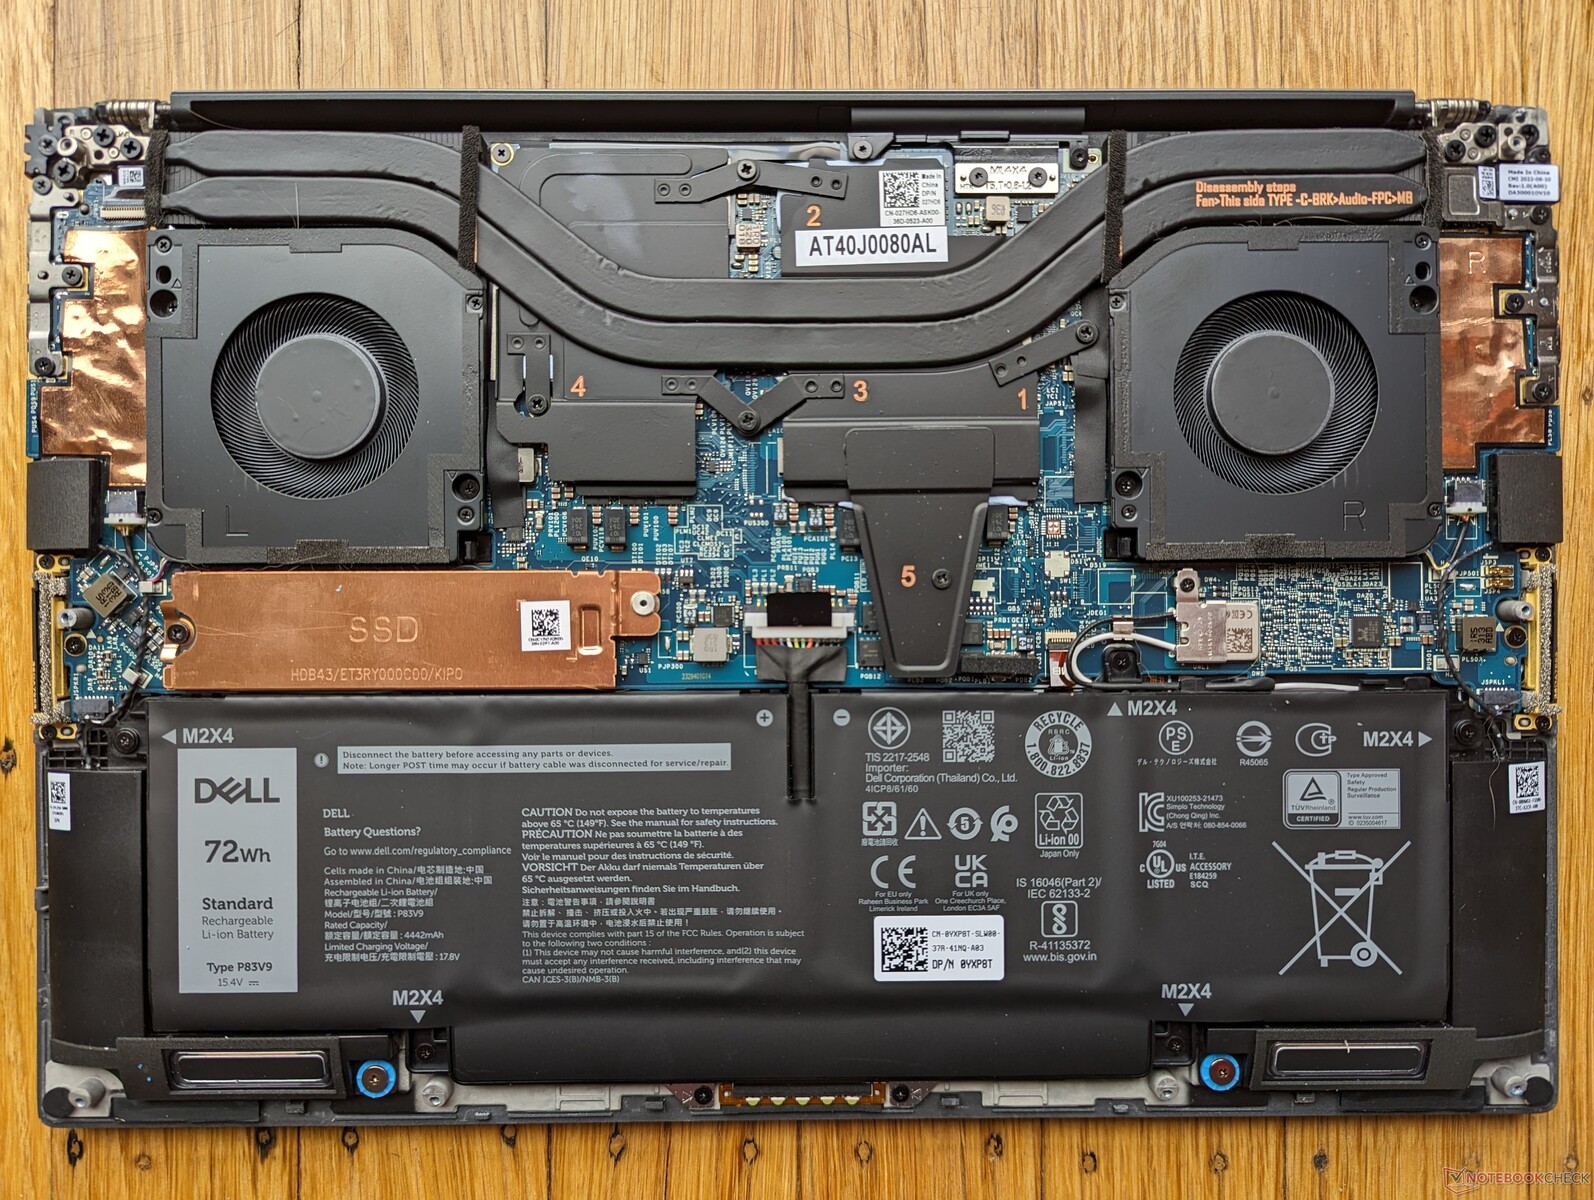
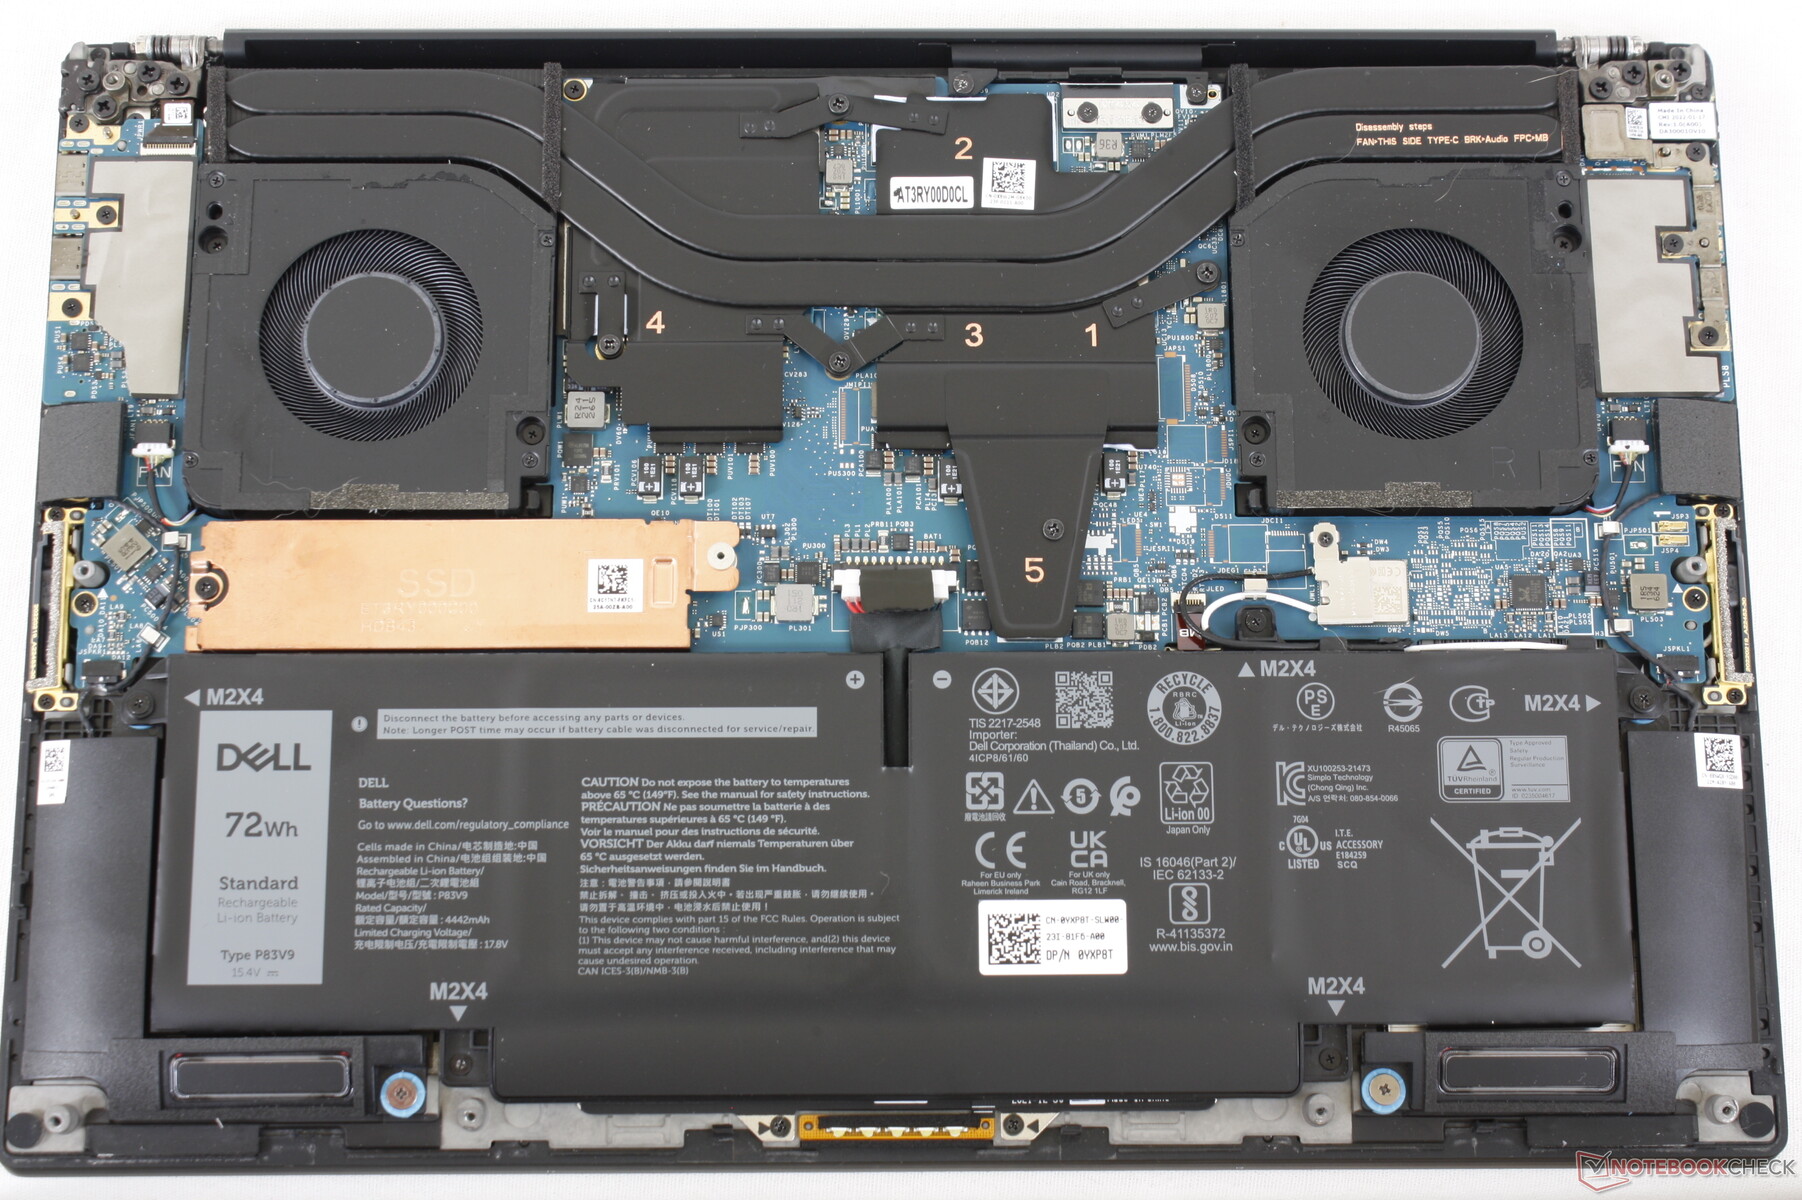
Wartung
Zubehör & Garantie
Der Lieferumfang enthält den gleichen USB-C-zu-HDMI- und USB-A-Adapter wie beim letztjährigen Modell, zusätzlich zu den Unterlagen und dem 130-W-USB-C-Netzteil. Dell bietet auch einen kleineren 100-W-USB-C-Netzadapter an, der für Konfigurationen ohne separate Nvidia-Grafik ausreichen sollte.
Eine dreijährige Garantie ist Standard, wenn sie von Dell Deutschland gekauft wird, ähnlich wie bei der Precision 7000-Serie.
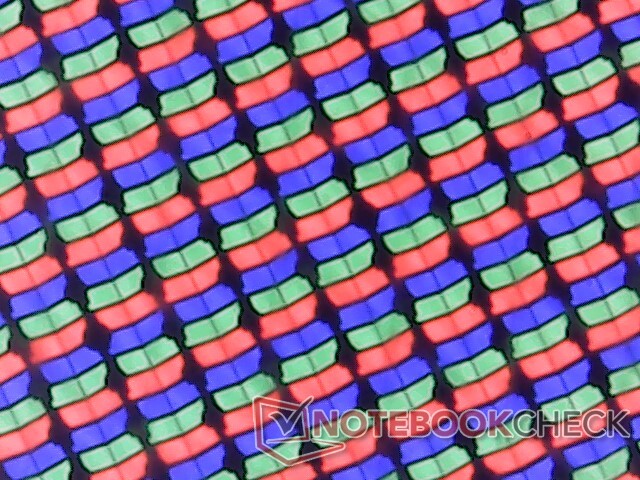
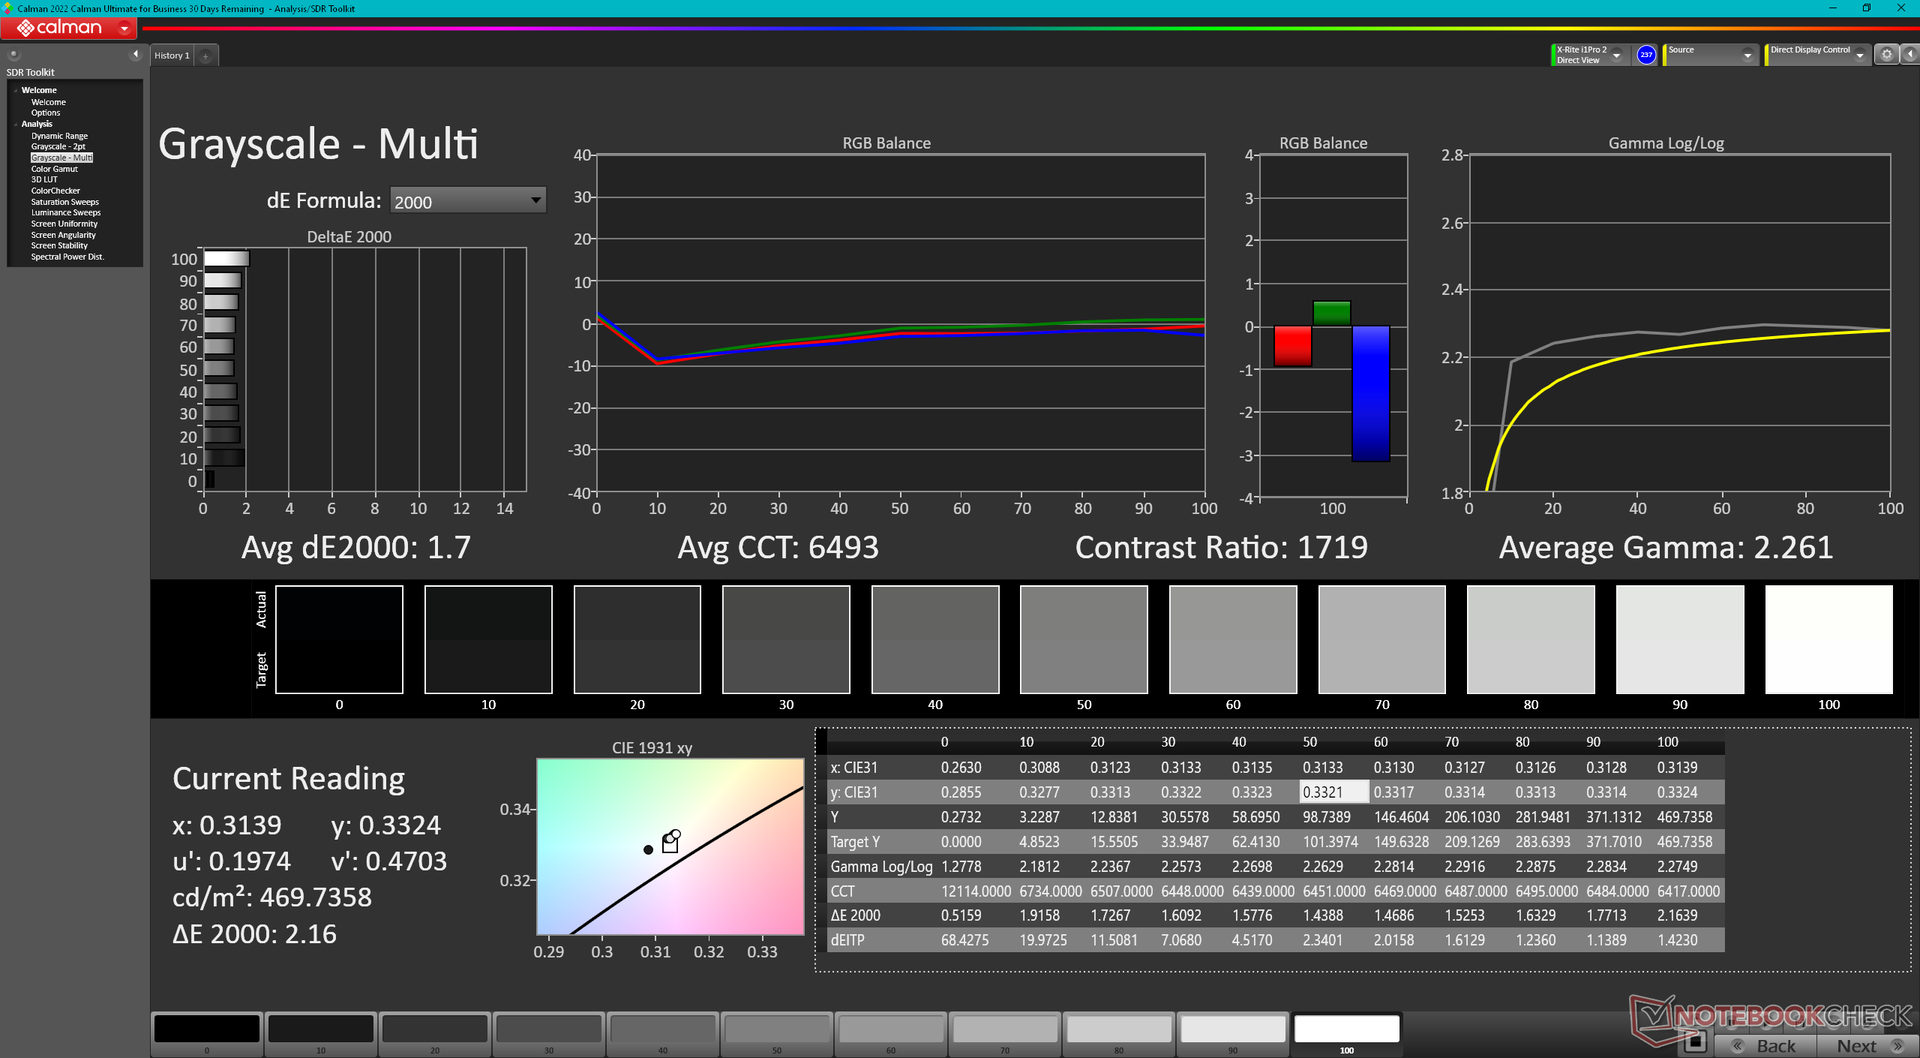
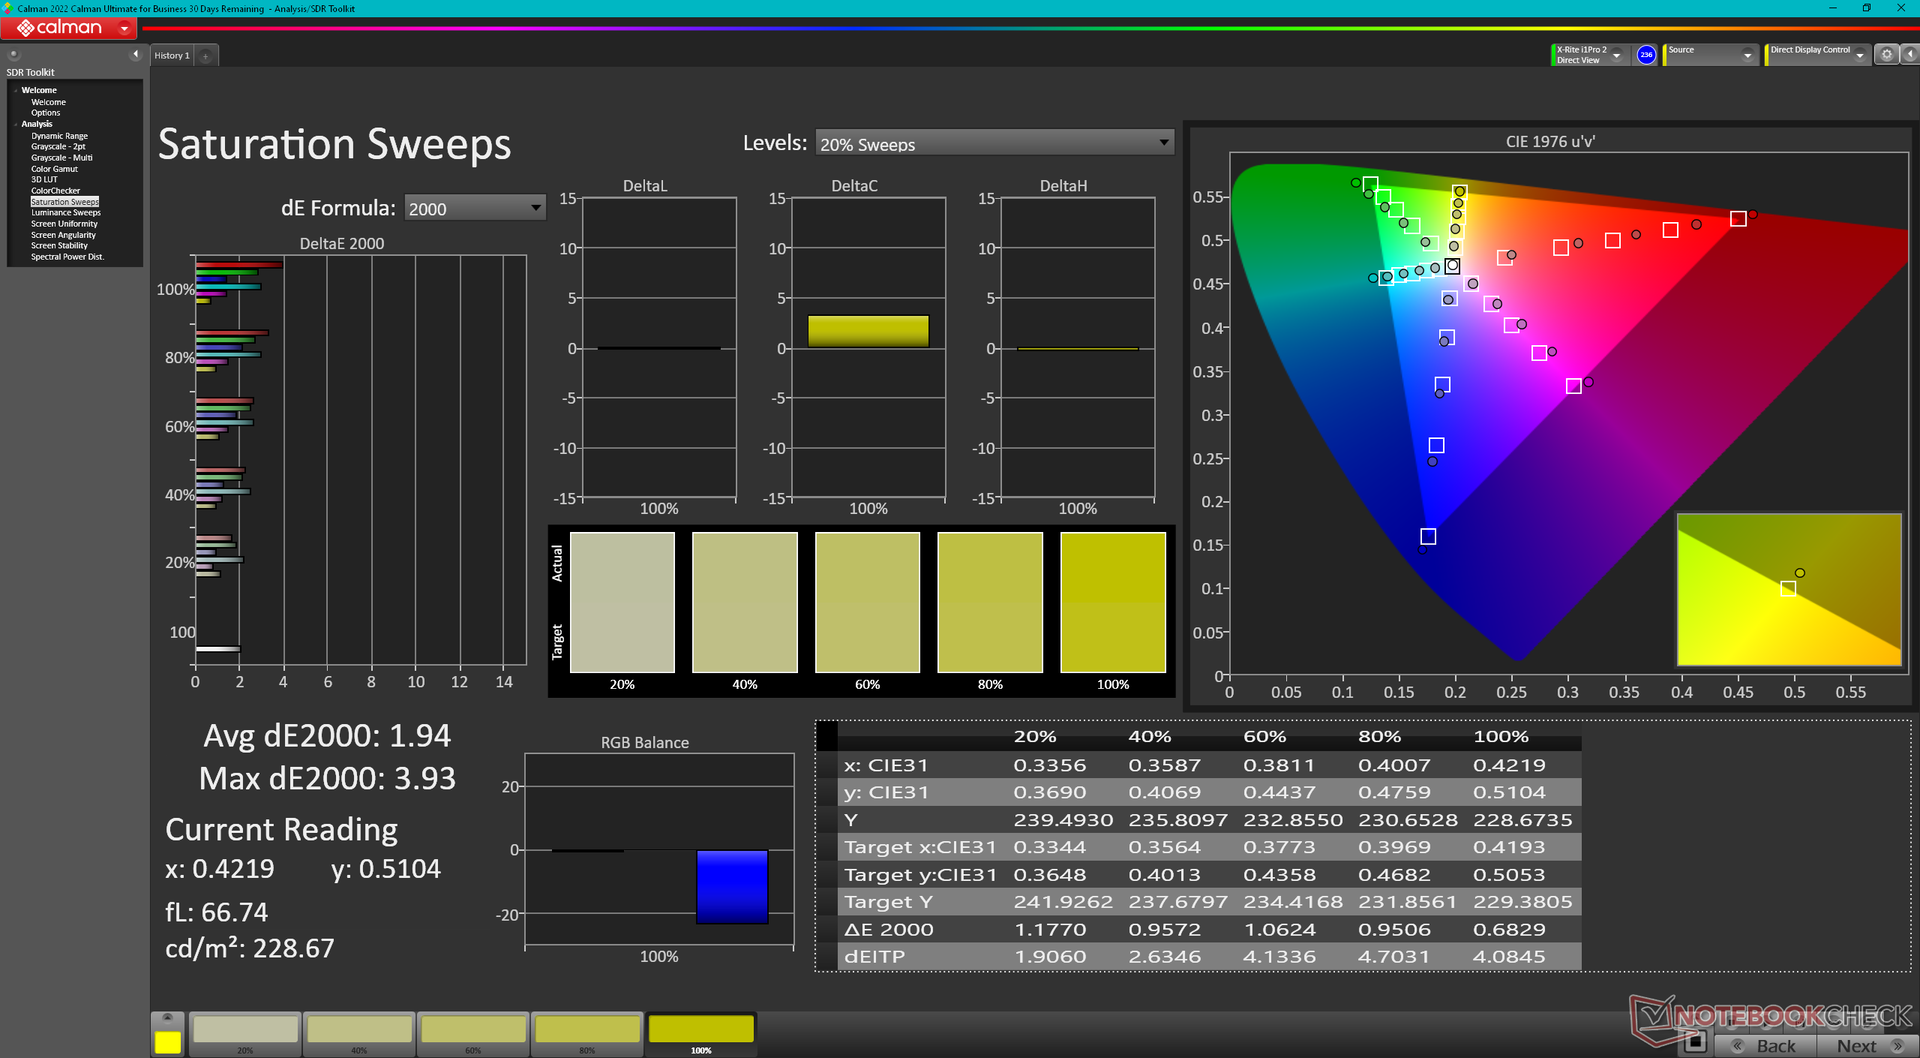
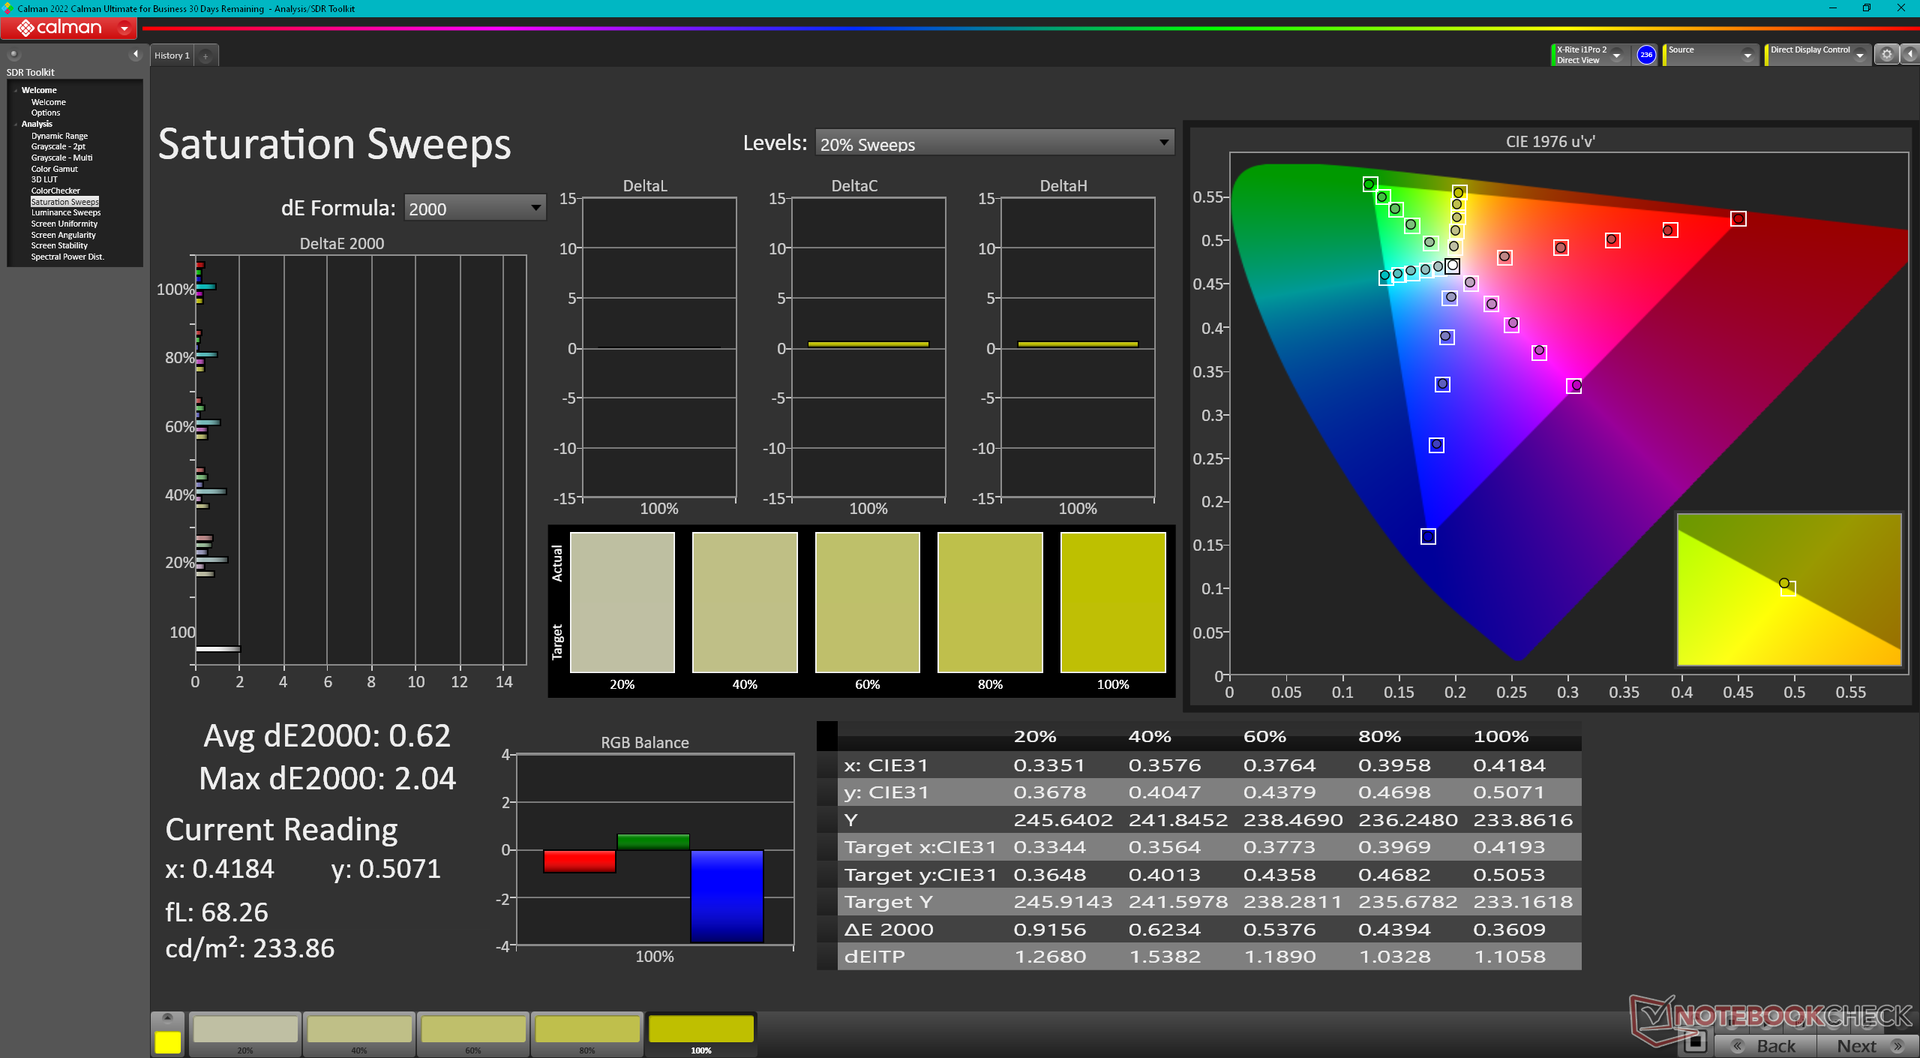
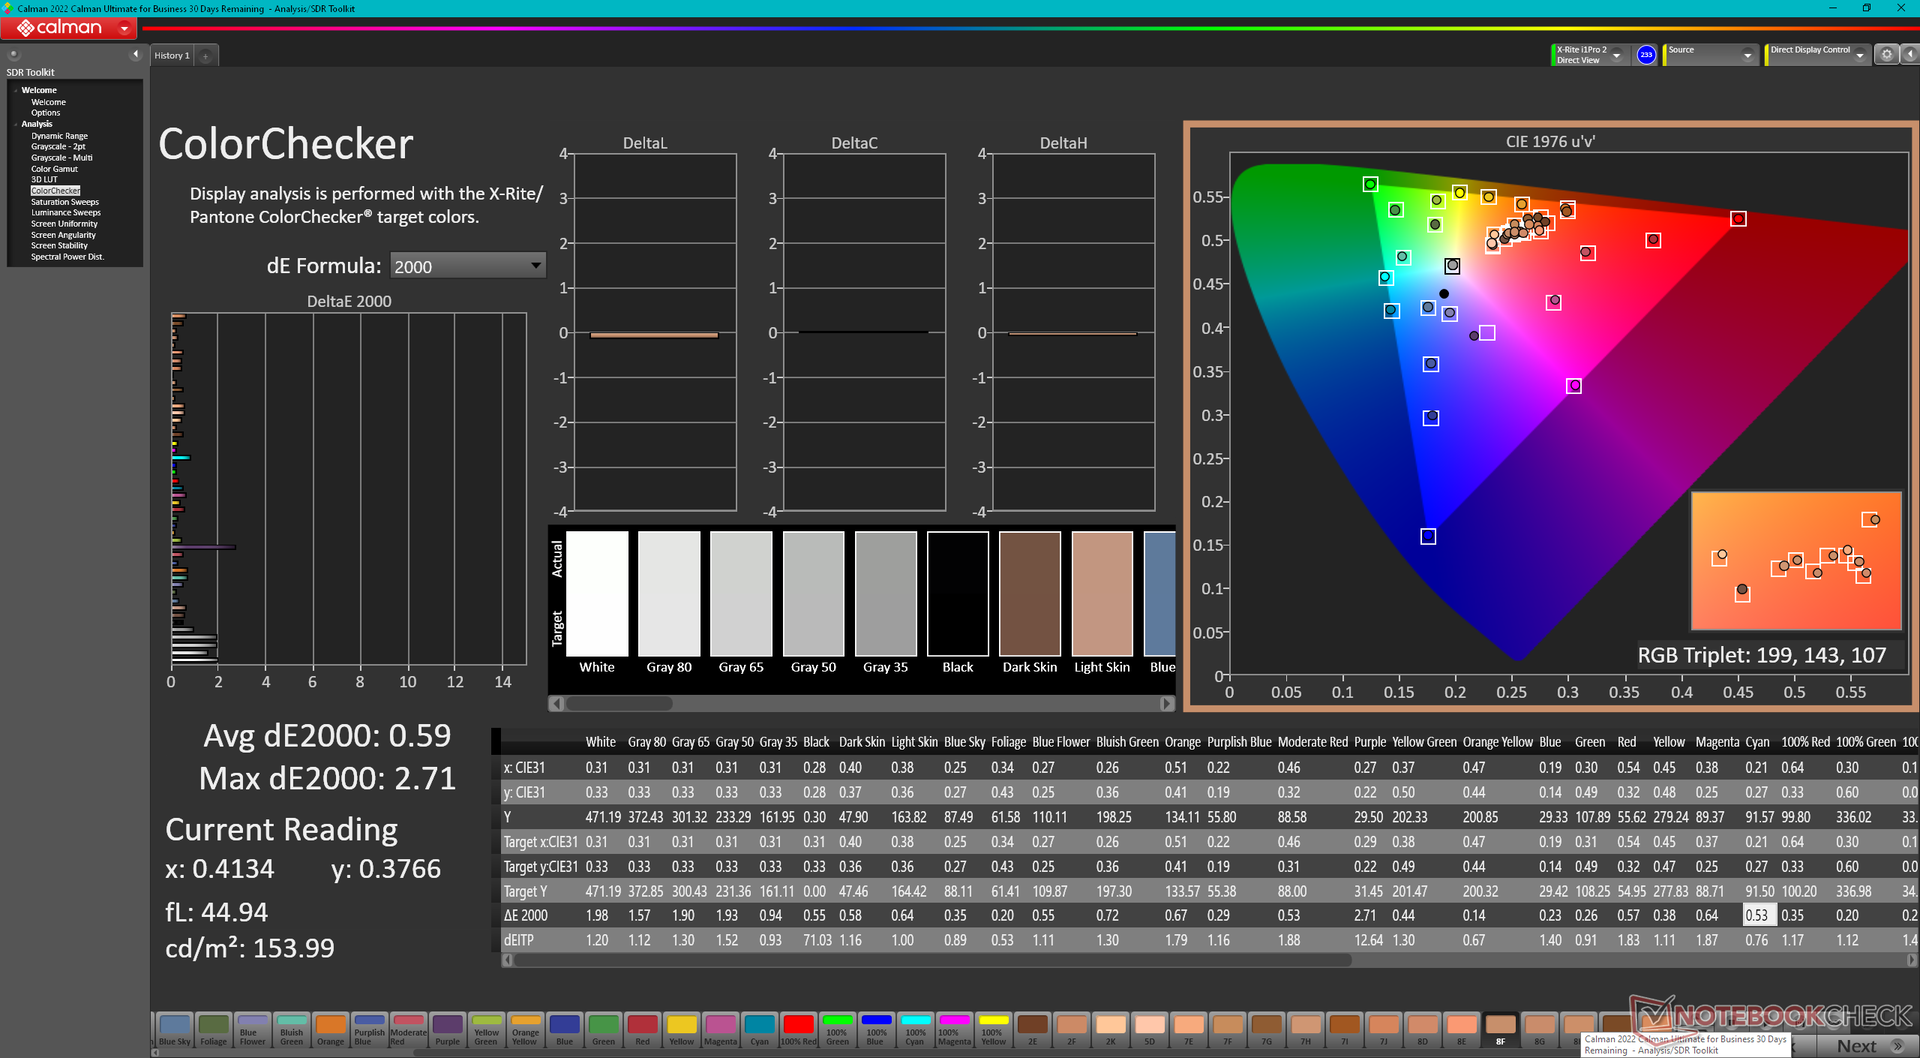
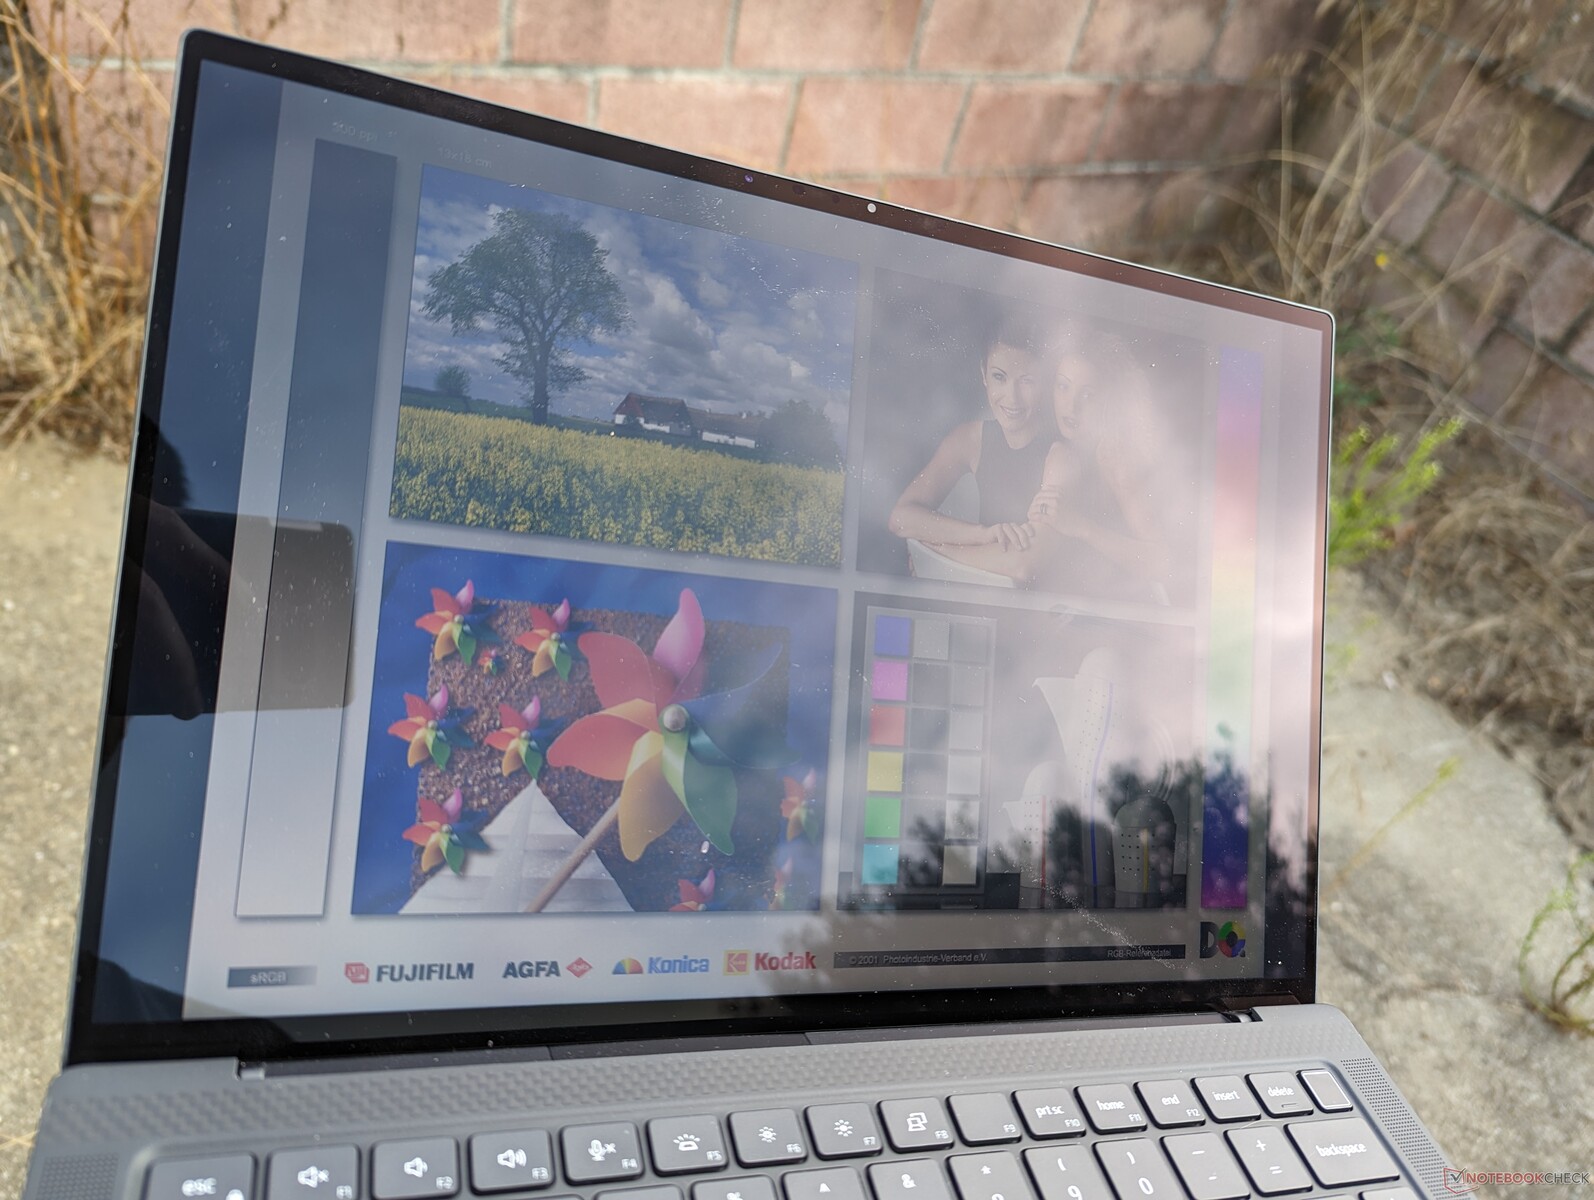
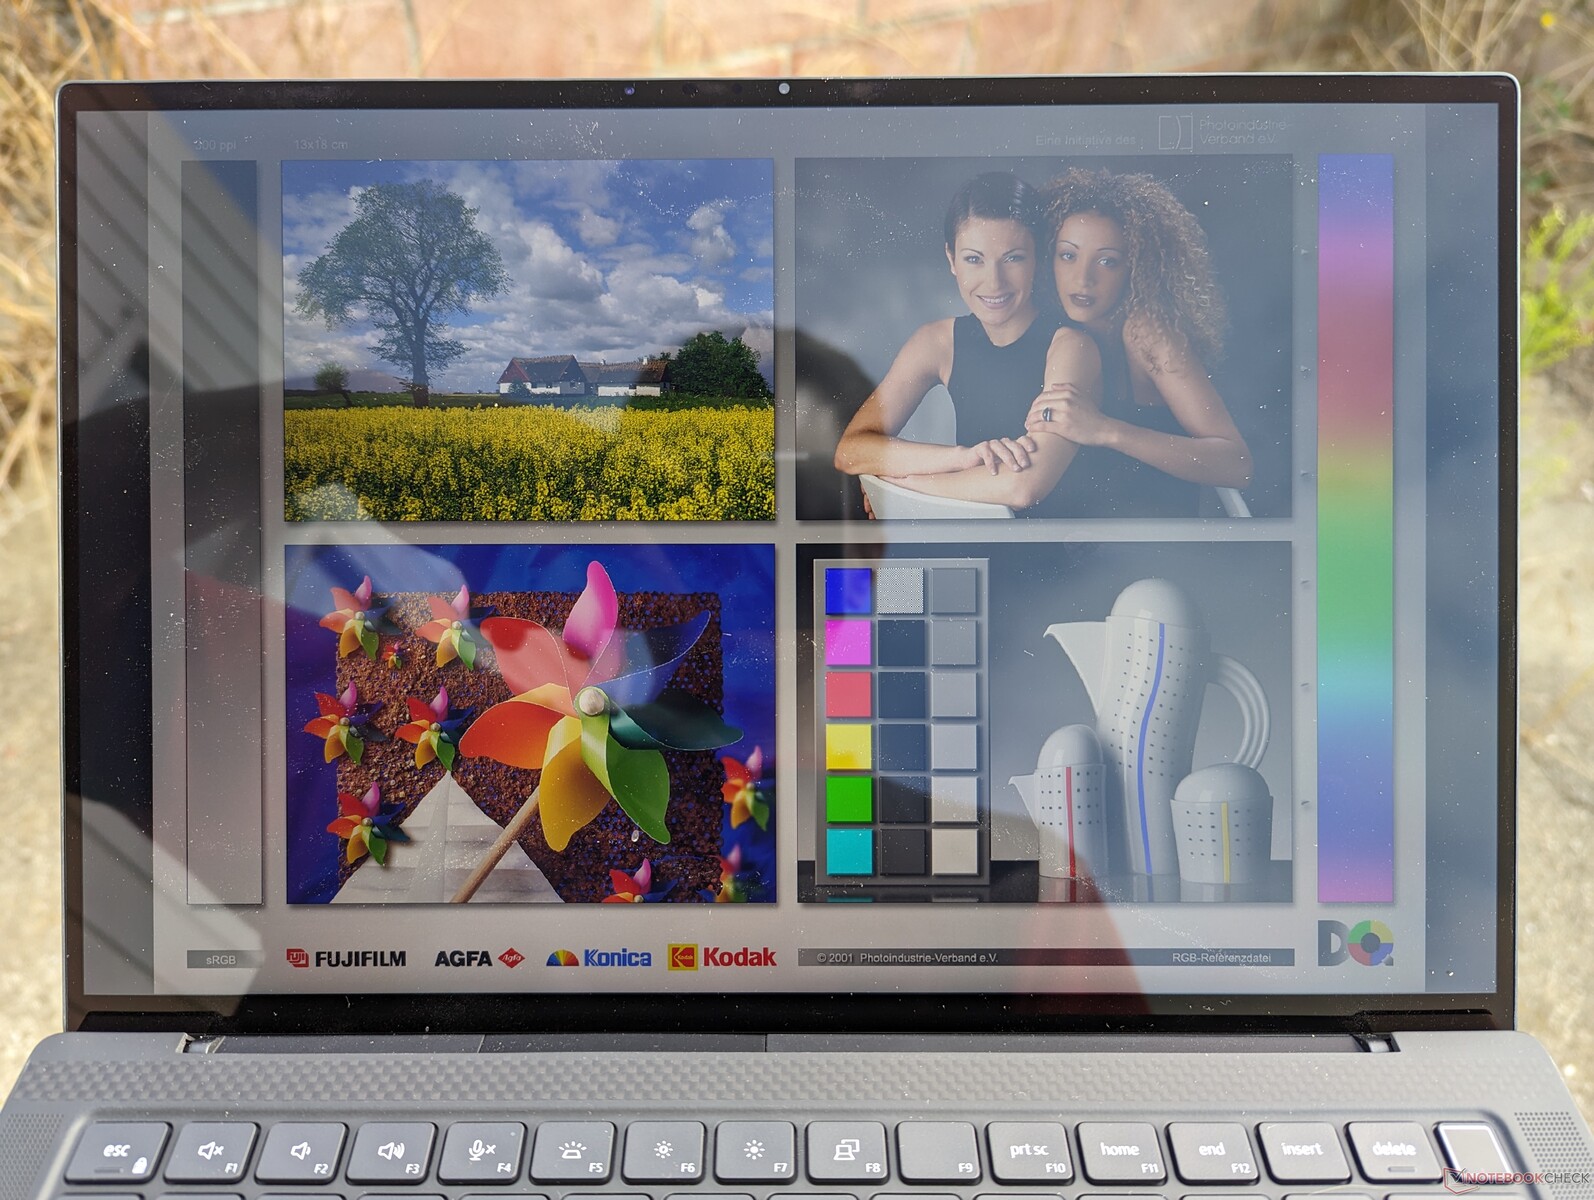
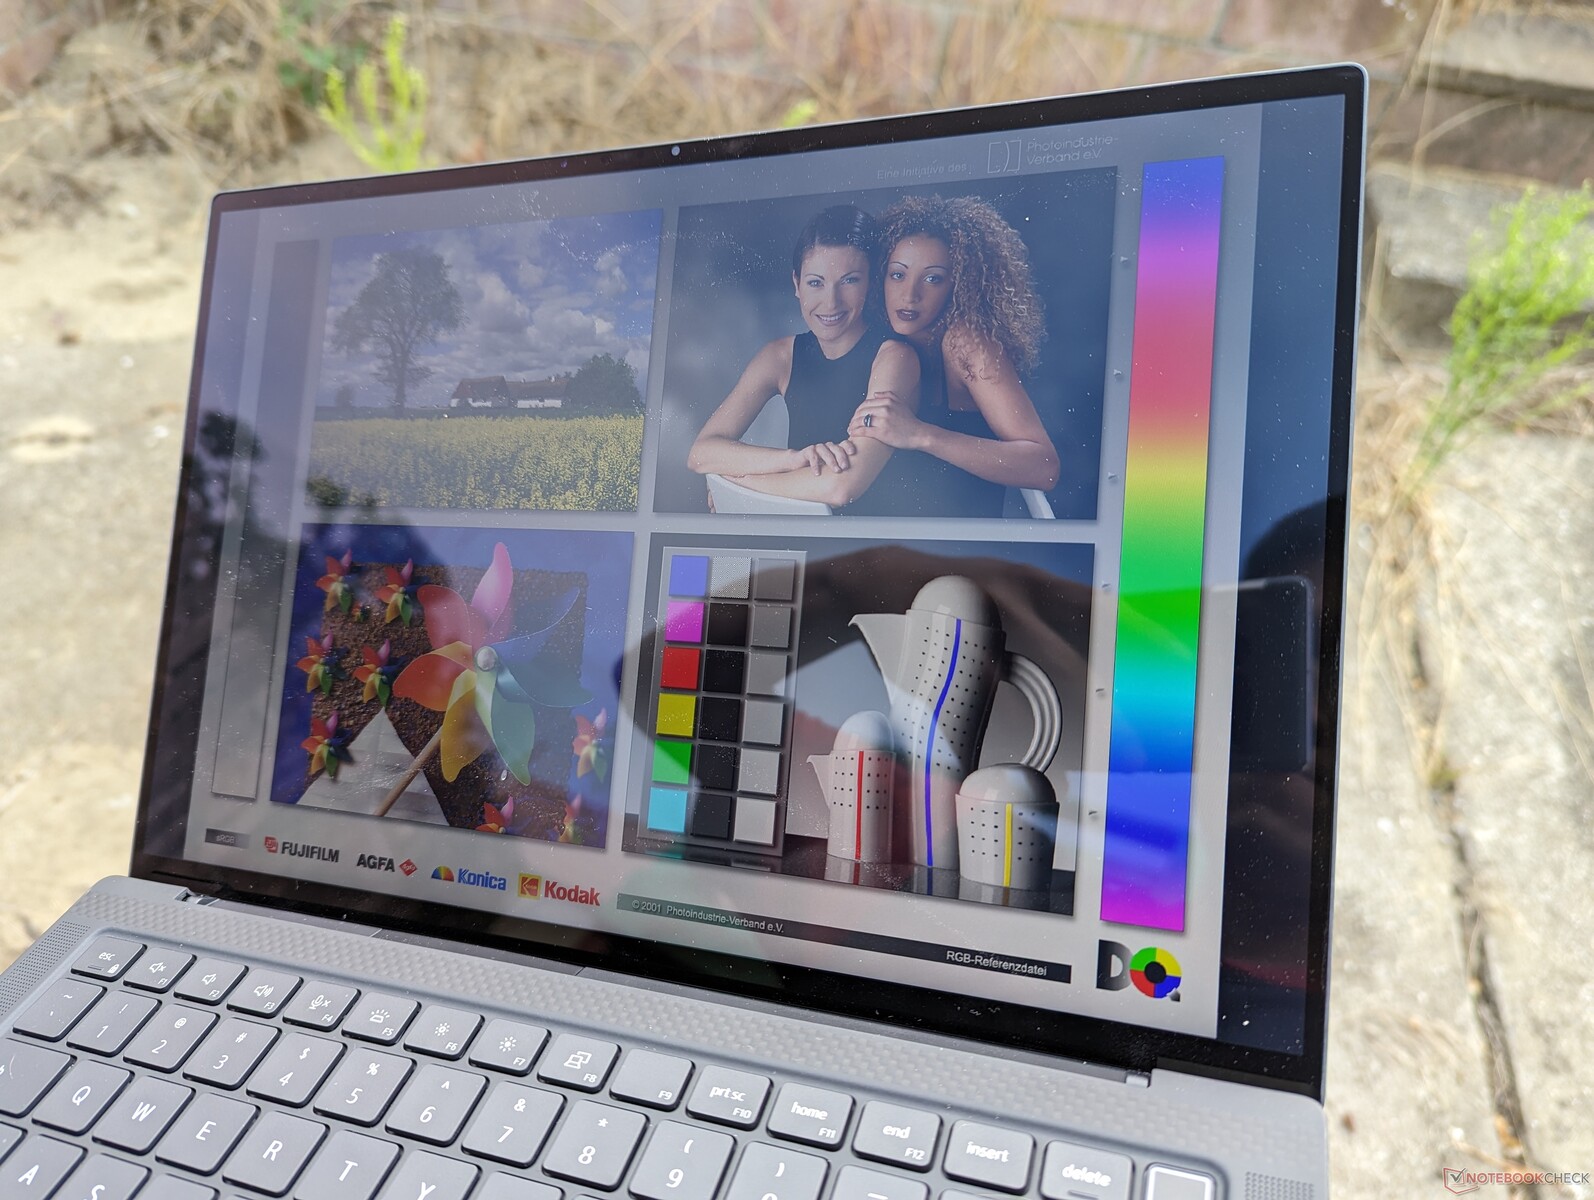
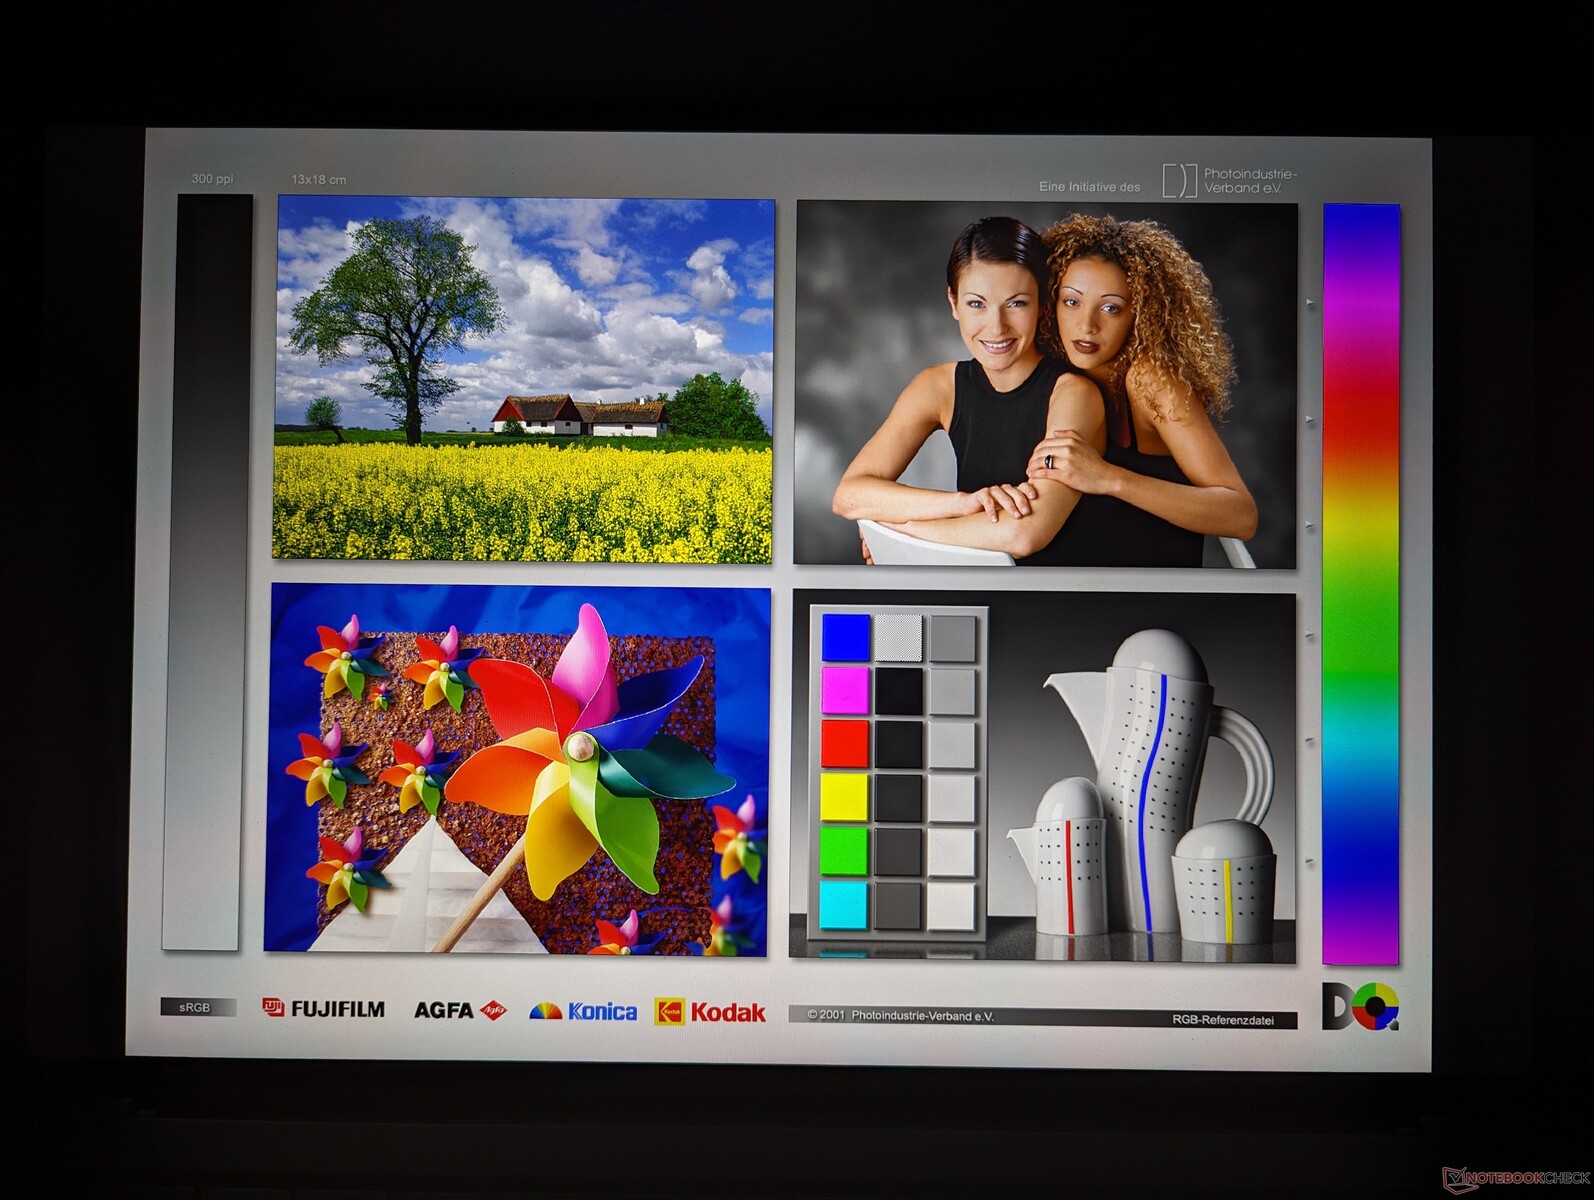
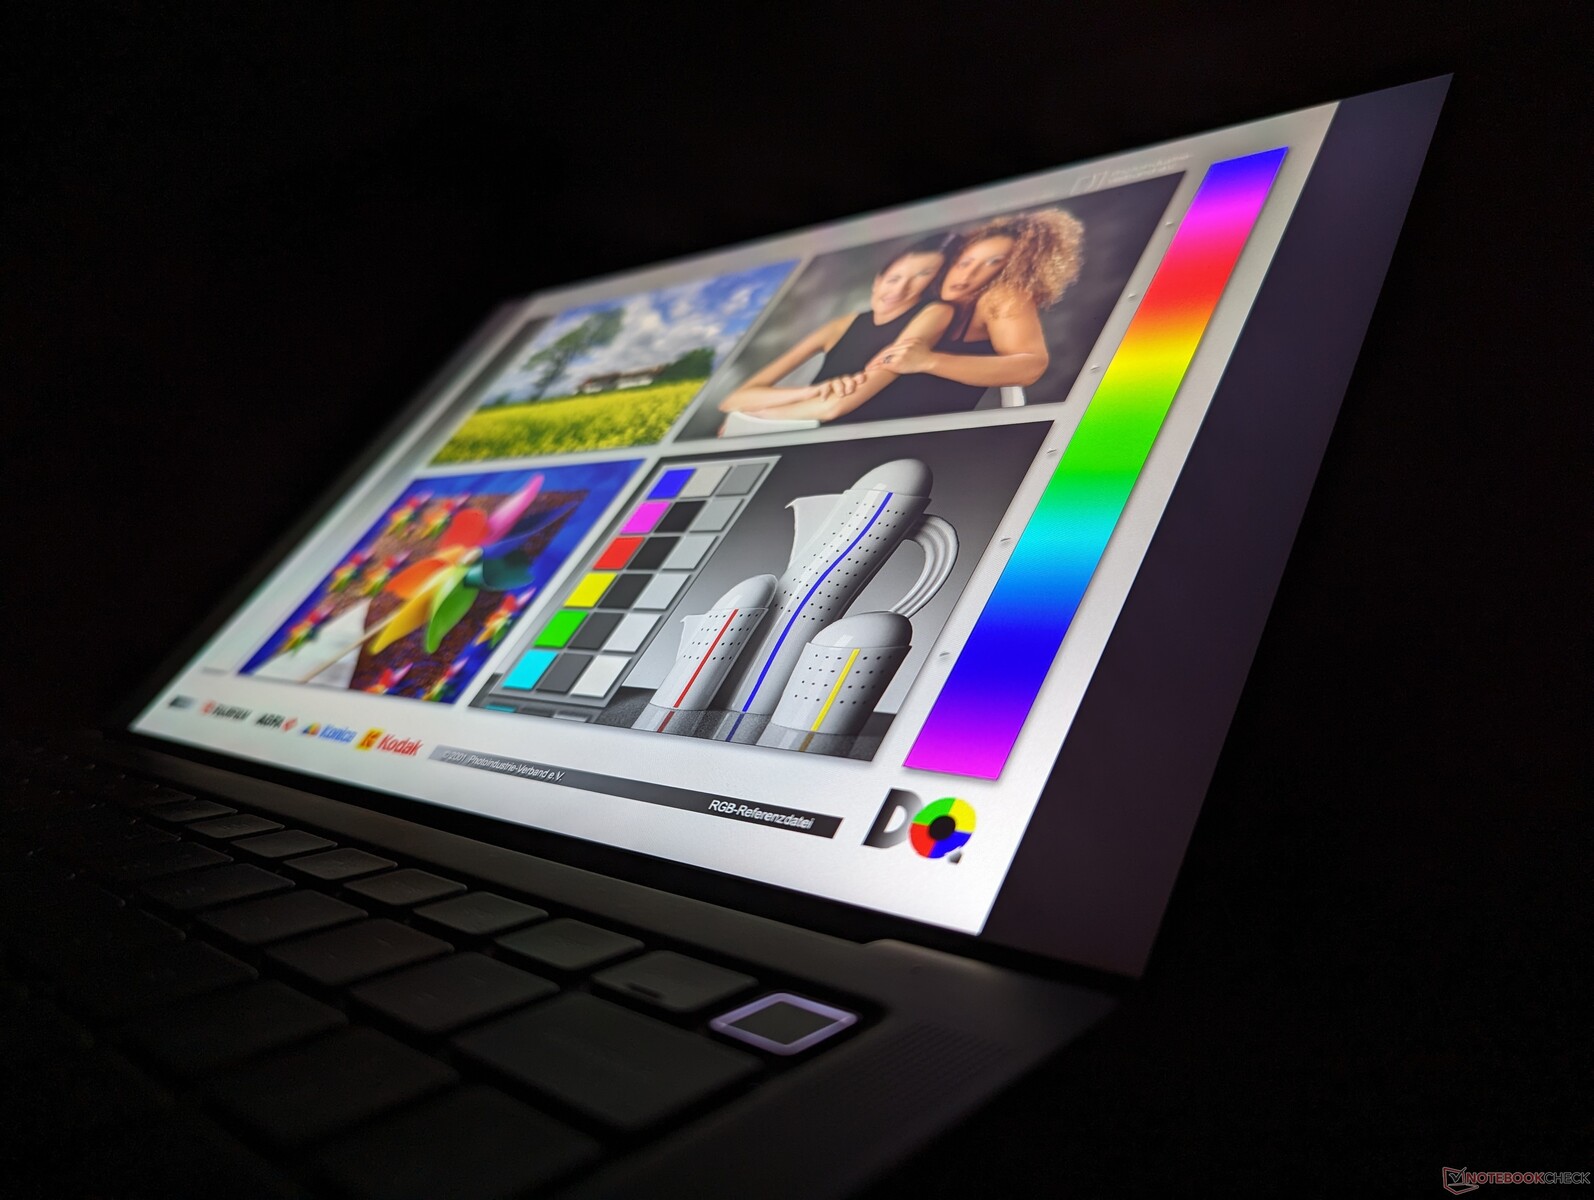
Display — QHD+ mit vollen sRGB-Farben
Unser Testgerät ist mit dem gleichen AU Optronics B140QAN IPS-Panel ausgestattet, das auch im Vorjahresmodell zu finden war. Dell bietet keine neuen Panel-Optionen für die diesjährige Aktualisierung an, was bedeutet, dass volle DCi-P3-Farben oder OLED immer noch außer Reichweite sind.
| |||||||||||||||||||||||||
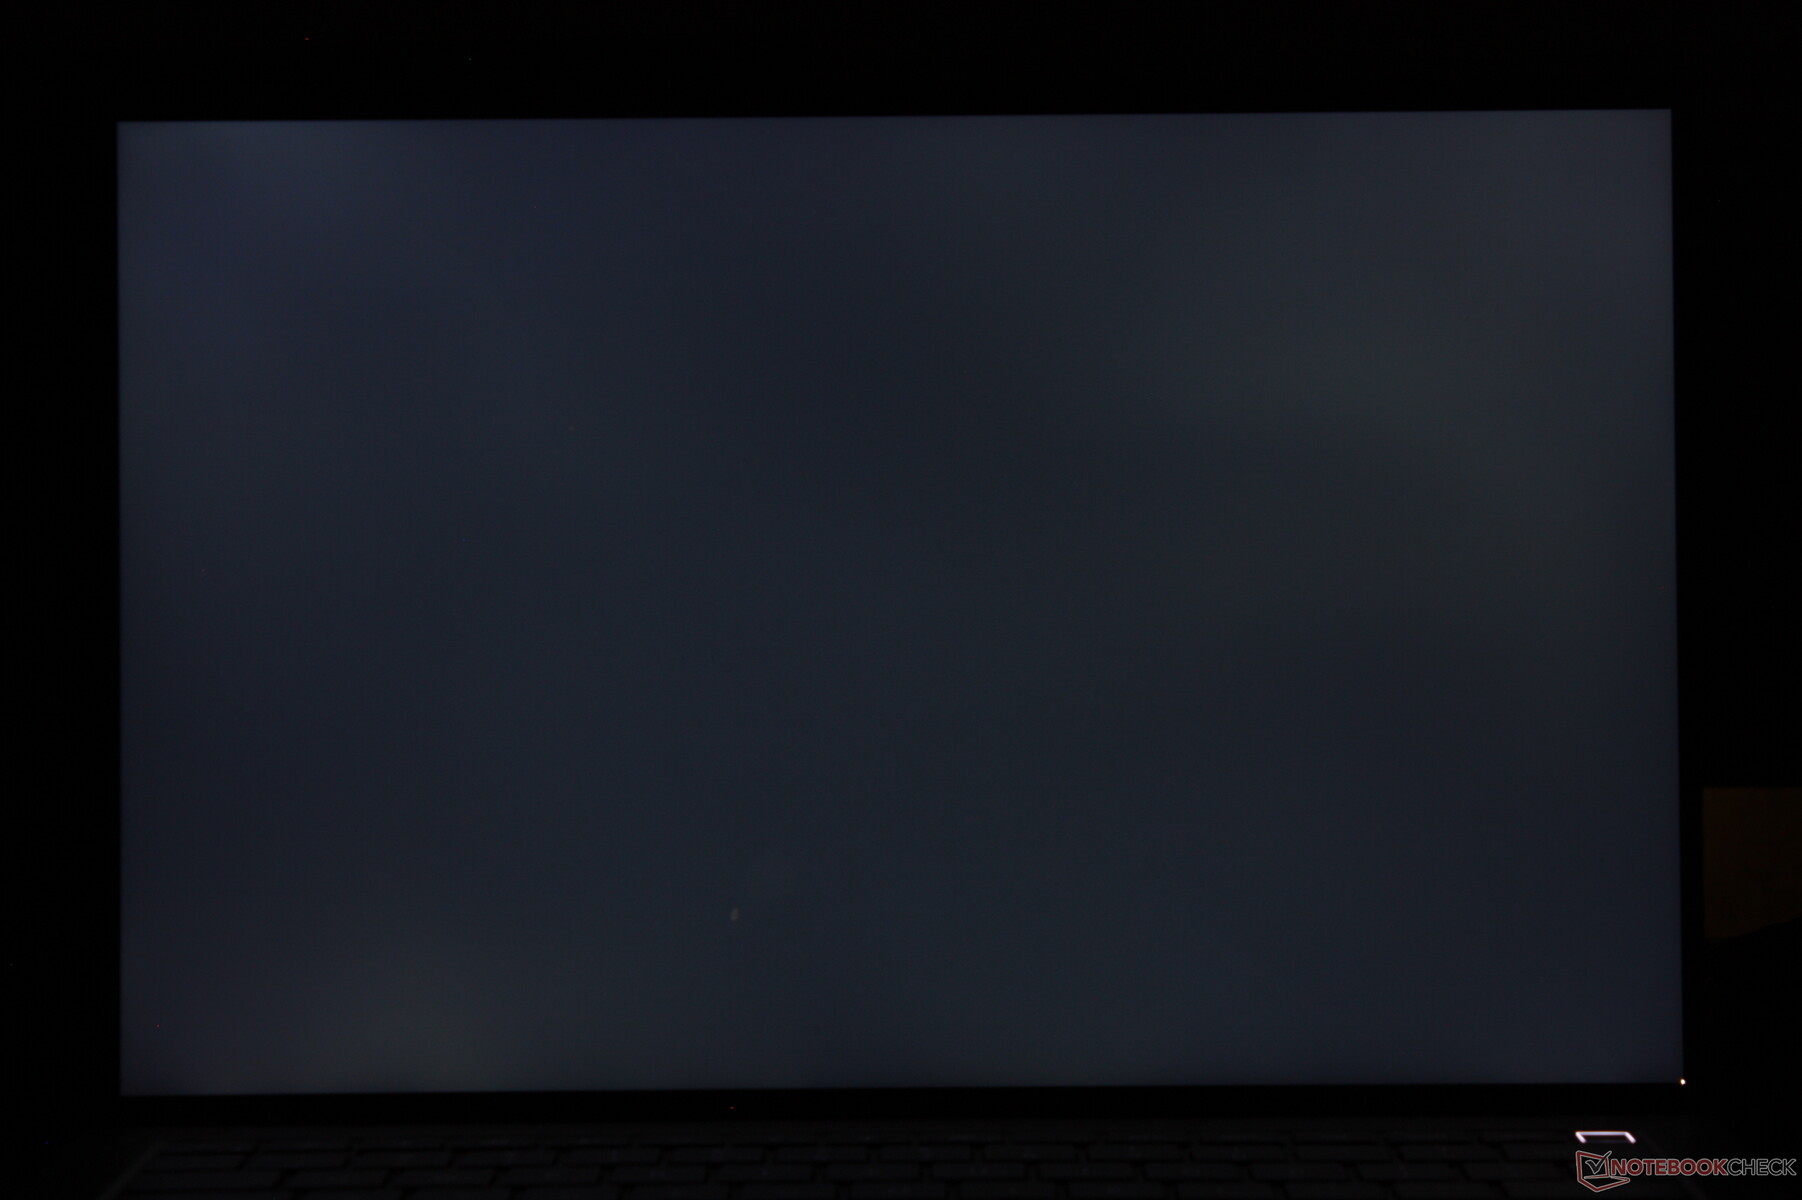
Ausleuchtung: 87 %
Helligkeit Akku: 472.8 cd/m²
Kontrast: 1351:1 (Schwarzwert: 0.35 cd/m²)
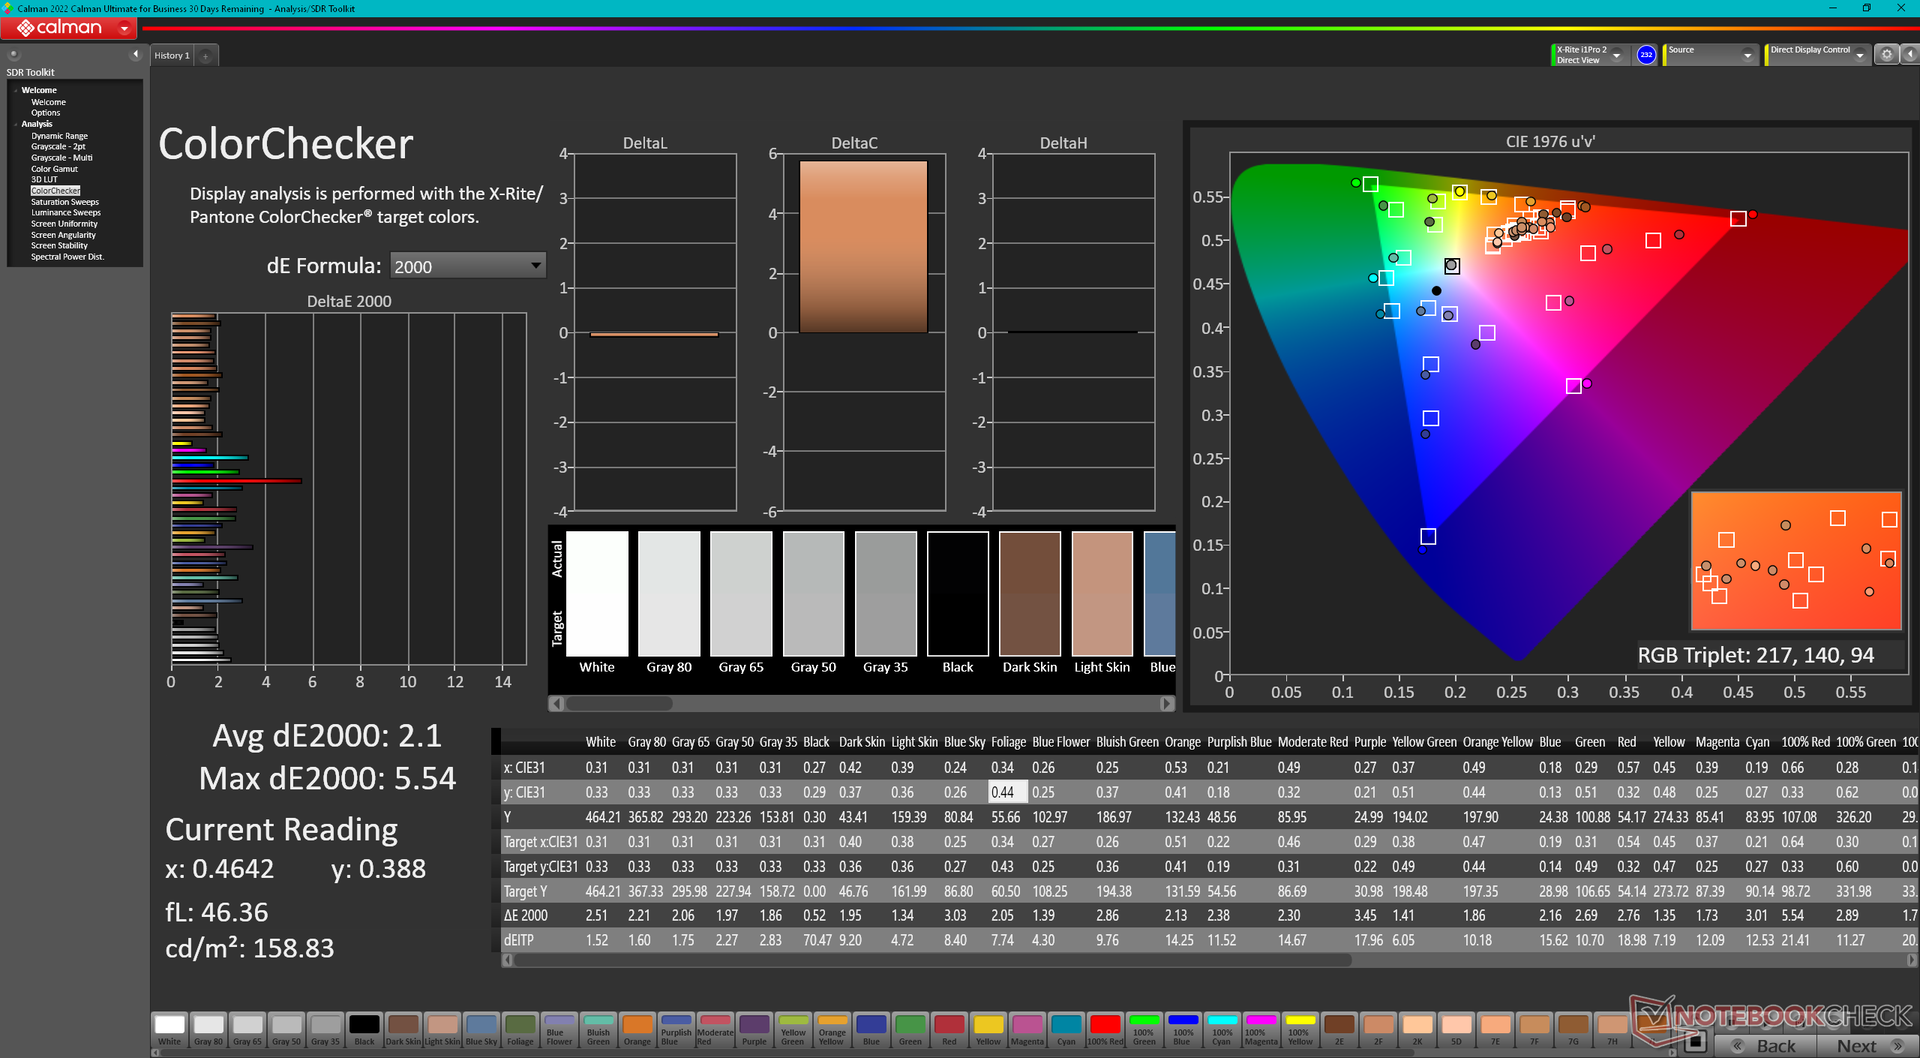
ΔE ColorChecker Calman: 2.1 | ∀{0.5-29.43 Ø4.73}
calibrated: 0.59
ΔE Greyscale Calman: 1.7 | ∀{0.09-98 Ø4.97}
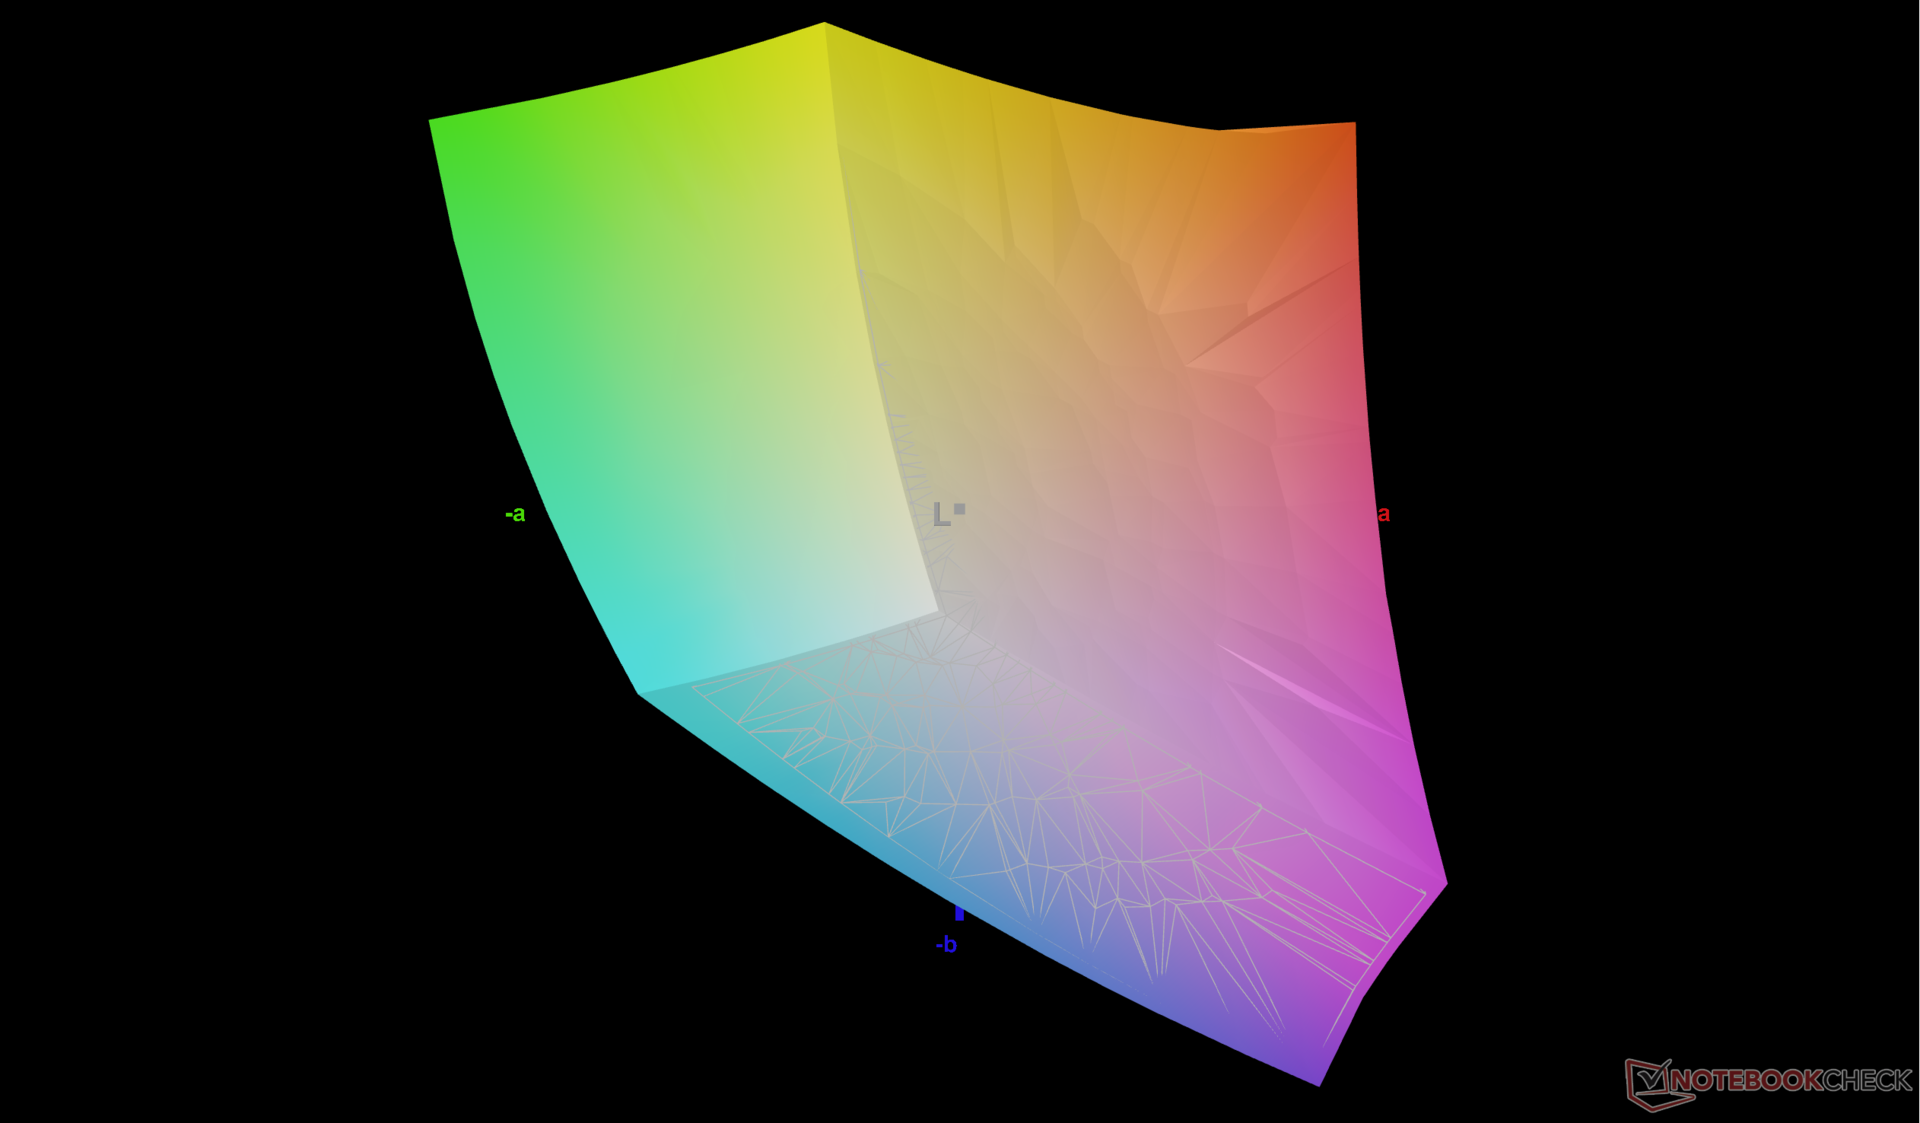
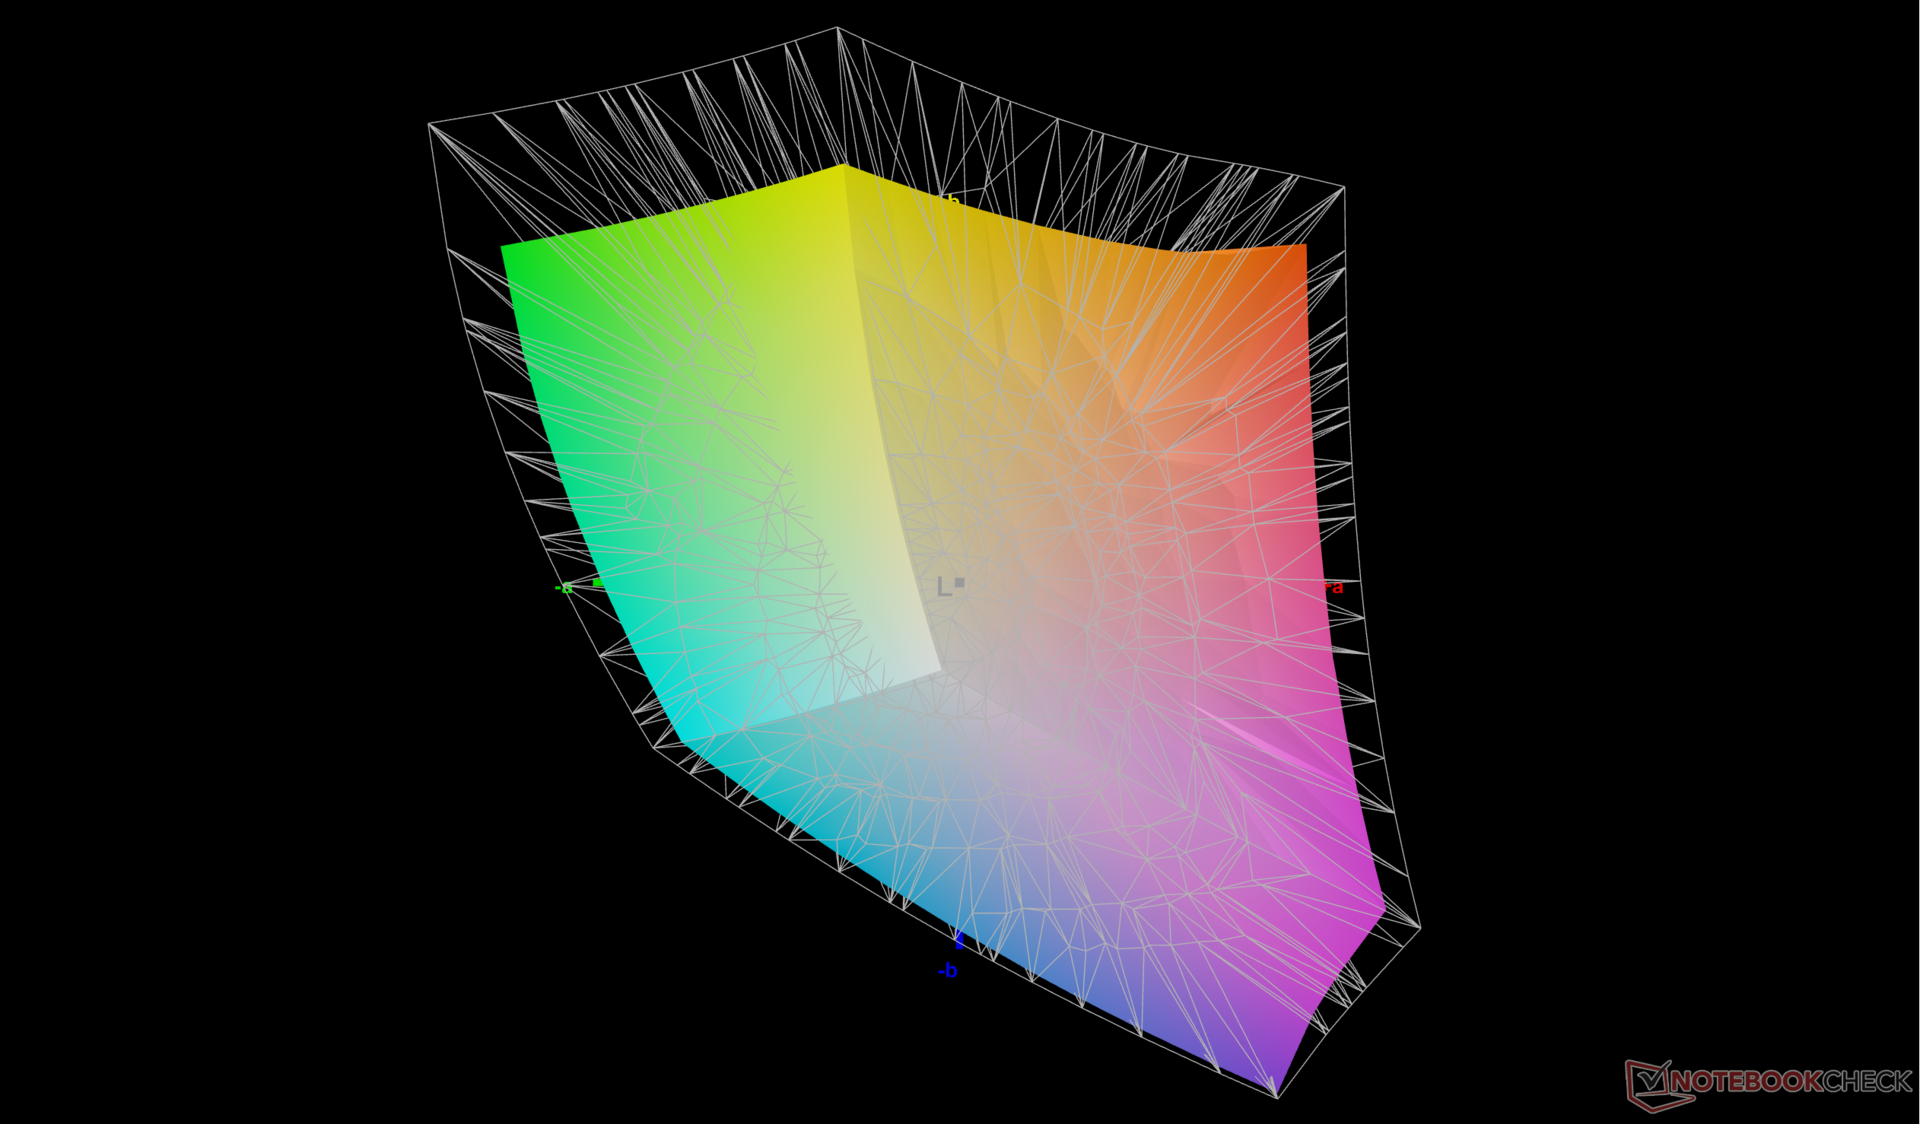
78% AdobeRGB 1998 (Argyll 3D)
99.8% sRGB (Argyll 3D)
77.6% Display P3 (Argyll 3D)
Gamma: 2.26
CCT: 6493 K
| Dell Precision 5480 AU Optronics B140QAN, IPS, 2560x1600, 14" | Dell Precision 5000 5470 AU Optronics B140QAN, IPS, 2560x1600, 14" | Dell Precision 5000 5560 Sharp LQ156R1, IPS, 3840x2400, 15.6" | Lenovo ThinkPad P14s G3 AMD 21J6S05000 LP140WU1-SPB2, IPS LED, 1920x1200, 14" | Lenovo ThinkPad P15v G3 21EM001AGE NE156QUM-N6C, IPS LED, 3840x2160, 15.6" | HP ZBook Firefly 14 G9-6B8A2EA CMN1435, IPS, 1920x1200, 14" | |
|---|---|---|---|---|---|---|
| Display | 1% | 17% | -11% | 15% | -6% | |
| Display P3 Coverage (%) | 77.6 | 79.3 2% | 94.9 22% | 65.9 -15% | 89.9 16% | 69.6 -10% |
| sRGB Coverage (%) | 99.8 | 100 0% | 100 0% | 94.3 -6% | 100 0% | 99.9 0% |
| AdobeRGB 1998 Coverage (%) | 78 | 78.7 1% | 100 28% | 68.2 -13% | 99.9 28% | 71.1 -9% |
| Response Times | -24% | -14% | 13% | -7% | -16% | |
| Response Time Grey 50% / Grey 80% * (ms) | 43.9 ? | 52.4 ? -19% | 47.2 ? -8% | 33.5 ? 24% | 46.7 ? -6% | 56.3 ? -28% |
| Response Time Black / White * (ms) | 25.3 ? | 32.4 ? -28% | 30.4 ? -20% | 24.9 ? 2% | 27.3 ? -8% | 26.2 ? -4% |
| PWM Frequency (Hz) | ||||||
| Bildschirm | -8% | -35% | -13% | -55% | -26% | |
| Helligkeit Bildmitte (cd/m²) | 472.8 | 537 14% | 501.5 6% | 448 -5% | 588 24% | 432 -9% |
| Brightness (cd/m²) | 469 | 518 10% | 467 0% | 422 -10% | 536 14% | 407 -13% |
| Brightness Distribution (%) | 87 | 94 8% | 83 -5% | 85 -2% | 83 -5% | 91 5% |
| Schwarzwert * (cd/m²) | 0.35 | 0.33 6% | 0.44 -26% | 0.23 34% | 0.38 -9% | 0.28 20% |
| Kontrast (:1) | 1351 | 1627 20% | 1140 -16% | 1948 44% | 1547 15% | 1543 14% |
| Delta E Colorchecker * | 2.1 | 2.97 -41% | 4.73 -125% | 2.5 -19% | 3.9 -86% | 3.1 -48% |
| Colorchecker dE 2000 max. * | 5.54 | 5.33 4% | 8.45 -53% | 3.7 33% | 8.8 -59% | 5.6 -1% |
| Colorchecker dE 2000 calibrated * | 0.59 | 0.88 -49% | 0.51 14% | 1.3 -120% | 1 -69% | 0.8 -36% |
| Delta E Graustufen * | 1.7 | 2.4 -41% | 3.6 -112% | 2.9 -71% | 7.1 -318% | 4.5 -165% |
| Gamma | 2.26 97% | 2.06 107% | 2.08 106% | 2.03 108% | 2.12 104% | 2 110% |
| CCT | 6493 100% | 6668 97% | 6447 101% | 6840 95% | 7268 89% | 6528 100% |
| Durchschnitt gesamt (Programm / Settings) | -10% /
-8% | -11% /
-21% | -4% /
-9% | -16% /
-33% | -16% /
-20% |
* ... kleinere Werte sind besser
Der Bildschirm ist mit durchschnittlichen Graustufen- und Farb-DeltaE-Werten von nur 1,7 bzw. 2,1 bereits gut kalibriert. Eine Kalibrierung durch den Endbenutzer ist möglich, aber nicht erforderlich.

Reaktionszeiten (Response Times) des Displays
| ↔ Reaktionszeiten Schwarz zu Weiß | ||
|---|---|---|
| 25.3 ms ... steigend ↗ und fallend ↘ kombiniert | ↗ 12.6 ms steigend | 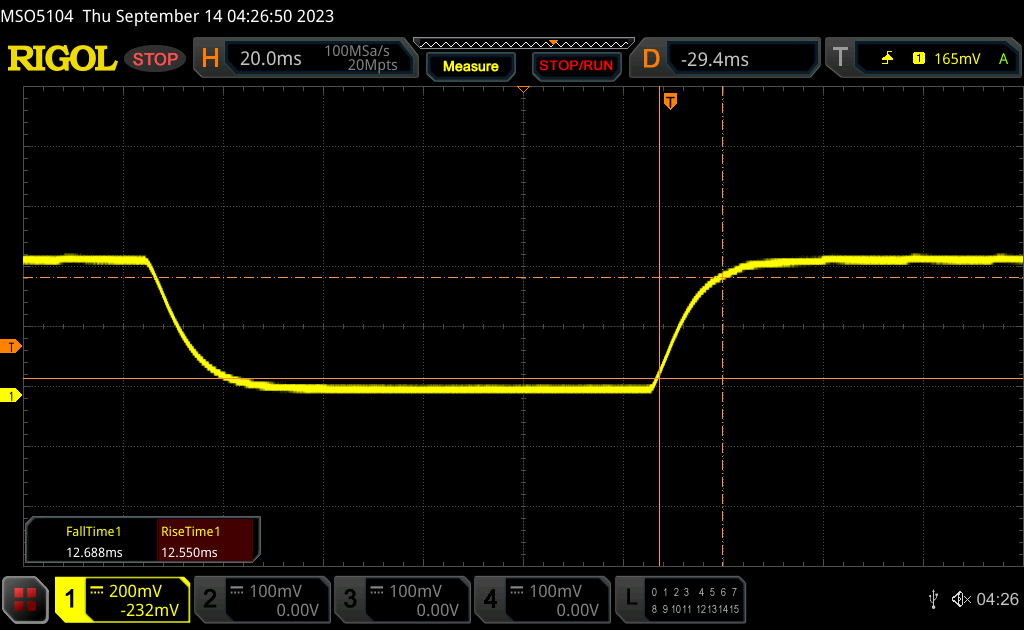 |
| ↘ 12.7 ms fallend | ||
| Die gemessenen Reaktionszeiten sind mittelmäßig und dadurch für Spieler eventuell zu langsam. Im Vergleich rangierten die bei uns getesteten Geräte von 0.1 (Minimum) zu 240 (Maximum) ms. » 61 % aller Screens waren schneller als der getestete. Daher sind die gemessenen Reaktionszeiten schlechter als der Durchschnitt aller vermessenen Geräte (19.9 ms). | ||
| ↔ Reaktionszeiten 50% Grau zu 80% Grau | ||
| 43.9 ms ... steigend ↗ und fallend ↘ kombiniert | ↗ 19.2 ms steigend | 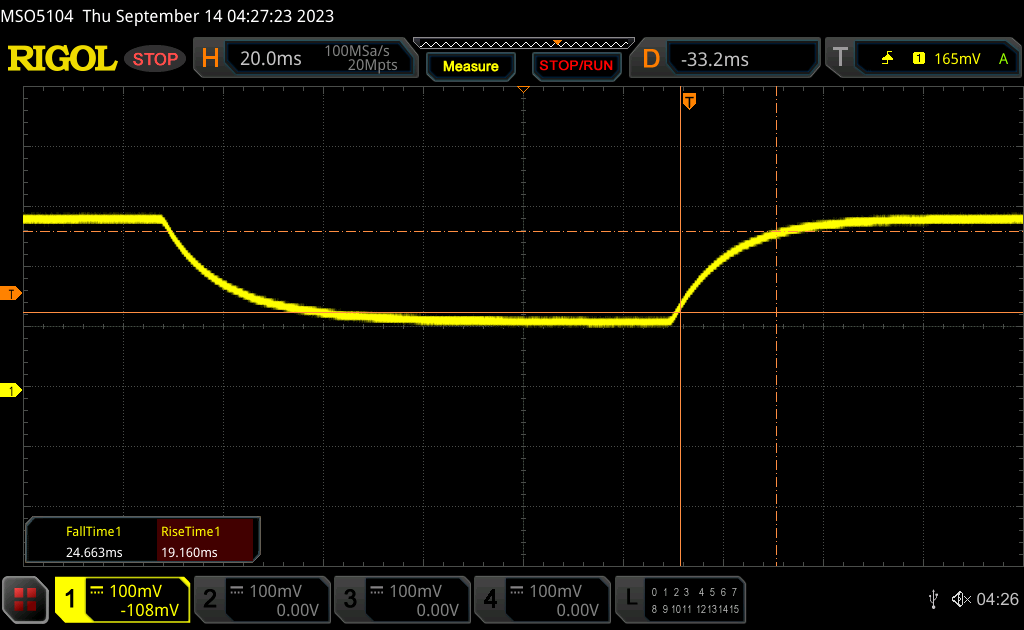 |
| ↘ 24.7 ms fallend | ||
| Die gemessenen Reaktionszeiten sind langsam und dadurch für viele Spieler wahrscheinlich zu langsam. Im Vergleich rangierten die bei uns getesteten Geräte von 0.165 (Minimum) zu 636 (Maximum) ms. » 73 % aller Screens waren schneller als der getestete. Daher sind die gemessenen Reaktionszeiten schlechter als der Durchschnitt aller vermessenen Geräte (31.1 ms). | ||
Bildschirm-Flackern / PWM (Pulse-Width Modulation)
| Flackern / PWM nicht festgestellt | 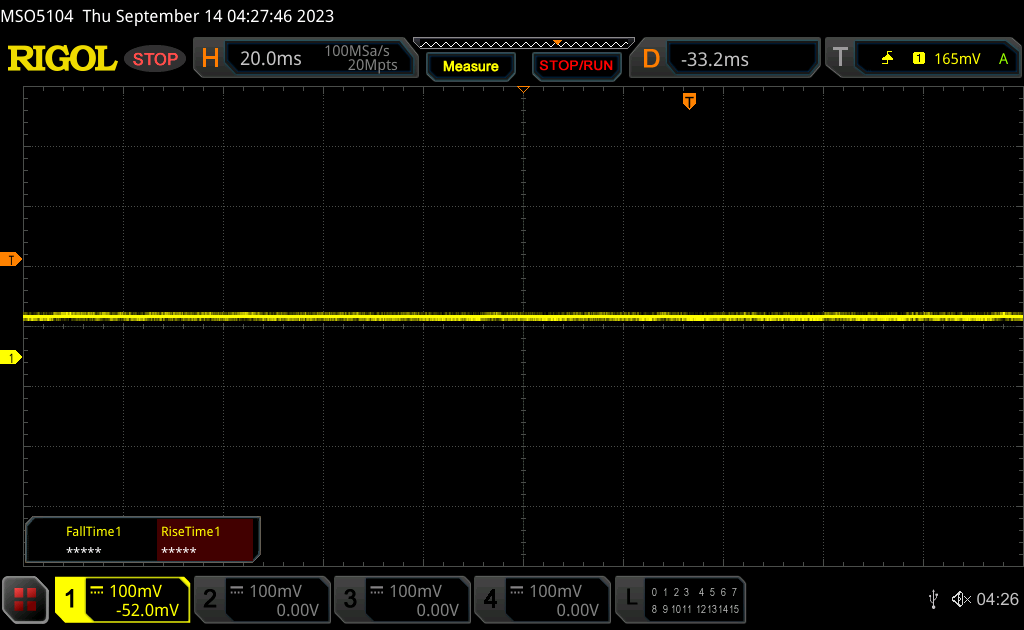 | ||
Im Vergleich: 52 % aller getesteten Geräte nutzten kein PWM um die Helligkeit zu reduzieren. Wenn PWM eingesetzt wurde, dann bei einer Frequenz von durchschnittlich 7798 (Minimum 5, Maximum 343500) Hz. | |||
Leistung — 13th Gen Raptor Lake-H
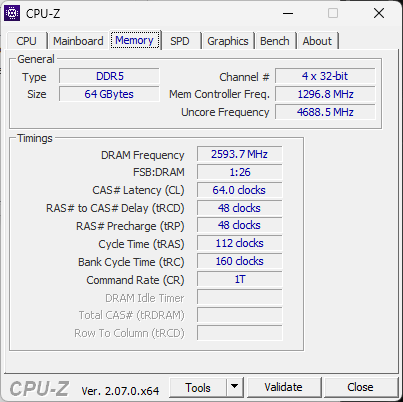
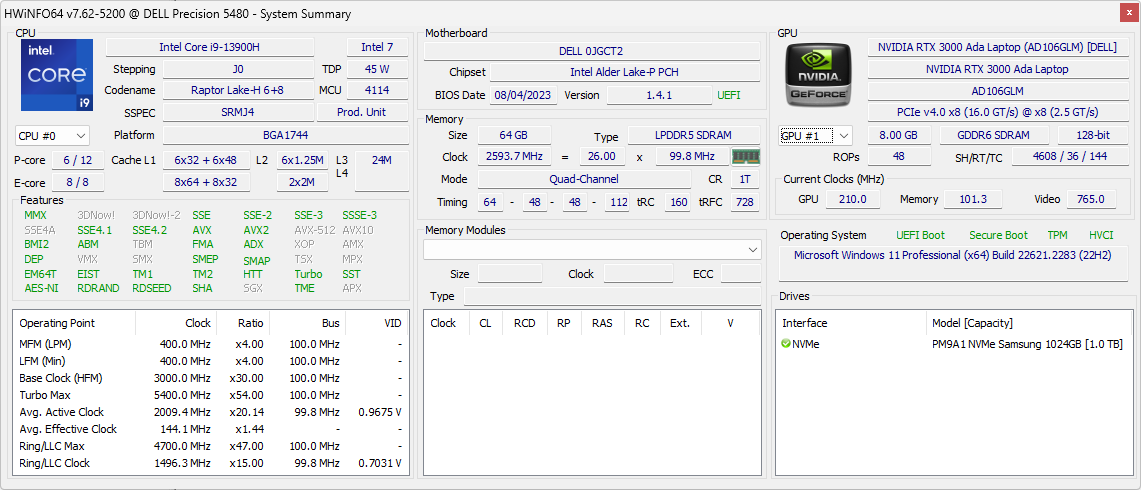
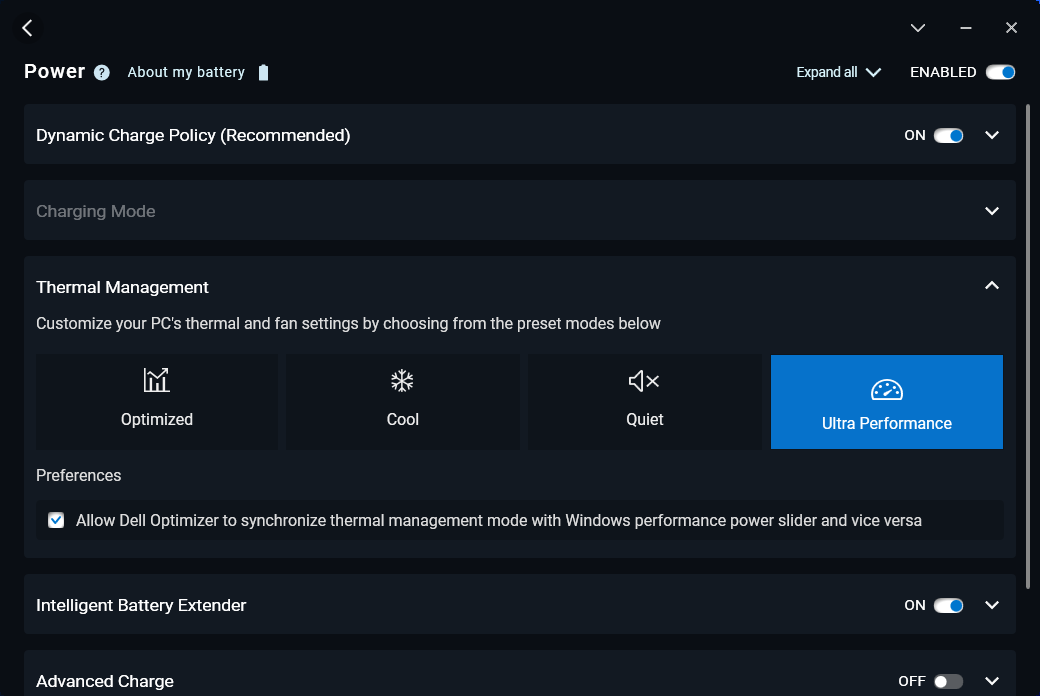
Testbedingungen
Wir haben unser Gerät über Dell Optimizer auf den Ultra-Performance-Modus eingestellt, bevor wir die folgenden Benchmarks durchgeführt haben. Im Gegensatz zu den meisten anderen Laptops können die Optimizer-Energieprofile mit den Windows-Energieprofilen synchronisiert werden.
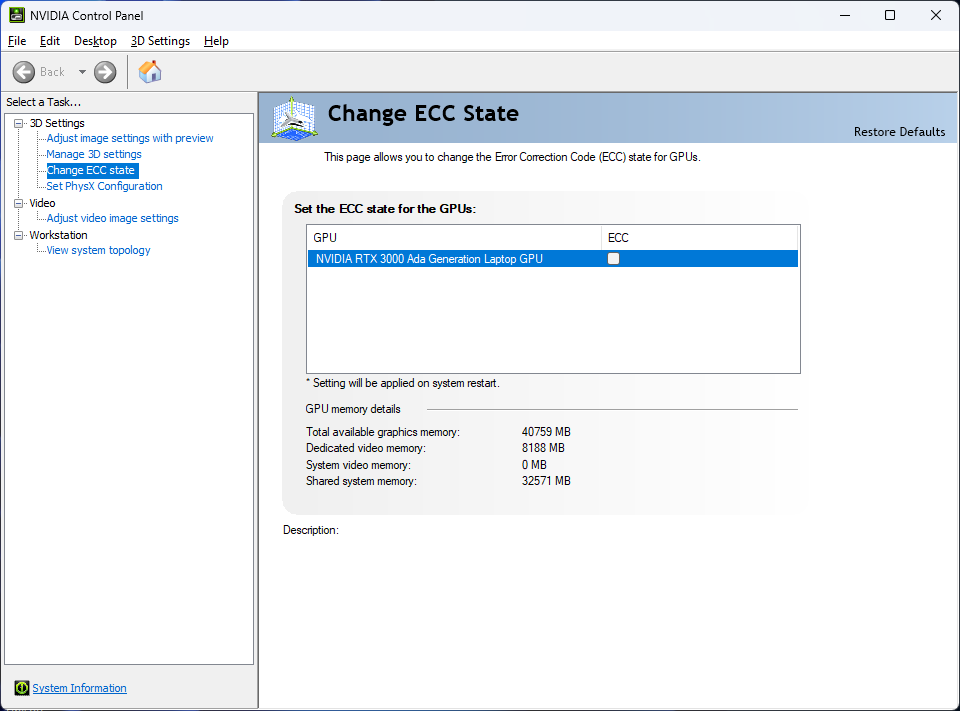
Advanced Optimus, MUX und G-Sync werden auf dem internen Display nicht unterstützt. Der VRAM ECC-Modus kann über das Nvidia Control Panel ein- oder ausgeschaltet werden, ähnlich wie bei anderen RTX-GPUs der Workstation-Klasse aus der Ada Lovelace-Generation.
Prozessor
Unser Core i9-13900H bietet eine bis zu 25 bis 35 Prozent schnellere Multi-Thread-Leistung als der Core i9-12900H in der Precision 5470 des letzten Jahres. Der bemerkenswerte Anstieg kann auf die stabilere Turbo Boost-Leistung des Precision 5480 im Vergleich zum Precision 5470 zurückgeführt werden, wie unser CineBench R15 xT-Dauertest-Ergebniss unten zeigt.
Die durchschnittliche Leistung für ein Notebook mit einem Core i9-13900H ist immer noch langsamer als erwartet, was wahrscheinlich auf die geringe Größe des Precision 5480 zurückzuführen ist. Beispielsweise verfügt das größere Precision 5680 über die gleiche CPU und ist dennoch um etwa 15 % schneller.
Cinebench R15 Multi Dauertest
Cinebench R23: Multi Core | Single Core
Cinebench R20: CPU (Multi Core) | CPU (Single Core)
Cinebench R15: CPU Multi 64Bit | CPU Single 64Bit
Blender: v2.79 BMW27 CPU
7-Zip 18.03: 7z b 4 | 7z b 4 -mmt1
Geekbench 5.5: Multi-Core | Single-Core
HWBOT x265 Benchmark v2.2: 4k Preset
LibreOffice : 20 Documents To PDF
R Benchmark 2.5: Overall mean
* ... kleinere Werte sind besser
AIDA64: FP32 Ray-Trace | FPU Julia | CPU SHA3 | CPU Queen | FPU SinJulia | FPU Mandel | CPU AES | CPU ZLib | FP64 Ray-Trace | CPU PhotoWorxx
| Performance Rating | |
| Lenovo ThinkPad P15v G3 21EM001AGE | |
| Dell Precision 5480 | |
| Durchschnittliche Intel Core i9-13900H | |
| Lenovo ThinkPad P14s G3 AMD 21J6S05000 | |
| Dell Precision 5000 5470 | |
| HP ZBook Firefly 14 G9-6B8A2EA | |
| AIDA64 / FP32 Ray-Trace | |
| Dell Precision 5480 | |
| Durchschnittliche Intel Core i9-13900H (6788 - 19557, n=25) | |
| Lenovo ThinkPad P15v G3 21EM001AGE | |
| Dell Precision 5000 5470 | |
| Lenovo ThinkPad P14s G3 AMD 21J6S05000 | |
| HP ZBook Firefly 14 G9-6B8A2EA | |
| AIDA64 / FPU Julia | |
| Lenovo ThinkPad P15v G3 21EM001AGE | |
| Lenovo ThinkPad P14s G3 AMD 21J6S05000 | |
| Dell Precision 5480 | |
| Durchschnittliche Intel Core i9-13900H (22551 - 95579, n=25) | |
| Dell Precision 5000 5470 | |
| HP ZBook Firefly 14 G9-6B8A2EA | |
| AIDA64 / CPU SHA3 | |
| Durchschnittliche Intel Core i9-13900H (2491 - 4270, n=25) | |
| Dell Precision 5480 | |
| Lenovo ThinkPad P15v G3 21EM001AGE | |
| Dell Precision 5000 5470 | |
| Lenovo ThinkPad P14s G3 AMD 21J6S05000 | |
| HP ZBook Firefly 14 G9-6B8A2EA | |
| AIDA64 / CPU Queen | |
| Dell Precision 5480 | |
| Dell Precision 5000 5470 | |
| Durchschnittliche Intel Core i9-13900H (65121 - 120936, n=25) | |
| Lenovo ThinkPad P15v G3 21EM001AGE | |
| Lenovo ThinkPad P14s G3 AMD 21J6S05000 | |
| HP ZBook Firefly 14 G9-6B8A2EA | |
| AIDA64 / FPU SinJulia | |
| Lenovo ThinkPad P15v G3 21EM001AGE | |
| Lenovo ThinkPad P14s G3 AMD 21J6S05000 | |
| Dell Precision 5480 | |
| Durchschnittliche Intel Core i9-13900H (6108 - 11631, n=25) | |
| Dell Precision 5000 5470 | |
| HP ZBook Firefly 14 G9-6B8A2EA | |
| AIDA64 / FPU Mandel | |
| Lenovo ThinkPad P15v G3 21EM001AGE | |
| Lenovo ThinkPad P14s G3 AMD 21J6S05000 | |
| Dell Precision 5480 | |
| Durchschnittliche Intel Core i9-13900H (11283 - 48474, n=25) | |
| Dell Precision 5000 5470 | |
| HP ZBook Firefly 14 G9-6B8A2EA | |
| AIDA64 / CPU AES | |
| Lenovo ThinkPad P15v G3 21EM001AGE | |
| Durchschnittliche Intel Core i9-13900H (3691 - 149377, n=25) | |
| Dell Precision 5480 | |
| Lenovo ThinkPad P14s G3 AMD 21J6S05000 | |
| HP ZBook Firefly 14 G9-6B8A2EA | |
| Dell Precision 5000 5470 | |
| AIDA64 / CPU ZLib | |
| Durchschnittliche Intel Core i9-13900H (789 - 1254, n=25) | |
| Dell Precision 5480 | |
| Lenovo ThinkPad P15v G3 21EM001AGE | |
| Lenovo ThinkPad P14s G3 AMD 21J6S05000 | |
| HP ZBook Firefly 14 G9-6B8A2EA | |
| Dell Precision 5000 5470 | |
| AIDA64 / FP64 Ray-Trace | |
| Durchschnittliche Intel Core i9-13900H (3655 - 10716, n=25) | |
| Dell Precision 5480 | |
| Lenovo ThinkPad P15v G3 21EM001AGE | |
| Dell Precision 5000 5470 | |
| Lenovo ThinkPad P14s G3 AMD 21J6S05000 | |
| HP ZBook Firefly 14 G9-6B8A2EA | |
| AIDA64 / CPU PhotoWorxx | |
| Dell Precision 5480 | |
| Dell Precision 5000 5470 | |
| HP ZBook Firefly 14 G9-6B8A2EA | |
| Durchschnittliche Intel Core i9-13900H (10871 - 50488, n=25) | |
| Lenovo ThinkPad P14s G3 AMD 21J6S05000 | |
| Lenovo ThinkPad P15v G3 21EM001AGE | |
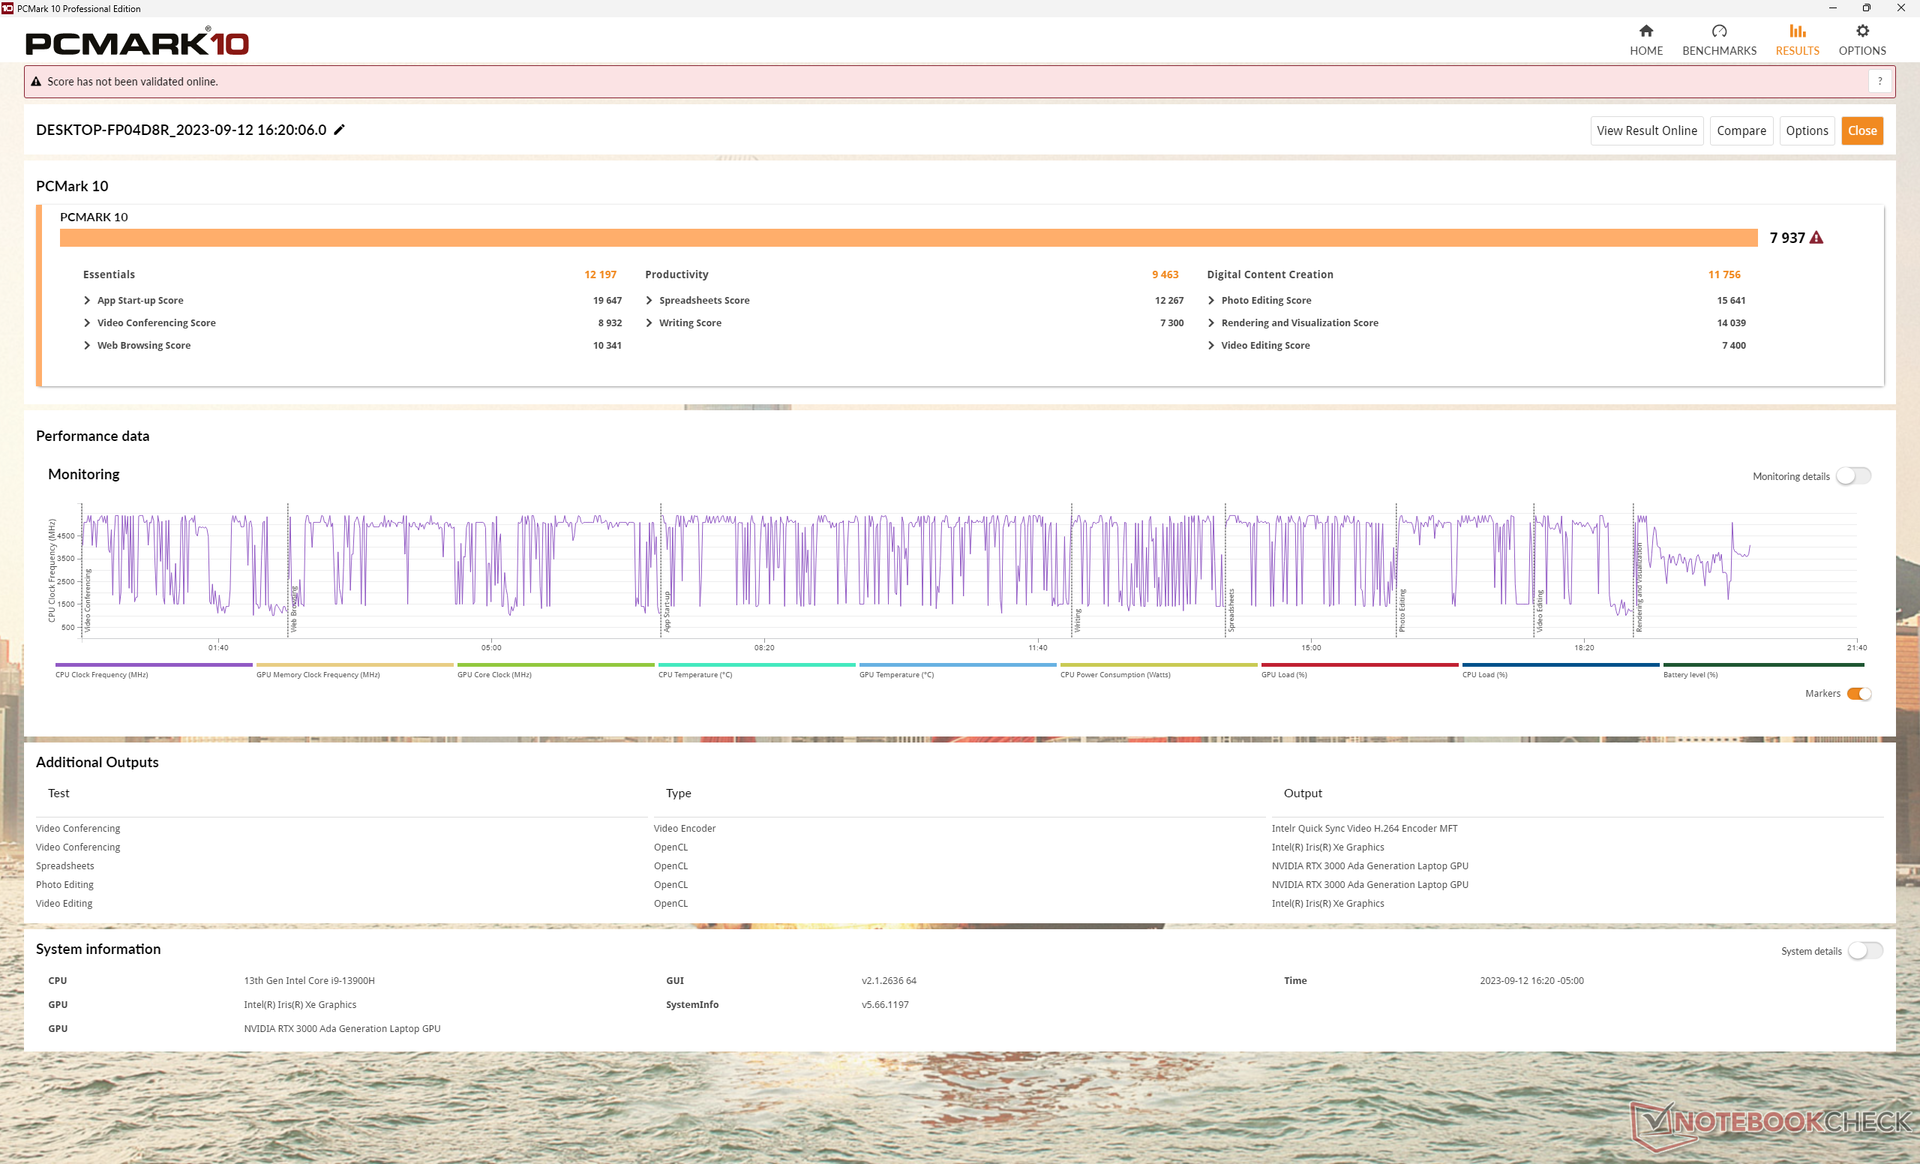
System Performance
Die PCMark-Ergebnisse sind besser als bei anderen 14-Zoll-Workstations, die wir bisher getestet haben. Ein Großteil des Zugewinns kann der neuen RTX 3000 Ada GPU zugeschrieben werden, die deutliche Leistungsvorteile gegenüber den Ampere-Optionen des letzten Jahres bietet, wie unser Abschnitt zur GPU-Leistung weiter unten zeigen wird.
CrossMark: Overall | Productivity | Creativity | Responsiveness
| CrossMark / Overall | |
| Dell Precision 5480 | |
| Dell Precision 5000 5470 | |
| HP ZBook Firefly 14 G9-6B8A2EA | |
| Lenovo ThinkPad P15v G3 21EM001AGE | |
| Lenovo ThinkPad P14s G3 AMD 21J6S05000 | |
| CrossMark / Productivity | |
| Dell Precision 5480 | |
| Dell Precision 5000 5470 | |
| HP ZBook Firefly 14 G9-6B8A2EA | |
| Lenovo ThinkPad P15v G3 21EM001AGE | |
| Lenovo ThinkPad P14s G3 AMD 21J6S05000 | |
| CrossMark / Creativity | |
| Dell Precision 5480 | |
| Dell Precision 5000 5470 | |
| HP ZBook Firefly 14 G9-6B8A2EA | |
| Lenovo ThinkPad P15v G3 21EM001AGE | |
| Lenovo ThinkPad P14s G3 AMD 21J6S05000 | |
| CrossMark / Responsiveness | |
| Dell Precision 5480 | |
| Dell Precision 5000 5470 | |
| HP ZBook Firefly 14 G9-6B8A2EA | |
| Lenovo ThinkPad P15v G3 21EM001AGE | |
| Lenovo ThinkPad P14s G3 AMD 21J6S05000 | |
| PCMark 10 Score | 7937 Punkte | |
Hilfe | ||
| AIDA64 / Memory Copy | |
| Dell Precision 5480 | |
| Dell Precision 5000 5470 | |
| Durchschnittliche Intel Core i9-13900H (37448 - 74486, n=25) | |
| HP ZBook Firefly 14 G9-6B8A2EA | |
| Lenovo ThinkPad P14s G3 AMD 21J6S05000 | |
| Lenovo ThinkPad P15v G3 21EM001AGE | |
| AIDA64 / Memory Read | |
| Dell Precision 5000 5470 | |
| Dell Precision 5480 | |
| HP ZBook Firefly 14 G9-6B8A2EA | |
| Durchschnittliche Intel Core i9-13900H (41599 - 75433, n=25) | |
| Lenovo ThinkPad P14s G3 AMD 21J6S05000 | |
| Lenovo ThinkPad P15v G3 21EM001AGE | |
| AIDA64 / Memory Write | |
| Dell Precision 5480 | |
| Durchschnittliche Intel Core i9-13900H (36152 - 88505, n=25) | |
| HP ZBook Firefly 14 G9-6B8A2EA | |
| Dell Precision 5000 5470 | |
| Lenovo ThinkPad P14s G3 AMD 21J6S05000 | |
| Lenovo ThinkPad P15v G3 21EM001AGE | |
| AIDA64 / Memory Latency | |
| Lenovo ThinkPad P14s G3 AMD 21J6S05000 | |
| Dell Precision 5000 5470 | |
| Lenovo ThinkPad P15v G3 21EM001AGE | |
| Dell Precision 5480 | |
| Durchschnittliche Intel Core i9-13900H (75.8 - 102.3, n=25) | |
| HP ZBook Firefly 14 G9-6B8A2EA | |
* ... kleinere Werte sind besser
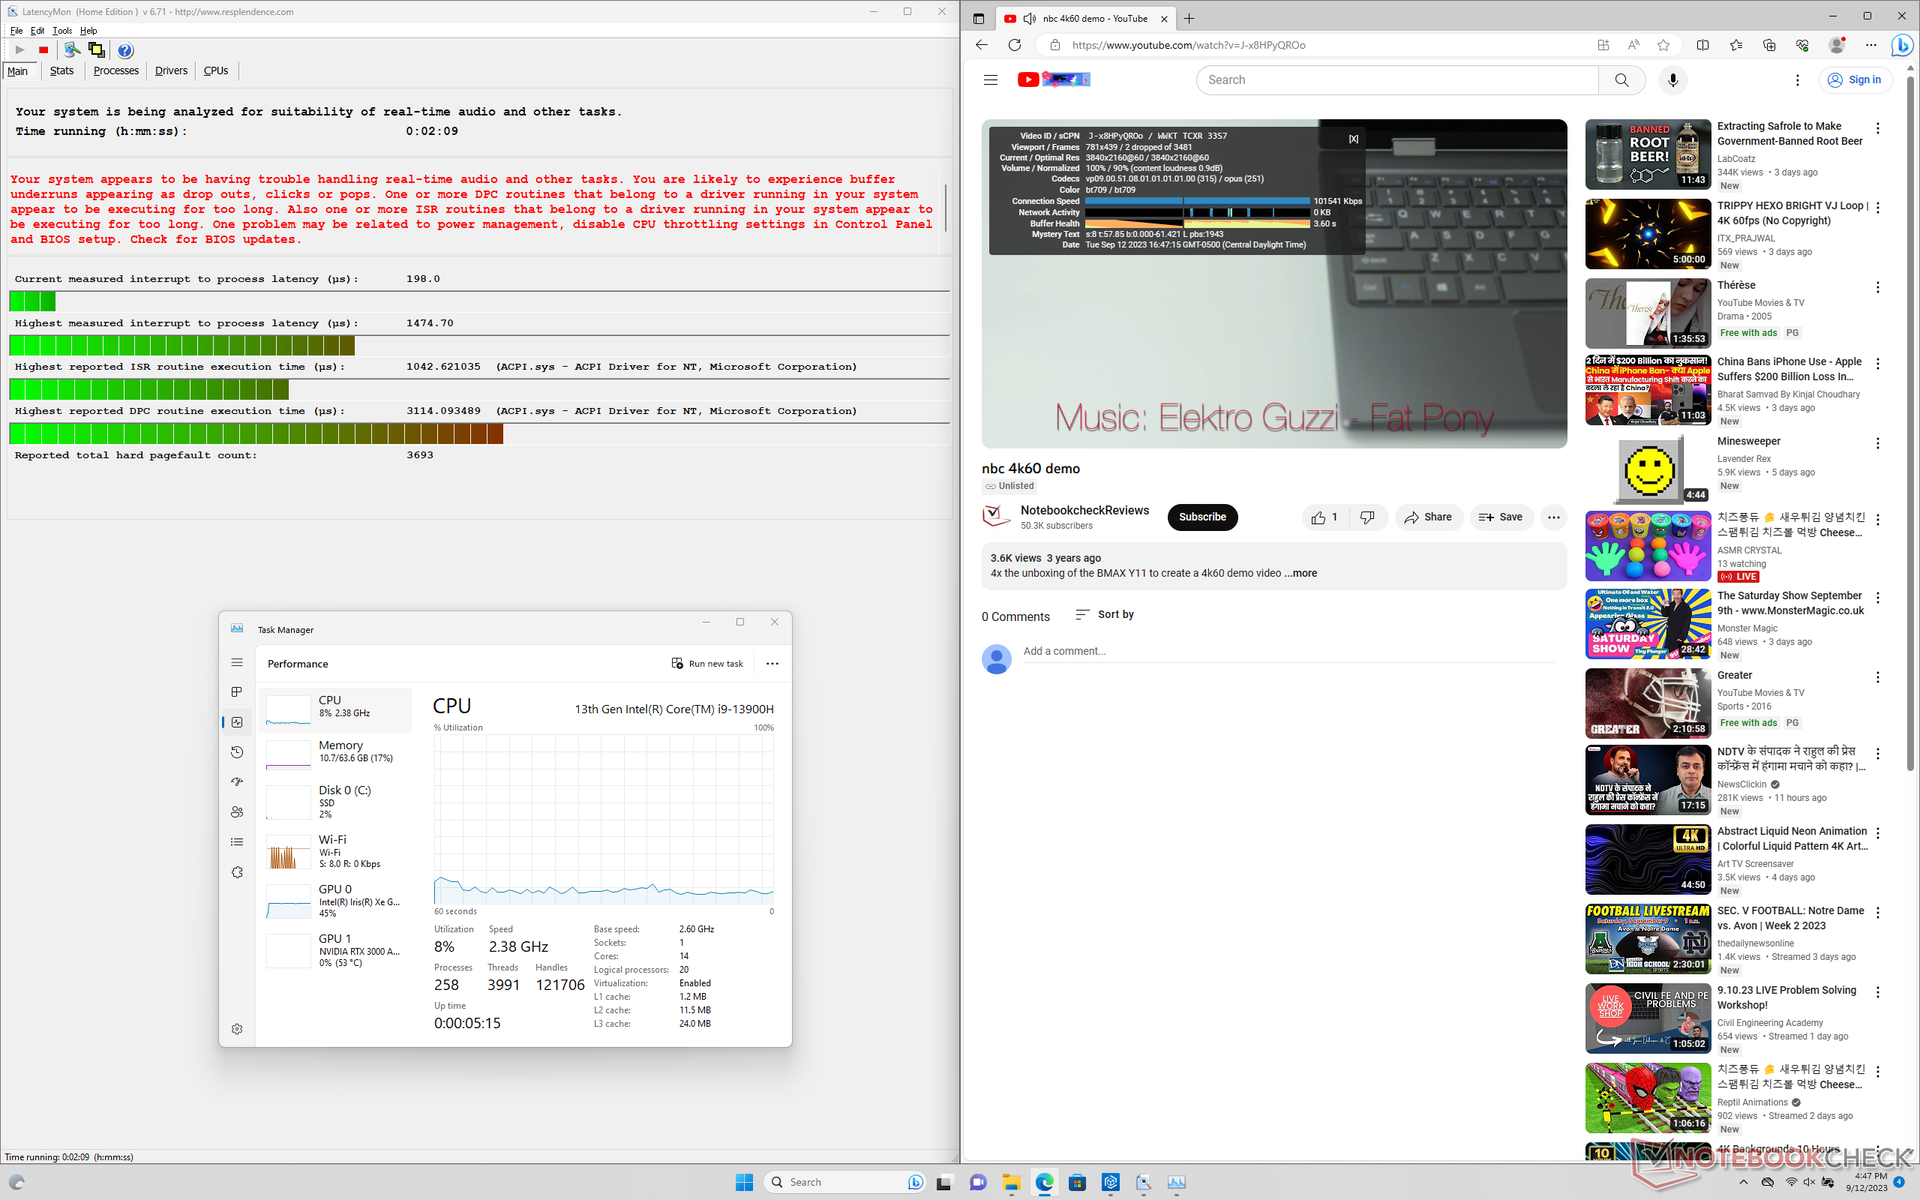
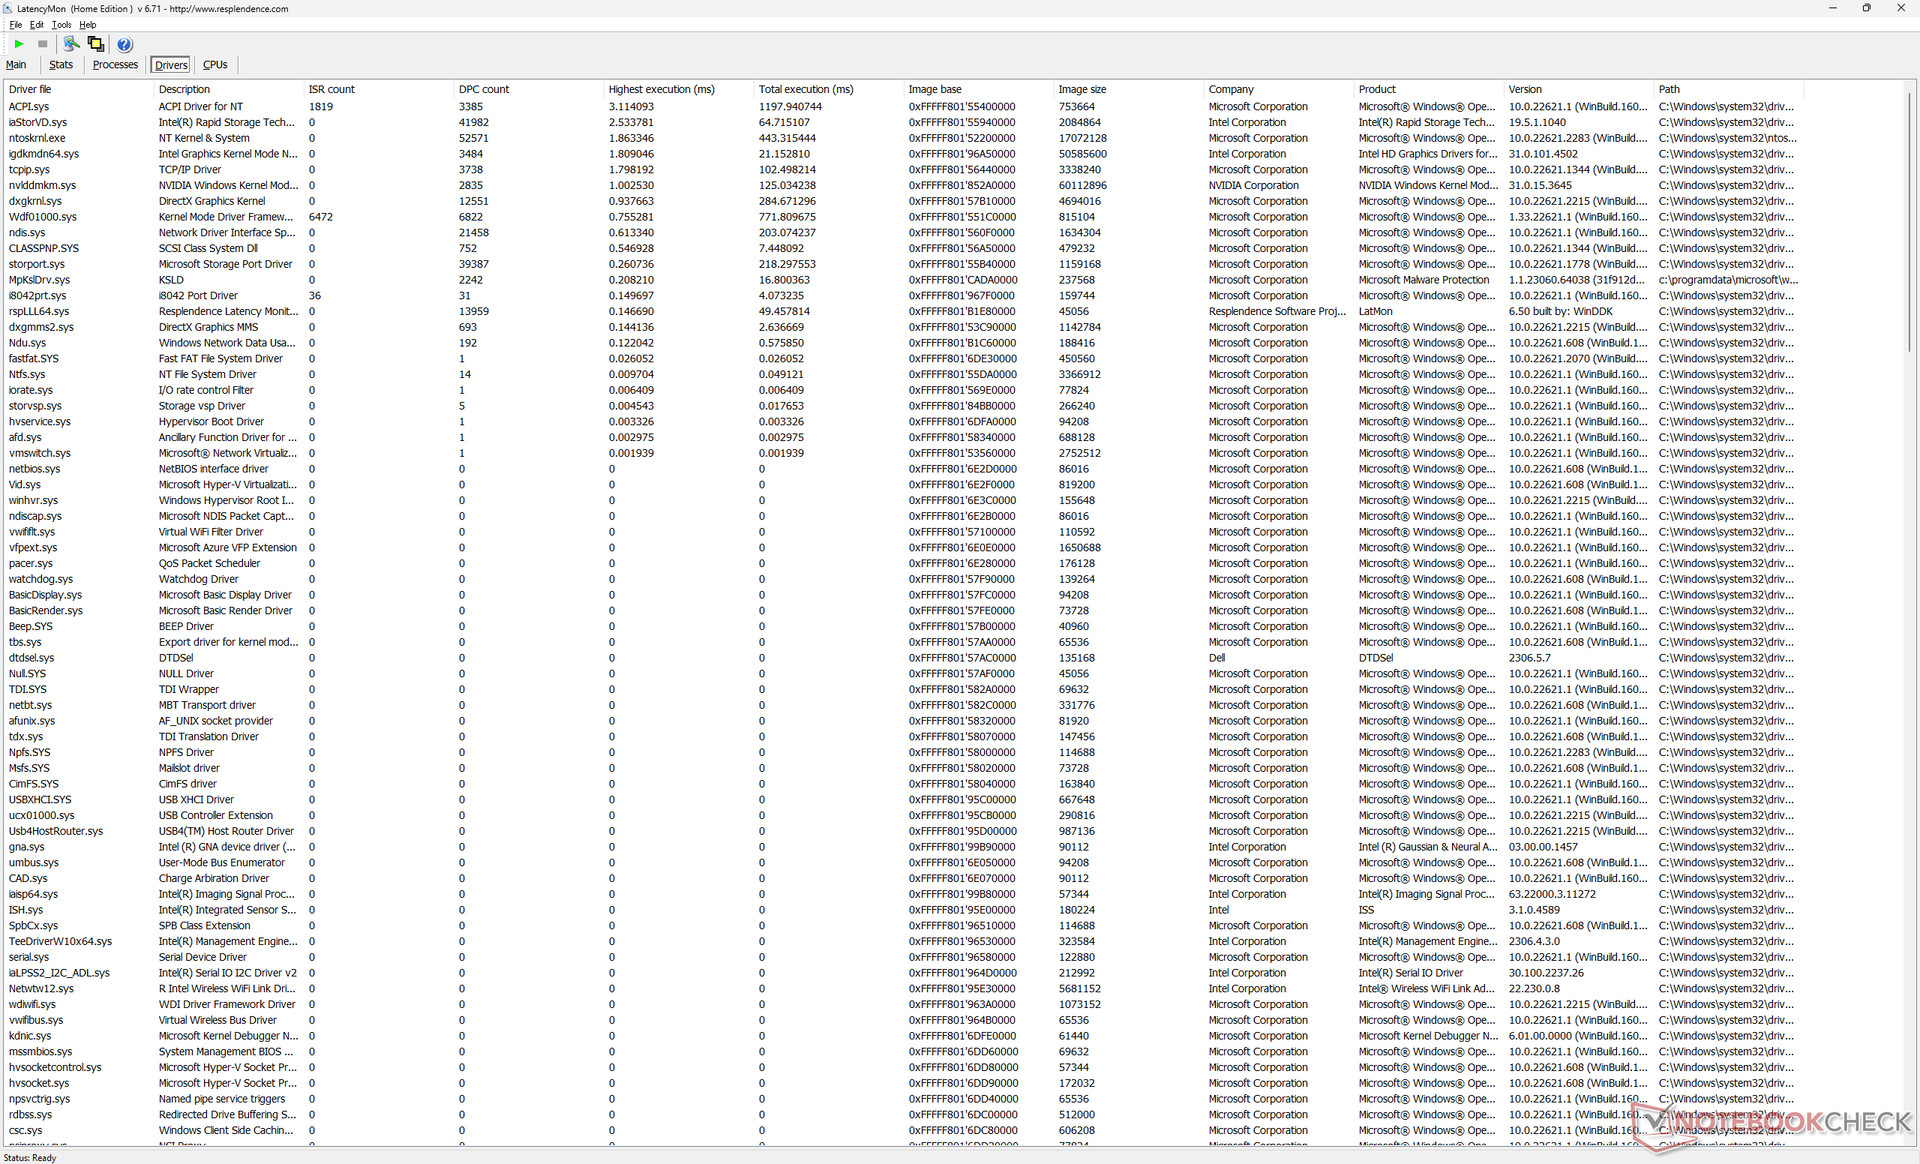
DPC-Latenzen
LatencyMon hat Schwierigkeiten, mehrere Browser-Tabs auf unserer Website zu öffnen. Darüber hinaus konnten wir während eines einminütigen 4K60-Videos zwei ausgelassene Frames aufzeichnen, was auf einer mobilen Workstation unglücklich ist.
| DPC Latencies / LatencyMon - interrupt to process latency (max), Web, Youtube, Prime95 | |
| Dell Precision 5480 | |
| Dell Precision 5000 5470 | |
| Lenovo ThinkPad P14s G3 AMD 21J6S05000 | |
| Dell Precision 5000 5560 | |
| Lenovo ThinkPad P15v G3 21EM001AGE | |
* ... kleinere Werte sind besser
Massenspeicher
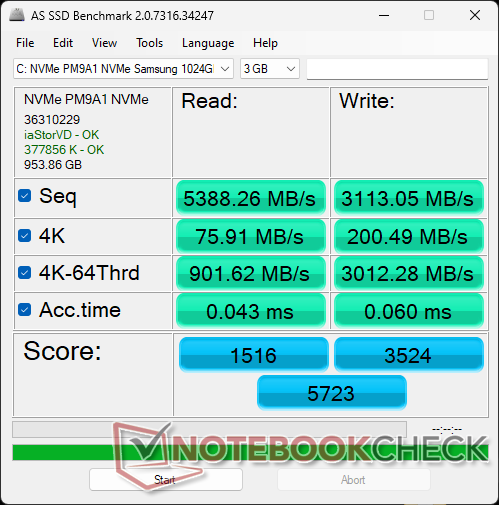
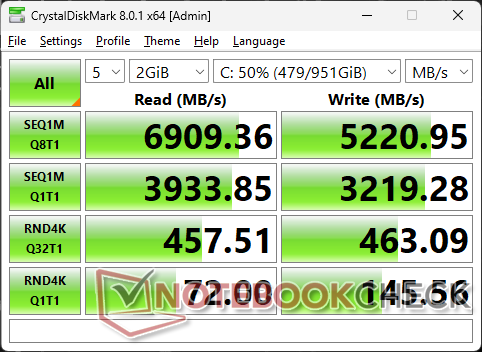
Dell scheint für die meisten seiner Precision-Modelle, einschließlich der Precision 5470 und 5560, Samsung PM9A1 SSDs zu verwenden. Die maximalen Übertragungsraten liegen konstant bei etwa 6900 MB/s, ohne dass es zu Drosselungsproblemen kommt.
Selbstverschlüsselnde Laufwerke sind bei Dell optional, jedoch kann das Modell nur eine interne SSD unterstützen.

* ... kleinere Werte sind besser
Disk Throttling: DiskSpd Read Loop, Queue Depth 8
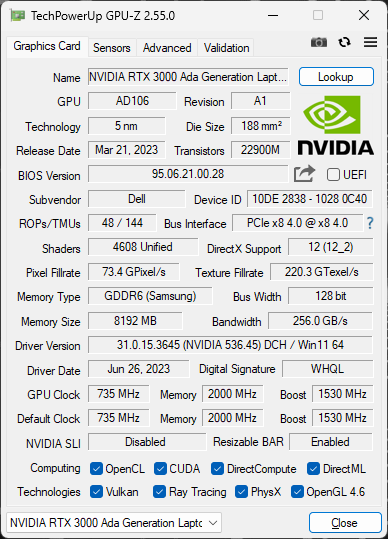
GPU-Leistung
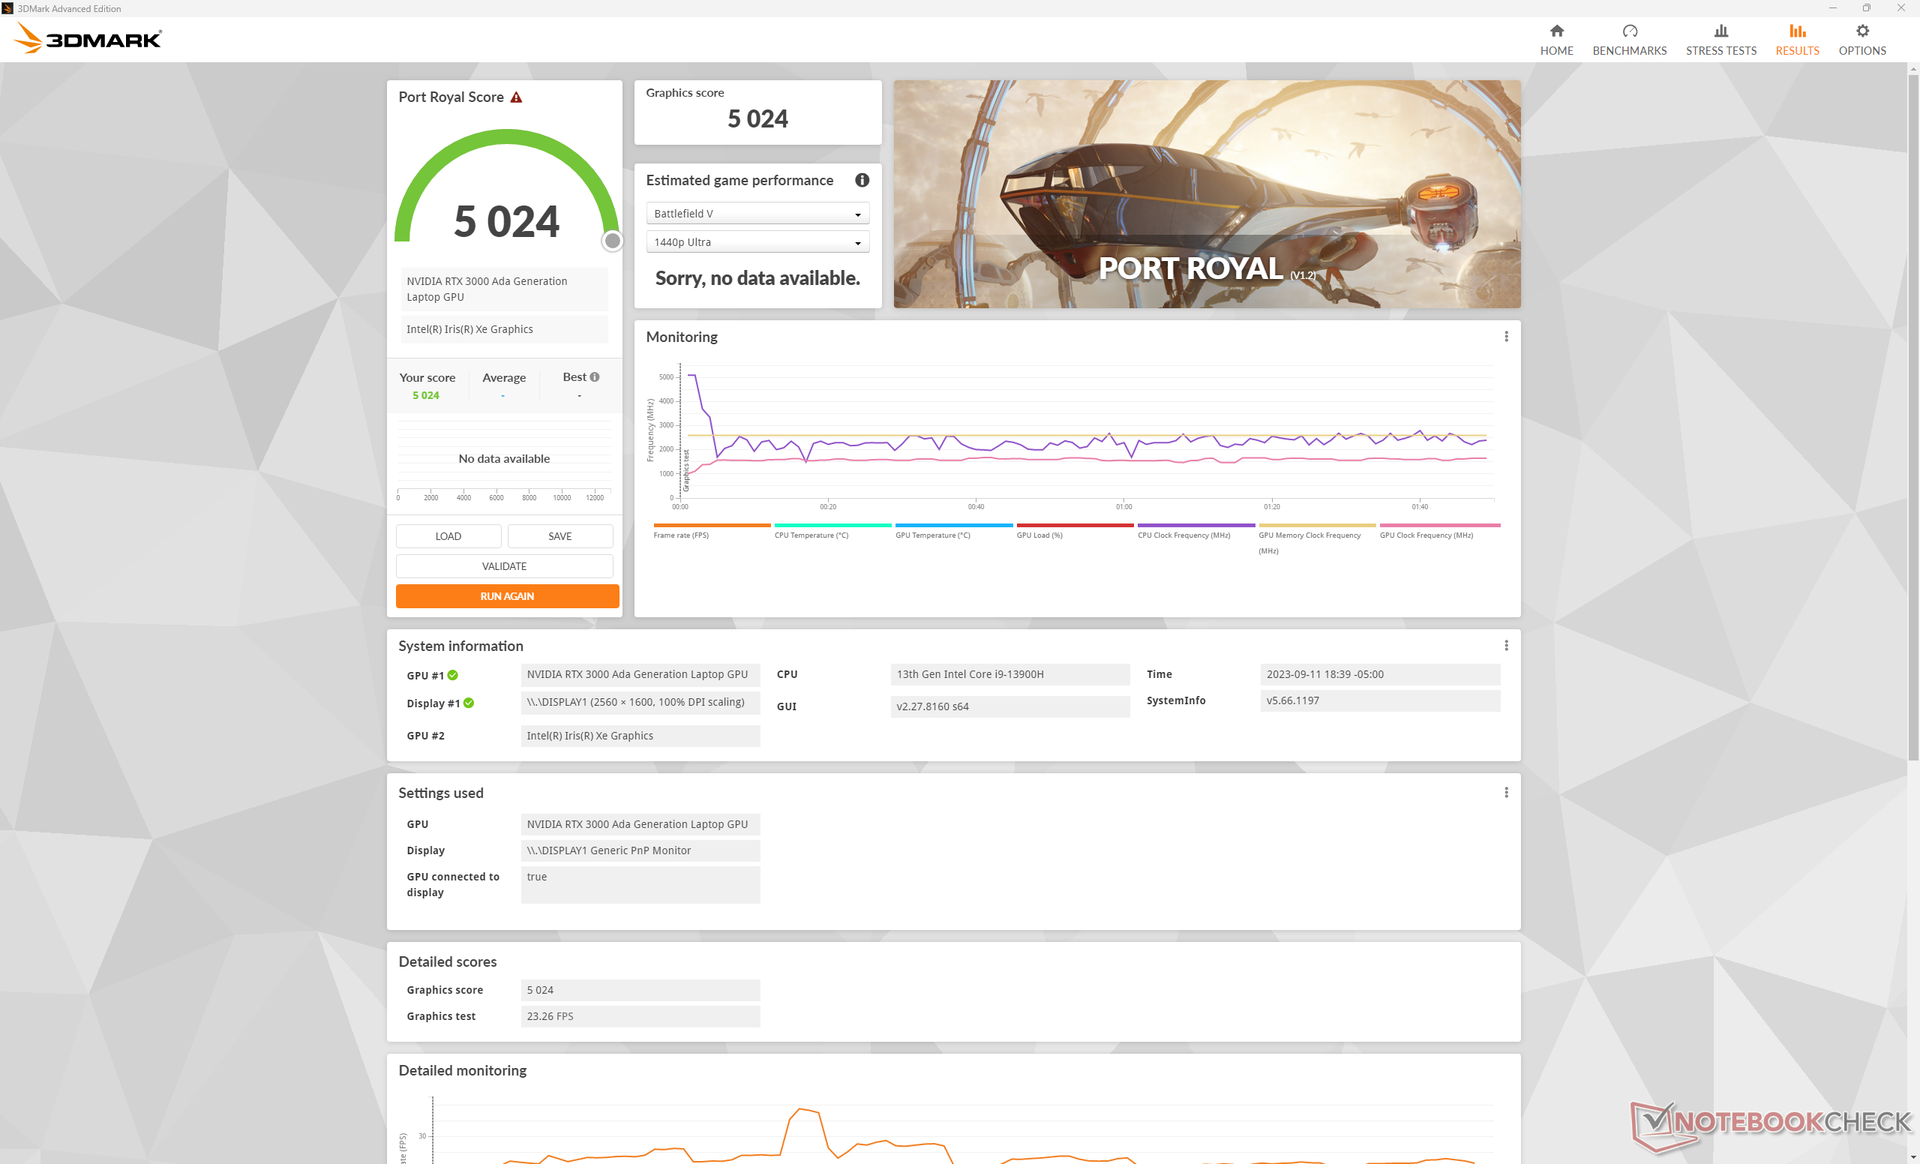
Die RTX 3000 Ada ist etwa 60 bis 80 Prozent schneller als die RTX A1000 im vorherigen Precision 5470 oder 10 bis 15 Prozent schneller als die RTX A3000, die sie direkt ersetzt. Während die GPU in der Precision 5470 auf 40 W begrenzt war, zielt die neuere GPU auf einen etwas höheren TGP von 50 W.
Obwohl die RTX A1000 der letzten Generation immer noch auf dem Precision 5480 konfiguriert werden kann, ist die RTX 3000 Ada aufgrund ihrer deutlichen Leistungssteigerung sehr zu empfehlen. Die aktuelle Ada-GPU liegt nur knapp hinter der älteren Ampere RTX A5500, die in größeren Workstations wie dem HP ZBook Fury 16 G9 vorhanden ist.
Die Ausführung im Balanced-Modus wirkt sich stärker auf die CPU-Leistung als auf die GPU-Leistung aus, wie unsere Fire-Strike-Ergebnisse in der Tabelle unten zeigen. Die Defizite sind relativ gering und liegen im einstelligen Prozentbereich, selbst im Akkubetrieb.
Interessanterweise stürzten zwei SpecViewPerf 12 Untertests (Energie und Medizin) auf unserem Gerät immer ab, weshalb diese Ergebnisse in den folgenden Grafiken nicht berücksichtigt wurden.
| Energieprofile | CPU-Leistung | Grafikleistung | Gesamtwert |
| Performance-Modus | 29061 | 20908 | 8316 |
| Balanced-Modus | 26880 (-8%) | 20411 (-2%) | 7633 (-8%) |
| Battery-Modus | 27852 (-4%) | 19755 (-6%) | 7569 (-9%) |
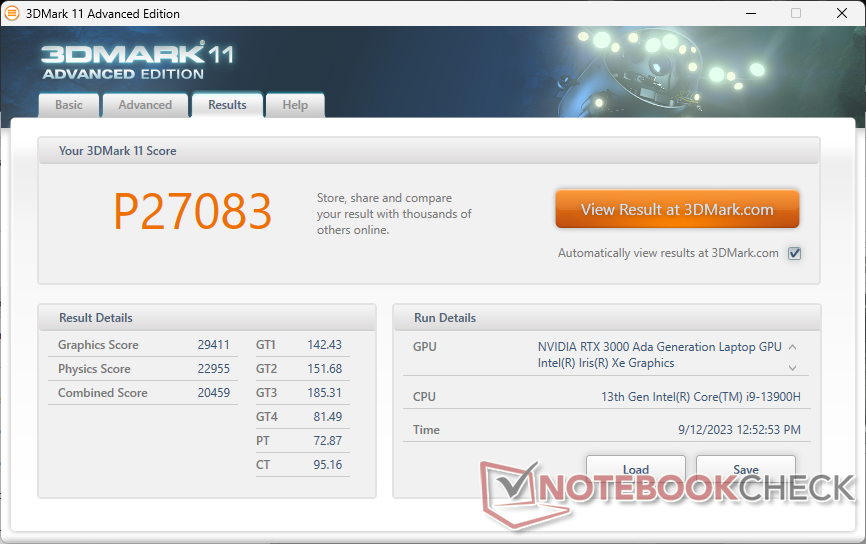
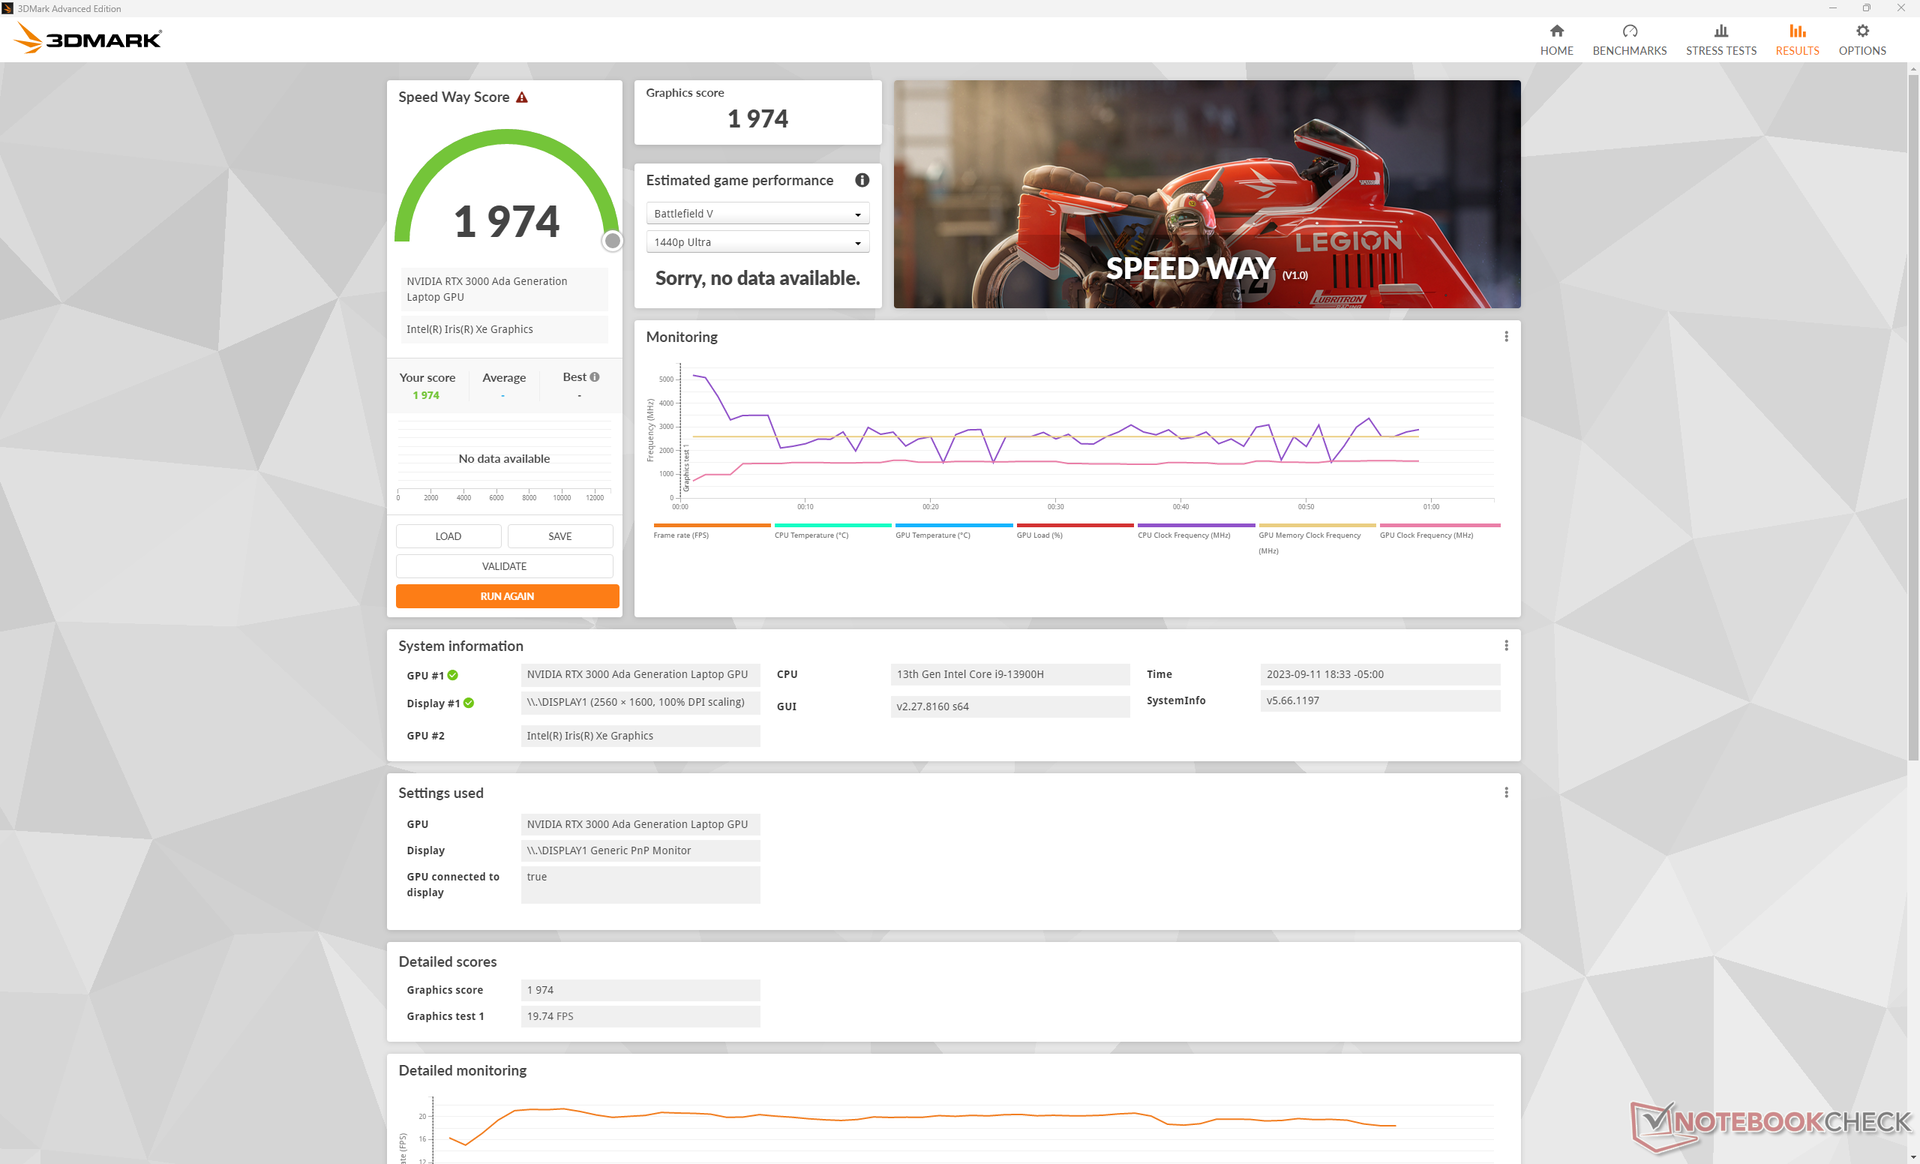
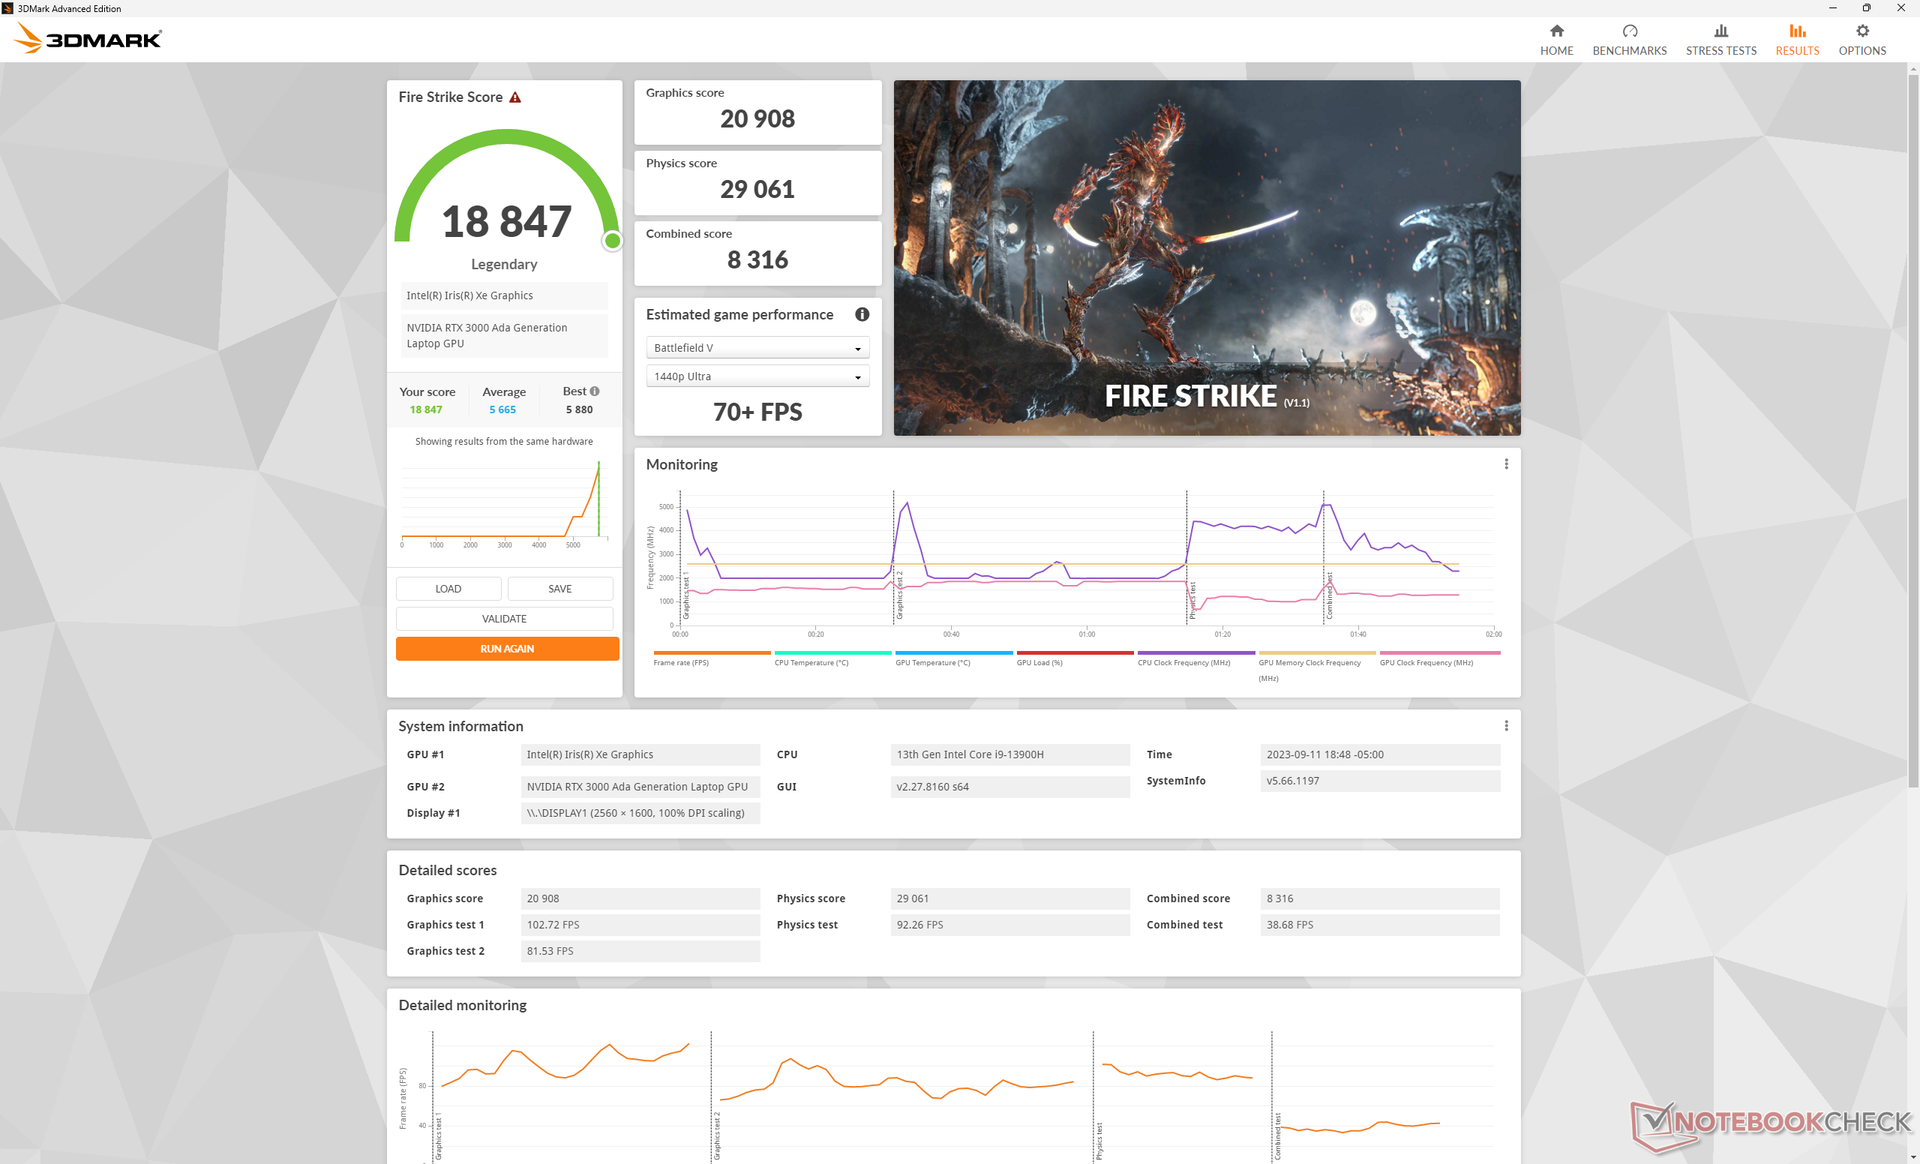
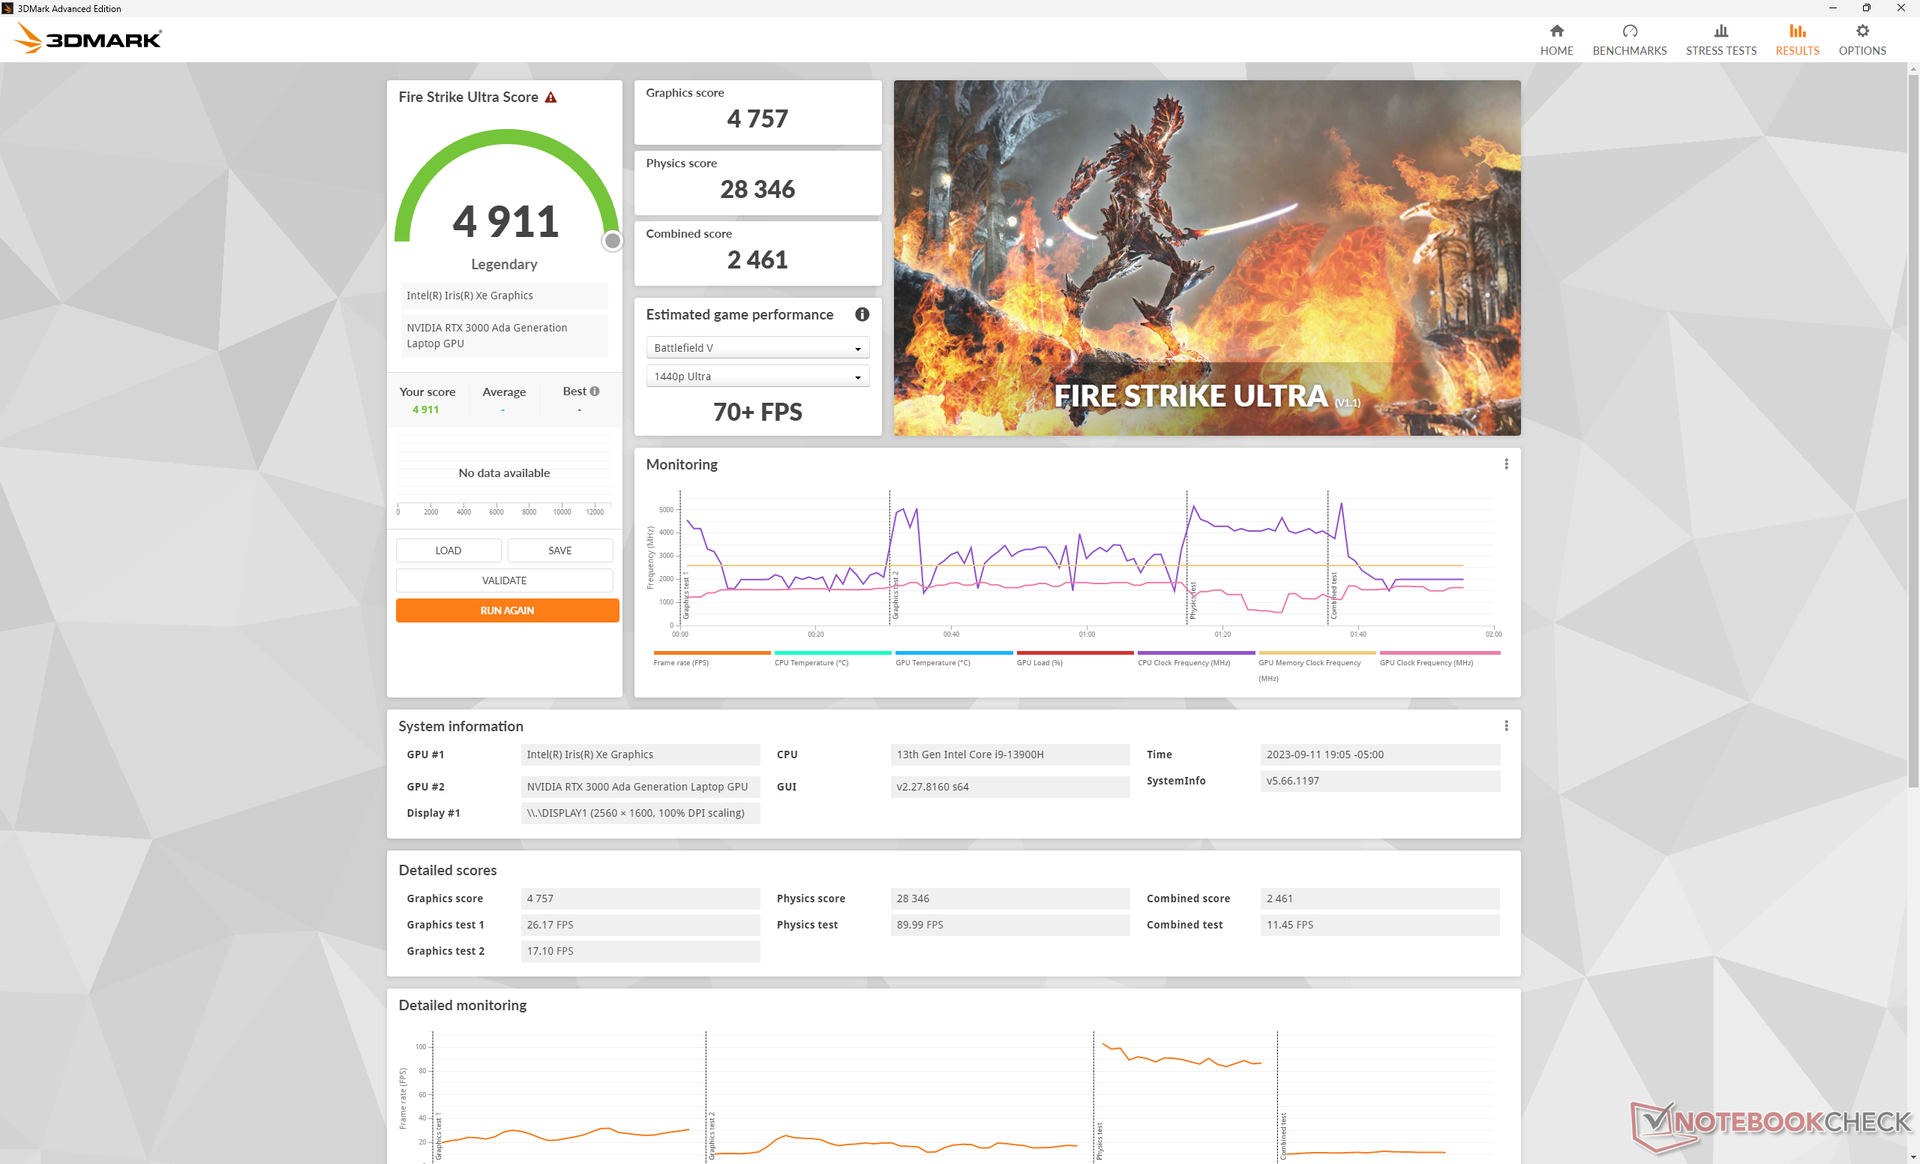
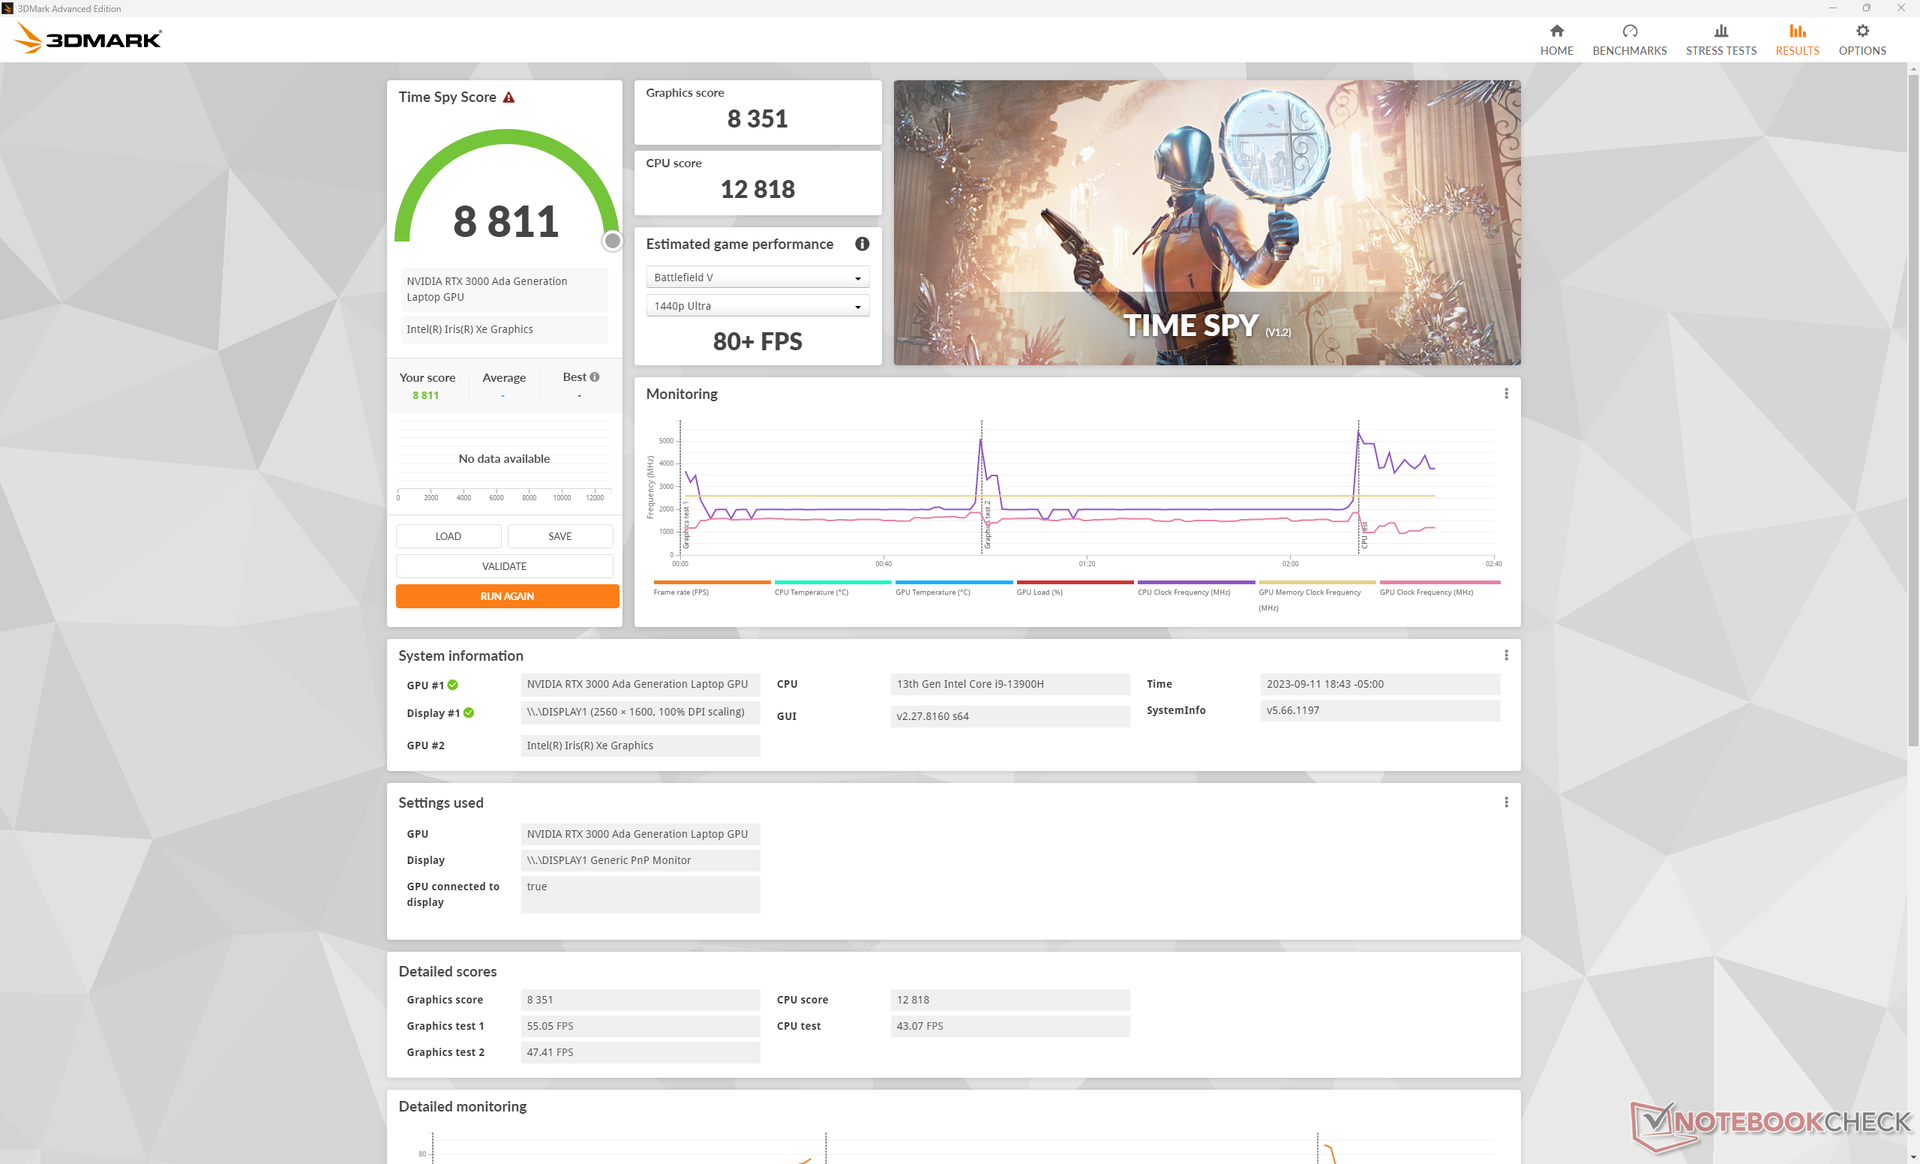
| 3DMark 11 Performance | 27083 Punkte | |
| 3DMark Fire Strike Score | 18847 Punkte | |
| 3DMark Time Spy Score | 8811 Punkte | |
Hilfe | ||
* ... kleinere Werte sind besser
Gaming Performance
Die Gaming-Leistung ist am ehesten mit Notebooks vergleichbar, die mit der GeForce RTX 4060 laufen, wie das aktuelle Inspiron 16 Plus 7630. Während bei nativem QHD+ niedrigere Einstellungen oder DLSS erforderlich sind, um die Frameraten aufrechtzuerhalten, ist unsere Workstation in der Lage, anspruchsvolle Titel wie Cyberpunk 2077 bei 1080p sehr gut auszuführen.
Witcher 3 FPS Chart
| min. | mittel | hoch | max. | |
|---|---|---|---|---|
| GTA V (2015) | 183.2 | 177 | 164.1 | 88.2 |
| The Witcher 3 (2015) | 364.1 | 242.5 | 150.1 | 78.7 |
| Dota 2 Reborn (2015) | 175.7 | 160.8 | 151.5 | 142.9 |
| Final Fantasy XV Benchmark (2018) | 155.1 | 108 | 78.9 | |
| X-Plane 11.11 (2018) | 152 | 126.8 | 102 | |
| Far Cry 5 (2018) | 155 | 116 | 106 | 101 |
| Strange Brigade (2018) | 400 | 191.3 | 160.1 | 140.7 |
| Cyberpunk 2077 1.6 (2022) | 92.3 | 72.4 | 61.2 | 56.2 |
| Tiny Tina's Wonderlands (2022) | 156 | 131.4 | 88 | 69 |
| F1 22 (2022) | 162.7 | 159.6 | 133.4 | 51.1 |
Emissionen
Geräuschemissionen
Lüftergeräusch und -verhalten haben sich gegenüber dem Vorjahresmodell nicht wirklich verändert. Bei höherer Last, vergleichbar mit Spielen, erreicht der Lüfter mit knapp über 50 dB(A) eine der lautesten 14-Zoll-Workstations auf dem Markt. Interessanterweise bleibt dieser Maximalwert zwischen den Balanced-Modus und Performance-Modus unverändert, sodass der Betrieb im Balanced-Modus hinsichtlich der Geräuschentwicklung wenig bis gar keinen Vorteil bietet.
Lautstärkediagramm
| Idle |
| 23.5 / 23.5 / 23.5 dB(A) |
| Last |
| 39.9 / 51 dB(A) |
 | ||
30 dB leise 40 dB(A) deutlich hörbar 50 dB(A) störend |
||
min: | ||
| Dell Precision 5480 RTX 3000 Ada Generation Laptop, i9-13900H, Samsung PM9A1 MZVL21T0HCLR | Dell Precision 5000 5470 RTX A1000 Laptop GPU, i9-12900H, Samsung PM9A1 MZVL21T0HCLR | Dell Precision 5000 5560 RTX A2000 Laptop GPU, i7-11850H, Samsung PM9A1 MZVL22T0HBLB | Lenovo ThinkPad P14s G3 AMD 21J6S05000 Radeon 680M, R7 PRO 6850U, Samsung PM9A1 MZVL21T0HCLR | HP ZBook Firefly 14 G9-6B8A2EA T550 Laptop GPU, i7-1265U, Micron 3400 1TB MTFDKBA1T0TFH | Lenovo ThinkPad P15v G3 21EM001AGE RTX A2000 Laptop GPU, R7 PRO 6850H, SK Hynix PC711 1TB HFS001TDE9X081N | |
|---|---|---|---|---|---|---|
| Geräuschentwicklung | -2% | 11% | 11% | 4% | 9% | |
| aus / Umgebung * (dB) | 23.5 | 23 2% | 23.4 -0% | 22.9 3% | 23.6 -0% | 23.2 1% |
| Idle min * (dB) | 23.5 | 23.3 1% | 23.6 -0% | 22.9 3% | 23.6 -0% | 23.2 1% |
| Idle avg * (dB) | 23.5 | 23.3 1% | 23.6 -0% | 22.9 3% | 23.6 -0% | 23.2 1% |
| Idle max * (dB) | 23.5 | 23.3 1% | 23.6 -0% | 22.9 3% | 23.6 -0% | 23.2 1% |
| Last avg * (dB) | 39.9 | 48.5 -22% | 25.8 35% | 30.8 23% | 42.5 -7% | 35 12% |
| Witcher 3 ultra * (dB) | 50.1 | 48.6 3% | 40.1 20% | 39.4 21% | 42.5 15% | 37.9 24% |
| Last max * (dB) | 51 | 50.4 1% | 41.4 19% | 39.5 23% | 42.5 17% | 37.5 26% |
* ... kleinere Werte sind besser
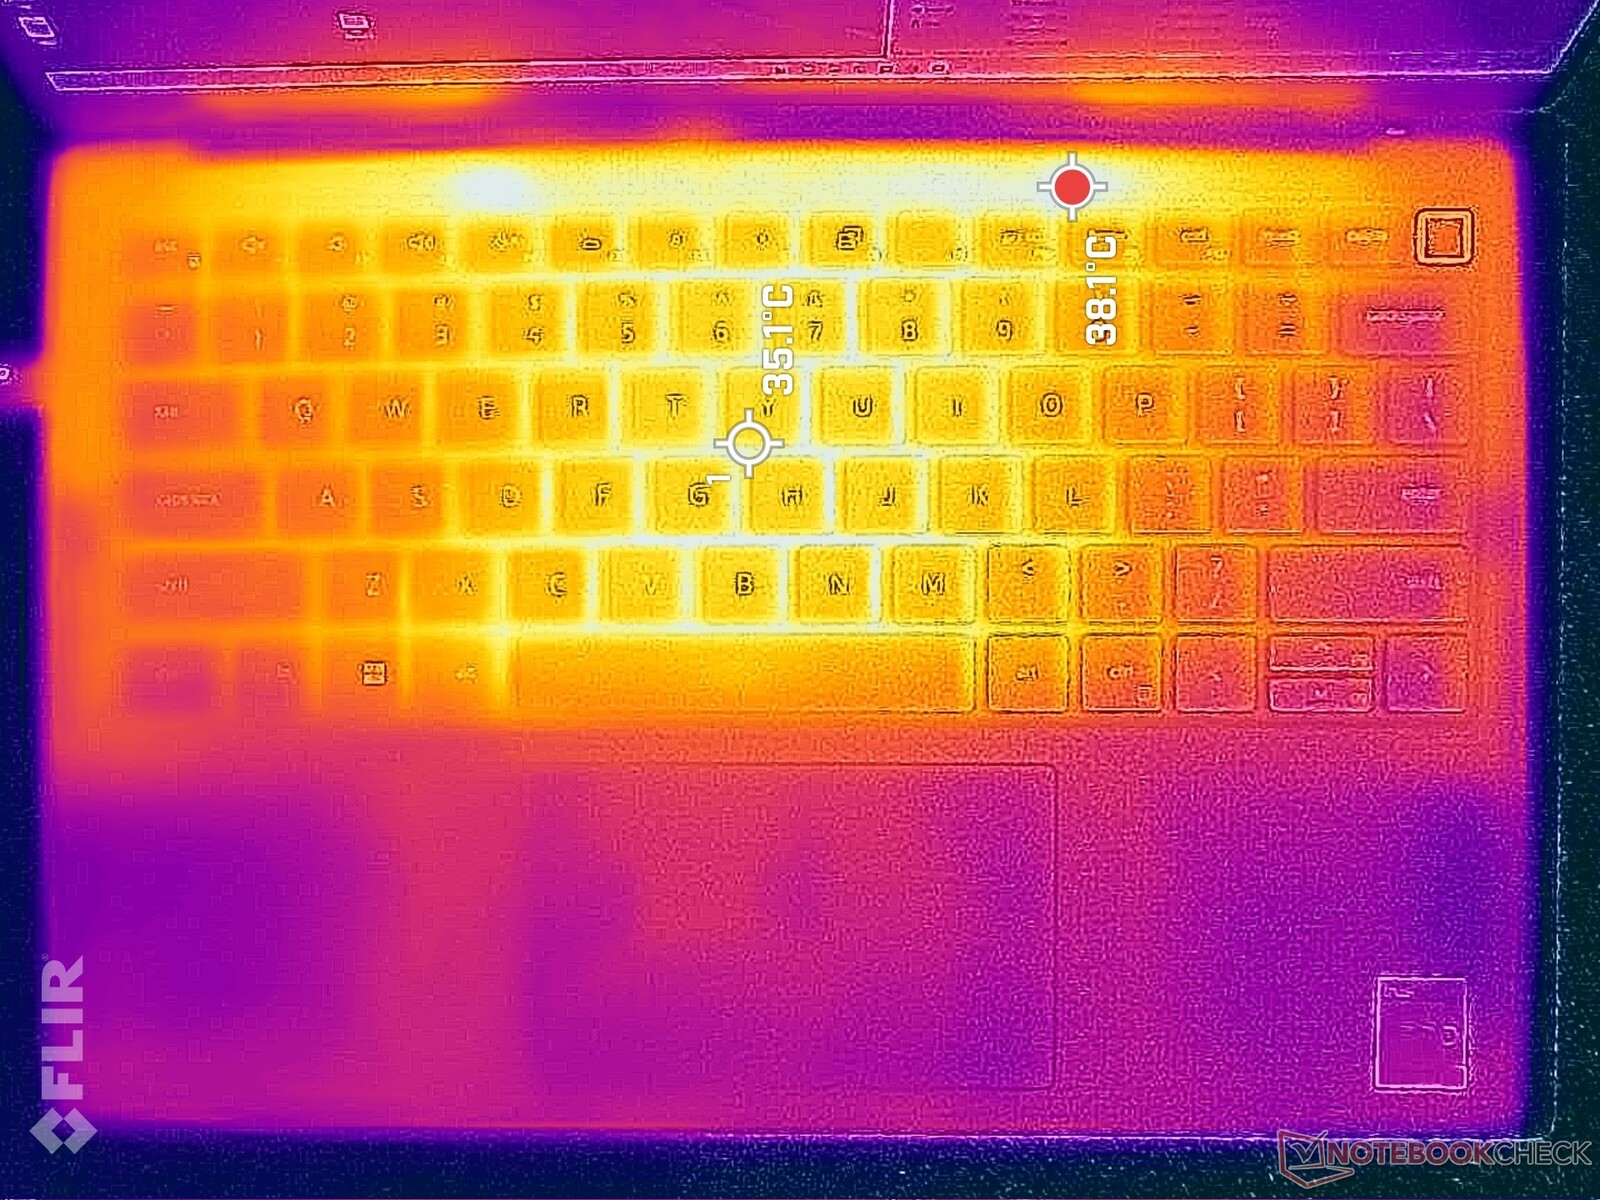
Temperatur
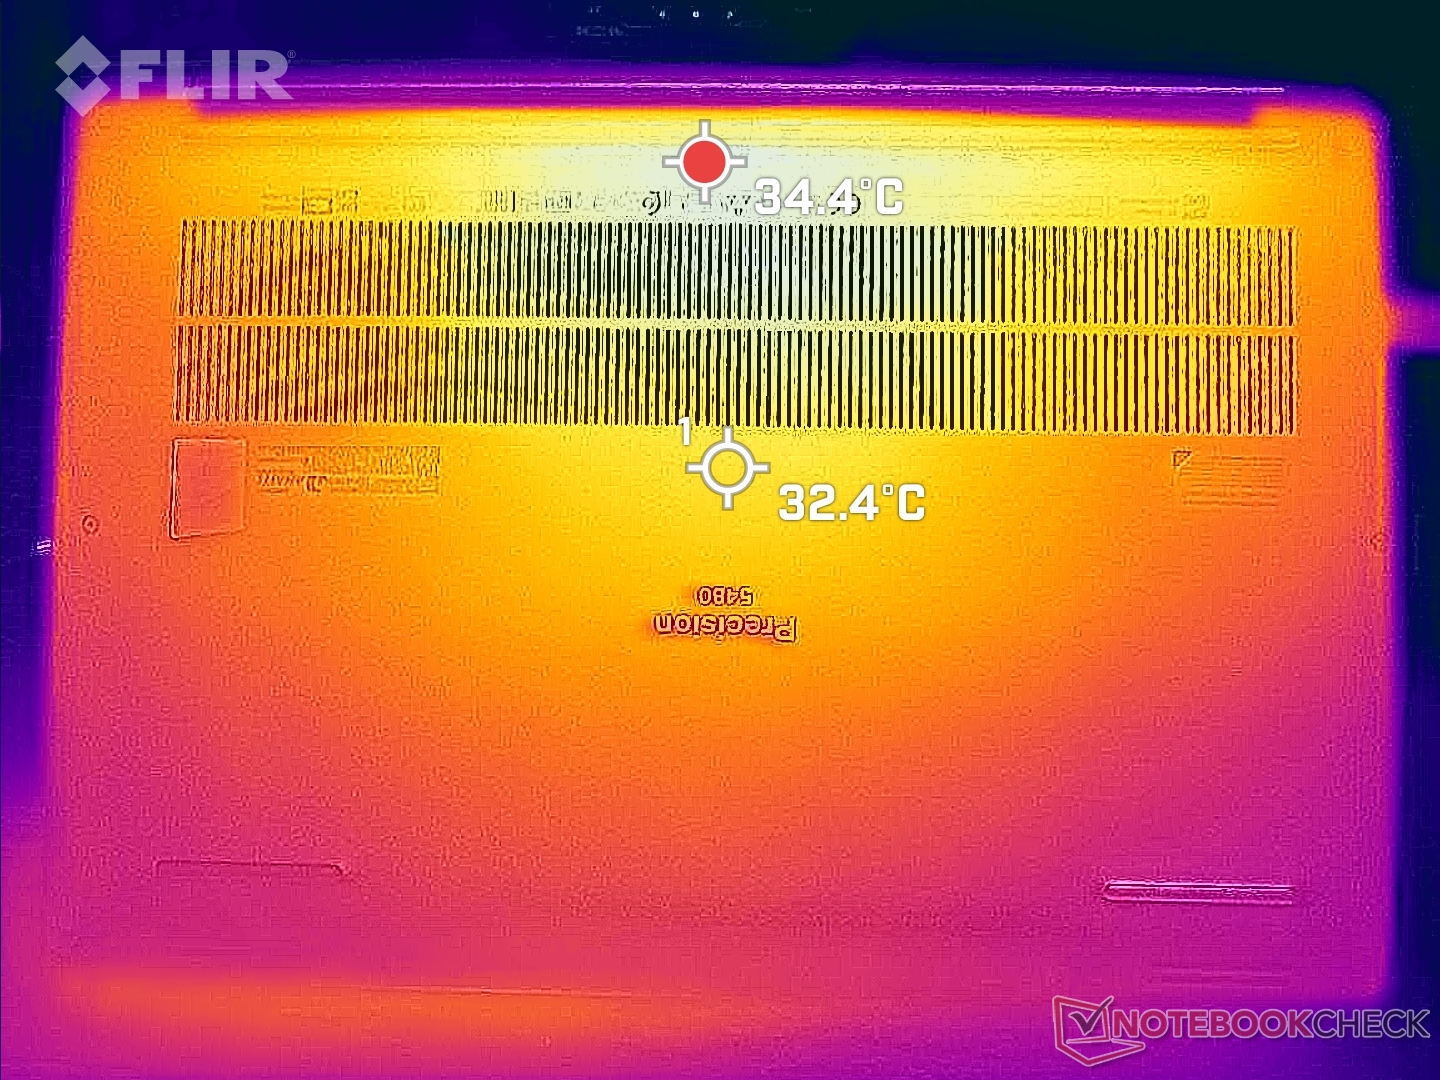
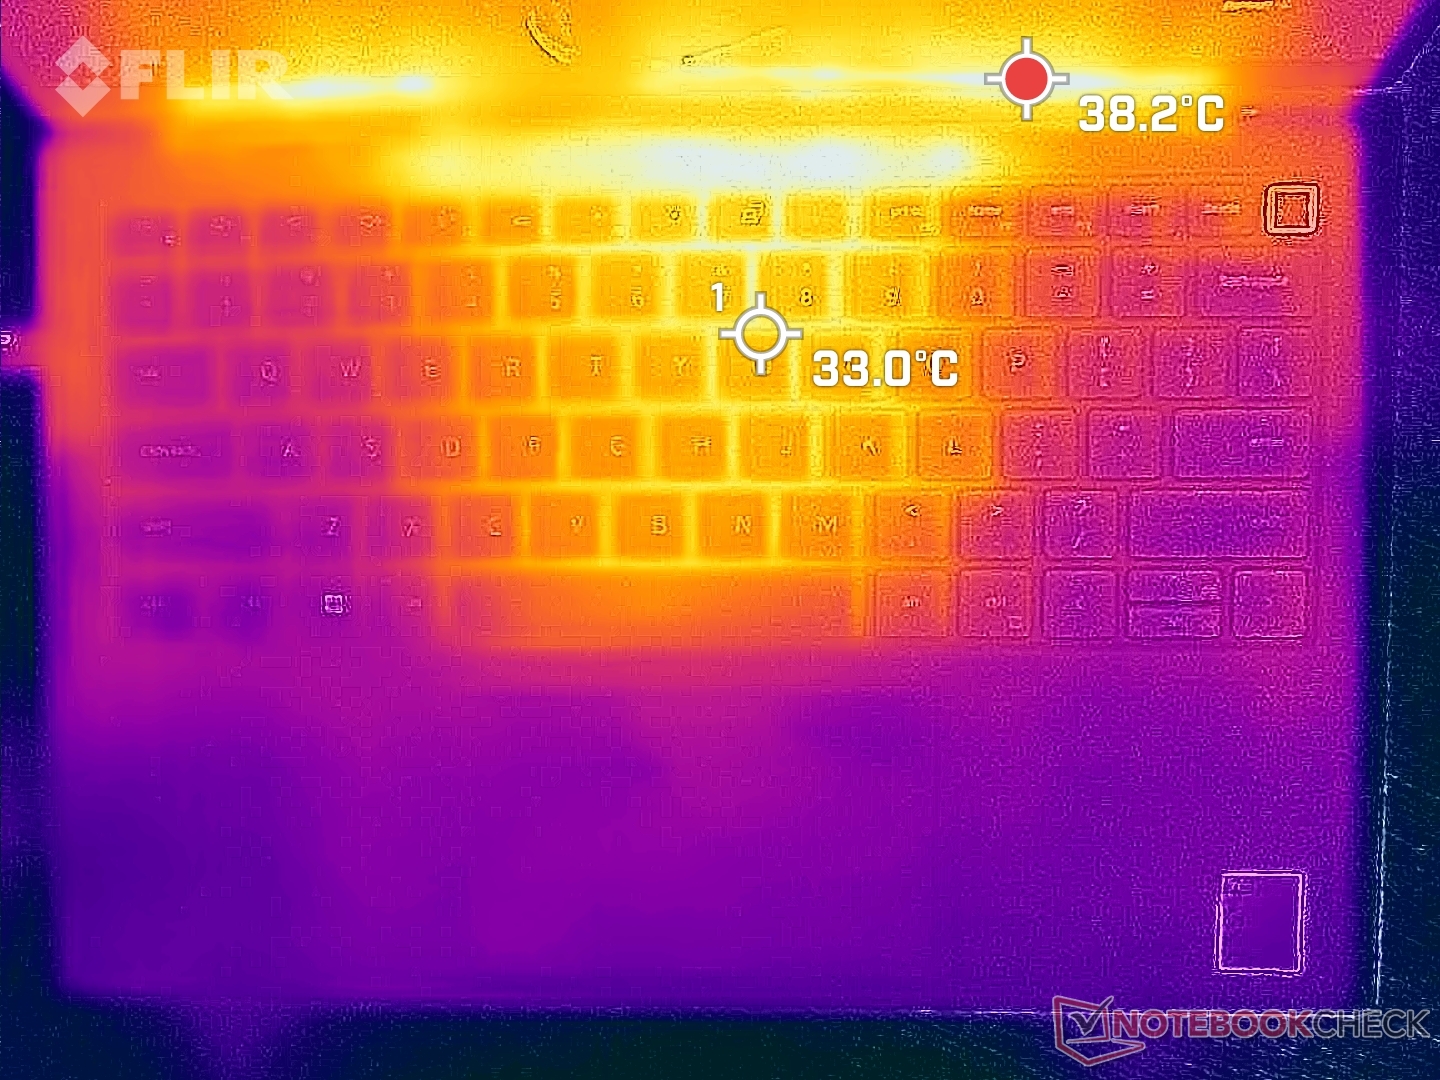
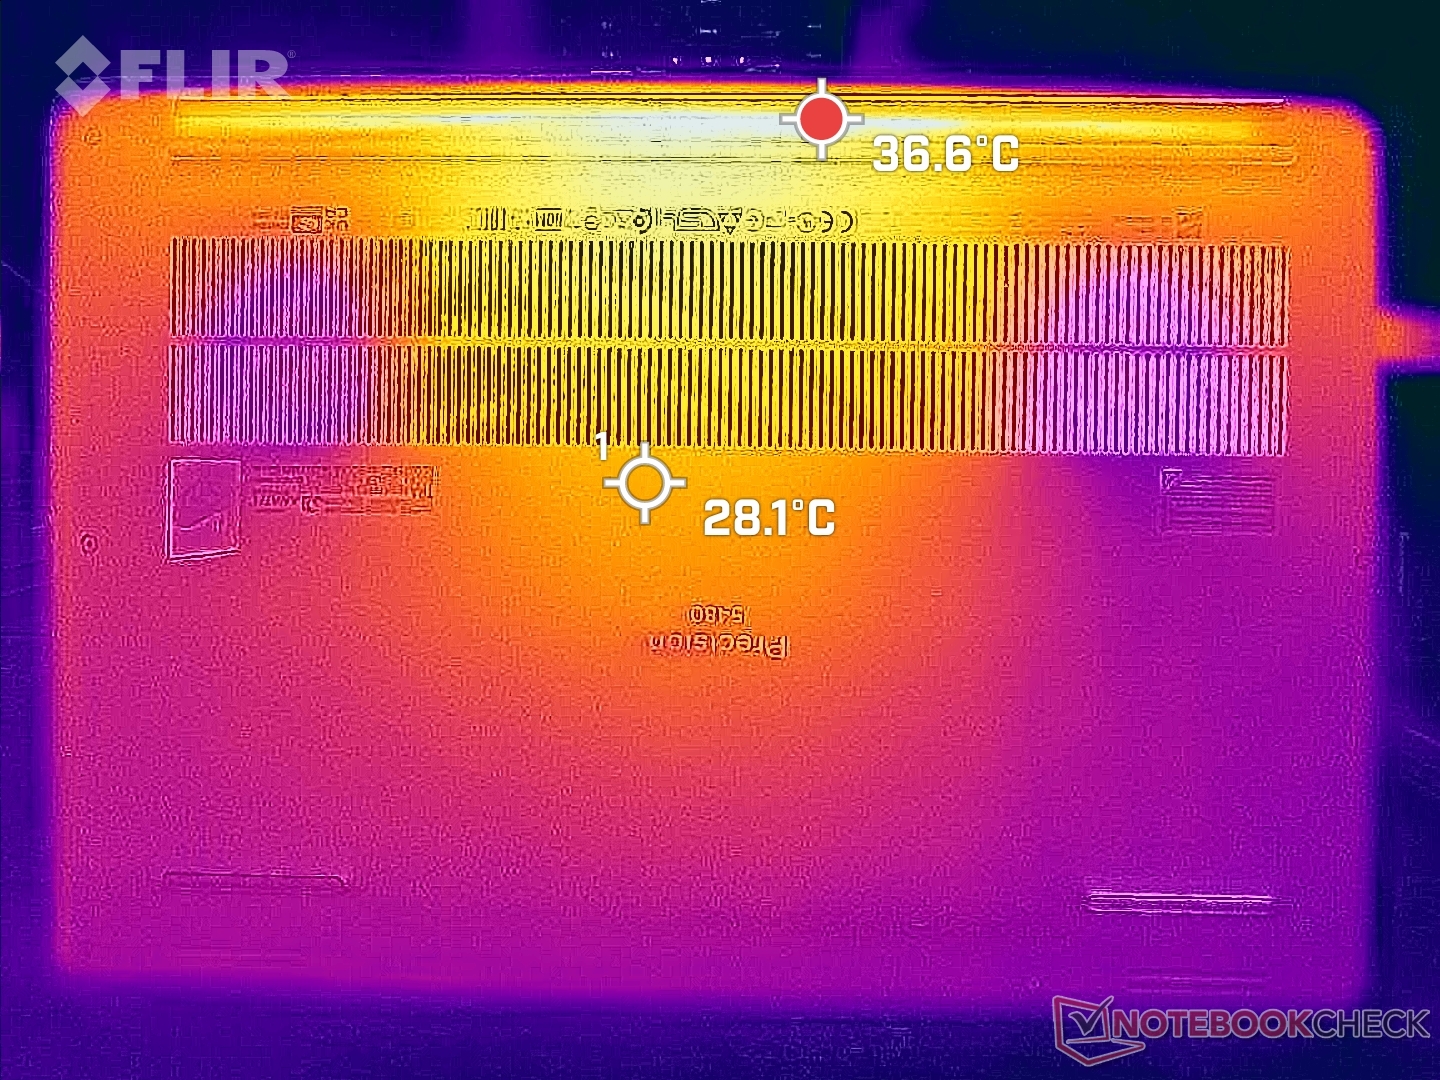
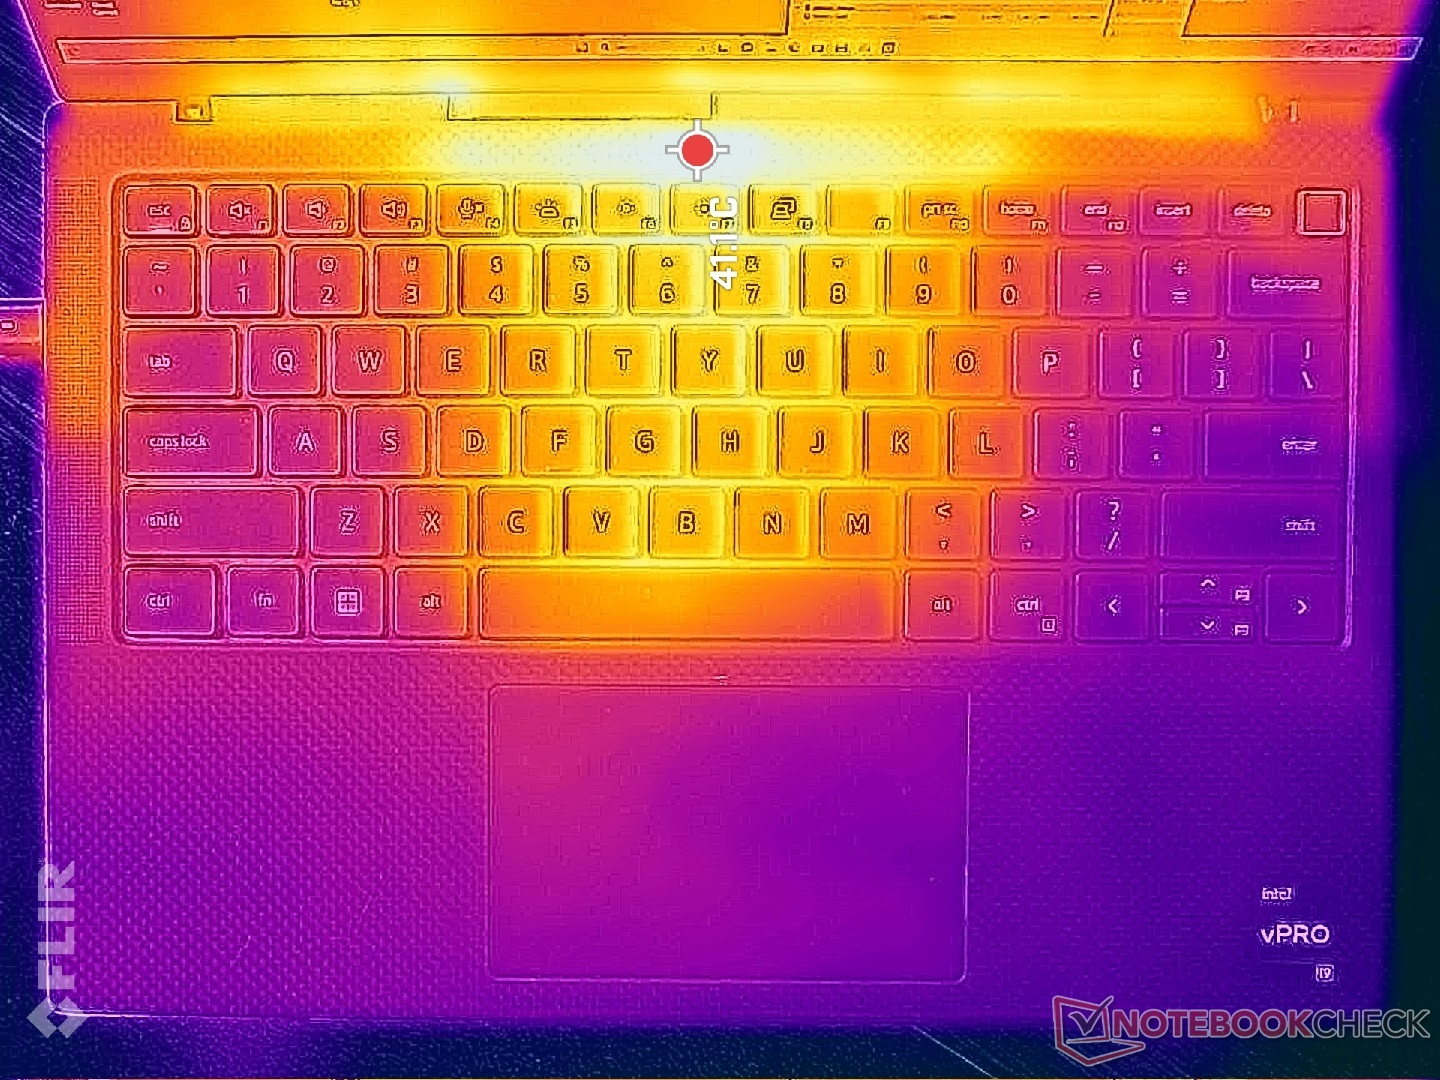
Die Oberflächentemperaturen sind aufgrund der trägen Lüfter im Leerlauf auf dem Desktop in der Mitte des Geräts wärmer als üblich. Der Nachteil für die Geräuschlosigkeit bei geringer Last sind also warme Oberflächentemperaturen, die einige Benutzer stören könnten.
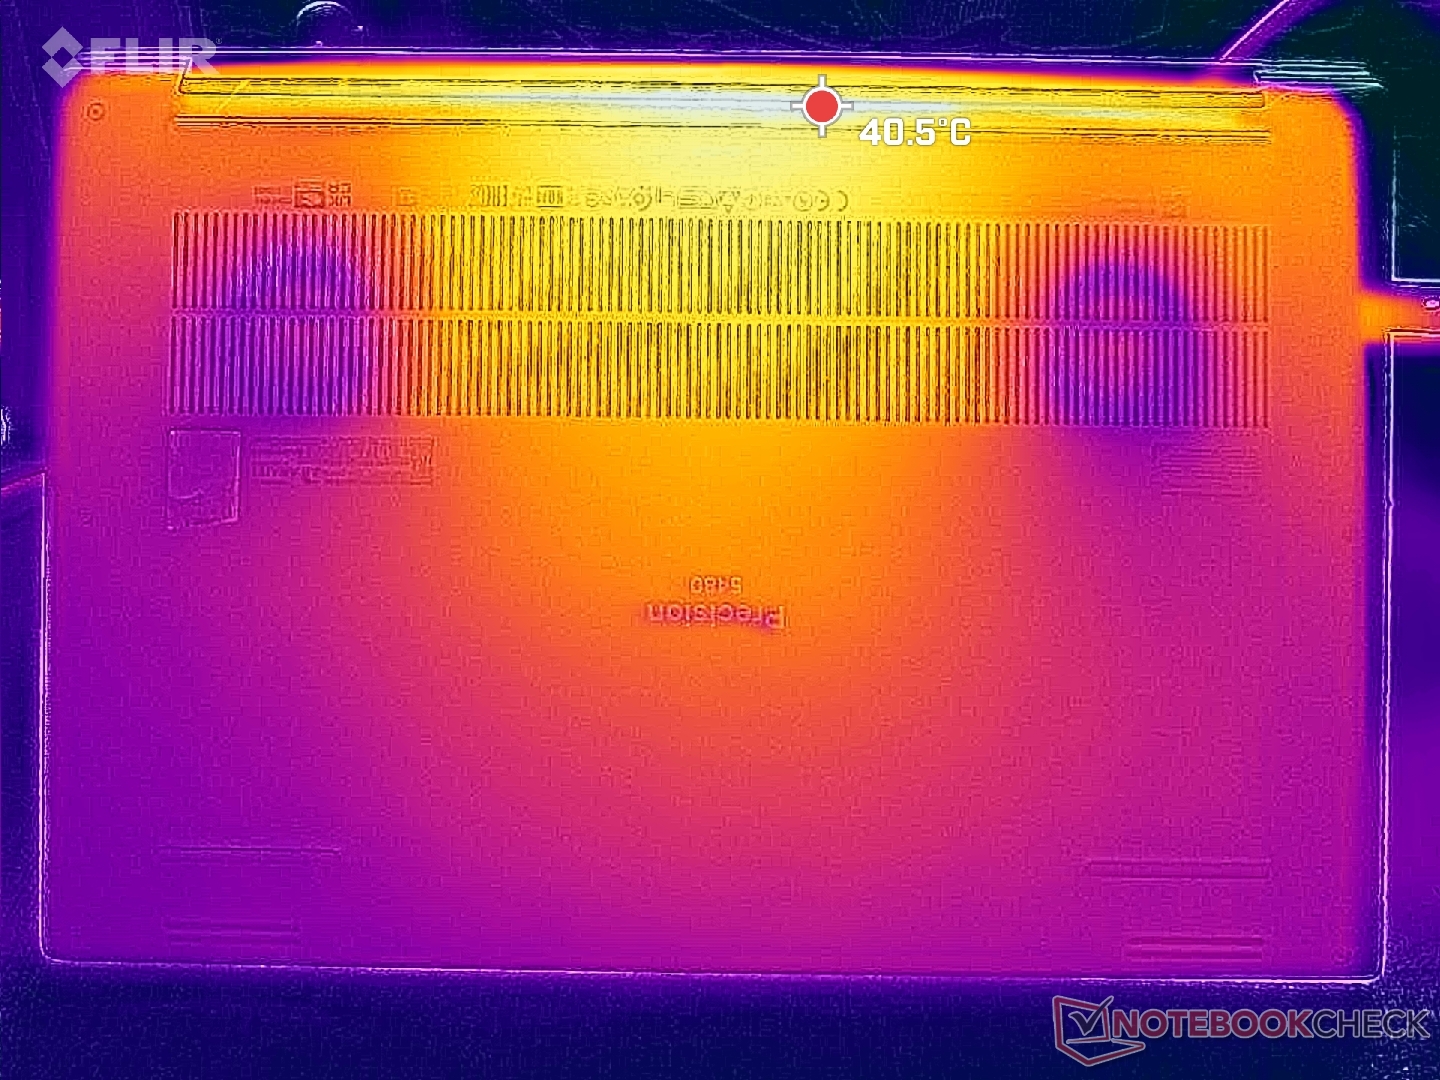
An der Ober- und Unterseite des Gehäuses können bei gleichzeitigem Betrieb von Prime95 und FurMark Temperaturen von über 40 °C erreicht werden. Diese Bereiche befinden sich in der Nähe der Rückseite des Geräts, sodass die Handballenablagen aus Kohlefaser immer noch angenehm kühl bleiben, aber der Großteil der Metallunterseite wird sehr warm.
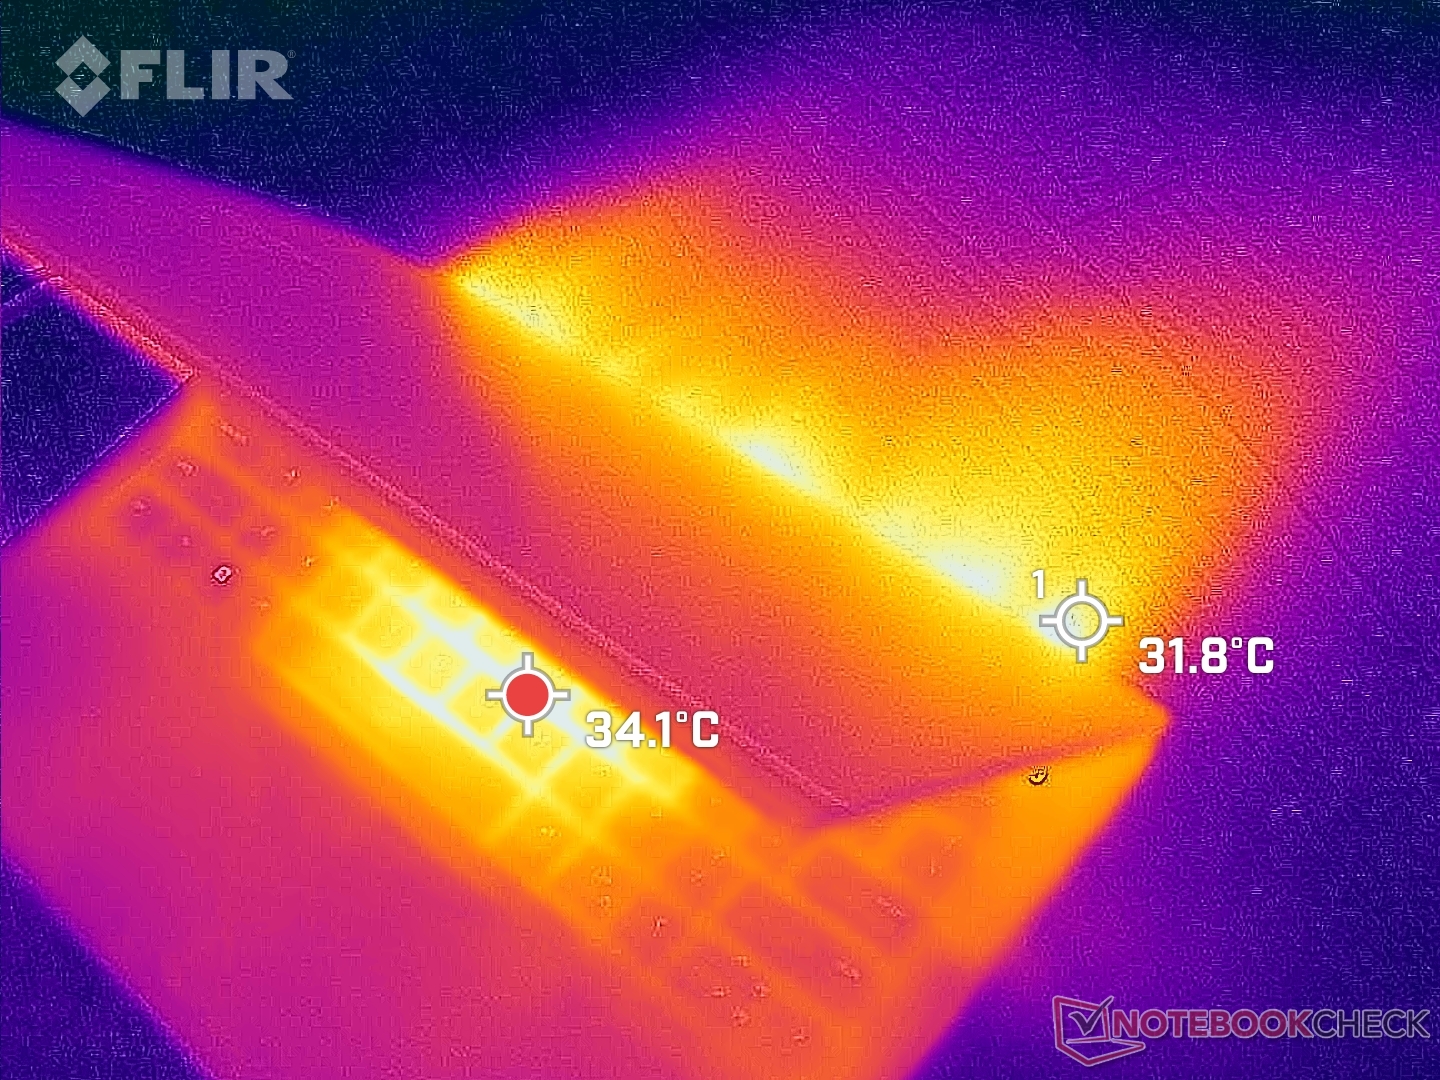
(±) Die maximale Temperatur auf der Oberseite ist 44 °C. Im Vergleich liegt der Klassendurchschnitt bei 38.2 °C (von 22.2 bis 69.8 °C für die Klasse Workstation).
(+) Auf der Unterseite messen wir eine maximalen Wert von 38.2 °C (im Vergleich zum Durchschnitt von 41.1 °C).
(±) Ohne Last messen wir eine durchschnittliche Temperatur von 34.2 °C auf der Oberseite. Der Klassendurchschnitt erreicht 32 °C.
(±) Beim längeren Spielen von The Witcher 3 erhitzt sich das Gerät durchschnittlich auf 32 °C. Der Durchschnitt der Klasse ist derzeit 32 °C.
(+) Die Handballen und der Touchpad-Bereich sind mit gemessenen 29.6 °C kühler als die typische Hauttemperatur und fühlen sich dadurch kühl an.
(±) Die durchschnittliche Handballen-Temperatur anderer getesteter Geräte war 27.8 °C (-1.8 °C).
| Dell Precision 5480 Intel Core i9-13900H, NVIDIA RTX 3000 Ada Generation Laptop | Dell Precision 5000 5470 Intel Core i9-12900H, NVIDIA RTX A1000 Laptop GPU | Dell Precision 5000 5560 Intel Core i7-11850H, NVIDIA RTX A2000 Laptop GPU | Lenovo ThinkPad P14s G3 AMD 21J6S05000 AMD Ryzen 7 PRO 6850U, AMD Radeon 680M | Lenovo ThinkPad P15v G3 21EM001AGE AMD Ryzen 7 PRO 6850H, NVIDIA RTX A2000 Laptop GPU | HP ZBook Firefly 14 G9-6B8A2EA Intel Core i7-1265U, NVIDIA T550 Laptop GPU | |
|---|---|---|---|---|---|---|
| Hitze | 9% | -1% | 14% | 7% | 11% | |
| Last oben max * (°C) | 44 | 41.8 5% | 48.2 -10% | 42.7 3% | 48.7 -11% | 41.2 6% |
| Last unten max * (°C) | 38.2 | 36 6% | 42.6 -12% | 43.1 -13% | 50.5 -32% | 47.9 -25% |
| Idle oben max * (°C) | 38.8 | 34.6 11% | 34.8 10% | 25.7 34% | 25 36% | 26.5 32% |
| Idle unten max * (°C) | 38.6 | 33.6 13% | 35.2 9% | 26.4 32% | 25.4 34% | 27 30% |
* ... kleinere Werte sind besser
Stresstest
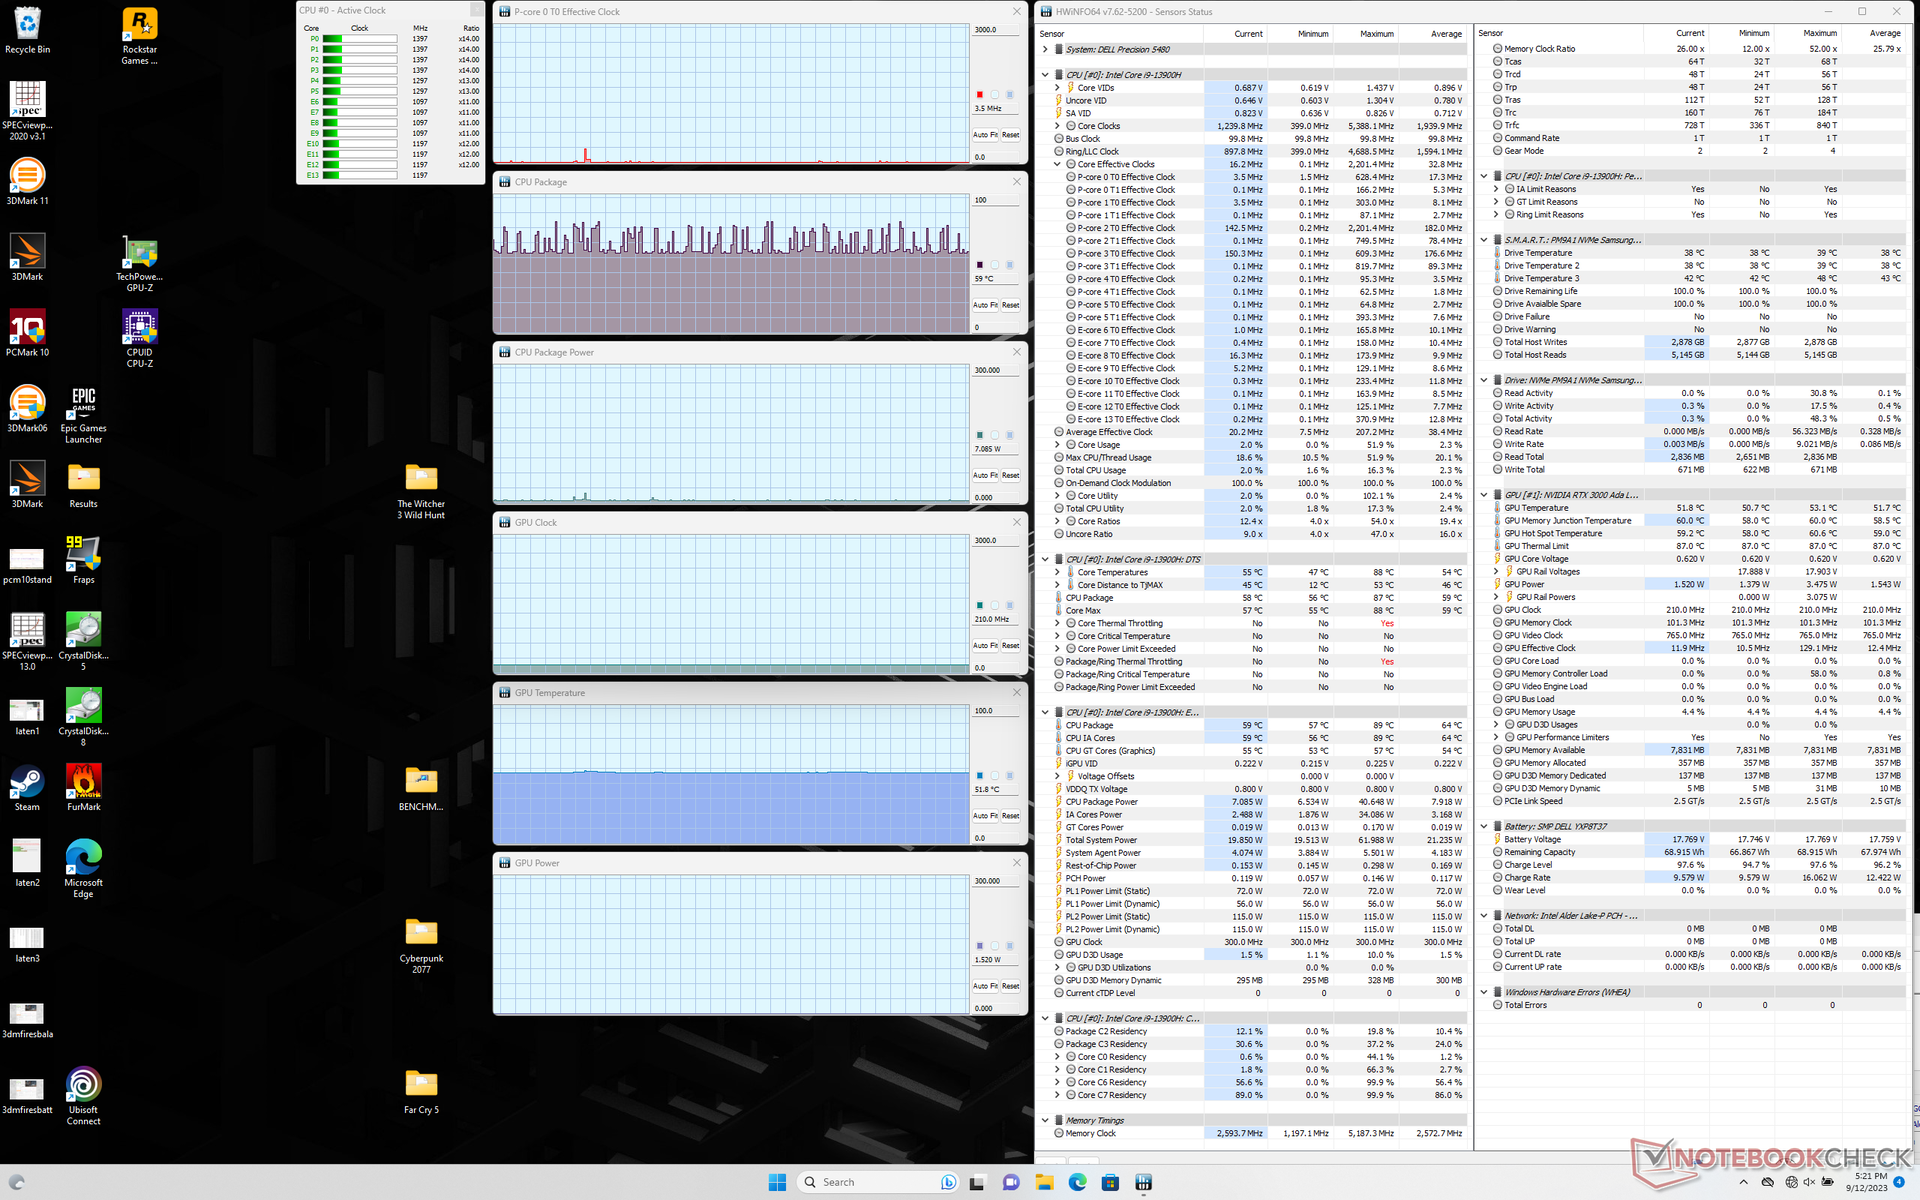
Im Prime95-Stresstest stieg die CPU für einige Minuten auf 3,4 GHz, 88 W und 100°C an. Schließlich stabilisierte sie sich bei etwa 2,4 GHz und 51 W, um eine etwas kühlere, aber handlichere Kerntemperatur von 93°C aufrechtzuerhalten. Der maximale Turbo Boost ist also nicht unbegrenzt, aber immer noch ziemlich gut, wenn man das kleine 14-Zoll-Gerät in Betracht zieht.
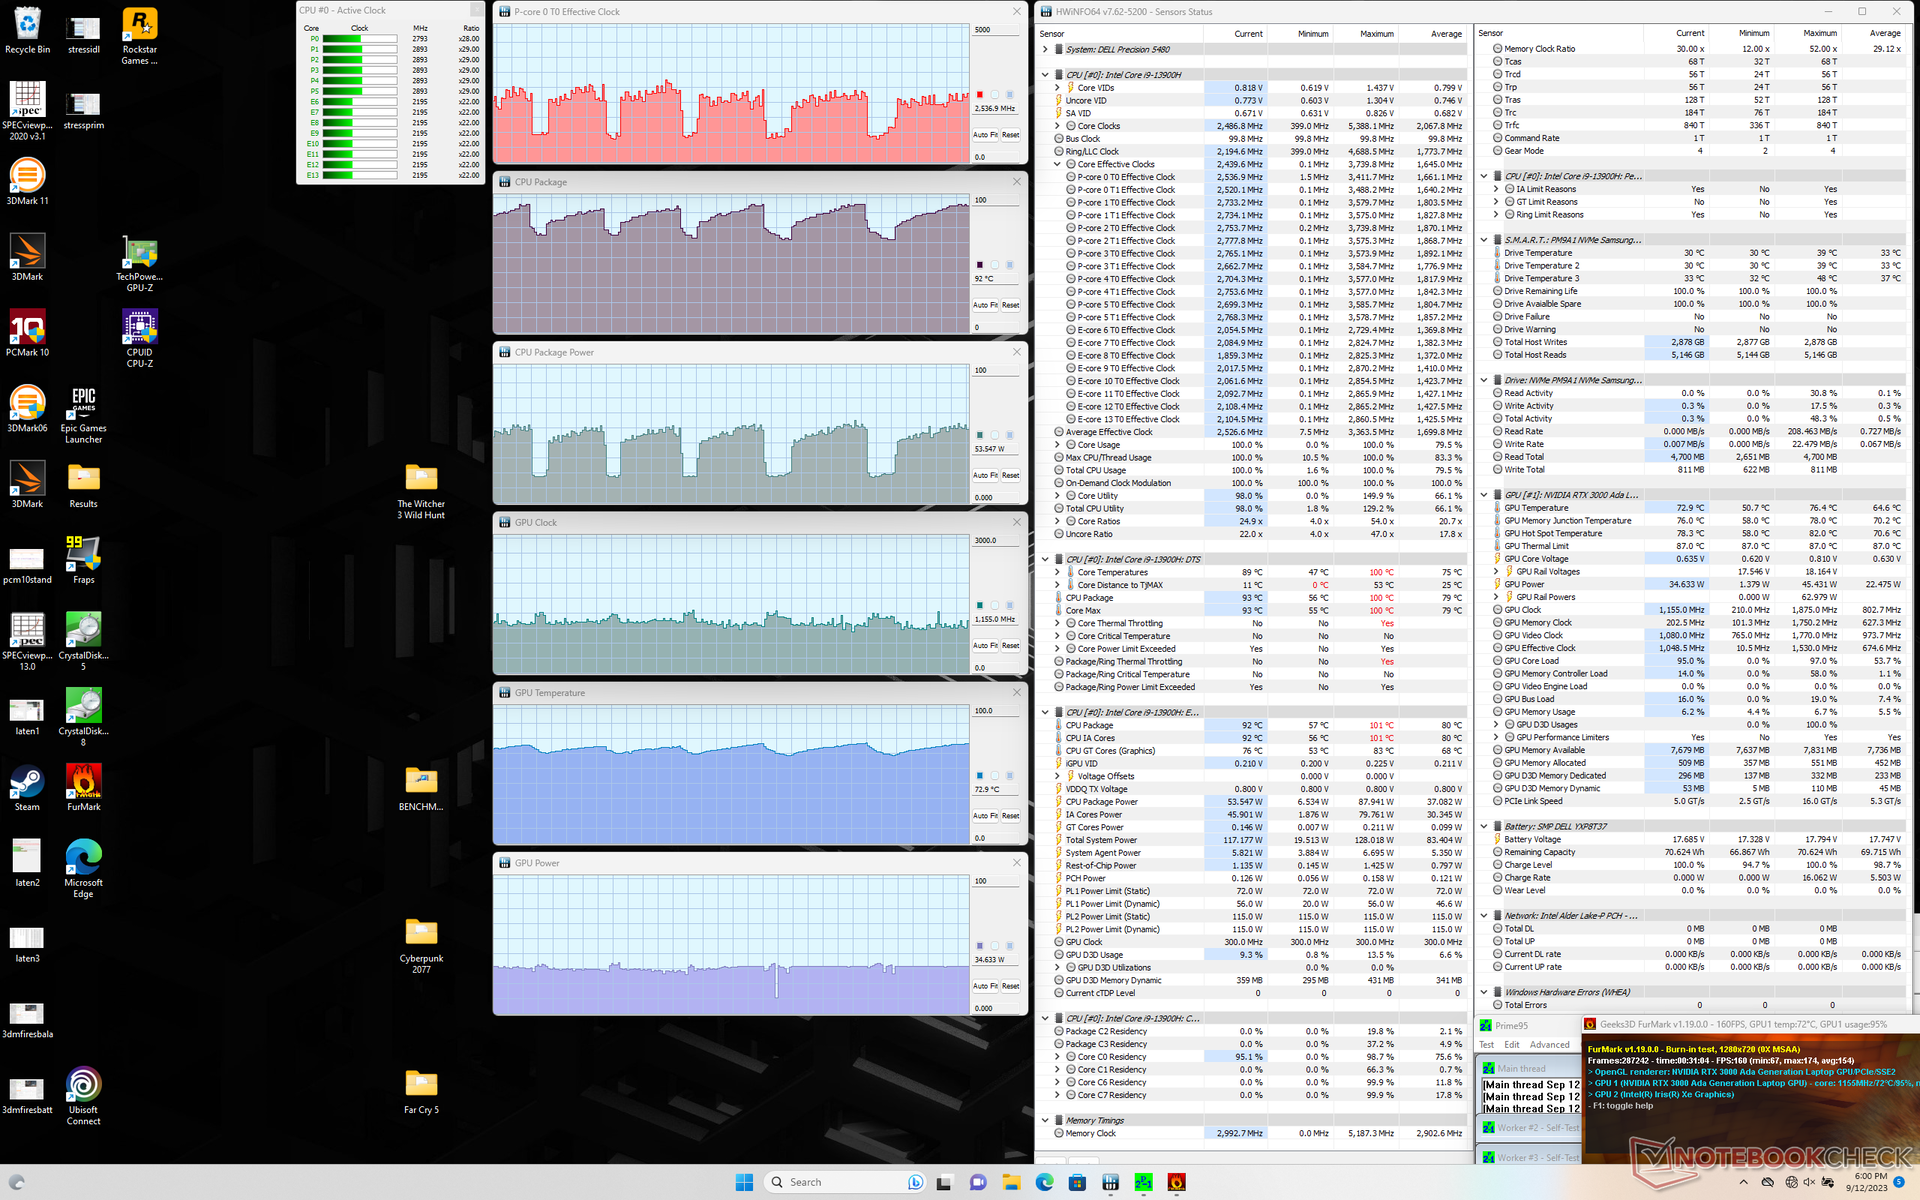
Bei der Ausführung von Witcher 3 stabilisieren sich CPU und GPU bei jeweils etwa 64°C, was eine hohe Belastung darstellt. Diese Werte änderten sich nicht, wenn man zwischen den Balanced-Modus und Performance-Modus wechselte, was darauf hindeutet, dass der Balanced-Modus für die meisten Aufgaben ausreichend sein sollte. Die GPU-Platine erfordert 45 bis 50 W mehr Leistung als die letztjährige Precision 5470, die nur 36 W benötigte. Bei einer ähnlichen Anzahl von Spielen wären die Kerntemperaturen jedoch niedriger als beim Vorjahresmodell.
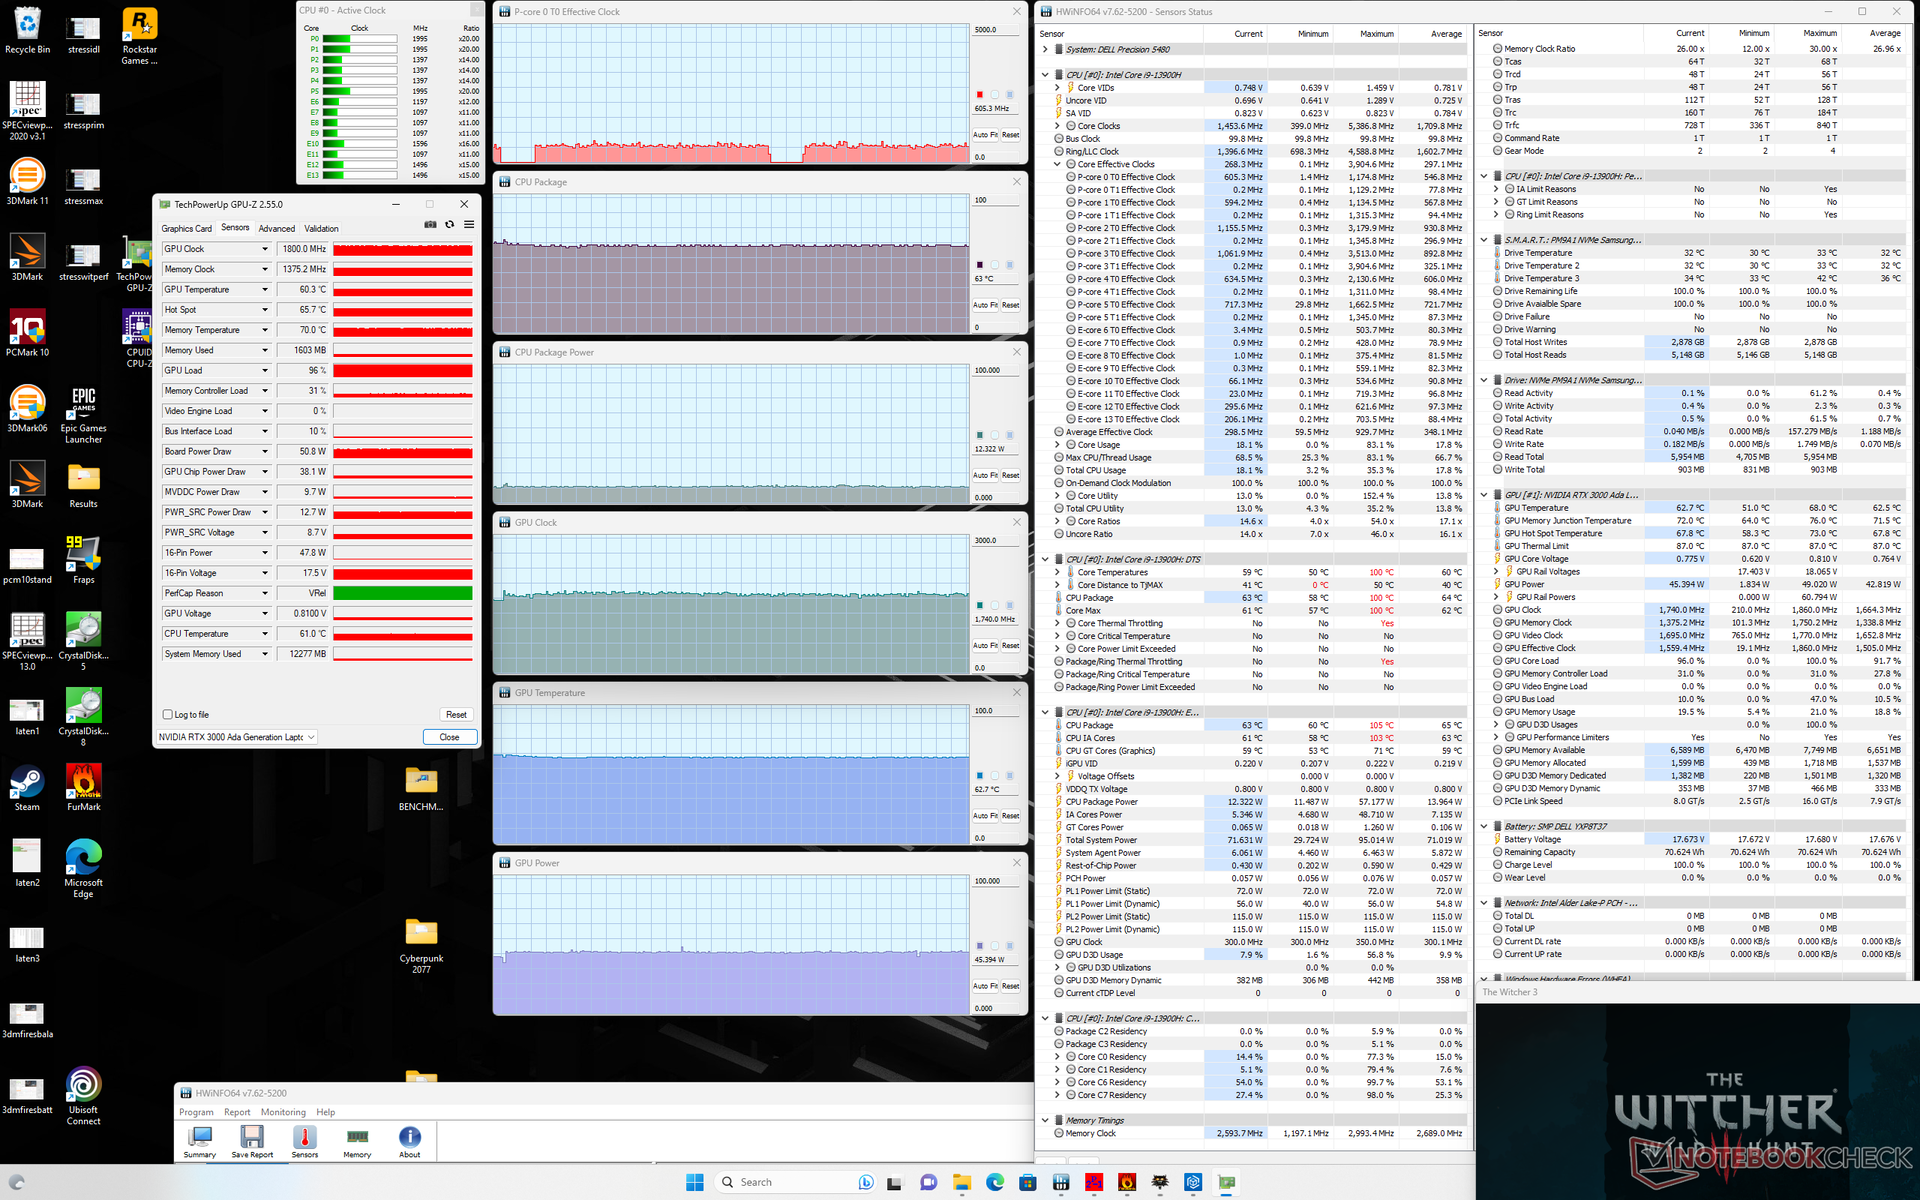
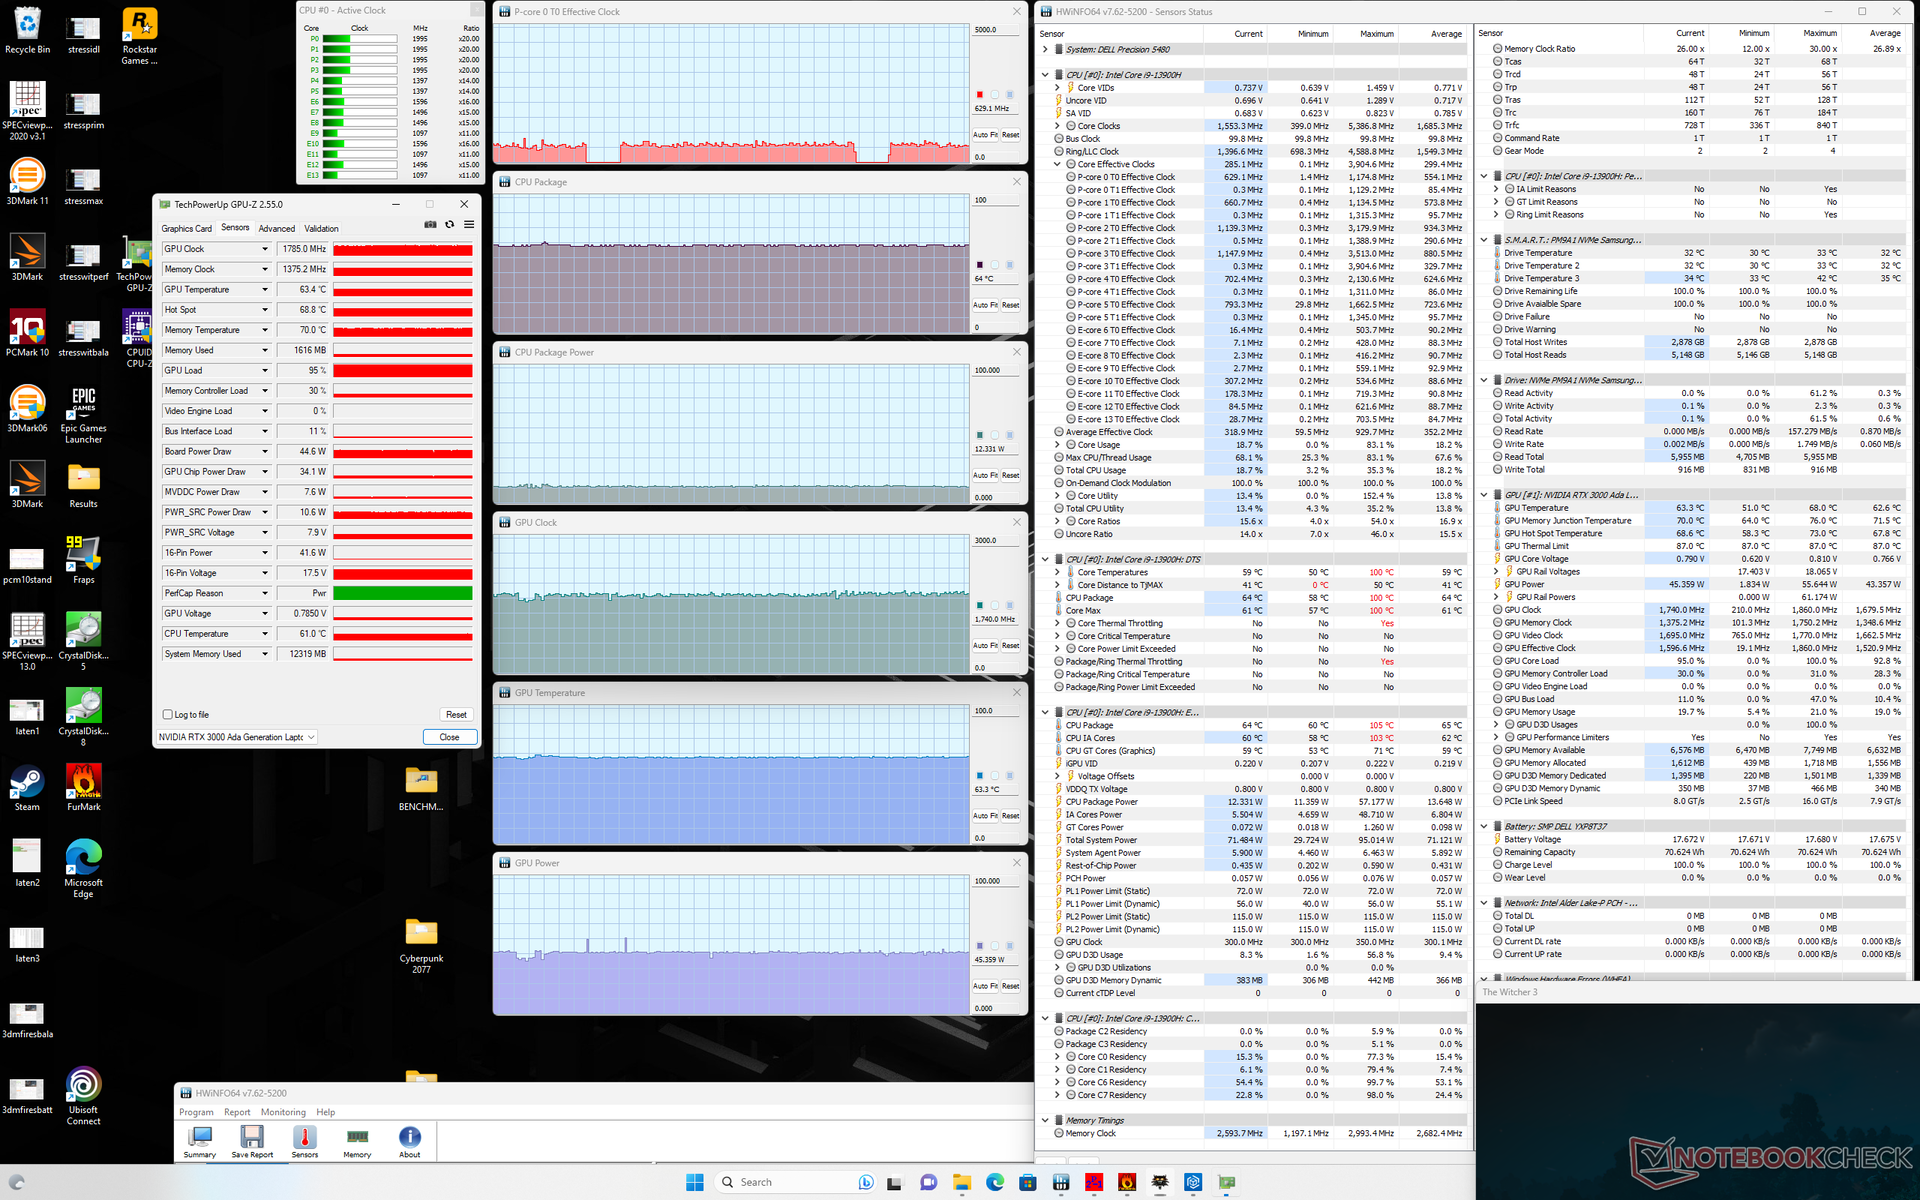
| CPU Clock (GHz) | GPU Clock (MHz) | Average CPU Temperature (°C) | Average GPU Temperature (°C) | |
| System Idle | -- | -- | 59 | 52 |
| Prime95 Stress | 2.5 | -- | 93 | 65 |
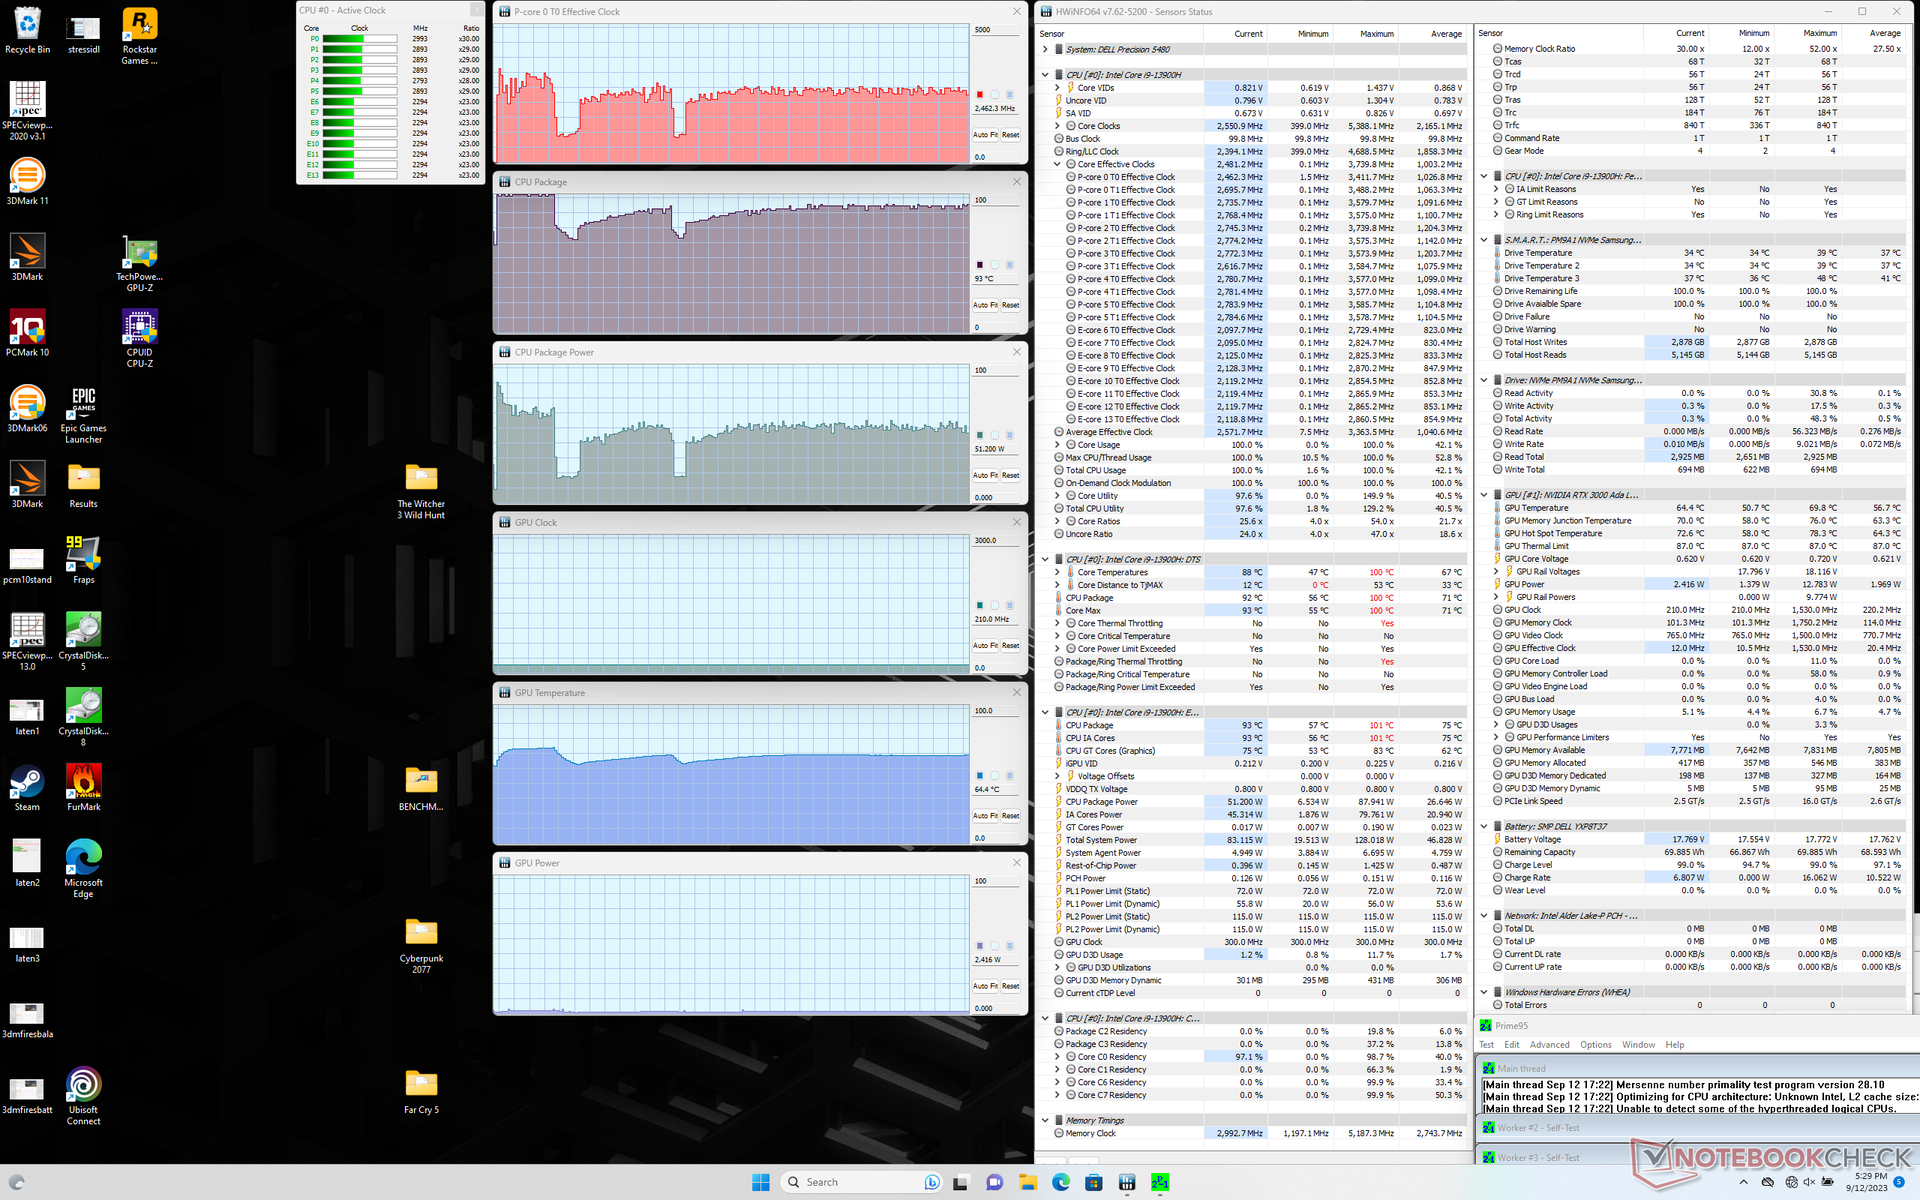
| Prime95 + FurMark Stress | 1.0 - 2.6 | 1155 | 69 - 92 | 66 - 73 |
| Witcher 3 Stress (Balanced mode) | 0.6 | 1740 | 63 | 63 |
| Witcher 3 Stress (Performance mode) | 0.6 | 1740 | 64 | 63 |
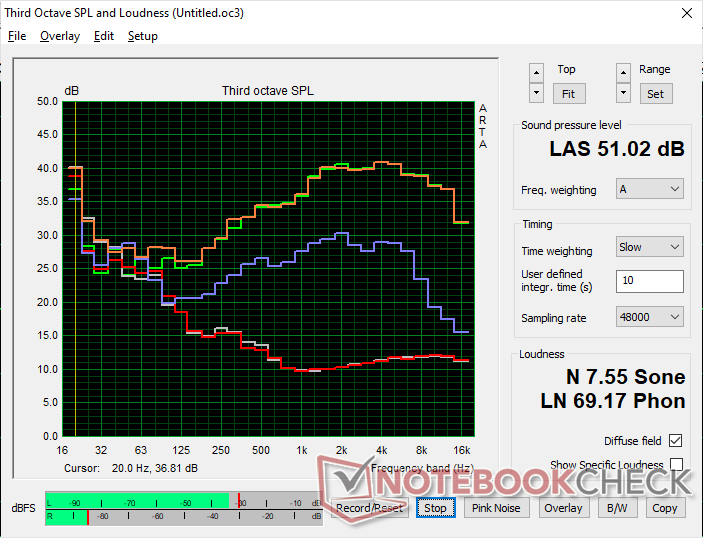
Lautsprecher
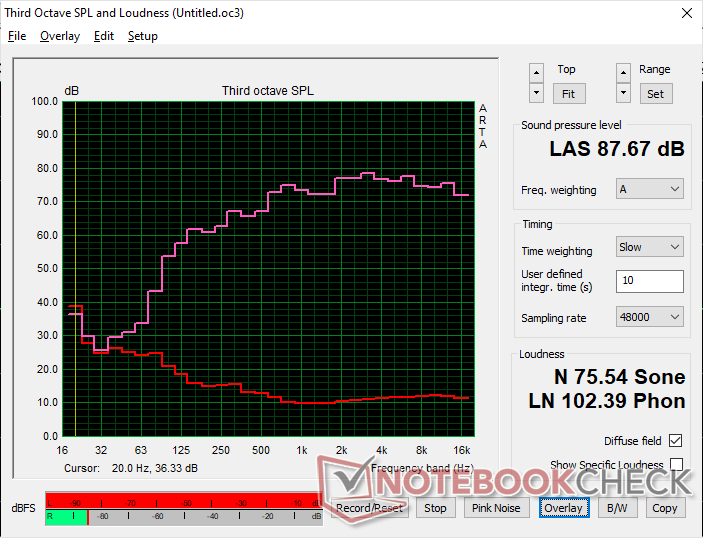
Dell Precision 5480 Audio Analyse
(+) | Die Lautsprecher können relativ laut spielen (87.7 dB)
Bass 100 - 315 Hz
(±) | abgesenkter Bass - 12.9% geringer als der Median
(±) | durchschnittlich lineare Bass-Wiedergabe (7% Delta zum Vorgänger)
Mitteltöne 400 - 2000 Hz
(+) | ausgeglichene Mitten, vom Median nur 2.8% abweichend
(+) | lineare Mitten (3.6% Delta zum Vorgänger)
Hochtöne 2 - 16 kHz
(+) | ausgeglichene Hochtöne, vom Median nur 2.9% abweichend
(+) | sehr lineare Hochtöne (2% Delta zum Vorgänger)
Gesamt im hörbaren Bereich 100 - 16.000 Hz
(+) | hörbarer Bereich ist sehr linear (9% Abstand zum Median
Im Vergleich zu allen Geräten derselben Klasse
» 4% aller getesteten Geräte dieser Klasse waren besser, 2% vergleichbar, 94% schlechter
» Das beste Gerät hat einen Delta-Wert von 7%, durchschnittlich ist 17%, das schlechteste Gerät hat 35%
Im Vergleich zu allen Geräten im Test
» 3% aller getesteten Geräte waren besser, 1% vergleichbar, 96% schlechter
» Das beste Gerät hat einen Delta-Wert von 4%, durchschnittlich ist 24%, das schlechteste Gerät hat 134%
Apple MacBook Pro 16 2021 M1 Pro Audio Analyse
(+) | Die Lautsprecher können relativ laut spielen (84.7 dB)
Bass 100 - 315 Hz
(+) | guter Bass - nur 3.8% Abweichung vom Median
(+) | lineare Bass-Wiedergabe (5.2% Delta zum Vorgänger)
Mitteltöne 400 - 2000 Hz
(+) | ausgeglichene Mitten, vom Median nur 1.3% abweichend
(+) | lineare Mitten (2.1% Delta zum Vorgänger)
Hochtöne 2 - 16 kHz
(+) | ausgeglichene Hochtöne, vom Median nur 1.9% abweichend
(+) | sehr lineare Hochtöne (2.7% Delta zum Vorgänger)
Gesamt im hörbaren Bereich 100 - 16.000 Hz
(+) | hörbarer Bereich ist sehr linear (4.6% Abstand zum Median
Im Vergleich zu allen Geräten derselben Klasse
» 0% aller getesteten Geräte dieser Klasse waren besser, 0% vergleichbar, 100% schlechter
» Das beste Gerät hat einen Delta-Wert von 5%, durchschnittlich ist 17%, das schlechteste Gerät hat 45%
Im Vergleich zu allen Geräten im Test
» 0% aller getesteten Geräte waren besser, 0% vergleichbar, 100% schlechter
» Das beste Gerät hat einen Delta-Wert von 4%, durchschnittlich ist 24%, das schlechteste Gerät hat 134%
Energieverwaltung
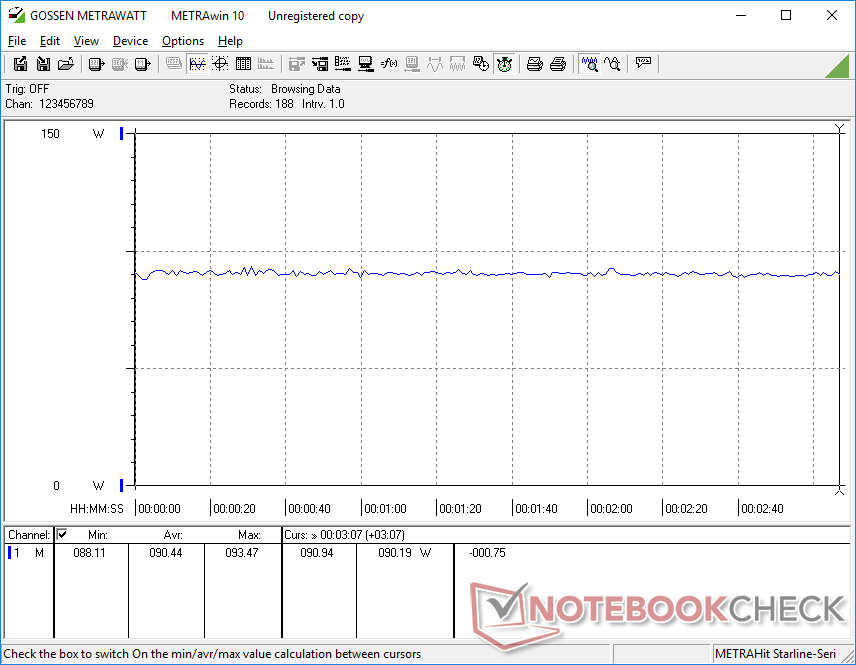
Energieverbrauch
Die Precision 5470 ist nicht so belastbar wie die Precision 5480. Zum Beispiel verbraucht Witcher 3 etwa 90 W im Vergleich zum vorherigen Modell von 83 W, aber der erhebliche Leistungssprung (siehe oben) verdrängt den geringfügigen Anstieg.
Wenn man die Leistungsdrosselung berücksichtigt, ist die Energieaufnahme bei Prime95 mehr als doppelt so hoch wie beim Vorjahresmodell (98 W gegenüber 42 W), wie in den folgenden Grafiken gezeigt wird. Im Vergleich zum Vorjahr kostet die Erhöhung der Prozessorleistung viel mehr als die Erhöhung der Grafikleistung.
Darüber hinaus ist es bemerkenswert, dass unser Gerät mehr Energie verbraucht als erwartet, wenn es einfach im Leerlauf auf dem Desktop ohne aktive Programme läuft. Wie bereits erwähnt, könnten die allgemein wärmeren Oberflächentemperaturen dafür verantwortlich sein.
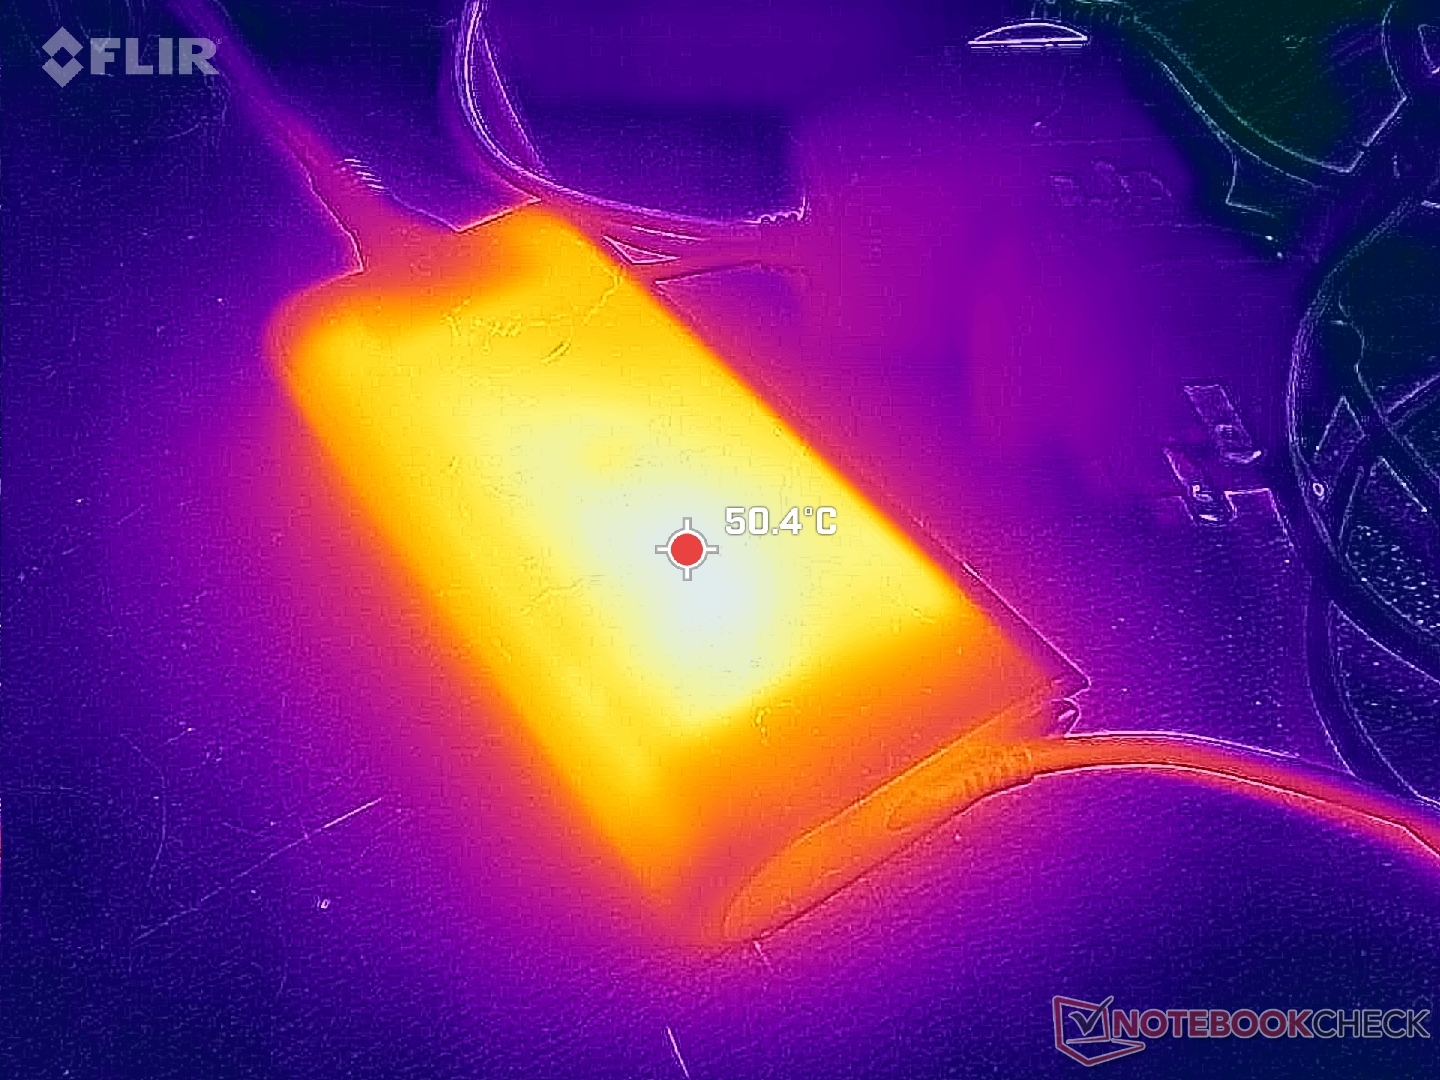
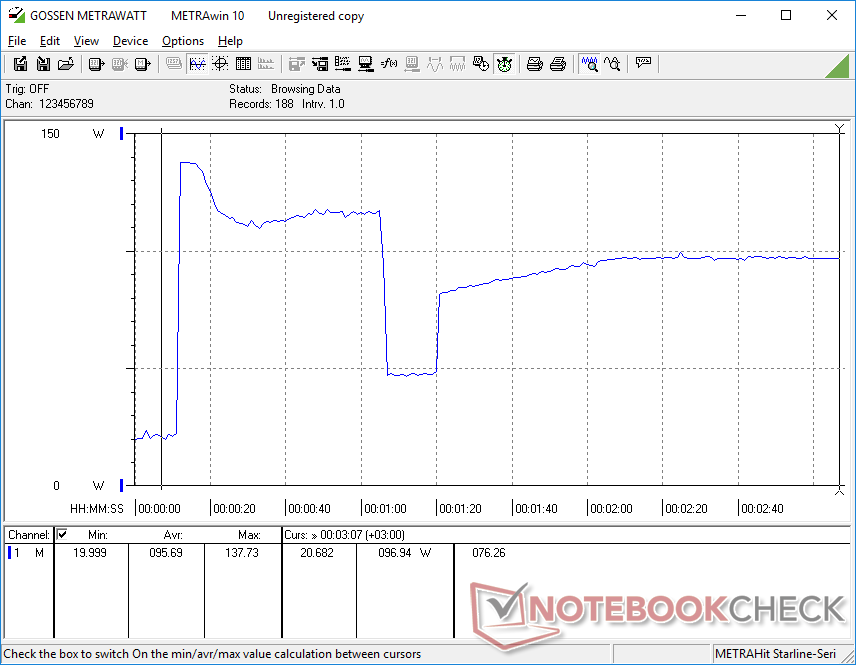
Wir konnten einen temporären Maximalverbrauch von 138 W mit dem kleinen bis mittelgroßen (~14,3 x 6,5 x 2,1 cm) 130-W-USB-C-Netzteil messen, wenn die CPU und GPU voll ausgelastet sind. Diese hohe Verbrauchsrate ist nicht konstant, da sie etwa jede Minute zwischen 76 W und 138 W schwankt, wie die Grafik unten zeigt, die mit den zyklischen Taktraten korreliert.


| Aus / Standby | |
| Idle | |
| Last |
|
Legende:
min: | |
| Dell Precision 5480 i9-13900H, RTX 3000 Ada Generation Laptop, Samsung PM9A1 MZVL21T0HCLR, IPS, 2560x1600, 14" | Dell Precision 5000 5470 i9-12900H, RTX A1000 Laptop GPU, Samsung PM9A1 MZVL21T0HCLR, IPS, 2560x1600, 14" | Dell Precision 5000 5560 i7-11850H, RTX A2000 Laptop GPU, Samsung PM9A1 MZVL22T0HBLB, IPS, 3840x2400, 15.6" | Lenovo ThinkPad P14s G3 AMD 21J6S05000 R7 PRO 6850U, Radeon 680M, Samsung PM9A1 MZVL21T0HCLR, IPS LED, 1920x1200, 14" | Lenovo ThinkPad P15v G3 21EM001AGE R7 PRO 6850H, RTX A2000 Laptop GPU, SK Hynix PC711 1TB HFS001TDE9X081N, IPS LED, 3840x2160, 15.6" | HP ZBook Firefly 14 G9-6B8A2EA i7-1265U, T550 Laptop GPU, Micron 3400 1TB MTFDKBA1T0TFH, IPS, 1920x1200, 14" | |
|---|---|---|---|---|---|---|
| Stromverbrauch | 25% | 15% | 63% | 24% | 60% | |
| Idle min * (Watt) | 14.9 | 4.3 71% | 6.2 58% | 2.6 83% | 6.3 58% | 4.2 72% |
| Idle avg * (Watt) | 19.5 | 8.9 54% | 13.9 29% | 5 74% | 13.9 29% | 6.5 67% |
| Idle max * (Watt) | 27.2 | 18.9 31% | 23.8 12% | 5.6 79% | 14.5 47% | 7.2 74% |
| Last avg * (Watt) | 81.6 | 94 -15% | 95.7 -17% | 49.7 39% | 82.8 -1% | 47.7 42% |
| Witcher 3 ultra * (Watt) | 90.4 | 83.2 8% | 87 4% | 50.6 44% | 88.8 2% | 42.9 53% |
| Last max * (Watt) | 137.8 | 137.5 -0% | 132.6 4% | 61.1 56% | 124.8 9% | 68.2 51% |
* ... kleinere Werte sind besser
Energieaufnahme Witcher 3 / Stresstest
Energieverbrauch externer Monitor
Akkulaufzeit
Die WLAN-Laufzeit beträgt etwa 1 bis 2 Stunden länger als beim Vorjahresmodell, was angesichts der Leistungsvorteile im Vergleich zum letzten Jahr ziemlich gut ist. Das Aufladen von leer bis zur vollen Kapazität dauert etwas über 2 Stunden.
| Dell Precision 5480 i9-13900H, RTX 3000 Ada Generation Laptop, 72 Wh | Dell Precision 5000 5470 i9-12900H, RTX A1000 Laptop GPU, 72 Wh | Dell Precision 5000 5560 i7-11850H, RTX A2000 Laptop GPU, 86 Wh | Lenovo ThinkPad P14s G3 AMD 21J6S05000 R7 PRO 6850U, Radeon 680M, 52.5 Wh | Lenovo ThinkPad P15v G3 21EM001AGE R7 PRO 6850H, RTX A2000 Laptop GPU, 68 Wh | HP ZBook Firefly 14 G9-6B8A2EA i7-1265U, T550 Laptop GPU, 51 Wh | |
|---|---|---|---|---|---|---|
| Akkulaufzeit | 5% | 29% | 17% | 32% | -19% | |
| WLAN (h) | 10.9 | 9.6 -12% | 6.3 -42% | 12.2 12% | 6.9 -37% | 8.8 -19% |
| Last (h) | 0.9 | 1.1 22% | 1.8 100% | 1.1 22% | 1.8 100% | |
| Idle (h) | 14.7 | 12 | ||||
| H.264 (h) | 12 | 10.7 |
Pro
Contra
Fazit — RTX 3000 Ada überzeugt
Das Precision 5480 ist eine interne Weiterentwicklung des Precision 5470 aus dem letzten Jahr. Die CPU-Leistung ist schneller und stabiler als zuvor, während der Ada-Grafikprozessor der eigentliche Star der Show ist und der Hauptgrund für den Kauf des Precision 5480 gegenüber dem älteren Precision 5470 darstellt. Der Energieverbrauch mag zwar etwas höher sein, aber die Akkulaufzeit hat sich nicht wesentlich verändert, und der Leistungszuwachs wird sich für anspruchsvolle Benutzer durchaus lohnen.
Der vielleicht auffälligste Nachteil dieses Systems ist die Lautstärke, wenn volle Leistung verwendet wird. Obwohl das Power-Volumen-Verhältnis sehr hoch ist, werden die Lüfter aufgrund der kompakten und tragbaren Größe lauter. Im Vergleich dazu arbeiten andere 14-Zoll-Workstations wie das Lenovo ThinkPad P14s oder das HP ZBook Firefly 14 G9 wesentlich leiser. Jedoch erfordert dies oft einen Kompromiss, indem man einen Großteil der Grafikleistung aufgeben muss.
Das 14-Zoll-Precision 5480 richtet sich an Power-Nutzer, die unterwegs sind und die schnelle RTX 3000 Ada-GPU voll ausnutzen möchten. Andernfalls sind die Alternativen von Lenovo und HP in der Regel viel leiser und unauffälliger.
Preis und Verfügbarkeit
Dell liefert seine Precision 5480-Workstation jetzt ab 2.386 Euro für die Core i5-Basiskonfiguration ohne separate Grafik bis zu über 2.986 Euro für unsere Core i7 RTX 3000 Ada-Konfiguration.
Dell Precision 5480
- 15.09.2023 v7 (old)
Allen Ngo
Transparenz
Die Auswahl der zu testenden Geräte erfolgt innerhalb der Redaktion. Das vorliegende Testmuster wurde dem Autor vom Hersteller oder einem Shop zu Testzwecken leihweise zur Verfügung gestellt. Eine Einflussnahme des Leihstellers auf den Testbericht gab es nicht, der Hersteller erhielt keine Version des Reviews vor der Veröffentlichung. Es bestand keine Verpflichtung zur Publikation. Als eigenständiges, unabhängiges Unternehmen unterliegt Notebookcheck keiner Diktion von Herstellern, Shops und Verlagen.
So testet Notebookcheck
Pro Jahr werden von Notebookcheck hunderte Laptops und Smartphones unabhängig in von uns standardisierten technischen Verfahren getestet, um eine Vergleichbarkeit aller Testergebnisse zu gewährleisten. Seit rund 20 Jahren entwickeln wir diese Testmethoden kontinuierlich weiter und setzen damit Branchenstandards. In unseren Testlaboren kommt ausschließlich hochwertiges Messequipment in die Hände erfahrener Techniker und Redakteure. Die Tests unterliegen einer mehrstufigen Kontrolle. Unsere komplexe Gesamtbewertung basiert auf hunderten fundierten Messergebnissen und Benchmarks, womit Ihnen Objektivität garantiert ist. Weitere Informationen zu unseren Testmethoden gibt es hier.
Preisvergleich

