Dell Inspiron 16 Plus 7630 Laptop-Test: Die 60-W-GeForce-RTX-4060 ist gar nicht so schlecht

Das Dell Inspiron 16 Plus 7630 aus dem Jahr 2023 folgt auf das letztjährige Inspiron 16 Plus 7620 mit aktualisiertem Innenleben und äußerem Look, obwohl das 2022er Modell bereits ein komplettes Redesign des Inspiron 16 Plus 7610 aus dem Jahr 2021 war. Es ist selten, dass eine Serie in drei aufeinanderfolgenden Jahren drei größere Umgestaltungen erfährt, da die Hersteller in der Regel nur alle paar Jahre das Äußere überarbeiten. Wie andere Multimedia-Notebooks des Jahres 2023 ist auch das Inspiron 16 Plus 7630 mit Intel-Raptor-Lake-H-CPUs der 13. Generation und Nvidia-Ada-Lovelace-GPUs ausgestattet.
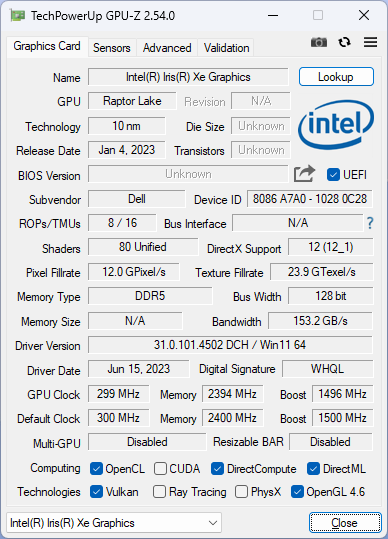
Unser Testgerät ist eine High-End-Konfiguration mit Core-i7-13700H-CPU, GeForce-RTX-4060-GPU und 2.560x1.600-120-Hz-IPS-Display für ca. 1.250 US-Dollar oder 400 US-Dollar unter dem ursprünglichen Einführungspreis zum Zeitpunkt des Schreibens. Kleinere SKUs mit dem Core i5-13500H, integrierter Iris Xe, RTX 3050, RTX 4050 oder 1.200p-60-Hz-Display sind in Arbeit. Auch AMD Varianten mit Ryzen 5 7640HS und Ryzen 7 7840HS sind unter der Modellbezeichnung Inspiron 16 Plus 7635 geplant.
Alternativen zum Inspiron 16 Plus 7630 sind andere 16-Zoll-Multimedia-Notebooks wie das Lenovo Slim Pro 9i 16, Asus VivoBook Pro 16X, HP Envy 16 oder MSI Summit E16 Flip. Das Inspiron 16 Plus 7630 sollte nicht mit dem langsameren Inspiron 16 oder dem Inspiron 16 Plus 7630 2-in-1 verwechselt werden, die sehr unterschiedliche Spezifikationen und Funktionen haben.
Mehr Dell Bewertungen:
Mögliche Konkurrenten im Vergleich
Bew. | Datum | Modell | Gewicht | Dicke | Größe | Auflösung | Preis ab |
|---|---|---|---|---|---|---|---|
| 87.1 % v7 (old) | 09 / 2023 | Dell Inspiron 16 Plus 7630 i7-13700H, GeForce RTX 4060 Laptop GPU | 2.2 kg | 19.95 mm | 16.00" | 2560x1600 | |
| 87.4 % v7 (old) | 08 / 2022 | Dell Inspiron 16 Plus 7620 i7-12700H, GeForce RTX 3050 Ti Laptop GPU | 2.1 kg | 18.99 mm | 16.00" | 3072x1920 | |
| 88 % v7 (old) | 08 / 2023 | Lenovo Slim Pro 9i 16IRP8 i9-13905H, GeForce RTX 4050 Laptop GPU | 2.2 kg | 18.2 mm | 16.00" | 3200x2000 | |
| 86.2 % v7 (old) | 07 / 2023 | Asus Vivobook Pro 16X K6604JV-MX016W i9-13980HX, GeForce RTX 4060 Laptop GPU | 2.1 kg | 22.8 mm | 16.00" | 3200x2000 | |
| 86.9 % v7 (old) | 10 / 2022 | HP Envy 16 h0112nr i7-12700H, GeForce RTX 3060 Laptop GPU | 2.3 kg | 19.8 mm | 16.00" | 3840x2400 | |
| 84.2 % v7 (old) | 10 / 2022 | MSI Summit E16 Flip A12UDT-031 i7-1280P, GeForce RTX 3050 Ti Laptop GPU | 1.9 kg | 16.85 mm | 16.00" | 2560x1600 |
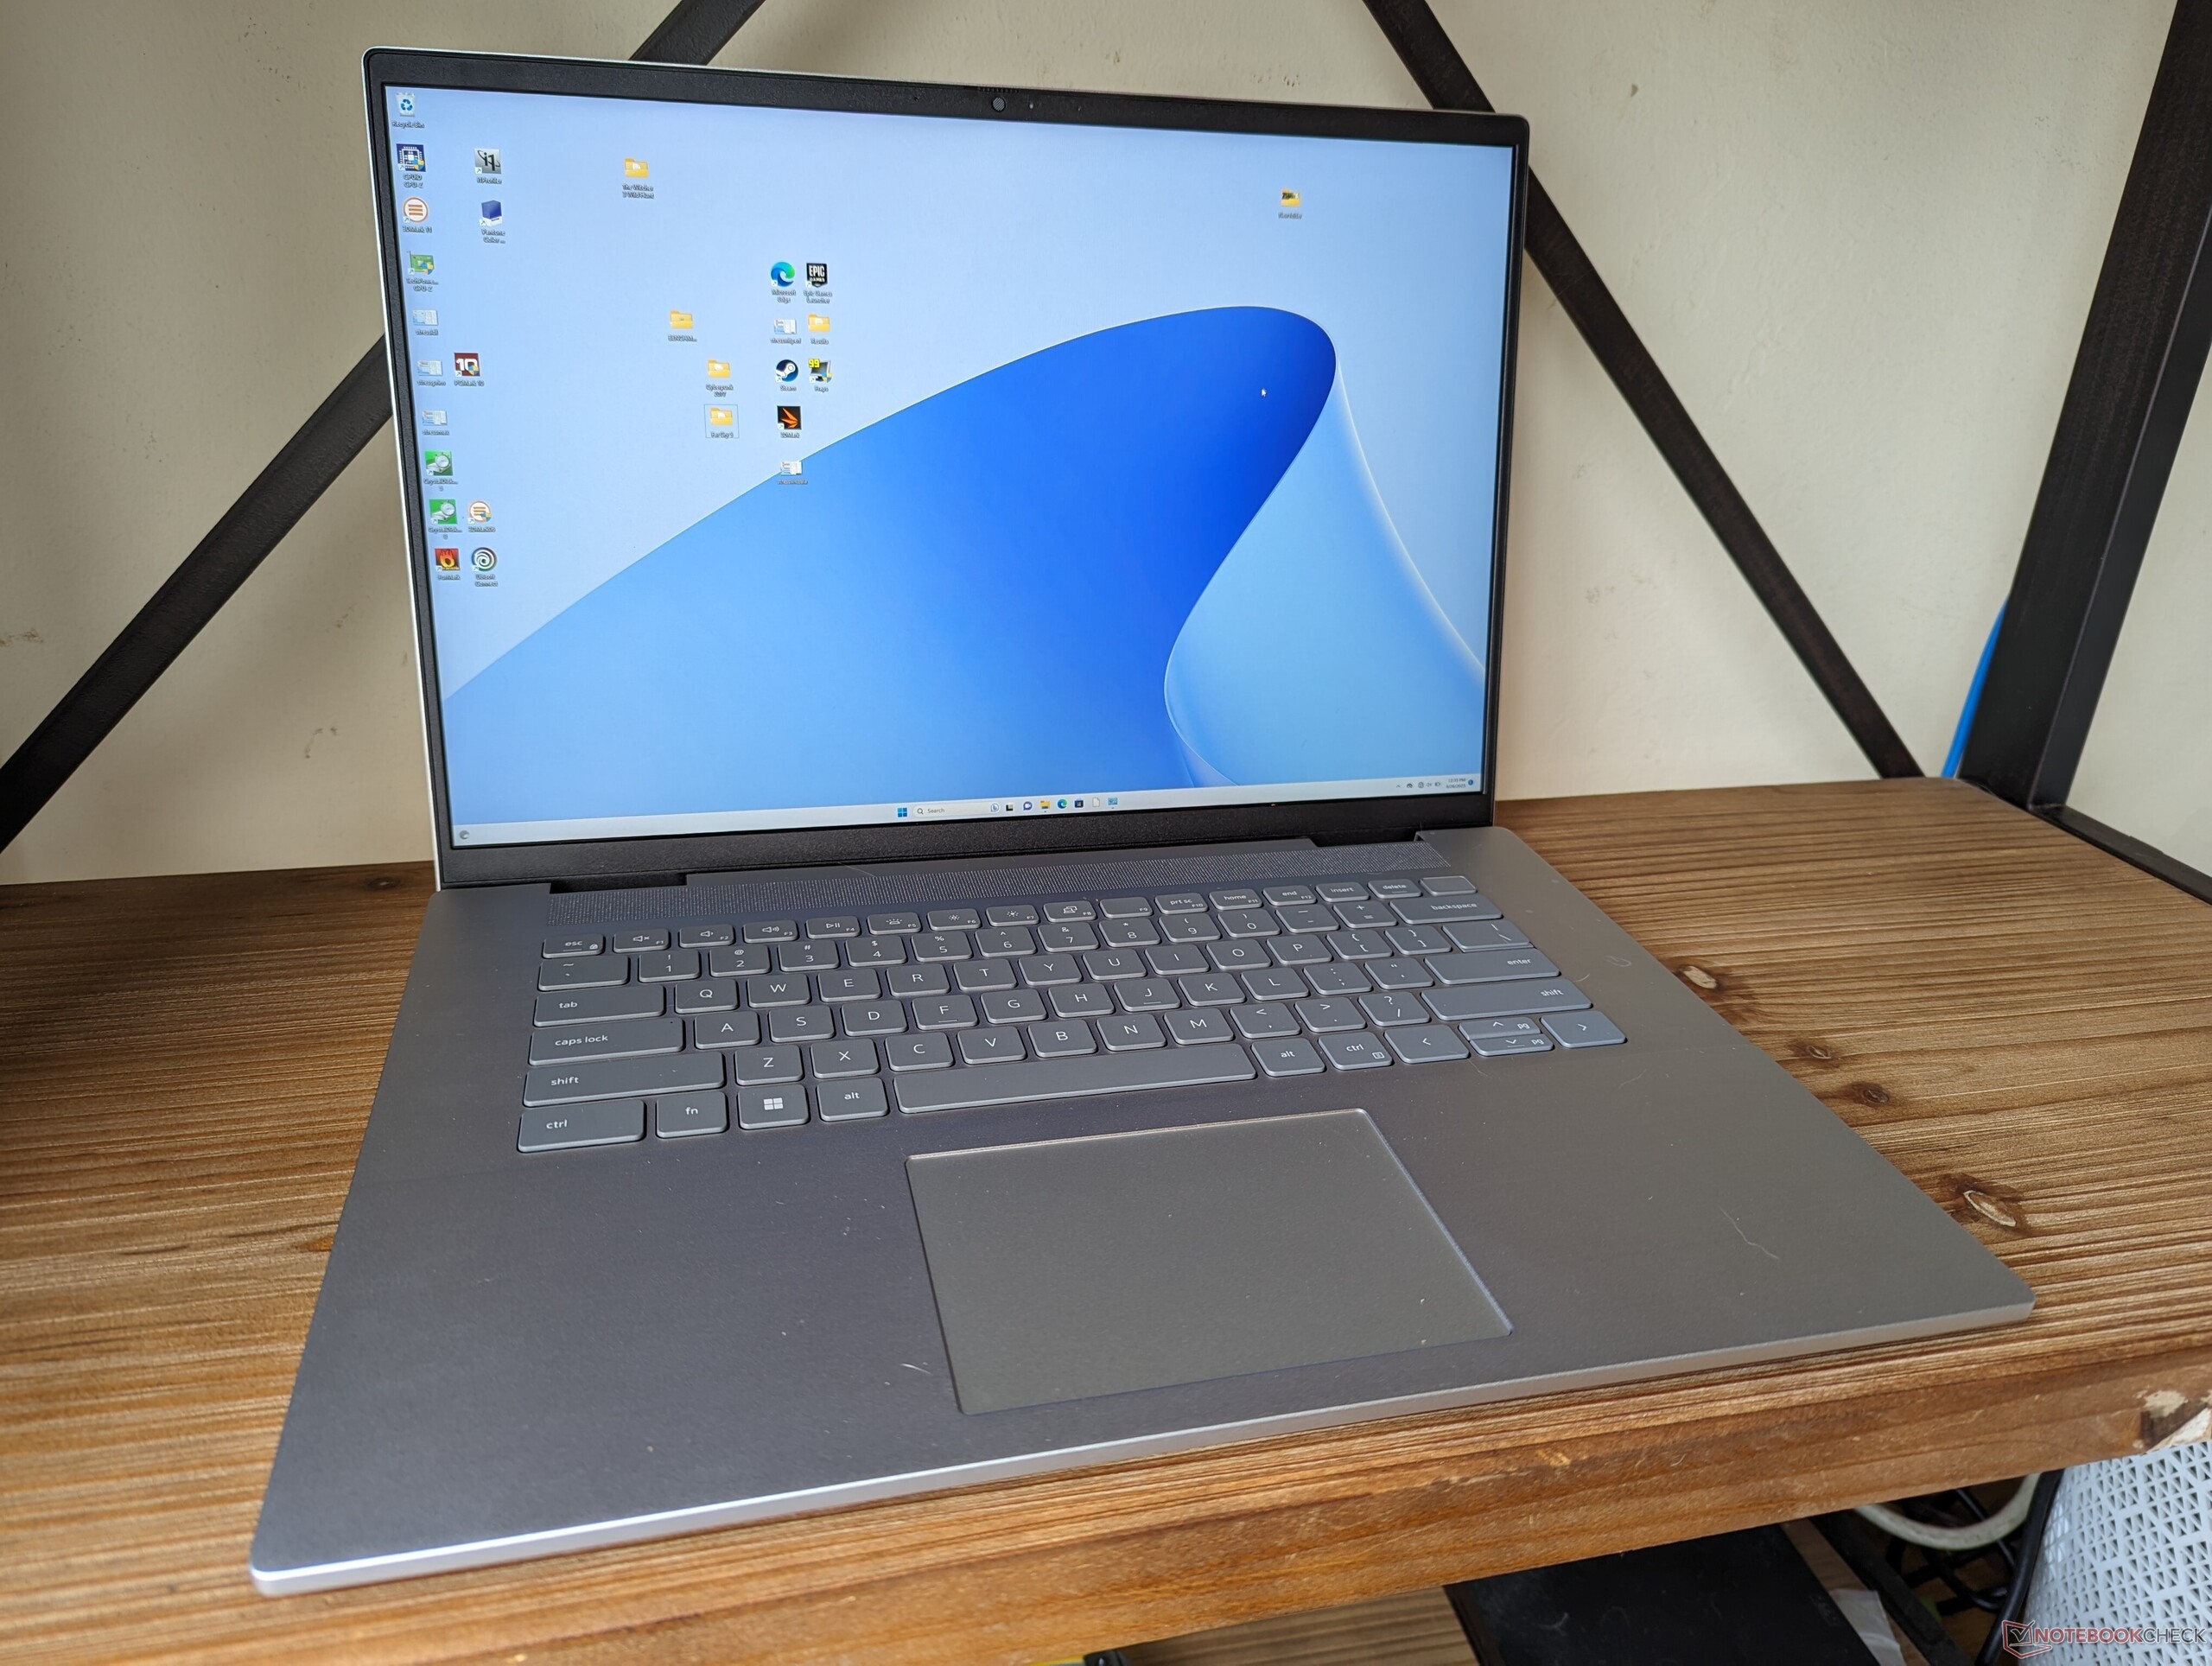
Gehäuse - Ganz schlicht
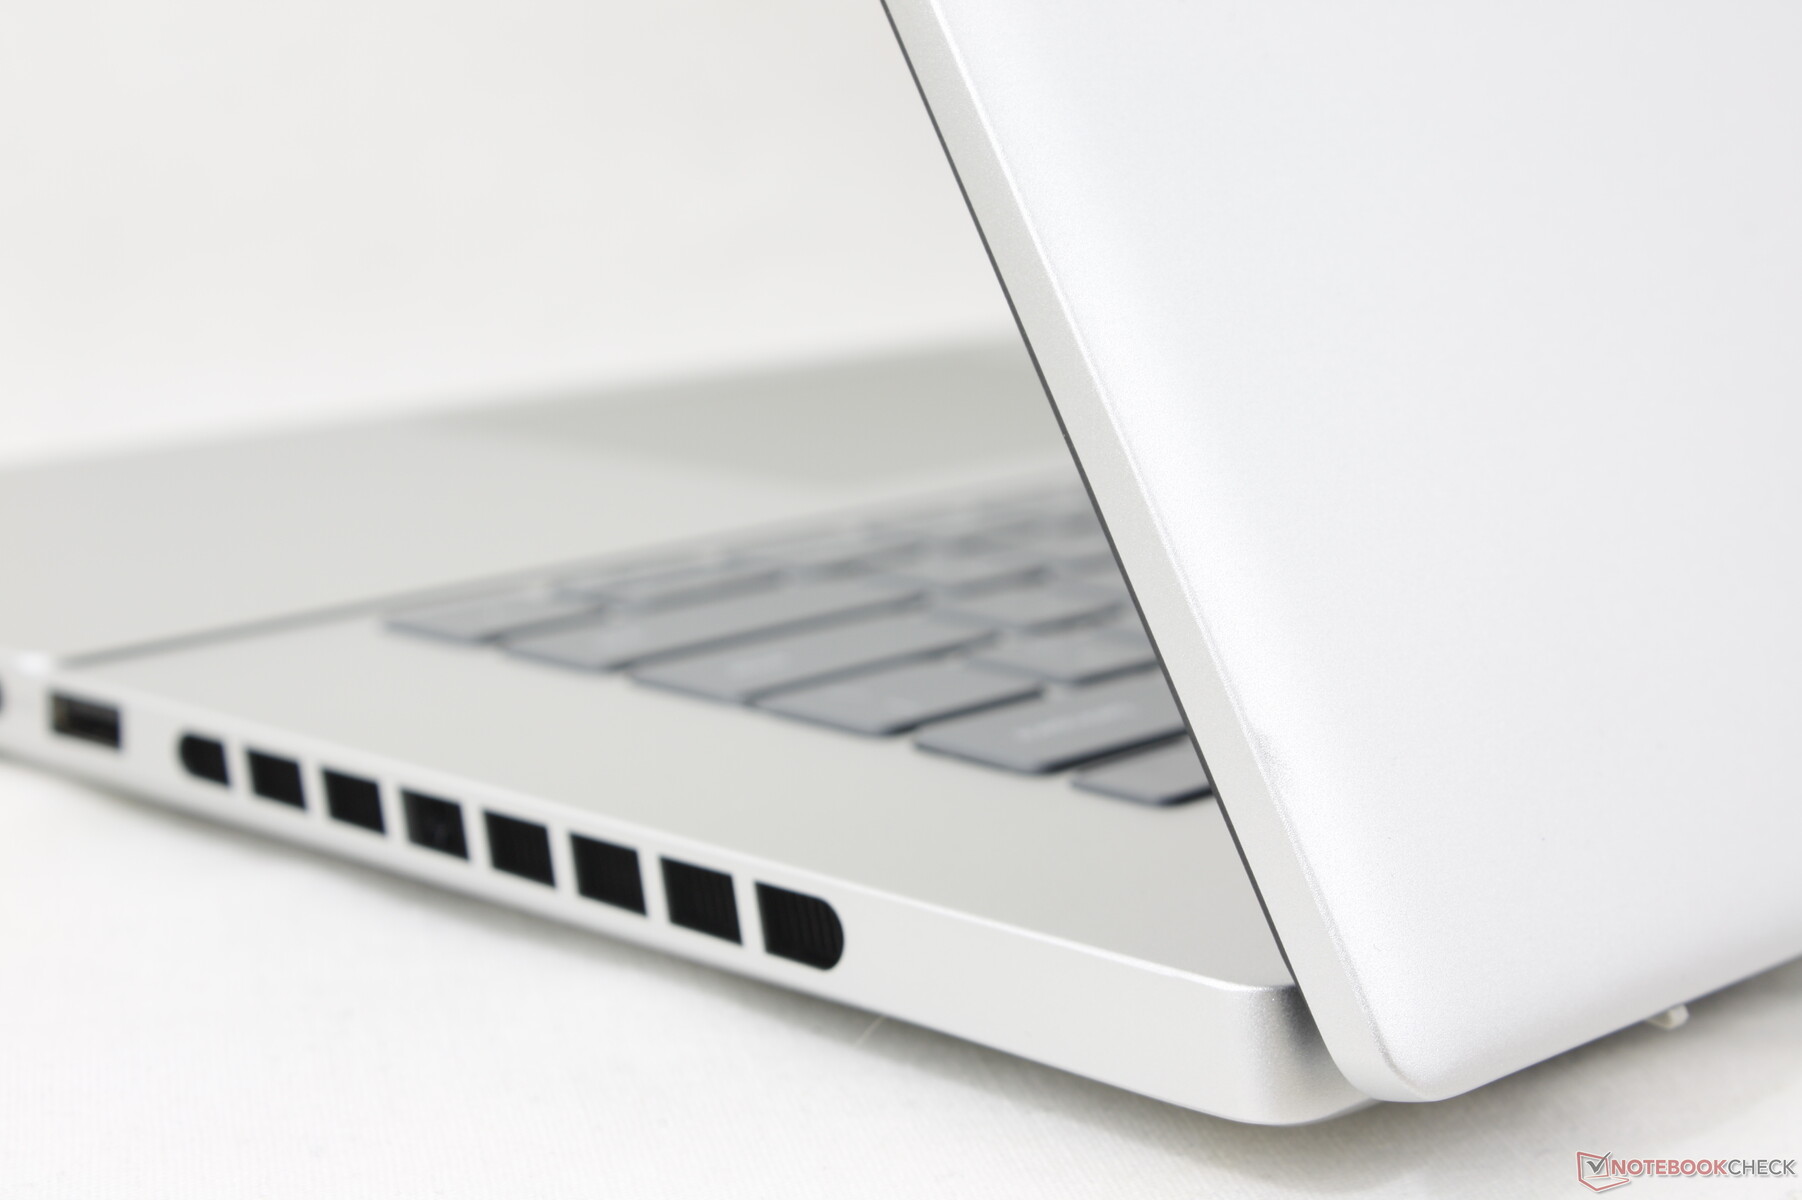
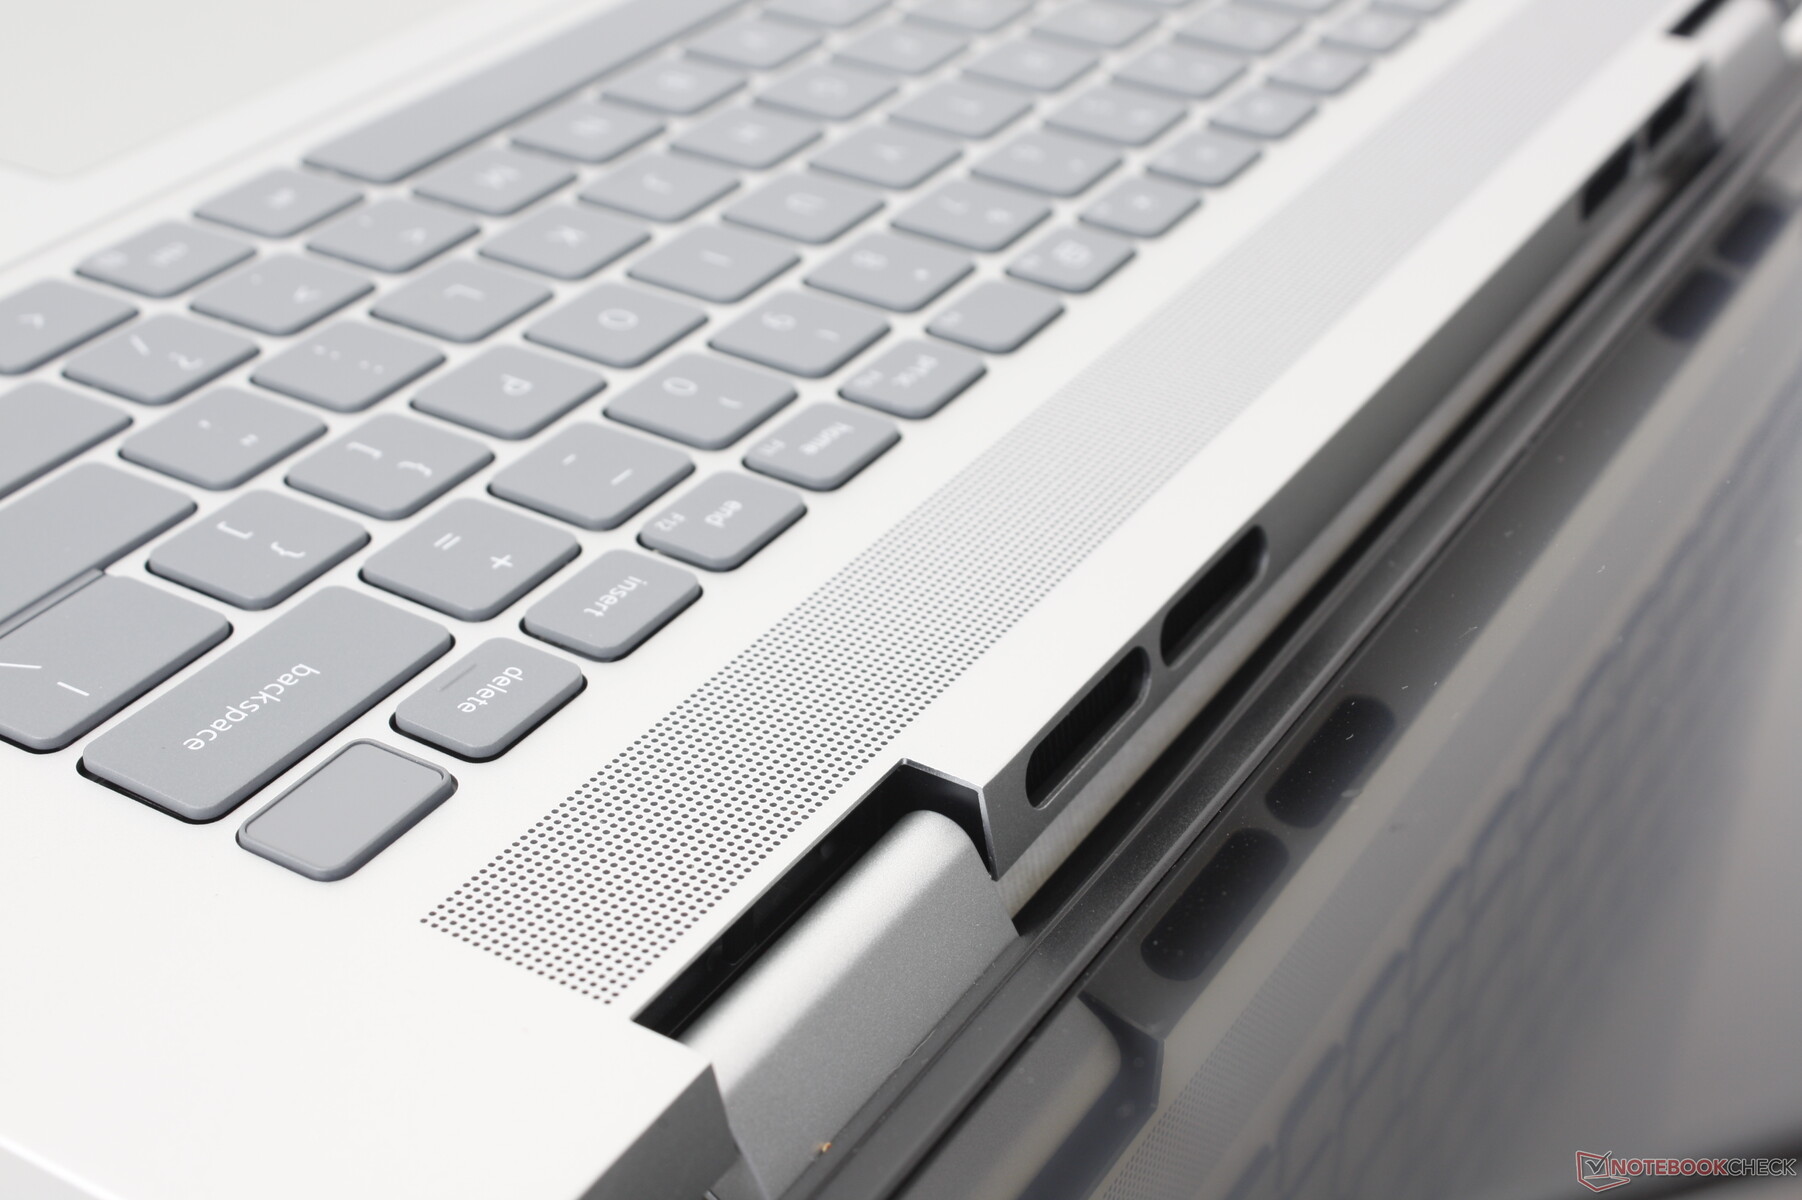
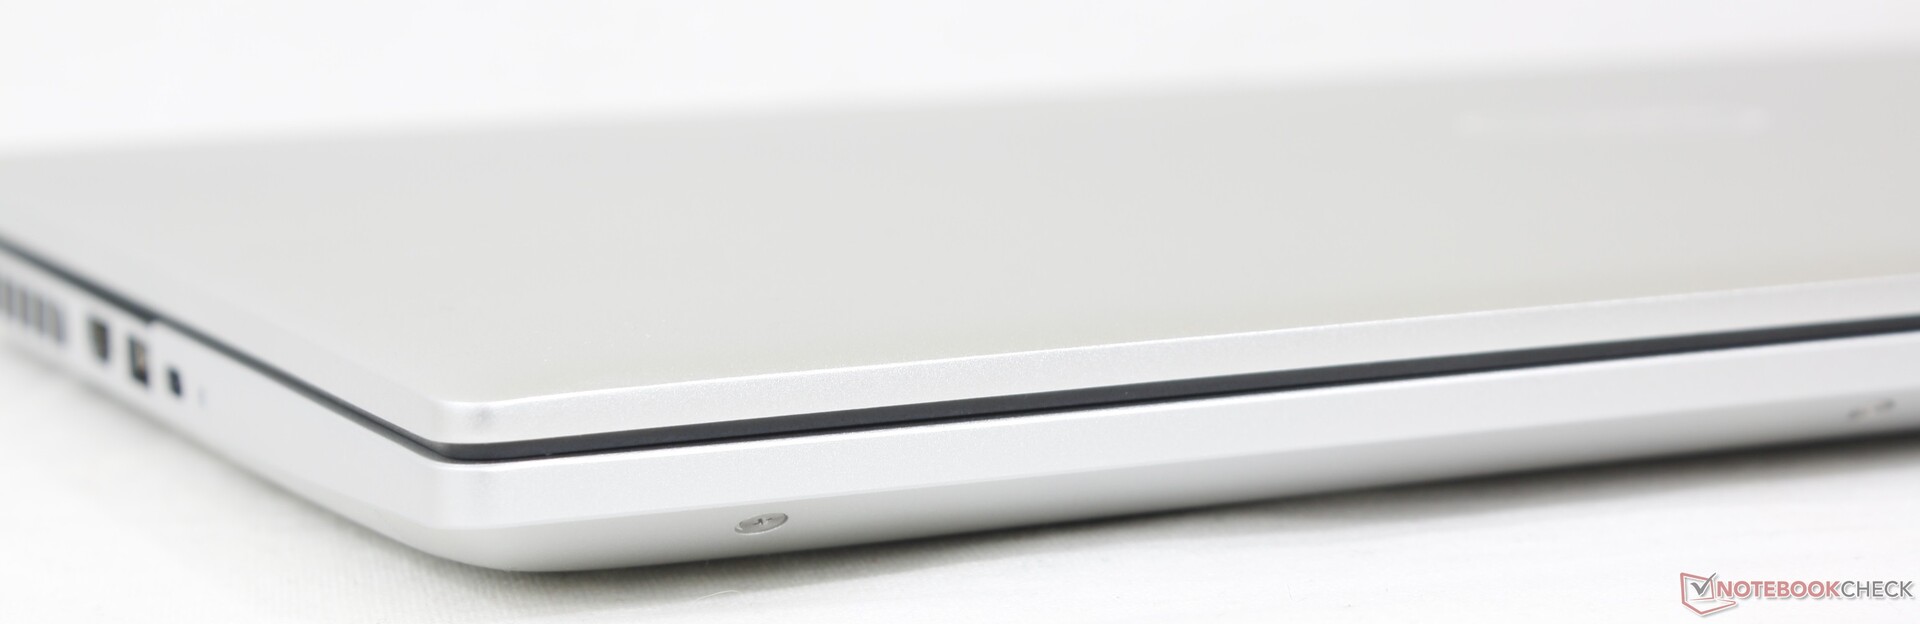
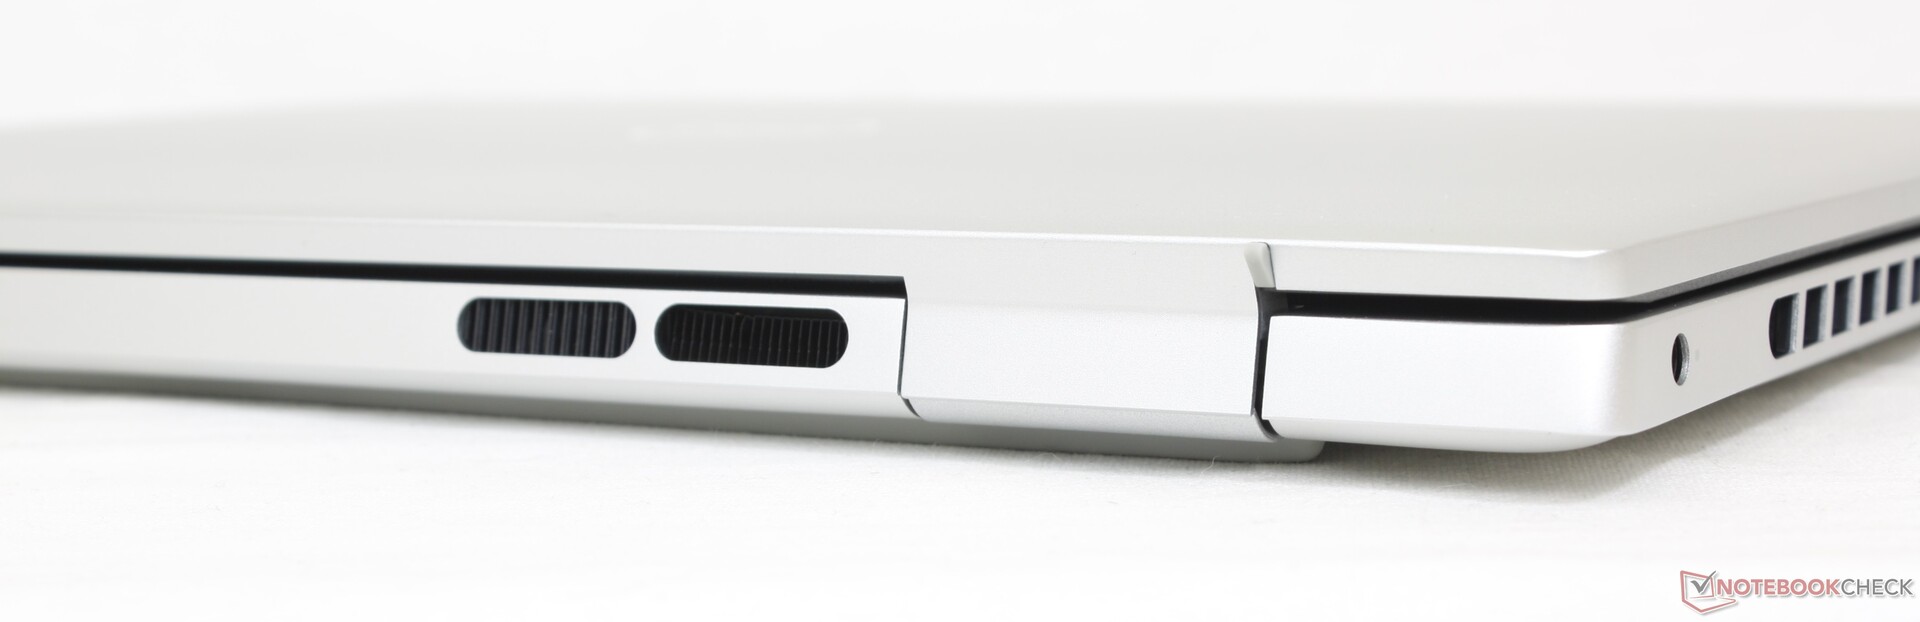
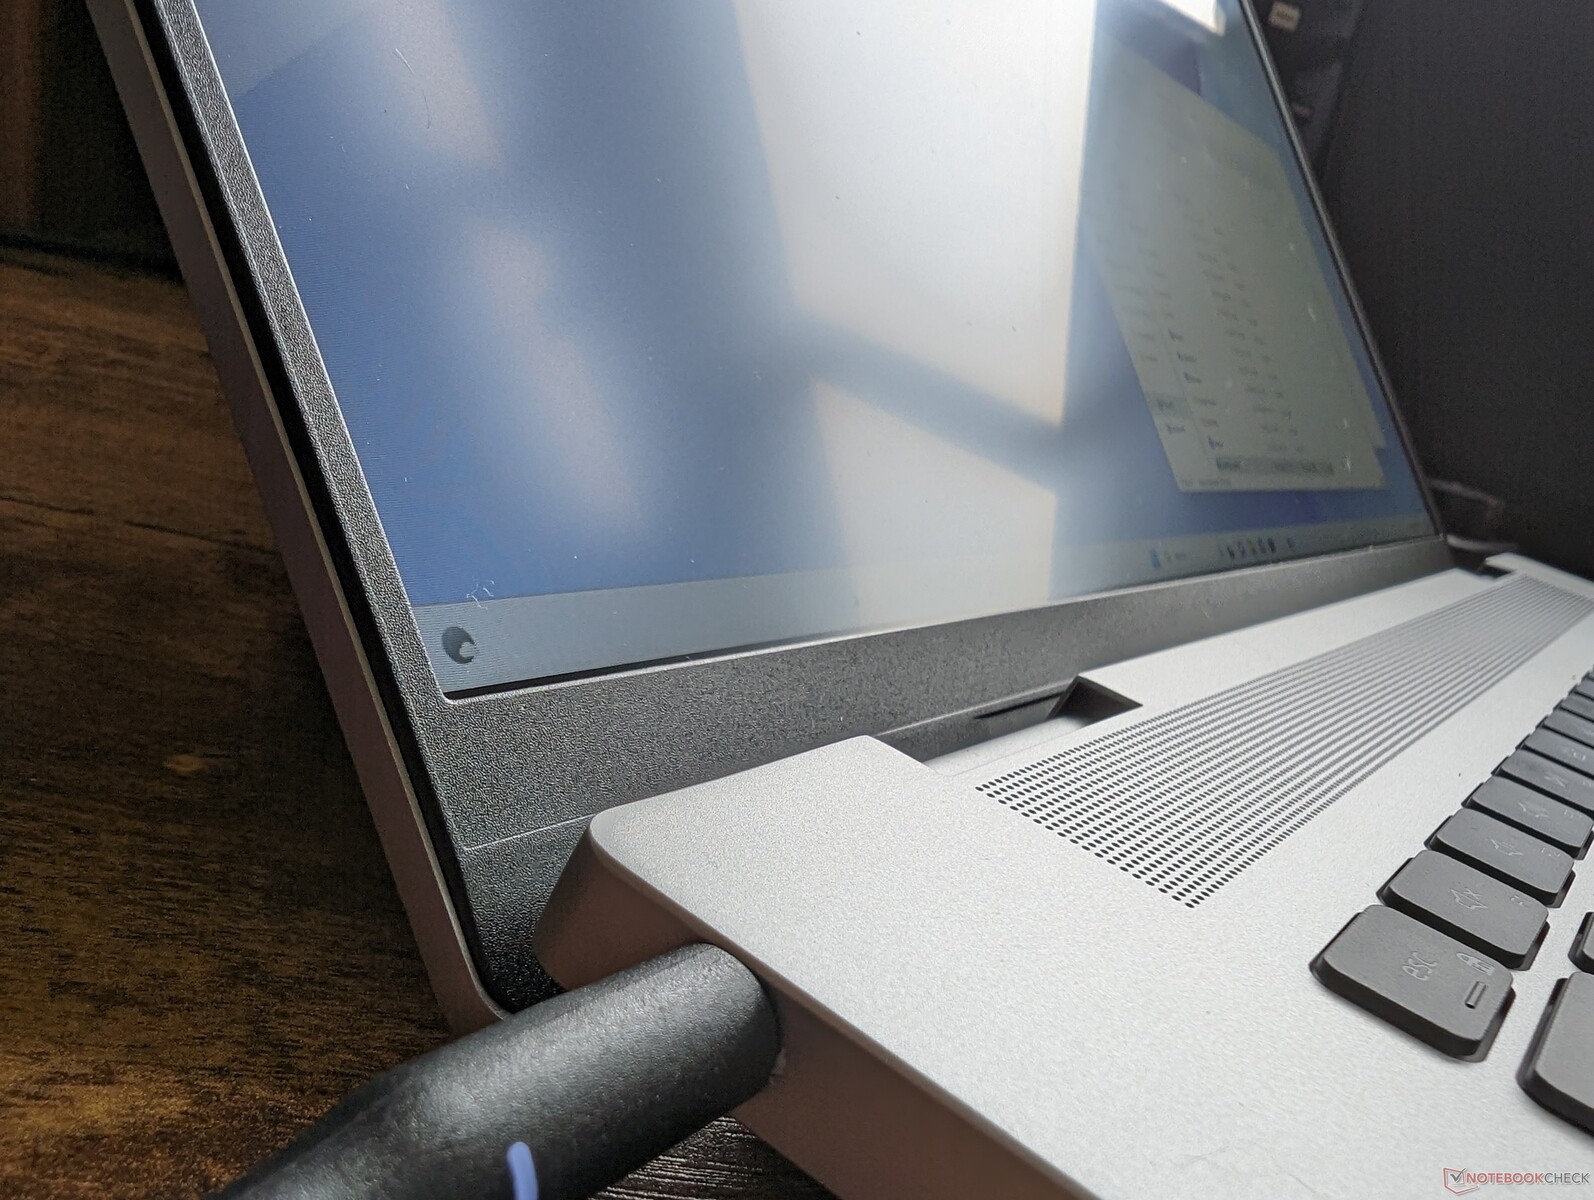
Das Inspiron 16 Plus 7630 weist drei bemerkenswerte äußere Veränderungen gegenüber dem letztjährigen Modell auf. Erstens, und das ist vielleicht das Wichtigste, wurden die Scharniere neu gestaltet und sind nun dicker und stabiler als zuvor. Zweitens gibt es jetzt zusätzliche Lüftungsgitter an den Rändern, um die Kühlung zu unterstützen. Und schließlich wurden die Mylar-Handballenablagen und das Clickpad entfernt, ähnlich wie beim Inspiron 16 Plus 7635 2-in-1. Vor allem die ersten beiden Punkte sollen die Lebensdauer des Systems erhöhen, während der letzte Punkt wahrscheinlich eine kostensparende Maßnahme ist.
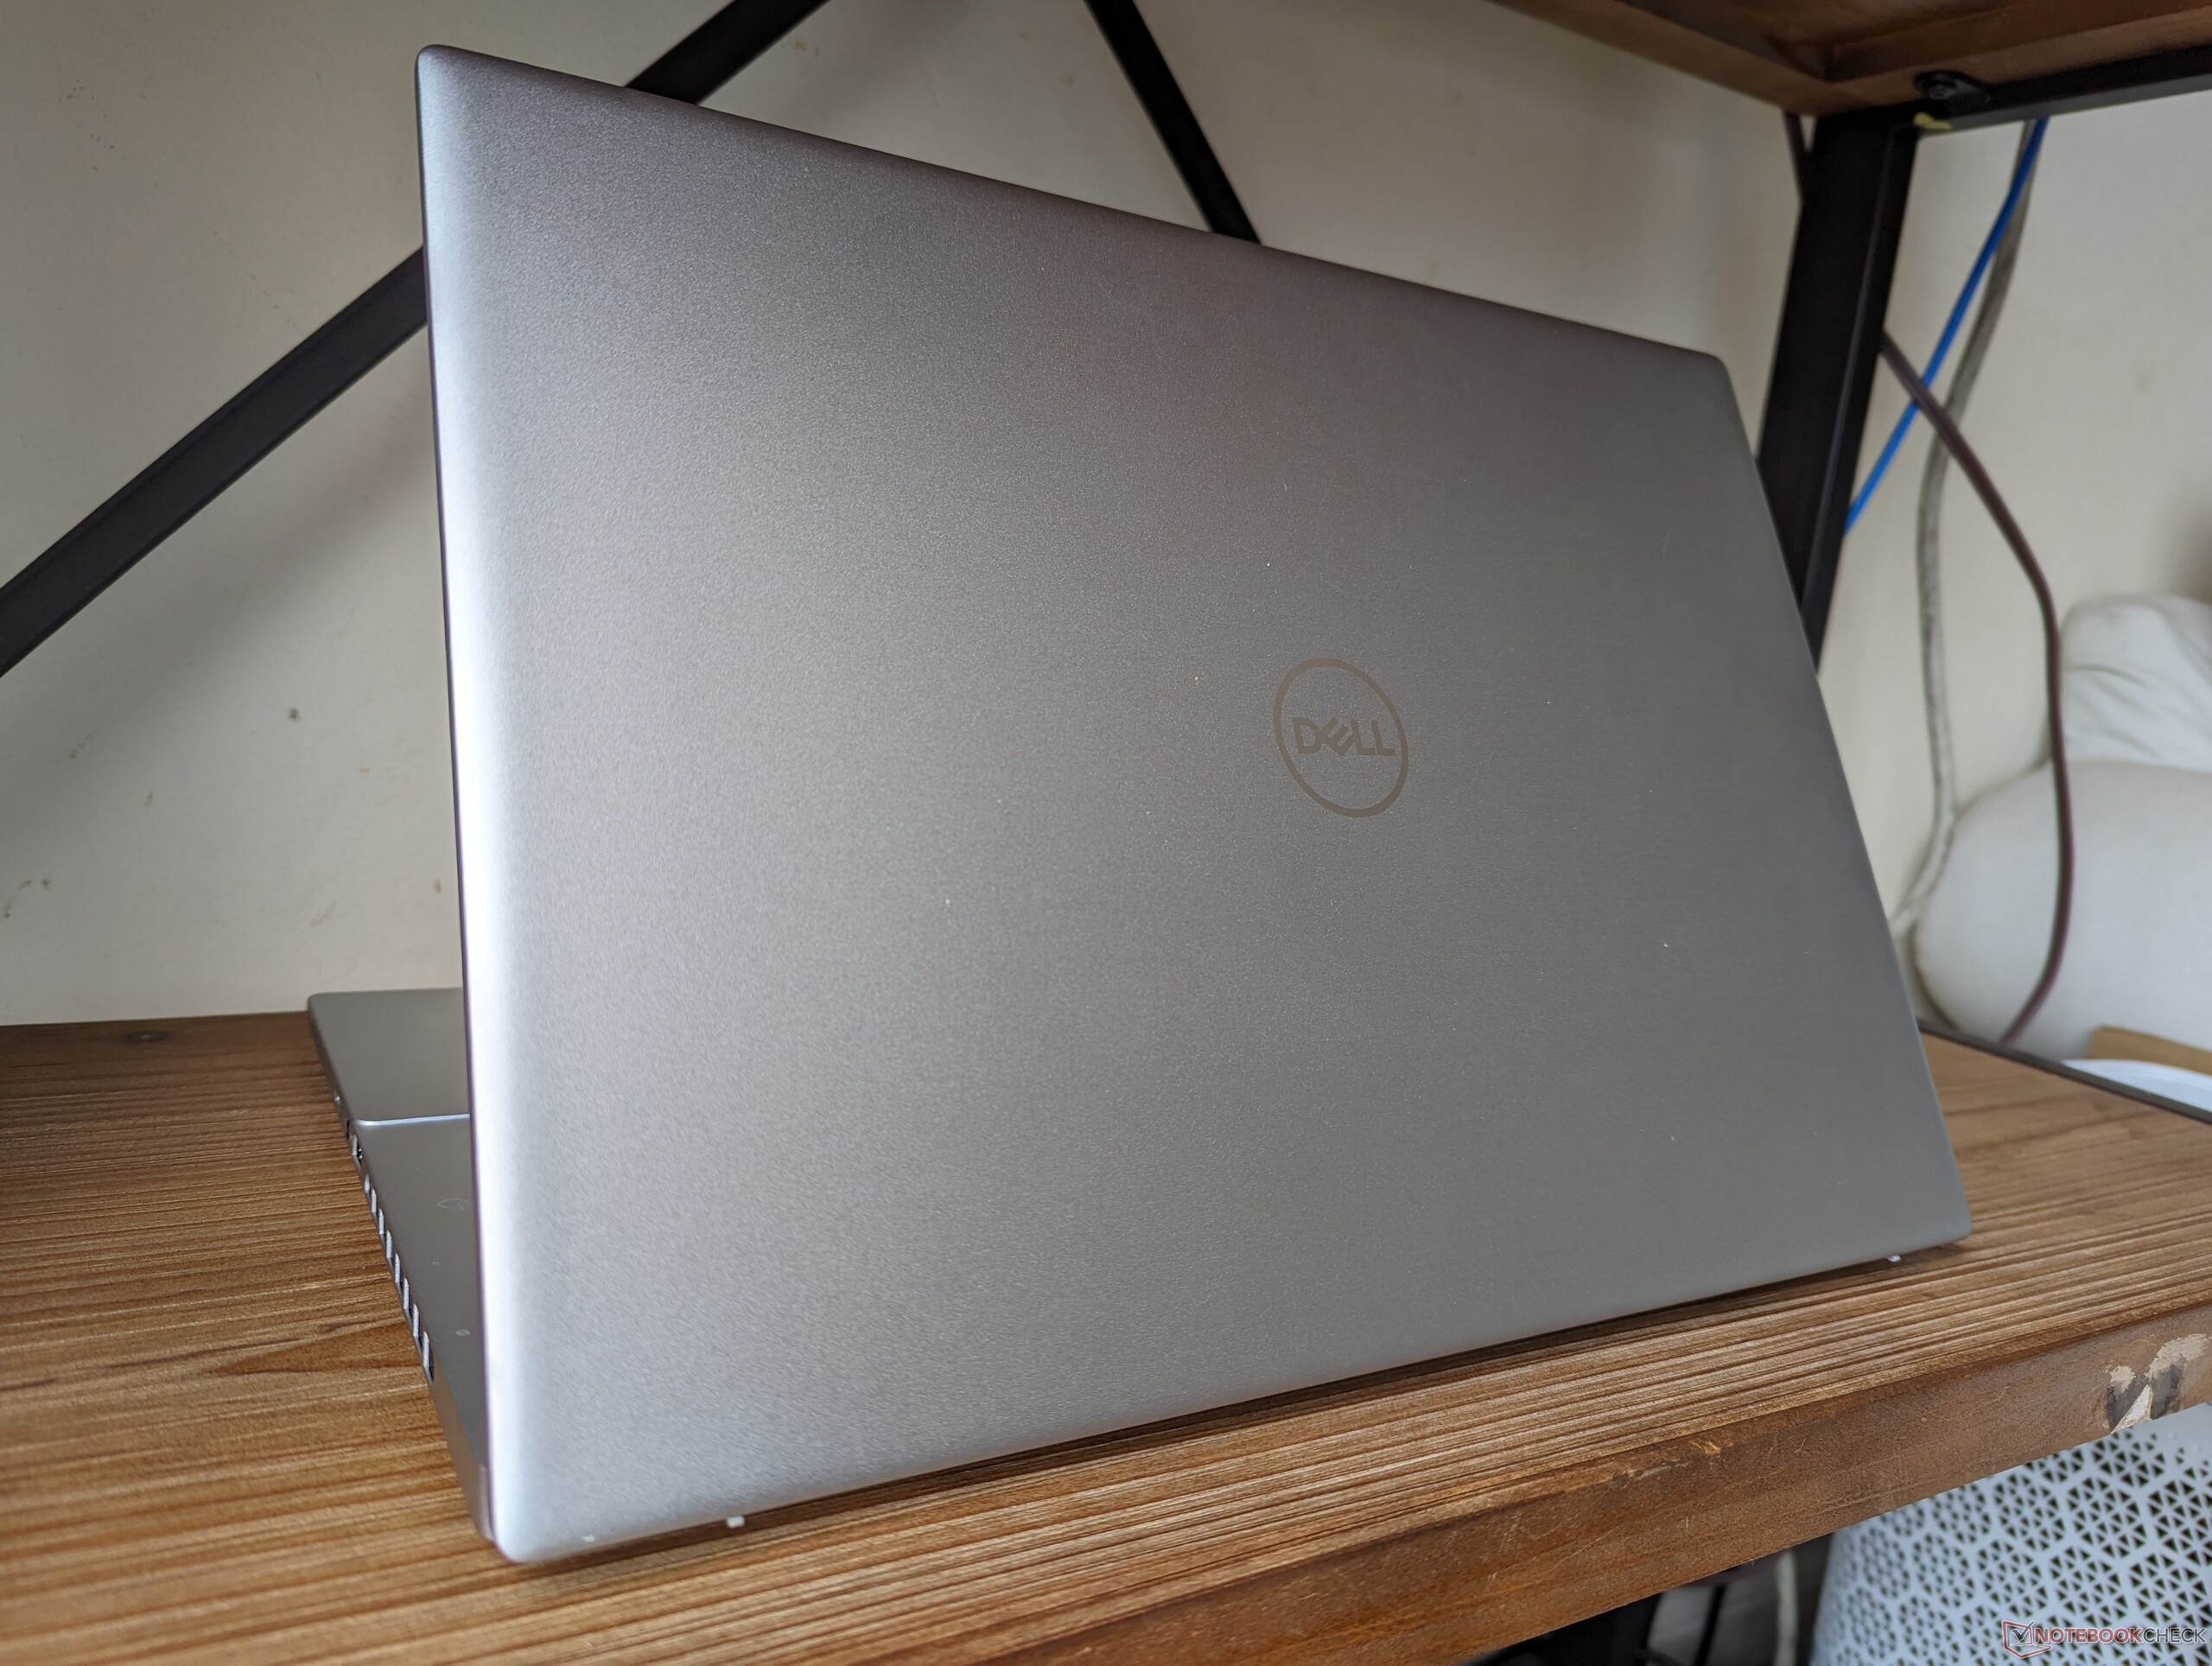
Die Gesamtsteifigkeit des Gehäuse ist ansonsten in etwa die gleiche wie beim Inspiron 16 Plus 7620, da ihre Skelette aus den gleichen Materialien bestehen. Das Gerät liegt gut in der Hand, ähnlich wie das Envy 16, aber mit einem etwas schwächeren Deckel, da das Dell keine Gorilla-Glass-Verstärkung hat.
Abmessungen und Gewicht sind in etwa gleich geblieben wie beim letztjährigen Design, wenn auch mit etwa 100 g etwas schwerer. Obwohl nicht gerade ein Leichtgewicht, ist der Dell immer noch vergleichbar mit Alternativen wie dem Slim Pro 9i 16 oder Envy 16 in dieser Hinsicht.
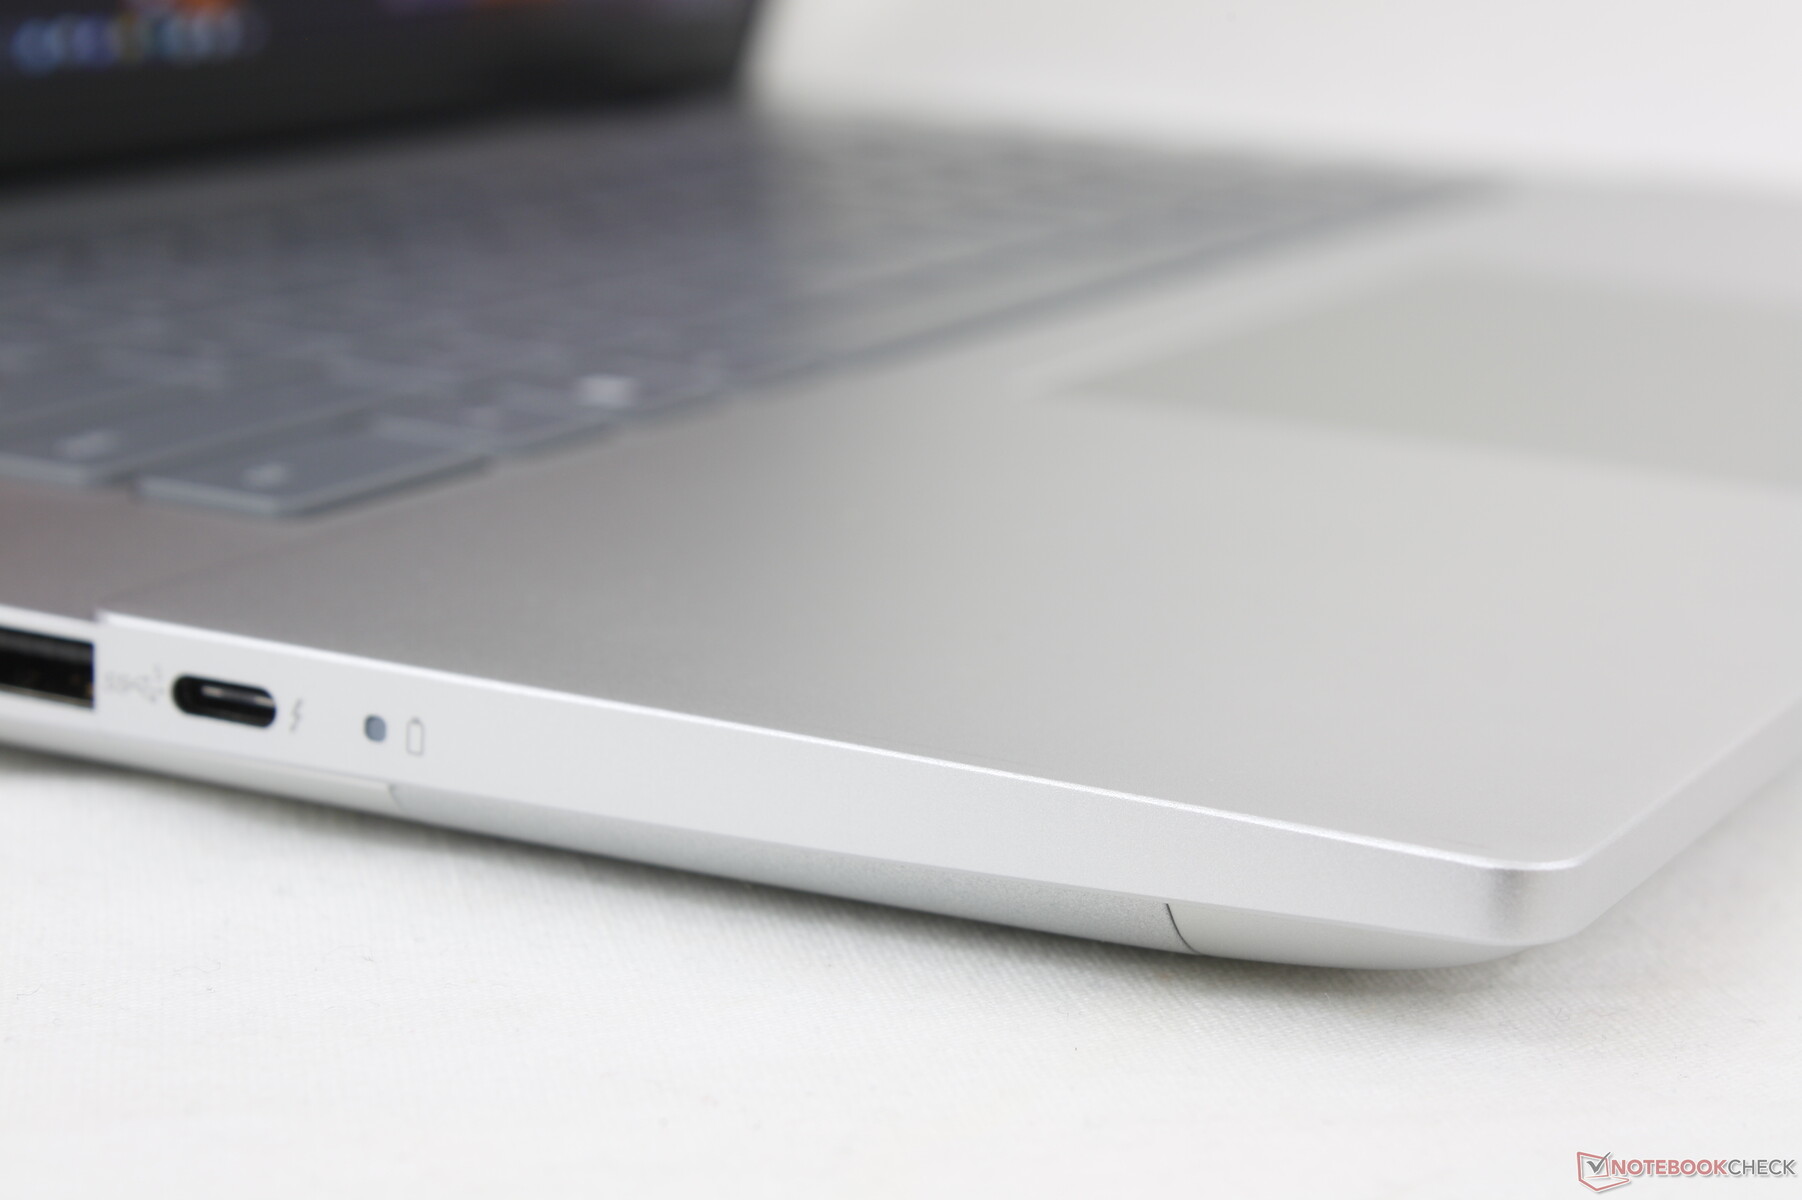
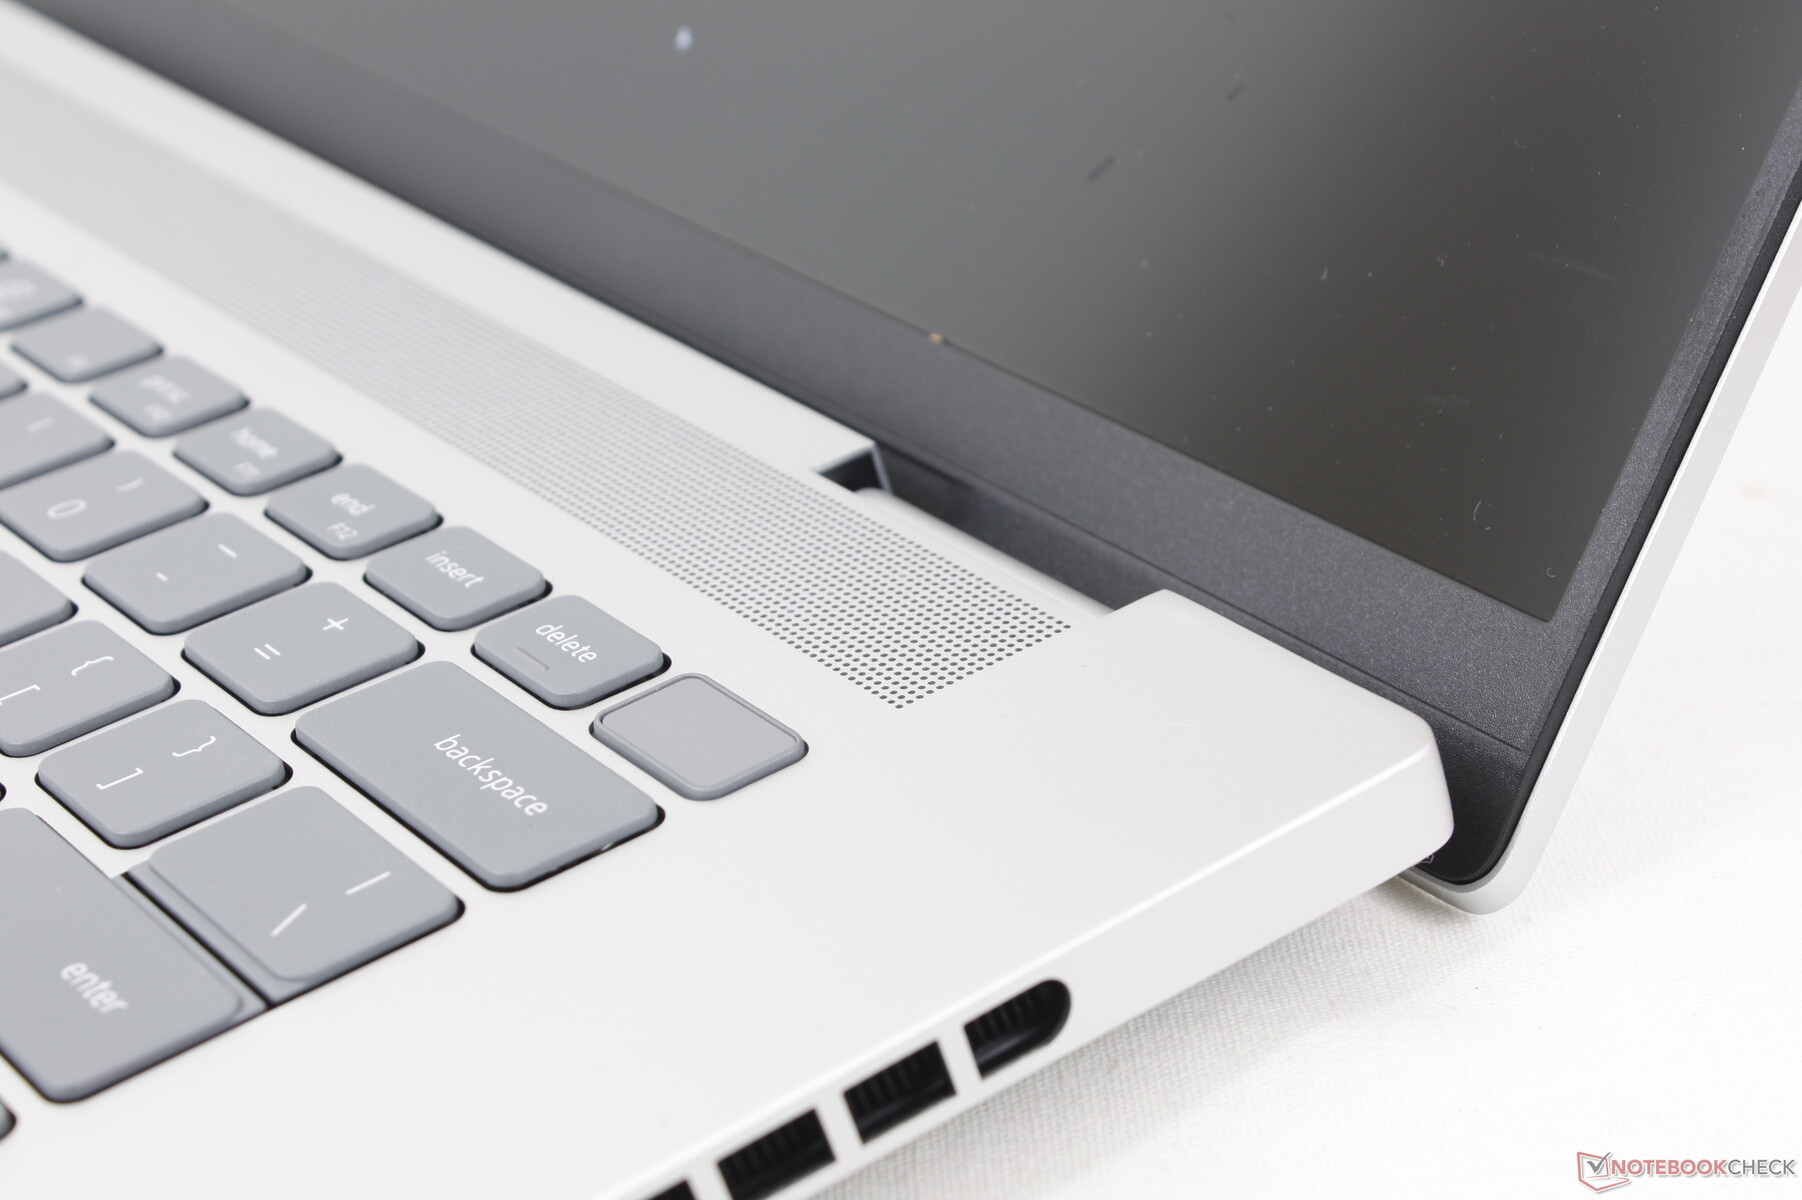
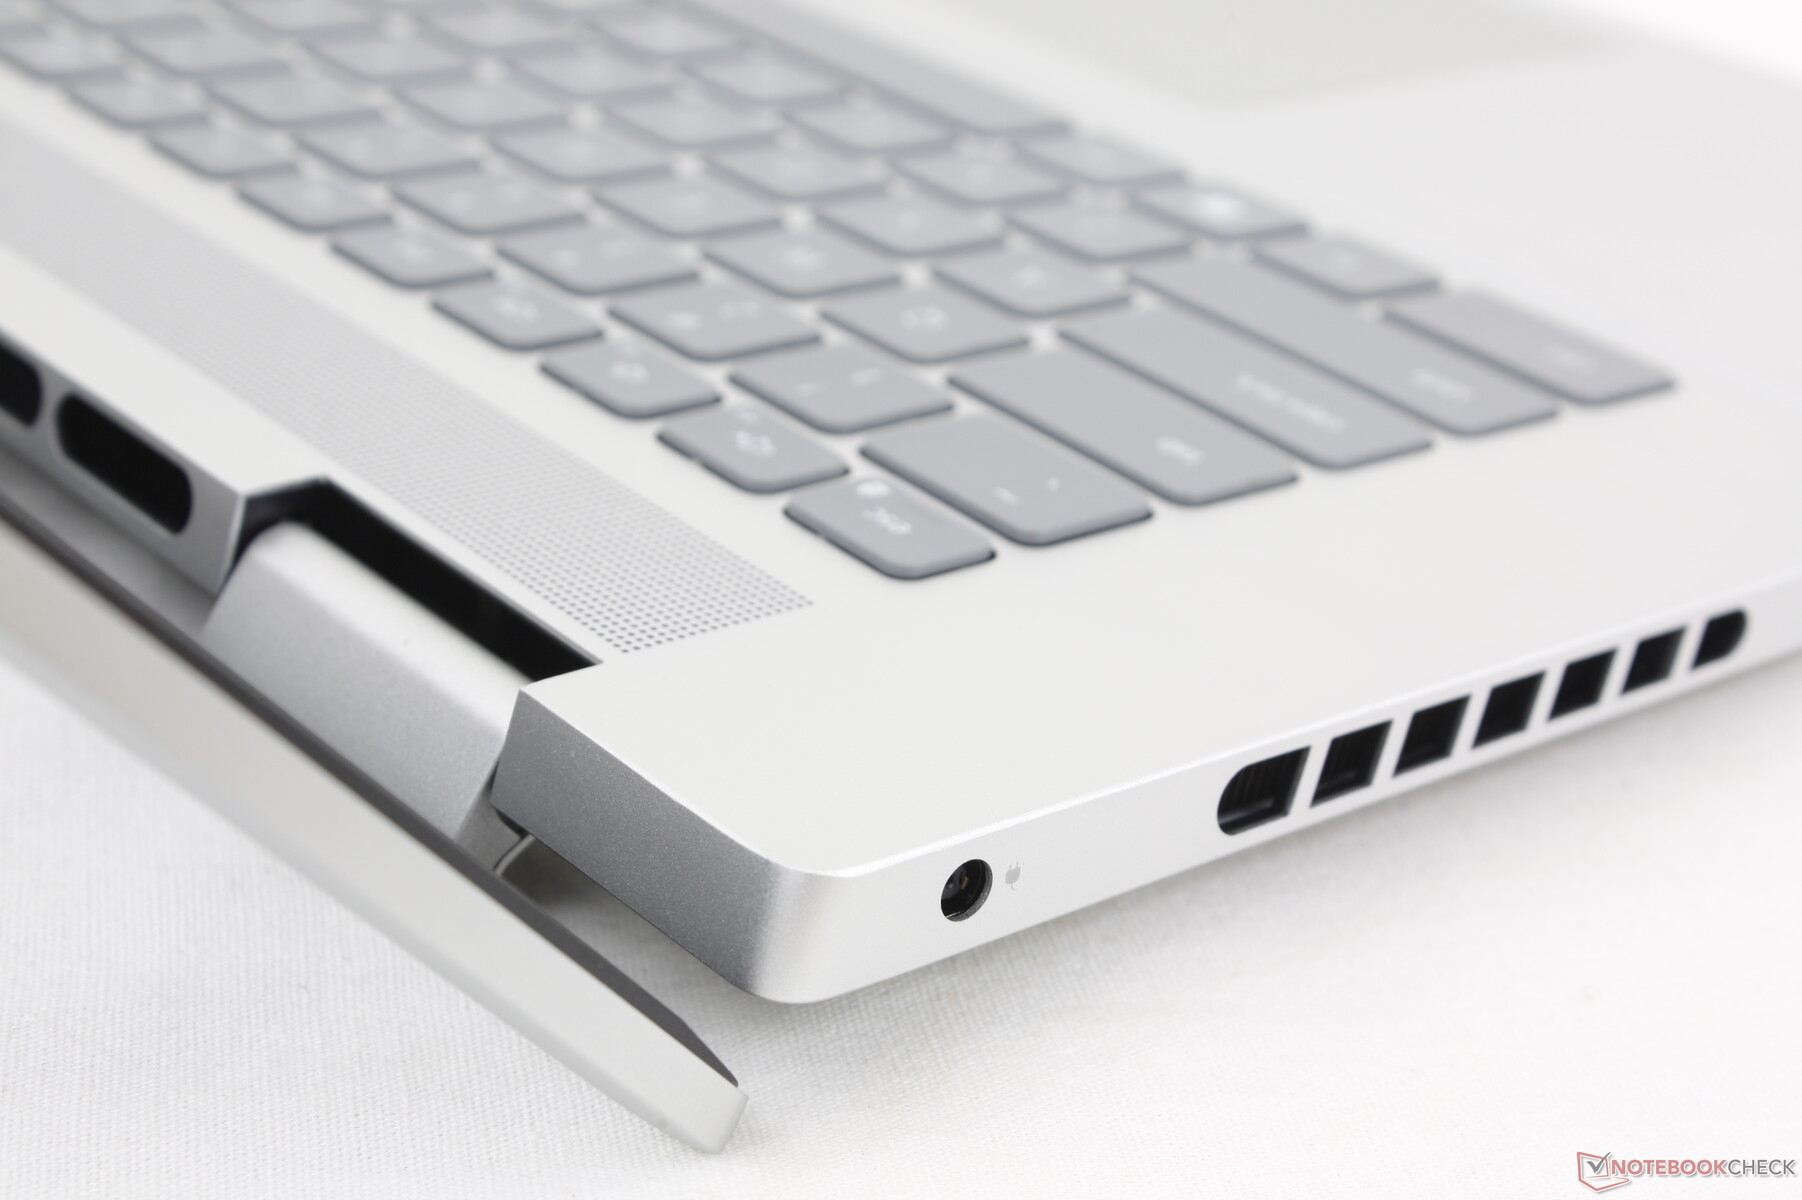
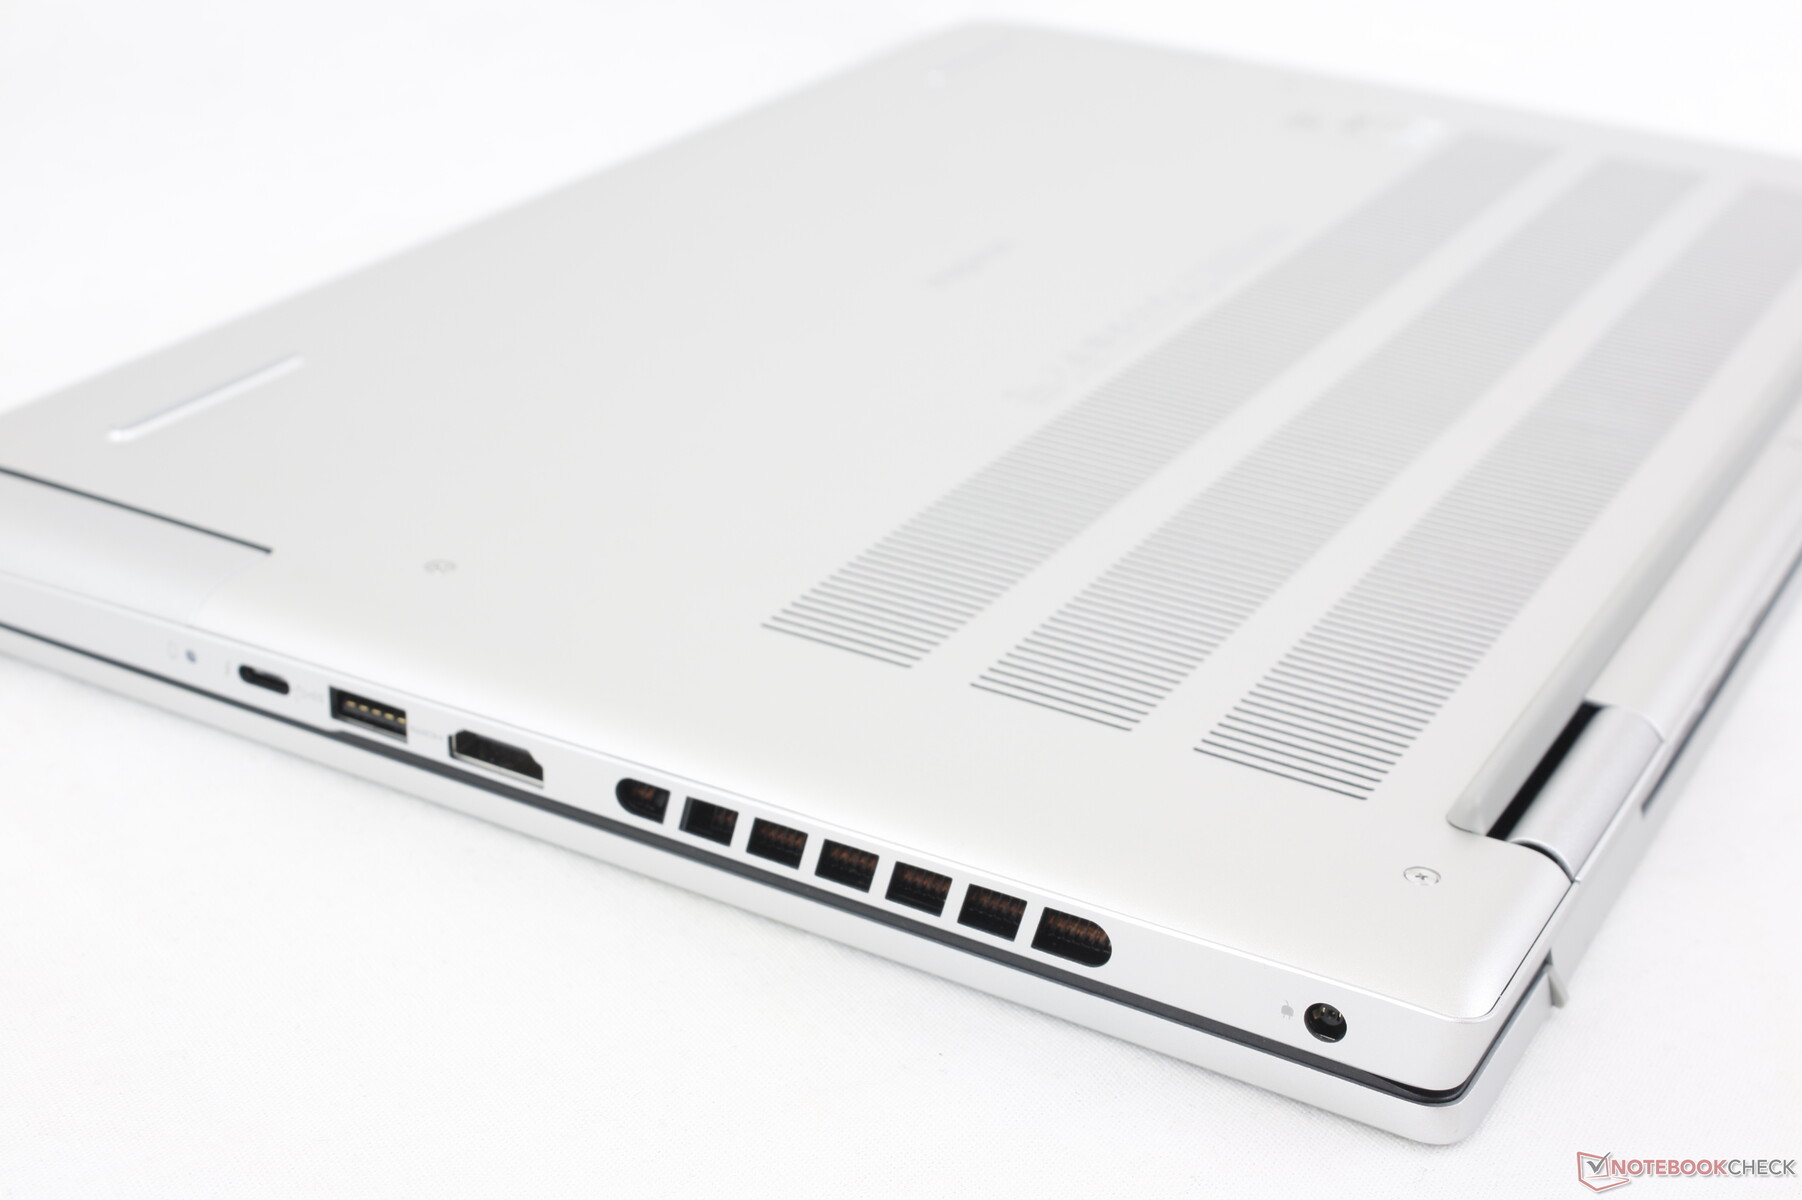
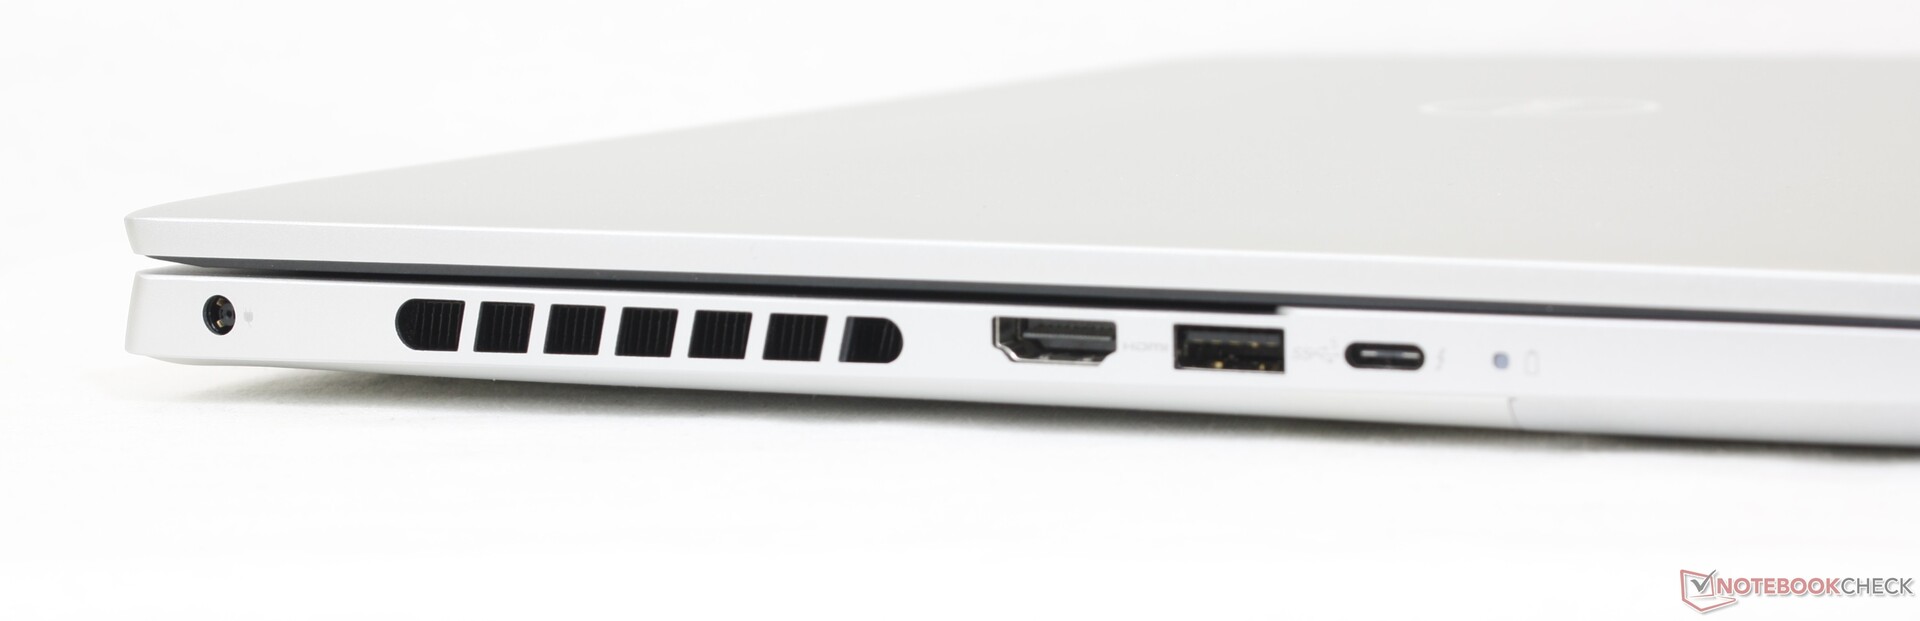
Anschlussausstattung - Könnte mehr USB-C verwenden
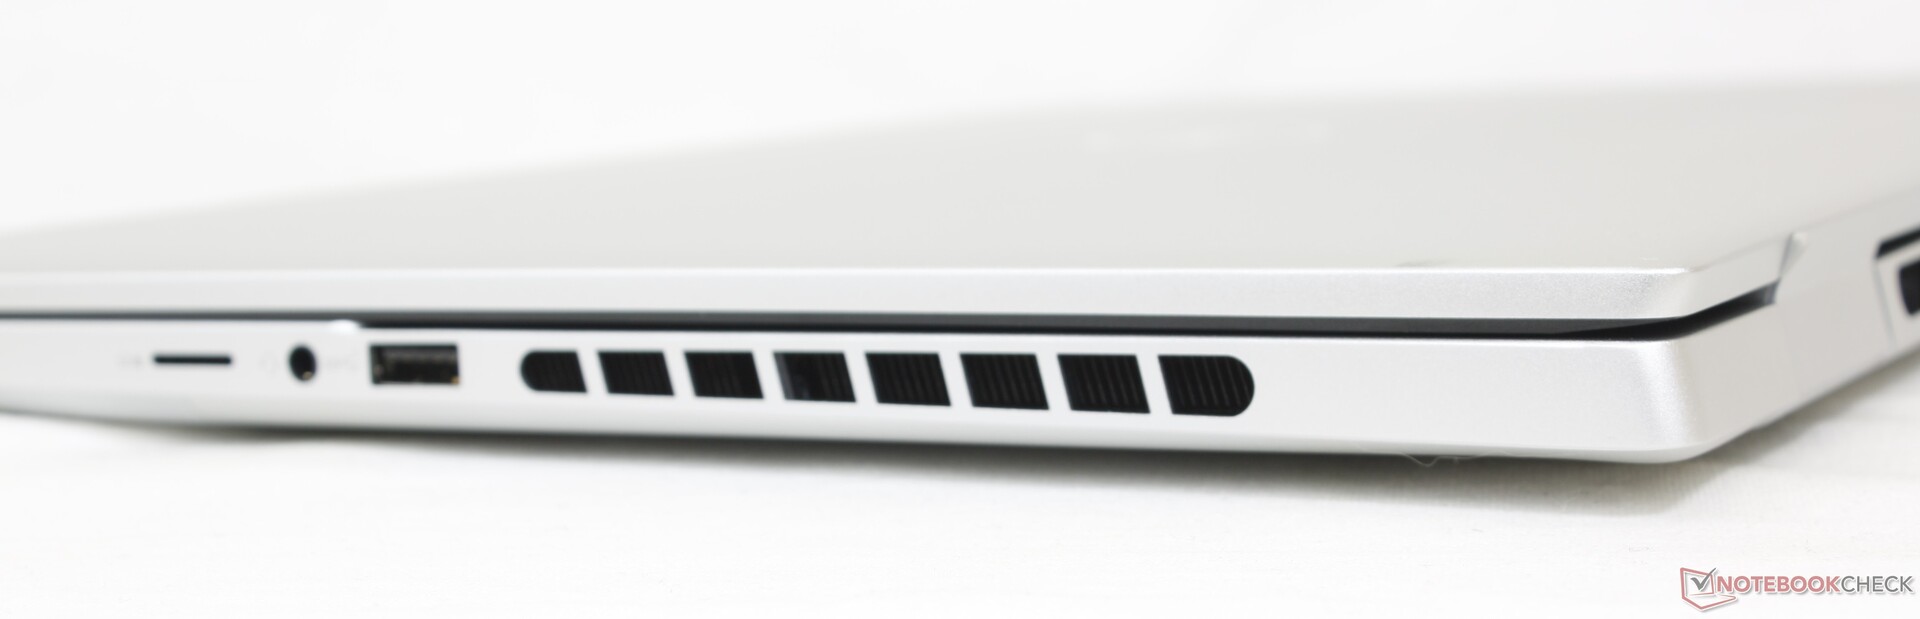
Die Positionierung der Anschlüsse und die Optionen entsprechen denen des letztjährigen Modells, allerdings mit einer bemerkenswerten Verschlechterung: Der SD-Kartenleser in voller Größe wurde bei allen RTX-4060-Konfigurationen durch einen kleineren microSD-Leser ersetzt. Alternativen wie das Envy 16 oder VivoBook Pro 16X integrieren mehr USB-C-Ports als unser Dell oder haben SD-Kartenleser in voller Größe.
Wir würden es auch gerne sehen, wenn zukünftige Inspiron Modelle den proprietären AC-Adapter-Barrel-Port zugunsten des USB-C-Ladens aufgeben würden, ähnlich wie bei der XPS-15- und XPS-17-Serie.
SD-Kartenleser
Während die XPS-Serie einige der schnellsten SD-Kartenleser aller Laptops beherbergt, verfügt die Inspiron Serie über einige der langsamsten. Das Verschieben von 1 GB Bildern von unserer UHS-II-Testkarte auf den Desktop dauert über 50 Sekunden, verglichen mit nur 5 bis 6 Sekunden auf einem XPS 15 oder XPS 17.

| SD Card Reader | |
| average JPG Copy Test (av. of 3 runs) | |
| MSI Summit E16 Flip A12UDT-031 (AV Pro SD microSD 128 GB V60) | |
| Asus Vivobook Pro 16X K6604JV-MX016W | |
| Lenovo Slim Pro 9i 16IRP8 (PNY EliteX-Pro60 V60 256 GB) | |
| HP Envy 16 h0112nr (AV Pro SD microSD 128 GB V60) | |
| Dell Inspiron 16 Plus 7620 (Toshiba Exceria Pro SDXC 64 GB UHS-II) | |
| Dell Inspiron 16 Plus 7630 (AV Pro SD microSD 128 GB V60) | |
| maximum AS SSD Seq Read Test (1GB) | |
| MSI Summit E16 Flip A12UDT-031 (AV Pro SD microSD 128 GB V60) | |
| Asus Vivobook Pro 16X K6604JV-MX016W | |
| Lenovo Slim Pro 9i 16IRP8 (PNY EliteX-Pro60 V60 256 GB) | |
| HP Envy 16 h0112nr (AV Pro SD microSD 128 GB V60) | |
| Dell Inspiron 16 Plus 7620 (Toshiba Exceria Pro SDXC 64 GB UHS-II) | |
| Dell Inspiron 16 Plus 7630 (AV Pro SD microSD 128 GB V60) | |
Kommunikation
Ein Intel AX211 kommt standardmäßig für Wi-Fi-6E- und Bluetooth-5.3-Anschlüsse. Bei der Kopplung mit unserem Asus-AXE11000-6-GHz-Testnetz haben wir eine stabile und zuverlässige Leistung festgestellt.
Bei Konfiguration mit einer AMD CPU ist stattdessen ein MediaTek Modul enthalten.
Webcam
Die 2-MP-Webcam ist mittlerweile bei den meisten Multimedia-Laptops Standard. Teurere Modelle von HP verfügen über 5-MP- oder sogar 8-MP-Webcams, wenn die Qualität der Webcam Priorität hat.
Ein physischer Schieberegler sorgt für Privatsphäre, aber IR wird nicht unterstützt.


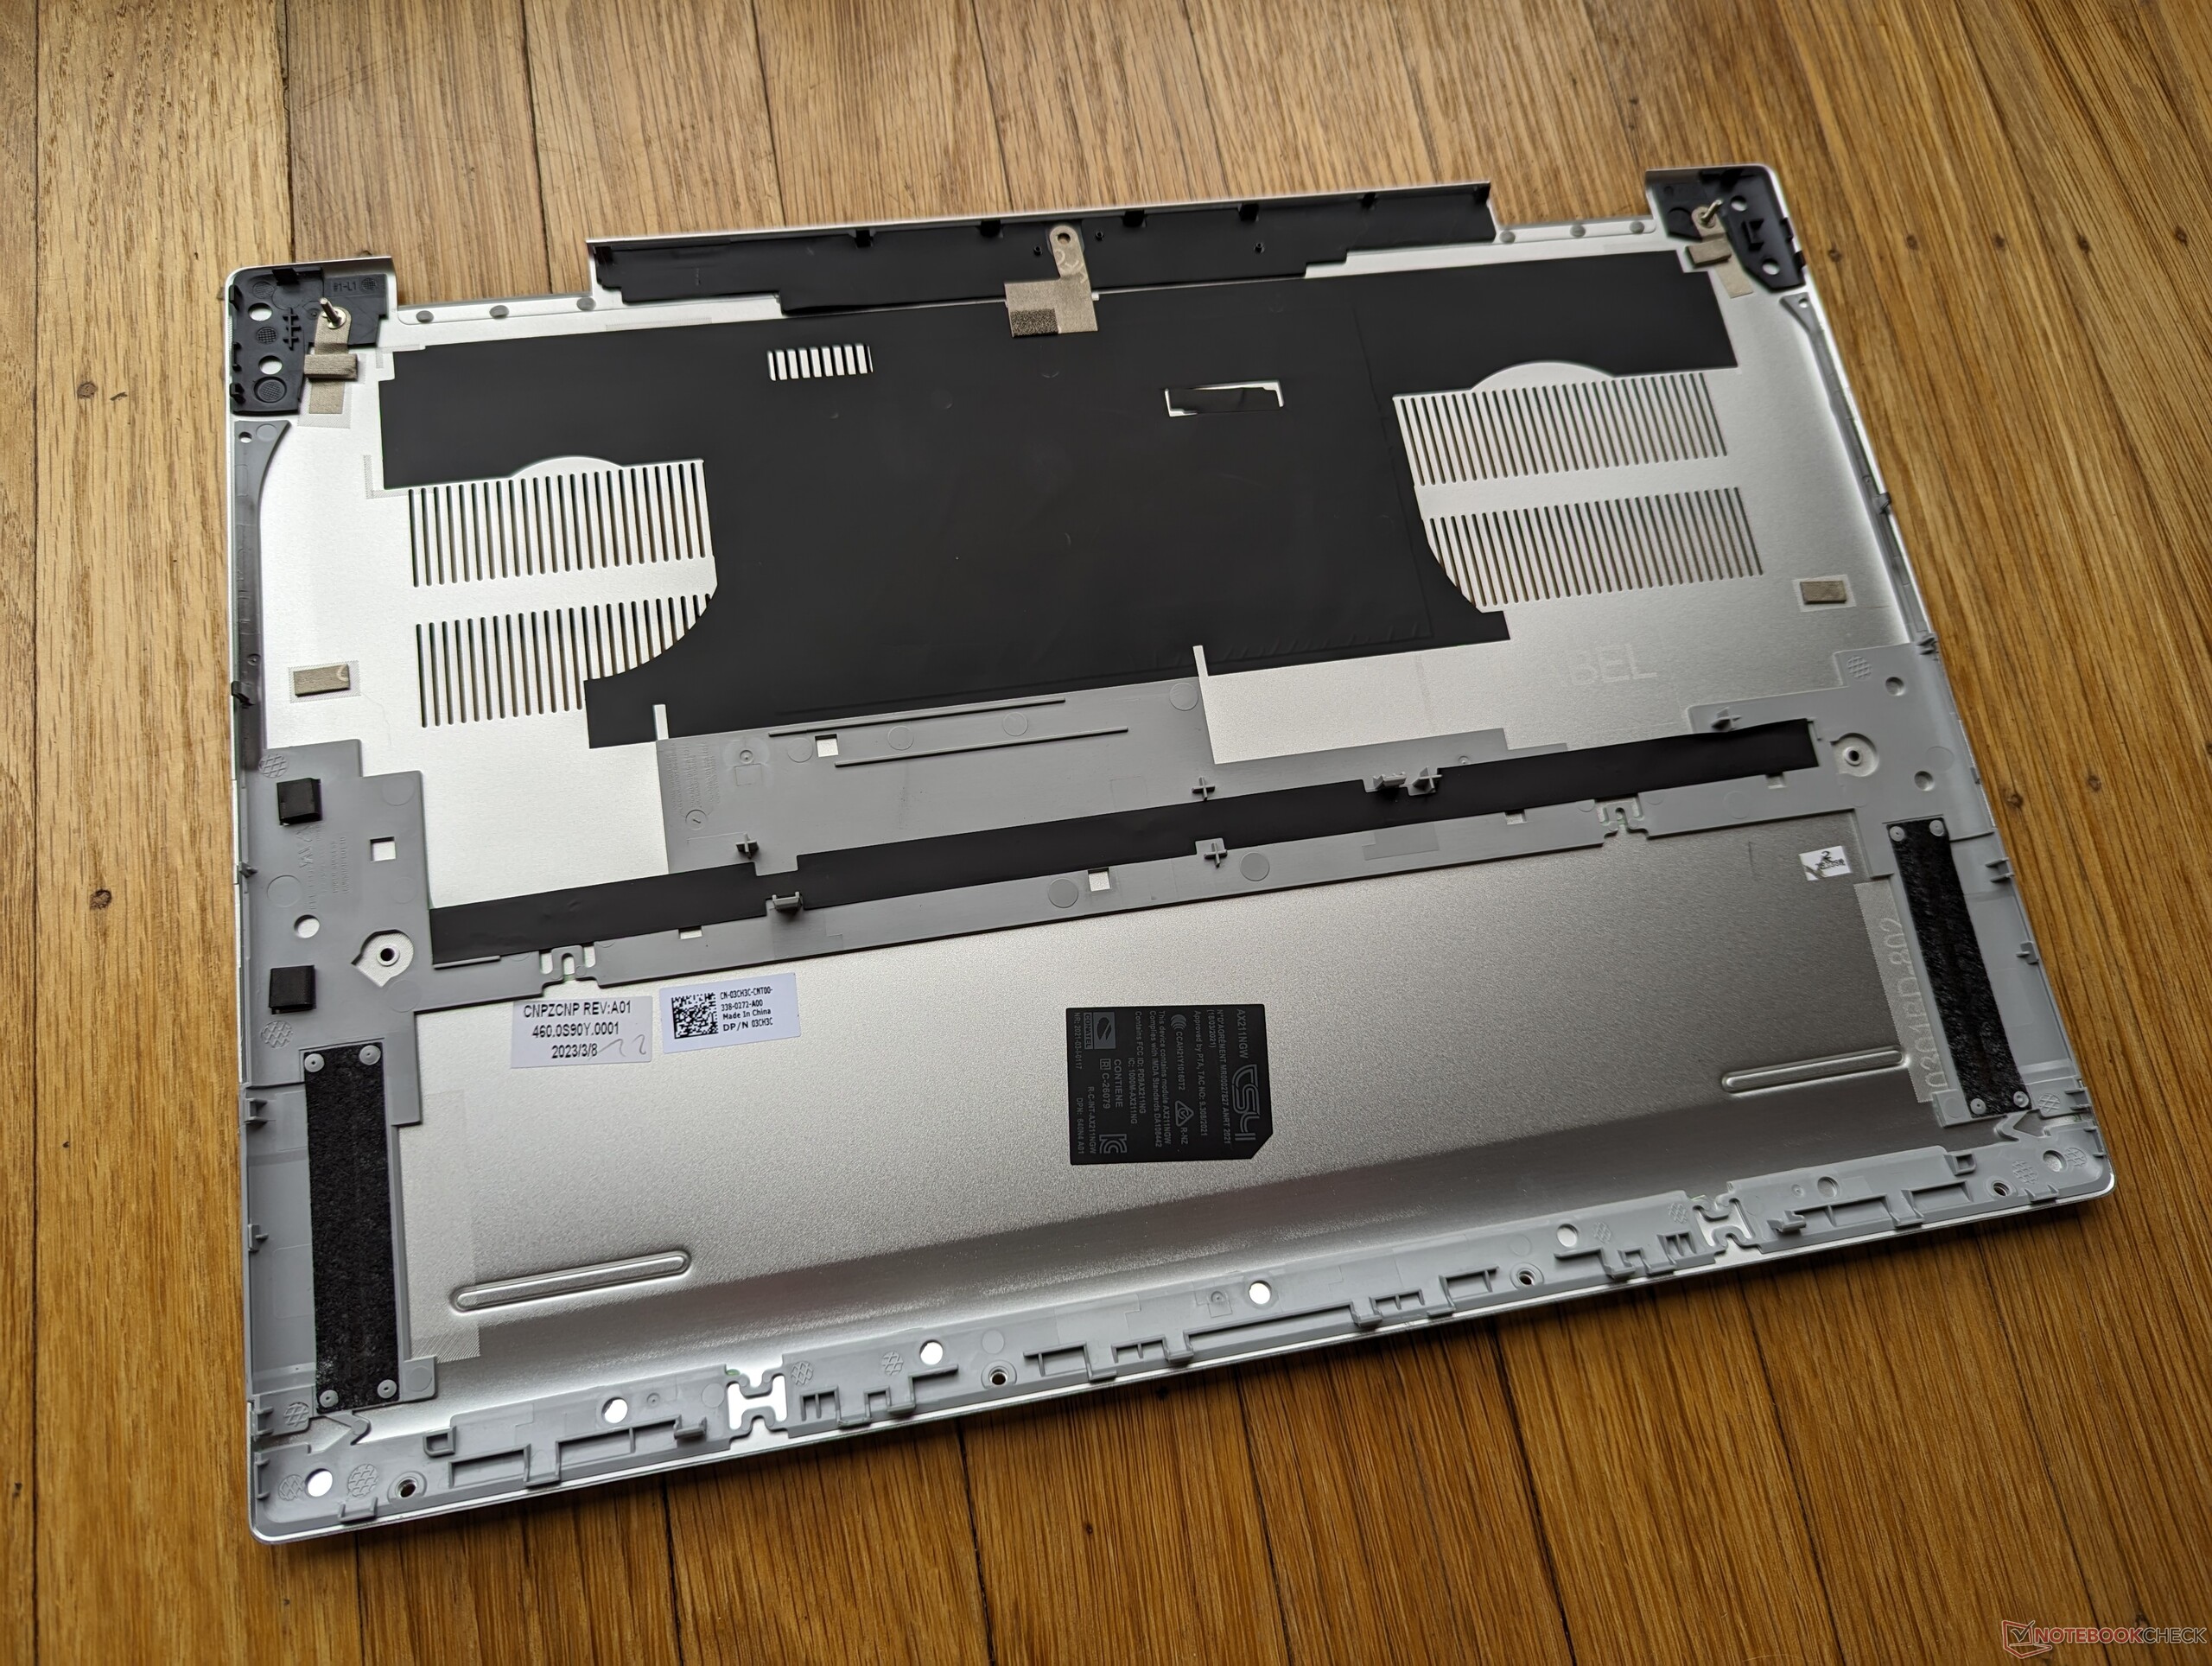
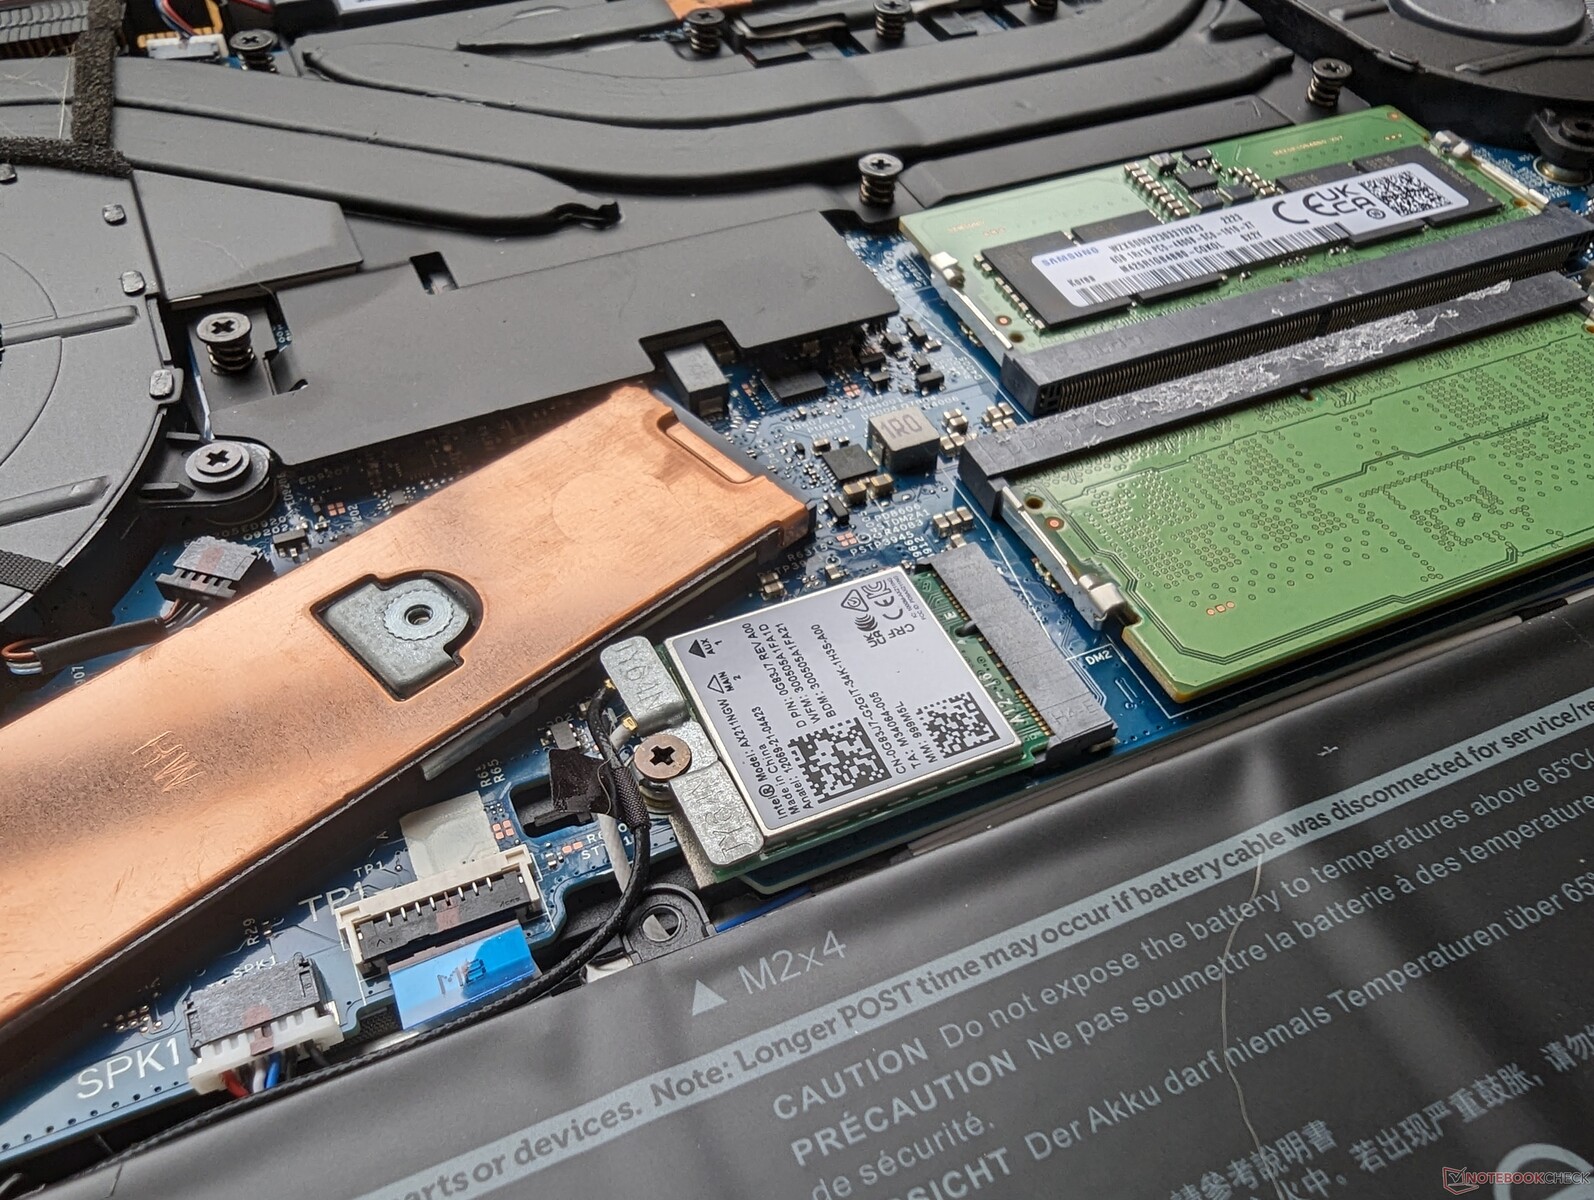
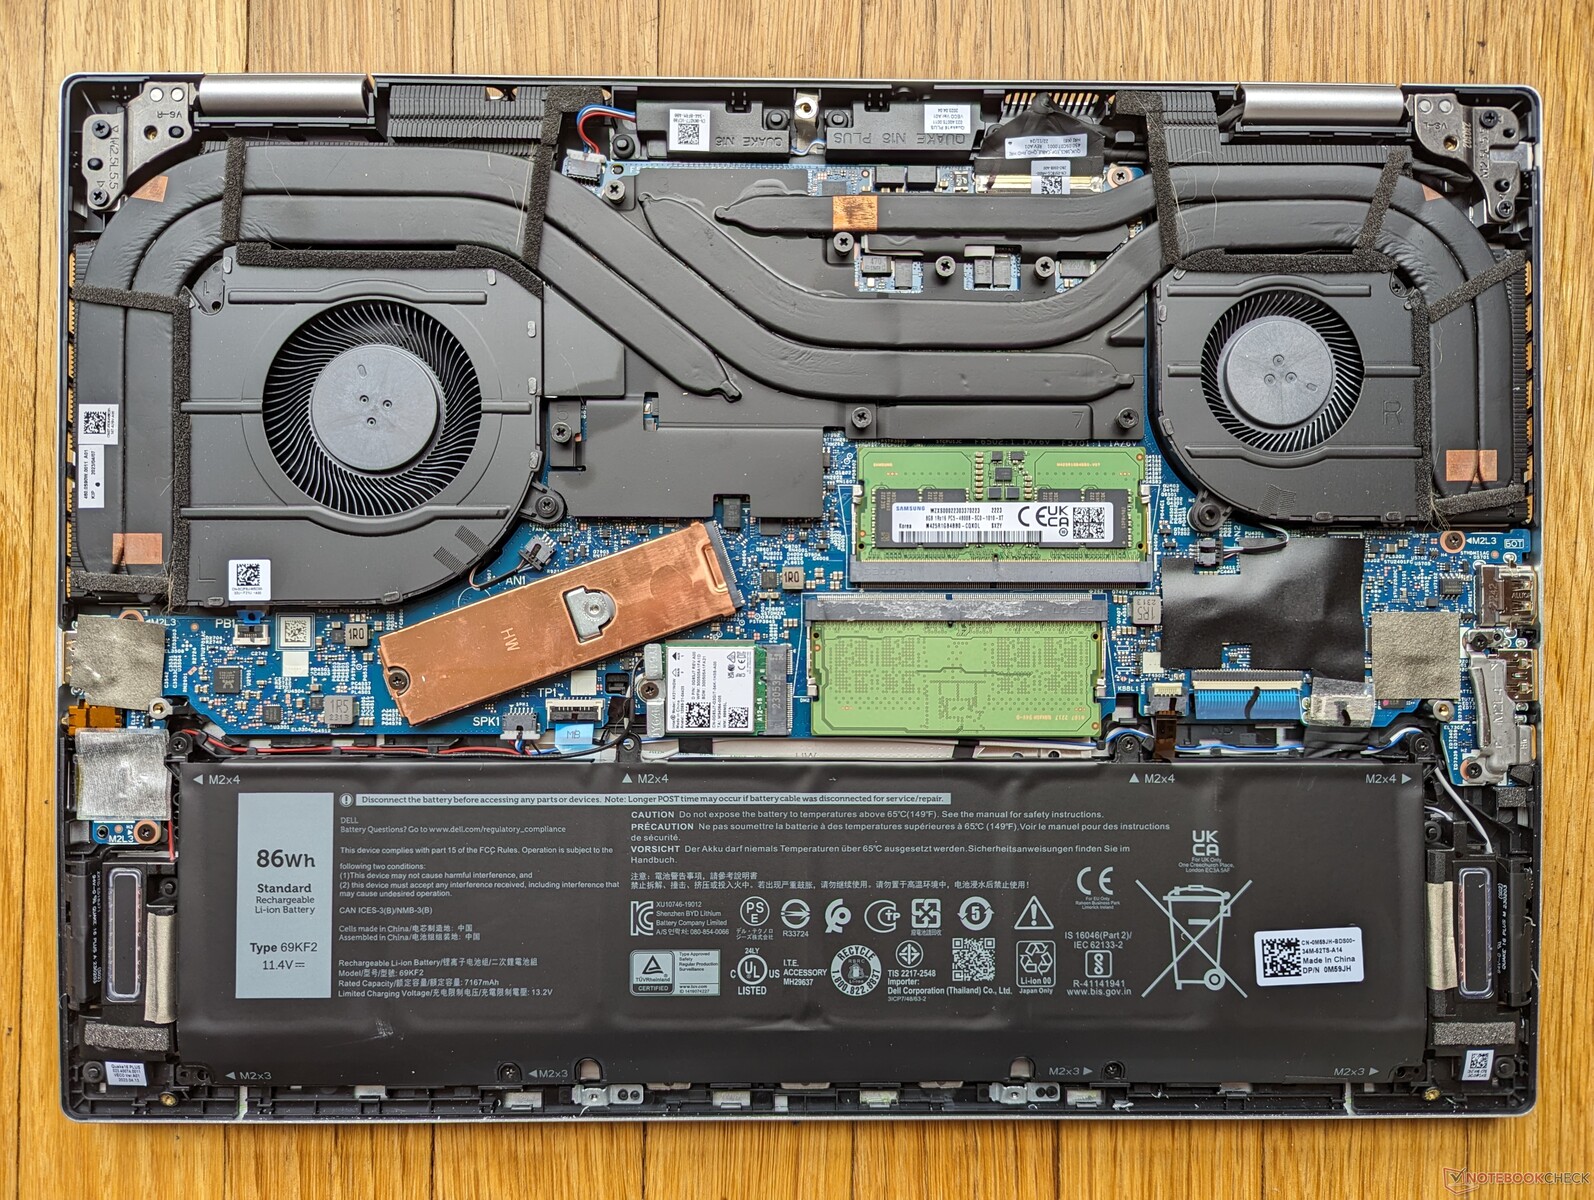
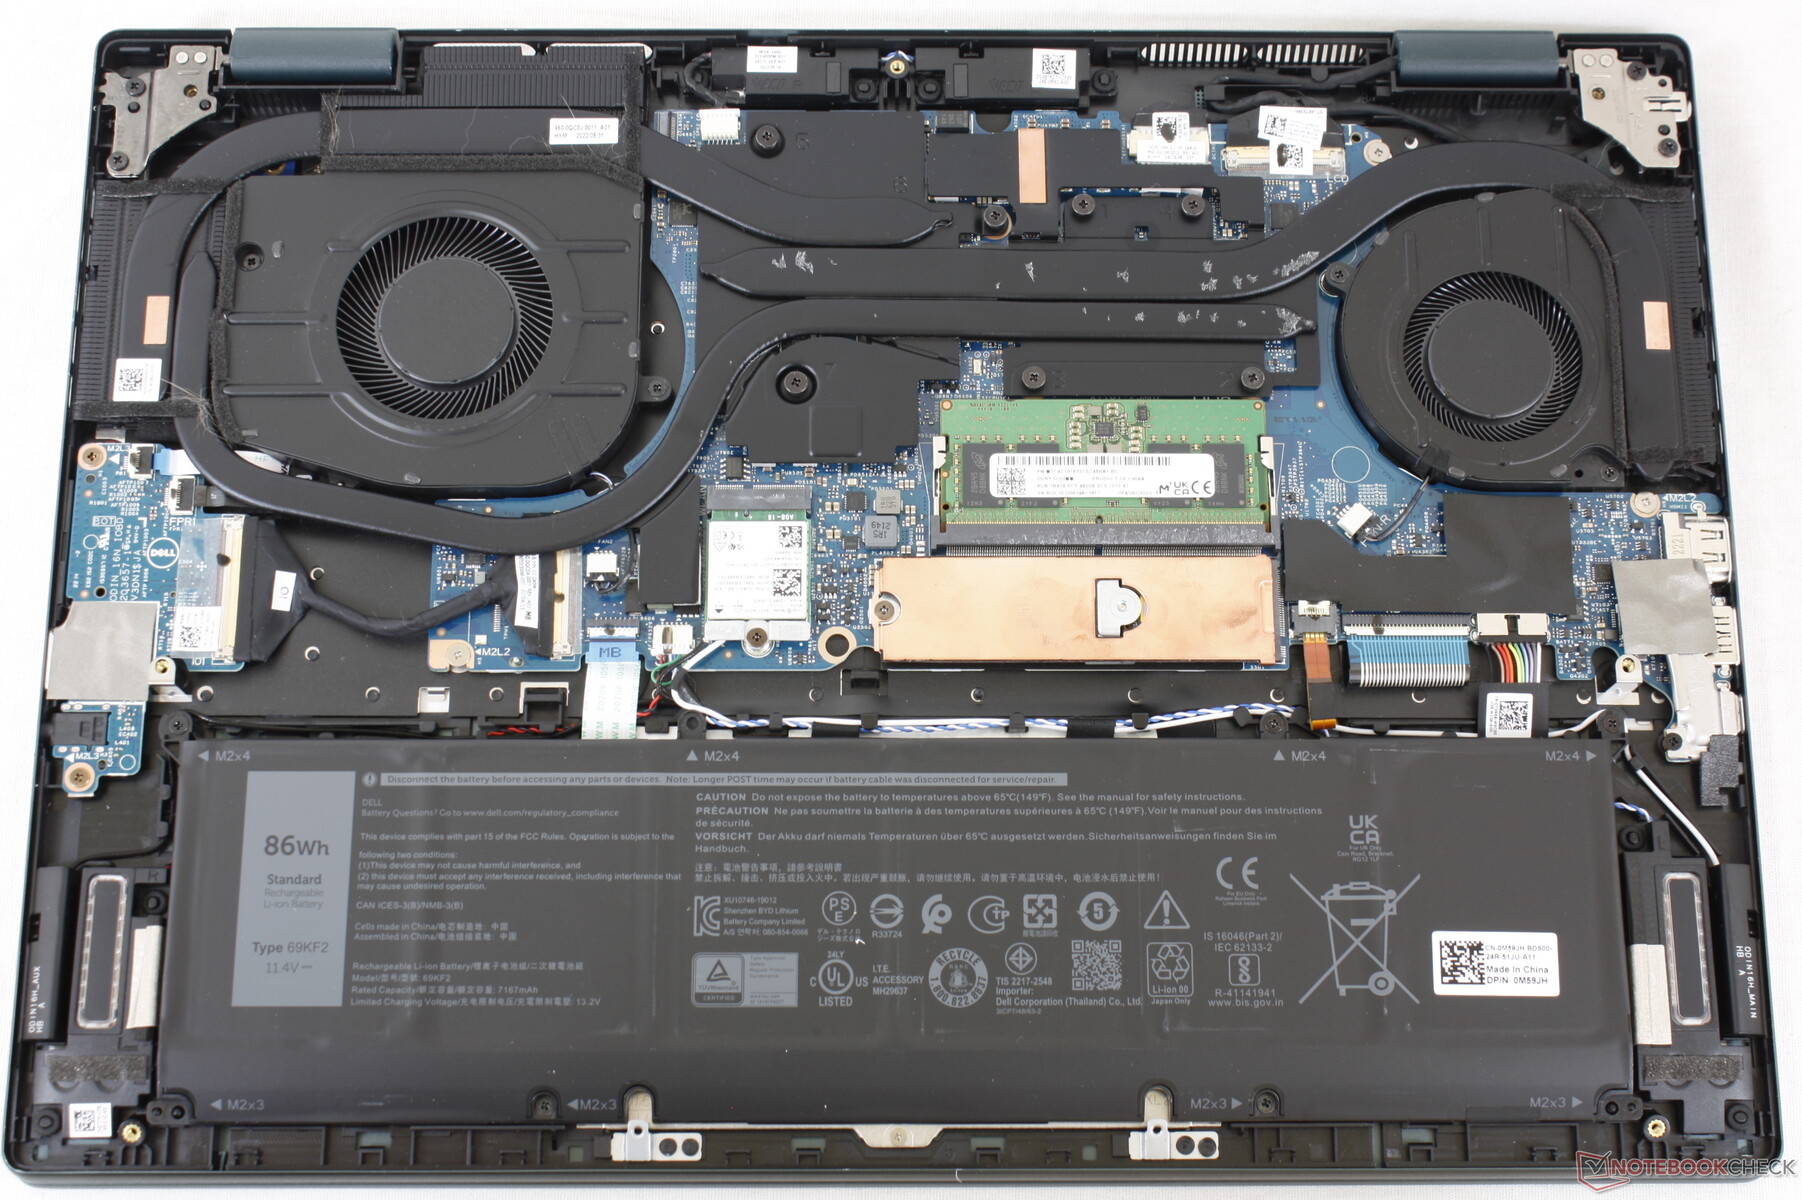
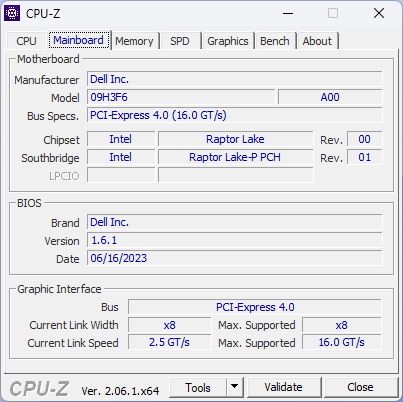
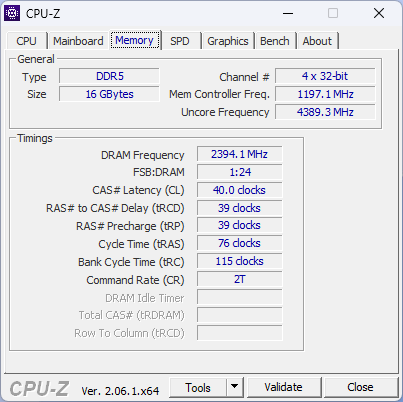
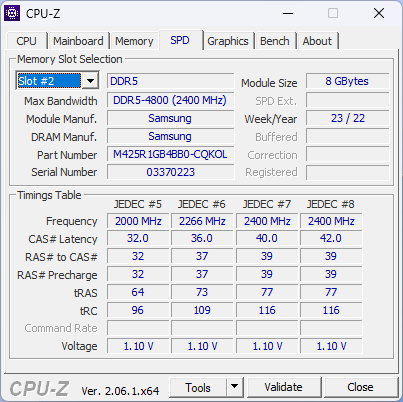
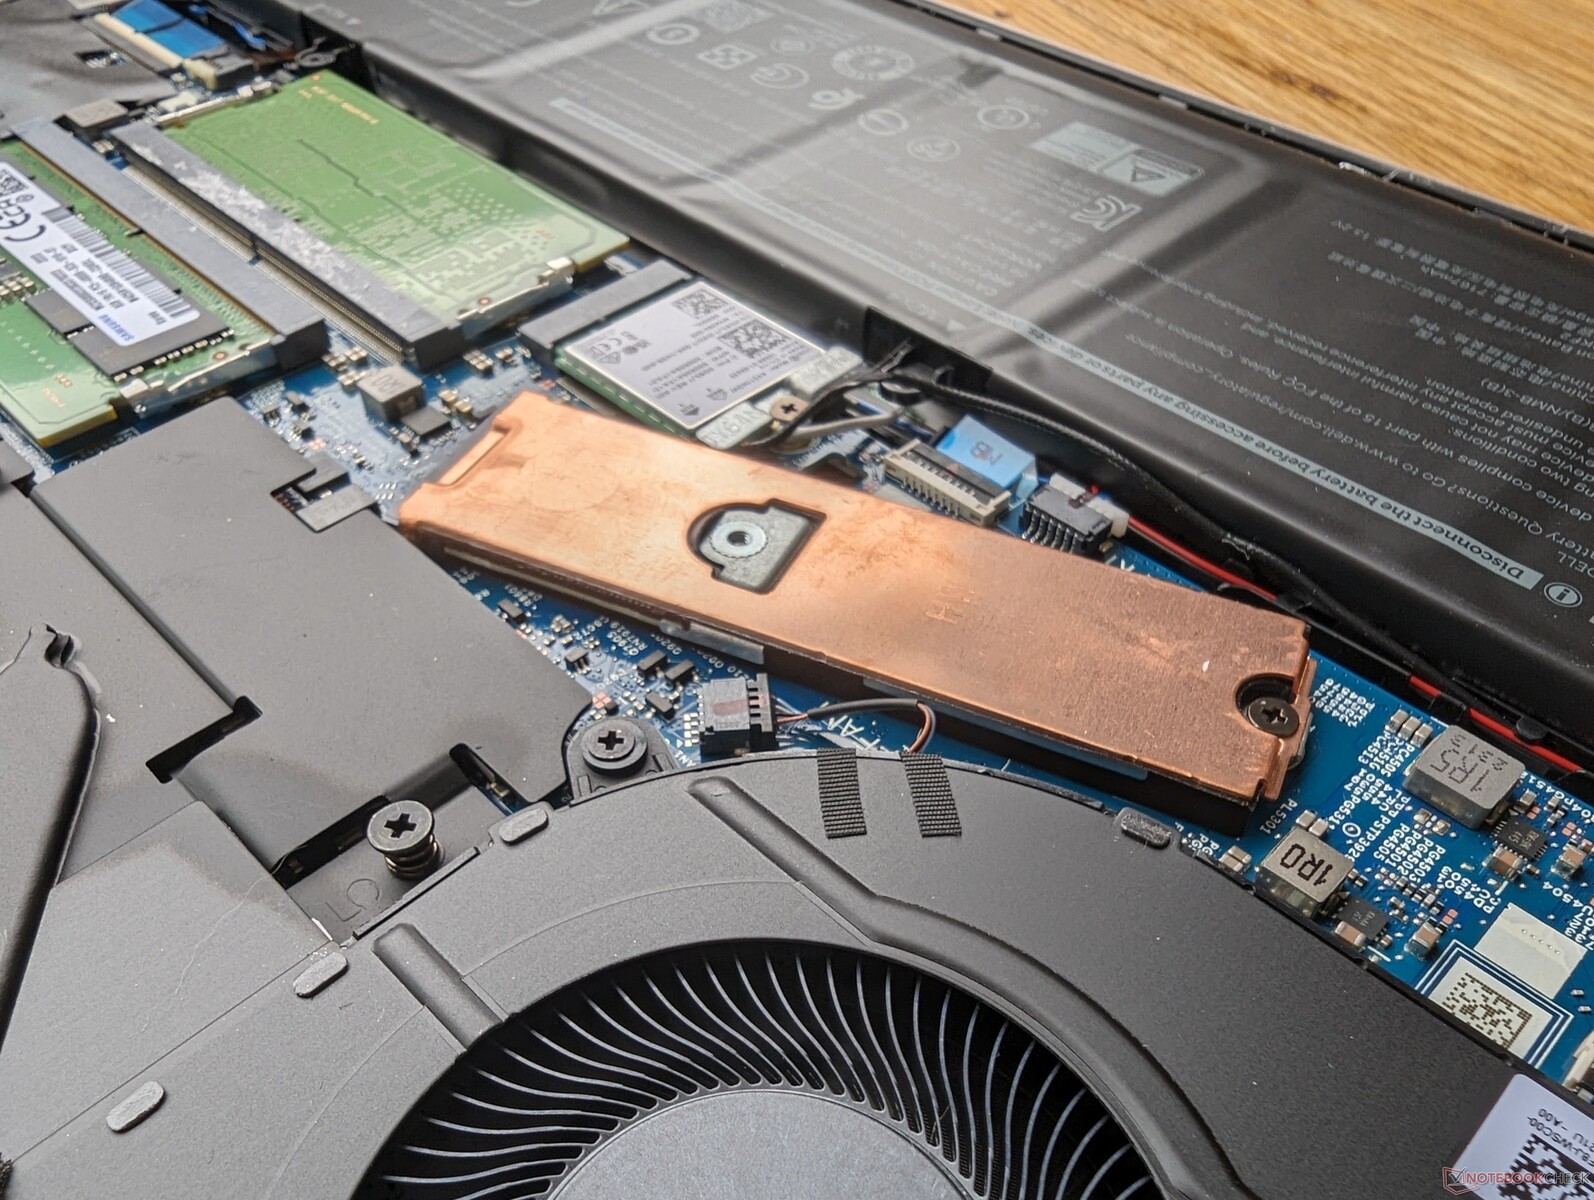
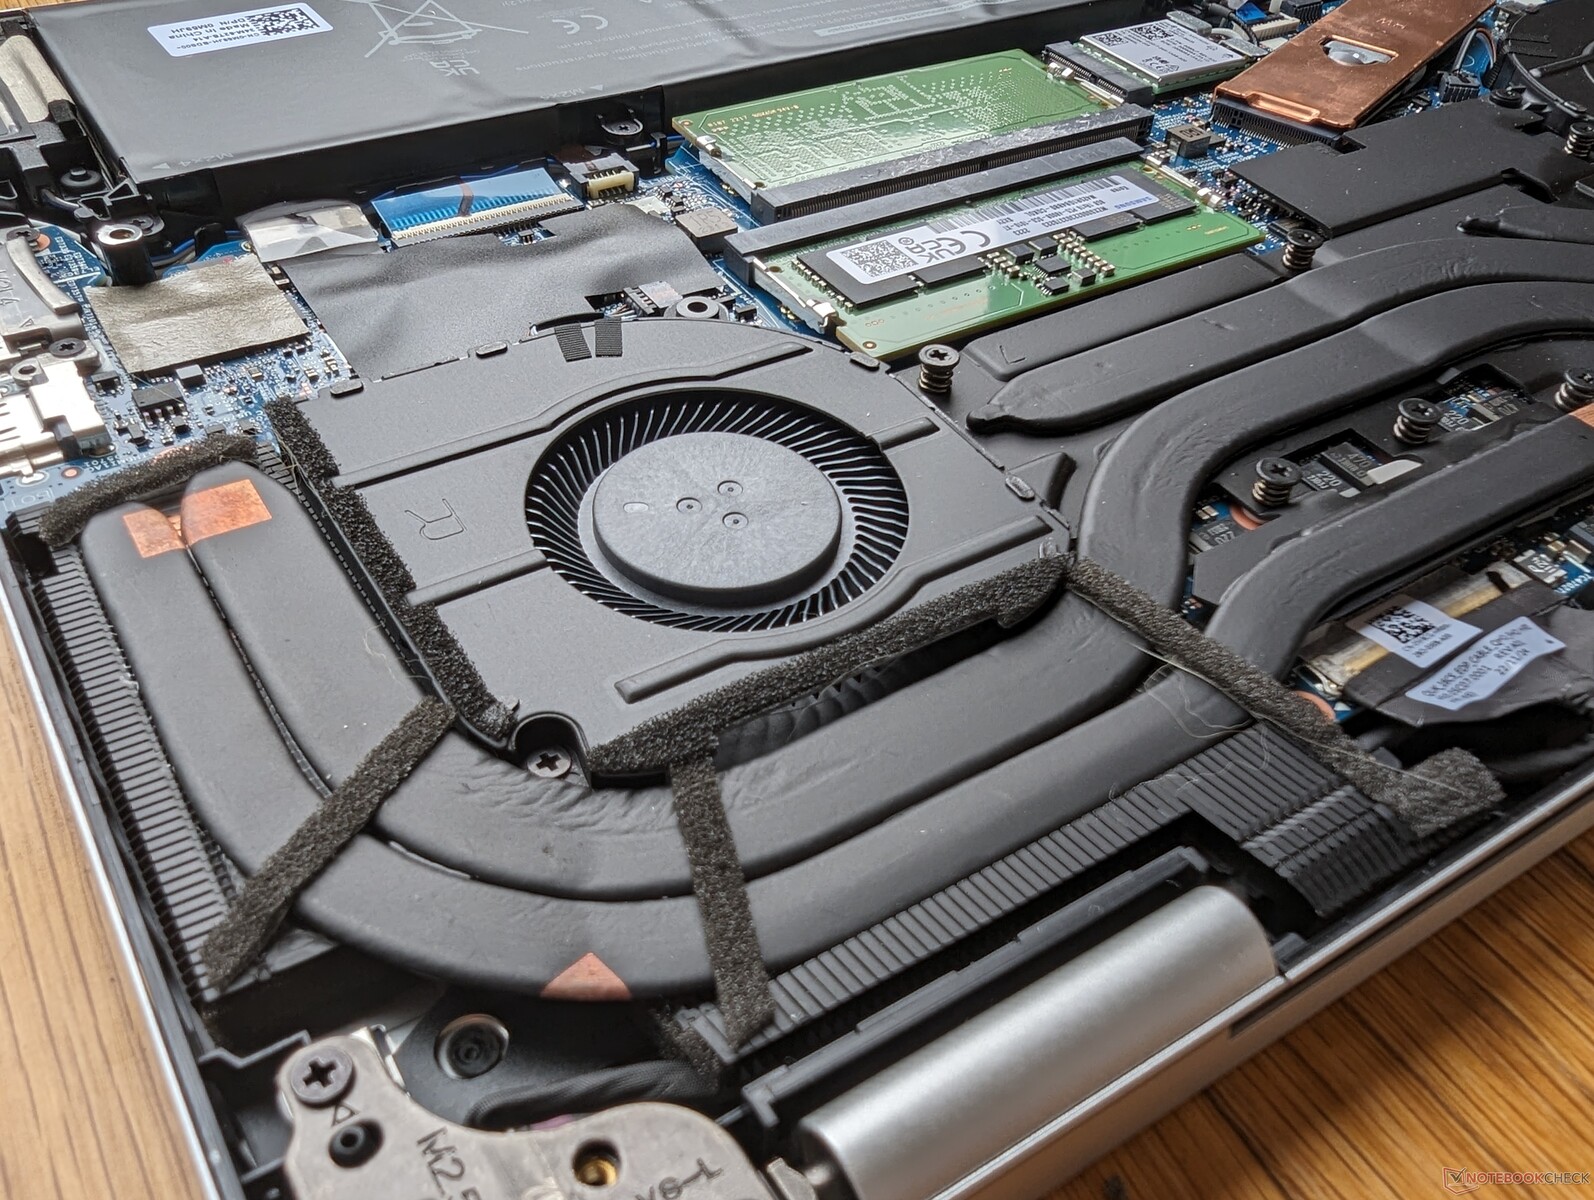
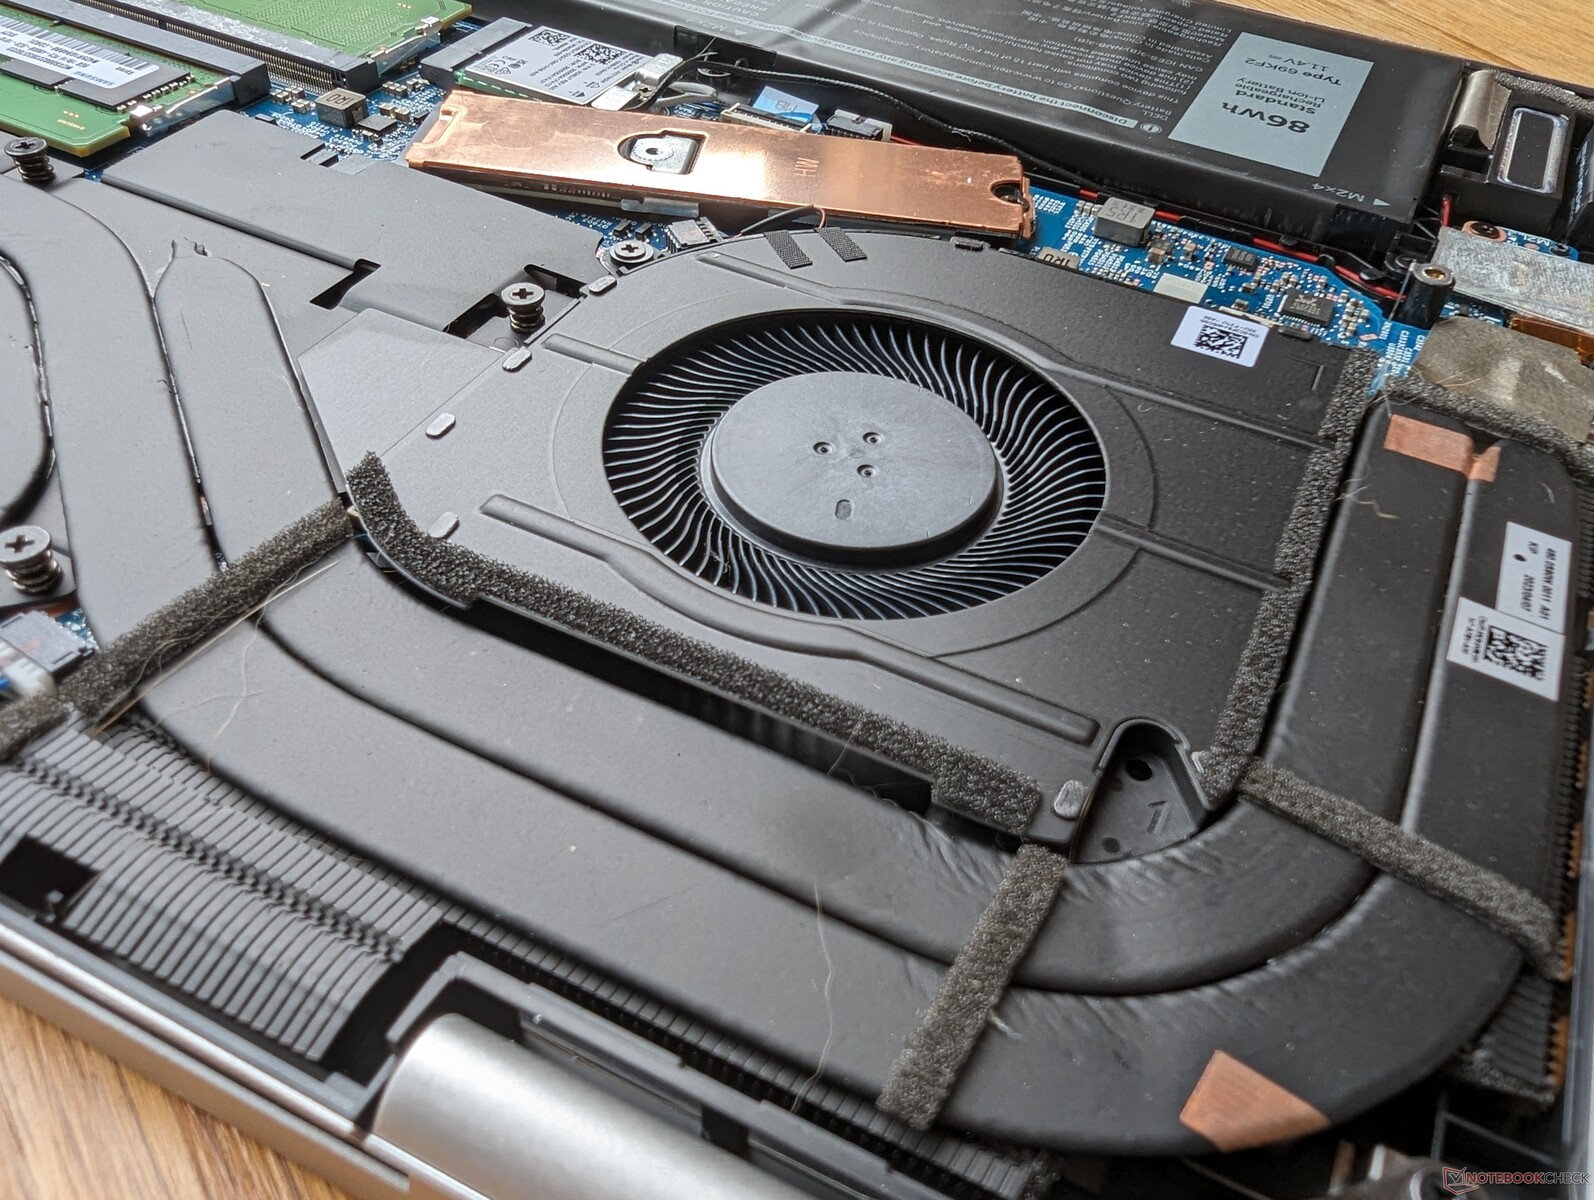
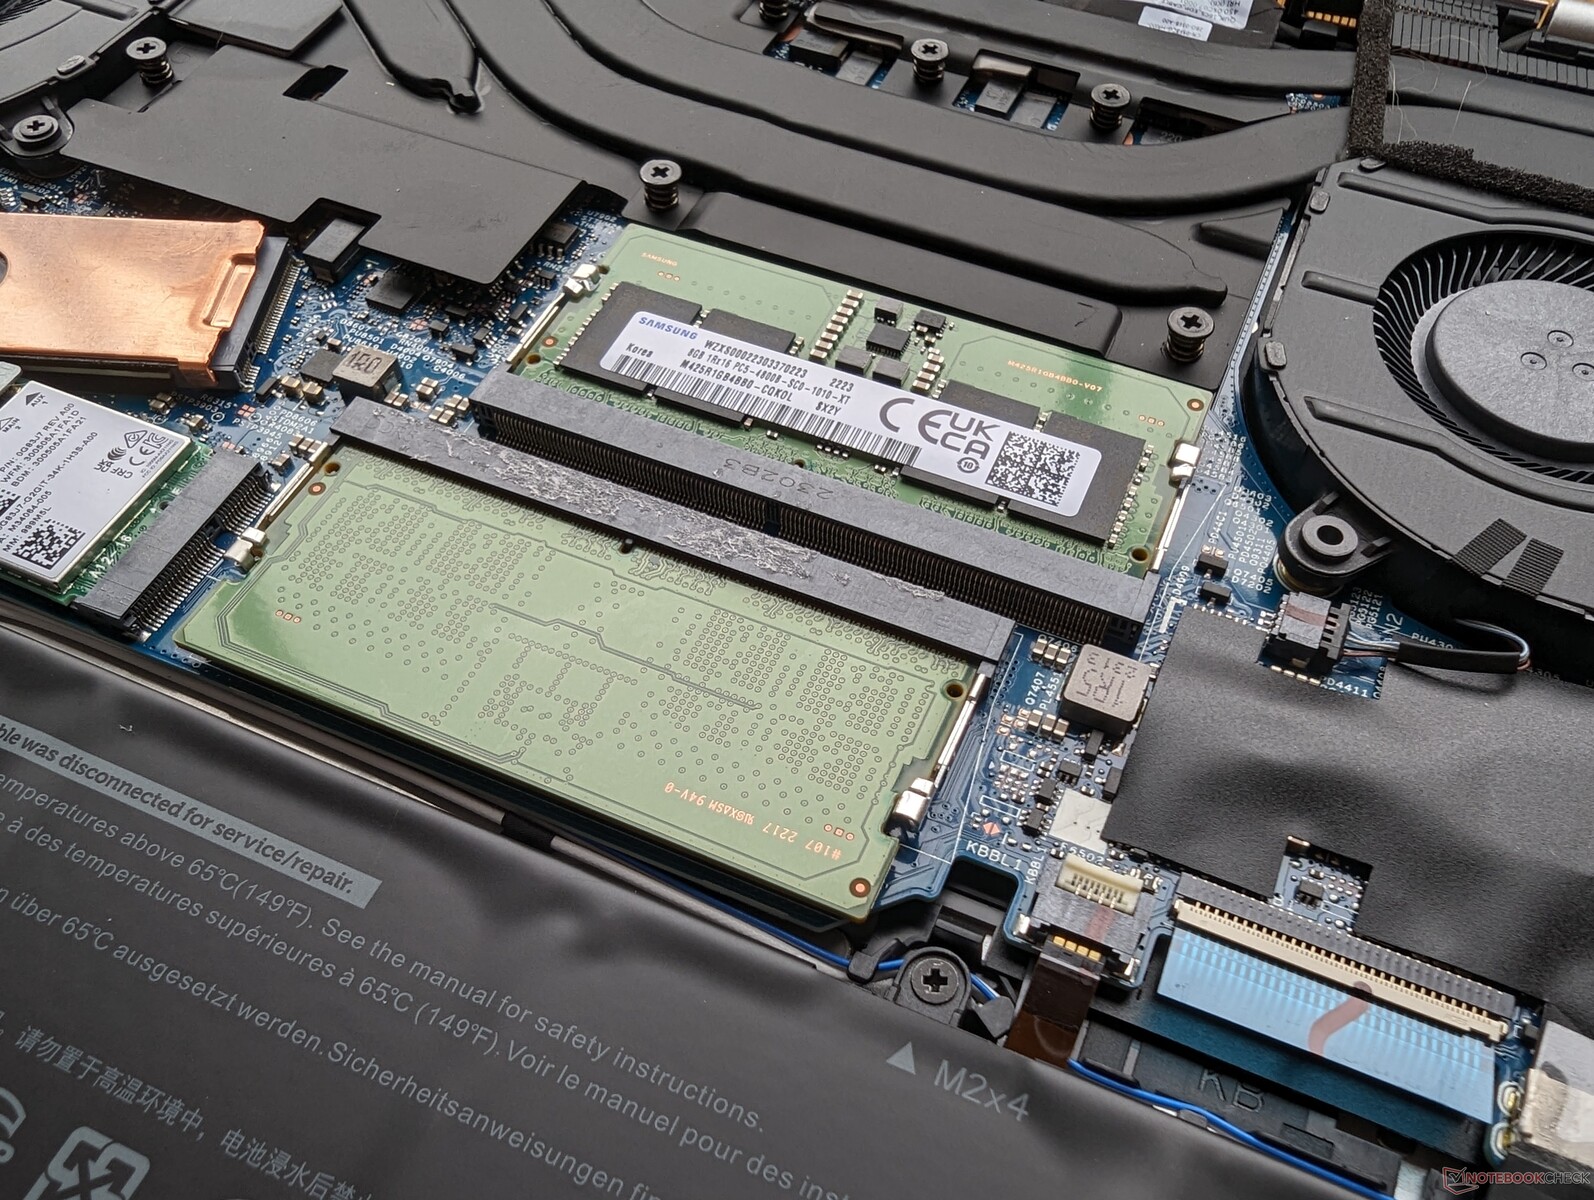
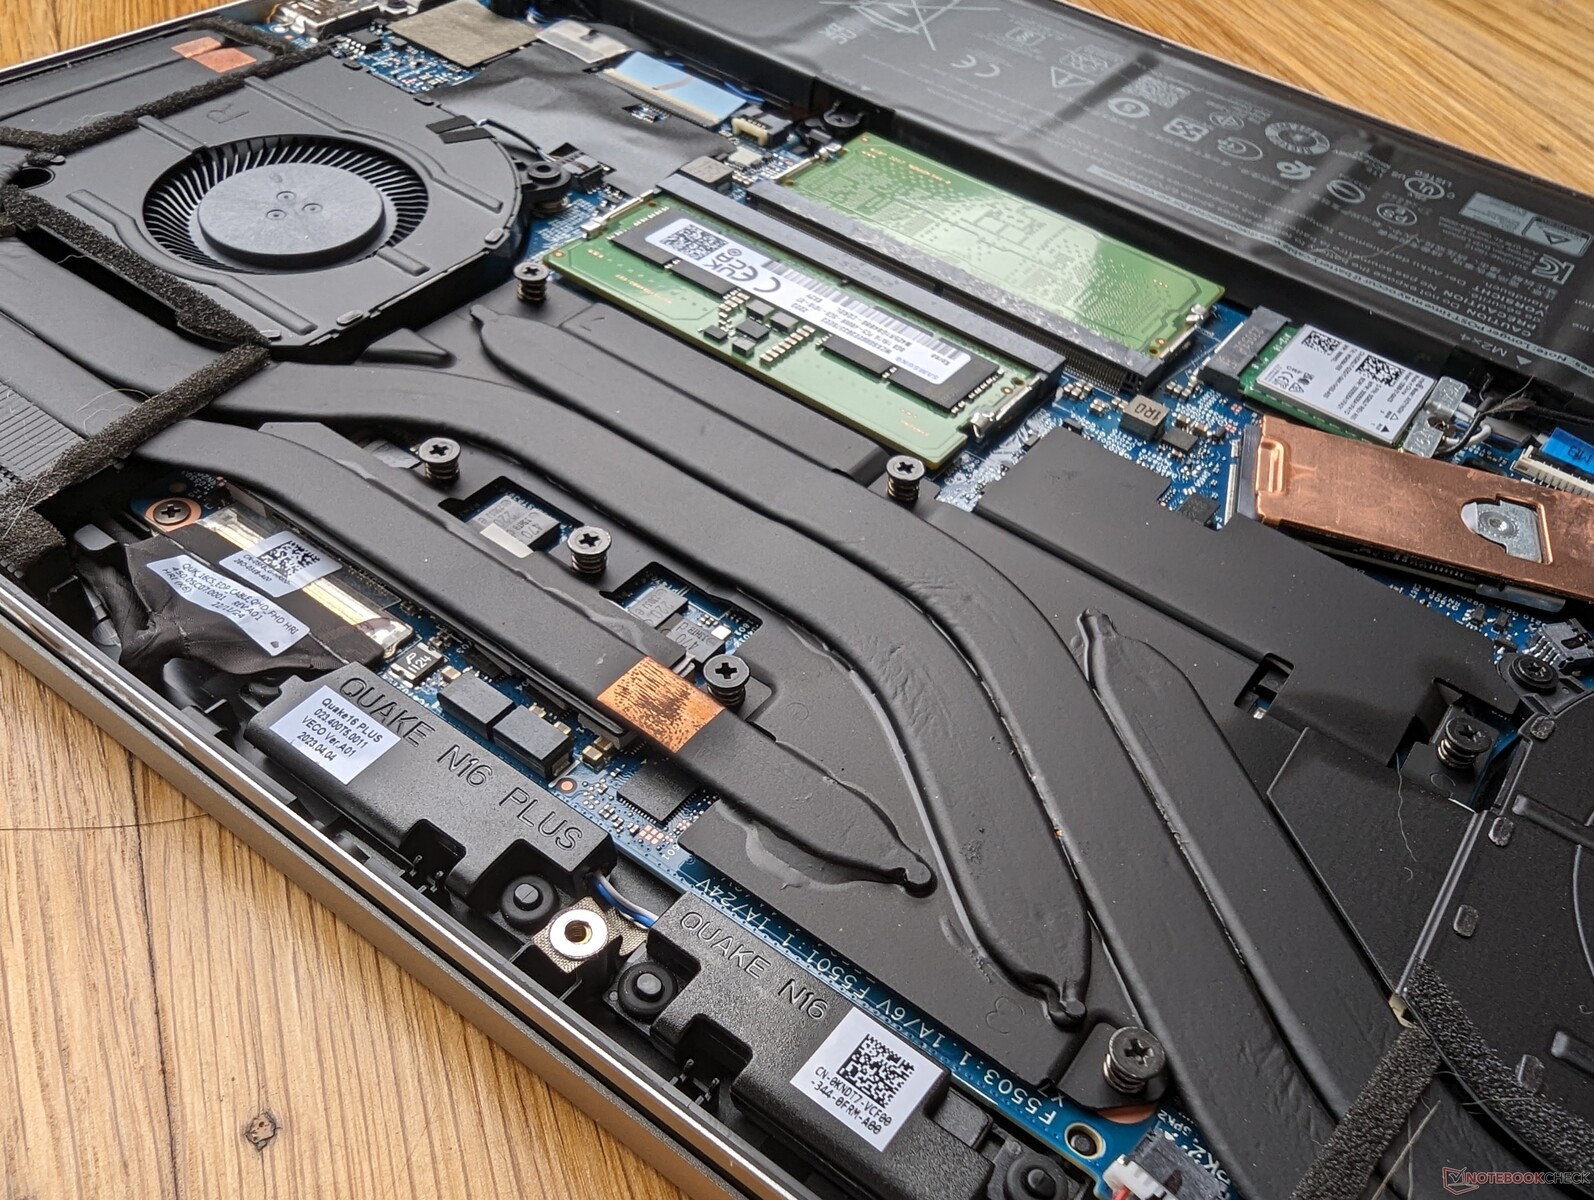
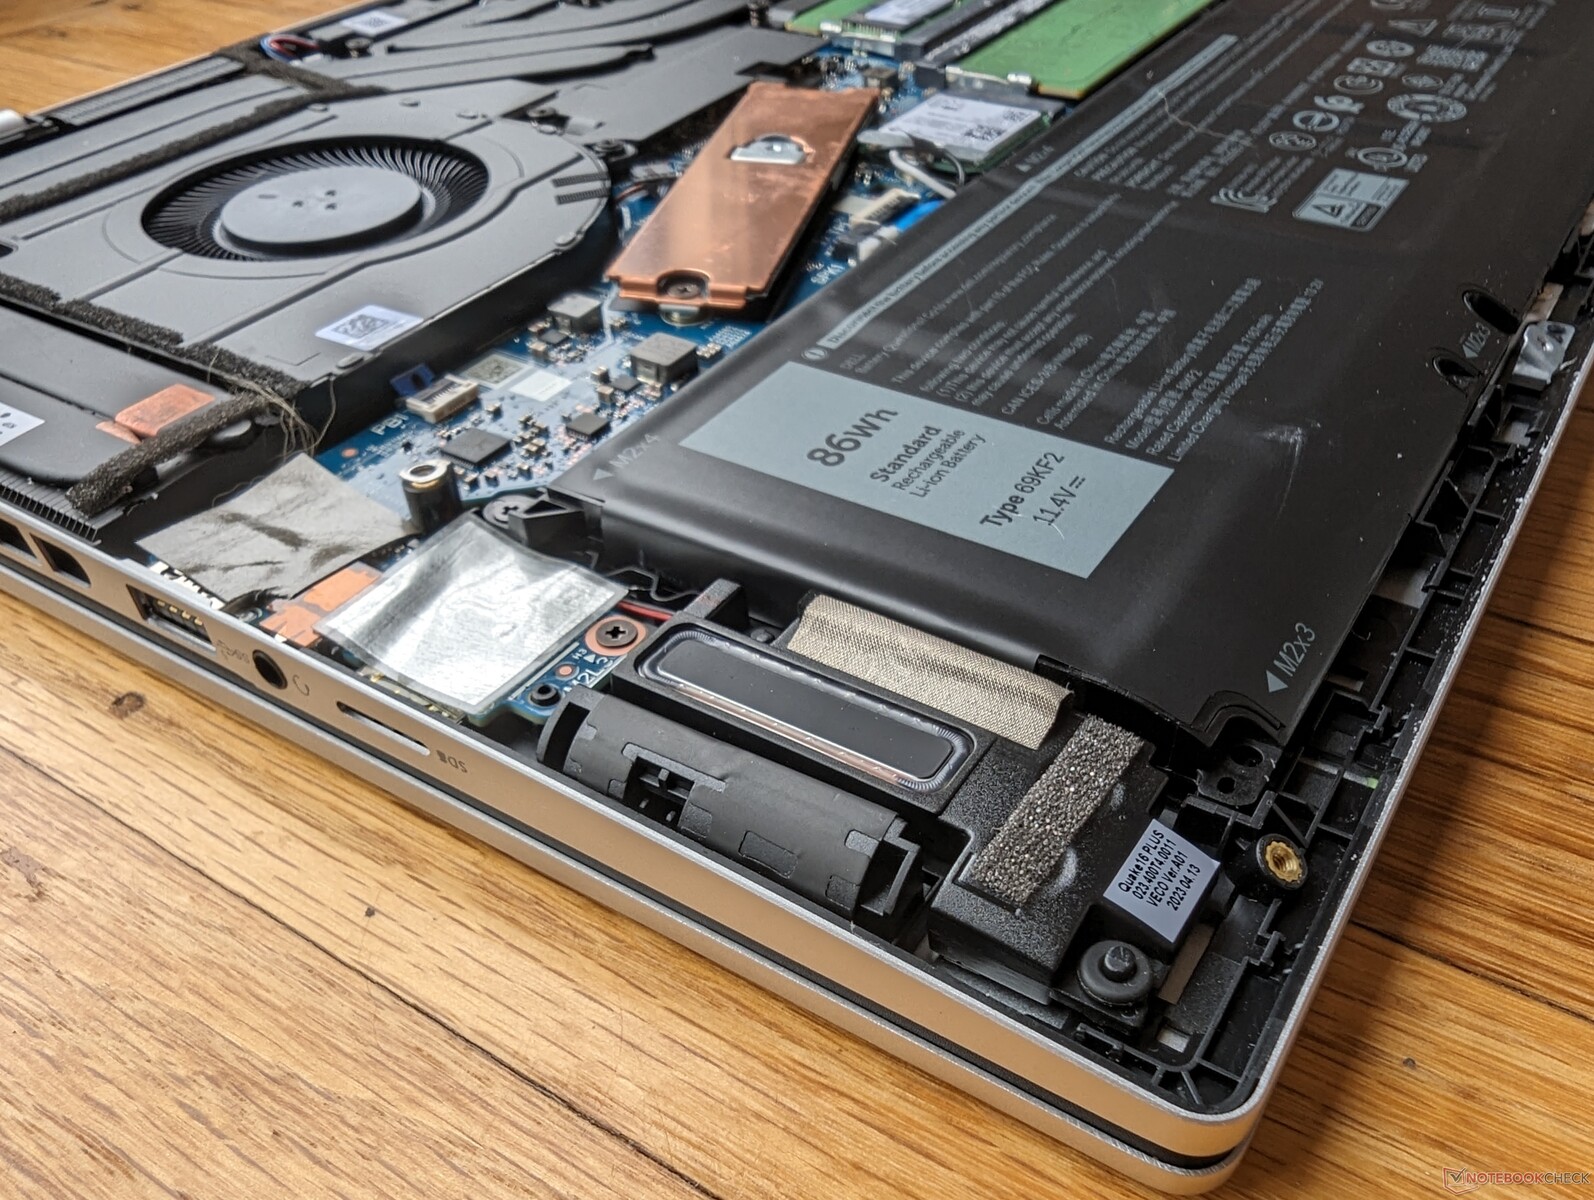
Wartung
Die Unterseite erfordert nur einen Kreuzschlitzschraubendreher und eine scharfe Kante für relativ einfache Wartungsarbeiten. Besitzer haben direkten Zugriff auf die SSD, WLAN und zwei SODIMM-Steckplätze, während das letztjährige Modell nur einen SODIMM-Steckplatz hatte, wie die Vergleichsfotos unten zeigen. Die Lüfter sind dieses Mal auch größer und mit dickeren Kupfer-Heatpipes ausgestattet, um das Kühlpotenzial zu verbessern.
Beachten Sie, dass die AMD Version dieses Modells gelöteten LPDDR5-RAM verwendet, im Gegensatz zum voll erweiterbaren 2-fach-SODIMM-Ansatz unserer Intel Version.
Zubehör und Garantie
Im Karton befinden sich außer dem Netzgerät und den Unterlagen keine weiteren Extras. Beim Kauf in den USA gilt die übliche einjährige Herstellergarantie.
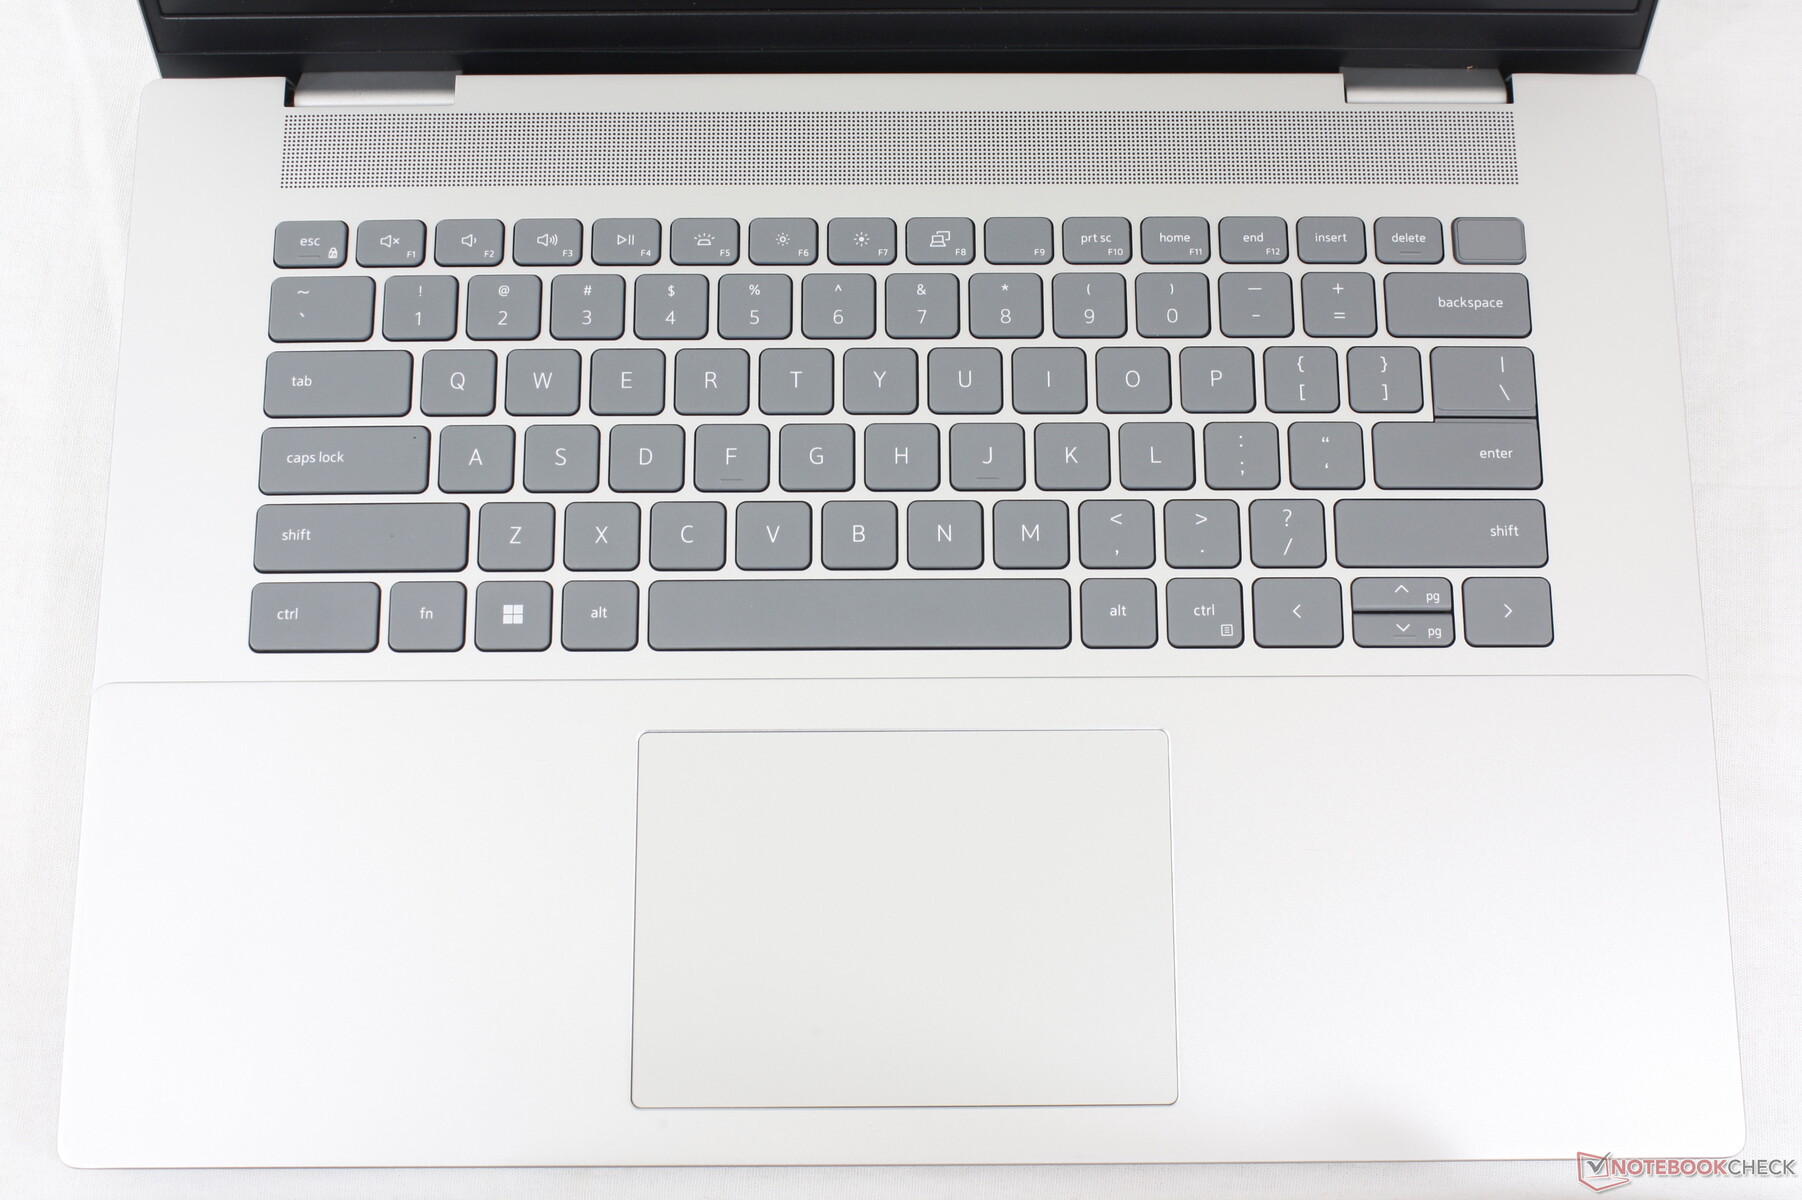
Eingabegeräte - Vertrautes Inspiron Gefühl
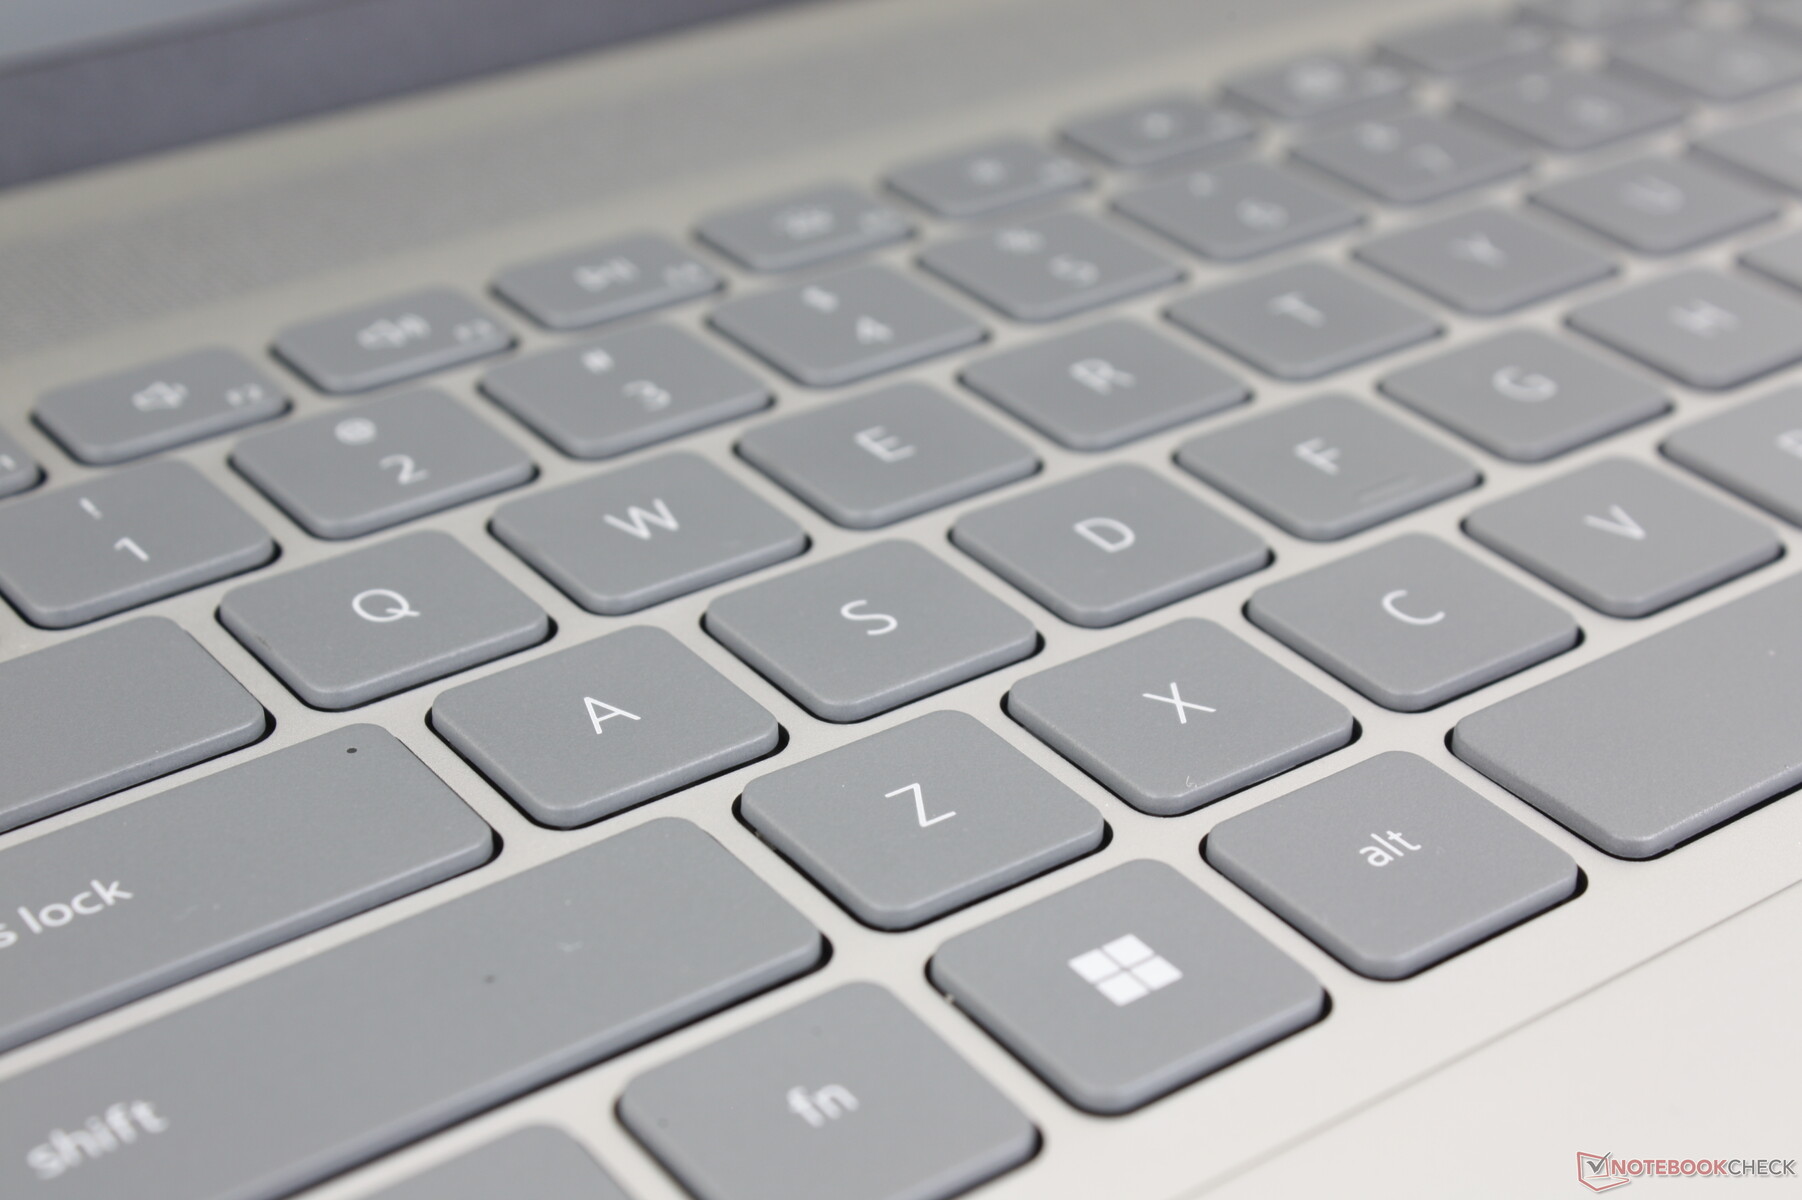
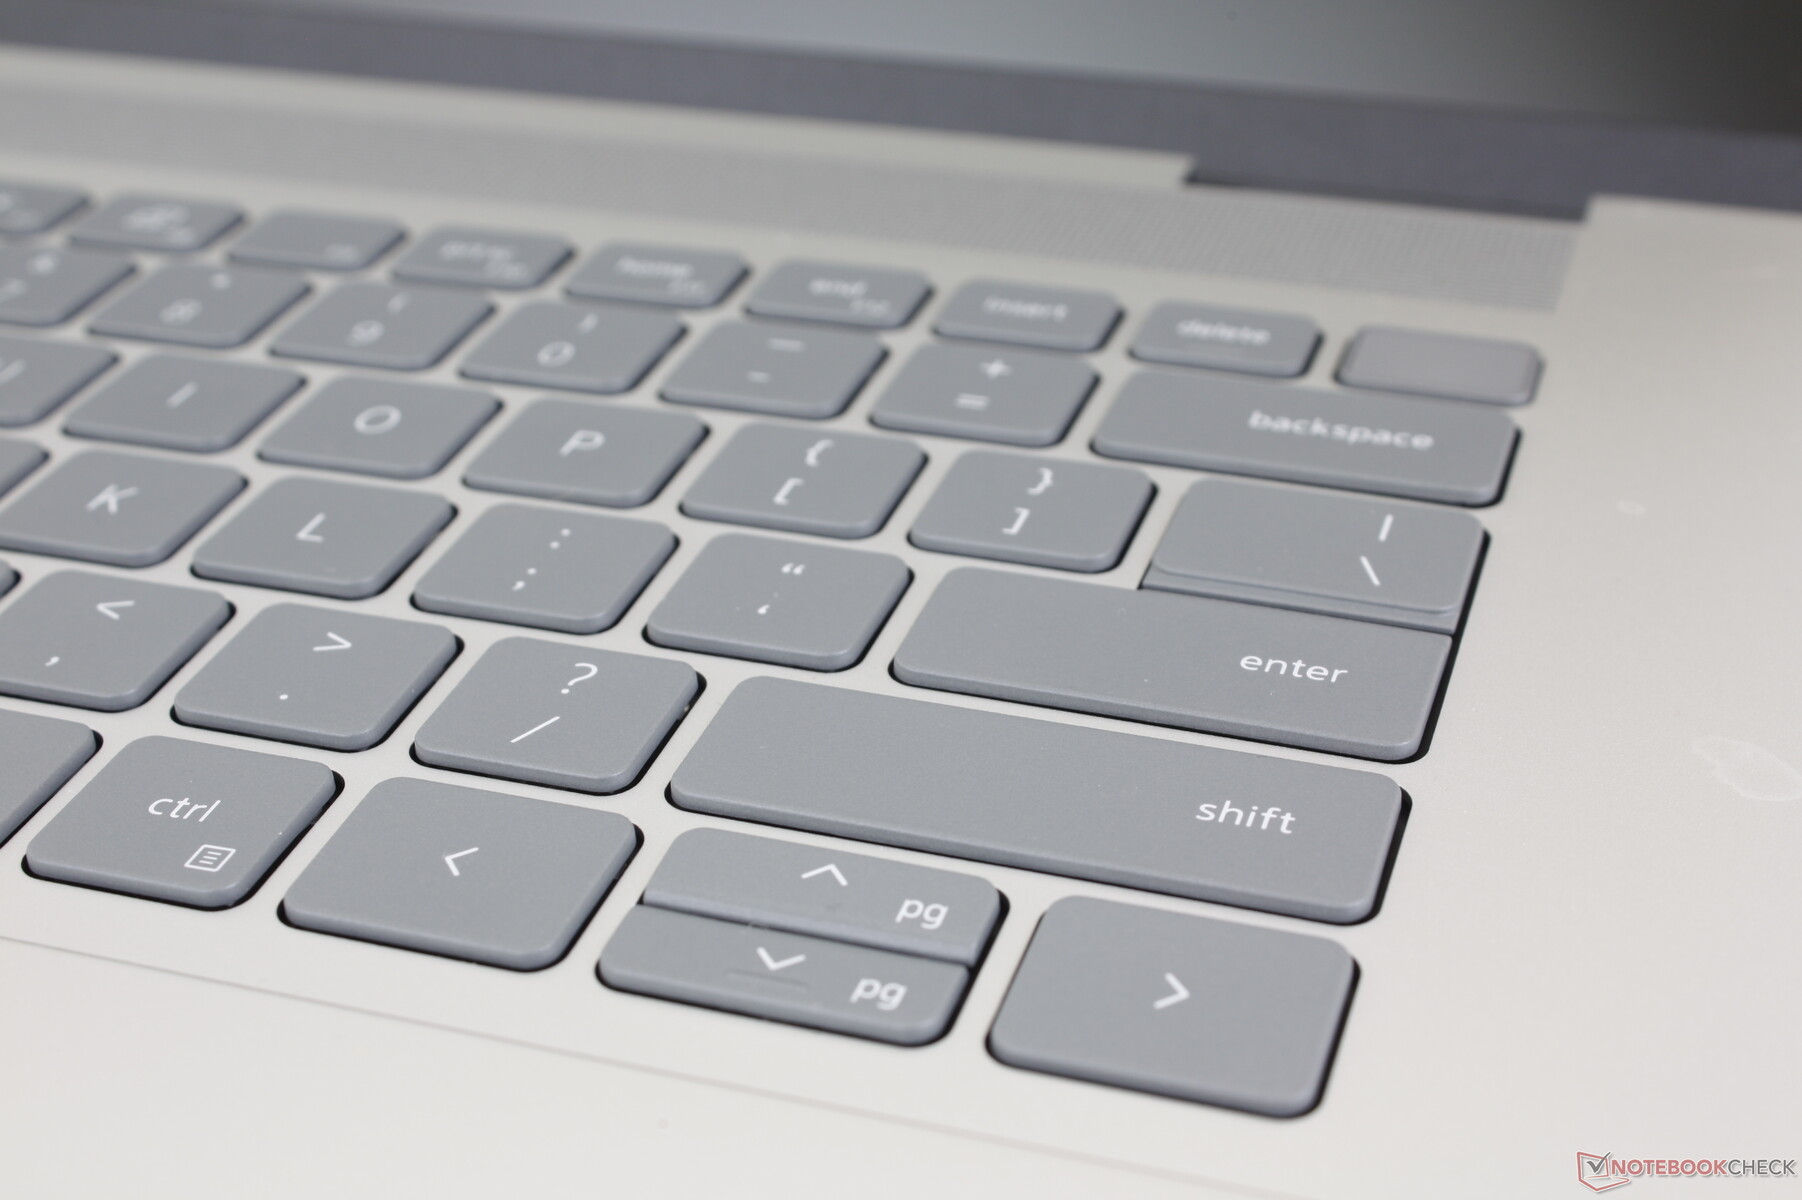
Tastatur
Das Tipperlebnis bleibt identisch mit dem Inspiron 16 Plus 7620 bis hin zu den einzelnen Funktionstasten und sekundären Aktionen. Das ist nicht unbedingt etwas Schlechtes, denn die Konsistenz zwischen den verschiedenen Inspiron Modellen wird sehr geschätzt. Aber andere Multimedia-Notebooks wie das LG Gram 16 oder HP Spectre x360 16 haben deutlich festere und komfortablere Tasten.
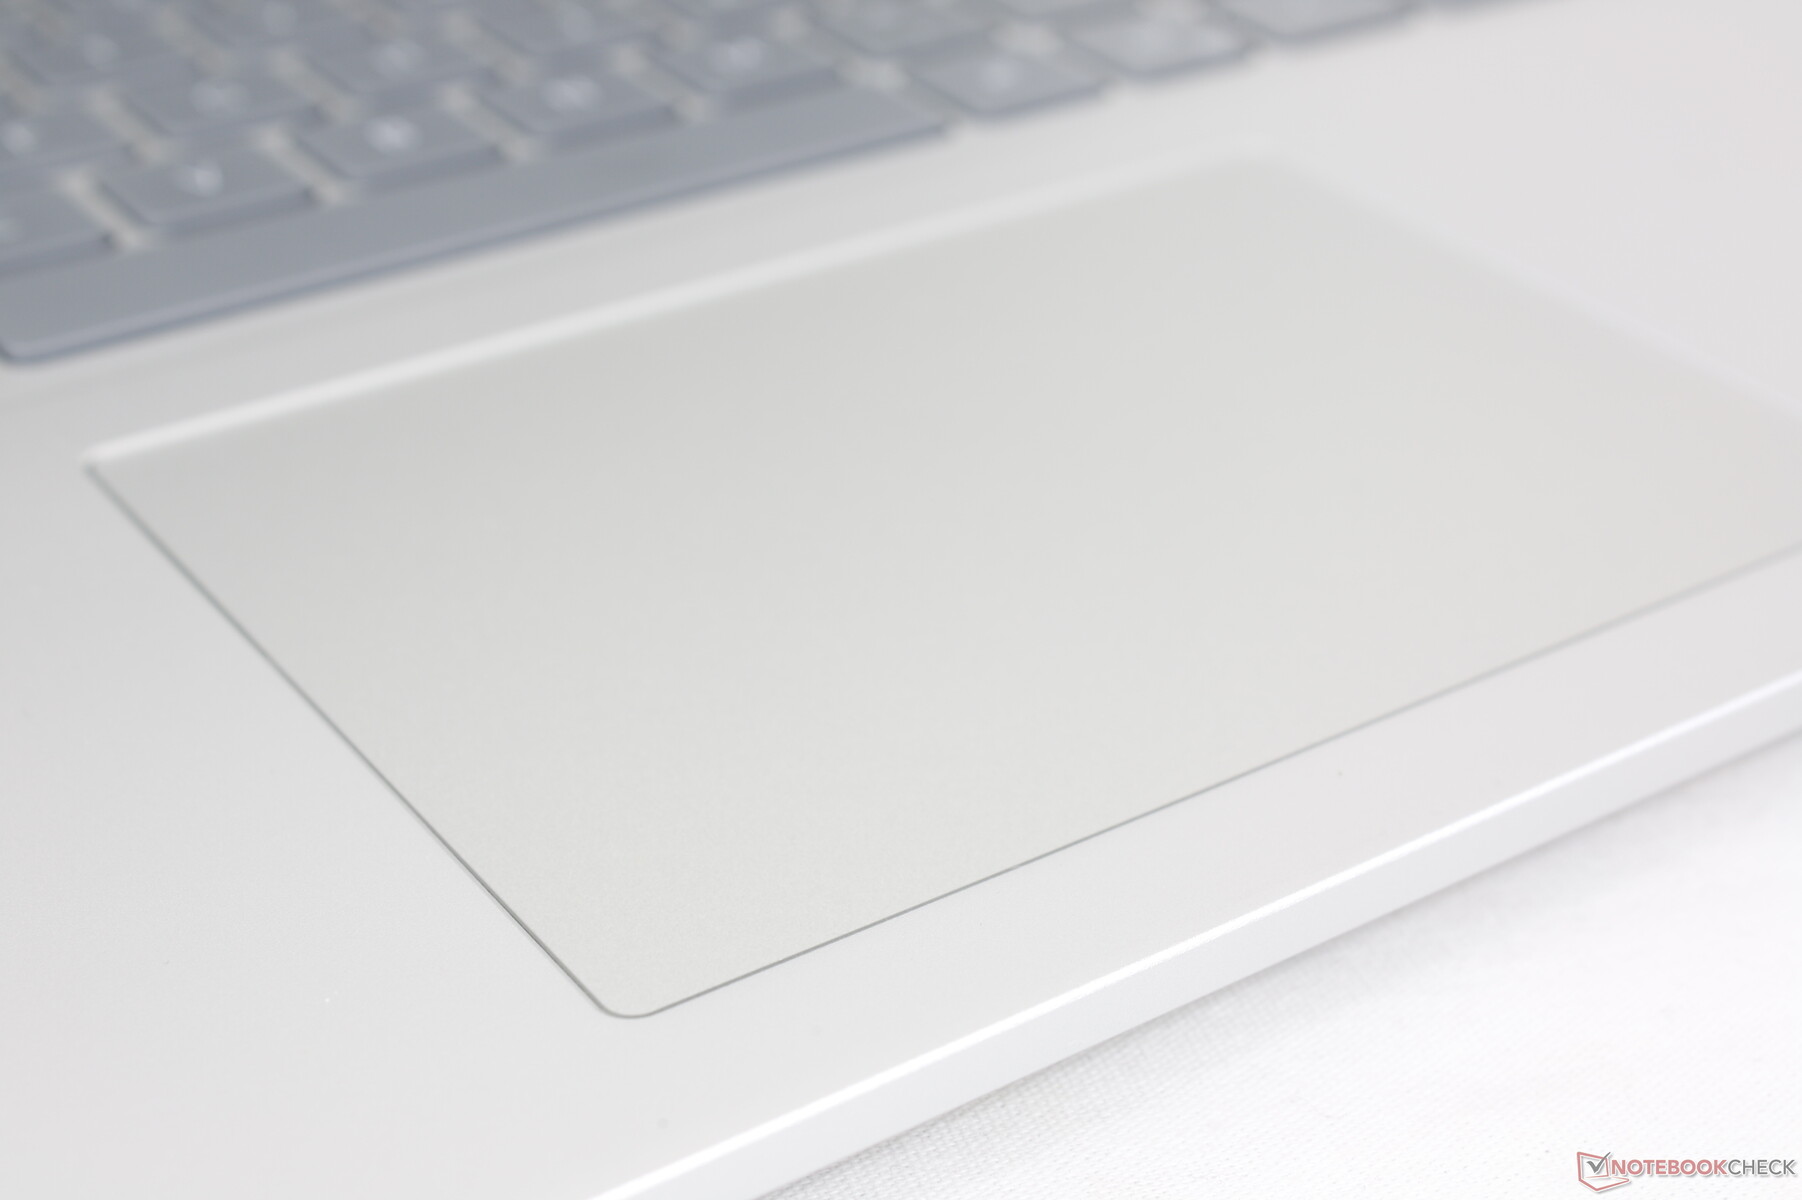
Touchpad
Das Clickpad hat die gleiche Größe wie das des Vorjahresmodells (11,5 x 8 cm). Das Gleiten ist geschmeidig mit einem leichten Hängenbleiben bei langsameren Geschwindigkeiten für genauere Eingaben. Die Rückmeldung beim Drücken des Clickpads ist trotz dem lauten Klick leider etwas schwammig.
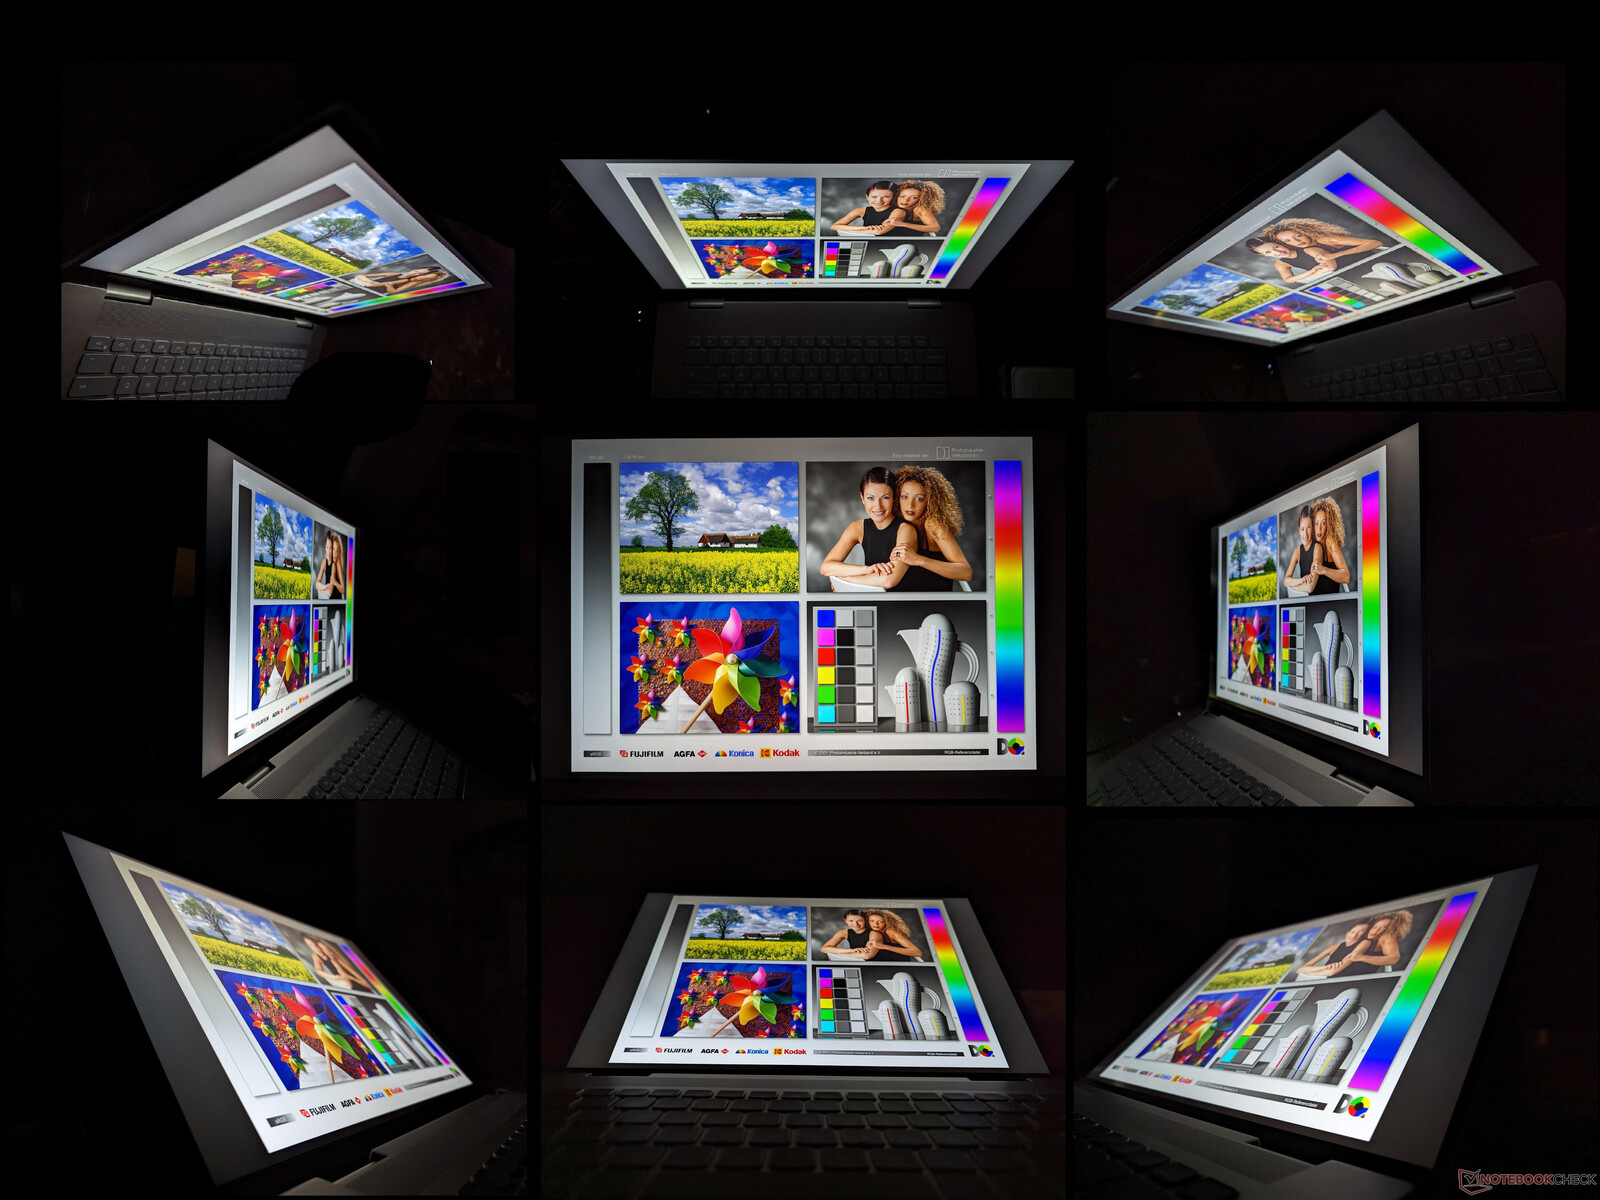
Display - Anständige, aber begrenzte Optionen
Die Displayoptionen haben sich gegenüber dem älteren Inspiron 16 Plus 7620 geändert. Das 3K-Panel mit einer Auflösung von 3.072 x 1.920 Pixeln ist verschwunden, dafür gibt es zwei neue Optionen:
- 2.560 x 1.600 (2,5K), 120 Hz
- 1.920 x 1.200, 60 Hz
Beide Optionen sind IPS und berührungslos und unterstützen kein G-Sync. Unsere Messungen unten beziehen sich nur auf die fettgedruckte 1.600p-Option.
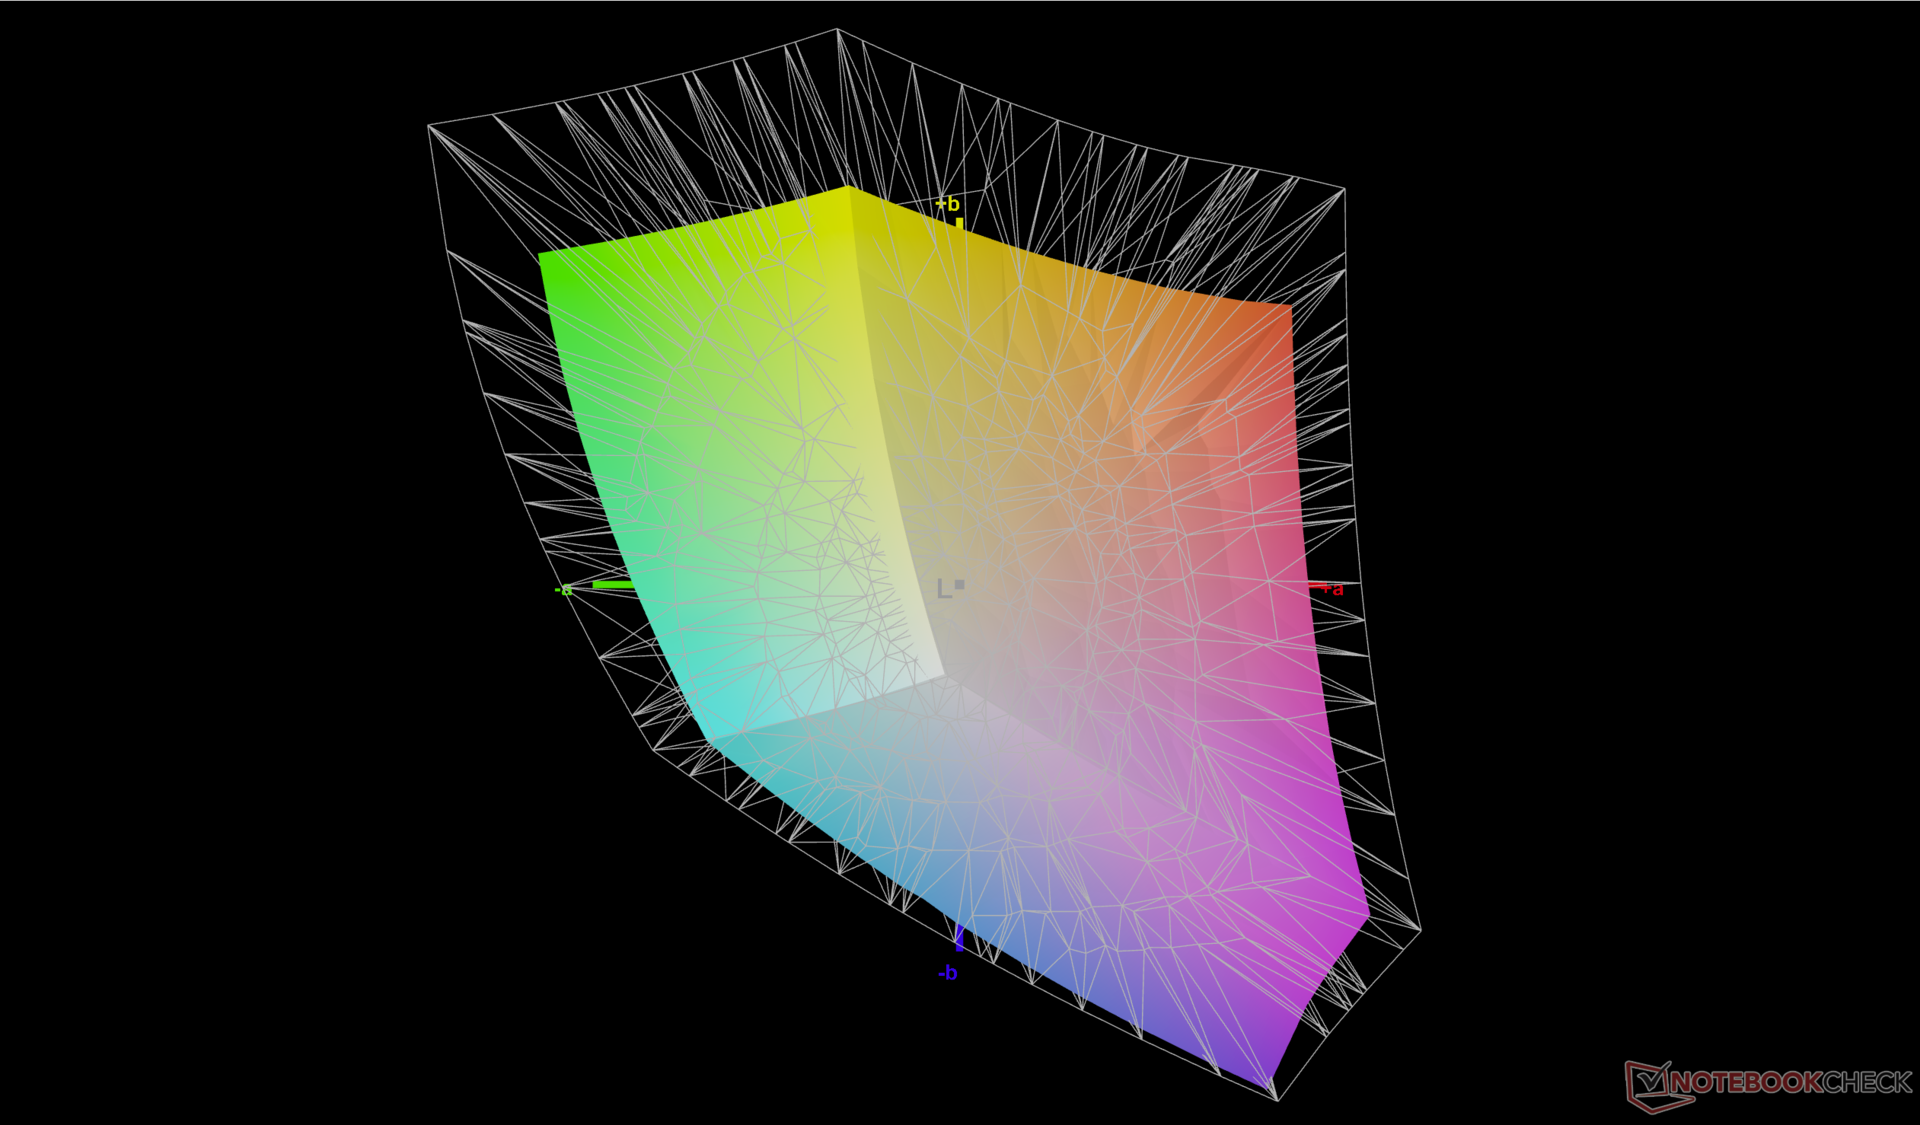
Im Vergleich zum letztjährigen BOE-3K-Panel hat das neue LG-Philips-2,5K-Panel eine doppelt so hohe native Bildwiederholfrequenz, allerdings auf Kosten einer niedrigeren nativen Auflösung. Die volle sRGB-Abdeckung, die 300-Nit-Helligkeit, das Kontrastverhältnis von über 1.000:1 und die durchschnittlichen Reaktionszeiten sind ansonsten recht ähnlich. Dennoch bieten konkurrierende Modelle wie das Vivobook Pro 16X oder das Envy 16 jeweils höhere Auflösungsoptionen mit noch satteren Farben, die Content-Ersteller sicherlich zu schätzen wissen. Unser LG-Philips-Panel ist daher preisbewusster.

| |||||||||||||||||||||||||
Ausleuchtung: 92 %
Helligkeit Akku: 299.4 cd/m²
Kontrast: 1426:1 (Schwarzwert: 0.21 cd/m²)
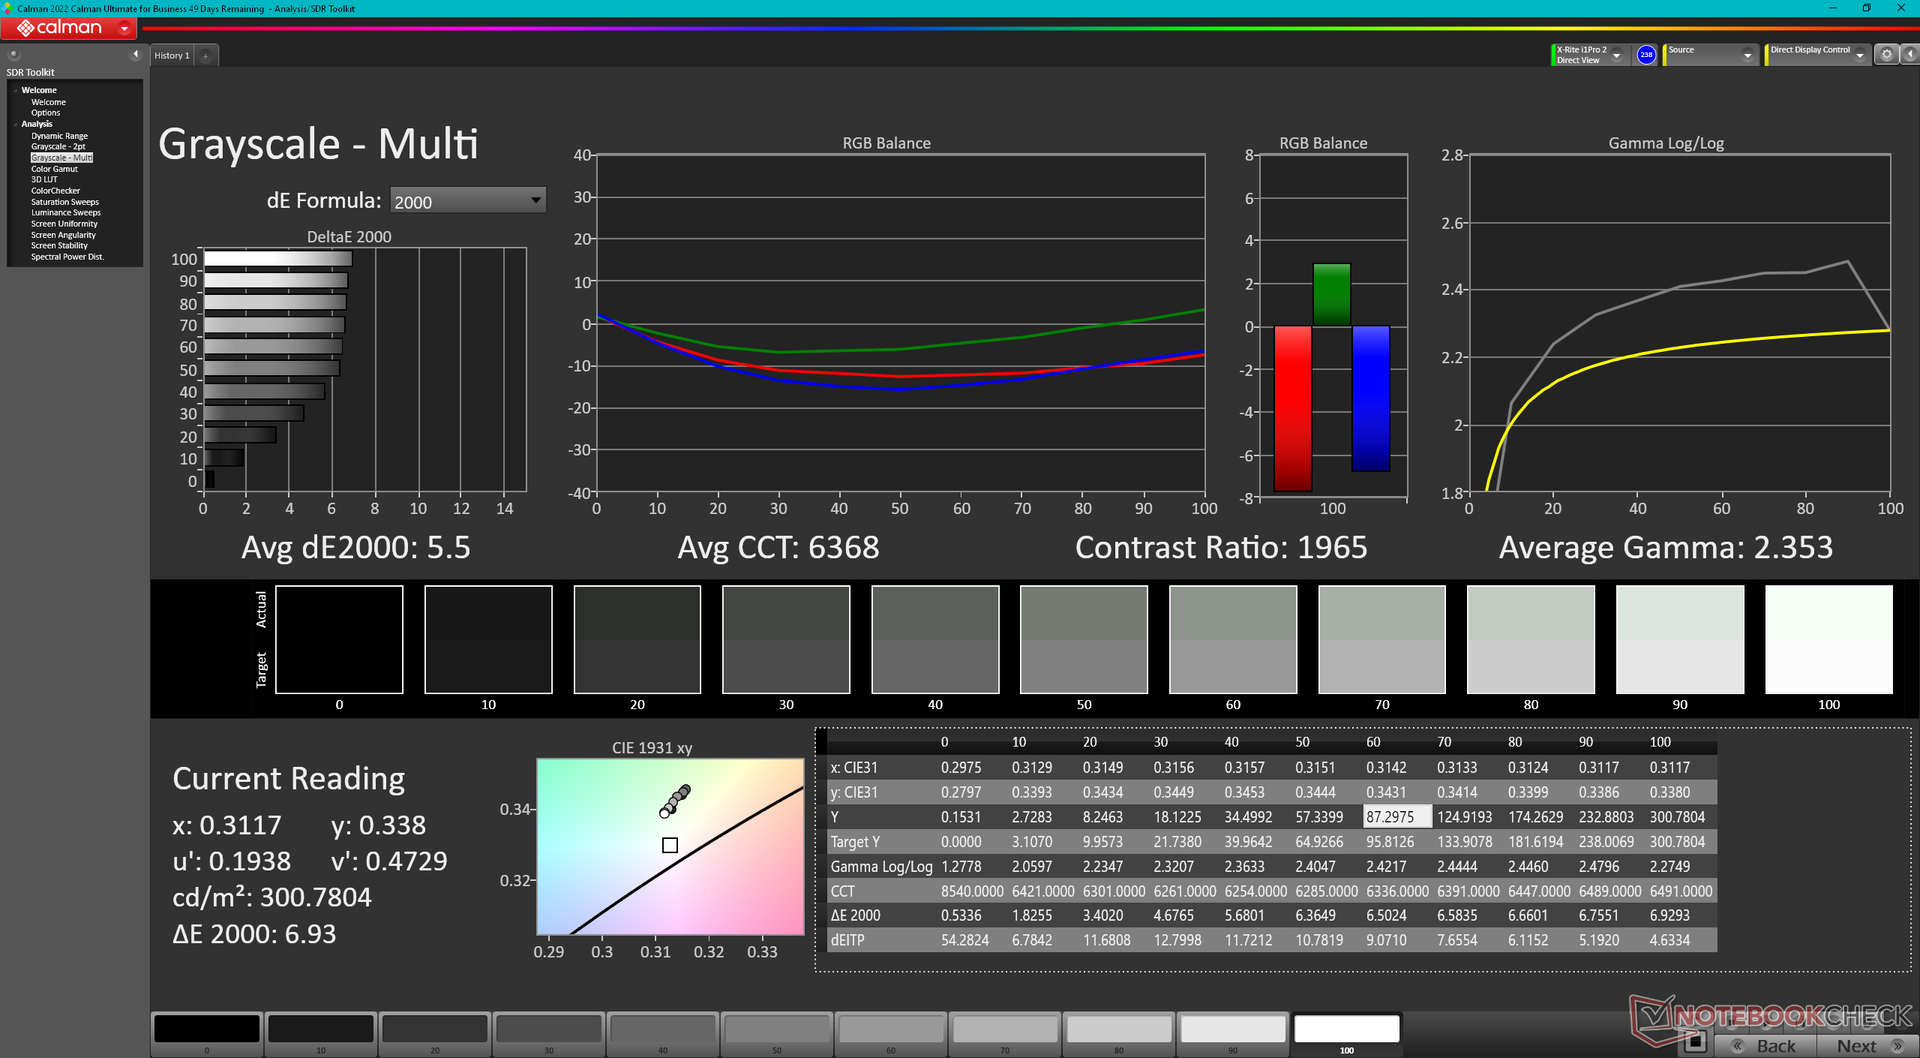
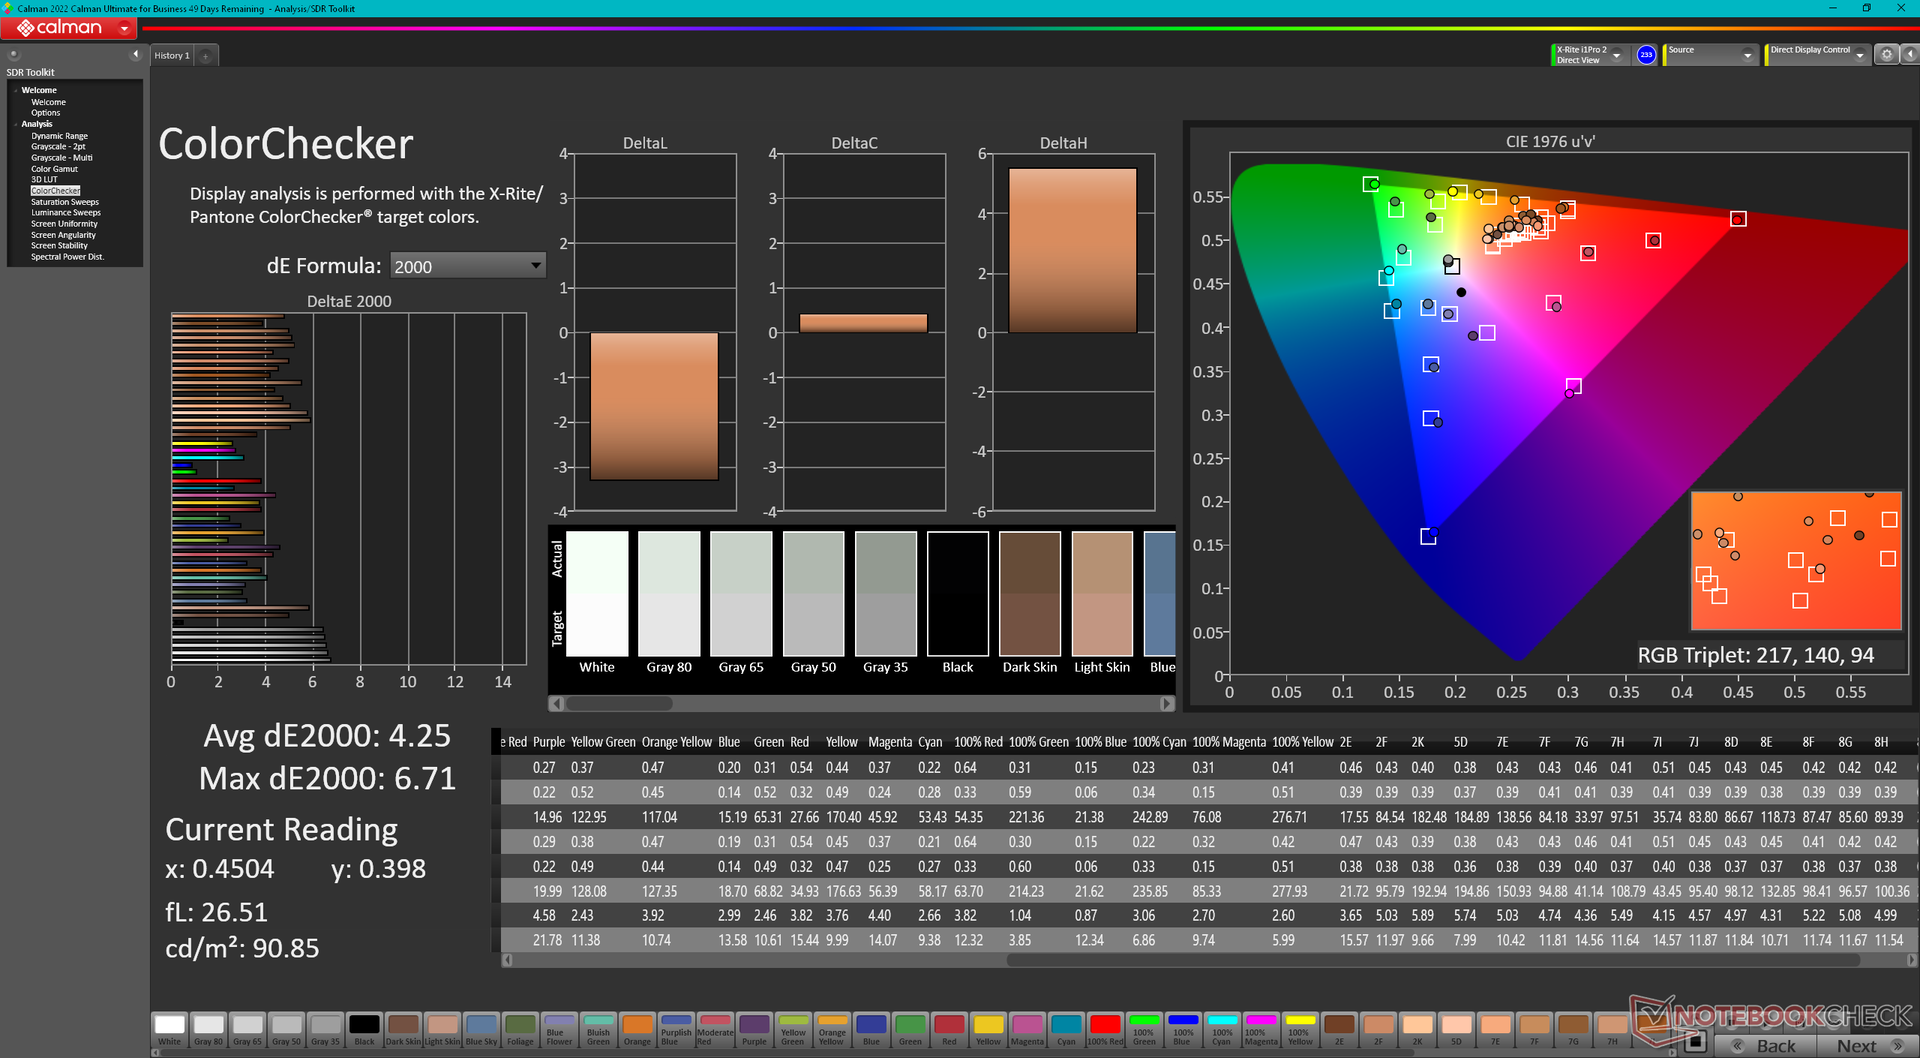
ΔE ColorChecker Calman: 4.25 | ∀{0.5-29.43 Ø4.72}
calibrated: 0.52
ΔE Greyscale Calman: 5.5 | ∀{0.09-98 Ø4.97}
72.3% AdobeRGB 1998 (Argyll 3D)
99.6% sRGB (Argyll 3D)
70.1% Display P3 (Argyll 3D)
Gamma: 2.35
CCT: 6368 K
| Dell Inspiron 16 Plus 7630 LG Philips 160WQ2, IPS, 2560x1600, 16" | Dell Inspiron 16 Plus 7620 BOE NE16N41, IPS, 3072x1920, 16" | Lenovo Slim Pro 9i 16IRP8 LEN160-3.2K, Mini-LED, 3200x2000, 16" | Asus Vivobook Pro 16X K6604JV-MX016W Samsung SDC4178 ATNA60BX01-1, OLED, 3200x2000, 16" | HP Envy 16 h0112nr Samsung SDC4174, OLED, 3840x2400, 16" | MSI Summit E16 Flip A12UDT-031 AU Optronics B16QAN02.N, IPS, 2560x1600, 16" | |
|---|---|---|---|---|---|---|
| Display | 1% | 18% | 24% | 21% | 20% | |
| Display P3 Coverage (%) | 70.1 | 70.8 1% | 95.1 36% | 98.4 40% | 99.3 42% | 98.9 41% |
| sRGB Coverage (%) | 99.6 | 99.5 0% | 99.9 0% | 99.7 0% | 100 0% | 100 0% |
| AdobeRGB 1998 Coverage (%) | 72.3 | 73.2 1% | 84.6 17% | 95.8 33% | 88 22% | 86.5 20% |
| Response Times | -13% | 61% | 95% | 93% | 63% | |
| Response Time Grey 50% / Grey 80% * (ms) | 35 ? | 38 ? -9% | 14 ? 60% | 1.6 ? 95% | 2 ? 94% | 13 ? 63% |
| Response Time Black / White * (ms) | 24.2 ? | 28 ? -16% | 9.2 ? 62% | 1.4 ? 94% | 1.9 ? 92% | 9 ? 63% |
| PWM Frequency (Hz) | 5784 ? | 120 ? | 240.4 ? | |||
| Bildschirm | 14% | -55% | 35% | 30% | -5% | |
| Helligkeit Bildmitte (cd/m²) | 299.4 | 288.9 -4% | 627.4 110% | 347 16% | 328.8 10% | 314 5% |
| Brightness (cd/m²) | 290 | 276 -5% | 618 113% | 346 19% | 332 14% | 294 1% |
| Brightness Distribution (%) | 92 | 92 0% | 95 3% | 97 5% | 97 5% | 89 -3% |
| Schwarzwert * (cd/m²) | 0.21 | 0.26 -24% | 0.19 10% | 0.06 71% | 0.28 -33% | |
| Kontrast (:1) | 1426 | 1111 -22% | 3302 132% | 5783 306% | 1121 -21% | |
| Delta E Colorchecker * | 4.25 | 1.88 56% | 5.84 -37% | 1.89 56% | 1.53 64% | 3.08 28% |
| Colorchecker dE 2000 max. * | 6.71 | 4.37 35% | 10.22 -52% | 3.26 51% | 6.04 10% | 5.49 18% |
| Colorchecker dE 2000 calibrated * | 0.52 | 0.42 19% | 4.45 -756% | 1.97 -279% | 0.88 -69% | |
| Delta E Graustufen * | 5.5 | 1.4 75% | 6.7 -22% | 1.55 72% | 1.3 76% | 3.99 27% |
| Gamma | 2.35 94% | 2.3 96% | 2.77 79% | 2.39 92% | 2.18 101% | 2.3 96% |
| CCT | 6368 102% | 6634 98% | 5795 112% | 6458 101% | 6362 102% | 6219 105% |
| Durchschnitt gesamt (Programm / Settings) | 1% /
8% | 8% /
-23% | 51% /
41% | 48% /
39% | 26% /
10% |
* ... kleinere Werte sind besser
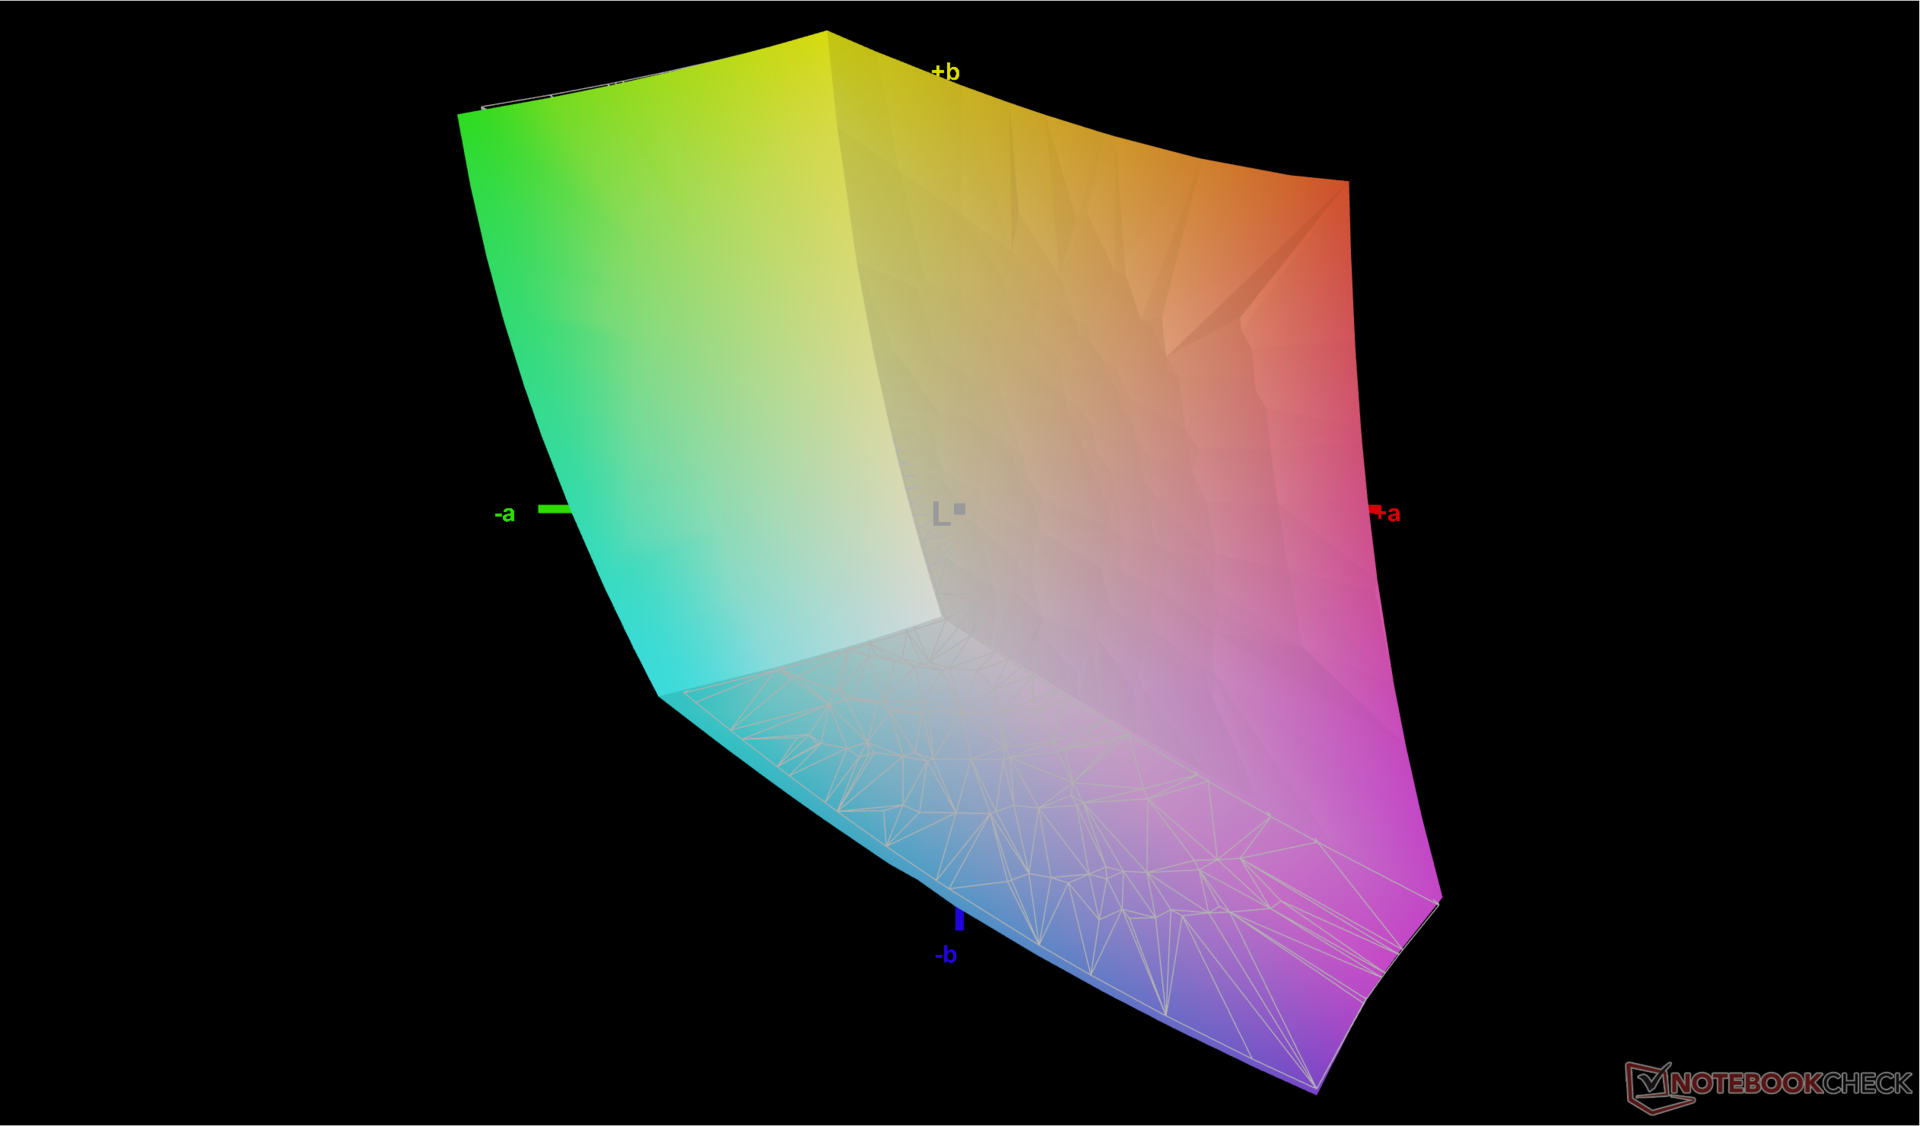
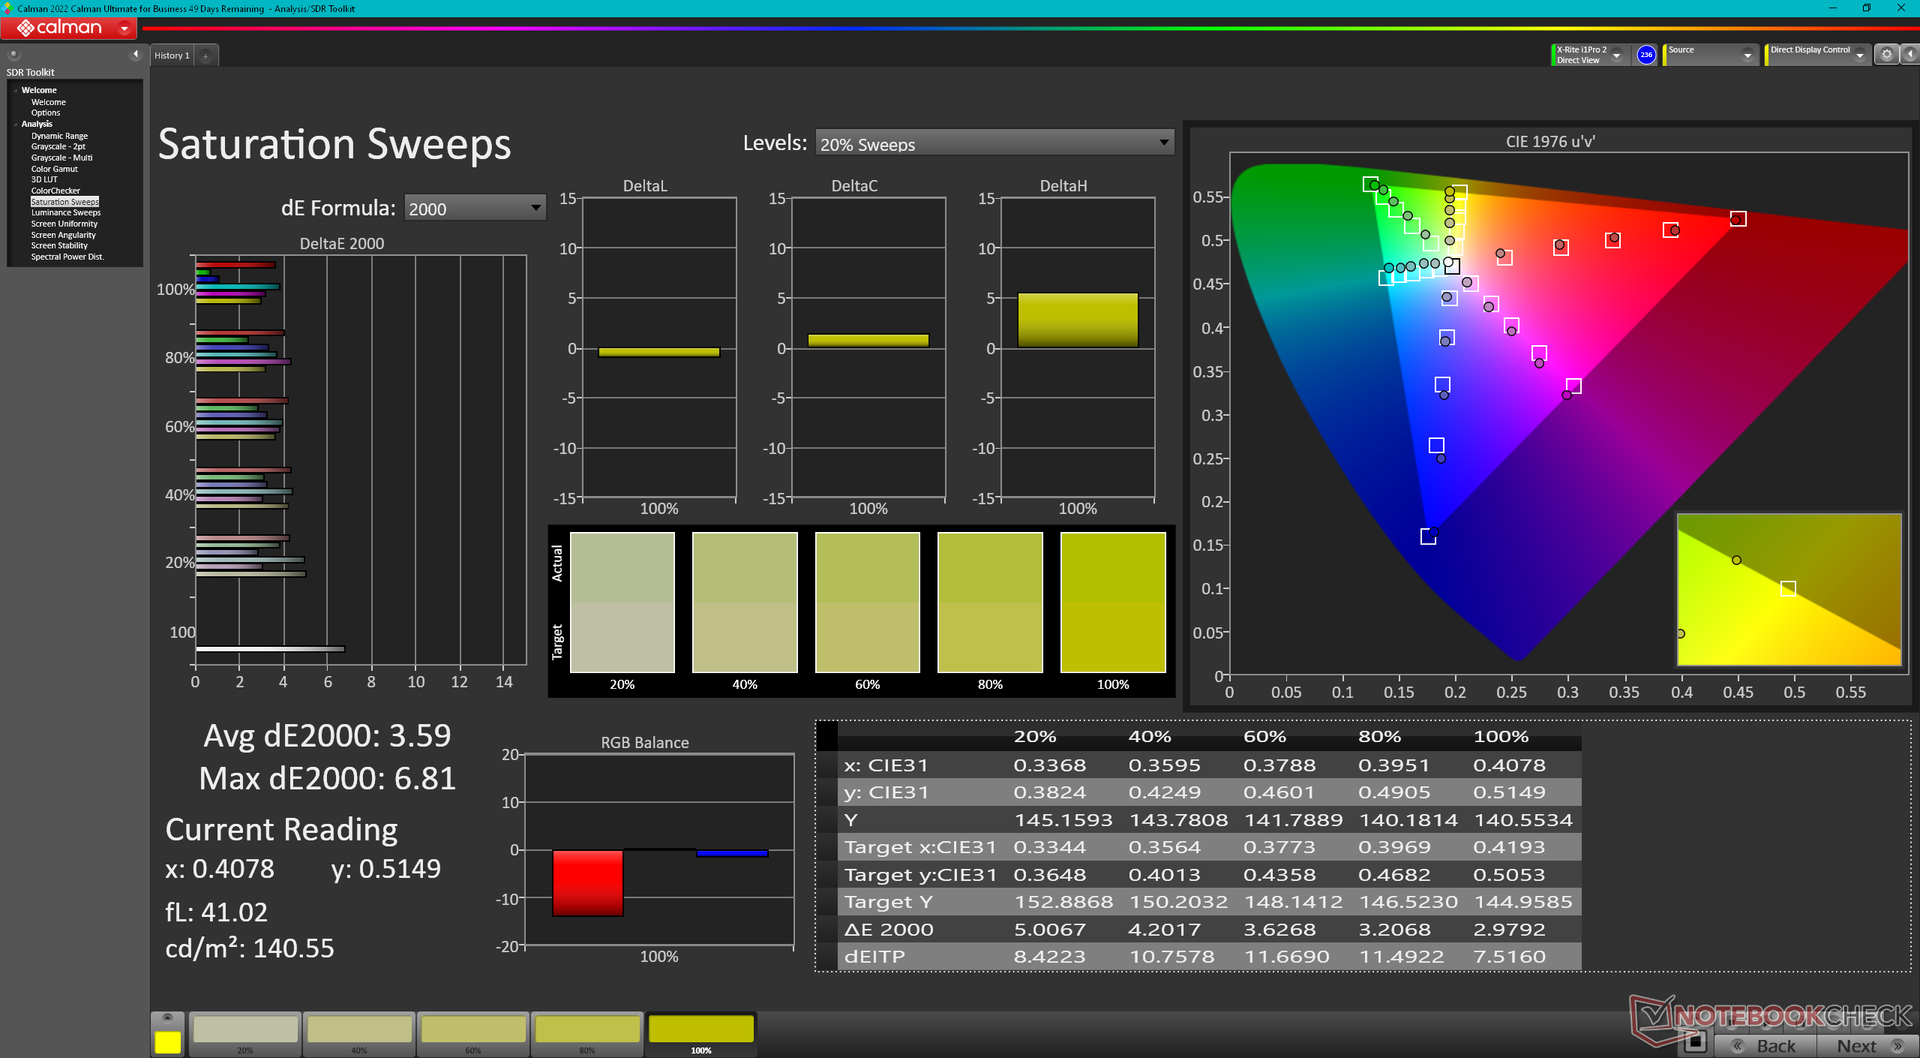
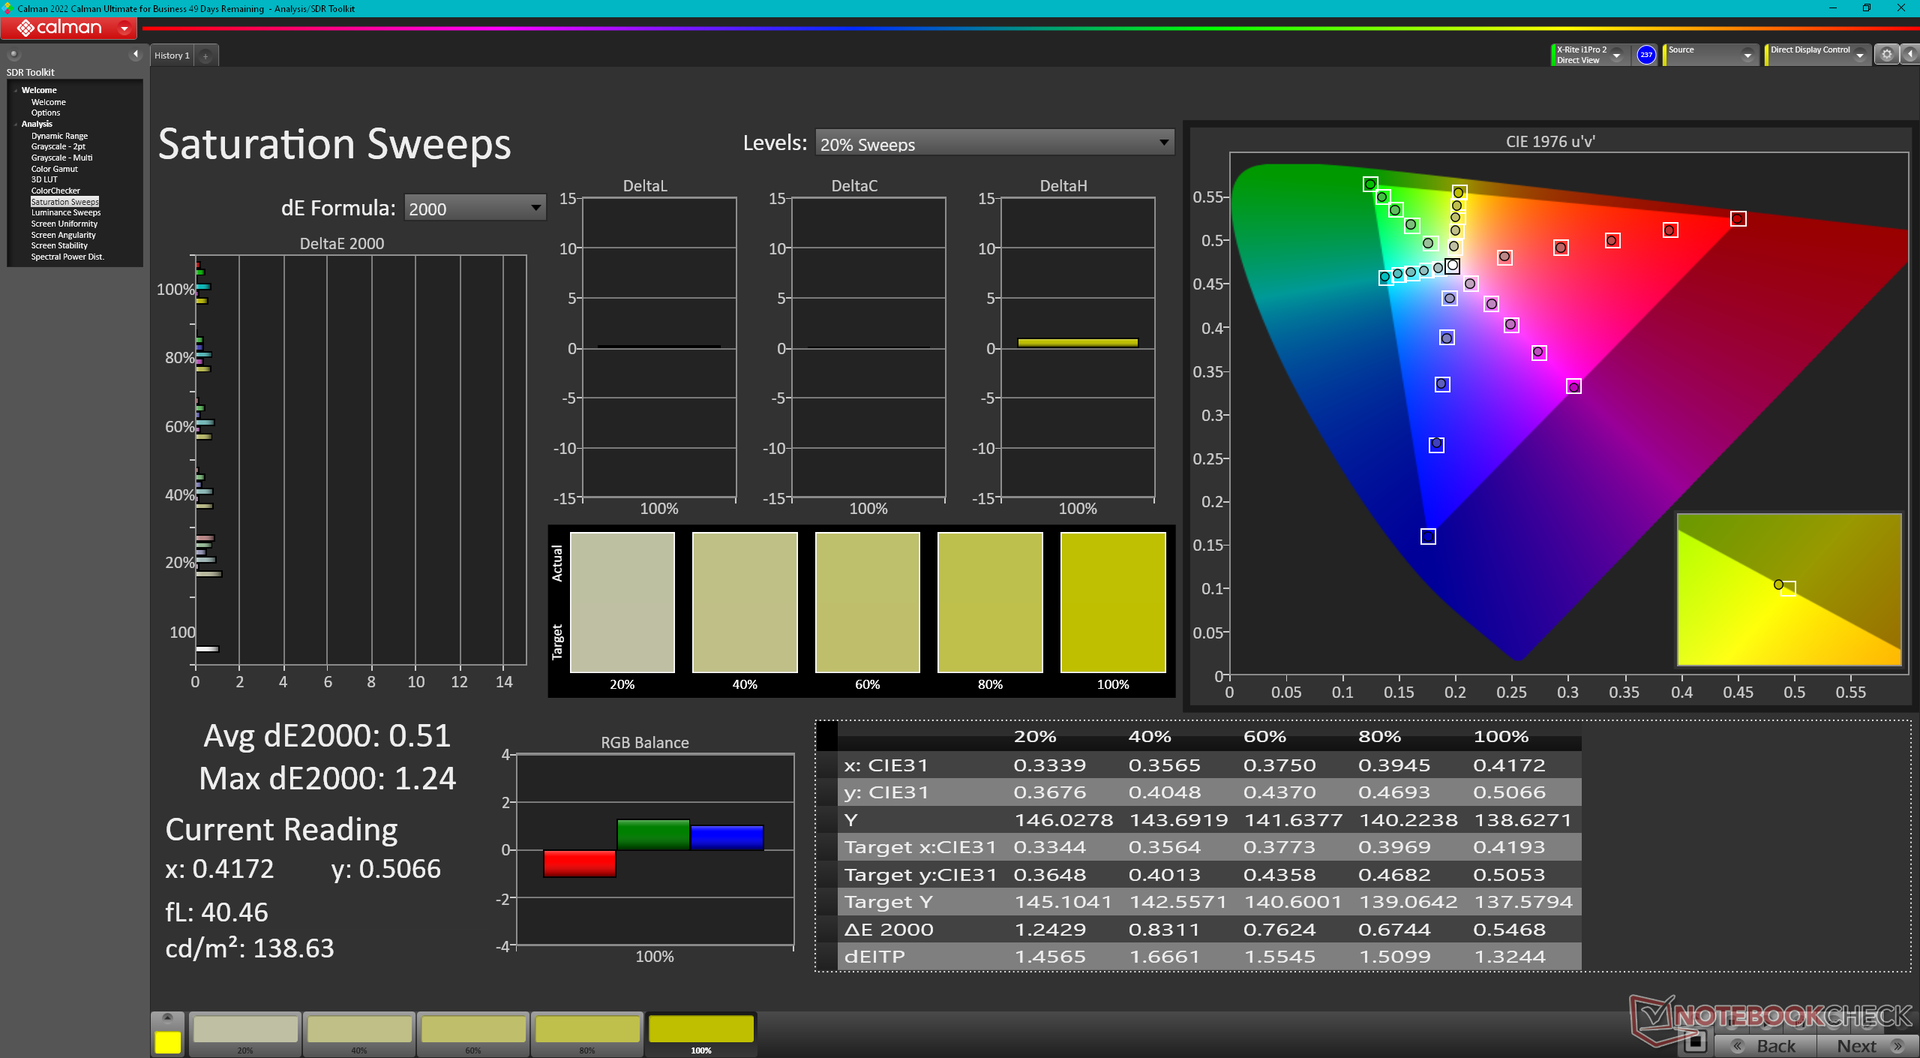
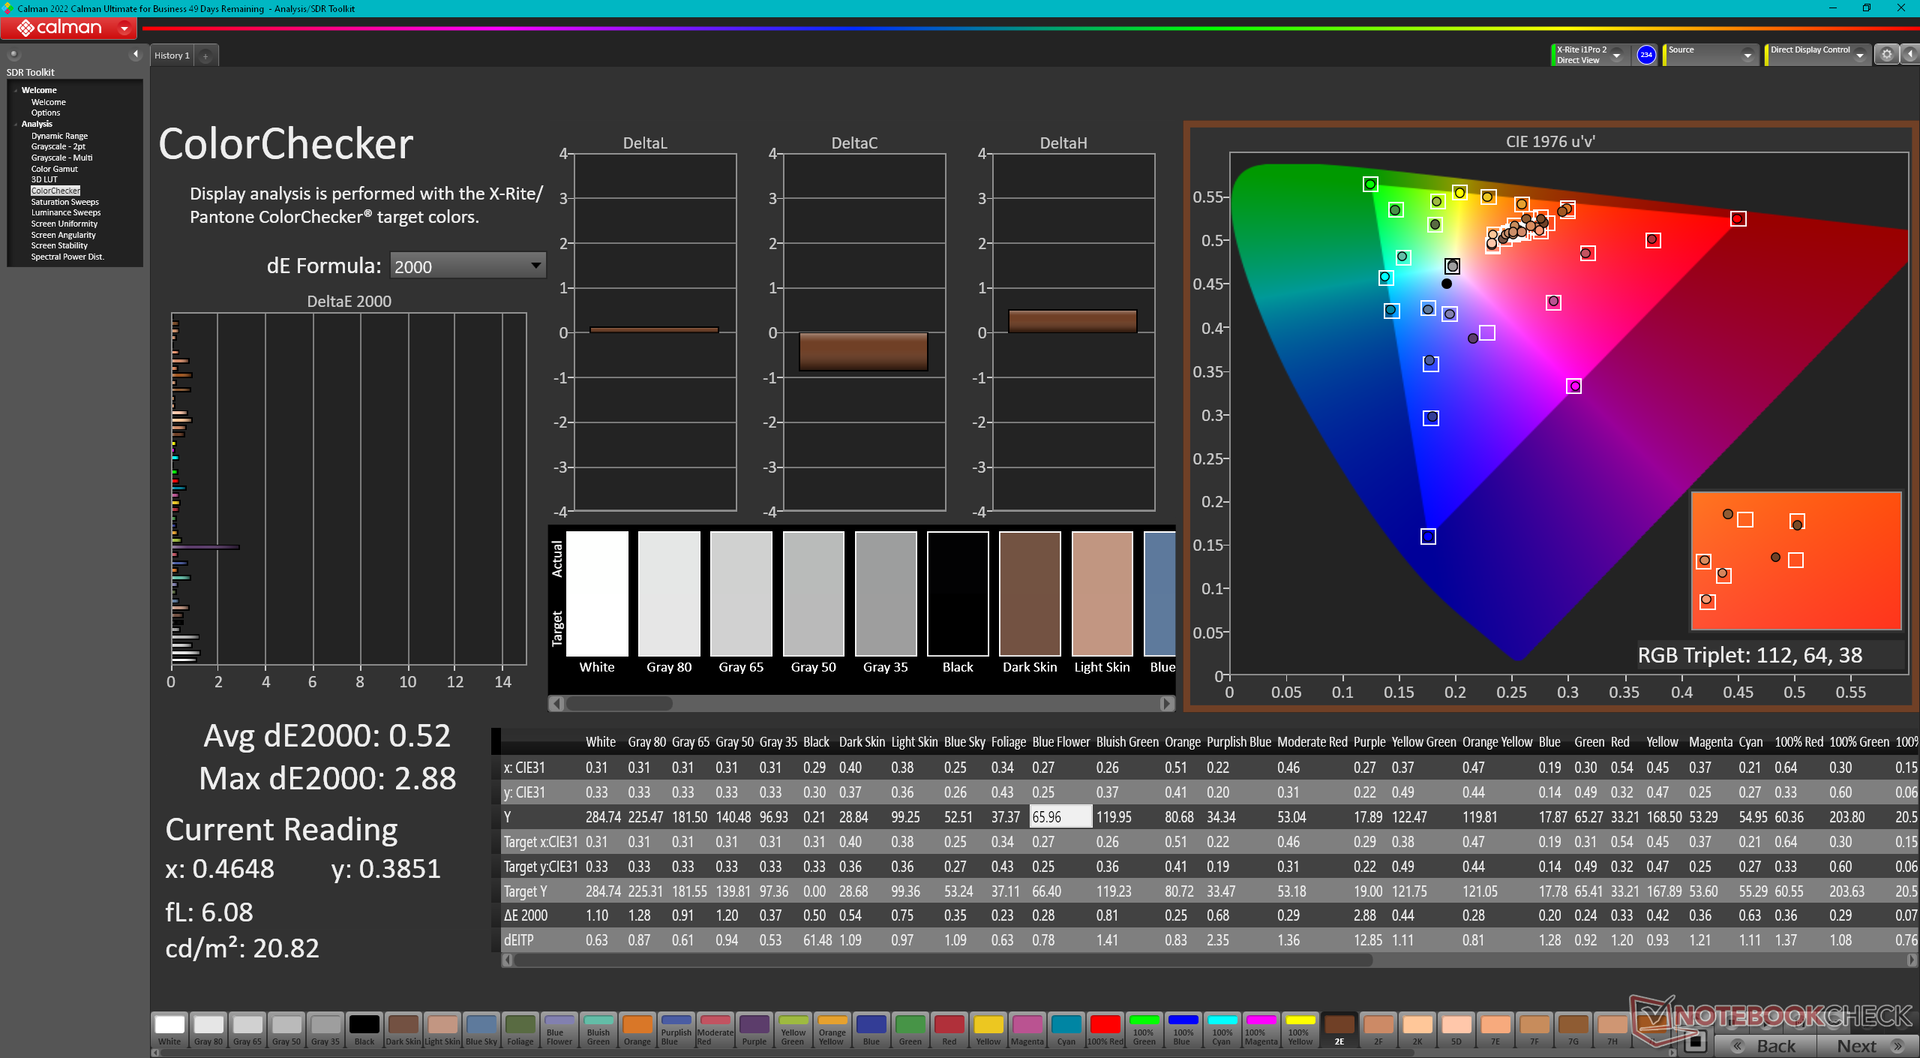
Das Display ist nicht vorkalibriert und hat durchschnittliche Graustufen- und Farb-DeltaE-Werte von 5,5 bzw. 4,25. Auch die Farbtemperatur ist mit 6.368 wärmer als üblich. Eine ordnungsgemäße Kalibrierung mit unserem X-Rite-Kolorimeter würde alle diese Probleme beheben und zu einer deutlich genaueren Anzeige führen, wie unsere CalMAN-Ergebnisse unten zeigen. Unser kalibriertes ICM-Profil kann kostenlos heruntergeladen werden, falls die Besitzer keine eigenen Kalibrierungswerkzeuge besitzen.

Reaktionszeiten (Response Times) des Displays
| ↔ Reaktionszeiten Schwarz zu Weiß | ||
|---|---|---|
| 24.2 ms ... steigend ↗ und fallend ↘ kombiniert | ↗ 10.8 ms steigend | 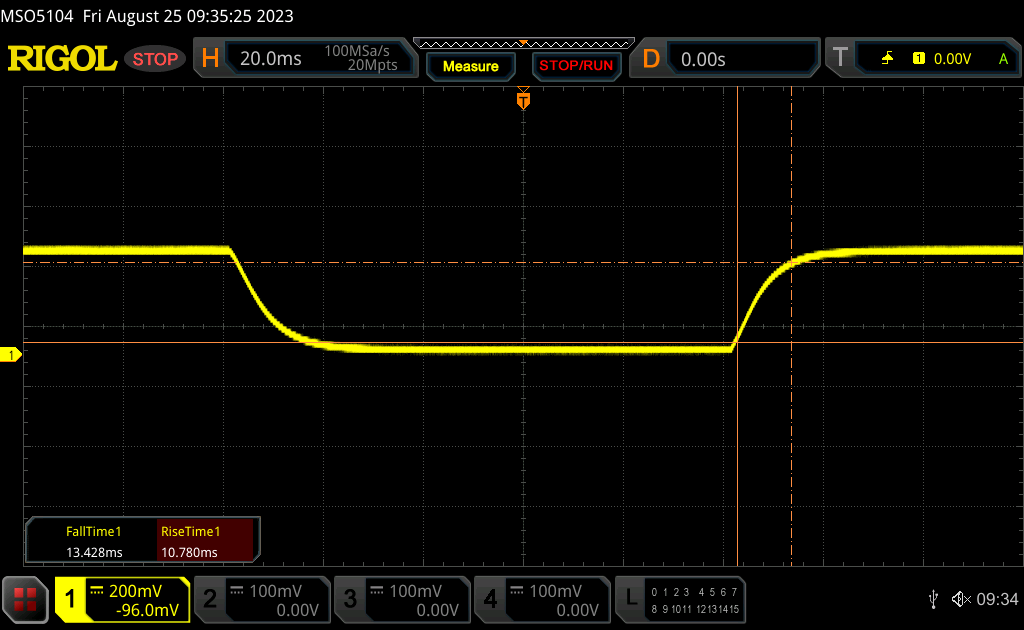 |
| ↘ 13.4 ms fallend | ||
| Die gemessenen Reaktionszeiten sind gut, für anspruchsvolle Spieler könnten der Bildschirm jedoch zu langsam sein. Im Vergleich rangierten die bei uns getesteten Geräte von 0.1 (Minimum) zu 240 (Maximum) ms. » 57 % aller Screens waren schneller als der getestete. Daher sind die gemessenen Reaktionszeiten schlechter als der Durchschnitt aller vermessenen Geräte (19.8 ms). | ||
| ↔ Reaktionszeiten 50% Grau zu 80% Grau | ||
| 35 ms ... steigend ↗ und fallend ↘ kombiniert | ↗ 15.7 ms steigend | 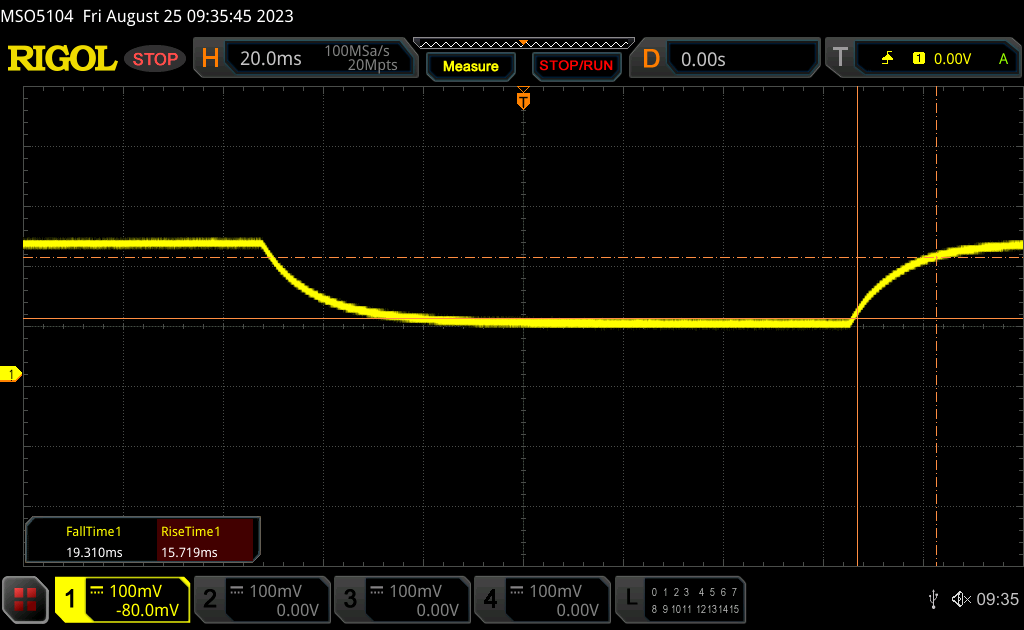 |
| ↘ 19.3 ms fallend | ||
| Die gemessenen Reaktionszeiten sind langsam und dadurch für viele Spieler wahrscheinlich zu langsam. Im Vergleich rangierten die bei uns getesteten Geräte von 0.165 (Minimum) zu 636 (Maximum) ms. » 49 % aller Screens waren schneller als der getestete. Daher sind die gemessenen Reaktionszeiten schlechter als der Durchschnitt aller vermessenen Geräte (31 ms). | ||
Bildschirm-Flackern / PWM (Pulse-Width Modulation)
| Flackern / PWM nicht festgestellt |  | ||
Im Vergleich: 52 % aller getesteten Geräte nutzten kein PWM um die Helligkeit zu reduzieren. Wenn PWM eingesetzt wurde, dann bei einer Frequenz von durchschnittlich 7763 (Minimum 5, Maximum 343500) Hz. | |||
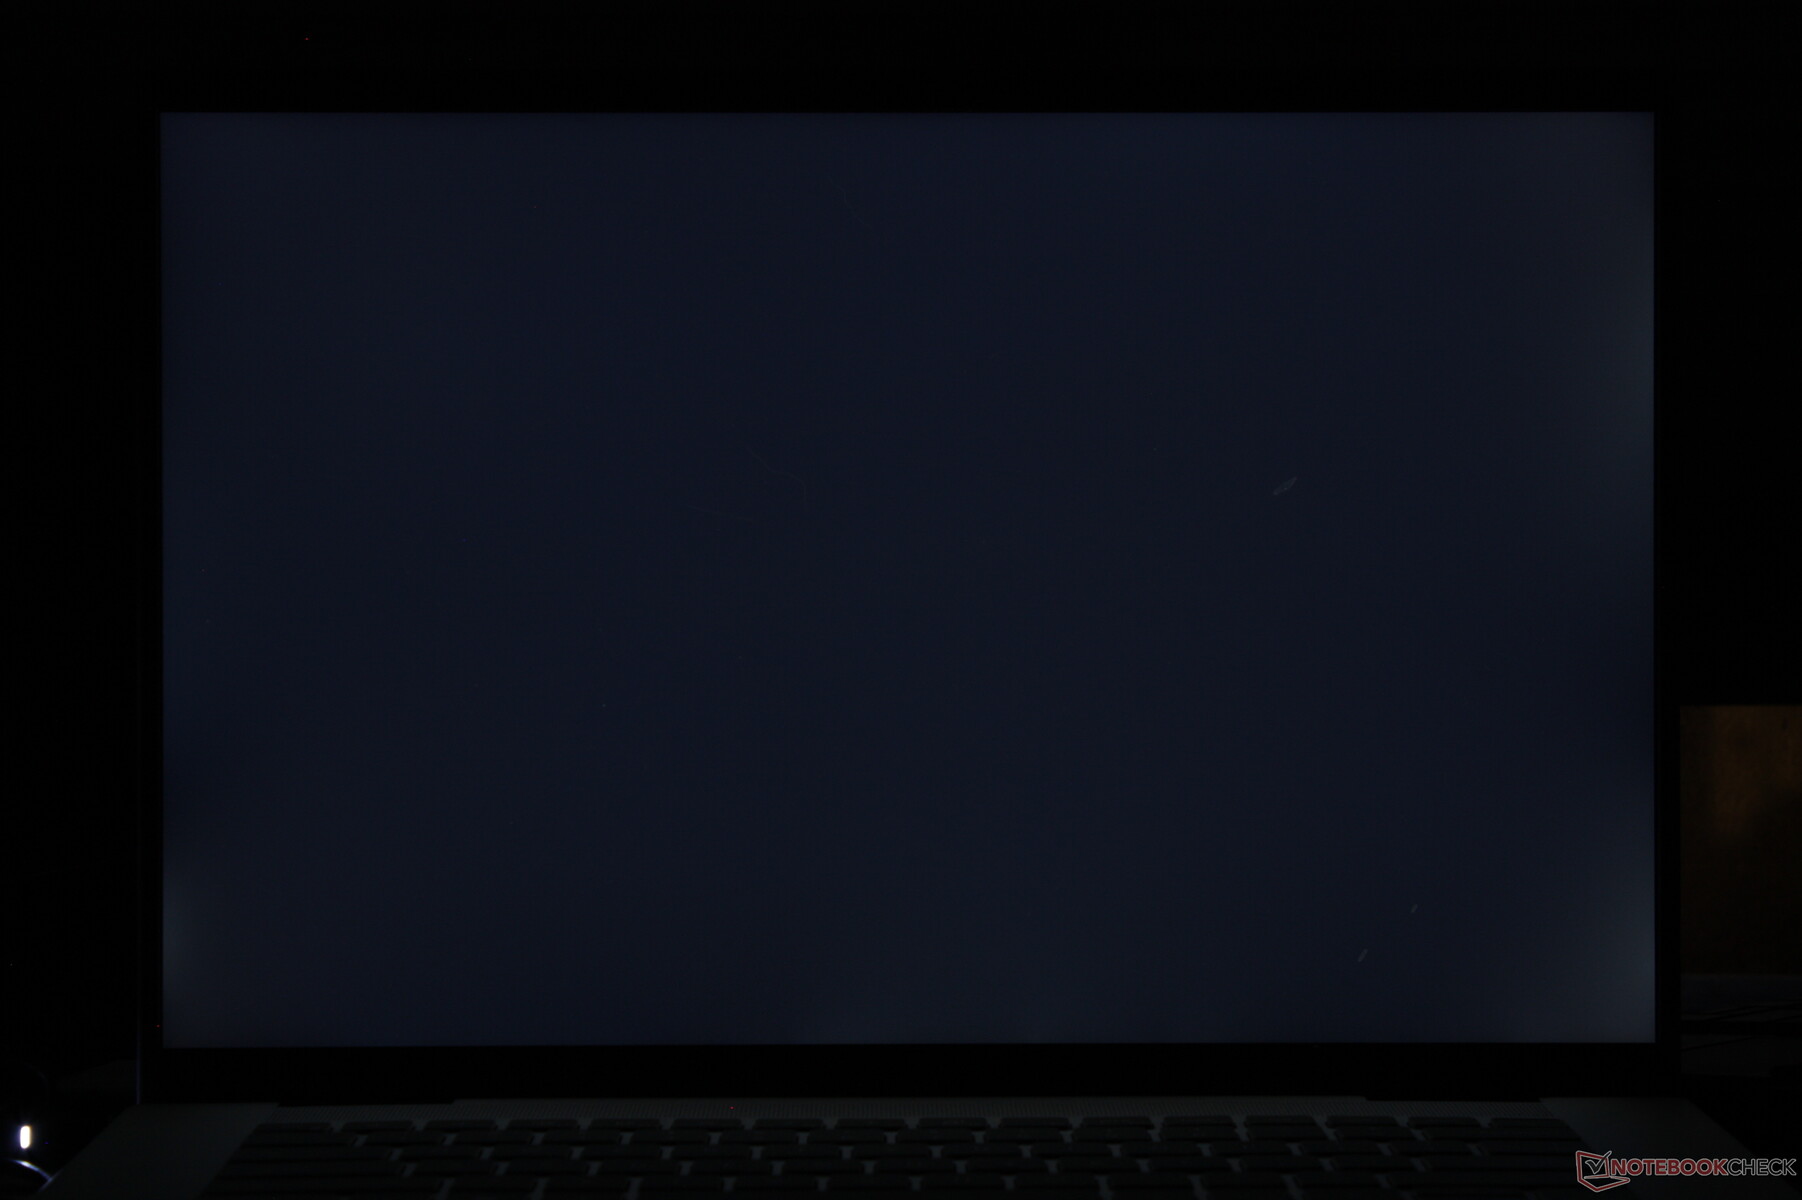
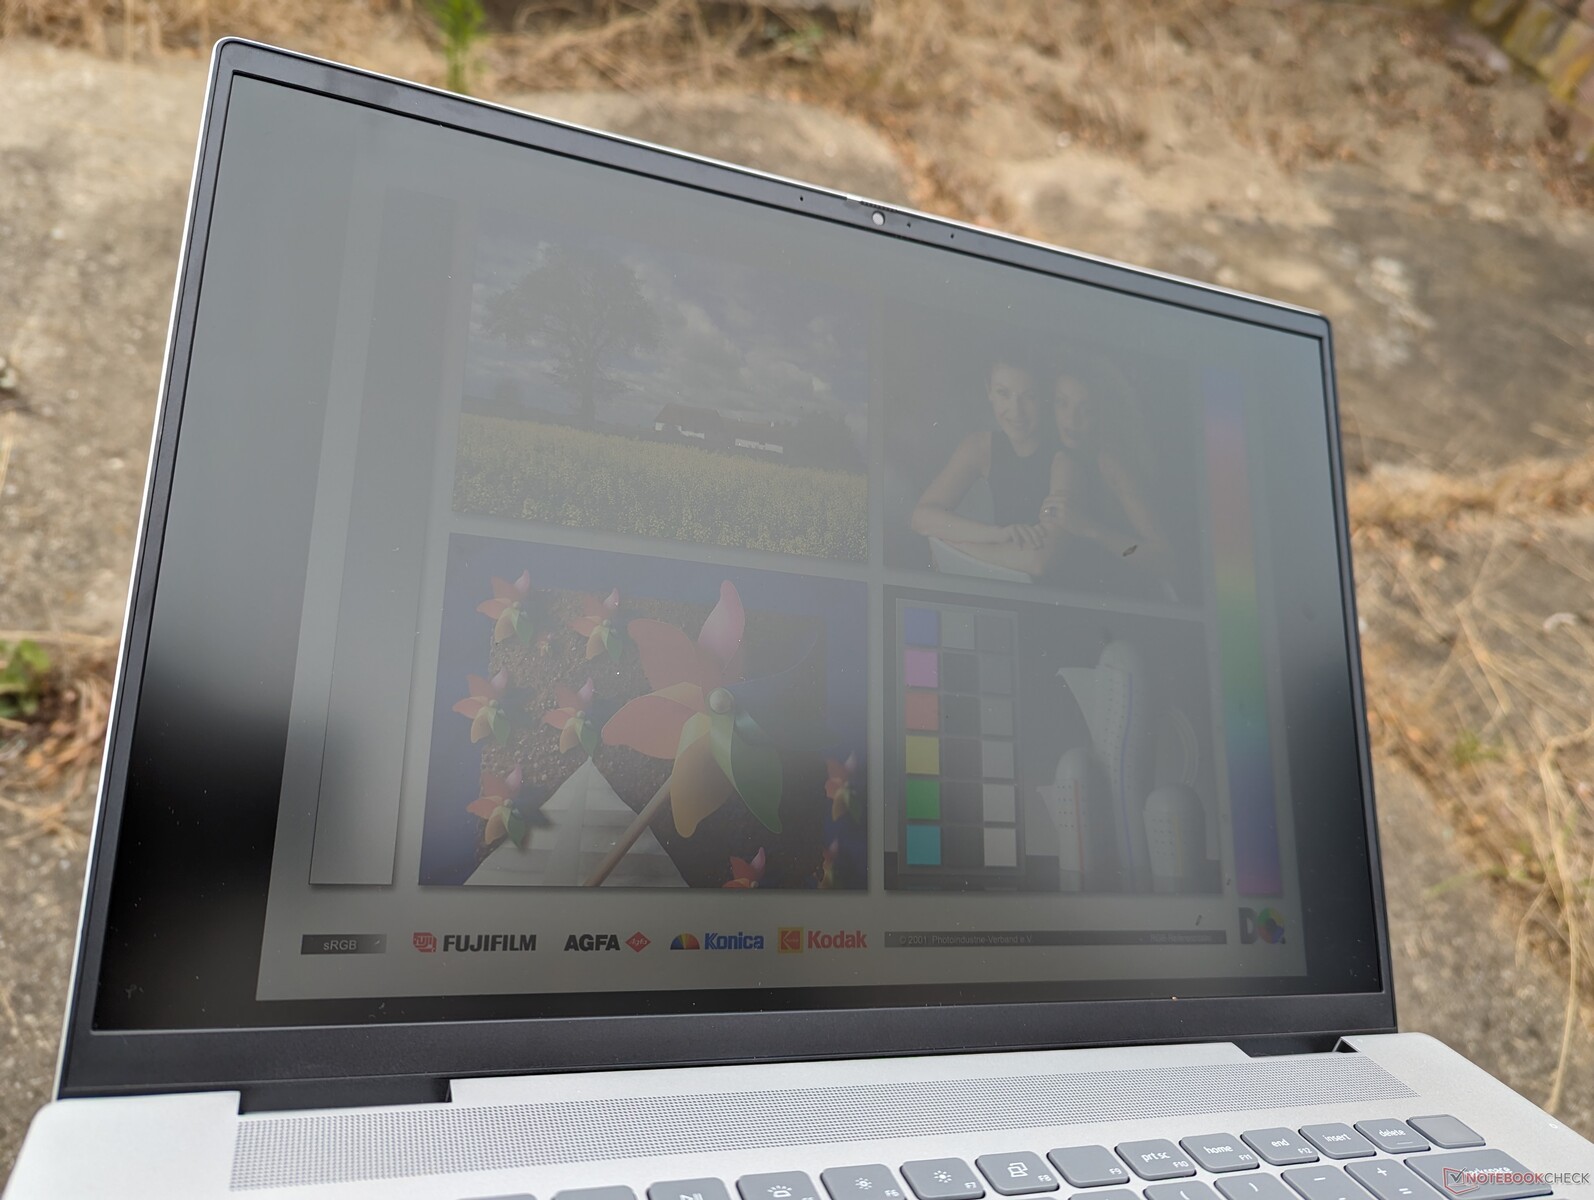
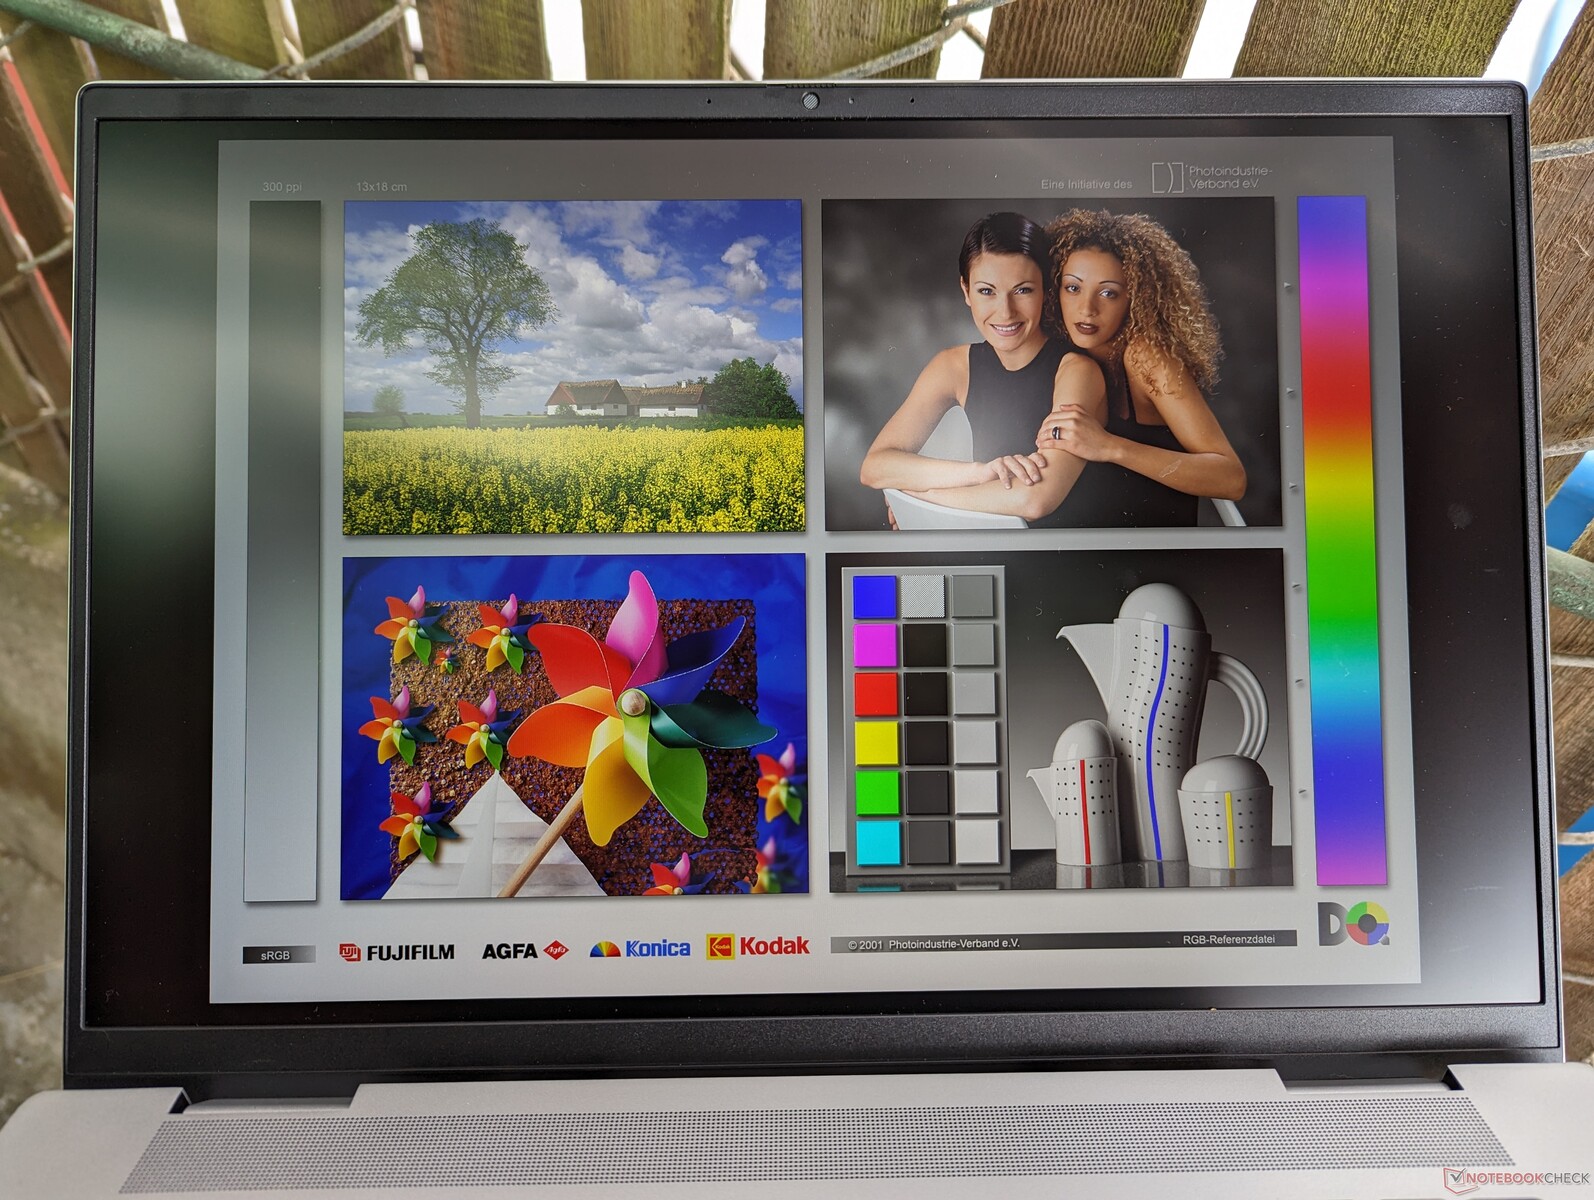
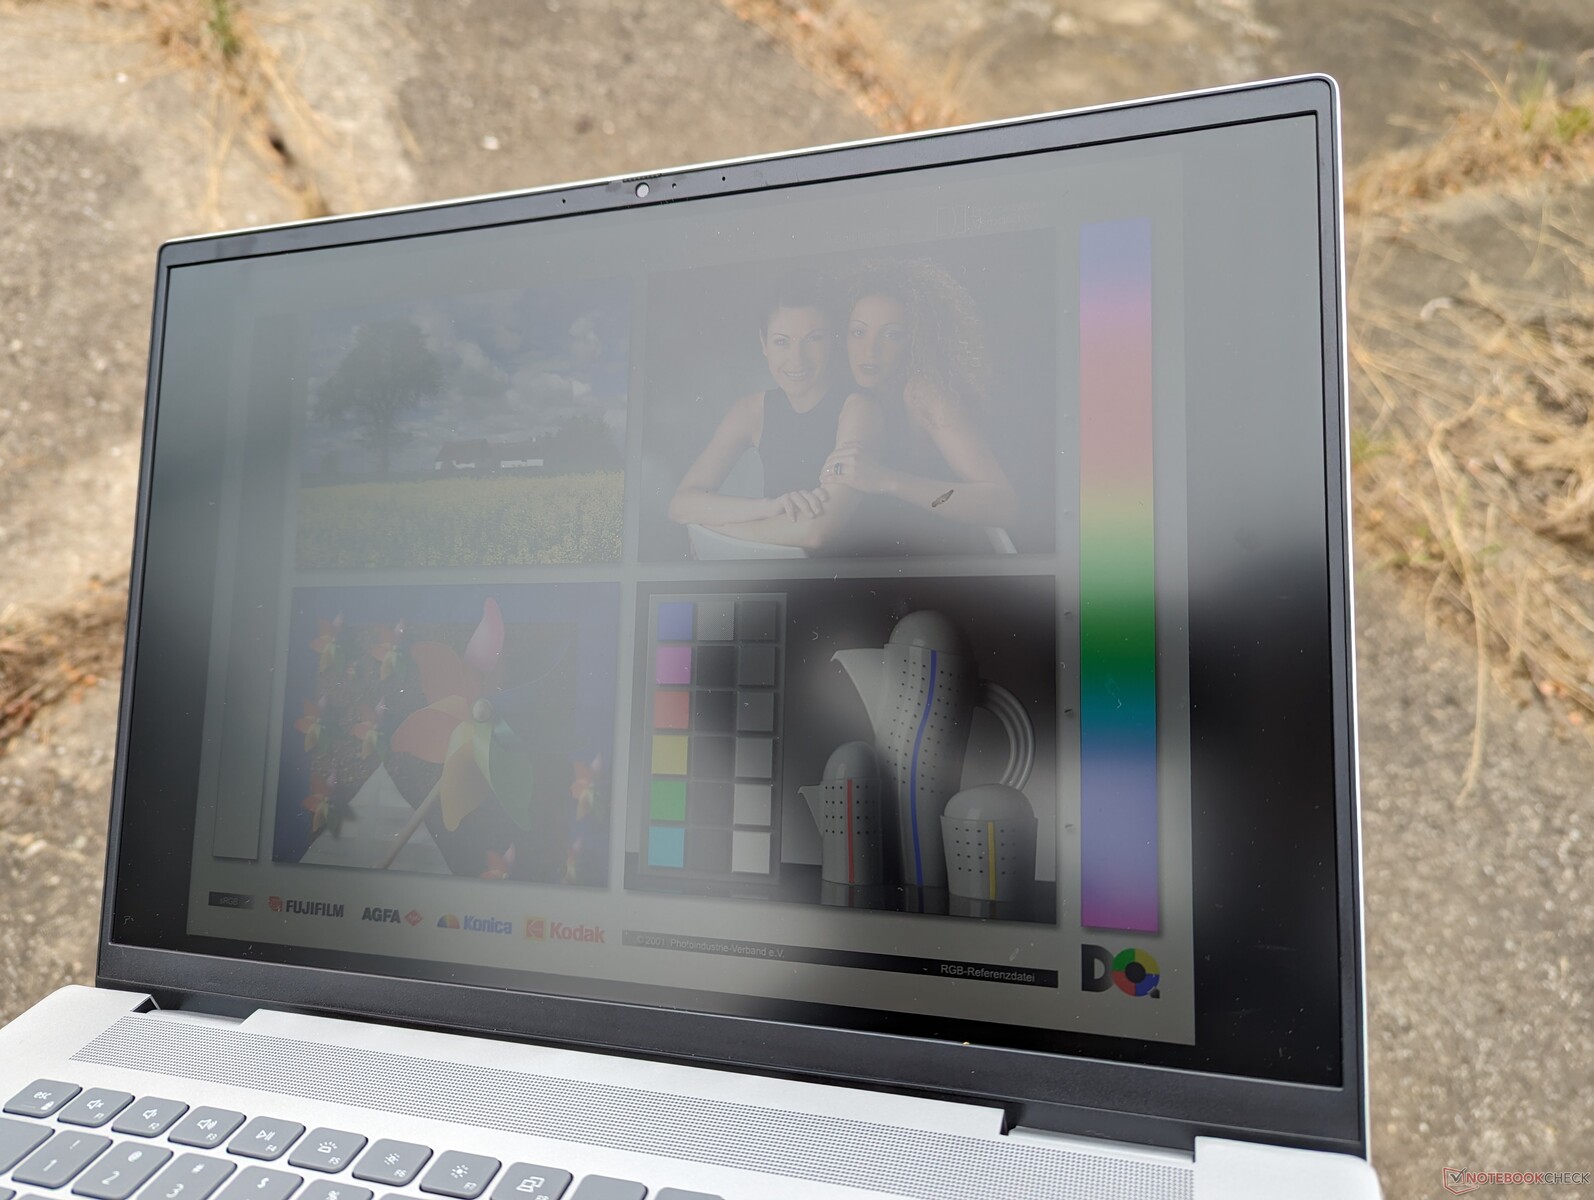
Die Sichtbarkeit im Freien ist vergleichbar mit der des Vorjahresmodells und nur dann gut, wenn es im Schatten liegt, um die Blendwirkung zu minimieren. Andere 16-Zoll-Notebooks mit Mini-LED oder OLED wie das Yoga 9i 16 oder Razer Blade 16 sind tendenziell heller, um die Sichtbarkeit im Freien zu verbessern, aber sie sind auch viel teurer als unser Dell.
Performance - Intel 13. Gen Raptor Lake-H

Testbedingungen
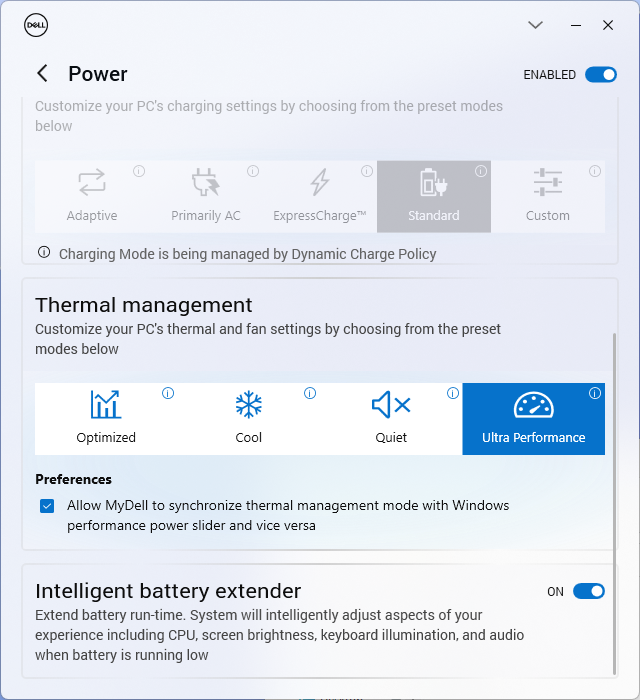
Wir haben unser Gerät über die vorinstallierte MyDell Software auf den Modus Performance eingestellt, bevor wir die folgenden Benchmarks durchgeführt haben. Die MyDell Energieprofile können mit den Windows Energieprofilen synchronisiert werden, um Verwirrung zu vermeiden und widersprüchliche Einstellungen zu verhindern.
Das Inspiron unterstützt weder Advanced Optimus noch MUX, die stattdessen bei dedizierten Gaming-Modellen der Dell-G-Serie oder der Alienware Serie üblich sind.

Prozessor
Die CPU-Leistung unseres 13. Gen Core i7-13700H ist nur bis zu 10 Prozent schneller als die des 12. Gen Core i7-12700H im Inspiron 16 Plus 7620 aus dem letzten Jahr. Sobald die jeweiligen Turbo-Boost-Vorteile jedoch nachlassen, werden die Leistungsunterschiede noch geringer, wie die Ergebnisse unserer CineBench-R15-xT-Schleifen unten zeigen. Mit anderen Worten: Das Inspiron 16 Plus 7630 ist bestenfalls geringfügig schneller als das Vorjahresmodell, wenn es um die Prozessorleistung geht.
Ein Downgrade auf den Core i5-13500H dürfte sich nur um etwa 10 Prozent auf die Prozessorleistung auswirken, basierend auf unseren Erfahrungen mit dem Asus VivoBook 14X. In der Zwischenzeit wird die AMD basierte Ryzen-7-7840HS-Konfiguration voraussichtlich ein Kopf-an-Kopf-Rennen mit unserem Core i7-13700H eingehen.
Cinebench R15 Multi Loop
Cinebench R23: Multi Core | Single Core
Cinebench R20: CPU (Multi Core) | CPU (Single Core)
Cinebench R15: CPU Multi 64Bit | CPU Single 64Bit
Blender: v2.79 BMW27 CPU
7-Zip 18.03: 7z b 4 | 7z b 4 -mmt1
Geekbench 5.5: Multi-Core | Single-Core
HWBOT x265 Benchmark v2.2: 4k Preset
LibreOffice : 20 Documents To PDF
R Benchmark 2.5: Overall mean
* ... kleinere Werte sind besser
AIDA64: FP32 Ray-Trace | FPU Julia | CPU SHA3 | CPU Queen | FPU SinJulia | FPU Mandel | CPU AES | CPU ZLib | FP64 Ray-Trace | CPU PhotoWorxx
| Performance Rating | |
| Asus Vivobook Pro 16X K6604JV-MX016W | |
| Lenovo Slim Pro 9i 16IRP8 | |
| Durchschnittliche Intel Core i7-13700H | |
| Dell Inspiron 16 Plus 7630 | |
| MSI Summit E16 Flip A12UDT-031 | |
| HP Envy 16 h0112nr | |
| Dell Inspiron 16 Plus 7620 | |
| AIDA64 / FP32 Ray-Trace | |
| Asus Vivobook Pro 16X K6604JV-MX016W | |
| Lenovo Slim Pro 9i 16IRP8 | |
| Durchschnittliche Intel Core i7-13700H (4986 - 18908, n=29) | |
| Dell Inspiron 16 Plus 7630 | |
| MSI Summit E16 Flip A12UDT-031 | |
| Dell Inspiron 16 Plus 7620 | |
| HP Envy 16 h0112nr | |
| AIDA64 / FPU Julia | |
| Asus Vivobook Pro 16X K6604JV-MX016W | |
| Lenovo Slim Pro 9i 16IRP8 | |
| Durchschnittliche Intel Core i7-13700H (25360 - 92359, n=29) | |
| Dell Inspiron 16 Plus 7630 | |
| MSI Summit E16 Flip A12UDT-031 | |
| Dell Inspiron 16 Plus 7620 | |
| HP Envy 16 h0112nr | |
| AIDA64 / CPU SHA3 | |
| Asus Vivobook Pro 16X K6604JV-MX016W | |
| Lenovo Slim Pro 9i 16IRP8 | |
| Durchschnittliche Intel Core i7-13700H (1339 - 4224, n=29) | |
| Dell Inspiron 16 Plus 7630 | |
| MSI Summit E16 Flip A12UDT-031 | |
| Dell Inspiron 16 Plus 7620 | |
| HP Envy 16 h0112nr | |
| AIDA64 / CPU Queen | |
| Asus Vivobook Pro 16X K6604JV-MX016W | |
| Lenovo Slim Pro 9i 16IRP8 | |
| Dell Inspiron 16 Plus 7630 | |
| HP Envy 16 h0112nr | |
| MSI Summit E16 Flip A12UDT-031 | |
| Durchschnittliche Intel Core i7-13700H (59324 - 107159, n=29) | |
| Dell Inspiron 16 Plus 7620 | |
| AIDA64 / FPU SinJulia | |
| Asus Vivobook Pro 16X K6604JV-MX016W | |
| Lenovo Slim Pro 9i 16IRP8 | |
| Dell Inspiron 16 Plus 7630 | |
| Durchschnittliche Intel Core i7-13700H (4800 - 11050, n=29) | |
| MSI Summit E16 Flip A12UDT-031 | |
| Dell Inspiron 16 Plus 7620 | |
| HP Envy 16 h0112nr | |
| AIDA64 / FPU Mandel | |
| Asus Vivobook Pro 16X K6604JV-MX016W | |
| Lenovo Slim Pro 9i 16IRP8 | |
| Durchschnittliche Intel Core i7-13700H (12321 - 45118, n=29) | |
| Dell Inspiron 16 Plus 7630 | |
| MSI Summit E16 Flip A12UDT-031 | |
| Dell Inspiron 16 Plus 7620 | |
| HP Envy 16 h0112nr | |
| AIDA64 / CPU AES | |
| HP Envy 16 h0112nr | |
| Asus Vivobook Pro 16X K6604JV-MX016W | |
| Lenovo Slim Pro 9i 16IRP8 | |
| Durchschnittliche Intel Core i7-13700H (28769 - 151254, n=29) | |
| Dell Inspiron 16 Plus 7620 | |
| MSI Summit E16 Flip A12UDT-031 | |
| Dell Inspiron 16 Plus 7630 | |
| AIDA64 / CPU ZLib | |
| Asus Vivobook Pro 16X K6604JV-MX016W | |
| Lenovo Slim Pro 9i 16IRP8 | |
| Dell Inspiron 16 Plus 7620 | |
| Durchschnittliche Intel Core i7-13700H (389 - 1215, n=29) | |
| MSI Summit E16 Flip A12UDT-031 | |
| Dell Inspiron 16 Plus 7630 | |
| HP Envy 16 h0112nr | |
| AIDA64 / FP64 Ray-Trace | |
| Asus Vivobook Pro 16X K6604JV-MX016W | |
| Lenovo Slim Pro 9i 16IRP8 | |
| Durchschnittliche Intel Core i7-13700H (2540 - 10135, n=29) | |
| Dell Inspiron 16 Plus 7630 | |
| MSI Summit E16 Flip A12UDT-031 | |
| Dell Inspiron 16 Plus 7620 | |
| HP Envy 16 h0112nr | |
| AIDA64 / CPU PhotoWorxx | |
| Lenovo Slim Pro 9i 16IRP8 | |
| Asus Vivobook Pro 16X K6604JV-MX016W | |
| MSI Summit E16 Flip A12UDT-031 | |
| Durchschnittliche Intel Core i7-13700H (12872 - 52727, n=29) | |
| Dell Inspiron 16 Plus 7630 | |
| HP Envy 16 h0112nr | |
| Dell Inspiron 16 Plus 7620 | |
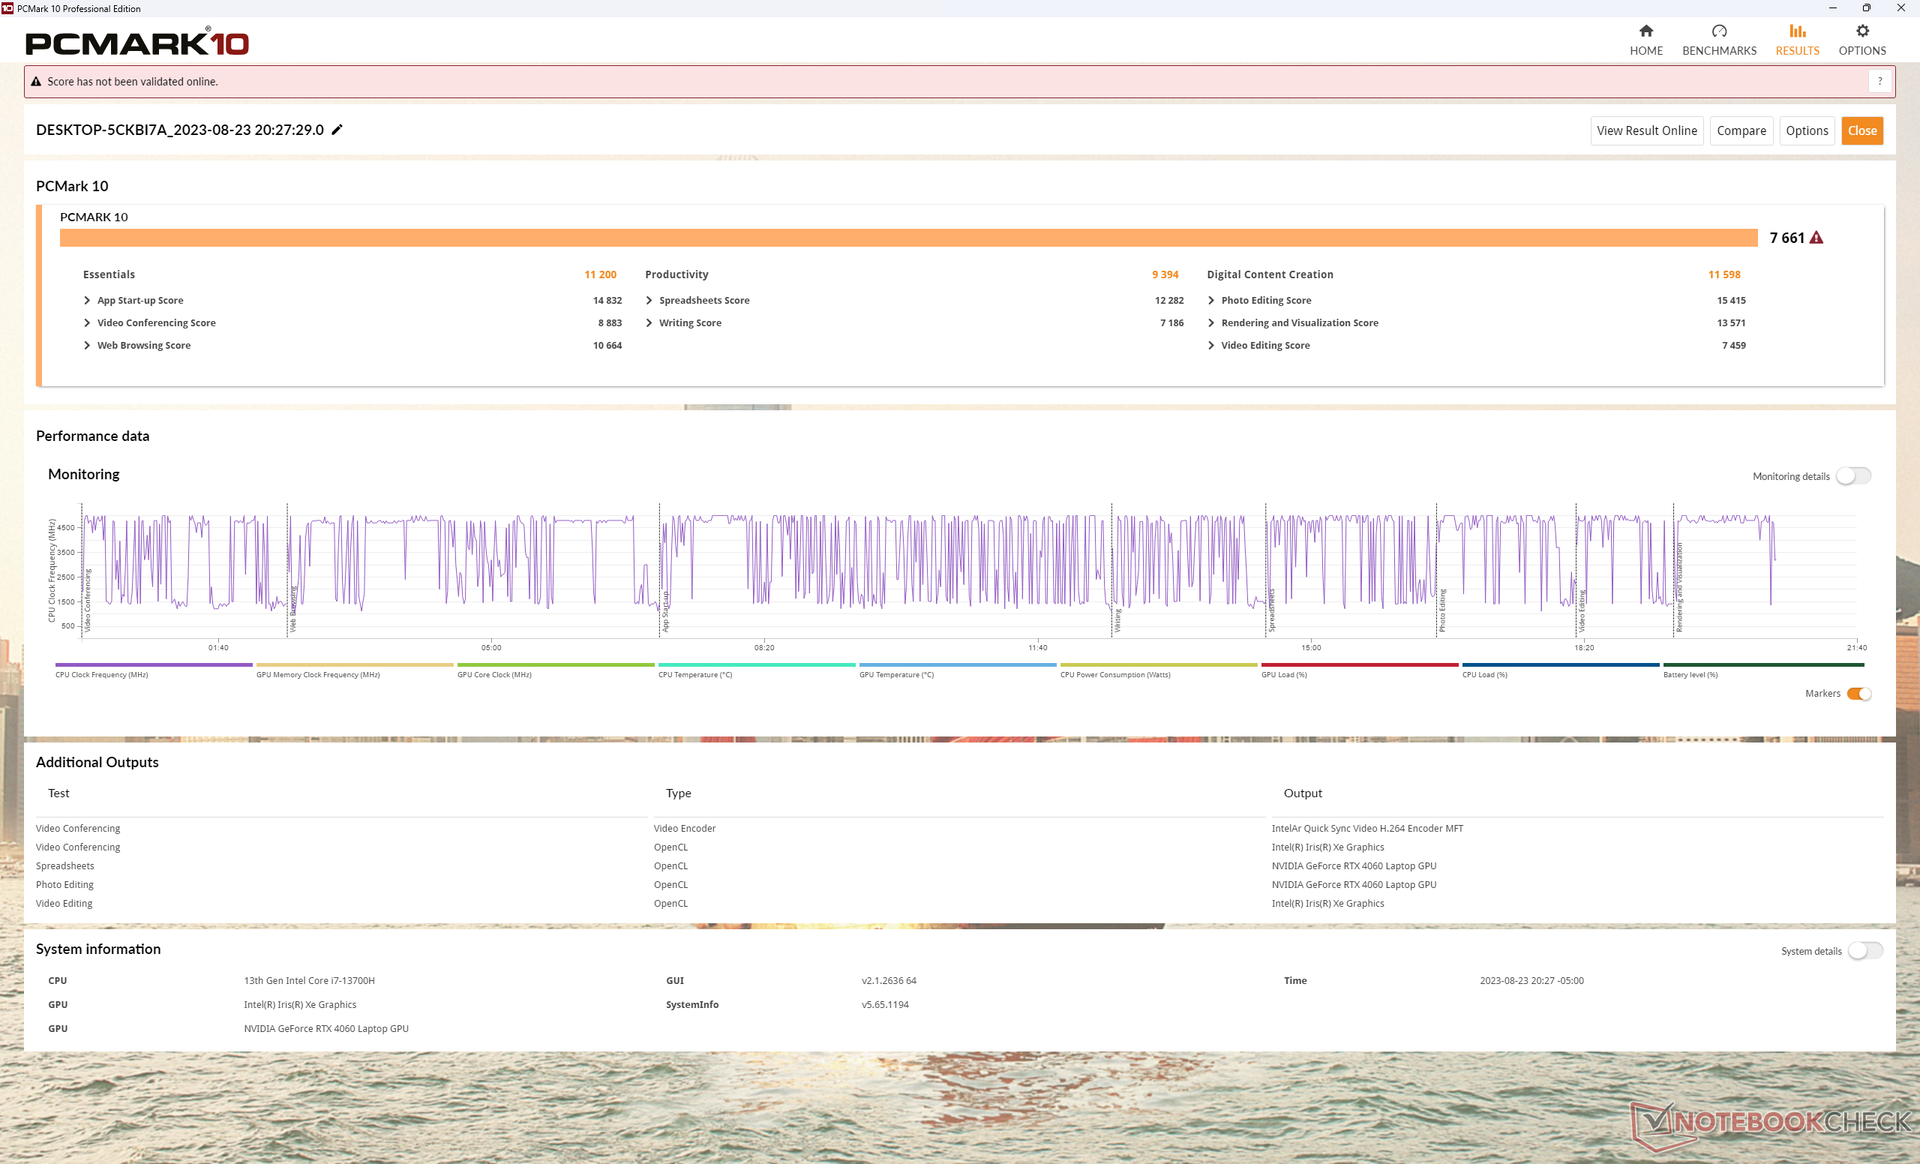
System Performance
Die PCMark-Ergebnisse sind durchweg höher als beim letztjährigen Inspiron 16 Plus 7620, insbesondere im Subtest Digital Content Creation, wo die GPU-Leistung am wichtigsten ist.
Wir haben keine Probleme beim Aufwachen aus dem Ruhezustand oder BSODs erlebt, anders als bei dem aktuellen Alienware m16 R1.
CrossMark: Overall | Productivity | Creativity | Responsiveness
| PCMark 10 / Score | |
| Lenovo Slim Pro 9i 16IRP8 | |
| Dell Inspiron 16 Plus 7630 | |
| HP Envy 16 h0112nr | |
| Durchschnittliche Intel Core i7-13700H, NVIDIA GeForce RTX 4060 Laptop GPU (7157 - 7661, n=5) | |
| Asus Vivobook Pro 16X K6604JV-MX016W | |
| Dell Inspiron 16 Plus 7620 | |
| MSI Summit E16 Flip A12UDT-031 | |
| PCMark 10 / Essentials | |
| HP Envy 16 h0112nr | |
| Lenovo Slim Pro 9i 16IRP8 | |
| Dell Inspiron 16 Plus 7630 | |
| Durchschnittliche Intel Core i7-13700H, NVIDIA GeForce RTX 4060 Laptop GPU (10179 - 11200, n=5) | |
| Asus Vivobook Pro 16X K6604JV-MX016W | |
| Dell Inspiron 16 Plus 7620 | |
| MSI Summit E16 Flip A12UDT-031 | |
| PCMark 10 / Productivity | |
| Lenovo Slim Pro 9i 16IRP8 | |
| Durchschnittliche Intel Core i7-13700H, NVIDIA GeForce RTX 4060 Laptop GPU (8238 - 10249, n=5) | |
| Dell Inspiron 16 Plus 7630 | |
| HP Envy 16 h0112nr | |
| Dell Inspiron 16 Plus 7620 | |
| Asus Vivobook Pro 16X K6604JV-MX016W | |
| MSI Summit E16 Flip A12UDT-031 | |
| PCMark 10 / Digital Content Creation | |
| Dell Inspiron 16 Plus 7630 | |
| Lenovo Slim Pro 9i 16IRP8 | |
| Durchschnittliche Intel Core i7-13700H, NVIDIA GeForce RTX 4060 Laptop GPU (10308 - 11862, n=5) | |
| HP Envy 16 h0112nr | |
| Dell Inspiron 16 Plus 7620 | |
| Asus Vivobook Pro 16X K6604JV-MX016W | |
| MSI Summit E16 Flip A12UDT-031 | |
| CrossMark / Overall | |
| Asus Vivobook Pro 16X K6604JV-MX016W | |
| Dell Inspiron 16 Plus 7630 | |
| HP Envy 16 h0112nr | |
| Lenovo Slim Pro 9i 16IRP8 | |
| Dell Inspiron 16 Plus 7620 | |
| Durchschnittliche Intel Core i7-13700H, NVIDIA GeForce RTX 4060 Laptop GPU (1629 - 1849, n=5) | |
| MSI Summit E16 Flip A12UDT-031 | |
| CrossMark / Productivity | |
| Asus Vivobook Pro 16X K6604JV-MX016W | |
| Dell Inspiron 16 Plus 7630 | |
| HP Envy 16 h0112nr | |
| Dell Inspiron 16 Plus 7620 | |
| Lenovo Slim Pro 9i 16IRP8 | |
| Durchschnittliche Intel Core i7-13700H, NVIDIA GeForce RTX 4060 Laptop GPU (1561 - 1743, n=5) | |
| MSI Summit E16 Flip A12UDT-031 | |
| CrossMark / Creativity | |
| Asus Vivobook Pro 16X K6604JV-MX016W | |
| Lenovo Slim Pro 9i 16IRP8 | |
| Dell Inspiron 16 Plus 7630 | |
| HP Envy 16 h0112nr | |
| Dell Inspiron 16 Plus 7620 | |
| Durchschnittliche Intel Core i7-13700H, NVIDIA GeForce RTX 4060 Laptop GPU (1691 - 2064, n=5) | |
| MSI Summit E16 Flip A12UDT-031 | |
| CrossMark / Responsiveness | |
| Asus Vivobook Pro 16X K6604JV-MX016W | |
| HP Envy 16 h0112nr | |
| Dell Inspiron 16 Plus 7630 | |
| MSI Summit E16 Flip A12UDT-031 | |
| Dell Inspiron 16 Plus 7620 | |
| Durchschnittliche Intel Core i7-13700H, NVIDIA GeForce RTX 4060 Laptop GPU (1381 - 1656, n=5) | |
| Lenovo Slim Pro 9i 16IRP8 | |
| PCMark 10 Score | 7661 Punkte | |
Hilfe | ||
| AIDA64 / Memory Copy | |
| Lenovo Slim Pro 9i 16IRP8 | |
| Asus Vivobook Pro 16X K6604JV-MX016W | |
| MSI Summit E16 Flip A12UDT-031 | |
| Durchschnittliche Intel Core i7-13700H (24334 - 78081, n=29) | |
| Dell Inspiron 16 Plus 7630 | |
| HP Envy 16 h0112nr | |
| Dell Inspiron 16 Plus 7620 | |
| AIDA64 / Memory Read | |
| Asus Vivobook Pro 16X K6604JV-MX016W | |
| Lenovo Slim Pro 9i 16IRP8 | |
| Dell Inspiron 16 Plus 7630 | |
| HP Envy 16 h0112nr | |
| MSI Summit E16 Flip A12UDT-031 | |
| Durchschnittliche Intel Core i7-13700H (23681 - 79656, n=29) | |
| Dell Inspiron 16 Plus 7620 | |
| AIDA64 / Memory Write | |
| Lenovo Slim Pro 9i 16IRP8 | |
| Asus Vivobook Pro 16X K6604JV-MX016W | |
| Durchschnittliche Intel Core i7-13700H (22986 - 99898, n=29) | |
| Dell Inspiron 16 Plus 7630 | |
| HP Envy 16 h0112nr | |
| MSI Summit E16 Flip A12UDT-031 | |
| Dell Inspiron 16 Plus 7620 | |
| AIDA64 / Memory Latency | |
| MSI Summit E16 Flip A12UDT-031 | |
| Lenovo Slim Pro 9i 16IRP8 | |
| Dell Inspiron 16 Plus 7620 | |
| Durchschnittliche Intel Core i7-13700H (82.4 - 136.8, n=29) | |
| Dell Inspiron 16 Plus 7630 | |
| HP Envy 16 h0112nr | |
| Asus Vivobook Pro 16X K6604JV-MX016W | |
* ... kleinere Werte sind besser
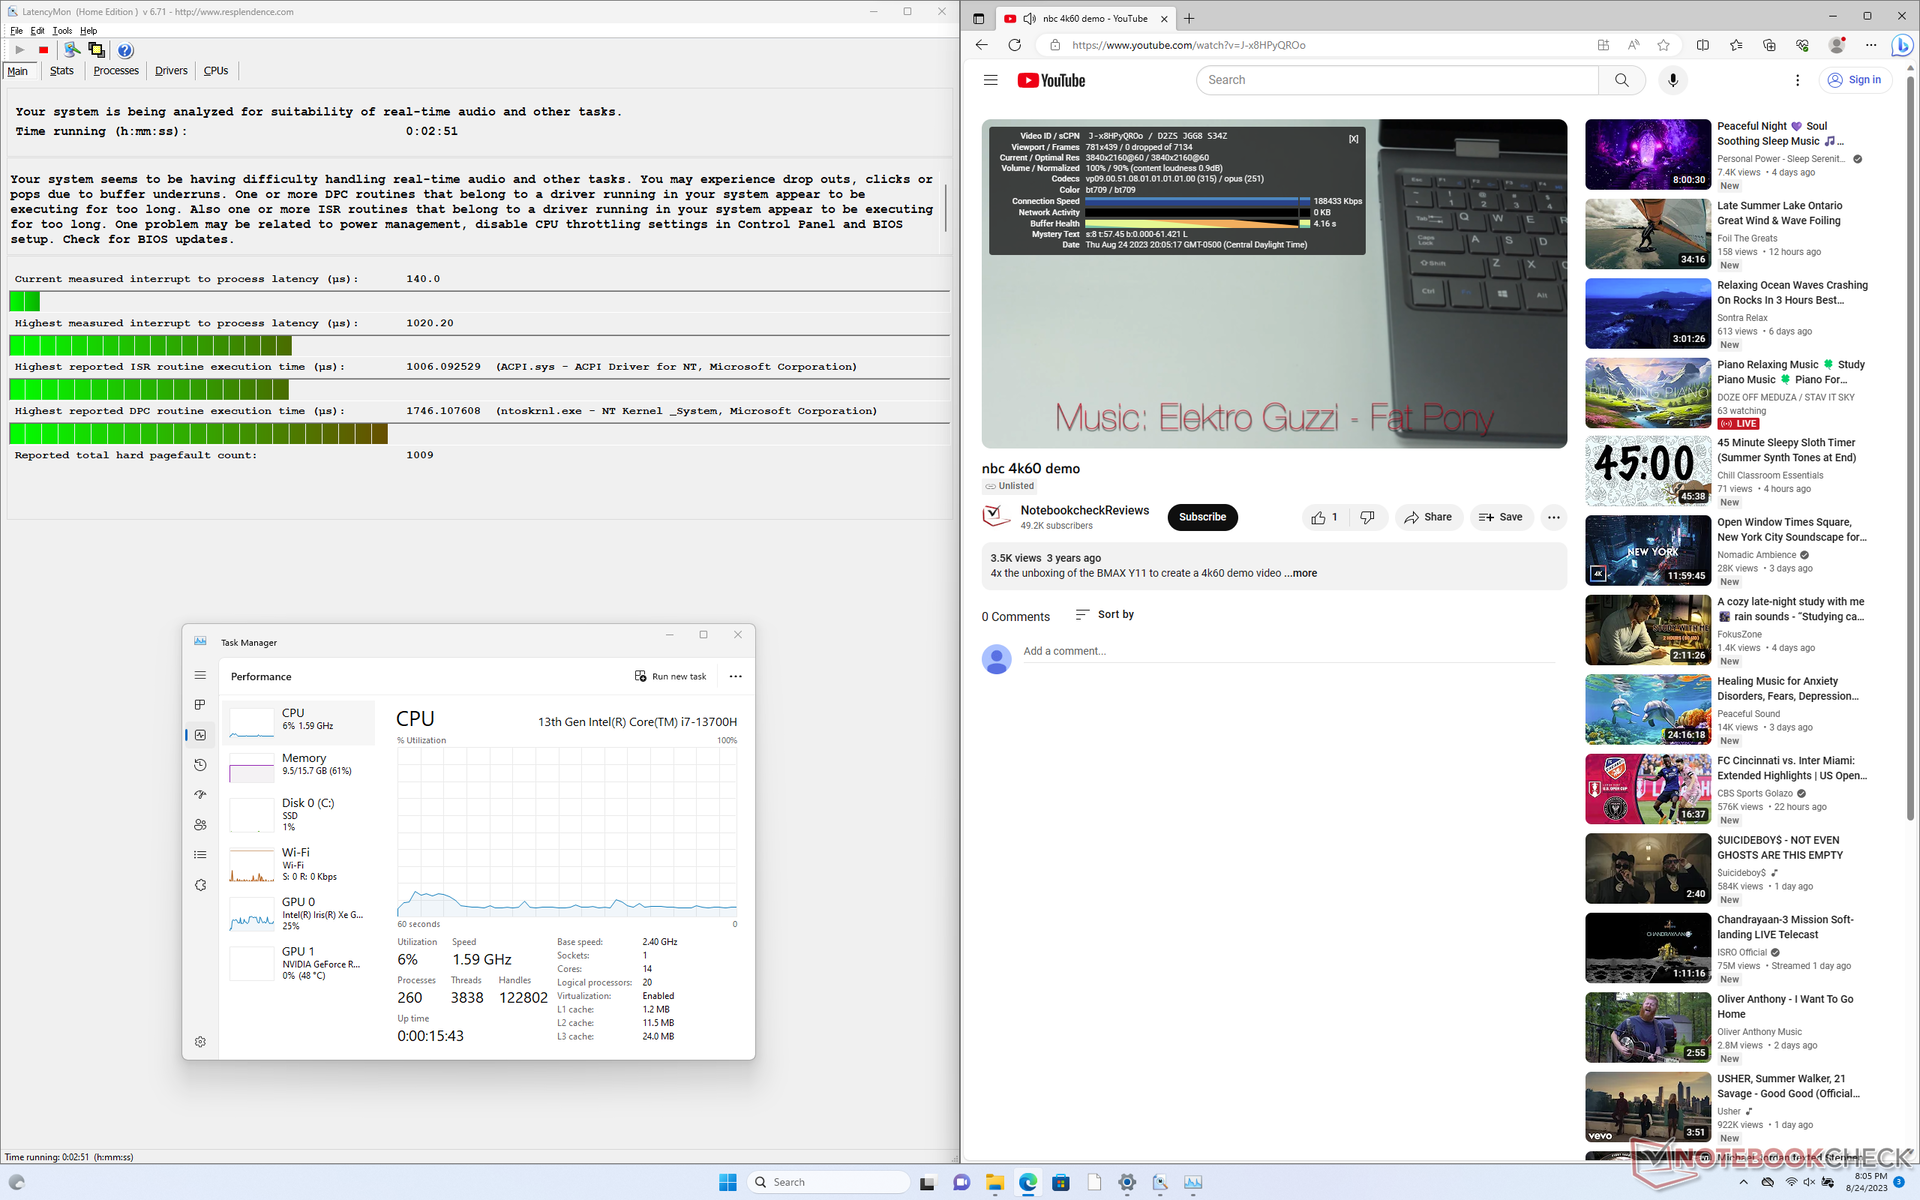
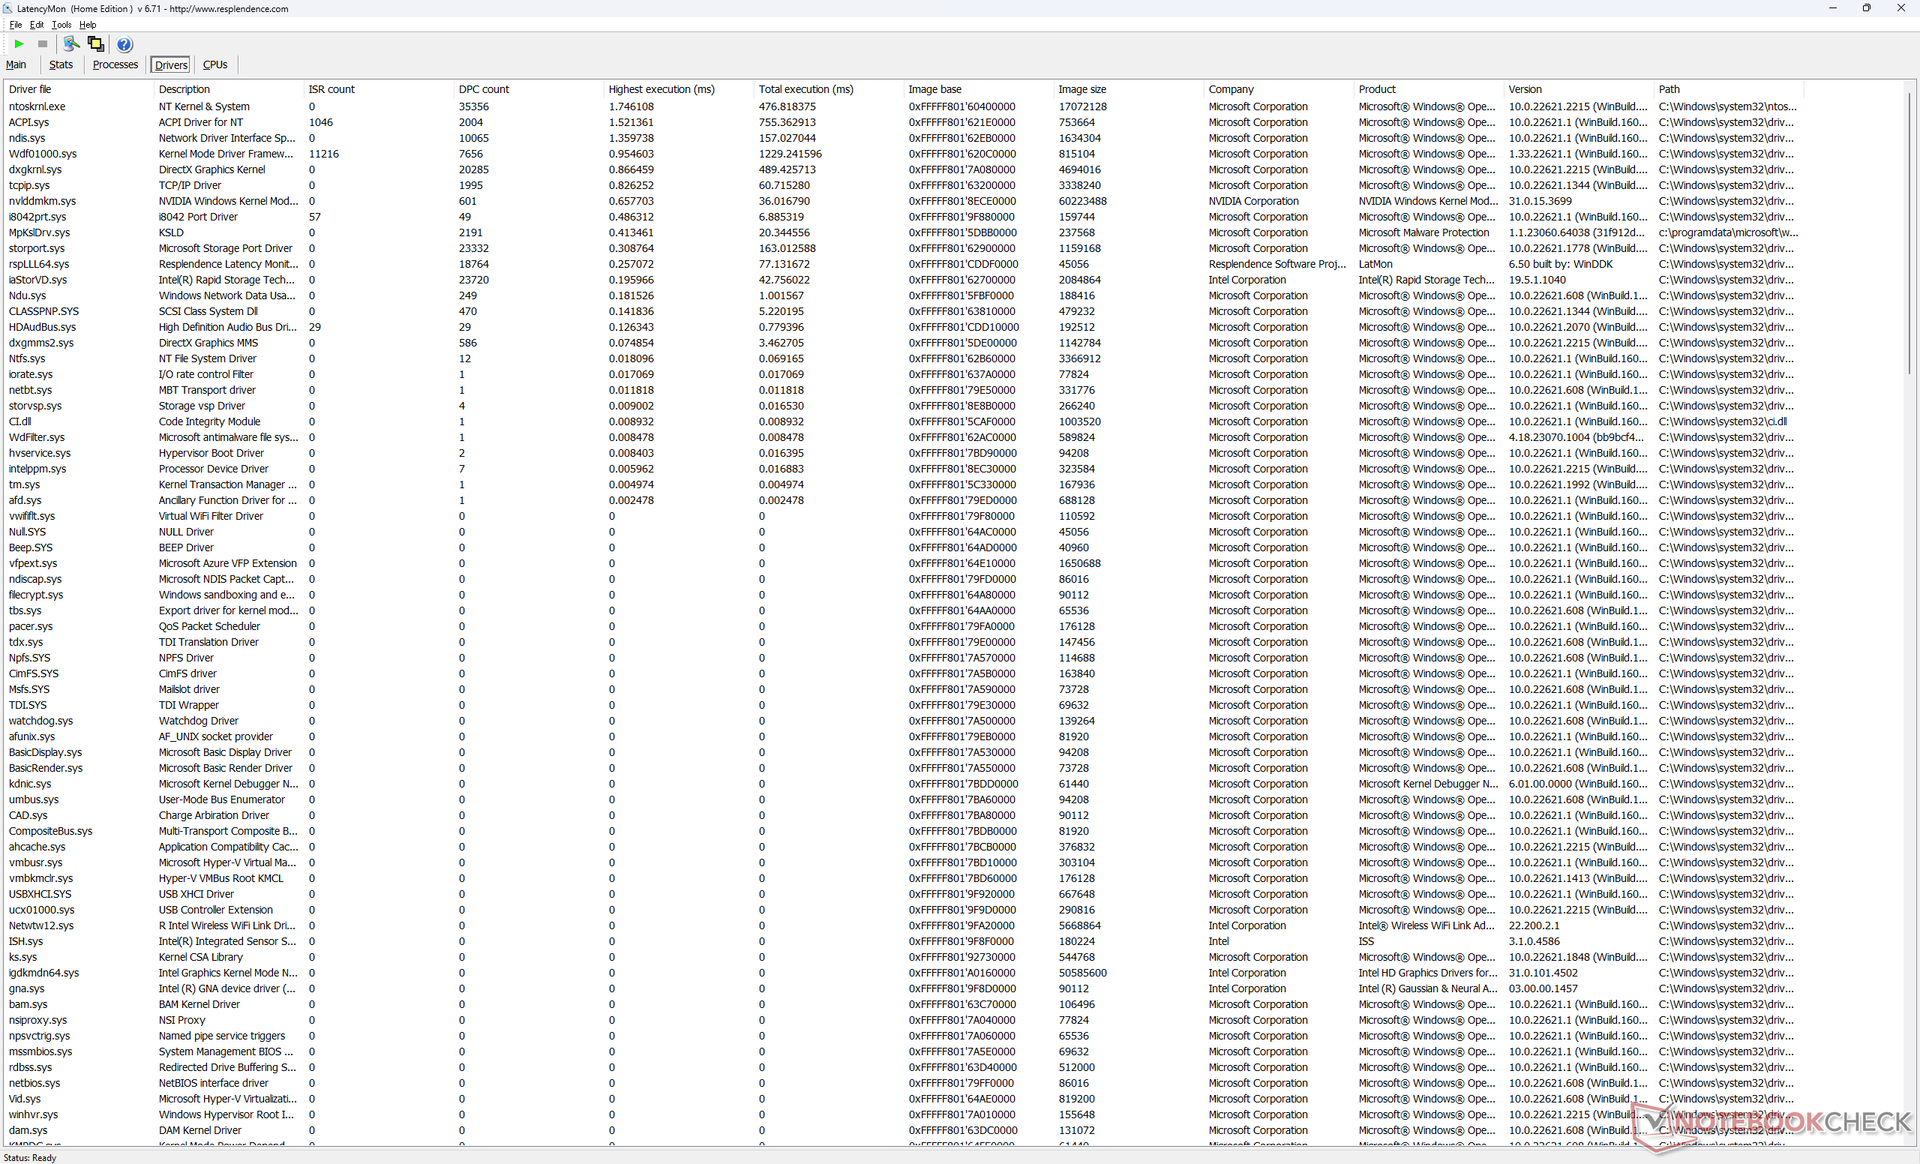
DPC-Latenzzeit
LatencyMon zeigt nur geringe DPC-Probleme beim Öffnen mehrerer Browser Tabs unserer Homepage. Die 4K-Videowiedergabe bei 60 fps ist ansonsten perfekt, und es gibt keine Bildaussetzer, anders als beim Alienware m16 R1, bei dem es immer wieder zu Bildaussetzern kam.
| DPC Latencies / LatencyMon - interrupt to process latency (max), Web, Youtube, Prime95 | |
| Asus Vivobook Pro 16X K6604JV-MX016W | |
| Lenovo Slim Pro 9i 16IRP8 | |
| Dell Inspiron 16 Plus 7630 | |
| Dell Inspiron 16 Plus 7620 | |
| MSI Summit E16 Flip A12UDT-031 | |
| HP Envy 16 h0112nr | |
* ... kleinere Werte sind besser
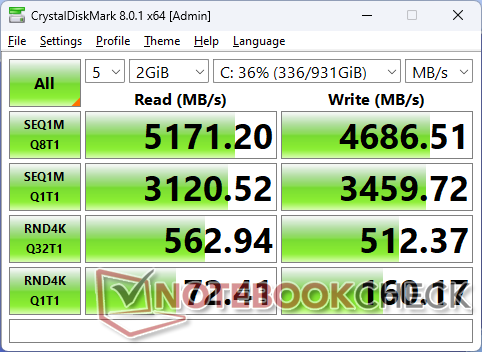
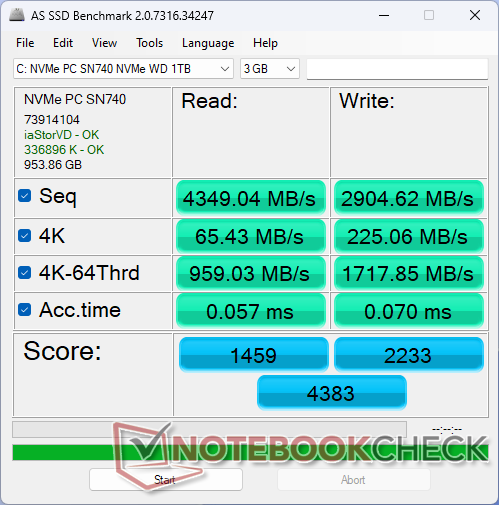
Speichergeräte - Unterstützt nur eine SSD
Unser Gerät wird mit einer Mittelklasse-Western-Digital-SN740-PCIe4-x4-NVMe-SSD geliefert, die Übertragungsraten von bis zu 5.200 MB/s bietet. Dieses Maximum ist jedoch nur für etwa eine Minute haltbar, bevor es schließlich auf die niedrigen 2.400 MB/s gedrosselt wird, wie unsere DiskSpd-Schleifentest-Ergebnisse unten zeigen. Diese Einschränkung ist für die Gaming Performance und die überwiegende Mehrheit der Nutzungsszenarien kein Problem.
Das Modell unterstützt nur eine interne SSD, während einige andere 16-Zoll-Notebooks wie das Envy 16 bis zu zwei Laufwerke unterstützen können.

| Drive Performance Rating - Percent | |
| MSI Summit E16 Flip A12UDT-031 | |
| Lenovo Slim Pro 9i 16IRP8 | |
| HP Envy 16 h0112nr | |
| Dell Inspiron 16 Plus 7630 | |
| Asus Vivobook Pro 16X K6604JV-MX016W | |
| Dell Inspiron 16 Plus 7620 | |
* ... kleinere Werte sind besser
Disk Throttling: DiskSpd Read Loop, Queue Depth 8
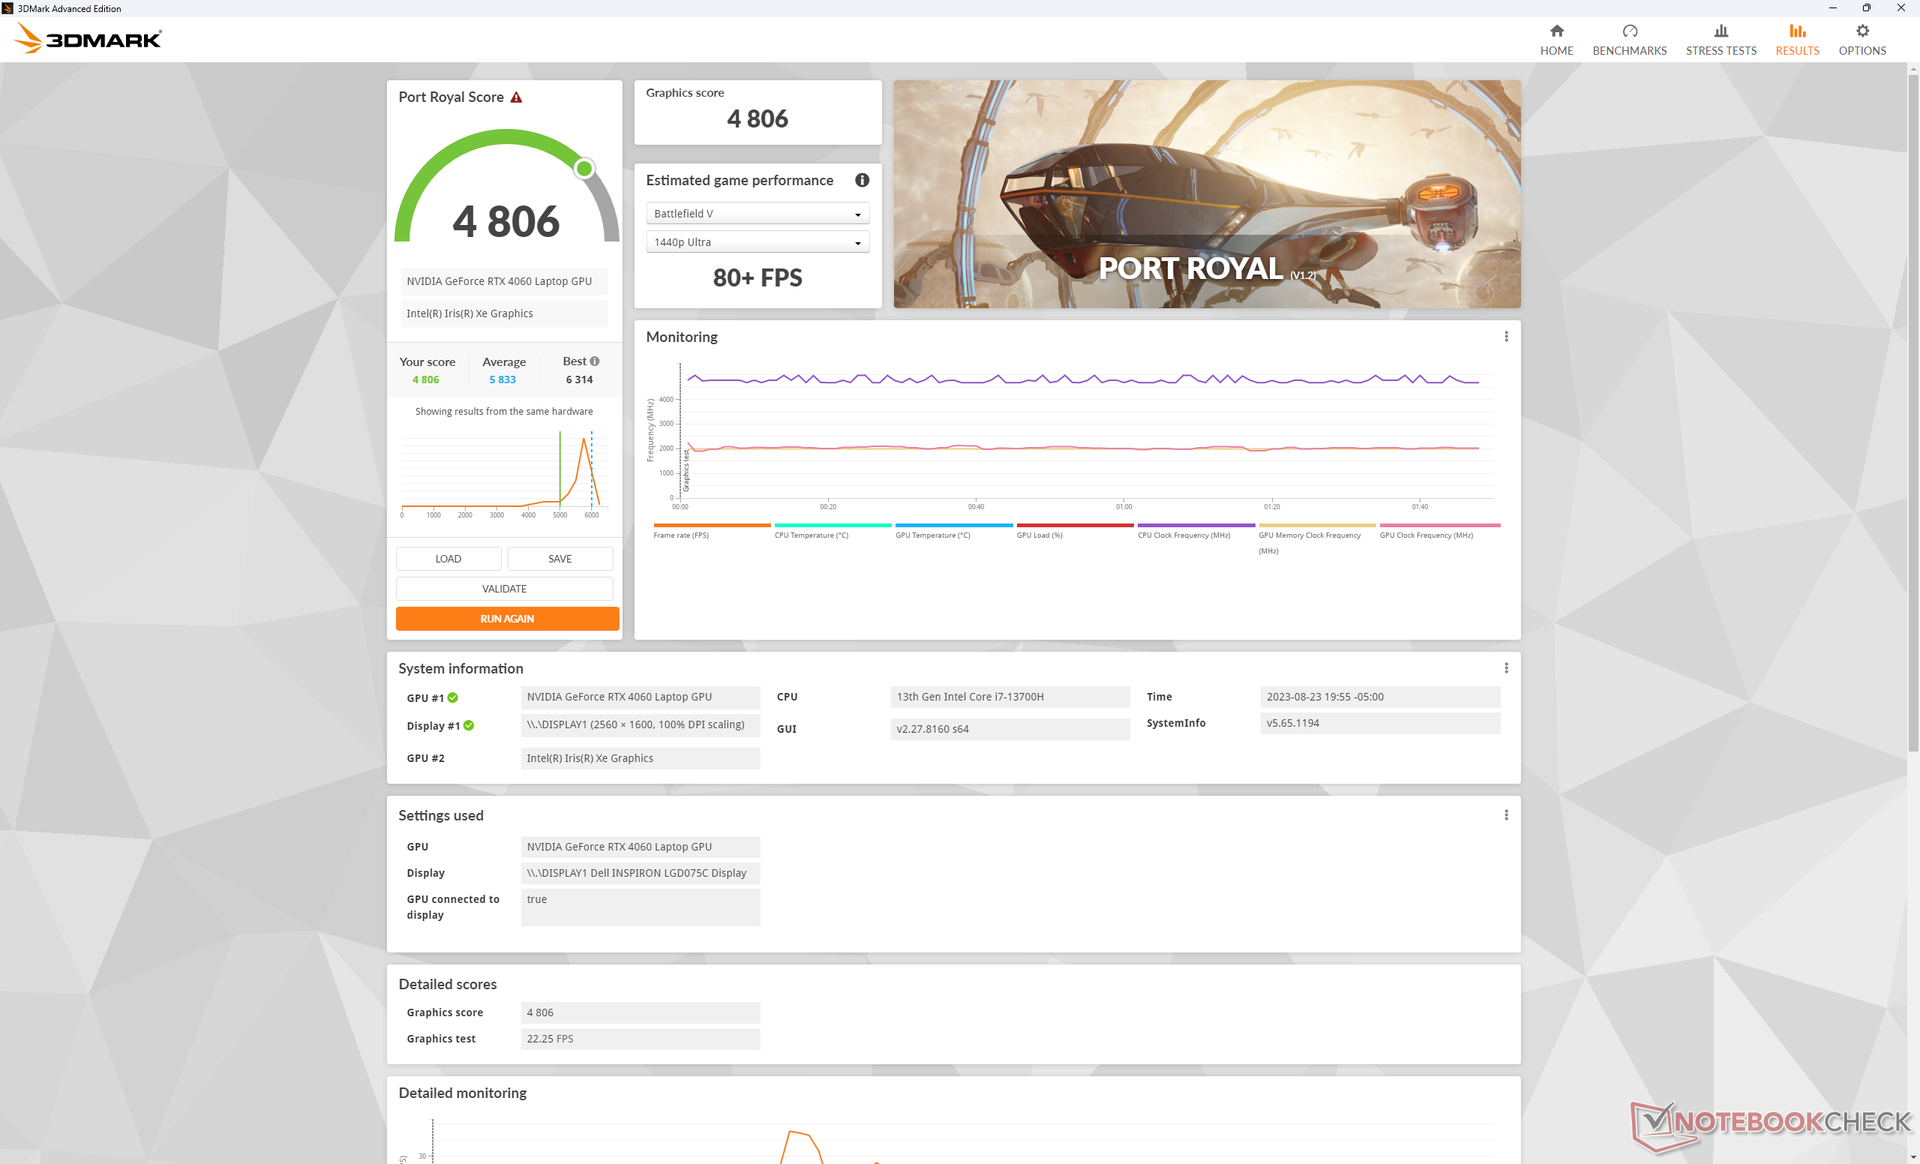
GPU Performance
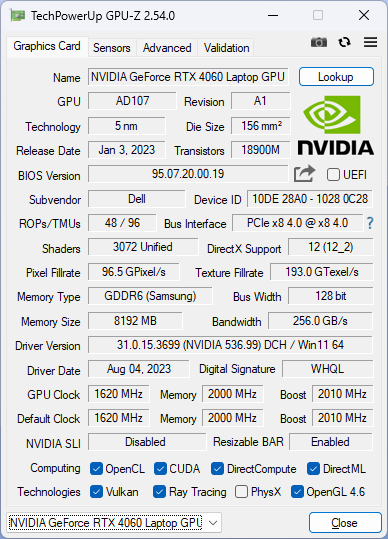
Die GeForce RTX 4060 in unserem Dell ist etwa 10 bis 15 Prozent langsamer als der durchschnittliche Laptop in unserer Datenbank, der mit der gleichen GPU ausgestattet ist. Das Delta ist wahrscheinlich auf das relativ niedrige 60-W-TGP-Ziel des Inspiron 16 Plus 7630 zurückzuführen, da es sich mit den meisten Laptops mit der RTX 4060 vorwiegend um dedizierte Gaming-Laptops handelt, die für höhere GPU-Leistungsbereiche von 90 W oder mehr optimiert sind. Die Gesamtleistung ist daher eher mit der GeForce RTX 4050 im Lenovo Slim Pro 9i 16 vergleichbar, was ein wenig enttäuschend ist. Nichtsdestotrotz ist die Leistungssteigerung von Generation zu Generation gegenüber der RTX 3050 Ti im Inspiron 16 Plus 7620 des letzten Jahres mit 40 bis 60 Prozent immer noch signifikant.
Nutzer sollten in Erwägung ziehen, das Inspiron 16 Plus 7630 stattdessen mit der preiswerteren RTX 4050 zu konfigurieren, da die RTX-4060-Option eine Underperformer-Option ist. Alle GPU-Optionen zielen auf die gleichen 60 W TGP ab.
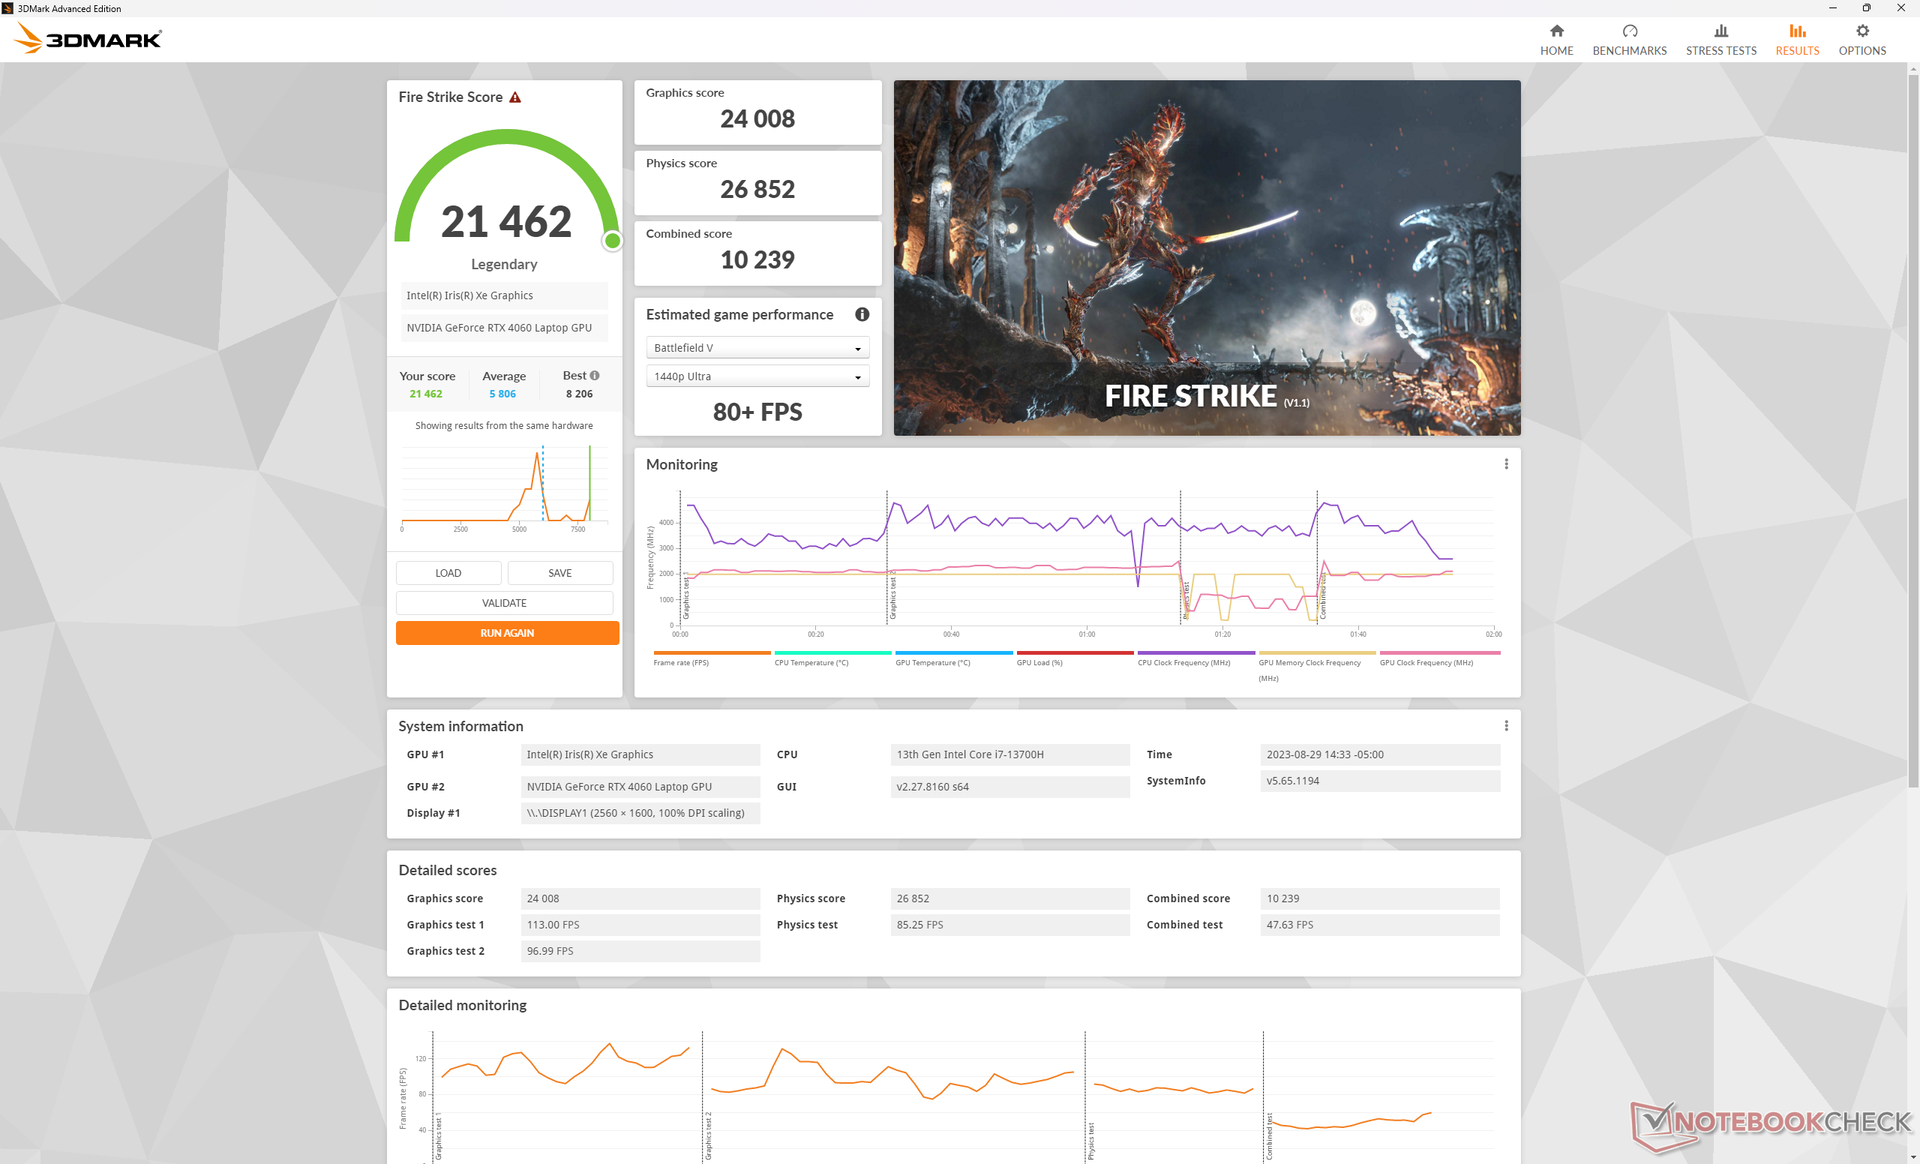
Der Wechsel vom Modus Performance in den Modus "Ausgewogen" wirkt sich ziemlich stark auf die CPU-Leistung aus, während die GPU-Leistung fast gleich bleibt, wie unsere Ergebnisse unter Fire Strike zeigen. Stellen Sie sicher, dass Sie den Modus Performance wählen, wenn Sie CPU-intensive Aufgaben ausführen.
| Leistungsprofil | Grafik-Punktzahl | Physik-Punktzahl | Kombinierte Punktzahl |
| Akku-Leistung | 19.574 (-9 %) | 10.010 (-61 %) | 4.793 (-46 %) |
| Balanced-Modus | 23.511 (-2 %) | 15.963 (-41%) | 8.110 (-21 %) |
| Performance-Modus | 24.008 | 26.852 | 10.239 |

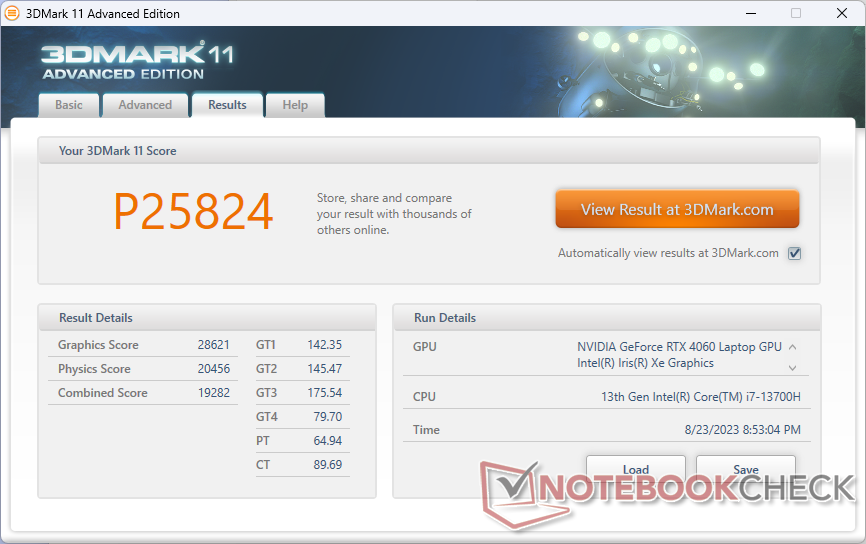

| 3DMark 11 Performance | 25824 Punkte | |
| 3DMark Fire Strike Score | 19289 Punkte | |
| 3DMark Time Spy Score | 8240 Punkte | |
Hilfe | ||
* ... kleinere Werte sind besser
Spiele-Performance
Wie von den obigen 3DMark Ergebnissen vorhergesagt, ist Gaming Performance insgesamt leicht unterdurchschnittlich für ein Notebook mit RTX-4060-Grafik. Tiny Tina's Wonderlands läuft zum Beispiel mit 48 fps bei den maximalen 1.440p-Einstellungen, verglichen mit 57 fps bei den meisten anderen RTX-4060-Notebooks. G-Sync wird von der Inspiron-7630-Serie leider nicht unterstützt, was das Frame Tearing geglättet hätte.
Witcher 3 FPS Chart
| min. | mittel | hoch | max. | QHD | |
|---|---|---|---|---|---|
| The Witcher 3 (2015) | 409.3 | 275.3 | 169.5 | 90.9 | 68 |
| Dota 2 Reborn (2015) | 184.7 | 166.6 | 157.9 | 146.1 | |
| Final Fantasy XV Benchmark (2018) | 172.2 | 122.2 | 88.9 | 64.4 | |
| X-Plane 11.11 (2018) | 153.5 | 135.7 | 109.7 | ||
| Far Cry 5 (2018) | 133 | 120 | 115 | 103 | 83 |
| Strange Brigade (2018) | 378 | 234 | 185.9 | 161 | 110.9 |
| Cyberpunk 2077 1.6 (2022) | 108.1 | 84.2 | 72.9 | 65.7 | 40.8 |
| Tiny Tina's Wonderlands (2022) | 169.5 | 141.5 | 92.1 | 71.4 | 48 |
| F1 22 (2022) | 205 | 201 | 148.4 | 53.8 | 34.1 |
| Returnal (2023) | 71 | 68 | 63 | 57 | 39 |
Emissionen
Systemgeräusche - Leiser und lauter als zuvor
Die internen Lüfter können im Leerlauf auf dem Desktop leise sein, aber sie bewegen sich meist um die 26 bis 28 dB(A), wenn gängige Lasten wie Webbrowser oder Videostreams laufen. Noch beeindruckender ist, dass sie auch bei höherer Last eine ganze Weile relativ leise bleiben können, während die Lüfter im Inspiron 16 Plus 7620 schneller und schneller pulsieren. Beim 3DMark 06 zum Beispiel steigt das Lüftergeräusch erst gegen Ende der ersten 90-sekündigen Benchmark-Szene auf 35 dB(A) an.
Bei Spielen nimmt das Lüftergeräusch deutlich zu. Während das Inspiron 16 Plus 7630 bei anspruchsloser Last generell leiser ist als das Vorjahresmodell, ist bei Spielen das Gegenteil der Fall. Das Lüftergeräusch erreicht bei Witcher 3 einen Spitzenwert von fast 53 dB(A) im Vergleich zu knapp über 49 dB(A) beim Inspiron 16 Plus 7620. Nichtsdestotrotz ist der niedrige 50 dB(A)-Bereich vergleichbar mit Konkurrenten wie dem Slim Pro 9i 16 oder Envy 16.
Interessanterweise hat der Wechsel des Leistungsprofils zwischen den Modi "Ausgeglichen" und " Performance " keinen Einfluss auf die Geräuschgrenze des Lüfters beim Spielen, da er in beiden Einstellungen immer noch bei 52,5 dB(A) liegt.
Lautstärkediagramm
| Idle |
| 23.2 / 23.2 / 23.2 dB(A) |
| Last |
| 35.1 / 52.5 dB(A) |
 | ||
30 dB leise 40 dB(A) deutlich hörbar 50 dB(A) störend |
||
min: | ||
| Dell Inspiron 16 Plus 7630 GeForce RTX 4060 Laptop GPU, i7-13700H, WD PC SN740 SDDPTQD-1T00 | Dell Inspiron 16 Plus 7620 GeForce RTX 3050 Ti Laptop GPU, i7-12700H, Kioxia BG5 KBG50ZNS512G | Lenovo Slim Pro 9i 16IRP8 GeForce RTX 4050 Laptop GPU, i9-13905H, Samsung PM9A1 MZVL21T0HCLR | Asus Vivobook Pro 16X K6604JV-MX016W GeForce RTX 4060 Laptop GPU, i9-13980HX, Solidigm P41 Plus SSDPFKNU010TZ | HP Envy 16 h0112nr GeForce RTX 3060 Laptop GPU, i7-12700H, Micron 3400 1TB MTFDKBA1T0TFH | MSI Summit E16 Flip A12UDT-031 GeForce RTX 3050 Ti Laptop GPU, i7-1280P, Samsung PM9A1 MZVL22T0HBLB | |
|---|---|---|---|---|---|---|
| Geräuschentwicklung | -11% | 1% | -21% | -6% | -14% | |
| aus / Umgebung * (dB) | 23.2 | 23.3 -0% | 22.7 2% | 25.2 -9% | 22.8 2% | 25 -8% |
| Idle min * (dB) | 23.2 | 25.7 -11% | 22.7 2% | 26.6 -15% | 22.9 1% | 25 -8% |
| Idle avg * (dB) | 23.2 | 26.1 -13% | 22.7 2% | 26.6 -15% | 22.9 1% | 25 -8% |
| Idle max * (dB) | 23.2 | 30.6 -32% | 27.5 -19% | 29.2 -26% | 30.5 -31% | 28.9 -25% |
| Last avg * (dB) | 35.1 | 46.2 -32% | 28.9 18% | 53.4 -52% | 41.4 -18% | 49.3 -40% |
| Witcher 3 ultra * (dB) | 52.5 | 49.2 6% | 52.6 -0% | 51.1 3% | ||
| Last max * (dB) | 52.5 | 49.4 6% | 52.5 -0% | 56.9 -8% | 51.4 2% | 48.2 8% |
* ... kleinere Werte sind besser
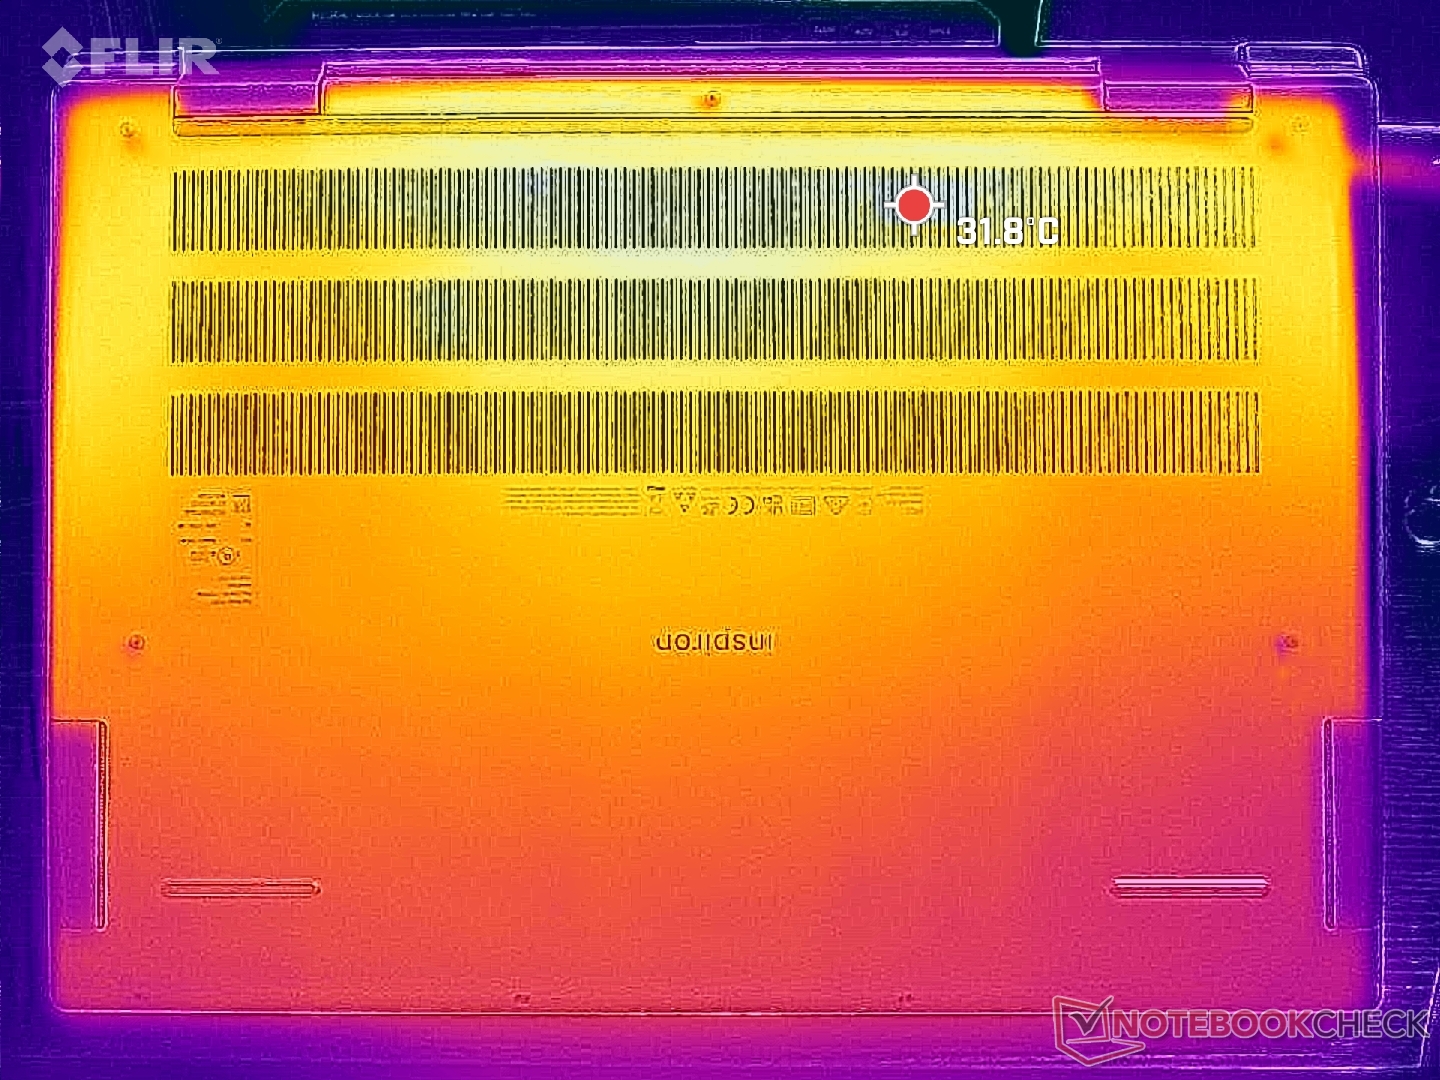
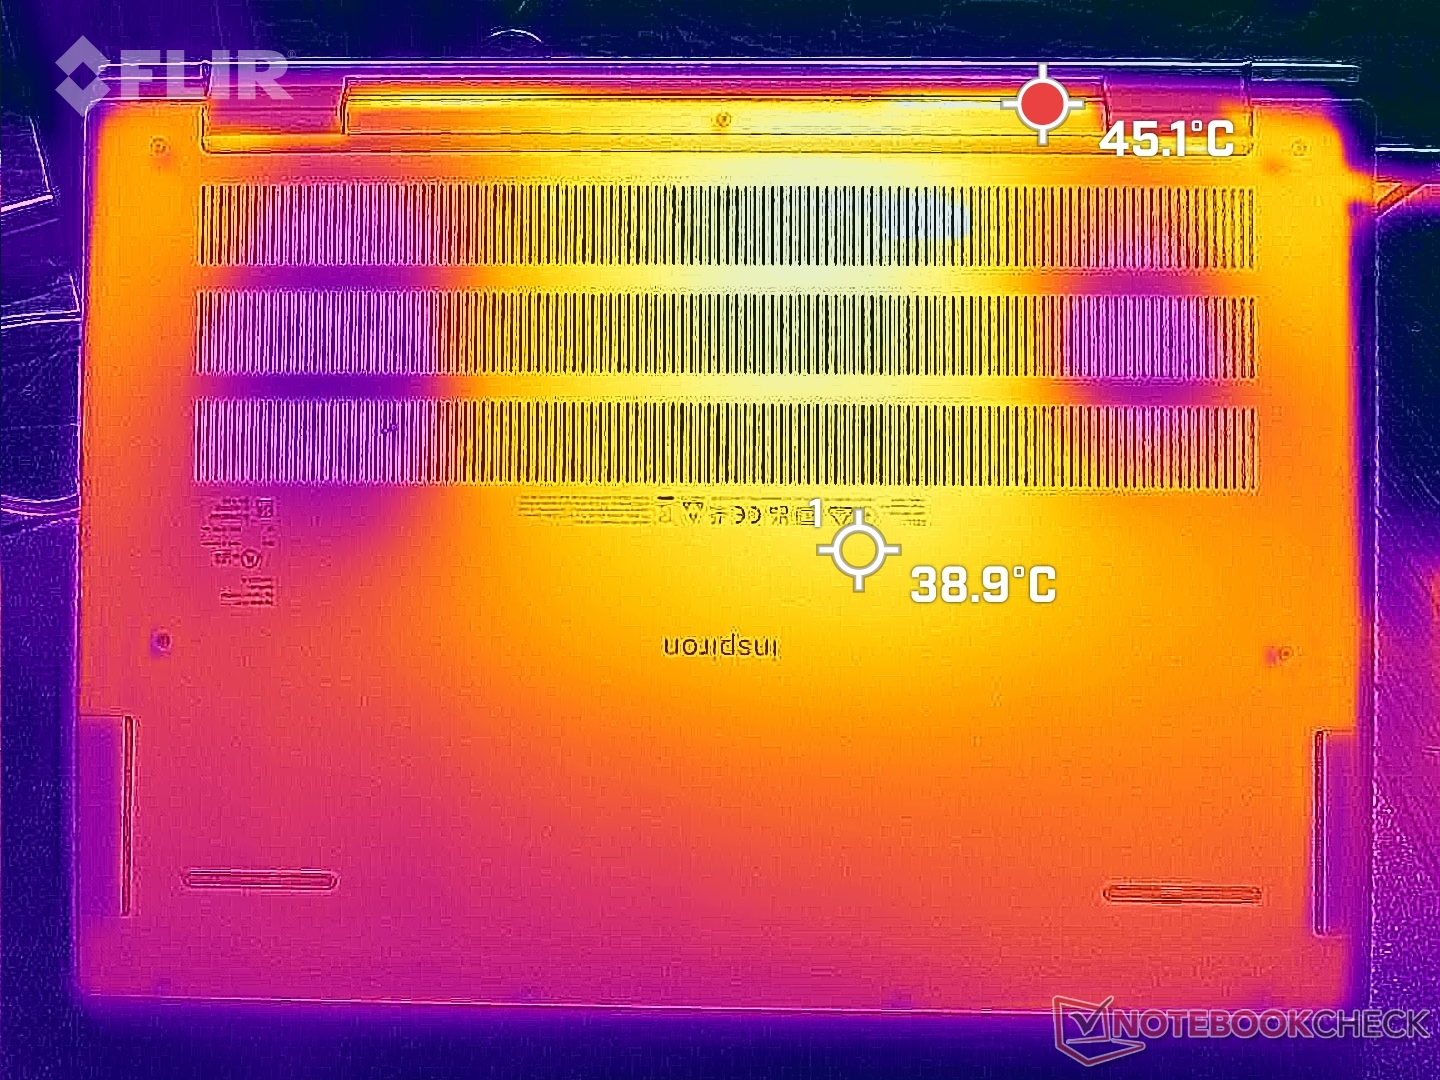
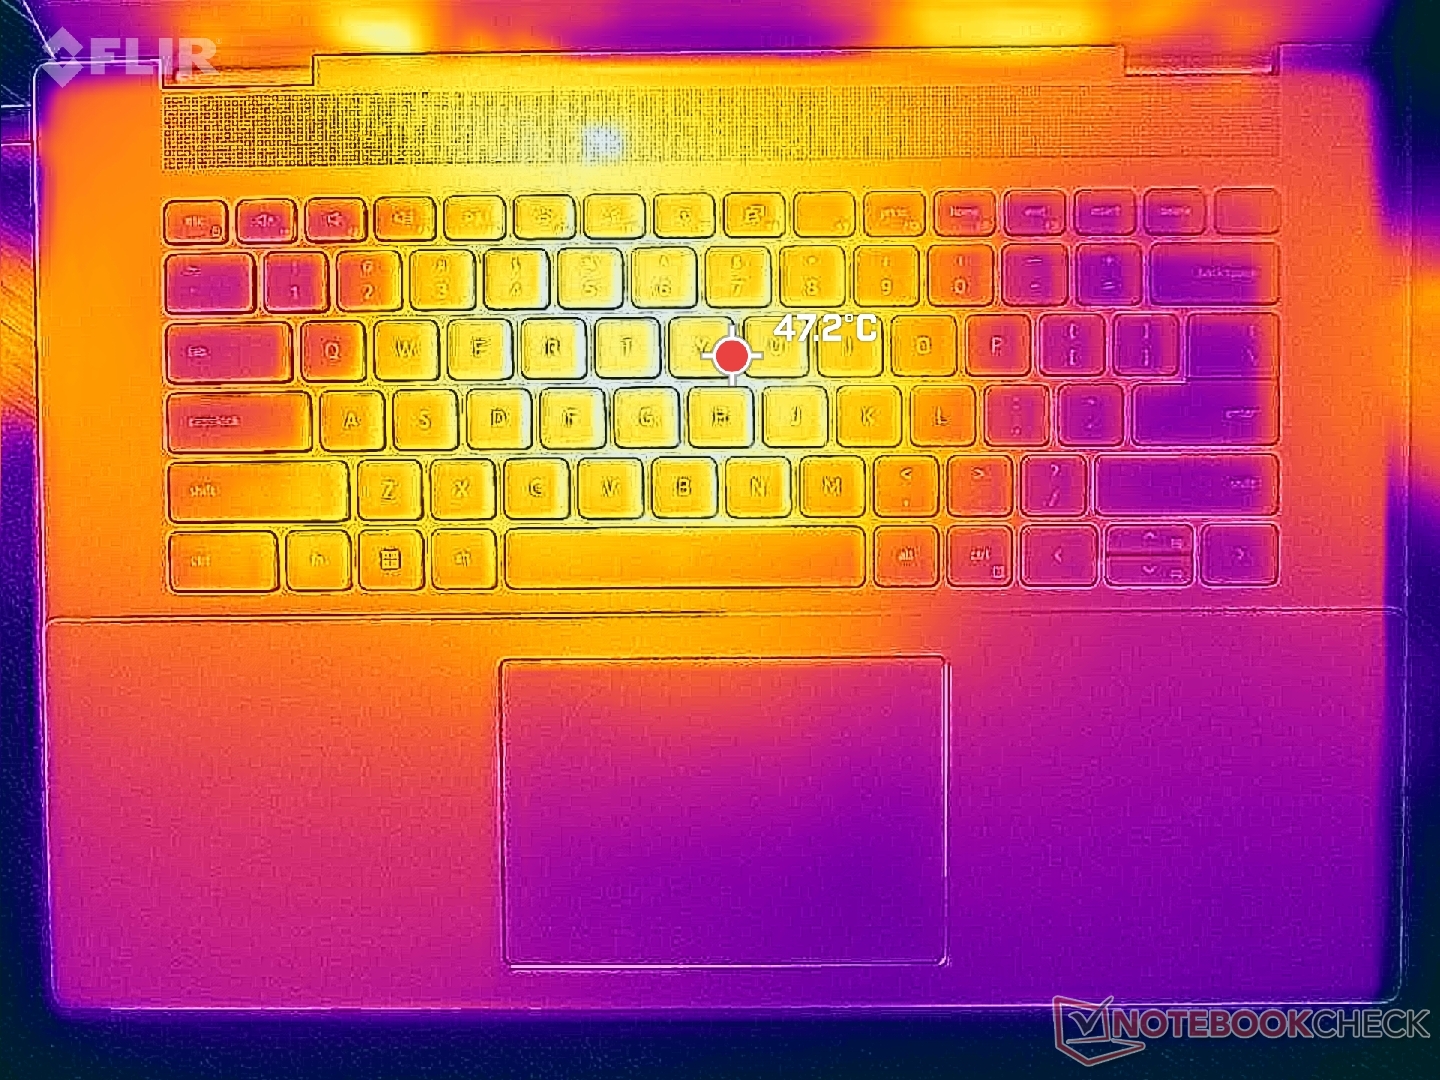
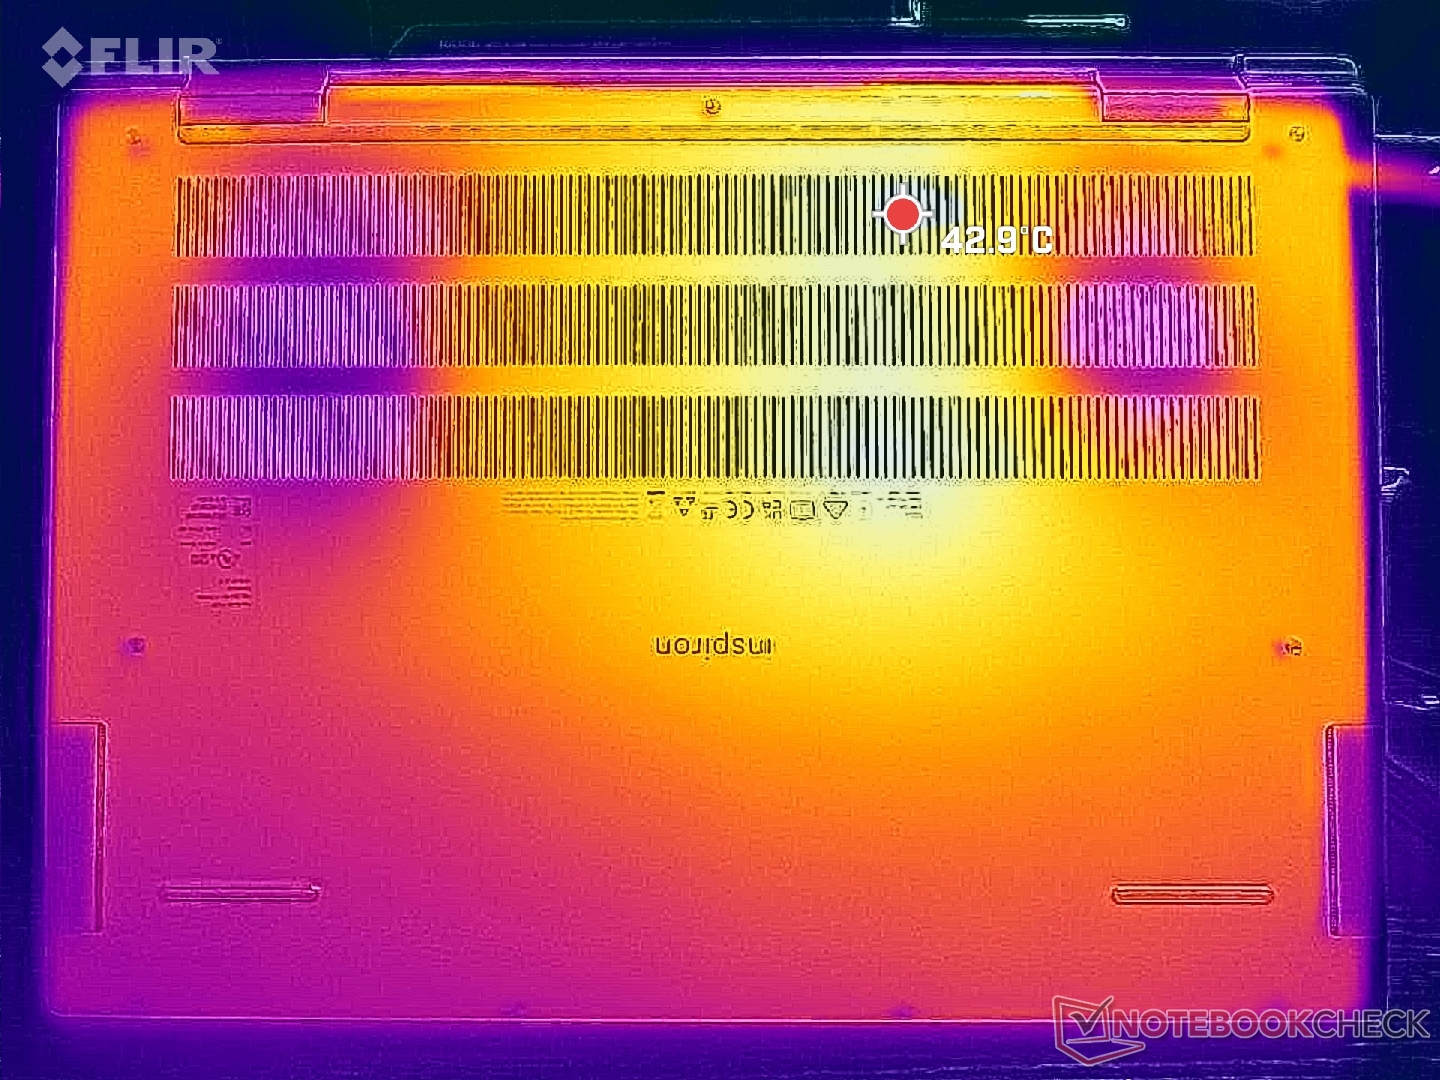
Temperatur
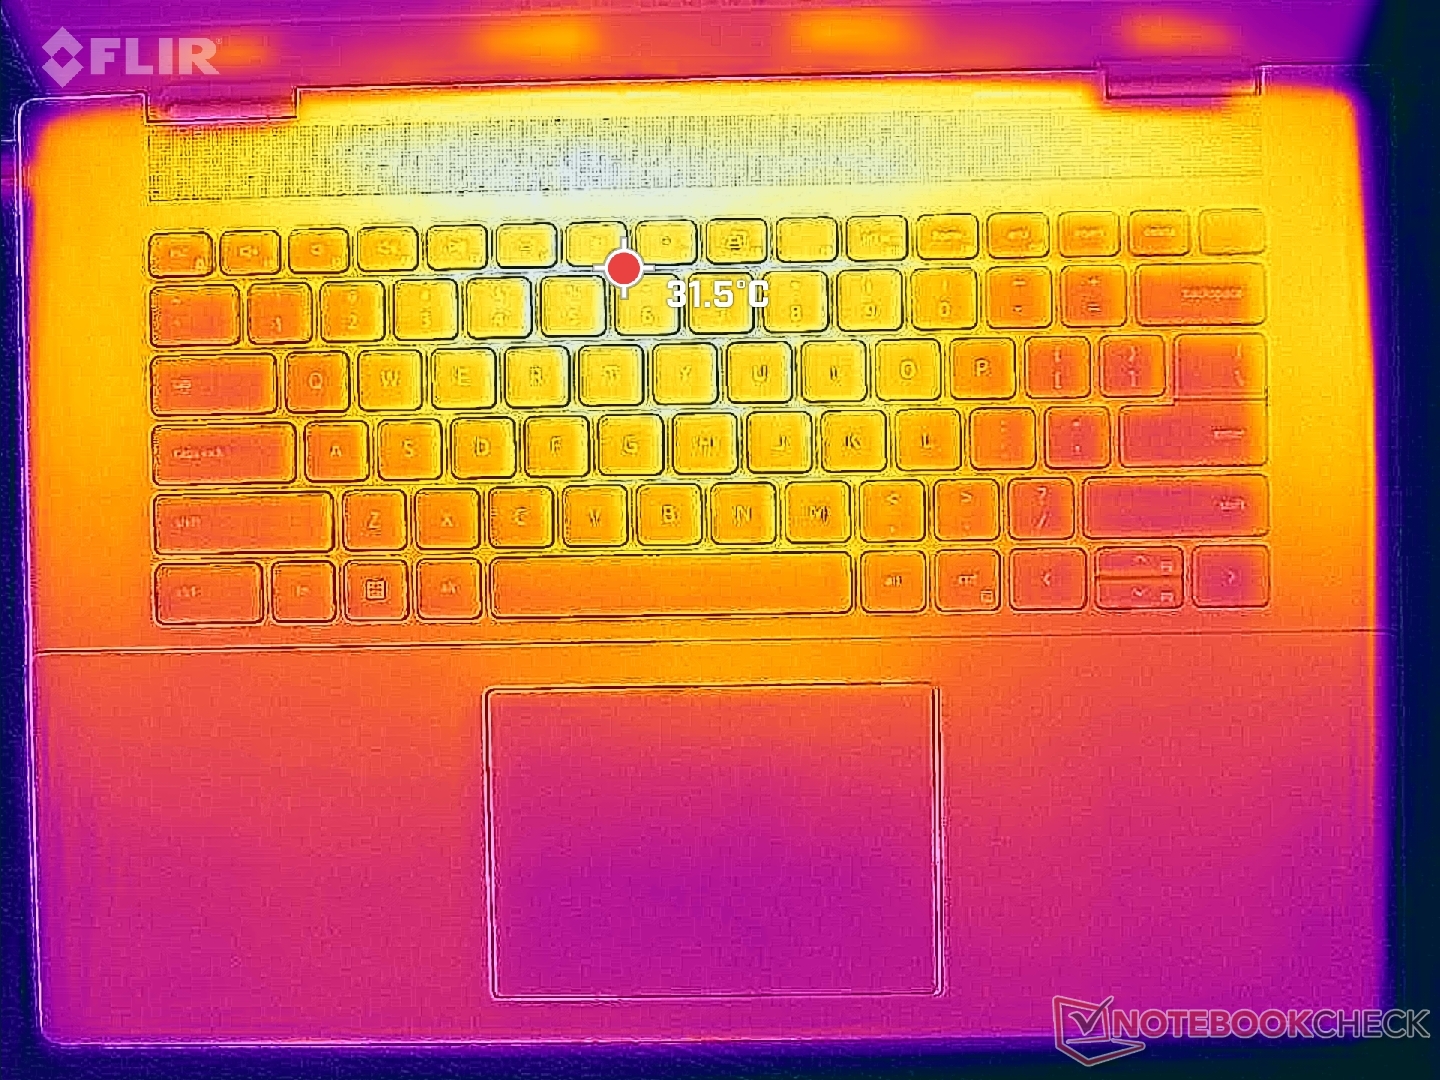
Die Oberflächentemperaturen bei anspruchsvollen Anwendungen wie Spielen sind wärmer als erwartet. Heiße Stellen auf der Ober- und Unterseite können in der Mitte der Tastatur bis zu 48 bzw. 43 °C warm werden. Auch die Handballenablagen können mit bis zu 37 °C sehr warm werden, im Vergleich zu nur 31 °C beim Asus Vivobook Pro 16X oder HP Envy 16. Im Vergleich zu anderen Laptops ist dies sicherlich eher ein Handwärmer.
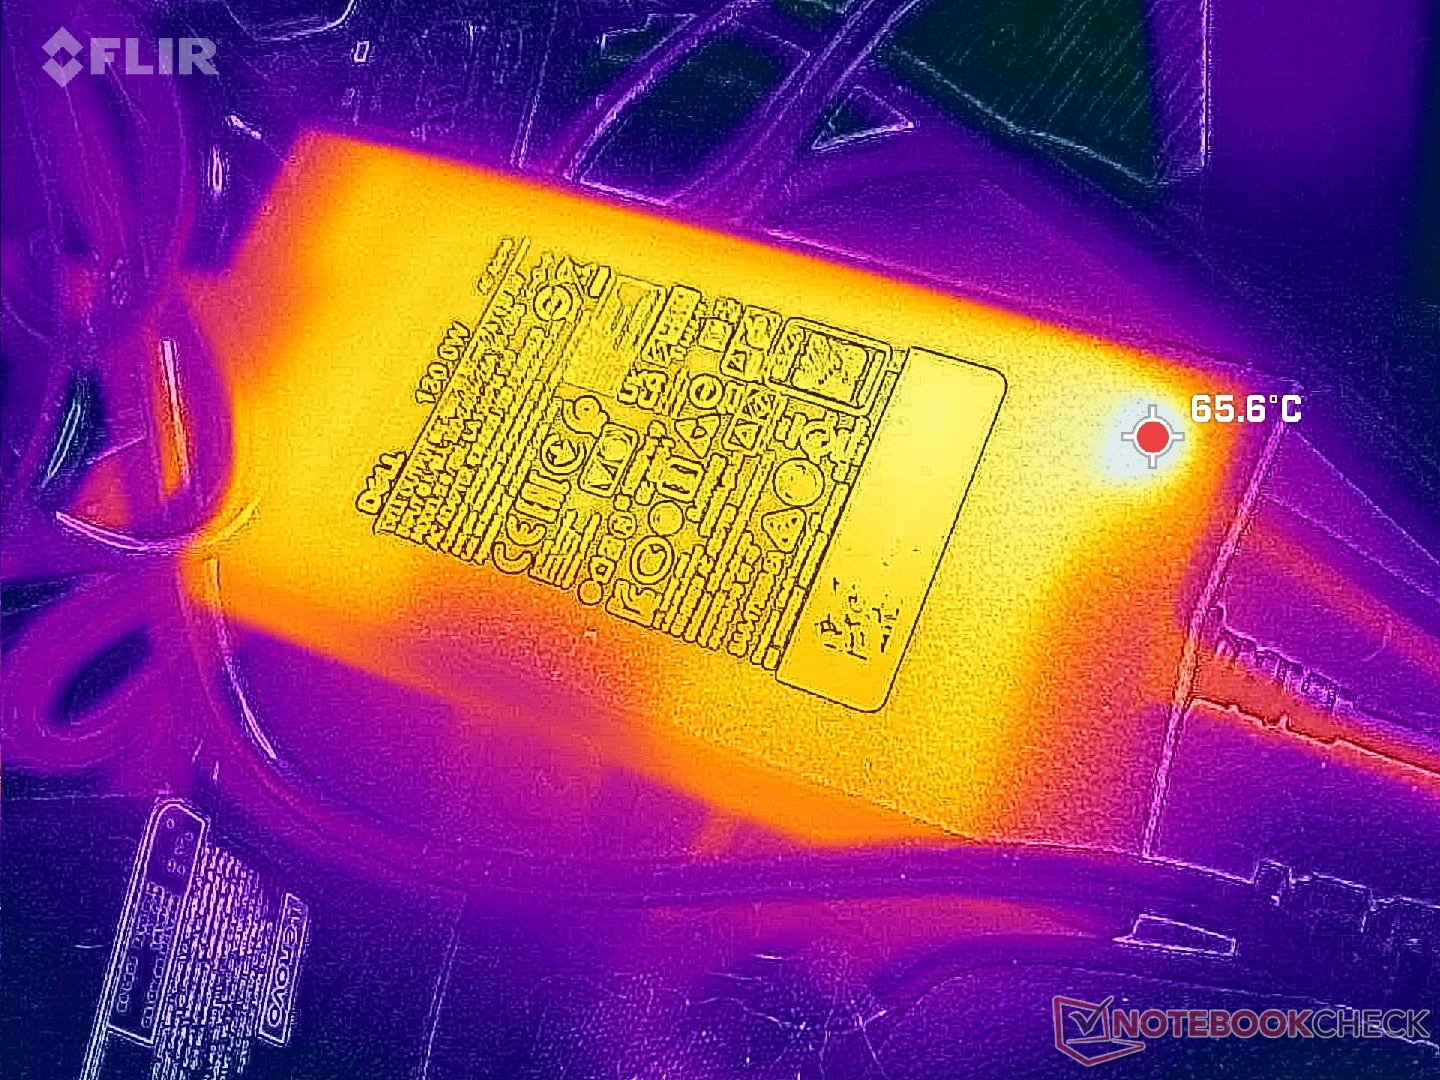
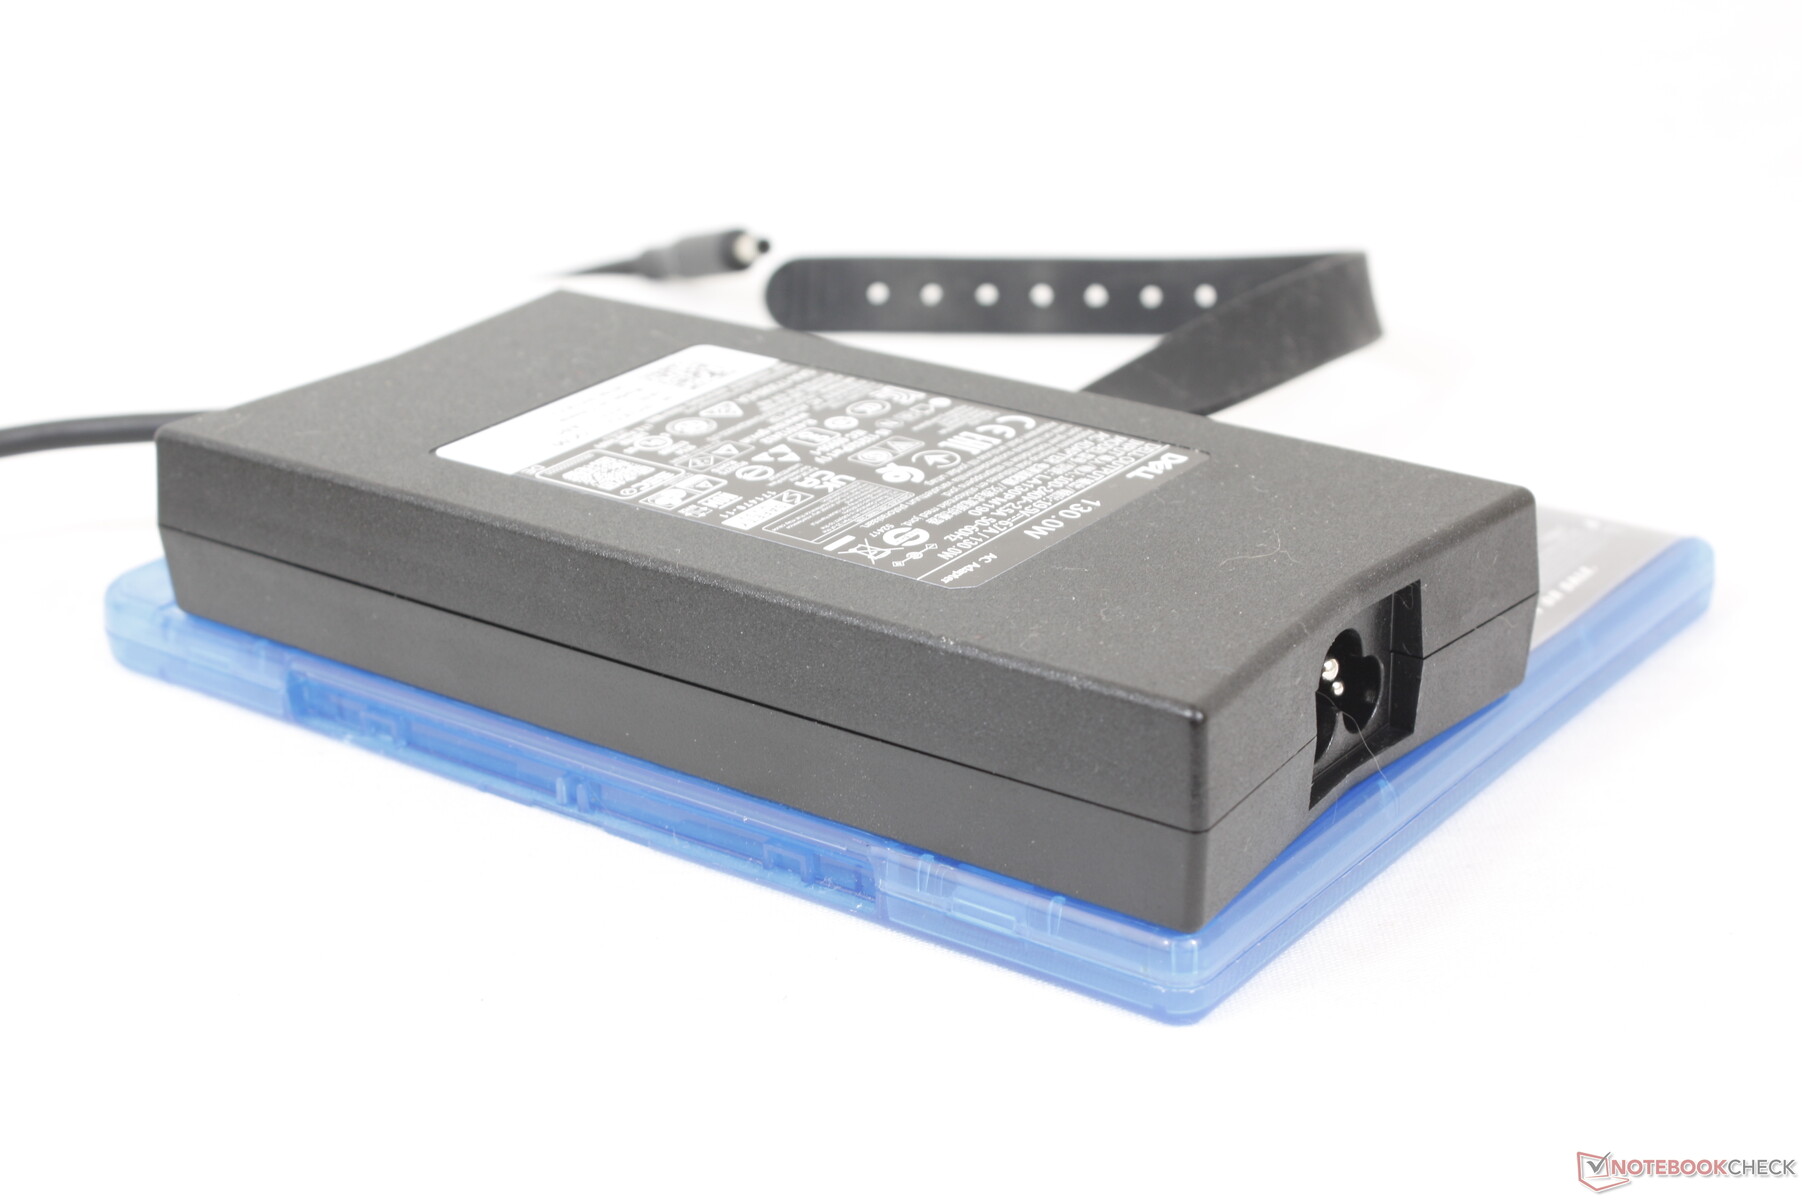
Außerdem ist das Netzteil mit über 65 °C merklich wärmer als der Durchschnitt. Sie sollten für den Fall der Fälle ausreichend Platz für das Netzteil einplanen.
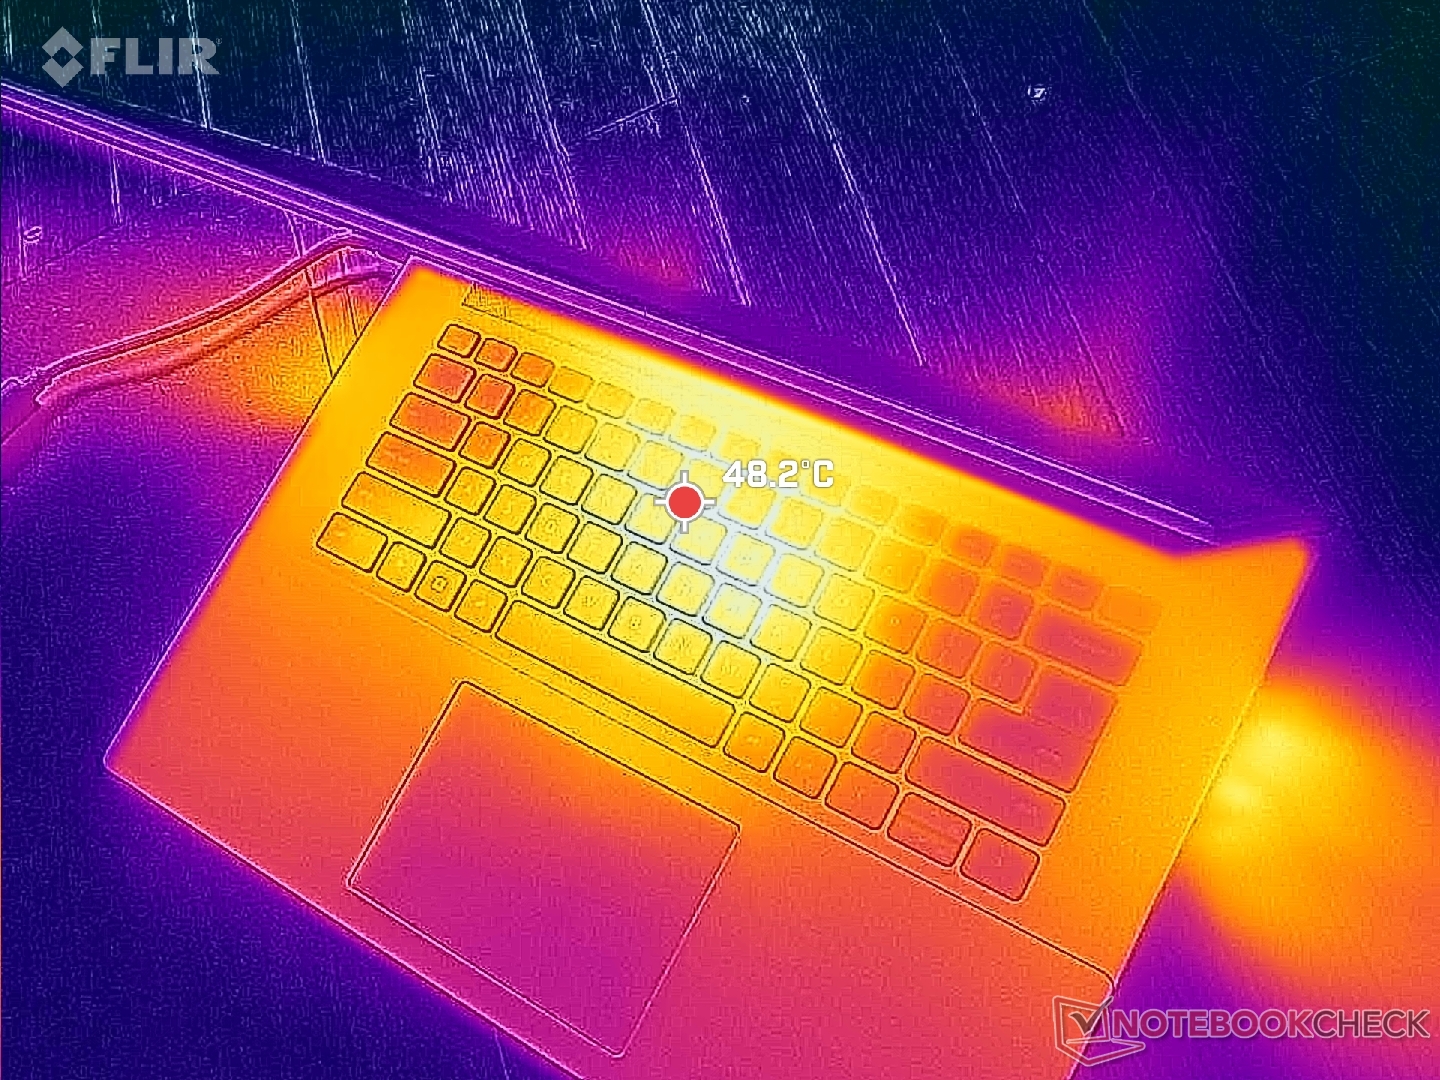
(-) Die maximale Temperatur auf der Oberseite ist 47.8 °C. Im Vergleich liegt der Klassendurchschnitt bei 36.8 °C (von 21 bis 71 °C für die Klasse Multimedia).
(±) Auf der Unterseite messen wir eine maximalen Wert von 42.2 °C (im Vergleich zum Durchschnitt von 39.1 °C).
(±) Ohne Last messen wir eine durchschnittliche Temperatur von 32 °C auf der Oberseite. Der Klassendurchschnitt erreicht 31.3 °C.
(-) Beim längeren Spielen von The Witcher 3 erhitzt sich das Gerät durchschnittlich auf 40.6 °C. Der Durchschnitt der Klasse ist derzeit 31.3 °C.
(±) Die Handballen und der Touchpad-Bereich können sehr heiß werden mit maximal 36.6 °C.
(-) Die durchschnittliche Handballen-Temperatur anderer getesteter Geräte war 28.7 °C (-7.9 °C).

| Dell Inspiron 16 Plus 7630 Intel Core i7-13700H, NVIDIA GeForce RTX 4060 Laptop GPU | Dell Inspiron 16 Plus 7620 Intel Core i7-12700H, NVIDIA GeForce RTX 3050 Ti Laptop GPU | Lenovo Slim Pro 9i 16IRP8 Intel Core i9-13905H, NVIDIA GeForce RTX 4050 Laptop GPU | Asus Vivobook Pro 16X K6604JV-MX016W Intel Core i9-13980HX, NVIDIA GeForce RTX 4060 Laptop GPU | HP Envy 16 h0112nr Intel Core i7-12700H, NVIDIA GeForce RTX 3060 Laptop GPU | MSI Summit E16 Flip A12UDT-031 Intel Core i7-1280P, NVIDIA GeForce RTX 3050 Ti Laptop GPU | |
|---|---|---|---|---|---|---|
| Hitze | 6% | 10% | -3% | 3% | 2% | |
| Last oben max * (°C) | 47.8 | 46 4% | 37.8 21% | 39.7 17% | 45.2 5% | 49.2 -3% |
| Last unten max * (°C) | 42.2 | 45.8 -9% | 44.8 -6% | 60 -42% | 44 -4% | 50.2 -19% |
| Idle oben max * (°C) | 35.2 | 29.2 17% | 30.6 13% | 30.9 12% | 33.6 5% | 29.4 16% |
| Idle unten max * (°C) | 35 | 31 11% | 31 11% | 34.7 1% | 32.6 7% | 30 14% |
* ... kleinere Werte sind besser
Stresstest
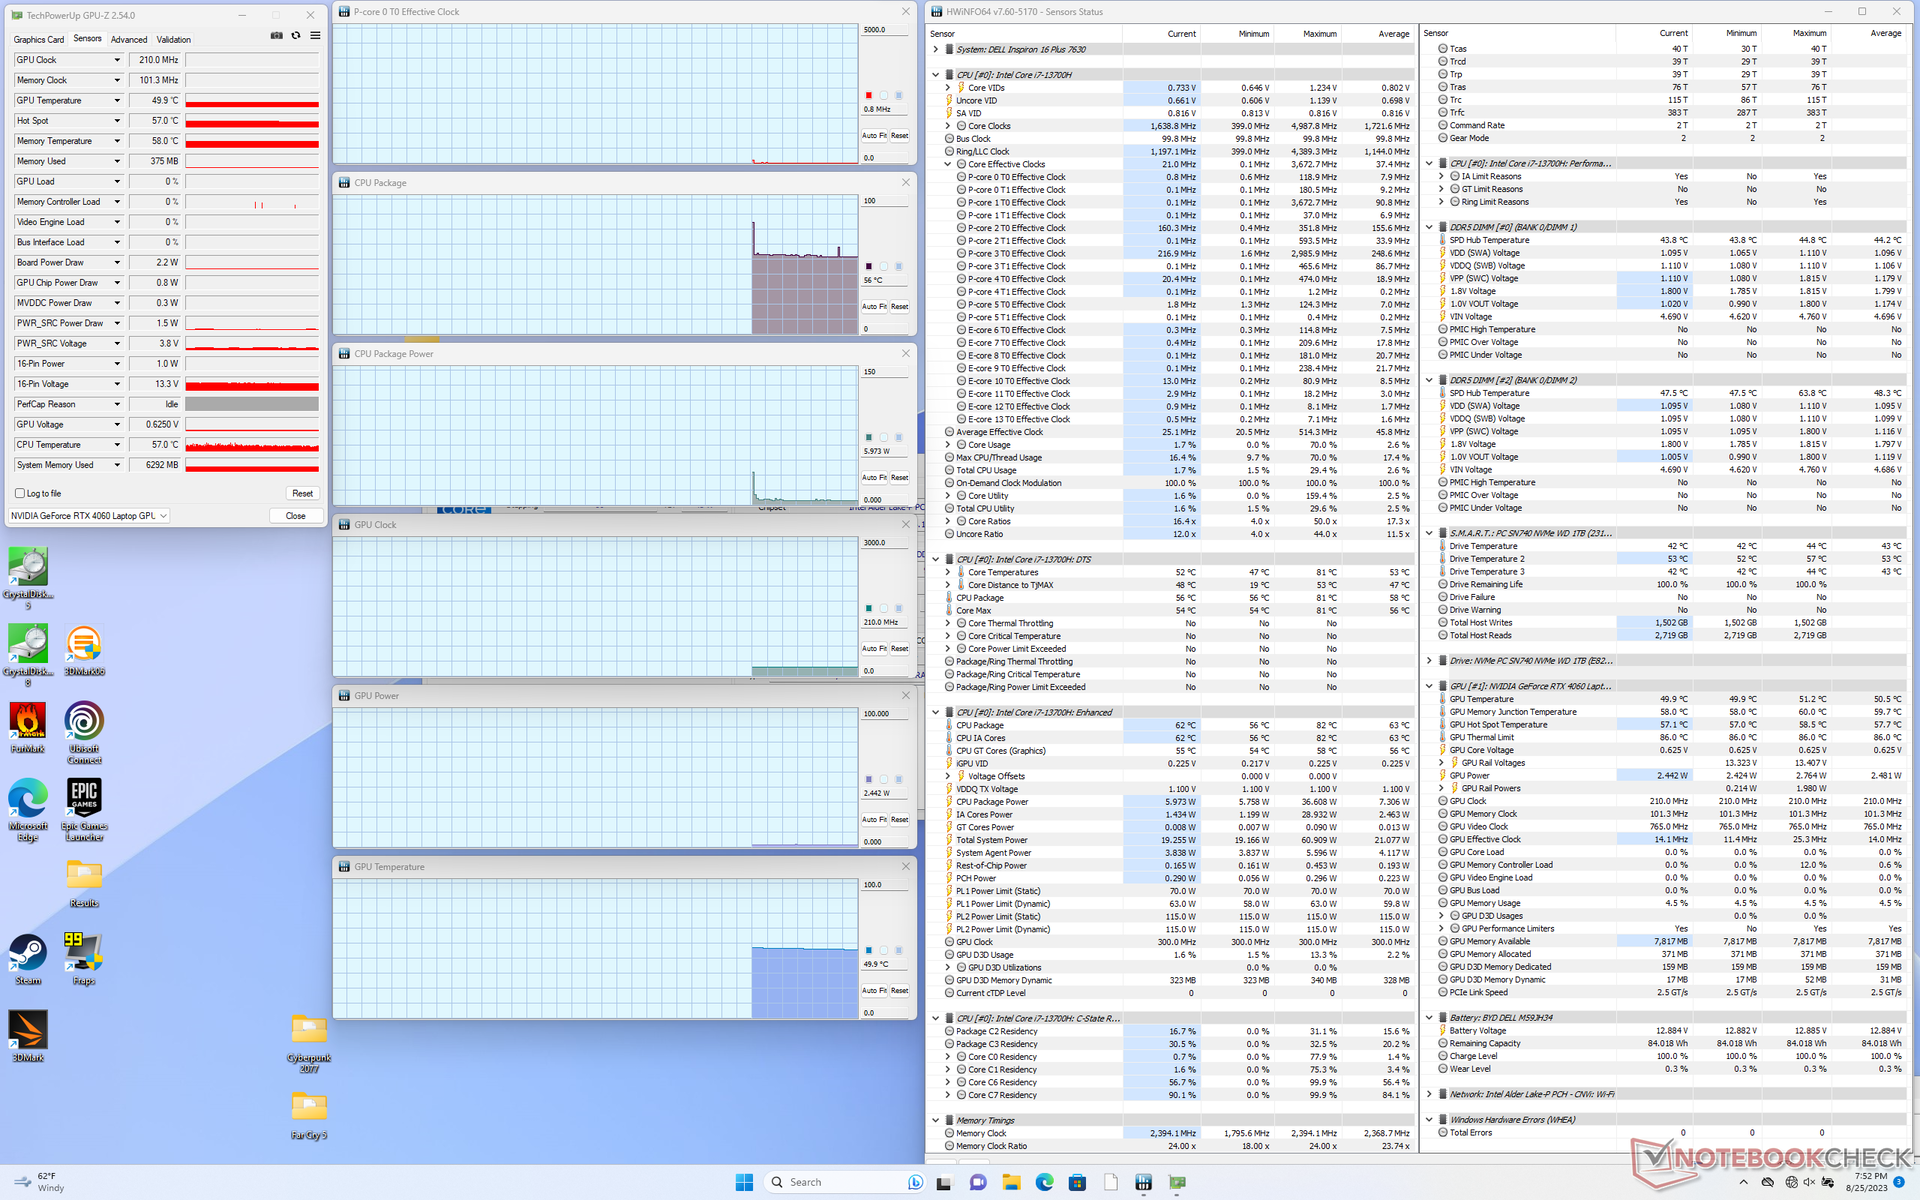
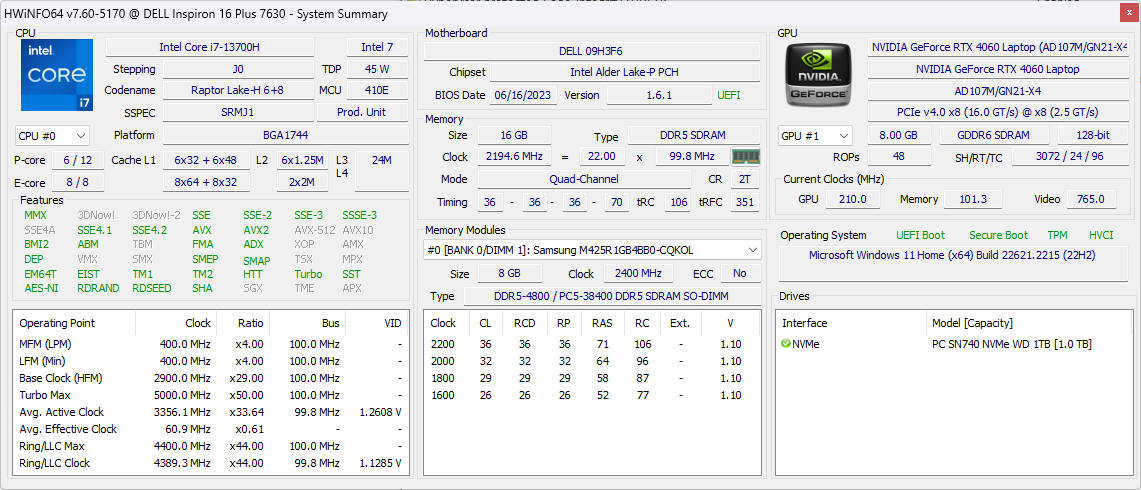
Bei der Ausführung von Prime95 erhöht sich die CPU für einige Sekunden auf 3,4 GHz, 89 W und 100 °C, bevor sie sich schließlich bei 2,3 GHz und 50 W stabilisiert, um eine vernünftige Kerntemperatur von 84 °C aufrechtzuerhalten. Das Vorjahresmodell stabilisierte sich bei demselben Test ebenfalls bei denselben Werten.
Bei der Ausführung Witcher 3 im Modus Performance, der eine typische Spielelast darstellt, stabilisiert sich die Nvidia GPU laut HWiNFO bei 2.235 MHz, 71 °C und 69 W. Ein Wechsel in den Modus Balanced hat keinen signifikanten Einfluss auf diese Werte, was sich mit unseren obigen Beobachtungen auf Fire Strike deckt. Interessanterweise sind die Kerntemperaturen viel kühler als die Werte, die wir auf dem Inspiron 16 Plus 7620 gemessen haben, was wahrscheinlich auf die lauteren Lüftergeräusche und die allgemeinen Verbesserungen der Kühllösung zurückzuführen ist.
Beachten Sie, dass HWiNFO eine GPU-Leistungsaufnahme von 69 W beim Spielen meldet, während Dell eine GPU-Leistung von nur 60 W angibt. Das Nvidia Control Panel meldet eine GPU-Zielleistung von 70 W.
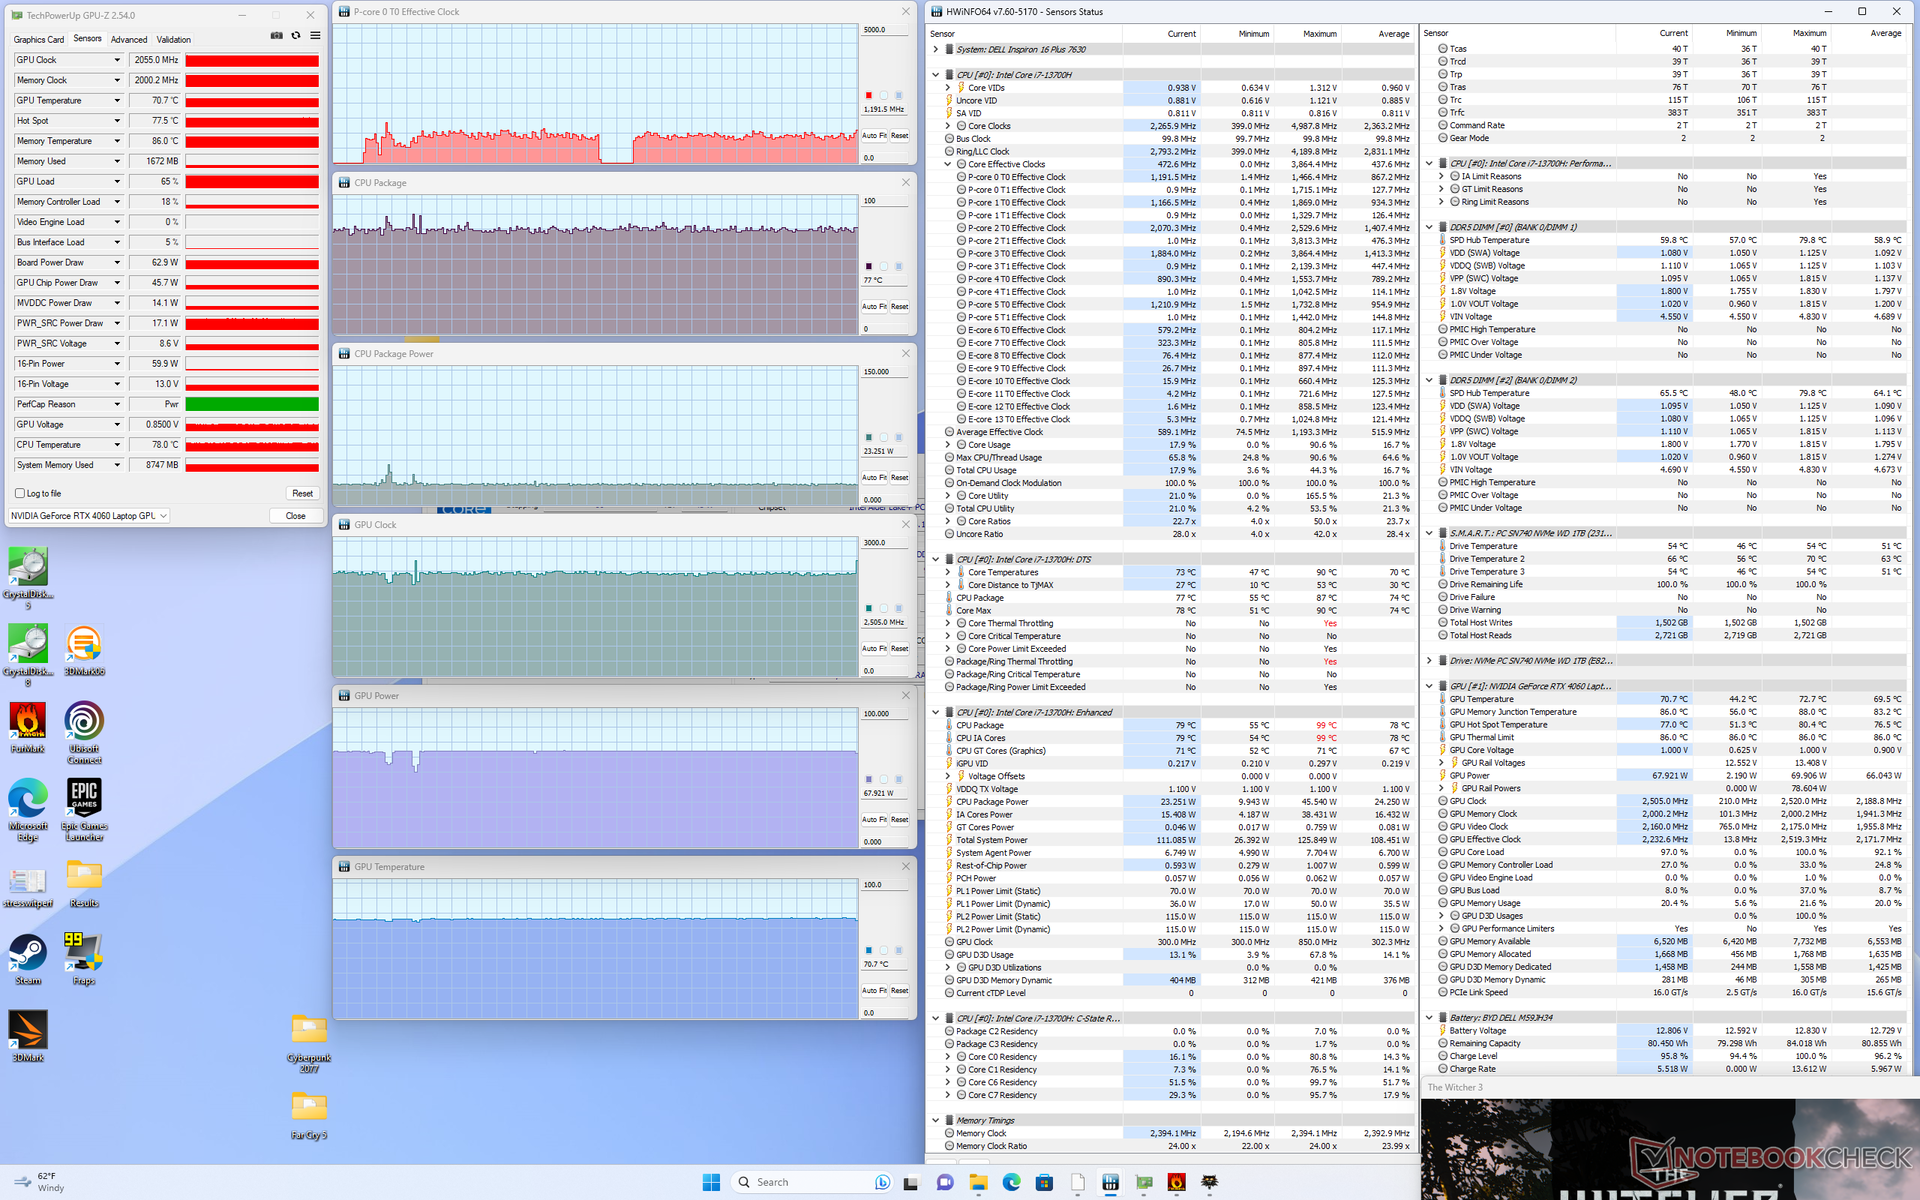
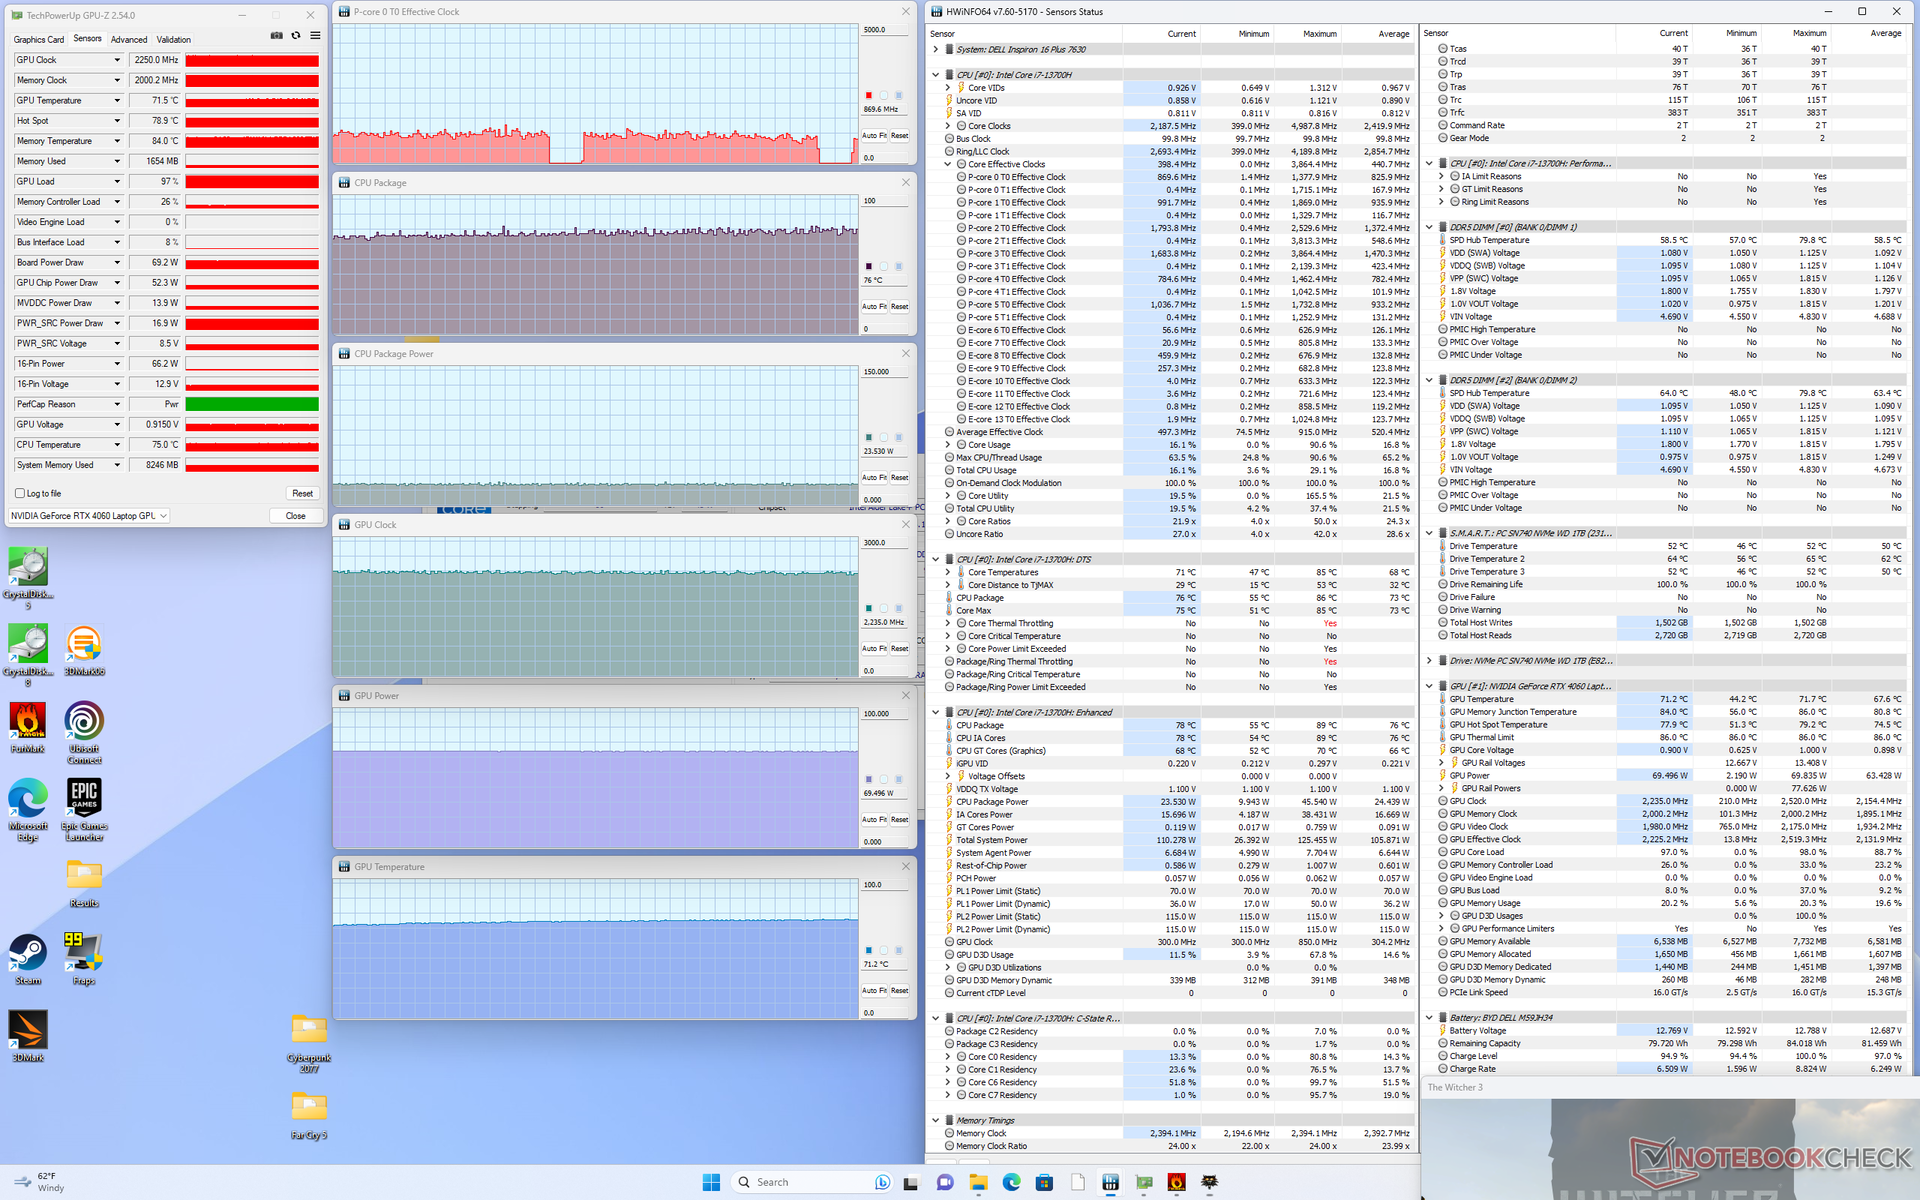
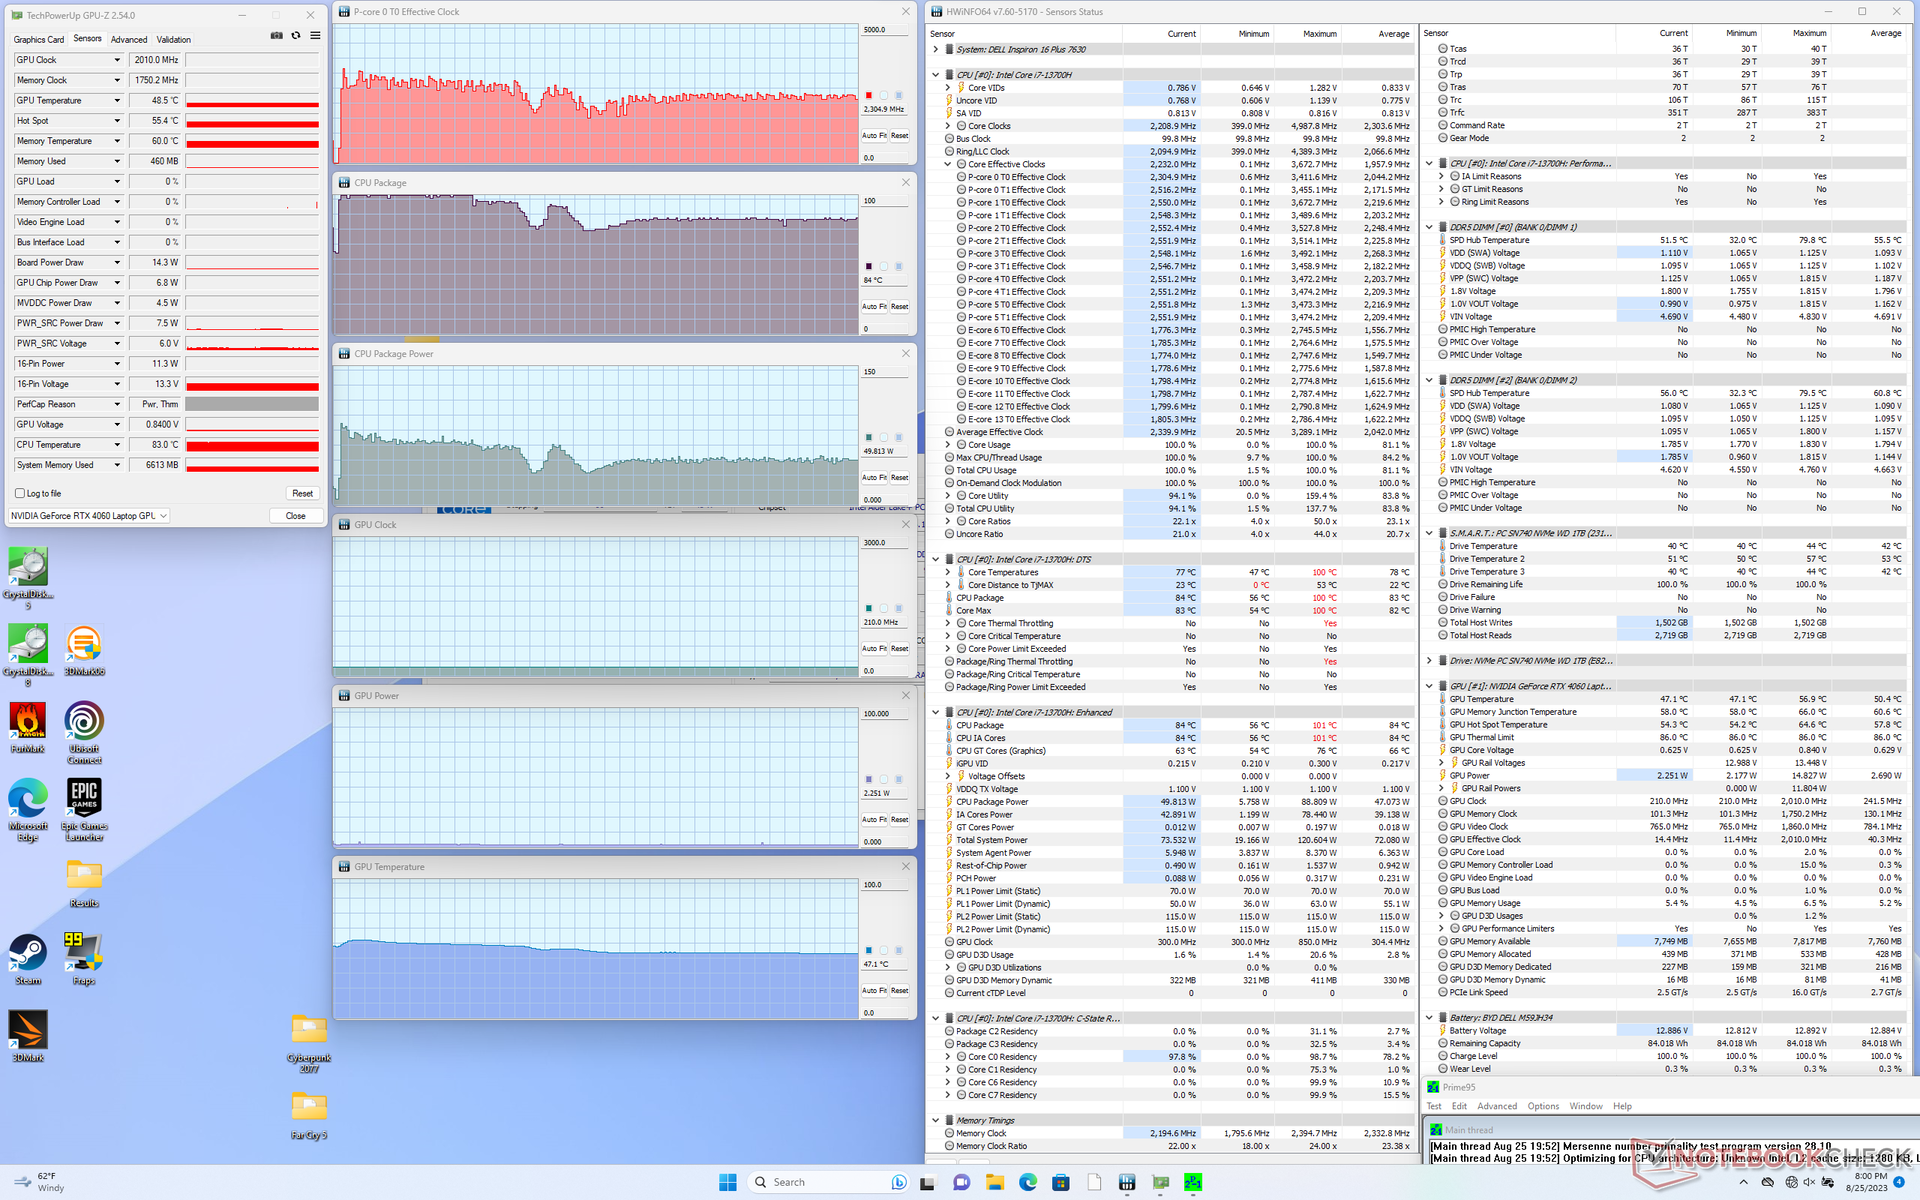
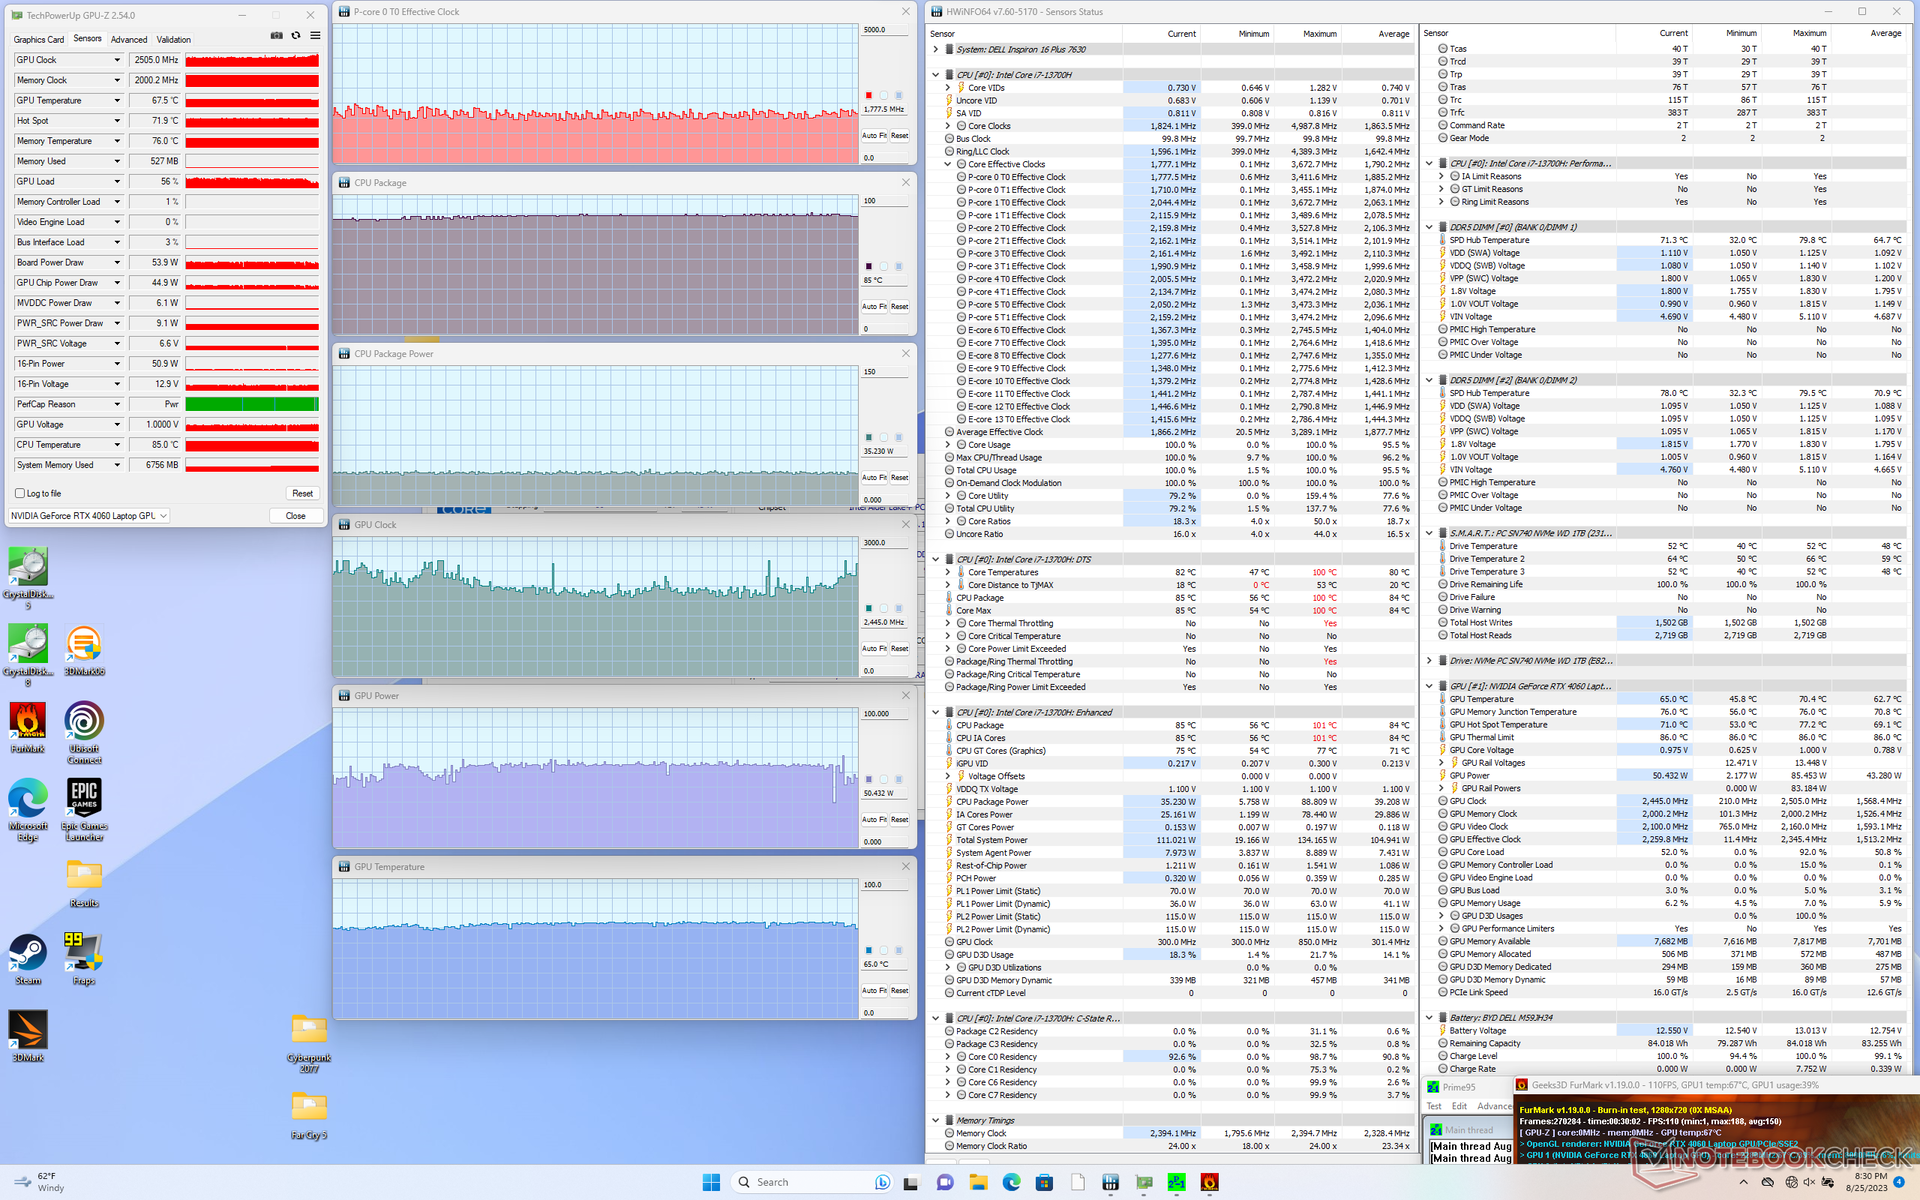
| CPU-Takt (GHz) | GPU-Takt (MHz) | durchschnittliche CPU-Temperatur (°C) | durchschnittliche GPU-Temperatur (°C) | |
| System Leerlauf | -- | -- | 56 | 50 |
| Prime95, Stress | 2,3-2,4 | -- | 84 | 47 |
| Prime95 + FurMark, Stress | ~1.8 | ~2.445 | 85 | 65 |
| Witcher 3, Stress (Balanced-Modus) | ~1.1 | 2.055 | 77 | 71 |
| Witcher 3, Stress (Performance-Modus) | ~1,1 | 2.250 | 76 | 71 |
Lautsprecher
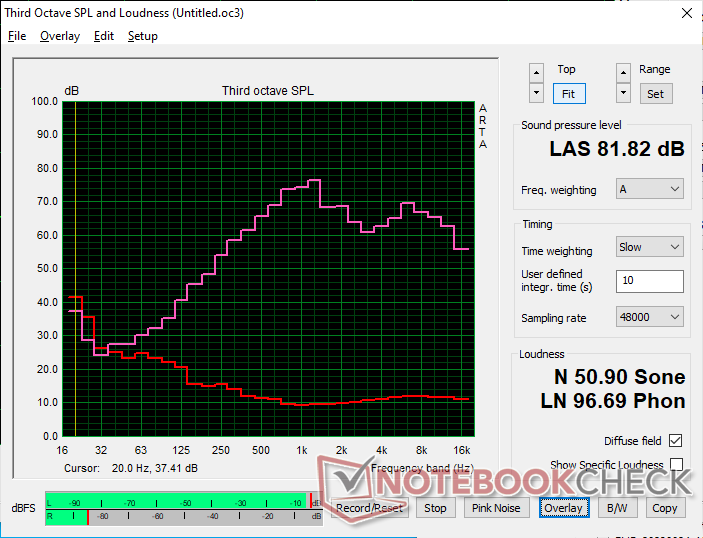
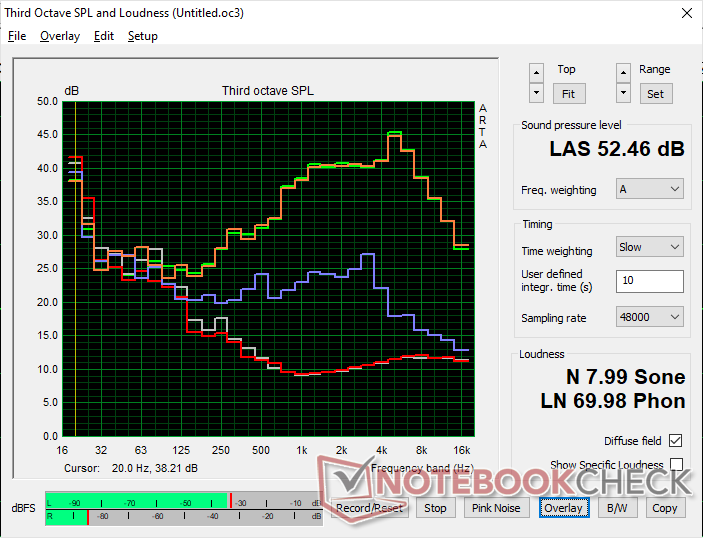
Dell Inspiron 16 Plus 7630 Audio Analyse
(±) | Mittelmäßig laut spielende Lautsprecher (81.8 dB)
Bass 100 - 315 Hz
(-) | kaum Bass - 17% niedriger als der Median
(±) | durchschnittlich lineare Bass-Wiedergabe (8.4% Delta zum Vorgänger)
Mitteltöne 400 - 2000 Hz
(±) | zu hohe Mitten, vom Median 6.3% abweichend
(+) | lineare Mitten (6.2% Delta zum Vorgänger)
Hochtöne 2 - 16 kHz
(+) | ausgeglichene Hochtöne, vom Median nur 2.2% abweichend
(+) | sehr lineare Hochtöne (5.6% Delta zum Vorgänger)
Gesamt im hörbaren Bereich 100 - 16.000 Hz
(±) | hörbarer Bereich ist durchschnittlich linear (15.9% Abstand zum Median)
Im Vergleich zu allen Geräten derselben Klasse
» 40% aller getesteten Geräte dieser Klasse waren besser, 6% vergleichbar, 54% schlechter
» Das beste Gerät hat einen Delta-Wert von 5%, durchschnittlich ist 17%, das schlechteste Gerät hat 45%
Im Vergleich zu allen Geräten im Test
» 25% aller getesteten Geräte waren besser, 5% vergleichbar, 70% schlechter
» Das beste Gerät hat einen Delta-Wert von 4%, durchschnittlich ist 24%, das schlechteste Gerät hat 134%
Apple MacBook Pro 16 2021 M1 Pro Audio Analyse
(+) | Die Lautsprecher können relativ laut spielen (84.7 dB)
Bass 100 - 315 Hz
(+) | guter Bass - nur 3.8% Abweichung vom Median
(+) | lineare Bass-Wiedergabe (5.2% Delta zum Vorgänger)
Mitteltöne 400 - 2000 Hz
(+) | ausgeglichene Mitten, vom Median nur 1.3% abweichend
(+) | lineare Mitten (2.1% Delta zum Vorgänger)
Hochtöne 2 - 16 kHz
(+) | ausgeglichene Hochtöne, vom Median nur 1.9% abweichend
(+) | sehr lineare Hochtöne (2.7% Delta zum Vorgänger)
Gesamt im hörbaren Bereich 100 - 16.000 Hz
(+) | hörbarer Bereich ist sehr linear (4.6% Abstand zum Median
Im Vergleich zu allen Geräten derselben Klasse
» 0% aller getesteten Geräte dieser Klasse waren besser, 0% vergleichbar, 100% schlechter
» Das beste Gerät hat einen Delta-Wert von 5%, durchschnittlich ist 17%, das schlechteste Gerät hat 45%
Im Vergleich zu allen Geräten im Test
» 0% aller getesteten Geräte waren besser, 0% vergleichbar, 100% schlechter
» Das beste Gerät hat einen Delta-Wert von 4%, durchschnittlich ist 24%, das schlechteste Gerät hat 134%
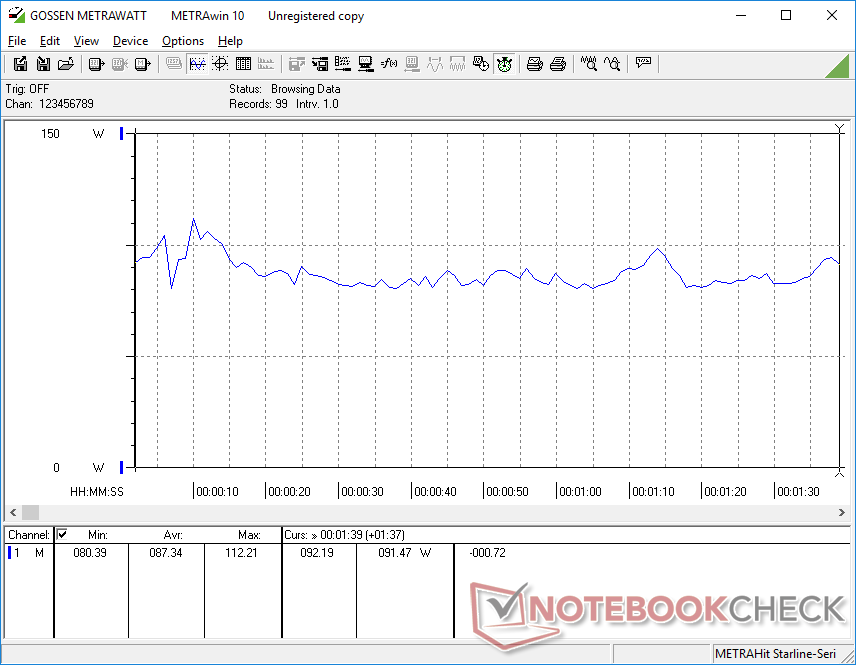
Energieverwaltung
Stromverbrauch - Hohe GPU-Performance-per-Watt
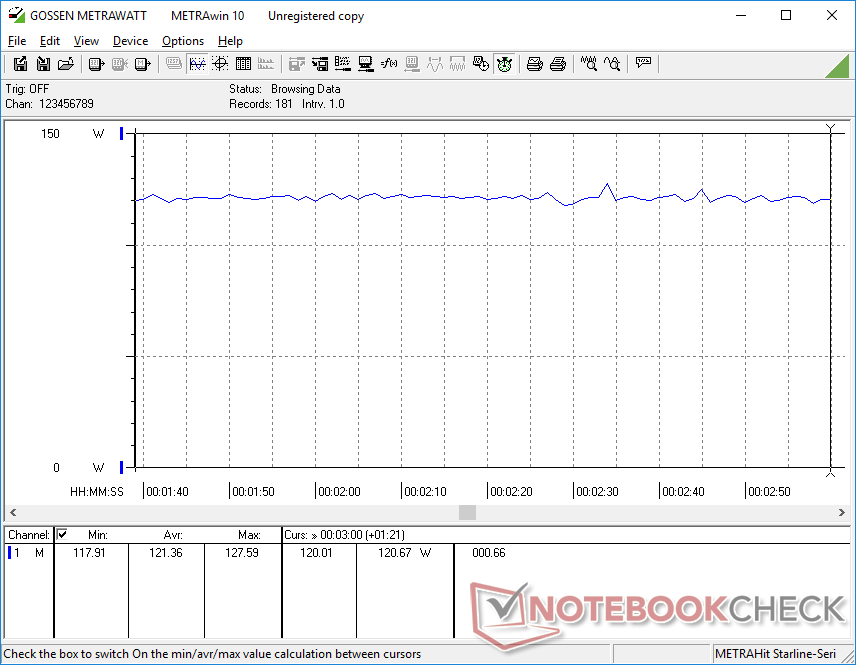
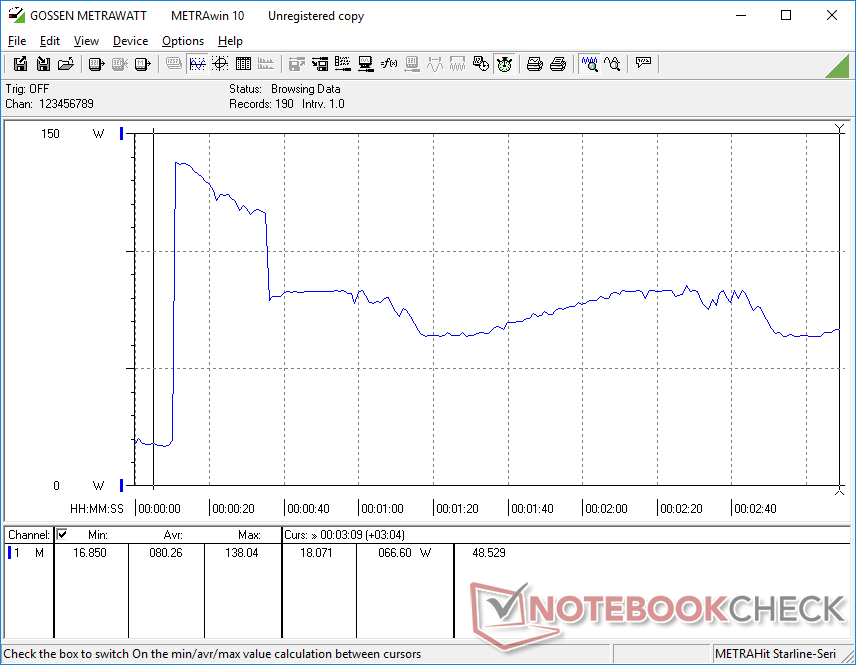
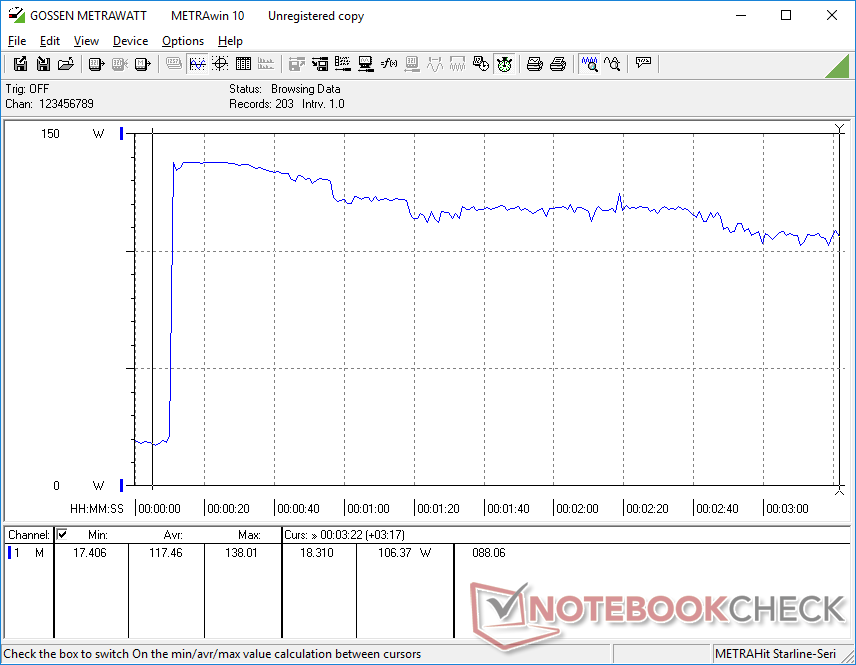
Im Leerlauf auf dem Desktop oder bei der Ausführung von Spielen ist der Verbrauch etwas höher als beim letztjährigen Modell. Der 8-prozentige Anstieg bei der Ausführung von Spielen verblasst jedoch im Vergleich zur 40- bis 60-prozentigen Steigerung der Grafikleistung gegenüber der RTX 3050 Ti. Die Leistung pro Watt spricht also immer noch für unser neueres Modell, auch wenn der Stromverbrauch etwas höher sein kann.
Gaming-Notebooks mit der gleichen CPU und GPU wie unser Dell Inspiron, wie z. B. das Acer Nitro 17 sind in der Regel stromhungriger, da sie einen höheren Stromverbrauch anstreben, um mehr Leistung aus den Prozessoren herauszuholen. Beim Spielen zum Beispiel benötigt das Acer etwa 30 W mehr.
Wir konnten mit dem mittelgroßen (~15 x 7,4 x 2,5 cm) 130-Watt-Netzteil einen temporären Maximalverbrauch von 138 W messen, wenn CPU und GPU zu 100 Prozent ausgelastet sind. Beachten Sie, dass Konfigurationen ohne diskrete Grafik stattdessen mit einem kleineren 90-W-Netzteil ausgeliefert werden.
| Aus / Standby | |
| Idle | |
| Last |
|
Legende:
min: | |
| Dell Inspiron 16 Plus 7630 i7-13700H, GeForce RTX 4060 Laptop GPU, WD PC SN740 SDDPTQD-1T00, IPS, 2560x1600, 16" | Dell Inspiron 16 Plus 7620 i7-12700H, GeForce RTX 3050 Ti Laptop GPU, Kioxia BG5 KBG50ZNS512G, IPS, 3072x1920, 16" | Lenovo Slim Pro 9i 16IRP8 i9-13905H, GeForce RTX 4050 Laptop GPU, Samsung PM9A1 MZVL21T0HCLR, Mini-LED, 3200x2000, 16" | Asus Vivobook Pro 16X K6604JV-MX016W i9-13980HX, GeForce RTX 4060 Laptop GPU, Solidigm P41 Plus SSDPFKNU010TZ, OLED, 3200x2000, 16" | HP Envy 16 h0112nr i7-12700H, GeForce RTX 3060 Laptop GPU, Micron 3400 1TB MTFDKBA1T0TFH, OLED, 3840x2400, 16" | MSI Summit E16 Flip A12UDT-031 i7-1280P, GeForce RTX 3050 Ti Laptop GPU, Samsung PM9A1 MZVL22T0HBLB, IPS, 2560x1600, 16" | |
|---|---|---|---|---|---|---|
| Stromverbrauch | 15% | -28% | -23% | -9% | 22% | |
| Idle min * (Watt) | 15.6 | 6.8 56% | 16 -3% | 13.8 12% | 10 36% | 9.8 37% |
| Idle avg * (Watt) | 17.7 | 9.6 46% | 30 -69% | 16 10% | 10.9 38% | 15.3 14% |
| Idle max * (Watt) | 20.6 | 17 17% | 30.4 -48% | 19 8% | 27.8 -35% | 16.3 21% |
| Last avg * (Watt) | 87.4 | 117.5 -34% | 78.9 10% | 147 -68% | 116.4 -33% | 87 -0% |
| Witcher 3 ultra * (Watt) | 121.7 | 113.1 7% | 155.3 -28% | 147.8 -21% | 133.7 -10% | 86.1 29% |
| Last max * (Watt) | 138 | 137.4 -0% | 180.4 -31% | 244 -77% | 209.8 -52% | 100 28% |
* ... kleinere Werte sind besser
Power Consumption Witcher 3 / Stresstest
Power Consumption external Monitor
Akkulaufzeit
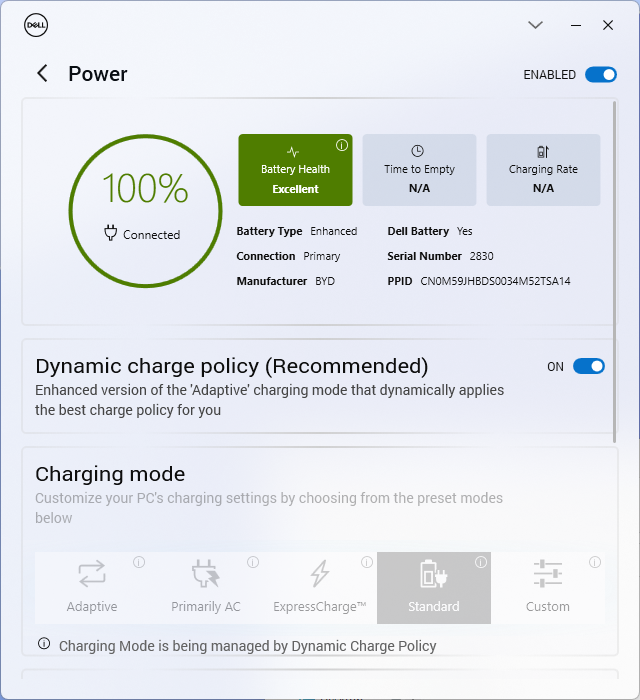
Sowohl die Akkukapazität als auch Akkulaufzeit sind gleich geblieben. Im Modus "Balanced" konnten wir 9,5 Stunden reales WLAN-Browsing aufzeichnen, was länger ist als bei konkurrierenden Modellen wie dem Lenovo Slim Pro 9i 16IRP8 oder HP Envy 16 um jeweils mindestens ein paar Stunden.
Das Aufladen von der leeren zur vollen Kapazität dauert mit dem mitgelieferten Netzteil etwa 90 Minuten. Das System kann auch mit USB-C-Adaptern aufgeladen werden, zum Beispiel denen, welche mit der XPS-Serie geliefert werden.
| Dell Inspiron 16 Plus 7630 i7-13700H, GeForce RTX 4060 Laptop GPU, 86 Wh | Dell Inspiron 16 Plus 7620 i7-12700H, GeForce RTX 3050 Ti Laptop GPU, 86 Wh | Lenovo Slim Pro 9i 16IRP8 i9-13905H, GeForce RTX 4050 Laptop GPU, 75 Wh | Asus Vivobook Pro 16X K6604JV-MX016W i9-13980HX, GeForce RTX 4060 Laptop GPU, 90 Wh | HP Envy 16 h0112nr i7-12700H, GeForce RTX 3060 Laptop GPU, 83 Wh | MSI Summit E16 Flip A12UDT-031 i7-1280P, GeForce RTX 3050 Ti Laptop GPU, 82 Wh | |
|---|---|---|---|---|---|---|
| Akkulaufzeit | -2% | -30% | -12% | -0% | -24% | |
| Idle (h) | 17.6 | 18.6 6% | 17.8 1% | |||
| WLAN (h) | 9.4 | 9.6 2% | 6.6 -30% | 6.5 -31% | 7.9 -16% | 7.1 -24% |
| Last (h) | 1.4 | 1.2 -14% | 1.5 7% | 1.6 14% | ||
| H.264 (h) | 5.3 |
Pro
Contra
Fazit - Upgrade für die schnellere GPU
Die Upgrades gegenüber dem letztjährigen Inspiron 16 Plus 7620 sind in vielerlei Hinsicht bedeutender als zunächst erwartet. Abgesehen von der enormen Steigerung der Grafikleistung beim Wechsel von der RTX 3050 Ti zur RTX 4060 sind die leiseren und lauteren Lüftergeräusche zwischen den beiden Modellen bemerkenswert, ebenso wie die kühleren Kerntemperaturen beim neueren Modell. Die Displayoptionen unterscheiden sich, da sie nun eine optionale 120-Hz-Bildwiederholrate beinhalten, während SODIMM-Upgrades nun zwei Steckplätze statt einem bieten. Die steiferen Scharniere sind ebenfalls eine willkommene Neuerung, um die Wahrscheinlichkeit zu verringern, dass sie zu schnell kaputt gehen. Das Benutzererlebnis hat sich ausreichend verbessert, auch wenn die CPU-Leistung nicht mehr so gut ist und die Tastatur die gleiche bleibt wie zuvor.
Beim Inspiron 16 Plus 7630 geht es um Ausgewogenheit. Seine Funktionen und seine Leistung sind gerade ausreichend, um die meisten Multimedia- und Spielanforderungen zu erfüllen, ohne dass man dafür viel Geld ausgeben muss.
Als Allrounder für Multimedia- und Spieleanwendungen fehlen dem Inspiron 16 Plus 7630 jedoch einige Funktionen, die Hardcore-Multimedia-Notebooks und Hardcore-Gaming-Notebooks in der Regel aufweisen. Auf der Multimedia-Seite werden Besitzer des Inspiron 16 Plus 7630 auf sattere DCi-P3-Farben, höhere native Auflösungen und einen schnellen integrierten SD-Kartenleser verzichten müssen. Auf der Spieleseite verzichtet das System auf G-Sync und MUX, und seine RTX 4060 ist generell langsamer als der Durchschnitt. Das Inspiron 16 Plus 7630 eignet sich hervorragend für die Erstellung von Inhalten und für Spiele, aber Nutzer, die sich mehr auf die Erstellung von Inhalten konzentrieren, sollten ein HP Envy 16 oder Asus ZenBook Pro Duo in Erwägung ziehen, während Vielspieler sich nach dedizierten Gaming-Rechnern umsehen sollten, z. B. einem Dell G-Modell oder einem Asus ROG.
Preis und Verfügbarkeit
Dell liefert jetzt das Inspiron 16 Plus 7630 mit Core i7 und RTX 4060 für 1.499 Euro aus.
Dell Inspiron 16 Plus 7630
- 30.08.2023 v7 (old)
Allen Ngo
Transparenz
Die Auswahl der zu testenden Geräte erfolgt innerhalb der Redaktion. Das vorliegende Testmuster wurde dem Autor vom Hersteller oder einem Shop zu Testzwecken leihweise zur Verfügung gestellt. Eine Einflussnahme des Leihstellers auf den Testbericht gab es nicht, der Hersteller erhielt keine Version des Reviews vor der Veröffentlichung. Es bestand keine Verpflichtung zur Publikation. Als eigenständiges, unabhängiges Unternehmen unterliegt Notebookcheck keiner Diktion von Herstellern, Shops und Verlagen.
So testet Notebookcheck
Pro Jahr werden von Notebookcheck hunderte Laptops und Smartphones unabhängig in von uns standardisierten technischen Verfahren getestet, um eine Vergleichbarkeit aller Testergebnisse zu gewährleisten. Seit rund 20 Jahren entwickeln wir diese Testmethoden kontinuierlich weiter und setzen damit Branchenstandards. In unseren Testlaboren kommt ausschließlich hochwertiges Messequipment in die Hände erfahrener Techniker und Redakteure. Die Tests unterliegen einer mehrstufigen Kontrolle. Unsere komplexe Gesamtbewertung basiert auf hunderten fundierten Messergebnissen und Benchmarks, womit Ihnen Objektivität garantiert ist. Weitere Informationen zu unseren Testmethoden gibt es hier.
Preisvergleich

