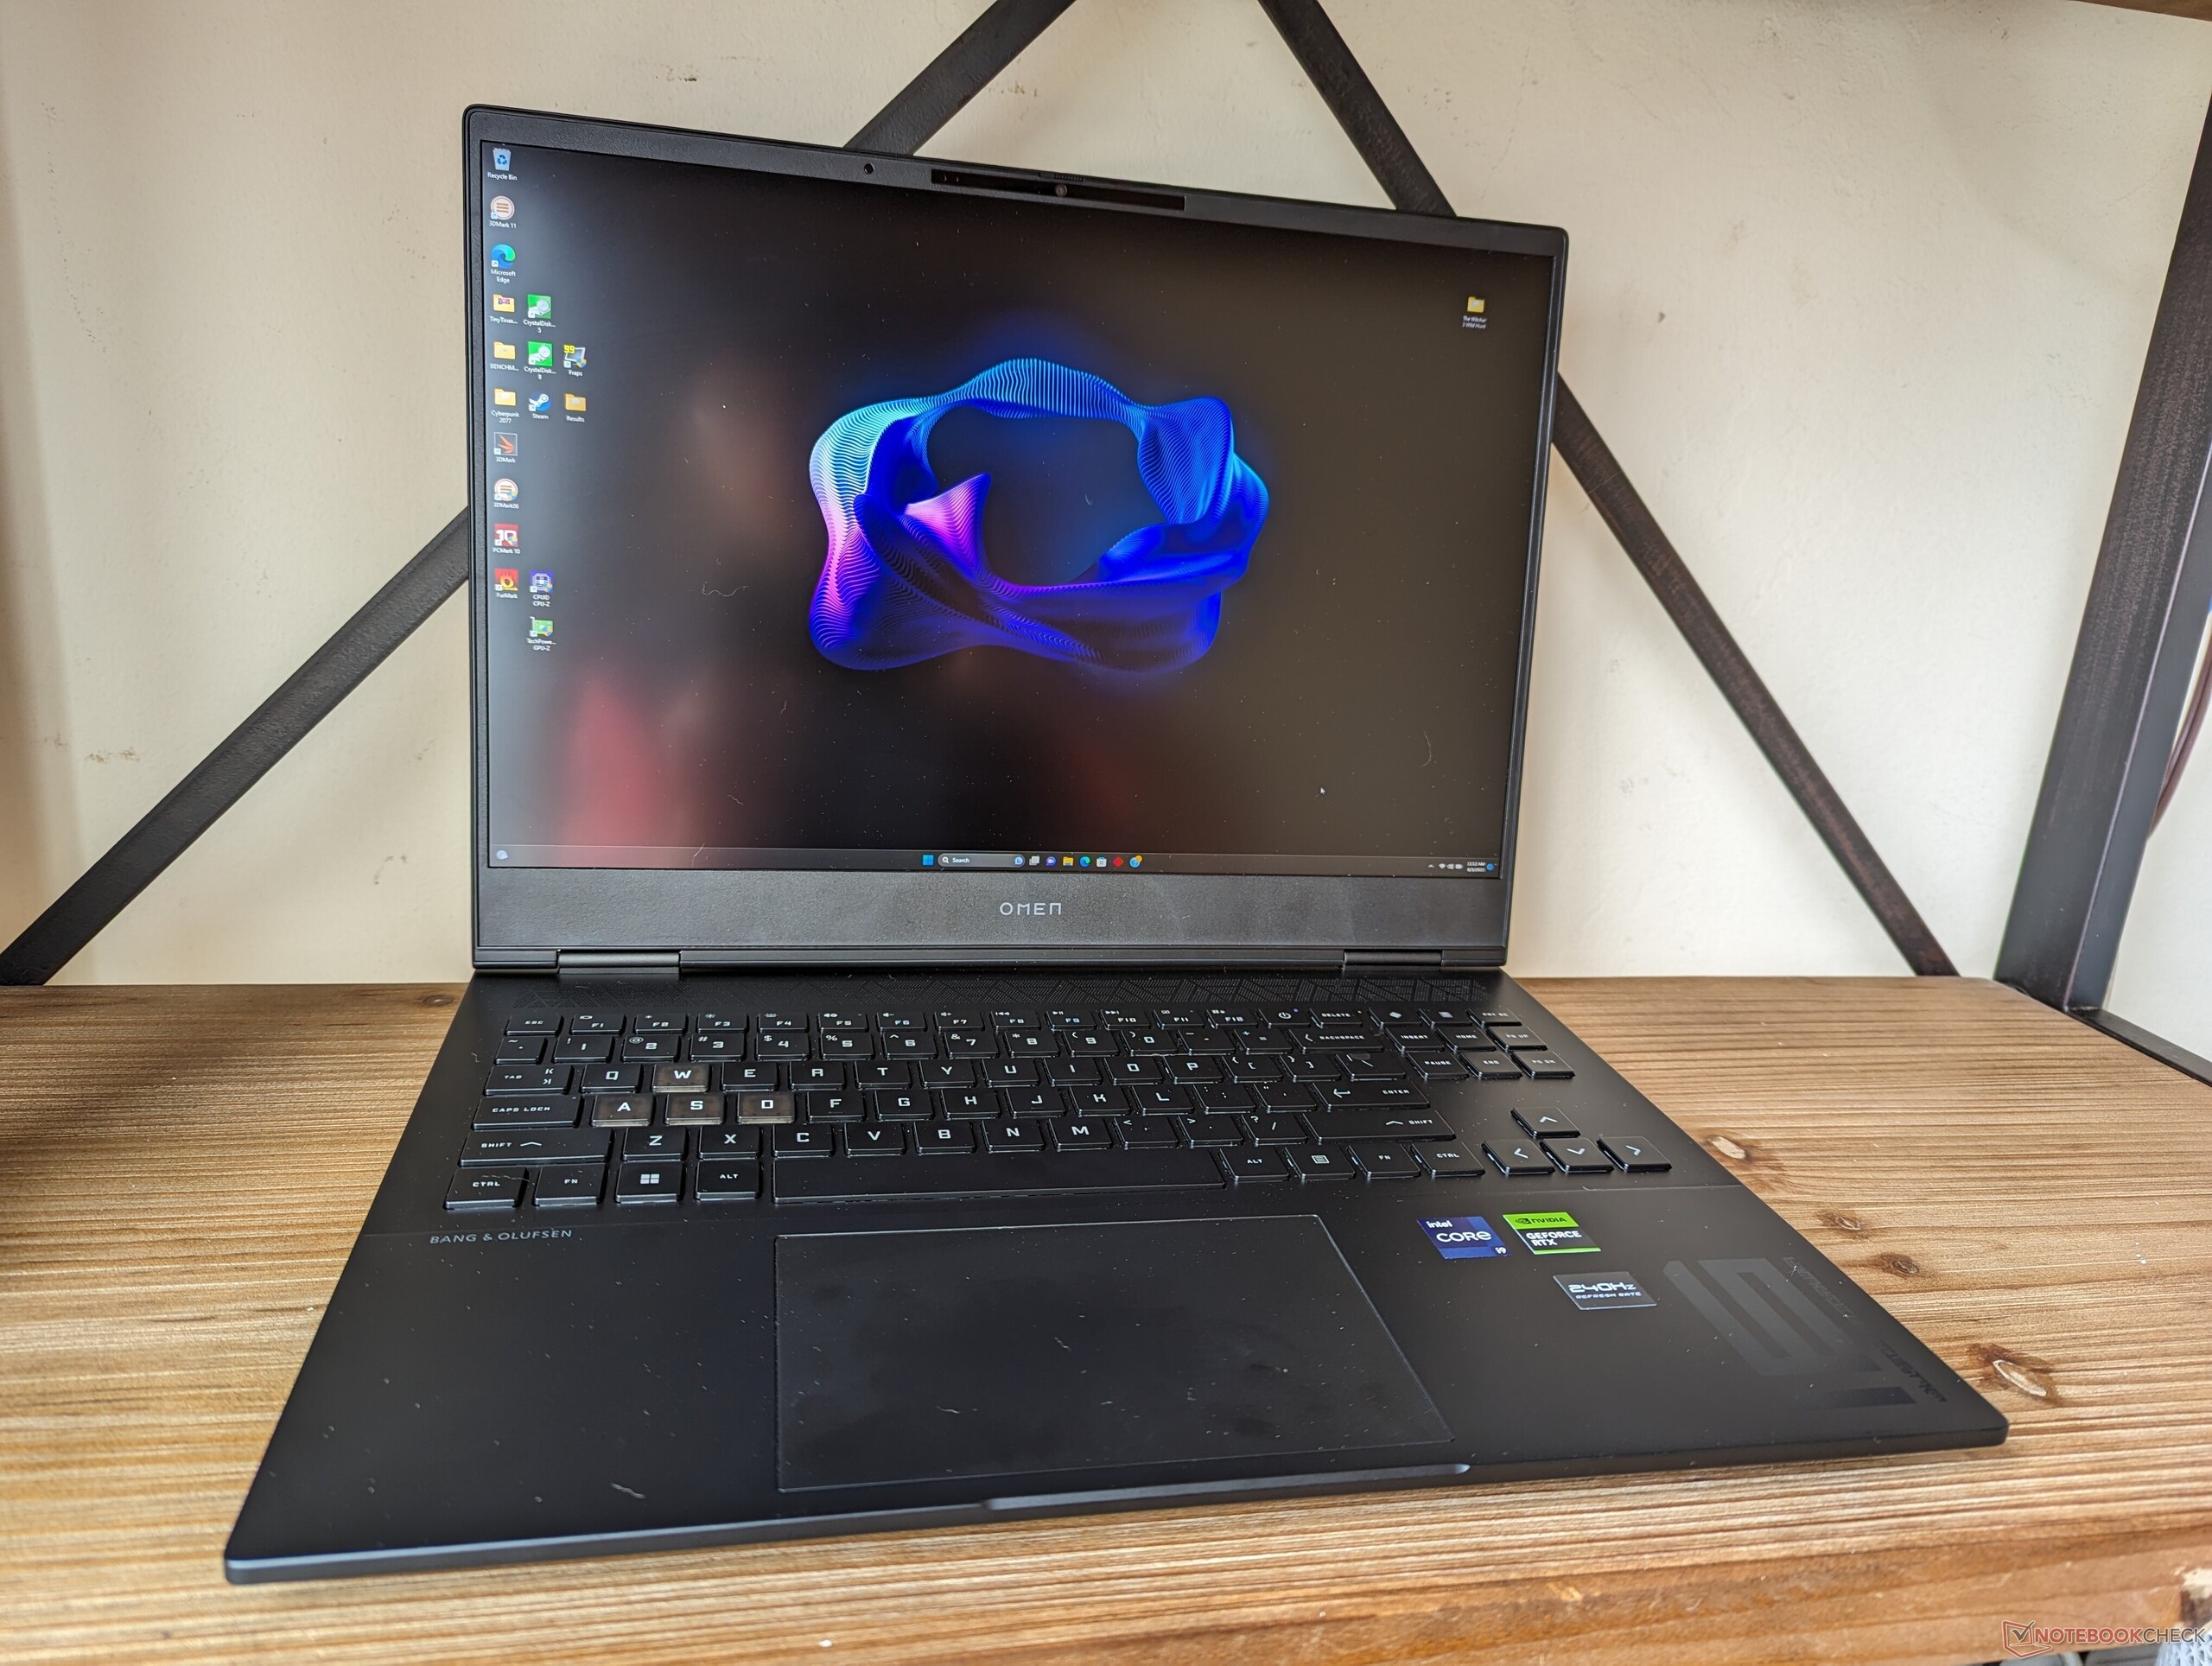
HP Omen Transcend 16 Laptop im Test: Mehr als nur ein anderer Name
")
Das Omen Transcend 16 ist eine Weiterentwicklung des regulären Omen 16, welches im Vergleich mit einigen Verbesserungen daher kommt. Auch wenn das Design und die Materialien des Gehäuses gleich geblieben sind, kann das Innenleben doch etwas mehr bieten.
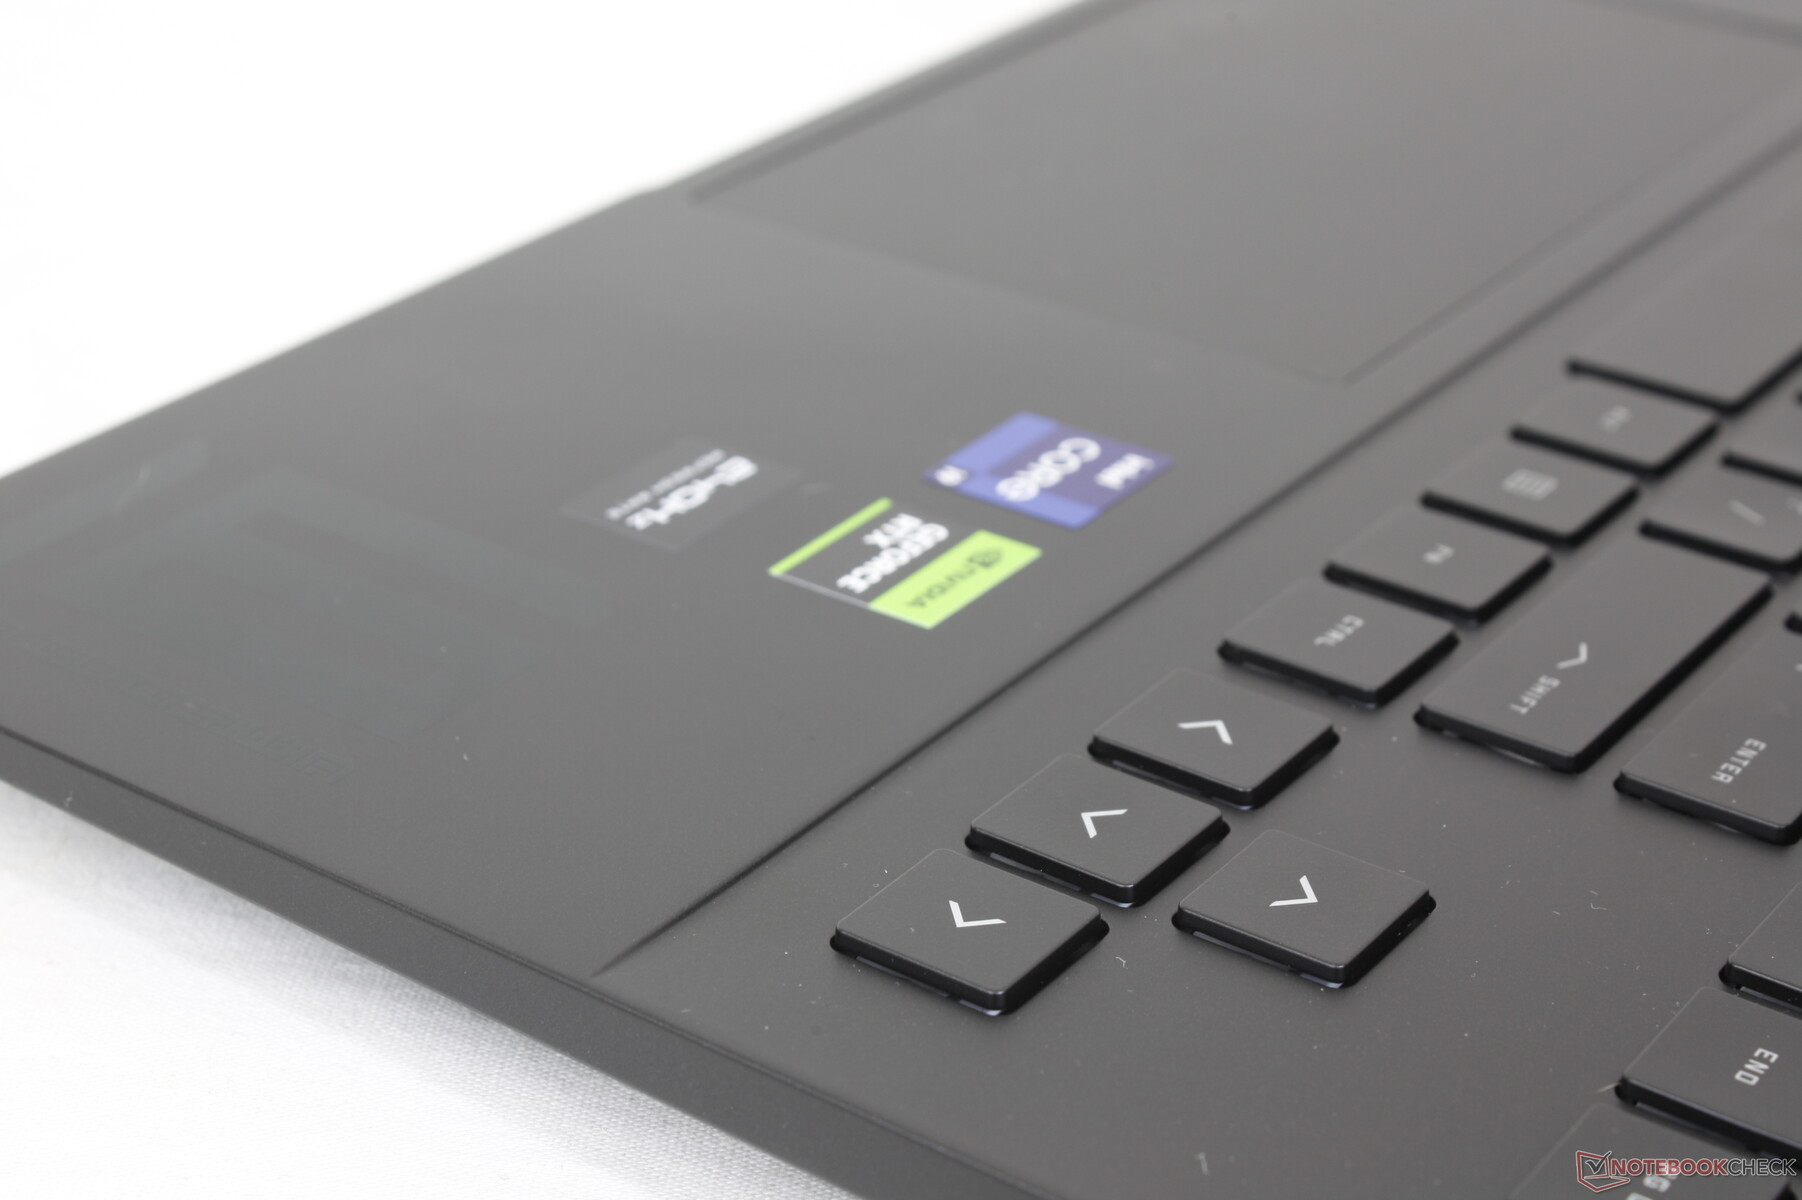
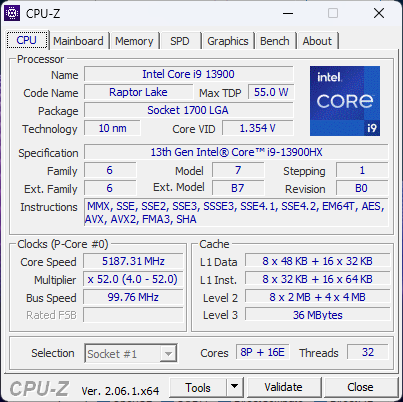
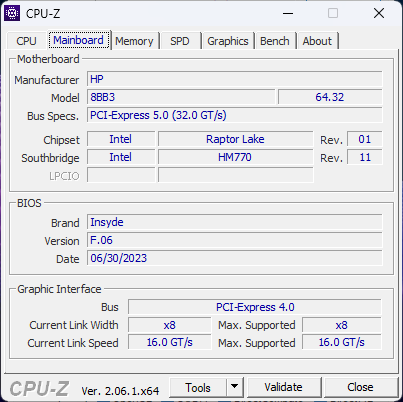
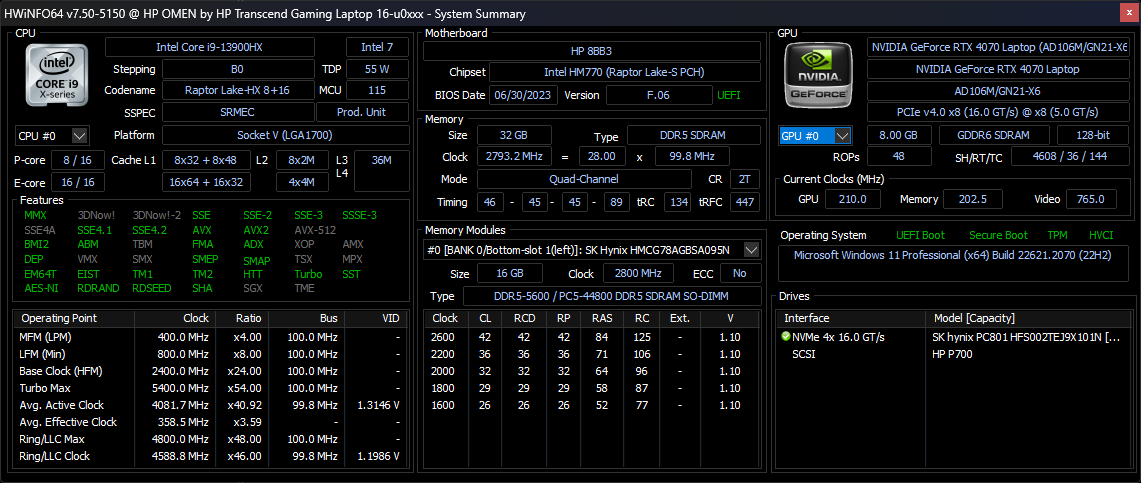
Unser Testgerät besitzt die höchstmögliche Konfiguration mit einem Core i9 der 13. Generation, dem i9-13900HX, einer GeForce-RTX-4070-GPU und einem QHD+-Mini-LED-Display. Letzteres kann dabei mit einer Auflösung von 2.560 x 1.600 Pixeln, einer Bildwiederholrate von 240 Hz und kräftigen P3-Farben überzeugen. Im Handel ist das Omen Transcend 16 für 2.999 Euro (UVP) zu haben. Falls man auf der Suche nach etwas Günstigerem ist, gibt es die Möglichkeit, das Notebook mit einer i7-13700HX-CPU, einer RTX-4050-GPU und einem 1.200-p-165-Hz-Display auszustatten. Exakt diese Konfiguration ist in Europa zwar noch nicht erhältlich, würde umgerechnet aber ca. 1.133 Euro (1.250 US-Dollar) kosten.
Konkurrenten zum Omen Transcend 16 wären andere High-End-Laptops mit 16-Zoll-Display, wie das Lenovo Legion Slim 7i 16 G8, das Acer Nitro 16, das Alienware x16 R1 oder das Asus ROG Zephyrus M16.
Weitere HP Tests:
Potentielle Mitstreiter im Vergleich
Bew. | Datum | Modell | Gewicht | Dicke | Größe | Auflösung | Preis ab |
|---|---|---|---|---|---|---|---|
| 87.9 % v7 (old) | 08 / 2023 | HP Omen Transcend 16 i9-13900HX, GeForce RTX 4070 Laptop GPU | 2.3 kg | 19.8 mm | 16.00" | 2560x1600 | |
| 90 % v7 (old) | 07 / 2023 | Lenovo Legion Slim 7i 16 Gen 8 i9-13900H, GeForce RTX 4070 Laptop GPU | 2.1 kg | 19.9 mm | 16.00" | 2560x1600 | |
| 87.4 % v7 (old) | 07 / 2023 | HP Omen 16-wf000 i7-13700HX, GeForce RTX 4080 Laptop GPU | 2.4 kg | 23.6 mm | 16.10" | 2560x1440 | |
| 88.4 % v7 (old) | 06 / 2023 | Alienware x16 R1 i9-13900HK, GeForce RTX 4080 Laptop GPU | 2.6 kg | 18.57 mm | 16.00" | 2560x1600 | |
| 88.1 % v7 (old) | 06 / 2023 | Acer Nitro 16 AN16-41 R7 7735HS, GeForce RTX 4070 Laptop GPU | 2.7 kg | 27.9 mm | 16.00" | 2560x1600 | |
| 87.8 % v7 (old) | 02 / 2023 | Asus ROG Zephyrus M16 GU603Z i9-12900H, GeForce RTX 3070 Ti Laptop GPU | 2.1 kg | 19.9 mm | 16.00" | 2560x1600 |
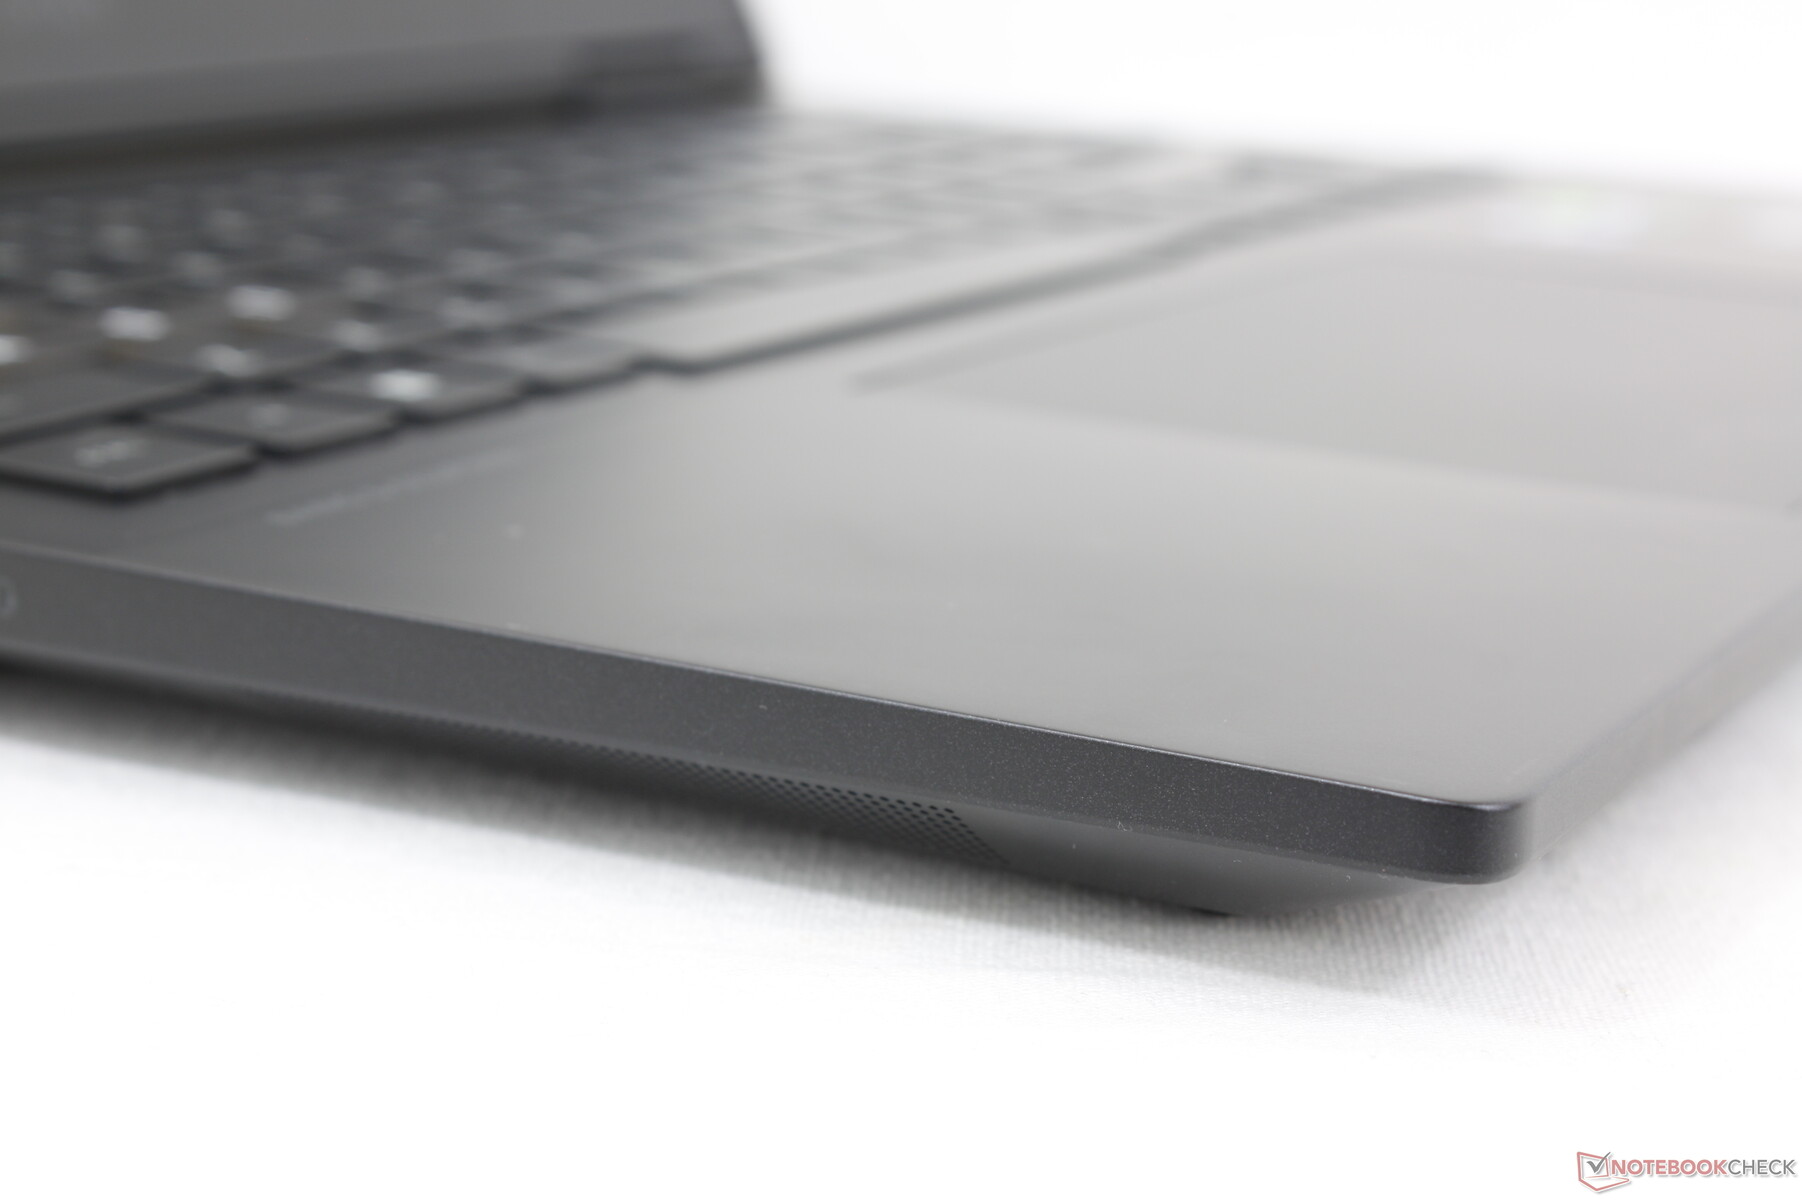
Gehäuse — Gleiche Materialien, andere Dimensionen
Einer der größten Veränderungen am Omen Transcend 16 - im Vergleich zum Omen 16 - ist das neue 16:10-Seitenverhältnis (statt wie bisher 16:9). Ansonsten wurden exakt die gleichen Materialien wie bisher verbaut. Hier ist erwähnenswert, dass sich die Breite der Ränder trotz dem neuen Seitenverhältnis nicht verändert hat.

Das neue 16:10-Seitenverhältnis macht das Omen Transcend 16 etwas viereckiger und um ca. vier mm kleiner. Dadurch ist es zwar minimal leichter, aber immer noch schwerer als das Asus ROG Zephyrus M16 oder das Lenovo Legion Slim 7i 16 G8.
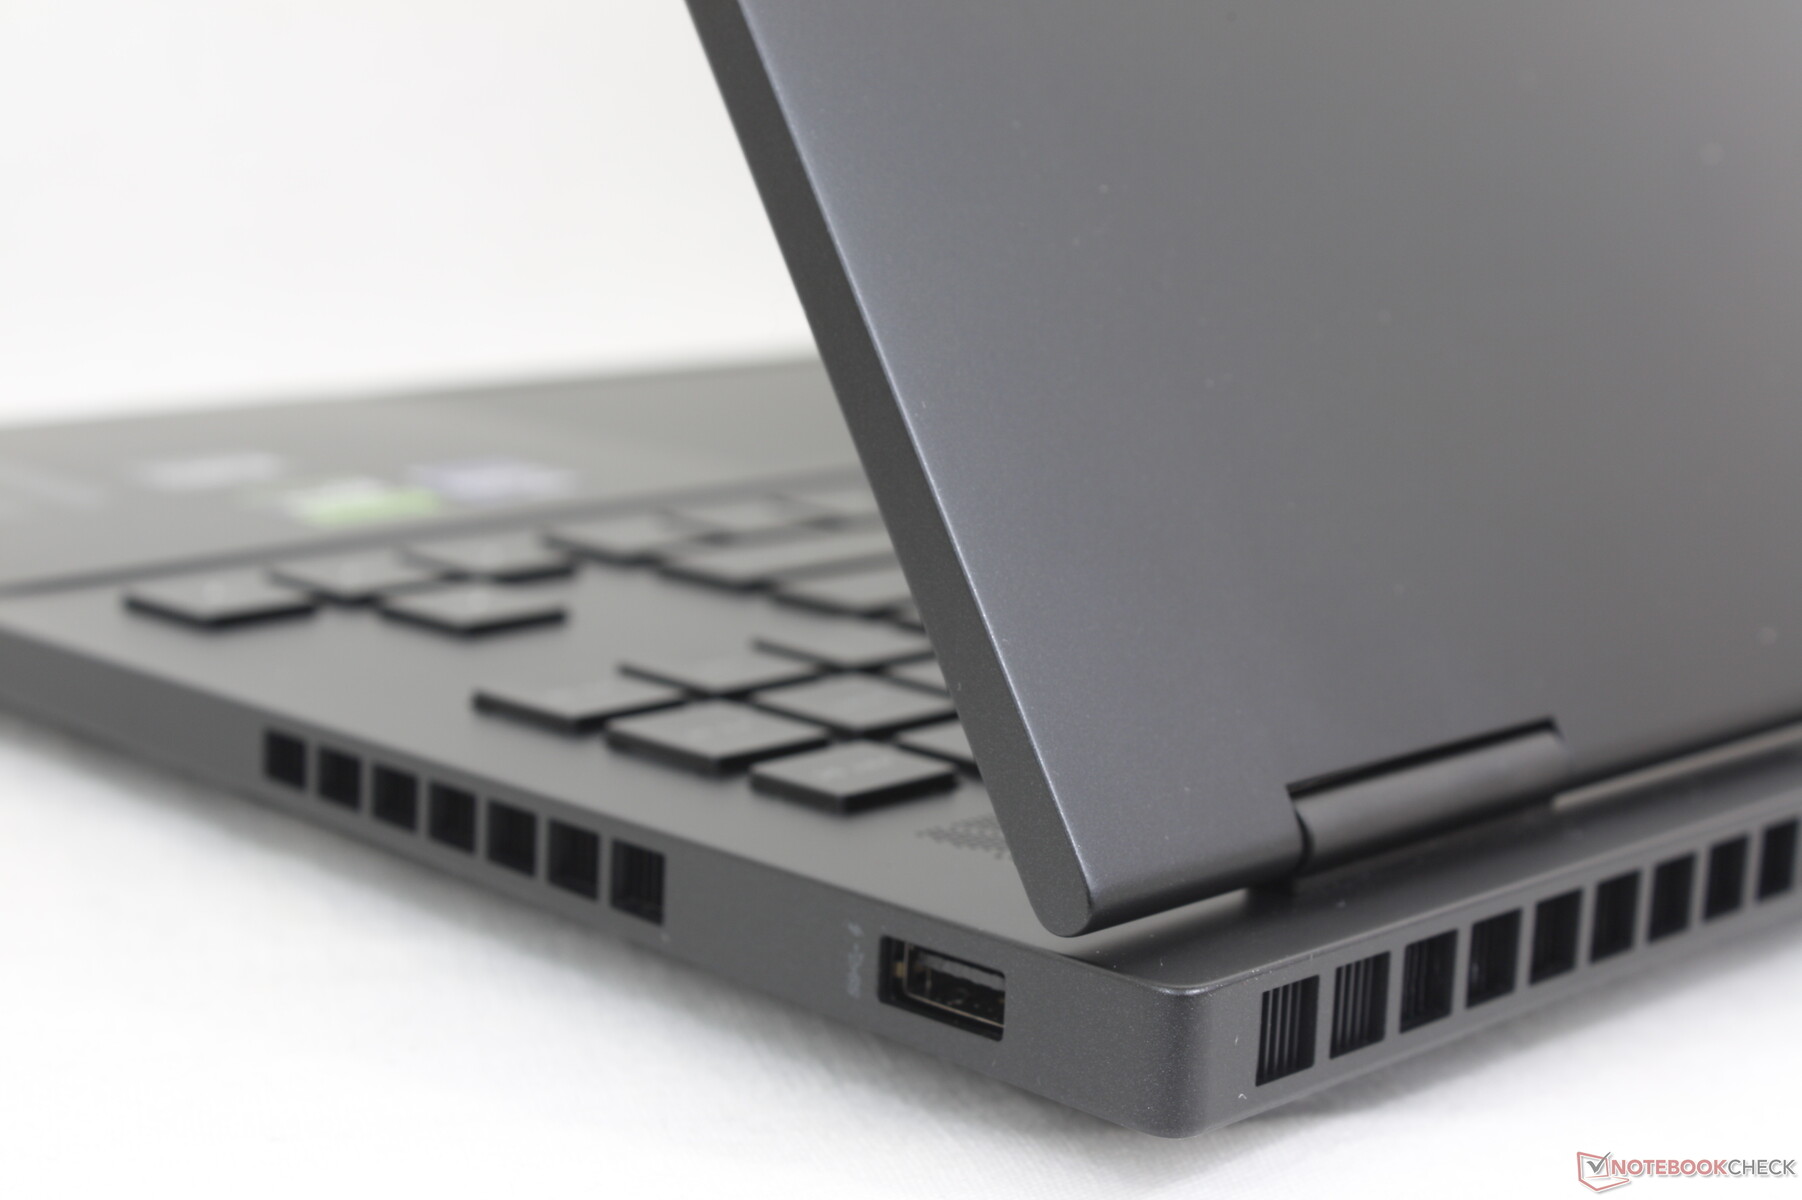
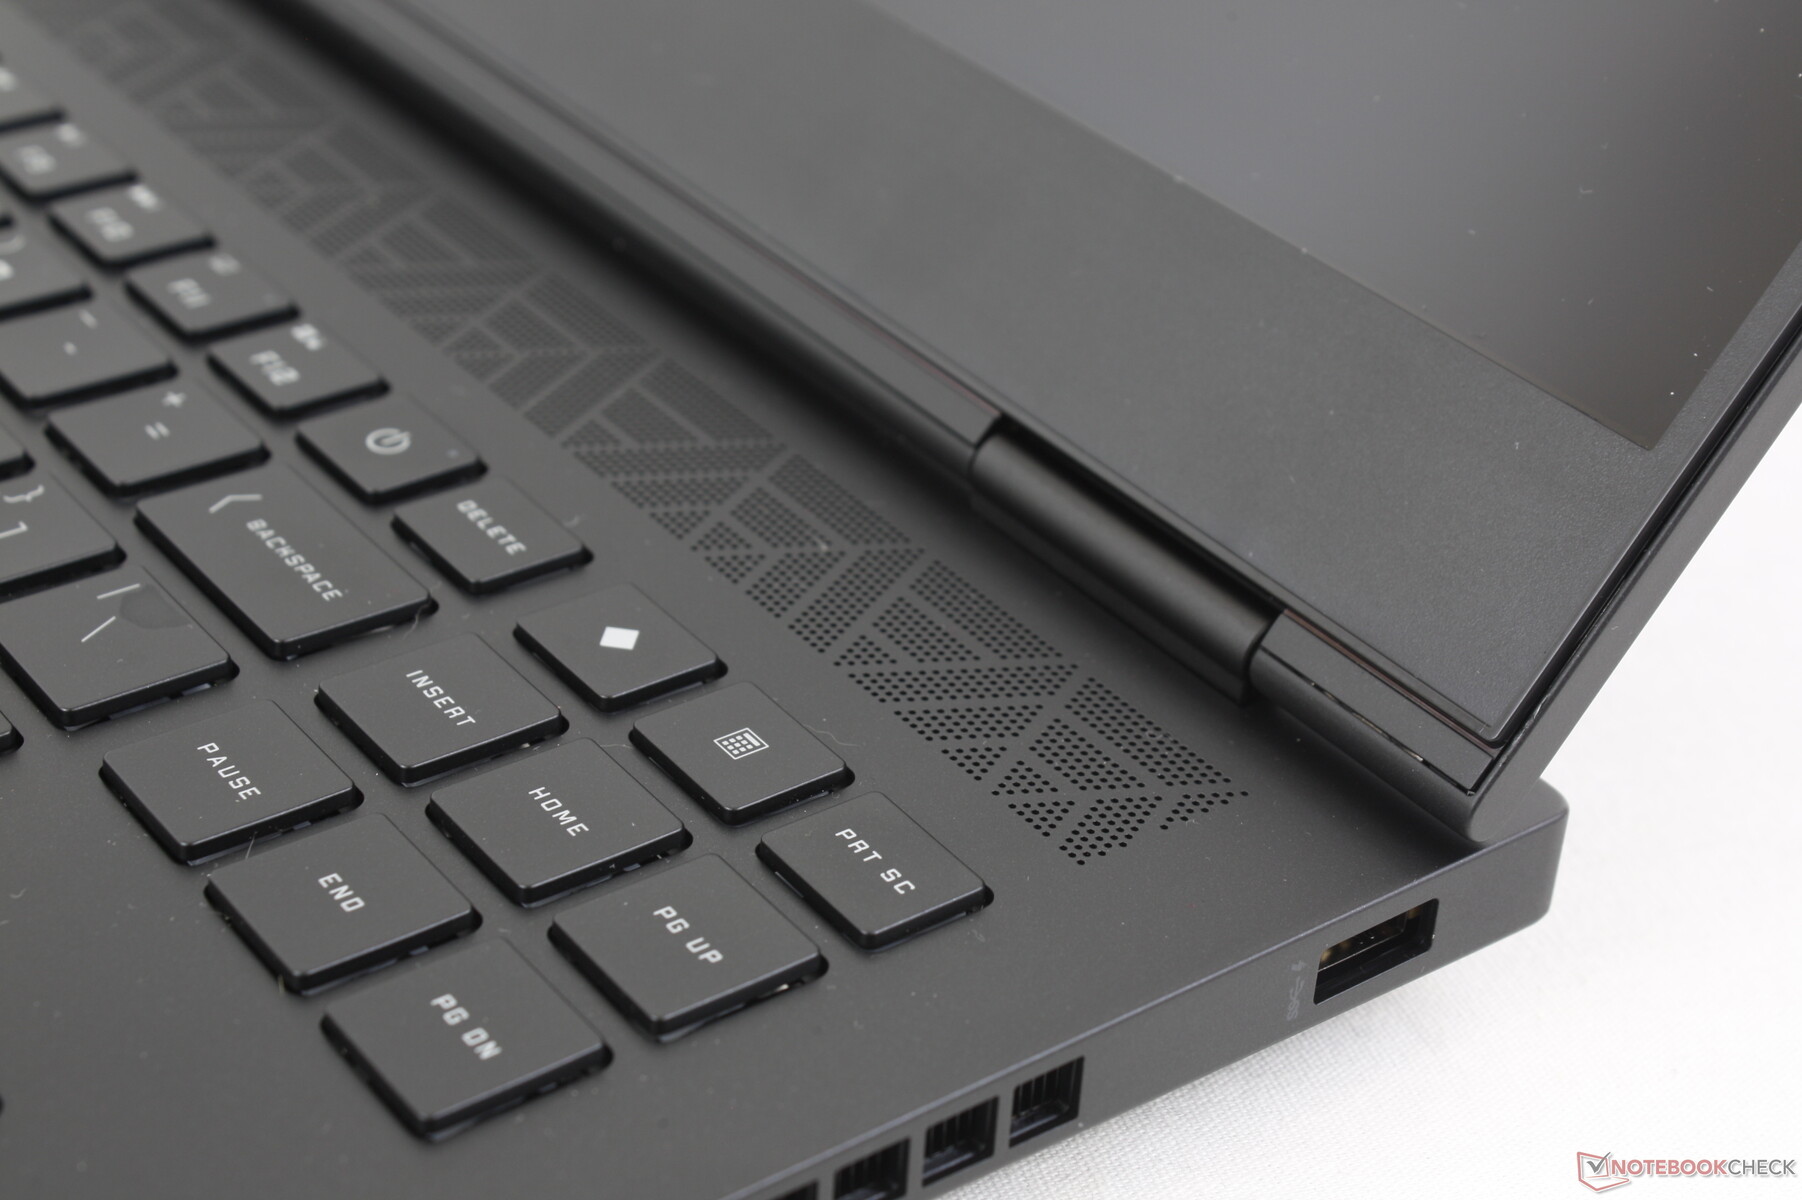
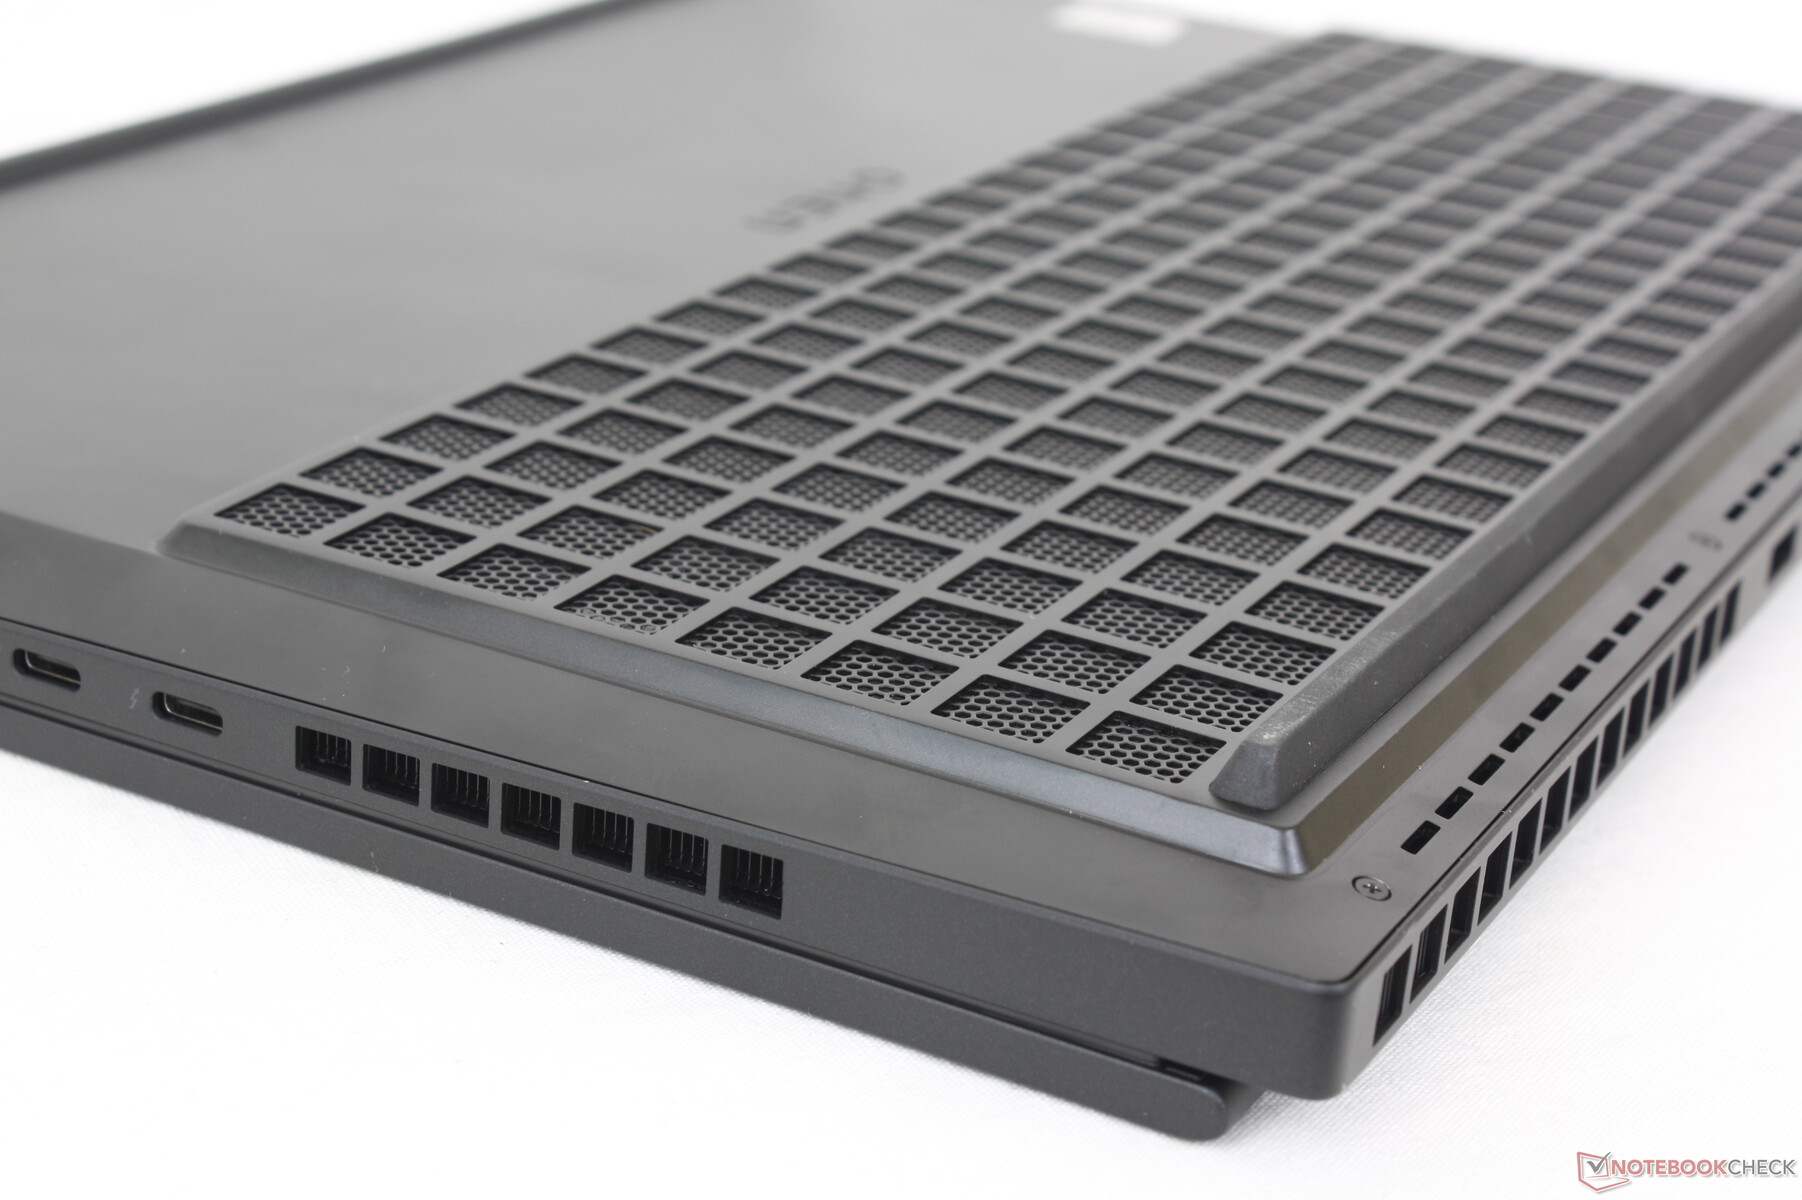
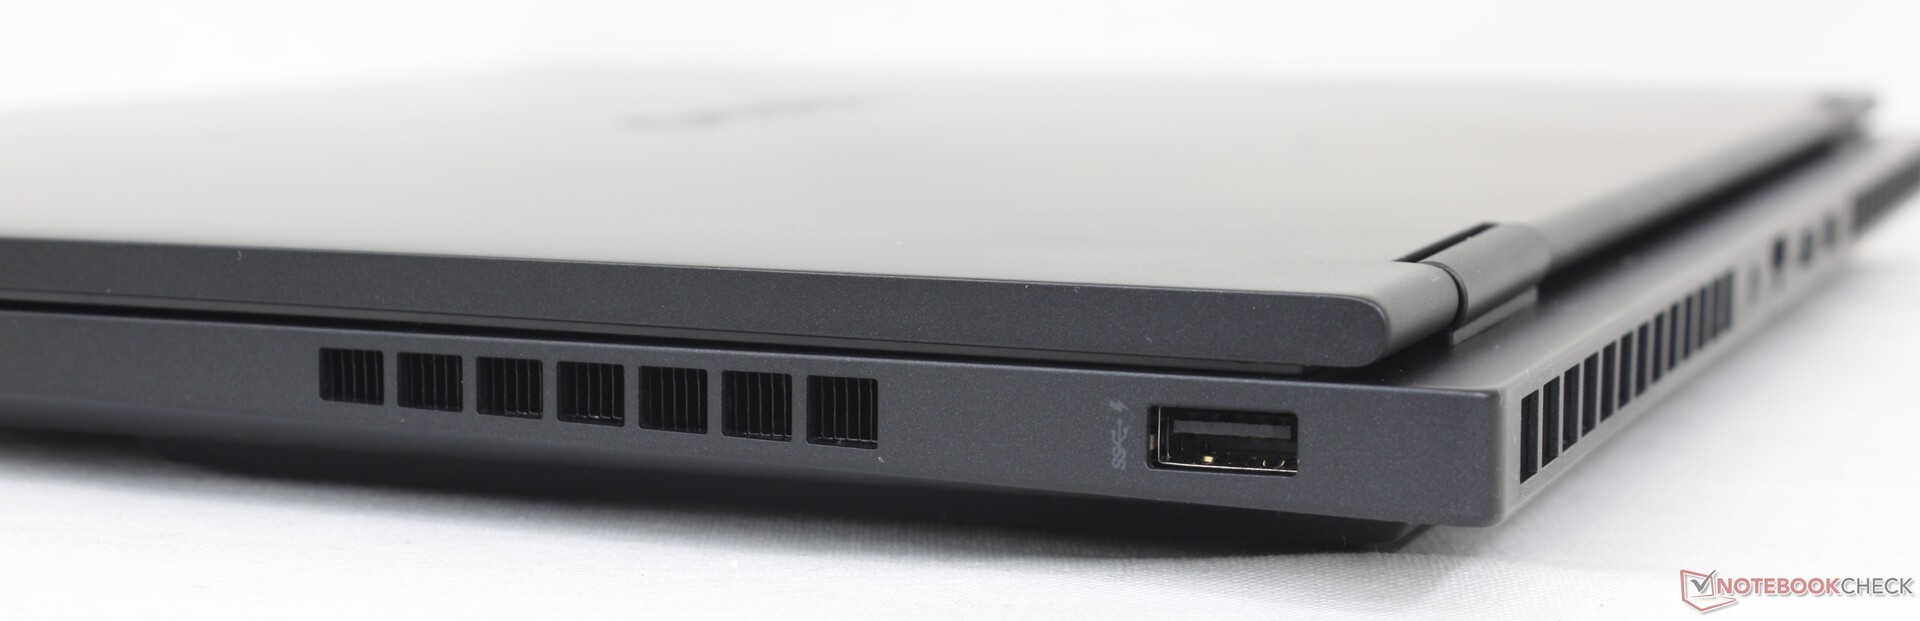
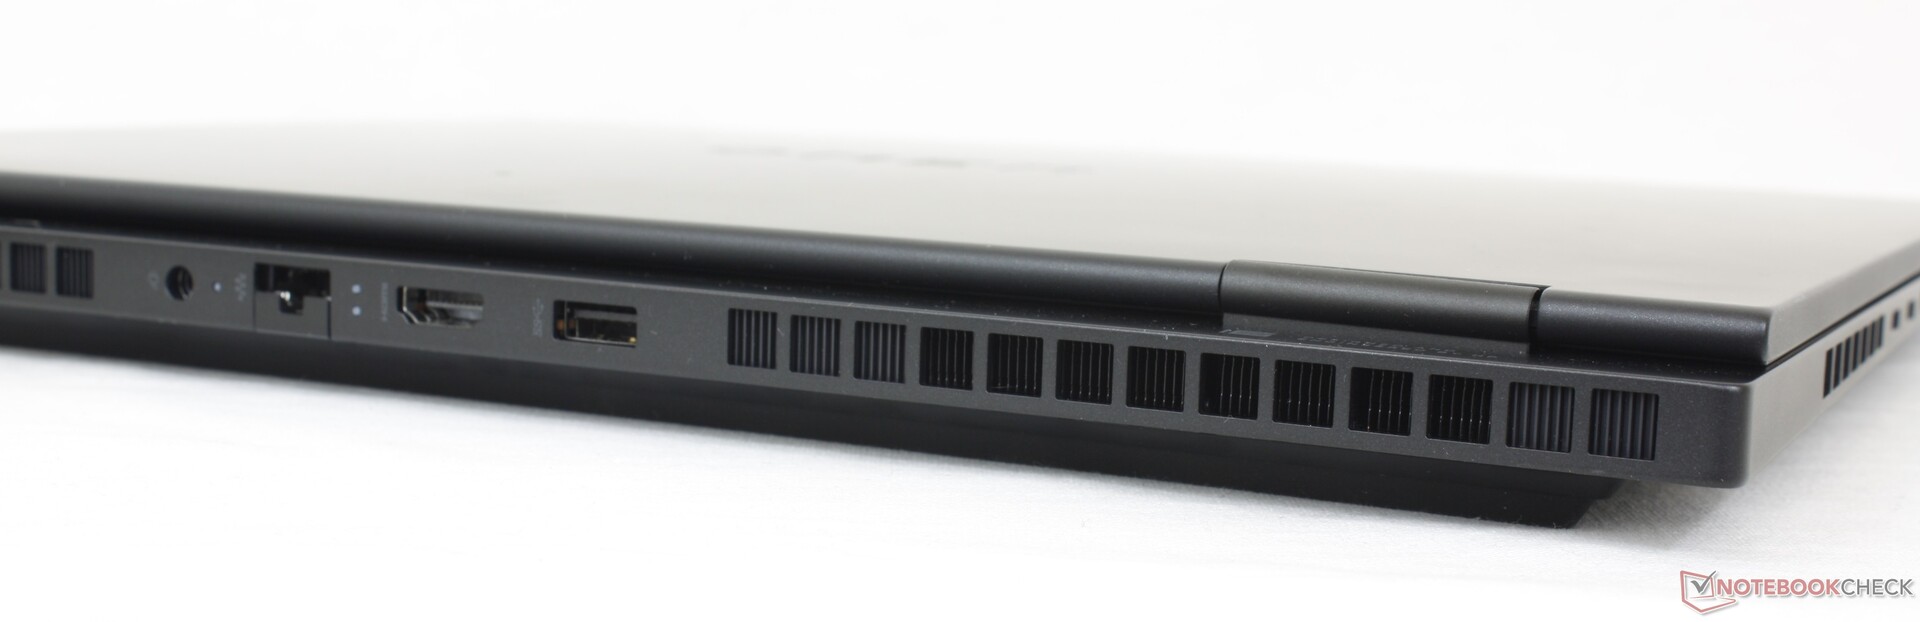
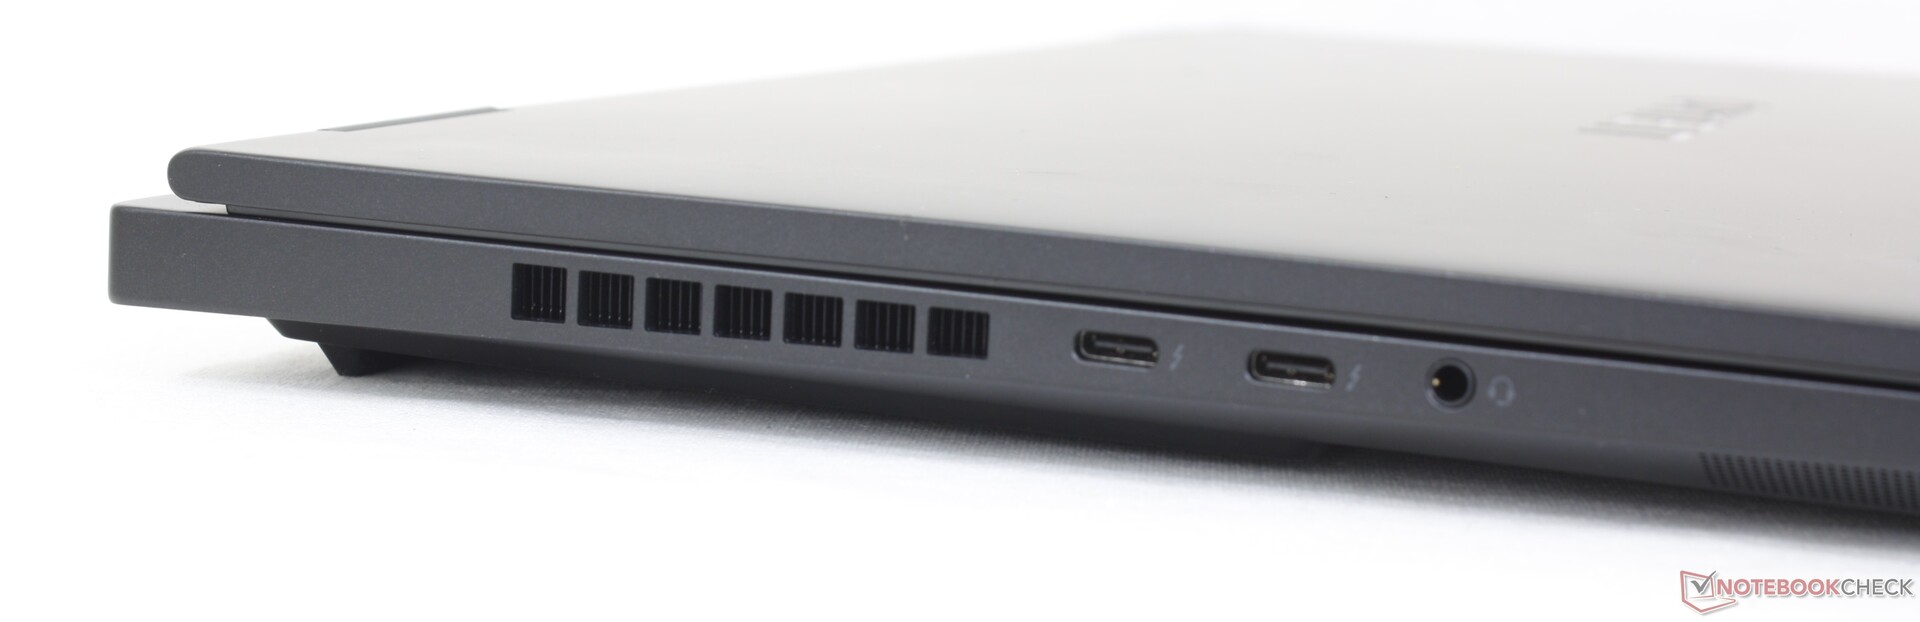
Anschlüsse
Die Anschlüsse sind identisch wie jene beim Omen 16. Nichtsdestotrotz wäre es schön gewesen, wenigstens ein Upgrade auf einen 2.5-Gbps-Port zu sehen.

Kommunikation
Wie bei vielen anderen Modellen auch, kommt hier der standardmäßige Intel-AX211-Chip für WiFi-6E und Bluetooth 5.3 zum Einsatz. Hierbei konnten wir mit unserem Asus-AXE11000-6GHz-Netzwerk konstante und stabile Transferraten messen.
Webcam
Eine weitere Neuigkeit ist der verbaute IR-Sensor für den Windows-Hello-Support, welcher beim regulären Omen 16 fehlte. Die 2-MP-Webcam und die Kameraverdeckung hingegen sind identisch wie beim anderen Modell.


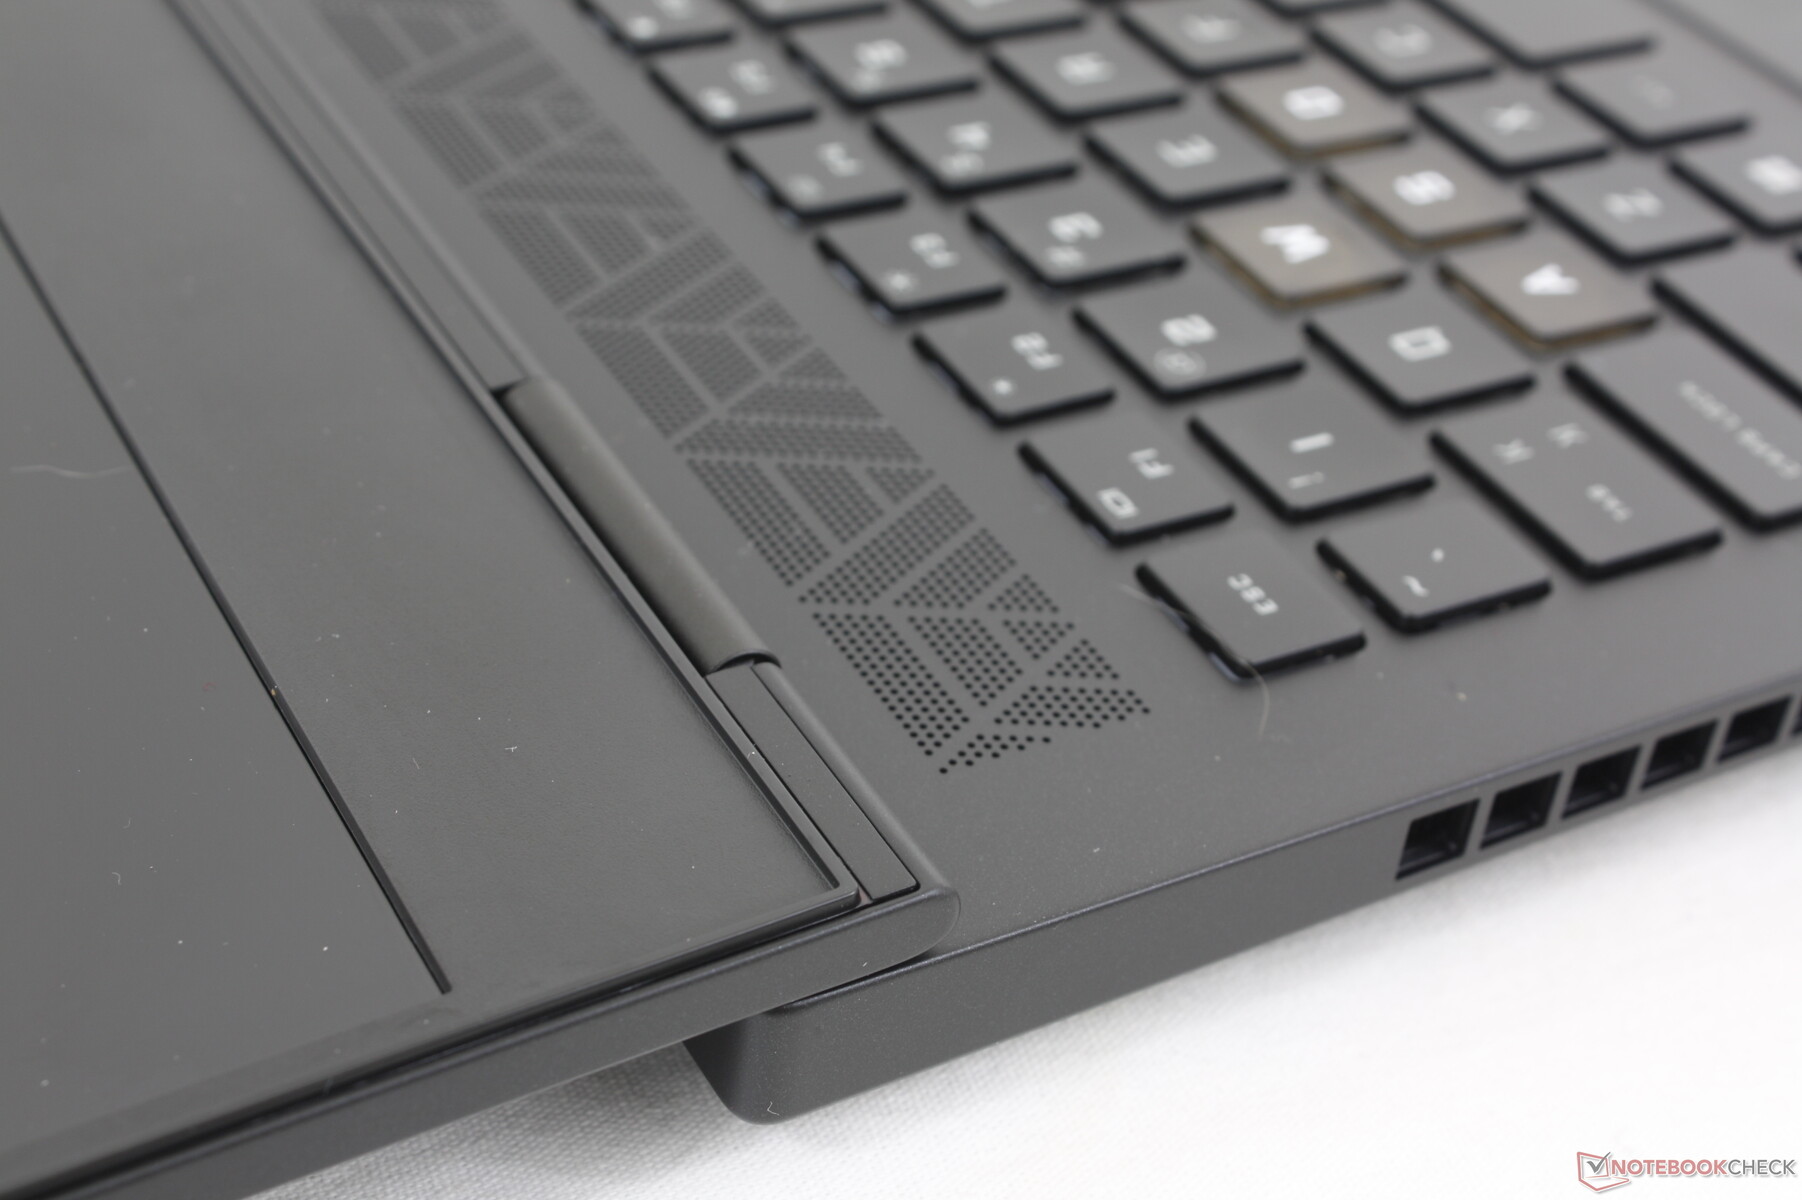
Wartung
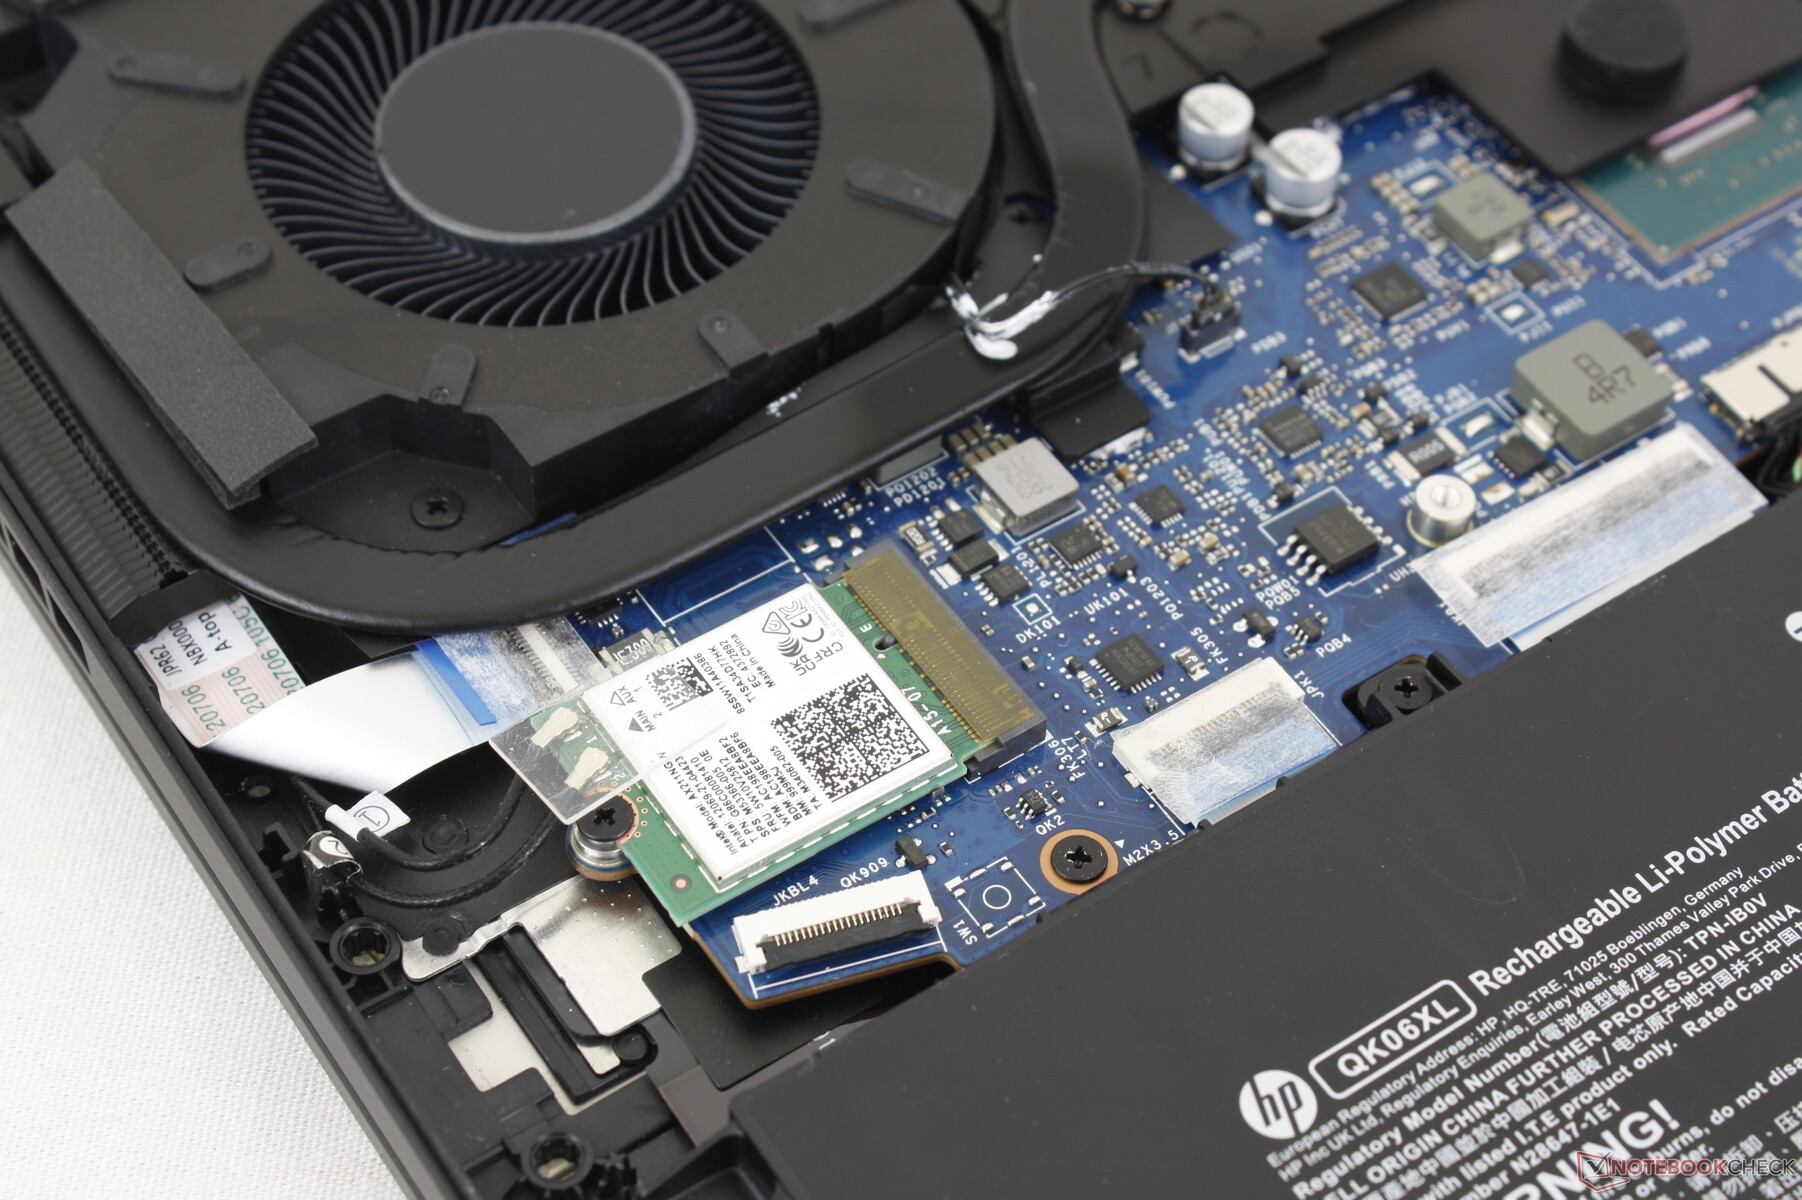
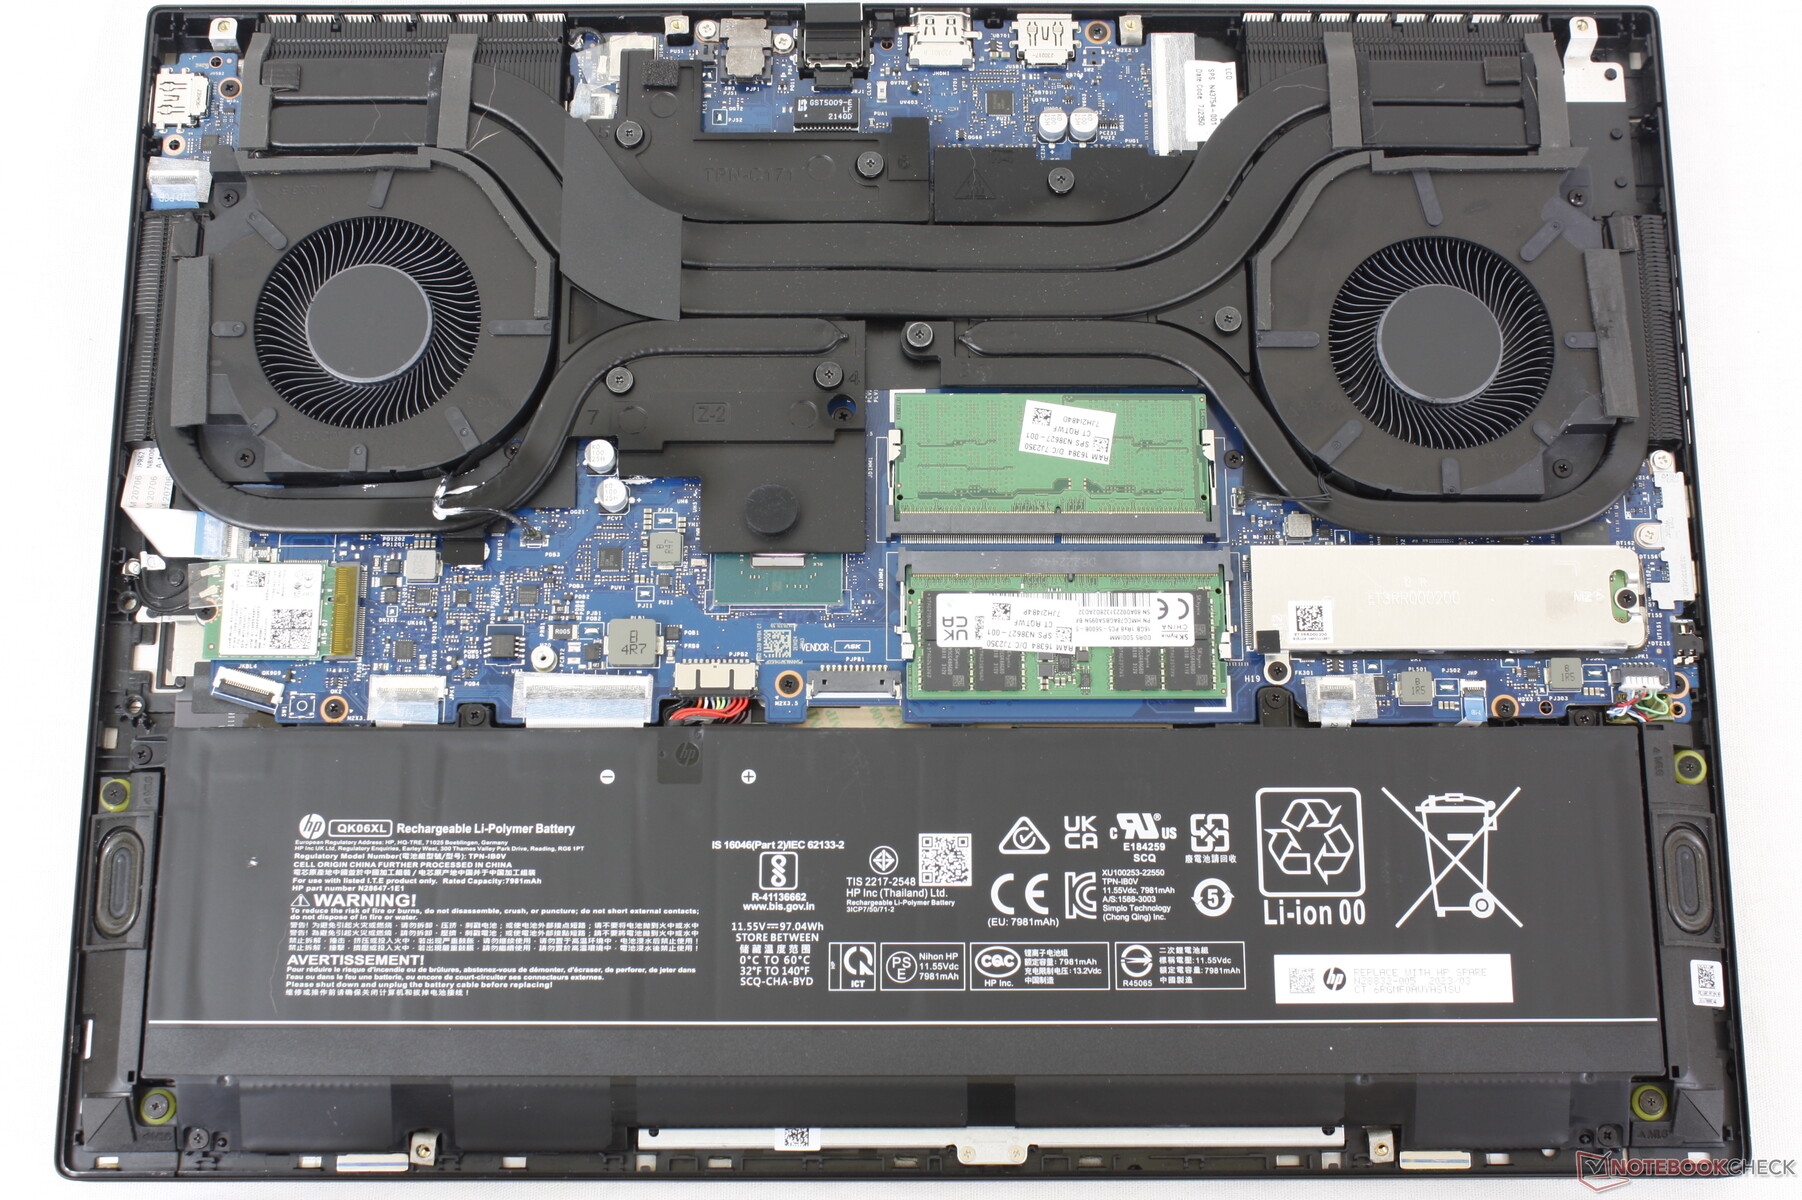
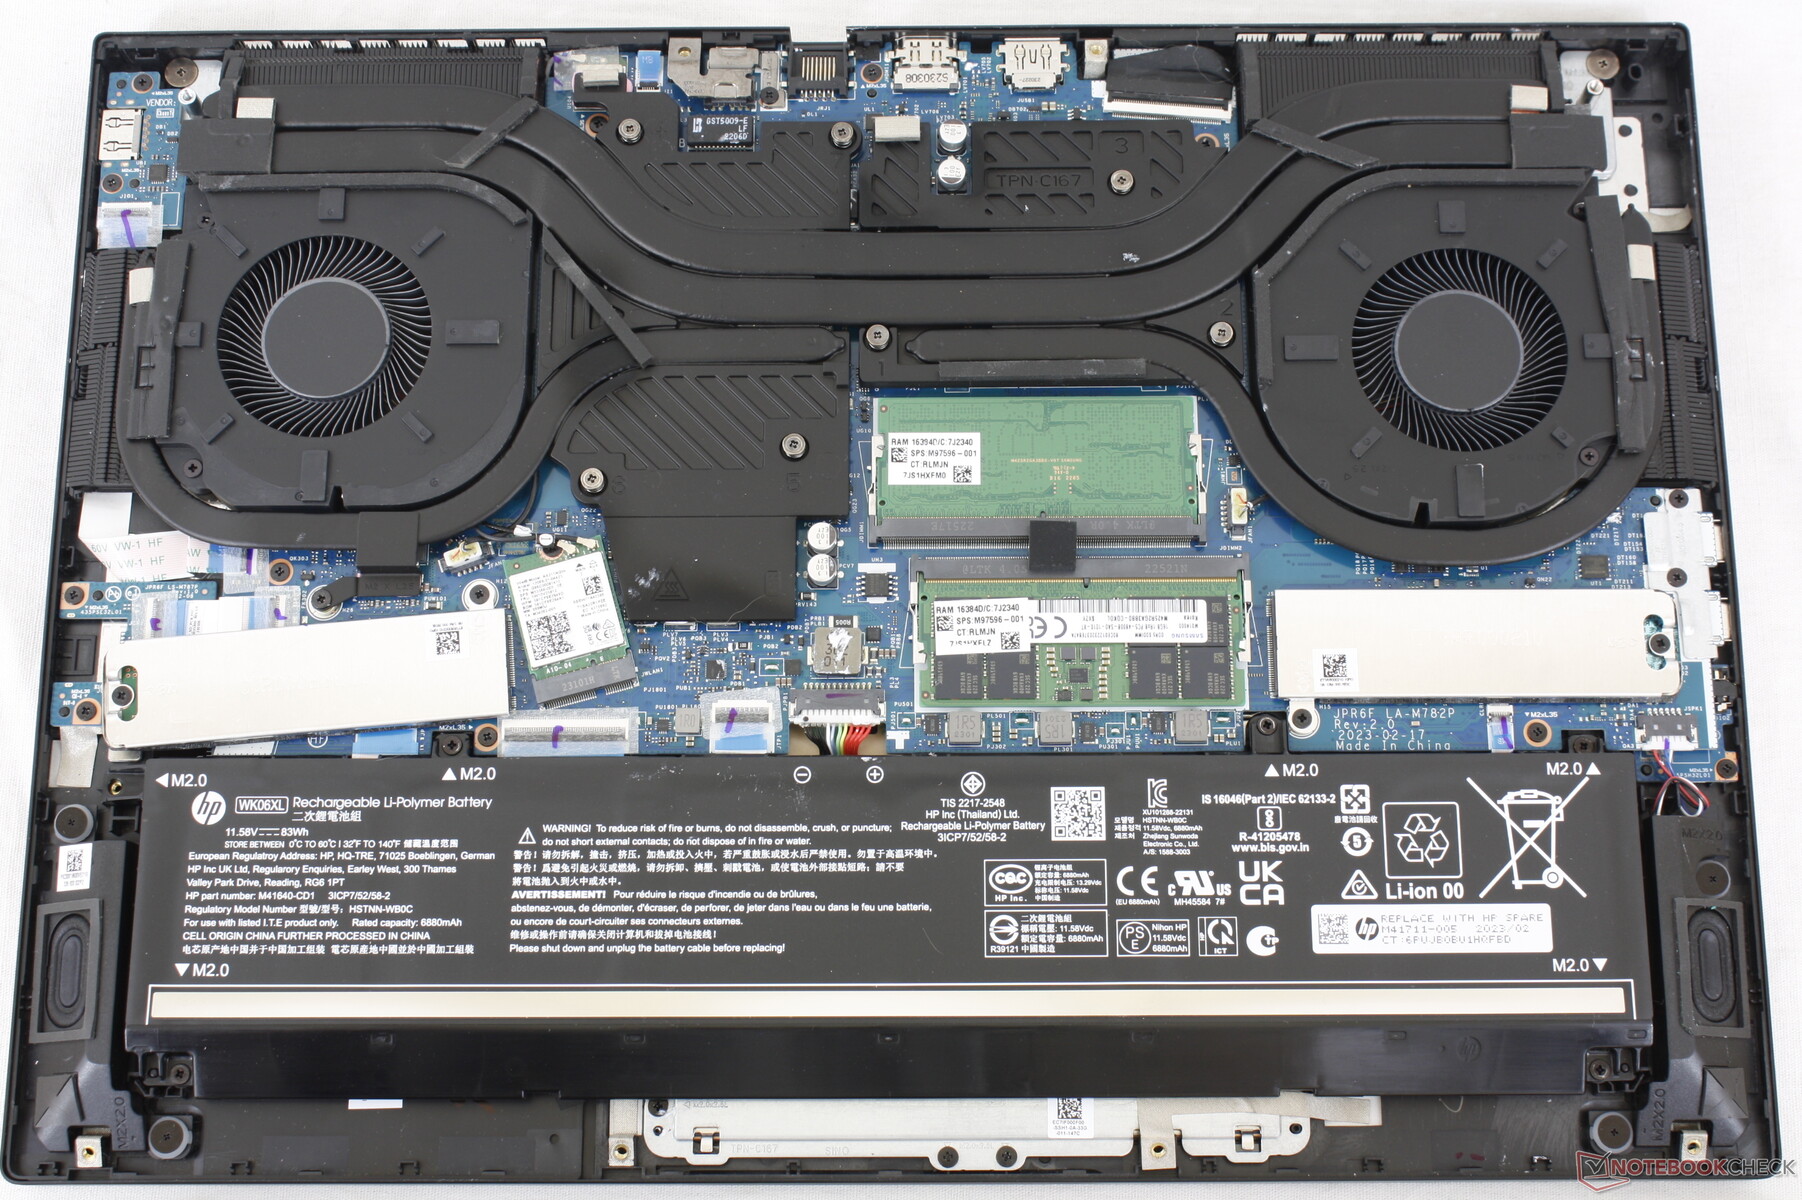
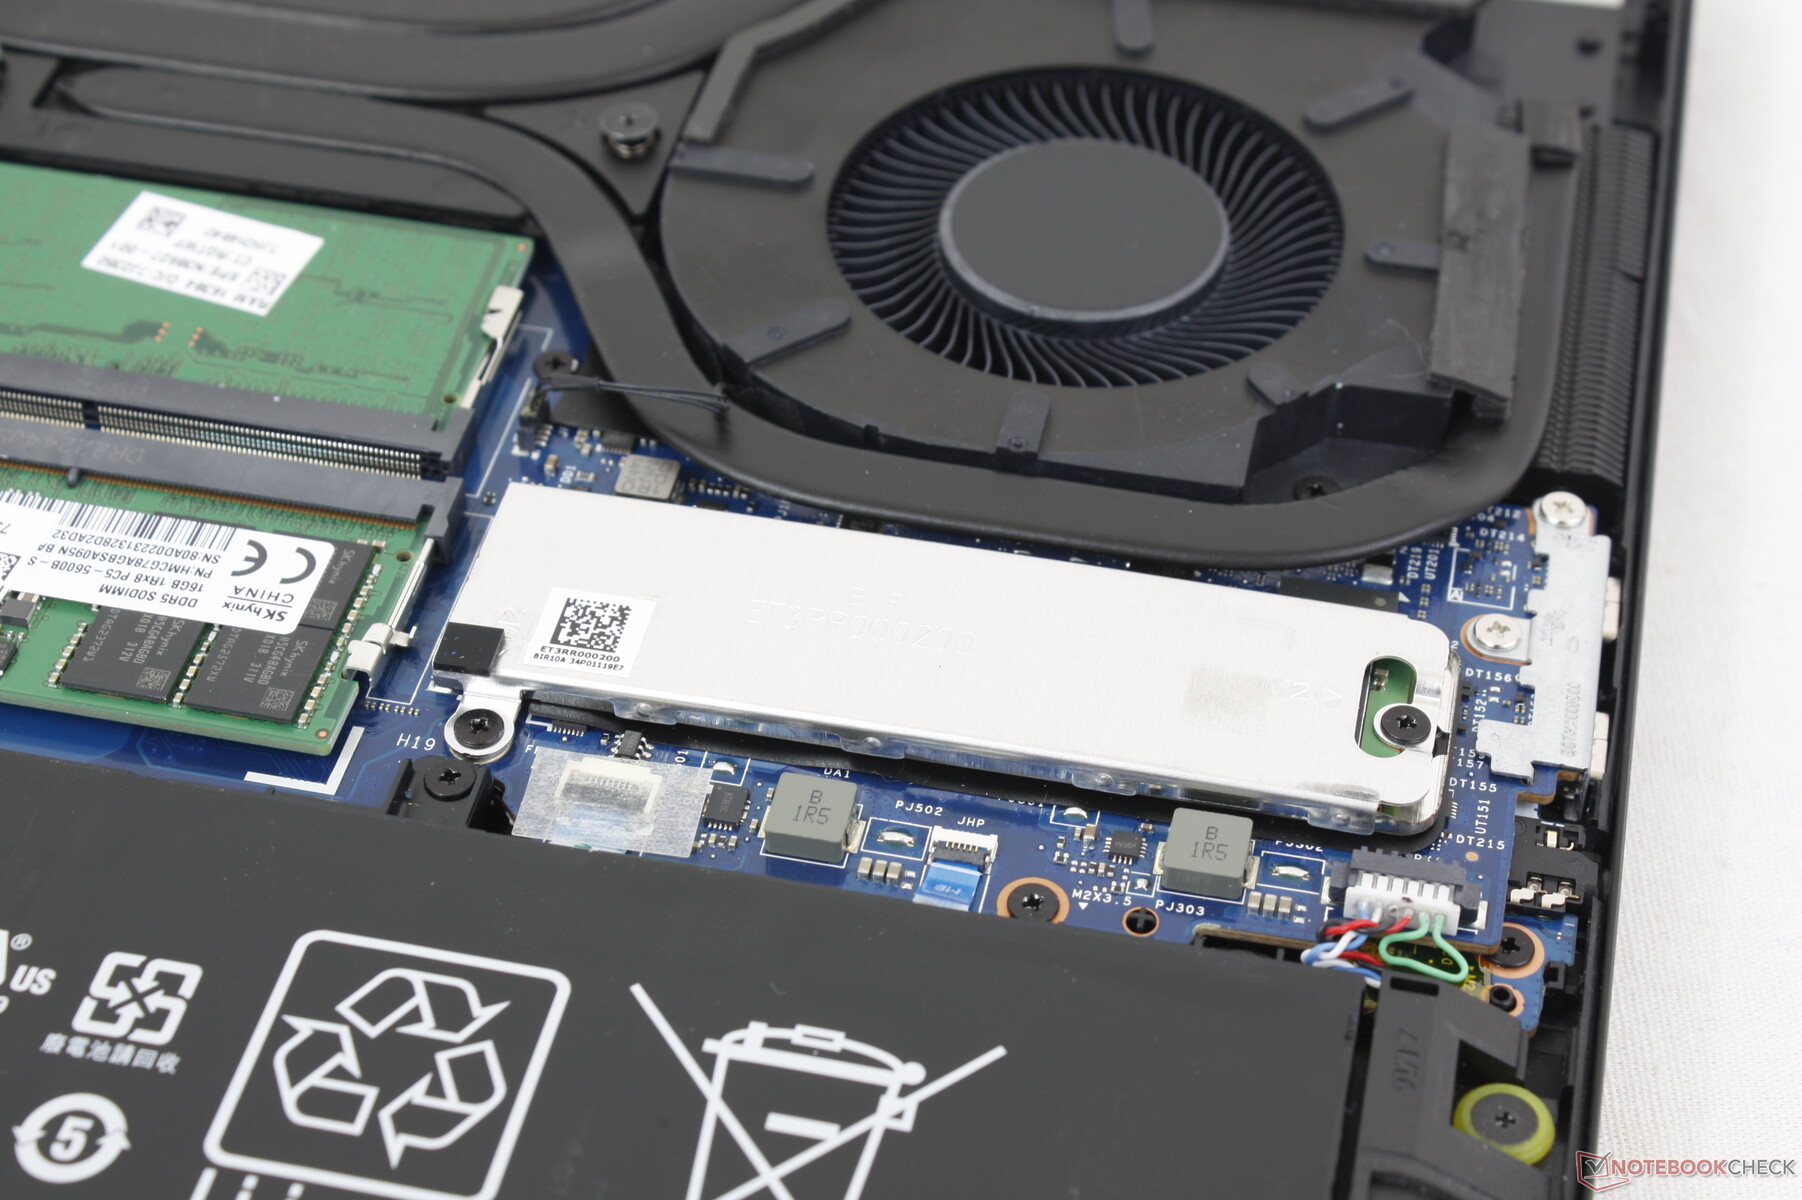
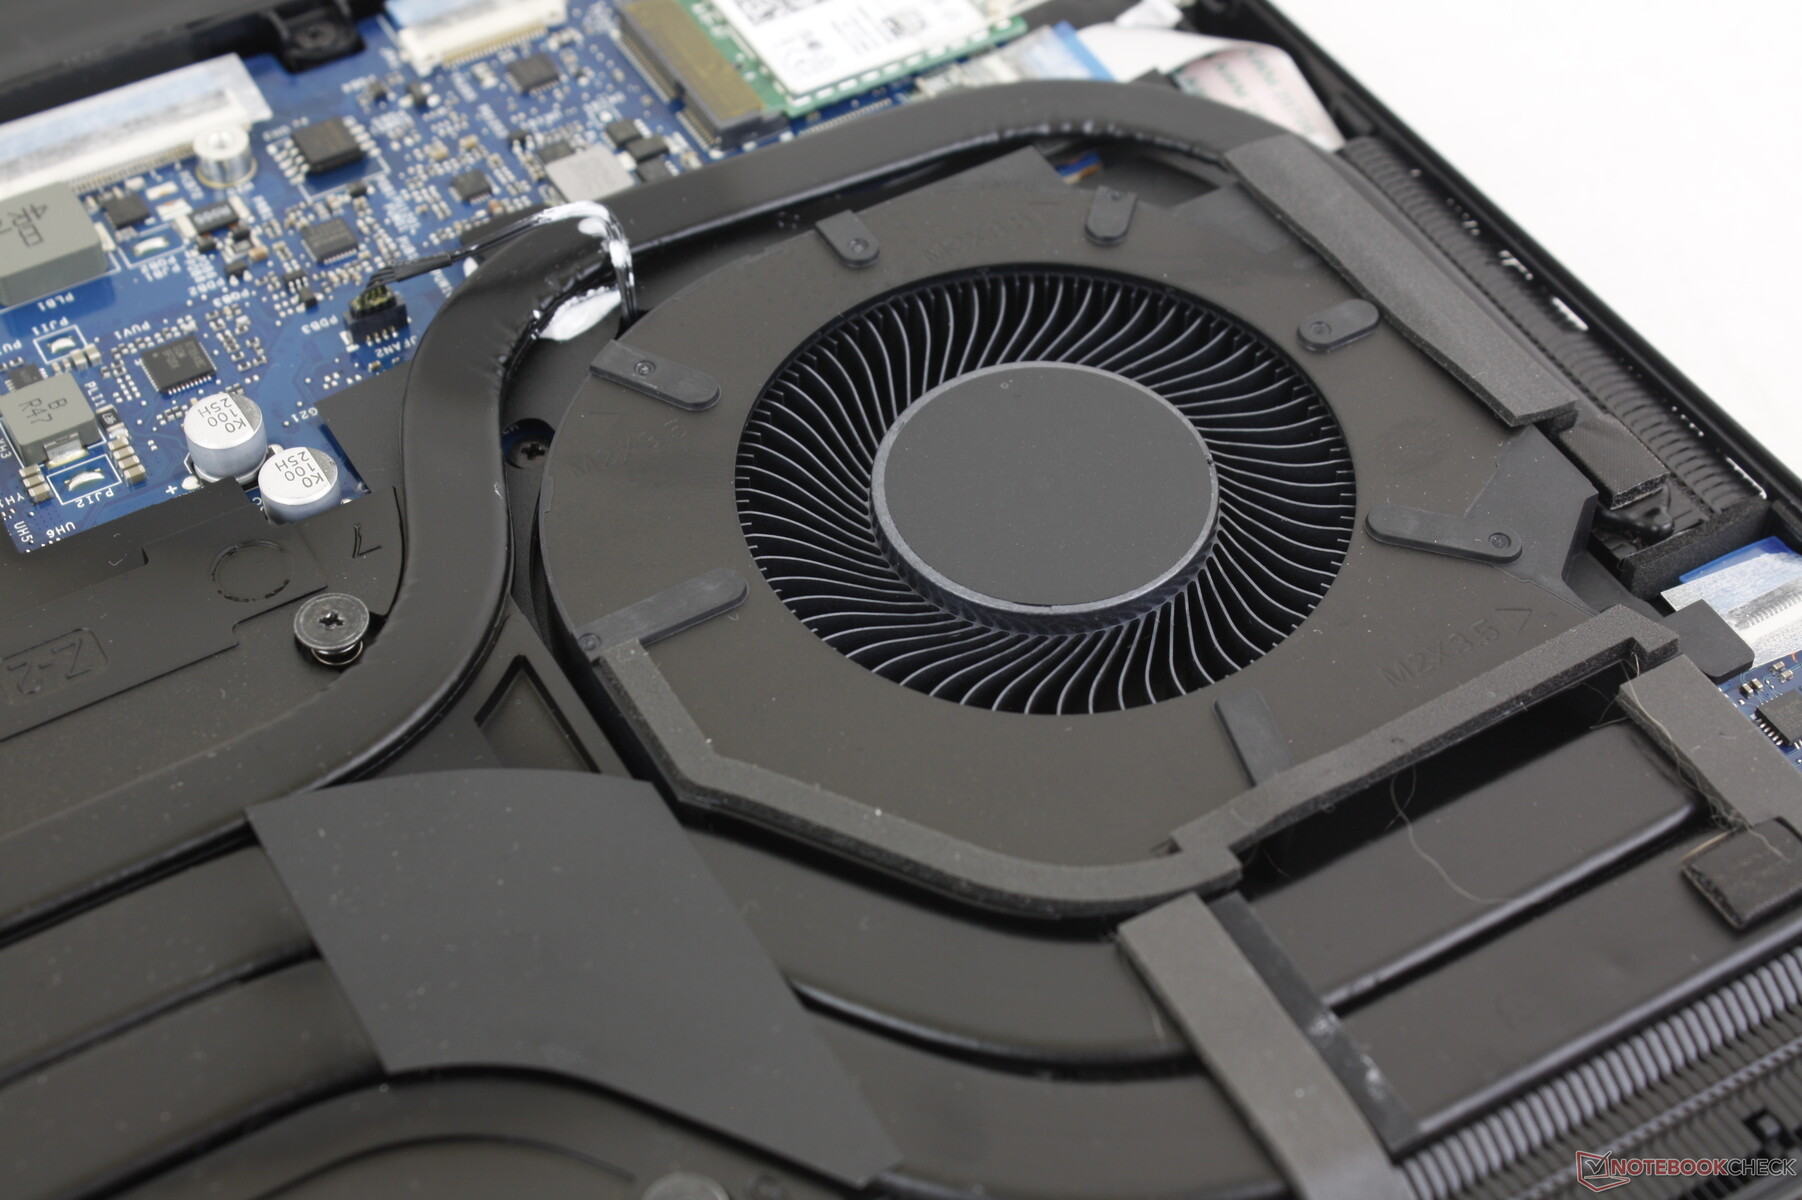
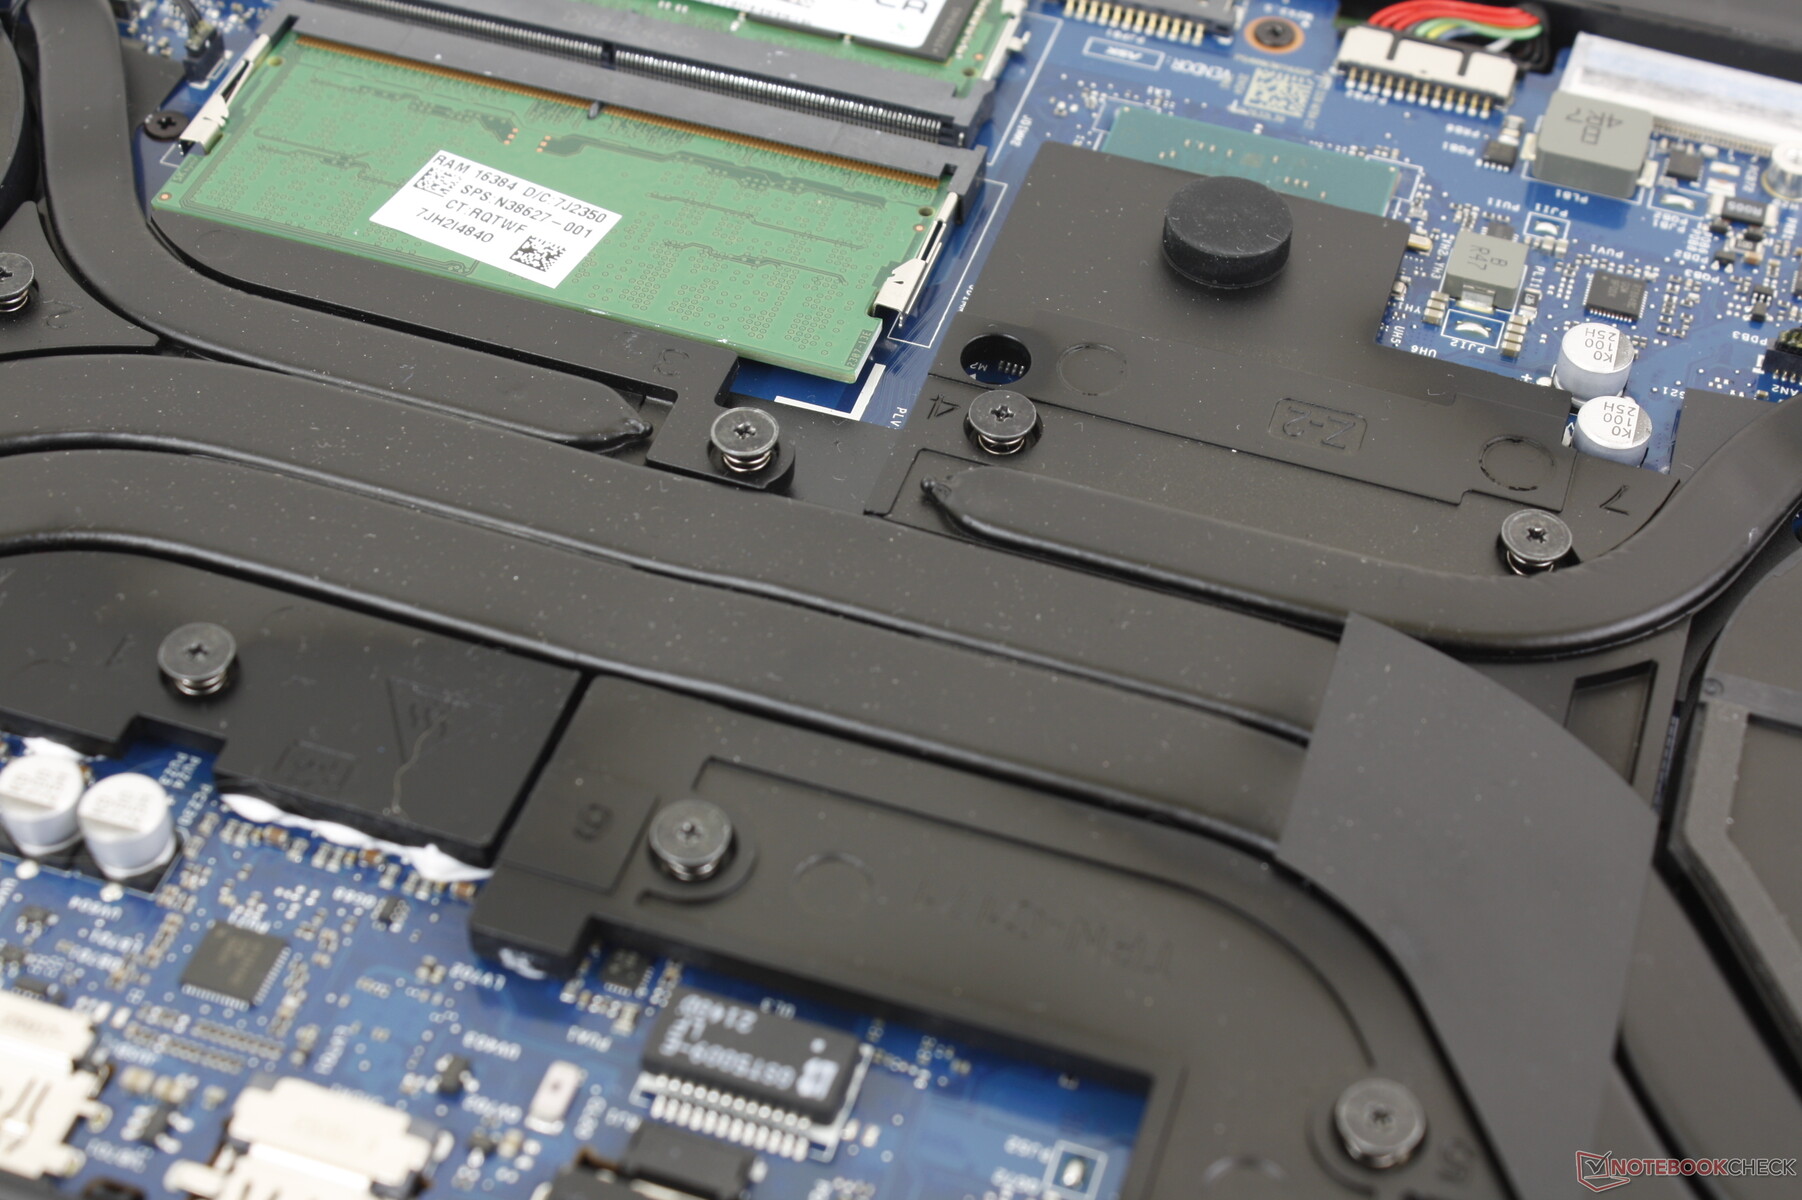
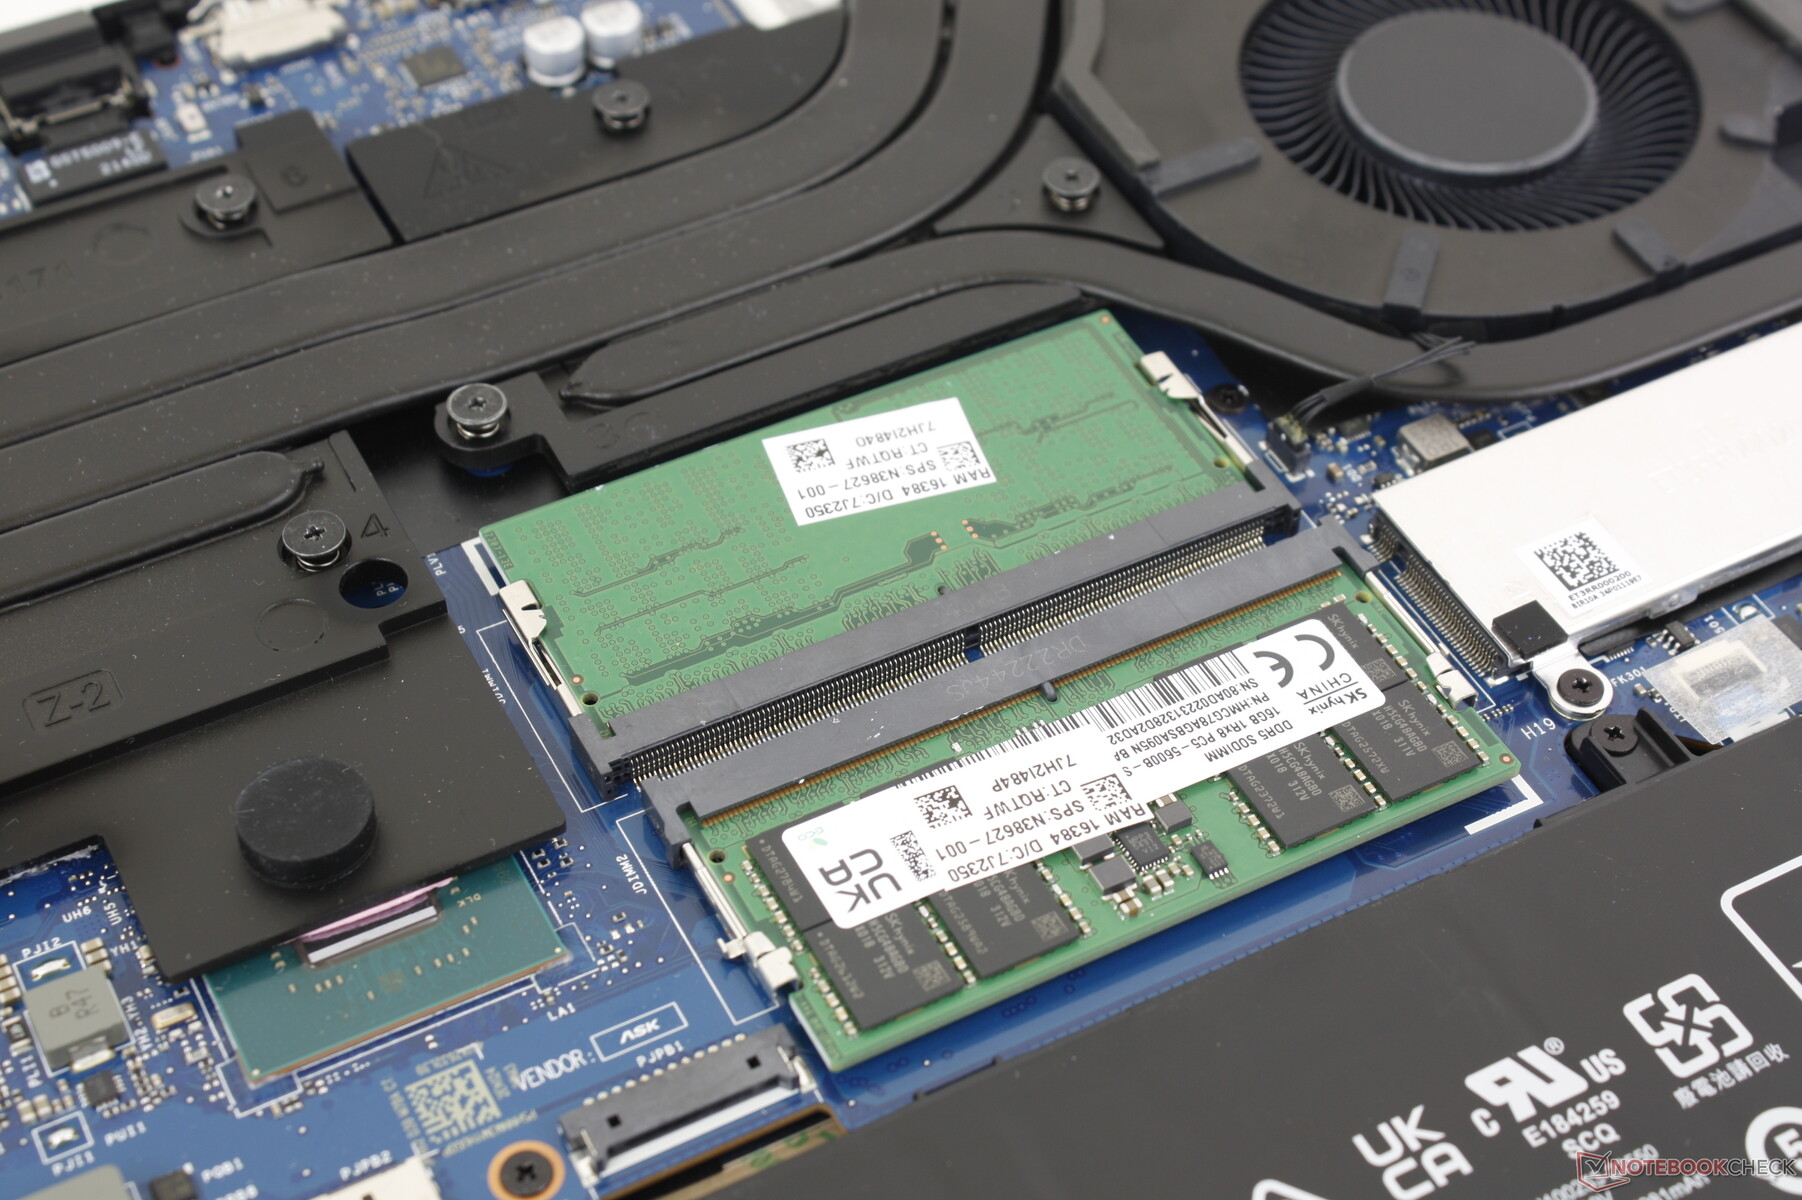
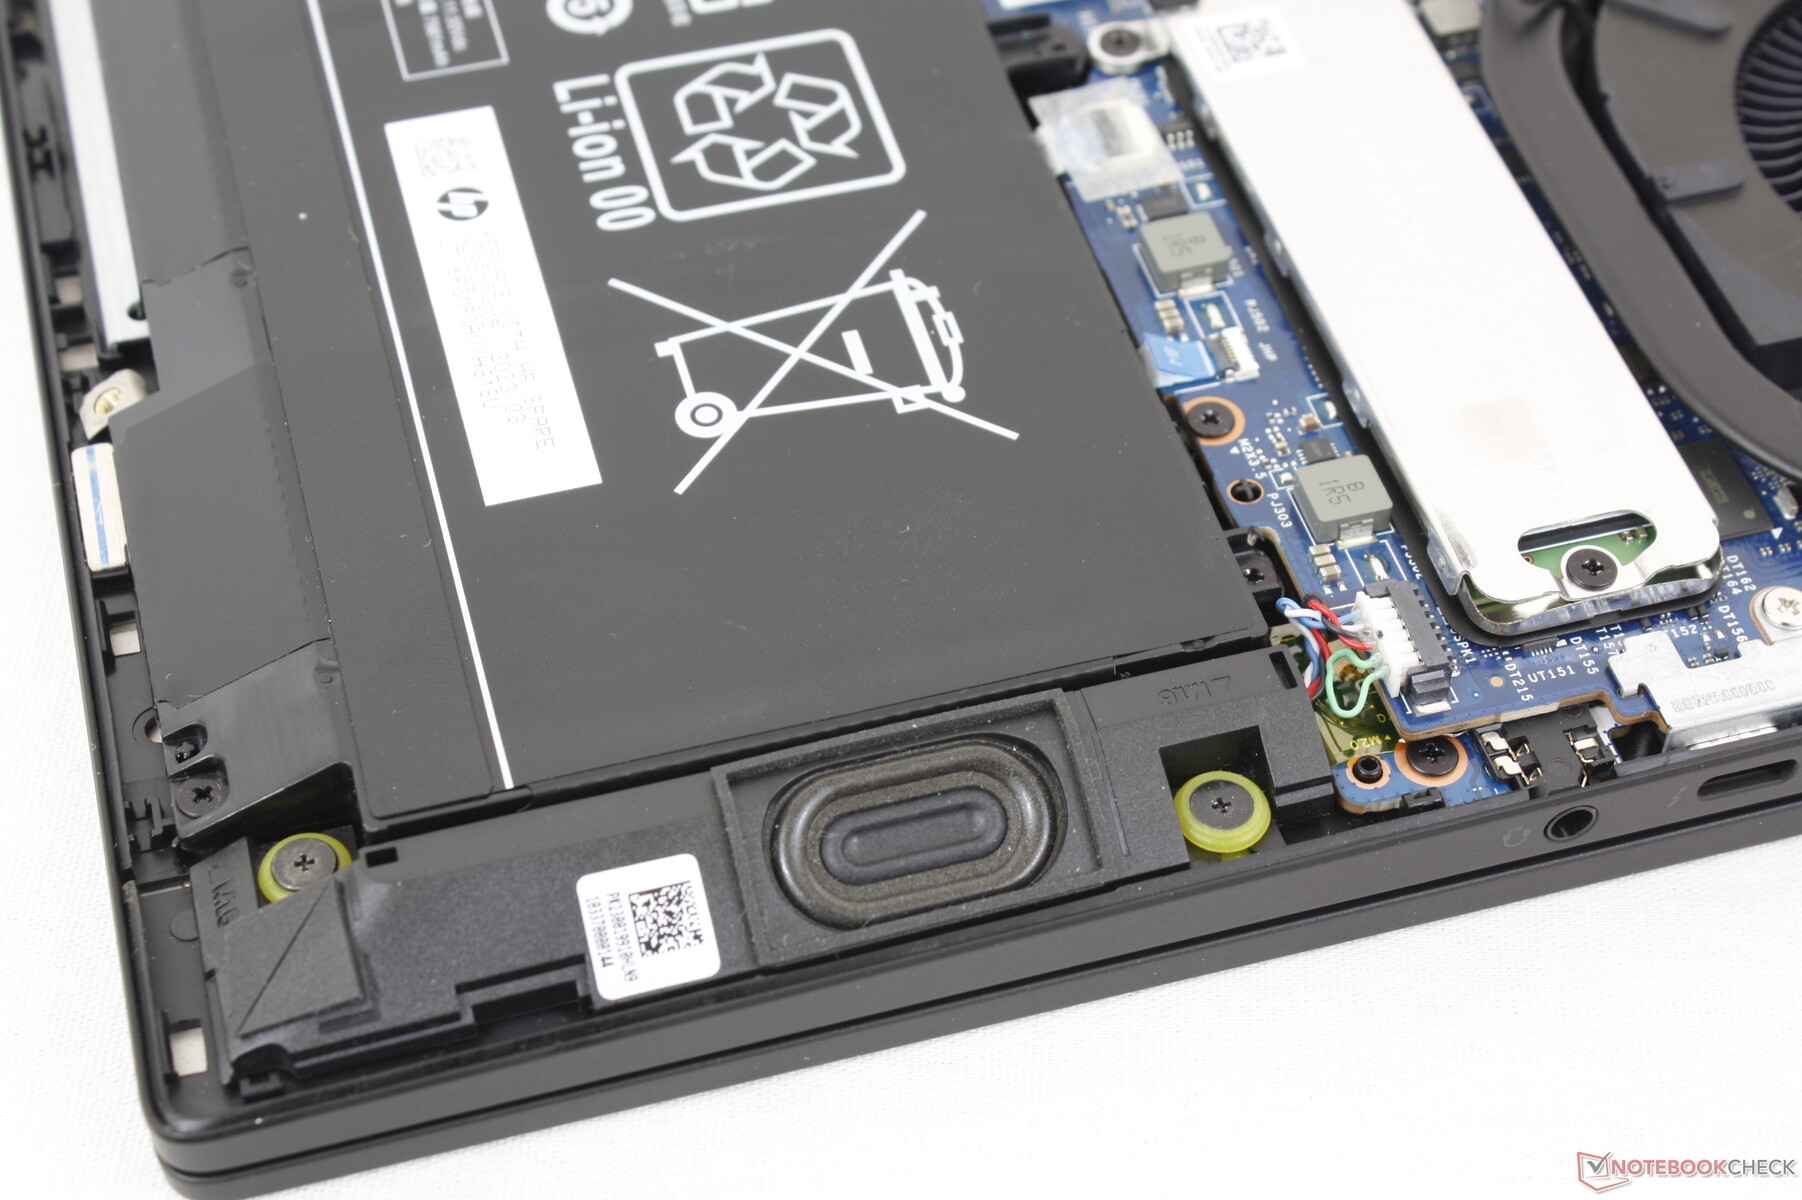
Die Unterseite des Notebooks ist ausschließlich durch sechs ziemlich einfach entfernbare Schrauben fixiert. Eine essentielle Änderung zum Omen 16 fällt nach Abnehmen dieser Abdeckung sofort auf: Der zweite M.2-SSD-Slot wurde aufgrund des M.2-WLAN-Slots entfernt, wie man auch unten in den Abbildungen erkennen kann. Dies bedeutet, dass das Omen Transcend 16 ausschließlich eine einzige interne SSD unterstützt. Außerdem wurden auch noch die Lautsprecher und die Kühlung des Geräts etwas überarbeitet.
Zubehör und Garantie
Bei gewissen Konfigurationen wird zusätzlich zum Gerät ein HyperX Cloud II Core Wireless Headset mitgeliefert. Ansonsten findet man hier nur ein Ladekabel und die üblichen Beipackzettel. Außerdem greift auch hier die standardmäßige 1-Jahr-Garantie auf das Gerät.
Eingabegeräte — Bekannter Omen Look
Tastatur
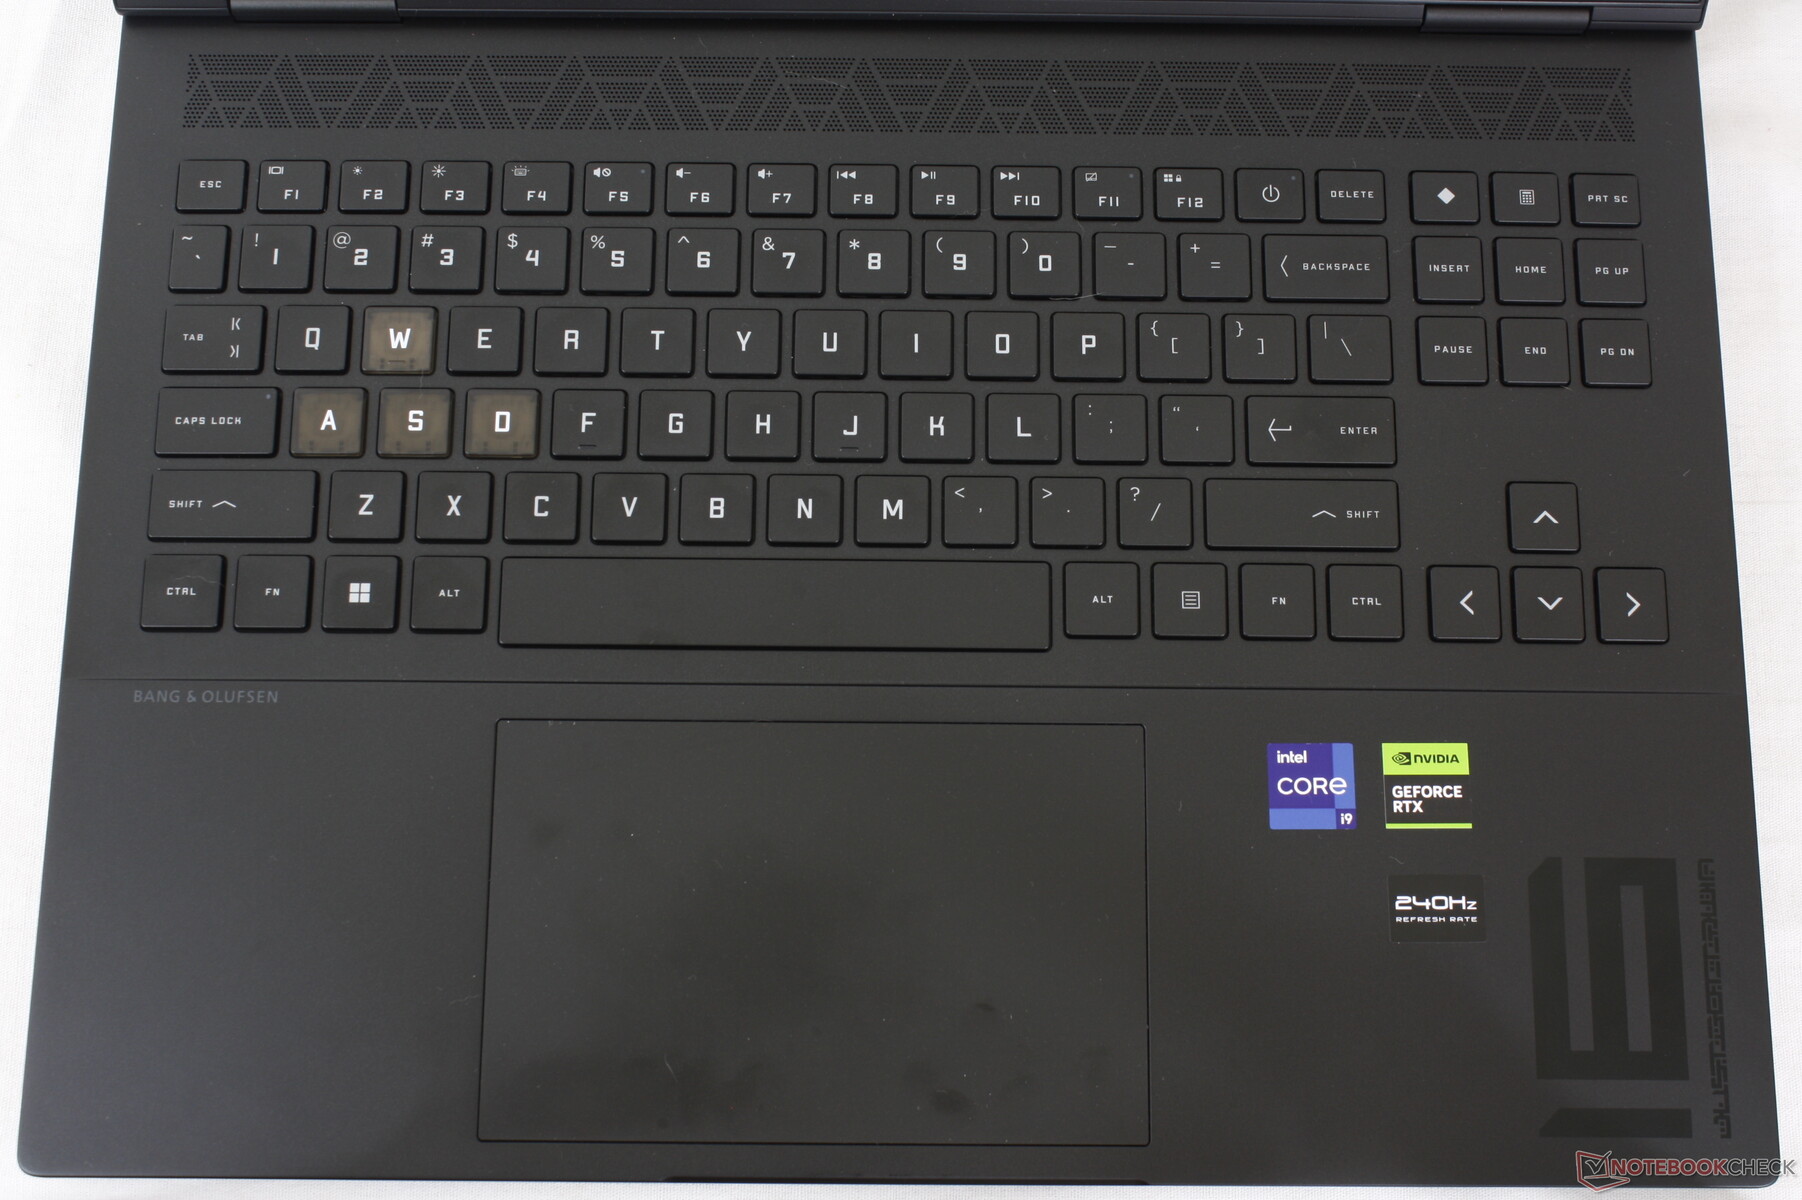
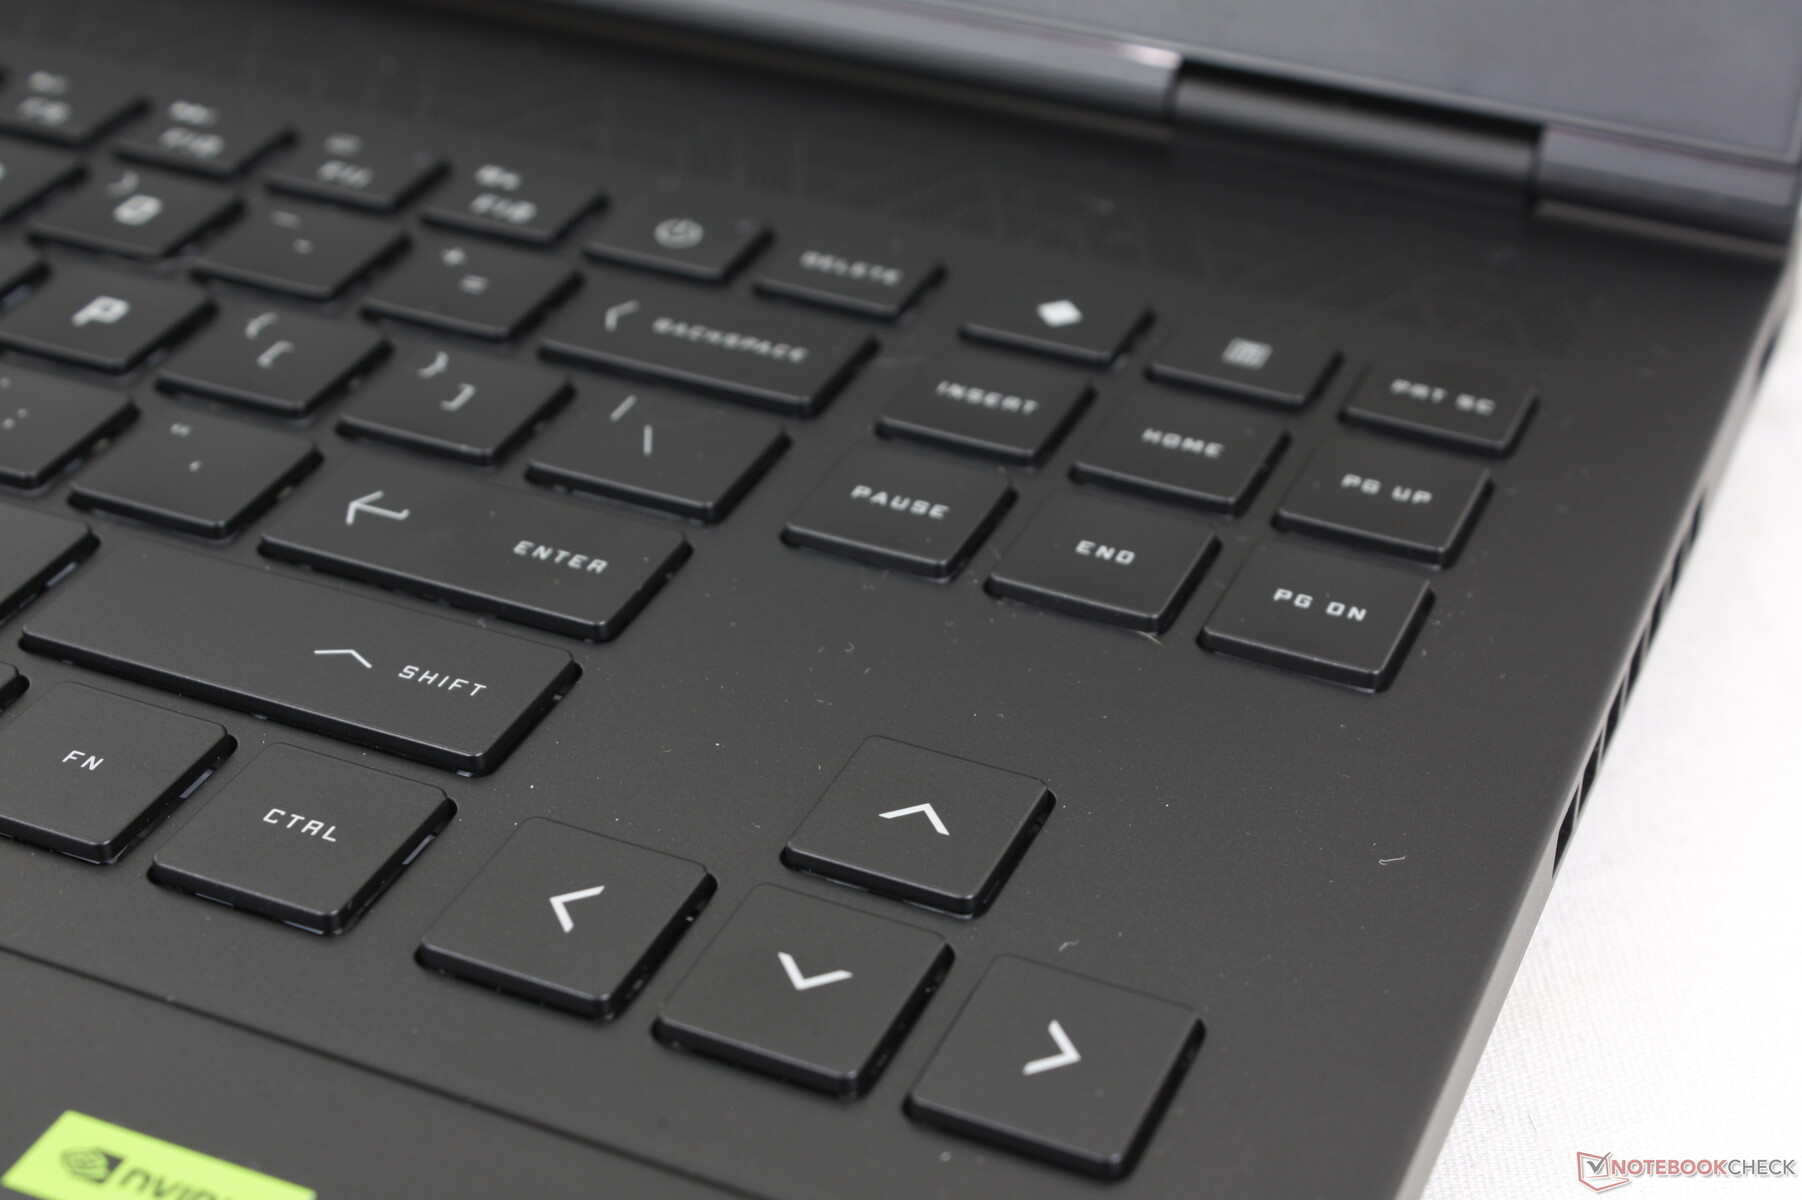
Die WASD-Tasten sind hier für ein besseres Gaming-Erlebnis mit einem transparenten Design verbaut. Abgesehen davon besitzt das Keyboard alle Stärken und Schwächen des bereits bekannten Tastenlayout vom Omen 16.
Touchpad
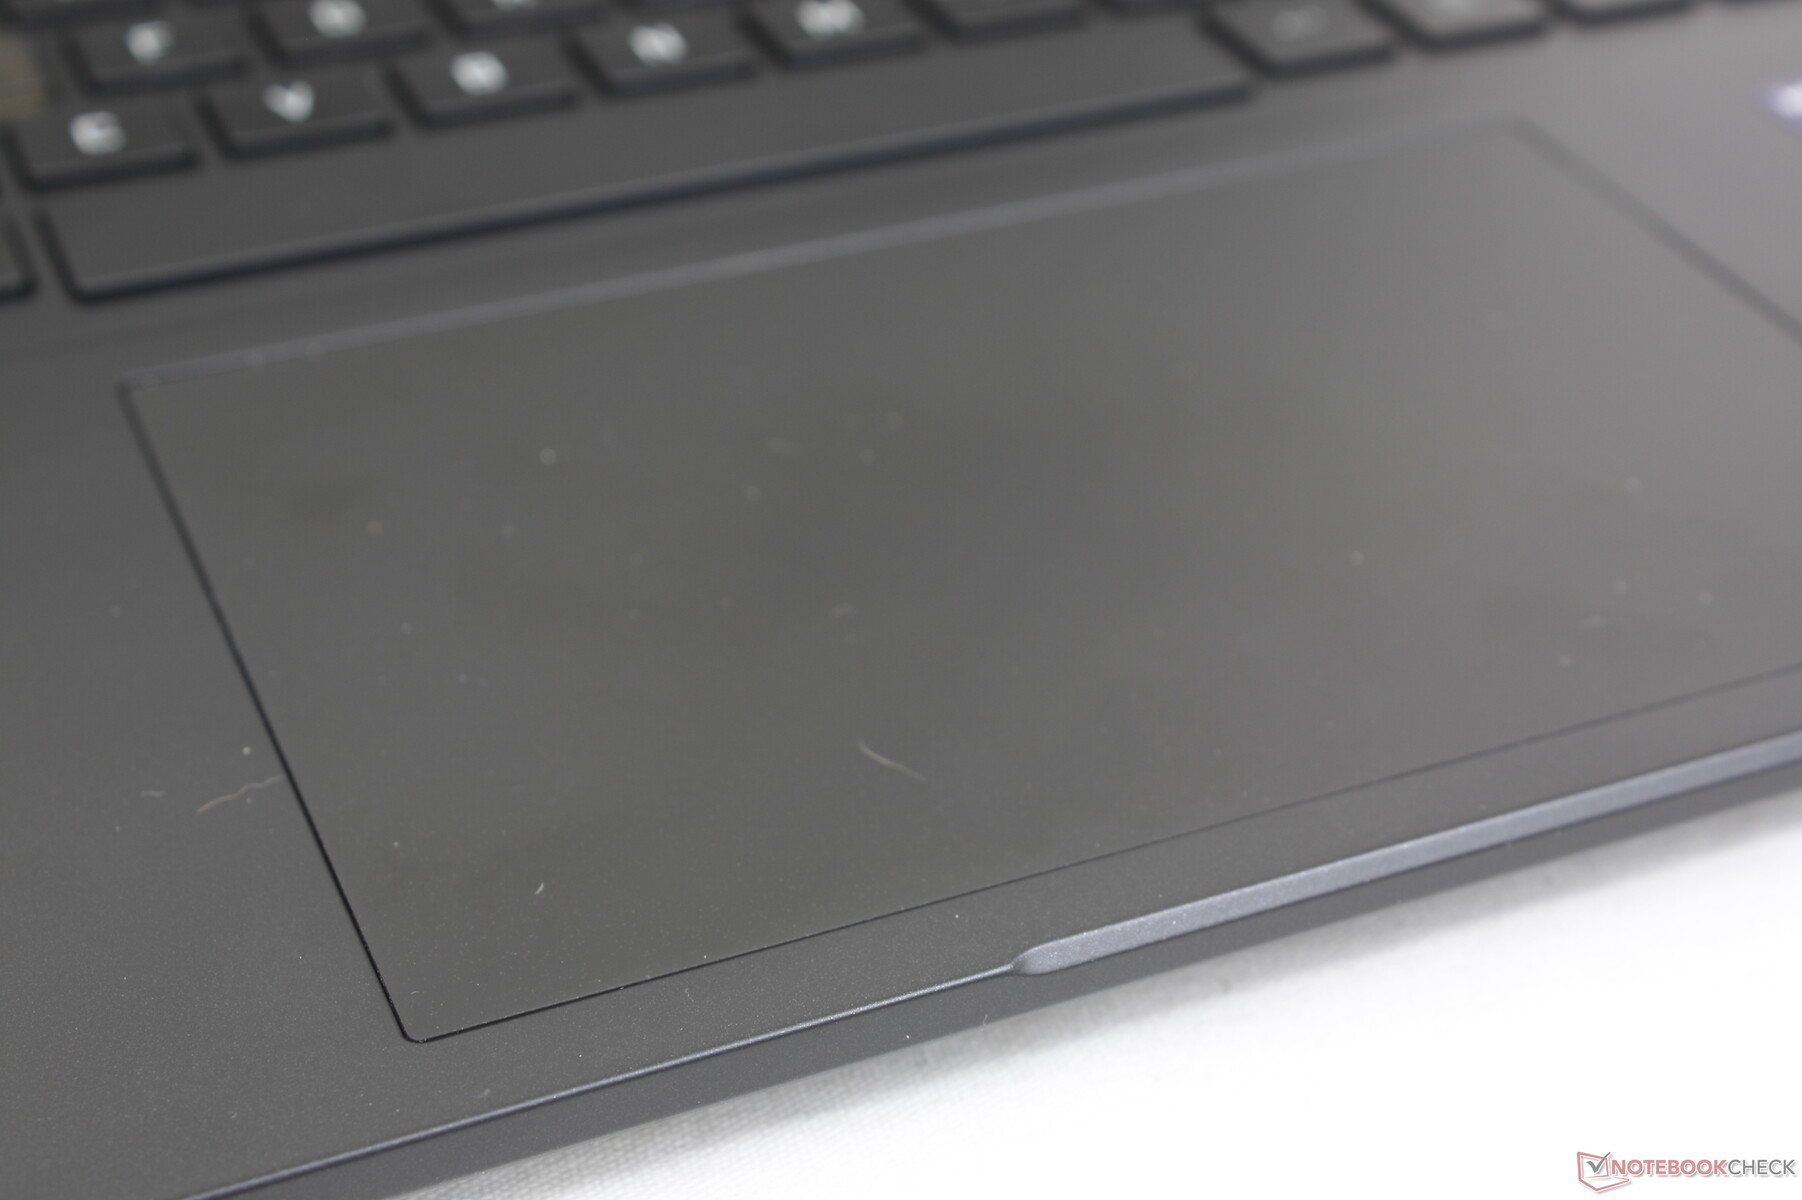
Das Clickpad wurde mit 13,5 x 8,6 cm etwas größer im Vergleich zu den bisherigen 12,5 x 8 cm beim Omen 16. Dieses ist sehr präzise und reagiert prompt, jedoch hätten wir uns hier ein strengeres Feedback gewünscht.

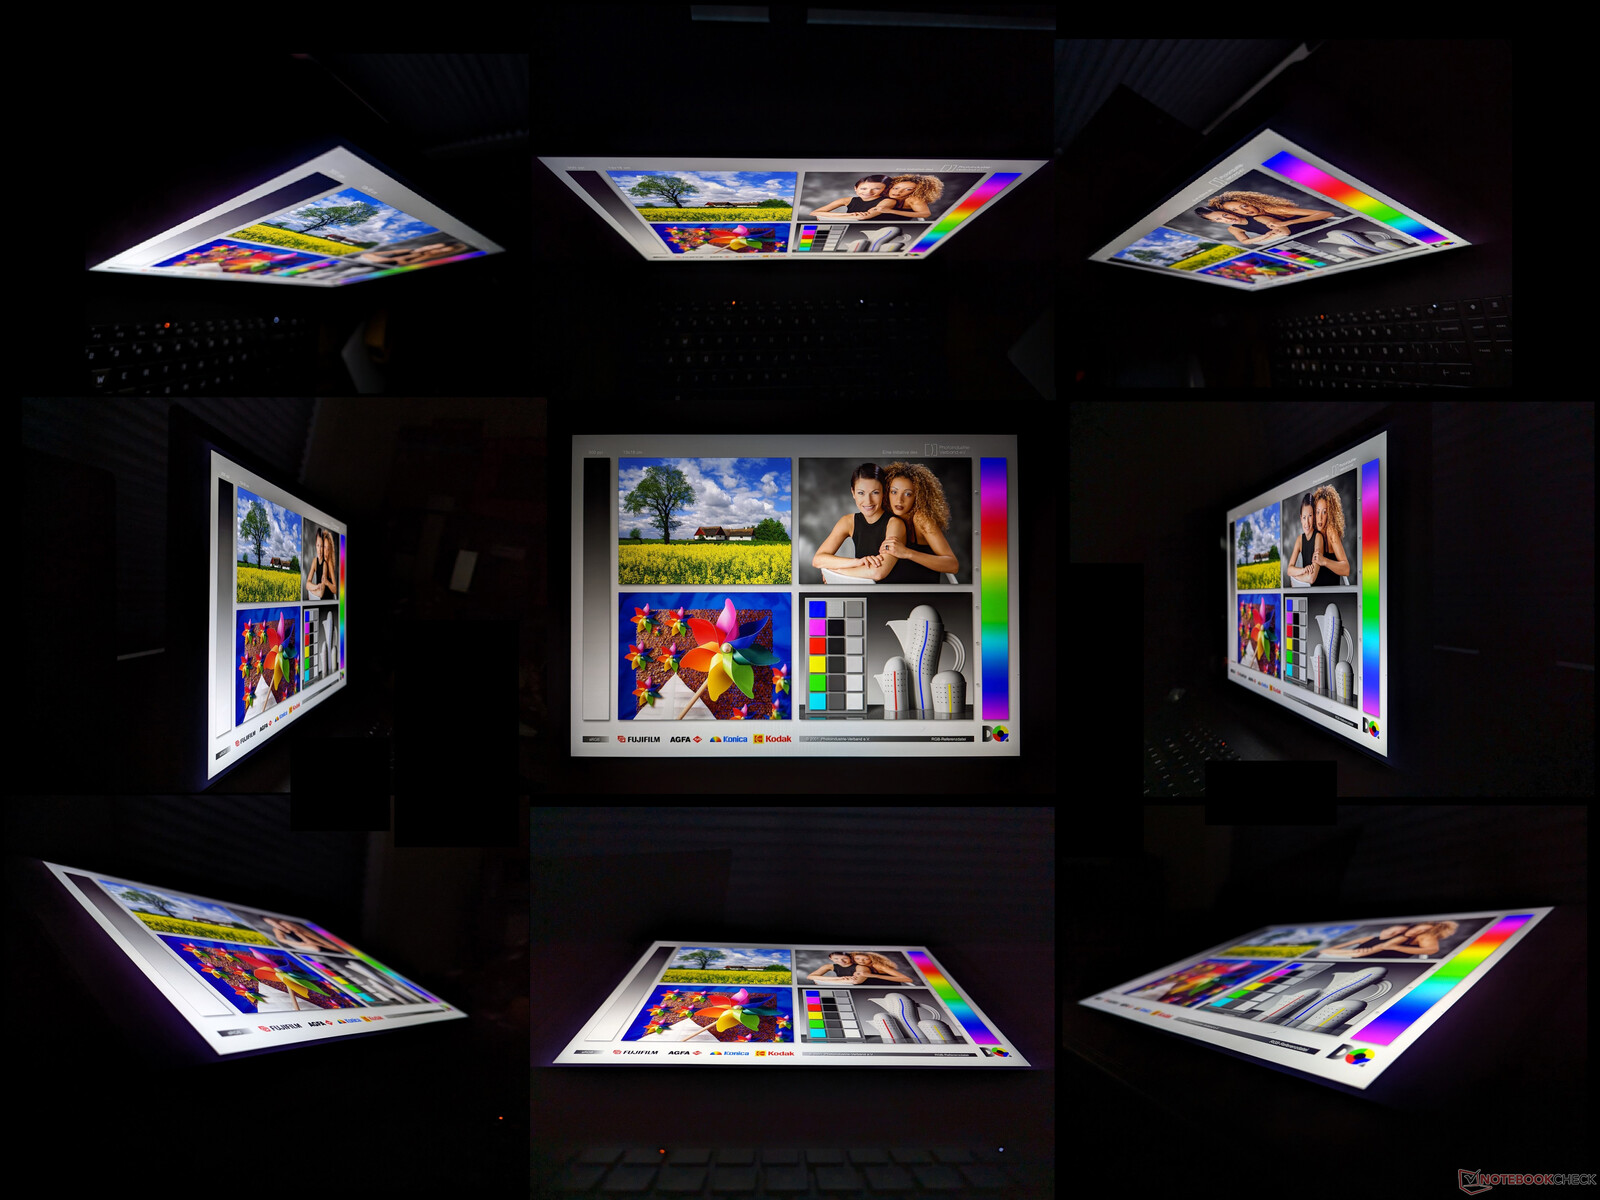
Display — Mini-LED, 240 Hz, 1.600p, 16:10, 1.180 Nits, 100 % P3-Farben

Eine weitere, große Neuigkeit beim Omen Transcend 16 ist das neue Mini-LED-Panel. Dieses vereint die Vorteile eines IPS-Displays (zum Beispiel die hohe Bildwiederholrate) mit jenen von OLED-Bildschirmen (beispielsweise eine hohe Helligkeit oder ein tieferes Schwarz). Die 1.000 individuell beleuchteten Zonen hinter dem Panel liefern dabei ein fast identisches Bilderlebnis wie bei OLED-Displays, bei welchem jeder Pixel einzeln beleuchtet wird.
HP gibt eine maximale Helligkeit von 1.180 Nits an. Wir konnten mithilfe unseres HDR-Helligkeits-Tests einen Wert von 1.233 Nits ermitteln, was HPs Angaben sogar übertrifft. Hier sollte jedoch beachtet werden, dass dieser Wert nur bei gewissen HDR-Inhalten erreicht werden kann, wie auch beim Asus VivoBook.
Vergleicht man das hier zum Einsatz kommende Display mit jenem Mini-LED-Panel vom Lenovo Slim Pro 9 16, hat das Omen Transcend 16 zwar eine niedriger Auflösung (2.560 x 1.600 vs. 3.200 x 2.000), dafür aber eine höhere Bildwiederholrate (240 vs. 165 Hz).


| |||||||||||||||||||||||||
Ausleuchtung: 95 %
Helligkeit Akku: 791.1 cd/m²
Kontrast: 19778:1 (Schwarzwert: 0.04 cd/m²)
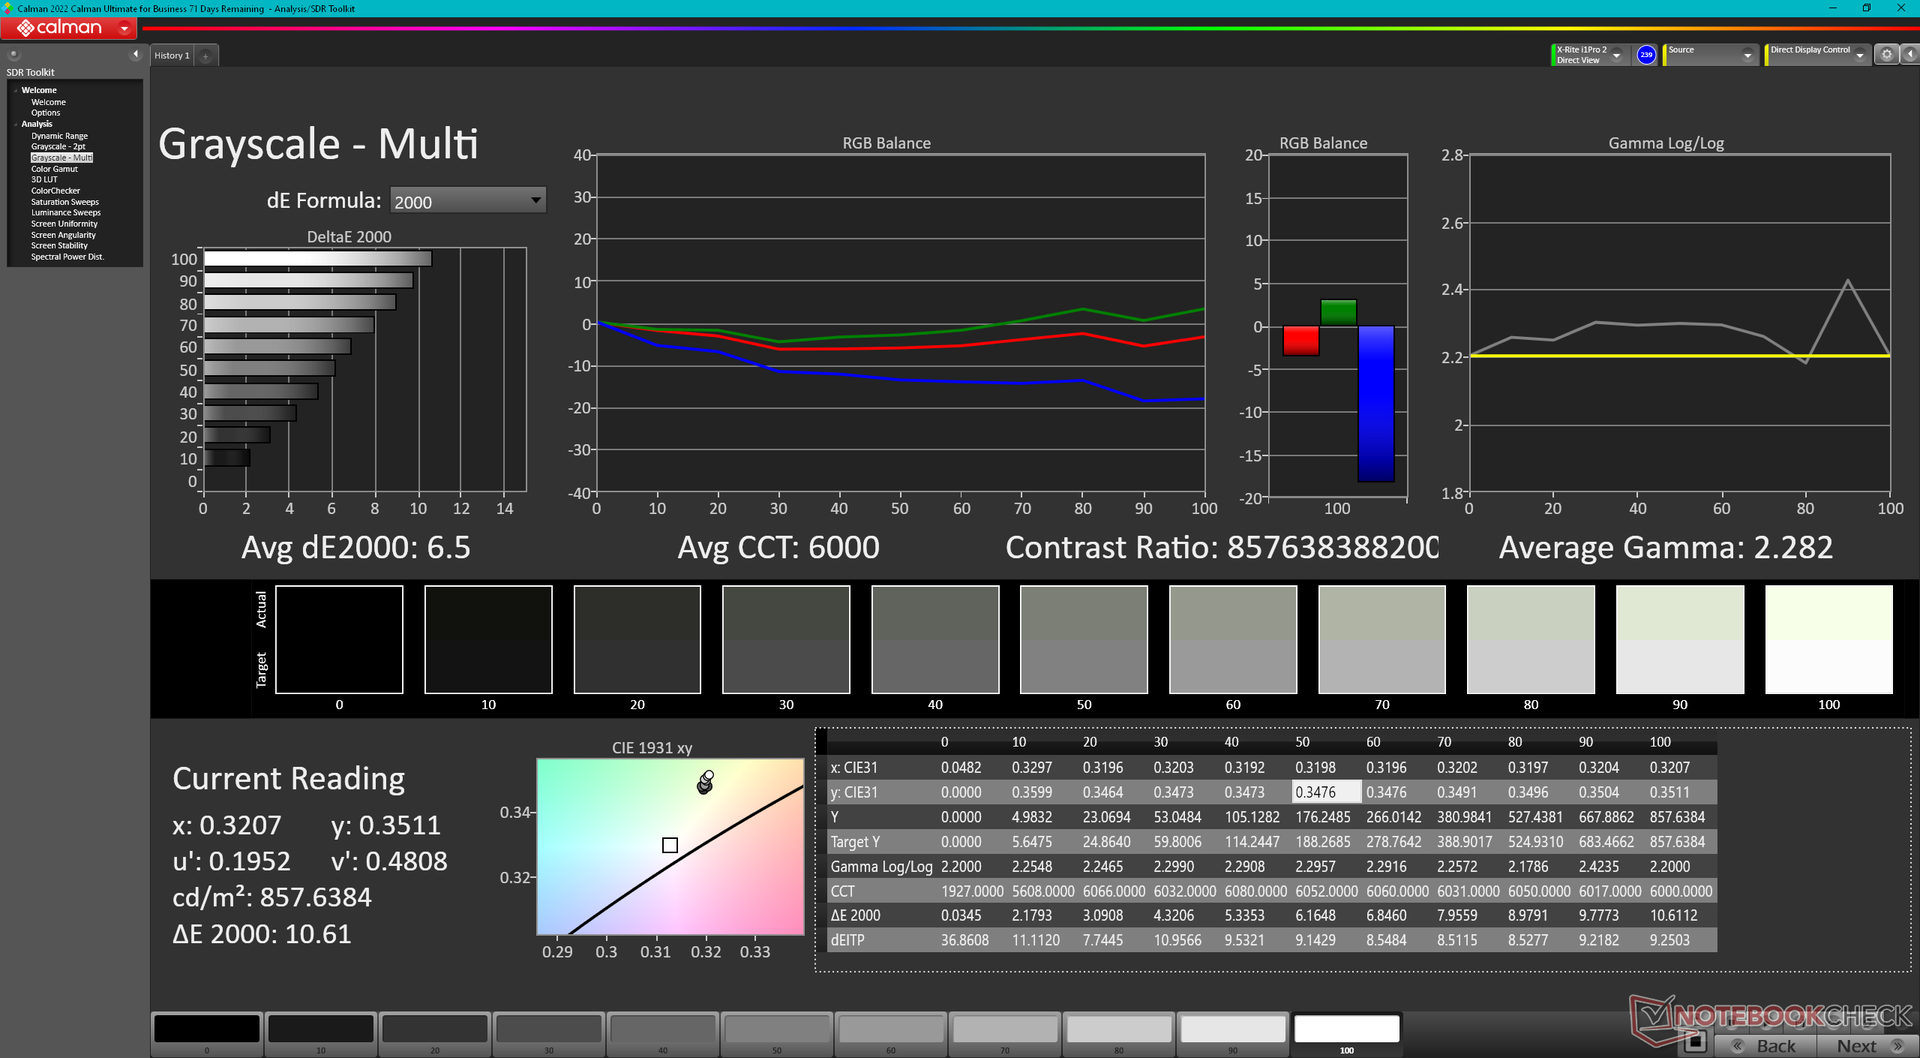
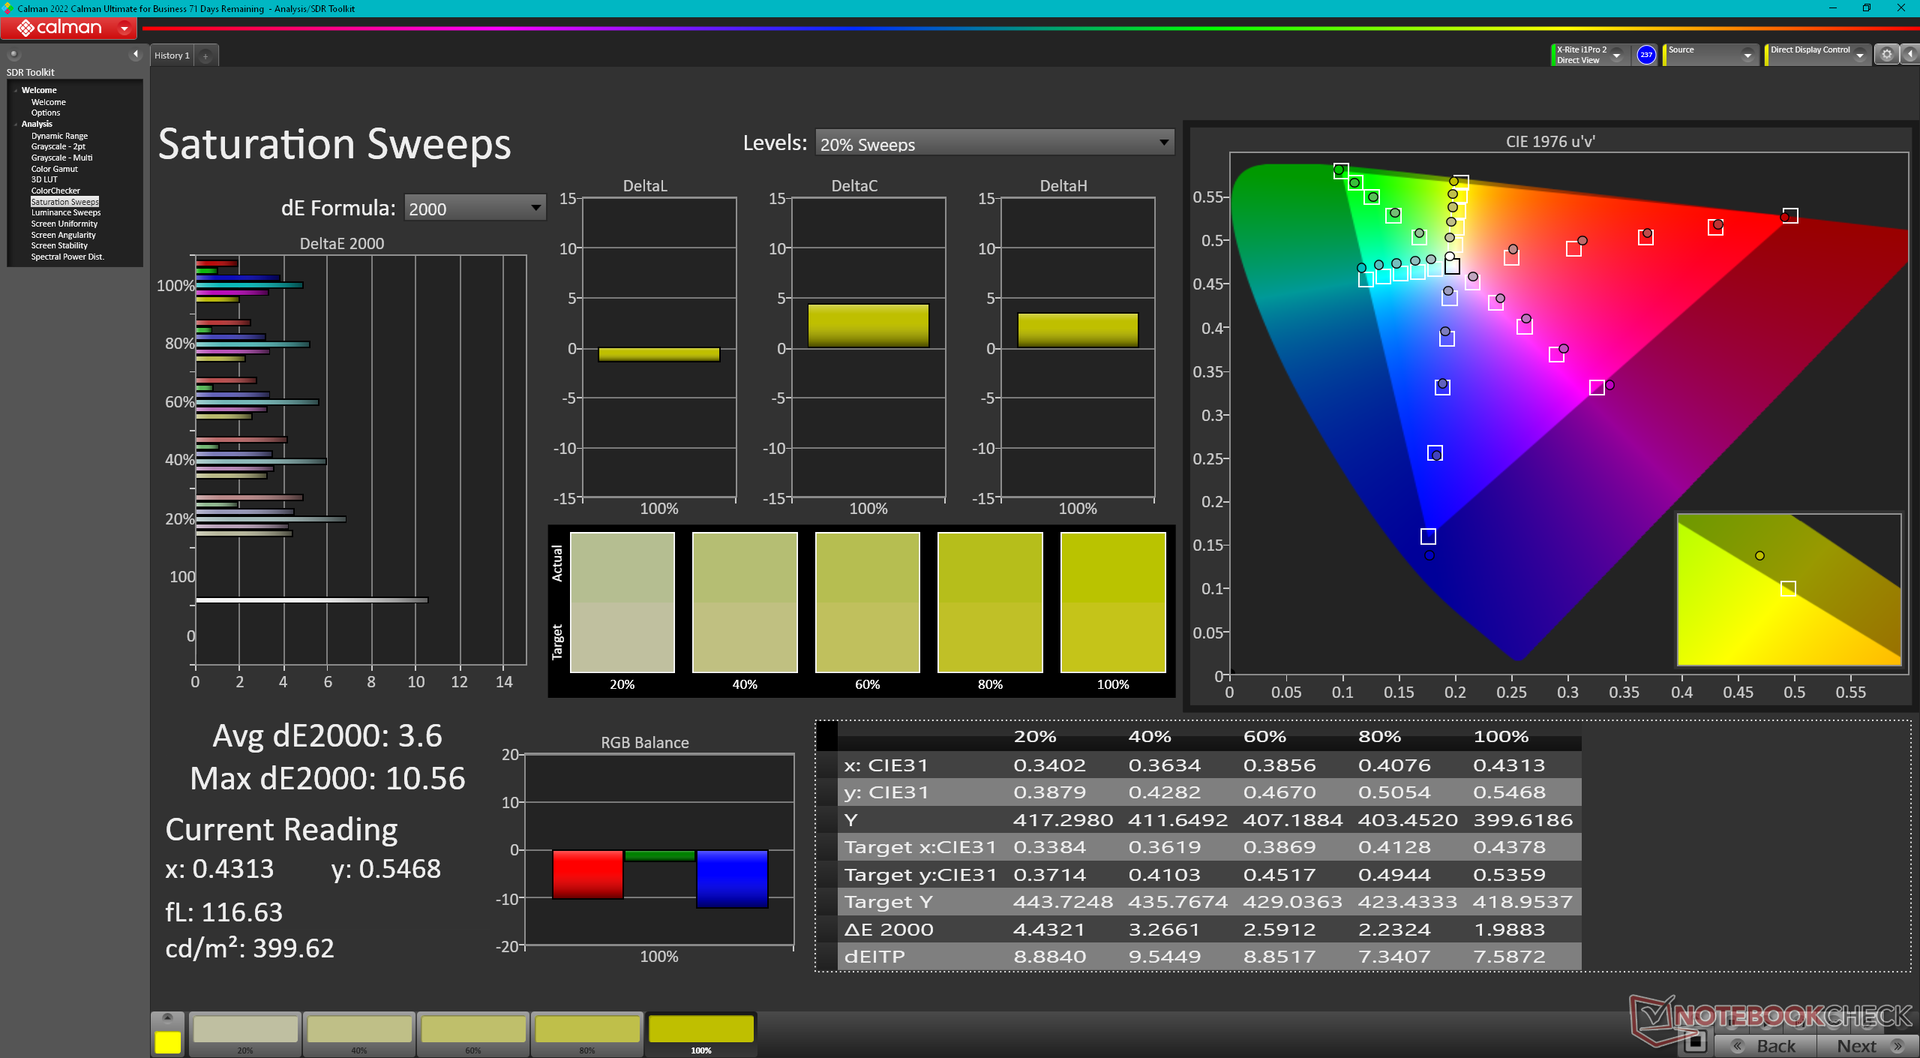
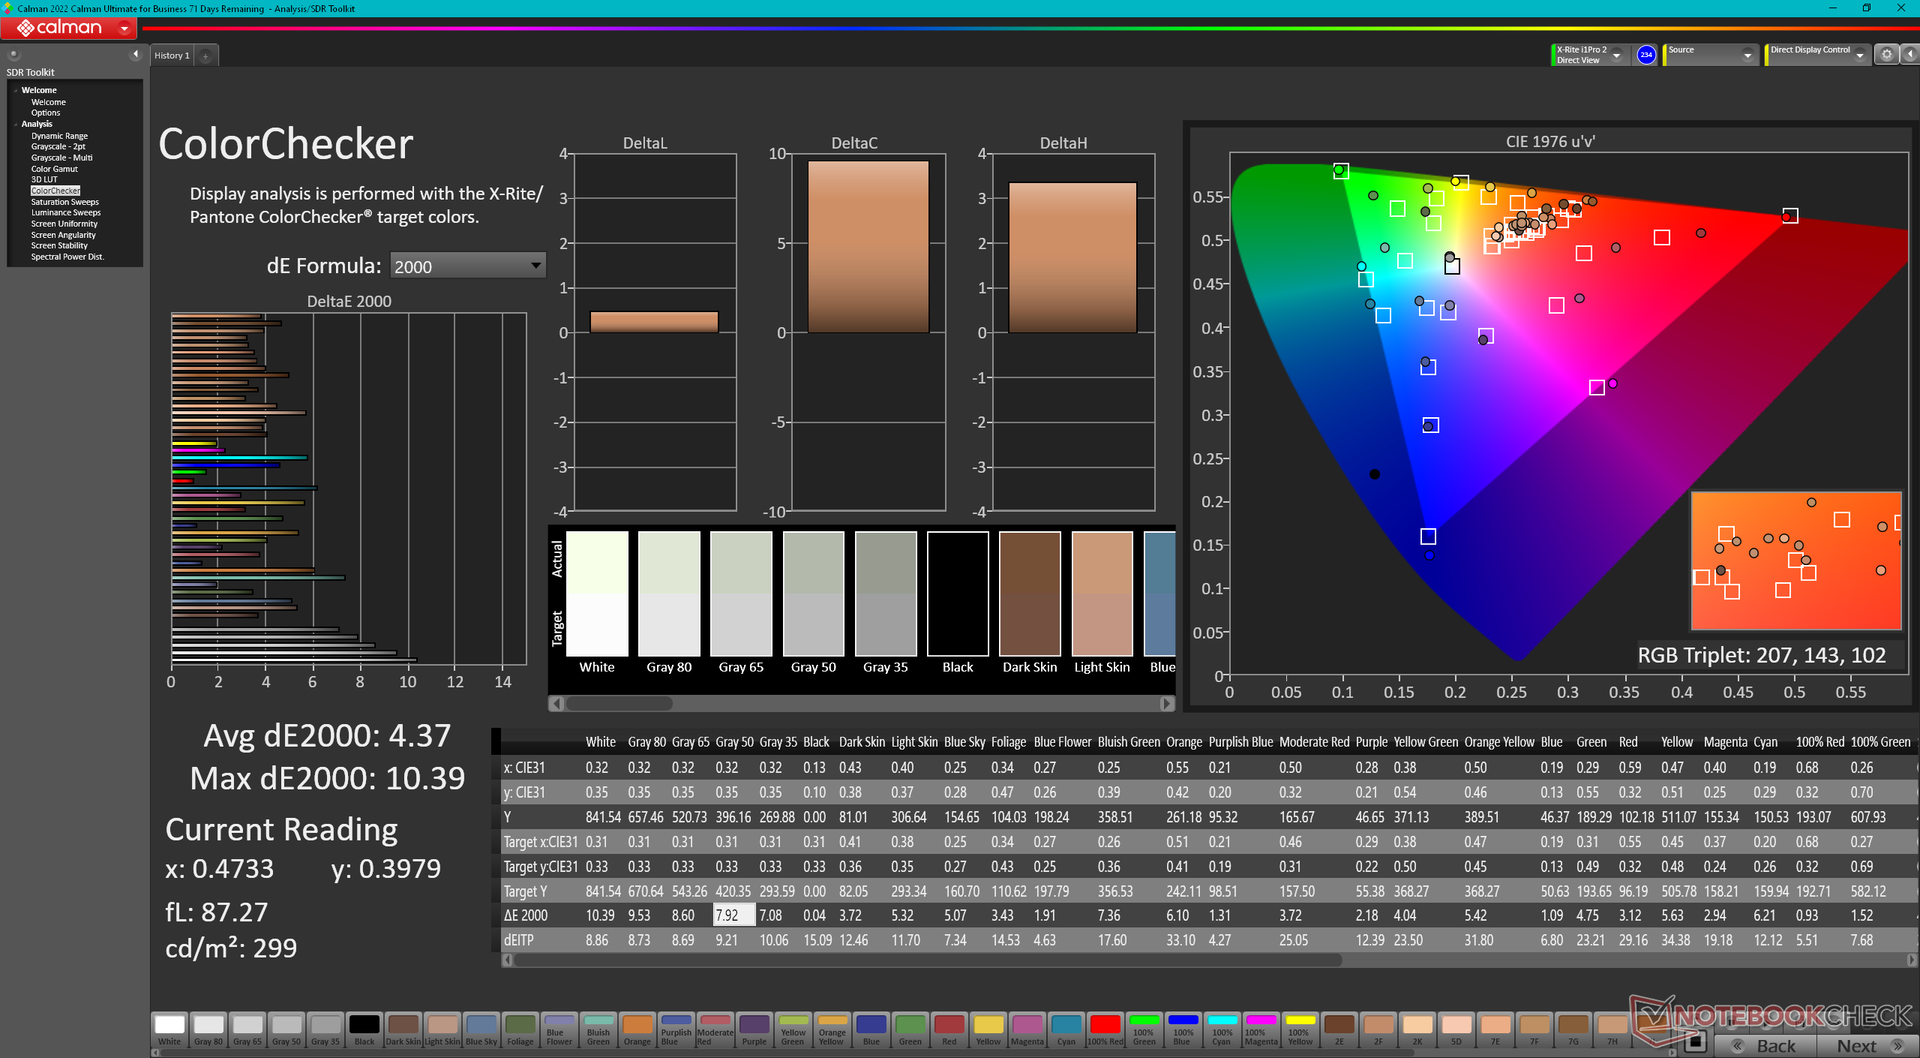
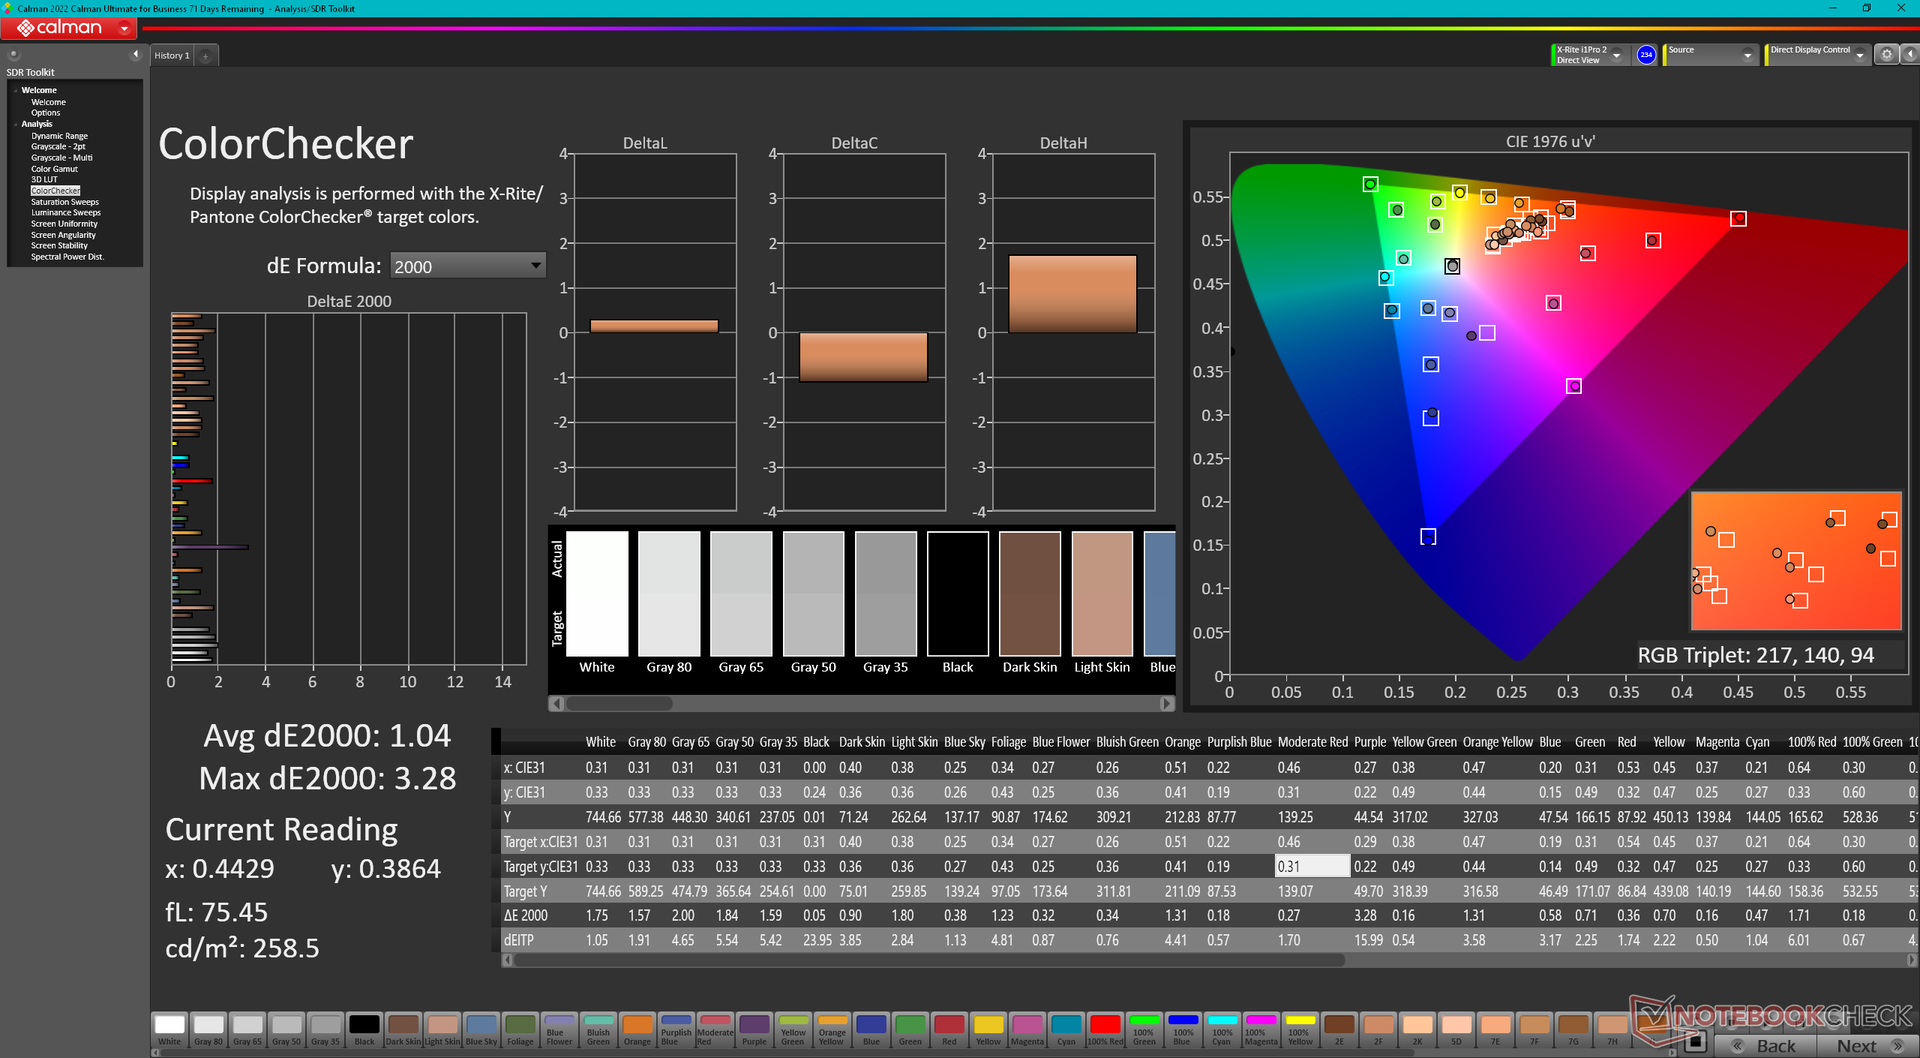
ΔE ColorChecker Calman: 4.37 | ∀{0.5-29.43 Ø4.73}
calibrated: 1.04
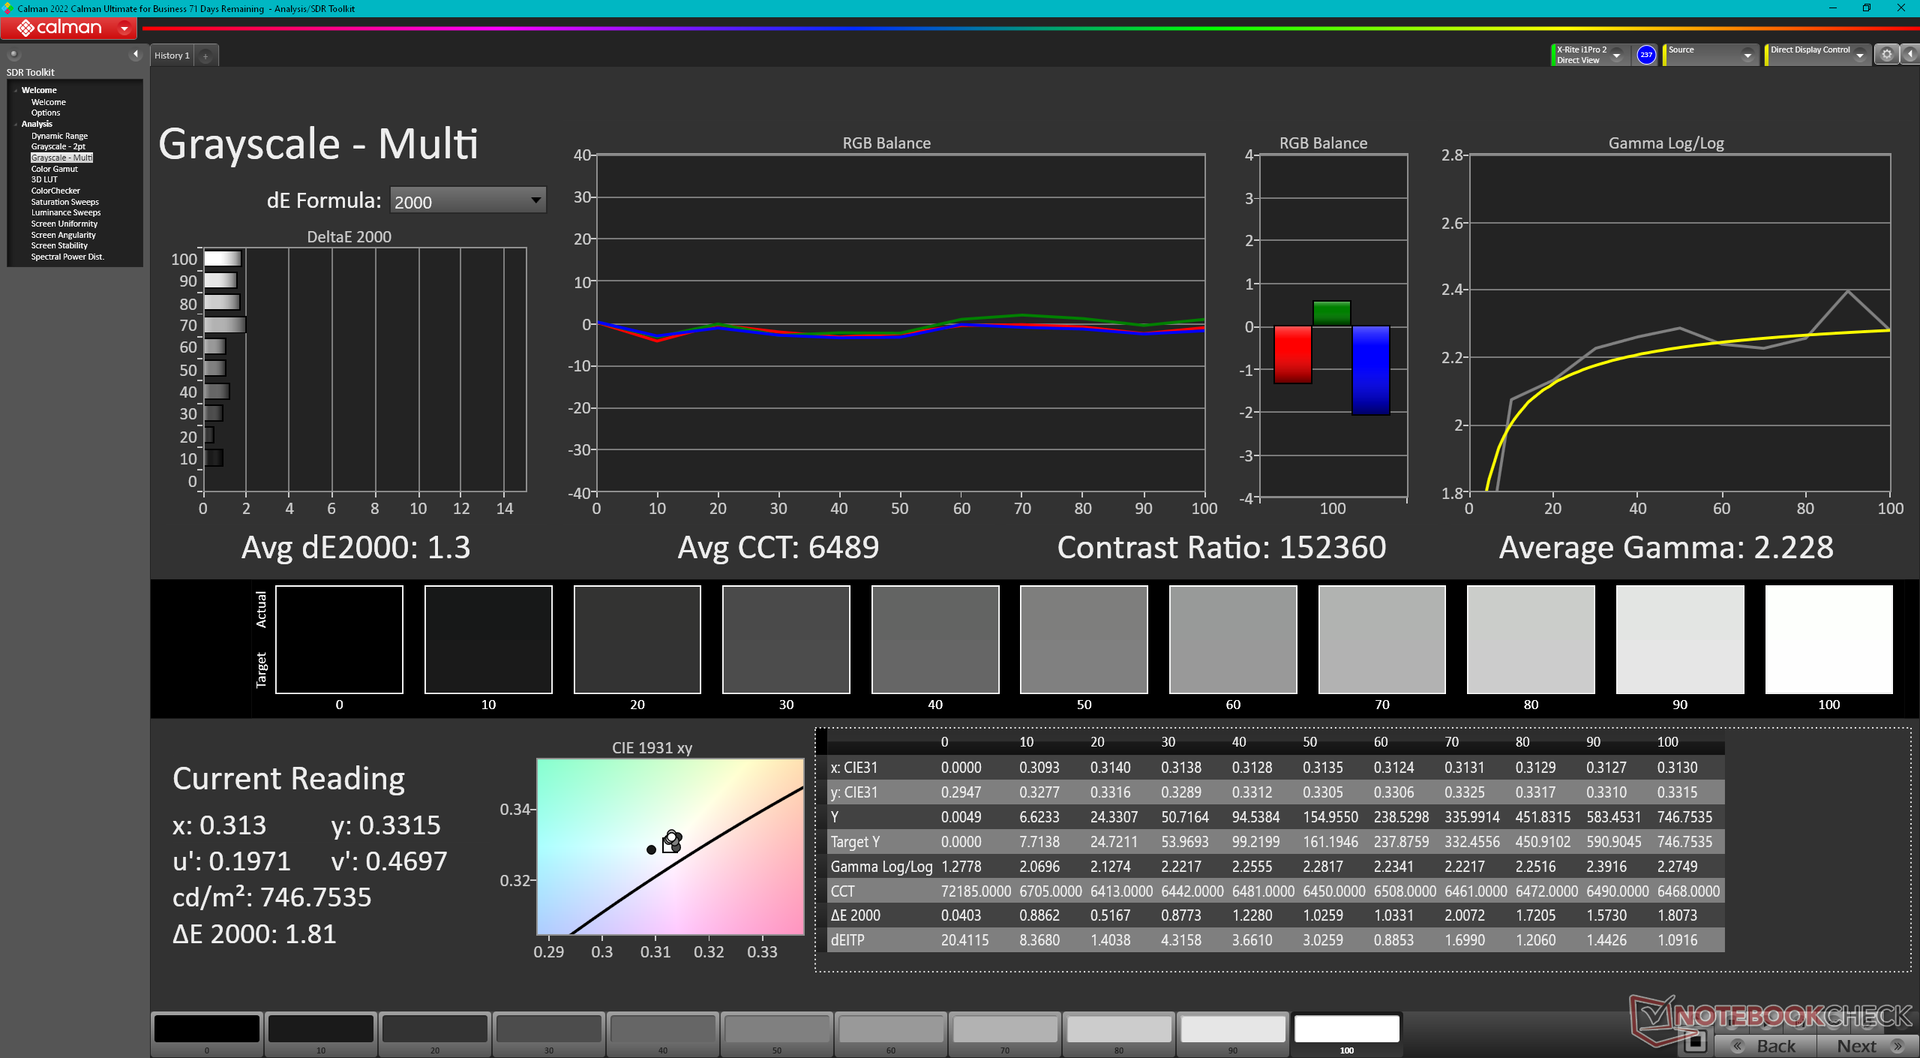
ΔE Greyscale Calman: 6.5 | ∀{0.09-98 Ø4.97}
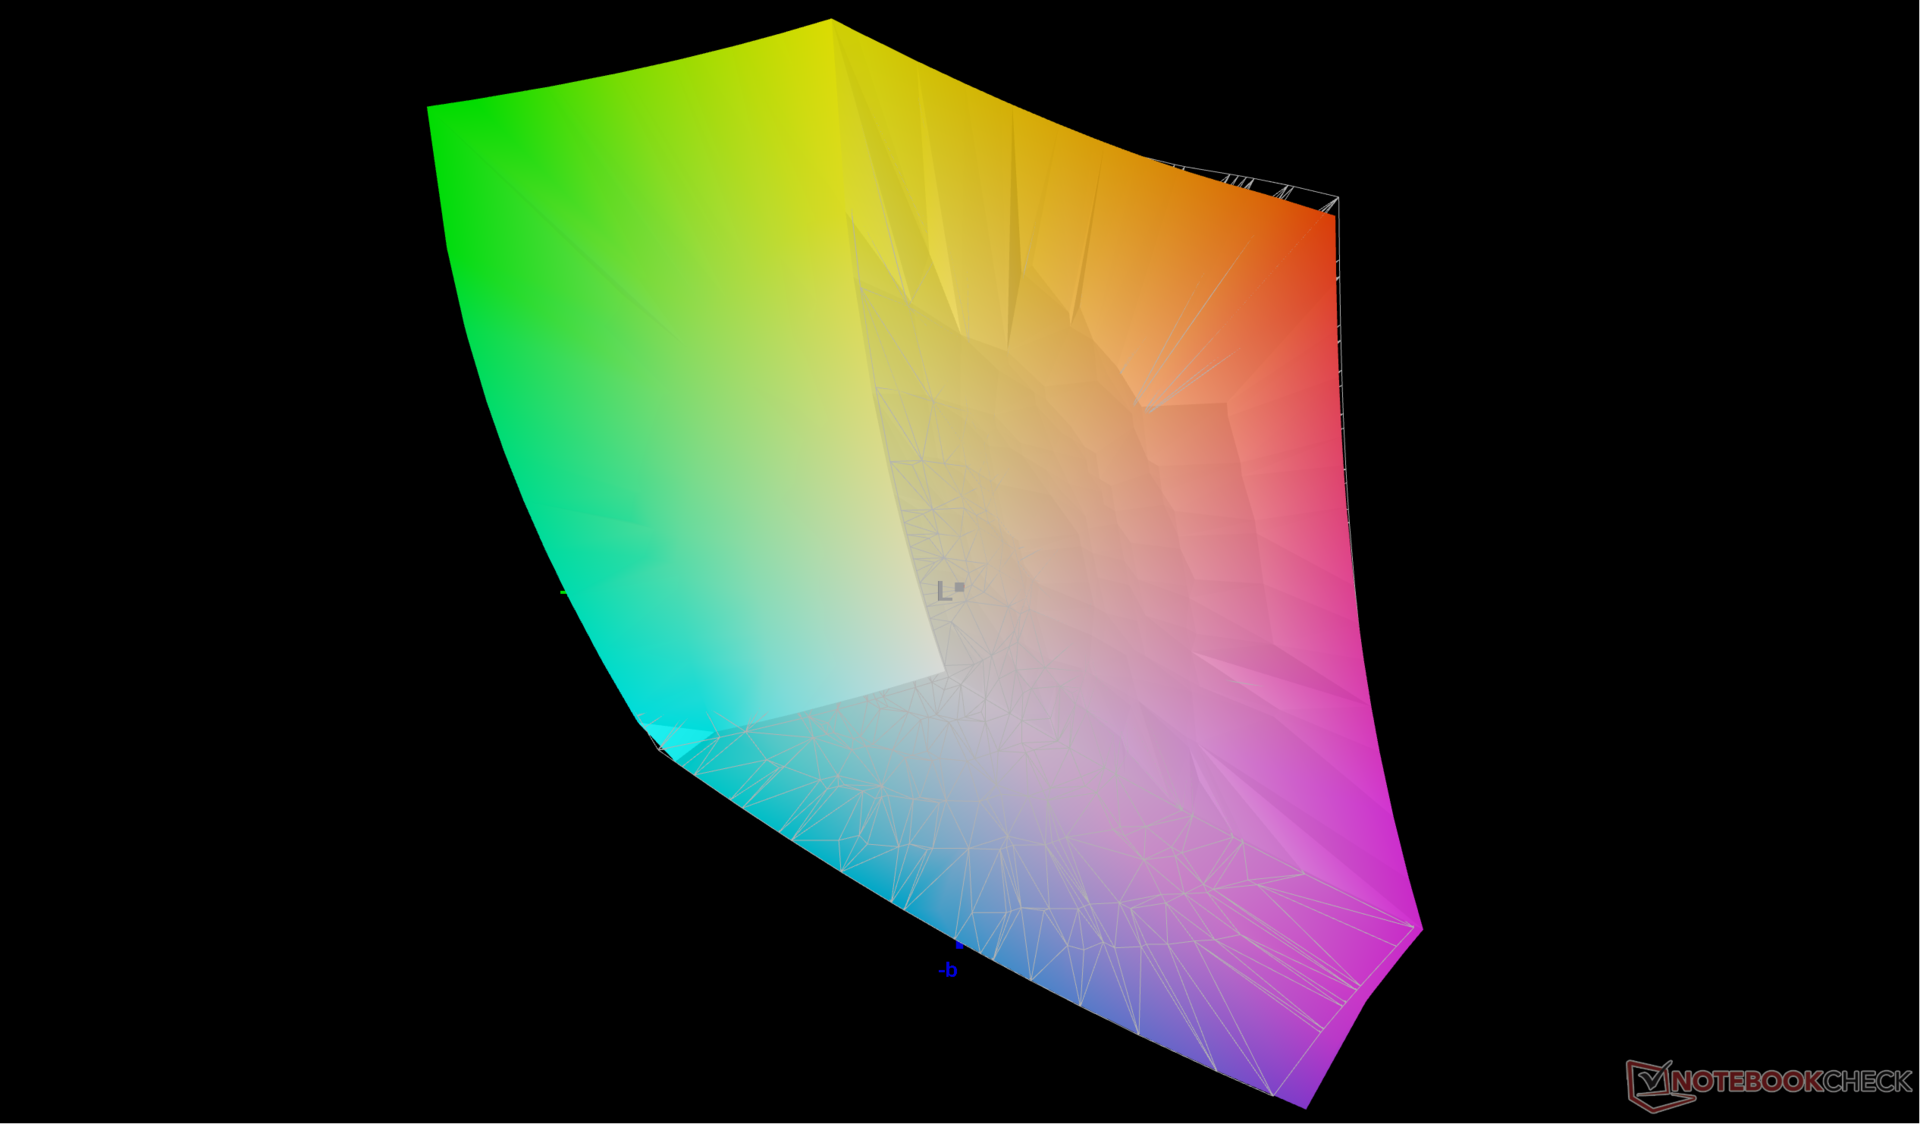
87.6% AdobeRGB 1998 (Argyll 3D)
100% sRGB (Argyll 3D)
99.2% Display P3 (Argyll 3D)
Gamma: 2.28
CCT: 6000 K
| HP Omen Transcend 16 AUOA3A6, Mini-LED, 2560x1600, 16" | Lenovo Legion Slim 7i 16 Gen 8 CSOT T3 MNG007DA2-3, IPS, 2560x1600, 16" | HP Omen 16-wf000 BOE0B7D, IPS, 2560x1440, 16.1" | Alienware x16 R1 BOE NE16NZ4, IPS, 2560x1600, 16" | Acer Nitro 16 AN16-41 BOE CQ NE16QDM-NY1, IPS, 2560x1600, 16" | Asus ROG Zephyrus M16 GU603Z BOE0A0B (BOE CQ NE160QDM-NY3), IPS, 2560x1600, 16" | |
|---|---|---|---|---|---|---|
| Display | -16% | -17% | 0% | -18% | -4% | |
| Display P3 Coverage (%) | 99.2 | 70.4 -29% | 69 -30% | 99.2 0% | 67.9 -32% | 92.8 -6% |
| sRGB Coverage (%) | 100 | 99.4 -1% | 99.2 -1% | 100 0% | 99.1 -1% | 98.5 -1% |
| AdobeRGB 1998 Coverage (%) | 87.6 | 72.5 -17% | 71.2 -19% | 88.6 1% | 69.9 -20% | 83.1 -5% |
| Response Times | 62% | 75% | 72% | 70% | 68% | |
| Response Time Grey 50% / Grey 80% * (ms) | 26.4 ? | 12 ? 55% | 4.6 ? 83% | 5.1 ? 81% | 11 ? 58% | 7.6 ? 71% |
| Response Time Black / White * (ms) | 28.2 ? | 8.9 ? 68% | 9.7 ? 66% | 10.3 ? 63% | 5 ? 82% | 10 ? 65% |
| PWM Frequency (Hz) | 3506 ? | |||||
| Bildschirm | -95% | -86% | -67% | -95% | -79% | |
| Helligkeit Bildmitte (cd/m²) | 791.1 | 474.6 -40% | 310.9 -61% | 302.2 -62% | 520 -34% | 497 -37% |
| Brightness (cd/m²) | 800 | 445 -44% | 296 -63% | 285 -64% | 494 -38% | 481 -40% |
| Brightness Distribution (%) | 95 | 86 -9% | 91 -4% | 89 -6% | 91 -4% | 82 -14% |
| Schwarzwert * (cd/m²) | 0.04 | 0.39 -875% | 0.35 -775% | 0.26 -550% | 0.39 -875% | 0.21 -425% |
| Kontrast (:1) | 19778 | 1217 -94% | 888 -96% | 1162 -94% | 1333 -93% | 2367 -88% |
| Delta E Colorchecker * | 4.37 | 2.12 51% | 2.18 50% | 1.63 63% | 1.94 56% | 3.53 19% |
| Colorchecker dE 2000 max. * | 10.39 | 4.73 54% | 3.58 66% | 4.13 60% | 5.62 46% | 6.15 41% |
| Colorchecker dE 2000 calibrated * | 1.04 | 0.57 45% | 0.52 50% | 1.17 -13% | 0.74 29% | 3.53 -239% |
| Delta E Graustufen * | 6.5 | 2.8 57% | 2.8 57% | 2.5 62% | 2.94 55% | 1.74 73% |
| Gamma | 2.28 96% | 2.22 99% | 2.18 101% | 2.23 99% | 2.37 93% | 2.2 100% |
| CCT | 6000 108% | 6542 99% | 6002 108% | 6590 99% | 6443 101% | 6418 101% |
| Durchschnitt gesamt (Programm / Settings) | -16% /
-56% | -9% /
-48% | 2% /
-33% | -14% /
-55% | -5% /
-42% |
* ... kleinere Werte sind besser

Ab Werk ist das Panel noch nicht kalibriert, weshalb wir dies mit unserem X-Rite-Colorimeter vorgenommen haben. So hoben wir die Farbtemperatur von 6.000K auf die standardmäßigen 6.500K an, was zu einer stabileren Farbdarstellung bei jeglichen Sättigungsstufen führt.
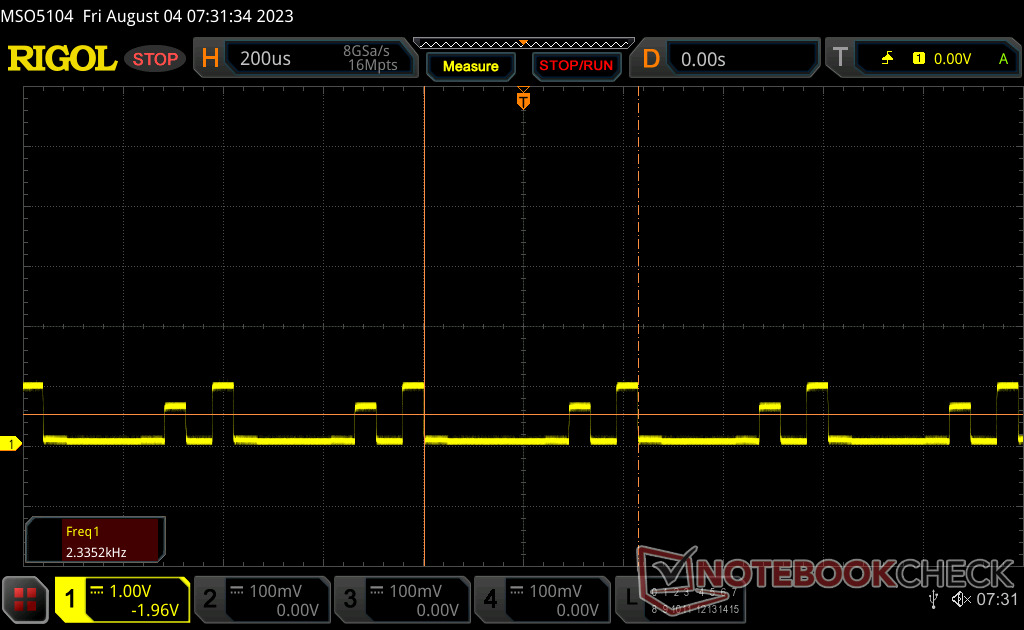
Reaktionszeiten (Response Times) des Displays
| ↔ Reaktionszeiten Schwarz zu Weiß | ||
|---|---|---|
| 28.2 ms ... steigend ↗ und fallend ↘ kombiniert | ↗ 21.6 ms steigend | 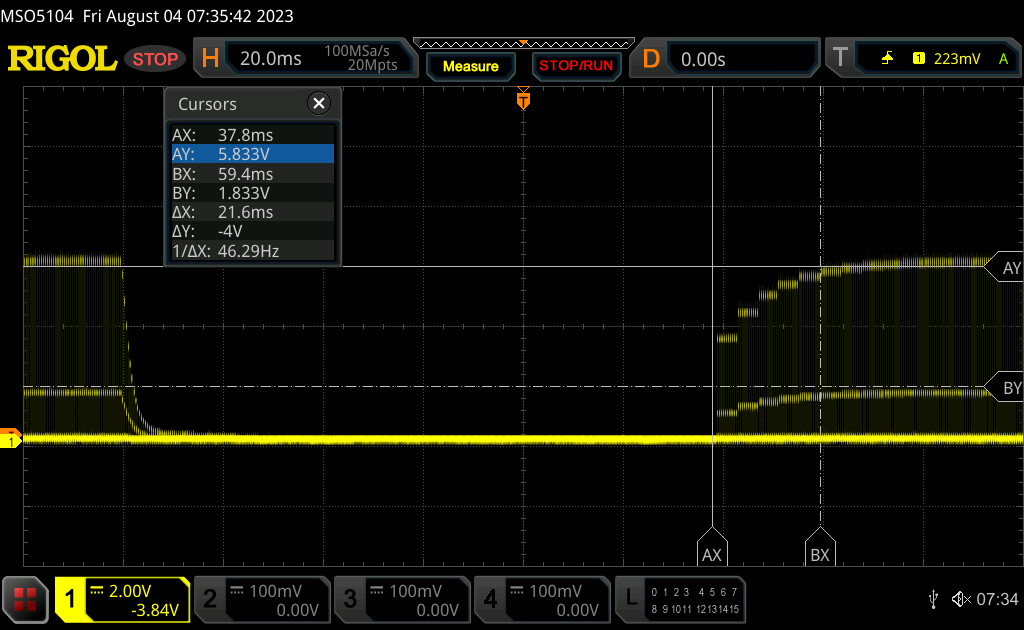 |
| ↘ 6.6 ms fallend | ||
| Die gemessenen Reaktionszeiten sind mittelmäßig und dadurch für Spieler eventuell zu langsam. Im Vergleich rangierten die bei uns getesteten Geräte von 0.1 (Minimum) zu 240 (Maximum) ms. » 75 % aller Screens waren schneller als der getestete. Daher sind die gemessenen Reaktionszeiten schlechter als der Durchschnitt aller vermessenen Geräte (19.9 ms). | ||
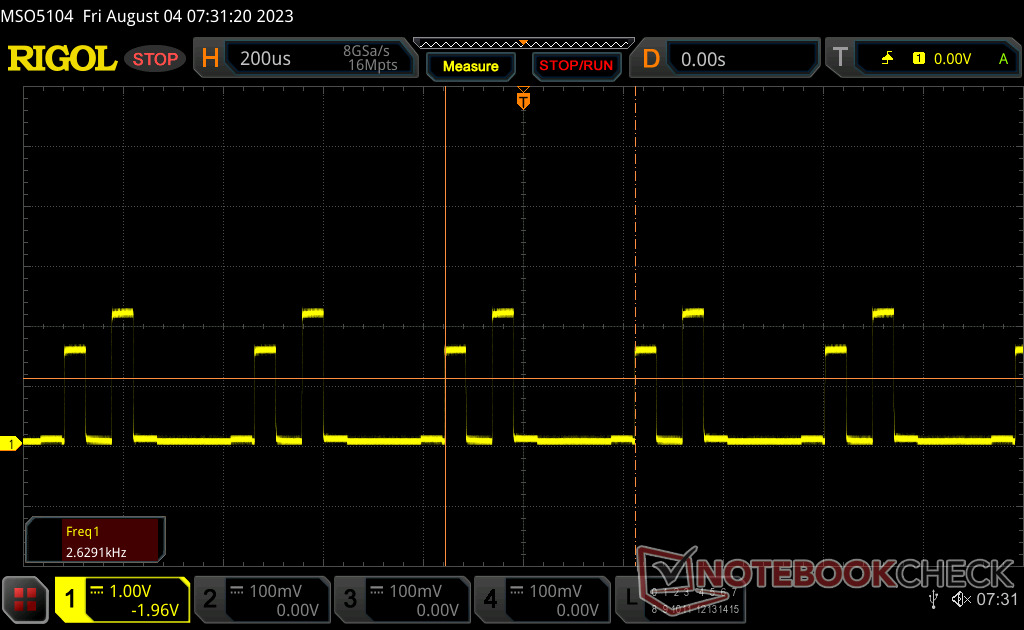
| ↔ Reaktionszeiten 50% Grau zu 80% Grau | ||
| 26.4 ms ... steigend ↗ und fallend ↘ kombiniert | ↗ 15 ms steigend | 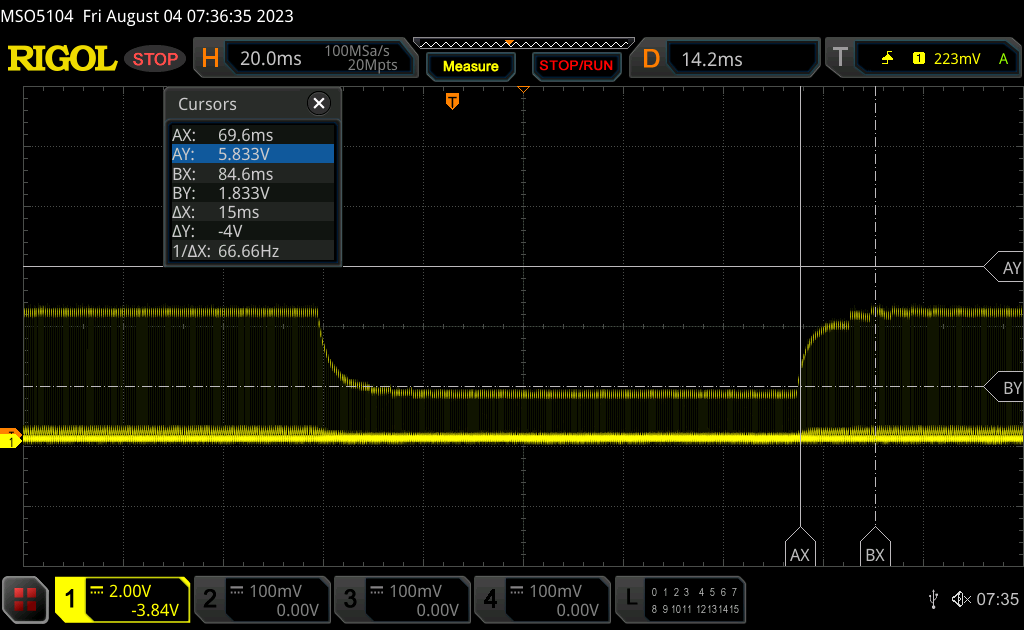 |
| ↘ 11.4 ms fallend | ||
| Die gemessenen Reaktionszeiten sind mittelmäßig und dadurch für Spieler eventuell zu langsam. Im Vergleich rangierten die bei uns getesteten Geräte von 0.165 (Minimum) zu 636 (Maximum) ms. » 36 % aller Screens waren schneller als der getestete. Daher sind die gemessenen Reaktionszeiten besser als der Durchschnitt aller vermessenen Geräte (31.1 ms). | ||
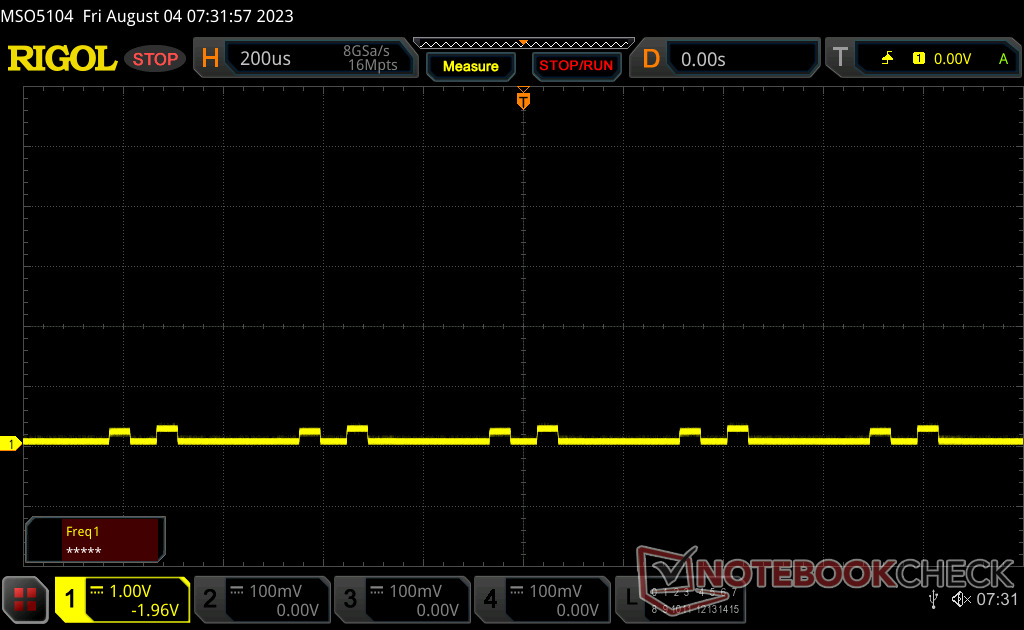
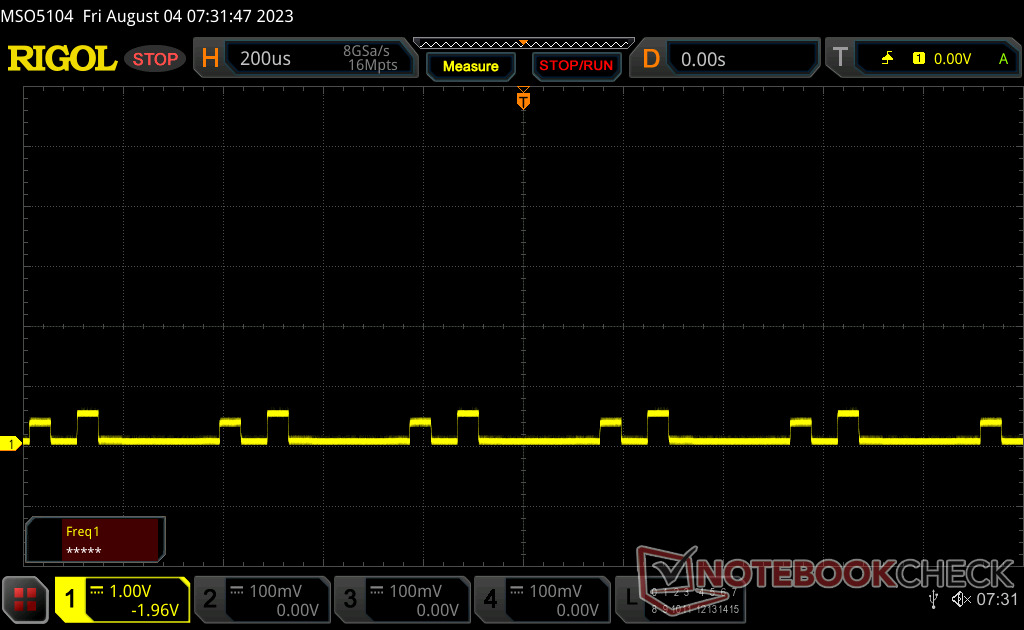
Bildschirm-Flackern / PWM (Pulse-Width Modulation)
| Flackern / PWM festgestellt | 3506 Hz | ≤ 100 % Helligkeit | 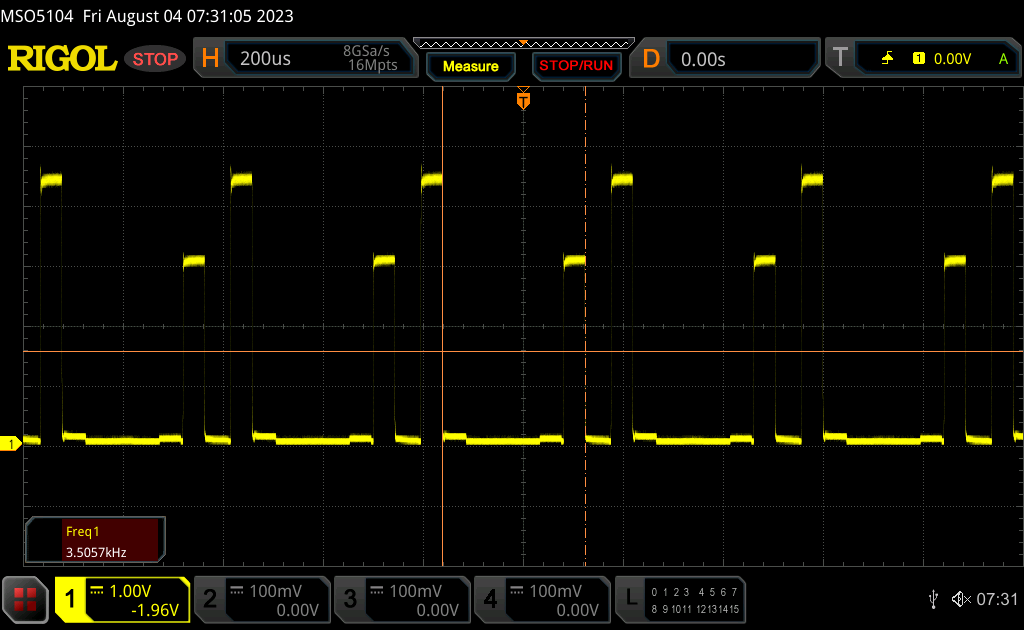 |
Das Display flackert mit 3506 Hz (im schlimmsten Fall, eventuell durch Pulsweitenmodulation PWM) bei einer eingestellten Helligkeit von 100 % und darunter. Darüber sollte es zu keinem Flackern kommen. Die Frequenz von 3506 Hz ist sehr hoch und sollte daher auch bei empfindlichen Personen zu keinen Problemen führen. Im Vergleich: 52 % aller getesteten Geräte nutzten kein PWM um die Helligkeit zu reduzieren. Wenn PWM eingesetzt wurde, dann bei einer Frequenz von durchschnittlich 7798 (Minimum 5, Maximum 343500) Hz. | |||
Ein Flackern konnten wir leider bei jeglichen Helligskeitsstufen messen. Jedoch sollte die Frequenz von 3.506 Hz dies für die meisten Nutzer wieder wett machen. Das Flackern hat jedoch trotzdem den Nachteil, dass die Reaktionszeiten nicht so exakt gemessen werden können.
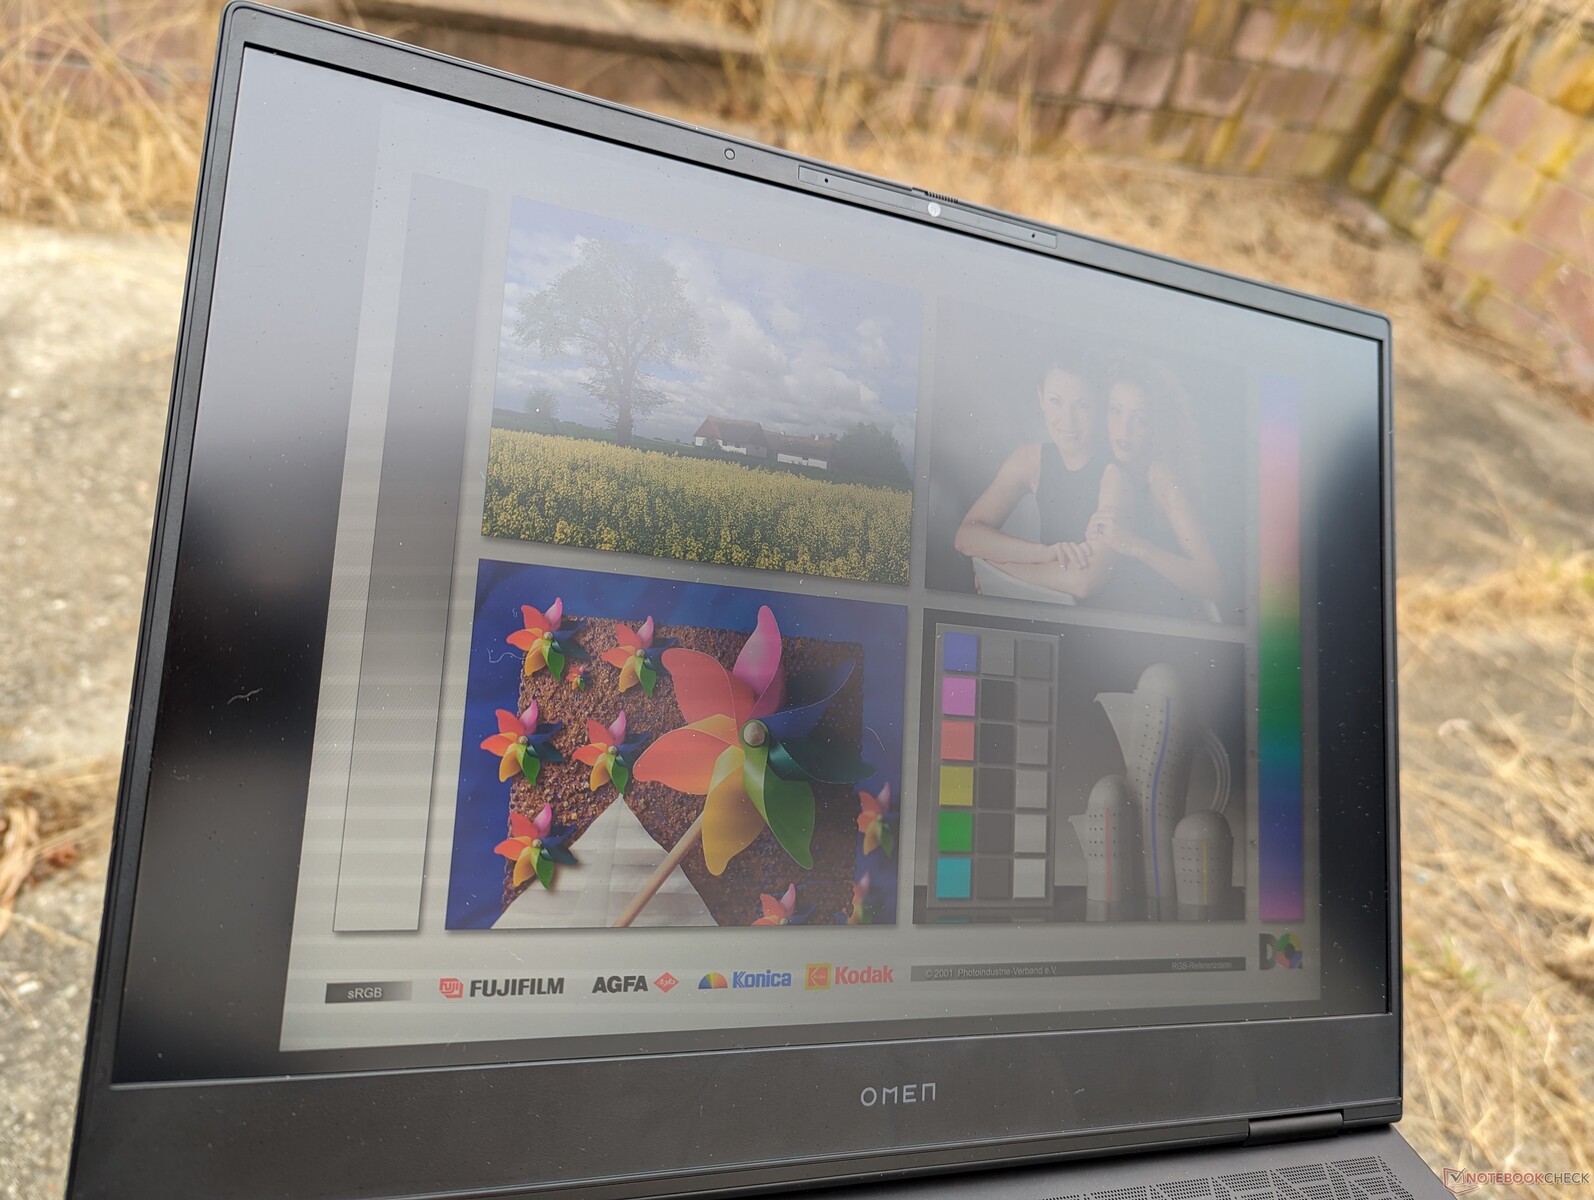
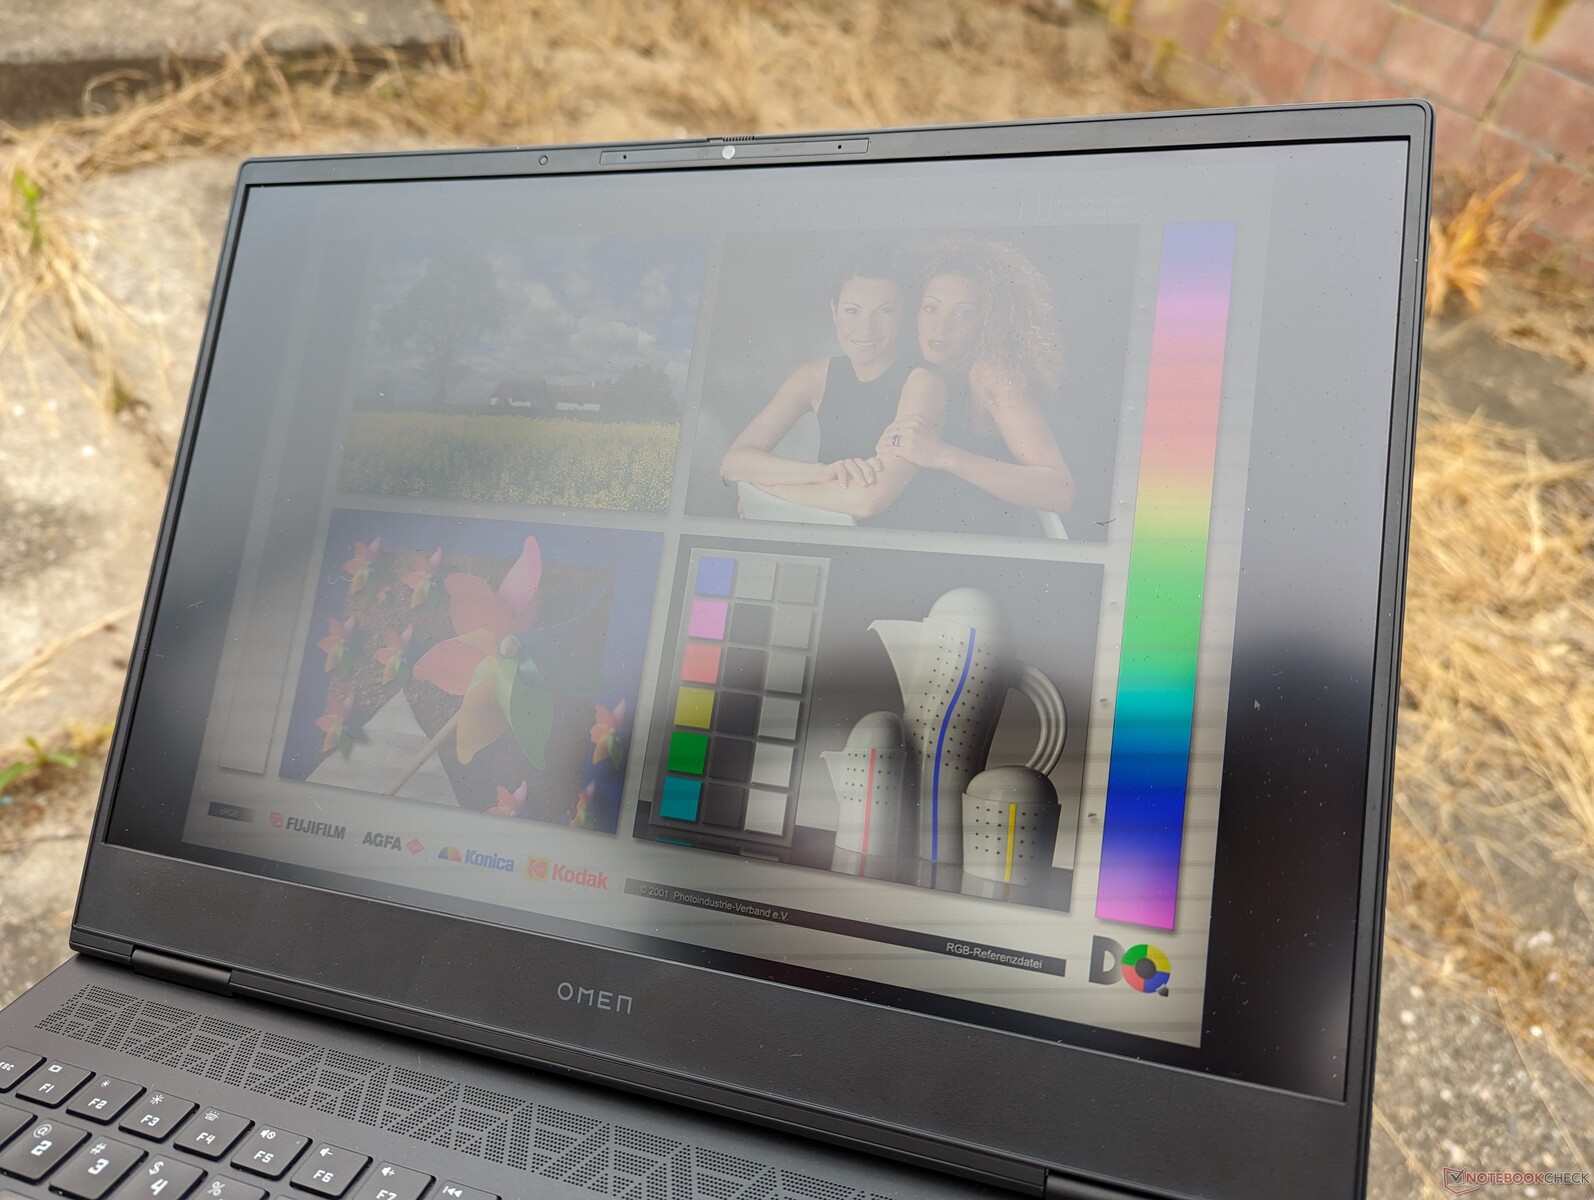
Befindet man sich draußen mit dem Notebook, lässt sich immer noch alles gut auf dem Display erkennen, auch wenn die Farben bei extremem Lichteinfall etwas verwaschen sind. Die maximale Helligkeit von 800 Nits ist aber ziemlich energiesparend.

Performance — Intel Raptor Lake-HX der 13. Generation
Testszenario
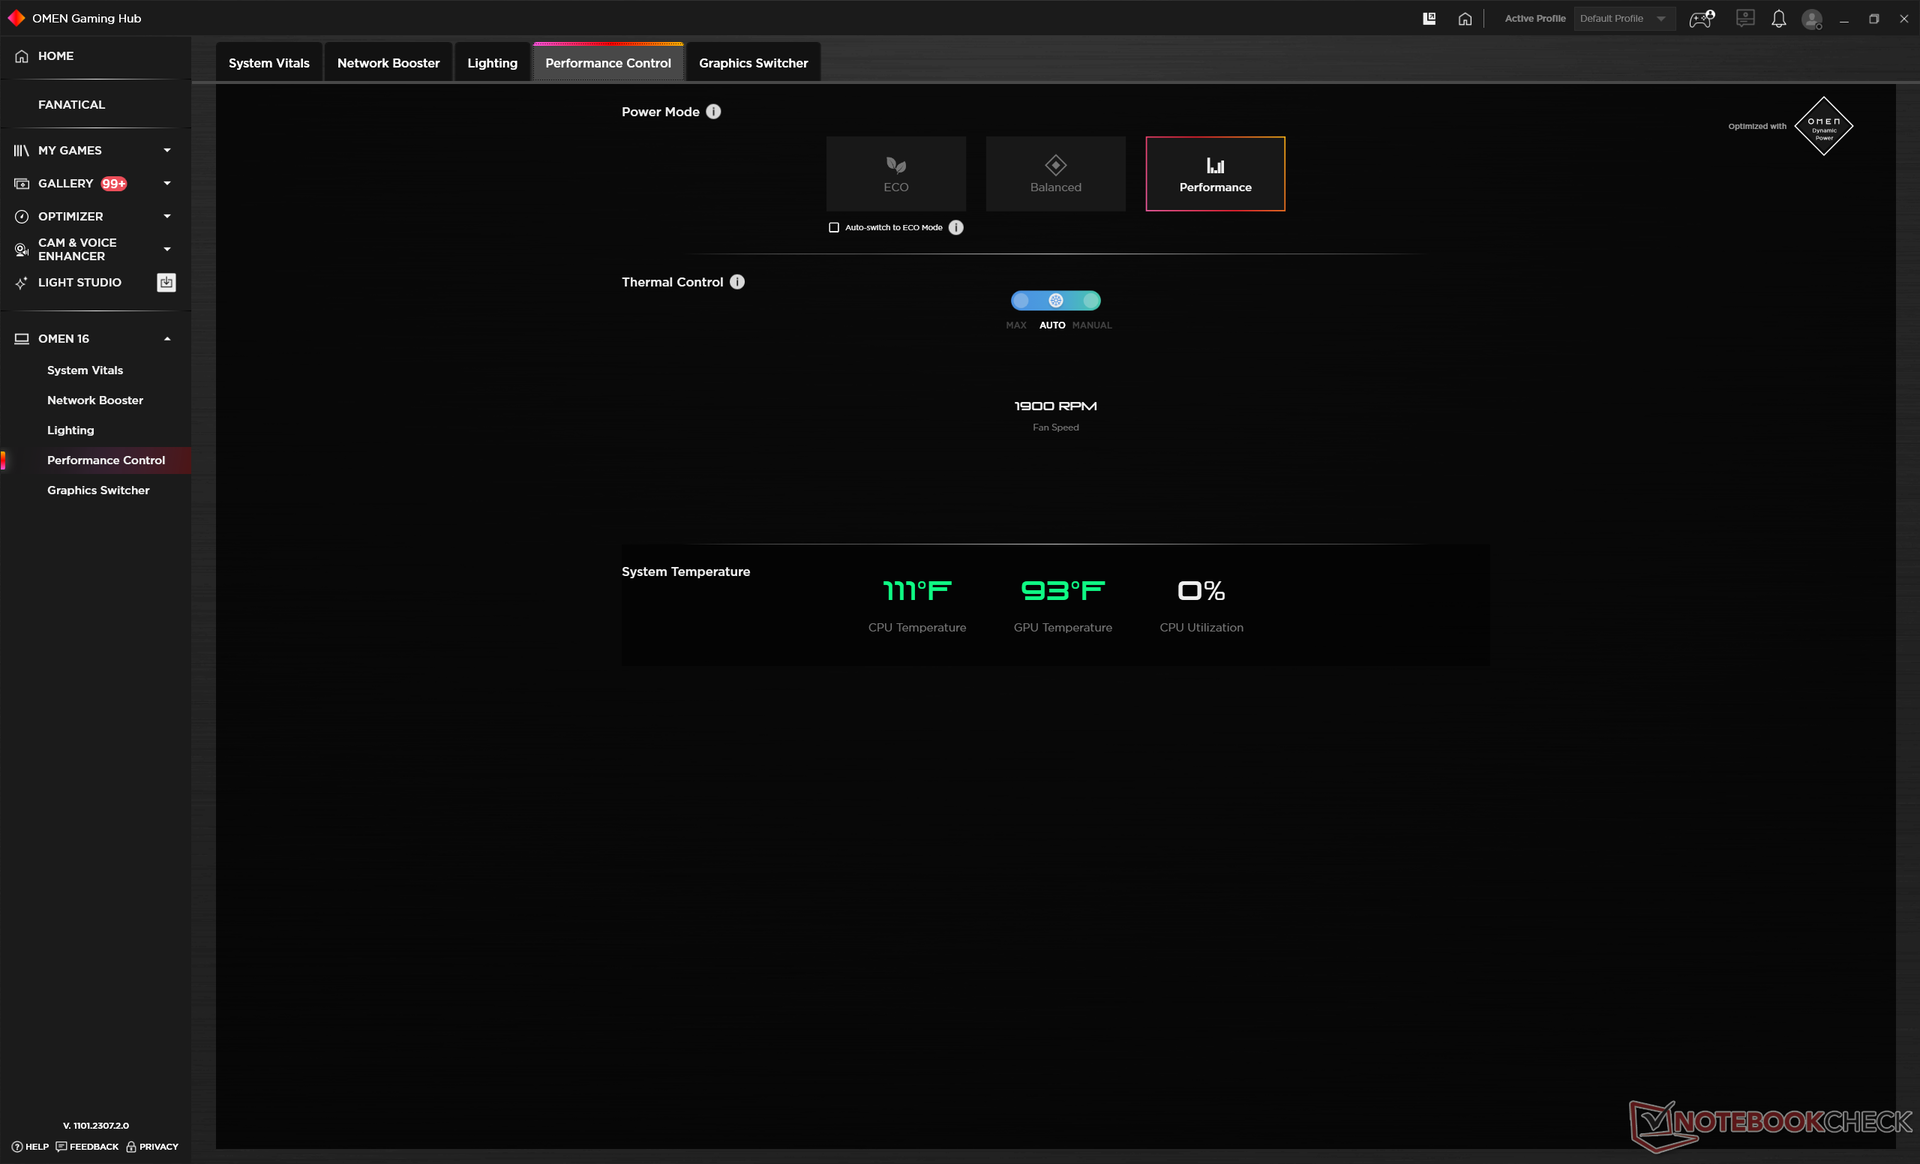
Bevor wir jegliche Benchmarks durchgeführt haben, aktivierten wir den Windows-Performance-Modus und den Performance-Modus in der Omen-Gaming-Hub-Software. Leider beeinflusst der eine Modus nicht den anderen, was bedeutet, dass man jegliche Einstellungen bei beiden getrennt voneinander adjustieren muss.
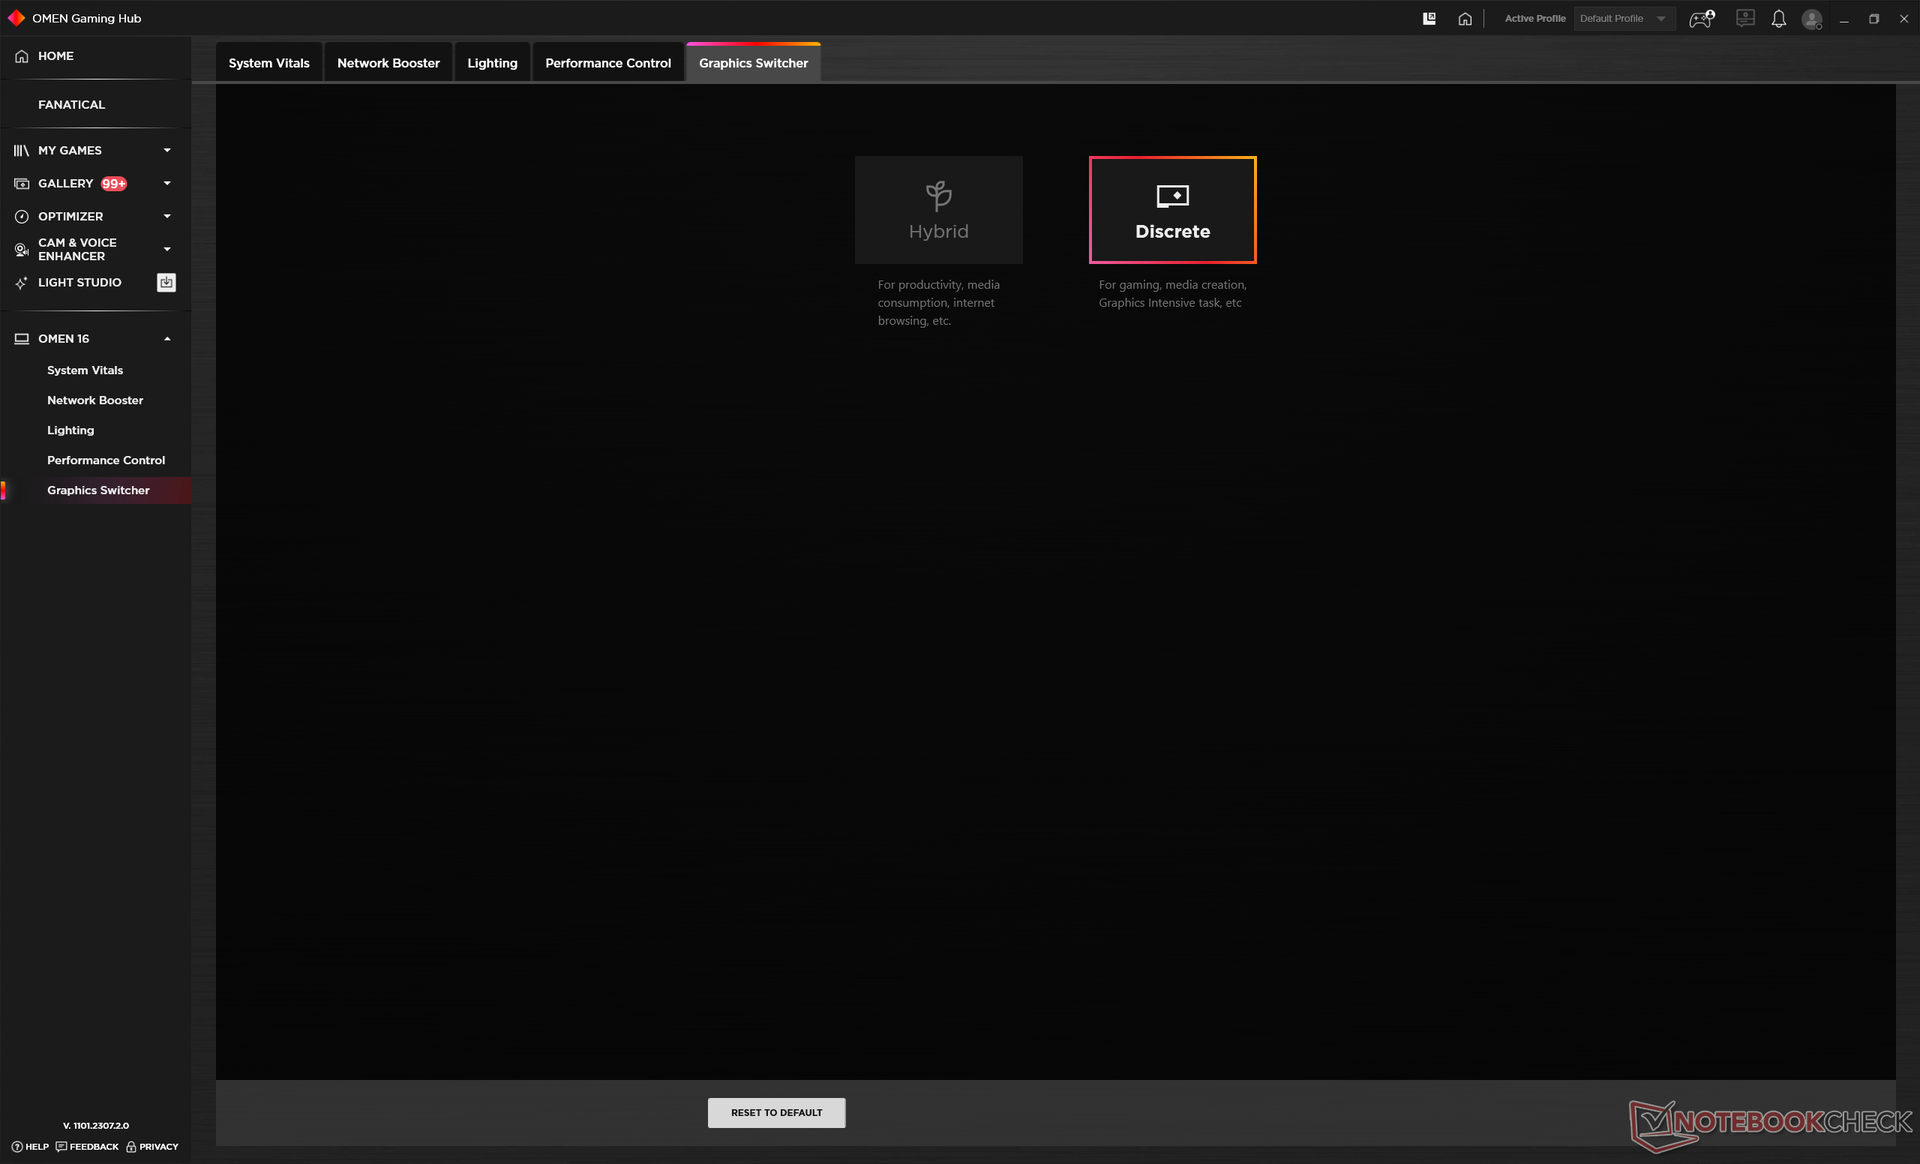
Der MUX Switch ist im Omen Gaming Hub integriert, weshalb es sinnvoll ist, sich vorab mit dieser Software zu beschäftigen. Die Performance-Profile sind hier jedoch in mehreren Submenüs versteckt, was unserer Ansicht nach mit der Zeit eher schlecht als recht ist.
Advanced Optimus oder Optimus 2.0 werden leider nicht unterstützt. Aus diesem Grund ist ein Soft-Reboot bei einem Wechsel zwischen der iGPU und der dGPU zwingend erforderlich. Außerdem wird G-Sync beim integrierten Display unterstützt.

Prozessor
Der i9-13900HX im Omen Transcend 16 performt bei unseren Tests um ca. fünf bis zehn Prozent langsamer als Referrenzmodelle mit dem gleichen Prozessor. Ein extremes Beispiel wäre hier der Lenovo Legion Pro 7, welcher um bis zu 20 Prozent schneller läuft als unser HP Testgerät. Nichtsdestotrotz ist das Omen Transcend 16 einer der schnellsten Gaming-Laptops auf dem Markt, auch wenn die Prozessorleistung für einen High-End-Gaming-Laptop unserer Meinung nach etwas besser hätte sein können.
Bei CineBench R15 xT ist die Performance trotzdem stabil, und es gab zu keiner Zeit irgendeine Drosselung.
Cinebench R15 Multi-Loop
Cinebench R23: Multi Core | Single Core
Cinebench R20: CPU (Multi Core) | CPU (Single Core)
Cinebench R15: CPU Multi 64Bit | CPU Single 64Bit
Blender: v2.79 BMW27 CPU
7-Zip 18.03: 7z b 4 | 7z b 4 -mmt1
Geekbench 5.5: Multi-Core | Single-Core
HWBOT x265 Benchmark v2.2: 4k Preset
LibreOffice : 20 Documents To PDF
R Benchmark 2.5: Overall mean
| CPU Performance Rating | |
| Asus Zephyrus Duo 16 GX650PY-NM006W | |
| Durchschnittliche Intel Core i9-13900HX | |
| HP Omen Transcend 16 | |
| Lenovo Legion Slim 7i 16 Gen 8 -1! | |
| Alienware x16 R1 -1! | |
| Lenovo Legion Pro 5 16ARX8 | |
| HP Omen 16-wf000 -1! | |
| Asus ROG Zephyrus M16 GU603Z | |
| Lenovo Legion S7 16ARHA7 | |
| Acer Nitro 16 AN16-41 | |
| HP Omen 16-n0033dx | |
| Dell Inspiron 16 Plus 7610-MHJ8F | |
| Cinebench R20 / CPU (Multi Core) | |
| Asus Zephyrus Duo 16 GX650PY-NM006W | |
| Durchschnittliche Intel Core i9-13900HX (9152 - 12541, n=21) | |
| HP Omen Transcend 16 | |
| HP Omen 16-wf000 | |
| Lenovo Legion Slim 7i 16 Gen 8 | |
| Alienware x16 R1 | |
| Lenovo Legion Pro 5 16ARX8 | |
| Asus ROG Zephyrus M16 GU603Z | |
| Lenovo Legion S7 16ARHA7 | |
| Acer Nitro 16 AN16-41 | |
| HP Omen 16-n0033dx | |
| Dell Inspiron 16 Plus 7610-MHJ8F | |
| Cinebench R20 / CPU (Single Core) | |
| HP Omen Transcend 16 | |
| Durchschnittliche Intel Core i9-13900HX (722 - 810, n=21) | |
| Lenovo Legion Slim 7i 16 Gen 8 | |
| Asus Zephyrus Duo 16 GX650PY-NM006W | |
| Alienware x16 R1 | |
| HP Omen 16-wf000 | |
| Lenovo Legion Pro 5 16ARX8 | |
| Asus ROG Zephyrus M16 GU603Z | |
| Lenovo Legion S7 16ARHA7 | |
| Acer Nitro 16 AN16-41 | |
| HP Omen 16-n0033dx | |
| Dell Inspiron 16 Plus 7610-MHJ8F | |
| Cinebench R15 / CPU Multi 64Bit | |
| Asus Zephyrus Duo 16 GX650PY-NM006W | |
| Durchschnittliche Intel Core i9-13900HX (3913 - 4970, n=22) | |
| HP Omen Transcend 16 | |
| HP Omen 16-wf000 | |
| Lenovo Legion Pro 5 16ARX8 | |
| Lenovo Legion Slim 7i 16 Gen 8 | |
| Alienware x16 R1 | |
| Asus ROG Zephyrus M16 GU603Z | |
| Lenovo Legion S7 16ARHA7 | |
| Acer Nitro 16 AN16-41 | |
| HP Omen 16-n0033dx | |
| Dell Inspiron 16 Plus 7610-MHJ8F | |
| Cinebench R15 / CPU Single 64Bit | |
| Asus Zephyrus Duo 16 GX650PY-NM006W | |
| HP Omen Transcend 16 | |
| Lenovo Legion Pro 5 16ARX8 | |
| Durchschnittliche Intel Core i9-13900HX (247 - 304, n=22) | |
| Alienware x16 R1 | |
| HP Omen 16-wf000 | |
| Asus ROG Zephyrus M16 GU603Z | |
| Lenovo Legion S7 16ARHA7 | |
| Acer Nitro 16 AN16-41 | |
| HP Omen 16-n0033dx | |
| Lenovo Legion Slim 7i 16 Gen 8 | |
| Dell Inspiron 16 Plus 7610-MHJ8F | |
| Blender / v2.79 BMW27 CPU | |
| Dell Inspiron 16 Plus 7610-MHJ8F | |
| HP Omen 16-n0033dx | |
| Acer Nitro 16 AN16-41 | |
| Lenovo Legion S7 16ARHA7 | |
| Asus ROG Zephyrus M16 GU603Z | |
| Lenovo Legion Pro 5 16ARX8 | |
| HP Omen Transcend 16 | |
| Durchschnittliche Intel Core i9-13900HX (101 - 153, n=22) | |
| Asus Zephyrus Duo 16 GX650PY-NM006W | |
| HWBOT x265 Benchmark v2.2 / 4k Preset | |
| Asus Zephyrus Duo 16 GX650PY-NM006W | |
| Durchschnittliche Intel Core i9-13900HX (23.5 - 34.4, n=22) | |
| HP Omen Transcend 16 | |
| Lenovo Legion Pro 5 16ARX8 | |
| Alienware x16 R1 | |
| Lenovo Legion Slim 7i 16 Gen 8 | |
| HP Omen 16-wf000 | |
| Asus ROG Zephyrus M16 GU603Z | |
| Lenovo Legion S7 16ARHA7 | |
| Acer Nitro 16 AN16-41 | |
| HP Omen 16-n0033dx | |
| Dell Inspiron 16 Plus 7610-MHJ8F | |
| LibreOffice / 20 Documents To PDF | |
| Asus Zephyrus Duo 16 GX650PY-NM006W | |
| HP Omen 16-n0033dx | |
| Acer Nitro 16 AN16-41 | |
| Lenovo Legion S7 16ARHA7 | |
| Dell Inspiron 16 Plus 7610-MHJ8F | |
| HP Omen 16-wf000 | |
| Alienware x16 R1 | |
| HP Omen Transcend 16 | |
| Durchschnittliche Intel Core i9-13900HX (32.8 - 51.1, n=21) | |
| Asus ROG Zephyrus M16 GU603Z | |
| Lenovo Legion Pro 5 16ARX8 | |
| Lenovo Legion Slim 7i 16 Gen 8 | |
| R Benchmark 2.5 / Overall mean | |
| Dell Inspiron 16 Plus 7610-MHJ8F | |
| HP Omen 16-n0033dx | |
| Acer Nitro 16 AN16-41 | |
| Lenovo Legion S7 16ARHA7 | |
| HP Omen 16-wf000 | |
| Asus ROG Zephyrus M16 GU603Z | |
| Alienware x16 R1 | |
| Lenovo Legion Pro 5 16ARX8 | |
| Lenovo Legion Slim 7i 16 Gen 8 | |
| HP Omen Transcend 16 | |
| Durchschnittliche Intel Core i9-13900HX (0.375 - 0.4564, n=22) | |
| Asus Zephyrus Duo 16 GX650PY-NM006W | |
* ... kleinere Werte sind besser
AIDA64: FP32 Ray-Trace | FPU Julia | CPU SHA3 | CPU Queen | FPU SinJulia | FPU Mandel | CPU AES | CPU ZLib | FP64 Ray-Trace | CPU PhotoWorxx
| Performance Rating | |
| Durchschnittliche Intel Core i9-13900HX | |
| HP Omen Transcend 16 | |
| Alienware x16 R1 | |
| HP Omen 16-wf000 | |
| Lenovo Legion Slim 7i 16 Gen 8 | |
| Acer Nitro 16 AN16-41 | |
| Asus ROG Zephyrus M16 GU603Z | |
| AIDA64 / FP32 Ray-Trace | |
| Durchschnittliche Intel Core i9-13900HX (17589 - 27615, n=22) | |
| HP Omen Transcend 16 | |
| HP Omen 16-wf000 | |
| Alienware x16 R1 | |
| Lenovo Legion Slim 7i 16 Gen 8 | |
| Acer Nitro 16 AN16-41 | |
| Asus ROG Zephyrus M16 GU603Z | |
| AIDA64 / FPU Julia | |
| Durchschnittliche Intel Core i9-13900HX (88686 - 137015, n=22) | |
| HP Omen Transcend 16 | |
| Acer Nitro 16 AN16-41 | |
| HP Omen 16-wf000 | |
| Alienware x16 R1 | |
| Lenovo Legion Slim 7i 16 Gen 8 | |
| Asus ROG Zephyrus M16 GU603Z | |
| AIDA64 / CPU SHA3 | |
| Durchschnittliche Intel Core i9-13900HX (4362 - 7029, n=22) | |
| HP Omen Transcend 16 | |
| HP Omen 16-wf000 | |
| Alienware x16 R1 | |
| Lenovo Legion Slim 7i 16 Gen 8 | |
| Asus ROG Zephyrus M16 GU603Z | |
| Acer Nitro 16 AN16-41 | |
| AIDA64 / CPU Queen | |
| Durchschnittliche Intel Core i9-13900HX (125644 - 141385, n=22) | |
| HP Omen Transcend 16 | |
| Lenovo Legion Slim 7i 16 Gen 8 | |
| Alienware x16 R1 | |
| Acer Nitro 16 AN16-41 | |
| Asus ROG Zephyrus M16 GU603Z | |
| HP Omen 16-wf000 | |
| AIDA64 / FPU SinJulia | |
| Durchschnittliche Intel Core i9-13900HX (12334 - 17179, n=22) | |
| HP Omen Transcend 16 | |
| Acer Nitro 16 AN16-41 | |
| HP Omen 16-wf000 | |
| Alienware x16 R1 | |
| Lenovo Legion Slim 7i 16 Gen 8 | |
| Asus ROG Zephyrus M16 GU603Z | |
| AIDA64 / FPU Mandel | |
| Durchschnittliche Intel Core i9-13900HX (43850 - 69202, n=22) | |
| HP Omen Transcend 16 | |
| Acer Nitro 16 AN16-41 | |
| HP Omen 16-wf000 | |
| Alienware x16 R1 | |
| Lenovo Legion Slim 7i 16 Gen 8 | |
| Asus ROG Zephyrus M16 GU603Z | |
| AIDA64 / CPU AES | |
| Durchschnittliche Intel Core i9-13900HX (89413 - 237881, n=22) | |
| Asus ROG Zephyrus M16 GU603Z | |
| HP Omen Transcend 16 | |
| HP Omen 16-wf000 | |
| Alienware x16 R1 | |
| Lenovo Legion Slim 7i 16 Gen 8 | |
| Acer Nitro 16 AN16-41 | |
| AIDA64 / CPU ZLib | |
| Durchschnittliche Intel Core i9-13900HX (1284 - 1958, n=22) | |
| HP Omen Transcend 16 | |
| HP Omen 16-wf000 | |
| Lenovo Legion Slim 7i 16 Gen 8 | |
| Alienware x16 R1 | |
| Asus ROG Zephyrus M16 GU603Z | |
| Acer Nitro 16 AN16-41 | |
| AIDA64 / FP64 Ray-Trace | |
| Durchschnittliche Intel Core i9-13900HX (9481 - 15279, n=22) | |
| HP Omen Transcend 16 | |
| HP Omen 16-wf000 | |
| Alienware x16 R1 | |
| Lenovo Legion Slim 7i 16 Gen 8 | |
| Acer Nitro 16 AN16-41 | |
| Asus ROG Zephyrus M16 GU603Z | |
| AIDA64 / CPU PhotoWorxx | |
| HP Omen Transcend 16 | |
| Alienware x16 R1 | |
| Durchschnittliche Intel Core i9-13900HX (42994 - 51994, n=22) | |
| Asus ROG Zephyrus M16 GU603Z | |
| HP Omen 16-wf000 | |
| Acer Nitro 16 AN16-41 | |
| Lenovo Legion Slim 7i 16 Gen 8 | |
System-Performance
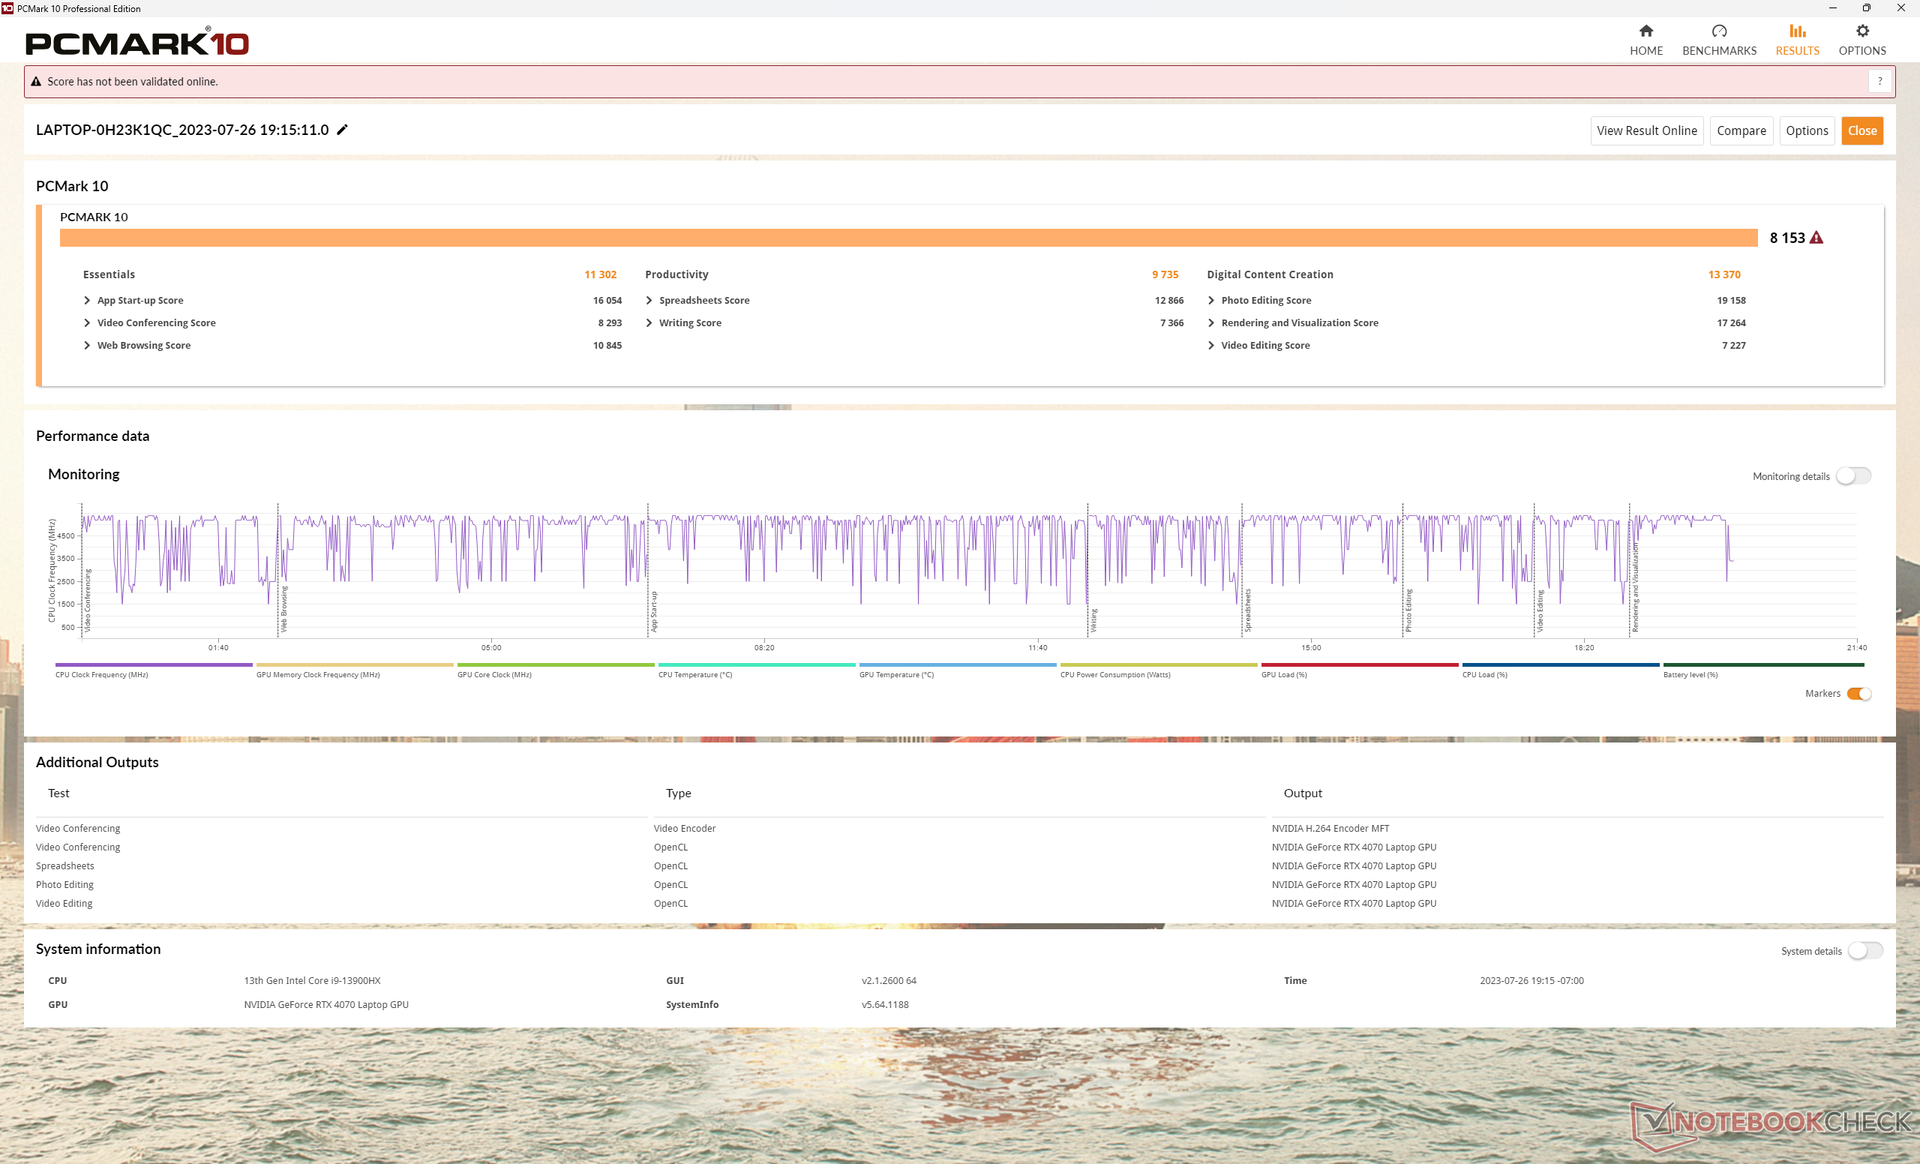
Die PCMark Ergebnisse sind leicht höher als jene beim Omen 16 mit seiner RTX 4080, ausgenommen vom Digital-Content-Creation-Test, was an der langsameren RTX 4070 liegt. Außerdem hatten wir keinerlei Bluescreens oder Wake-from-Sleep-Probleme, anders als beim aktuellen Lenovo Slim Pro 9i 16.
CrossMark: Overall | Productivity | Creativity | Responsiveness
| PCMark 10 / Score | |
| Lenovo Legion Slim 7i 16 Gen 8 | |
| Alienware x16 R1 | |
| HP Omen Transcend 16 | |
| Asus ROG Zephyrus M16 GU603Z | |
| HP Omen 16-wf000 | |
| Durchschnittliche Intel Core i9-13900HX, NVIDIA GeForce RTX 4070 Laptop GPU (6956 - 8153, n=3) | |
| Acer Nitro 16 AN16-41 | |
| PCMark 10 / Essentials | |
| Lenovo Legion Slim 7i 16 Gen 8 | |
| HP Omen Transcend 16 | |
| Alienware x16 R1 | |
| Durchschnittliche Intel Core i9-13900HX, NVIDIA GeForce RTX 4070 Laptop GPU (9865 - 11653, n=3) | |
| Asus ROG Zephyrus M16 GU603Z | |
| Acer Nitro 16 AN16-41 | |
| HP Omen 16-wf000 | |
| PCMark 10 / Productivity | |
| Lenovo Legion Slim 7i 16 Gen 8 | |
| Asus ROG Zephyrus M16 GU603Z | |
| Alienware x16 R1 | |
| HP Omen Transcend 16 | |
| Durchschnittliche Intel Core i9-13900HX, NVIDIA GeForce RTX 4070 Laptop GPU (9470 - 9850, n=3) | |
| Acer Nitro 16 AN16-41 | |
| HP Omen 16-wf000 | |
| PCMark 10 / Digital Content Creation | |
| Alienware x16 R1 | |
| Lenovo Legion Slim 7i 16 Gen 8 | |
| HP Omen 16-wf000 | |
| HP Omen Transcend 16 | |
| Asus ROG Zephyrus M16 GU603Z | |
| Durchschnittliche Intel Core i9-13900HX, NVIDIA GeForce RTX 4070 Laptop GPU (9776 - 13370, n=3) | |
| Acer Nitro 16 AN16-41 | |
| CrossMark / Overall | |
| Lenovo Legion Slim 7i 16 Gen 8 | |
| HP Omen Transcend 16 | |
| Durchschnittliche Intel Core i9-13900HX, NVIDIA GeForce RTX 4070 Laptop GPU (1842 - 2029, n=3) | |
| Alienware x16 R1 | |
| Asus ROG Zephyrus M16 GU603Z | |
| HP Omen 16-wf000 | |
| Acer Nitro 16 AN16-41 | |
| CrossMark / Productivity | |
| Lenovo Legion Slim 7i 16 Gen 8 | |
| Alienware x16 R1 | |
| HP Omen Transcend 16 | |
| Asus ROG Zephyrus M16 GU603Z | |
| Durchschnittliche Intel Core i9-13900HX, NVIDIA GeForce RTX 4070 Laptop GPU (1700 - 1872, n=3) | |
| HP Omen 16-wf000 | |
| Acer Nitro 16 AN16-41 | |
| CrossMark / Creativity | |
| HP Omen Transcend 16 | |
| Durchschnittliche Intel Core i9-13900HX, NVIDIA GeForce RTX 4070 Laptop GPU (2088 - 2316, n=3) | |
| Lenovo Legion Slim 7i 16 Gen 8 | |
| Alienware x16 R1 | |
| Asus ROG Zephyrus M16 GU603Z | |
| HP Omen 16-wf000 | |
| Acer Nitro 16 AN16-41 | |
| CrossMark / Responsiveness | |
| Alienware x16 R1 | |
| Lenovo Legion Slim 7i 16 Gen 8 | |
| Asus ROG Zephyrus M16 GU603Z | |
| Durchschnittliche Intel Core i9-13900HX, NVIDIA GeForce RTX 4070 Laptop GPU (1557 - 1752, n=3) | |
| HP Omen Transcend 16 | |
| HP Omen 16-wf000 | |
| Acer Nitro 16 AN16-41 | |
| PCMark 10 Score | 8153 Punkte | |
Hilfe | ||
| AIDA64 / Memory Copy | |
| HP Omen Transcend 16 | |
| Durchschnittliche Intel Core i9-13900HX (67716 - 79193, n=22) | |
| Alienware x16 R1 | |
| HP Omen 16-wf000 | |
| Asus ROG Zephyrus M16 GU603Z | |
| Acer Nitro 16 AN16-41 | |
| Lenovo Legion Slim 7i 16 Gen 8 | |
| AIDA64 / Memory Read | |
| HP Omen Transcend 16 | |
| Durchschnittliche Intel Core i9-13900HX (73998 - 88462, n=22) | |
| Alienware x16 R1 | |
| HP Omen 16-wf000 | |
| Asus ROG Zephyrus M16 GU603Z | |
| Acer Nitro 16 AN16-41 | |
| Lenovo Legion Slim 7i 16 Gen 8 | |
| AIDA64 / Memory Write | |
| Alienware x16 R1 | |
| HP Omen Transcend 16 | |
| Durchschnittliche Intel Core i9-13900HX (65472 - 77045, n=22) | |
| HP Omen 16-wf000 | |
| Asus ROG Zephyrus M16 GU603Z | |
| Acer Nitro 16 AN16-41 | |
| Lenovo Legion Slim 7i 16 Gen 8 | |
| AIDA64 / Memory Latency | |
| Alienware x16 R1 | |
| Acer Nitro 16 AN16-41 | |
| Asus ROG Zephyrus M16 GU603Z | |
| HP Omen Transcend 16 | |
| HP Omen 16-wf000 | |
| Durchschnittliche Intel Core i9-13900HX (75.3 - 91.1, n=22) | |
| Lenovo Legion Slim 7i 16 Gen 8 | |
* ... kleinere Werte sind besser
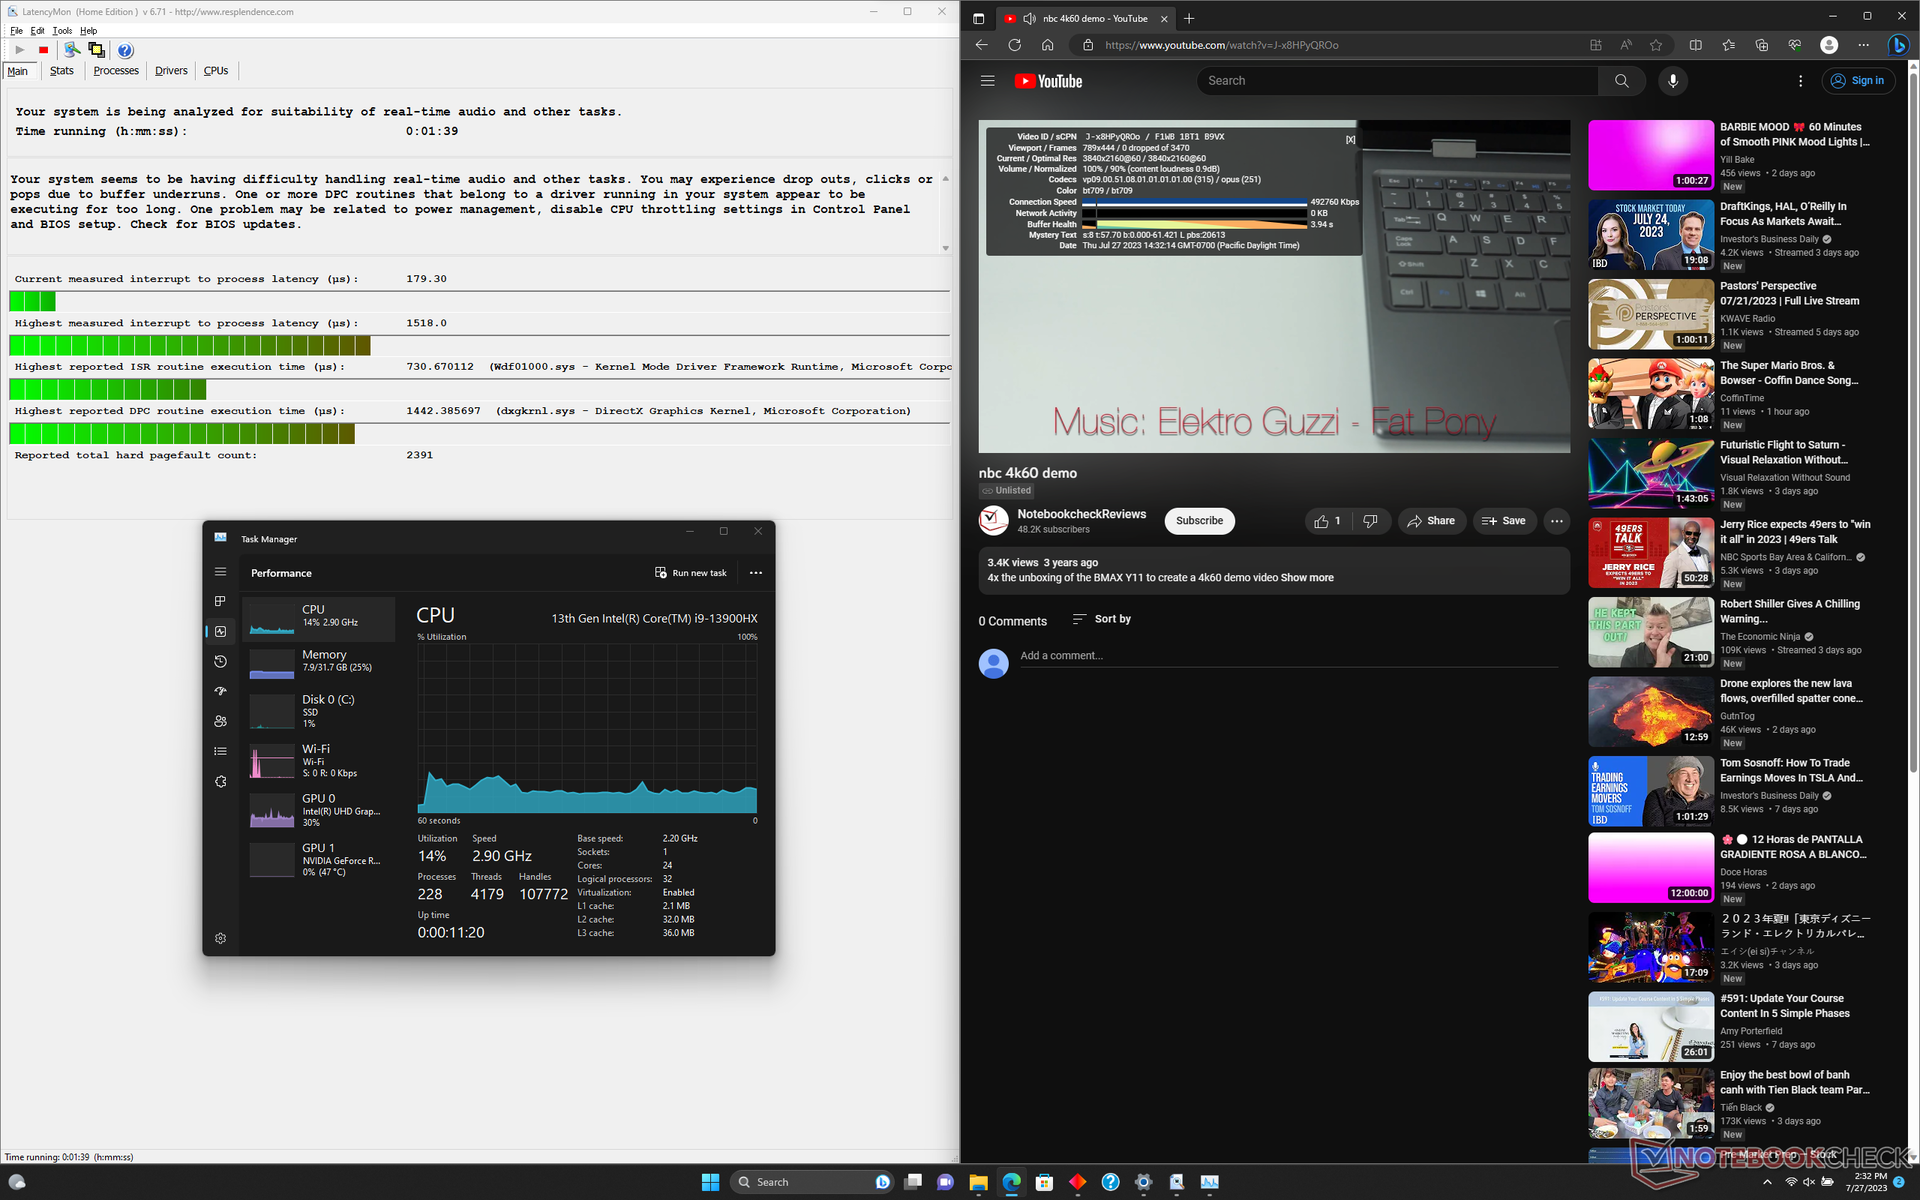
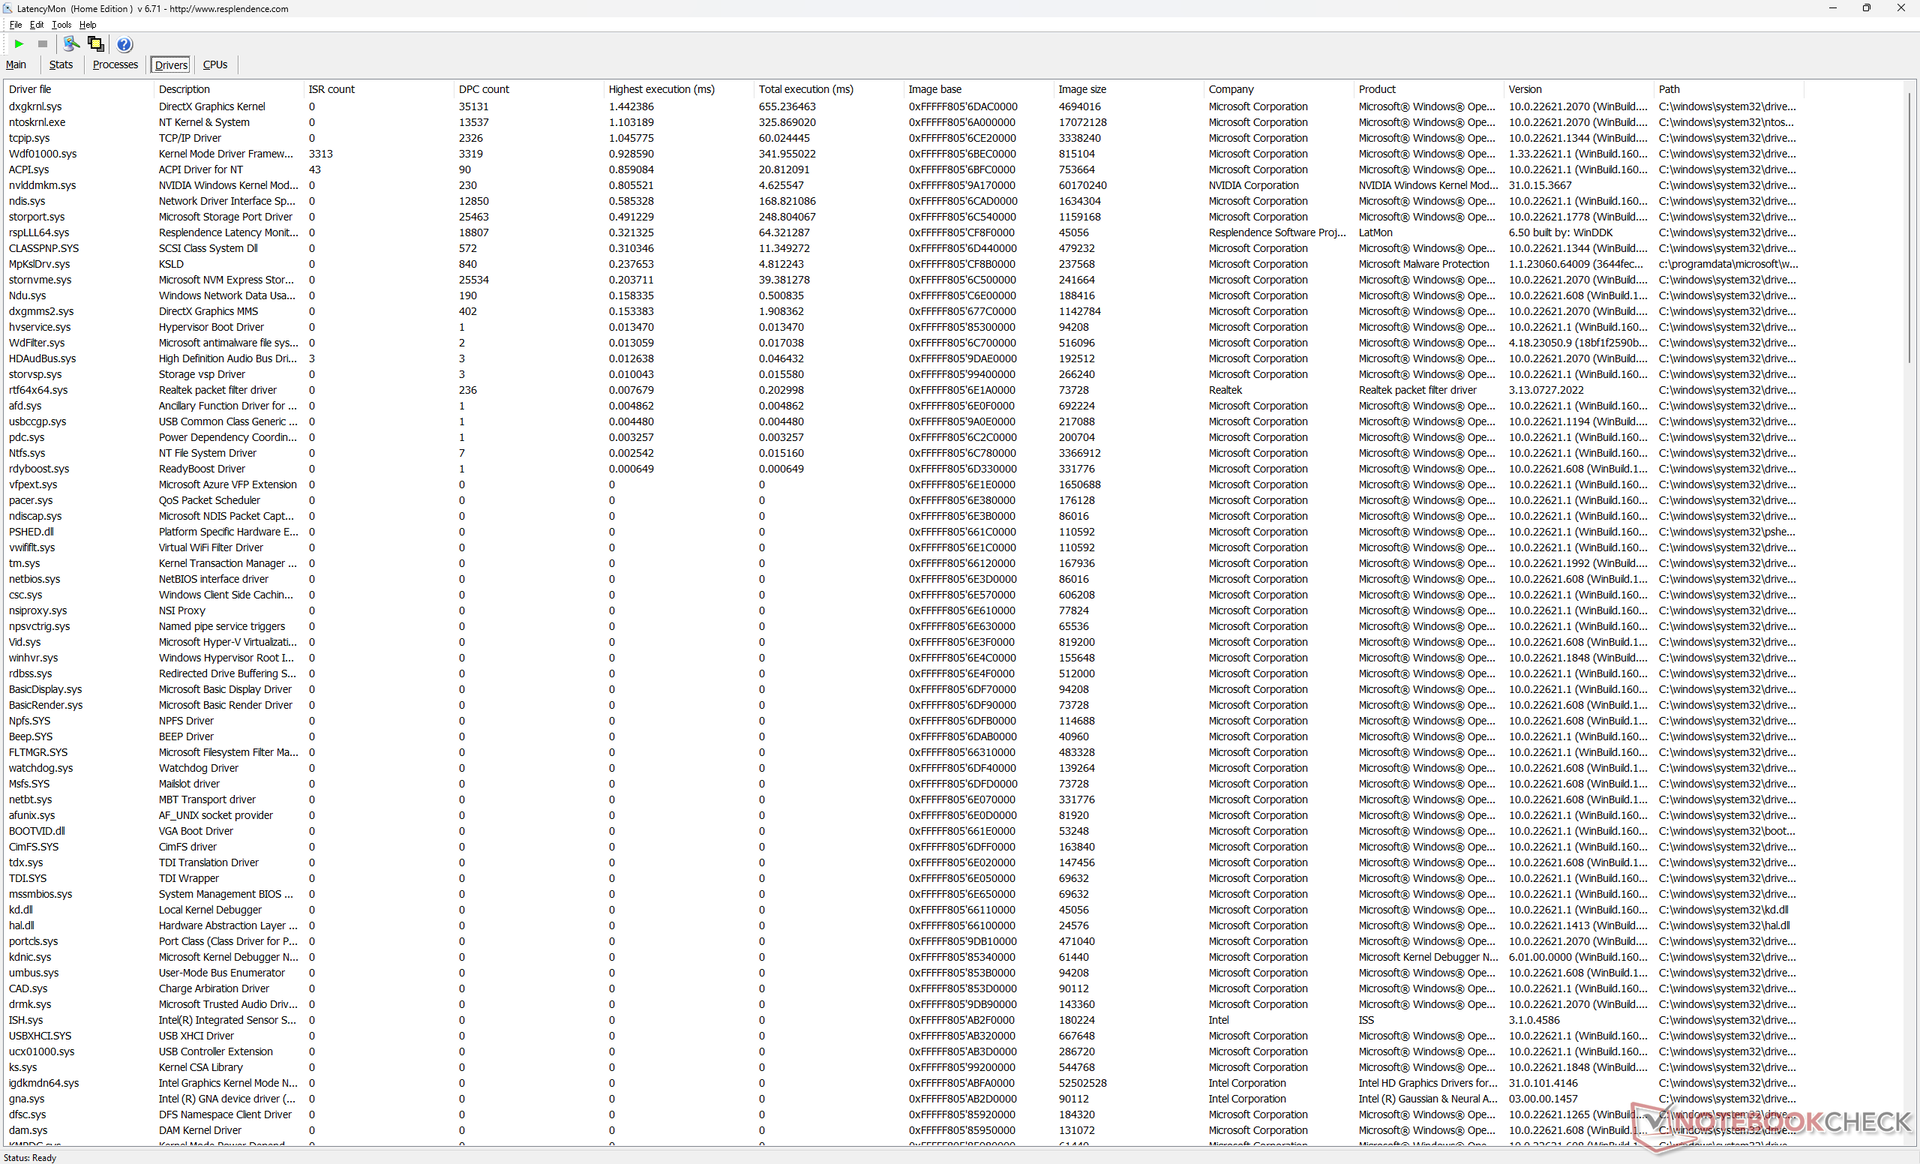
DPC-Latenz
LatencyMon zeigt, dass es kleinere DPC-Latenz-Probleme beim Öffnen mehrerer Browser-Tabs gibt. 4K-Videowiedergabe bei 60 fps ist aber ohne Qualitäts- oder Bildverlust möglich.
| DPC Latencies / LatencyMon - interrupt to process latency (max), Web, Youtube, Prime95 | |
| Lenovo Legion Slim 7i 16 Gen 8 | |
| HP Omen 16-wf000 | |
| HP Omen Transcend 16 | |
| Alienware x16 R1 | |
| Acer Nitro 16 AN16-41 | |
| Asus ROG Zephyrus M16 GU603Z | |
* ... kleinere Werte sind besser
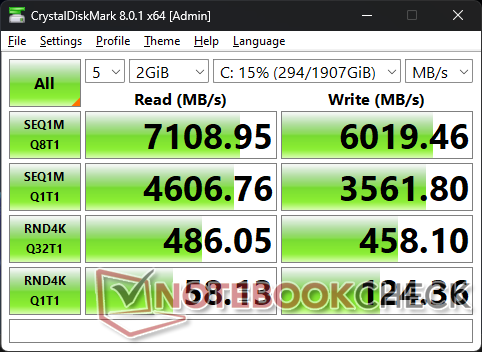
Speichergeräte
Das Omen Transcend 16 wird mit jener SSD vom Omen 16 ausgeliefert, einer SK hynix PC801. Diese weist keinerlei Performance-Probleme auf, weshalb es möglich ist, Daten ohne jeglichen Verlust mit bis zu 7.000 MB/s zu transferieren.


| Drive Performance Rating - Percent | |
| Alienware x16 R1 | |
| Lenovo Legion Slim 7i 16 Gen 8 | |
| Asus ROG Zephyrus M16 GU603Z | |
| HP Omen 16-wf000 | |
| Acer Nitro 16 AN16-41 | |
| HP Omen Transcend 16 | |
* ... kleinere Werte sind besser
Disk Throttling: DiskSpd Read Loop, Queue Depth 8
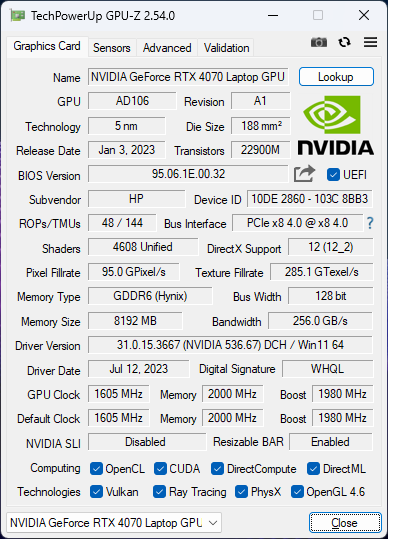
GPU-Performance — 130-W-TGP-GPU
Die Grafik-Performance ist vergleichbar mit anderen Modellen, die eine RTX-4070-GPU besitzen. Trotzdem ist das Lenovo Legion Slim 7i 16 G8 mit identischer GPU ca. zehn Prozent schneller, was auf eine höhere TGP zurückzuführen ist (145 vs. 130 W).
Entscheidet man sich für die etwas schwächere RTX-4060-Version, erhält man ungefähr zehn bis 20 Prozent weniger Grafik-Performance. Die RTX 4080 leistet dann schätzungsweise 40 bis 50 Prozent mehr. Diese Version ist jedoch momentan noch nicht erhältlich, im Gegensatz zum Omen 16, bei welchem auch Versionen mit schnelleren GPUs erworben werden können.
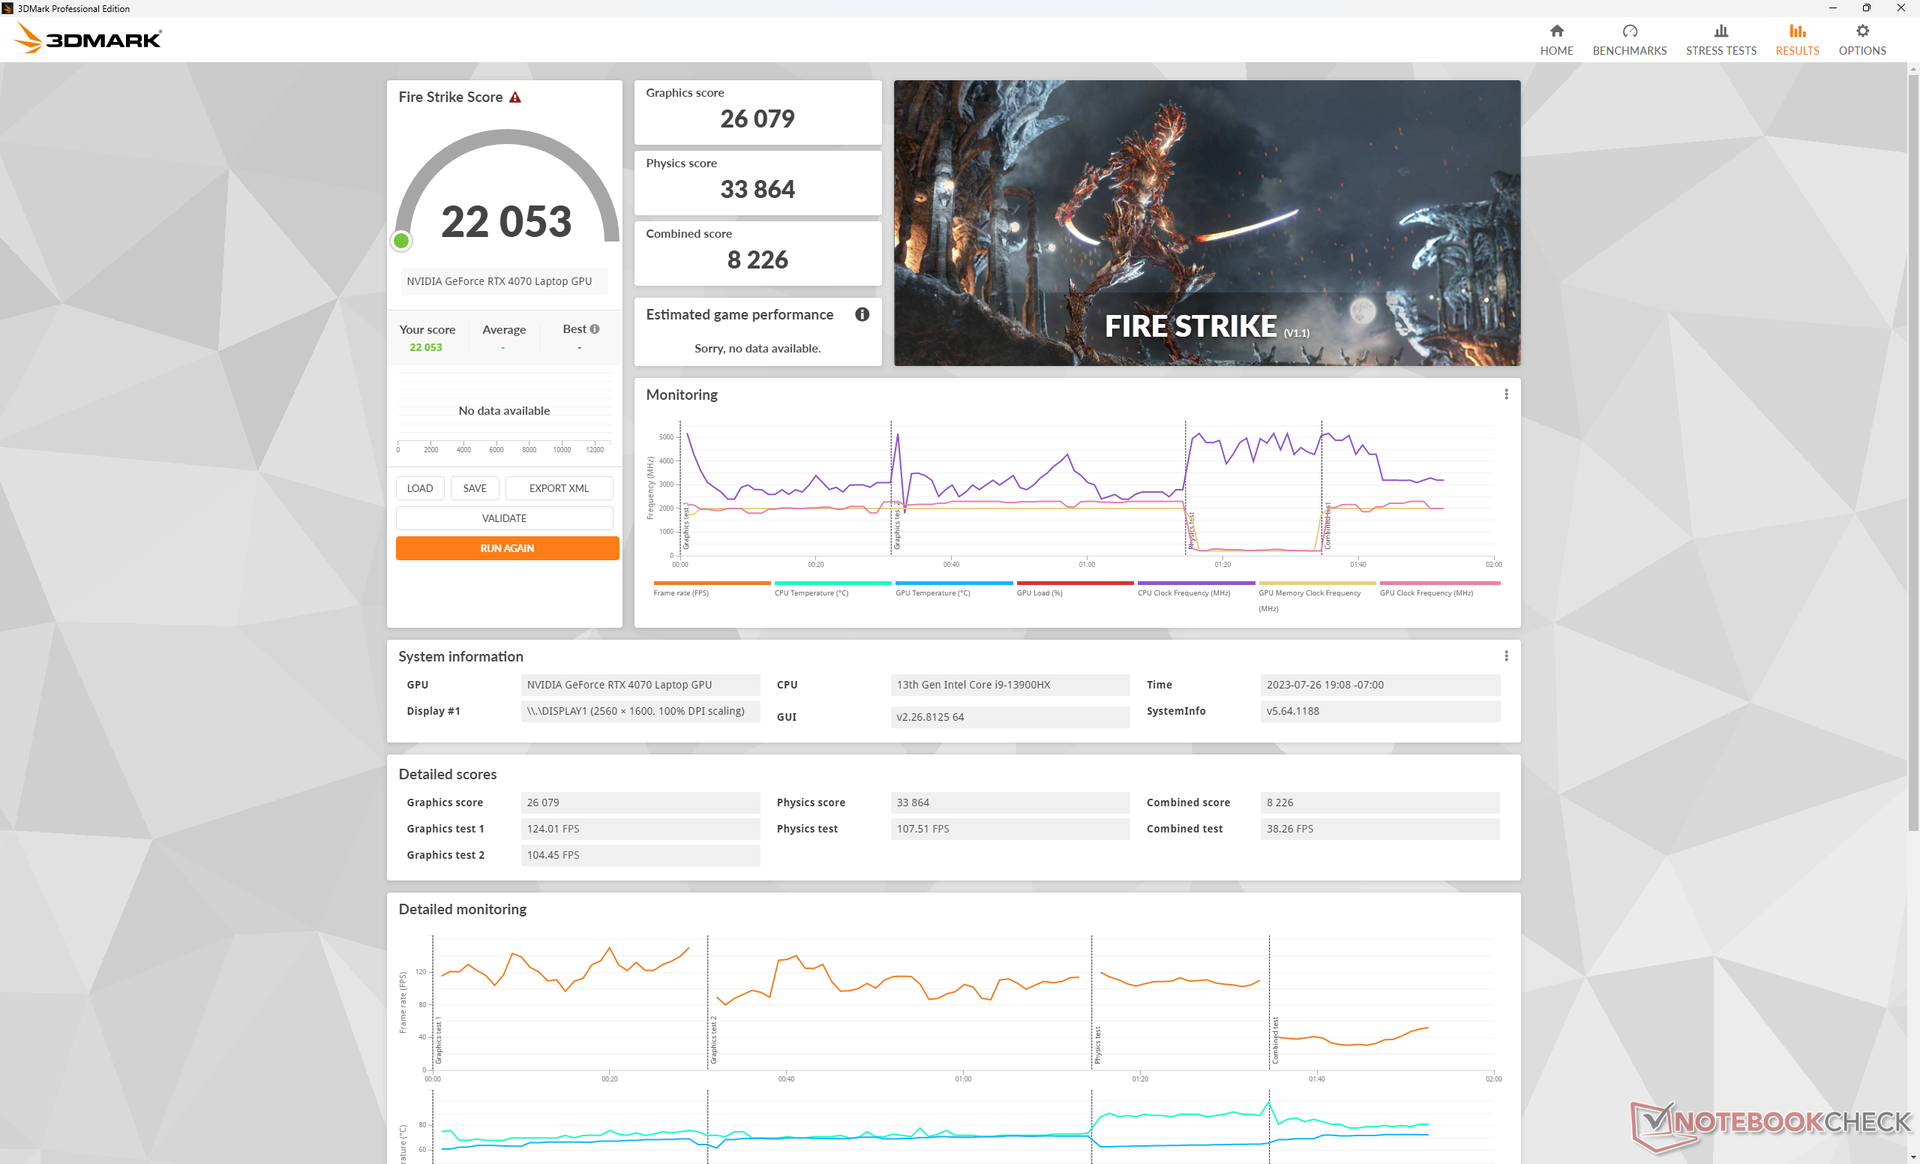
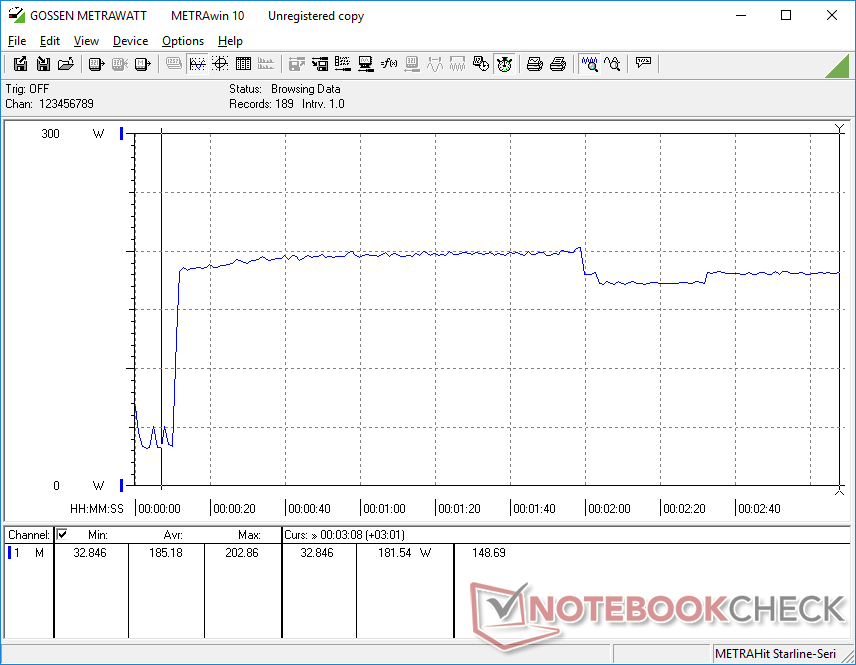
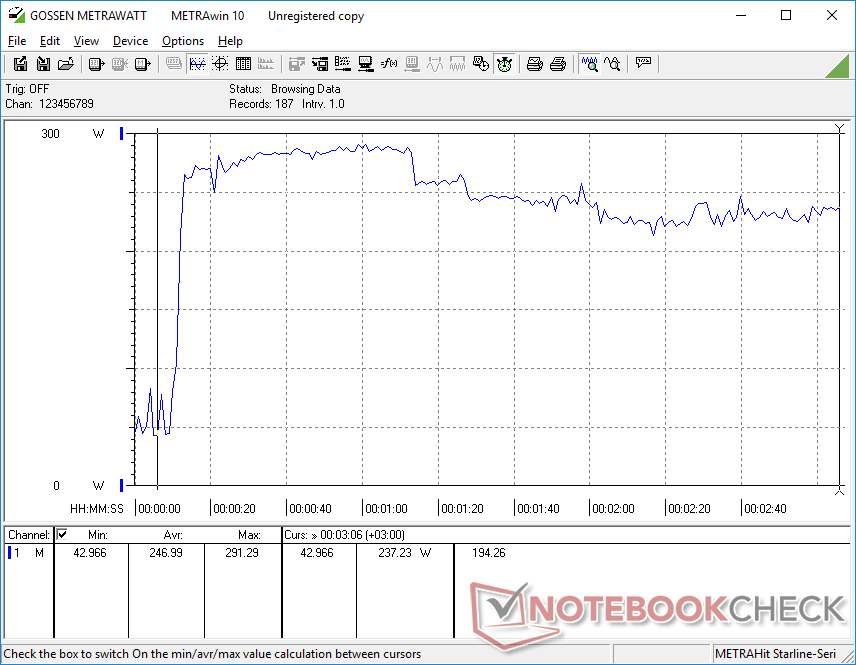
Stellt man statt dem Performance-Modus den Balanced-Modus ein, wird die Leistung nur leicht limitiert, wie man unten in den Abbildungen erkennen kann. Wir erwähnen dies hier so dediziert, da die Lautstärke der Lüfter einen deutlich merkbaren Unterschied zwischen den beiden Modi machen.
| Power-Profil | Graphics | Physics | Kombiniert |
| Balanced | 26.079 (-5 %) | 33.864 (-0 %) | 8.226 (-24 %) |
| Performance | 27.343 | 33.936 | 10.832 |
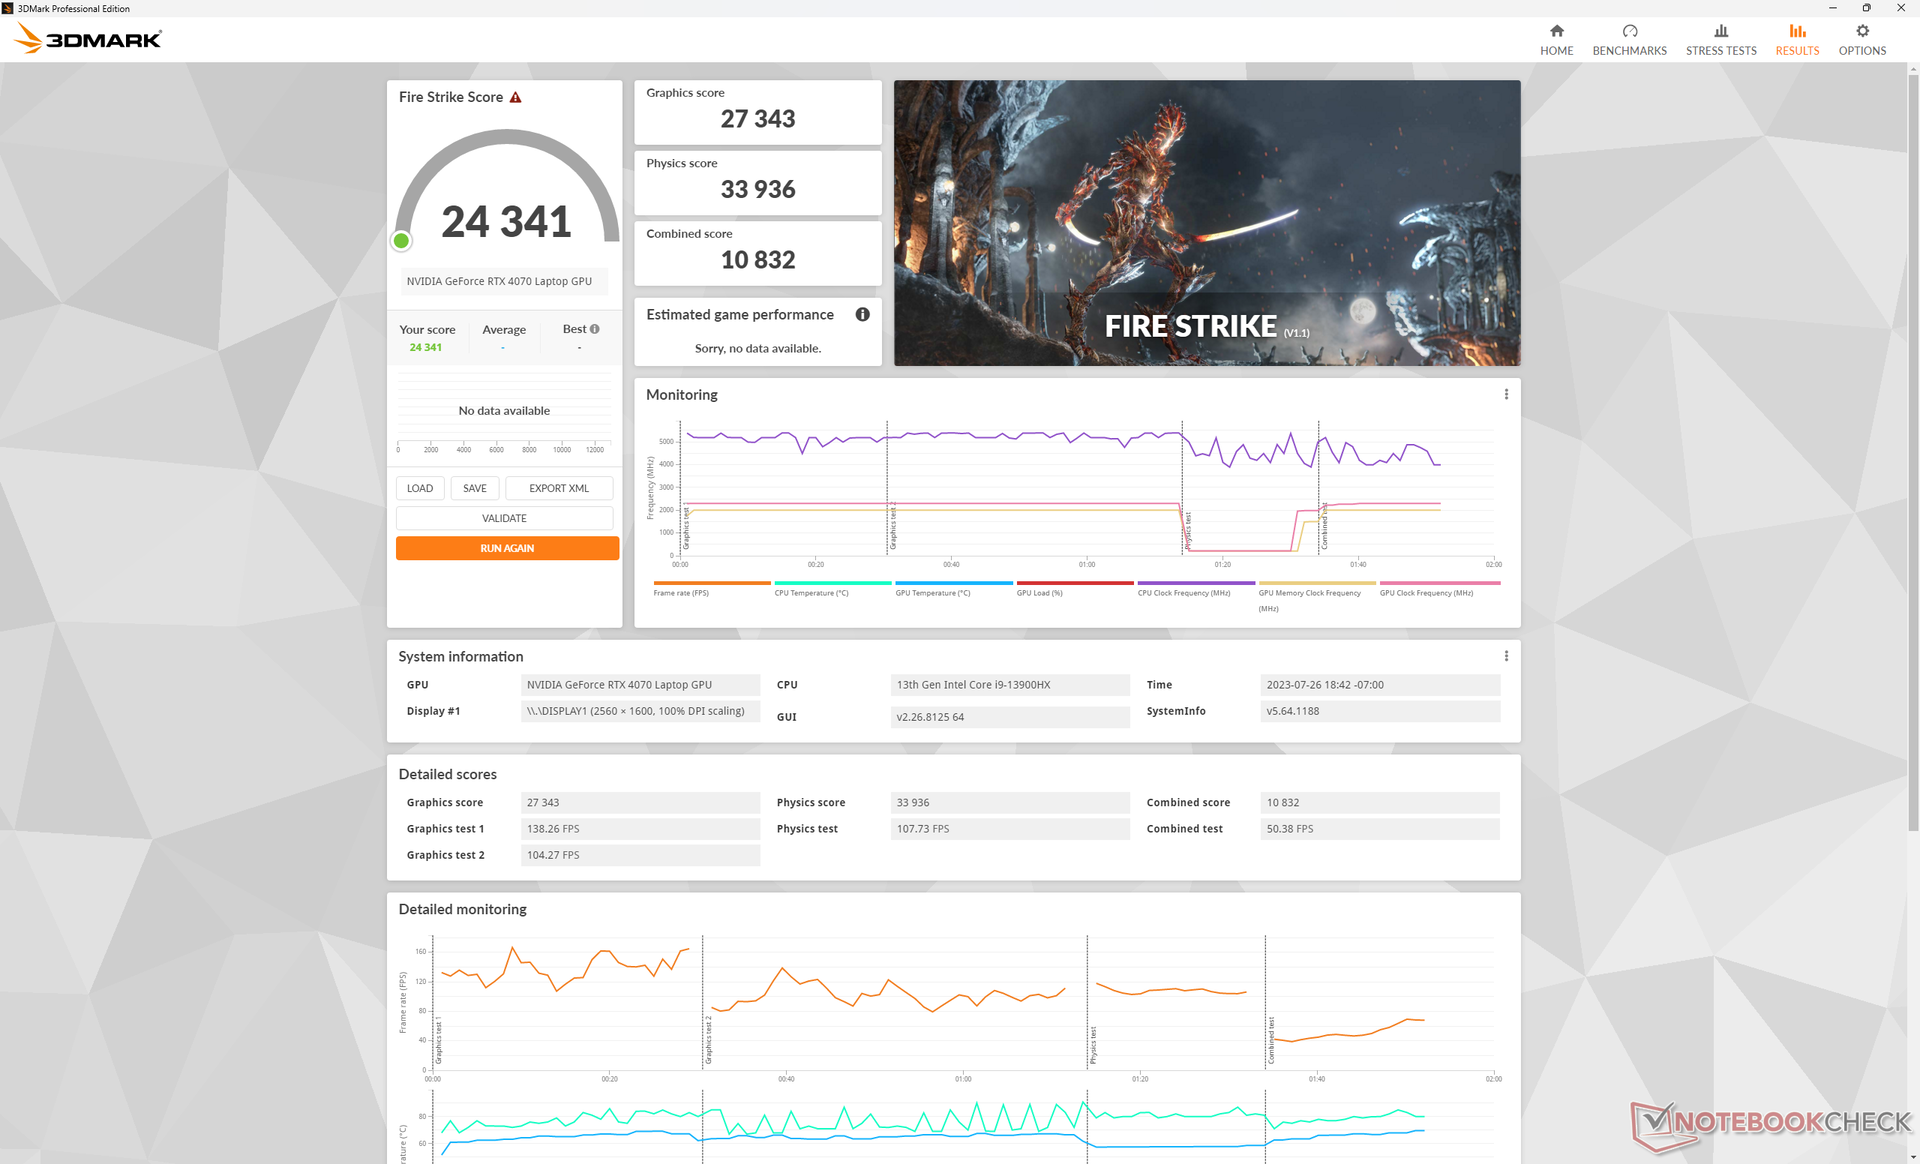
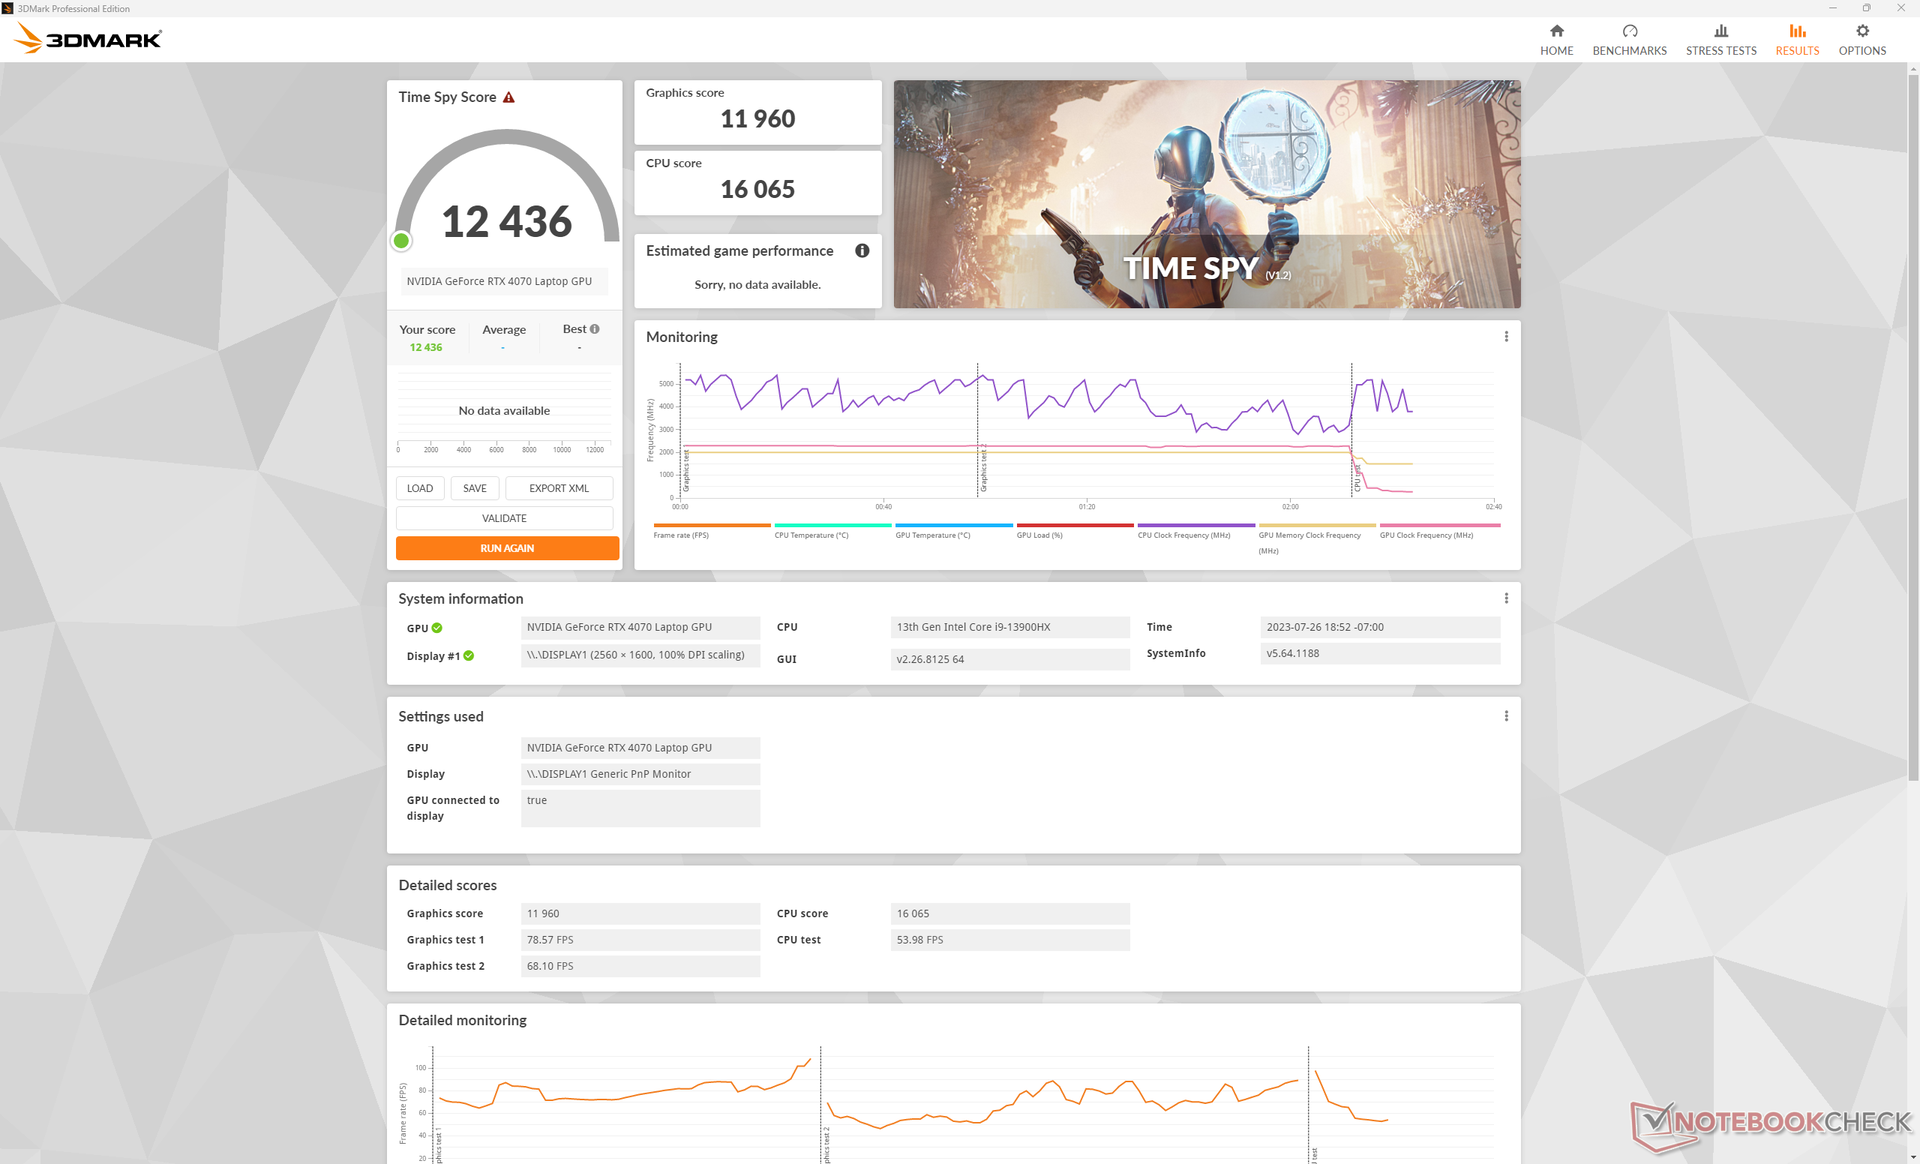
| 3DMark 11 Performance | 32031 Punkte | |
| 3DMark Fire Strike Score | 24341 Punkte | |
| 3DMark Time Spy Score | 12436 Punkte | |
Hilfe | ||
* ... kleinere Werte sind besser
Gaming-Performance
Alle von uns getesteten Titel sind mit maximalen Einstellungen und der nativen QHD+-Auflösung spielbar, wie beispielsweise Returnal oder Cyberpunk 2077. Wir empfehlen trotzdem, DLSS bei diversen RT-Inhalten oder bei einem externen 4K-Monitor zu aktivieren.
Witcher 3 FPS
| min. | mittel | hoch | max. | QHD | 4K | |
|---|---|---|---|---|---|---|
| The Witcher 3 (2015) | 500.9 | 375.9 | 222.7 | 111.8 | 65.7 | |
| Dota 2 Reborn (2015) | 212 | 192 | 188.4 | 168.4 | 142.5 | |
| Final Fantasy XV Benchmark (2018) | 220 | 164.8 | 82.6 | 47.1 | ||
| X-Plane 11.11 (2018) | 191.5 | 169.8 | 132.9 | 114 | ||
| Strange Brigade (2018) | 414 | 310 | 245 | 208 | 133.3 | 71.4 |
| Cyberpunk 2077 1.6 (2022) | 128.5 | 118.1 | 103 | 87.5 | 54.5 | 23.5 |
| Tiny Tina's Wonderlands (2022) | 241.7 | 195.6 | 132.5 | 102 | 70.4 | 33.6 |
| F1 22 (2022) | 301 | 289 | 221 | 79.3 | 50.4 | 24.7 |
| Returnal (2023) | 109 | 115 | 101 | 79 | 64 | 37 |
Emissionen
Systemlautstärke — Großer Unterschied zwischen Balanced- und Performance-Modus
Die Lautstärke der Lüfter ist grundsätzlich etwas leiser als beim Omen 16, wobei man beachten muss, dass das Omen 16 mit einer etwas schnelleren RTX 4080 betrieben wird. Im Performance-Modus erreichen die Lüfter beim Gaming eine maximale Lautstärke von 54,3 dB(A), im Balanced-Modus sind es 42 dB(A). In Letzterem verliert man zwar etwas an Performance, aber der Unterschied der Lüfterlautstärke ist deutlich merkbar. Eine Lautstärke um die 50 dB(A) liegt aber im Durchschnitt, wie es auch beispielsweise beim Alienware x16 R1 der Fall ist.

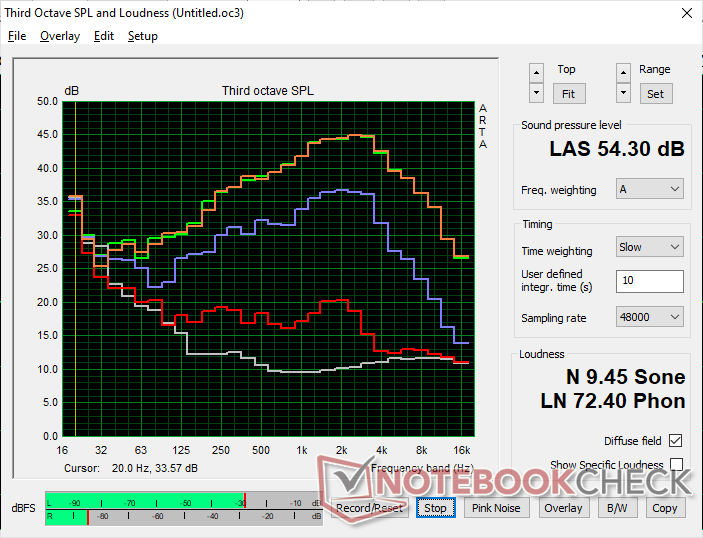
Lautstärkediagramm
| Idle |
| 29.1 / 29.1 / 29.1 dB(A) |
| Last |
| 45.7 / 54.3 dB(A) |
 | ||
30 dB leise 40 dB(A) deutlich hörbar 50 dB(A) störend |
||
min: | ||
| HP Omen Transcend 16 GeForce RTX 4070 Laptop GPU, i9-13900HX, SK hynix PC801 HFS002TEJ9X101N | Lenovo Legion Slim 7i 16 Gen 8 GeForce RTX 4070 Laptop GPU, i9-13900H, Samsung PM9A1 MZVL21T0HCLR | HP Omen 16-wf000 GeForce RTX 4080 Laptop GPU, i7-13700HX, SK hynix PC801 HFS002TEJ9X101N | Alienware x16 R1 GeForce RTX 4080 Laptop GPU, i9-13900HK, SK hynix PC801 HFS001TEJ9X101N | Acer Nitro 16 AN16-41 GeForce RTX 4070 Laptop GPU, R7 7735HS, Samsung PM9A1 MZVL21T0HCLR | Asus ROG Zephyrus M16 GU603Z GeForce RTX 3070 Ti Laptop GPU, i9-12900H, Micron 3400 1TB MTFDKBA1T0TFH | |
|---|---|---|---|---|---|---|
| Geräuschentwicklung | 13% | 1% | 9% | 6% | -2% | |
| aus / Umgebung * (dB) | 22.9 | 22.8 -0% | 23 -0% | 22.7 1% | 25.7 -12% | 23 -0% |
| Idle min * (dB) | 29.1 | 23.6 19% | 29.6 -2% | 23.1 21% | 25.7 12% | 23 21% |
| Idle avg * (dB) | 29.1 | 23.6 19% | 29.8 -2% | 25.8 11% | 25.7 12% | 24 18% |
| Idle max * (dB) | 29.1 | 25.7 12% | 30.4 -4% | 25.8 11% | 26.3 10% | 47 -62% |
| Last avg * (dB) | 45.7 | 27.6 40% | 33.8 26% | 39.3 14% | 33.9 26% | 47.91 -5% |
| Witcher 3 ultra * (dB) | 54.3 | 54.4 -0% | 57 -5% | 49.9 8% | 48.91 10% | |
| Last max * (dB) | 54.3 | 54.4 -0% | 58.3 -7% | 54.8 -1% | 62 -14% | 50.25 7% |
* ... kleinere Werte sind besser
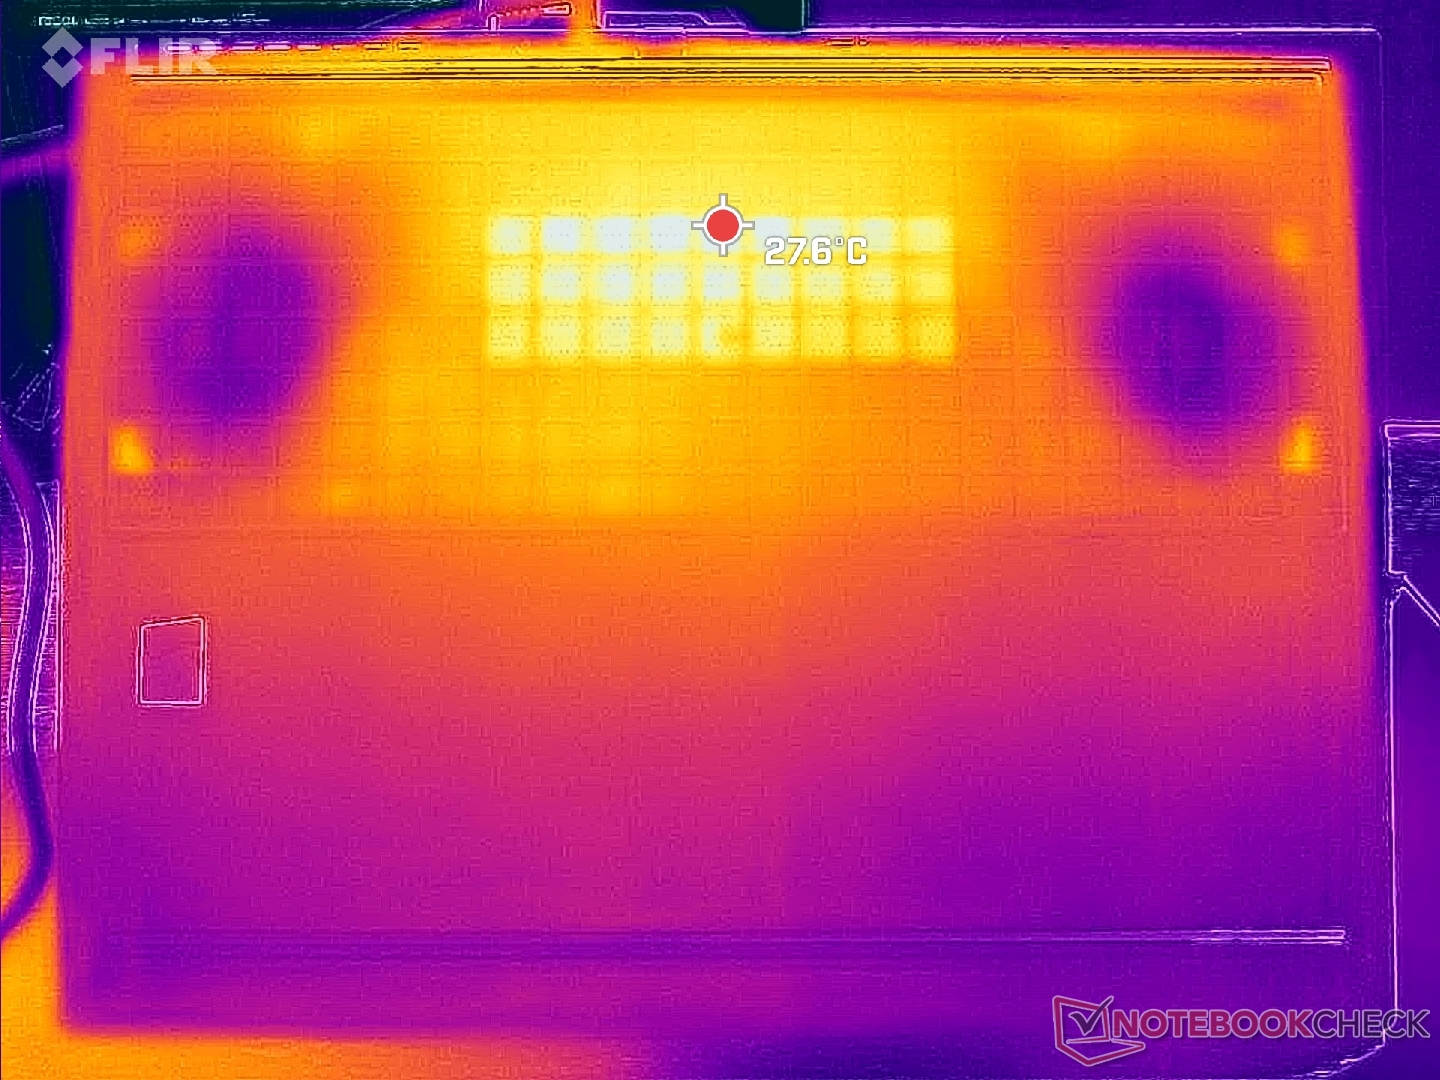
Temperaturen
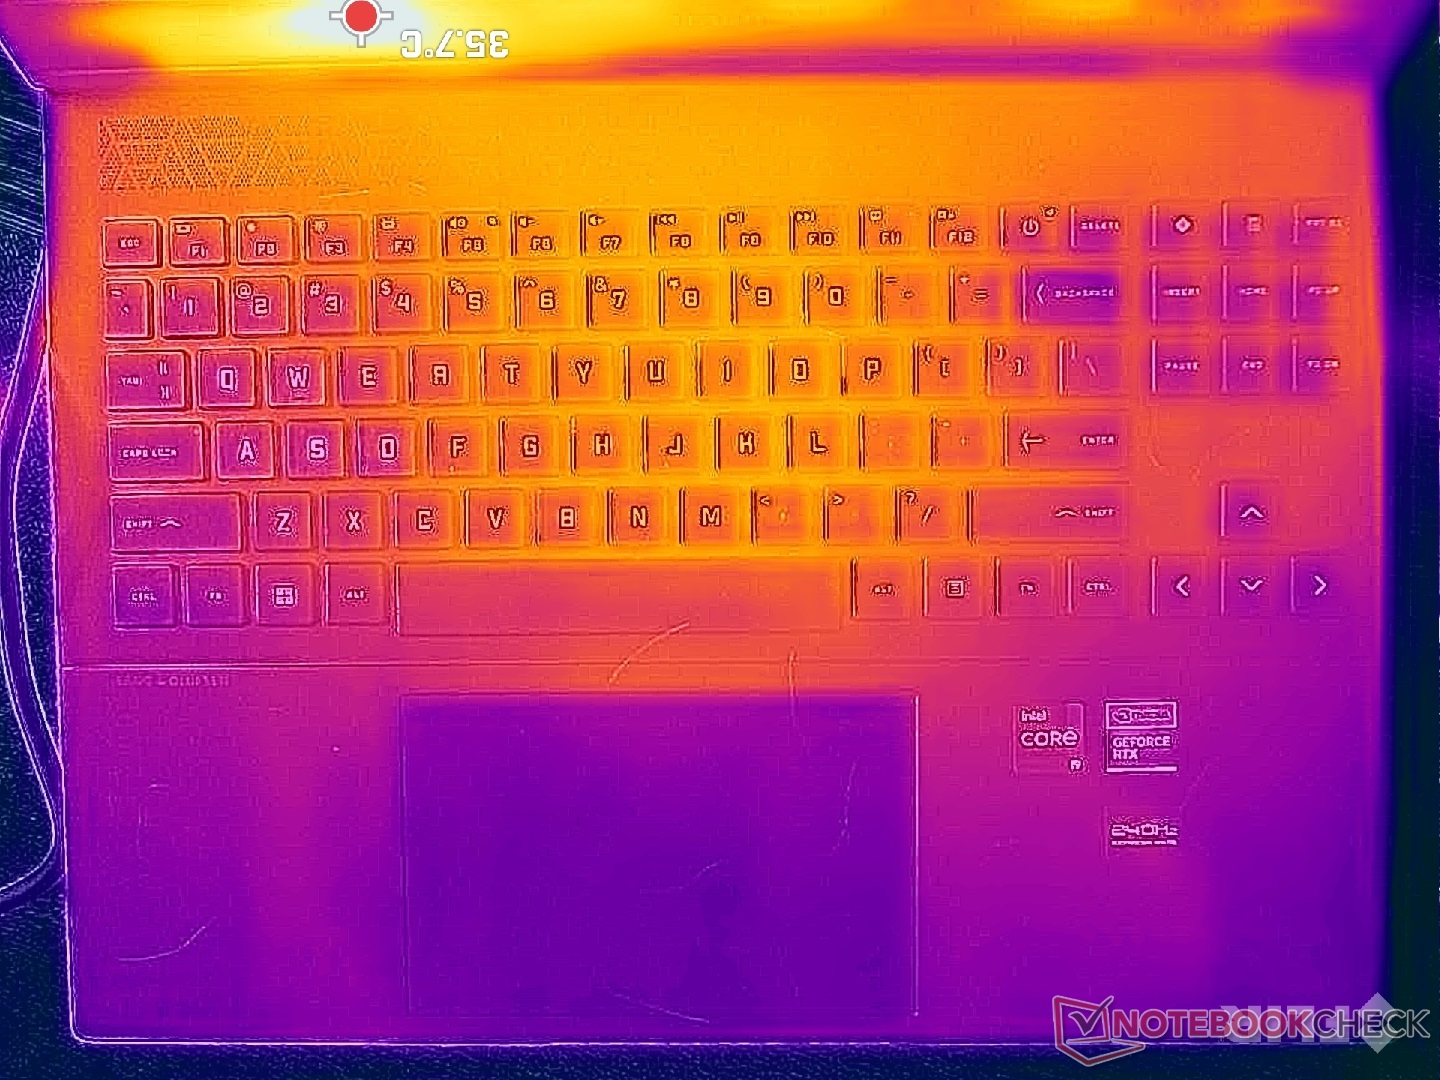
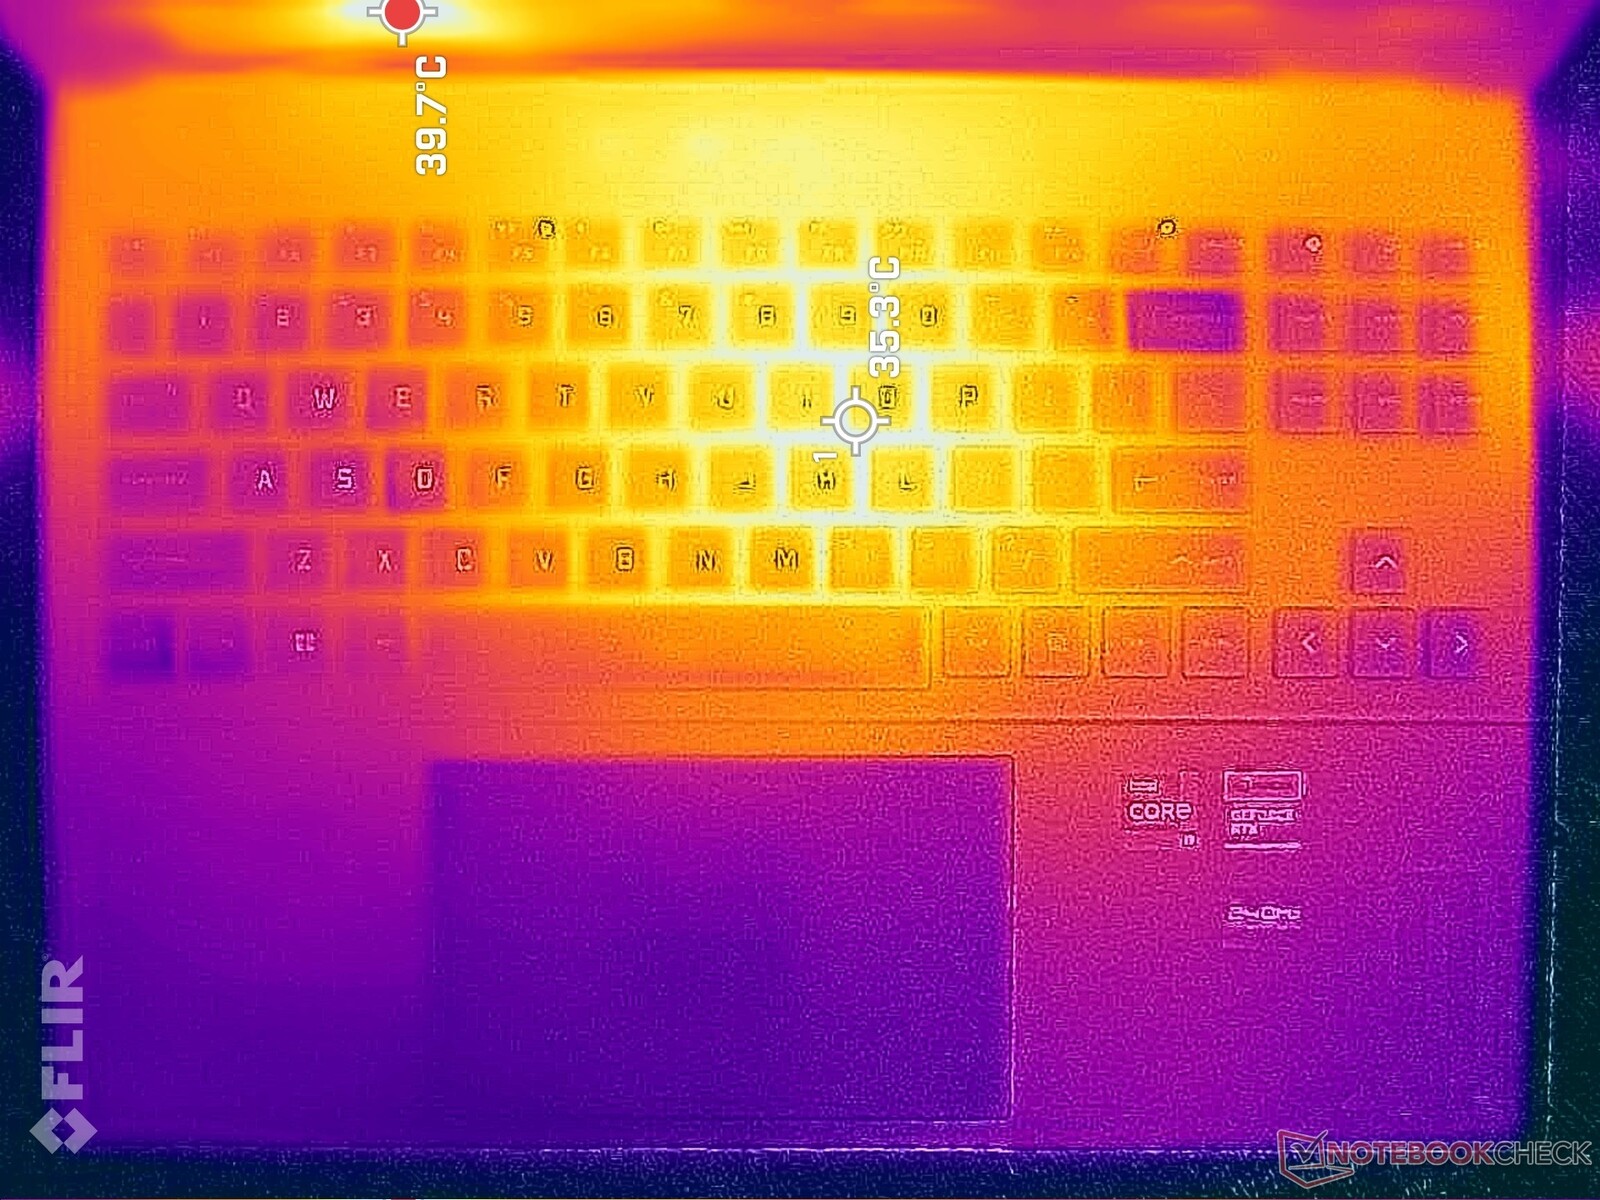
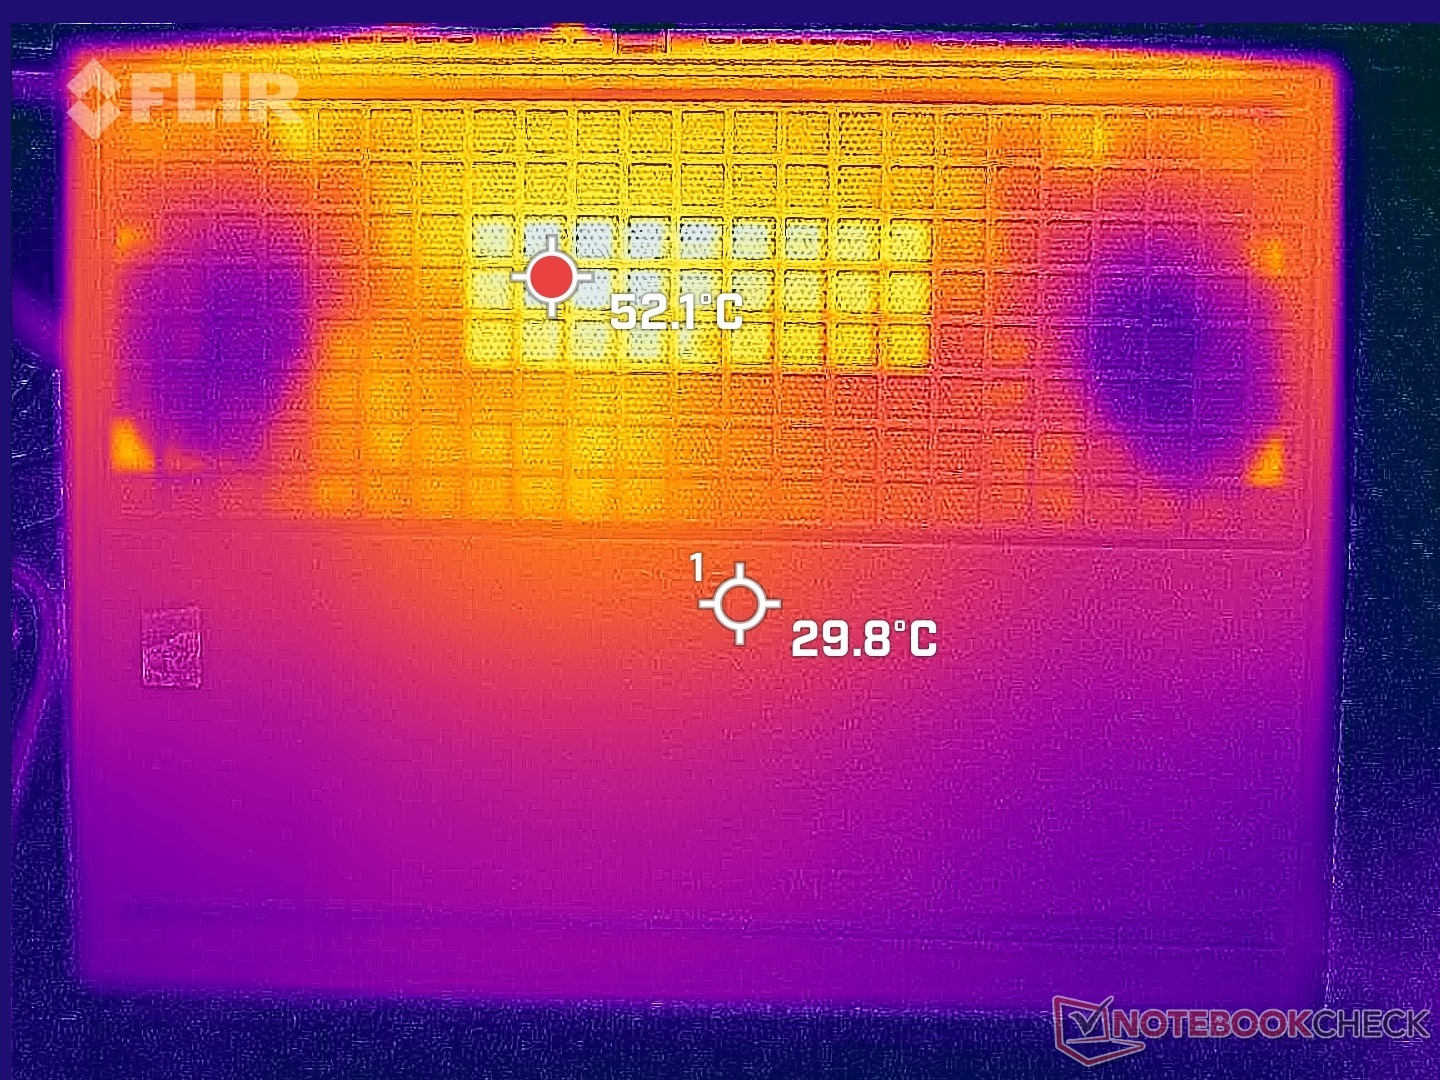
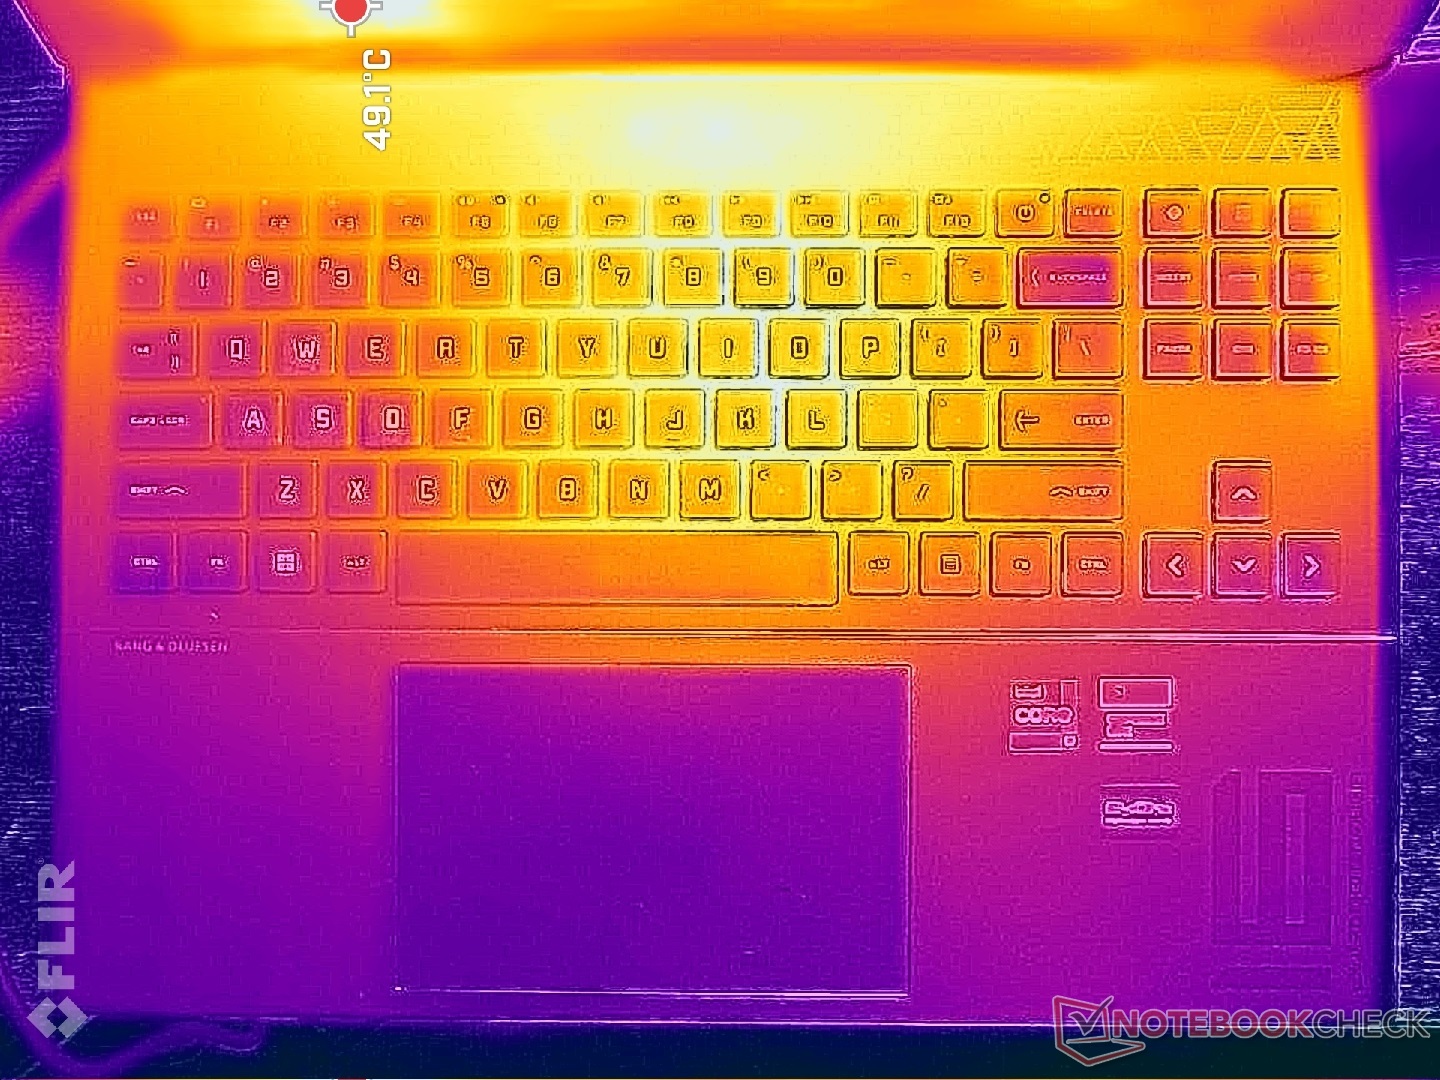
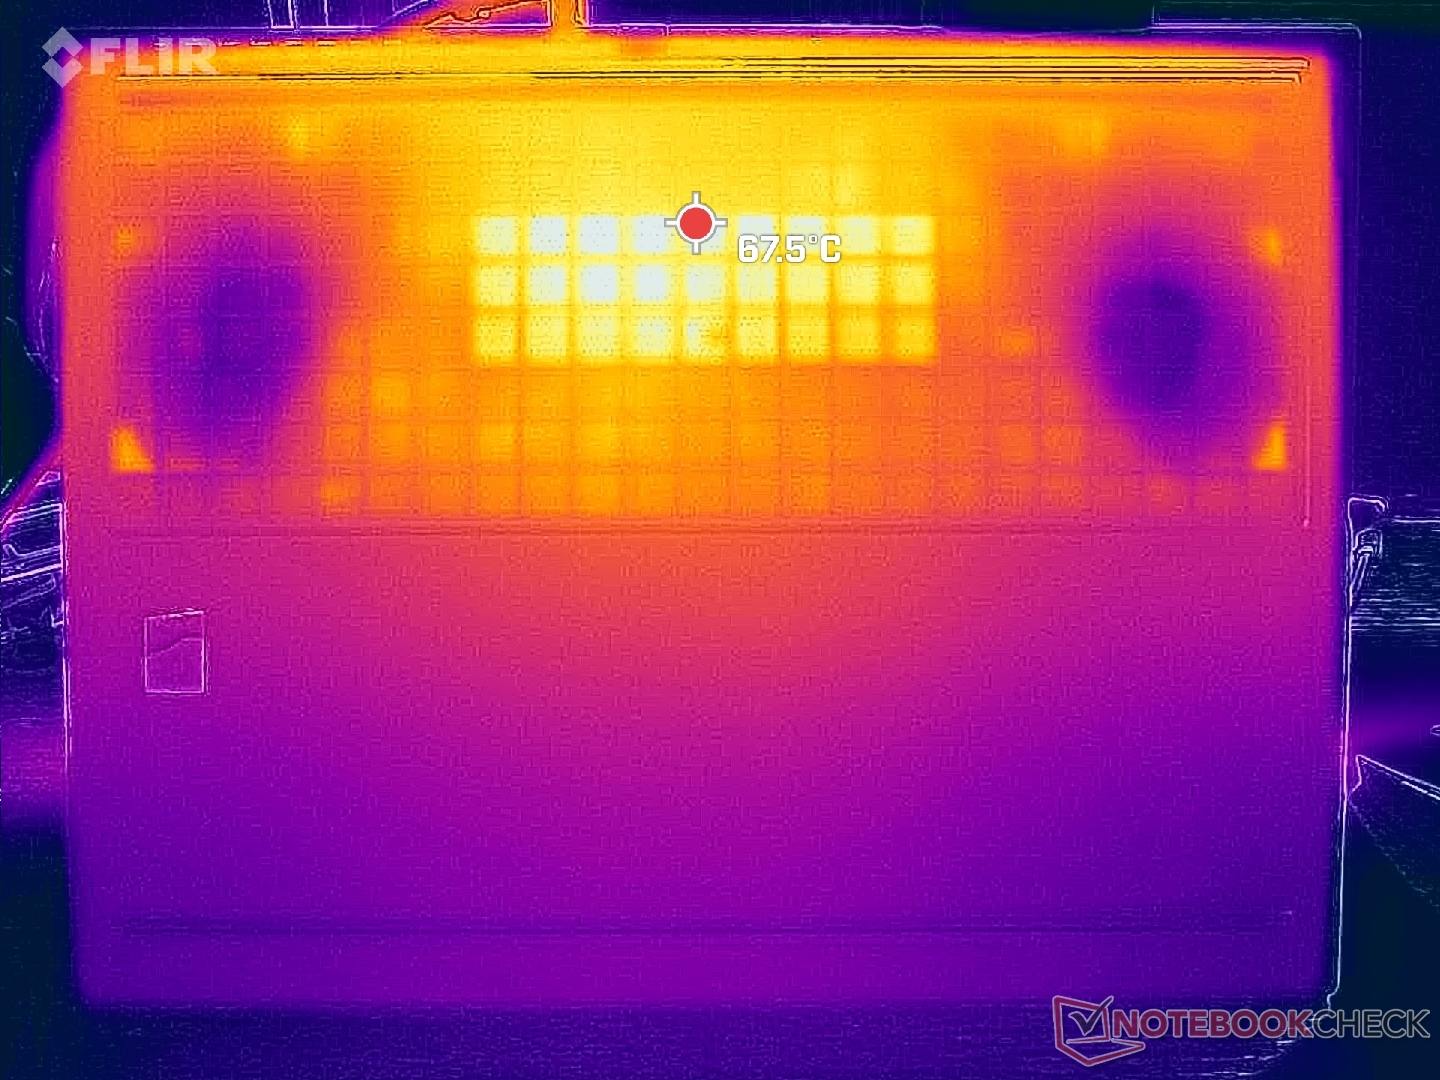
Die Oberflächentemperaturen sind aufgrund der symmetrischen Kühlung in der Mitte des Geräts am höchsten. Die Tastatur erreicht beim Gaming von 40 °C bis zu 45 °C, auf der Unterseite wird es dann teilweise noch wärmer. Diese Werte sind aber ähnlich wie bei anderen Referenzmodellen wie dem Legion Slim 7i 16 G8. Andere wichtige Stellen beim Gaming, wie die Handballenauflage, die WASD- oder die Pfeiltasten bleiben aber auch bei längeren Sessions angenehm kühl.
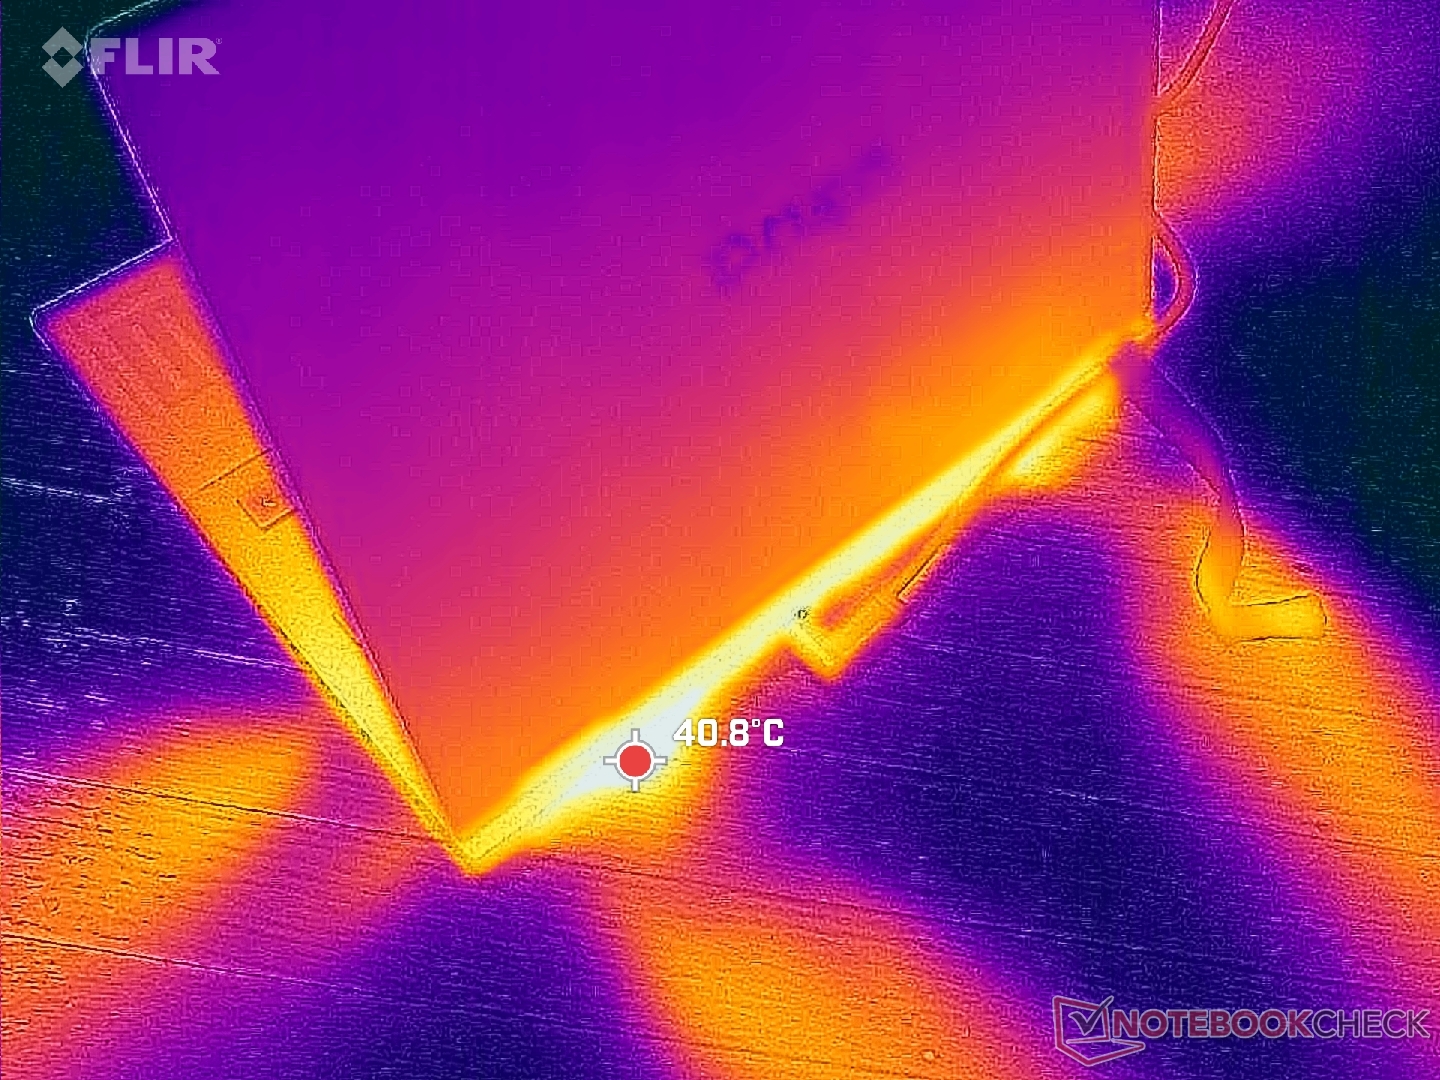
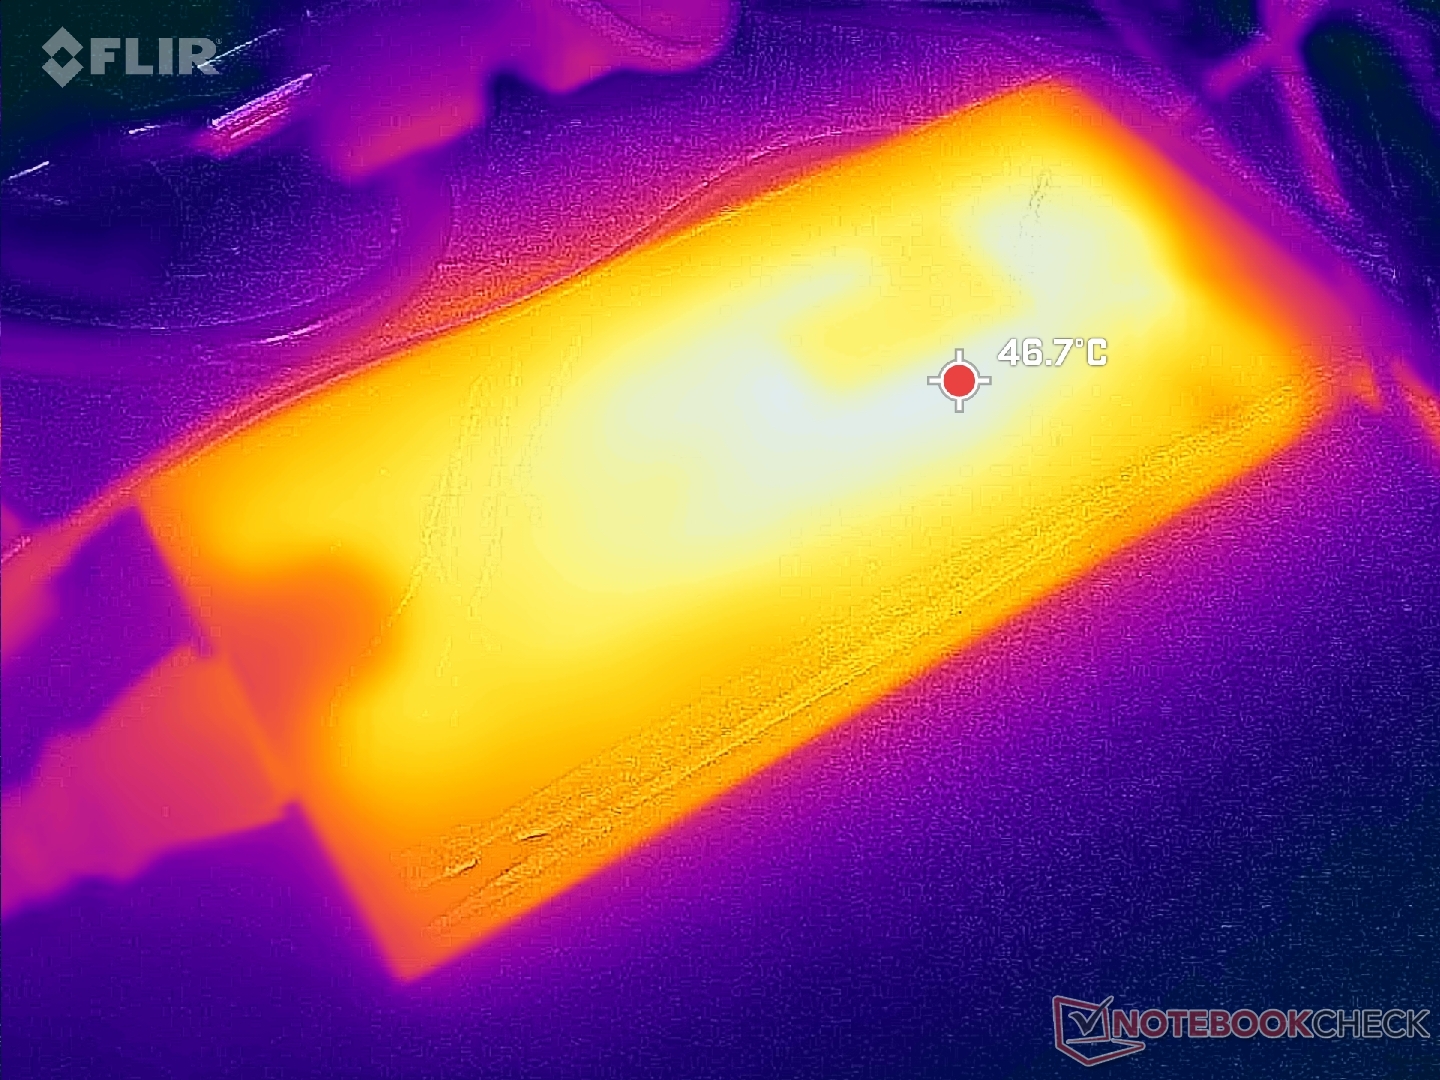
(-) Die maximale Temperatur auf der Oberseite ist 47.4 °C. Im Vergleich liegt der Klassendurchschnitt bei 40.4 °C (von 21.2 bis 68.8 °C für die Klasse Gaming).
(-) Auf der Unterseite messen wir eine maximalen Wert von 54.4 °C (im Vergleich zum Durchschnitt von 43.2 °C).
(+) Ohne Last messen wir eine durchschnittliche Temperatur von 25.4 °C auf der Oberseite. Der Klassendurchschnitt erreicht 33.9 °C.
(±) Beim längeren Spielen von The Witcher 3 erhitzt sich das Gerät durchschnittlich auf 32.5 °C. Der Durchschnitt der Klasse ist derzeit 33.9 °C.
(+) Die Handballen und der Touchpad-Bereich sind mit gemessenen 29.6 °C kühler als die typische Hauttemperatur und fühlen sich dadurch kühl an.
(±) Die durchschnittliche Handballen-Temperatur anderer getesteter Geräte war 28.8 °C (-0.8 °C).
| HP Omen Transcend 16 Intel Core i9-13900HX, NVIDIA GeForce RTX 4070 Laptop GPU | Lenovo Legion Slim 7i 16 Gen 8 Intel Core i9-13900H, NVIDIA GeForce RTX 4070 Laptop GPU | HP Omen 16-wf000 Intel Core i7-13700HX, NVIDIA GeForce RTX 4080 Laptop GPU | Alienware x16 R1 Intel Core i9-13900HK, NVIDIA GeForce RTX 4080 Laptop GPU | Acer Nitro 16 AN16-41 AMD Ryzen 7 7735HS, NVIDIA GeForce RTX 4070 Laptop GPU | Asus ROG Zephyrus M16 GU603Z Intel Core i9-12900H, NVIDIA GeForce RTX 3070 Ti Laptop GPU | |
|---|---|---|---|---|---|---|
| Hitze | -1% | 3% | -10% | -3% | -5% | |
| Last oben max * (°C) | 47.4 | 49.8 -5% | 45 5% | 47.2 -0% | 41.5 12% | 52 -10% |
| Last unten max * (°C) | 54.4 | 48.8 10% | 48.8 10% | 47.8 12% | 51.8 5% | 51 6% |
| Idle oben max * (°C) | 28.4 | 29.4 -4% | 29.2 -3% | 36.8 -30% | 31.6 -11% | 29 -2% |
| Idle unten max * (°C) | 29.2 | 30 -3% | 28.8 1% | 35.8 -23% | 34.5 -18% | 33 -13% |
* ... kleinere Werte sind besser
Stresstest
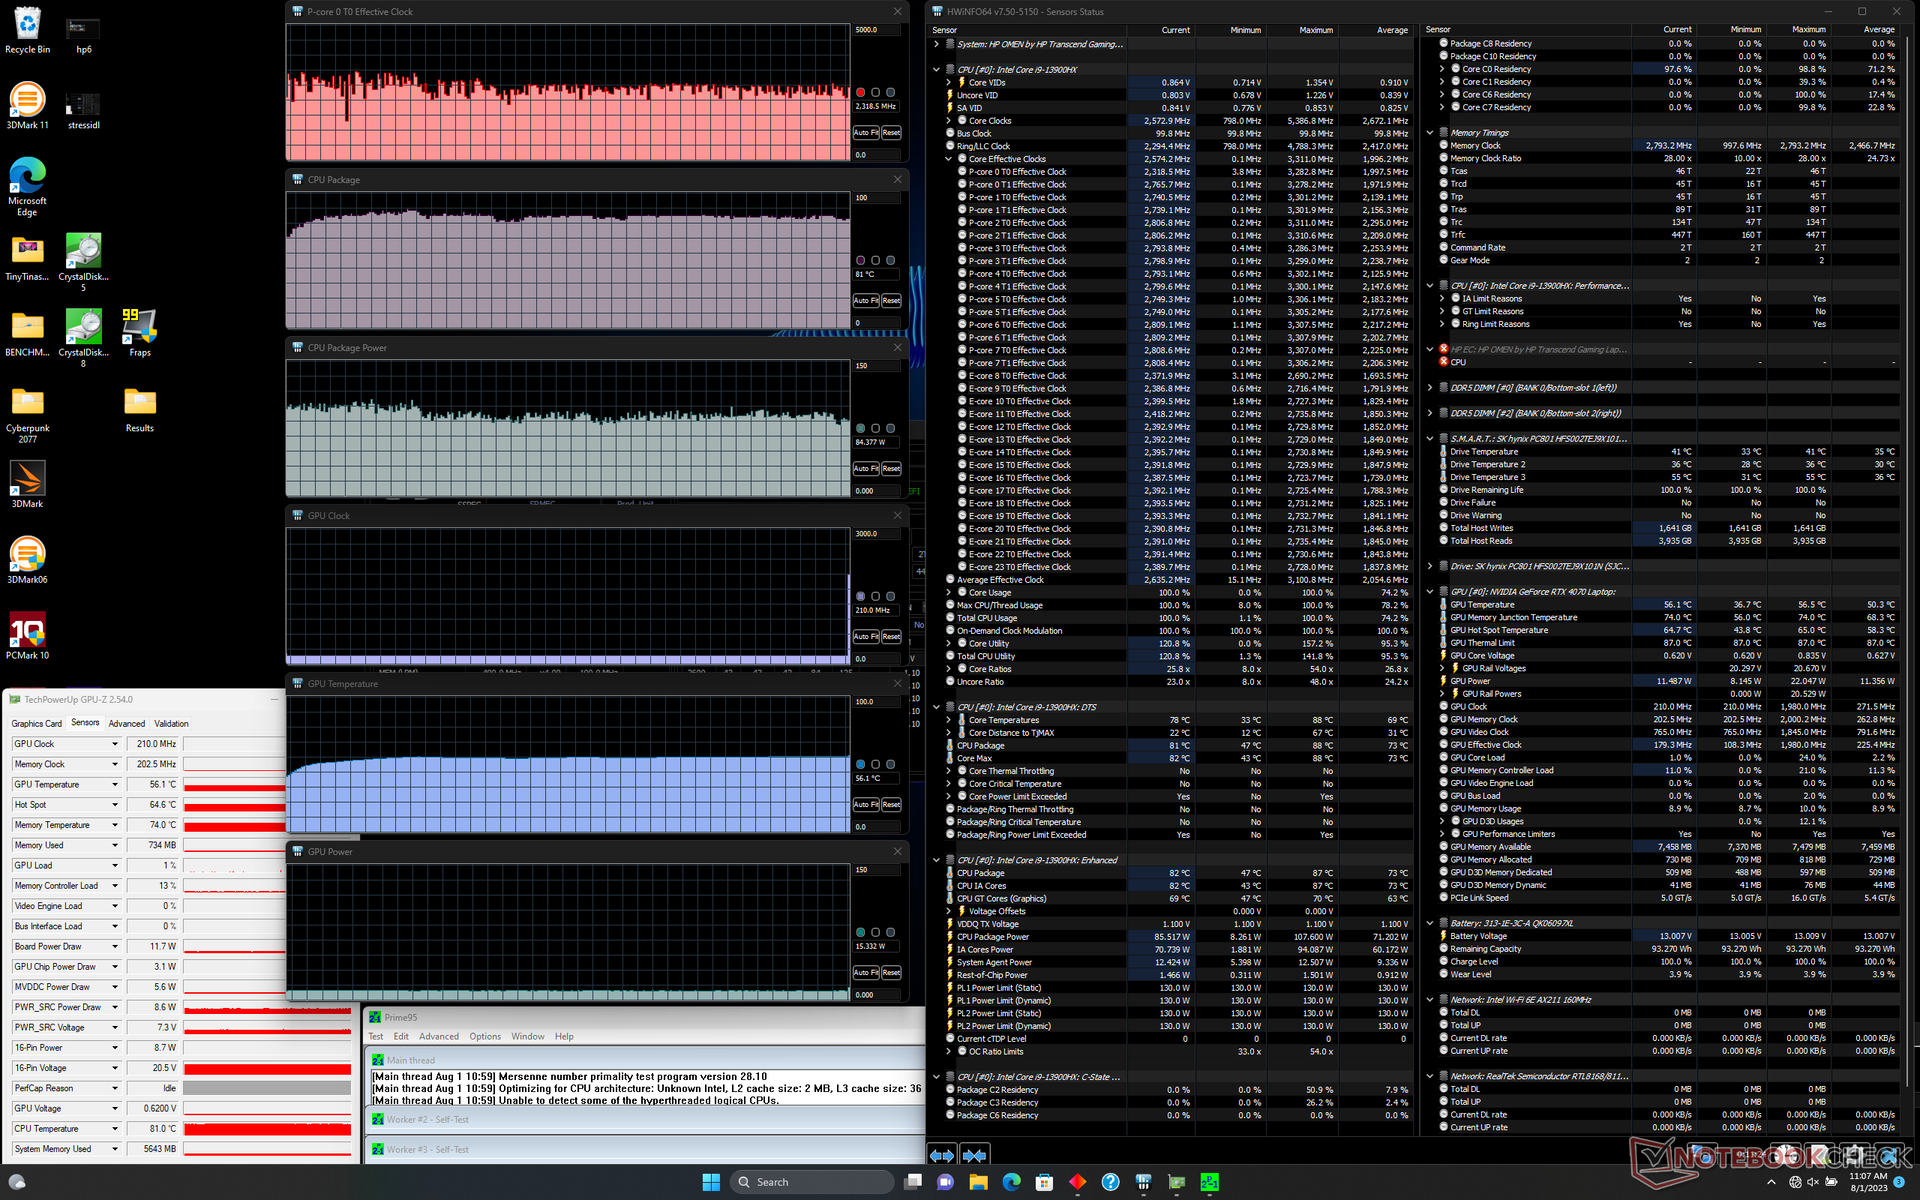
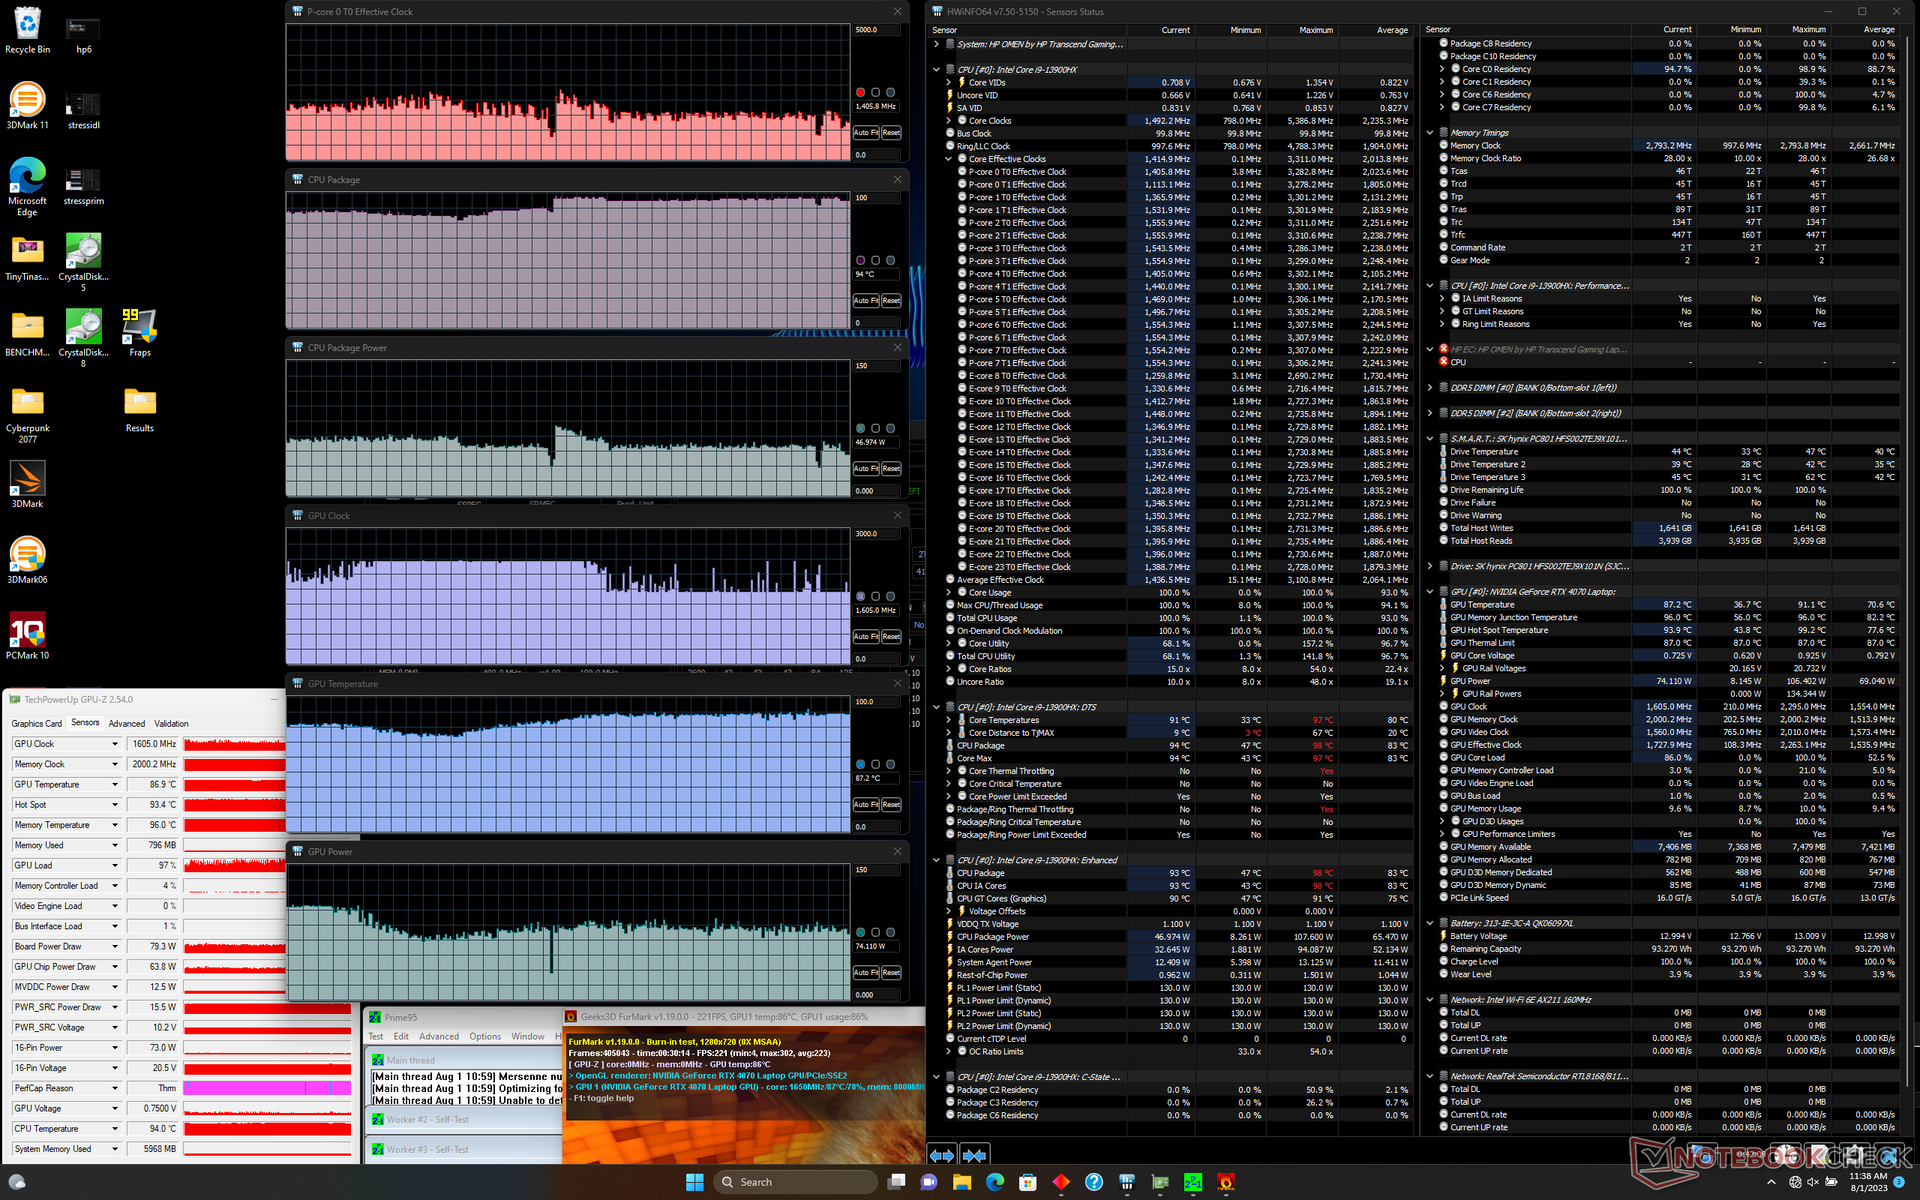
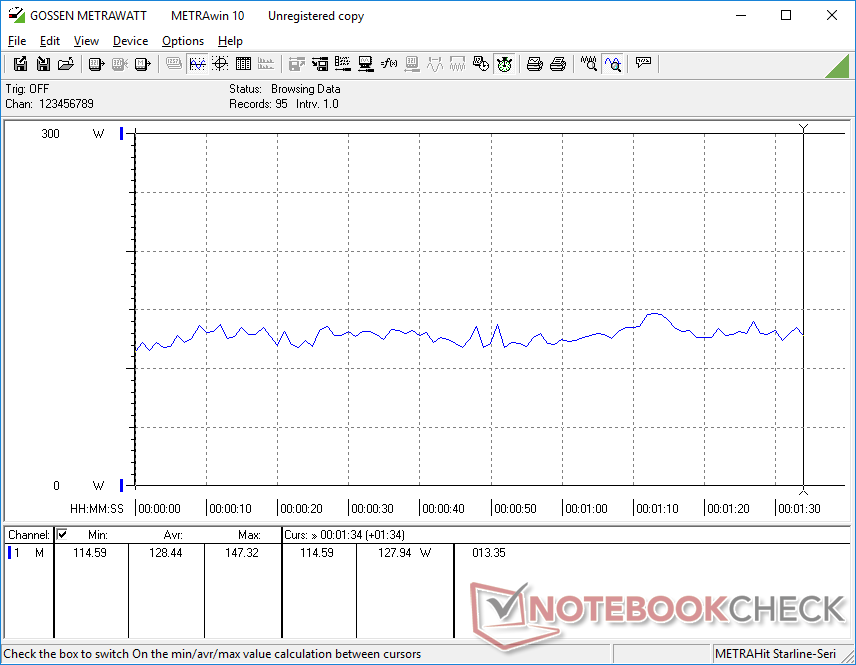
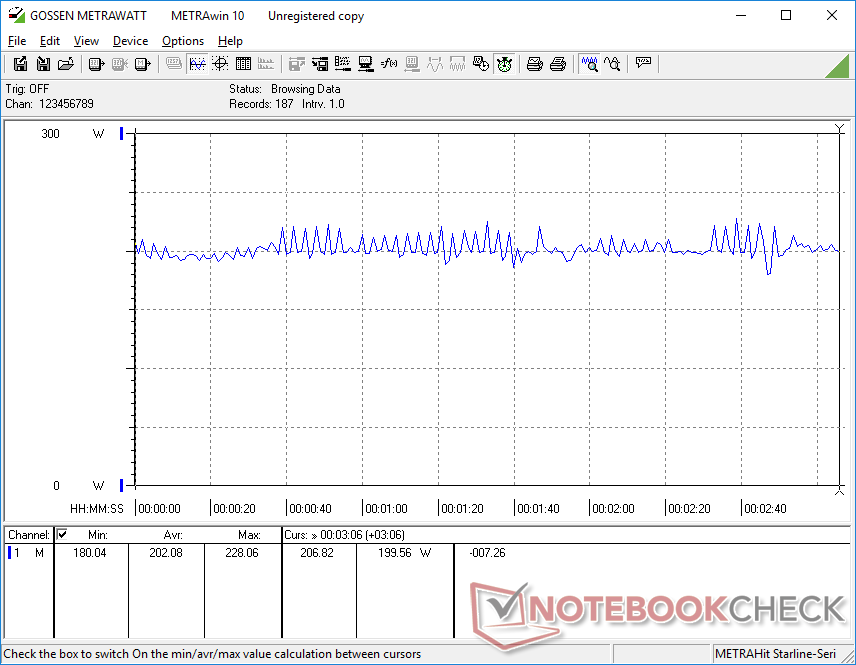
Bei unserem Prime95 Stresstest erreicht die CPU eine maximale Taktrate von 3,1 GHz bei einem Verbrauch von 101 W. Dieser Wert konnte sich auch für ein paar Sekunden halten, ehe sich die CPU auf 2,4 GHz heruntertaktete und bei konstanten 2,4 GHz (84 W) einpendelte. Die Temperatur kann dabei auch einen Maximalwert von 97 °C erreichen, da die GPU ebenfalls im Stresstest gefordert wird.
Die Nvidia Grafikkarte stabilisiert sich bei Witcher 3 und aktiviertem Performance-Modus bei 2.115 MHz (bei 94 W) und wird 86 °C warm. Im Balanced-Modus sind es 2.085 MHz, 86 W und 76 °C. Trotzdem konnten wir nur einen Real-World-GPU-Power-Peak von 105 W erreichen, im Vergleich zum 130-W-TGP-Zielwert.
Wie so oft ist die Performance ohne externe Stromversorgung etwas eingeschränkt. Beim Fire-Strike-Test ohne Netzteil erreichten wir Physics- und Graphics-Werte von 21.003 und 17.627 Punkte, im Vergleich zu 33.936 beziehungsweise 27.343 Punkten.

| CPU Clock (GHz) | GPU Clock (MHz) | Average CPU Temperature (°C) | Average GPU Temperature (°C) | |
| System Idle | -- | -- | 48 | 38 |
| Prime95 Stress | ~2.0 - 2.4 | -- | 81 | 56 |
| Prime95 + FurMark Stress | ~1.5 | 1605 | 94 | 87 |
| Witcher 3 Stress (Balanced mode) | ~0.7 | 2085 | 80 | 77 |
| Witcher 3 Stress (Performance mode) | ~0.7 | 2115 | 97 | 87 |
Lautsprecher
HP Omen Transcend 16 Audio Analyse
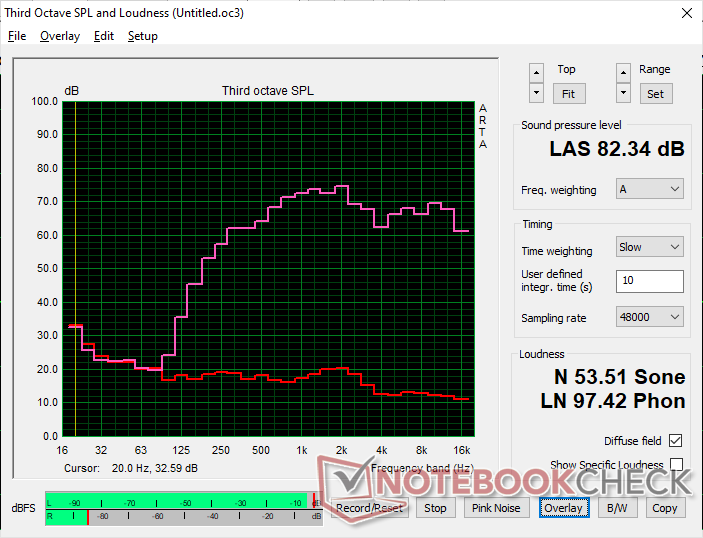
(+) | Die Lautsprecher können relativ laut spielen (82.3 dB)
Bass 100 - 315 Hz
(-) | kaum Bass - 20% niedriger als der Median
(±) | durchschnittlich lineare Bass-Wiedergabe (14.3% Delta zum Vorgänger)
Mitteltöne 400 - 2000 Hz
(±) | zu hohe Mitten, vom Median 5.2% abweichend
(+) | lineare Mitten (3.7% Delta zum Vorgänger)
Hochtöne 2 - 16 kHz
(+) | ausgeglichene Hochtöne, vom Median nur 2% abweichend
(+) | sehr lineare Hochtöne (6.7% Delta zum Vorgänger)
Gesamt im hörbaren Bereich 100 - 16.000 Hz
(±) | hörbarer Bereich ist durchschnittlich linear (17% Abstand zum Median)
Im Vergleich zu allen Geräten derselben Klasse
» 45% aller getesteten Geräte dieser Klasse waren besser, 12% vergleichbar, 43% schlechter
» Das beste Gerät hat einen Delta-Wert von 6%, durchschnittlich ist 18%, das schlechteste Gerät hat 132%
Im Vergleich zu allen Geräten im Test
» 30% aller getesteten Geräte waren besser, 8% vergleichbar, 62% schlechter
» Das beste Gerät hat einen Delta-Wert von 4%, durchschnittlich ist 24%, das schlechteste Gerät hat 134%
Apple MacBook Pro 16 2021 M1 Pro Audio Analyse
(+) | Die Lautsprecher können relativ laut spielen (84.7 dB)
Bass 100 - 315 Hz
(+) | guter Bass - nur 3.8% Abweichung vom Median
(+) | lineare Bass-Wiedergabe (5.2% Delta zum Vorgänger)
Mitteltöne 400 - 2000 Hz
(+) | ausgeglichene Mitten, vom Median nur 1.3% abweichend
(+) | lineare Mitten (2.1% Delta zum Vorgänger)
Hochtöne 2 - 16 kHz
(+) | ausgeglichene Hochtöne, vom Median nur 1.9% abweichend
(+) | sehr lineare Hochtöne (2.7% Delta zum Vorgänger)
Gesamt im hörbaren Bereich 100 - 16.000 Hz
(+) | hörbarer Bereich ist sehr linear (4.6% Abstand zum Median
Im Vergleich zu allen Geräten derselben Klasse
» 0% aller getesteten Geräte dieser Klasse waren besser, 0% vergleichbar, 100% schlechter
» Das beste Gerät hat einen Delta-Wert von 5%, durchschnittlich ist 17%, das schlechteste Gerät hat 45%
Im Vergleich zu allen Geräten im Test
» 0% aller getesteten Geräte waren besser, 0% vergleichbar, 100% schlechter
» Das beste Gerät hat einen Delta-Wert von 4%, durchschnittlich ist 24%, das schlechteste Gerät hat 134%
Energie-Management
Stromverbrauch — Ziemlich hoch im Idle
Unser Omen Transcend 16 kommt zwar mit einer schnelleren CPU, aber dafür mit einer langsameren GPU als der Omen 16, was bedeutet, dass der durchschnittliche Stromverbrauch irgendwo zwischen beiden liegt. Dieser Unterschied wird dann eher merkbarer, wenn man die Grafikkarte und den Prozessor getrennt voneinander anspricht. Beispielsweise verbraucht der Omen Transcend 16 bei Prime95 15 bis 20 W mehr, bei FurMark sind es 15 W weniger.
Im Desktop-Idle verbraucht er mit dem Performance-Profil knapp 55 W. Hierzu ist jedoch zu sagen, dass ein Mini-LED grundsätzlich mehr Strom verbraucht ein als IPS-Panel.
Wir konnten einen maximalen Stromverbrauch von 292 W im 280-W-AC-Adapter messen, wenn die CPU und die GPU zu 100 Prozent ausgelastet sind. Bei derselben Auslastung pendelt sich der Verbrauch dann nach einigen Momenten im Bereich von 240 W ein.
| Aus / Standby | |
| Idle | |
| Last |
|
Legende:
min: | |
| HP Omen Transcend 16 i9-13900HX, GeForce RTX 4070 Laptop GPU, SK hynix PC801 HFS002TEJ9X101N, Mini-LED, 2560x1600, 16" | Lenovo Legion Slim 7i 16 Gen 8 i9-13900H, GeForce RTX 4070 Laptop GPU, Samsung PM9A1 MZVL21T0HCLR, IPS, 2560x1600, 16" | HP Omen 16-wf000 i7-13700HX, GeForce RTX 4080 Laptop GPU, SK hynix PC801 HFS002TEJ9X101N, IPS, 2560x1440, 16.1" | Alienware x16 R1 i9-13900HK, GeForce RTX 4080 Laptop GPU, SK hynix PC801 HFS001TEJ9X101N, IPS, 2560x1600, 16" | Acer Nitro 16 AN16-41 R7 7735HS, GeForce RTX 4070 Laptop GPU, Samsung PM9A1 MZVL21T0HCLR, IPS, 2560x1600, 16" | Asus ROG Zephyrus M16 GU603Z i9-12900H, GeForce RTX 3070 Ti Laptop GPU, Micron 3400 1TB MTFDKBA1T0TFH, IPS, 2560x1600, 16" | |
|---|---|---|---|---|---|---|
| Stromverbrauch | 9% | 3% | -12% | 29% | 34% | |
| Idle min * (Watt) | 19.2 | 22 -15% | 21.8 -14% | 25.2 -31% | 11.6 40% | 10.8 44% |
| Idle avg * (Watt) | 22.7 | 29 -28% | 26 -15% | 29.9 -32% | 15.6 31% | 17 25% |
| Idle max * (Watt) | 55.4 | 39.5 29% | 36 35% | 49.8 10% | 16.5 70% | 17.8 68% |
| Last avg * (Watt) | 128.4 | 98.7 23% | 115.5 10% | 105.4 18% | 155 -21% | 116 10% |
| Witcher 3 ultra * (Watt) | 206 | 171.8 17% | 214 -4% | 263 -28% | 154.8 25% | 144 30% |
| Last max * (Watt) | 292 | 213.2 27% | 269.7 8% | 313.8 -7% | 205 30% | 220 25% |
* ... kleinere Werte sind besser
Stromverbrauch Witcher 3 / Stresstest
Stromverbrauch externer Monitor
Akkulaufzeit
Die Akku-Kapazität hat sich von 83 Wh im Omen 16 zu 97 Wh im Omen Transcend 16 etwas vergrößert. Nichtsdestotrotz ist die Akkulaufzeit kürzer aufgrund des Mini-LED-Displays. Im Balanced-Profil konnten wir knapp vier Stunden mit Real-World-Browsing und aktivierter iGPU erreichen, beim Omen 16 waren es noch fünf Stunden.
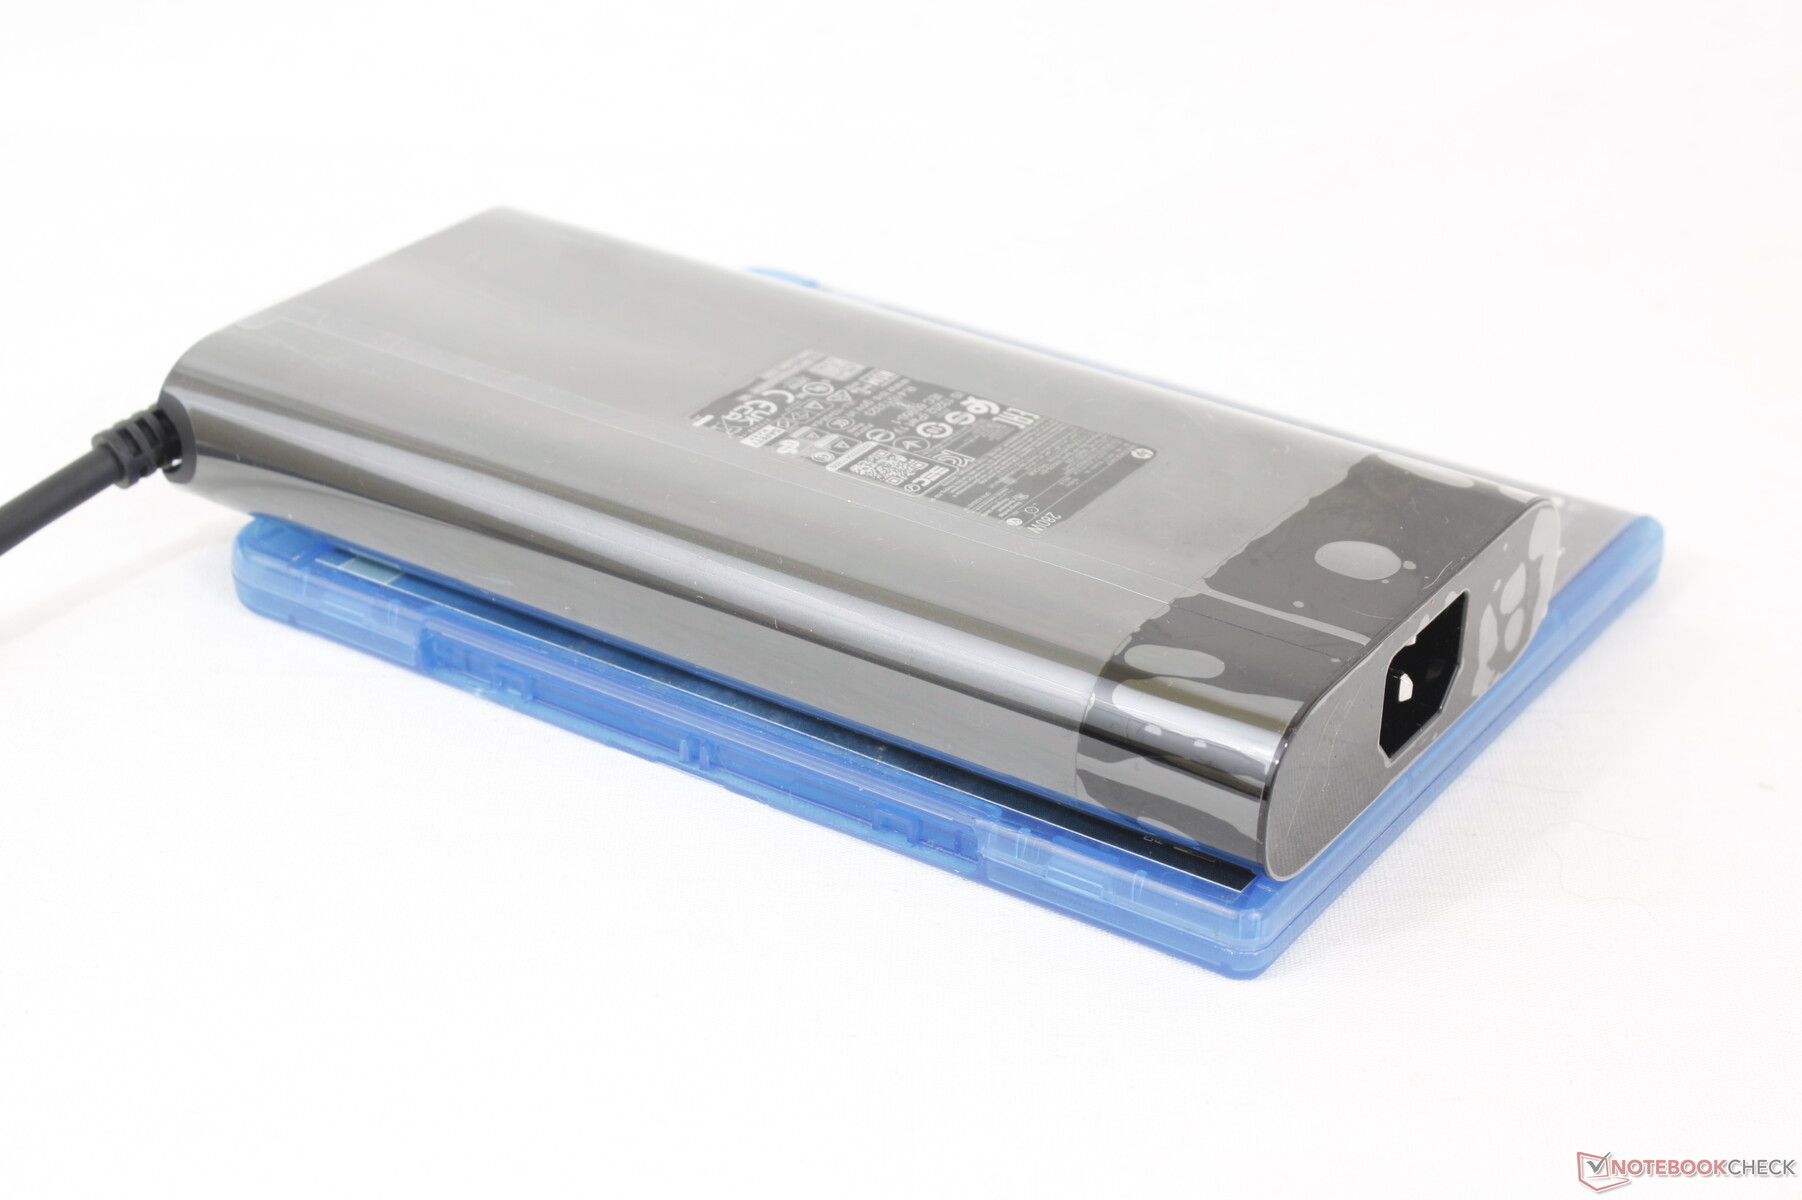
Um den komplett leeren Akku mit dem mitgelieferten AC-Netzteil auf 100 Prozent zu laden, dauert es ca. 90 Minuten. Man kann das Notebook zwar auch via USB-C laden, dies funktioniert aber dann nicht mit allen Netzteilen. Unser 65-W-USB-C-Netzteil beispielsweise führte ausschließlich zu Fehlermeldungen, beim 135-W-Netzteil funktionierte das Laden jedoch einwandfrei.
| HP Omen Transcend 16 i9-13900HX, GeForce RTX 4070 Laptop GPU, 97 Wh | Lenovo Legion Slim 7i 16 Gen 8 i9-13900H, GeForce RTX 4070 Laptop GPU, 99.9 Wh | HP Omen 16-wf000 i7-13700HX, GeForce RTX 4080 Laptop GPU, 83 Wh | Alienware x16 R1 i9-13900HK, GeForce RTX 4080 Laptop GPU, 90 Wh | Acer Nitro 16 AN16-41 R7 7735HS, GeForce RTX 4070 Laptop GPU, 90 Wh | Asus ROG Zephyrus M16 GU603Z i9-12900H, GeForce RTX 3070 Ti Laptop GPU, 90 Wh | |
|---|---|---|---|---|---|---|
| Akkulaufzeit | -13% | 0% | -22% | 86% | 47% | |
| Idle (h) | 6.3 | 5.1 -19% | 5.5 -13% | 7.3 16% | 12.2 94% | |
| WLAN (h) | 4.2 | 4.4 5% | 5.1 21% | 2.5 -40% | 9 114% | 7.4 76% |
| Last (h) | 1.2 | 0.9 -25% | 1.1 -8% | 0.7 -42% | 1.8 50% | 1.4 17% |
| H.264 (h) | 10.2 | 7.3 |
Pro
Contra
Fazit — Großartiges Design und einzigartiges Display, aber wo ist die RTX 4080?
Der Omen Transcend 16 bietet einige nützliche Upgrades im Vergleich zum Omen 16, wie einen IR-Sensor, ein 16:10-Seitenverhältnis, einen größeren Akku und Mini-LED. Letzteres ist wahrscheinlich auch einzigartig, da der Omen Transcend 16 einer der ersten Gaming-Laptops mit einem QHD+-240-Hz-Mini-LED-Panel ist. User, die diverse HDR1000-Features und eine überzeugende Helligkeit wünschen, werden die Vorteile der Mini-LED-Technologie deshalb nie mehr missen wollen.
Der Omen Transcend 16 tauscht höhere GPUs für eine schnellere CPU und verfügt über ein dünneres und gleichzeitig leichteres Gehäuse. Außerdem ist das Mini-LED-Display hell genug für den meisten HDR-Content auf einem Gaming-Laptop.
Trotzdem ist das neueste Modell nicht viel besser als der etwas ältere Bruder, der Omen 16. So unterstützt der Omen Transcend 16 beispielsweise nur eine interne SSD, im Vergleich zu zwei beim Omen 16. Außerdem ist die höchste Konfiguration jene mit einer 130-W-RTX-4070, während beim Omen 16 auch eine RTX 4080 konfigurierbar ist. Diese Limitierung liegt wahrscheinlich am dünneren Design und an der stärkeren i9-13900HX-CPU des Omen Transcend 16. Aus diesem Grund sollten Nutzer, die eine schnelle GPU-Performance brauchen, eher zum Omen 16 greifen, während jene mit großen Prozessoranforderungen hier ohne schlechtem Gewissen zugreifen können.
Preis und Verfügbarkeit
Den Omen Transcend 16 kann man momentan in Österreich auf HPs eigener Website bestellen. Die günstigste Version kostet dabei 2.399 Euro, für die teuerste muss man 2.999 Euro investieren.
HP Omen Transcend 16
- 04.08.2023 v7 (old)
Allen Ngo
Transparenz
Die Auswahl der zu testenden Geräte erfolgt innerhalb der Redaktion. Das vorliegende Testmuster wurde dem Autor vom Hersteller oder einem Shop zu Testzwecken leihweise zur Verfügung gestellt. Eine Einflussnahme des Leihstellers auf den Testbericht gab es nicht, der Hersteller erhielt keine Version des Reviews vor der Veröffentlichung. Es bestand keine Verpflichtung zur Publikation. Als eigenständiges, unabhängiges Unternehmen unterliegt Notebookcheck keiner Diktion von Herstellern, Shops und Verlagen.
So testet Notebookcheck
Pro Jahr werden von Notebookcheck hunderte Laptops und Smartphones unabhängig in von uns standardisierten technischen Verfahren getestet, um eine Vergleichbarkeit aller Testergebnisse zu gewährleisten. Seit rund 20 Jahren entwickeln wir diese Testmethoden kontinuierlich weiter und setzen damit Branchenstandards. In unseren Testlaboren kommt ausschließlich hochwertiges Messequipment in die Hände erfahrener Techniker und Redakteure. Die Tests unterliegen einer mehrstufigen Kontrolle. Unsere komplexe Gesamtbewertung basiert auf hunderten fundierten Messergebnissen und Benchmarks, womit Ihnen Objektivität garantiert ist. Weitere Informationen zu unseren Testmethoden gibt es hier.
Preisvergleich

