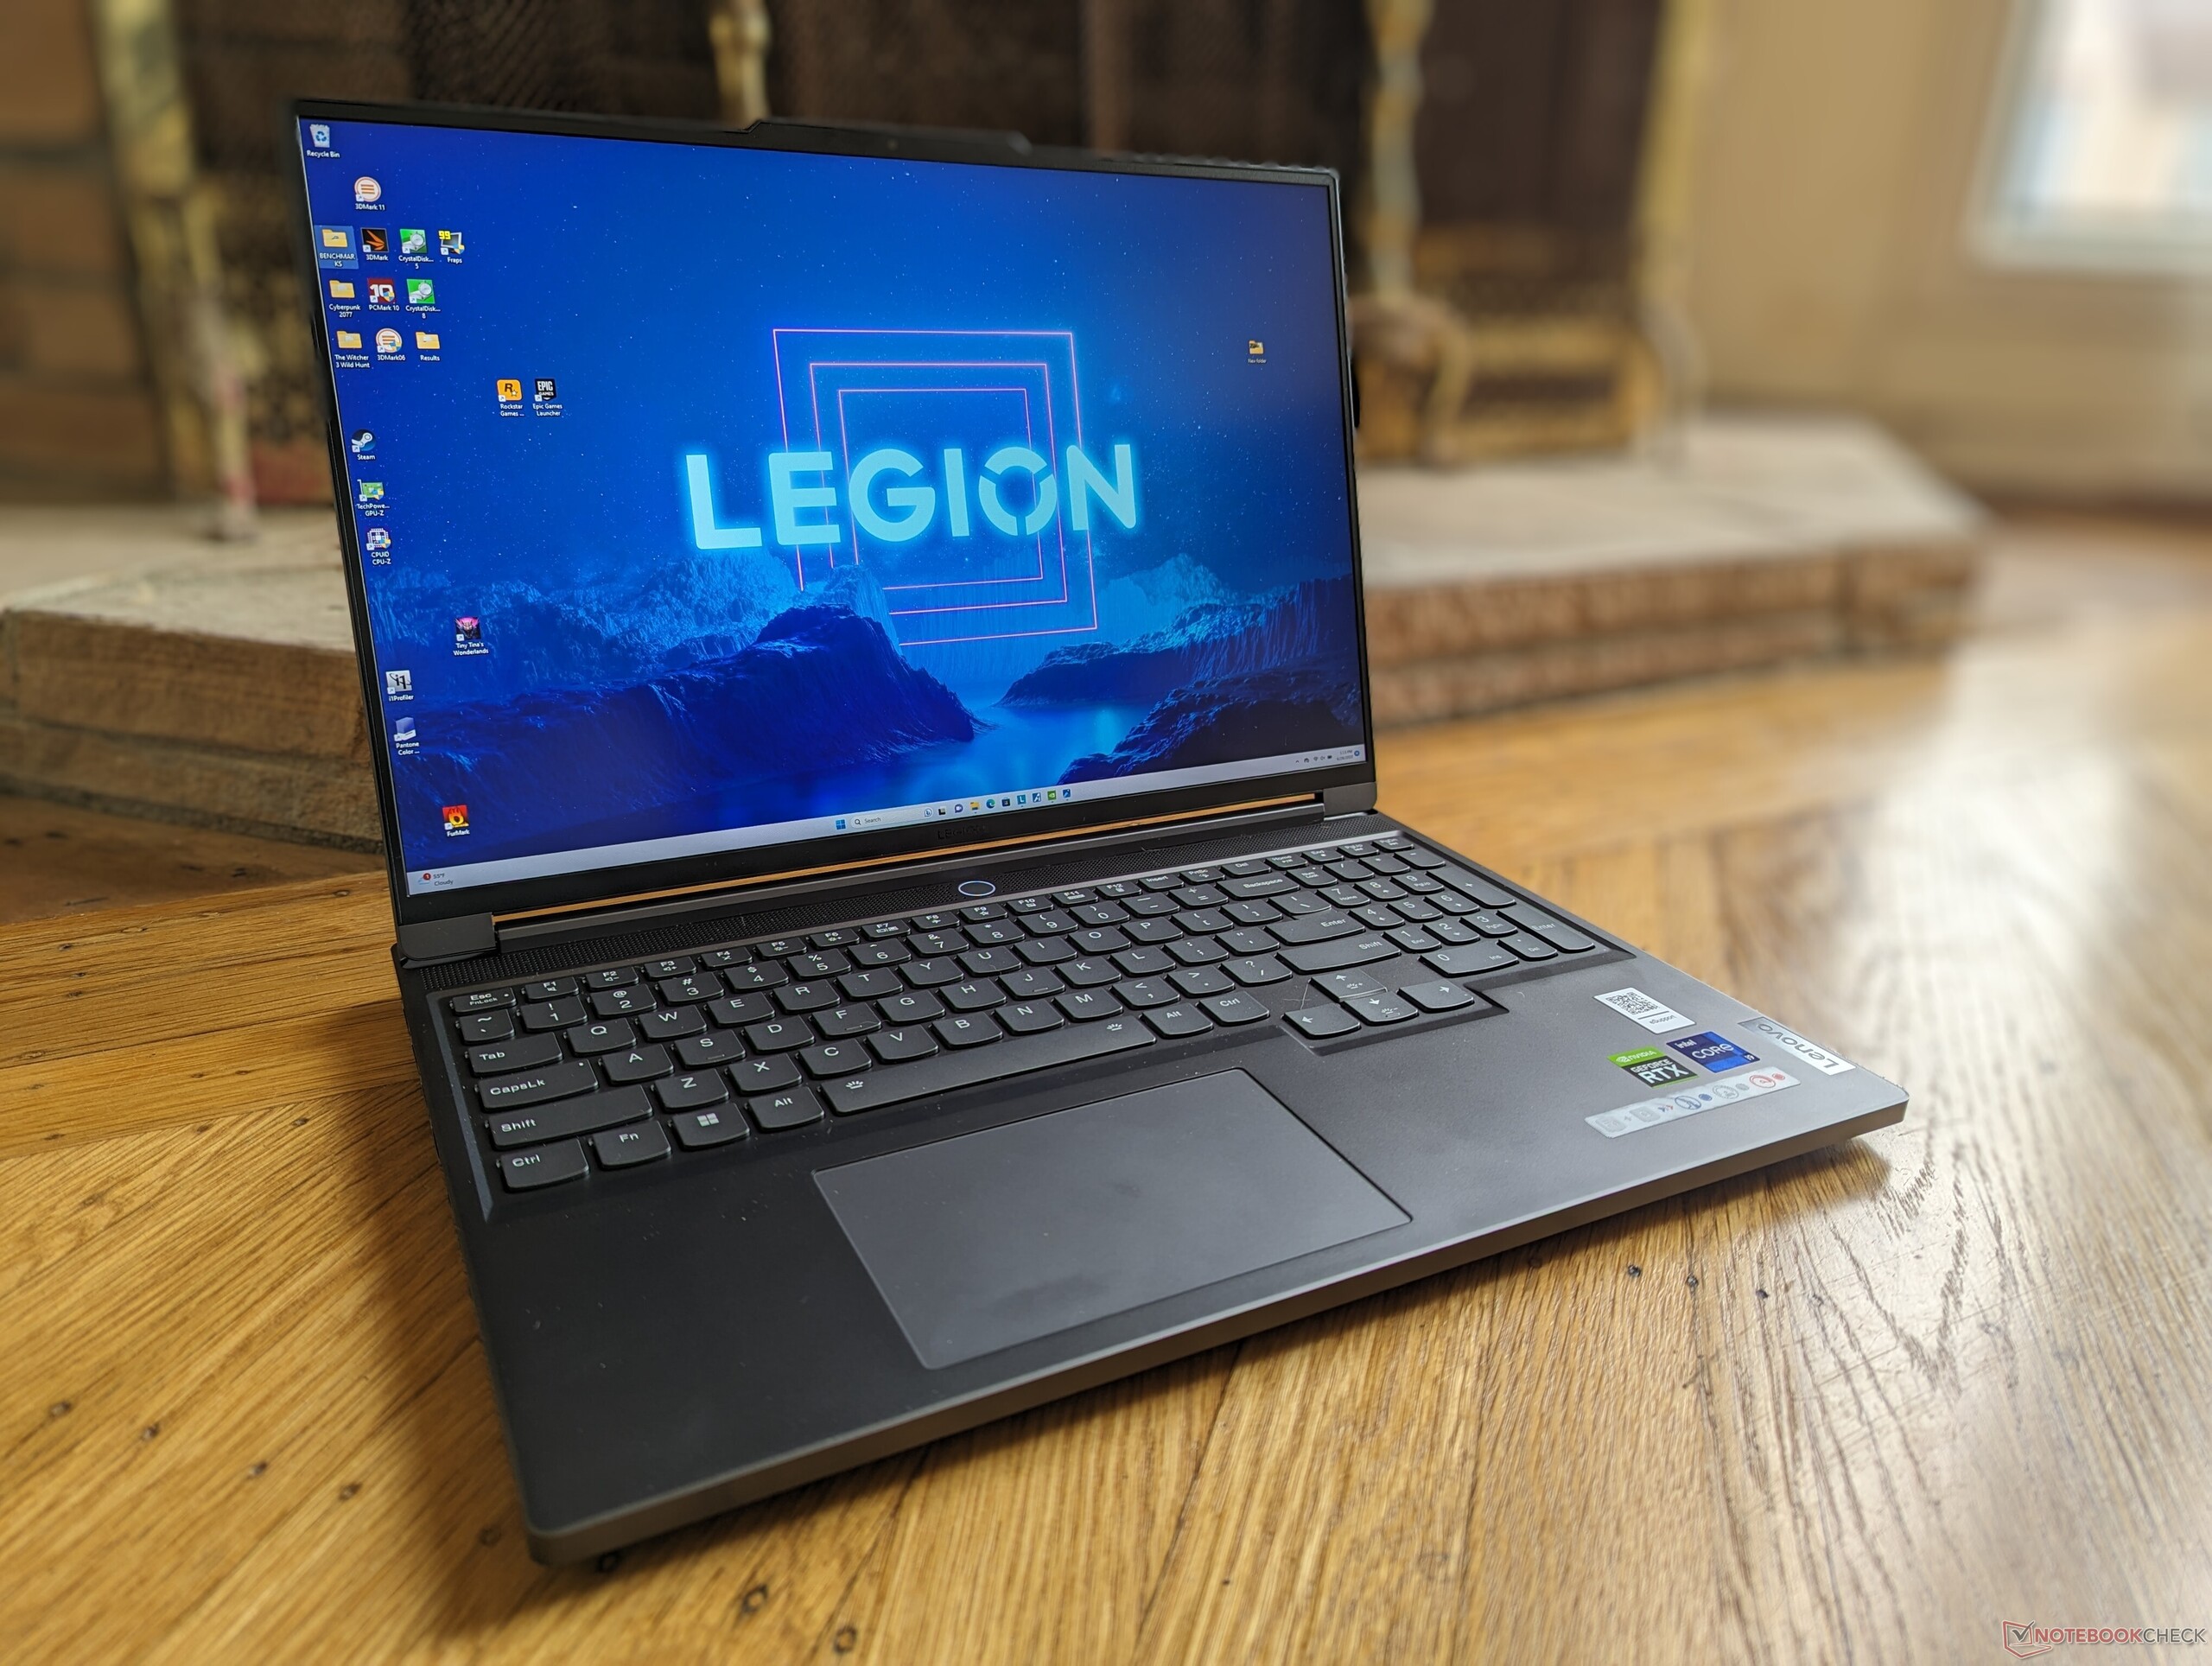
Lenovo Legion Slim 7i 16 (Gen 8) Gaming-Laptop im Test: Dünner als das Razer Blade 16

Das Lenovo Legion Slim 7i Gen 8 ersetzt das letztjährige Legion Slim 7i Gen 7 und erhält neue Raptor Lake-H-Prozessoren der 13. Generation, Nvidia Grafikkarten auf Ada-Lovelace-Basis und ein überarbeitetes Gehäuse-Design. Damit dient es als Ergänzung zur dickeren und leistungsfähigeren Legion Pro 7 Serie.
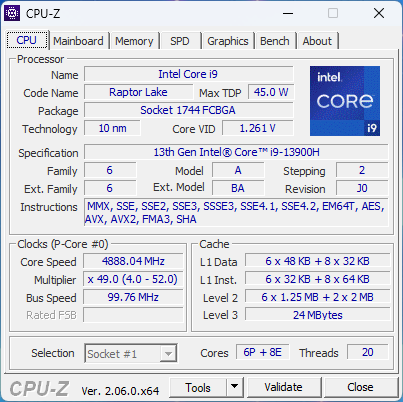
Unsere High-End-Testkonfiguration setzt auf den Core i9-13900H, eine 140 Watt starke RTX 4070 GPU und ein 240Hz schnelles QHD-IPS-Display und kostet in Deutschland aktuell rund 2.400 Euro. Andere Ausführungen mit dem schwächeren Core i7-13700H, einer RTX 4060 oder einem hochauflösenderen 3,2K-Bildschirm mit 165Hz sind ab circa 1.800 Euro erhältlich.
Zu den Konkurrenten des Legion Slim 7i G8 zählen andere portable 16-Zoll-Gaming-Laptops wie das Razer Blade 16, HP Omen 16, Asus ROG Zephyrus M16 und das Alienware x16 R1.
Weitere Lenovo-Testberichte:
Mögliche Konkurrenten im Vergleich
Bew. | Datum | Modell | Gewicht | Dicke | Größe | Auflösung | Preis ab |
|---|---|---|---|---|---|---|---|
| 90 % v7 (old) | 07 / 2023 | Lenovo Legion Slim 7i 16 Gen 8 i9-13900H, GeForce RTX 4070 Laptop GPU | 2.1 kg | 19.9 mm | 16.00" | 2560x1600 | |
| 87.4 % v7 (old) | 07 / 2023 | HP Omen 16-wf000 i7-13700HX, GeForce RTX 4080 Laptop GPU | 2.4 kg | 23.6 mm | 16.10" | 2560x1440 | |
| 88.4 % v7 (old) | 06 / 2023 | Alienware x16 R1 i9-13900HK, GeForce RTX 4080 Laptop GPU | 2.6 kg | 18.57 mm | 16.00" | 2560x1600 | |
| 88.8 % v7 (old) | 06 / 2023 | Lenovo Legion Pro 7 RTX4090 i9-13900HX, GeForce RTX 4090 Laptop GPU | 2.7 kg | 26 mm | 16.00" | 2560x1600 | |
| 88.4 % v7 (old) | 03 / 2023 | Asus ROG Strix G16 G614JZ i9-13980HX, GeForce RTX 4080 Laptop GPU | 2.4 kg | 30.4 mm | 16.00" | 2560x1600 | |
| 91.2 % v7 (old) | 02 / 2023 | Razer Blade 16 Early 2023 i9-13950HX, GeForce RTX 4080 Laptop GPU | 2.4 kg | 21.99 mm | 16.00" | 2560x1600 |
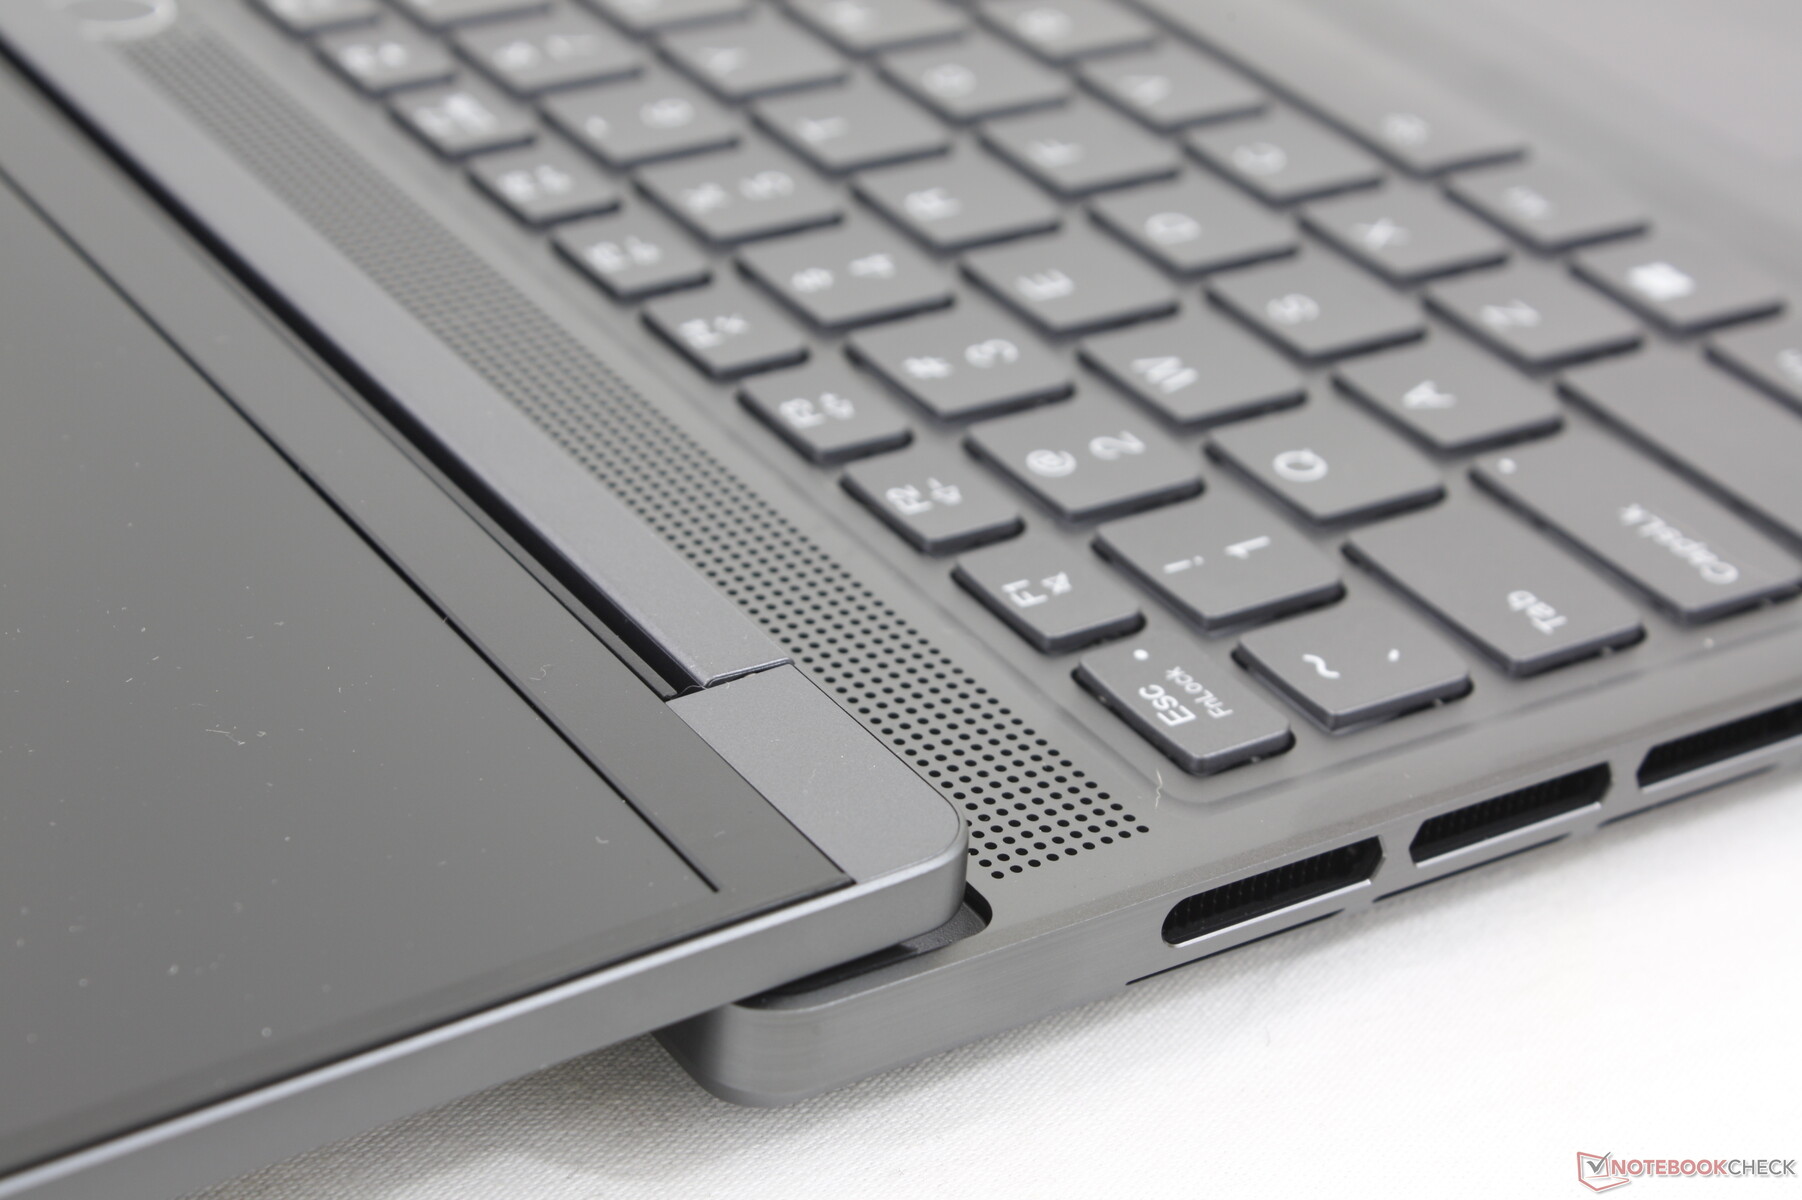
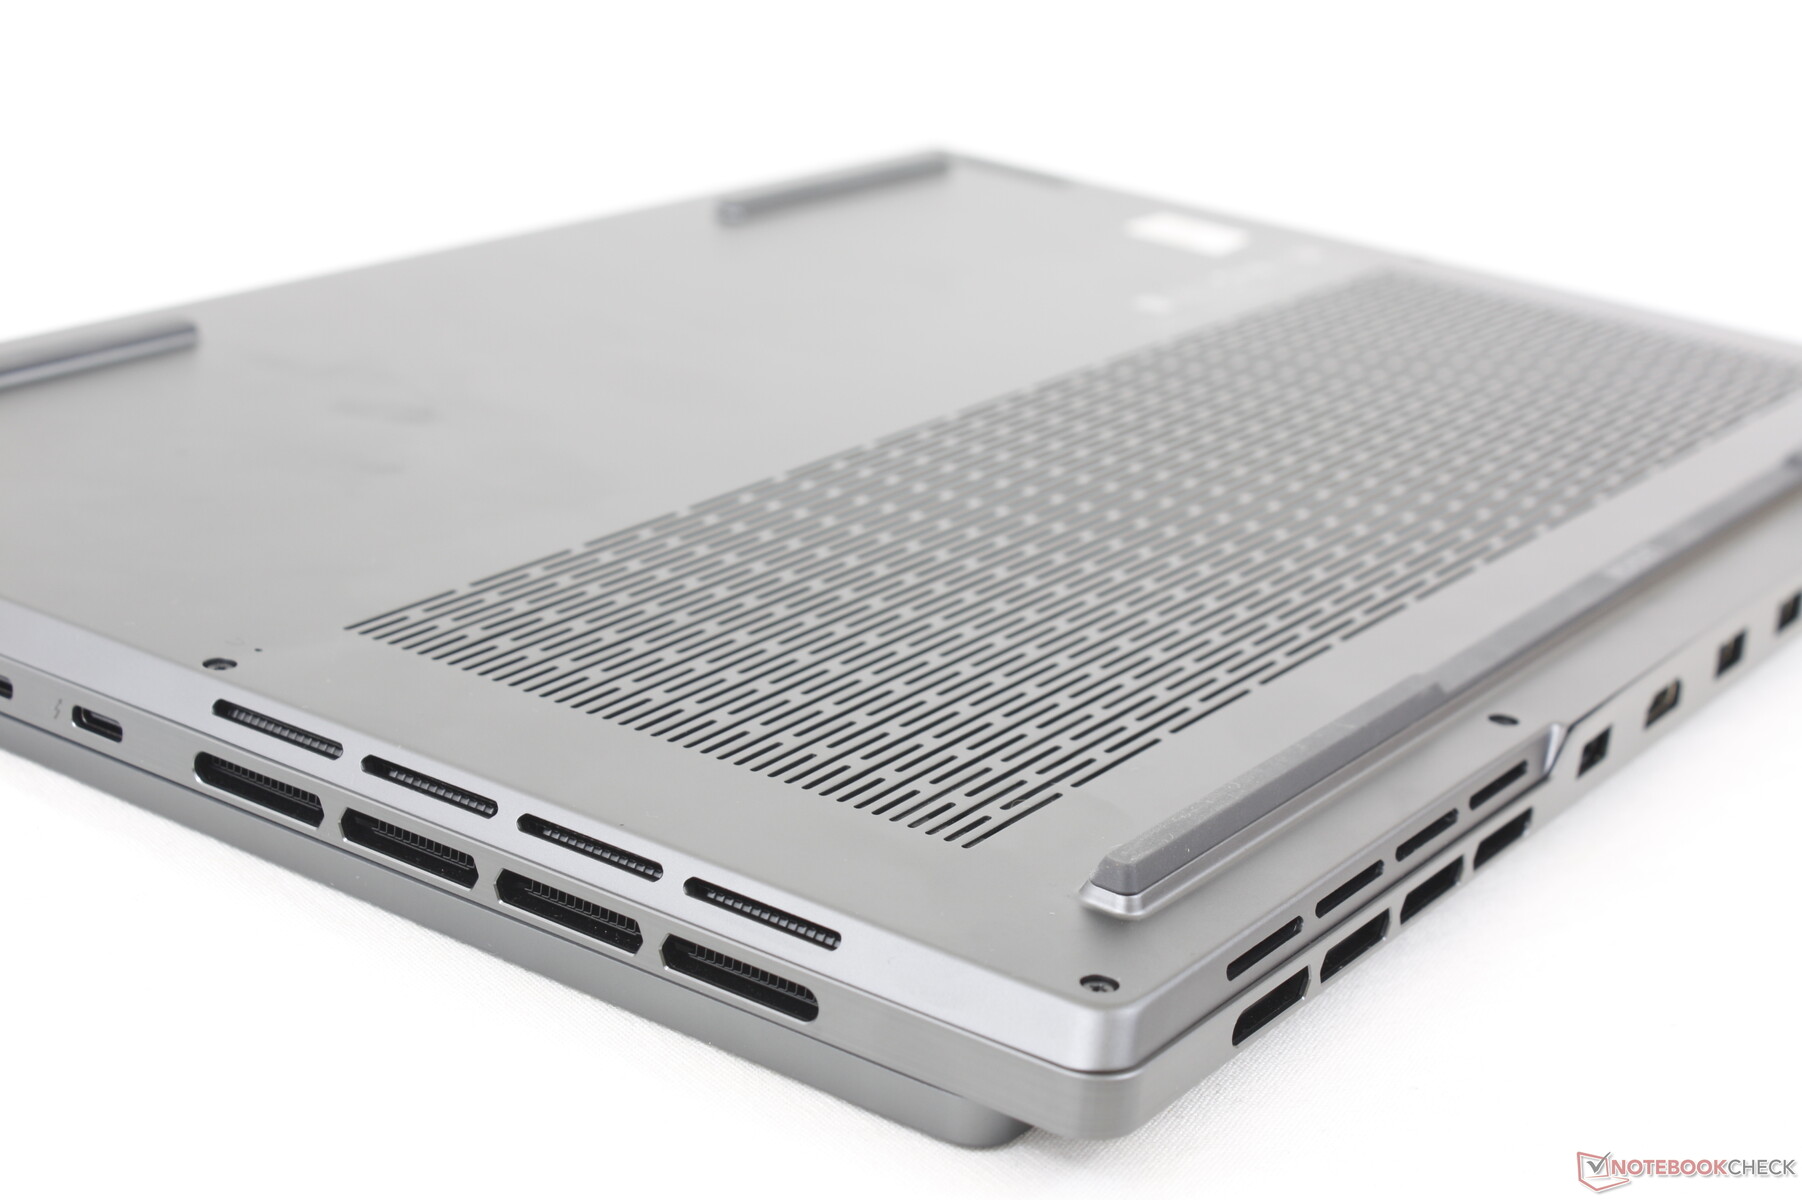
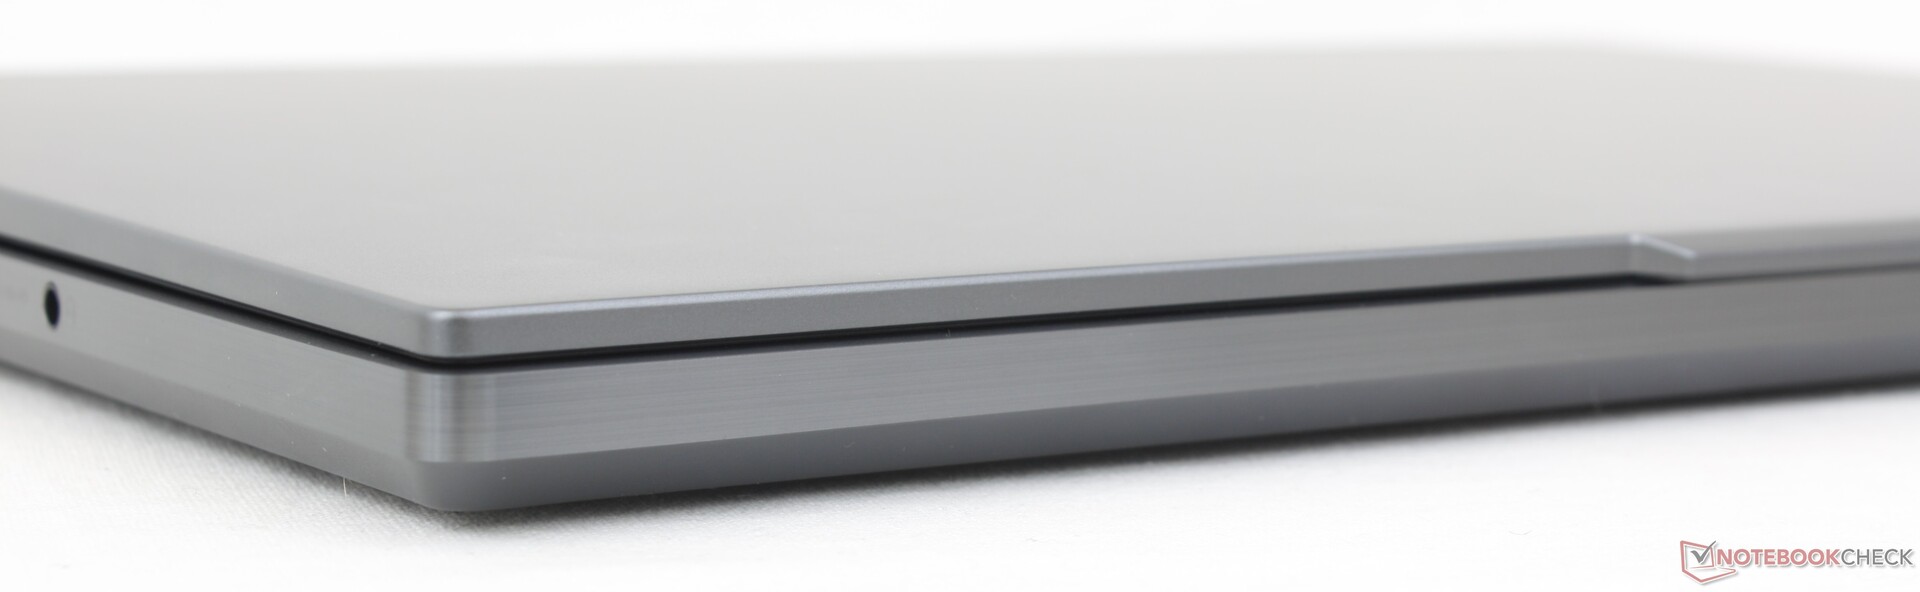
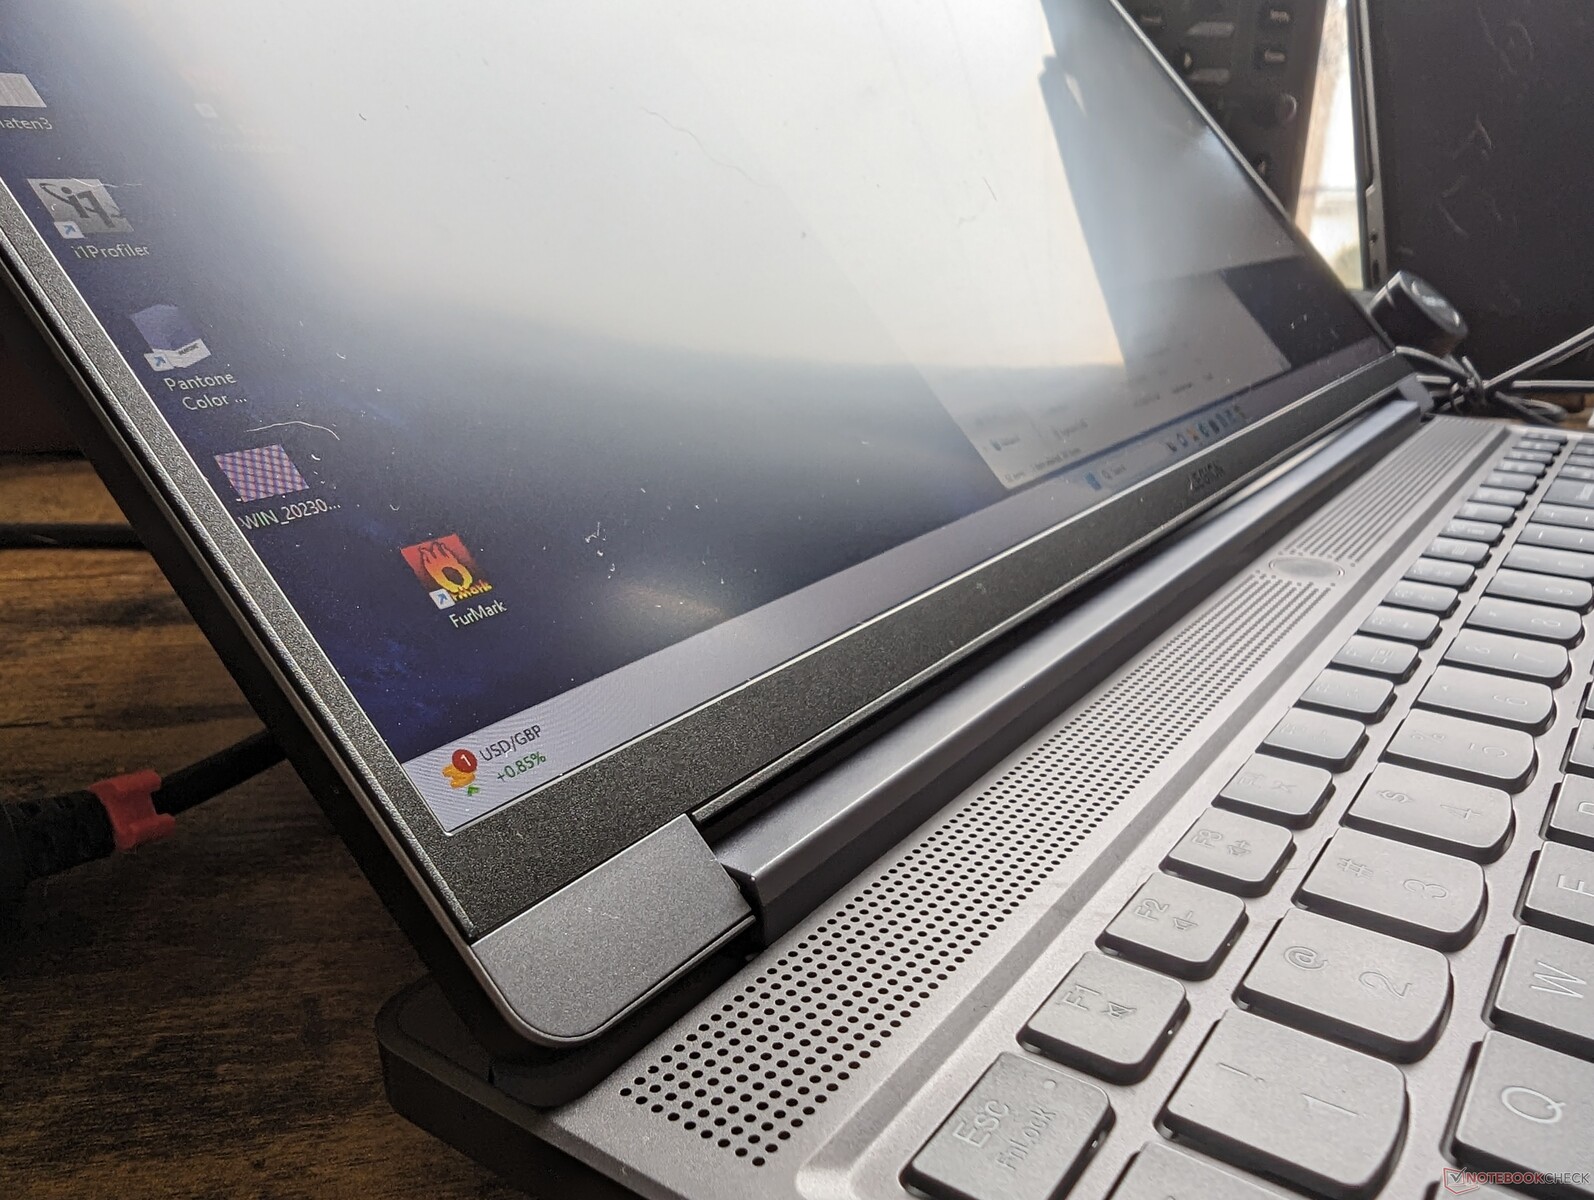
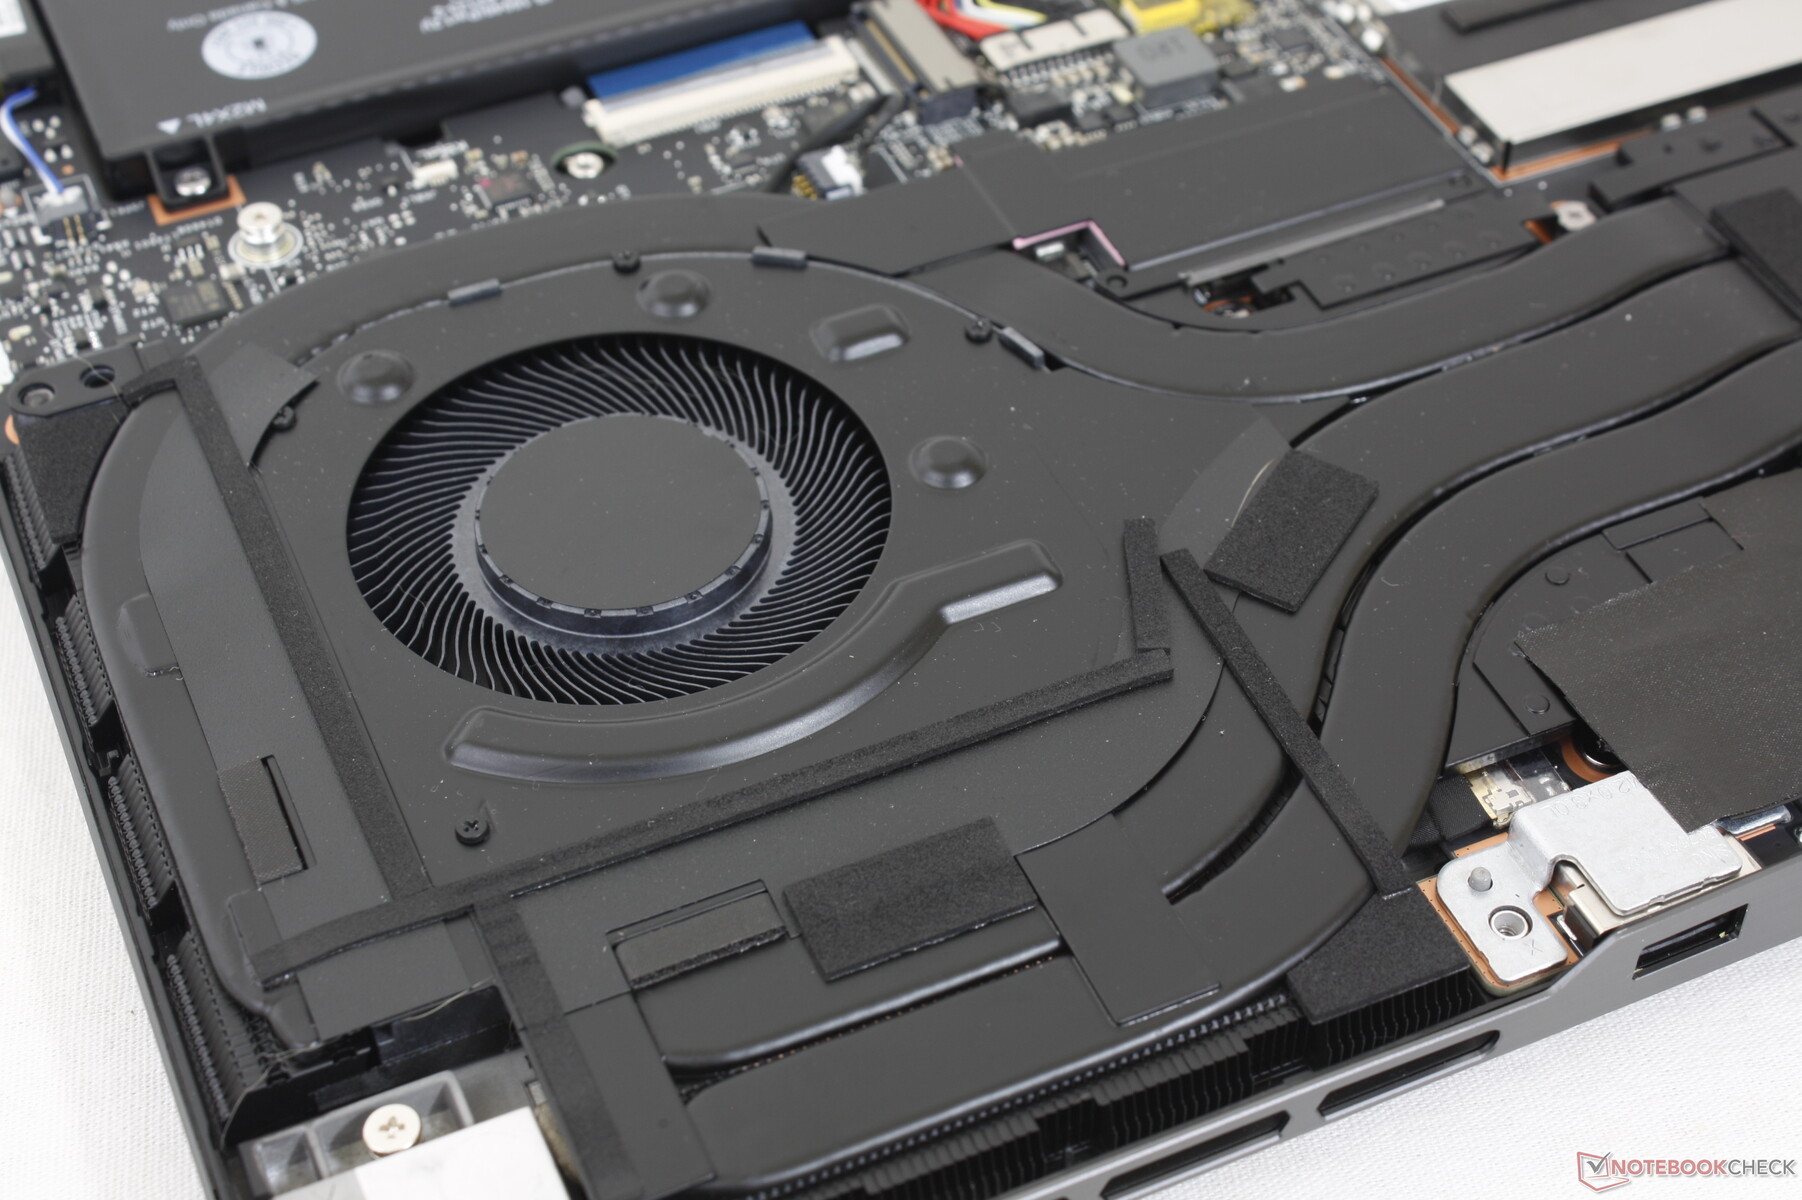
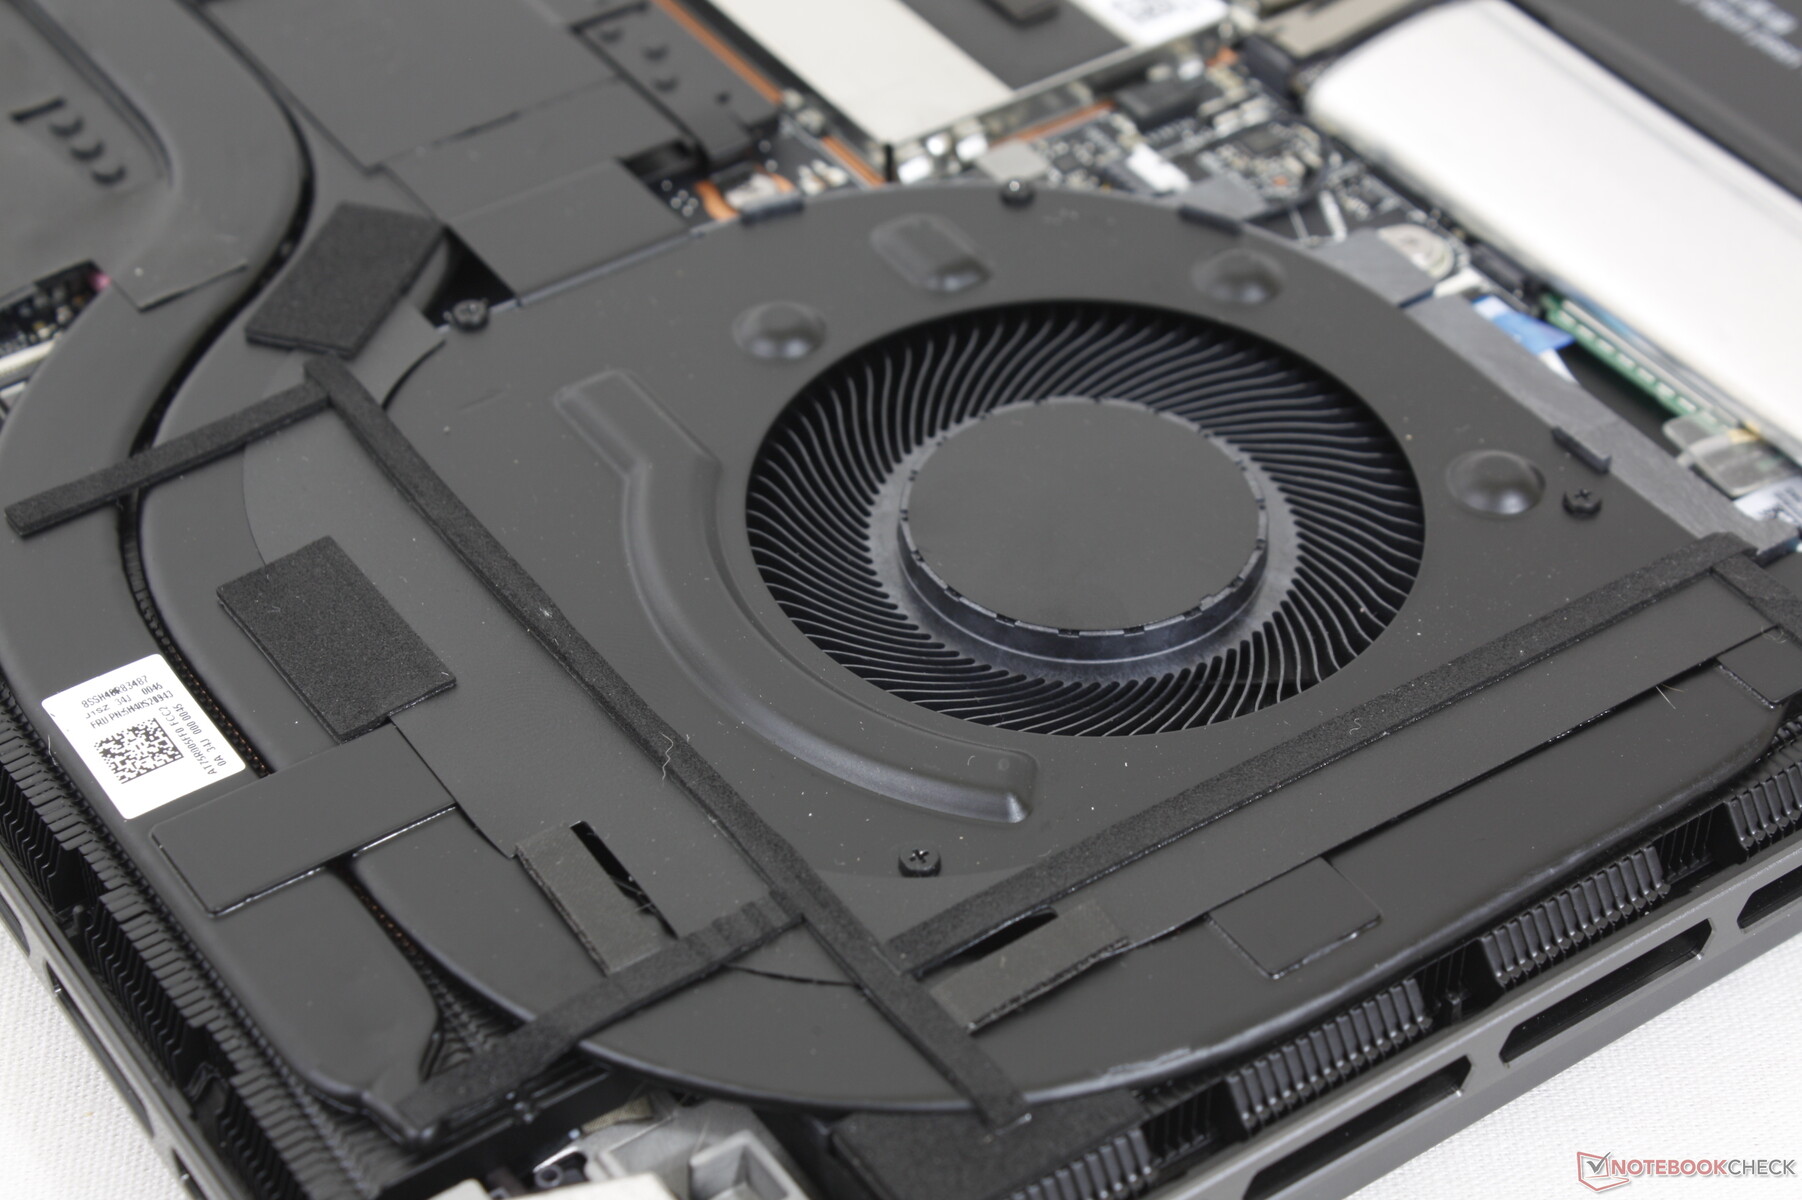
Gehäuse - Jetzt mit mehr Luftauslässen
Das Gehäuse sieht von vorne dem letztjährigen Legion Slim 7i 16 Gen 7 vielleicht ähnlich, die meisten äußerlichen Änderungen sind aber hinten und an der Unterseite zu finden. Die Heckkante ist jetzt beispielsweise flach und sieht damit etwas sauberer aus, während die Luftauslässe zur besseren Kühlung merklich vergrößert wurden.
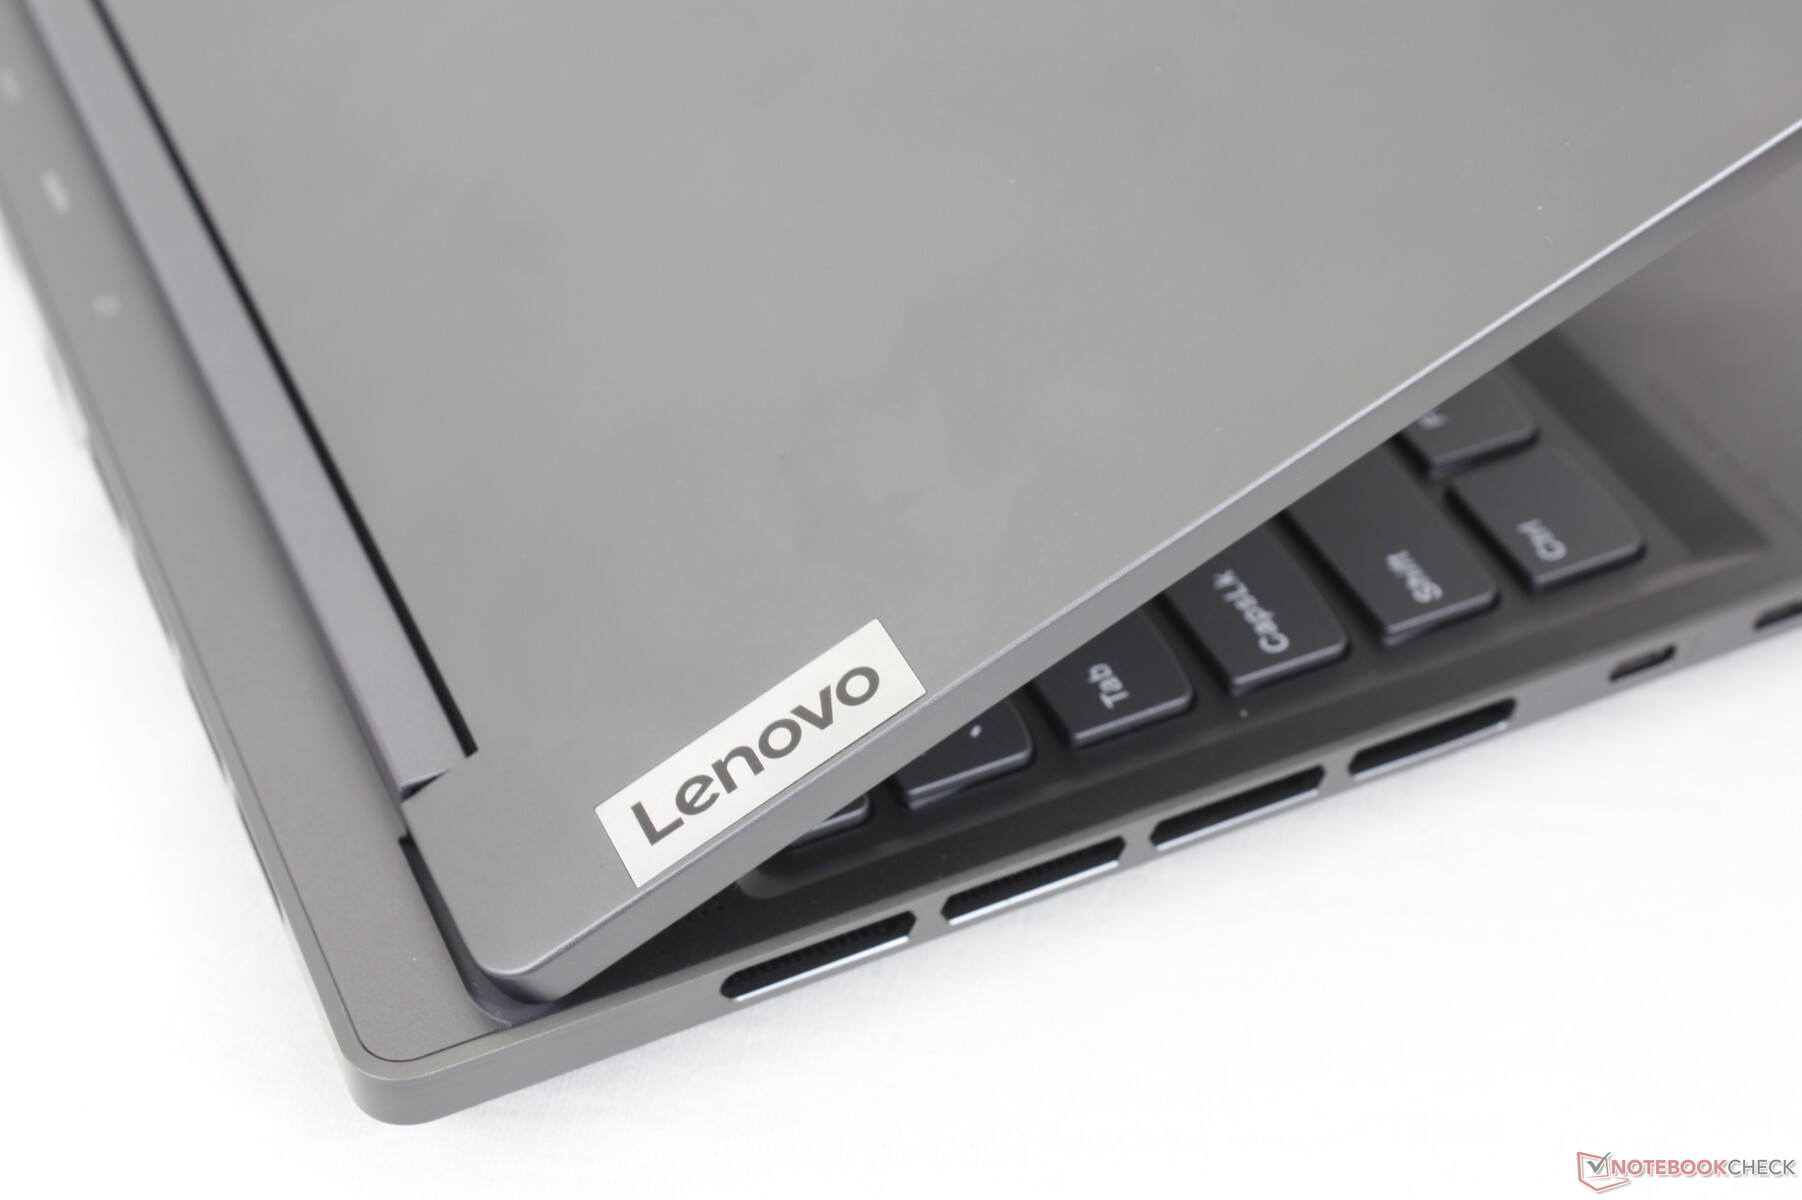
Die Gehäusematerialien, inklusive der grauen Aluminium-Oberfläche, sehen und fühlen sich ansonsten ähnlich wie bei den anderen Legion-7-Modellen an. Die Basis ist trotz der geringen Dicke stabil, auch der Deckel ist relativ solide. Die kleinen Scharniere sind nicht ganz so robust wie die größeren Gegenstücke am Asus ROG Strix G16, aber sie ermöglichen weite Öffnungswinkel um bis zu 180 Grad, was bei Gaming-Laptops eher selten ist.
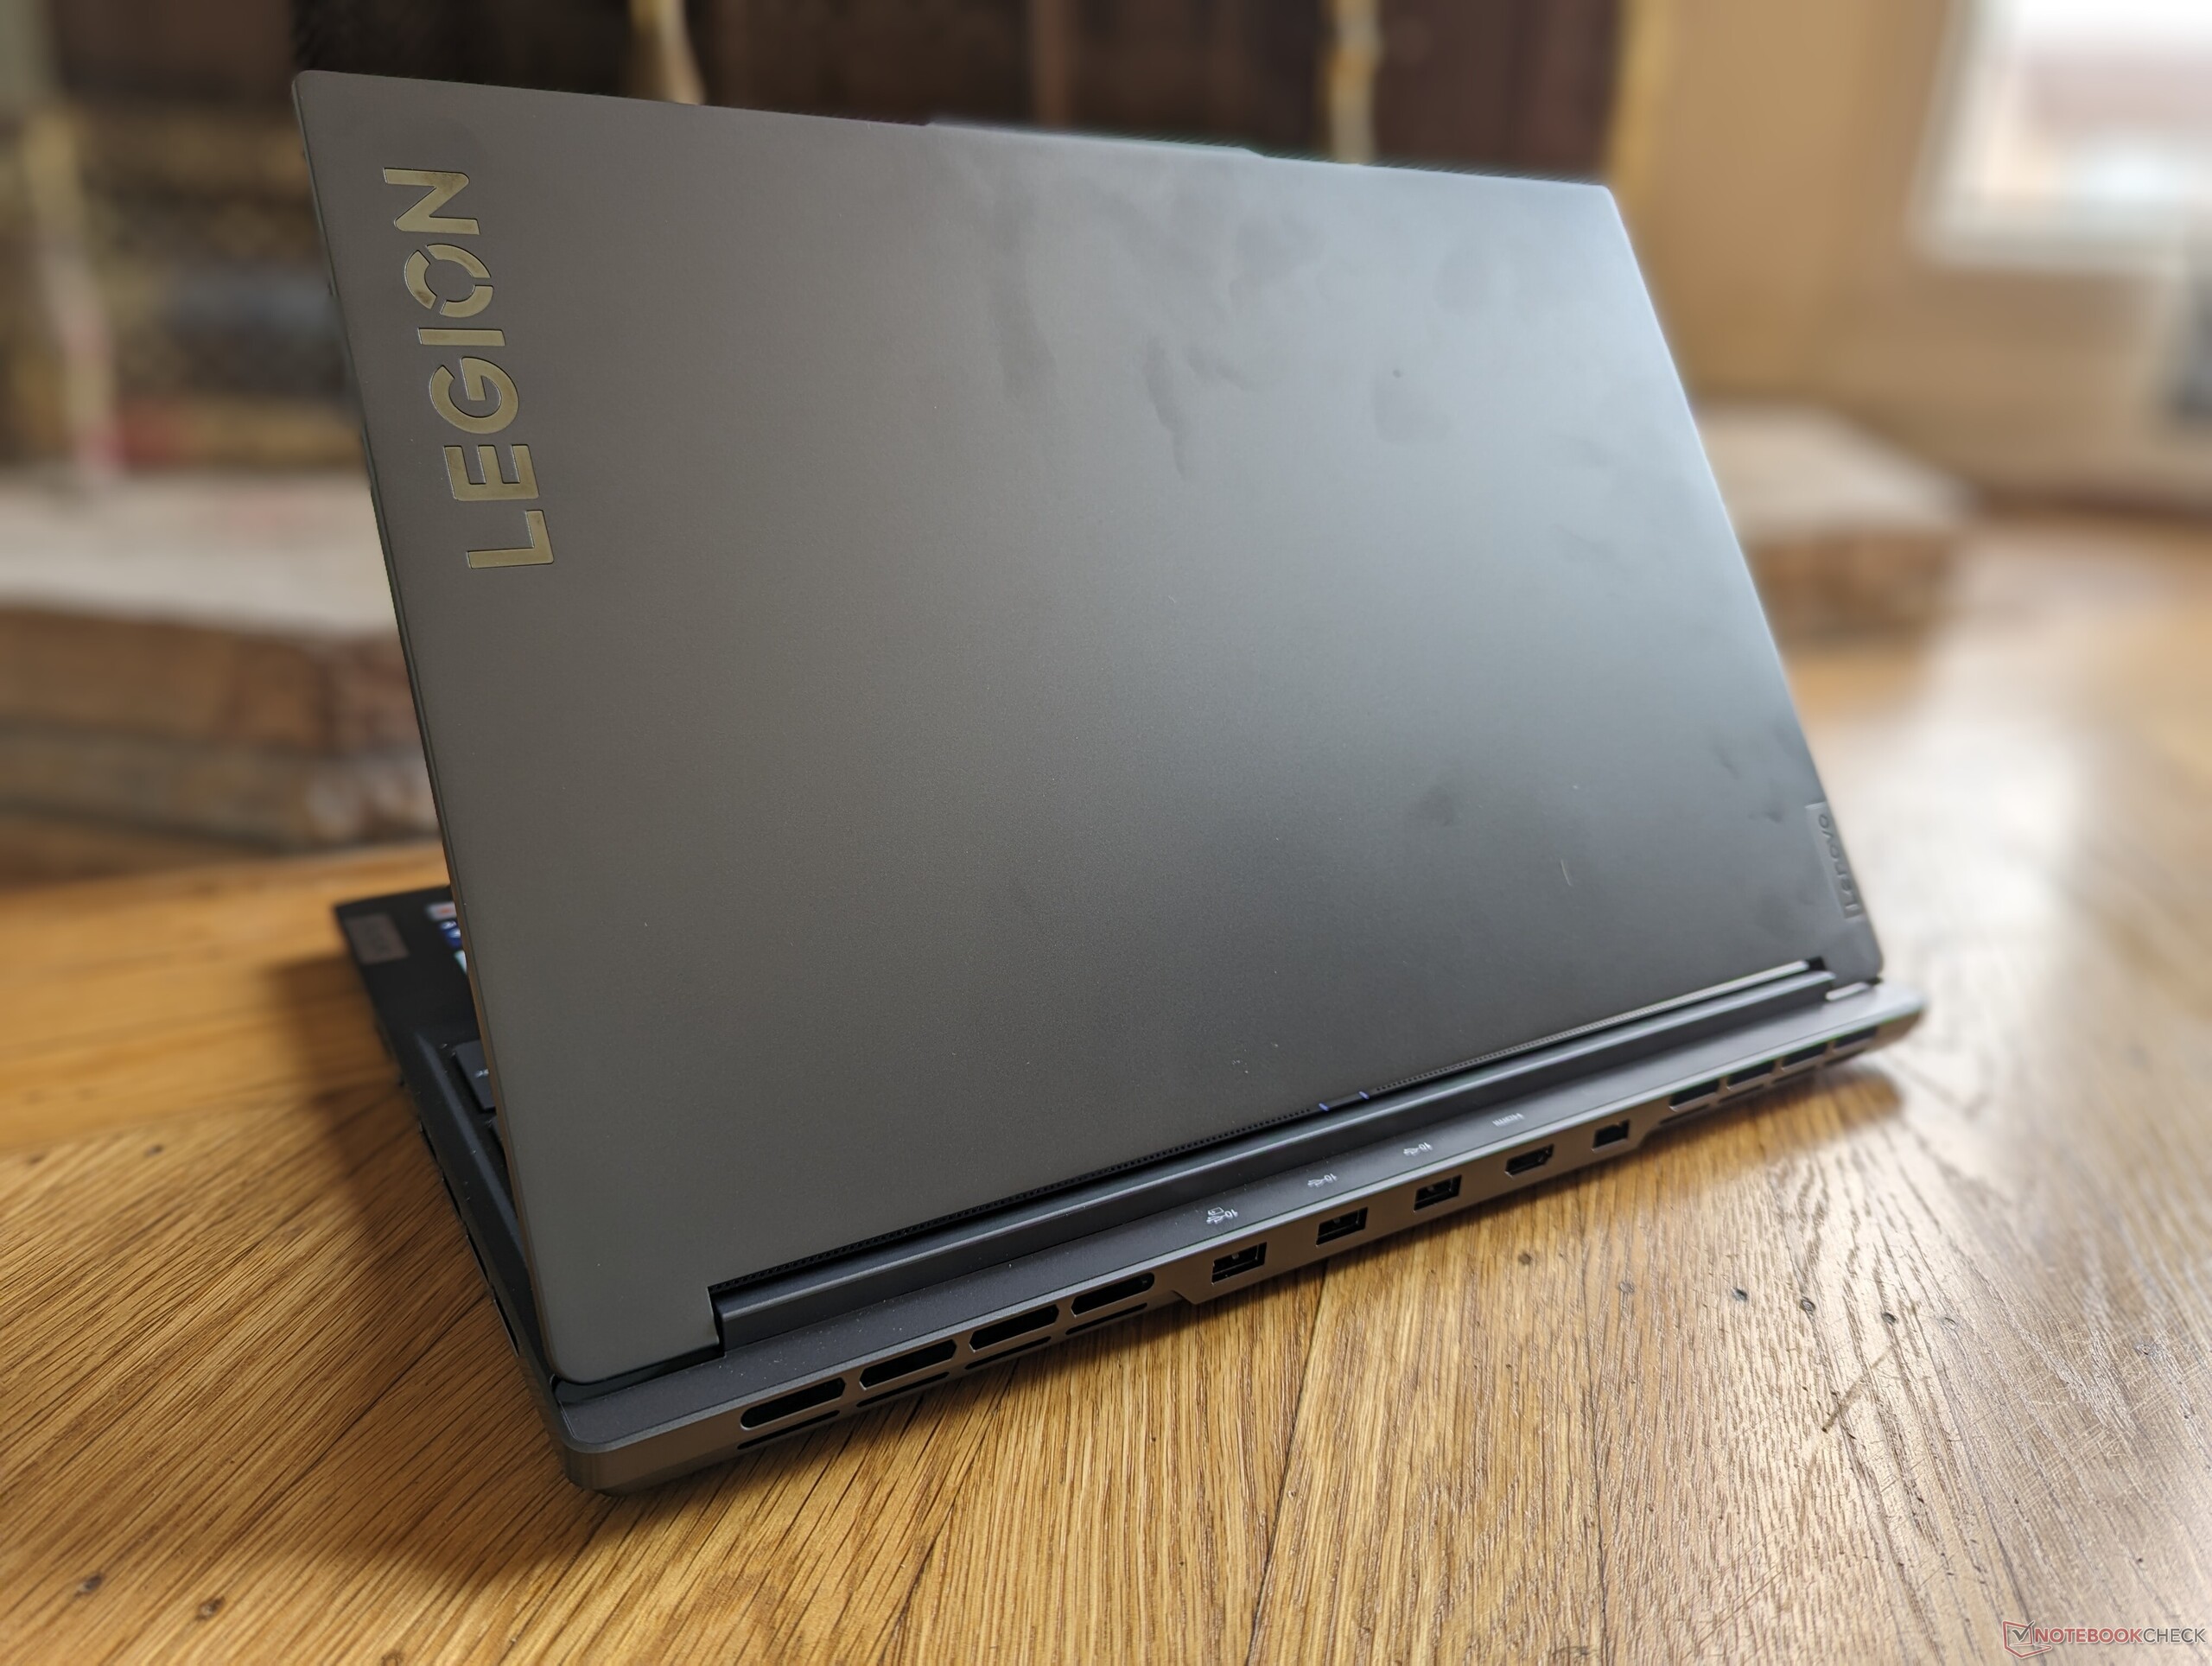

Lenovo hat den Namen des Legion Slim 7 nicht ohne Grund gewählt. Im Vergleich zum Legion Pro 7 ist das Gerät deutlich portabler, und zwar 600g leichter und mehr als 6mm dünner. In der Tat gehört das Legion Slim 7 damit zu den dünnsten und leichtesten 16-Zoll-Gaming-Laptops auf dem Markt, nur das MSI GS66 ist noch schlanker und leichter.
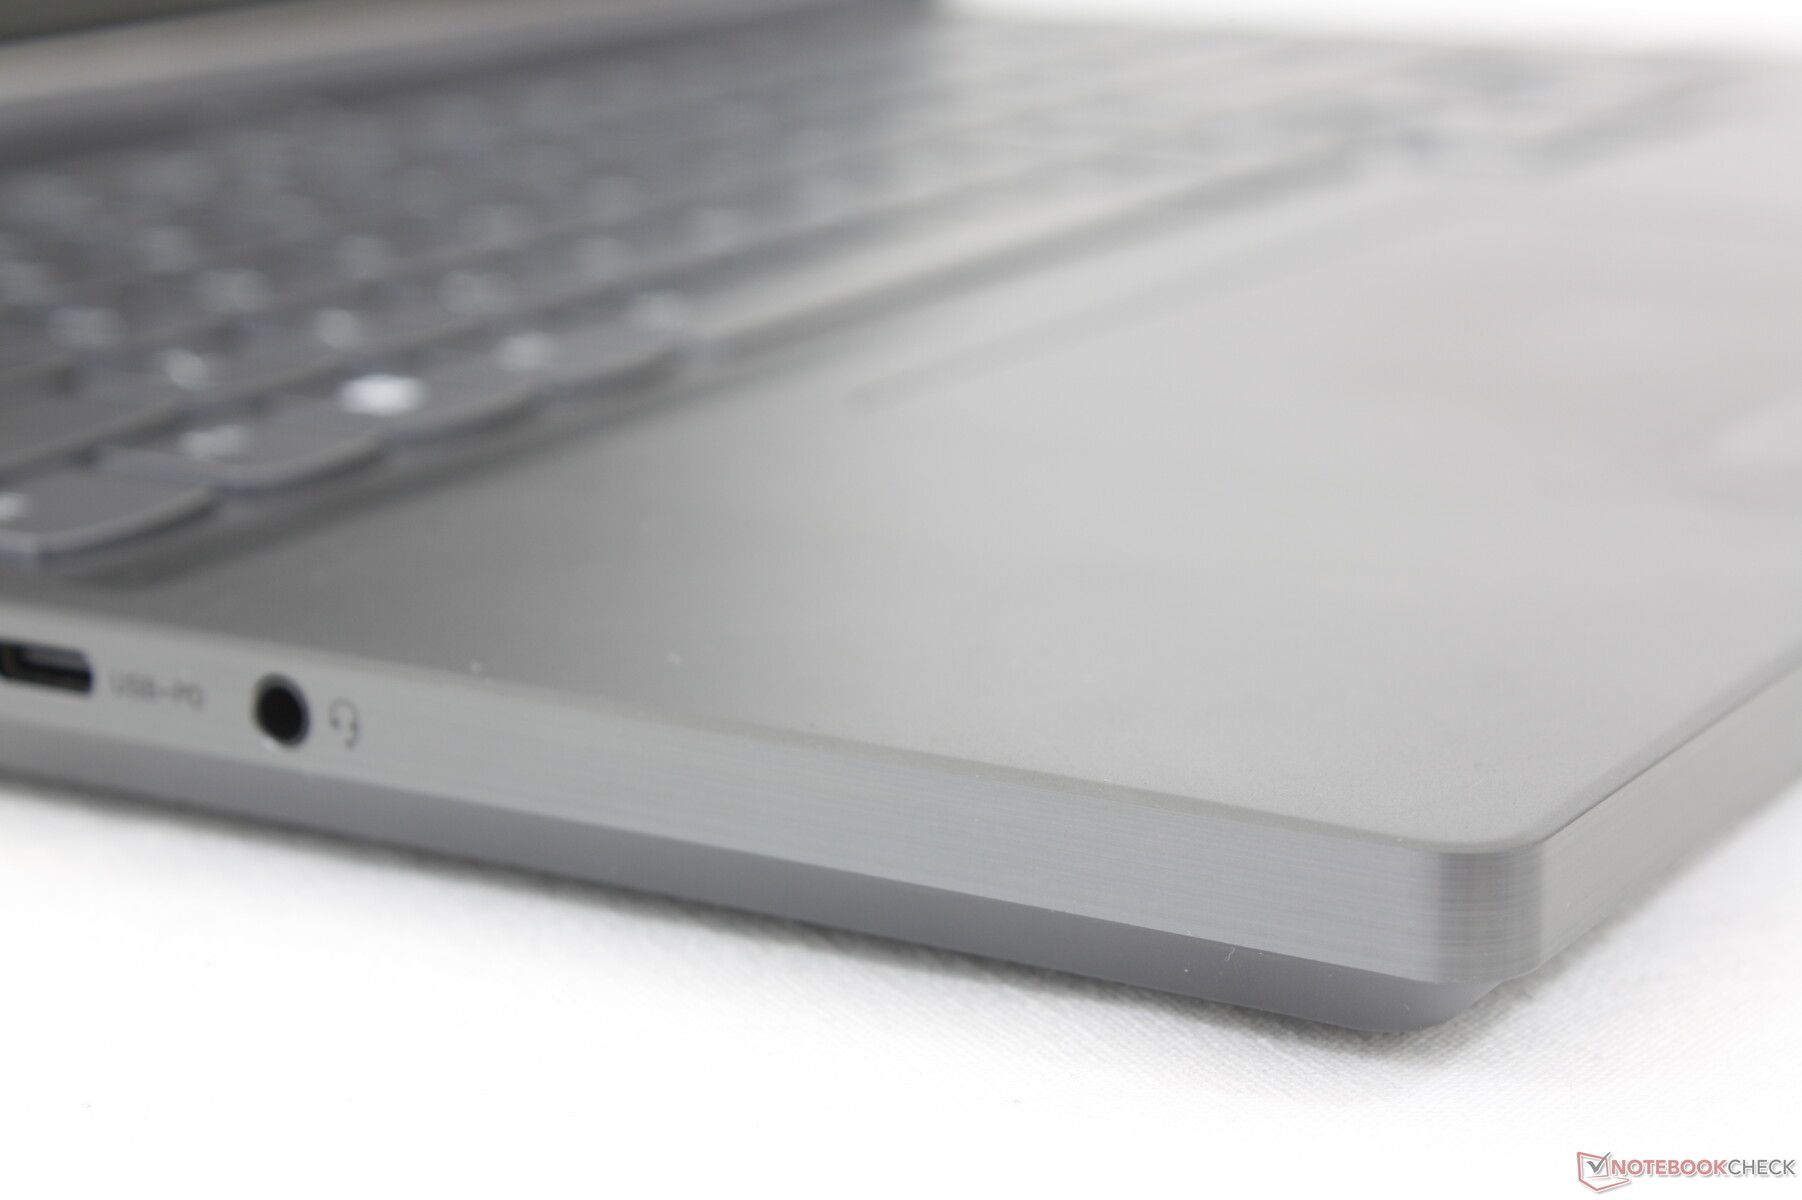
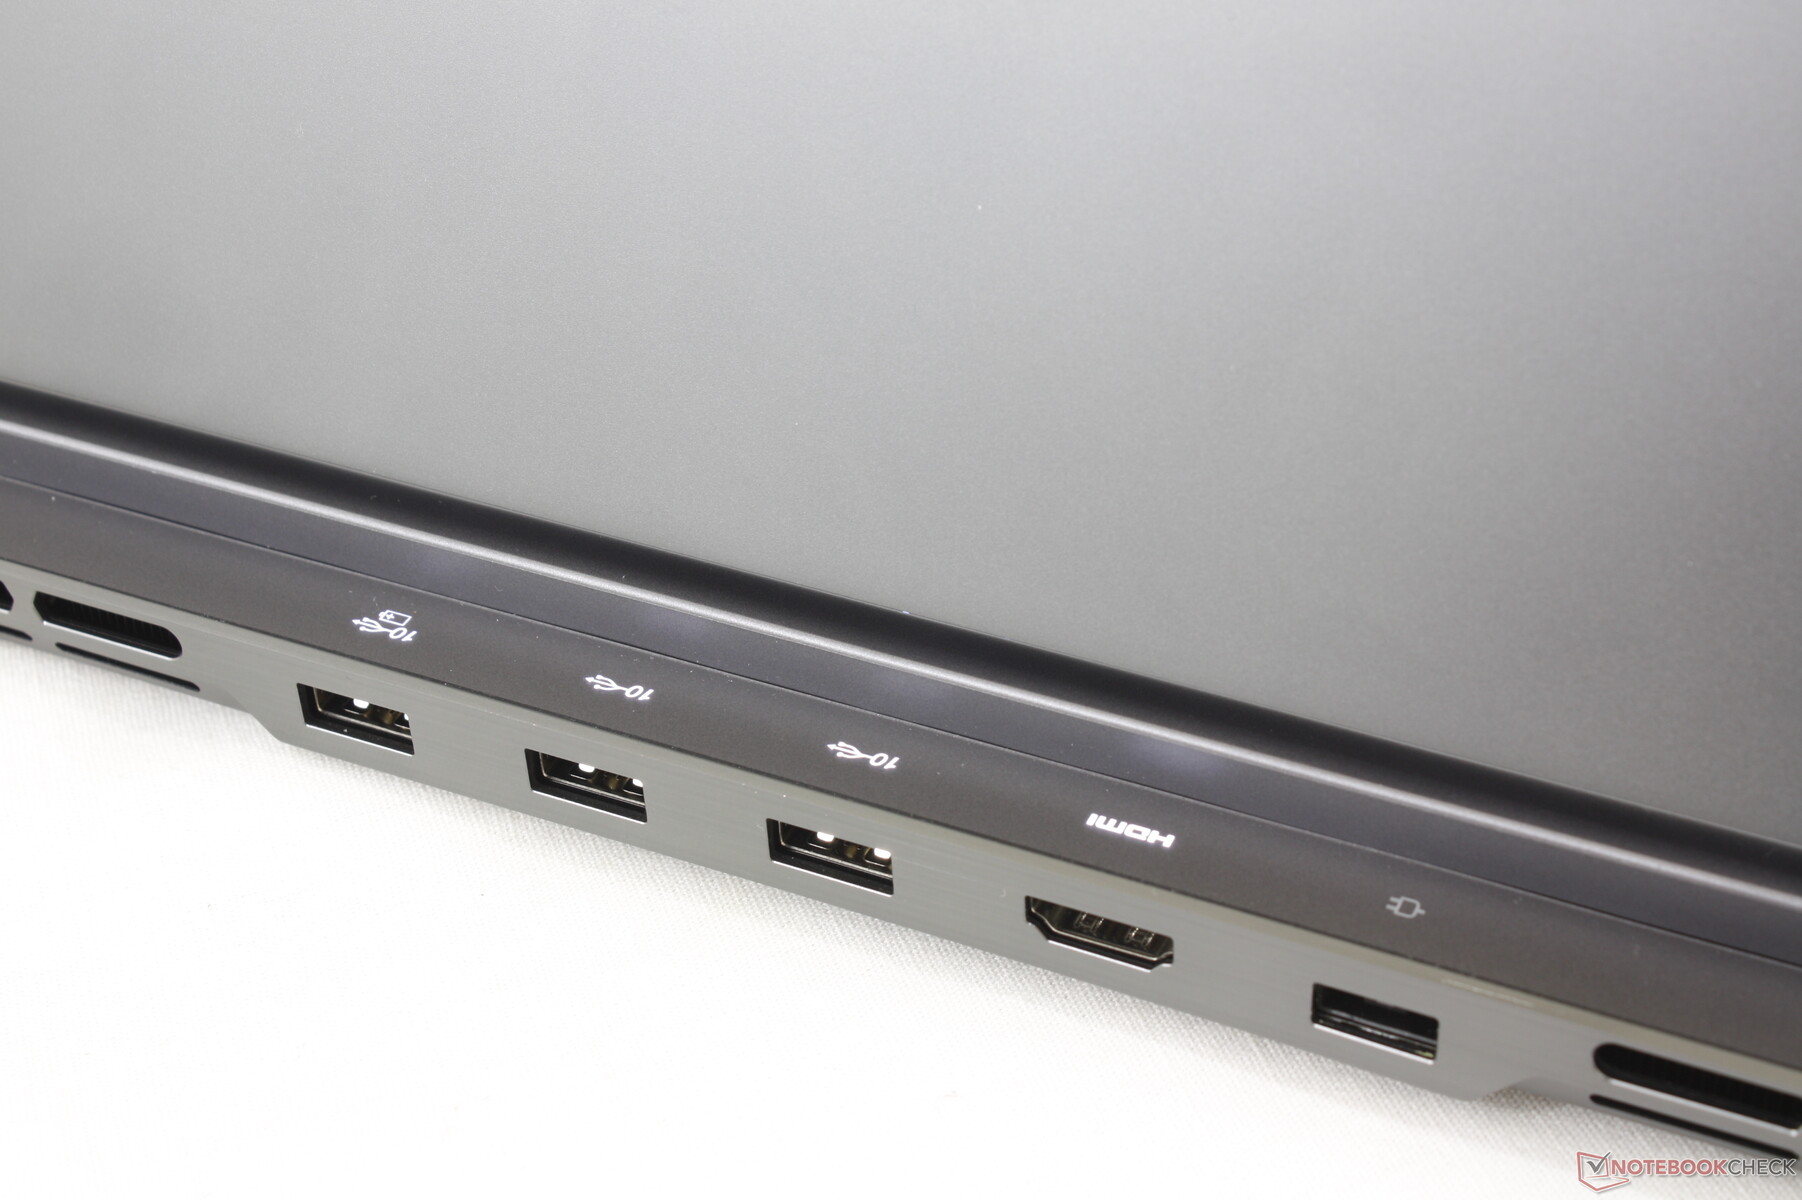
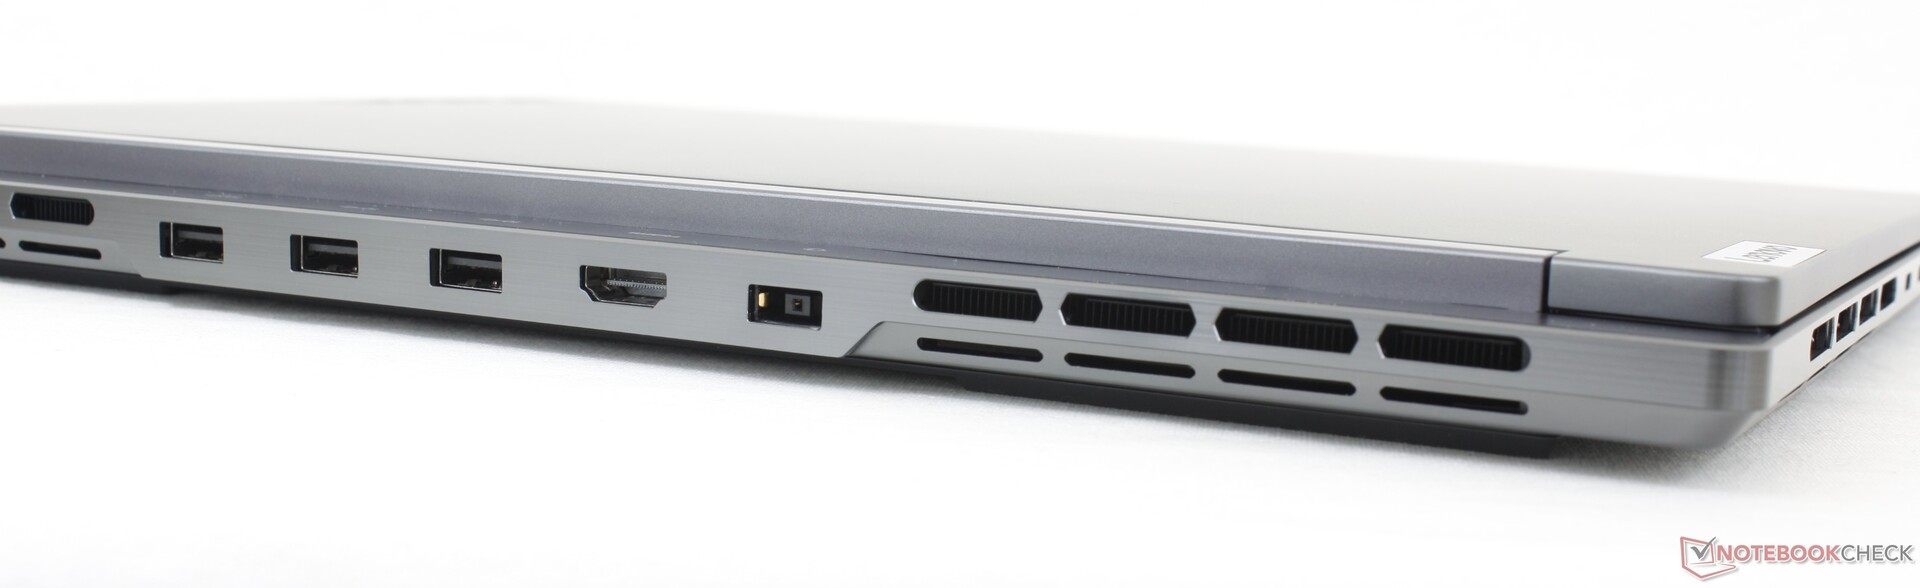
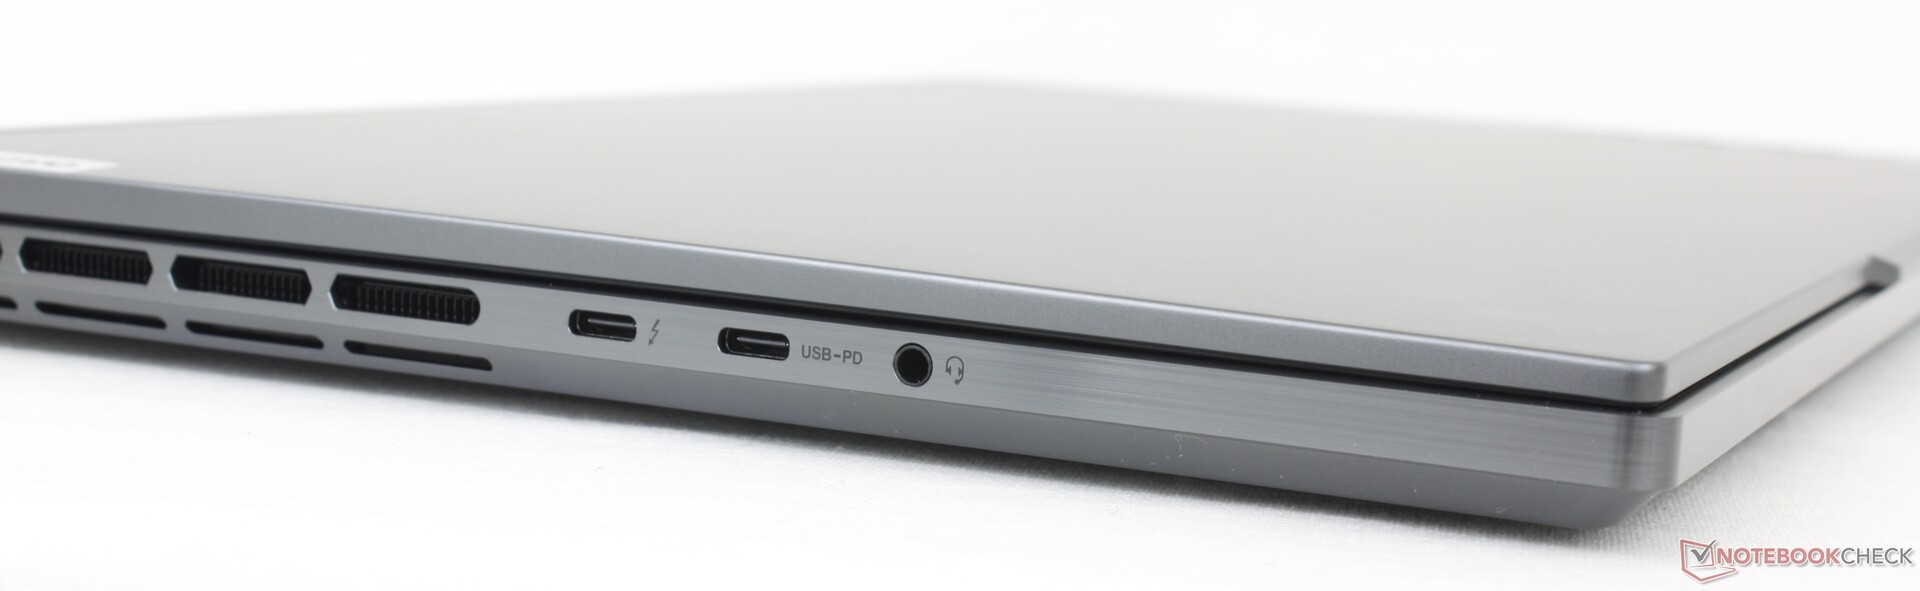
Konnektivität — Thunderbolt 4 wird unterstützt
Wie auch bei Alienware sind die meisten Anschlussmöglichkeiten an der Rückseite zu finden. Anders als als beim Alienware sind die zwei USB-C-Ports beim Lenovo aber an der linken Gehäuseseite platziert und somit leichter zu erreichen.
Es sollte angemerkt werden, dass nur einer der beiden USB-C-Anschlüsse Thunderbolt 4 unterstützt. Wenn bestimmtes Zubehör an einer Buchse nicht funktioniert, sollte also die andere ausprobiert werden. Unser externer Monitor von Lepow hat den Dienst über USB-C 3.2 beispielsweise verweigert, am USB-C-Thunderbolt-Port funktioniert er hingegen einwandfrei.
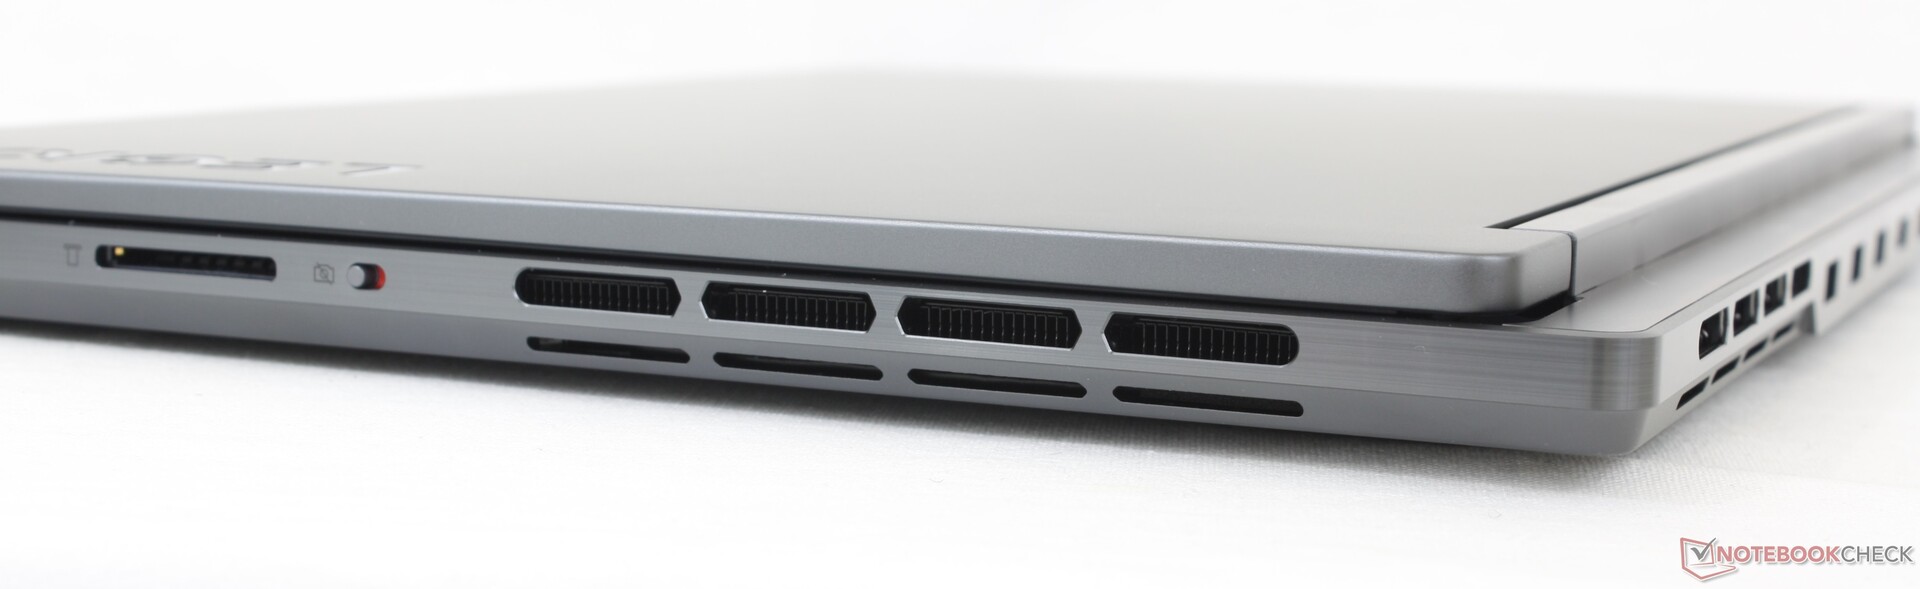
SD-Kartenleser
Die Transfergeschwindigkeiten des SD-Kartenlesers liegen mit unserer UHS-II-Karte bei rund 80 MB/s, was ungefähr halb so schnell ist wie der Slot des Blade 16.

| SD Card Reader | |
| average JPG Copy Test (av. of 3 runs) | |
| Razer Blade 16 Early 2023 (AV PRO microSD 128 GB V60) | |
| Lenovo Legion Slim 7i 16 Gen 8 (Toshiba Exceria Pro SDXC 64 GB UHS-II) | |
| Alienware x16 R1 (AV PRO microSD 128 GB V60) | |
| maximum AS SSD Seq Read Test (1GB) | |
| Alienware x16 R1 (AV PRO microSD 128 GB V60) | |
| Razer Blade 16 Early 2023 (AV PRO microSD 128 GB V60) | |
| Lenovo Legion Slim 7i 16 Gen 8 (Toshiba Exceria Pro SDXC 64 GB UHS-II) | |
Kommunikation
Eine Intel AX211 mit WiFI 6E und Bluetooth 5.3 gehört zur Standardausstattung. Die Verbindung mit unserem Asus AXE11000 ist im 6-GHz-WLAN konstant und zuverlässig.
| Networking | |
| iperf3 transmit AXE11000 | |
| Lenovo Legion Pro 7 RTX4090 | |
| Asus ROG Strix G16 G614JZ | |
| Razer Blade 16 Early 2023 | |
| Lenovo Legion Slim 7i 16 Gen 8 | |
| HP Omen 16-wf000 | |
| Alienware x16 R1 | |
| iperf3 receive AXE11000 | |
| Lenovo Legion Pro 7 RTX4090 | |
| Asus ROG Strix G16 G614JZ | |
| Razer Blade 16 Early 2023 | |
| Alienware x16 R1 | |
| HP Omen 16-wf000 | |
| Lenovo Legion Slim 7i 16 Gen 8 | |
| iperf3 transmit AXE11000 6GHz | |
| Lenovo Legion Slim 7i 16 Gen 8 | |
| Razer Blade 16 Early 2023 | |
| HP Omen 16-wf000 | |
| Alienware x16 R1 | |
| iperf3 receive AXE11000 6GHz | |
| Lenovo Legion Slim 7i 16 Gen 8 | |
| Razer Blade 16 Early 2023 | |
| HP Omen 16-wf000 | |
| Alienware x16 R1 | |
Webcam
Die 2-Megapixel-Webcam ist die gleiche wie beim Vorjahresmodell. Infrarot kann sie nicht, ein Kill-Switch ist aber standardmäßig vorhanden.


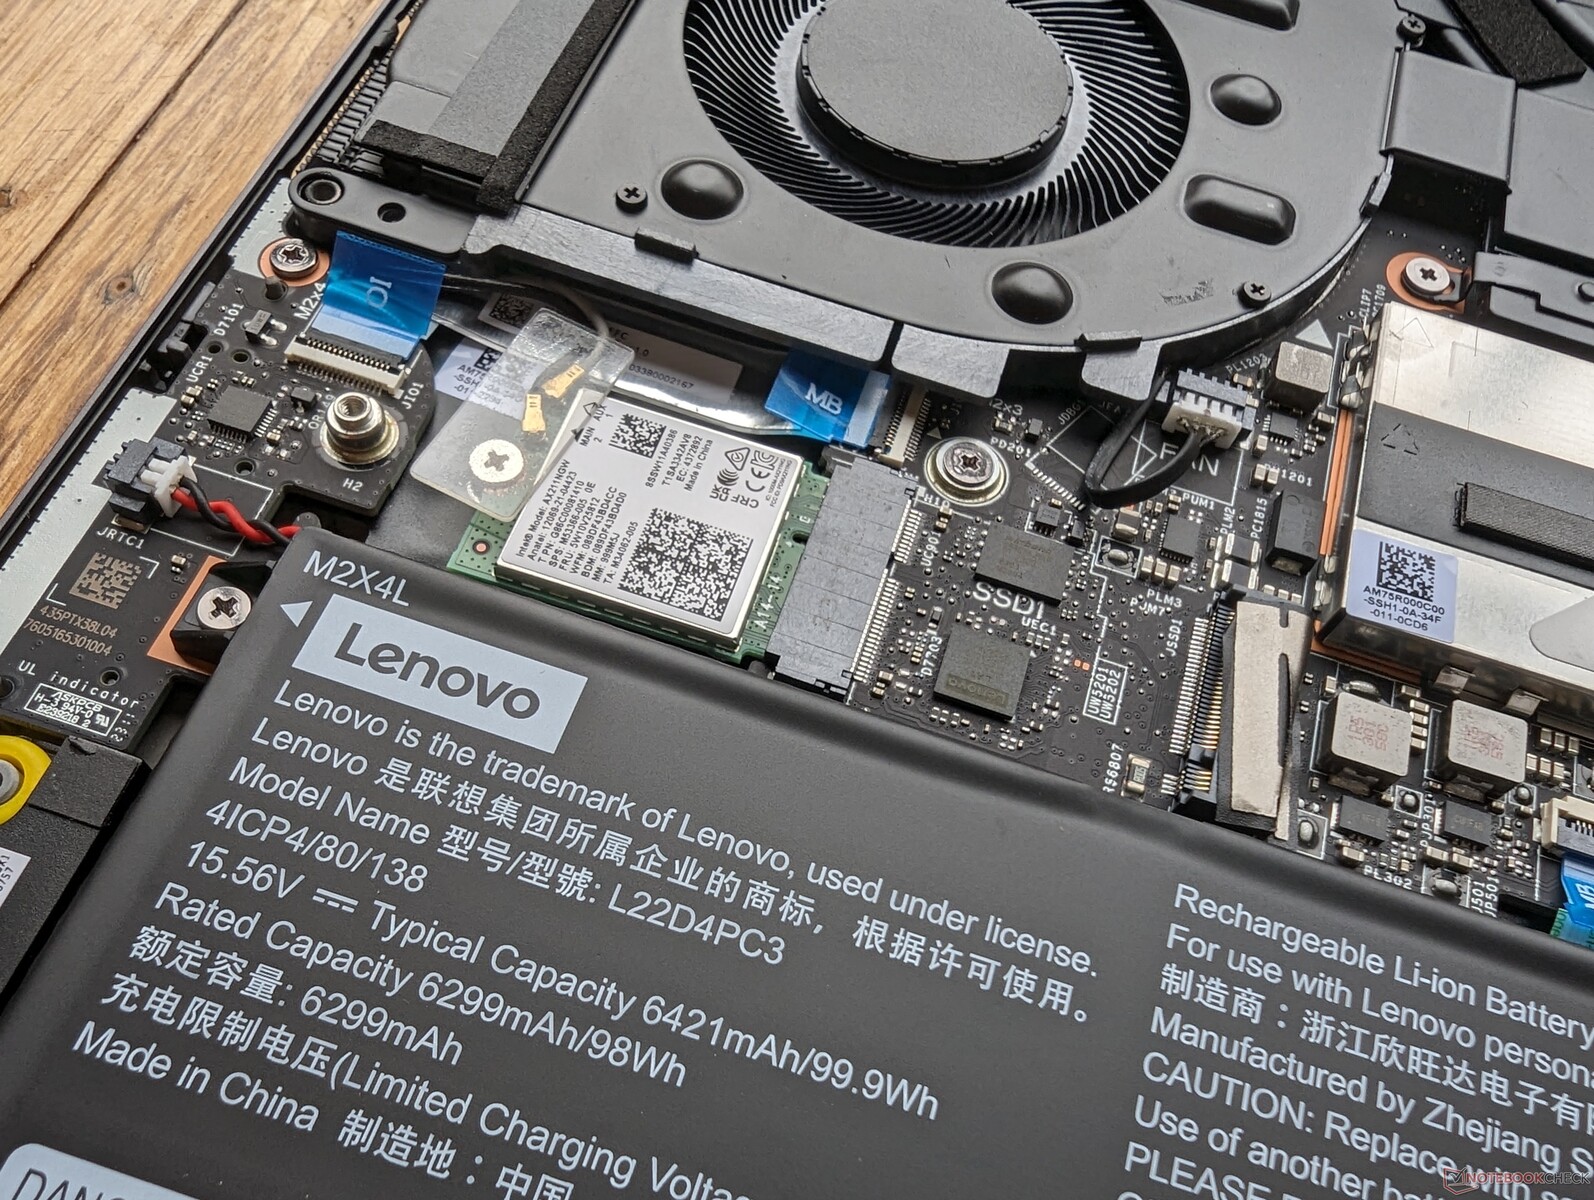
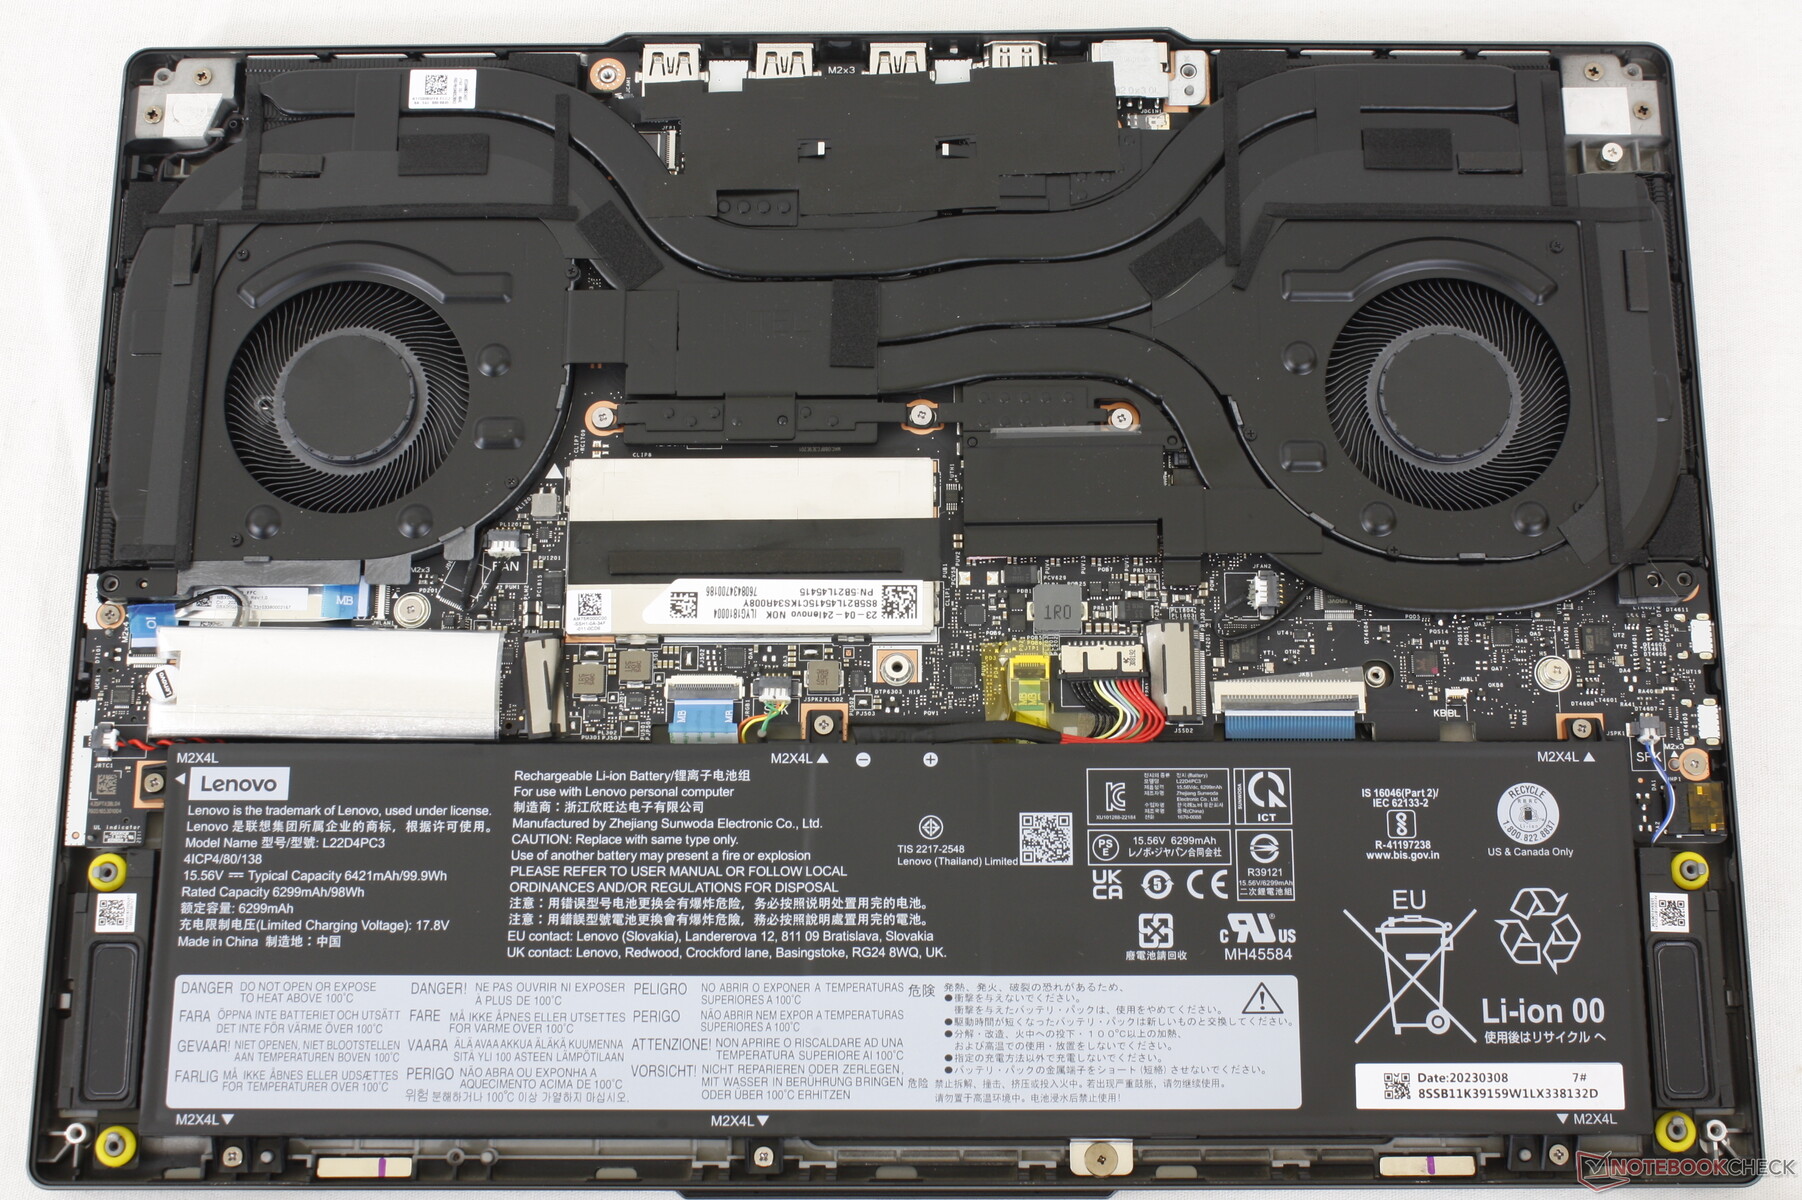
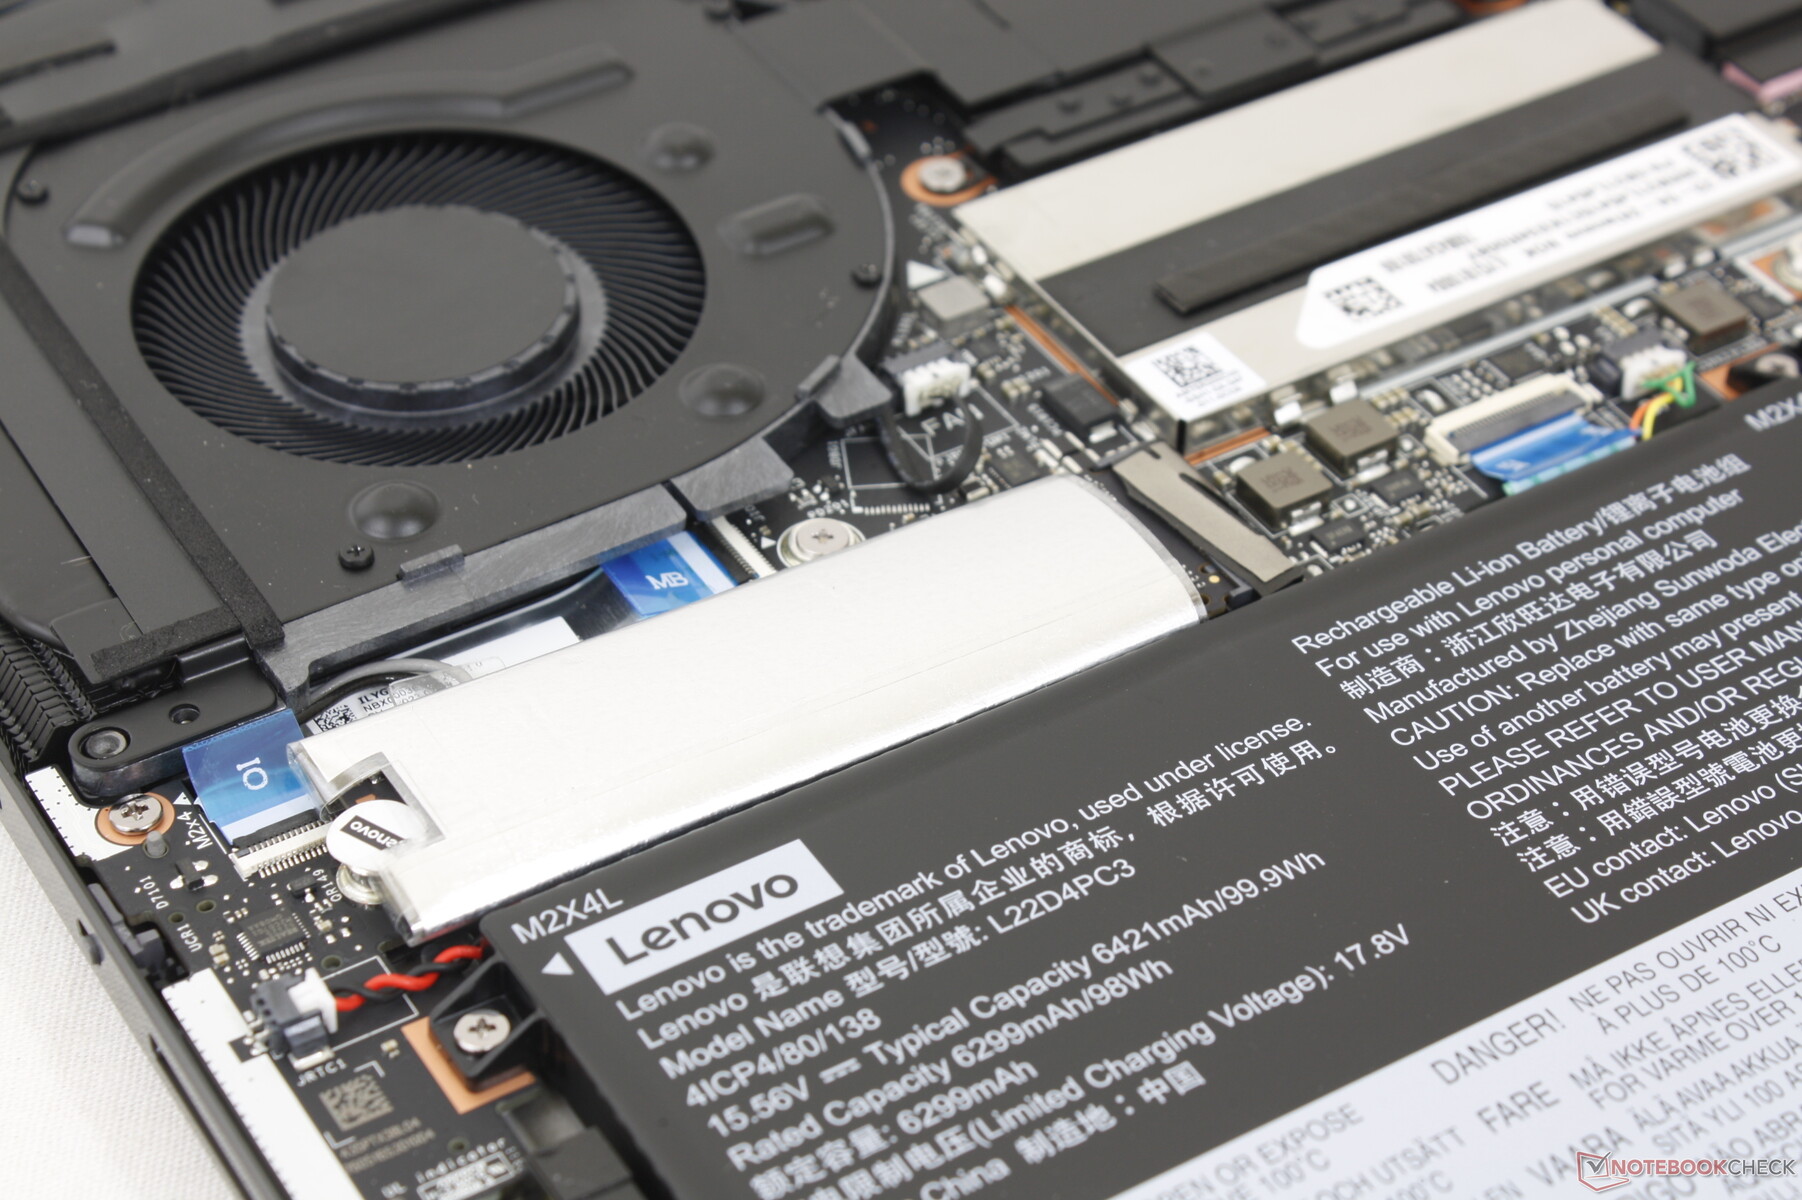
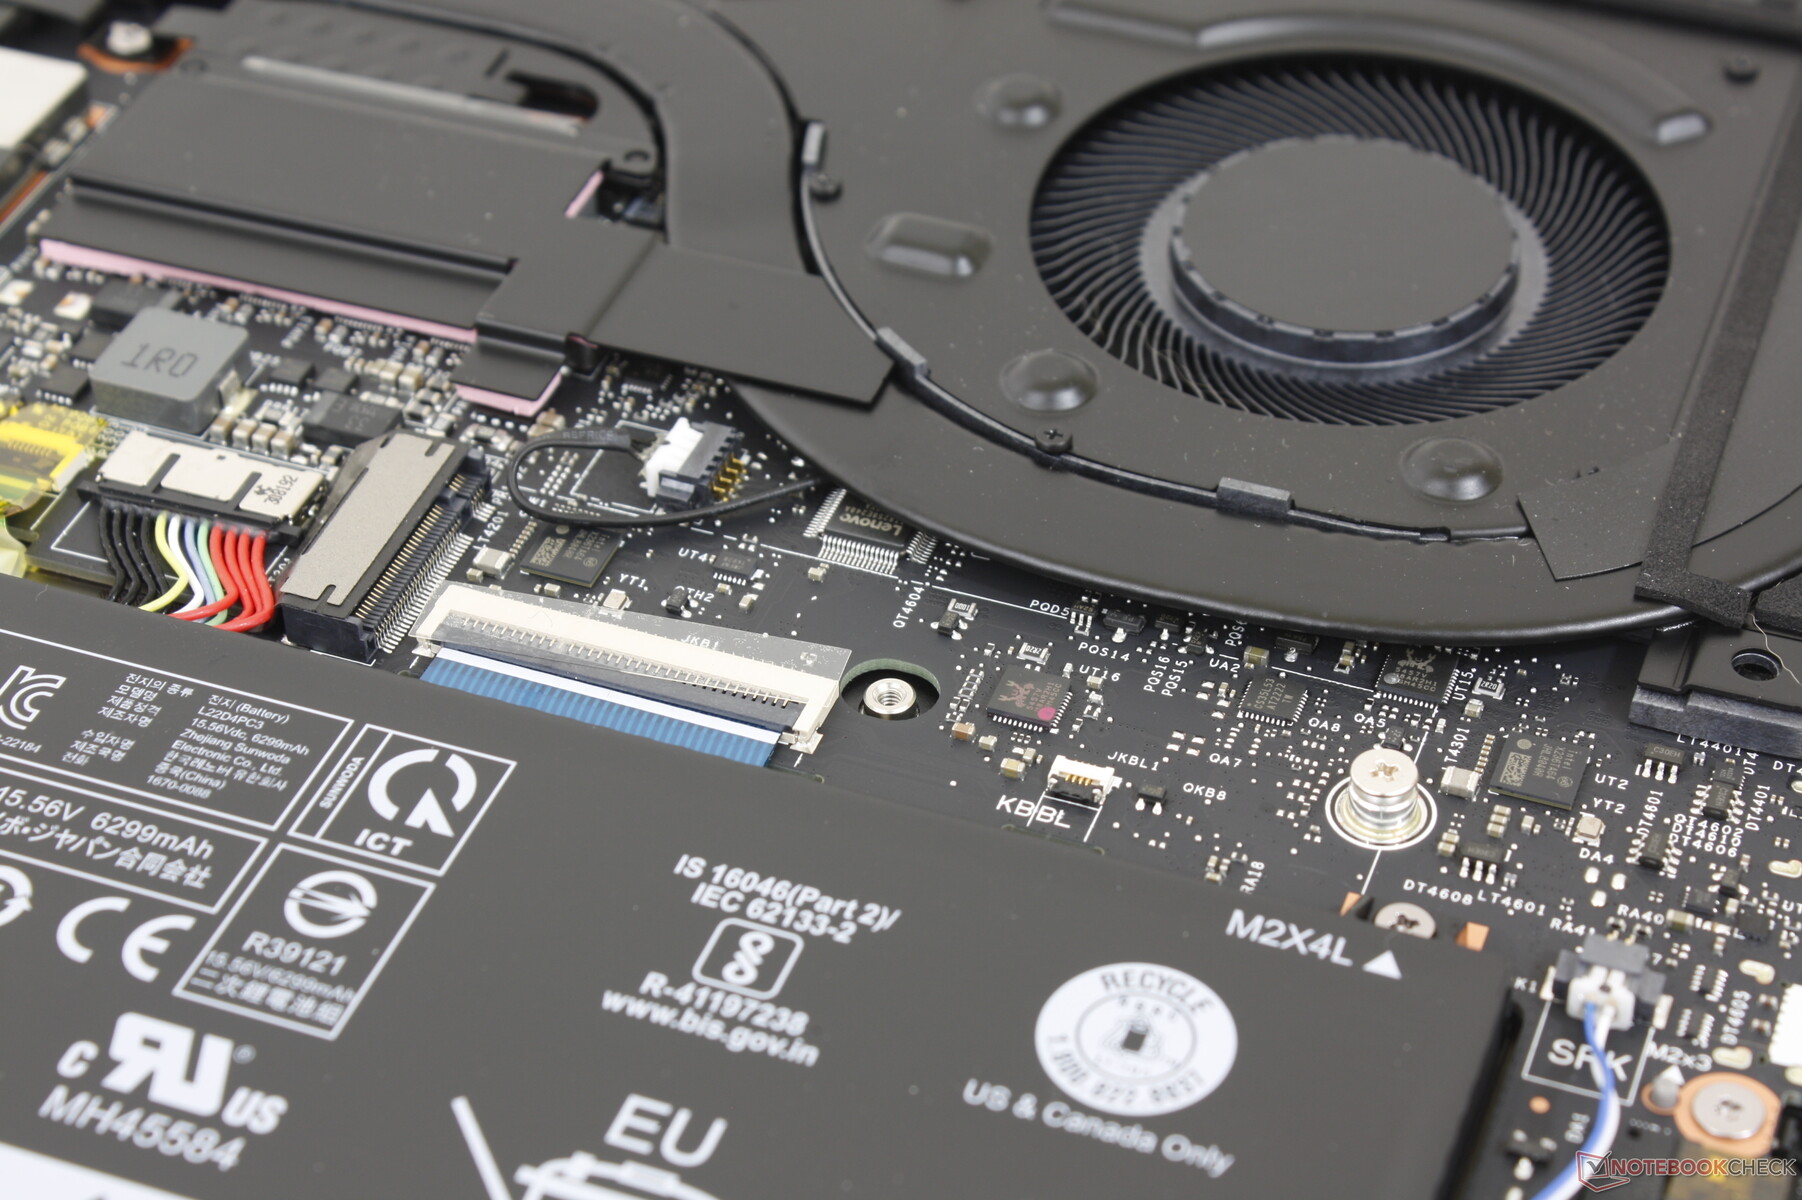
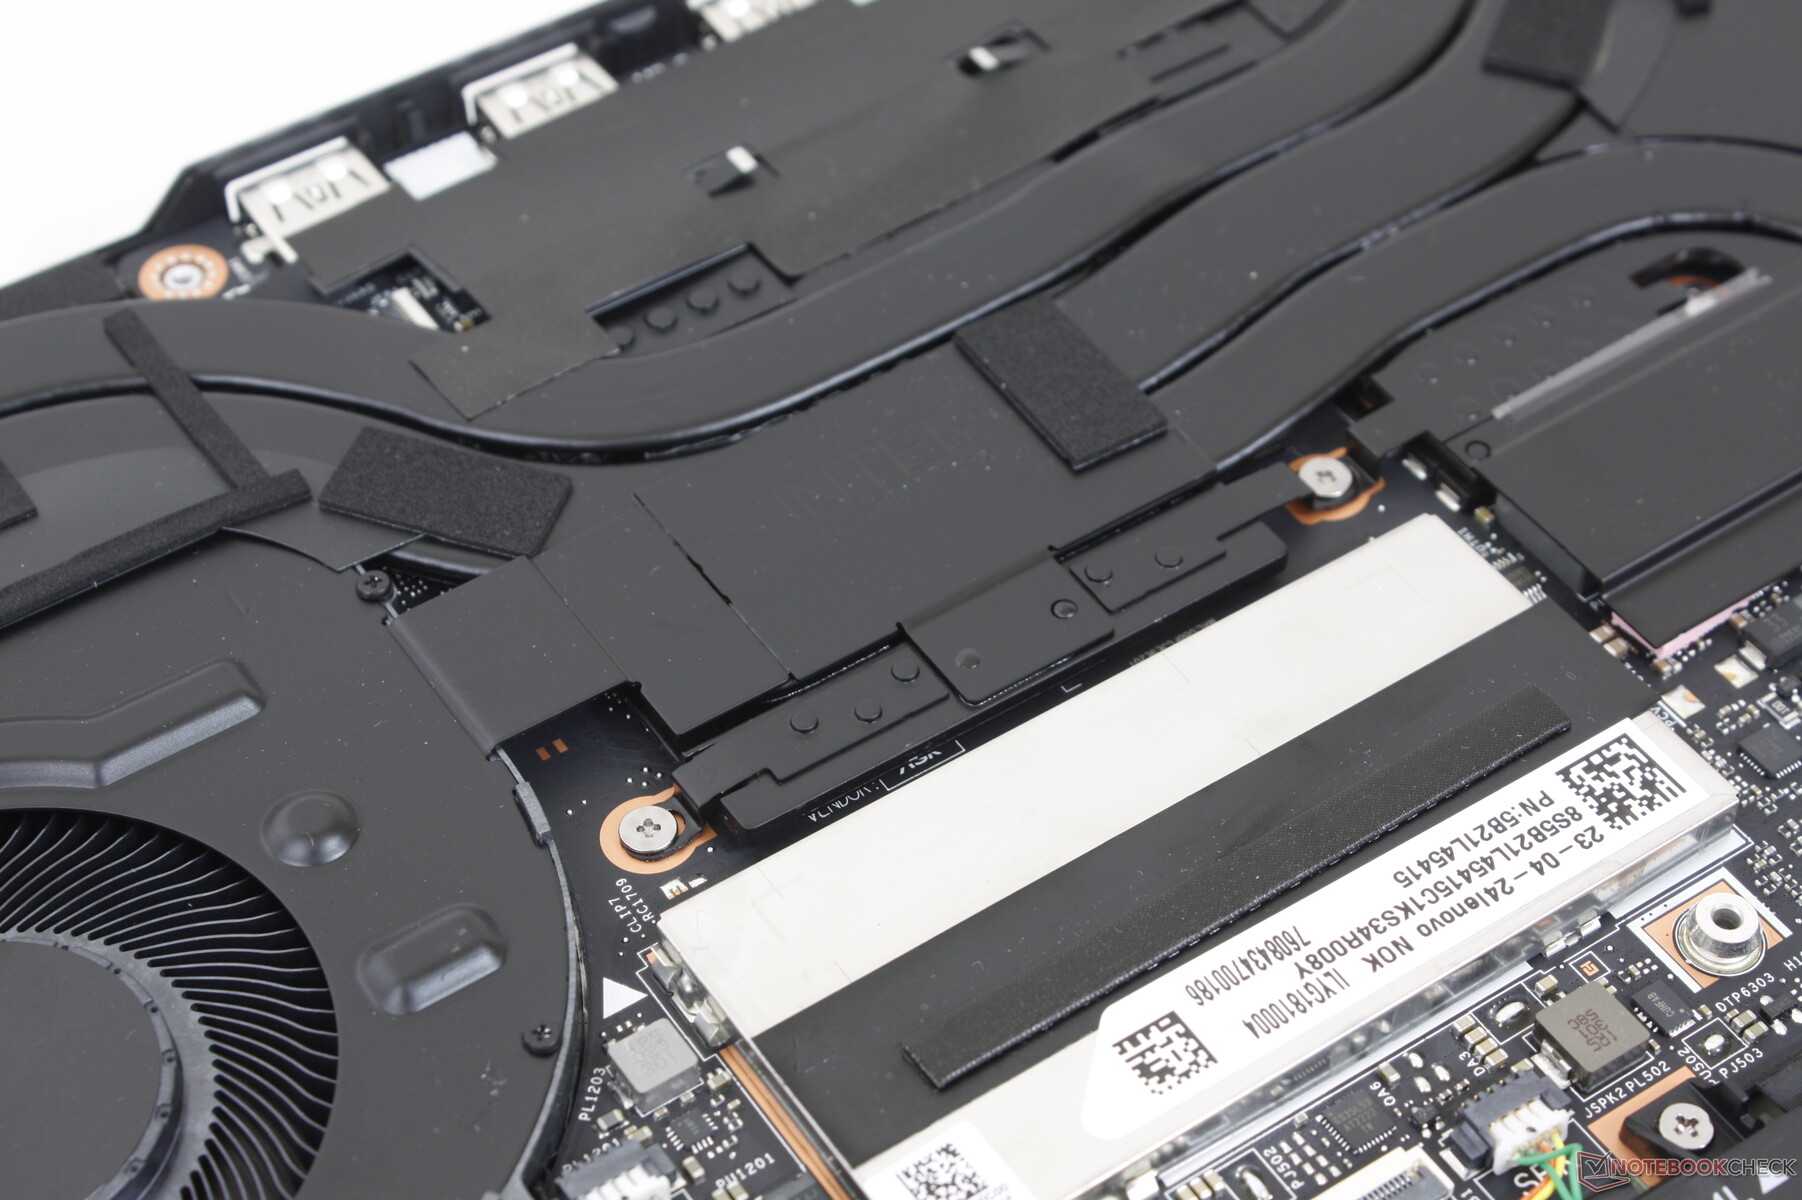
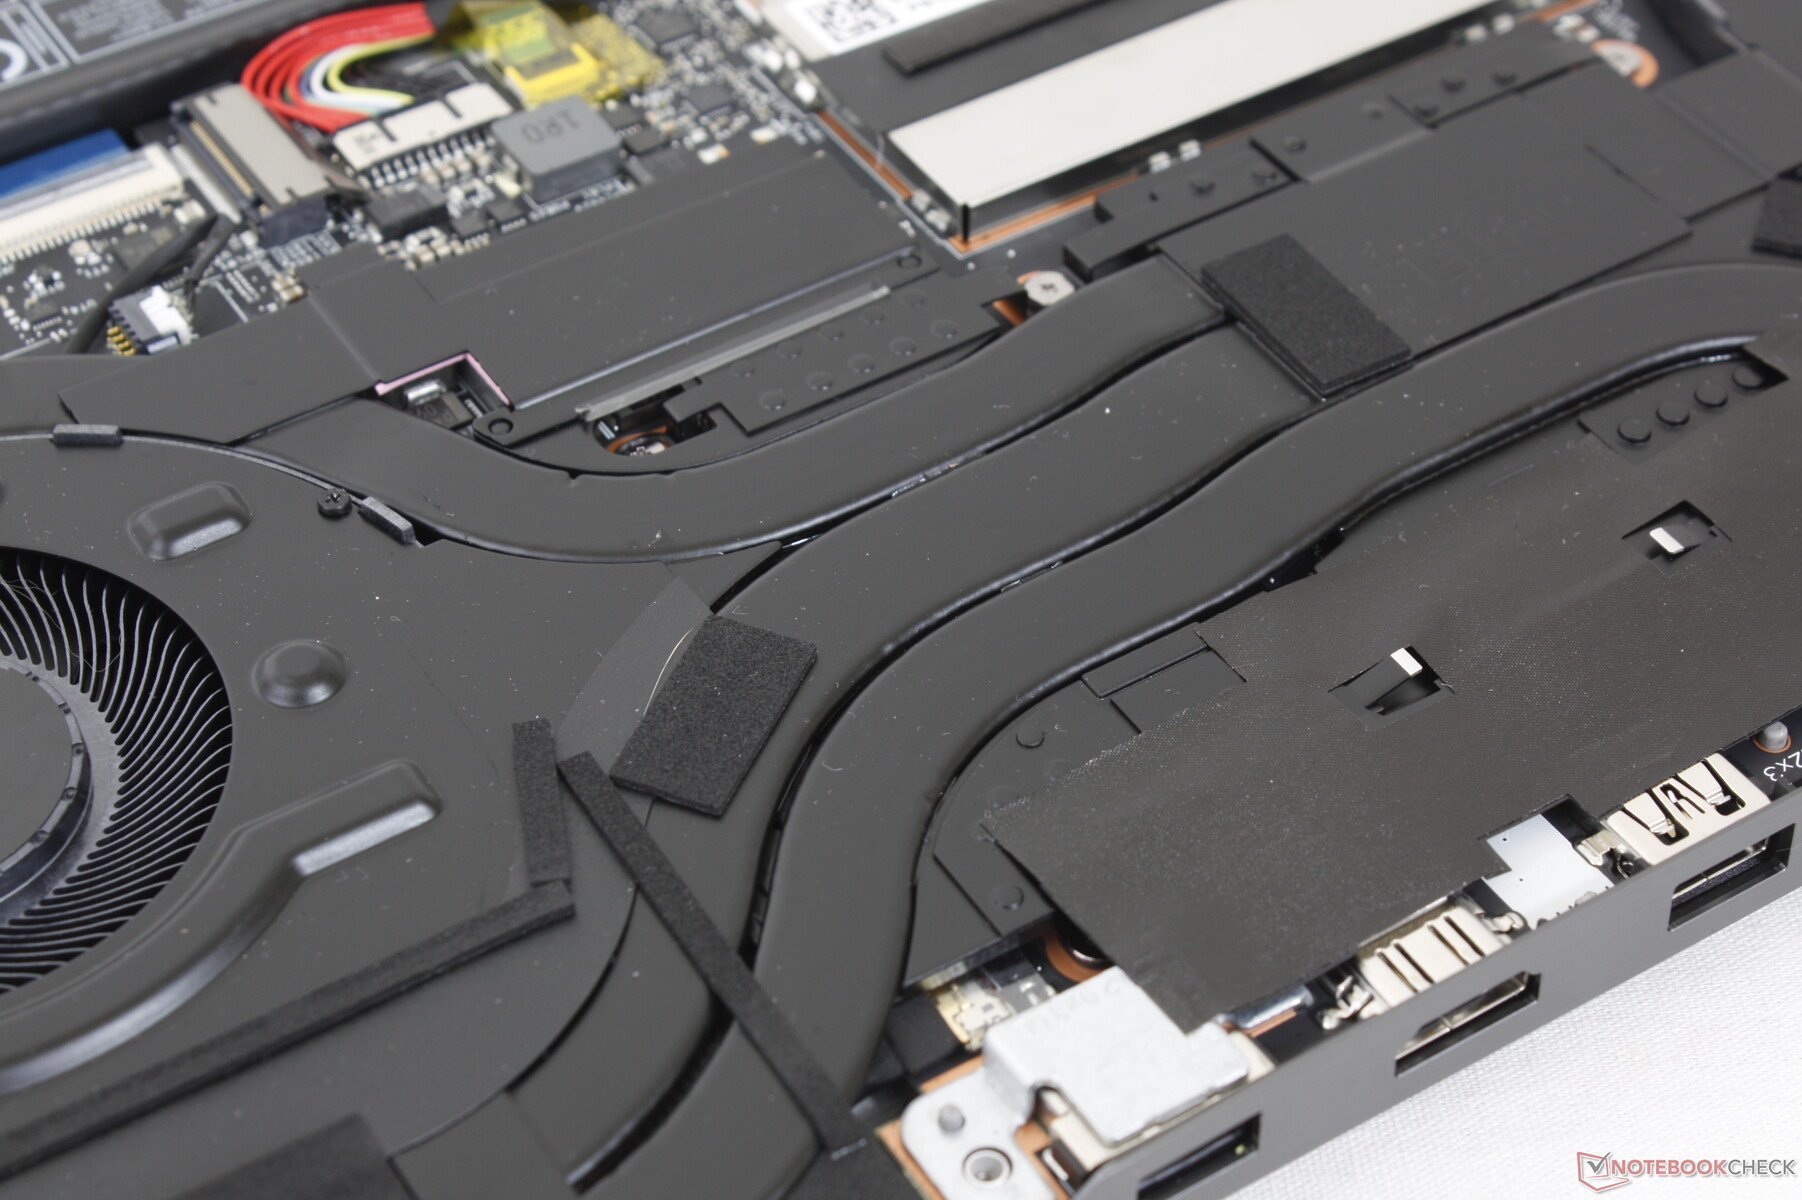
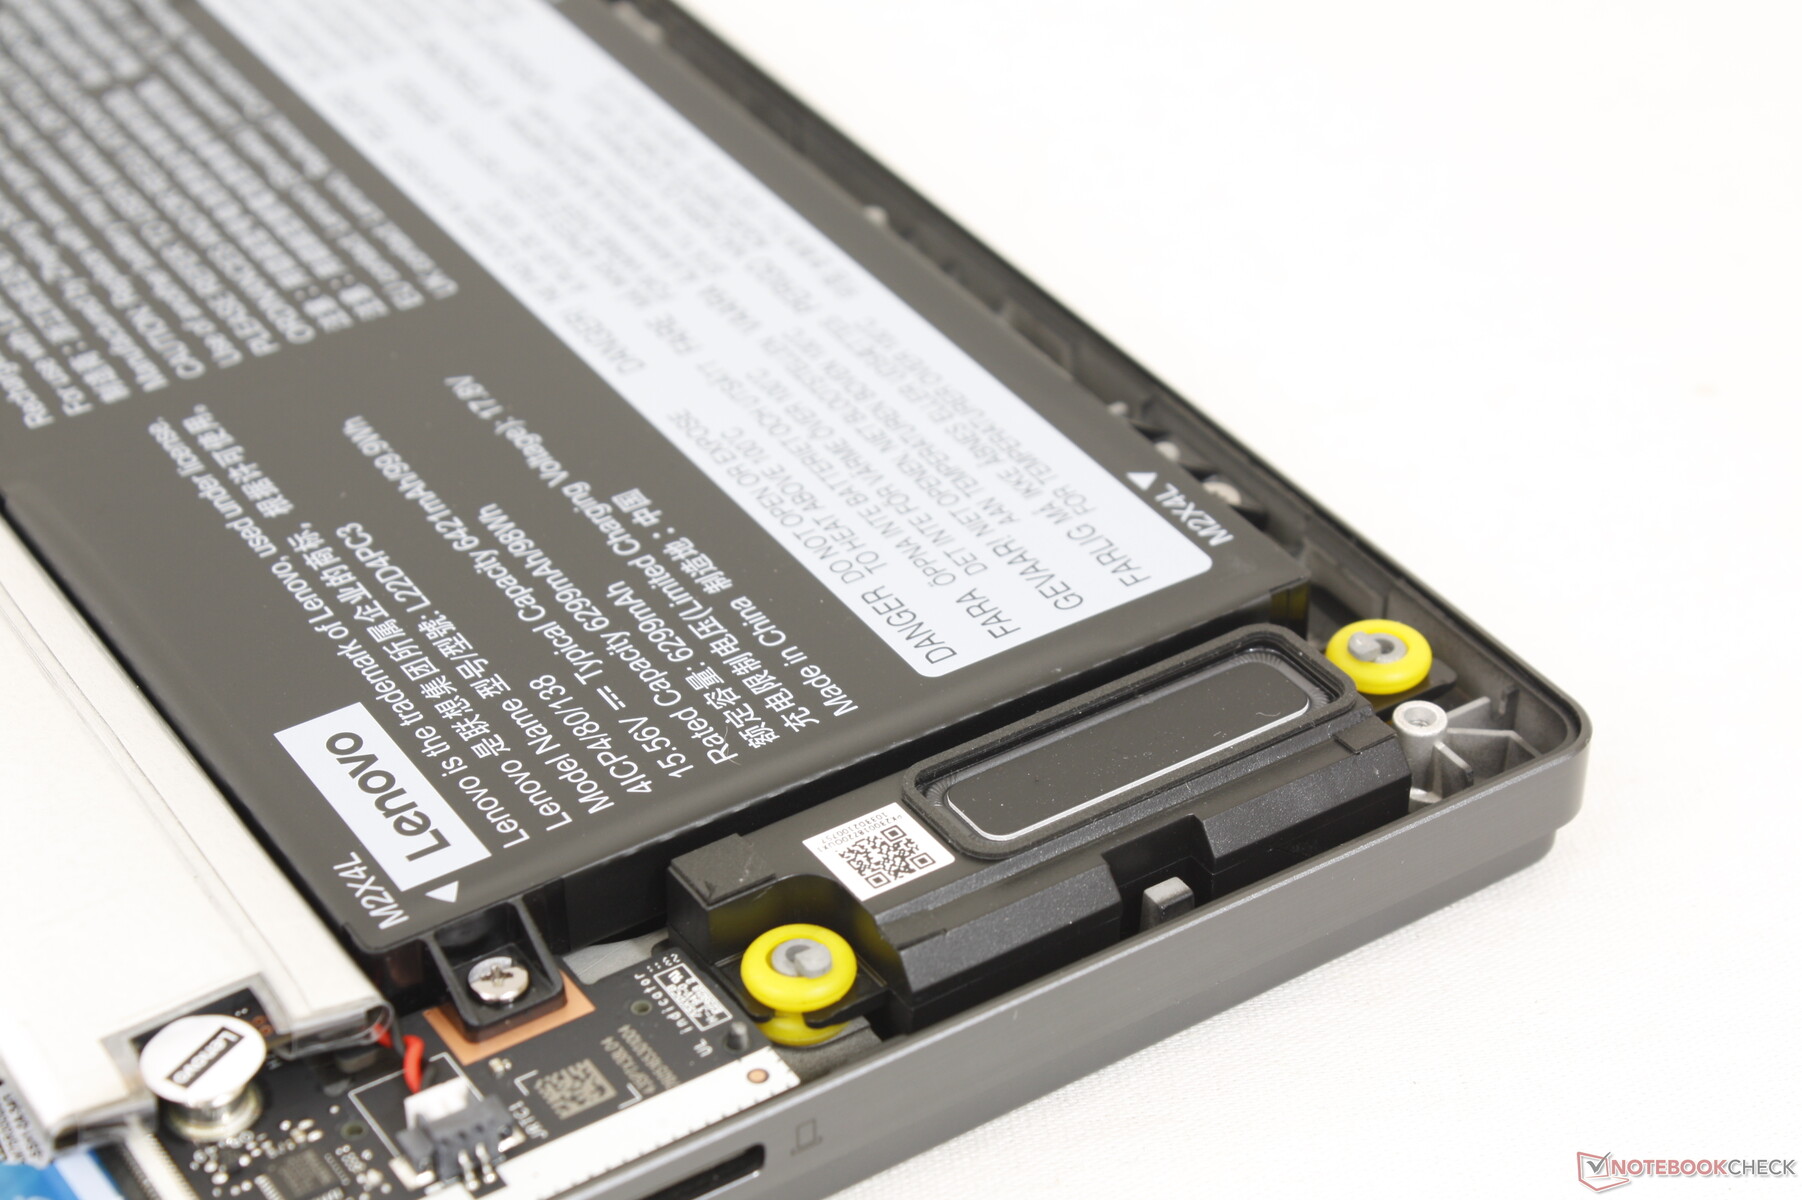
Wartung
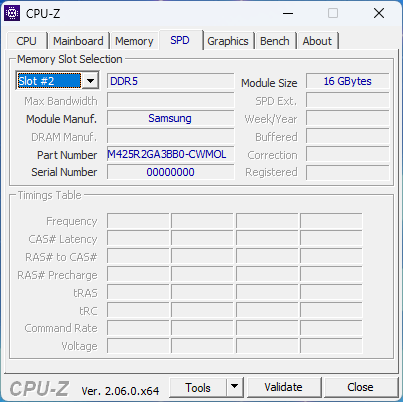
Die Bodenplatte ist mit acht Kreuzschlitzschrauben befestigt und kann leicht entfernt werden. Nutzer haben direkten Zugriff auf zwei M.2 2280 PCIe4 Slots, das WLAN-Modul und den Akku. 16GB Arbeitsspeicher sind fest verlötet, zur RAM-Erweiterung steht ein SODIMM-Slot unter der Abdeckung in der Mitte zur Verfügung.
Zubehör und Garantie
Abgesehen vom Netzteil und den üblichen Dokumenten sind keine Extras im Lieferumfang enthalten. In Deutschland ist der Gaming-Laptop von einer einjährigen Herstellergarantie abgedeckt.
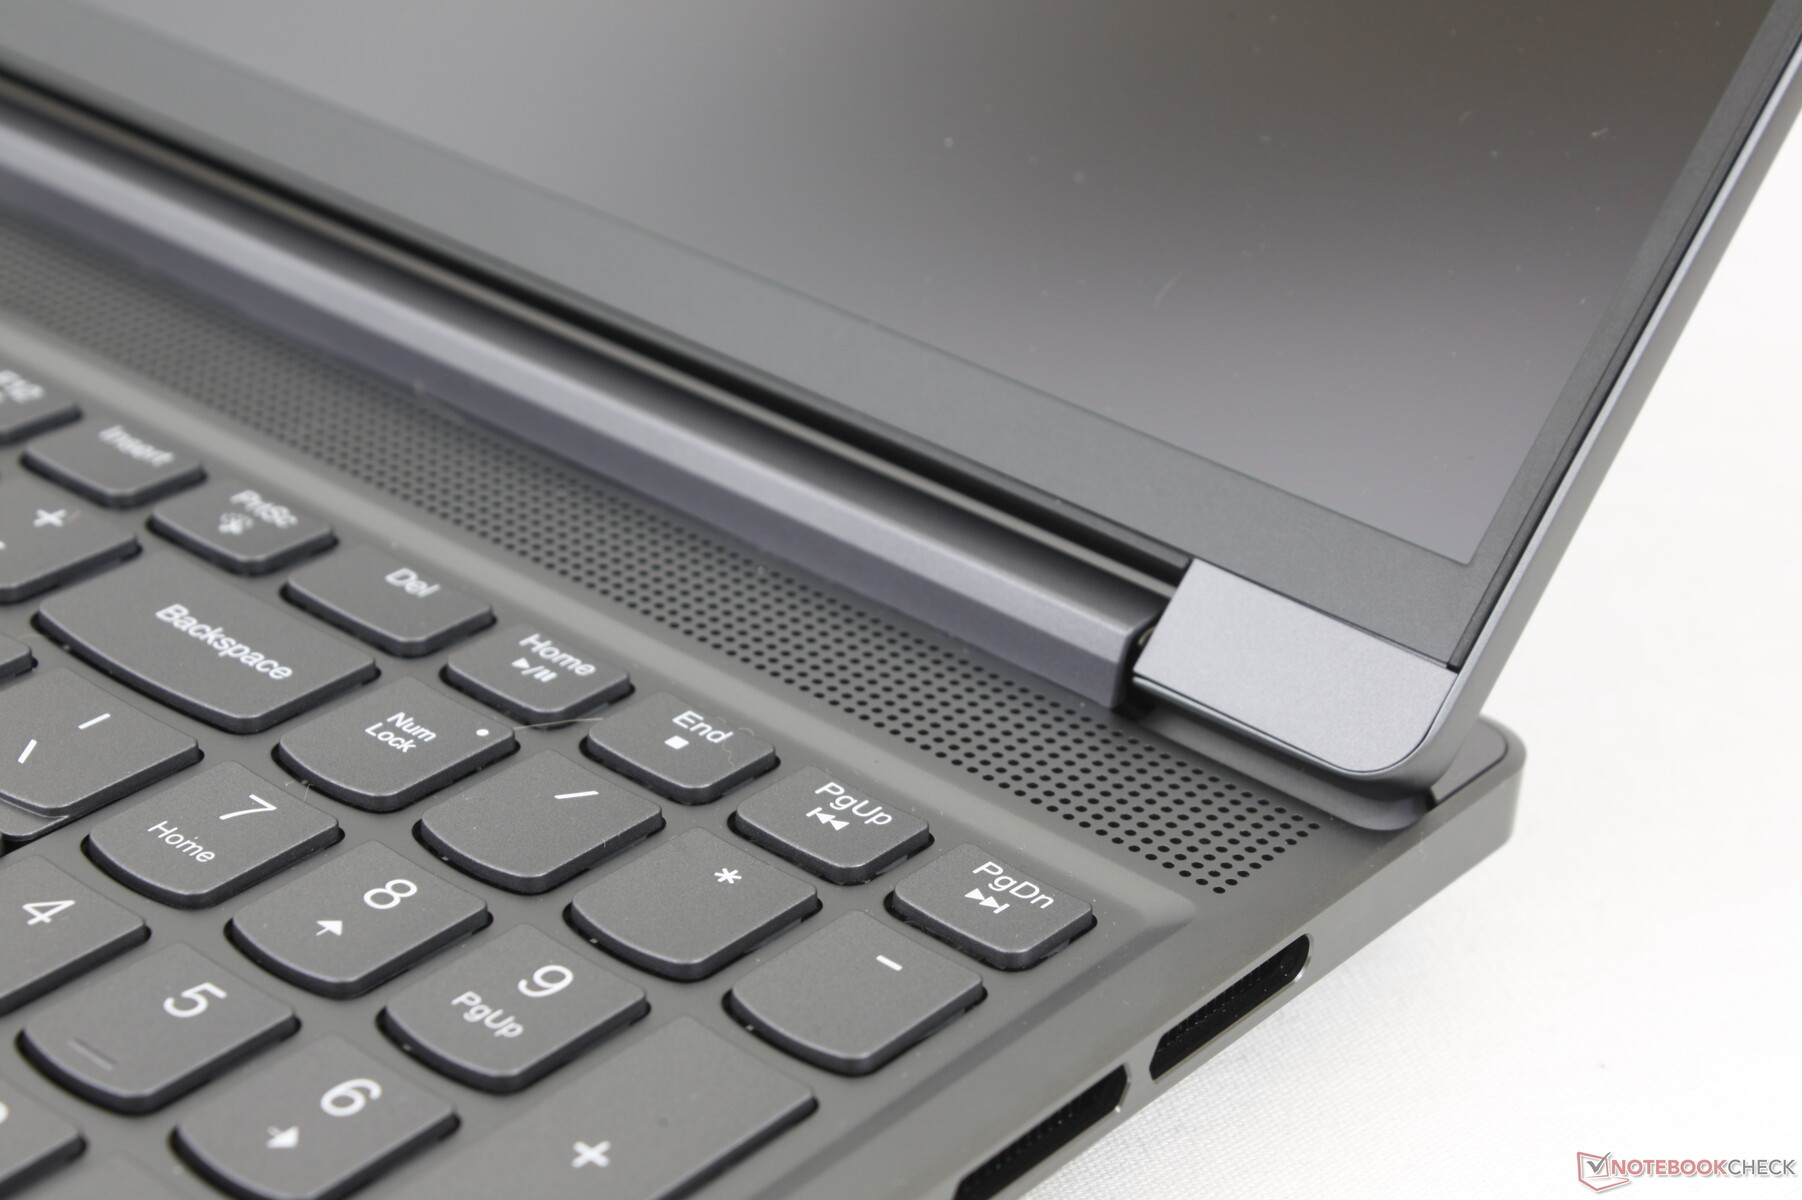
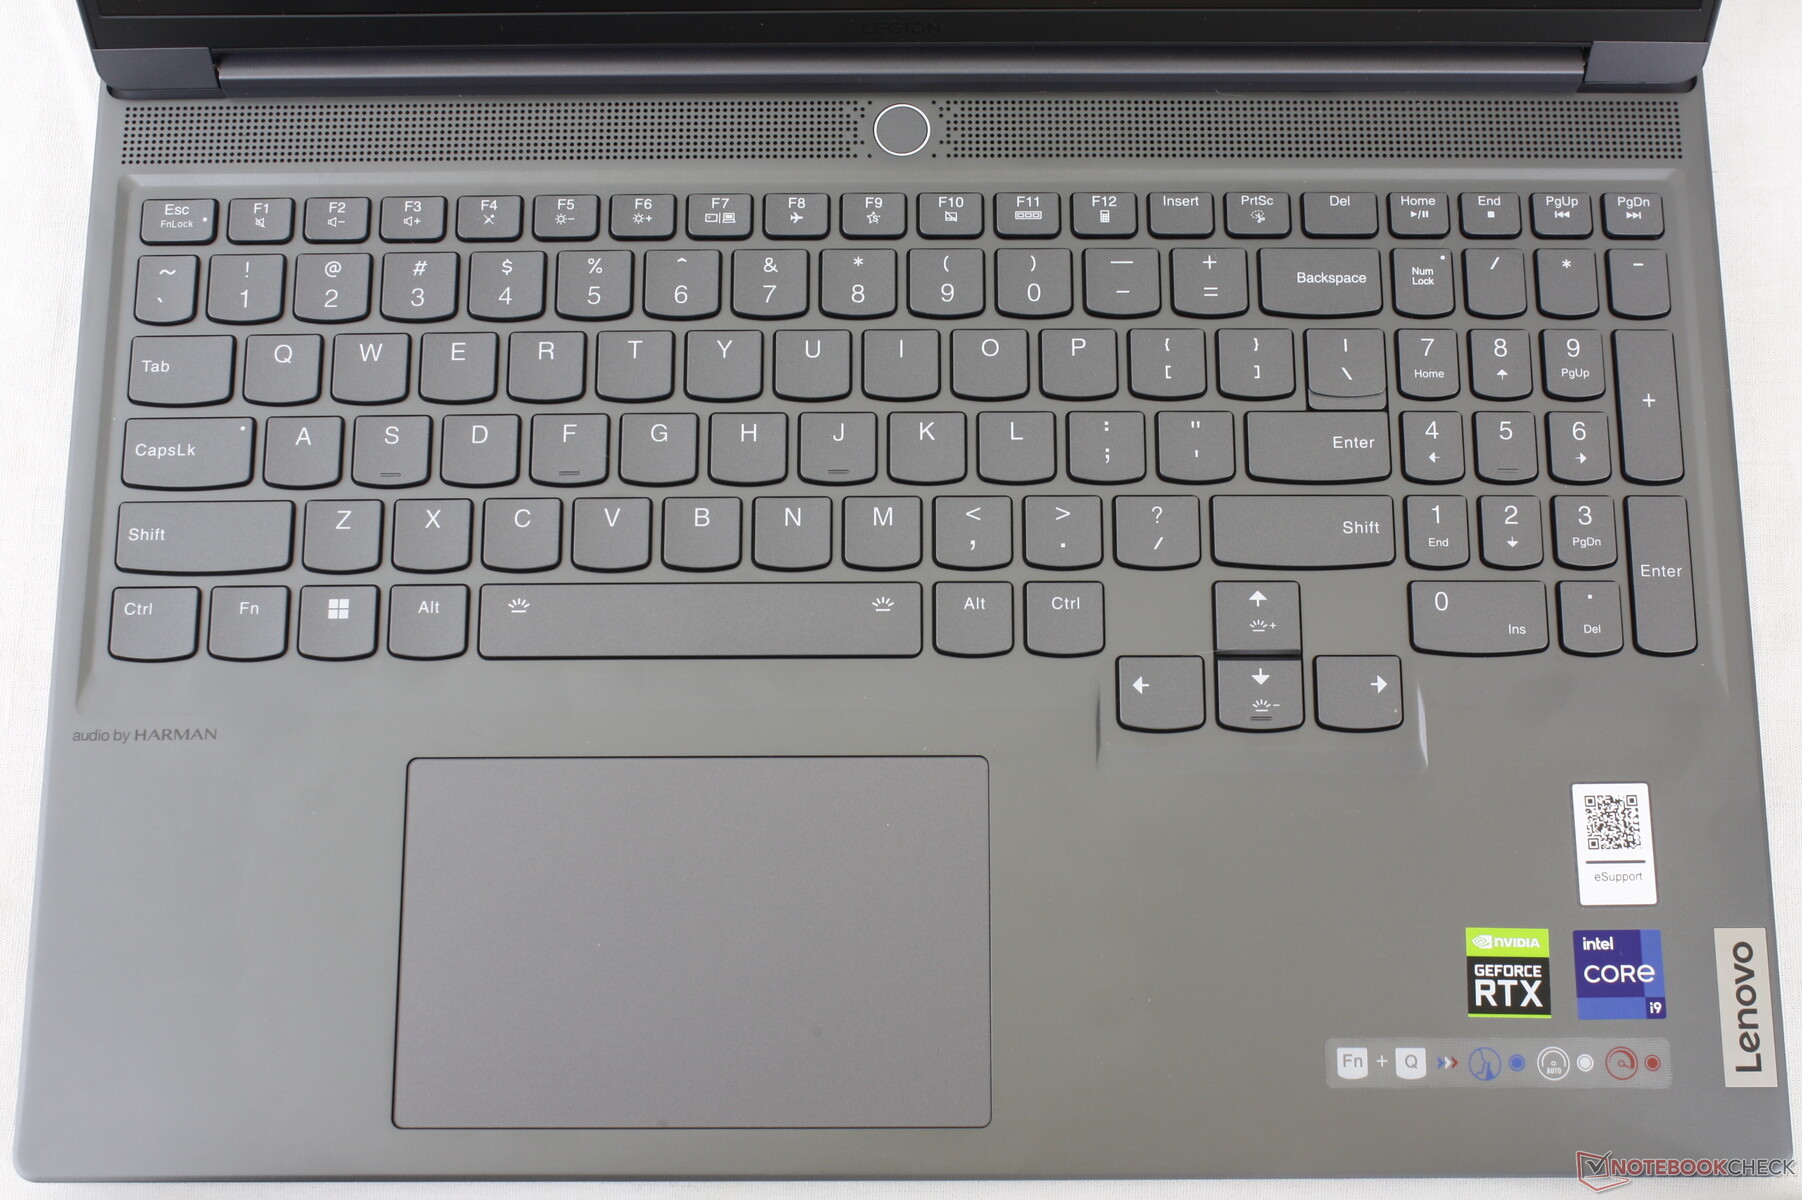
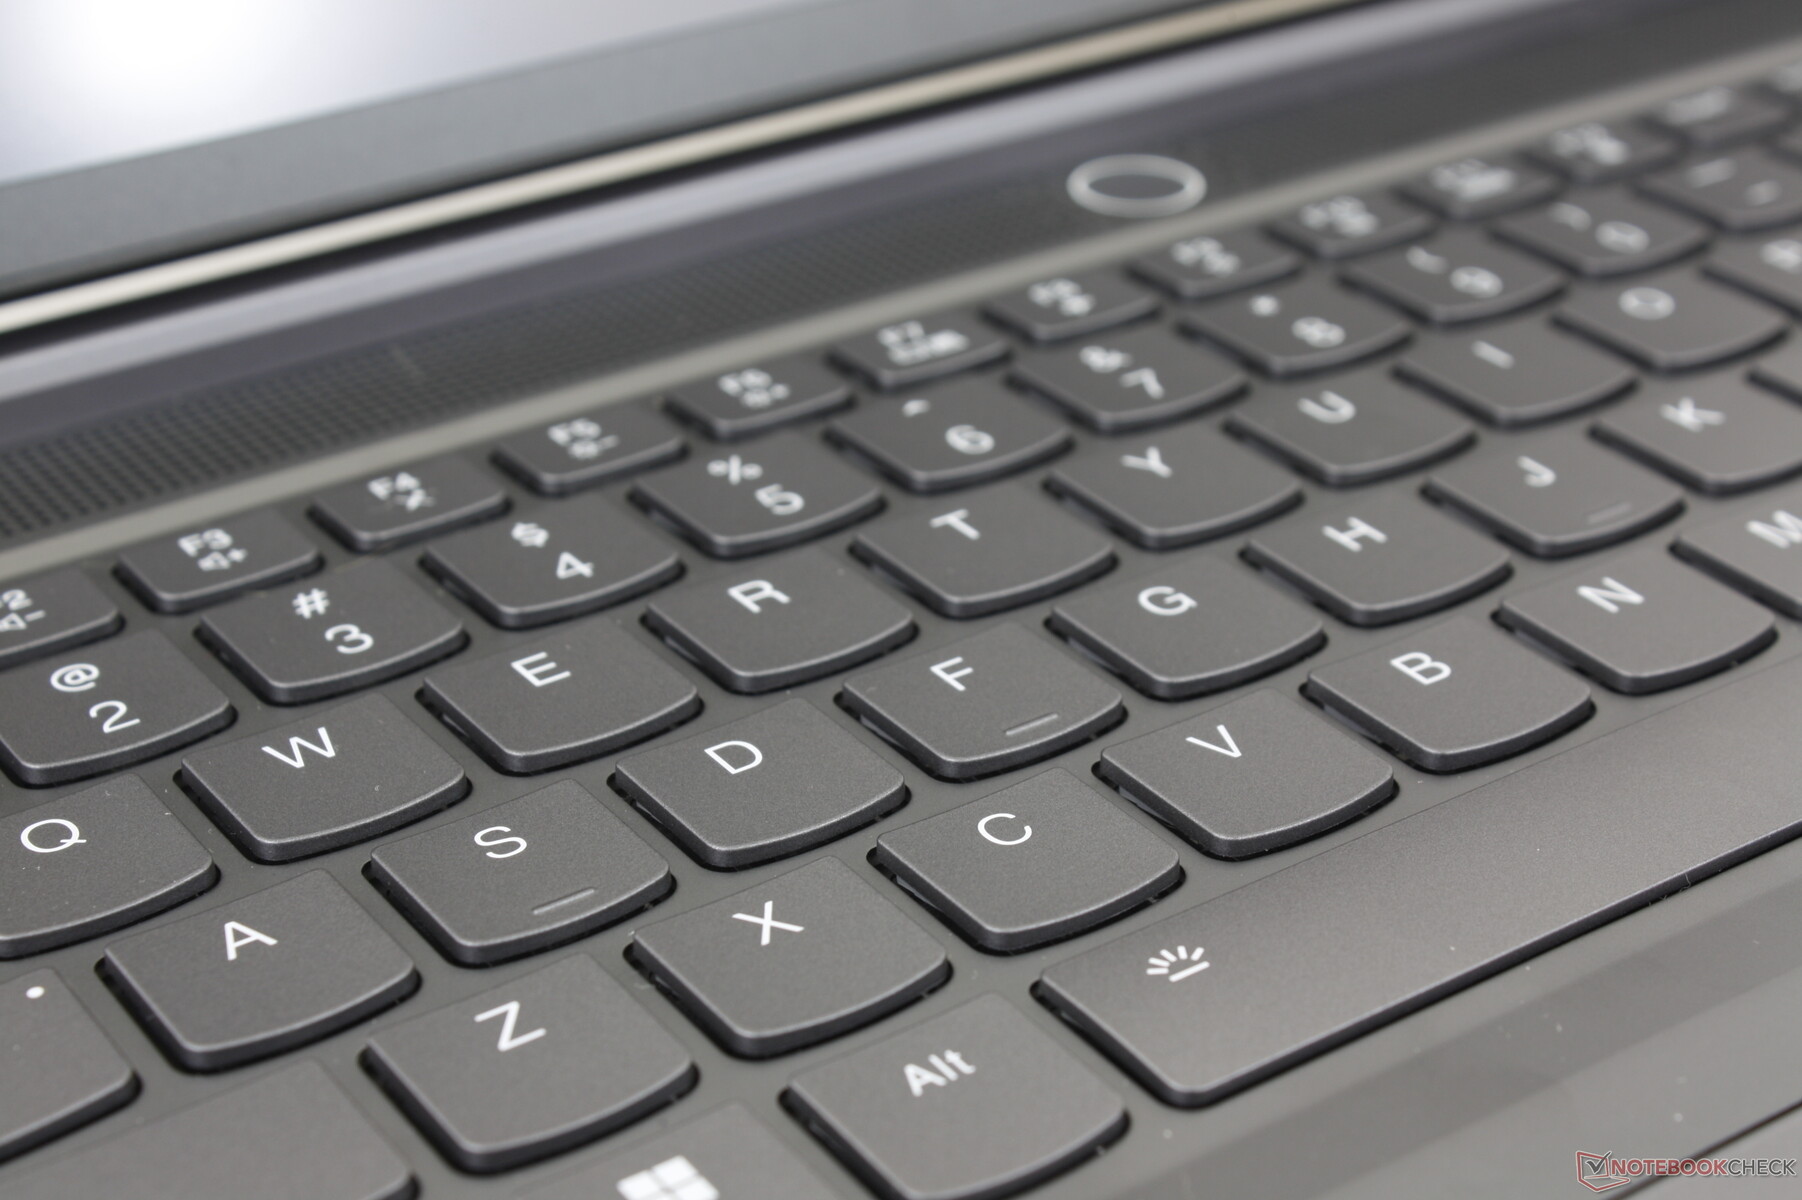
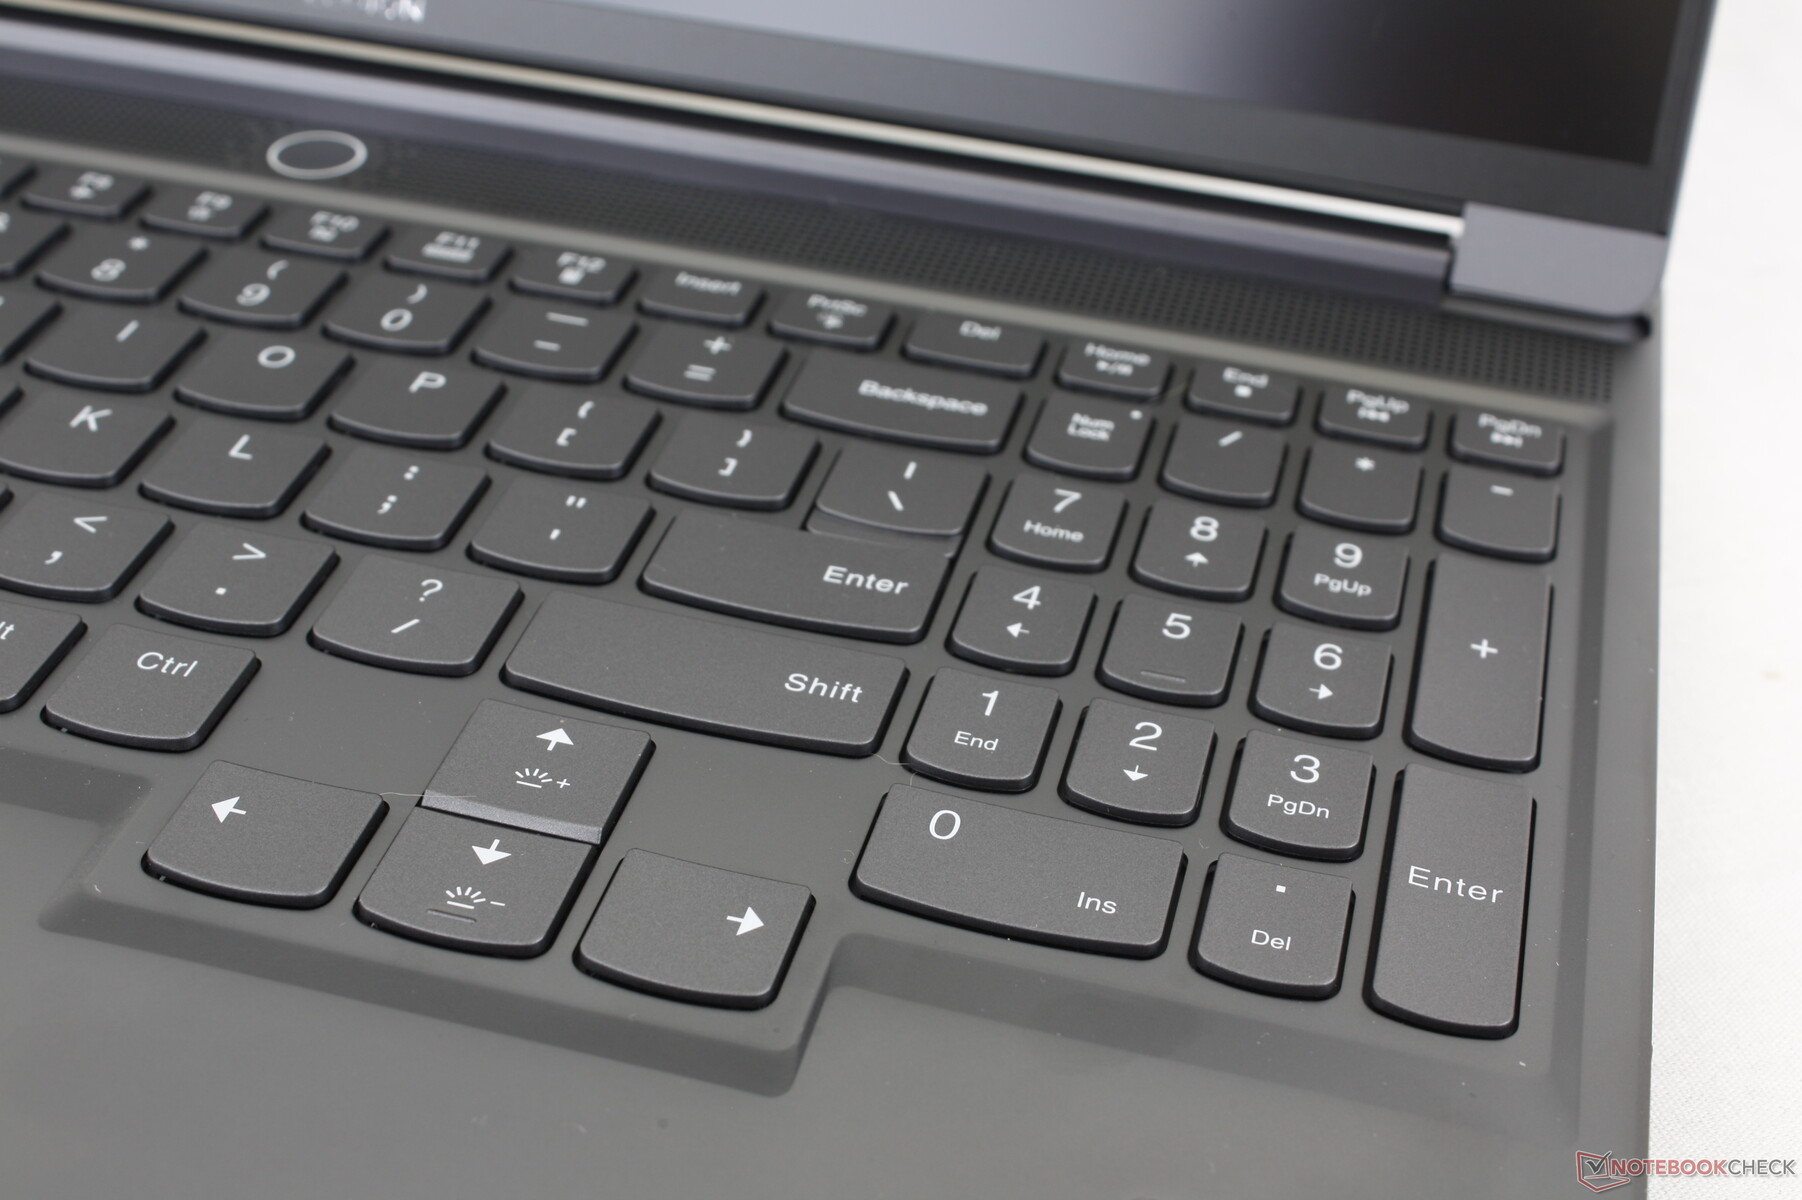
Eingabegeräte — Groß mit einzeln anpassbaren RGB-Tasten
Die Tastatur und das Touchpad wurden im Vergleich zum letztjährigen Legion Slim 7i G7 nicht verändert, das Nutzererlebnis bleibt also gleich. Das ist aber nicht unbedingt schlecht, denn die 1,5mm Hub und das straffe Feedback sind beim Tippen immer noch angenehmer als die flachere Tastatur des Blade 16. Auch die großen Pfeiltasten, die bei anderen Gaming-Laptops aus der Asus ROG Strix oder der MSI Pulse Serie oft frustrierend klein ausfallen, gefallen uns.
Display — Identisch zum Legion Pro 7
Es stehen die zwei folgenden Panel zur Auswahl, beide unterstützen G-Sync:
- 2560 x 1600, 240 Hz, 5 ms Reaktionszeit, 100% sRGB, 500 Nits, Pantone zertifiziert
- 3000 x 2000, 165 Hz, 3 ms Reaktionszeit, 100% DCI-P3, 430 Nits, Pantone zertifiziert
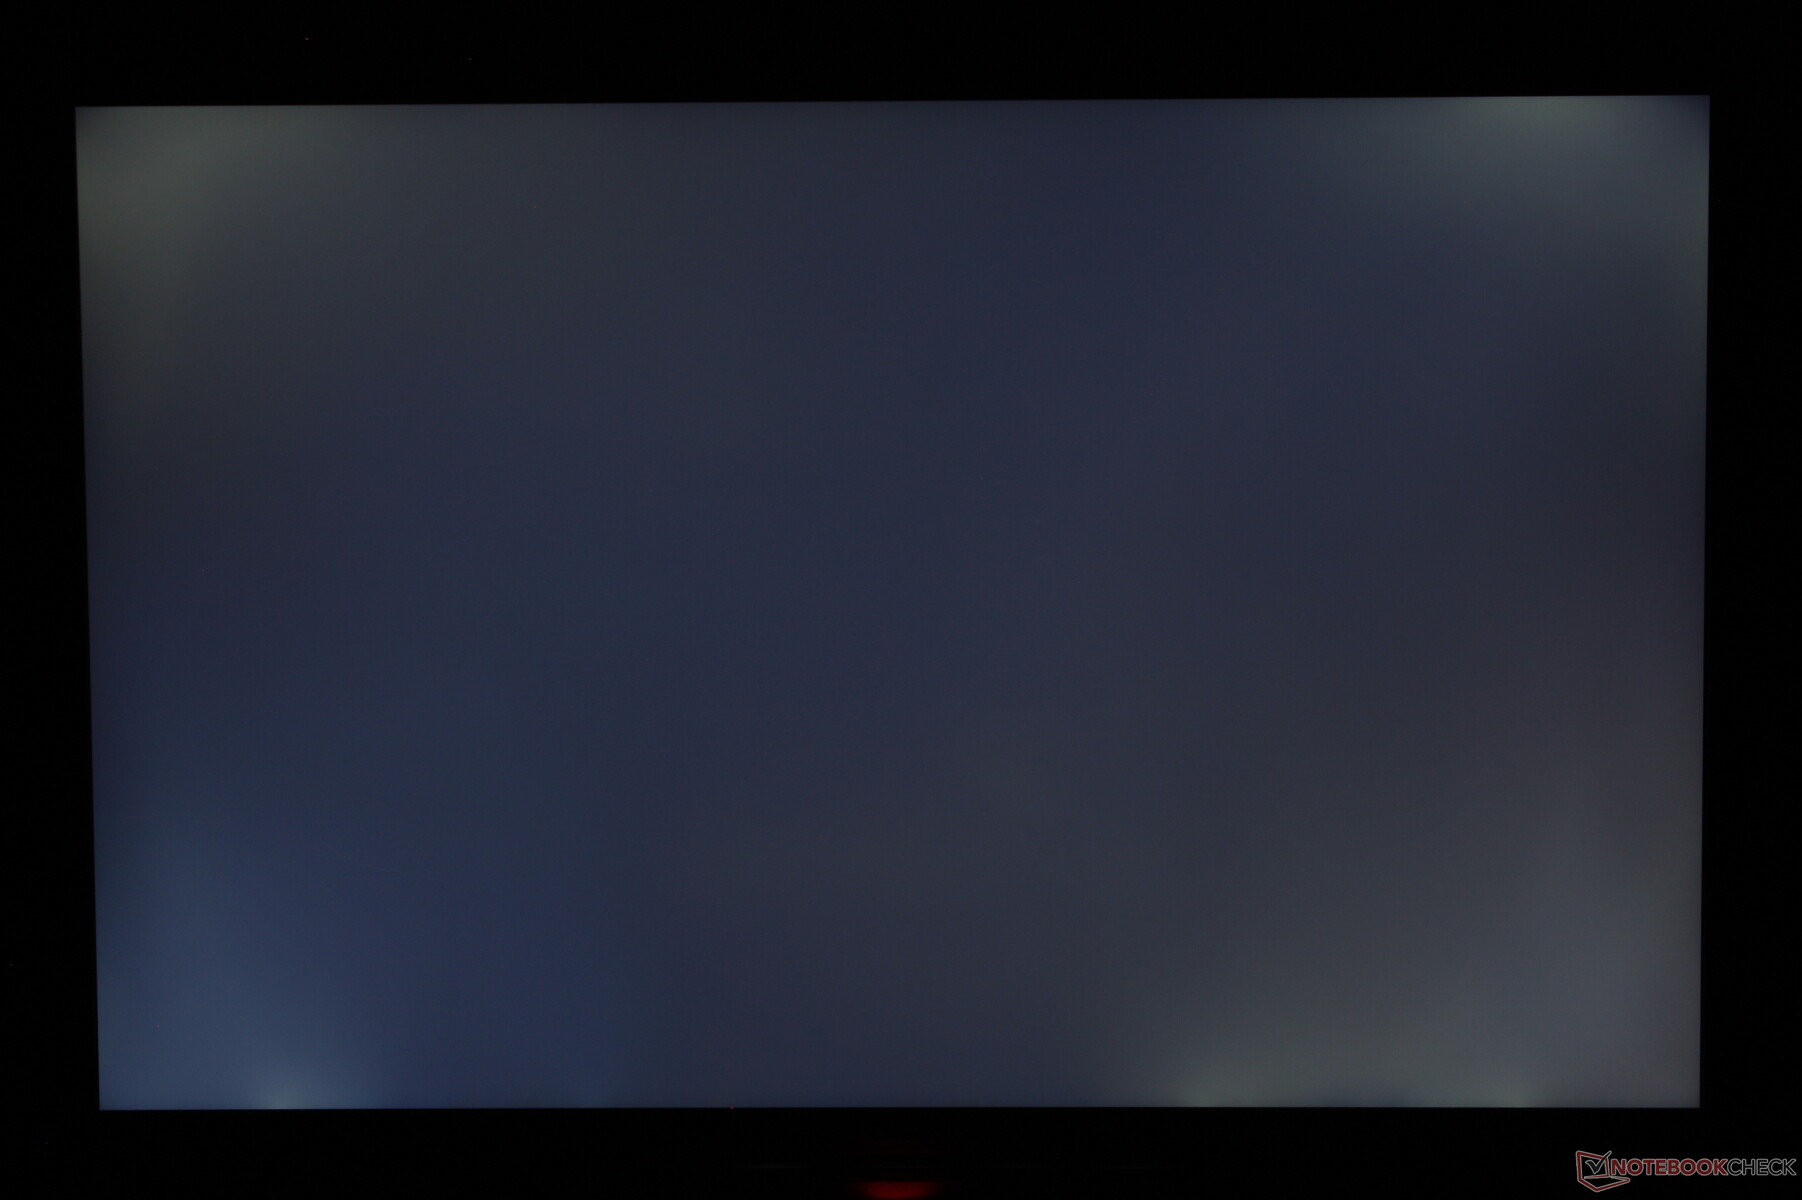
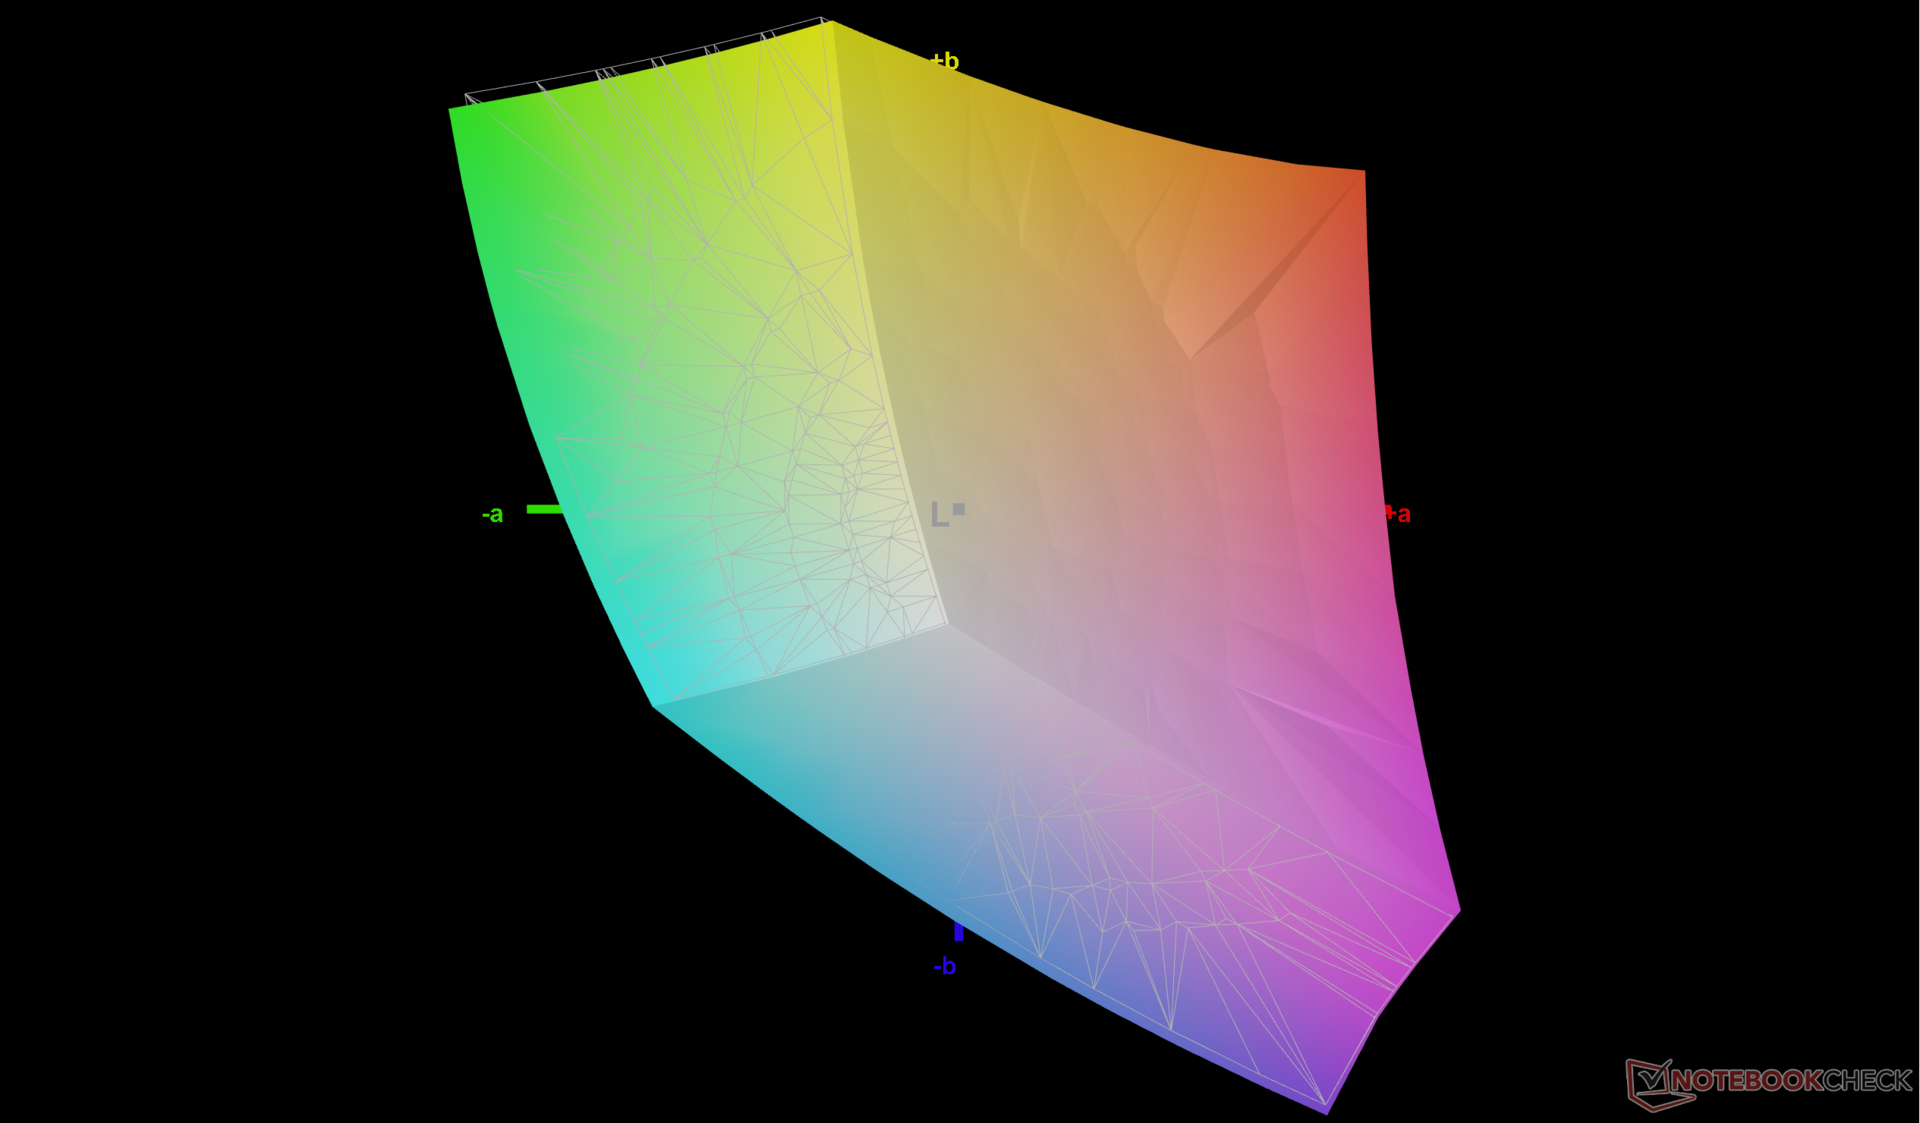
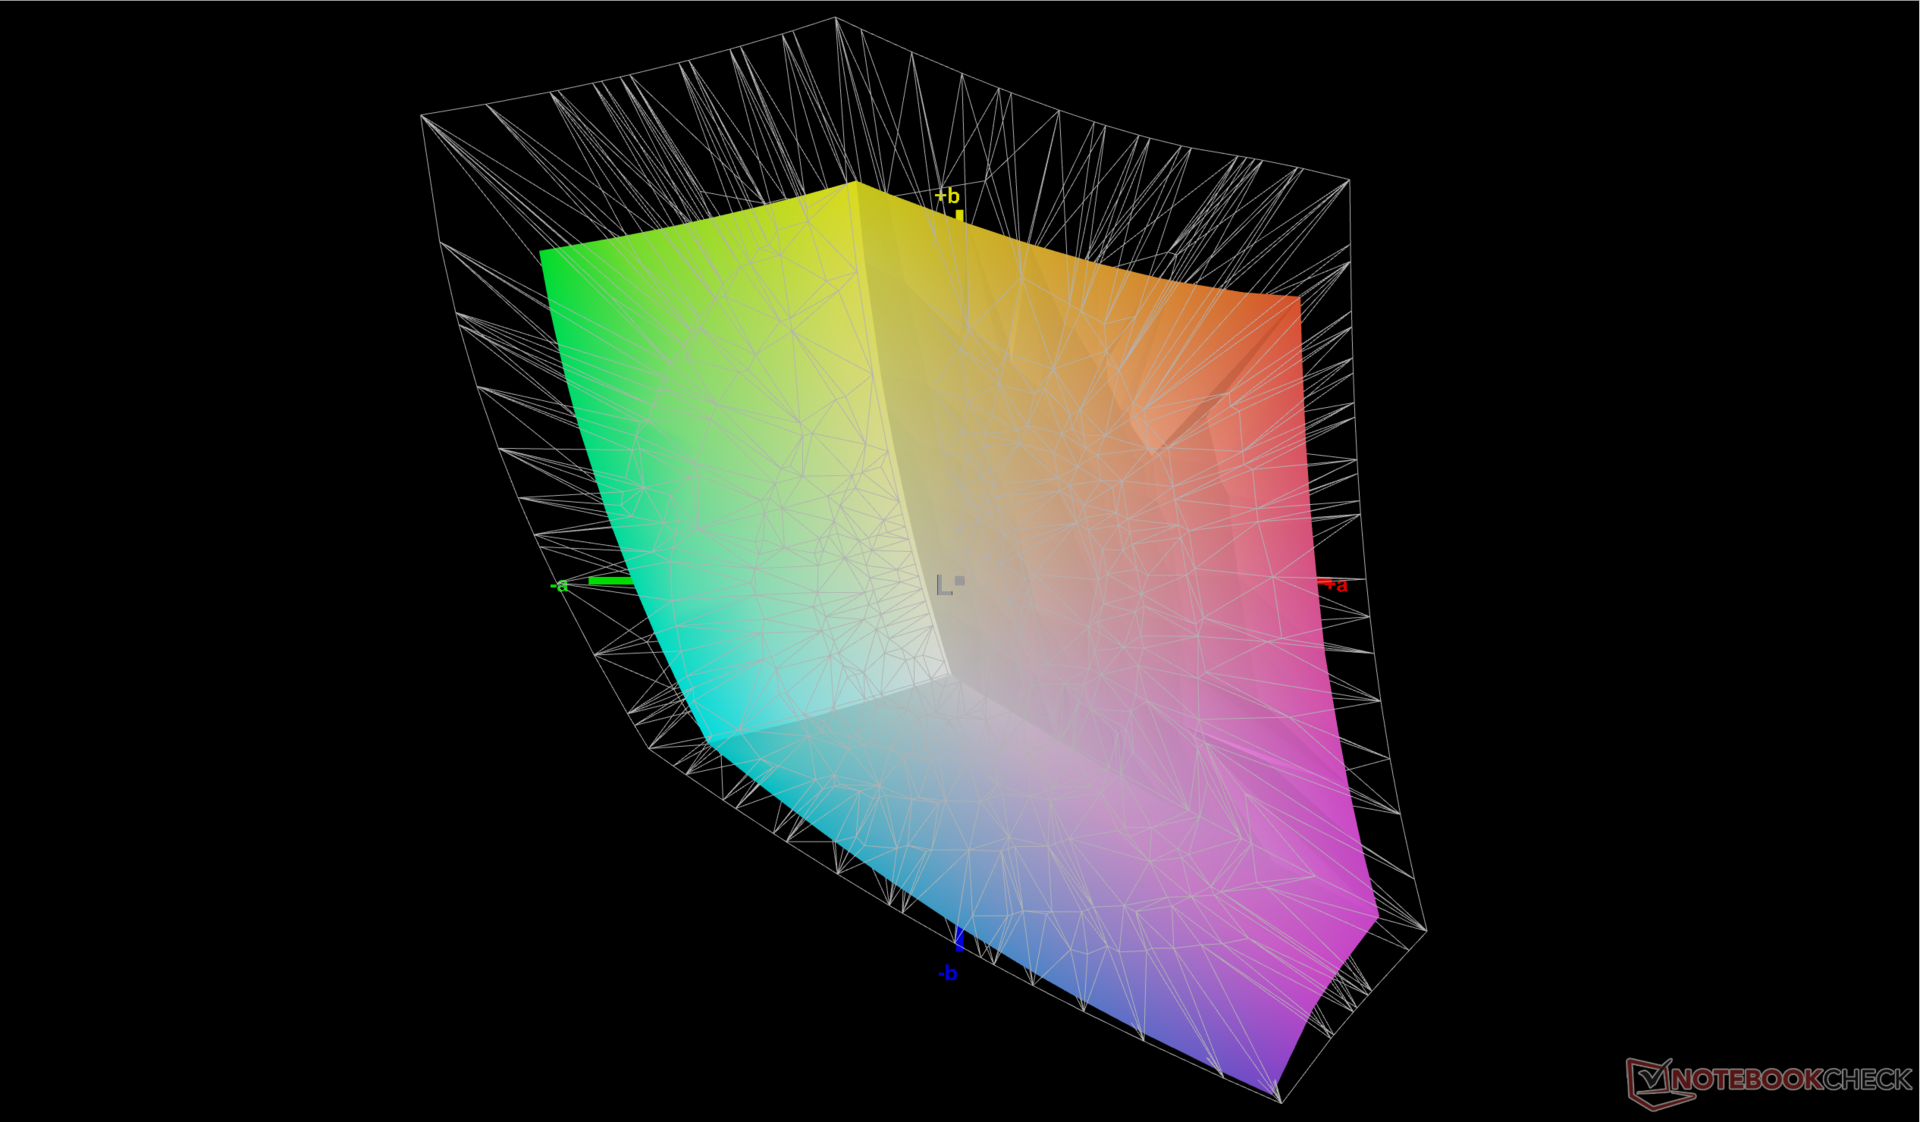
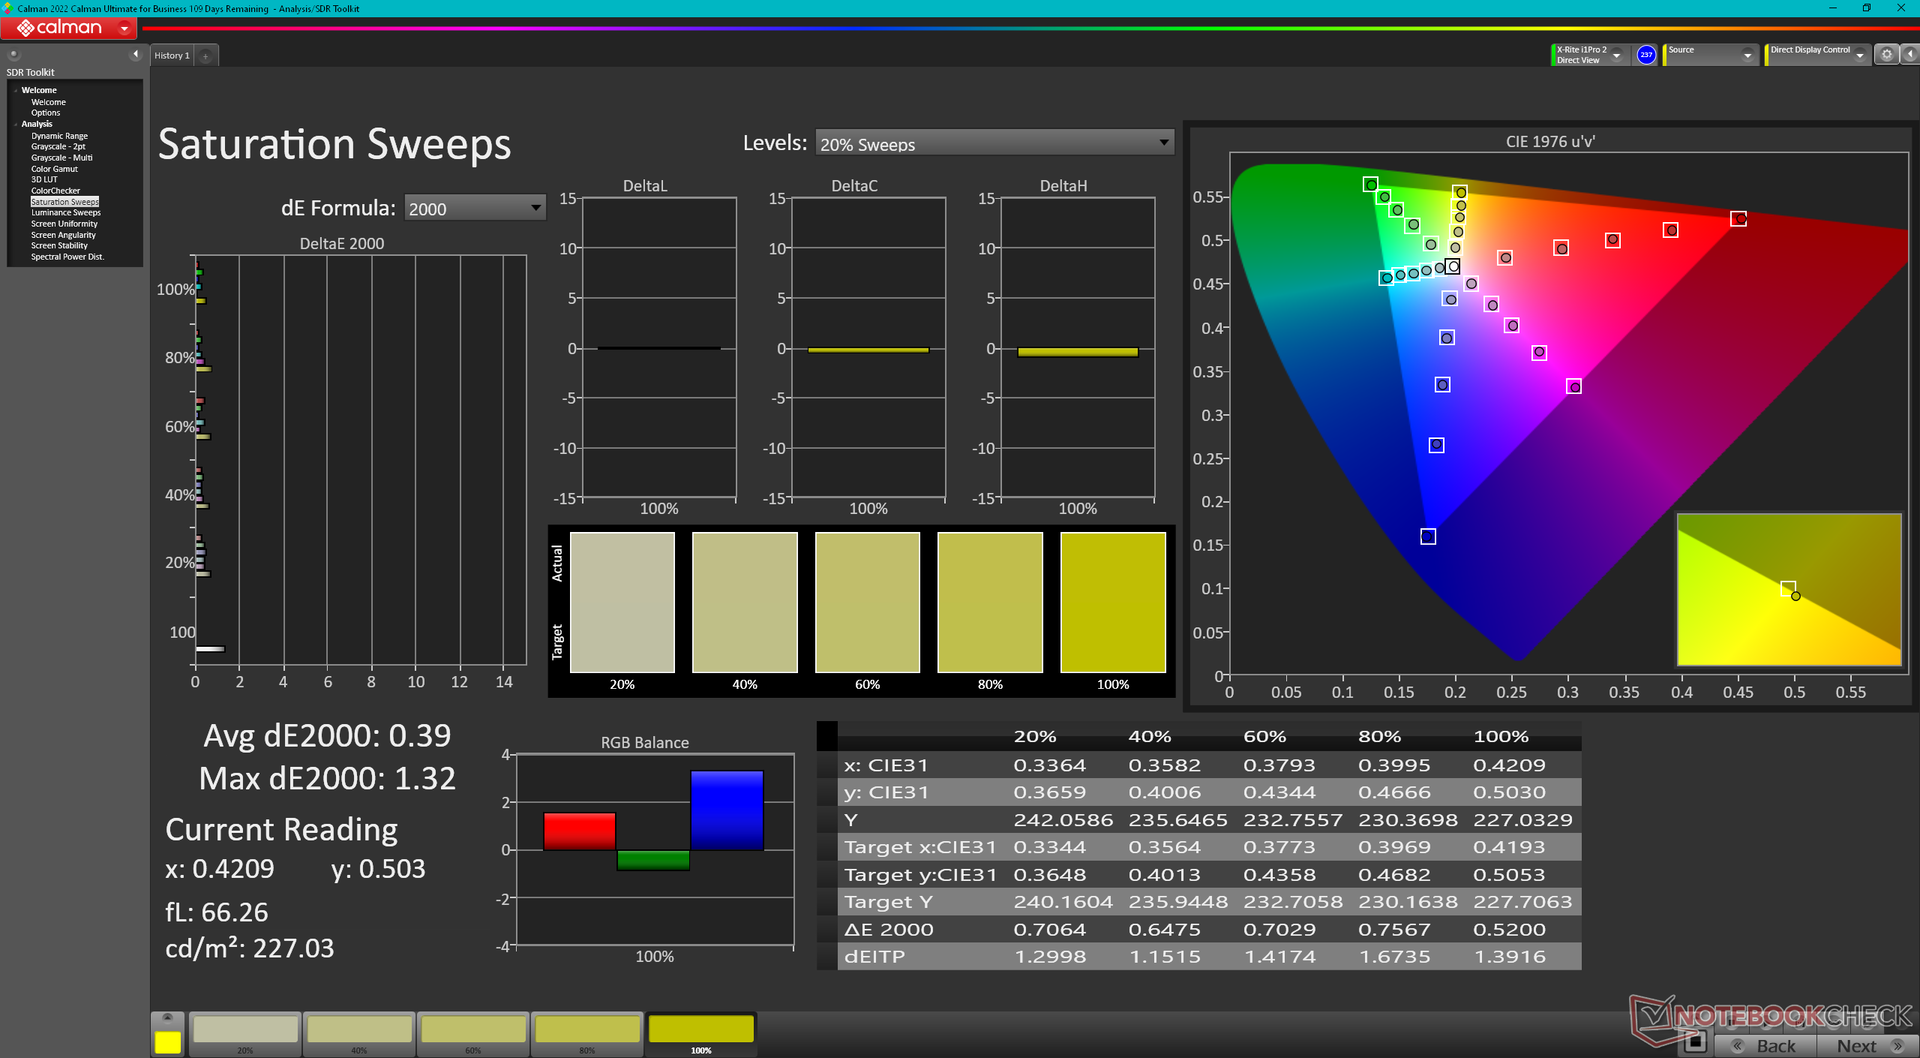
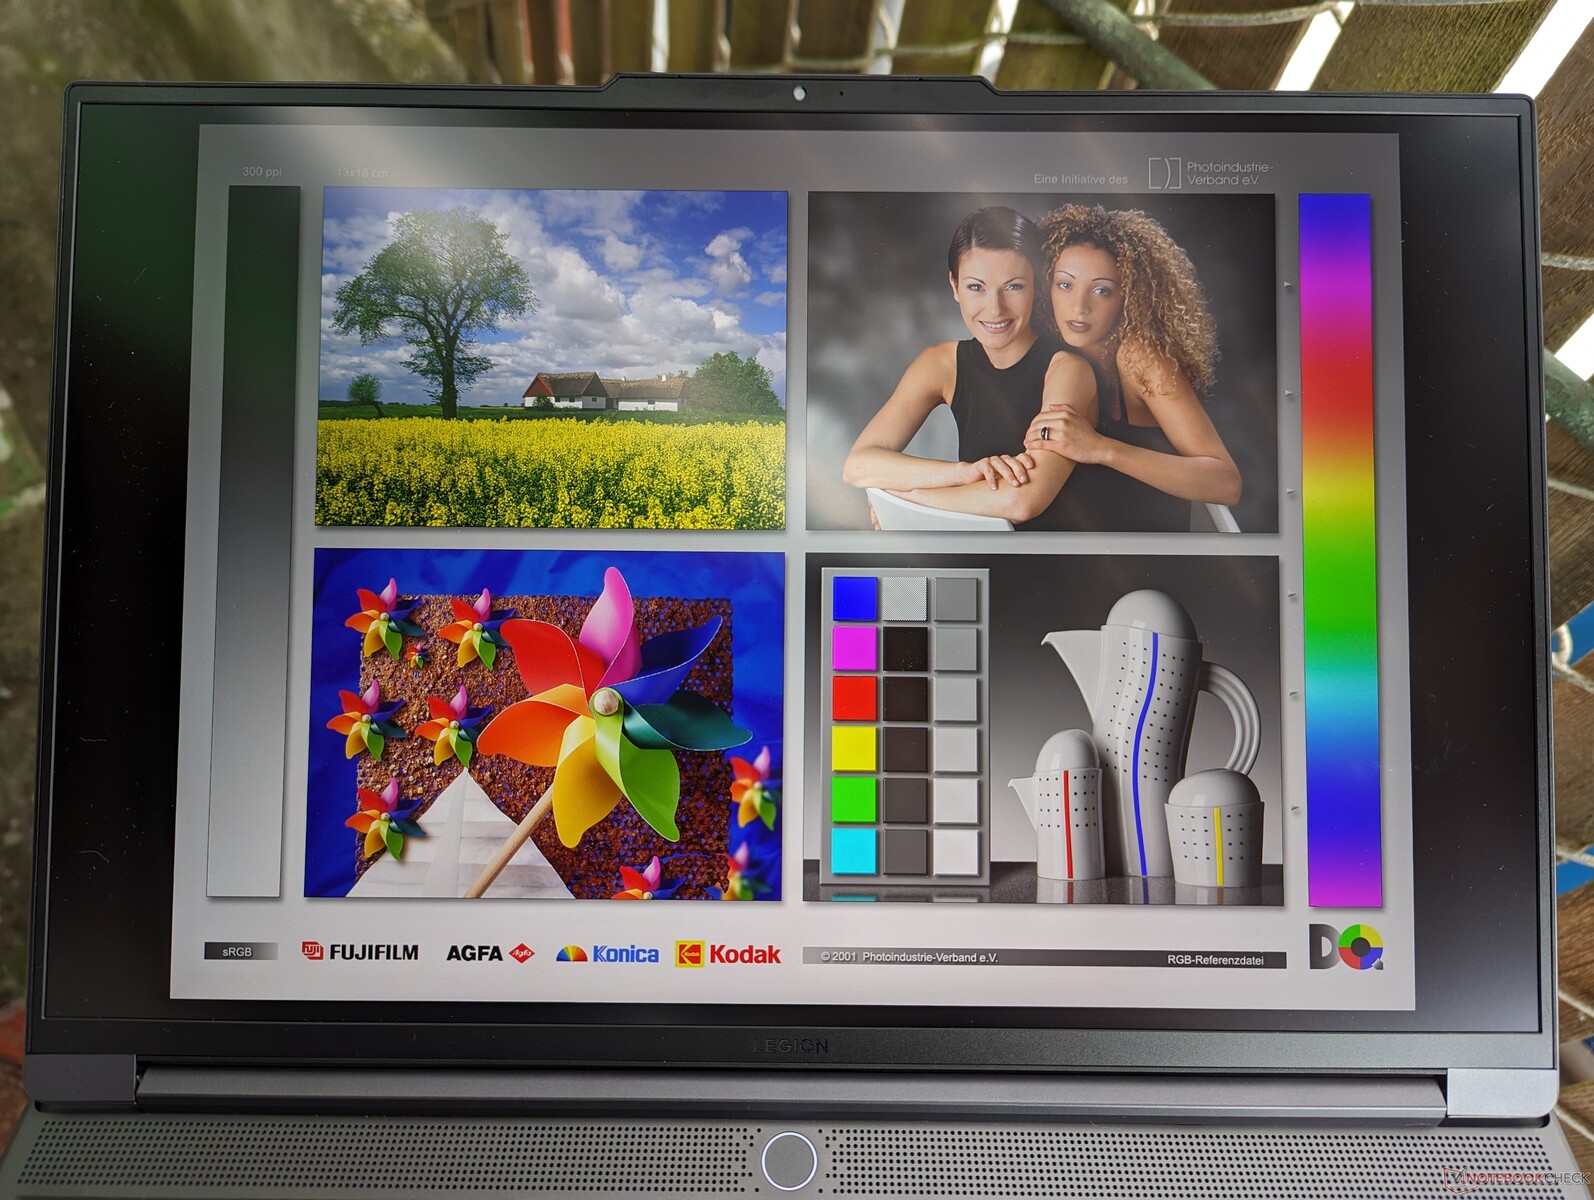
Unsere 1600p-Konfiguration ist mit dem exakt gleichen IPS-Panel MNG007DA2-3 wie das größere und teurere Legion Pro 7 bestückt, die Bildqualität dürfte somit also identisch sein. Obwohl es sich hierbei um das Basisdisplay handelt, handelt es sich um ein High-End-Panel, das fürs Zocken und die Hobby-Bildbearbeitung geeignet ist. Die Ausleuchtung des Bildschirm hätten wir uns aber gerne etwas gleichmäßiger gewünscht, wie die Screenshots unten aufzeigen.


| |||||||||||||||||||||||||
Ausleuchtung: 86 %
Helligkeit Akku: 474.6 cd/m²
Kontrast: 1217:1 (Schwarzwert: 0.39 cd/m²)
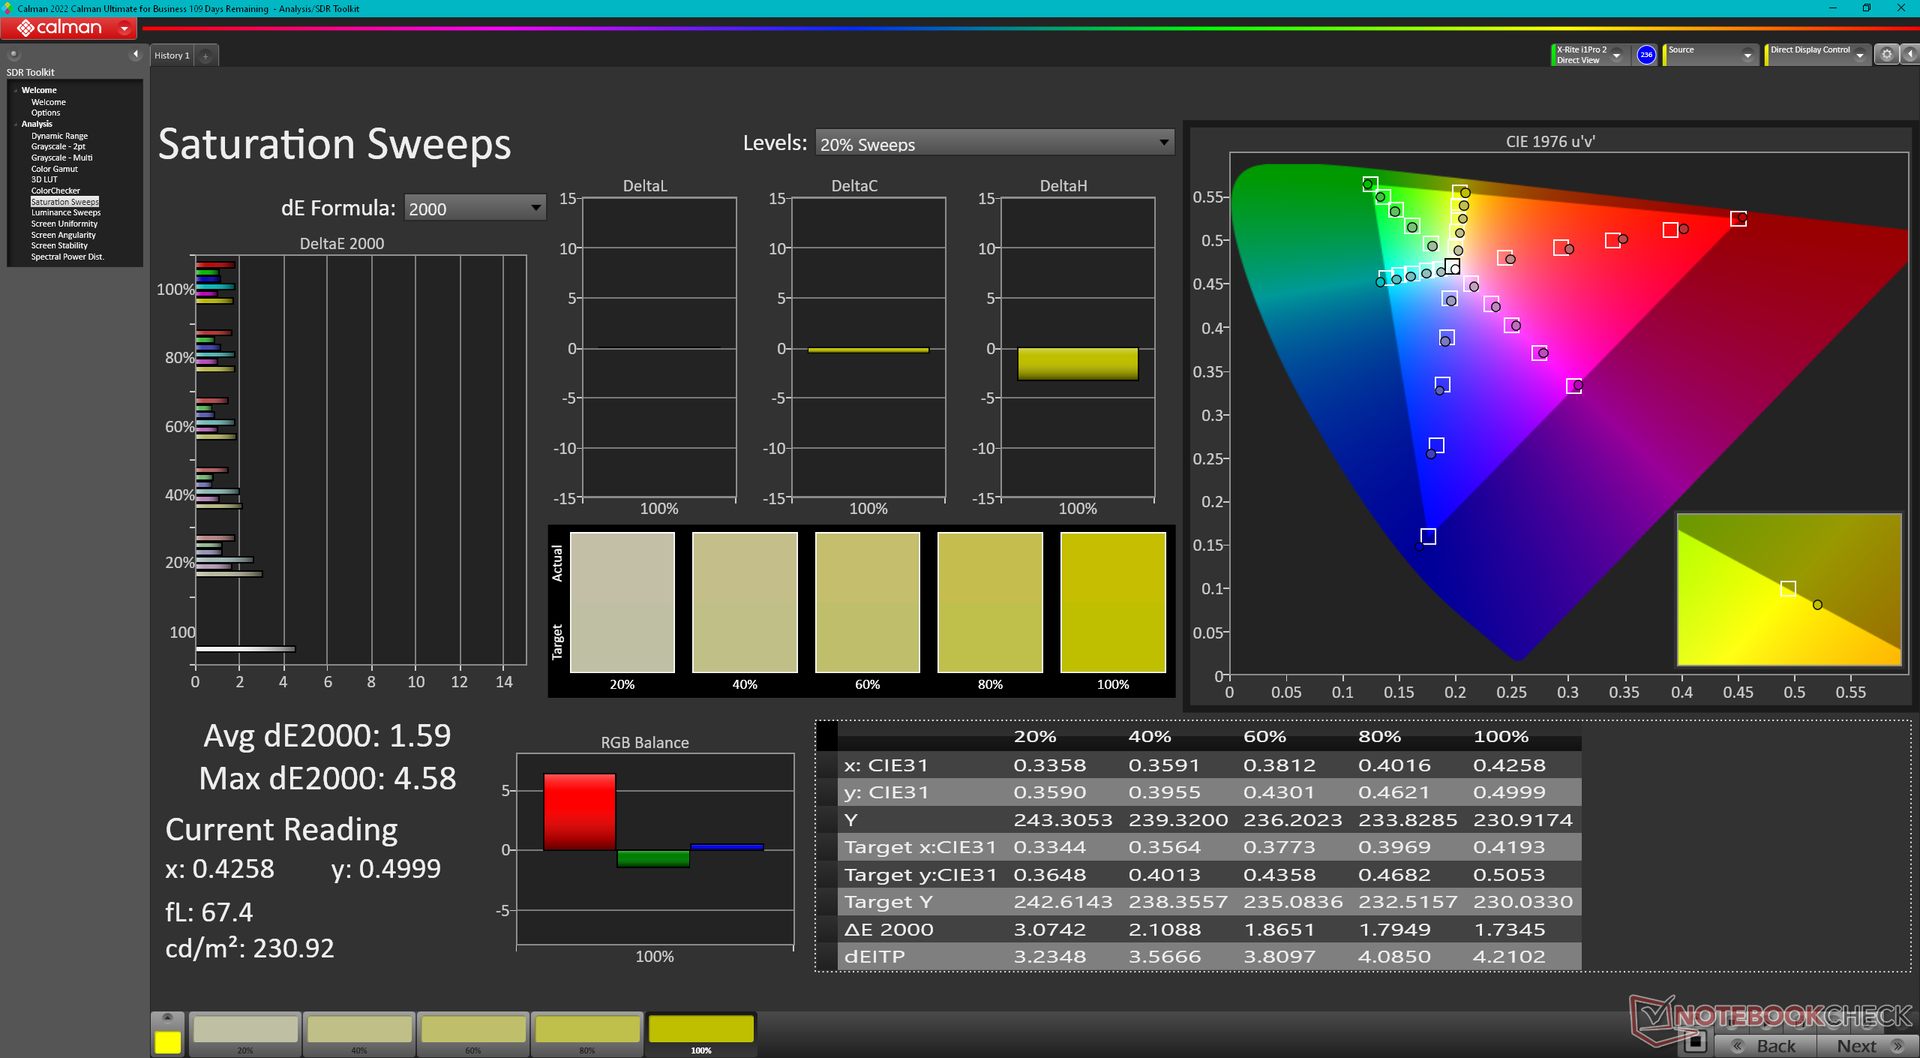
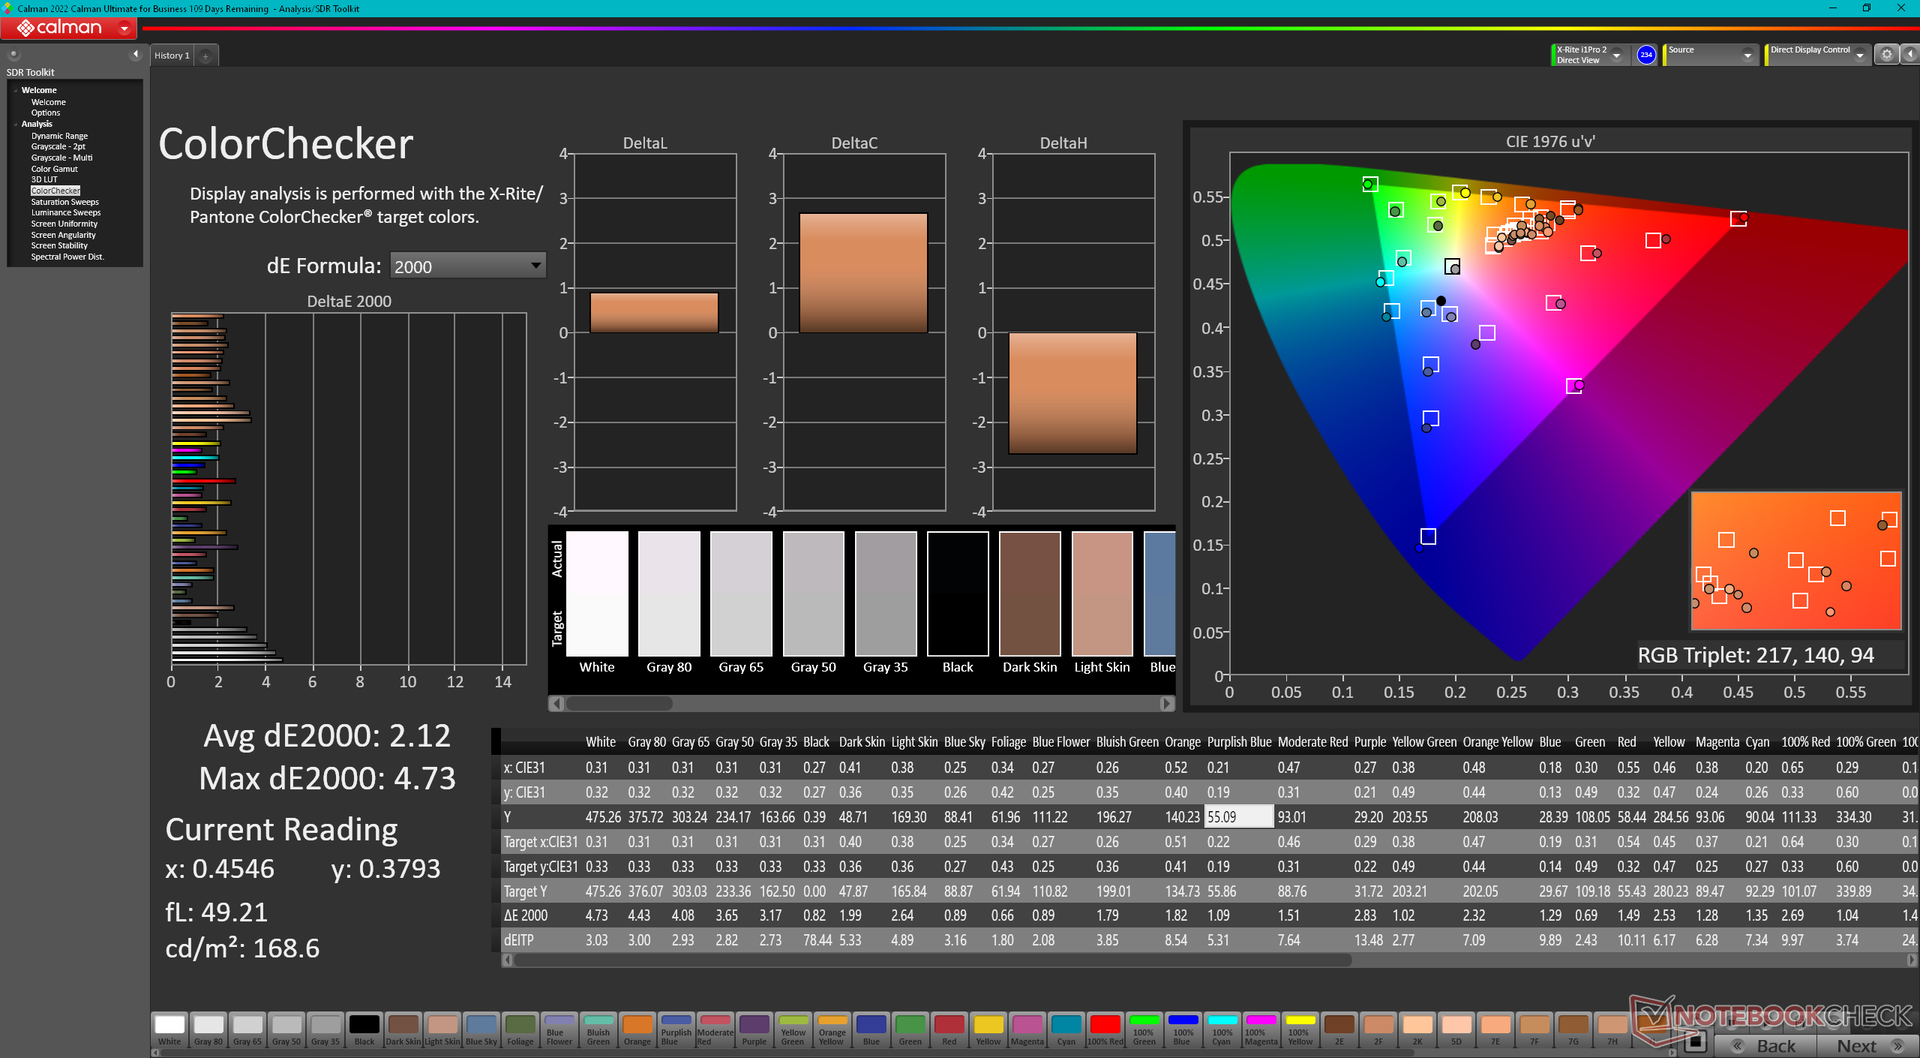
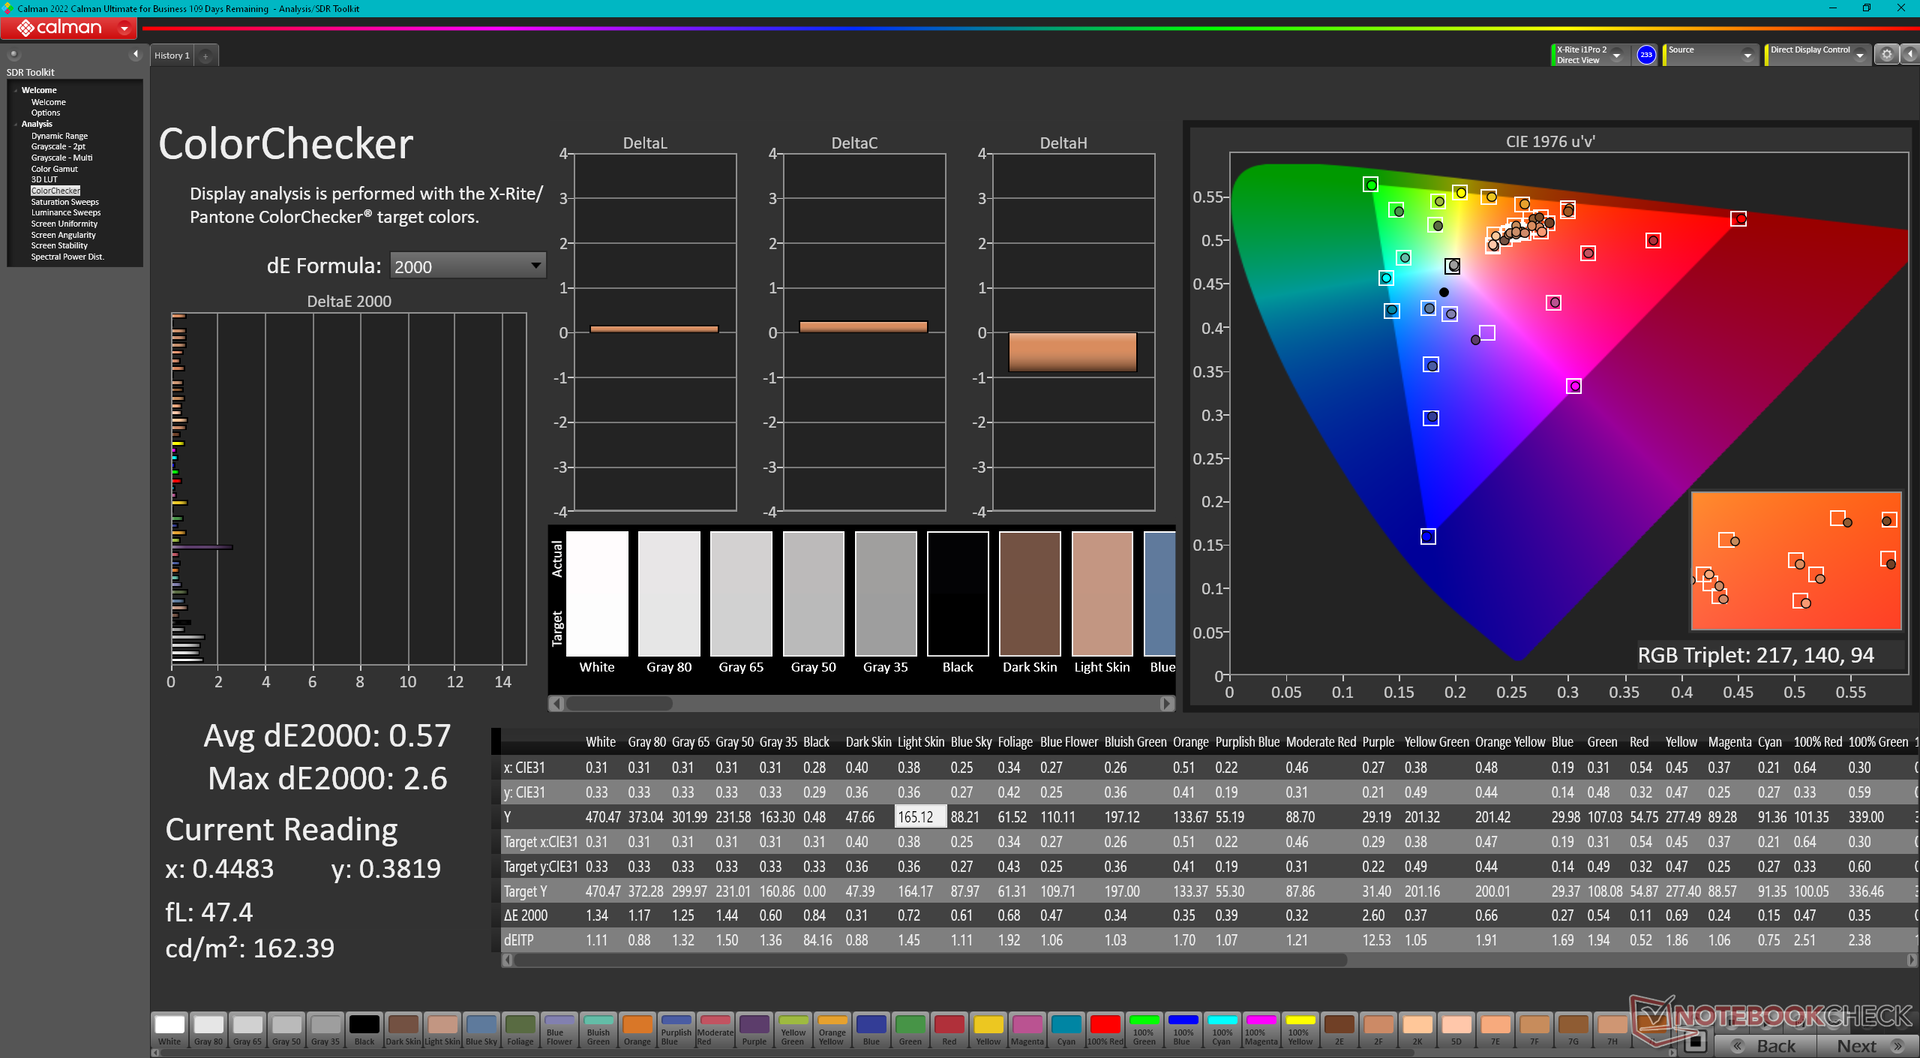
ΔE ColorChecker Calman: 2.12 | ∀{0.5-29.43 Ø4.72}
calibrated: 0.57
ΔE Greyscale Calman: 2.8 | ∀{0.09-98 Ø4.97}
72.5% AdobeRGB 1998 (Argyll 3D)
99.4% sRGB (Argyll 3D)
70.4% Display P3 (Argyll 3D)
Gamma: 2.22
CCT: 6542 K
| Lenovo Legion Slim 7i 16 Gen 8 CSOT T3 MNG007DA2-3, IPS, 2560x1600, 16" | HP Omen 16-wf000 BOE0B7D, IPS, 2560x1440, 16.1" | Alienware x16 R1 BOE NE16NZ4, IPS, 2560x1600, 16" | Lenovo Legion Pro 7 RTX4090 MNG007DA2-3 (CSO1628), IPS, 2560x1600, 16" | Asus ROG Strix G16 G614JZ TL160ADMP03-0, IPS, 2560x1600, 16" | Razer Blade 16 Early 2023 CSOT T3 MNG007DA4-1, IPS, 2560x1600, 16" | |
|---|---|---|---|---|---|---|
| Display | -1% | 21% | -1% | 19% | 22% | |
| Display P3 Coverage (%) | 70.4 | 69 -2% | 99.2 41% | 69.5 -1% | 97 38% | 98.5 40% |
| sRGB Coverage (%) | 99.4 | 99.2 0% | 100 1% | 99.8 0% | 99.9 1% | 100 1% |
| AdobeRGB 1998 Coverage (%) | 72.5 | 71.2 -2% | 88.6 22% | 71.6 -1% | 84.9 17% | 89.7 24% |
| Response Times | 27% | 21% | 29% | 42% | 5% | |
| Response Time Grey 50% / Grey 80% * (ms) | 12 ? | 4.6 ? 62% | 5.1 ? 57% | 10.9 ? 9% | 5.1 ? 57% | 6.6 ? 45% |
| Response Time Black / White * (ms) | 8.9 ? | 9.7 ? -9% | 10.3 ? -16% | 4.6 ? 48% | 6.6 ? 26% | 12 ? -35% |
| PWM Frequency (Hz) | ||||||
| Bildschirm | -5% | -11% | -5% | -4% | -12% | |
| Helligkeit Bildmitte (cd/m²) | 474.6 | 310.9 -34% | 302.2 -36% | 491 3% | 470 -1% | 456.8 -4% |
| Brightness (cd/m²) | 445 | 296 -33% | 285 -36% | 472 6% | 459 3% | 437 -2% |
| Brightness Distribution (%) | 86 | 91 6% | 89 3% | 91 6% | 93 8% | 83 -3% |
| Schwarzwert * (cd/m²) | 0.39 | 0.35 10% | 0.26 33% | 0.4 -3% | 0.42 -8% | 0.35 10% |
| Kontrast (:1) | 1217 | 888 -27% | 1162 -5% | 1228 1% | 1119 -8% | 1305 7% |
| Delta E Colorchecker * | 2.12 | 2.18 -3% | 1.63 23% | 1.6 25% | 1.86 12% | 3.7 -75% |
| Colorchecker dE 2000 max. * | 4.73 | 3.58 24% | 4.13 13% | 5.15 -9% | 3.87 18% | 6.42 -36% |
| Colorchecker dE 2000 calibrated * | 0.57 | 0.52 9% | 1.17 -105% | 0.97 -70% | 0.93 -63% | 0.66 -16% |
| Delta E Graustufen * | 2.8 | 2.8 -0% | 2.5 11% | 3 -7% | 2.7 4% | 2.6 7% |
| Gamma | 2.22 99% | 2.18 101% | 2.23 99% | 2.211 100% | 2.246 98% | 2.3 96% |
| CCT | 6542 99% | 6002 108% | 6590 99% | 6979 93% | 6711 97% | 6108 106% |
| Durchschnitt gesamt (Programm / Settings) | 7% /
0% | 10% /
0% | 8% /
1% | 19% /
7% | 5% /
-3% |
* ... kleinere Werte sind besser
Das Display ist von Werk aus kalibriert und zeigt durchschnittliche DeltaE-Werte von 2,8 und 2,12 für Grauwerte beziehungsweise Farben. Mit unserem X-Rite-Farbmessungsgerät konnten wir diese Werte auf 0,8 und 0,57 verbessern. Eine nachträgliche Kalibrierung ist somit also nicht unbedingt notwendig, auf Wunsch kann aber unser oben zur Verfügung gestelltes ICM-Profil kostenlos heruntergeladen werden.


Reaktionszeiten (Response Times) des Displays
| ↔ Reaktionszeiten Schwarz zu Weiß | ||
|---|---|---|
| 8.9 ms ... steigend ↗ und fallend ↘ kombiniert | ↗ 5.1 ms steigend | 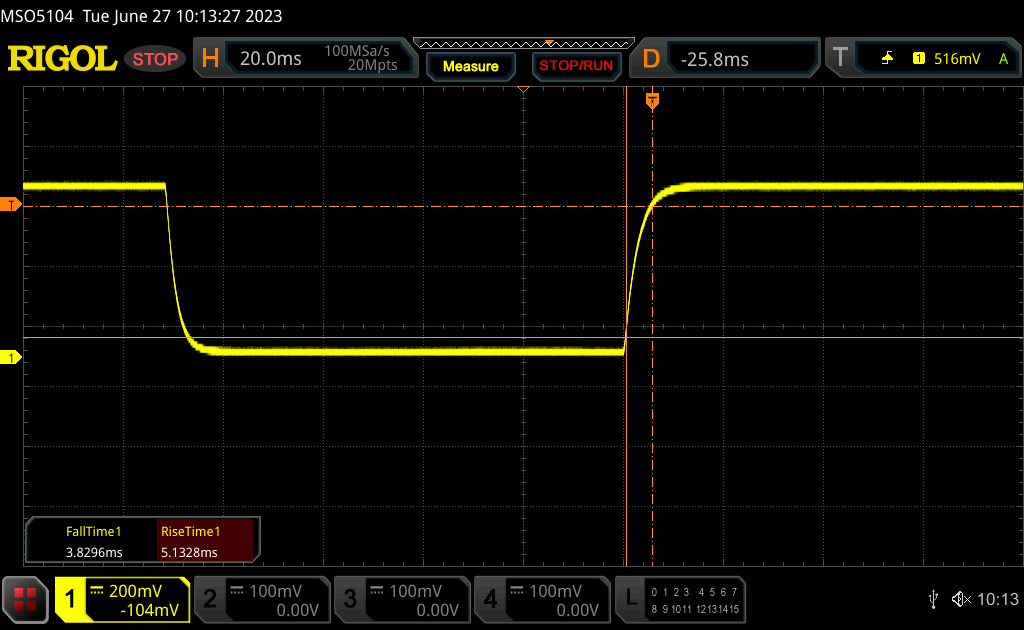 |
| ↘ 3.8 ms fallend | ||
| Die gemessenen Reaktionszeiten sind kurz wodurch sich der Bildschirm auch für Spiele gut eignen sollte. Im Vergleich rangierten die bei uns getesteten Geräte von 0.1 (Minimum) zu 240 (Maximum) ms. » 25 % aller Screens waren schneller als der getestete. Daher sind die gemessenen Reaktionszeiten besser als der Durchschnitt aller vermessenen Geräte (19.8 ms). | ||
| ↔ Reaktionszeiten 50% Grau zu 80% Grau | ||
| 12 ms ... steigend ↗ und fallend ↘ kombiniert | ↗ 6 ms steigend | 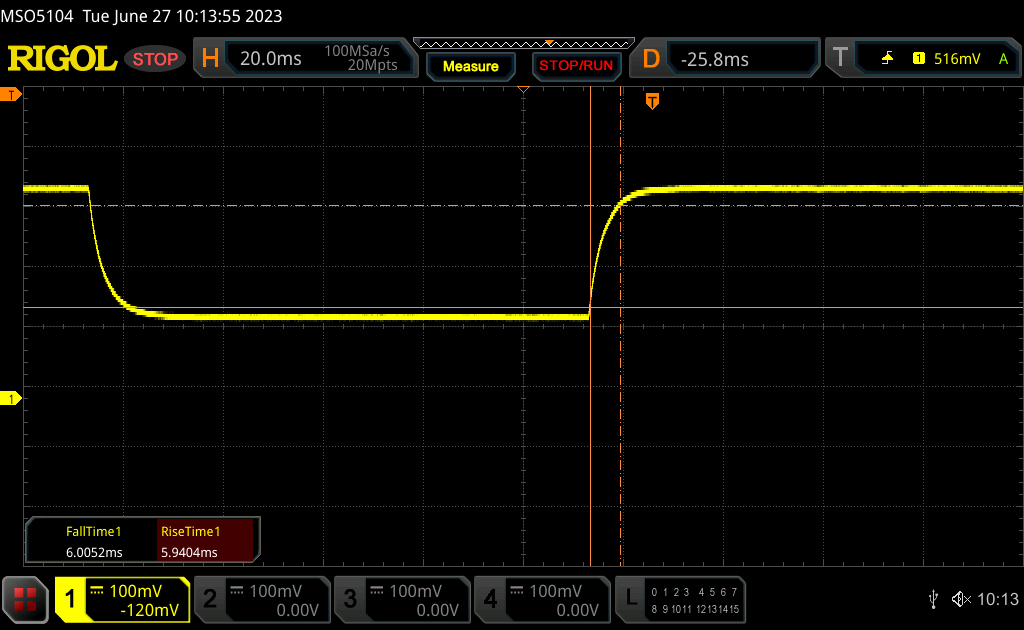 |
| ↘ 6 ms fallend | ||
| Die gemessenen Reaktionszeiten sind gut, für anspruchsvolle Spieler könnten der Bildschirm jedoch zu langsam sein. Im Vergleich rangierten die bei uns getesteten Geräte von 0.165 (Minimum) zu 636 (Maximum) ms. » 25 % aller Screens waren schneller als der getestete. Daher sind die gemessenen Reaktionszeiten besser als der Durchschnitt aller vermessenen Geräte (31 ms). | ||
Bildschirm-Flackern / PWM (Pulse-Width Modulation)
| Flackern / PWM nicht festgestellt | 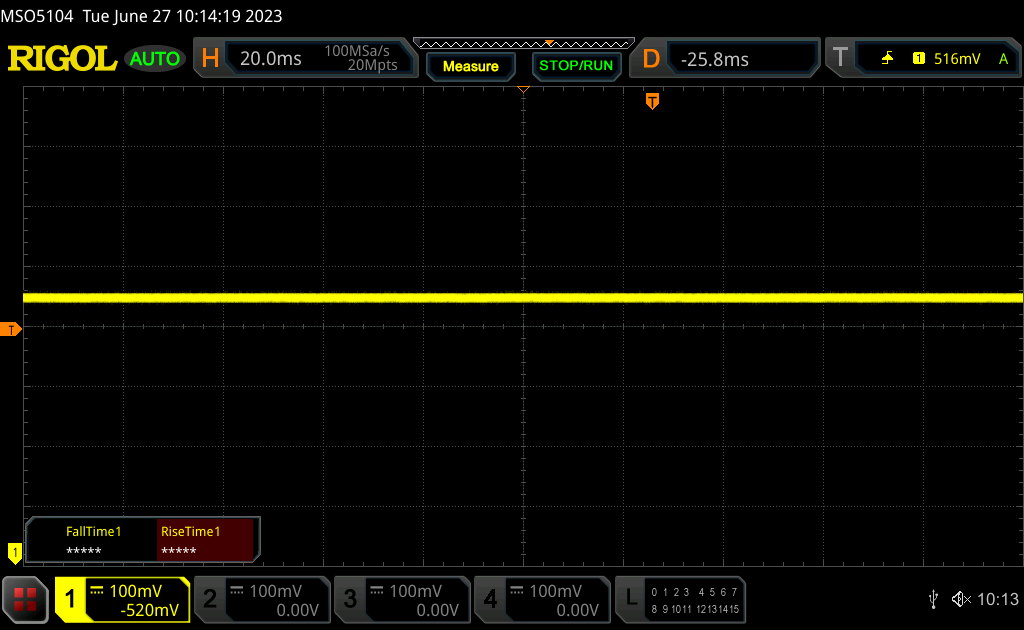 | ||
Im Vergleich: 52 % aller getesteten Geräte nutzten kein PWM um die Helligkeit zu reduzieren. Wenn PWM eingesetzt wurde, dann bei einer Frequenz von durchschnittlich 7769 (Minimum 5, Maximum 343500) Hz. | |||
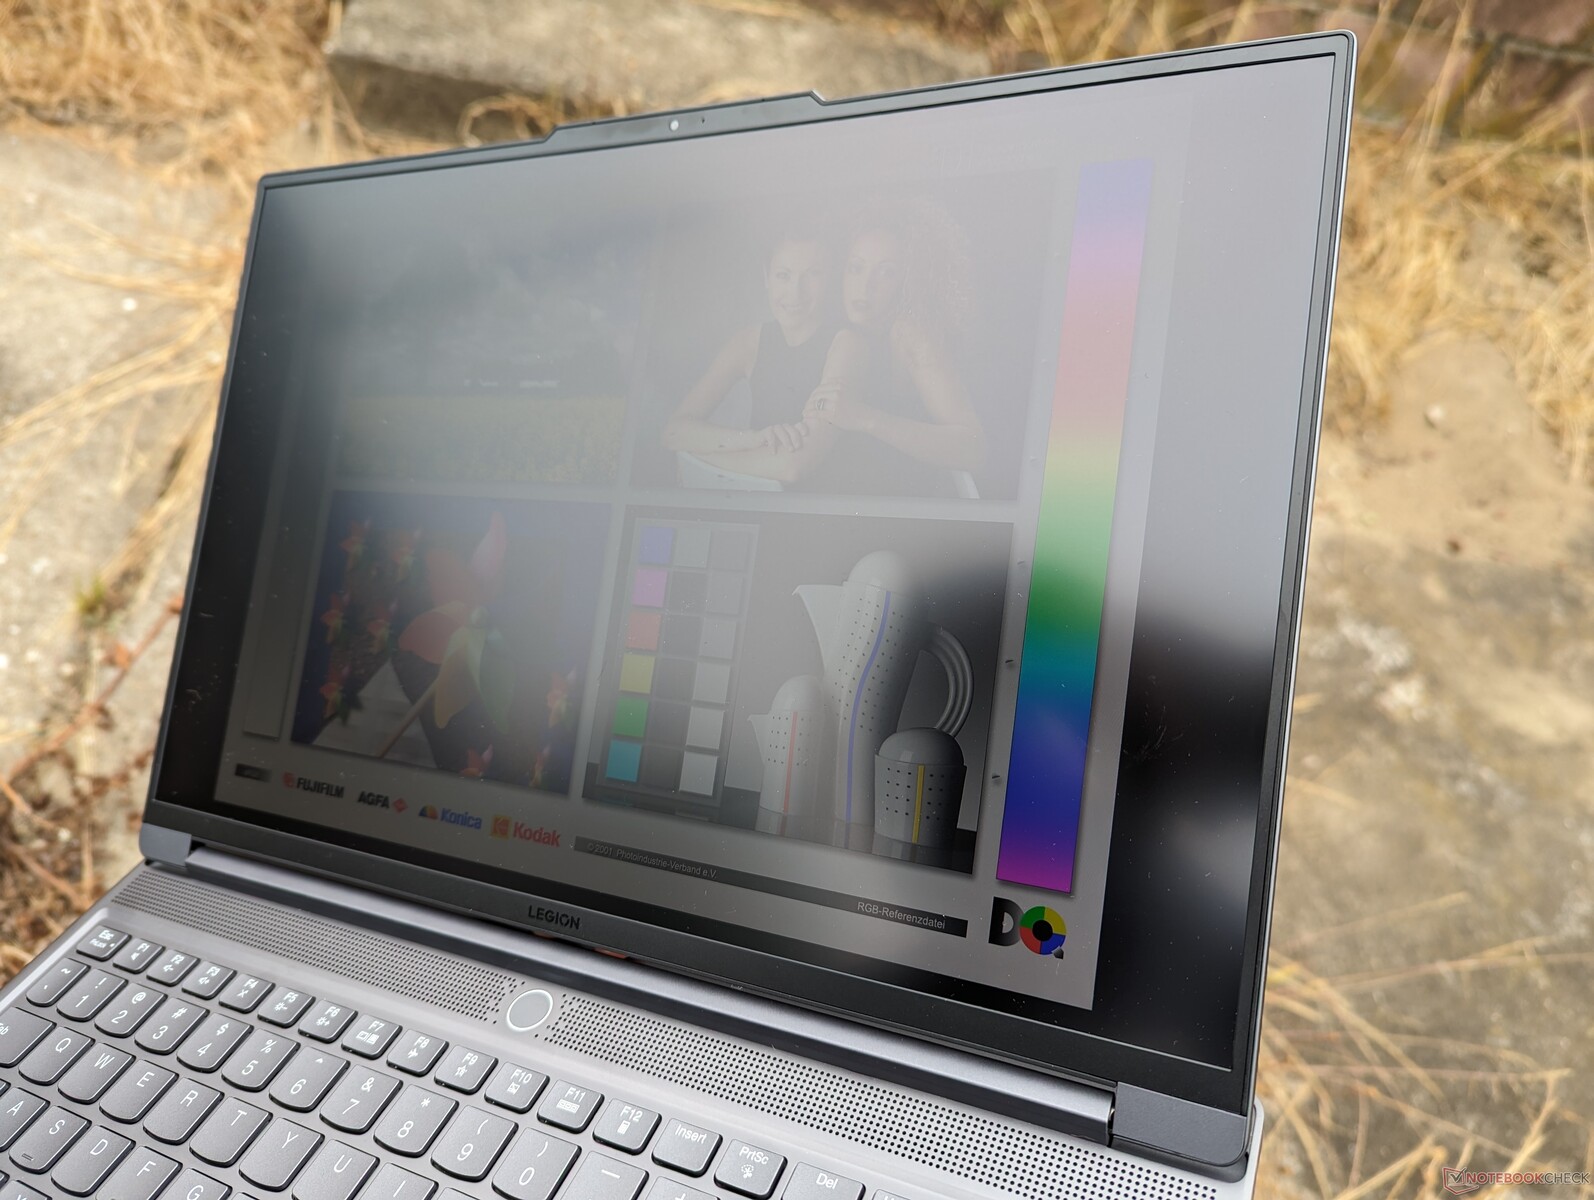
Das Display ist merklich heller und draußen deshalb besser abzulesen als beim Omen 16 oder Alienware x16 R1. Tatsächlich ist die Spitzenhelligkeit nur rund 10 Prozent dunkler als beim MacBook Pro 16.

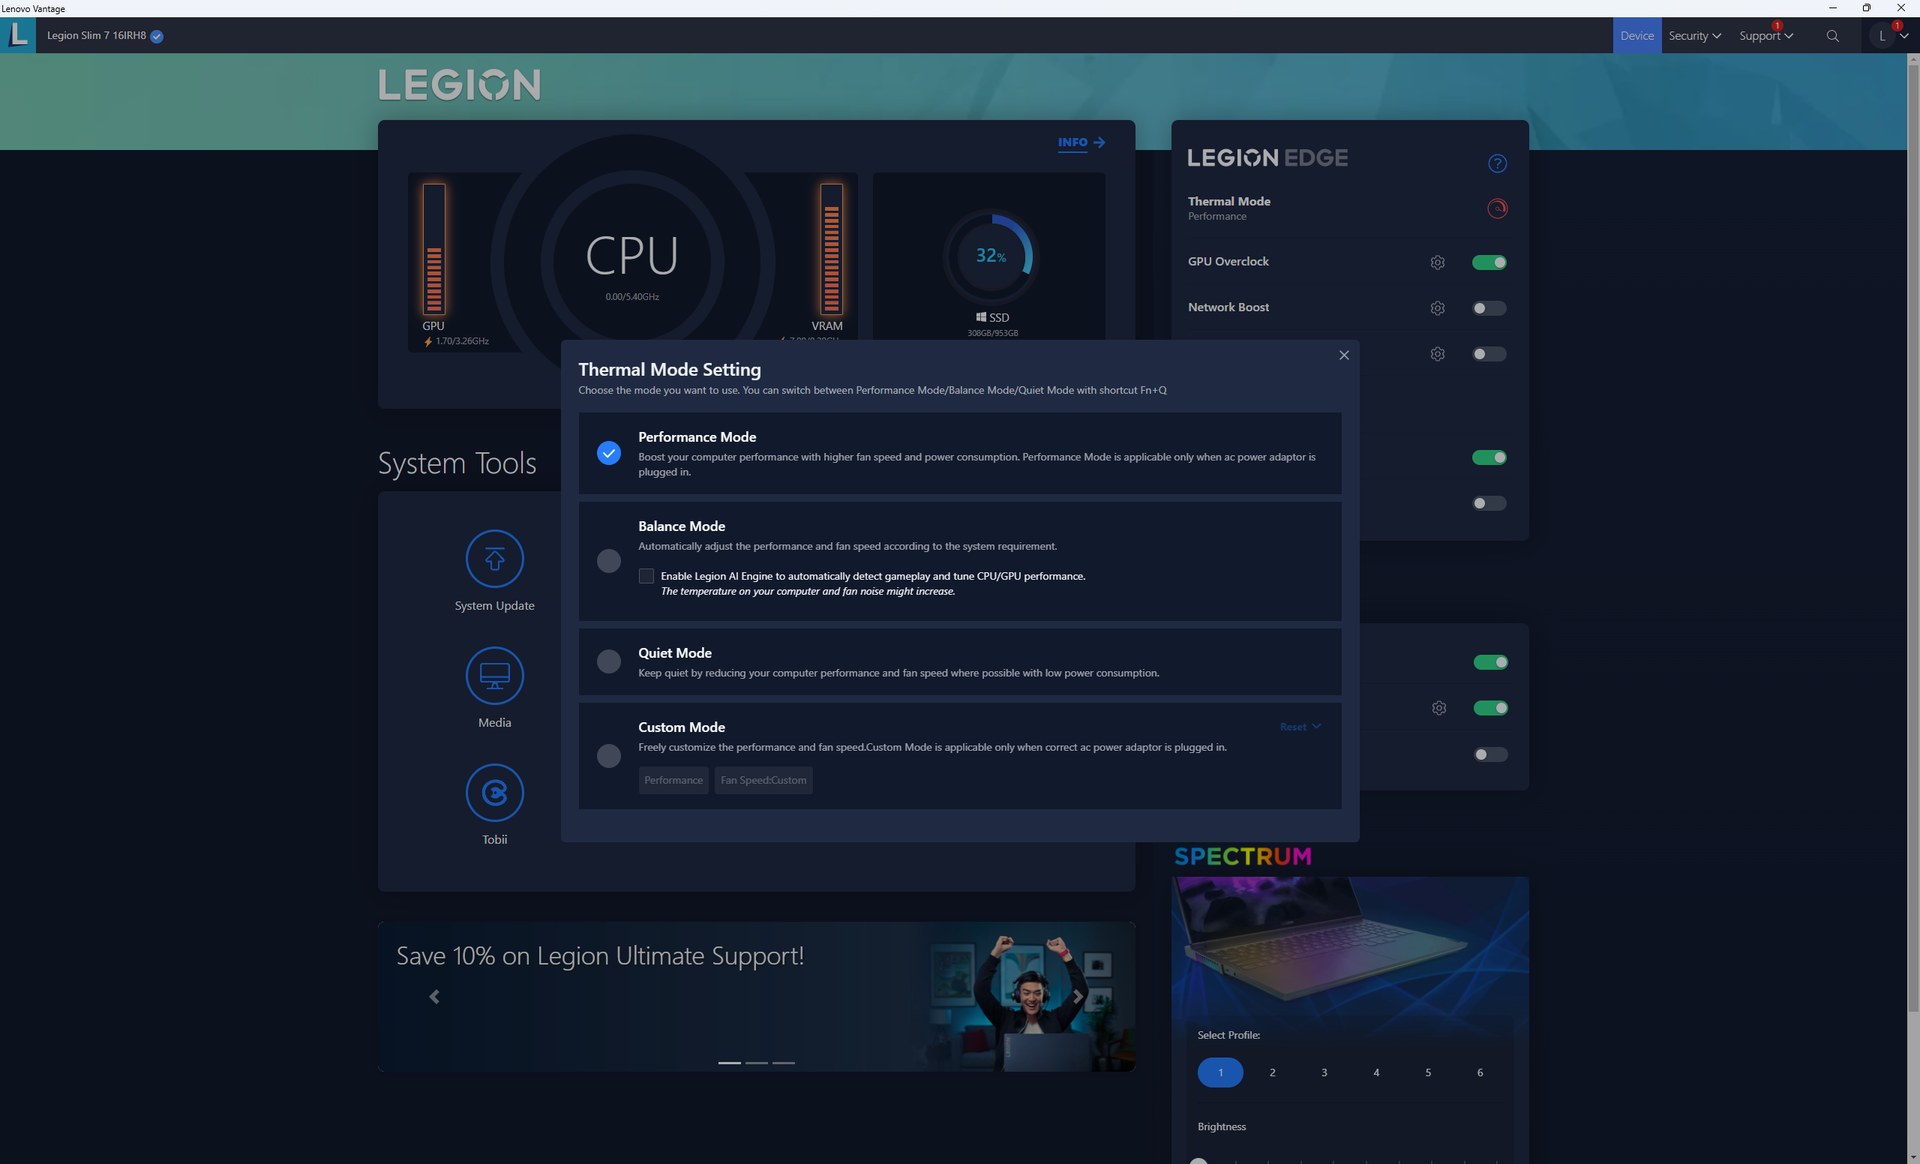
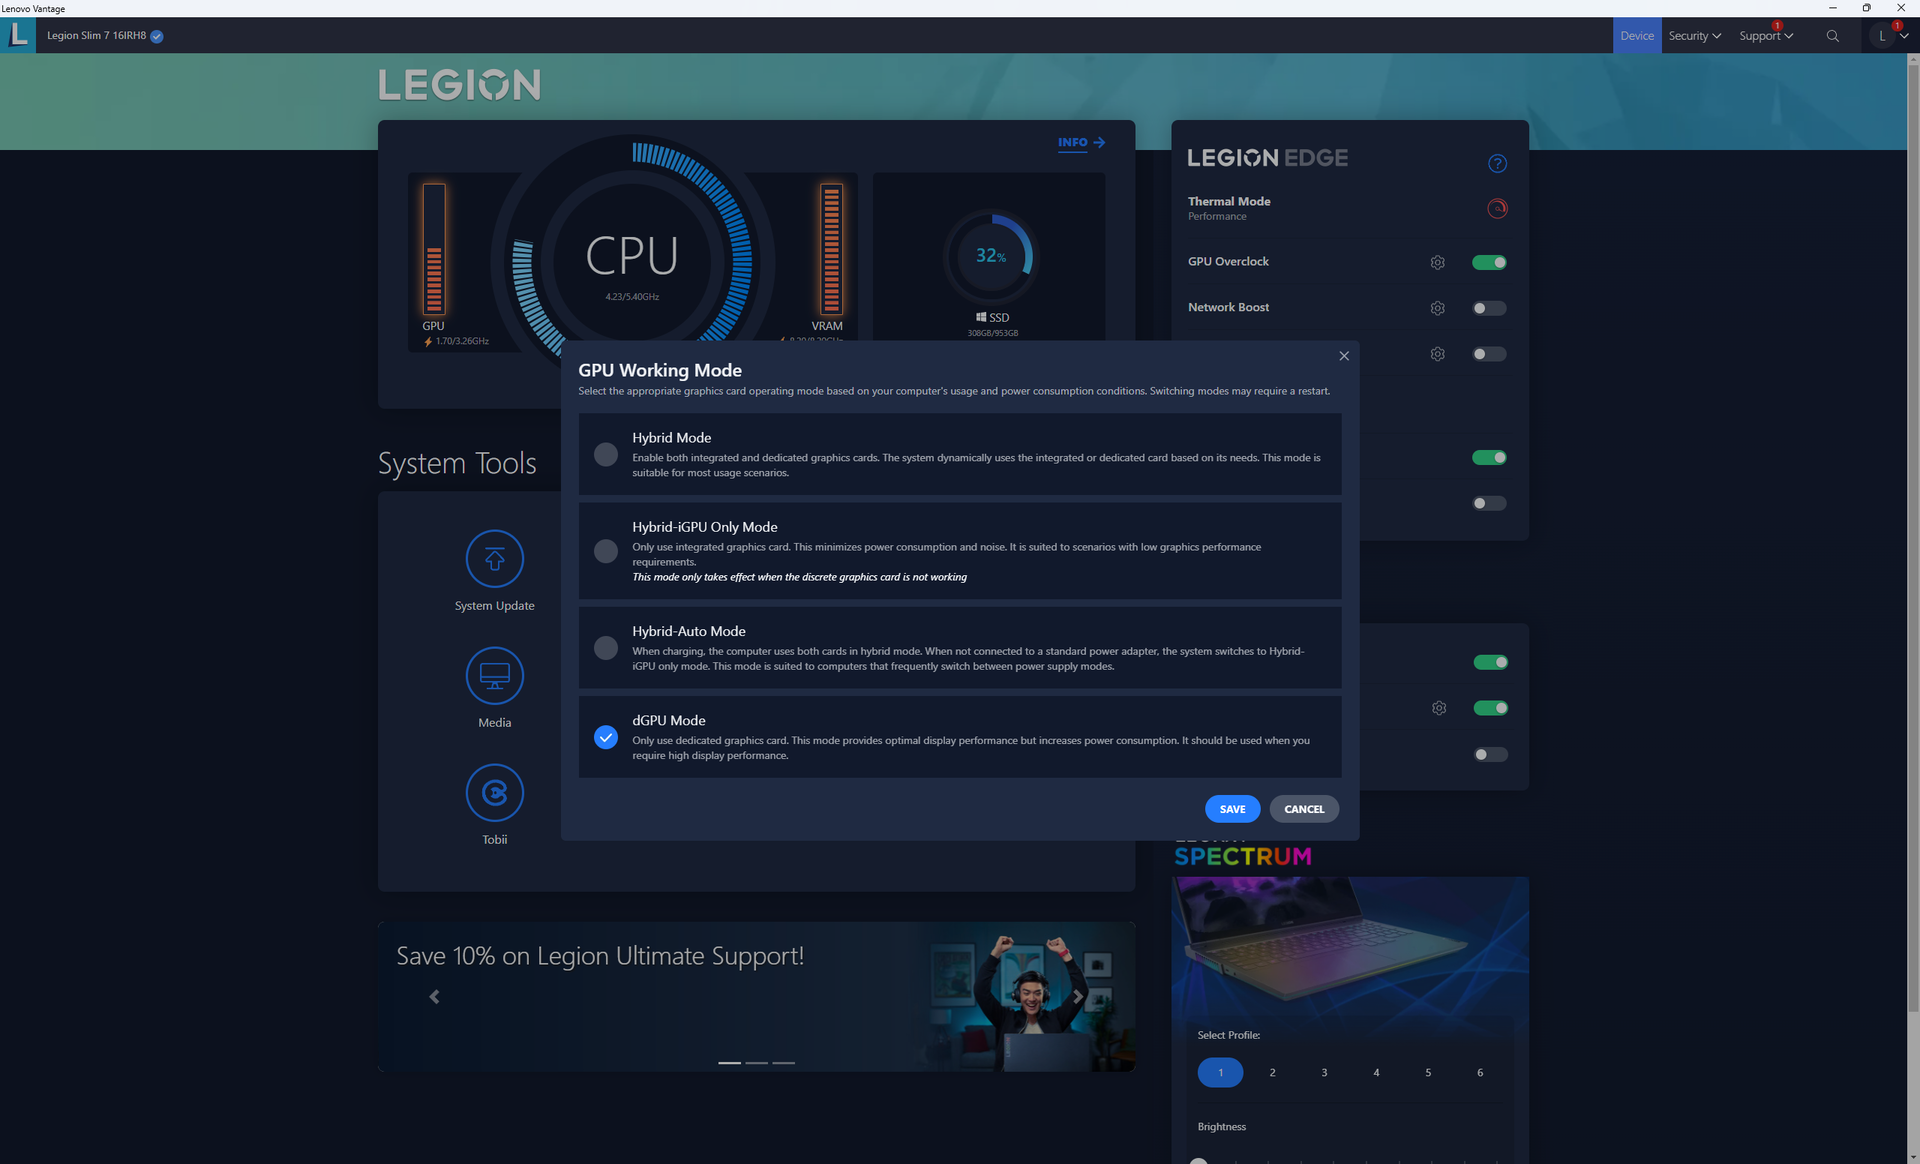
Leistung — Core i9 der 13. Generation
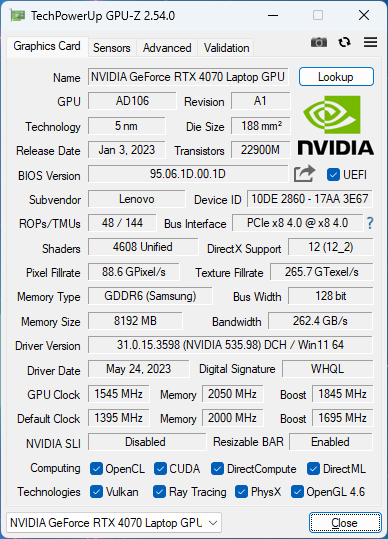

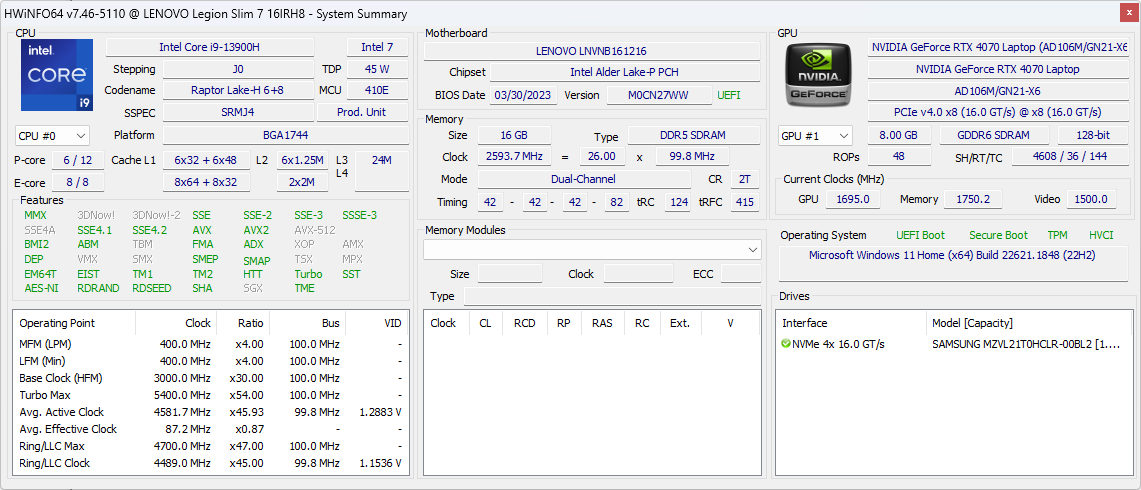
Testbedingungen
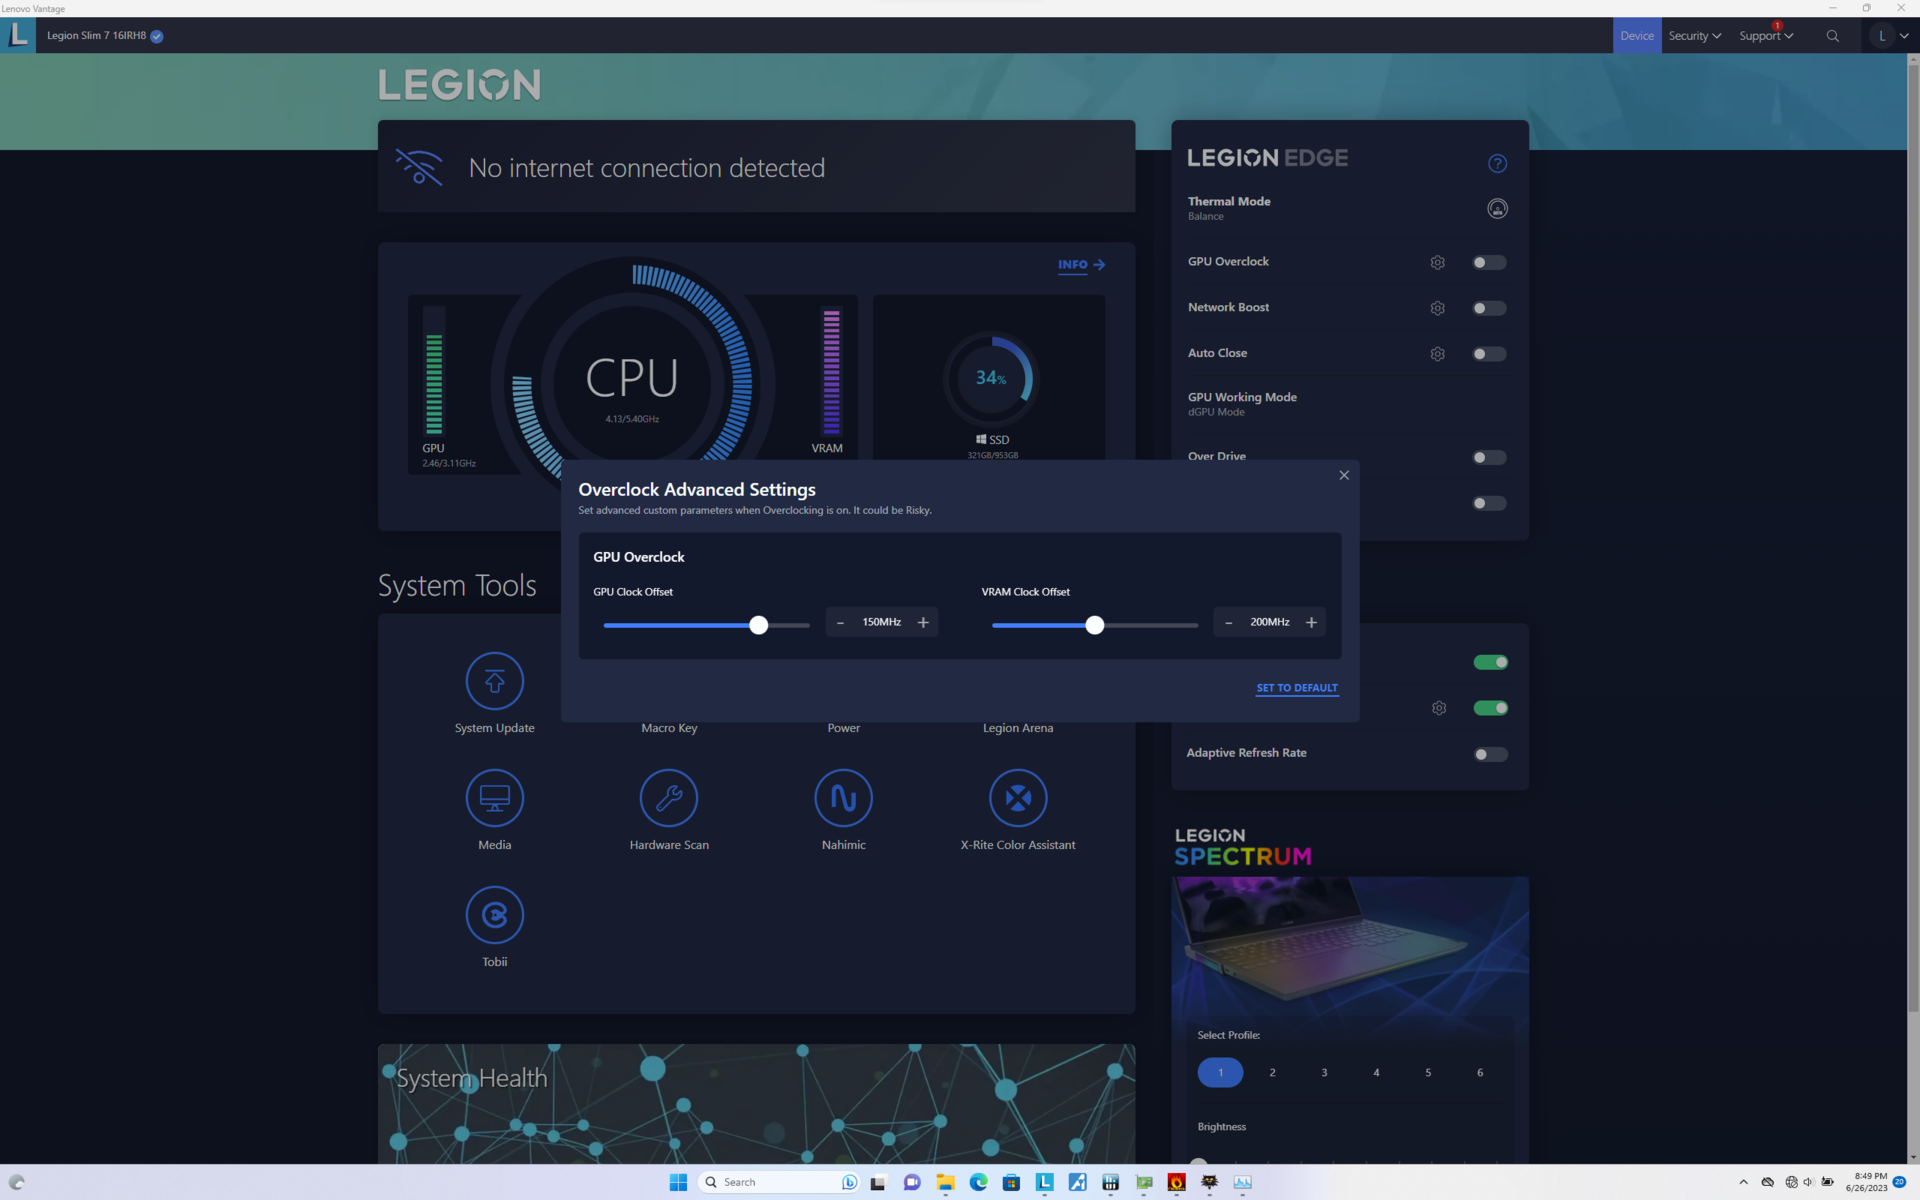
Beim Durchführen der Benchmarks haben wir unser Testgerät im dGPU- und Leistungsmodus mit aktivierter GPU-Übertaktung und Overdrive laufen lassen. Das Lenovo Vantage Kontrollzentrum bietet die Anpassung der Leistungsmodi, Software-Updates, Garantieinformationen, RGB-Einstellungen und weitere Funktionen.
Der Advanced Optimus MUX-Switch wird unterstützt.
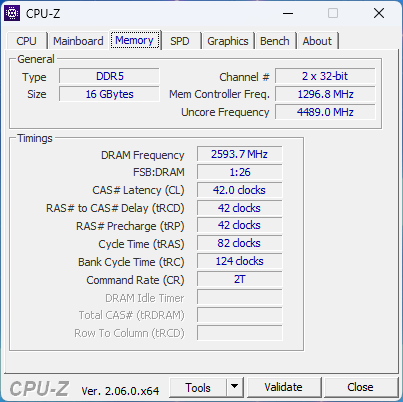
Es sollte beachtet werden, dass der SODIMM-Slot unseres Testgeräts nicht belegt war, weshalb die 16GB RAM im Single-Channel-Modus liefen. Die Ergebnisse des AIDA64 Arbeitsspeicher-Benchmarks sind deshalb auch sehr viel niedriger als bei vielen anderen Gaming-Laptops.

Prozessor
Der Core i9-13900H aus der Raptor-Lake-H-Familie bietet respektable 25 Prozent mehr Multi-Thread-Leistung als der auf Alder Lake basierende Core i9-12900H. Der Chip performt praktisch genauso gut wie die teureren Core i7-13700HX und Core i9-13900HK. Wer sich jemals zwischen diesen drei CPUs der 13. Generation entscheiden muss, der sollte für das beste Preis-Leistungsverhältnis also den Core i9-13900H wählen.
Das Downgrade auf das Basismodell mit dem Core i7-13700H dürfte zu einer circa 20 bis 25 Prozent geringeren CPU-Leistung führen.
Cinebench R15 Dauertest
Cinebench R20: CPU (Multi Core) | CPU (Single Core)
Cinebench R23: Multi Core | Single Core
Cinebench R15: CPU Multi 64Bit | CPU Single 64Bit
Blender: v2.79 BMW27 CPU
7-Zip 18.03: 7z b 4 | 7z b 4 -mmt1
Geekbench 5.5: Multi-Core | Single-Core
HWBOT x265 Benchmark v2.2: 4k Preset
LibreOffice : 20 Documents To PDF
R Benchmark 2.5: Overall mean
* ... kleinere Werte sind besser
AIDA64: FP32 Ray-Trace | FPU Julia | CPU SHA3 | CPU Queen | FPU SinJulia | FPU Mandel | CPU AES | CPU ZLib | FP64 Ray-Trace | CPU PhotoWorxx
| Performance Rating | |
| Lenovo Legion Pro 7 RTX4090 | |
| Asus ROG Strix G16 G614JZ | |
| Razer Blade 16 Early 2023 | |
| Alienware x16 R1 | |
| HP Omen 16-wf000 | |
| Lenovo Legion Slim 7i 16 Gen 8 | |
| Durchschnittliche Intel Core i9-13900H | |
| AIDA64 / FP32 Ray-Trace | |
| Asus ROG Strix G16 G614JZ | |
| Lenovo Legion Pro 7 RTX4090 | |
| Razer Blade 16 Early 2023 | |
| Razer Blade 16 Early 2023 | |
| Razer Blade 16 Early 2023 | |
| HP Omen 16-wf000 | |
| Alienware x16 R1 | |
| Lenovo Legion Slim 7i 16 Gen 8 | |
| Durchschnittliche Intel Core i9-13900H (6788 - 19557, n=25) | |
| AIDA64 / FPU Julia | |
| Lenovo Legion Pro 7 RTX4090 | |
| Asus ROG Strix G16 G614JZ | |
| Razer Blade 16 Early 2023 | |
| Razer Blade 16 Early 2023 | |
| Razer Blade 16 Early 2023 | |
| HP Omen 16-wf000 | |
| Alienware x16 R1 | |
| Lenovo Legion Slim 7i 16 Gen 8 | |
| Durchschnittliche Intel Core i9-13900H (22551 - 95579, n=25) | |
| AIDA64 / CPU SHA3 | |
| Lenovo Legion Pro 7 RTX4090 | |
| Asus ROG Strix G16 G614JZ | |
| Razer Blade 16 Early 2023 | |
| Razer Blade 16 Early 2023 | |
| Razer Blade 16 Early 2023 | |
| HP Omen 16-wf000 | |
| Alienware x16 R1 | |
| Lenovo Legion Slim 7i 16 Gen 8 | |
| Durchschnittliche Intel Core i9-13900H (2491 - 4270, n=25) | |
| AIDA64 / CPU Queen | |
| Asus ROG Strix G16 G614JZ | |
| Lenovo Legion Pro 7 RTX4090 | |
| Razer Blade 16 Early 2023 | |
| Razer Blade 16 Early 2023 | |
| Lenovo Legion Slim 7i 16 Gen 8 | |
| Alienware x16 R1 | |
| Durchschnittliche Intel Core i9-13900H (65121 - 120936, n=25) | |
| HP Omen 16-wf000 | |
| AIDA64 / FPU SinJulia | |
| Asus ROG Strix G16 G614JZ | |
| Razer Blade 16 Early 2023 | |
| Razer Blade 16 Early 2023 | |
| Razer Blade 16 Early 2023 | |
| Lenovo Legion Pro 7 RTX4090 | |
| HP Omen 16-wf000 | |
| Alienware x16 R1 | |
| Lenovo Legion Slim 7i 16 Gen 8 | |
| Durchschnittliche Intel Core i9-13900H (6108 - 11631, n=25) | |
| AIDA64 / FPU Mandel | |
| Lenovo Legion Pro 7 RTX4090 | |
| Asus ROG Strix G16 G614JZ | |
| Razer Blade 16 Early 2023 | |
| Razer Blade 16 Early 2023 | |
| Razer Blade 16 Early 2023 | |
| HP Omen 16-wf000 | |
| Alienware x16 R1 | |
| Lenovo Legion Slim 7i 16 Gen 8 | |
| Durchschnittliche Intel Core i9-13900H (11283 - 48474, n=25) | |
| AIDA64 / CPU AES | |
| Razer Blade 16 Early 2023 | |
| Razer Blade 16 Early 2023 | |
| Razer Blade 16 Early 2023 | |
| Lenovo Legion Pro 7 RTX4090 | |
| Asus ROG Strix G16 G614JZ | |
| HP Omen 16-wf000 | |
| Durchschnittliche Intel Core i9-13900H (3691 - 149377, n=25) | |
| Alienware x16 R1 | |
| Lenovo Legion Slim 7i 16 Gen 8 | |
| AIDA64 / CPU ZLib | |
| Lenovo Legion Pro 7 RTX4090 | |
| Asus ROG Strix G16 G614JZ | |
| Razer Blade 16 Early 2023 | |
| Razer Blade 16 Early 2023 | |
| Razer Blade 16 Early 2023 | |
| HP Omen 16-wf000 | |
| Lenovo Legion Slim 7i 16 Gen 8 | |
| Alienware x16 R1 | |
| Durchschnittliche Intel Core i9-13900H (789 - 1254, n=25) | |
| AIDA64 / FP64 Ray-Trace | |
| Asus ROG Strix G16 G614JZ | |
| Lenovo Legion Pro 7 RTX4090 | |
| Razer Blade 16 Early 2023 | |
| Razer Blade 16 Early 2023 | |
| Razer Blade 16 Early 2023 | |
| HP Omen 16-wf000 | |
| Alienware x16 R1 | |
| Lenovo Legion Slim 7i 16 Gen 8 | |
| Durchschnittliche Intel Core i9-13900H (3655 - 10716, n=25) | |
| AIDA64 / CPU PhotoWorxx | |
| Razer Blade 16 Early 2023 | |
| Razer Blade 16 Early 2023 | |
| Razer Blade 16 Early 2023 | |
| Lenovo Legion Pro 7 RTX4090 | |
| Alienware x16 R1 | |
| HP Omen 16-wf000 | |
| Durchschnittliche Intel Core i9-13900H (10871 - 50488, n=25) | |
| Asus ROG Strix G16 G614JZ | |
| Lenovo Legion Slim 7i 16 Gen 8 | |
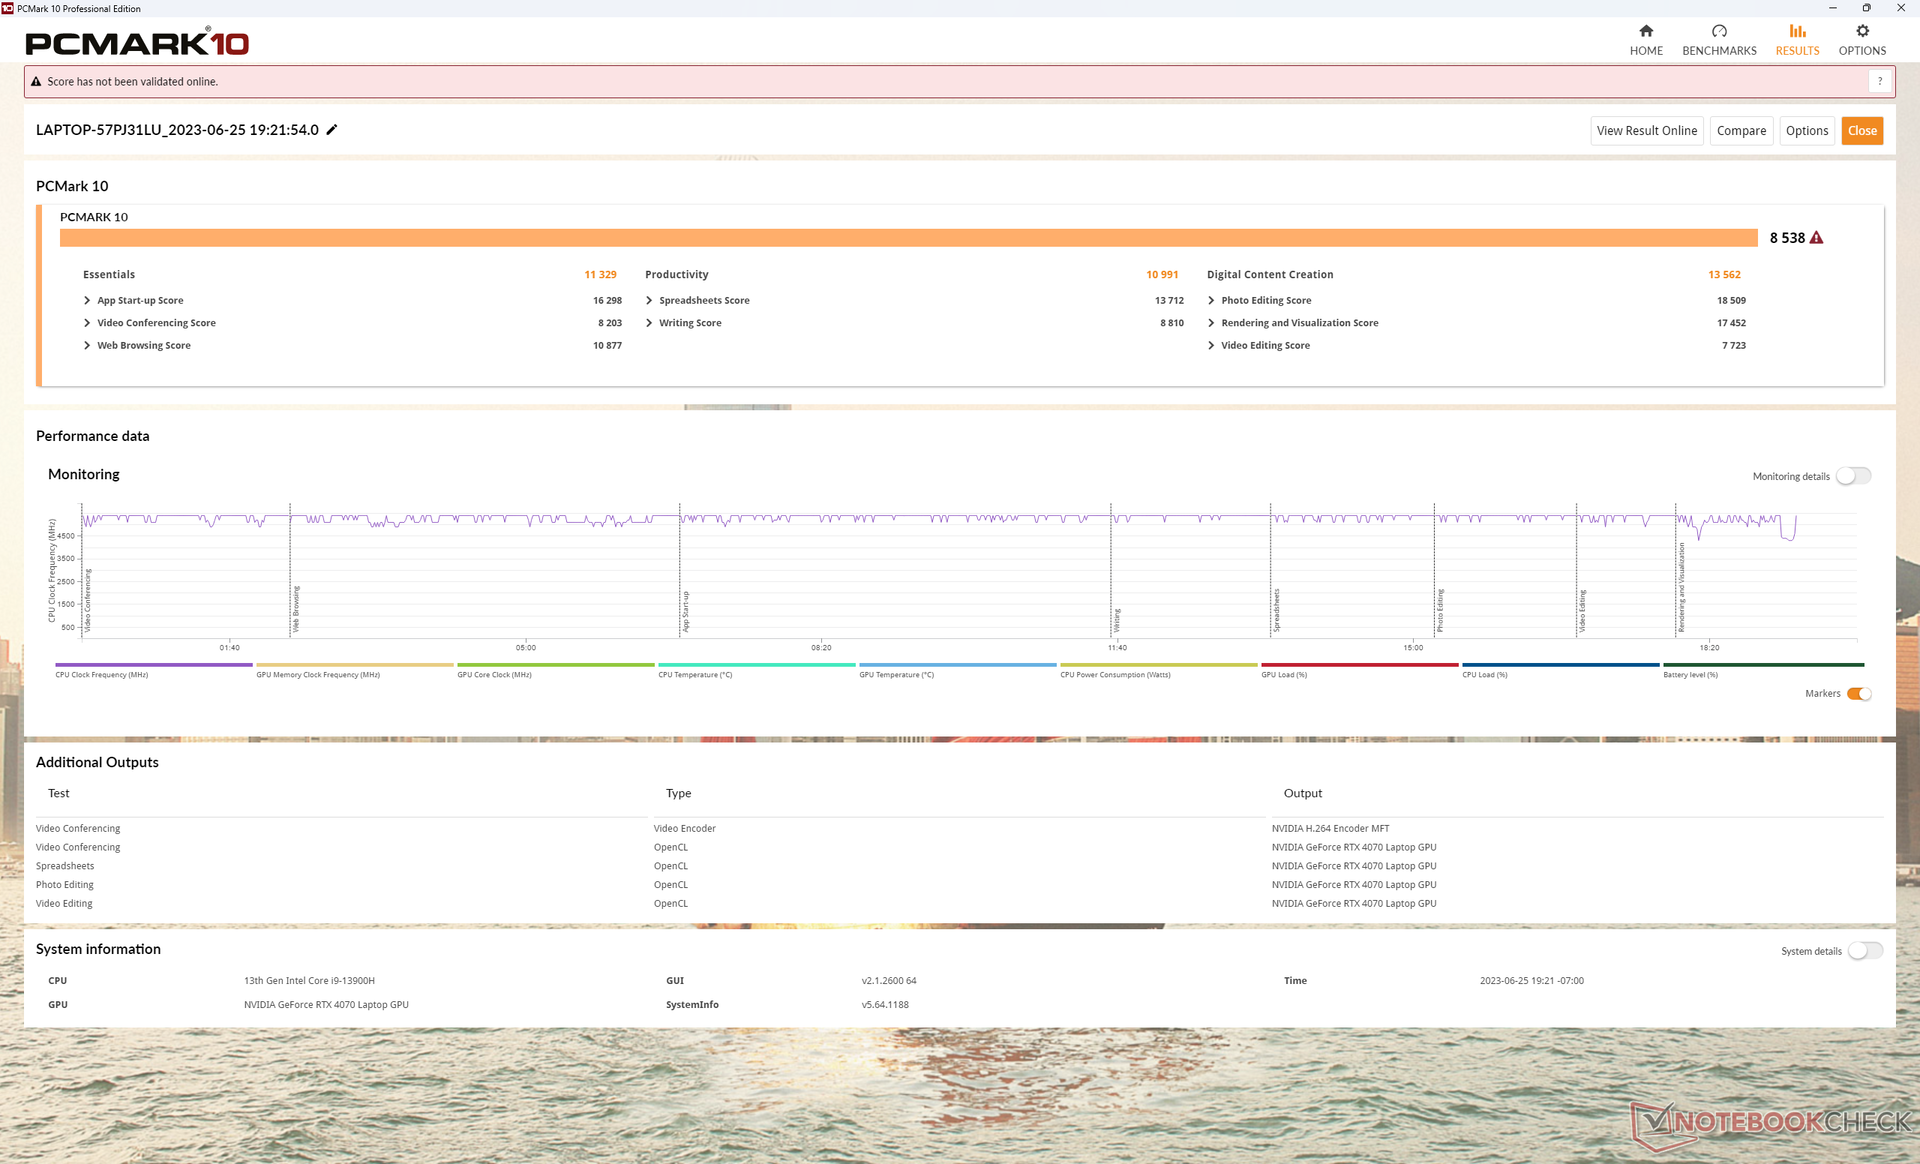
Systemleistung
Die PCMark-Ergebnisse sind exzellent und vergleichbar mit anderen High-End-Gaming-Notebooks. Wir haben allerdings Probleme beim Aufwecken des Laptops beobachtet, der Bildschirm bleibt manchmal bis zu 10 Sekunden lang schwarz, während die meisten anderen Notebooks schon nach ein paar Sekunden einsatzbereit sind.
CrossMark: Overall | Productivity | Creativity | Responsiveness
| PCMark 10 / Score | |
| Lenovo Legion Slim 7i 16 Gen 8 | |
| Alienware x16 R1 | |
| Lenovo Legion Pro 7 RTX4090 | |
| Razer Blade 16 Early 2023 | |
| HP Omen 16-wf000 | |
| Durchschnittliche Intel Core i9-13900H, NVIDIA GeForce RTX 4070 Laptop GPU (5855 - 8538, n=8) | |
| Asus ROG Strix G16 G614JZ | |
| PCMark 10 / Essentials | |
| Asus ROG Strix G16 G614JZ | |
| Lenovo Legion Slim 7i 16 Gen 8 | |
| Alienware x16 R1 | |
| Lenovo Legion Pro 7 RTX4090 | |
| Razer Blade 16 Early 2023 | |
| Durchschnittliche Intel Core i9-13900H, NVIDIA GeForce RTX 4070 Laptop GPU (8835 - 11940, n=8) | |
| HP Omen 16-wf000 | |
| PCMark 10 / Productivity | |
| Lenovo Legion Slim 7i 16 Gen 8 | |
| Alienware x16 R1 | |
| Durchschnittliche Intel Core i9-13900H, NVIDIA GeForce RTX 4070 Laptop GPU (7967 - 10991, n=8) | |
| HP Omen 16-wf000 | |
| Lenovo Legion Pro 7 RTX4090 | |
| Razer Blade 16 Early 2023 | |
| Asus ROG Strix G16 G614JZ | |
| PCMark 10 / Digital Content Creation | |
| Lenovo Legion Pro 7 RTX4090 | |
| Razer Blade 16 Early 2023 | |
| Alienware x16 R1 | |
| Lenovo Legion Slim 7i 16 Gen 8 | |
| HP Omen 16-wf000 | |
| Durchschnittliche Intel Core i9-13900H, NVIDIA GeForce RTX 4070 Laptop GPU (7738 - 13575, n=8) | |
| Asus ROG Strix G16 G614JZ | |
| CrossMark / Overall | |
| Asus ROG Strix G16 G614JZ | |
| Lenovo Legion Slim 7i 16 Gen 8 | |
| Alienware x16 R1 | |
| Durchschnittliche Intel Core i9-13900H, NVIDIA GeForce RTX 4070 Laptop GPU (1104 - 1974, n=7) | |
| HP Omen 16-wf000 | |
| Razer Blade 16 Early 2023 | |
| CrossMark / Productivity | |
| Asus ROG Strix G16 G614JZ | |
| Lenovo Legion Slim 7i 16 Gen 8 | |
| Alienware x16 R1 | |
| Durchschnittliche Intel Core i9-13900H, NVIDIA GeForce RTX 4070 Laptop GPU (1058 - 1914, n=7) | |
| HP Omen 16-wf000 | |
| Razer Blade 16 Early 2023 | |
| CrossMark / Creativity | |
| Asus ROG Strix G16 G614JZ | |
| Lenovo Legion Slim 7i 16 Gen 8 | |
| Alienware x16 R1 | |
| Durchschnittliche Intel Core i9-13900H, NVIDIA GeForce RTX 4070 Laptop GPU (1178 - 2254, n=7) | |
| HP Omen 16-wf000 | |
| Razer Blade 16 Early 2023 | |
| CrossMark / Responsiveness | |
| Asus ROG Strix G16 G614JZ | |
| Alienware x16 R1 | |
| Lenovo Legion Slim 7i 16 Gen 8 | |
| Durchschnittliche Intel Core i9-13900H, NVIDIA GeForce RTX 4070 Laptop GPU (1037 - 1952, n=7) | |
| HP Omen 16-wf000 | |
| Razer Blade 16 Early 2023 | |
| PCMark 10 Score | 8538 Punkte | |
Hilfe | ||
| AIDA64 / Memory Copy | |
| Razer Blade 16 Early 2023 | |
| Razer Blade 16 Early 2023 | |
| Razer Blade 16 Early 2023 | |
| Lenovo Legion Pro 7 RTX4090 | |
| Alienware x16 R1 | |
| HP Omen 16-wf000 | |
| Asus ROG Strix G16 G614JZ | |
| Durchschnittliche Intel Core i9-13900H (37448 - 74486, n=25) | |
| Lenovo Legion Slim 7i 16 Gen 8 | |
| AIDA64 / Memory Read | |
| Lenovo Legion Pro 7 RTX4090 | |
| Razer Blade 16 Early 2023 | |
| Razer Blade 16 Early 2023 | |
| Razer Blade 16 Early 2023 | |
| Asus ROG Strix G16 G614JZ | |
| Alienware x16 R1 | |
| HP Omen 16-wf000 | |
| Durchschnittliche Intel Core i9-13900H (41599 - 75433, n=25) | |
| Lenovo Legion Slim 7i 16 Gen 8 | |
| AIDA64 / Memory Write | |
| Alienware x16 R1 | |
| Razer Blade 16 Early 2023 | |
| Razer Blade 16 Early 2023 | |
| Razer Blade 16 Early 2023 | |
| Lenovo Legion Pro 7 RTX4090 | |
| HP Omen 16-wf000 | |
| Durchschnittliche Intel Core i9-13900H (36152 - 88505, n=25) | |
| Asus ROG Strix G16 G614JZ | |
| Lenovo Legion Slim 7i 16 Gen 8 | |
| AIDA64 / Memory Latency | |
| Alienware x16 R1 | |
| Razer Blade 16 Early 2023 | |
| Razer Blade 16 Early 2023 | |
| Razer Blade 16 Early 2023 | |
| Durchschnittliche Intel Core i9-13900H (75.8 - 102.3, n=25) | |
| Asus ROG Strix G16 G614JZ | |
| HP Omen 16-wf000 | |
| Lenovo Legion Pro 7 RTX4090 | |
| Lenovo Legion Slim 7i 16 Gen 8 | |
* ... kleinere Werte sind besser
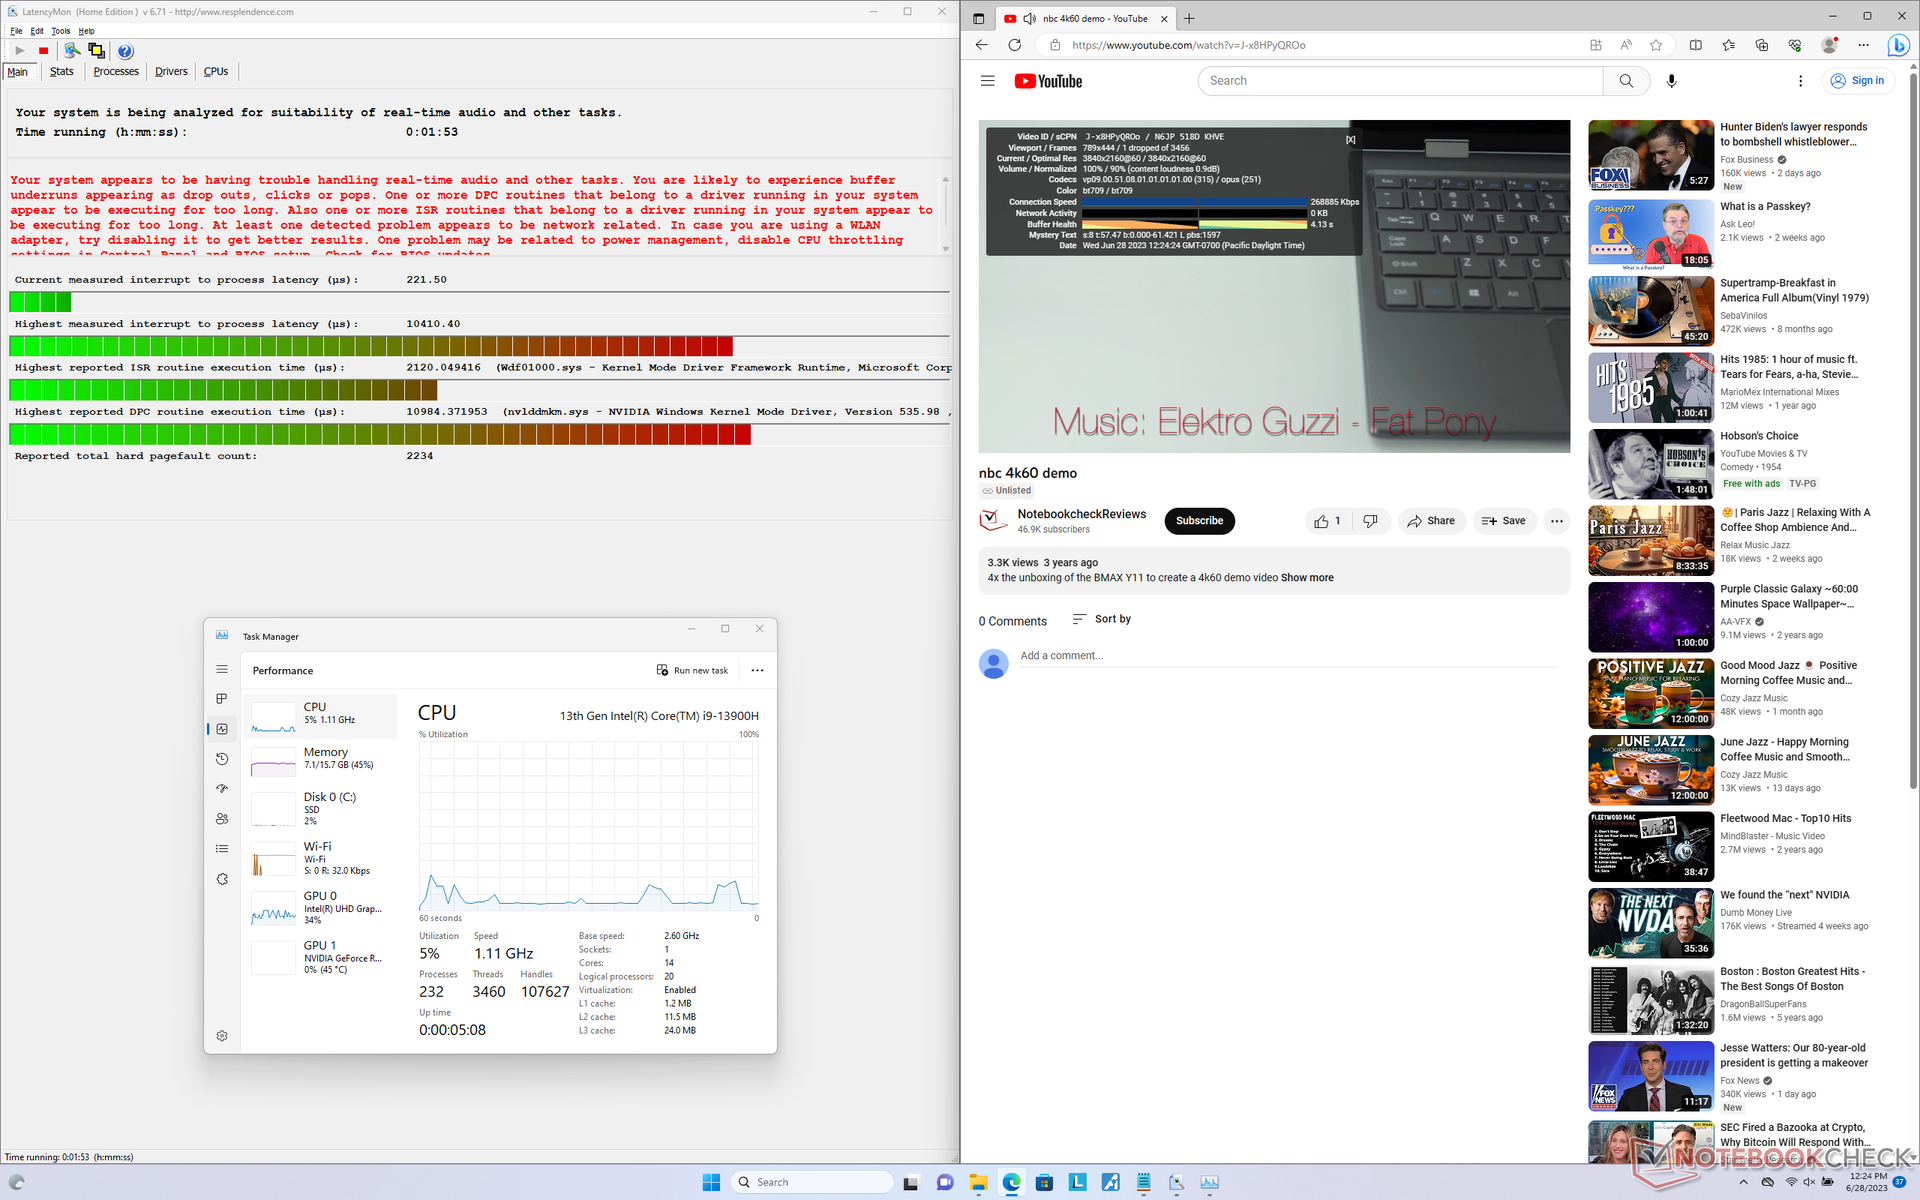
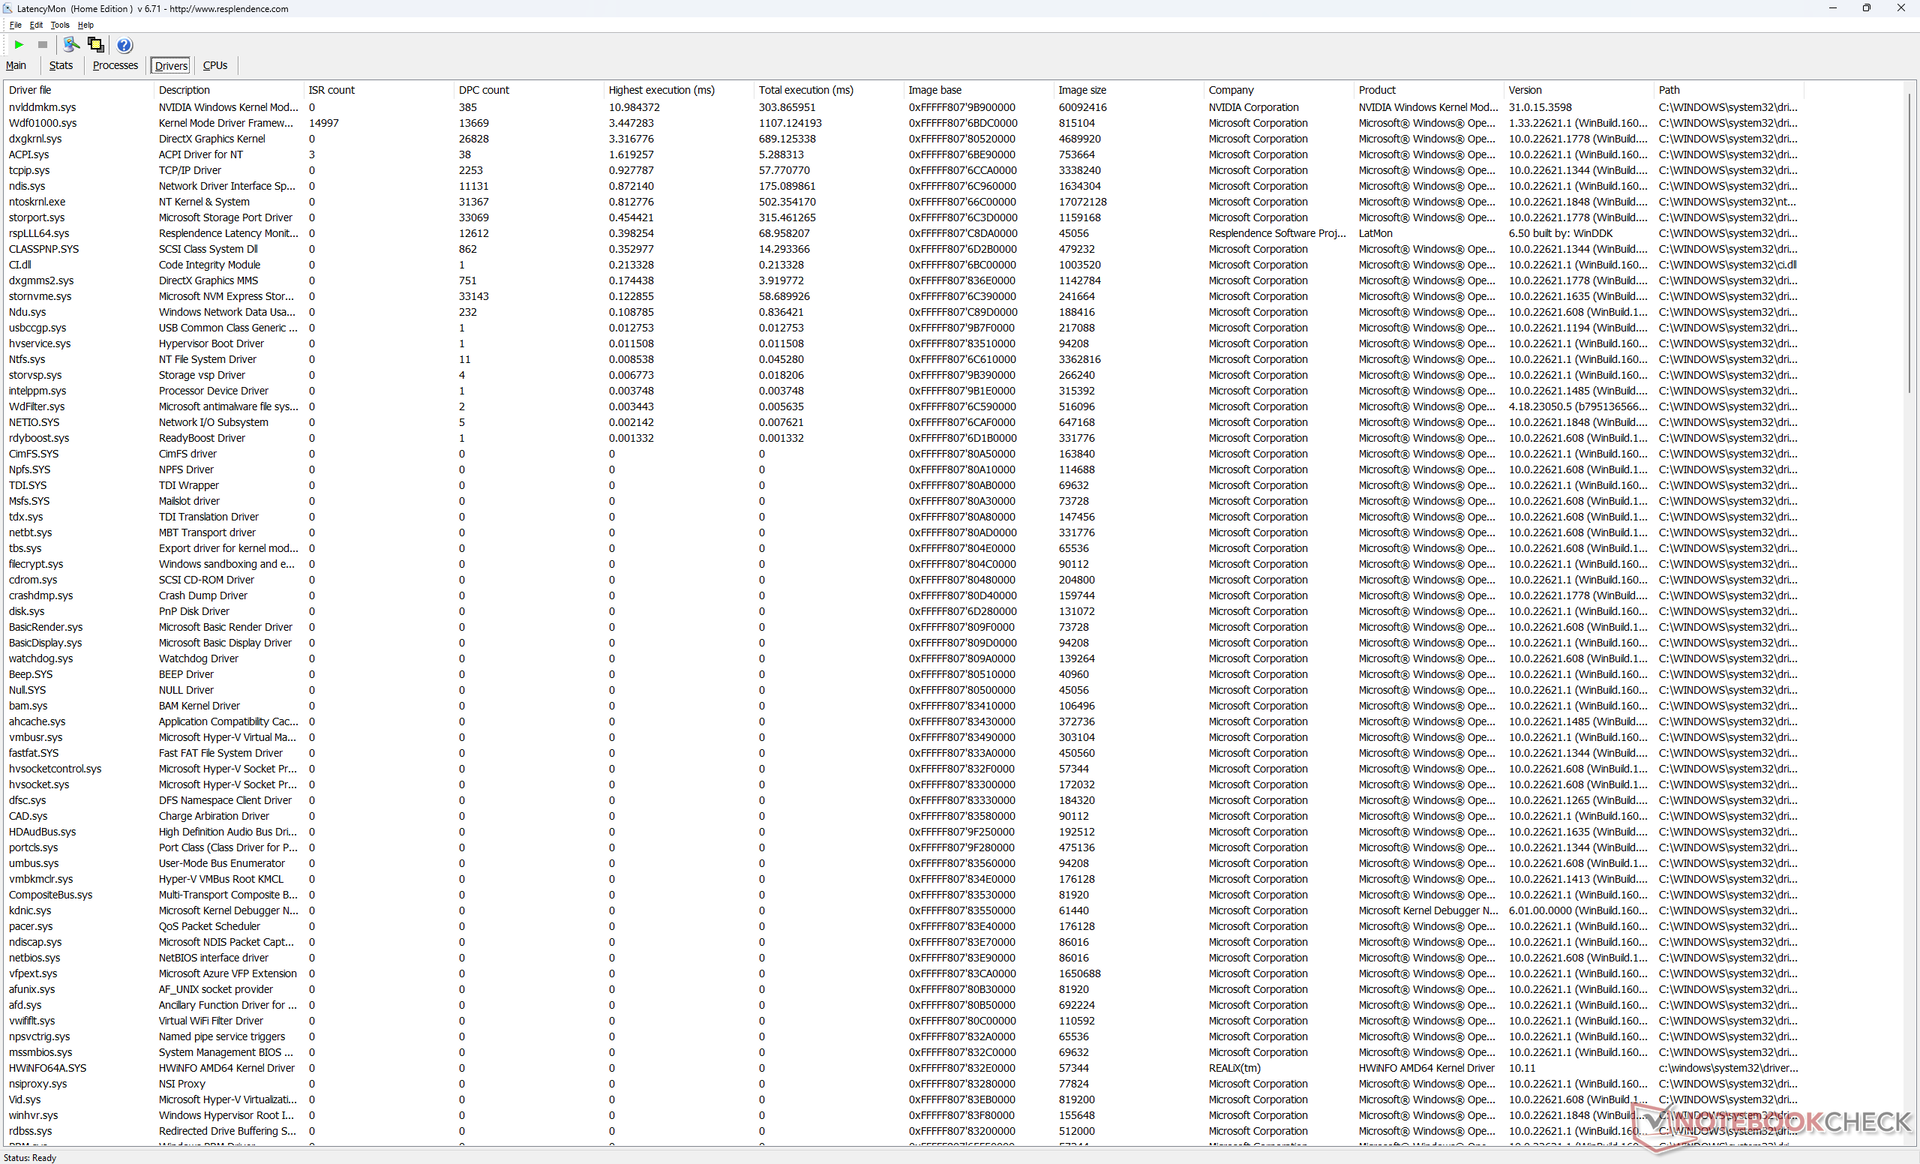
DPC-Latenzen
Wie schon beim Legion Pro 7 erkennt LatencyMon DPC-Probleme in Verbindung mit dem Nvidia-Treiber NVLDDMKM, auch nach mehrmaligen Versuchen. Die Wiedergabe von 4K-Videos mit 60 Bildern pro Sekunde ist aber fast perfekt, ein einziger Frame wurde in unserem Test übersprungen.
| DPC Latencies / LatencyMon - interrupt to process latency (max), Web, Youtube, Prime95 | |
| Lenovo Legion Pro 7 RTX4090 | |
| Lenovo Legion Slim 7i 16 Gen 8 | |
| HP Omen 16-wf000 | |
| Asus ROG Strix G16 G614JZ | |
| Razer Blade 16 Early 2023 | |
| Alienware x16 R1 | |
* ... kleinere Werte sind besser
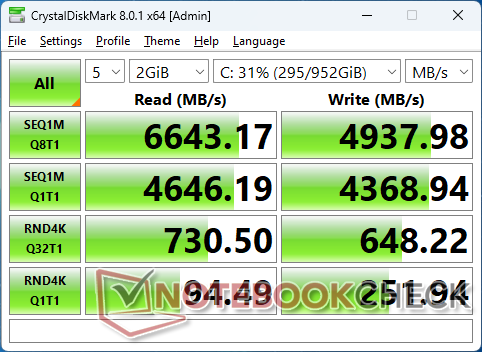
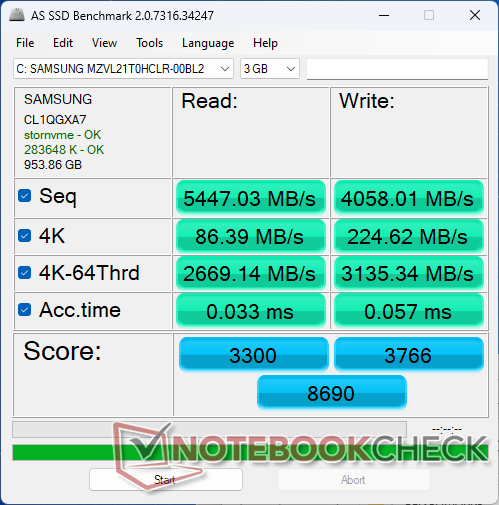
Massenspeicher — Platz für zwei M.2-SSDs
Unser Testgerät ist mit der 1TB fassenden Samsung PM9A1 ausgerüstet, die mit zu den schnellsten PCIe-4.0-SSDs im Consumer-Bereich gehört. Leider werden die Übertragungsraten von 6.700 MB/s aufgrund der schlechten Wärmeableitung unter Last auf bis zu 3.300 MB/s gedrosselt. Das Razer Blade 14 ist mit der gleichen Samsung-SSD bestückt und hatte keine derartigen Probleme.

| Drive Performance Rating - Percent | |
| Alienware x16 R1 | |
| Lenovo Legion Slim 7i 16 Gen 8 | |
| Lenovo Legion Pro 7 RTX4090 | |
| HP Omen 16-wf000 | |
| Razer Blade 16 Early 2023 | |
| Asus ROG Strix G16 G614JZ | |
* ... kleinere Werte sind besser
Lesegeschwindigkeit Dauertest: DiskSpd Read Loop, Queue Depth 8
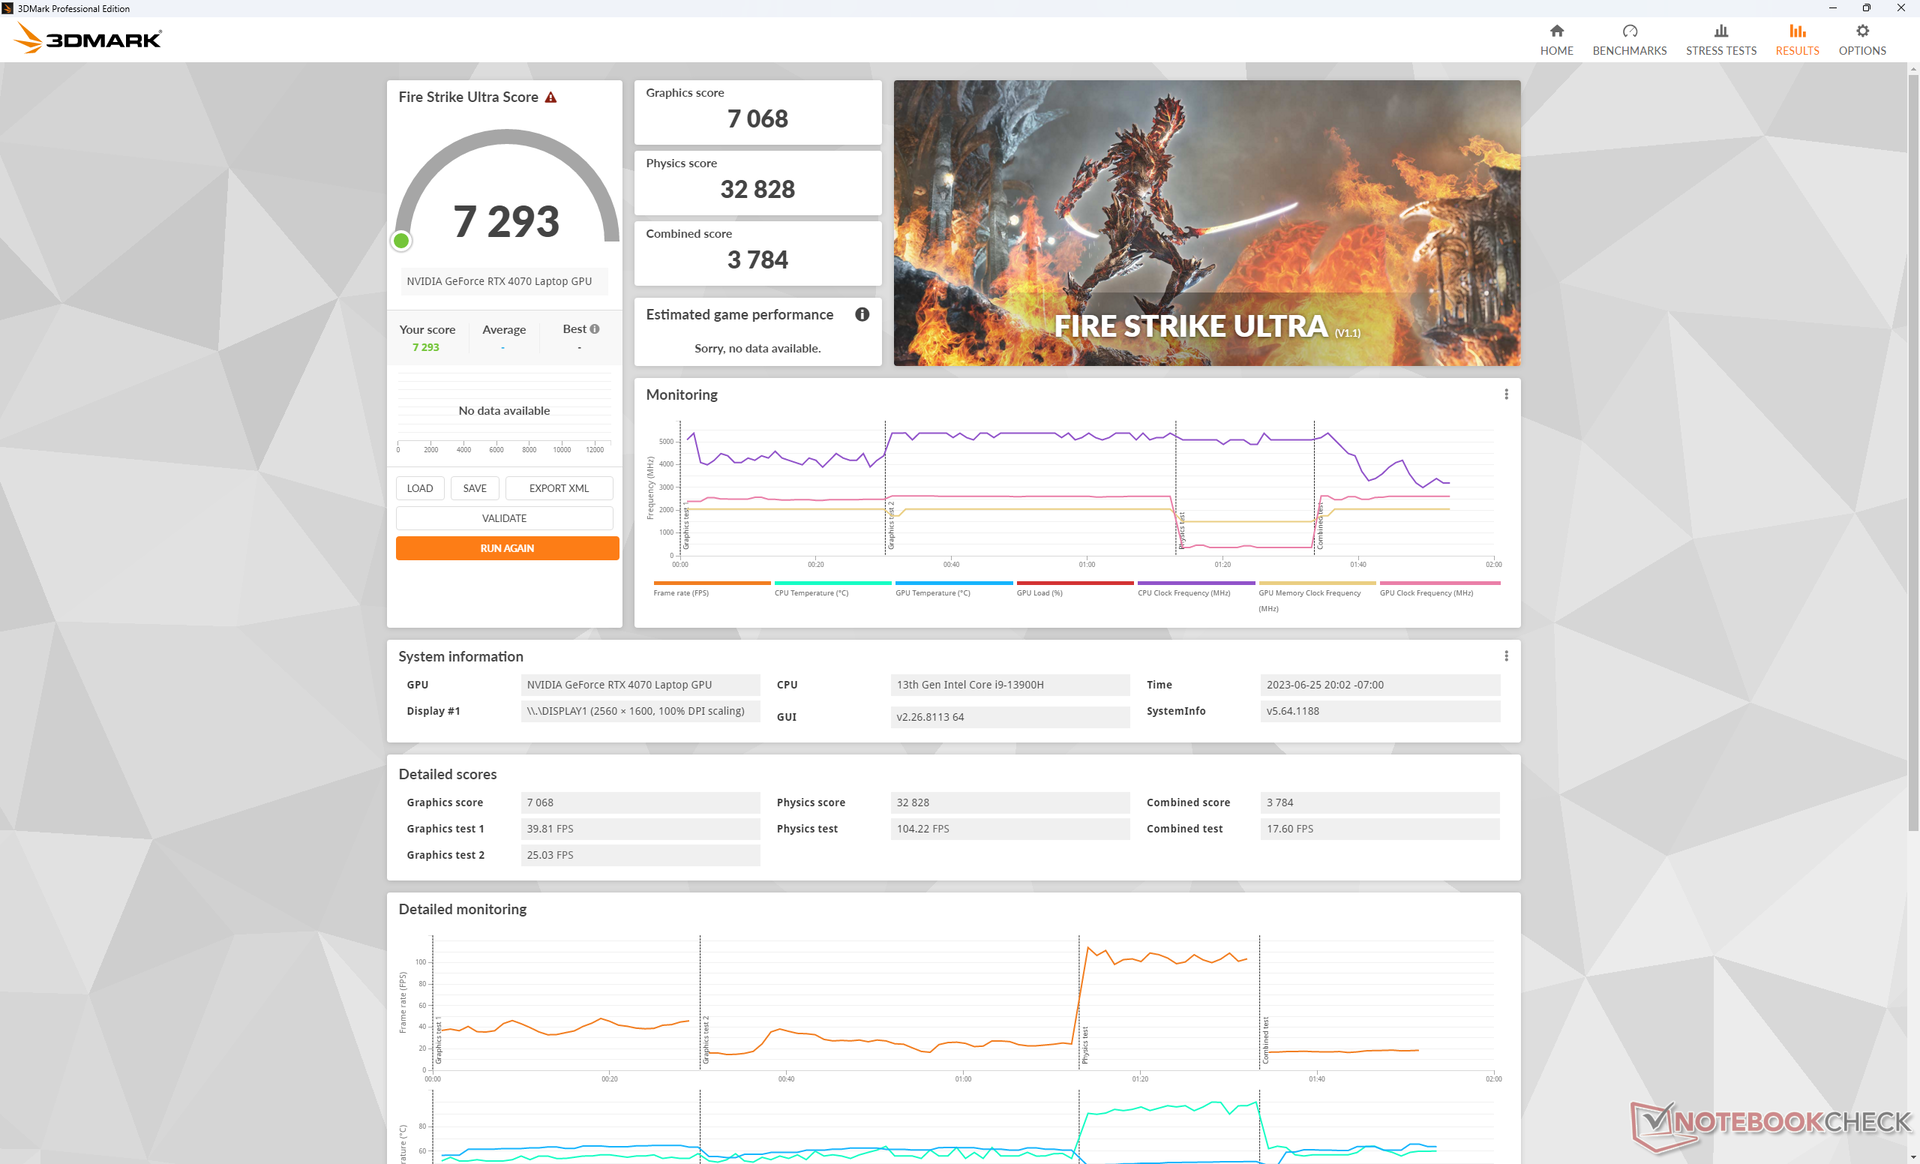
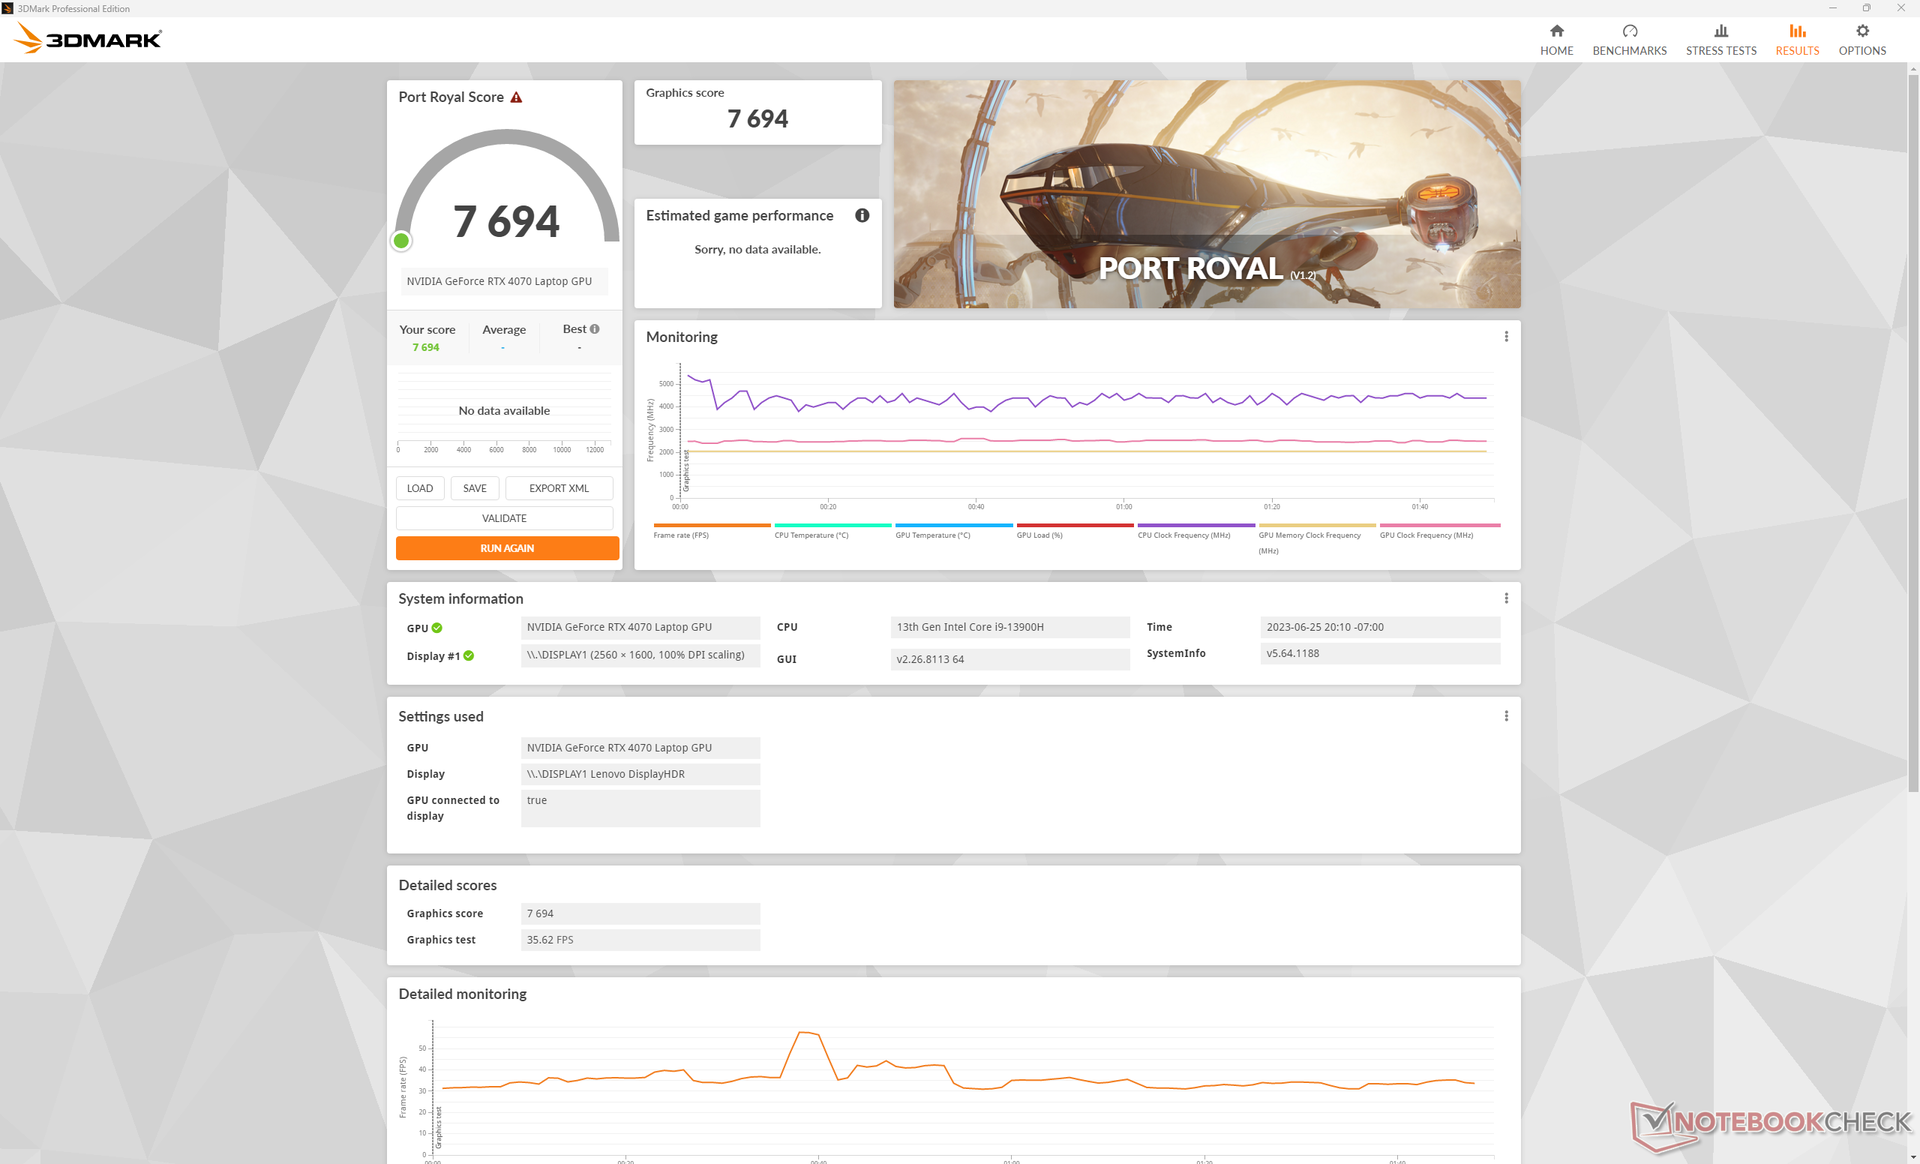
Grafikleistung — 140 Watt starke RTX-GPU
Die rohe Grafikleistung ist laut unserer Datenbank zwischen 5 und 10 Prozent schneller als der durchschnittliche Laptop mit einer mobilen RTX 4070 Grafikkarte. Die Gesamtleistung ist damit ungefähr auf dem Niveau einer mobilen RTX 3080 Ti.
Mit deaktivierter Übertaktung ist die GPU-Leistung 5 Prozent niedriger. Im ausbalancierten Modus fällt die CPU-Leistung um 10 Prozent, die Grafikeinheit ist 15 Prozent langsamer, wie die Tabelle unten aufzeigt. Trotz der niedrigeren Leistung könnten manche Nutzer das leisere Lüftergeräusch im ausbalancierten Modus bevorzugen.
Das Downgrade von unserer RTX-4070 auf die RTX-4060-Konfiguration resultiert nach unseren Erfahrungen mit dem Legion Pro 5 16 in einer rund 10 bis 15 Prozent geringeren Grafikleistung.
| Energieeinstellung | Fire Strike Physics | Fire Strike GPU | Fire Strike kombiniert |
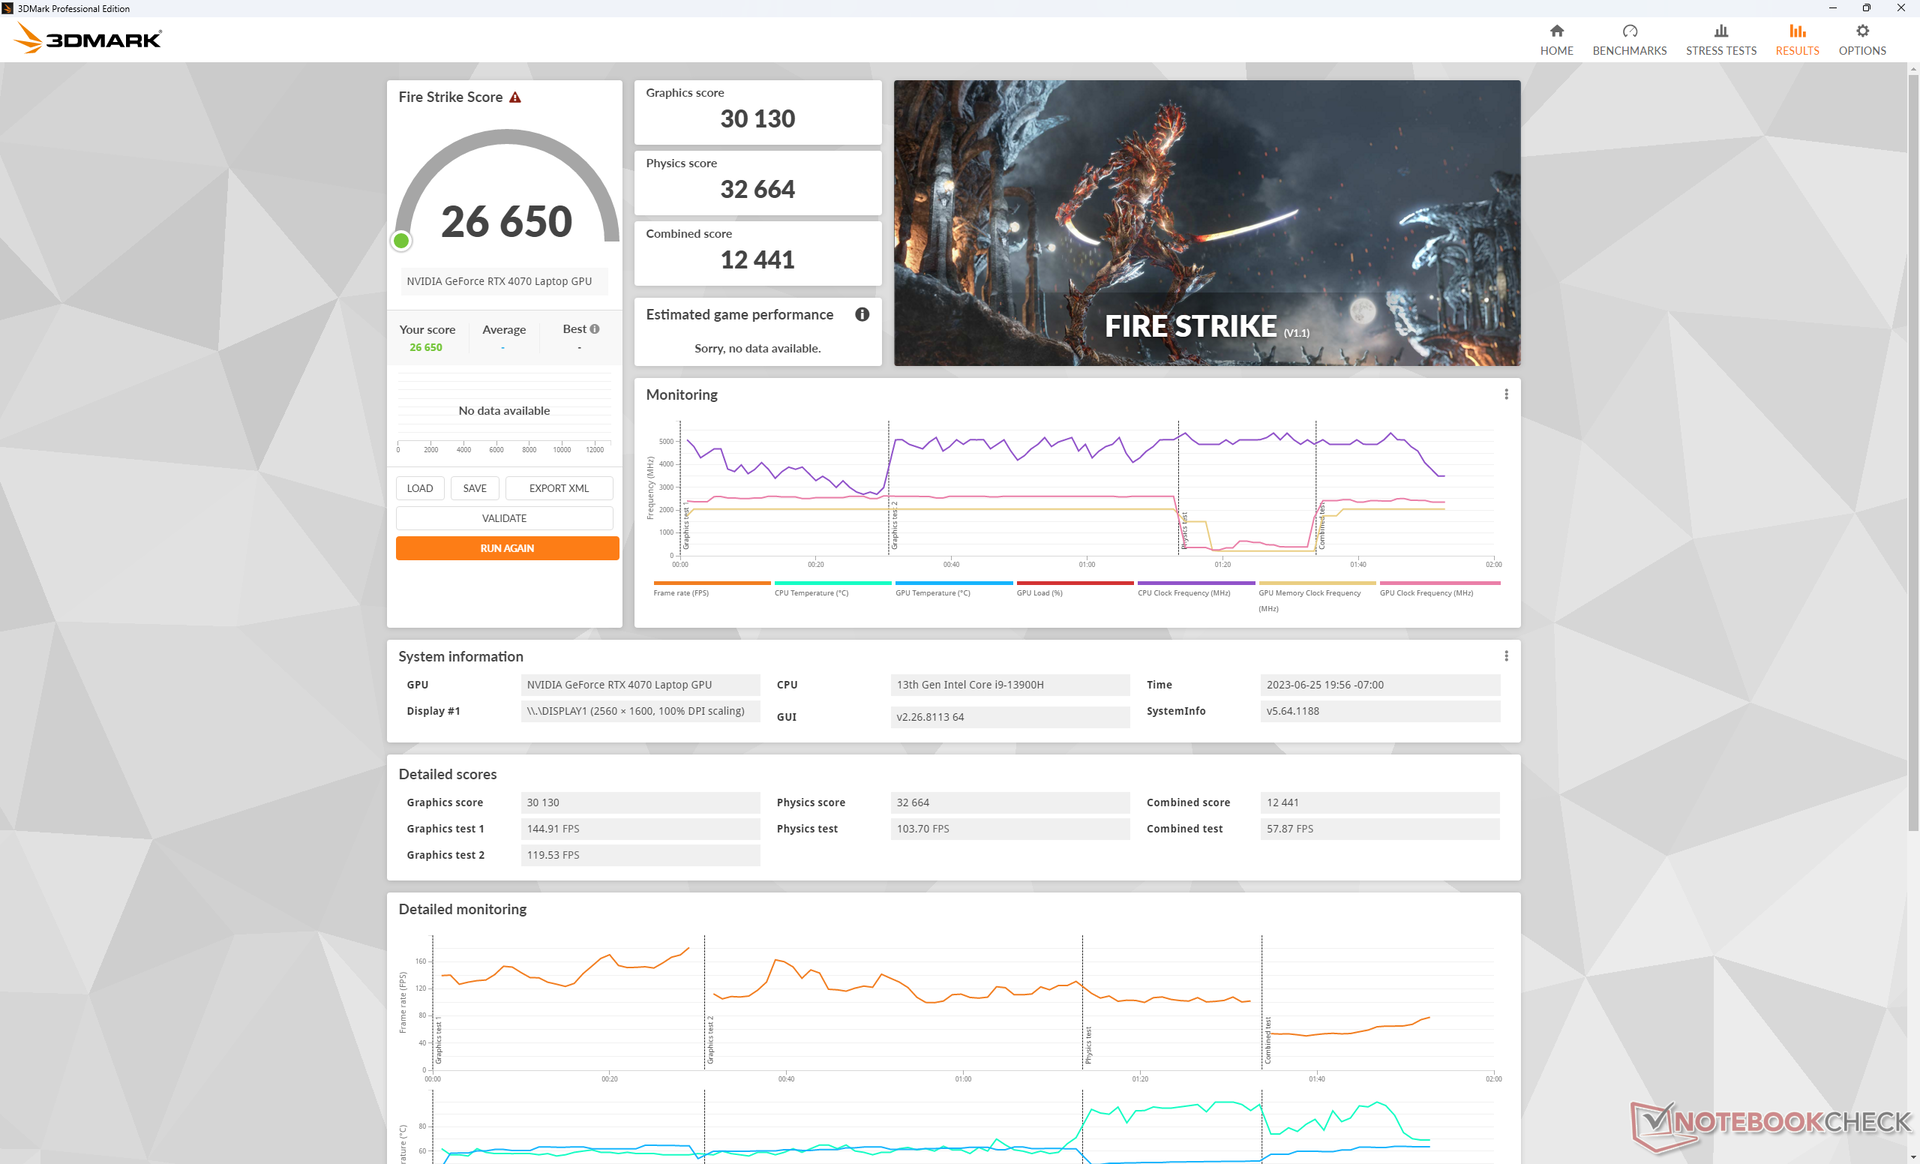
| Leistungsmodus + GPU-Übertaktung an + Overdrive an | 32664 | 30130 | 12441 |
| Leistungsmodus + GPU-Übertaktung an + Overdrive aus | 32439 | 30153 | 13360 |
| Leistungsmodus + GPU-Übertaktung aus + Overdrive aus | 32550 | 28629 (-5%) | 12319 |
| Ausbalanciert | 27499 (-16%) | 27708 (-8%) | 11295 (-9%) |
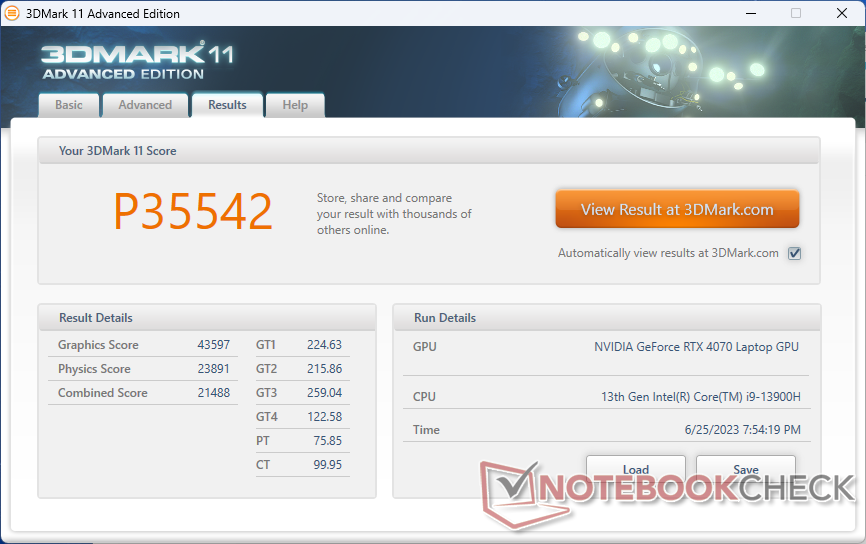
| 3DMark 11 Performance | 35542 Punkte | |
| 3DMark Fire Strike Score | 26650 Punkte | |
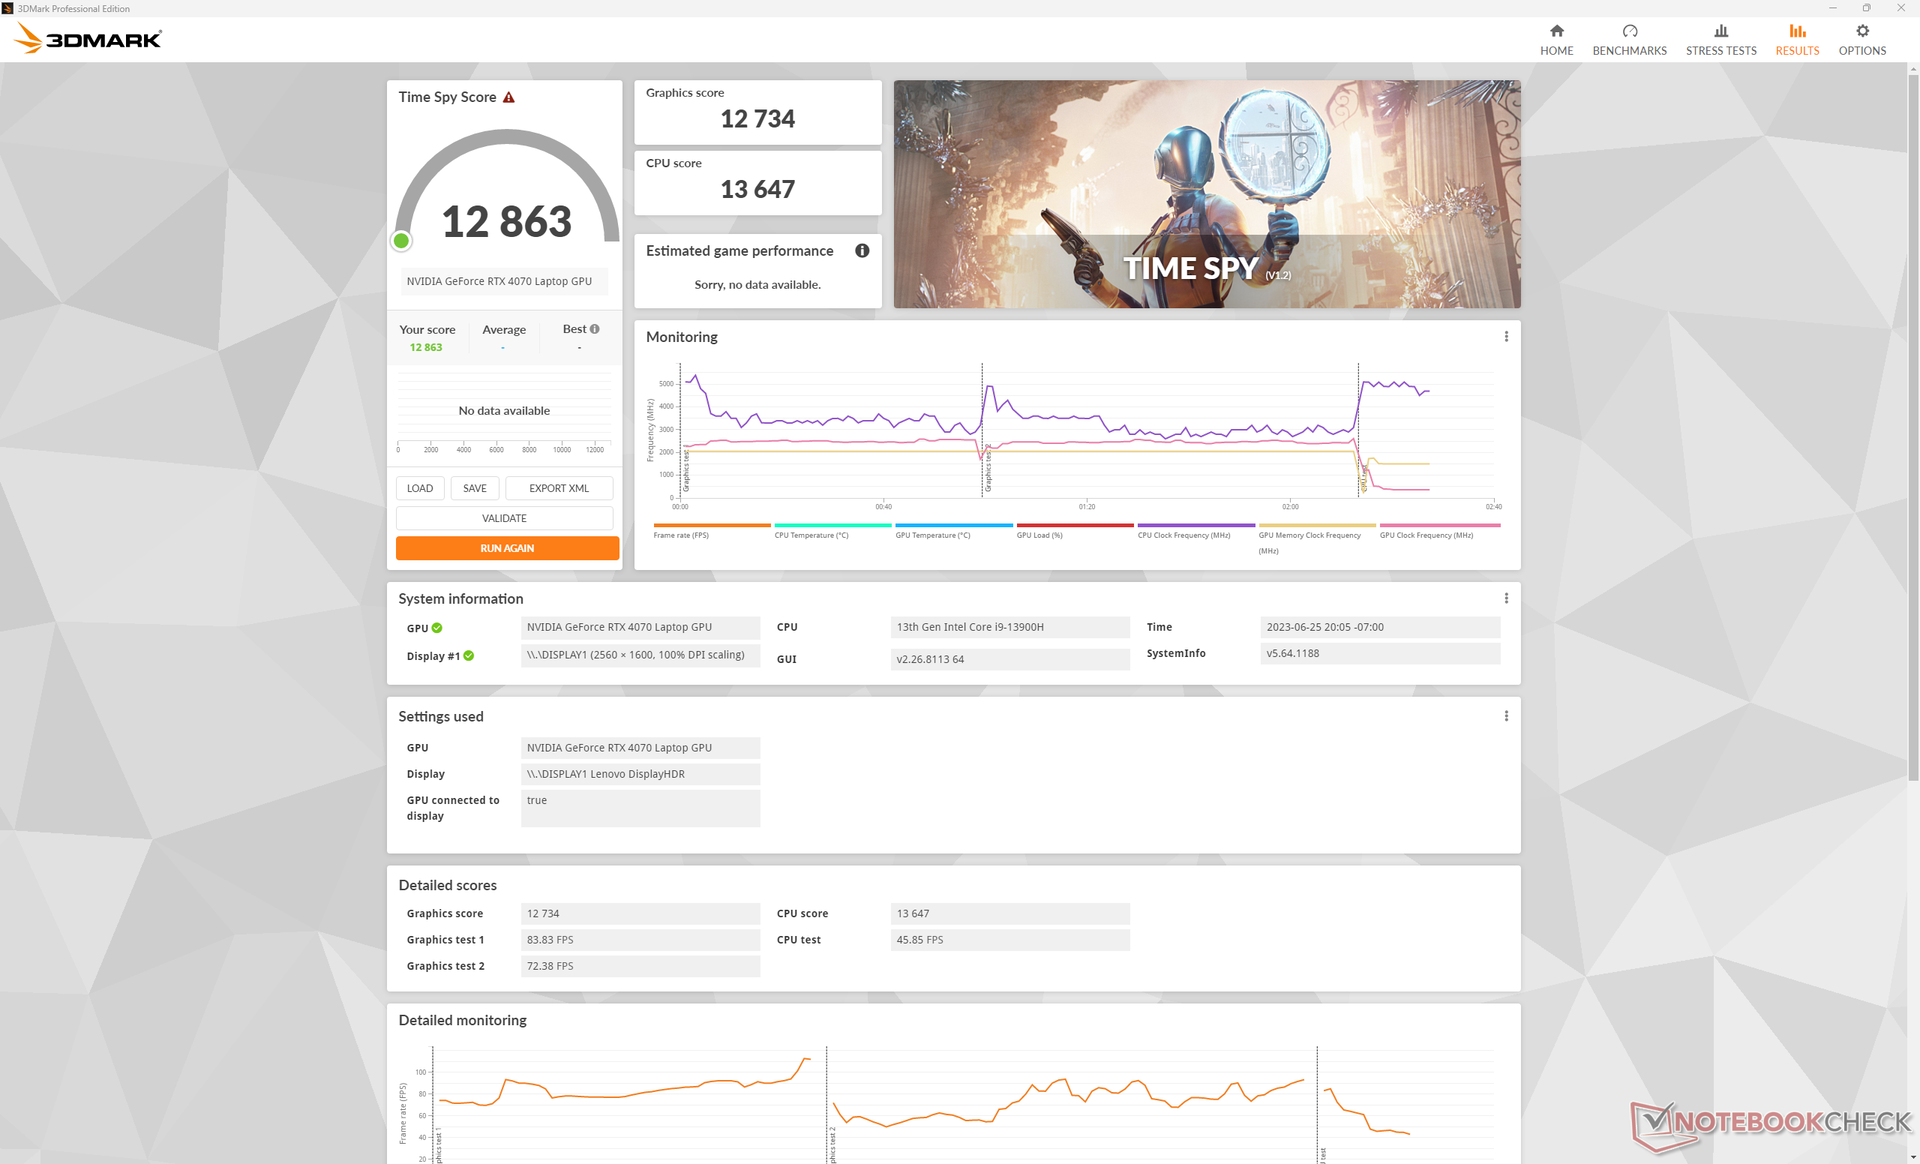
| 3DMark Time Spy Score | 12863 Punkte | |
Hilfe | ||
* ... kleinere Werte sind besser
Gaming-Performance
Die mobile RTX 4070 ist gut für QHD-Gaming mit Auflösungen von 1440p beziehungsweise 1600p und 60 fps bei hohen Settings geeignet, während die deutlich schnellere Desktop-Variante der RTX 4070 schnell genug für Ultra oder gar maximale Settings ist. Das Lenovo-Notebook knackt in Returnal bei maximalen Settings und 1440p beispielsweise kaum die 50-fps-Marke.
In Situationen wo sich die RTX 4070 zu schwach anfühlt, wird DLSS besonders wichtig. Cyberpunk 2077 in 4K Ultra wird ohne DLSS beispielsweise nur mit durchschnittlich 23 fps dargestellt, mit DLSS 2 sind es besser spielbare 38 fps.
Witcher 3 FPS-Diagramm
| min. | mittel | hoch | max. | QHD | 4K | |
|---|---|---|---|---|---|---|
| GTA V (2015) | 184 | 180.3 | 175 | 115.2 | 94.3 | 98.7 |
| The Witcher 3 (2015) | 459.3 | 356.8 | 225.9 | 117.9 | 70 | |
| Dota 2 Reborn (2015) | 203 | 183.2 | 175.8 | 165.3 | 141.3 | |
| Final Fantasy XV Benchmark (2018) | 213 | 168.8 | 122.7 | 91.4 | 51.5 | |
| X-Plane 11.11 (2018) | 182.9 | 158.7 | 122.4 | 105.7 | ||
| Strange Brigade (2018) | 483 | 316 | 259 | 228 | 149.2 | 75.7 |
| Cyberpunk 2077 1.6 (2022) | 138.3 | 141.9 | 106.1 | 91 | 54.4 | 23.1 |
| Tiny Tina's Wonderlands (2022) | 244.3 | 204.8 | 143.7 | 113.9 | 78.1 | 37 |
| F1 22 (2022) | 258 | 261 | 219 | 81.5 | 46.2 | 25.9 |
| Returnal (2023) | 83 | 81 | 76 | 61 | 52 | 27 |
Emissionen
Systemlautstärke
Die internen Lüfter sind bei einem Hintergrundgeräusch von 23 dB(A) immer mit 26 dB(A) aktiv. In den meisten Büros und Meetings ist das Notebook also nicht störend, und auch beim Start von Benchmarks wie 3DMark 06 machen die Lüfter einen ausgezeichneten Job und bleiben länger ruhig.
Spielen im Leistungsmodus erhöht das Lüftergeräusch auf konstante 54,4 dB(A), was ähnlich laut wie beim Alienware x16 R1 aber lauter als das Blade 16 ist. Im ausbalancierten Modus geht wie oben bereits erklärt zwar etwas Leistung verloren, dafür reduziert sich die Lautstärke der Lüfter aber auch auf 48,9 dB(A).

Lautstärkediagramm
| Idle |
| 23.6 / 23.6 / 25.7 dB(A) |
| Last |
| 27.6 / 54.4 dB(A) |
 | ||
30 dB leise 40 dB(A) deutlich hörbar 50 dB(A) störend |
||
min: | ||
| Lenovo Legion Slim 7i 16 Gen 8 GeForce RTX 4070 Laptop GPU, i9-13900H, Samsung PM9A1 MZVL21T0HCLR | HP Omen 16-wf000 GeForce RTX 4080 Laptop GPU, i7-13700HX, SK hynix PC801 HFS002TEJ9X101N | Alienware x16 R1 GeForce RTX 4080 Laptop GPU, i9-13900HK, SK hynix PC801 HFS001TEJ9X101N | Lenovo Legion Pro 7 RTX4090 GeForce RTX 4090 Laptop GPU, i9-13900HX, Samsung PM9A1 MZVL21T0HCLR | Asus ROG Strix G16 G614JZ GeForce RTX 4080 Laptop GPU, i9-13980HX, WD PC SN560 SDDPNQE-1T00 | Razer Blade 16 Early 2023 GeForce RTX 4080 Laptop GPU, i9-13950HX, SSSTC CA6-8D1024 | |
|---|---|---|---|---|---|---|
| Geräuschentwicklung | -15% | -6% | -25% | -17% | -2% | |
| aus / Umgebung * (dB) | 22.8 | 23 -1% | 22.7 -0% | 25 -10% | 25 -10% | 23 -1% |
| Idle min * (dB) | 23.6 | 29.6 -25% | 23.1 2% | 28 -19% | 26 -10% | 23 3% |
| Idle avg * (dB) | 23.6 | 29.8 -26% | 25.8 -9% | 30 -27% | 28 -19% | 23 3% |
| Idle max * (dB) | 25.7 | 30.4 -18% | 25.8 -0% | 38 -48% | 30 -17% | 23.6 8% |
| Last avg * (dB) | 27.6 | 33.8 -22% | 39.3 -42% | 48 -74% | 48 -74% | 39 -41% |
| Witcher 3 ultra * (dB) | 54.4 | 57 -5% | 49.9 8% | 53 3% | 49 10% | 51.6 5% |
| Last max * (dB) | 54.4 | 58.3 -7% | 54.8 -1% | 55 -1% | 52 4% | 51.3 6% |
* ... kleinere Werte sind besser
Temperatur
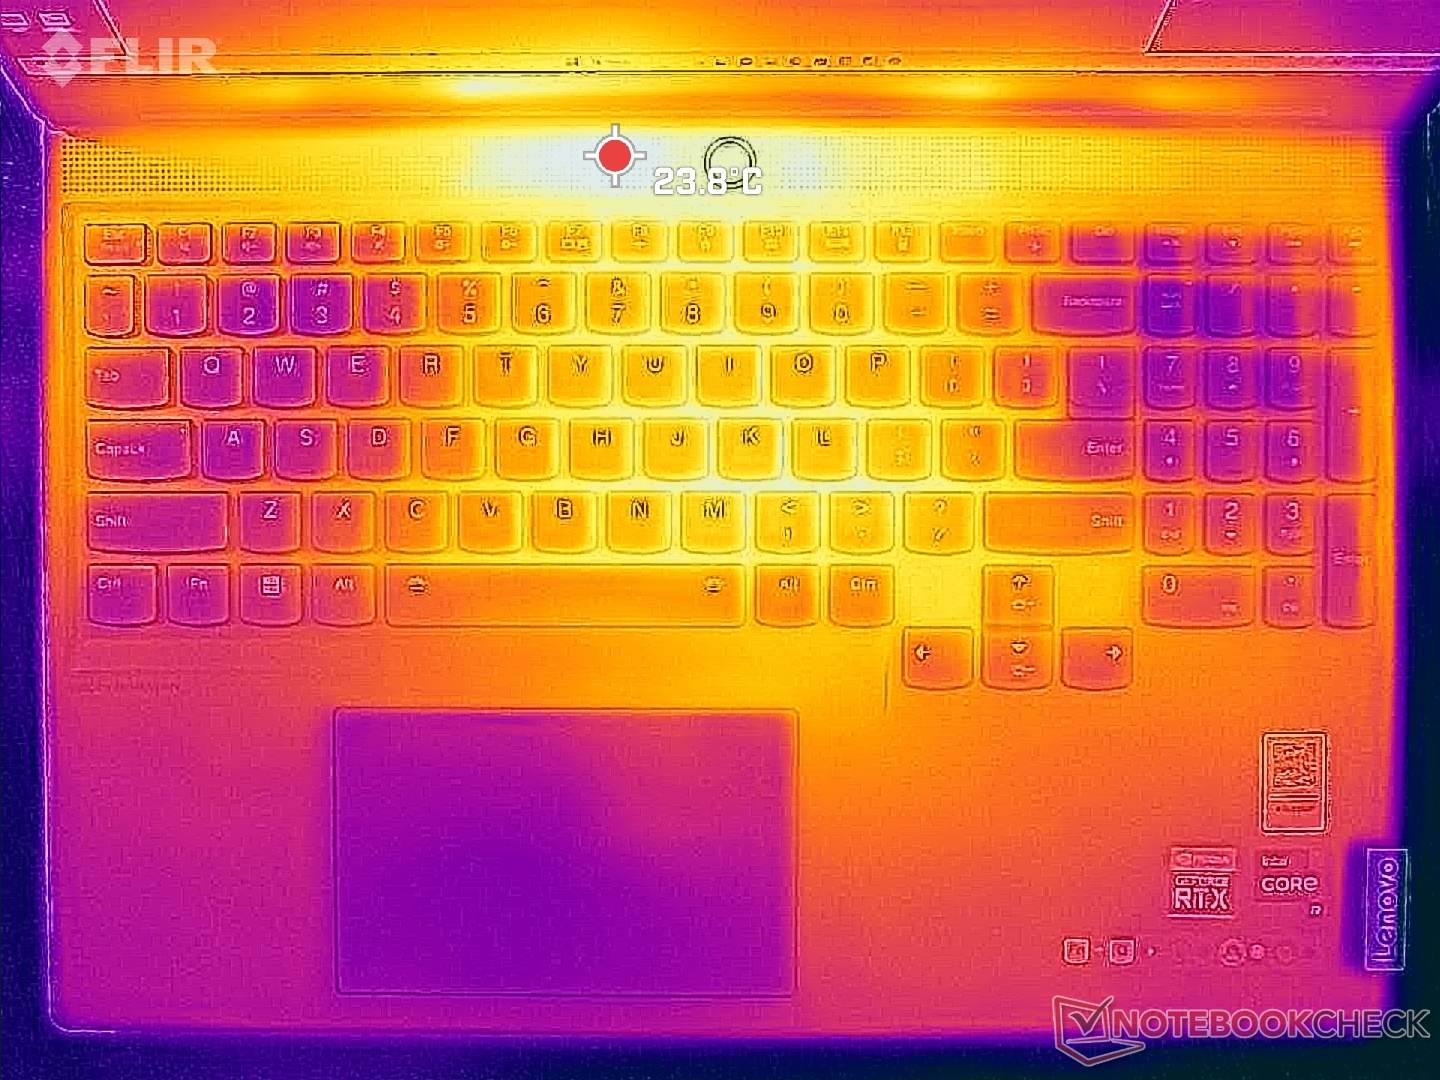
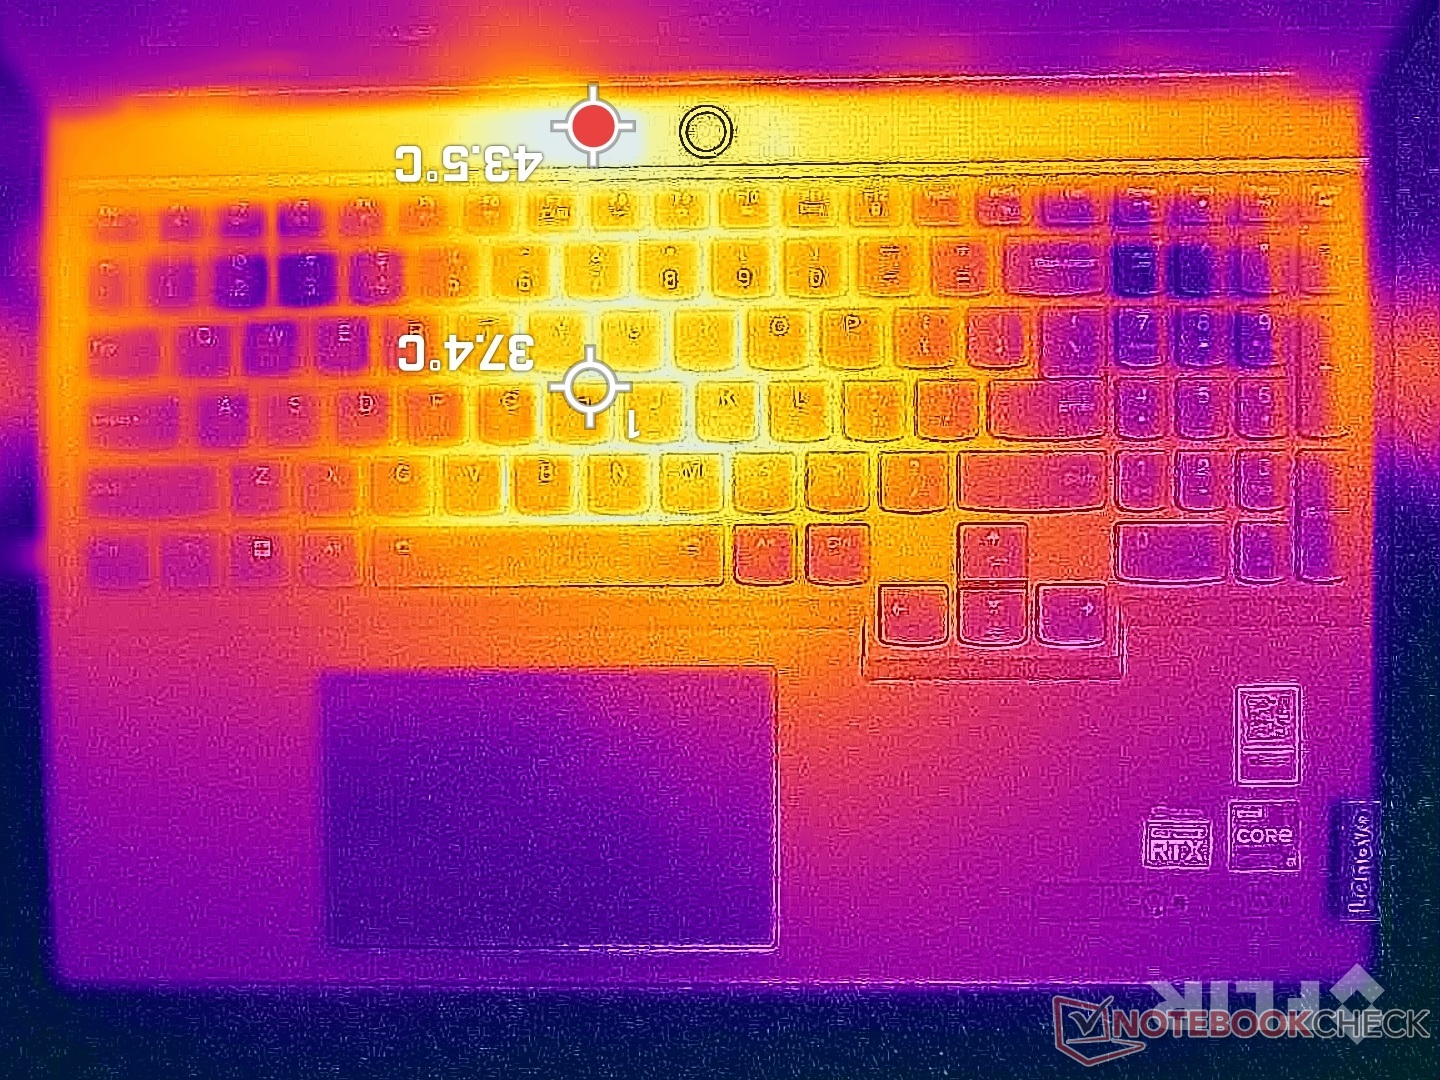
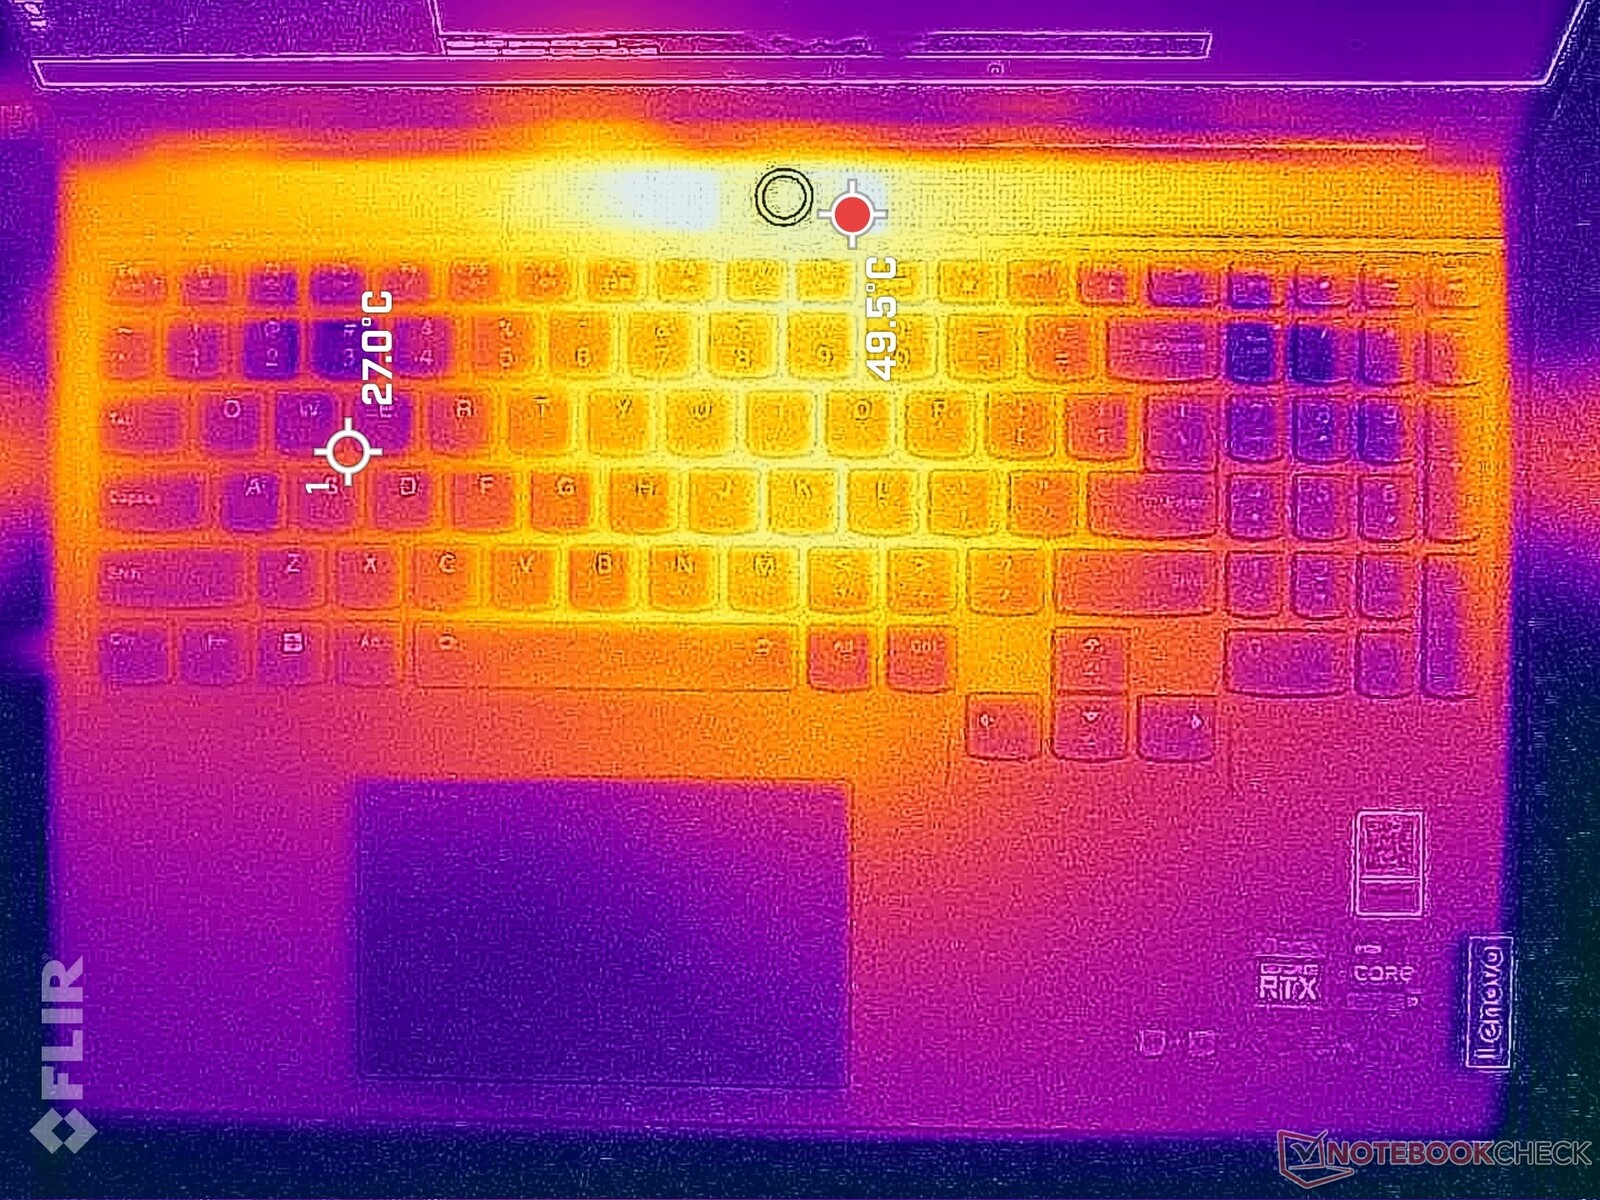
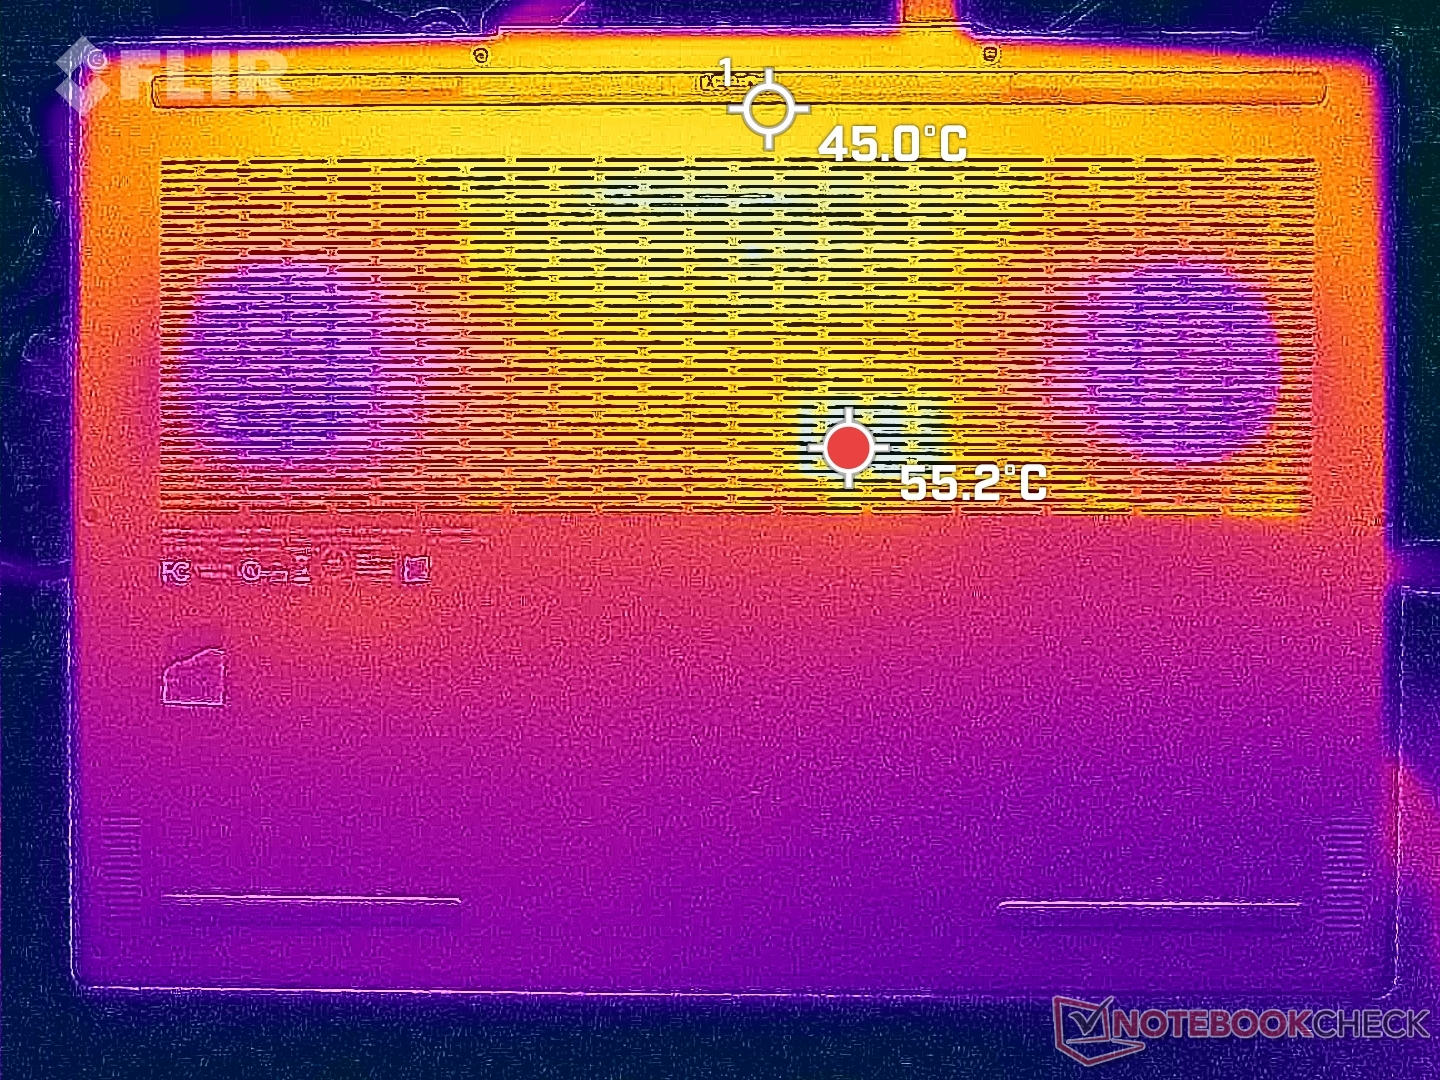
Die heißesten Stellen der Oberfläche werden bei anspruchsvollen Spielen zwischen 43 und 50 Grad Celsius warm, ähnlich wie beim Alienware x16 R1. Laut unseren unten eingebundenen Wärmebildern sind die Hot-Spots glücklicherweise aber in der Nähe der hinteren Gehäusekante und unter der ersten Tastenreihe der Tastatur und somit in Bereichen angesiedelt, die man üblicherweise nicht berührt. Die Handballenauflage und WASD-Tasten sind im Vergleich deutlich kühler.
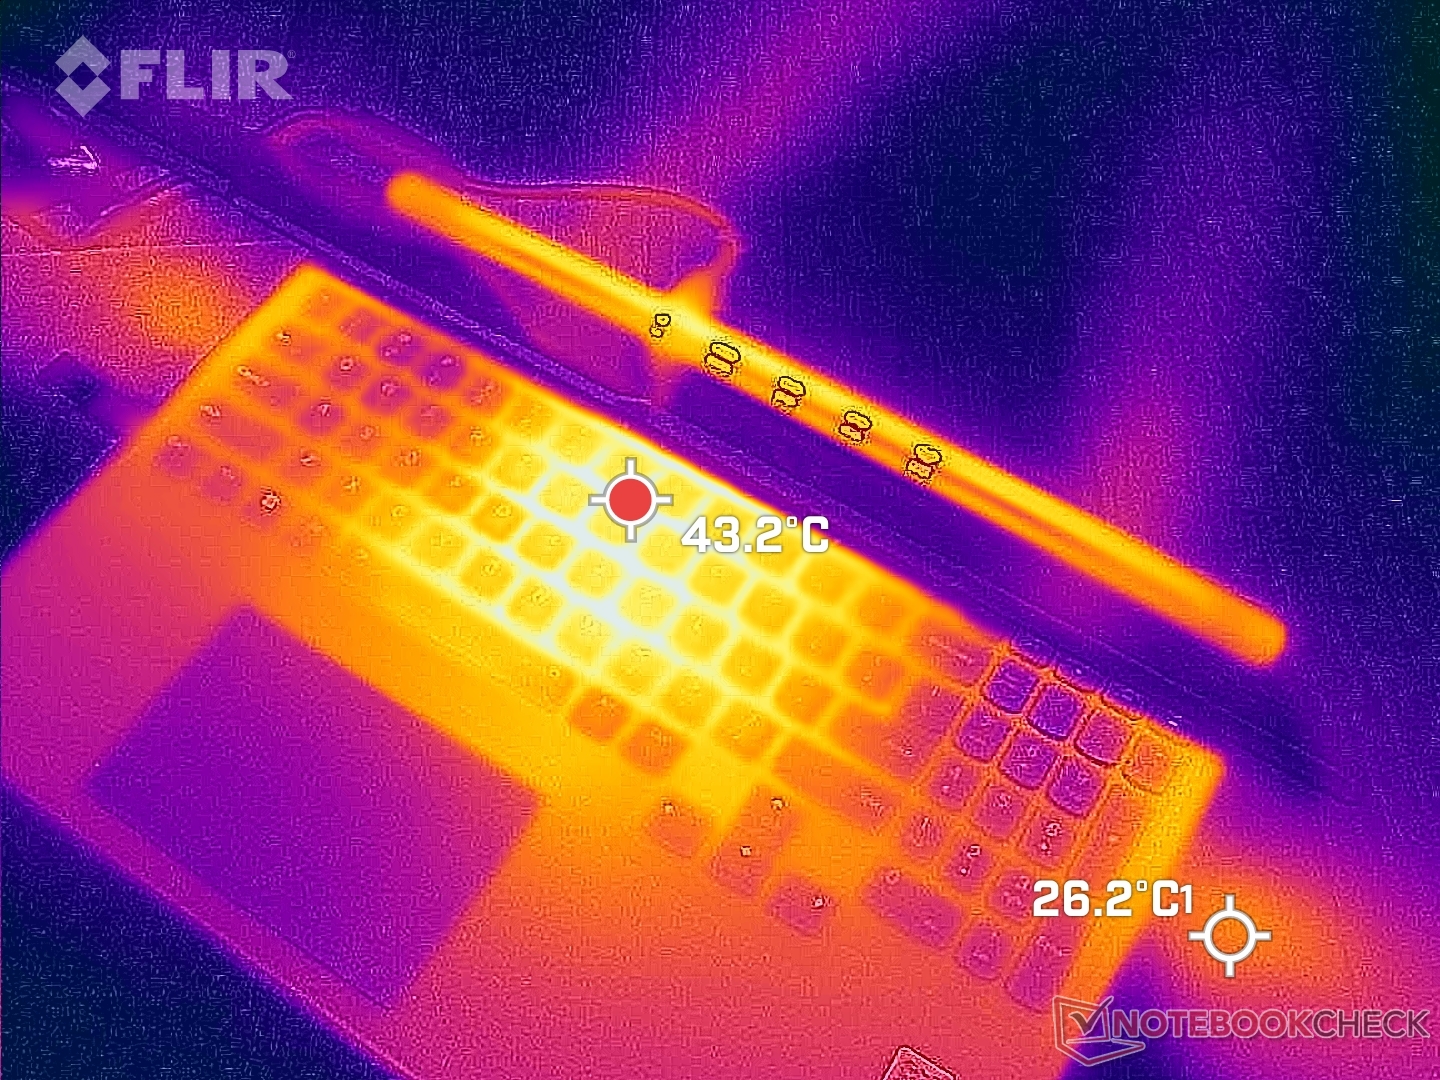
(-) Die maximale Temperatur auf der Oberseite ist 49.8 °C. Im Vergleich liegt der Klassendurchschnitt bei 40.4 °C (von 21.2 bis 68.8 °C für die Klasse Gaming).
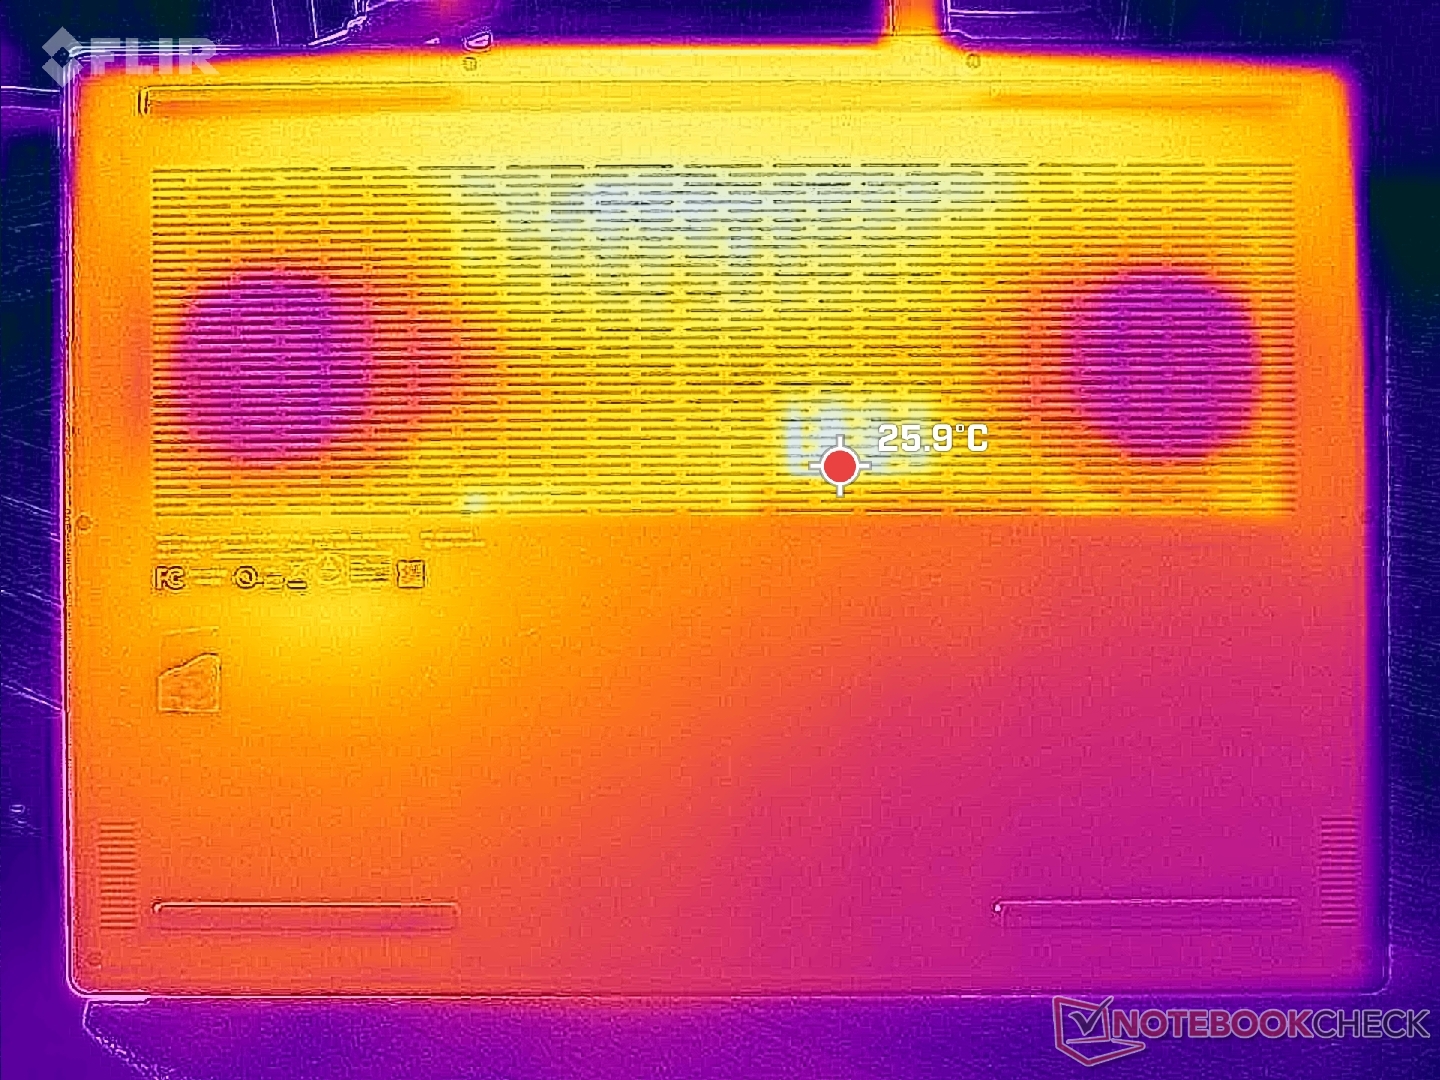
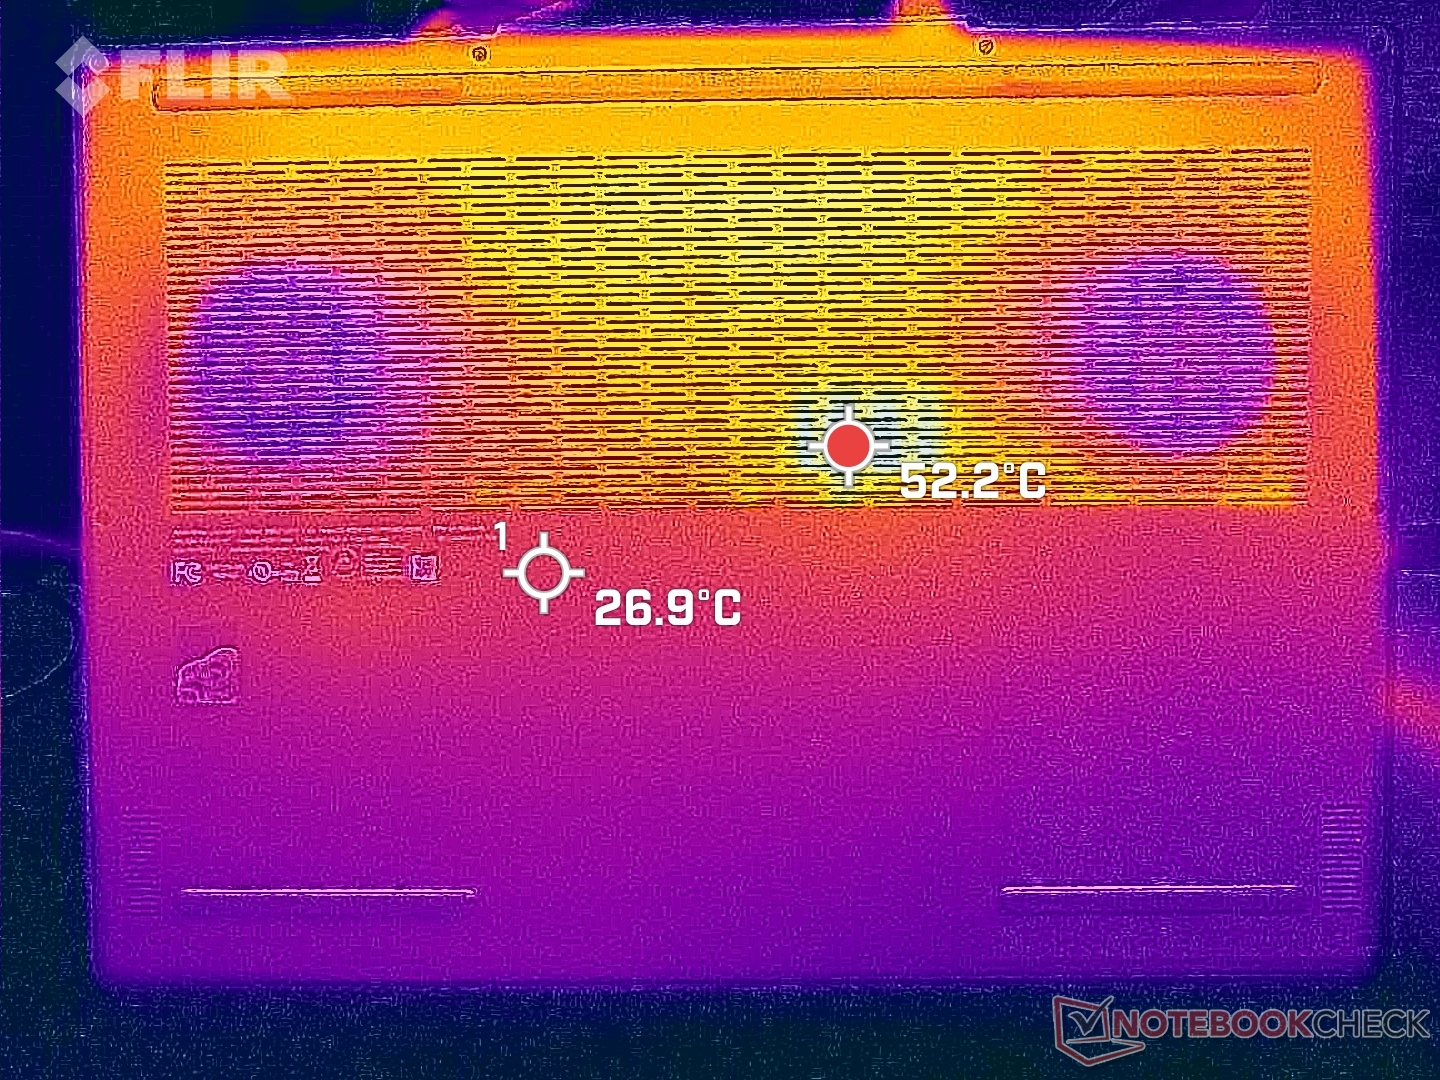
(-) Auf der Unterseite messen wir eine maximalen Wert von 48.8 °C (im Vergleich zum Durchschnitt von 43.2 °C).
(+) Ohne Last messen wir eine durchschnittliche Temperatur von 26 °C auf der Oberseite. Der Klassendurchschnitt erreicht 33.9 °C.
(±) Beim längeren Spielen von The Witcher 3 erhitzt sich das Gerät durchschnittlich auf 35.1 °C. Der Durchschnitt der Klasse ist derzeit 33.9 °C.
(+) Die Handballen und der Touchpad-Bereich sind mit gemessenen 29.4 °C kühler als die typische Hauttemperatur und fühlen sich dadurch kühl an.
(±) Die durchschnittliche Handballen-Temperatur anderer getesteter Geräte war 28.8 °C (-0.6 °C).
| Lenovo Legion Slim 7i 16 Gen 8 Intel Core i9-13900H, NVIDIA GeForce RTX 4070 Laptop GPU | HP Omen 16-wf000 Intel Core i7-13700HX, NVIDIA GeForce RTX 4080 Laptop GPU | Alienware x16 R1 Intel Core i9-13900HK, NVIDIA GeForce RTX 4080 Laptop GPU | Lenovo Legion Pro 7 RTX4090 Intel Core i9-13900HX, NVIDIA GeForce RTX 4090 Laptop GPU | Asus ROG Strix G16 G614JZ Intel Core i9-13980HX, NVIDIA GeForce RTX 4080 Laptop GPU | Razer Blade 16 Early 2023 Intel Core i9-13950HX, NVIDIA GeForce RTX 4080 Laptop GPU | |
|---|---|---|---|---|---|---|
| Hitze | 4% | -9% | -13% | -8% | 7% | |
| Last oben max * (°C) | 49.8 | 45 10% | 47.2 5% | 53 -6% | 54 -8% | 40 20% |
| Last unten max * (°C) | 48.8 | 48.8 -0% | 47.8 2% | 59 -21% | 55 -13% | 37.6 23% |
| Idle oben max * (°C) | 29.4 | 29.2 1% | 36.8 -25% | 34 -16% | 29 1% | 32.4 -10% |
| Idle unten max * (°C) | 30 | 28.8 4% | 35.8 -19% | 32 -7% | 33 -10% | 31.4 -5% |
* ... kleinere Werte sind besser
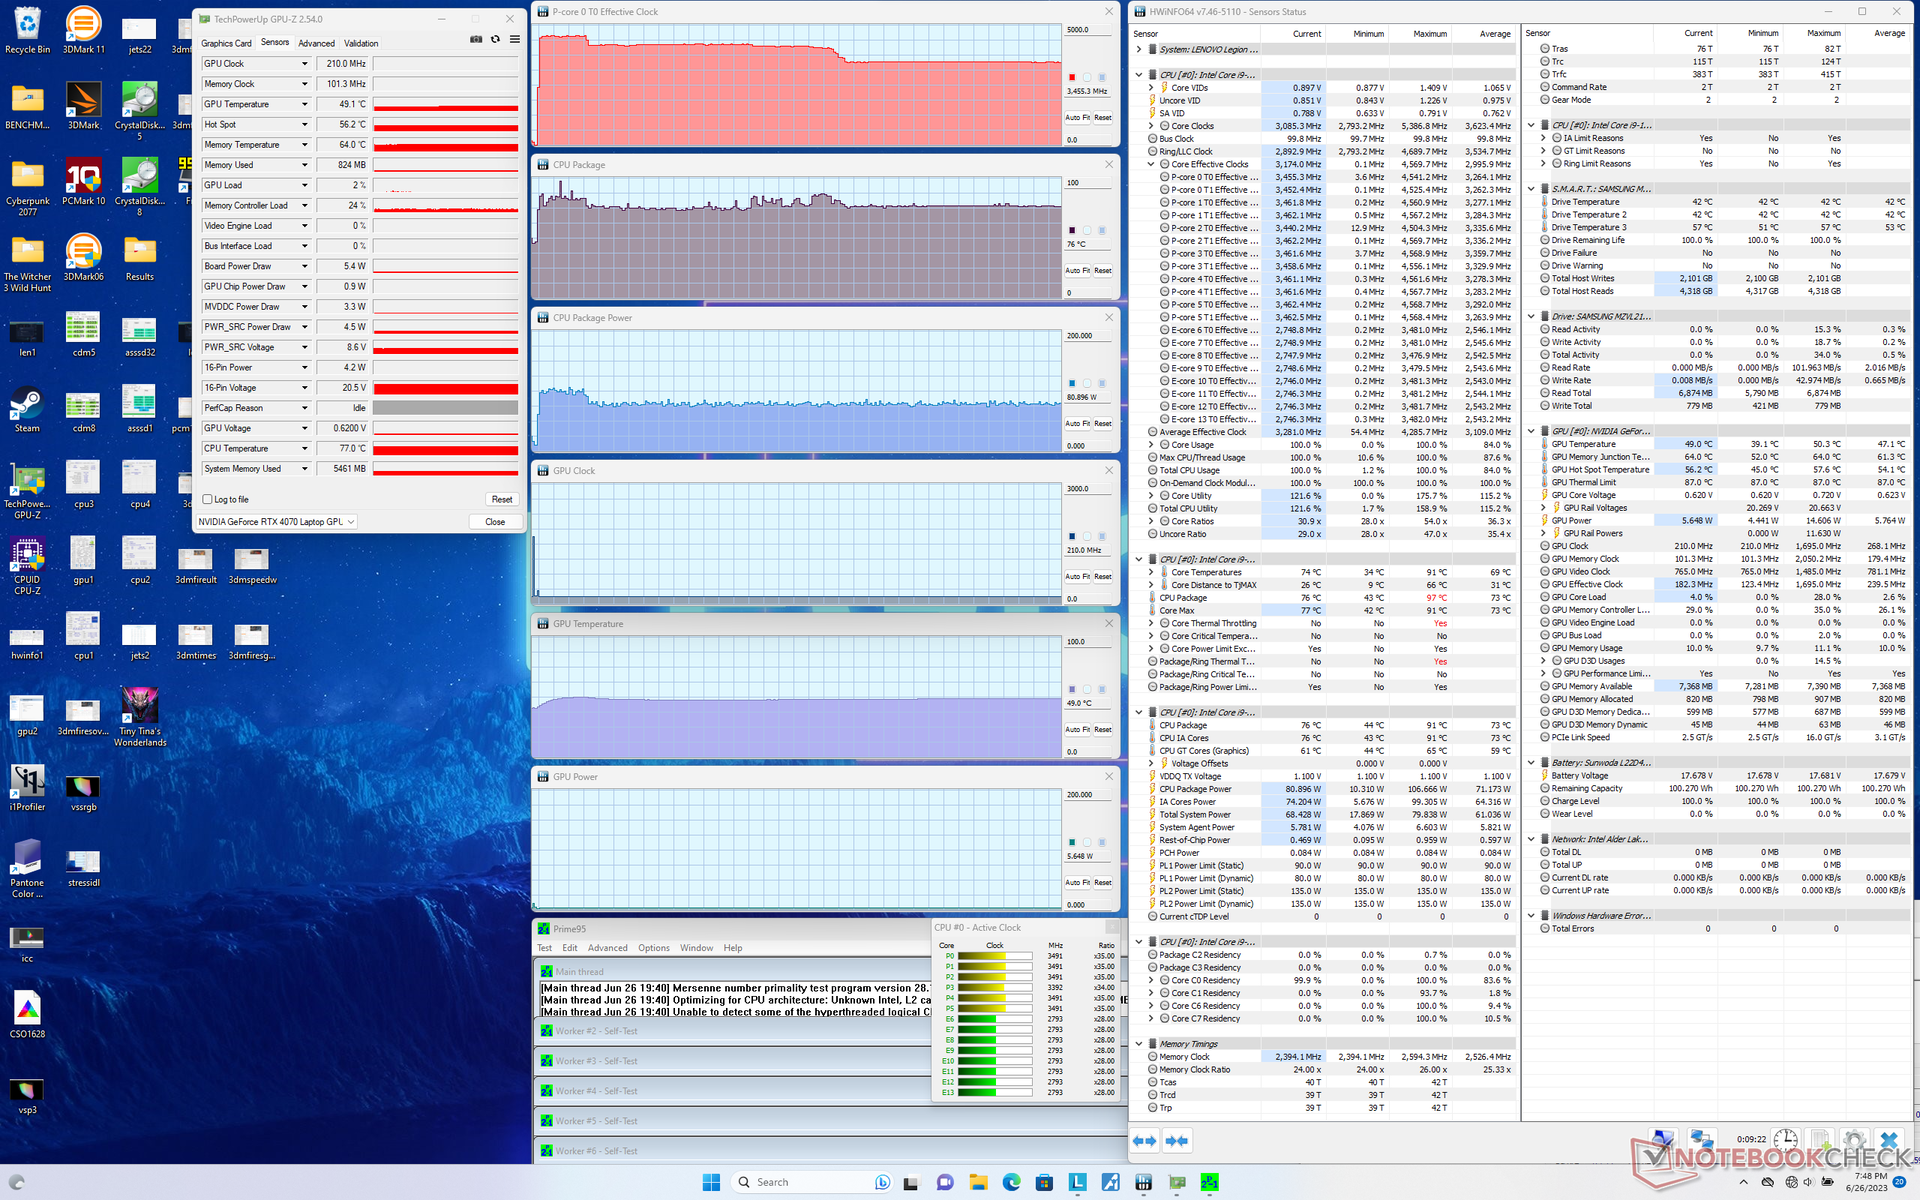
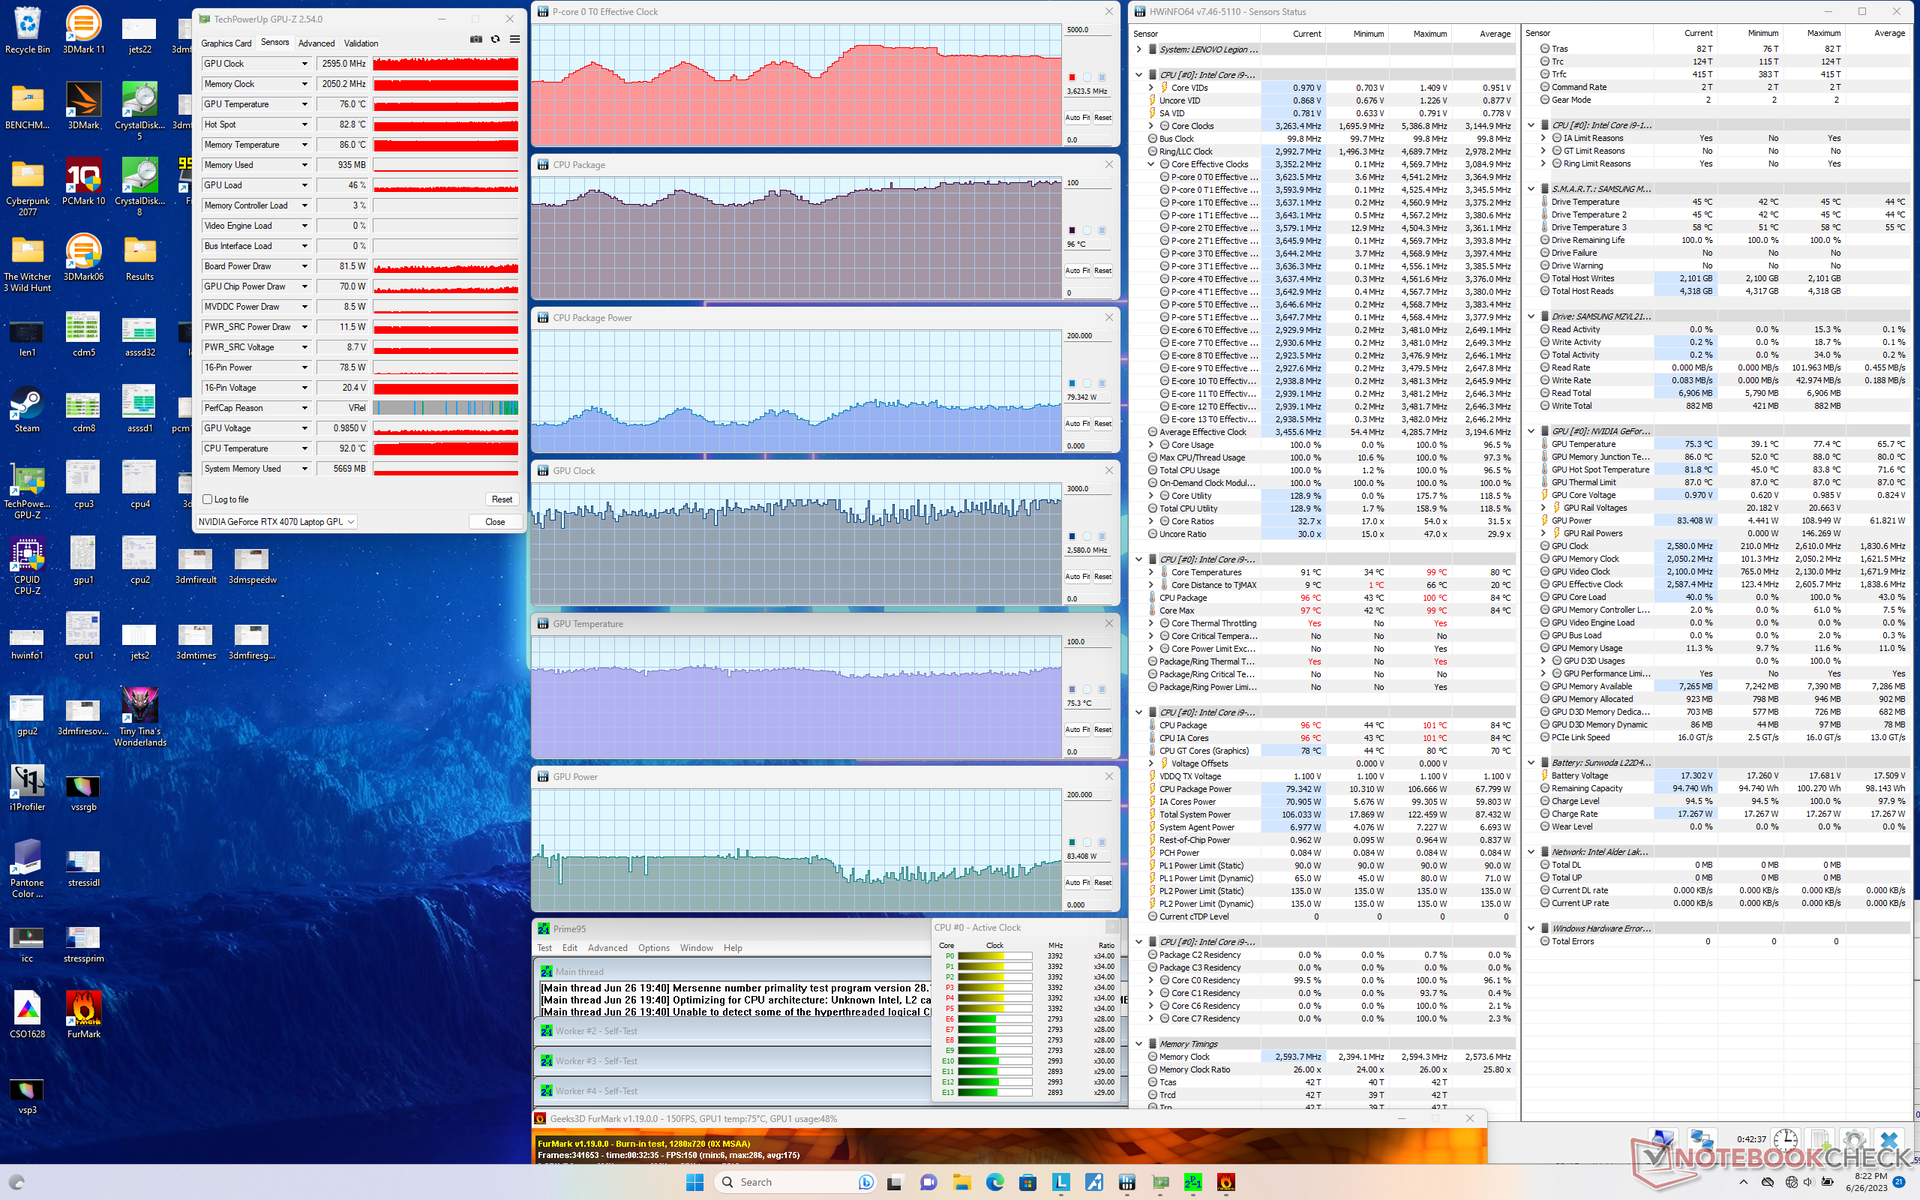
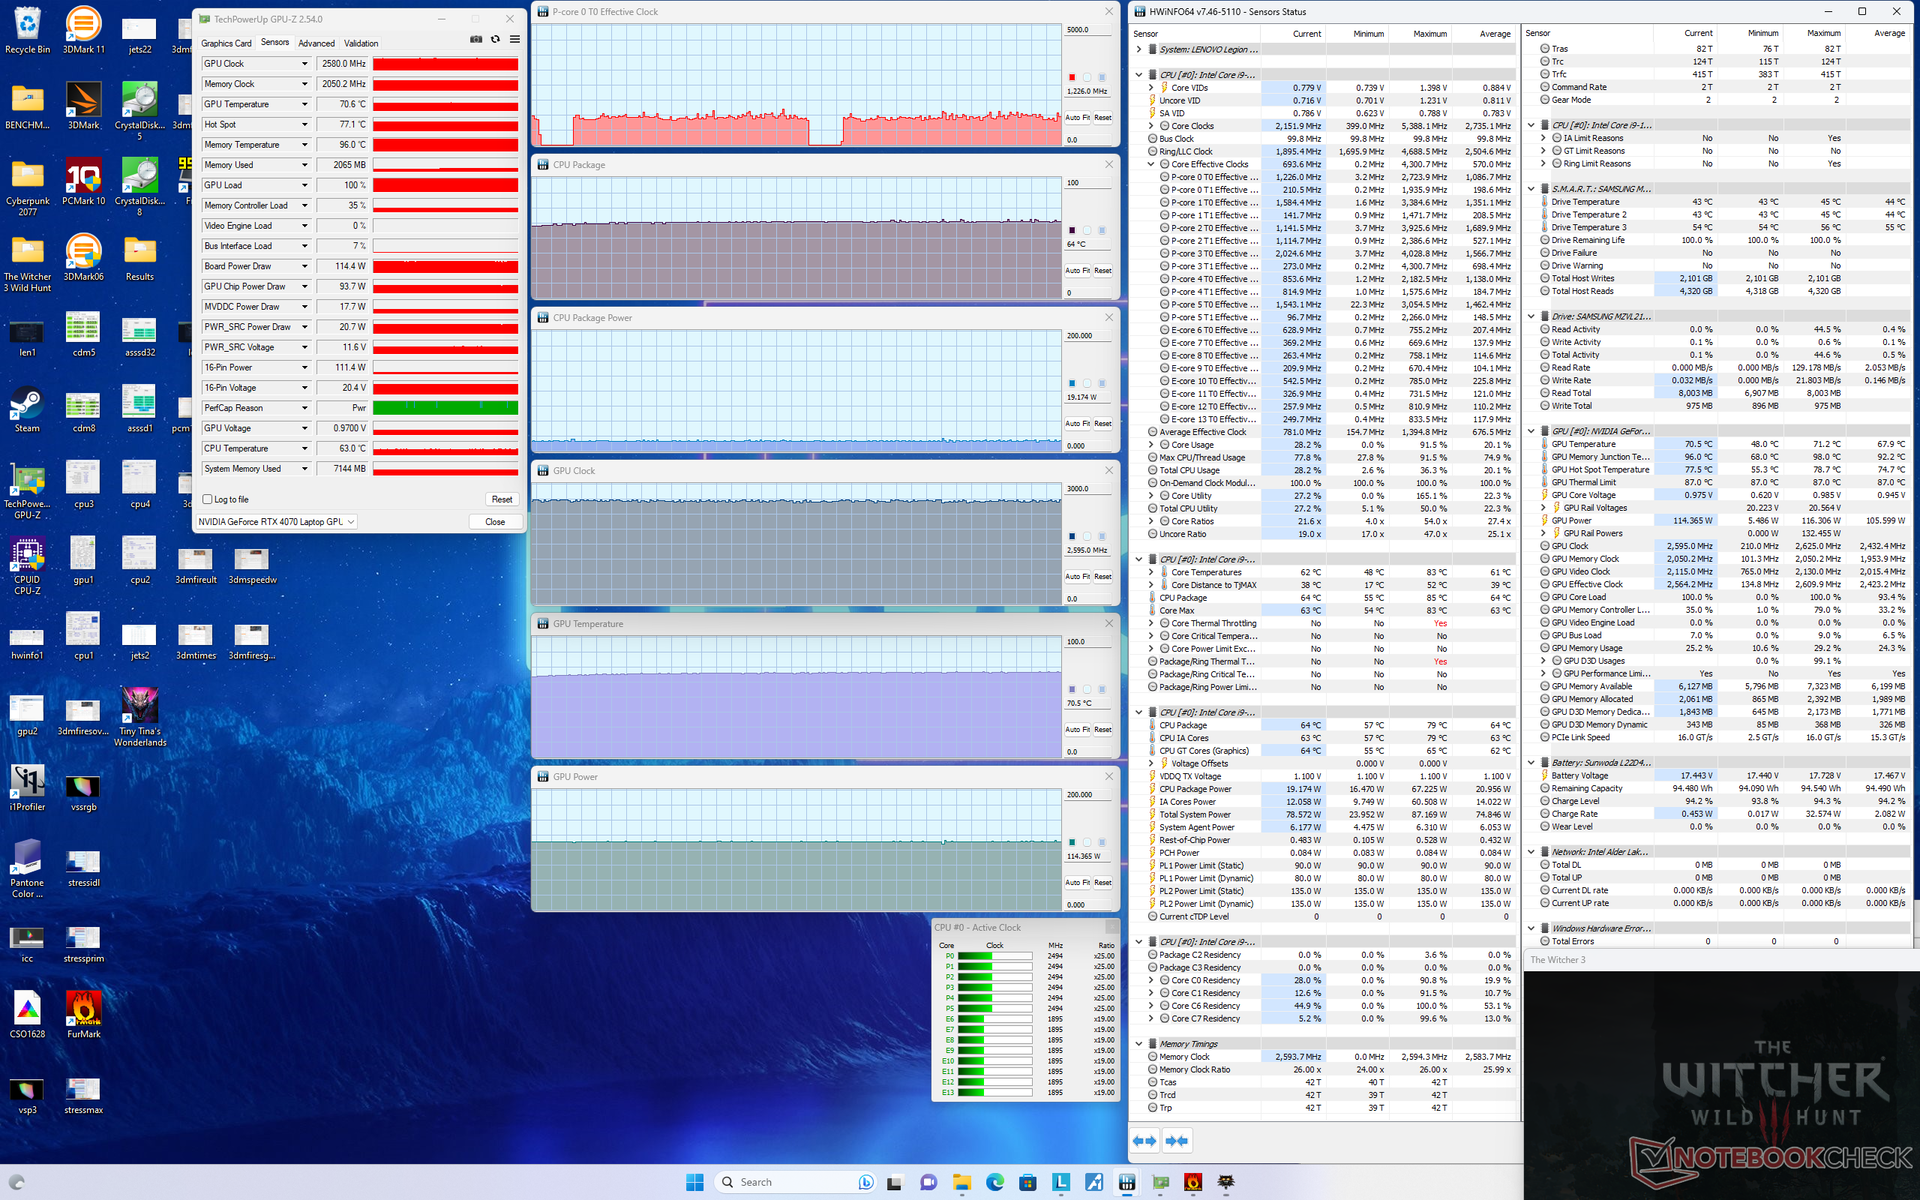
Stresstest
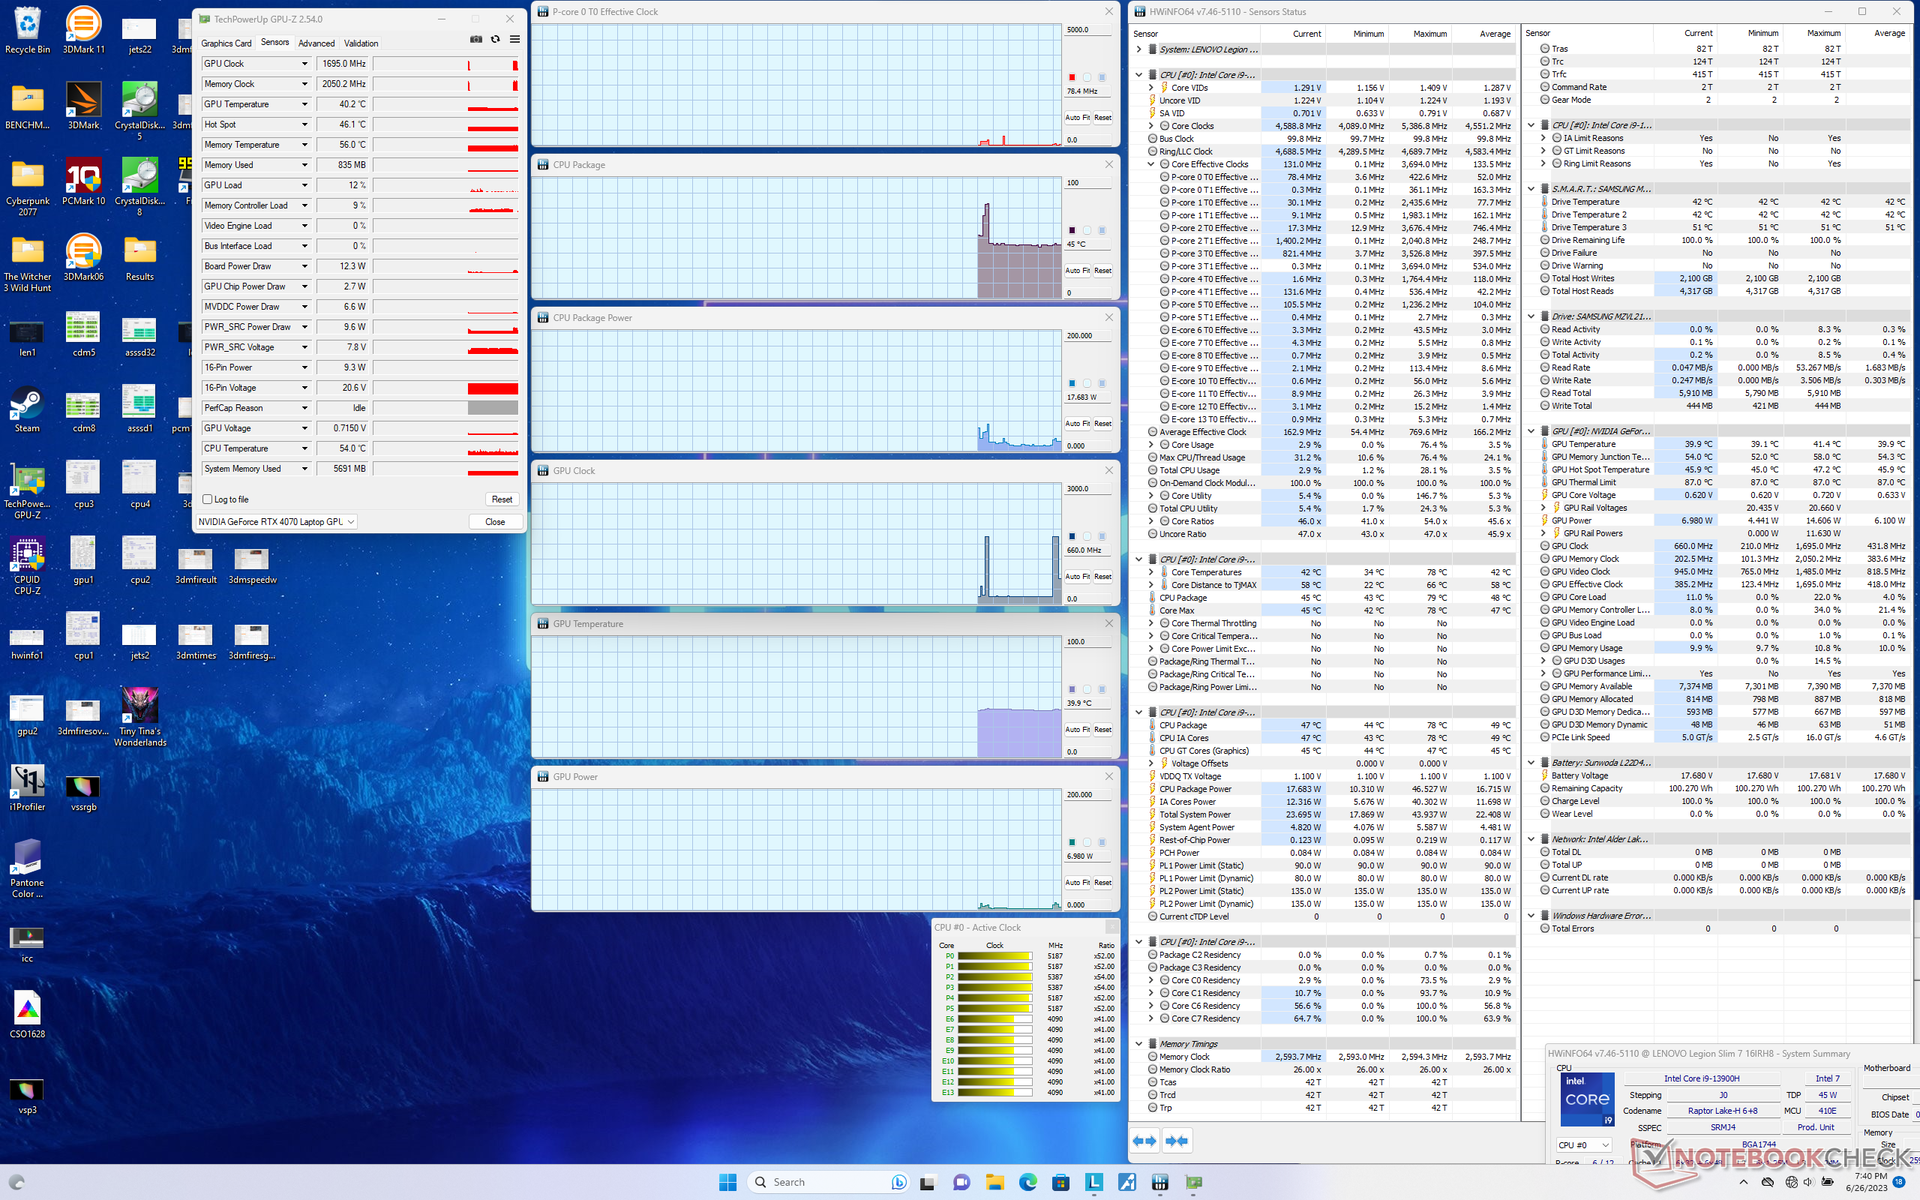
In Prime95 läuft die CPU anfangs circa eine Minute lang mit einer Taktrate von 4,5 GHz bei einer Temperatur von 87 Grad und einer Energieaufnahme von 100 Watt. Der Prozessor taktet dann auf 3,5 GHz bei 80 Watt herunter, um eine vernünftigere Kerntemperatur von 76 Grad zu halten. Der schnellere im Blade 16 verbaute Core i9-13950HX wurde in diesem Test mit 82 Grad Celsius etwas wärmer.
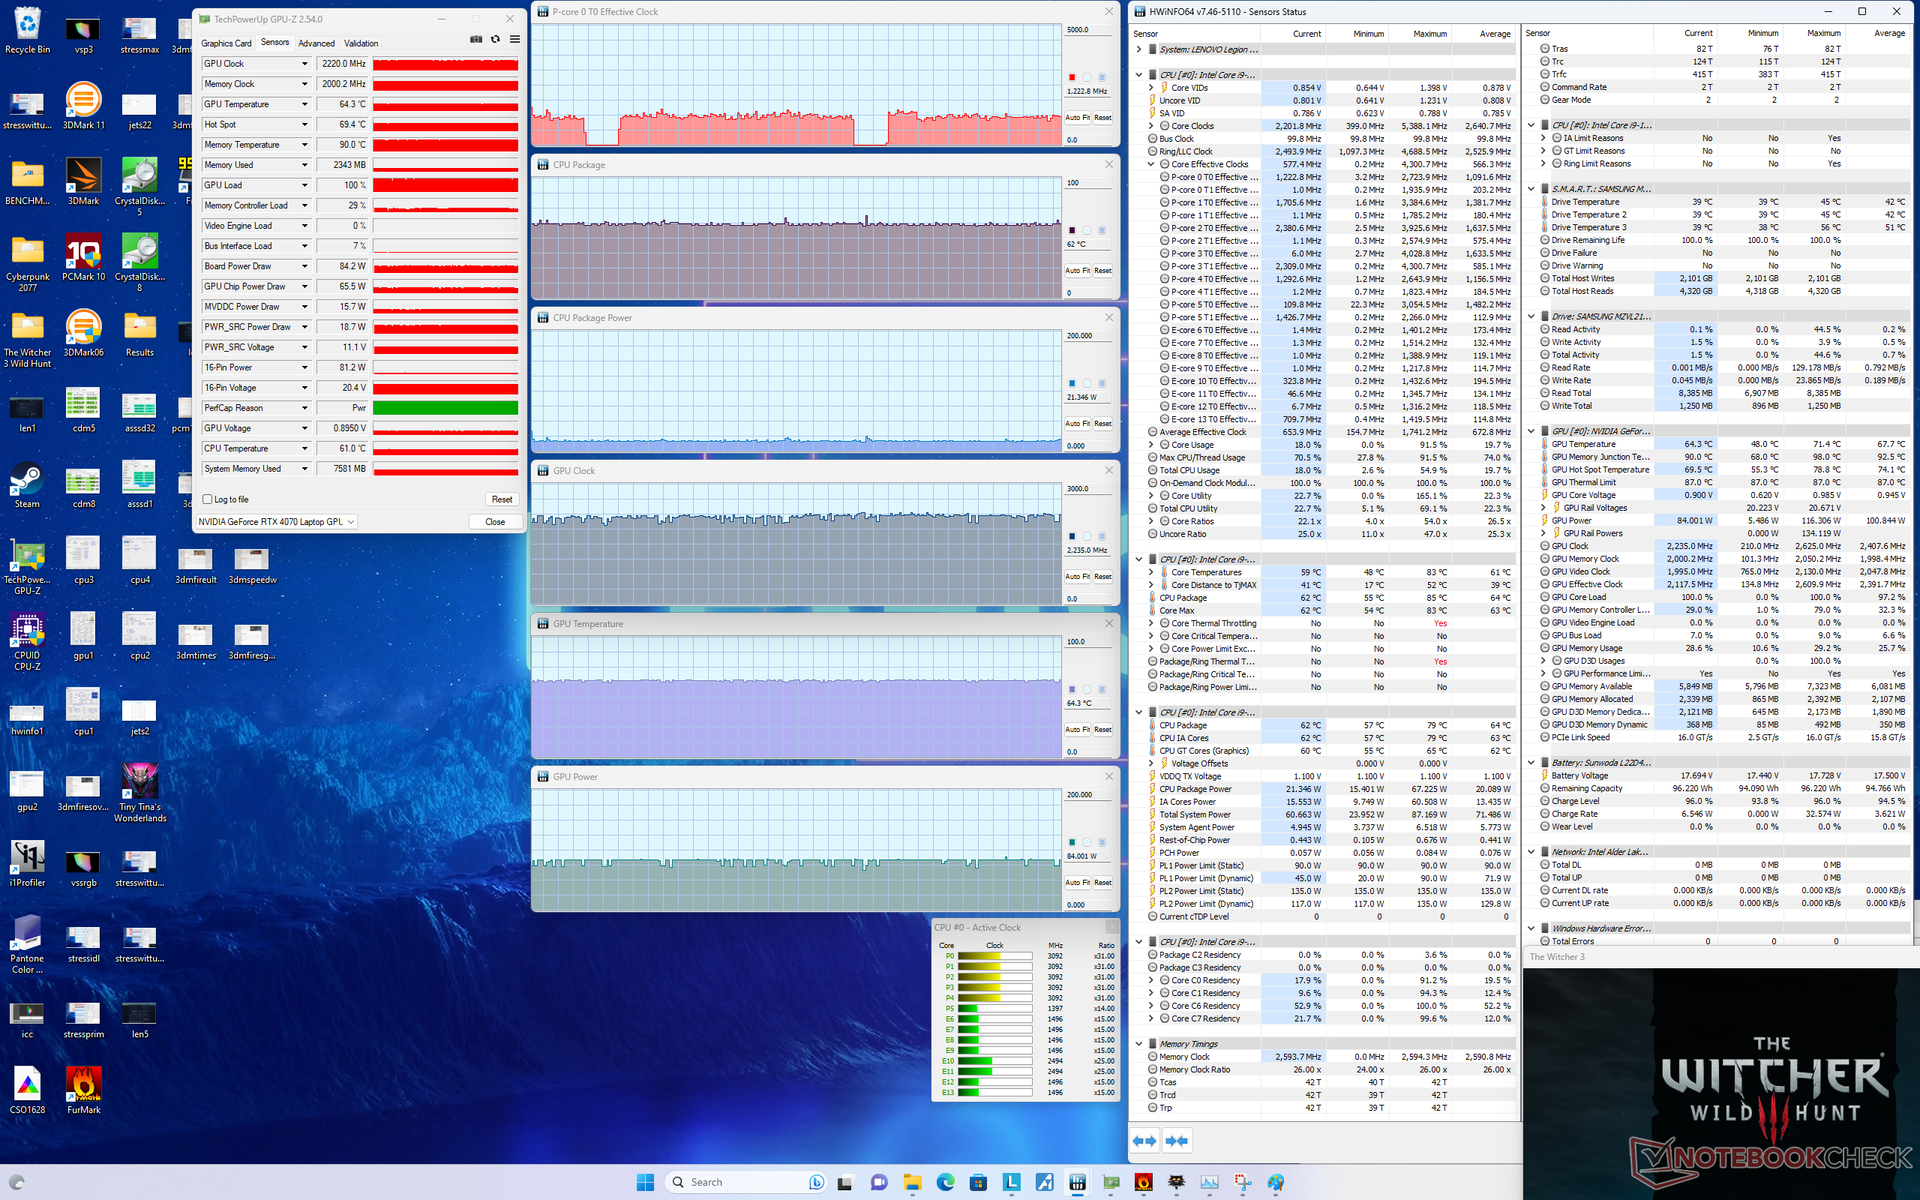
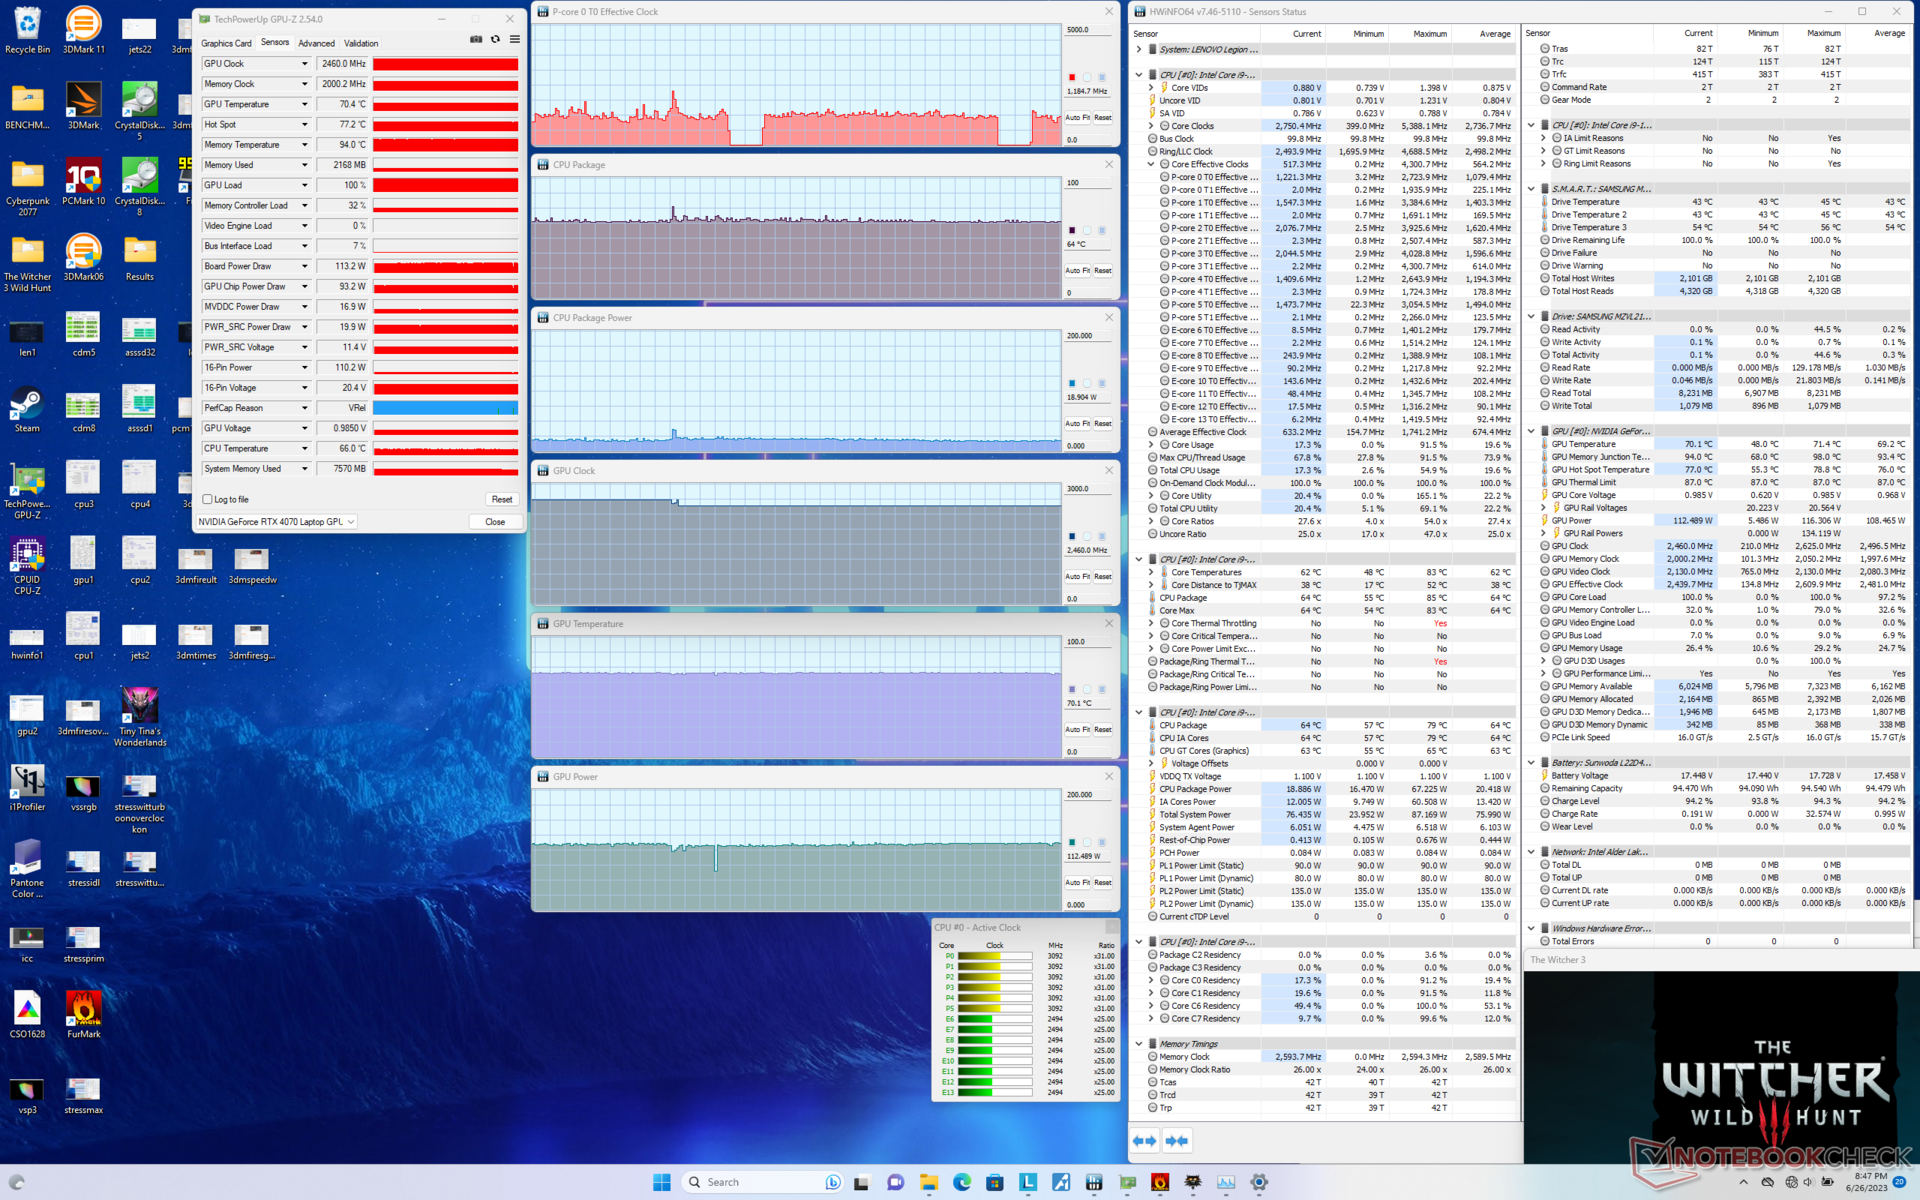
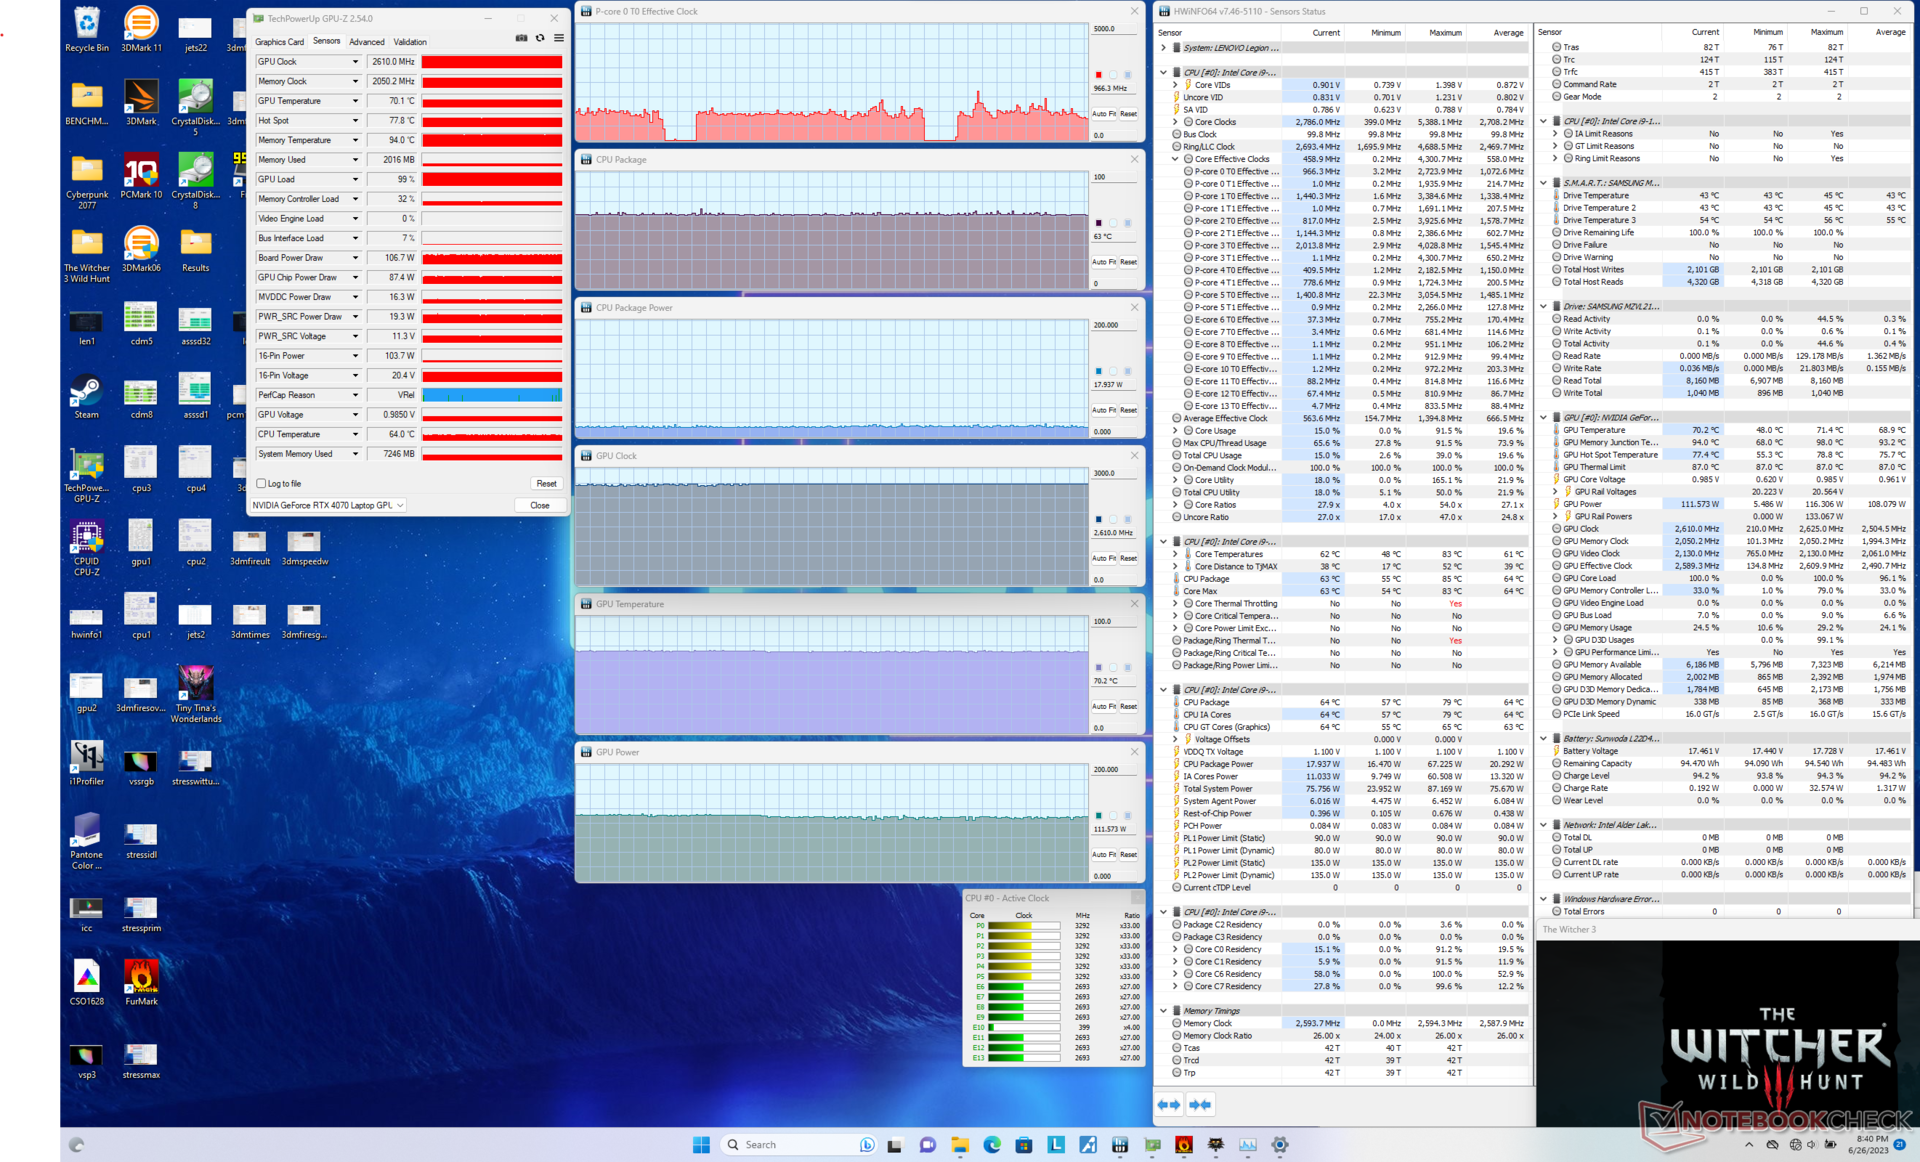
Die Nvidia-Grafikkarte stabilisiert sich unterdessen bei 2580 MHz, 114 Watt und 71 Grad Celsius im Leistungsmodus mit aktivierter Übertaktung und Overdrive. Auf dem Papier zielt es die GPU zwar auf 140 Watt ab, in Cyberpunk 2077 haben wir aber nur maximal 123 Watt erreicht. Im ausbalancierten Energiemodus fällt die Energieaufnahme und Temperatur auf 84 Watt beziehungsweise 64 Grad. Die Kerntemperaturen sind für einen portablen Gaming-Laptop eher auf der kühleren Seite, im Alienware x16 R1 liegen die CPU- und GPU-Temperaturen in den gleichen Spielen zum Beispiel zwischen 80 und 95 Grad.
Im Akkubetrieb ist der Leistungsmodus nicht wählbar. Die daraus resultierenden Leistungseinbußen führen im Fire Strike-Benchmark zu Scores von 25602 und 21049 anstelle den im Netzbetrieb erreichten 32664 und 30130 Punkten.
| CPU-Taktrate (GHz) | GPU-Taktrate (MHz) | Durchschnittliche CPU-Temperatur (°C) | Durchschnittliche GPU-Temperatur (°C) | |
| Leerlauf | -- | -- | 45 | 40 |
| Prime95 Stresstest | 3.5 | -- | 76 | 49 |
| Prime95 + FurMark Stresstest | 2.6 - 3.5 | 1920 - 2610 | 77 - 90 | 75 |
| Witcher 3 Stresstest (ausbalancierter Modus) | ~1.2 | 2220 | 62 | 64 |
| Witcher 3 Stresstest (Leistungsmodus mit GPU-Übertaktung aus + Overdrive aus) | ~1.2 | 2460 | 64 | 70 |
| Witcher 3 Stresstest (Leistungsmodus mit GPU-Übertaktung an + Overdrive aus) | ~1.2 | 2610 | 63 | 70 |
| Witcher 3 Stresstest (Leistungsmodus mit GPU-Übertaktung an + Overdrive an) | ~1.2 | 2580 | 64 | 71 |
Lautsprecher
Mit einer maximalen Lautstärke von 85 dB(A) sind die Lautsprecher ähnlich laut wie die der meisten anderen Gaming-Laptops. Die Soundqualität und die Bässe sind ebenfalls nichts besonderes. Im ausbalancierten Energiemodus klingen die Lautsprecher aufgrund der leiseren Lüfter besser.

Lenovo Legion Slim 7i 16 Gen 8 Audio Analyse
(+) | Die Lautsprecher können relativ laut spielen (84.8 dB)
Bass 100 - 315 Hz
(±) | abgesenkter Bass - 12.1% geringer als der Median
(±) | durchschnittlich lineare Bass-Wiedergabe (9% Delta zum Vorgänger)
Mitteltöne 400 - 2000 Hz
(+) | ausgeglichene Mitten, vom Median nur 1.4% abweichend
(+) | lineare Mitten (3.3% Delta zum Vorgänger)
Hochtöne 2 - 16 kHz
(+) | ausgeglichene Hochtöne, vom Median nur 4.4% abweichend
(+) | sehr lineare Hochtöne (5.6% Delta zum Vorgänger)
Gesamt im hörbaren Bereich 100 - 16.000 Hz
(+) | hörbarer Bereich ist sehr linear (10.5% Abstand zum Median
Im Vergleich zu allen Geräten derselben Klasse
» 6% aller getesteten Geräte dieser Klasse waren besser, 2% vergleichbar, 92% schlechter
» Das beste Gerät hat einen Delta-Wert von 6%, durchschnittlich ist 18%, das schlechteste Gerät hat 132%
Im Vergleich zu allen Geräten im Test
» 5% aller getesteten Geräte waren besser, 1% vergleichbar, 93% schlechter
» Das beste Gerät hat einen Delta-Wert von 4%, durchschnittlich ist 24%, das schlechteste Gerät hat 134%
Apple MacBook Pro 16 2021 M1 Pro Audio Analyse
(+) | Die Lautsprecher können relativ laut spielen (84.7 dB)
Bass 100 - 315 Hz
(+) | guter Bass - nur 3.8% Abweichung vom Median
(+) | lineare Bass-Wiedergabe (5.2% Delta zum Vorgänger)
Mitteltöne 400 - 2000 Hz
(+) | ausgeglichene Mitten, vom Median nur 1.3% abweichend
(+) | lineare Mitten (2.1% Delta zum Vorgänger)
Hochtöne 2 - 16 kHz
(+) | ausgeglichene Hochtöne, vom Median nur 1.9% abweichend
(+) | sehr lineare Hochtöne (2.7% Delta zum Vorgänger)
Gesamt im hörbaren Bereich 100 - 16.000 Hz
(+) | hörbarer Bereich ist sehr linear (4.6% Abstand zum Median
Im Vergleich zu allen Geräten derselben Klasse
» 0% aller getesteten Geräte dieser Klasse waren besser, 0% vergleichbar, 100% schlechter
» Das beste Gerät hat einen Delta-Wert von 5%, durchschnittlich ist 17%, das schlechteste Gerät hat 45%
Im Vergleich zu allen Geräten im Test
» 0% aller getesteten Geräte waren besser, 0% vergleichbar, 100% schlechter
» Das beste Gerät hat einen Delta-Wert von 4%, durchschnittlich ist 24%, das schlechteste Gerät hat 134%
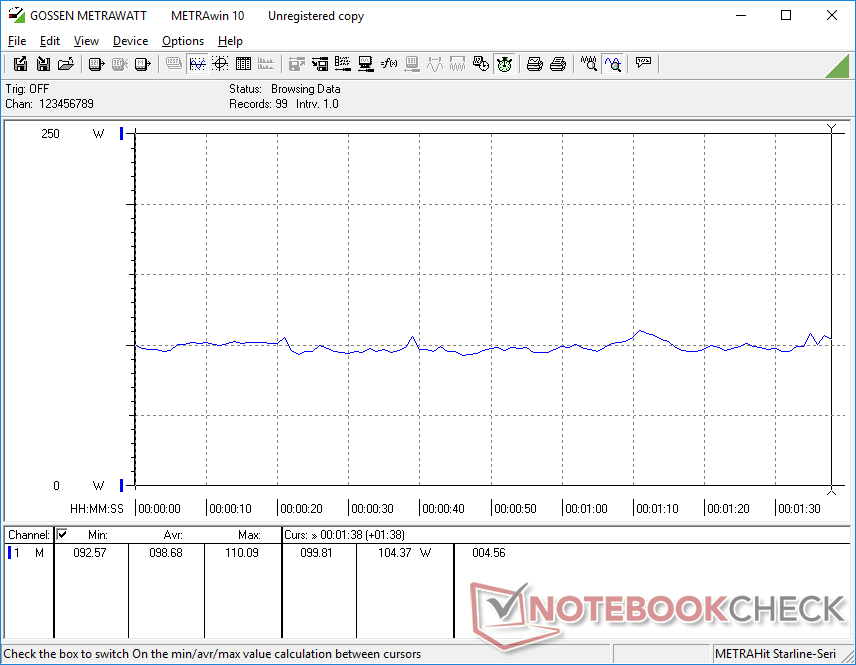
Energieverwaltung
Energieaufnahme — Hoher Verbrauch im Leerlauf
Die Energieaufnahme ist im Leerlauf mit 22 Watt ziemlich hoch, selbst wenn der Energiesparmodus aktiviert und die Bildschirmhelligkeit auf der niedrigsten Einstellung ist. Dieses Phänomen zeigt sich auch bei anderen Gaming-Laptops mit Core-H-Prozessoren der 13. Generation und führt wahrscheinlich zu den eher mittelmäßigen Akkulaufzeiten. Das von einem AMD-Prozessor auf Zen-4-Basis angetriebene Legion Pro 5 16 verbraucht unter ähnlichen Bedingungen gute 8 Watt.
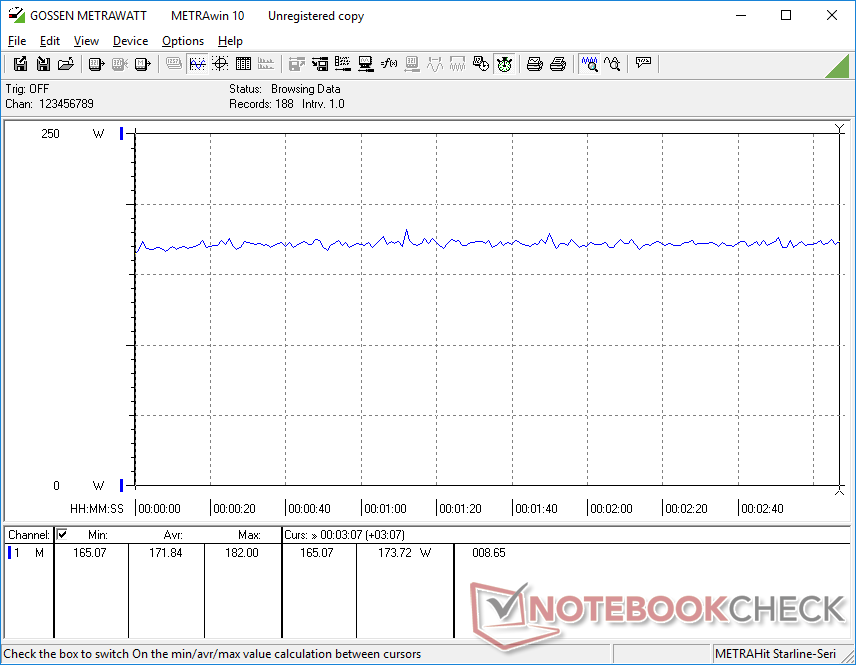
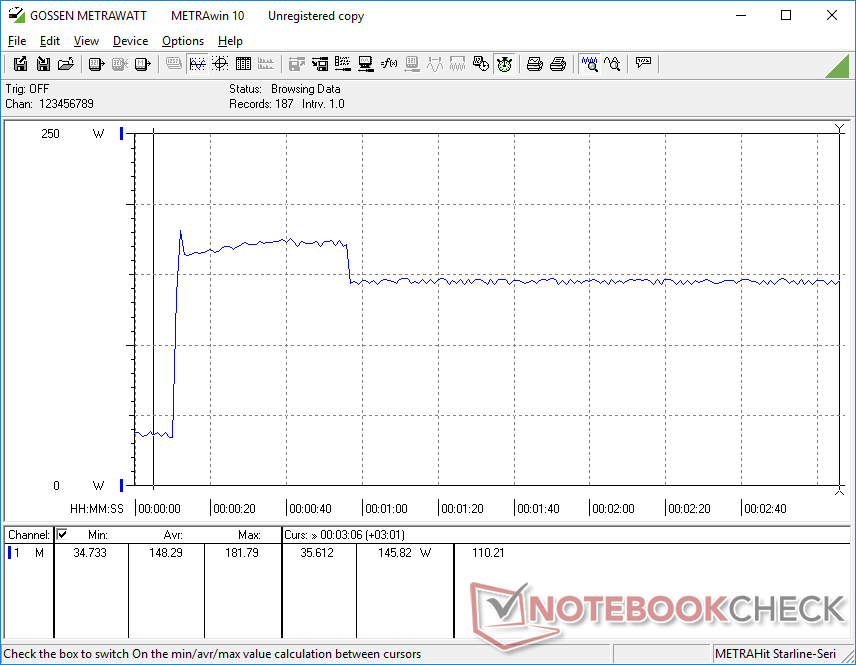
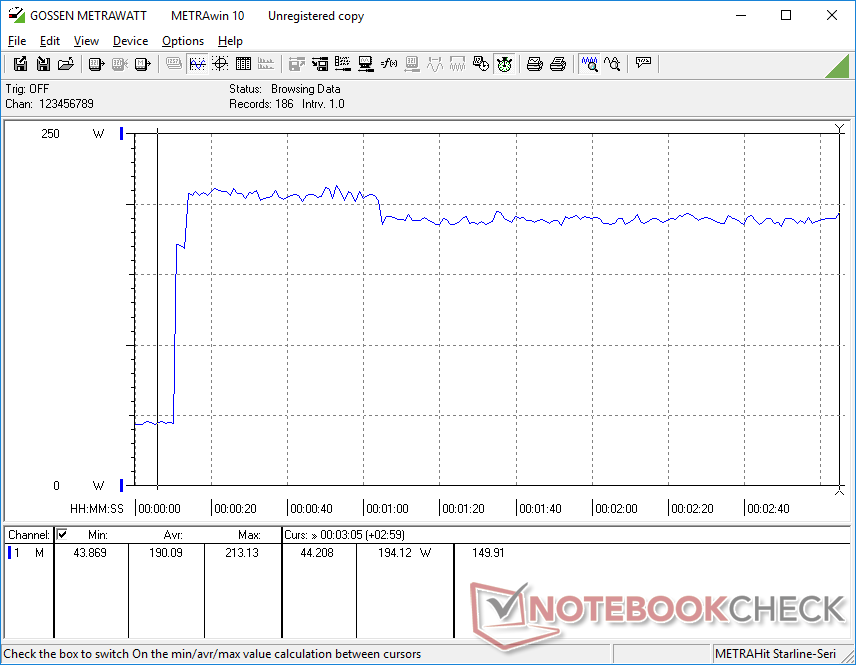
Der Energieverbrauch von 172 Watt beim Spielen liegt auf einem Level mit dem älteren Zephyrus M16, in dem ein Core i9-12900H und eine RTX 3070 Ti verbaut waren. Unser Legion Slim 7 bietet deshalb rund 15 Prozent mehr Grafikleistung ohne Mehrverbrauch dank der besseren Leistung pro Watt im Vergleich zu älteren Gaming-Laptops mit Ampere-Grafikchips.
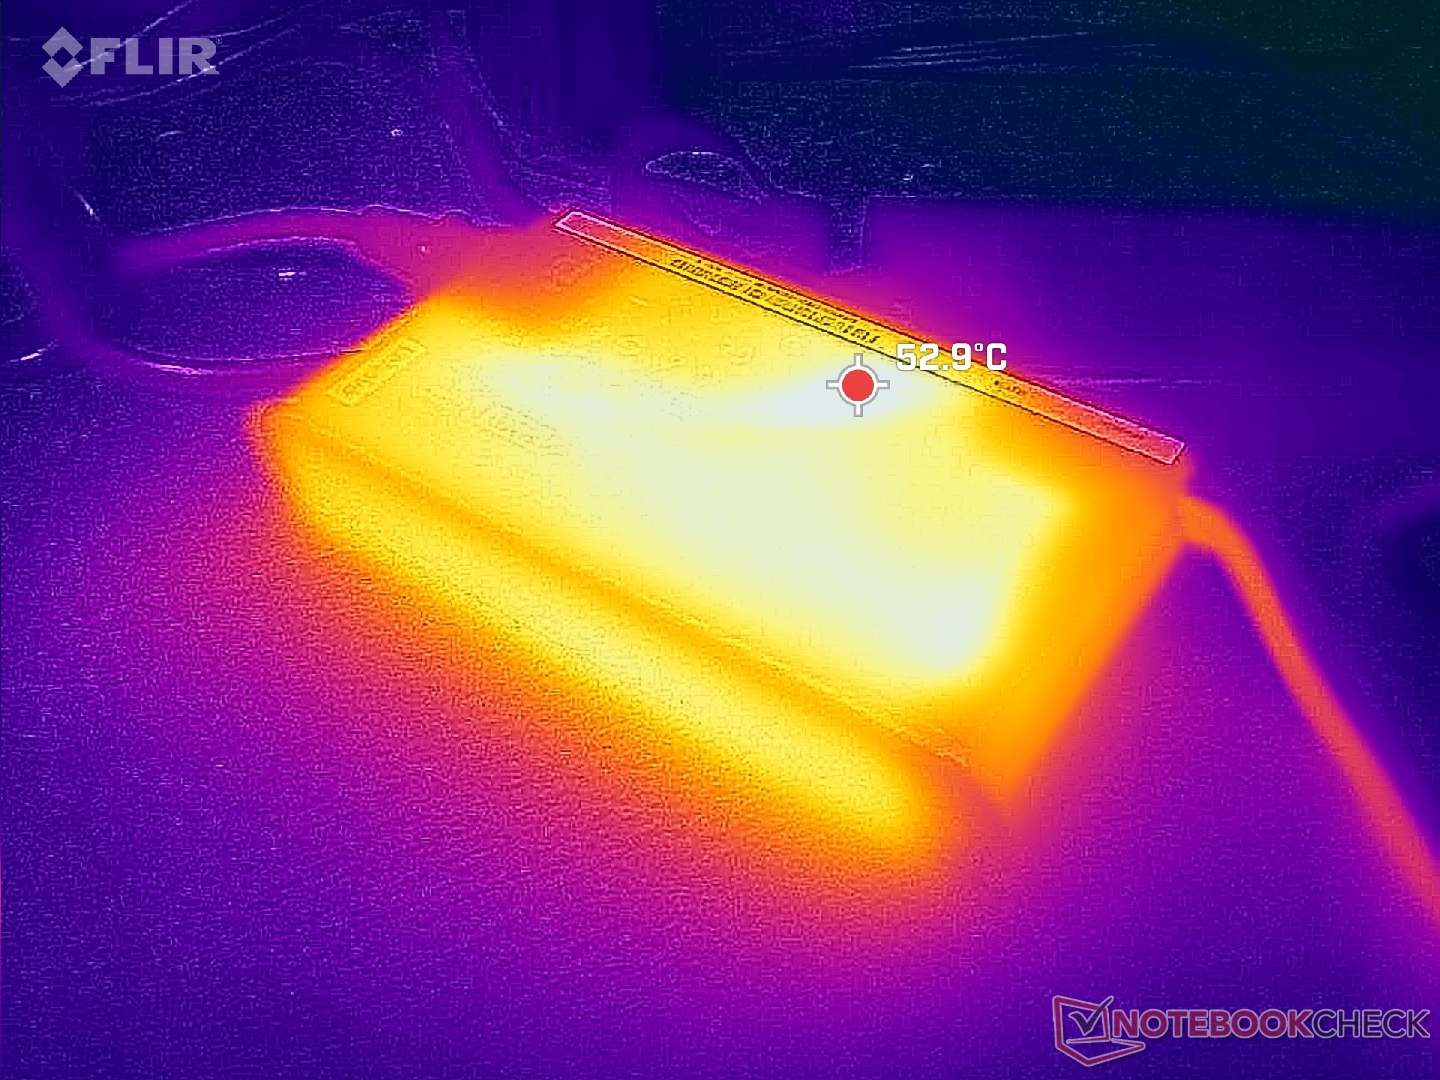
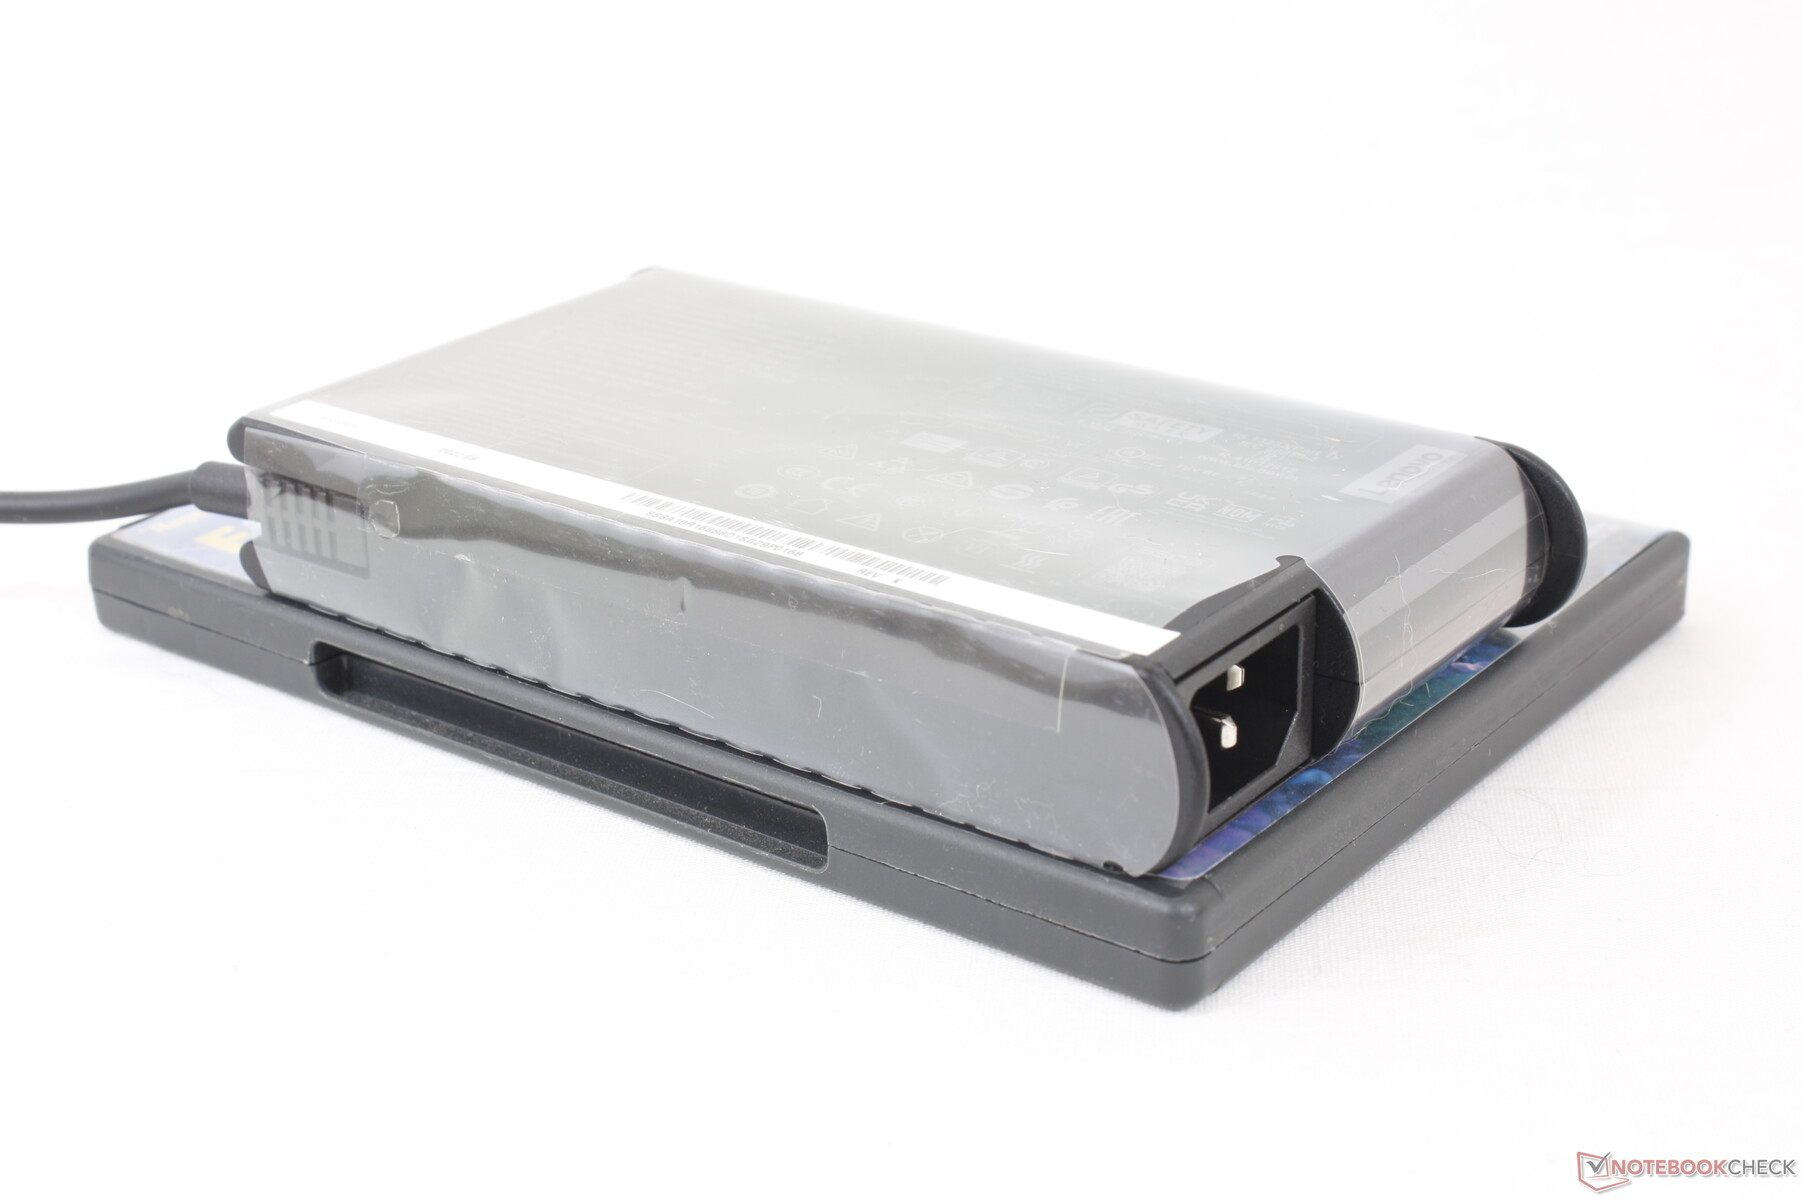
In der Spitze konnten wir eine Energieaufnahme von 213 Watt messen. Die Abmessungen des mittelgroßen 230-Watt-Netzteils betragen etwa 16,9 x 8,8 x 2,6 cm. Das größere Legion Pro 7, das mit dem leistungsfähigeren Core i9-13900HX und einer RTX 4080 bestückt ist, wird mit einem stärkeren Netzteil mit 330 Watt ausgeliefert.
| Aus / Standby | |
| Idle | |
| Last |
|
Legende:
min: | |
| Lenovo Legion Slim 7i 16 Gen 8 i9-13900H, GeForce RTX 4070 Laptop GPU, Samsung PM9A1 MZVL21T0HCLR, IPS, 2560x1600, 16" | Acer Predator Helios 16 PH16-71-731Q i7-13700HX, GeForce RTX 4060 Laptop GPU, Micron 3400 1TB MTFDKBA1T0TFH, IPS-LED, 2560x1600, 16" | HP Omen 16-wf000 i7-13700HX, GeForce RTX 4080 Laptop GPU, SK hynix PC801 HFS002TEJ9X101N, IPS, 2560x1440, 16.1" | Lenovo Legion Pro 7 RTX4090 i9-13900HX, GeForce RTX 4090 Laptop GPU, Samsung PM9A1 MZVL21T0HCLR, IPS, 2560x1600, 16" | Alienware x16 R1 i9-13900HK, GeForce RTX 4080 Laptop GPU, SK hynix PC801 HFS001TEJ9X101N, IPS, 2560x1600, 16" | Lenovo Legion Pro 5 16ARX8 R7 7745HX, GeForce RTX 4070 Laptop GPU, Samsung PM9A1 MZVL21T0HCLR, IPS, 2560x1600, 16" | |
|---|---|---|---|---|---|---|
| Stromverbrauch | 11% | -8% | -20% | -25% | 15% | |
| Idle min * (Watt) | 22 | 15.9 28% | 21.8 1% | 20 9% | 25.2 -15% | 8.1 63% |
| Idle avg * (Watt) | 29 | 20.5 29% | 26 10% | 25 14% | 29.9 -3% | 15.9 45% |
| Idle max * (Watt) | 39.5 | 20.9 47% | 36 9% | 35 11% | 49.8 -26% | 37.2 6% |
| Last avg * (Watt) | 98.7 | 106 -7% | 115.5 -17% | 136 -38% | 105.4 -7% | 90.9 8% |
| Witcher 3 ultra * (Watt) | 171.8 | 175 -2% | 214 -25% | 282 -64% | 263 -53% | 189.6 -10% |
| Last max * (Watt) | 213.2 | 276 -29% | 269.7 -27% | 320 -50% | 313.8 -47% | 263.5 -24% |
* ... kleinere Werte sind besser
Energieverbrauch Witcher 3 / Stresstest
Energieverbrauch mit externem Monitor
Akkulaufzeit
Überraschender Weise ist die Akkukapazität trotz des dünneren Gehäuses des Slim 7i genauso hoch wie beim Legion Pro 7 17. Trotzdem liegen die Akkulaufzeiten beim normalen Webbrowsen nur bei durchschnittlich 4,5 Stunden. Die meisten anderen Gaming-Laptops mit Intel-Prozessoren der 13. Generation, wie das Omen 16 oder Alienware x16 R1, liefern ähnliche oder kürzere Laufzeiten.
Das komplette Aufladen des Akkus dauert mit aktivierter Schnellladefunktion nur 70 Minuten, die meisten anderen Gaming-Notebooks brauchen hierfür 90 Minuten oder länger. Das Gerät kann auch über USB-C mit bis zu 140 Watt geladen werden.
| Lenovo Legion Slim 7i 16 Gen 8 i9-13900H, GeForce RTX 4070 Laptop GPU, 99.9 Wh | HP Omen 16-wf000 i7-13700HX, GeForce RTX 4080 Laptop GPU, 83 Wh | Alienware x16 R1 i9-13900HK, GeForce RTX 4080 Laptop GPU, 90 Wh | Lenovo Legion Pro 7 RTX4090 i9-13900HX, GeForce RTX 4090 Laptop GPU, 99.9 Wh | Asus ROG Strix G16 G614JZ i9-13980HX, GeForce RTX 4080 Laptop GPU, 90 Wh | Razer Blade 16 Early 2023 i9-13950HX, GeForce RTX 4080 Laptop GPU, 95.2 Wh | |
|---|---|---|---|---|---|---|
| Akkulaufzeit | 15% | -7% | 16% | 71% | 57% | |
| Idle (h) | 5.1 | 5.5 8% | 7.3 43% | 8.9 75% | ||
| WLAN (h) | 4.4 | 5.1 16% | 2.5 -43% | 5.1 16% | 9.7 120% | 6.1 39% |
| Last (h) | 0.9 | 1.1 22% | 0.7 -22% | 1.1 22% | 1.4 56% |
Pro
Contra
Fazit — In fast jeder Hinsicht überzeugend
Das Legion Slim 7i 16 Gen 8 ist einer der ausgewogensten Gaming-Laptops in der Legion-Familie. Es ist nicht nur dünner und leichter als die meisten Geräte im 16-Zoll-Segment, es gibt auch keinerlei Einsparungen in Sachen Anschlussmöglichkeiten, der großen RGB-Tastatur, den ordentlichen Display-Optionen für Gamer und Content Creator, der größeren Akkukapazität sowie dem SD-Kartenleser. Dieses dünne Notebook hat also einiges zu bieten.
Das Lenovo Legion Slim 7i 16 G8 opfert etwas Leistung für die schlankeren Abmessungen und das geringere Gewicht. Da der Gaming-Laptop ansonsten aber einen sehr guten Kompromiss aus Performance und Portabilität bietet, dürften sich die meisten Gamer darüber nicht beschweren.
Ein paar Kritikpunkte gibt es allerdings, wenn man sich das Gerät etwas näher anschaut. Der teilverlötete RAM ist in Gaming-Laptops beispielsweise eher selten anzufinden und die SSD wird unter Last des Öfteren gedrosselt. Als CPU und GPU steht weder der High-End-Chip Core i9-13900HX oder eine RTX 4080 zur Auswahl, diese bleiben dem dickeren und schwereren Legion Pro 7 16 vorenthalten. Enthusiasten, die absolut keine Abstriche machen möchten, müssen deshalb zu den klobigeren Alternativen wie dem Legion Pro 7, Alienware m16 oder dem Razer Blade 16 greifen, die allesamt stärkere Prozessoren anbieten.
Preis und Verfügbarkeit
Das Lenovo Legion Slim 7i Gen 8 ist in Deutschland zu Preisen ab 1.799 Euro für die Basiskonfiguration mit einem Core i7-13700H und einer RTX 4060 bestellbar. Unser Testmodell mit dem Core i9-13900H und einer RTX 4070 gibt es regulär ab 2.489 Euro. Auch bei Cyberport kann das Gaming-Notebook bereits bestellt werden.
Lenovo Legion Slim 7i 16 Gen 8
- 03.07.2023 v7 (old)
Allen Ngo
Transparenz
Die Auswahl der zu testenden Geräte erfolgt innerhalb der Redaktion. Das vorliegende Testmuster wurde dem Autor vom Hersteller oder einem Shop zu Testzwecken leihweise zur Verfügung gestellt. Eine Einflussnahme des Leihstellers auf den Testbericht gab es nicht, der Hersteller erhielt keine Version des Reviews vor der Veröffentlichung. Es bestand keine Verpflichtung zur Publikation. Als eigenständiges, unabhängiges Unternehmen unterliegt Notebookcheck keiner Diktion von Herstellern, Shops und Verlagen.
So testet Notebookcheck
Pro Jahr werden von Notebookcheck hunderte Laptops und Smartphones unabhängig in von uns standardisierten technischen Verfahren getestet, um eine Vergleichbarkeit aller Testergebnisse zu gewährleisten. Seit rund 20 Jahren entwickeln wir diese Testmethoden kontinuierlich weiter und setzen damit Branchenstandards. In unseren Testlaboren kommt ausschließlich hochwertiges Messequipment in die Hände erfahrener Techniker und Redakteure. Die Tests unterliegen einer mehrstufigen Kontrolle. Unsere komplexe Gesamtbewertung basiert auf hunderten fundierten Messergebnissen und Benchmarks, womit Ihnen Objektivität garantiert ist. Weitere Informationen zu unseren Testmethoden gibt es hier.
Preisvergleich

