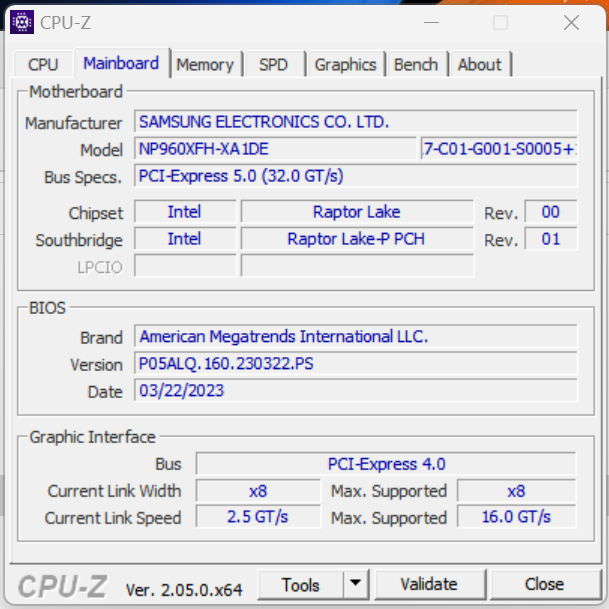
Samsung Galaxy Book3 Ultra 16 im Test: Ausdauerndes 16-Zoll-Ultrabook mit RTX 4050
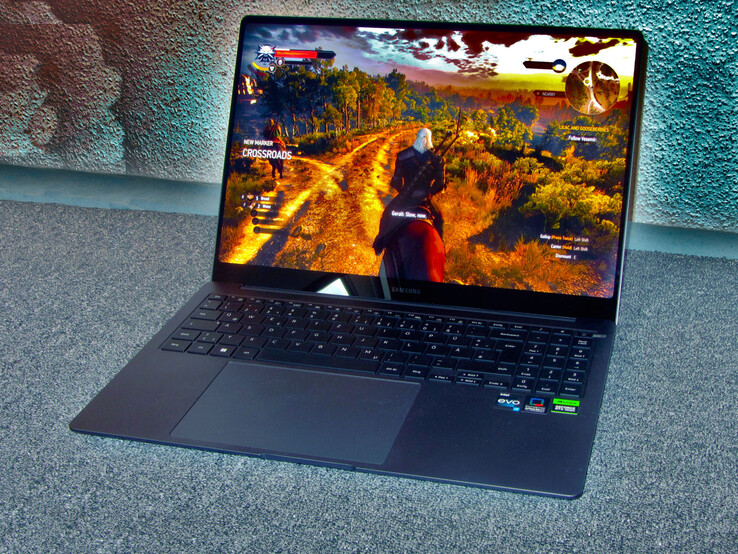
Samsung legt mit dem Galaxy Book 3 Ultra 16 eine Art Mischung aus Gaming-Notebook, Workstation und Laptop für Kreativ-Arbeiter vor, dessen Fokus auf Mobilität, Ergonomie und niedrigem Energiebedarf liegt. Höchstleistungen sind nicht geboten: Core i7-13700H und GeForce RTX 4050 werden durch konservative Power Limits bzw. eine niedrige TGP (60 Watt) eingebremst. Ein 100-Watt-Netzteil deckt alle Ansprüche der Hardware ab.
Zu den Konkurrenten zählen Geräte wie das Schenker Vision 16 Pro, das LG Gram 17, das Dell XPS 15 9520, das Asus VivoBook Pro 16X OLED, das Acer Swift X SFX16-52G, das Lenovo ThinkBook 16p G3 ARH.
mögliche Konkurrenten im Vergleich
Bew. | Datum | Modell | Gewicht | Dicke | Größe | Auflösung | Preis ab |
|---|---|---|---|---|---|---|---|
| 89.4 % v7 (old) | 04 / 2023 | Samsung Galaxy Book3 Ultra 16 i7-13700H, GeForce RTX 4050 Laptop GPU | 1.8 kg | 16.5 mm | 16.00" | 2880x1800 | |
| 87.8 % v7 (old) | 11 / 2022 | Schenker Vision 16 Pro RTX 3070 Ti i7-12700H, GeForce RTX 3070 Ti Laptop GPU | 1.7 kg | 17.1 mm | 16.00" | 2560x1600 | |
| 86.4 % v7 (old) | 03 / 2023 | LG Gram 17Z90Q-E.AD78G i7-1260P, GeForce RTX 2050 Mobile | 1.4 kg | 17.8 mm | 17.00" | 2560x1600 | |
| 87.9 % v7 (old) | 10 / 2022 | Lenovo ThinkBook 16p G3 ARH R9 6900HX, GeForce RTX 3060 Laptop GPU | 2.1 kg | 19.5 mm | 16.00" | 2560x1600 | |
| 89.5 % v7 (old) | 05 / 2022 | Dell XPS 15 9520 RTX 3050 Ti i7-12700H, GeForce RTX 3050 Ti Laptop GPU | 1.9 kg | 18 mm | 15.60" | 3456x2160 | |
| 83.7 % v7 (old) | 11 / 2022 | Asus VivoBook Pro 16X OLED N7600PC-L2026X i7-11370H, GeForce RTX 3050 4GB Laptop GPU | 2 kg | 18.9 mm | 16.00" | 3840x2400 | |
| 86.4 % v7 (old) | 10 / 2022 | Acer Swift X SFX16-52G-77RX i7-1260P, A370M | 1.8 kg | 21.2 mm | 16.00" | 2560x1600 |
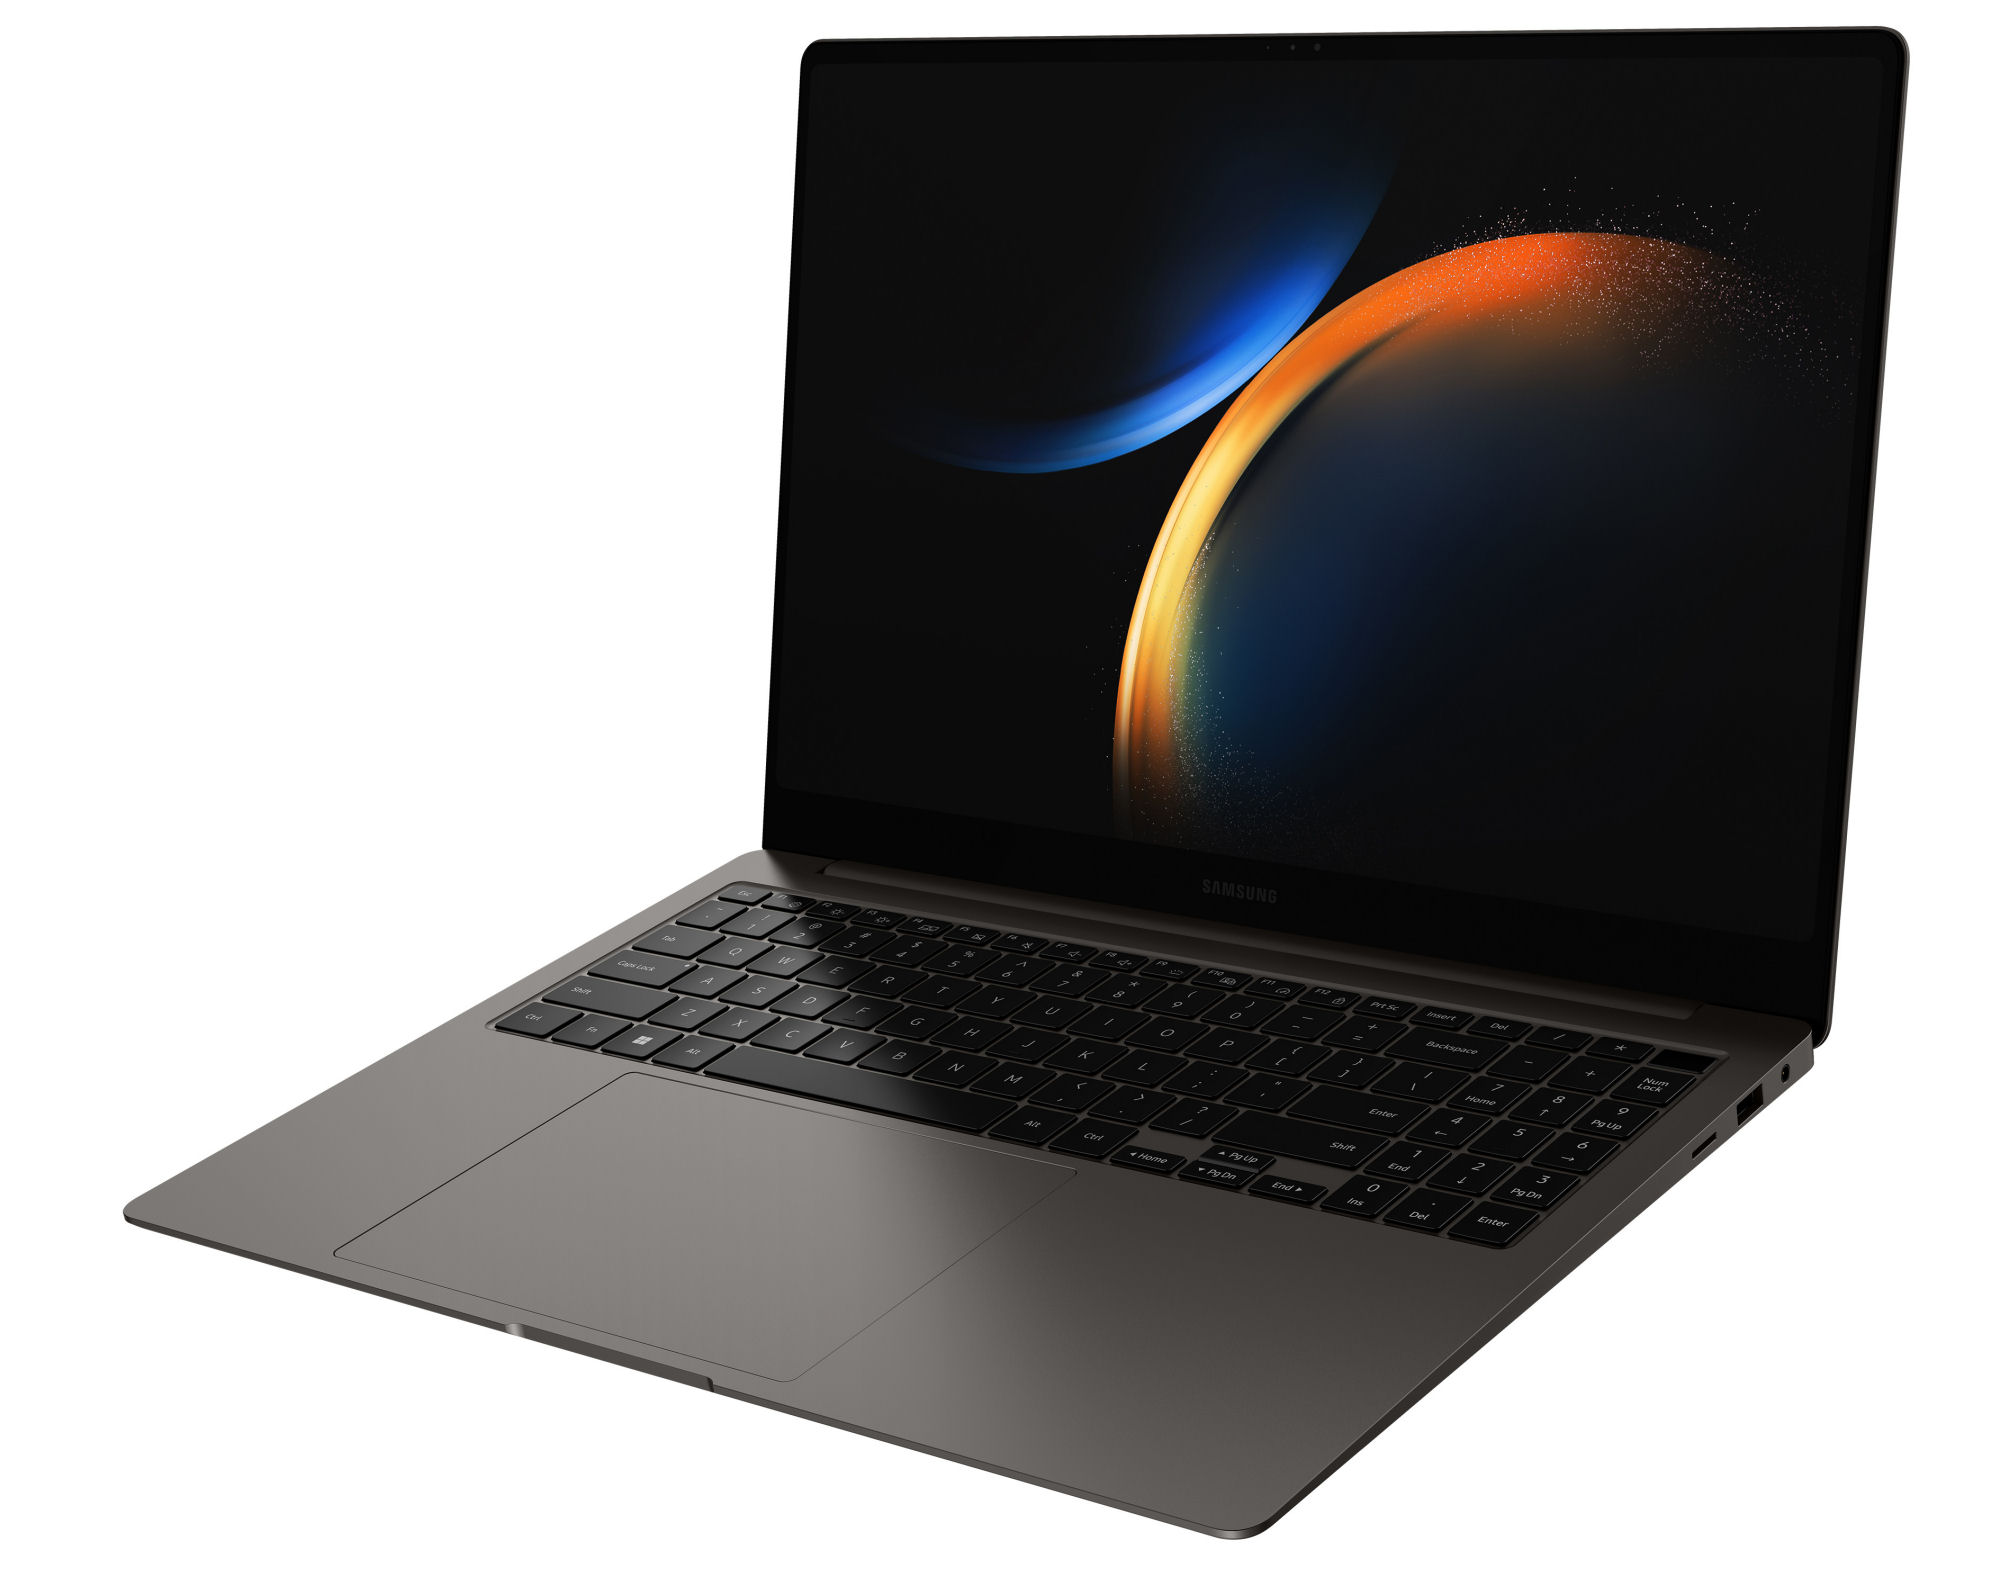
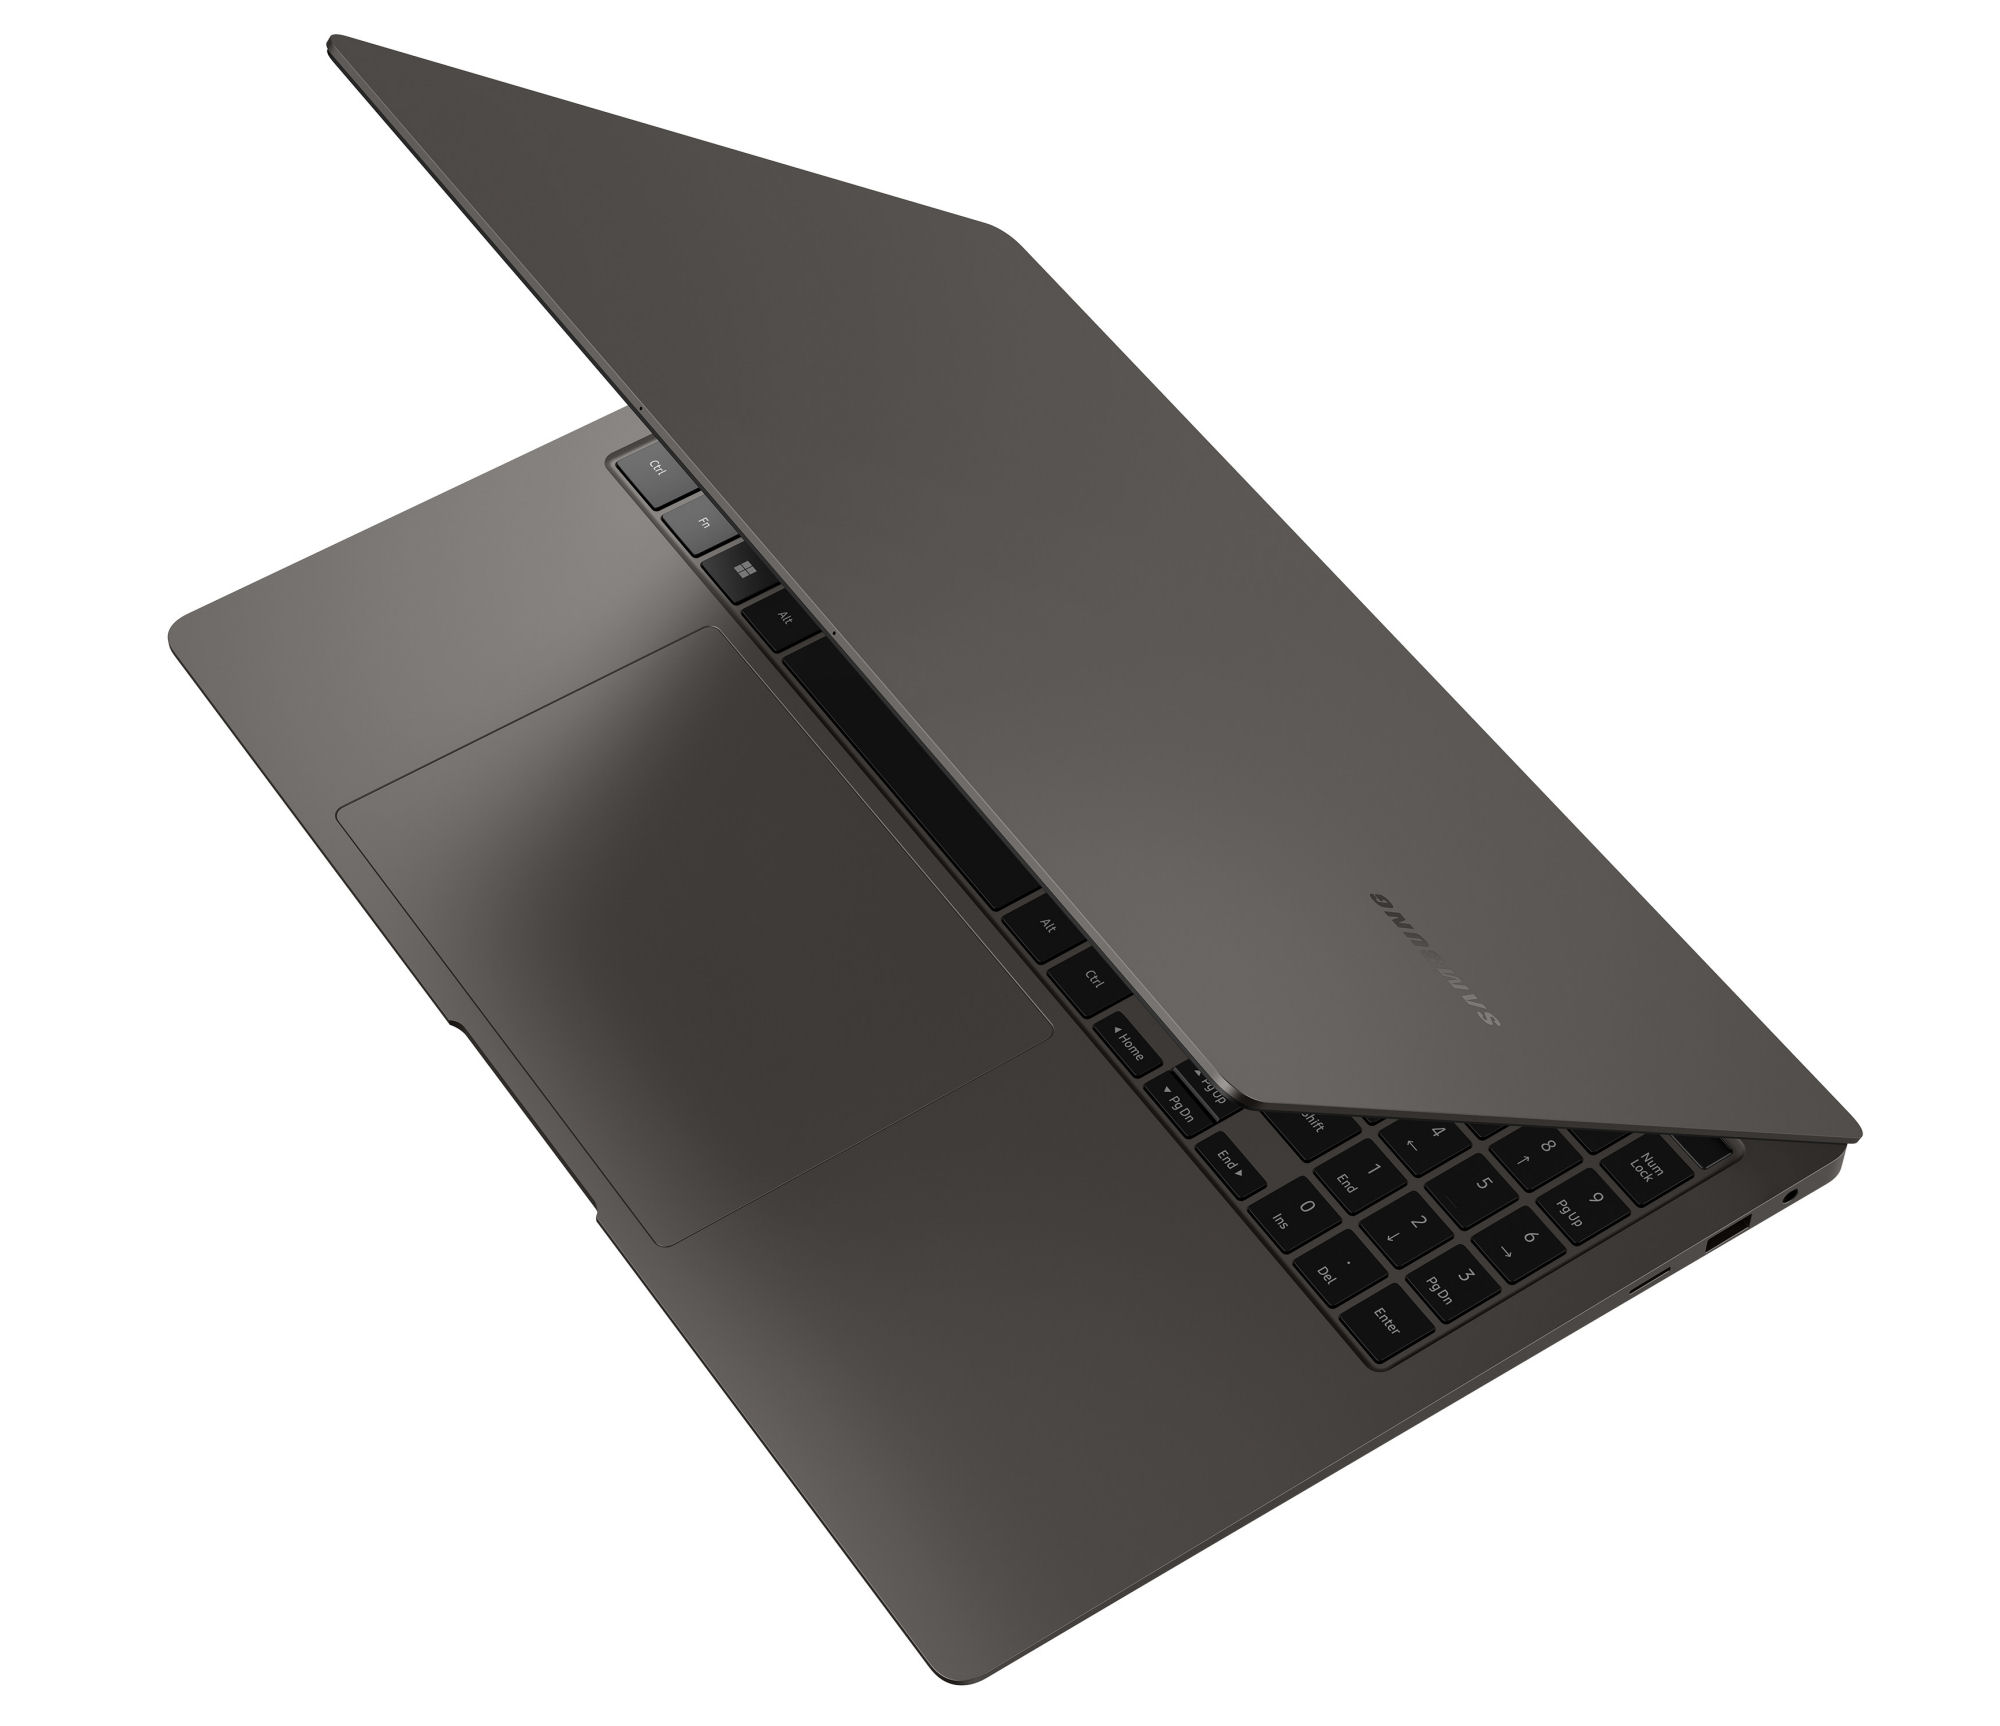
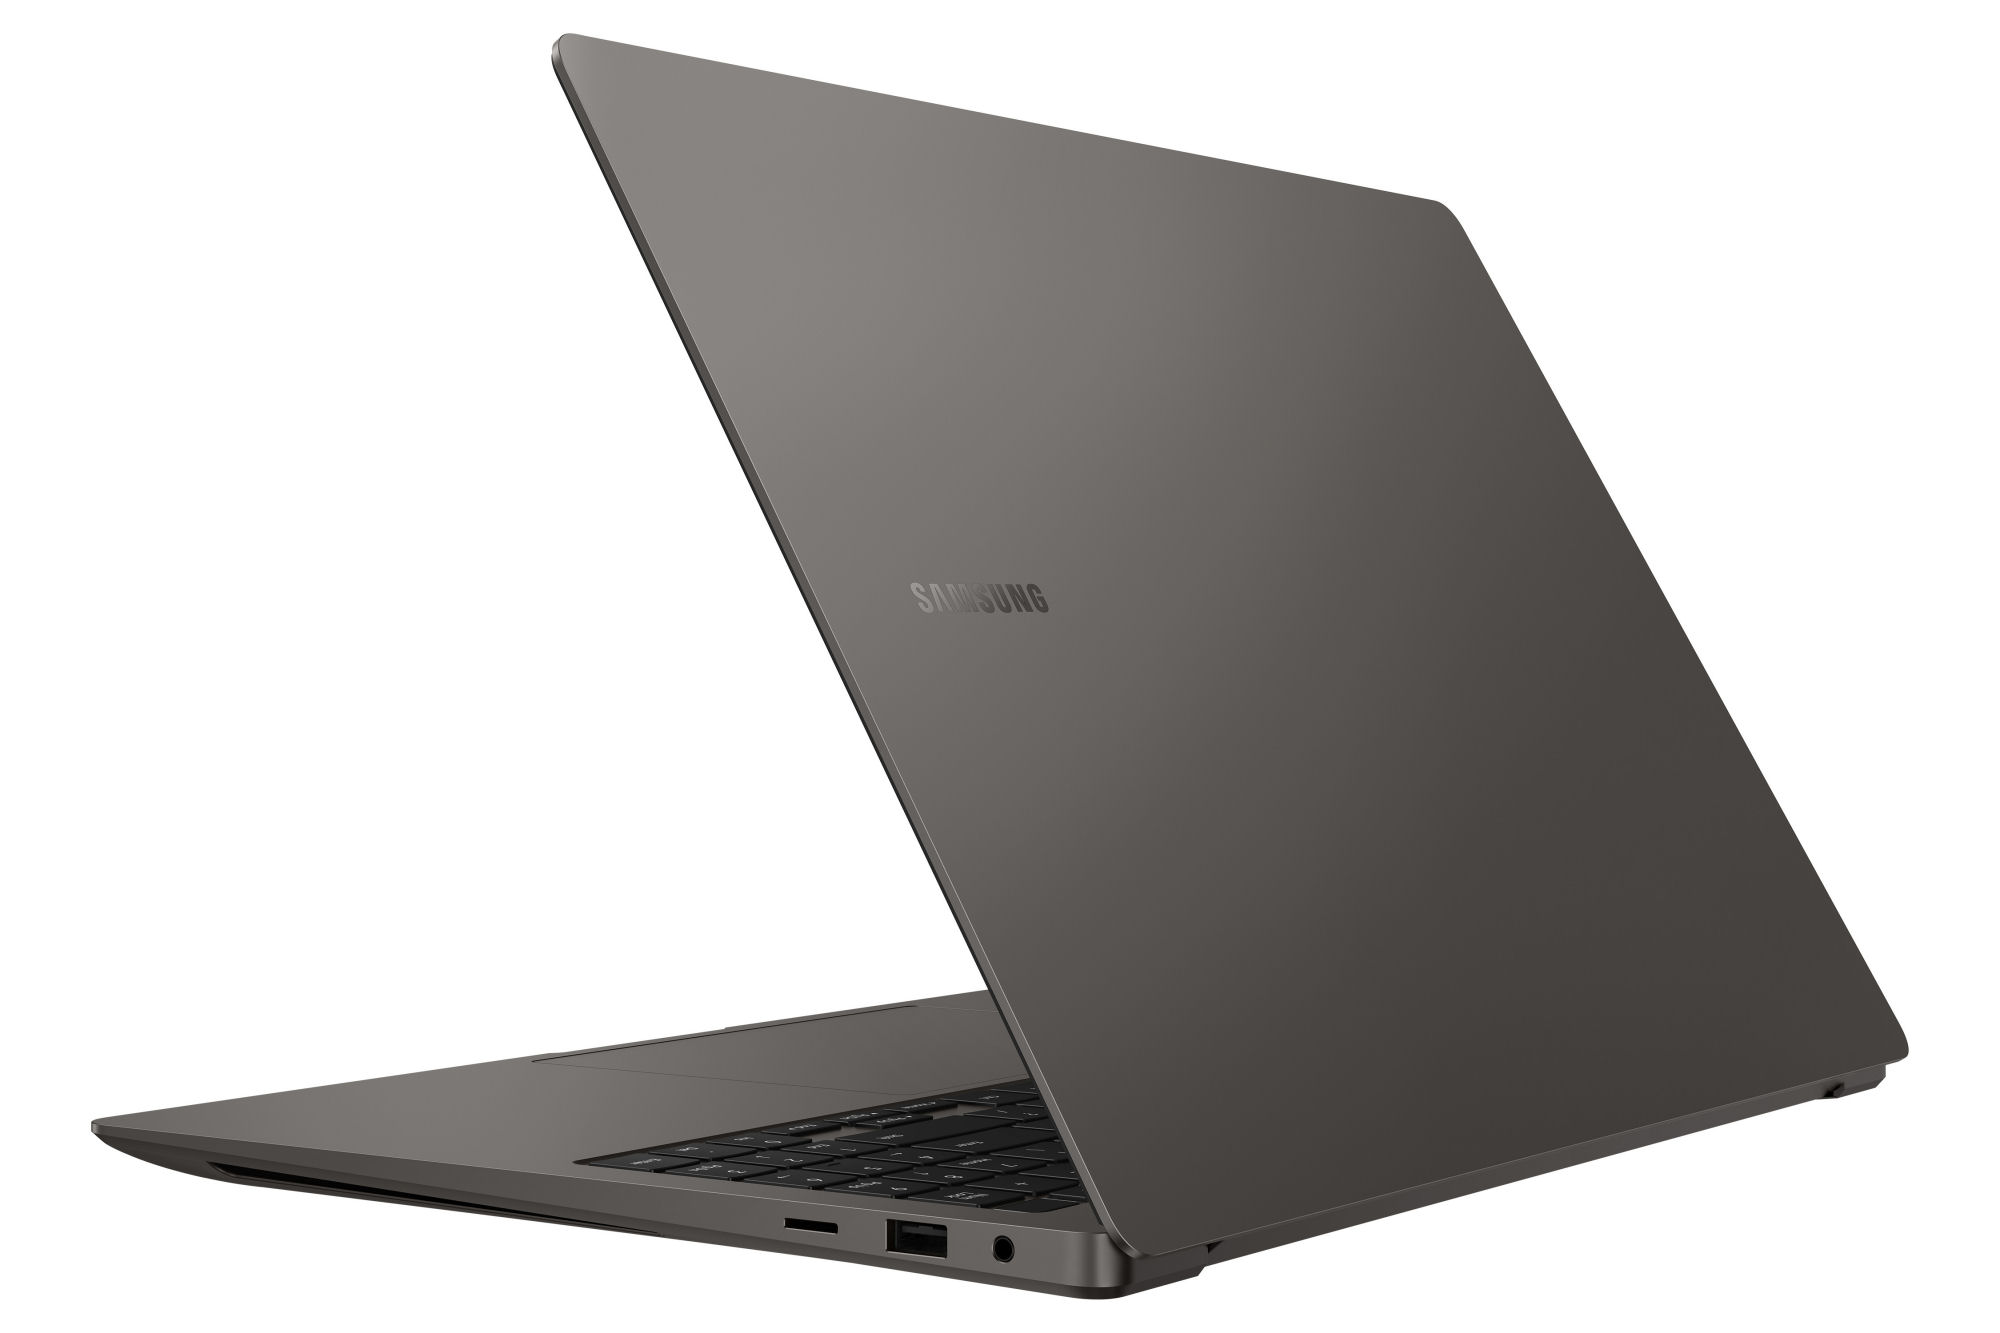
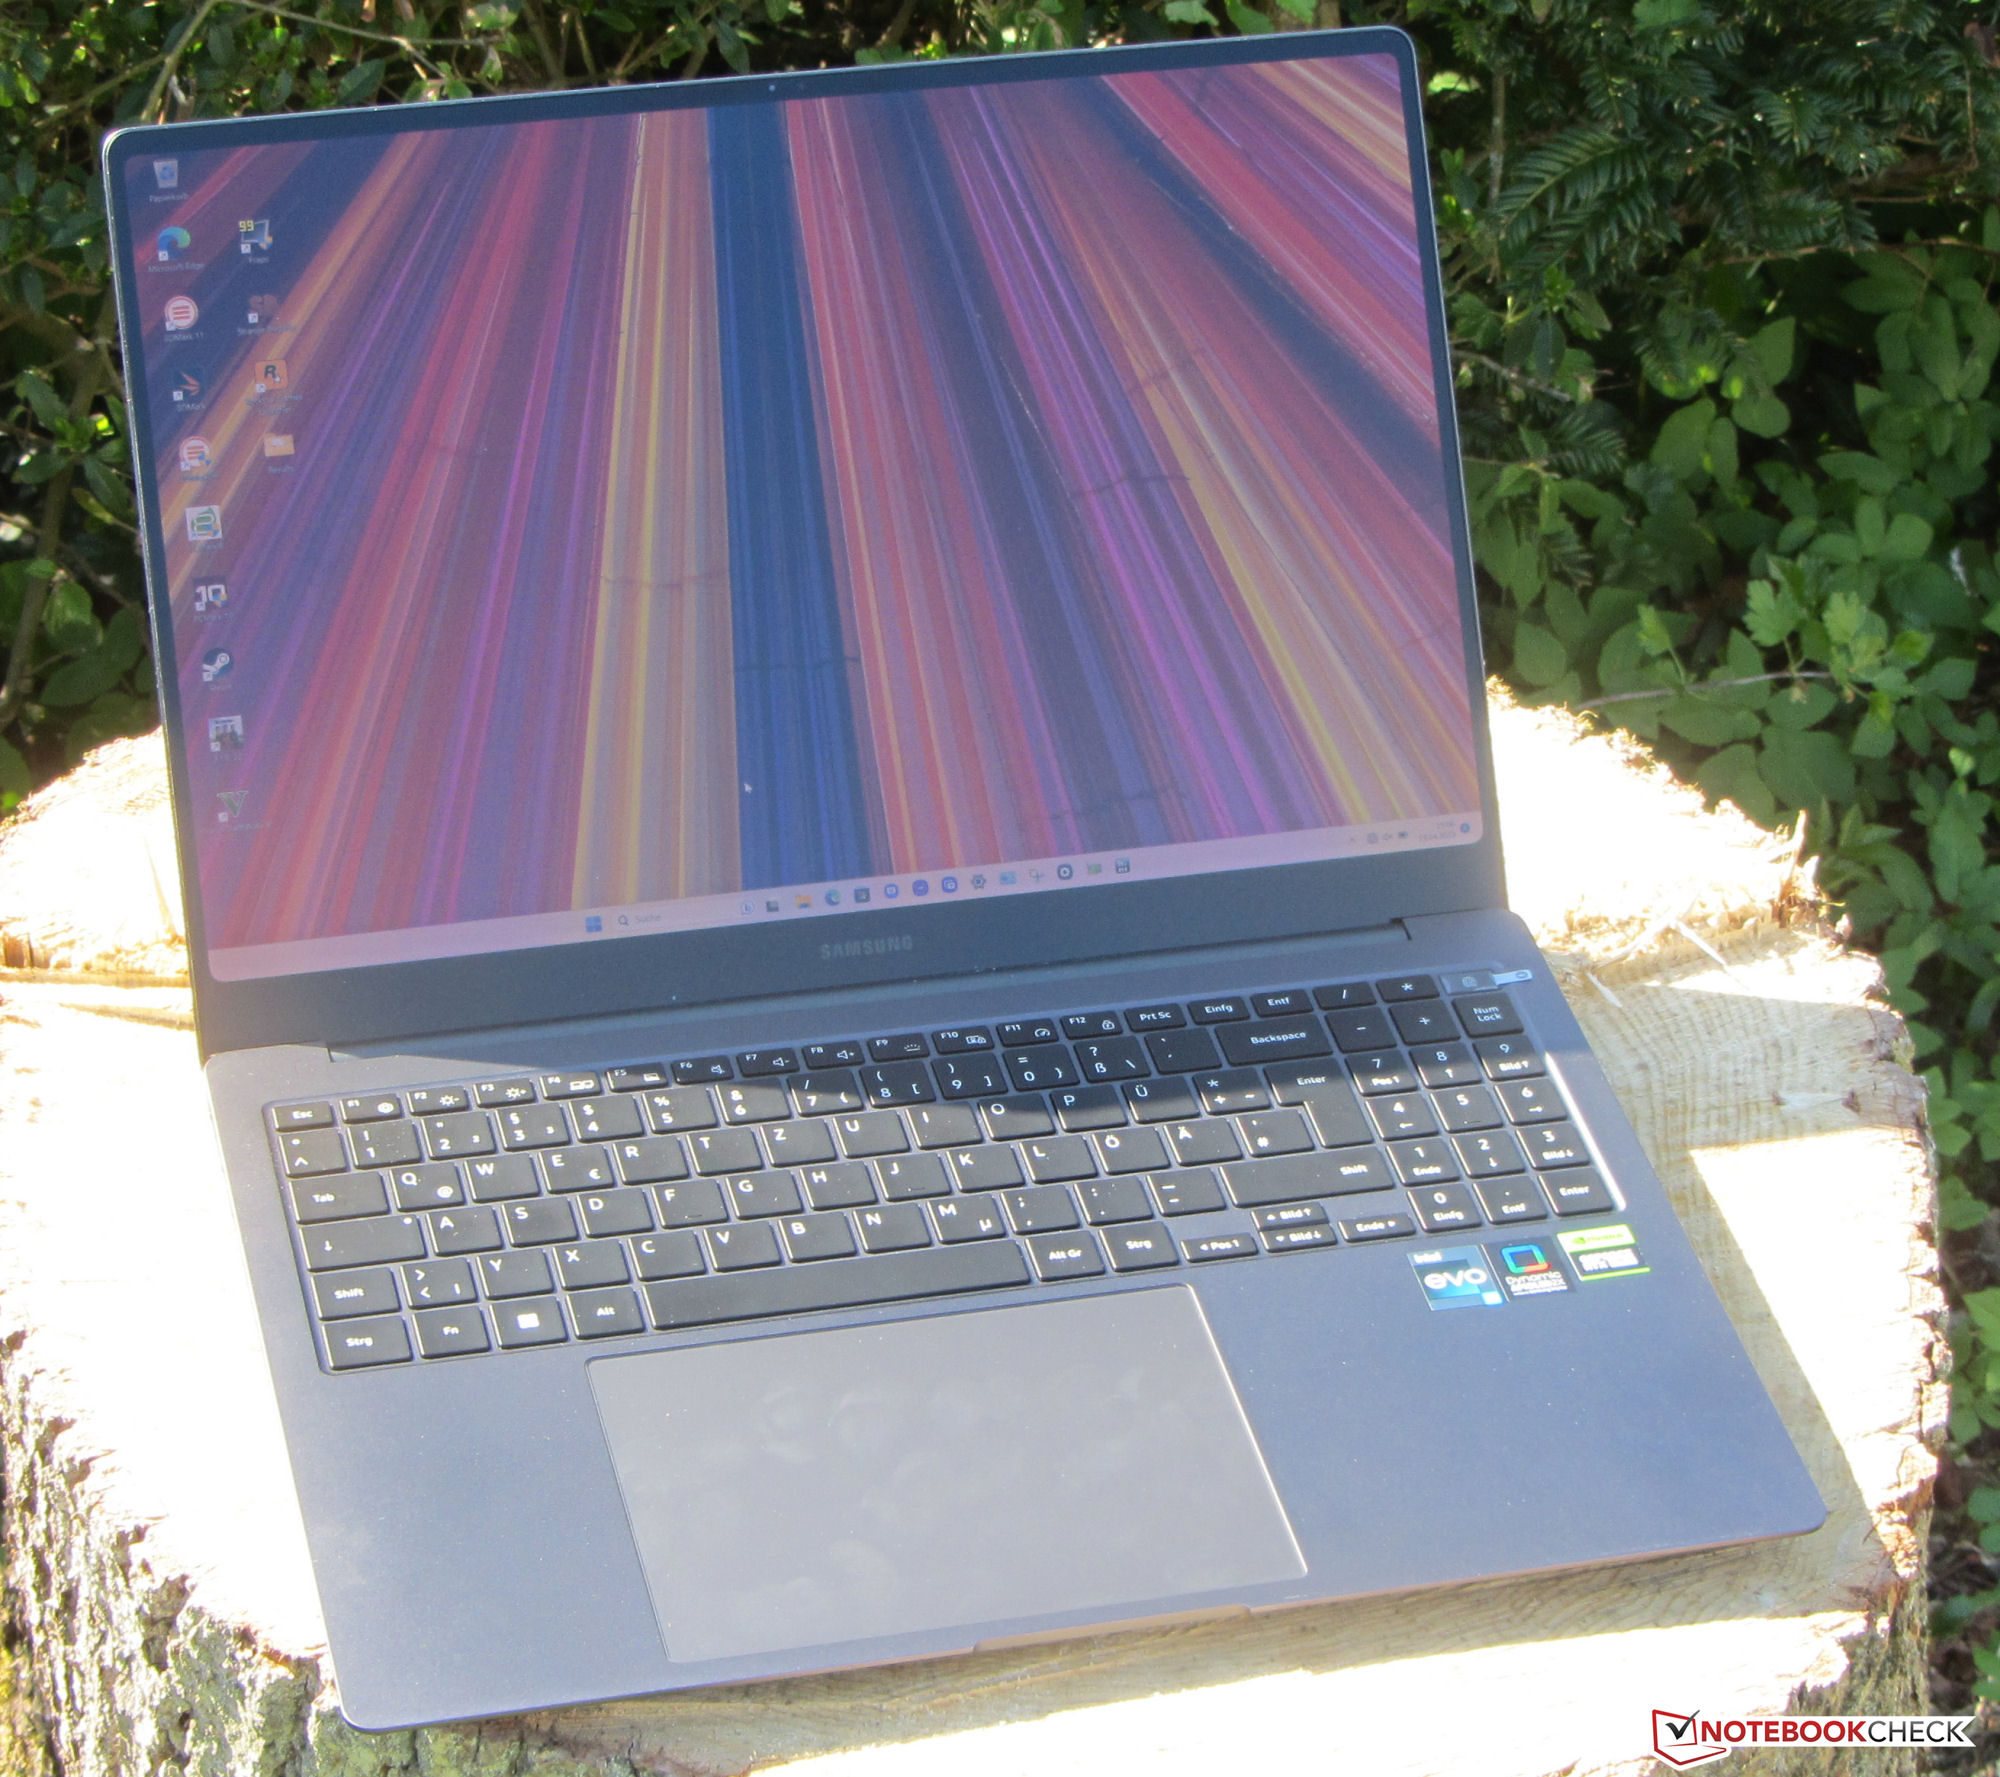
Gehäuse - Ein schickes Alu-Chassis für das Galaxy
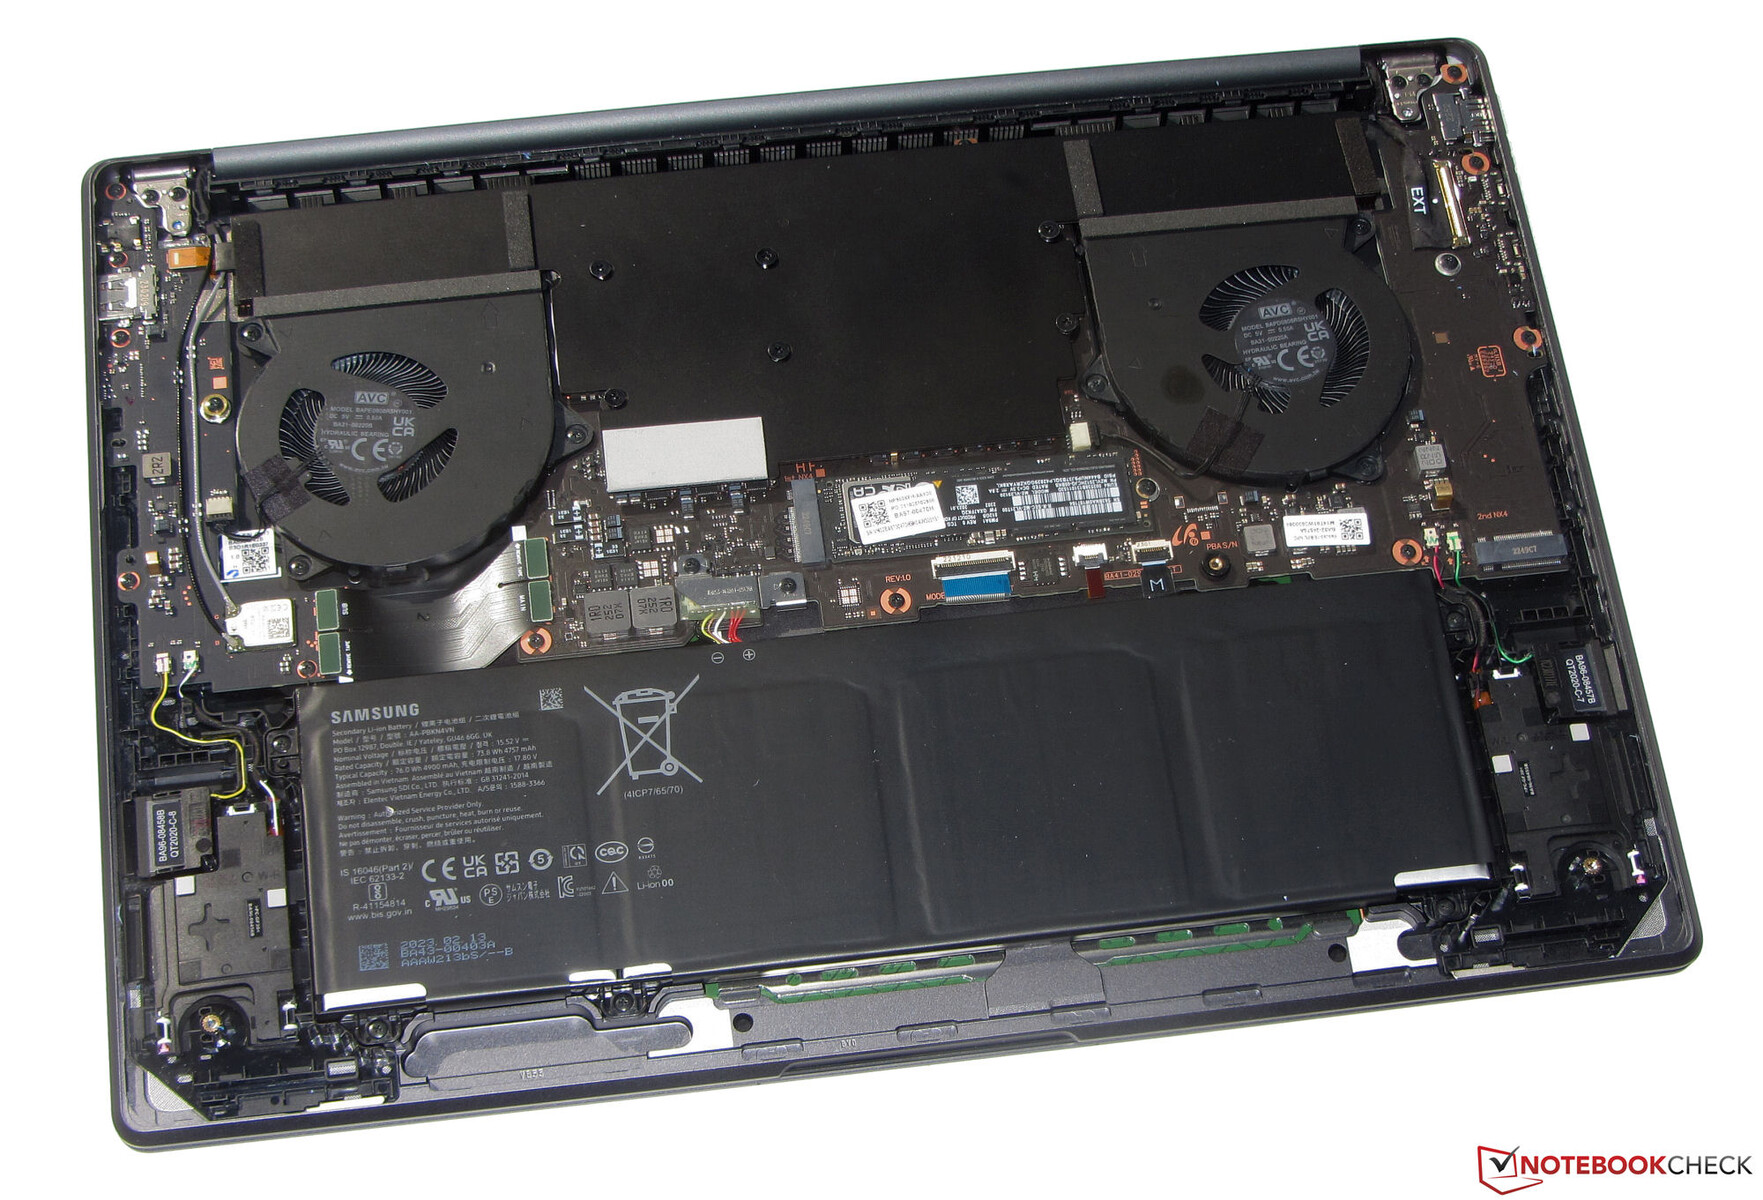
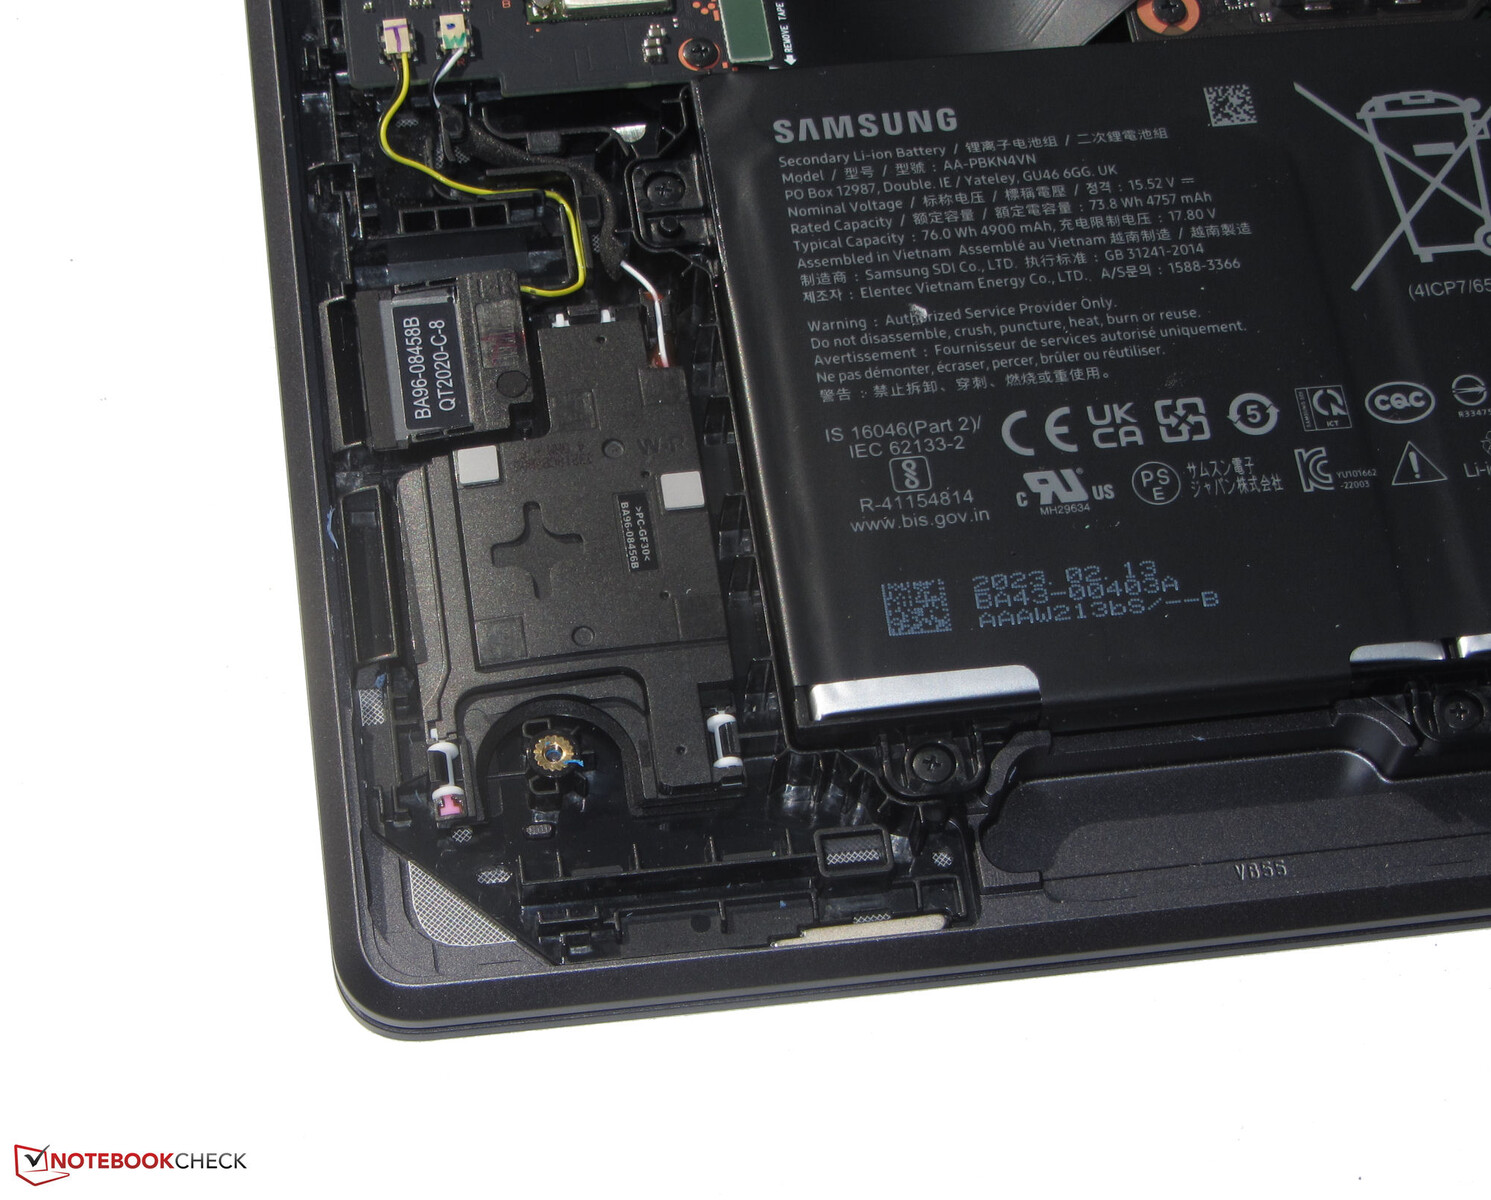
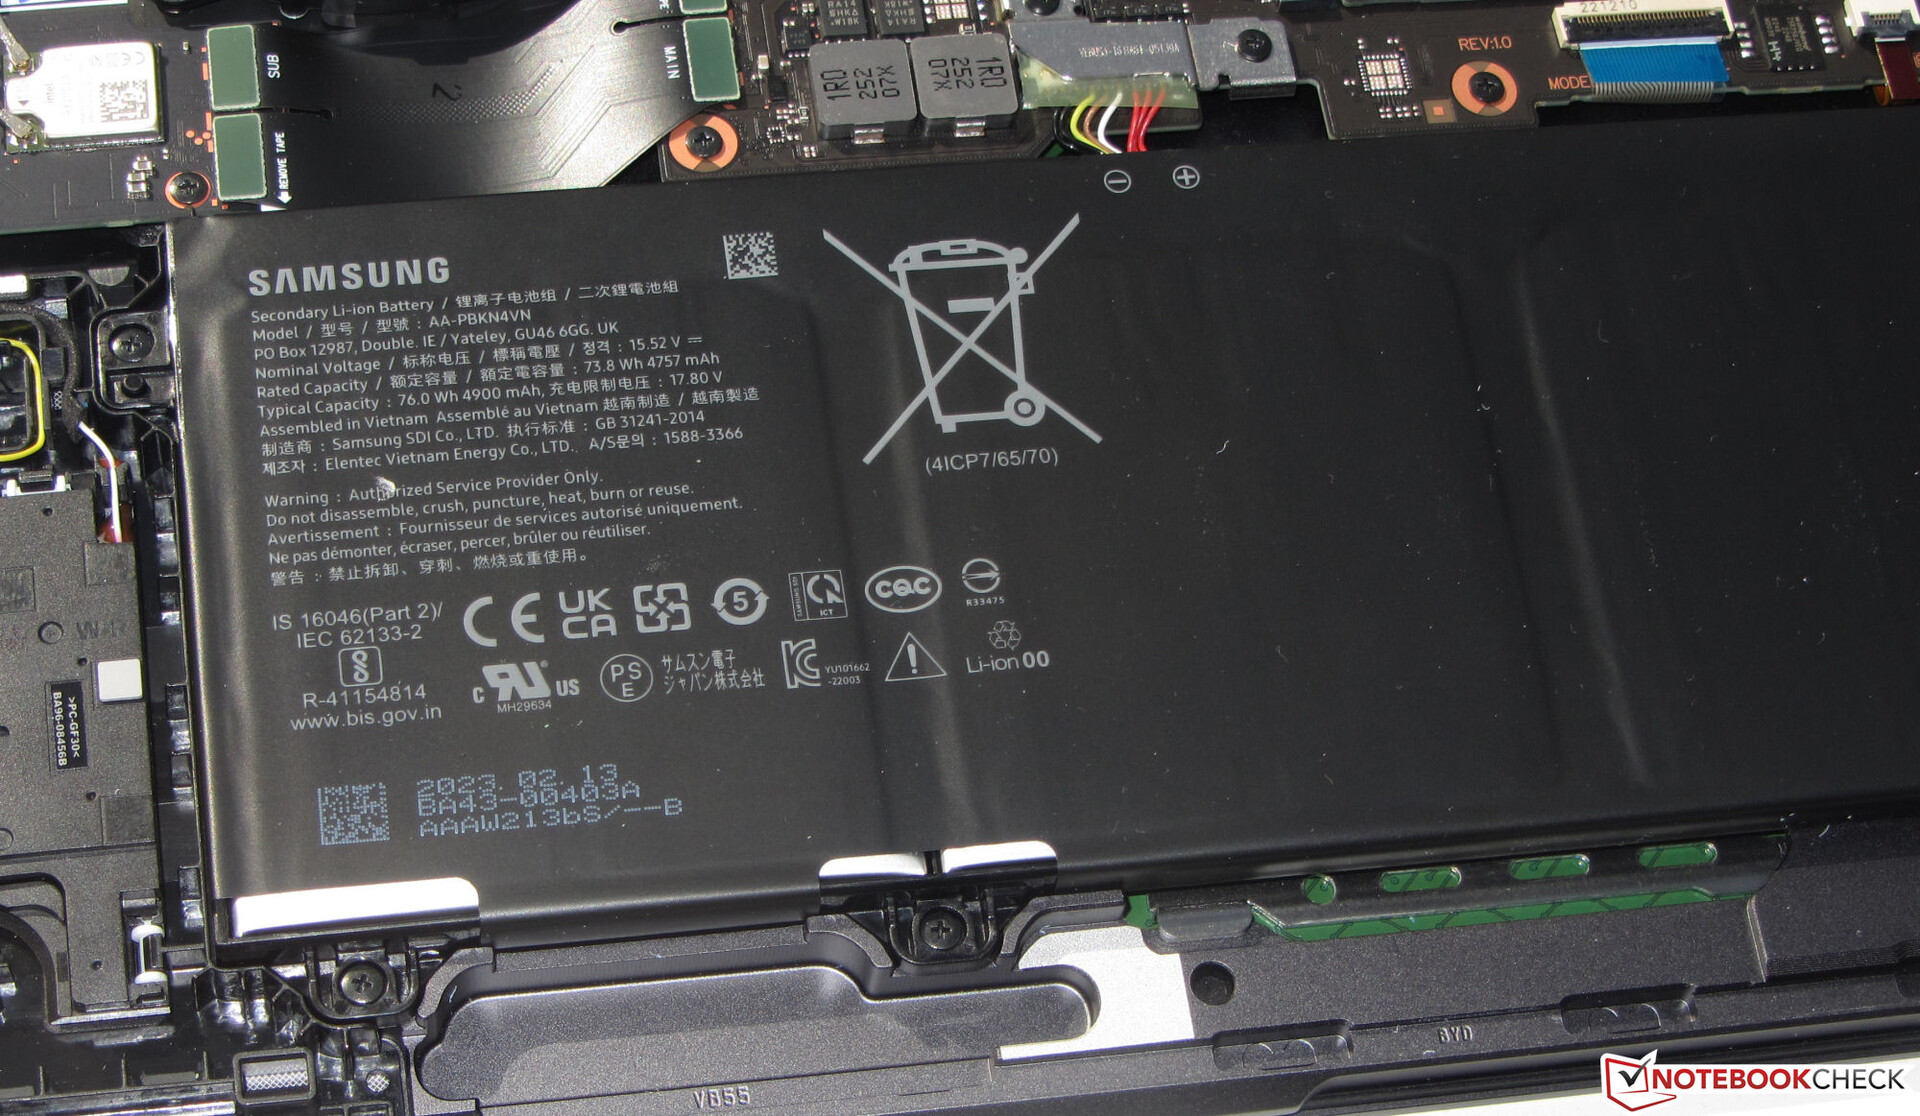
Samsung nutzt ein grau-schwarzes (Graphite) Aluminiumgehäuse samt glatter, matter Oberflächen. Auffällige Designmerkmale hat der schick-elegante Rechner nicht zu bieten - die hat er auch nicht nötig. Der Akku (verschraubt, nicht verklebt) sowie die übrigen Innereien liegen nach Demontage der Unterschale frei.
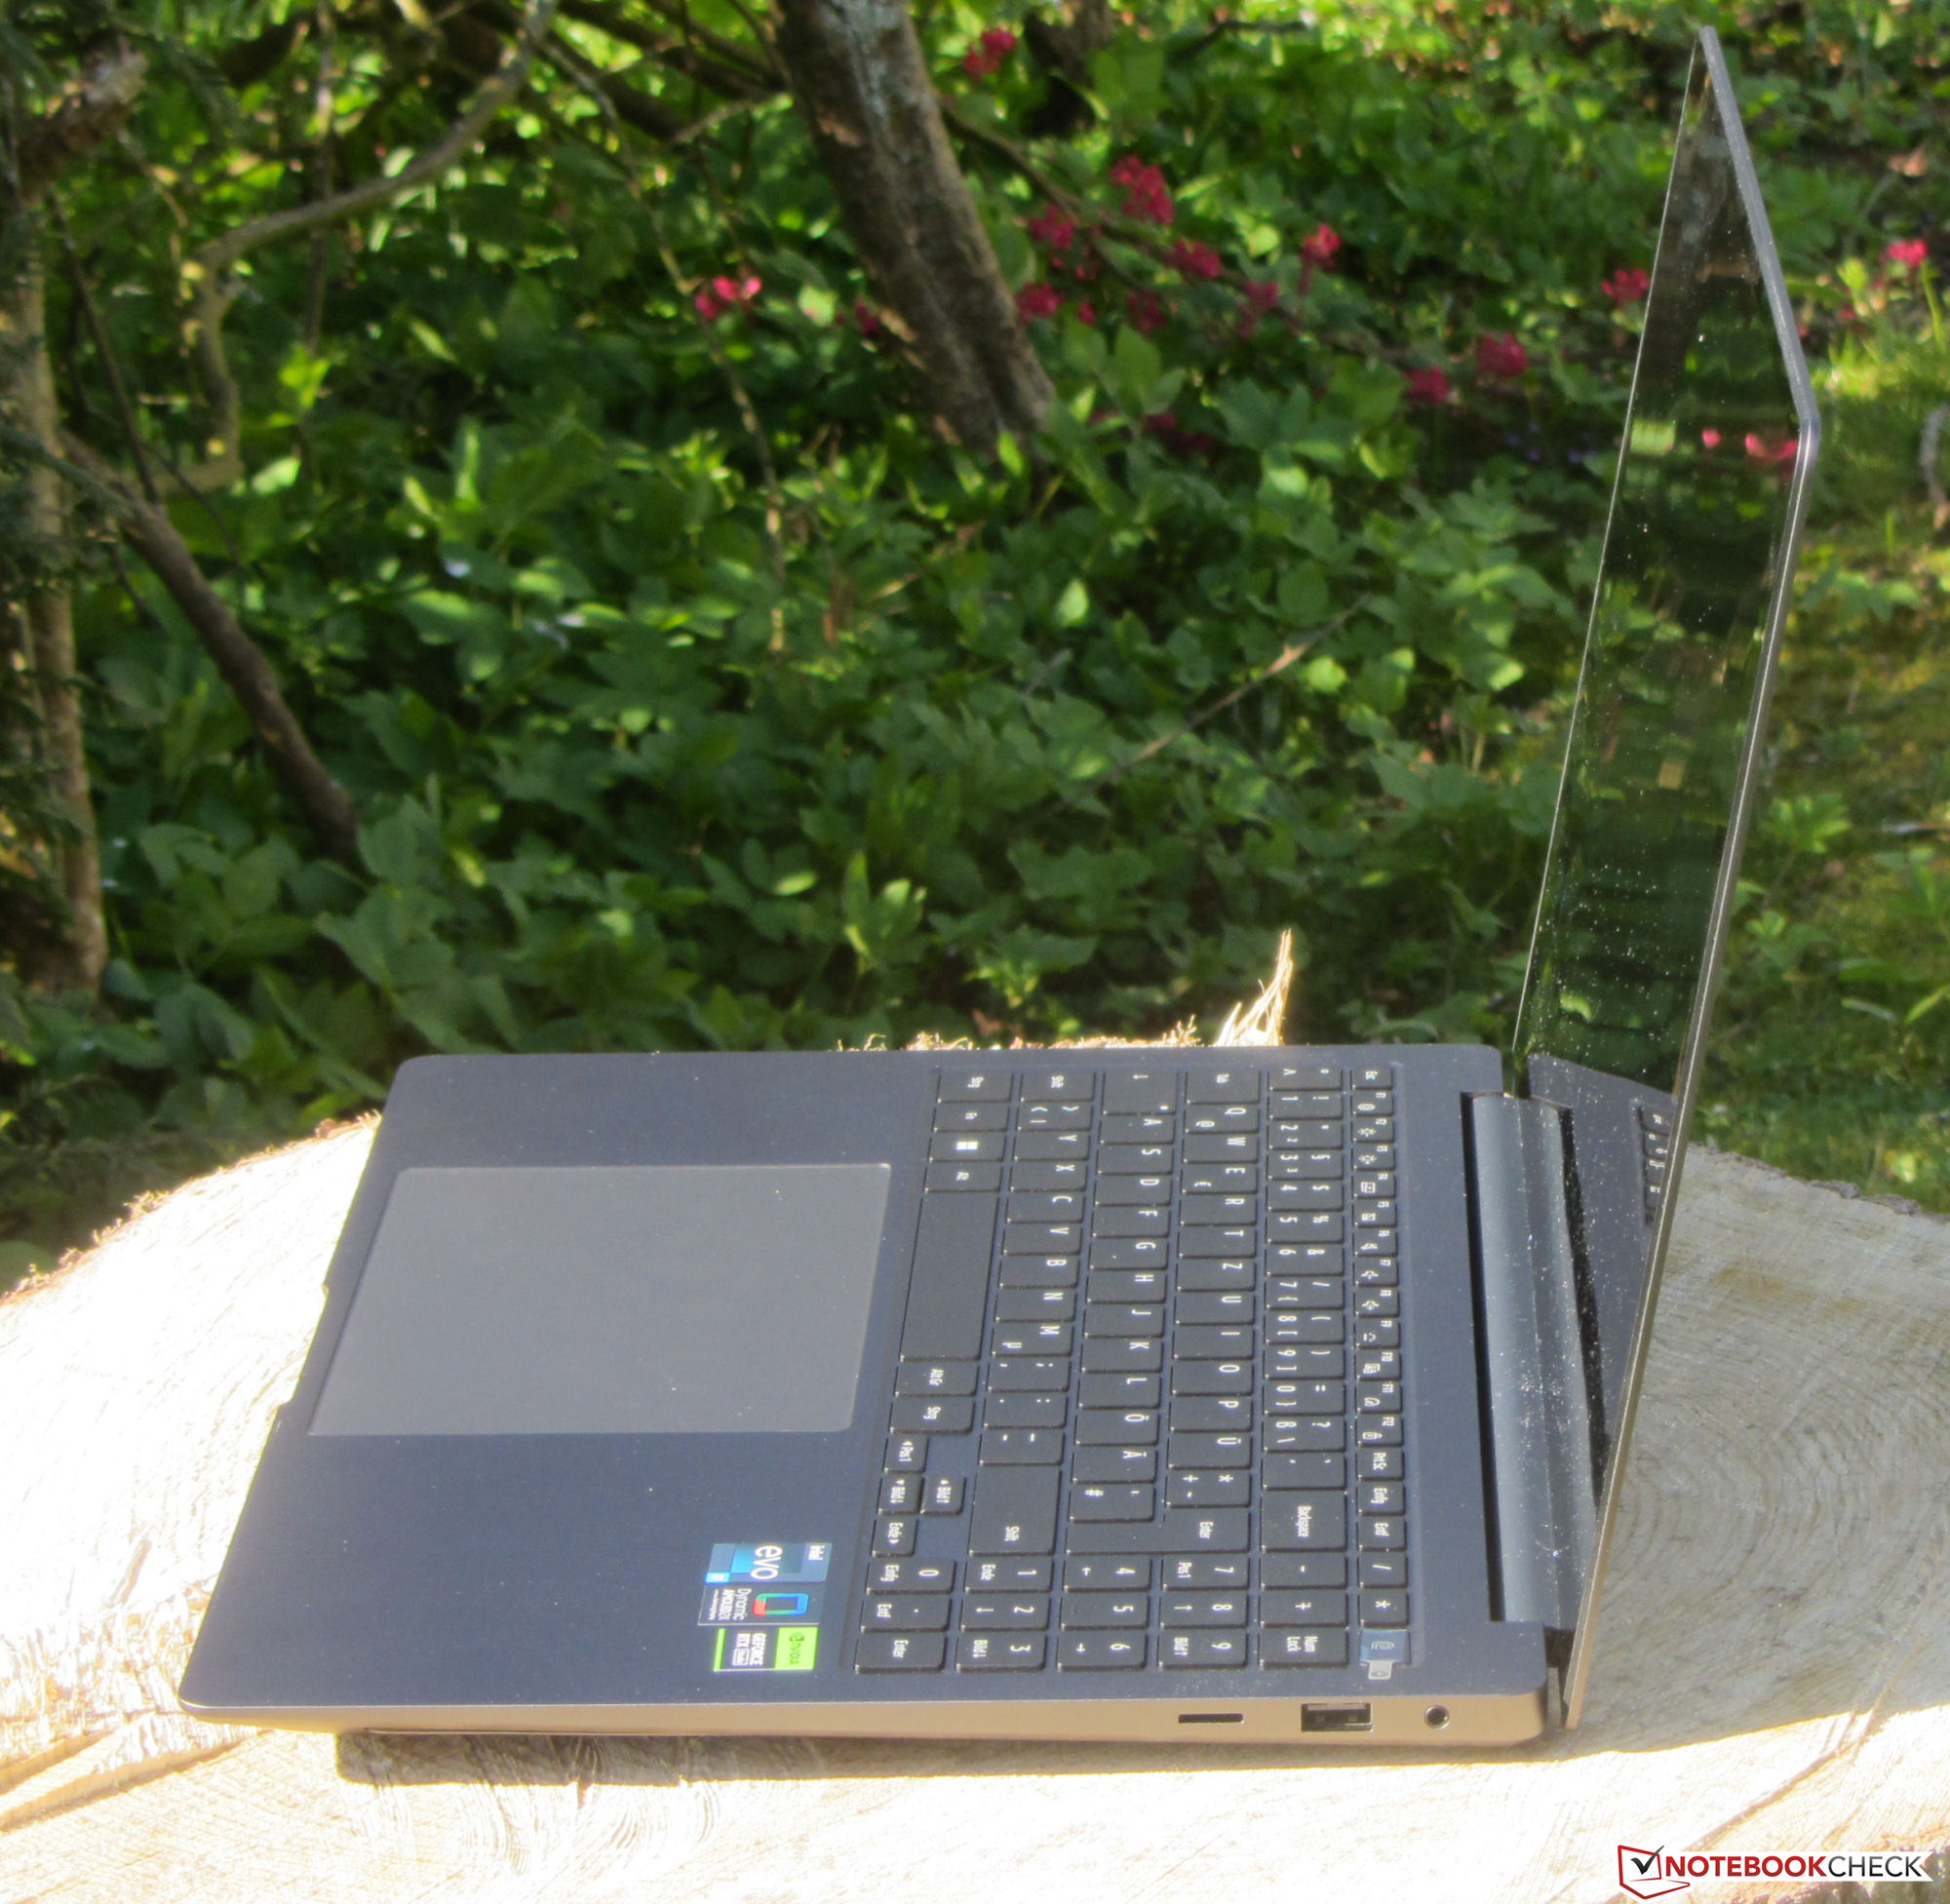
Das Notebook darf sich einer guten Verarbeitung rühmen. Die Spaltmaße stimmen, es sind keine Materialüberstände aufzuspüren. Baseunit und Deckel können nur in sehr geringem Maße verdreht werden. Die Scharniere halten den Deckel fest in Position. Der maximale Öffnungswinkel liegt bei etwa 125 Grad. Eine Ein-Hand-Öffnung ist möglich.
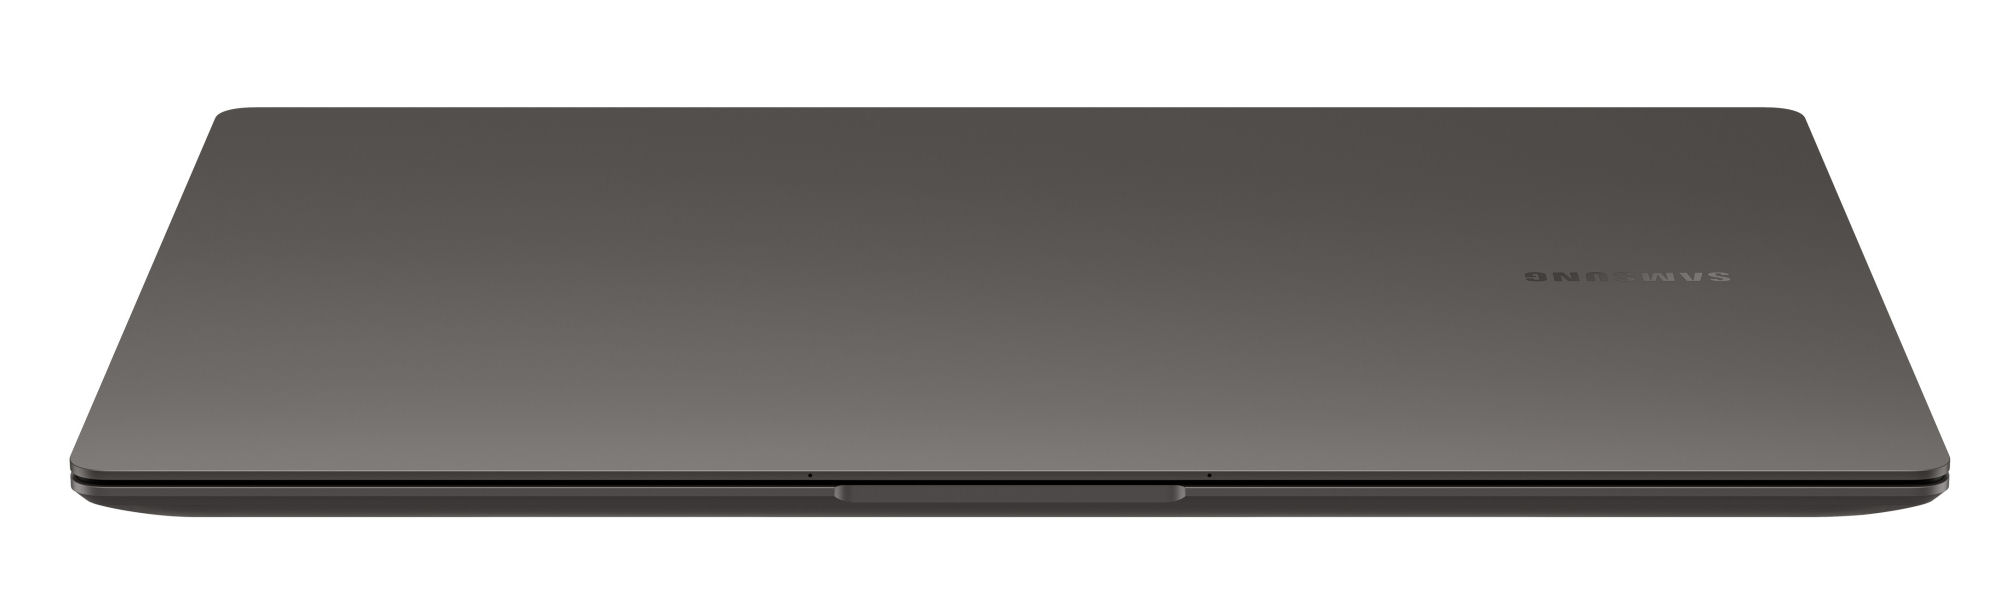

Das Galaxy Book3 zählt grundsätzlich zu den kompakten und leichten Notebooks. Innerhalb des Vergleichsfeldes findet es sich aber nur im Mittelfeld ein. Der direkte Konkurrent Schenker Vision 16 Pro fällt noch etwas kompakter und leichter aus. An das geringe Gewicht (1,4 kg) des LG Gram 17 reicht keiner der Rechner heran.
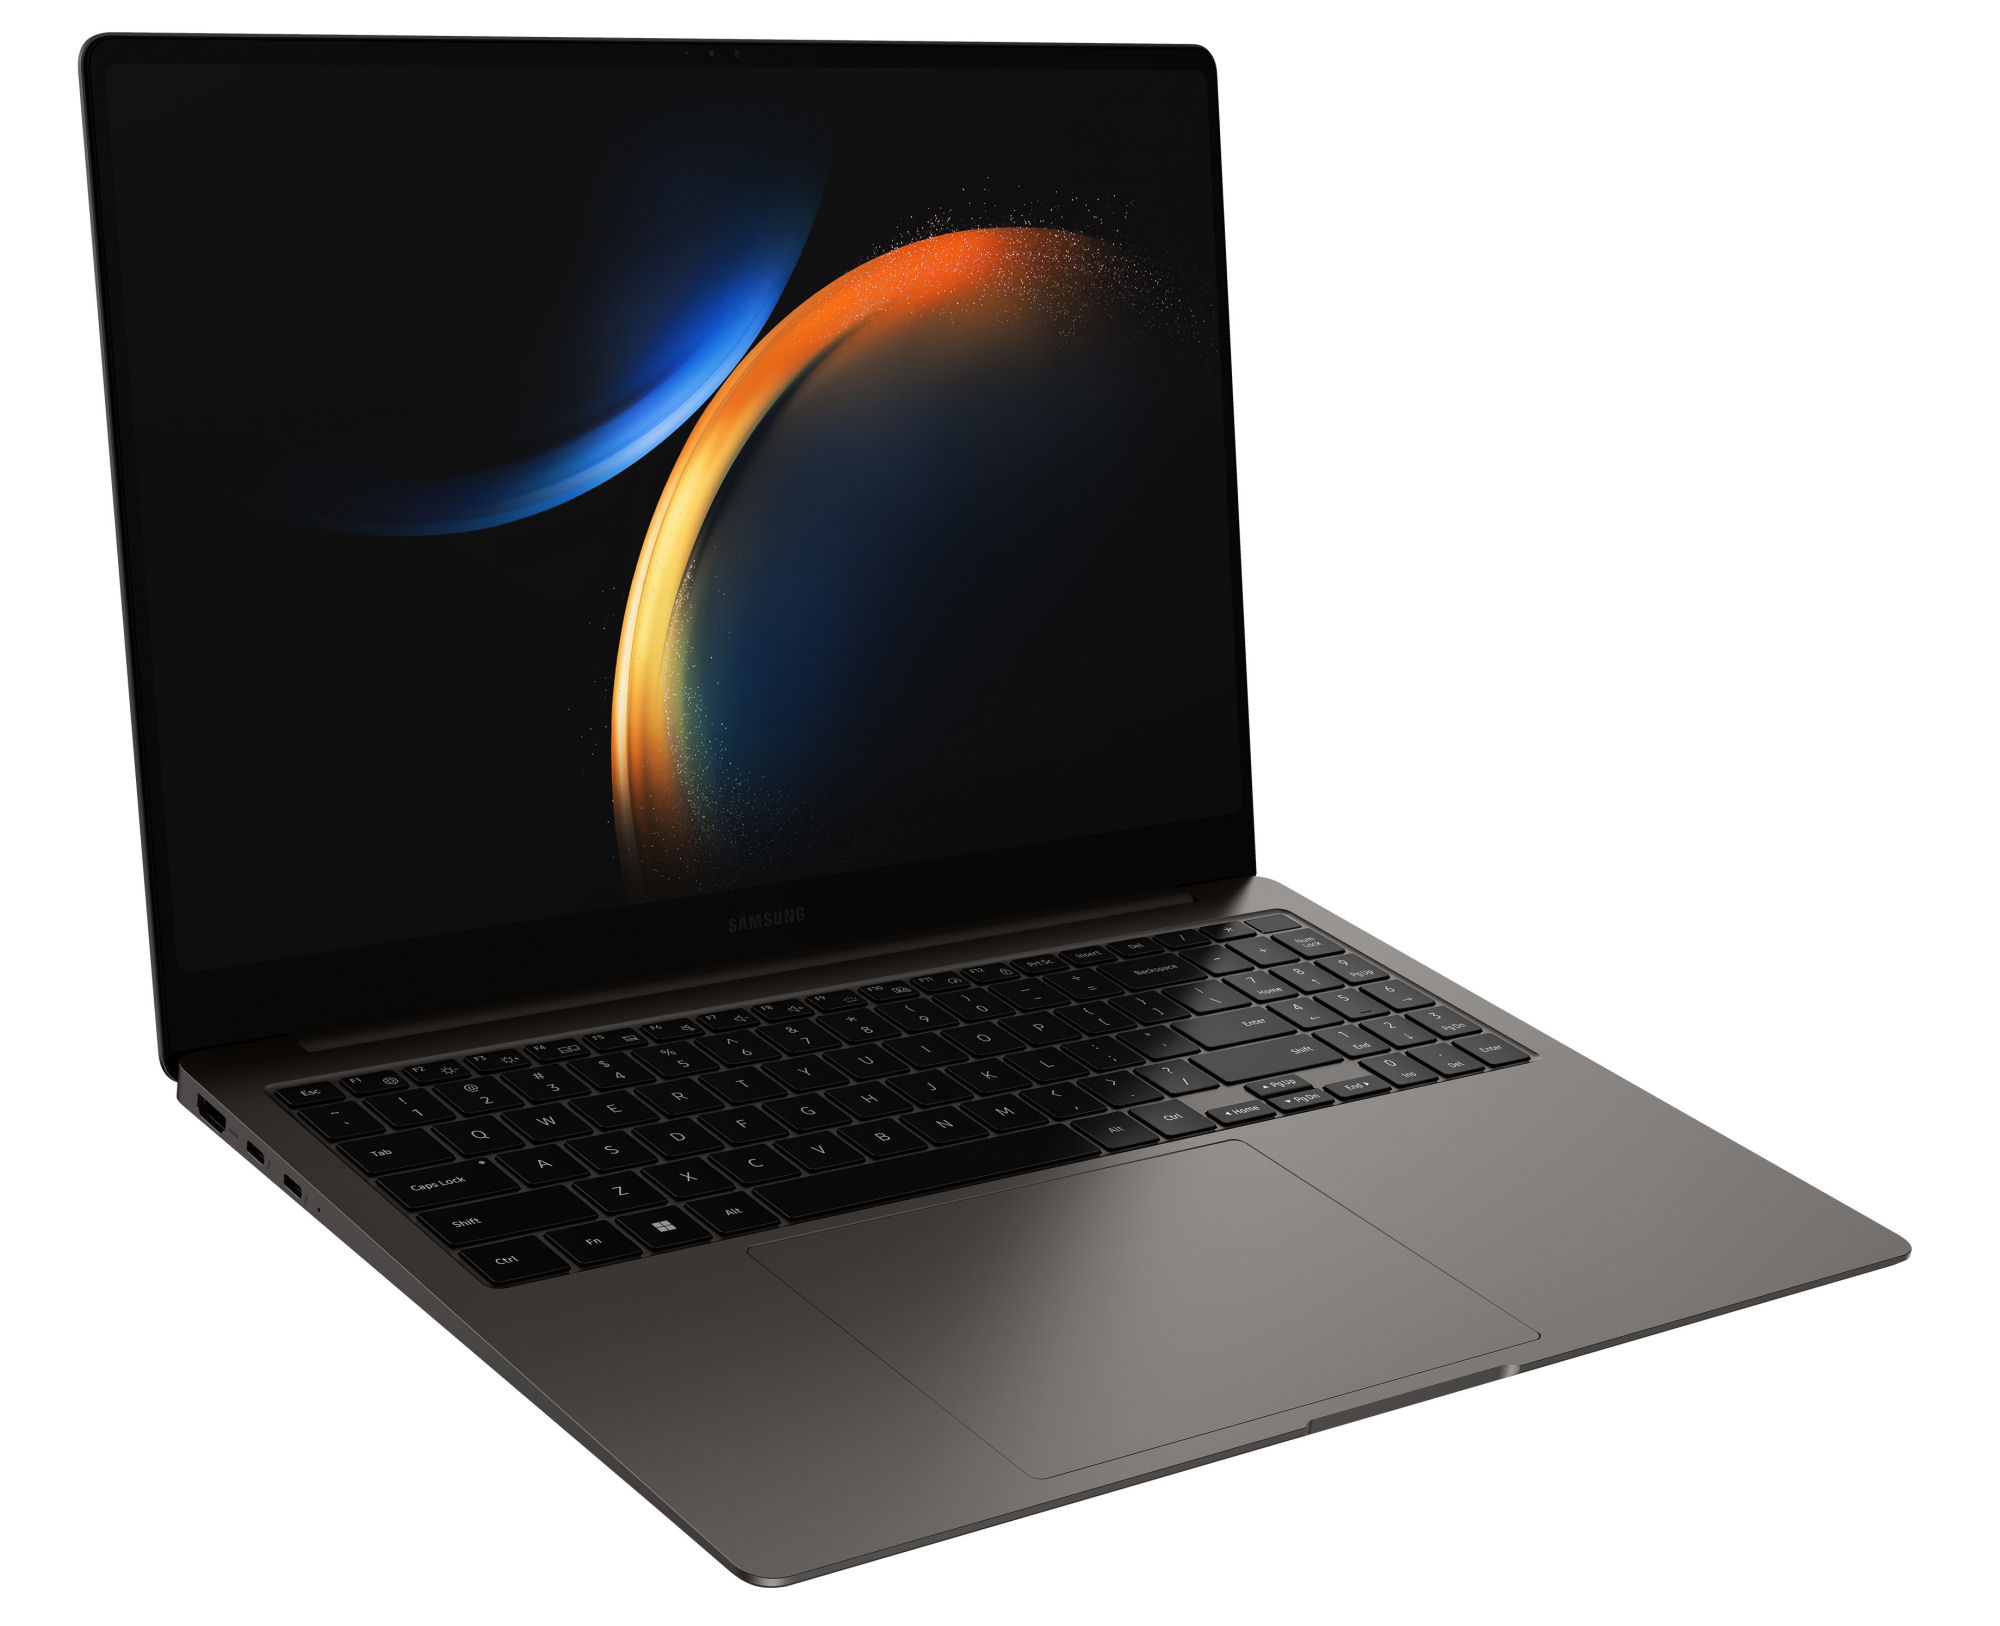
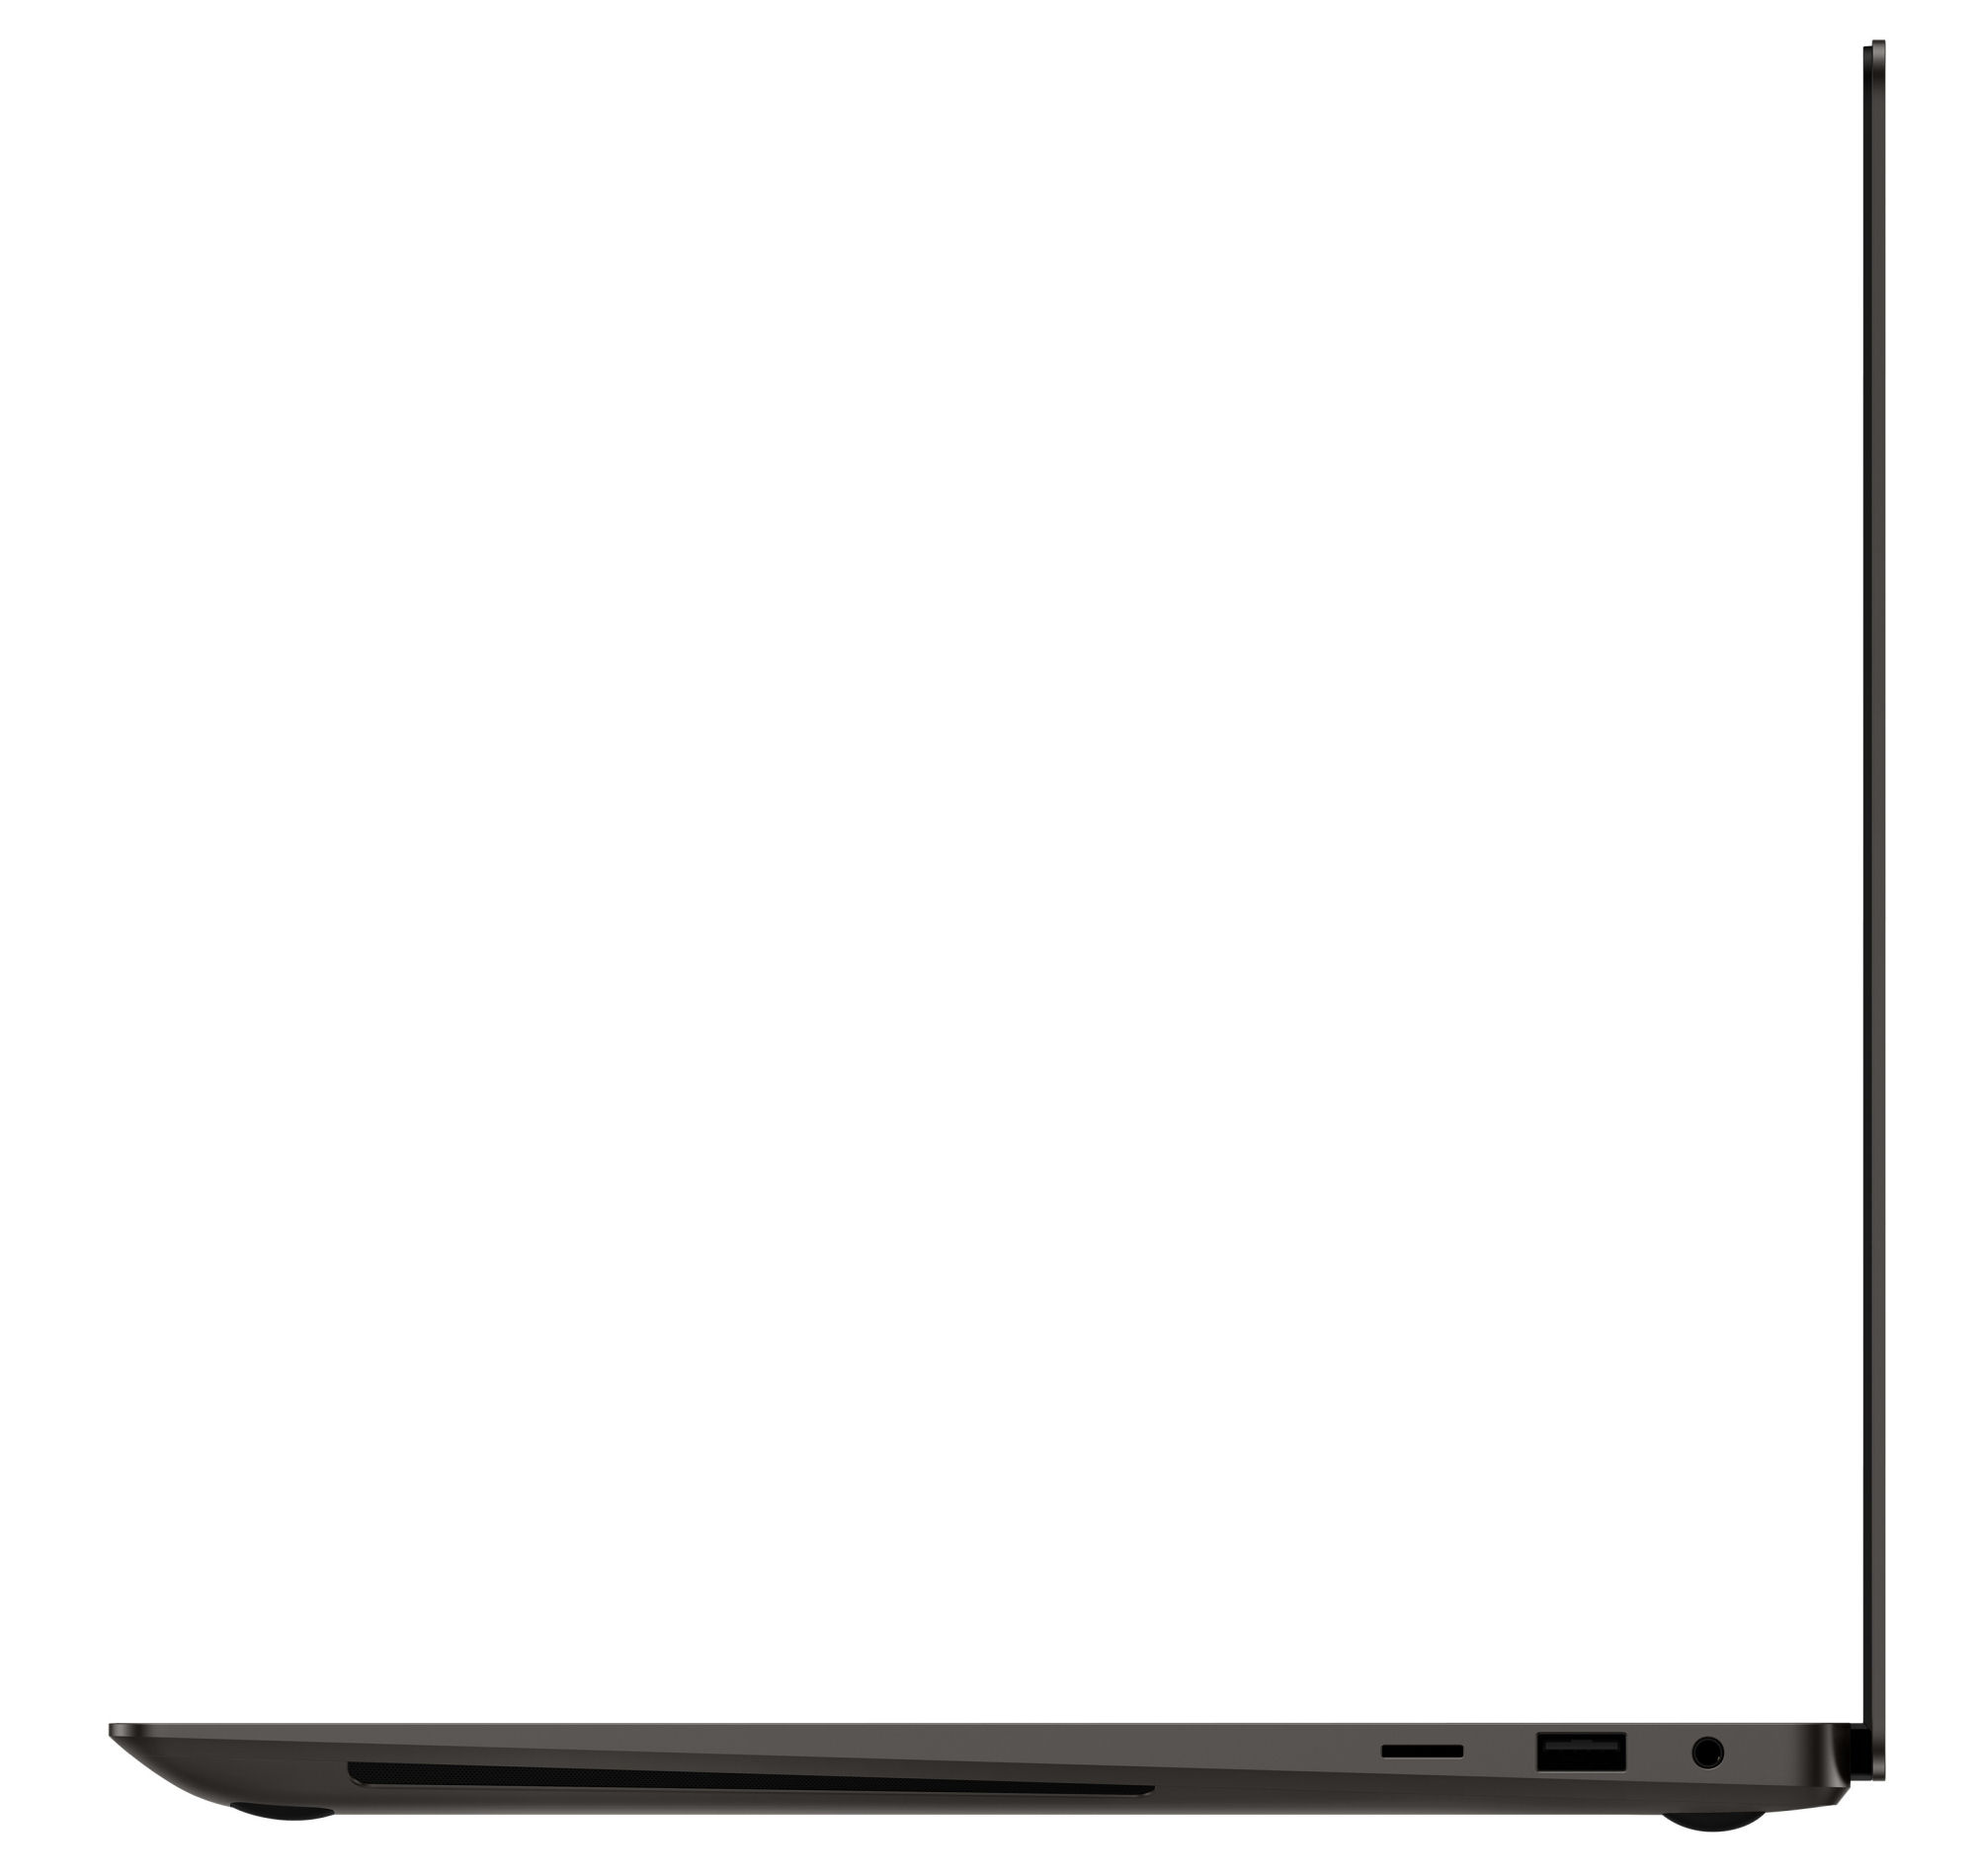
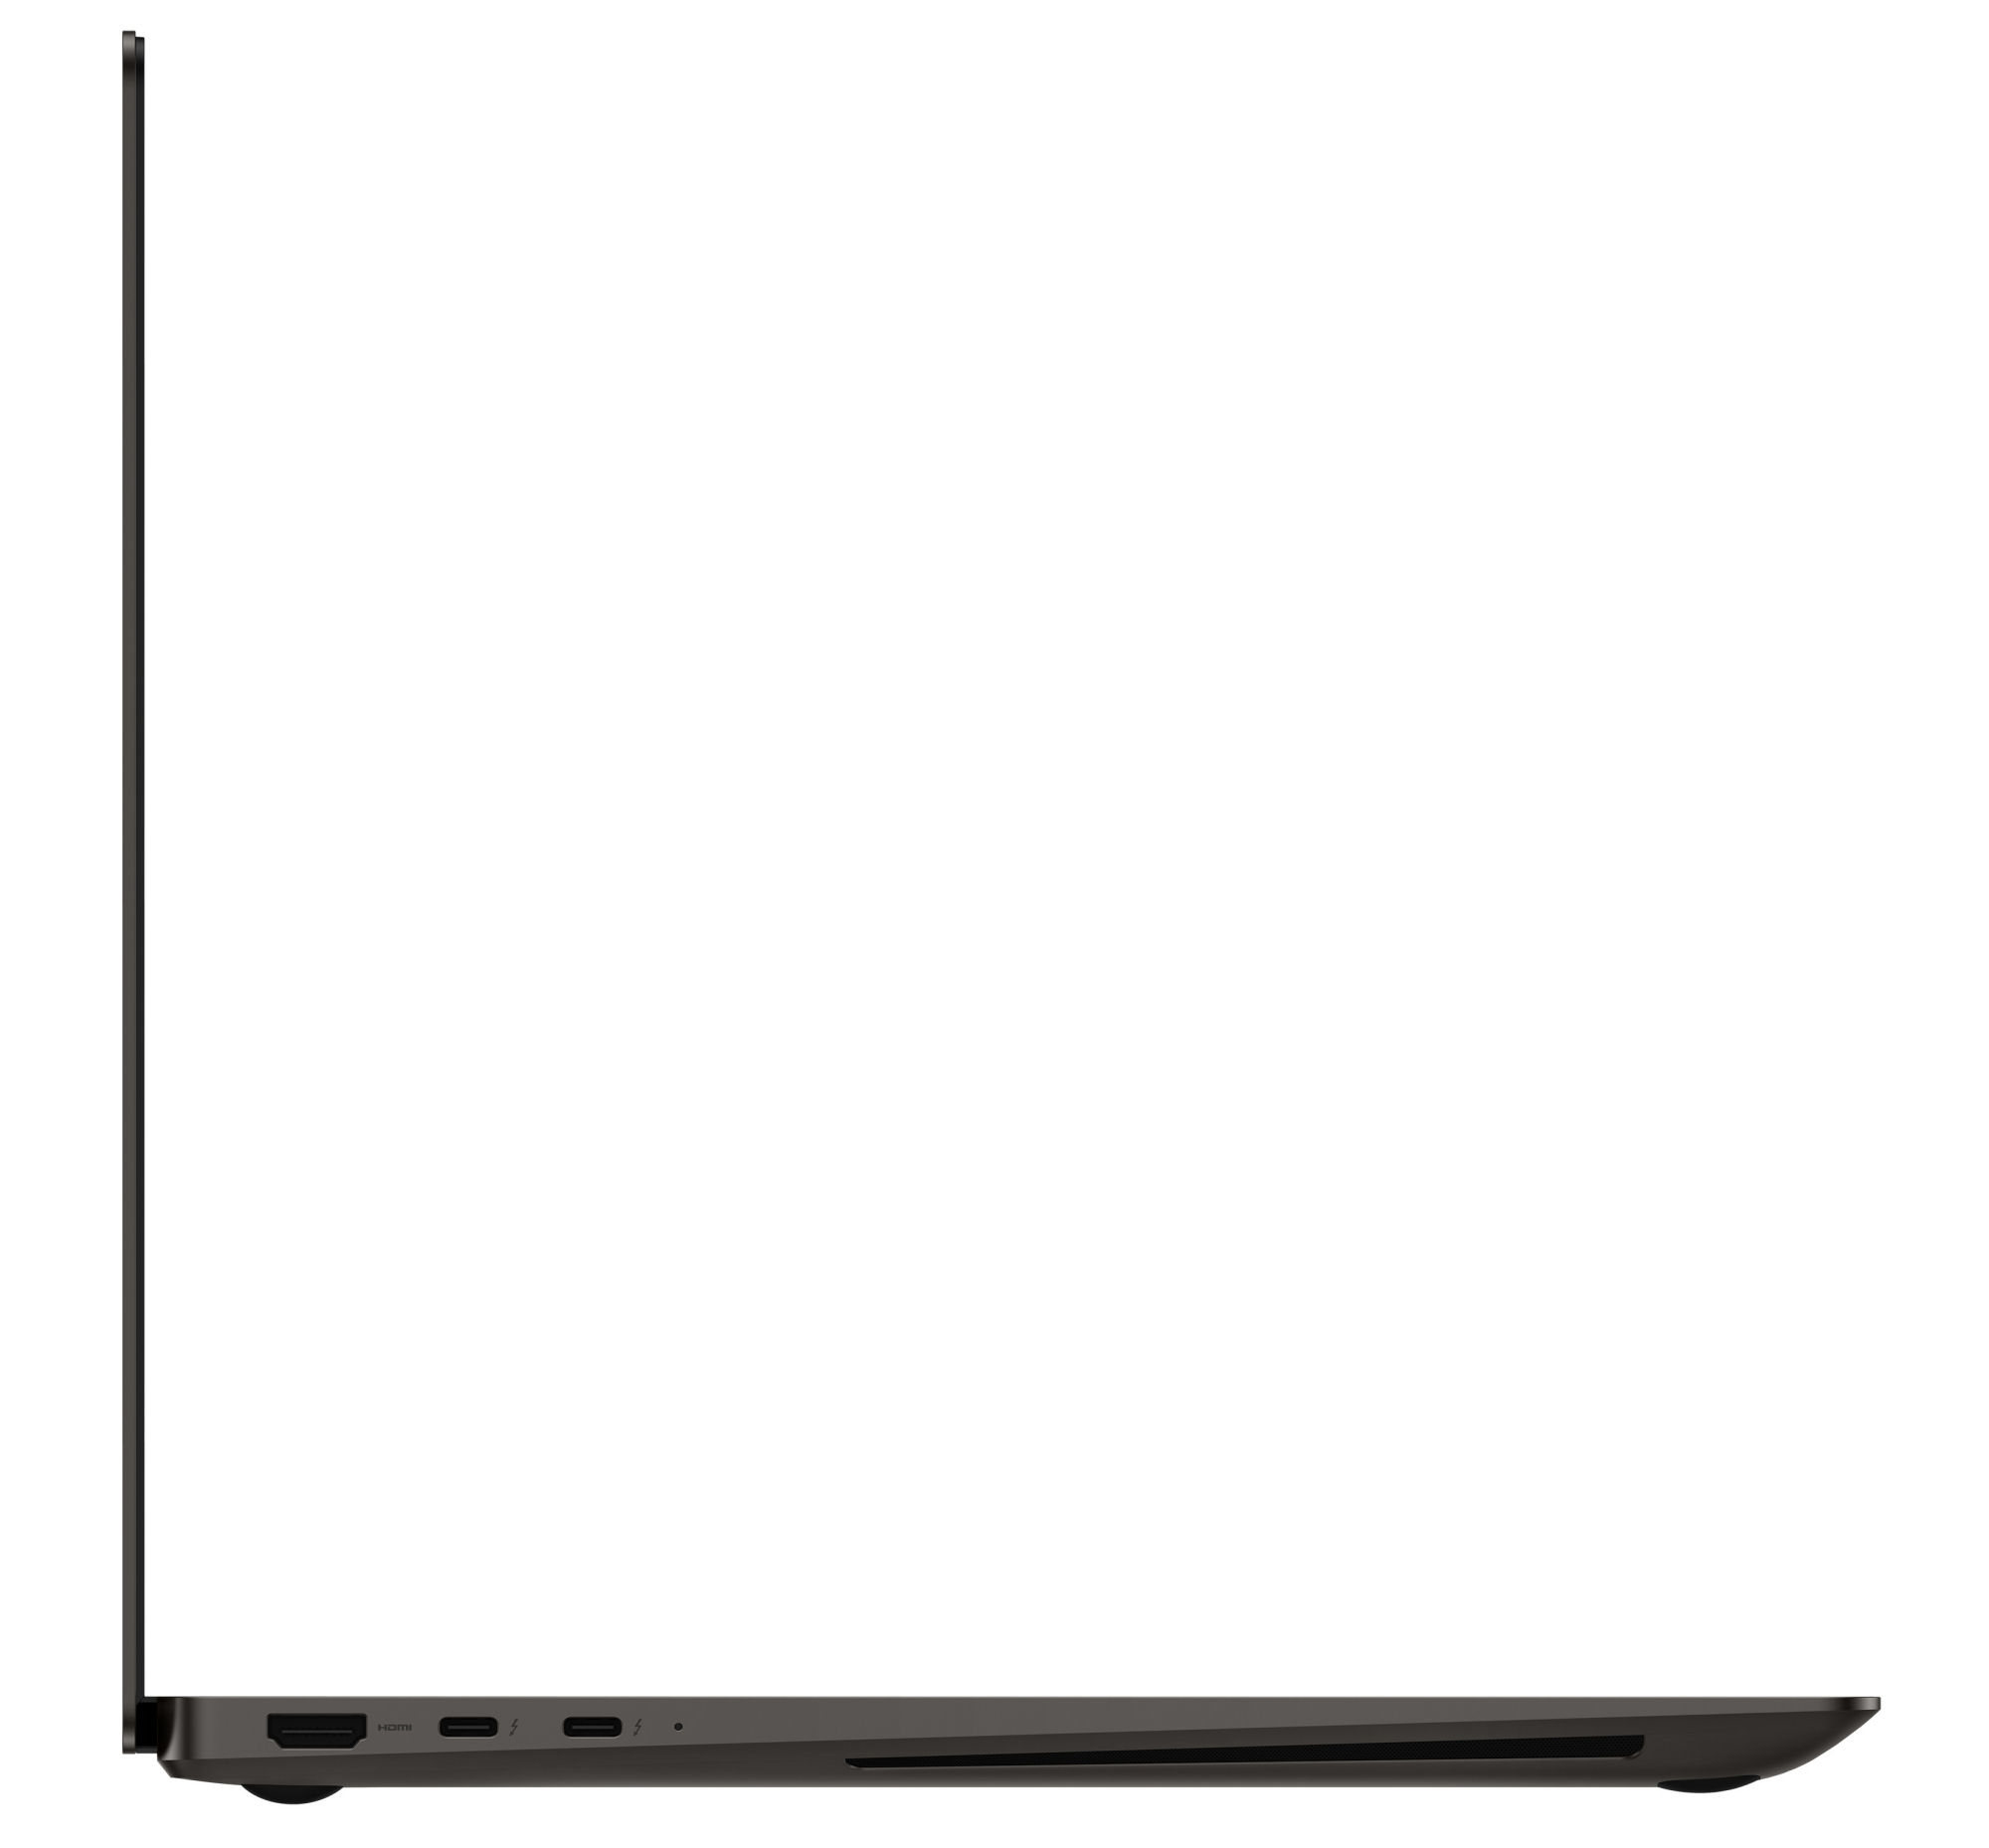
Ausstattung - Samsung spendiert dem Ultra 16 Thunderbolt 4
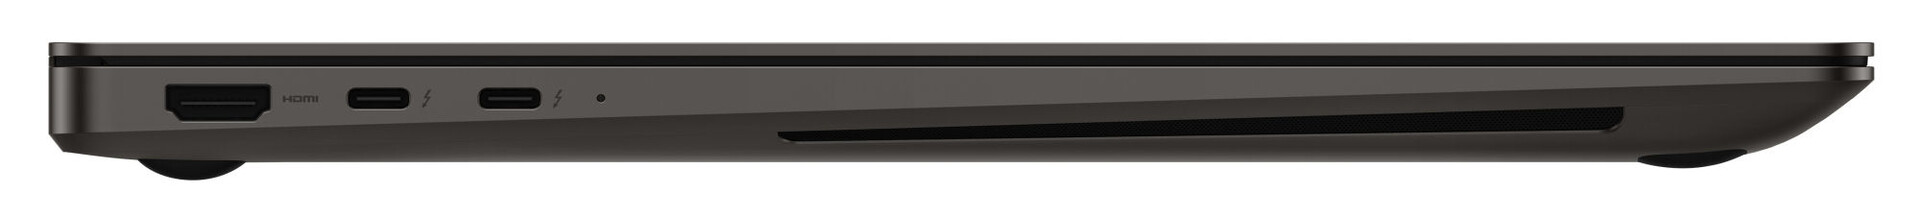
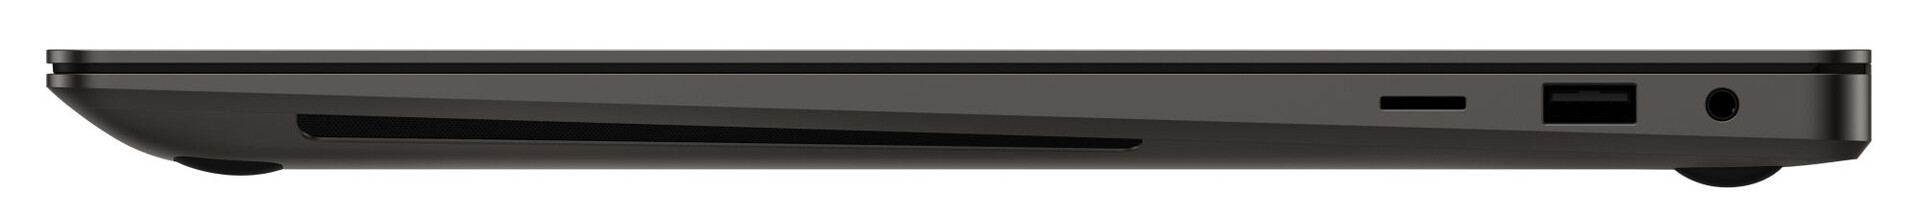
Der Rechner hält einen USB-A-Anschluss (USB 3.2 Gen 1) sowie zwei USB-C-Steckplätze (Thunderbolt 4) bereit. Letztere dienen der Energieversorgung (Power Delivery) des Laptops und können zudem ein Displayport-Signal ausgeben. Insgesamt gibt es drei Videoausgänge (2x DP, 1x HDMI). Fehlende Anschlüsse könnten mittels einer Dockingstation nachgerüstet werden.
Die Steckplätze befinden sich in den hinteren Bereichen der rechten und linken Seite. Somit bleibt der Platz neben der Handballenablage frei von Kabeln. Negativ: Alle Videoausgänge bzw. Netzanschlüsse befinden sich auf der linken Seite. Hier wäre doch eine beidseitige Bestückung mit Thunderbolt 4 sinnvoll gewesen.
SD Card Reader
Der MicroSD-Speicherkartenleser (Referenzkarte: AV PRO microSD 128 GB V60) zählt mit maximalen Transferraten von 74 MB/s (Übertragung von 250 jpg-Bilddateien mit je rund 5 MB) und 83 MB/s (Kopieren großer Datenblöcke) zu den mittelschnellen Modellen.
| SD Card Reader | |
| average JPG Copy Test (av. of 3 runs) | |
| Dell XPS 15 9520 RTX 3050 Ti (Toshiba Exceria Pro SDXC 64 GB UHS-II) | |
| Durchschnitt der Klasse Multimedia (23 - 531, n=43, der letzten 2 Jahre) | |
| Schenker Vision 16 Pro RTX 3070 Ti (AV Pro V60) | |
| Lenovo ThinkBook 16p G3 ARH (AV PRO microSD 128 GB V60) | |
| LG Gram 17Z90Q-E.AD78G (AV Pro SD microSD 128 GB V60) | |
| Samsung Galaxy Book3 Ultra 16 (AV PRO microSD 128 GB V60) | |
| Asus VivoBook Pro 16X OLED N7600PC-L2026X | |
| maximum AS SSD Seq Read Test (1GB) | |
| Durchschnitt der Klasse Multimedia (27.9 - 1455, n=42, der letzten 2 Jahre) | |
| Dell XPS 15 9520 RTX 3050 Ti (Toshiba Exceria Pro SDXC 64 GB UHS-II) | |
| LG Gram 17Z90Q-E.AD78G (AV Pro SD microSD 128 GB V60) | |
| Lenovo ThinkBook 16p G3 ARH (AV PRO microSD 128 GB V60) | |
| Samsung Galaxy Book3 Ultra 16 (AV PRO microSD 128 GB V60) | |
| Schenker Vision 16 Pro RTX 3070 Ti (AV Pro V60) | |
| Asus VivoBook Pro 16X OLED N7600PC-L2026X | |
Kommunikation
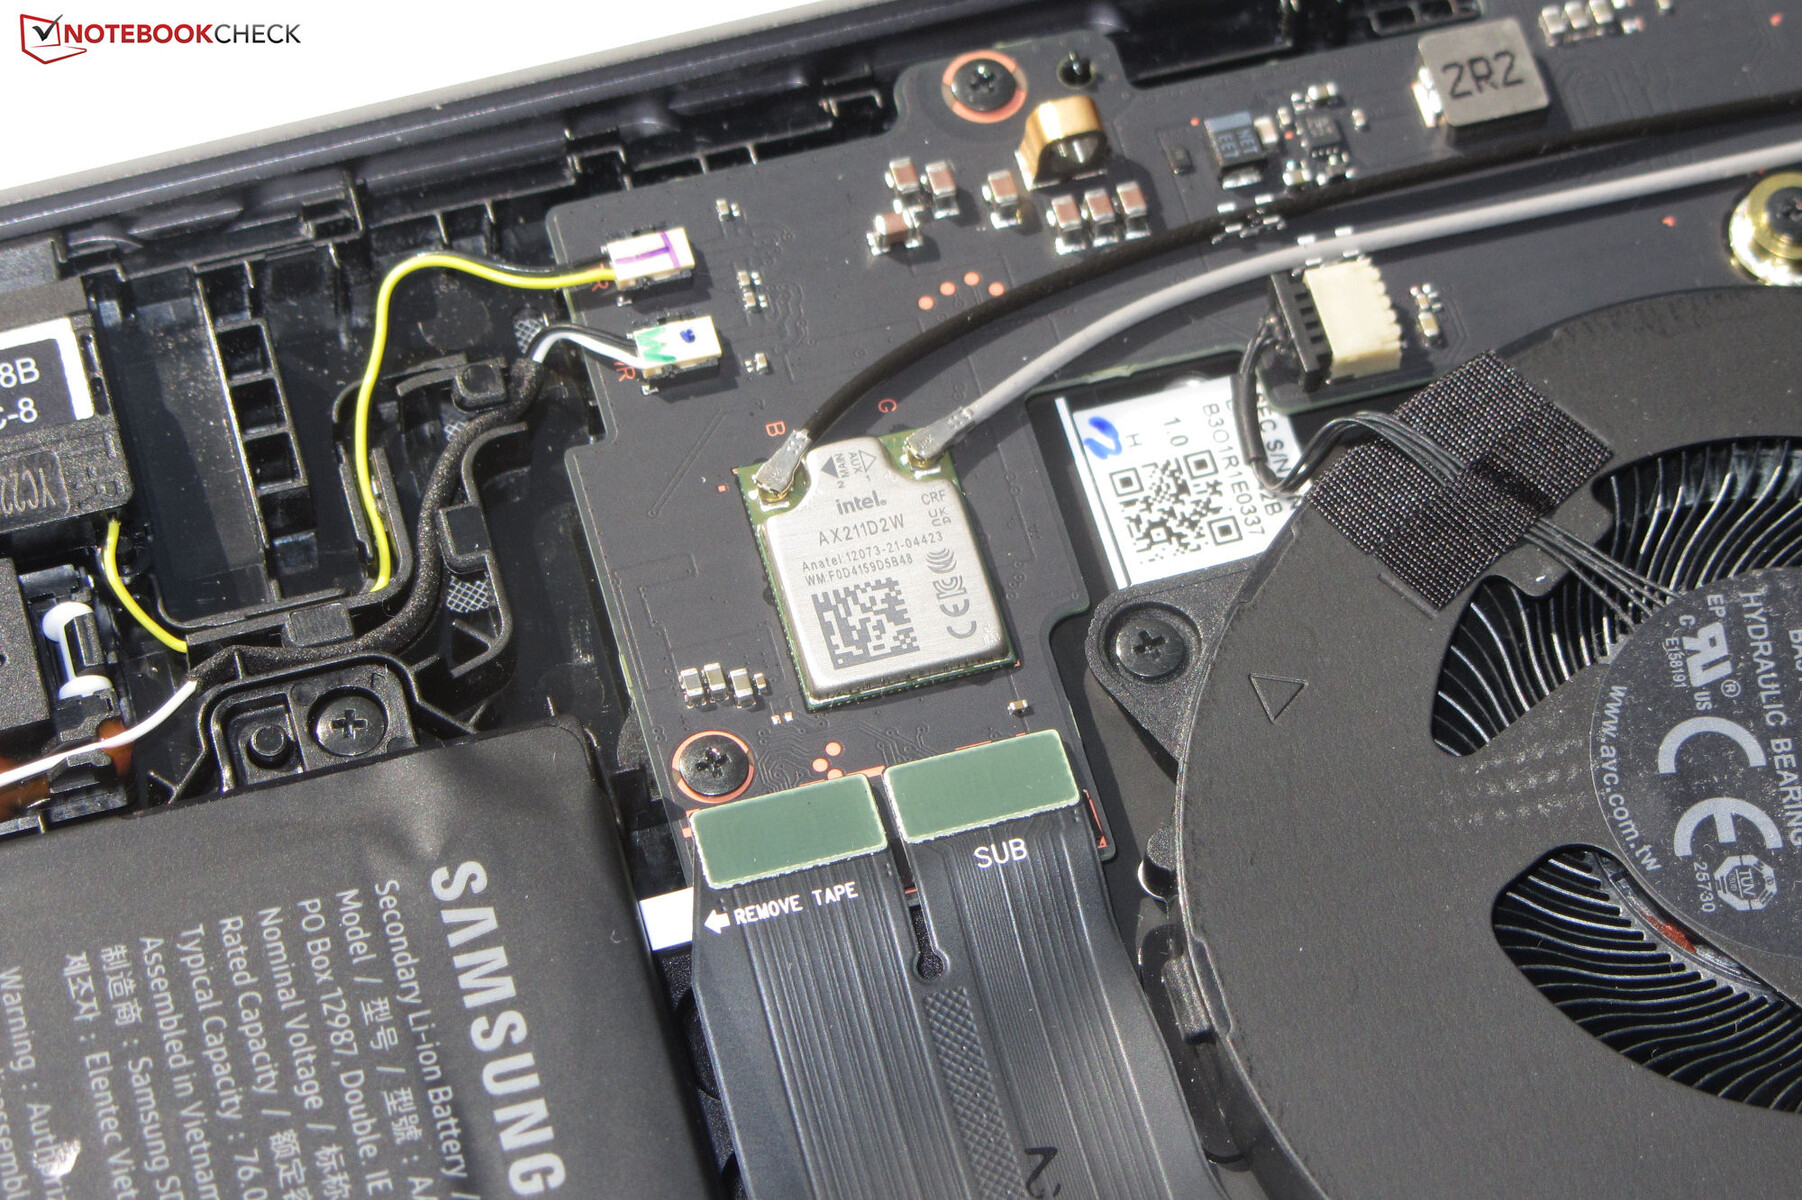
Unter optimalen Bedingungen (keine WLAN-Geräte in der näheren Umgebung, geringer Abstand zwischen Laptop und Server-PC) werden hervorragende WiFi-Datenraten erreicht. Das Samsung Notebook hat einen WiFi-6E-Chip (Intel AX211) an Bord. Einen Ethernet-Steckplatz hält der Rechner nicht bereit.
Webcam
Eine mechanische Abdeckung hat die Webcam (2,1 MP, max. 1.920 x 1.080 Pixel) nicht zu bieten. Qualitativ liefert sie Standardkost. Es hapert bei der Farbgenauigkeit: Mit einer Farbabweichung von knapp 8 wird das Soll (DeltaE kleiner 3) verfehlt.


Zubehör
Neben den üblichen Dokumenten (Garantieinformationen, Schnellstartanleitung) liegt dem Notebook kein weiteres Zubehör bei.
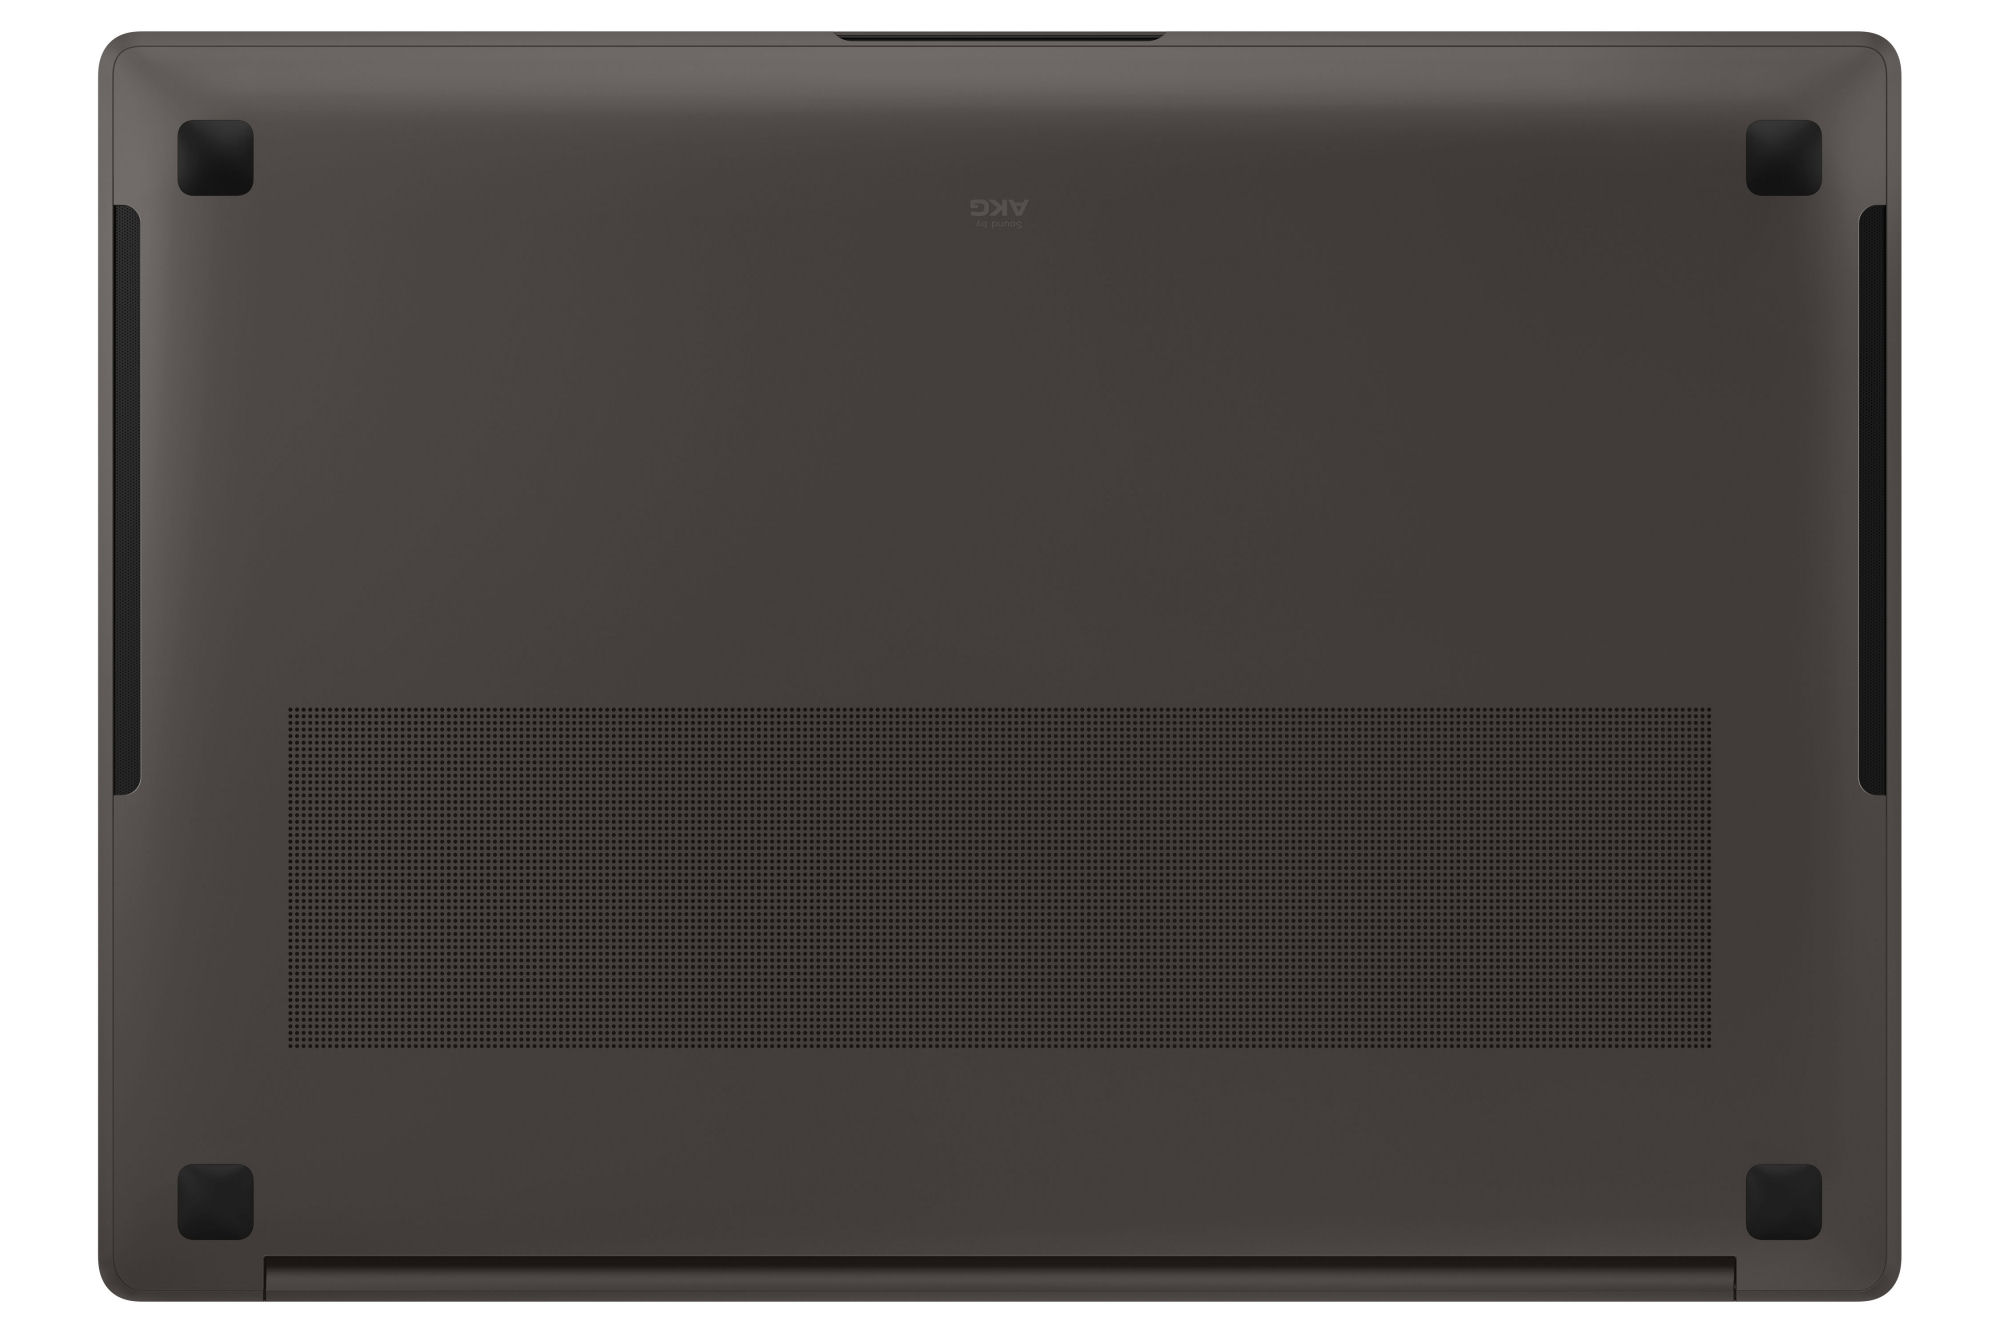
Wartung
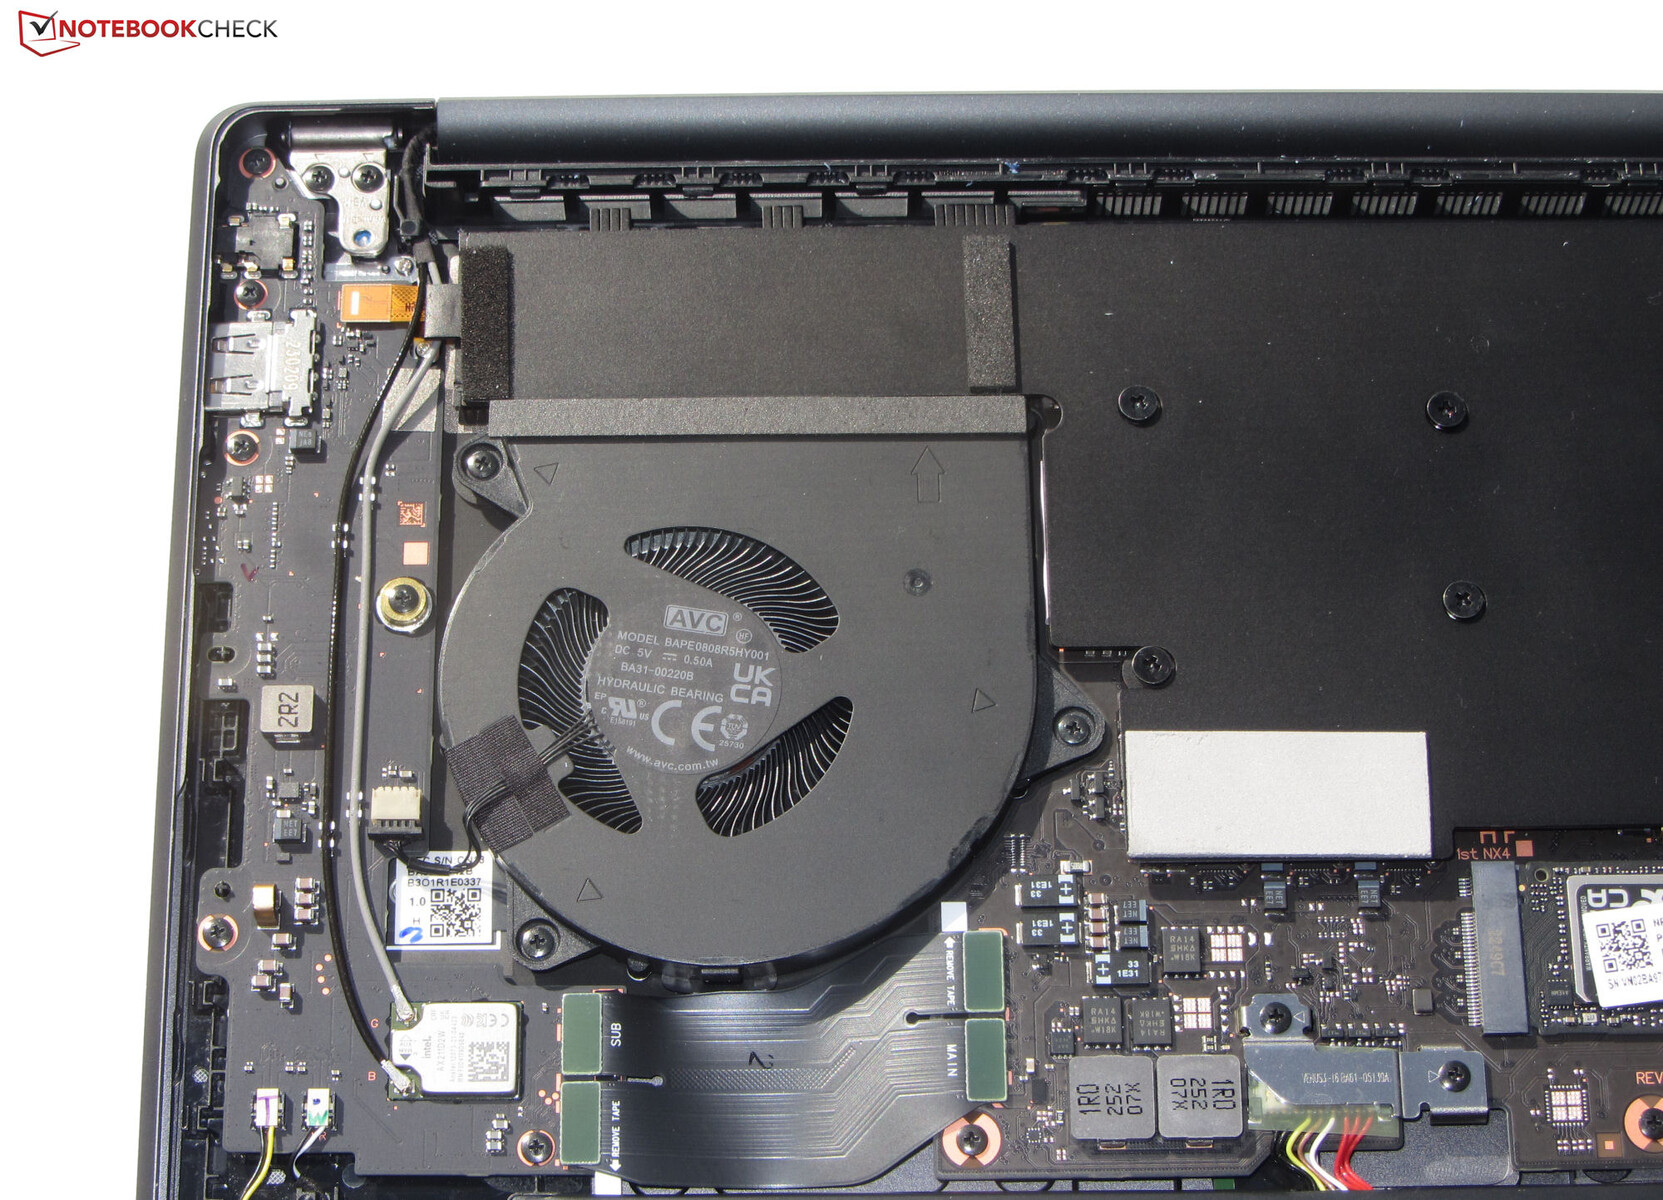
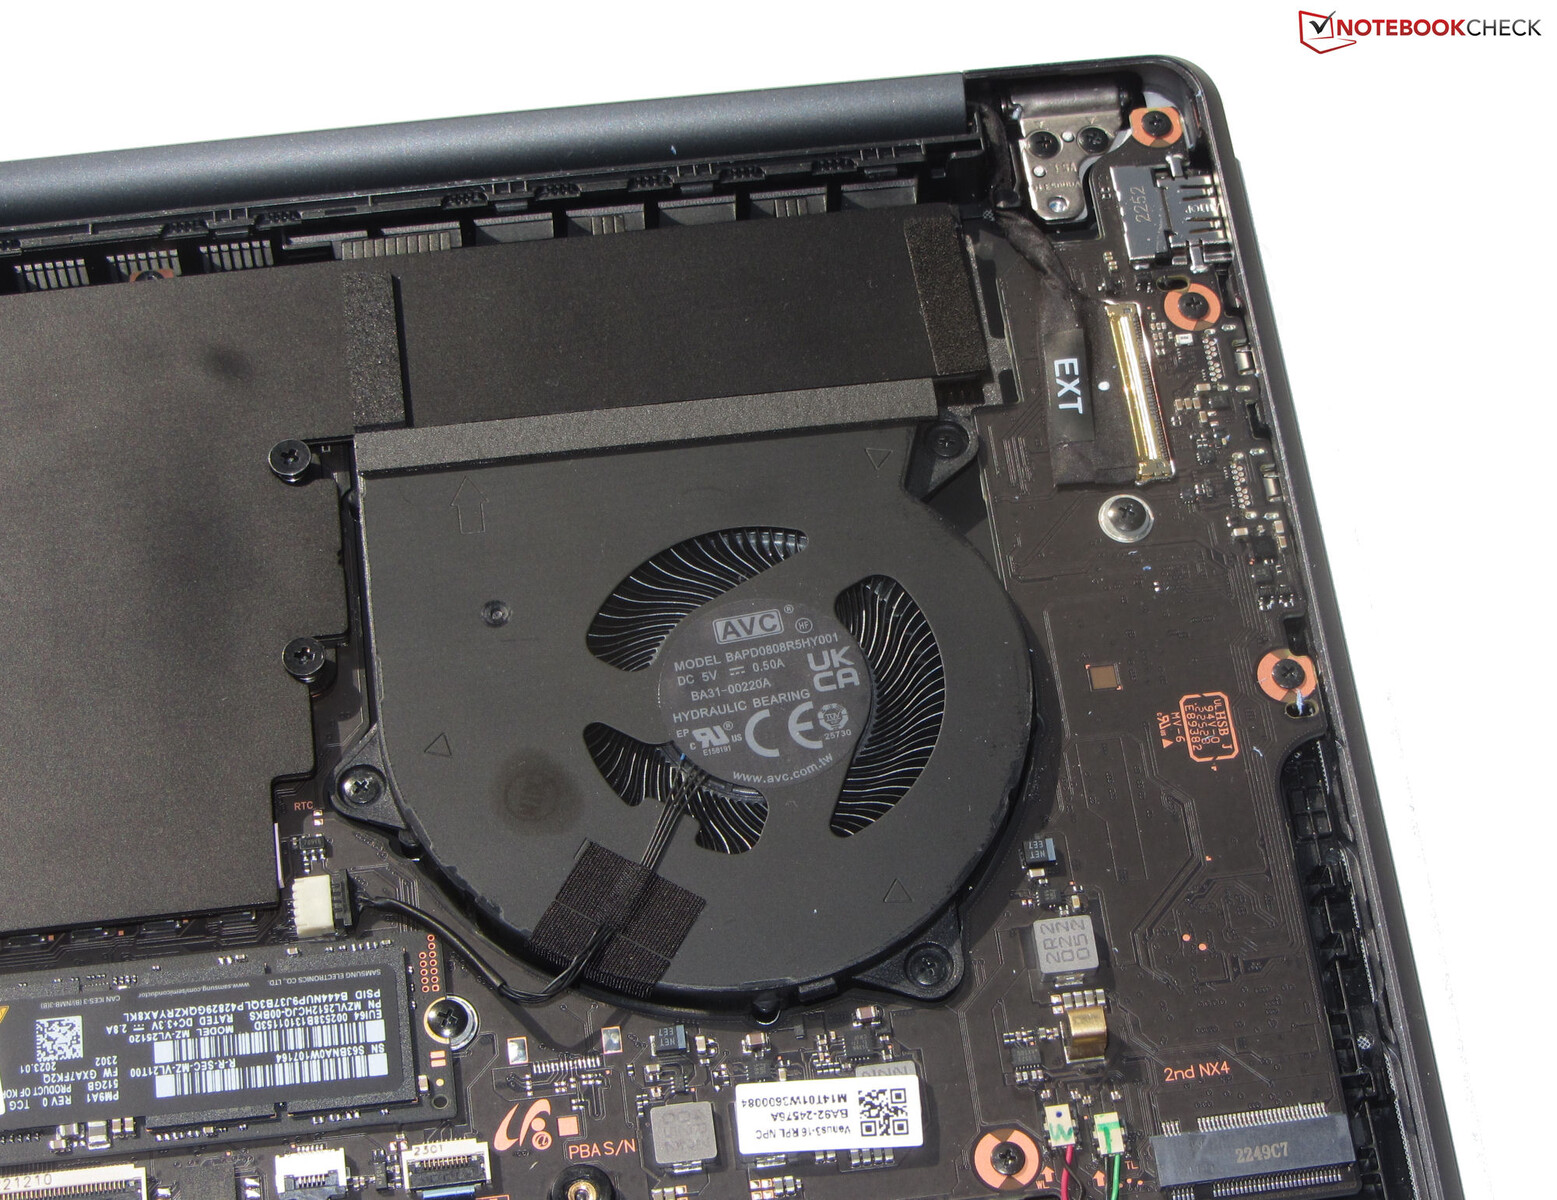
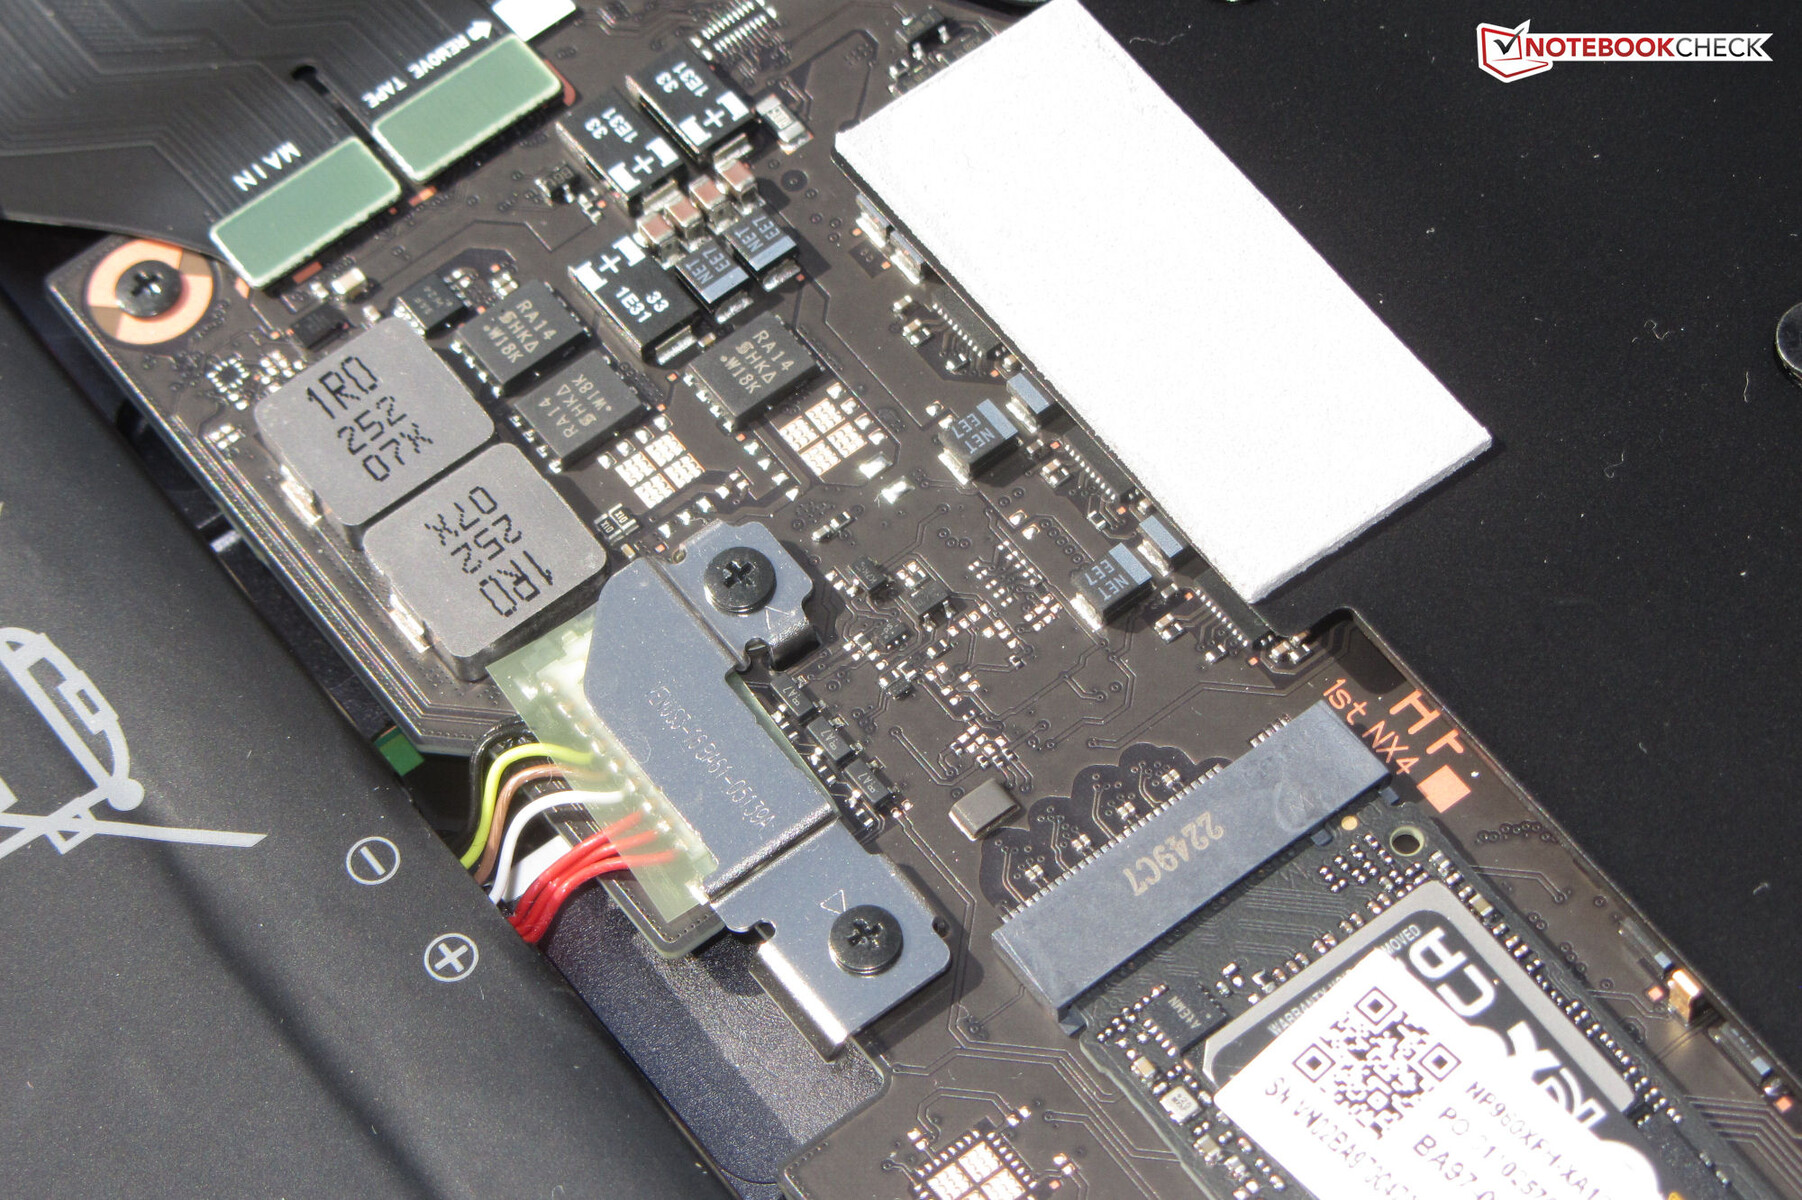
Die Demontage der Unterschale erfordert die Entfernung aller Schrauben, die sich unter den vier Gummifüßen (gesteckt, nicht geklebt) verbergen. Anschließend geht es an das vorsichtige (!) Ablösen der Unterschale - sie sitzt sehr fest und könnte beschädigt werden. Es empfiehlt sich die Nutzung eines flachen Spatels. Anschließend besteht Zugriff auf die SSD (PCIe 4, M.2-2280), den zweiten SSD-Slot, die Lüfter, die Lautsprecher und den Akku.
Garantie
Samsung gewährt dem 16-Zöller in Deutschland eine zweijährige Garantie. Eine Erweiterung um ein Jahr bzw. zwei Jahre schlüge mit 79 bzw. 149 Euro zu Buche.
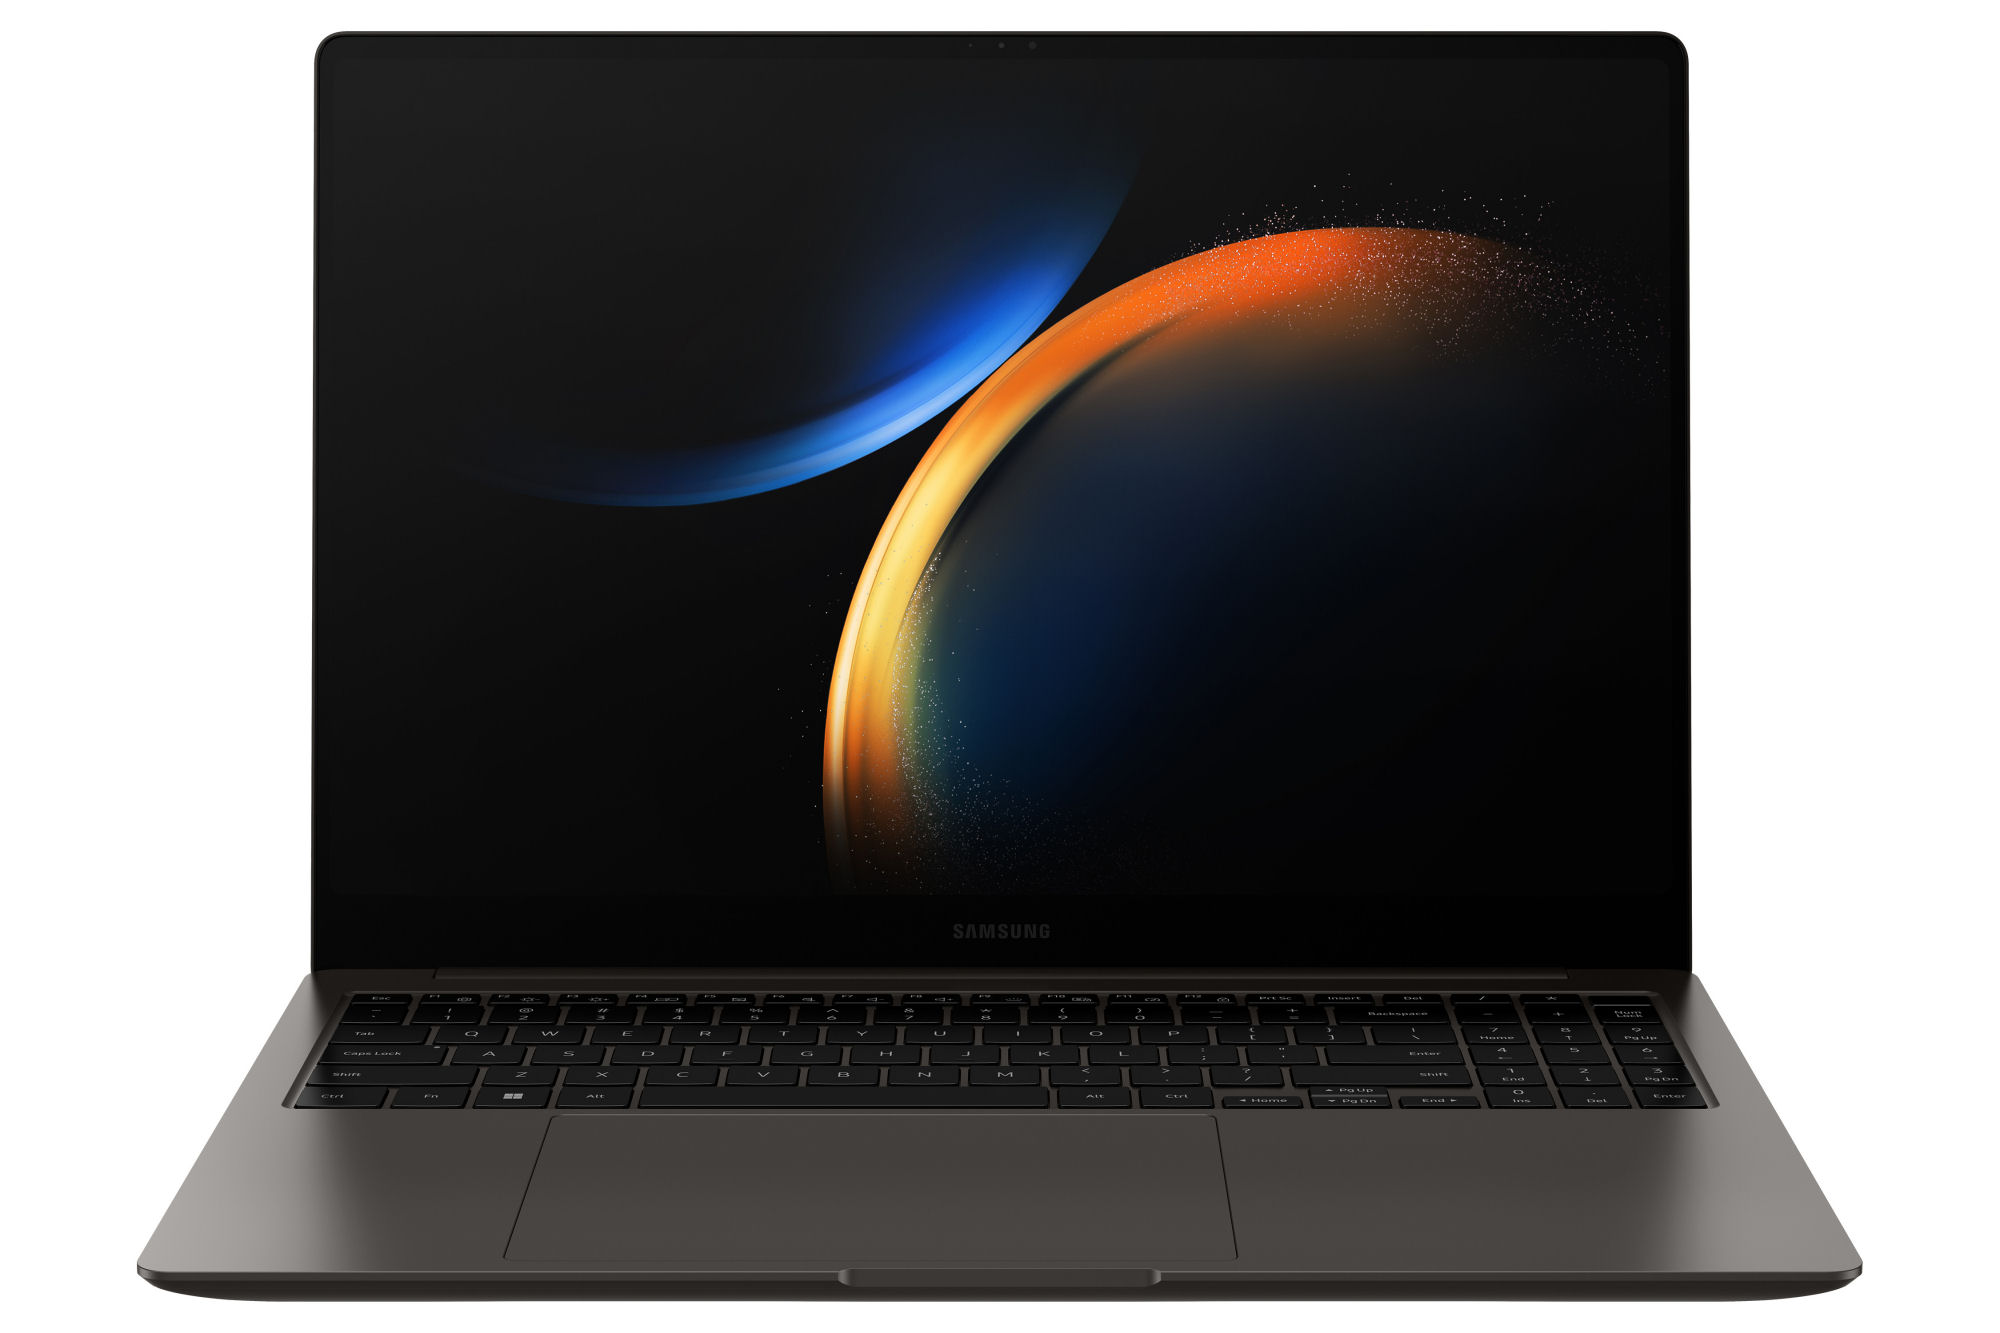
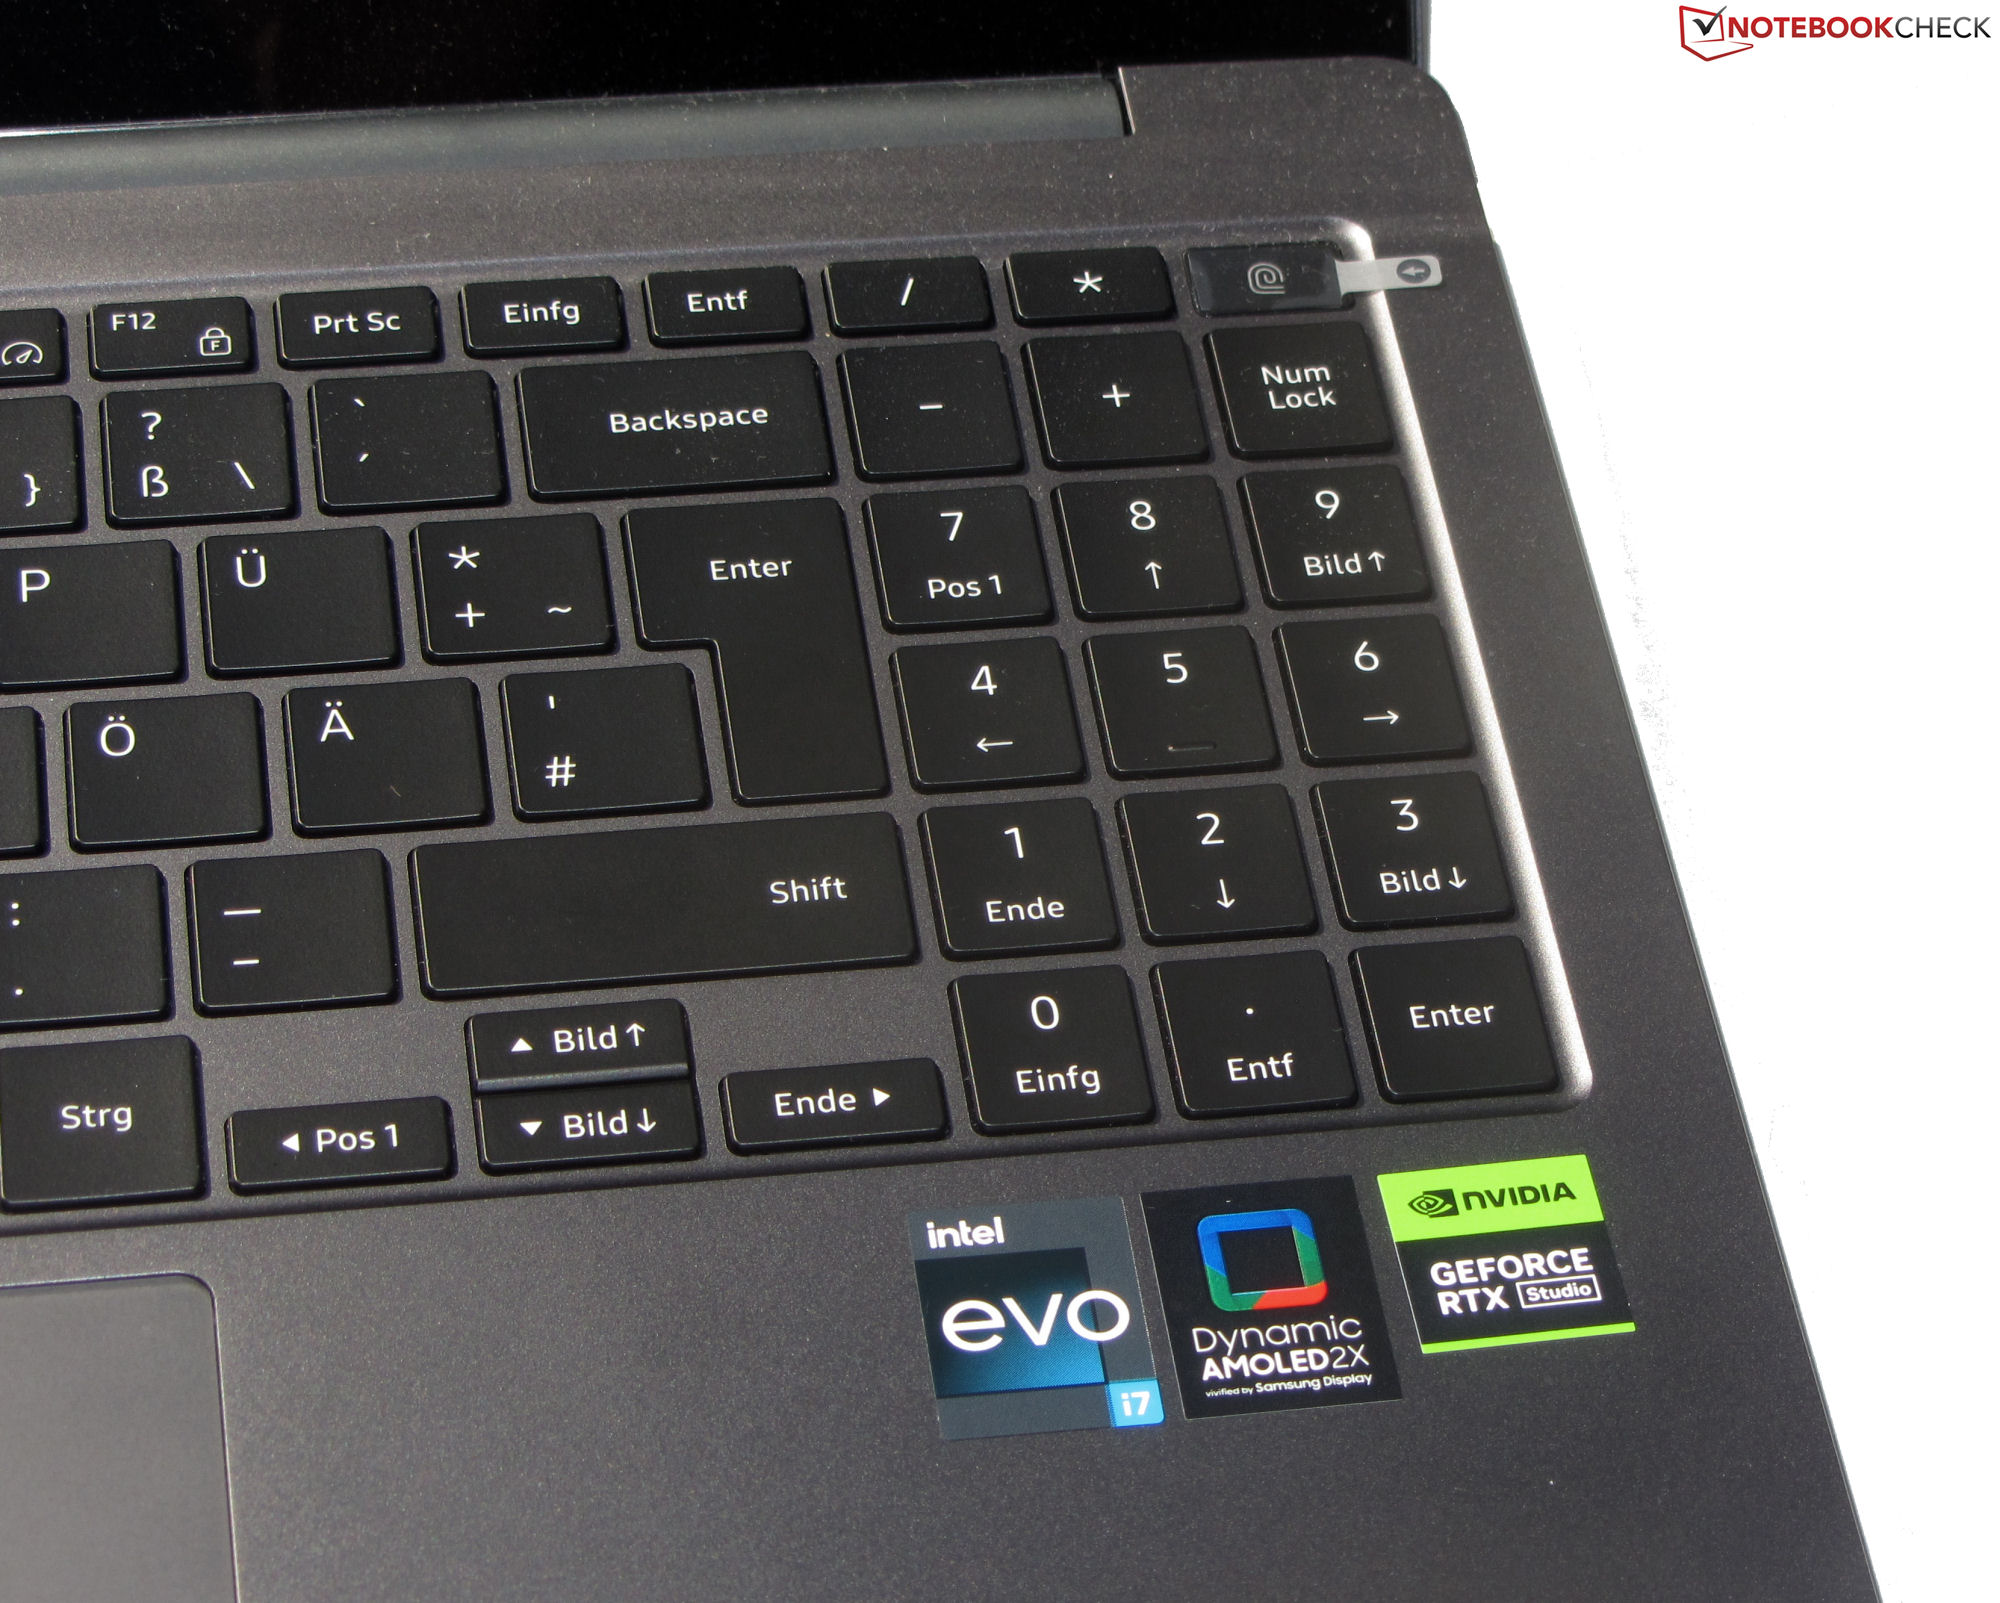
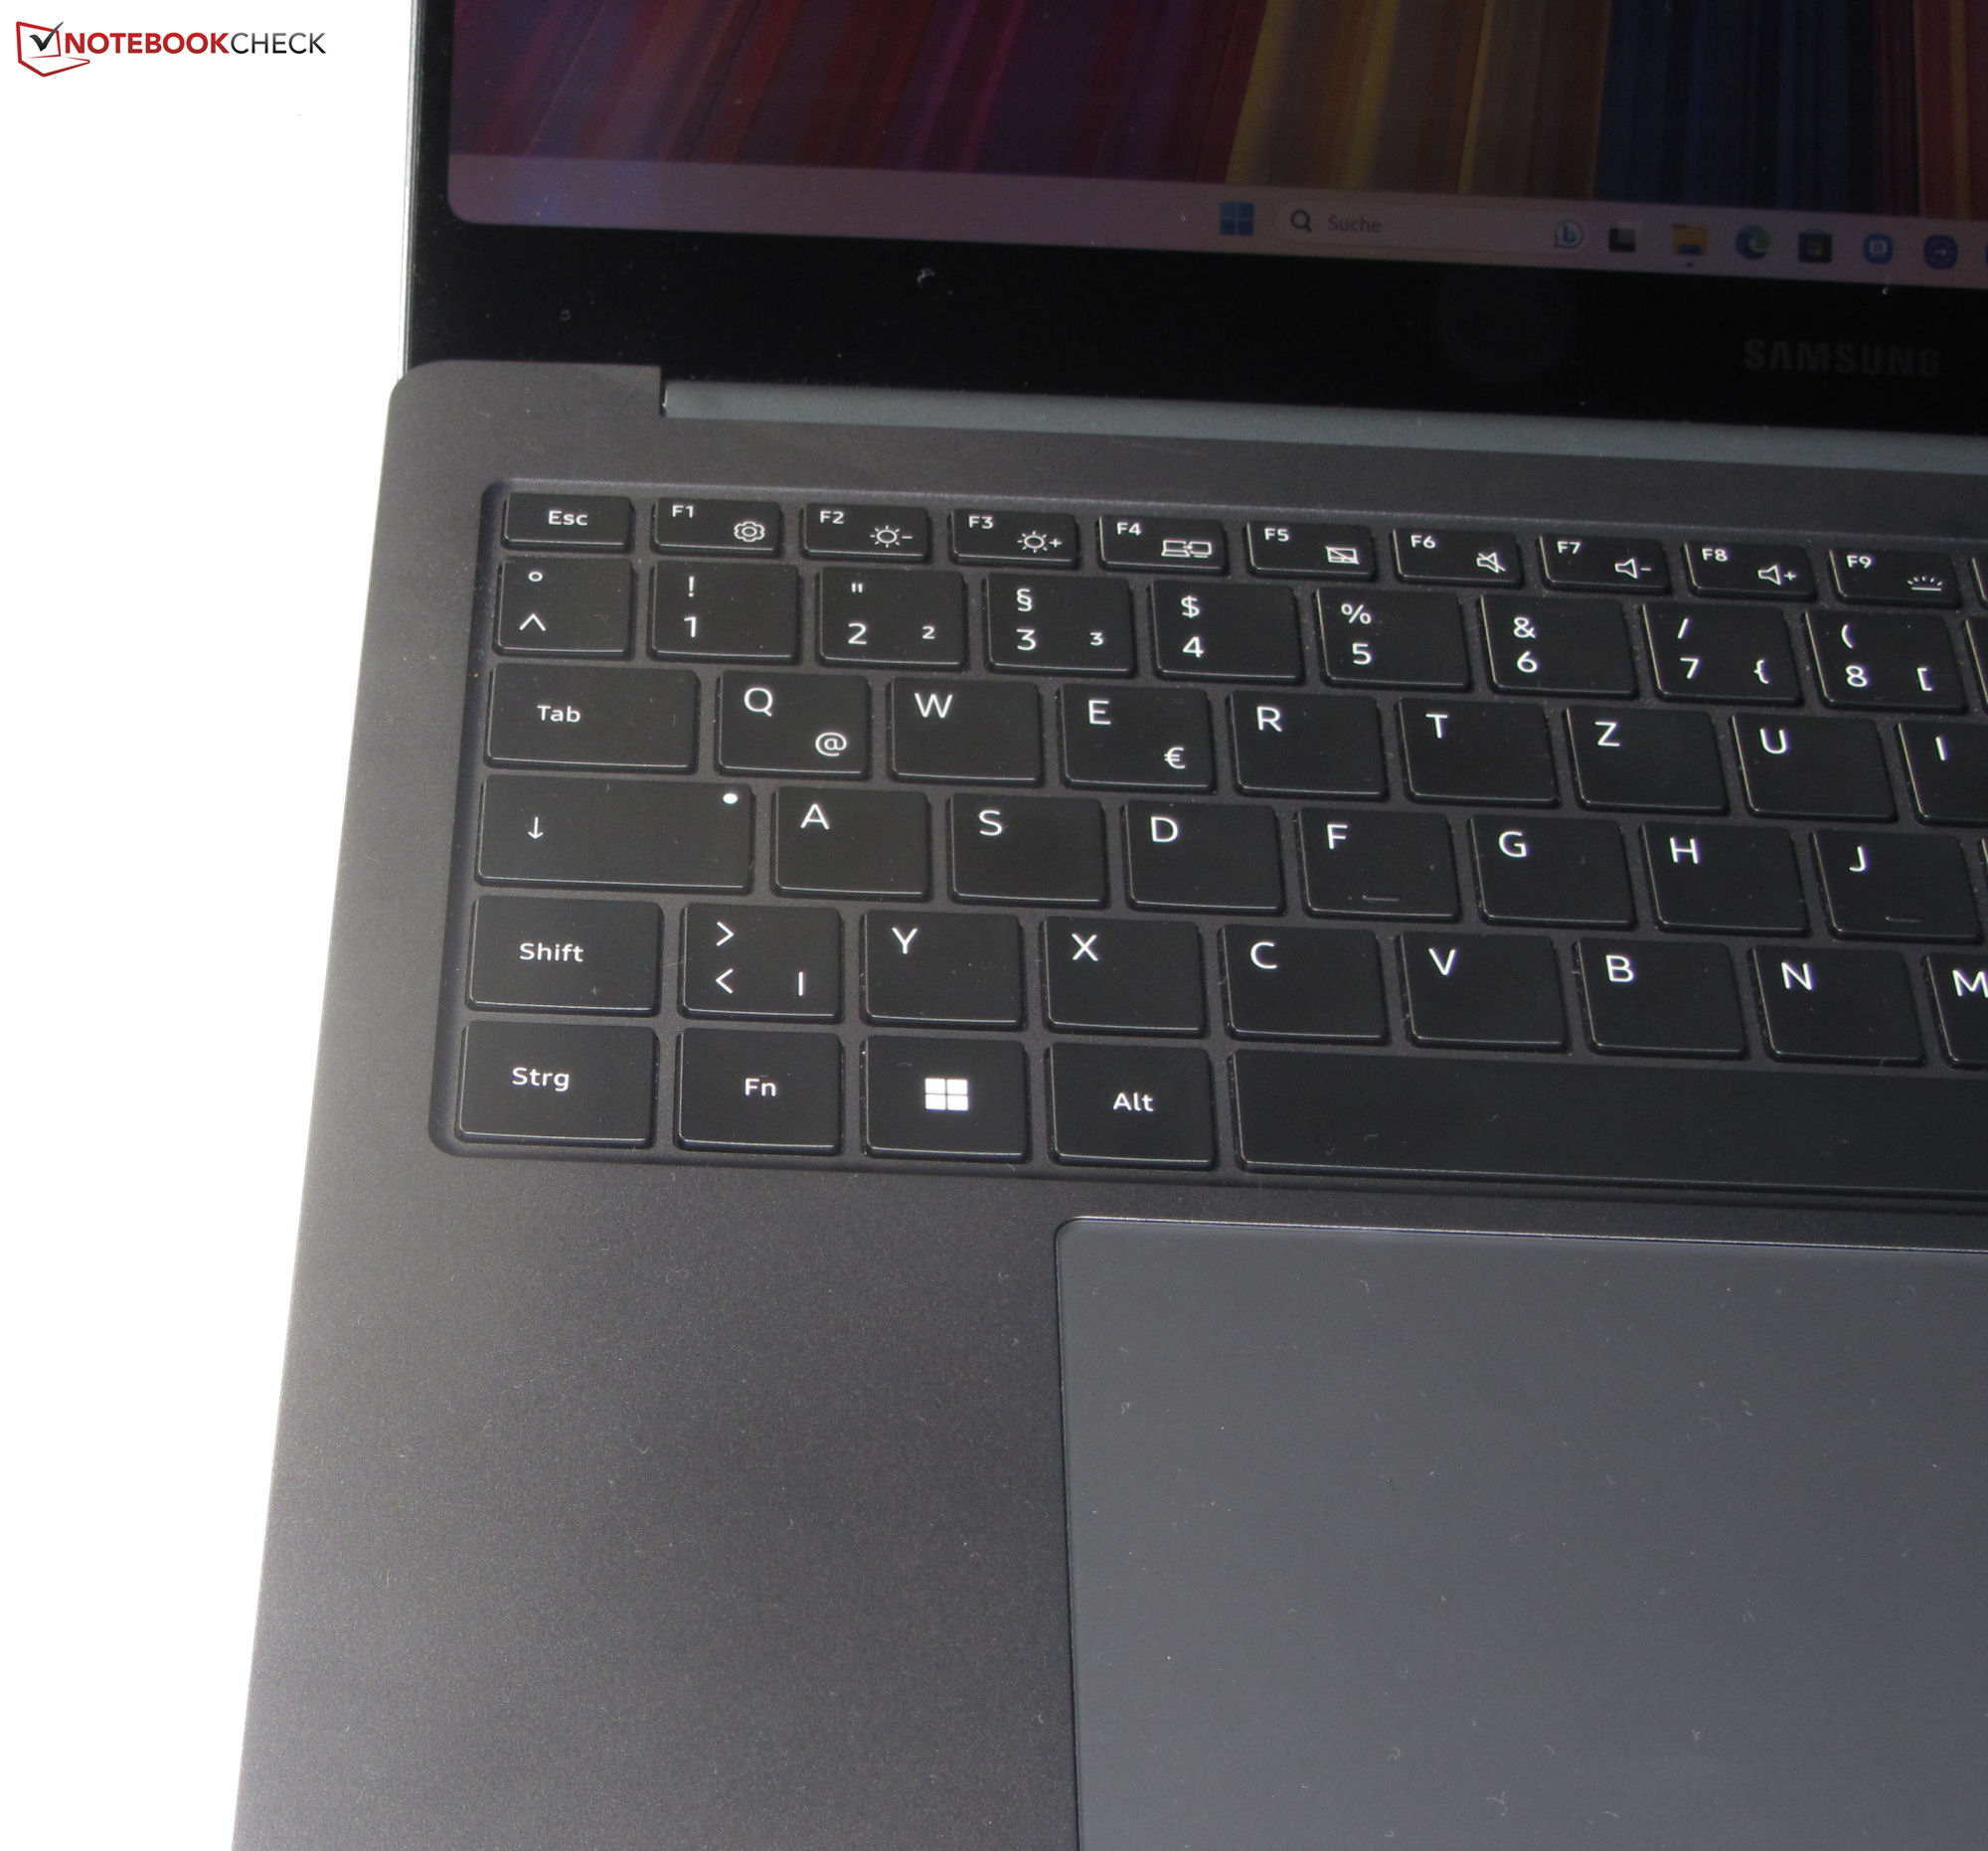
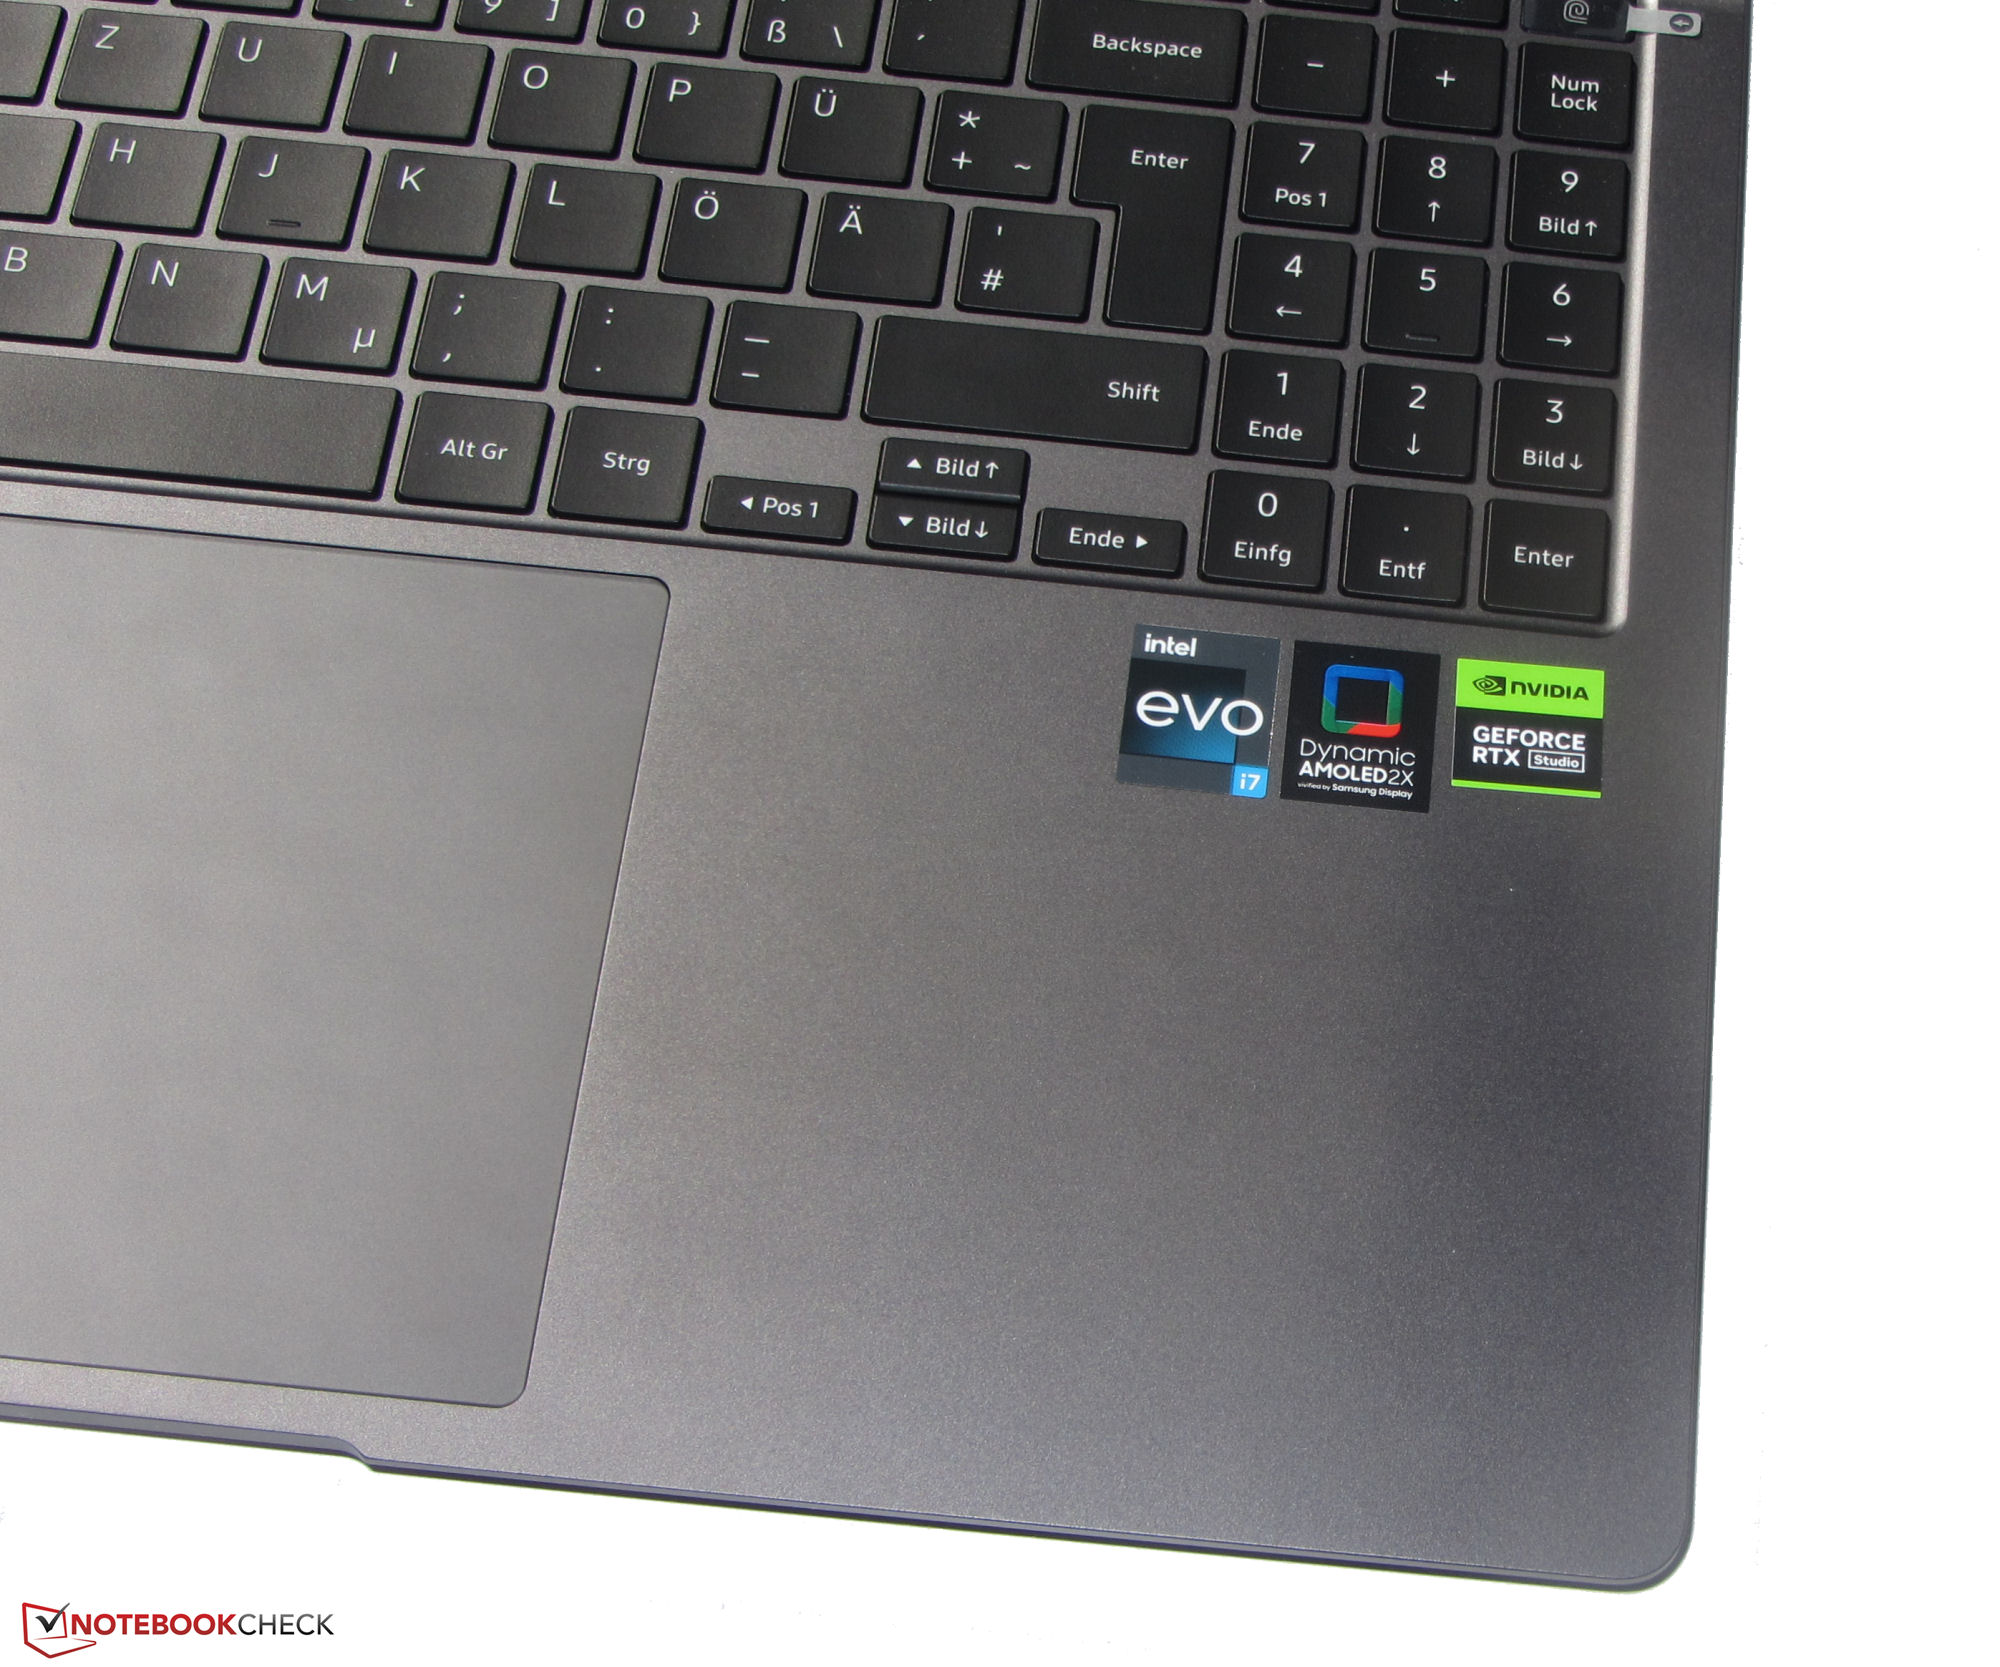
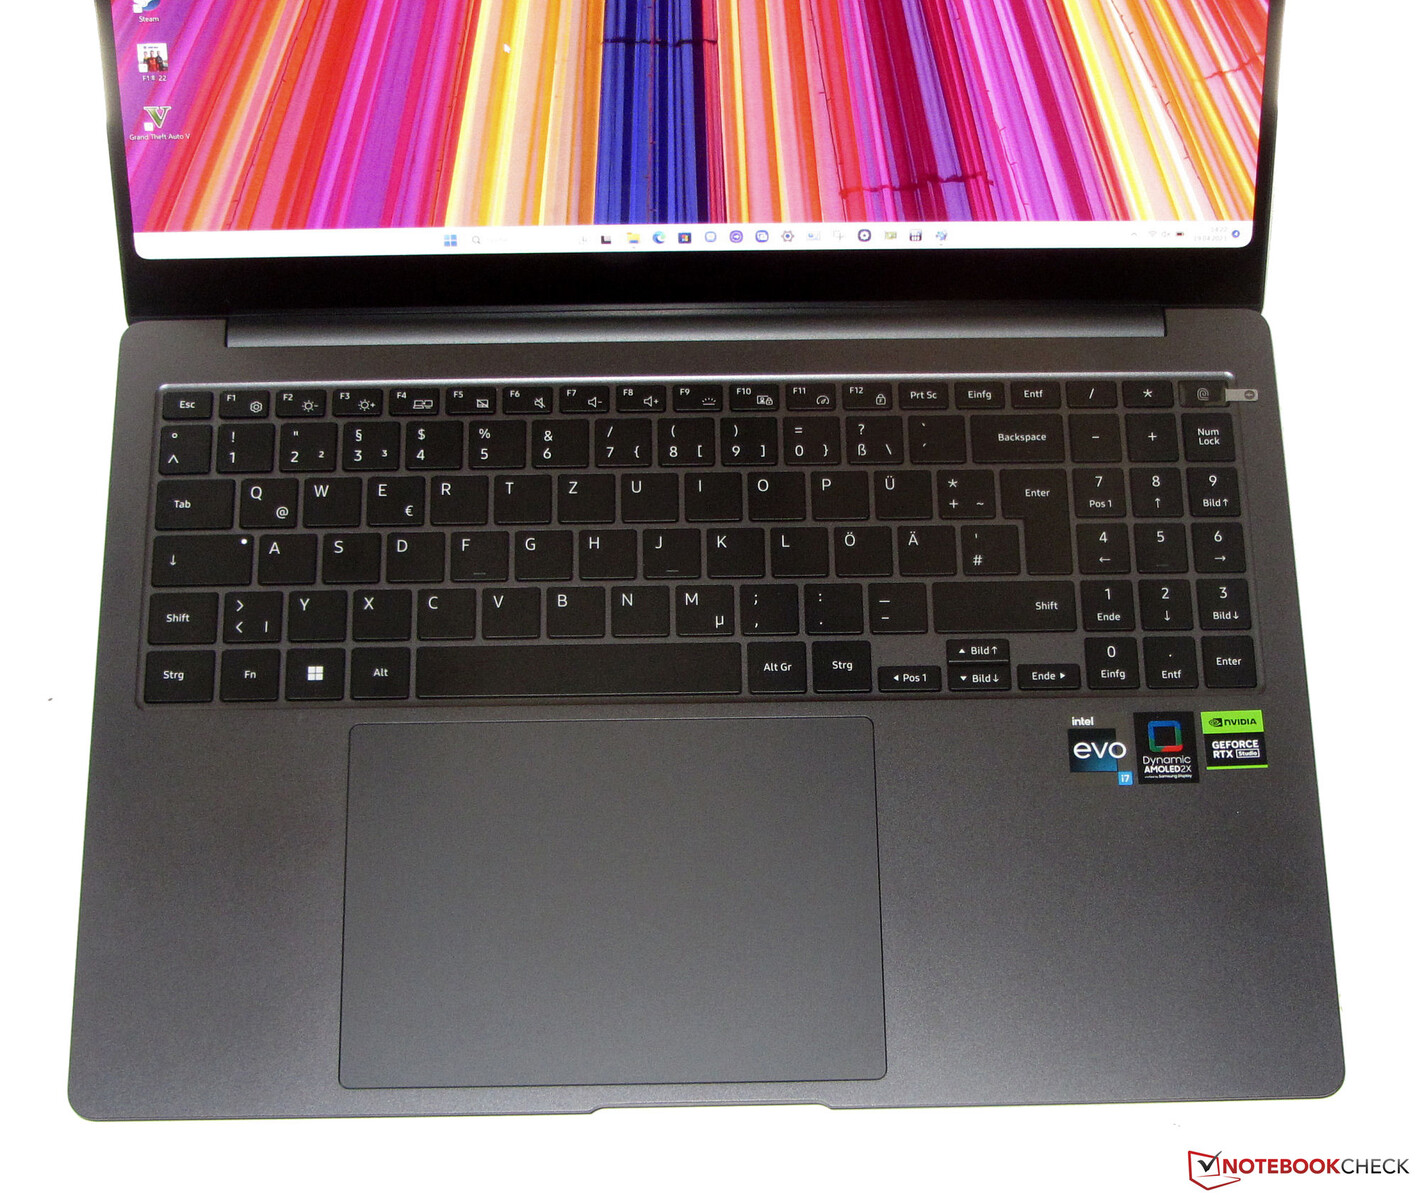
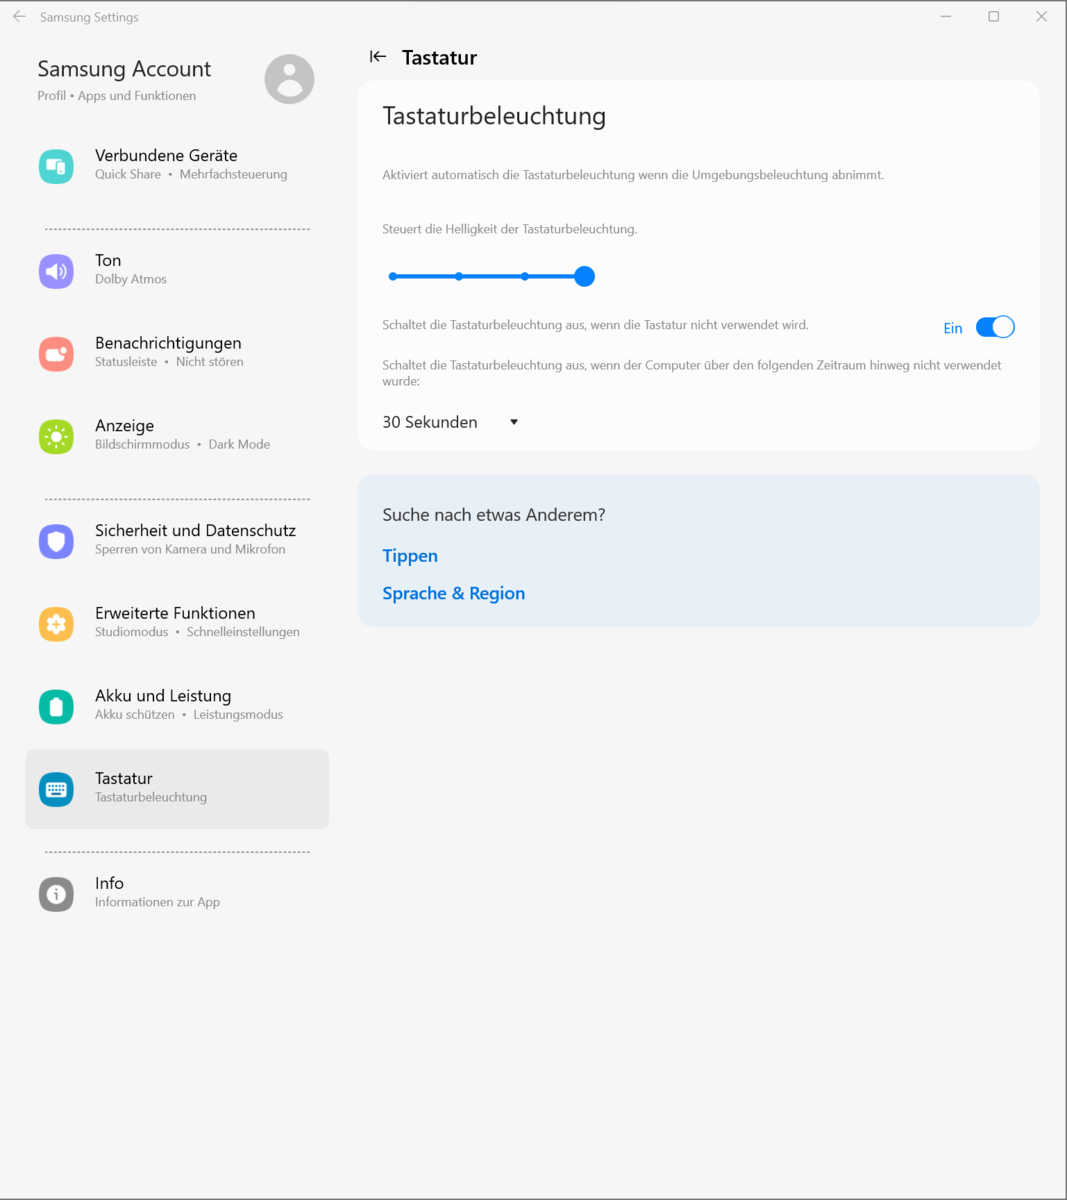
Eingabegeräte - Galaxy Book3 bietet eine beleuchtete Tastatur
Tastatur
Das NP960XFH hat eine beleuchtete Chiclet-Tastatur samt Nummernblock an Bord. Die glatten, leicht konkav gewölbten Tasten bieten einen kurzen Hub und einen klaren Druckpunkt. Der Tastenwiderstand geht in Ordnung. Ein leichtes Nachgeben der Tastatur stört nicht weiter. Die dreistufige Beleuchtung wird mittels einer Funktionstaste gesteuert. Alles in allem liefert Samsung hier eine alltagstaugliche Tastatur.
Touchpad
Das Clickpad bringt es auf Maße von etwa 15,1 x 10,8 cm. Eine Nummer kleiner hätte es auch getan: Werden die WASD-Tasten mit der linken Hand genutzt, liegt der komplette Daumen auf dem Pad. Letzteres müsste ausgeschaltet werden. Ansonsten: Die glatte Oberfläche macht den Fingern das Gleiten leicht. Es reagiert in den Ecken auf Eingaben, bietet einen kurzen Hub und einen deutlichen Druckpunkt.
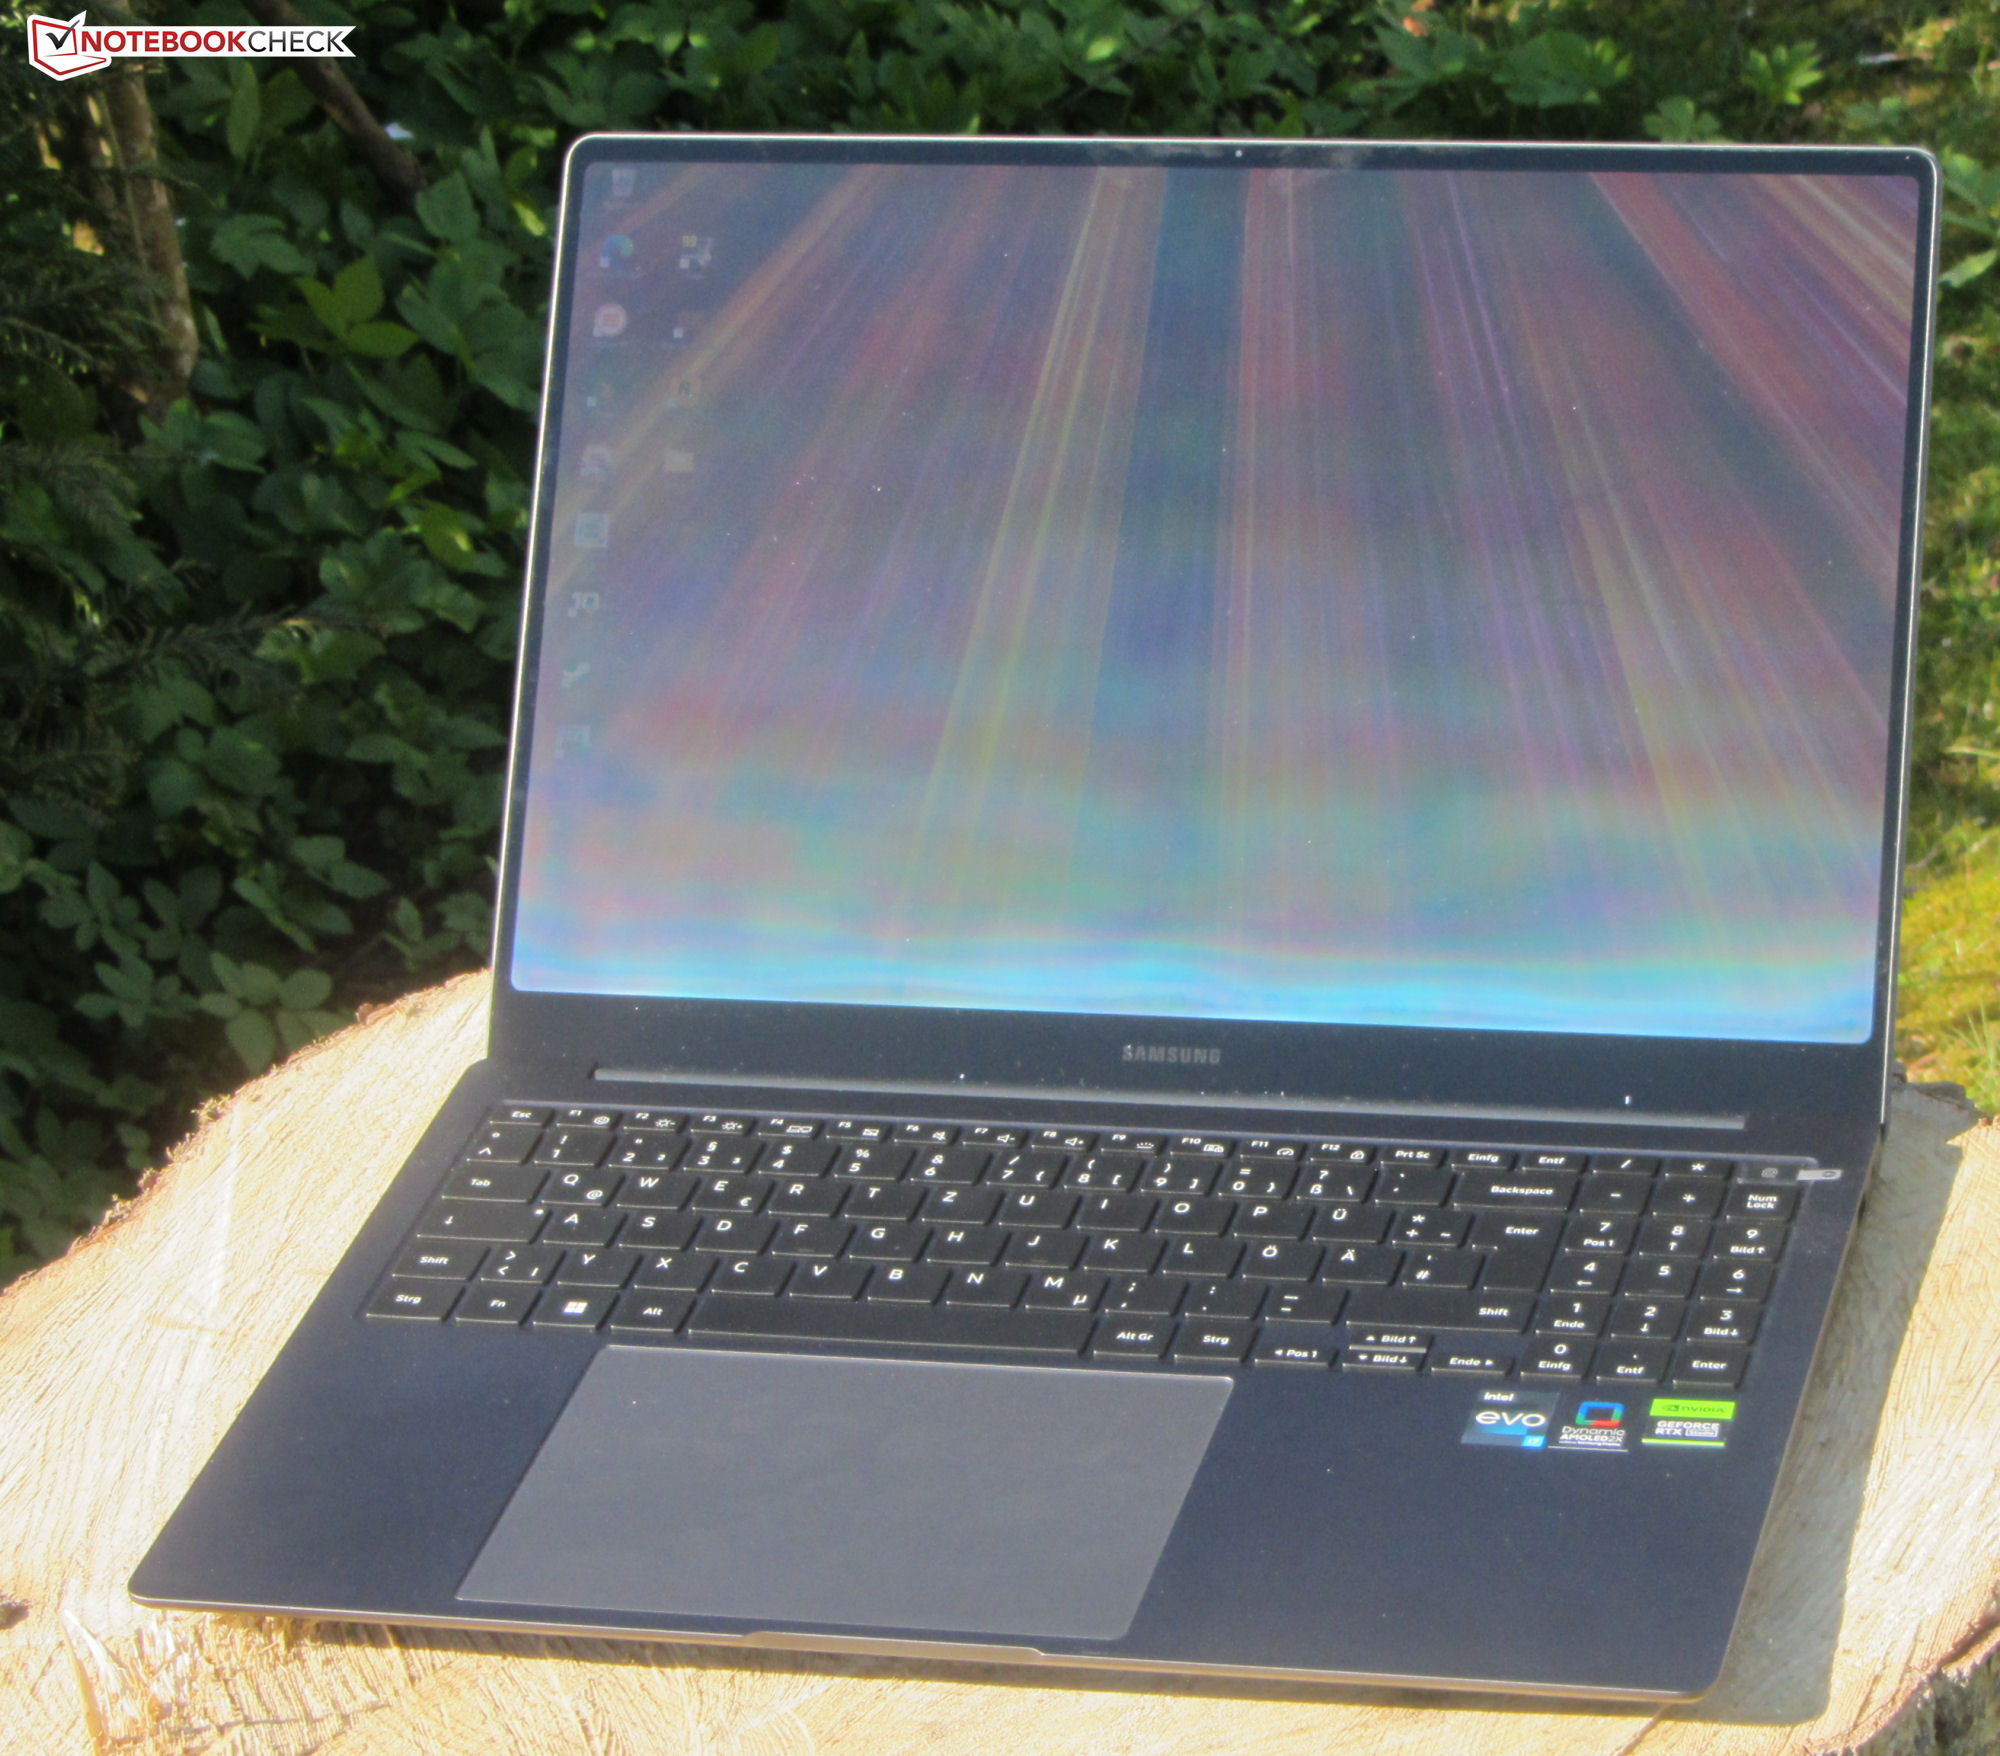
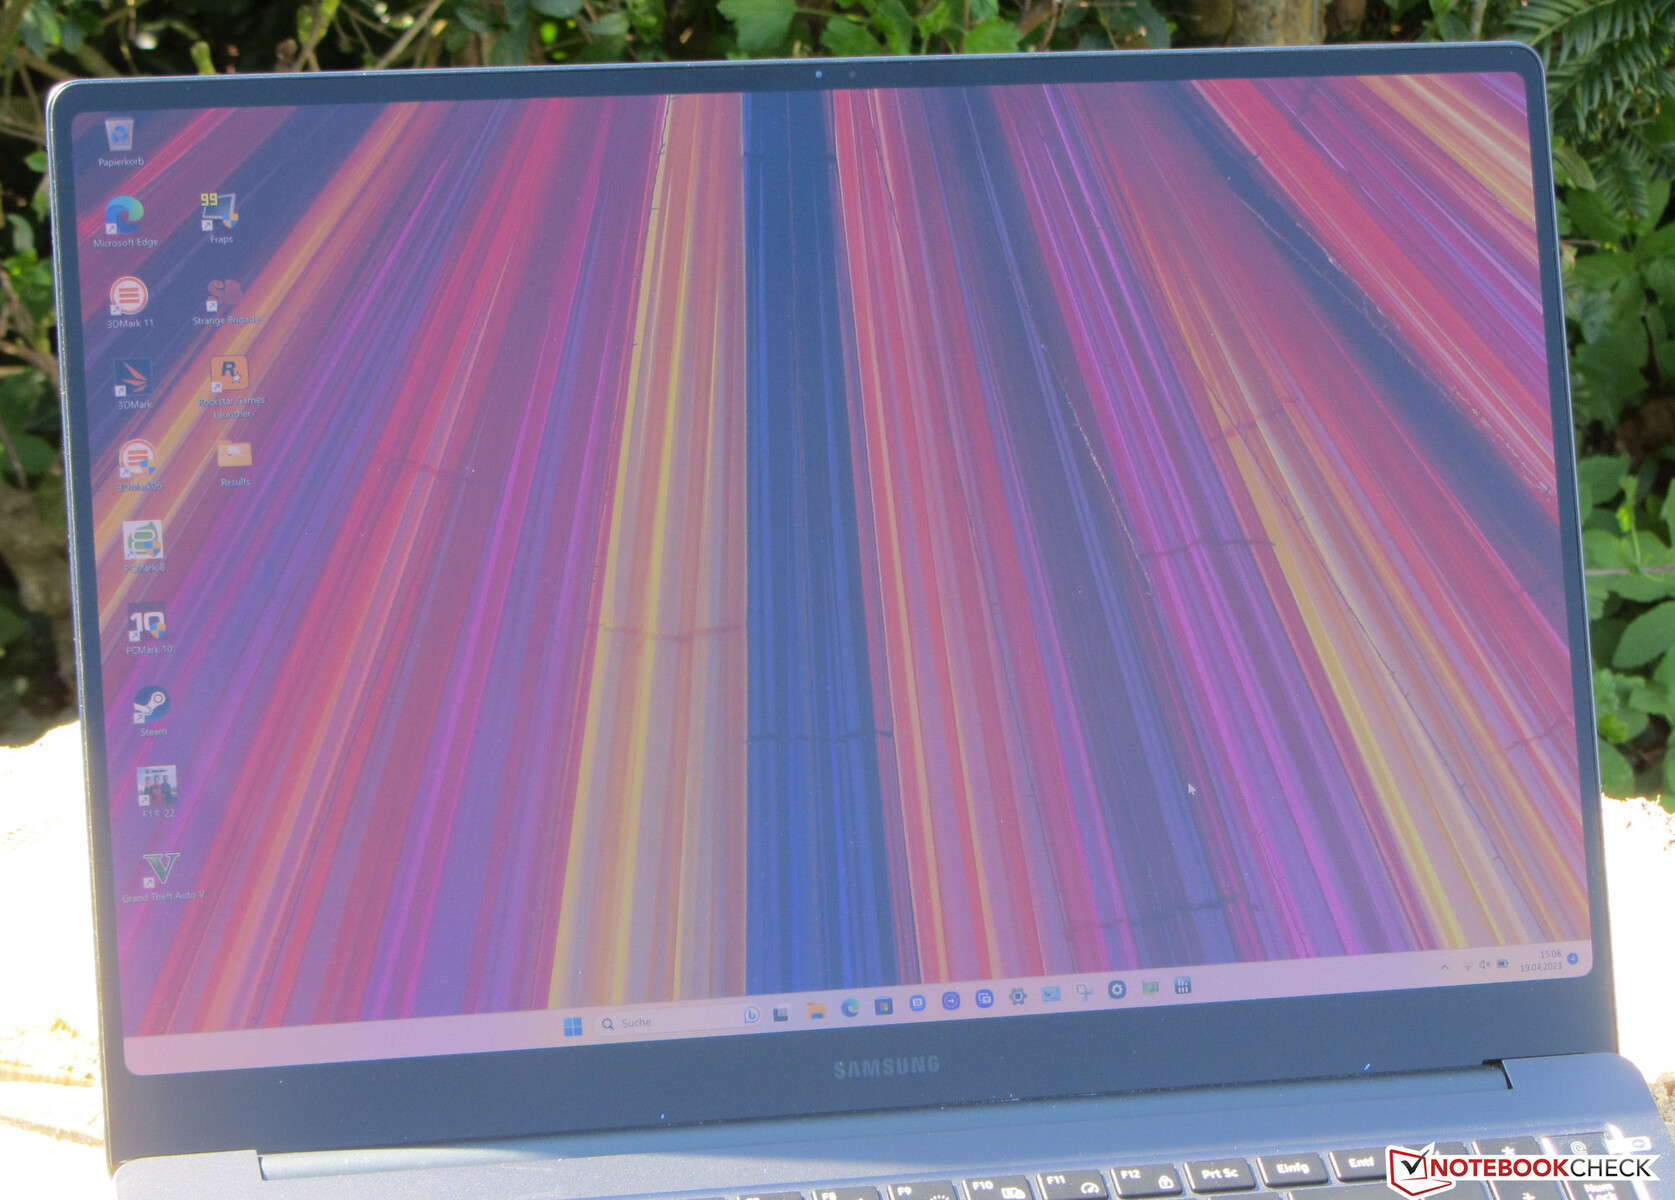
Display - AMOLED im 16:10-Format
Der große 16-Zoll-Bildschirm (2.880 x 1.800 Bildpunkte) im arbeitsfreundlichen 16:10-Format bietet OLED-typisch einen hervorragenden Schwarzwert und kurze Reaktionszeiten. Die Leuchtkraft des Displays übersteigt das Soll. Ein deutlich helleres Display kann das ThinkBook 16p G3 ARH vorweisen.
Die Schwächen des OLED-Panels: Es verfügt über eine spiegelnde Oberfläche und flackert bei Helligkeitsstufen ≤ 100 Prozent mit einer Frequenz von 240 Hz. Das technisch bedingte Flackern hängt mit der Helligkeitsregulierung des Panels zusammen.
| |||||||||||||||||||||||||
Ausleuchtung: 93 %
Helligkeit Akku: 400 cd/m²
Kontrast: 13333:1 (Schwarzwert: 0.03 cd/m²)
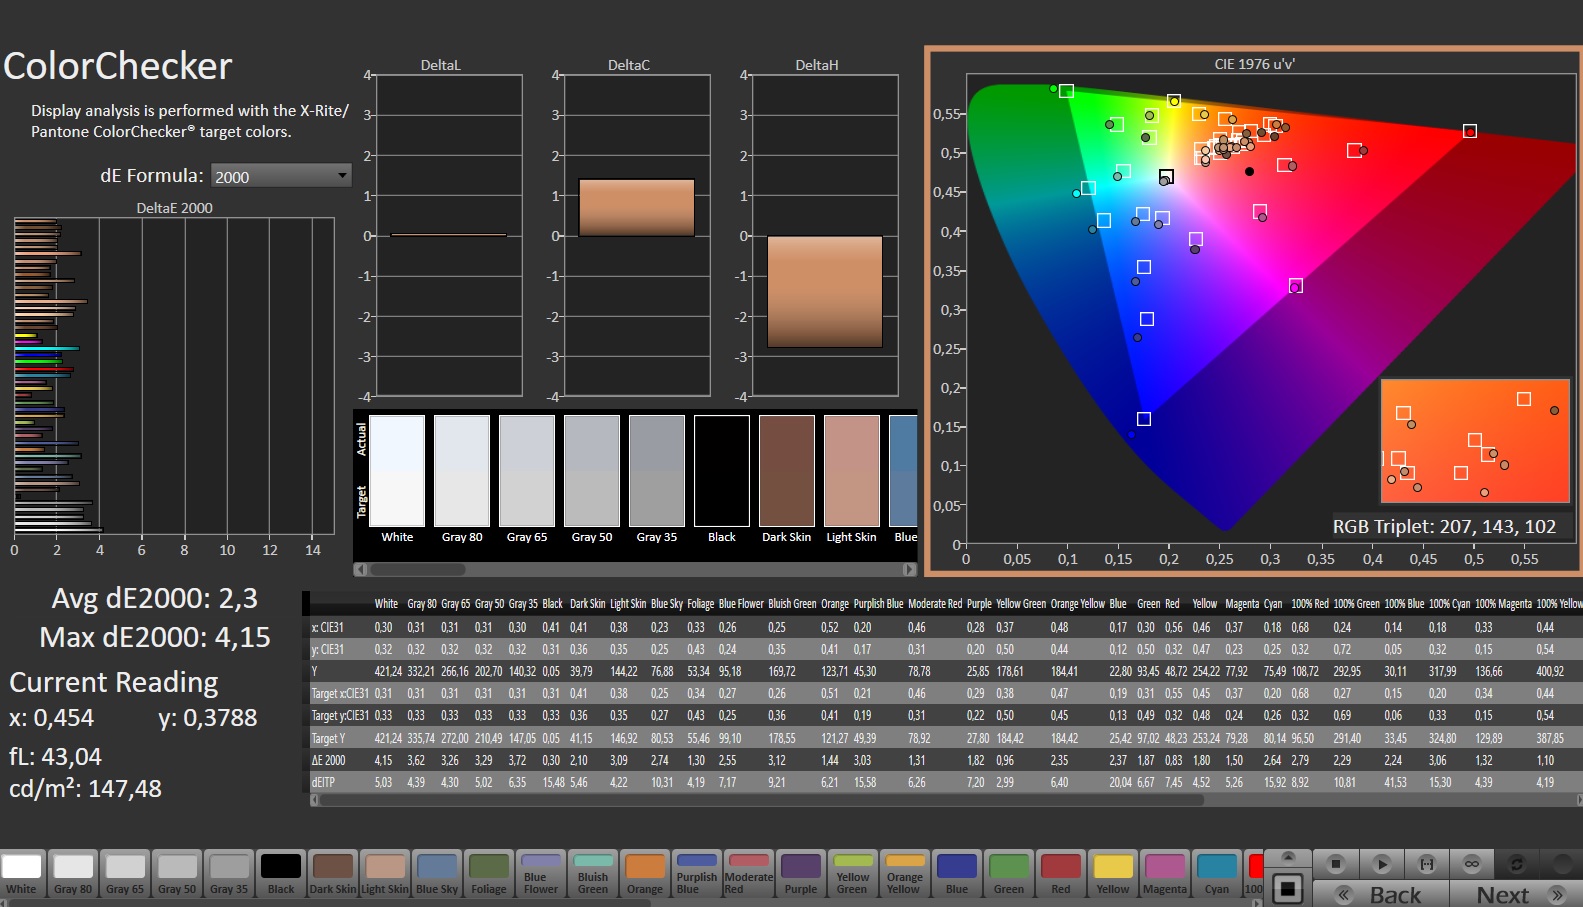
ΔE ColorChecker Calman: 2.3 | ∀{0.5-29.43 Ø4.72}
calibrated: 1.66
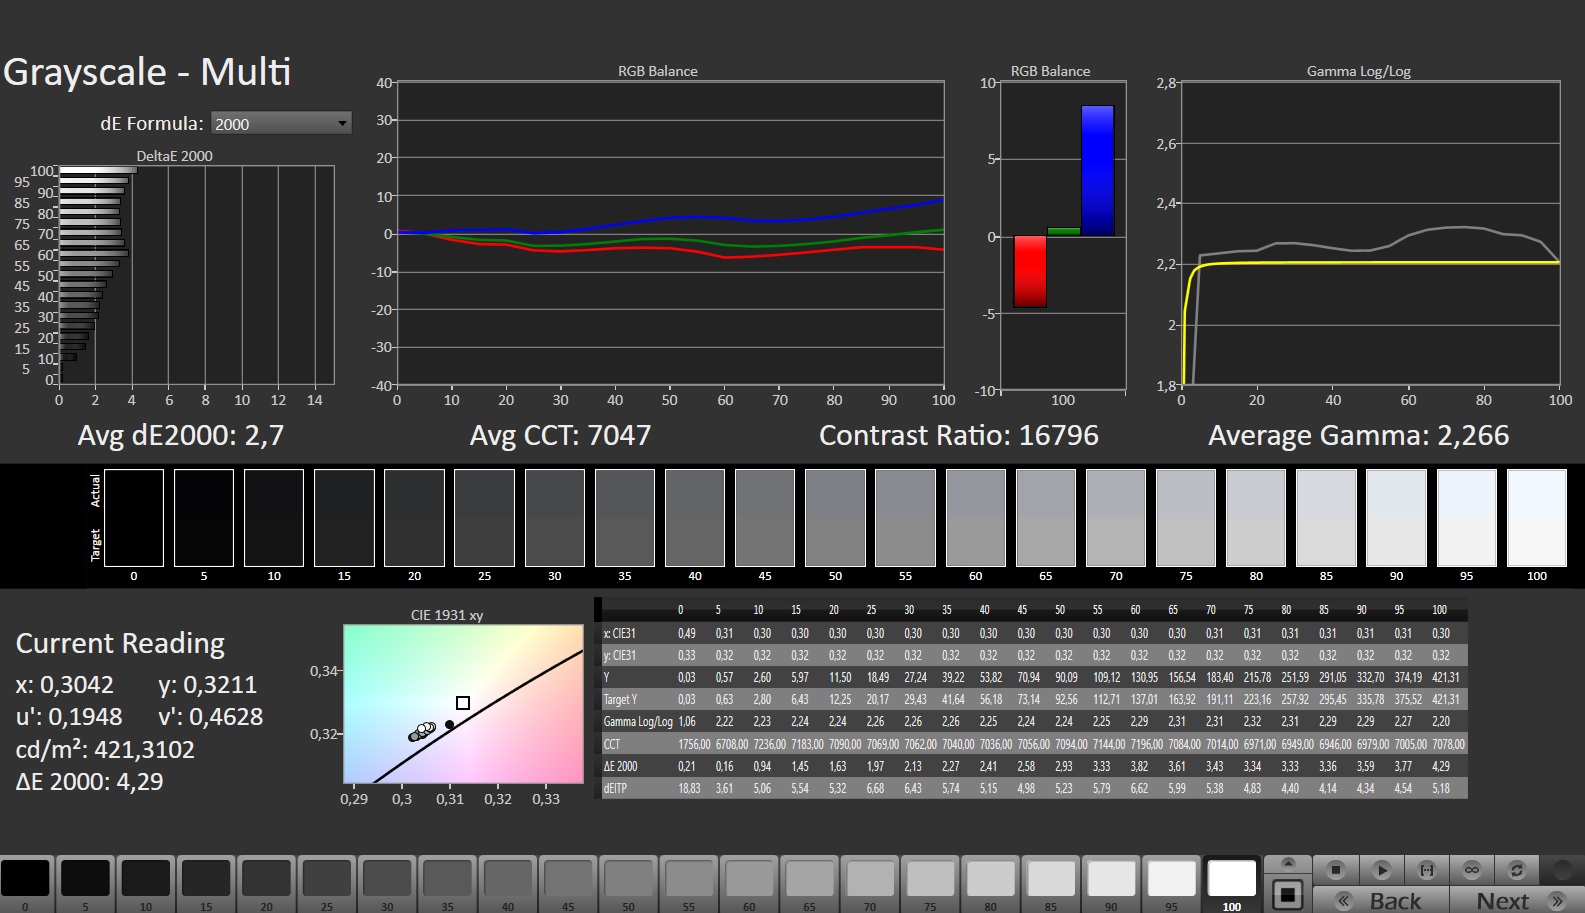
ΔE Greyscale Calman: 2.7 | ∀{0.09-98 Ø4.97}
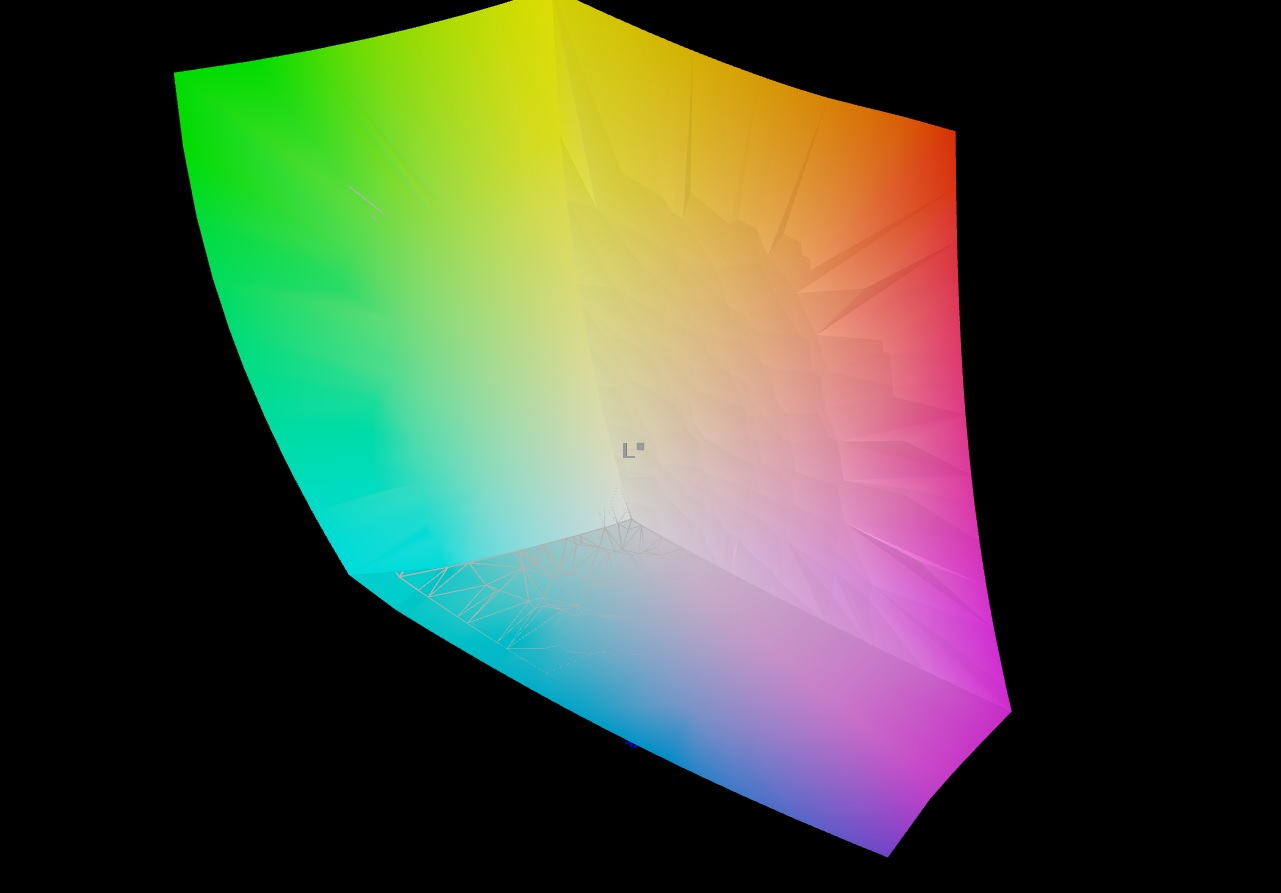
96.3% AdobeRGB 1998 (Argyll 3D)
100% sRGB (Argyll 3D)
99.9% Display P3 (Argyll 3D)
Gamma: 2.266
CCT: 7047 K
| Samsung Galaxy Book3 Ultra 16 Samsung ATNA60CL03-0, AMOLED, 2880x1800, 16" | Schenker Vision 16 Pro RTX 3070 Ti N160QDM-NZ1, IPS, 2560x1600, 16" | LG Gram 17Z90Q-E.AD78G LG Display LP170WQ1-SPF2, IPS, 2560x1600, 17" | Lenovo ThinkBook 16p G3 ARH BOE CQ NE160QDM-NY1, IPS, 2560x1600, 16" | Dell XPS 15 9520 RTX 3050 Ti Samsung 156XG01, OLED, 3456x2160, 15.6" | Asus VivoBook Pro 16X OLED N7600PC-L2026X Samsung ATNA60YV02-0, OLED, 3840x2400, 16" | Acer Swift X SFX16-52G-77RX B160QAN02.M, IPS-LED, 2560x1600, 16" | |
|---|---|---|---|---|---|---|---|
| Display | -20% | -8% | -19% | -4% | 1% | -15% | |
| Display P3 Coverage (%) | 99.9 | 68.7 -31% | 92.2 -8% | 69.8 -30% | 97.8 -2% | 99.9 0% | 76.4 -24% |
| sRGB Coverage (%) | 100 | 96.7 -3% | 98.66 -1% | 98.2 -2% | 99.9 0% | 100 0% | 100 0% |
| AdobeRGB 1998 Coverage (%) | 96.3 | 70 -27% | 82.98 -14% | 71.4 -26% | 86 -11% | 98.05 2% | 76.6 -20% |
| Response Times | -2021% | -3068% | -2354% | -240% | -156% | -4422% | |
| Response Time Grey 50% / Grey 80% * (ms) | 0.49 ? | 14.3 ? -2818% | 22 ? -4390% | 15.6 ? -3084% | 1.9 ? -288% | 1 -104% | 33 ? -6635% |
| Response Time Black / White * (ms) | 0.65 ? | 8.6 ? -1223% | 12 ? -1746% | 11.2 ? -1623% | 1.9 ? -192% | 2 ? -208% | 15 ? -2208% |
| PWM Frequency (Hz) | 240 ? | 59.52 ? | 247 ? | ||||
| Bildschirm | -140% | -125% | -186% | -32% | 8% | -108% | |
| Helligkeit Bildmitte (cd/m²) | 400 | 364 -9% | 391 -2% | 532.8 33% | 381.4 -5% | 383 -4% | 411 3% |
| Brightness (cd/m²) | 399 | 347 -13% | 358 -10% | 519 30% | 384 -4% | 390 -2% | 378 -5% |
| Brightness Distribution (%) | 93 | 89 -4% | 84 -10% | 94 1% | 95 2% | 96 3% | 83 -11% |
| Schwarzwert * (cd/m²) | 0.03 | 0.3 -900% | 0.29 -867% | 0.55 -1733% | 0.027 10% | 0.29 -867% | |
| Kontrast (:1) | 13333 | 1213 -91% | 1348 -90% | 969 -93% | 14185 6% | 1417 -89% | |
| Delta E Colorchecker * | 2.3 | 3.3 -43% | 3.52 -53% | 1.32 43% | 4.34 -89% | 2.29 -0% | 2.18 5% |
| Colorchecker dE 2000 max. * | 4.15 | 6.6 -59% | 6.06 -46% | 3.97 4% | 9.24 -123% | 3.47 16% | 4.84 -17% |
| Colorchecker dE 2000 calibrated * | 1.66 | 2.5 -51% | 1.43 14% | 1.59 4% | 1.48 11% | ||
| Delta E Graustufen * | 2.7 | 5.2 -93% | 4.27 -58% | 1.8 33% | 2 26% | 1.84 32% | 2.68 1% |
| Gamma | 2.266 97% | 2.14 103% | 2.3 96% | 2.64 83% | 2.13 103% | 2.32 95% | 2.43 91% |
| CCT | 7047 92% | 6331 103% | 7203 90% | 6761 96% | 6210 105% | 6308 103% | 6717 97% |
| Durchschnitt gesamt (Programm / Settings) | -727% /
-383% | -1067% /
-520% | -853% /
-460% | -92% /
-62% | -49% /
-19% | -1515% /
-704% |
* ... kleinere Werte sind besser
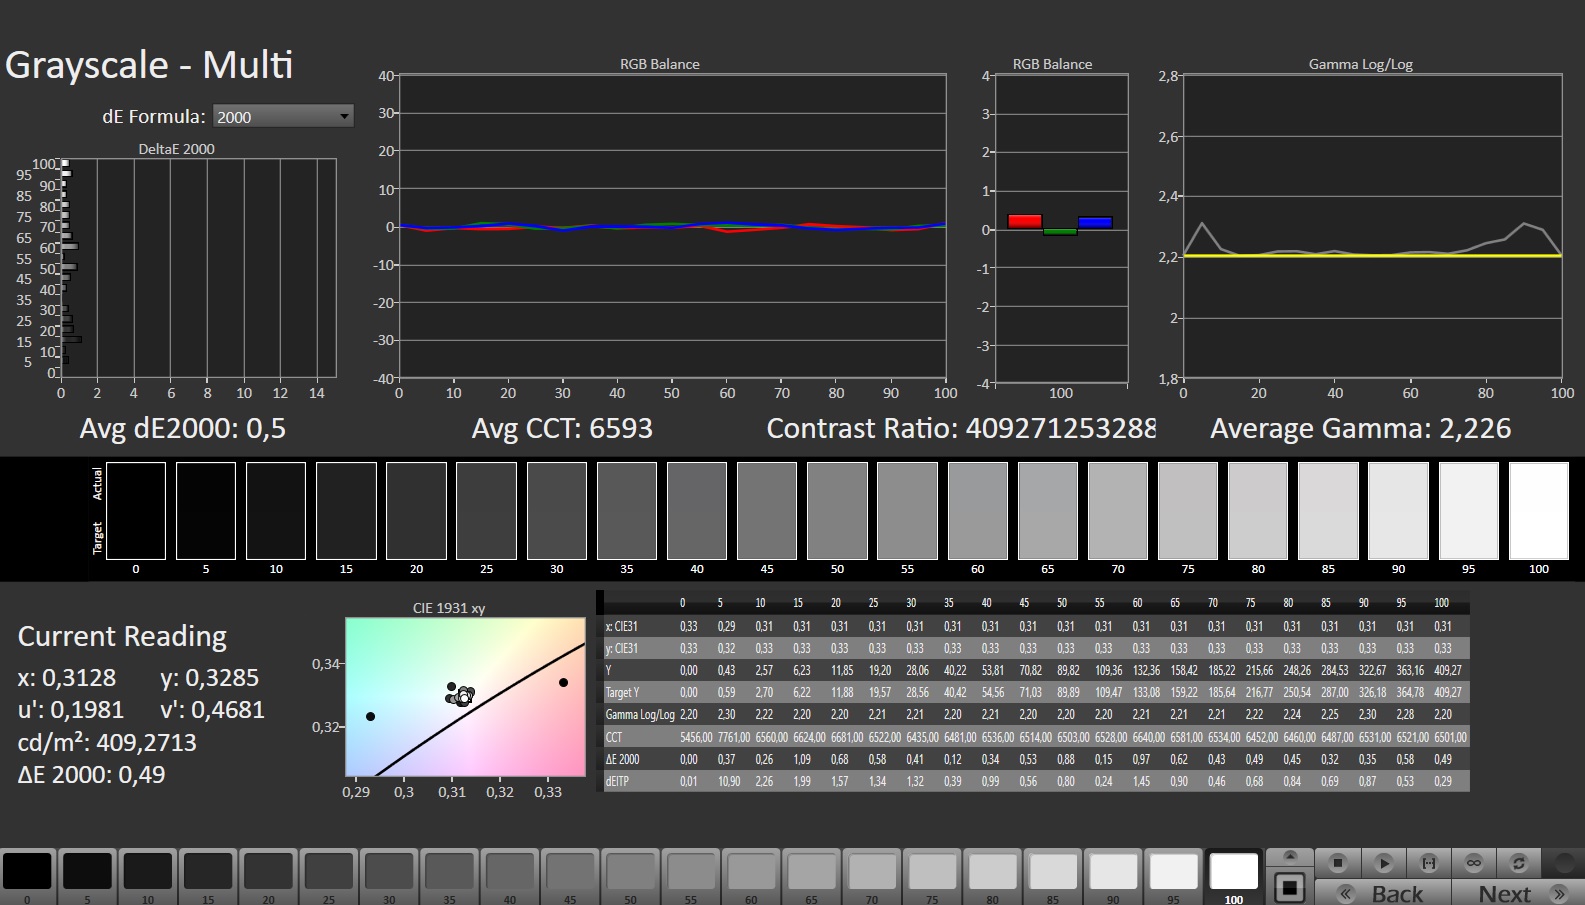
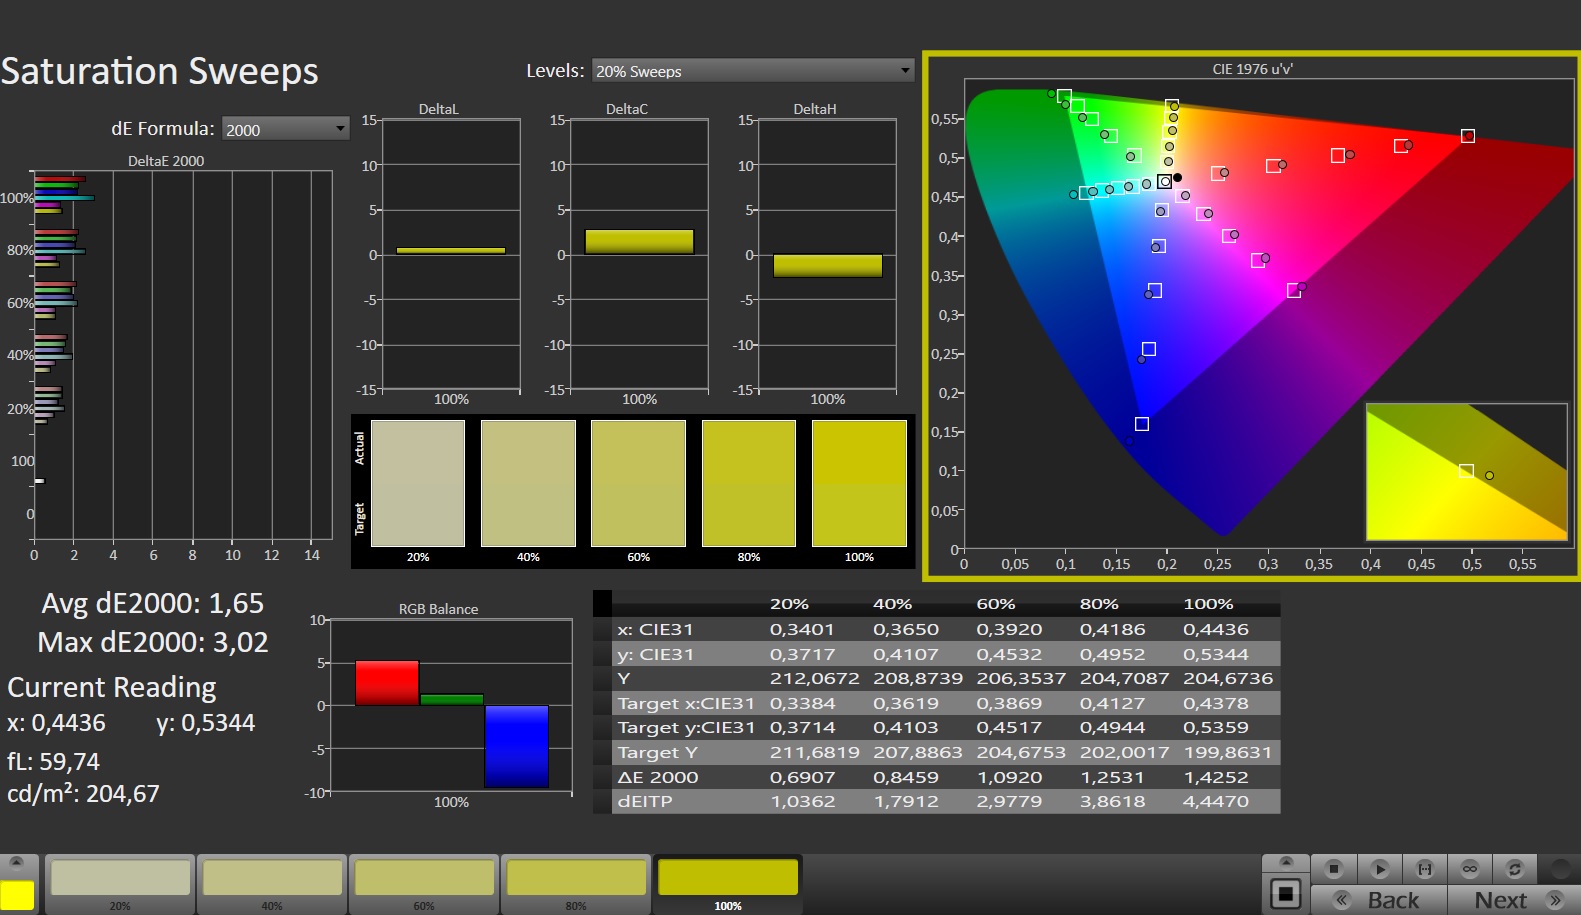
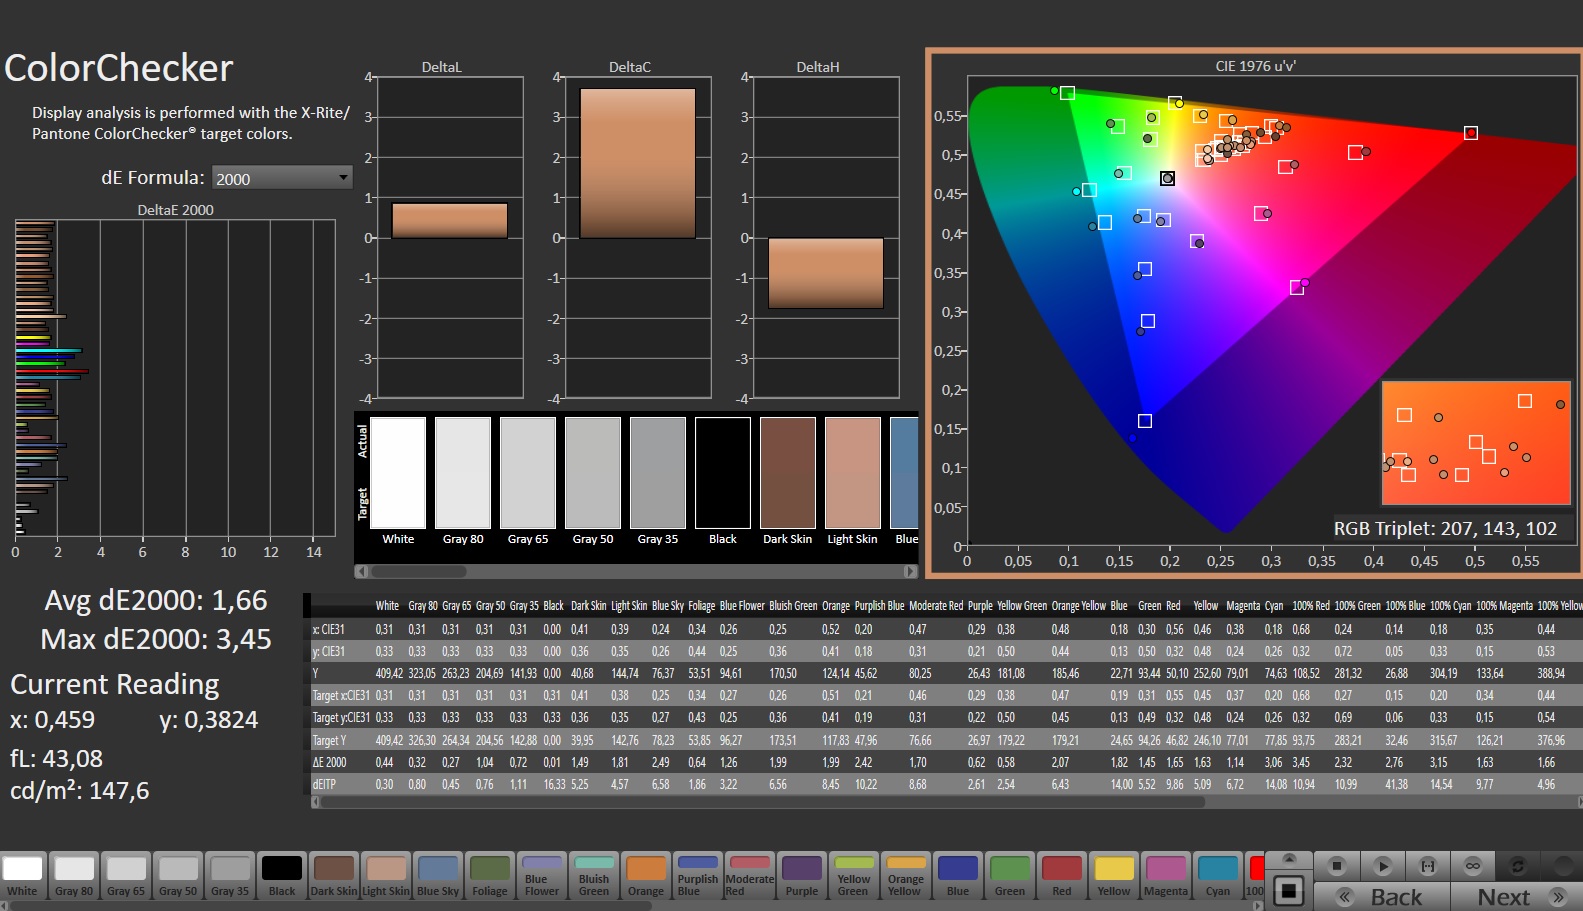
Bereits im Auslieferungszustand kann dem Bildschirm eine gute Farbdarstellung attestiert werden: Mit einer Abweichung von 2,3 wird das Soll (DeltaE < 3) erfüllt. Eine Kalibrierung verringert den Wert auf 1,66 und sorgt für ausgewogenere Graustufen.
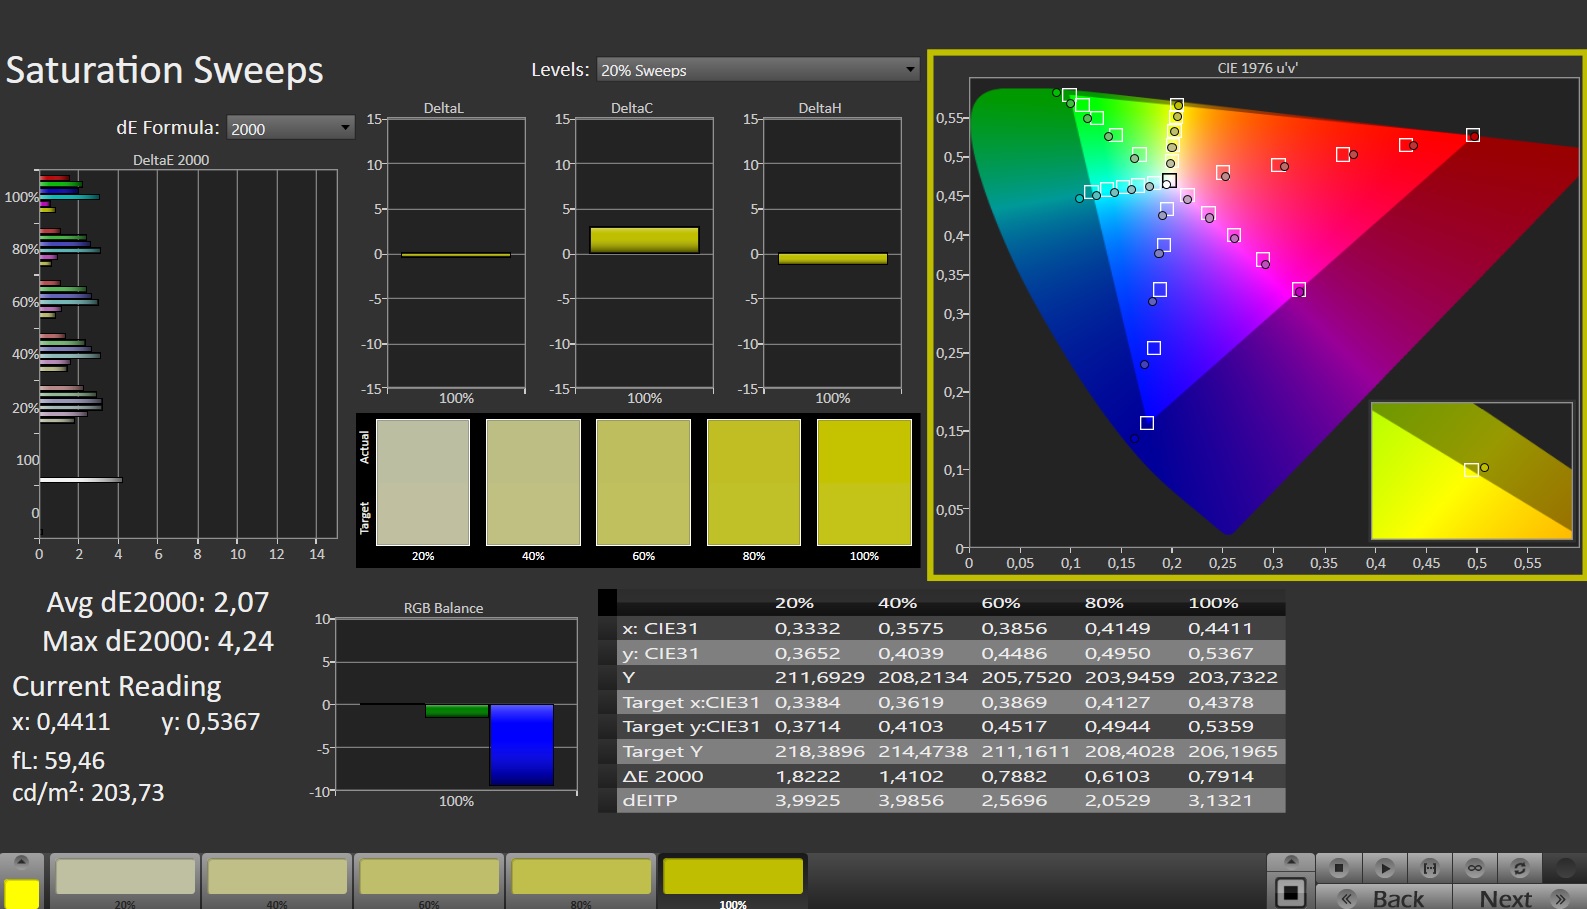
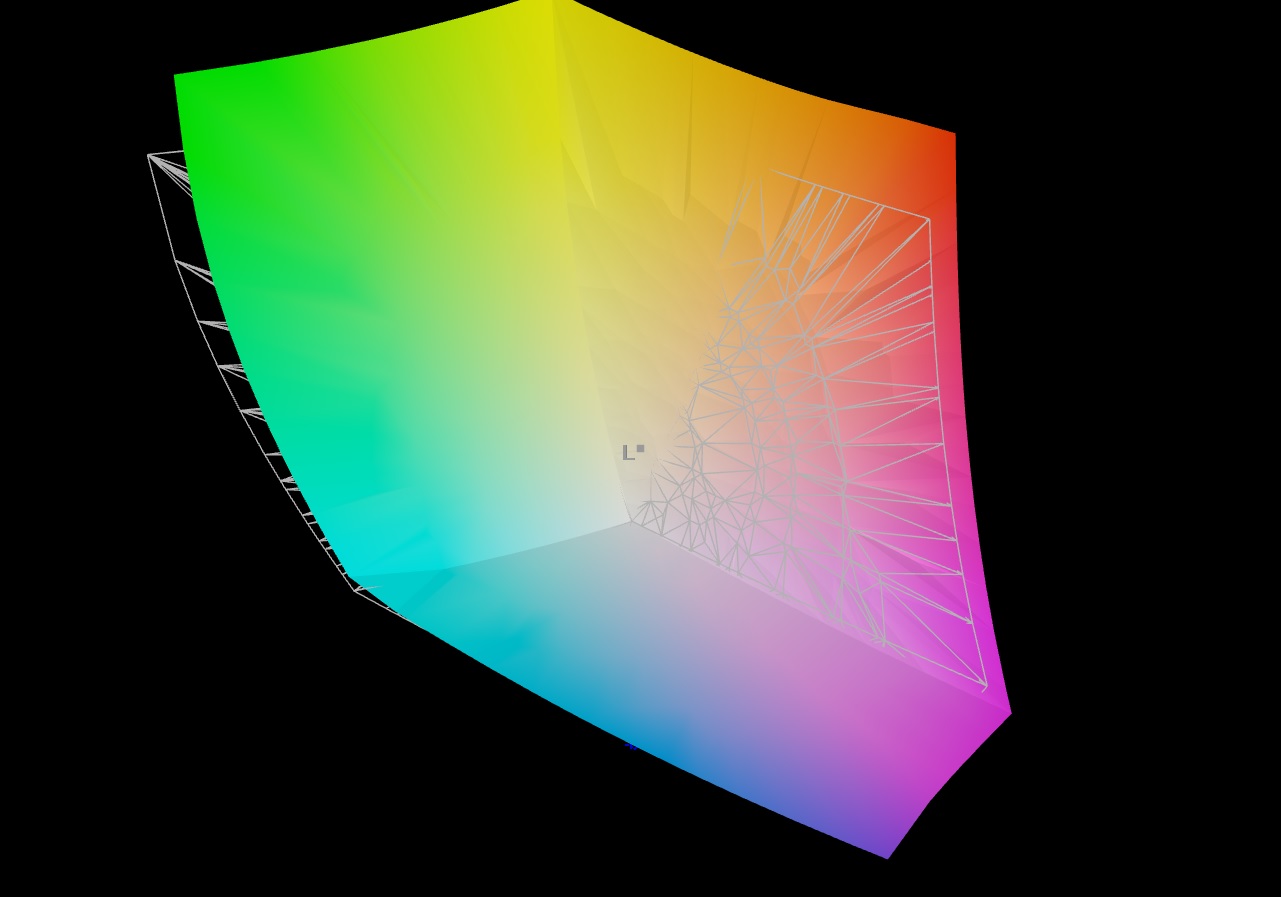
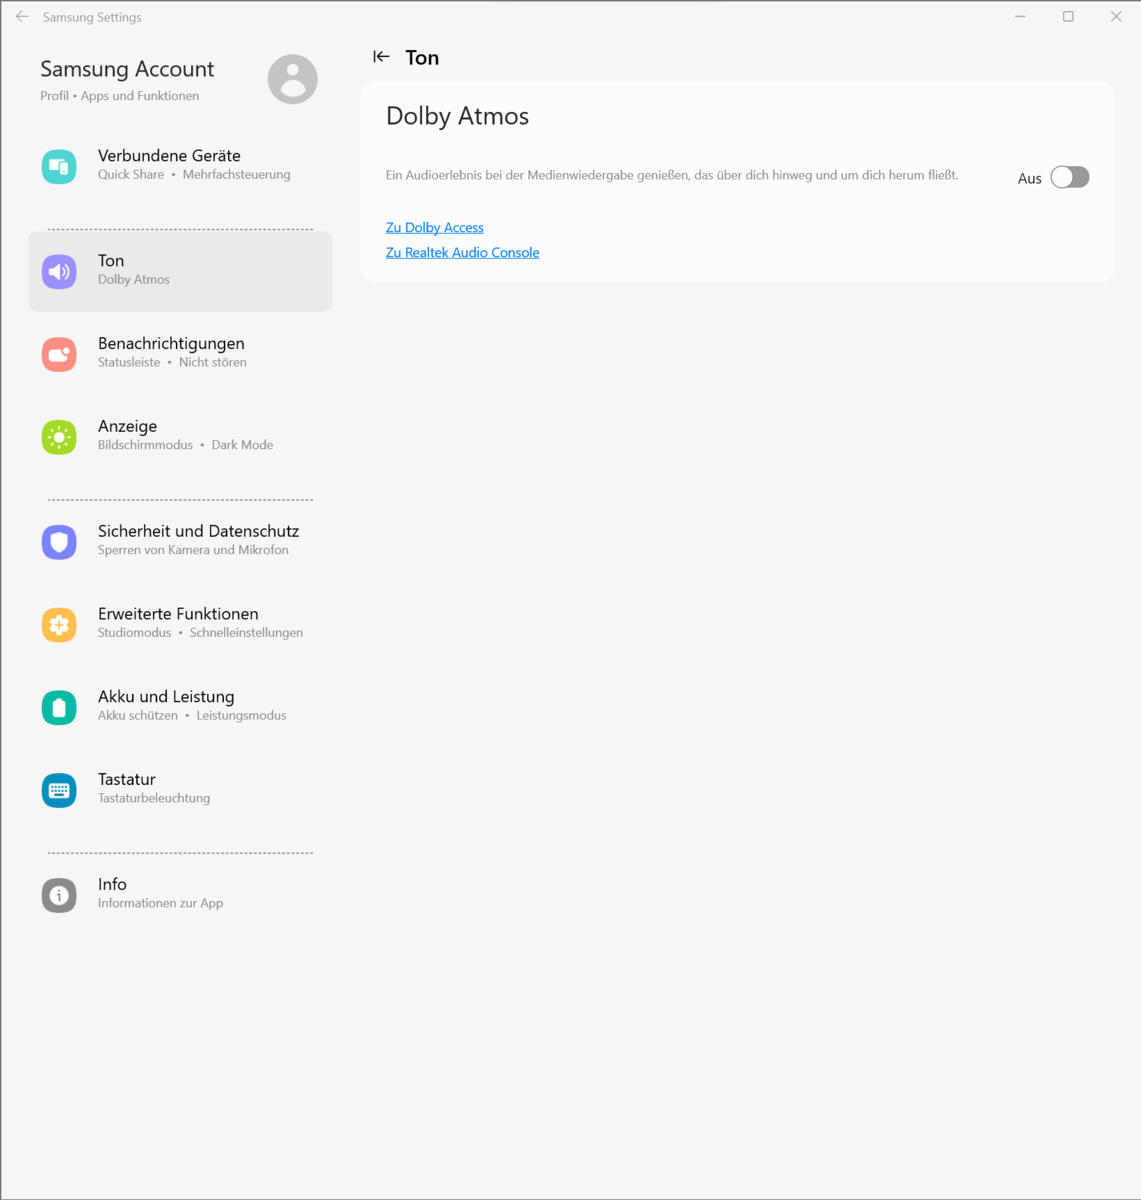
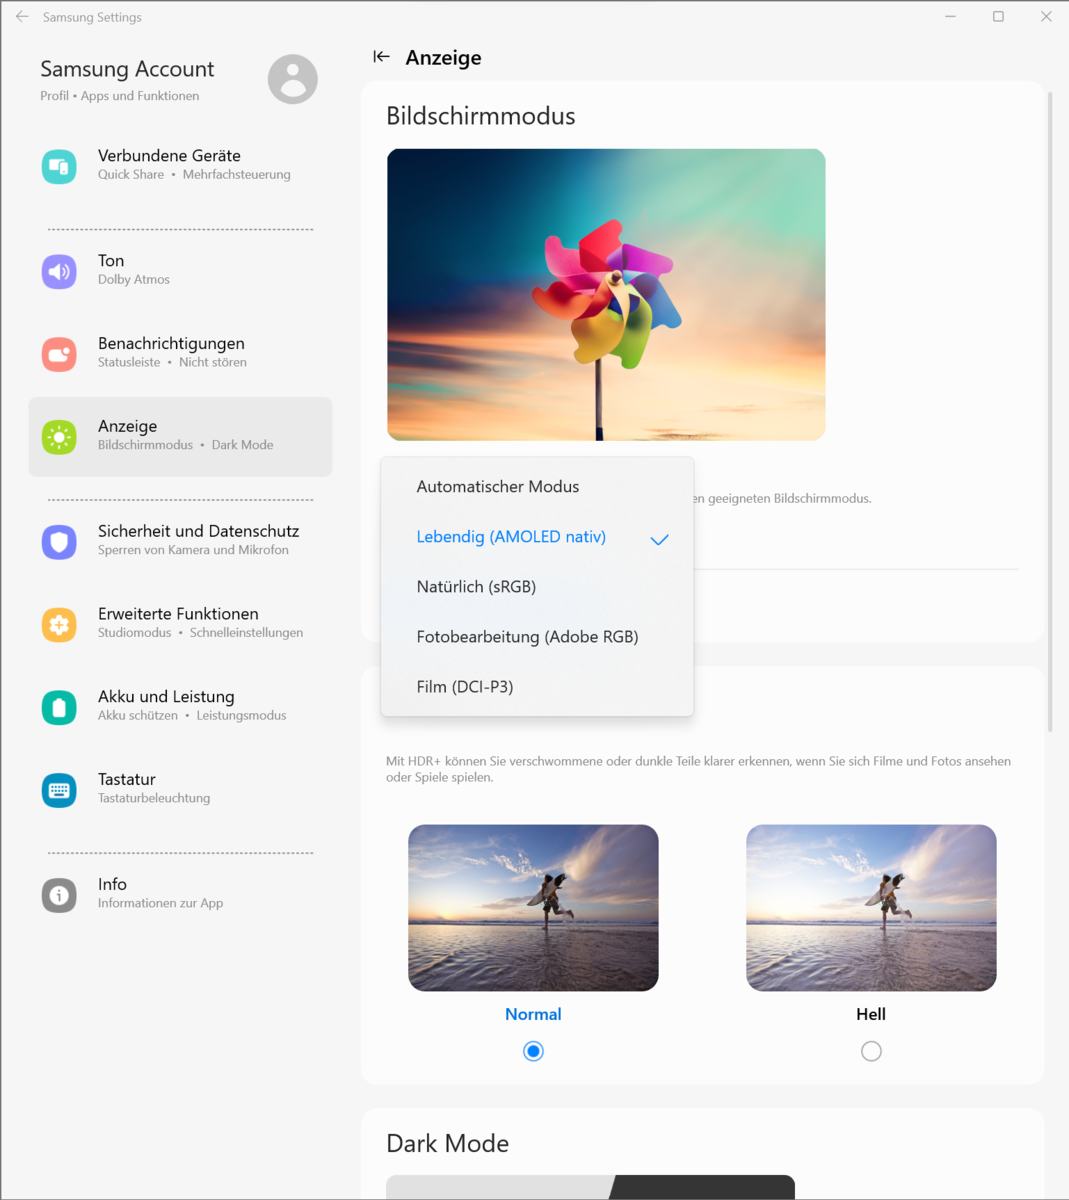
Farbtreue ist gegeben: Der sRGB- und der DCI-P3-Farbraum werden komplett, der Adobe-RGB-Raum nahezu komplett abgebildet. Die Darstellung kann über die vorinstallierte Samsung-Settings-Software jeweils in Richtung einer der drei Räume angepasst werden. Wir nutzen hier die Standardeinstellung "Lebendig (AMOLED nativ)".

Reaktionszeiten (Response Times) des Displays
| ↔ Reaktionszeiten Schwarz zu Weiß | ||
|---|---|---|
| 0.65 ms ... steigend ↗ und fallend ↘ kombiniert | ↗ 0.37 ms steigend | 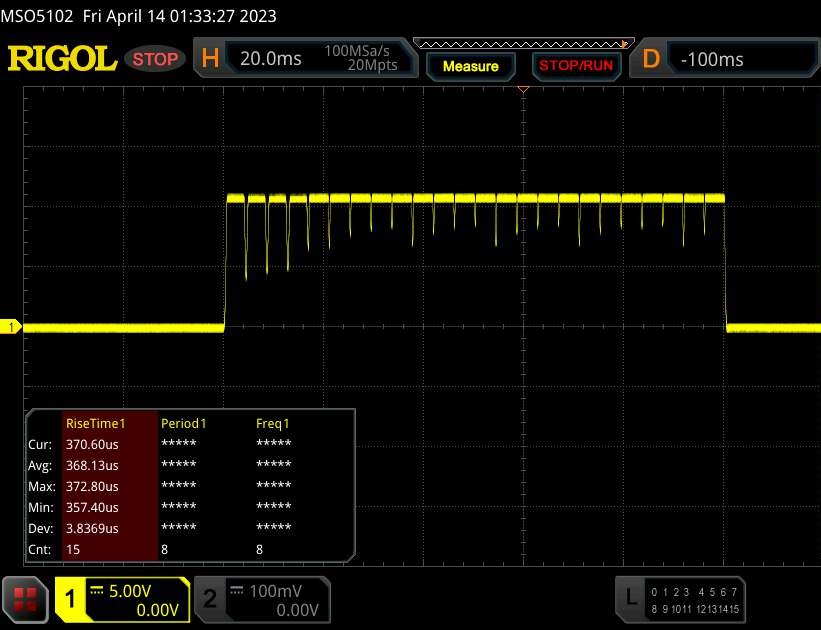 |
| ↘ 0.28 ms fallend | ||
| Die gemessenen Reaktionszeiten sind sehr kurz, wodurch sich der Bildschirm auch für schnelle 3D Spiele eignen sollte. Im Vergleich rangierten die bei uns getesteten Geräte von 0.1 (Minimum) zu 240 (Maximum) ms. » 2 % aller Screens waren schneller als der getestete. Daher sind die gemessenen Reaktionszeiten besser als der Durchschnitt aller vermessenen Geräte (19.8 ms). | ||
| ↔ Reaktionszeiten 50% Grau zu 80% Grau | ||
| 0.49 ms ... steigend ↗ und fallend ↘ kombiniert | ↗ 0.26 ms steigend | 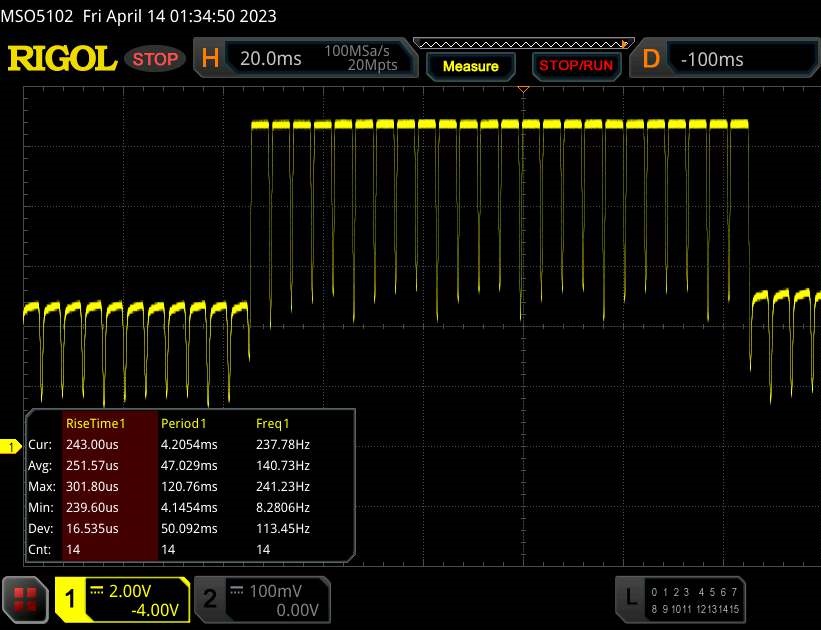 |
| ↘ 0.23 ms fallend | ||
| Die gemessenen Reaktionszeiten sind sehr kurz, wodurch sich der Bildschirm auch für schnelle 3D Spiele eignen sollte. Im Vergleich rangierten die bei uns getesteten Geräte von 0.165 (Minimum) zu 636 (Maximum) ms. » 1 % aller Screens waren schneller als der getestete. Daher sind die gemessenen Reaktionszeiten besser als der Durchschnitt aller vermessenen Geräte (31 ms). | ||
Bildschirm-Flackern / PWM (Pulse-Width Modulation)
| Flackern / PWM festgestellt | 240 Hz | ≤ 100 % Helligkeit | 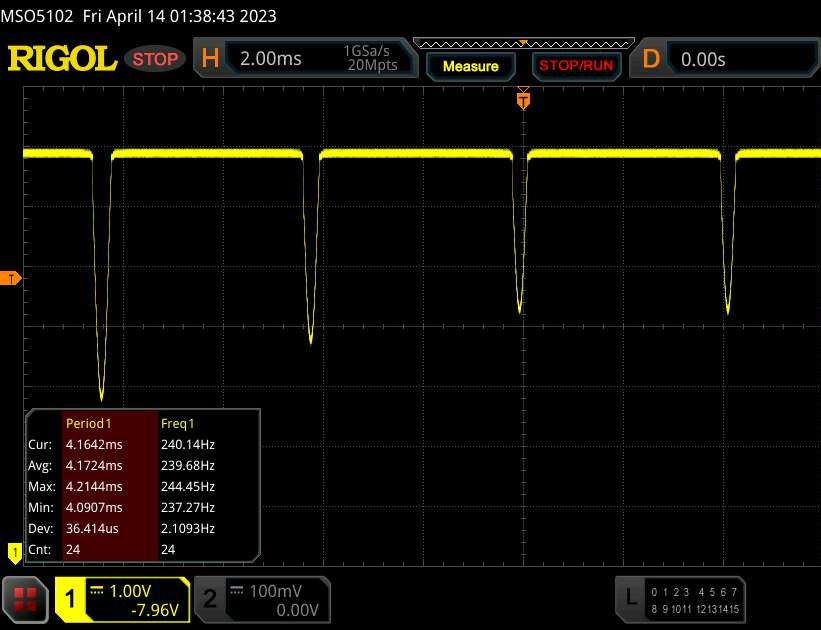 |
Das Display flackert mit 240 Hz (im schlimmsten Fall, eventuell durch Pulsweitenmodulation PWM) bei einer eingestellten Helligkeit von 100 % und darunter. Darüber sollte es zu keinem Flackern kommen. Die Frequenz von 240 Hz ist relativ gering und daher sollte es bei sensiblen Personen zu Problemen wie Flackern oder Augenbeschwerden führen. Im Vergleich: 52 % aller getesteten Geräte nutzten kein PWM um die Helligkeit zu reduzieren. Wenn PWM eingesetzt wurde, dann bei einer Frequenz von durchschnittlich 7763 (Minimum 5, Maximum 343500) Hz. | |||
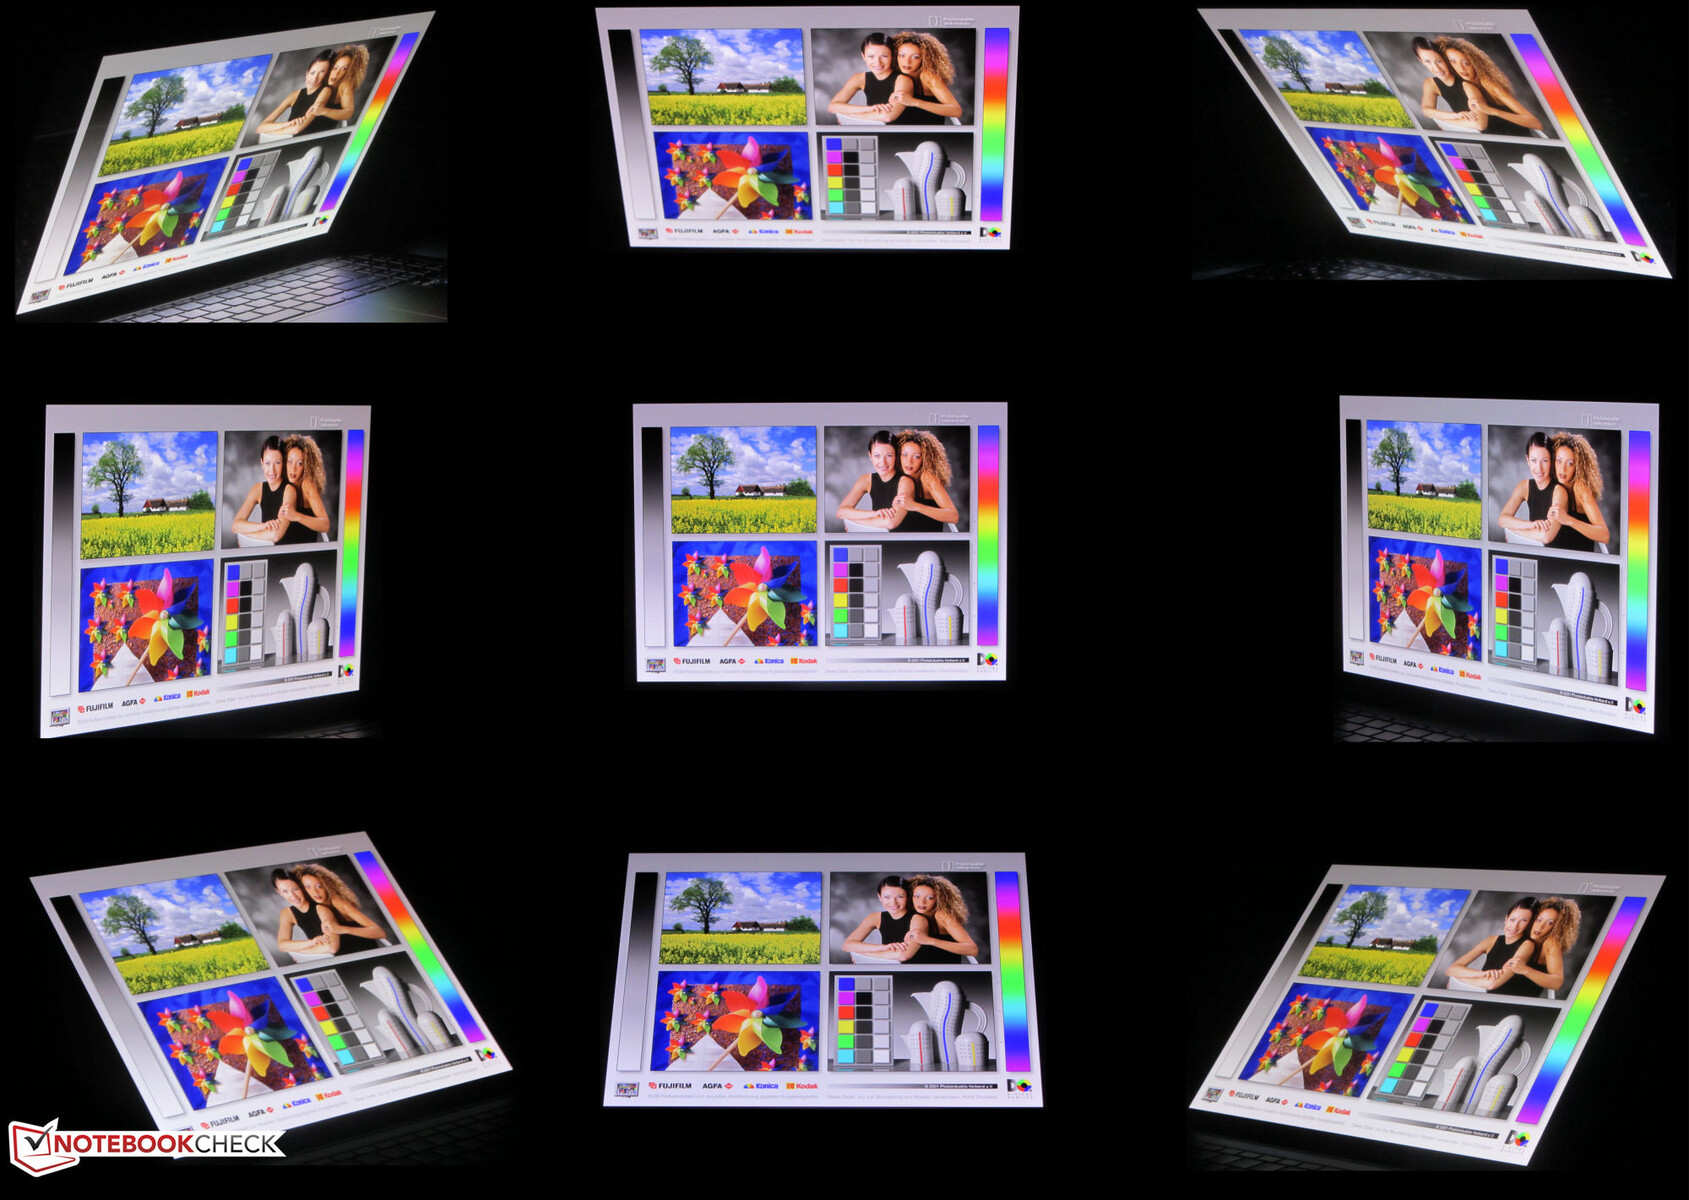
Das blickwinkelstabile Panel ist aus jeder Position heraus ablesbar. Im Freien gestaltet sich das Ablesen aufgrund der spiegelnden Displayoberfläche schwierig.
Leistung - Alder Lake und Ada Lovelace an Bord
Samsung bietet mit den Galaxy-Book3-Ultra-16-Modellen eine Serie von mobilen Notebooks für Gamer und Kreativ-Arbeiter. Eine GeForce-RTX-Studio-Zertifizierung soll eine hohe Rechenleistung, angepasste Treiber, eine gute Softwareunterstützung und eine passende Farbraumabdeckung des Displays gewährleisten.
Es kommen Low-Power-Versionen der RTX-4050- oder RTX-4070-GPU zum Einsatz, die Prozessoren stammen von Intel (Raptor Lake). Die vorliegende Variante setzt auf die RTX 4050 und stellt mit einem Preis von etwa 2.800 Euro das Einsteigermodell dar.
Testbedingungen
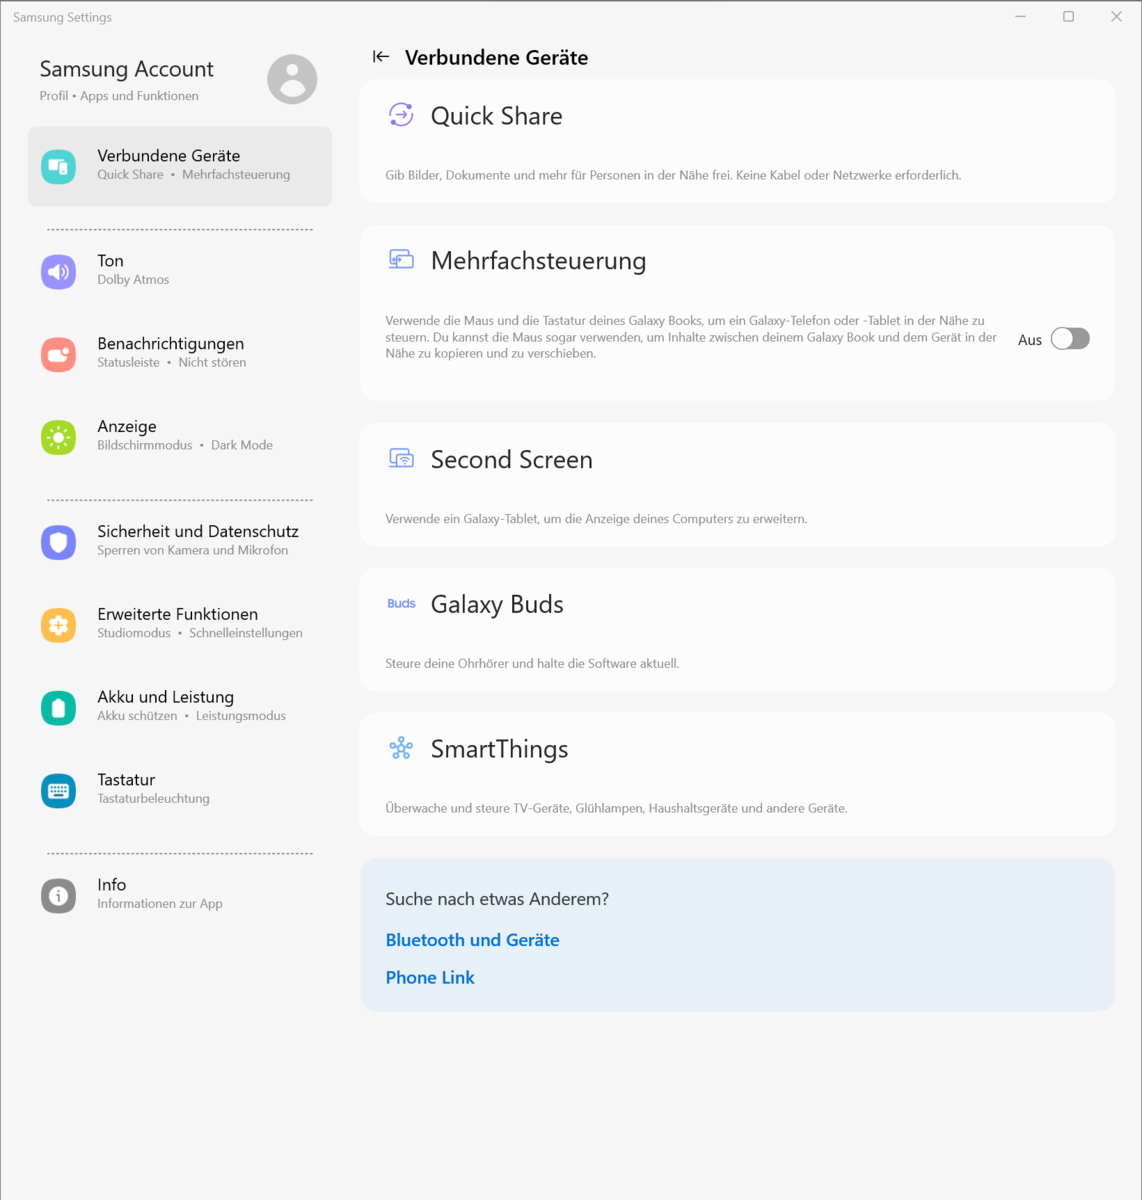
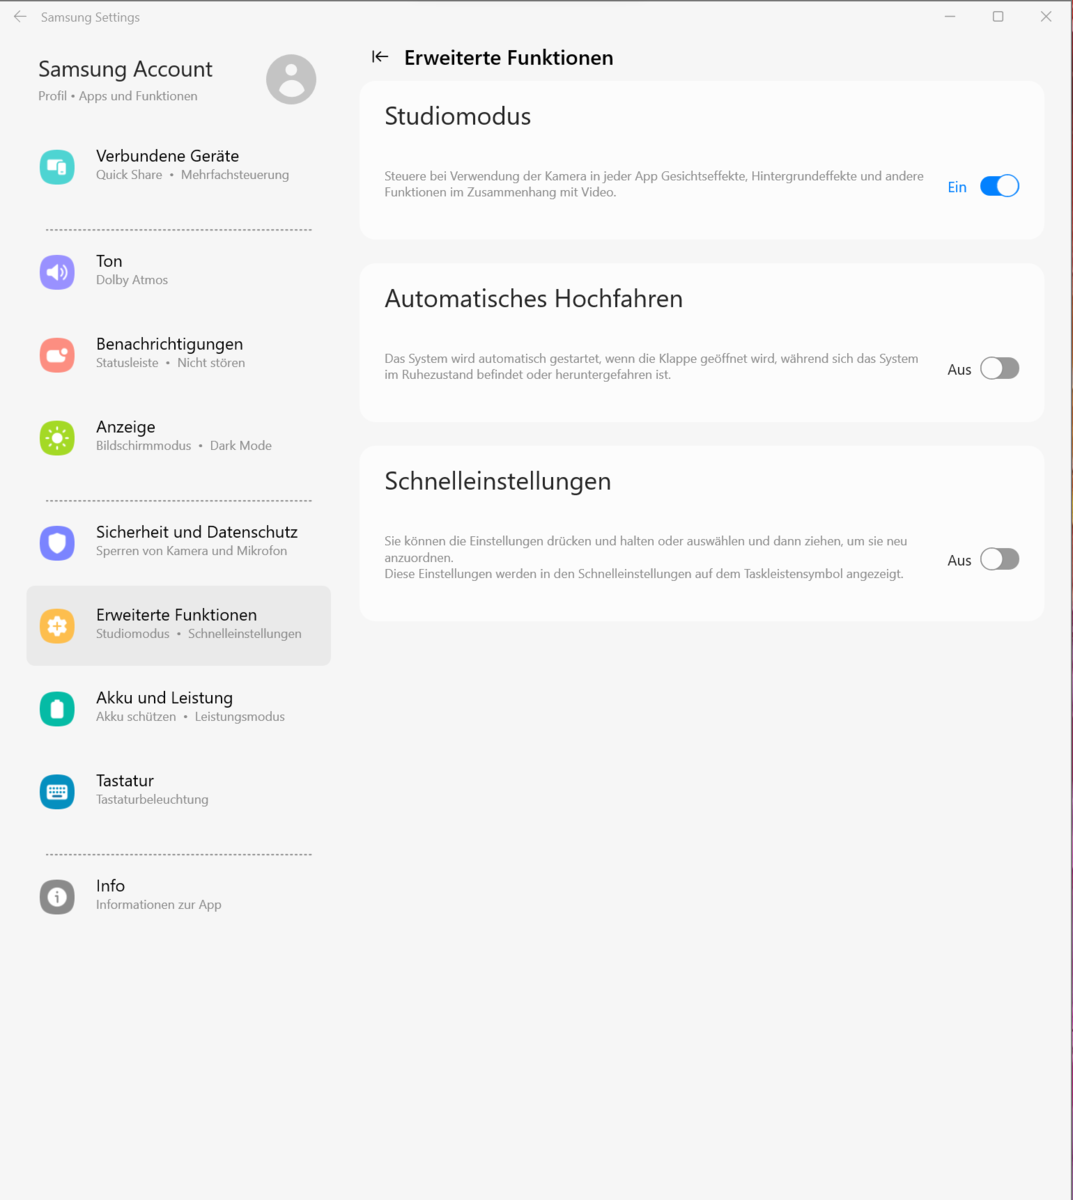
Das Notebook verfügt über drei herstellerspezifische Leistungsmodi (siehe Tabelle), zwischen denen über die Tastenkombination "Fn" + "F11" (oder via Samsung-Settings-Software, dem Kontrollcenter des Laptops) gewechselt werden kann. Es wurden die Modi "Optimiert" (Benchmarks) und "Leise" (Akkutests) verwendet.
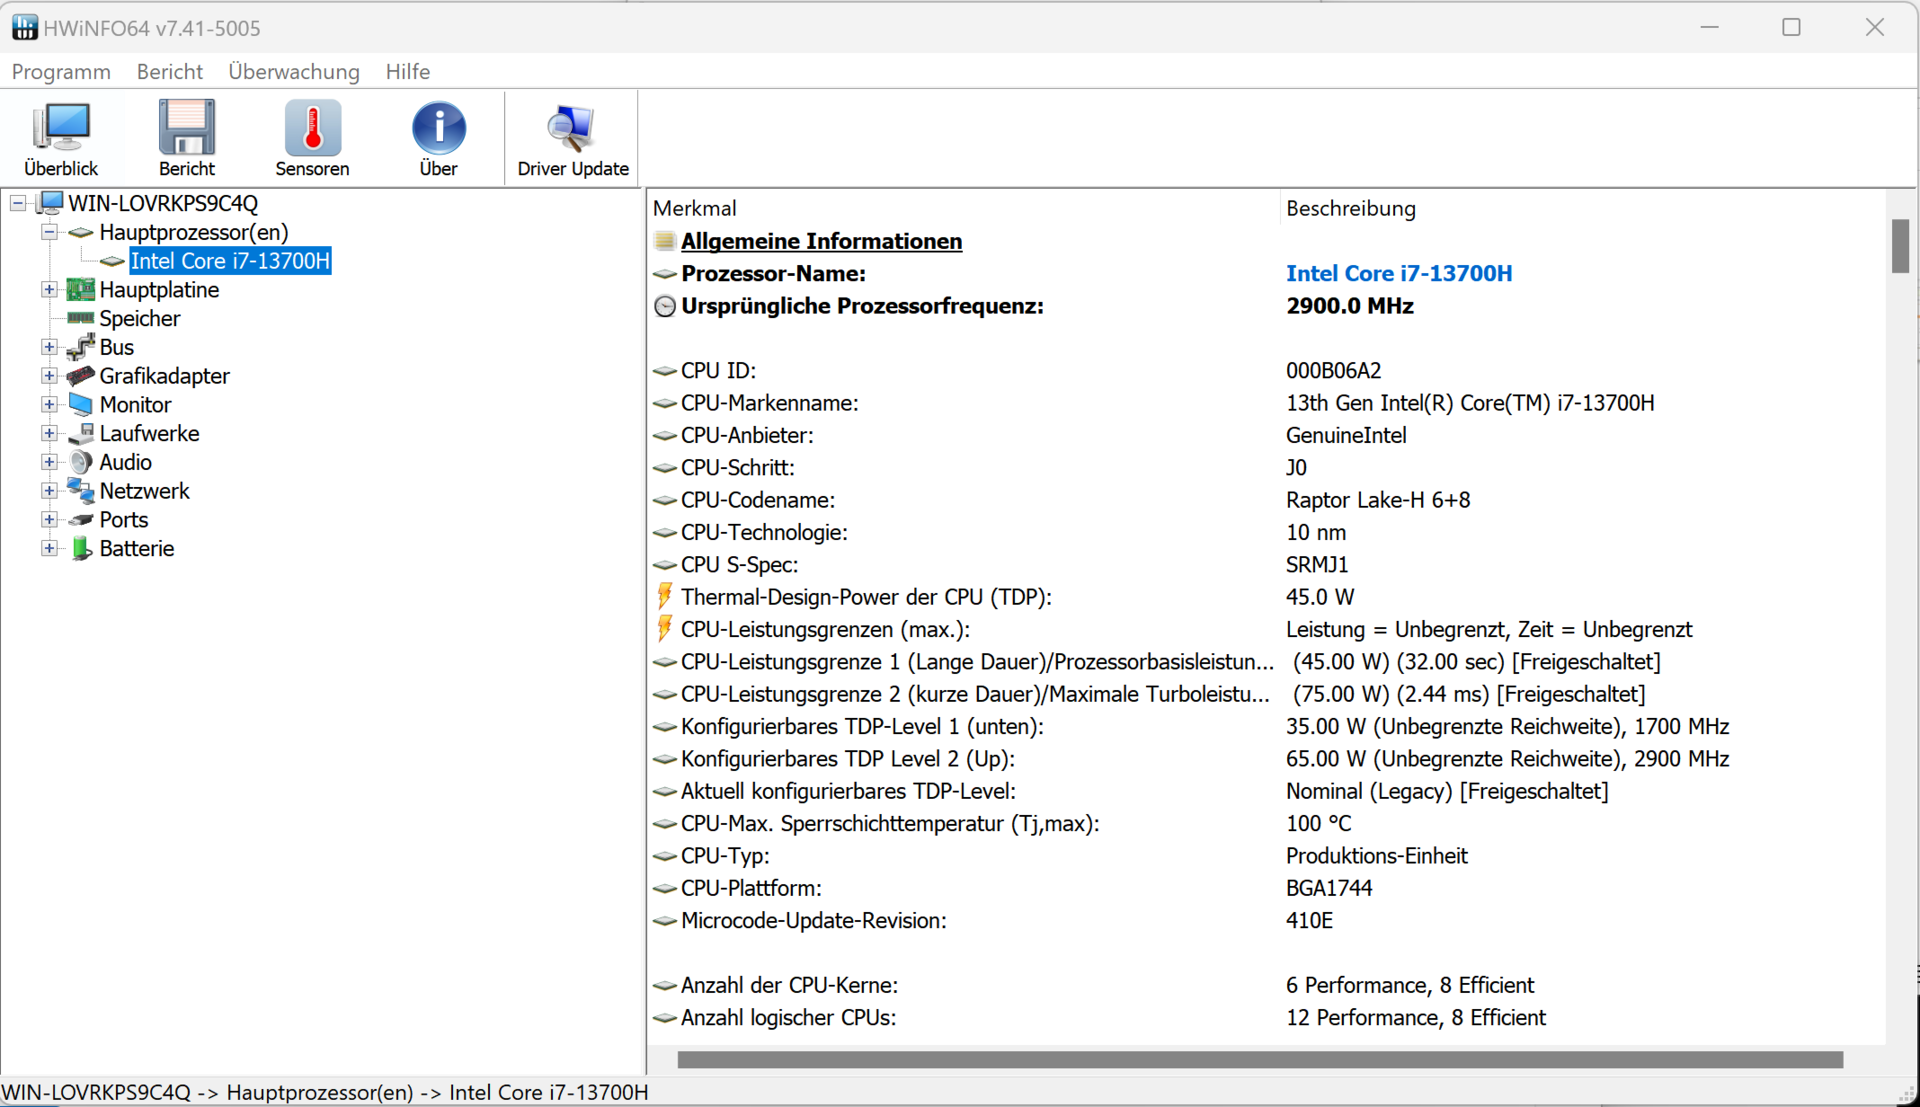
| Hohe Leistung | Optimiert | Leise | |
|---|---|---|---|
| Powerlimit 1 (HWInfo) | 70 Watt | 45 Watt | 30 Watt |
| Powerlimit 2 (HWInfo) | 75 Watt | 75 Watt | 75 Watt |
| TGP RTX 4050 | 60 Watt | ~ 40 - 45 Watt | 20 Watt |
| Noise (Witcher 3) | 48 dB(A) | 39 dB(A) | 34 dB(A) |
| Performance (Witcher 3) | ~ 73 fps | ~ 60 fps | ~ 20 fps |


Prozessor
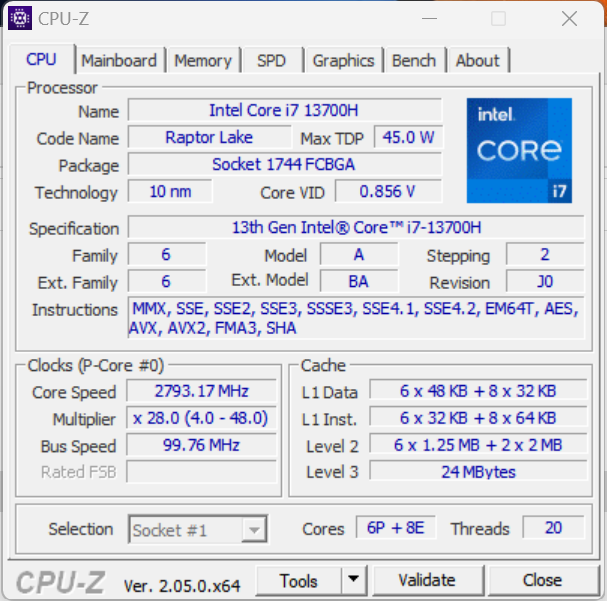
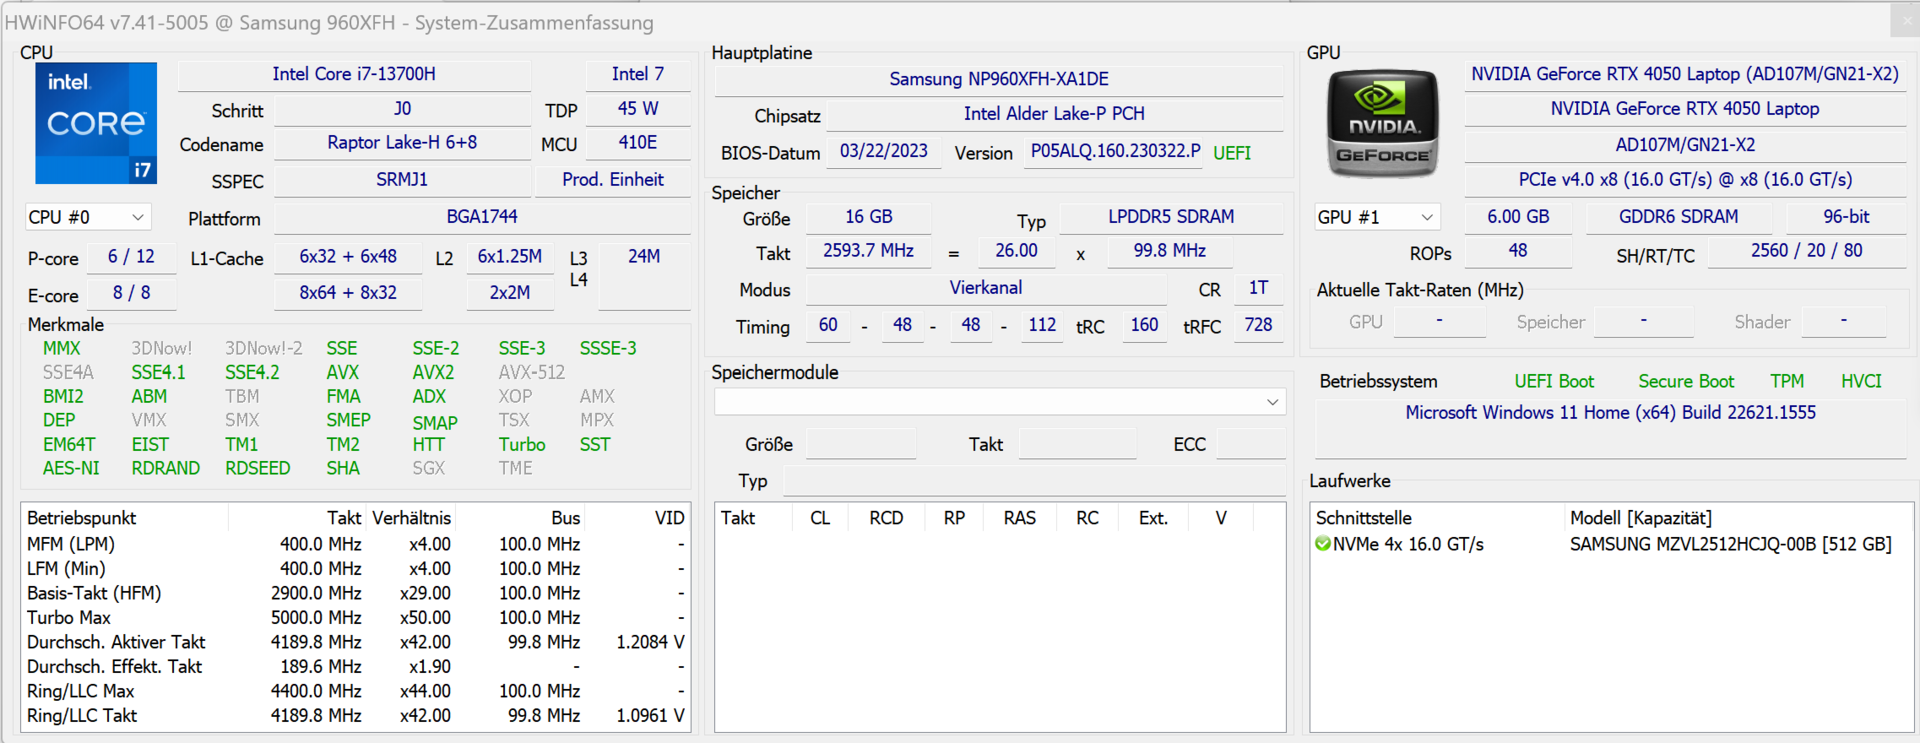
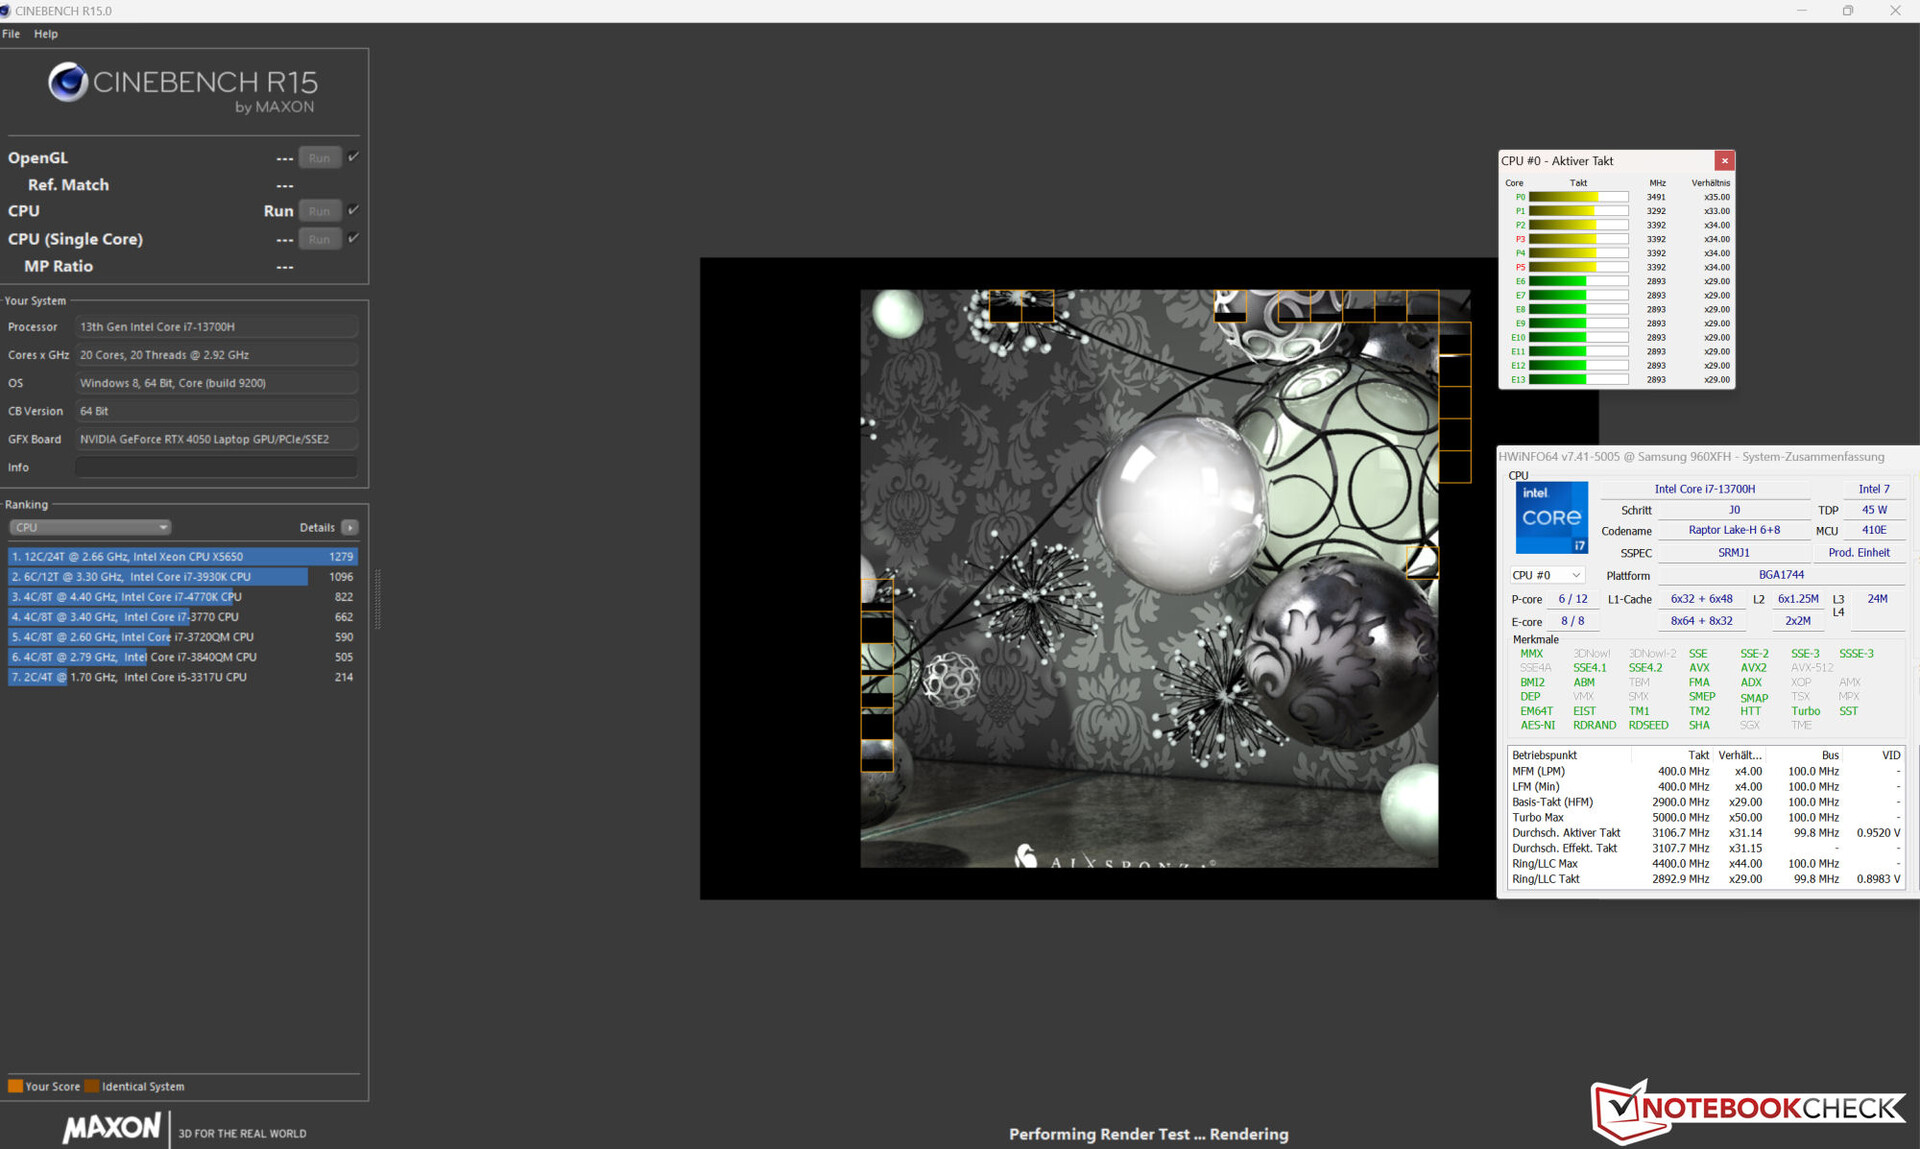
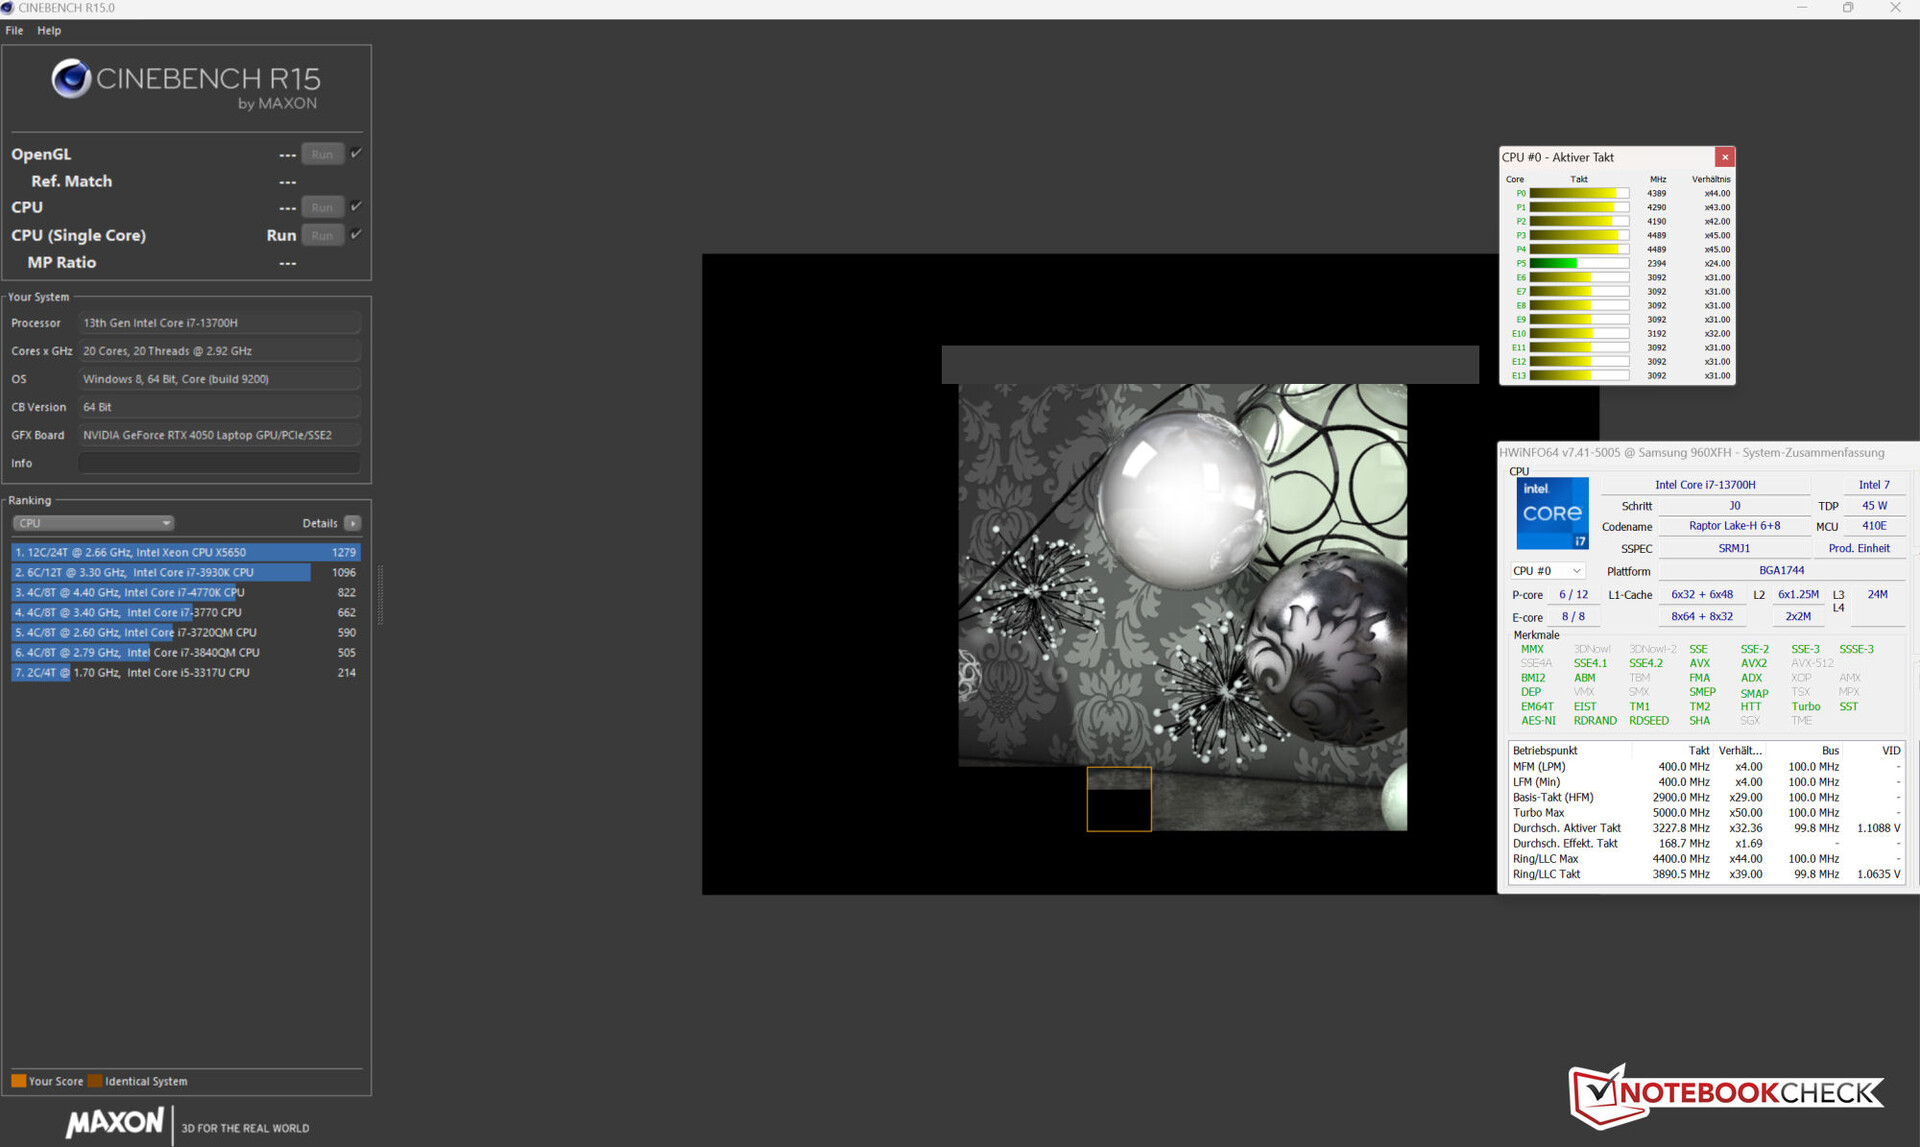
Der Core-i7-13700H-Prozessor (Raptor Lake) setzt sich aus acht Effizienzkernen (kein Hyperthreading, 1,8 bis 3,7 GHz) und sechs Performancekernen (Hyperthreading, 2,4 bis 5 GHz) zusammen. In der Summe ergeben sich 20 logische CPU-Kerne.
Die Leistungsmodi "Hohe Leistung" bzw. "Optimiert" sorgen für Benchmarkresultate etwa auf Höhe des bisher ermittelten Durchschnitts der CPU. Das Profil "Leise" drückt die Werte weit darunter, liefert aber noch mehr als genug Leistung für den Alltagsbetrieb.
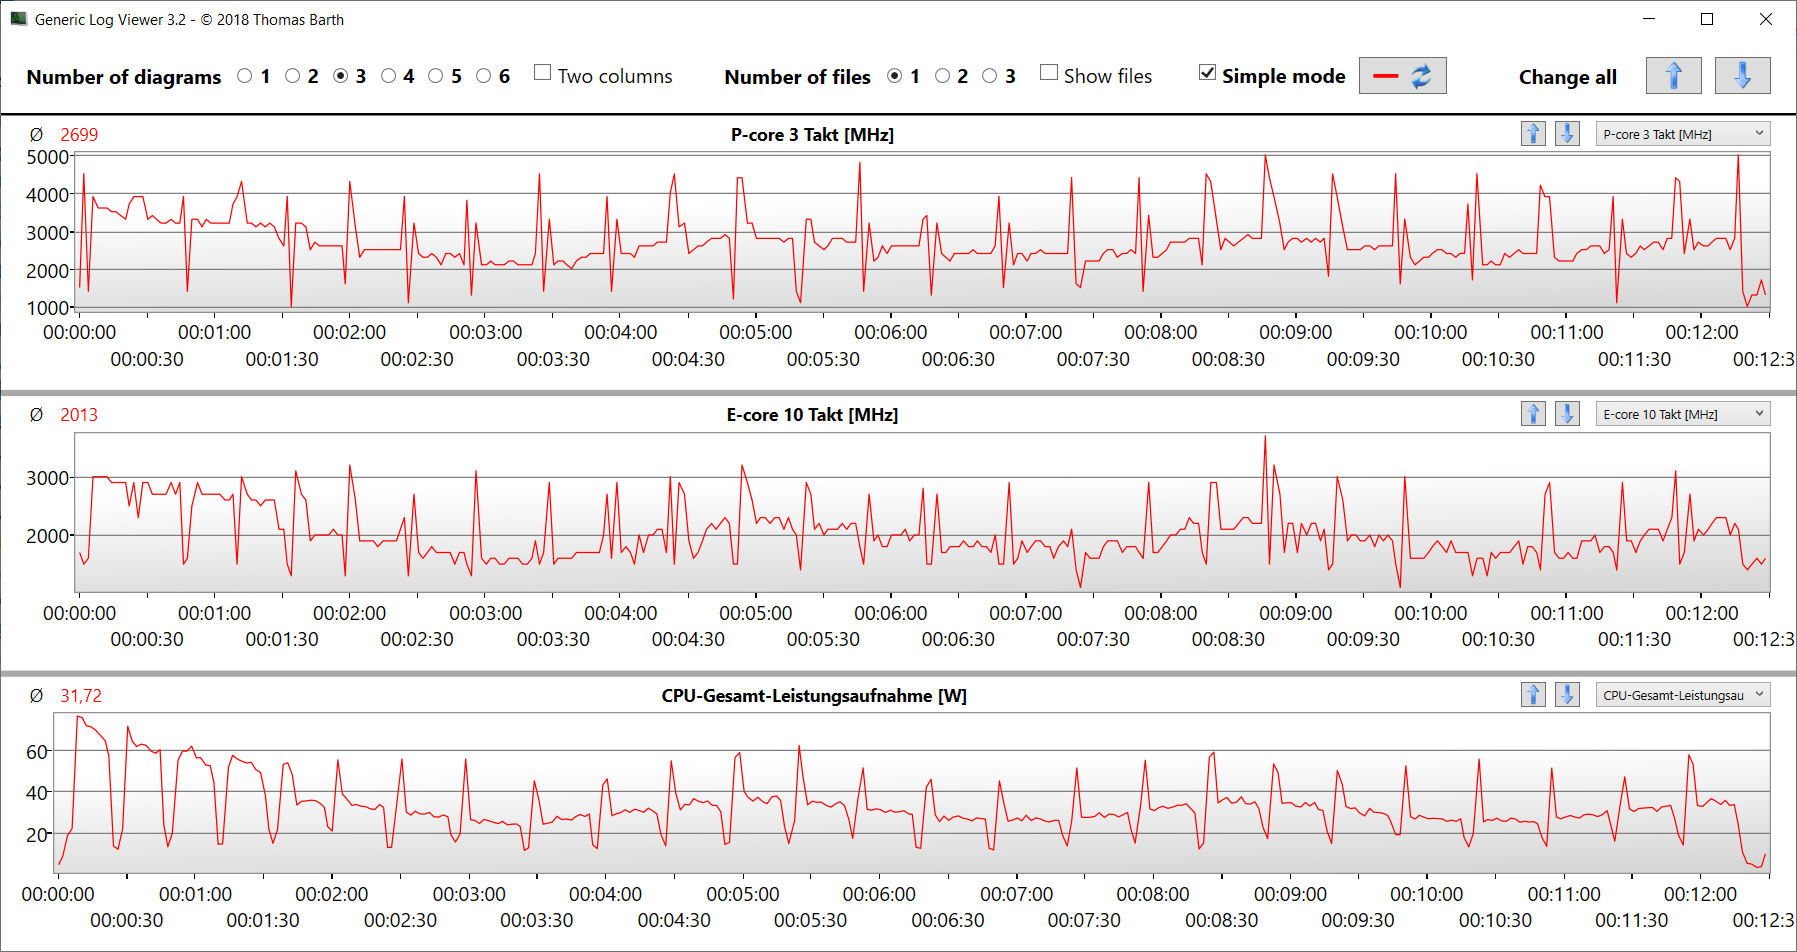
Der CB15-Schleifentest zeigt: Dauerhafte Multi-Thread-Last lässt den Turbo-Takt mit jedem weiteren Durchlauf sinken und ab dem achten Durchlauf schwanken. Es kann kein konstantes Niveau gehalten werden. Das Profil "Hohe Leistung" sorgt für einen höheren Durchschnittstakt und geringere Schwankungen.
Cinebench R15 Multi Dauertest
| CPU Performance Rating - Percent | |
| Durchschnitt der Klasse Multimedia | |
| Samsung Galaxy Book3 Ultra 16 | |
| Durchschnittliche Intel Core i7-13700H | |
| Dell XPS 15 9520 RTX 3050 Ti | |
| Samsung Galaxy Book3 Ultra 16 | |
| Schenker Vision 16 Pro RTX 3070 Ti | |
| Lenovo ThinkBook 16p G3 ARH | |
| Acer Swift X SFX16-52G-77RX | |
| Samsung Galaxy Book3 Ultra 16 | |
| LG Gram 17Z90Q-E.AD78G | |
| Asus VivoBook Pro 16X OLED N7600PC-L2026X | |
| Cinebench R23 | |
| Multi Core | |
| Durchschnitt der Klasse Multimedia (4861 - 33362, n=80, der letzten 2 Jahre) | |
| Samsung Galaxy Book3 Ultra 16 | |
| Durchschnittliche Intel Core i7-13700H (5890 - 20034, n=29) | |
| Samsung Galaxy Book3 Ultra 16 (Hohe Leistung) | |
| Dell XPS 15 9520 RTX 3050 Ti | |
| Lenovo ThinkBook 16p G3 ARH | |
| Schenker Vision 16 Pro RTX 3070 Ti | |
| Samsung Galaxy Book3 Ultra 16 (Leise) | |
| Acer Swift X SFX16-52G-77RX | |
| LG Gram 17Z90Q-E.AD78G | |
| LG Gram 17Z90Q-E.AD78G | |
| Asus VivoBook Pro 16X OLED N7600PC-L2026X | |
| Single Core | |
| Durchschnitt der Klasse Multimedia (1128 - 2459, n=72, der letzten 2 Jahre) | |
| Samsung Galaxy Book3 Ultra 16 (Hohe Leistung) | |
| Schenker Vision 16 Pro RTX 3070 Ti | |
| Durchschnittliche Intel Core i7-13700H (1323 - 1914, n=29) | |
| Dell XPS 15 9520 RTX 3050 Ti | |
| Acer Swift X SFX16-52G-77RX | |
| Samsung Galaxy Book3 Ultra 16 | |
| LG Gram 17Z90Q-E.AD78G | |
| Lenovo ThinkBook 16p G3 ARH | |
| Asus VivoBook Pro 16X OLED N7600PC-L2026X | |
| Samsung Galaxy Book3 Ultra 16 (Leise) | |
| Cinebench R20 | |
| CPU (Multi Core) | |
| Durchschnitt der Klasse Multimedia (1887 - 12912, n=63, der letzten 2 Jahre) | |
| Samsung Galaxy Book3 Ultra 16 | |
| Durchschnittliche Intel Core i7-13700H (2322 - 7674, n=29) | |
| Samsung Galaxy Book3 Ultra 16 (Hohe Leistung) | |
| Dell XPS 15 9520 RTX 3050 Ti | |
| Lenovo ThinkBook 16p G3 ARH | |
| Schenker Vision 16 Pro RTX 3070 Ti | |
| Samsung Galaxy Book3 Ultra 16 (Leise) | |
| Acer Swift X SFX16-52G-77RX | |
| LG Gram 17Z90Q-E.AD78G | |
| Asus VivoBook Pro 16X OLED N7600PC-L2026X | |
| CPU (Single Core) | |
| Durchschnitt der Klasse Multimedia (425 - 853, n=63, der letzten 2 Jahre) | |
| Samsung Galaxy Book3 Ultra 16 (Hohe Leistung) | |
| Schenker Vision 16 Pro RTX 3070 Ti | |
| Durchschnittliche Intel Core i7-13700H (508 - 741, n=29) | |
| Dell XPS 15 9520 RTX 3050 Ti | |
| Acer Swift X SFX16-52G-77RX | |
| Samsung Galaxy Book3 Ultra 16 | |
| LG Gram 17Z90Q-E.AD78G | |
| Lenovo ThinkBook 16p G3 ARH | |
| Asus VivoBook Pro 16X OLED N7600PC-L2026X | |
| Samsung Galaxy Book3 Ultra 16 (Leise) | |
| Cinebench R15 | |
| CPU Multi 64Bit | |
| Schenker Vision 16 Pro RTX 3070 Ti (Turbo) | |
| Schenker Vision 16 Pro RTX 3070 Ti | |
| Durchschnitt der Klasse Multimedia (856 - 5224, n=67, der letzten 2 Jahre) | |
| Samsung Galaxy Book3 Ultra 16 | |
| Samsung Galaxy Book3 Ultra 16 (Hohe Leistung) | |
| Durchschnittliche Intel Core i7-13700H (905 - 2982, n=29) | |
| Samsung Galaxy Book3 Ultra 16 (Leise) | |
| Dell XPS 15 9520 RTX 3050 Ti | |
| Lenovo ThinkBook 16p G3 ARH | |
| Acer Swift X SFX16-52G-77RX | |
| LG Gram 17Z90Q-E.AD78G | |
| Asus VivoBook Pro 16X OLED N7600PC-L2026X | |
| CPU Single 64Bit | |
| Durchschnitt der Klasse Multimedia (184.8 - 326, n=65, der letzten 2 Jahre) | |
| Samsung Galaxy Book3 Ultra 16 (Hohe Leistung) | |
| Schenker Vision 16 Pro RTX 3070 Ti | |
| Durchschnittliche Intel Core i7-13700H (213 - 278, n=29) | |
| Dell XPS 15 9520 RTX 3050 Ti | |
| Acer Swift X SFX16-52G-77RX | |
| Samsung Galaxy Book3 Ultra 16 | |
| Lenovo ThinkBook 16p G3 ARH | |
| Asus VivoBook Pro 16X OLED N7600PC-L2026X | |
| Asus VivoBook Pro 16X OLED N7600PC-L2026X | |
| LG Gram 17Z90Q-E.AD78G | |
| Samsung Galaxy Book3 Ultra 16 (Leise) | |
| Blender - v2.79 BMW27 CPU | |
| Asus VivoBook Pro 16X OLED N7600PC-L2026X | |
| LG Gram 17Z90Q-E.AD78G | |
| Acer Swift X SFX16-52G-77RX | |
| Samsung Galaxy Book3 Ultra 16 (Leise) | |
| Schenker Vision 16 Pro RTX 3070 Ti | |
| Durchschnitt der Klasse Multimedia (100 - 557, n=64, der letzten 2 Jahre) | |
| Lenovo ThinkBook 16p G3 ARH | |
| Durchschnittliche Intel Core i7-13700H (169 - 555, n=29) | |
| Dell XPS 15 9520 RTX 3050 Ti | |
| Samsung Galaxy Book3 Ultra 16 | |
| Samsung Galaxy Book3 Ultra 16 (Hohe Leistung) | |
| 7-Zip 18.03 | |
| 7z b 4 | |
| Dell XPS 15 9520 RTX 3050 Ti | |
| Samsung Galaxy Book3 Ultra 16 | |
| Durchschnittliche Intel Core i7-13700H (27322 - 76344, n=29) | |
| Durchschnitt der Klasse Multimedia (26062 - 130368, n=61, der letzten 2 Jahre) | |
| Samsung Galaxy Book3 Ultra 16 (Hohe Leistung) | |
| Lenovo ThinkBook 16p G3 ARH | |
| Schenker Vision 16 Pro RTX 3070 Ti | |
| Samsung Galaxy Book3 Ultra 16 (Leise) | |
| Acer Swift X SFX16-52G-77RX | |
| LG Gram 17Z90Q-E.AD78G | |
| Asus VivoBook Pro 16X OLED N7600PC-L2026X | |
| 7z b 4 -mmt1 | |
| Samsung Galaxy Book3 Ultra 16 (Hohe Leistung) | |
| Durchschnitt der Klasse Multimedia (3666 - 7545, n=62, der letzten 2 Jahre) | |
| Durchschnittliche Intel Core i7-13700H (4825 - 6238, n=29) | |
| Schenker Vision 16 Pro RTX 3070 Ti | |
| Dell XPS 15 9520 RTX 3050 Ti | |
| Samsung Galaxy Book3 Ultra 16 | |
| Asus VivoBook Pro 16X OLED N7600PC-L2026X | |
| Acer Swift X SFX16-52G-77RX | |
| Lenovo ThinkBook 16p G3 ARH | |
| LG Gram 17Z90Q-E.AD78G | |
| Samsung Galaxy Book3 Ultra 16 (Leise) | |
| Geekbench 5.5 | |
| Multi-Core | |
| Durchschnitt der Klasse Multimedia (4652 - 20422, n=61, der letzten 2 Jahre) | |
| Samsung Galaxy Book3 Ultra 16 (Hohe Leistung) | |
| Dell XPS 15 9520 RTX 3050 Ti | |
| Durchschnittliche Intel Core i7-13700H (6165 - 14215, n=29) | |
| Samsung Galaxy Book3 Ultra 16 | |
| Schenker Vision 16 Pro RTX 3070 Ti | |
| Acer Swift X SFX16-52G-77RX | |
| Samsung Galaxy Book3 Ultra 16 (Leise) | |
| Lenovo ThinkBook 16p G3 ARH | |
| LG Gram 17Z90Q-E.AD78G | |
| Asus VivoBook Pro 16X OLED N7600PC-L2026X | |
| Single-Core | |
| Durchschnitt der Klasse Multimedia (805 - 2974, n=61, der letzten 2 Jahre) | |
| Samsung Galaxy Book3 Ultra 16 (Hohe Leistung) | |
| Schenker Vision 16 Pro RTX 3070 Ti | |
| Durchschnittliche Intel Core i7-13700H (1362 - 1919, n=29) | |
| Acer Swift X SFX16-52G-77RX | |
| Dell XPS 15 9520 RTX 3050 Ti | |
| Samsung Galaxy Book3 Ultra 16 | |
| LG Gram 17Z90Q-E.AD78G | |
| Lenovo ThinkBook 16p G3 ARH | |
| Asus VivoBook Pro 16X OLED N7600PC-L2026X | |
| Samsung Galaxy Book3 Ultra 16 (Leise) | |
| HWBOT x265 Benchmark v2.2 - 4k Preset | |
| Durchschnitt der Klasse Multimedia (5.26 - 36.1, n=62, der letzten 2 Jahre) | |
| Samsung Galaxy Book3 Ultra 16 (Hohe Leistung) | |
| Lenovo ThinkBook 16p G3 ARH | |
| Samsung Galaxy Book3 Ultra 16 | |
| Durchschnittliche Intel Core i7-13700H (6.72 - 21.2, n=29) | |
| Dell XPS 15 9520 RTX 3050 Ti | |
| Schenker Vision 16 Pro RTX 3070 Ti | |
| Acer Swift X SFX16-52G-77RX | |
| Samsung Galaxy Book3 Ultra 16 (Leise) | |
| LG Gram 17Z90Q-E.AD78G | |
| Asus VivoBook Pro 16X OLED N7600PC-L2026X | |
| LibreOffice - 20 Documents To PDF | |
| LG Gram 17Z90Q-E.AD78G | |
| Lenovo ThinkBook 16p G3 ARH | |
| Acer Swift X SFX16-52G-77RX | |
| Asus VivoBook Pro 16X OLED N7600PC-L2026X | |
| Samsung Galaxy Book3 Ultra 16 (Leise) | |
| Durchschnitt der Klasse Multimedia (23.9 - 146.7, n=63, der letzten 2 Jahre) | |
| Samsung Galaxy Book3 Ultra 16 | |
| Durchschnittliche Intel Core i7-13700H (31.3 - 62.4, n=29) | |
| Schenker Vision 16 Pro RTX 3070 Ti | |
| Dell XPS 15 9520 RTX 3050 Ti | |
| Samsung Galaxy Book3 Ultra 16 (Hohe Leistung) | |
| R Benchmark 2.5 - Overall mean | |
| Samsung Galaxy Book3 Ultra 16 (Leise) | |
| Asus VivoBook Pro 16X OLED N7600PC-L2026X | |
| LG Gram 17Z90Q-E.AD78G | |
| Lenovo ThinkBook 16p G3 ARH | |
| Samsung Galaxy Book3 Ultra 16 | |
| Samsung Galaxy Book3 Ultra 16 (Hohe Leistung) | |
| Acer Swift X SFX16-52G-77RX | |
| Durchschnitt der Klasse Multimedia (0.3604 - 0.947, n=62, der letzten 2 Jahre) | |
| Durchschnittliche Intel Core i7-13700H (0.4308 - 0.607, n=29) | |
| Schenker Vision 16 Pro RTX 3070 Ti | |
| Dell XPS 15 9520 RTX 3050 Ti | |
* ... kleinere Werte sind besser
AIDA64: FP32 Ray-Trace | FPU Julia | CPU SHA3 | CPU Queen | FPU SinJulia | FPU Mandel | CPU AES | CPU ZLib | FP64 Ray-Trace | CPU PhotoWorxx
| Performance Rating | |
| Durchschnitt der Klasse Multimedia | |
| Lenovo ThinkBook 16p G3 ARH | |
| Samsung Galaxy Book3 Ultra 16 | |
| Durchschnittliche Intel Core i7-13700H | |
| Schenker Vision 16 Pro RTX 3070 Ti | |
| Dell XPS 15 9520 RTX 3050 Ti | |
| Acer Swift X SFX16-52G-77RX | |
| LG Gram 17Z90Q-E.AD78G | |
| Asus VivoBook Pro 16X OLED N7600PC-L2026X | |
| AIDA64 / FP32 Ray-Trace | |
| Durchschnitt der Klasse Multimedia (2214 - 50388, n=59, der letzten 2 Jahre) | |
| Lenovo ThinkBook 16p G3 ARH (v6.75.6100) | |
| Samsung Galaxy Book3 Ultra 16 (v6.75.6100) | |
| Durchschnittliche Intel Core i7-13700H (4986 - 18908, n=29) | |
| Schenker Vision 16 Pro RTX 3070 Ti (v6.75.6100) | |
| Acer Swift X SFX16-52G-77RX (v6.70.6000) | |
| Dell XPS 15 9520 RTX 3050 Ti (v6.50.5800) | |
| Asus VivoBook Pro 16X OLED N7600PC-L2026X (v6.75.6100) | |
| LG Gram 17Z90Q-E.AD78G (v6.50.5800) | |
| AIDA64 / FPU Julia | |
| Lenovo ThinkBook 16p G3 ARH (v6.75.6100) | |
| Durchschnitt der Klasse Multimedia (12867 - 201874, n=60, der letzten 2 Jahre) | |
| Durchschnittliche Intel Core i7-13700H (25360 - 92359, n=29) | |
| Samsung Galaxy Book3 Ultra 16 (v6.75.6100) | |
| Schenker Vision 16 Pro RTX 3070 Ti (v6.75.6100) | |
| Acer Swift X SFX16-52G-77RX (v6.70.6000) | |
| Dell XPS 15 9520 RTX 3050 Ti (v6.50.5800) | |
| Asus VivoBook Pro 16X OLED N7600PC-L2026X (v6.75.6100) | |
| LG Gram 17Z90Q-E.AD78G (v6.50.5800) | |
| AIDA64 / CPU SHA3 | |
| Durchschnitt der Klasse Multimedia (626 - 8623, n=60, der letzten 2 Jahre) | |
| Lenovo ThinkBook 16p G3 ARH (v6.75.6100) | |
| Samsung Galaxy Book3 Ultra 16 (v6.75.6100) | |
| Durchschnittliche Intel Core i7-13700H (1339 - 4224, n=29) | |
| Schenker Vision 16 Pro RTX 3070 Ti (v6.75.6100) | |
| Dell XPS 15 9520 RTX 3050 Ti (v6.50.5800) | |
| Acer Swift X SFX16-52G-77RX (v6.70.6000) | |
| Asus VivoBook Pro 16X OLED N7600PC-L2026X (v6.75.6100) | |
| LG Gram 17Z90Q-E.AD78G (v6.50.5800) | |
| AIDA64 / CPU Queen | |
| Lenovo ThinkBook 16p G3 ARH (v6.75.6100) | |
| Samsung Galaxy Book3 Ultra 16 (v6.75.6100) | |
| Dell XPS 15 9520 RTX 3050 Ti (v6.50.5800) | |
| Durchschnittliche Intel Core i7-13700H (59324 - 107159, n=29) | |
| Schenker Vision 16 Pro RTX 3070 Ti (v6.75.6100) | |
| Acer Swift X SFX16-52G-77RX (v6.70.6000) | |
| Durchschnitt der Klasse Multimedia (13483 - 181505, n=47, der letzten 2 Jahre) | |
| LG Gram 17Z90Q-E.AD78G (v6.50.5800) | |
| Asus VivoBook Pro 16X OLED N7600PC-L2026X (v6.75.6100) | |
| AIDA64 / FPU SinJulia | |
| Lenovo ThinkBook 16p G3 ARH (v6.75.6100) | |
| Samsung Galaxy Book3 Ultra 16 (v6.75.6100) | |
| Durchschnitt der Klasse Multimedia (886 - 28794, n=60, der letzten 2 Jahre) | |
| Durchschnittliche Intel Core i7-13700H (4800 - 11050, n=29) | |
| Dell XPS 15 9520 RTX 3050 Ti (v6.50.5800) | |
| Schenker Vision 16 Pro RTX 3070 Ti (v6.75.6100) | |
| Acer Swift X SFX16-52G-77RX (v6.70.6000) | |
| LG Gram 17Z90Q-E.AD78G (v6.50.5800) | |
| Asus VivoBook Pro 16X OLED N7600PC-L2026X (v6.75.6100) | |
| AIDA64 / FPU Mandel | |
| Lenovo ThinkBook 16p G3 ARH (v6.75.6100) | |
| Durchschnitt der Klasse Multimedia (6395 - 105740, n=59, der letzten 2 Jahre) | |
| Samsung Galaxy Book3 Ultra 16 (v6.75.6100) | |
| Durchschnittliche Intel Core i7-13700H (12321 - 45118, n=29) | |
| Schenker Vision 16 Pro RTX 3070 Ti (v6.75.6100) | |
| Acer Swift X SFX16-52G-77RX (v6.70.6000) | |
| Dell XPS 15 9520 RTX 3050 Ti (v6.50.5800) | |
| Asus VivoBook Pro 16X OLED N7600PC-L2026X (v6.75.6100) | |
| LG Gram 17Z90Q-E.AD78G (v6.50.5800) | |
| AIDA64 / CPU AES | |
| Dell XPS 15 9520 RTX 3050 Ti (v6.50.5800) | |
| Durchschnittliche Intel Core i7-13700H (28769 - 151254, n=29) | |
| Samsung Galaxy Book3 Ultra 16 (v6.75.6100) | |
| Durchschnitt der Klasse Multimedia (8171 - 126790, n=60, der letzten 2 Jahre) | |
| Schenker Vision 16 Pro RTX 3070 Ti (v6.75.6100) | |
| Asus VivoBook Pro 16X OLED N7600PC-L2026X (v6.75.6100) | |
| Lenovo ThinkBook 16p G3 ARH (v6.75.6100) | |
| Acer Swift X SFX16-52G-77RX (v6.70.6000) | |
| LG Gram 17Z90Q-E.AD78G (v6.50.5800) | |
| AIDA64 / CPU ZLib | |
| Samsung Galaxy Book3 Ultra 16 (v6.75.6100) | |
| Durchschnitt der Klasse Multimedia (143.8 - 2022, n=60, der letzten 2 Jahre) | |
| Durchschnittliche Intel Core i7-13700H (389 - 1215, n=29) | |
| Lenovo ThinkBook 16p G3 ARH (v6.75.6100) | |
| Schenker Vision 16 Pro RTX 3070 Ti (v6.75.6100) | |
| Dell XPS 15 9520 RTX 3050 Ti (v6.50.5800) | |
| Acer Swift X SFX16-52G-77RX (v6.70.6000) | |
| LG Gram 17Z90Q-E.AD78G (v6.50.5800) | |
| Asus VivoBook Pro 16X OLED N7600PC-L2026X (v6.75.6100) | |
| AIDA64 / FP64 Ray-Trace | |
| Durchschnitt der Klasse Multimedia (1014 - 26875, n=60, der letzten 2 Jahre) | |
| Lenovo ThinkBook 16p G3 ARH (v6.75.6100) | |
| Samsung Galaxy Book3 Ultra 16 (v6.75.6100) | |
| Durchschnittliche Intel Core i7-13700H (2540 - 10135, n=29) | |
| Schenker Vision 16 Pro RTX 3070 Ti (v6.75.6100) | |
| Acer Swift X SFX16-52G-77RX (v6.70.6000) | |
| Dell XPS 15 9520 RTX 3050 Ti (v6.50.5800) | |
| Asus VivoBook Pro 16X OLED N7600PC-L2026X (v6.75.6100) | |
| LG Gram 17Z90Q-E.AD78G (v6.50.5800) | |
| AIDA64 / CPU PhotoWorxx | |
| Durchschnitt der Klasse Multimedia (8187 - 88154, n=60, der letzten 2 Jahre) | |
| Samsung Galaxy Book3 Ultra 16 (v6.75.6100) | |
| Acer Swift X SFX16-52G-77RX (v6.70.6000) | |
| Schenker Vision 16 Pro RTX 3070 Ti (v6.75.6100) | |
| Durchschnittliche Intel Core i7-13700H (12872 - 52727, n=29) | |
| LG Gram 17Z90Q-E.AD78G (v6.50.5800) | |
| Dell XPS 15 9520 RTX 3050 Ti (v6.50.5800) | |
| Lenovo ThinkBook 16p G3 ARH (v6.75.6100) | |
| Asus VivoBook Pro 16X OLED N7600PC-L2026X (v6.75.6100) | |
System Performance
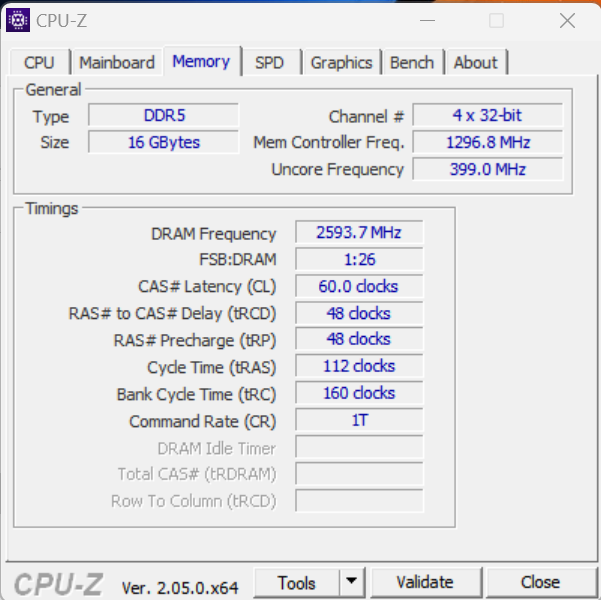
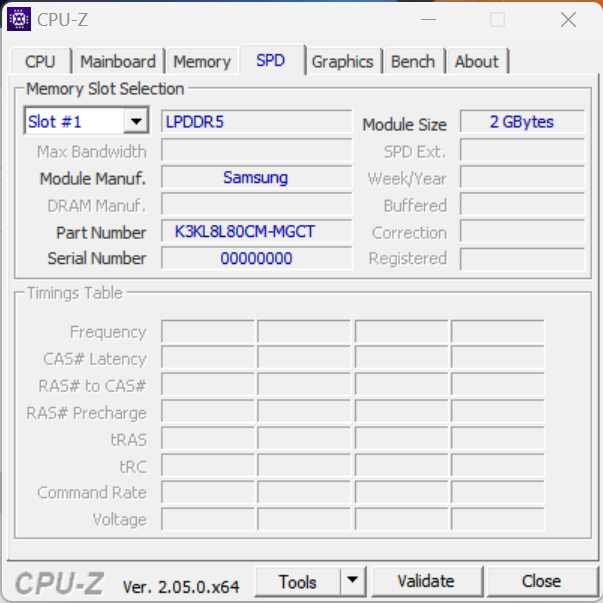
Das flüssig laufende System ist nicht auf Höchstleistung ausgelegt. Ein Kompromiss aus Kompaktheit, Mobilität, Energiebedarf und Leistung wird angestrebt. Gleichwohl bewältigt der Rechner fordernde Anwendungsbereiche á la Rendering und Gaming - das bestätigen auch die guten PC-Mark-Resultate. Die Transferraten des Arbeitsspeichers bewegen sich auf einem normalen Niveau für LPDDR5-5200-RAM.
CrossMark: Overall | Productivity | Creativity | Responsiveness
| PCMark 10 / Score | |
| Durchschnitt der Klasse Multimedia (4325 - 10386, n=57, der letzten 2 Jahre) | |
| Durchschnittliche Intel Core i7-13700H, NVIDIA GeForce RTX 4050 Laptop GPU (6822 - 7556, n=7) | |
| Dell XPS 15 9520 RTX 3050 Ti | |
| Lenovo ThinkBook 16p G3 ARH | |
| Samsung Galaxy Book3 Ultra 16 | |
| LG Gram 17Z90Q-E.AD78G | |
| Acer Swift X SFX16-52G-77RX | |
| Asus VivoBook Pro 16X OLED N7600PC-L2026X | |
| PCMark 10 / Essentials | |
| Dell XPS 15 9520 RTX 3050 Ti | |
| Durchschnittliche Intel Core i7-13700H, NVIDIA GeForce RTX 4050 Laptop GPU (10283 - 11549, n=7) | |
| Acer Swift X SFX16-52G-77RX | |
| Samsung Galaxy Book3 Ultra 16 | |
| Durchschnitt der Klasse Multimedia (8025 - 11664, n=56, der letzten 2 Jahre) | |
| Lenovo ThinkBook 16p G3 ARH | |
| LG Gram 17Z90Q-E.AD78G | |
| Asus VivoBook Pro 16X OLED N7600PC-L2026X | |
| PCMark 10 / Productivity | |
| Durchschnitt der Klasse Multimedia (7323 - 18233, n=56, der letzten 2 Jahre) | |
| Dell XPS 15 9520 RTX 3050 Ti | |
| LG Gram 17Z90Q-E.AD78G | |
| Durchschnittliche Intel Core i7-13700H, NVIDIA GeForce RTX 4050 Laptop GPU (8368 - 9836, n=7) | |
| Lenovo ThinkBook 16p G3 ARH | |
| Samsung Galaxy Book3 Ultra 16 | |
| Asus VivoBook Pro 16X OLED N7600PC-L2026X | |
| Acer Swift X SFX16-52G-77RX | |
| PCMark 10 / Digital Content Creation | |
| Durchschnitt der Klasse Multimedia (3651 - 16240, n=56, der letzten 2 Jahre) | |
| Durchschnittliche Intel Core i7-13700H, NVIDIA GeForce RTX 4050 Laptop GPU (9527 - 10643, n=7) | |
| Samsung Galaxy Book3 Ultra 16 | |
| Lenovo ThinkBook 16p G3 ARH | |
| Dell XPS 15 9520 RTX 3050 Ti | |
| LG Gram 17Z90Q-E.AD78G | |
| Acer Swift X SFX16-52G-77RX | |
| Asus VivoBook Pro 16X OLED N7600PC-L2026X | |
| CrossMark / Overall | |
| Dell XPS 15 9520 RTX 3050 Ti | |
| Durchschnitt der Klasse Multimedia (866 - 2728, n=66, der letzten 2 Jahre) | |
| Durchschnittliche Intel Core i7-13700H, NVIDIA GeForce RTX 4050 Laptop GPU (1205 - 1937, n=9) | |
| Acer Swift X SFX16-52G-77RX | |
| Schenker Vision 16 Pro RTX 3070 Ti | |
| Samsung Galaxy Book3 Ultra 16 | |
| Lenovo ThinkBook 16p G3 ARH | |
| LG Gram 17Z90Q-E.AD78G | |
| Asus VivoBook Pro 16X OLED N7600PC-L2026X | |
| CrossMark / Productivity | |
| Dell XPS 15 9520 RTX 3050 Ti | |
| Durchschnitt der Klasse Multimedia (931 - 2489, n=66, der letzten 2 Jahre) | |
| Acer Swift X SFX16-52G-77RX | |
| Durchschnittliche Intel Core i7-13700H, NVIDIA GeForce RTX 4050 Laptop GPU (1158 - 1877, n=9) | |
| Schenker Vision 16 Pro RTX 3070 Ti | |
| Lenovo ThinkBook 16p G3 ARH | |
| Samsung Galaxy Book3 Ultra 16 | |
| LG Gram 17Z90Q-E.AD78G | |
| Asus VivoBook Pro 16X OLED N7600PC-L2026X | |
| CrossMark / Creativity | |
| Durchschnitt der Klasse Multimedia (907 - 3465, n=66, der letzten 2 Jahre) | |
| Dell XPS 15 9520 RTX 3050 Ti | |
| Durchschnittliche Intel Core i7-13700H, NVIDIA GeForce RTX 4050 Laptop GPU (1293 - 2044, n=9) | |
| Schenker Vision 16 Pro RTX 3070 Ti | |
| Acer Swift X SFX16-52G-77RX | |
| Samsung Galaxy Book3 Ultra 16 | |
| LG Gram 17Z90Q-E.AD78G | |
| Lenovo ThinkBook 16p G3 ARH | |
| Asus VivoBook Pro 16X OLED N7600PC-L2026X | |
| CrossMark / Responsiveness | |
| Dell XPS 15 9520 RTX 3050 Ti | |
| Acer Swift X SFX16-52G-77RX | |
| Durchschnittliche Intel Core i7-13700H, NVIDIA GeForce RTX 4050 Laptop GPU (1097 - 1929, n=9) | |
| Durchschnitt der Klasse Multimedia (605 - 2024, n=66, der letzten 2 Jahre) | |
| Samsung Galaxy Book3 Ultra 16 | |
| Schenker Vision 16 Pro RTX 3070 Ti | |
| Lenovo ThinkBook 16p G3 ARH | |
| LG Gram 17Z90Q-E.AD78G | |
| Asus VivoBook Pro 16X OLED N7600PC-L2026X | |
| PCMark 8 Home Score Accelerated v2 | 4564 Punkte | |
| PCMark 8 Work Score Accelerated v2 | 5090 Punkte | |
| PCMark 10 Score | 6822 Punkte | |
Hilfe | ||
| AIDA64 / Memory Copy | |
| Durchschnitt der Klasse Multimedia (11299 - 132135, n=60, der letzten 2 Jahre) | |
| Samsung Galaxy Book3 Ultra 16 | |
| LG Gram 17Z90Q-E.AD78G | |
| Acer Swift X SFX16-52G-77RX | |
| Schenker Vision 16 Pro RTX 3070 Ti | |
| Durchschnittliche Intel Core i7-13700H (24334 - 78081, n=29) | |
| Dell XPS 15 9520 RTX 3050 Ti | |
| Lenovo ThinkBook 16p G3 ARH | |
| Asus VivoBook Pro 16X OLED N7600PC-L2026X | |
| AIDA64 / Memory Read | |
| Durchschnitt der Klasse Multimedia (11624 - 174586, n=60, der letzten 2 Jahre) | |
| LG Gram 17Z90Q-E.AD78G | |
| Samsung Galaxy Book3 Ultra 16 | |
| Acer Swift X SFX16-52G-77RX | |
| Schenker Vision 16 Pro RTX 3070 Ti | |
| Durchschnittliche Intel Core i7-13700H (23681 - 79656, n=29) | |
| Dell XPS 15 9520 RTX 3050 Ti | |
| Lenovo ThinkBook 16p G3 ARH | |
| Asus VivoBook Pro 16X OLED N7600PC-L2026X | |
| AIDA64 / Memory Write | |
| Samsung Galaxy Book3 Ultra 16 | |
| Durchschnitt der Klasse Multimedia (11755 - 134998, n=60, der letzten 2 Jahre) | |
| Durchschnittliche Intel Core i7-13700H (22986 - 99898, n=29) | |
| Schenker Vision 16 Pro RTX 3070 Ti | |
| LG Gram 17Z90Q-E.AD78G | |
| Acer Swift X SFX16-52G-77RX | |
| Dell XPS 15 9520 RTX 3050 Ti | |
| Lenovo ThinkBook 16p G3 ARH | |
| Asus VivoBook Pro 16X OLED N7600PC-L2026X | |
| AIDA64 / Memory Latency | |
| Durchschnitt der Klasse Multimedia (7 - 535, n=59, der letzten 2 Jahre) | |
| Lenovo ThinkBook 16p G3 ARH | |
| Acer Swift X SFX16-52G-77RX | |
| LG Gram 17Z90Q-E.AD78G | |
| Dell XPS 15 9520 RTX 3050 Ti | |
| Samsung Galaxy Book3 Ultra 16 | |
| Durchschnittliche Intel Core i7-13700H (82.4 - 136.8, n=29) | |
| Schenker Vision 16 Pro RTX 3070 Ti | |
| Asus VivoBook Pro 16X OLED N7600PC-L2026X | |
* ... kleinere Werte sind besser
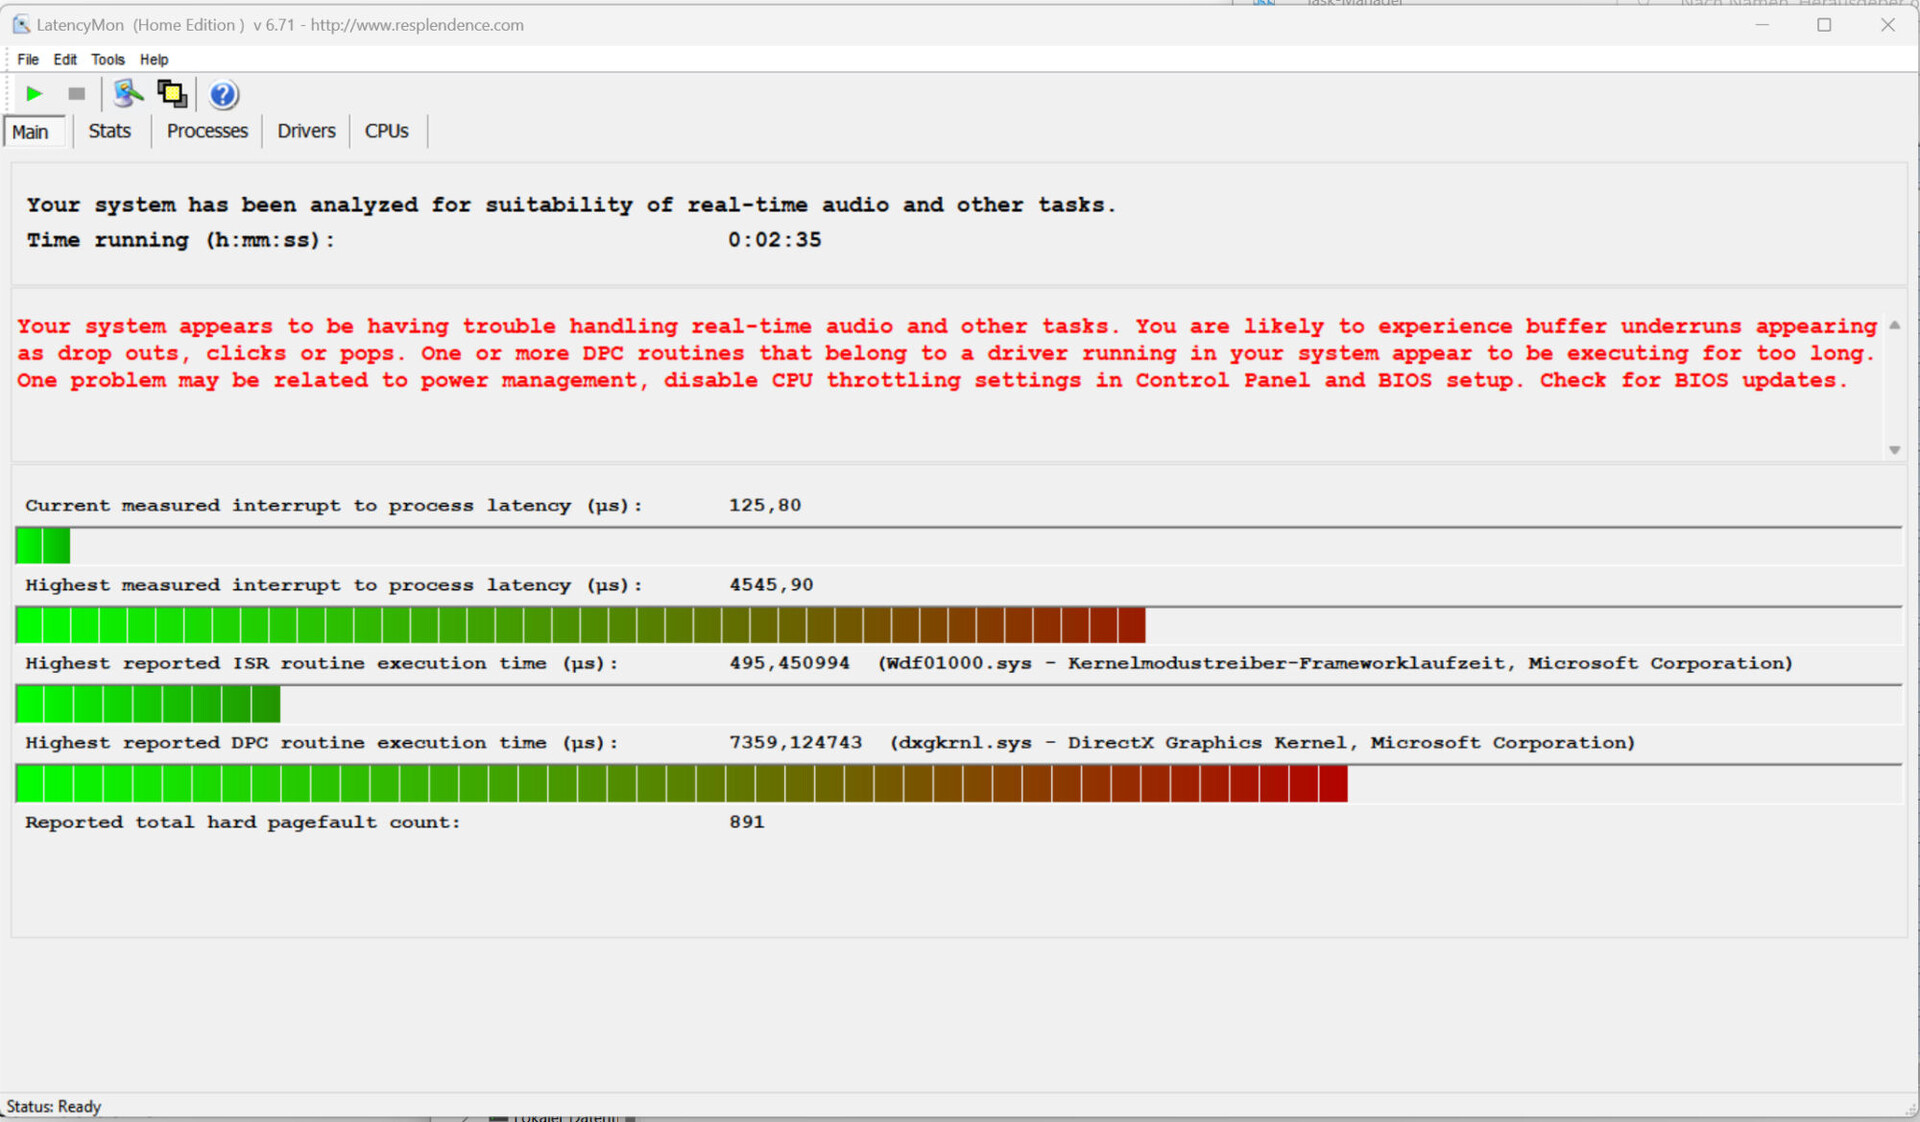
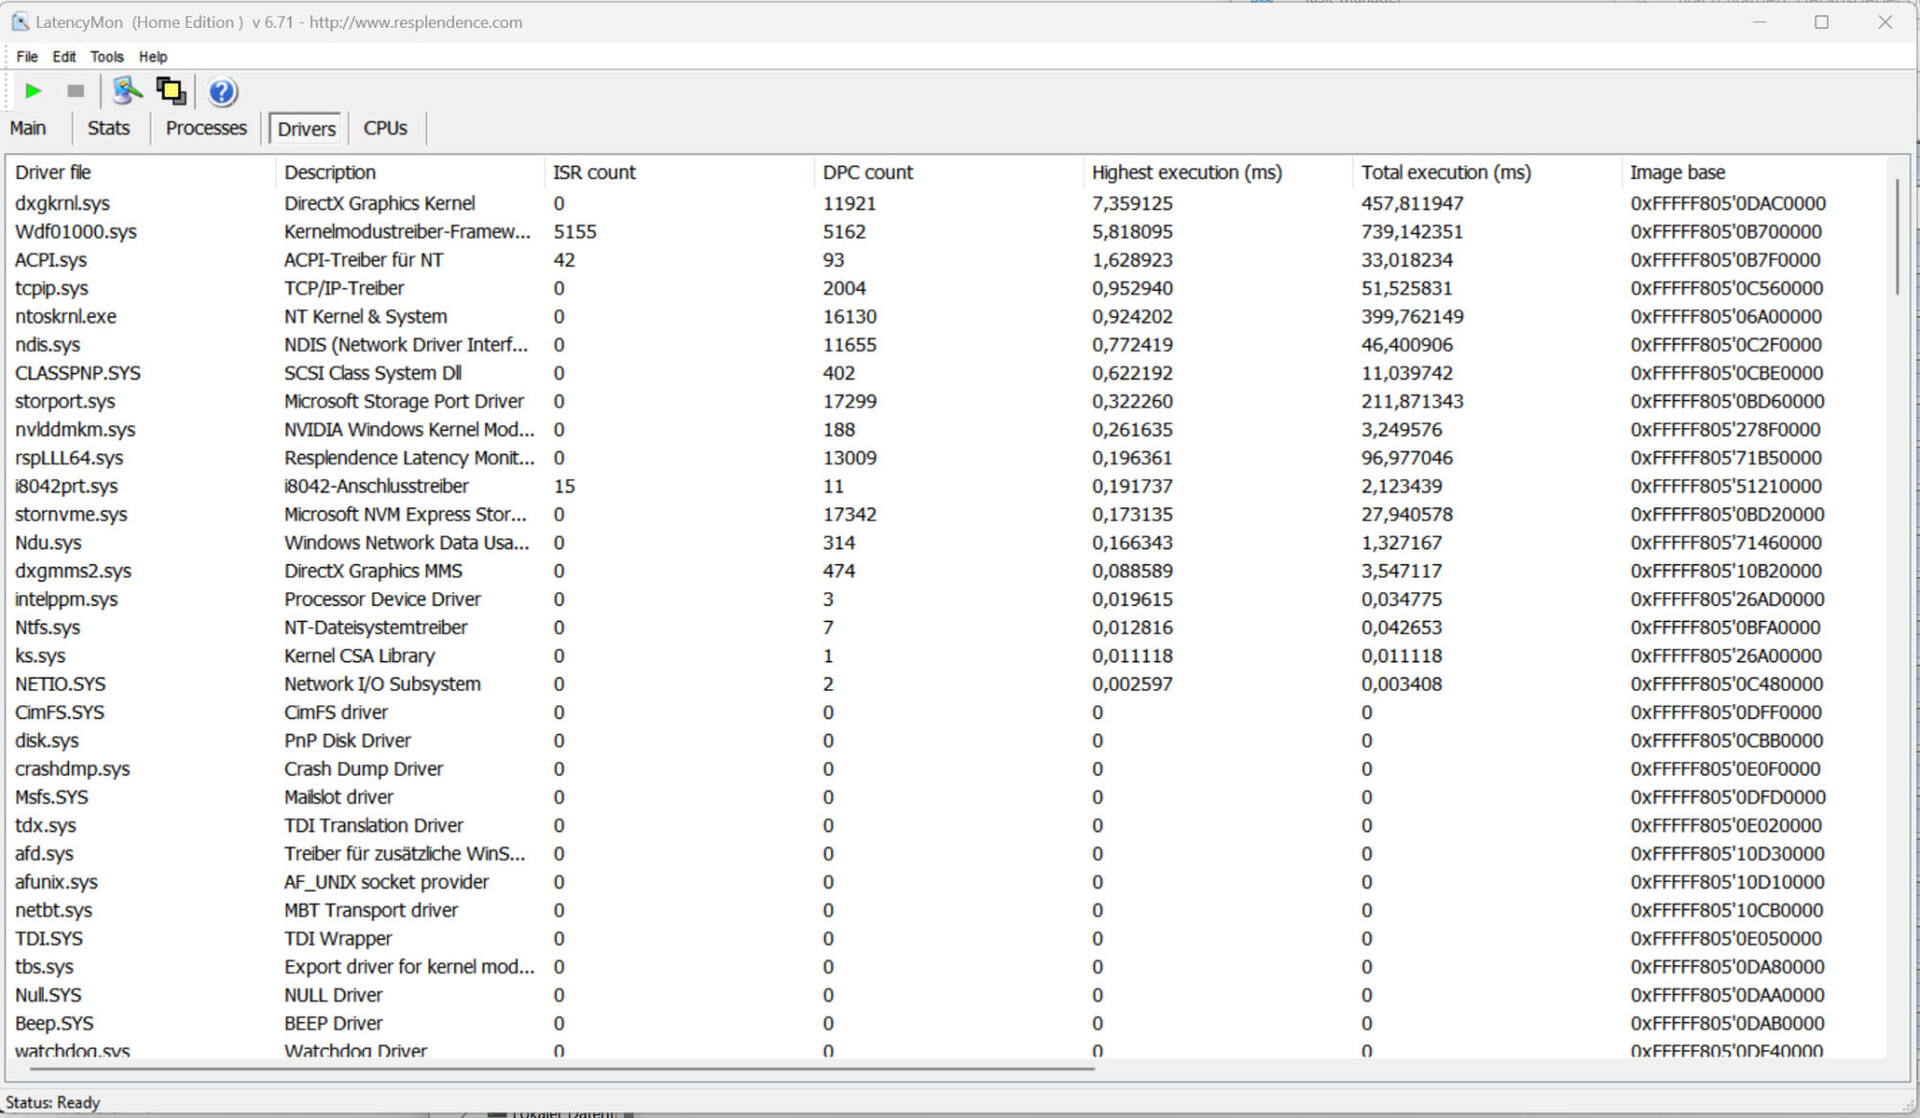
DPC-Latenzen
Der standardisierte Latency-Monitor-Test (Websurfen, 4k-Videowiedergabe, Prime95 High-Load) hat Auffälligkeiten offenbart. Das System scheint nicht für Video- und Audiobearbeitung in Echtzeit geeignet zu sein. Zukünftige Software-Updates könnten zu Verbesserungen oder auch Verschlechterungen führen.
| DPC Latencies / LatencyMon - interrupt to process latency (max), Web, Youtube, Prime95 | |
| LG Gram 17Z90Q-E.AD78G | |
| Samsung Galaxy Book3 Ultra 16 | |
| Lenovo ThinkBook 16p G3 ARH | |
| Dell XPS 15 9520 RTX 3050 Ti | |
| Acer Swift X SFX16-52G-77RX | |
| Schenker Vision 16 Pro RTX 3070 Ti | |
| Asus VivoBook Pro 16X OLED N7600PC-L2026X | |
* ... kleinere Werte sind besser
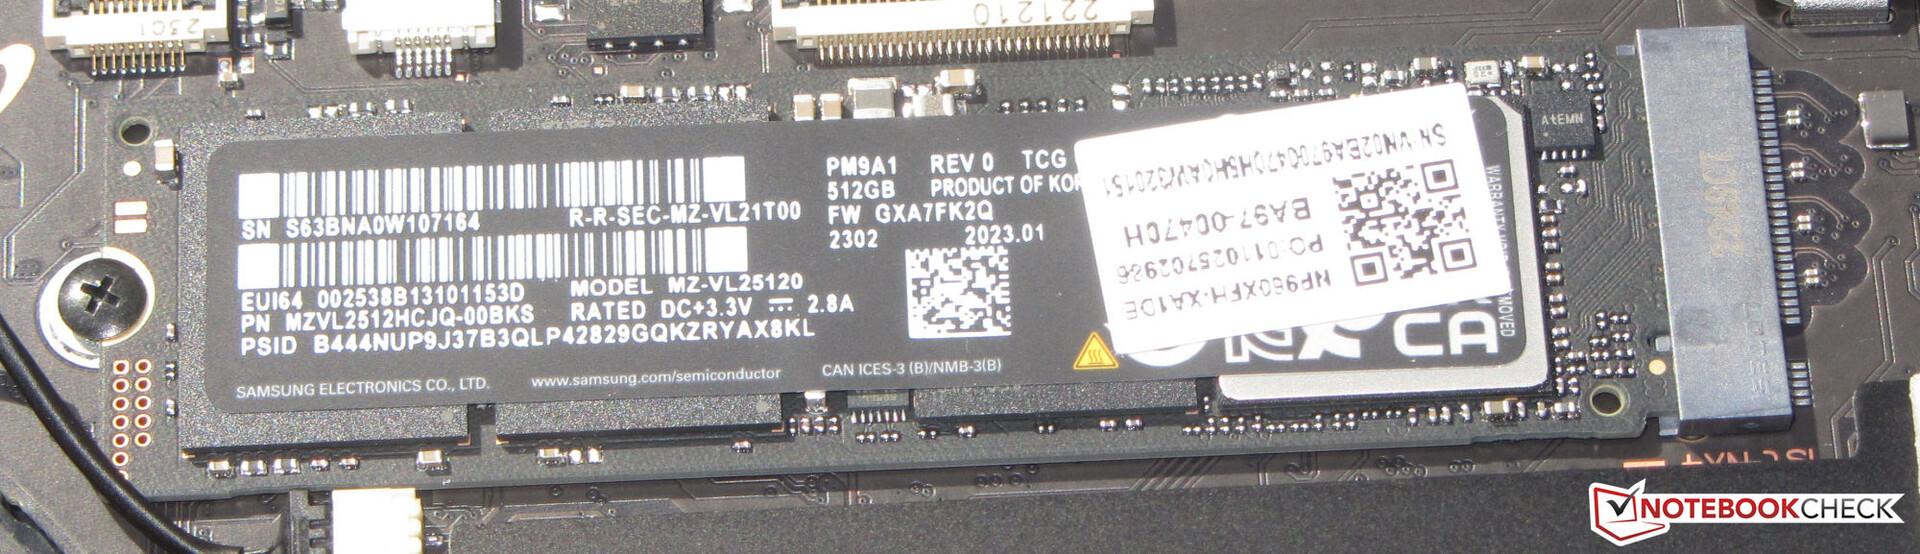
Massenspeicher
Knauserig zeigt sich Samsung beim Speicherplatz: Die verbaute PCIe-4-SSD (M.2-2280) fasst lediglich 512 GB - zu wenig für einen 2.800-Euro-Laptop. Immerhin überzeugt sie mit hervorragenden Datenraten. Das Notebook kann eine zweite SSD aufnehmen.

* ... kleinere Werte sind besser
Dauerleistung Lesen: DiskSpd Read Loop, Queue Depth 8
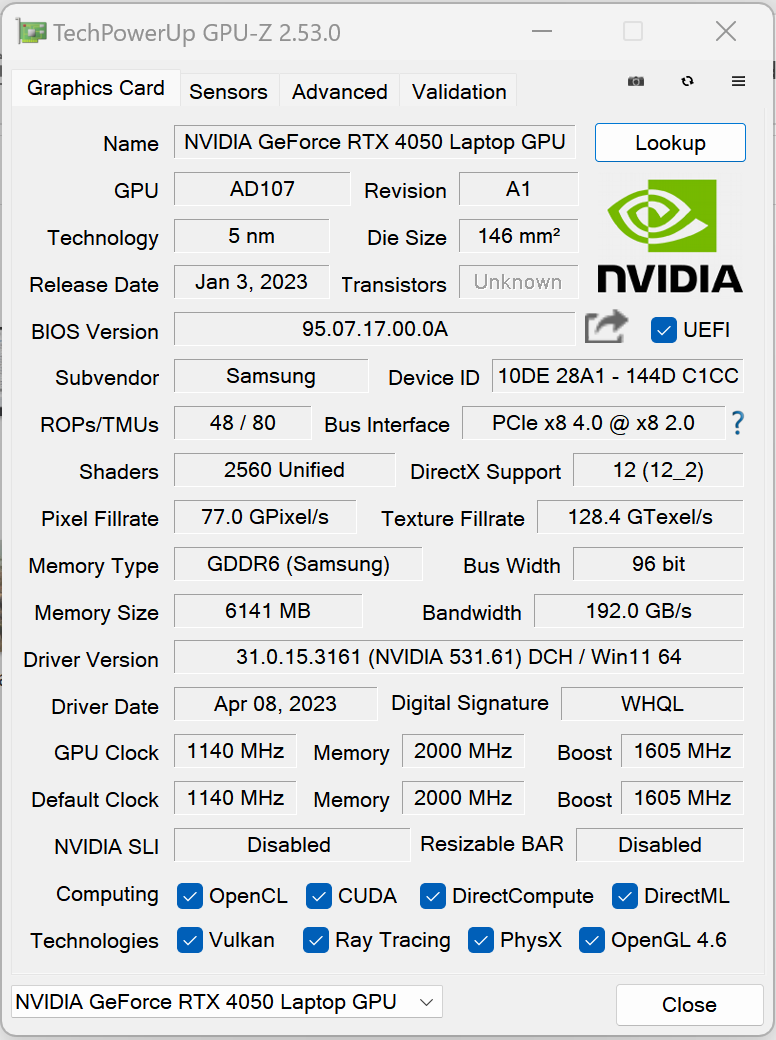
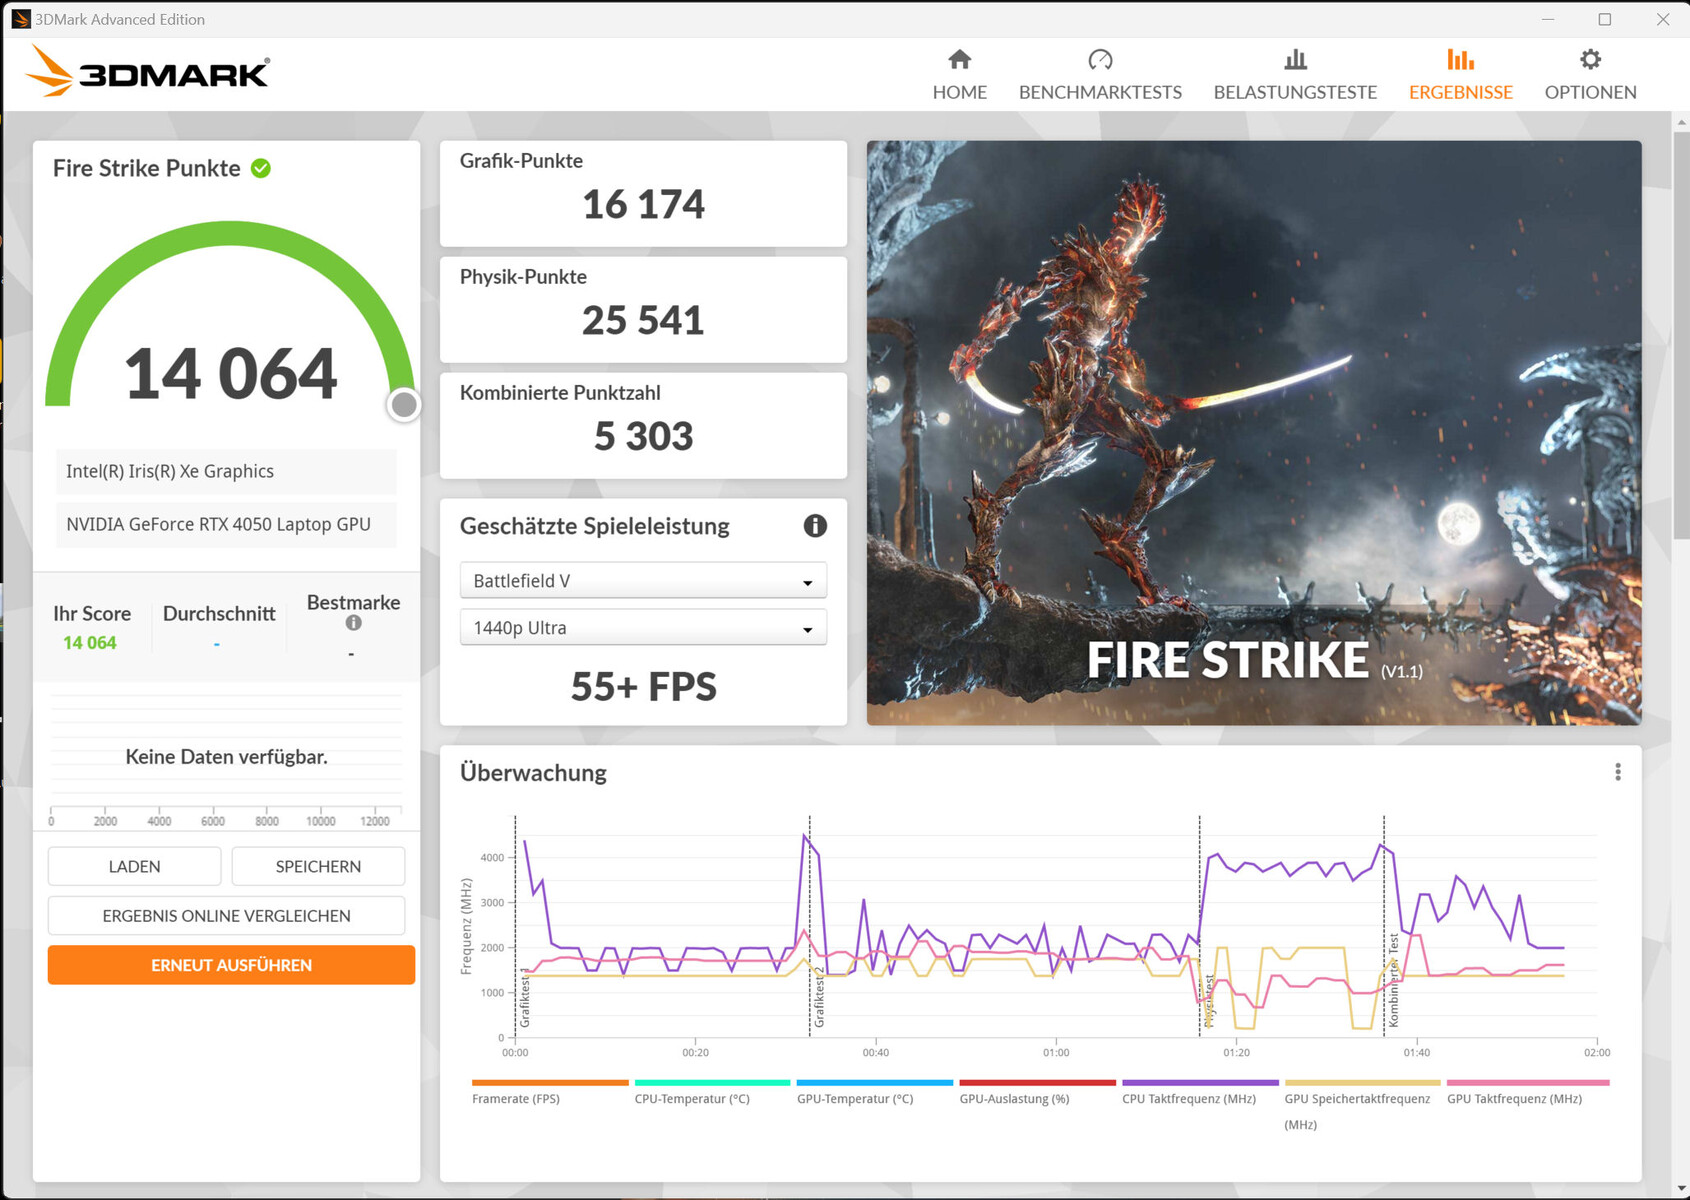
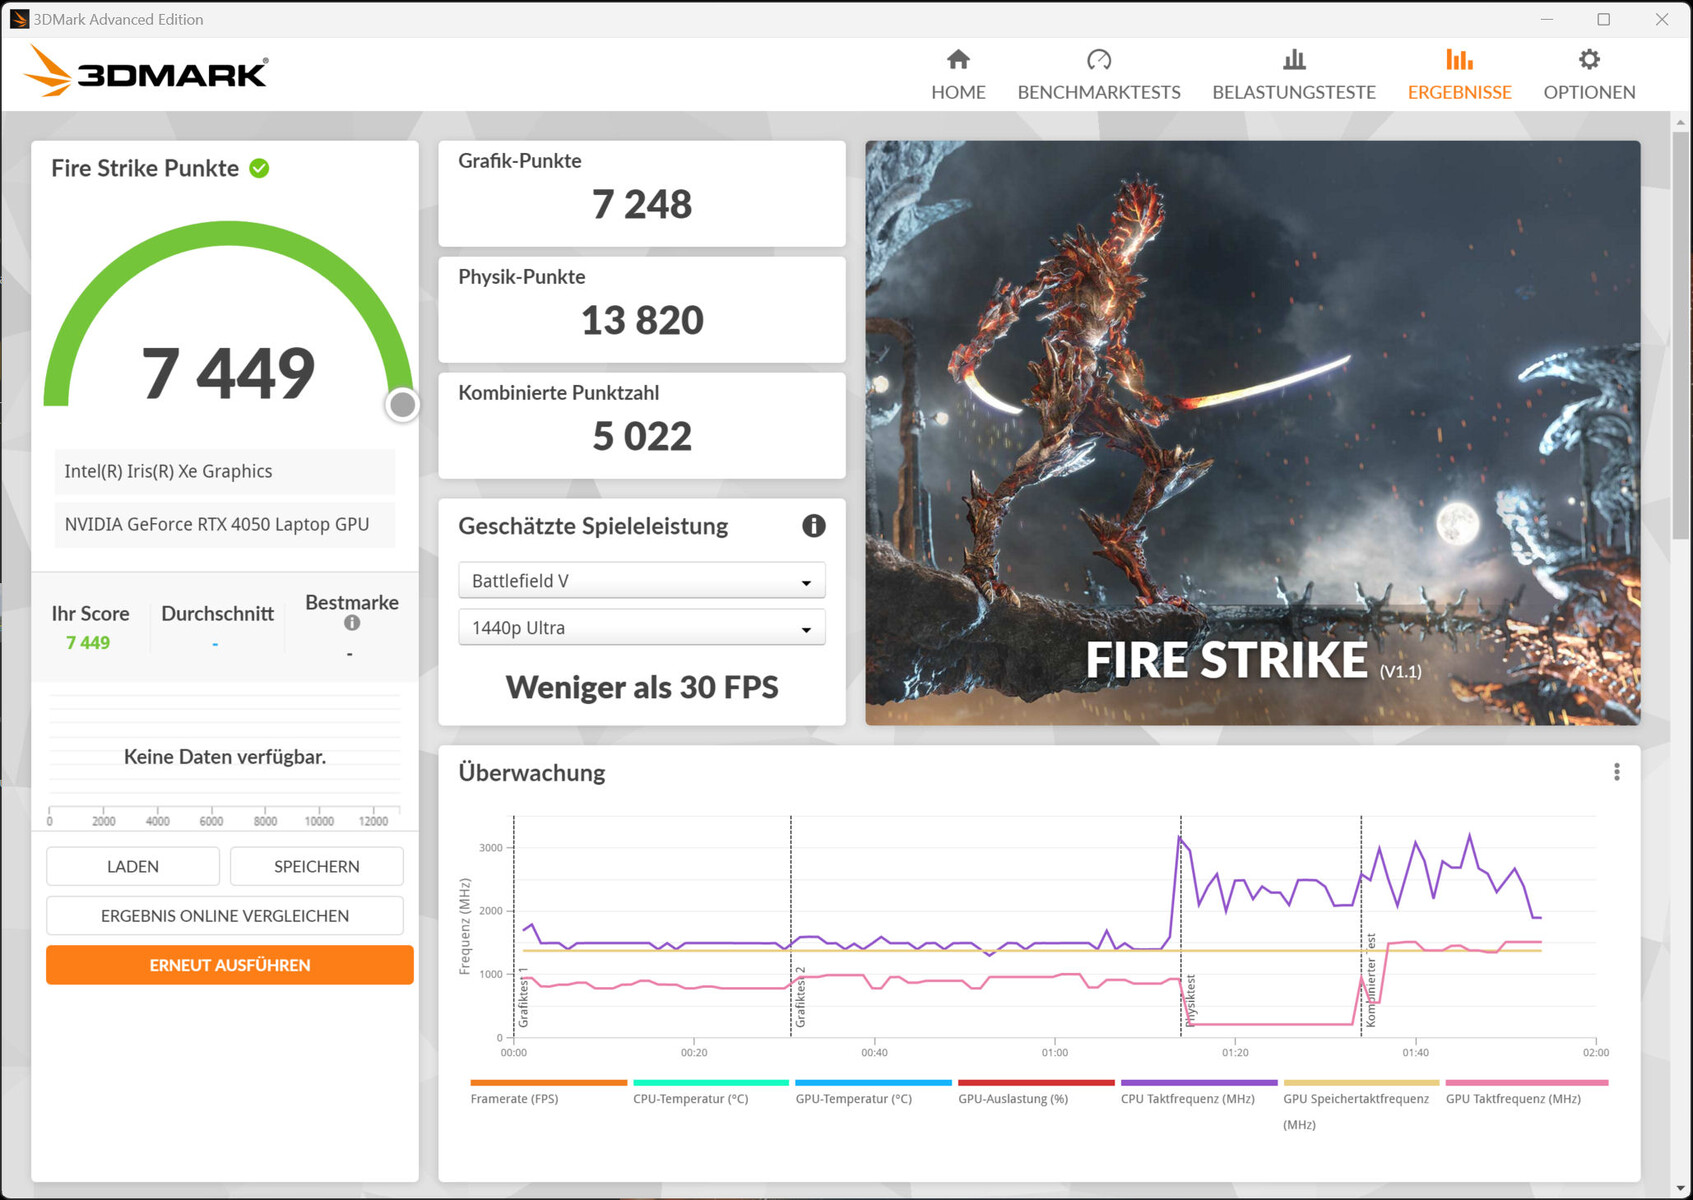
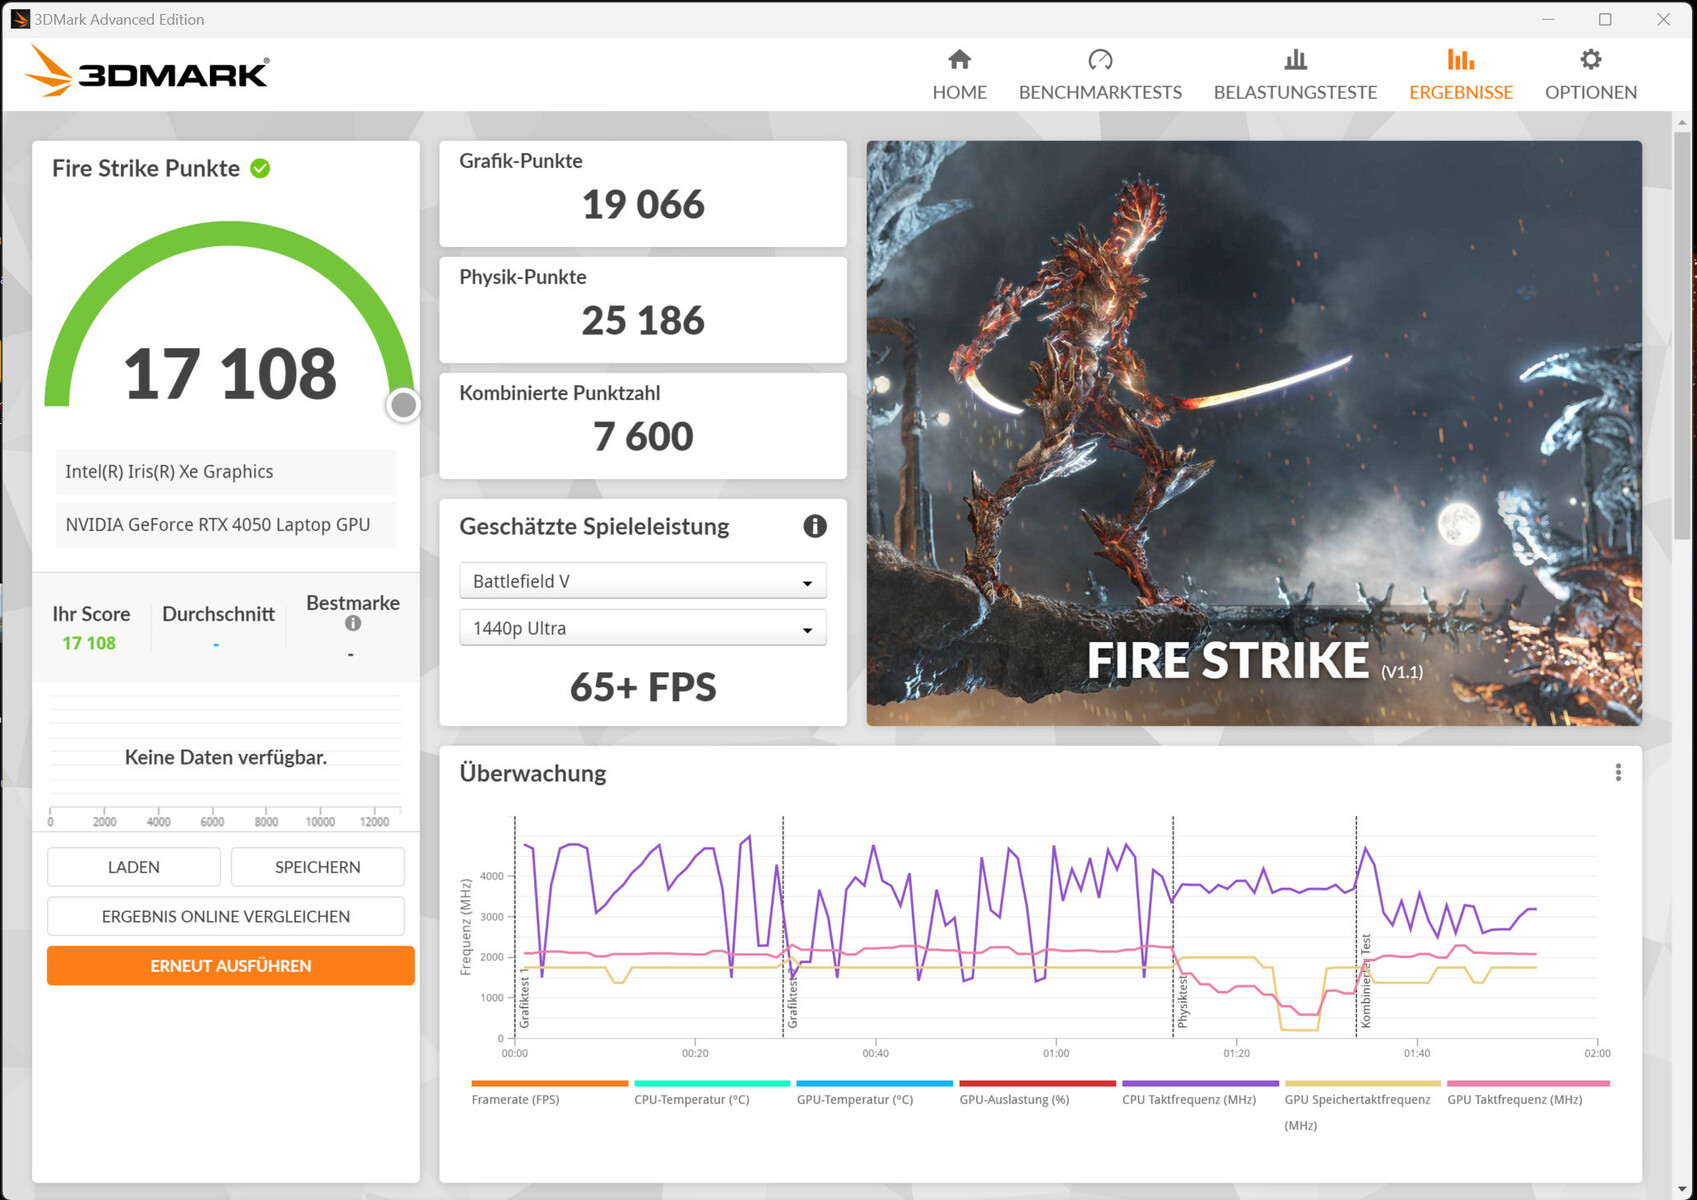
Grafikkarte
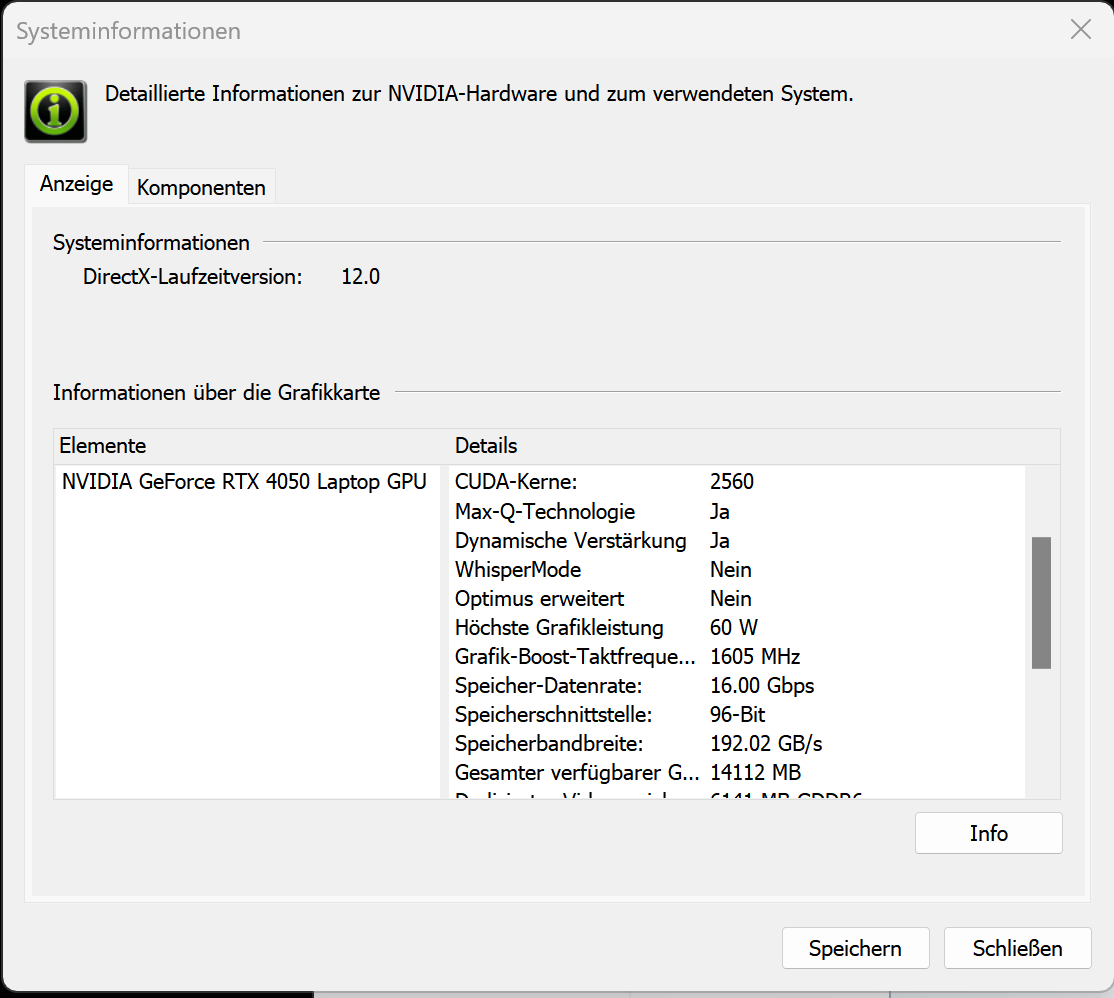
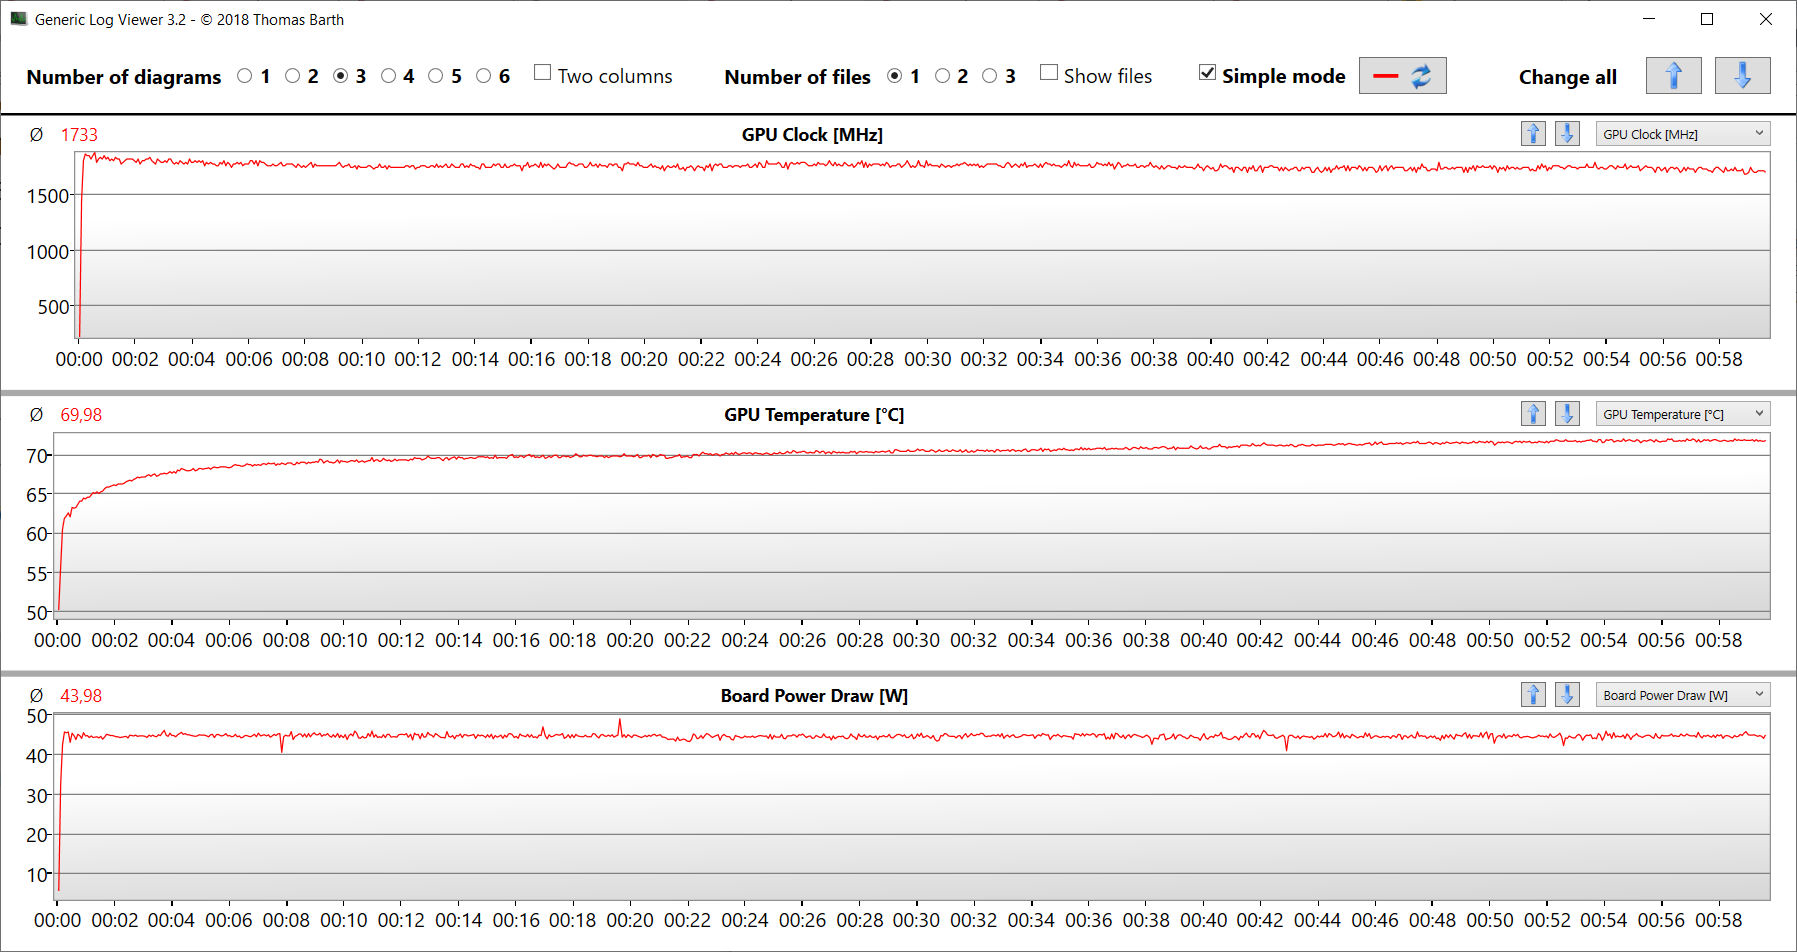
Die GeForce-RTX-4050-Laptop-GPU bietet 2.560 Shader, einen 96 Bit breiten Bus und schnellen GDDR6-Speicher (6.144 MB). Samsung gesteht ihr eine TGP von 60 Watt (35 Watt + 25 Watt Dynamic Boost) zu - ein Wert am unteren Rand der Möglichkeiten. Die TGP wird laut Witcher-3-Test voll ausgereizt - allerdings nur bei aktivem Profil "Hohe Leistung". Einen dGPU-Modus bietet das Notebook nicht.
Die Benchmarkresultate hängen vom gewählten Leistungsprofil ab, bewegen sich aber in jedem Fall unterhalb des RTX-4050-Durchschnitts. Grundsätzlich arbeitet die RTX 4050 bei niedriger TGP recht effizient: Pro Watt erreicht sie mehr Punkte bzw. höhere Frameraten als die RTX 4050 des MSI Katana 15 (TGP: 105 Watt).
| 3DMark Performance Rating - Percent | |
| Schenker Vision 16 Pro RTX 3070 Ti -1! | |
| MSI Katana 15 B12VEK | |
| Durchschnittliche NVIDIA GeForce RTX 4050 Laptop GPU | |
| Lenovo ThinkBook 16p G3 ARH | |
| Samsung Galaxy Book3 Ultra 16 | |
| Samsung Galaxy Book3 Ultra 16 | |
| Durchschnitt der Klasse Multimedia | |
| Samsung Galaxy Book3 Ultra 16 | |
| Dell XPS 15 9520 RTX 3050 Ti | |
| Asus VivoBook Pro 16X OLED N7600PC-L2026X | |
| Acer Swift X SFX16-52G-77RX | |
| LG Gram 17Z90Q-E.AD78G | |
| 3DMark 11 - 1280x720 Performance GPU | |
| Schenker Vision 16 Pro RTX 3070 Ti | |
| MSI Katana 15 B12VEK | |
| Durchschnittliche NVIDIA GeForce RTX 4050 Laptop GPU (13339 - 32642, n=41) | |
| Samsung Galaxy Book3 Ultra 16 (Hohe Leistung) | |
| Lenovo ThinkBook 16p G3 ARH | |
| Samsung Galaxy Book3 Ultra 16 | |
| Durchschnitt der Klasse Multimedia (3749 - 60002, n=61, der letzten 2 Jahre) | |
| Samsung Galaxy Book3 Ultra 16 (Leise) | |
| Asus VivoBook Pro 16X OLED N7600PC-L2026X | |
| Dell XPS 15 9520 RTX 3050 Ti | |
| Acer Swift X SFX16-52G-77RX | |
| LG Gram 17Z90Q-E.AD78G | |
| 3DMark 06 Standard Score | 45618 Punkte | |
| 3DMark 11 Performance | 18217 Punkte | |
| 3DMark Cloud Gate Standard Score | 41061 Punkte | |
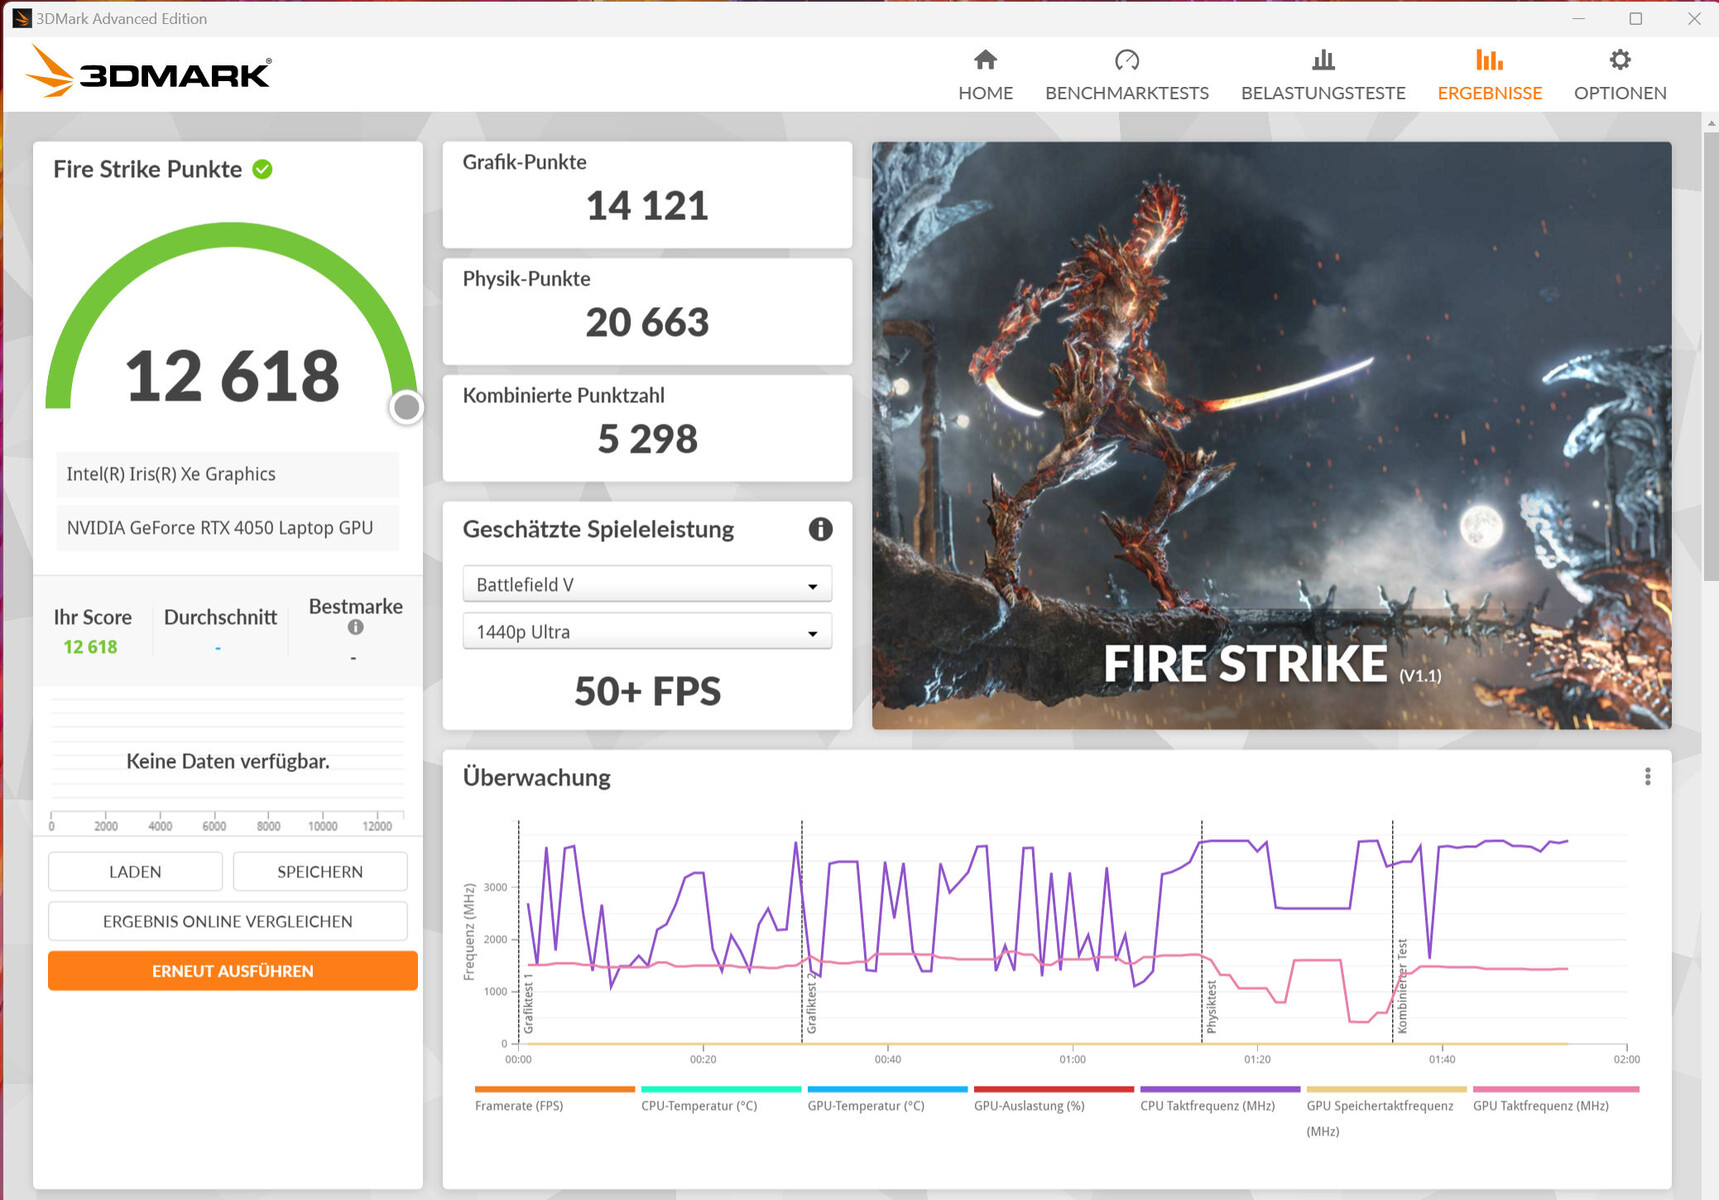
| 3DMark Fire Strike Score | 14064 Punkte | |
| 3DMark Time Spy Score | 5784 Punkte | |
Hilfe | ||
| V-Ray Benchmark Next 4.10 | |
| GPU | |
| Durchschnittliche NVIDIA GeForce RTX 4050 Laptop GPU (333 - 565, n=35) | |
| Schenker Vision 16 Pro RTX 3070 Ti (v4.10.07 ) | |
| Samsung Galaxy Book3 Ultra 16 (v4.10.07, Hohe Leistung) | |
| Samsung Galaxy Book3 Ultra 16 (v4.10.07 ) | |
| Samsung Galaxy Book3 Ultra 16 (v4.10.07, Leise) | |
| Durchschnitt der Klasse Multimedia (32 - 1191, n=59, der letzten 2 Jahre) | |
| Asus VivoBook Pro 16X OLED N7600PC-L2026X (v4.10.07 ) | |
| LG Gram 17Z90Q-E.AD78G (v4.10.07 ) | |
| Acer Swift X SFX16-52G-77RX (v4.10.07 ) | |
| CPU | |
| Durchschnitt der Klasse Multimedia (4772 - 35165, n=59, der letzten 2 Jahre) | |
| Samsung Galaxy Book3 Ultra 16 (v4.10.07, Hohe Leistung ) | |
| Durchschnittliche NVIDIA GeForce RTX 4050 Laptop GPU (5413 - 24181, n=35) | |
| Samsung Galaxy Book3 Ultra 16 (v4.10.07 ) | |
| Schenker Vision 16 Pro RTX 3070 Ti (v4.10.07 ) | |
| Samsung Galaxy Book3 Ultra 16 (v4.10.07, Leise) | |
| Acer Swift X SFX16-52G-77RX (v4.10.07 ) | |
| LG Gram 17Z90Q-E.AD78G (v4.10.07 ) | |
| Asus VivoBook Pro 16X OLED N7600PC-L2026X (v4.10.07 ) | |
* ... kleinere Werte sind besser
Gaming Performance
Der Laptop bewältigt FHD-Gaming bei mittleren bis hohen teils maximalen Settings. Die volle Pracht (2.880 x 1.800 Pixel) des OLED-Bildschirms kann bei reduzierten Settings zur Geltung gebracht werden. Die Bildwiederholraten hängen vom genutzten Leistungsmodus ab, bewegen sich aber immer unterhalb des RTX-4050-Durchschnitts. "Hohe Leistung" liefert um etwa 20 bis 30 Prozent höhere Frameraten als "Optimiert". Das Profil "Leise" eignet sich primär für Gaming auf HD-Niveau.
| Performance Rating - Percent | |
| Schenker Vision 16 Pro RTX 3070 Ti | |
| MSI Katana 15 B12VEK | |
| Durchschnittliche NVIDIA GeForce RTX 4050 Laptop GPU | |
| Samsung Galaxy Book3 Ultra 16 | |
| Lenovo ThinkBook 16p G3 ARH | |
| Samsung Galaxy Book3 Ultra 16 | |
| Dell XPS 15 9520 RTX 3050 Ti | |
| Durchschnitt der Klasse Multimedia | |
| Asus VivoBook Pro 16X OLED N7600PC-L2026X | |
| LG Gram 17Z90Q-E.AD78G | |
| Samsung Galaxy Book3 Ultra 16 | |
| Acer Swift X SFX16-52G-77RX | |
| The Witcher 3 - 1920x1080 Ultra Graphics & Postprocessing (HBAO+) | |
| Schenker Vision 16 Pro RTX 3070 Ti | |
| MSI Katana 15 B12VEK | |
| Durchschnittliche NVIDIA GeForce RTX 4050 Laptop GPU (18.5 - 94.7, n=40) | |
| Lenovo ThinkBook 16p G3 ARH | |
| Samsung Galaxy Book3 Ultra 16 (Hohe Leistung) | |
| Samsung Galaxy Book3 Ultra 16 | |
| Durchschnitt der Klasse Multimedia (11 - 121, n=11, der letzten 2 Jahre) | |
| Asus VivoBook Pro 16X OLED N7600PC-L2026X | |
| Dell XPS 15 9520 RTX 3050 Ti | |
| LG Gram 17Z90Q-E.AD78G | |
| Acer Swift X SFX16-52G-77RX | |
| Samsung Galaxy Book3 Ultra 16 | |
| GTA V - 1920x1080 Highest AA:4xMSAA + FX AF:16x | |
| Schenker Vision 16 Pro RTX 3070 Ti | |
| MSI Katana 15 B12VEK | |
| Samsung Galaxy Book3 Ultra 16 (Hohe Leistung) | |
| Durchschnittliche NVIDIA GeForce RTX 4050 Laptop GPU (14.9 - 101.7, n=35) | |
| Lenovo ThinkBook 16p G3 ARH | |
| Samsung Galaxy Book3 Ultra 16 | |
| Durchschnitt der Klasse Multimedia (7.92 - 141.6, n=61, der letzten 2 Jahre) | |
| Asus VivoBook Pro 16X OLED N7600PC-L2026X | |
| Dell XPS 15 9520 RTX 3050 Ti | |
| LG Gram 17Z90Q-E.AD78G | |
| Acer Swift X SFX16-52G-77RX | |
| Samsung Galaxy Book3 Ultra 16 (Leise) | |
| Final Fantasy XV Benchmark - 1920x1080 High Quality | |
| Schenker Vision 16 Pro RTX 3070 Ti (1.3) | |
| MSI Katana 15 B12VEK (1.3) | |
| Lenovo ThinkBook 16p G3 ARH (1.3) | |
| Durchschnittliche NVIDIA GeForce RTX 4050 Laptop GPU (15.5 - 122.3, n=39) | |
| Samsung Galaxy Book3 Ultra 16 (1.3, Hohe Leistung) | |
| Samsung Galaxy Book3 Ultra 16 (1.3) | |
| Durchschnitt der Klasse Multimedia (7.61 - 144.4, n=64, der letzten 2 Jahre) | |
| Dell XPS 15 9520 RTX 3050 Ti (1.3) | |
| Asus VivoBook Pro 16X OLED N7600PC-L2026X (1.3) | |
| LG Gram 17Z90Q-E.AD78G (1.3) | |
| Acer Swift X SFX16-52G-77RX (1.3) | |
| Samsung Galaxy Book3 Ultra 16 (1.3, Leise) | |
| Strange Brigade - 1920x1080 ultra AA:ultra AF:16 | |
| Schenker Vision 16 Pro RTX 3070 Ti (1.47.22.14 D3D12) | |
| MSI Katana 15 B12VEK (1.47.22.14 D3D12) | |
| Durchschnittliche NVIDIA GeForce RTX 4050 Laptop GPU (21.2 - 156.6, n=38) | |
| Lenovo ThinkBook 16p G3 ARH (1.47.22.14 D3D12) | |
| Samsung Galaxy Book3 Ultra 16 (1.47.22.14 D3D12, Hohe Leistung) | |
| Samsung Galaxy Book3 Ultra 16 (1.47.22.14 D3D12) | |
| Durchschnitt der Klasse Multimedia (13.3 - 303, n=64, der letzten 2 Jahre) | |
| Dell XPS 15 9520 RTX 3050 Ti (1.47.22.14 D3D12) | |
| Asus VivoBook Pro 16X OLED N7600PC-L2026X (1.47.22.14 D3D12) | |
| Acer Swift X SFX16-52G-77RX (1.47.22.14 D3D12) | |
| LG Gram 17Z90Q-E.AD78G (1.47.22.14 D3D12) | |
| Samsung Galaxy Book3 Ultra 16 (1.47.22.14 D3D12, Leise) | |
| Dota 2 Reborn - 1920x1080 ultra (3/3) best looking | |
| Schenker Vision 16 Pro RTX 3070 Ti | |
| MSI Katana 15 B12VEK | |
| Samsung Galaxy Book3 Ultra 16 (Hohe Leistung) | |
| Durchschnittliche NVIDIA GeForce RTX 4050 Laptop GPU (73.5 - 175.6, n=39) | |
| Samsung Galaxy Book3 Ultra 16 (Leise) | |
| Dell XPS 15 9520 RTX 3050 Ti | |
| Asus VivoBook Pro 16X OLED N7600PC-L2026X | |
| Lenovo ThinkBook 16p G3 ARH | |
| Durchschnitt der Klasse Multimedia (29 - 179.9, n=66, der letzten 2 Jahre) | |
| Samsung Galaxy Book3 Ultra 16 | |
| Acer Swift X SFX16-52G-77RX | |
| LG Gram 17Z90Q-E.AD78G | |
| X-Plane 11.11 - 1920x1080 high (fps_test=3) | |
| Schenker Vision 16 Pro RTX 3070 Ti | |
| Dell XPS 15 9520 RTX 3050 Ti | |
| Samsung Galaxy Book3 Ultra 16 (Hohe Leistung) | |
| MSI Katana 15 B12VEK | |
| Durchschnittliche NVIDIA GeForce RTX 4050 Laptop GPU (55.5 - 117, n=40) | |
| Samsung Galaxy Book3 Ultra 16 (Leise) | |
| Samsung Galaxy Book3 Ultra 16 | |
| Asus VivoBook Pro 16X OLED N7600PC-L2026X | |
| Lenovo ThinkBook 16p G3 ARH | |
| LG Gram 17Z90Q-E.AD78G | |
| LG Gram 17Z90Q-E.AD78G | |
| Durchschnitt der Klasse Multimedia (16.9 - 141.1, n=60, der letzten 2 Jahre) | |
| Acer Swift X SFX16-52G-77RX | |
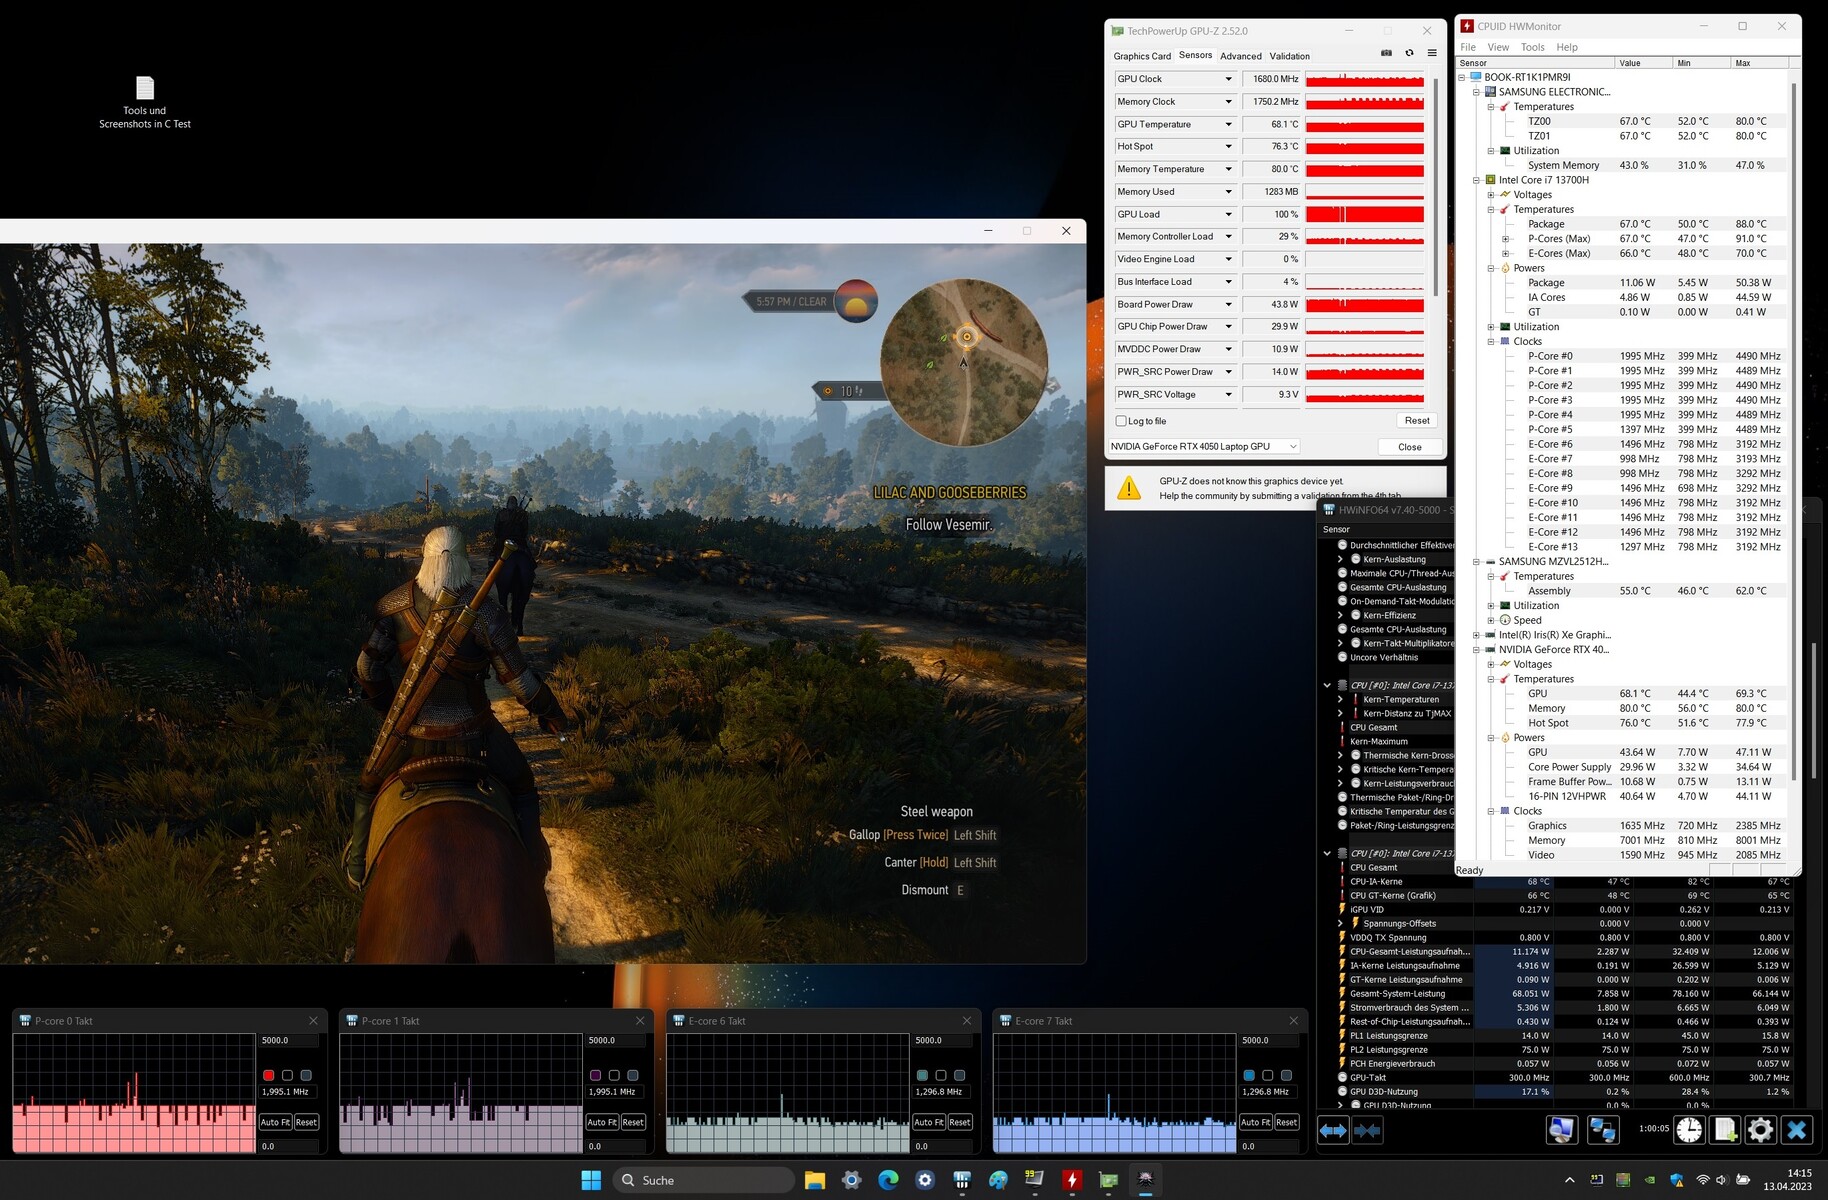
Um zu überprüfen, ob die Bildwiederholraten über einen längeren Zeitraum weitgehend konstant bleiben, lassen wir das Spiel "The Witcher 3" für etwa 60 Minuten mit Full-HD-Auflösung und maximalen Qualitätseinstellungen laufen. Die Spielfigur wird nicht bewegt. Ein Einbruch der Bildwiederholraten ist nicht festzustellen.
Witcher 3 FPS-Diagramm

| min. | mittel | hoch | max. | QHD | |
|---|---|---|---|---|---|
| GTA V (2015) | 182.1 | 166.5 | 133.2 | 65.3 | 50.5 |
| The Witcher 3 (2015) | 268.5 | 184.1 | 107.1 | 60.1 | |
| Dota 2 Reborn (2015) | 161.8 | 138.7 | 79.2 | 73.5 | |
| Final Fantasy XV Benchmark (2018) | 105 | 77.2 | 56.9 | 41.5 | |
| X-Plane 11.11 (2018) | 143.6 | 88.2 | 79 | ||
| Far Cry 5 (2018) | 148 | 87 | 74 | 71 | 56 |
| Strange Brigade (2018) | 321 | 153.5 | 120.1 | 103.9 | 72.7 |
| The Division 2 (2019) | 130 | 83 | 69 | 53 | 35 |
| Doom Eternal (2020) | 228 | 135.6 | 124.7 | 114.3 | 82.5 |
| Gears Tactics (2020) | 268.5 | 141.8 | 95.2 | 64.8 | 44.8 |
| Flight Simulator 2020 (2020) | 107.2 | 57.6 | 40.5 | 30.6 | 22.9 |
| Crysis Remastered (2020) | 242 | 121.1 | 49.5 | 41.6 | 28.6 |
| Hitman 3 (2021) | 193.9 | 111.4 | 101 | 94.2 | 60.1 |
| Alan Wake Remastered (2021) | 161.5 | 98.3 | 86.7 | 63.2 | |
| Riders Republic (2021) | 138 | 72 | 67 | 63 | 44 |
| Forza Horizon 5 (2021) | 119 | 68 | 69 | 42 | 36 |
| Rainbow Six Extraction (2022) | 139 | 115 | 111 | 89 | 56 |
| Cyberpunk 2077 1.6 (2022) | 71 | 54.7 | 48 | 44.4 | 27.2 |
| Tiny Tina's Wonderlands (2022) | 104.5 | 93.4 | 63.3 | 49.8 | 33.6 |
| F1 22 (2022) | 135.3 | 127.4 | 97.5 | 36.2 | 23.1 |
| The Quarry (2022) | 91 | 68.8 | 57 | 44.6 | 28.5 |
| FIFA 23 (2022) | 94.3 | ||||
| A Plague Tale Requiem (2022) | 58.6 | 49 | 42.8 | 36.3 | 27.5 |
| Call of Duty Modern Warfare 2 2022 (2022) | 79 | 73 | 56 | 54 | 36 |
| Spider-Man Miles Morales (2022) | 72.9 | 67.1 | 56.9 | 51.5 | 42.5 |
| The Callisto Protocol (2022) | 74 | 62.5 | 59.3 | 41.4 | 29.5 |
| Need for Speed Unbound (2022) | 51.2 | 42.8 | 37 | 28.9 | 26.7 |
| High On Life (2023) | 104.9 | 78.1 | 65.3 | 57.3 | 35.7 |
| The Witcher 3 v4 (2023) | 113.4 | 82.5 | 43 | 38.1 | 23.8 |
| Dead Space Remake (2023) | 47.9 | 47.7 | 40.2 | 39.8 | 25.1 |
| Hogwarts Legacy (2023) | 92 | 74.2 | 59.6 | 51.9 | 23.9 |
| Returnal (2023) | 59 | 57 | 52 | 44 | |
| Atomic Heart (2023) | 95 | 76.1 | 47.8 | 37.8 | 28.2 |
| Company of Heroes 3 (2023) | 116.4 | 106.2 | 79 | 79.7 | 55.7 |
| Resident Evil 4 Remake (2023) | 81 | 57.7 | 53.4 | 36.8 | 23.8 |
Emissionen - Samsung Ultrabook mit moderater Lärmentwicklung
Geräuschemissionen
Insgesamt hat Samsung die Lärmentwicklung recht gut im Griff. Die Profile des Notebooks bieten ein akzeptables Verhältnis von Lärm und Leistung. Der Höchstwert von 48 dB(A) wird während des Witcher-3-Tests bei aktivem Profil "Hohe Leistung" erreicht. "Optimiert" sorgt für eine moderate Lärmentwicklung bei immer noch spielbaren Frameraten. Das Profil "Leise" hält, was der Name verspricht. Im Leerlauf und Alltagsbetrieb ist von den zwei Lüftern wenig bis gar nichts zu hören. Oftmals stehen sie still.
Lautstärkediagramm
| Idle |
| 26 / 27 / 28 dB(A) |
| Last |
| 40 / 41 dB(A) |
 | ||
30 dB leise 40 dB(A) deutlich hörbar 50 dB(A) störend |
||
min: | ||
| Samsung Galaxy Book3 Ultra 16 i7-13700H, GeForce RTX 4050 Laptop GPU | Schenker Vision 16 Pro RTX 3070 Ti i7-12700H, GeForce RTX 3070 Ti Laptop GPU | LG Gram 17Z90Q-E.AD78G i7-1260P, GeForce RTX 2050 Mobile | Lenovo ThinkBook 16p G3 ARH R9 6900HX, GeForce RTX 3060 Laptop GPU | Dell XPS 15 9520 RTX 3050 Ti i7-12700H, GeForce RTX 3050 Ti Laptop GPU | Asus VivoBook Pro 16X OLED N7600PC-L2026X i7-11370H, GeForce RTX 3050 4GB Laptop GPU | Acer Swift X SFX16-52G-77RX i7-1260P, A370M | |
|---|---|---|---|---|---|---|---|
| Geräuschentwicklung | -2% | -10% | 5% | 10% | -22% | -0% | |
| aus / Umgebung * (dB) | 25 | 22.9 8% | 26 -4% | 22.7 9% | 22.8 9% | 25.15 -1% | 25 -0% |
| Idle min * (dB) | 26 | 24.3 7% | 28 -8% | 23.1 11% | 22.9 12% | 30 -15% | 25 4% |
| Idle avg * (dB) | 27 | 24.3 10% | 28 -4% | 23.2 14% | 22.9 15% | 30 -11% | 25 7% |
| Idle max * (dB) | 28 | 24.3 13% | 28.8 -3% | 23.6 16% | 22.9 18% | 30 -7% | 25 11% |
| Last avg * (dB) | 40 | 38.5 4% | 49.3 -23% | 30.6 23% | 30.9 23% | 57.6 -44% | 44.7 -12% |
| Witcher 3 ultra * (dB) | 39 | 51 -31% | 47.6 -22% | 37.8 3% | |||
| Last max * (dB) | 41 | 51 -24% | 49.1 -20% | 47.5 -16% | 44.7 -9% | 62.9 -53% | 45.6 -11% |
* ... kleinere Werte sind besser
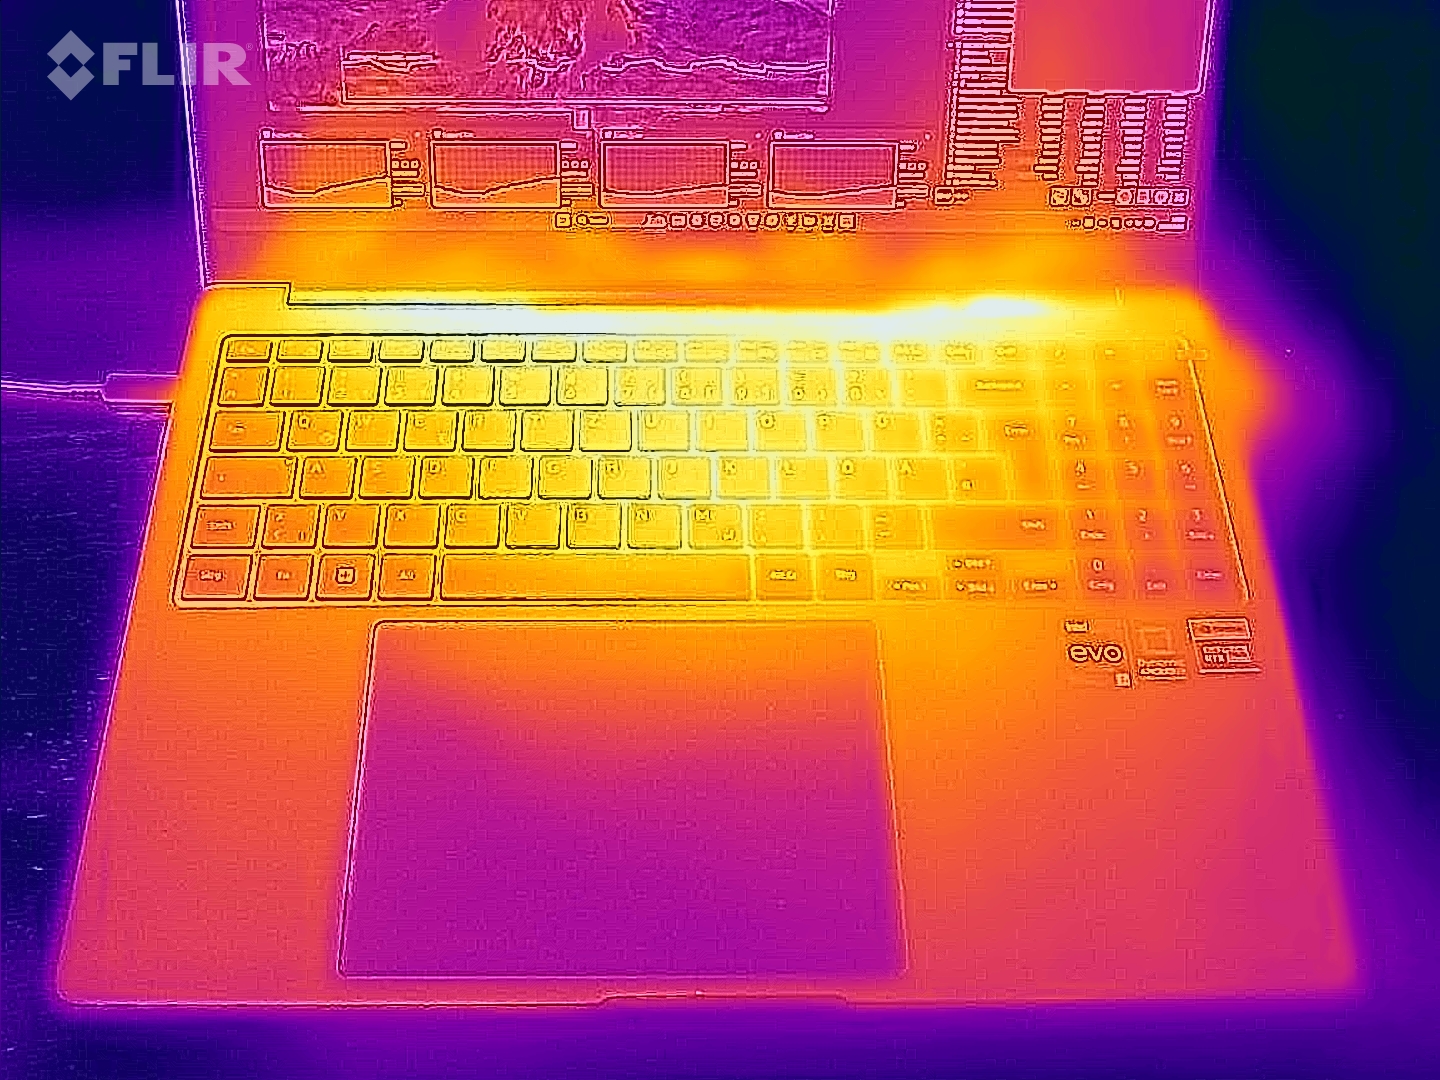
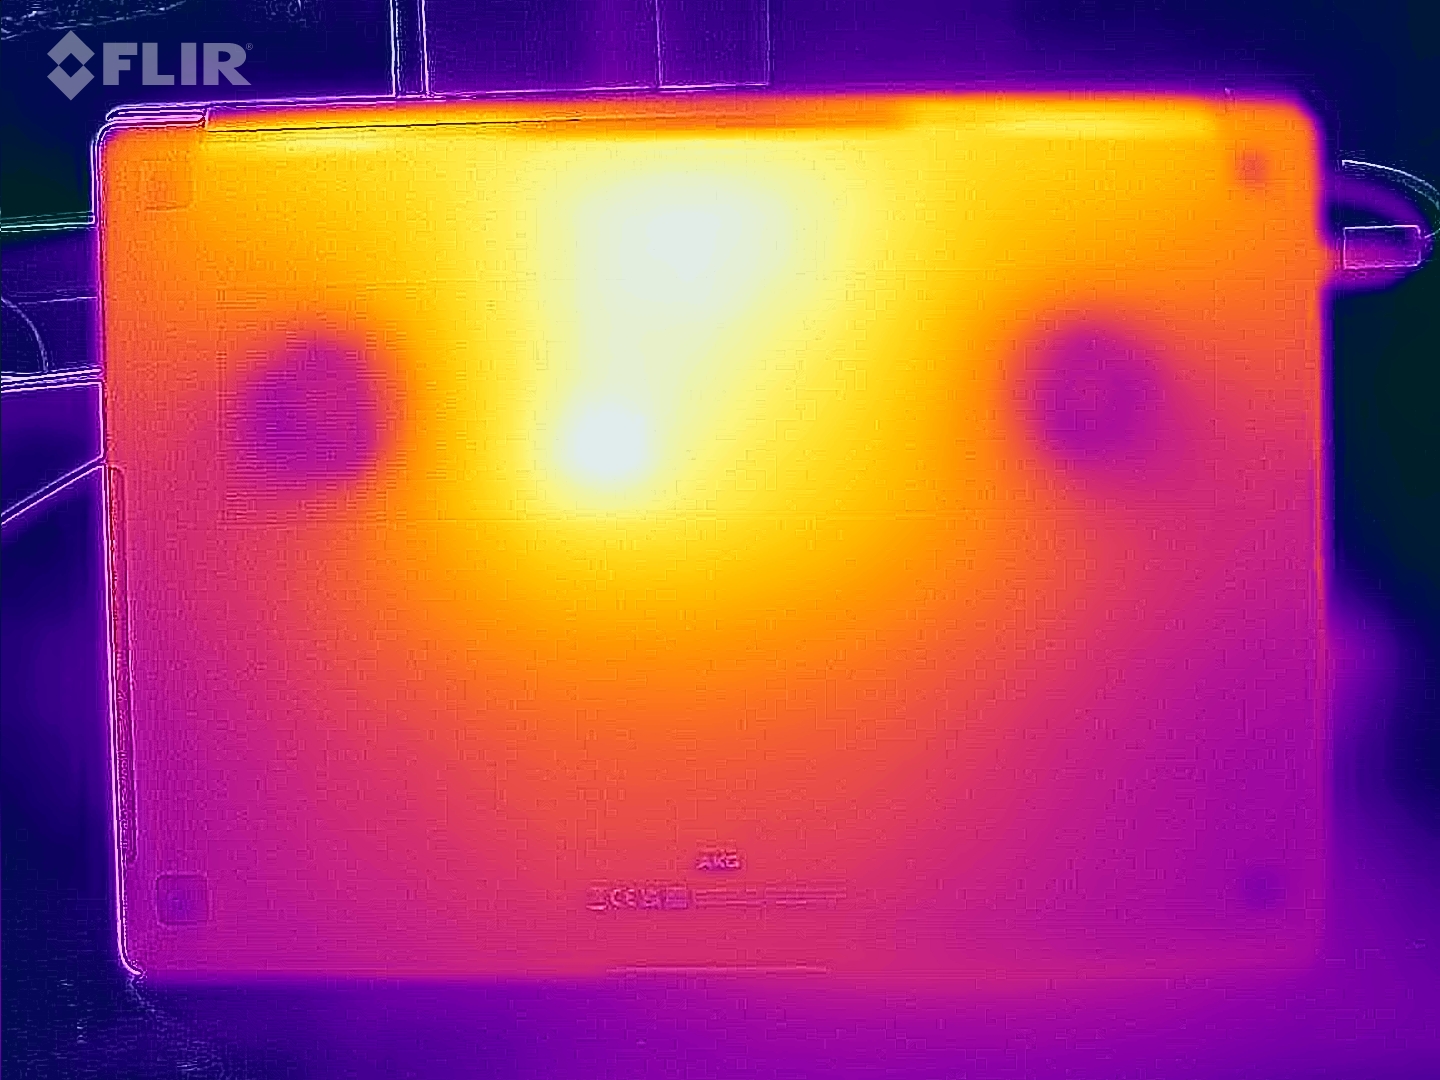
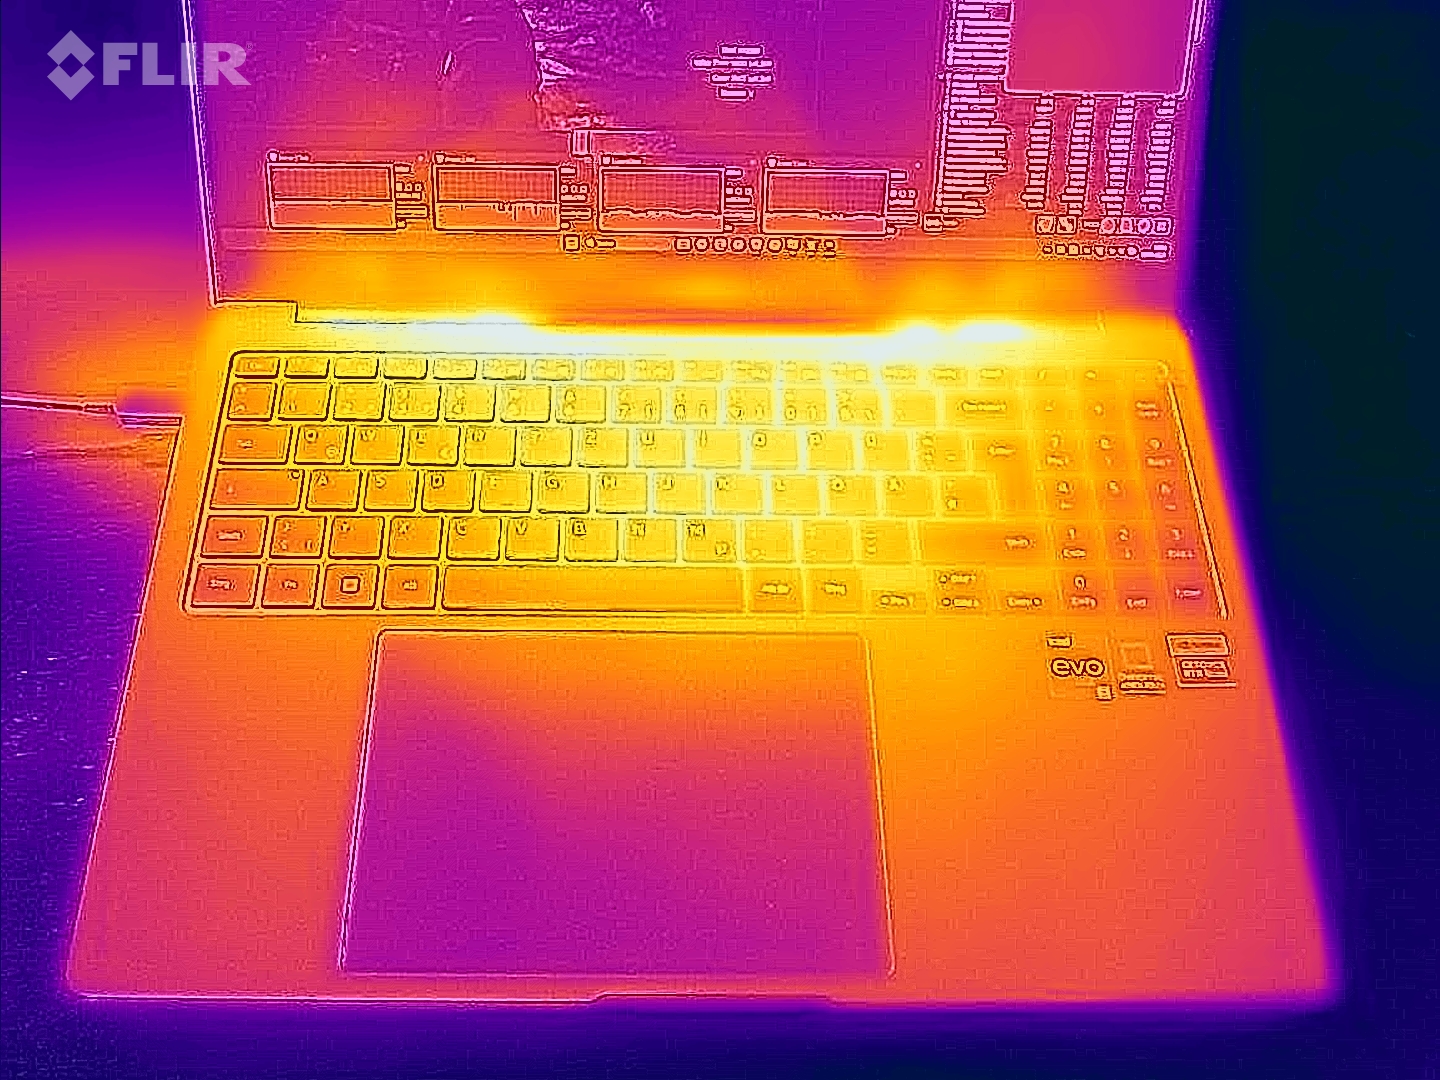
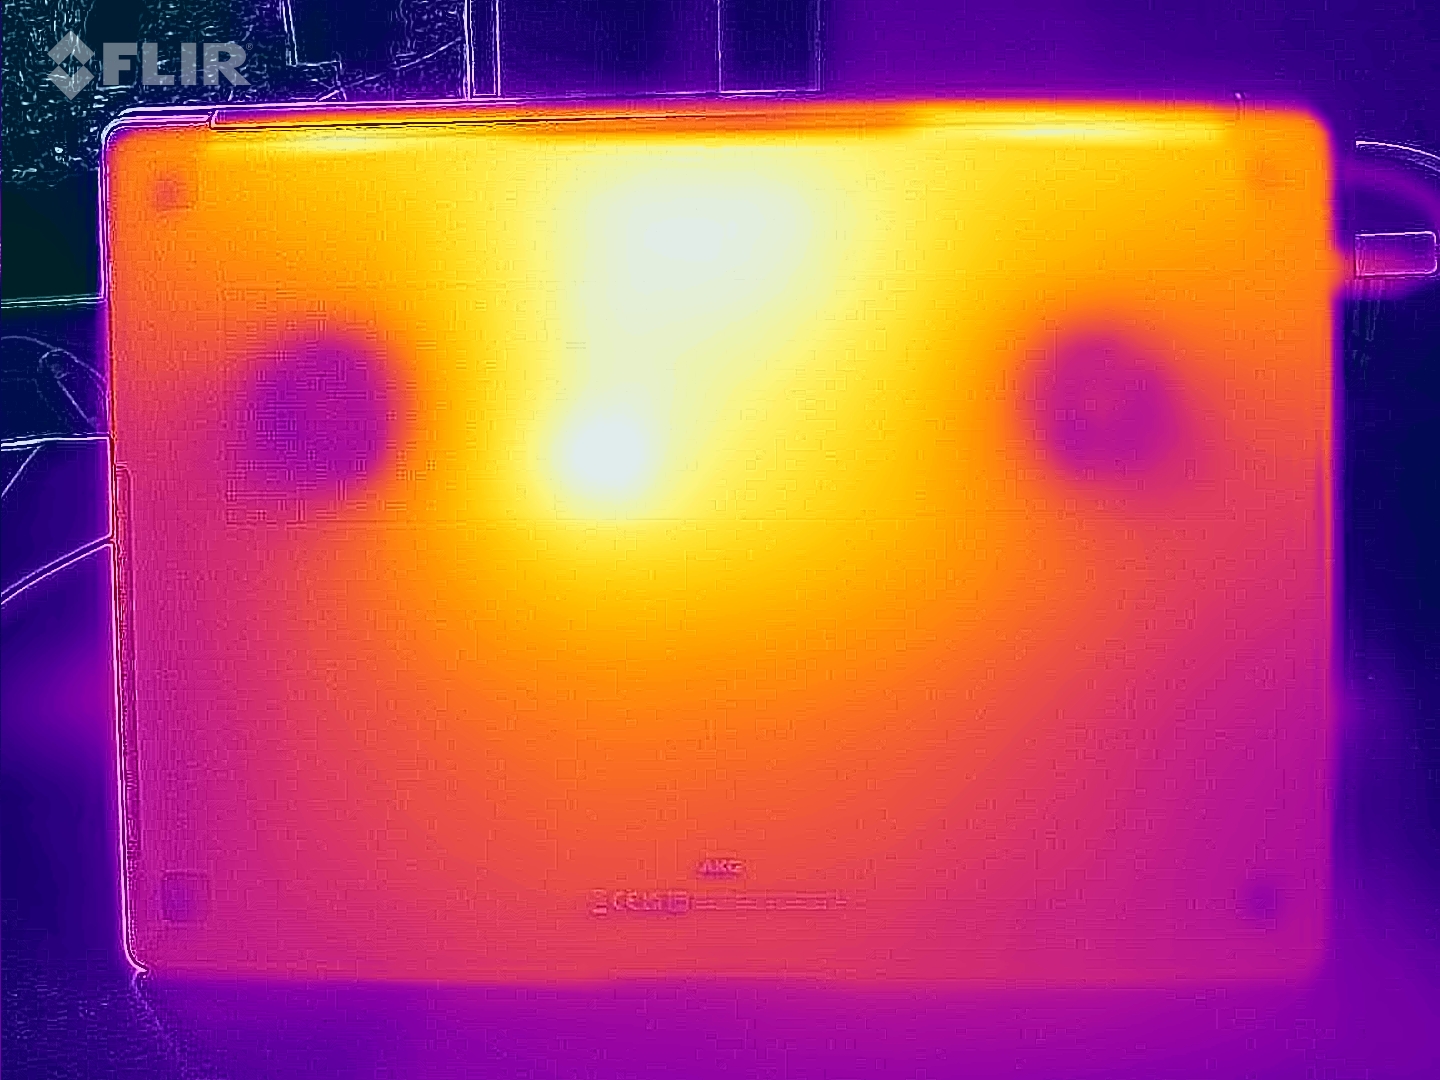
Temperatur
Im Alltagsbetrieb (Office, Internet) verbleiben die Gehäuse-Temperaturen im grünen Bereich. Unter Last (Stresstest, Witcher-3-Test) erwärmt sich das Notebook spürbar, aber nicht übermäßig stark. Die CPU-Temperaturen geben keinen Anlass zur Sorge.
(±) Die maximale Temperatur auf der Oberseite ist 41 °C. Im Vergleich liegt der Klassendurchschnitt bei 36.8 °C (von 21 bis 71 °C für die Klasse Multimedia).
(±) Auf der Unterseite messen wir eine maximalen Wert von 44 °C (im Vergleich zum Durchschnitt von 39.1 °C).
(+) Ohne Last messen wir eine durchschnittliche Temperatur von 22.9 °C auf der Oberseite. Der Klassendurchschnitt erreicht 31.3 °C.
(-) Beim längeren Spielen von The Witcher 3 erhitzt sich das Gerät durchschnittlich auf 38.6 °C. Der Durchschnitt der Klasse ist derzeit 31.3 °C.
(+) Die Handballen und der Touchpad-Bereich erreichen maximal 35 °C und damit die typische Hauttemperatur und fühlen sich daher nicht heiß an.
(-) Die durchschnittliche Handballen-Temperatur anderer getesteter Geräte war 28.7 °C (-6.3 °C).
| Samsung Galaxy Book3 Ultra 16 Intel Core i7-13700H, NVIDIA GeForce RTX 4050 Laptop GPU | Schenker Vision 16 Pro RTX 3070 Ti Intel Core i7-12700H, NVIDIA GeForce RTX 3070 Ti Laptop GPU | LG Gram 17Z90Q-E.AD78G Intel Core i7-1260P, NVIDIA GeForce RTX 2050 Mobile | Lenovo ThinkBook 16p G3 ARH AMD Ryzen 9 6900HX, NVIDIA GeForce RTX 3060 Laptop GPU | Dell XPS 15 9520 RTX 3050 Ti Intel Core i7-12700H, NVIDIA GeForce RTX 3050 Ti Laptop GPU | Asus VivoBook Pro 16X OLED N7600PC-L2026X Intel Core i7-11370H, NVIDIA GeForce RTX 3050 4GB Laptop GPU | Acer Swift X SFX16-52G-77RX Intel Core i7-1260P, Intel Arc A370M | |
|---|---|---|---|---|---|---|---|
| Hitze | -12% | -15% | -25% | -25% | -14% | -24% | |
| Last oben max * (°C) | 41 | 50.8 -24% | 50.3 -23% | 48.2 -18% | 51.4 -25% | 40.6 1% | 49.4 -20% |
| Last unten max * (°C) | 44 | 46.3 -5% | 52.5 -19% | 49.6 -13% | 51 -16% | 53 -20% | 55.5 -26% |
| Idle oben max * (°C) | 23 | 27.2 -18% | 26.9 -17% | 31.8 -38% | 30 -30% | 29 -26% | 28.4 -23% |
| Idle unten max * (°C) | 26 | 26.6 -2% | 26.5 -2% | 33.6 -29% | 33 -27% | 28.3 -9% | 32.6 -25% |
* ... kleinere Werte sind besser
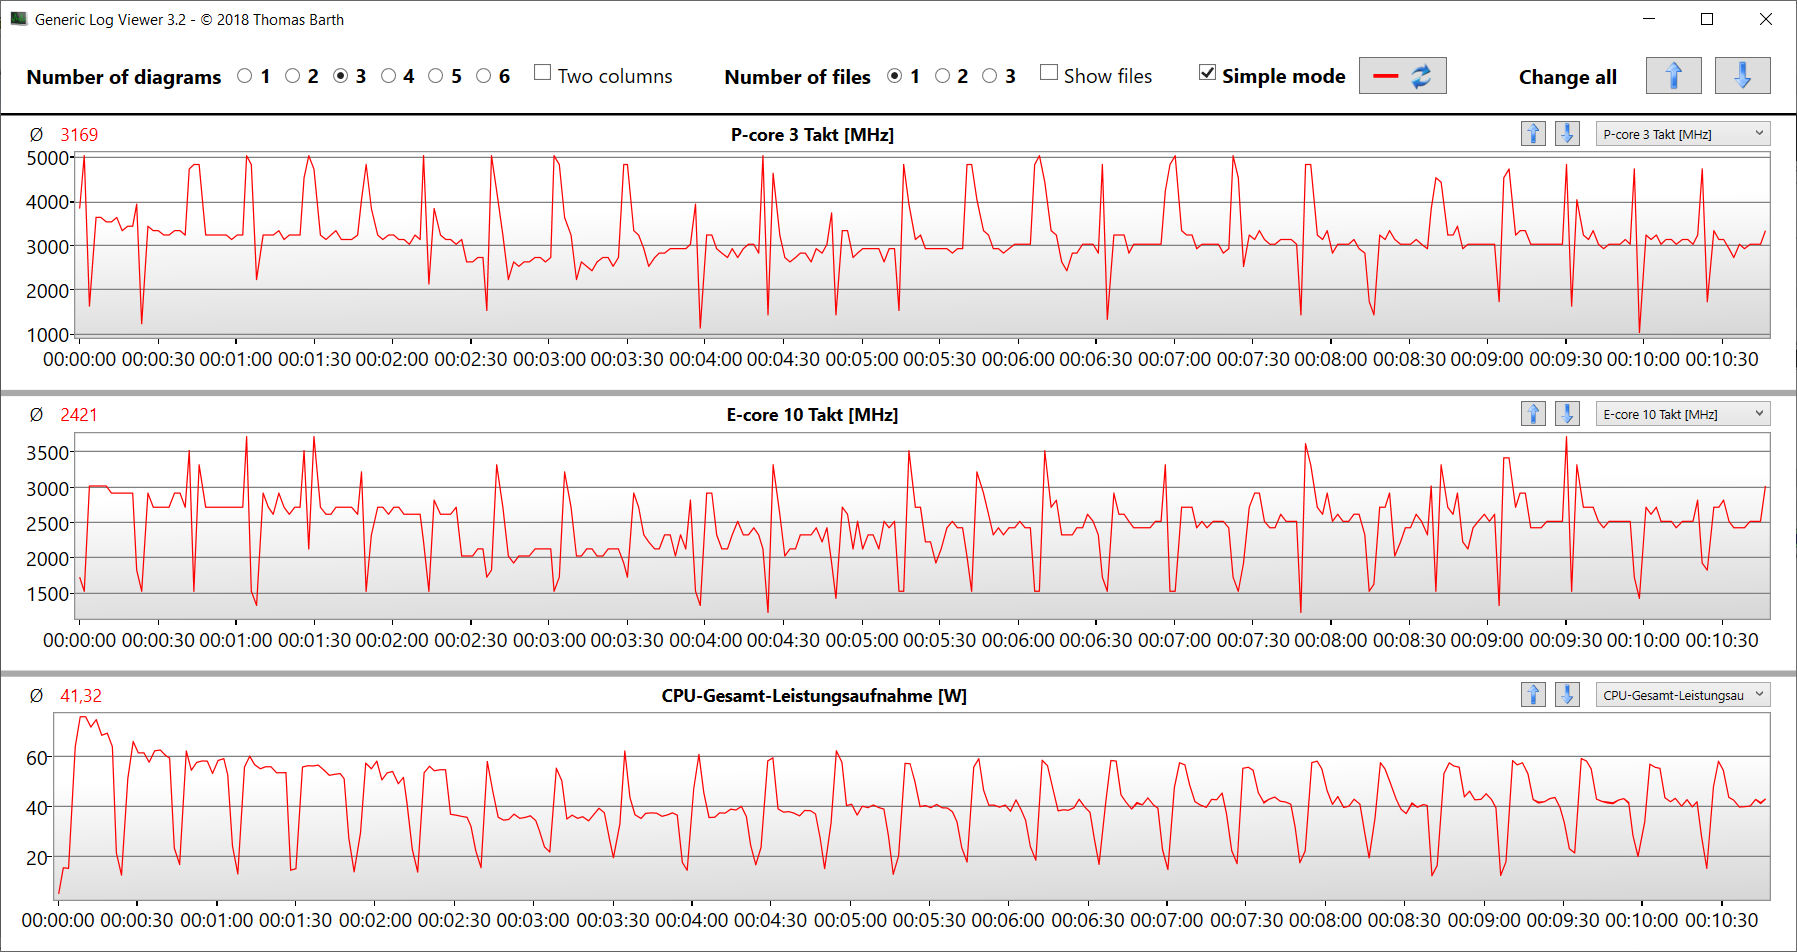
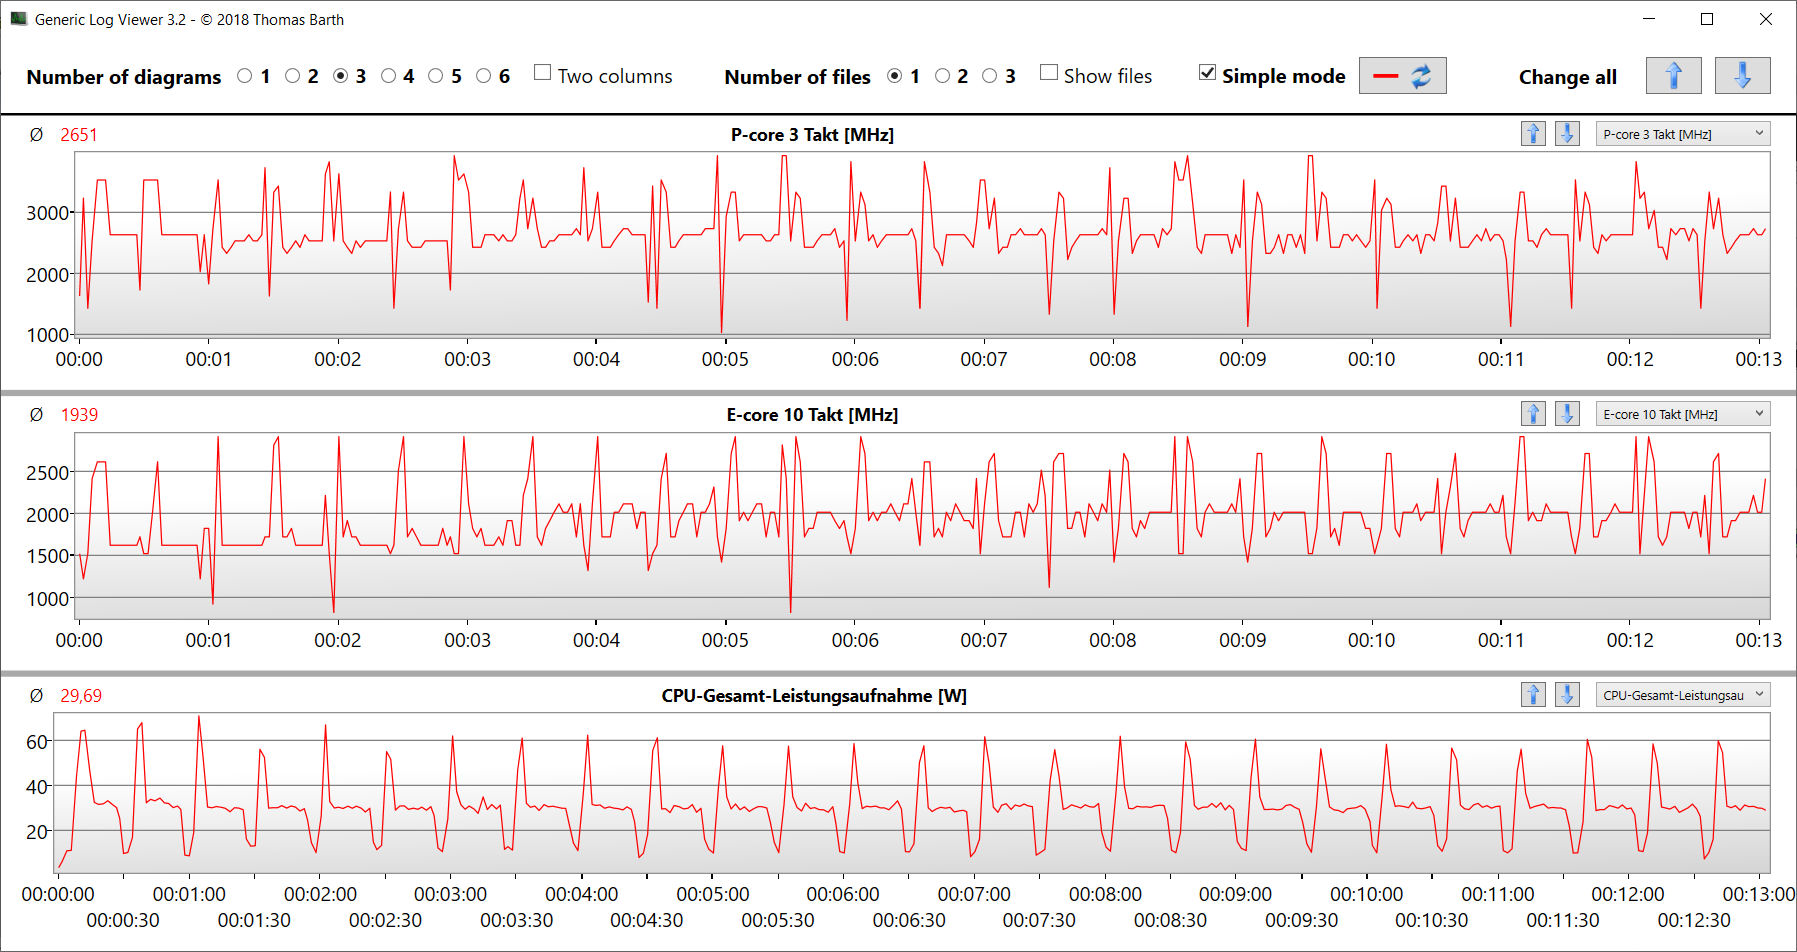
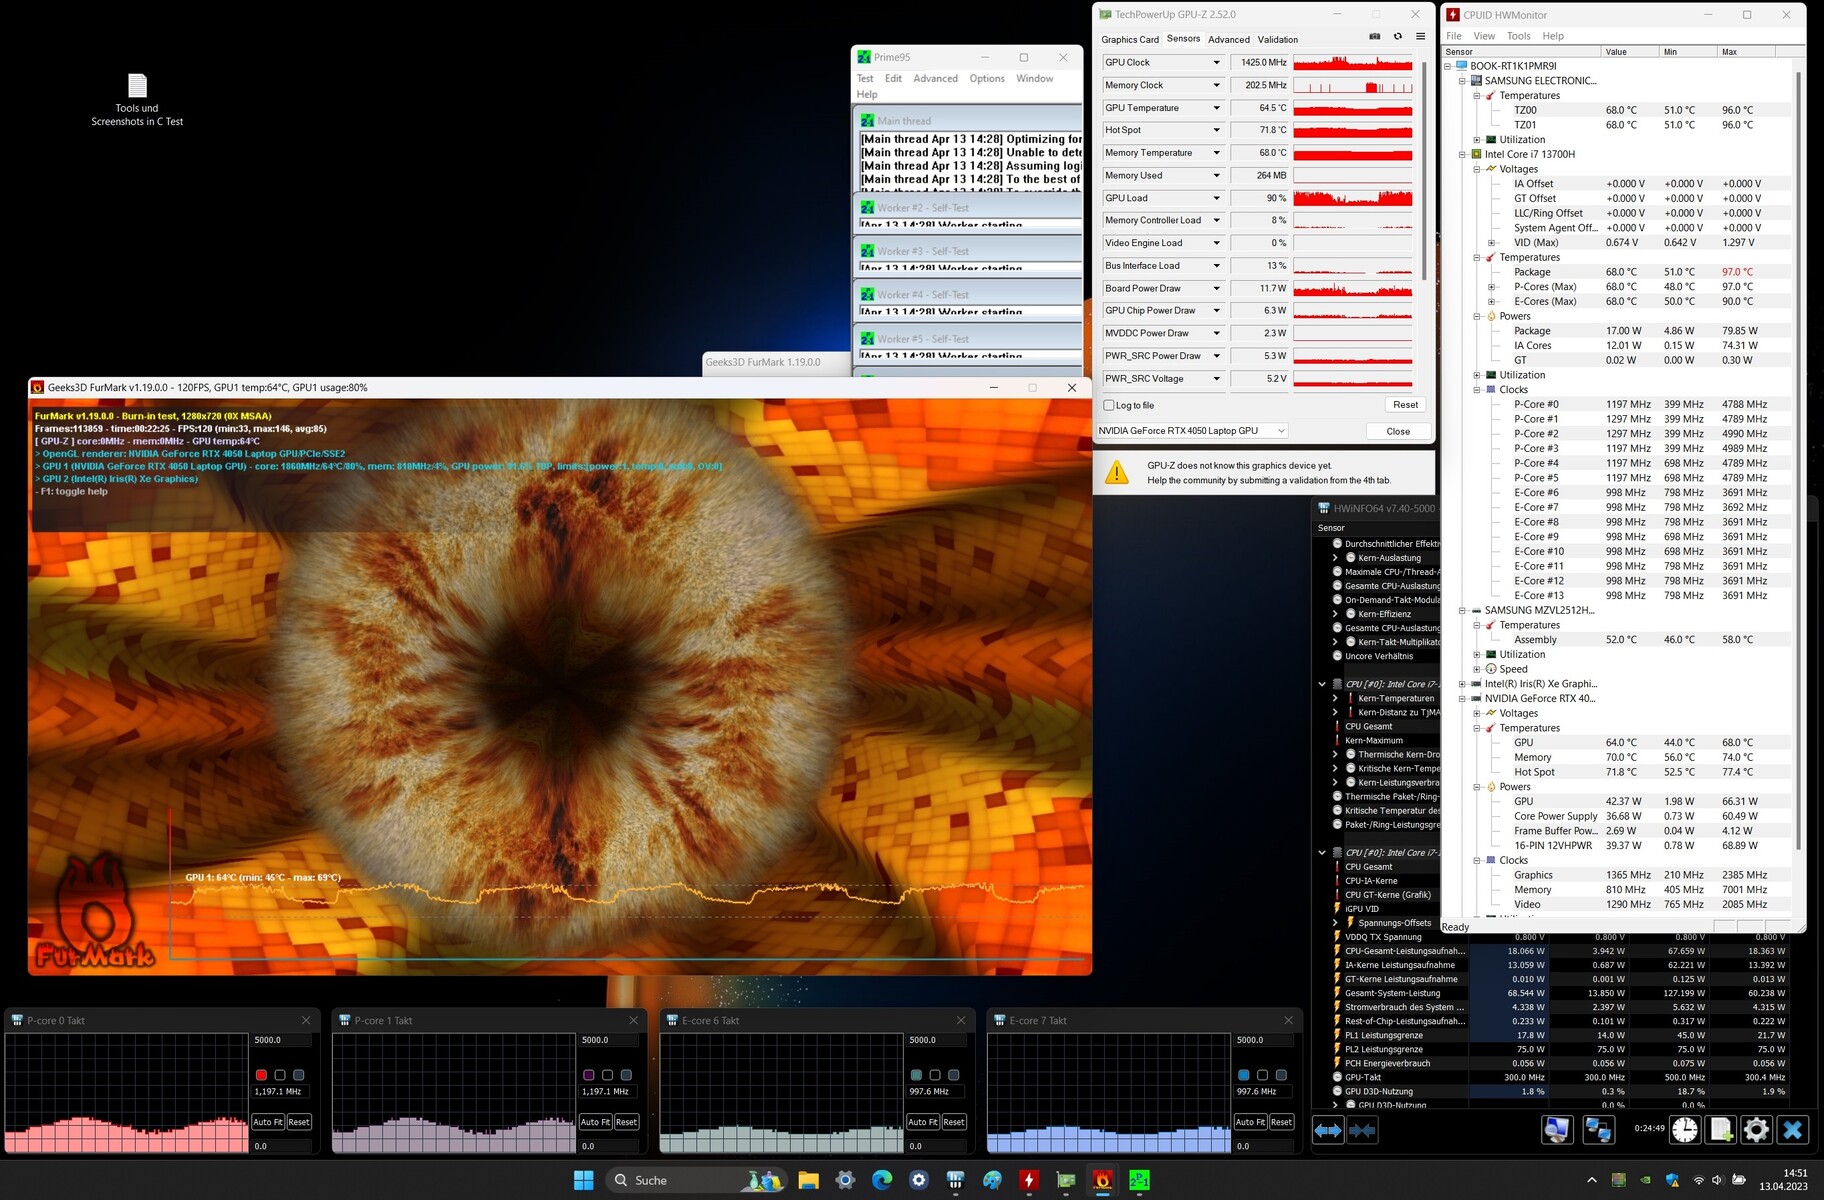
Stresstest
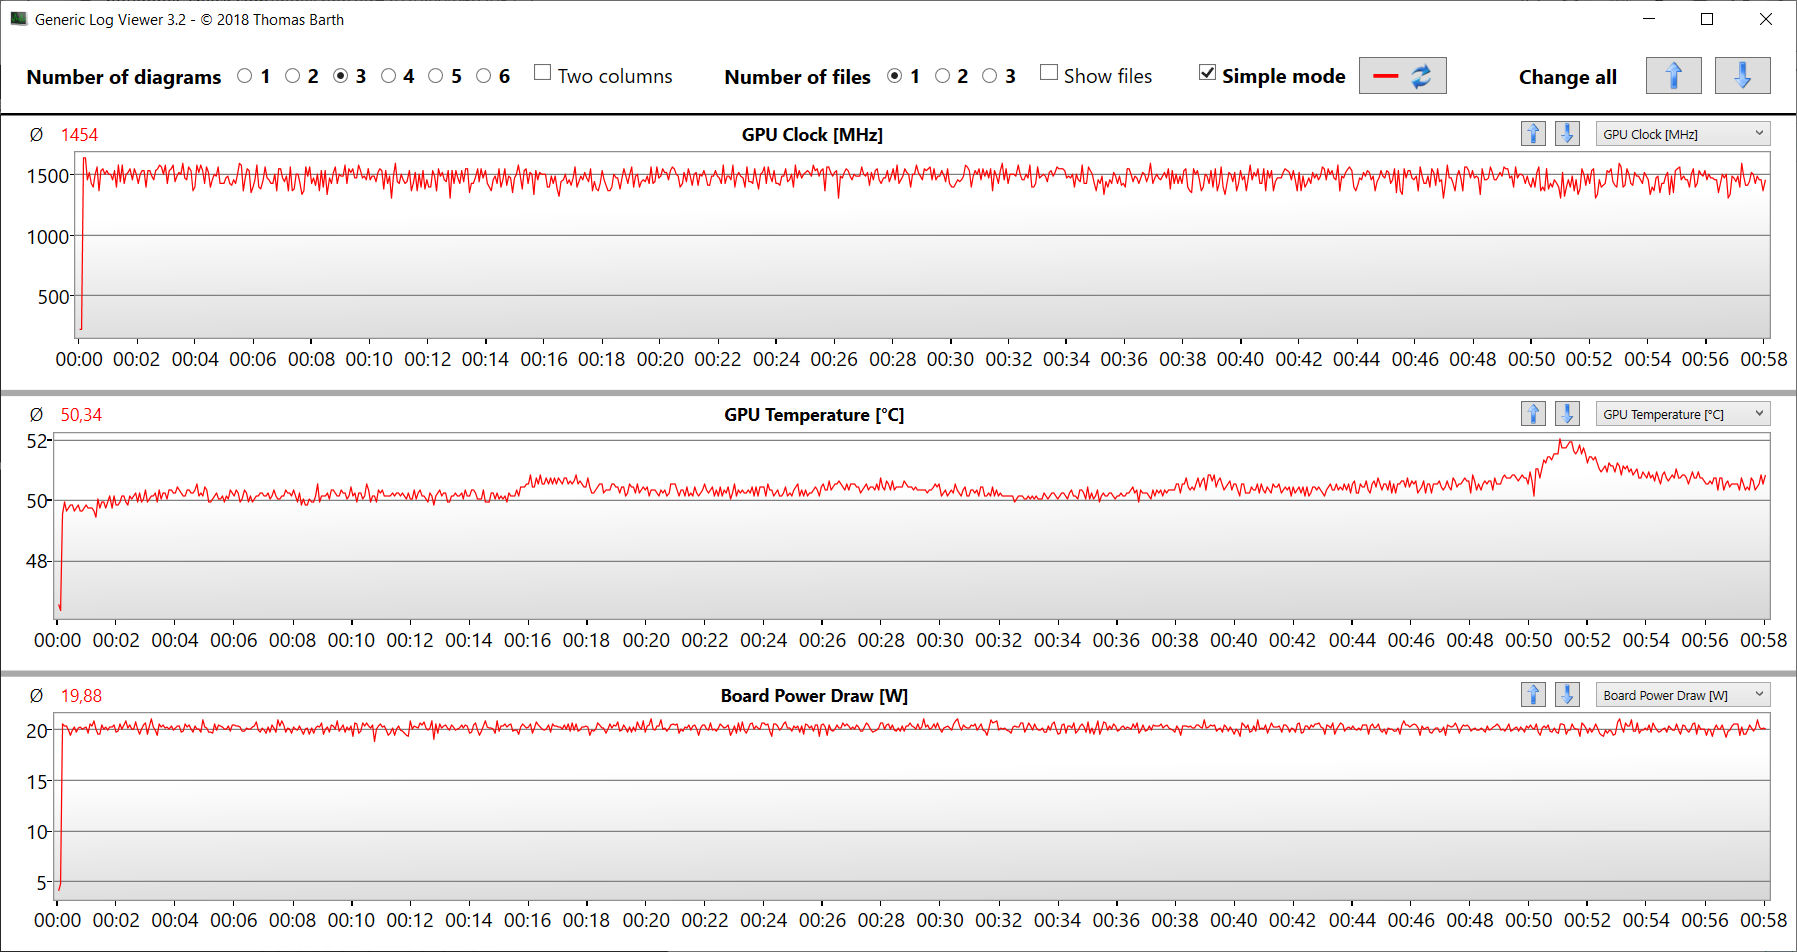
Der Stresstest (Prime95 und Furmark im Dauerbetrieb) stellt ein Extremszenario zur Überprüfung der Systemstabilität unter Volllast dar. CPU (P: 2,8 bis 2,9 GHz, E: 2,3 bis 2,4 GHz) und GPU (ca. 1.100 MHz) beginnen den Test mit Geschwindigkeiten etwa auf Basistaktniveau. Im weiteren Verlauf sinken die Werte deutlich.
Lautsprecher
Die Stereolautsprecher produzieren einen sehr ordentlichen Klang, der allerdings mehr Bass vertragen könnte. Für ein besseres Klangerlebnis empfehlen sich Kopfhörer oder externe Lautsprecher.
Samsung Galaxy Book3 Ultra 16 Audio Analyse
(+) | Die Lautsprecher können relativ laut spielen (83 dB)
Bass 100 - 315 Hz
(±) | abgesenkter Bass - 11.4% geringer als der Median
(±) | durchschnittlich lineare Bass-Wiedergabe (10.3% Delta zum Vorgänger)
Mitteltöne 400 - 2000 Hz
(±) | zu hohe Mitten, vom Median 5.4% abweichend
(+) | lineare Mitten (3% Delta zum Vorgänger)
Hochtöne 2 - 16 kHz
(+) | ausgeglichene Hochtöne, vom Median nur 1.6% abweichend
(+) | sehr lineare Hochtöne (3.8% Delta zum Vorgänger)
Gesamt im hörbaren Bereich 100 - 16.000 Hz
(+) | hörbarer Bereich ist sehr linear (11.8% Abstand zum Median
Im Vergleich zu allen Geräten derselben Klasse
» 19% aller getesteten Geräte dieser Klasse waren besser, 4% vergleichbar, 76% schlechter
» Das beste Gerät hat einen Delta-Wert von 5%, durchschnittlich ist 17%, das schlechteste Gerät hat 45%
Im Vergleich zu allen Geräten im Test
» 8% aller getesteten Geräte waren besser, 3% vergleichbar, 89% schlechter
» Das beste Gerät hat einen Delta-Wert von 4%, durchschnittlich ist 23%, das schlechteste Gerät hat 134%
Schenker Vision 16 Pro RTX 3070 Ti Audio Analyse
(±) | Mittelmäßig laut spielende Lautsprecher (77.6 dB)
Bass 100 - 315 Hz
(-) | kaum Bass - 17.9% niedriger als der Median
(±) | durchschnittlich lineare Bass-Wiedergabe (12.2% Delta zum Vorgänger)
Mitteltöne 400 - 2000 Hz
(+) | ausgeglichene Mitten, vom Median nur 3.3% abweichend
(+) | lineare Mitten (4.9% Delta zum Vorgänger)
Hochtöne 2 - 16 kHz
(+) | ausgeglichene Hochtöne, vom Median nur 2.8% abweichend
(+) | sehr lineare Hochtöne (5.1% Delta zum Vorgänger)
Gesamt im hörbaren Bereich 100 - 16.000 Hz
(±) | hörbarer Bereich ist durchschnittlich linear (15.1% Abstand zum Median)
Im Vergleich zu allen Geräten derselben Klasse
» 36% aller getesteten Geräte dieser Klasse waren besser, 4% vergleichbar, 60% schlechter
» Das beste Gerät hat einen Delta-Wert von 5%, durchschnittlich ist 17%, das schlechteste Gerät hat 45%
Im Vergleich zu allen Geräten im Test
» 21% aller getesteten Geräte waren besser, 4% vergleichbar, 75% schlechter
» Das beste Gerät hat einen Delta-Wert von 4%, durchschnittlich ist 23%, das schlechteste Gerät hat 134%
Energieverwaltung - An Ausdauer mangelt es dem NP960XFH nicht
Energieaufnahme
Alles in allem gibt sich der Samsung Rechner mit verhältnismäßig wenig Energie zufrieden. Sowohl im Leerlauf als auch unter Last liegt der Bedarf niedriger als bei der Konkurrenz - eine Ausnahme stellt das LG Gram dar. Witcher-3-Test und Stresstest werden mit relativ konstanter Leistungsaufnahme durchlaufen. Gegen Ende des Stresstests bricht der Bedarf etwas ein. Das USB-C-Netzteil (100 Watt) ist ausreichend dimensioniert.
| Aus / Standby | |
| Idle | |
| Last |
|
Legende:
min: | |
| Samsung Galaxy Book3 Ultra 16 i7-13700H, GeForce RTX 4050 Laptop GPU | Schenker Vision 16 Pro RTX 3070 Ti i7-12700H, GeForce RTX 3070 Ti Laptop GPU | LG Gram 17Z90Q-E.AD78G i7-1260P, GeForce RTX 2050 Mobile | Lenovo ThinkBook 16p G3 ARH R9 6900HX, GeForce RTX 3060 Laptop GPU | Dell XPS 15 9520 RTX 3050 Ti i7-12700H, GeForce RTX 3050 Ti Laptop GPU | Asus VivoBook Pro 16X OLED N7600PC-L2026X i7-11370H, GeForce RTX 3050 4GB Laptop GPU | Acer Swift X SFX16-52G-77RX i7-1260P, A370M | Durchschnittliche NVIDIA GeForce RTX 4050 Laptop GPU | Durchschnitt der Klasse Multimedia | |
|---|---|---|---|---|---|---|---|---|---|
| Stromverbrauch | -105% | -7% | -126% | -39% | -63% | -12% | -123% | -39% | |
| Idle min * (Watt) | 3 | 9 -200% | 4.1 -37% | 10.3 -243% | 5.5 -83% | 8.9 -197% | 3.7 -23% | 9.95 ? -232% | 5.65 ? -88% |
| Idle avg * (Watt) | 5 | 13.3 -166% | 9.8 -96% | 16 -220% | 7.2 -44% | 10.2 -104% | 7.6 -52% | 15.8 ? -216% | 10 ? -100% |
| Idle max * (Watt) | 11 | 14.3 -30% | 12 -9% | 24 -118% | 16 -45% | 12 -9% | 11.1 -1% | 20.1 ? -83% | 12.3 ? -12% |
| Last avg * (Watt) | 72 | 107 -49% | 49.3 32% | 85.4 -19% | 91.8 -27% | 94 -31% | 70 3% | 88 ? -22% | 65.1 ? 10% |
| Witcher 3 ultra * (Watt) | 69.7 | 155.2 -123% | 49.3 29% | 132.2 -90% | 74.6 -7% | 93.1 -34% | 68.8 1% | ||
| Last max * (Watt) | 108 | 172 -59% | 66 39% | 181.9 -68% | 134.7 -25% | 112 -4% | 108 -0% | 176.3 ? -63% | 112.5 ? -4% |
* ... kleinere Werte sind besser
Energieaufnahme Witcher 3 / Stresstest
Energieaufnahme mit externem Monitor
Akkulaufzeit
Der 16-Zöller erreicht im WLAN-Test (Aufruf von Webseiten mittels eines Skripts) bzw. Videotest (Kurzfilm Big Buck Bunny (H.264-Kodierung, FHD) in einer Schleife) Laufzeiten von 9:36 h bzw. 13:23 h. Während beider Tests sind die Energiesparfunktionen des Notebooks deaktiviert und die Displayhelligkeit wird auf etwa 150 cd/m² geregelt. Zur Durchführung des Videotests werden zudem die Funkmodule abgeschaltet.
| Samsung Galaxy Book3 Ultra 16 i7-13700H, GeForce RTX 4050 Laptop GPU, 76 Wh | Schenker Vision 16 Pro RTX 3070 Ti i7-12700H, GeForce RTX 3070 Ti Laptop GPU, 80 Wh | LG Gram 17Z90Q-E.AD78G i7-1260P, GeForce RTX 2050 Mobile, 90 Wh | Lenovo ThinkBook 16p G3 ARH R9 6900HX, GeForce RTX 3060 Laptop GPU, 71 Wh | Dell XPS 15 9520 RTX 3050 Ti i7-12700H, GeForce RTX 3050 Ti Laptop GPU, 86 Wh | Asus VivoBook Pro 16X OLED N7600PC-L2026X i7-11370H, GeForce RTX 3050 4GB Laptop GPU, 96 Wh | Acer Swift X SFX16-52G-77RX i7-1260P, A370M, 56 Wh | Durchschnitt der Klasse Multimedia | |
|---|---|---|---|---|---|---|---|---|
| Akkulaufzeit | -40% | 37% | -32% | 17% | -3% | -22% | 19% | |
| Idle (h) | 18.2 | 14.8 -19% | 11.1 -39% | 25.2 ? 38% | ||||
| H.264 (h) | 13.4 | 6.1 -54% | 10.4 -22% | 16.2 ? 21% | ||||
| WLAN (h) | 9.6 | 6 -37% | 14.5 51% | 6.5 -32% | 8.8 -8% | 8.7 -9% | 9.1 -5% | 12 ? 25% |
| Last (h) | 1.8 | 1.3 -28% | 2.2 22% | 3.2 78% | 2.5 39% | 1.1 -39% | 1.669 ? -7% |
Pro
Contra
Fazit - Ein gelungener Kompromiss

Das Galaxy Book3 Ultra 16 stellt einen durchaus stimmigen Kompromiss aus Leistung, Mobilität und Ergonomie dar. Core i7-13700H und GeForce RTX 4050 Laptop werden mit reduzierter Leistung betrieben, liefern aber auch dann noch genug Power für FHD-Gaming und Rendering.
Samsung liefert mit dem Galaxy Book3 Ultra 16 ein mobiles Notebook für Gamer und Kreativ-Arbeiter. Das zu hoch gegriffene Preisniveau trübt den guten Eindruck des Rechners.
Das kompakte Gerät bringt mit 1,8 kg nicht allzu viel Gewicht auf die Waage. In Kombination mit praxisnahen Akkulaufzeiten von 9 bis 13 h hat man es mit einem recht mobilen Gerät zu tun. Lärm- und Wärmeentwicklung fallen moderat aus. Zwei USB-C-Steckplätze (Thunderbolt 4) dienen der Energieversorgung und ermöglichen eine einfache Integration in bestehende Arbeitsplatz-Setups.
Der große 16-Zoll-Bildschirm (2.880 x 1.800 Pixel, OLED) im arbeitsfreundlichen 16:10-Format punktet mit hoher Leuchtkraft, hervorragendem Kontrast, stabilen Blickwinkeln, kurzen Reaktionszeiten, toller Farbdarstellung und sehr guter Farbraumabdeckung. Die negativen Seiten: Das Panel verfügt über eine spiegelnde Oberfläche, zudem nutzt es PWM bei allen Helligkeitsstufen - hier muss ein 2.800-Euro-Gerät mehr bieten.
Auch an anderer Stelle darf mehr fürs Geld erwartet werden: Eine 512-GB-SSD ist bei dem gebotenen Preisniveau definitiv zu wenig. Hier wären mindestens 1 TB, eher 2 TB angebracht. Auch der Arbeitsspeicher fällt mit 16 GB etwas dünn aus. Ein Gerät mit dem Anspruch des Galaxy Book sollte hier 32 GB bieten - zumal der Speicher (onboard) nicht erweitert werden kann. Immerhin sind höherpreisige 32-GB-Modelle verfügbar.
Als Alternative käme das Schenker Vision 16 Pro in Frage. Es bietet mehr Grafikleistung und erweiterbaren Arbeitsspeicher, hat aber bei den Laufzeiten sowie den Emissionen das Nachsehen. Das Asus VivoBook Pro 16X OLED (ca. 1.400 €) und das Acer Swift X 16 (ca. 1.100 €) wären preisgünstigere Alternativen zum Samsung Rechner. Sie warten mit weniger Leistung, teilweise kürzeren Laufzeiten und fest verlötetem Arbeitsspeicher auf.
Preis und Verfügbarkeit
Das Samsung Galaxy Book3 Ultra 16 ist in der getesteten Ausstattung zu einem Preis von knapp 2.800 Euro bei Notebooksbilliger.de und Cyberport.de zu bekommen.
Samsung Galaxy Book3 Ultra 16
- 26.04.2023 v7 (old)
Sascha Mölck
Transparenz
Die Auswahl der zu testenden Geräte erfolgt innerhalb der Redaktion. Das vorliegende Testmuster wurde dem Autor vom Hersteller oder einem Shop zu Testzwecken leihweise zur Verfügung gestellt. Eine Einflussnahme des Leihstellers auf den Testbericht gab es nicht, der Hersteller erhielt keine Version des Reviews vor der Veröffentlichung. Es bestand keine Verpflichtung zur Publikation. Als eigenständiges, unabhängiges Unternehmen unterliegt Notebookcheck keiner Diktion von Herstellern, Shops und Verlagen.
So testet Notebookcheck
Pro Jahr werden von Notebookcheck hunderte Laptops und Smartphones unabhängig in von uns standardisierten technischen Verfahren getestet, um eine Vergleichbarkeit aller Testergebnisse zu gewährleisten. Seit rund 20 Jahren entwickeln wir diese Testmethoden kontinuierlich weiter und setzen damit Branchenstandards. In unseren Testlaboren kommt ausschließlich hochwertiges Messequipment in die Hände erfahrener Techniker und Redakteure. Die Tests unterliegen einer mehrstufigen Kontrolle. Unsere komplexe Gesamtbewertung basiert auf hunderten fundierten Messergebnissen und Benchmarks, womit Ihnen Objektivität garantiert ist. Weitere Informationen zu unseren Testmethoden gibt es hier.
Preisvergleich
