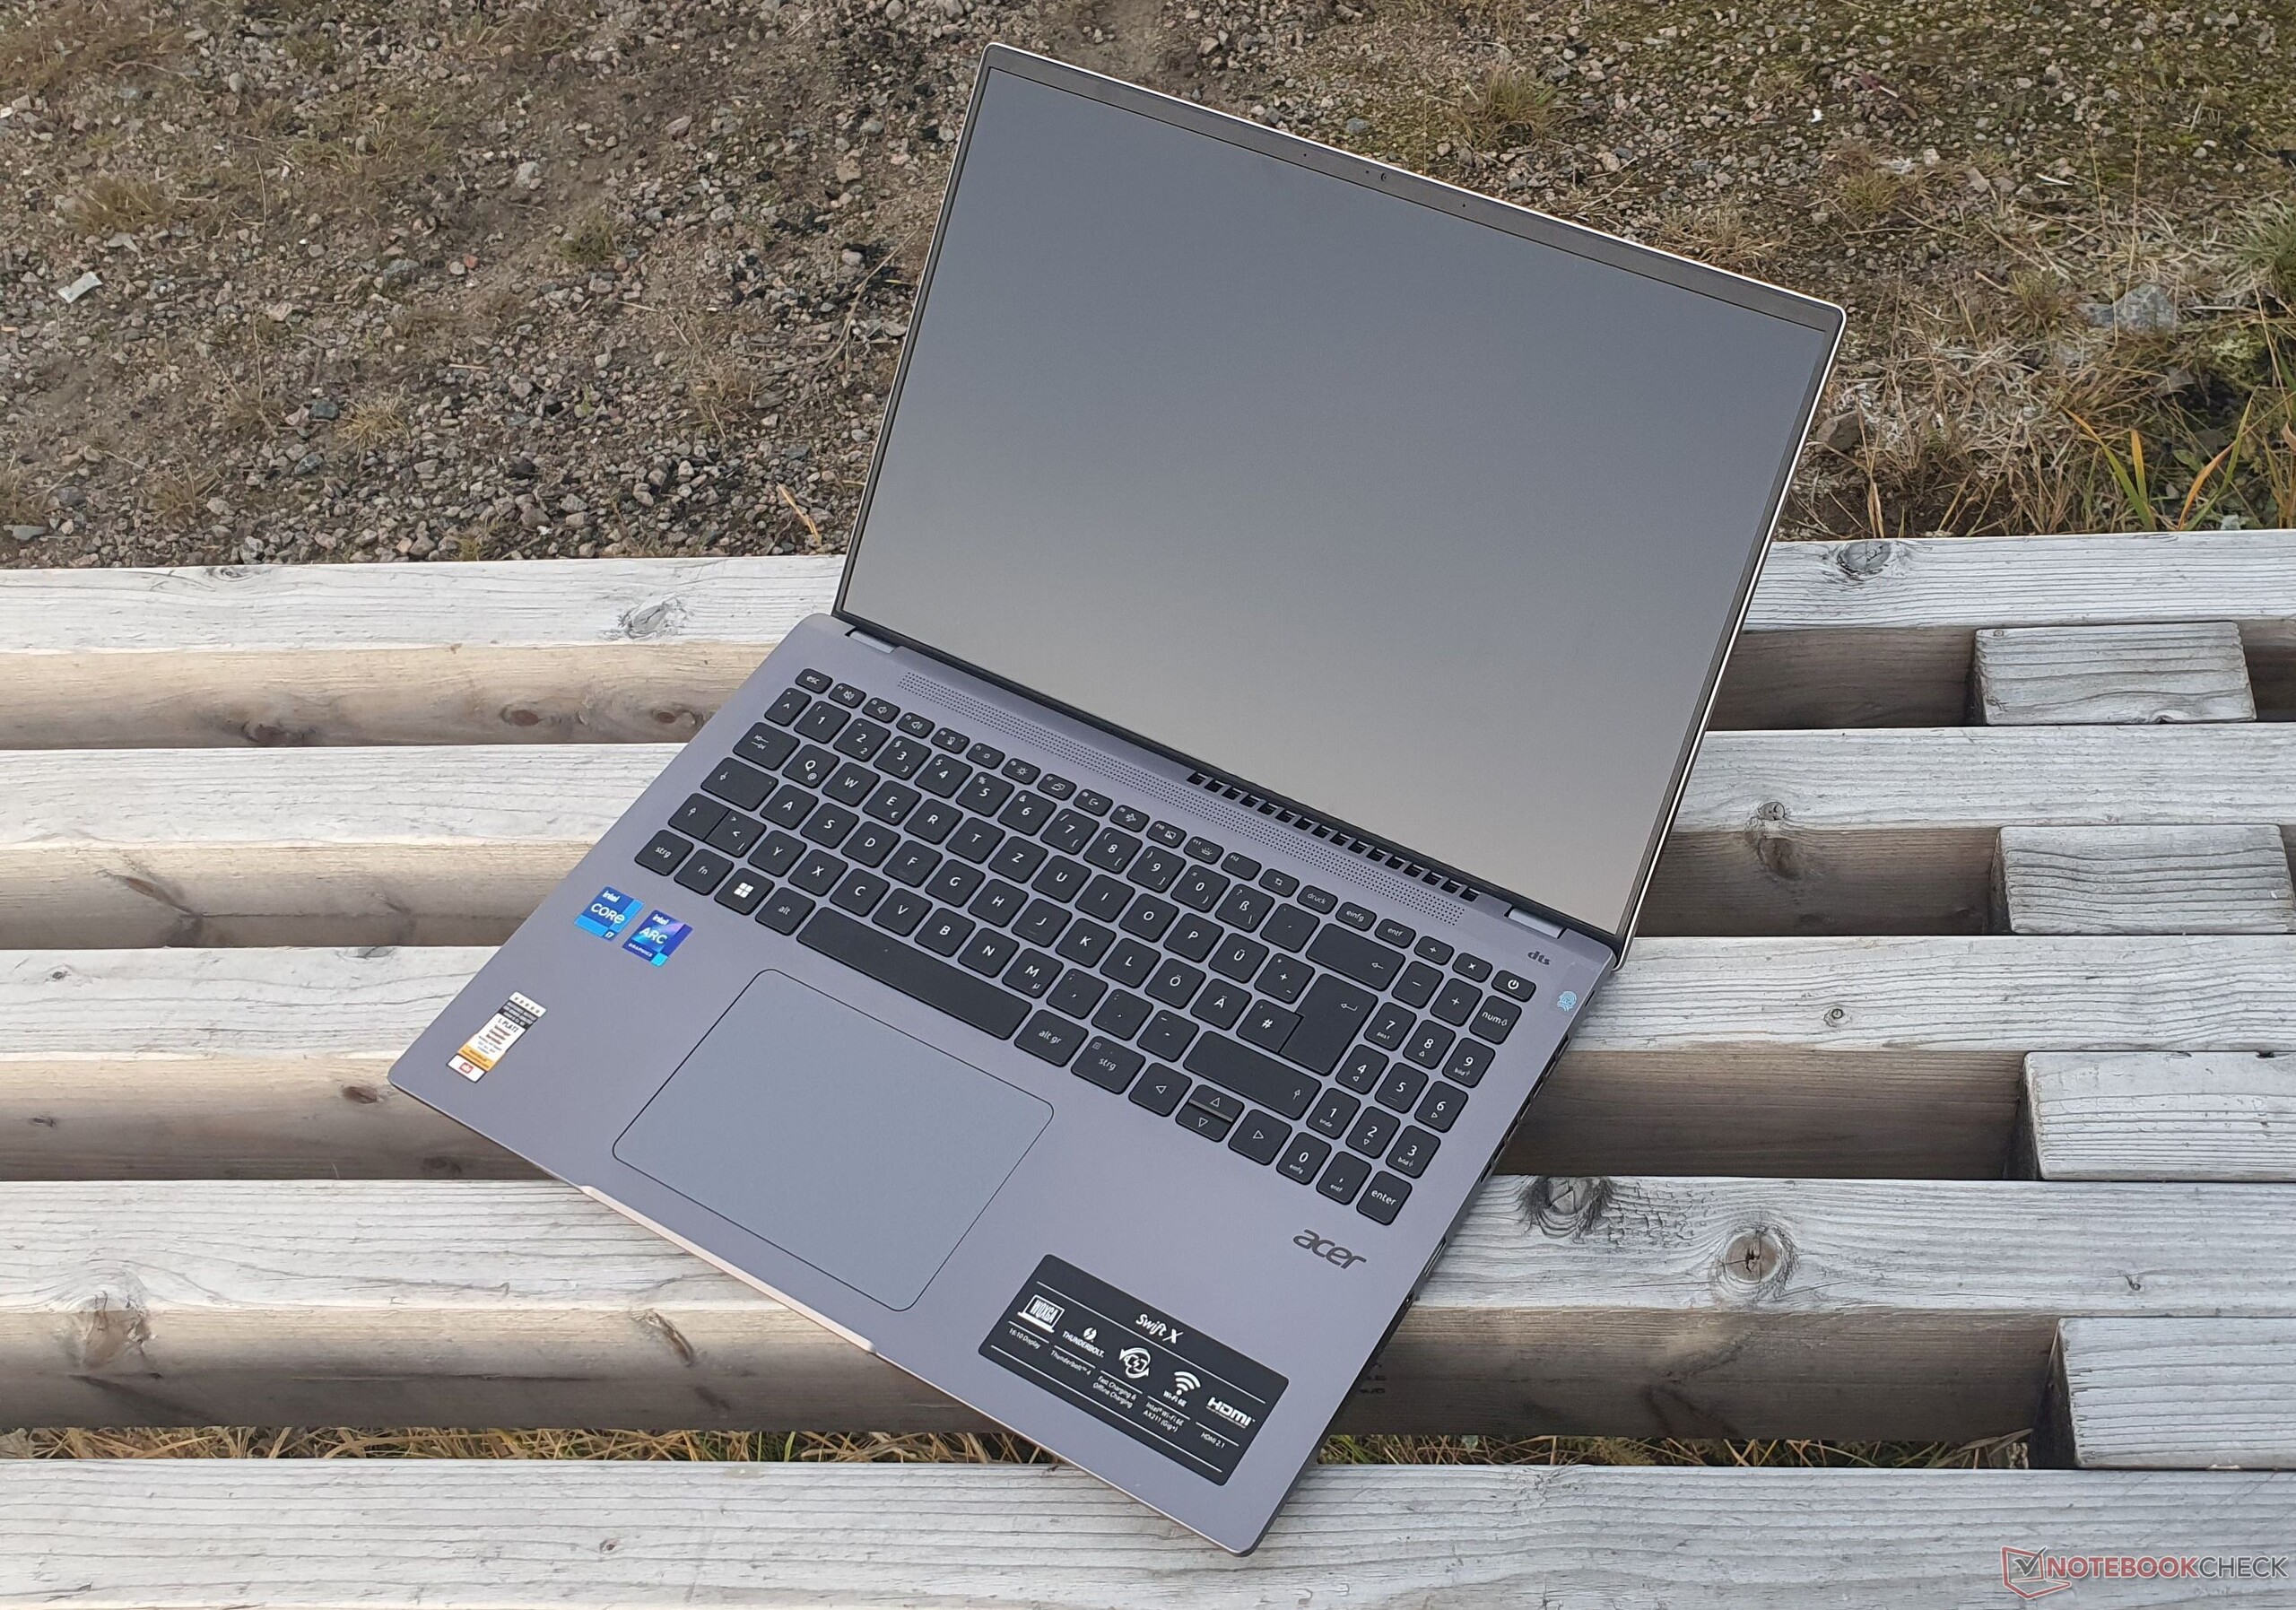
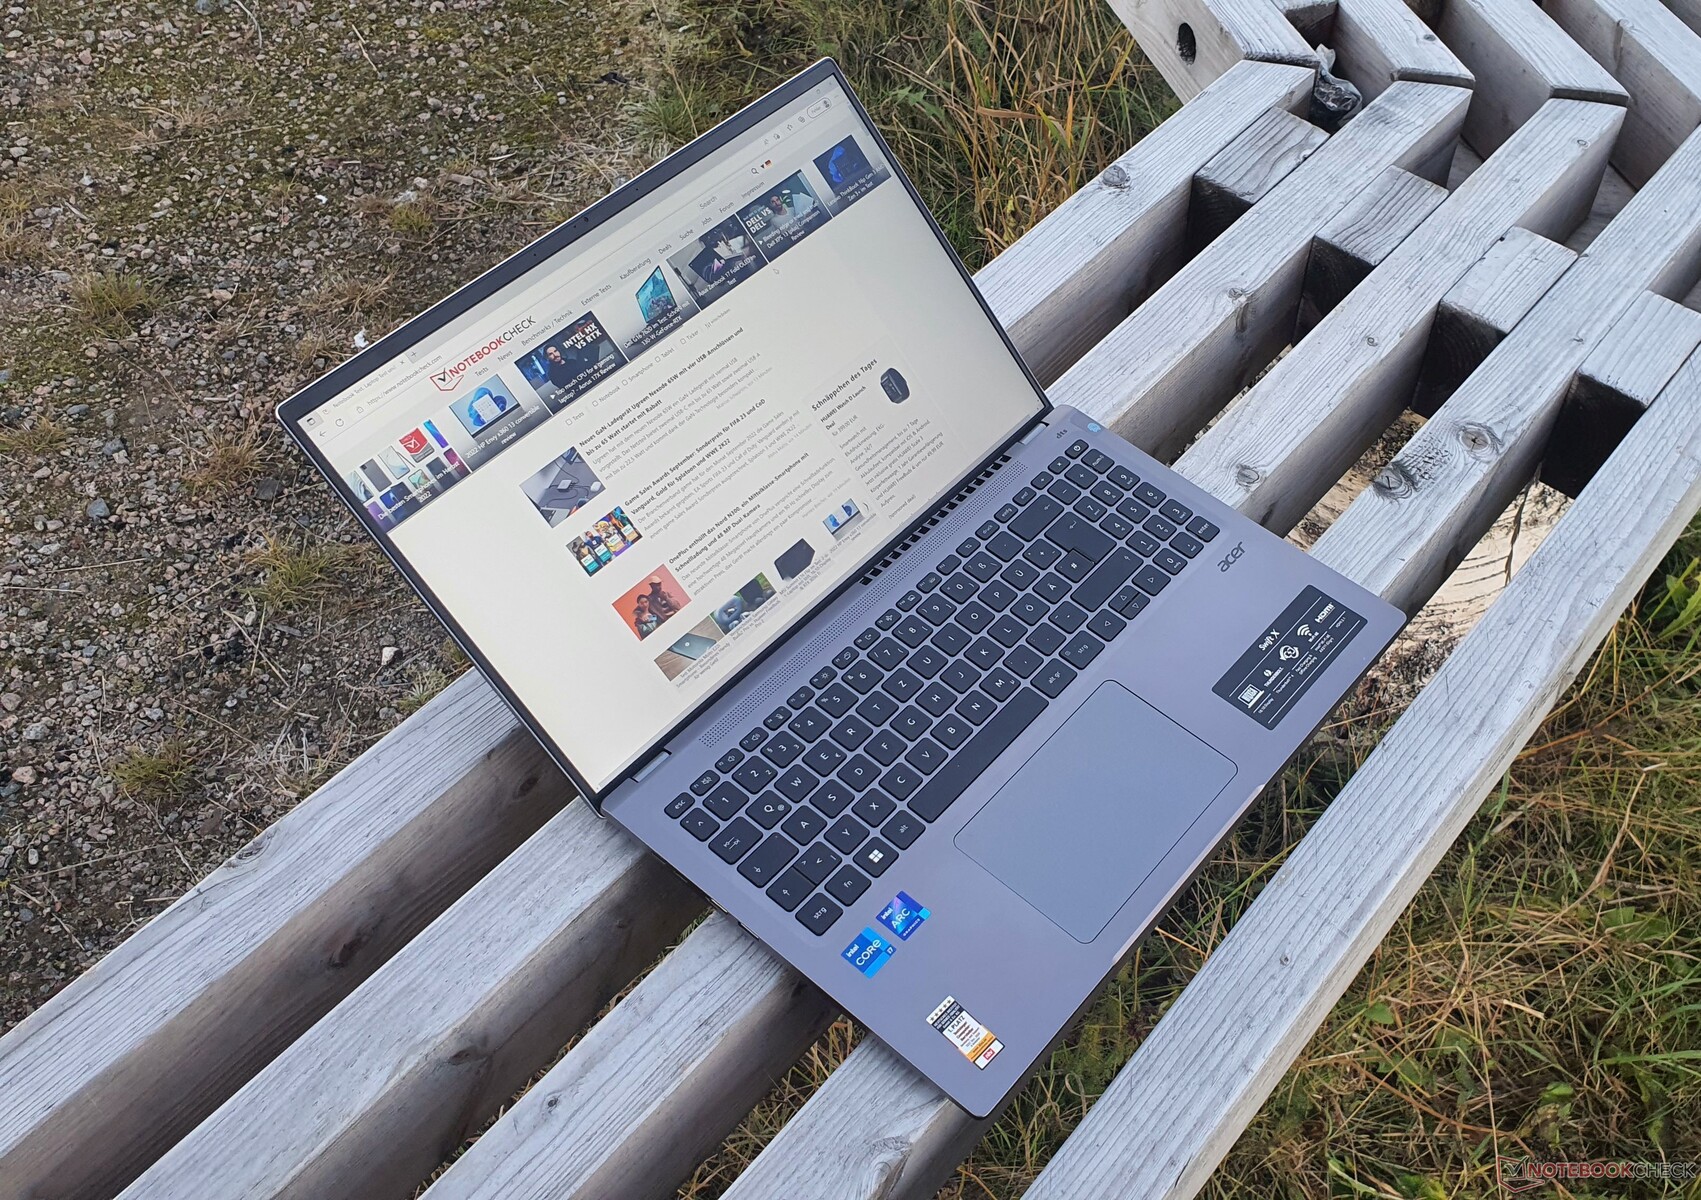
Acer Swift X 16 (2022) Laptop im Test: 16-Zöller mit starken Updates
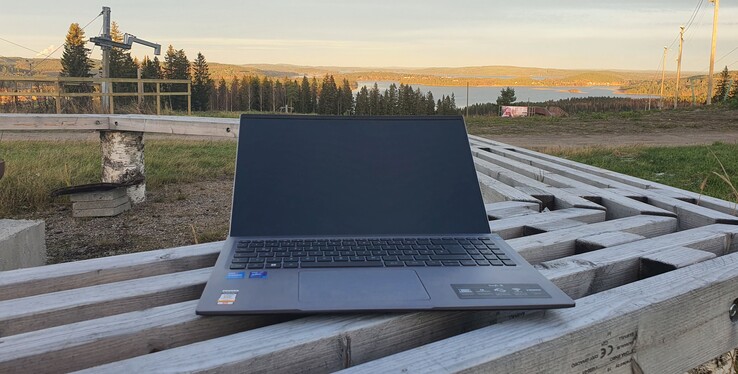
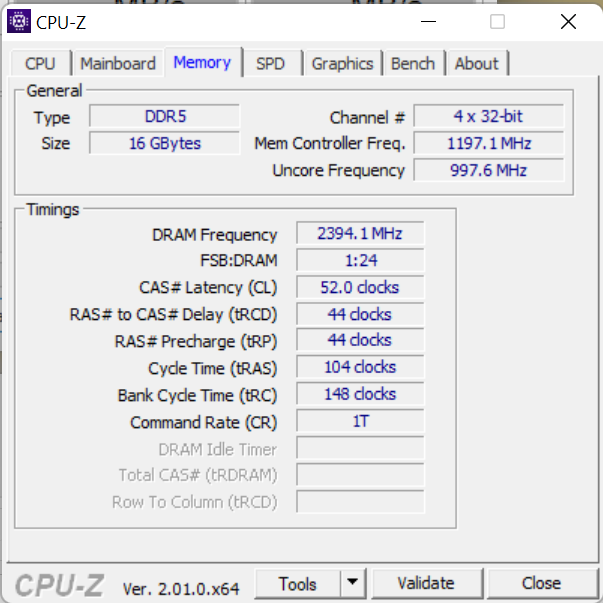
Viele Verbesserungen für das robuste Acer Swift X 16 (2022): Ein helles 16-Zoll-Display mit 2,5K-Auflösung im 16:10-Format, befeuert durch Intel Arc A370M, Core i7-1260P und schneller 1-TB-PCIe-4.0-SSD. In jedem Fall findet man 16 GB verlöteten DDR5-4800-RAM vor. Auch kleinere Neuerungen wie HDMI 2.1 und die 1.080p-Webcam tun dem Multimedia-Laptop gut.
Acer kan mit der aktuellen Generation des Swift X 16 viele Mankos des Vorgängers ausmerzen, doch wie performt Intels Arc A370M gegenüber einer Nvidia GeForce RTX 3050 Ti von Vergleichsgeräten wie Dells Inspiron 16 Plus, Asus Vivobook Pro 16X oder der RTX 2050 im Lenovo ThinkBook 16 G4+?
Da das von uns kürzlich getestete Schwestermodell bis auf die CPU und SSD identisch ist, verweisen wir für Details zu Gehäuse, Ausstattung, Eingabegeräten und Kommunikation auf entsprechenden Testbericht des Acer Swift X SFX16-52G-52VE. Sogar das verbaute Display ist identisch.
Weitere Acer Testberichte:
mögliche Konkurrenten im Vergleich
Bew. | Datum | Modell | Gewicht | Dicke | Größe | Auflösung | Preis ab |
|---|---|---|---|---|---|---|---|
| 86.4 % v7 (old) | 10 / 2022 | Acer Swift X SFX16-52G-77RX i7-1260P, A370M | 1.8 kg | 21.2 mm | 16.00" | 2560x1600 | |
| 88.4 % v7 (old) | 09 / 2022 | Lenovo ThinkBook 16 G4+ IAP i7-12700H, GeForce RTX 2050 Mobile | 1.8 kg | 16.5 mm | 16.00" | 2560x1600 | |
| 87.4 % v7 (old) | 08 / 2022 | Dell Inspiron 16 Plus 7620 i7-12700H, GeForce RTX 3050 Ti Laptop GPU | 2.1 kg | 18.99 mm | 16.00" | 3072x1920 | |
| 86.9 % v7 (old) | 10 / 2022 | HP Envy 16 h0112nr i7-12700H, GeForce RTX 3060 Laptop GPU | 2.3 kg | 19.8 mm | 16.00" | 3840x2400 | |
| 86.2 % v7 (old) | 10 / 2022 | Acer Swift X SFX16-52G-52VE i5-1240P, A370M | 1.8 kg | 21.3 mm | 16.00" | 2560x1600 | |
| 86.2 % v7 (old) | 07 / 2022 | Acer Swift X SFX16-51G-5388 i5-11320H, GeForce RTX 3050 4GB Laptop GPU | 1.8 kg | 18.9 mm | 16.10" | 1920x1080 | |
| 85.7 % v7 (old) | 09 / 2022 | Lenovo IdeaPad 5 Pro 16ARH7 R5 6600HS, Radeon 660M | 1.9 kg | 18.4 mm | 16.00" | 2560x1600 | |
v (old) | 10 / 2021 | Asus Vivobook Pro 16X-M7600QE R9 5900HX, GeForce RTX 3050 Ti Laptop GPU | 1.9 kg | 19 mm | 16.10" | 3840x2400 |
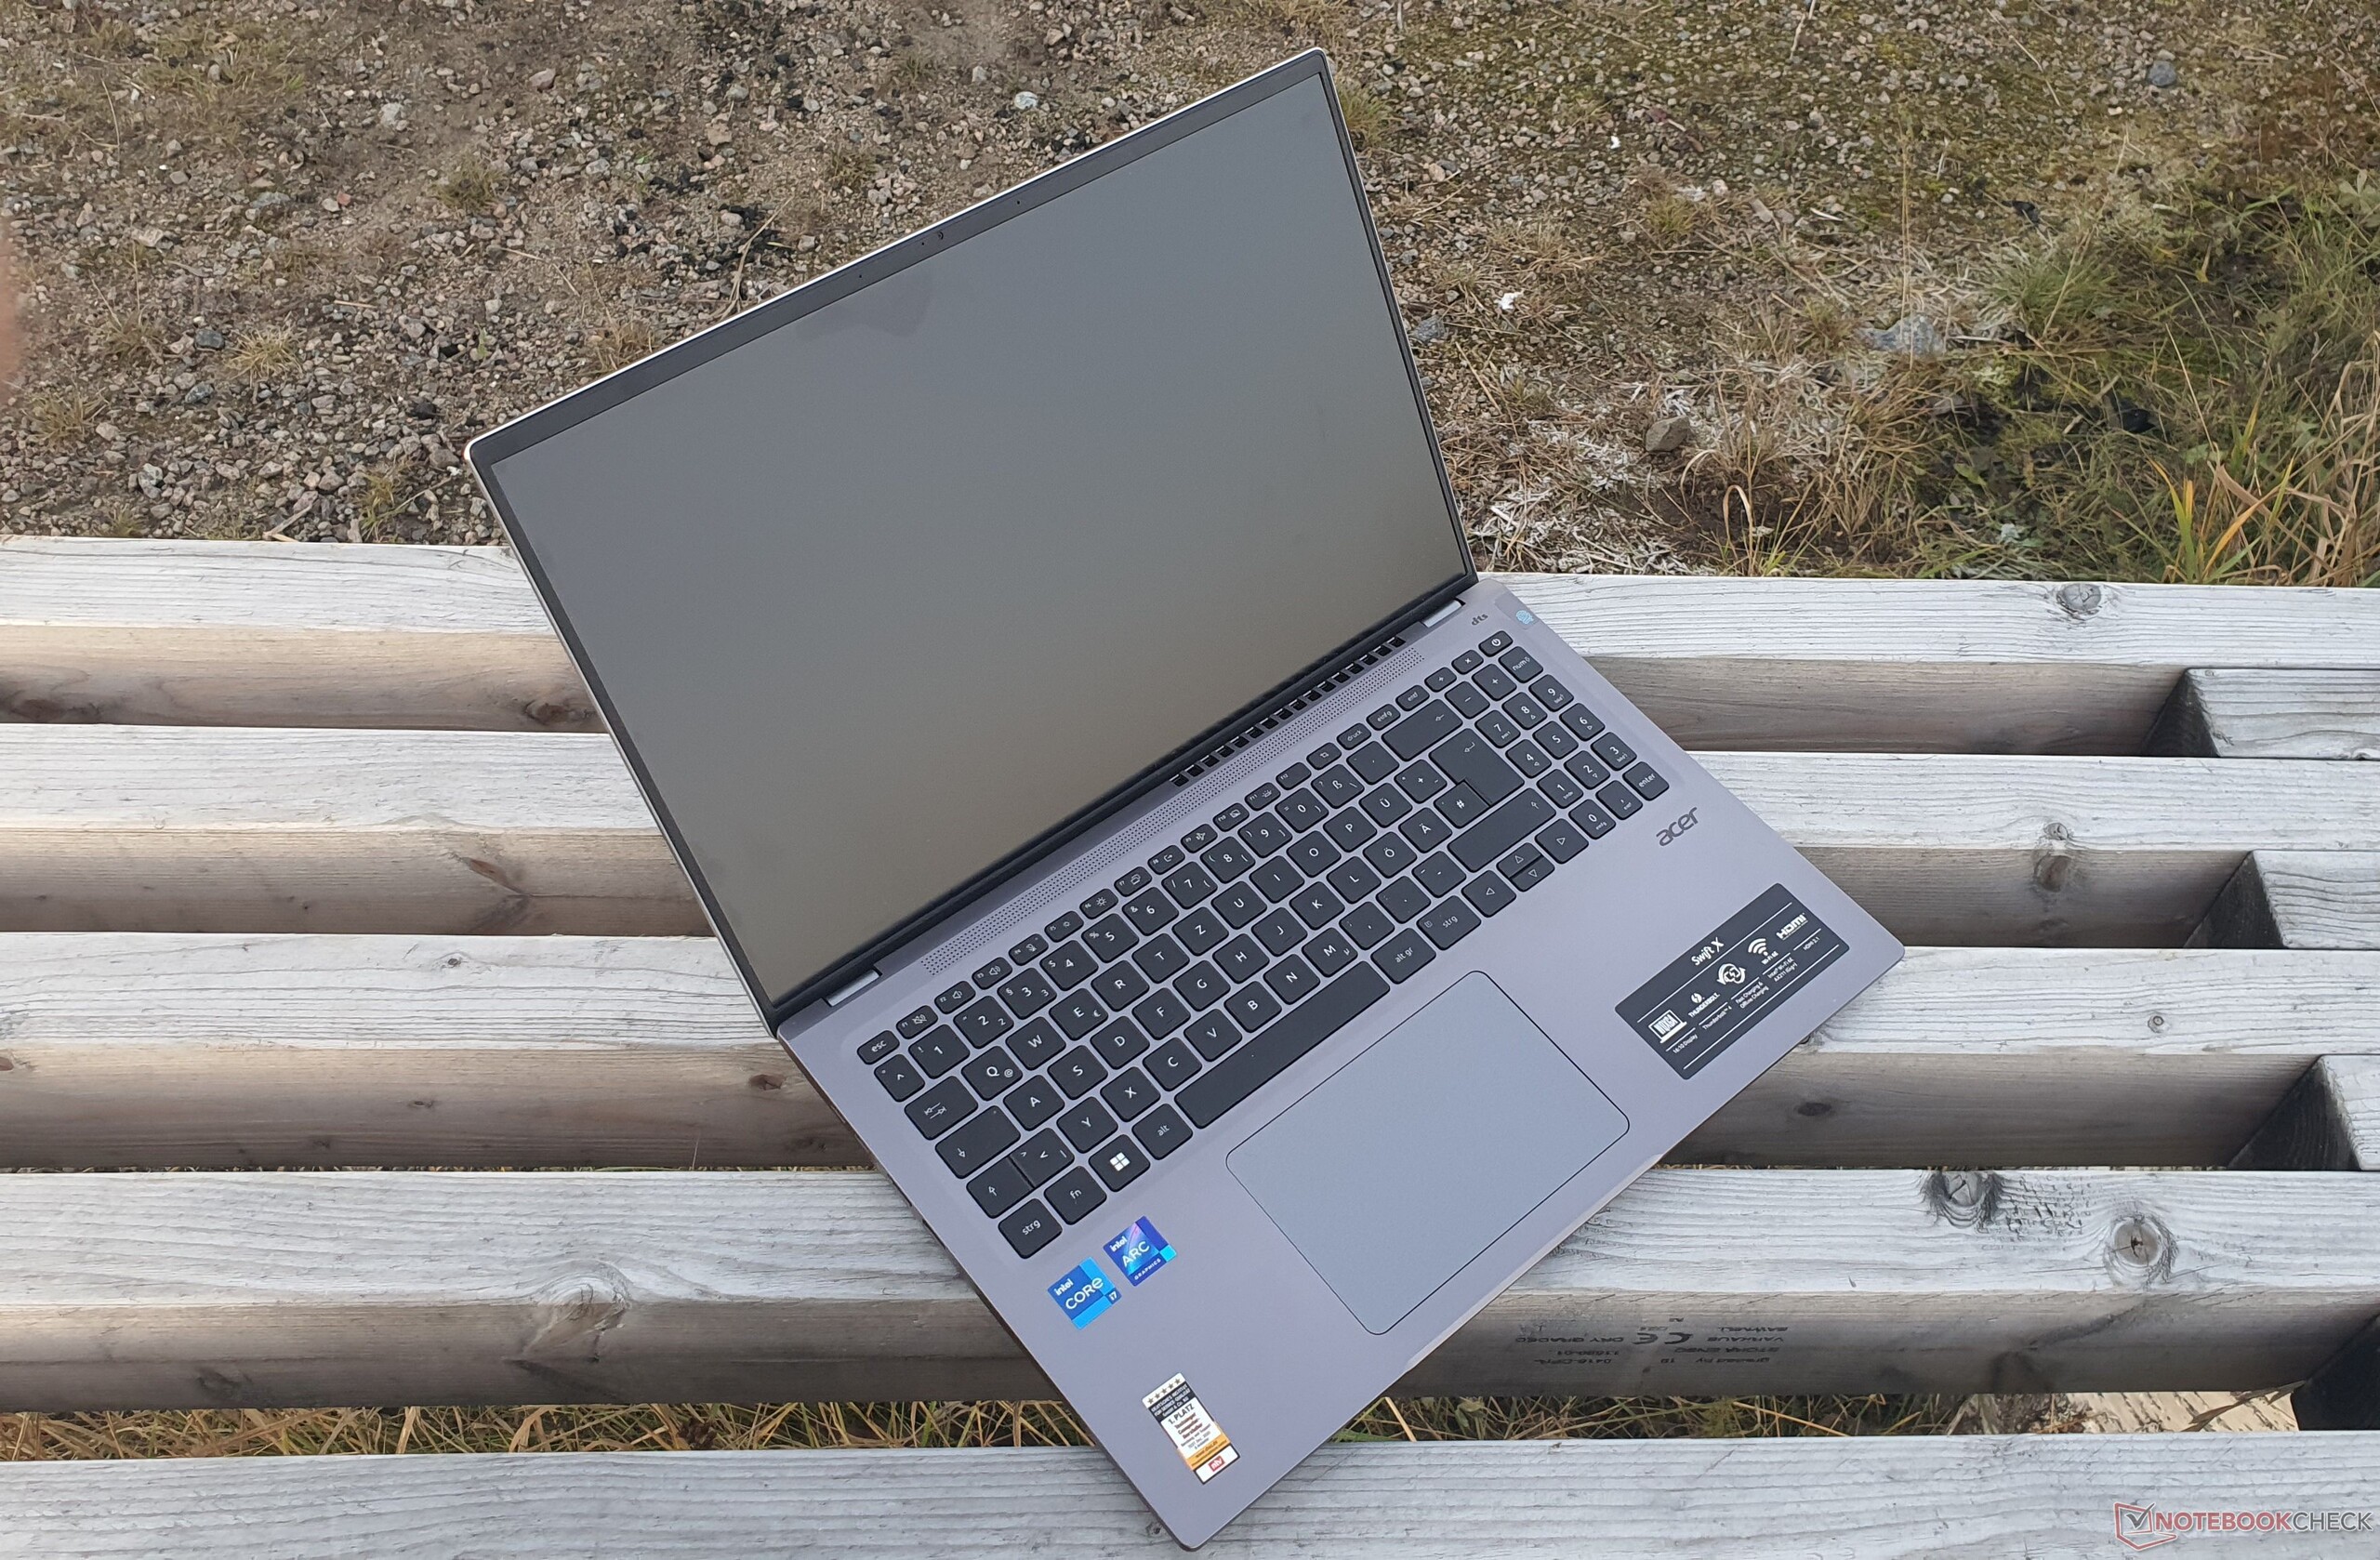
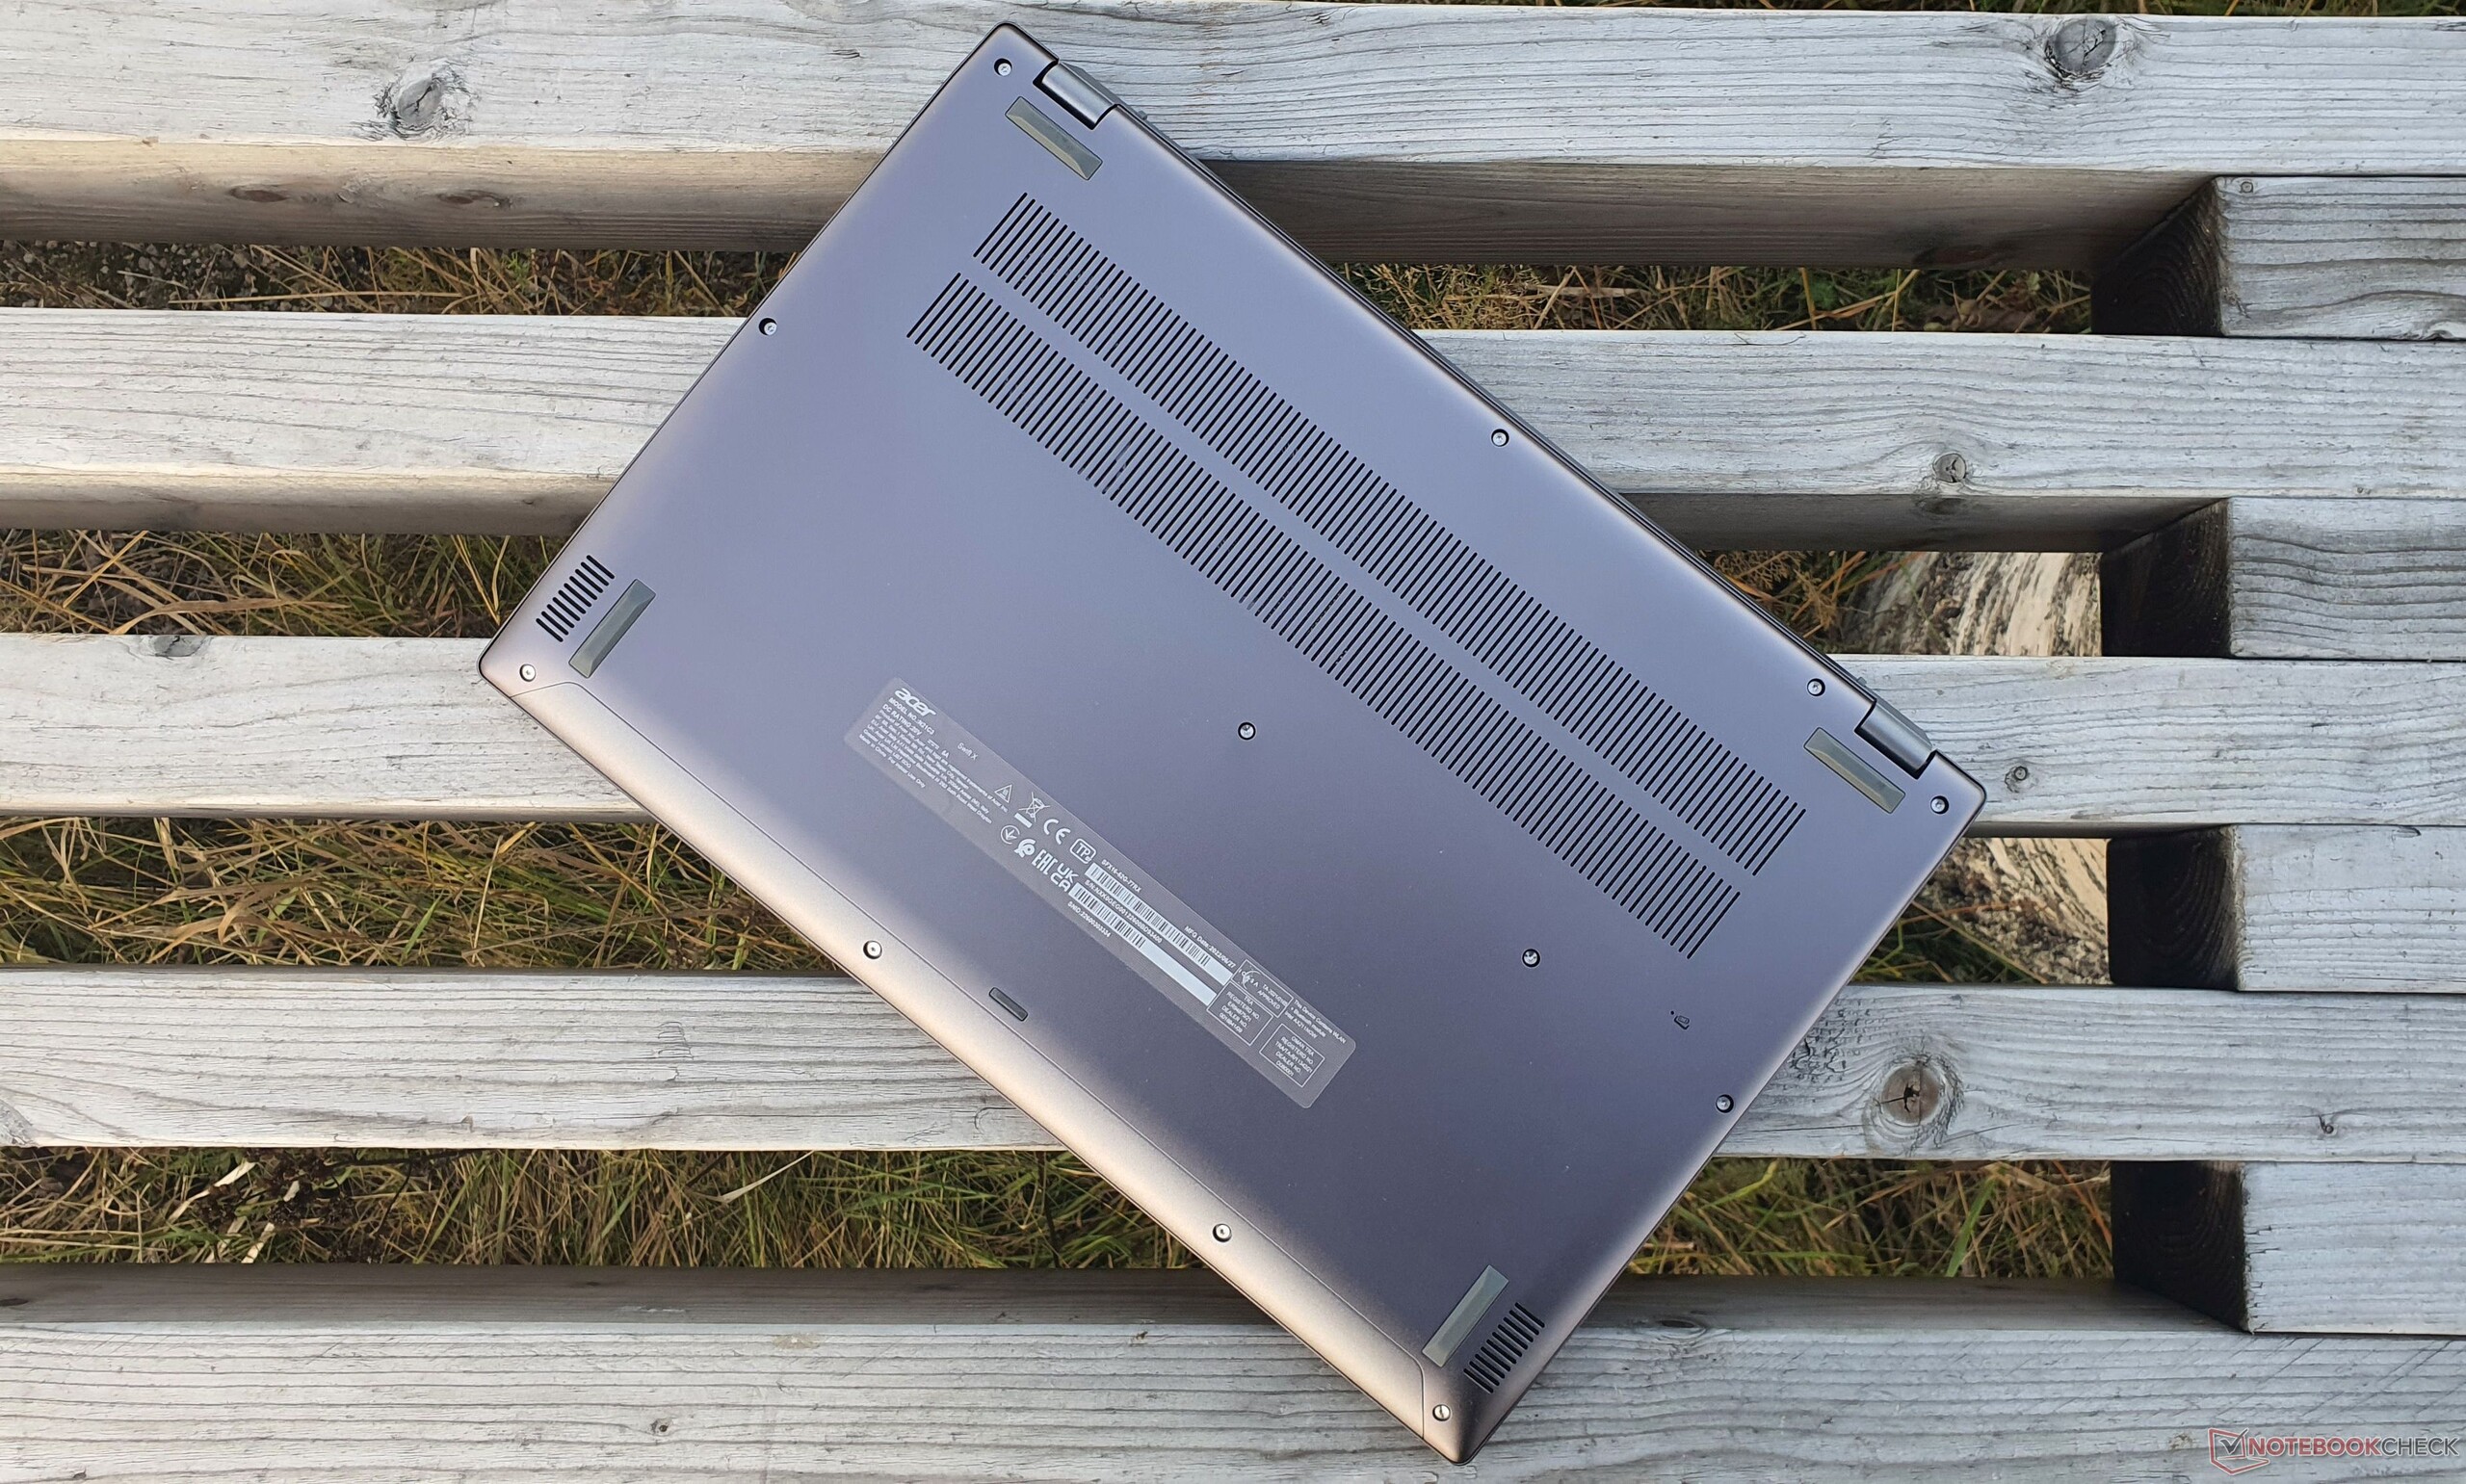
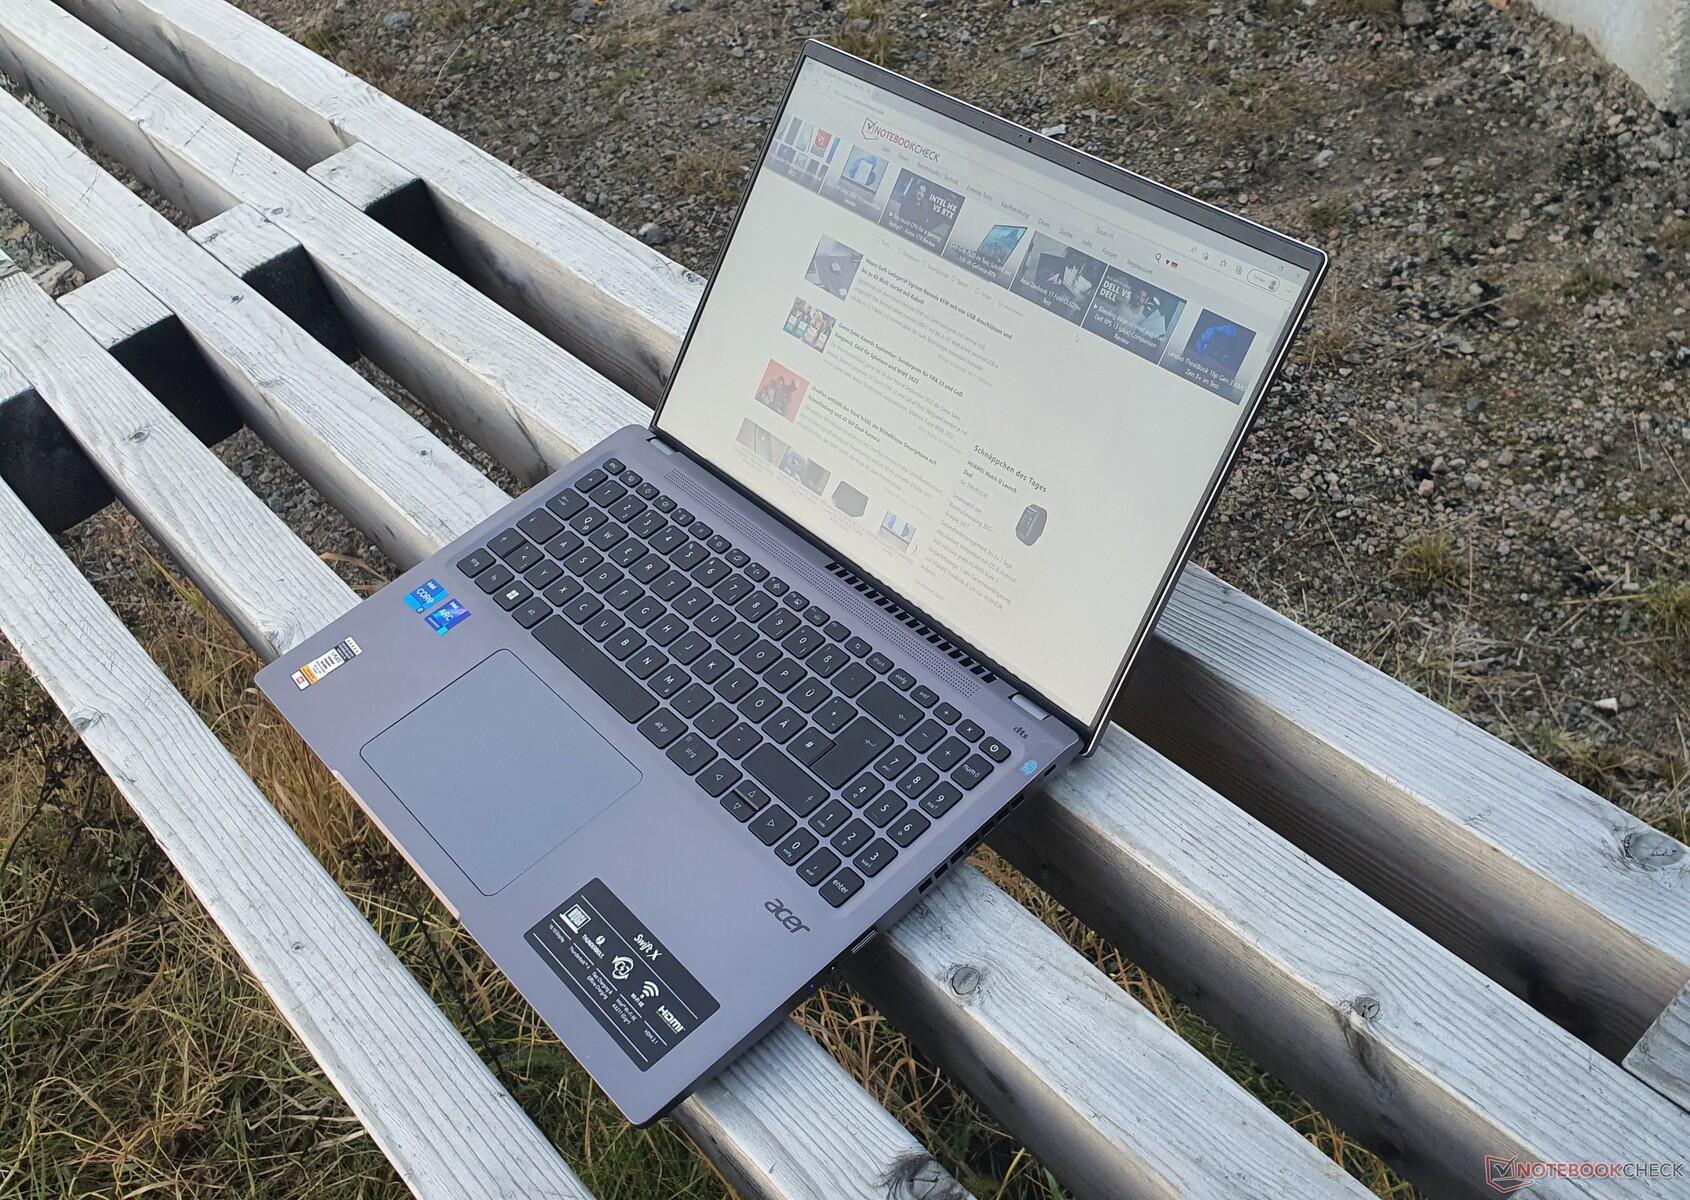
Durch die gesamtflächige Wölbung des Unterbodens ergibt sich eine maximale Gehäusedicke von etwa 21 mm. Die Herstellerangabe von 17,9 mm bezieht sich auf die Messung ohne diese Wölbung.
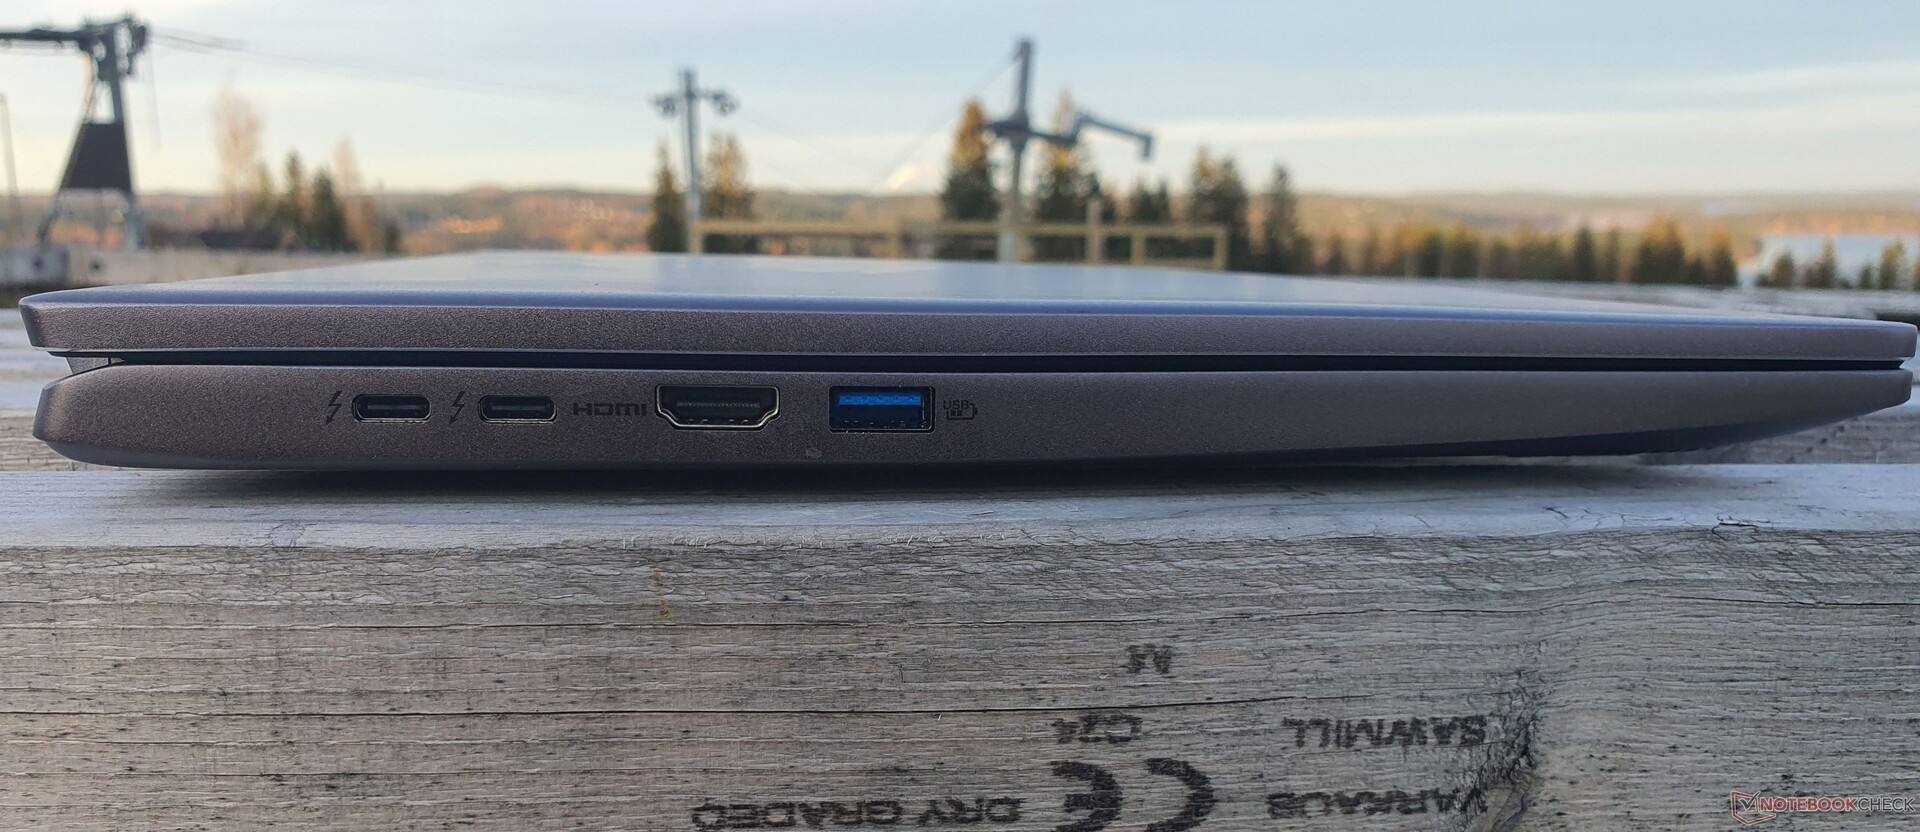
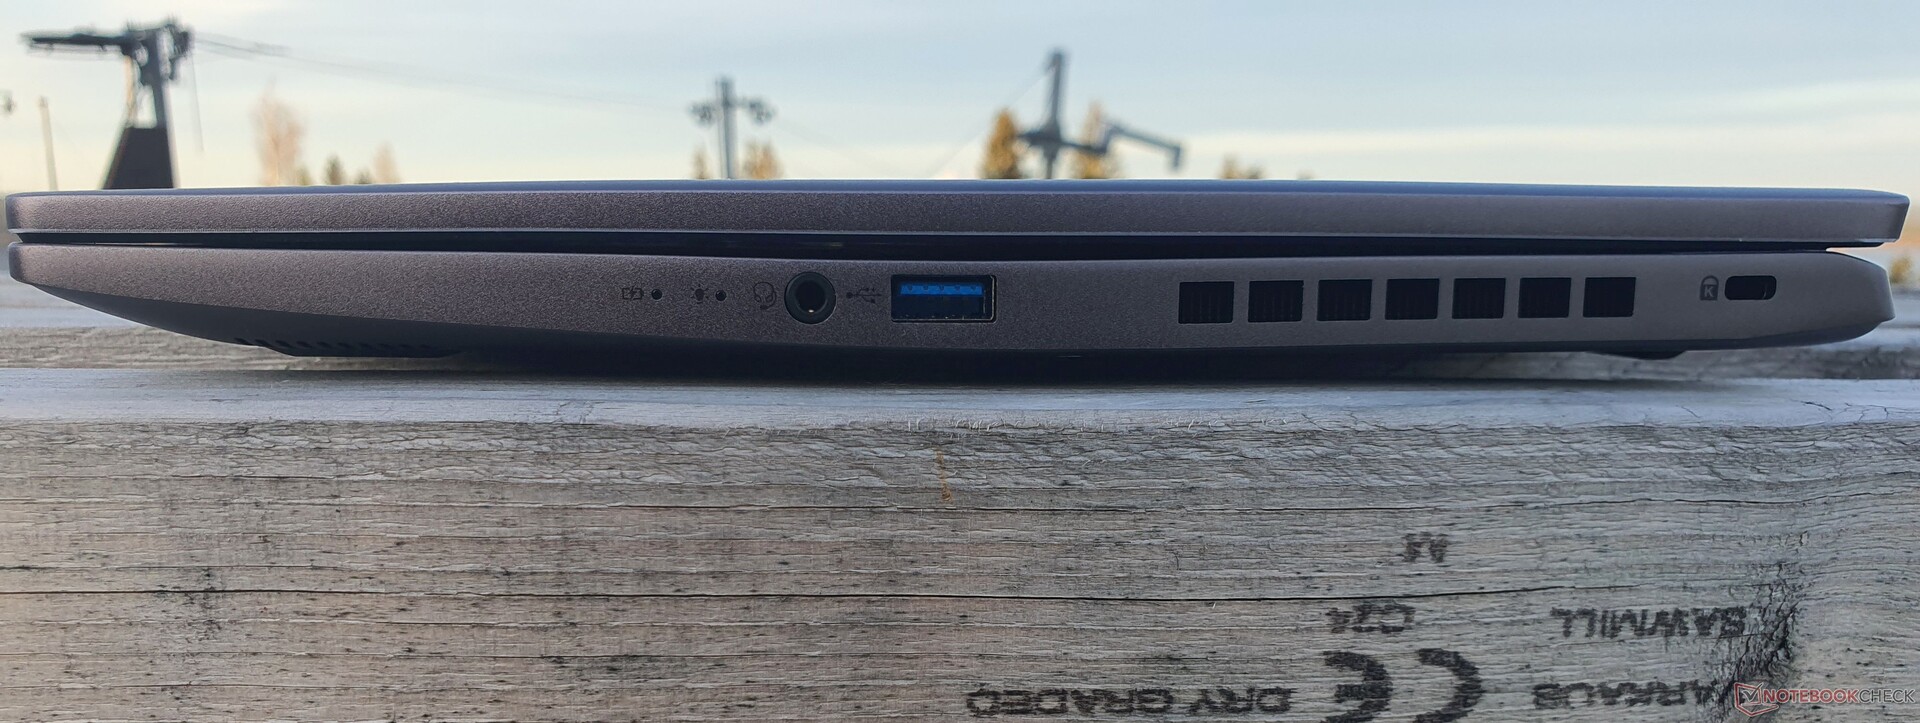
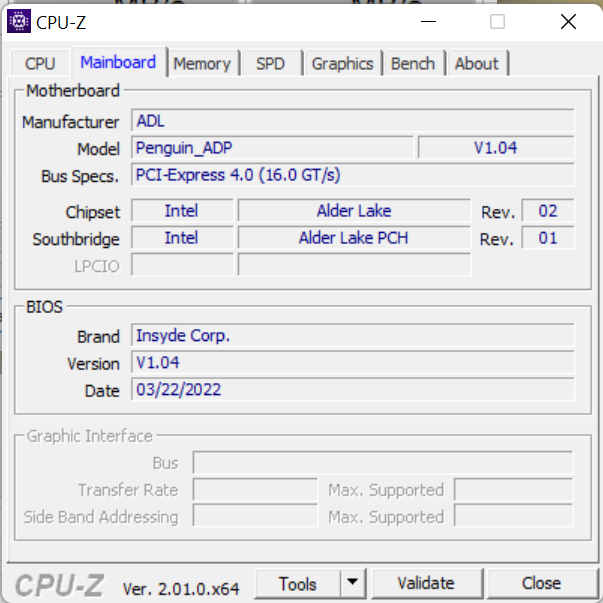
Ausstattung: Update auf HDMI 2.1 & TB4 für Acer Swift X
| Networking | |
| Acer Swift X SFX16-52G-77RX | |
| iperf3 receive AXE11000 | |
| iperf3 transmit AXE11000 | |
| Acer Swift X SFX16-52G-52VE | |
| iperf3 receive AXE11000 | |
| iperf3 transmit AXE11000 | |
| Acer Swift X SFX16-51G-5388 | |
| iperf3 transmit AX12 | |
| iperf3 receive AX12 | |
| Lenovo ThinkBook 16 G4+ IAP | |
| iperf3 receive AXE11000 | |
| iperf3 transmit AXE11000 | |
| HP Envy 16 h0112nr | |
| iperf3 receive AXE11000 6GHz | |
| iperf3 transmit AXE11000 6GHz | |
| Dell Inspiron 16 Plus 7620 | |
| iperf3 receive AXE11000 6GHz | |
| iperf3 transmit AXE11000 6GHz | |
| Lenovo IdeaPad 5 Pro 16ARH7 | |
| iperf3 receive AXE11000 | |
| iperf3 transmit AXE11000 | |
| Asus Vivobook Pro 16X-M7600QE | |
| iperf3 transmit AX12 | |
| iperf3 receive AX12 | |
WiFi-Graph
Webcam


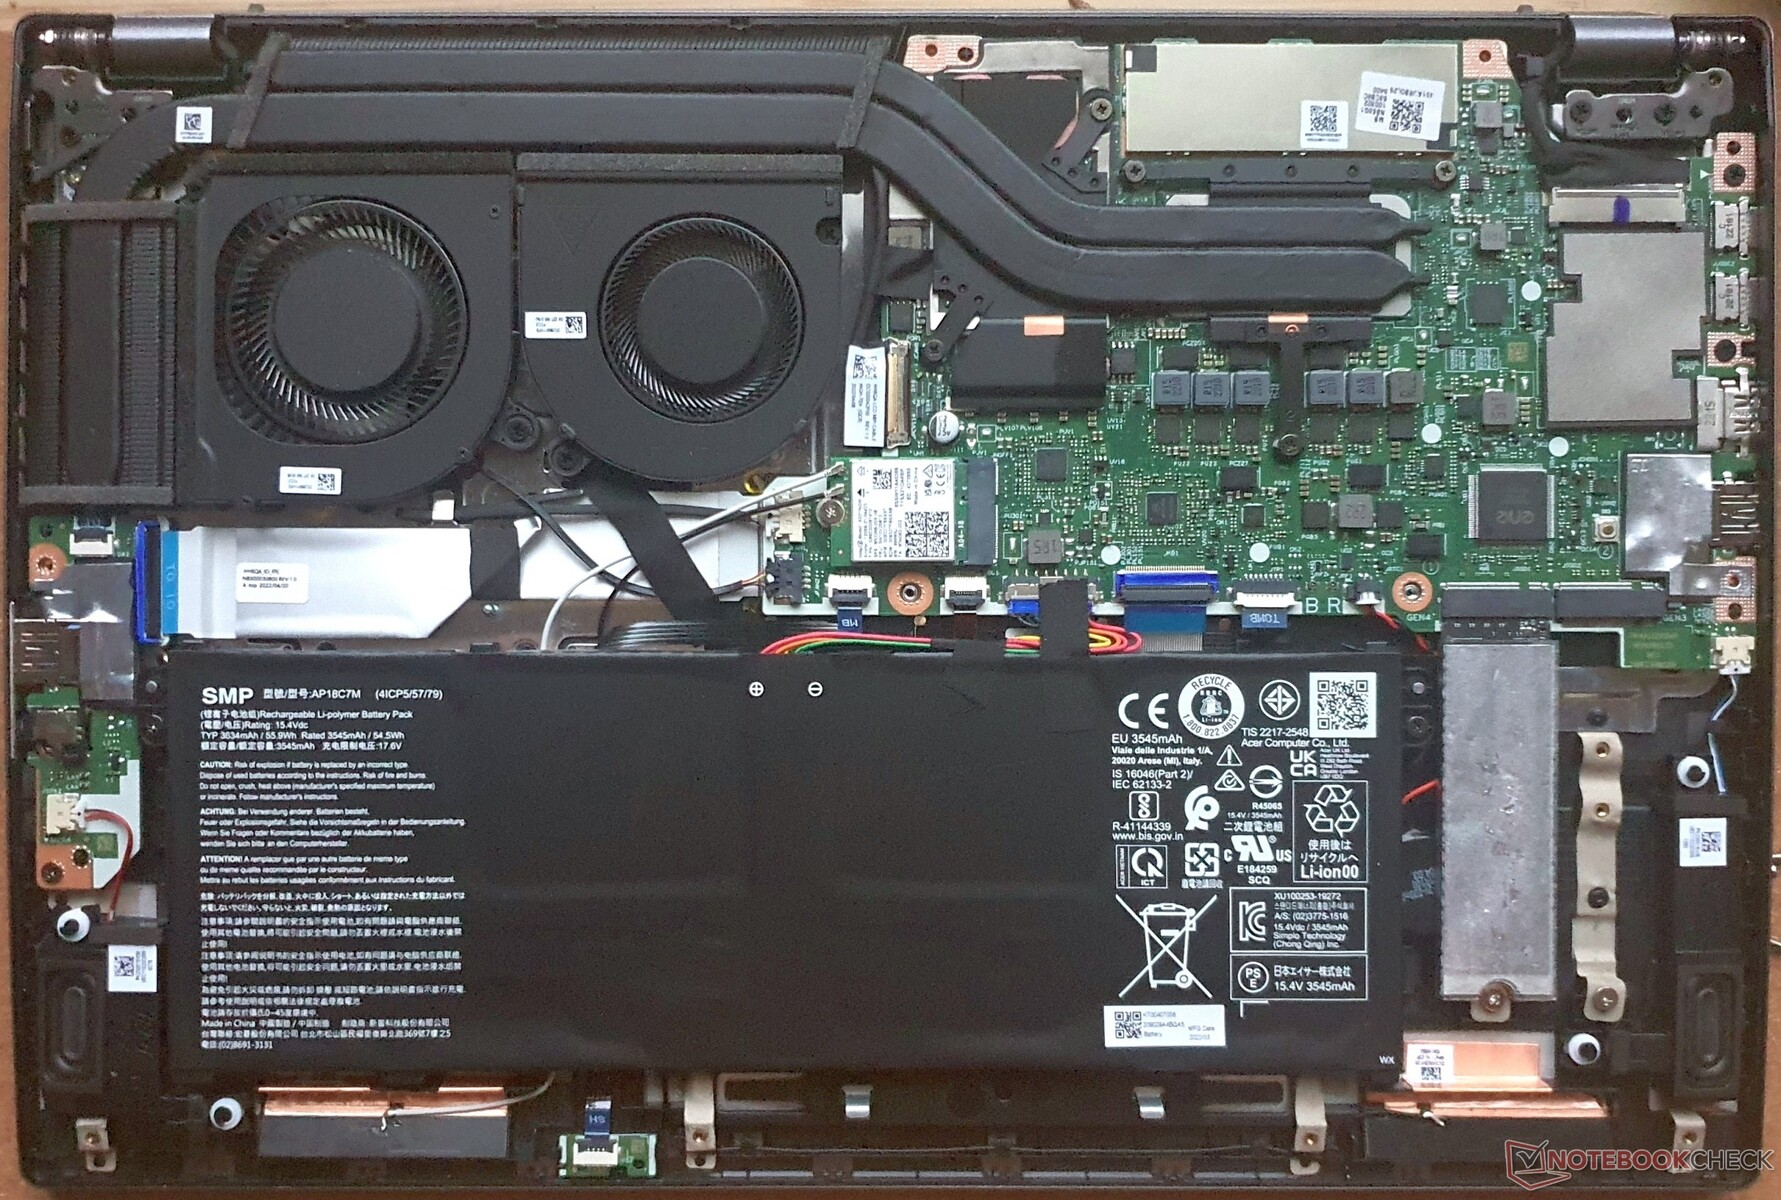
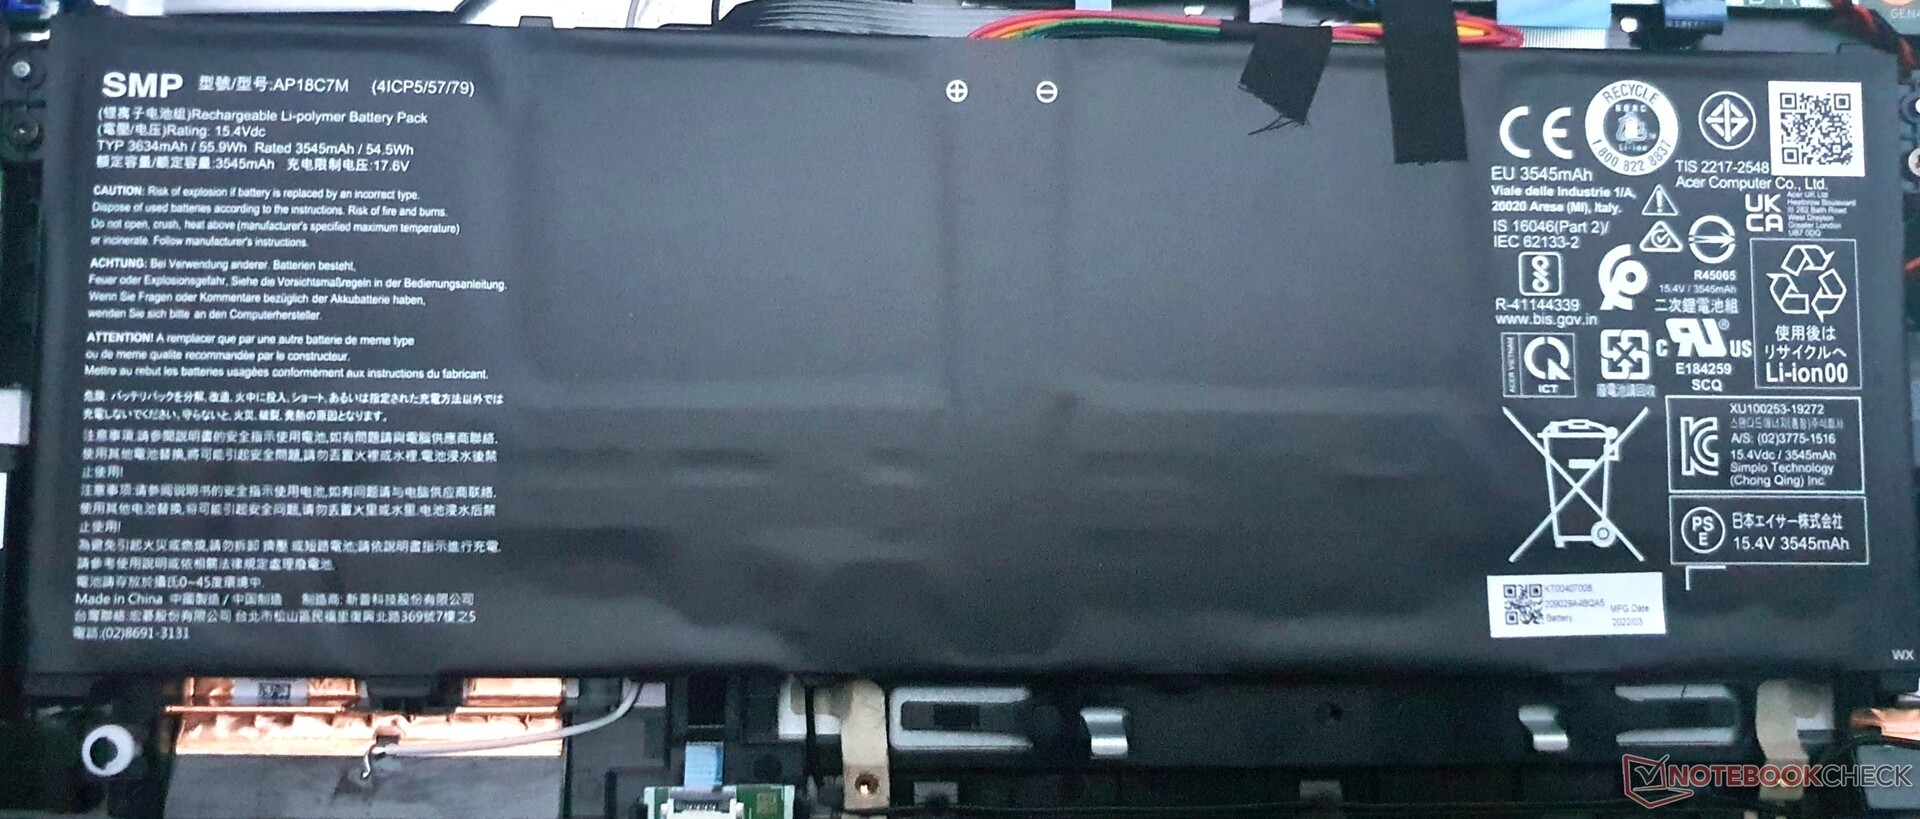
Wartung
Garantie
Acer bietet die für seine Swift Serie üblichen 2 Jahre Garantie innerhalb Deutschlands.
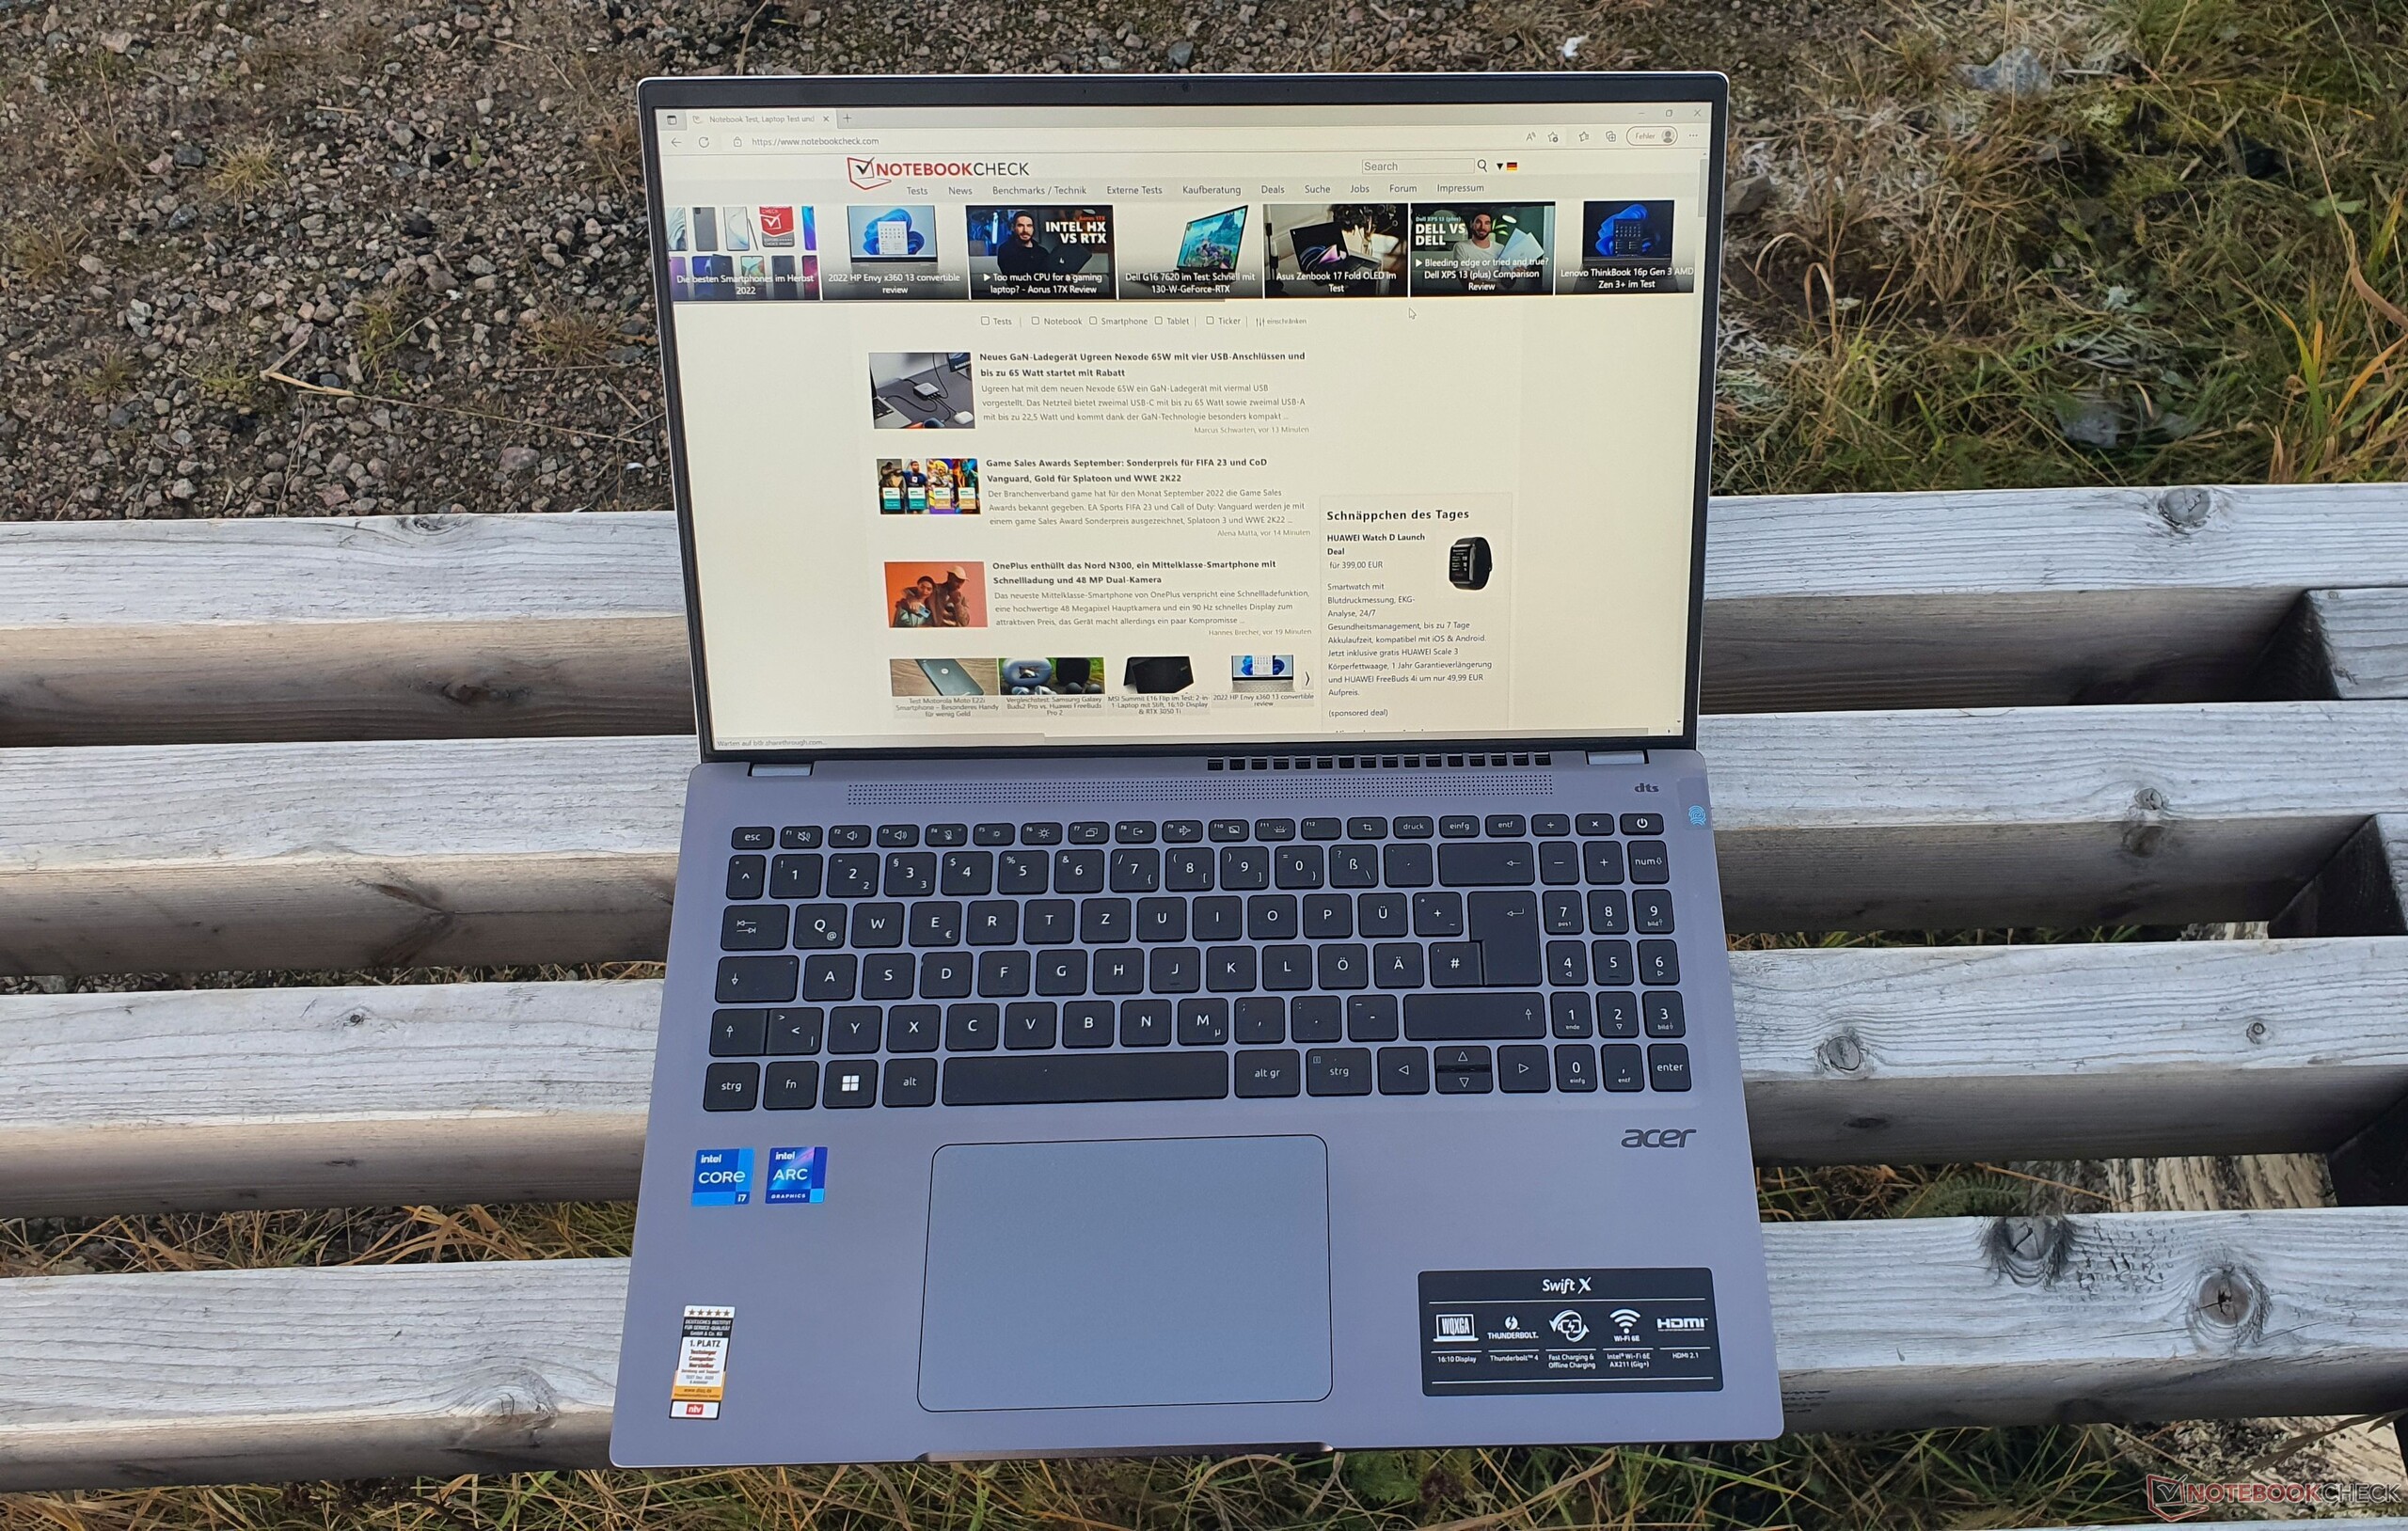
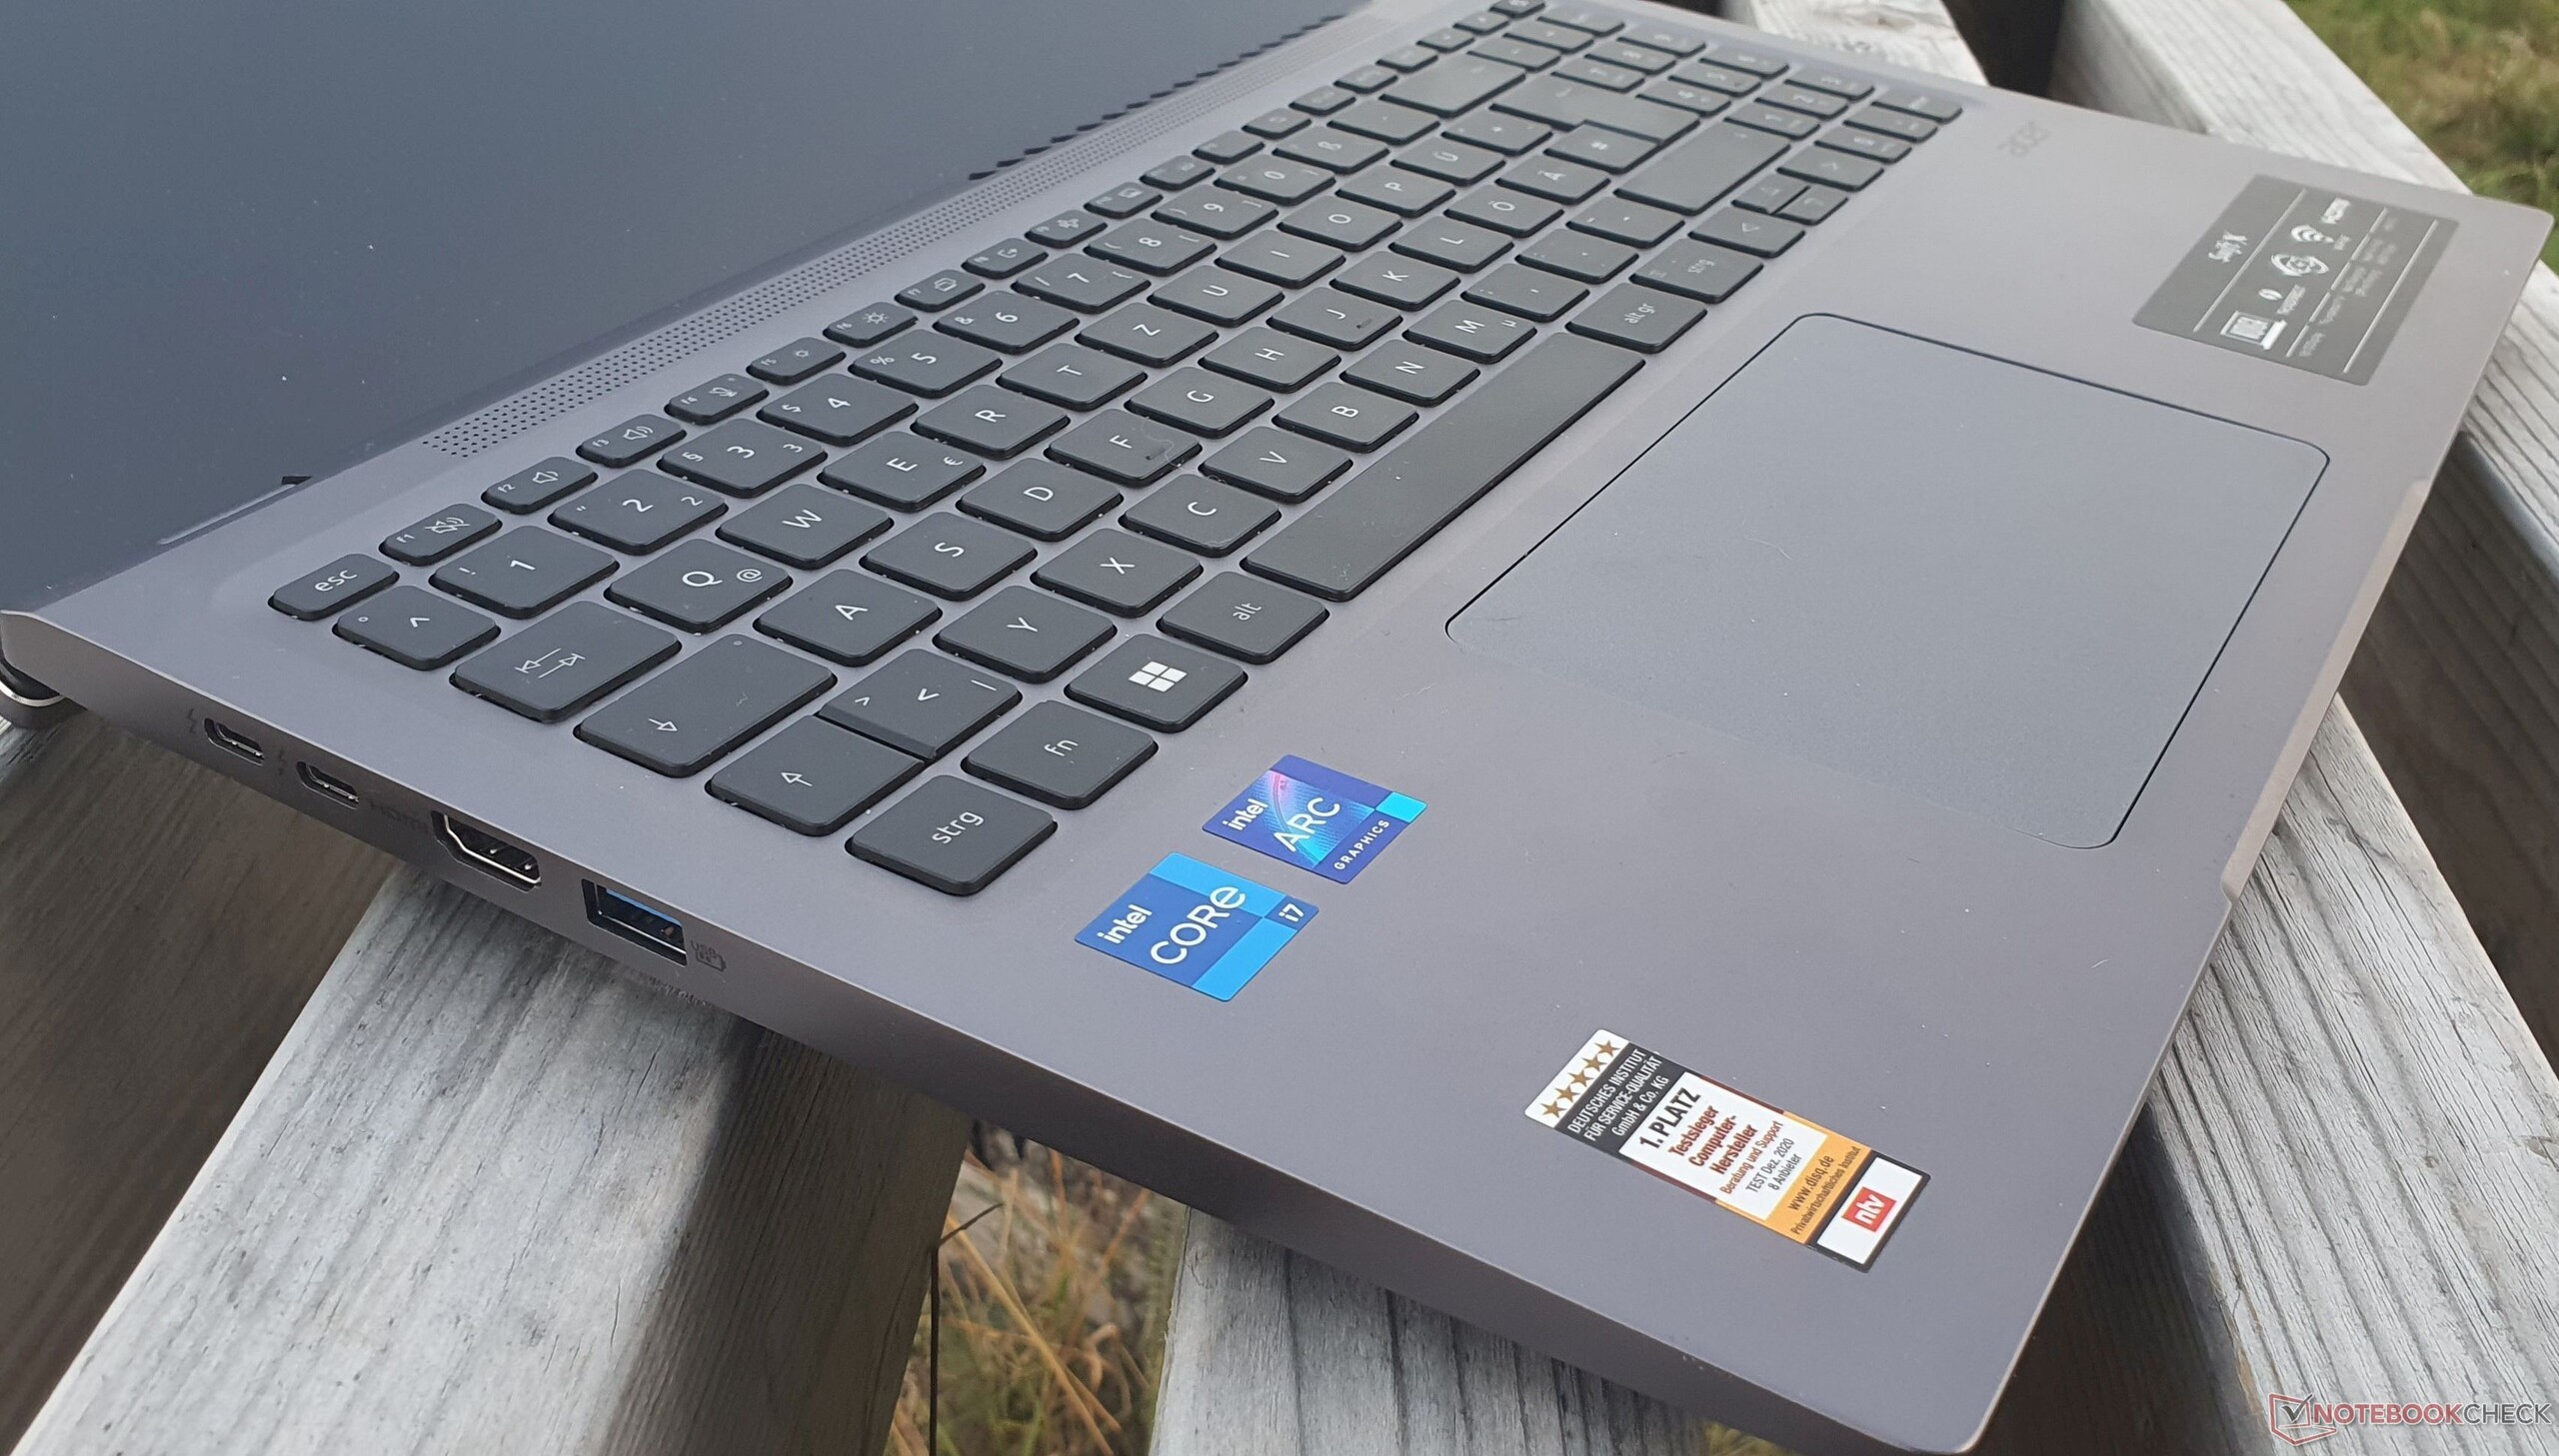
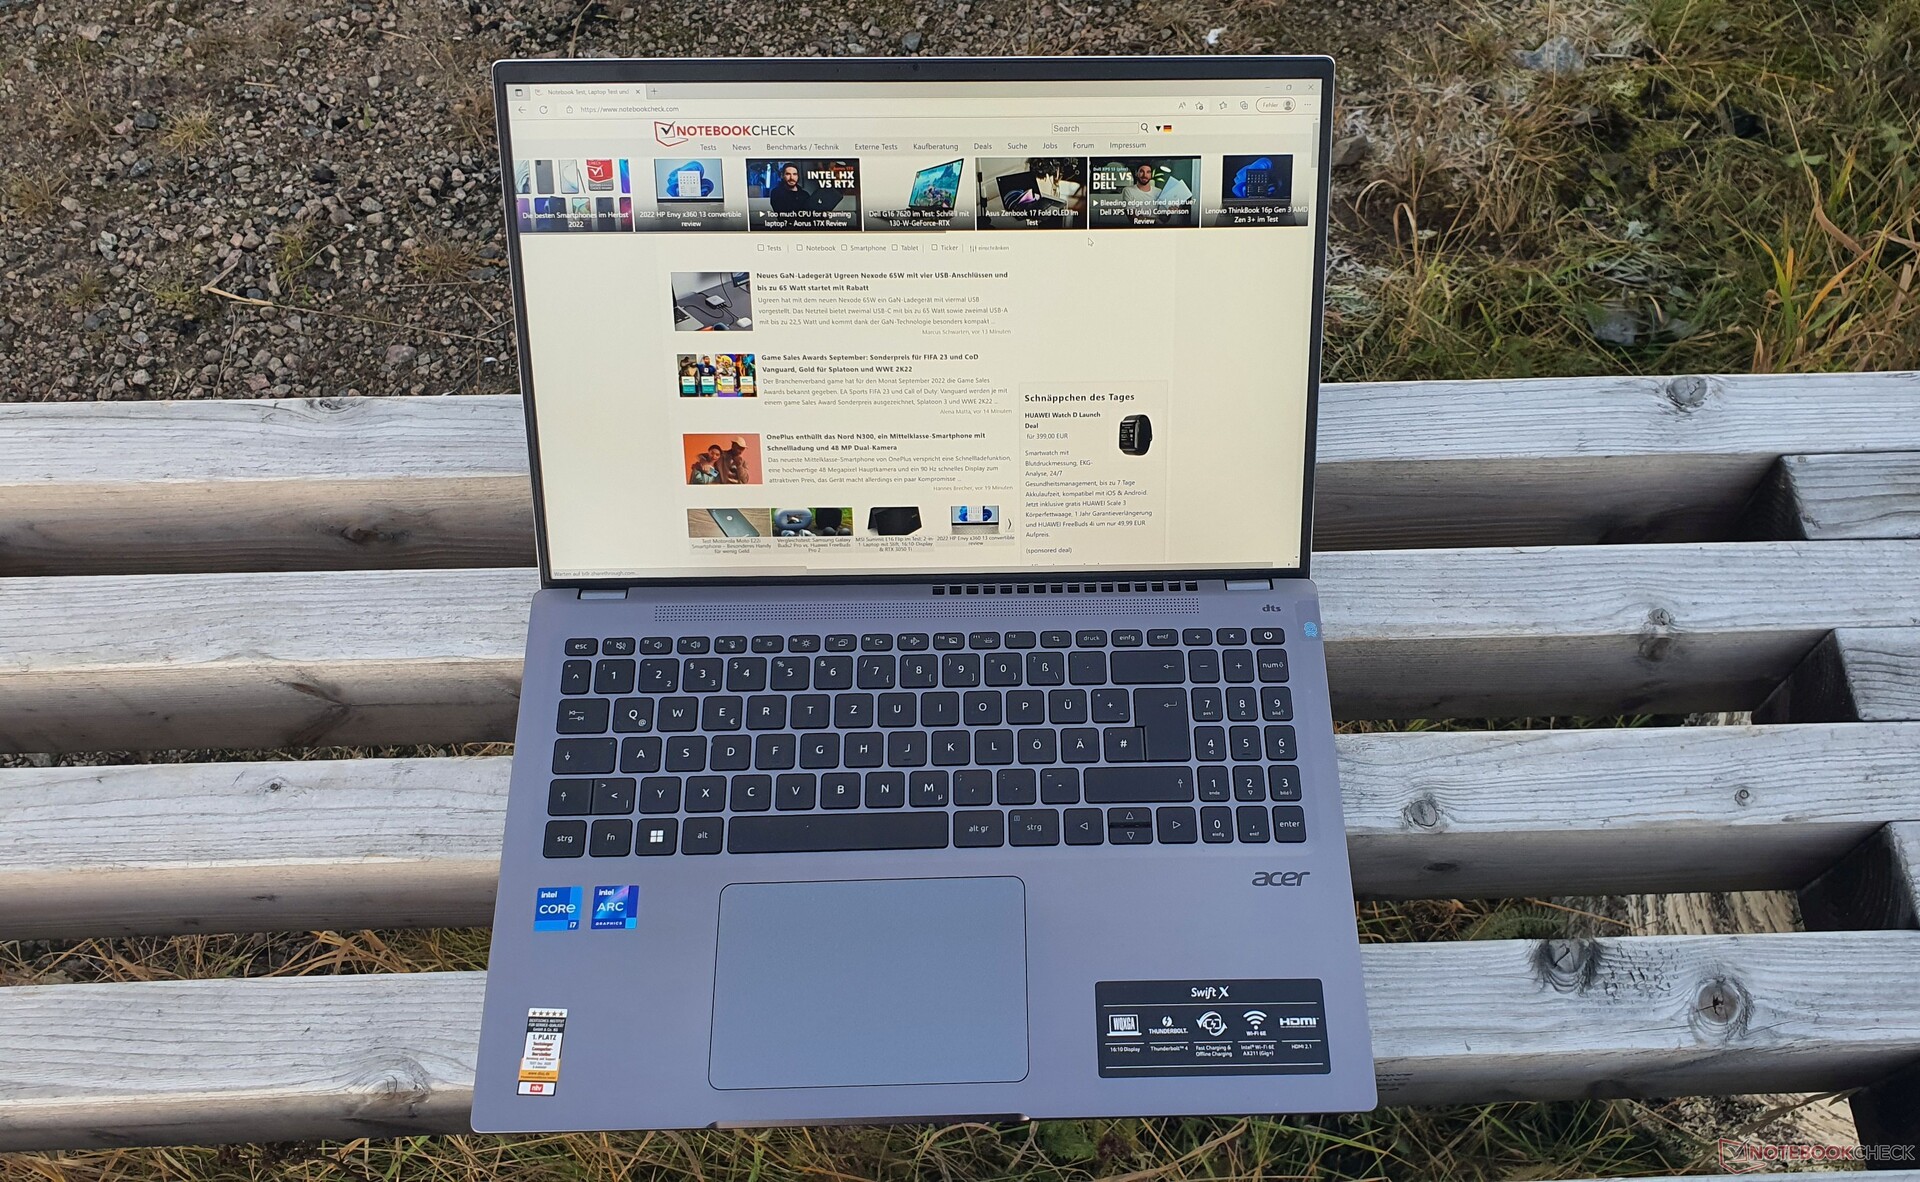
Eingabegeräte: Starke Tastatur, schwaches Touchpad im Acer Swift X
Tastatur
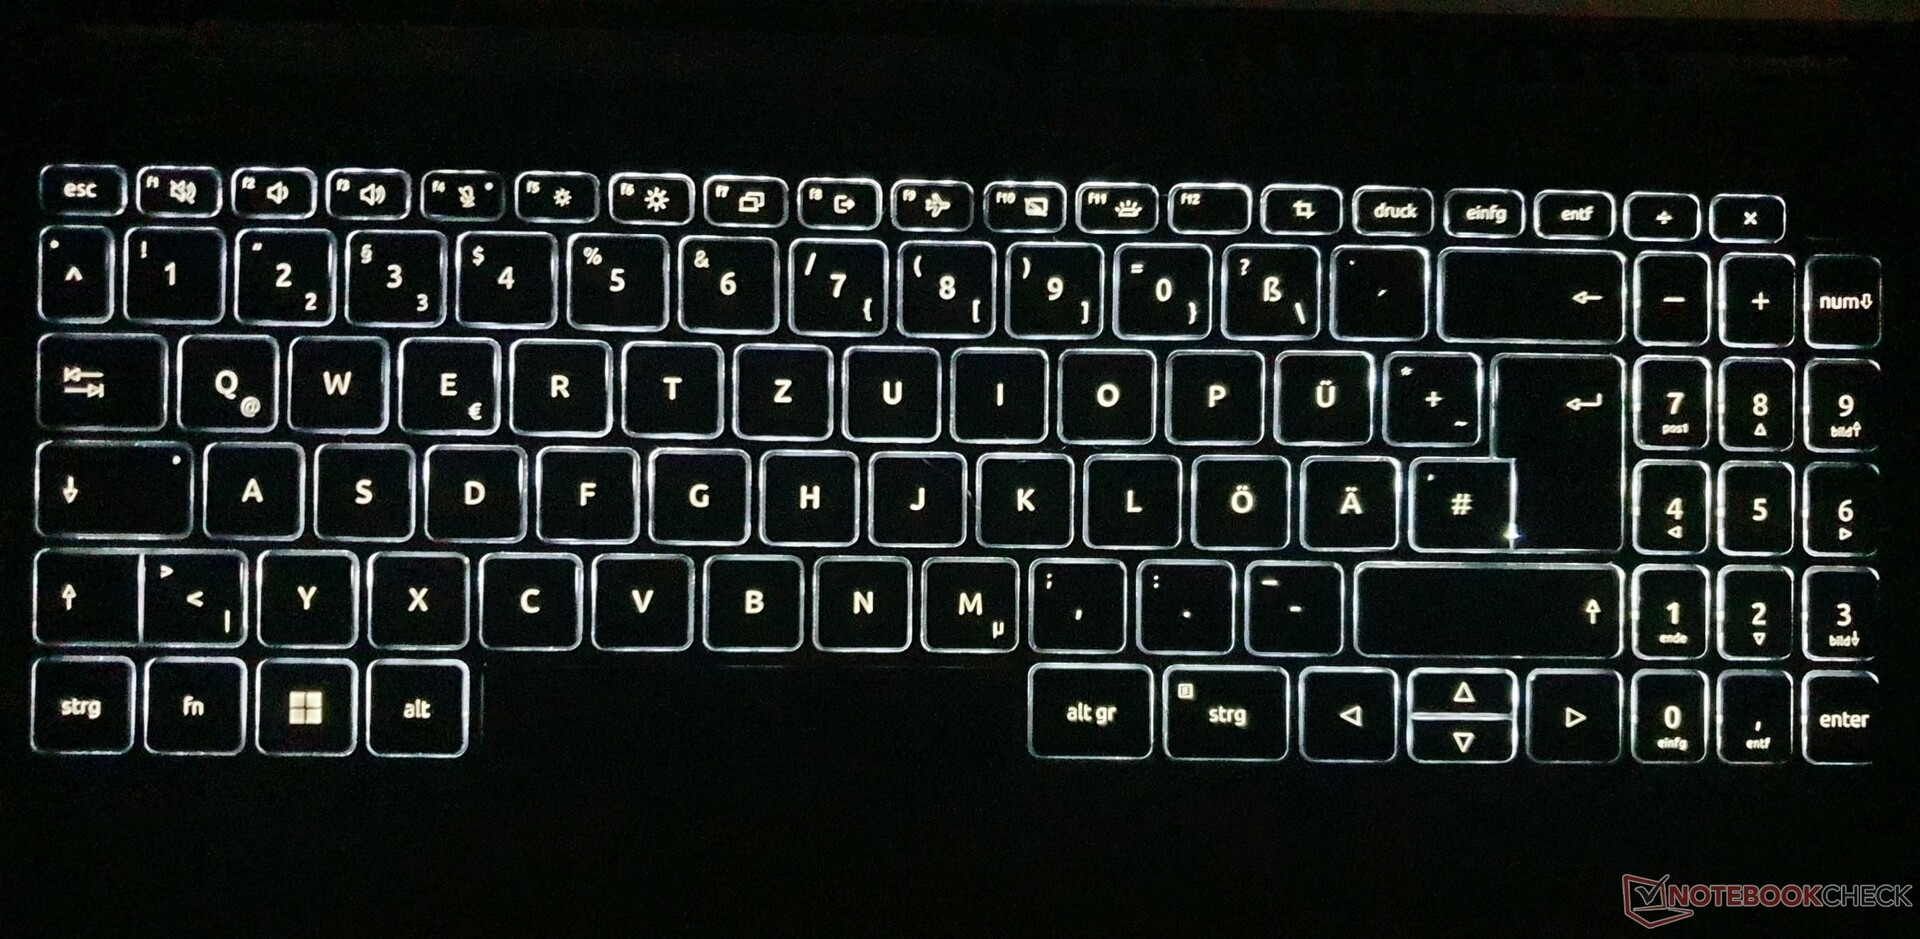
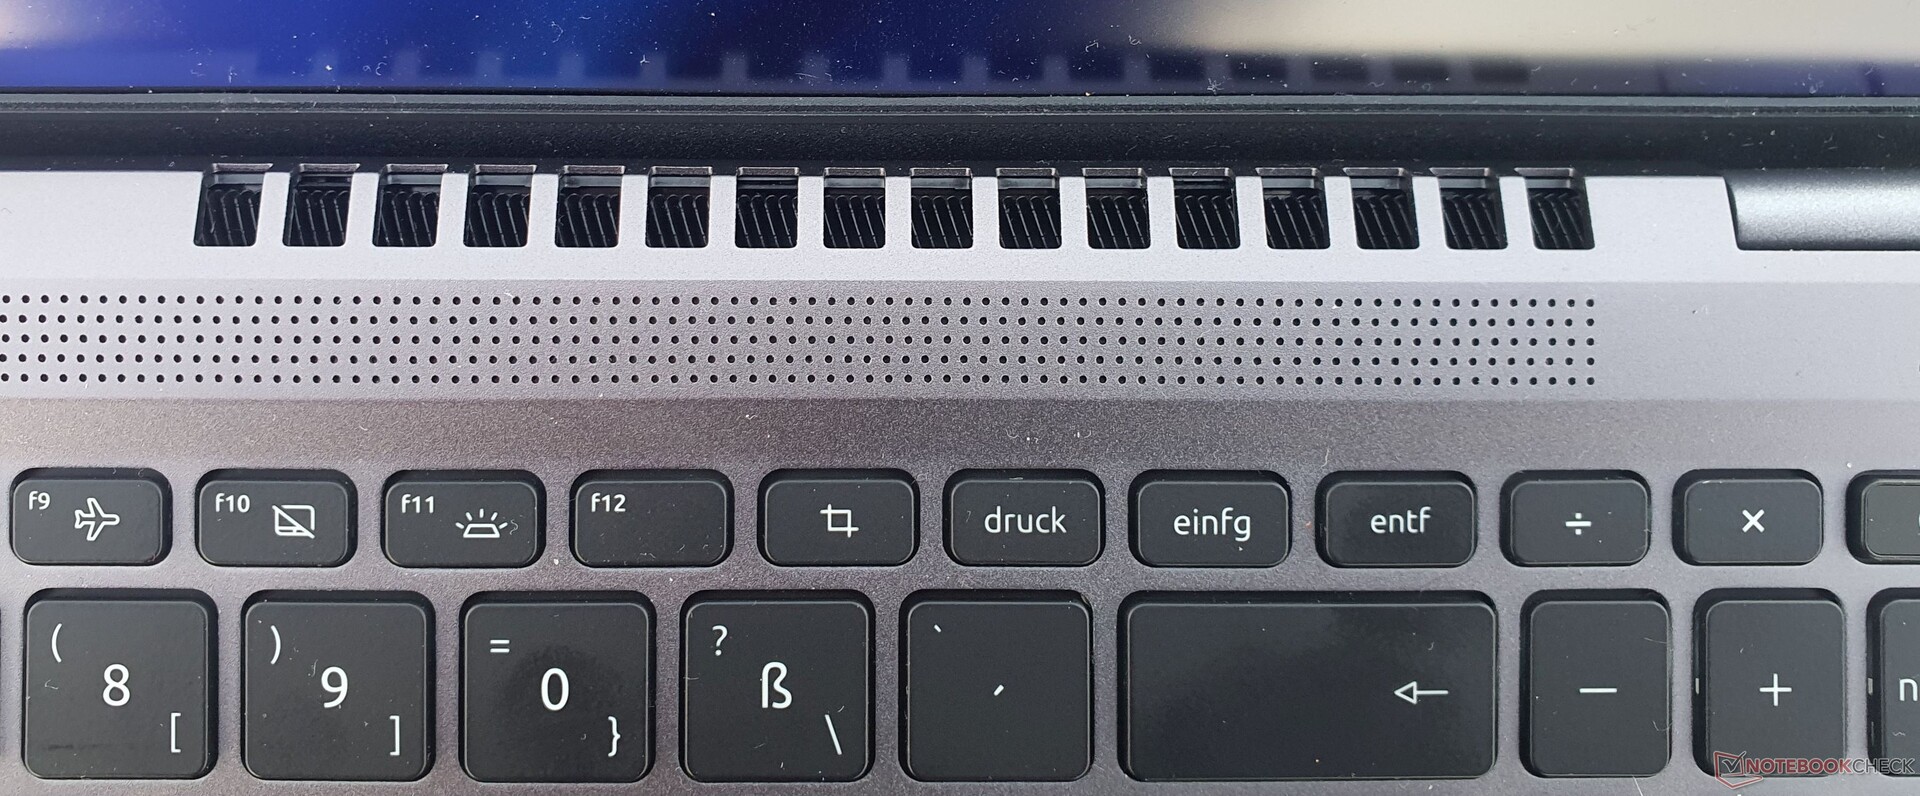
Die Tasten der 6-reihigen Chiclet-Tastatur sind mit 15x15 mm etwas verkleinert. Der Hub ist kurz, aber der Druckpunkt erzeugt, zusammen mit dem gut gewählten Widerstand, ein starkes Feedback. Auch längere Texte lassen sich damit problemlos verfassen.
Unter gezieltem Druck gibt die Tastatur etwas nach, beim Tippen äußert sich das durch eine leicht klapprige Enter- und Raute-Taste. Das Layout der Acer Tastatur bietet die typischen Doppelbelegungen, einen gedrängten Nummernblock und verkleinerte Pfeil-Auf-/Ab-Tasten.
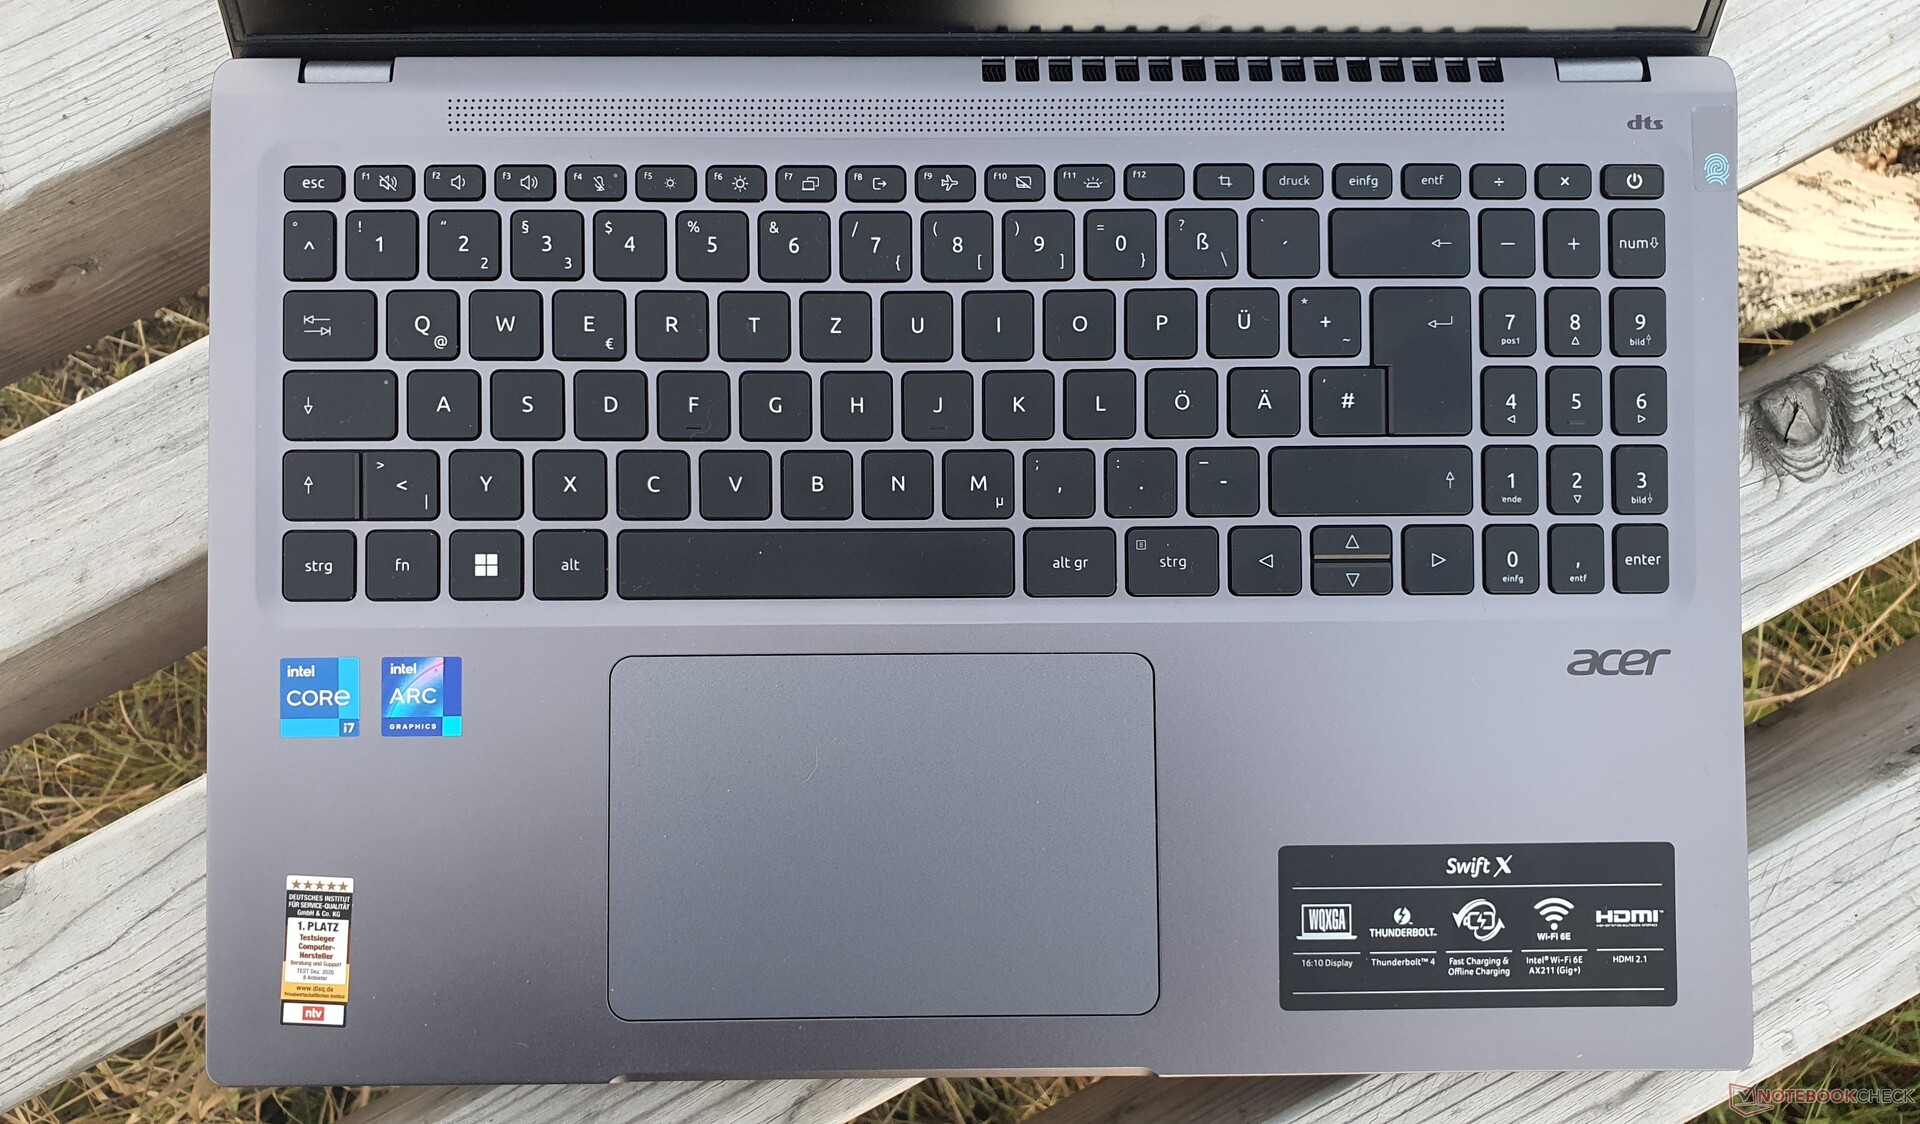
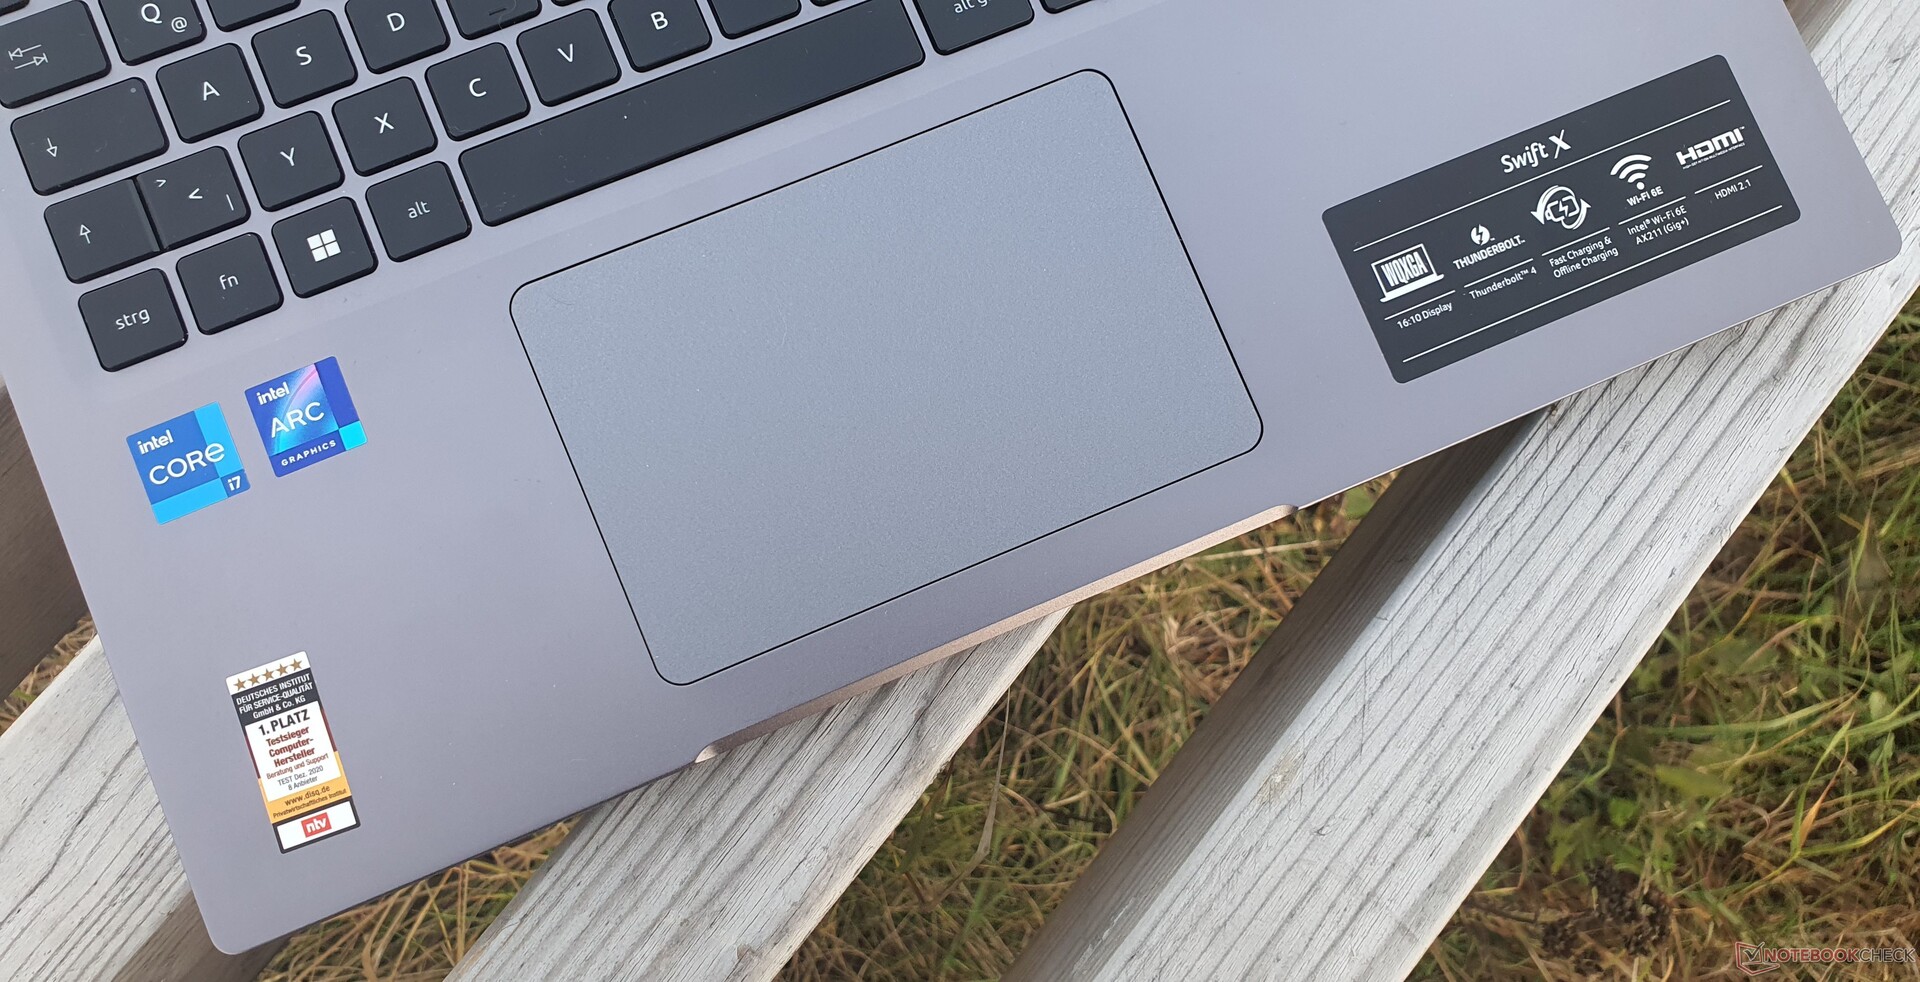
Touchpad
Acer verbaut beim Swift X 16 dieses Jahr sein "OceanGlass"-Touchpad. Die 12,7 x 8,3mm große Oberfläche ist rutschig, fast schon "ölig", sodass eine präzise Eingabe kaum möglich ist. Drag-&-Drop wird ebenfalls deutlich erschwert. Die integrierten Klicktasten mit mittlerem Hub sind dumpf und klappern beim Gleiten des Fingers übers Touchpad.
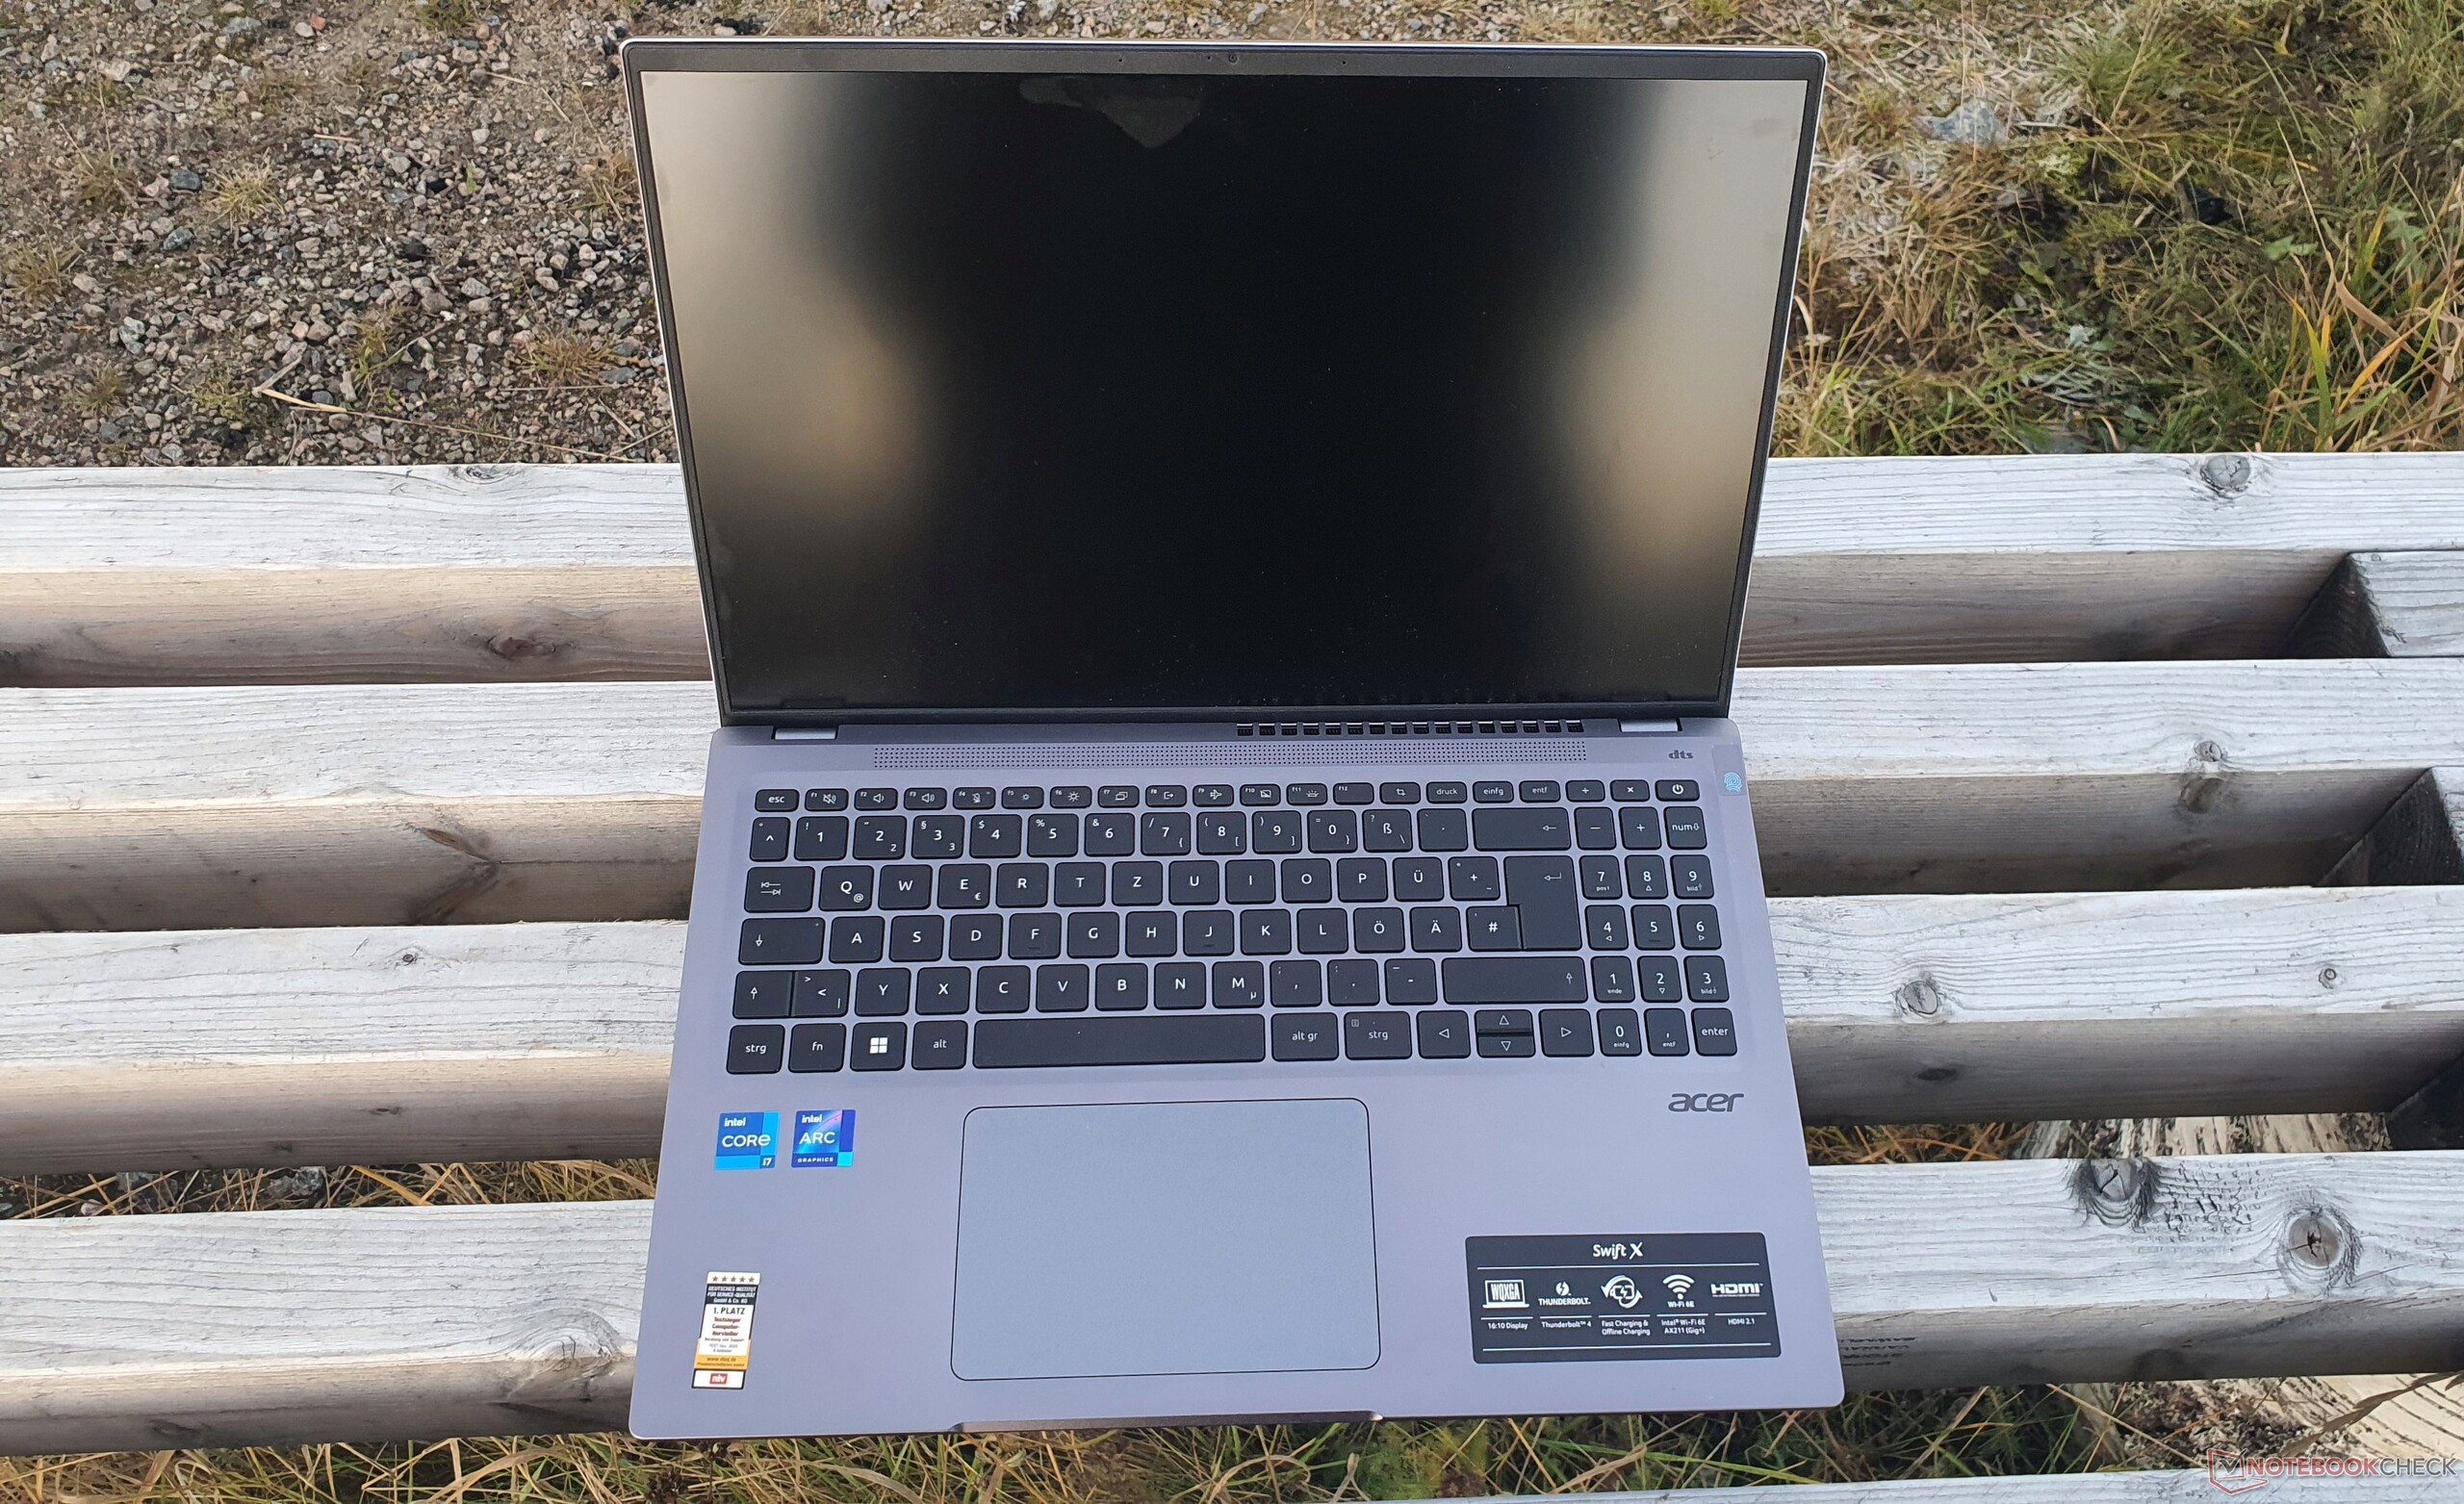
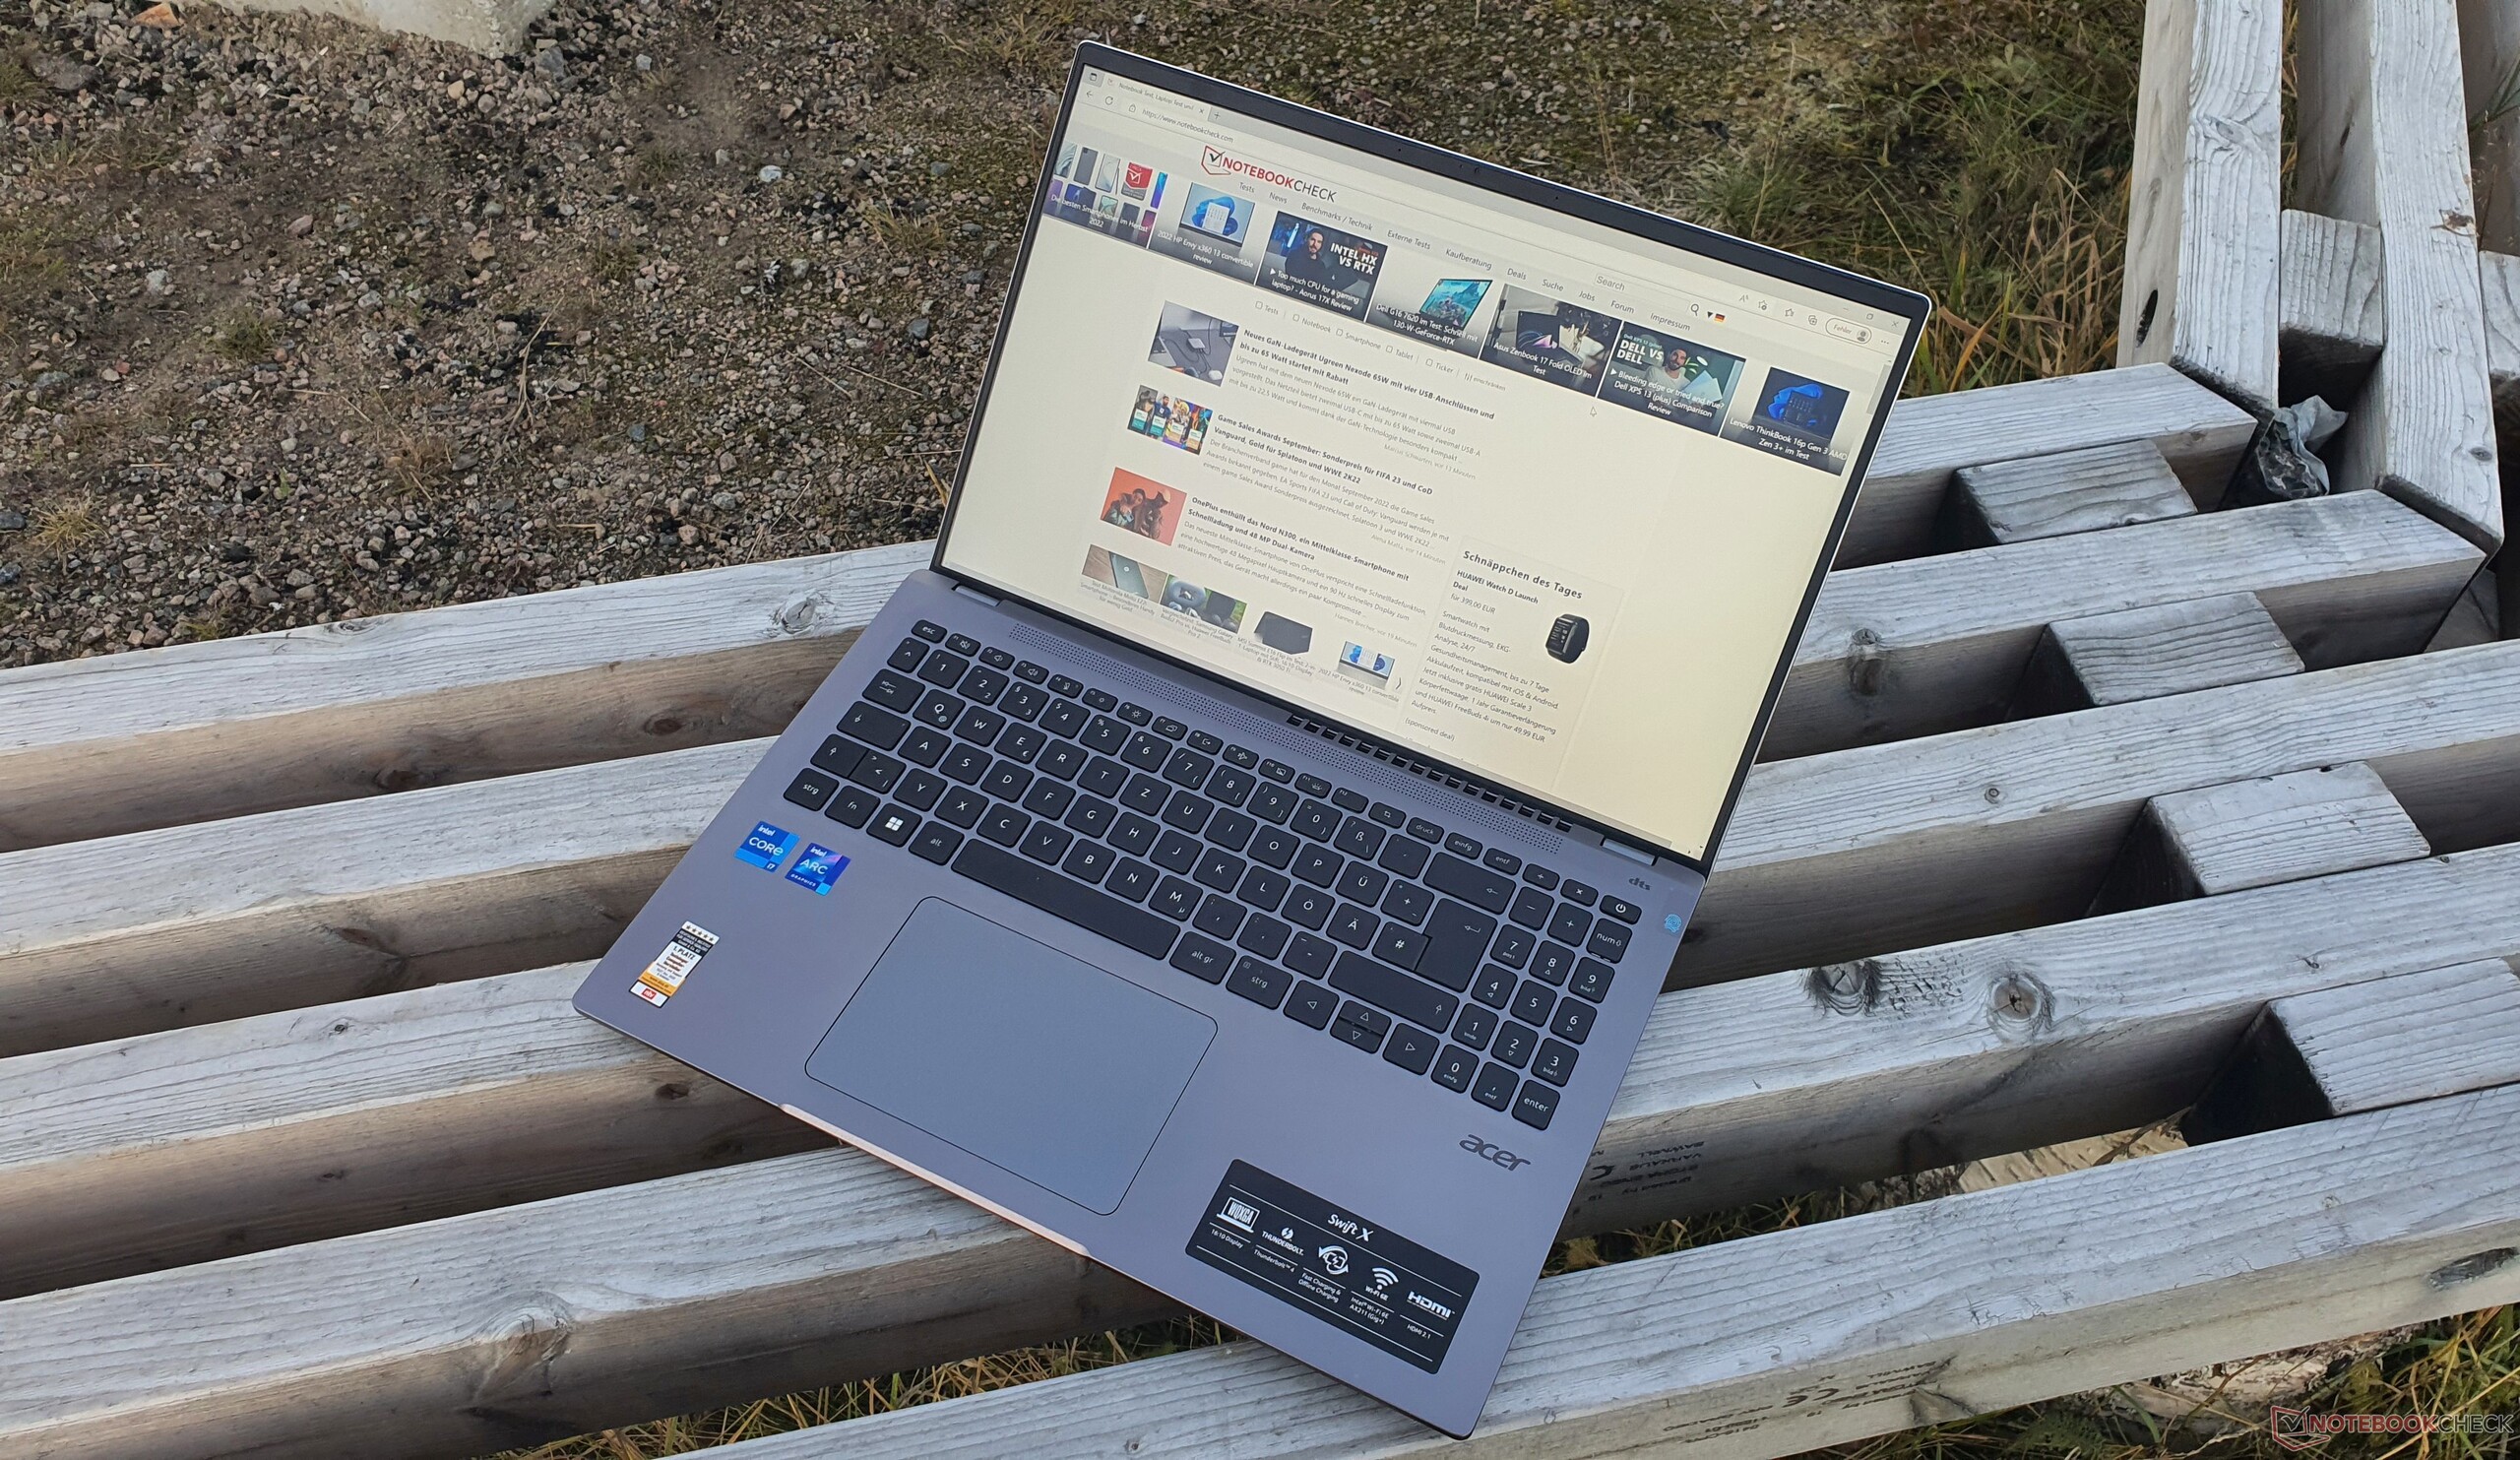
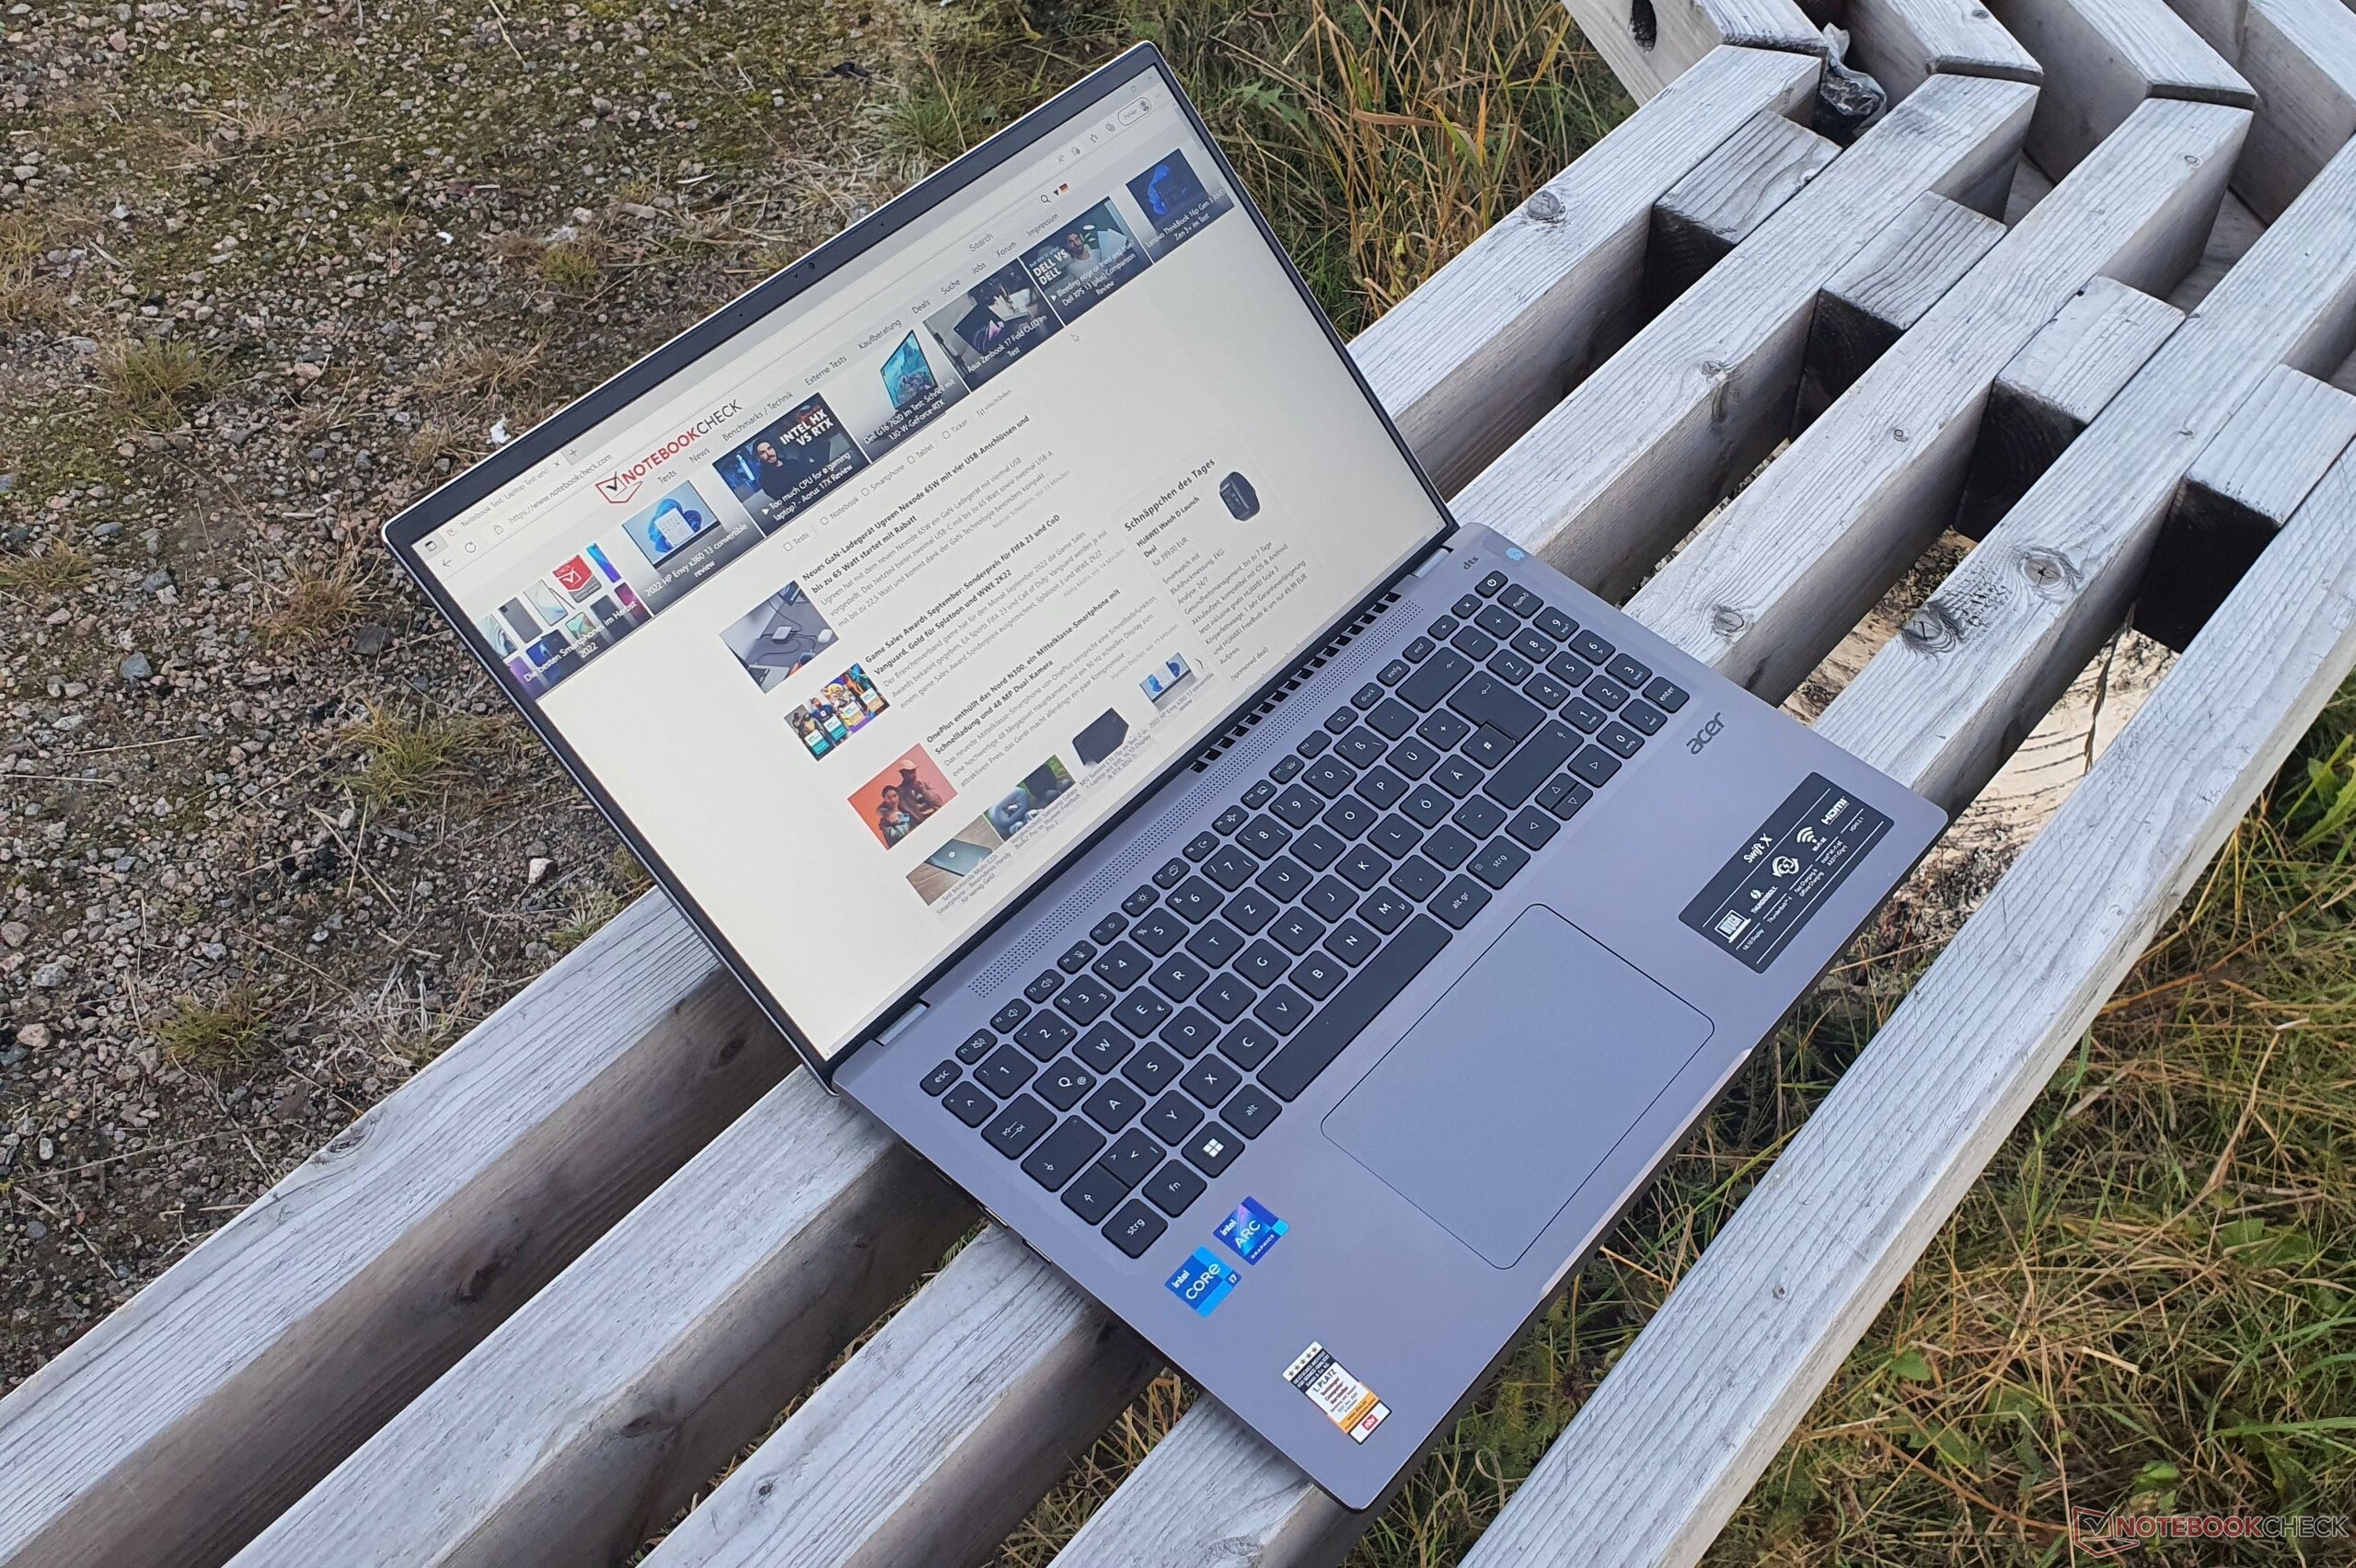
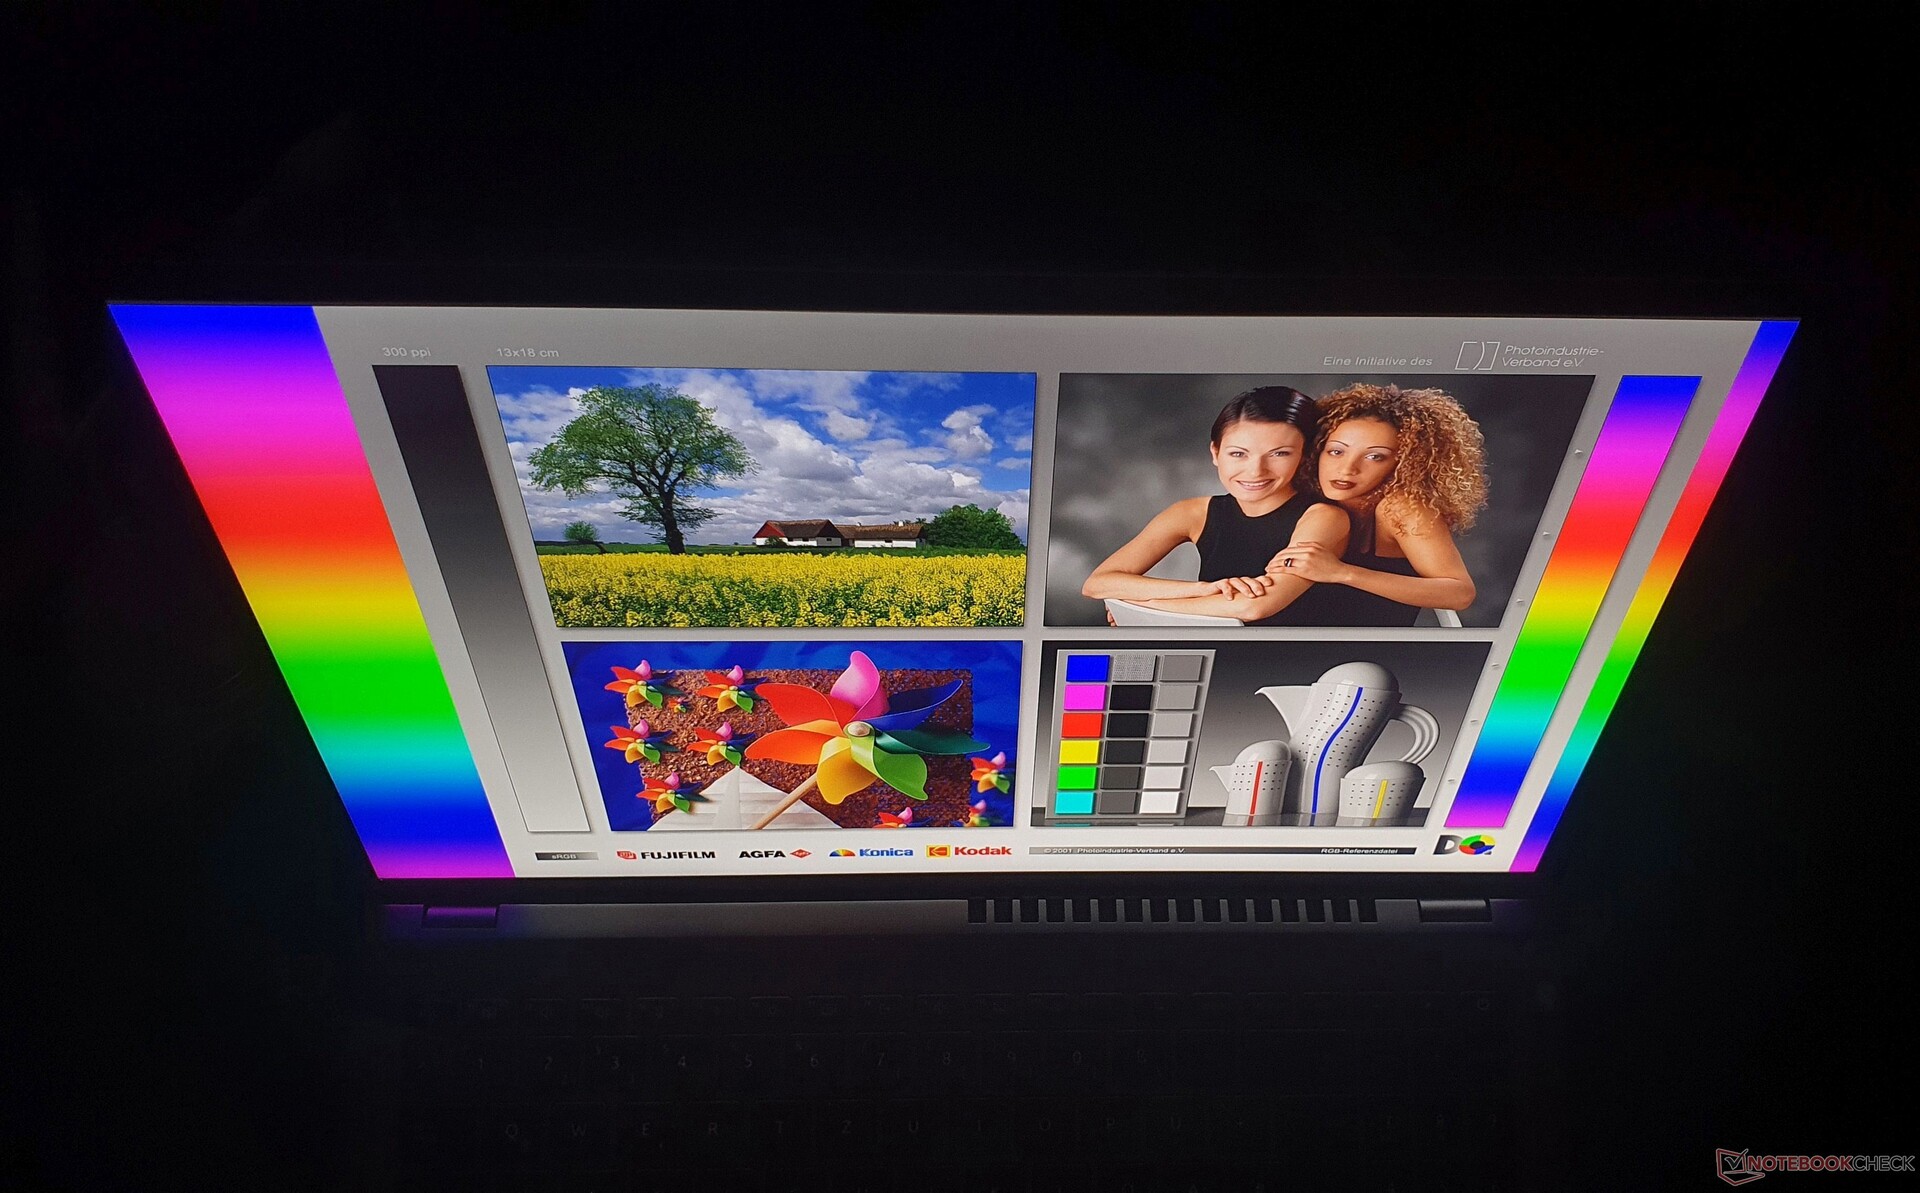
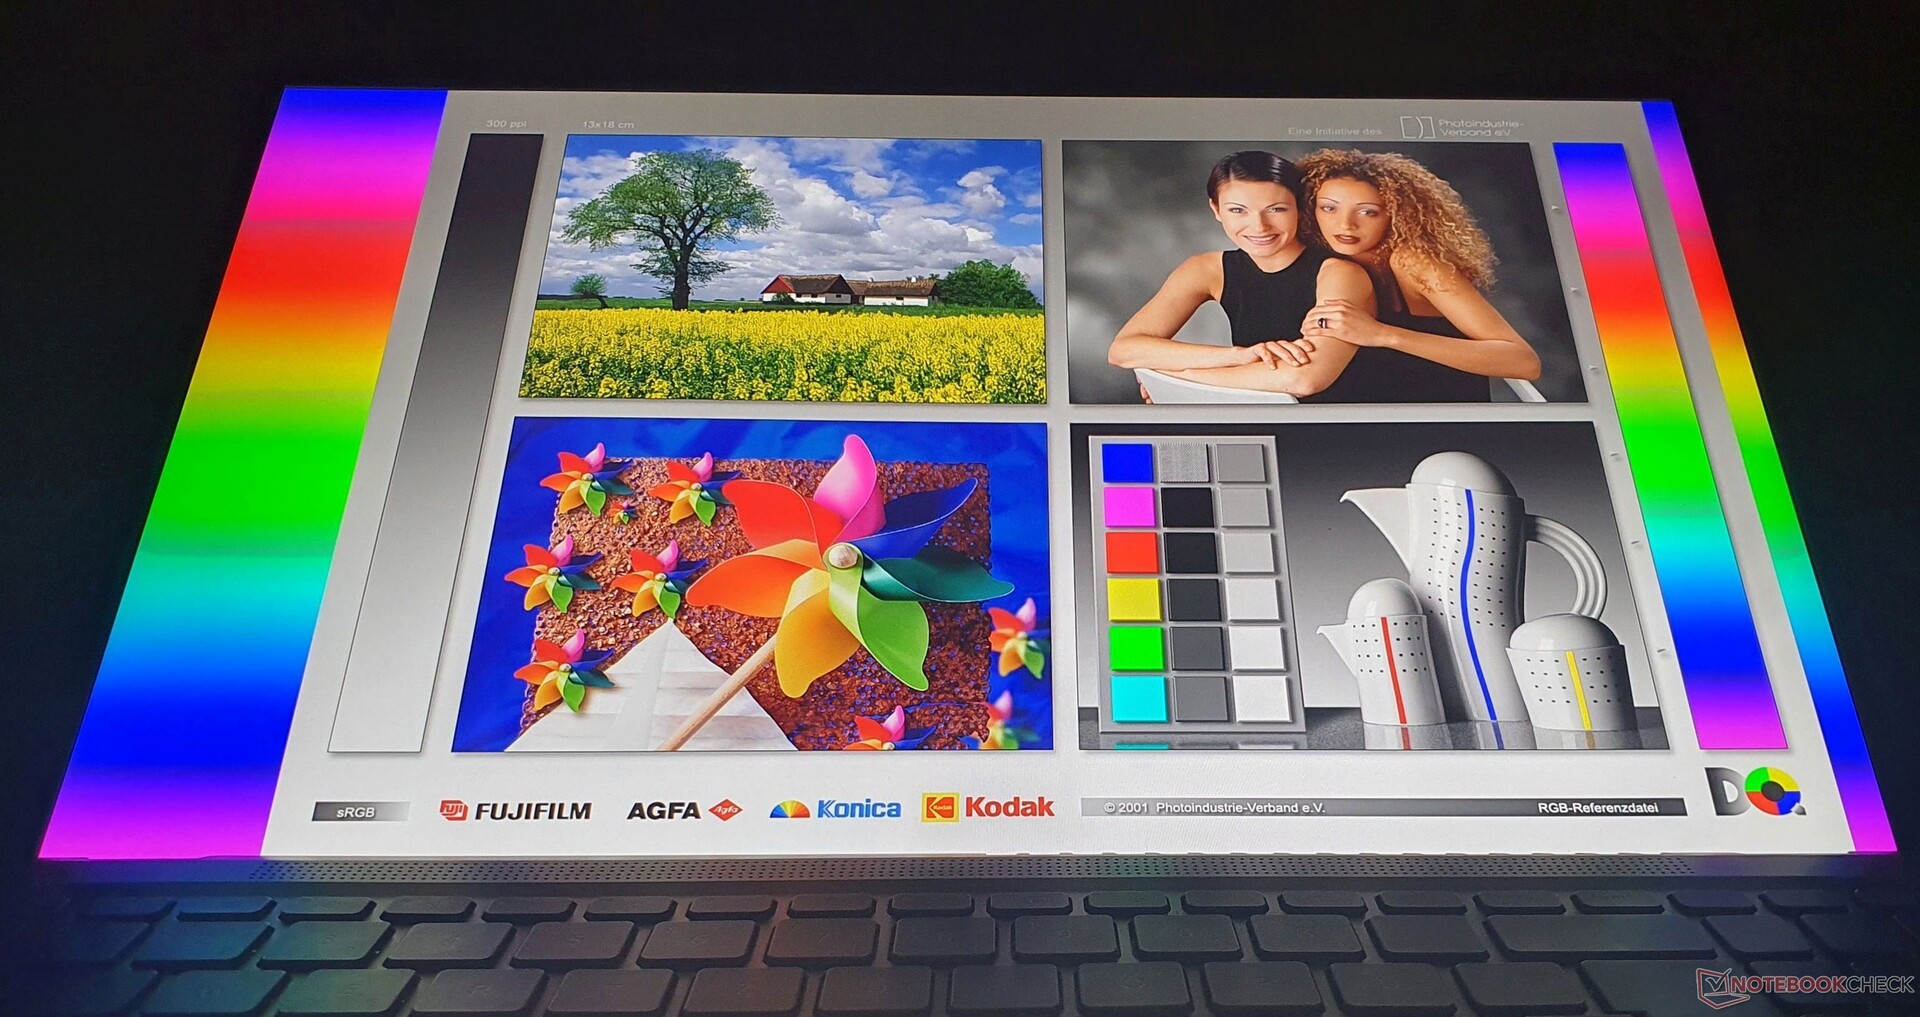
Display: Helles 2,5K-Panel und endlich 16:10 im Swift X 16

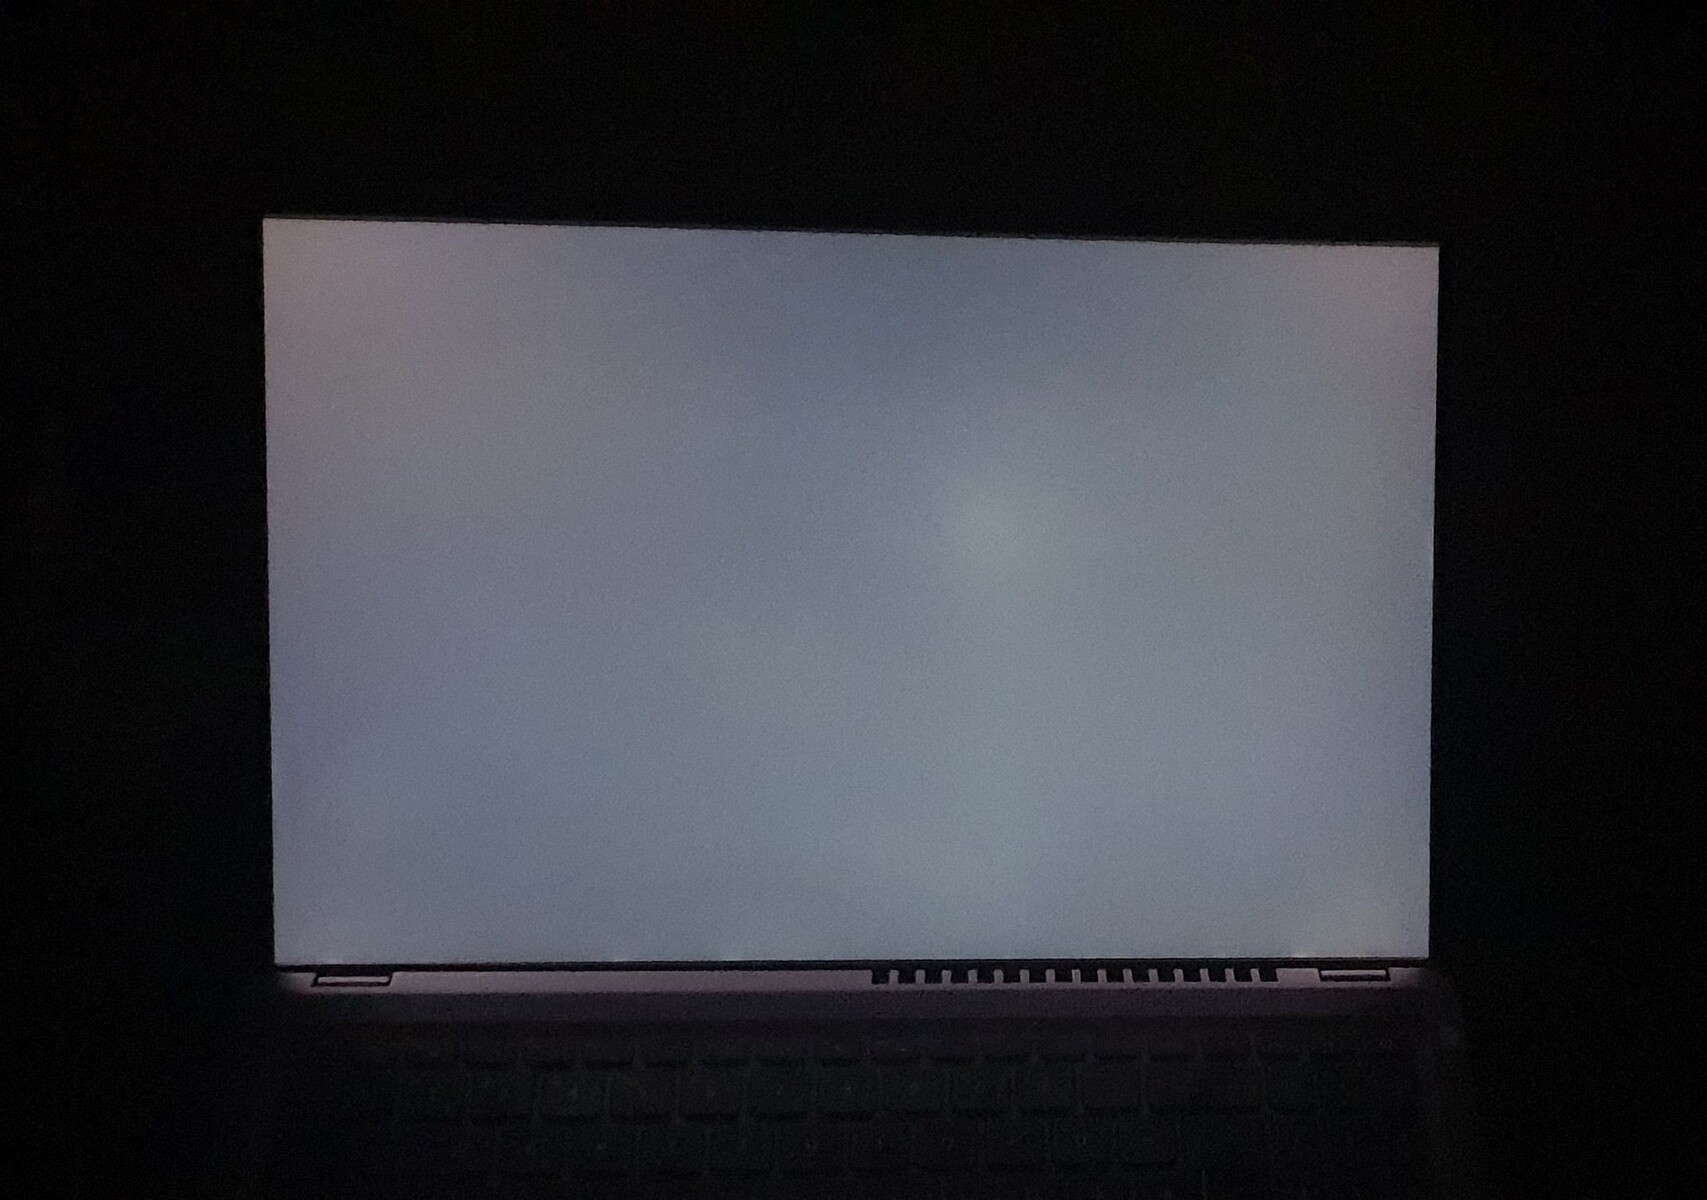
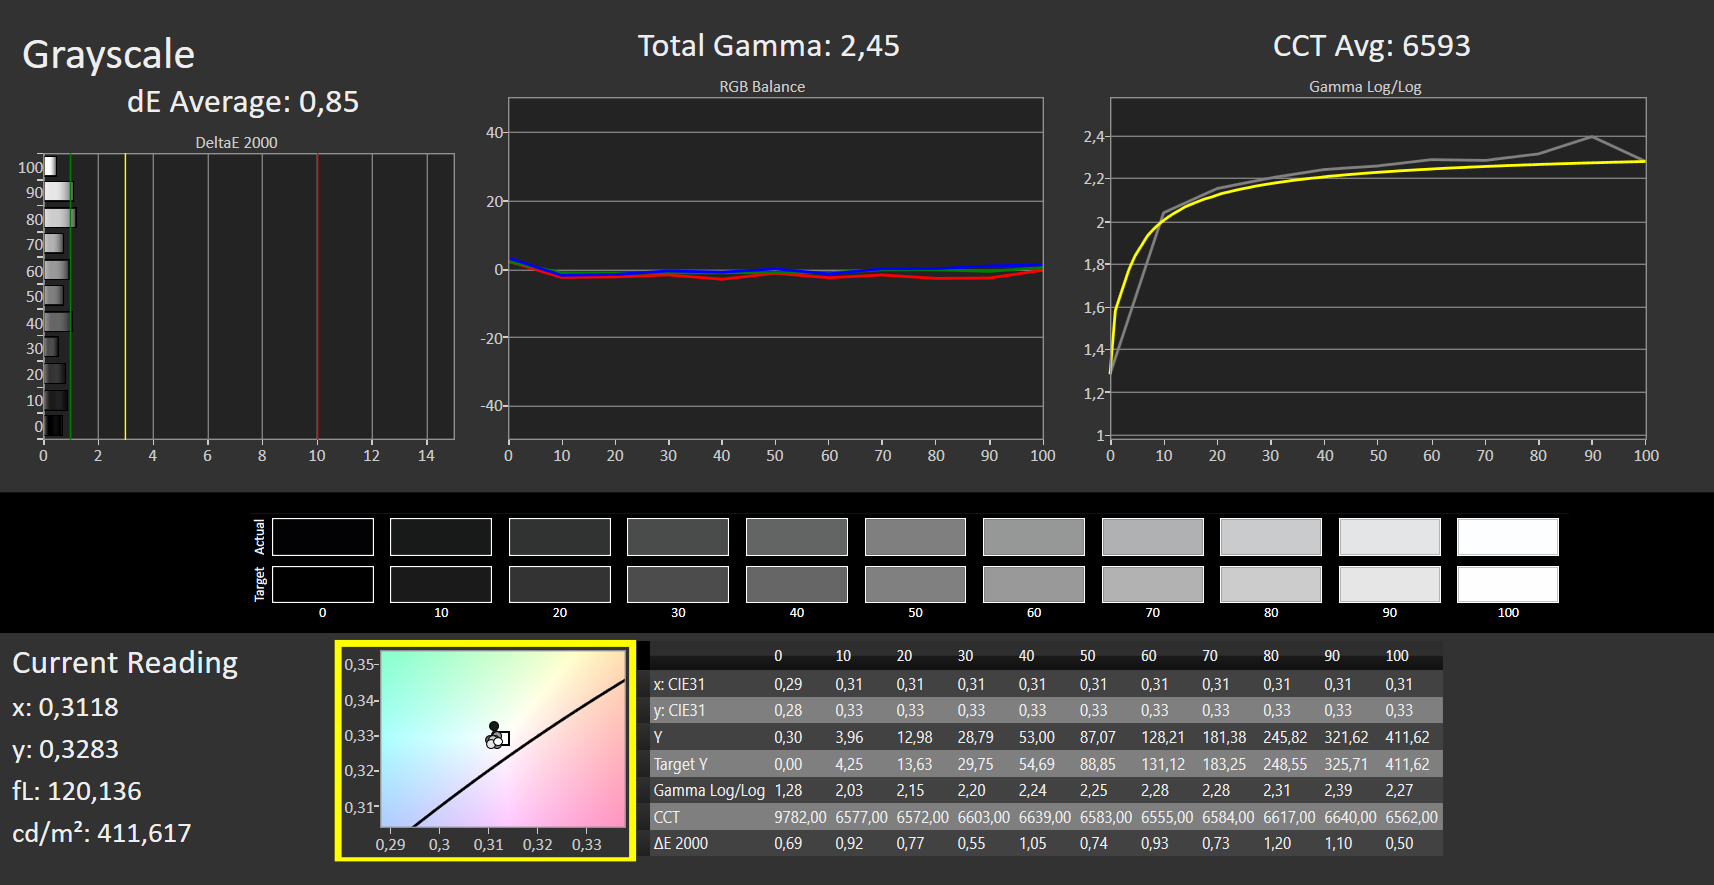
Bei dem matten Panel mit der Bezeichnung "B160QAN02.M" handelt es sich um das gleiche wie im Schwestermodell. Im Gegensatz zum Vorgänger wird auf das 16:10-Format gesetzt, und die Helligkeit beträgt nun gute 378 Nits.
Die Auflösung von 2.560x1.600 Pixeln bedeutet auf 16 Zoll eine scharfe Darstellung. Asus Vivobook Pro 16X und HPs Envy 16 warten mit 3.840x2.400 Pixeln und OLED-Panels auf.
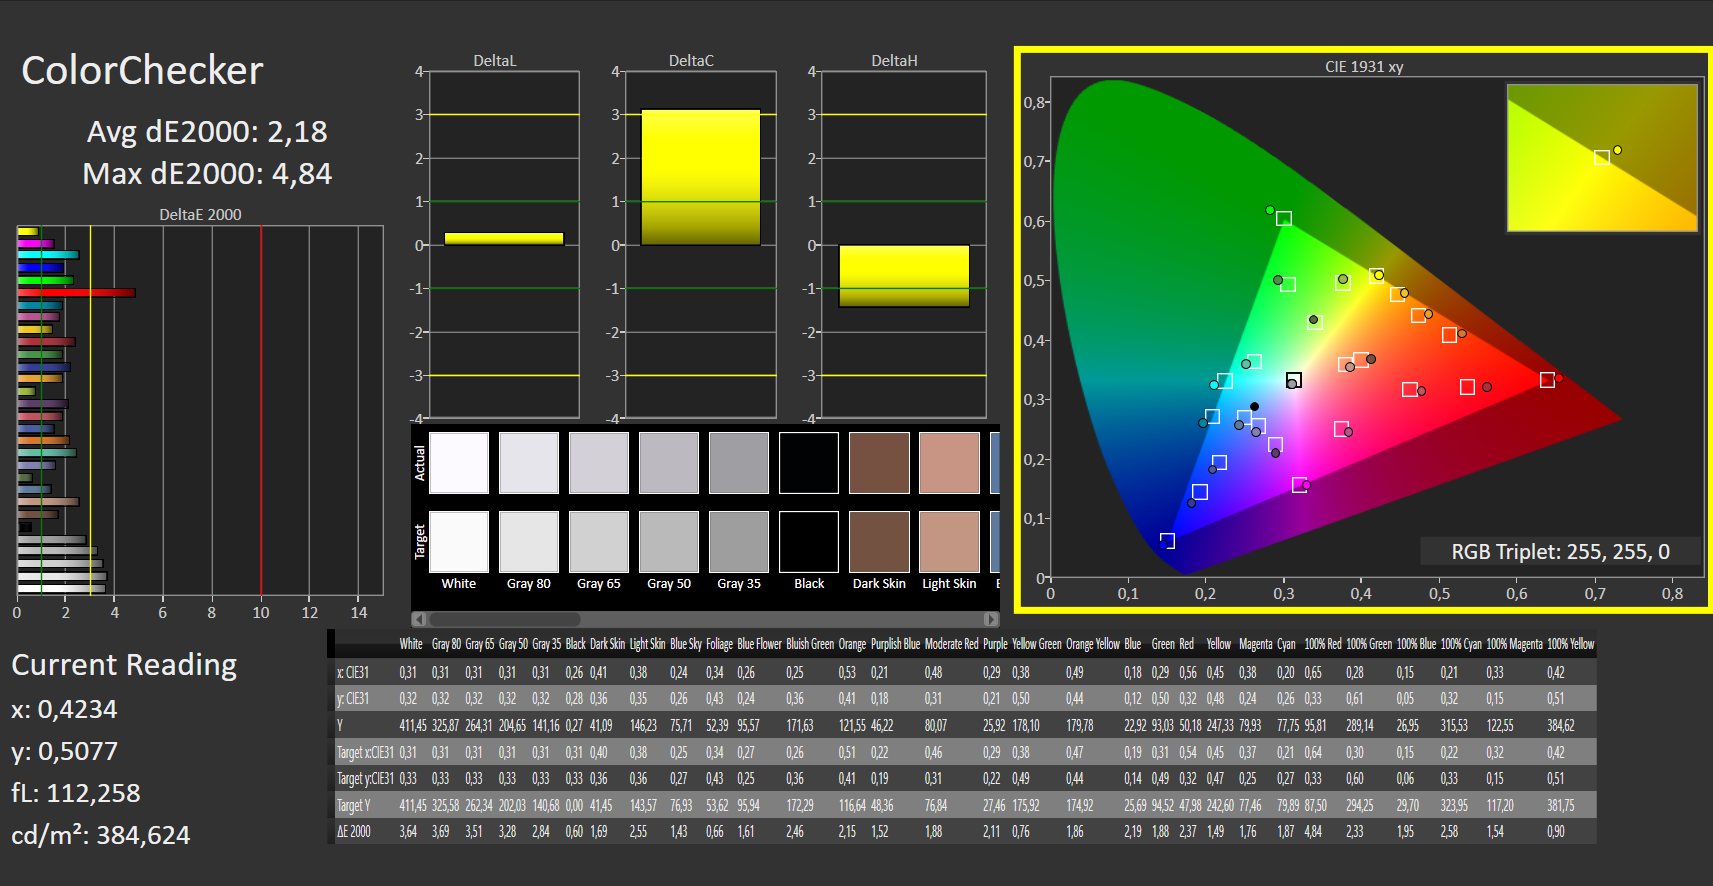
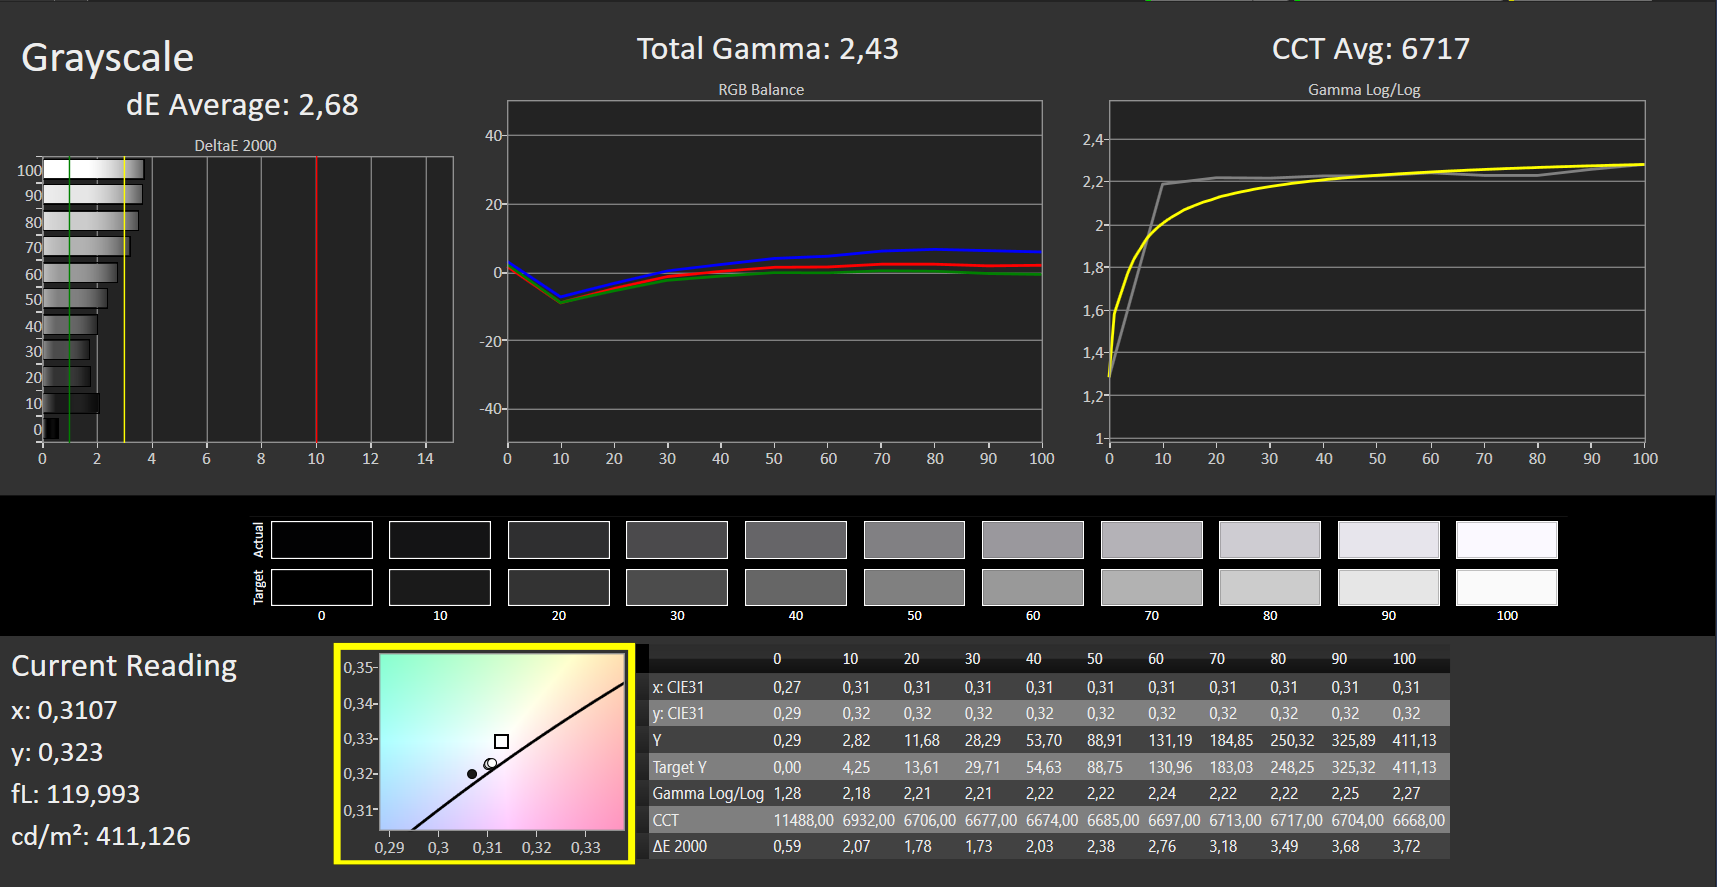
Der Kontrast von 1.417:1 und der Schwarzwert von 0,29 Nits führen zu einem satten Schwarz. Der Weißwert von 6717K befindet sich zudem nah am Optimum (6.500K).
Die Ausleuchtung ist mit 83 % nicht sehr gleichmäßig, fällt im Alltag aber nicht auf. Alternativ wird ein Panel mit 1.920x1.200 Pixeln angeboten. PWM-Flackern gibt es nicht.
| |||||||||||||||||||||||||
Ausleuchtung: 83 %
Helligkeit Akku: 411 cd/m²
Kontrast: 1417:1 (Schwarzwert: 0.29 cd/m²)
ΔE ColorChecker Calman: 2.18 | ∀{0.5-29.43 Ø4.72}
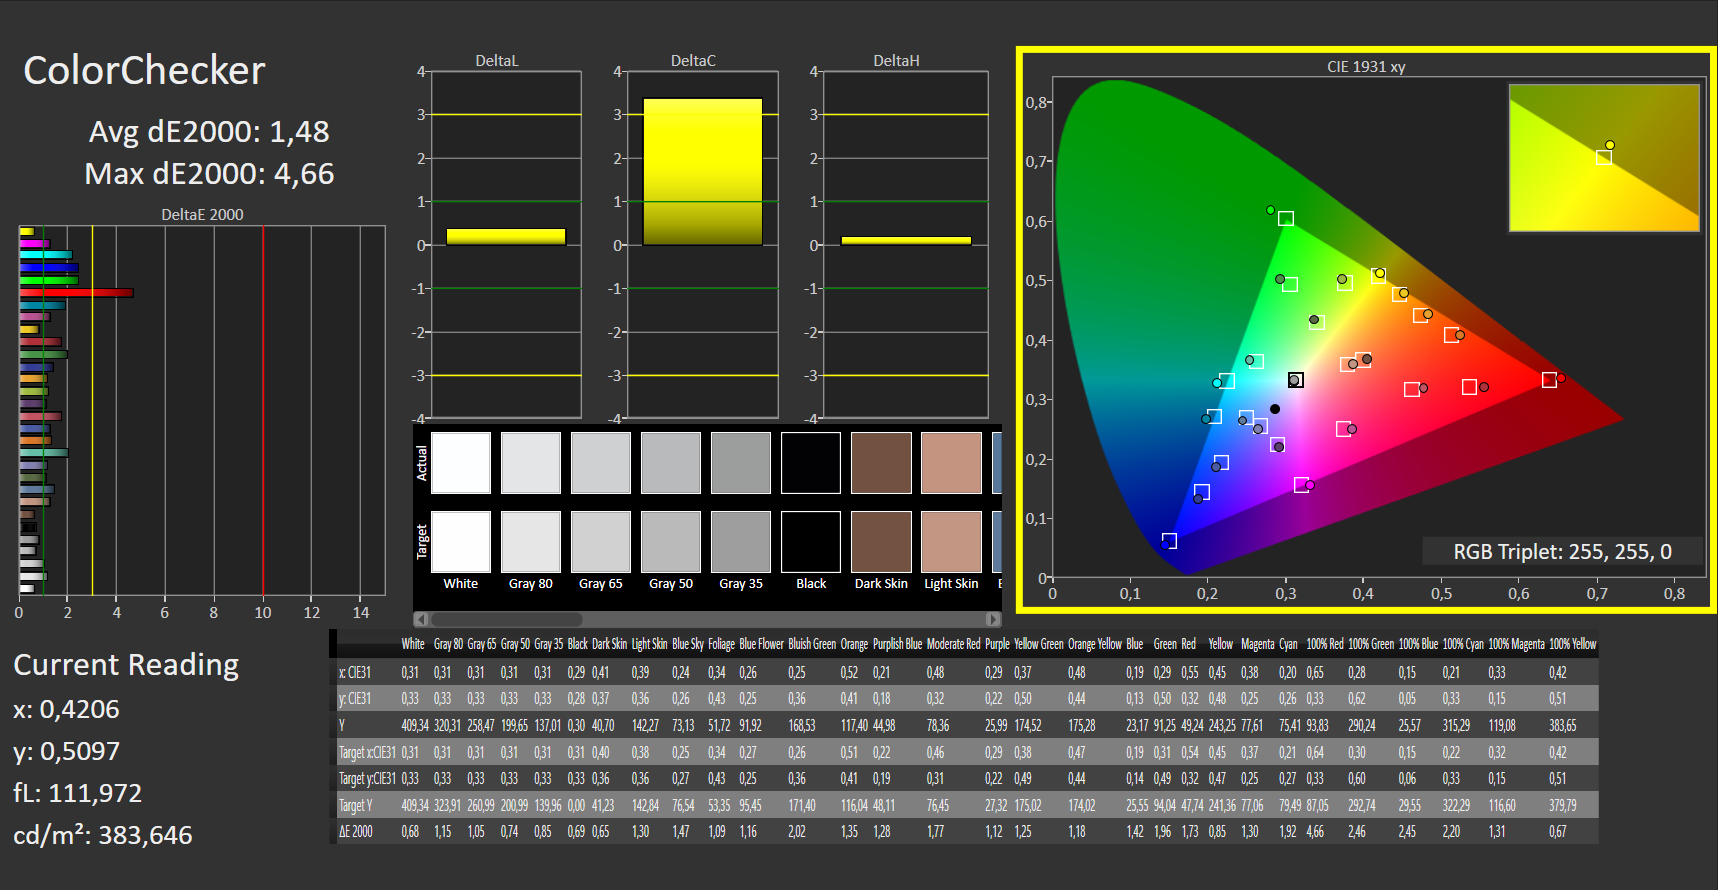
calibrated: 1.48
ΔE Greyscale Calman: 2.68 | ∀{0.09-98 Ø4.97}
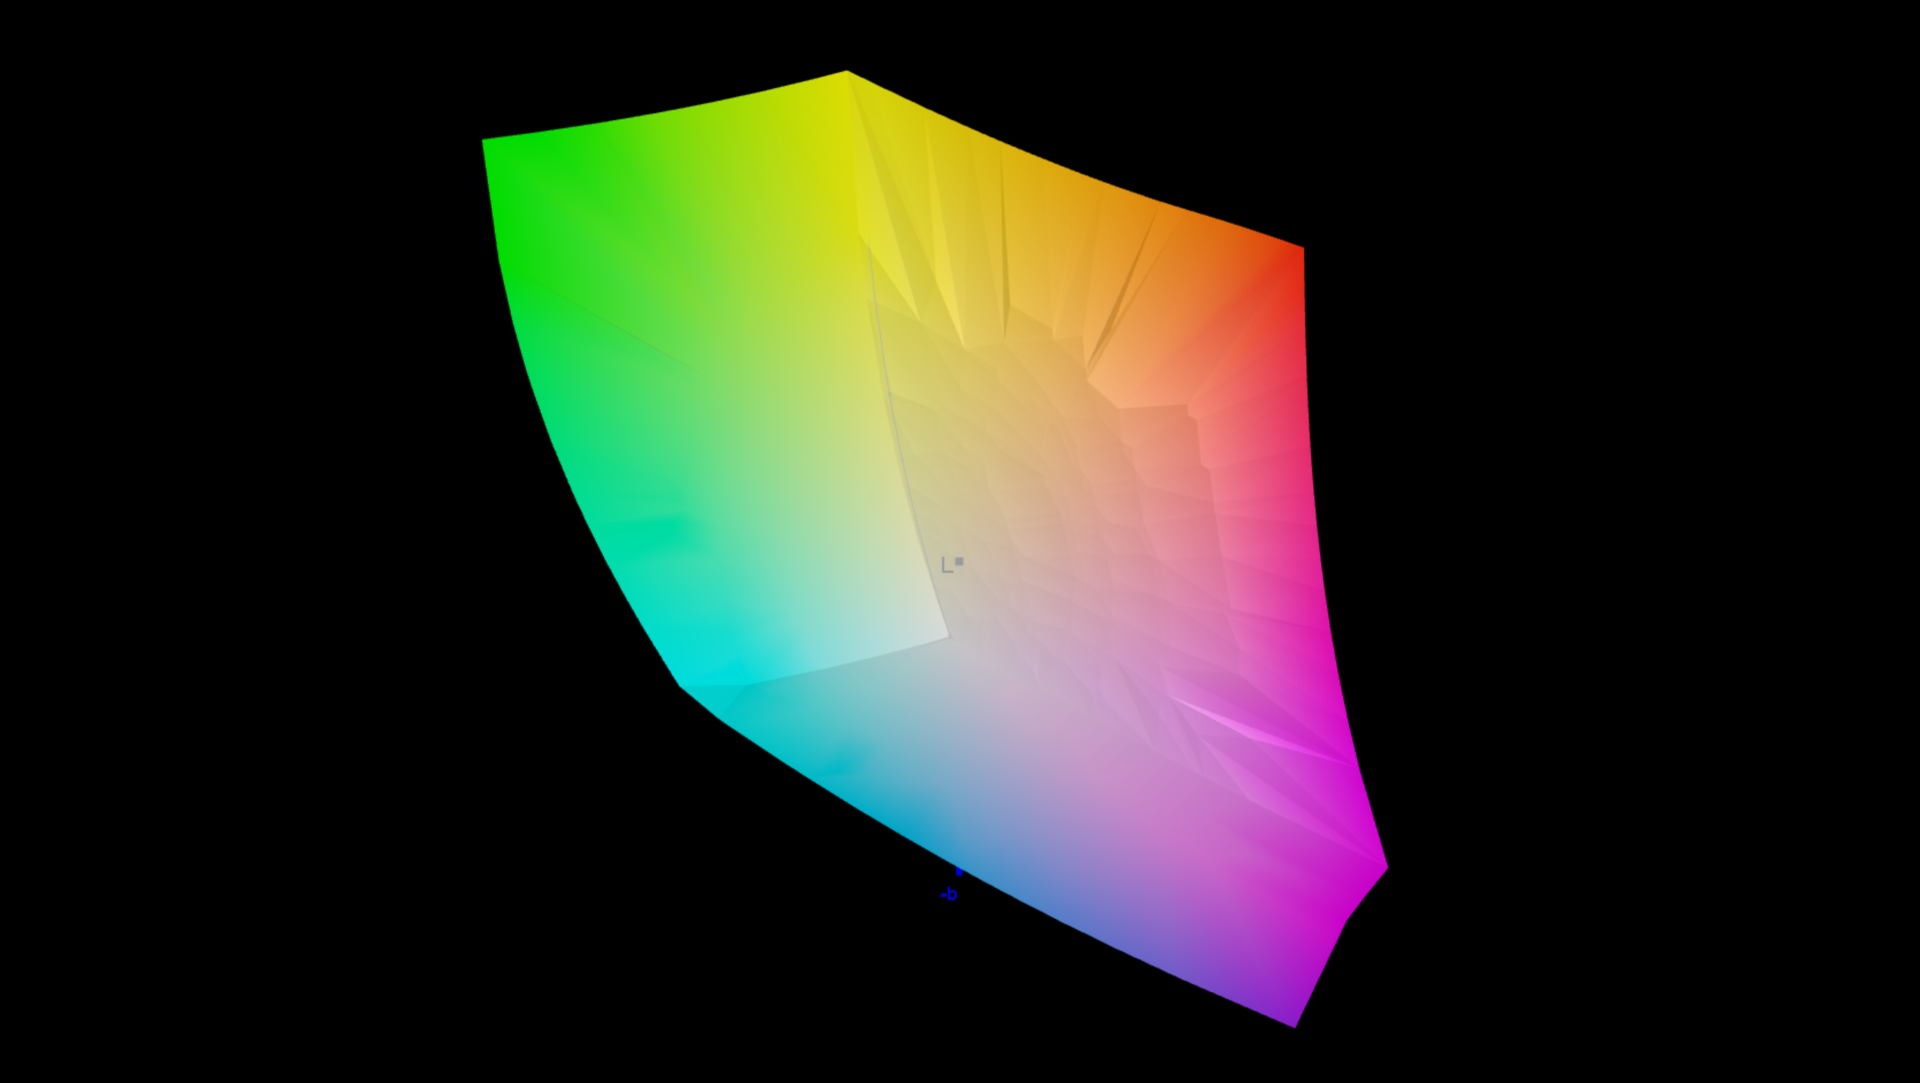
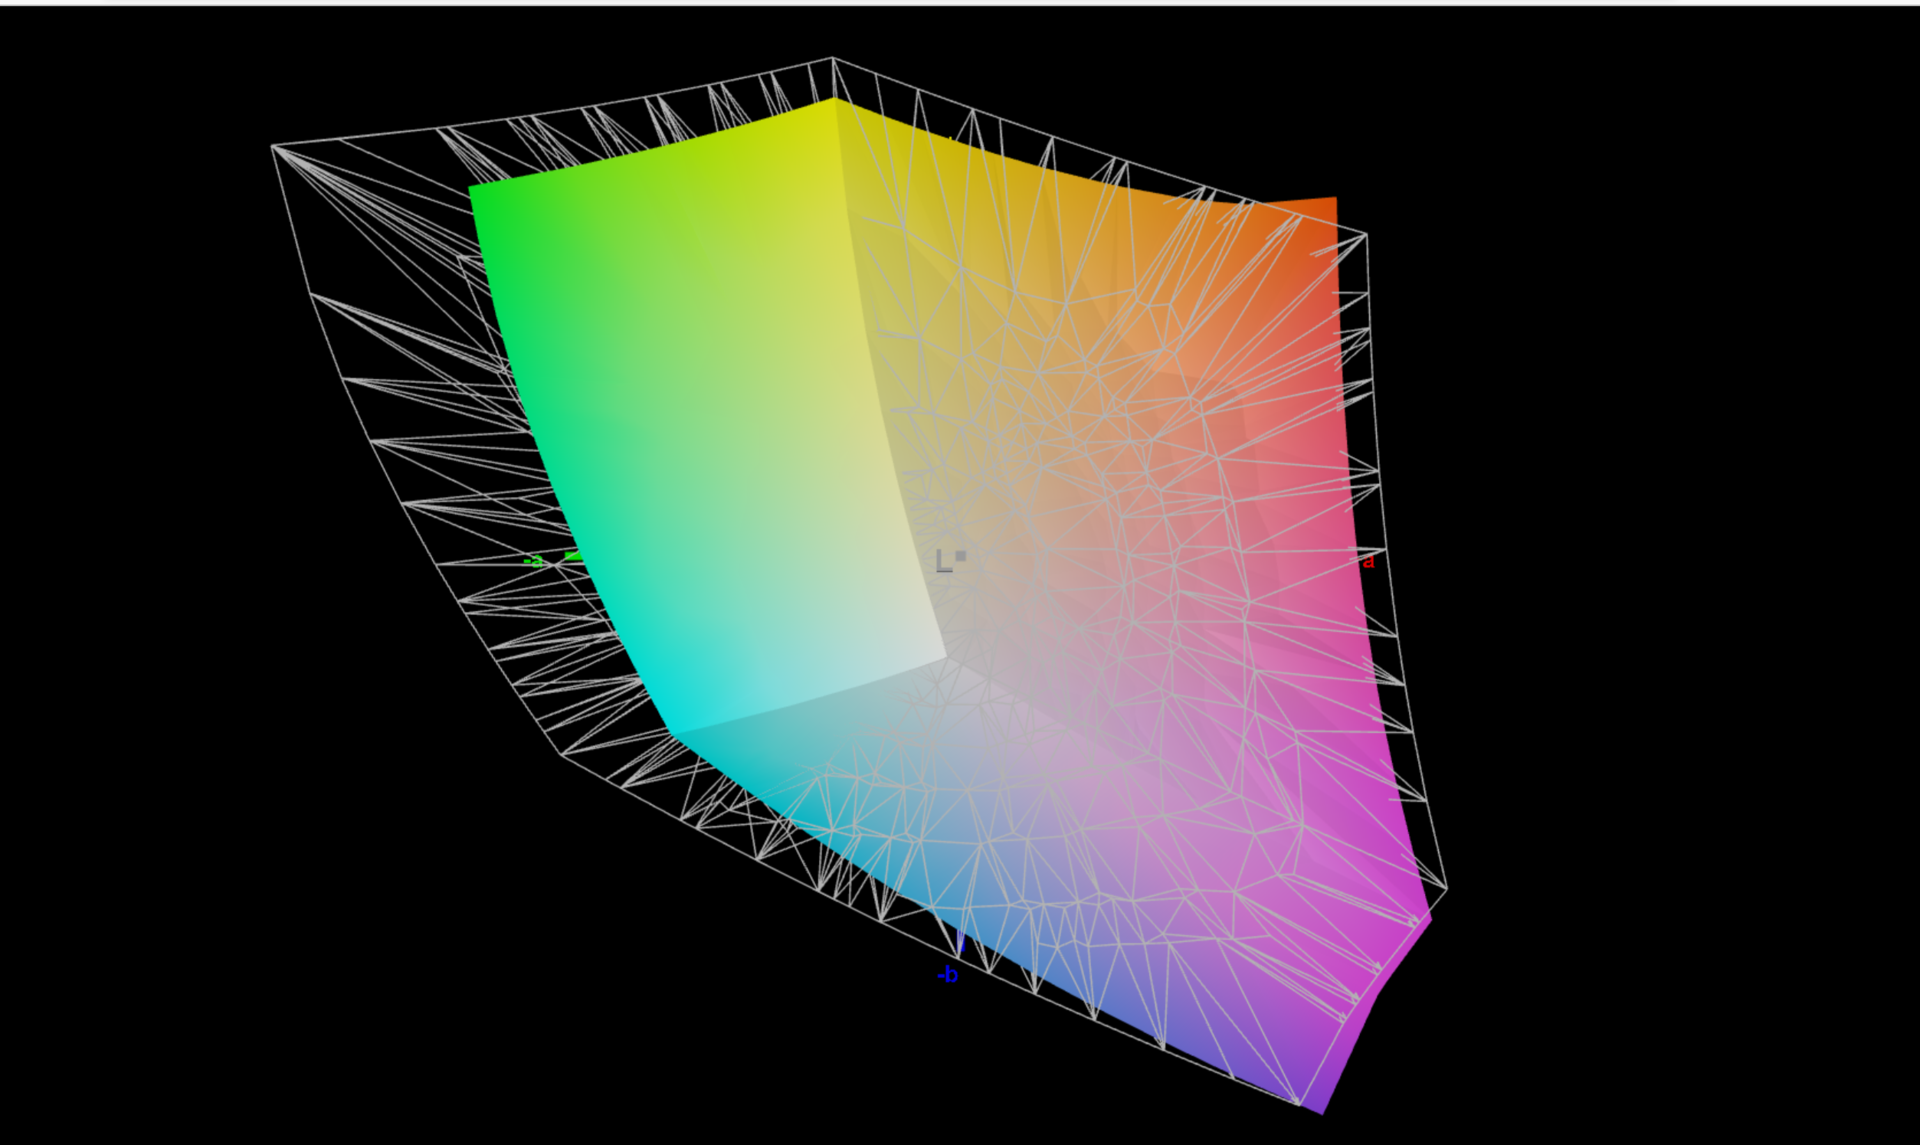
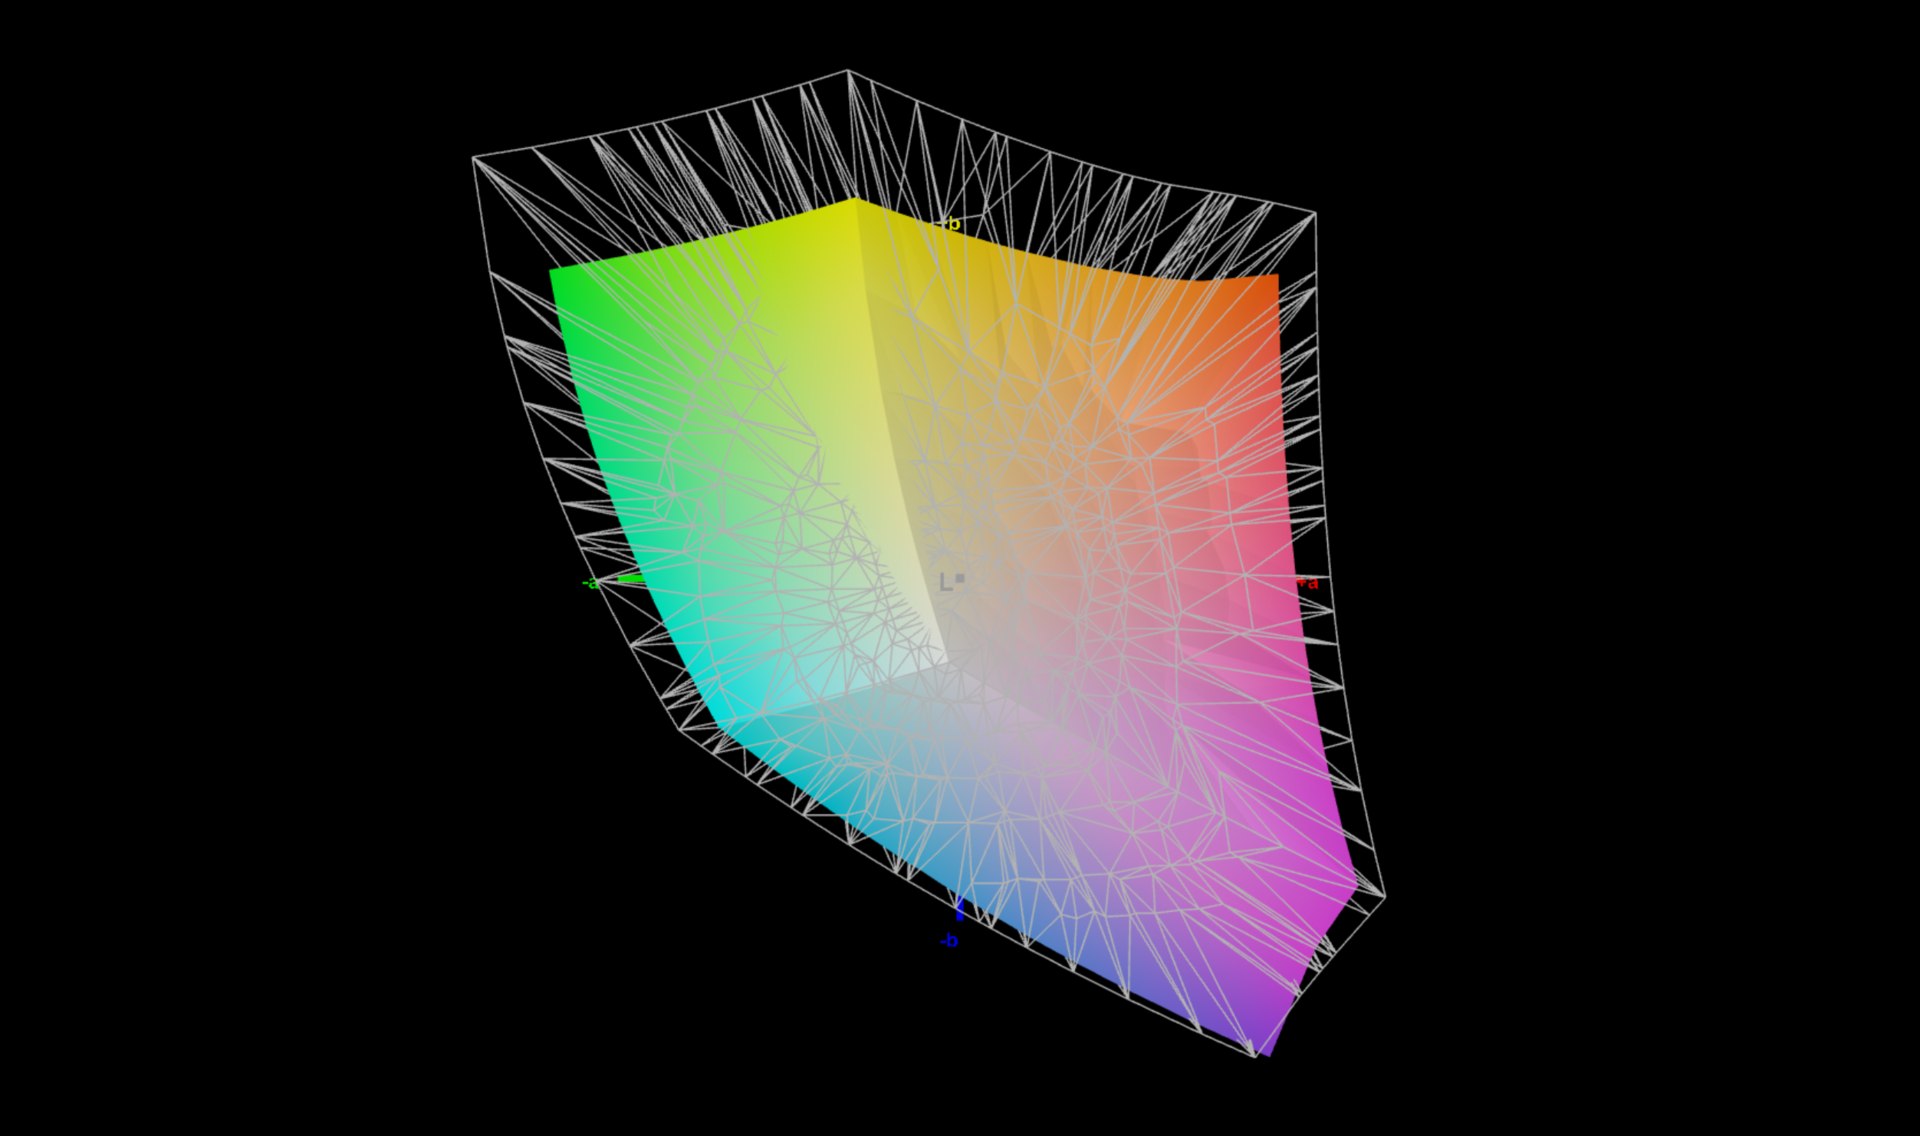
76.6% AdobeRGB 1998 (Argyll 3D)
100% sRGB (Argyll 3D)
76.4% Display P3 (Argyll 3D)
Gamma: 2.43
CCT: 6717 K
| Acer Swift X SFX16-52G-77RX B160QAN02.M, IPS-LED, 2560x1600, 16" | Acer Swift X SFX16-52G-52VE AU Optronics AUOBD9E, , 2560x1600, 16" | Acer Swift X SFX16-51G-5388 Chi Mei N161HCA-EA3, , 1920x1080, 16.1" | Lenovo ThinkBook 16 G4+ IAP LEN160WQXGA, IPS, 2560x1600, 16" | Dell Inspiron 16 Plus 7620 BOE NE16N41, IPS, 3072x1920, 16" | HP Envy 16 h0112nr Samsung SDC4174, OLED, 3840x2400, 16" | Lenovo IdeaPad 5 Pro 16ARH7 AUO B160QAN02.H, IPS, 2560x1600, 16" | Asus Vivobook Pro 16X-M7600QE Samsung ATNA60YV02-0, OLED, 3840x2400, 16.1" | |
|---|---|---|---|---|---|---|---|---|
| Display | -0% | -11% | -6% | -4% | 15% | -10% | 19% | |
| Display P3 Coverage (%) | 76.4 | 75.75 -1% | 65.1 -15% | 69.6 -9% | 70.8 -7% | 99.3 30% | 65 -15% | 99.8 31% |
| sRGB Coverage (%) | 100 | 100 0% | 95.65 -4% | 97.5 -2% | 99.5 0% | 100 0% | 98 -2% | 100 0% |
| AdobeRGB 1998 Coverage (%) | 76.6 | 76.51 0% | 66.75 -13% | 71.7 -6% | 73.2 -4% | 88 15% | 67.2 -12% | 96.9 27% |
| Response Times | -10% | -12% | -6% | -51% | 91% | 55% | 91% | |
| Response Time Grey 50% / Grey 80% * (ms) | 33 ? | 37 ? -12% | 30 ? 9% | 32.7 ? 1% | 38 ? -15% | 2 ? 94% | 14.1 ? 57% | 2 ? 94% |
| Response Time Black / White * (ms) | 15 ? | 16 ? -7% | 20 ? -33% | 16.8 ? -12% | 28 ? -87% | 1.9 ? 87% | 7.1 ? 53% | 2 ? 87% |
| PWM Frequency (Hz) | 240.4 ? | 60 ? | ||||||
| Bildschirm | 14% | 11% | -1% | 10% | 7% | 2% | 12% | |
| Helligkeit Bildmitte (cd/m²) | 411 | 411 0% | 276 -33% | 371 -10% | 288.9 -30% | 328.8 -20% | 415 1% | 392 -5% |
| Brightness (cd/m²) | 378 | 364 -4% | 264 -30% | 357 -6% | 276 -27% | 332 -12% | 409 8% | 396 5% |
| Brightness Distribution (%) | 83 | 81 -2% | 85 2% | 91 10% | 92 11% | 97 17% | 91 10% | 98 18% |
| Schwarzwert * (cd/m²) | 0.29 | 0.295 -2% | 0.16 45% | 0.23 21% | 0.26 10% | 0.32 -10% | ||
| Kontrast (:1) | 1417 | 1393 -2% | 1725 22% | 1613 14% | 1111 -22% | 1297 -8% | ||
| Delta E Colorchecker * | 2.18 | 1.73 21% | 1.8 17% | 2.6 -19% | 1.88 14% | 1.53 30% | 1.92 12% | 1.74 20% |
| Colorchecker dE 2000 max. * | 4.84 | 2.7 44% | 3.77 22% | 4.4 9% | 4.37 10% | 6.04 -25% | 5.71 -18% | 3.18 34% |
| Colorchecker dE 2000 calibrated * | 1.48 | 1.18 20% | 0.63 57% | 1.3 12% | 0.42 72% | 0.58 61% | 1.85 -25% | |
| Delta E Graustufen * | 2.68 | 1.26 53% | 2.76 -3% | 3.7 -38% | 1.4 48% | 1.3 51% | 3.7 -38% | 1.77 34% |
| Gamma | 2.43 91% | 2.35 94% | 2.37 93% | 2.32 95% | 2.3 96% | 2.18 101% | 2.272 97% | 2.22 99% |
| CCT | 6717 97% | 6616 98% | 6564 99% | 7271 89% | 6634 98% | 6362 102% | 7132 91% | 6483 100% |
| Durchschnitt gesamt (Programm / Settings) | 1% /
8% | -4% /
3% | -4% /
-3% | -15% /
-2% | 38% /
24% | 16% /
7% | 41% /
27% |
* ... kleinere Werte sind besser
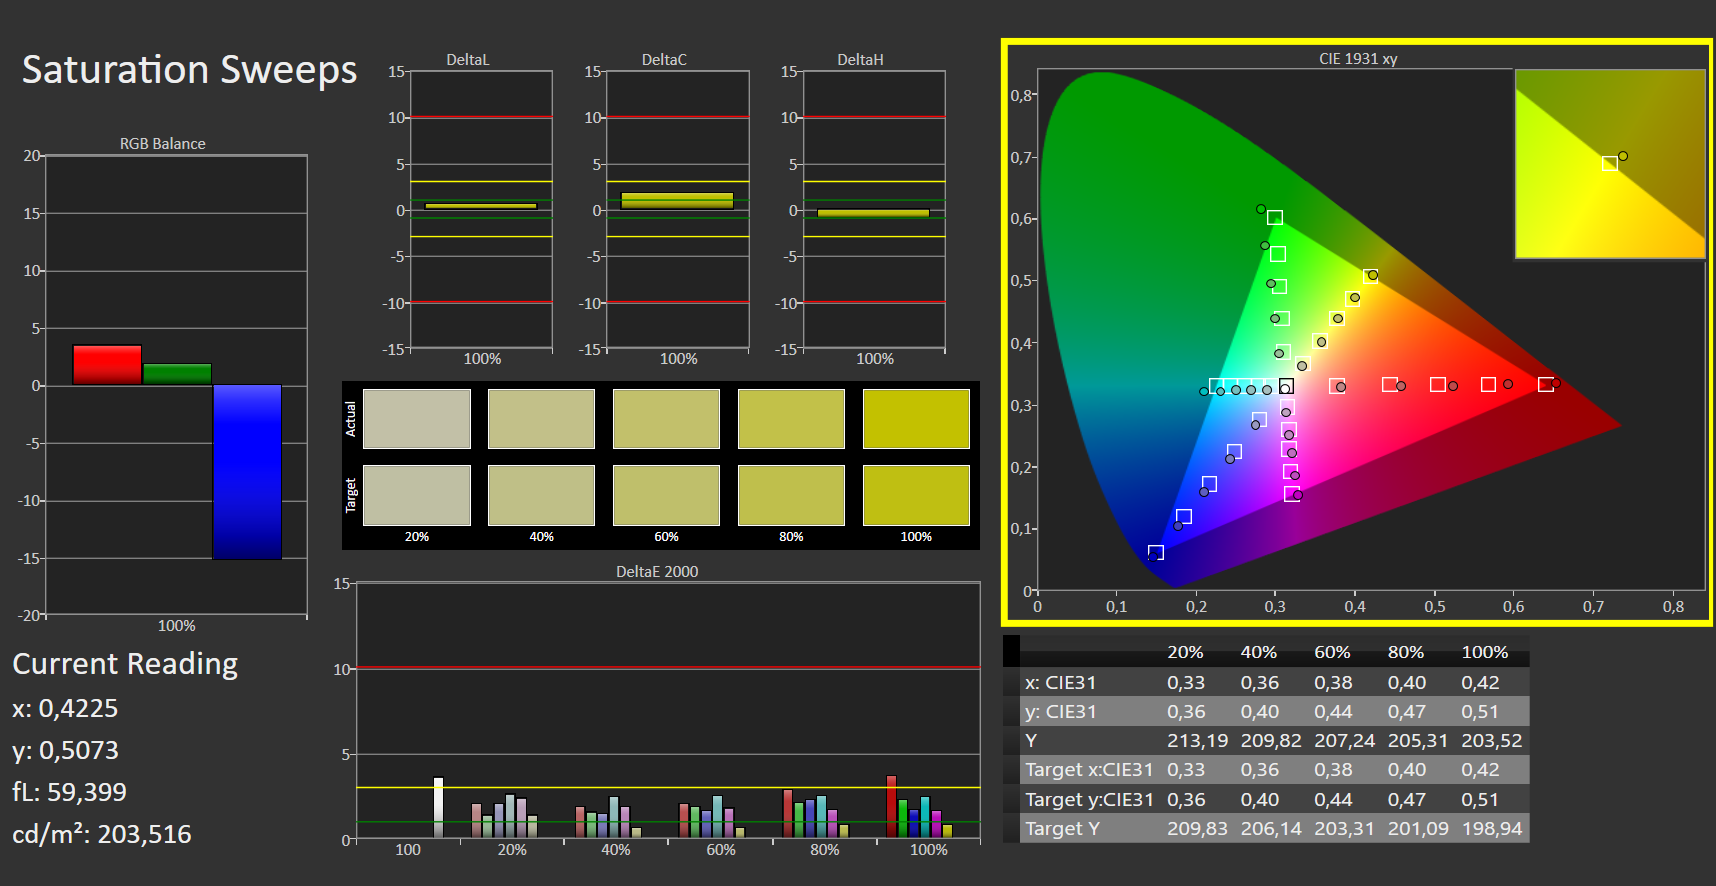
Der sRGB-Farbraum wird zu 100 % abgedeckt, was weniger ambitionierte Bild-/Videobearbeitung ermöglicht.
Der DeltaE-Wert von knapp über 2 kann nach unserer Kalibrierung auf akkuratere 1,48 gebracht werden. Lediglich Rot weicht weiterhin mit einem Wert von knapp 5 deutlich ab. Unser kalibriertes Farbprofil kann rechts neben der Ausleuchtungsgrafik heruntergeladen werden.

Reaktionszeiten (Response Times) des Displays
| ↔ Reaktionszeiten Schwarz zu Weiß | ||
|---|---|---|
| 15 ms ... steigend ↗ und fallend ↘ kombiniert | ↗ 5 ms steigend |  |
| ↘ 10 ms fallend | ||
| Die gemessenen Reaktionszeiten sind gut, für anspruchsvolle Spieler könnten der Bildschirm jedoch zu langsam sein. Im Vergleich rangierten die bei uns getesteten Geräte von 0.1 (Minimum) zu 240 (Maximum) ms. » 36 % aller Screens waren schneller als der getestete. Daher sind die gemessenen Reaktionszeiten besser als der Durchschnitt aller vermessenen Geräte (19.8 ms). | ||
| ↔ Reaktionszeiten 50% Grau zu 80% Grau | ||
| 33 ms ... steigend ↗ und fallend ↘ kombiniert | ↗ 15 ms steigend |  |
| ↘ 18 ms fallend | ||
| Die gemessenen Reaktionszeiten sind langsam und dadurch für viele Spieler wahrscheinlich zu langsam. Im Vergleich rangierten die bei uns getesteten Geräte von 0.165 (Minimum) zu 636 (Maximum) ms. » 45 % aller Screens waren schneller als der getestete. Daher sind die gemessenen Reaktionszeiten durchschnittlich (31 ms). | ||
Bildschirm-Flackern / PWM (Pulse-Width Modulation)
| Flackern / PWM nicht festgestellt |    | ||
Im Vergleich: 52 % aller getesteten Geräte nutzten kein PWM um die Helligkeit zu reduzieren. Wenn PWM eingesetzt wurde, dann bei einer Frequenz von durchschnittlich 7781 (Minimum 5, Maximum 343500) Hz. | |||
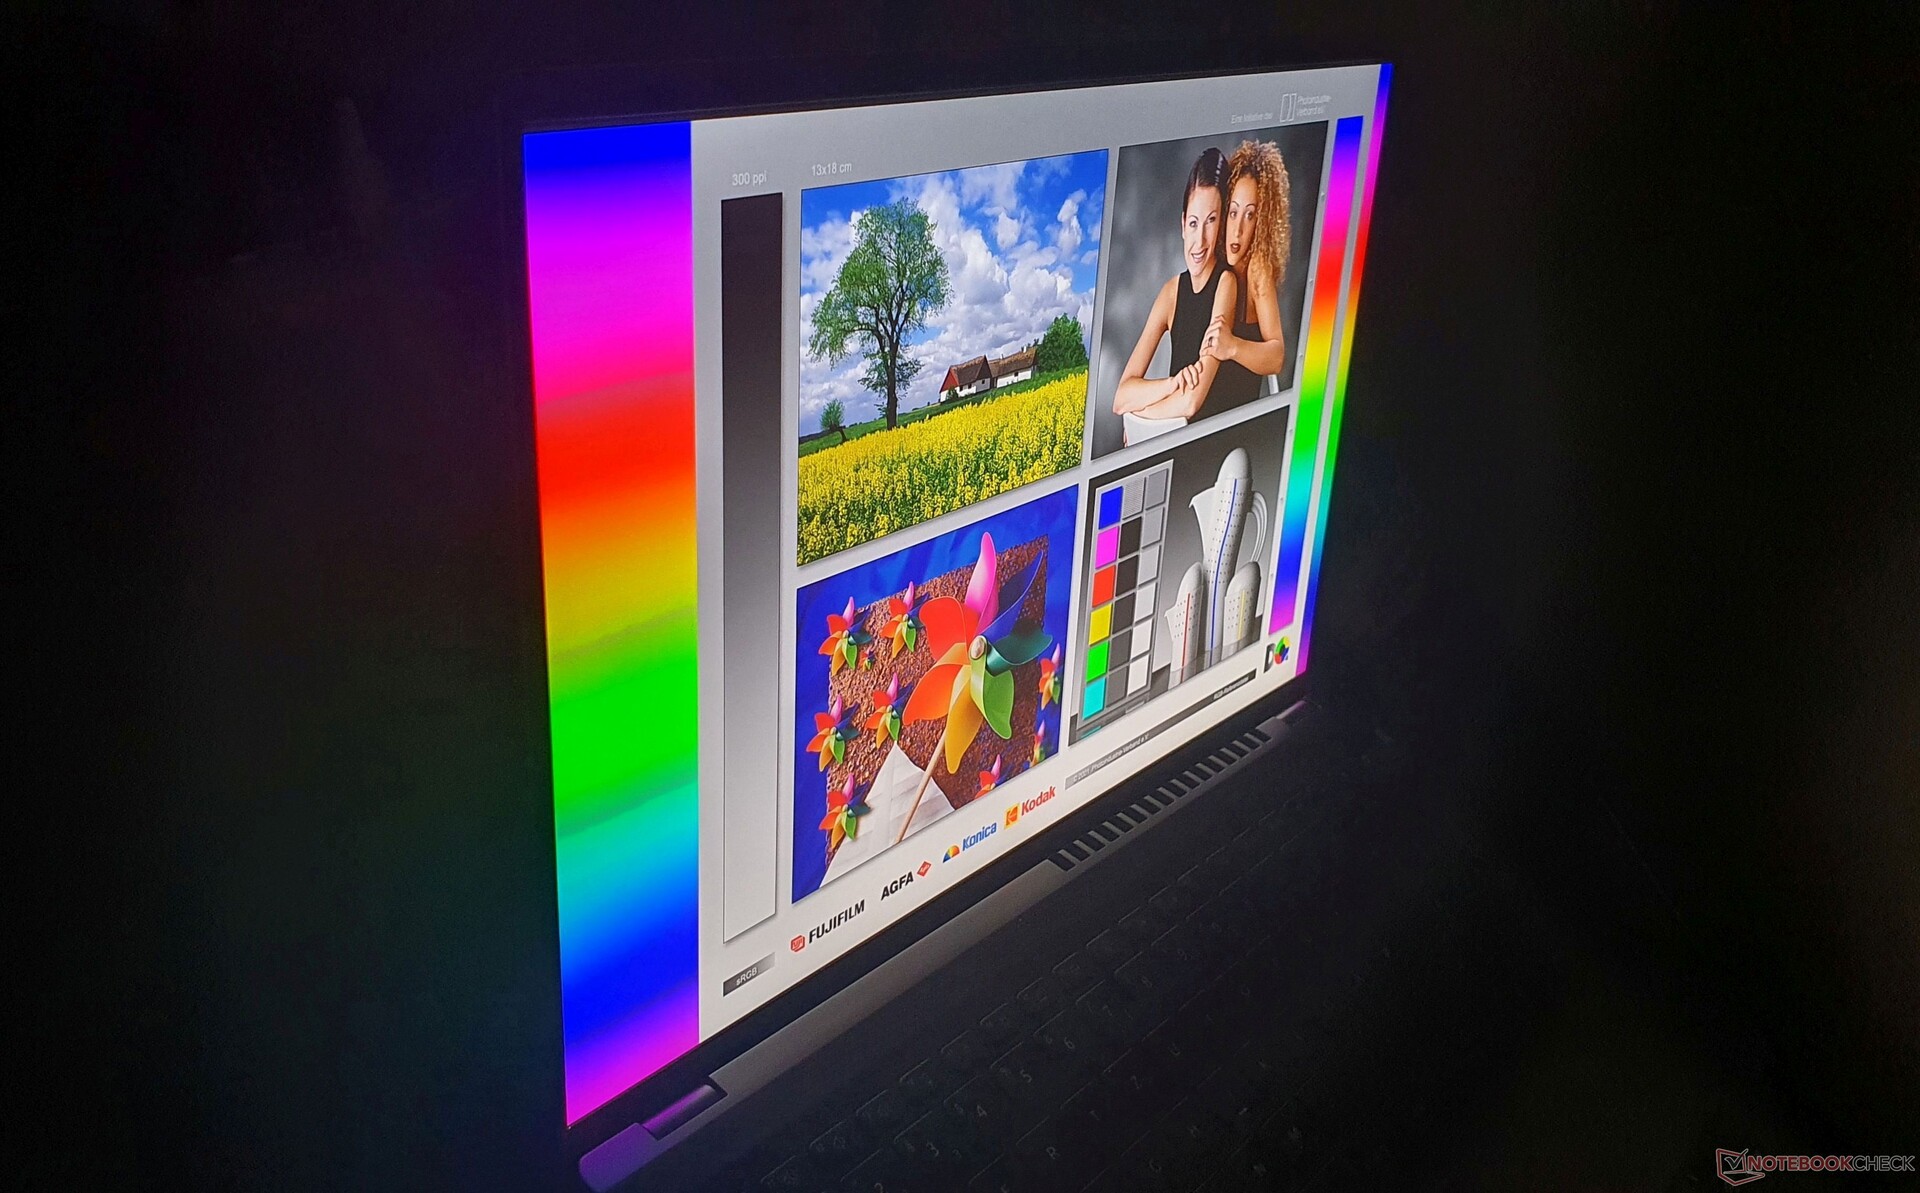
Die Bildschirm-Helligkeit von 378 Nits reicht dank der matten Bildschirmoberfläche aus, um das Acer Swift X 16 auch draußen zu verwenden. Direkte Sonneneinstrahlung sollte allerdings vermieden werden.
Leistung: Schneller Turbo aber schwache Intel Arc A370M
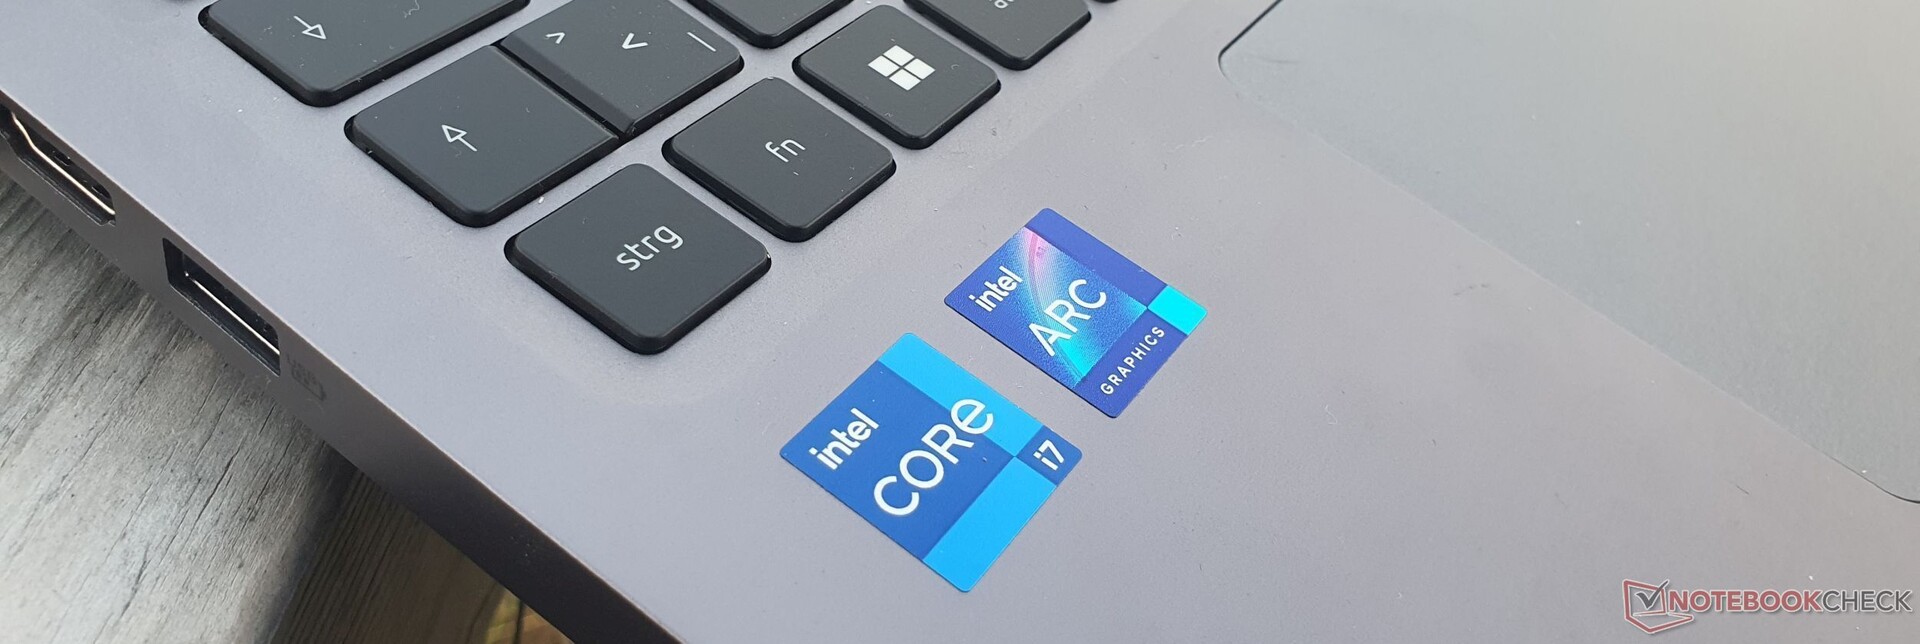
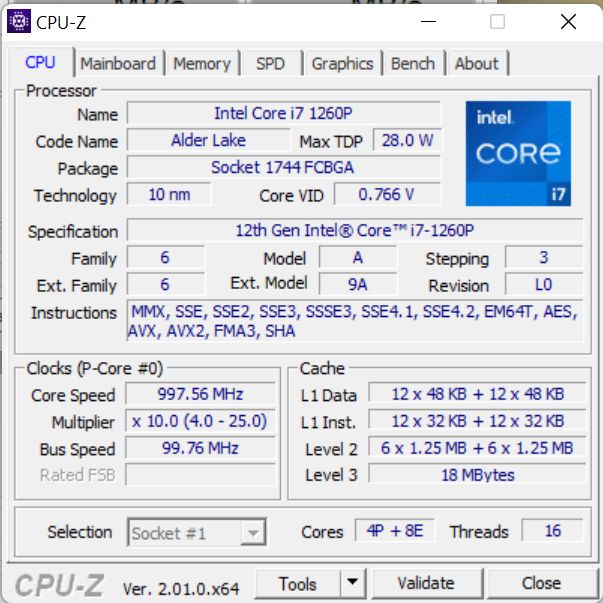
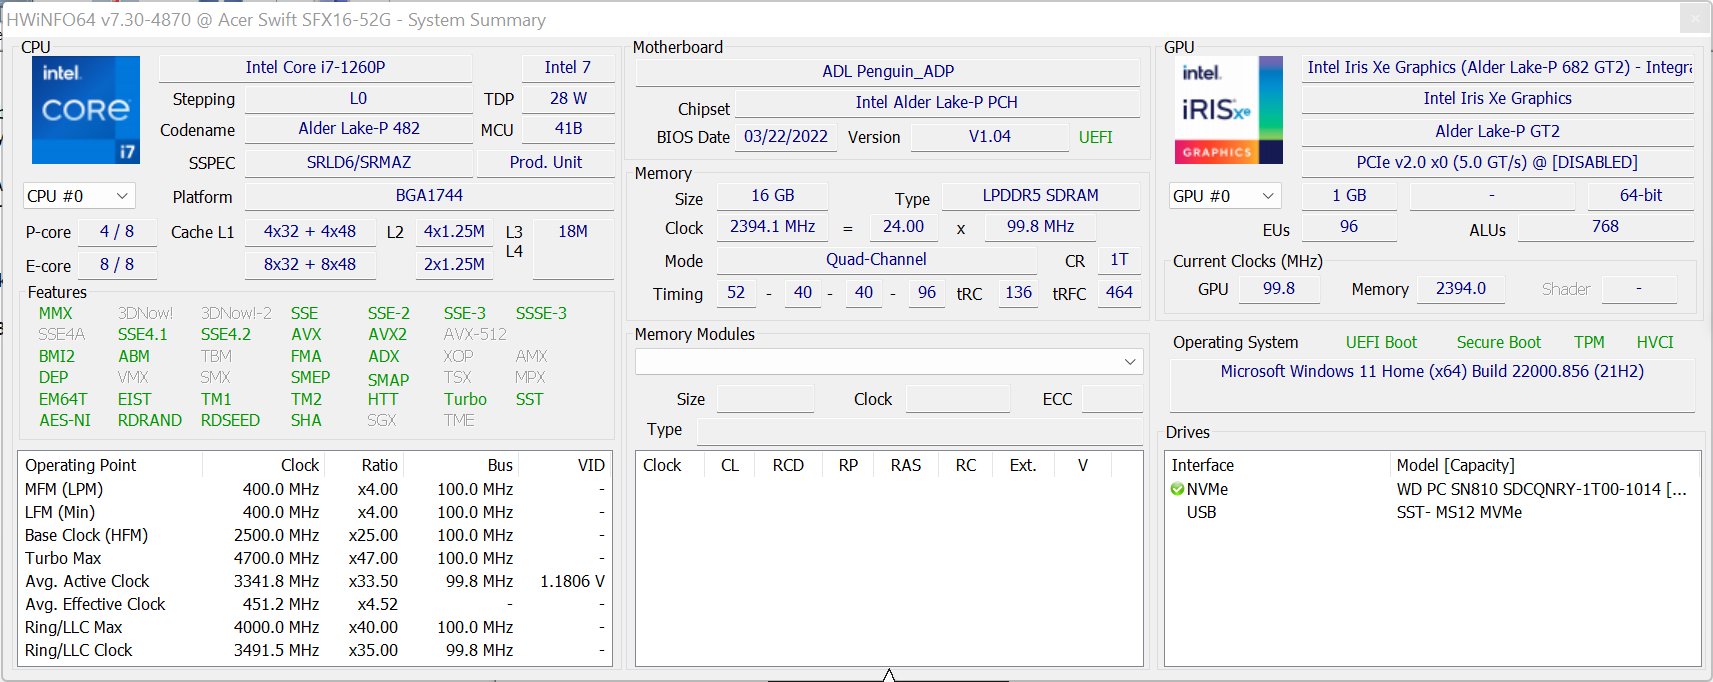
Während das Schwestermodell auf einen Intel Core i5-1240P und eine 512 GB fassende PCIe-4.0-SSD setzt, kommt unser Testgerät - als einziges Alternativmodell - mit einem Core i7-1260P und einer schnelleren 1-TB-SSD. AMD Versionen gibt es nicht. Beide Geräte setzen auf 16 GB verlöteten DDR5-4800-RAM und Intels Arc A370M. Gedacht ist der 16-Zöller etwa für leichten Videoschnitt und für den Mediengenuss inklusive FullHD-Gaming.
Testbedingungen
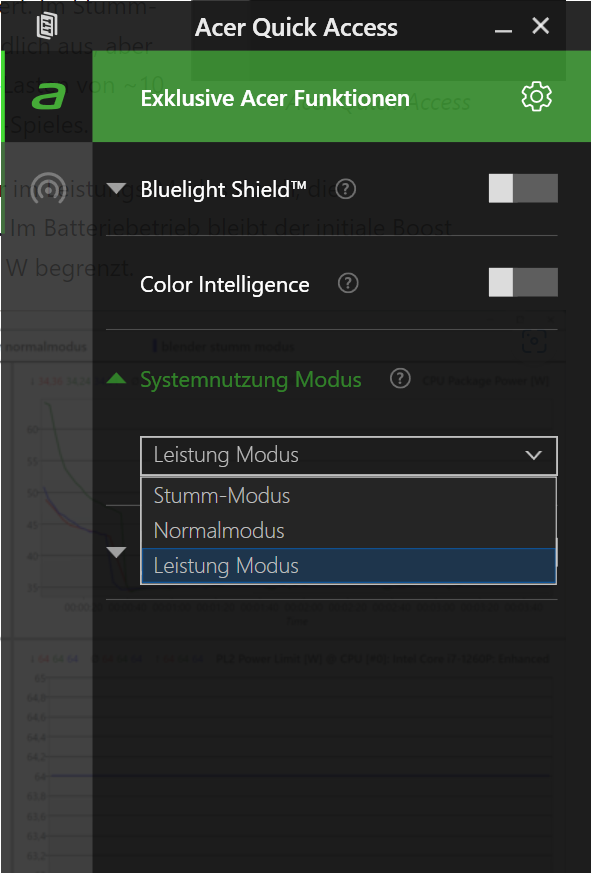
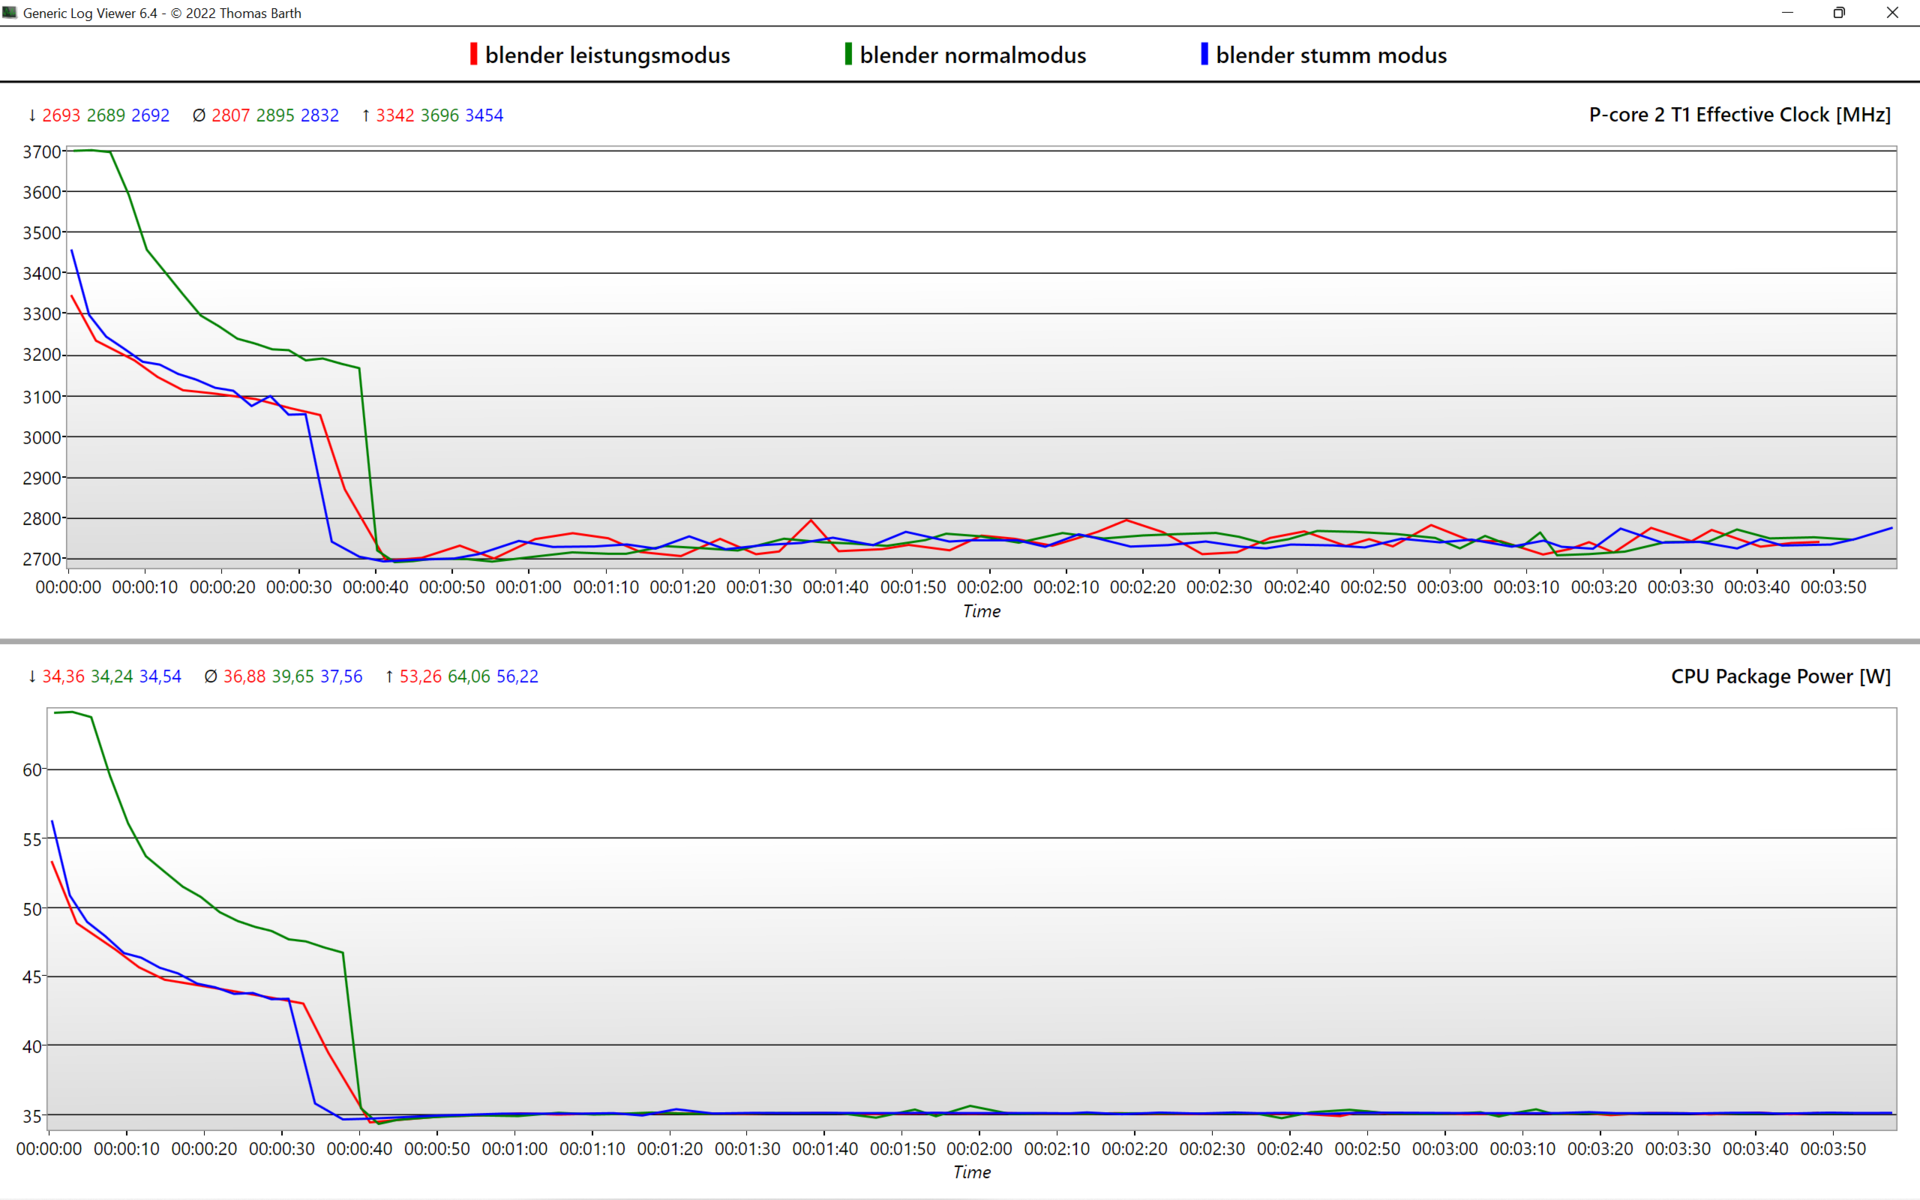
Mit "Acer Quick Access" kann man zwischen drei Leistungsmodi wählen. Auswirkungen hat das lediglich auf Intels Arc GPU, wie die nachfolgende Tabelle aufschlüsselt. Auch verändert sich das Lüfterverhalten, wie wir im Abschnitt "Emissionen" erläutern.
Unsere leistungsbezogenen Tests führten wir im Leistungsmodus durch, die Akkulaufzeiten ermittelten wir im Normal-Modus. Im Batteriebetrieb fällt der initiale Boost von 64 W ganz weg, und die CPU wird auf 28 W begrenzt.
| Performance Mode | Normal Mode | Silent Mode | Battery Mode | |
|---|---|---|---|---|
| CPU | 64 W > 35 W | 56 W > 35 W | 53 W > 35 W | 28 W |
| GPU | 35 W | 25 W | 20 W | 25 W |
Prozessor
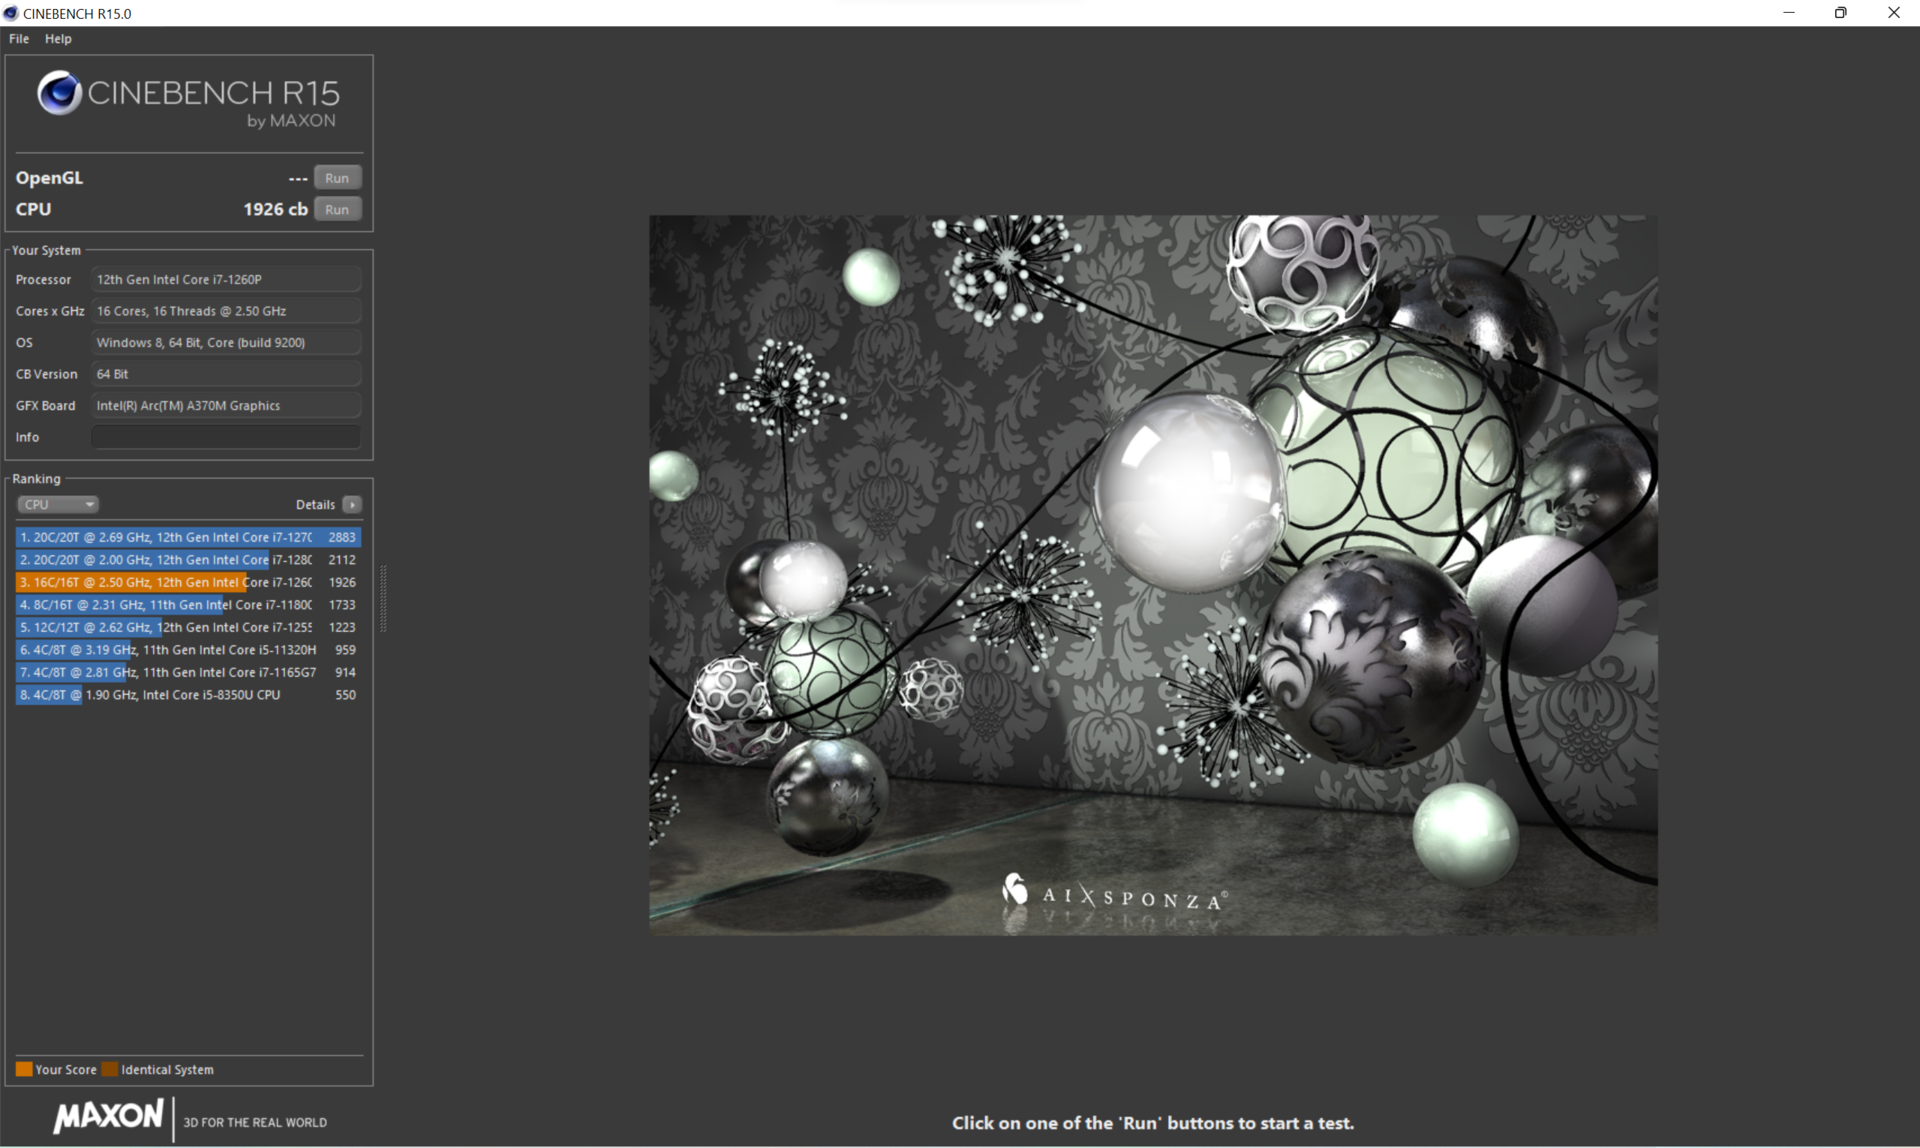
Die Multikern-Leistung des Intel Core i7-1260P liegt mit dem Core i5 des Schwestermodells gleichauf. Lediglich bei der Einzelkern-Leistung gibt es einen Vorsprung von 10 %. Der Aufpreis von 200 Euro ist trotz der größeren SSD demnach nicht gerechtfertigt.
Die P-Kerne takten zu Anfang mit 3,7 GHz, sinken innerhalb von 40 Sekunden graduell auf 3,2 GHz, bis dann das Power-Limit von 35 Watt greift und dauerhaft mit 2,8 GHz weiter getaktet wird. Die Kerntemperaturen pendeln sich bei angemessenen 70 °C ein.
Die Langzeit-Leistung übertrifft die des Vorgängers mit Quad-Core-CPU um ~65 %, bei gleicher 35-W-Leistungsgrenze. Selbst AMDs Ryzen 9 5900X im Asus Vivobook Pro 16X rechnet in den meisten Szenarien nur marginal schneller. Das ThinkBook 16 G4+ und Dells Inspiron 16 Plus führen das Rating dank Core i7-12700H mit höheren Leistungsgrenzen allerdings mit Abstand an.
Da im Akkubetrieb der Turbo-Boost wegfällt und auf 28 Watt begrenzt wird, fällt die Leistung je nach Szenario um 20 bis 30 % ab.
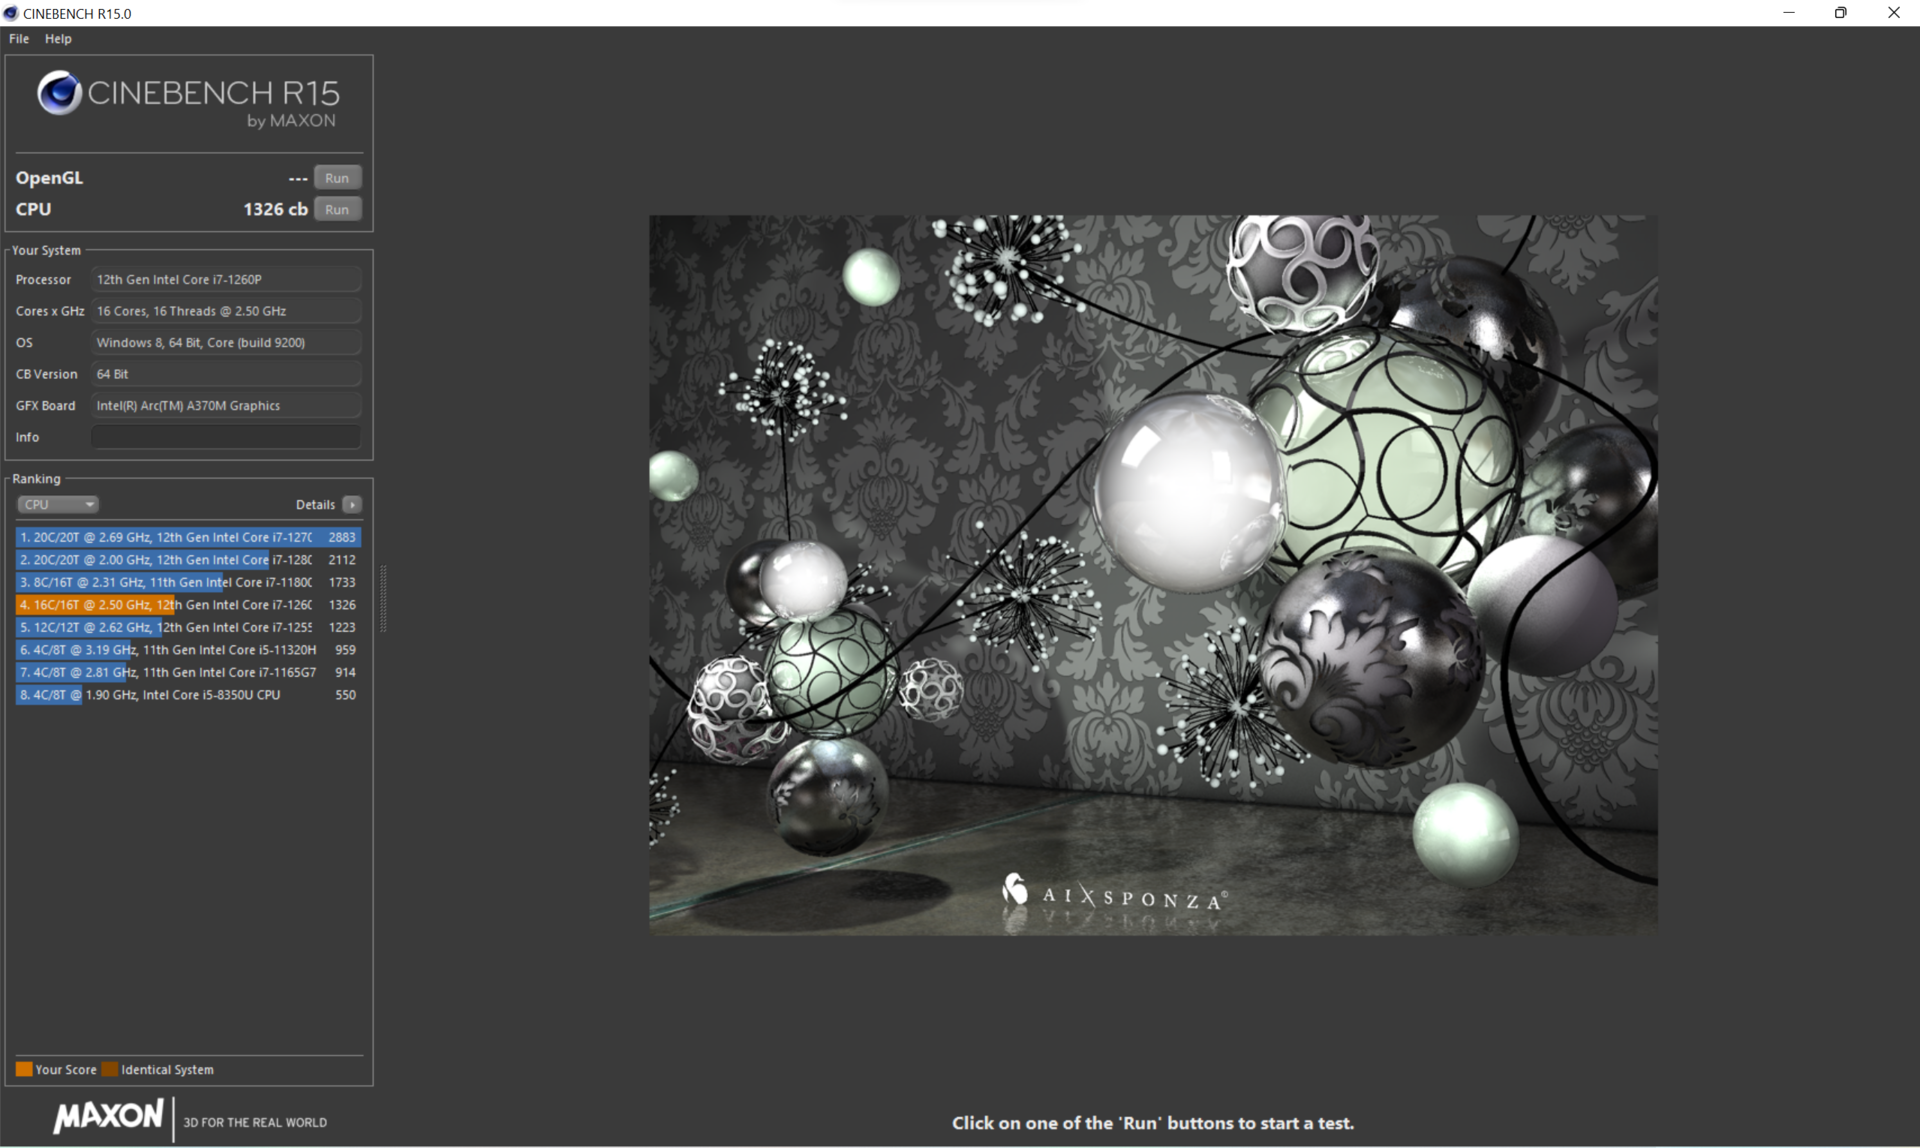
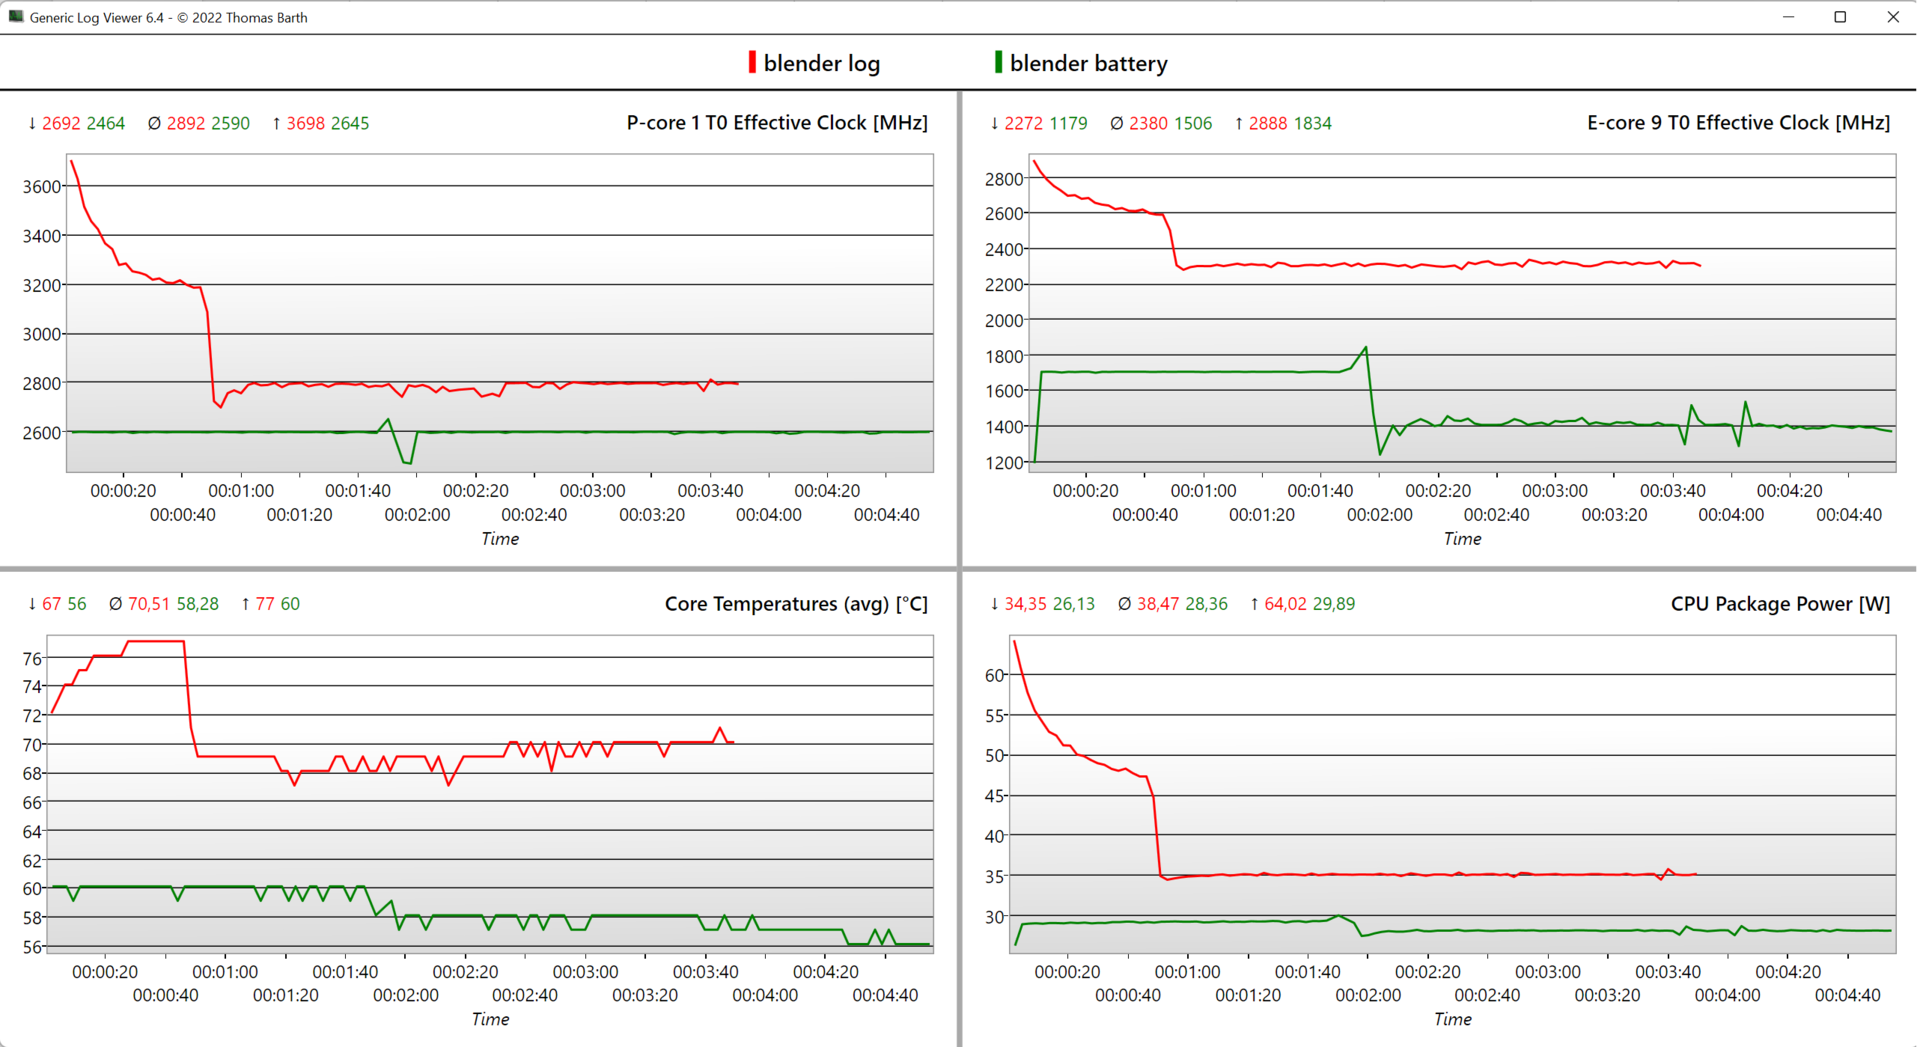
Cinebench R15 Multi Dauertest
Cinebench R23: Multi Core | Single Core
Cinebench R20: CPU (Multi Core) | CPU (Single Core)
Cinebench R15: CPU Multi 64Bit | CPU Single 64Bit
Blender: v2.79 BMW27 CPU
7-Zip 18.03: 7z b 4 | 7z b 4 -mmt1
Geekbench 5.5: Multi-Core | Single-Core
HWBOT x265 Benchmark v2.2: 4k Preset
LibreOffice : 20 Documents To PDF
R Benchmark 2.5: Overall mean
| CPU Performance Rating | |
| Durchschnitt der Klasse Multimedia | |
| Lenovo ThinkBook 16 G4+ IAP | |
| Dell Inspiron 16 Plus 7620 | |
| HP Envy 16 h0112nr | |
| Asus Vivobook Pro 16X-M7600QE | |
| Acer Swift X SFX16-52G-77RX | |
| Acer Swift X SFX16-52G-52VE | |
| Durchschnittliche Intel Core i7-1260P | |
| Lenovo IdeaPad 5 Pro 16ARH7 | |
| Acer Swift X SFX16-51G-5388 | |
| Cinebench R23 / Multi Core | |
| Durchschnitt der Klasse Multimedia (4861 - 33362, n=81, der letzten 2 Jahre) | |
| Lenovo ThinkBook 16 G4+ IAP | |
| Dell Inspiron 16 Plus 7620 | |
| HP Envy 16 h0112nr | |
| Asus Vivobook Pro 16X-M7600QE | |
| Asus Vivobook Pro 16X-M7600QE | |
| Acer Swift X SFX16-52G-77RX | |
| Acer Swift X SFX16-52G-52VE | |
| Durchschnittliche Intel Core i7-1260P (3173 - 12150, n=27) | |
| Lenovo IdeaPad 5 Pro 16ARH7 | |
| Acer Swift X SFX16-51G-5388 | |
| Cinebench R23 / Single Core | |
| Durchschnitt der Klasse Multimedia (1128 - 2459, n=73, der letzten 2 Jahre) | |
| Lenovo ThinkBook 16 G4+ IAP | |
| HP Envy 16 h0112nr | |
| Dell Inspiron 16 Plus 7620 | |
| Acer Swift X SFX16-52G-77RX | |
| Durchschnittliche Intel Core i7-1260P (1155 - 1812, n=25) | |
| Acer Swift X SFX16-52G-52VE | |
| Asus Vivobook Pro 16X-M7600QE | |
| Asus Vivobook Pro 16X-M7600QE | |
| Lenovo IdeaPad 5 Pro 16ARH7 | |
| Acer Swift X SFX16-51G-5388 | |
| Cinebench R20 / CPU (Multi Core) | |
| Durchschnitt der Klasse Multimedia (1887 - 12912, n=64, der letzten 2 Jahre) | |
| Lenovo ThinkBook 16 G4+ IAP | |
| Dell Inspiron 16 Plus 7620 | |
| HP Envy 16 h0112nr | |
| Asus Vivobook Pro 16X-M7600QE | |
| Asus Vivobook Pro 16X-M7600QE | |
| Acer Swift X SFX16-52G-77RX | |
| Acer Swift X SFX16-52G-52VE | |
| Lenovo IdeaPad 5 Pro 16ARH7 | |
| Durchschnittliche Intel Core i7-1260P (1234 - 4748, n=25) | |
| Acer Swift X SFX16-51G-5388 | |
| Cinebench R20 / CPU (Single Core) | |
| Durchschnitt der Klasse Multimedia (425 - 853, n=64, der letzten 2 Jahre) | |
| Lenovo ThinkBook 16 G4+ IAP | |
| HP Envy 16 h0112nr | |
| Dell Inspiron 16 Plus 7620 | |
| Acer Swift X SFX16-52G-77RX | |
| Durchschnittliche Intel Core i7-1260P (448 - 698, n=25) | |
| Acer Swift X SFX16-52G-52VE | |
| Lenovo IdeaPad 5 Pro 16ARH7 | |
| Asus Vivobook Pro 16X-M7600QE | |
| Asus Vivobook Pro 16X-M7600QE | |
| Acer Swift X SFX16-51G-5388 | |
| Cinebench R15 / CPU Multi 64Bit | |
| Durchschnitt der Klasse Multimedia (856 - 5224, n=68, der letzten 2 Jahre) | |
| HP Envy 16 h0112nr | |
| Lenovo ThinkBook 16 G4+ IAP | |
| Dell Inspiron 16 Plus 7620 | |
| Asus Vivobook Pro 16X-M7600QE | |
| Asus Vivobook Pro 16X-M7600QE | |
| Acer Swift X SFX16-52G-77RX | |
| Acer Swift X SFX16-52G-52VE | |
| Lenovo IdeaPad 5 Pro 16ARH7 | |
| Durchschnittliche Intel Core i7-1260P (549 - 2034, n=29) | |
| Acer Swift X SFX16-51G-5388 | |
| Cinebench R15 / CPU Single 64Bit | |
| Durchschnitt der Klasse Multimedia (184.8 - 326, n=66, der letzten 2 Jahre) | |
| Lenovo ThinkBook 16 G4+ IAP | |
| HP Envy 16 h0112nr | |
| Dell Inspiron 16 Plus 7620 | |
| Acer Swift X SFX16-52G-77RX | |
| Asus Vivobook Pro 16X-M7600QE | |
| Asus Vivobook Pro 16X-M7600QE | |
| Lenovo IdeaPad 5 Pro 16ARH7 | |
| Acer Swift X SFX16-52G-52VE | |
| Durchschnittliche Intel Core i7-1260P (165.4 - 260, n=27) | |
| Acer Swift X SFX16-51G-5388 | |
| Blender / v2.79 BMW27 CPU | |
| Acer Swift X SFX16-51G-5388 | |
| Durchschnittliche Intel Core i7-1260P (264 - 906, n=26) | |
| Lenovo IdeaPad 5 Pro 16ARH7 | |
| Acer Swift X SFX16-52G-52VE | |
| Acer Swift X SFX16-52G-77RX | |
| Asus Vivobook Pro 16X-M7600QE | |
| Asus Vivobook Pro 16X-M7600QE | |
| HP Envy 16 h0112nr | |
| Durchschnitt der Klasse Multimedia (100 - 557, n=65, der letzten 2 Jahre) | |
| Dell Inspiron 16 Plus 7620 | |
| Lenovo ThinkBook 16 G4+ IAP | |
| 7-Zip 18.03 / 7z b 4 | |
| Lenovo ThinkBook 16 G4+ IAP | |
| Dell Inspiron 16 Plus 7620 | |
| Durchschnitt der Klasse Multimedia (26062 - 130368, n=62, der letzten 2 Jahre) | |
| Asus Vivobook Pro 16X-M7600QE | |
| Asus Vivobook Pro 16X-M7600QE | |
| HP Envy 16 h0112nr | |
| Acer Swift X SFX16-52G-52VE | |
| Lenovo IdeaPad 5 Pro 16ARH7 | |
| Acer Swift X SFX16-52G-77RX | |
| Durchschnittliche Intel Core i7-1260P (16146 - 47064, n=25) | |
| Acer Swift X SFX16-51G-5388 | |
| 7-Zip 18.03 / 7z b 4 -mmt1 | |
| Durchschnitt der Klasse Multimedia (3666 - 7545, n=63, der letzten 2 Jahre) | |
| Asus Vivobook Pro 16X-M7600QE | |
| Asus Vivobook Pro 16X-M7600QE | |
| HP Envy 16 h0112nr | |
| Lenovo ThinkBook 16 G4+ IAP | |
| Dell Inspiron 16 Plus 7620 | |
| Lenovo IdeaPad 5 Pro 16ARH7 | |
| Durchschnittliche Intel Core i7-1260P (4064 - 5791, n=25) | |
| Acer Swift X SFX16-52G-77RX | |
| Acer Swift X SFX16-52G-52VE | |
| Acer Swift X SFX16-51G-5388 | |
| Geekbench 5.5 / Multi-Core | |
| Durchschnitt der Klasse Multimedia (4652 - 20422, n=62, der letzten 2 Jahre) | |
| HP Envy 16 h0112nr | |
| Lenovo ThinkBook 16 G4+ IAP | |
| Dell Inspiron 16 Plus 7620 | |
| Acer Swift X SFX16-52G-77RX | |
| Acer Swift X SFX16-52G-52VE | |
| Durchschnittliche Intel Core i7-1260P (3866 - 10570, n=25) | |
| Asus Vivobook Pro 16X-M7600QE | |
| Asus Vivobook Pro 16X-M7600QE | |
| Lenovo IdeaPad 5 Pro 16ARH7 | |
| Acer Swift X SFX16-51G-5388 | |
| Geekbench 5.5 / Single-Core | |
| Durchschnitt der Klasse Multimedia (805 - 2974, n=62, der letzten 2 Jahre) | |
| Acer Swift X SFX16-52G-77RX | |
| HP Envy 16 h0112nr | |
| Lenovo ThinkBook 16 G4+ IAP | |
| Dell Inspiron 16 Plus 7620 | |
| Durchschnittliche Intel Core i7-1260P (1436 - 1786, n=25) | |
| Acer Swift X SFX16-52G-52VE | |
| Asus Vivobook Pro 16X-M7600QE | |
| Asus Vivobook Pro 16X-M7600QE | |
| Lenovo IdeaPad 5 Pro 16ARH7 | |
| Acer Swift X SFX16-51G-5388 | |
| HWBOT x265 Benchmark v2.2 / 4k Preset | |
| Durchschnitt der Klasse Multimedia (5.26 - 36.1, n=63, der letzten 2 Jahre) | |
| Lenovo ThinkBook 16 G4+ IAP | |
| Dell Inspiron 16 Plus 7620 | |
| Asus Vivobook Pro 16X-M7600QE | |
| Asus Vivobook Pro 16X-M7600QE | |
| HP Envy 16 h0112nr | |
| Acer Swift X SFX16-52G-77RX | |
| Acer Swift X SFX16-52G-52VE | |
| Lenovo IdeaPad 5 Pro 16ARH7 | |
| Durchschnittliche Intel Core i7-1260P (3.45 - 13.6, n=26) | |
| Acer Swift X SFX16-51G-5388 | |
| LibreOffice / 20 Documents To PDF | |
| Lenovo IdeaPad 5 Pro 16ARH7 | |
| Acer Swift X SFX16-52G-77RX | |
| Asus Vivobook Pro 16X-M7600QE | |
| Asus Vivobook Pro 16X-M7600QE | |
| Acer Swift X SFX16-51G-5388 | |
| Durchschnitt der Klasse Multimedia (23.9 - 146.7, n=64, der letzten 2 Jahre) | |
| Durchschnittliche Intel Core i7-1260P (40.2 - 65.7, n=25) | |
| Acer Swift X SFX16-52G-52VE | |
| Lenovo ThinkBook 16 G4+ IAP | |
| Dell Inspiron 16 Plus 7620 | |
| HP Envy 16 h0112nr | |
| R Benchmark 2.5 / Overall mean | |
| Acer Swift X SFX16-51G-5388 | |
| Acer Swift X SFX16-52G-52VE | |
| Lenovo IdeaPad 5 Pro 16ARH7 | |
| Durchschnittliche Intel Core i7-1260P (0.4559 - 0.727, n=25) | |
| Asus Vivobook Pro 16X-M7600QE | |
| Asus Vivobook Pro 16X-M7600QE | |
| Dell Inspiron 16 Plus 7620 | |
| Acer Swift X SFX16-52G-77RX | |
| Durchschnitt der Klasse Multimedia (0.3604 - 0.947, n=63, der letzten 2 Jahre) | |
| Lenovo ThinkBook 16 G4+ IAP | |
| HP Envy 16 h0112nr | |
* ... kleinere Werte sind besser
AIDA64: FP32 Ray-Trace | FPU Julia | CPU SHA3 | CPU Queen | FPU SinJulia | FPU Mandel | CPU AES | CPU ZLib | FP64 Ray-Trace | CPU PhotoWorxx
| Performance Rating | |
| Durchschnitt der Klasse Multimedia | |
| Asus Vivobook Pro 16X-M7600QE | |
| Lenovo ThinkBook 16 G4+ IAP | |
| HP Envy 16 h0112nr | |
| Dell Inspiron 16 Plus 7620 | |
| Lenovo IdeaPad 5 Pro 16ARH7 | |
| Acer Swift X SFX16-52G-77RX | |
| Acer Swift X SFX16-52G-52VE | |
| Durchschnittliche Intel Core i7-1260P | |
| Acer Swift X SFX16-51G-5388 | |
| AIDA64 / FP32 Ray-Trace | |
| Durchschnitt der Klasse Multimedia (2214 - 50388, n=60, der letzten 2 Jahre) | |
| Lenovo ThinkBook 16 G4+ IAP | |
| Asus Vivobook Pro 16X-M7600QE | |
| Asus Vivobook Pro 16X-M7600QE | |
| Dell Inspiron 16 Plus 7620 | |
| HP Envy 16 h0112nr | |
| Lenovo IdeaPad 5 Pro 16ARH7 | |
| Acer Swift X SFX16-52G-52VE | |
| Acer Swift X SFX16-52G-77RX | |
| Durchschnittliche Intel Core i7-1260P (2176 - 10898, n=26) | |
| Acer Swift X SFX16-51G-5388 | |
| AIDA64 / FPU Julia | |
| Asus Vivobook Pro 16X-M7600QE | |
| Asus Vivobook Pro 16X-M7600QE | |
| Durchschnitt der Klasse Multimedia (12867 - 201874, n=61, der letzten 2 Jahre) | |
| Lenovo ThinkBook 16 G4+ IAP | |
| Lenovo IdeaPad 5 Pro 16ARH7 | |
| Dell Inspiron 16 Plus 7620 | |
| HP Envy 16 h0112nr | |
| Acer Swift X SFX16-52G-77RX | |
| Acer Swift X SFX16-52G-52VE | |
| Durchschnittliche Intel Core i7-1260P (11015 - 56906, n=26) | |
| Acer Swift X SFX16-51G-5388 | |
| AIDA64 / CPU SHA3 | |
| Durchschnitt der Klasse Multimedia (626 - 8623, n=61, der letzten 2 Jahre) | |
| Lenovo ThinkBook 16 G4+ IAP | |
| Asus Vivobook Pro 16X-M7600QE | |
| Asus Vivobook Pro 16X-M7600QE | |
| Dell Inspiron 16 Plus 7620 | |
| HP Envy 16 h0112nr | |
| Lenovo IdeaPad 5 Pro 16ARH7 | |
| Acer Swift X SFX16-52G-77RX | |
| Acer Swift X SFX16-52G-52VE | |
| Acer Swift X SFX16-51G-5388 | |
| Durchschnittliche Intel Core i7-1260P (669 - 2709, n=26) | |
| AIDA64 / CPU Queen | |
| Lenovo ThinkBook 16 G4+ IAP | |
| HP Envy 16 h0112nr | |
| Asus Vivobook Pro 16X-M7600QE | |
| Asus Vivobook Pro 16X-M7600QE | |
| Dell Inspiron 16 Plus 7620 | |
| Acer Swift X SFX16-52G-77RX | |
| Lenovo IdeaPad 5 Pro 16ARH7 | |
| Durchschnitt der Klasse Multimedia (13483 - 181505, n=48, der letzten 2 Jahre) | |
| Durchschnittliche Intel Core i7-1260P (42571 - 82493, n=26) | |
| Acer Swift X SFX16-52G-52VE | |
| Acer Swift X SFX16-51G-5388 | |
| AIDA64 / FPU SinJulia | |
| Asus Vivobook Pro 16X-M7600QE | |
| Asus Vivobook Pro 16X-M7600QE | |
| Lenovo ThinkBook 16 G4+ IAP | |
| Lenovo IdeaPad 5 Pro 16ARH7 | |
| Durchschnitt der Klasse Multimedia (886 - 28794, n=61, der letzten 2 Jahre) | |
| Dell Inspiron 16 Plus 7620 | |
| HP Envy 16 h0112nr | |
| Acer Swift X SFX16-52G-77RX | |
| Acer Swift X SFX16-52G-52VE | |
| Durchschnittliche Intel Core i7-1260P (2901 - 6975, n=26) | |
| Acer Swift X SFX16-51G-5388 | |
| AIDA64 / FPU Mandel | |
| Asus Vivobook Pro 16X-M7600QE | |
| Asus Vivobook Pro 16X-M7600QE | |
| Durchschnitt der Klasse Multimedia (6395 - 105740, n=60, der letzten 2 Jahre) | |
| Lenovo IdeaPad 5 Pro 16ARH7 | |
| Lenovo ThinkBook 16 G4+ IAP | |
| Dell Inspiron 16 Plus 7620 | |
| HP Envy 16 h0112nr | |
| Acer Swift X SFX16-52G-77RX | |
| Acer Swift X SFX16-52G-52VE | |
| Acer Swift X SFX16-51G-5388 | |
| Durchschnittliche Intel Core i7-1260P (5950 - 26376, n=26) | |
| AIDA64 / CPU AES | |
| Asus Vivobook Pro 16X-M7600QE | |
| Asus Vivobook Pro 16X-M7600QE | |
| HP Envy 16 h0112nr | |
| Lenovo ThinkBook 16 G4+ IAP | |
| Durchschnitt der Klasse Multimedia (8171 - 126790, n=61, der letzten 2 Jahre) | |
| Dell Inspiron 16 Plus 7620 | |
| Acer Swift X SFX16-51G-5388 | |
| Acer Swift X SFX16-52G-77RX | |
| Acer Swift X SFX16-52G-52VE | |
| Durchschnittliche Intel Core i7-1260P (16041 - 92356, n=26) | |
| Lenovo IdeaPad 5 Pro 16ARH7 | |
| AIDA64 / CPU ZLib | |
| Lenovo ThinkBook 16 G4+ IAP | |
| Durchschnitt der Klasse Multimedia (143.8 - 2022, n=61, der letzten 2 Jahre) | |
| Dell Inspiron 16 Plus 7620 | |
| Acer Swift X SFX16-52G-52VE | |
| HP Envy 16 h0112nr | |
| Asus Vivobook Pro 16X-M7600QE | |
| Asus Vivobook Pro 16X-M7600QE | |
| Acer Swift X SFX16-52G-77RX | |
| Lenovo IdeaPad 5 Pro 16ARH7 | |
| Durchschnittliche Intel Core i7-1260P (259 - 771, n=26) | |
| Acer Swift X SFX16-51G-5388 | |
| AIDA64 / FP64 Ray-Trace | |
| Durchschnitt der Klasse Multimedia (1014 - 26875, n=61, der letzten 2 Jahre) | |
| Asus Vivobook Pro 16X-M7600QE | |
| Asus Vivobook Pro 16X-M7600QE | |
| Lenovo ThinkBook 16 G4+ IAP | |
| Dell Inspiron 16 Plus 7620 | |
| HP Envy 16 h0112nr | |
| Lenovo IdeaPad 5 Pro 16ARH7 | |
| Acer Swift X SFX16-52G-77RX | |
| Acer Swift X SFX16-52G-52VE | |
| Durchschnittliche Intel Core i7-1260P (1237 - 5858, n=26) | |
| Acer Swift X SFX16-51G-5388 | |
| AIDA64 / CPU PhotoWorxx | |
| Durchschnitt der Klasse Multimedia (8187 - 88154, n=61, der letzten 2 Jahre) | |
| Acer Swift X SFX16-52G-52VE | |
| Acer Swift X SFX16-52G-77RX | |
| Lenovo ThinkBook 16 G4+ IAP | |
| HP Envy 16 h0112nr | |
| Acer Swift X SFX16-51G-5388 | |
| Dell Inspiron 16 Plus 7620 | |
| Durchschnittliche Intel Core i7-1260P (13261 - 43652, n=26) | |
| Lenovo IdeaPad 5 Pro 16ARH7 | |
| Asus Vivobook Pro 16X-M7600QE | |
| Asus Vivobook Pro 16X-M7600QE | |
System Performance
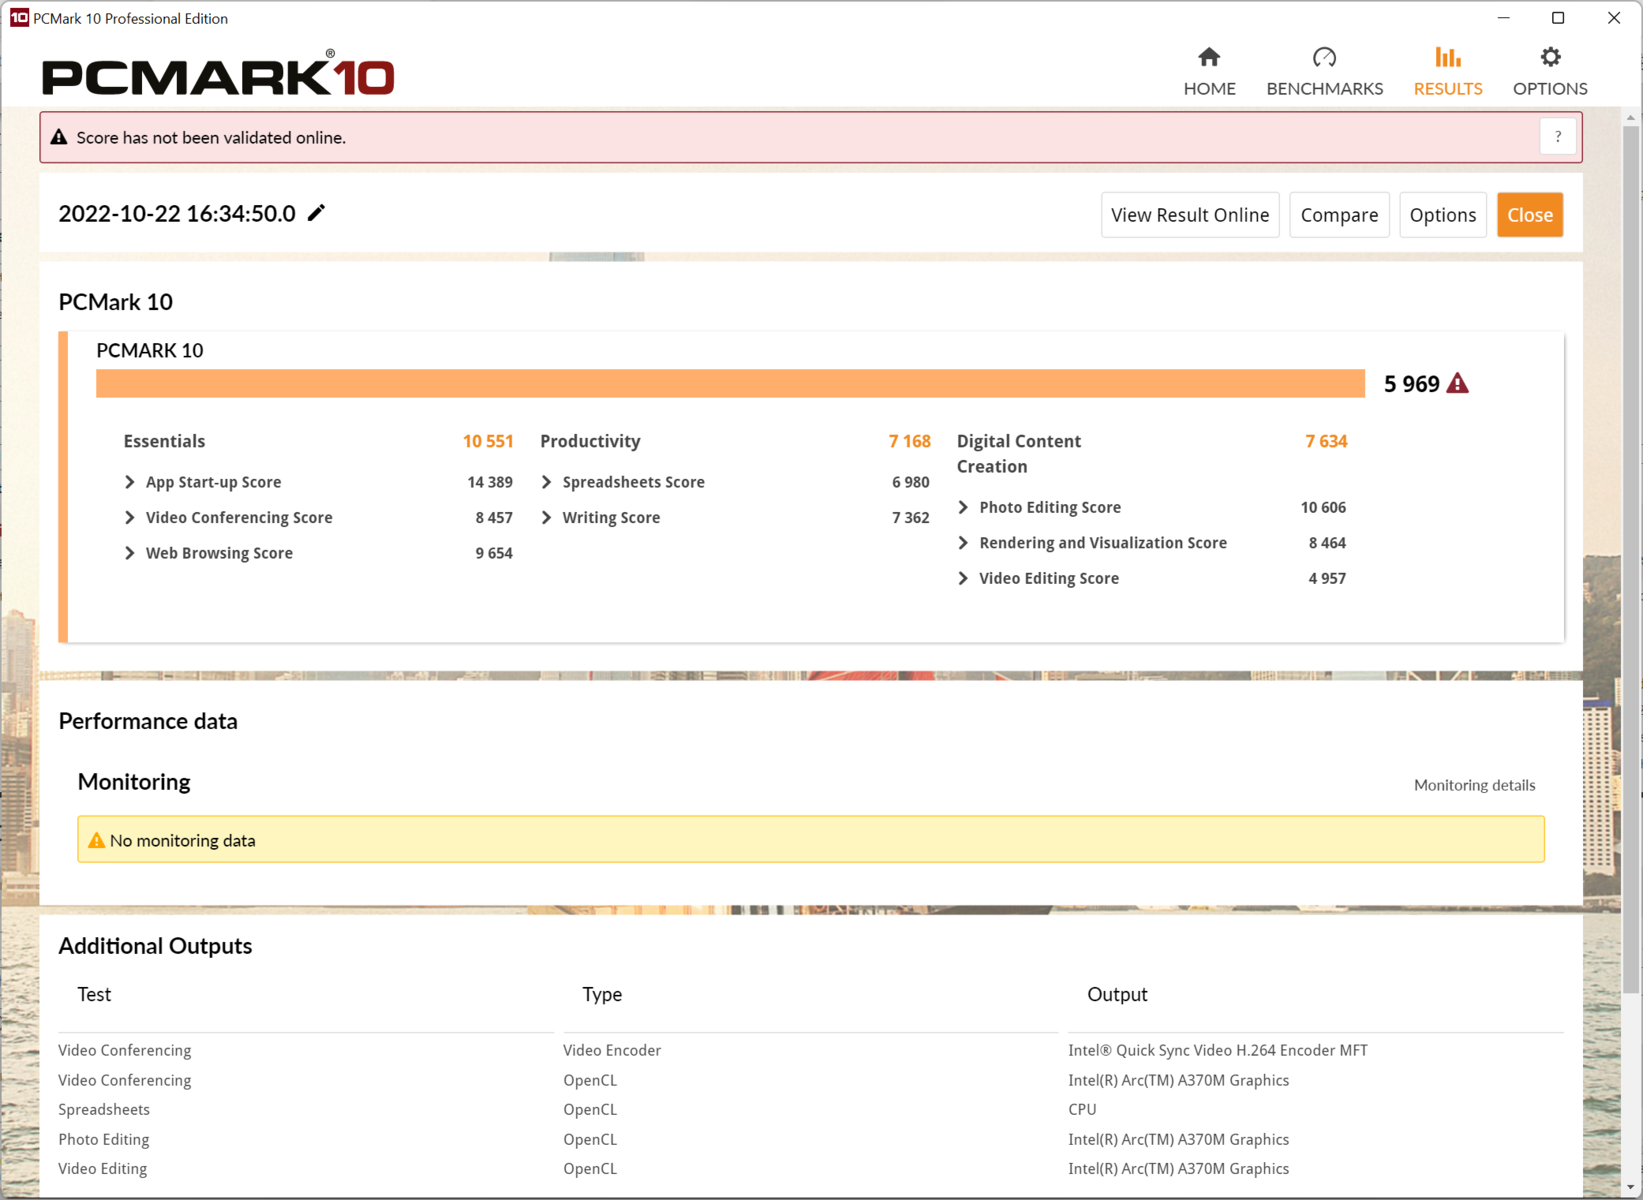
Die System-Performance liegt parallel zum Schwestermodell auf einem hohen Niveau, besonders beim Websurfen durch den hohen Turbo-Boost bei Intel Prozessoren.
HPs Envy 16 kann sich durch seine RTX 3060 besonders im Feld der Content Creation absetzen. Beim CPU-lastigen Websurfen vermindert sich der Abstand mit dem dort verbautem Core i7-12700H auf 10 bis 15 %.
CrossMark: Overall | Productivity | Creativity | Responsiveness
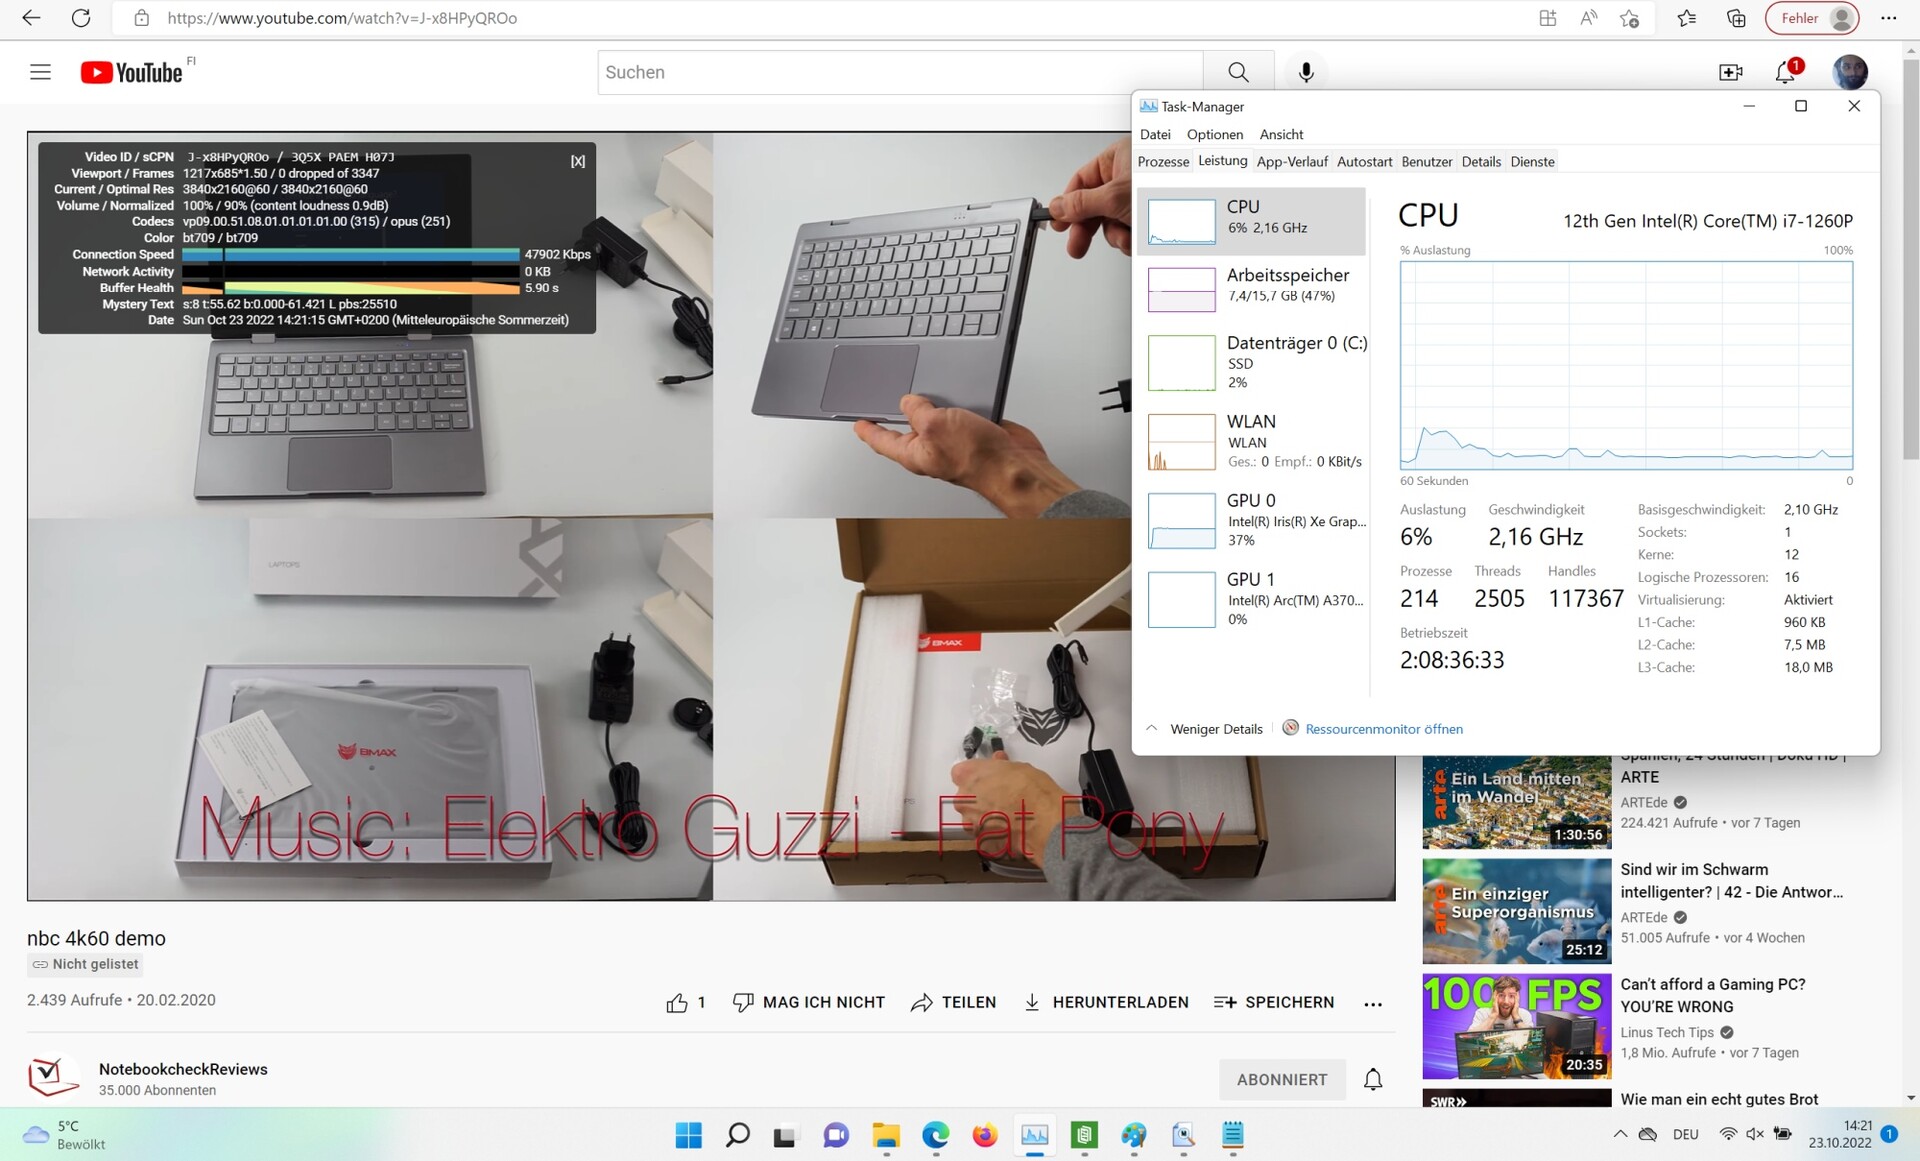
Youtube: 2160p60 CPU Load
Sunspider: 1.0 Total Score
Mozilla Kraken 1.1: Total
Speedometer 2.0: Result 2.0
Octane V2: Total Score
Jetstream 2: 2.0 Total
WebXPRT 3: Overall
WebXPRT 4: Overall
| PCMark 10 / Score | |
| Durchschnitt der Klasse Multimedia (4325 - 10386, n=58, der letzten 2 Jahre) | |
| HP Envy 16 h0112nr | |
| Dell Inspiron 16 Plus 7620 | |
| Asus Vivobook Pro 16X-M7600QE | |
| Acer Swift X SFX16-52G-77RX | |
| Durchschnittliche Intel Core i7-1260P, Intel Arc A370M (n=1) | |
| Acer Swift X SFX16-52G-52VE | |
| Lenovo IdeaPad 5 Pro 16ARH7 | |
| Acer Swift X SFX16-51G-5388 | |
| PCMark 10 / Essentials | |
| HP Envy 16 h0112nr | |
| Acer Swift X SFX16-52G-77RX | |
| Durchschnittliche Intel Core i7-1260P, Intel Arc A370M (n=1) | |
| Asus Vivobook Pro 16X-M7600QE | |
| Durchschnitt der Klasse Multimedia (8025 - 11664, n=57, der letzten 2 Jahre) | |
| Dell Inspiron 16 Plus 7620 | |
| Lenovo IdeaPad 5 Pro 16ARH7 | |
| Acer Swift X SFX16-52G-52VE | |
| Acer Swift X SFX16-51G-5388 | |
| PCMark 10 / Productivity | |
| Durchschnitt der Klasse Multimedia (7323 - 18233, n=57, der letzten 2 Jahre) | |
| Asus Vivobook Pro 16X-M7600QE | |
| HP Envy 16 h0112nr | |
| Dell Inspiron 16 Plus 7620 | |
| Lenovo IdeaPad 5 Pro 16ARH7 | |
| Acer Swift X SFX16-51G-5388 | |
| Acer Swift X SFX16-52G-52VE | |
| Acer Swift X SFX16-52G-77RX | |
| Durchschnittliche Intel Core i7-1260P, Intel Arc A370M (n=1) | |
| PCMark 10 / Digital Content Creation | |
| HP Envy 16 h0112nr | |
| Durchschnitt der Klasse Multimedia (3651 - 16240, n=57, der letzten 2 Jahre) | |
| Dell Inspiron 16 Plus 7620 | |
| Asus Vivobook Pro 16X-M7600QE | |
| Acer Swift X SFX16-52G-77RX | |
| Durchschnittliche Intel Core i7-1260P, Intel Arc A370M (n=1) | |
| Acer Swift X SFX16-52G-52VE | |
| Acer Swift X SFX16-51G-5388 | |
| Lenovo IdeaPad 5 Pro 16ARH7 | |
| CrossMark / Overall | |
| Durchschnitt der Klasse Multimedia (866 - 2728, n=67, der letzten 2 Jahre) | |
| HP Envy 16 h0112nr | |
| Lenovo ThinkBook 16 G4+ IAP | |
| Dell Inspiron 16 Plus 7620 | |
| Acer Swift X SFX16-52G-77RX | |
| Durchschnittliche Intel Core i7-1260P, Intel Arc A370M (n=1) | |
| Acer Swift X SFX16-52G-52VE | |
| Acer Swift X SFX16-51G-5388 | |
| CrossMark / Productivity | |
| Durchschnitt der Klasse Multimedia (931 - 2489, n=67, der letzten 2 Jahre) | |
| HP Envy 16 h0112nr | |
| Lenovo ThinkBook 16 G4+ IAP | |
| Acer Swift X SFX16-52G-77RX | |
| Durchschnittliche Intel Core i7-1260P, Intel Arc A370M (n=1) | |
| Dell Inspiron 16 Plus 7620 | |
| Acer Swift X SFX16-51G-5388 | |
| Acer Swift X SFX16-52G-52VE | |
| CrossMark / Creativity | |
| Durchschnitt der Klasse Multimedia (907 - 3465, n=67, der letzten 2 Jahre) | |
| HP Envy 16 h0112nr | |
| Lenovo ThinkBook 16 G4+ IAP | |
| Dell Inspiron 16 Plus 7620 | |
| Acer Swift X SFX16-52G-77RX | |
| Durchschnittliche Intel Core i7-1260P, Intel Arc A370M (n=1) | |
| Acer Swift X SFX16-52G-52VE | |
| Acer Swift X SFX16-51G-5388 | |
| CrossMark / Responsiveness | |
| Acer Swift X SFX16-52G-77RX | |
| Durchschnittliche Intel Core i7-1260P, Intel Arc A370M (n=1) | |
| HP Envy 16 h0112nr | |
| Lenovo ThinkBook 16 G4+ IAP | |
| Dell Inspiron 16 Plus 7620 | |
| Durchschnitt der Klasse Multimedia (605 - 2024, n=67, der letzten 2 Jahre) | |
| Acer Swift X SFX16-52G-52VE | |
| Acer Swift X SFX16-51G-5388 | |
| Youtube / 2160p60 CPU Load | |
| Durchschnitt der Klasse Multimedia (3 - 46, n=58, der letzten 2 Jahre) | |
| Acer Swift X SFX16-52G-52VE (42, 1) | |
| Lenovo ThinkBook 16 G4+ IAP (43, 8) | |
| Acer Swift X SFX16-52G-77RX (37) | |
| Durchschnittliche Intel Core i7-1260P, Intel Arc A370M (n=1) | |
| Asus Vivobook Pro 16X-M7600QE (76, 38) | |
| Dell Inspiron 16 Plus 7620 (46, 1) | |
| HP Envy 16 h0112nr (45, 3) | |
| Lenovo IdeaPad 5 Pro 16ARH7 (1) | |
| Sunspider / 1.0 Total Score | |
| Lenovo IdeaPad 5 Pro 16ARH7 | |
| Acer Swift X SFX16-52G-77RX | |
| Durchschnittliche Intel Core i7-1260P, Intel Arc A370M (n=1) | |
| Durchschnitt der Klasse Multimedia (n=1der letzten 2 Jahre) | |
| Mozilla Kraken 1.1 / Total | |
| Acer Swift X SFX16-51G-5388 | |
| Lenovo IdeaPad 5 Pro 16ARH7 | |
| Asus Vivobook Pro 16X-M7600QE | |
| Asus Vivobook Pro 16X-M7600QE | |
| Acer Swift X SFX16-52G-77RX | |
| Durchschnittliche Intel Core i7-1260P, Intel Arc A370M (n=1) | |
| Acer Swift X SFX16-52G-52VE | |
| HP Envy 16 h0112nr | |
| Dell Inspiron 16 Plus 7620 | |
| Lenovo ThinkBook 16 G4+ IAP | |
| Durchschnitt der Klasse Multimedia (228 - 835, n=73, der letzten 2 Jahre) | |
| Speedometer 2.0 / Result 2.0 | |
| Durchschnitt der Klasse Multimedia (337 - 946, n=34, der letzten 2 Jahre) | |
| Lenovo ThinkBook 16 G4+ IAP | |
| Acer Swift X SFX16-52G-77RX | |
| Durchschnittliche Intel Core i7-1260P, Intel Arc A370M (n=1) | |
| Octane V2 / Total Score | |
| Durchschnitt der Klasse Multimedia (64079 - 153175, n=34, der letzten 2 Jahre) | |
| Lenovo ThinkBook 16 G4+ IAP | |
| Acer Swift X SFX16-52G-77RX | |
| Durchschnittliche Intel Core i7-1260P, Intel Arc A370M (n=1) | |
| Acer Swift X SFX16-52G-52VE | |
| Acer Swift X SFX16-51G-5388 | |
| Jetstream 2 / 2.0 Total | |
| Durchschnitt der Klasse Multimedia (287 - 481, n=35, der letzten 2 Jahre) | |
| HP Envy 16 h0112nr | |
| Dell Inspiron 16 Plus 7620 | |
| Lenovo ThinkBook 16 G4+ IAP | |
| Acer Swift X SFX16-52G-77RX | |
| Durchschnittliche Intel Core i7-1260P, Intel Arc A370M (n=1) | |
| Acer Swift X SFX16-52G-52VE | |
| Acer Swift X SFX16-51G-5388 | |
| WebXPRT 3 / Overall | |
| Durchschnitt der Klasse Multimedia (136.4 - 596, n=70, der letzten 2 Jahre) | |
| HP Envy 16 h0112nr | |
| Dell Inspiron 16 Plus 7620 | |
| Lenovo ThinkBook 16 G4+ IAP | |
| Asus Vivobook Pro 16X-M7600QE | |
| Acer Swift X SFX16-52G-77RX | |
| Durchschnittliche Intel Core i7-1260P, Intel Arc A370M (n=1) | |
| Acer Swift X SFX16-52G-52VE | |
| Acer Swift X SFX16-51G-5388 | |
| Lenovo IdeaPad 5 Pro 16ARH7 | |
| WebXPRT 4 / Overall | |
| Durchschnitt der Klasse Multimedia (167.3 - 402, n=71, der letzten 2 Jahre) | |
| HP Envy 16 h0112nr | |
| Lenovo ThinkBook 16 G4+ IAP | |
| Dell Inspiron 16 Plus 7620 | |
| Acer Swift X SFX16-52G-77RX | |
| Durchschnittliche Intel Core i7-1260P, Intel Arc A370M (n=1) | |
| Acer Swift X SFX16-52G-52VE | |
| Acer Swift X SFX16-51G-5388 | |
* ... kleinere Werte sind besser
| PCMark 10 Score | 5969 Punkte | |
Hilfe | ||
| AIDA64 / Memory Copy | |
| Durchschnitt der Klasse Multimedia (11299 - 132135, n=61, der letzten 2 Jahre) | |
| Acer Swift X SFX16-52G-77RX | |
| Acer Swift X SFX16-52G-52VE | |
| Lenovo ThinkBook 16 G4+ IAP | |
| HP Envy 16 h0112nr | |
| Acer Swift X SFX16-51G-5388 | |
| Dell Inspiron 16 Plus 7620 | |
| Durchschnittliche Intel Core i7-1260P (25125 - 71544, n=25) | |
| Lenovo IdeaPad 5 Pro 16ARH7 | |
| Asus Vivobook Pro 16X-M7600QE | |
| Asus Vivobook Pro 16X-M7600QE | |
| AIDA64 / Memory Read | |
| Durchschnitt der Klasse Multimedia (11624 - 174586, n=61, der letzten 2 Jahre) | |
| Lenovo ThinkBook 16 G4+ IAP | |
| Acer Swift X SFX16-52G-77RX | |
| HP Envy 16 h0112nr | |
| Acer Swift X SFX16-52G-52VE | |
| Dell Inspiron 16 Plus 7620 | |
| Durchschnittliche Intel Core i7-1260P (24983 - 72065, n=25) | |
| Acer Swift X SFX16-51G-5388 | |
| Asus Vivobook Pro 16X-M7600QE | |
| Asus Vivobook Pro 16X-M7600QE | |
| Lenovo IdeaPad 5 Pro 16ARH7 | |
| AIDA64 / Memory Write | |
| Lenovo IdeaPad 5 Pro 16ARH7 | |
| Durchschnitt der Klasse Multimedia (11755 - 134998, n=61, der letzten 2 Jahre) | |
| Acer Swift X SFX16-51G-5388 | |
| Acer Swift X SFX16-52G-77RX | |
| HP Envy 16 h0112nr | |
| Acer Swift X SFX16-52G-52VE | |
| Lenovo ThinkBook 16 G4+ IAP | |
| Dell Inspiron 16 Plus 7620 | |
| Durchschnittliche Intel Core i7-1260P (23512 - 66799, n=25) | |
| Asus Vivobook Pro 16X-M7600QE | |
| Asus Vivobook Pro 16X-M7600QE | |
| AIDA64 / Memory Latency | |
| Durchschnitt der Klasse Multimedia (7 - 535, n=60, der letzten 2 Jahre) | |
| Lenovo IdeaPad 5 Pro 16ARH7 | |
| Acer Swift X SFX16-51G-5388 | |
| Acer Swift X SFX16-52G-77RX | |
| Lenovo ThinkBook 16 G4+ IAP | |
| Acer Swift X SFX16-52G-52VE | |
| Dell Inspiron 16 Plus 7620 | |
| HP Envy 16 h0112nr | |
| Durchschnittliche Intel Core i7-1260P (77.9 - 118.4, n=21) | |
| Asus Vivobook Pro 16X-M7600QE | |
| Asus Vivobook Pro 16X-M7600QE | |
* ... kleinere Werte sind besser
DPC-Latenzen
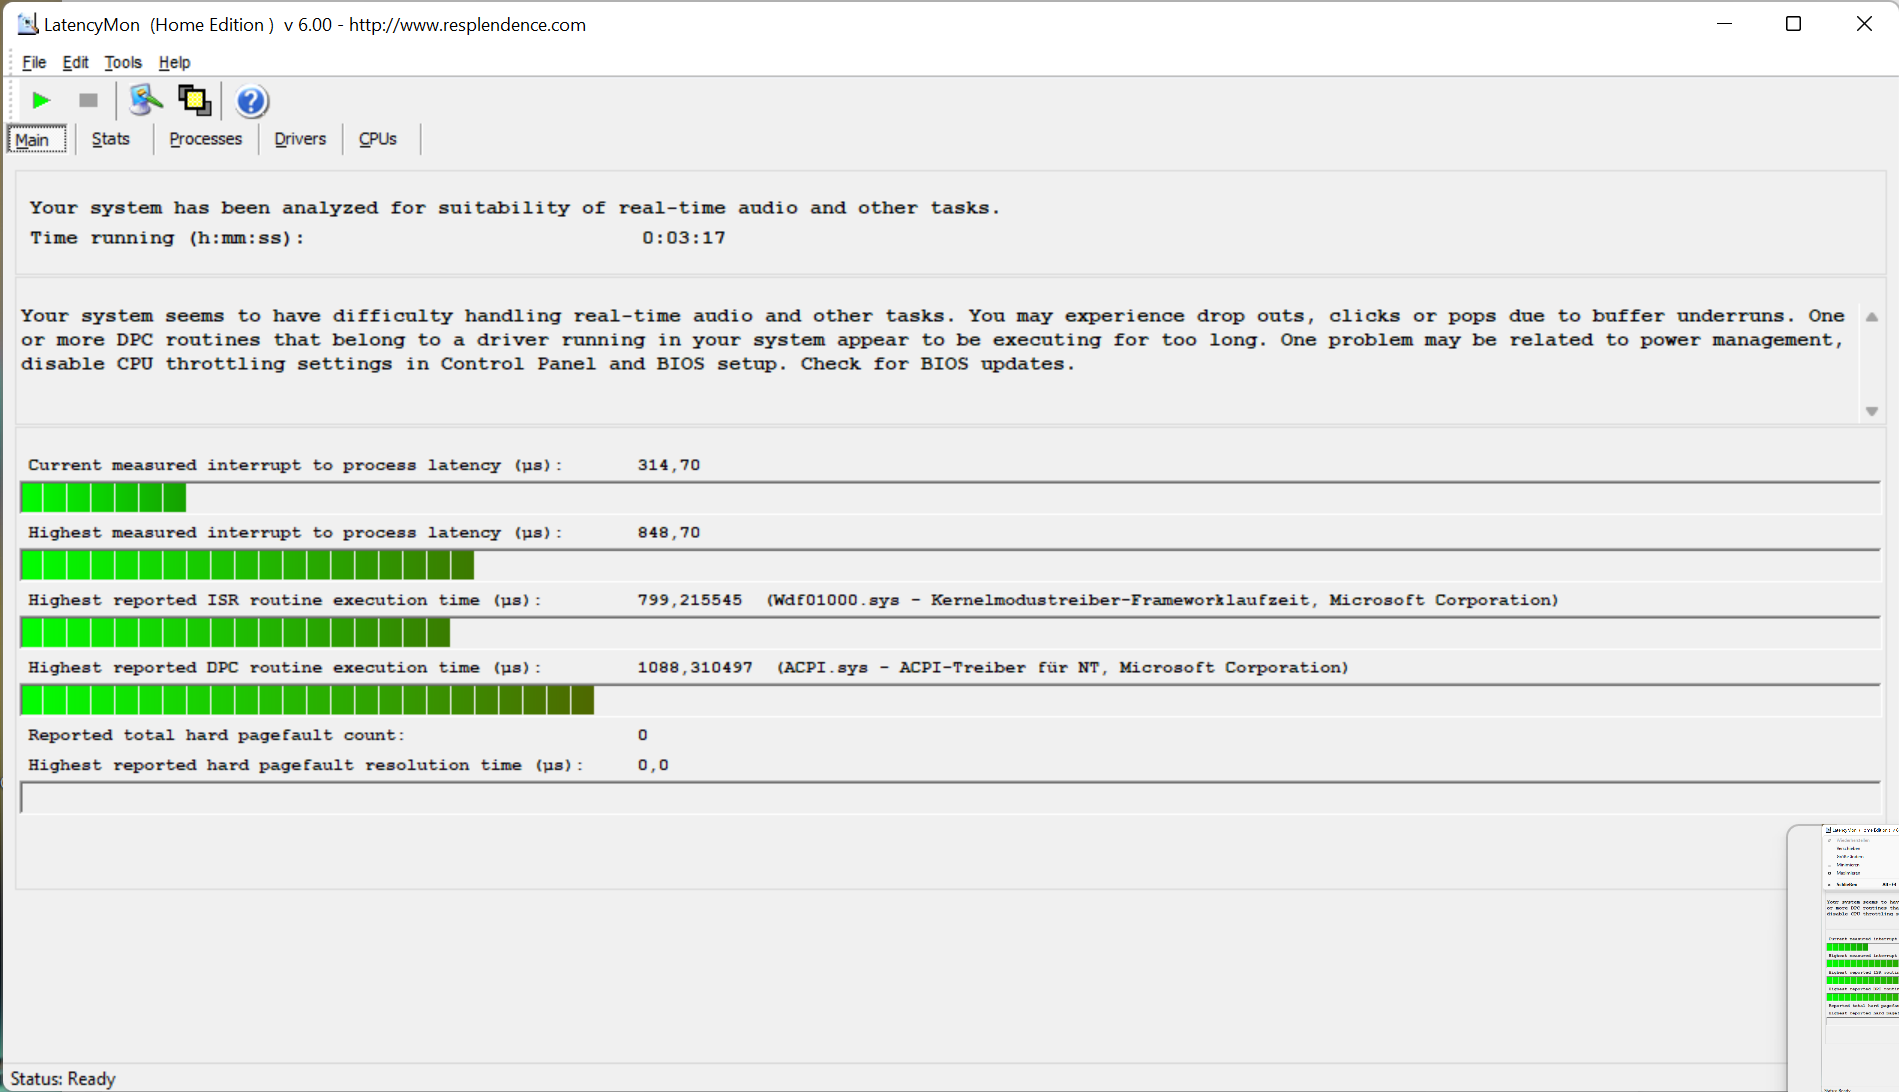
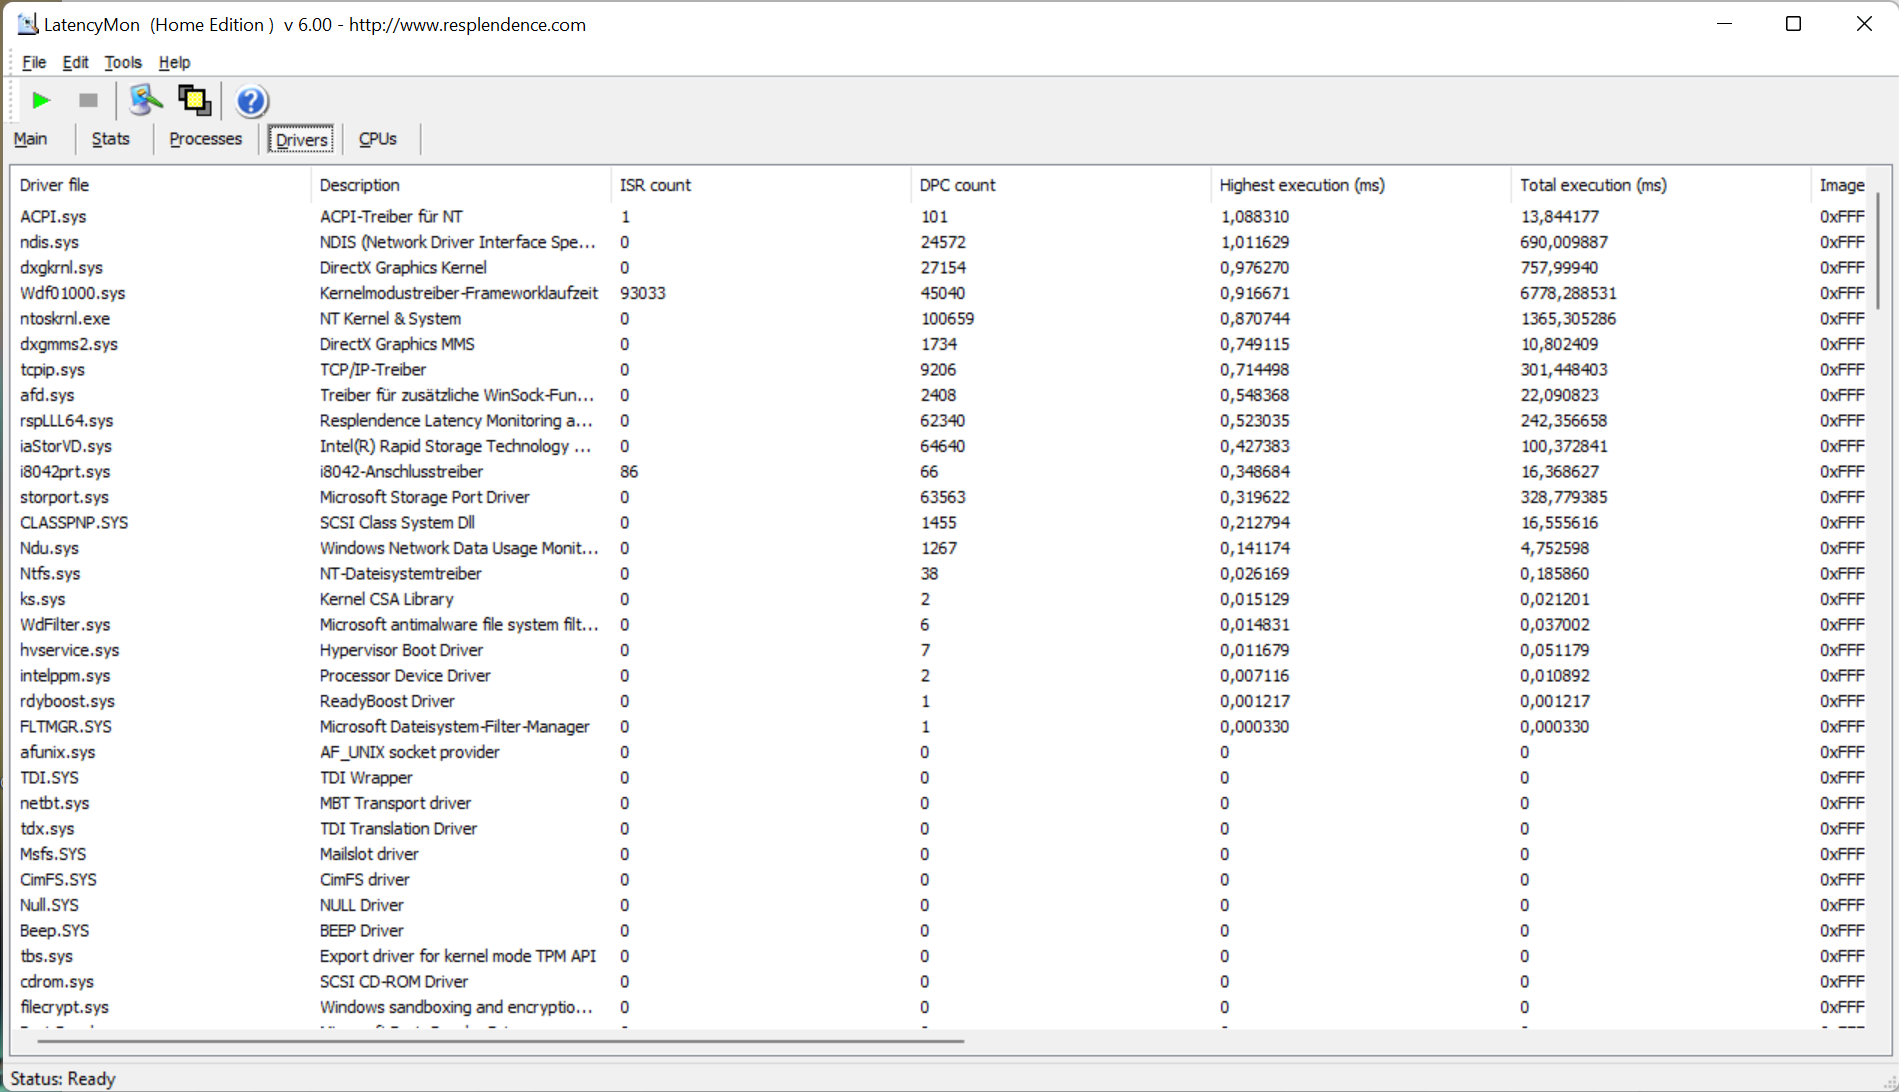
| DPC Latencies / LatencyMon - interrupt to process latency (max), Web, Youtube, Prime95 | |
| Acer Swift X SFX16-51G-5388 | |
| Lenovo ThinkBook 16 G4+ IAP | |
| Asus Vivobook Pro 16X-M7600QE | |
| Acer Swift X SFX16-52G-52VE | |
| Dell Inspiron 16 Plus 7620 | |
| HP Envy 16 h0112nr | |
| Acer Swift X SFX16-52G-77RX | |
| Lenovo IdeaPad 5 Pro 16ARH7 | |
* ... kleinere Werte sind besser
Massenspeicher
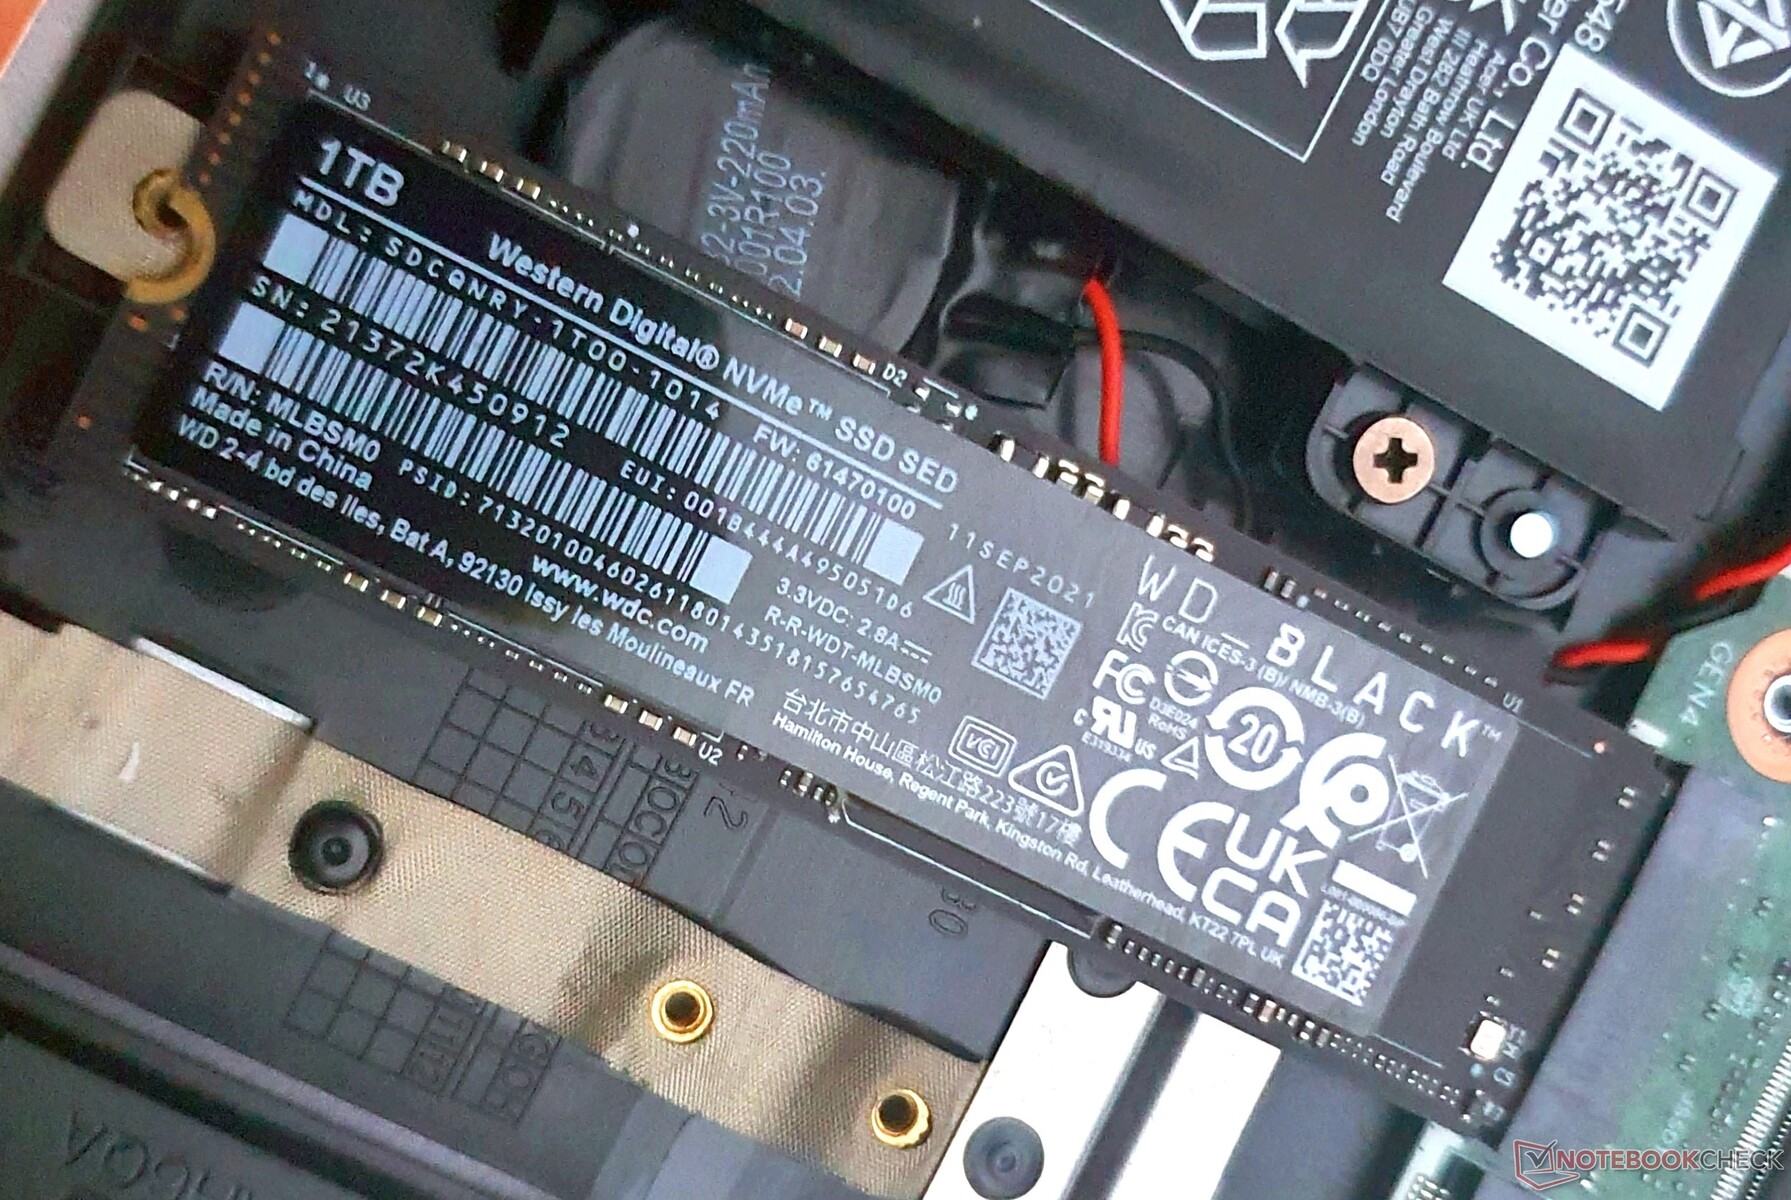
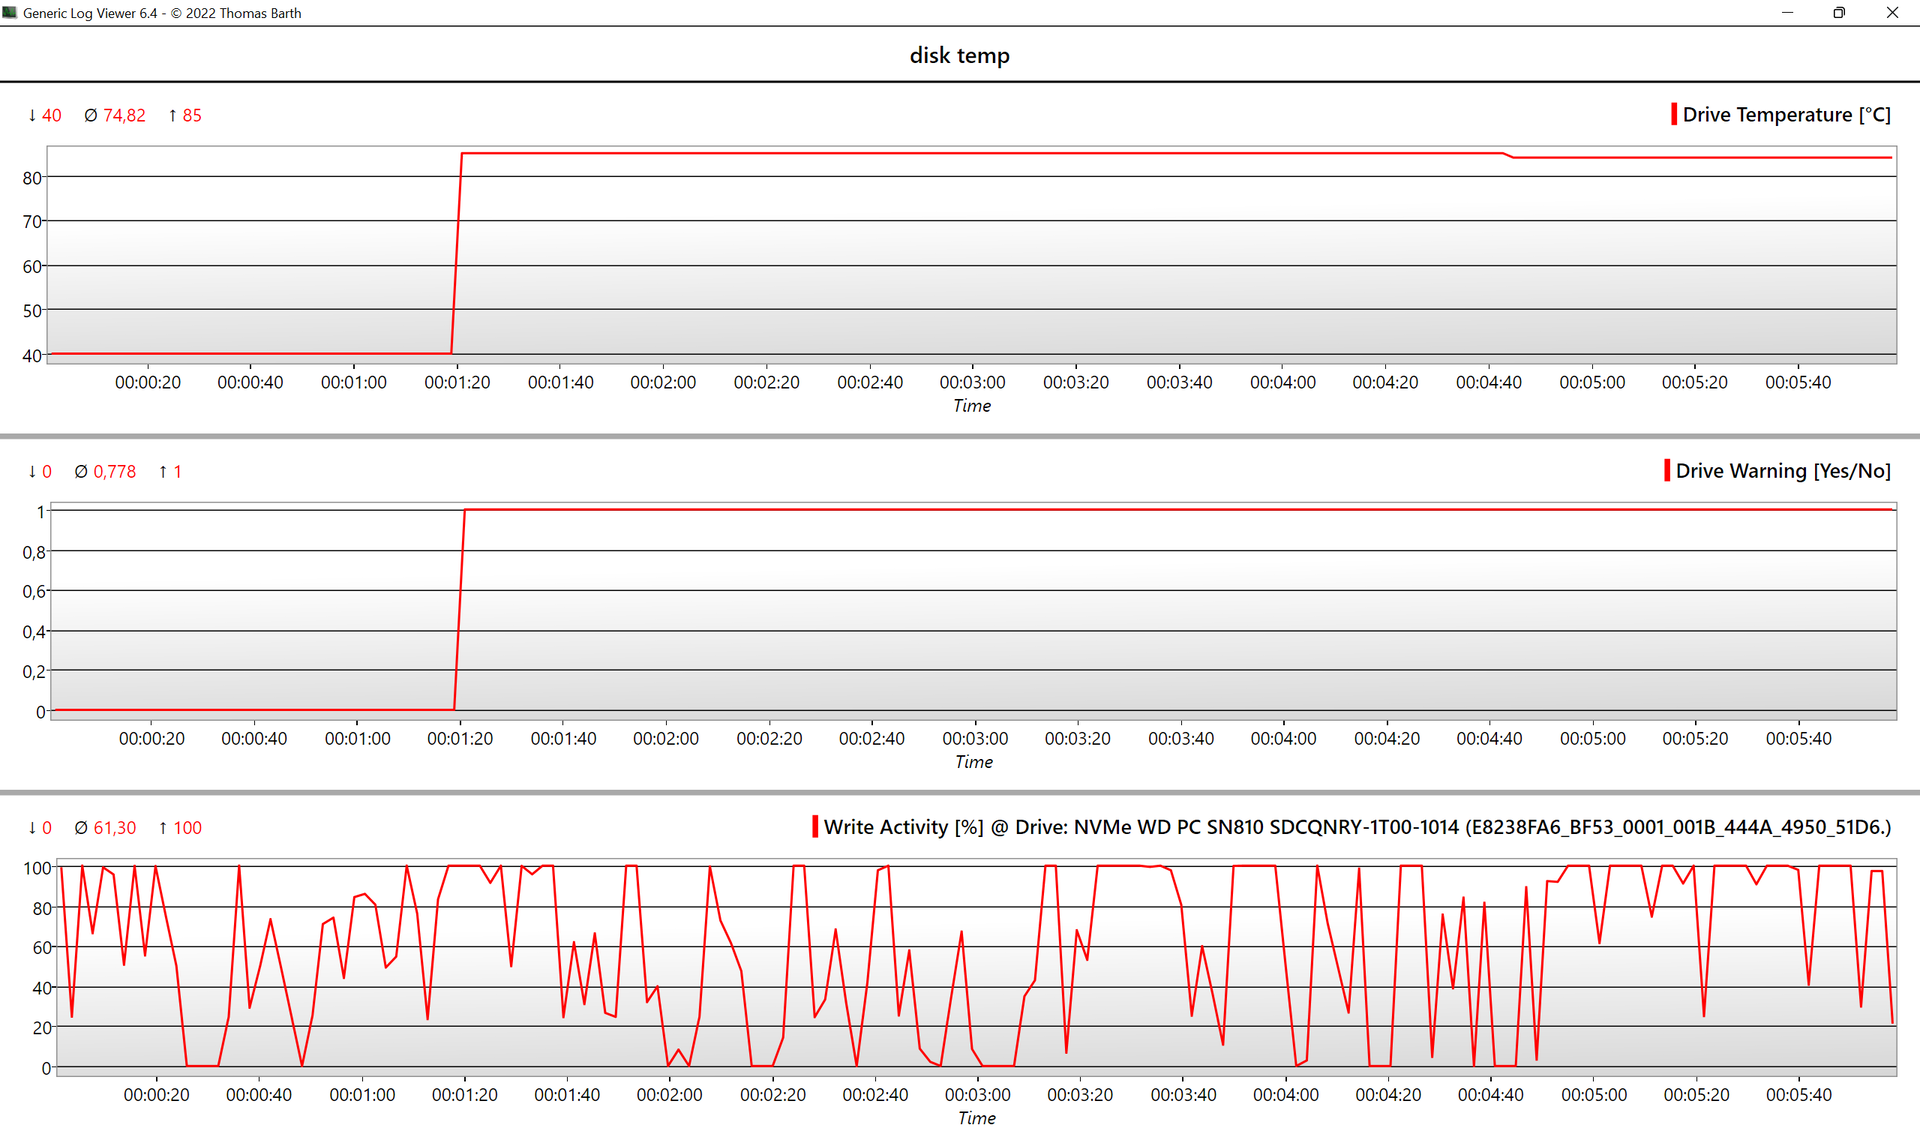
Die 1-TB-SSD von Western Digital wird dem PCIe-4.0-Standard durch ihre sehr hohen Transferraten gerecht.
Während sich der direkte Vorgänger des Acer Swift X am Ende unseres SSD-Performance-Ratings ansiedelt, kann sich das diesjährige Modell mit Abstand an die Spitze setzen.
Auch das Schwestermodell mit 512-GB-SSD wird deutlich hinter sich gelassen. Die SSDs in beiden Modellen drosseln aufgrund von Überhitzung jedoch stark.
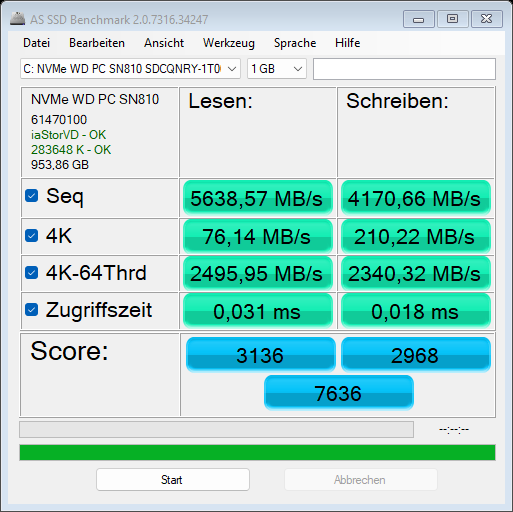
| Acer Swift X SFX16-52G-77RX WDC PC SN810 1TB | Acer Swift X SFX16-52G-52VE Micron 3400 MTFDKBA512TFH 512GB | Acer Swift X SFX16-51G-5388 Samsung PM991 MZVLQ512HBLU | Lenovo ThinkBook 16 G4+ IAP Micron 2450 1TB MTFDKCD1T0TFK | Dell Inspiron 16 Plus 7620 Kioxia BG5 KBG50ZNS512G | Lenovo IdeaPad 5 Pro 16ARH7 Samsung PM9A1 MZVL2512HCJQ | |
|---|---|---|---|---|---|---|
| AS SSD | -39% | -55% | -70% | -69% | -53% | |
| Seq Read (MB/s) | 5639 | 3200 -43% | 2744.12 -51% | 2825 -50% | 2693.29 -52% | 4687.88 -17% |
| Seq Write (MB/s) | 4171 | 3430 -18% | 1559.79 -63% | 1852 -56% | 1683.46 -60% | 2697.07 -35% |
| 4K Read (MB/s) | 76.1 | 63.1 -17% | 51.41 -32% | 58.44 -23% | 65.01 -15% | 61.12 -20% |
| 4K Write (MB/s) | 210.2 | 141.6 -33% | 156.13 -26% | 227.47 8% | 197.81 -6% | 125.7 -40% |
| 4K-64 Read (MB/s) | 2496 | 1354 -46% | 1014.34 -59% | 954.65 -62% | 855.48 -66% | 827.56 -67% |
| 4K-64 Write (MB/s) | 2340 | 1802 -23% | 940.2 -60% | 2413.44 3% | 395.8 -83% | 1884.06 -19% |
| Access Time Read * (ms) | 0.031 | 0.064 -106% | 0.073 -135% | 0.026 16% | 0.078 -152% | 0.073 -135% |
| Access Time Write * (ms) | 0.018 | 0.026 -44% | 0.028 -56% | 0.131 -628% | 0.06 -233% | 0.04 -122% |
| Score Read (Points) | 3136 | 1737 -45% | 1340 -57% | 1296 -59% | 1190 -62% | 1357 -57% |
| Score Write (Points) | 2968 | 2287 -23% | 1252 -58% | 2826 -5% | 762 -74% | 2279 -23% |
| Score Total (Points) | 7636 | 4936 -35% | 3229 -58% | 4750 -38% | 2529 -67% | 4247 -44% |
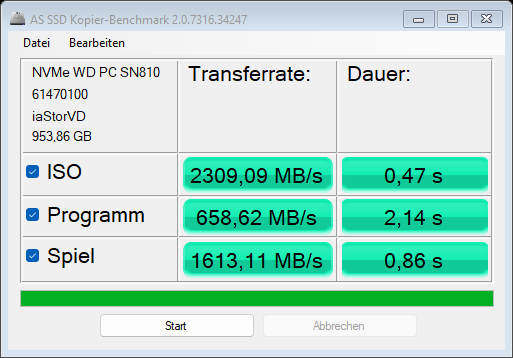
| Copy ISO MB/s (MB/s) | 2309 | 1363.82 -41% | 2155.05 -7% | 1634.1 -29% | ||
| Copy Program MB/s (MB/s) | 658.6 | 433.2 -34% | 414.57 -37% | 379.46 -42% | ||
| Copy Game MB/s (MB/s) | 1613 | 1055.69 -35% | 1055.89 -35% | 1174.45 -27% | ||
| DiskSpd | -25% | -71% | -50% | -56% | -40% | |
| seq read (MB/s) | 4206 | 2619 -38% | 1248 -70% | 2124 -50% | 2355 -44% | 3304 -21% |
| seq write (MB/s) | 5015 | 3900 -22% | 790 -84% | 2677 -47% | 2020 -60% | 2744 -45% |
| seq q8 t1 read (MB/s) | 6940 | 6439 -7% | 1655 -76% | 3377 -51% | 2569 -63% | 6708 -3% |
| seq q8 t1 write (MB/s) | 5031 | 3911 -22% | 871 -83% | 3241 -36% | 2752 -45% | 4857 -3% |
| 4k q32 t16 read (MB/s) | 2605 | 1522 -42% | 778 -70% | 923 -65% | 652 -75% | 824 -68% |
| 4k q32 t16 write (MB/s) | 2780 | 2390 -14% | 640 -77% | 501 -82% | 408 -85% | 299 -89% |
| 4k q1 t1 read (MB/s) | 88 | 65.3 -26% | 43.2 -51% | 61.2 -30% | 62.7 -29% | 63.4 -28% |
| 4k q1 t1 write (MB/s) | 305 | 208 -32% | 123.5 -60% | 187.8 -38% | 162.6 -47% | 125.7 -59% |
| Durchschnitt gesamt (Programm / Settings) | -32% /
-33% | -63% /
-61% | -60% /
-62% | -63% /
-64% | -47% /
-47% |
* ... kleinere Werte sind besser
* ... kleinere Werte sind besser
Dauerleistung Lesen: DiskSpd Read Loop, Queue Depth 8
Grafikkarte
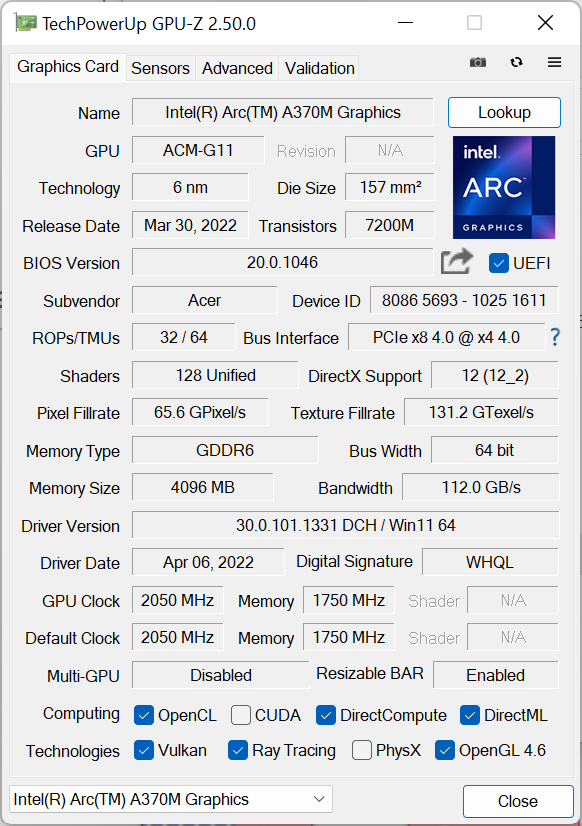
Bei der verbauten Intel Arc A370M handelt es sich um die Variante mit der niedrigsten TGP von 35 Watt. Im Schnitt rechnet die RTX 3050 im Asus Vivobook Pro 16X und im eigenen Vorgängergerät um 50 % schneller in synthetischen Benchmarks. In Workstation bezogenen 3D-Benchmarks können daraus schnell mal 150 bis 200 % werden. Die synthetische Leistung einer integrierten AMD Radeon 680M liegt ungefähr auf Niveau der Arc A370M.
Im Akkubetrieb wird die Grafikleistung um weitere 30 % reduziert.
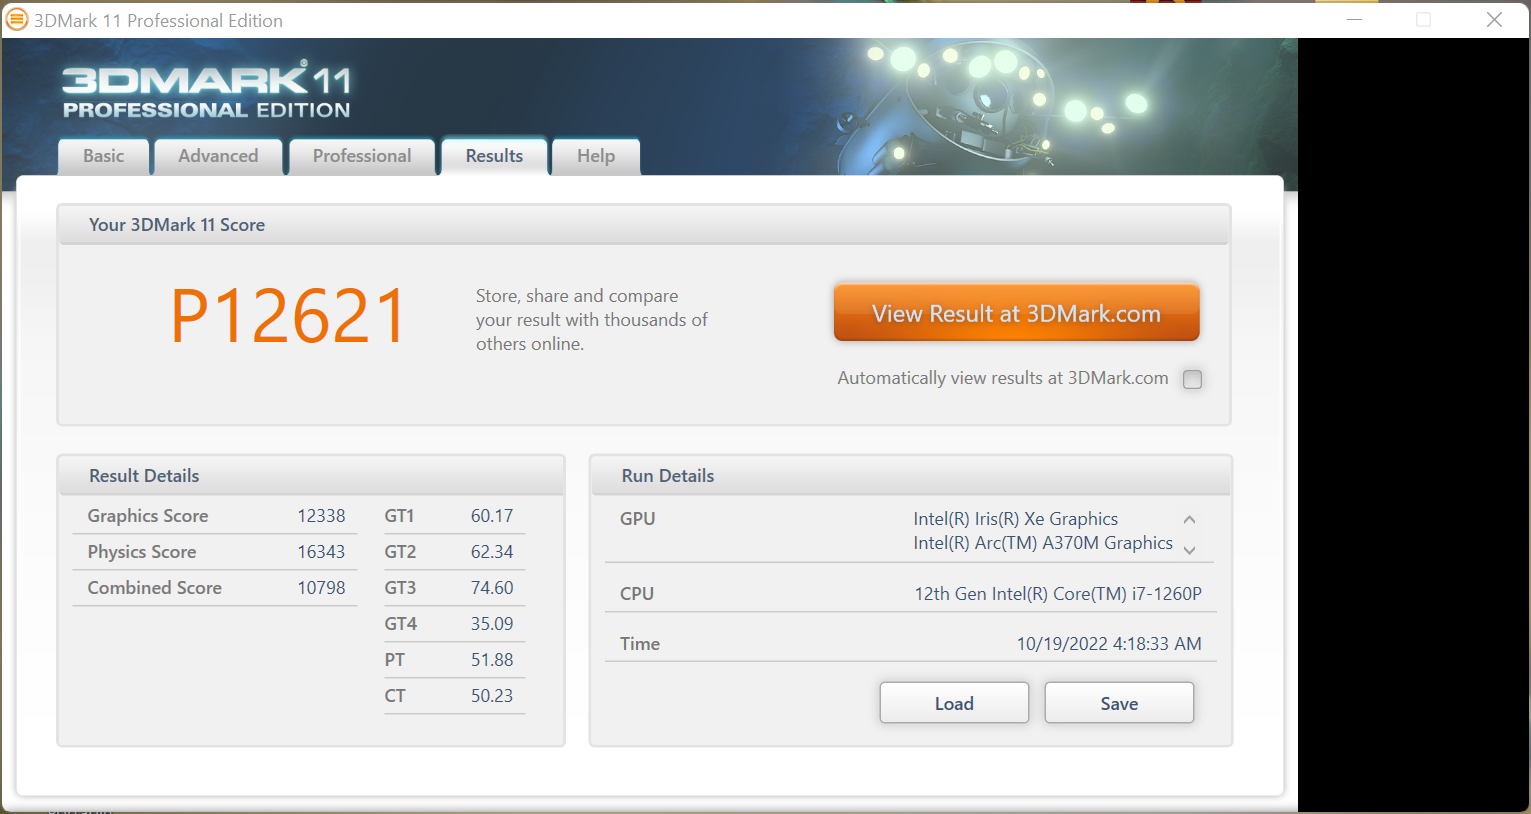

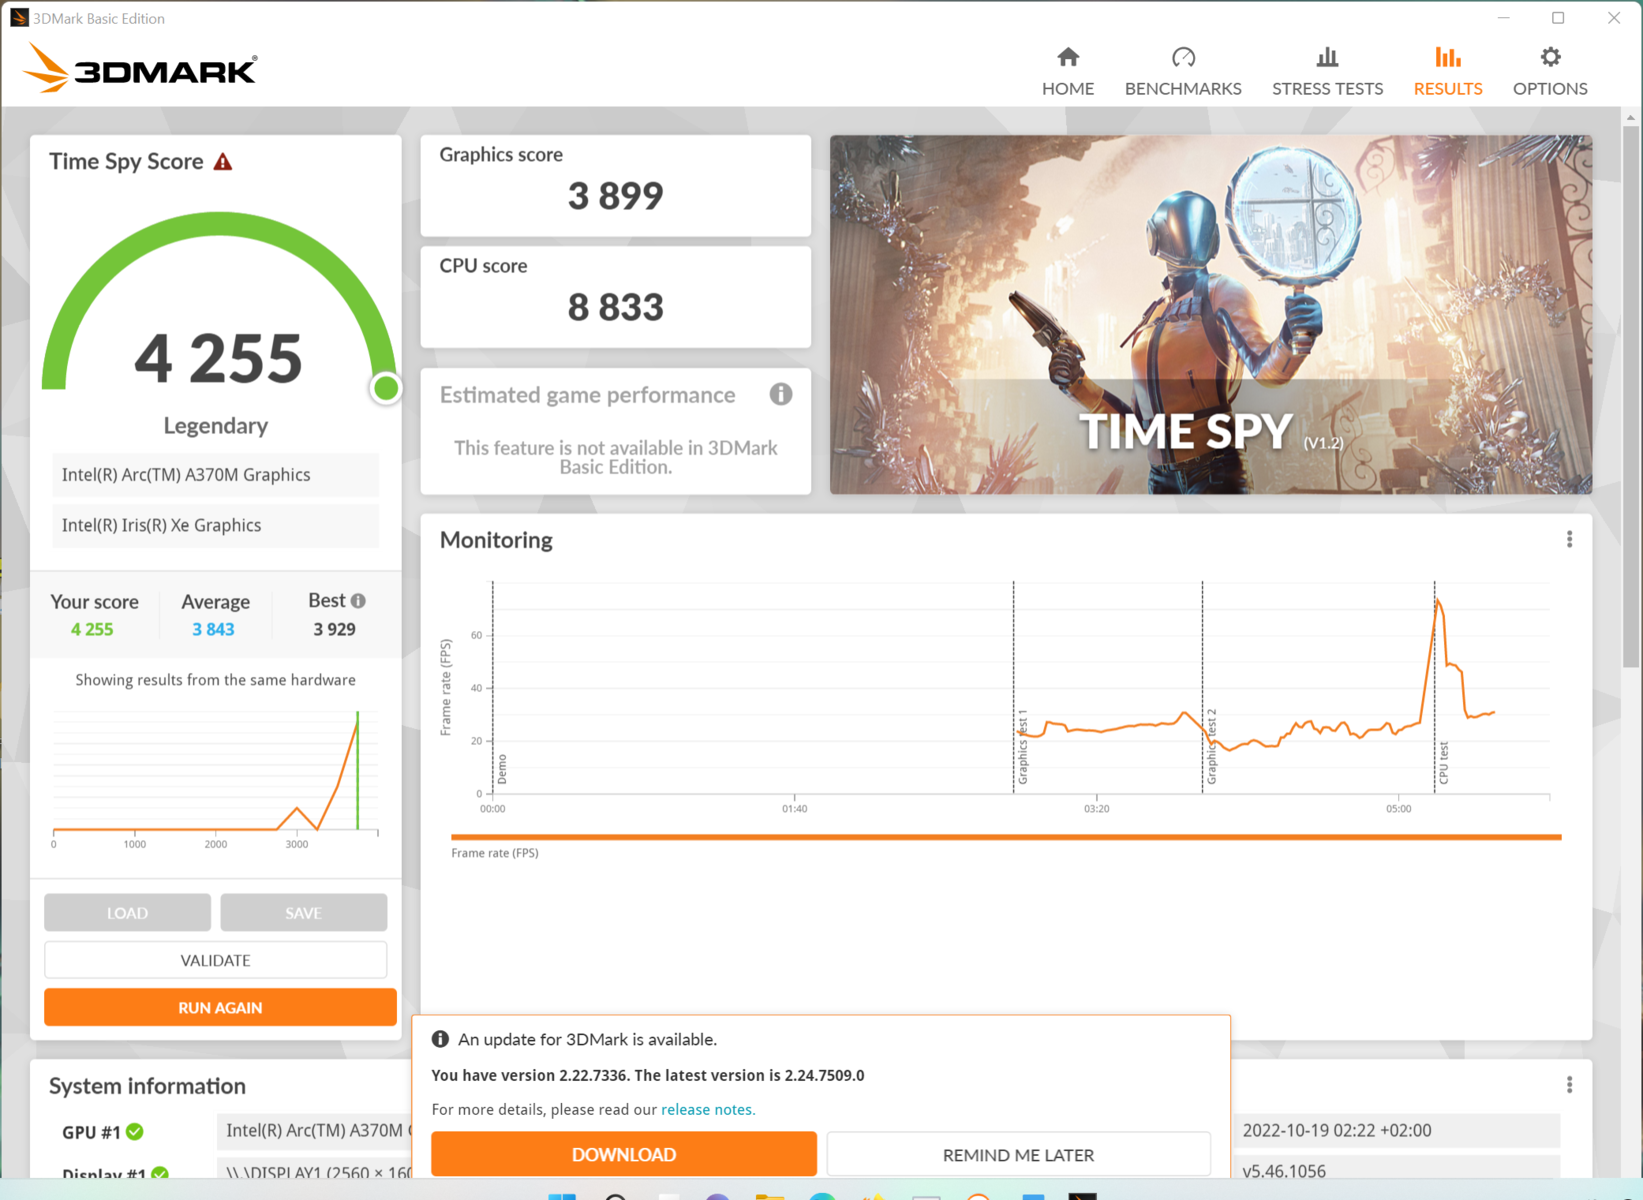
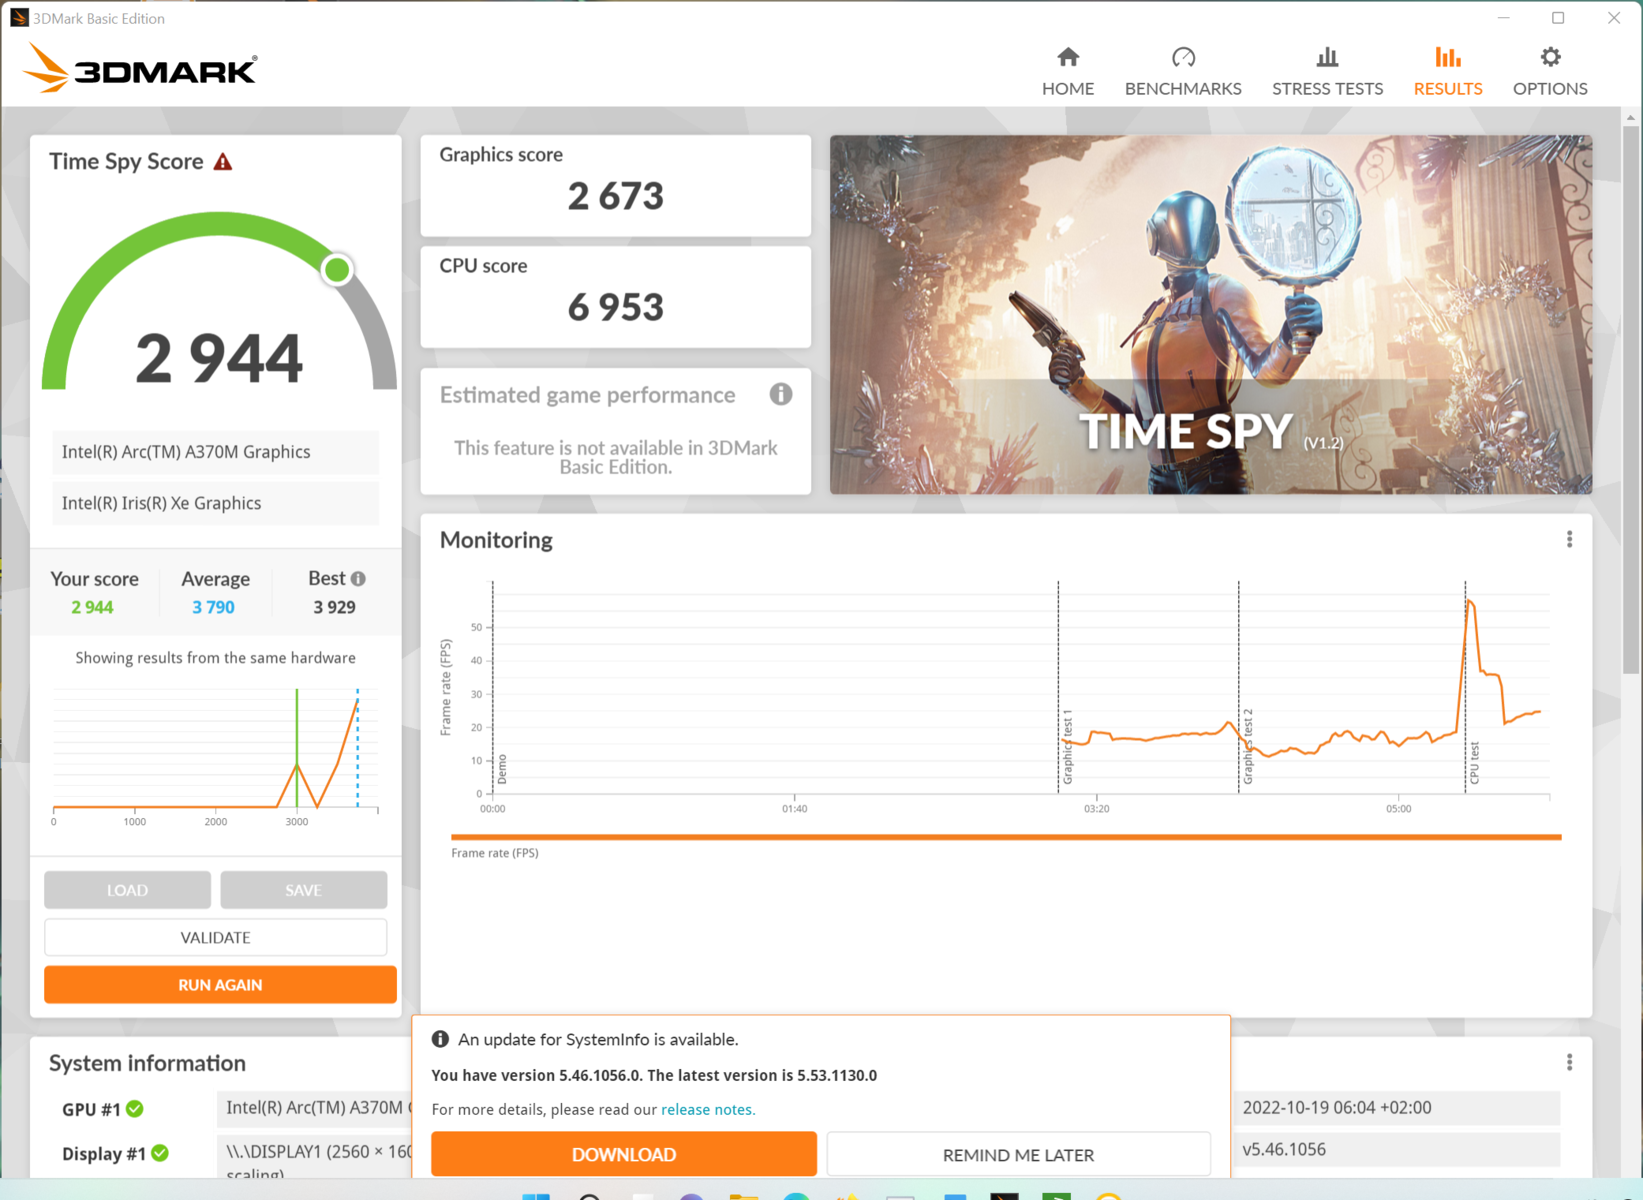
| 3DMark 11 Performance | 12621 Punkte | |
| 3DMark Cloud Gate Standard Score | 28727 Punkte | |
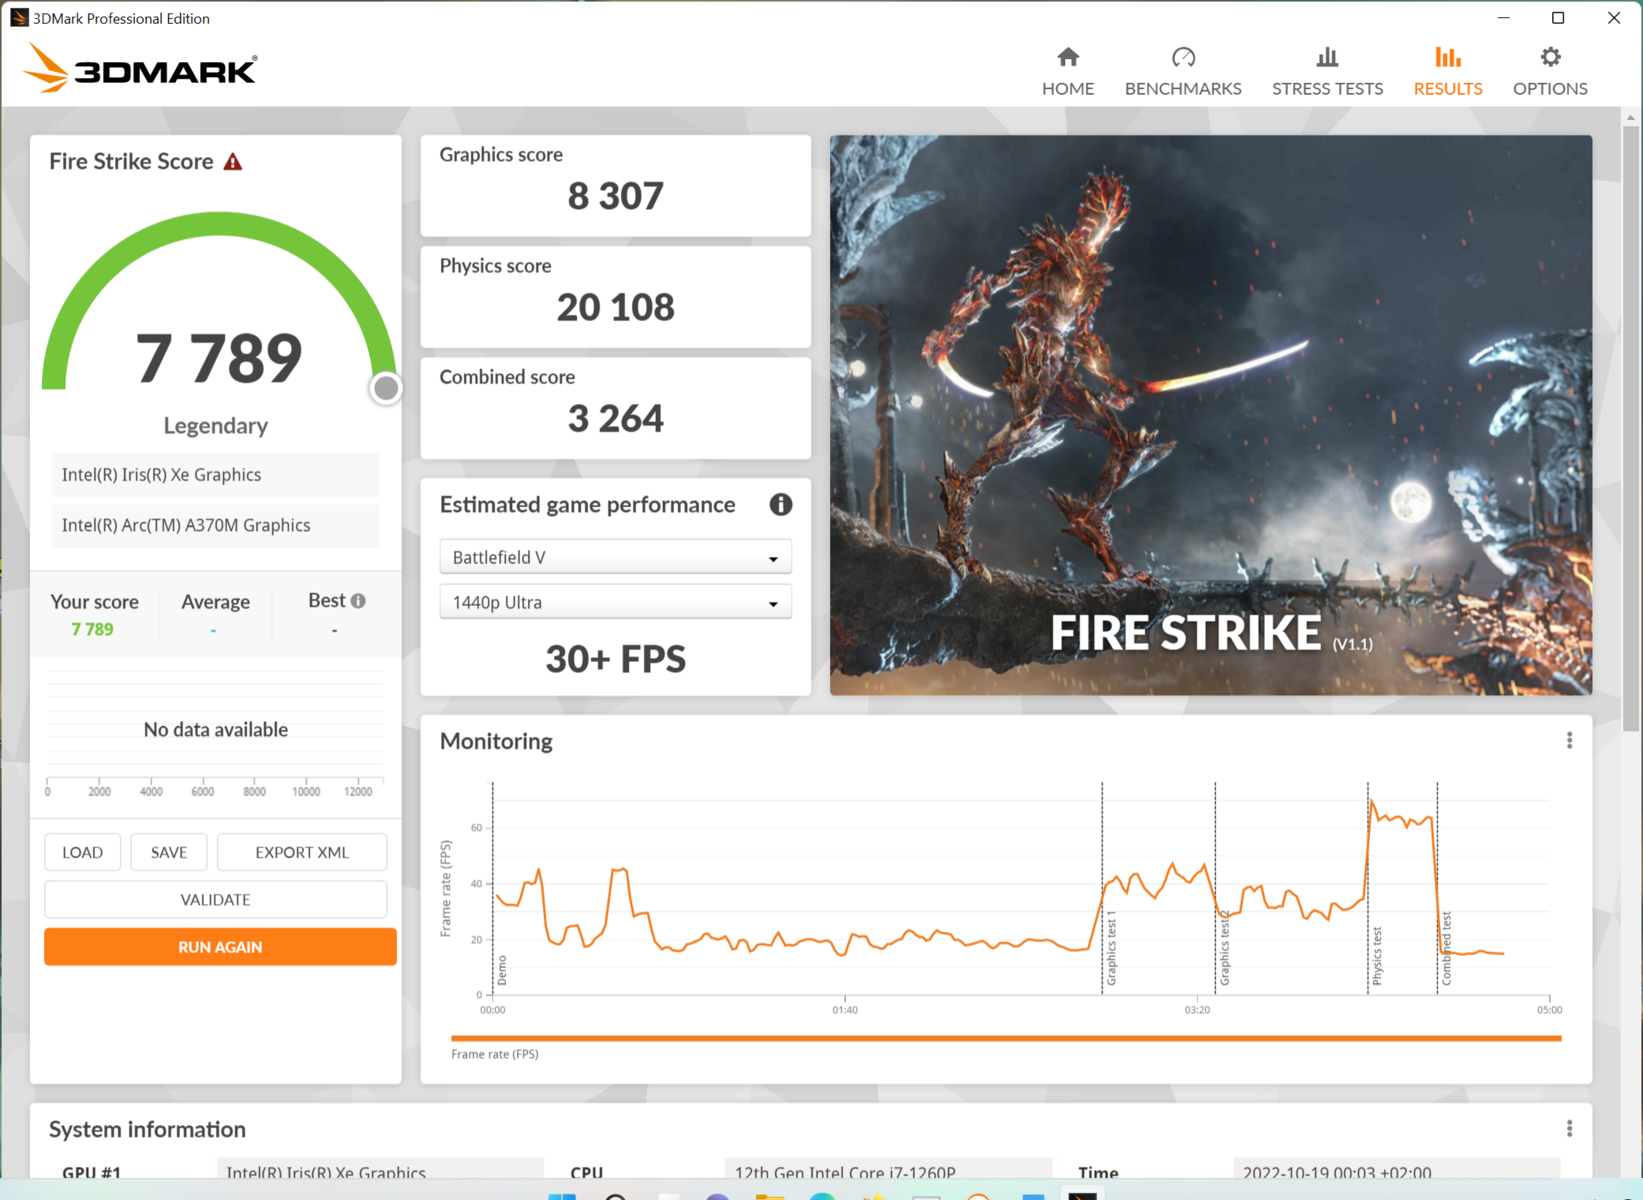
| 3DMark Fire Strike Score | 7789 Punkte | |
| 3DMark Time Spy Score | 4255 Punkte | |
Hilfe | ||
| Blender | |
| v3.3 Classroom oneAPI/Intel | |
| Acer Swift X SFX16-52G-77RX | |
| v3.3 Classroom HIP/AMD | |
| Lenovo ThinkPad T14 G3-21CF004NGE | |
| v3.3 Classroom CUDA | |
| HP ZBook Firefly 14 G9-6B8A2EA | |
| Acer Swift X SFX16-51G-5388 | |
| HP Envy 16 h0112nr | |
| Dell Inspiron 16 Plus 7620 | |
| v3.3 Classroom CPU | |
| HP ZBook Firefly 14 G9-6B8A2EA | |
| Acer Swift X SFX16-51G-5388 | |
| Acer Swift X SFX16-52G-77RX | |
| Acer Swift X SFX16-52G-52VE | |
| Lenovo ThinkPad T14 G3-21CF004NGE | |
| HP Envy 16 h0112nr | |
| Dell Inspiron 16 Plus 7620 | |
* ... kleinere Werte sind besser
Gaming Performance
In Spielen wird Intels Arc A370M meist um 60 % von der RTX 3050 Ti im Vivobook Pro 16X, respektive um etwa 100 % vom Dell Inspiron 16 abgehängt. Bei einigen Spielen wird dieser Vorsprung mit 200-300 % extrem, aufgrund von unzureichenden Treiber-Optimierungen der noch recht jungen Grafikeinheit.
Die GeForce RTX 3060 im HP Envy 16 ist in nahezu jedem Fall circa 3-mal schneller unterwegs, und eine integrierte Radeon 680M wird nur zu 10-20 % abgehängt.
Wenn man eine niedrigere Auflösung (FullHD) als die Native (QHD+) wählt und die Details auf mittel bis hoch belässt, können die meisten Spiele flüssig dargestellt werden. Bei modernen Spielen sind hohe Detailstufen dann nur noch selten drin.
| The Witcher 3 - 1920x1080 High Graphics & Postprocessing (Nvidia HairWorks Off) | |
| HP Envy 16 h0112nr | |
| Dell Inspiron 16 Plus 7620 | |
| Durchschnitt der Klasse Multimedia (22 - 224, n=13, der letzten 2 Jahre) | |
| Lenovo ThinkBook 16 G4+ IAP | |
| Acer Swift X SFX16-51G-5388 | |
| Acer Swift X SFX16-52G-77RX | |
| Lenovo IdeaCentre AIO 3 24IAP7 | |
| Acer Swift X SFX16-52G-52VE | |
| Lenovo IdeaPad 5 Pro 16ARH7 | |
| Shadow of the Tomb Raider | |
| 1920x1080 High Preset AA:SM | |
| Durchschnitt der Klasse Multimedia (26 - 143, n=8, der letzten 2 Jahre) | |
| Durchschnittliche Intel Arc A370M (39 - 42, n=2) | |
| Acer Swift X SFX16-52G-77RX | |
| 1920x1080 Highest Preset AA:T | |
| Durchschnitt der Klasse Multimedia (23 - 129, n=8, der letzten 2 Jahre) | |
| Acer Swift X SFX16-52G-77RX | |
| Durchschnittliche Intel Arc A370M (n=1) | |
| GRID Legends | |
| 1920x1080 Ultra Preset | |
| Acer Swift X SFX16-52G-77RX | |
| Durchschnittliche Intel Arc A370M (41.7 - 41.9, n=2) | |
| Acer Swift X SFX16-52G-52VE | |
| 2560x1440 Ultra Preset | |
| Acer Swift X SFX16-52G-77RX | |
| Durchschnittliche Intel Arc A370M (31.3 - 34.4, n=2) | |
| Acer Swift X SFX16-52G-52VE | |
Witcher 3 FPS-Diagramm
| min. | mittel | hoch | max. | QHD | 4K | |
|---|---|---|---|---|---|---|
| GTA V (2015) | 148.6 | 136.9 | 41.4 | 16.4 | 11 | |
| The Witcher 3 (2015) | 168.8 | 100 | 53 | 26.3 | ||
| Dota 2 Reborn (2015) | 99.1 | 83.5 | 68.4 | 66.3 | 39.5 | |
| Final Fantasy XV Benchmark (2018) | 70.4 | 37.9 | 26.3 | 19.3 | ||
| X-Plane 11.11 (2018) | 34.7 | 27.8 | 24 | 22.2 | ||
| Far Cry 5 (2018) | 90 | 49 | 46 | 43 | 29 | |
| Strange Brigade (2018) | 175.8 | 73.2 | 61.4 | 52.1 | ||
| Shadow of the Tomb Raider (2018) | 67 | 49 | 39 | 32 | 20 | |
| God of War (2022) | 35.8 | 31.8 | 25.6 | 20.4 | 12.4 | |
| GRID Legends (2022) | 95.6 | 69.4 | 55 | 41.9 | 34.4 |
Emissionen: Das Acer Swift X 16 pustet viel und gerne
Geräuschemissionen
Im Leistungsmodus verhalten sich die Lüfter am lautesten und drehen auch meist bei sehr geringer Last.
Im Normalmodus drehen sie zurückhaltender und bleiben bei geringer Last immerhin kaum noch wahrnehmbar, was sich bei leicht höheren Lasten aber wieder ändert.
Im Stumm-Modus bleiben die Lüfter deutlich öfter aus, aber auch hier drehen diese bereits bei CPU-Lasten von nur ~10 % an, etwa beim Herunterladen eines Steam-Spieles.
Mit im Schnitt 44,7 dB(A) sind die Lüfter bei stärkerer Last auch nicht gerade leise. Die 36,5 dB(A) des Core-i5-Modells sind deutlich leiser.
Alle anderen Geräte in unserem Testfeld sind unter Last aber ähnlich laut. Beim Laden kommt es in Nähe der USB-C-Buchse ab und an zu elektronischen Störgeräuschen.
Lautstärkediagramm
| Idle |
| 25 / 25 / 25 dB(A) |
| Last |
| 44.7 / 45.6 dB(A) |
 | ||
30 dB leise 40 dB(A) deutlich hörbar 50 dB(A) störend |
||
min: | ||
| Acer Swift X SFX16-52G-77RX A370M, i7-1260P, WDC PC SN810 1TB | Acer Swift X SFX16-52G-52VE A370M, i5-1240P, Micron 3400 MTFDKBA512TFH 512GB | Lenovo ThinkBook 16 G4+ IAP GeForce RTX 2050 Mobile, i7-12700H, Micron 2450 1TB MTFDKCD1T0TFK | Dell Inspiron 16 Plus 7620 GeForce RTX 3050 Ti Laptop GPU, i7-12700H, Kioxia BG5 KBG50ZNS512G | HP Envy 16 h0112nr GeForce RTX 3060 Laptop GPU, i7-12700H, Micron 3400 1TB MTFDKBA1T0TFH | Asus Vivobook Pro 16X-M7600QE GeForce RTX 3050 Ti Laptop GPU, R9 5900HX, SK Hynix HFM001TD3JX013N | |
|---|---|---|---|---|---|---|
| Geräuschentwicklung | 3% | 1% | -6% | -1% | -4% | |
| aus / Umgebung * (dB) | 25 | 25 -0% | 24.2 3% | 23.3 7% | 22.8 9% | 26 -4% |
| Idle min * (dB) | 25 | 25 -0% | 24.2 3% | 25.7 -3% | 22.9 8% | 27 -8% |
| Idle avg * (dB) | 25 | 25 -0% | 24.2 3% | 26.1 -4% | 22.9 8% | 27 -8% |
| Idle max * (dB) | 25 | 26.4 -6% | 24.2 3% | 30.6 -22% | 30.5 -22% | 27.5 -10% |
| Last avg * (dB) | 44.7 | 36.5 18% | 47 -5% | 46.2 -3% | 41.4 7% | 41.7 7% |
| Last max * (dB) | 45.6 | 43 6% | 47 -3% | 49.4 -8% | 51.4 -13% | 45.3 1% |
| Witcher 3 ultra * (dB) | 47 | 49.2 | 51.1 |
* ... kleinere Werte sind besser
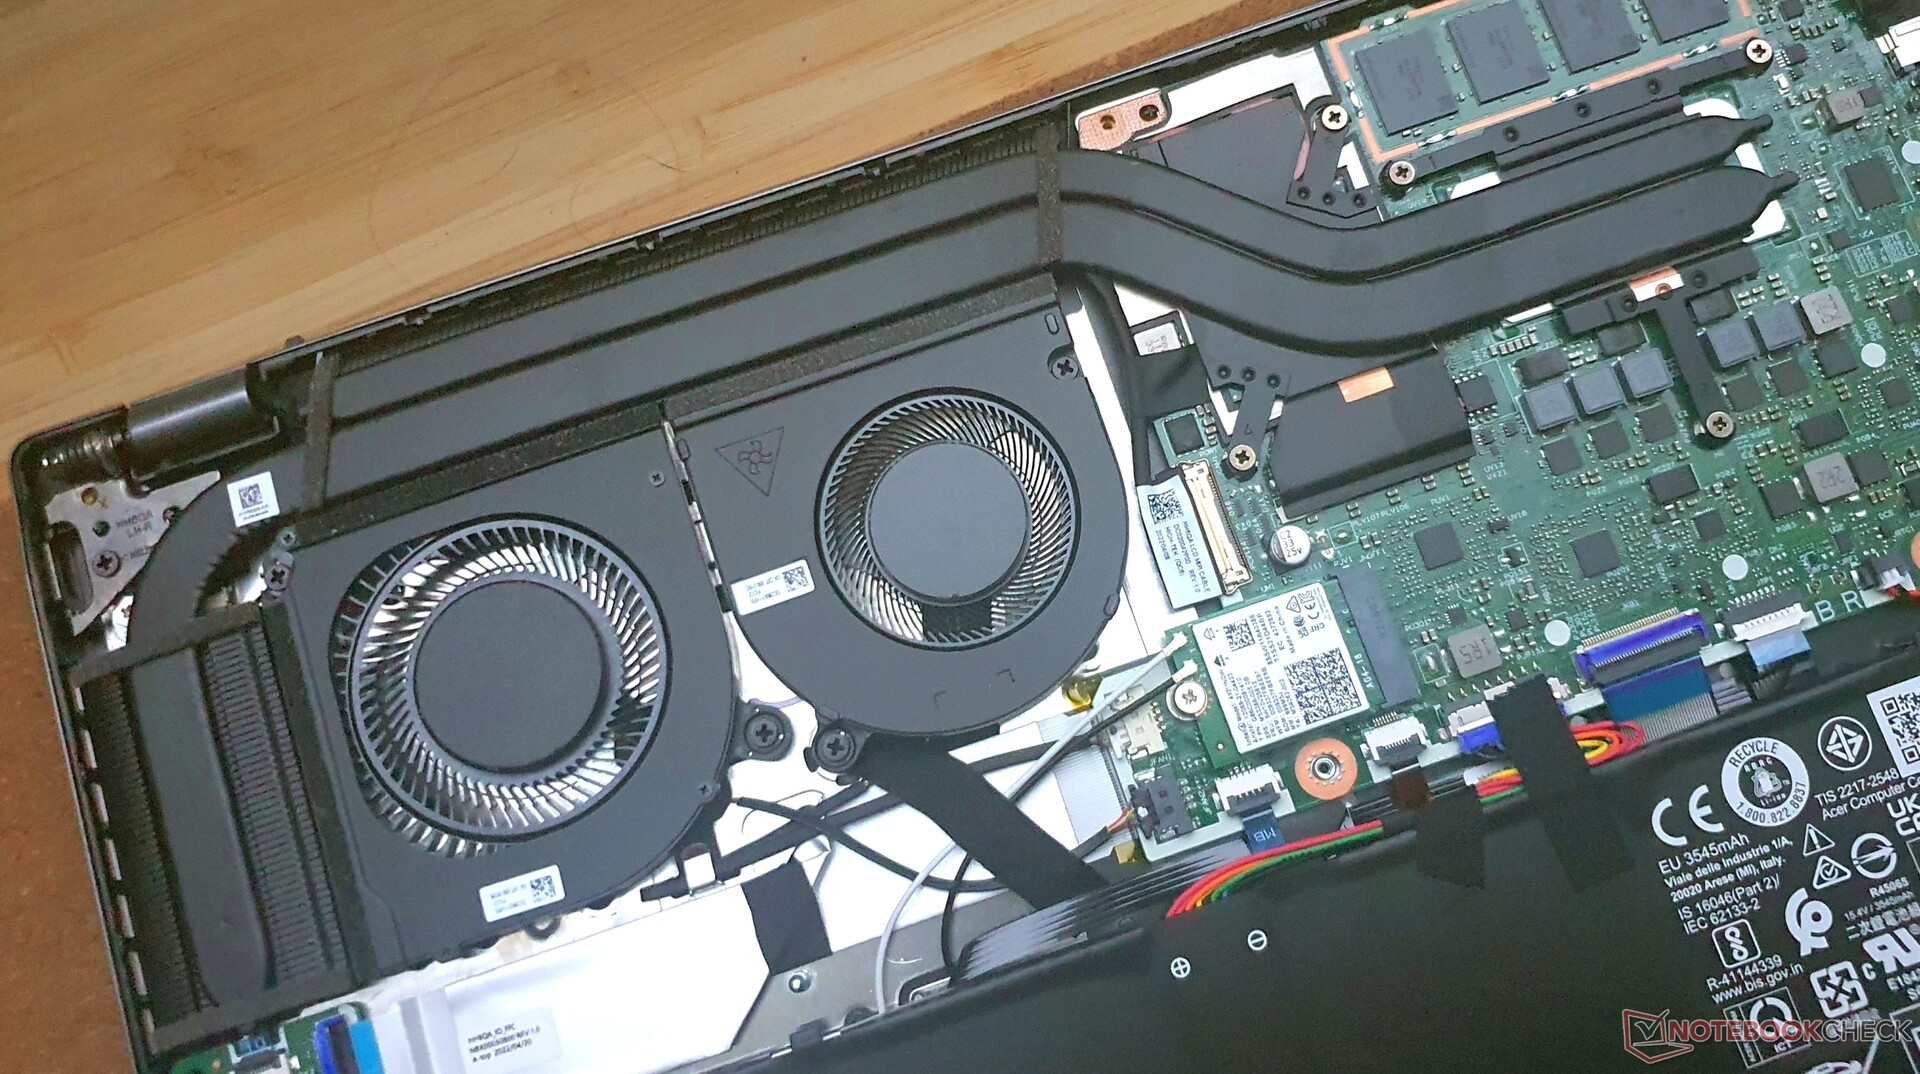
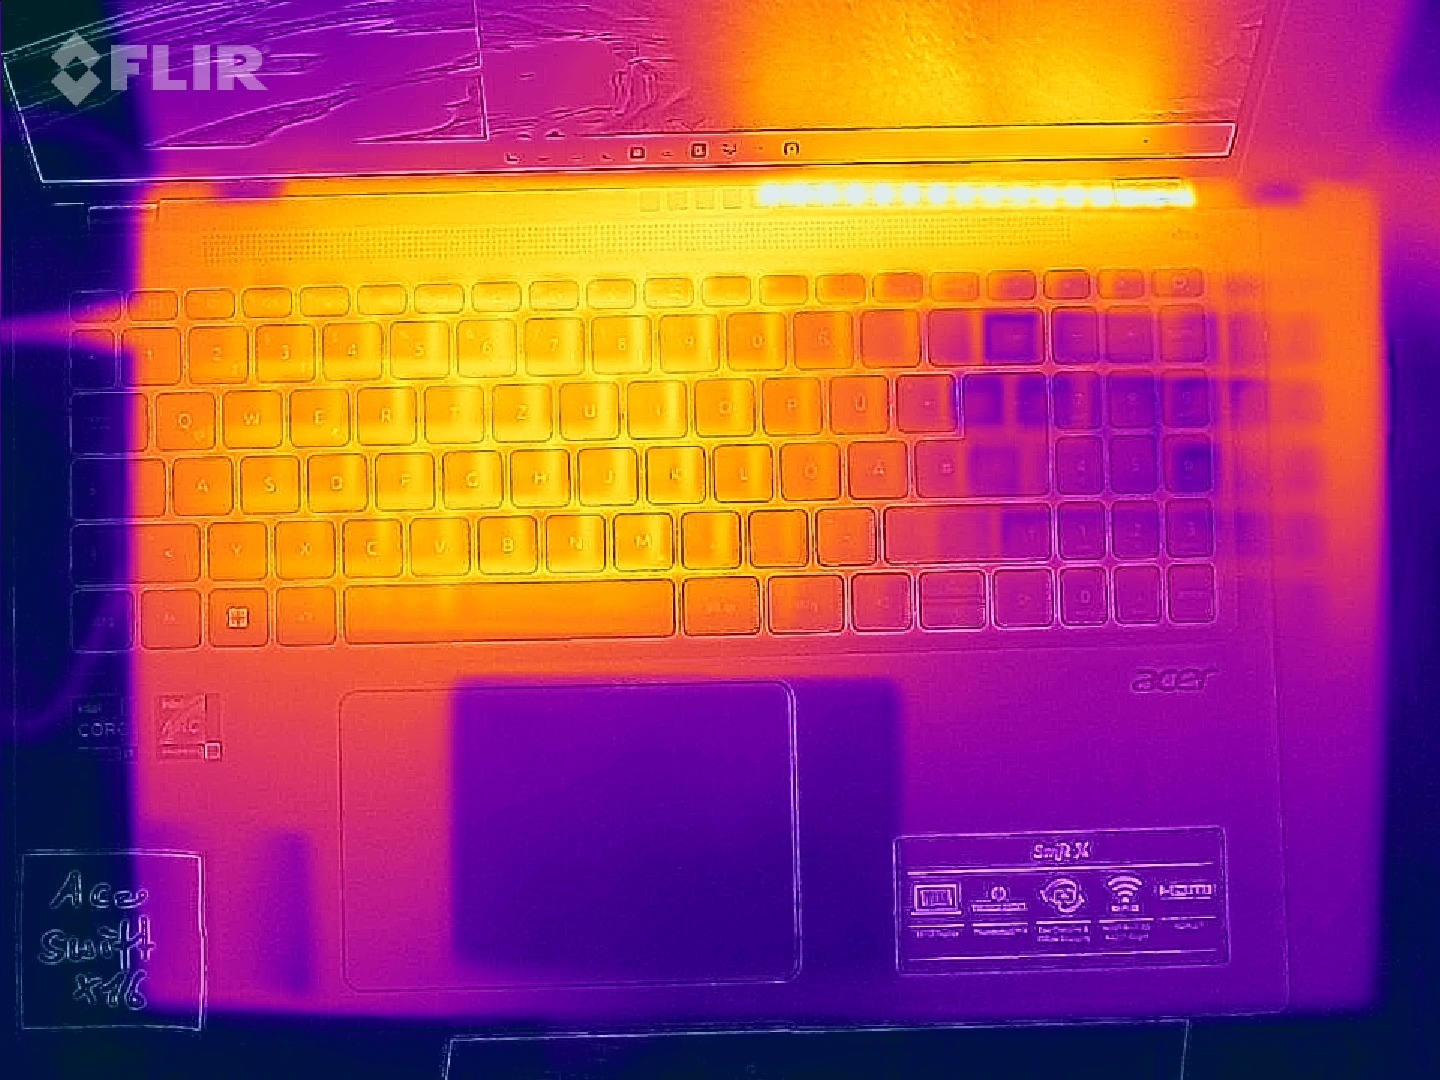
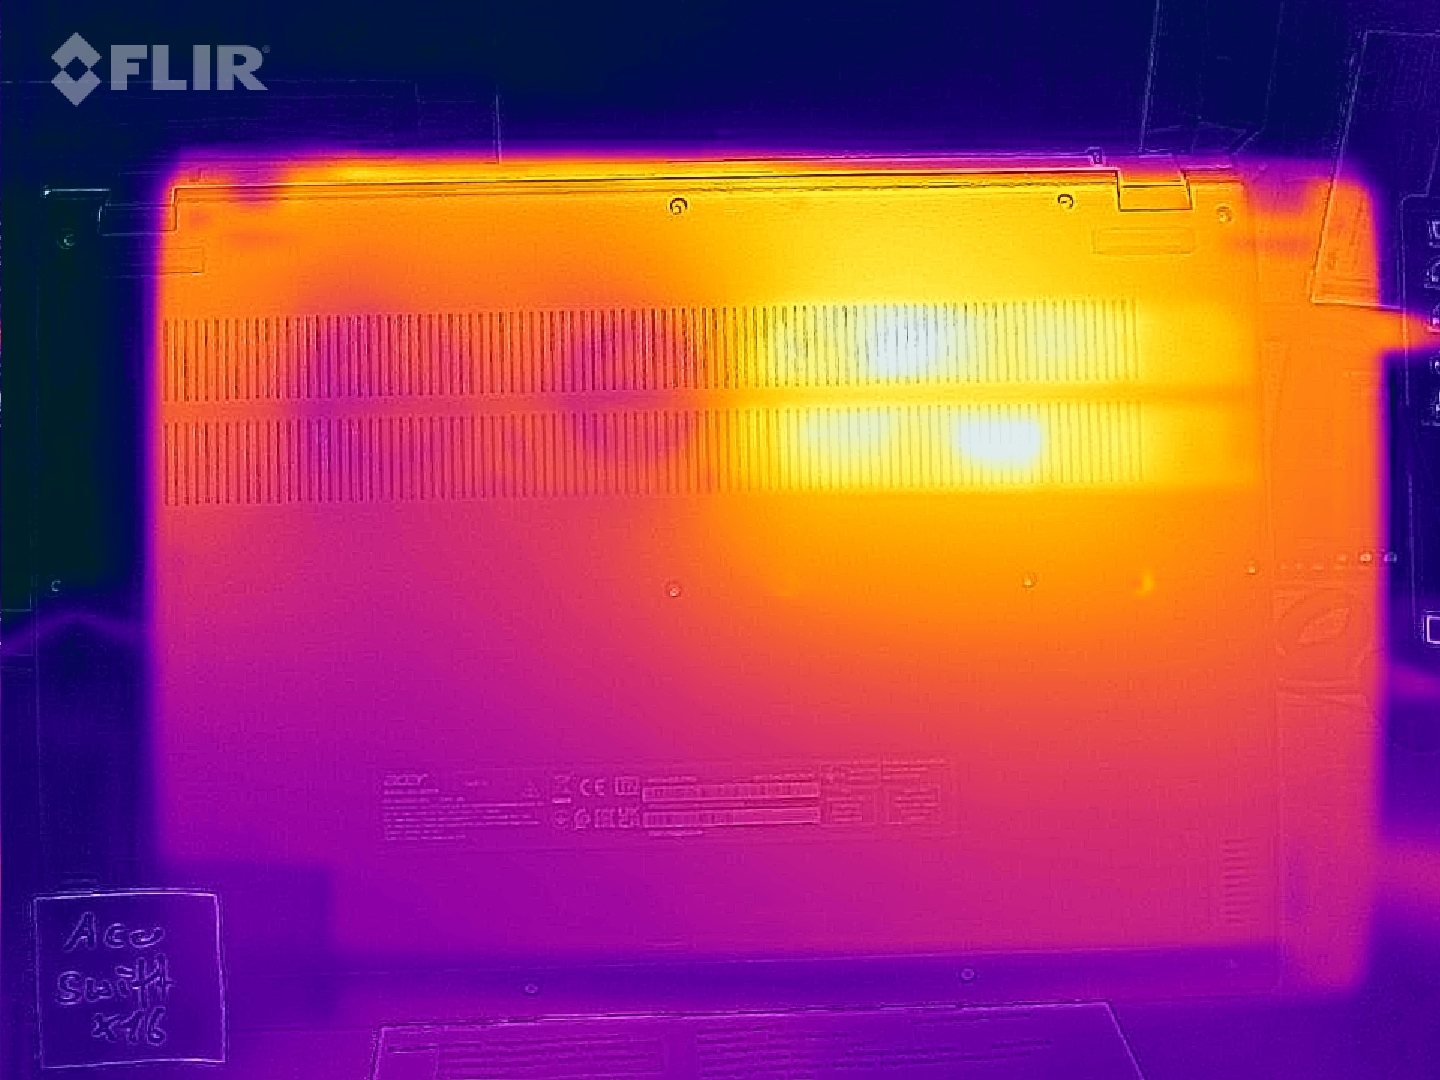
Temperatur
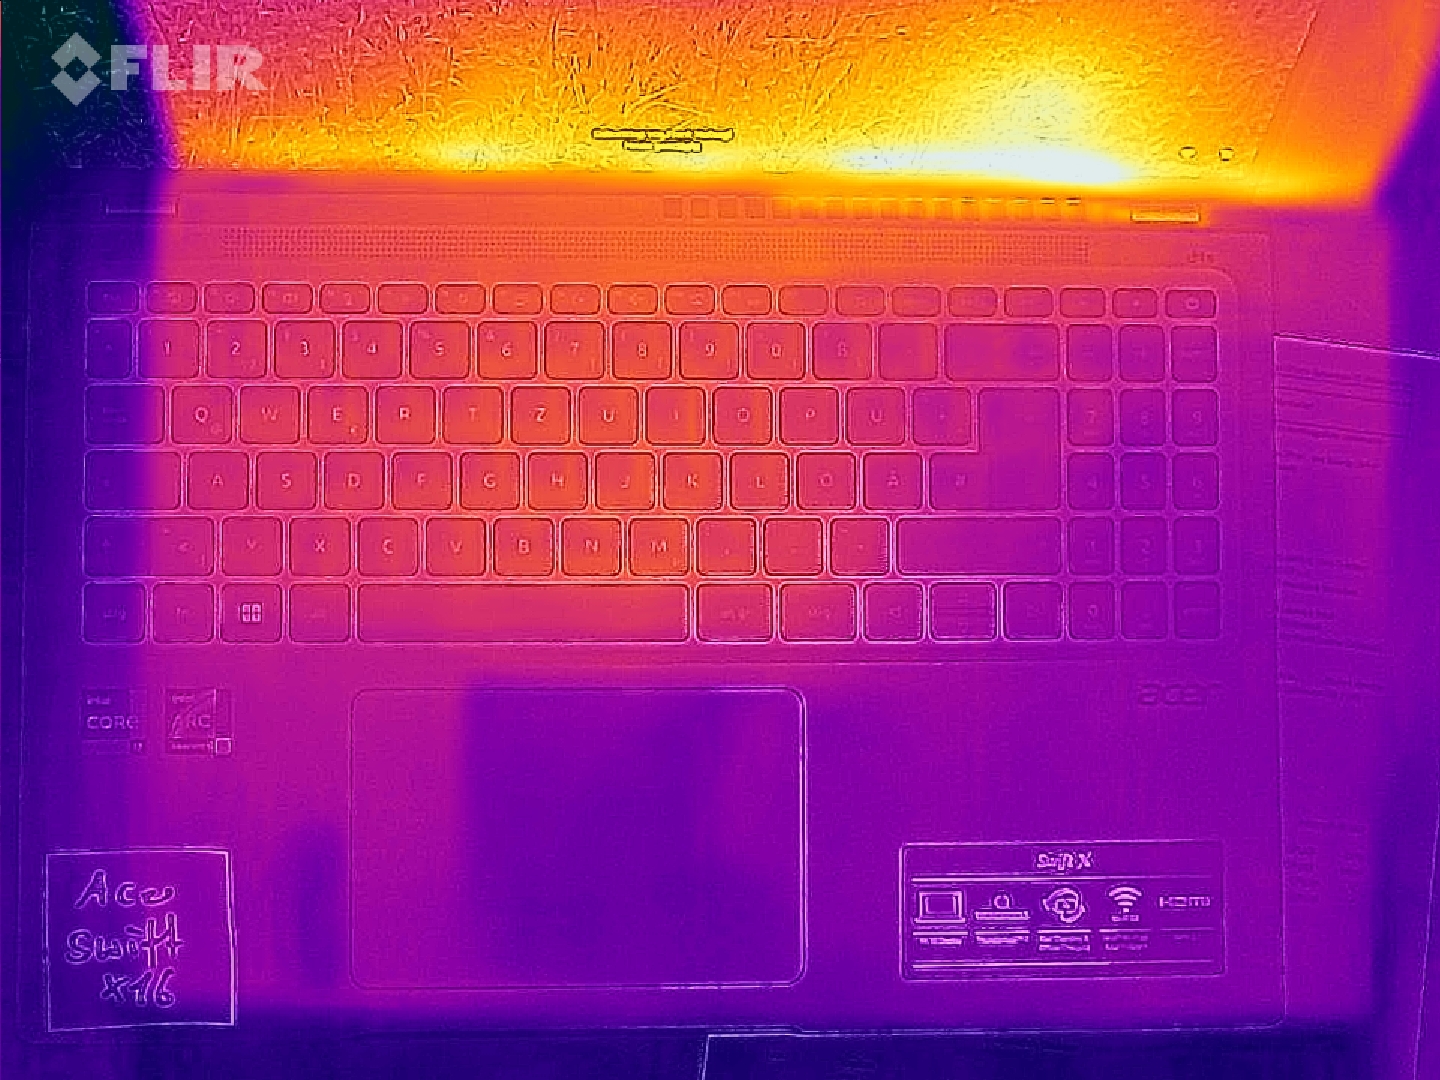
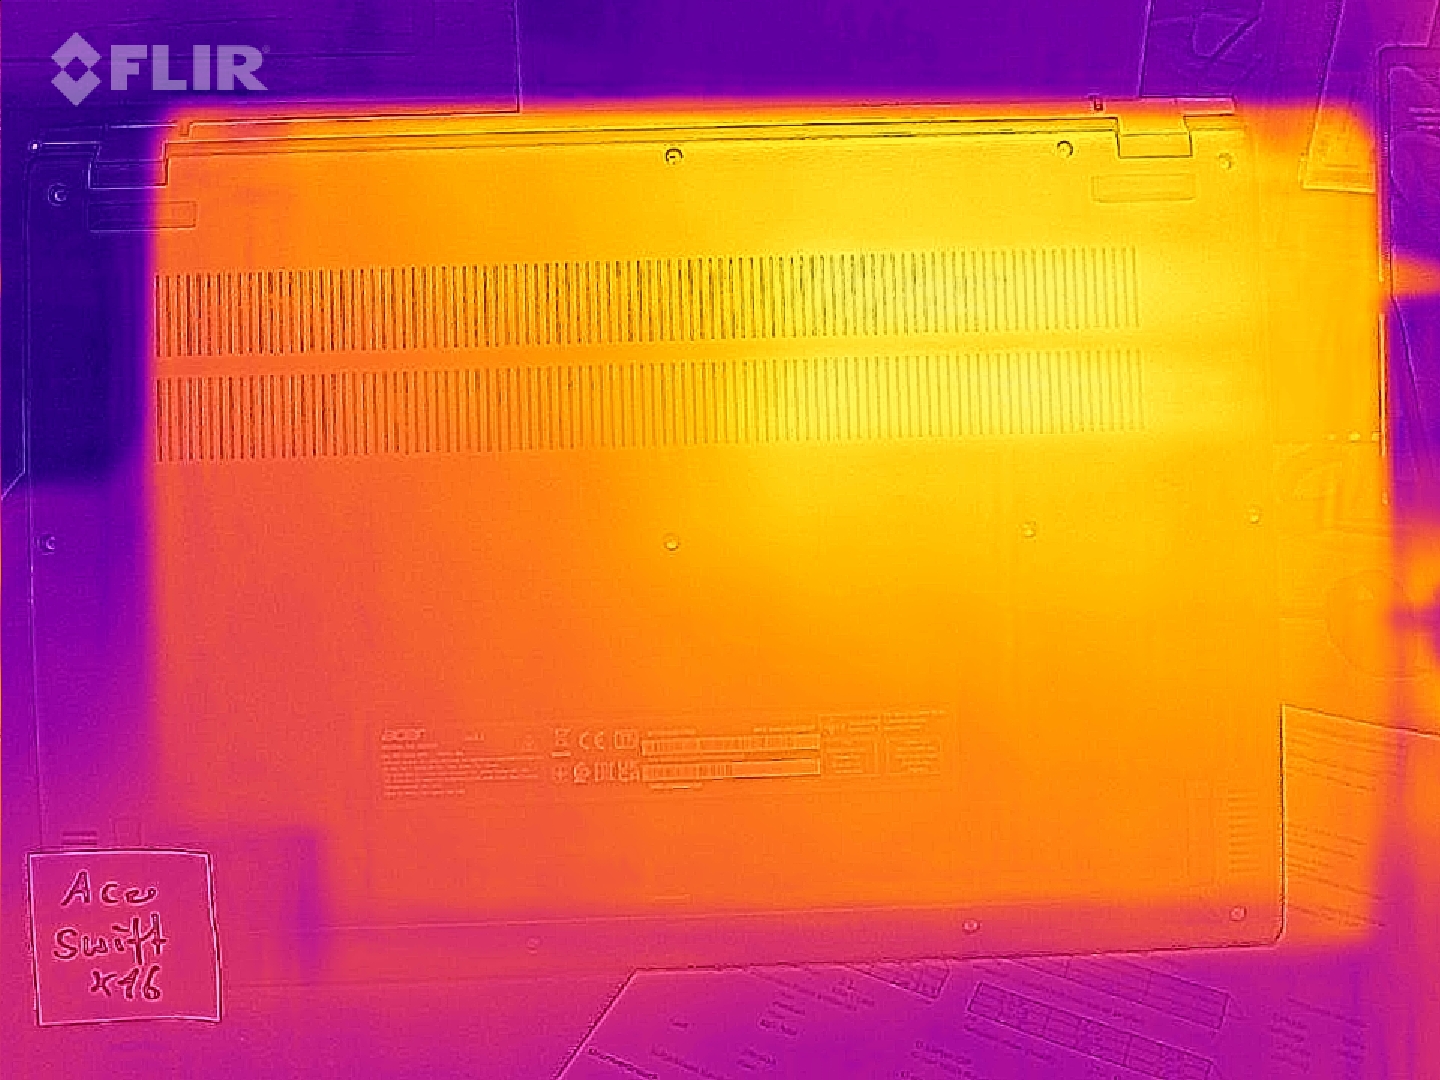
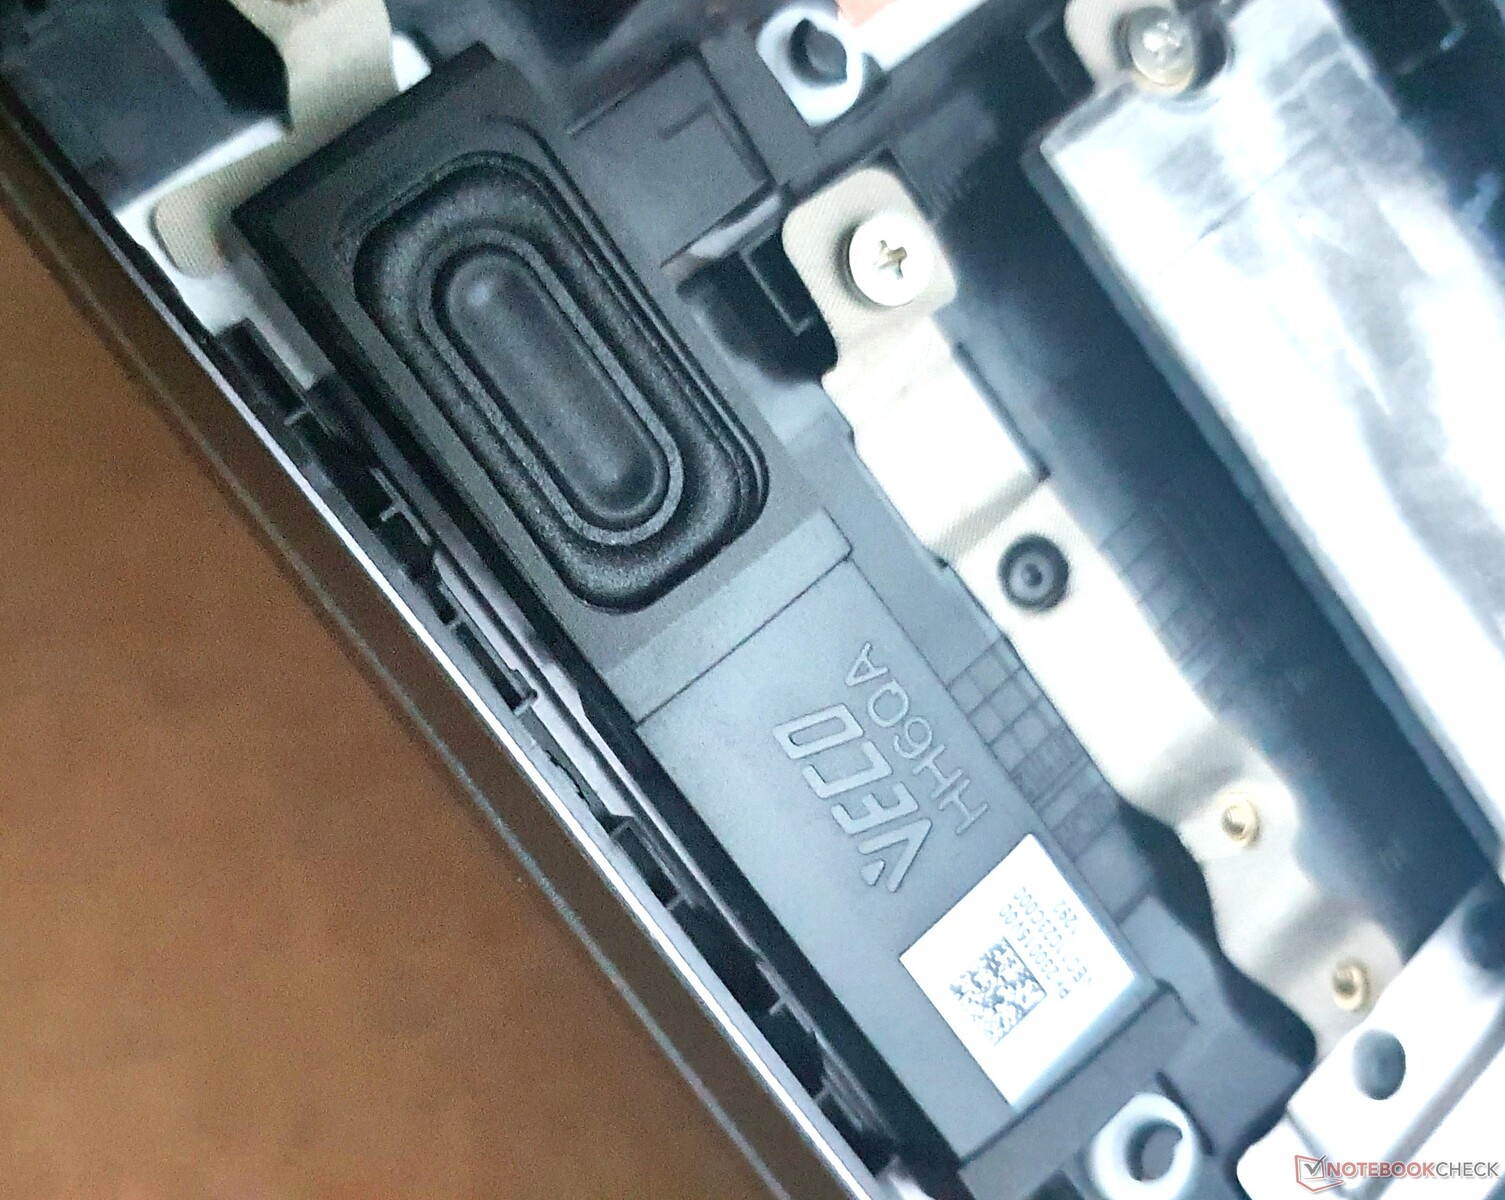
Das Kühlsystem ist nicht nur laut, sondern auch schwach. Besonders im Bereich oberhalb der Tastatur beim Lautsprechergitter kann es unter voller Last unangenehm heiß werden, und auch die Geräte-Unterseite erhitzt sich dabei mit einem Hotspot von bis zu 55,5 °C. Die Konkurrenz versteht es, selbst mit leistungsstärkeren Komponenten kühler zu bleiben.
(-) Die maximale Temperatur auf der Oberseite ist 49.4 °C. Im Vergleich liegt der Klassendurchschnitt bei 36.8 °C (von 21 bis 71 °C für die Klasse Multimedia).
(-) Auf der Unterseite messen wir eine maximalen Wert von 55.5 °C (im Vergleich zum Durchschnitt von 39.1 °C).
(+) Ohne Last messen wir eine durchschnittliche Temperatur von 25.9 °C auf der Oberseite. Der Klassendurchschnitt erreicht 31.3 °C.
(-) Die Handballen und der Touchpad-Bereich können sehr heiß werden mit maximal 49.4 °C.
(-) Die durchschnittliche Handballen-Temperatur anderer getesteter Geräte war 28.7 °C (-20.7 °C).
| Acer Swift X SFX16-52G-77RX Intel Core i7-1260P, Intel Arc A370M | Acer Swift X SFX16-52G-52VE Intel Core i5-1240P, Intel Arc A370M | Lenovo ThinkBook 16 G4+ IAP Intel Core i7-12700H, NVIDIA GeForce RTX 2050 Mobile | Dell Inspiron 16 Plus 7620 Intel Core i7-12700H, NVIDIA GeForce RTX 3050 Ti Laptop GPU | HP Envy 16 h0112nr Intel Core i7-12700H, NVIDIA GeForce RTX 3060 Laptop GPU | Lenovo IdeaPad 5 Pro 16ARH7 AMD Ryzen 5 6600HS, AMD Radeon 660M | Asus Vivobook Pro 16X-M7600QE AMD Ryzen 9 5900HX, NVIDIA GeForce RTX 3050 Ti Laptop GPU | |
|---|---|---|---|---|---|---|---|
| Hitze | -0% | 12% | 7% | 3% | 10% | 15% | |
| Last oben max * (°C) | 49.4 | 52 -5% | 42.9 13% | 46 7% | 45.2 9% | 46 7% | 39.4 20% |
| Last unten max * (°C) | 55.5 | 50.4 9% | 50.6 9% | 45.8 17% | 44 21% | 48 14% | 43.6 21% |
| Idle oben max * (°C) | 28.4 | 30 -6% | 26 8% | 29.2 -3% | 33.6 -18% | 28 1% | 27.6 3% |
| Idle unten max * (°C) | 32.6 | 32.4 1% | 26.5 19% | 31 5% | 32.6 -0% | 27 17% | 27.5 16% |
* ... kleinere Werte sind besser
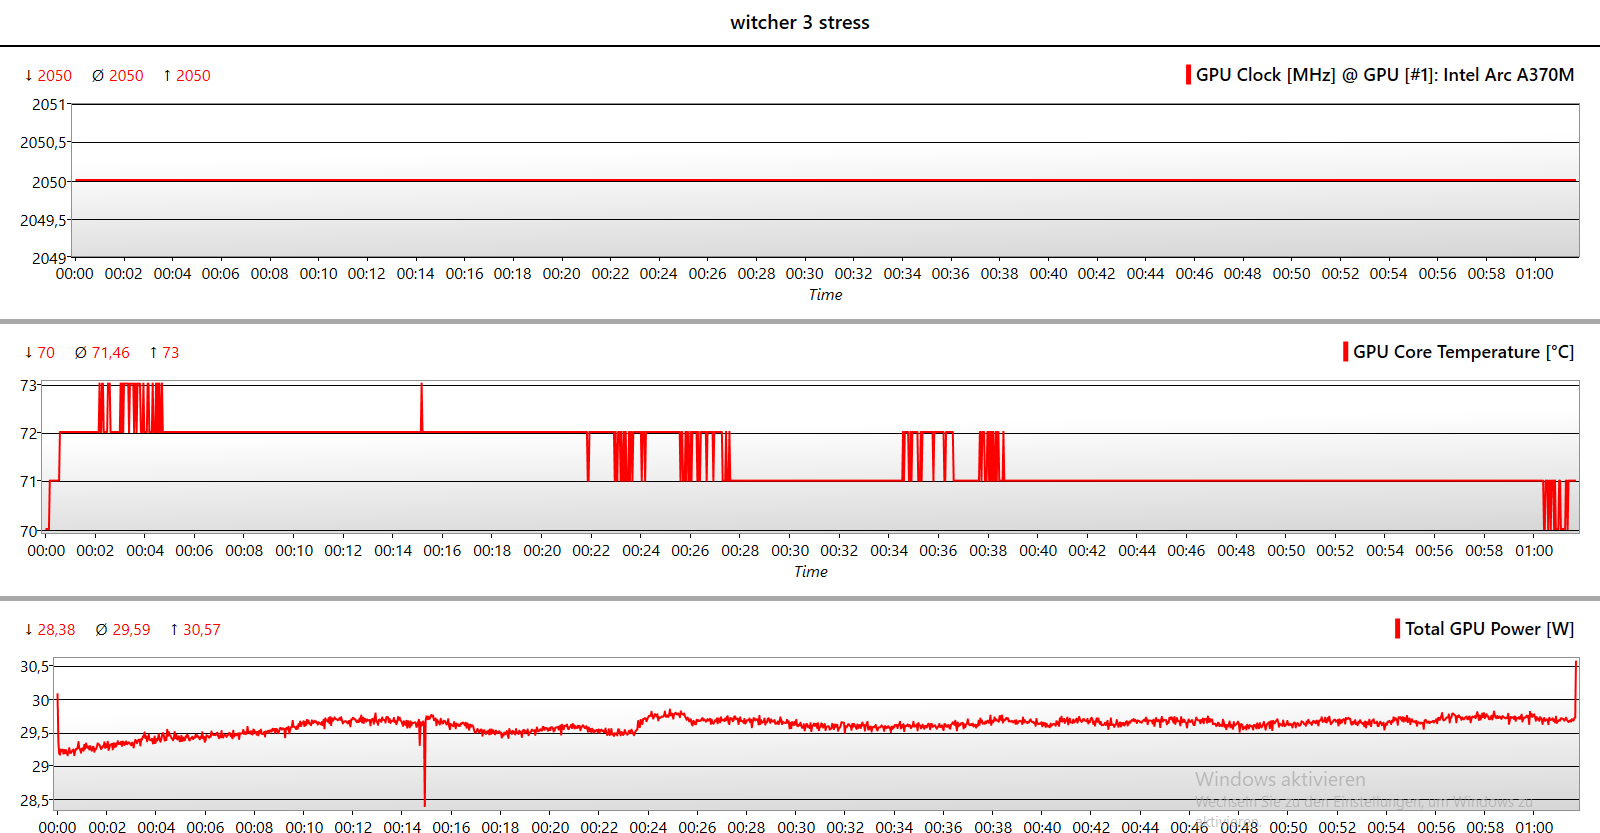
Stresstest
Selbst im einstündigen, kombinierten Stresstest (Prime95 + FurMark) bleibt der GPU-Takt nur 5 % unterm Maximum. Der Prozessor wird dabei von 35 auf 25 W gedrosselt und erreicht 88 °C, während sich die GPU bei 86 °C einpendelt. Die P-Kerne takten dann nur noch mit etwa 1,75 GHz, was unter dem Basistakt von 2,1 GHz liegt. Dieser wird bei reinem CPU-Stress wiederum nicht unterschritten.
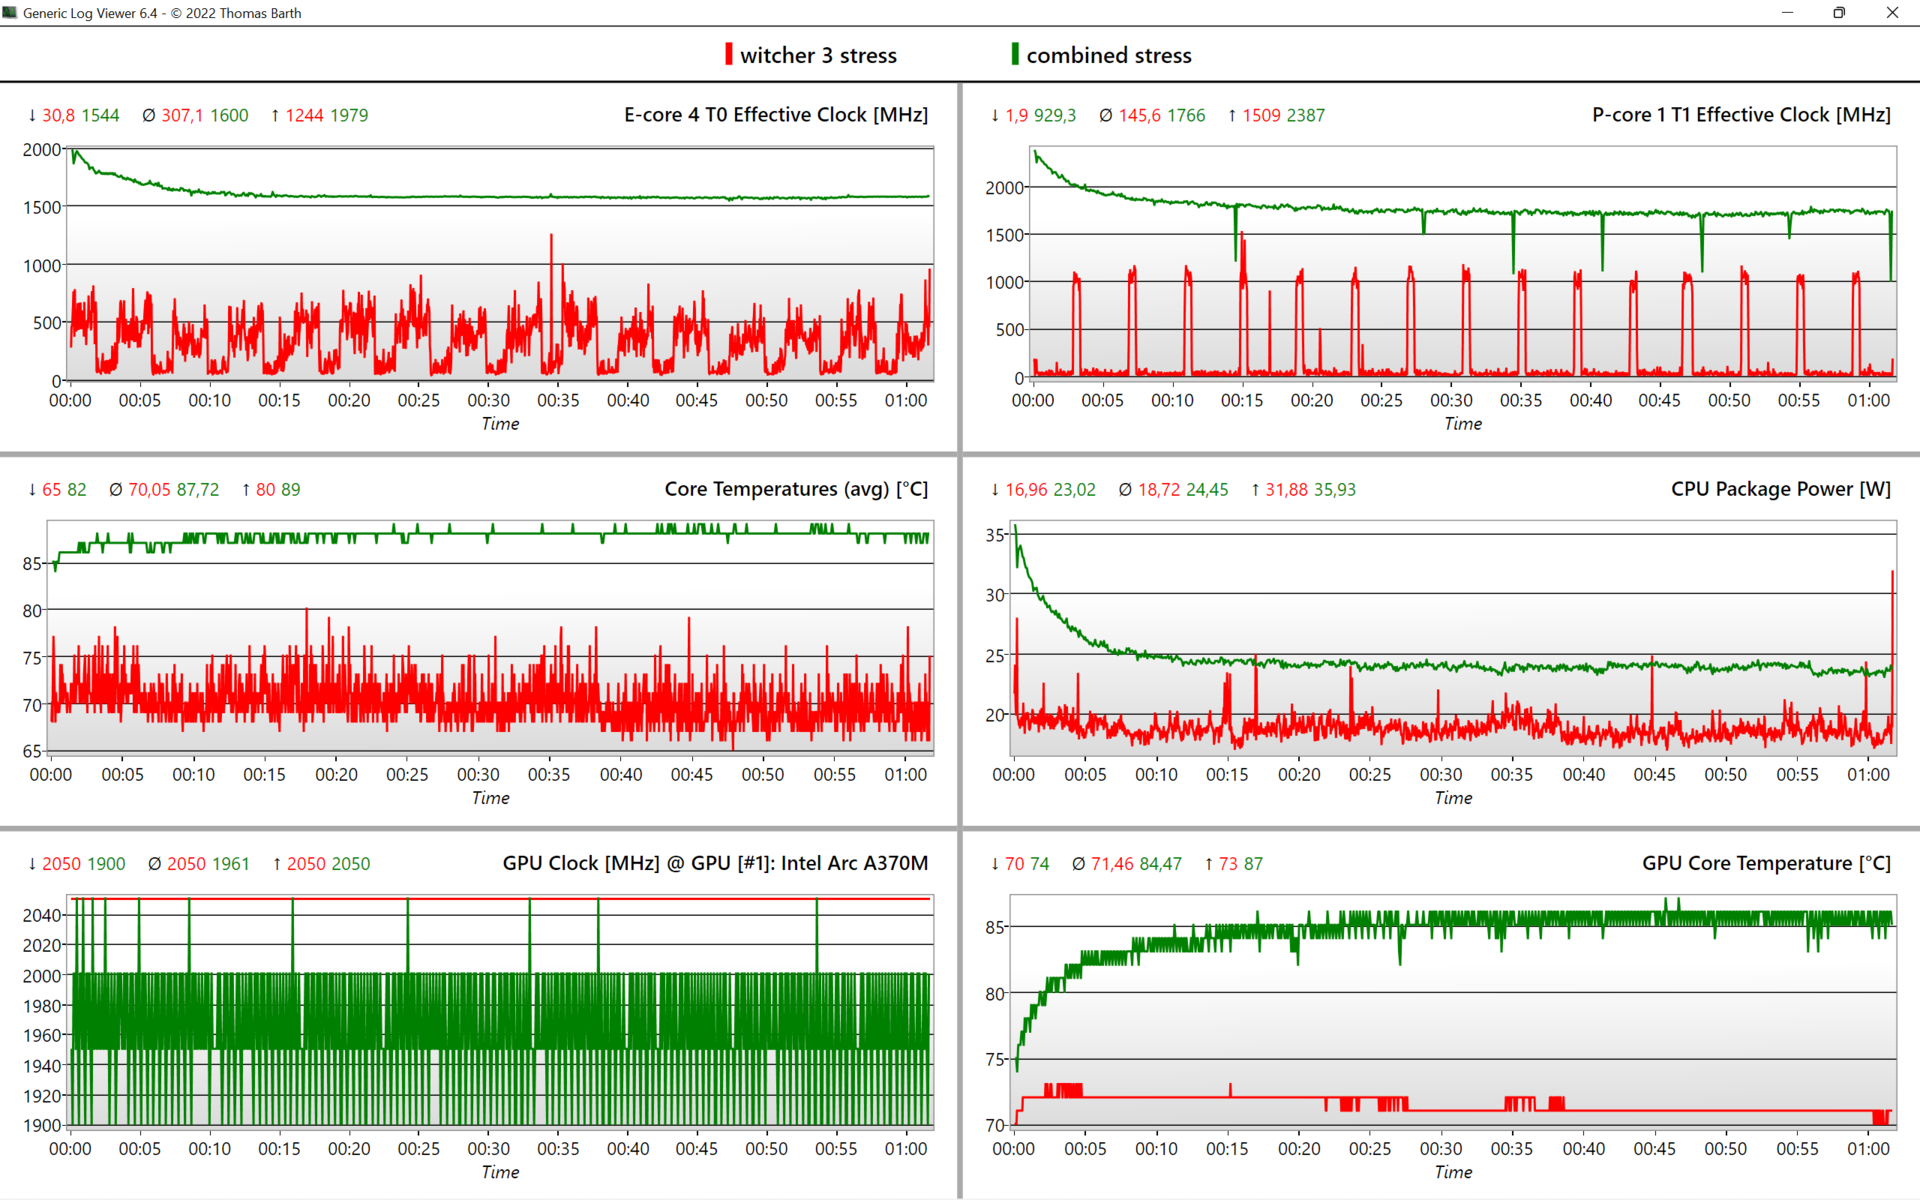
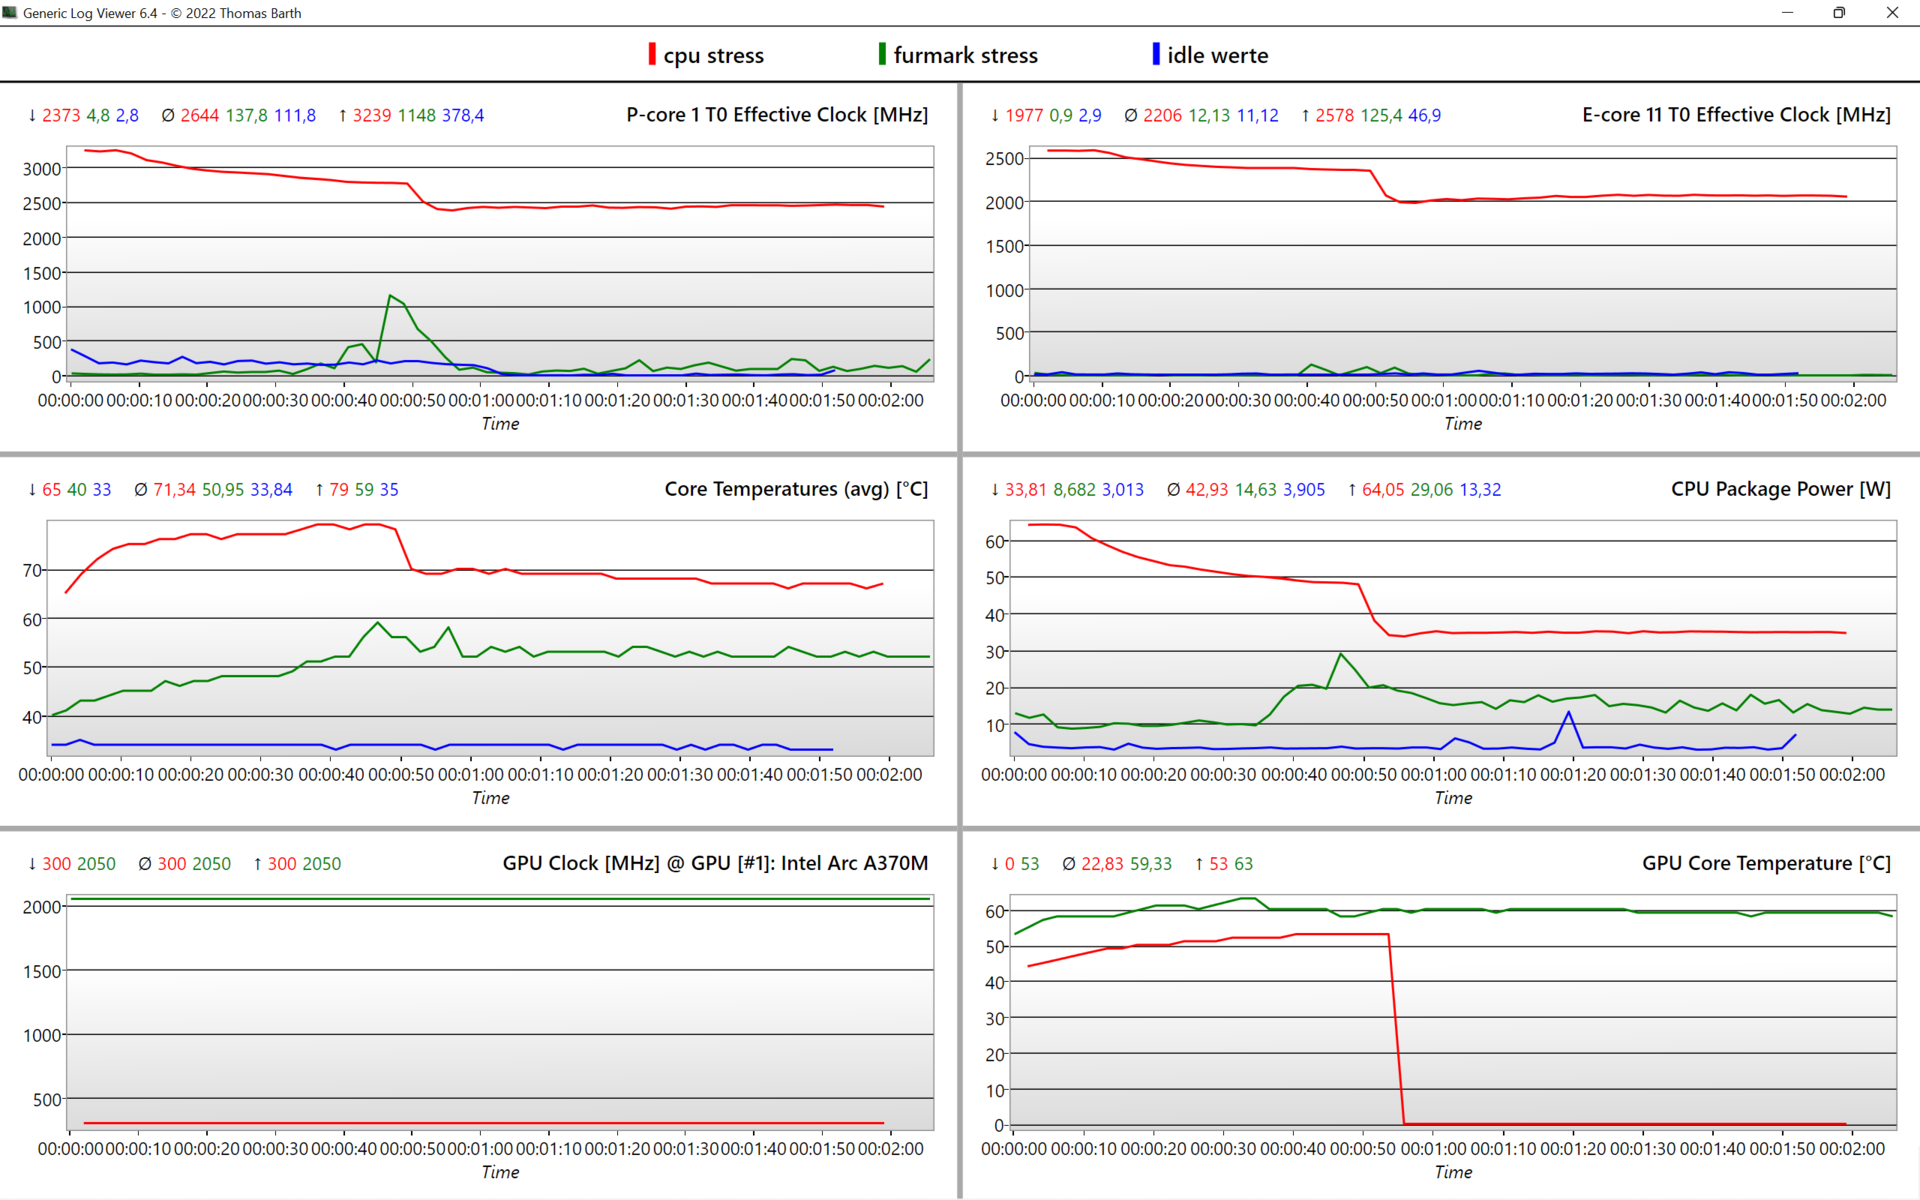
| CPU Clock E-/P-Cores (GHz) | GPU Clock (MHz) | Average CPU Temperature (°C) | Average GPU Temperature (°C) | |
| System Idle | - | 300 | 34 | 29 |
| Prime95 Stress | 2,1 / 2,5 | 300 | 67 | 53 |
| Prime95 + FurMark Stress | 1,6 / 1,75 | 1.960 | 88 | 86 |
| FurMark Stress | - | 2.050 | 52 | 60 |
| Witcher 3 Stress | 0,3 / 0,15 | 2.050 | 70 | 71 |
Lautsprecher
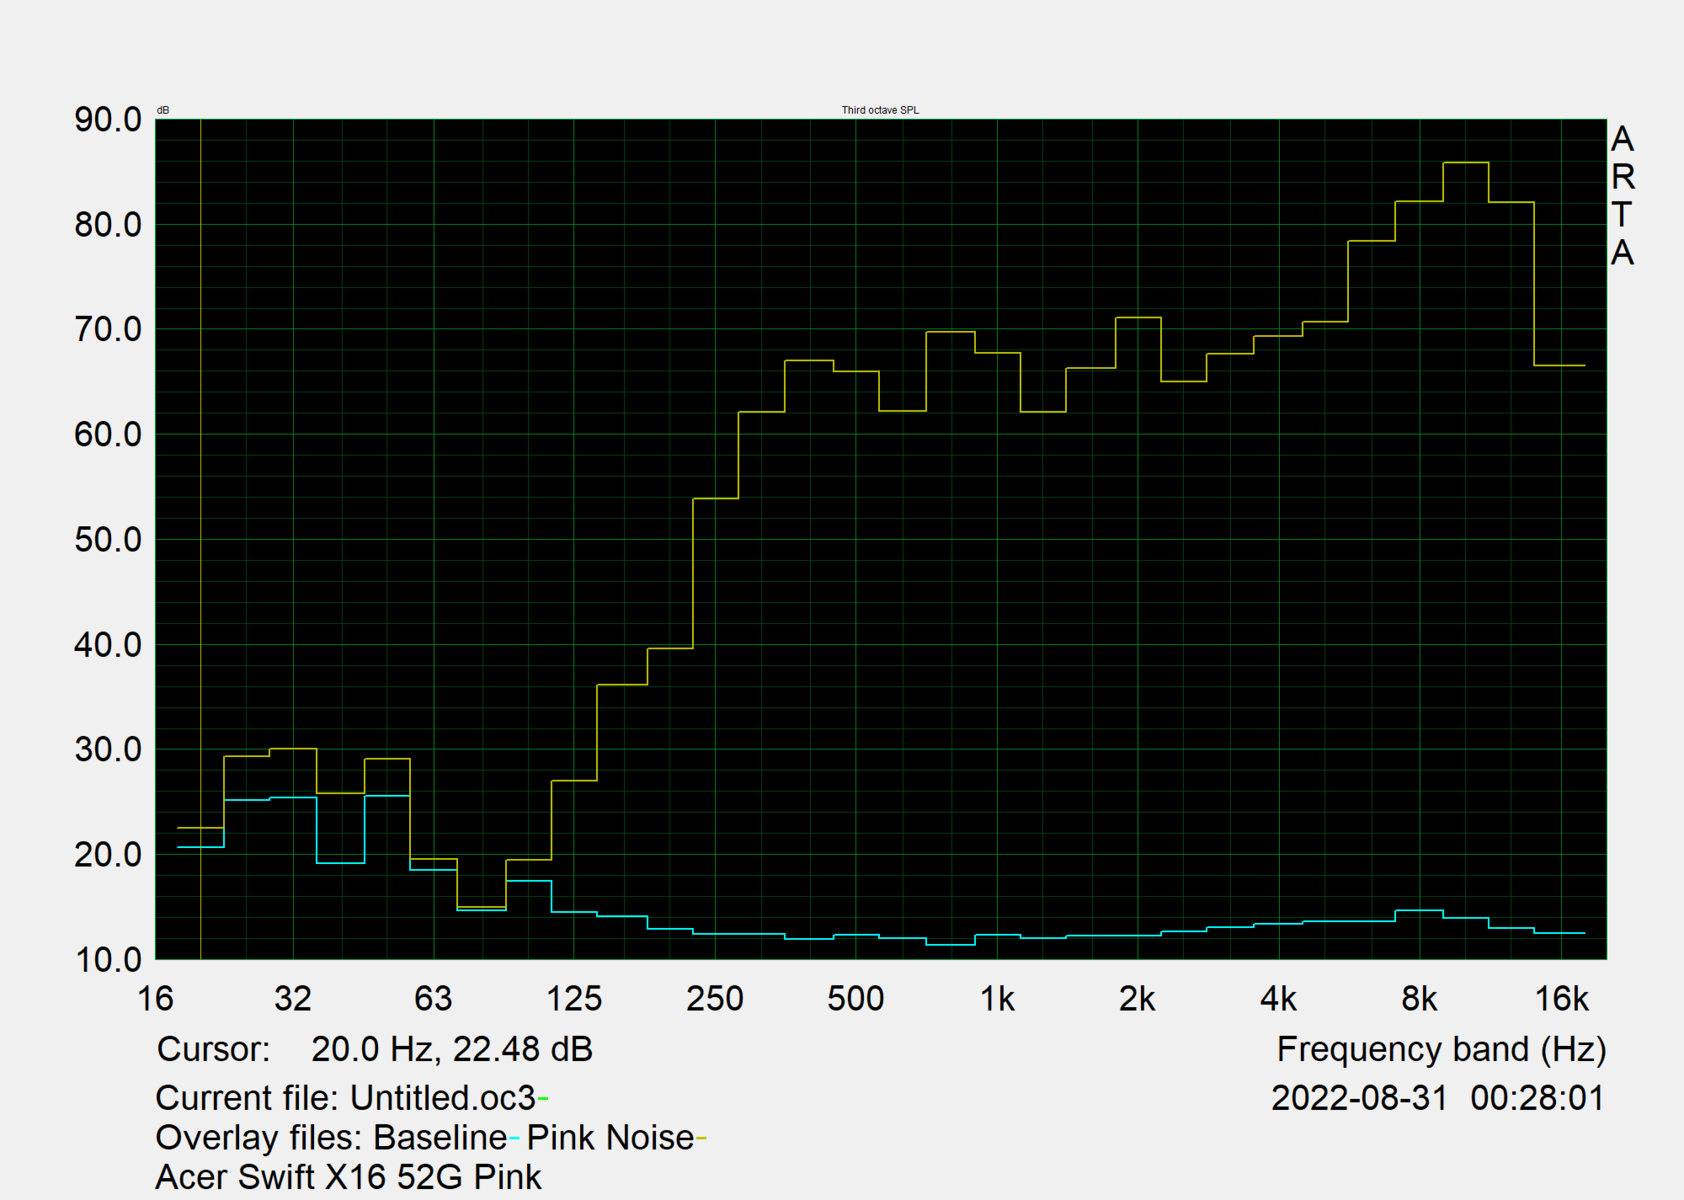
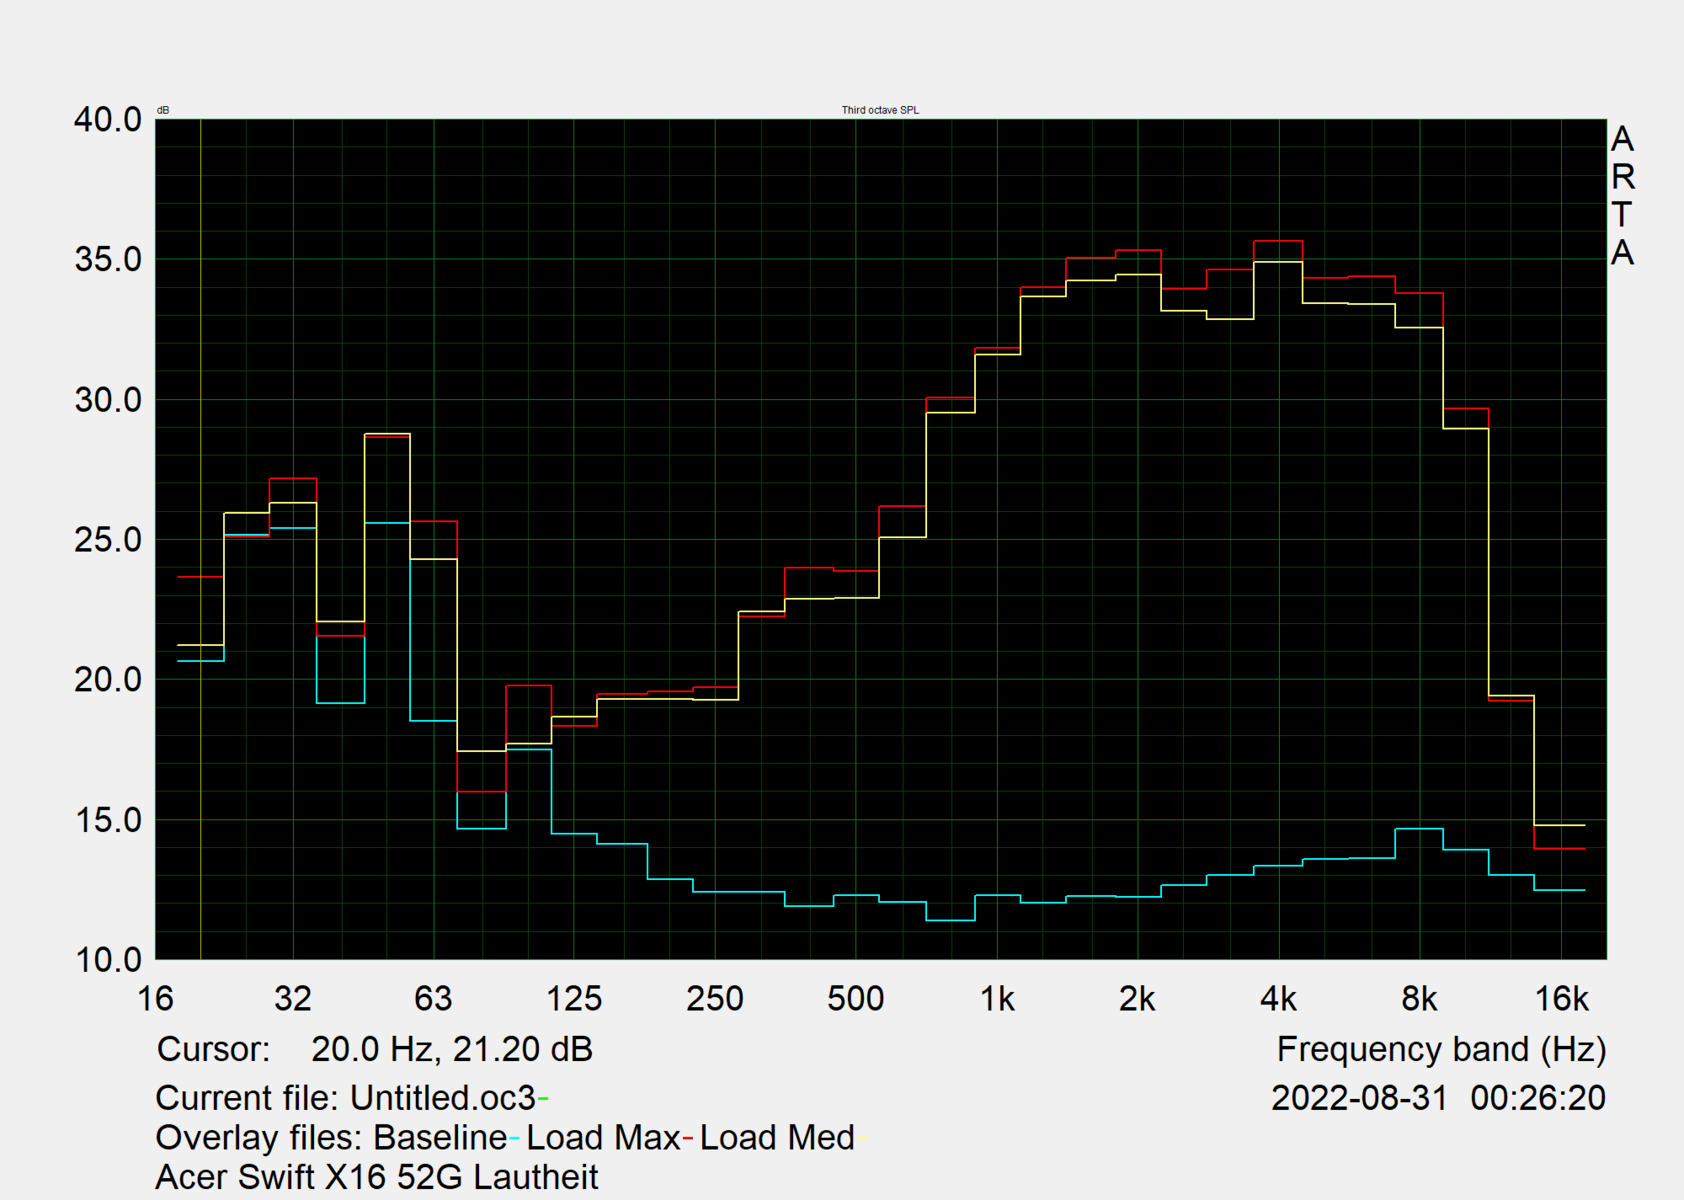
Die nach oben gerichteten Lautsprecher sind bassarm und bieten eine unterdurchschnittliche Qualität. Mit knapp 88 dB(A) schaffen sie es allerdings, auch einen großen Raum zu beschallen. Wenn es nur um Stimmwiedergaben geht, sind sie ausreichend. Für Musikgenuss sollte man auf externe Audioperipherie via Klinke oder Bluetooth setzen.
Acer Swift X SFX16-52G-77RX Audio Analyse
(+) | Die Lautsprecher können relativ laut spielen (87.8 dB)
Bass 100 - 315 Hz
(-) | kaum Bass - 26.8% niedriger als der Median
(±) | durchschnittlich lineare Bass-Wiedergabe (14.6% Delta zum Vorgänger)
Mitteltöne 400 - 2000 Hz
(+) | ausgeglichene Mitten, vom Median nur 2.4% abweichend
(±) | Linearität der Mitten ist durchschnittlich (7.9% Delta zum Vorgänger)
Hochtöne 2 - 16 kHz
(±) | zu hohe Hochtöne, vom Median nur 8.1% abweichend
(±) | durchschnittlich lineare Hochtöne (7.1% Delta zum Vorgänger)
Gesamt im hörbaren Bereich 100 - 16.000 Hz
(±) | hörbarer Bereich ist durchschnittlich linear (20.6% Abstand zum Median)
Im Vergleich zu allen Geräten derselben Klasse
» 70% aller getesteten Geräte dieser Klasse waren besser, 8% vergleichbar, 22% schlechter
» Das beste Gerät hat einen Delta-Wert von 5%, durchschnittlich ist 17%, das schlechteste Gerät hat 45%
Im Vergleich zu allen Geräten im Test
» 55% aller getesteten Geräte waren besser, 8% vergleichbar, 37% schlechter
» Das beste Gerät hat einen Delta-Wert von 4%, durchschnittlich ist 24%, das schlechteste Gerät hat 134%
Lenovo ThinkBook 16 G4+ IAP Audio Analyse
(±) | Mittelmäßig laut spielende Lautsprecher (77.6 dB)
Bass 100 - 315 Hz
(-) | kaum Bass - 17.3% niedriger als der Median
(±) | durchschnittlich lineare Bass-Wiedergabe (10.3% Delta zum Vorgänger)
Mitteltöne 400 - 2000 Hz
(+) | ausgeglichene Mitten, vom Median nur 4.6% abweichend
(+) | lineare Mitten (4.6% Delta zum Vorgänger)
Hochtöne 2 - 16 kHz
(+) | ausgeglichene Hochtöne, vom Median nur 1.6% abweichend
(+) | sehr lineare Hochtöne (6.2% Delta zum Vorgänger)
Gesamt im hörbaren Bereich 100 - 16.000 Hz
(±) | hörbarer Bereich ist durchschnittlich linear (15.7% Abstand zum Median)
Im Vergleich zu allen Geräten derselben Klasse
» 39% aller getesteten Geräte dieser Klasse waren besser, 5% vergleichbar, 56% schlechter
» Das beste Gerät hat einen Delta-Wert von 5%, durchschnittlich ist 17%, das schlechteste Gerät hat 45%
Im Vergleich zu allen Geräten im Test
» 24% aller getesteten Geräte waren besser, 5% vergleichbar, 71% schlechter
» Das beste Gerät hat einen Delta-Wert von 4%, durchschnittlich ist 24%, das schlechteste Gerät hat 134%
Energieverwaltung: Üppige Laufzeit & geringer Verbrauch des Swift X
Energieaufnahme
Bei Alltagsaufgaben werden etwa 7,6 W gemessen, was in der Multimediaklasse nur von wenigen Geräten geschlagen werden kann, etwa vom IdeaPad 5 Pro 16.
~70 W beim Spielen und in anderen Last-Szenarien sind das, was bereits der Vorgänger mit Nvidia RTX 3050 aufnahm. Geräte mit integrierter RDNA-2-GPU von AMD sind laut unserer Datenbank mit etwa 45 W noch deutlich sparsamer. Das HP Envy 16 benötigt aufgrund der RTX 3060 hingegen etwa das Doppelte an Saft beim Zocken (133 W).
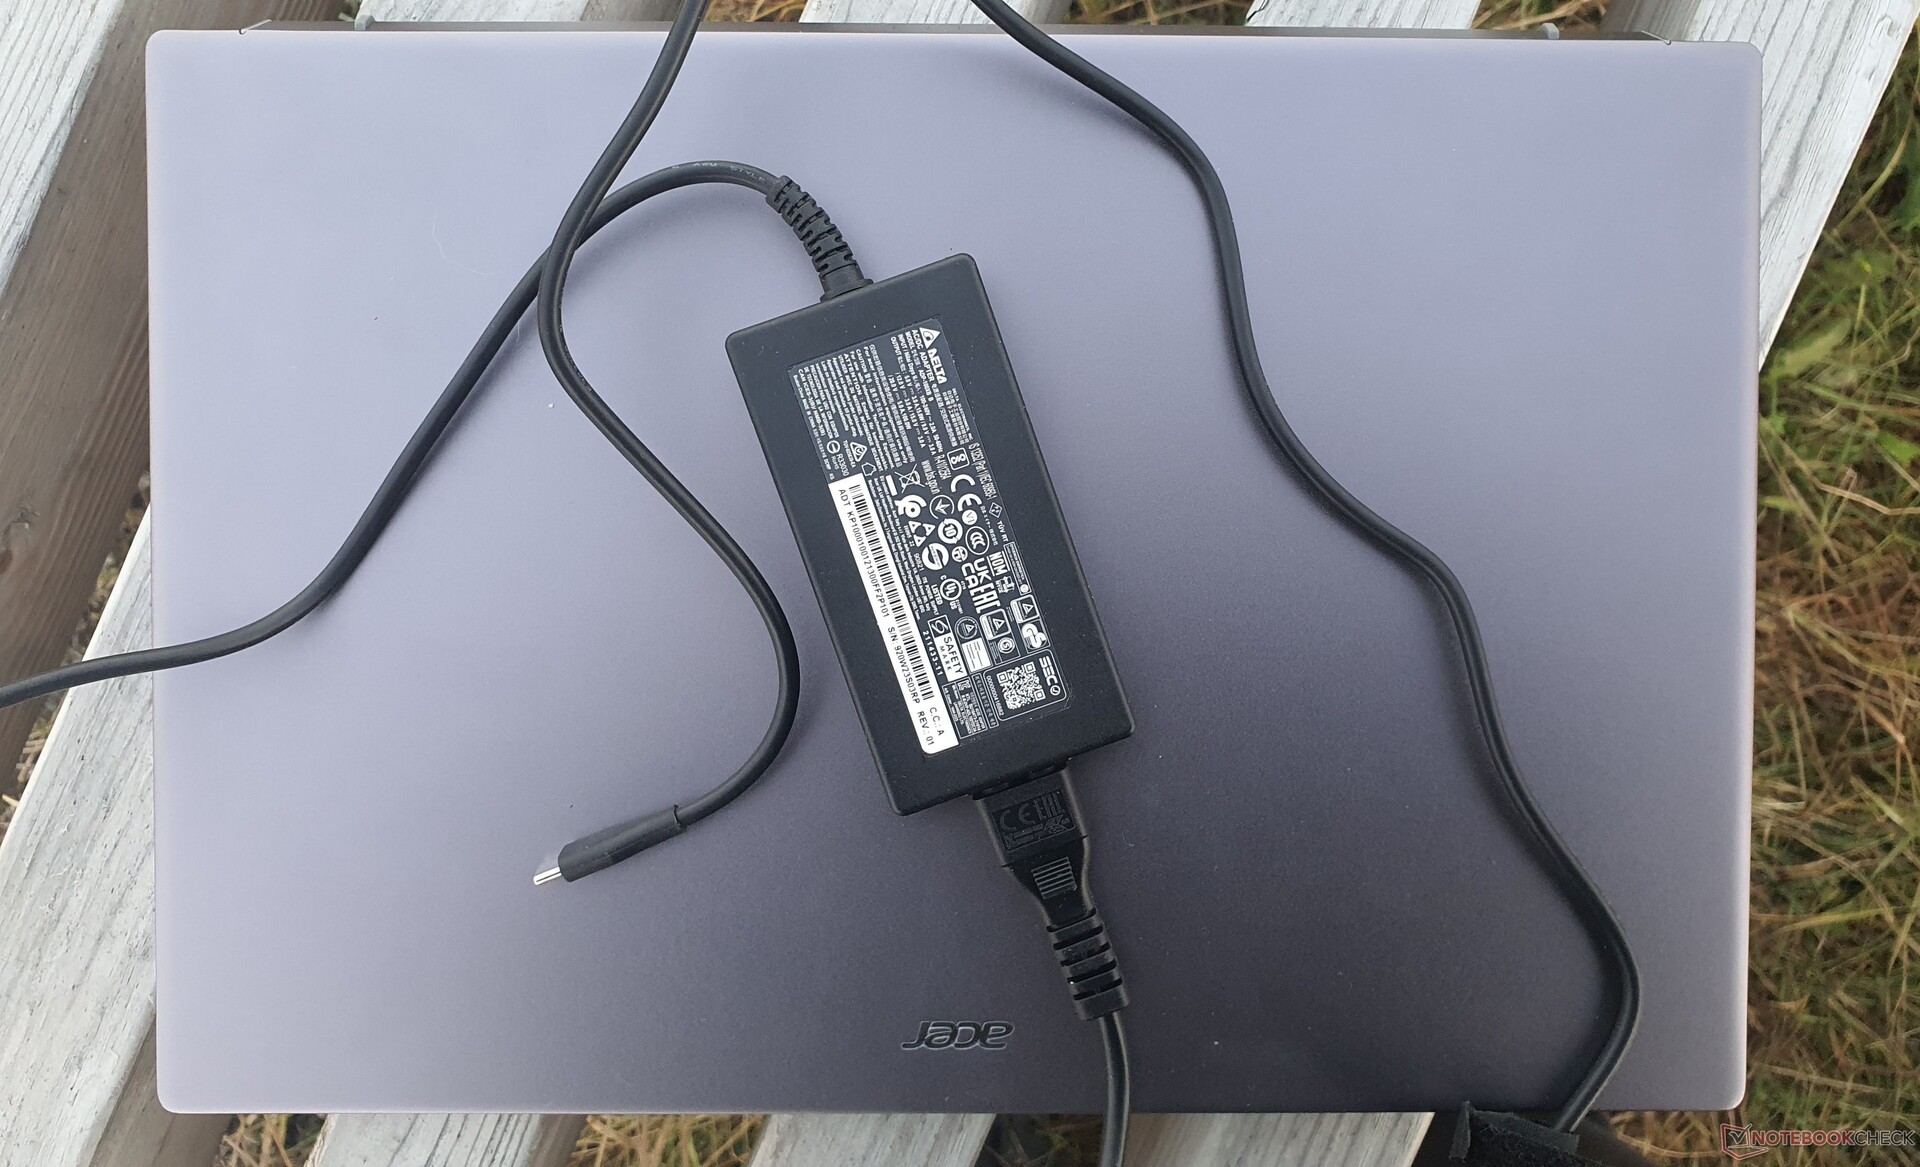
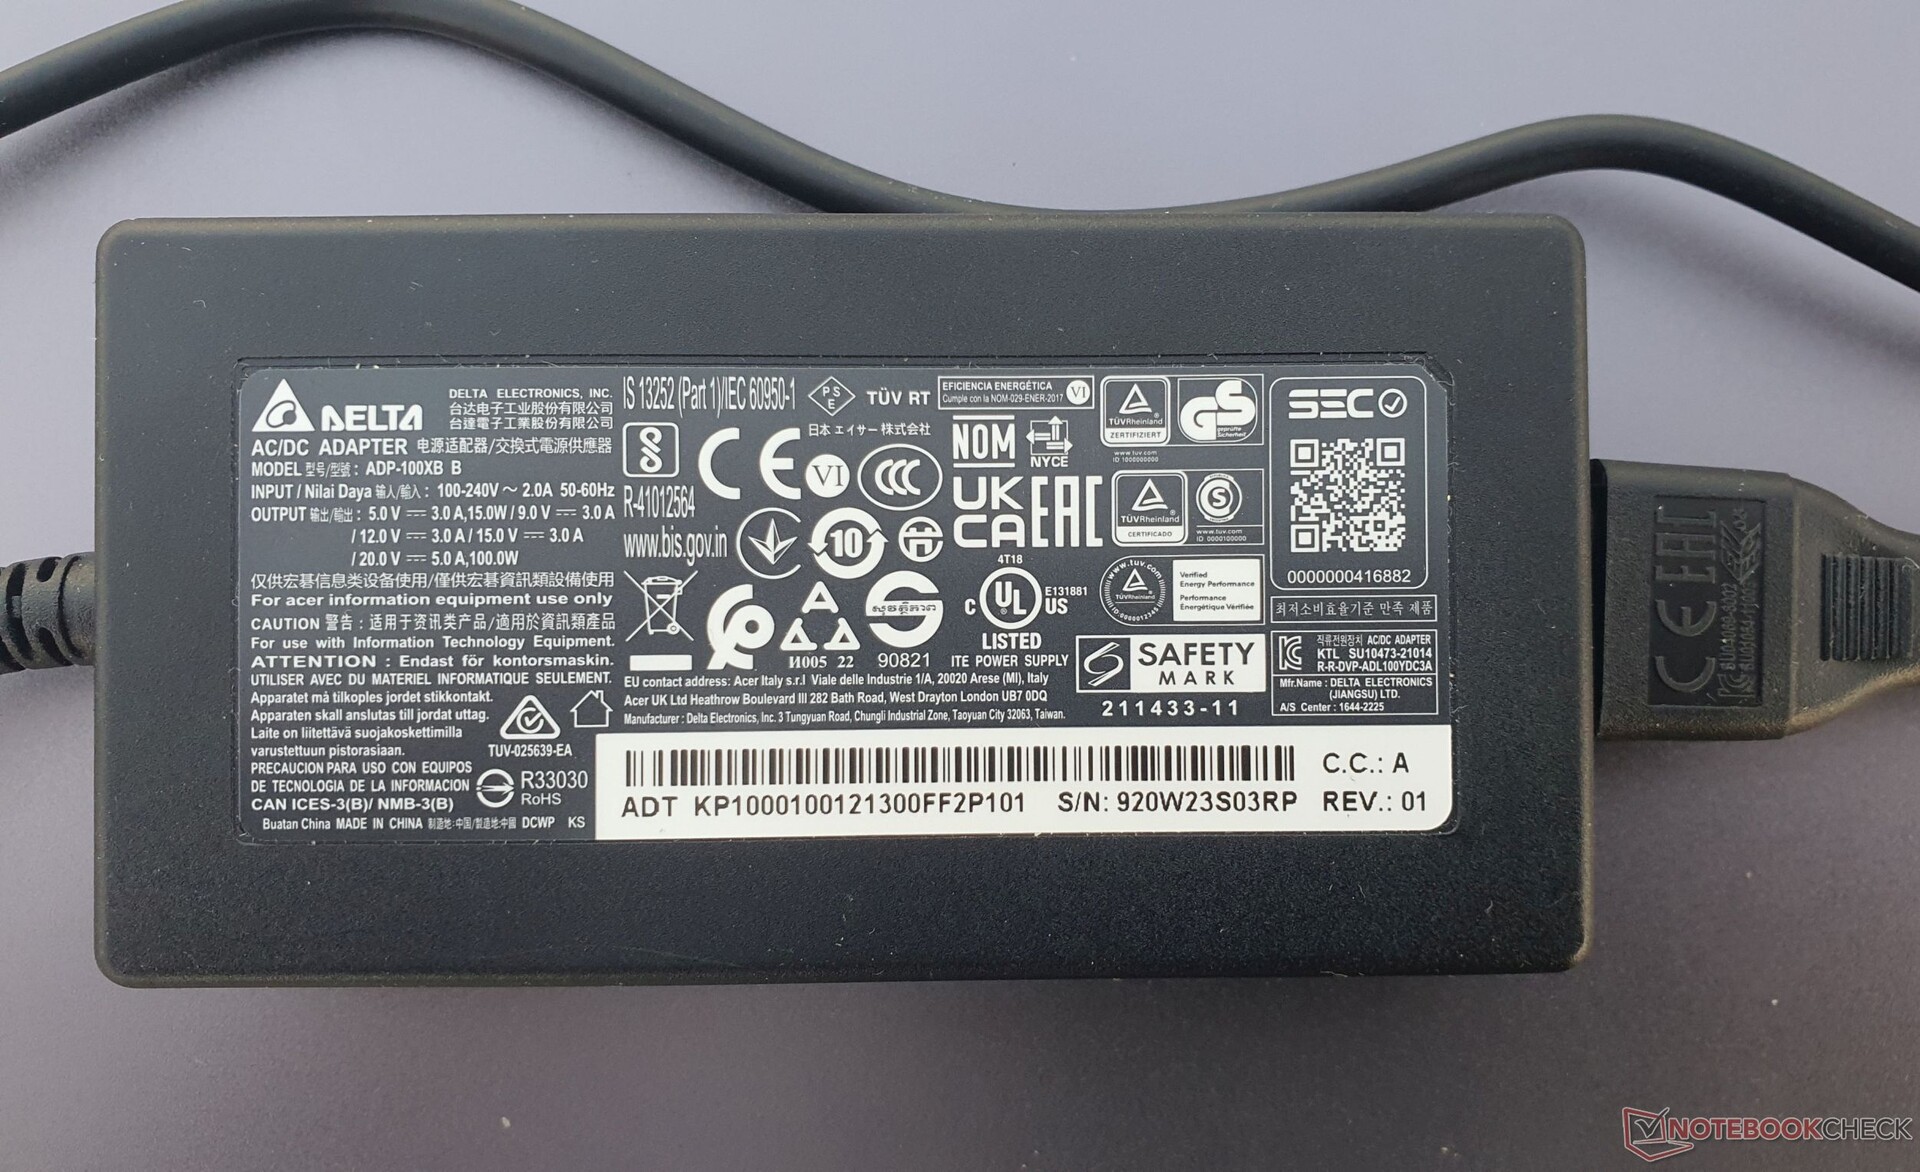
Das 100 W starke USB-C-Netzteil ist ausreichend, da Lastspitzen von knapp über 100 W nur im alltagsfremden Szenario unseres kombinierten Stresstests auftreten. Im Alltag treten sie allenfalls in der ersten Sekunde auf, etwa bei reiner CPU-Volllast oder beim Spielen.
| Aus / Standby | |
| Idle | |
| Last |
|
Legende:
min: | |
| Acer Swift X SFX16-52G-77RX i7-1260P, A370M, WDC PC SN810 1TB, IPS-LED, 2560x1600, 16" | Acer Swift X SFX16-52G-52VE i5-1240P, A370M, Micron 3400 MTFDKBA512TFH 512GB, , 2560x1600, 16" | Lenovo ThinkBook 16 G4+ IAP i7-12700H, GeForce RTX 2050 Mobile, Micron 2450 1TB MTFDKCD1T0TFK, IPS, 2560x1600, 16" | Dell Inspiron 16 Plus 7620 i7-12700H, GeForce RTX 3050 Ti Laptop GPU, Kioxia BG5 KBG50ZNS512G, IPS, 3072x1920, 16" | HP Envy 16 h0112nr i7-12700H, GeForce RTX 3060 Laptop GPU, Micron 3400 1TB MTFDKBA1T0TFH, OLED, 3840x2400, 16" | Asus Vivobook Pro 16X-M7600QE R9 5900HX, GeForce RTX 3050 Ti Laptop GPU, SK Hynix HFM001TD3JX013N, OLED, 3840x2400, 16.1" | Durchschnitt der Klasse Multimedia | |
|---|---|---|---|---|---|---|---|
| Stromverbrauch | -9% | -22% | -54% | -103% | -50% | -18% | |
| Idle min * (Watt) | 3.7 | 5.7 -54% | 5 -35% | 6.8 -84% | 10 -170% | 8.2 -122% | 5.64 ? -52% |
| Idle avg * (Watt) | 7.6 | 8 -5% | 11.2 -47% | 9.6 -26% | 10.9 -43% | 16.2 -113% | 10 ? -32% |
| Idle max * (Watt) | 11.1 | 10.4 6% | 11.6 -5% | 17 -53% | 27.8 -150% | 19.7 -77% | 12.2 ? -10% |
| Last avg * (Watt) | 70 | 74 -6% | 89.3 -28% | 117.5 -68% | 116.4 -66% | 65.8 6% | 64.8 ? 7% |
| Witcher 3 ultra * (Watt) | 68.8 | 65 6% | 83 -21% | 113.1 -64% | 133.7 -94% | 65.6 5% | |
| Last max * (Watt) | 108 | 108.5 -0% | 102 6% | 137.4 -27% | 209.8 -94% | 104 4% | 111.7 ? -3% |
* ... kleinere Werte sind besser
Energieaufnahme Witcher 3 / Stresstest
Energieaufnahme mit externem Monitor
Akkulaufzeit
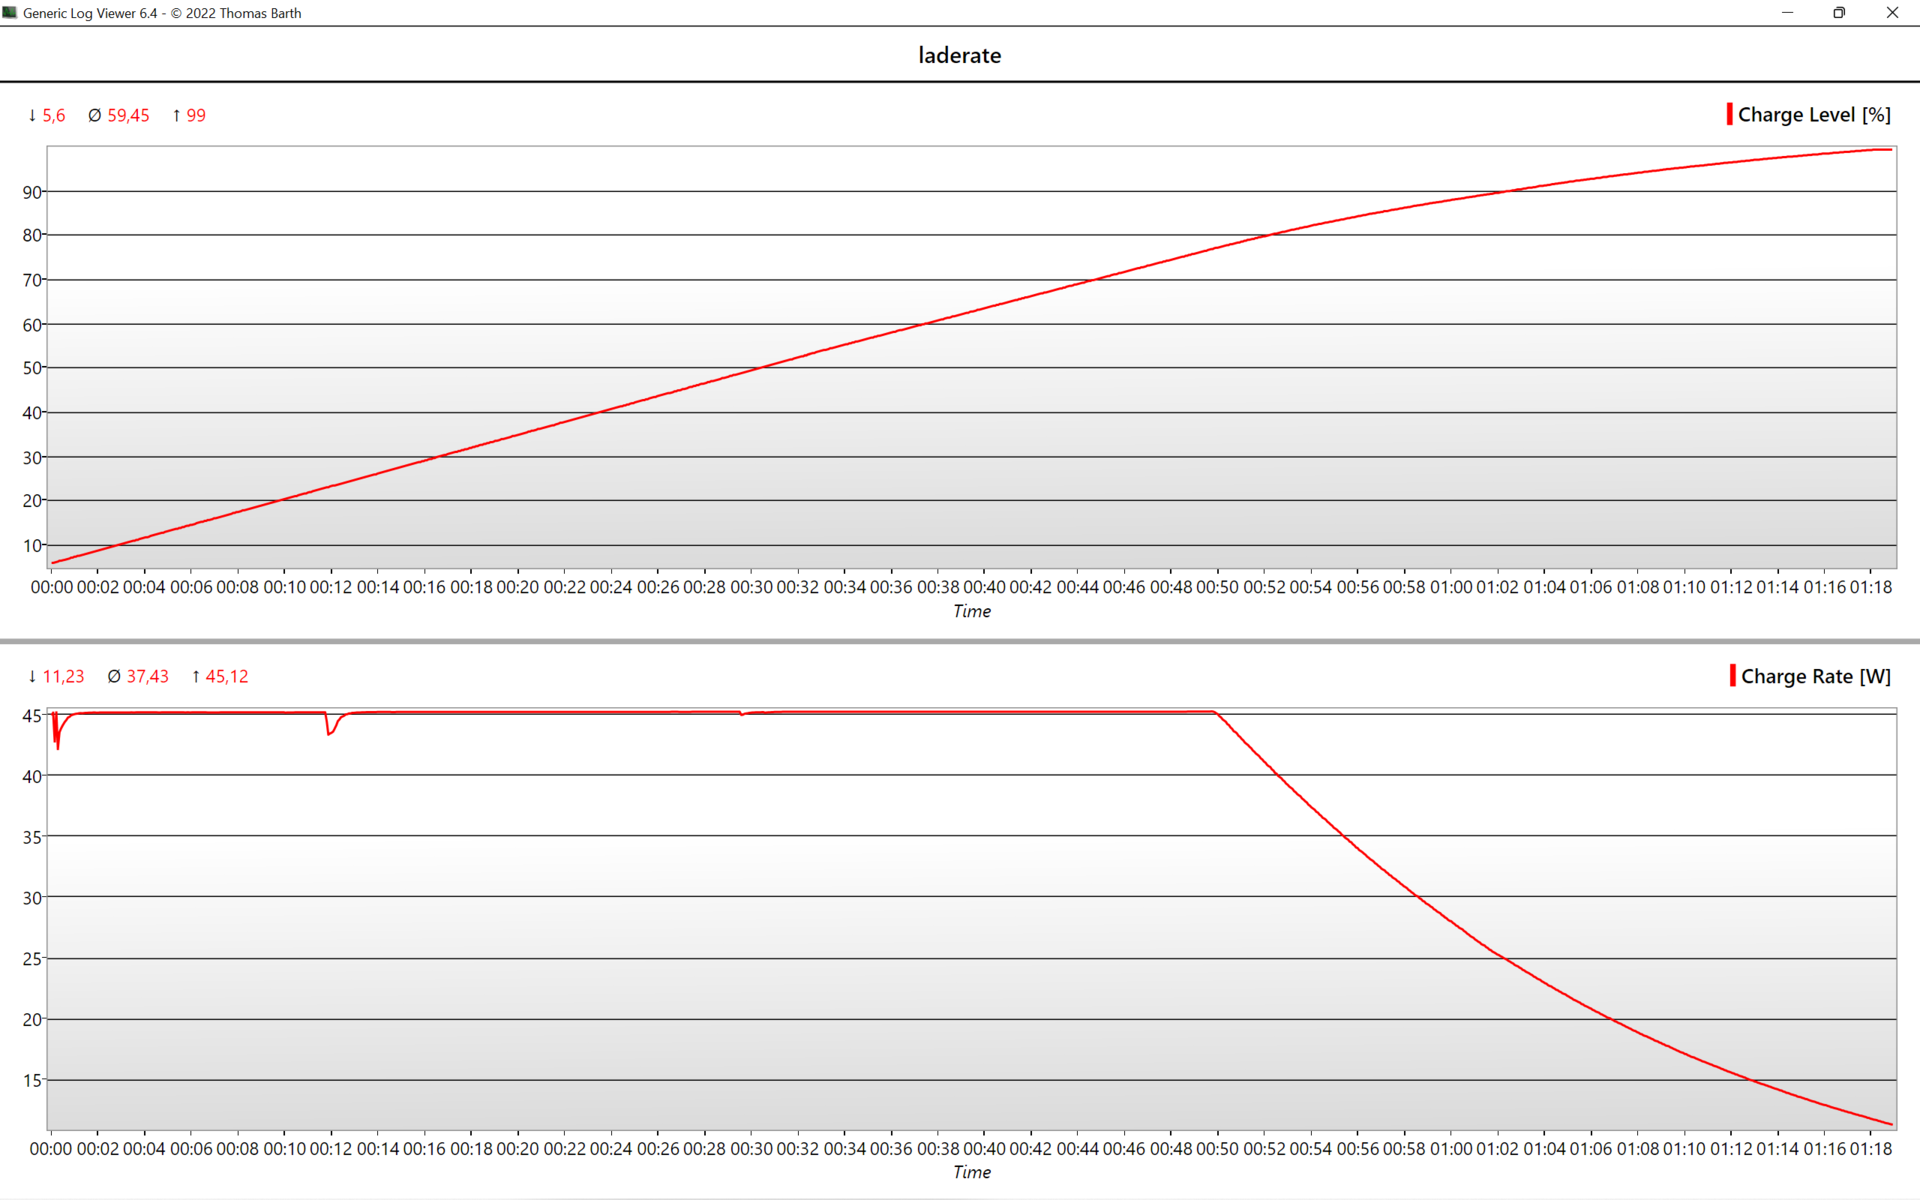
In unserem WLAN-Test bei gesetzten 150 Nits und in Acers Normal-Modus, hält das Swift X 16 neun Stunden durch. Das ist eine Stunde länger als beim Vorgänger und 40 Minuten weniger als beim Schwestermodell, das jedoch im Modus "Beste Energieeinsparung" getestet wurde.
Insgesamt liegen die Werte im Klassen-Durchschnitt. Asus Vivobook Pro 16X schafft allerdings über 11 Stunden, während Dells Inspiron 16 Plus und das Lenovo IdeaPad 5 Pro 16 ähnliche Werte zum Swift X erreichen.
| Acer Swift X SFX16-52G-77RX i7-1260P, A370M, 56 Wh | Acer Swift X SFX16-52G-52VE i5-1240P, A370M, 56 Wh | Acer Swift X SFX16-51G-5388 i5-11320H, GeForce RTX 3050 4GB Laptop GPU, 58.7 Wh | Lenovo ThinkBook 16 G4+ IAP i7-12700H, GeForce RTX 2050 Mobile, 71 Wh | Dell Inspiron 16 Plus 7620 i7-12700H, GeForce RTX 3050 Ti Laptop GPU, 86 Wh | HP Envy 16 h0112nr i7-12700H, GeForce RTX 3060 Laptop GPU, 83 Wh | Lenovo IdeaPad 5 Pro 16ARH7 R5 6600HS, Radeon 660M, 75 Wh | Asus Vivobook Pro 16X-M7600QE R9 5900HX, GeForce RTX 3050 Ti Laptop GPU, 96 Wh | Durchschnitt der Klasse Multimedia | |
|---|---|---|---|---|---|---|---|---|---|
| Akkulaufzeit | -6% | 2% | 16% | 7% | 16% | 8% | 12% | 47% | |
| H.264 (h) | 10.4 | 9.8 -6% | 8.4 -19% | 12.6 21% | 16.4 ? 58% | ||||
| WLAN (h) | 9.1 | 9.7 7% | 8.1 -11% | 8.2 -10% | 9.6 5% | 7.9 -13% | 9.8 8% | 11.3 24% | 12 ? 32% |
| Last (h) | 1.1 | 0.9 -18% | 1.5 36% | 1.5 36% | 1.2 9% | 1.6 45% | 1.1 0% | 1.675 ? 52% |
Pro
Contra
Fazit: Acer Swift X 16 liefert nicht trotz kerniger Updates
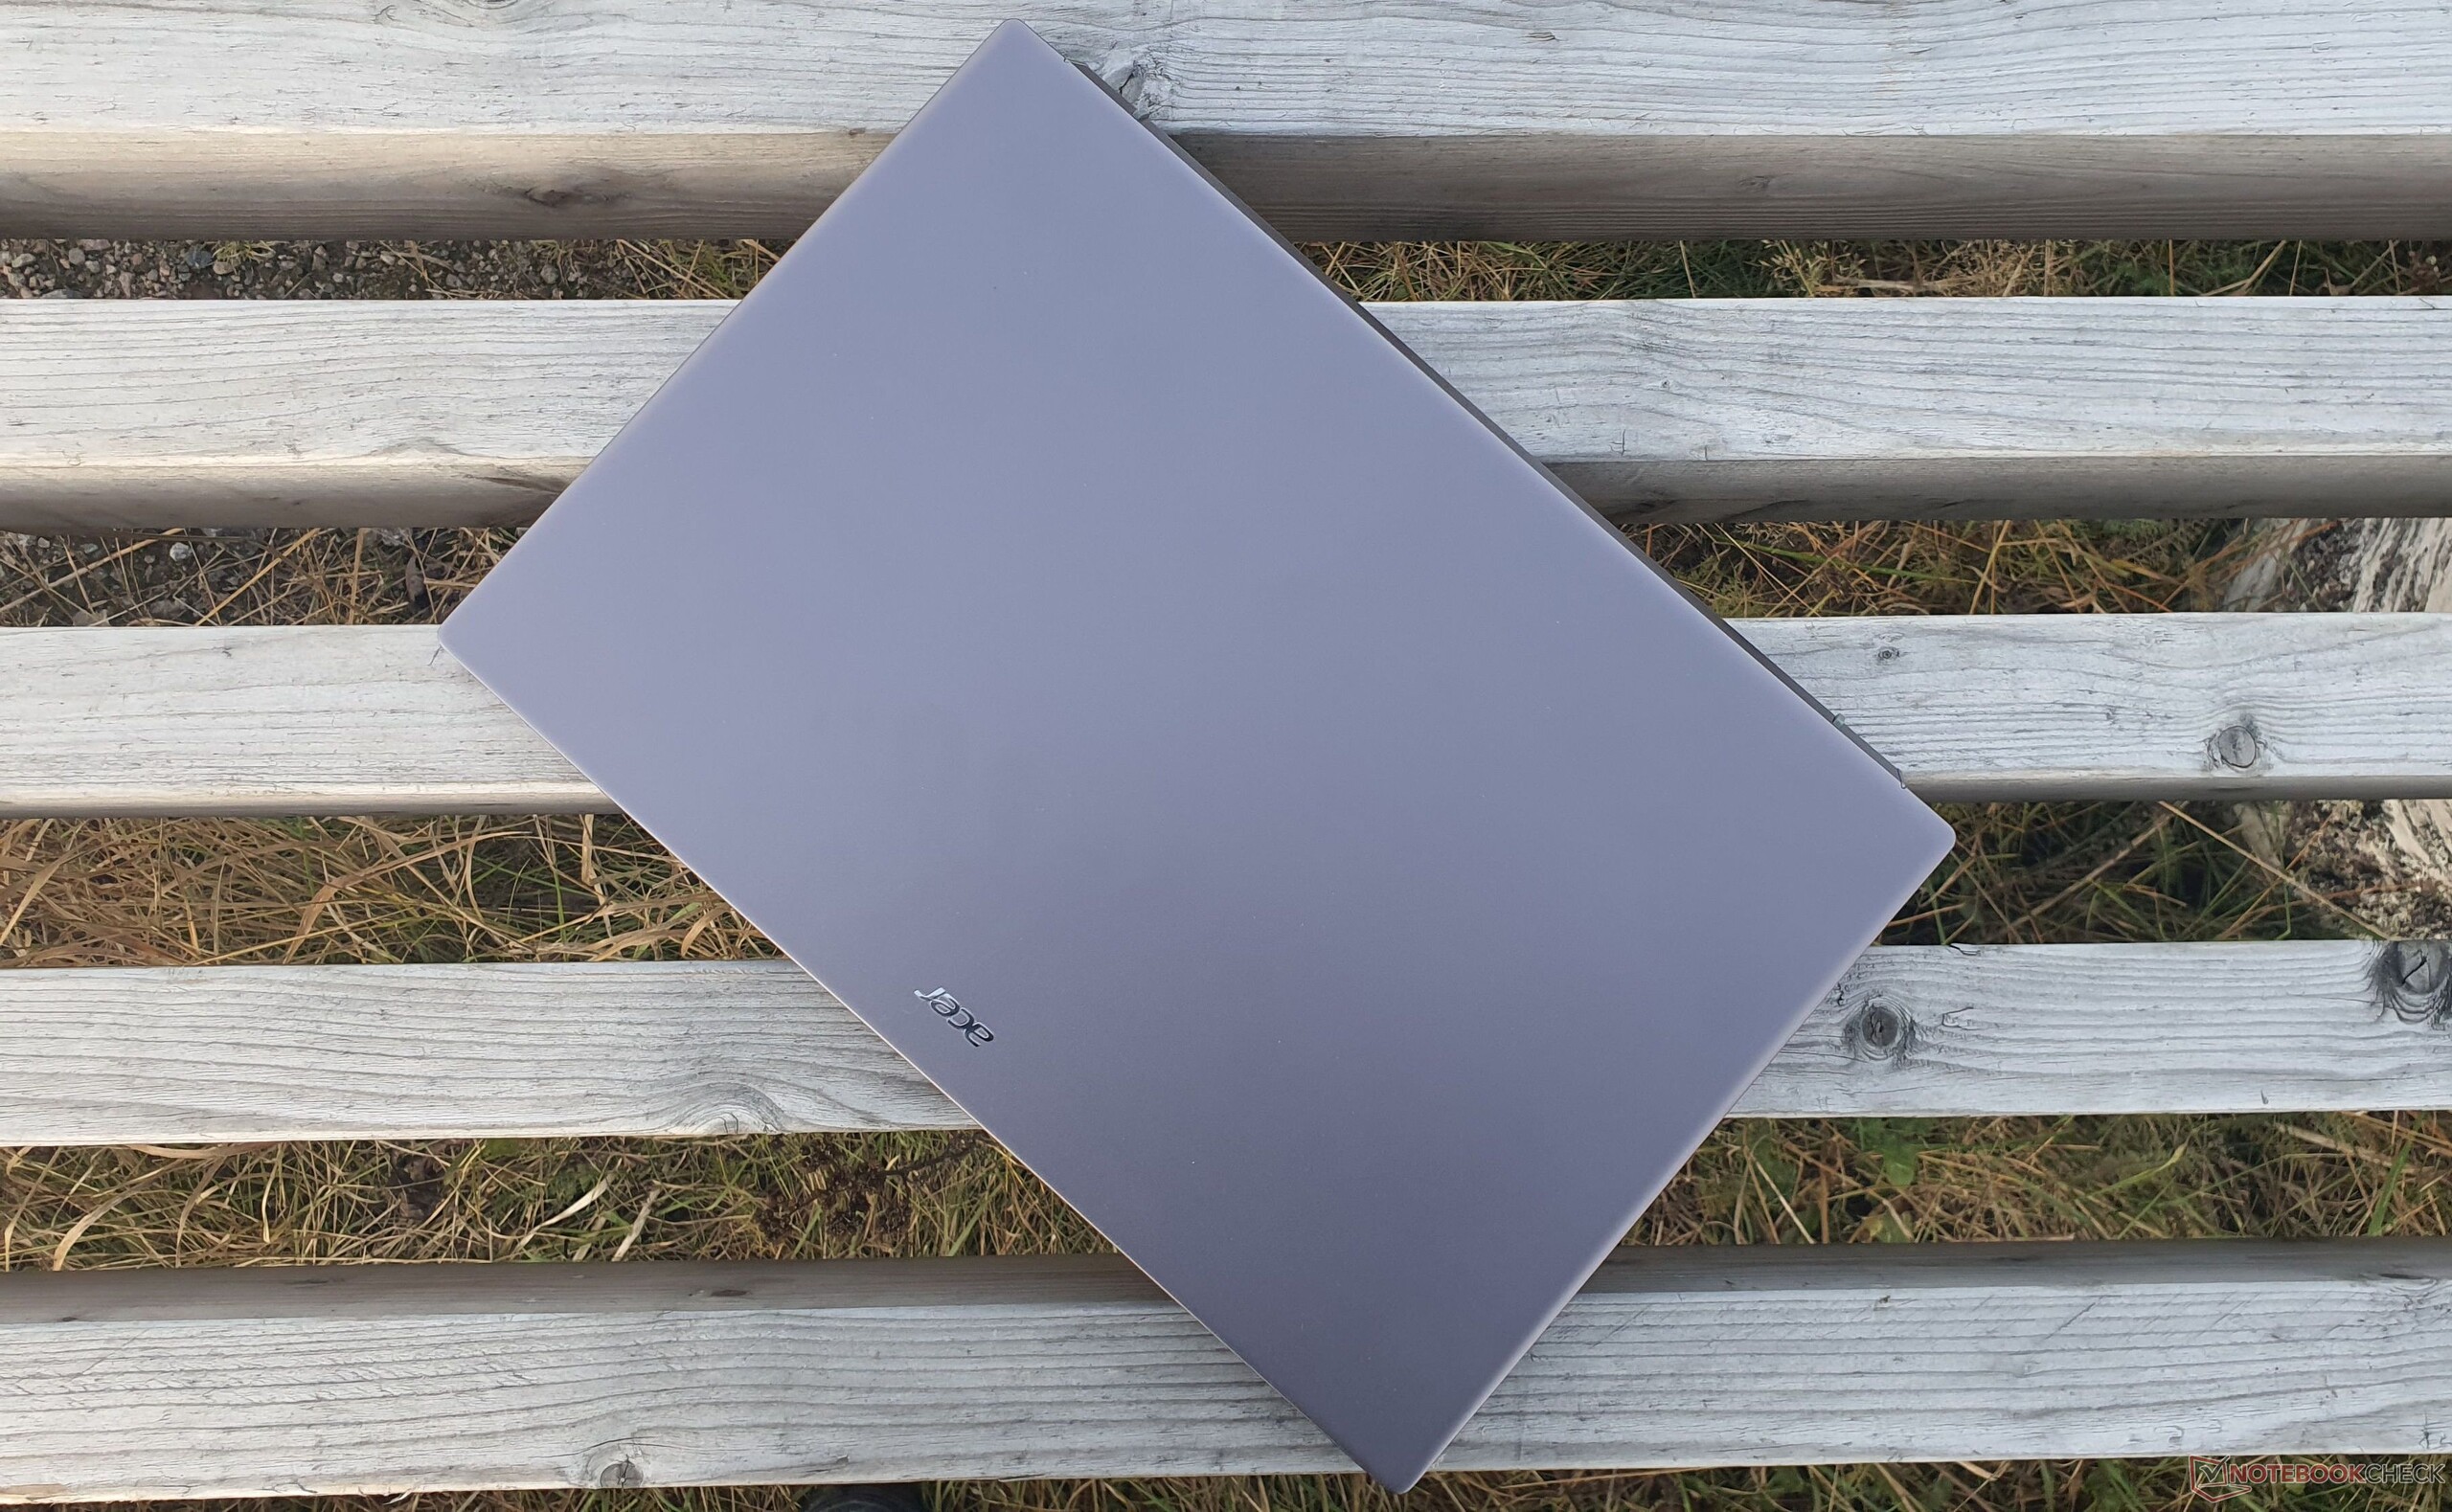
Das Acer Swift X 16 (2022) ist ein kompakter 16-Zöller bei leichten 1,75 kg. Viele Problemstellen des Vorgängers wurden erfreulicherweise ausgemerzt. Das Display ist mit 380 Nits nun deutlich heller, mit 2.560 x 1600 Pixeln hochauflösend, und auch das 16:10-Format gefällt.
Leider ist Intels Arc-GPU nicht für 3D-Arbeiten ausgelegt und hinkt auch in Spielen der GeForce RTX 3050 Ti im Dell Inspiron 16 Plus und Asus VivoBook Pro 16X hinterher. Durch Intels Alder-Lake-P-CPU ist das System jedoch sehr performant. Dazu ist die verbaute PCIe-4.0-SSD eine der Schnellsten, leidet jedoch unter starkem Thermal Throttling. Immerhin lässt sich eine zweite M.2-SSD in voller Größe verbauen.
Erfreulich ist zudem das Update auf HDMI 2.1 und die 1.080p-Webcam, während das Gehäuse weiterhin aus robustem Metall gefertigt und die Tastatur auch für Vielschreiber geeignet ist. Das rutschige Touchpad hat sich jedoch deutlich verschlechtert.
Trotz deutlichen Verbesserungen bei Display und Systemleistung ist angesichts der verminderten Grafikleistung durch Intel Arc sowie der hohen Emissionen ein Preis von 1.500 Euro einfach zu hoch.
Das Lüfterverhalten und die Kühlleistung können nicht überzeugen, die Lautsprecher sind weiterhin schlecht, und eine AMD Version mit effizienter iGPU wird nicht angeboten. Insgesamt sehen wir den hohen Preis von 1.500 Euro nicht gerechtfertigt. Die Core-i5-Variante mit 512-GB-SSD kostet bei etwa gleicher Leistung immerhin 200 Euro weniger.
Jedoch liefert die Konkurrenz selbst bei günstigeren Preisen in vielerlei Hinsicht mehr, etwa Lenovos ThinkBook 16 G4+ für 1.200 Euro oder das IdeaPad 5 Pro 16 für 1.000 Euro. HPs Envy 16 bietet einen Mix aus Multimedia, Business und Gaming, das für 1.700 Euro deutlich mehr Leistung liefert.
Preis und Verfügbarkeit
Das Acer Swift X SFX16-52G-77RX ist mit 1-TB-SSD, 16 GB verlöteten DDR5-RAM, 2,5K-Display und Intel Core i7-1260P für 1.500 Euro direkt in Acers Online-Shop bestellbar. Hier kann man mit einem Newsletter-Gutschein 10 % einsparen. Amazon und Cyberport listen es für 1.429 Euro. Mit Core i5-1240P und 512-GB-SSD ist man für 1.300 Euro dabei.
Acer Swift X SFX16-52G-77RX
- 25.10.2022 v7 (old)
Marvin Gollor
Preisvergleich
