2022 Dell XPS 15 9520 3,5K OLED Laptop Test: Überspringen oder kaufen?
Dell eröffnete das neue Jahrzehnt mit einem Paukenschlag, indem es das vollständig überarbeitete XPS 15 9500 als Nachfolger der XPS-15-7590-Reihe der älteren Generation einführte. Mit diesem Modell wurde die XPS-15-Familie von 16:9 auf 16:10 umgestellt, zusammen mit einem brandneuen Gehäuse-Design mit Intel-10.-Gen-Comet-Lake-H-CPUs und der GeForce-GTX-1650-Ti-GPU. Das XPS 15 9510 ging noch einen Schritt weiter mit 11.-Gen-Tiger-Lake-H-CPUs und optionalen 3,5K-OLED-Panels. Jetzt ist das XPS 15 9520 ein weiteres inkrementelles Update mit Alder-Lake-H-CPUs der 12. Generation und schnellerem DDR5-RAM.
Wir empfehlen einen Blick auf unseren bestehenden Test des XPS 15 9500, da das XPS-15-9520-Gehäuse identisch bleibt. Dieser Test konzentriert sich auf die Leistung des XPS 15 9520 und andere Unterschiede, die Nutzer im Vergleich zu früheren Modellen erwarten können.
Zu den Alternativen zum Dell XPS 15 9520 gehören andere hochwertige 15,6-Zoll-Multimedia-Notebooks mit diskreter Grafik wie das Asus Zenbook Pro 15 OLED, Lenovo Yoga Creator 7 15, HP Spectre x360 15, HP Envy 15 oder das MSI Creator 15.
Weitere Bewertungen von Dell:
Mögliche Konkurrenten im Vergleich
Bew | Datum | Modell | Gewicht | Dicke | Größe | Auflösung | Preis ab |
|---|---|---|---|---|---|---|---|
| 89.5 % v7 (old) | 05 / 2022 | Dell XPS 15 9520 RTX 3050 Ti i7-12700H, GeForce RTX 3050 Ti Laptop GPU | 1.9 kg | 18 mm | 15.60" | 3456x2160 | |
| 88.4 % v7 (old) | 08 / 2021 | Dell XPS 15 9510 11800H RTX 3050 Ti OLED i7-11800H, GeForce RTX 3050 Ti Laptop GPU | 1.9 kg | 18 mm | 15.60" | 3456x2160 | |
| 85 % v7 (old) | 01 / 2020 | HP Spectre X360 15-5ZV31AV i7-10510U, GeForce MX250 | 2.1 kg | 19.3 mm | 15.60" | 3840x2160 | |
| 87.7 % v7 (old) | 05 / 2022 | Asus Zenbook Pro 15 OLED UM535Q R9 5900HX, GeForce RTX 3050 Ti Laptop GPU | 1.9 kg | 18 mm | 15.60" | 1920x1080 | |
| 82.4 % v7 (old) | 02 / 2021 | MSI Stealth 15M A11SEK i7-1185G7, GeForce RTX 2060 Max-Q | 1.7 kg | 16.15 mm | 15.60" | 1920x1080 | |
| 93.2 % v7 (old) | 11 / 2021 | Apple MacBook Pro 16 2021 M1 Pro M1 Pro, M1 Pro 16-Core GPU | 2.2 kg | 16.8 mm | 16.20" | 3456x2234 |
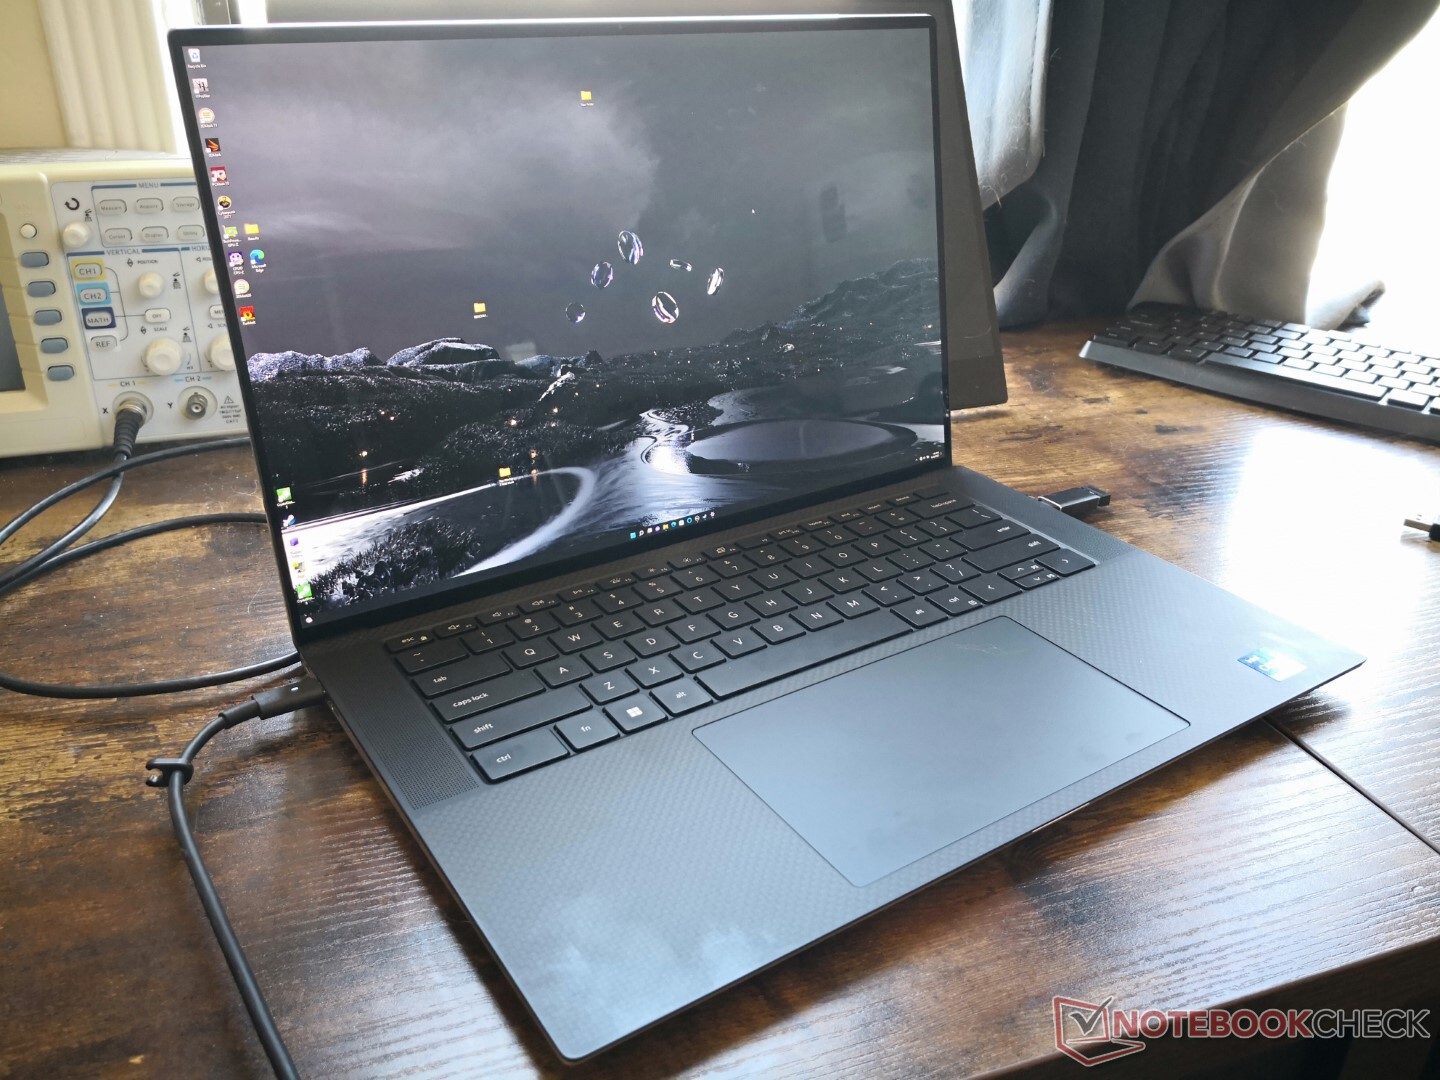
Gehäuse
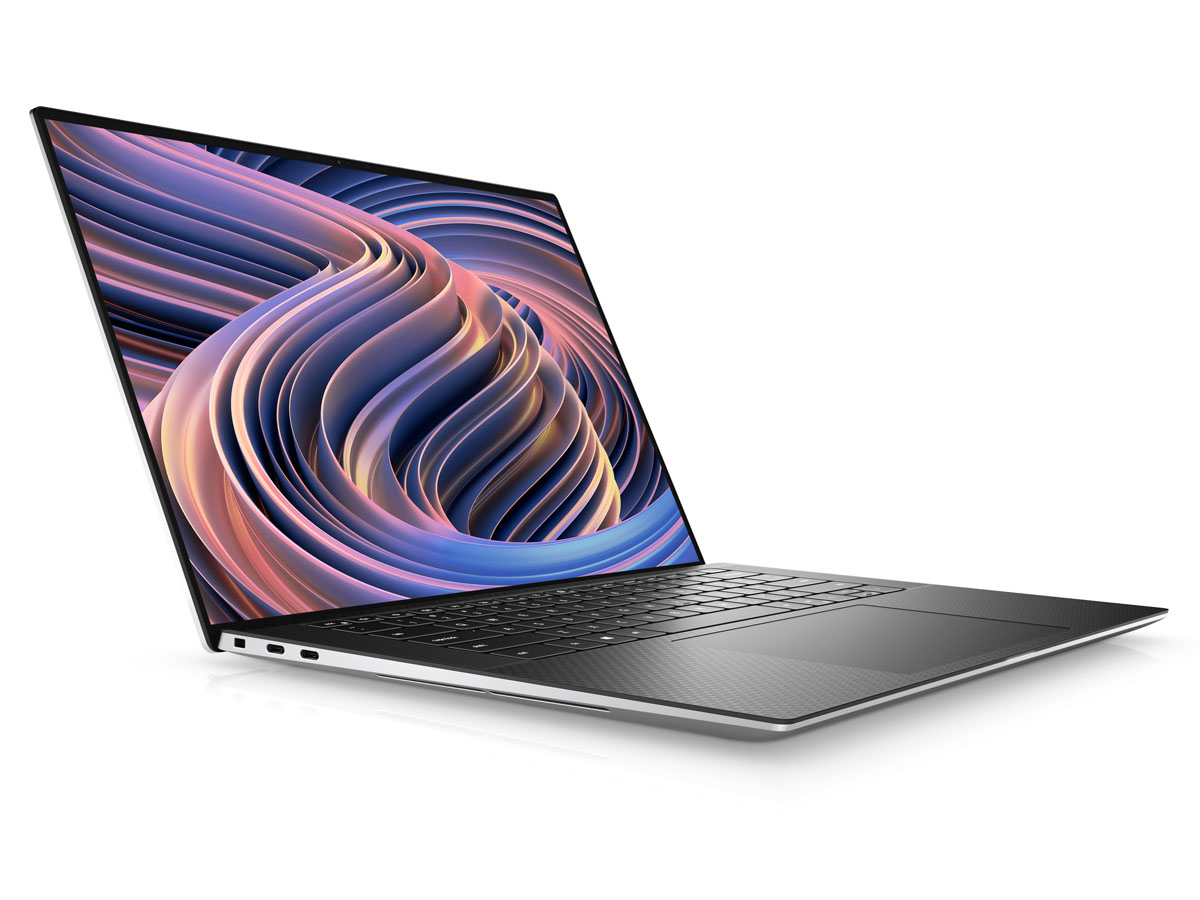
Das XPS-15-9520-Gehäuse ist trotz seinem Alter von zwei Jahren immer noch eines der kleinsten Modelle in seiner Größenklasse. Die sehr schmalen Einfassungen an allen vier Seiten, einschließlich des Kinns, tragen dazu bei, den Platzbedarf um ein Vielfaches geringer zu halten als etwa beim Zenbook Pro 15 oder Spectre x360 15.
SD-Kartenleser
| SD Card Reader | |
| average JPG Copy Test (av. of 3 runs) | |
| Dell XPS 15 9510 11800H RTX 3050 Ti OLED (AV Pro V60) | |
| Dell XPS 15 9500 Core i7 4K UHD (Toshiba Exceria Pro SDXC 64 GB UHS-II) | |
| MSI Stealth 15M A11SEK (Toshiba Exceria Pro M501 microSDXC 32GB) | |
| Dell XPS 15 9520 RTX 3050 Ti (Toshiba Exceria Pro SDXC 64 GB UHS-II) | |
| HP Spectre X360 15-5ZV31AV (Toshiba Exceria Pro M501 UHS-II) | |
| Asus Zenbook Pro 15 OLED UM535Q (Toshiba Exceria Pro SDXC 64 GB UHS-II) | |
| maximum AS SSD Seq Read Test (1GB) | |
| MSI Stealth 15M A11SEK (Toshiba Exceria Pro M501 microSDXC 32GB) | |
| Dell XPS 15 9510 11800H RTX 3050 Ti OLED (AV Pro V60) | |
| Dell XPS 15 9500 Core i7 4K UHD (Toshiba Exceria Pro SDXC 64 GB UHS-II) | |
| HP Spectre X360 15-5ZV31AV (Toshiba Exceria Pro M501 UHS-II) | |
| Dell XPS 15 9520 RTX 3050 Ti (Toshiba Exceria Pro SDXC 64 GB UHS-II) | |
| Asus Zenbook Pro 15 OLED UM535Q (Toshiba Exceria Pro SDXC 64 GB UHS-II) | |
Kommunikation
Ein Intel AX211 kommt standardmäßig für Wi-Fi-6E- und Bluetooth-5.2-Konnektivität. Dell hat uns jedoch bestätigt, dass das XPS 15 9520 nicht für die Unterstützung von 6-GHz-Wi-Fi-6E-Netzwerken konzipiert wurde, obwohl der AX211-Chip dies kann. Besitzer des XPS 15 9520 können sich also nur mit 2,4-GHz- und 5-GHz-Netzwerken bis Wi-Fi 6 verbinden.
| Networking | |
| iperf3 transmit AX12 | |
| Dell XPS 15 9510 11800H RTX 3050 Ti OLED | |
| Dell XPS 15 9500 Core i7 4K UHD | |
| MSI Stealth 15M A11SEK | |
| Asus Zenbook Pro 15 OLED UM535Q | |
| iperf3 receive AX12 | |
| Dell XPS 15 9500 Core i7 4K UHD | |
| Dell XPS 15 9510 11800H RTX 3050 Ti OLED | |
| MSI Stealth 15M A11SEK | |
| Asus Zenbook Pro 15 OLED UM535Q | |
| iperf3 receive AXE11000 | |
| Dell XPS 15 9520 RTX 3050 Ti | |
| iperf3 transmit AXE11000 | |
| Dell XPS 15 9520 RTX 3050 Ti | |
Webcam
Dell hat die Farben der Webcam im Vergleich zum XPS 15 9510 oder 9500 verbessert, indem die IR- und RGB-Sensoren getrennt wurden. Sie bleibt jedoch nur bei 1 MP, verglichen mit 2 MP bei anderen 15,6-Zoll-Flaggschiffen wie dem Razer Blade 15. Während die Farben also etwas besser sind, ist das Bild immer noch matschig.


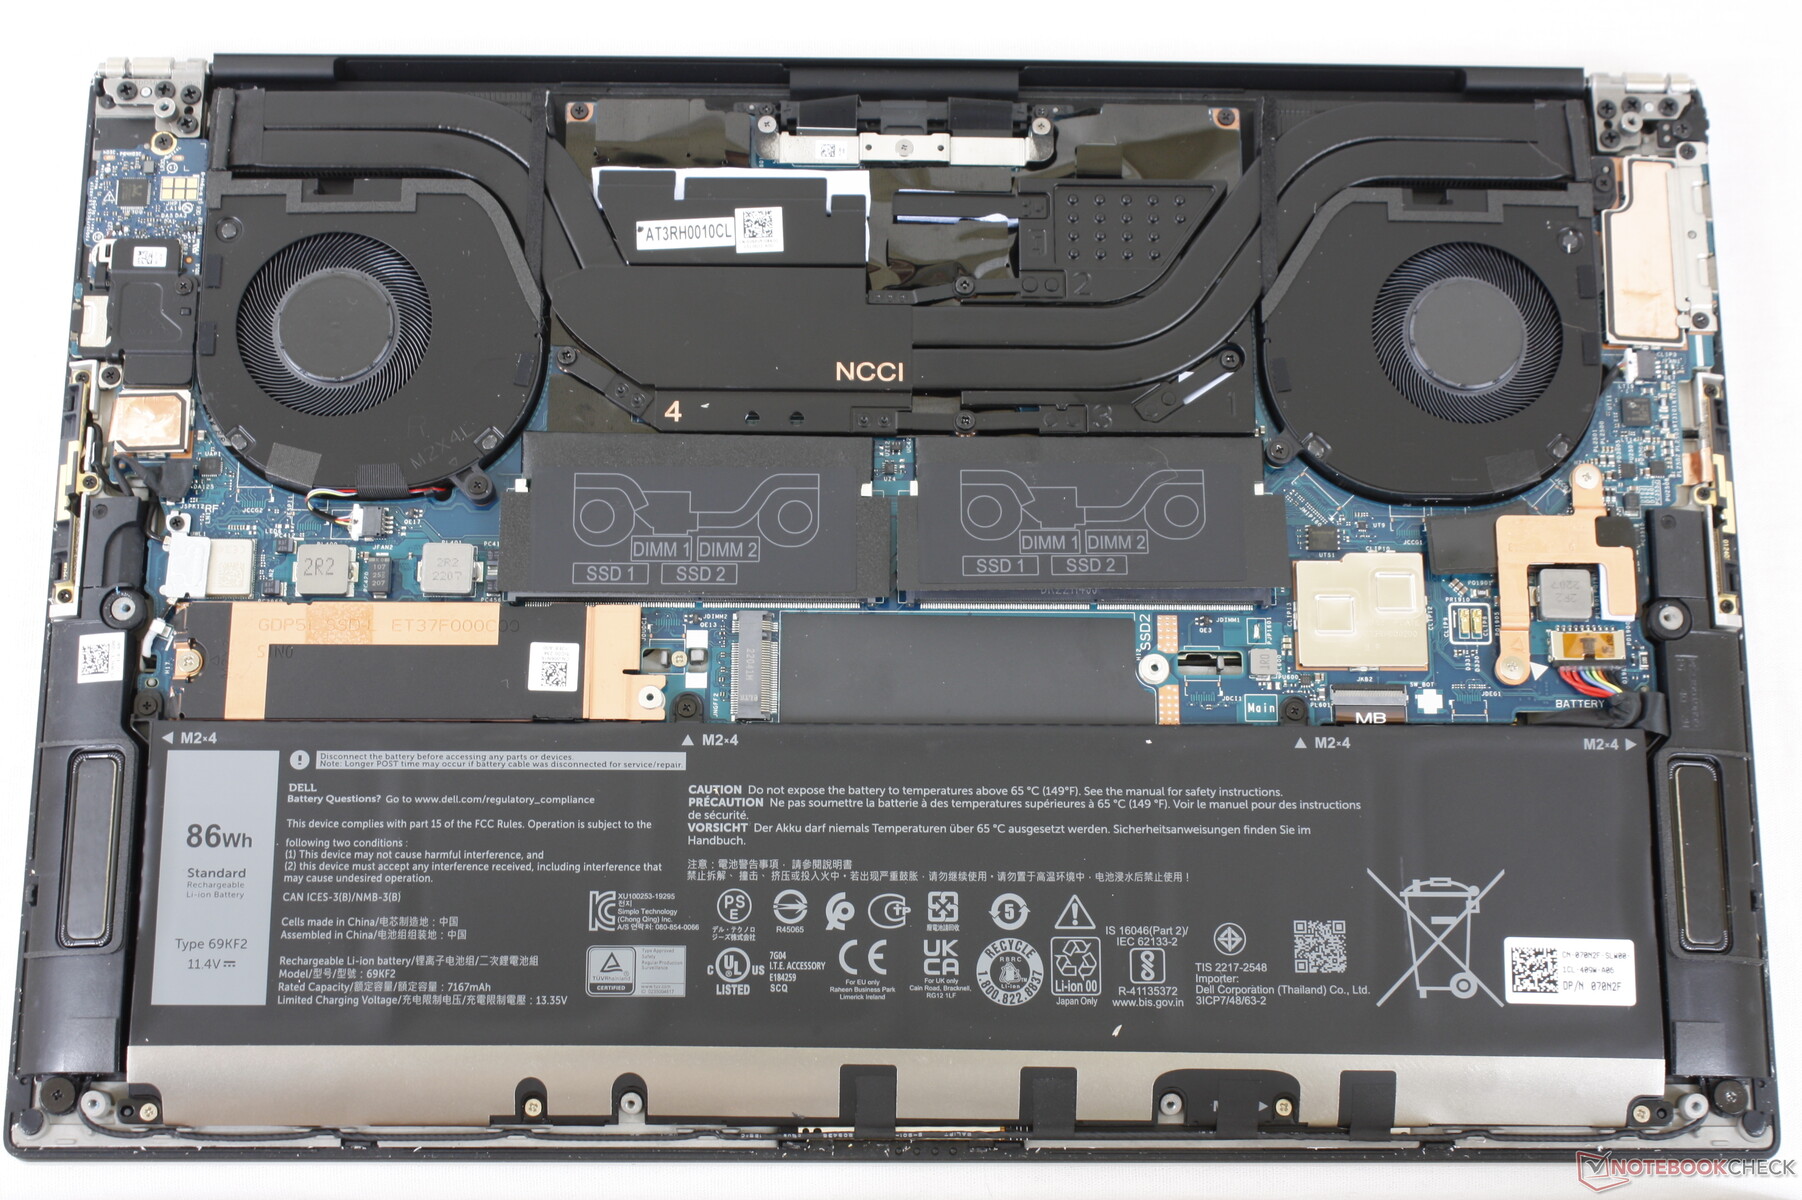
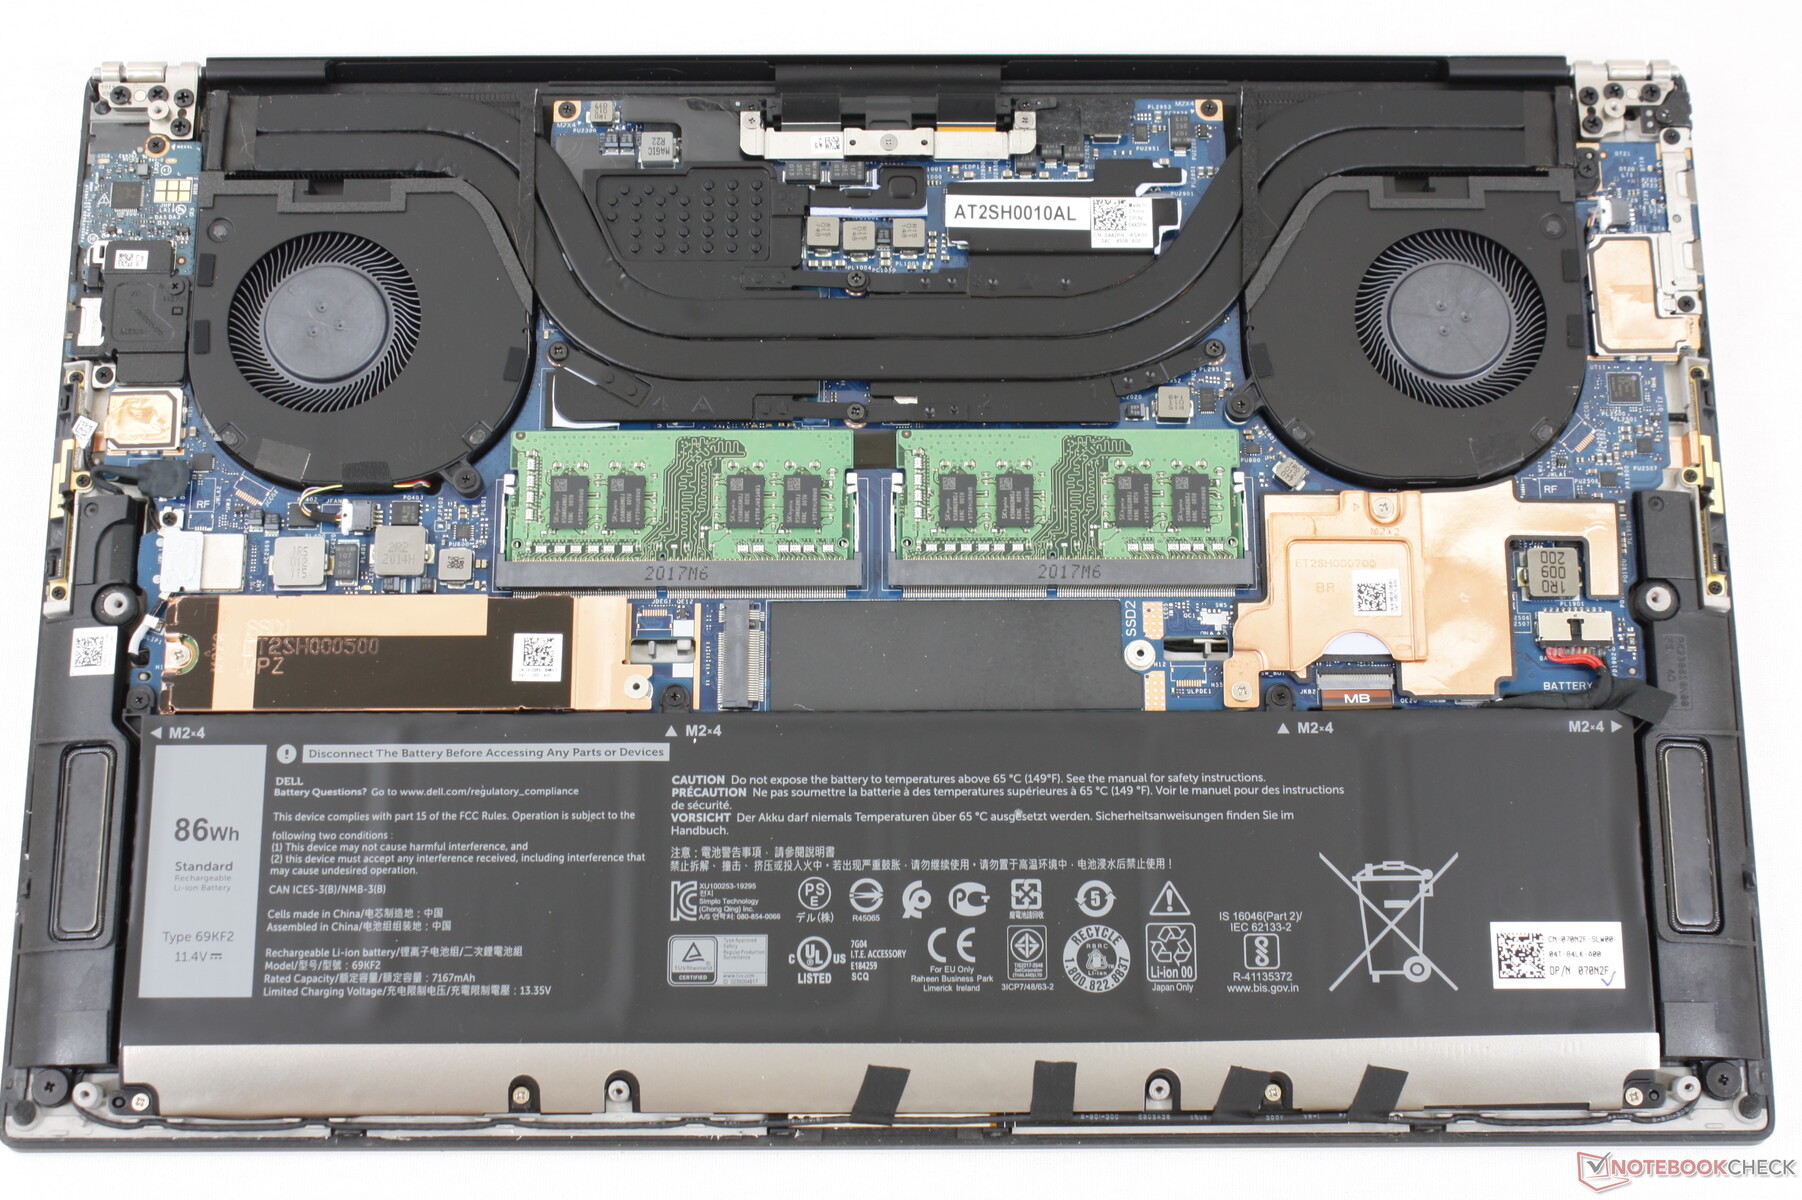
Wartung
Zubehör und Garantie
Die Verkaufsverpackung enthält das USB-C-Netzteil, Papierkram und einen USB-C-auf-HDMI-und-USB-A-Adapter in voller Größe. Letzterer ist besonders hilfreich, da das System nur USB-C-Anschlüsse bietet.
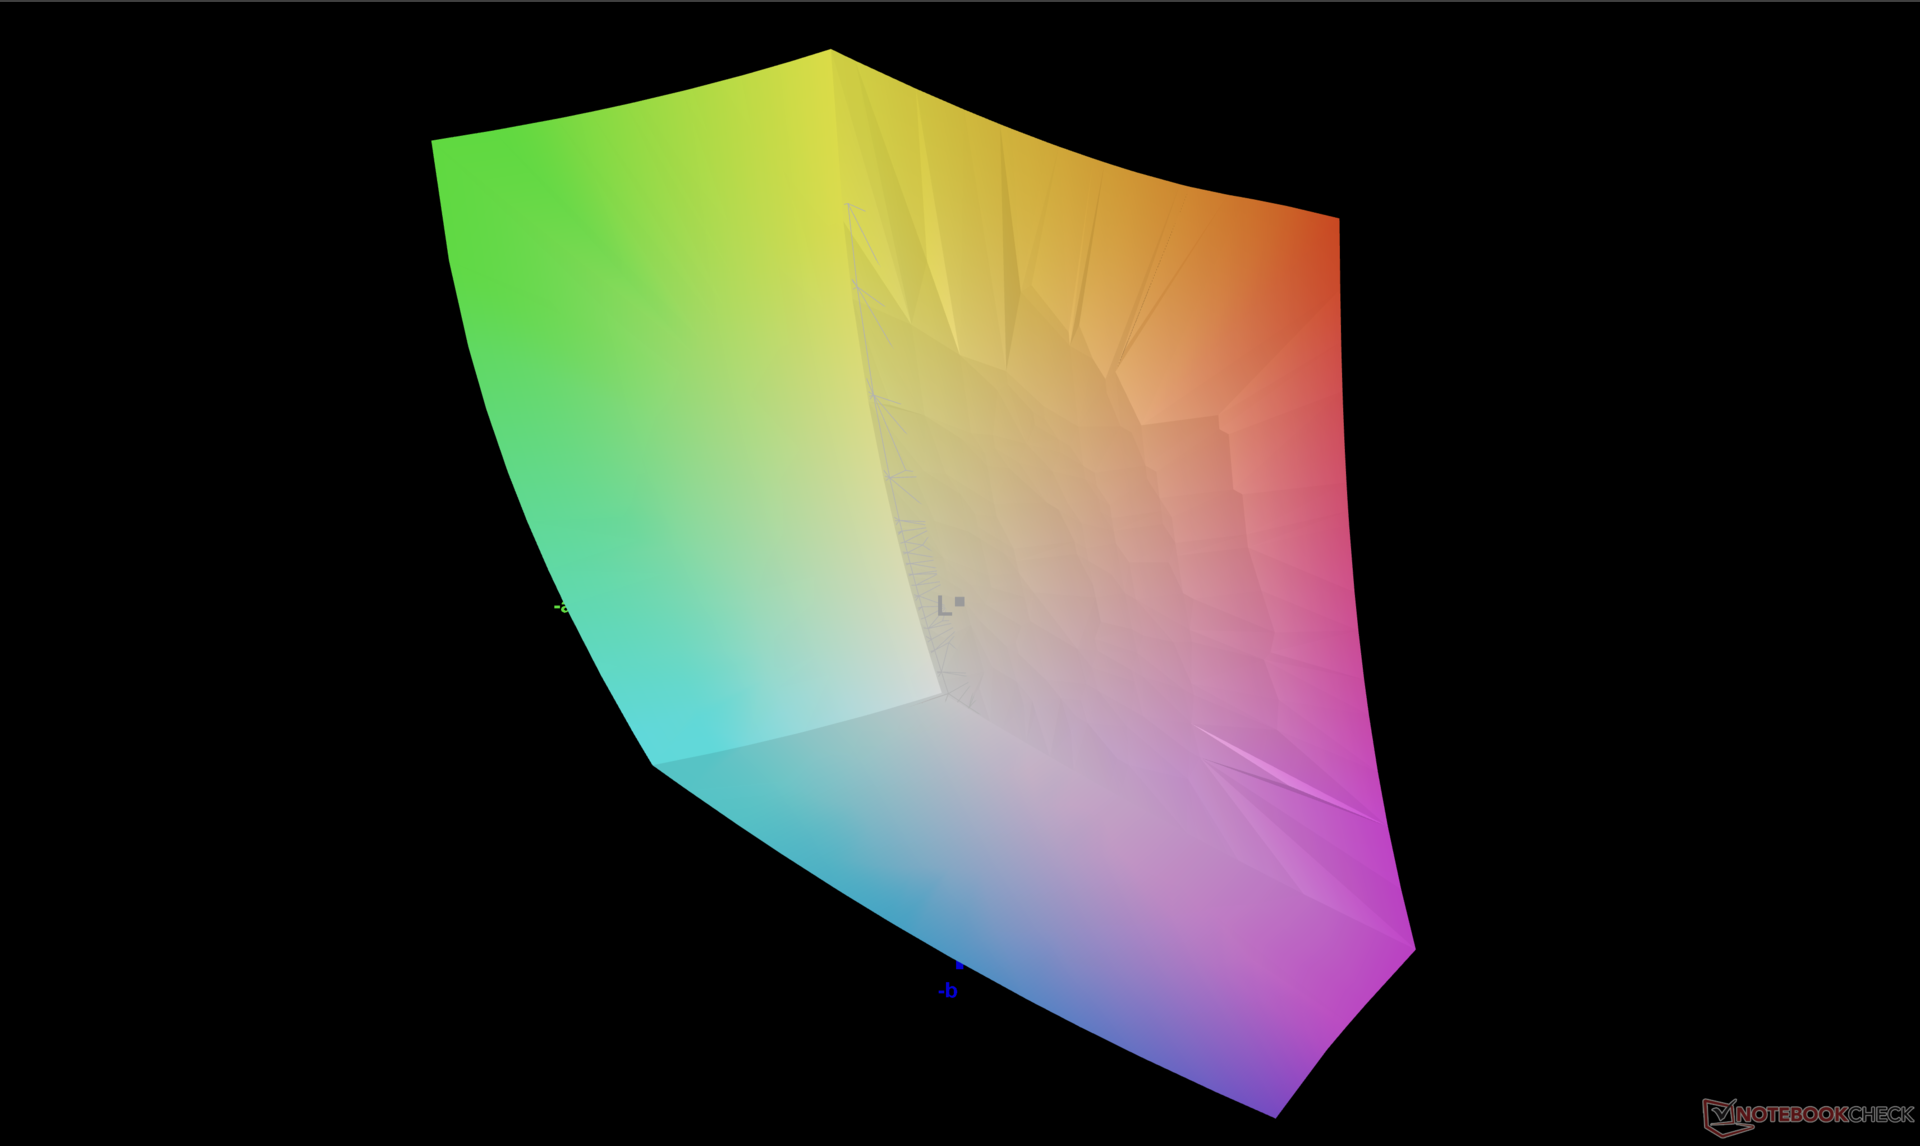
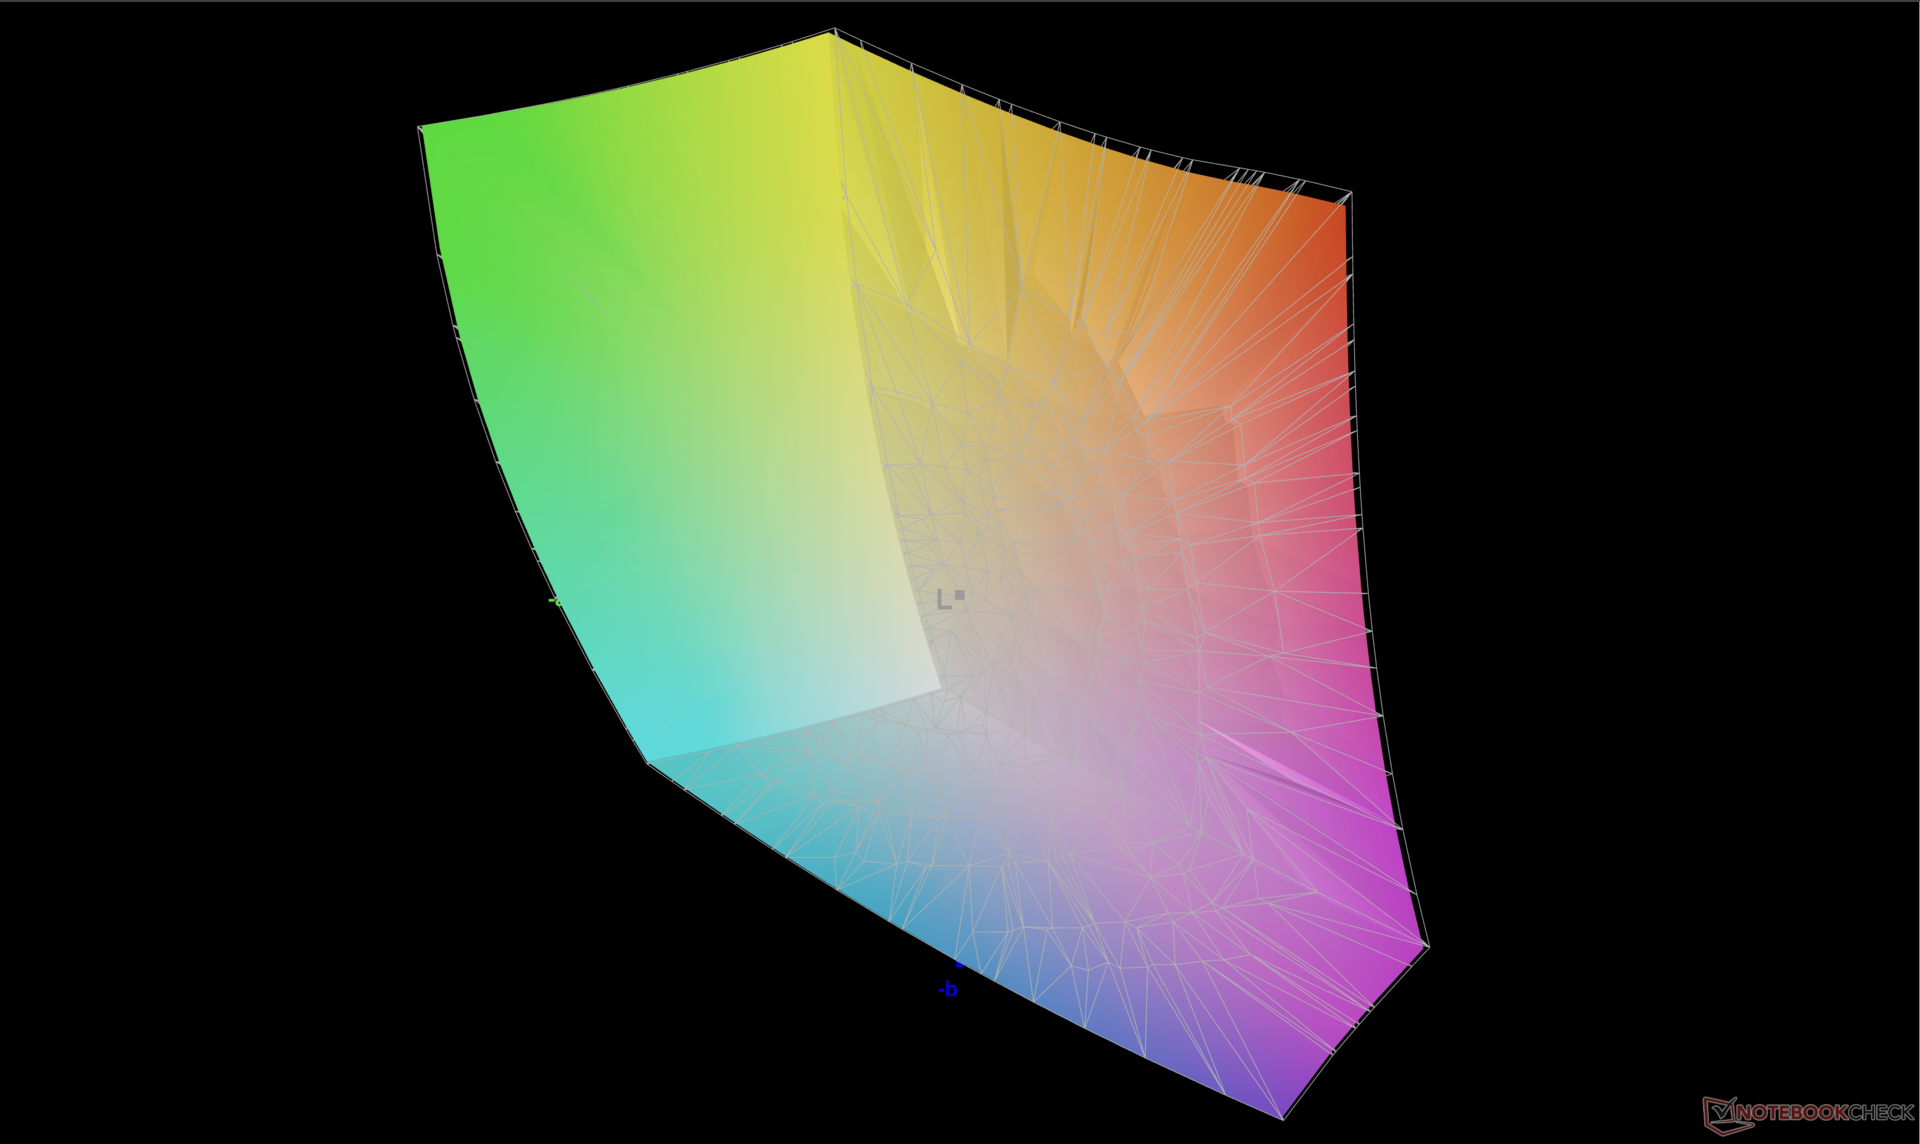
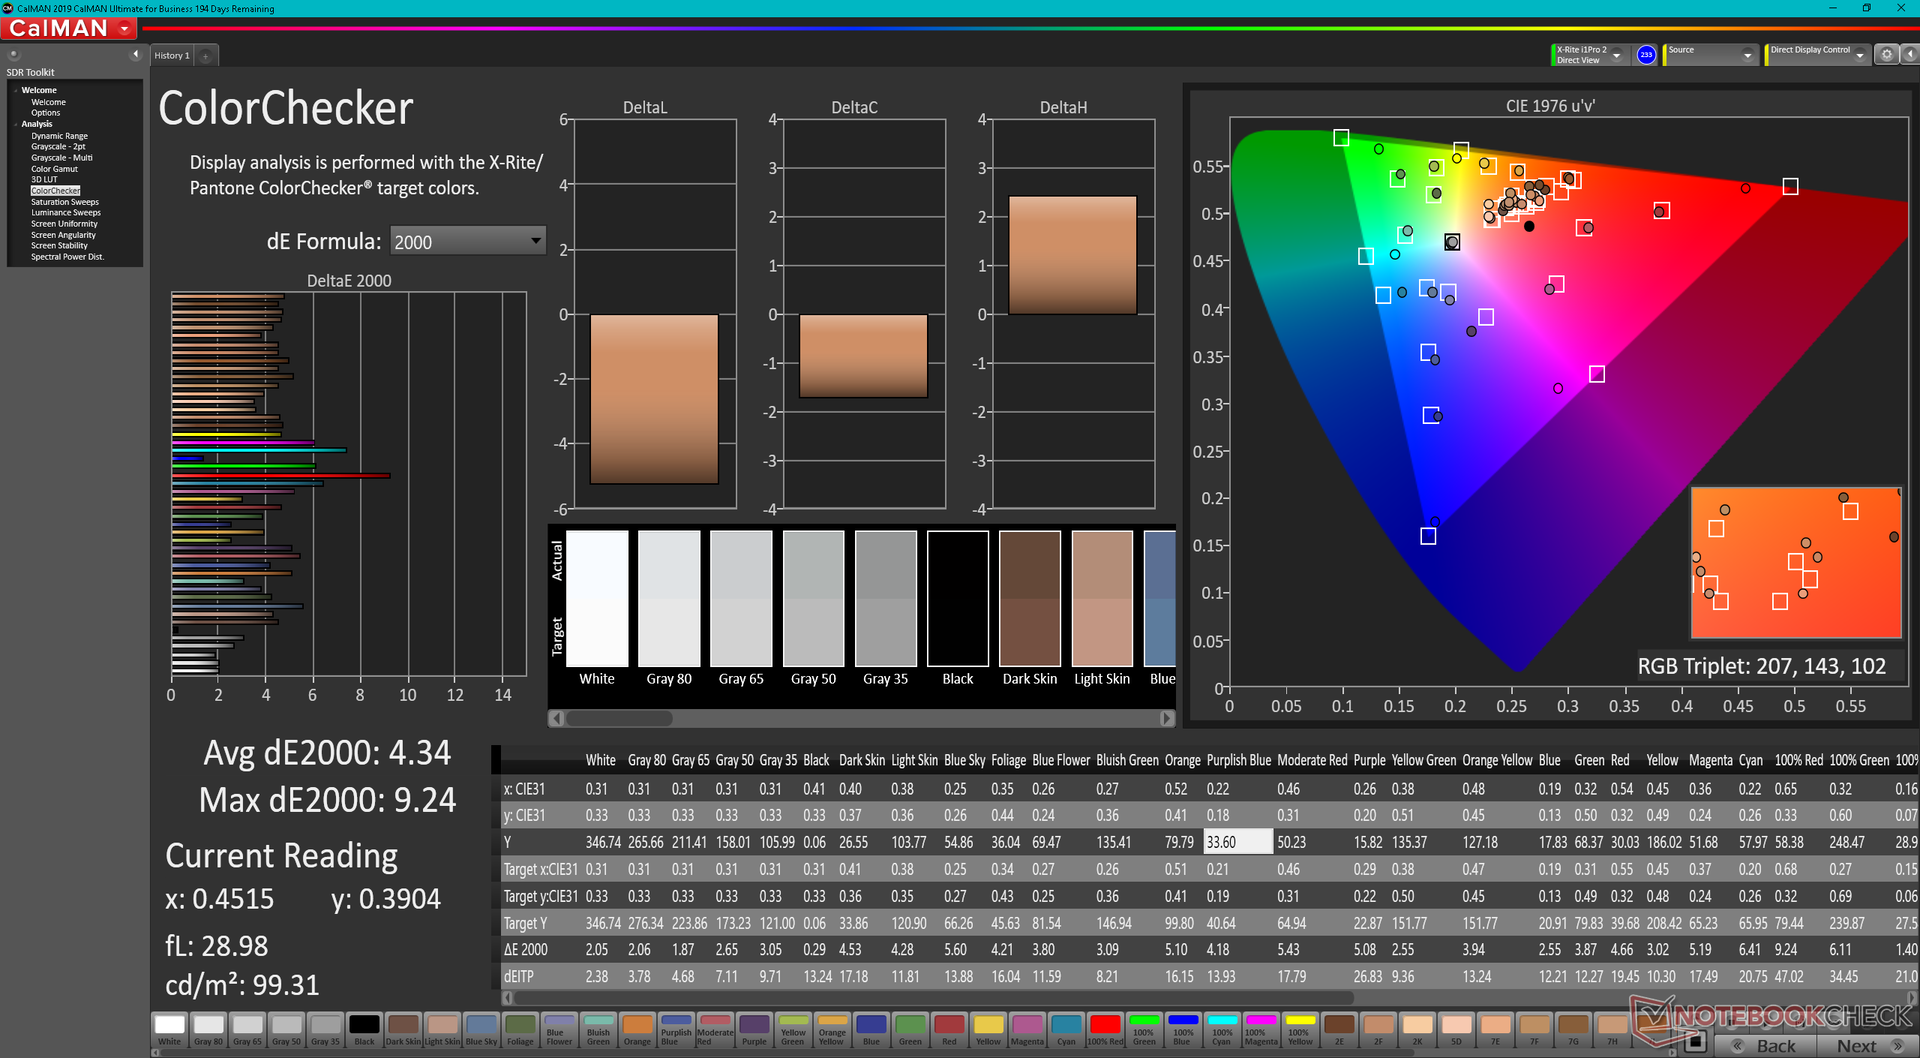
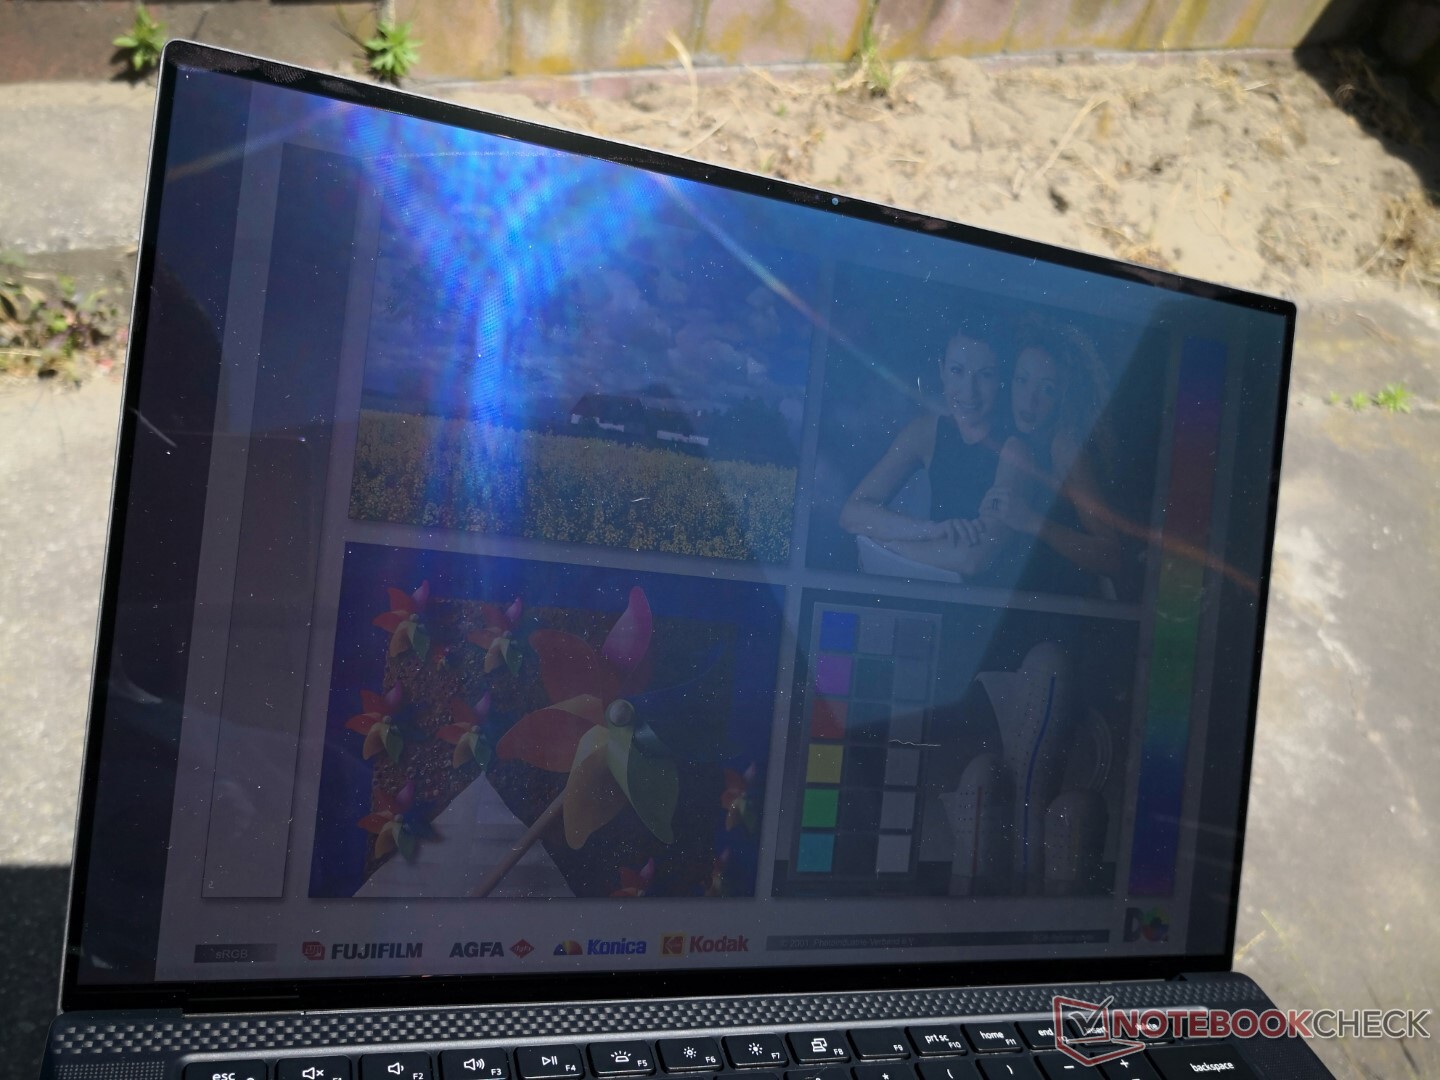
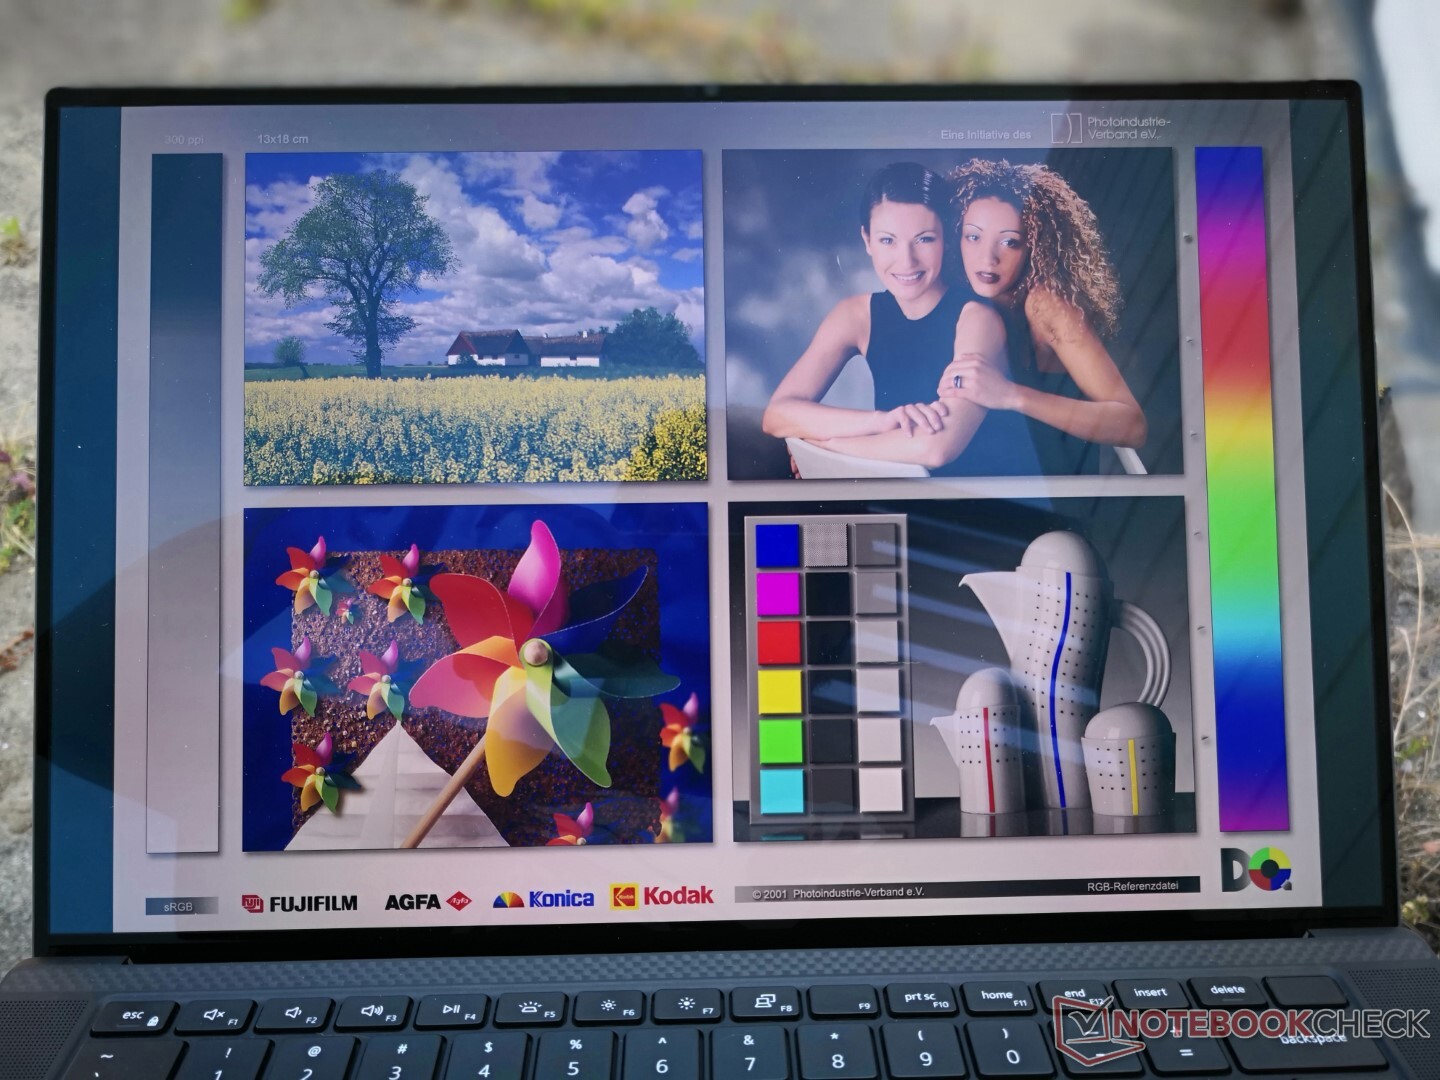
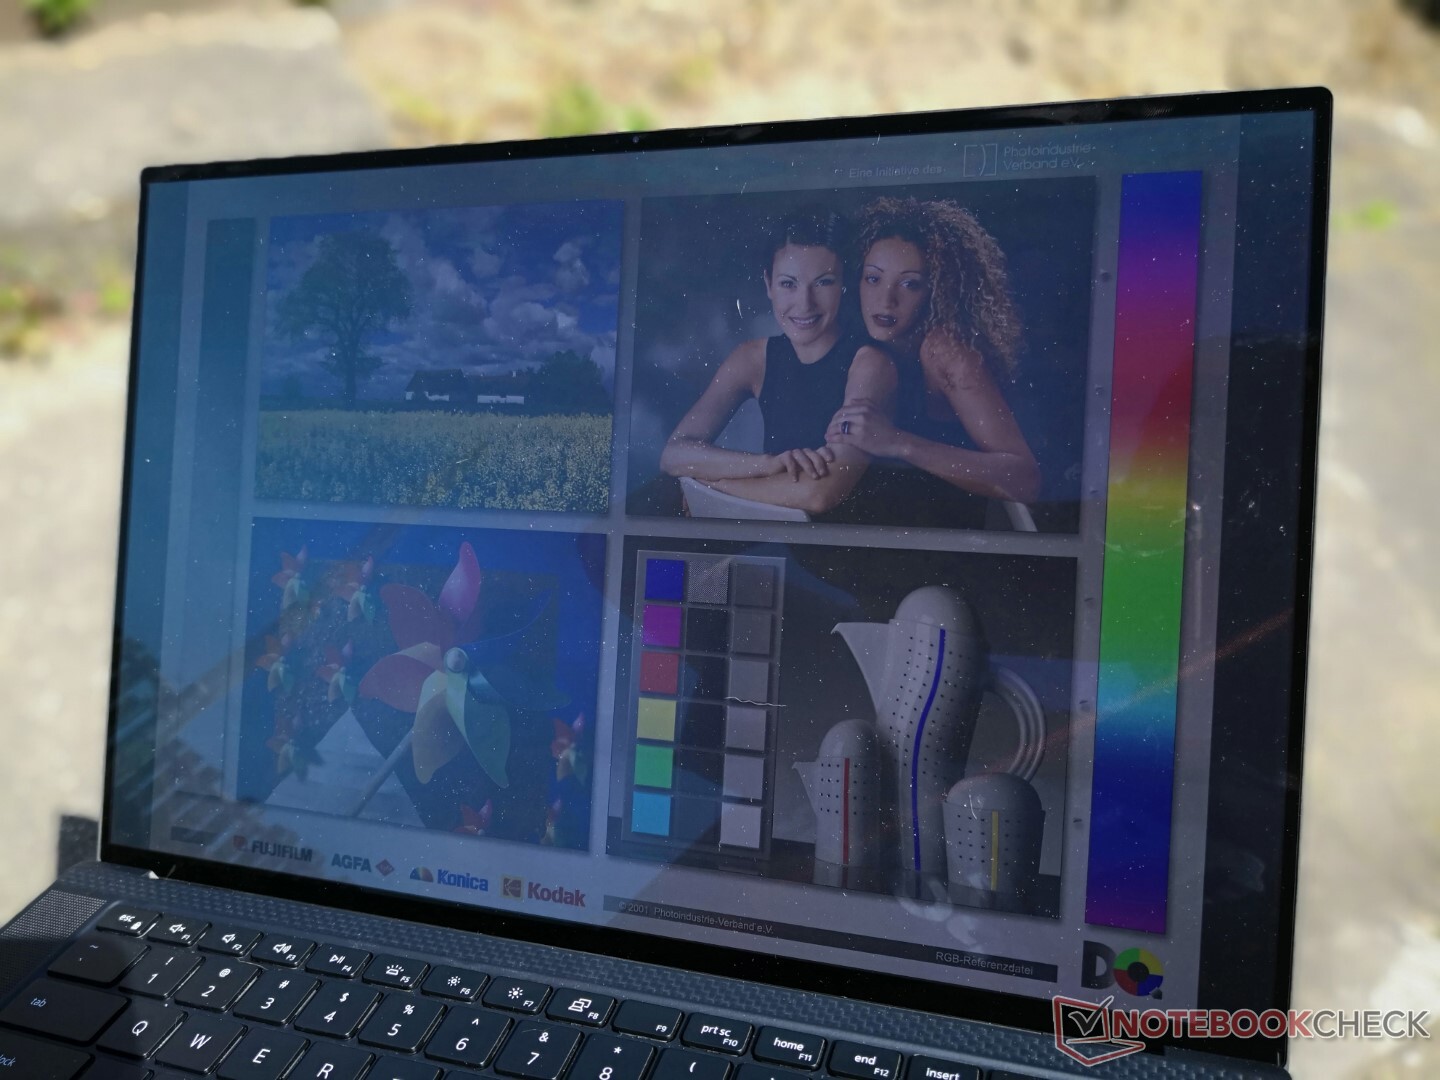
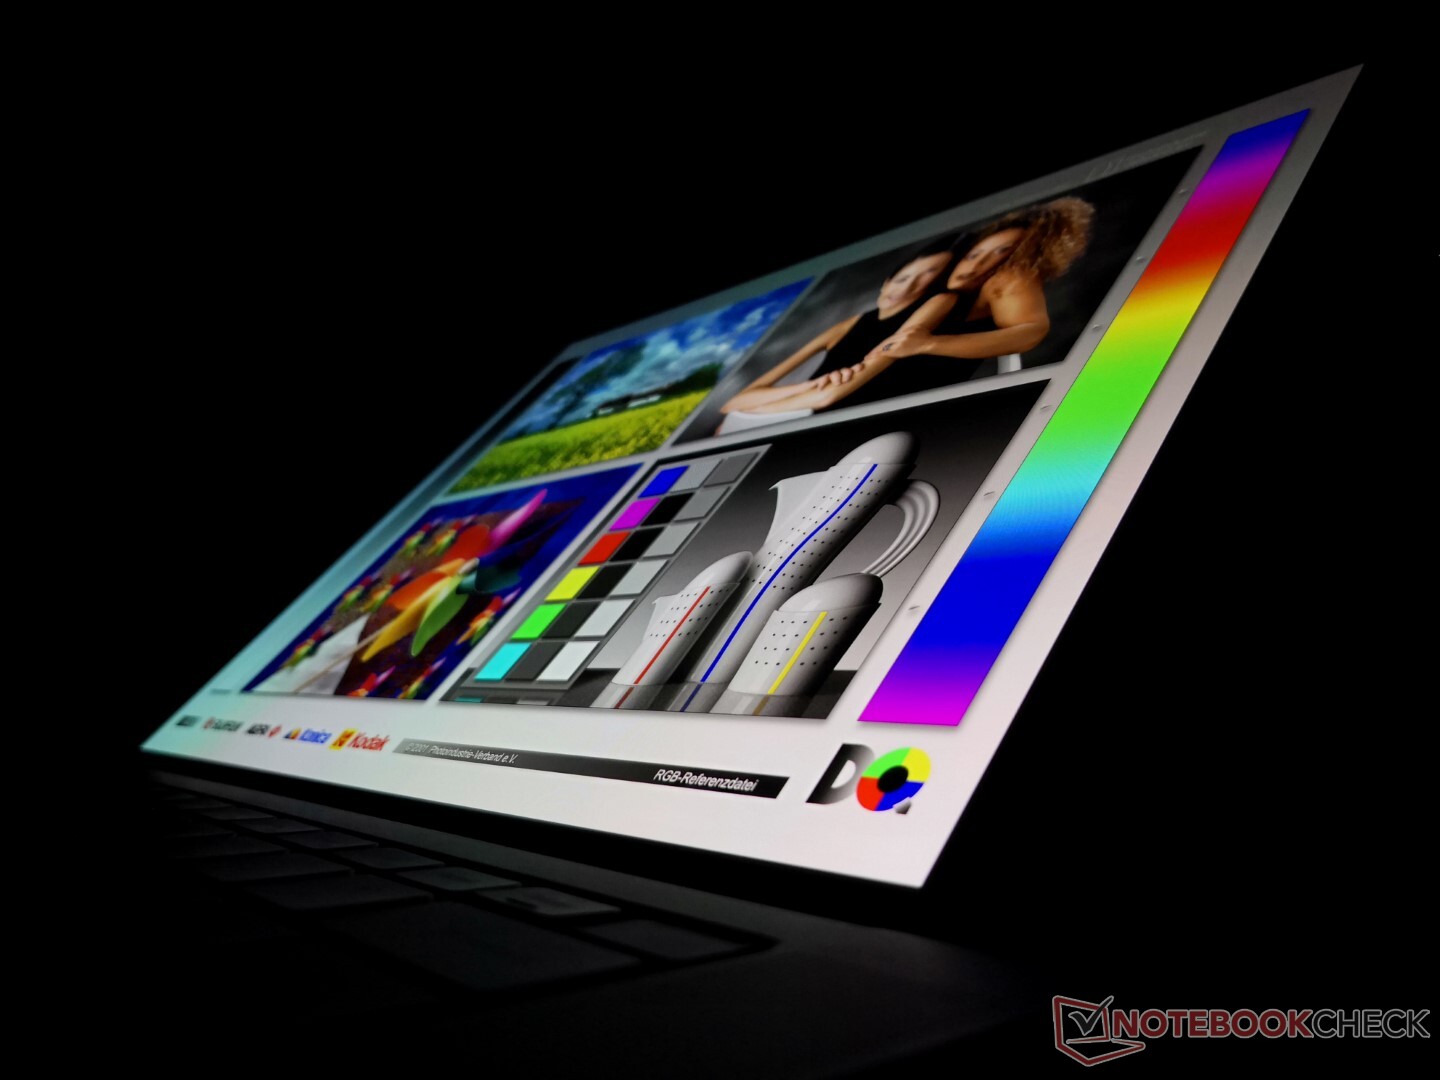
Display - Ungewöhnliches 3,5K-OLED
Unser Testgerät ist mit dem gleichen 3,5K-OLED-Touchscreen ausgestattet wie das XPS 15 9510 aus dem letzten Jahr, was bedeutet, dass sich das visuelle Erlebnis im Vergleich zum letzten Jahr nicht verändert hat. Eine IPS-Option mit niedrigerer Auflösung von 1.920x1.200 und eine IPS-Option mit höherer Auflösung von 3.840x2.400 sind ebenfalls verfügbar, aber leider sind alle Panels auf eine Bildwiederholfrequenz von 60 Hz beschränkt. Bestimmte Ultrabooks wie das Lenovo IdeaPad Slim 7i Pro oder das Asus Vivobook Pro 14 werden bereits mit schnelleren 90-Hz-Panels ausgeliefert, die eine deutlich flüssigere Benutzeroberfläche bieten.
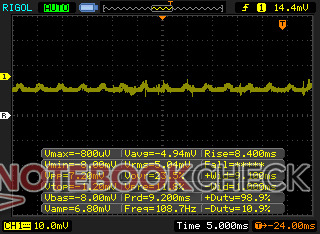
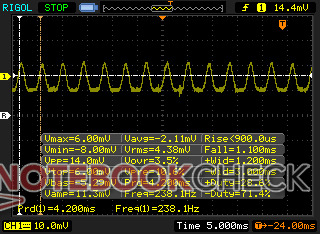
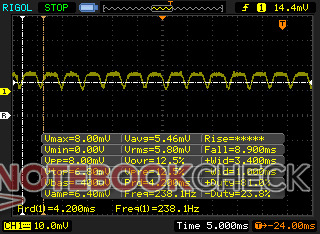
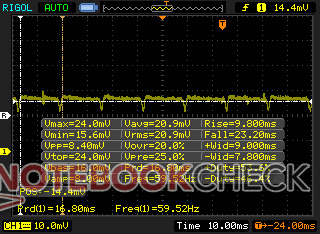
Beachten Sie, dass die Pulsweitenmodulation bei allen Helligkeitsstufen mit 238 Hz von 0 bis 25 % Helligkeit und mit 59 Hz von 26 bis 100 % Helligkeit vorhanden ist. Wenn Bildschirmflimmern ein Problem ist, empfehlen wir stattdessen die Konfiguration mit IPS.


| |||||||||||||||||||||||||
Ausleuchtung: 95 %
Helligkeit Akku: 381.4 cd/m²
Kontrast: ∞:1 (Schwarzwert: 0 cd/m²)
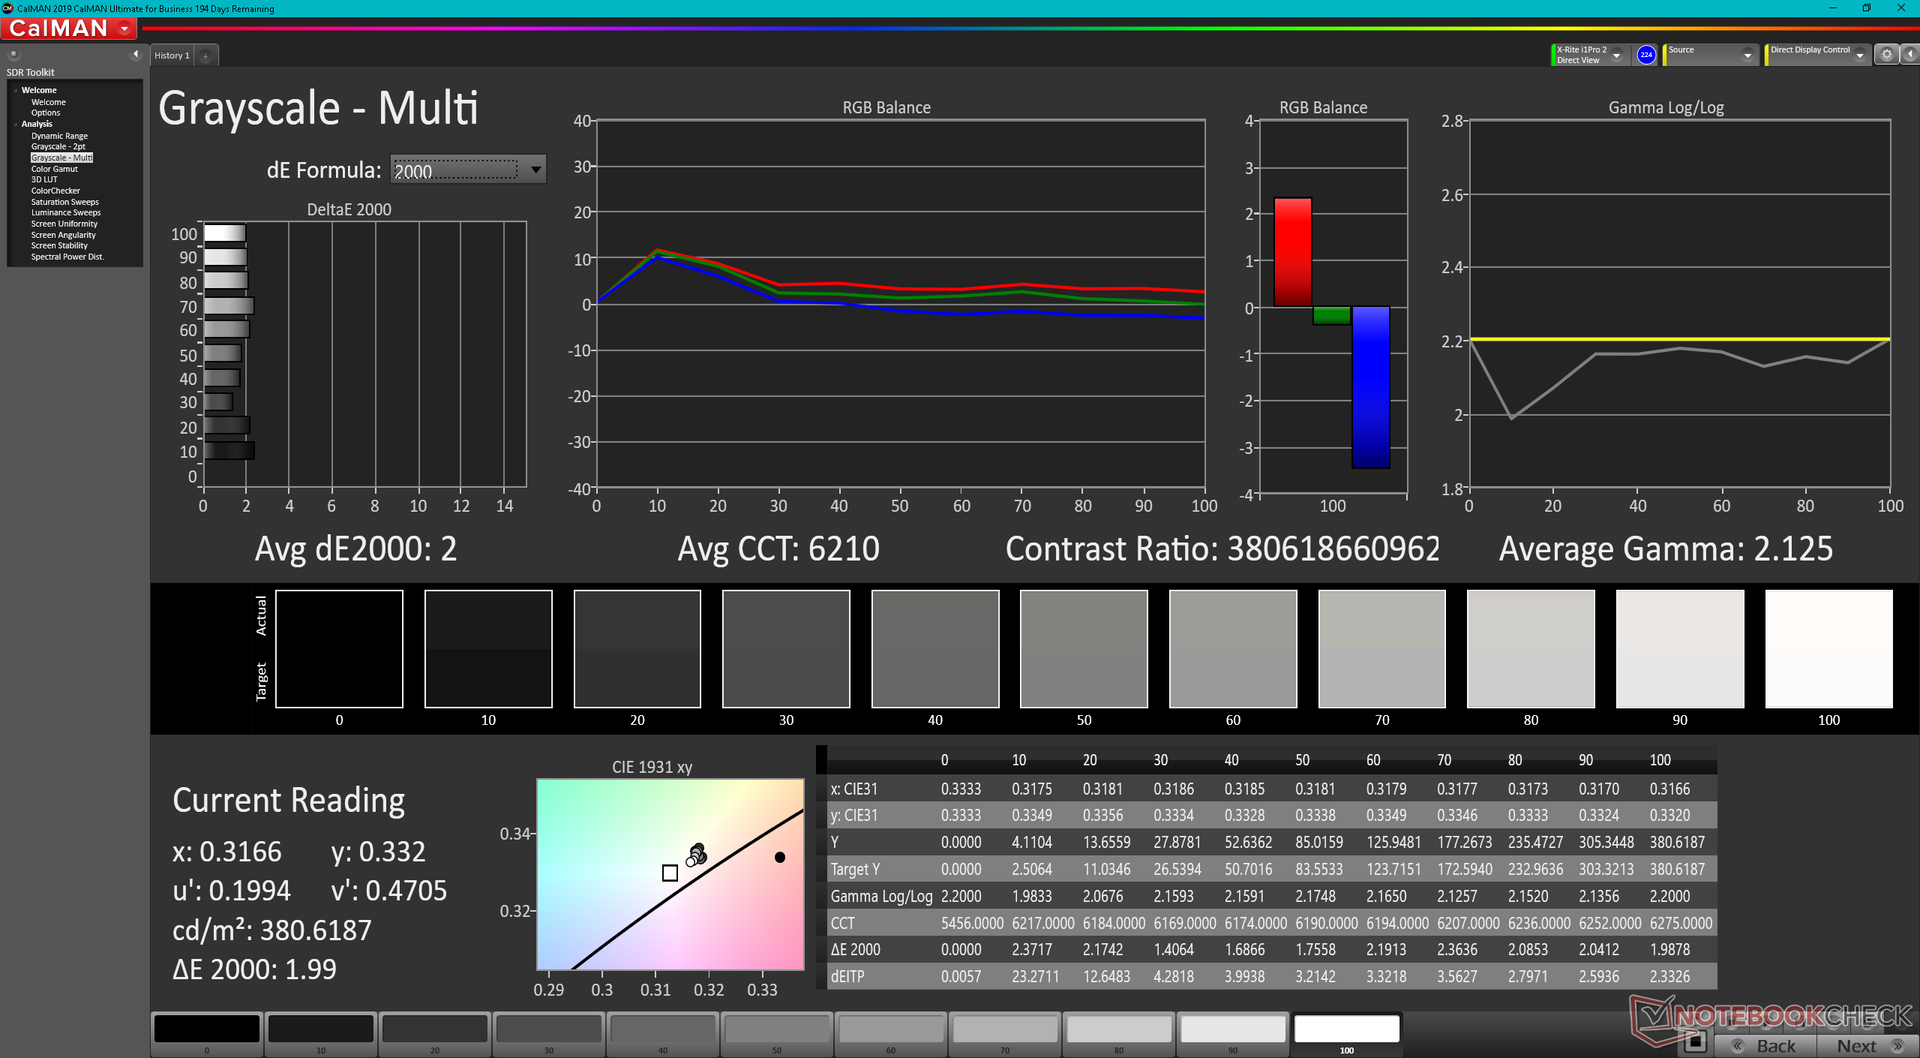
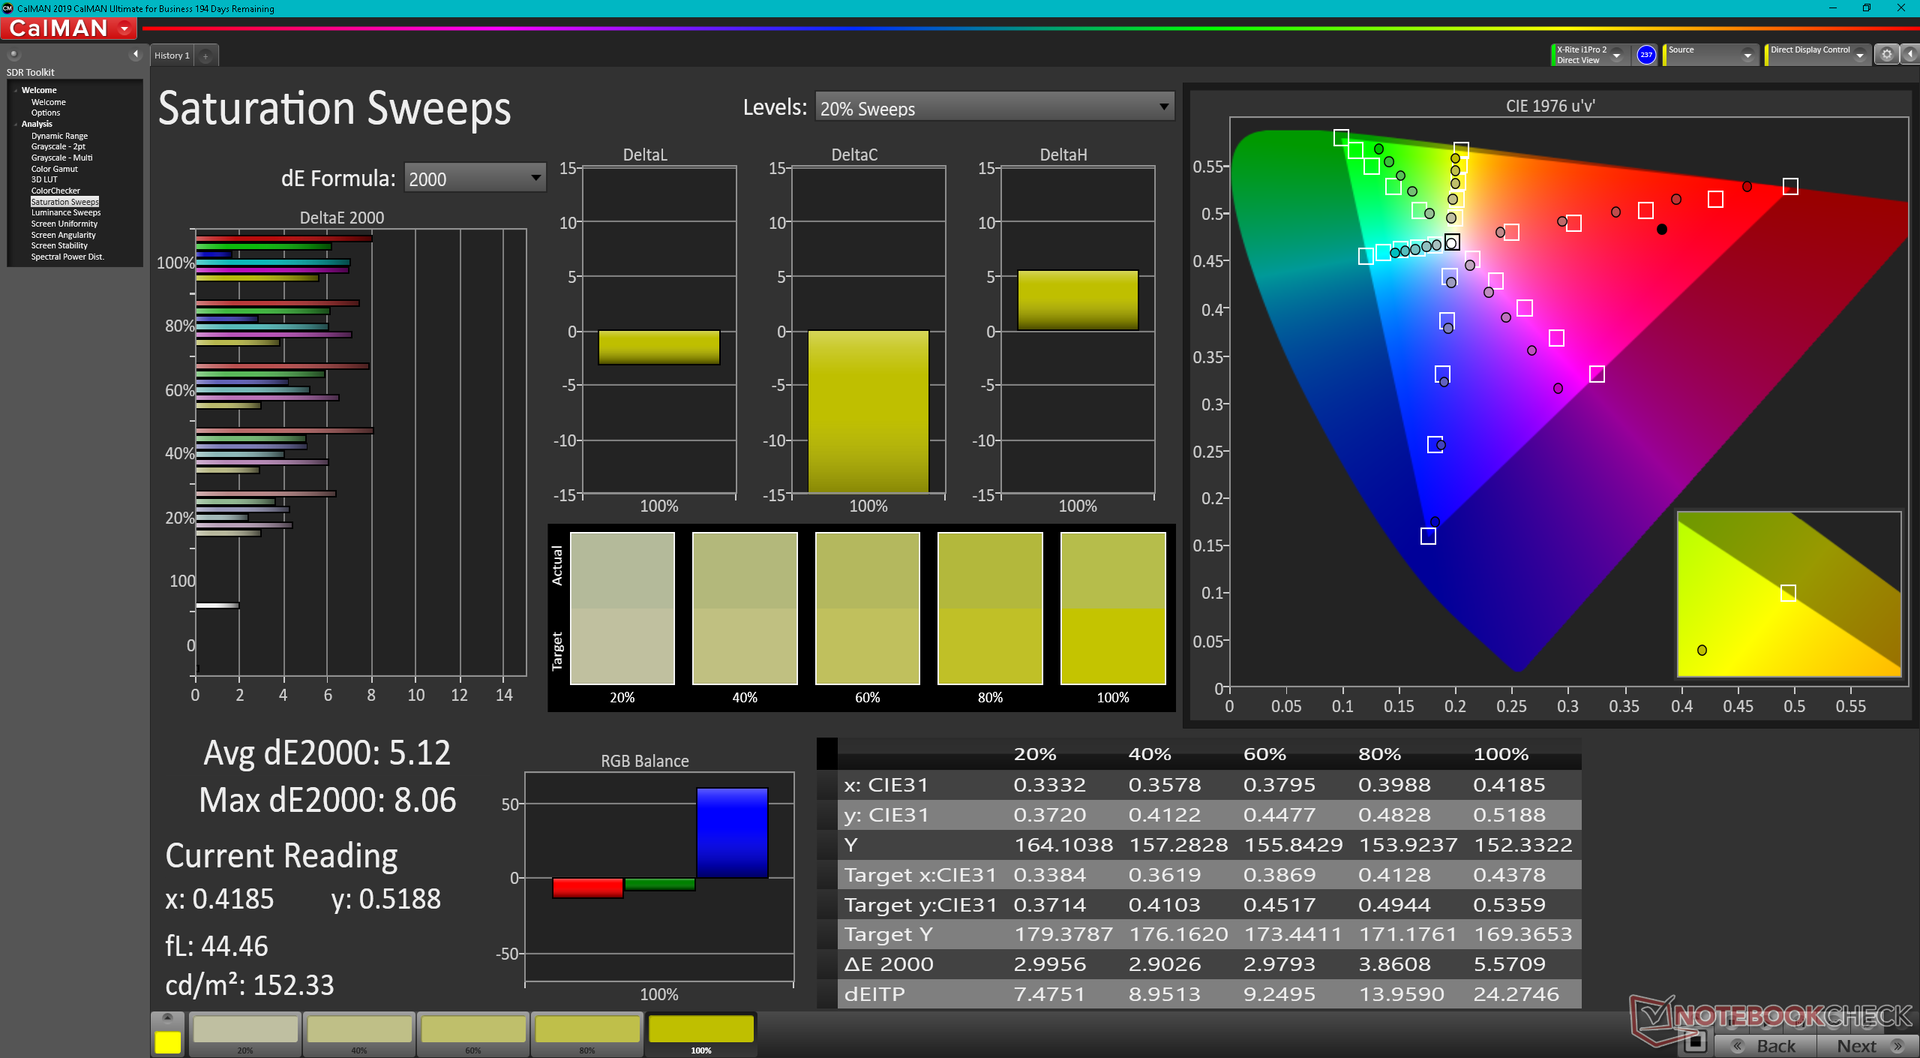
ΔE ColorChecker Calman: 4.34 | ∀{0.5-29.43 Ø4.72}
ΔE Greyscale Calman: 2 | ∀{0.09-98 Ø4.97}
86% AdobeRGB 1998 (Argyll 3D)
99.9% sRGB (Argyll 3D)
97.8% Display P3 (Argyll 3D)
Gamma: 2.13
CCT: 6210 K
| Dell XPS 15 9520 RTX 3050 Ti Samsung 156XG01, OLED, 3456x2160, 15.6" | Dell XPS 15 9510 11800H RTX 3050 Ti OLED SDC414D, OLED, 3456x2160, 15.6" | Dell XPS 15 9500 Core i7 4K UHD Sharp LQ156R1, IPS, 3840x2400, 15.6" | HP Spectre X360 15-5ZV31AV AU Optronics AUO30EB, IPS, 3840x2160, 15.6" | Asus Zenbook Pro 15 OLED UM535Q Samsung ATNA56YX03-0, OLED, 1920x1080, 15.6" | MSI Stealth 15M A11SEK Chi Mei N156HCE-EN1, IPS, 1920x1080, 15.6" | |
|---|---|---|---|---|---|---|
| Display | 5% | 3% | -19% | -7% | -23% | |
| Display P3 Coverage (%) | 97.8 | 99.9 2% | 89.7 -8% | 68.3 -30% | 79.3 -19% | 62 -37% |
| sRGB Coverage (%) | 99.9 | 100 0% | 100 0% | 94.3 -6% | 95.6 -4% | 93.4 -7% |
| AdobeRGB 1998 Coverage (%) | 86 | 98.1 14% | 99.8 16% | 68.4 -20% | 87.3 2% | 64.1 -25% |
| Response Times | -68% | -2195% | -2468% | -16% | -2079% | |
| Response Time Grey 50% / Grey 80% * (ms) | 1.9 ? | 3.6 ? -89% | 54 ? -2742% | 56.8 ? -2889% | 2.1 ? -11% | 47.6 ? -2405% |
| Response Time Black / White * (ms) | 1.9 ? | 2.8 ? -47% | 33.2 ? -1647% | 40.8 ? -2047% | 2.3 ? -21% | 35.2 ? -1753% |
| PWM Frequency (Hz) | 59.52 ? | 59.5 ? | 60.2 | 25000 ? | ||
| Bildschirm | 22% | 5% | -11% | 13% | -4% | |
| Helligkeit Bildmitte (cd/m²) | 381.4 | 362 -5% | 557.9 46% | 284.6 -25% | 342.9 -10% | 279 -27% |
| Brightness (cd/m²) | 384 | 367 -4% | 541 41% | 285 -26% | 346 -10% | 252 -34% |
| Brightness Distribution (%) | 95 | 97 2% | 91 -4% | 85 -11% | 98 3% | 82 -14% |
| Schwarzwert * (cd/m²) | 0.06 | 0.39 | 0.25 | 0.32 | ||
| Delta E Colorchecker * | 4.34 | 2.1 52% | 4.54 -5% | 3.52 19% | 2.42 44% | 1.72 60% |
| Colorchecker dE 2000 max. * | 9.24 | 4.1 56% | 7.92 14% | 5.56 40% | 4.05 56% | 5.62 39% |
| Delta E Graustufen * | 2 | 1.4 30% | 3.2 -60% | 3.2 -60% | 2.1 -5% | 2.9 -45% |
| Gamma | 2.13 103% | 2.18 101% | 1.99 111% | 2.28 96% | 2.21 100% | 2.3 96% |
| CCT | 6210 105% | 6608 98% | 6451 101% | 7070 92% | 6364 102% | 6700 97% |
| Kontrast (:1) | 6033 | 1431 | 1138 | 872 | ||
| Colorchecker dE 2000 calibrated * | 2.5 | 3.82 | 3 | 1.39 | ||
| Farbraum (Prozent von AdobeRGB 1998) (%) | 89.5 | 61.1 | 59 | |||
| Color Space (Percent of sRGB) (%) | 100 | 93.8 | 93.2 | |||
| Durchschnitt gesamt (Programm / Settings) | -14% /
1% | -729% /
-395% | -833% /
-460% | -3% /
2% | -702% /
-386% |
* ... kleinere Werte sind besser
Obwohl wir eine mindestens 98-prozentige DCI-P3-Abdeckung bestätigen können, wurden die Farben auf unserem Gerät nicht gut gegenüber dem Standard kalibriert, selbst wenn sie über die PremierColor Software auf DCI-P3 eingestellt wurden.
Reaktionszeiten (Response Times) des Displays
| ↔ Reaktionszeiten Schwarz zu Weiß | ||
|---|---|---|
| 1.9 ms ... steigend ↗ und fallend ↘ kombiniert | ↗ 1.1 ms steigend | 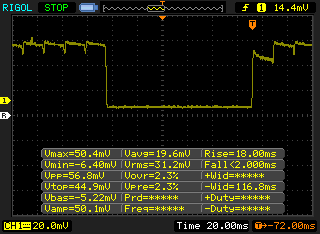 |
| ↘ 0.8 ms fallend | ||
| Die gemessenen Reaktionszeiten sind sehr kurz, wodurch sich der Bildschirm auch für schnelle 3D Spiele eignen sollte. Im Vergleich rangierten die bei uns getesteten Geräte von 0.1 (Minimum) zu 240 (Maximum) ms. » 11 % aller Screens waren schneller als der getestete. Daher sind die gemessenen Reaktionszeiten besser als der Durchschnitt aller vermessenen Geräte (19.8 ms). | ||
| ↔ Reaktionszeiten 50% Grau zu 80% Grau | ||
| 1.9 ms ... steigend ↗ und fallend ↘ kombiniert | ↗ 1.1 ms steigend | 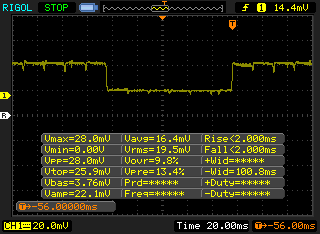 |
| ↘ 0.8 ms fallend | ||
| Die gemessenen Reaktionszeiten sind sehr kurz, wodurch sich der Bildschirm auch für schnelle 3D Spiele eignen sollte. Im Vergleich rangierten die bei uns getesteten Geräte von 0.165 (Minimum) zu 636 (Maximum) ms. » 9 % aller Screens waren schneller als der getestete. Daher sind die gemessenen Reaktionszeiten besser als der Durchschnitt aller vermessenen Geräte (31 ms). | ||
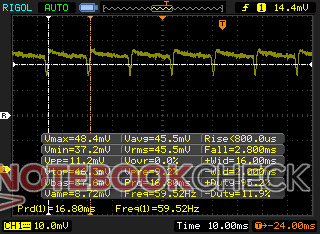
Bildschirm-Flackern / PWM (Pulse-Width Modulation)
| Flackern / PWM festgestellt | 59.52 Hz | ≤ 100 % Helligkeit | 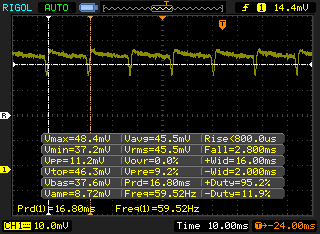 |
Das Display flackert mit 59.52 Hz (im schlimmsten Fall, eventuell durch Pulsweitenmodulation PWM) bei einer eingestellten Helligkeit von 100 % und darunter. Darüber sollte es zu keinem Flackern kommen. Die Frequenz von 59.52 Hz ist sehr gering und daher kann es bei allen Usern zu sichtbaren Flackern, brennenden Augen oder Kopfweh kommen. Im Vergleich: 52 % aller getesteten Geräte nutzten kein PWM um die Helligkeit zu reduzieren. Wenn PWM eingesetzt wurde, dann bei einer Frequenz von durchschnittlich 7781 (Minimum 5, Maximum 343500) Hz. | |||


Performance - Intel 12. Generation Optionen
Testbedingungen
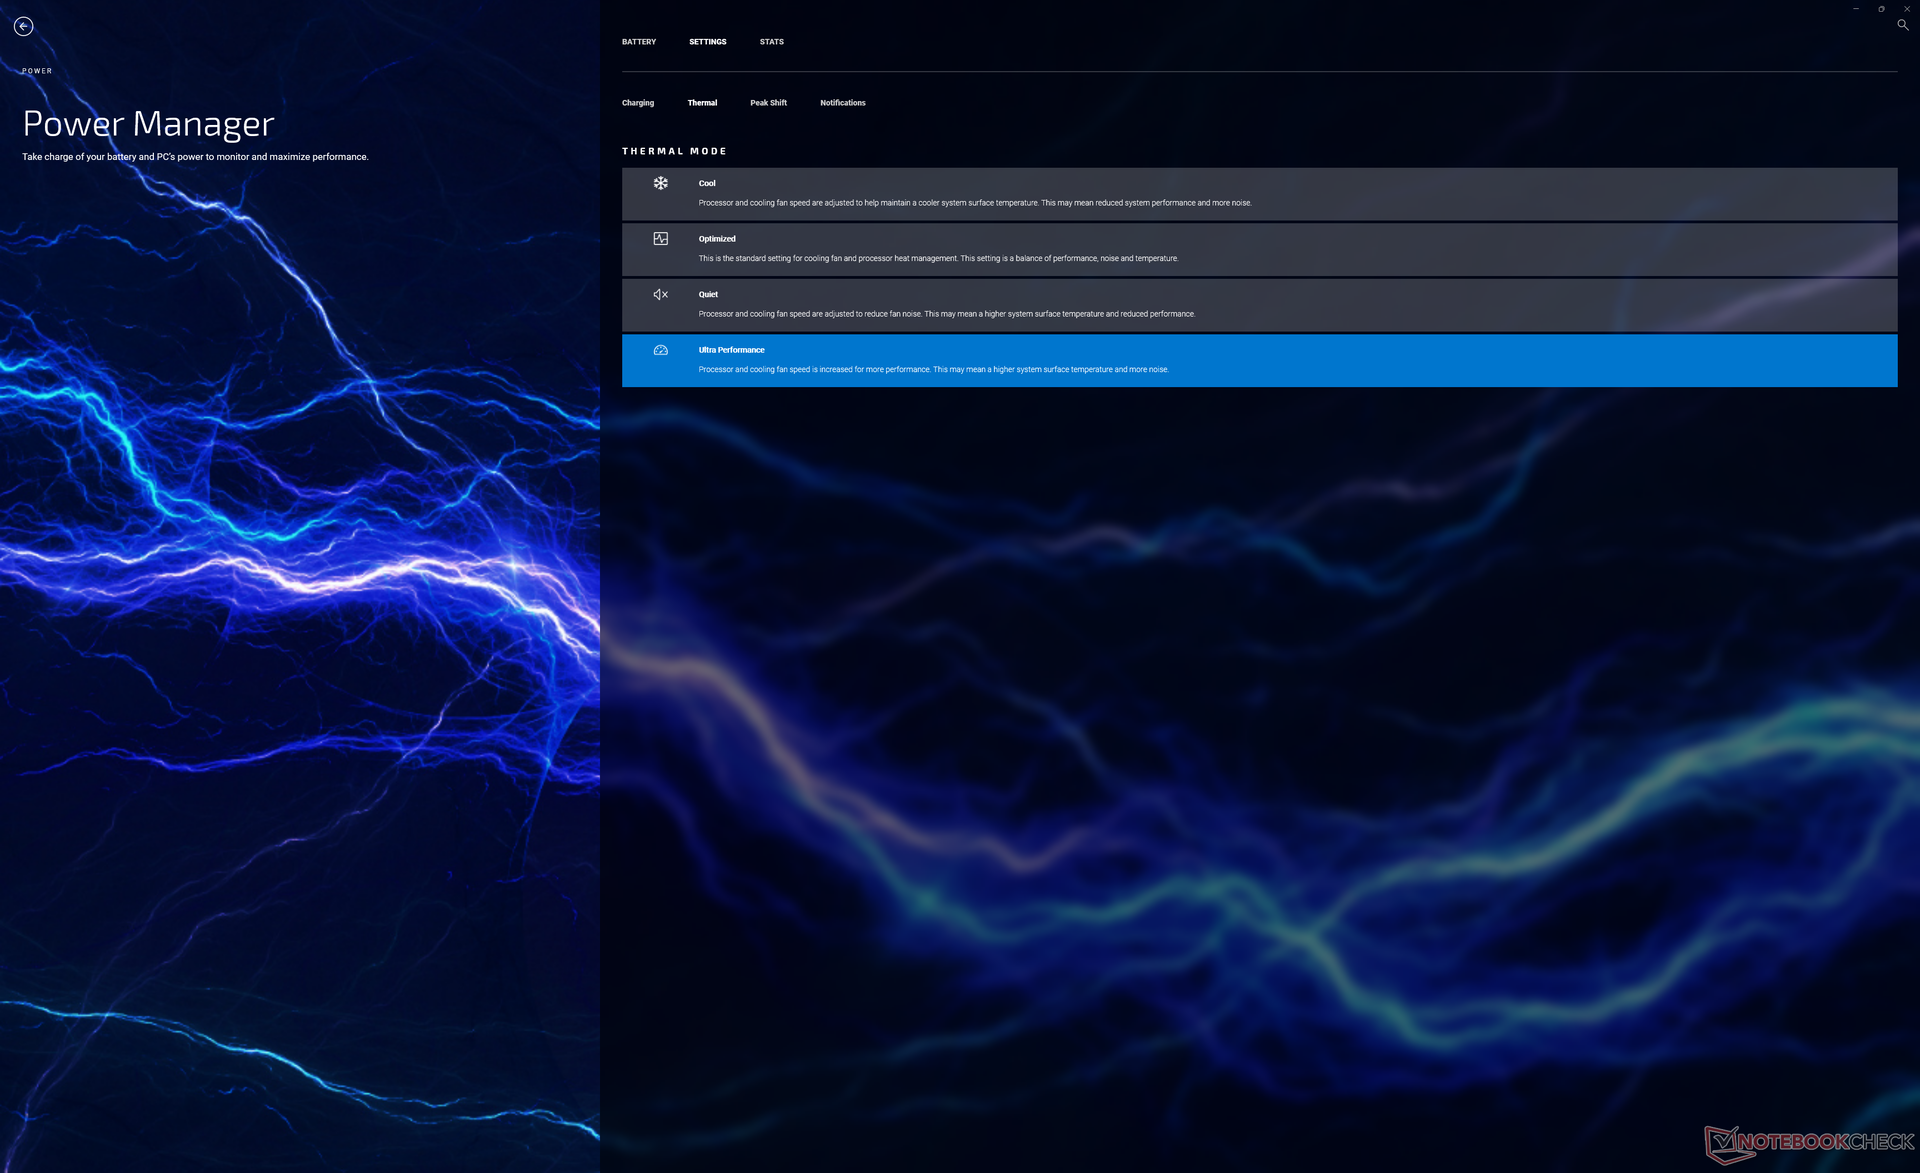
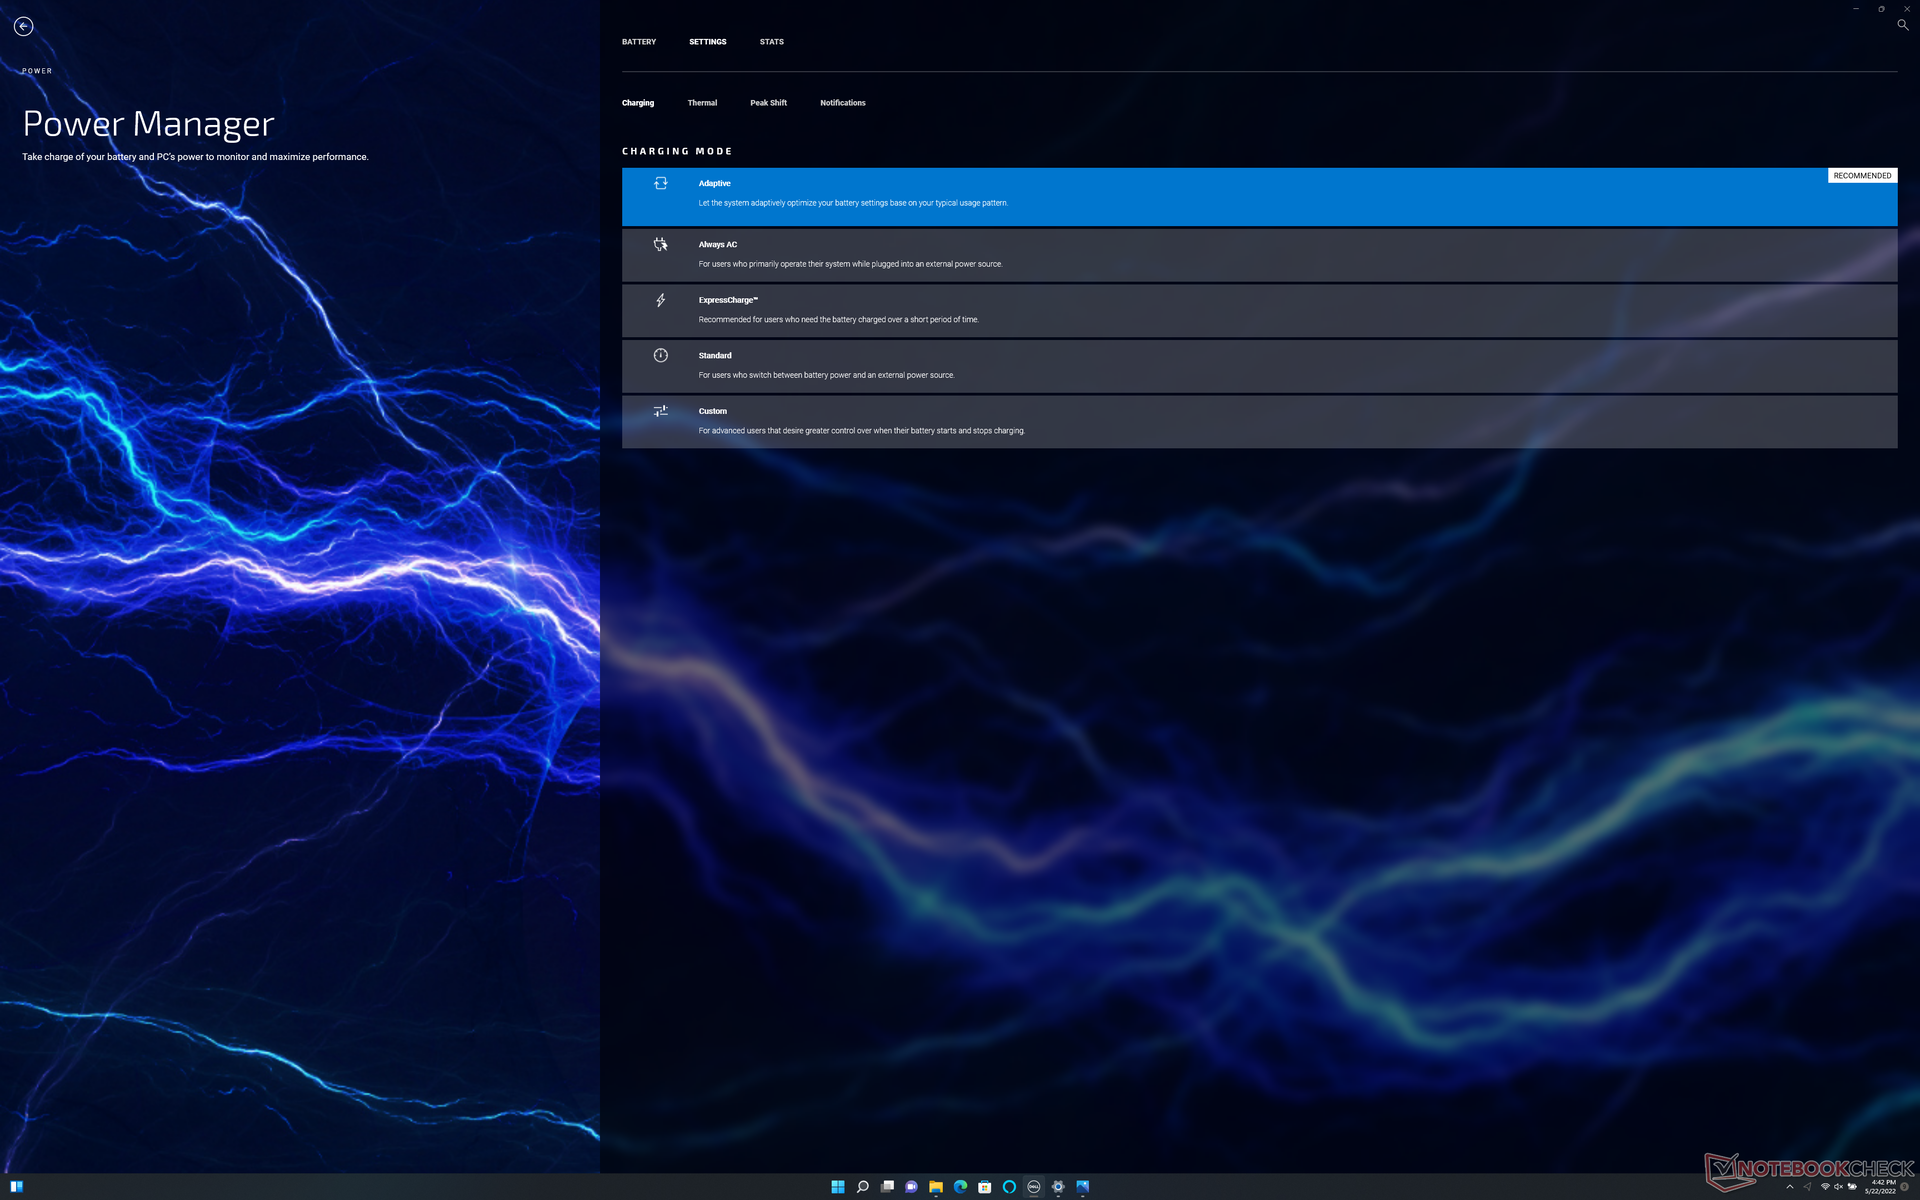
Unser Gerät wurde über Windows auf den Modus Performance und über die Anwendung My Dell auf den Modus Ultra Performance eingestellt, bevor wir die folgenden Benchmarks durchführten, um die bestmöglichen Ergebnisse zu erzielen. Beachten Sie, dass My Dell die ältere Dell-Power-Manager-Software ersetzt hat. Wir empfehlen den Benutzern, sich mit der neuen Anwendung vertraut zu machen, da sie die zentrale Anlaufstelle für Dell Updates und Leistungseinstellungen ist.
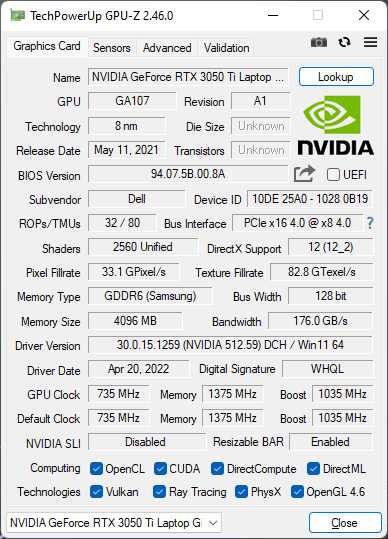
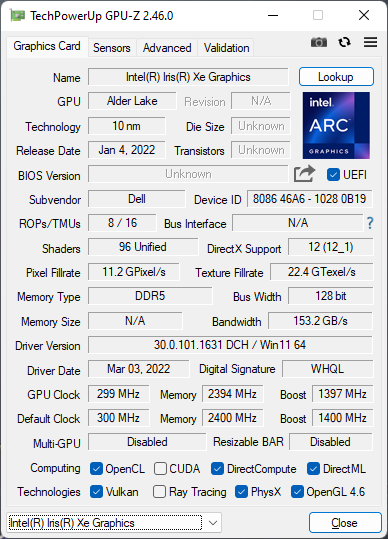
Die 45 W TGP GeForce RTX 3050 Ti GPU hat sich gegenüber dem vorherigen XPS 15 9510 nicht verändert. Es gibt erwartungsgemäß keinen MUX-Schalter oder adaptive Sync, da das XPS 15 nicht für Spiele konzipiert ist.
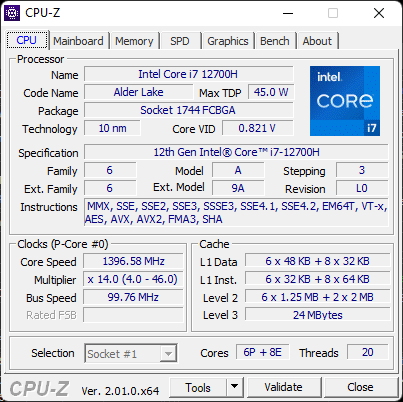
Prozessor
Die Steigerung der CPU-Leistung vom XPS 15 9510 zum 9520 ist deutlicher als die Steigerung der CPU-Leistung vom XPS 9500 zum 9510. Der Sprung vom Core i7-11800H im XPS 15 9510 auf den Core i7-12700H in unserem 9520 erzielt eine 35- bis 40-prozentige Steigerung der Multi-Thread-Leistung und eine 15- bis 20-prozentige Steigerung der Single-Thread-Leistung. Der Sprung reicht aus, um die Intel CPU der 12. Generation leicht vor den beliebten Ryzen 7 5800H zu treiben, der die meisten Intel-Core-H-CPUs der 11. Generation bei Multi-Thread-Workloads übertrifft.
Die CPU-Leistung hätte trotz der erwähnten Steigerung im Vergleich zum Vorjahr besser sein können. Im Vergleich zu den mehr als 20 anderen Laptops, die wir bisher mit der gleichen Core-i7-12700H-CPU getestet haben, ist die CPU in unserem XPS 15 9520 um etwa 5 bis 15 Prozent langsamer als der Durchschnitt. Die Ausführung von CineBench R15 xT in einer Schleife zeigt, dass die CPU im Dell nicht in der Lage ist, hohe Turbo-Boost-Taktraten so lange aufrechtzuerhalten wie die meisten anderen Laptops mit dem gleichen Prozessor. Modelle wie das Asus TUF Gaming F15 FX507ZM können dieselbe CPU bis zu 36 % schneller betreiben als unser Dell.
Cinebench R15 Multi Loop
Cinebench R23: Multi Core | Single Core
Cinebench R15: CPU Multi 64Bit | CPU Single 64Bit
Blender: v2.79 BMW27 CPU
7-Zip 18.03: 7z b 4 | 7z b 4 -mmt1
Geekbench 5.5: Multi-Core | Single-Core
HWBOT x265 Benchmark v2.2: 4k Preset
LibreOffice : 20 Documents To PDF
R Benchmark 2.5: Overall mean
| Cinebench R23 / Multi Core | |
| Corsair One i300 | |
| Asus TUF Gaming F15 FX507ZM | |
| MSI Vector GP66 12UGS | |
| Durchschnittliche Intel Core i7-12700H (4032 - 19330, n=64) | |
| Dell XPS 15 9520 RTX 3050 Ti | |
| Asus Zenbook Pro 15 OLED UM535Q | |
| MSI Alpha 15 B5EEK-008 | |
| Dell XPS 15 9510 11800H RTX 3050 Ti OLED | |
| Lenovo Legion 5 15ACH6A-82NW0010GE | |
| MSI Stealth 15M A11SEK | |
| Cinebench R23 / Single Core | |
| Corsair One i300 | |
| MSI Vector GP66 12UGS | |
| Dell XPS 15 9520 RTX 3050 Ti | |
| Asus TUF Gaming F15 FX507ZM | |
| Durchschnittliche Intel Core i7-12700H (778 - 1826, n=63) | |
| MSI Stealth 15M A11SEK | |
| Dell XPS 15 9510 11800H RTX 3050 Ti OLED | |
| Asus Zenbook Pro 15 OLED UM535Q | |
| MSI Alpha 15 B5EEK-008 | |
| Lenovo Legion 5 15ACH6A-82NW0010GE | |
| HWBOT x265 Benchmark v2.2 / 4k Preset | |
| Corsair One i300 | |
| Asus TUF Gaming F15 FX507ZM | |
| MSI Vector GP66 12UGS | |
| Durchschnittliche Intel Core i7-12700H (4.67 - 21.8, n=64) | |
| MSI Alpha 15 B5EEK-008 | |
| Asus Zenbook Pro 15 OLED UM535Q | |
| Dell XPS 15 9520 RTX 3050 Ti | |
| Lenovo Legion 5 15ACH6A-82NW0010GE | |
| Dell XPS 15 9510 11800H RTX 3050 Ti OLED | |
| Dell XPS 15 9500 Core i7 4K UHD | |
| MSI Stealth 15M A11SEK | |
| LibreOffice / 20 Documents To PDF | |
| MSI Alpha 15 B5EEK-008 | |
| Lenovo Legion 5 15ACH6A-82NW0010GE | |
| Dell XPS 15 9500 Core i7 4K UHD | |
| MSI Stealth 15M A11SEK | |
| Asus TUF Gaming F15 FX507ZM | |
| Asus Zenbook Pro 15 OLED UM535Q | |
| Dell XPS 15 9510 11800H RTX 3050 Ti OLED | |
| Durchschnittliche Intel Core i7-12700H (34.2 - 95.3, n=63) | |
| Dell XPS 15 9520 RTX 3050 Ti | |
| MSI Vector GP66 12UGS | |
| Corsair One i300 | |
* ... kleinere Werte sind besser
AIDA64: FP32 Ray-Trace | FPU Julia | CPU SHA3 | CPU Queen | FPU SinJulia | FPU Mandel | CPU AES | CPU ZLib | FP64 Ray-Trace | CPU PhotoWorxx
| Performance Rating | |
| Asus Zenbook Pro 15 OLED UM535Q | |
| Durchschnittliche Intel Core i7-12700H | |
| Dell XPS 15 9520 RTX 3050 Ti | |
| Dell XPS 15 9500 Core i7 4K UHD | |
| Dell XPS 15 9510 11800H RTX 3050 Ti OLED -9! | |
| AIDA64 / FP32 Ray-Trace | |
| Asus Zenbook Pro 15 OLED UM535Q | |
| Durchschnittliche Intel Core i7-12700H (2585 - 17957, n=64) | |
| Dell XPS 15 9500 Core i7 4K UHD | |
| Dell XPS 15 9520 RTX 3050 Ti | |
| AIDA64 / FPU Julia | |
| Asus Zenbook Pro 15 OLED UM535Q | |
| Dell XPS 15 9500 Core i7 4K UHD | |
| Durchschnittliche Intel Core i7-12700H (12439 - 90760, n=64) | |
| Dell XPS 15 9520 RTX 3050 Ti | |
| AIDA64 / CPU SHA3 | |
| Asus Zenbook Pro 15 OLED UM535Q | |
| Durchschnittliche Intel Core i7-12700H (833 - 4242, n=64) | |
| Dell XPS 15 9500 Core i7 4K UHD | |
| Dell XPS 15 9520 RTX 3050 Ti | |
| AIDA64 / CPU Queen | |
| Asus Zenbook Pro 15 OLED UM535Q | |
| Dell XPS 15 9520 RTX 3050 Ti | |
| Durchschnittliche Intel Core i7-12700H (57923 - 103202, n=63) | |
| Dell XPS 15 9500 Core i7 4K UHD | |
| AIDA64 / FPU SinJulia | |
| Asus Zenbook Pro 15 OLED UM535Q | |
| Dell XPS 15 9500 Core i7 4K UHD | |
| Durchschnittliche Intel Core i7-12700H (3249 - 9939, n=64) | |
| Dell XPS 15 9520 RTX 3050 Ti | |
| AIDA64 / FPU Mandel | |
| Asus Zenbook Pro 15 OLED UM535Q | |
| Dell XPS 15 9500 Core i7 4K UHD | |
| Durchschnittliche Intel Core i7-12700H (7135 - 44760, n=64) | |
| Dell XPS 15 9520 RTX 3050 Ti | |
| AIDA64 / CPU AES | |
| Asus Zenbook Pro 15 OLED UM535Q | |
| Durchschnittliche Intel Core i7-12700H (31839 - 144360, n=64) | |
| Dell XPS 15 9520 RTX 3050 Ti | |
| Dell XPS 15 9500 Core i7 4K UHD | |
| AIDA64 / CPU ZLib | |
| Durchschnittliche Intel Core i7-12700H (305 - 1171, n=64) | |
| Dell XPS 15 9520 RTX 3050 Ti | |
| Asus Zenbook Pro 15 OLED UM535Q | |
| Dell XPS 15 9500 Core i7 4K UHD | |
| Dell XPS 15 9510 11800H RTX 3050 Ti OLED | |
| AIDA64 / FP64 Ray-Trace | |
| Asus Zenbook Pro 15 OLED UM535Q | |
| Durchschnittliche Intel Core i7-12700H (1437 - 9692, n=64) | |
| Dell XPS 15 9520 RTX 3050 Ti | |
| Dell XPS 15 9500 Core i7 4K UHD | |
| AIDA64 / CPU PhotoWorxx | |
| Dell XPS 15 9520 RTX 3050 Ti | |
| Durchschnittliche Intel Core i7-12700H (12863 - 52207, n=64) | |
| Dell XPS 15 9500 Core i7 4K UHD | |
| Asus Zenbook Pro 15 OLED UM535Q | |
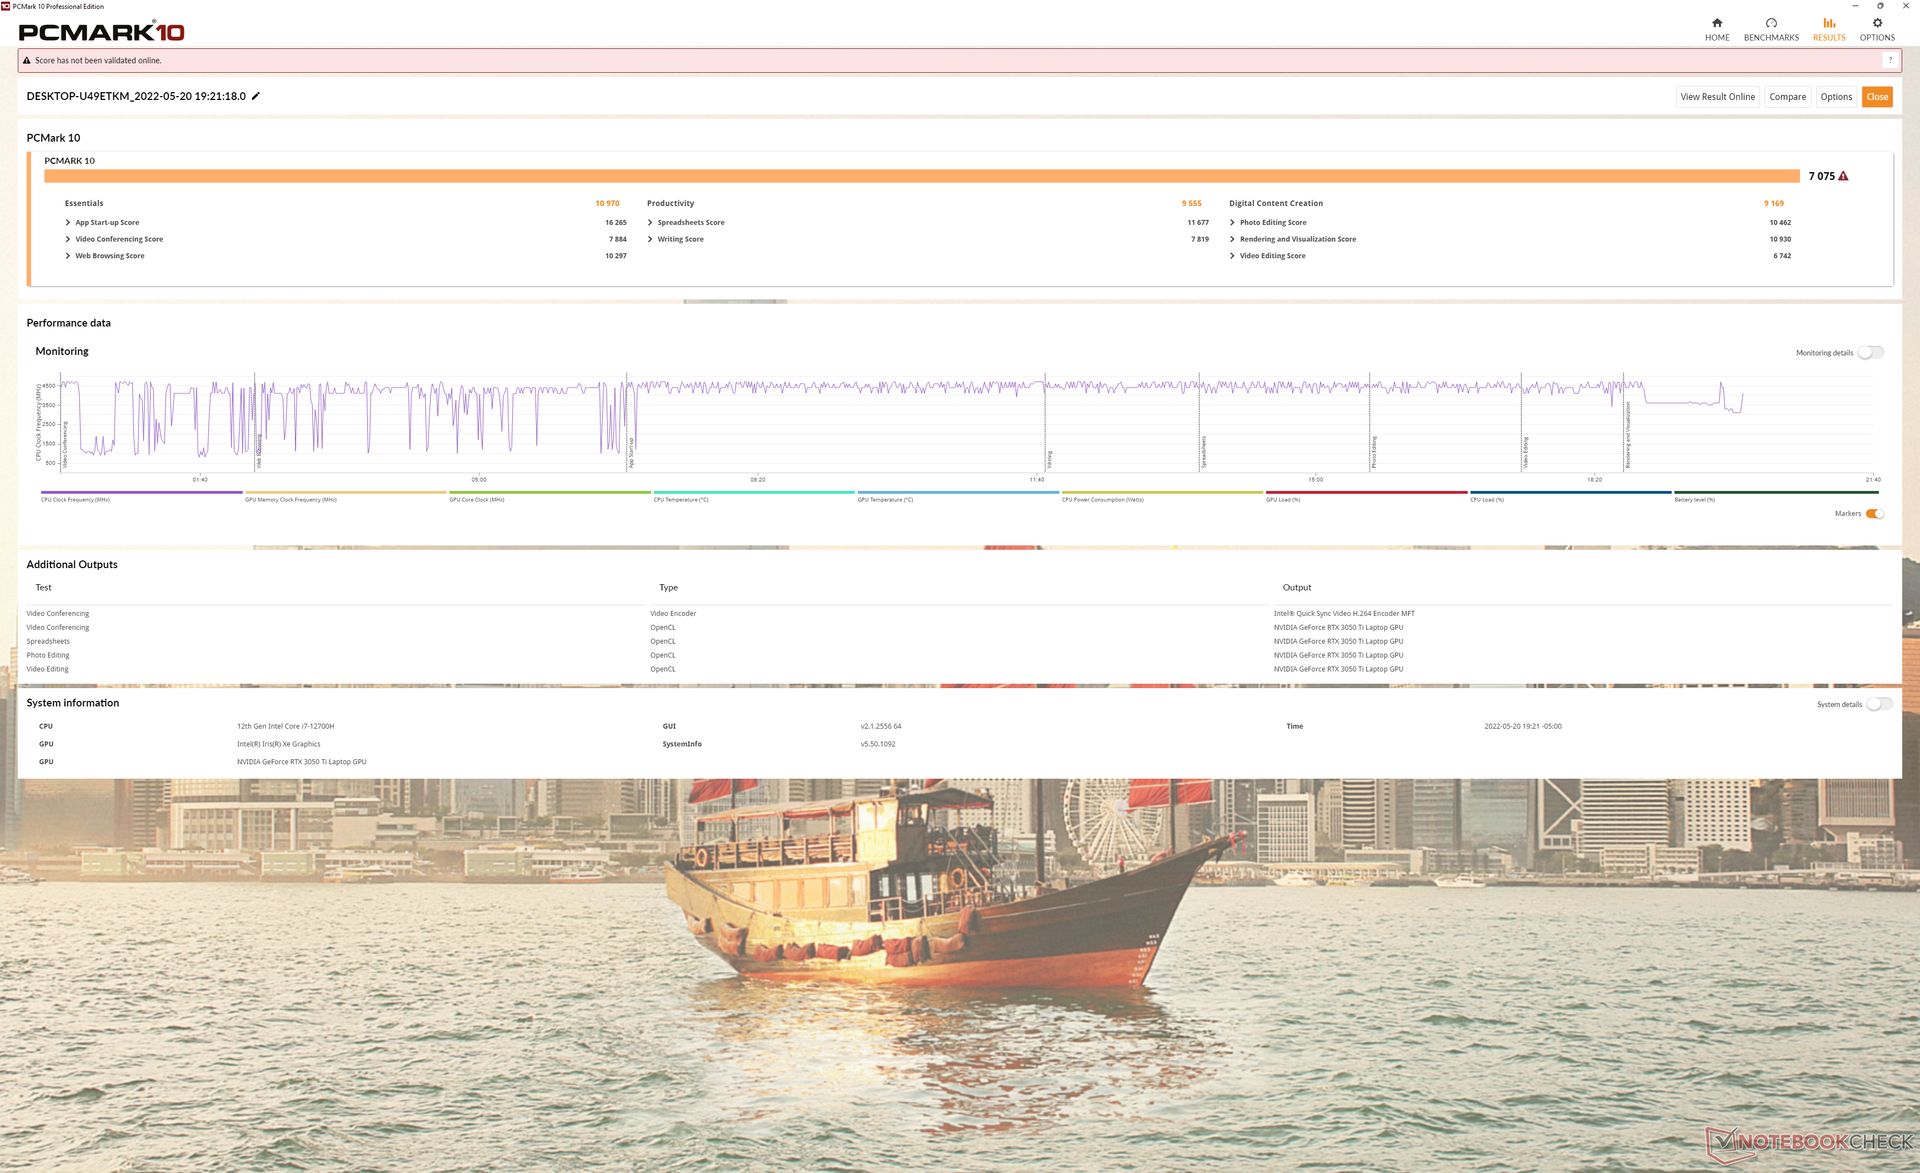
System Performance
Die Ergebnisse des PCMark 10 sind durchweg besser als bei den älteren XPS 15 9510 und 9500, was vor allem auf die höhere CPU- und SSD-Leistung zurückzuführen ist.
CrossMark: Overall | Productivity | Creativity | Responsiveness
| PCMark 10 / Score | |
| Dell XPS 15 9520 RTX 3050 Ti | |
| Durchschnittliche Intel Core i7-12700H, NVIDIA GeForce RTX 3050 Ti Laptop GPU (6623 - 7075, n=5) | |
| Asus Zenbook Pro 15 OLED UM535Q | |
| Dell XPS 15 9510 11800H RTX 3050 Ti OLED | |
| MSI Stealth 15M A11SEK | |
| Dell XPS 15 9500 Core i7 4K UHD | |
| HP Spectre X360 15-5ZV31AV | |
| PCMark 10 / Essentials | |
| Dell XPS 15 9520 RTX 3050 Ti | |
| Asus Zenbook Pro 15 OLED UM535Q | |
| Durchschnittliche Intel Core i7-12700H, NVIDIA GeForce RTX 3050 Ti Laptop GPU (9540 - 10970, n=5) | |
| Dell XPS 15 9500 Core i7 4K UHD | |
| MSI Stealth 15M A11SEK | |
| Dell XPS 15 9510 11800H RTX 3050 Ti OLED | |
| HP Spectre X360 15-5ZV31AV | |
| PCMark 10 / Productivity | |
| Asus Zenbook Pro 15 OLED UM535Q | |
| Dell XPS 15 9520 RTX 3050 Ti | |
| Durchschnittliche Intel Core i7-12700H, NVIDIA GeForce RTX 3050 Ti Laptop GPU (8530 - 9555, n=5) | |
| MSI Stealth 15M A11SEK | |
| Dell XPS 15 9510 11800H RTX 3050 Ti OLED | |
| Dell XPS 15 9500 Core i7 4K UHD | |
| HP Spectre X360 15-5ZV31AV | |
| PCMark 10 / Digital Content Creation | |
| Durchschnittliche Intel Core i7-12700H, NVIDIA GeForce RTX 3050 Ti Laptop GPU (8855 - 9542, n=5) | |
| Dell XPS 15 9520 RTX 3050 Ti | |
| Asus Zenbook Pro 15 OLED UM535Q | |
| Dell XPS 15 9510 11800H RTX 3050 Ti OLED | |
| MSI Stealth 15M A11SEK | |
| Dell XPS 15 9500 Core i7 4K UHD | |
| HP Spectre X360 15-5ZV31AV | |
| CrossMark / Overall | |
| Dell XPS 15 9520 RTX 3050 Ti | |
| Durchschnittliche Intel Core i7-12700H, NVIDIA GeForce RTX 3050 Ti Laptop GPU (1654 - 1872, n=5) | |
| Asus Zenbook Pro 15 OLED UM535Q | |
| CrossMark / Productivity | |
| Dell XPS 15 9520 RTX 3050 Ti | |
| Durchschnittliche Intel Core i7-12700H, NVIDIA GeForce RTX 3050 Ti Laptop GPU (1595 - 1792, n=5) | |
| Asus Zenbook Pro 15 OLED UM535Q | |
| CrossMark / Creativity | |
| Dell XPS 15 9520 RTX 3050 Ti | |
| Durchschnittliche Intel Core i7-12700H, NVIDIA GeForce RTX 3050 Ti Laptop GPU (1699 - 1993, n=5) | |
| Asus Zenbook Pro 15 OLED UM535Q | |
| CrossMark / Responsiveness | |
| Dell XPS 15 9520 RTX 3050 Ti | |
| Durchschnittliche Intel Core i7-12700H, NVIDIA GeForce RTX 3050 Ti Laptop GPU (1383 - 1768, n=5) | |
| Asus Zenbook Pro 15 OLED UM535Q | |
| PCMark 10 Score | 7075 Punkte | |
Hilfe | ||
| AIDA64 / Memory Copy | |
| Dell XPS 15 9520 RTX 3050 Ti | |
| Durchschnittliche Intel Core i7-12700H (25615 - 80511, n=64) | |
| Asus Zenbook Pro 15 OLED UM535Q | |
| Dell XPS 15 9500 Core i7 4K UHD | |
| AIDA64 / Memory Read | |
| Dell XPS 15 9520 RTX 3050 Ti | |
| Durchschnittliche Intel Core i7-12700H (25586 - 79442, n=64) | |
| Asus Zenbook Pro 15 OLED UM535Q | |
| Dell XPS 15 9500 Core i7 4K UHD | |
| AIDA64 / Memory Write | |
| Dell XPS 15 9520 RTX 3050 Ti | |
| Durchschnittliche Intel Core i7-12700H (23679 - 88660, n=64) | |
| Asus Zenbook Pro 15 OLED UM535Q | |
| Dell XPS 15 9500 Core i7 4K UHD | |
| AIDA64 / Memory Latency | |
| Dell XPS 15 9520 RTX 3050 Ti | |
| Asus Zenbook Pro 15 OLED UM535Q | |
| Durchschnittliche Intel Core i7-12700H (76.2 - 133.9, n=62) | |
| Dell XPS 15 9500 Core i7 4K UHD | |
| Dell XPS 15 9510 11800H RTX 3050 Ti OLED | |
* ... kleinere Werte sind besser
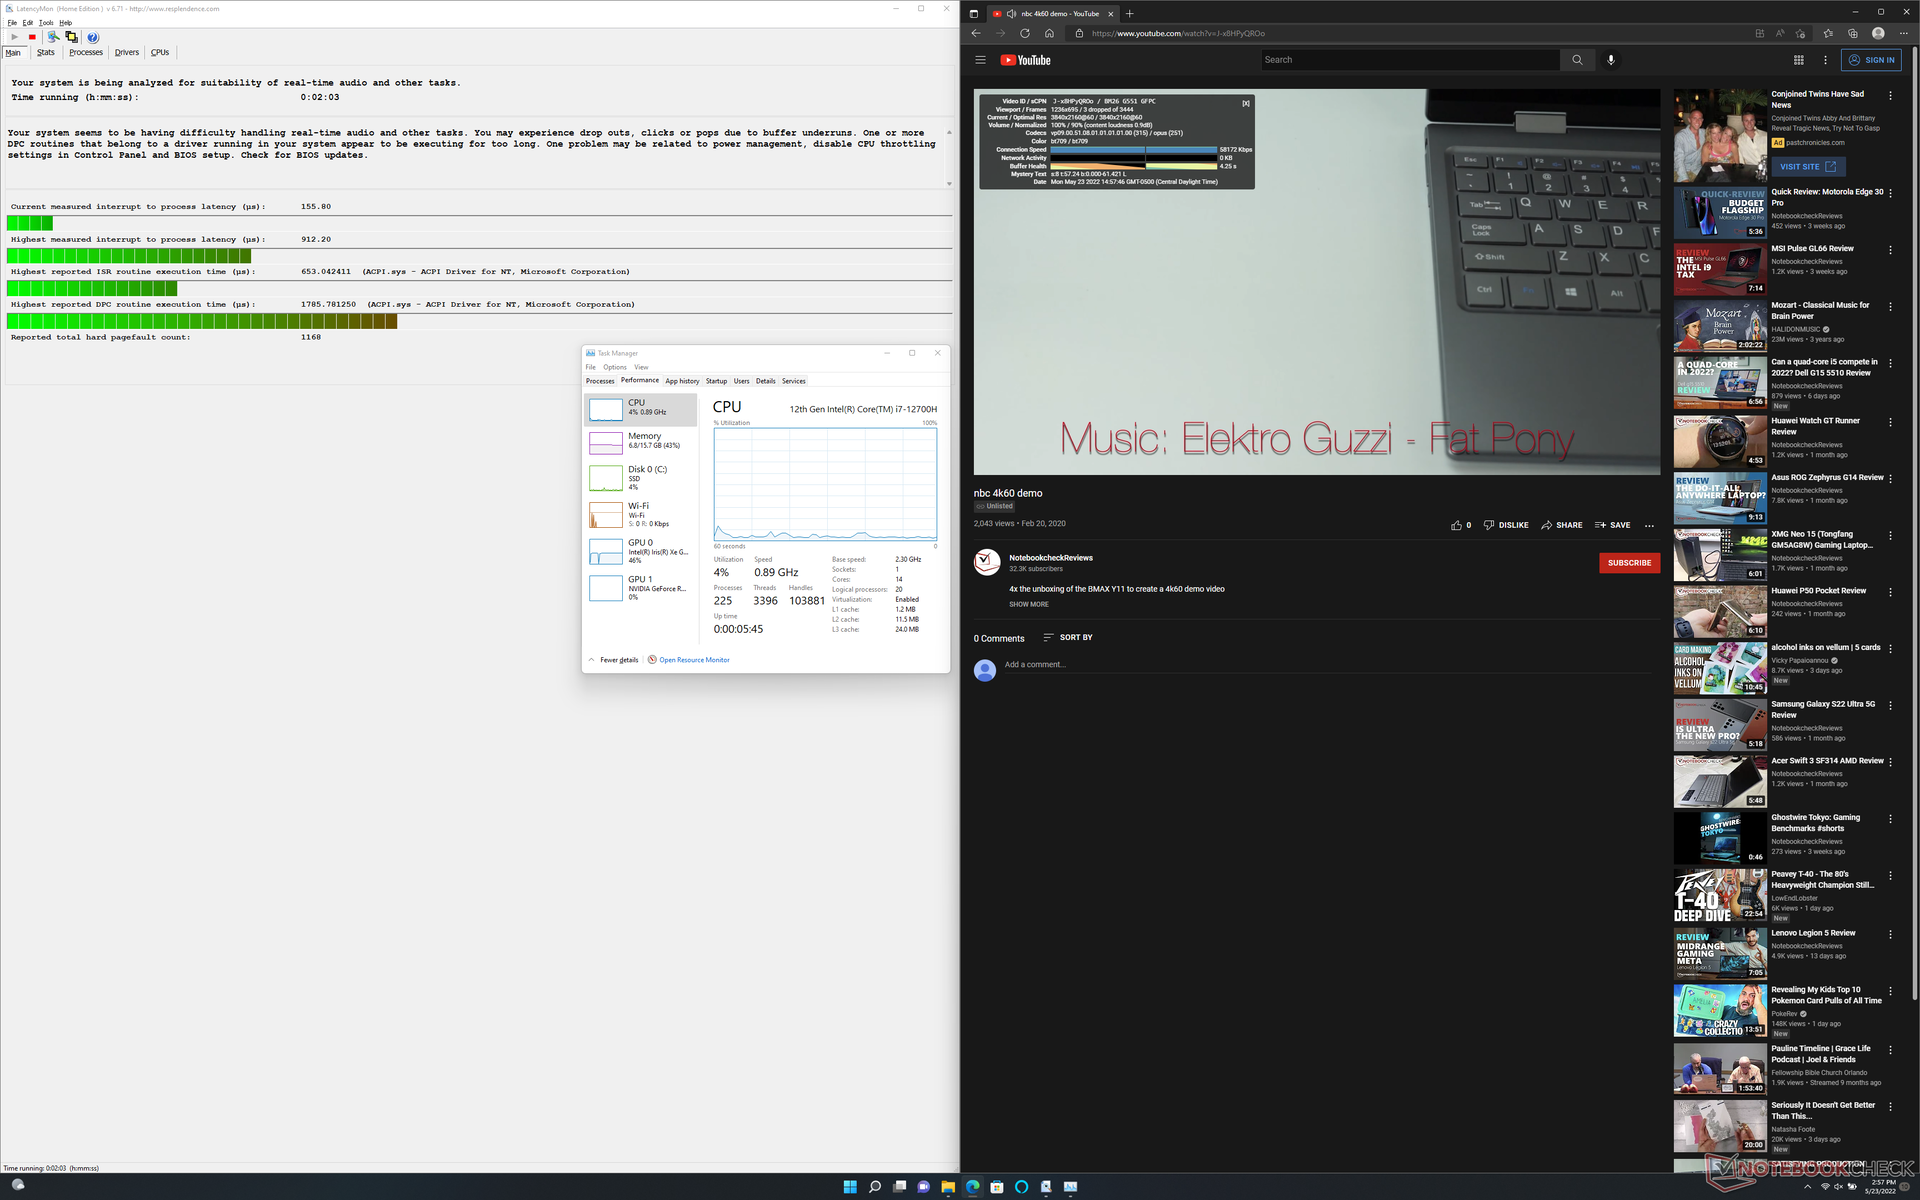
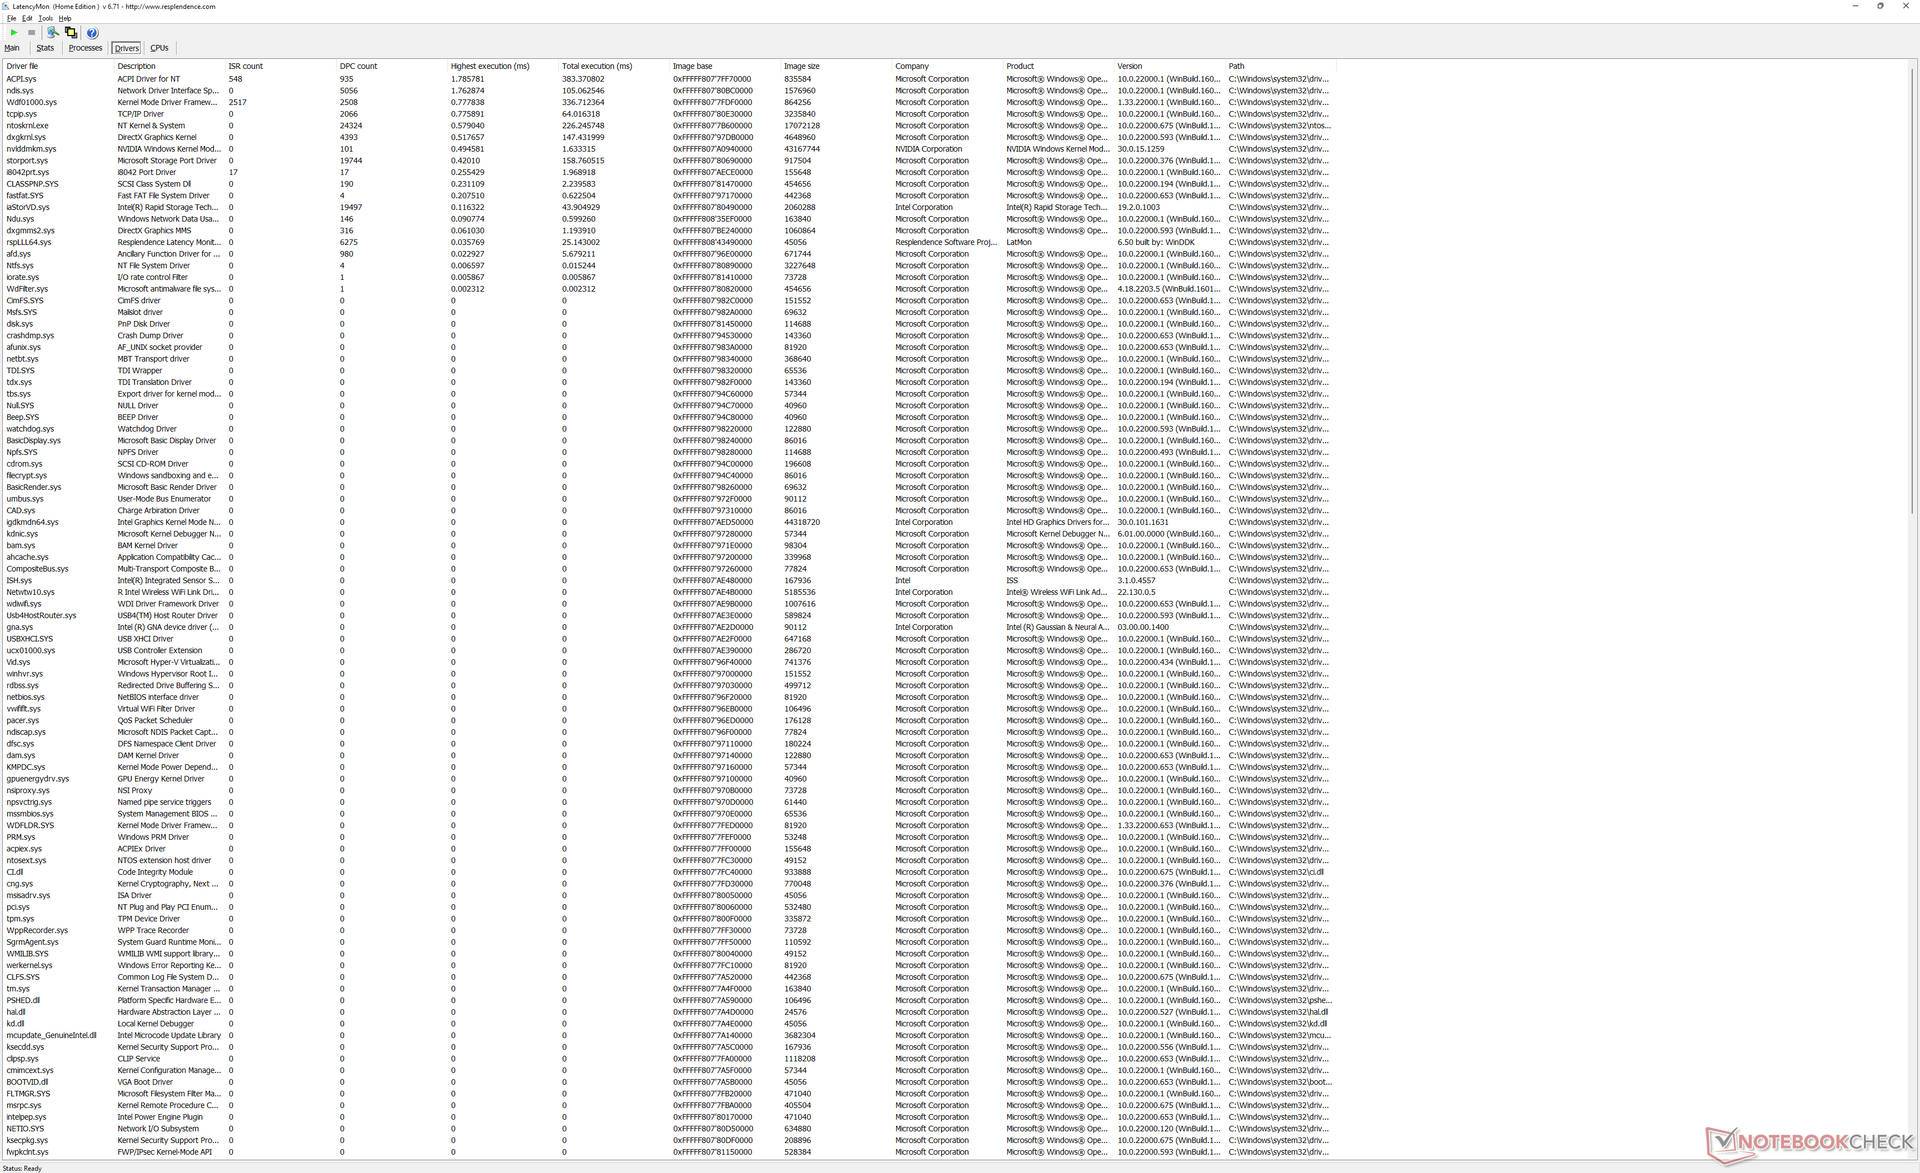
DPC-Latenzzeit
LatencyMon zeigt kleinere DPC-Probleme beim Öffnen mehrerer Browser Tabs auf unserer Homepage. Die 4K-Videowiedergabe bei 60 fps läuft ansonsten flüssig, und während unseres einminütigen Videotests gab es nur drei Bildaussetzer.
| DPC Latencies / LatencyMon - interrupt to process latency (max), Web, Youtube, Prime95 | |
| Dell XPS 15 9500 Core i7 4K UHD | |
| Dell XPS 15 9510 11800H RTX 3050 Ti OLED | |
| Dell XPS 15 9520 RTX 3050 Ti | |
| MSI Stealth 15M A11SEK | |
| Asus Zenbook Pro 15 OLED UM535Q | |
* ... kleinere Werte sind besser
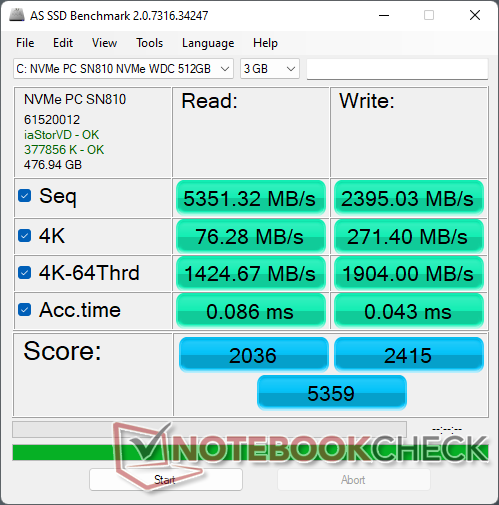
Speichergeräte - Unterstützt bis zu zwei PCIe4-NVMe-SSDs
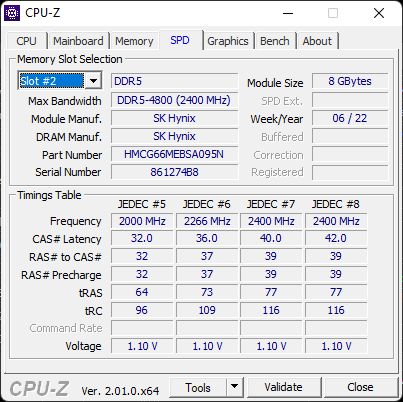
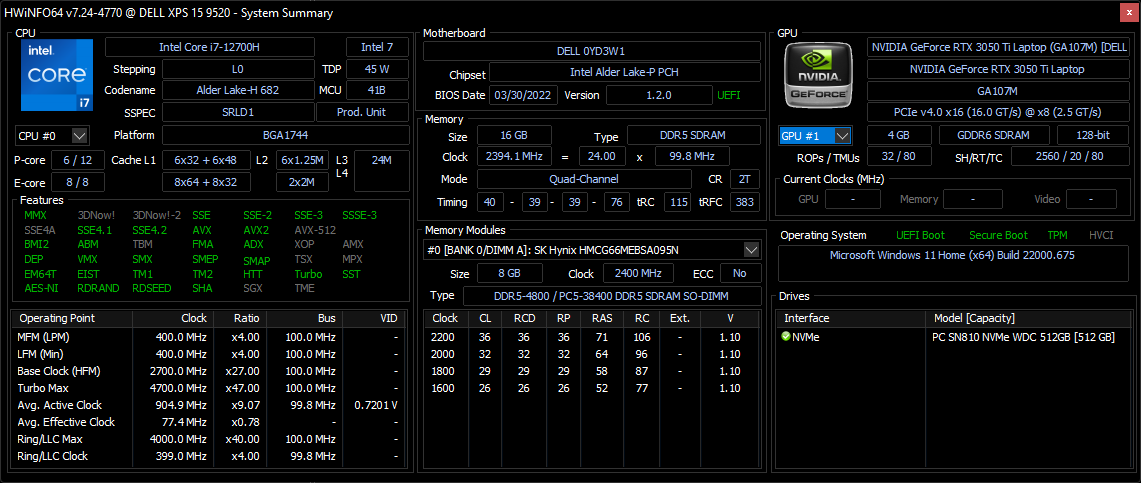
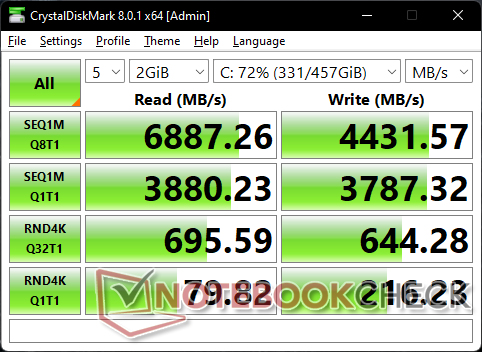
Unser Testgerät ist mit einer PCIe4 x4 Western Digital SN810 NVMe SSD versehen im Gegensatz zu den PCIe3-x4-Lösungen in älteren Modellen. Die Übertragungsraten sind daher mit bis zu 6.700 MB/s deutlich schneller als die der meisten PCIe3-Laufwerke. Die SN810 in unserem Gerät hatte keine Probleme, ihre maximale Übertragungsrate über längere Zeiträume beizubehalten, wenn sie unter DiskSpd belastet wurde, was auf eine hervorragende Wärmeableitung schließen lässt.

* ... kleinere Werte sind besser
Dauerleistung Lesen: DiskSpd Read Loop, Queue Depth 8
GPU Performance - GeForce RTX 3050 Ti für ein zweites Jahr in Folge
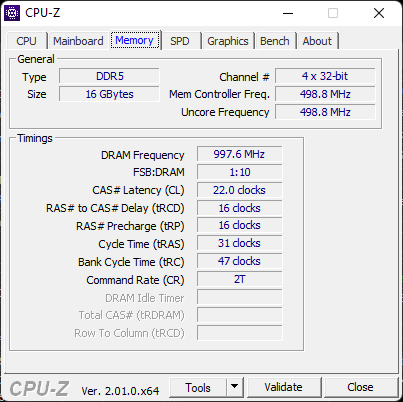
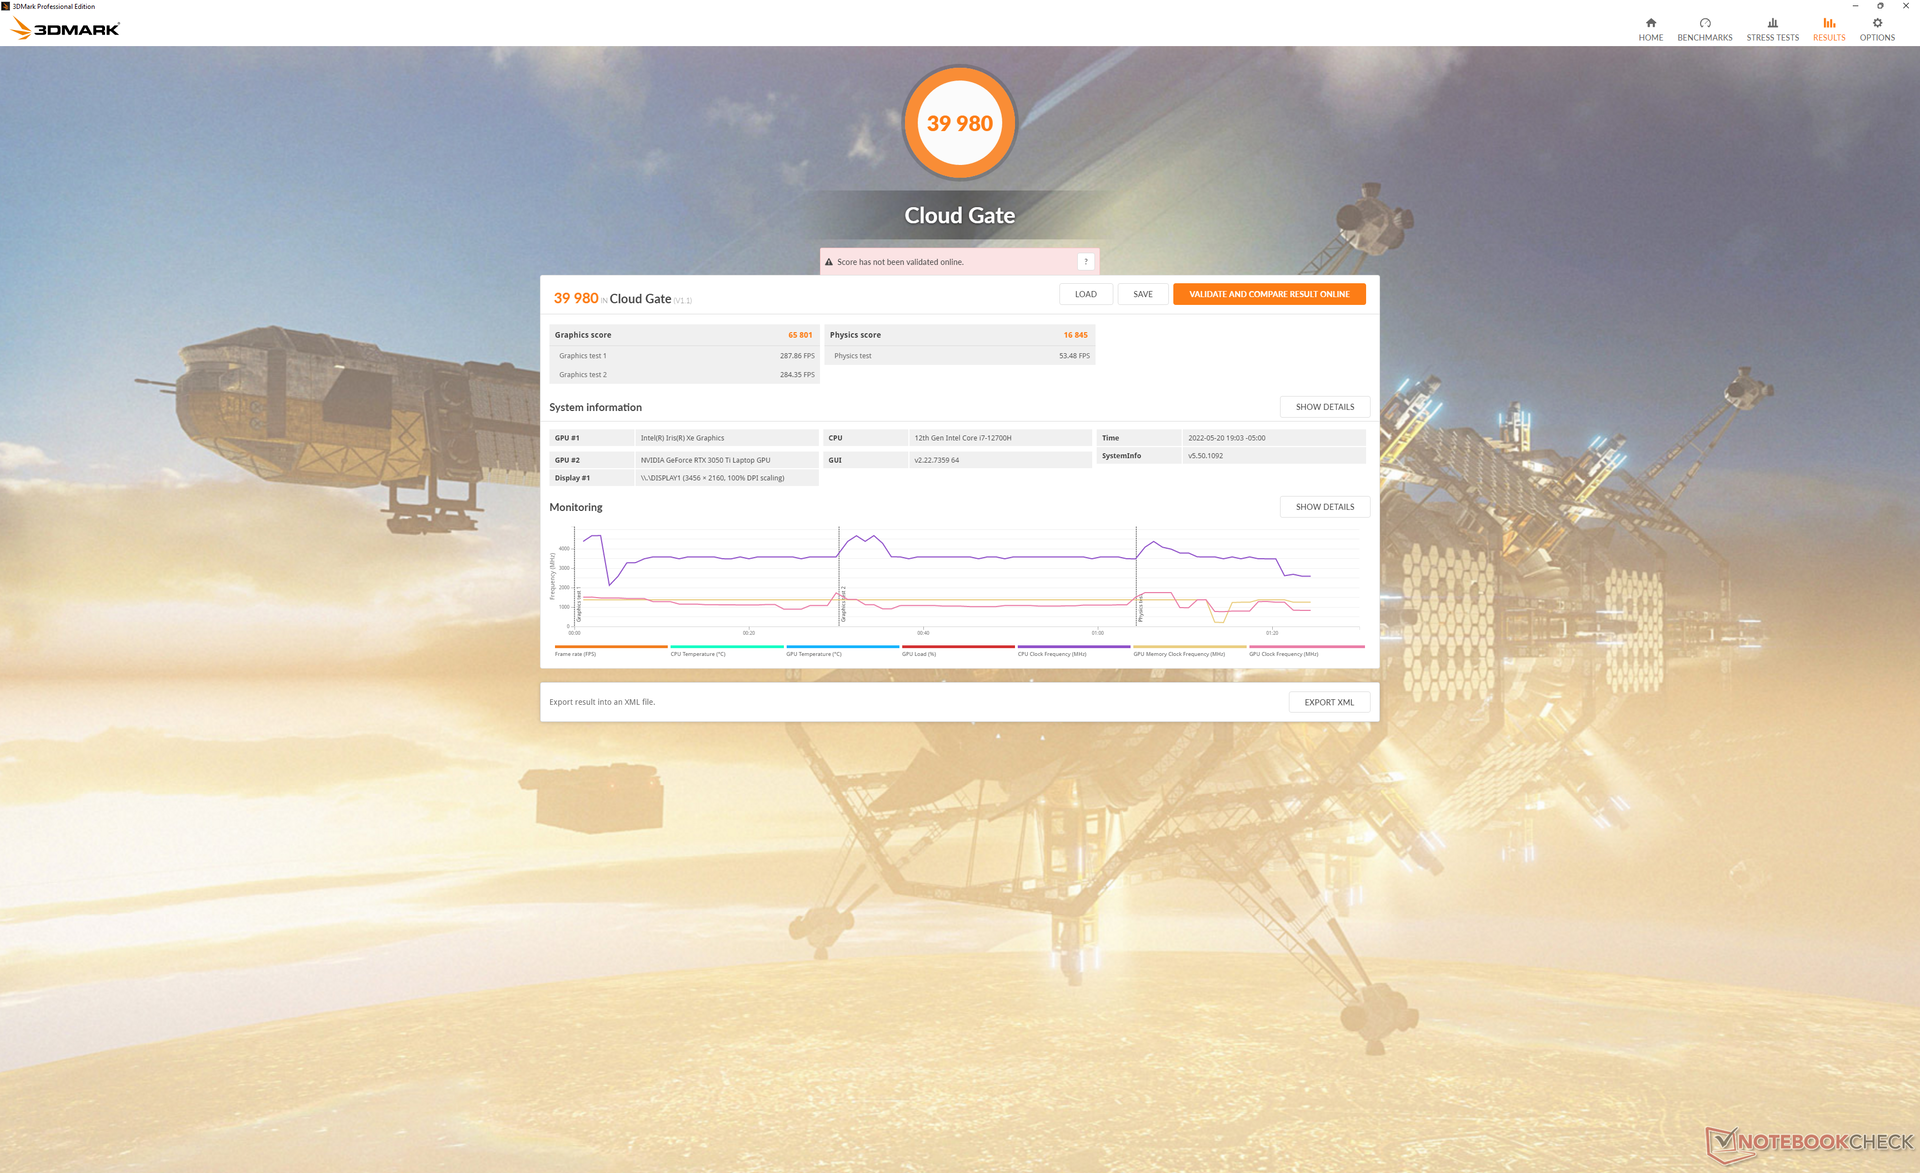
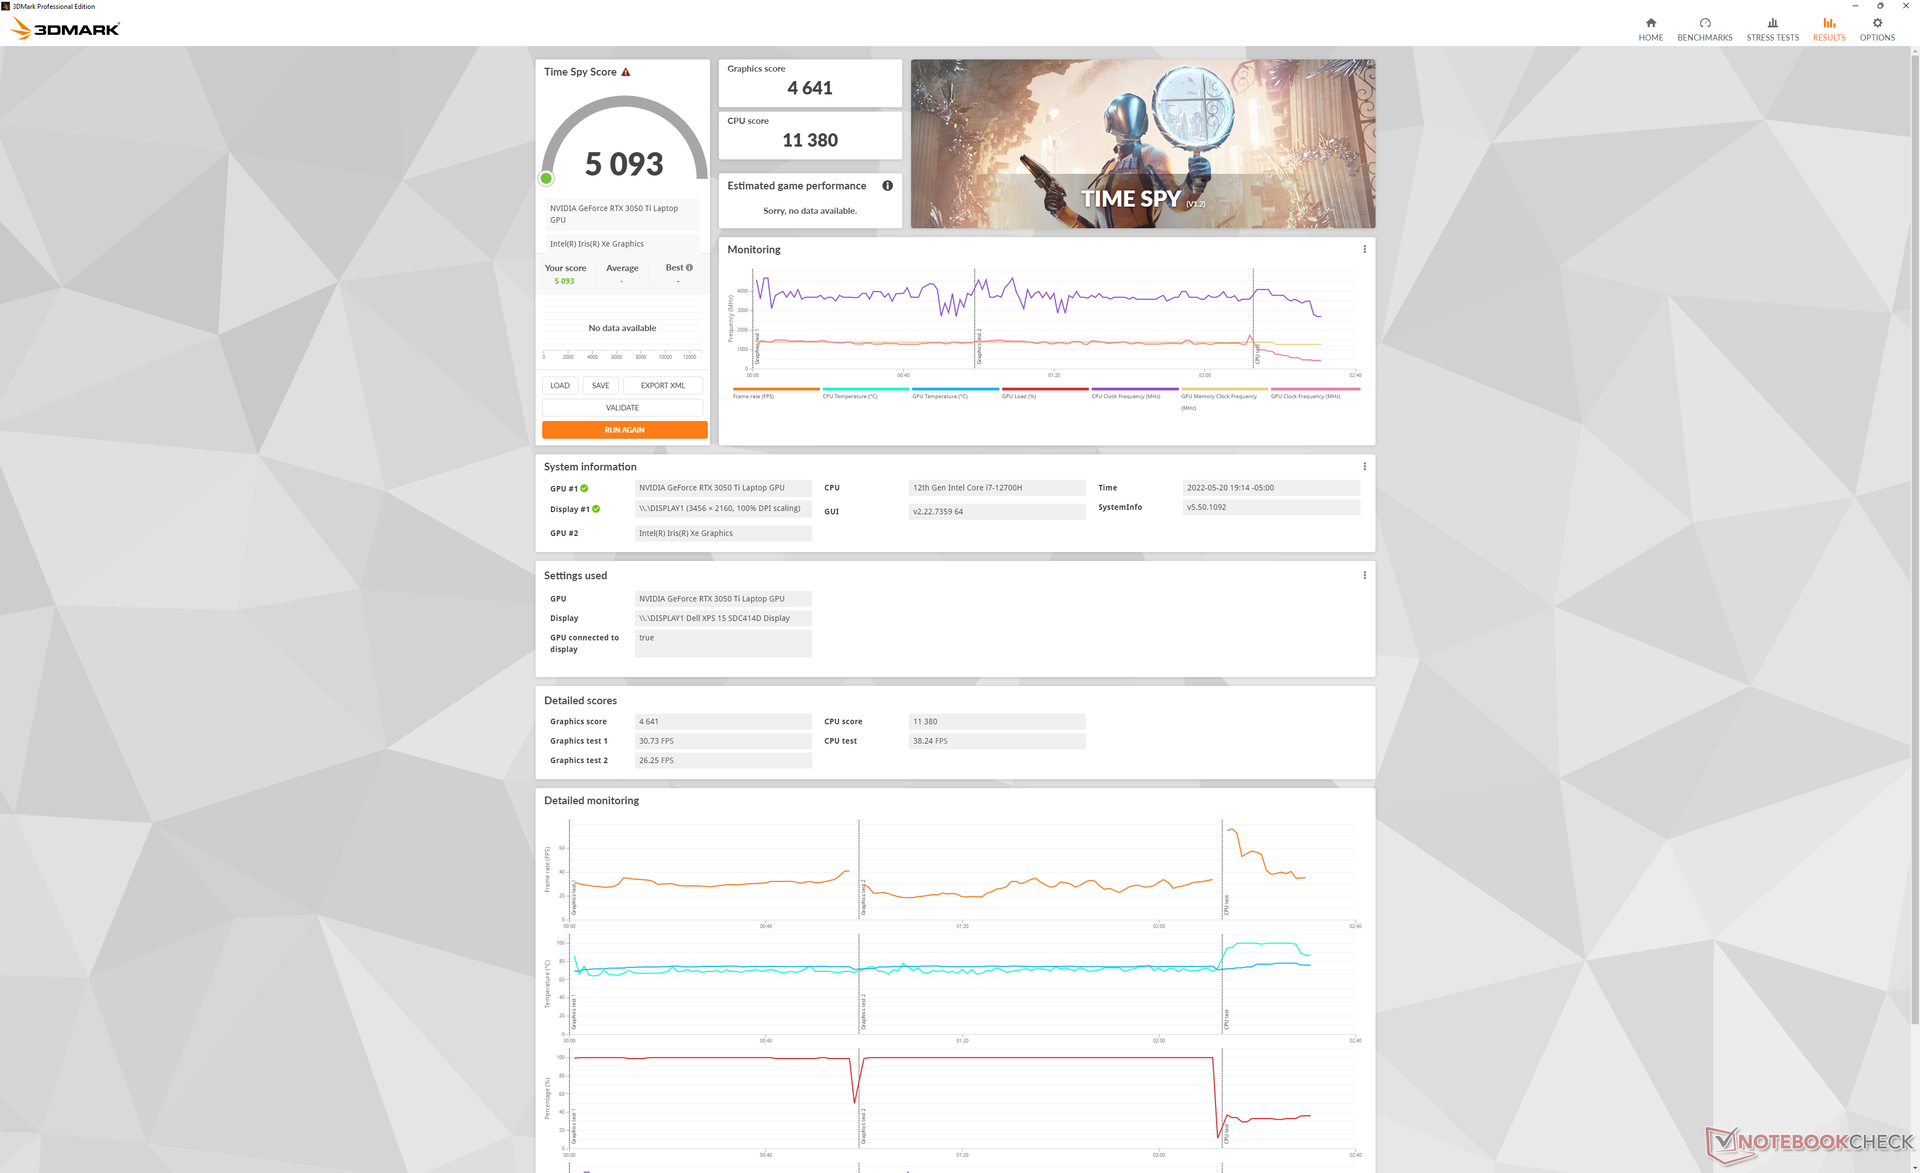
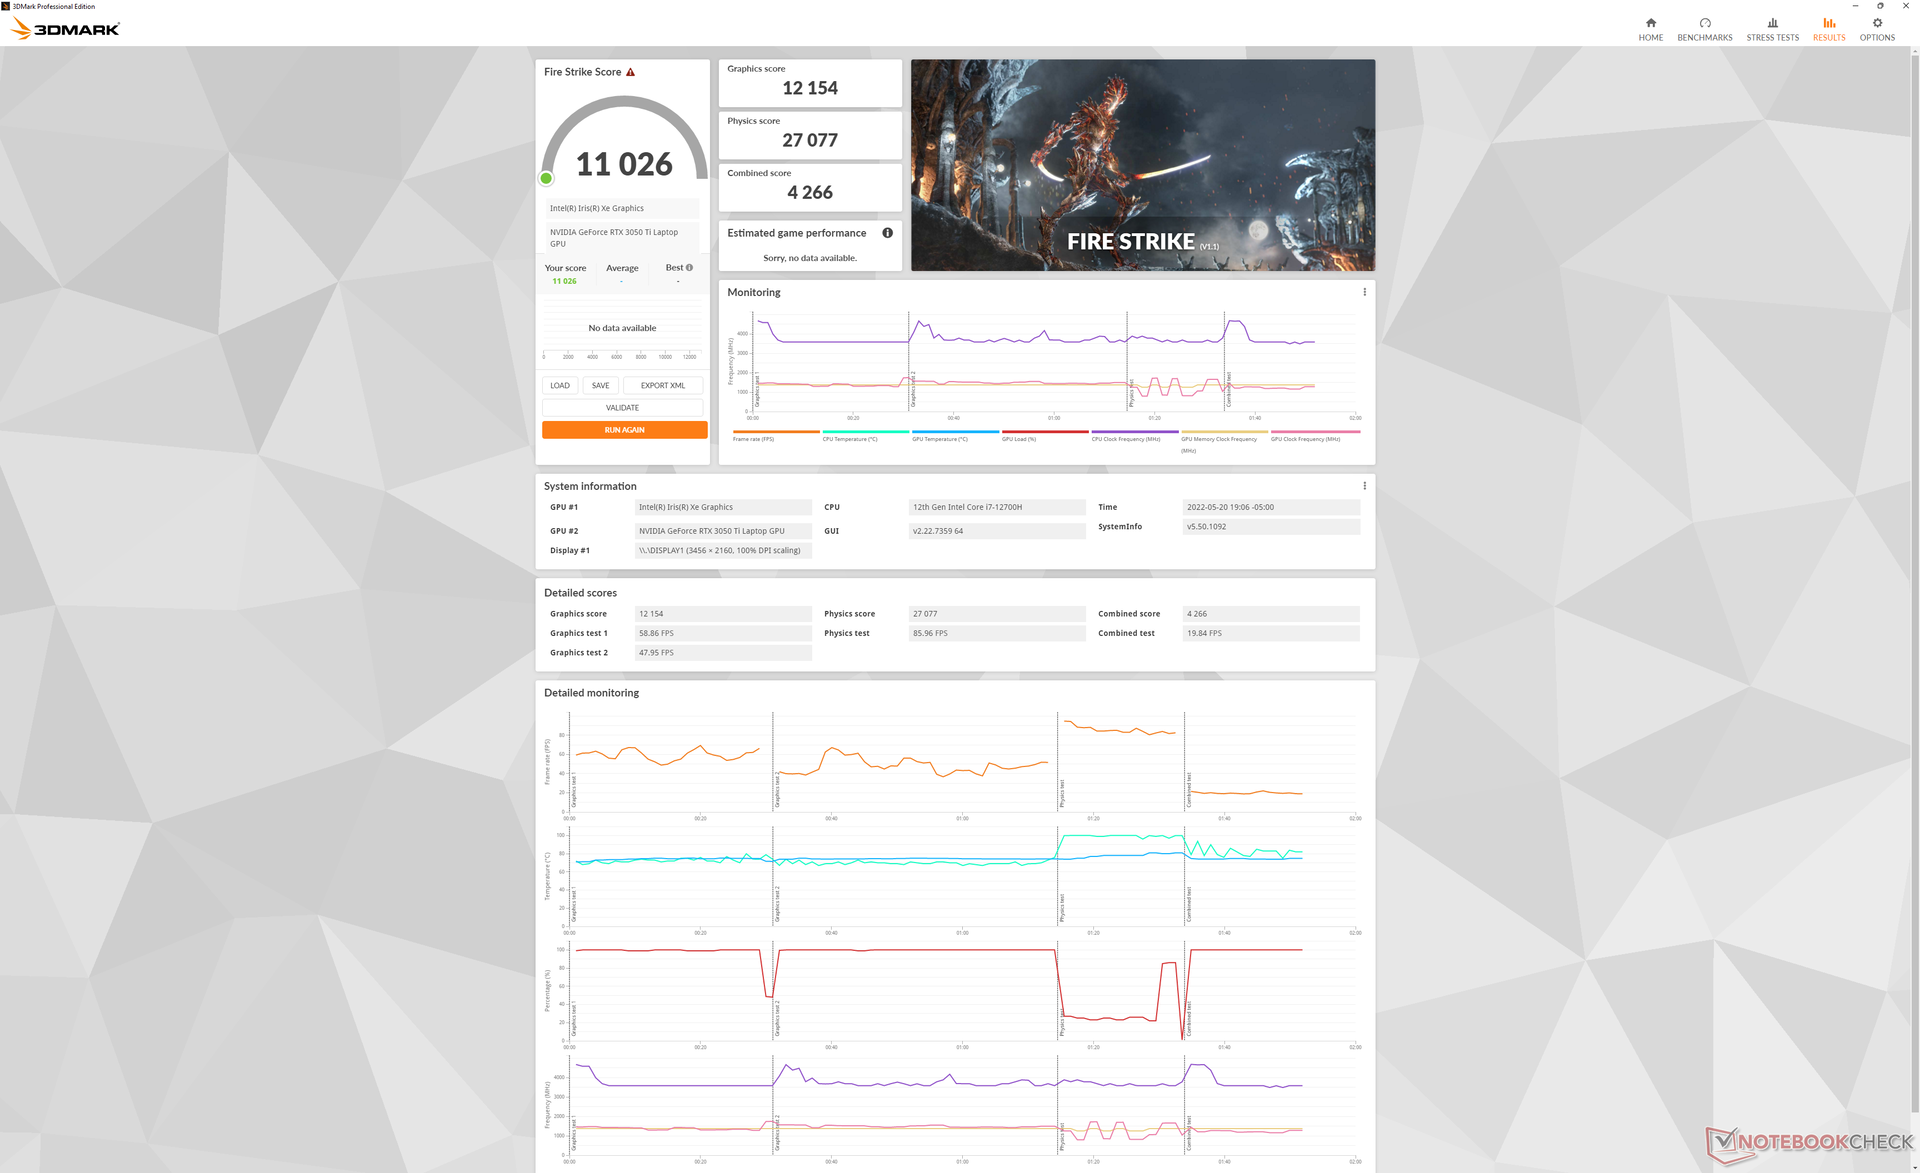
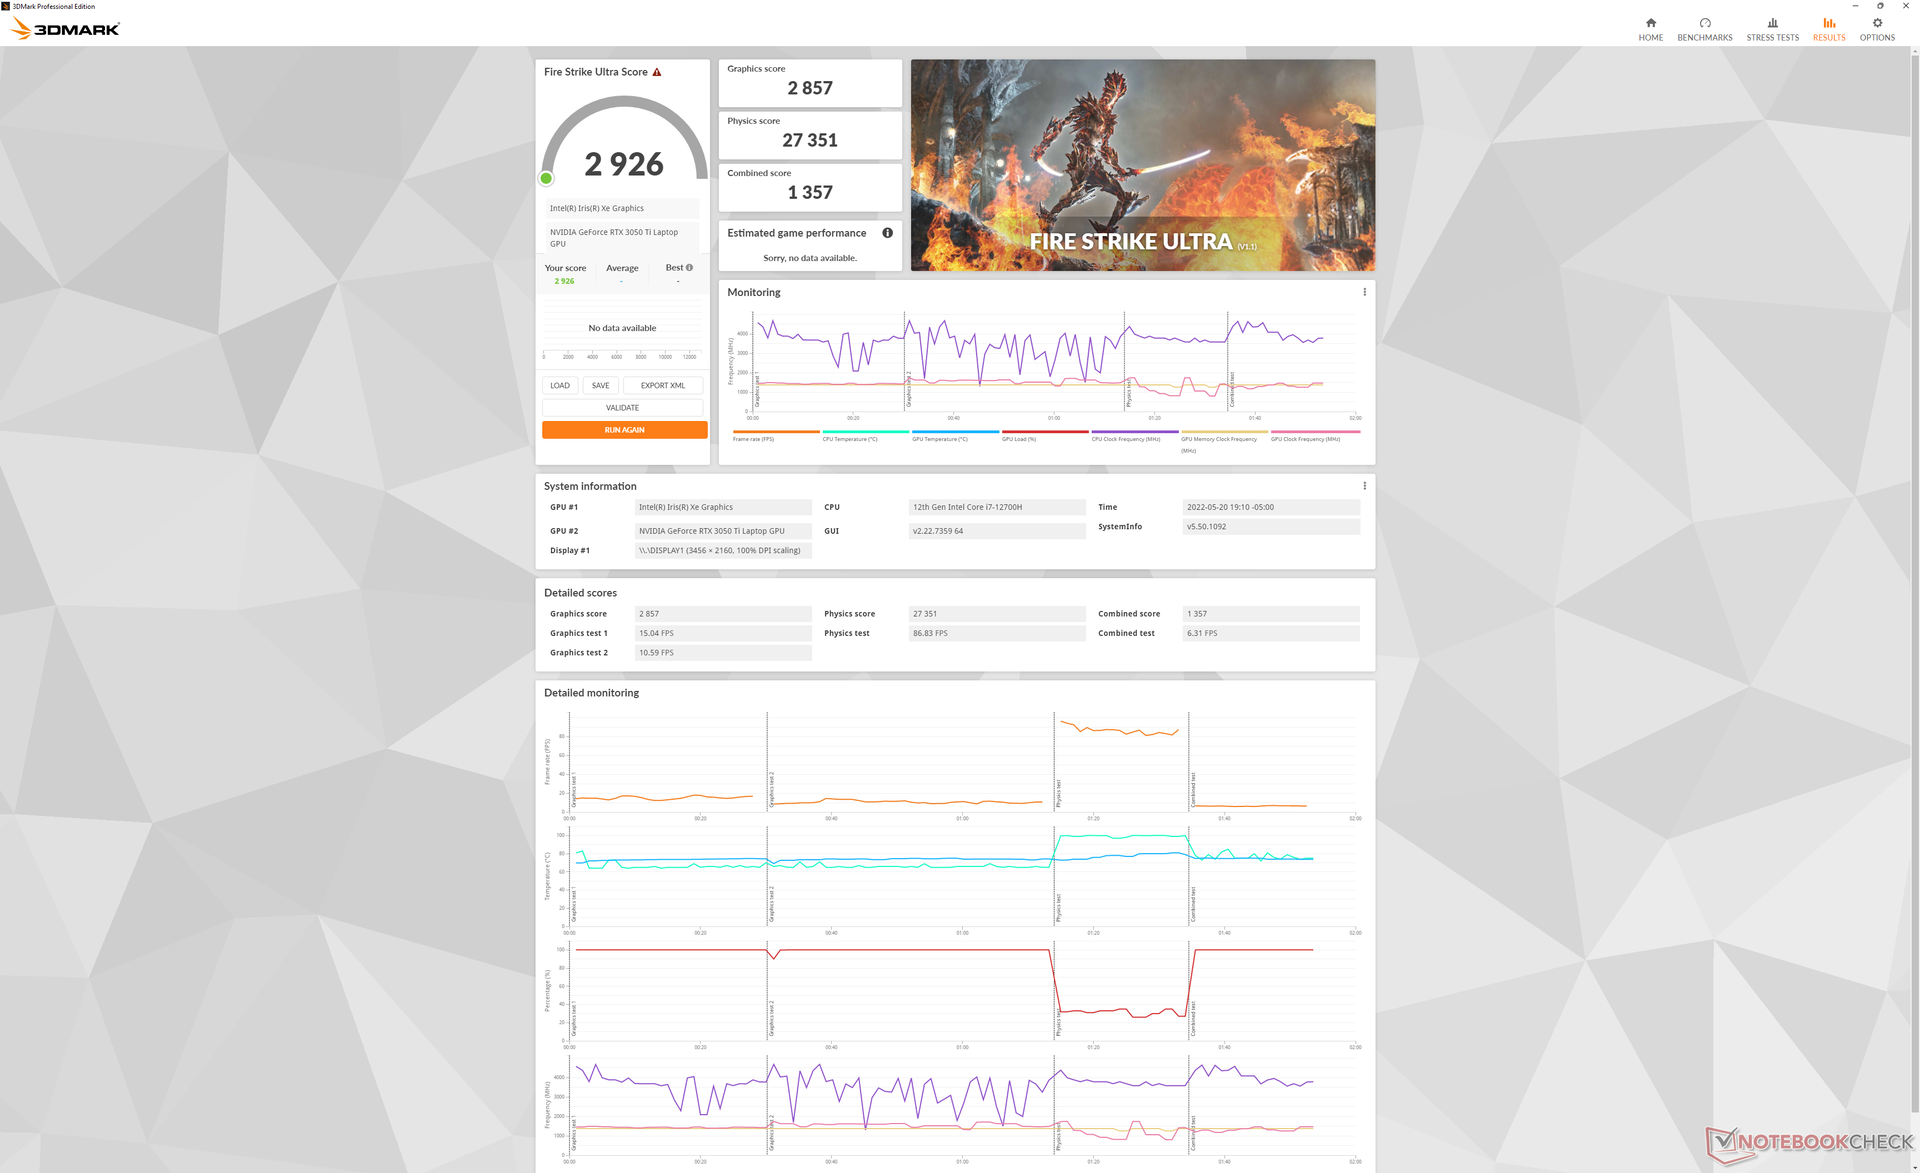
Das XPS 15 9520 ist mit schnellerem Arbeitsspeicher ausgestattet als das XPS 15 9510 (DDR5-4800 vs. DDR4-3200), was zu einer etwas schnelleren Grafikleistung führen sollte. Leider hat Dell den GPU-Takt von 1.530 MHz beim XPS 15 9510 auf 1.035 MHz beim 9520 heruntergetaktet, wodurch mögliche Leistungsgewinne durch den schnelleren Arbeitsspeicher wieder zunichte gemacht werden.Die 3DMark-Ergebnisse der GeForce RTX 3050 Ti zwischen dem XPS 15 9510 und 9520 sind nahezu identisch.
Die Grafikleistung bleibt etwa 20 bis 30 Prozent schneller als bei der GTX 1650 Ti auf dem älteren XPS 15 9500.
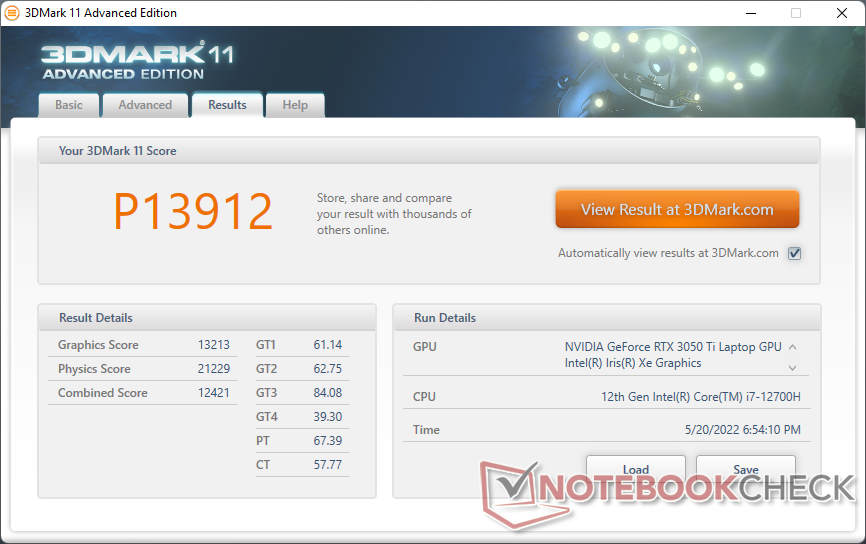
| 3DMark 11 Performance | 13912 Punkte | |
| 3DMark Cloud Gate Standard Score | 39980 Punkte | |
| 3DMark Fire Strike Score | 11026 Punkte | |
| 3DMark Time Spy Score | 5093 Punkte | |
Hilfe | ||
Witcher 3 FPS Chart
| min. | mittel | hoch | max. | QHD | 4K | |
|---|---|---|---|---|---|---|
| GTA V (2015) | 185 | 181.3 | 90.3 | 49.9 | 37.4 | |
| The Witcher 3 (2015) | 226.5 | 127.1 | 62.4 | 34.2 | ||
| Dota 2 Reborn (2015) | 180.3 | 166.1 | 116.1 | 104.5 | 47.1 | |
| Final Fantasy XV Benchmark (2018) | 106.6 | 62.9 | 45.7 | 34.1 | ||
| X-Plane 11.11 (2018) | 137.6 | 117 | 100.6 | 73.7 | ||
| Strange Brigade (2018) | 206 | 109.6 | 91.1 | 79.4 | 60.4 | |
| Cyberpunk 2077 1.6 (2022) | 59.4 | 47.4 | 39.3 | 39.5 | 20.2 |
Emissionen
Systemgeräusche
Das Lüftergeräusch scheint bei ähnlicher Belastung leiser zu sein als bei den älteren XPS-Modellen. Zumindest dauert es etwas länger, bis die Lüfter des 9520 die Drehzahl erhöhen, wenn anspruchsvolle Lasten anliegen. Am Ende der ersten 3DMark-06-Benchmark-Szene beträgt das Lüftergeräusch beispielsweise nur 31 dB(A) im Vergleich zu 36 dB(A) und 46 dB(A) beim XPS 15 9510 bzw. 9500. Das System ist unter den meisten Bedingungen immer noch leiser als erwartet, selbst wenn der Ultra-Performance-Modus eingestellt ist.
Lautstärkediagramm
| Idle |
| 22.9 / 22.9 / 22.9 dB(A) |
| Last |
| 30.9 / 44.7 dB(A) |
 | ||
30 dB leise 40 dB(A) deutlich hörbar 50 dB(A) störend |
||
min: | ||
| Dell XPS 15 9520 RTX 3050 Ti GeForce RTX 3050 Ti Laptop GPU, i7-12700H, WDC PC SN810 512GB | Dell XPS 15 9510 11800H RTX 3050 Ti OLED GeForce RTX 3050 Ti Laptop GPU, i7-11800H, Micron 2300 512GB MTFDHBA512TDV | Dell XPS 15 9500 Core i7 4K UHD GeForce GTX 1650 Ti Mobile, i7-10875H, SK Hynix PC611 512GB | HP Spectre X360 15-5ZV31AV GeForce MX250, i7-10510U, Intel SSD 660p 2TB SSDPEKNW020T8 | Asus Zenbook Pro 15 OLED UM535Q GeForce RTX 3050 Ti Laptop GPU, R9 5900HX, WDC PC SN730 SDBPNTY-1T00 | MSI Stealth 15M A11SEK GeForce RTX 2060 Max-Q, i7-1185G7, WDC PC SN530 SDBPNPZ-1T00 | |
|---|---|---|---|---|---|---|
| Geräuschentwicklung | -2% | -23% | -17% | -7% | -34% | |
| aus / Umgebung * (dB) | 22.8 | 23.8 -4% | 28.4 -25% | 30.1 -32% | 22.8 -0% | 27.5 -21% |
| Idle min * (dB) | 22.9 | 23.8 -4% | 28.4 -24% | 30.1 -31% | 22.9 -0% | 32.3 -41% |
| Idle avg * (dB) | 22.9 | 23.8 -4% | 28.4 -24% | 30.1 -31% | 22.9 -0% | 32.3 -41% |
| Idle max * (dB) | 22.9 | 23.8 -4% | 28.4 -24% | 30.1 -31% | 22.9 -0% | 33.7 -47% |
| Last avg * (dB) | 30.9 | 36 -17% | 46 -49% | 30.1 3% | 33.2 -7% | 46.3 -50% |
| Witcher 3 ultra * (dB) | 37.8 | 36 5% | 42 -11% | 39.7 -5% | 47.3 -25% | 41.3 -9% |
| Last max * (dB) | 44.7 | 38.2 15% | 47.1 -5% | 42 6% | 52.8 -18% | 56.2 -26% |
* ... kleinere Werte sind besser
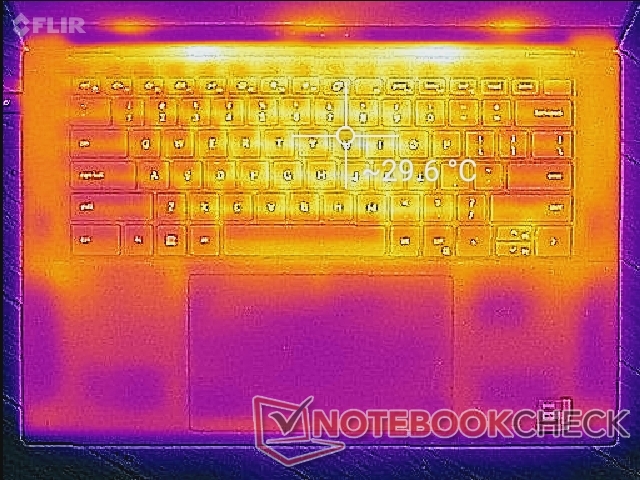
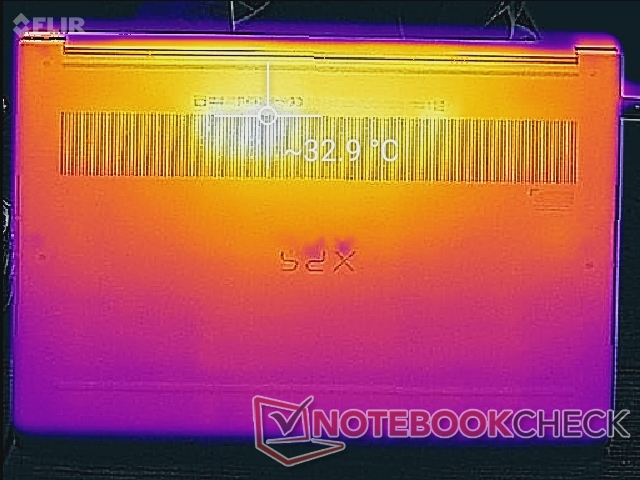
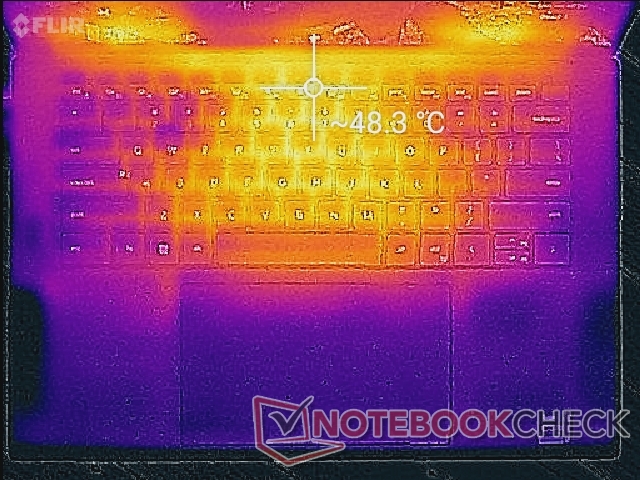
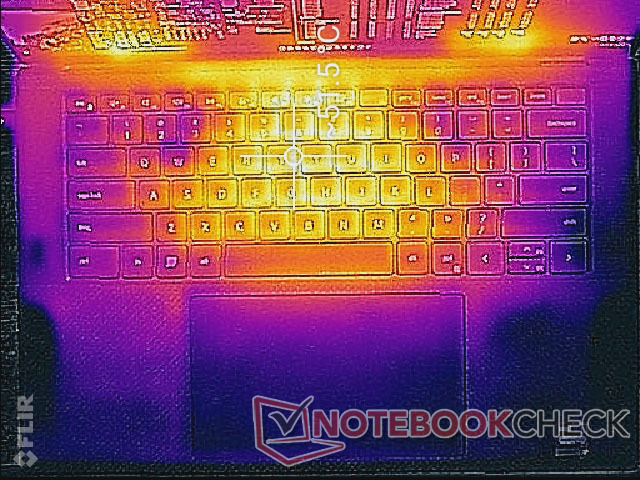
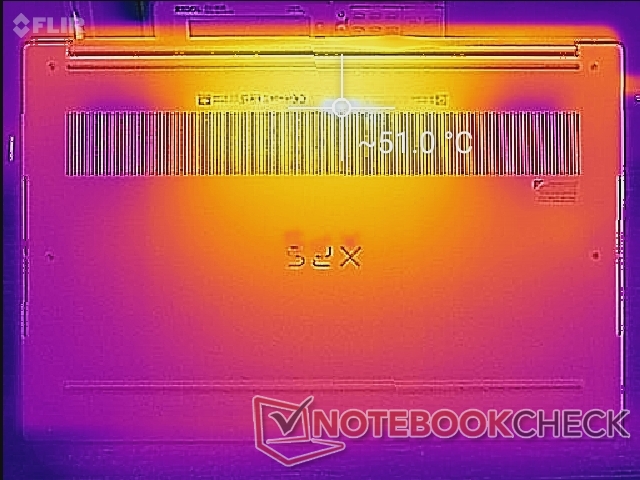
Temperatur - insgesamt etwas wärmer
Die Oberflächentemperaturen unter Last sind wärmer als bei den älteren XPS-15-9510- und -9500-Modellen. Hotspots können 51 bis 52 °C auf der Ober- bzw. Unterseite erreichen, verglichen mit 44 bis 47 °C bei den Vorgängermodellen. Die Hotspots von Konkurrenten wie dem Zenbook Pro 15 OLED sind unter ähnlichen Bedingungen um einige Grad Celsius kühler. Immerhin ist das XPS 9520 eines der kleinsten 15,6-Zoll-Notebooks mit Core-H-Prozessor auf dem Markt.
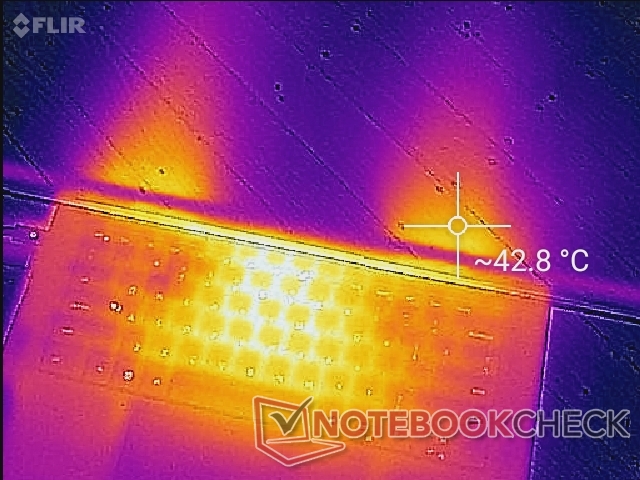
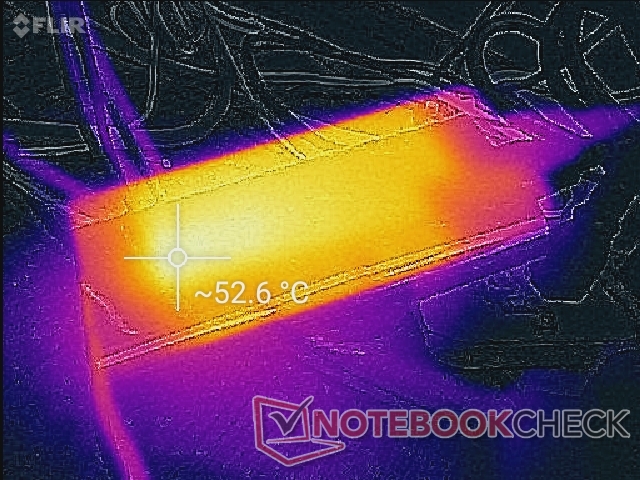
(-) Die maximale Temperatur auf der Oberseite ist 51.4 °C. Im Vergleich liegt der Klassendurchschnitt bei 36.8 °C (von 21 bis 71 °C für die Klasse Multimedia).
(-) Auf der Unterseite messen wir eine maximalen Wert von 51 °C (im Vergleich zum Durchschnitt von 39.1 °C).
(+) Ohne Last messen wir eine durchschnittliche Temperatur von 27.8 °C auf der Oberseite. Der Klassendurchschnitt erreicht 31.3 °C.
(±) Beim längeren Spielen von The Witcher 3 erhitzt sich das Gerät durchschnittlich auf 35.2 °C. Der Durchschnitt der Klasse ist derzeit 31.3 °C.
(+) Die Handballen und der Touchpad-Bereich sind mit gemessenen 31.6 °C kühler als die typische Hauttemperatur und fühlen sich dadurch kühl an.
(-) Die durchschnittliche Handballen-Temperatur anderer getesteter Geräte war 28.7 °C (-2.9 °C).

| Dell XPS 15 9520 RTX 3050 Ti Intel Core i7-12700H, NVIDIA GeForce RTX 3050 Ti Laptop GPU | Dell XPS 15 9510 11800H RTX 3050 Ti OLED Intel Core i7-11800H, NVIDIA GeForce RTX 3050 Ti Laptop GPU | Dell XPS 15 9500 Core i7 4K UHD Intel Core i7-10875H, NVIDIA GeForce GTX 1650 Ti Mobile | HP Spectre X360 15-5ZV31AV Intel Core i7-10510U, NVIDIA GeForce MX250 | Asus Zenbook Pro 15 OLED UM535Q AMD Ryzen 9 5900HX, NVIDIA GeForce RTX 3050 Ti Laptop GPU | MSI Stealth 15M A11SEK Intel Core i7-1185G7, NVIDIA GeForce RTX 2060 Max-Q | |
|---|---|---|---|---|---|---|
| Hitze | 13% | 3% | 17% | -1% | 10% | |
| Last oben max * (°C) | 51.4 | 45.5 11% | 44 14% | 47 9% | 36 30% | 47.2 8% |
| Last unten max * (°C) | 51 | 44.2 13% | 48.8 4% | 47.4 7% | 47.2 7% | 47.4 7% |
| Idle oben max * (°C) | 30 | 27 10% | 33 -10% | 22.8 24% | 37 -23% | 27.2 9% |
| Idle unten max * (°C) | 33 | 26.7 19% | 32.4 2% | 23.6 28% | 39.2 -19% | 28.2 15% |
* ... kleinere Werte sind besser
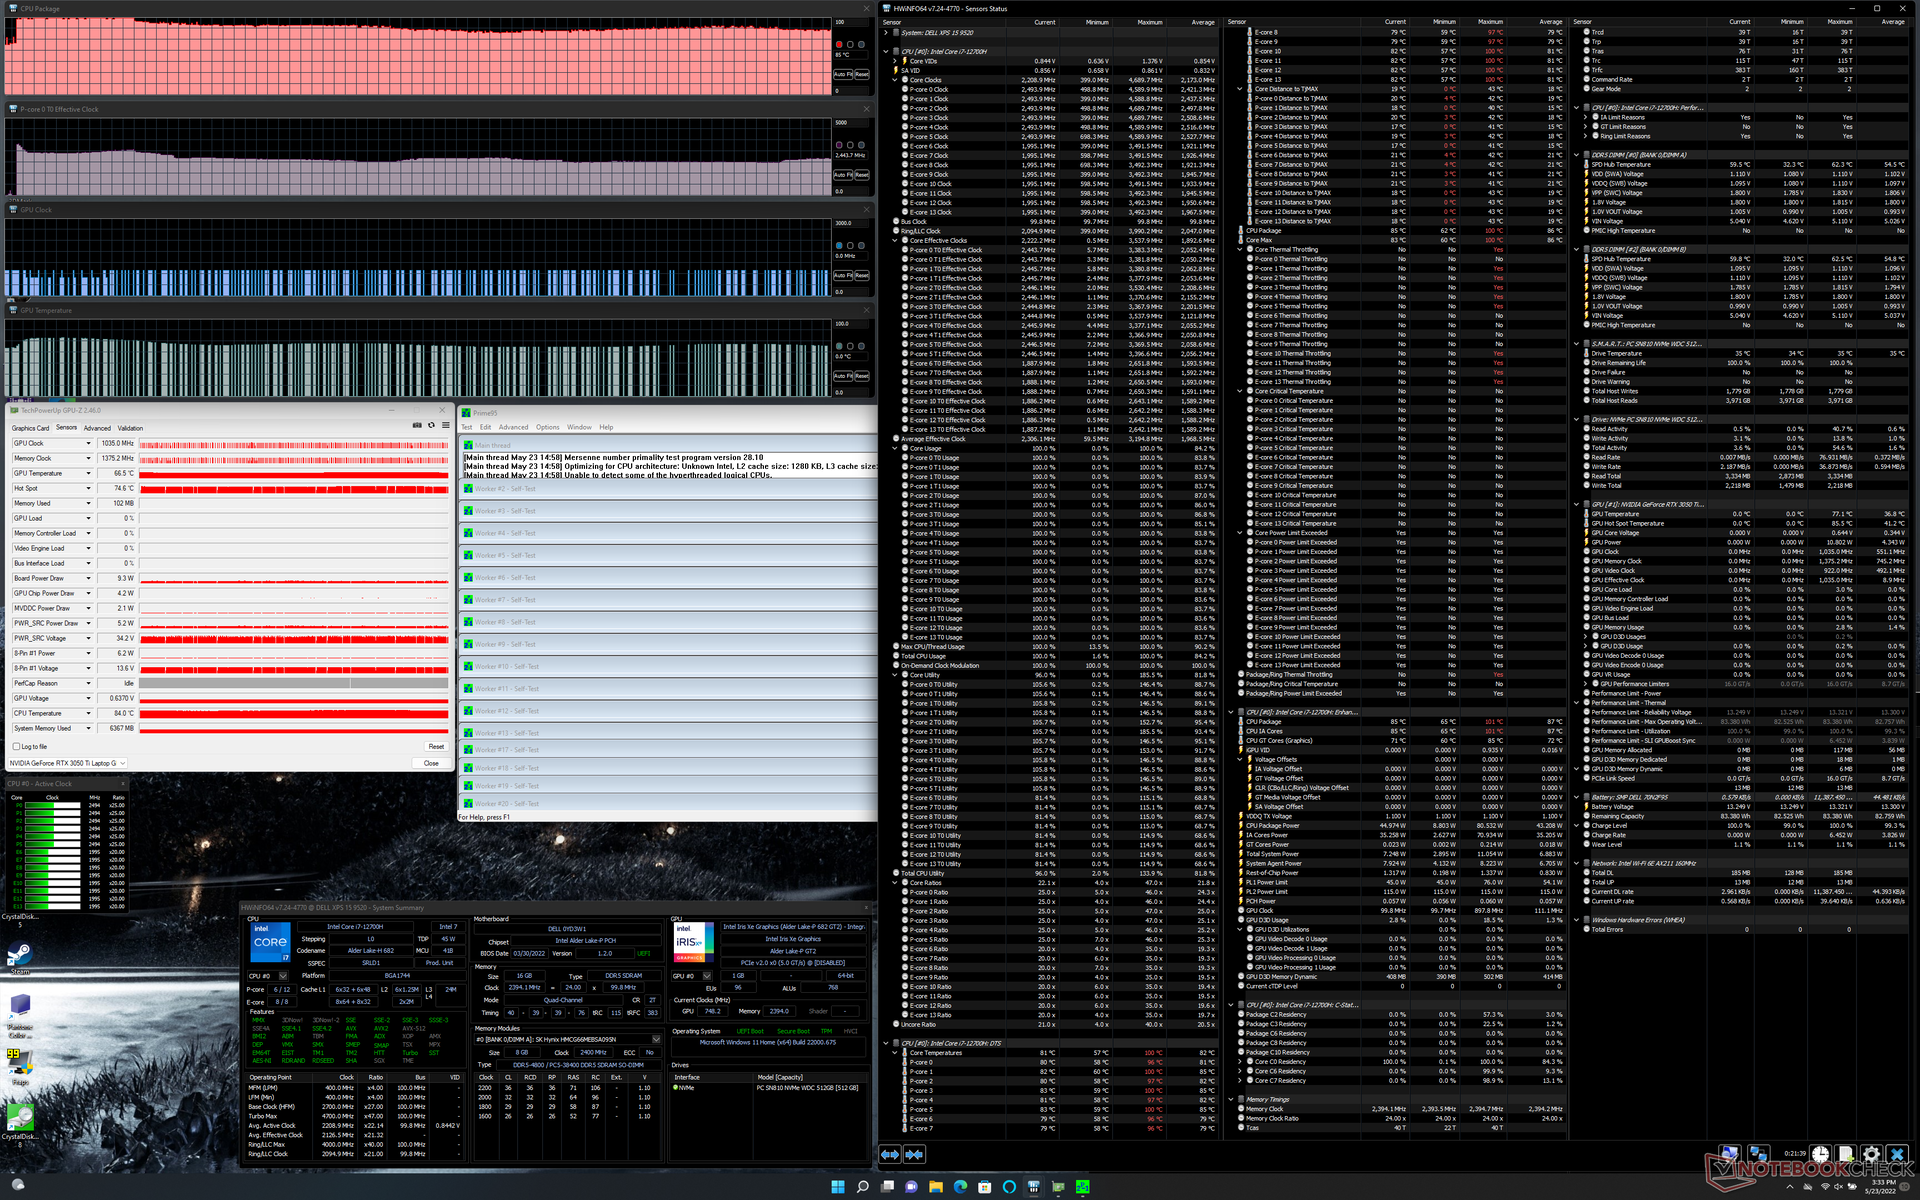
Stresstest
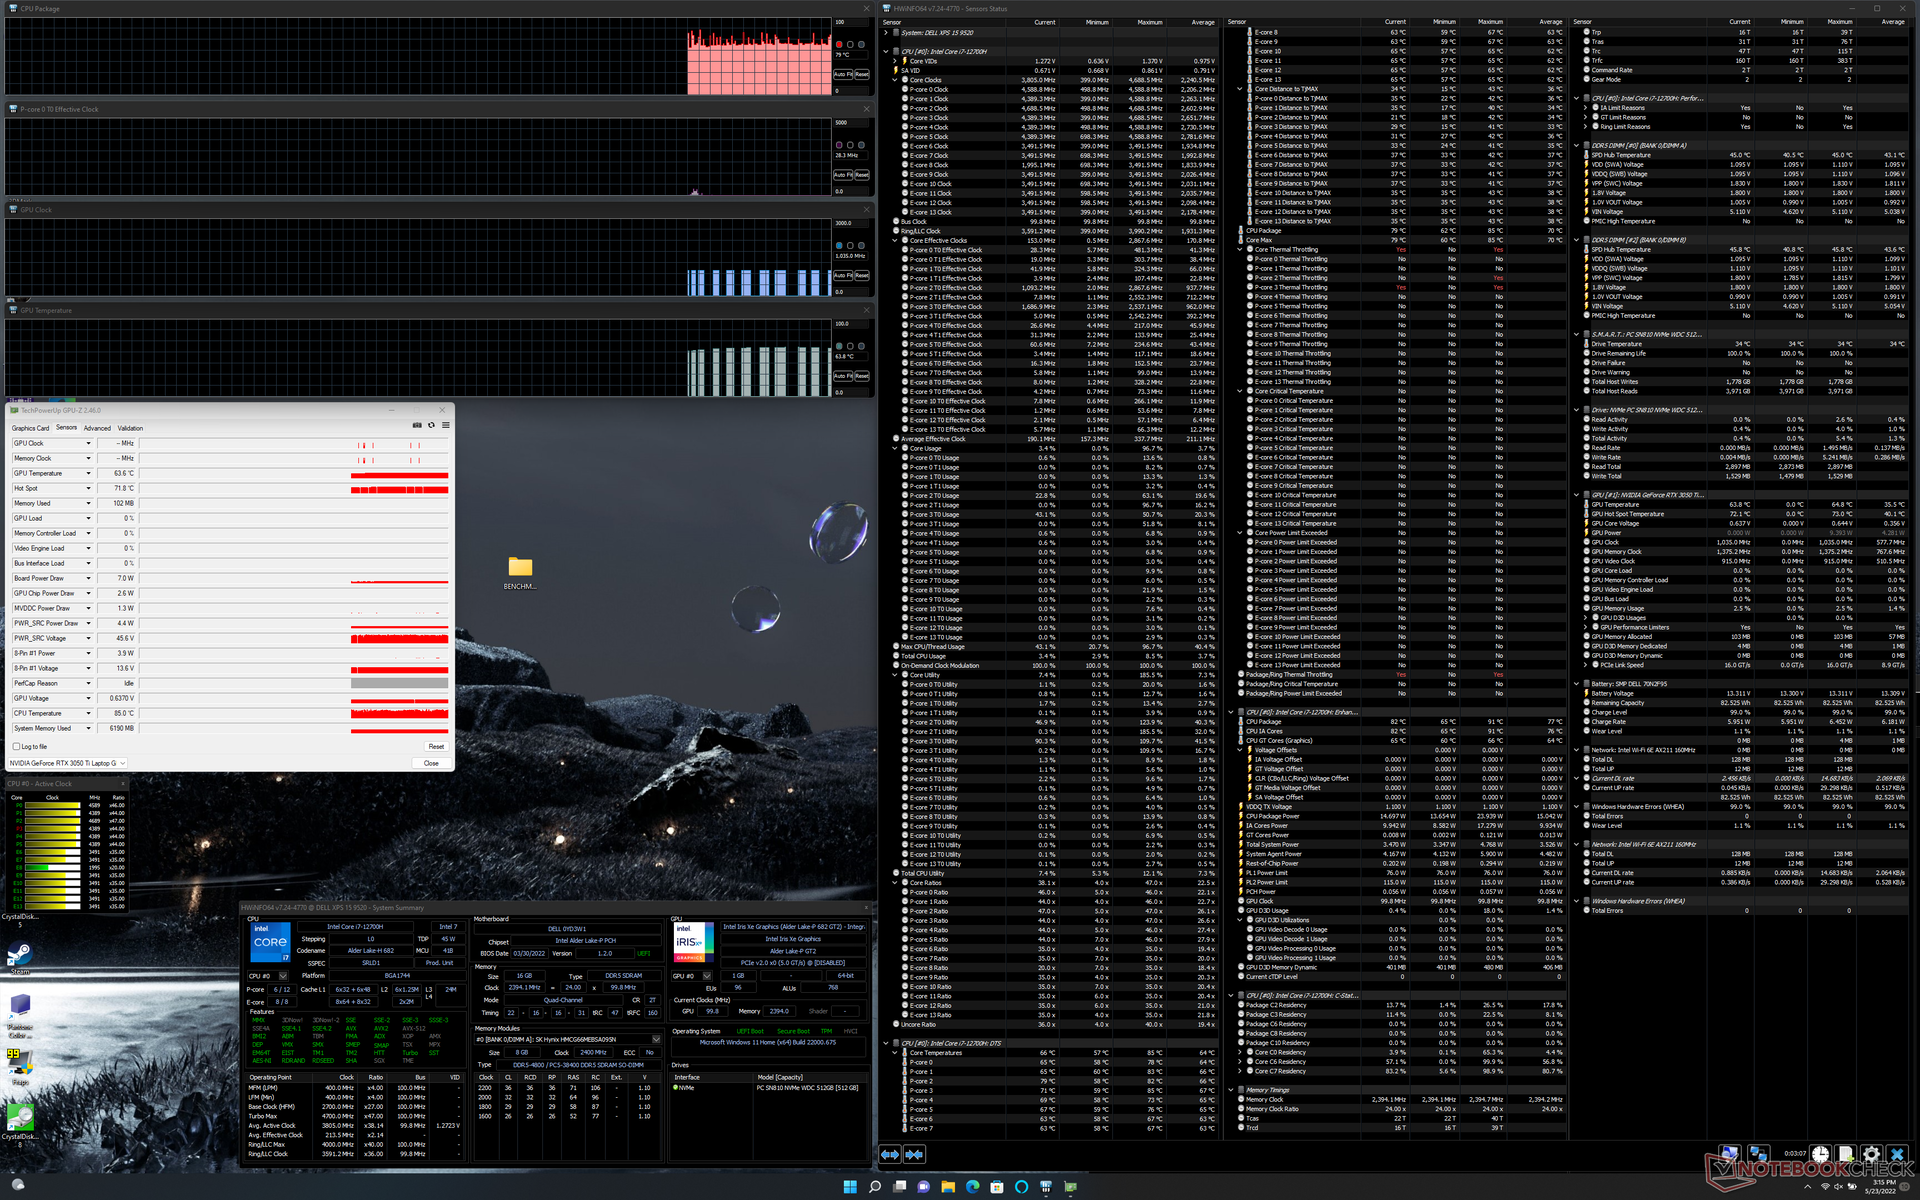
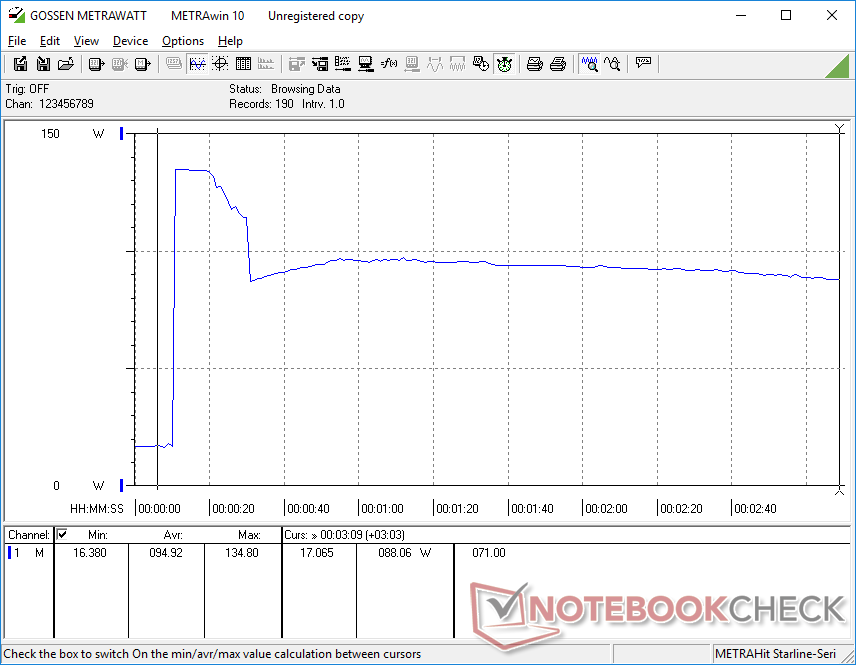
Unter Prime95 stieg die CPU in den ersten zehn Sekunden auf 81 W, 100 °C und 3,3 GHz, bevor sie schnell wieder auf 45 W, 85 °C und 2,5 GHz abfiel, um die Temperaturen in Schach zu halten. Wenn man den gleichen Test mit dem XPS 15 9500 durchführt, ergibt sich im Vergleich dazu eine stabile CPU-Temperatur von 73 °C. Es hat also den Anschein, dass das XPS 15 9520 wärmer läuft als seine Vorgänger, um mehr Prozessorleistung aus demselben Gehäuse-Design zu holen.
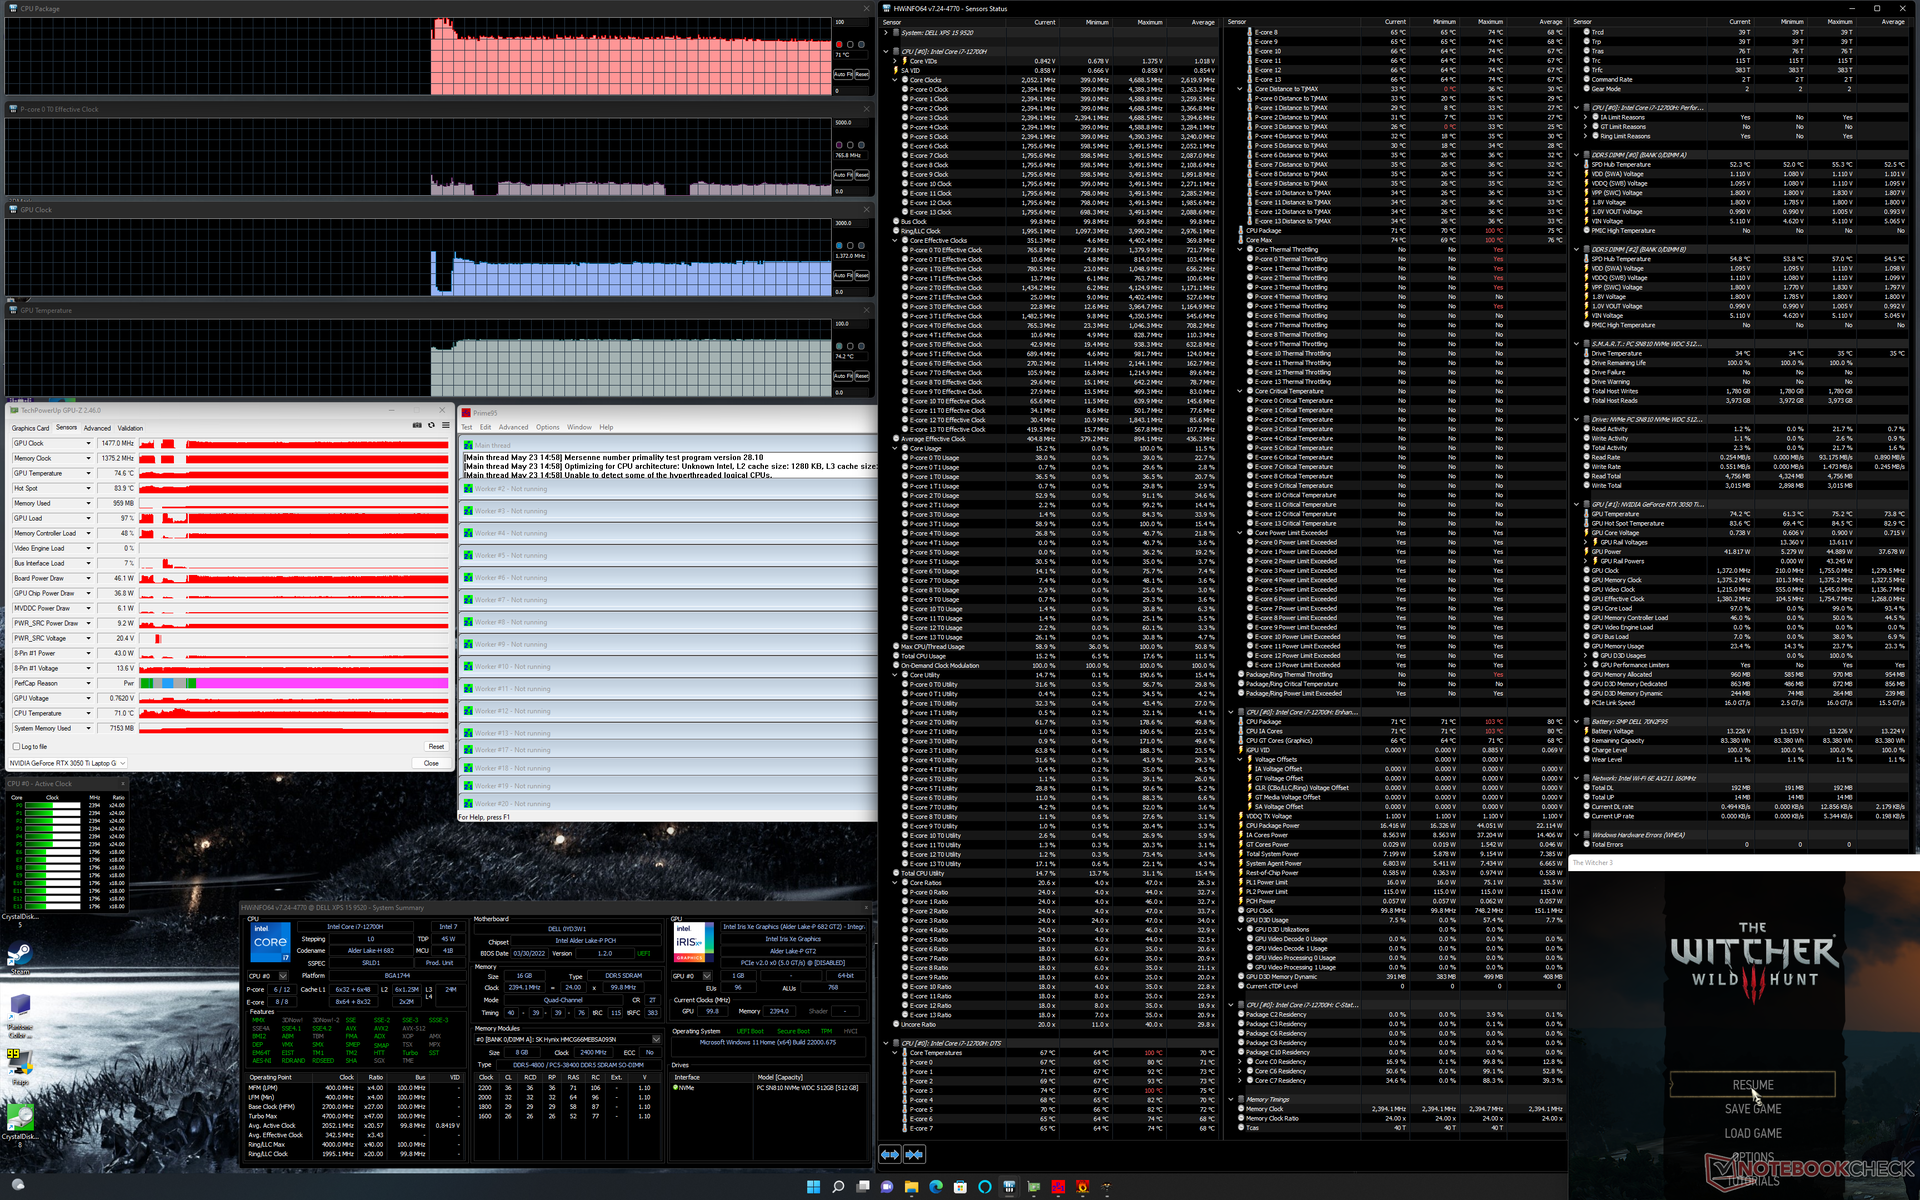
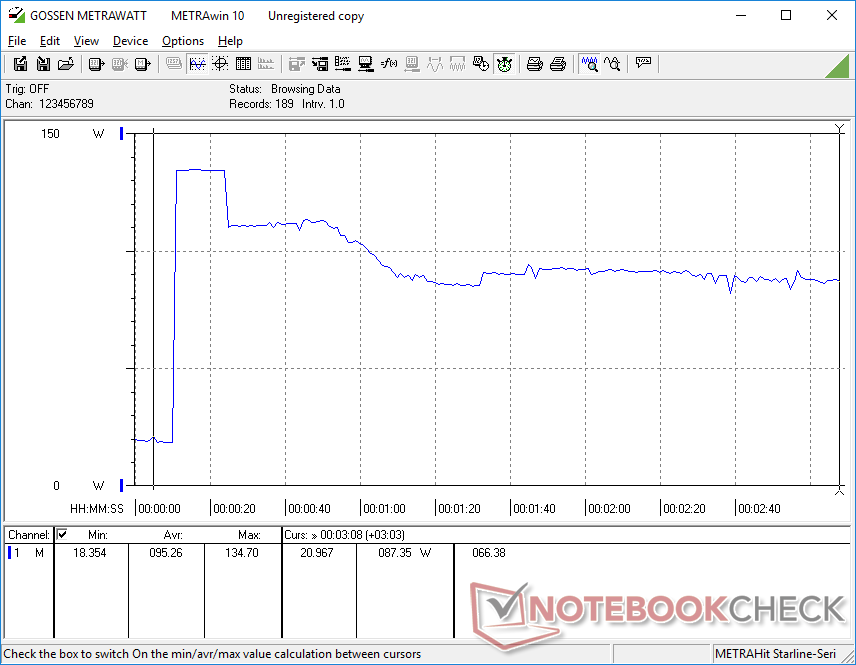
Die GPU-Taktraten, die Leistungsaufnahme und die Temperatur würden sich bei 1.477 MHz, 46 W bzw. 74 °C stabilisieren, wenn The Witcher 3 im Modus Ultra Performance läuft. Die Ausführung im optimierten Modus würde zu etwas niedrigeren Taktraten und Temperaturen führen, wie die Tabelle unten zeigt, sowie zu einer geringeren Leistungsaufnahme von 41 W. Benutzer müssen das System im Modus Ultra Performance ausführen, wenn sie so viel Leistung wie möglich aus der GPU herausholen möchten. Die Durchführung desselben Tests auf dem XPS 15 9500 mit der langsameren GeForce GTX 1650 Ti würde zu ähnlichen CPU- und GPU-Temperaturen führen.
Der Akkubetrieb schränkt die Leistung ein. Ein Fire-Strike-Test im Akkubetrieb würde Physik- und Grafik-Scores von 9.450 bzw. 8.332 Punkten liefern, verglichen mit 27.077 und 12.154 Punkten im Netzbetrieb.
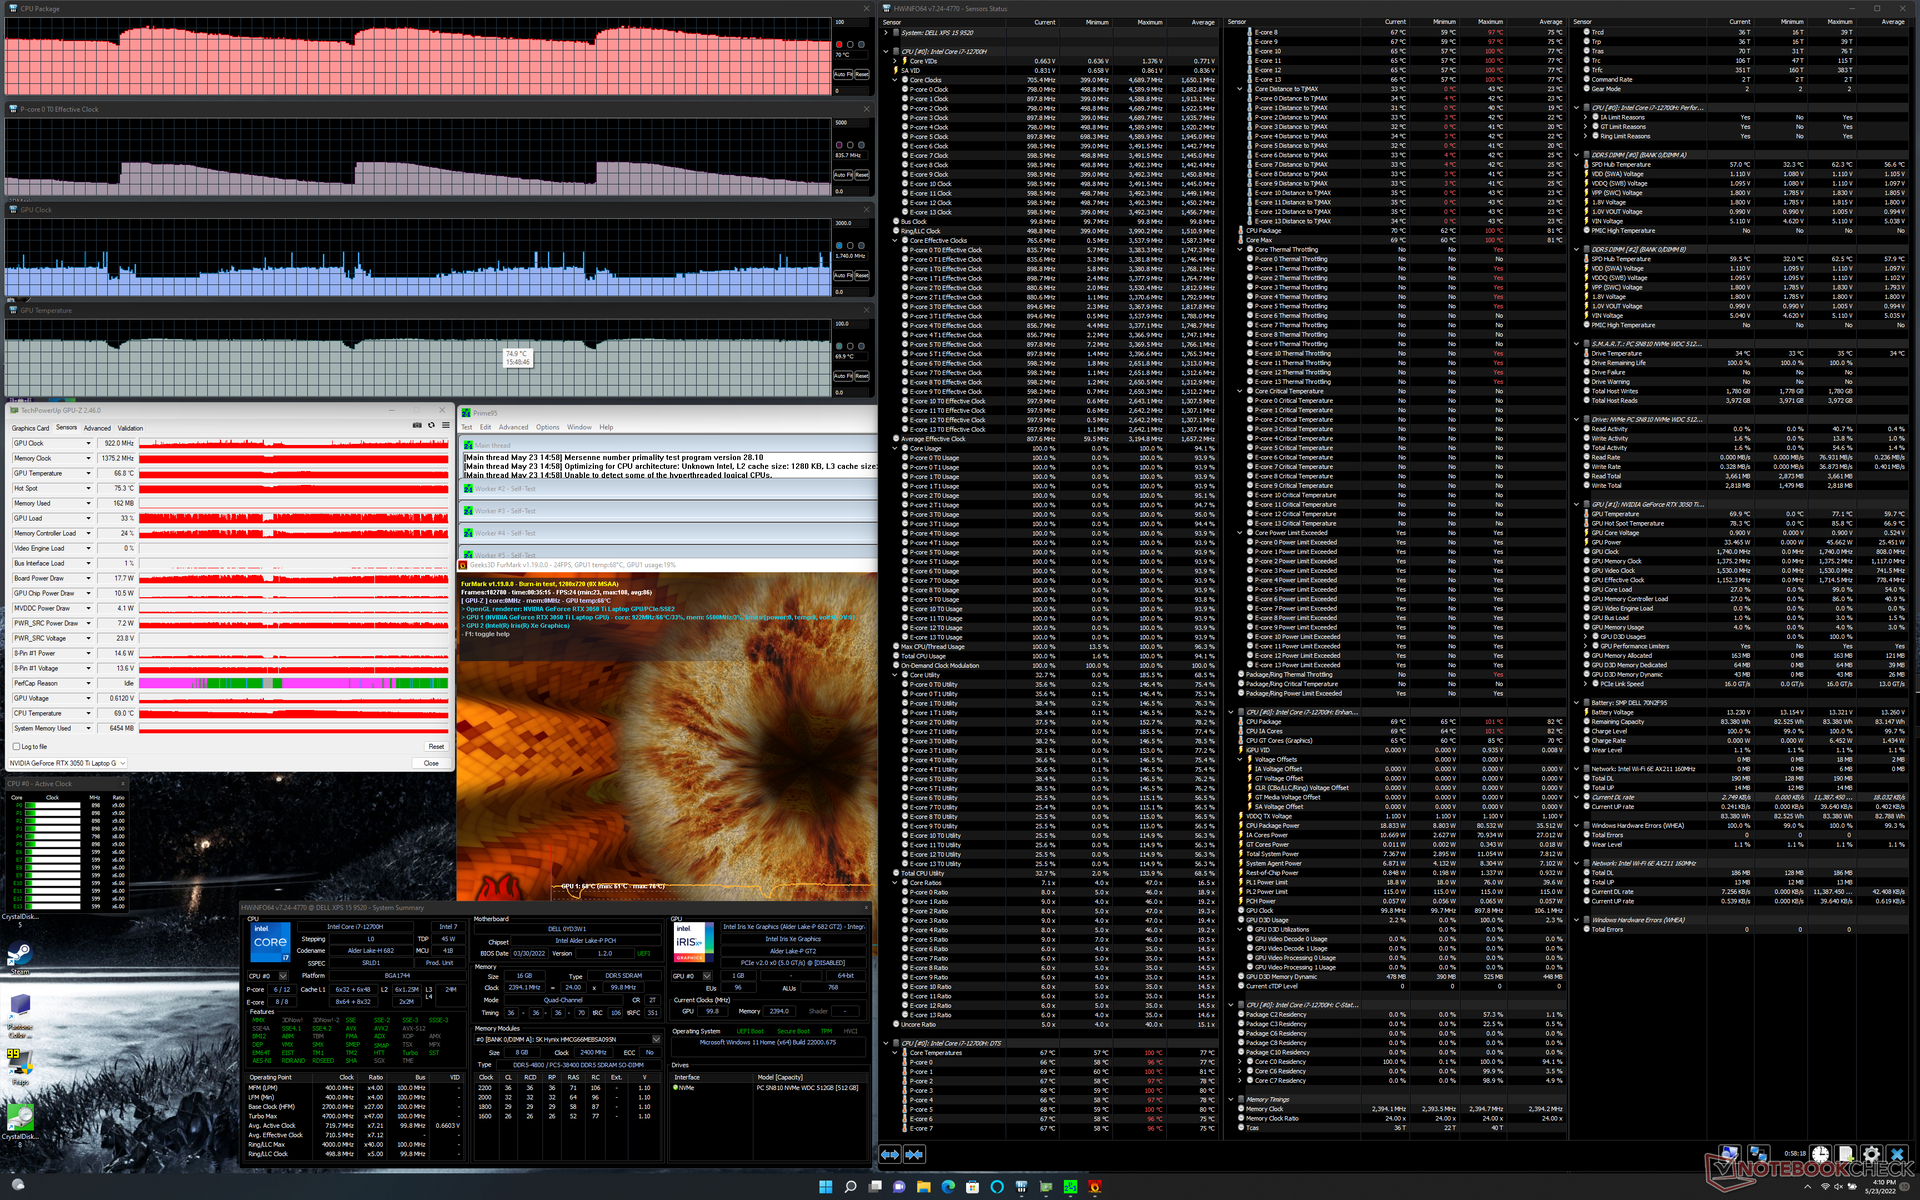
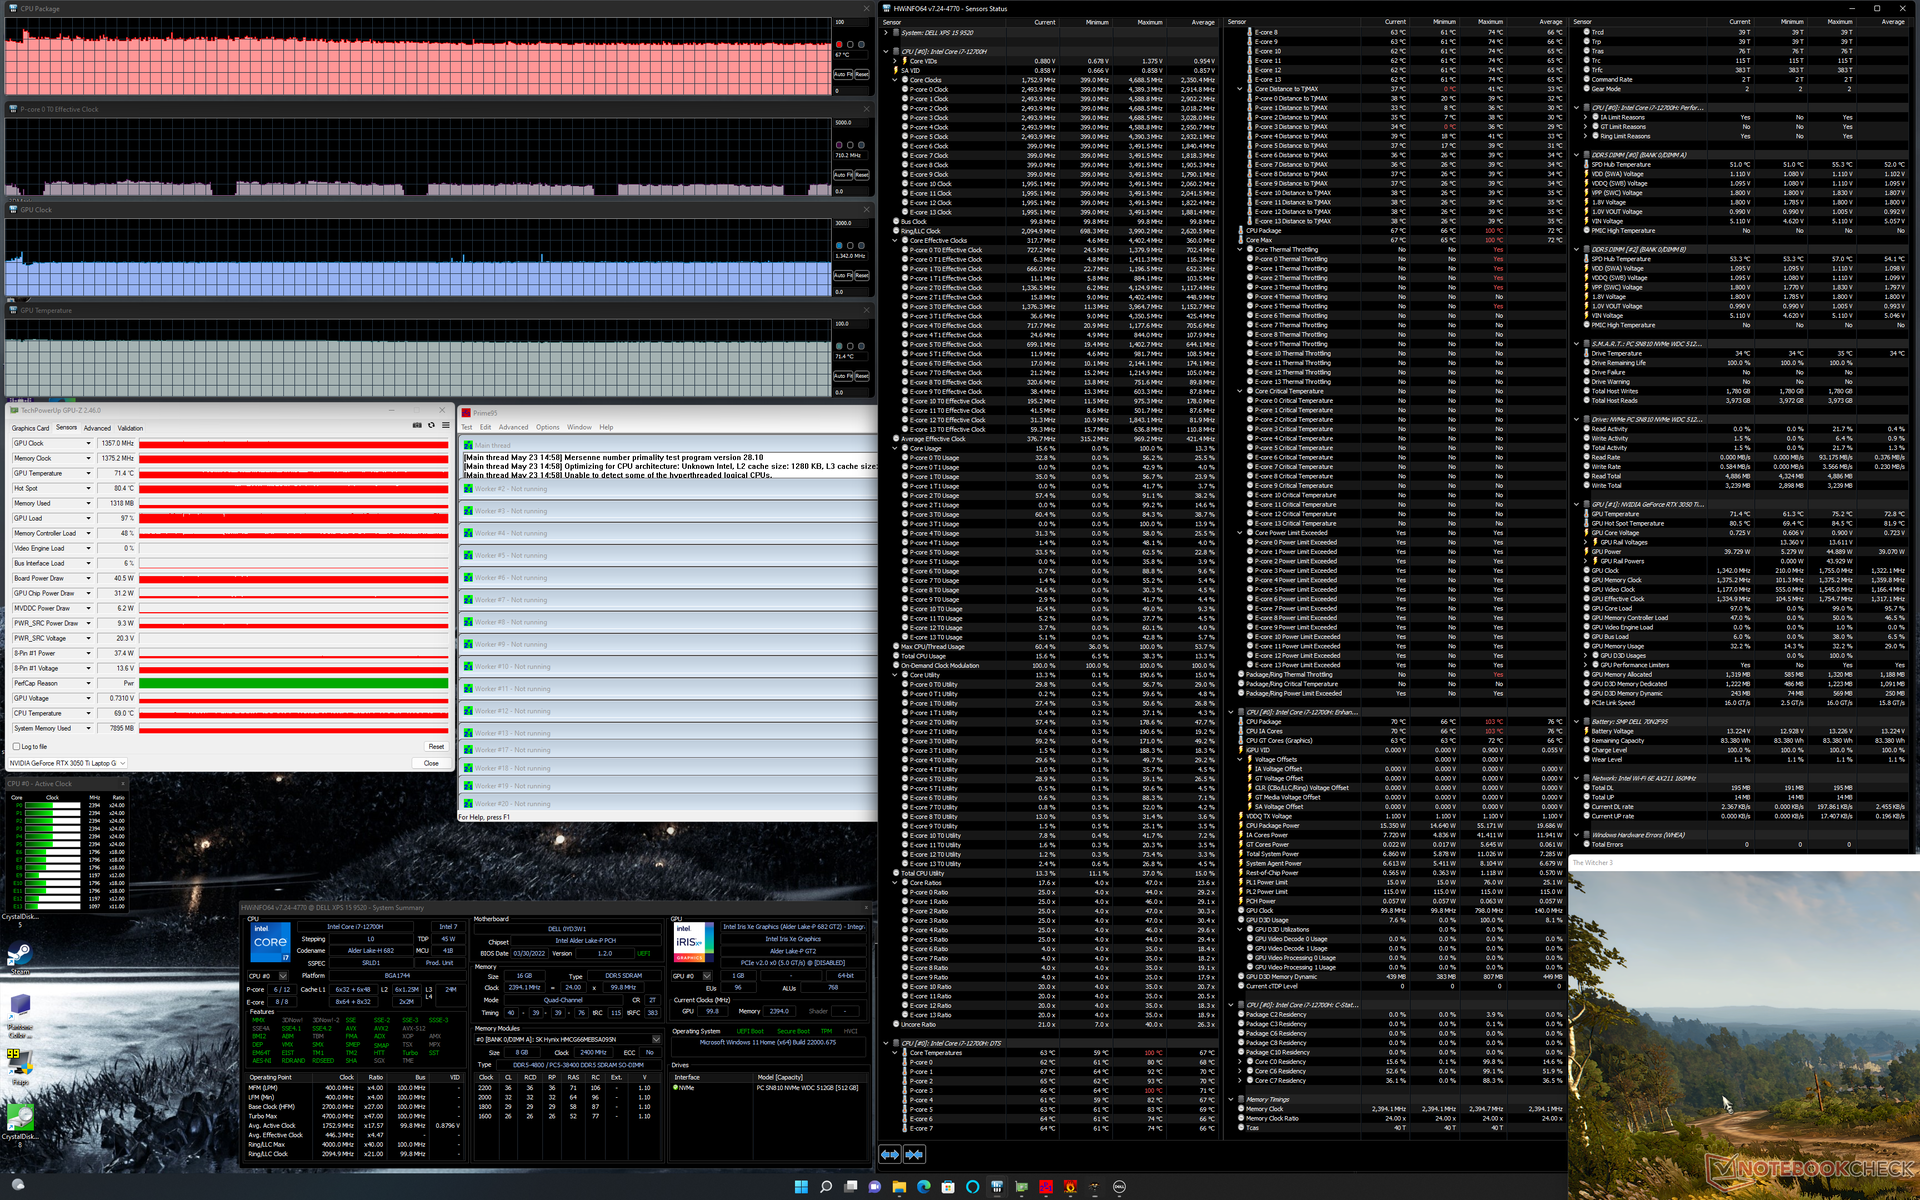
| CPU-Takt (GHz) | GPU-Takt (MHz) | durchschnittliche CPU-Temperatur (°C) | durchschnittliche GPU-Temperatur (°C) | |
| System-Leerlauf | -- | -- | 79 | 64 |
| Prime95 Stress | 2,4 | 85 | -- | 67 |
| Prime95 + FurMark Stress | 0,8-2,3 | 700-1.100 | 79-86 | 62-75 |
| Witcher 3 Stress (Balance-Modus) | 0,7 | 1.357 | 67 | 71 |
| Witcher 3 Stress (Performance Modus) | 0,8 | 1.477 | 71 | 74 |
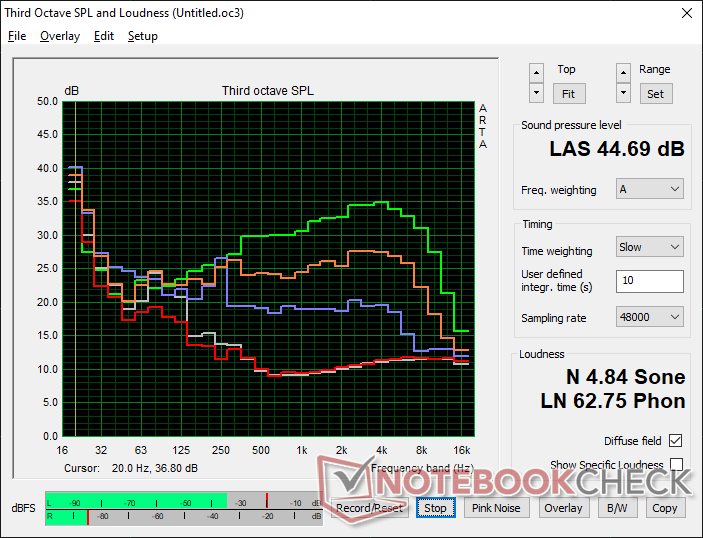
Lautsprecher
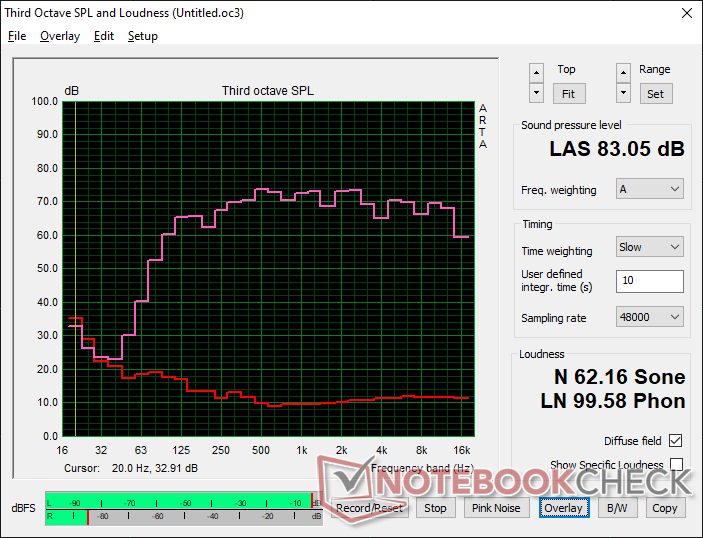
Dell XPS 15 9520 RTX 3050 Ti Audio Analyse
(+) | Die Lautsprecher können relativ laut spielen (83.1 dB)
Bass 100 - 315 Hz
(+) | guter Bass - nur 4.4% Abweichung vom Median
(+) | lineare Bass-Wiedergabe (6.8% Delta zum Vorgänger)
Mitteltöne 400 - 2000 Hz
(+) | ausgeglichene Mitten, vom Median nur 2.6% abweichend
(+) | lineare Mitten (4.1% Delta zum Vorgänger)
Hochtöne 2 - 16 kHz
(+) | ausgeglichene Hochtöne, vom Median nur 1.9% abweichend
(+) | sehr lineare Hochtöne (5.4% Delta zum Vorgänger)
Gesamt im hörbaren Bereich 100 - 16.000 Hz
(+) | hörbarer Bereich ist sehr linear (6.4% Abstand zum Median
Im Vergleich zu allen Geräten derselben Klasse
» 4% aller getesteten Geräte dieser Klasse waren besser, 1% vergleichbar, 95% schlechter
» Das beste Gerät hat einen Delta-Wert von 5%, durchschnittlich ist 17%, das schlechteste Gerät hat 45%
Im Vergleich zu allen Geräten im Test
» 1% aller getesteten Geräte waren besser, 0% vergleichbar, 99% schlechter
» Das beste Gerät hat einen Delta-Wert von 4%, durchschnittlich ist 24%, das schlechteste Gerät hat 134%
Apple MacBook Pro 16 2021 M1 Pro Audio Analyse
(+) | Die Lautsprecher können relativ laut spielen (84.7 dB)
Bass 100 - 315 Hz
(+) | guter Bass - nur 3.8% Abweichung vom Median
(+) | lineare Bass-Wiedergabe (5.2% Delta zum Vorgänger)
Mitteltöne 400 - 2000 Hz
(+) | ausgeglichene Mitten, vom Median nur 1.3% abweichend
(+) | lineare Mitten (2.1% Delta zum Vorgänger)
Hochtöne 2 - 16 kHz
(+) | ausgeglichene Hochtöne, vom Median nur 1.9% abweichend
(+) | sehr lineare Hochtöne (2.7% Delta zum Vorgänger)
Gesamt im hörbaren Bereich 100 - 16.000 Hz
(+) | hörbarer Bereich ist sehr linear (4.6% Abstand zum Median
Im Vergleich zu allen Geräten derselben Klasse
» 0% aller getesteten Geräte dieser Klasse waren besser, 0% vergleichbar, 100% schlechter
» Das beste Gerät hat einen Delta-Wert von 5%, durchschnittlich ist 17%, das schlechteste Gerät hat 45%
Im Vergleich zu allen Geräten im Test
» 0% aller getesteten Geräte waren besser, 0% vergleichbar, 100% schlechter
» Das beste Gerät hat einen Delta-Wert von 4%, durchschnittlich ist 24%, das schlechteste Gerät hat 134%
Energieverwaltung - Mehr Leistung
Stromverbrauch
Das XPS 15 9500, 9510 und 9520 sind die einzigen großen Laptops auf dem Markt mit 130-W-USB-C-Adaptern, welche die 100-W-USB-C-Power-Delivery-Grenze, die von der USB-IF festgelegt wurde, übertreffen. Der höhere Overhead ermöglicht es dem Akku, auch bei anspruchsvollen Lasten wie Spielen weiterhin mit einer angemessenen Rate zu laden. Es ist auch erwähnenswert, dass unser Testgerät keine Ladeprobleme aufwies, wie wir sie bei dem XPS 17 9700 erlebten.
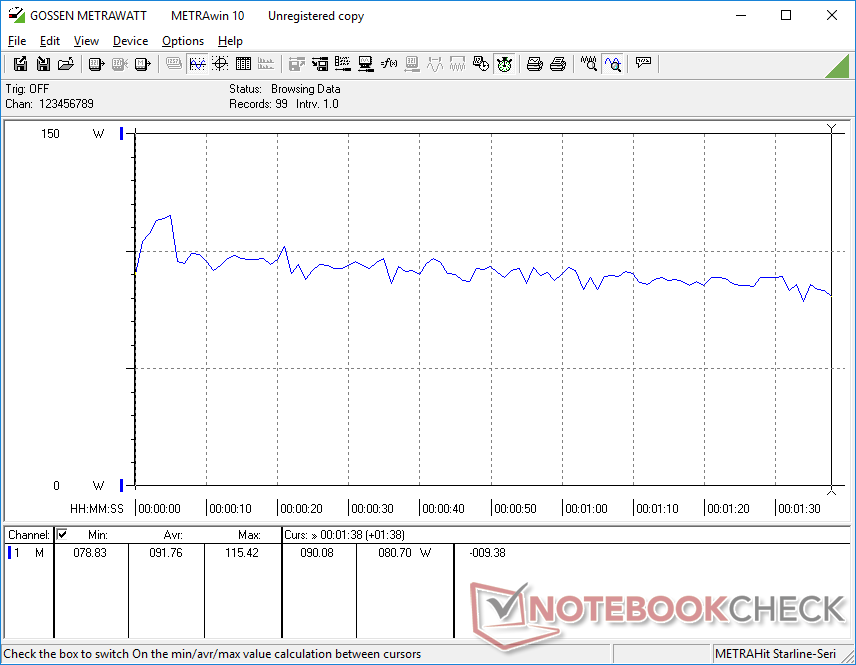
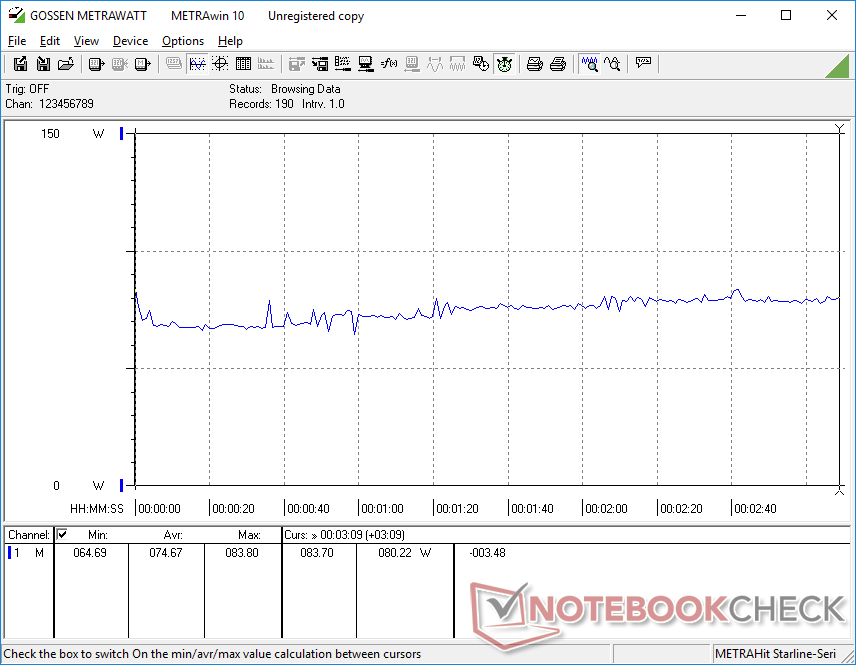
Unter Witcher 3 verbraucht es 75 W und liegt damit in der Nähe der Werte, die wir beim XPS 15 9510 oder dem konkurrierenden AMD Zenbook Pro 15 OLED gemessen haben. Vielleicht noch interessanter ist, dass Prime95 im Betrieb konstant 88 W verbraucht, verglichen mit 65 W auf dem Core7-11800H-betriebenen XPS 15 9510. Der Stromverbrauch ist also um ca. 35 % gestiegen, während die Multi-Thread-Leistung im Jahresvergleich um 35 bis 42 % zugenommen hat, wie wir oben festgestellt haben. Der allgemein höhere Stromverbrauch deckt sich mit dem, was wir auf der Alder-Lake-Plattform als Ganzes beobachten.
Das kleine bis mittelgroße (~14,3 x 6,6 x 2,3 cm) 130-W-USB-C-Netzteil, das mit dem XPS 15 9520 geliefert wird, ist identisch mit dem, welches dem XPS 9500 und 9510 beiliegt.
| Aus / Standby | |
| Idle | |
| Last |
|
Legende:
min: | |
| Dell XPS 15 9520 RTX 3050 Ti i7-12700H, GeForce RTX 3050 Ti Laptop GPU, WDC PC SN810 512GB, OLED, 3456x2160, 15.6" | Dell XPS 15 9510 11800H RTX 3050 Ti OLED i7-11800H, GeForce RTX 3050 Ti Laptop GPU, Micron 2300 512GB MTFDHBA512TDV, OLED, 3456x2160, 15.6" | Dell XPS 15 9500 Core i7 4K UHD i7-10875H, GeForce GTX 1650 Ti Mobile, SK Hynix PC611 512GB, IPS, 3840x2400, 15.6" | HP Spectre X360 15-5ZV31AV i7-10510U, GeForce MX250, Intel SSD 660p 2TB SSDPEKNW020T8, IPS, 3840x2160, 15.6" | Asus Zenbook Pro 15 OLED UM535Q R9 5900HX, GeForce RTX 3050 Ti Laptop GPU, WDC PC SN730 SDBPNTY-1T00, OLED, 1920x1080, 15.6" | MSI Stealth 15M A11SEK i7-1185G7, GeForce RTX 2060 Max-Q, WDC PC SN530 SDBPNPZ-1T00, IPS, 1920x1080, 15.6" | |
|---|---|---|---|---|---|---|
| Stromverbrauch | -5% | -27% | 20% | 5% | -25% | |
| Idle min * (Watt) | 5.5 | 7.6 -38% | 5.7 -4% | 5.2 5% | 5.5 -0% | 7.3 -33% |
| Idle avg * (Watt) | 7.2 | 9.9 -38% | 13.5 -88% | 8.5 -18% | 7.4 -3% | 10.1 -40% |
| Idle max * (Watt) | 16 | 10.8 32% | 19.6 -23% | 8.7 46% | 14.9 7% | 17.6 -10% |
| Last avg * (Watt) | 91.8 | 81 12% | 114.1 -24% | 65.6 29% | 78.2 15% | 106.6 -16% |
| Witcher 3 ultra * (Watt) | 74.6 | 76.2 -2% | 93 -25% | 56.5 24% | 80.1 -7% | 105.4 -41% |
| Last max * (Watt) | 134.7 | 131 3% | 135.2 -0% | 92.4 31% | 110.9 18% | 151.2 -12% |
* ... kleinere Werte sind besser
Power Consumption Witcher 3 / Stresstest
Stromverbrauch mit externem Monitor
Akkulaufzeit
Mit fast neun Stunden konstanter WLAN-Nutzung unter realen Bedingungen sind die Laufzeiten insgesamt ähnlich wie beim XPS 9500 und fast zwei Stunden länger als beim XPS 9510. Man sollte jedoch bedenken, dass weiße Farben bei gleicher Helligkeitseinstellung ein paar Watt mehr benötigen als dunklere Farben, da unsere Konfiguration ein OLED-Panel verwendet.
Das Aufladen von der leeren auf die volle Kapazität mit dem mitgelieferten Netzteil dauert etwa 2 bis 2,5 Stunden im Leerlauf oder bei geringer Last.
| Dell XPS 15 9520 RTX 3050 Ti i7-12700H, GeForce RTX 3050 Ti Laptop GPU, 86 Wh | Dell XPS 15 9510 11800H RTX 3050 Ti OLED i7-11800H, GeForce RTX 3050 Ti Laptop GPU, 86 Wh | Dell XPS 15 9500 Core i7 4K UHD i7-10875H, GeForce GTX 1650 Ti Mobile, 86 Wh | HP Spectre X360 15-5ZV31AV i7-10510U, GeForce MX250, 84 Wh | Asus Zenbook Pro 15 OLED UM535Q R9 5900HX, GeForce RTX 3050 Ti Laptop GPU, 96 Wh | MSI Stealth 15M A11SEK i7-1185G7, GeForce RTX 2060 Max-Q, 52 Wh | |
|---|---|---|---|---|---|---|
| Akkulaufzeit | -32% | 7% | 22% | 45% | -42% | |
| Idle (h) | 14.8 | 23 55% | 22.6 53% | 26.2 77% | 10.5 -29% | |
| WLAN (h) | 8.8 | 7 -20% | 9.1 3% | 10.8 23% | 12.8 45% | 6.3 -28% |
| Last (h) | 3.2 | 1.8 -44% | 2 -37% | 2.9 -9% | 3.6 13% | 1 -69% |
| H.264 (h) | 10.4 |
Pro
Contra
Fazit - Der Alder-Lake-Unterschied
Wenn die CPUs im XPS 15 9500 oder 9510 für Ihre speziellen Anwendungen zu langsam sind, dann wäre das 9520 eine Überlegung wert. Sein 12 Core i7-12700H bietet 70 Prozent bzw. 40 Prozent schnellere Multi-Thread-Leistung als der 10. Gen. Core i7-10875H bzw. der 11. Gen. Core i7-11800H ohne signifikante Auswirkungen auf die Akkulaufzeit. Der inhärente Zuwachs an integrierter Grafikleistung kann auch ausreichen, um die meisten Büroanwender zufrieden zu stellen, ohne dass ein Upgrade auf eine teure diskrete Nvidia Option erforderlich ist.
Power-User werden die signifikanten Leistungszuwächse des Prozessors gegenüber den Intel Optionen der 11. oder 10. Generation wertschätzen. Für einfachere oder moderate Office-Aufgaben ist die zusätzliche Leistung der 12.-Gen.-Serie jedoch nicht den Preisanstieg wert.
Abgesehen von der CPU-Leistung bleibt die Erfahrung allerdings die gleiche wie beim XPS 9510 oder sogar 9500. Der Nvidia Grafikprozessor wurde gegenüber dem 9510 heruntergetaktet, so dass die Vorteile des schnelleren DDR5-RAM minimiert wurden. Bestimmte Änderungen, die wir gerne gesehen hätten, wie z. B. ein Display mit höherer Bildwiederholfrequenz, eine höher auflösende Webcam, Wi-Fi-6E-Unterstützung oder ein Privacy Shutter sind weiterhin nicht vorhanden. Wenn Sie die schnellere CPU der 12. Generation nicht anspricht, dann können Sie stattdessen das XPS 15 9510 kaufen, das genau die gleichen Display- und GPU-Optionen wie unser 9520 hat, aber zu einem niedrigeren Preis.
Preis und Verfügbarkeit
Dell liefert derzeit seine XPS 15 9520 Serie ab 1.798 Euro für das Basismodell bis zu 3.199 Euro bei maximaler Konfiguration aus.
Dell XPS 15 9520 RTX 3050 Ti
- 30.08.2022 v7 (old)
Allen Ngo
Preisvergleich

