Corsair One i300 Desktop-PC bändigt Core i9-12900K und RTX 3080 Ti im 12-Liter-Gehäuse

Seit 2018 vermarktet Corsair die One-Serie und verpackt aktuelle Gaming-Hardware in einem kompakten Gehäuse samt Wasserkühlung. Dass dieses System funktioniert, konnten wir bereits beim Corsair One i160 sehen.
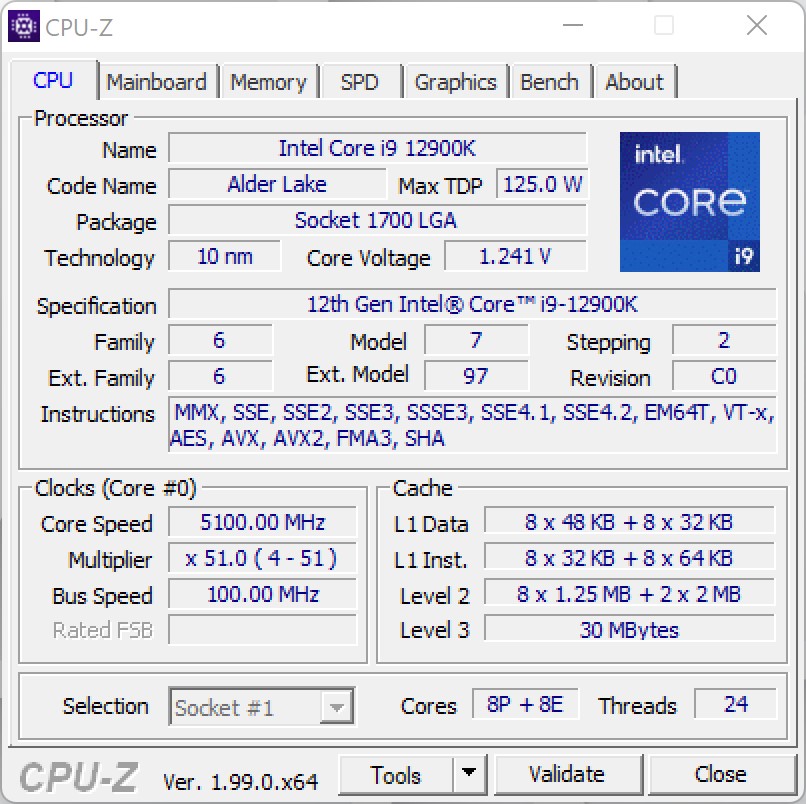
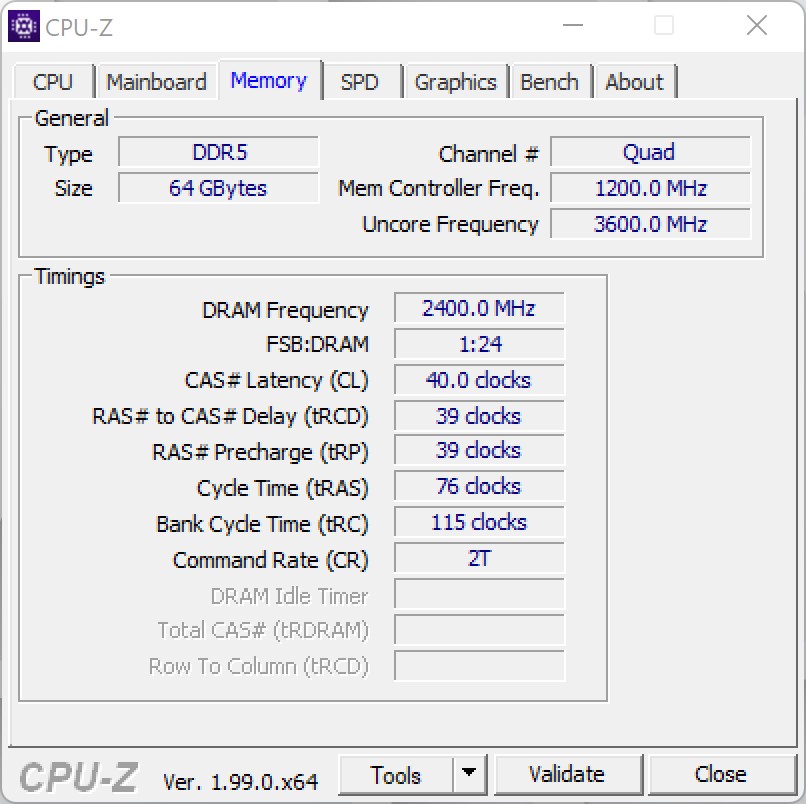
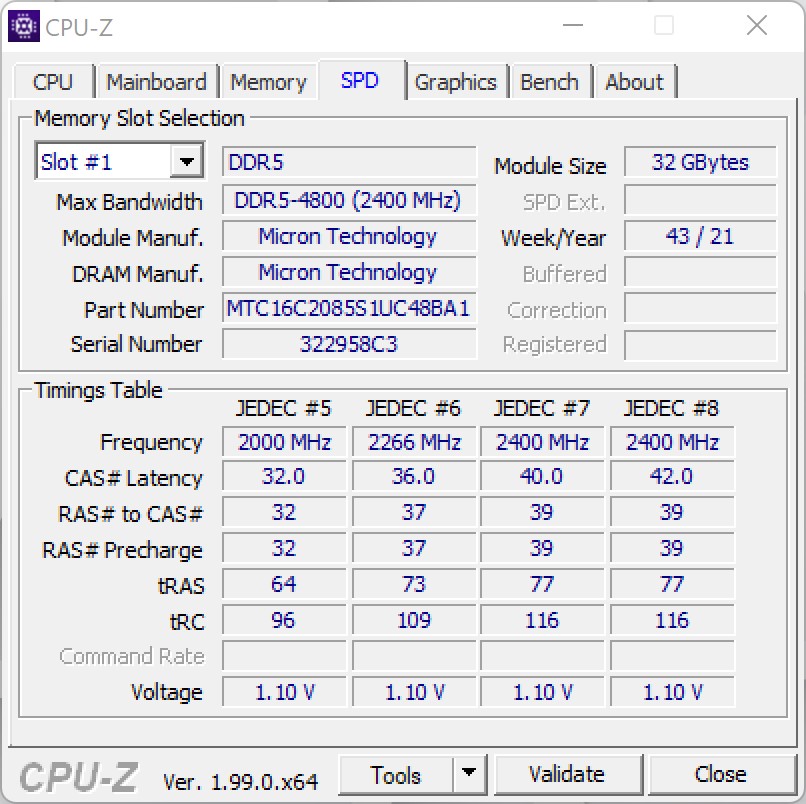
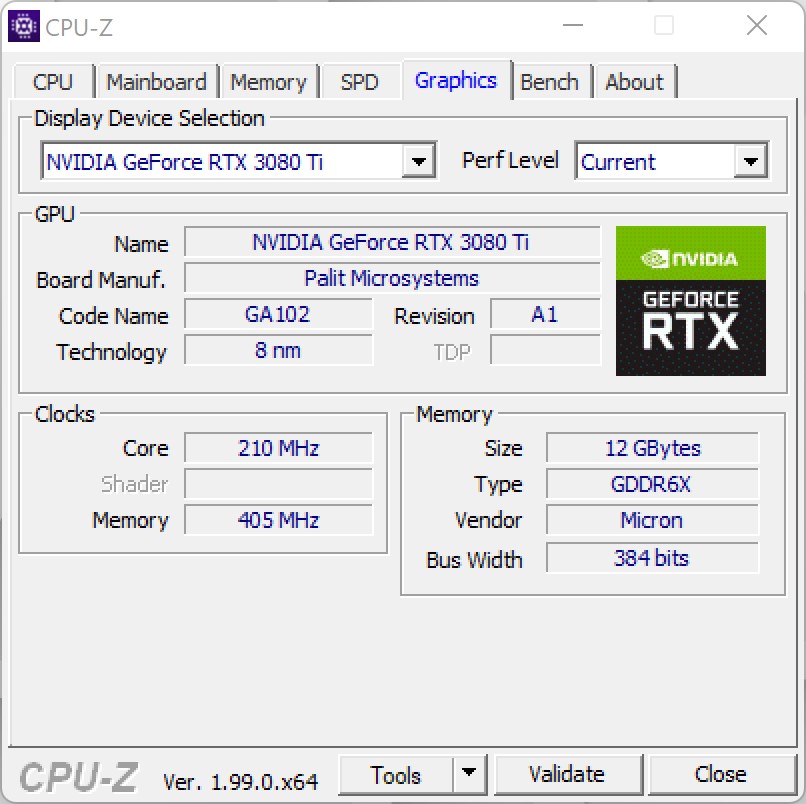
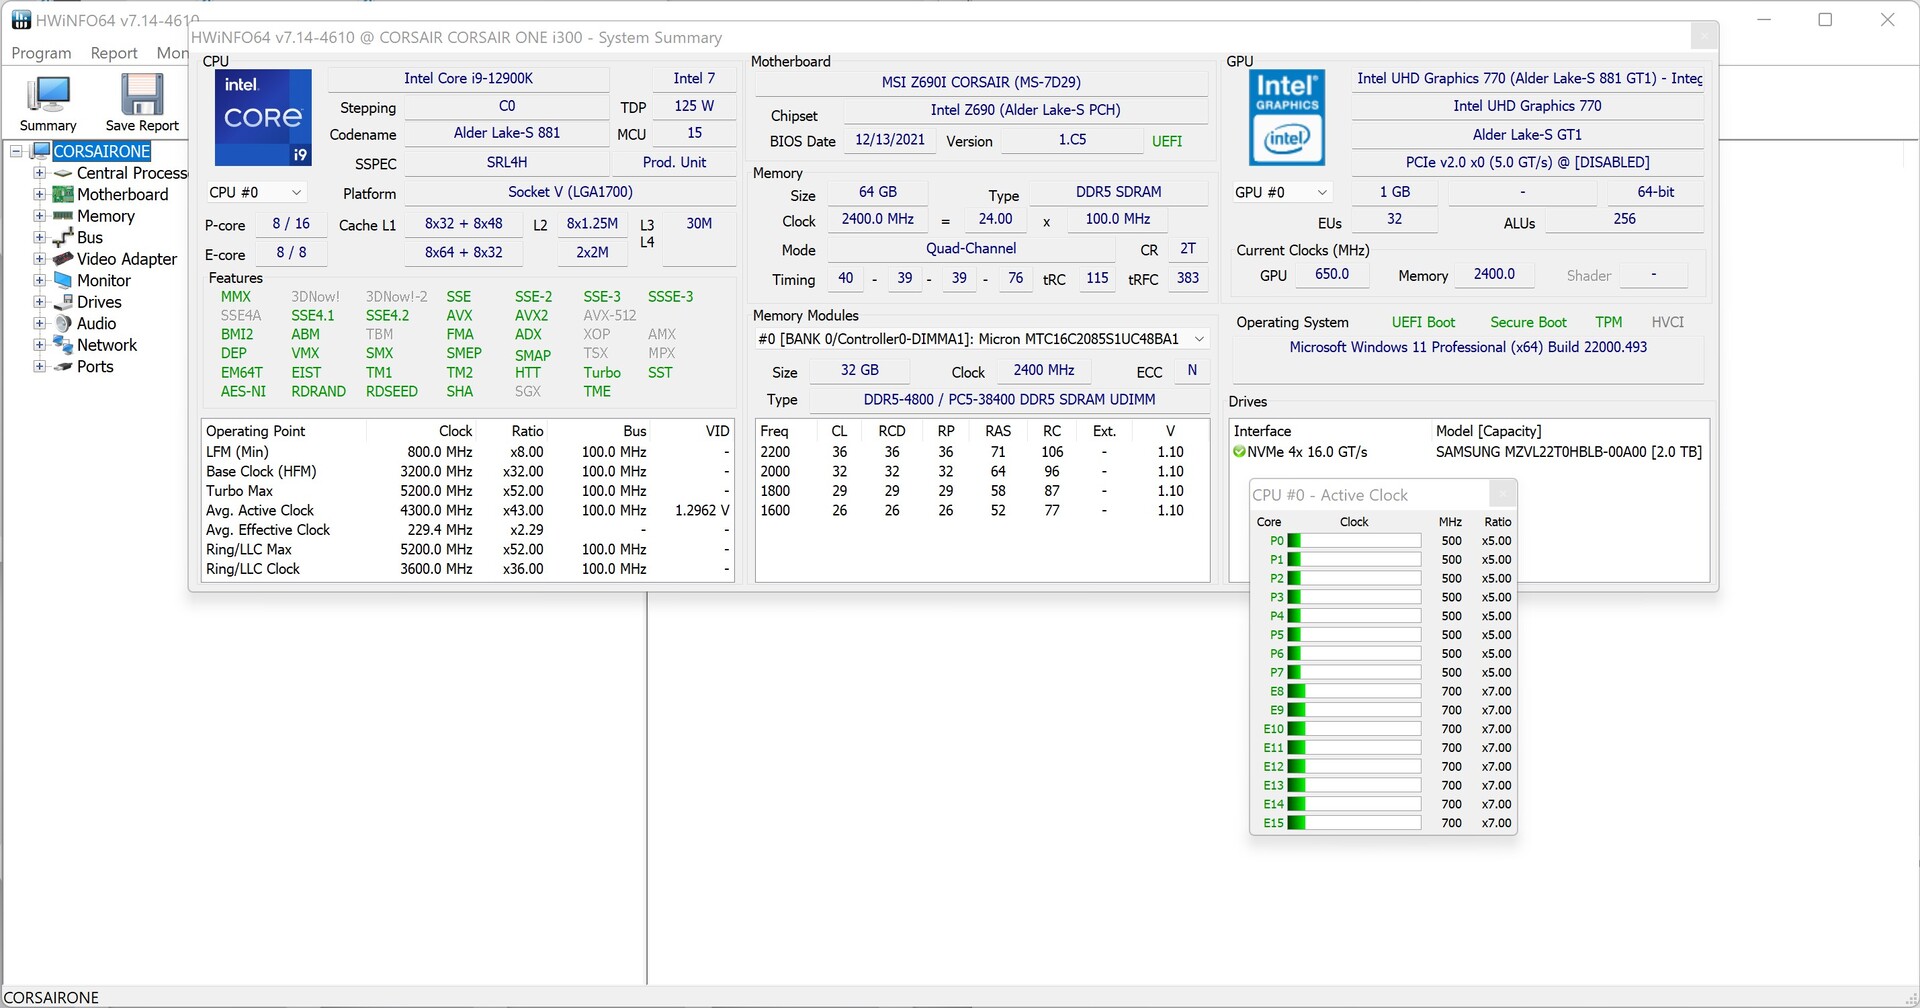
Auf der diesjährigen CES hat Corsair ein Update für den Corsair One angekündigt und verpasst dem System nun die aktuelle Alder-Lake-Serie, welche nun wieder die Leistungskrone als schnellste Gaming-CPU zurückerobert hat. Neben dem Intel Core i9-12900K verbaut Corsair noch eine Nvidia GeForce RTX 3080 Ti. Beide Komponenten bietet eine hervorragende Grundlage für kompromissloses 4K-Gaming. Nach ersten Tests können wir dies auch so bestätigen, auch wenn der Hersteller den Intel Core i9-12900K nicht ganz von der Kette lässt. Genaueres dazu klären wir später im Test. An der Seite der potenten Komponenten gibt es noch satte 64 GB Arbeitsspeicher und eine pfeilschnelle 2 TB SSD inklusive Windows 11 in der Professional Version.
Corsair ruft für das System in unserer Testausstattung 5.100 Euro auf. Genau 1.000 Euro weniger muss man auf den Tisch legen, wenn man sich mit 32 GB Arbeitsspeicher und einer Nvidia GeForce RTX 3080 zufriedengibt.
Gehäuse
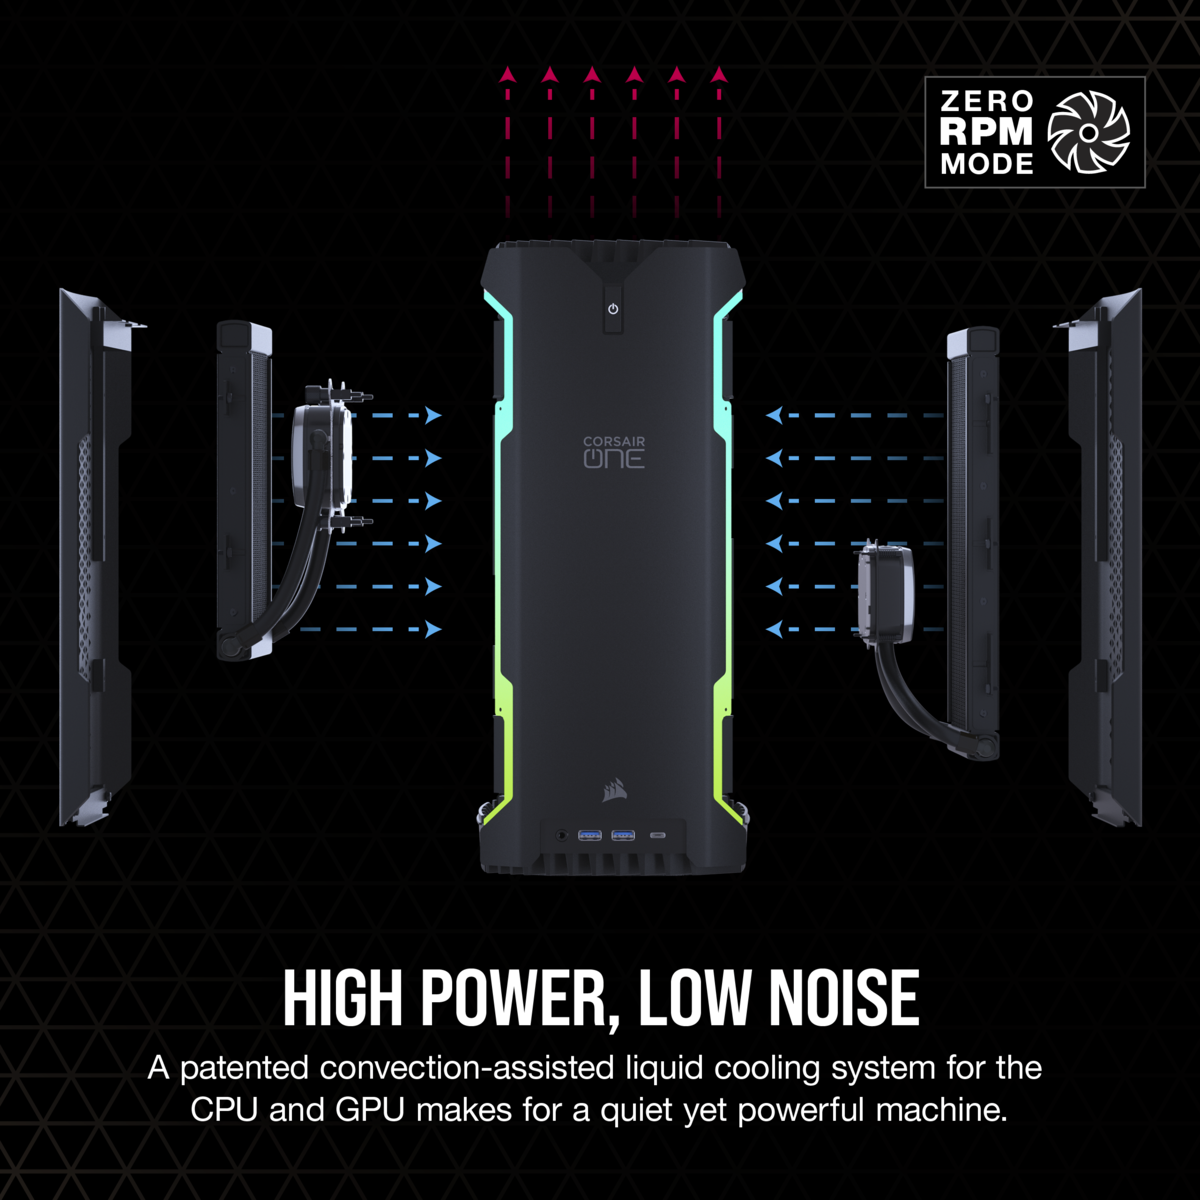
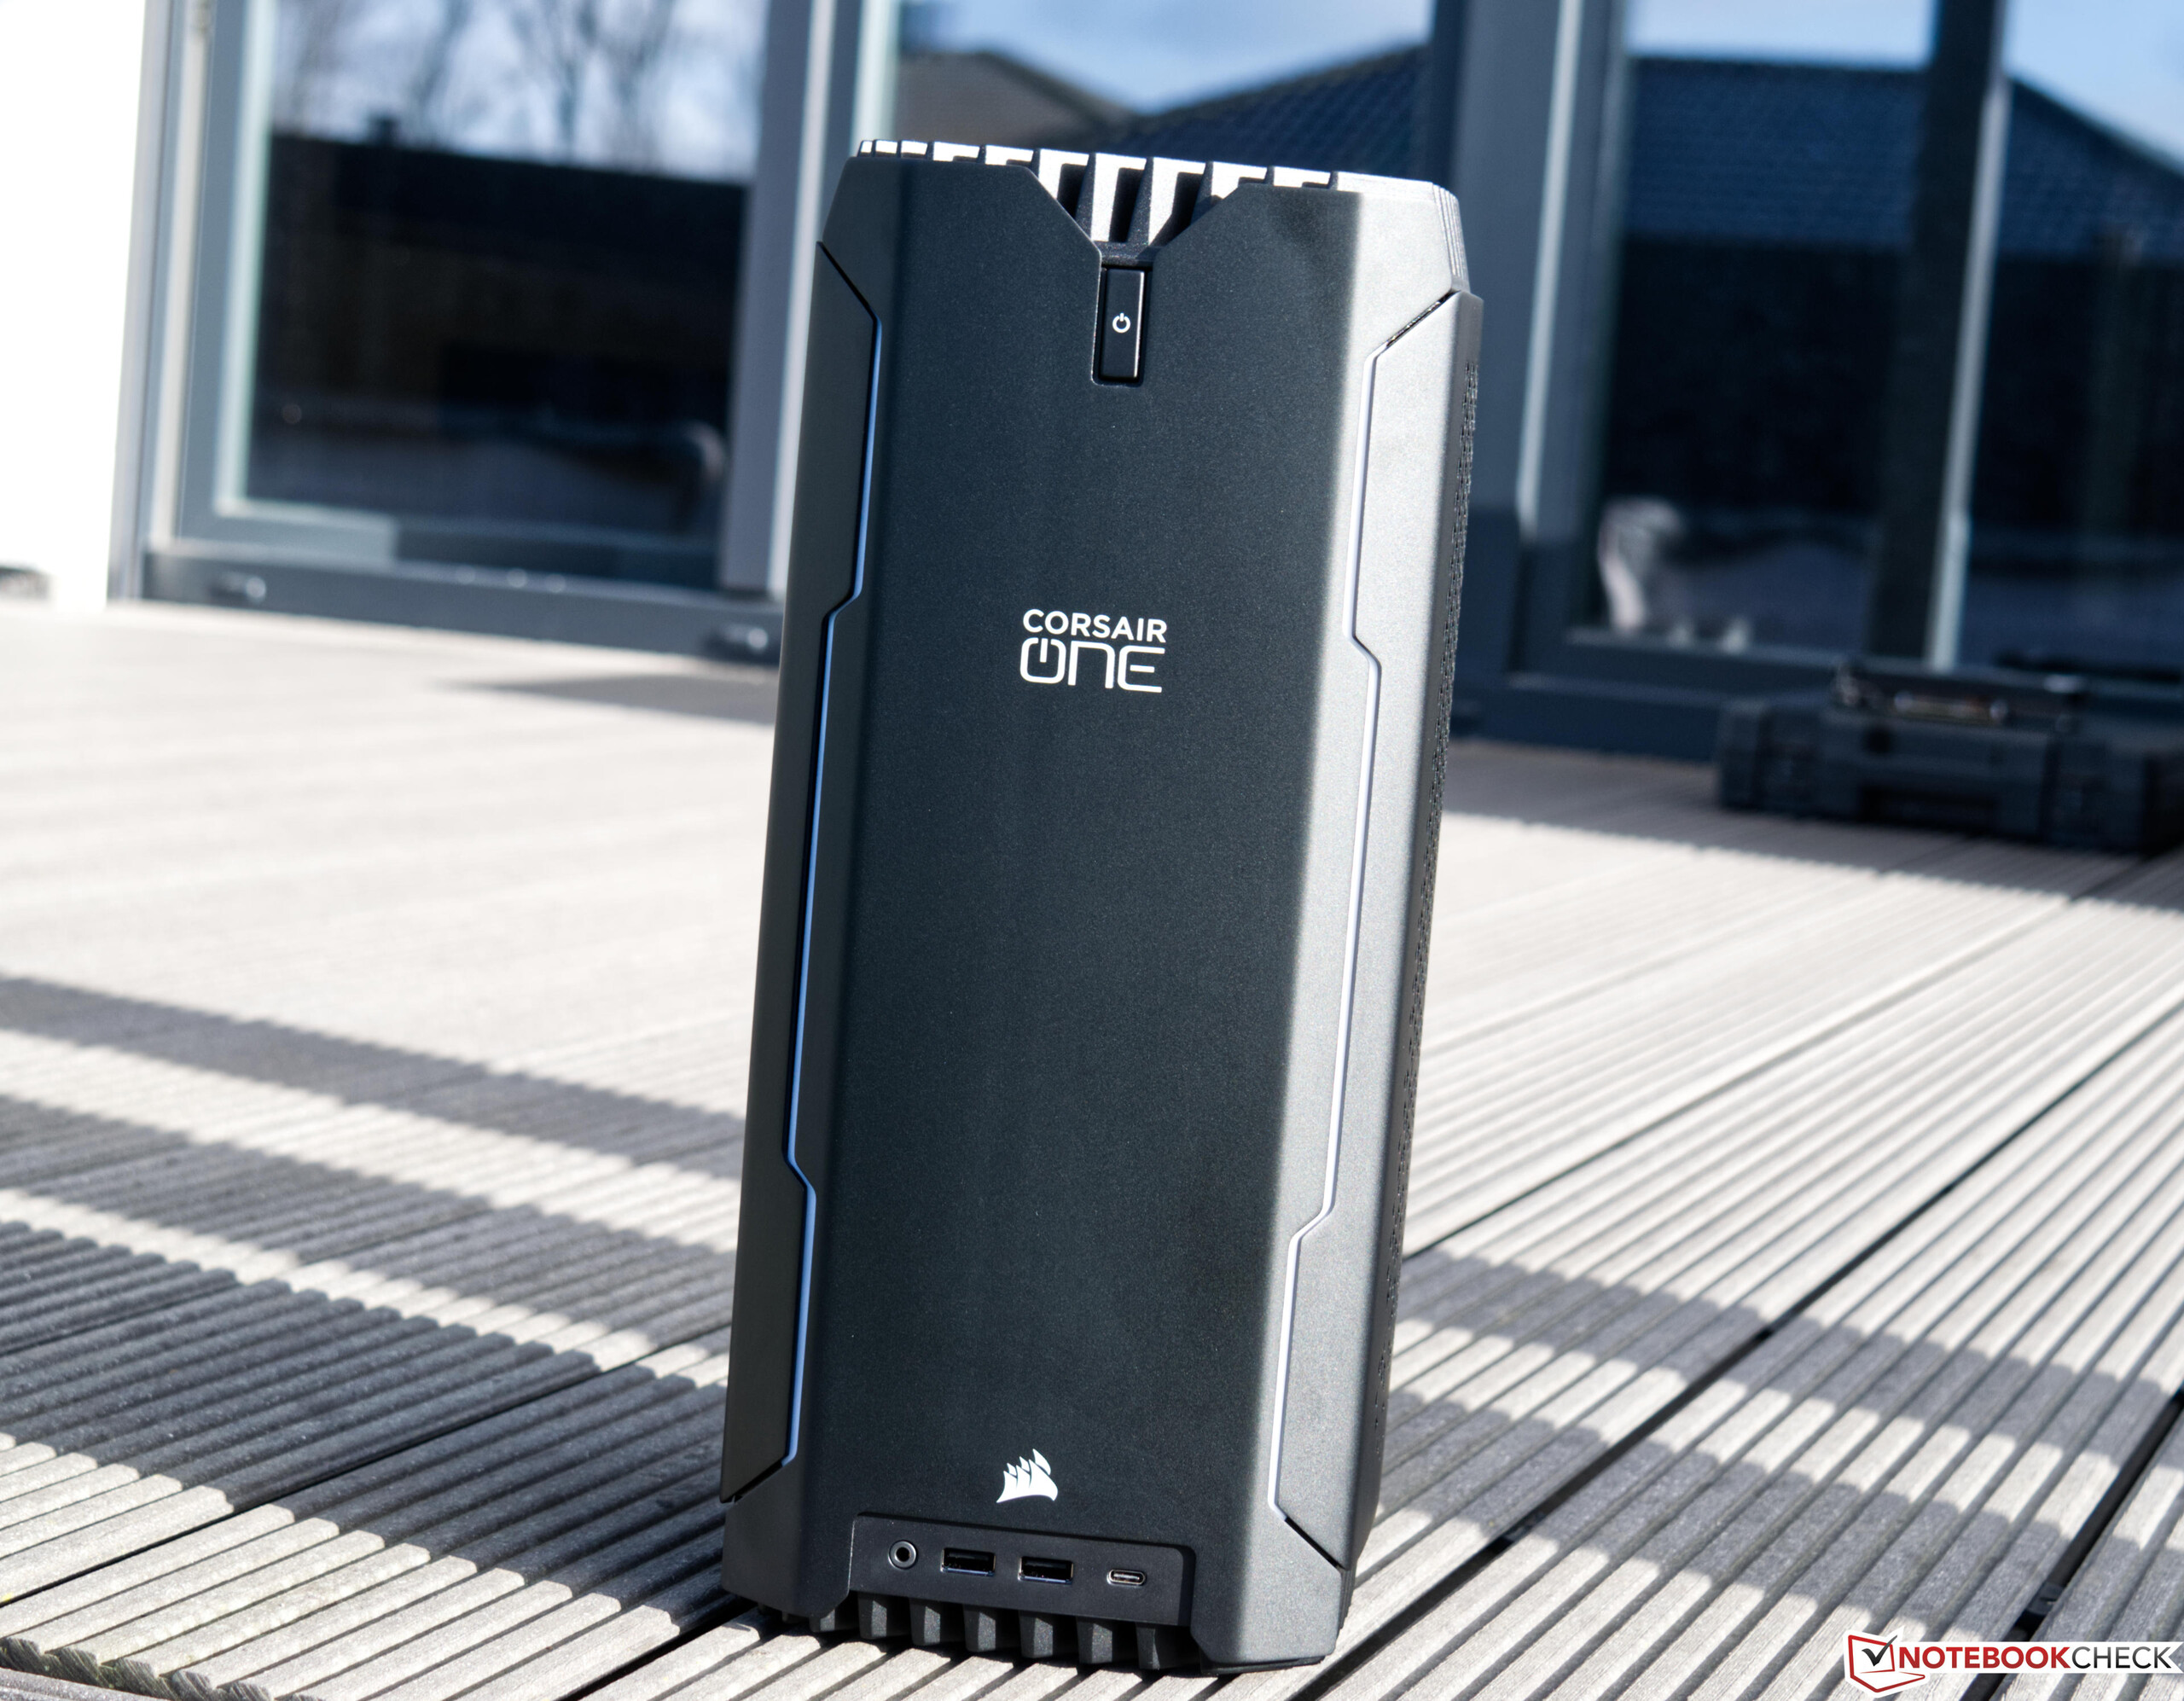
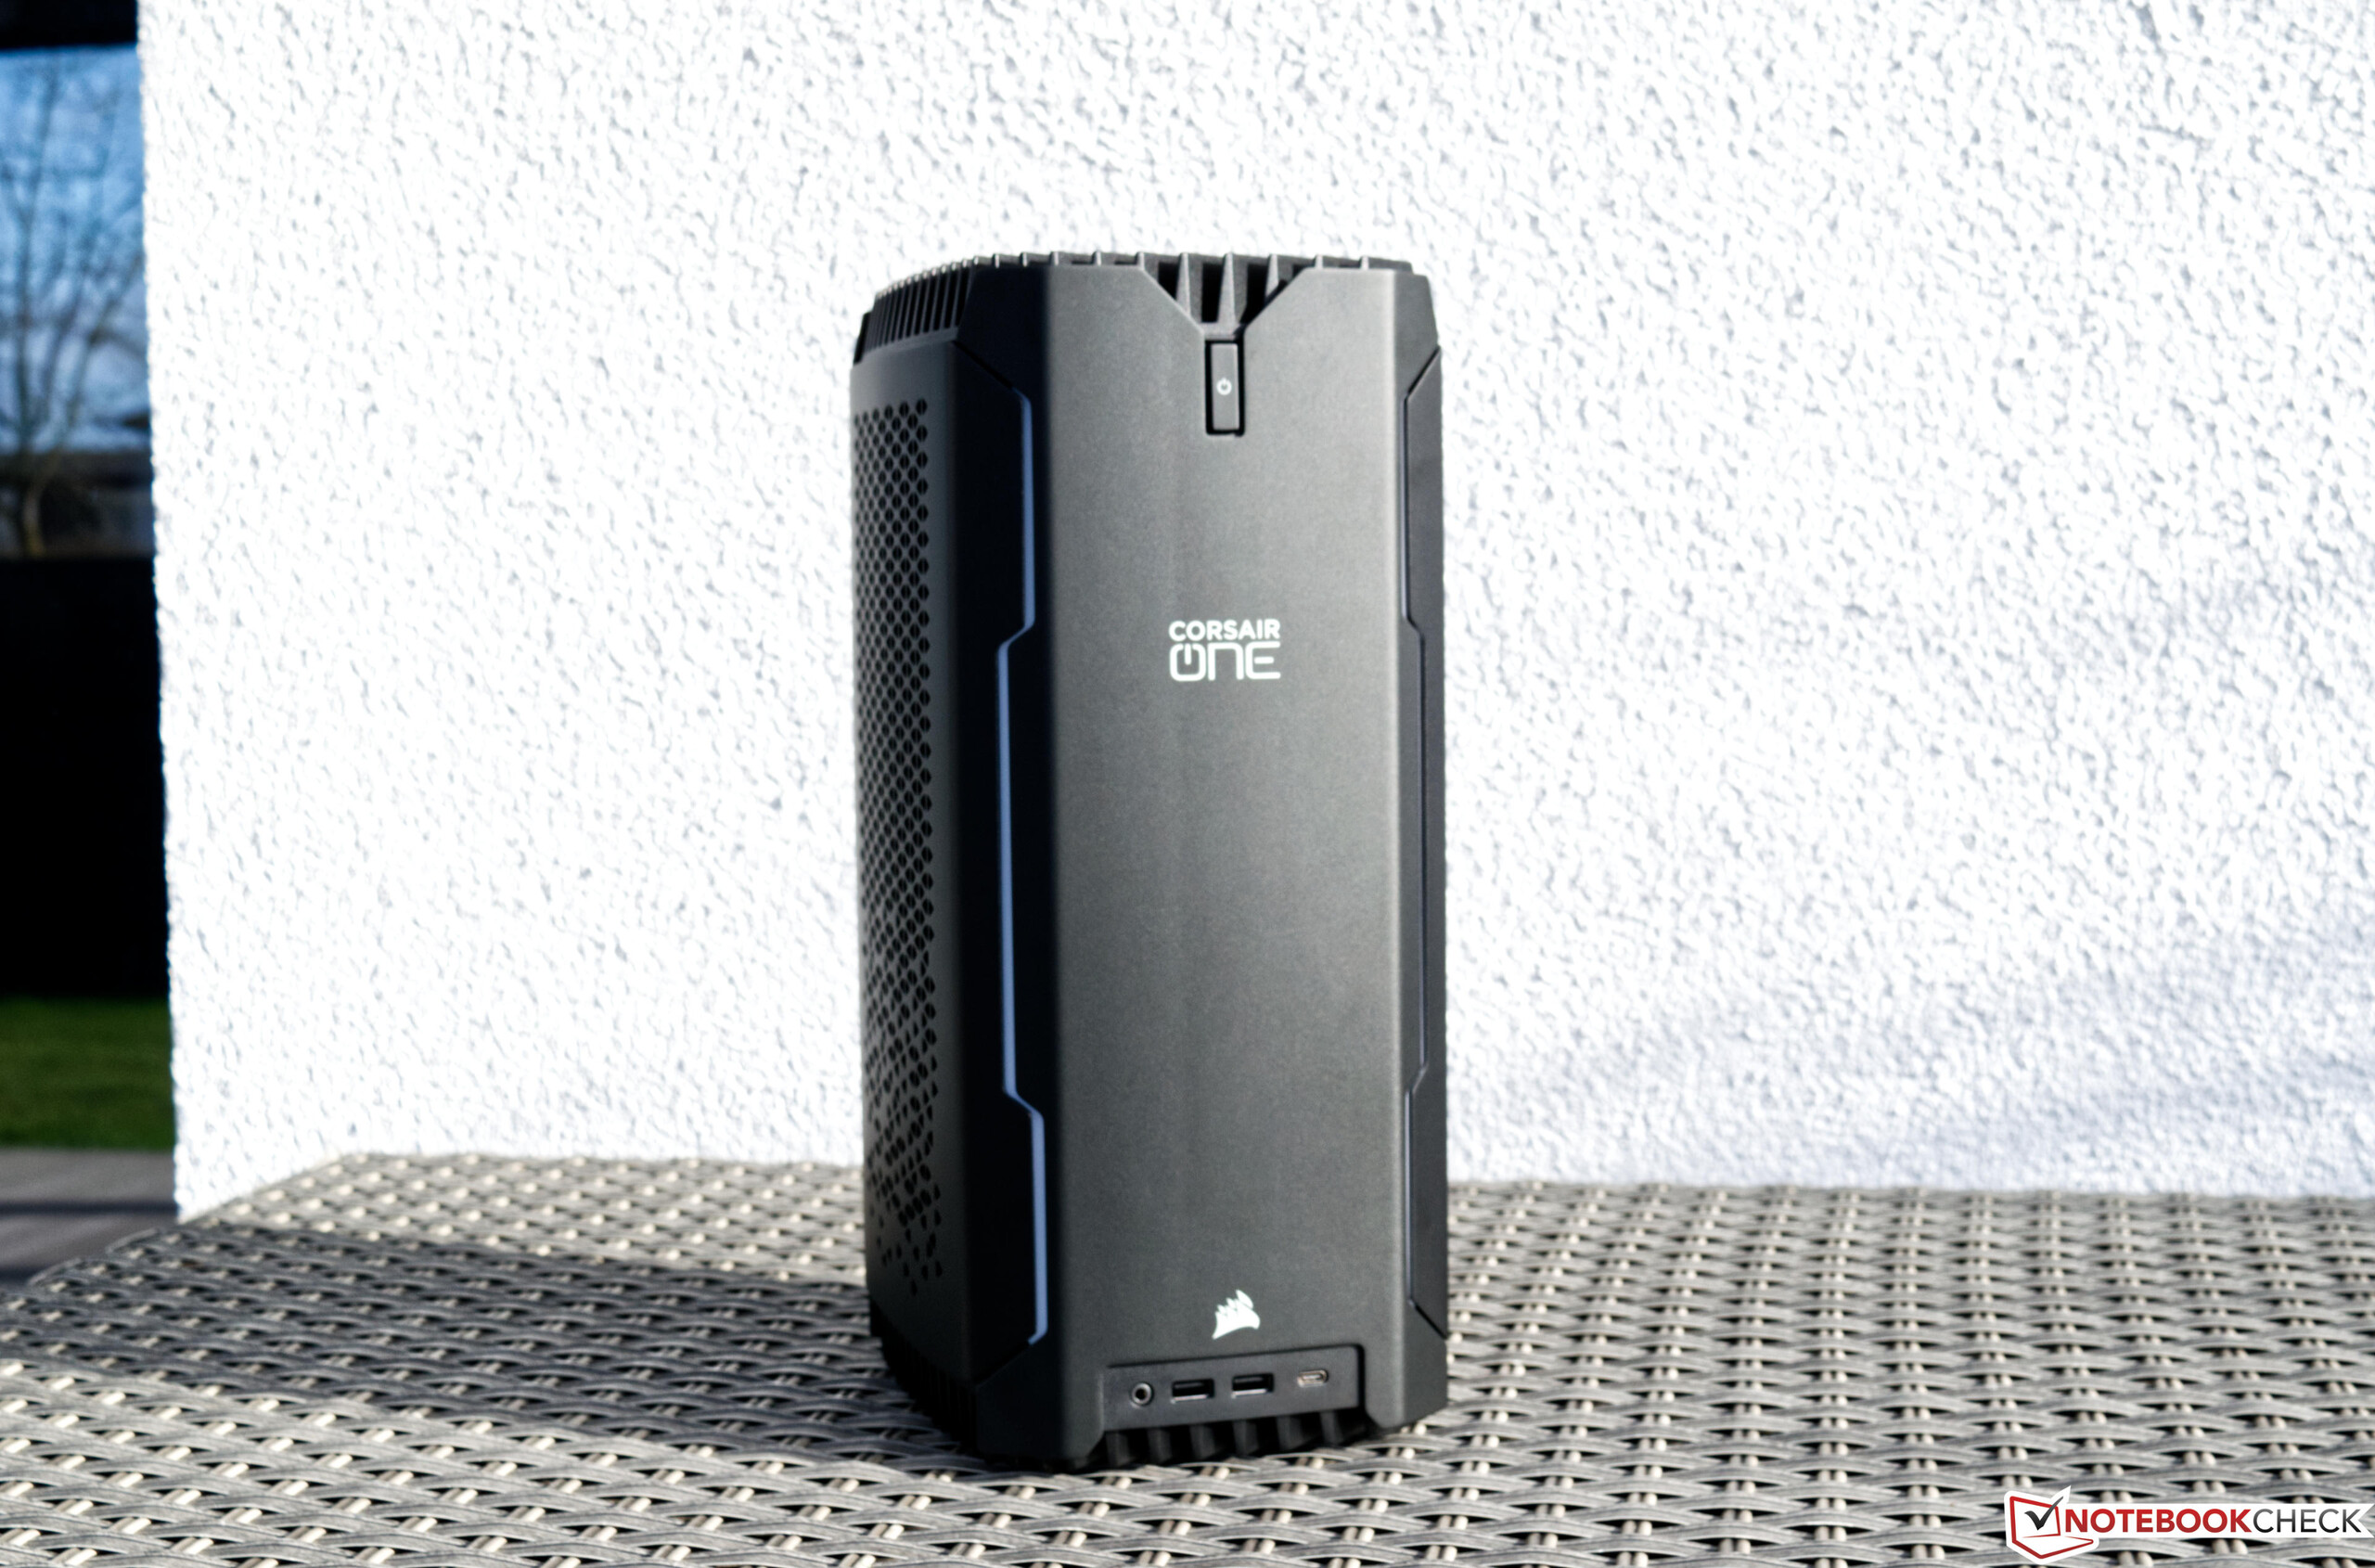
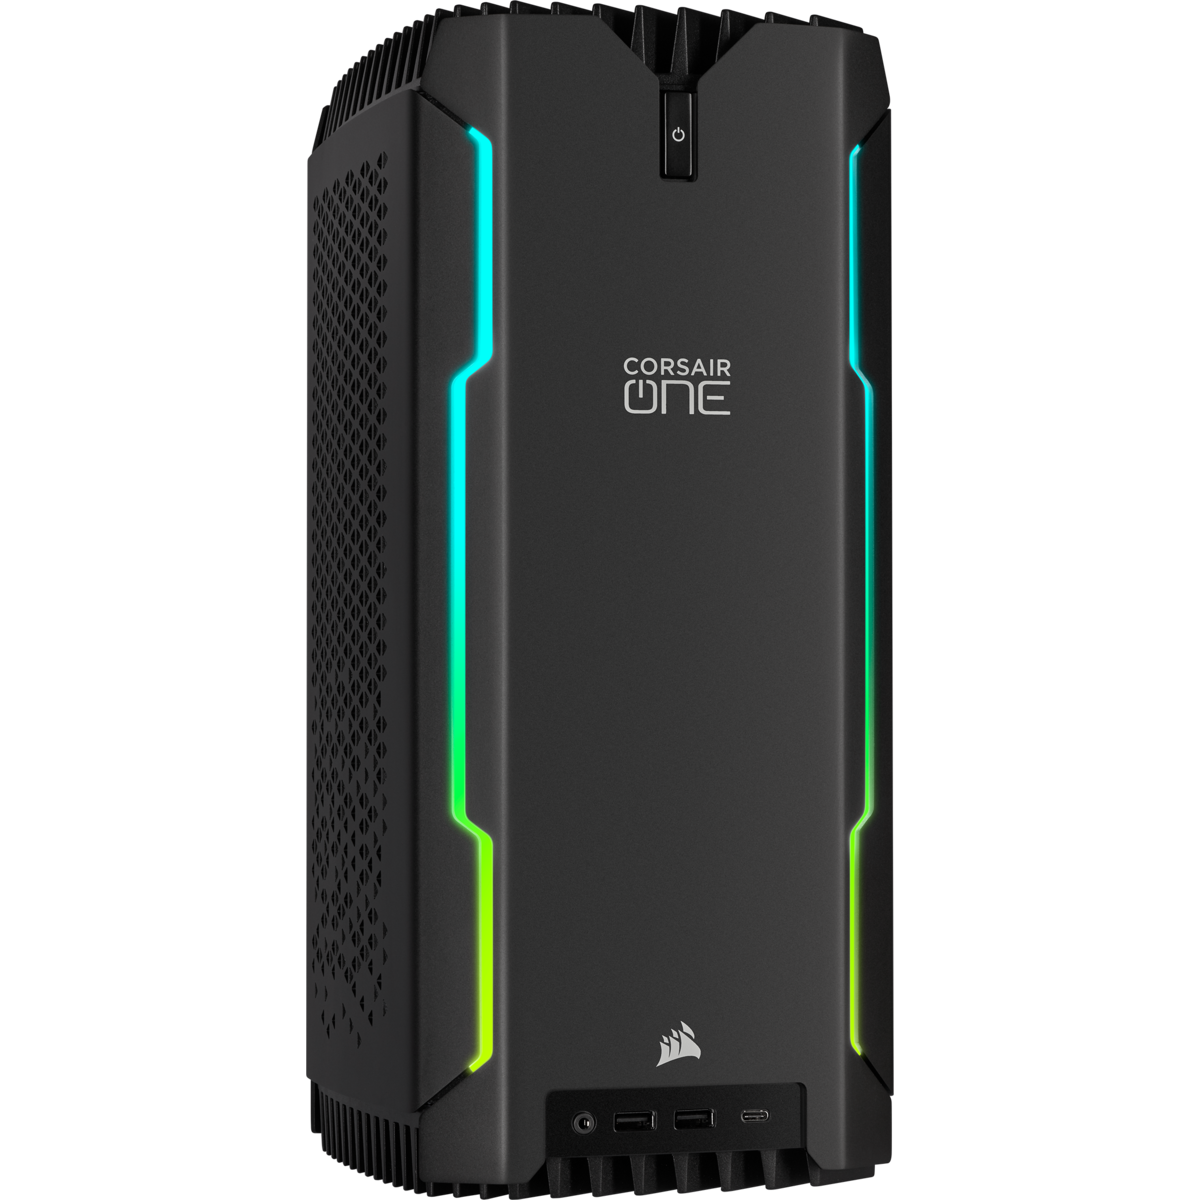
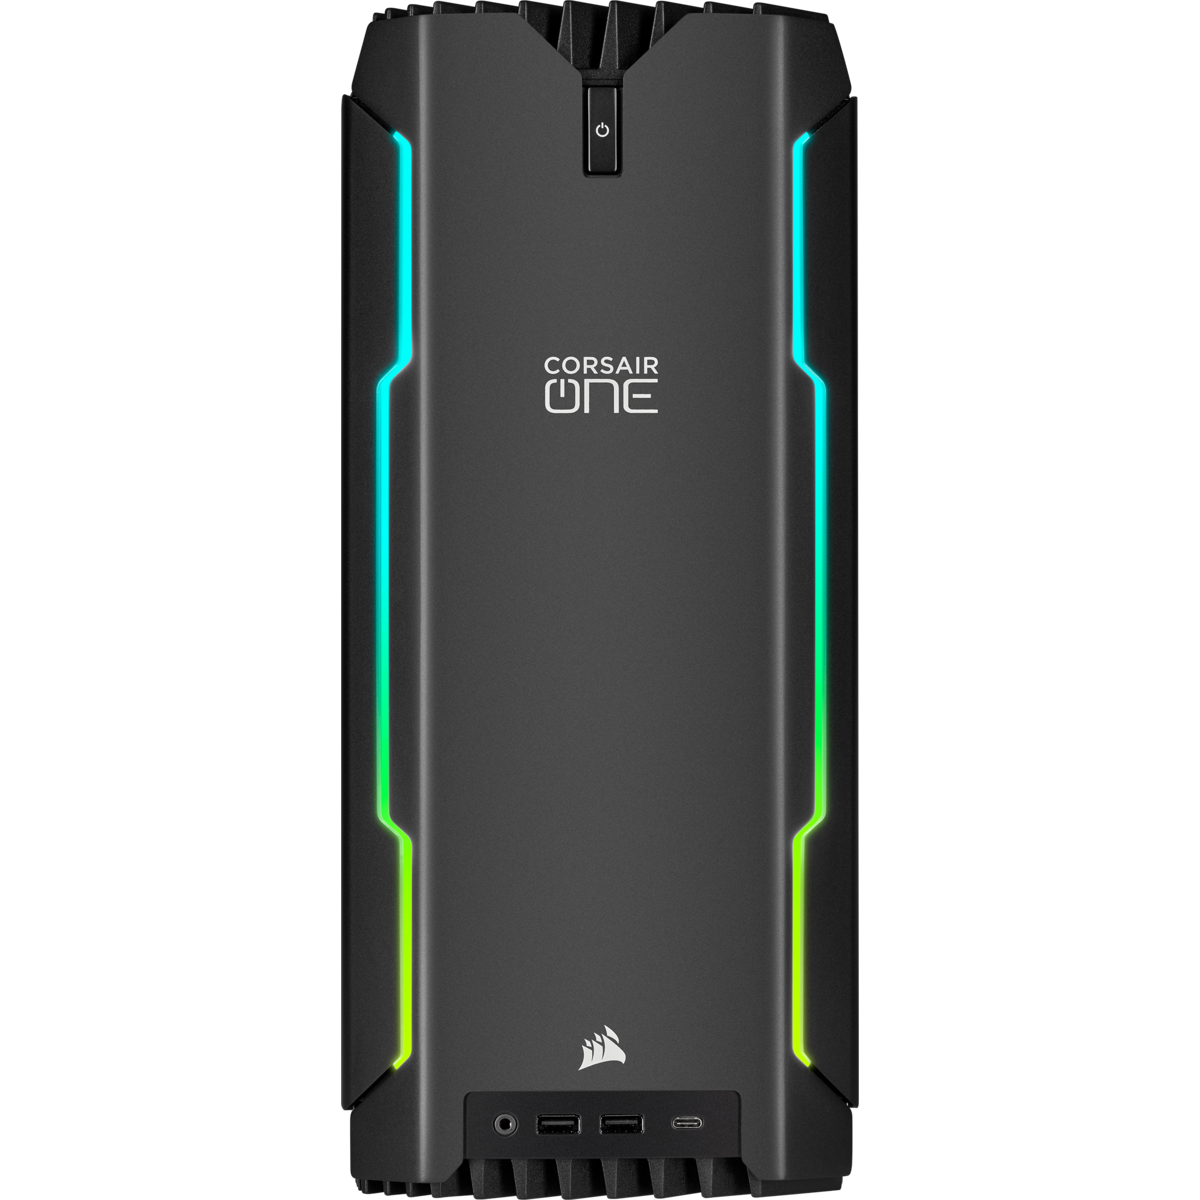
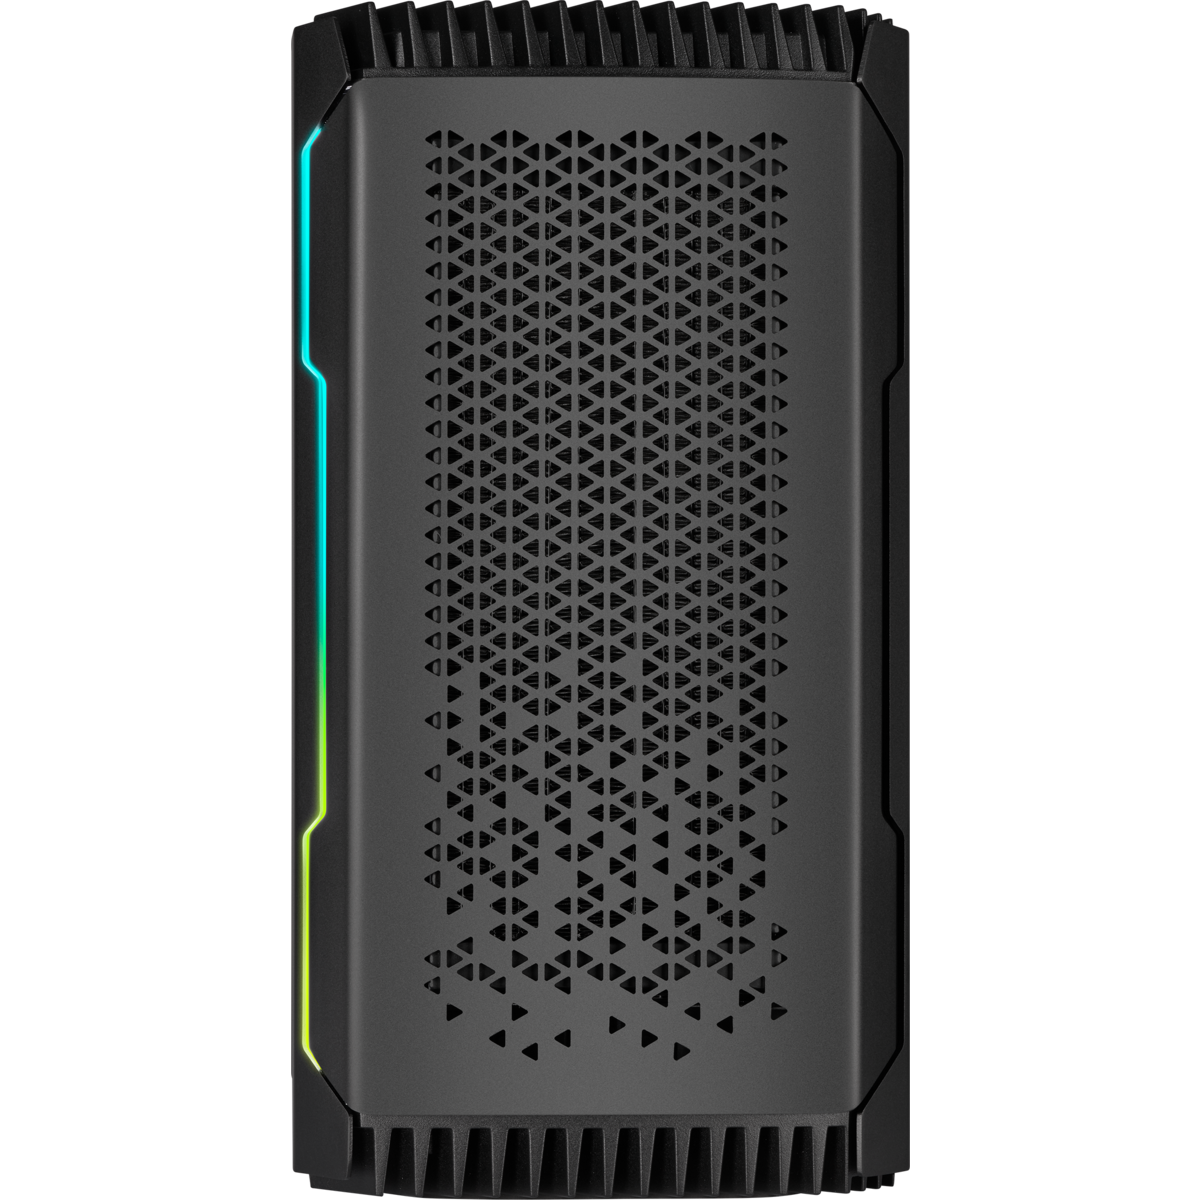
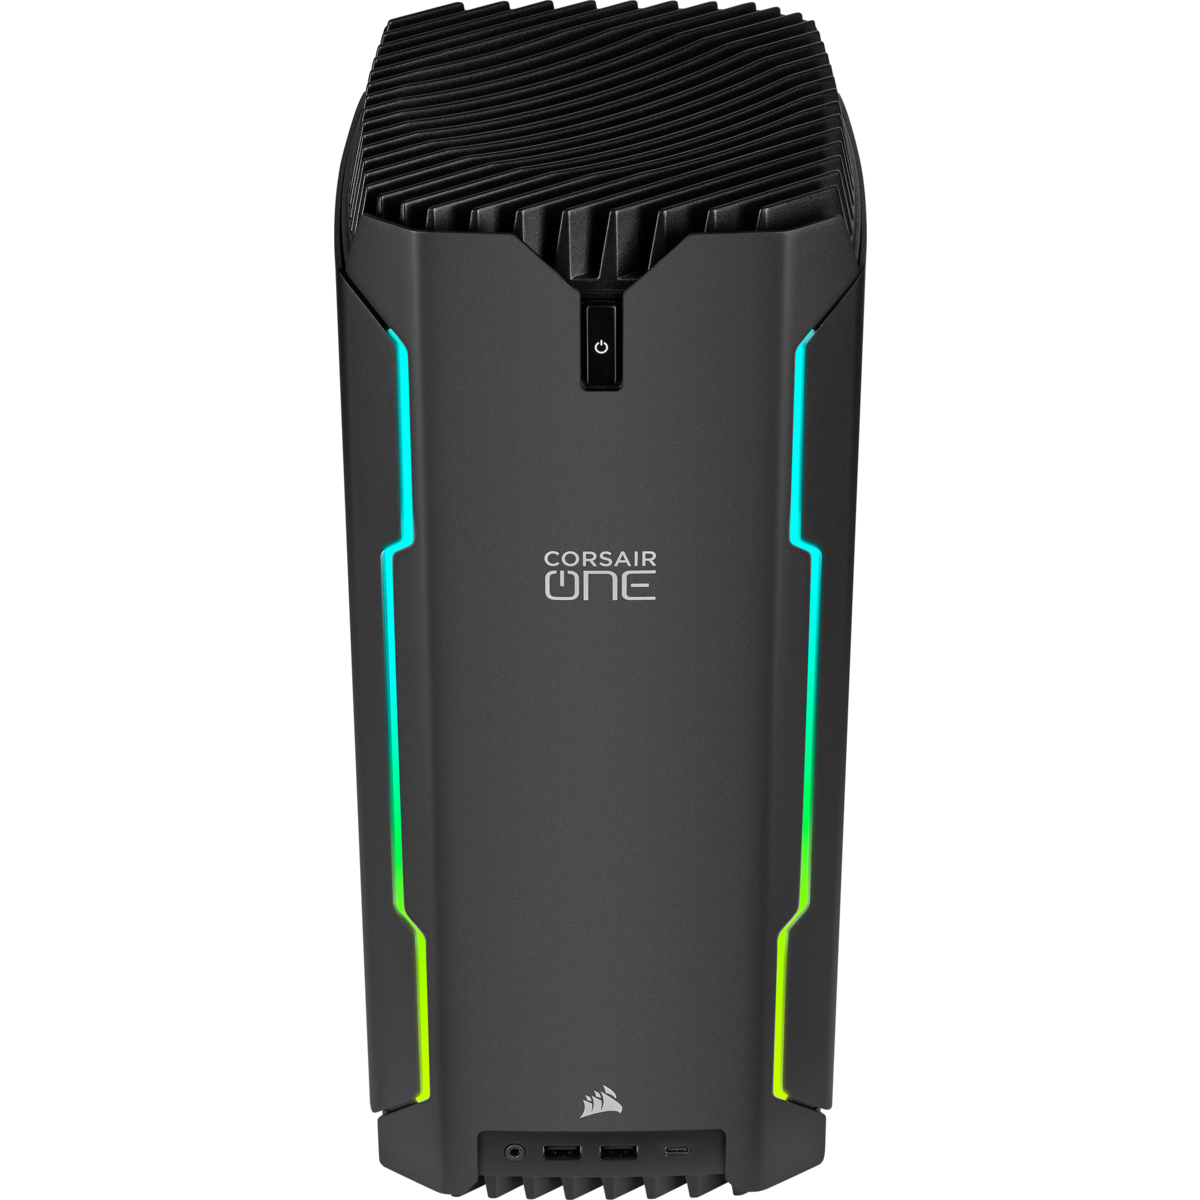
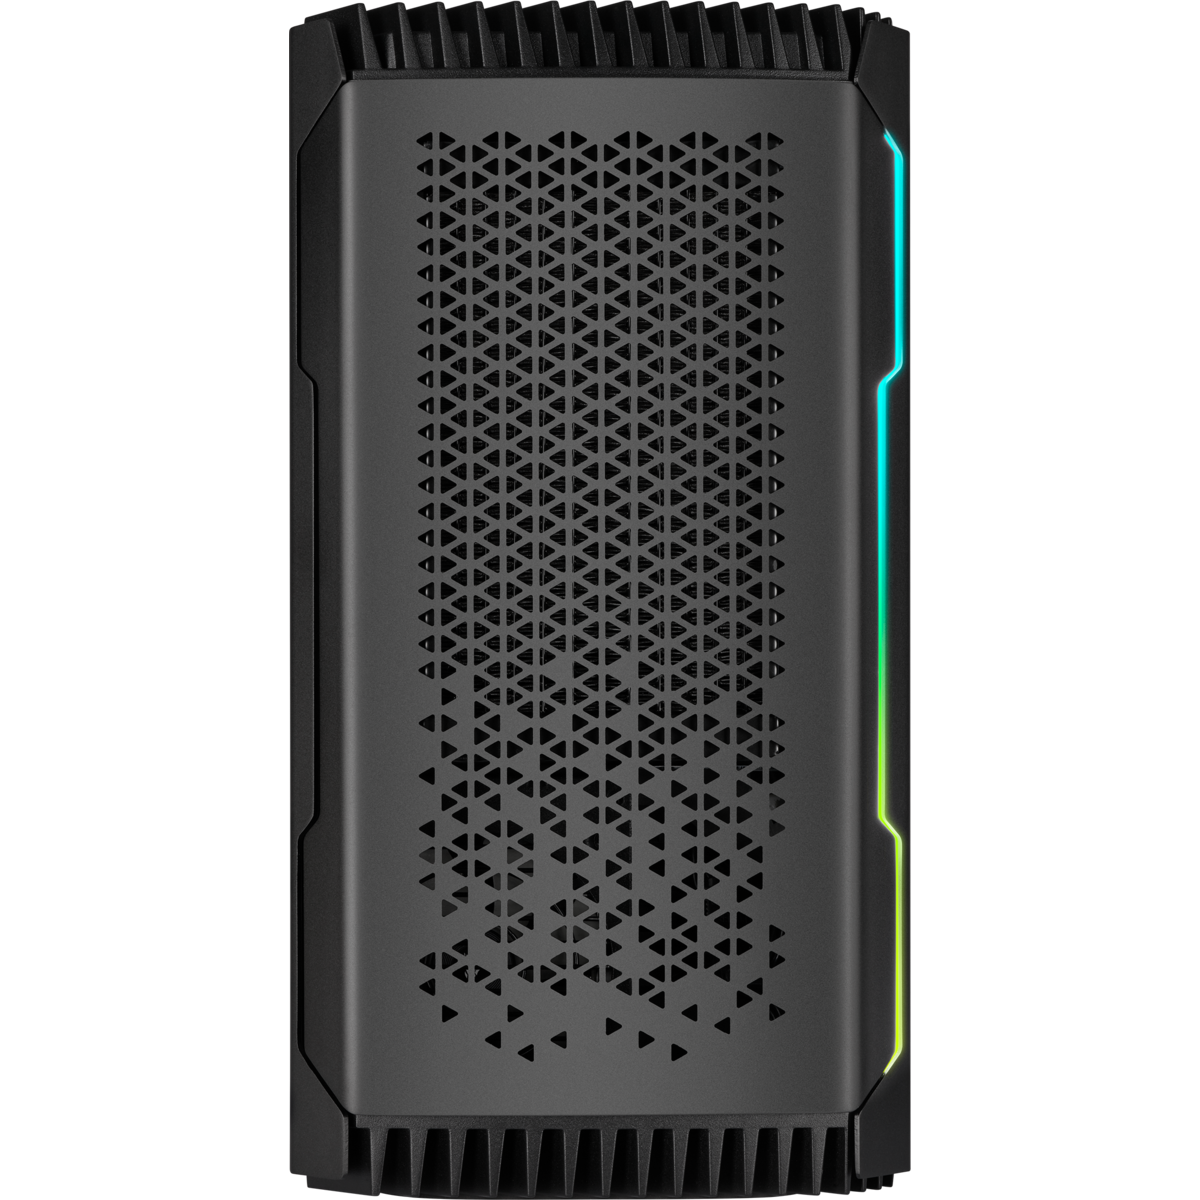
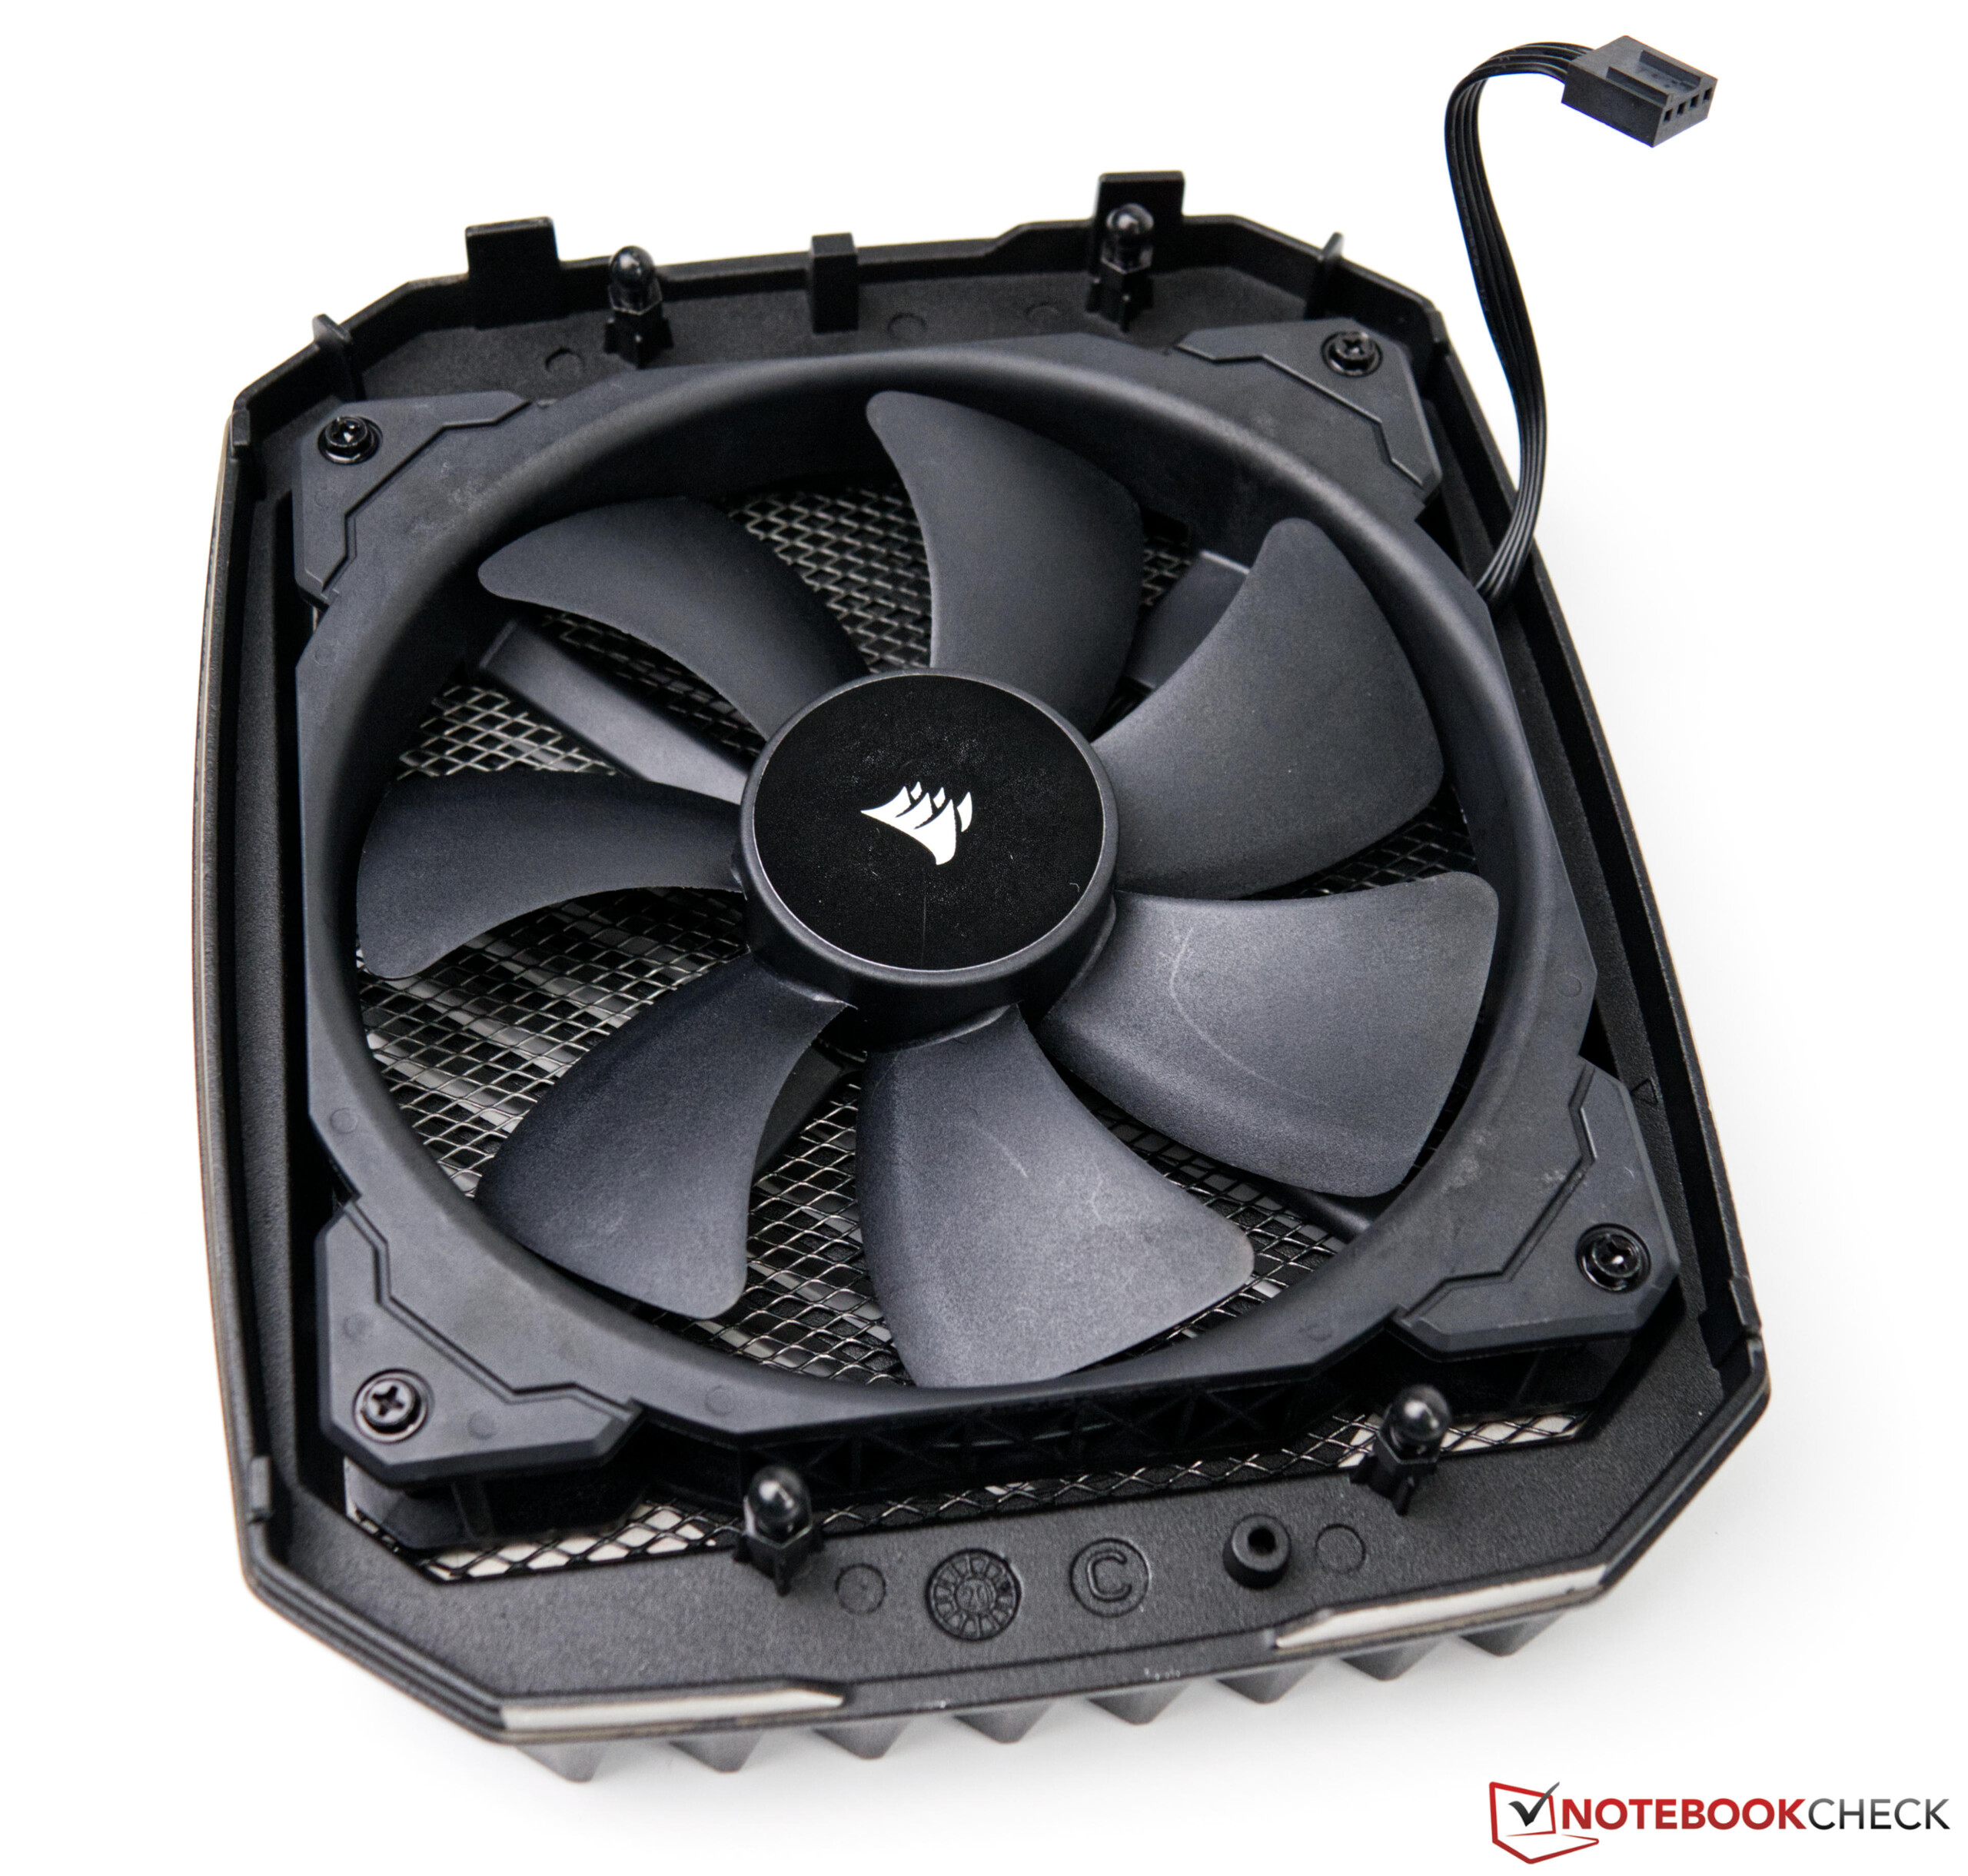
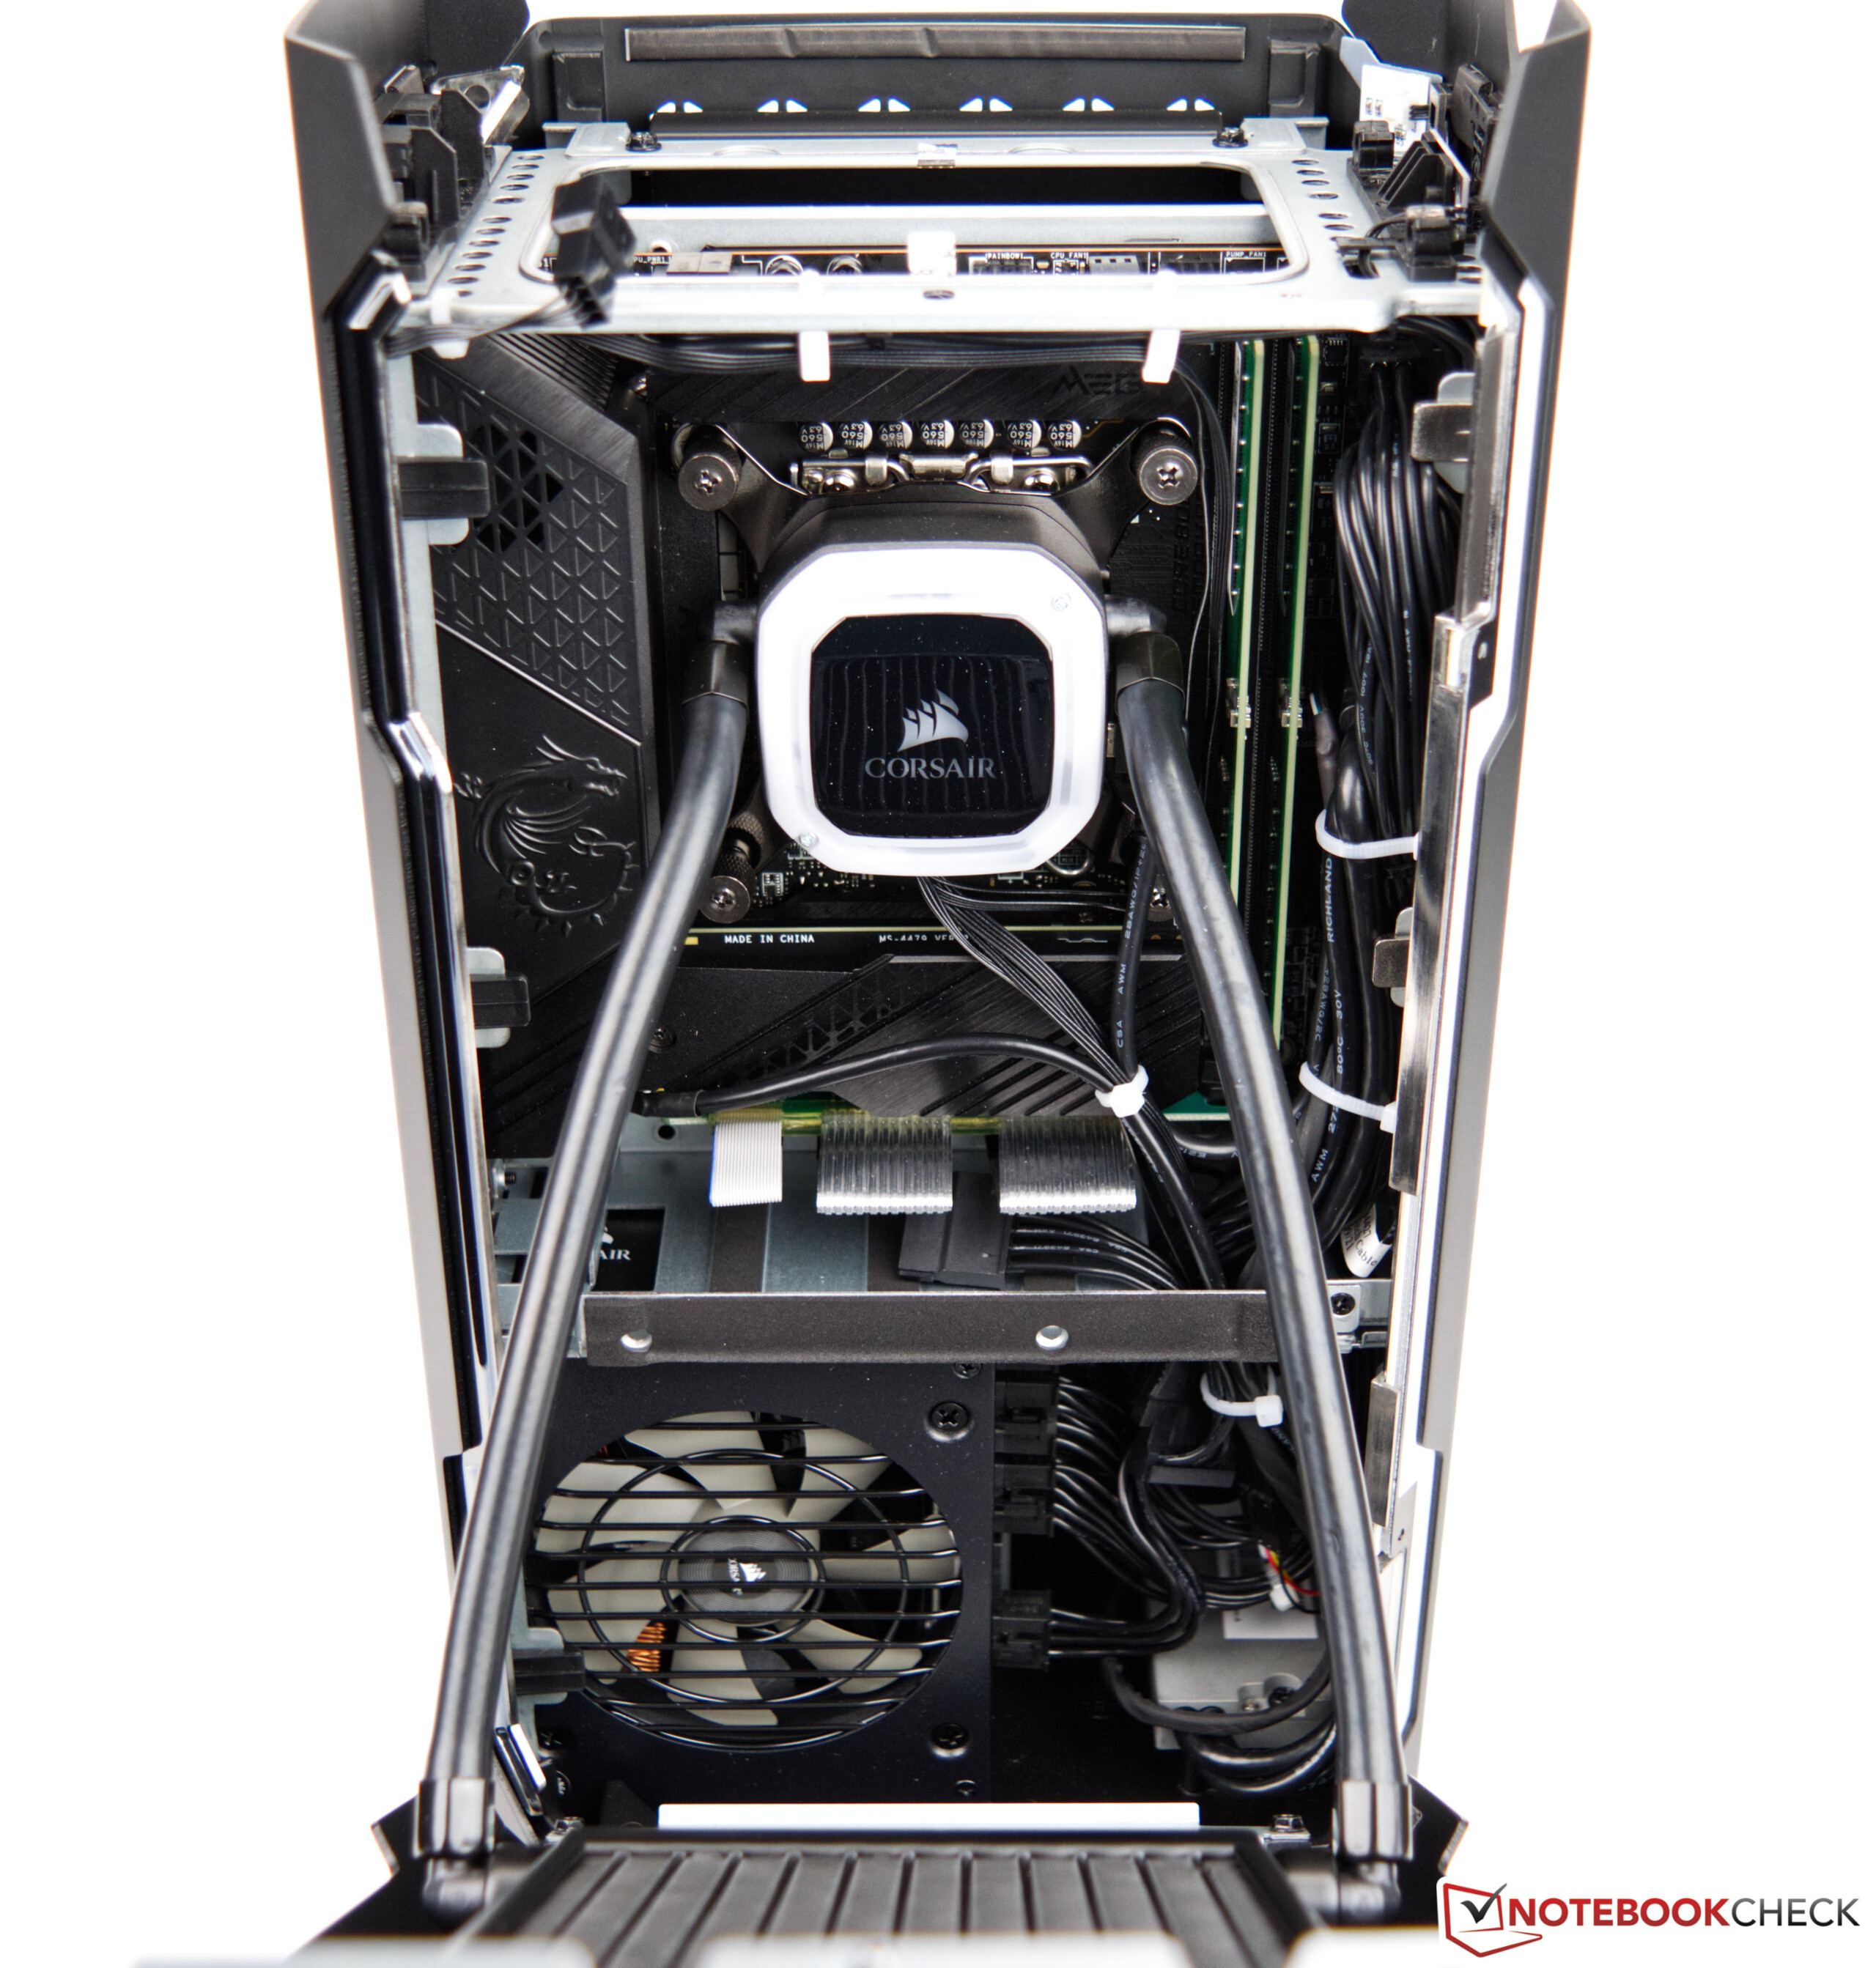
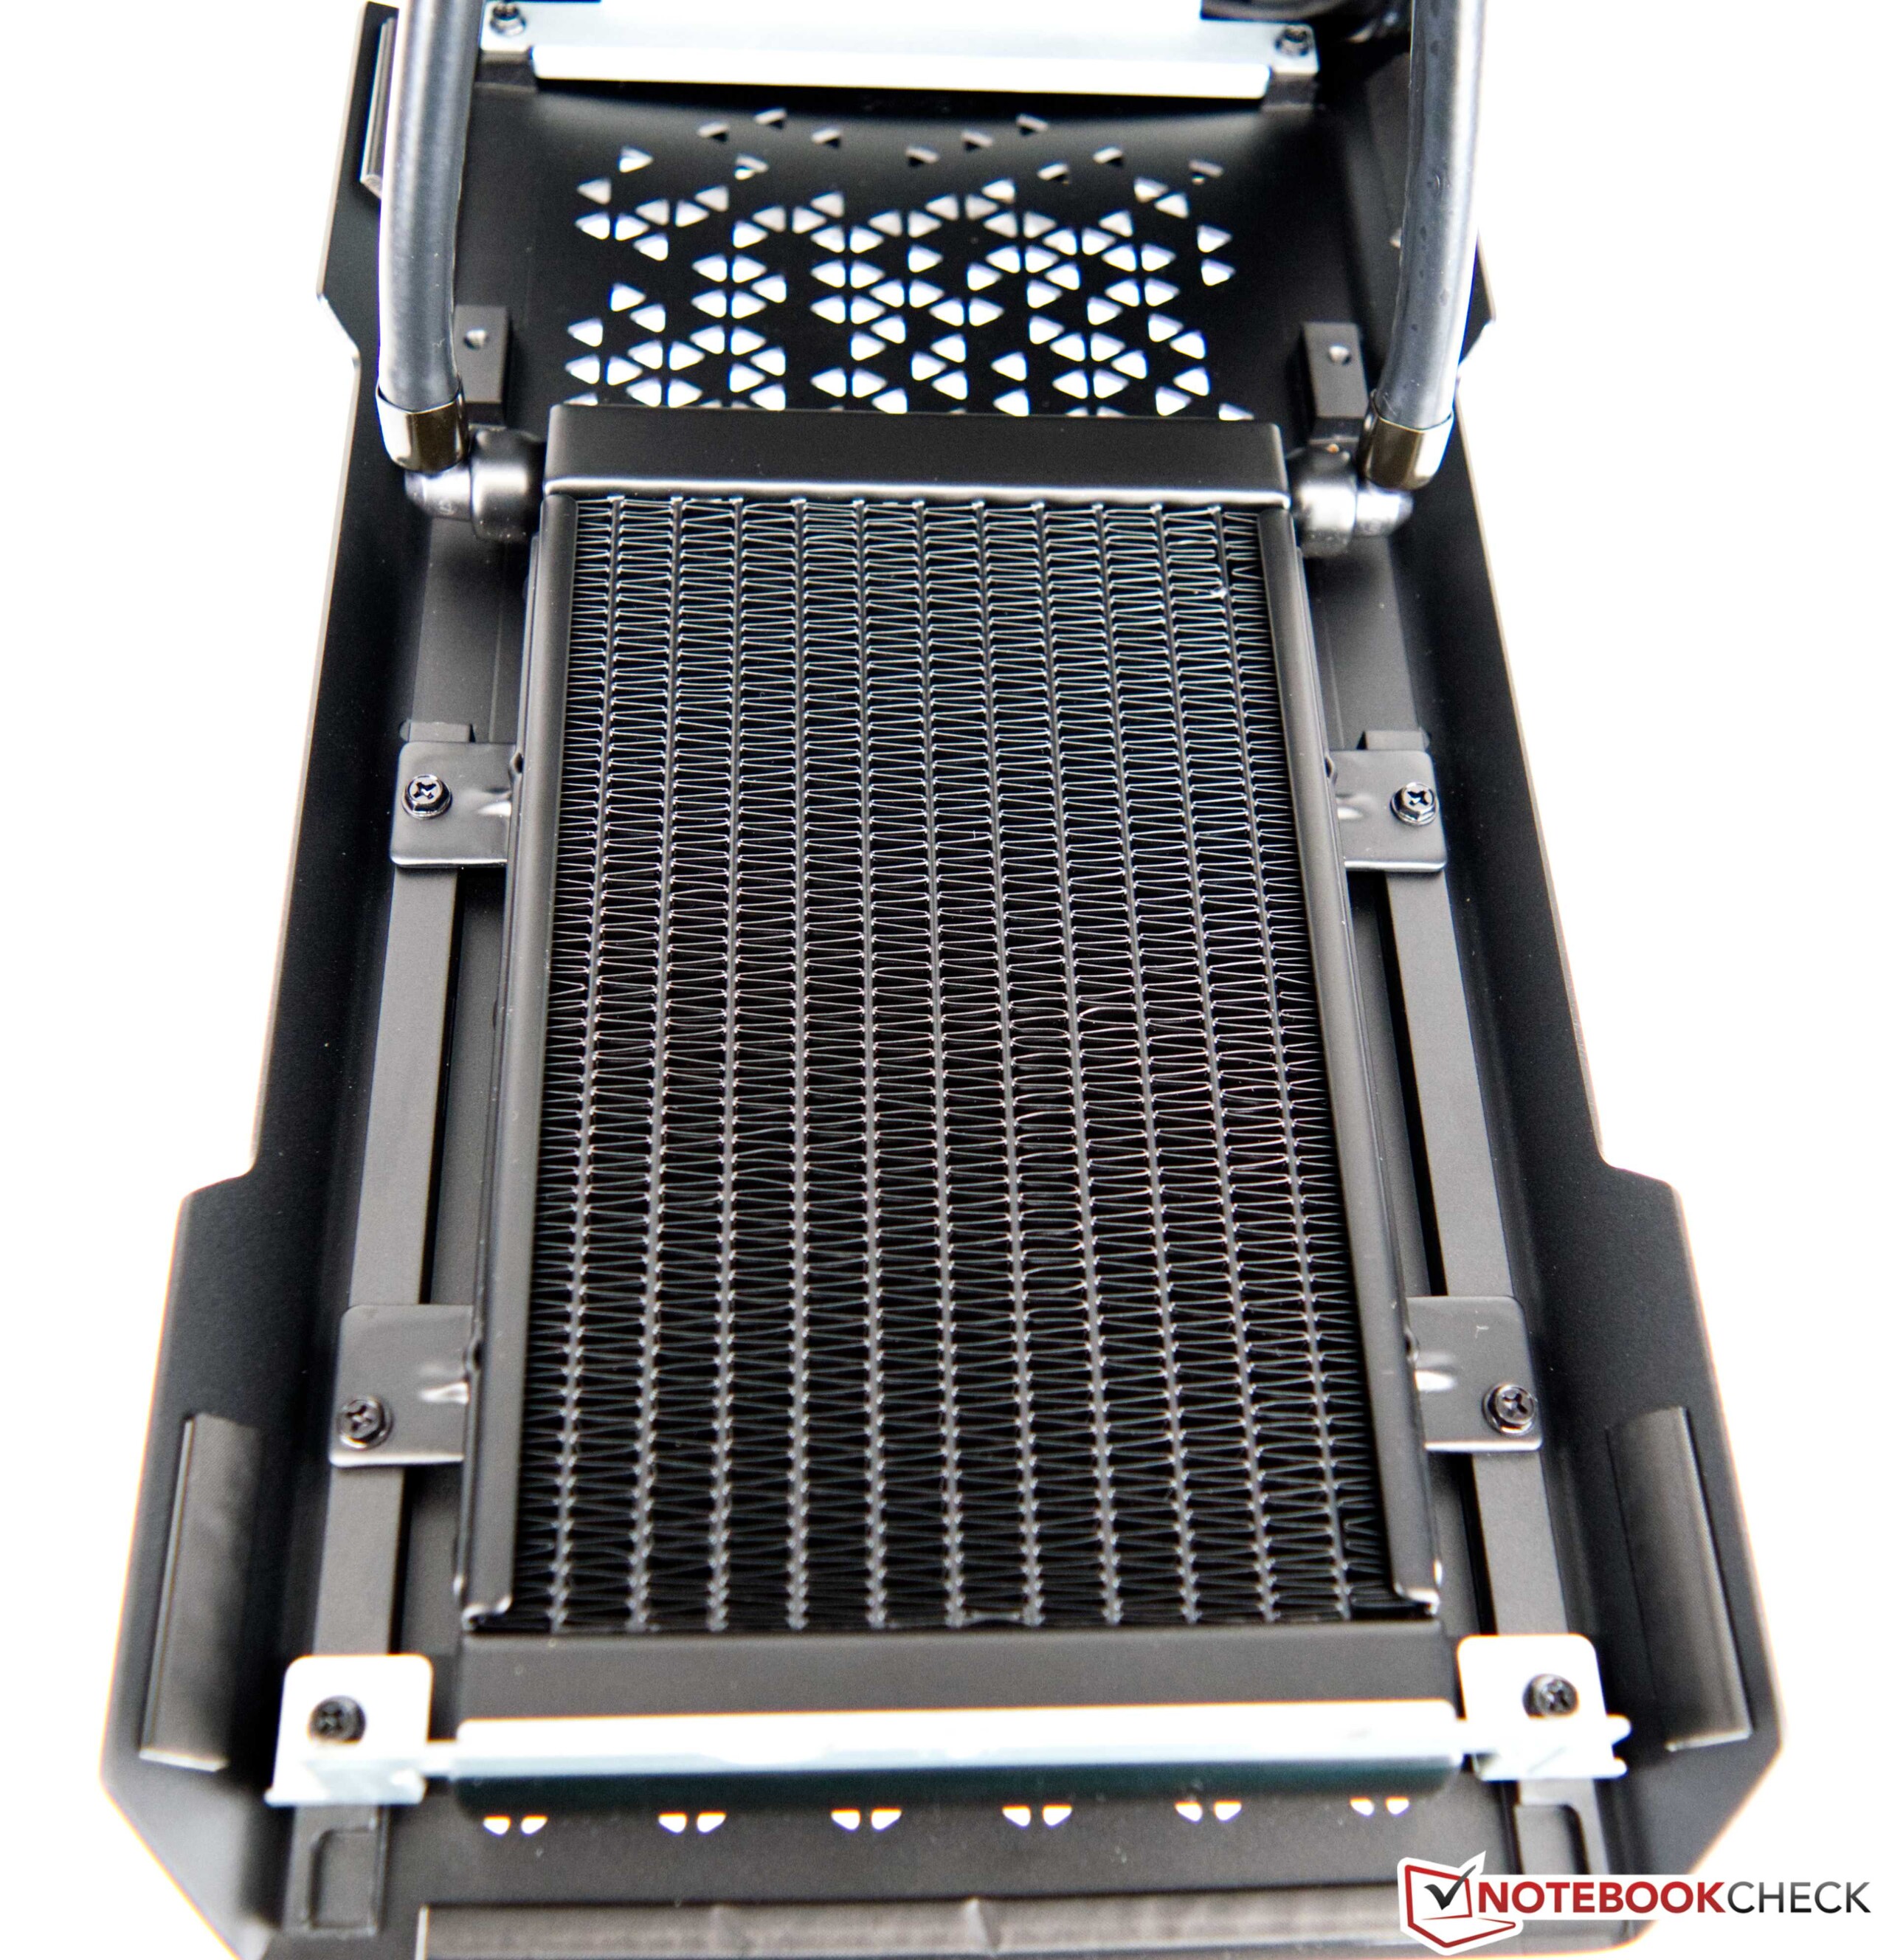
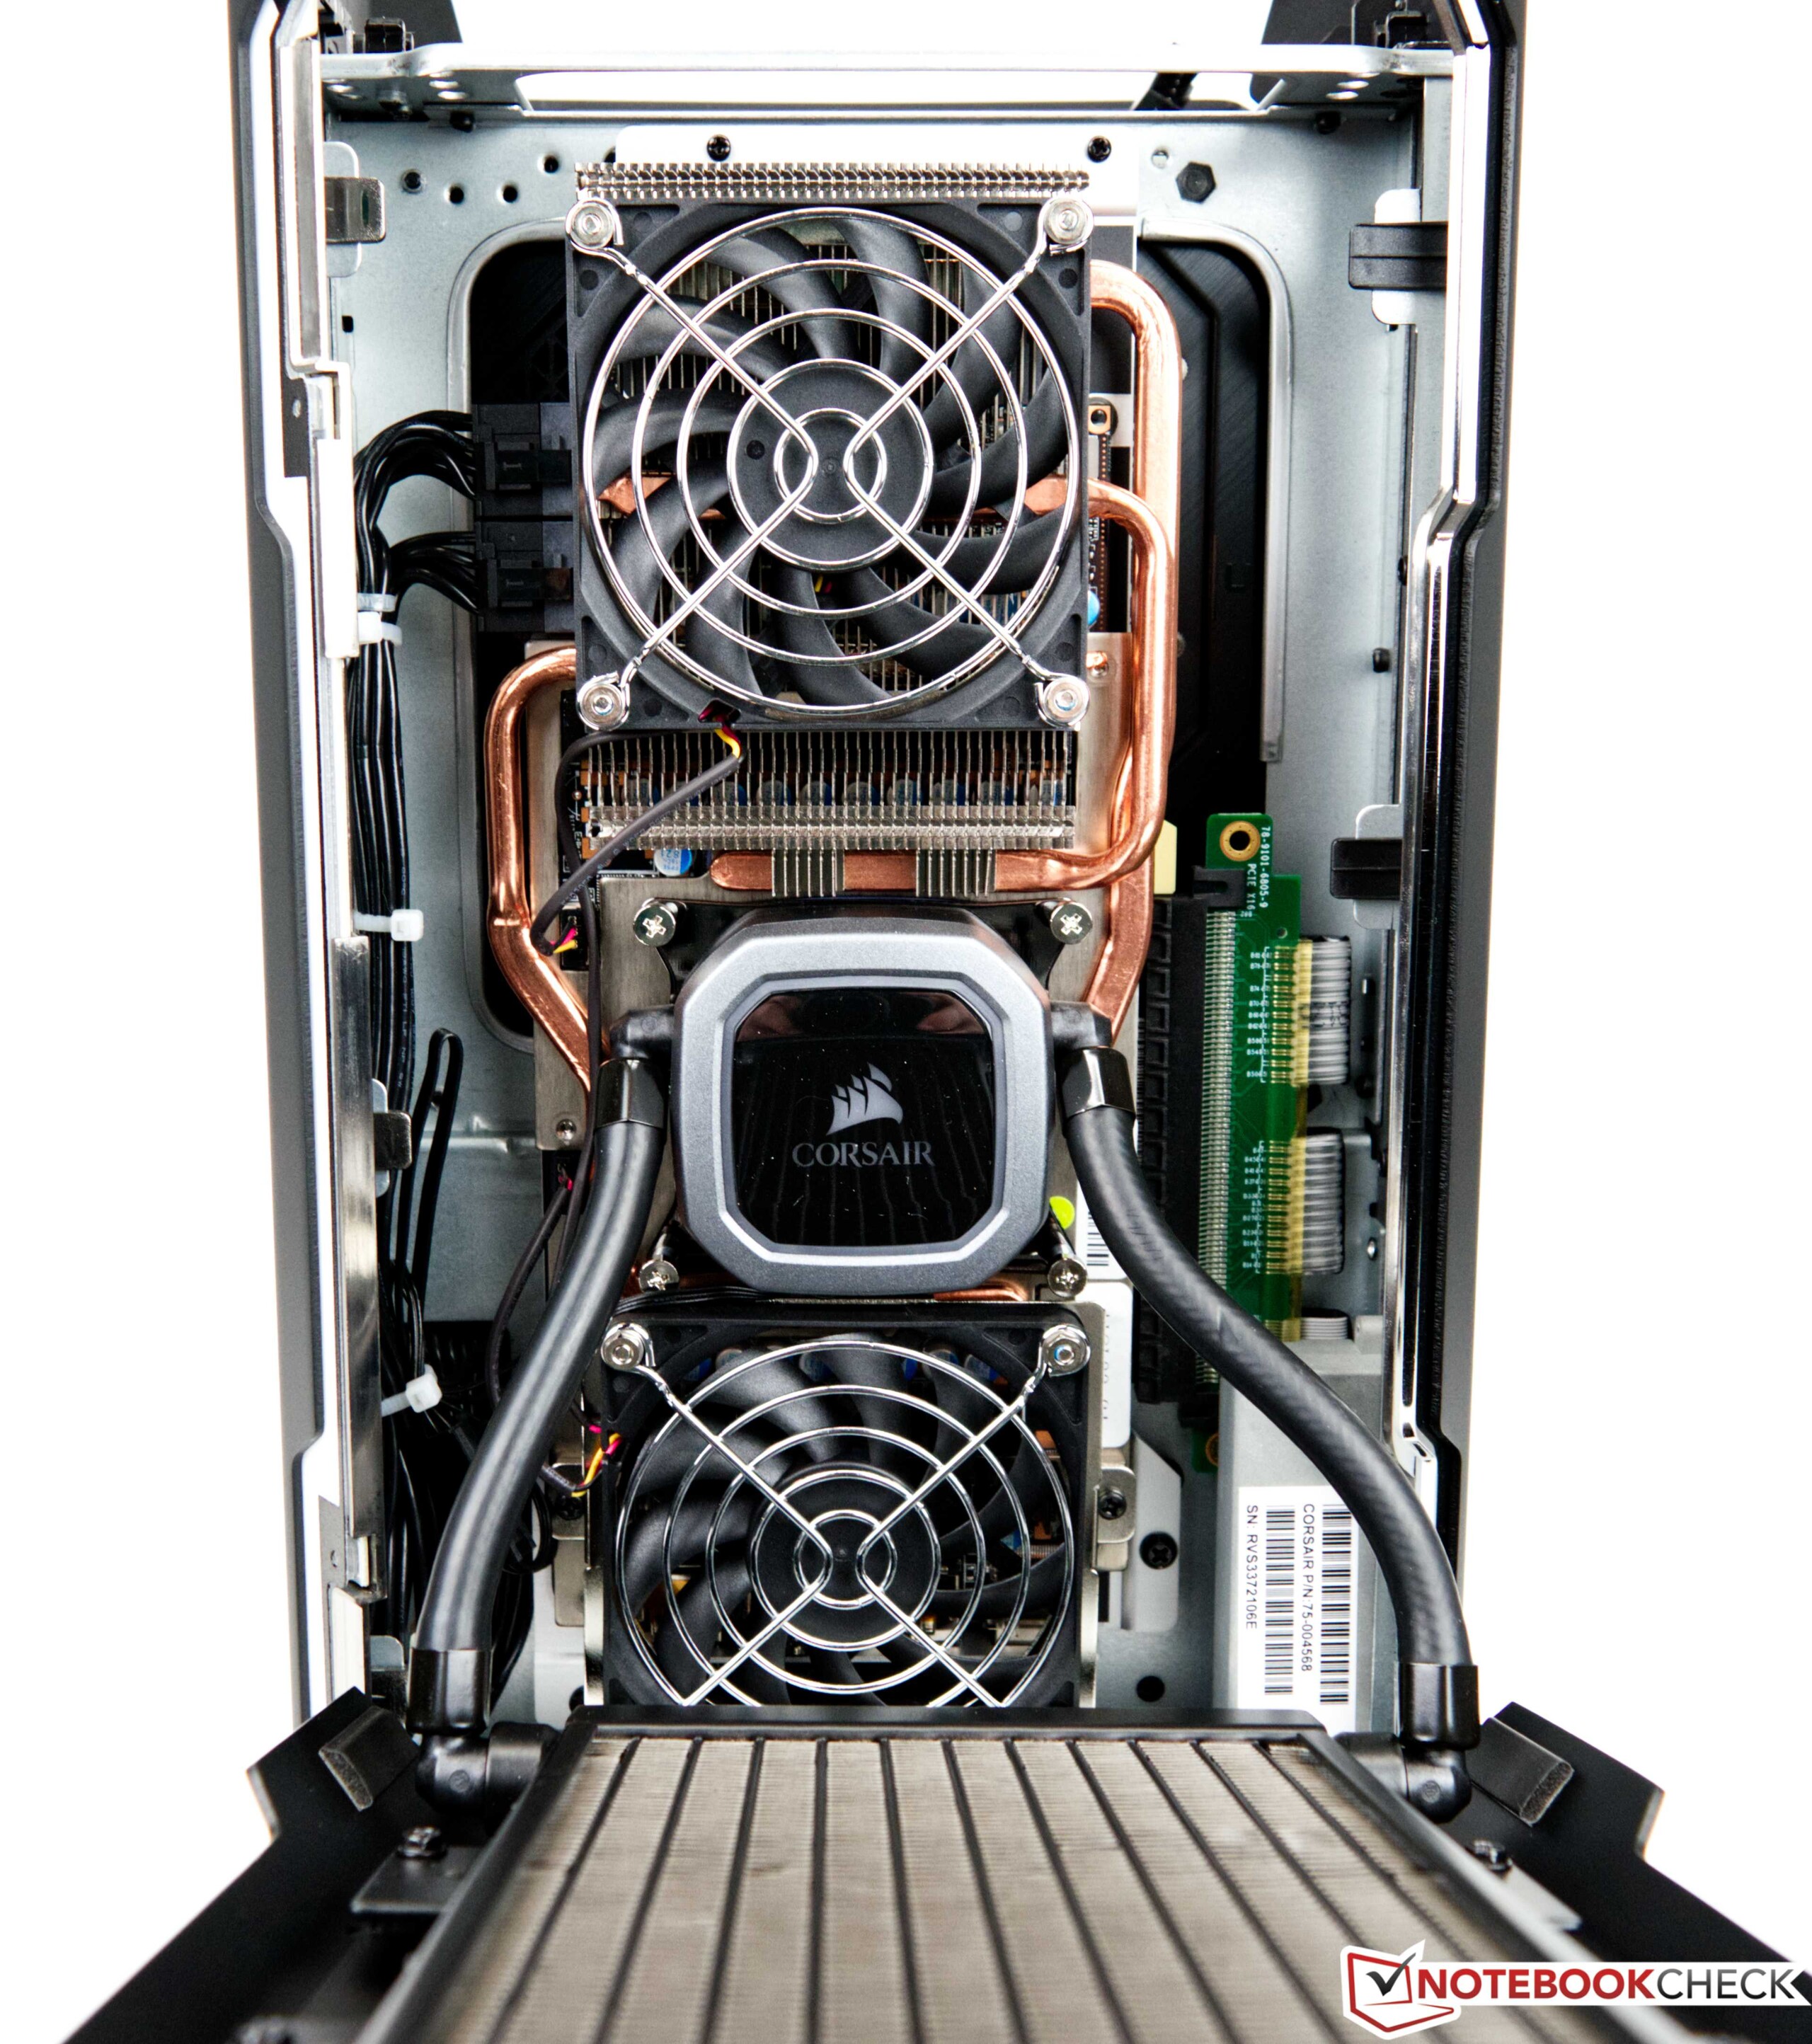
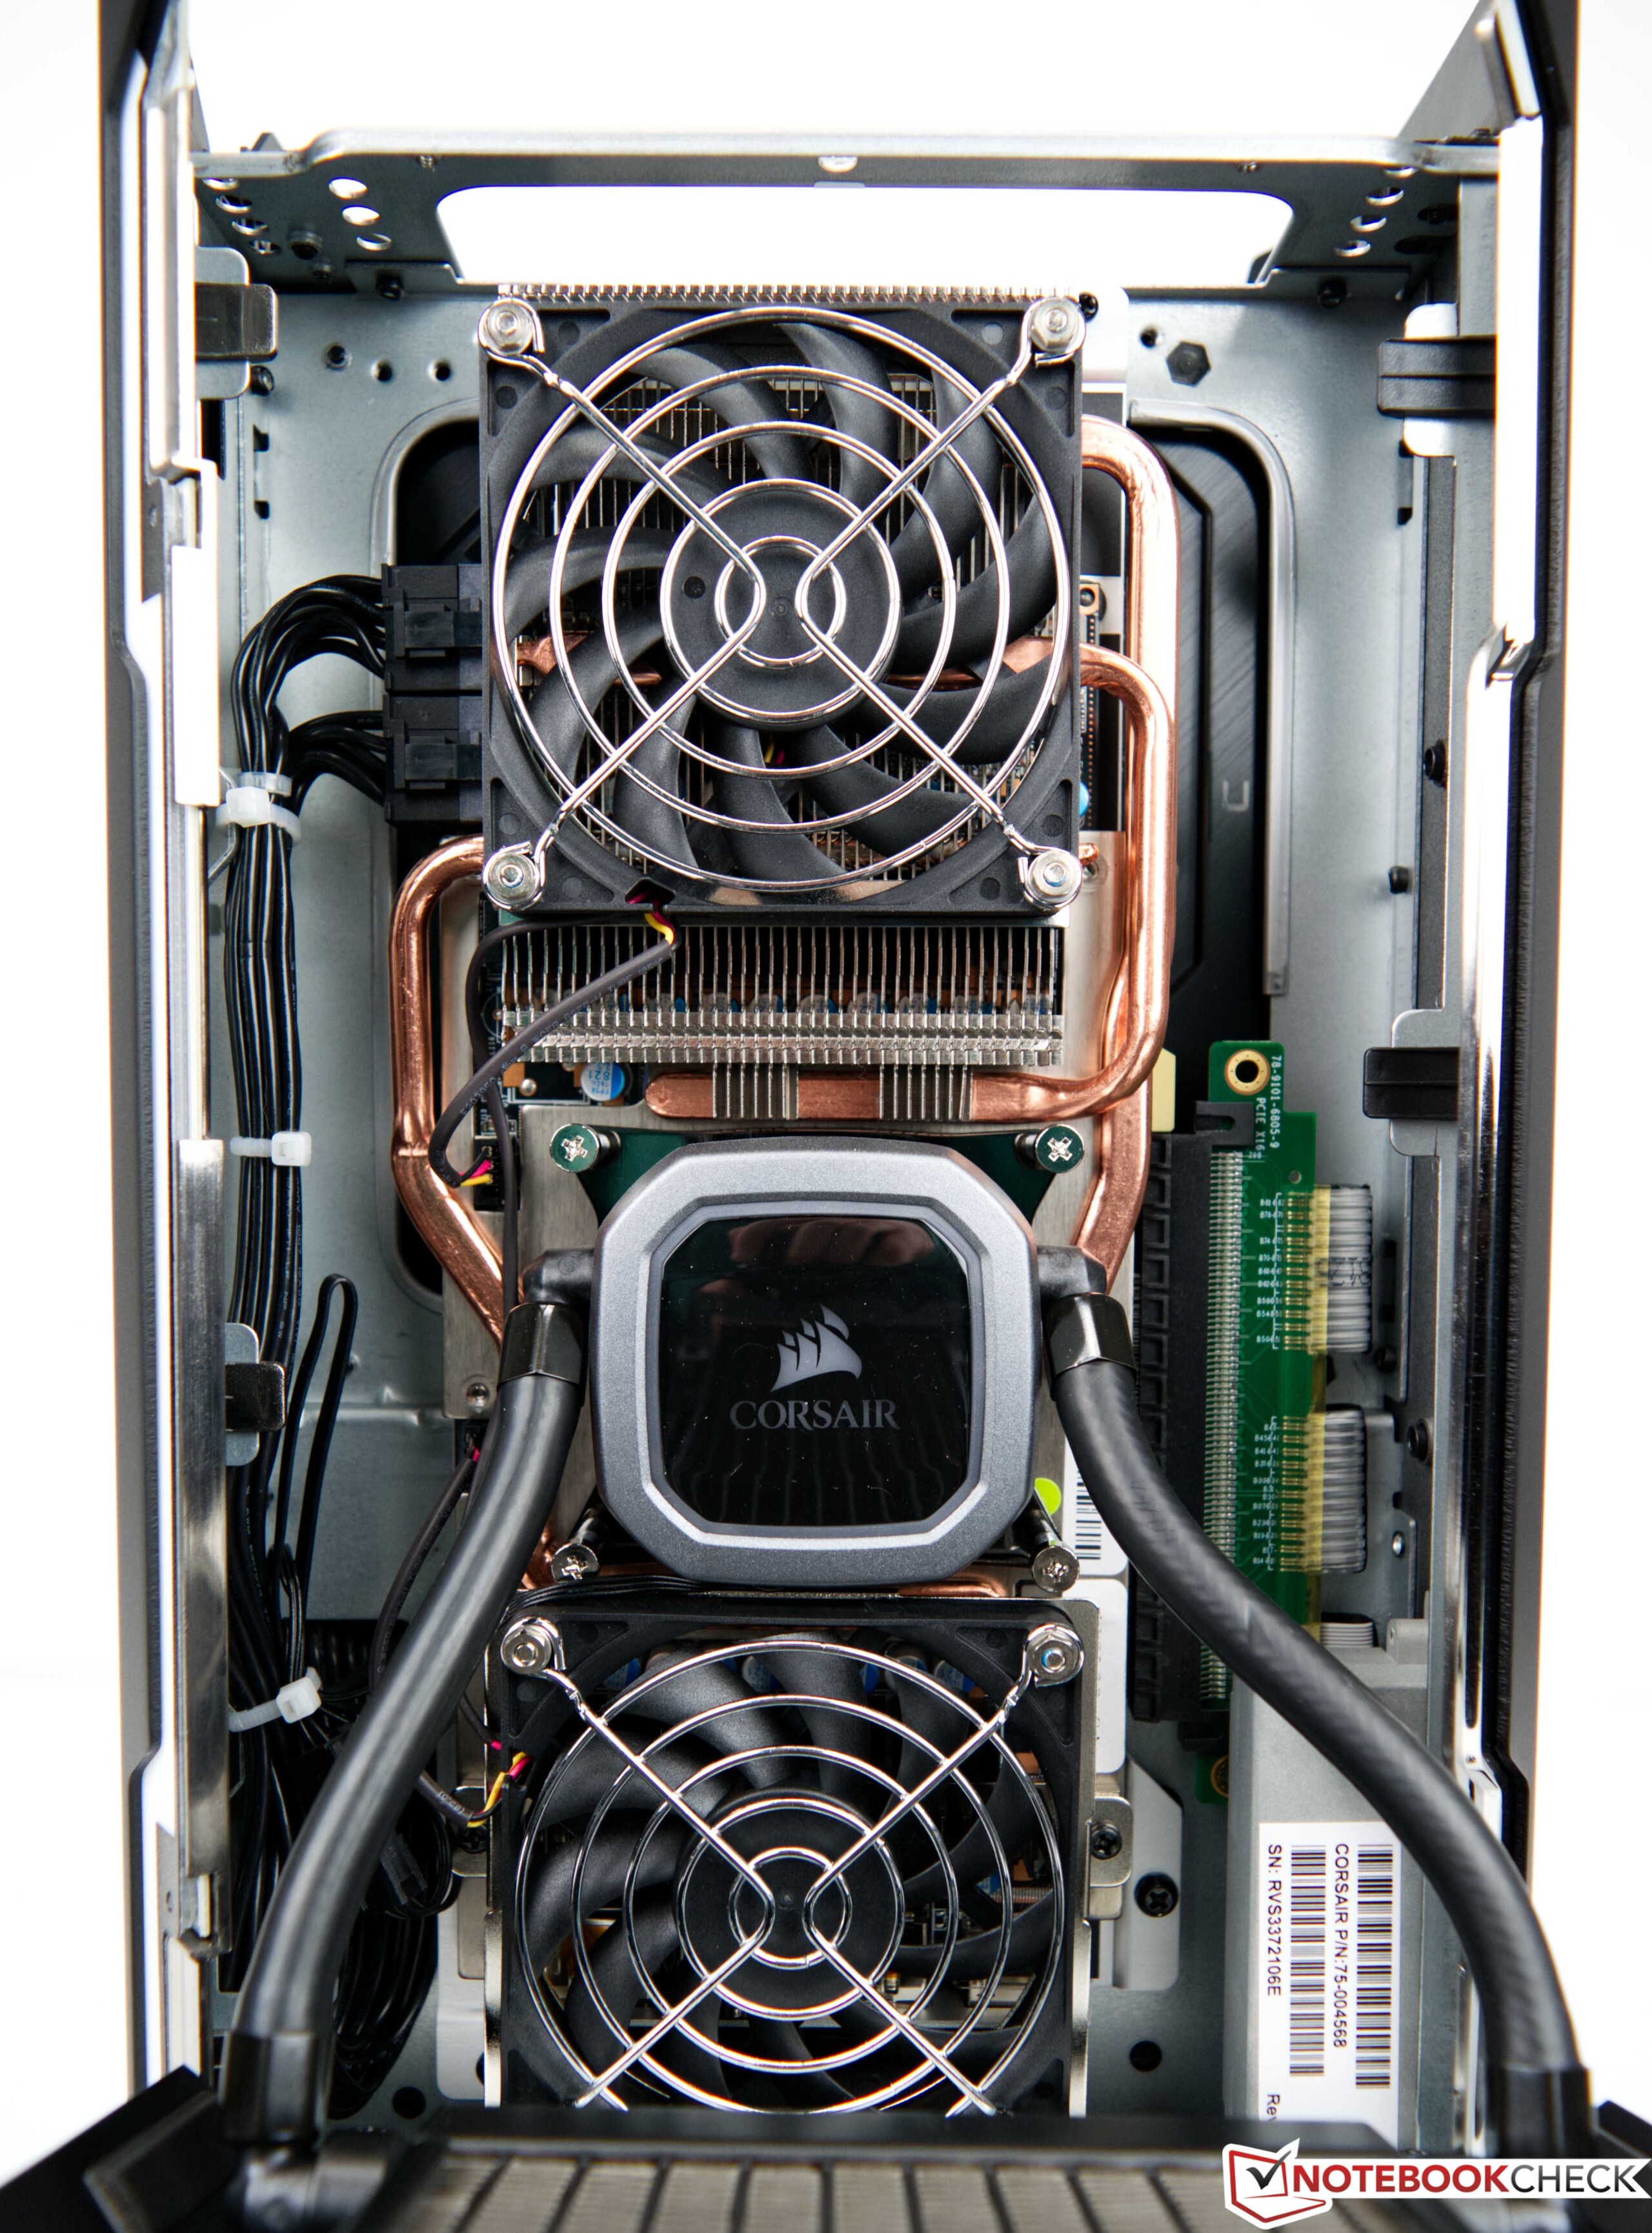
Das Gehäuse des Corsair One i300 ist optisch kaum von dem Corsair One i160 zu unterscheiden. Auch bei der Materialauswahl ist der Hersteller seiner Linie treu geblieben, denn alle Oberflächen bestehen aus Metall und wirken nicht nur optisch sehr hochwertig. Auch haptisch hat man immer das Gefühl ein sehr hochwertiges Produkt in Händen zu halten. Das schwarze, schlichte Design wird an der Vorderseite mit zwei RGB-Lichtstreifen aufgehübscht. Über die iCUE-Software lässt sich diese unter anderem auf die eigenen Bedürfnisse anpassen. Die Verarbeitung ist Top und wir haben keine Mängel erkennen können. Das Innere ist so konzipiert, dass zwei unabhängige Wasserkühlungen für CPU und GPU Platz finden.
Trotz der Kompaktheit bringt der kleine PC schlappe 7,5 Kilogramm auf die Waage. Das vermutet man beim ersten Anblick nicht. Dies untermauert aber nochmals die Materialbeschaffenheit, denn bei so einem kleinen Gehäuse wird alles verwendet, um die entstehende Abwärme abzuleiten.
Ausstattung - topmodern

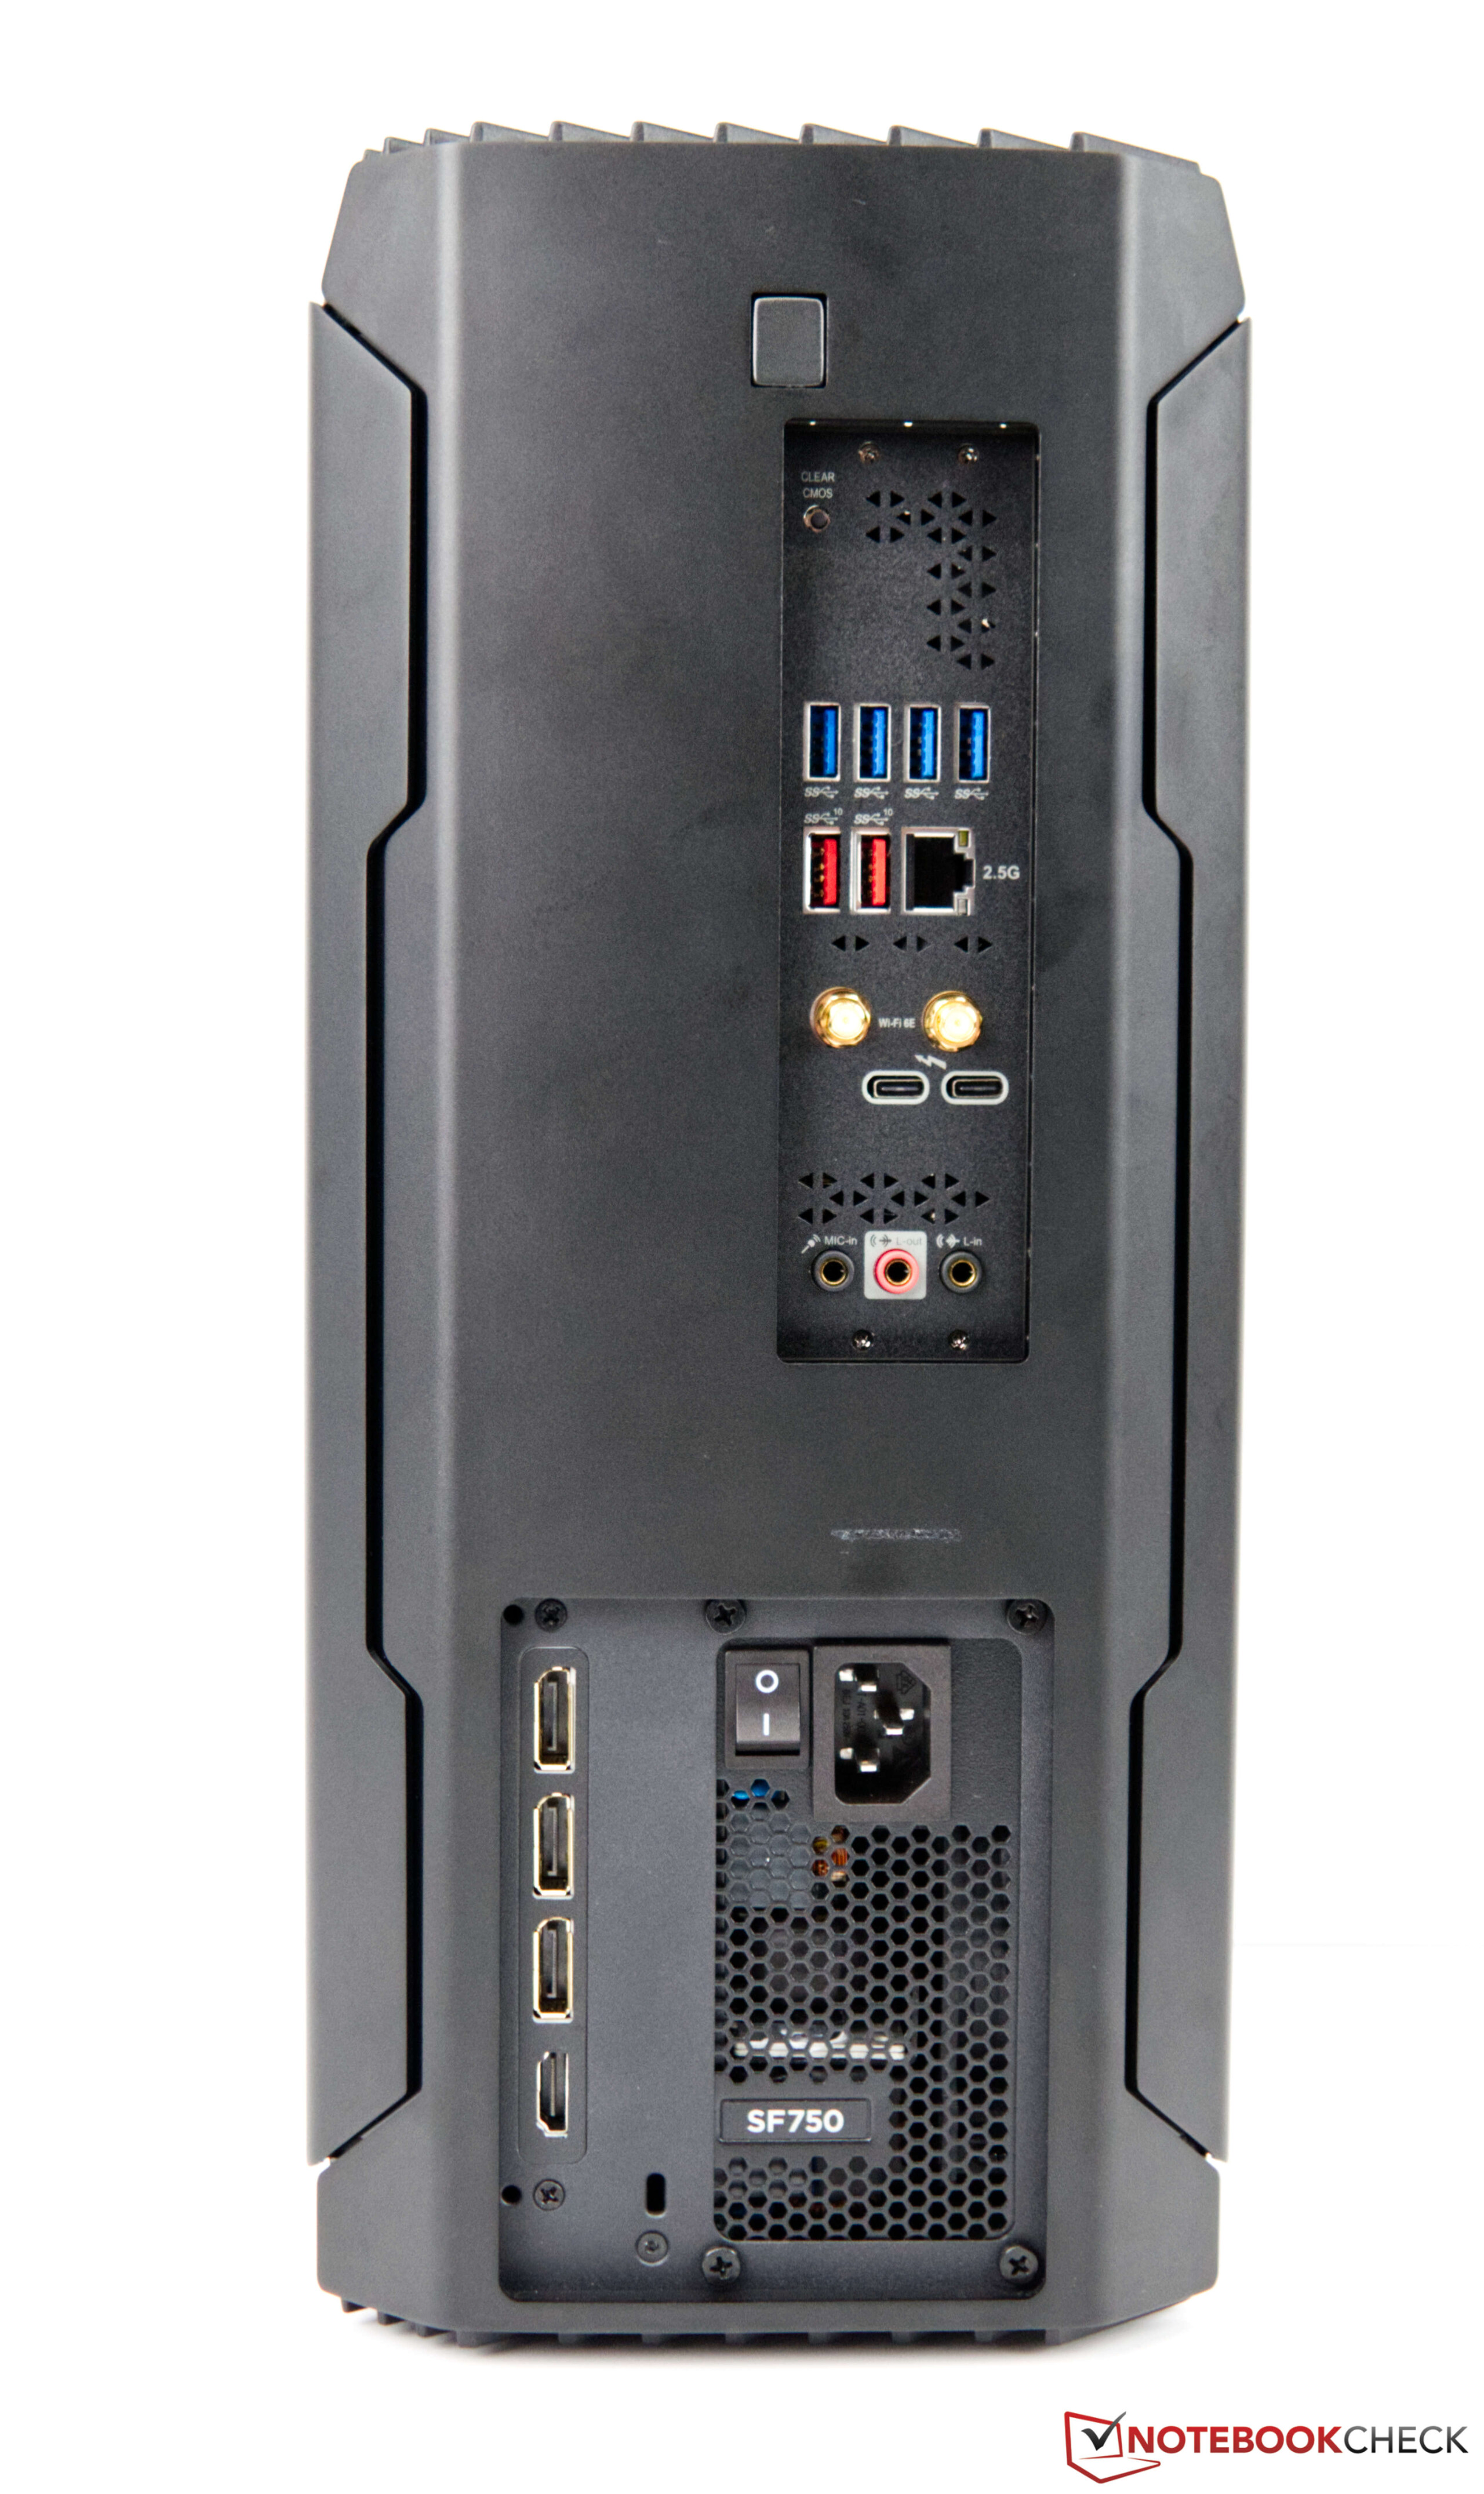
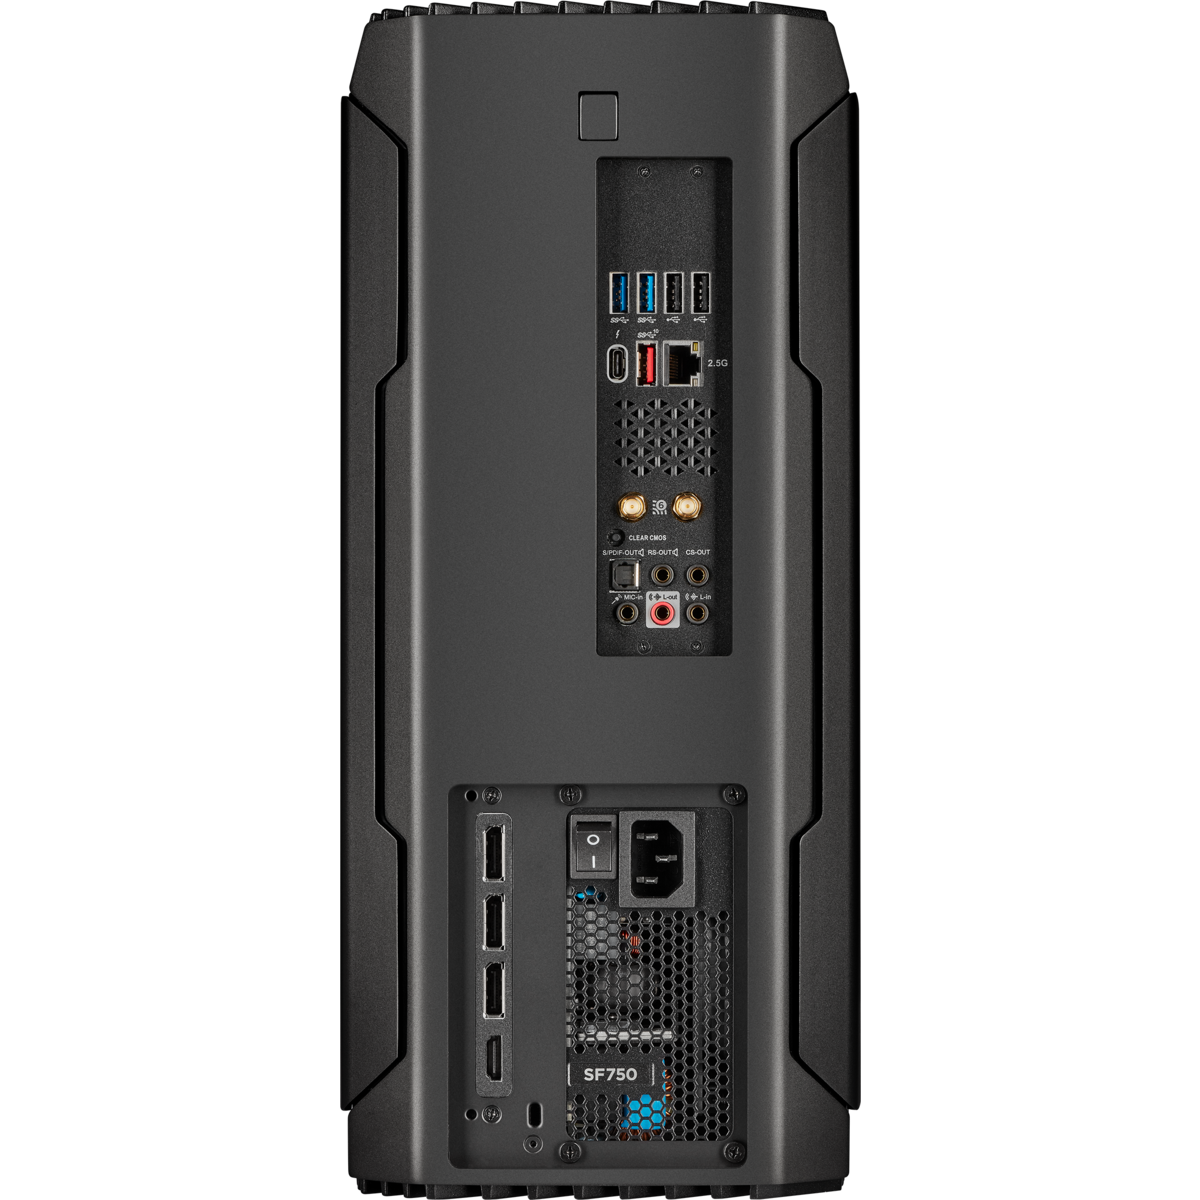
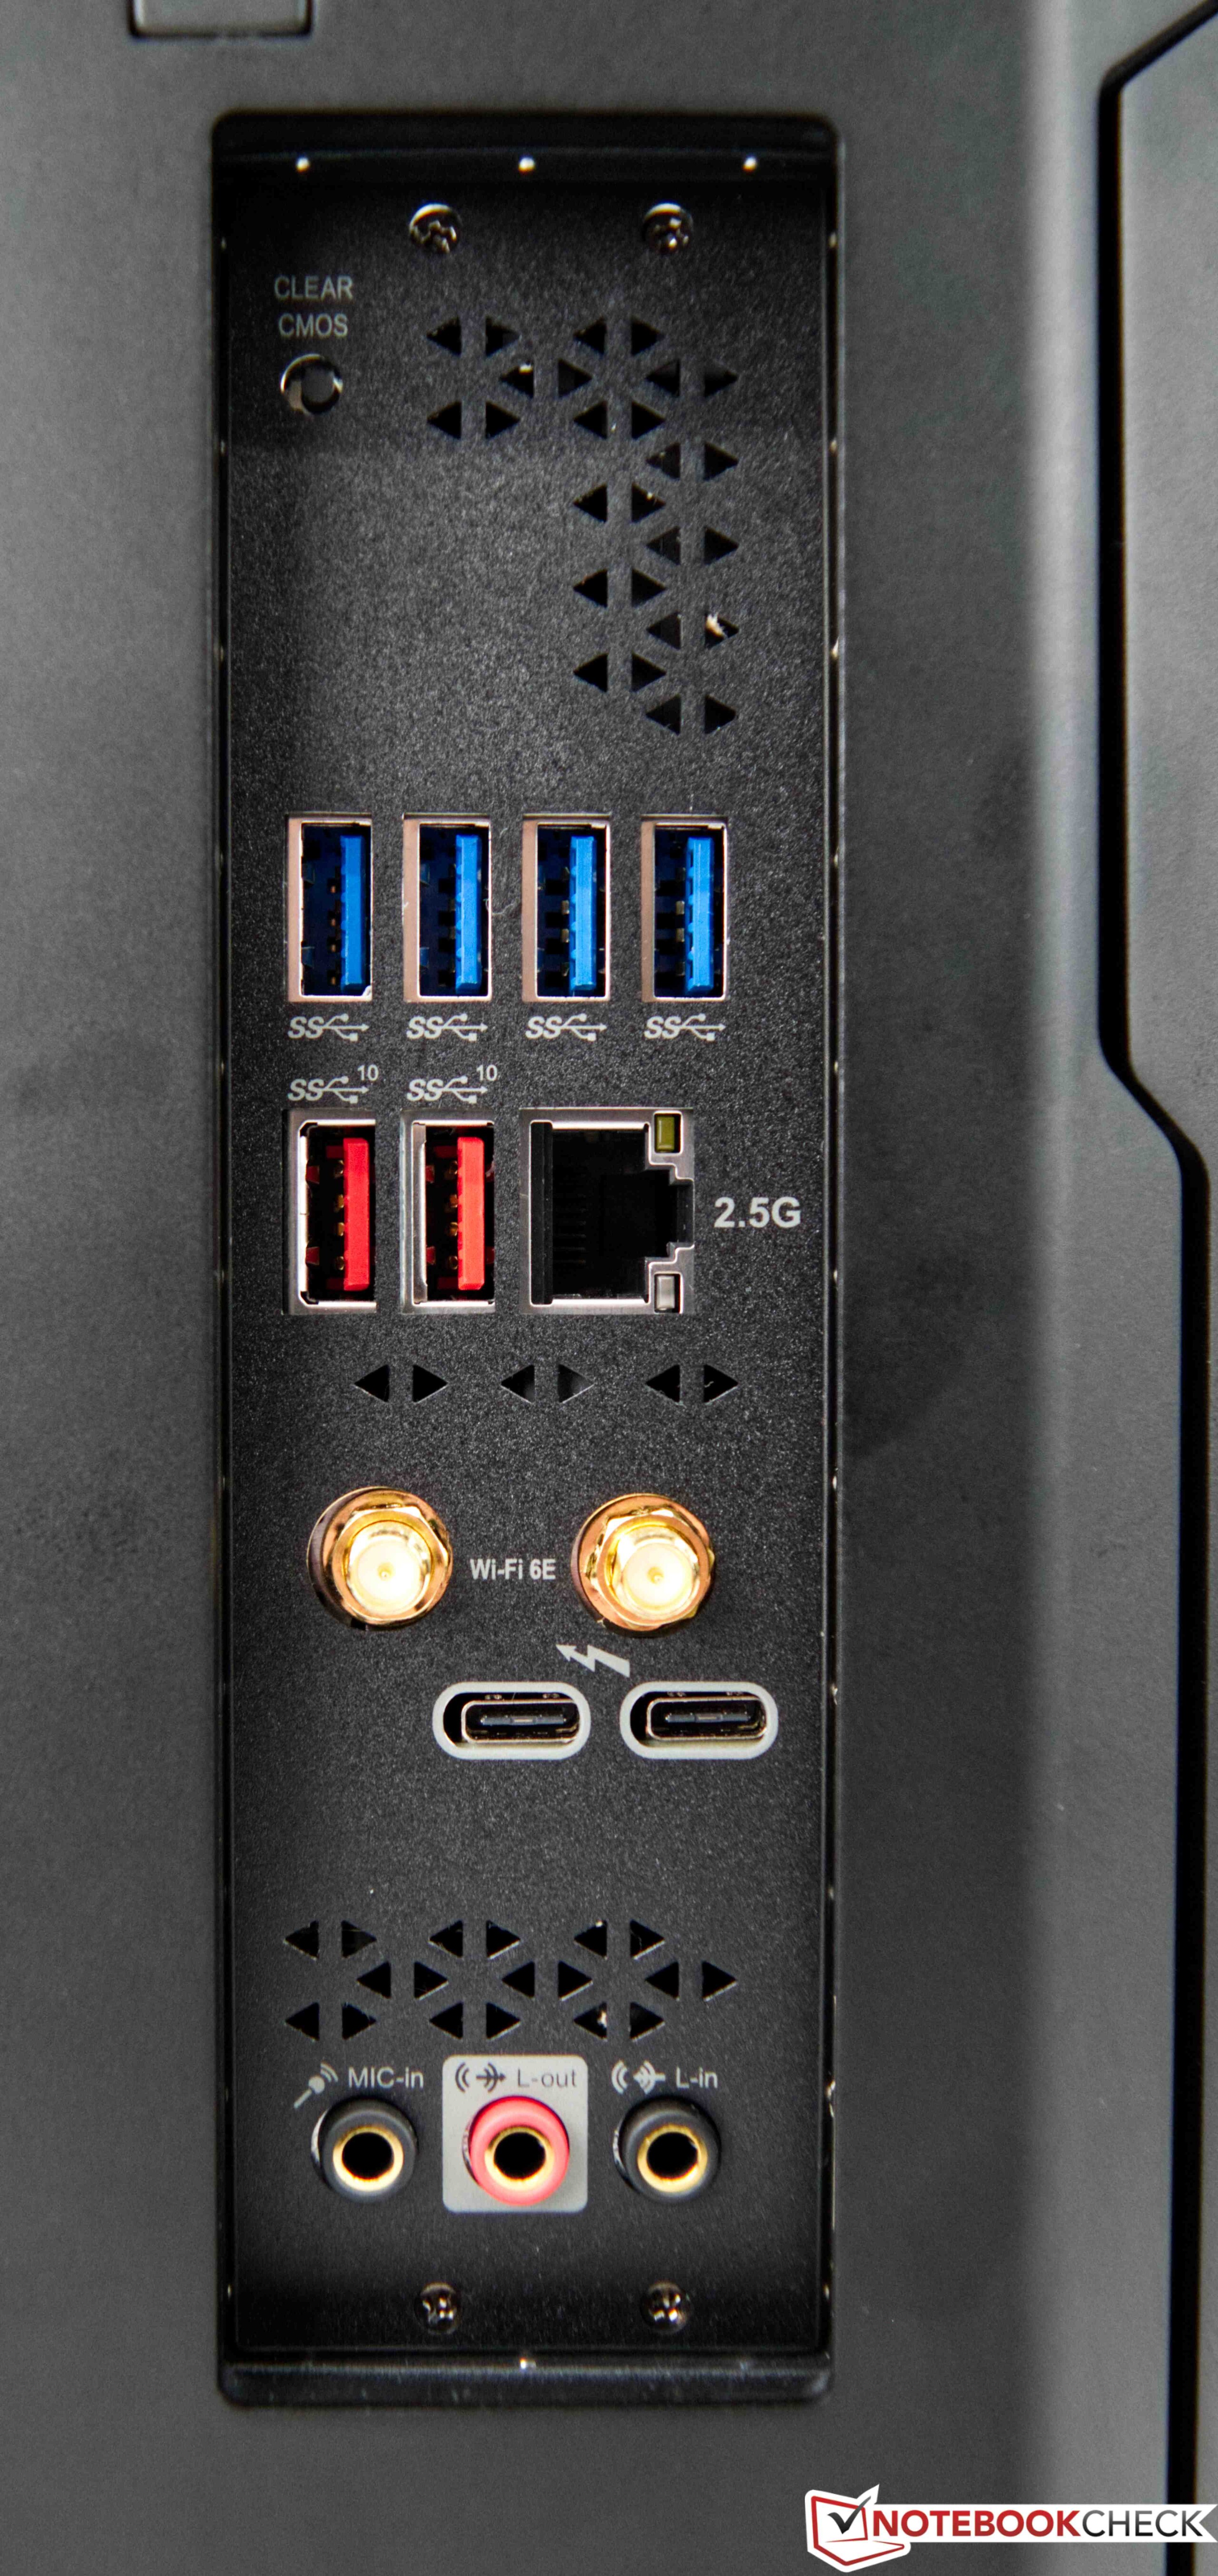
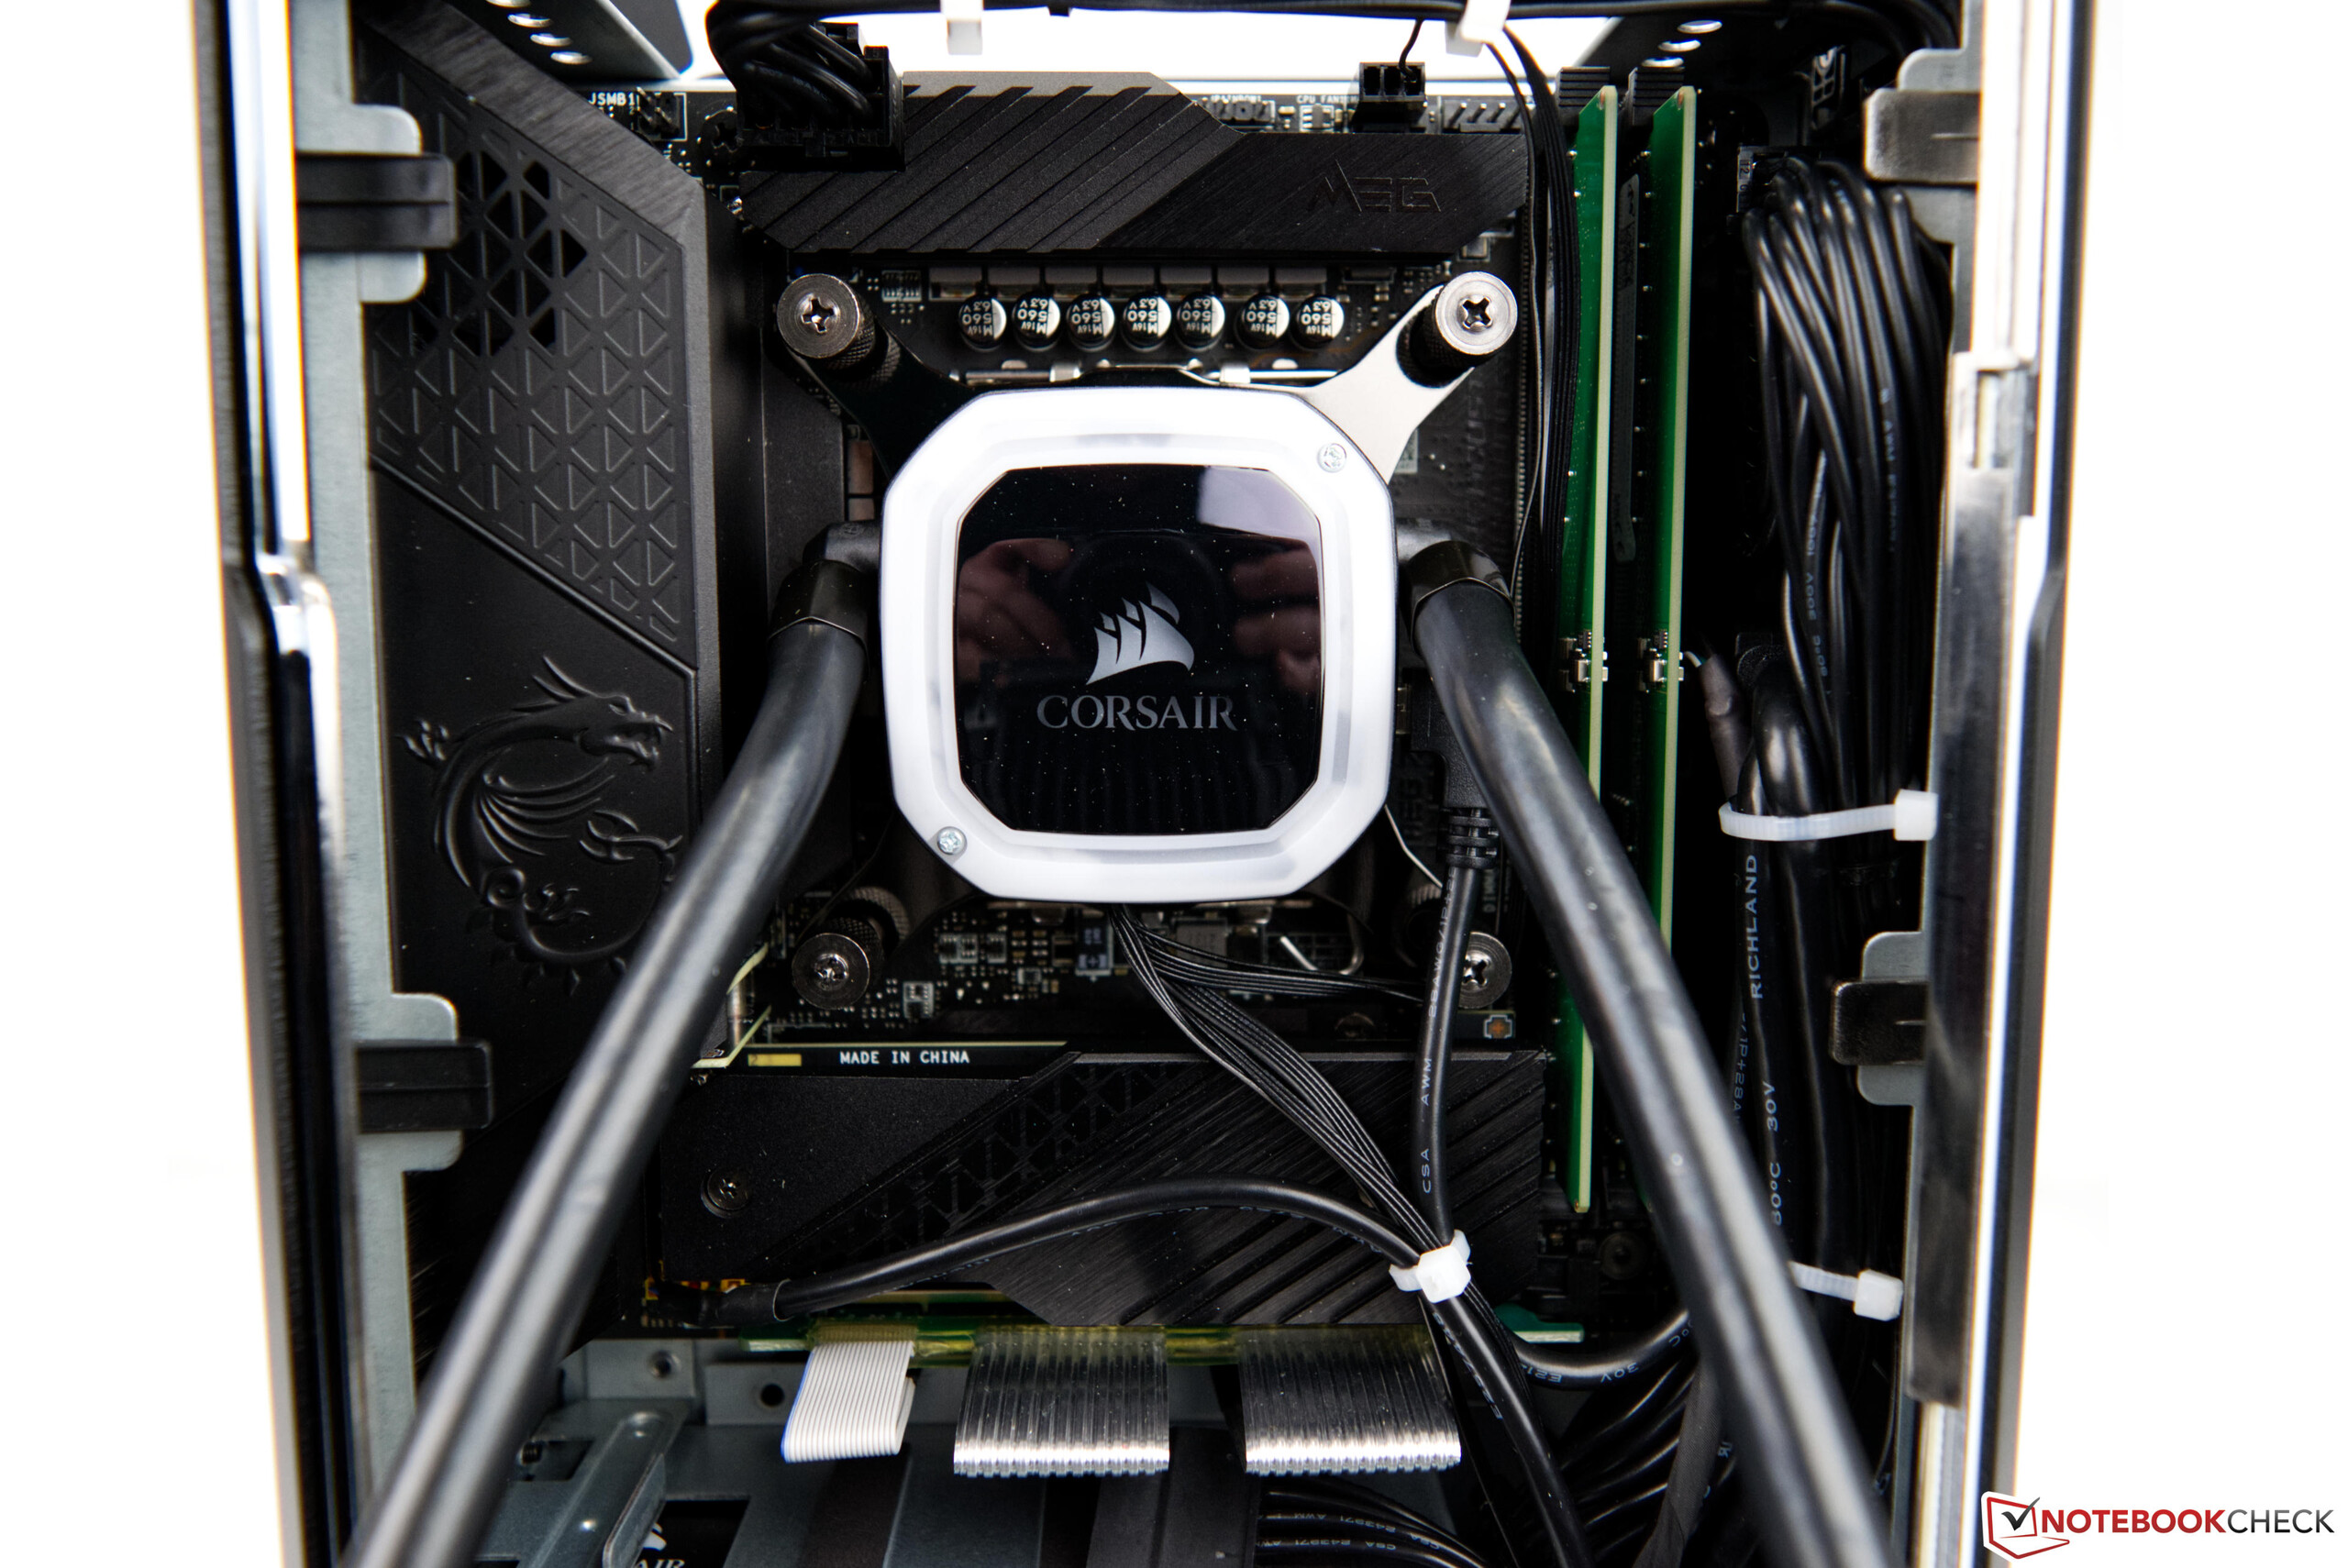
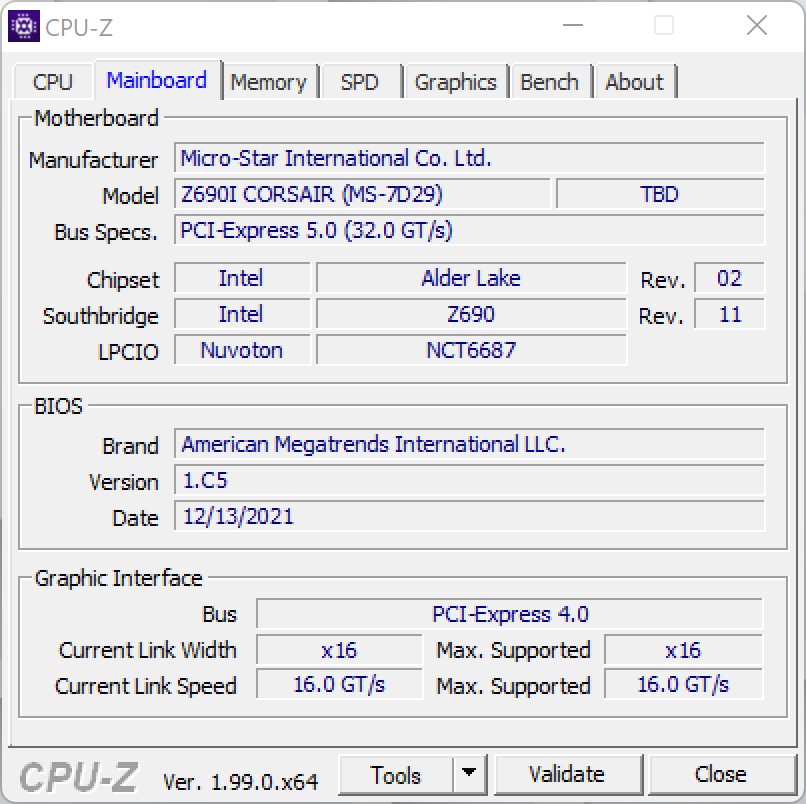
Corsair setzt beim One i300 auf ein herkömmliches Mini-ITX-Mainboard von MSI. Genauer gesagt verbaut Corsair in unserem Testsample das MSI MEG Z690I Unify. Damit ist der Desktop-PC zudem auch bestens mit externen Schnittstellen versorgt. Ruckseitig gibt es insgesamt 8 USB-Schnittstellen von denen zwei auch Thunderbolt 4 fähig sind. An der Front gibt es noch einmal 3 USB-Ports. Die Nvidia GeForce RTX 3080 Ti bringt selbst noch 3x DisplayPort und einen HDMI-Anschluss mit.
Für die Netzwerkverbindung stehen dem Anwender entweder WLAN mit dem neuesten Standard oder Ethernet (2.5G) zur Verfügung.
Kommunikation
Das auf dem Mainboard verbaute Intel Wi-Fi 6E AX211 Modul ist das Aktuellste, was es derzeit gibt und somit lassen sich auch Wi-Fi 6G Netze nutzen. Mit unserem aktuellen Testrouter, welcher ebenfalls auf den neuesten Standard setzt, liefert der Corsair One i300 bei unserem WLAN-Test schnelle und stabile Transferraten.
Hinweis:
Da uns das Testsample leider ohne die originalen WLAN-Antennen zugeschickt wurde, haben wir diesen Test mit alternativen Antennen durchgeführt. Ob die Transferraten mit den originalen Antennen noch etwas besser sind können wir derzeit nicht sagen.
Wartung
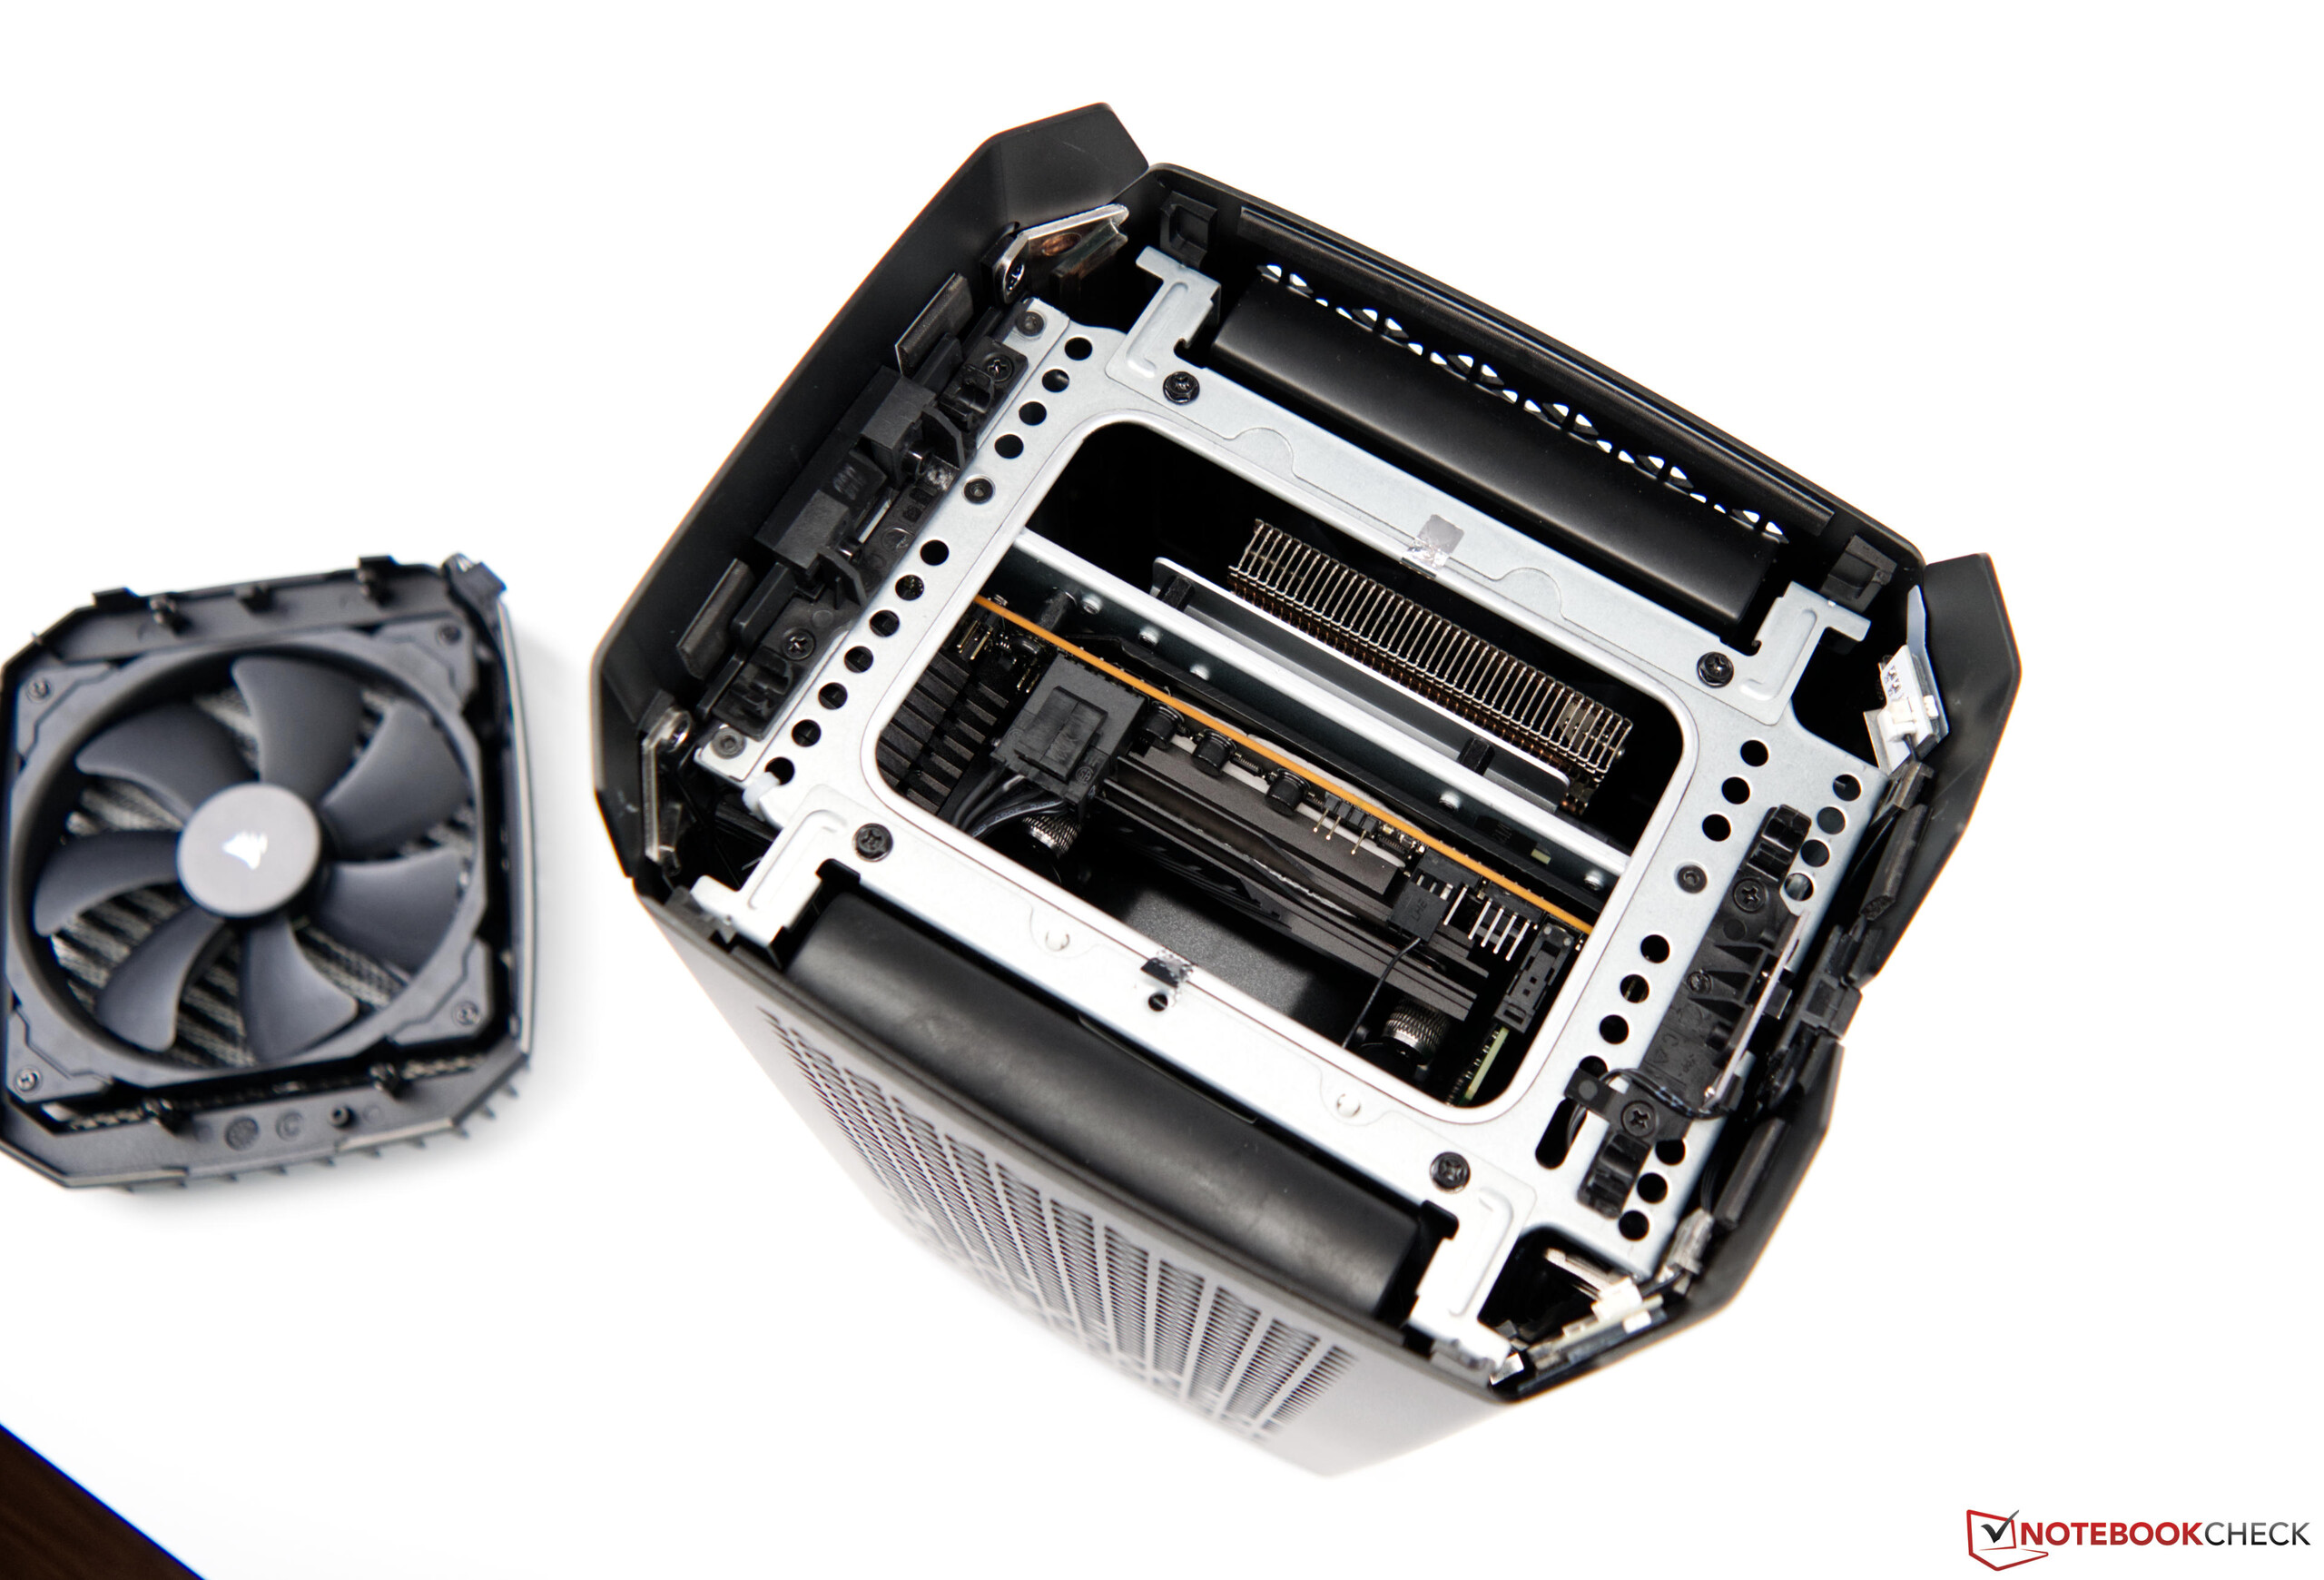
Sollte die Leistung des Corsair One i300 nicht reichen oder der Massenspeicher zu knapp ausfallen, kann man das Gerät aufrüsten. Allerdings sollte man etwas Fingerspitzengefühl mitbringen, denn der Platz im Inneren ist sehr begrenzt. Der Desktop-PC lässt sich sehr einfach öffnen. Der Gehäusedeckel inklusive dem 140-mm-Lüfter ist schnell entfernt und auch die beiden Seitenelemente sind nur mit zwei Schrauben fixiert. Allerdings schränken die Schläuche der verbauten AiOs das schnelle Austauschen von Komponenten ein. An den Arbeitsspeicher gelangt man noch relativ schnell, soll es aber an den Massenspeicher gehen, sieht es schon etwas schwieriger aus. Aus diesem Grund hätten wir uns eine weitere Option bei den möglichen Konfigurationen gewünscht. Insgesamt gibt es drei M.2-Slots auf dem Mainboard. Mit 2 TB ist das System jedoch schon gut bestückt.

Leistung
Rein von den verbauten Komponenten bietet der Corsair One i300 mit dem Intel Core i9-12900K und der Nvidia GeForce RTX 3080 Ti sehr schnelle Komponenten, wenn es um den Bereich Gaming geht. Die GeForce RTX 3080 Ti ist derzeit Nvidias zweitschnellste Grafikkarte und liegt nur wenige Prozente hinter einer GeForce RTX 3090. Diese hätte, wenn es allein um die physische Größe gehen würde, vermutlich auch in das Gehäuse gepasst, aber die Kühlung der VRAM-Chips hat Corsair vermutlich dazu bewogen nur
eine GeForce RTX 3080 Ti zu verbauen. Das etwas schwächere Modell des Corsair One i300 ist mit einer GeForce RTX 3080 bestückt und ist aufgrund des geringeren Kaufpreises vermutlich die vernünftigere Wahl.
Prozessor
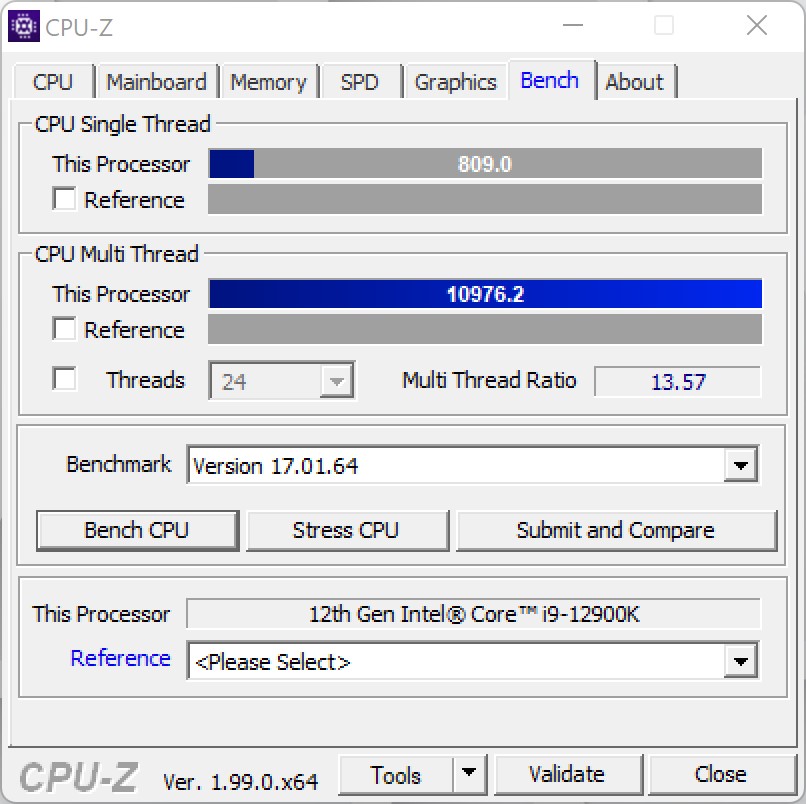
Der Corsair One i300 ist mit Intels schnellsten Prozessor ausgestattet, den man derzeit als fürs Gaming nutzt. Genauer verbaut Corsair den Intel Core i9-12900K auf Basis einer Z690-Platine von MSI. Welche Leistung das neue Flaggschiff aus dem Hause Intel liefert, konnten wir uns schon im Vorfeld anschauen. Für weitere Details bezüglich des Intel Core i9-12900K verweisen wir auf diese Seite. Beim Corsair One i300 gibt es aber hinsichtlich der maximalen Leistungsaufnahme der CPU eine kleine Einschränkung. PL1 und auch PL2 sind auf die Werte 165 bzw. 175 Watt festgelegt, was bedeutet, dass der Prozessor unter Last etwas eingebremst wird. Ohne Einschränkungen dürfte sich der Intel Core i9-12900K bis zu 241 Watt genehmigen. Diese Option lässt sich jedoch im BIOS verändern. Jedoch sind dann eine höhere Lautstärke und höhere Temperaturen das Resultat.
Bei unseren durchgeführten Benchmarks kann sich der Intel Core i9-12900K aber sehr gut schlagen, auch wenn nicht die volle Leistung unter Last abgerufen werden kann. Der Leistungszuwachs im Vergleich zum Corsair One i160 ist allerdings enorm. Im Gesamtrating bietet das aktuelle System 48 Prozent mehr Leistung.
Für weitere Vergleiche und Benchmarks verweisen wir hier auf unsere CPU-Vergleichstabelle.
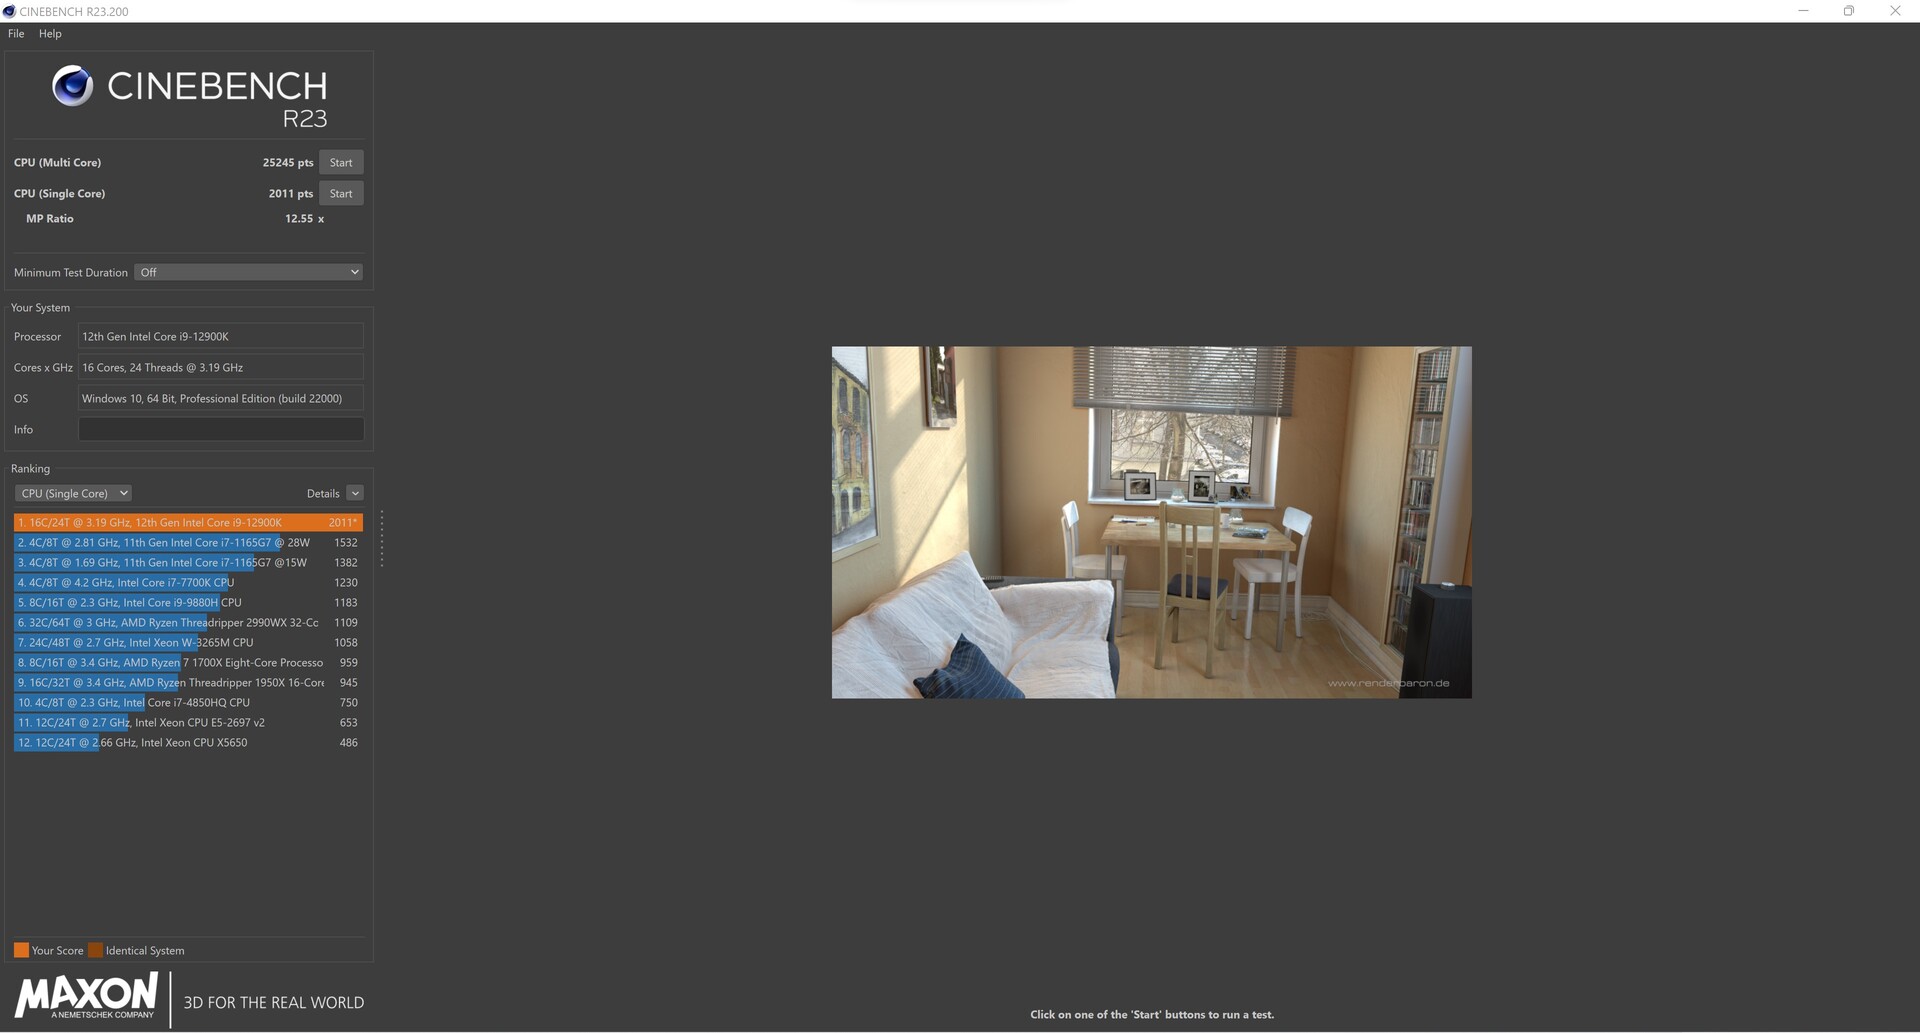
Cinebench R23: Multi Core | Single Core
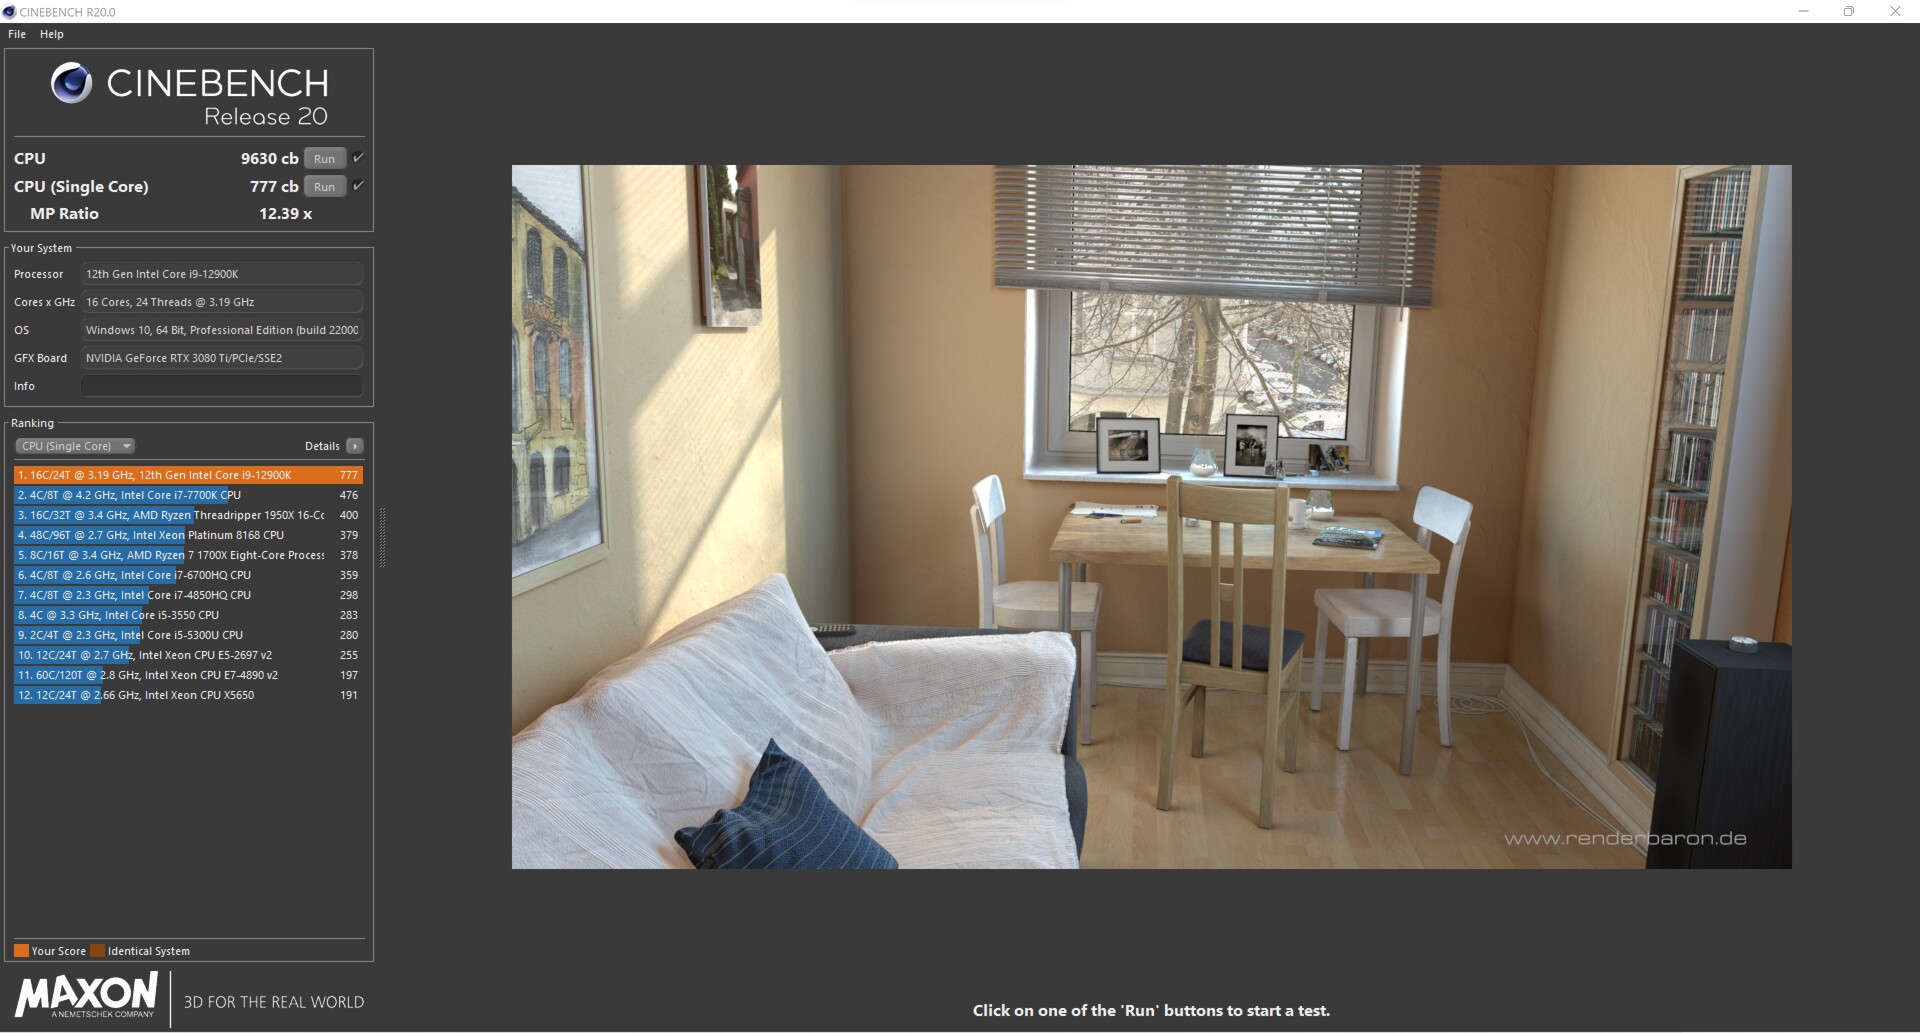
Cinebench R20: CPU (Multi Core) | CPU (Single Core)
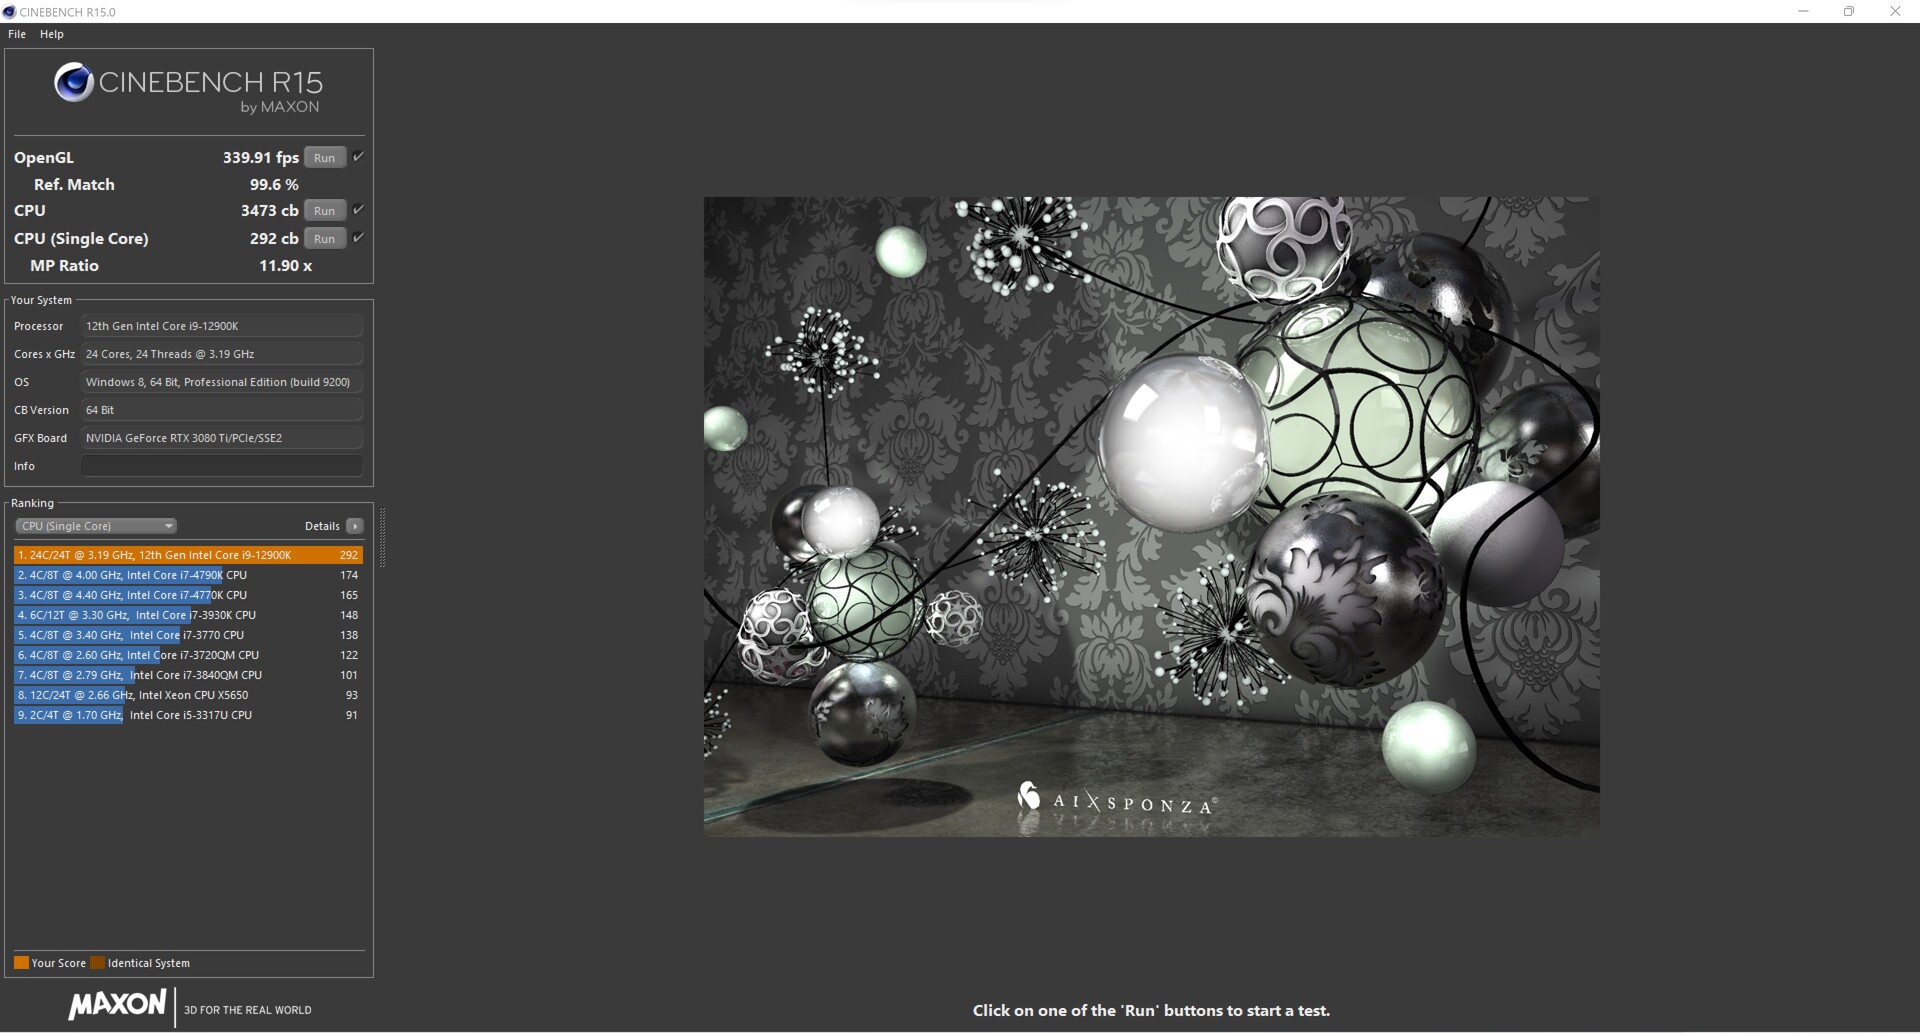
Cinebench R15: CPU Multi 64Bit | CPU Single 64Bit
Blender: v2.79 BMW27 CPU
7-Zip 18.03: 7z b 4 | 7z b 4 -mmt1
Geekbench 5.5: Multi-Core | Single-Core
HWBOT x265 Benchmark v2.2: 4k Preset
LibreOffice : 20 Documents To PDF
R Benchmark 2.5: Overall mean
| CPU Performance Rating | |
| Durchschnitt der Klasse Desktop | |
| Intel Core i9-12900K | |
| Durchschnittliche Intel Core i9-12900K | |
| AMD Ryzen 9 5950X | |
| Intel Core i9-12900K | |
| AMD Ryzen 9 5900X | |
| Intel Core i9-11900K | |
| Intel Core i9-10900K | |
| Intel Core i9-9900K -6! | |
| Cinebench R23 / Multi Core | |
| Durchschnitt der Klasse Desktop (16119 - 44253, n=16, der letzten 2 Jahre) | |
| AMD Ryzen 9 5950X | |
| Intel Core i9-12900K | |
| Durchschnittliche Intel Core i9-12900K (25245 - 27005, n=2) | |
| Intel Core i9-12900K | |
| AMD Ryzen 9 5900X | |
| Intel Core i9-10900K | |
| Intel Core i9-11900K | |
| Cinebench R23 / Single Core | |
| Durchschnitt der Klasse Desktop (1722 - 2439, n=16, der letzten 2 Jahre) | |
| Intel Core i9-12900K | |
| Durchschnittliche Intel Core i9-12900K (1998 - 2011, n=2) | |
| Intel Core i9-12900K | |
| Intel Core i9-11900K | |
| AMD Ryzen 9 5950X | |
| AMD Ryzen 9 5900X | |
| Intel Core i9-10900K | |
| Cinebench R20 / CPU (Multi Core) | |
| Durchschnitt der Klasse Desktop (5710 - 17190, n=15, der letzten 2 Jahre) | |
| AMD Ryzen 9 5950X | |
| Intel Core i9-12900K | |
| Durchschnittliche Intel Core i9-12900K (9630 - 10240, n=2) | |
| Intel Core i9-12900K | |
| AMD Ryzen 9 5900X | |
| Intel Core i9-10900K | |
| Intel Core i9-11900K | |
| Intel Core i9-9900K | |
| Cinebench R20 / CPU (Single Core) | |
| Durchschnitt der Klasse Desktop (674 - 922, n=15, der letzten 2 Jahre) | |
| Intel Core i9-12900K | |
| Durchschnittliche Intel Core i9-12900K (766 - 777, n=2) | |
| Intel Core i9-12900K | |
| Intel Core i9-11900K | |
| AMD Ryzen 9 5950X | |
| AMD Ryzen 9 5900X | |
| Intel Core i9-10900K | |
| Intel Core i9-9900K | |
| Cinebench R15 / CPU Multi 64Bit | |
| Durchschnitt der Klasse Desktop (2652 - 6656, n=16, der letzten 2 Jahre) | |
| AMD Ryzen 9 5950X | |
| Intel Core i9-12900K | |
| Durchschnittliche Intel Core i9-12900K (3473 - 4102, n=3) | |
| AMD Ryzen 9 5900X | |
| Intel Core i9-12900K | |
| Intel Core i9-10900K | |
| Intel Core i9-11900K | |
| Intel Core i9-9900K | |
| Cinebench R15 / CPU Single 64Bit | |
| Durchschnitt der Klasse Desktop (246 - 356, n=16, der letzten 2 Jahre) | |
| Intel Core i9-12900K | |
| Durchschnittliche Intel Core i9-12900K (286 - 292, n=3) | |
| Intel Core i9-12900K | |
| AMD Ryzen 9 5950X | |
| AMD Ryzen 9 5900X | |
| Intel Core i9-11900K | |
| Intel Core i9-10900K | |
| Intel Core i9-9900K | |
| Blender / v2.79 BMW27 CPU | |
| Intel Core i9-9900K | |
| Intel Core i9-11900K | |
| Intel Core i9-10900K | |
| AMD Ryzen 9 5900X | |
| Intel Core i9-12900K | |
| Durchschnittliche Intel Core i9-12900K (121.1 - 128.3, n=2) | |
| Intel Core i9-12900K | |
| Durchschnitt der Klasse Desktop (75 - 218, n=15, der letzten 2 Jahre) | |
| AMD Ryzen 9 5950X | |
| 7-Zip 18.03 / 7z b 4 | |
| AMD Ryzen 9 5950X | |
| Durchschnitt der Klasse Desktop (91898 - 163125, n=17, der letzten 2 Jahre) | |
| Intel Core i9-12900K | |
| Durchschnittliche Intel Core i9-12900K (96960 - 97671, n=2) | |
| Intel Core i9-12900K | |
| AMD Ryzen 9 5900X | |
| Intel Core i9-10900K | |
| Intel Core i9-11900K | |
| Intel Core i9-9900K | |
| 7-Zip 18.03 / 7z b 4 -mmt1 | |
| Durchschnitt der Klasse Desktop (5092 - 8790, n=17, der letzten 2 Jahre) | |
| AMD Ryzen 9 5950X | |
| AMD Ryzen 9 5900X | |
| Intel Core i9-11900K | |
| Intel Core i9-12900K | |
| Durchschnittliche Intel Core i9-12900K (6571 - 6580, n=2) | |
| Intel Core i9-12900K | |
| Intel Core i9-10900K | |
| Intel Core i9-9900K | |
| Geekbench 5.5 / Multi-Core | |
| Durchschnitt der Klasse Desktop (12626 - 28535, n=30, der letzten 2 Jahre) | |
| Intel Core i9-12900K | |
| Durchschnittliche Intel Core i9-12900K (17698 - 17854, n=2) | |
| Intel Core i9-12900K | |
| AMD Ryzen 9 5950X | |
| AMD Ryzen 9 5900X | |
| Intel Core i9-10900K | |
| Intel Core i9-11900K | |
| Geekbench 5.5 / Single-Core | |
| Durchschnitt der Klasse Desktop (1755 - 2597, n=30, der letzten 2 Jahre) | |
| Intel Core i9-12900K | |
| Durchschnittliche Intel Core i9-12900K (1969 - 2042, n=2) | |
| Intel Core i9-12900K | |
| Intel Core i9-11900K | |
| AMD Ryzen 9 5950X | |
| AMD Ryzen 9 5900X | |
| Intel Core i9-10900K | |
| HWBOT x265 Benchmark v2.2 / 4k Preset | |
| Durchschnitt der Klasse Desktop (18.6 - 48.5, n=15, der letzten 2 Jahre) | |
| AMD Ryzen 9 5950X | |
| Intel Core i9-12900K | |
| Durchschnittliche Intel Core i9-12900K (29 - 30, n=2) | |
| Intel Core i9-12900K | |
| AMD Ryzen 9 5900X | |
| Intel Core i9-10900K | |
| Intel Core i9-11900K | |
| Intel Core i9-9900K | |
| LibreOffice / 20 Documents To PDF | |
| Intel Core i9-10900K | |
| Intel Core i9-11900K | |
| AMD Ryzen 9 5900X | |
| AMD Ryzen 9 5950X | |
| Durchschnitt der Klasse Desktop (35.5 - 79.2, n=16, der letzten 2 Jahre) | |
| Intel Core i9-12900K | |
| Durchschnittliche Intel Core i9-12900K (38.1 - 40.6, n=2) | |
| Intel Core i9-12900K | |
| R Benchmark 2.5 / Overall mean | |
| Intel Core i9-10900K | |
| Intel Core i9-11900K | |
| AMD Ryzen 9 5950X | |
| AMD Ryzen 9 5900X | |
| Intel Core i9-12900K | |
| Durchschnittliche Intel Core i9-12900K (0.3946 - 0.4216, n=2) | |
| Intel Core i9-12900K | |
| Durchschnitt der Klasse Desktop (0.3299 - 0.4909, n=16, der letzten 2 Jahre) | |
* ... kleinere Werte sind besser
AIDA64: FP32 Ray-Trace | FPU Julia | CPU SHA3 | CPU Queen | FPU SinJulia | FPU Mandel | CPU AES | CPU ZLib | FP64 Ray-Trace | CPU PhotoWorxx
| Performance Rating | |
| Durchschnitt der Klasse Desktop | |
| AMD Ryzen 9 5950X, NVIDIA Titan RTX | |
| AMD Ryzen 9 5900X, NVIDIA Titan RTX | |
| Intel Core i9-11900K, NVIDIA Titan RTX | |
| Intel Core i9-12900K, NVIDIA GeForce RTX 3080 Ti | |
| Durchschnittliche Intel Core i9-12900K | |
| Intel Core i9-12900K, NVIDIA Titan RTX | |
| AIDA64 / FP32 Ray-Trace | |
| Durchschnitt der Klasse Desktop (12248 - 84577, n=21, der letzten 2 Jahre) | |
| AMD Ryzen 9 5950X, NVIDIA Titan RTX | |
| AMD Ryzen 9 5900X, NVIDIA Titan RTX | |
| Intel Core i9-11900K, NVIDIA Titan RTX | |
| Intel Core i9-12900K, NVIDIA Titan RTX | |
| Durchschnittliche Intel Core i9-12900K (12739 - 13345, n=3) | |
| Intel Core i9-12900K, NVIDIA GeForce RTX 3080 Ti | |
| AIDA64 / FPU Julia | |
| Durchschnitt der Klasse Desktop (65152 - 246125, n=21, der letzten 2 Jahre) | |
| AMD Ryzen 9 5950X, NVIDIA Titan RTX | |
| AMD Ryzen 9 5900X, NVIDIA Titan RTX | |
| Intel Core i9-11900K, NVIDIA Titan RTX | |
| Intel Core i9-12900K, NVIDIA Titan RTX | |
| Durchschnittliche Intel Core i9-12900K (58406 - 59419, n=3) | |
| Intel Core i9-12900K, NVIDIA GeForce RTX 3080 Ti | |
| AIDA64 / CPU SHA3 | |
| Durchschnitt der Klasse Desktop (2982 - 10804, n=21, der letzten 2 Jahre) | |
| Intel Core i9-11900K, NVIDIA Titan RTX | |
| Durchschnittliche Intel Core i9-12900K (4796 - 5127, n=3) | |
| Intel Core i9-12900K, NVIDIA Titan RTX | |
| Intel Core i9-12900K, NVIDIA GeForce RTX 3080 Ti | |
| AMD Ryzen 9 5950X, NVIDIA Titan RTX | |
| AMD Ryzen 9 5900X, NVIDIA Titan RTX | |
| AIDA64 / CPU Queen | |
| AMD Ryzen 9 5950X, NVIDIA Titan RTX | |
| AMD Ryzen 9 5900X, NVIDIA Titan RTX | |
| Durchschnitt der Klasse Desktop (76512 - 187912, n=18, der letzten 2 Jahre) | |
| Intel Core i9-12900K, NVIDIA Titan RTX | |
| Durchschnittliche Intel Core i9-12900K (112066 - 112694, n=3) | |
| Intel Core i9-12900K, NVIDIA GeForce RTX 3080 Ti | |
| Intel Core i9-11900K, NVIDIA Titan RTX | |
| AIDA64 / FPU SinJulia | |
| AMD Ryzen 9 5950X, NVIDIA Titan RTX | |
| AMD Ryzen 9 5900X, NVIDIA Titan RTX | |
| Durchschnitt der Klasse Desktop (6443 - 35251, n=21, der letzten 2 Jahre) | |
| Intel Core i9-12900K, NVIDIA Titan RTX | |
| Durchschnittliche Intel Core i9-12900K (14590 - 14664, n=3) | |
| Intel Core i9-12900K, NVIDIA GeForce RTX 3080 Ti | |
| Intel Core i9-11900K, NVIDIA Titan RTX | |
| AIDA64 / FPU Mandel | |
| Durchschnitt der Klasse Desktop (31697 - 129745, n=21, der letzten 2 Jahre) | |
| AMD Ryzen 9 5950X, NVIDIA Titan RTX | |
| AMD Ryzen 9 5900X, NVIDIA Titan RTX | |
| Intel Core i9-11900K, NVIDIA Titan RTX | |
| Intel Core i9-12900K, NVIDIA Titan RTX | |
| Durchschnittliche Intel Core i9-12900K (35801 - 39323, n=3) | |
| Intel Core i9-12900K, NVIDIA GeForce RTX 3080 Ti | |
| AIDA64 / CPU AES | |
| Intel Core i9-11900K, NVIDIA Titan RTX | |
| AMD Ryzen 9 5950X, NVIDIA Titan RTX | |
| Durchschnitt der Klasse Desktop (57777 - 513073, n=21, der letzten 2 Jahre) | |
| Intel Core i9-12900K, NVIDIA GeForce RTX 3080 Ti | |
| Durchschnittliche Intel Core i9-12900K (94062 - 140055, n=3) | |
| AMD Ryzen 9 5900X, NVIDIA Titan RTX | |
| Intel Core i9-12900K, NVIDIA Titan RTX | |
| AIDA64 / CPU ZLib | |
| AMD Ryzen 9 5950X, NVIDIA Titan RTX | |
| Durchschnitt der Klasse Desktop (887 - 2674, n=21, der letzten 2 Jahre) | |
| Durchschnittliche Intel Core i9-12900K (1537 - 1608, n=3) | |
| Intel Core i9-12900K, NVIDIA Titan RTX | |
| Intel Core i9-12900K, NVIDIA GeForce RTX 3080 Ti | |
| AMD Ryzen 9 5900X, NVIDIA Titan RTX | |
| Intel Core i9-11900K, NVIDIA Titan RTX | |
| AIDA64 / FP64 Ray-Trace | |
| Durchschnitt der Klasse Desktop (6471 - 44013, n=21, der letzten 2 Jahre) | |
| AMD Ryzen 9 5950X, NVIDIA Titan RTX | |
| AMD Ryzen 9 5900X, NVIDIA Titan RTX | |
| Intel Core i9-11900K, NVIDIA Titan RTX | |
| Intel Core i9-12900K, NVIDIA Titan RTX | |
| Durchschnittliche Intel Core i9-12900K (7586 - 8283, n=3) | |
| Intel Core i9-12900K, NVIDIA GeForce RTX 3080 Ti | |
| AIDA64 / CPU PhotoWorxx | |
| Intel Core i9-12900K, NVIDIA GeForce RTX 3080 Ti | |
| Intel Core i9-12900K, NVIDIA Titan RTX | |
| Durchschnitt der Klasse Desktop (38071 - 63949, n=21, der letzten 2 Jahre) | |
| Durchschnittliche Intel Core i9-12900K (33311 - 49236, n=3) | |
| Intel Core i9-11900K, NVIDIA Titan RTX | |
| AMD Ryzen 9 5950X, NVIDIA Titan RTX | |
| AMD Ryzen 9 5900X, NVIDIA Titan RTX | |
Cinebench R15 Multi Dauertest
Mit der Cinebench-R15-Multi-Schleife schauen wir uns das System unter Dauerbelastung an. Hier können wir feststellen, ob das Kühlsystem leistungsstark genug ist, um den Prozessor effektiv zu kühlen. Beim Corsair One i300 arbeitet die AiO sehr zuverlässig und auch nach 50 Durchläufen ist das Ergebnis stabil. Die etwas geringere TDP des Intel Core i9-12900K ist hier aber deutlich sichtbar. Lässt man den Core i9-12900K von der Leine, so sind noch knapp 500 Punkte mehr drin.
System Performance
Das gesamte System arbeitete während des Testzeitraumes sehr schnell. Das spiegelt sich auch bei den Systembenchmarks wider. Bei den PCMark 10 Tests führt der Corsair One i300 in allen Einzeltests. Einzig bei den Rendertests kann der Corsair One i300 aufgrund der Grafikkarte nicht ganz mithalten. Die Nvidia Titan RTX der Vergleichssysteme ist hier die bessere Wahl, was aufgrund der Nähe zur Quadro-Serie einhergeht.
| LuxMark v2.0 64Bit | |
| Room GPUs-only | |
| Intel Core i9-12900K | |
| Intel Core i9-9900K | |
| Sala GPUs-only | |
| Intel Core i9-12900K | |
| Intel Core i9-9900K | |
| ComputeMark v2.1 | |
| 1024x600 Normal, Score | |
| Intel Core i9-12900K | |
| Intel Core i9-9900K | |
| 1024x600 Normal, Fluid 3DTex | |
| Intel Core i9-12900K | |
| Intel Core i9-9900K | |
| 1024x600 Normal, Fluid 2DTexArr | |
| Intel Core i9-12900K | |
| Intel Core i9-9900K | |
| 1024x600 Normal, Mandel Vector | |
| Intel Core i9-12900K | |
| Intel Core i9-9900K | |
| 1024x600 Normal, Mandel Scalar | |
| Intel Core i9-12900K | |
| Intel Core i9-9900K | |
| 1024x600 Normal, QJuliaRayTrace | |
| Intel Core i9-12900K | |
| Intel Core i9-9900K | |
| PCMark 10 Score | 8897 Punkte | |
Hilfe | ||
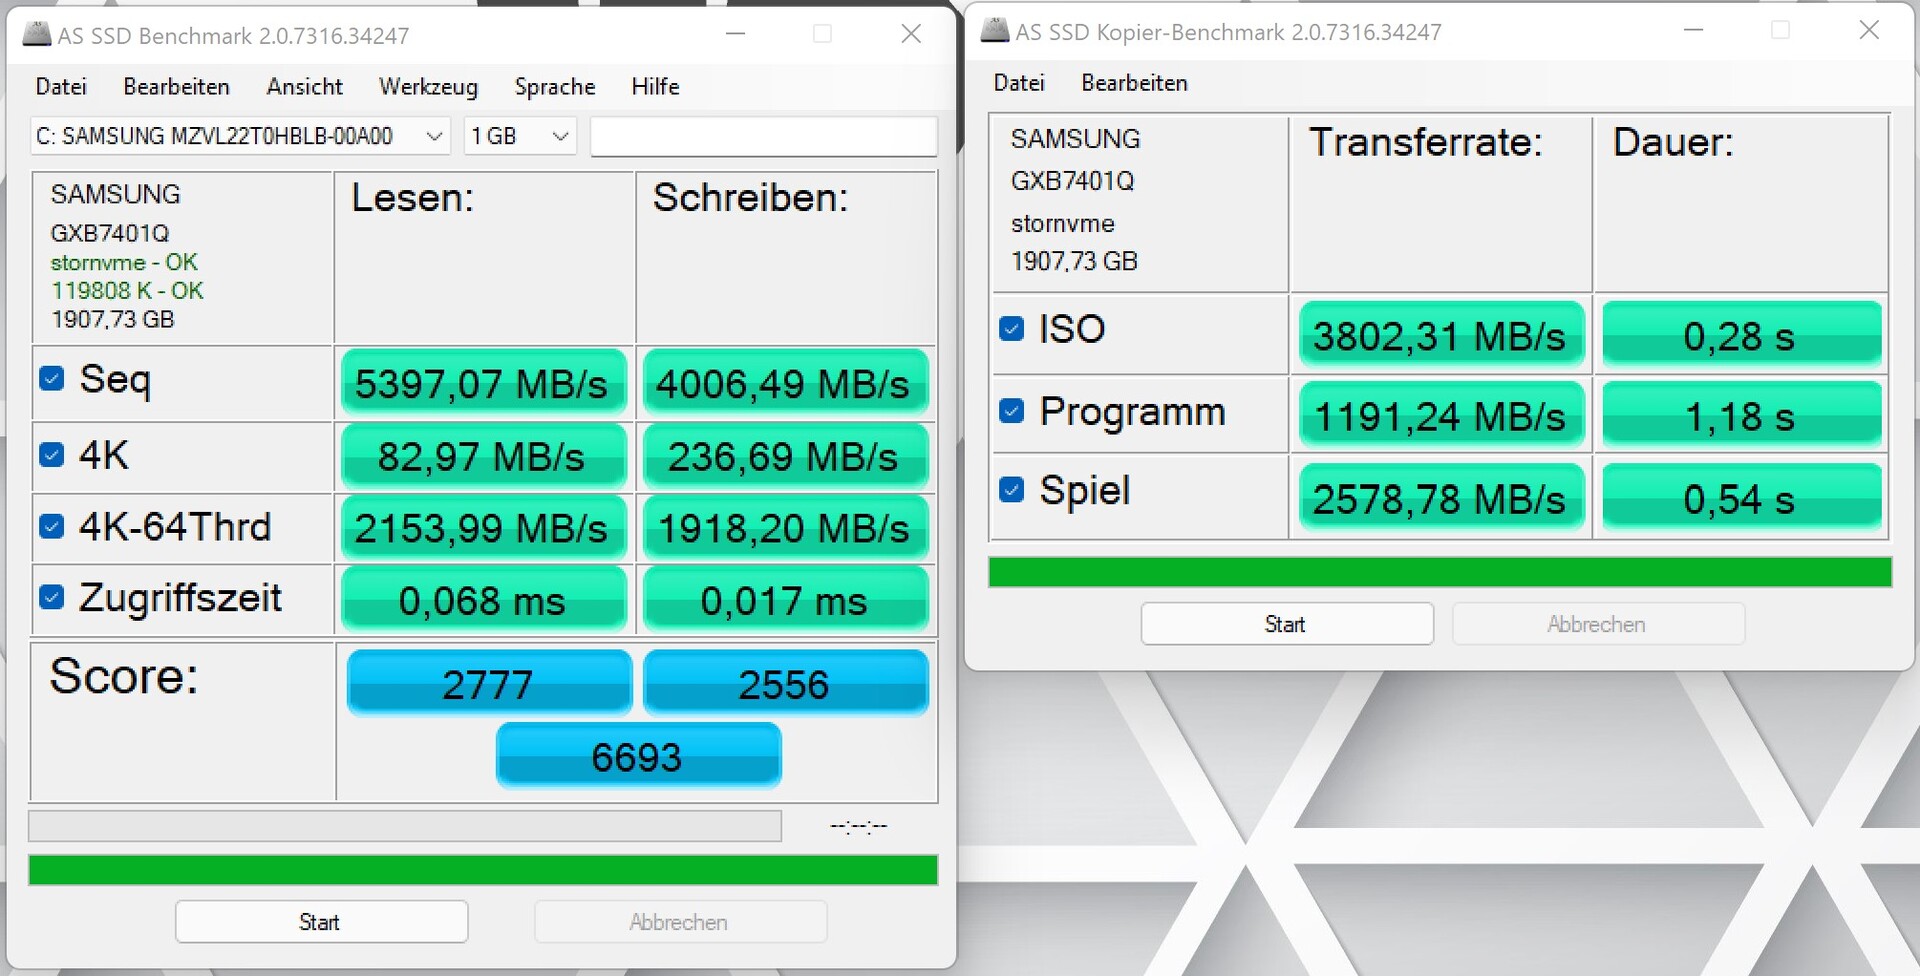
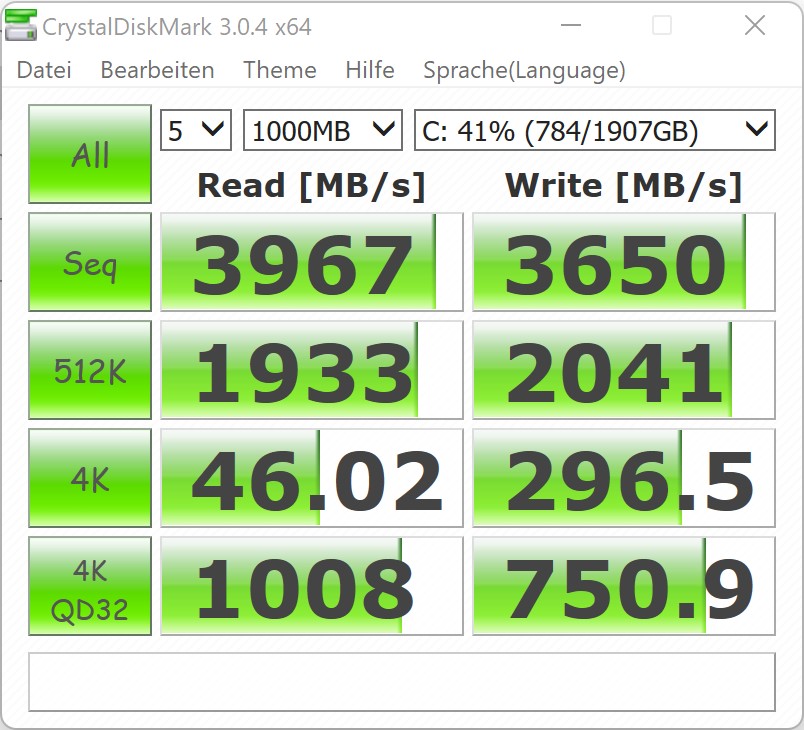
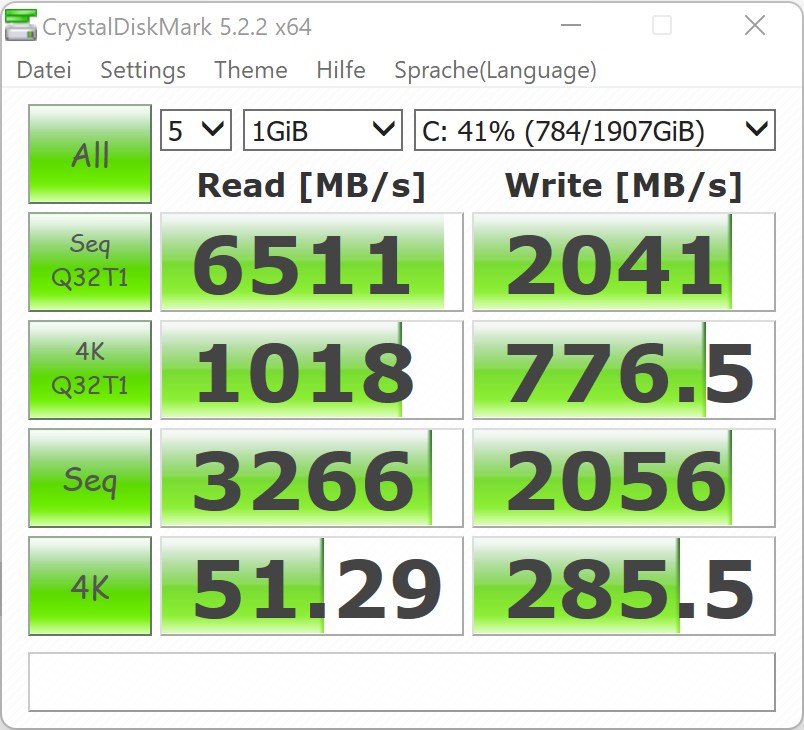
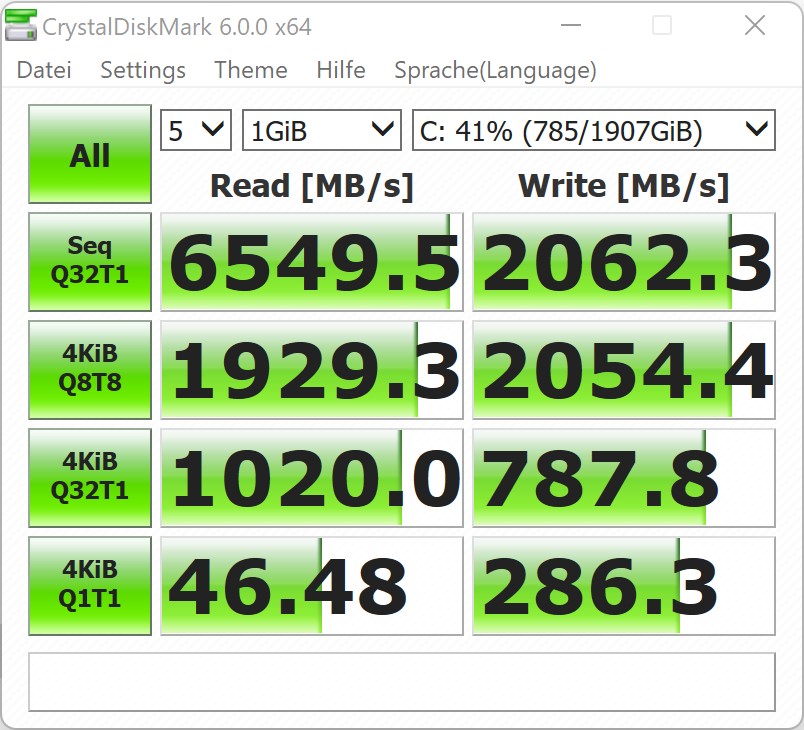
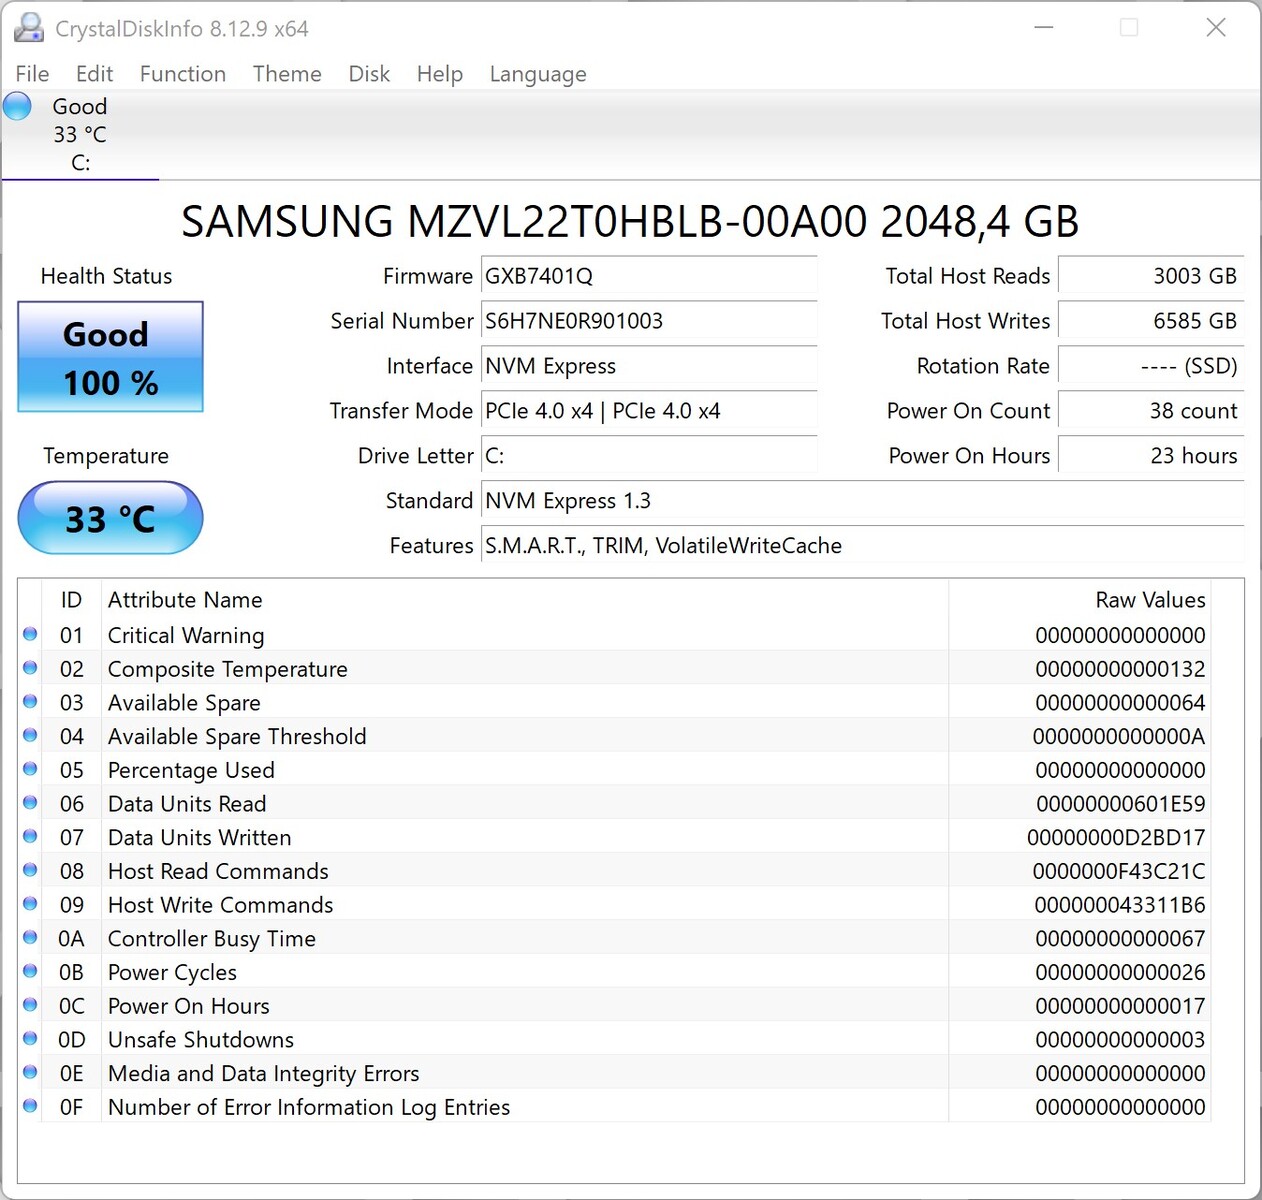
Massenspeicher
Corsair verbaut bei unserem Testsystem eine schnelle NVMe SSD mit 2 TB Speicherplatz. Damit bekommen die Anwender genügend Speicherplatz um problemlos mehrere Games zu installieren. Im Test konnte die verbaute Samsung SSD mit sehr hohen Transferraten überzeugen. Auf den Einsatz einer herkömmlichen Festplatte, wie es noch beim Corsair One i160 der Fall war, wird verzichtet. Das System lässt sich noch mit weiteren M.2 SSDs erweitern. Allerdings sollte man hier etwas Schrauber-Erfahrung mitbringen, denn der Platz im Inneren ist sehr beschränkt.
Weitere Massenspeicher finden in dem kompakten Gehäuse leider keinen Platz mehr.

* ... kleinere Werte sind besser
Grafikkarte
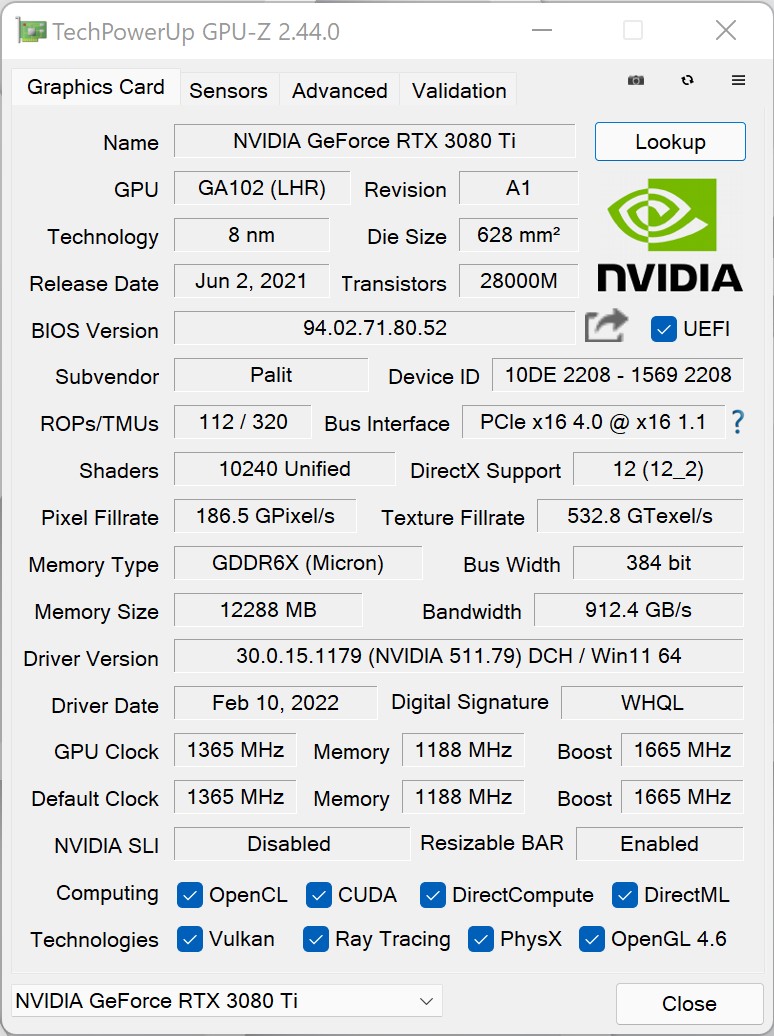
Corsair verbaut in dem kompakten Gaming-System eine Nvidia GeForce RTX 3080 Ti, welche in puncto Leistung nahezu identisch zu einer Nvidia GeForce RTX 3090 ist. Mit 12 GB VRAM bietet diese aber nur halb so viel wie Nvidias Topmodell, was aber bei aktuellen Spielen momentan nicht weiter ins Gewicht fällt. Damit bietet das System absolute Leistung in Sachen Gaming. Sehr durchdacht ist die Kühlung der Grafikkarte, denn auch hier kommt wie bei der CPU eine AiO zum Einsatz. Zusätzlich befinden sich aber noch zwei kleine Lüfter auf der Grafikkarte, um die Spannungswandler und den VRAM zusätzlich aktiv zu kühlen. Dass dieses Unterfangen gut funktioniert, sieht man, wenn man sich die synthetischen Benchmarks anschaut. Beste Werte erreicht der Corsair One i300 auch dank des Intel Core i9-12900K.
Im Vergleich zum Corsair One i160 ist mit einer Leistungssteigerung von 20 bis 30 Prozent zu rechnen.
| 3DMark 05 Standard | 63621 Punkte | |
| 3DMark 06 Standard Score | 66161 Punkte | |
| 3DMark Vantage P Result | 120236 Punkte | |
| 3DMark 11 Performance | 47170 Punkte | |
| 3DMark Ice Storm Standard Score | 336443 Punkte | |
| 3DMark Cloud Gate Standard Score | 81921 Punkte | |
| 3DMark Fire Strike Score | 40079 Punkte | |
| 3DMark Fire Strike Extreme Score | 23109 Punkte | |
| 3DMark Time Spy Score | 18985 Punkte | |
Hilfe | ||
Gaming Performance
Da Corsair beim One i300 auf aktuellste Hardware setzt, war klar, dass auch die Spieleleistung des Systems auf Topniveau ist. Aktuell lassen sich alle Spiele ohne Kompromisse in 2160p genießen. Im Vergleich der anderen Desktop-GPUs, die wir bereits getestet haben, schneidet das Testsystem deutlich besser ab. Der relativ große Vorsprung auf die Nvidia GeForce RTX 3090 ist der besseren CPU des Corsair One i300 geschuldet. Unser GPU-Testsystem basiert auf einem AMD Ryzen 9 5900X und ist damit dem Intel Core i9-12900K deutlich unterlegen.
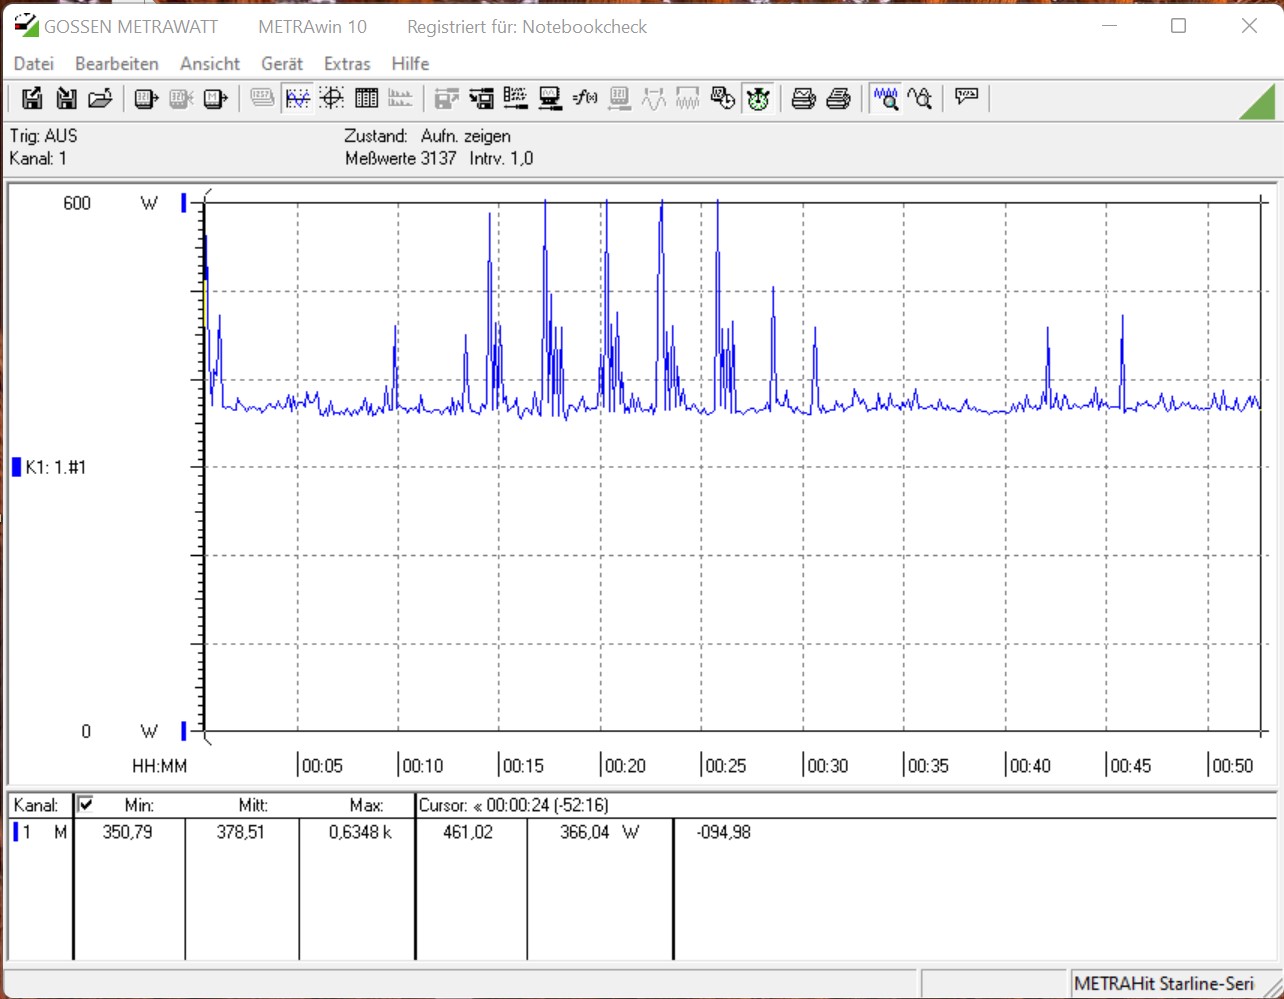
Wie schon bei den CPU-Tests haben wir auch die Grafikkarte über einen längeren Zeitraum belastet. Dafür nutzen wir The Witcher 3 mit dem Ultra-Preset. Während des Tests ist die Leistung der Nvidia GeForce RTX 3080 Ti durchweg stabil und keine Leistungseinbußen sind zu erkennen. Mit durchschnittlich 189 Bildern pro Sekunde läuft das Spiel sehr gut, sodass auch Monitore mit 165 Hz befeuert werden können.
Witcher 3 FPS-Diagramm
| min. | mittel | hoch | max. | QHD | 4K | |
|---|---|---|---|---|---|---|
| GTA V (2015) | 187 | 187 | 187 | 149 | 147 | 180 |
| The Witcher 3 (2015) | 681 | 554 | 365 | 183 | 149 | |
| Dota 2 Reborn (2015) | 240.3 | 214.8 | 207.6 | 196.1 | 191.5 | |
| Rise of the Tomb Raider (2016) | 487 | 340 | 257 | 221 | 114 | |
| Final Fantasy XV Benchmark (2018) | 232 | 227 | 175 | 136 | 84 | |
| X-Plane 11.11 (2018) | 205 | 178 | 135 | 118 | ||
| Far Cry 5 (2018) | 230 | 200 | 190 | 175 | 168 | 108 |
| Strange Brigade (2018) | 667 | 484 | 392 | 345 | 260 | 156 |
| Shadow of the Tomb Raider (2018) | 245 | 226 | 226 | 212 | 164 | 93.7 |
| Far Cry New Dawn (2019) | 190 | 165 | 157 | 141 | 137 | 107 |
| Metro Exodus (2019) | 258 | 212 | 169 | 137 | 113 | 75 |
| Anno 1800 (2019) | 159 | 163 | 124 | 69.4 | 66.1 | 55.9 |
| Control (2019) | 240 | 233 | 187 | 124 | 63.9 | |
| Borderlands 3 (2019) | 208 | 181 | 167 | 152 | 125 | 72 |
| F1 2020 (2020) | 478 | 379 | 397 | 298 | 233 | 143 |
| F1 2021 (2021) | 534 | 498 | 410 | 219 | 170 | 101 |
| New World (2021) | 194 | 165 | 153 | 142 | 133 | 79.2 |
| Far Cry 6 (2021) | 200 | 176 | 155 | 149 | 129 | 81.6 |
| Guardians of the Galaxy (2021) | 194 | 196 | 191 | 191 | 186 | 110 |
| Riders Republic (2021) | 284 | 220 | 188 | 176 | 136 | 80 |
| Forza Horizon 5 (2021) | 292 | 200 | 188 | 126 | 111 | 84 |
| Battlefield 2042 (2021) | 216 | 194 | 169 | 150 | 123 | 83 |
| Farming Simulator 22 (2021) | 349 | 270 | 226 | 203 | 201 | 157 |
| Halo Infinite (2021) | 229 | 198 | 188 | 142 | 83.1 | |
| God of War (2022) | 209 | 181 | 163 | 117 | 98.7 | 64.7 |
| Rainbow Six Extraction (2022) | 365 | 353 | 348 | 282 | 194 | 104 |
| Dying Light 2 (2022) | 189 | 164 | 149 | 109 | 61.5 |
Emissionen
Geräuschemissionen
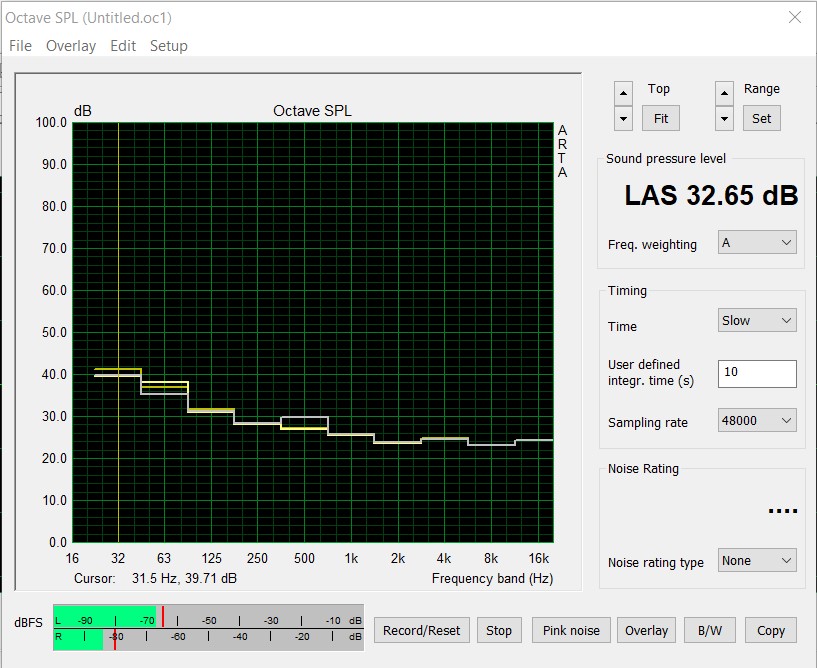
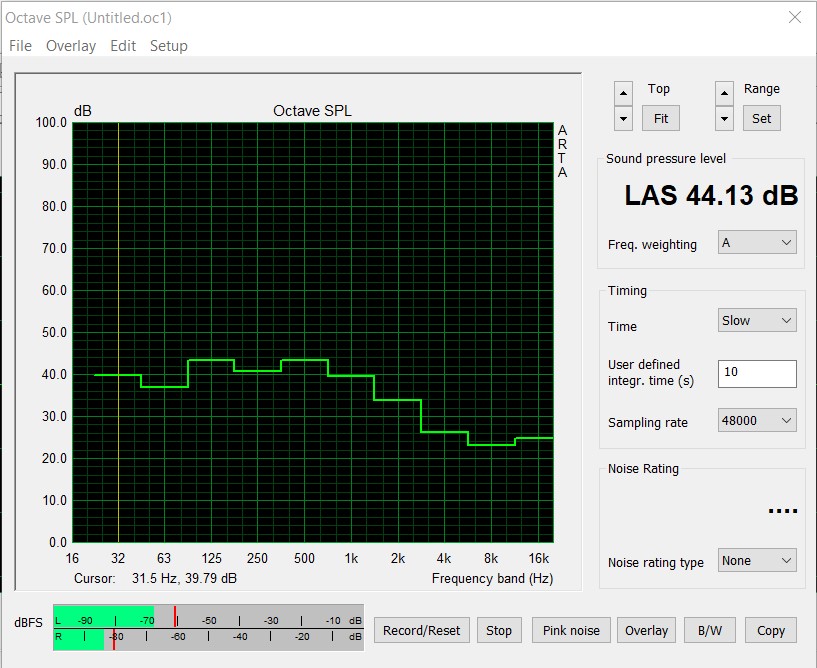
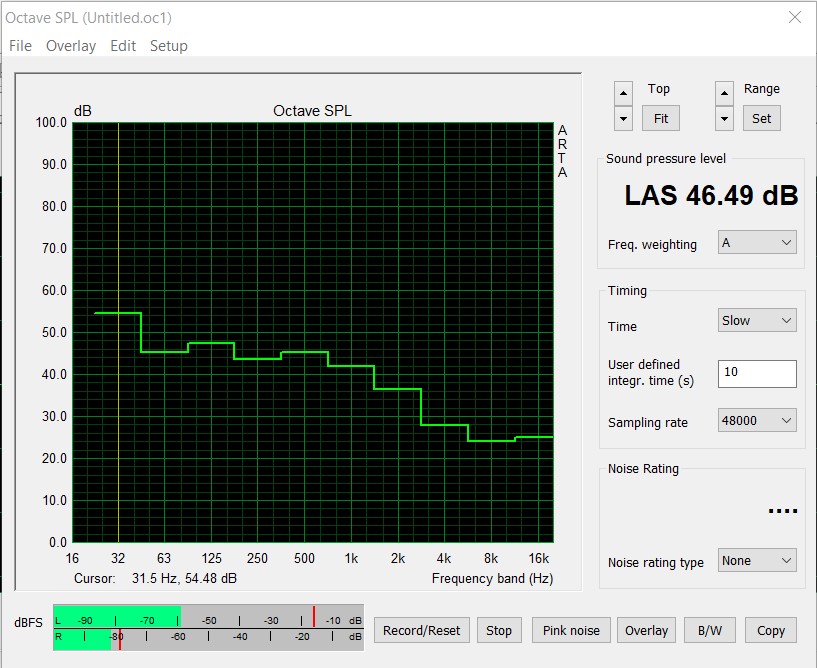
Der Corsair One i300 basiert auf der gleichen Kühlmethode wie der Corsair One i160. Im 2D-Betrieb arbeitet das System mit ca. 32,6 dB(A) relativ leise. Gleichwohl arbeitet der große 140-mm-Lüfter an dieser Stelle noch nicht. Vielmehr sind die beiden Pumpen der AiO zu hören und immer präsent. Dies ist leider auf Dauer nicht schön. Hier gibt es sicherlich auch Pumpen, die deutlich leiser ihre Arbeit verrichten. Unter Last beginnt dann auch nach kurzer Zeit der 140-mm-Lüfter im Gehäusedeckel zu arbeiten. Mit gut 44 dB(A) beim Stresstest ist das System dann schon deutlich hörbar. Noch etwas lauter wird es dann beim Spielen mit etwas über 46 dB(A).
Lautstärkediagramm
| Idle |
| 32.4 / 32.5 / 32.6 dB(A) |
| Last |
| / 44.13 dB(A) |
 | ||
30 dB leise 40 dB(A) deutlich hörbar 50 dB(A) störend |
||
min: | ||
Temperatur und Energiebedarf
Das massive Gehäuse bietet eine sehr große Fläche um die Wärmeabfuhr zu gewährleisten. Unter Last wird diese spürbar warm und der sogenannte Kamineffekt sorgt dafür, dass seitlich die Kühle Luft angesaugt wird und direkt durch die Kühlfinnen der beiden AiOs geleitet wird um dann an der Oberseite durch den großen 140-mm-Lüfter wieder aus dem Gehäuse geleitet zu werden. Für die effektive Kühlung der Grafikkarte wird diese zusätzlich mit zwei kleinen Lüftern ausgestattet um die Spannungswandler und den VRAM zu kühlen.
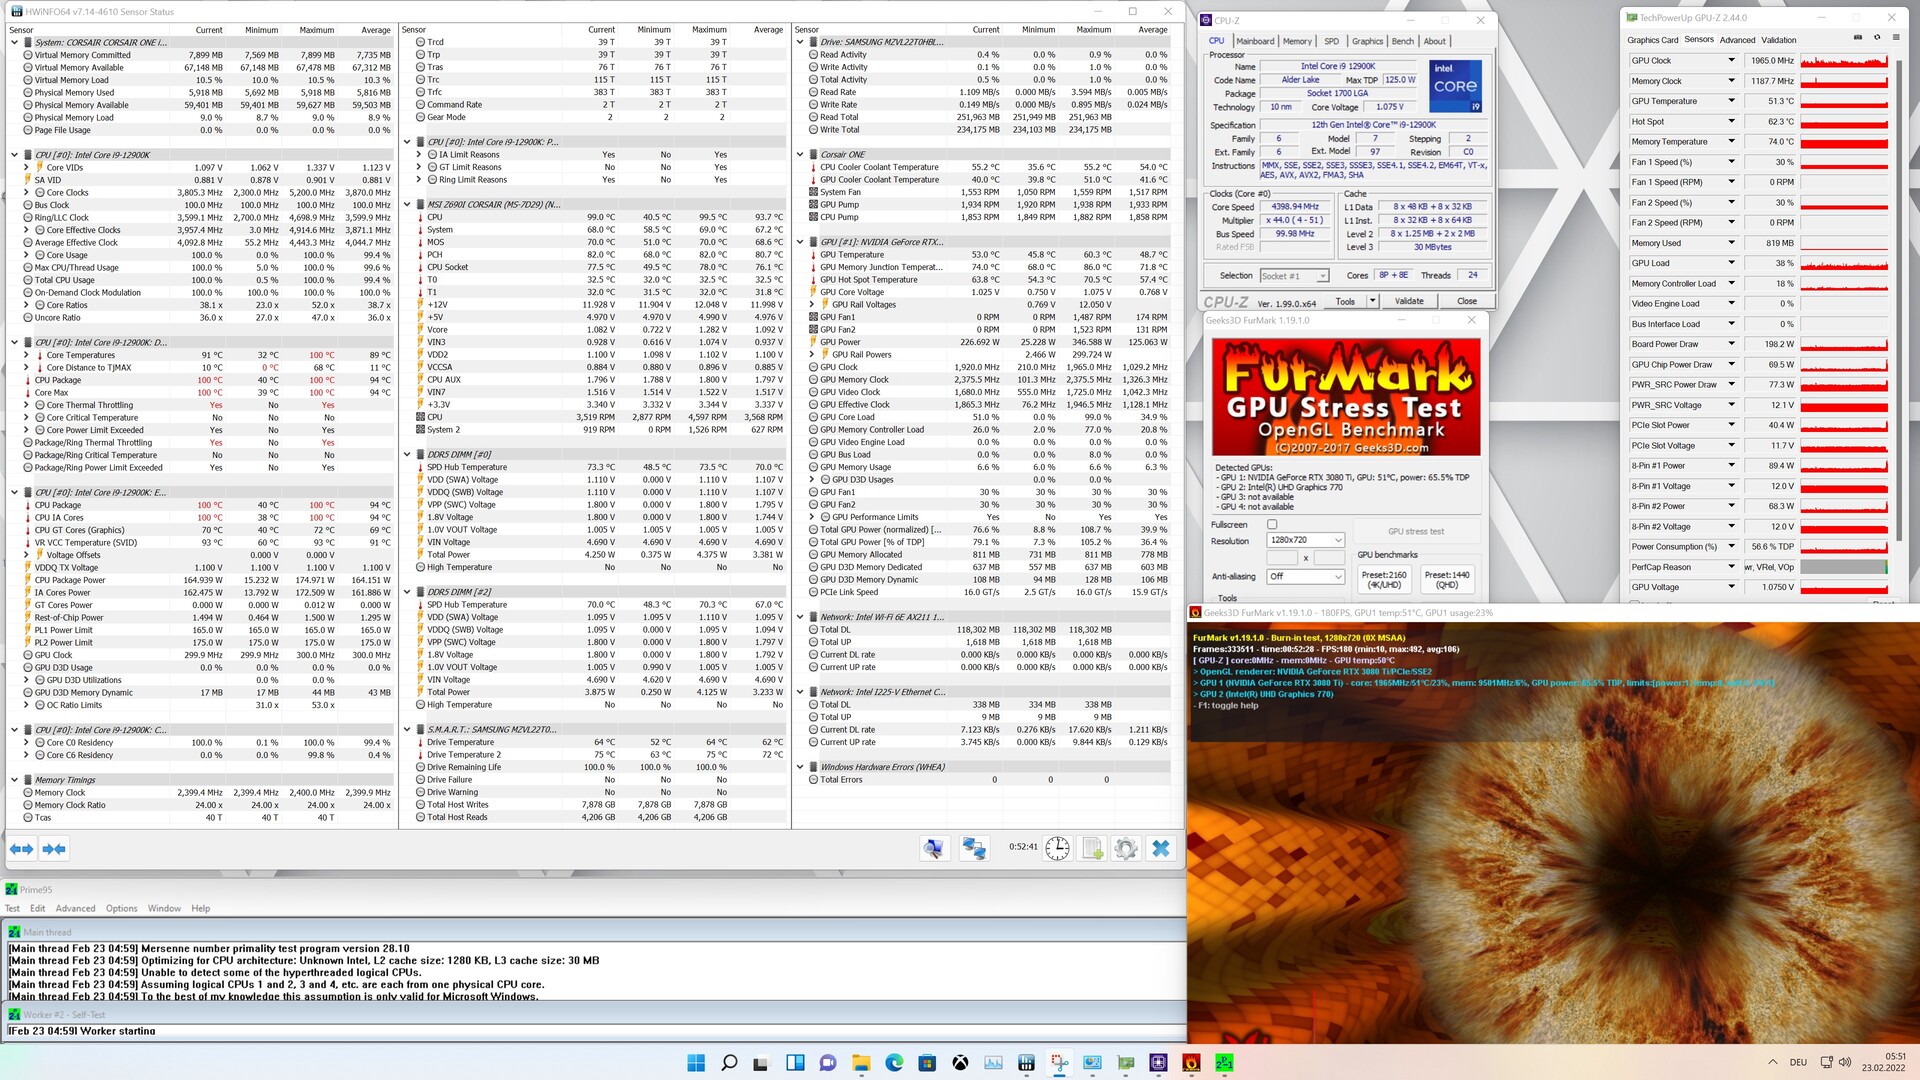
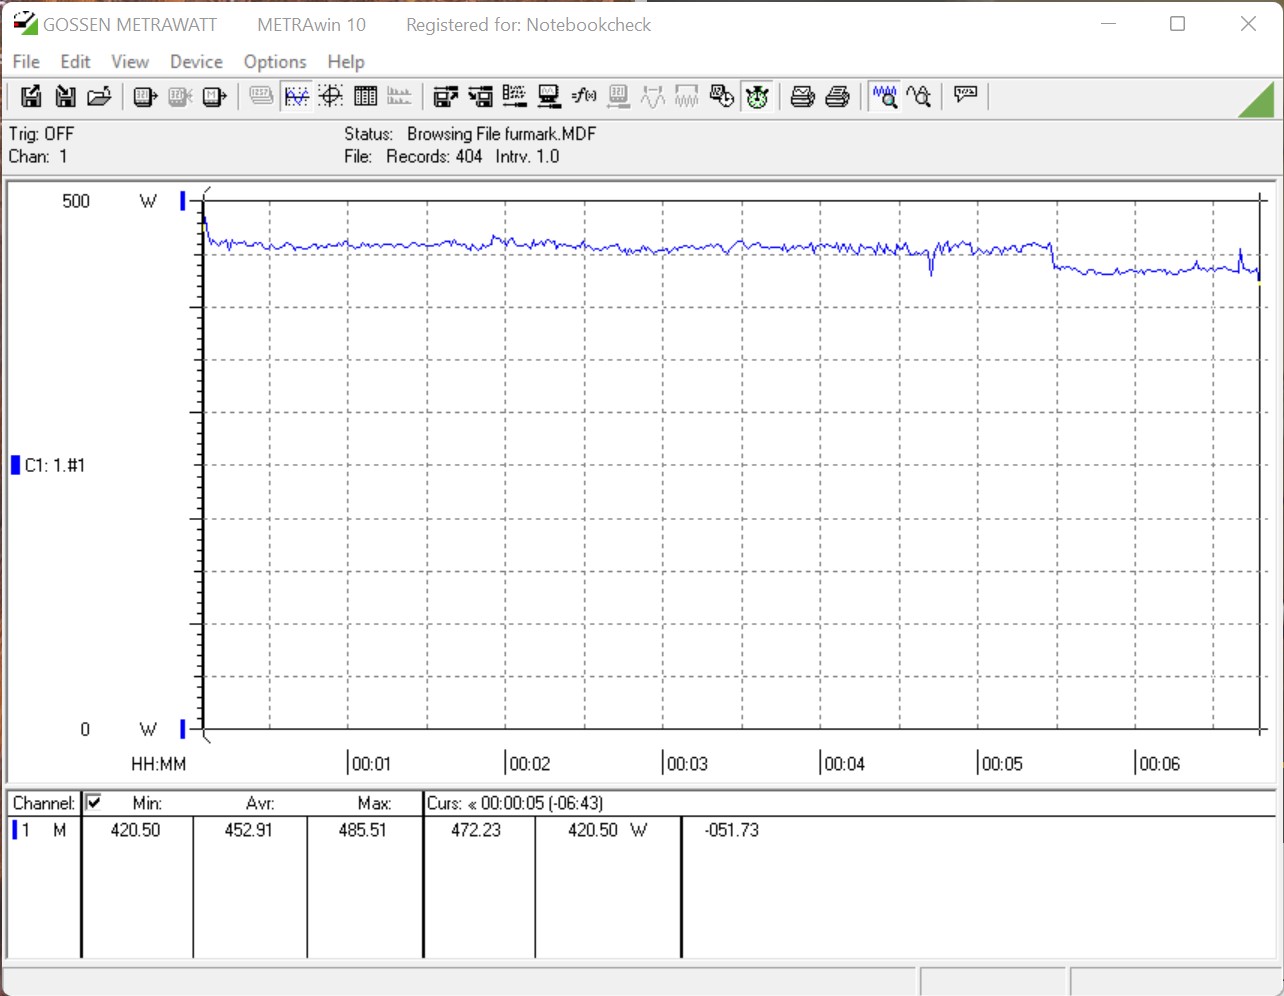
Das Kühlkonzept geht auf und alle Komponenten können effektiv gekühlt werden, ohne bei Volllast zu überhitzen. Dennoch erreichte beim Stresstest die CPU 100 °C. Somit ist klar, warum Corsair die Leistung dieser auf maximal 175 Watt drosselt. Wem die 100 °C noch zu hoch sind, kann die Leistung im BIOS weiter herabsetzen. Dennoch sind die Temperaturen des Intel Core i9-12900K kein Problem, wie wir bereits bei der Cinebench-R15-Multi-Schleife gesehen heben. Der Stresstest bei dem FurMark und Prime95 gleichzeitig laufen ist ein Extremszenario, welches im Alltag so gut wie nie vorkommt.
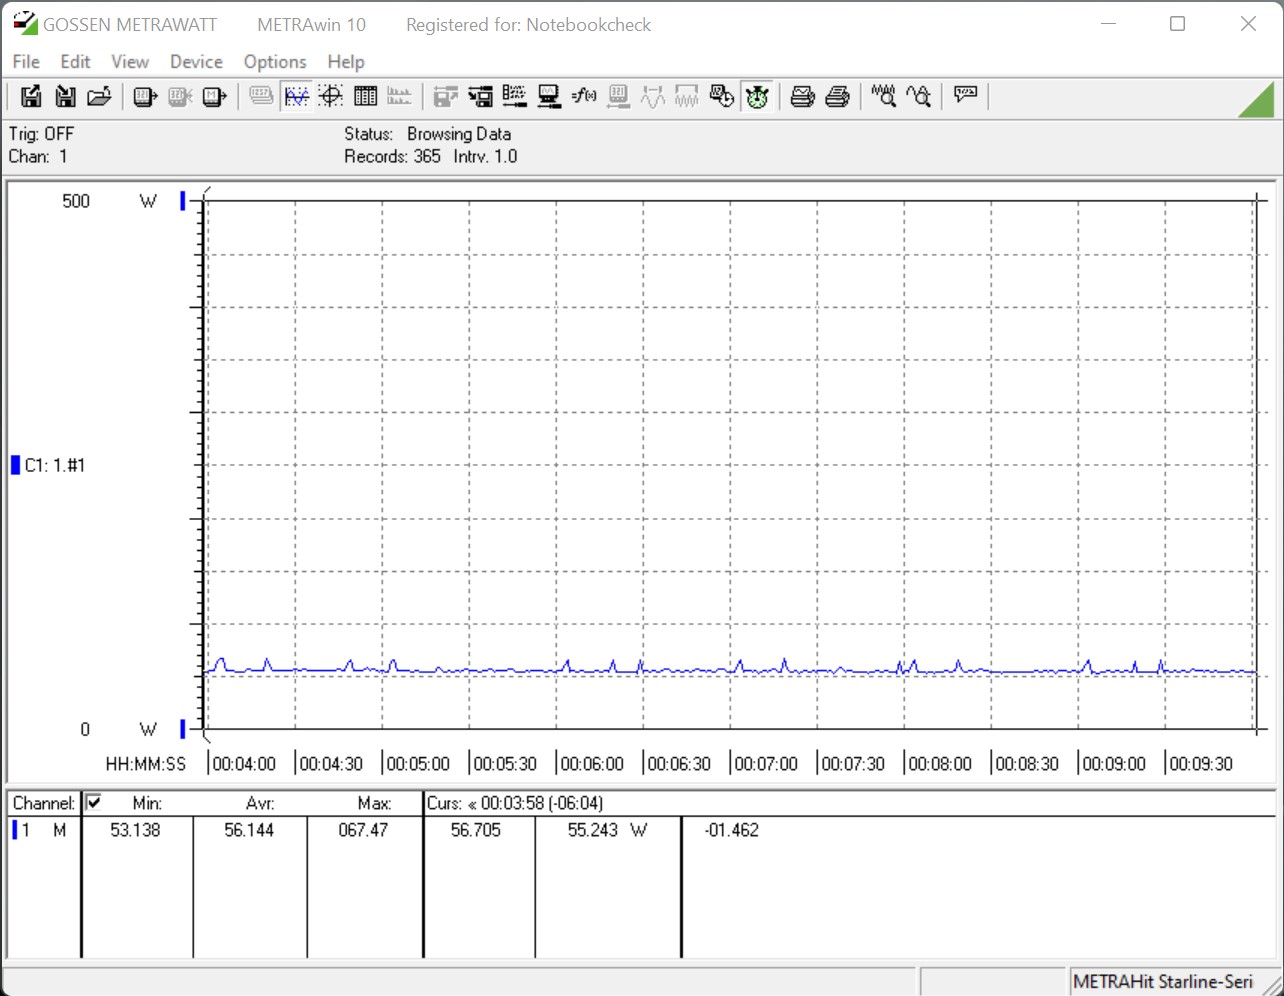
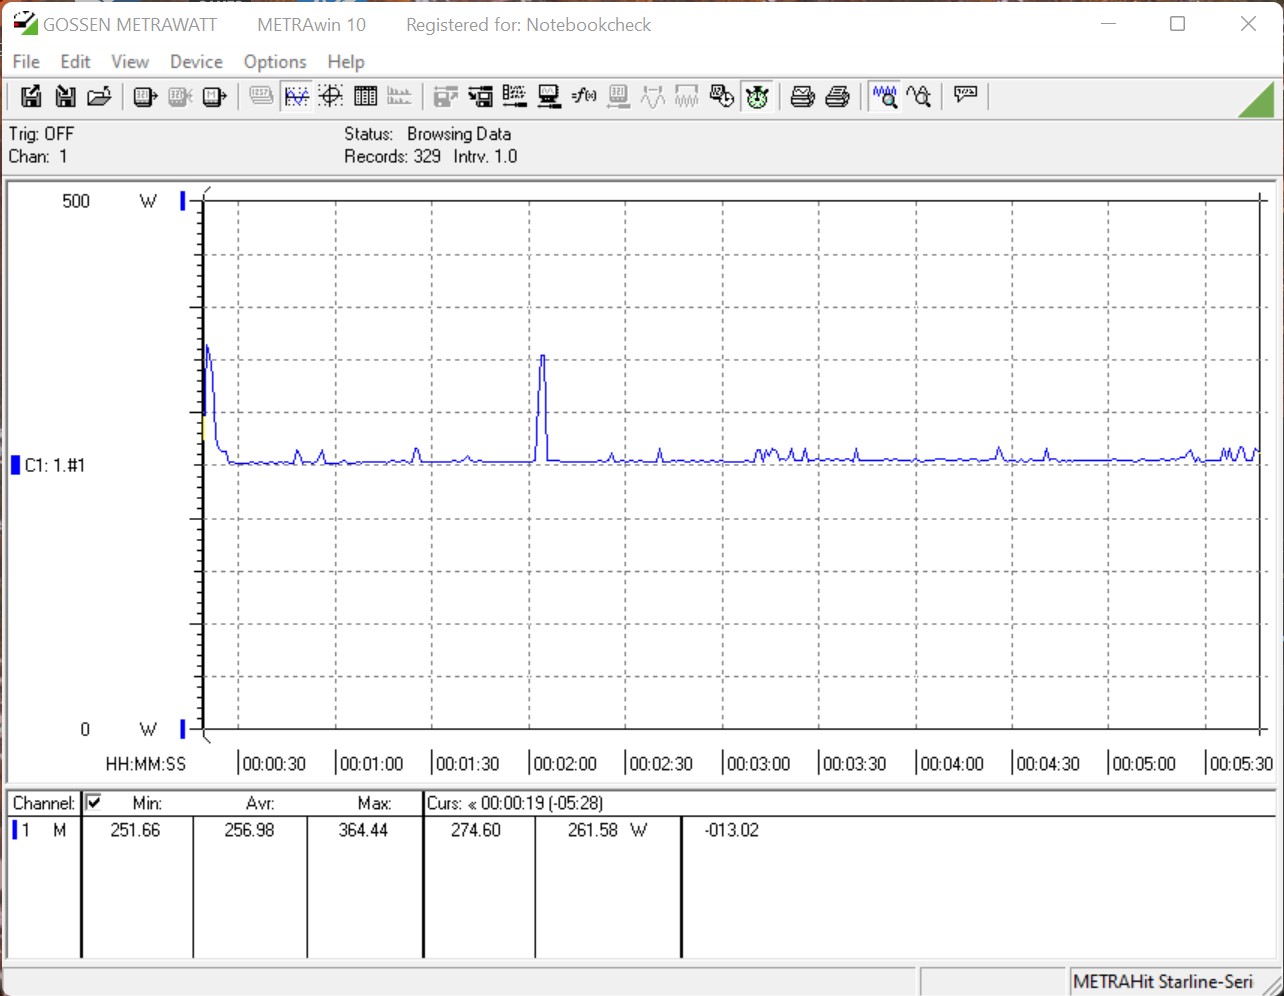
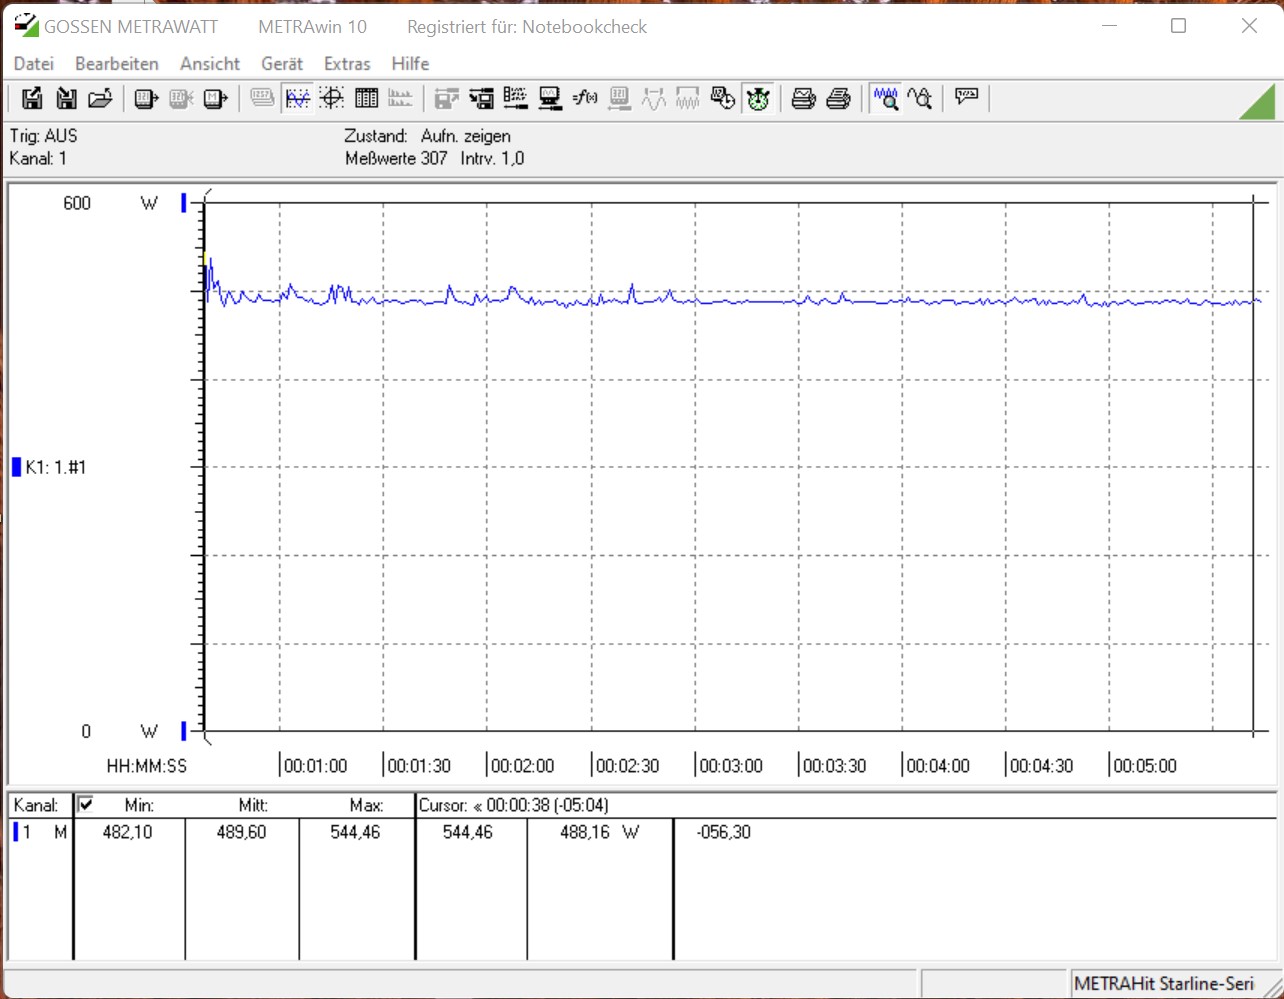
Beim Energiebedarf sticht das System mit einem geringen Verbrauch im Leerlauf hervor. Nur 56 Watt haben ist ein guter Wert. Beim Spielen muss das kompakte 750 Watt (SFF-Bauform) schon durchschnittlich 489 Watt bereitstellen, wenngleich in Spitzen auch bis zu 544 Watt erreicht wurden. Beim Stresstest notierten wir sogar kurzzeitig 635 Watt. Damit ist das Netzteil jederzeit zurechtgekommen und wir konnten keine Probleme feststellen.
| Power Consumption - 1920x1080 The Witcher 3 ultra (external Monitor) | |
| Intel Core i9-12900K, NVIDIA GeForce RTX 3080 Ti | |
| Intel Core i9-12900K, NVIDIA Titan RTX (Idle: 70.5 W) | |
| AMD Ryzen 9 5950X, NVIDIA Titan RTX (Idle: 78 W) | |
| AMD Ryzen 9 5900X, NVIDIA Titan RTX (Idle: 78.1 W) | |
| Intel Core i5-11600K, NVIDIA Titan RTX (Idle: 69.49 W) | |
| Intel Core i5-12600K, NVIDIA Titan RTX (Idle: 70.45 W) | |
| Intel Core i9-11900K, NVIDIA Titan RTX (Idle: 57.3 W) | |
* ... kleinere Werte sind besser
| Power Consumption - 1280x720 FurMark 1.19 GPU Stress Test (external Monitor) | |
| AMD Ryzen 9 5900X, NVIDIA GeForce RTX 3090 (Idle: 105.9 W) | |
| AMD Ryzen 9 5900X, NVIDIA GeForce RTX 3080 (Idle: 88.3 W) | |
| Intel Core i9-12900K, NVIDIA GeForce RTX 3080 Ti | |
| AMD Ryzen 9 5950X, AMD Radeon RX 6800 XT (Idle: 99.5 W) | |
| AMD Ryzen 9 5900X, NVIDIA GeForce RTX 3070 (Idle: 95.1 W) | |
| AMD Ryzen 9 5900X, AMD Radeon RX 6800 (Idle: 81.4 W) | |
| AMD Ryzen 9 5900X, AMD Radeon RX 6700 XT (Idle: 77.1 W) | |
* ... kleinere Werte sind besser
Energieaufnahme Witcher 3 / Stresstest
Energieaufnahme mit externem Monitor
Fazit - Perfekter 4K-Gaming-PC
Pro
Contra

Der Corsair One i300 ist keine komplette Neuheit, was aber auch nicht unbedingt nötigt ist. Die Optik des kompakten Premium-PCs ist schlicht und modern. Zudem ist der interne Aufbau so gestrickt, dass herkömmliche Komponenten, was Mainboard und Netzteil betrifft, verbaut werden können. Einzig die Kühlung ist eine Eigenkreation und wird in unserem Modell dem Premium-Segment leider nicht gerecht. Nichtsdestotrotz arbeiten die beiden AiOs gut und kühlen das System zuverlässig. Dennoch machten die beiden Pumpen akustisch auf sich aufmerksam. Auf Dauer ist das nicht schön und in Anbetracht des Kaufpreises von 5.099 Euro muss man das nicht akzeptieren. Dennoch ist das Kühldesign das Highlight neben den topmodernen Komponenten. Mit dem Intel Core i9-12900K gibt es die schnellste Gaming-CPU, die gepaart auf einem aktuellen Mainboard samt DDR5-RAM und einer Nvidia GeForce RTX 3080 Ti kompromissloses 4K-Gaming ermöglicht. Dazu gibt es noch eine 2 TB SSD mit sehr guten Transferraten.
Der Corsair One i300 bietet dank Intel Core i9-12900K und Nvidia GeForce RTX 3080 Ti kompromisslose 4K-Gaming-Leistung auf kleinstem Raum.
Ein Premiumprodukt hat natürlich auch seinen Preis. Mit 5.099 Euro ist der bei unserem Testsample kein Pappenstiel und dennoch sollte man die einzelnen Komponenten nicht schlechtreden. Das Gehäuse ist nicht von der Stange und nicht separat zu erwerben. Zudem ist die Verfügbarkeit von diversen Grafikkarten und anderen aktuellen Komponenten noch immer ein Problem, was den Preis unterm Stich fast rechtfertigt. Des Weitern ist das System mit zwei AiOs ausgestattet, die speziell für die Corsair-One-Serie entwickelt wurden. Das muss bei der Preisgestaltung mit einkalkuliert werden. Das preislich vernünftigere System wäre unserer Ansicht nach aber der Corsair One i300 mit Intel Core i9-12900K und Nvidia GeForce RTX 3080. Allerdings sind auch der RAM und die SSD mit 32 GB respektive 1 TB nur halb so groß. Für 4.099 Euro wechselt das System mit diesen Komponenten den Besitzer. Dabei ist das Leistungsdefizit der Nvidia GeForce RTX 3080 gegenüber dem Ti-Modell aber überschaubar und zu verschmerzen.
Preis und Verfügbarkeit
Zum Testzeitpunkt kann das Gerät direkt bei Corsair für 5.099 Euro erworben werden. Alternativ kann der Corsair One alias a200 aber auch mit einem AMD Ryzen 9 bestückt werden. Preise beginnen hier bei gut 4.000 Euro.
