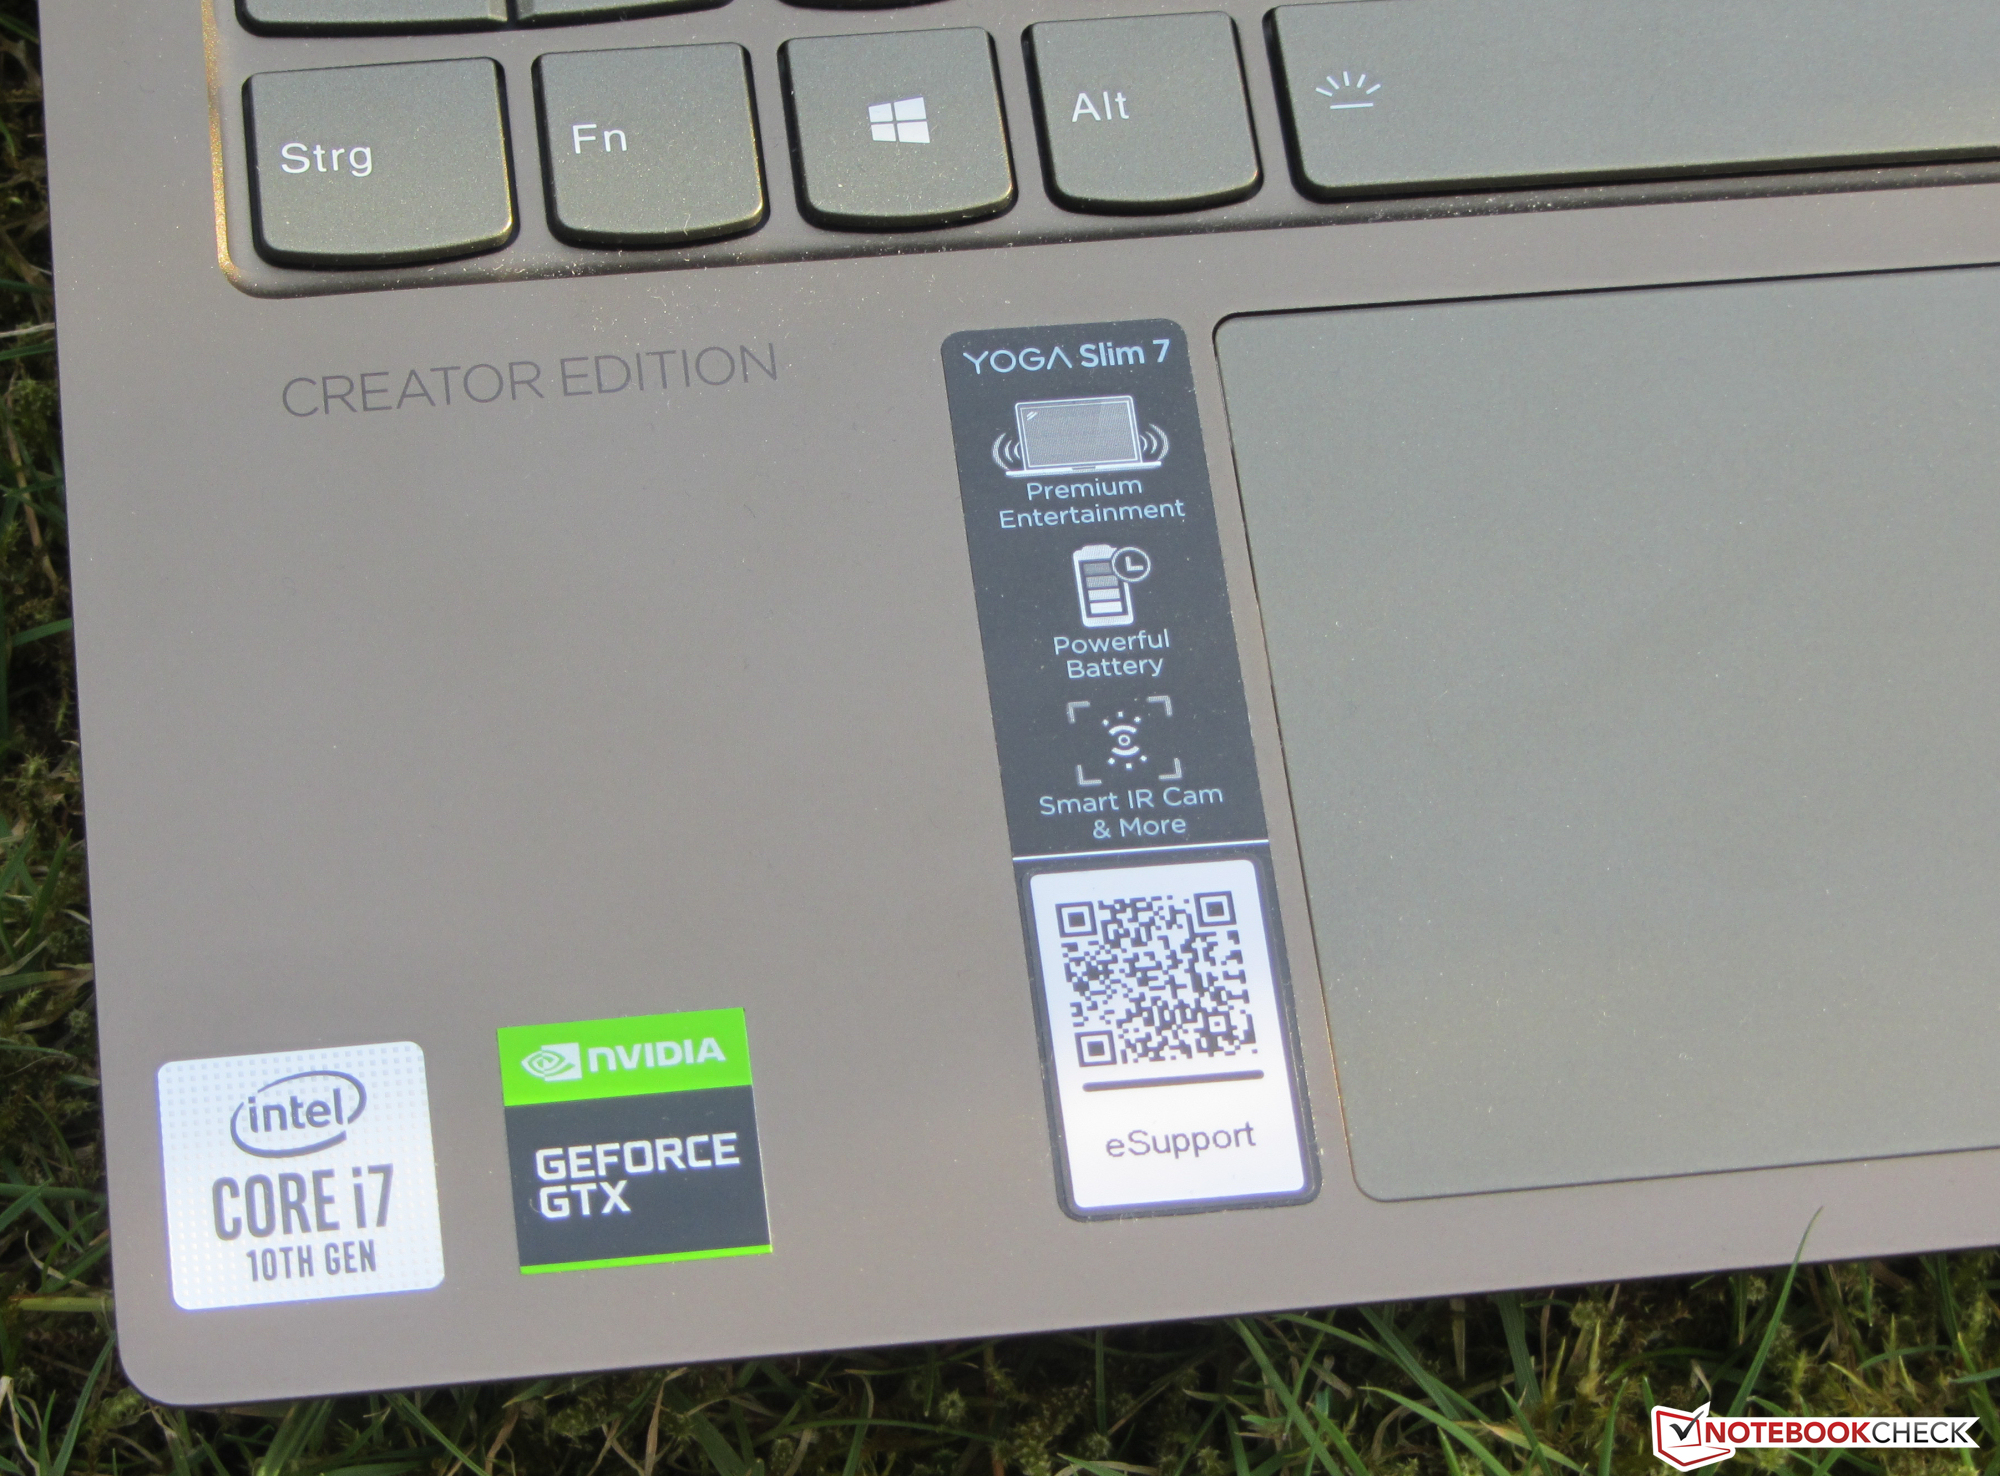
Lenovo Yoga Creator 7 15IMH05 im Test: Dolby Vision, sehr gute Akkulaufzeiten, drei Jahre Garantie

Lenovo zielt mit dem Yoga Creator 7 auf sogenannte "Content Creator". Das Gerät dürfte aber auch jenseits dieser Gruppe auf Interesse stoßen, da es sich hier letztlich um ein Allround-Notebook handelt. Der mobile Rechner wird von einem Core-i7-10750H-Prozessor und einer GeForce-GTX-1650-GPU angetrieben. Zu den Konkurrenten zählen Geräte wie das Asus ZenBook Pro 15 UX535, das HP Envy 15, das Schenker Vision 15, das MSI Summit E15 und das Dell XPS 15 9500.
mögliche Konkurrenten im Vergleich
Bew. | Datum | Modell | Gewicht | Dicke | Größe | Auflösung | Preis ab |
|---|---|---|---|---|---|---|---|
| 87.1 % v7 (old) | 04 / 2021 | Lenovo Yoga Creator 7 15IMH05 82DS000VGE i7-10750H, GeForce GTX 1650 Mobile | 1.8 kg | 17.5 mm | 15.60" | 1920x1080 | |
| 87 % v7 (old) | 12 / 2020 | Asus ZenBook UX535-M01440 i7-10750H, GeForce GTX 1650 Ti Max-Q | 2 kg | 20 mm | 15.60" | 3840x2160 | |
| 83 % v7 (old) | 08 / 2020 | HP Envy 15-ep0098nr i7-10750H, GeForce RTX 2060 Max-Q | 2 kg | 19 mm | 15.60" | 3840x2160 | |
| 87.7 % v7 (old) | 12 / 2020 | Schenker Vision 15 i7-1165G7, Iris Xe G7 96EUs | 1.7 kg | 15 mm | 15.60" | 1920x1080 | |
| 90.1 % v7 (old) | 06 / 2020 | Dell XPS 15 9500 Core i7 4K UHD i7-10875H, GeForce GTX 1650 Ti Mobile | 2 kg | 18 mm | 15.60" | 3840x2400 | |
| 83.7 % v7 (old) | 01 / 2021 | MSI Summit E15 A11SCST i7-1185G7, GeForce GTX 1650 Ti Max-Q | 1.8 kg | 16.9 mm | 15.60" | 1920x1080 |
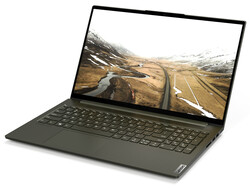
Gehäuse - Creator 7 mit Aluminium-Chassis
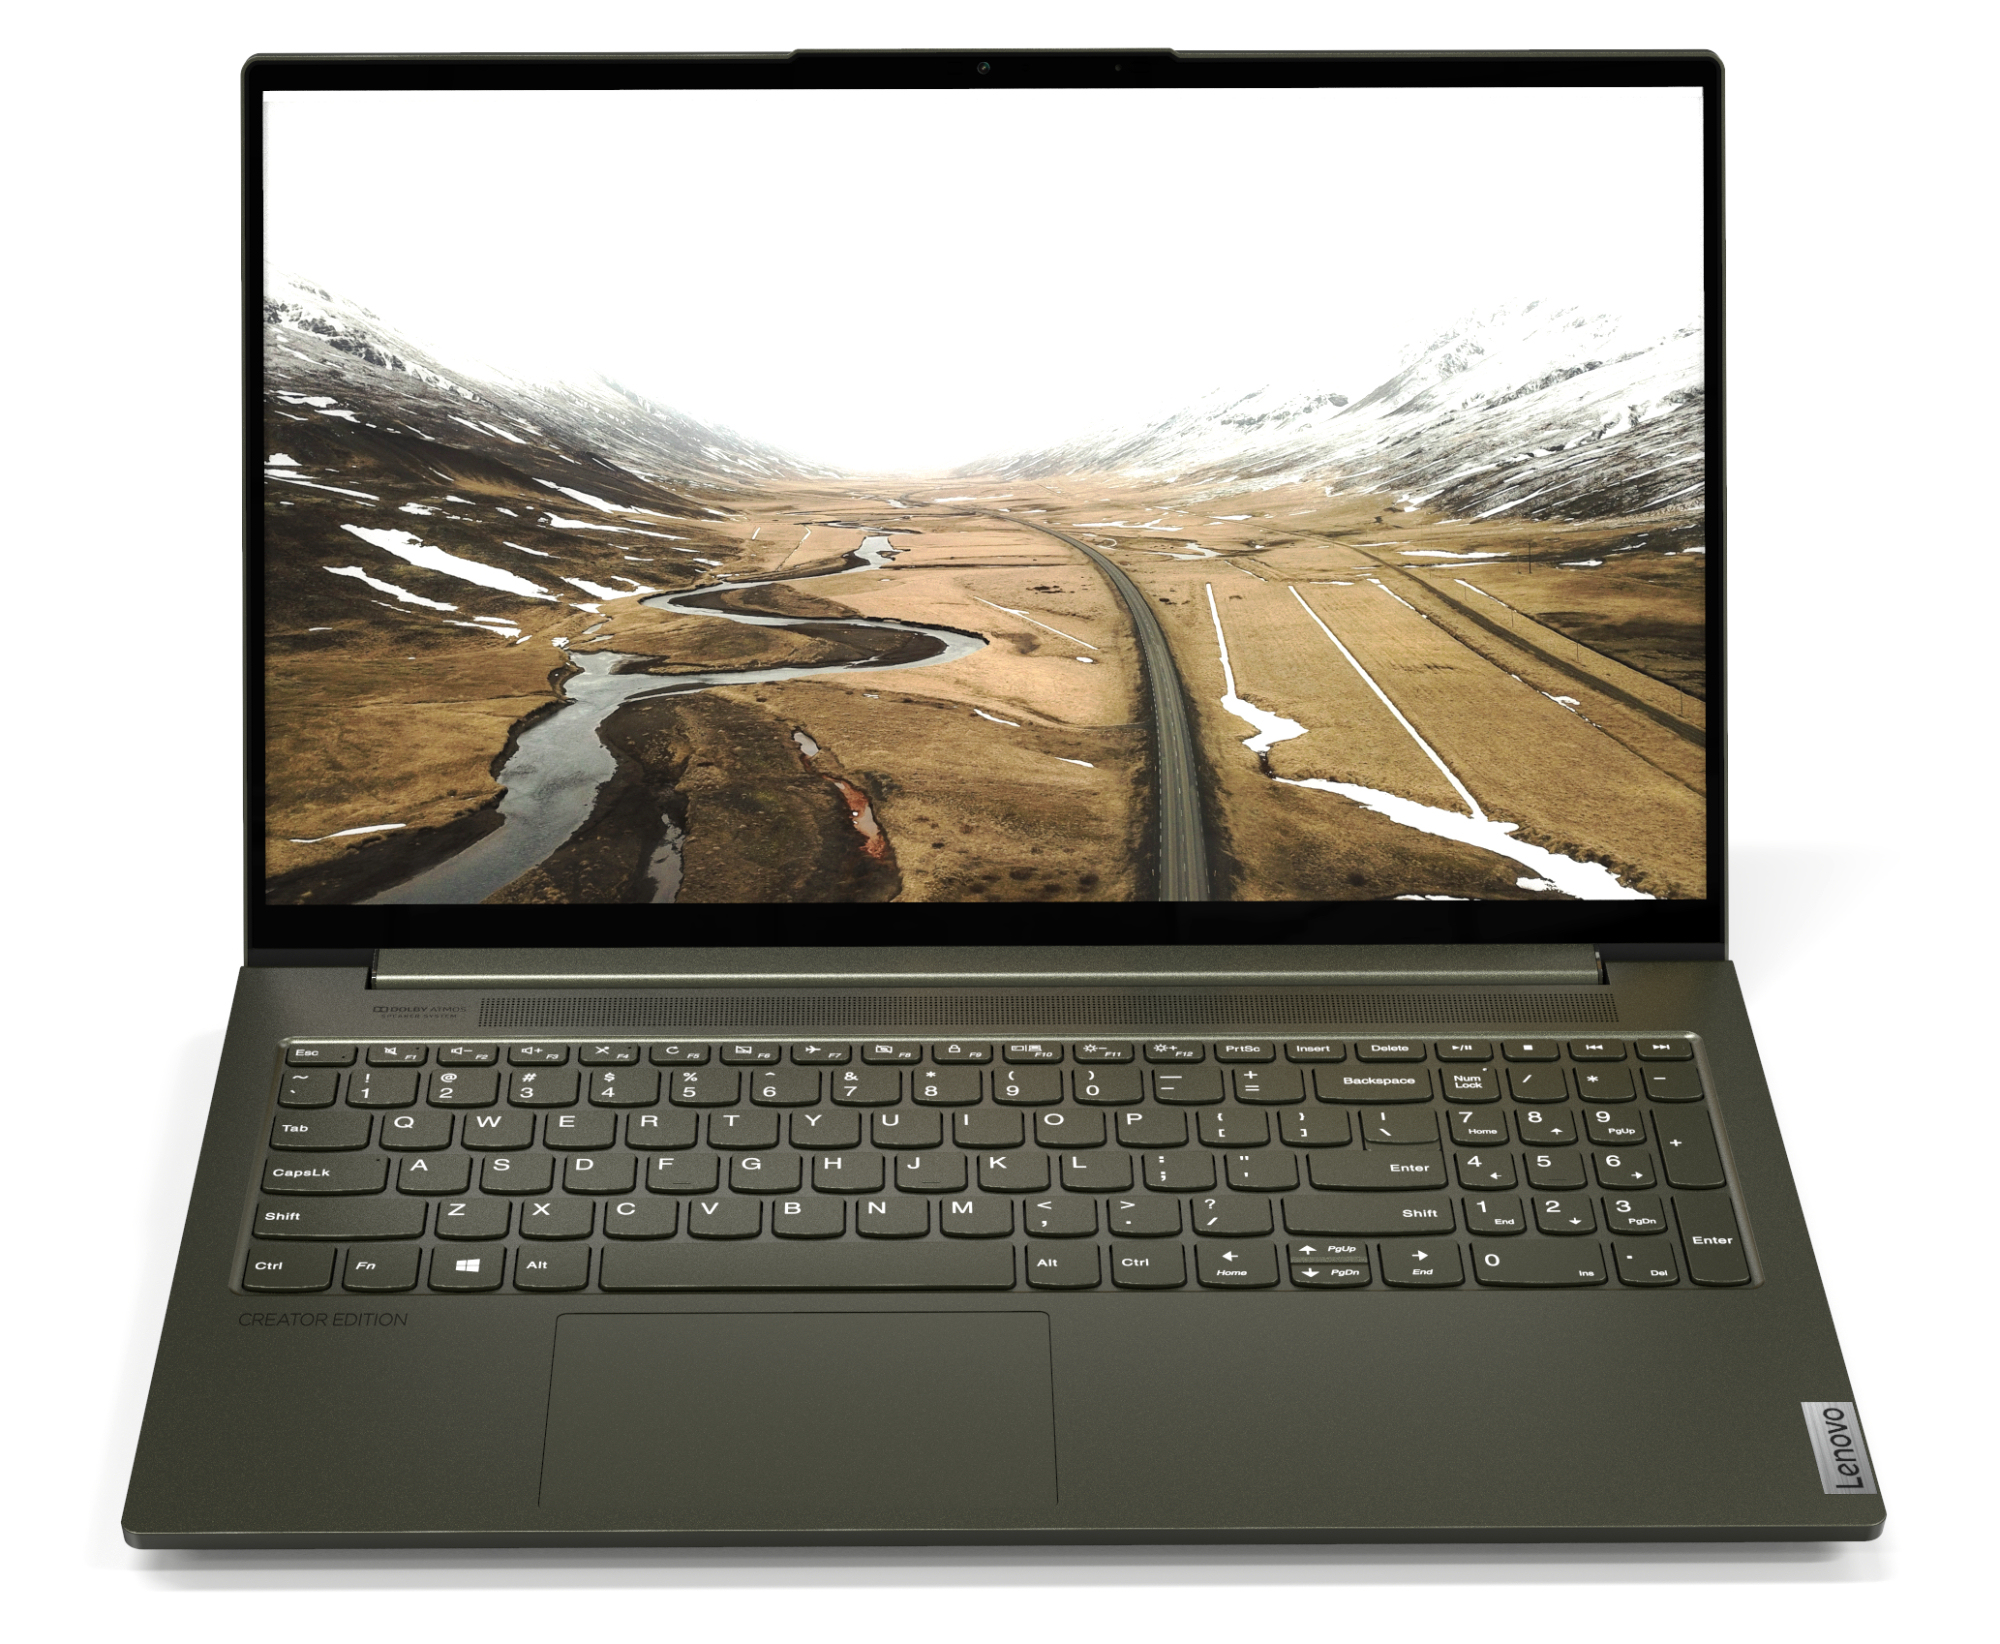
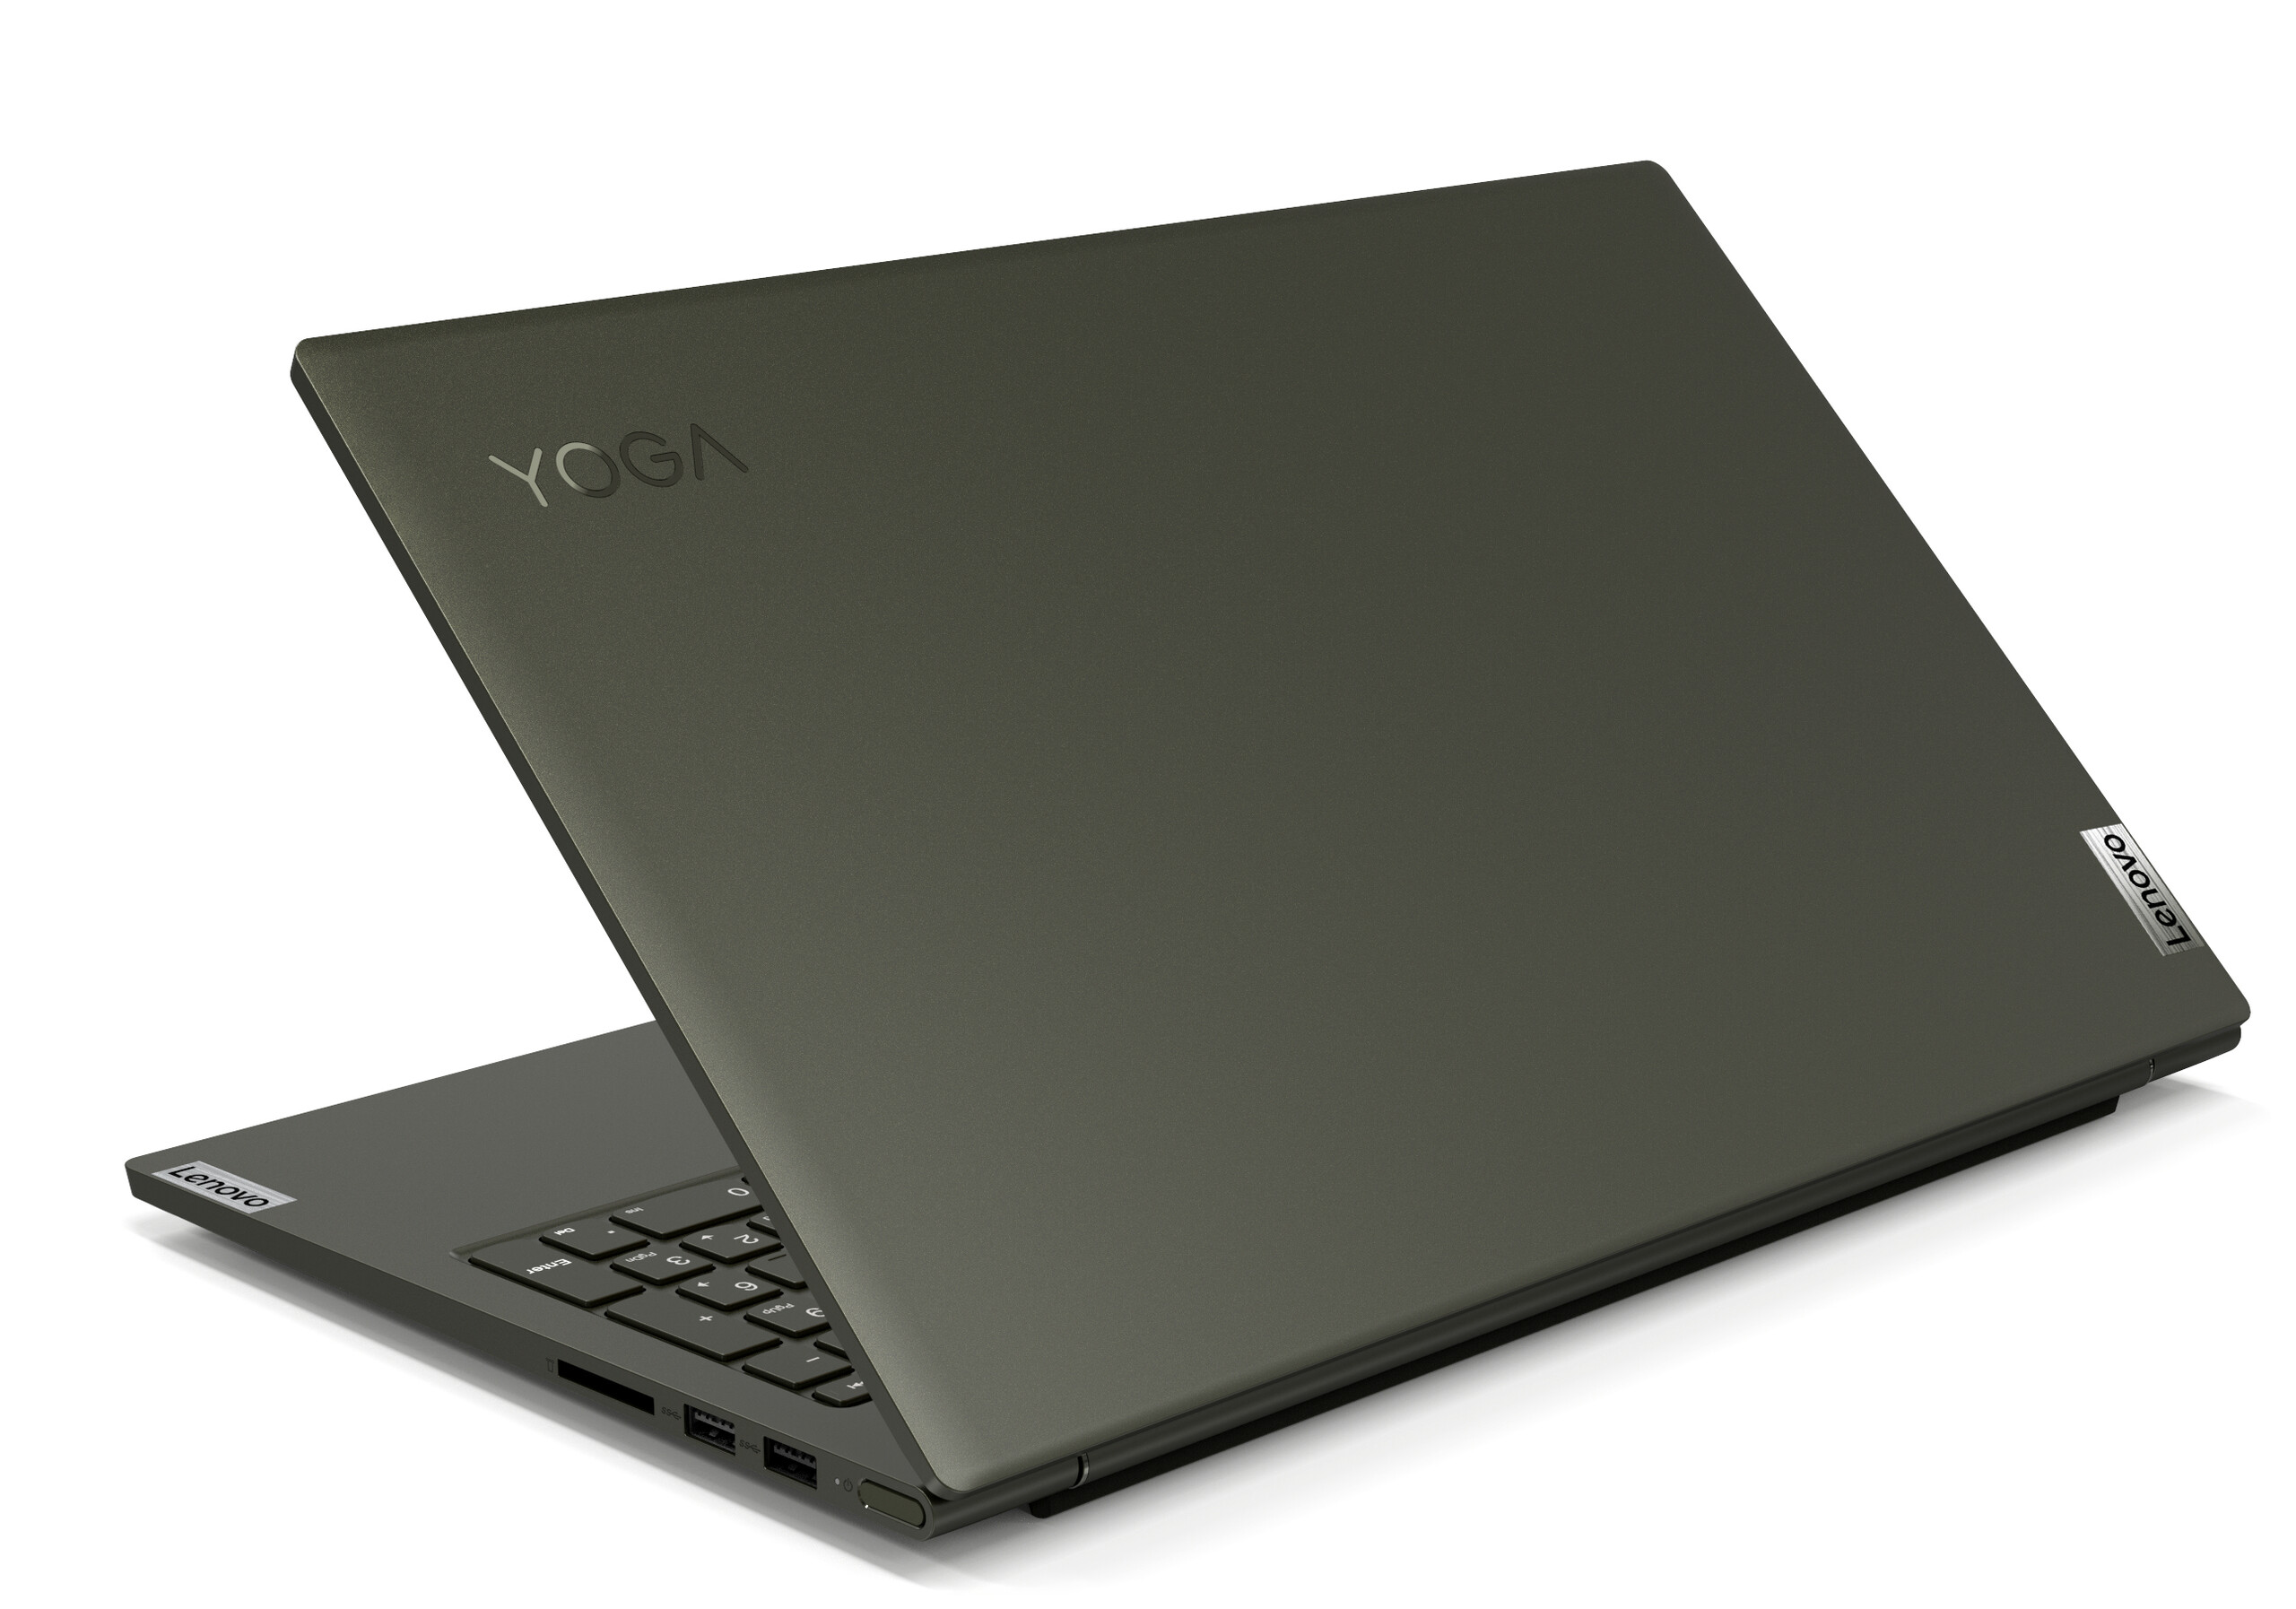
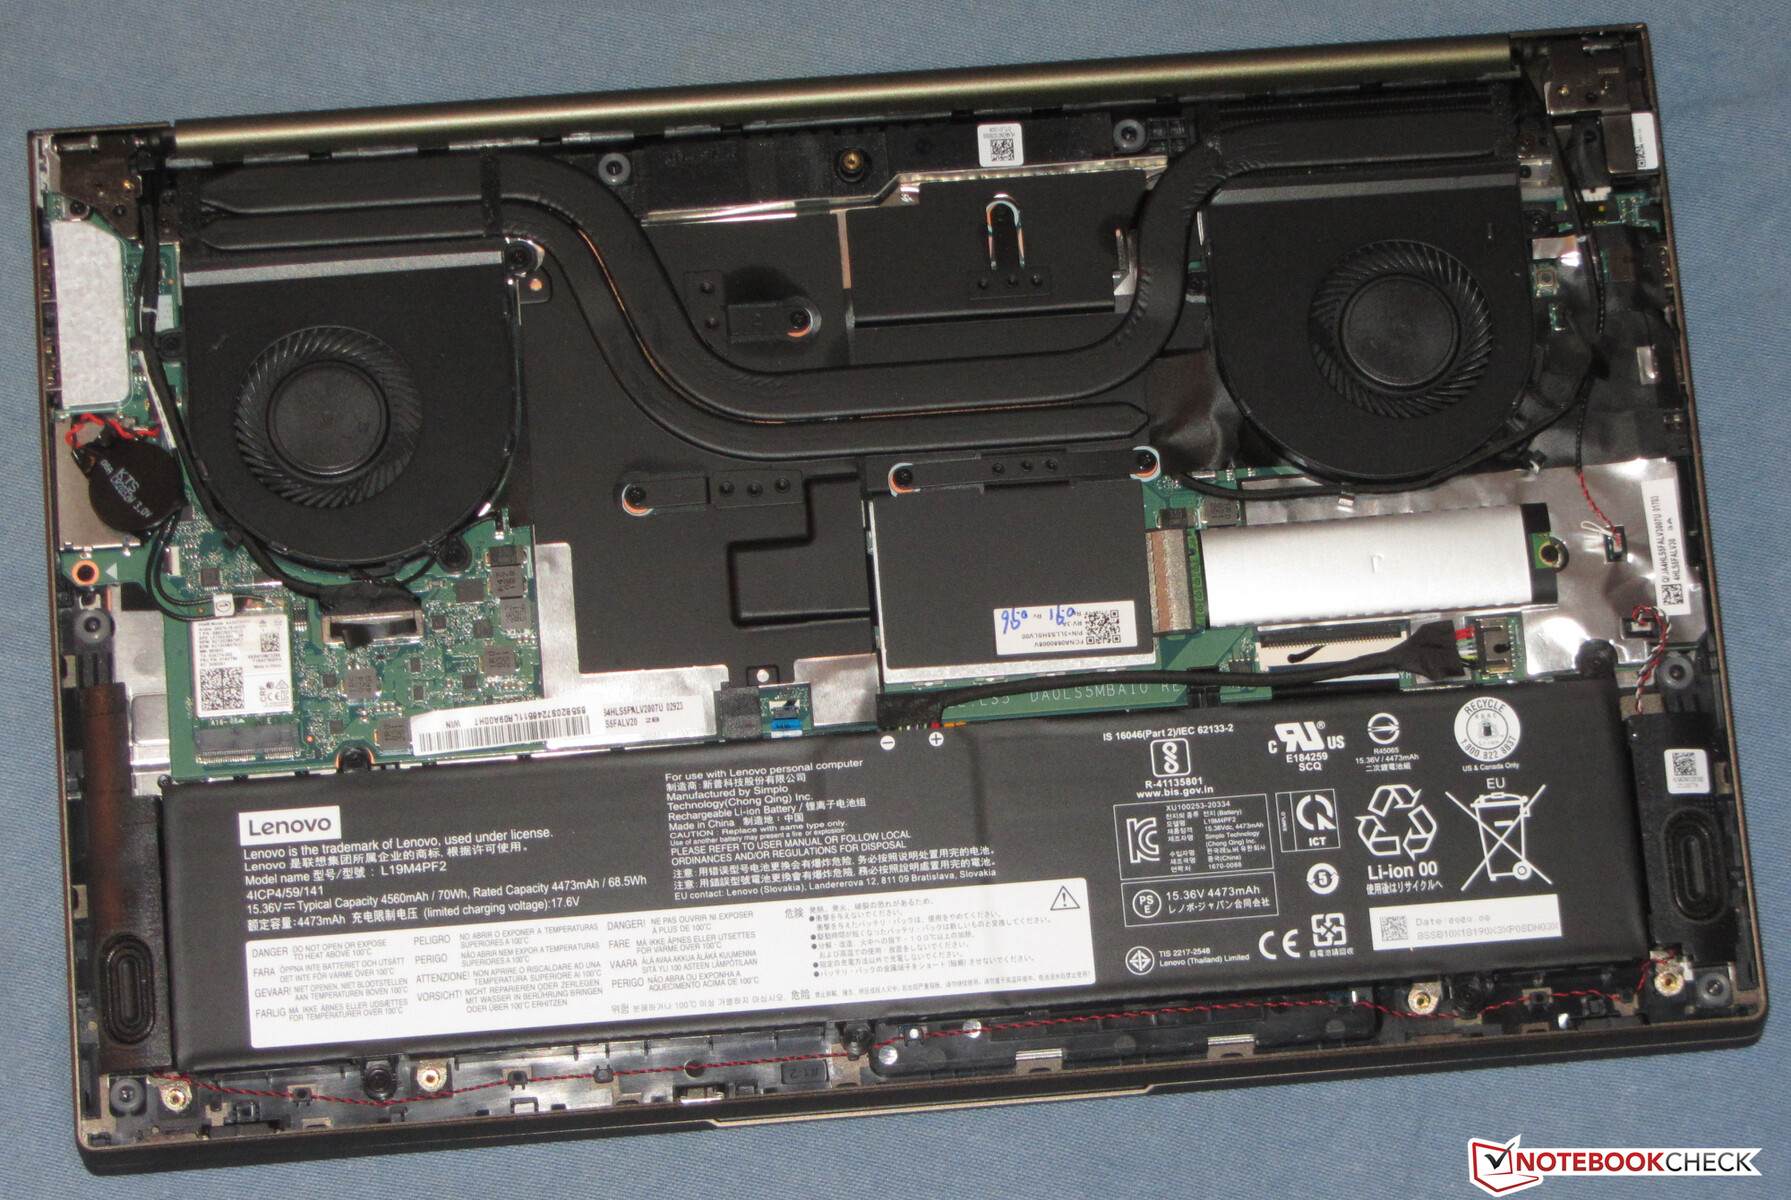
Lenovo setzt beim Yoga auf ein schlankes Metallgehäuse, das mit matten, glatten Oberflächen versehen ist. Farblich ist das Gerät in einem gräulich-bräunlichem Ton gehalten, der die Bezeichnung "Dark Moss" (dunkles Moos) trägt. Das schicke Chassis leistet sich keine optischen Extravaganzen und könnte somit problemlos im beruflichen Umfeld zum Einsatz kommen. Der Akku ist fest verbaut. Eine Wartungsklappe gibt es nicht. An die Hardware gelangt man nach Demontage der Unterschale.
Verarbeitungsmängel offenbart der Rechner nicht. Die Spaltmaße stimmen und es sind keine Materialüberstände auffindbar. Stabilität und Steifigkeit des Rechners gehen grundsätzlich in Ordnung, Raum für Verbesserungen gibt es aber: Baseunit und Deckel können für unseren Geschmack einen Tick zu stark verdreht werden. Druck auf die Deckelrückseite führt nicht zu Bildveränderungen. Die straffen Scharniere halten den Deckel fest in Position. Der maximale Öffnungswinkel beträgt 180 Grad. Eine Ein-Hand-Öffnung des Deckels ist möglich.

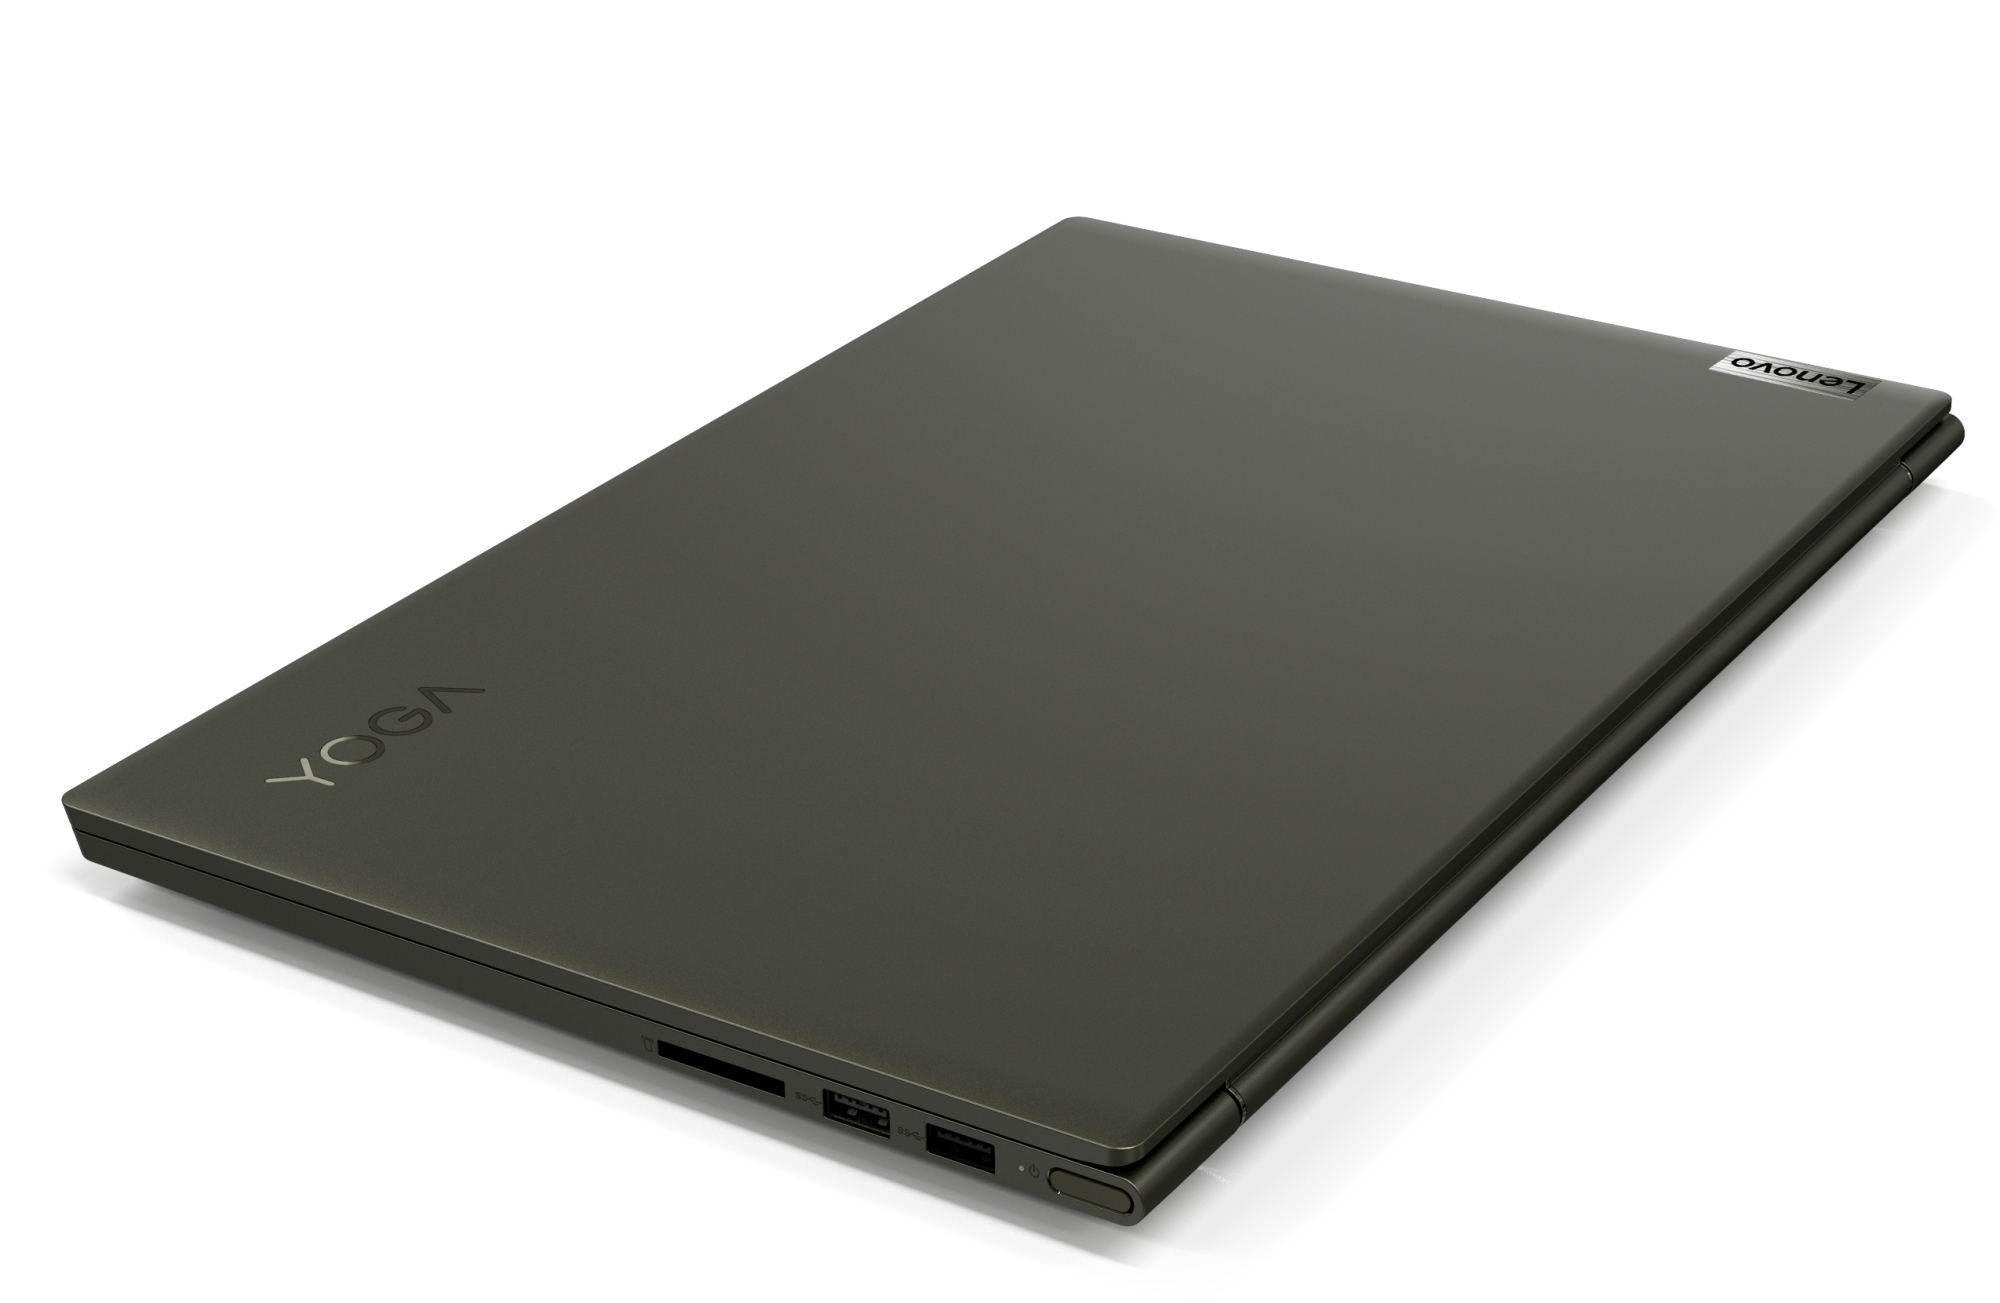
Innerhalb unseres Vergleichsfeldes stellt das Yoga Creator 7 eines der leichtesten und kompaktesten Geräte dar. Es muss sich knapp dem Schenker Vision 15 (leichter) und dem Dell XPS 15 (kompakter) geschlagen geben.
Ausstattung - Thunderbolt 3 ist dabei
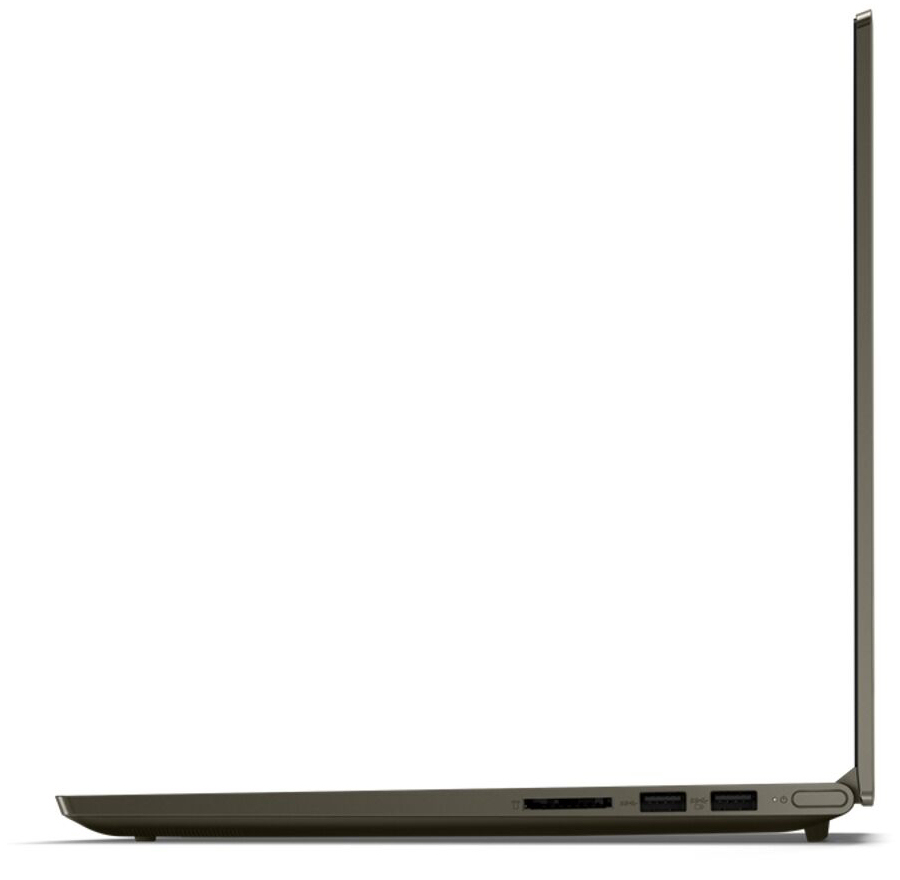
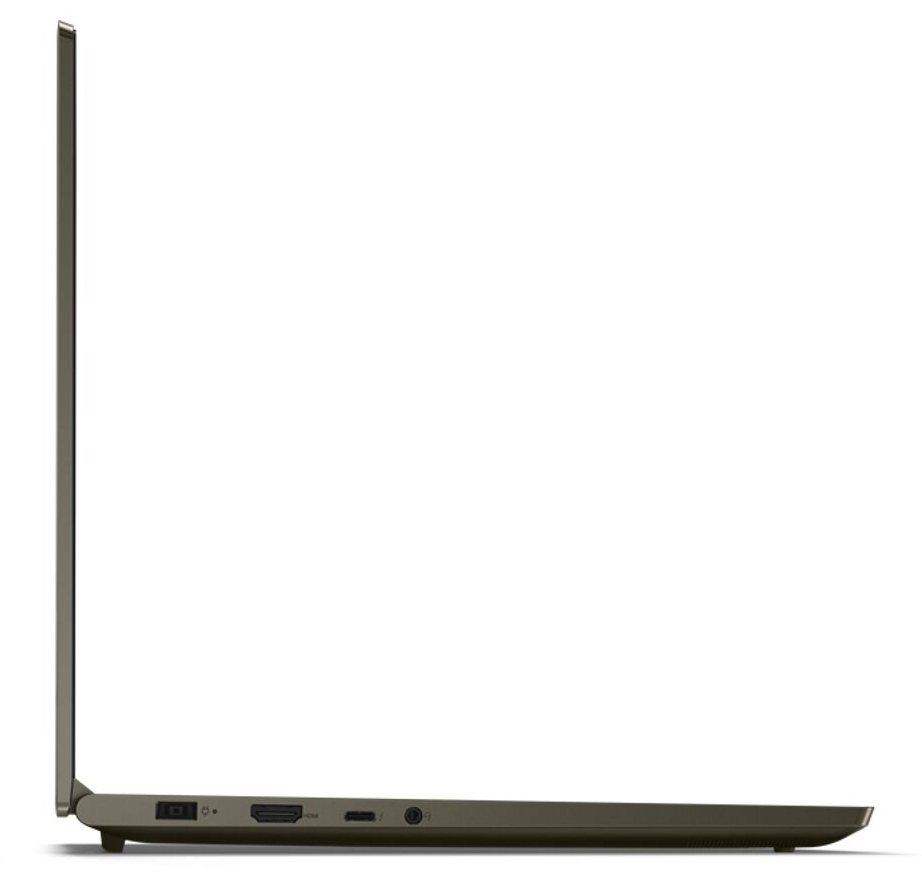
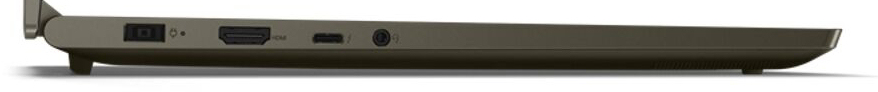
Lenovo stattet das Yoga mit zwei Typ-A-USB-Steckplätzen (USB 3.2 Gen 1) und einem Typ-C-USB-Steckplatz (Thunderbolt 3) aus. Letzterer unterstützt Power Delivery und Displayport per USB-C. Insgesamt hält der Rechner zwei Videoausgänge (1x DP, 1x HDMI) bereit. Die Anschlüsse befinden sich in den hinteren Bereichen der beiden Seiten. Somit bleibt der Platz neben der Handballenablage frei von Kabeln.
Der Thunderbolt-3-Steckplatz eröffnet Optionen. Im stationären Betrieb könnten eine umfangreiche Docking-Lösung, eine externe GPU oder ein Monitor angestöpselt werden. Bei mobiler Nutzung könnte der Akku per USB-C-Ladegerät geladen werden - das proprietäre Netzteil müsste nicht mitgeführt werden. Ein 45-Watt-USB-C-Netzteil genügt, um einen Ladevorgang zu starten - wir haben es ausprobiert. Allerdings: Das System meldet dann ein zu langsames Netzteil und empfiehlt ein leistungsstärkeres Modell. Eine vollumfängliche Energieversorgung des Notebooks per USB-C ist nicht möglich, da maximal 100 Watt übertragen werden können.

SDCardreader
Der SD-Speicherkartenleser (Referenzkarte: Toshiba Exceria Pro SDXC 64 GB UHS-II) gehört mit Transferraten von 23,4 MB/s (Übertragung von 250 jpg-Bilddateien á 5 MB) und 31,4 MB/s (Kopieren großer Datenblöcke) zu den langsamen Modellen. SD-Karten ragen gut 15 mm aus dem Lesegerät heraus.
| SD Card Reader | |
| average JPG Copy Test (av. of 3 runs) | |
| Dell XPS 15 9500 Core i7 4K UHD (Toshiba Exceria Pro SDXC 64 GB UHS-II) | |
| Durchschnitt der Klasse Multimedia (23 - 531, n=42, der letzten 2 Jahre) | |
| Asus ZenBook UX535-M01440 (Toshiba Exceria Pro M501 microSDXC 64GB) | |
| HP Envy 15-ep0098nr (Toshiba Exceria Pro M501 UHS-II) | |
| Lenovo Yoga Creator 7 15IMH05 82DS000VGE (Toshiba Exceria Pro SDXC 64 GB UHS-II) | |
| maximum AS SSD Seq Read Test (1GB) | |
| Dell XPS 15 9500 Core i7 4K UHD (Toshiba Exceria Pro SDXC 64 GB UHS-II) | |
| Durchschnitt der Klasse Multimedia (37.3 - 1455, n=41, der letzten 2 Jahre) | |
| HP Envy 15-ep0098nr (Toshiba Exceria Pro M501 UHS-II) | |
| Asus ZenBook UX535-M01440 (Toshiba Exceria Pro M501 microSDXC 64GB) | |
| Lenovo Yoga Creator 7 15IMH05 82DS000VGE (Toshiba Exceria Pro SDXC 64 GB UHS-II) | |
Kommunikation
Der WLAN-Chip (Intel AX201) unterstützt die Standards 802.11 a/b/g/n/ac/ax und bietet Bluetooth-5-Funktionalität. Die unter optimalen Bedingungen (keine weiteren WLAN-Geräte in der näheren Umgebung, geringer Abstand zwischen Notebook und Server-PC) ermittelten Datenraten fallen hervorragend aus.
Webcam
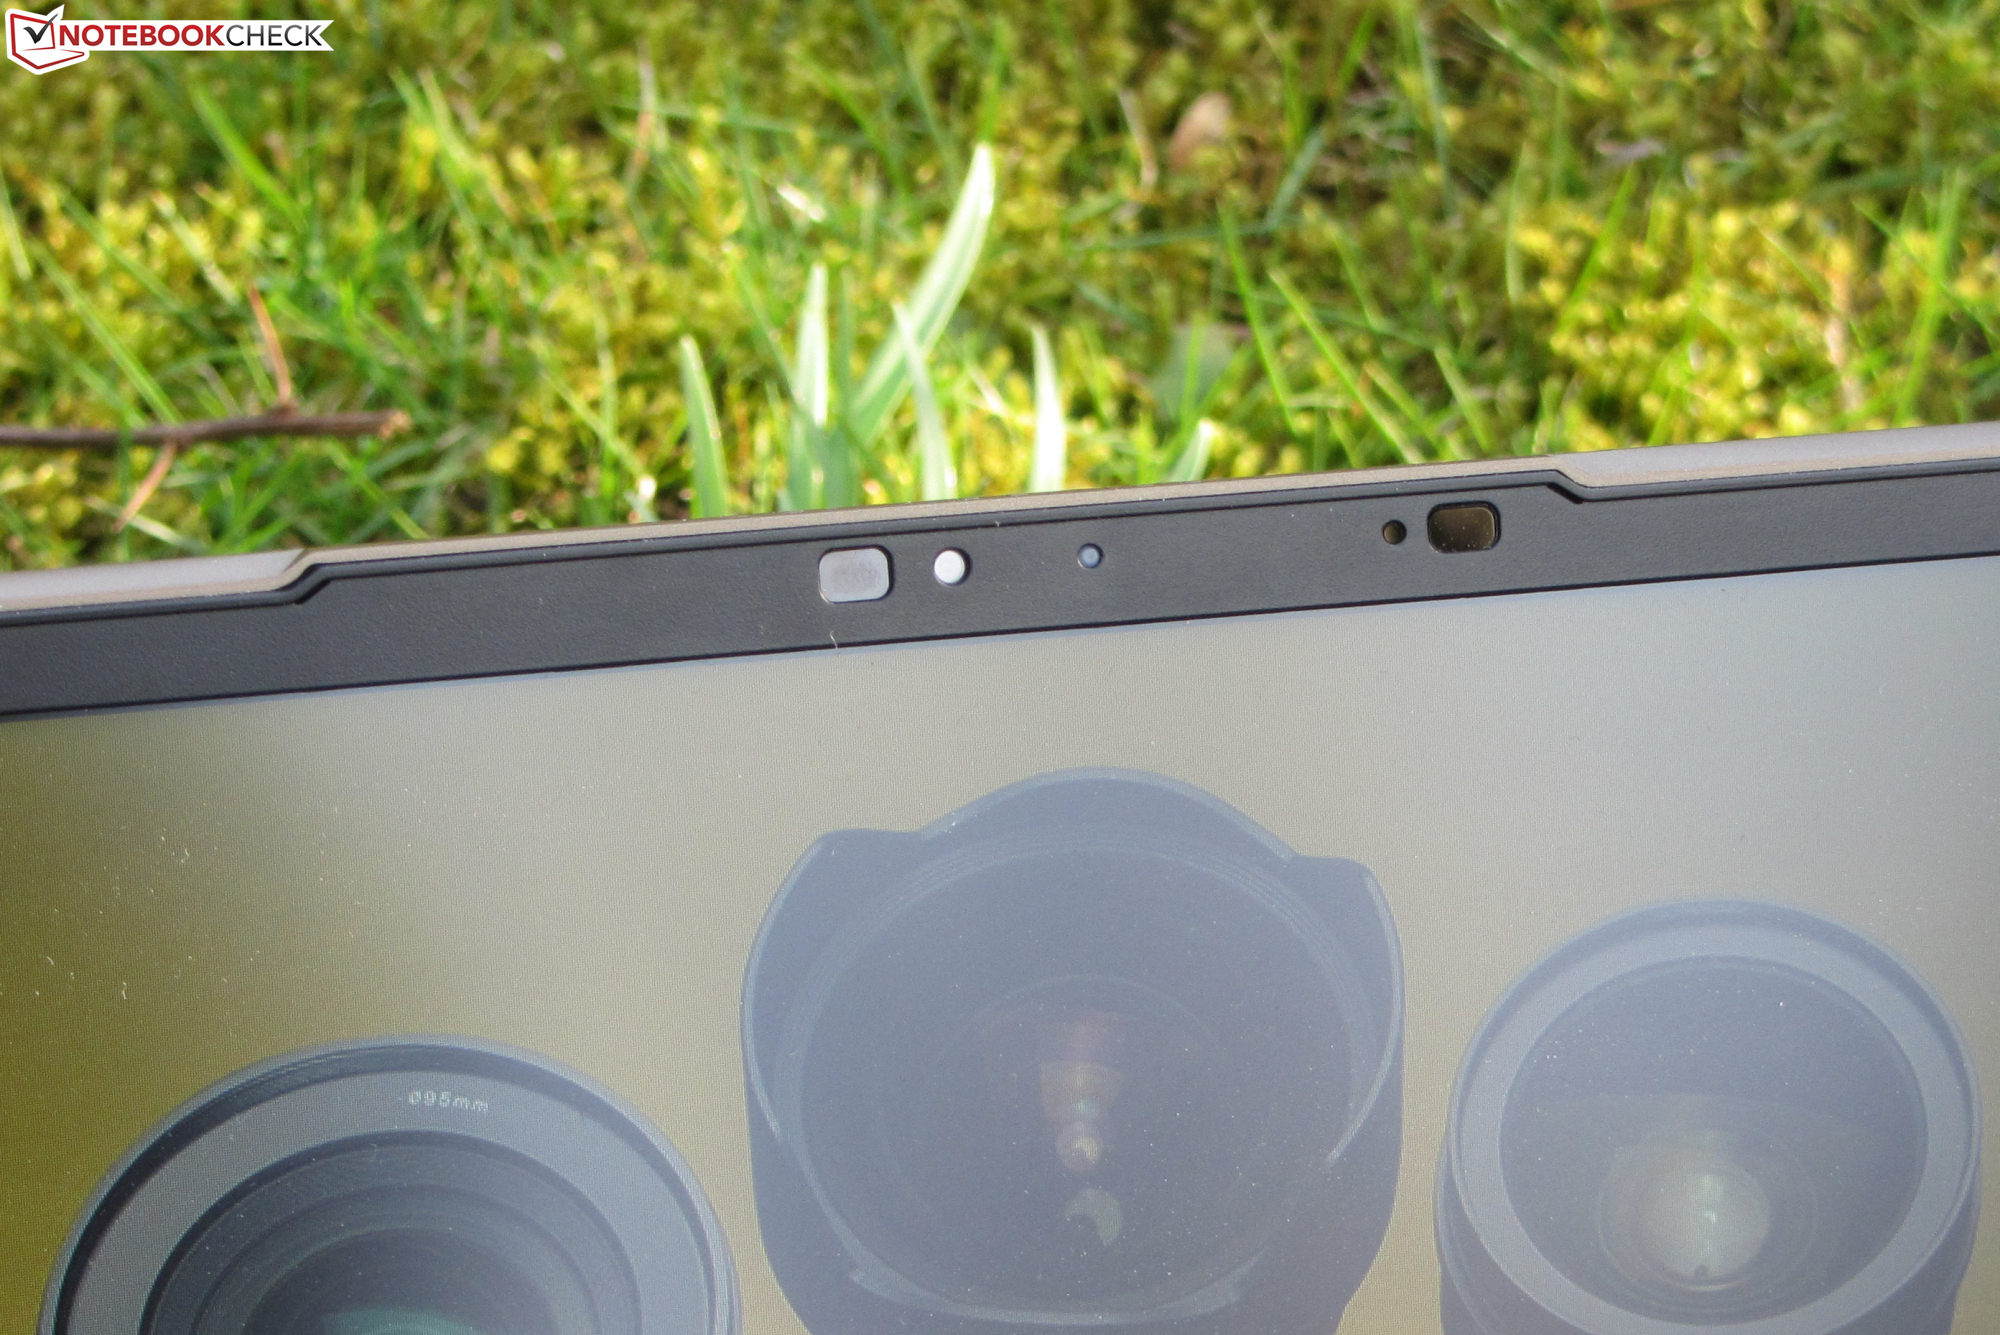
Die Webcam (0,9 MP) erzeugt Bilder in einer maximalen Auflösung von 1.280 x 720 Bildpunkten. Deutliche Defizite zeigen sich bei der Farbgenauigkeit. Mit einer Farbabweichung von knapp 35 wird das Soll (Delta-E < 3) klar verfehlt.


")
")


Zubehör
Neben den üblichen Dokumenten (Schnellstartanleitung, Garantieinformationen) liegt dem Gerät kein weiteres Zubehör bei.
Wartung
Nach Entfernung aller Schrauben auf der Geräteunterseite kann die Unterschale mit Hilfe eines flachen Spatels abgelöst werden. Es empfiehlt sich, im Bereich der Scharniere zu beginnen. Wurde die Unterschale in diesem Bereich gelöst, löst sich sie an den übrigen Stellen wie von alleine.
Garantie
Lenovo gewährt dem 15,6-Zöller eine dreijährige Vor-Ort-Garantie. Eine Erweiterung auf vier Jahre schlägt mit etwa 50 Euro zu Buche.
Eingabegeräte - Lenovo Computer bietet eine Tastenbeleuchtung
Tastatur
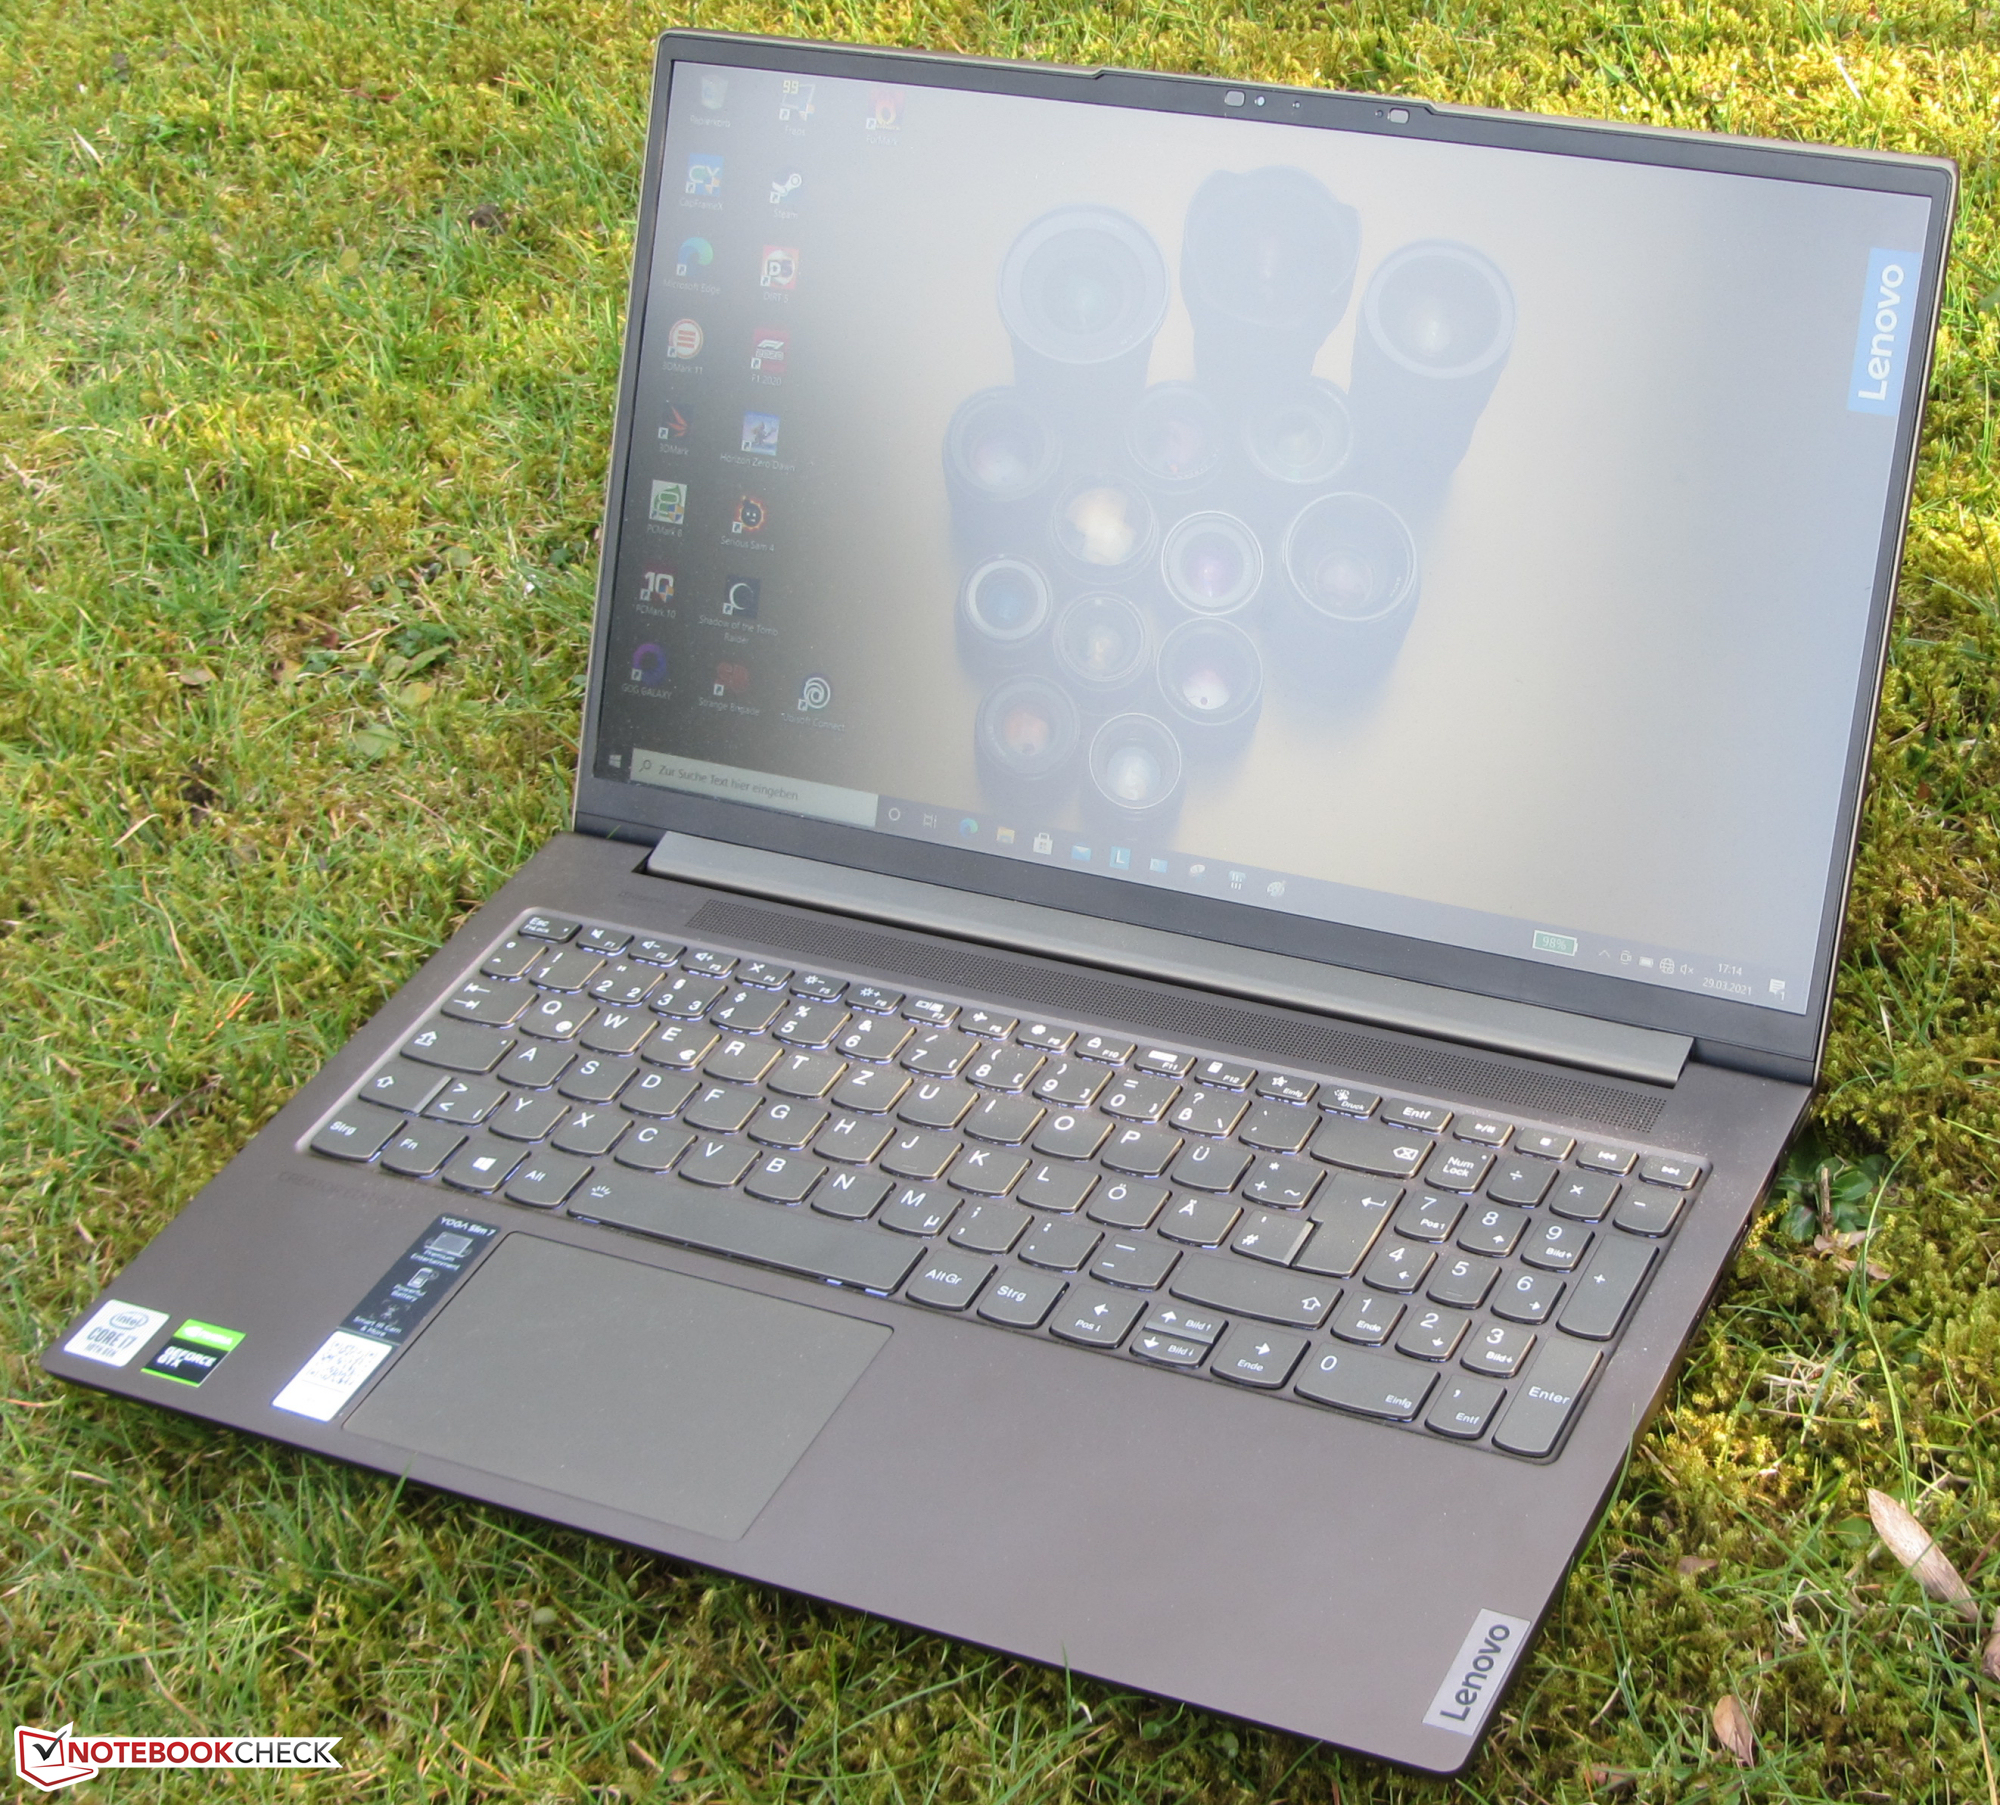
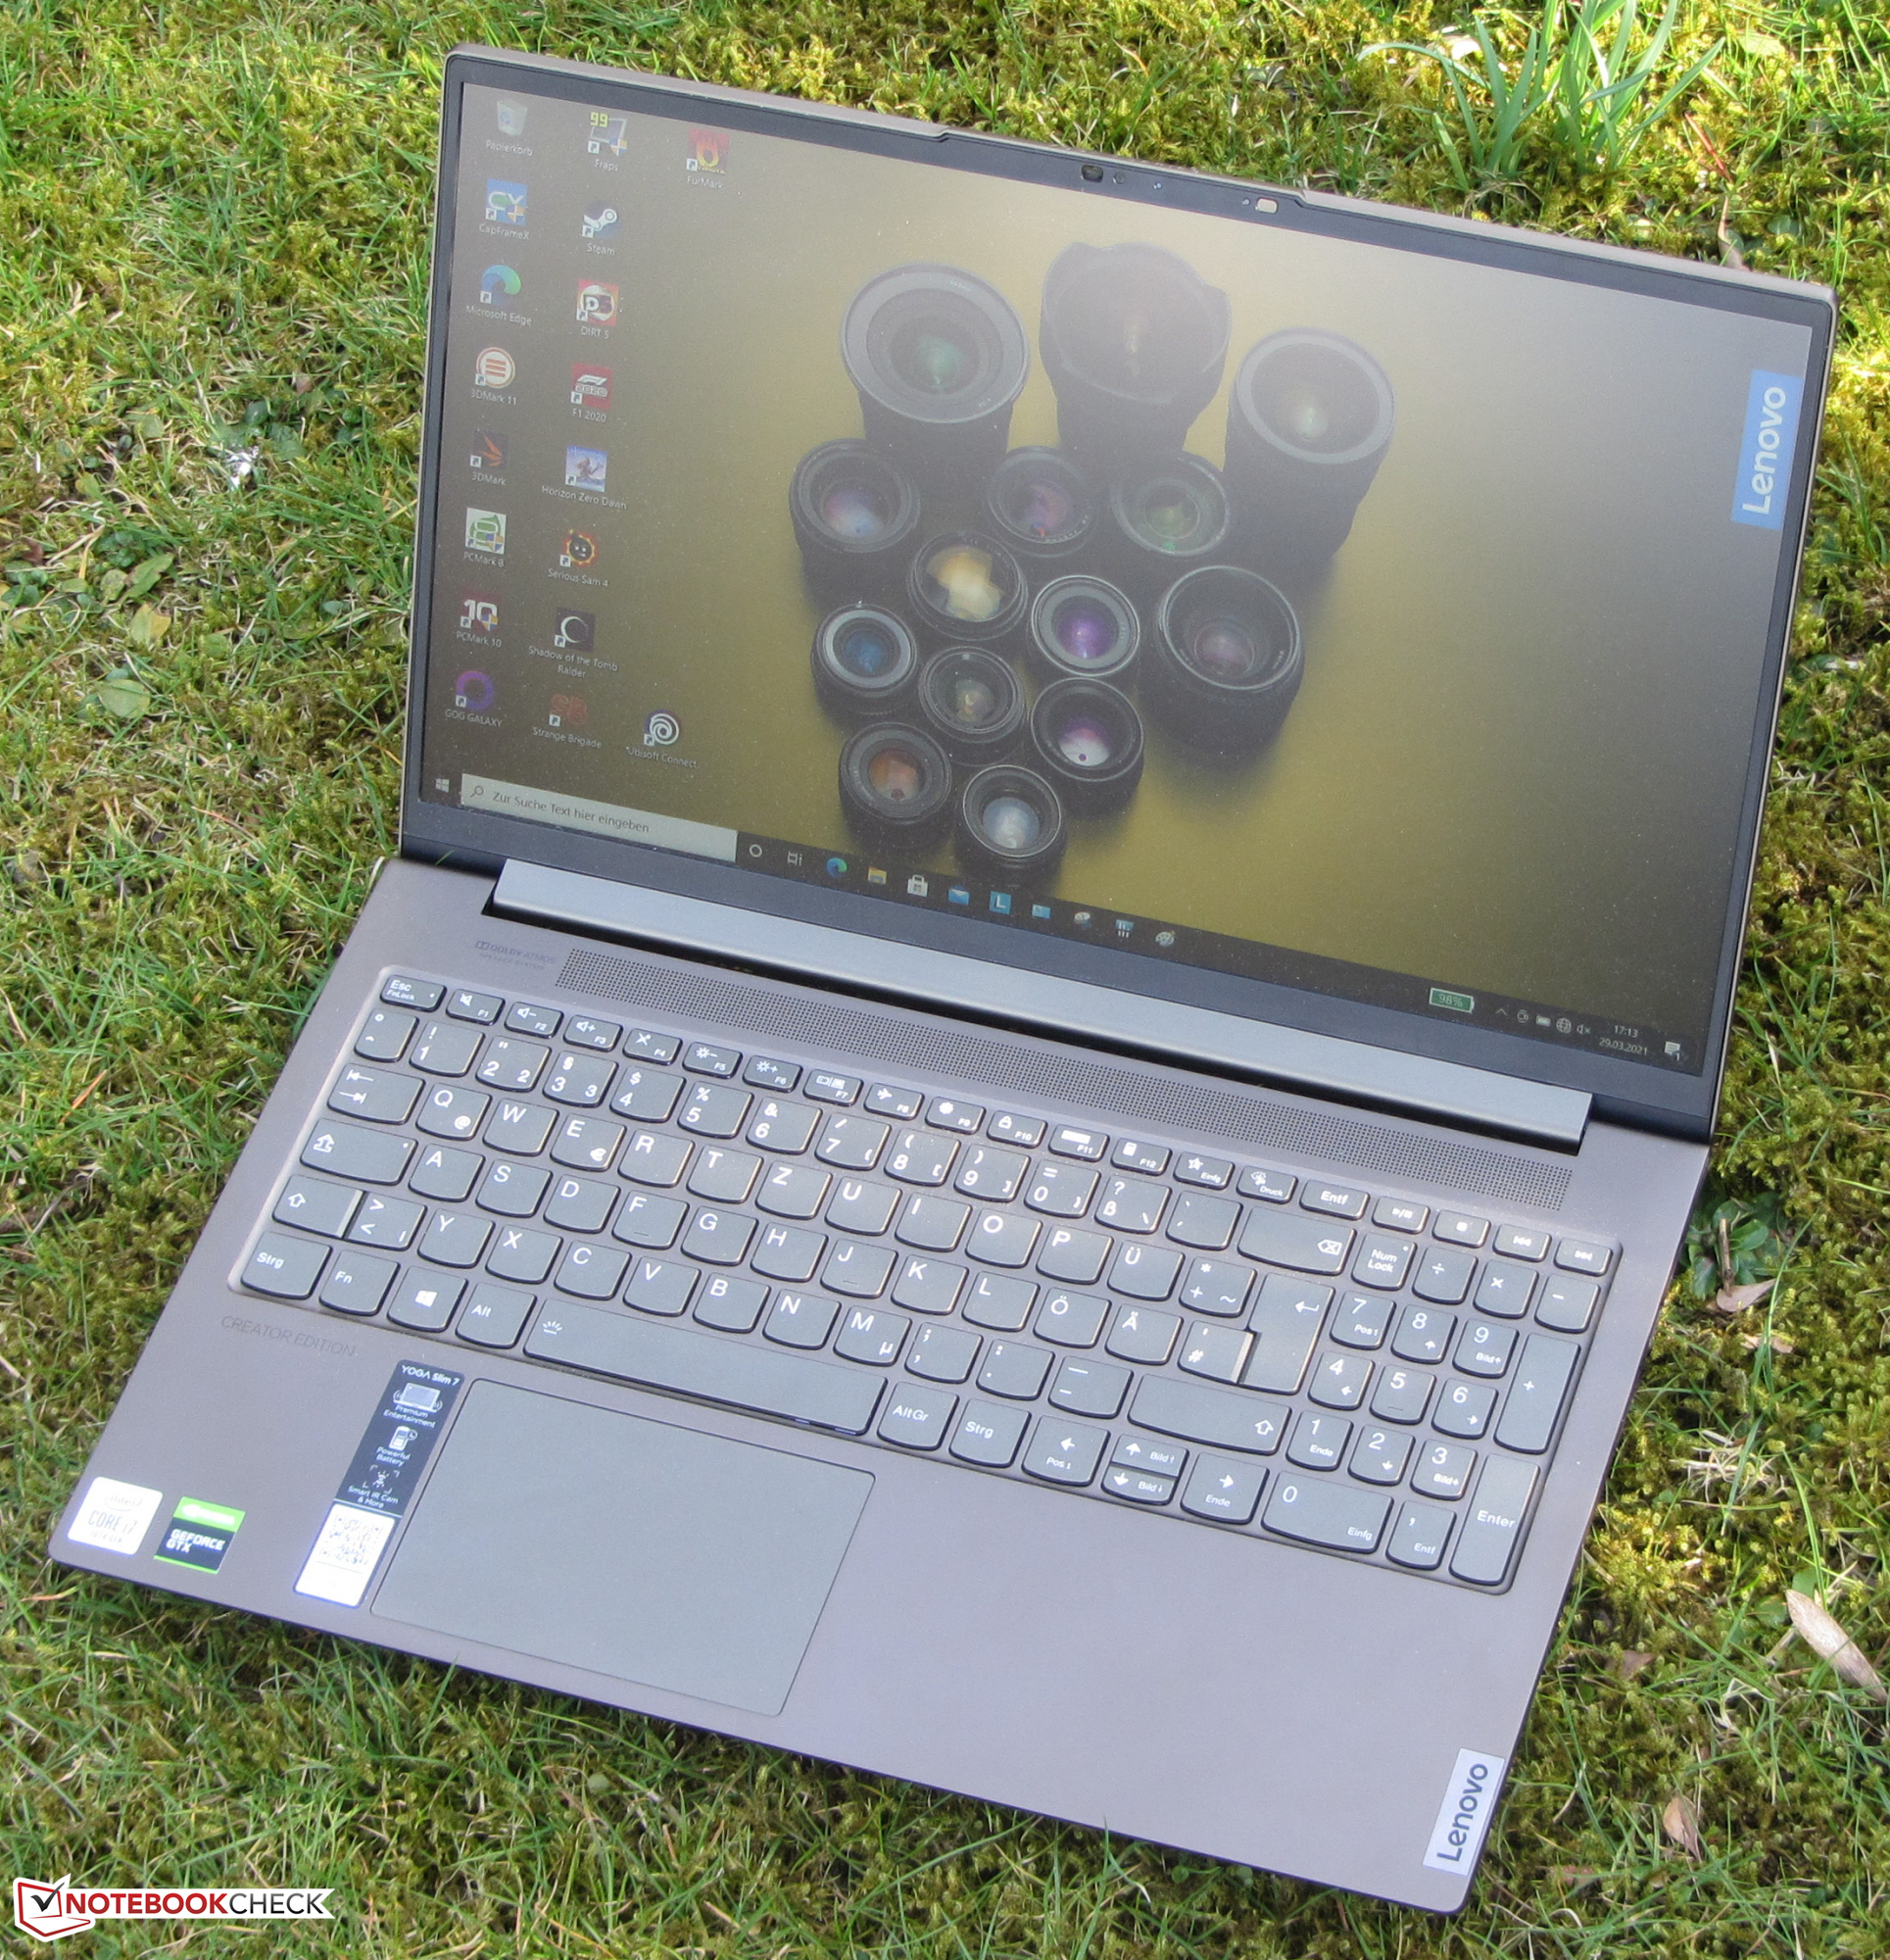
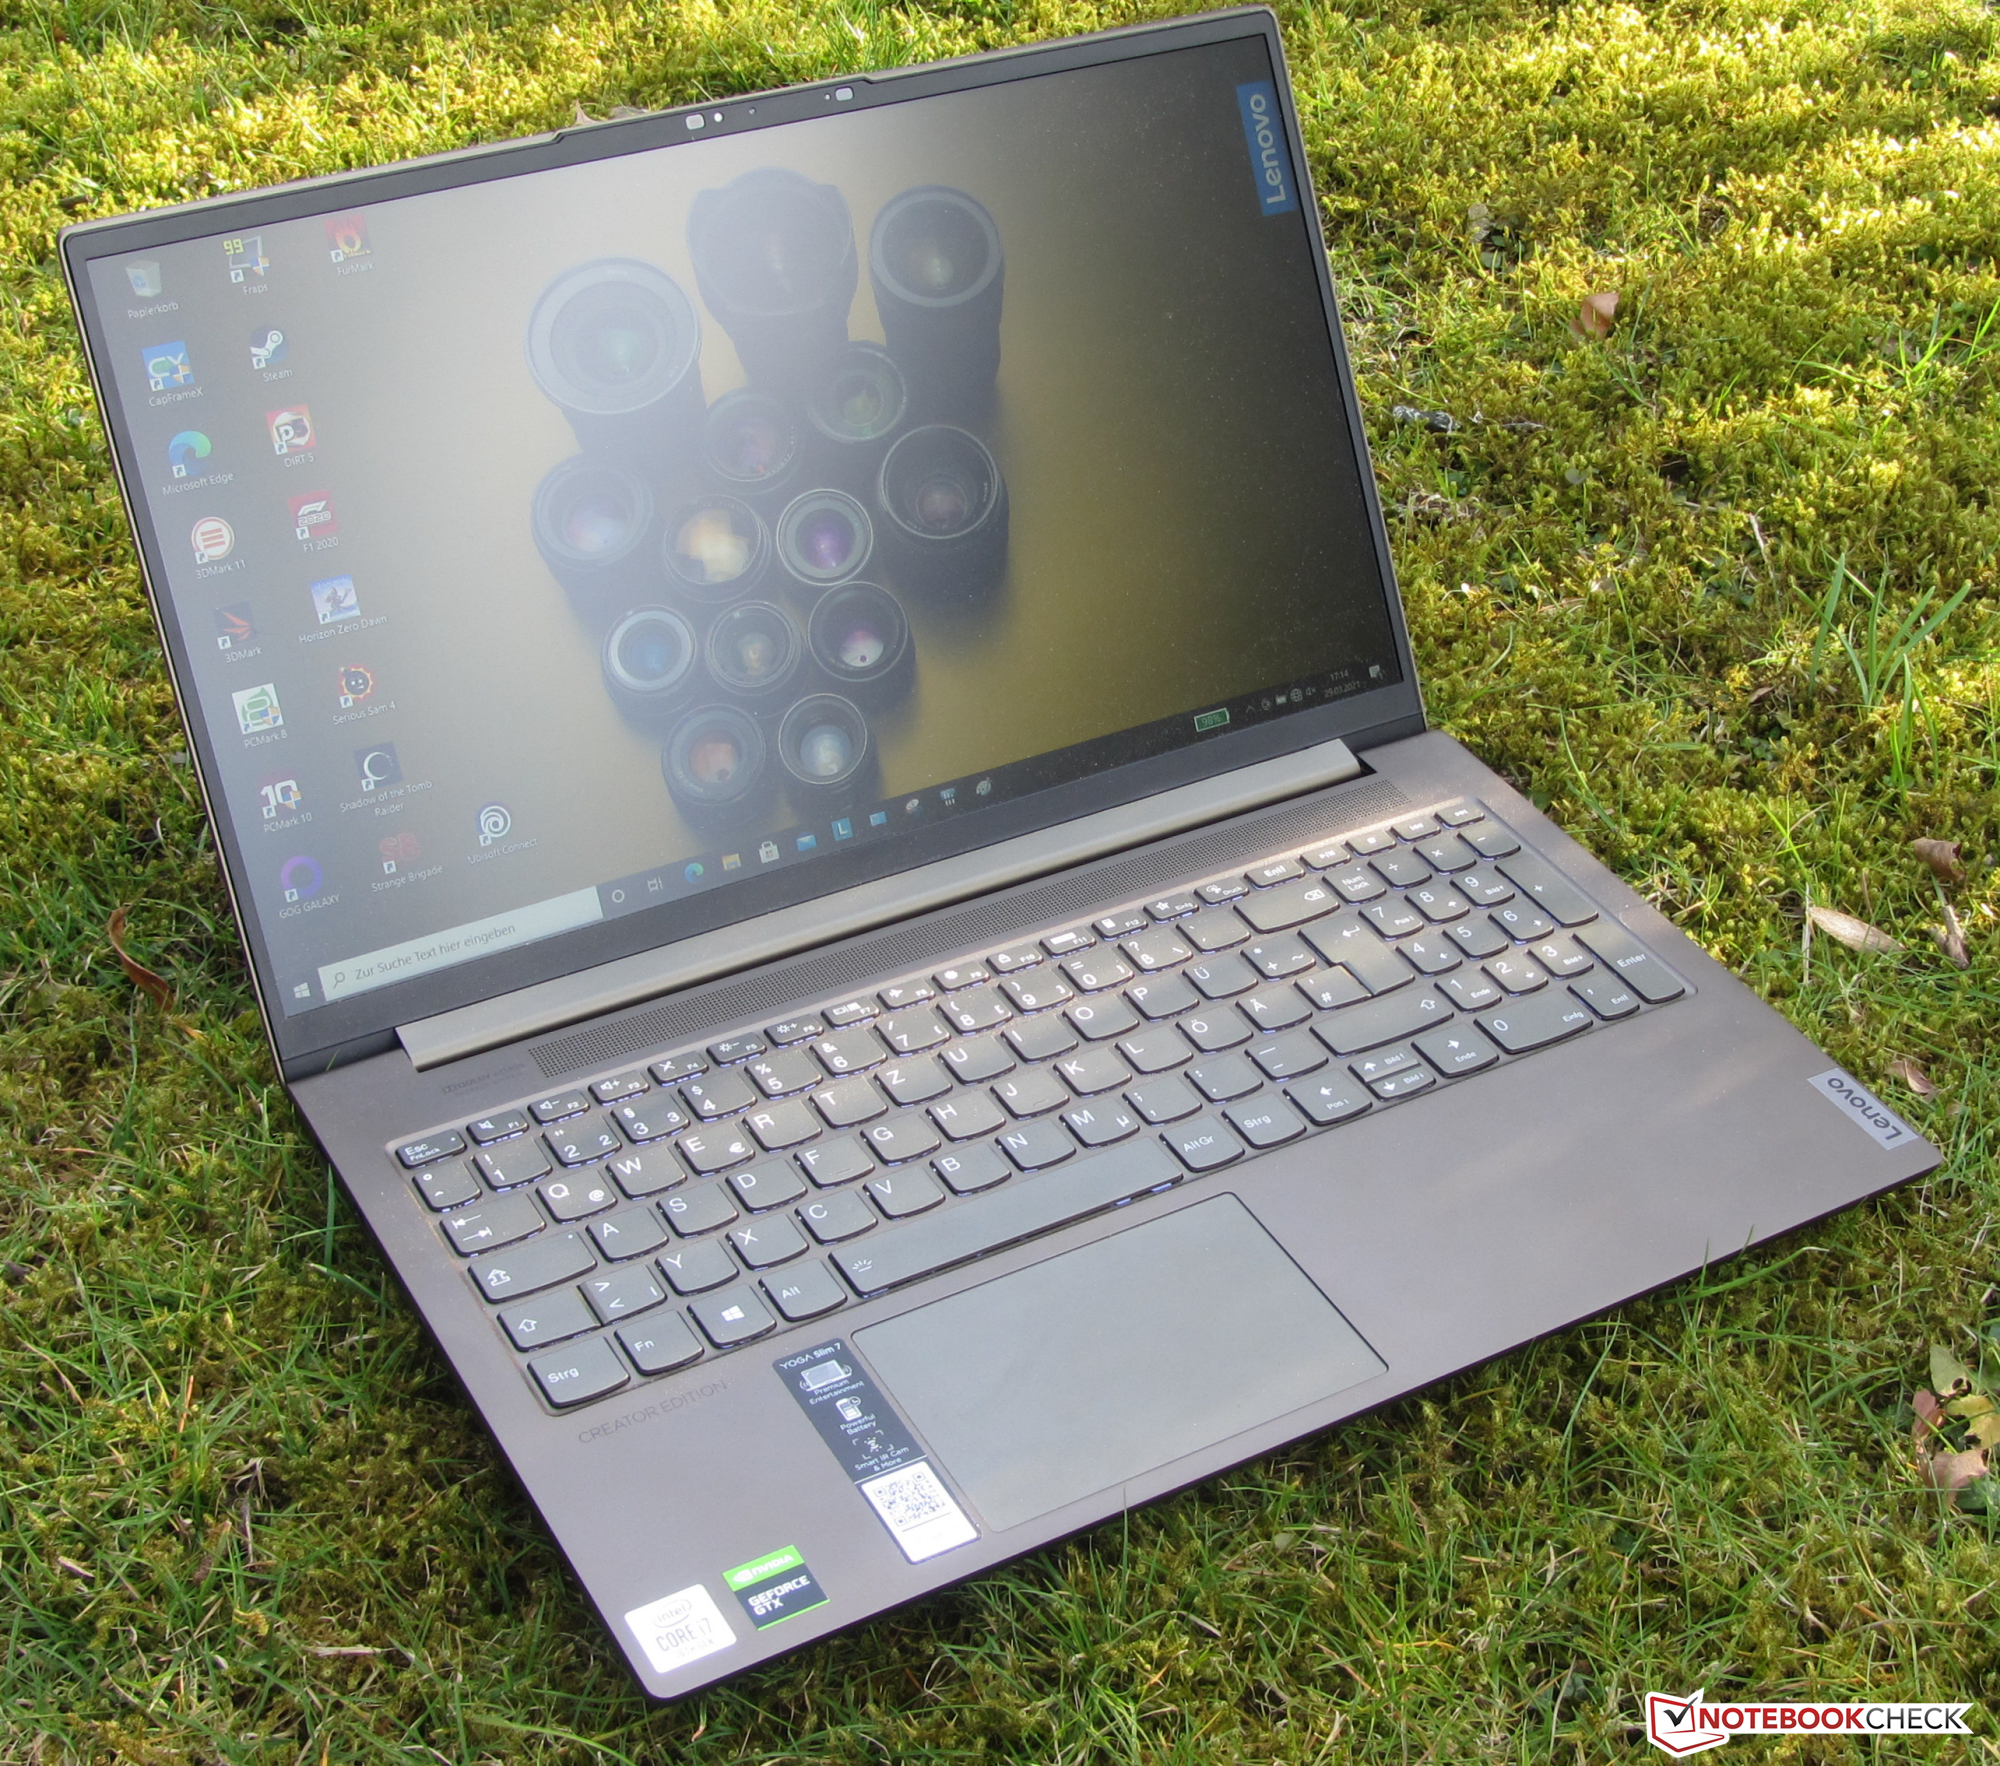
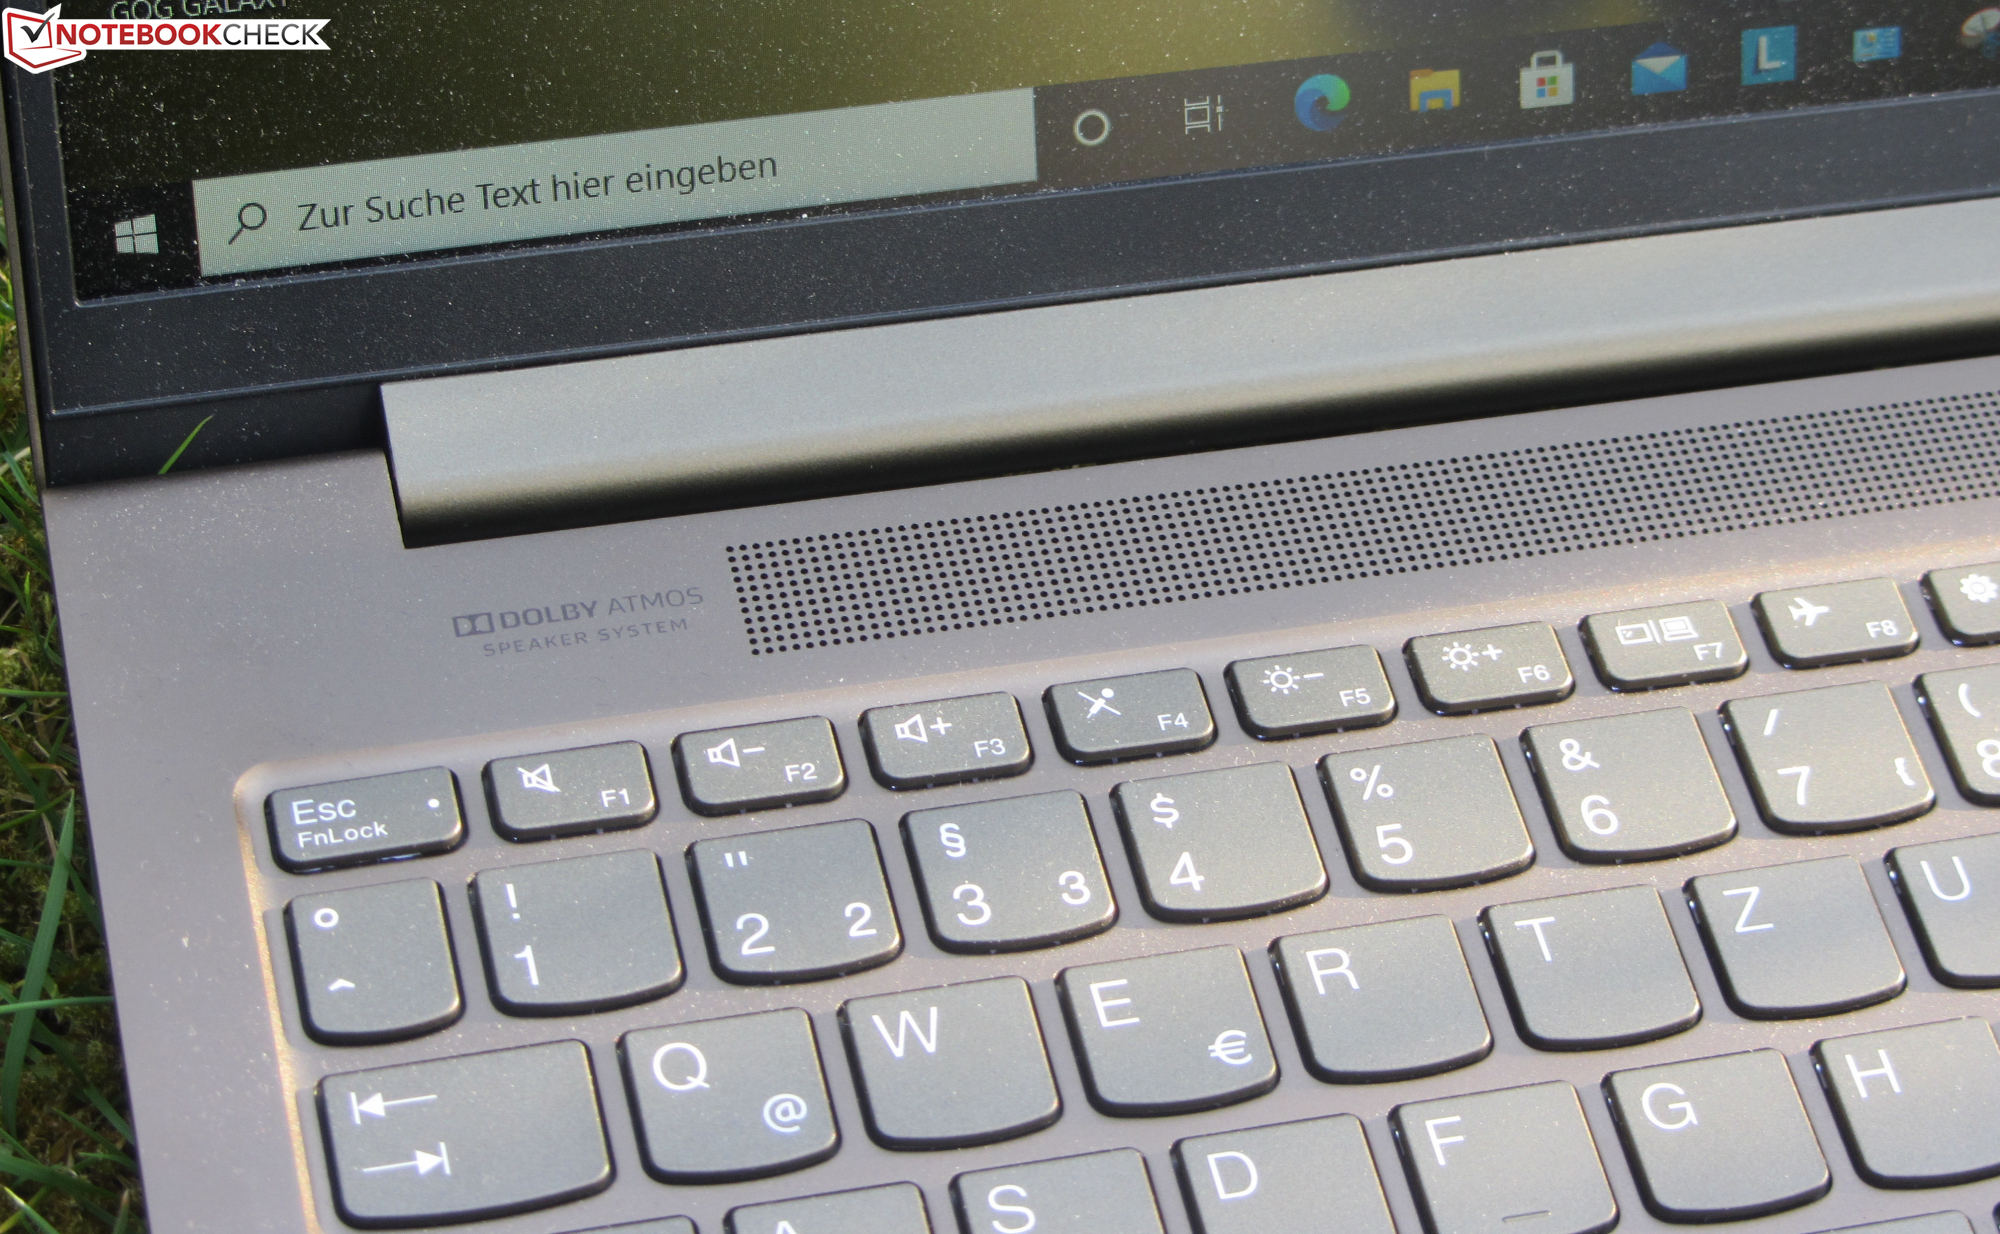
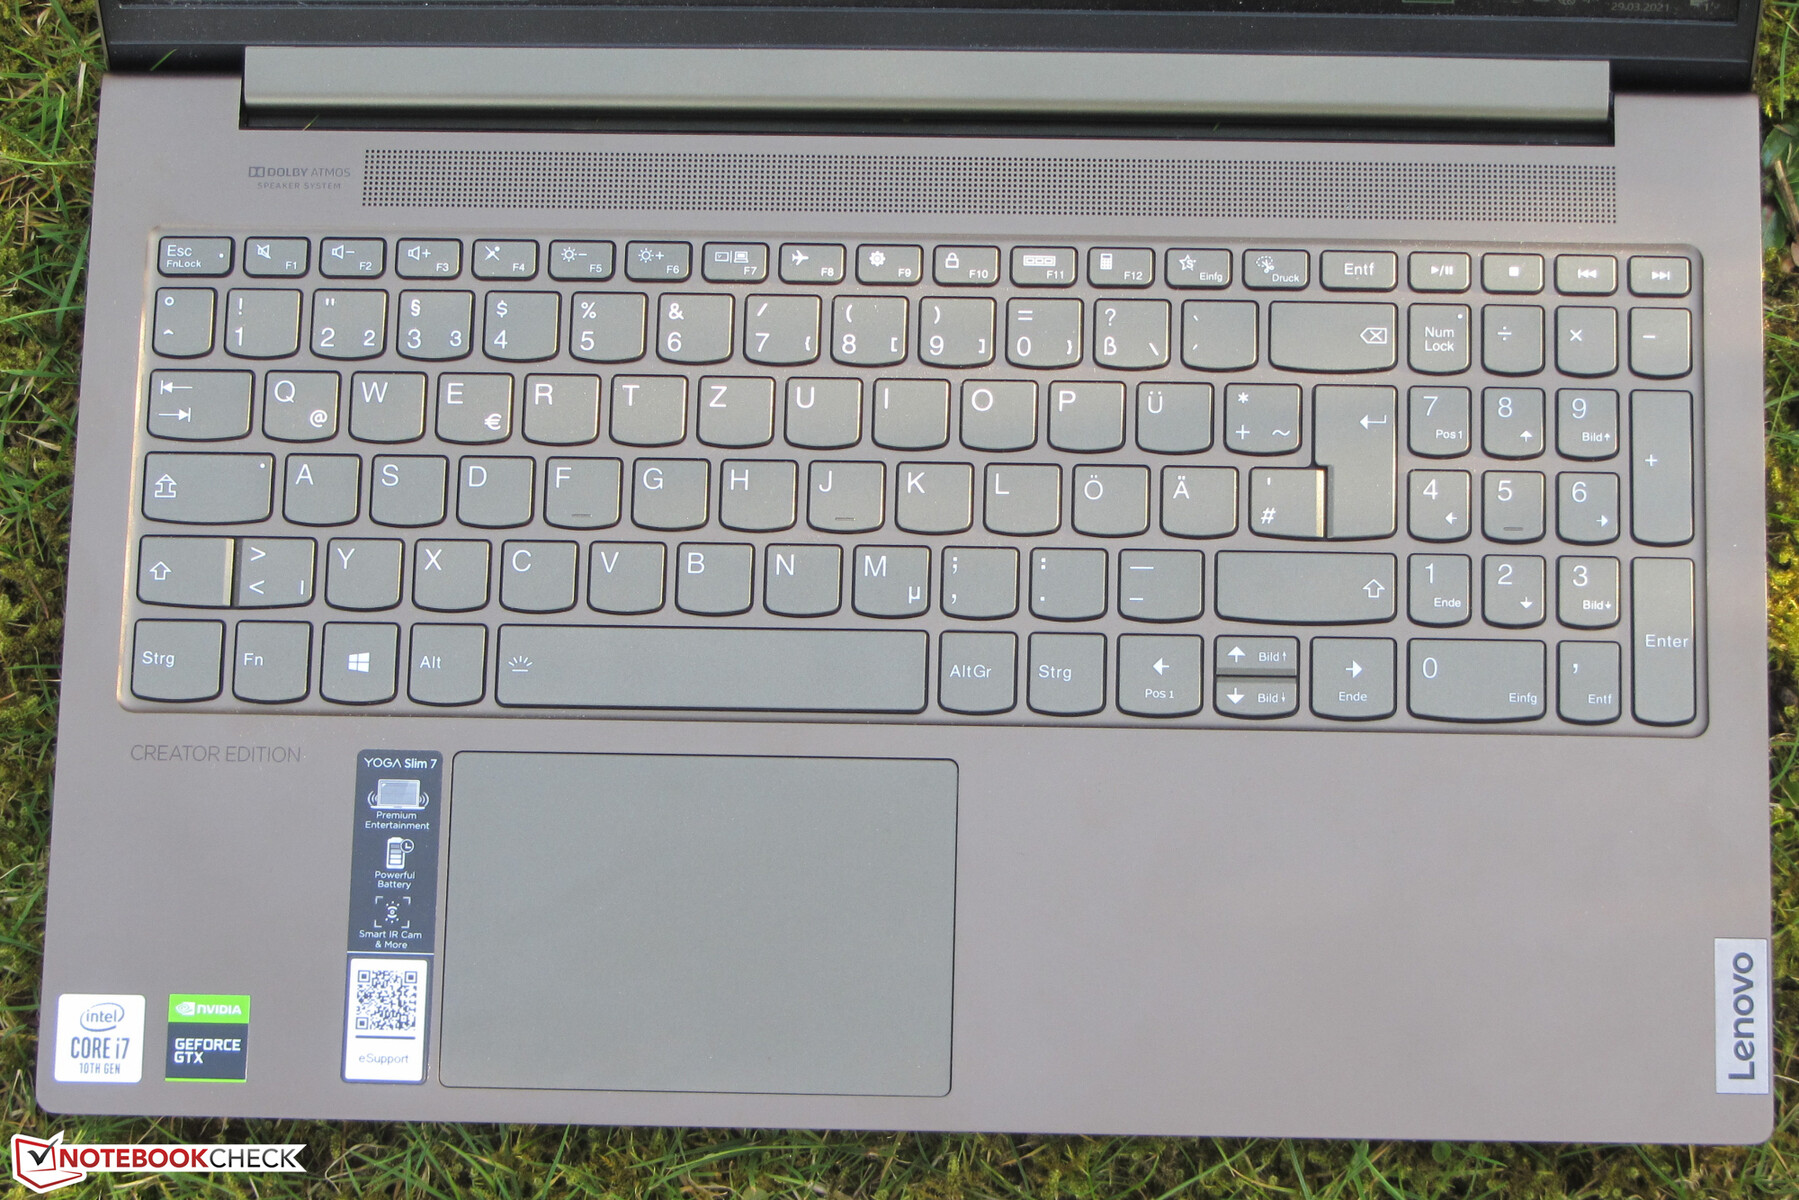
Die glatten, ebenen Tasten der beleuchteten Chiclet-Tastatur verfügen über einen kurzen Hub und einen deutlichen Druckpunkt. Der Tastenwiderstand gefällt uns. Während des Tippens gibt die Tastatur nicht nach. Die zweistufige Beleuchtung wird mittels einer Funktionstaste gesteuert. Die Tastatur hat insgesamt einen guten Eindruck hinterlassen und ihre Alltagstauglichkeit mehr als deutlich bewiesen.
Touchpad
Ein multitouchfähiges Clickpad (ca. 10,5 x 7 cm) dient als Mausersatz. Die glatte Oberfläche macht den Fingern das Gleiten leicht. Das Pad reagiert auch in den Ecken auf Eingaben. Es verfügt über einen kurzen Hub und einen klaren Druckpunkt.
Display - IPS an Bord
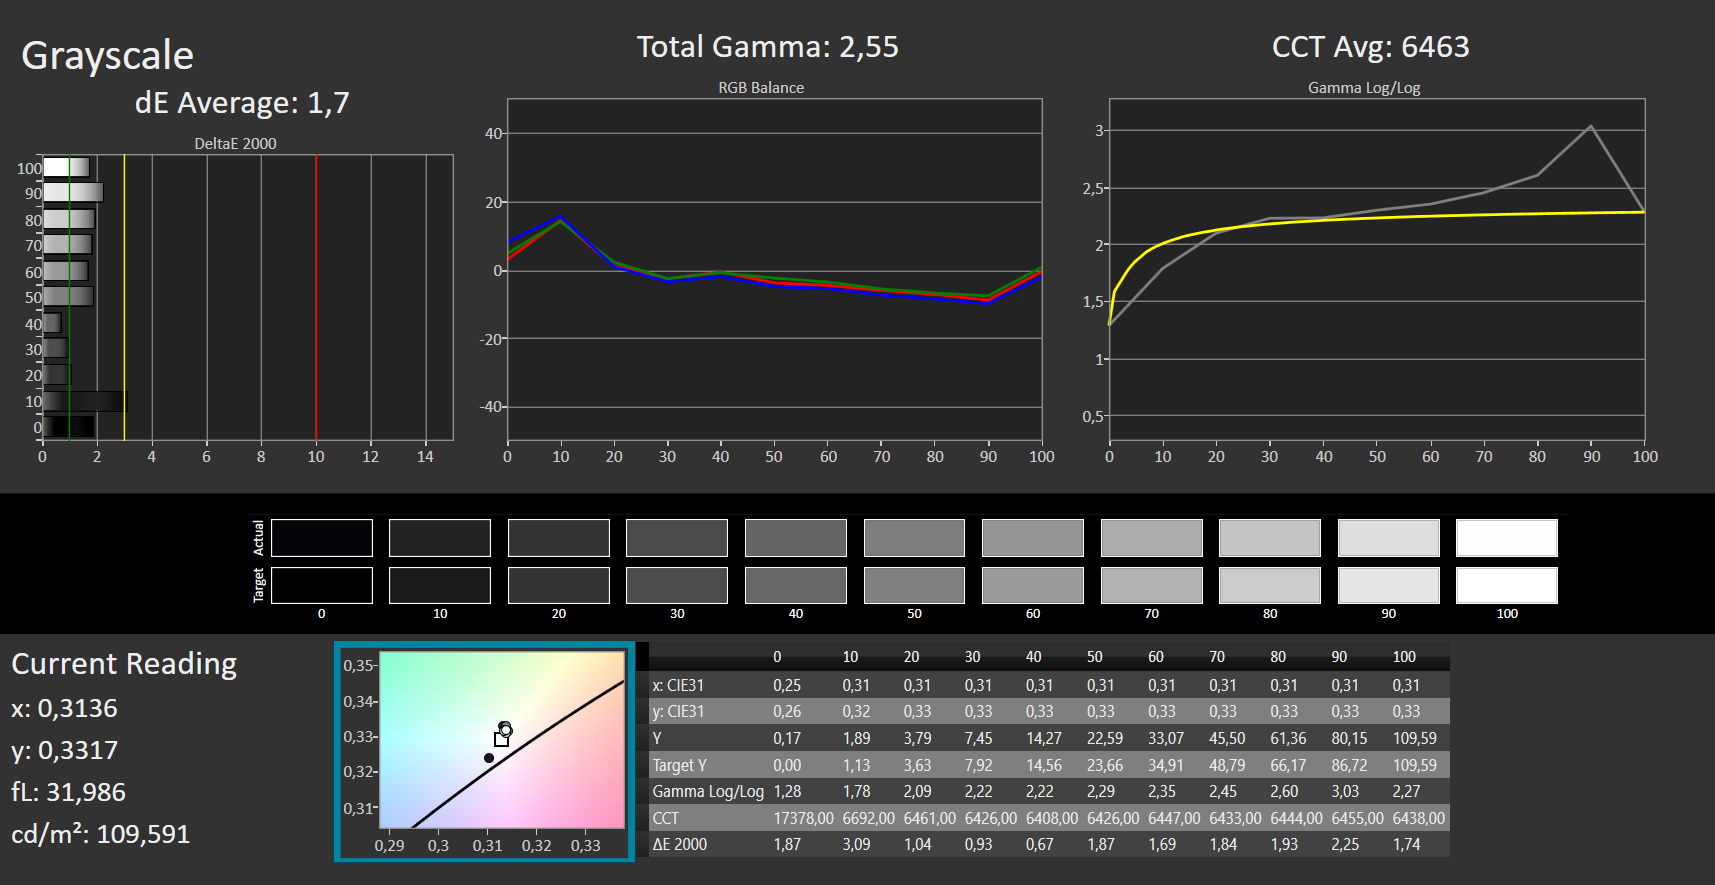
Der matte 15,6-Zoll-Bildschirm arbeitet mit einer nativen Auflösung von 1.920 x 1.080 Bildpunkten. Helligkeit (320,3 cd/m²) und Kontrast (2.000:1) fallen gut aus. Dazu gesellen sich hervorragende Reaktionszeiten. Positiv: Das Display zeigt kein PWM-Flimmern. Der Bildschirm unterstützt Dolby Vision - eine HDR-Variante.

| |||||||||||||||||||||||||
Ausleuchtung: 81 %
Helligkeit Akku: 363 cd/m²
Kontrast: 2000:1 (Schwarzwert: 0.18 cd/m²)
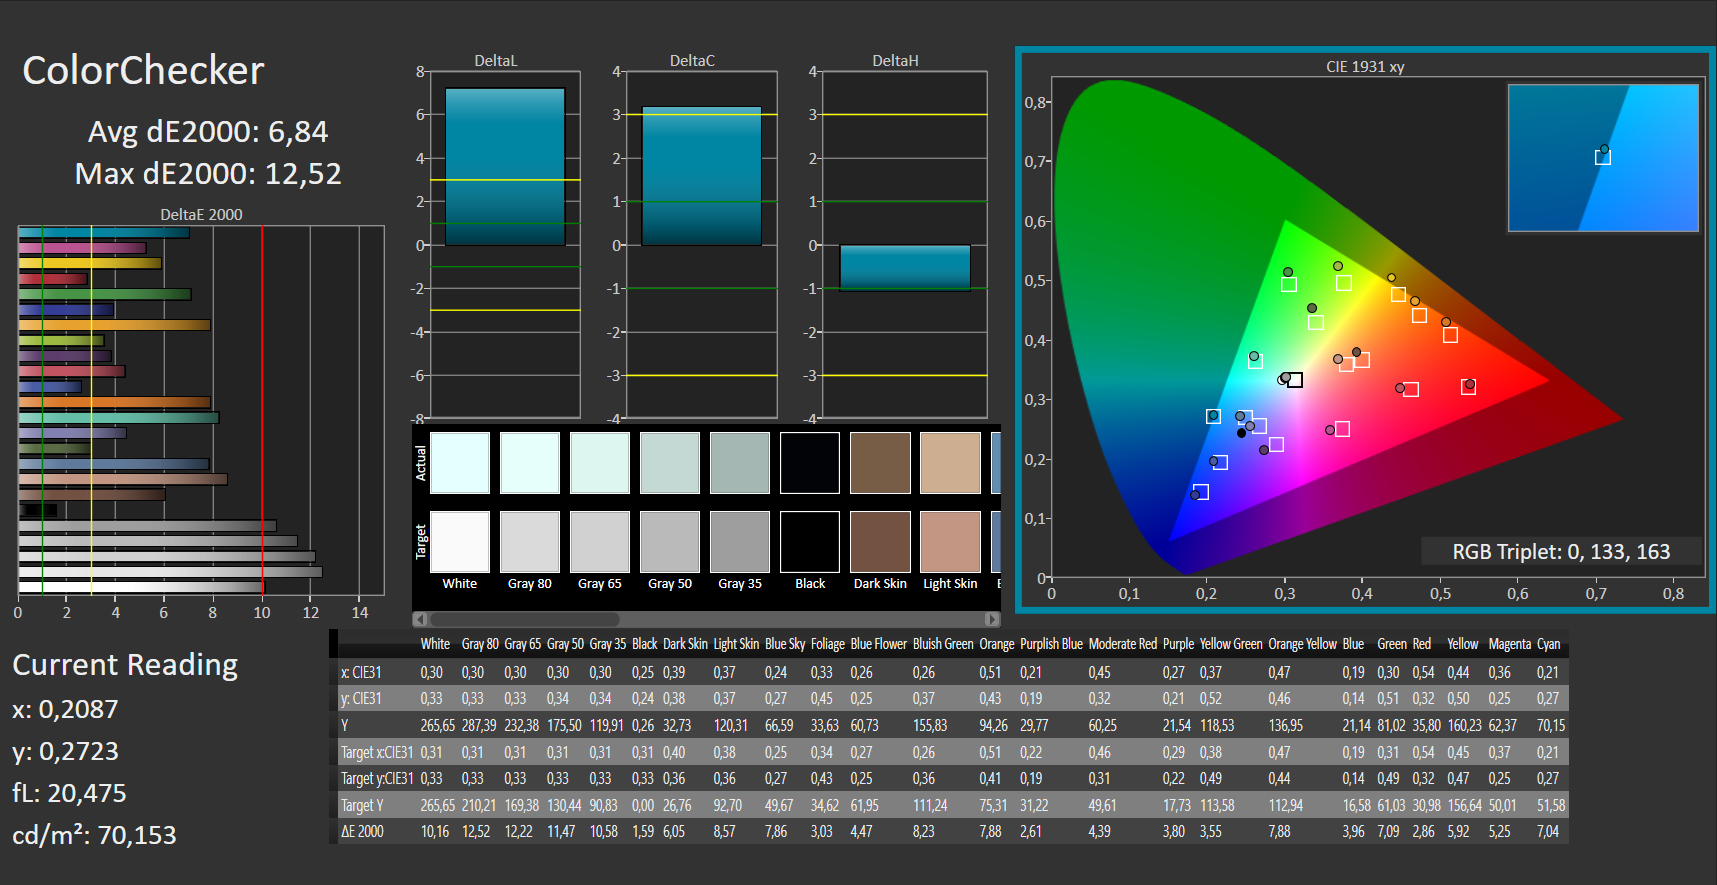
ΔE ColorChecker Calman: 6.84 | ∀{0.5-29.43 Ø4.72}
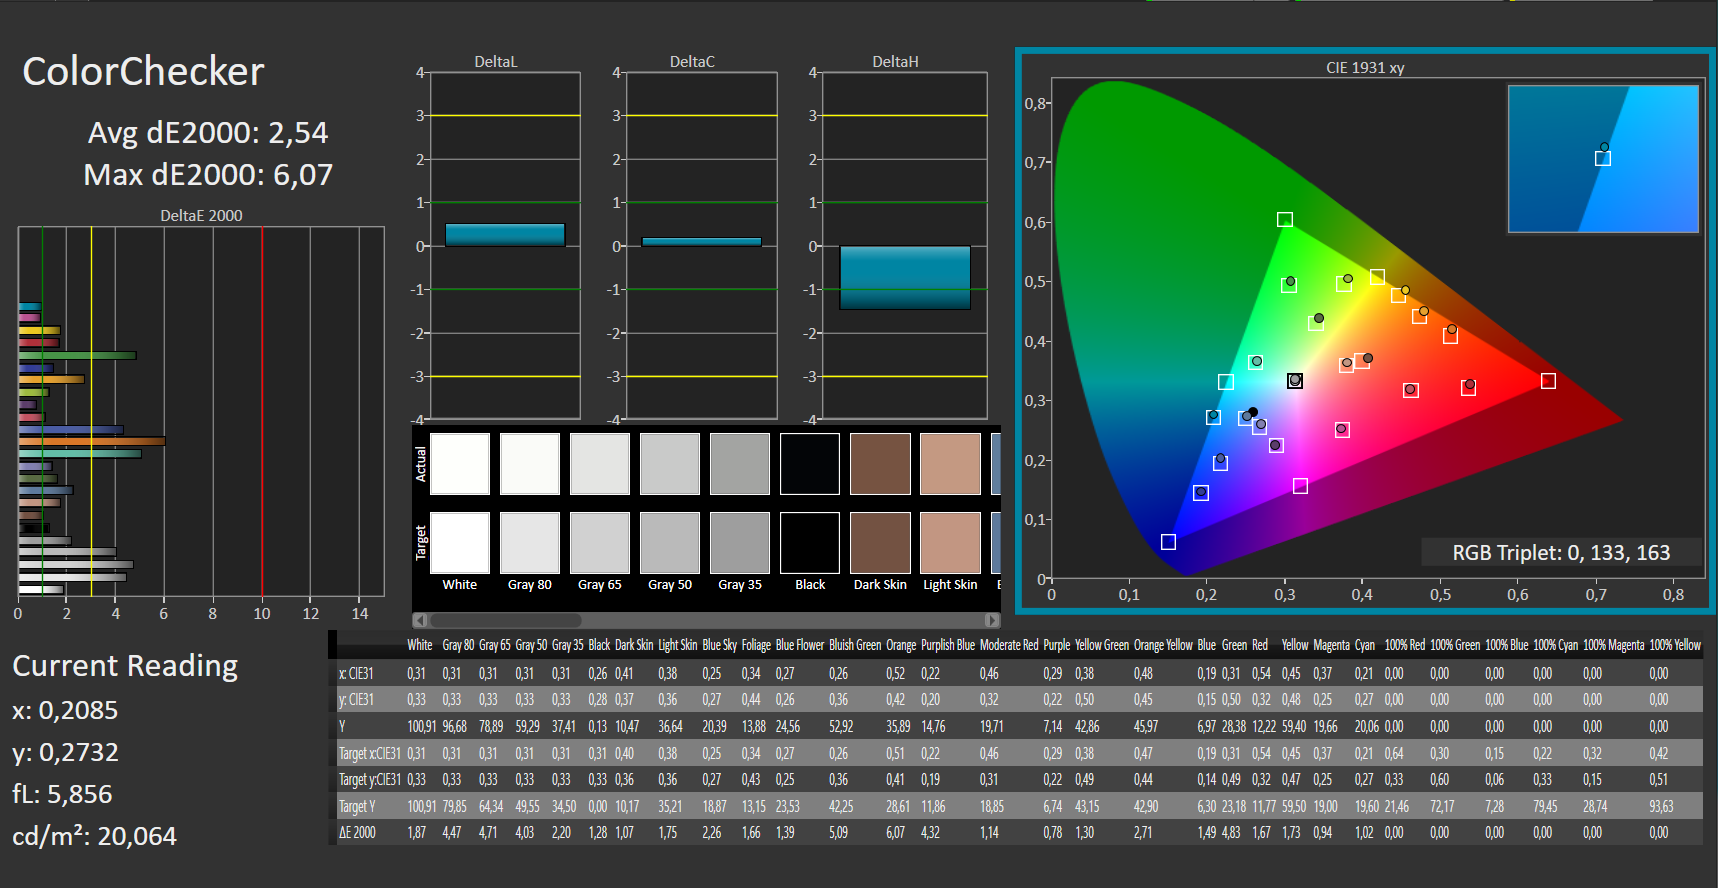
calibrated: 2.54
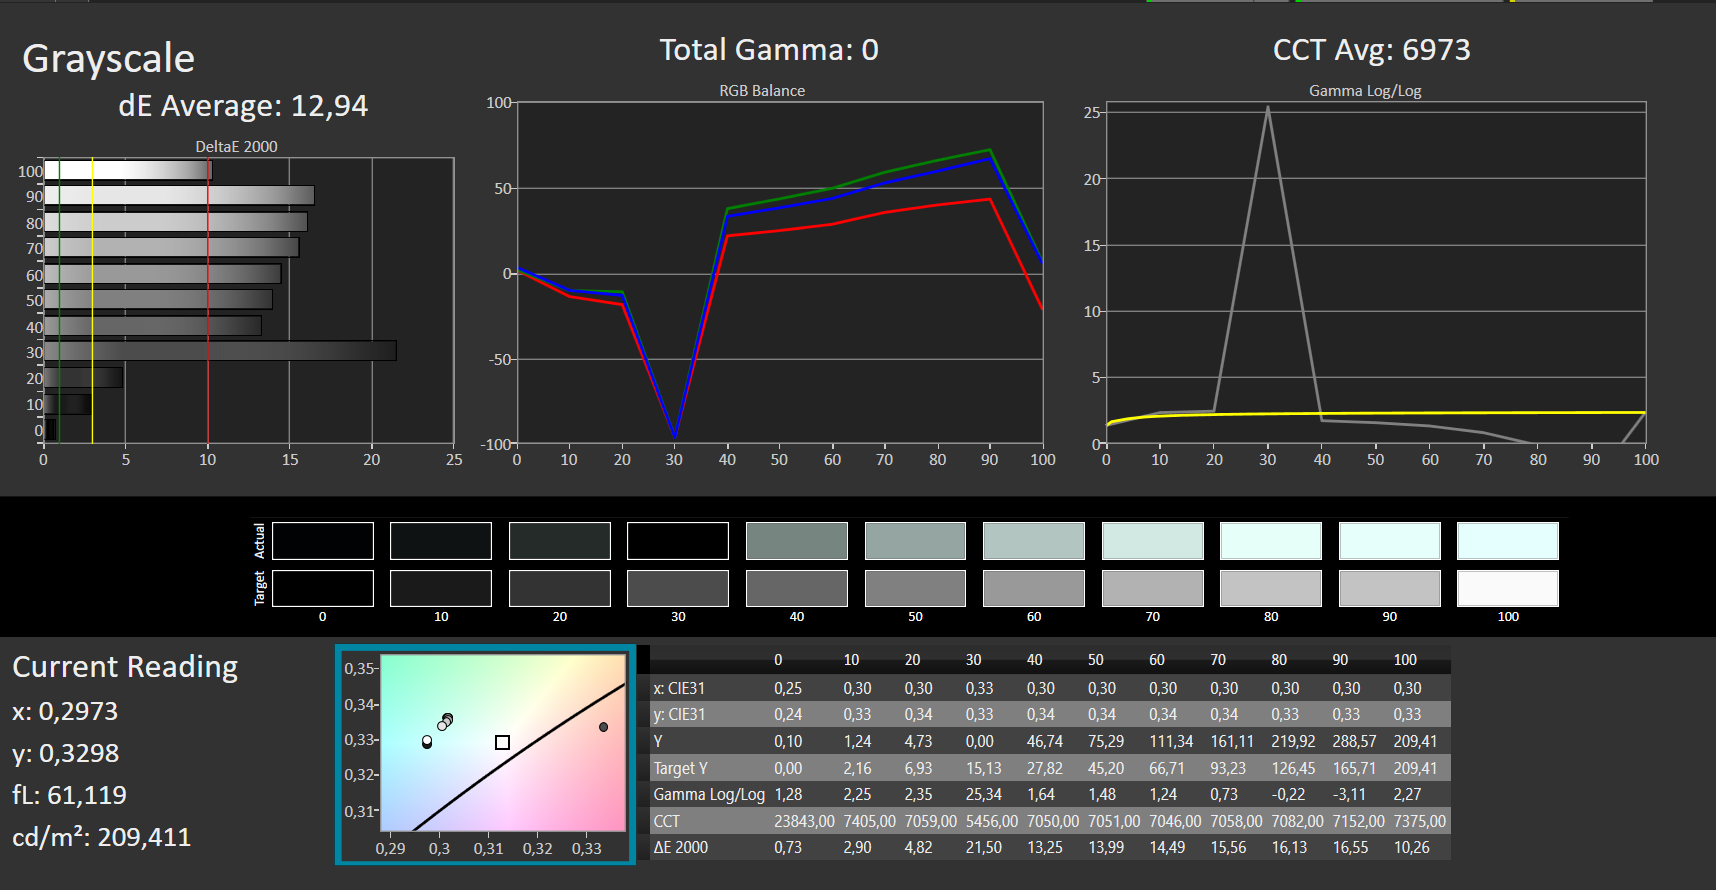
ΔE Greyscale Calman: 12.94 | ∀{0.09-98 Ø4.97}
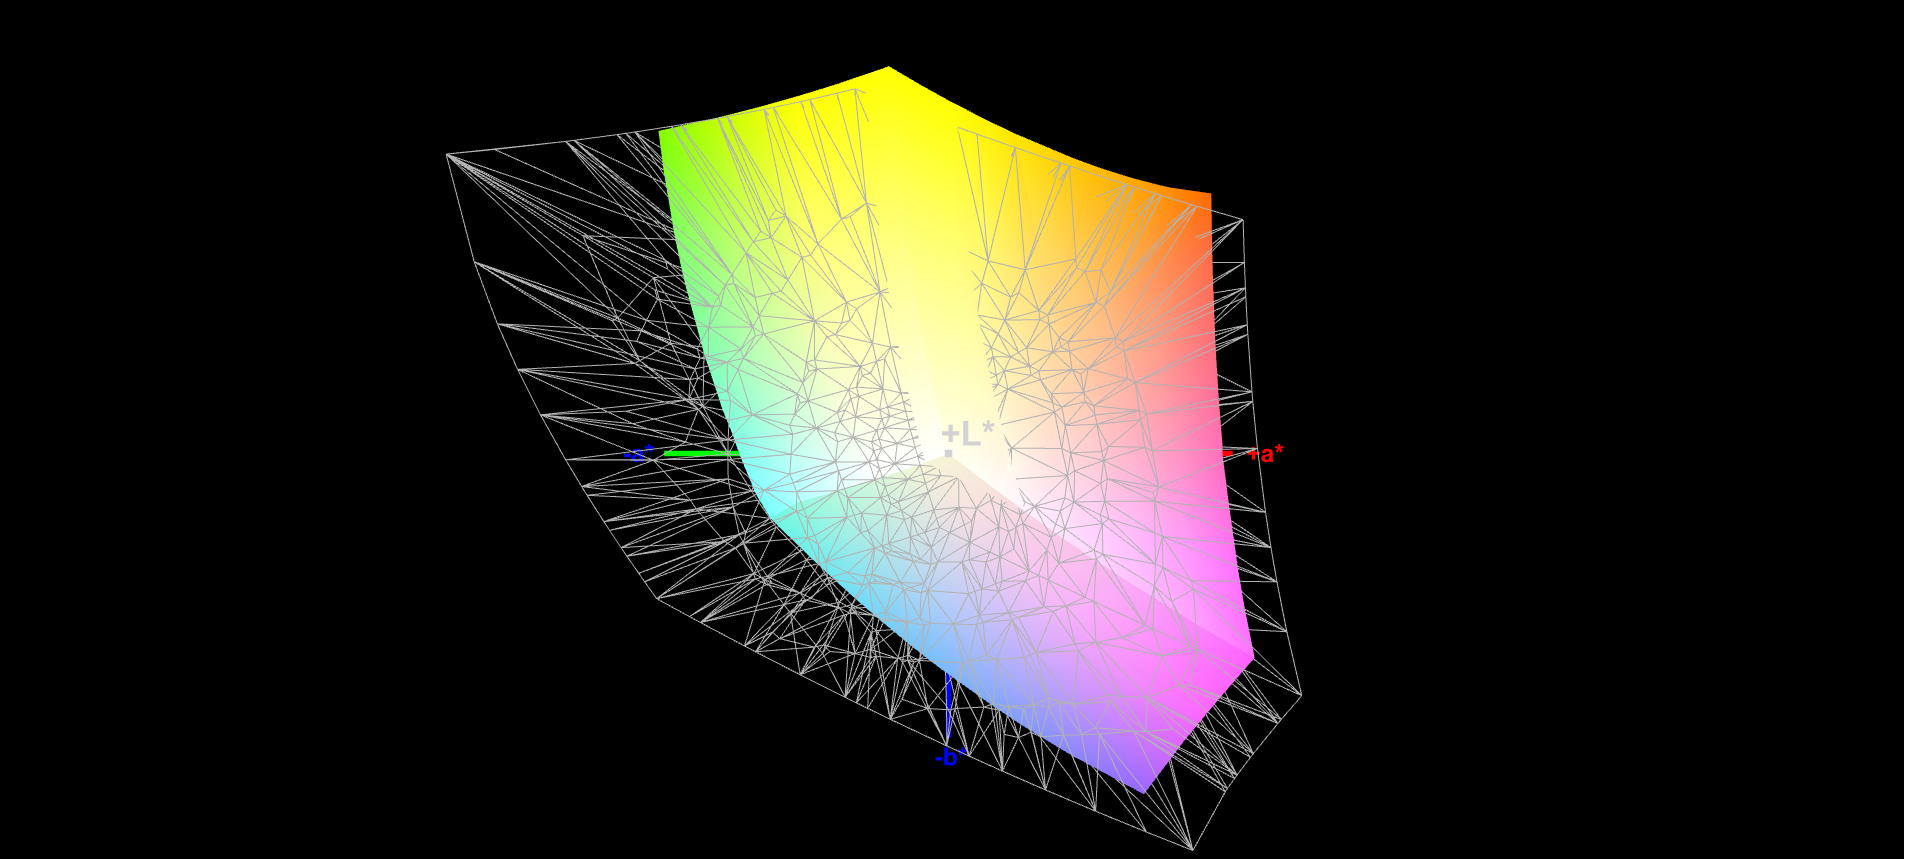
6973% sRGB (Calman 2D)
97% sRGB (Argyll 1.6.3 3D)
63% AdobeRGB 1998 (Argyll 1.6.3 3D)
70.3% AdobeRGB 1998 (Argyll 3D)
97.1% sRGB (Argyll 3D)
68.7% Display P3 (Argyll 3D)
Gamma: 2.55
CCT: 6973 K
| Lenovo Yoga Creator 7 15IMH05 82DS000VGE BOE CQ NV156FHM-N69, IPS, 1920x1080, 15.6" | Asus ZenBook UX535-M01440 BOE0866, IPS, 3840x2160, 15.6" | HP Envy 15-ep0098nr Samsung SDC4145, AMOLED, 3840x2160, 15.6" | Schenker Vision 15 BOE08F5, IPS, 1920x1080, 15.6" | Dell XPS 15 9500 Core i7 4K UHD Sharp LQ156R1, IPS, 3840x2400, 15.6" | MSI Summit E15 A11SCST AU Optronics B156HAB03.1, IPS, 1920x1080, 15.6" | |
|---|---|---|---|---|---|---|
| Display | 1% | 25% | -0% | 25% | -7% | |
| Display P3 Coverage (%) | 68.7 | 68.8 0% | 88.5 29% | 69.3 1% | 89.7 31% | 64.5 -6% |
| sRGB Coverage (%) | 97.1 | 99.5 2% | 100 3% | 94 -3% | 100 3% | 89.3 -8% |
| AdobeRGB 1998 Coverage (%) | 70.3 | 70.1 0% | 99.9 42% | 70.8 1% | 99.8 42% | 65.3 -7% |
| Response Times | -440% | 70% | -825% | -717% | -589% | |
| Response Time Grey 50% / Grey 80% * (ms) | 5 ? | 34 ? -580% | 0.8 ? 84% | 60 ? -1100% | 54 ? -980% | 43.2 ? -764% |
| Response Time Black / White * (ms) | 6 ? | 24 ? -300% | 2.7 ? 55% | 39 ? -550% | 33.2 ? -453% | 30.8 ? -413% |
| PWM Frequency (Hz) | 242.7 ? | |||||
| Bildschirm | 17% | 15% | 18% | 12% | 2% | |
| Helligkeit Bildmitte (cd/m²) | 360 | 402 12% | 374.3 4% | 478 33% | 557.9 55% | 298 -17% |
| Brightness (cd/m²) | 320 | 375 17% | 379 18% | 462 44% | 541 69% | 280 -12% |
| Brightness Distribution (%) | 81 | 84 4% | 91 12% | 94 16% | 91 12% | 90 11% |
| Schwarzwert * (cd/m²) | 0.18 | 0.35 -94% | 0.27 -50% | 0.39 -117% | 0.22 -22% | |
| Kontrast (:1) | 2000 | 1149 -43% | 1770 -11% | 1431 -28% | 1355 -32% | |
| Delta E Colorchecker * | 6.84 | 2.47 64% | 5.47 20% | 3.2 53% | 4.54 34% | 5.41 21% |
| Colorchecker dE 2000 max. * | 12.52 | 4.32 65% | 8.22 34% | 8.4 33% | 7.92 37% | 8.59 31% |
| Colorchecker dE 2000 calibrated * | 2.54 | 2.36 7% | 4.61 -81% | 2 21% | 3.82 -50% | 2.97 -17% |
| Delta E Graustufen * | 12.94 | 2.26 83% | 2.3 82% | 4.5 65% | 3.2 75% | 4.1 68% |
| Gamma | 2.55 86% | 2.49 88% | 2.09 105% | 2.16 102% | 1.99 111% | 2.334 94% |
| CCT | 6973 93% | 6285 103% | 6340 103% | 6788 96% | 6451 101% | 7025 93% |
| Farbraum (Prozent von AdobeRGB 1998) (%) | 63 | 99 57% | 87.8 39% | 63.1 0% | 89.5 42% | 65 3% |
| Color Space (Percent of sRGB) (%) | 97 | 100 3% | 93.6 -4% | 100 3% | 90 -7% | |
| Durchschnitt gesamt (Programm / Settings) | -141% /
-47% | 37% /
25% | -269% /
-91% | -227% /
-77% | -198% /
-73% |
* ... kleinere Werte sind besser
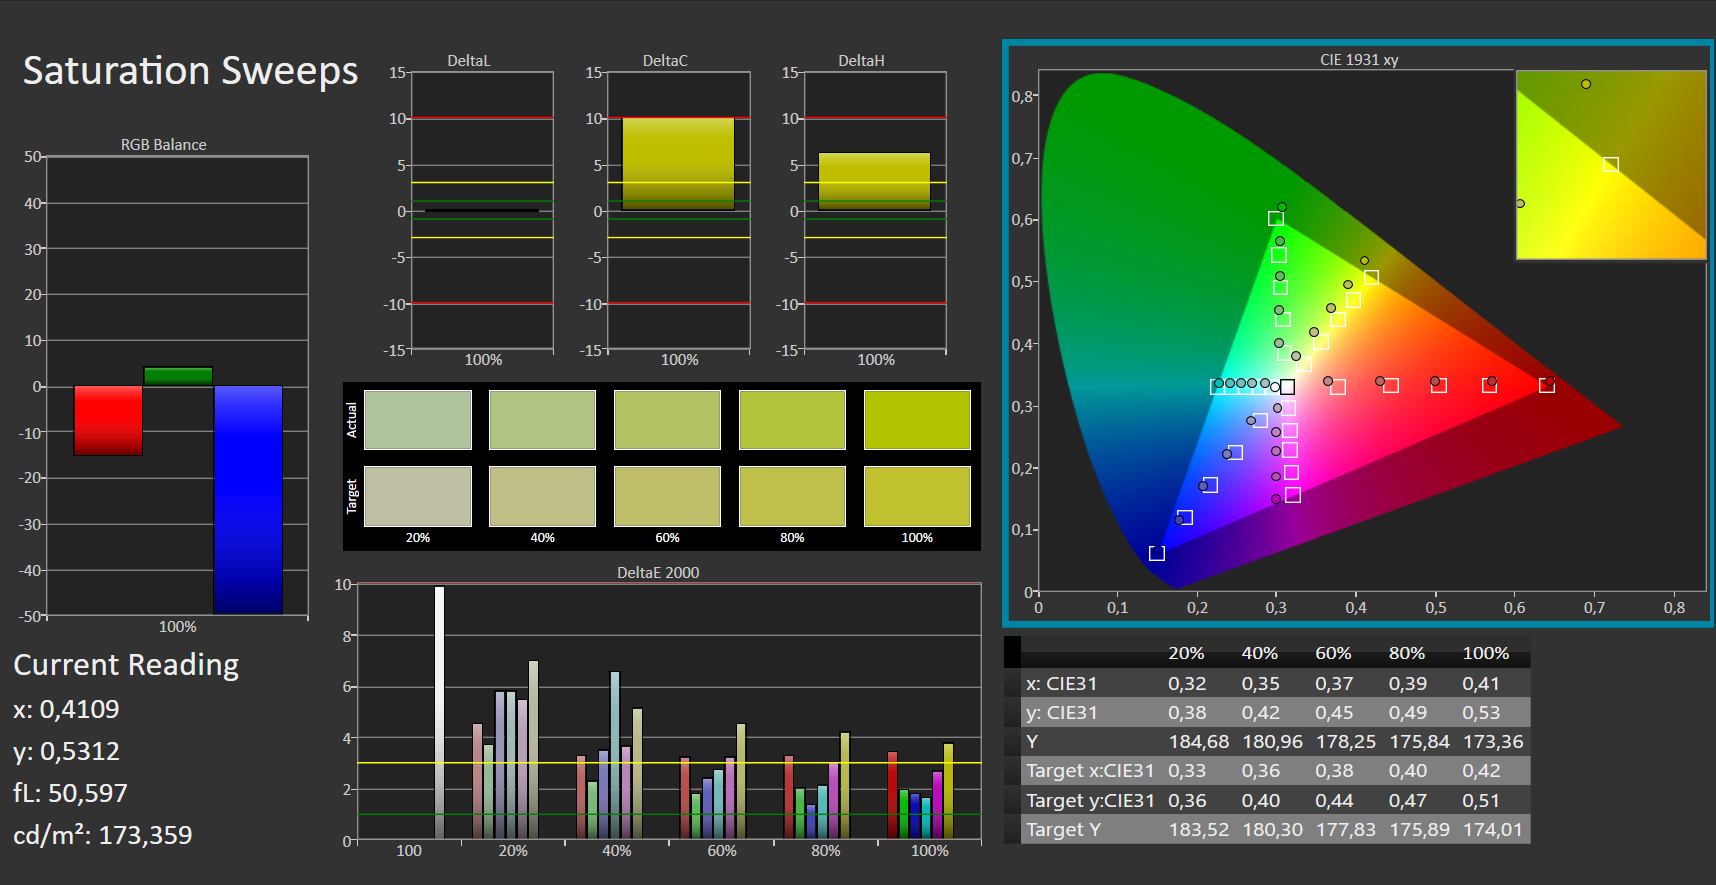
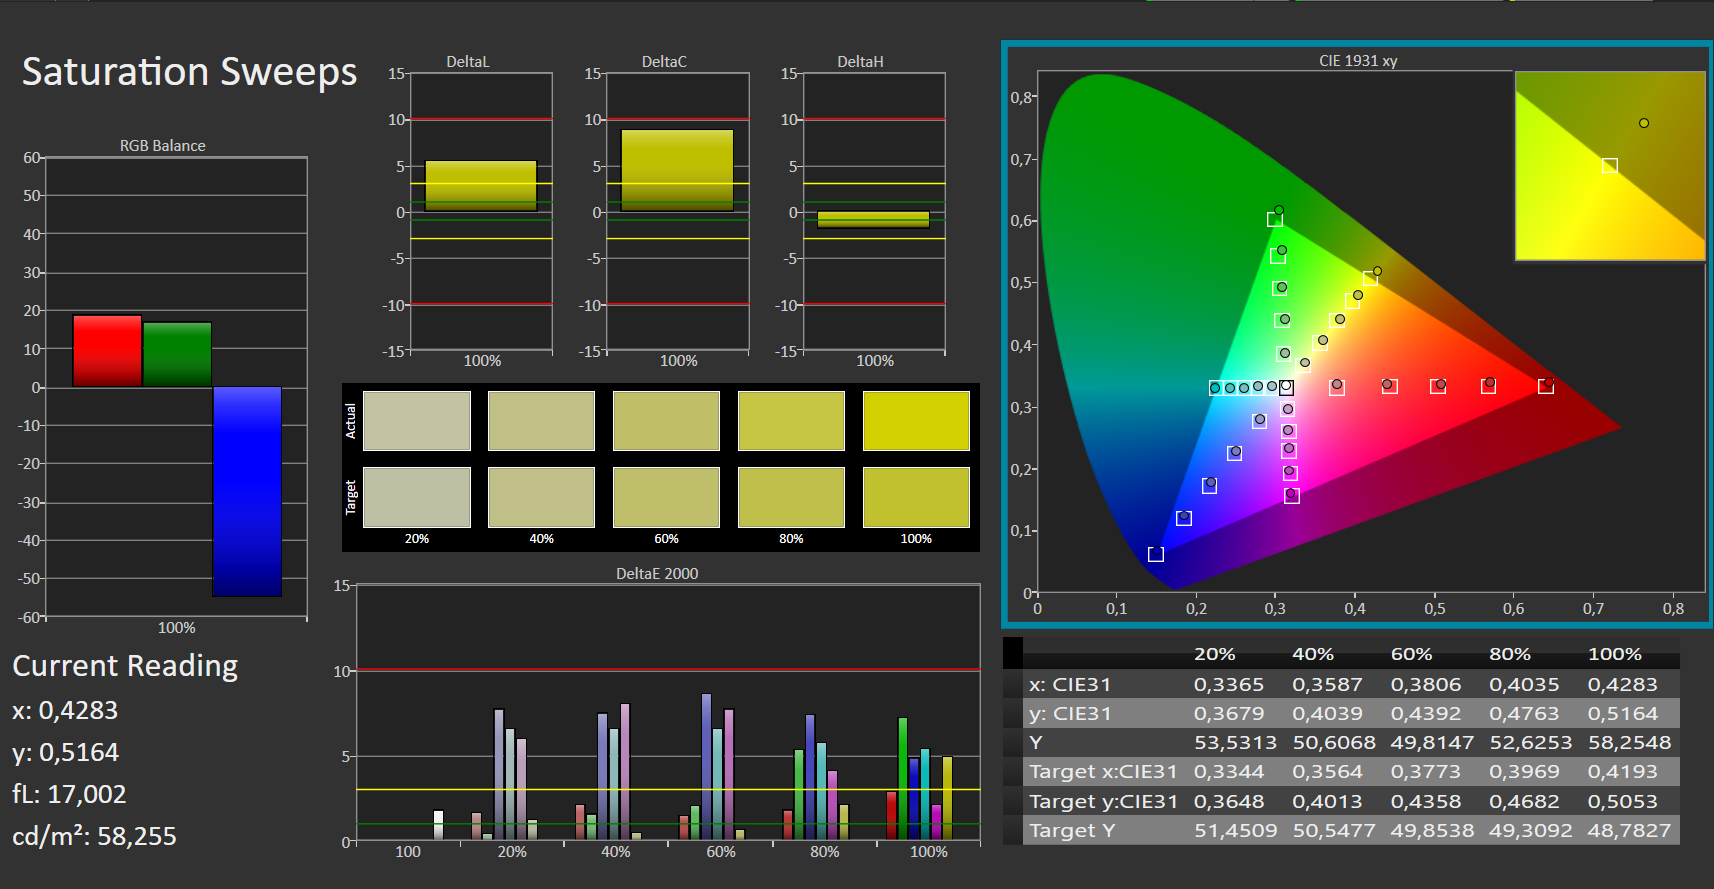
Im Auslieferungszustand zeigt der Bildschirm keine überzeugende Farbdarstellung und verfehlt mit einer Farbabweichung von knapp 7 das Soll (Delta E kleiner 3). Unter einem Blaustich leidet das Display nicht. Eine Kalibrierung sorgt für Verbesserungen: So sinkt die Farbabweichung auf 2,54 und die Graustufen werden ausgewogener dargestellt. Die Farbräume AdobeRGB (63 Prozent) und sRGB (97 Prozent) kann das Display nicht vollständig abbilden.

Reaktionszeiten (Response Times) des Displays
| ↔ Reaktionszeiten Schwarz zu Weiß | ||
|---|---|---|
| 6 ms ... steigend ↗ und fallend ↘ kombiniert | ↗ 1 ms steigend |  |
| ↘ 5 ms fallend | ||
| Die gemessenen Reaktionszeiten sind sehr kurz, wodurch sich der Bildschirm auch für schnelle 3D Spiele eignen sollte. Im Vergleich rangierten die bei uns getesteten Geräte von 0.1 (Minimum) zu 240 (Maximum) ms. » 19 % aller Screens waren schneller als der getestete. Daher sind die gemessenen Reaktionszeiten besser als der Durchschnitt aller vermessenen Geräte (19.8 ms). | ||
| ↔ Reaktionszeiten 50% Grau zu 80% Grau | ||
| 5 ms ... steigend ↗ und fallend ↘ kombiniert | ↗ 2 ms steigend |  |
| ↘ 3 ms fallend | ||
| Die gemessenen Reaktionszeiten sind sehr kurz, wodurch sich der Bildschirm auch für schnelle 3D Spiele eignen sollte. Im Vergleich rangierten die bei uns getesteten Geräte von 0.165 (Minimum) zu 636 (Maximum) ms. » 17 % aller Screens waren schneller als der getestete. Daher sind die gemessenen Reaktionszeiten besser als der Durchschnitt aller vermessenen Geräte (31 ms). | ||
Bildschirm-Flackern / PWM (Pulse-Width Modulation)
| Flackern / PWM nicht festgestellt |  | ||
Im Vergleich: 52 % aller getesteten Geräte nutzten kein PWM um die Helligkeit zu reduzieren. Wenn PWM eingesetzt wurde, dann bei einer Frequenz von durchschnittlich 7753 (Minimum 5, Maximum 343500) Hz. | |||
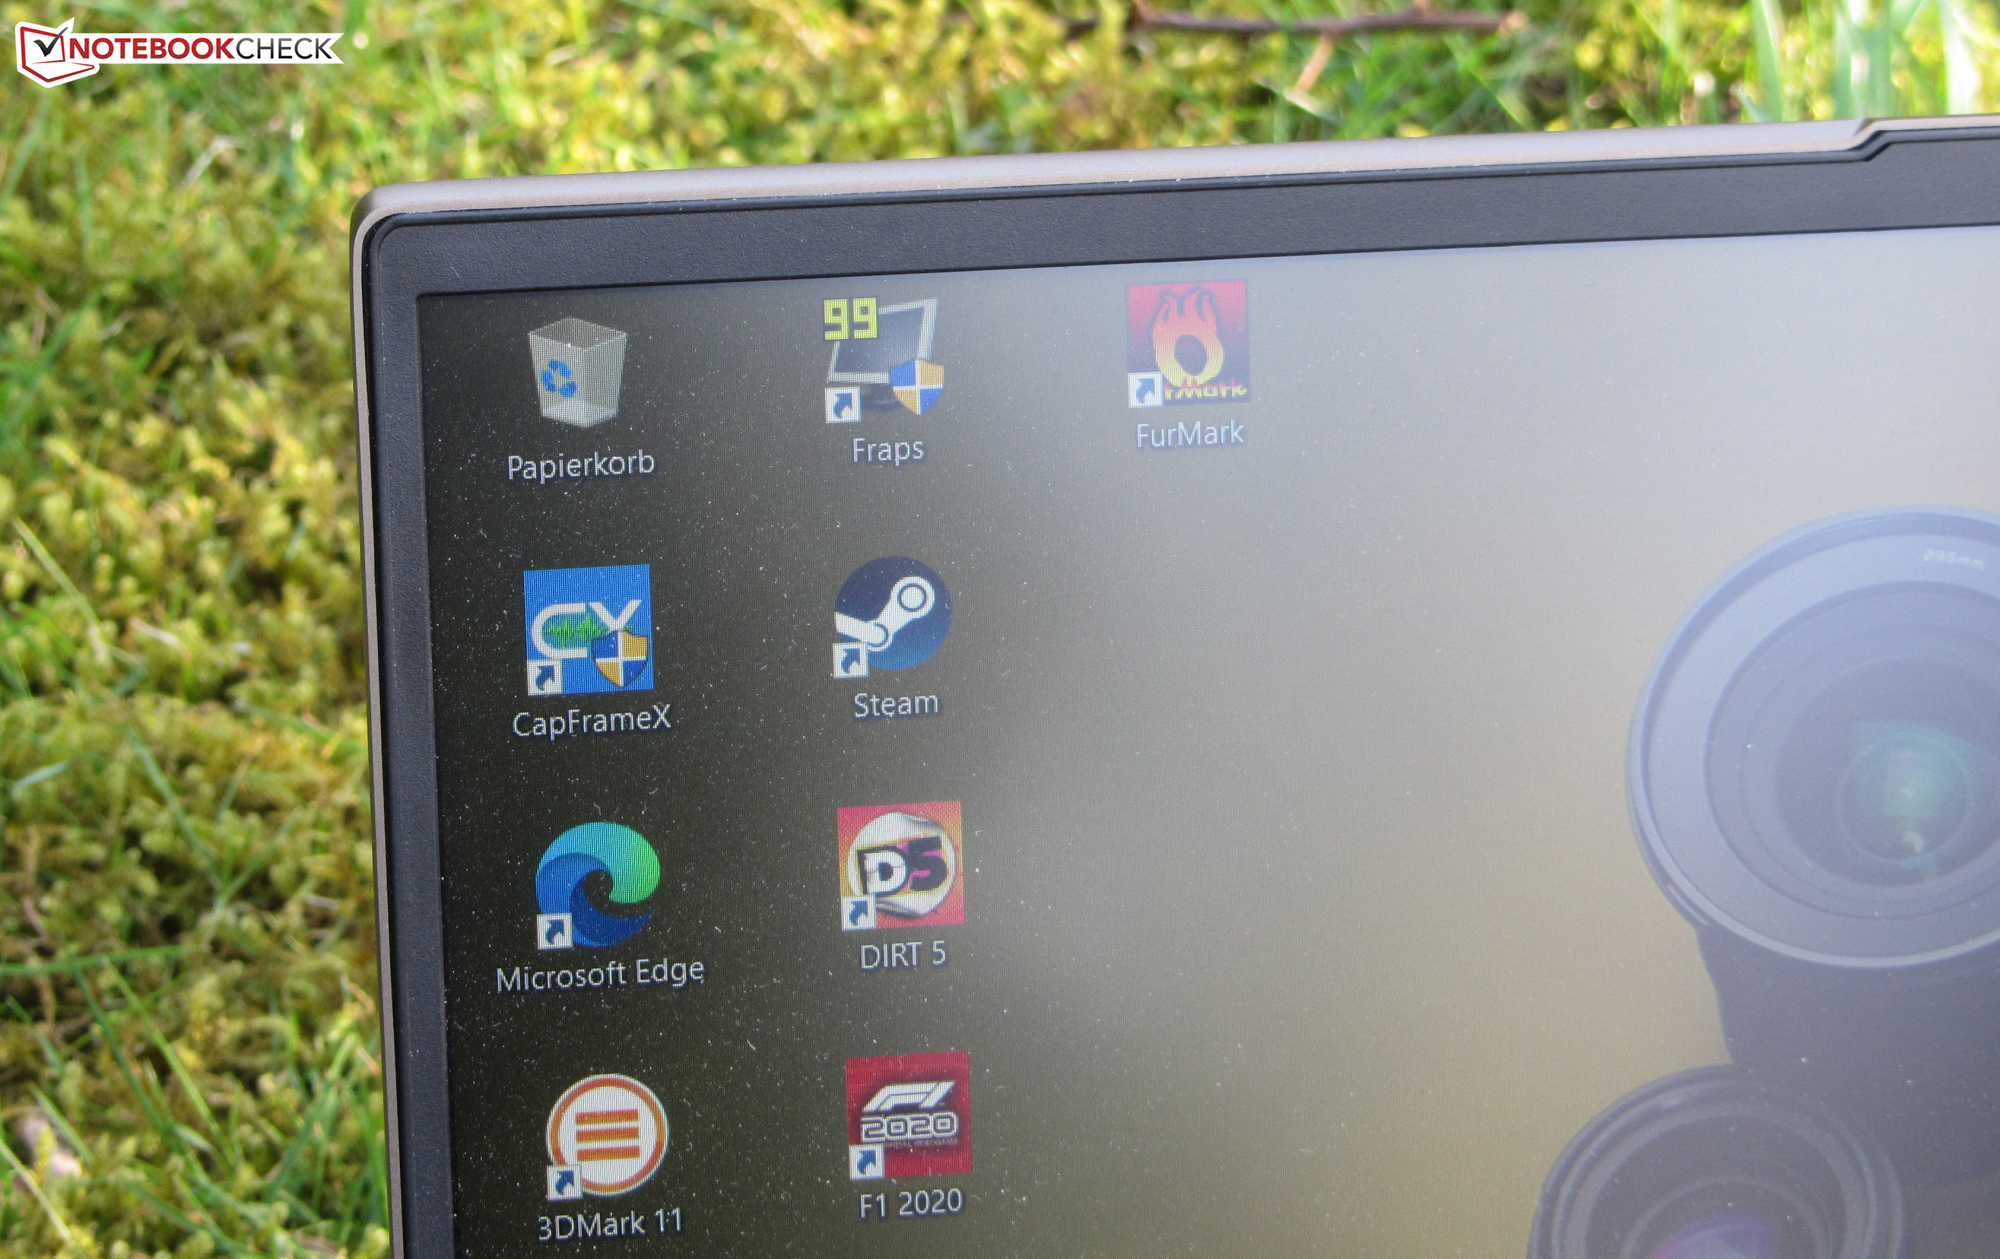
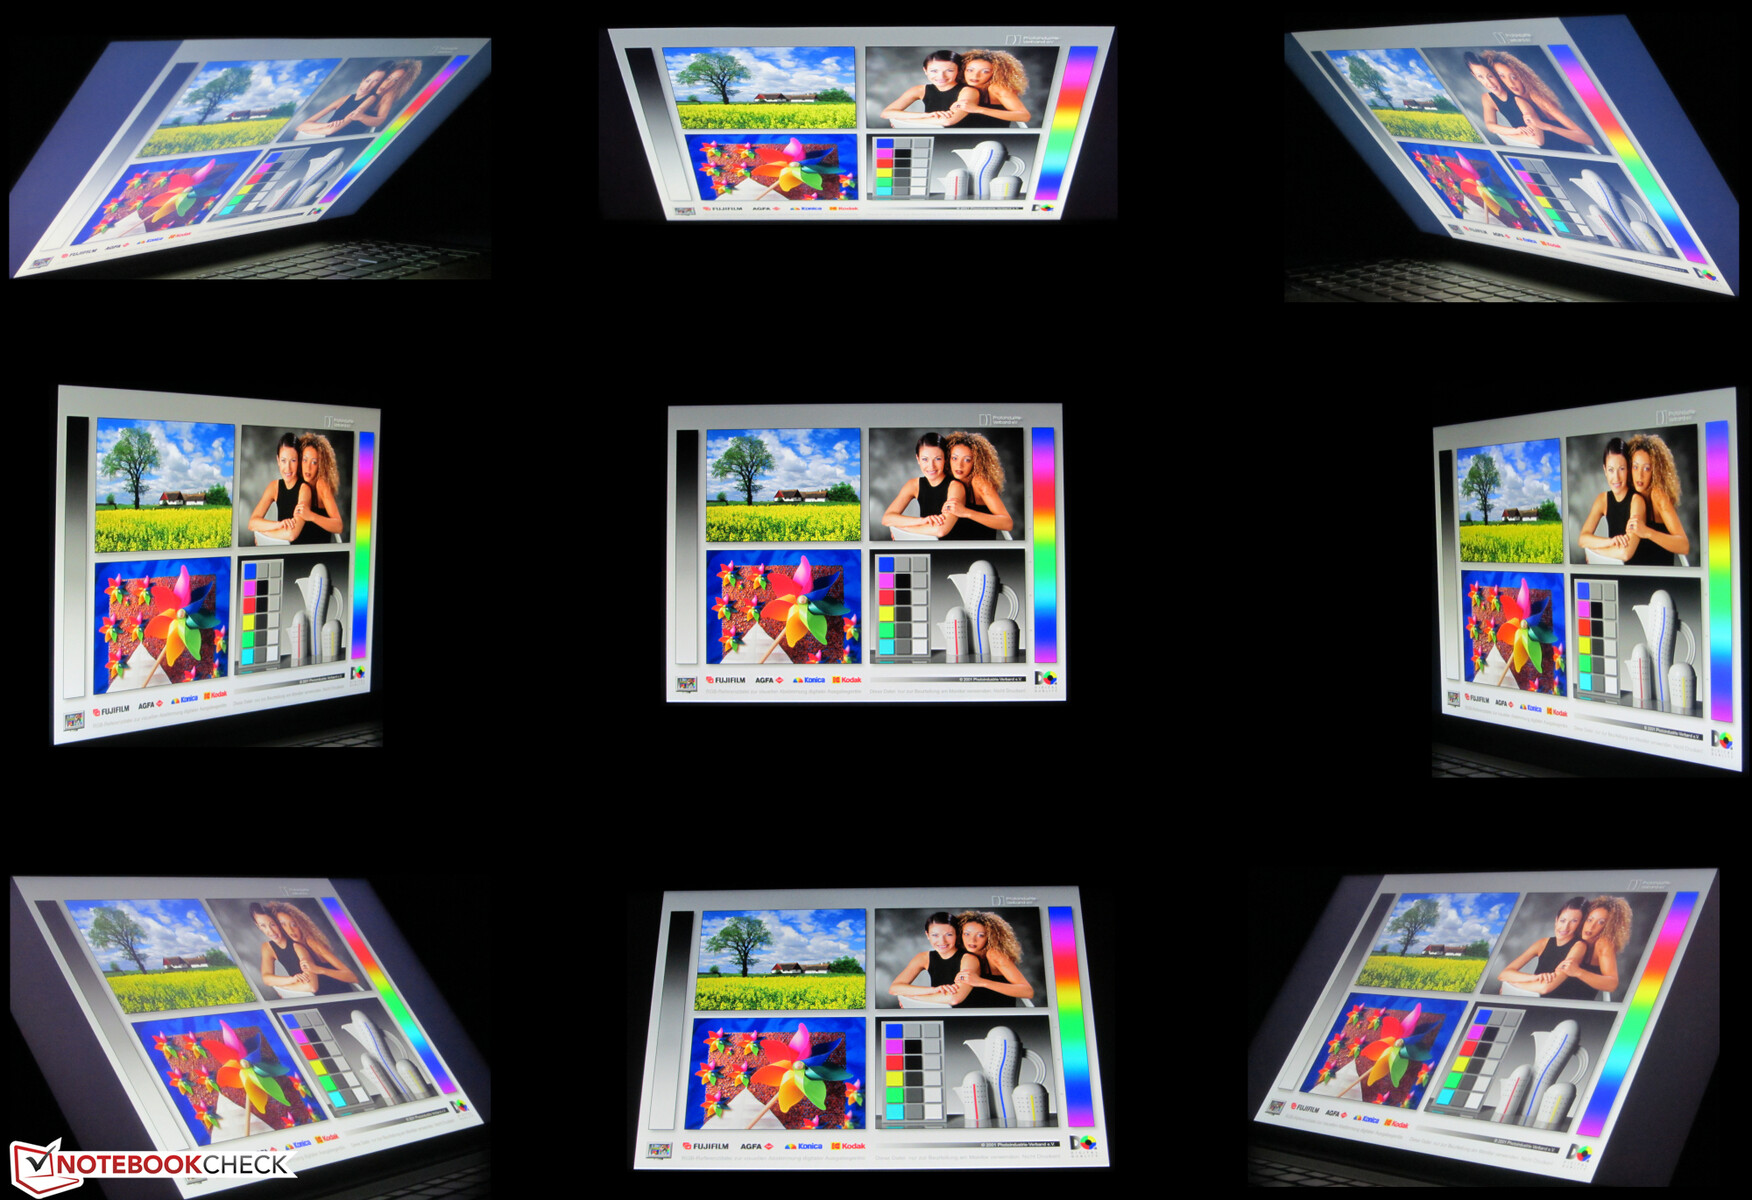
Das blickwinkelstabile IPS-Panel ist aus jeder Position heraus ablesbar. Im Freien ist ein Ablesen des Displays durchaus möglich.

Leistung - Genug für alle Anwendungsbereiche
Lenovo hat mit dem Yoga Creator 7 15IMH05 einen 15,6-Zoll-Allrounder im Sortiment, der genug Rechenleistung für Office, Internet, Videoschnitt, Bildbearbeitung und Gaming bereitstellt.
Testbedingungen
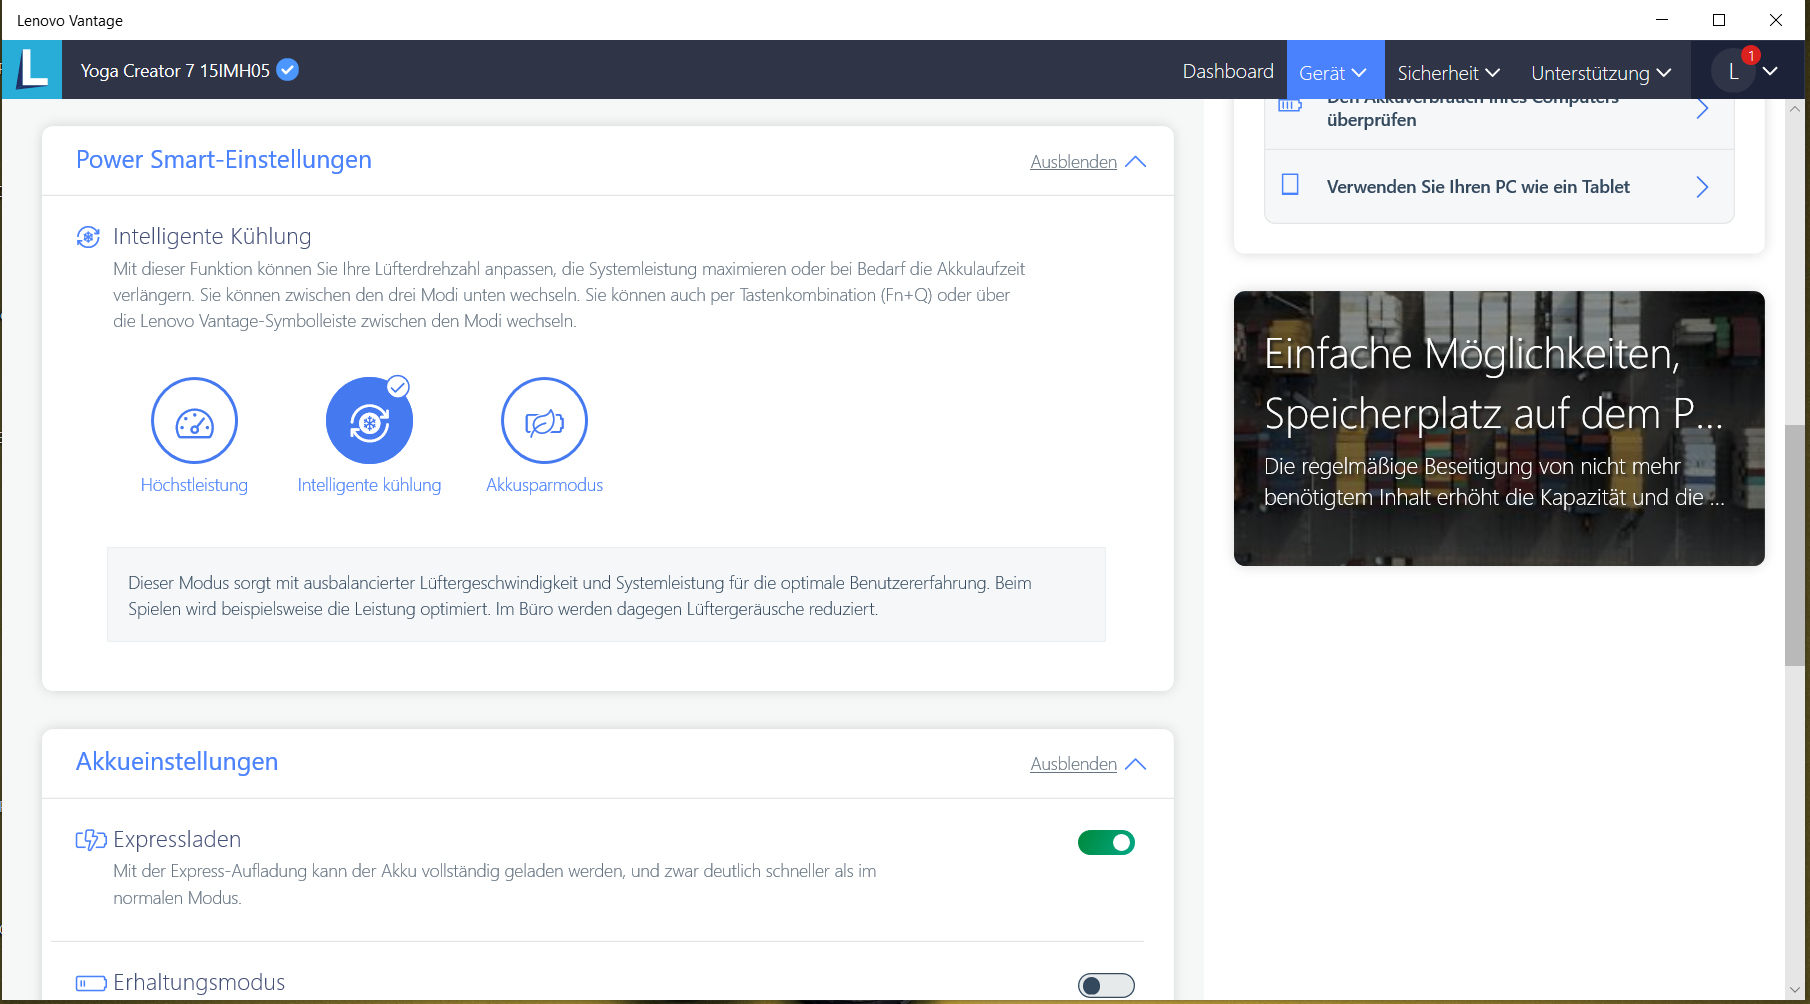
Das Notebook bietet drei Energieprofile: "Intelligente Kühlung", "Höchstleistung", "Akkusparmodus". Zwischen den Profilen kann über die Tastenkombination "Fn" + "Q" oder mittels der vorinstallierten Lenovo-Vantage-Software gewechselt werden. Wir haben unseren Test bei aktivem Modus "Intelligente Kühlung" durchgeführt. Einige Benchmarks haben wir zusätzlich bei aktiven Modi "Höchstleistung" und "Akkusparmodus" durchlaufen lassen. Die Resultate finden sich in den Vergleichsdiagrammen.
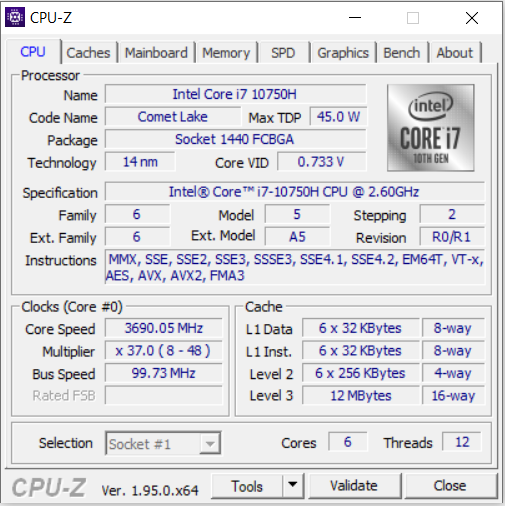
Prozessor
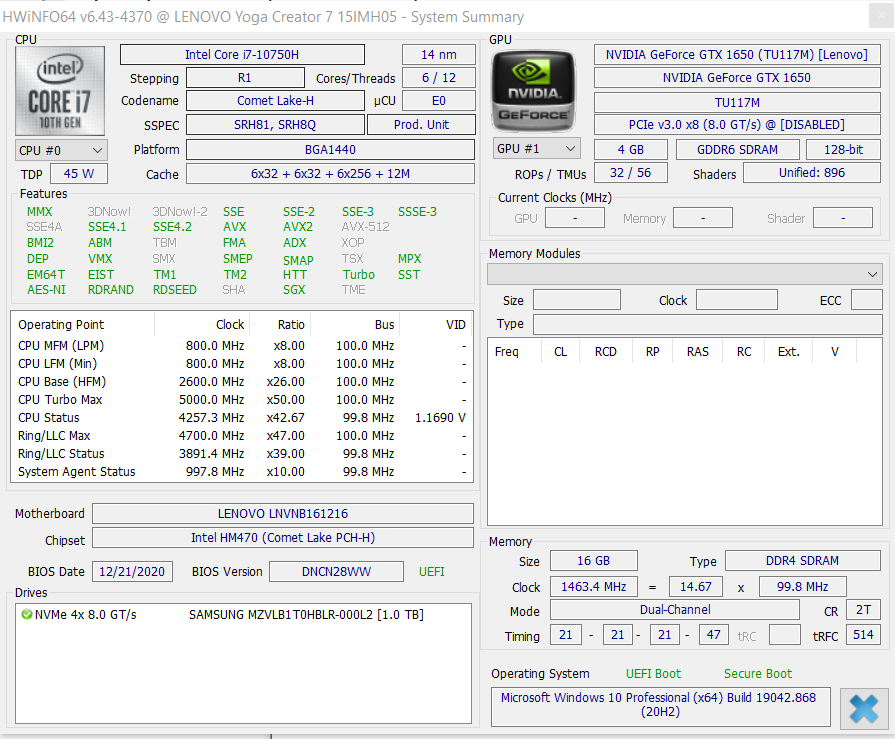
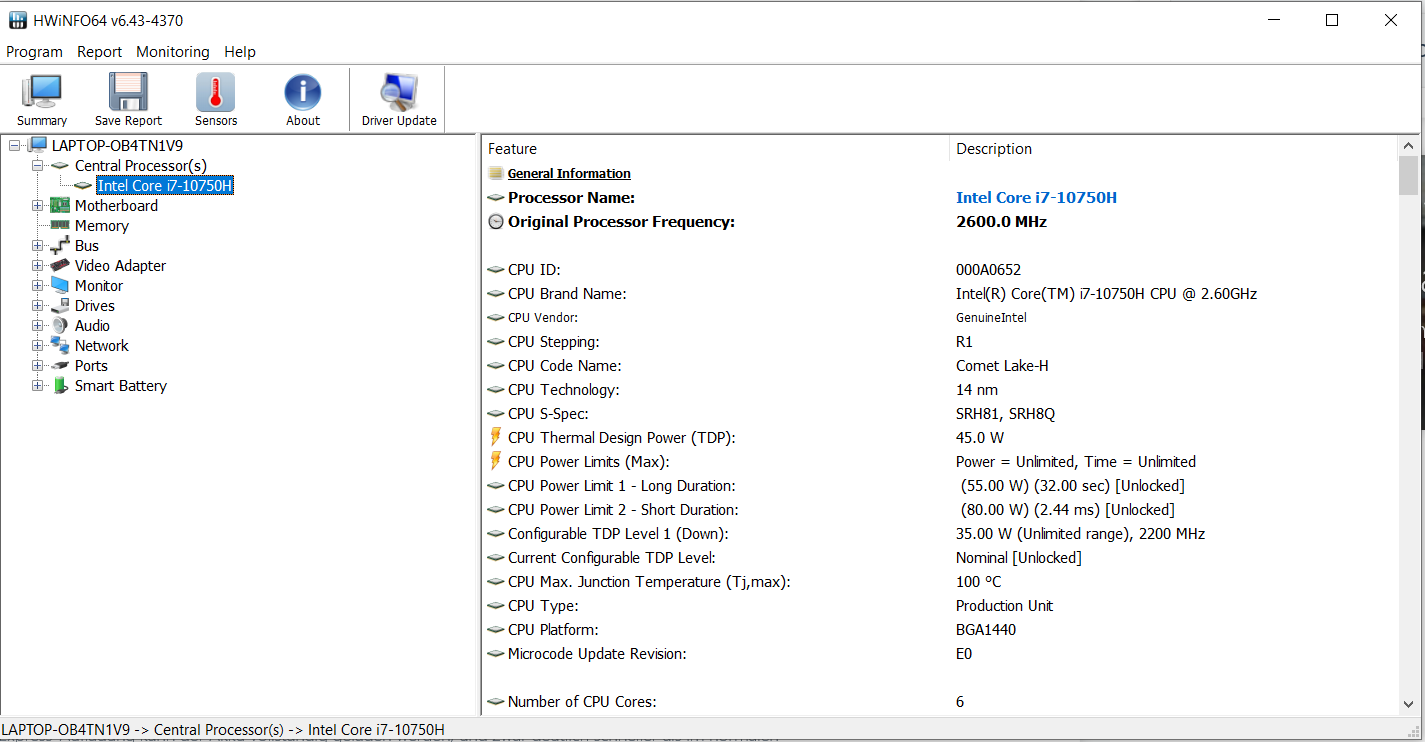
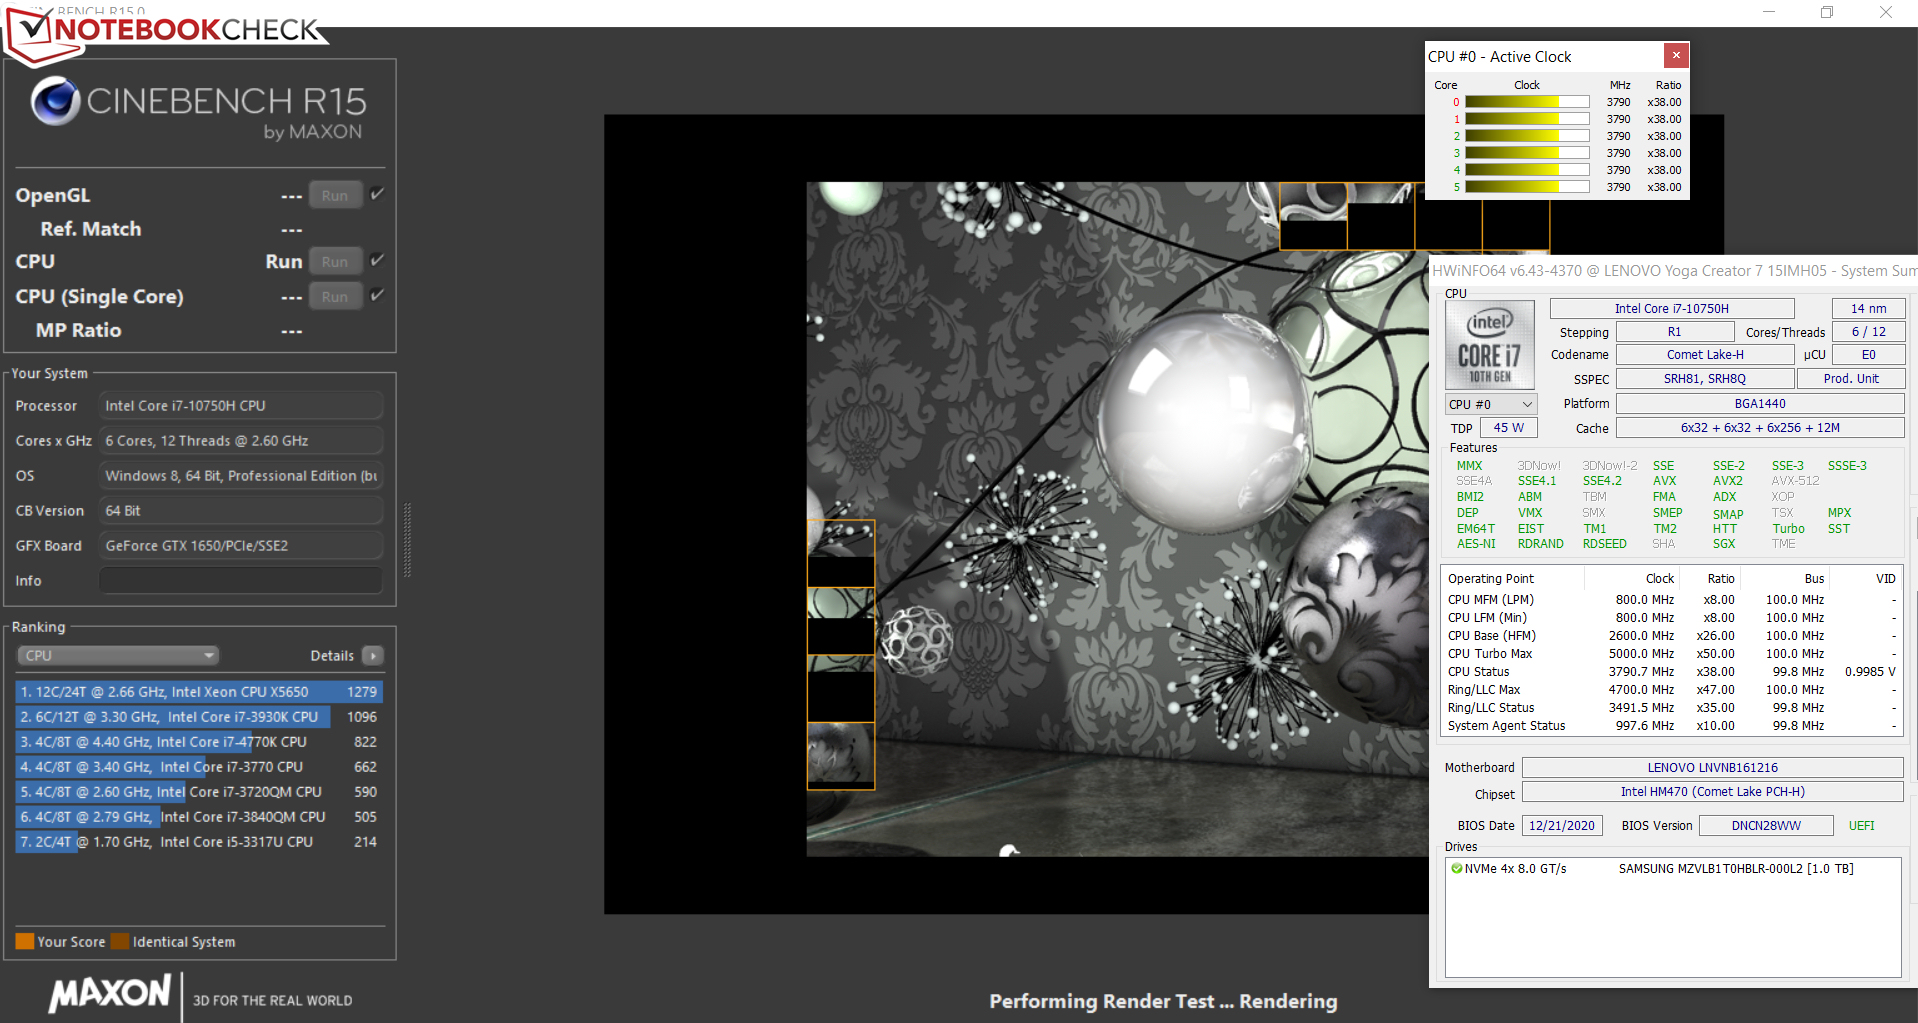
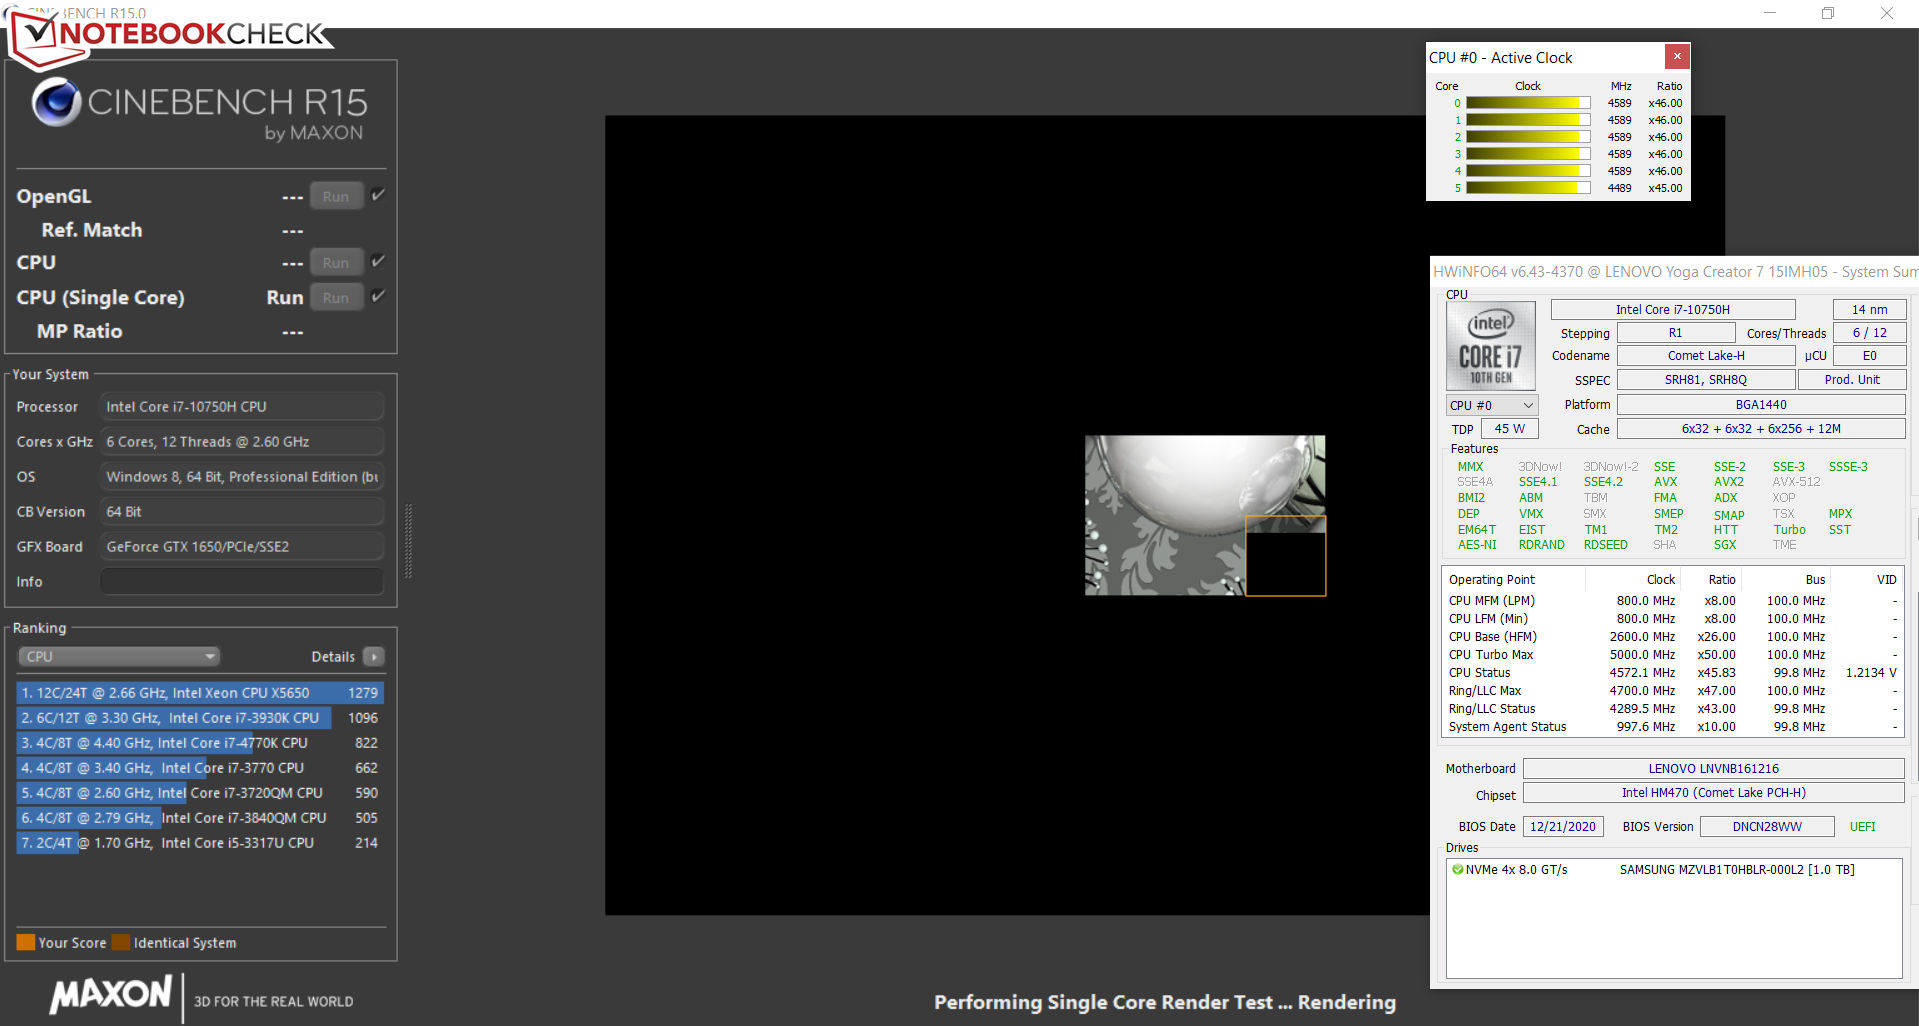
Der Core-i7-10750H-Sechskernprozessor (Comet Lake) arbeitet mit einem Basistakt von 2,6 GHz. Per Turbo ist eine Steigerung auf 4,3 GHz (sechs Kerne) bis 5 GHz (ein Kern) möglich. Hyperthreading (zwei Threads pro Kern) wird unterstützt.
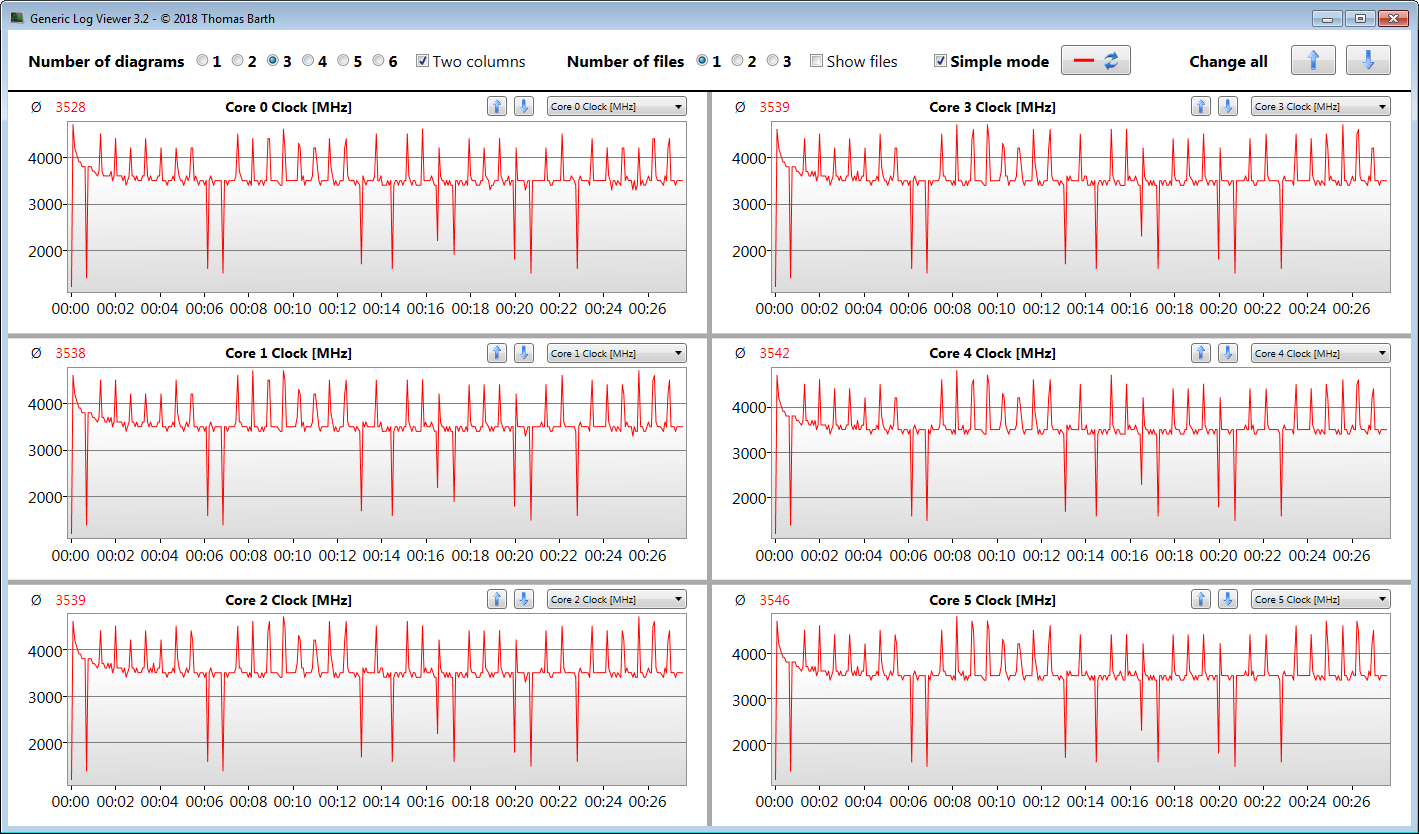
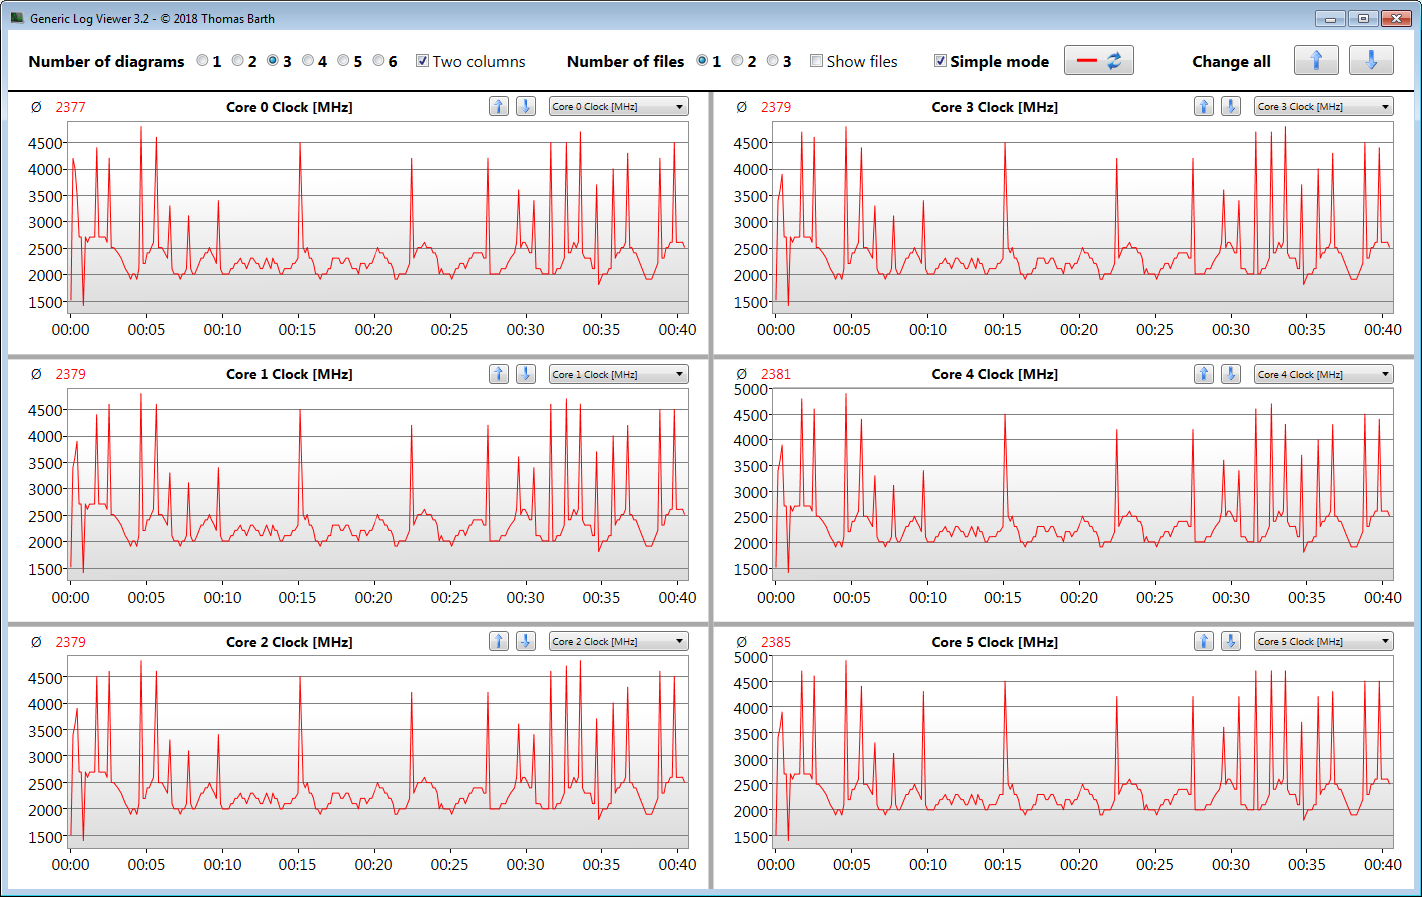
Den Multi-Thread-Test des Cinebench-R15-Benchmarks bearbeitet der Prozessor kurzzeitig mit 3,7 bis 4,2 GHz. Dann sinkt der Takt auf 3,6 bis 3,8 GHz. Der Single-Thread-Test wird mit 4,2 bis 4,8 GHz durchlaufen. Im Akkubetrieb liegen die Taktraten bei 3,3 bis 3,6 GHz (Multi-Thread) bzw. 3,5 bis 4,2 GHz (Single Thread).
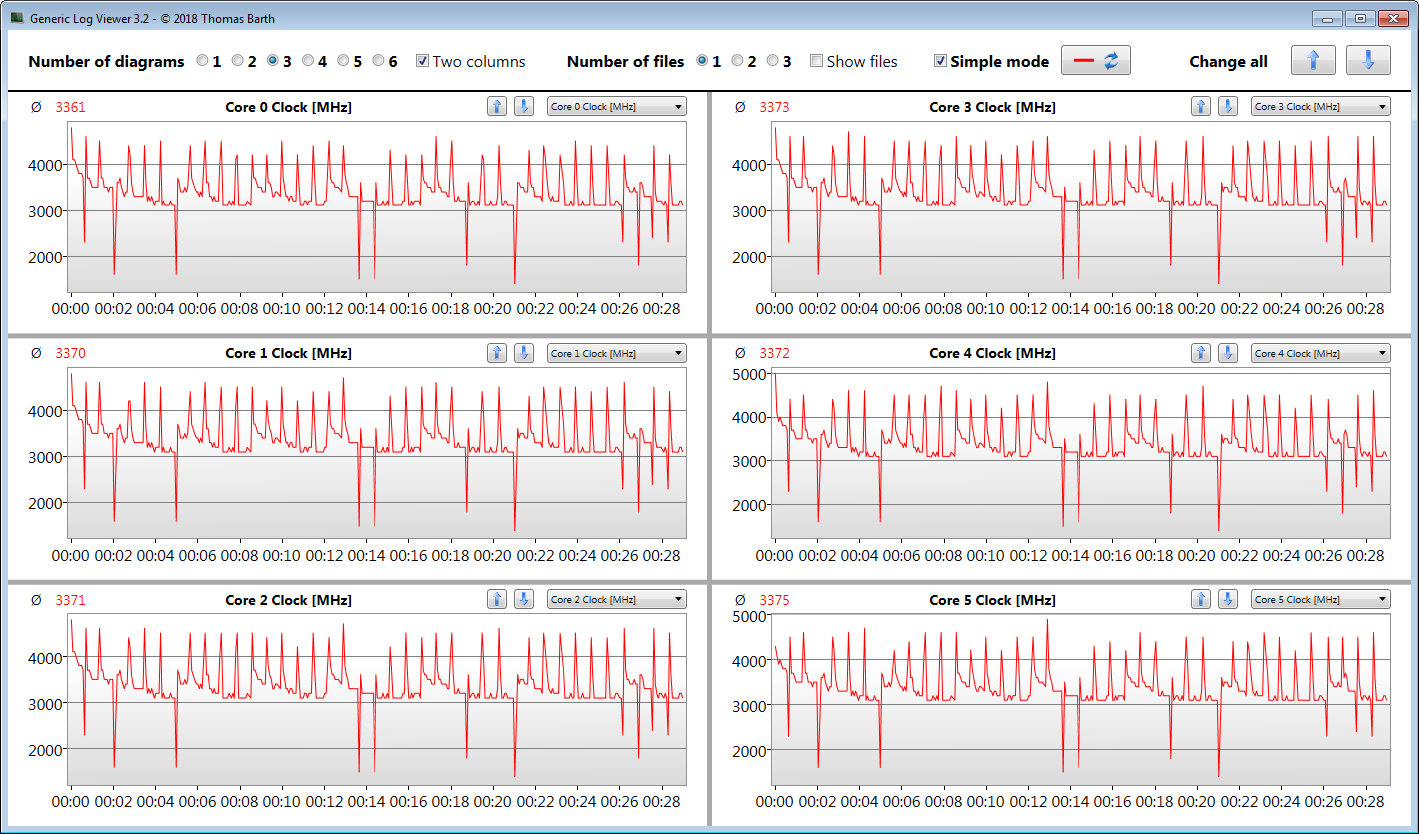
Ob der CPU-Turbo im Netzbetrieb dauerhaft genutzt wird, überprüfen wir, indem wir den Multi-Thread-Test des Cinebench-R15-Benchmarks für mindestens 30 Minuten in einer Schleife laufen lassen. Der Turbo kommt auf mittlerem Niveau zum Einsatz. Ist das Profil "Höchstleistungsmodus" aktiv, werden etwas höhere Arbeitsgeschwindigkeiten erreicht.
| Cinebench R15 | |
| CPU Single 64Bit | |
| Durchschnitt der Klasse Multimedia (184.8 - 326, n=64, der letzten 2 Jahre) | |
| Schenker Vision 15 | |
| Dell XPS 15 9500 Core i7 4K UHD | |
| Lenovo Yoga Creator 7 15IMH05 82DS000VGE | |
| Asus ZenBook UX535-M01440 | |
| HP Envy 15-ep0098nr | |
| MSI Summit E15 A11SCST | |
| Durchschnittliche Intel Core i7-10750H (184 - 213, n=45) | |
| CPU Multi 64Bit | |
| Durchschnitt der Klasse Multimedia (856 - 5224, n=66, der letzten 2 Jahre) | |
| Dell XPS 15 9500 Core i7 4K UHD | |
| Asus ZenBook UX535-M01440 | |
| HP Envy 15-ep0098nr | |
| Durchschnittliche Intel Core i7-10750H (804 - 1418, n=50) | |
| Lenovo Yoga Creator 7 15IMH05 82DS000VGE (Hoechstleistung) | |
| Lenovo Yoga Creator 7 15IMH05 82DS000VGE | |
| Schenker Vision 15 | |
| Lenovo Yoga Creator 7 15IMH05 82DS000VGE (Akkusparmodus) | |
| MSI Summit E15 A11SCST | |
| Blender - v2.79 BMW27 CPU | |
| Lenovo Yoga Creator 7 15IMH05 82DS000VGE (Akkusparmodus) | |
| MSI Summit E15 A11SCST | |
| Schenker Vision 15 | |
| Lenovo Yoga Creator 7 15IMH05 82DS000VGE | |
| Lenovo Yoga Creator 7 15IMH05 82DS000VGE (Hoechstleistung) | |
| Asus ZenBook UX535-M01440 | |
| Durchschnittliche Intel Core i7-10750H (322 - 587, n=43) | |
| Dell XPS 15 9500 Core i7 4K UHD | |
| HP Envy 15-ep0098nr | |
| Durchschnitt der Klasse Multimedia (100 - 557, n=63, der letzten 2 Jahre) | |
| 7-Zip 18.03 | |
| 7z b 4 -mmt1 | |
| Durchschnitt der Klasse Multimedia (3666 - 7545, n=61, der letzten 2 Jahre) | |
| Dell XPS 15 9500 Core i7 4K UHD | |
| Lenovo Yoga Creator 7 15IMH05 82DS000VGE (Akkusparmodus) | |
| Lenovo Yoga Creator 7 15IMH05 82DS000VGE (Hoechstleistung) | |
| Lenovo Yoga Creator 7 15IMH05 82DS000VGE | |
| Asus ZenBook UX535-M01440 | |
| MSI Summit E15 A11SCST | |
| Durchschnittliche Intel Core i7-10750H (4504 - 5470, n=43) | |
| Schenker Vision 15 | |
| HP Envy 15-ep0098nr | |
| 7z b 4 | |
| Durchschnitt der Klasse Multimedia (26062 - 130368, n=60, der letzten 2 Jahre) | |
| Dell XPS 15 9500 Core i7 4K UHD | |
| Lenovo Yoga Creator 7 15IMH05 82DS000VGE (Hoechstleistung) | |
| Lenovo Yoga Creator 7 15IMH05 82DS000VGE | |
| Durchschnittliche Intel Core i7-10750H (26040 - 37345, n=43) | |
| Asus ZenBook UX535-M01440 | |
| HP Envy 15-ep0098nr | |
| Lenovo Yoga Creator 7 15IMH05 82DS000VGE (Akkusparmodus) | |
| Schenker Vision 15 | |
| MSI Summit E15 A11SCST | |
| Cinebench R20 | |
| CPU (Single Core) | |
| Durchschnitt der Klasse Multimedia (425 - 853, n=62, der letzten 2 Jahre) | |
| MSI Summit E15 A11SCST | |
| Schenker Vision 15 | |
| Dell XPS 15 9500 Core i7 4K UHD | |
| Lenovo Yoga Creator 7 15IMH05 82DS000VGE (Hoechstleistung) | |
| Durchschnittliche Intel Core i7-10750H (431 - 504, n=43) | |
| Asus ZenBook UX535-M01440 | |
| Lenovo Yoga Creator 7 15IMH05 82DS000VGE | |
| Lenovo Yoga Creator 7 15IMH05 82DS000VGE (Akkusparmodus) | |
| HP Envy 15-ep0098nr | |
| CPU (Multi Core) | |
| Durchschnitt der Klasse Multimedia (1887 - 12912, n=62, der letzten 2 Jahre) | |
| Dell XPS 15 9500 Core i7 4K UHD | |
| HP Envy 15-ep0098nr | |
| Asus ZenBook UX535-M01440 | |
| Durchschnittliche Intel Core i7-10750H (1749 - 3325, n=43) | |
| Lenovo Yoga Creator 7 15IMH05 82DS000VGE (Hoechstleistung) | |
| Lenovo Yoga Creator 7 15IMH05 82DS000VGE | |
| MSI Summit E15 A11SCST | |
| Schenker Vision 15 | |
| Lenovo Yoga Creator 7 15IMH05 82DS000VGE (Akkusparmodus) | |
| Geekbench 5.5 | |
| Single-Core | |
| Durchschnitt der Klasse Multimedia (805 - 2974, n=60, der letzten 2 Jahre) | |
| Schenker Vision 15 | |
| MSI Summit E15 A11SCST | |
| Dell XPS 15 9500 Core i7 4K UHD | |
| HP Envy 15-ep0098nr | |
| Asus ZenBook UX535-M01440 | |
| Lenovo Yoga Creator 7 15IMH05 82DS000VGE (Akkusparmodus) | |
| Lenovo Yoga Creator 7 15IMH05 82DS000VGE (Hoechstleistung) | |
| Durchschnittliche Intel Core i7-10750H (1114 - 1333, n=43) | |
| Lenovo Yoga Creator 7 15IMH05 82DS000VGE | |
| Multi-Core | |
| Durchschnitt der Klasse Multimedia (4652 - 20422, n=60, der letzten 2 Jahre) | |
| Dell XPS 15 9500 Core i7 4K UHD | |
| HP Envy 15-ep0098nr | |
| Durchschnittliche Intel Core i7-10750H (4443 - 6674, n=43) | |
| Lenovo Yoga Creator 7 15IMH05 82DS000VGE (Hoechstleistung) | |
| Lenovo Yoga Creator 7 15IMH05 82DS000VGE | |
| Schenker Vision 15 | |
| Asus ZenBook UX535-M01440 | |
| MSI Summit E15 A11SCST | |
| Lenovo Yoga Creator 7 15IMH05 82DS000VGE (Akkusparmodus) | |
| HWBOT x265 Benchmark v2.2 - 4k Preset | |
| Durchschnitt der Klasse Multimedia (5.26 - 36.1, n=61, der letzten 2 Jahre) | |
| HP Envy 15-ep0098nr | |
| Dell XPS 15 9500 Core i7 4K UHD | |
| Asus ZenBook UX535-M01440 | |
| Durchschnittliche Intel Core i7-10750H (5.54 - 11.6, n=43) | |
| Lenovo Yoga Creator 7 15IMH05 82DS000VGE (Hoechstleistung) | |
| Lenovo Yoga Creator 7 15IMH05 82DS000VGE | |
| Schenker Vision 15 | |
| MSI Summit E15 A11SCST | |
| Lenovo Yoga Creator 7 15IMH05 82DS000VGE (Akkusparmodus) | |
| LibreOffice - 20 Documents To PDF | |
| Asus ZenBook UX535-M01440 | |
| MSI Summit E15 A11SCST | |
| Lenovo Yoga Creator 7 15IMH05 82DS000VGE | |
| Durchschnittliche Intel Core i7-10750H (43.1 - 99.2, n=43) | |
| Dell XPS 15 9500 Core i7 4K UHD | |
| Durchschnitt der Klasse Multimedia (23.9 - 146.7, n=62, der letzten 2 Jahre) | |
| Lenovo Yoga Creator 7 15IMH05 82DS000VGE (Akkusparmodus) | |
| HP Envy 15-ep0098nr | |
| Schenker Vision 15 | |
| Lenovo Yoga Creator 7 15IMH05 82DS000VGE (Hoechstleistung) | |
| R Benchmark 2.5 - Overall mean | |
| MSI Summit E15 A11SCST | |
| Lenovo Yoga Creator 7 15IMH05 82DS000VGE (Akkusparmodus) | |
| Durchschnittliche Intel Core i7-10750H (0.578 - 0.708, n=42) | |
| HP Envy 15-ep0098nr | |
| Asus ZenBook UX535-M01440 | |
| Lenovo Yoga Creator 7 15IMH05 82DS000VGE | |
| Lenovo Yoga Creator 7 15IMH05 82DS000VGE (Hoechstleistung) | |
| Dell XPS 15 9500 Core i7 4K UHD | |
| Schenker Vision 15 | |
| Durchschnitt der Klasse Multimedia (0.3604 - 0.947, n=61, der letzten 2 Jahre) | |
* ... kleinere Werte sind besser
System Performance
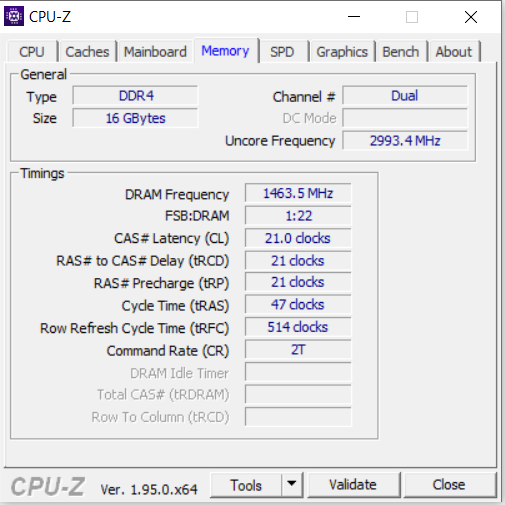
Das System arbeitet rund und flüssig. Der Core-i7-Prozessor bietet genug Rechenleistung für alle gängigen Anwendungsszenarien. Der dedizierte Grafikkern ermöglicht die Nutzung von Computerspielen. Dazu gesellen sich gute PC-Mark-Resultate. Der Arbeitsspeicher (16 GB, DDR4-2933, onboard) arbeitet im Dual-Channel-Modus. Eine Erweiterung des Speichers ist nicht möglich.
| PCMark 8 Home Score Accelerated v2 | 3980 Punkte | |
| PCMark 8 Creative Score Accelerated v2 | 5185 Punkte | |
| PCMark 8 Work Score Accelerated v2 | 5217 Punkte | |
| PCMark 10 Score | 5333 Punkte | |
Hilfe | ||
DPC-Latenzen
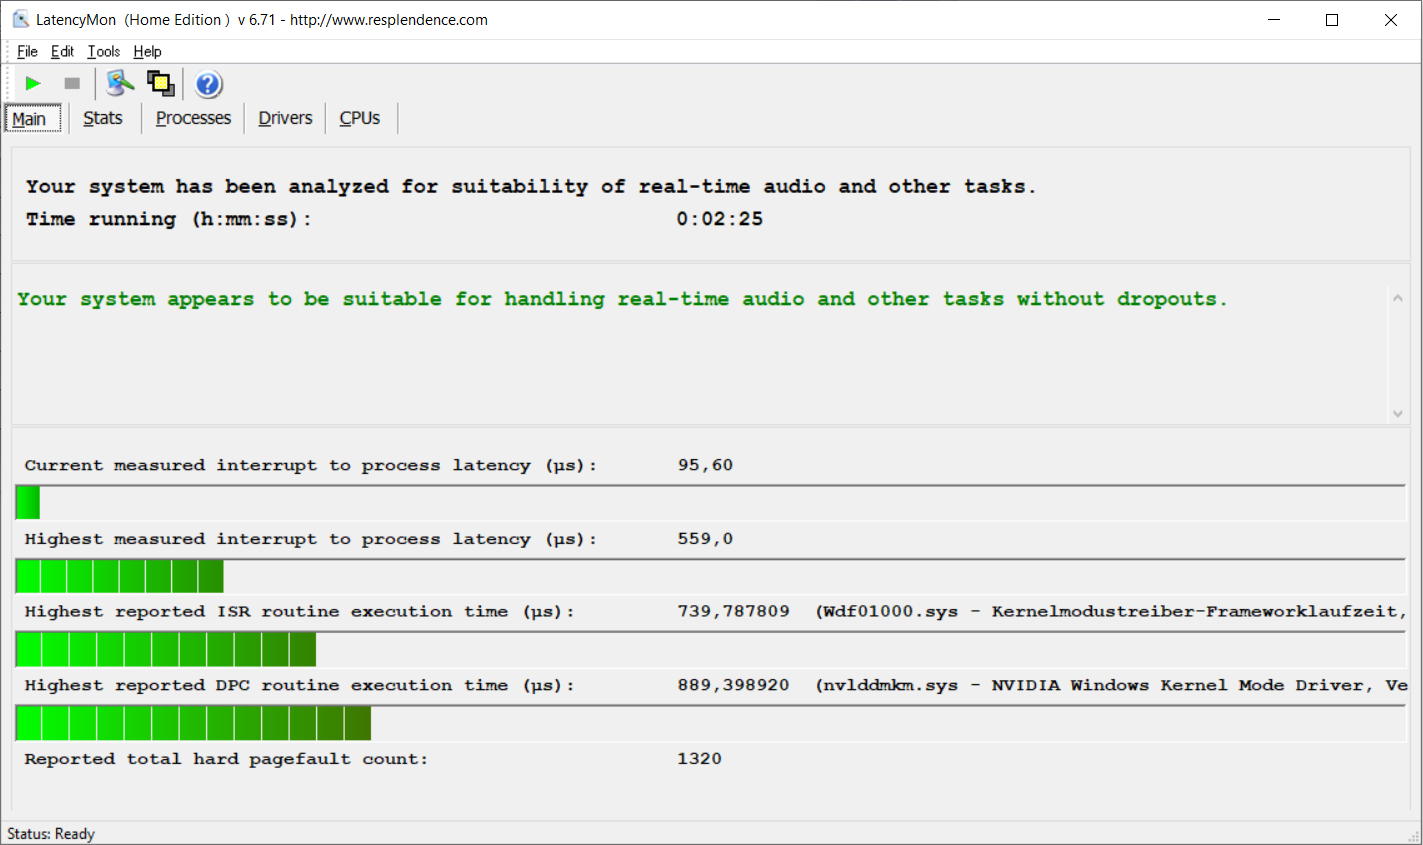
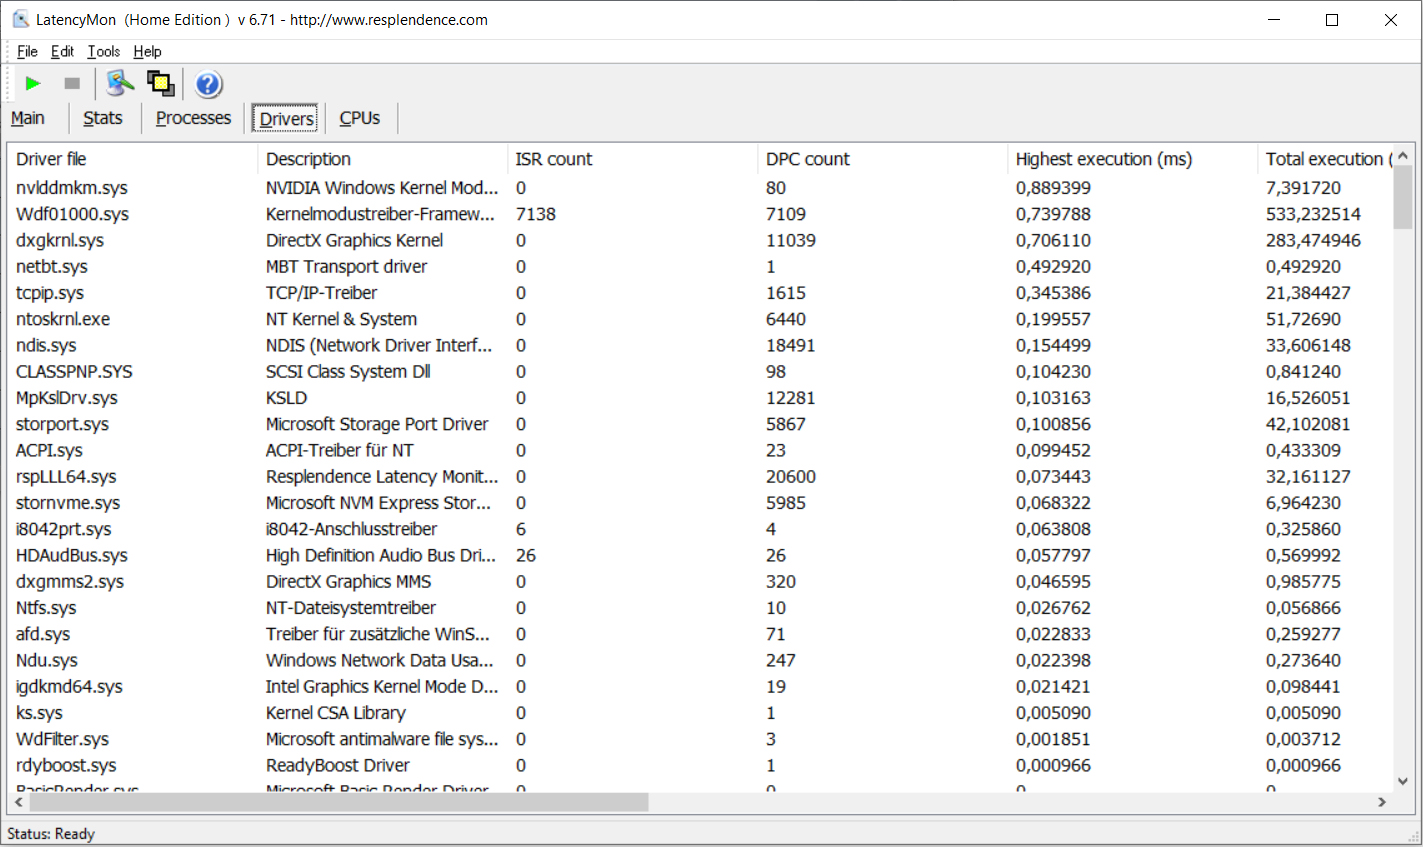
In unserem standardisierten Latency-Monitor-Test (Websurfen, 4K-Videowiedergabe, Prime95 High-Load) konnten wir keine Auffälligkeiten bei den DPC-Latenzen beobachten. Das System scheint für Video- und Audiobearbeitung in Echtzeit geeignet zu sein.
| DPC Latencies / LatencyMon - interrupt to process latency (max), Web, Youtube, Prime95 | |
| Dell XPS 15 9500 Core i7 4K UHD | |
| Schenker Vision 15 | |
| HP Envy 15-ep0098nr | |
| MSI Summit E15 A11SCST | |
| Asus ZenBook UX535-M01440 | |
| Lenovo Yoga Creator 7 15IMH05 82DS000VGE | |
* ... kleinere Werte sind besser
Massenspeicher
Lenovo bestückt das Yoga Creator 7 mit einer 1 TB fassenden NVMe-SSD aus dem Hause Samsung, die mit guten Transferraten aufwartet. Platz für weitere Speichermedien bietet das Notebook nicht.


| Lenovo Yoga Creator 7 15IMH05 82DS000VGE Samsung PM981a MZVLB1T0HBLR | Asus ZenBook UX535-M01440 WDC PC SN730 SDBPNTY-1T00 | HP Envy 15-ep0098nr Intel Optane Memory H10 with Solid State Storage 32GB + 512GB HBRPEKNX0202A(L/H) | Schenker Vision 15 Samsung SSD 980 Pro 1TB MZ-V8P1T0BW | Dell XPS 15 9500 Core i7 4K UHD SK Hynix PC611 512GB | MSI Summit E15 A11SCST Phison 1TB SM2801T24GKBB4S-E162 | Durchschnittliche Samsung PM981a MZVLB1T0HBLR | |
|---|---|---|---|---|---|---|---|
| CrystalDiskMark 5.2 / 6 | -11% | -10% | 85% | -8% | 25% | 4% | |
| Write 4K (MB/s) | 125.9 | 110 -13% | 100.2 -20% | 238.1 89% | 123.3 -2% | 242.9 93% | 139.7 ? 11% |
| Read 4K (MB/s) | 45.78 | 43.44 -5% | 112.8 146% | 79.2 73% | 41.85 -9% | 54.6 19% | 49.9 ? 9% |
| Write Seq (MB/s) | 2311 | 1957 -15% | 537 -77% | 4139 79% | 2054 -11% | 2420 5% | 2036 ? -12% |
| Read Seq (MB/s) | 1511 | 1615 7% | 1270 -16% | 4133 174% | 1617 7% | 2300 52% | 2014 ? 33% |
| Write 4K Q32T1 (MB/s) | 446.7 | 341.6 -24% | 480.6 8% | 697 56% | 413 -8% | 392.7 -12% | 461 ? 3% |
| Read 4K Q32T1 (MB/s) | 548 | 364.3 -34% | 364.9 -33% | 758 38% | 377.5 -31% | 667 22% | 499 ? -9% |
| Write Seq Q32T1 (MB/s) | 3020 | 3081 2% | 1224 -59% | 5187 72% | 2705 -10% | 2424 -20% | 2903 ? -4% |
| Read Seq Q32T1 (MB/s) | 3518 | 3251 -8% | 2635 -25% | 7117 102% | 3442 -2% | 4944 41% | 3479 ? -1% |
| AS SSD | -16% | -57% | 62% | -28% | 16% | 6% | |
| Seq Read (MB/s) | 2078 | 1886 -9% | 1005 -52% | 5427 161% | 2072 0% | 3597 73% | 2553 ? 23% |
| Seq Write (MB/s) | 2441 | 1221 -50% | 436.8 -82% | 3886 59% | 1486 -39% | 2101 -14% | 2084 ? -15% |
| 4K Read (MB/s) | 53.2 | 41.16 -23% | 51.5 -3% | 72.9 37% | 47.41 -11% | 62.5 17% | 53.1 ? 0% |
| 4K Write (MB/s) | 107 | 101.2 -5% | 88 -18% | 219.3 105% | 117.6 10% | 208.9 95% | 131.2 ? 23% |
| 4K-64 Read (MB/s) | 1533 | 1022 -33% | 517 -66% | 2209 44% | 967 -37% | 1145 -25% | 1477 ? -4% |
| 4K-64 Write (MB/s) | 1526 | 1618 6% | 839 -45% | 2265 48% | 715 -53% | 1482 -3% | 1805 ? 18% |
| Access Time Read * (ms) | 0.051 | 0.058 -14% | 0.088 -73% | 0.033 35% | 0.057 -12% | 0.05 2% | 0.04983 ? 2% |
| Access Time Write * (ms) | 0.036 | 0.037 -3% | 0.151 -319% | 0.02 44% | 0.096 -167% | 0.019 47% | 0.04222 ? -17% |
| Score Read (Points) | 1794 | 1252 -30% | 669 -63% | 2825 57% | 1222 -32% | 1567 -13% | 1786 ? 0% |
| Score Write (Points) | 1877 | 1841 -2% | 970 -48% | 2873 53% | 981 -48% | 1901 1% | 2144 ? 14% |
| Score Total (Points) | 4613 | 3706 -20% | 1972 -57% | 7069 53% | 2809 -39% | 4207 -9% | 4826 ? 5% |
| Copy ISO MB/s (MB/s) | 1633 | 1611 -1% | 1173 -28% | 2775 70% | 1999 22% | 2209 35% | 2098 ? 28% |
| Copy Program MB/s (MB/s) | 549 | 509 -7% | 769 40% | 662 21% | 627 14% | 455.2 -17% | 500 ? -9% |
| Copy Game MB/s (MB/s) | 940 | 677 -28% | 1045 11% | 1655 76% | 1001 6% | 1225 30% | 1132 ? 20% |
| Durchschnitt gesamt (Programm / Settings) | -14% /
-14% | -34% /
-40% | 74% /
70% | -18% /
-21% | 21% /
19% | 5% /
5% |
* ... kleinere Werte sind besser
Dauerleistung Lesen: DiskSpd Read Loop, Queue Depth 8
Grafikkarte
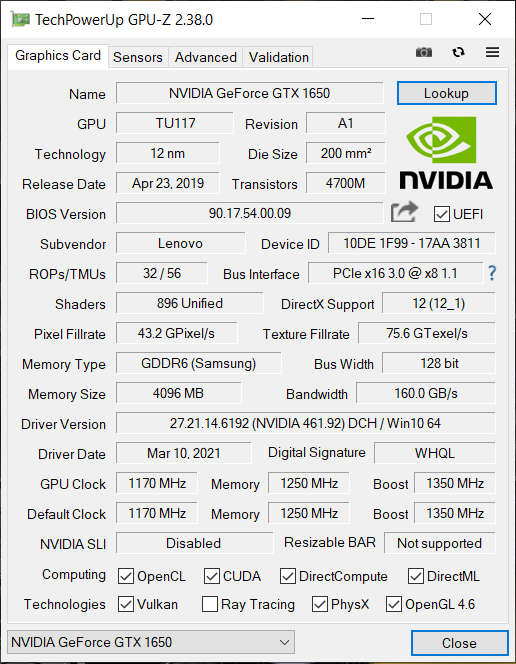
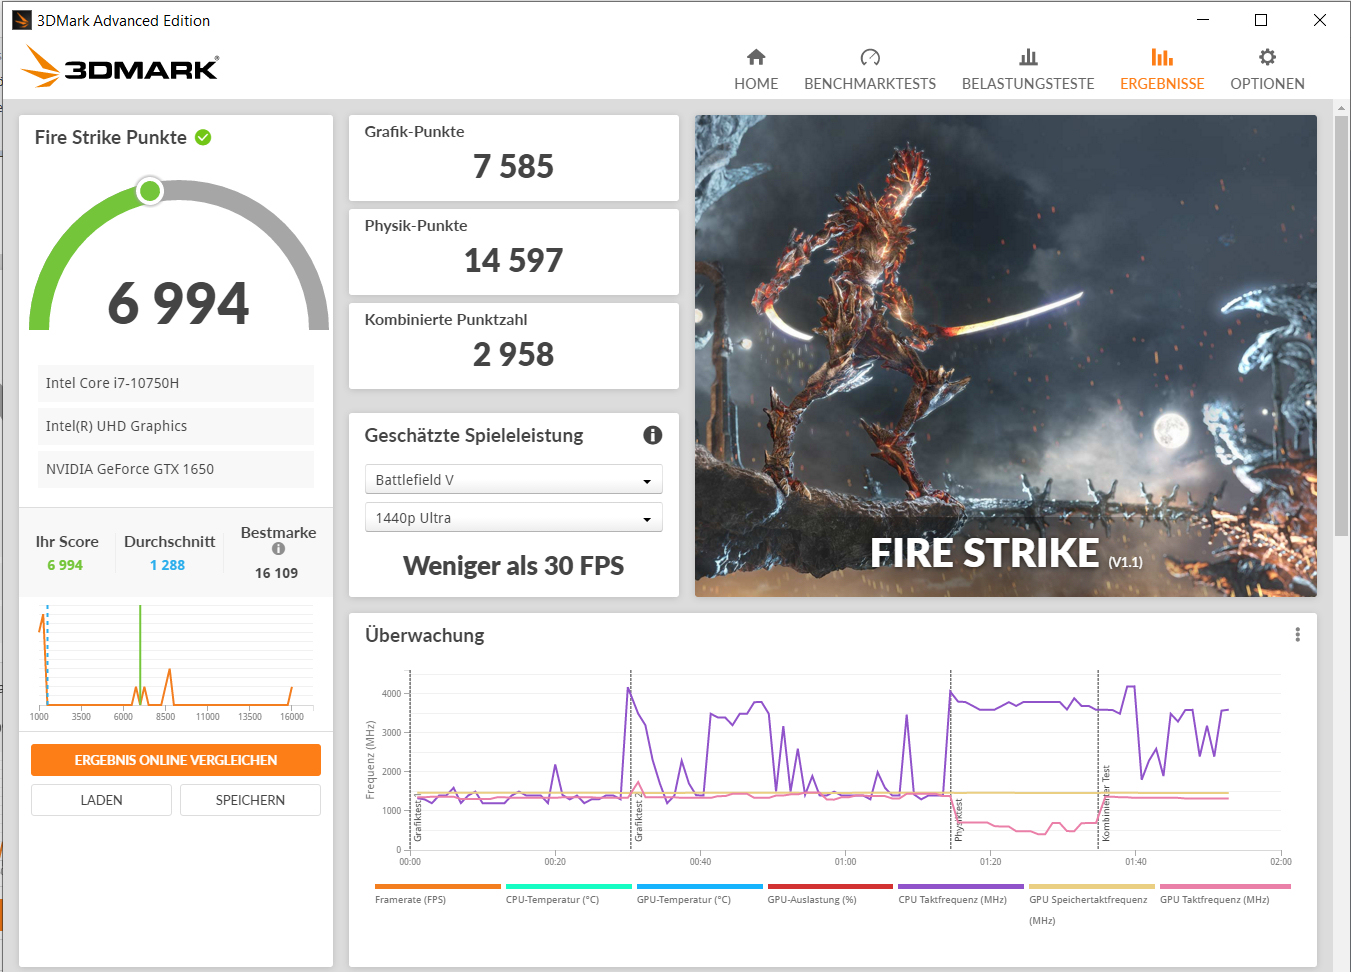
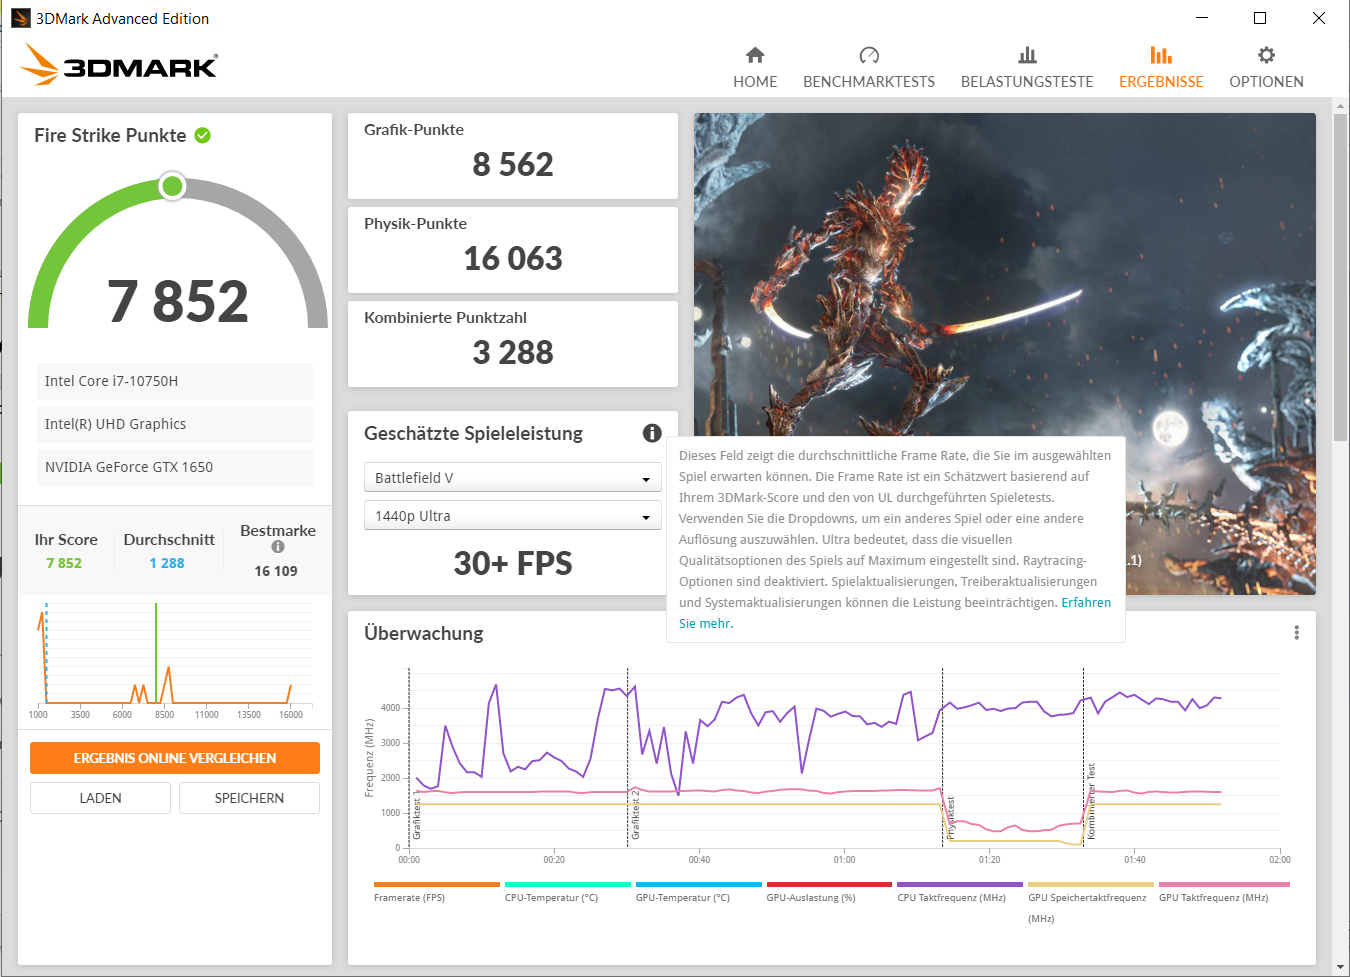
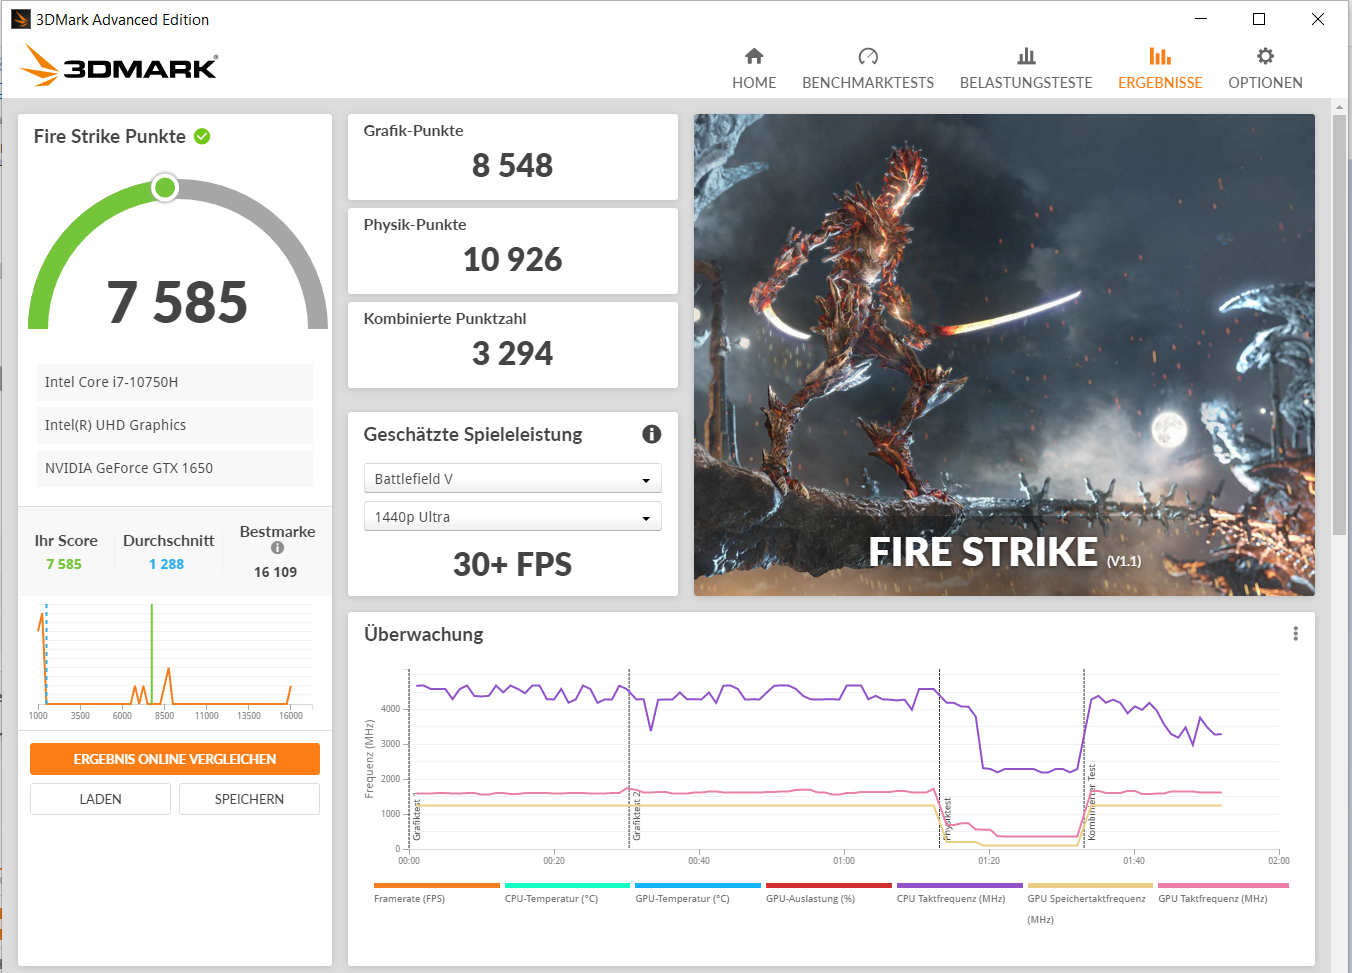
Lenovo bestückt das Yoga Creator 7 mit einer leistungsreduzierten Version des GeForce-GTX-1650-Grafikkerns. Statt mit der seitens Nvidia vorgesehen TGP von 50 Watt, arbeitet das hier verbaute Modell mit einer TGP von 40 Watt. Damit ordnet sich die GPU knapp oberhalb der Max-Q-Variante der GTX-1650-GPU (TGP: 35 Watt) ein. Die Resultate in den 3D-Mark-Benchmarks fallen entsprechend aus. Die Energieprofile des Notebooks haben keinen Einfluss auf die Grafikleistung.
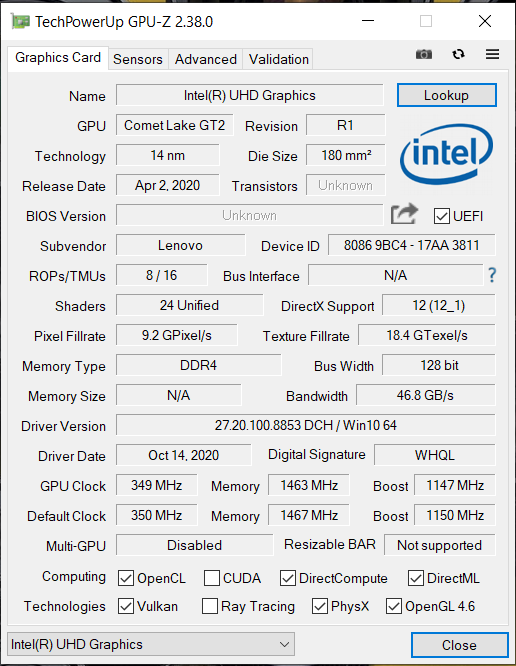
Die GTX-1650-GPU (Turing) gehört der Mittelklasse an. Ihr steht schneller GDDR6-Grafikspeicher (4.096 MB) zur Seite. Die in die CPU integrierte UHD-Graphics-630-GPU ist aktiv und das Notebook arbeitet mit Nvidias Umschaltgrafiklösung Optimus. Die GTX 1650 kann im BIOS deaktiviert werden.
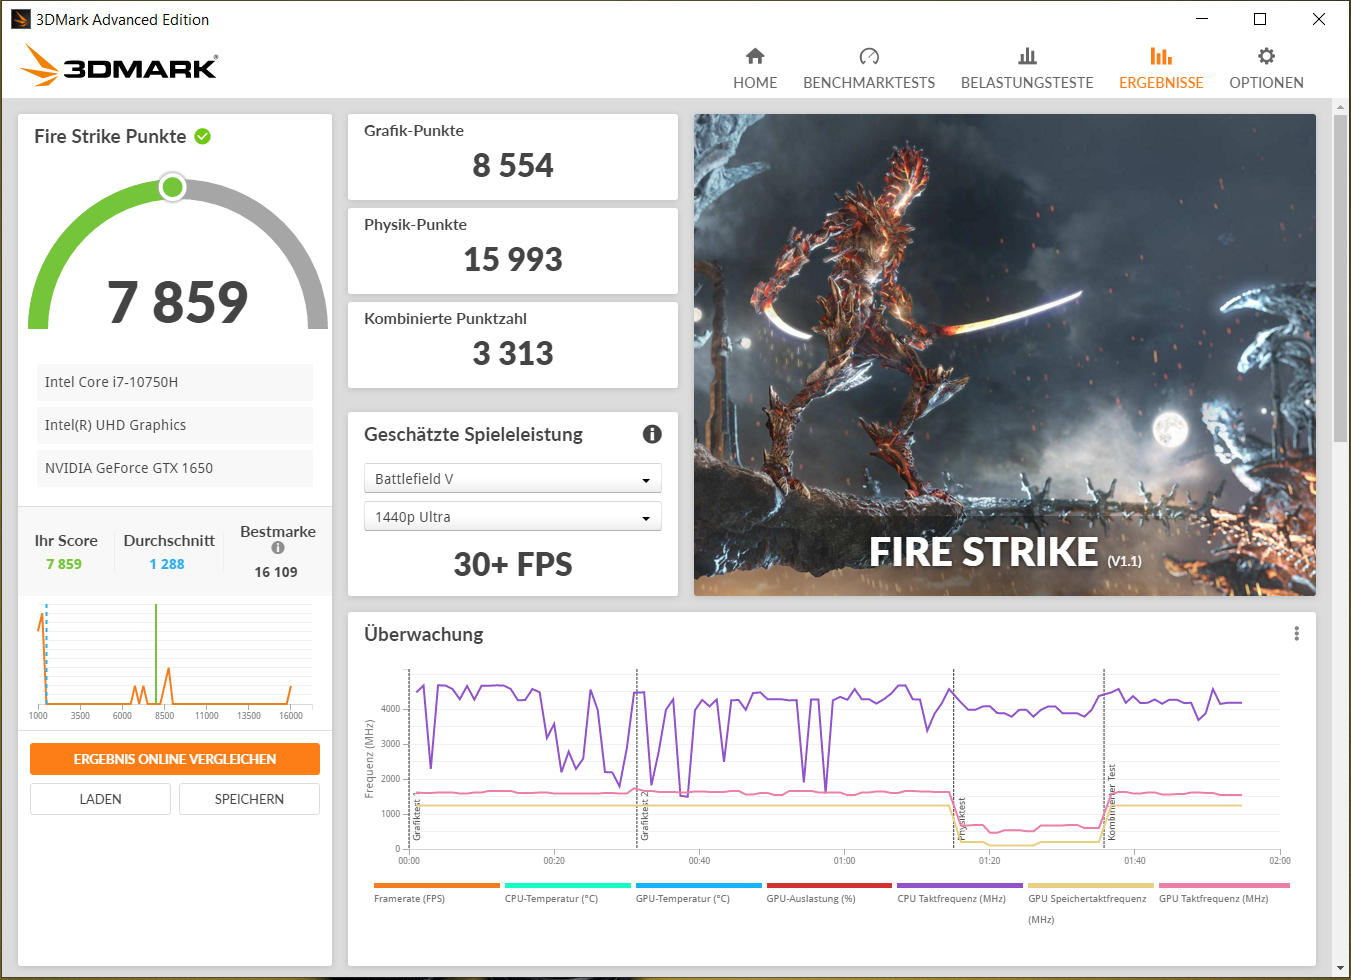
| 3DMark 11 Performance | 11667 Punkte | |
| 3DMark Cloud Gate Standard Score | 29483 Punkte | |
| 3DMark Fire Strike Score | 7859 Punkte | |
| 3DMark Time Spy Score | 3386 Punkte | |
Hilfe | ||
Gaming Performance
Die verbaute Hardware bringt alle Spiele, die sich in unserer Datenbank befinden, flüssig auf den Bildschirm. Dabei können in der Regel die Full-HD-Auflösung und mittlere Qualitätseinstellungen verwendet werden. In einigen Fällen ist mehr möglich. CPU-lastige Spiele profitieren vom Energieprofil "Höchstleistung". Ein leistungshungriger Titel wie Cyberpunk 2077 erfordert eine Reduzierung von Auflösung und/oder Qualitätsniveau.
| The Witcher 3 - 1920x1080 High Graphics & Postprocessing (Nvidia HairWorks Off) | |
| HP Envy 15-ep0098nr | |
| Durchschnitt der Klasse Multimedia (22 - 224, n=11, der letzten 2 Jahre) | |
| Lenovo IdeaPad Gaming 3i 15IMH05 | |
| Dell XPS 15 9500 Core i7 4K UHD | |
| Lenovo Yoga Creator 7 15IMH05 82DS000VGE | |
| Durchschnittliche NVIDIA GeForce GTX 1650 Mobile (45 - 70.4, n=29) | |
| Asus ZenBook UX535-M01440 | |
| MSI Summit E15 A11SCST | |
| Schenker Vision 15 | |
| Dota 2 Reborn - 1920x1080 high (2/3) | |
| Dell XPS 15 9500 Core i7 4K UHD | |
| Lenovo Yoga Creator 7 15IMH05 82DS000VGE | |
| Lenovo Yoga Creator 7 15IMH05 82DS000VGE (Hoechstleistung) | |
| HP Envy 15-ep0098nr | |
| Lenovo IdeaPad Gaming 3i 15IMH05 | |
| Asus ZenBook UX535-M01440 | |
| MSI Summit E15 A11SCST | |
| Lenovo Yoga Creator 7 15IMH05 82DS000VGE (Akkusparmodus) | |
| Durchschnittliche NVIDIA GeForce GTX 1650 Mobile (63.3 - 127, n=20) | |
| Durchschnitt der Klasse Multimedia (31.1 - 196.9, n=65, der letzten 2 Jahre) | |
| Schenker Vision 15 | |
| X-Plane 11.11 - 1920x1080 high (fps_test=3) | |
| HP Envy 15-ep0098nr | |
| Lenovo Yoga Creator 7 15IMH05 82DS000VGE (Hoechstleistung) | |
| Asus ZenBook UX535-M01440 | |
| Lenovo Yoga Creator 7 15IMH05 82DS000VGE | |
| MSI Summit E15 A11SCST | |
| Lenovo IdeaPad Gaming 3i 15IMH05 | |
| Dell XPS 15 9500 Core i7 4K UHD | |
| Durchschnittliche NVIDIA GeForce GTX 1650 Mobile (44.5 - 77.3, n=18) | |
| Lenovo Yoga Creator 7 15IMH05 82DS000VGE (Akkusparmodus) | |
| Durchschnitt der Klasse Multimedia (16.9 - 141.1, n=59, der letzten 2 Jahre) | |
| Schenker Vision 15 | |
| Shadow of the Tomb Raider - 1920x1080 Highest Preset AA:T | |
| Durchschnitt der Klasse Multimedia (23 - 129, n=8, der letzten 2 Jahre) | |
| Dell XPS 15 9500 Core i7 4K UHD | |
| Lenovo IdeaPad Gaming 3i 15IMH05 | |
| Durchschnittliche NVIDIA GeForce GTX 1650 Mobile (34 - 47, n=15) | |
| Lenovo Yoga Creator 7 15IMH05 82DS000VGE | |
| Lenovo Yoga Creator 7 15IMH05 82DS000VGE (Hoechstleistung) | |
| Asus ZenBook UX535-M01440 | |
| MSI Summit E15 A11SCST | |
| Dirt 5 - 1920x1080 Medium Preset | |
| Lenovo Yoga Creator 7 15IMH05 82DS000VGE | |
| Durchschnittliche NVIDIA GeForce GTX 1650 Mobile (44.4 - 46.8, n=3) | |
| Hitman 3 - 1920x1080 Maximum Settings AF:16x | |
| Durchschnittliche NVIDIA GeForce GTX 1650 Mobile (50.2 - 58.3, n=2) | |
| Lenovo Yoga Creator 7 15IMH05 82DS000VGE | |
Um zu überprüfen, ob die Bildwiederholraten über einen längeren Zeitraum weitgehend konstant bleiben, lassen wir das Spiel "The Witcher 3" für etwa 60 Minuten mit Full-HD-Auflösung und maximalen Qualitätseinstellungen laufen. Die Spielfigur wird nicht bewegt. Ein Einbruch der Bildwiederholraten ist nicht festzustellen.
| min. | mittel | hoch | max. | |
|---|---|---|---|---|
| The Witcher 3 (2015) | 185 | 107 | 61.8 | 35.3 |
| Dota 2 Reborn (2015) | 146 | 136 | 121 | 110 |
| X-Plane 11.11 (2018) | 95.2 | 83.3 | 67.1 | |
| Far Cry 5 (2018) | 115 | 59 | 54 | 50 |
| Strange Brigade (2018) | 195 | 78.8 | 63.9 | 55.3 |
| Shadow of the Tomb Raider (2018) | 122 | 57 | 49 | 43 |
| Watch Dogs Legion (2020) | 80.4 | 48 | 41.6 | 18 |
| Dirt 5 (2020) | 95.4 | 46.6 | 36.3 | 29.4 |
| Assassin´s Creed Valhalla (2020) | 68 | 41 | 27 | 10 |
| Immortals Fenyx Rising (2020) | 85 | 50 | 42 | 36 |
| Cyberpunk 2077 1.0 (2020) | 54 | 28.5 | 23.6 | 19 |
| Hitman 3 (2021) | 153.4 | 63.5 | 55.3 | 50.2 |
Emissionen - Der Lenovo Computer erwärmt sich nur moderat
Geräuschemissionen
Im Leerlauf ist von den beiden Lüftern selten etwas zu hören. Oftmals stehen sie still und es herrscht Lautlosigkeit. Unter Last drehen sie nicht übermäßig stark auf. Der maximale Schalldruckpegel beträgt 41,9 dB(A) (mittlere Last, Witcher-3-Test).
Lautstärkediagramm
| Idle |
| 24.9 / 24.9 / 30.8 dB(A) |
| Last |
| 41.9 / 41.7 dB(A) |
 | ||
30 dB leise 40 dB(A) deutlich hörbar 50 dB(A) störend |
||
min: | ||
| Lenovo Yoga Creator 7 15IMH05 82DS000VGE i7-10750H, GeForce GTX 1650 Mobile | Asus ZenBook UX535-M01440 i7-10750H, GeForce GTX 1650 Ti Max-Q | HP Envy 15-ep0098nr i7-10750H, GeForce RTX 2060 Max-Q | Schenker Vision 15 i7-1165G7, Iris Xe G7 96EUs | Dell XPS 15 9500 Core i7 4K UHD i7-10875H, GeForce GTX 1650 Ti Mobile | MSI Summit E15 A11SCST i7-1185G7, GeForce GTX 1650 Ti Max-Q | Durchschnittliche NVIDIA GeForce GTX 1650 Mobile | Durchschnitt der Klasse Multimedia | |
|---|---|---|---|---|---|---|---|---|
| Geräuschentwicklung | 4% | -22% | -7% | -8% | -5% | -9% | 4% | |
| aus / Umgebung * (dB) | 24.9 | 24.6 1% | 26.4 -6% | 29.8 -20% | 28.4 -14% | 24 4% | 27.6 ? -11% | 24.2 ? 3% |
| Idle min * (dB) | 24.9 | 24.6 1% | 32.2 -29% | 29.8 -20% | 28.4 -14% | 28 -12% | 28.1 ? -13% | 24.3 ? 2% |
| Idle avg * (dB) | 24.9 | 24.6 1% | 32.2 -29% | 29.8 -20% | 28.4 -14% | 29 -16% | 28.8 ? -16% | 24.7 ? 1% |
| Idle max * (dB) | 30.8 | 24.6 20% | 32.2 -5% | 31.1 -1% | 28.4 8% | 32 -4% | 31 ? -1% | 26.4 ? 14% |
| Last avg * (dB) | 41.9 | 41.3 1% | 48.3 -15% | 40.5 3% | 46 -10% | 43 -3% | 41.7 ? -0% | 37.4 ? 11% |
| Witcher 3 ultra * (dB) | 41.9 | 42 -0% | 53.7 -28% | 40.5 3% | 42 -0% | 41 2% | ||
| Last max * (dB) | 41.7 | 41.4 1% | 58.8 -41% | 40.5 3% | 47.1 -13% | 44 -6% | 46.4 ? -11% | 45.9 ? -10% |
* ... kleinere Werte sind besser
Temperatur
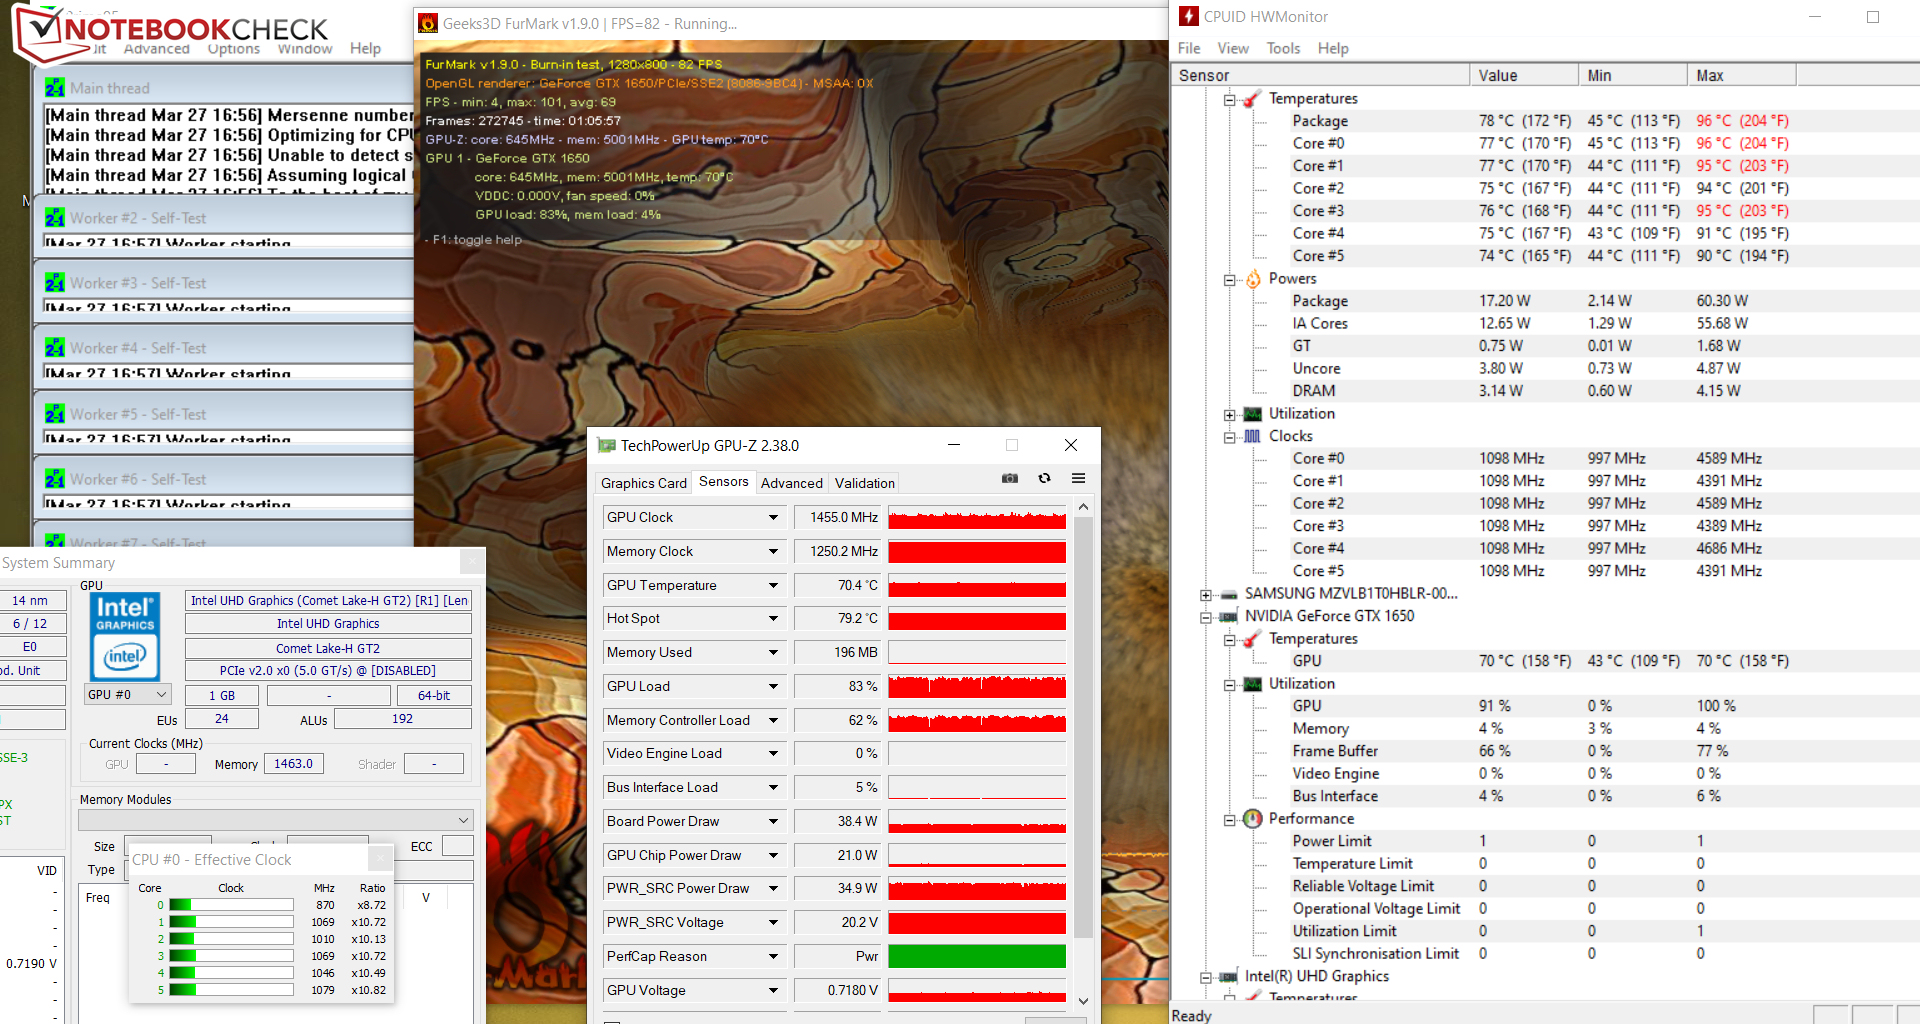
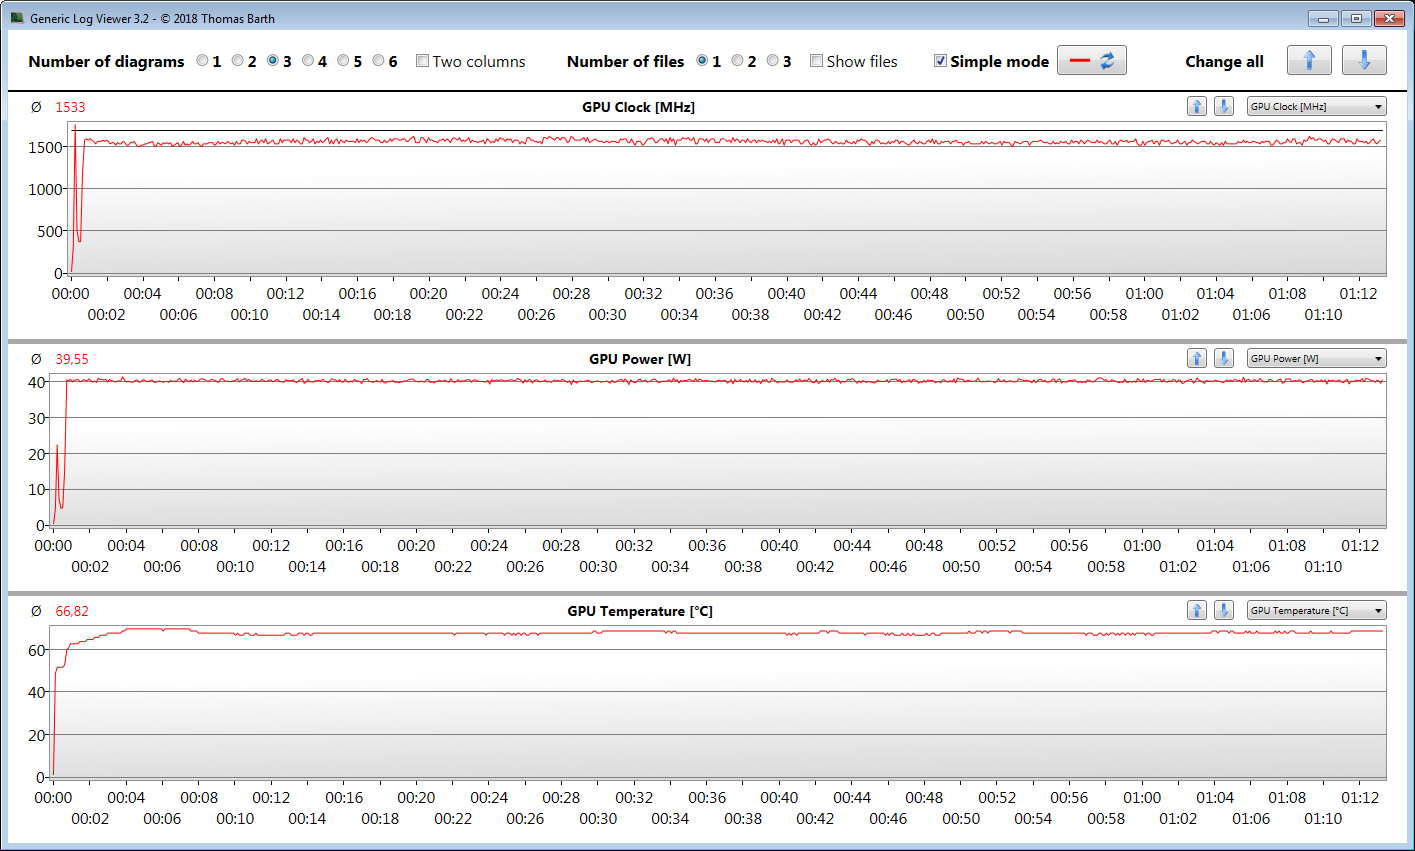
Unseren Stresstest (Prime95 und FurMark laufen für mindestens eine Stunde) bearbeitet der Prozessor anfänglich mit 2,5 bis 3,5 GHz. Dann sinkt der Takt auf 900 bis 1.200 MHz und verbleibt auf diesem Niveau. Beim Grafikkern verläuft es anders herum. Arbeitet er zu Beginn des Tests mit 700 bis 1.100 MHz, steigt der Takt später auf 1.400 bis 1.480 MHz. Der Stresstest stellt ein Extremszenario dar, welches so im Alltag nicht auftritt. Wir überprüfen mit diesem Test, ob das System auch bei voller Auslastung stabil läuft.
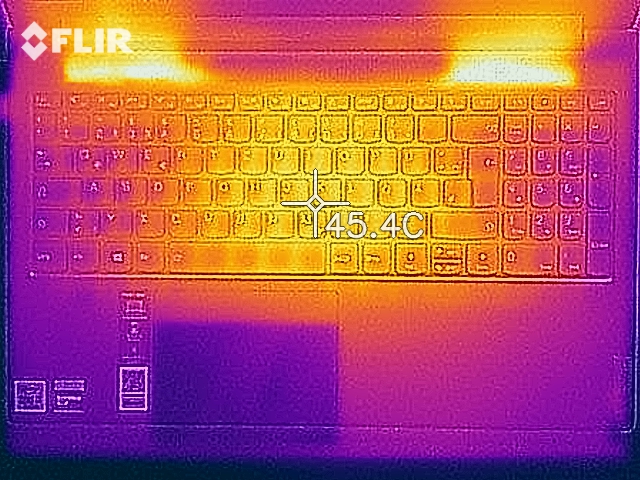
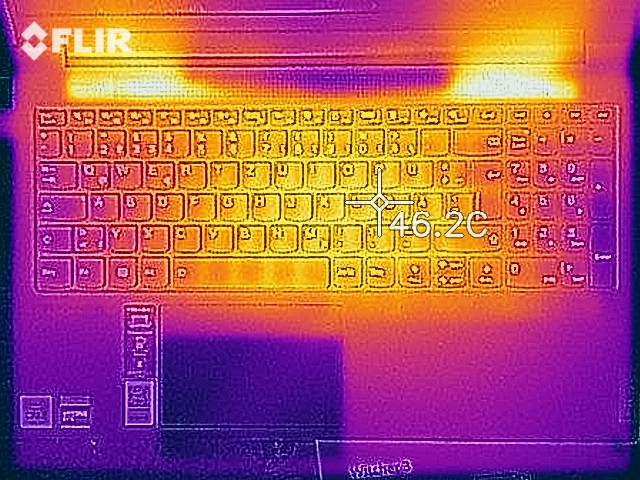
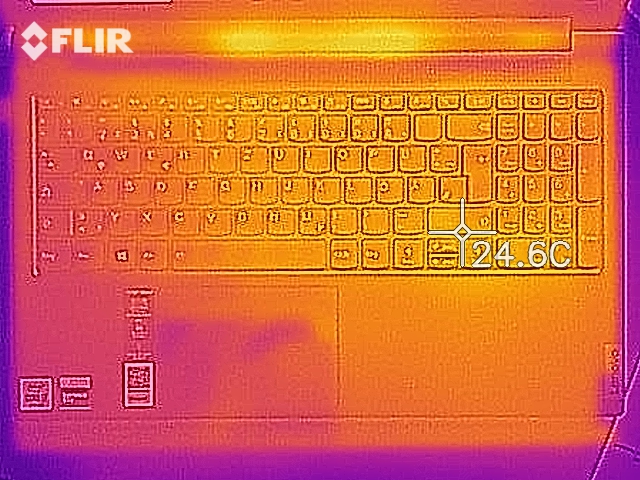
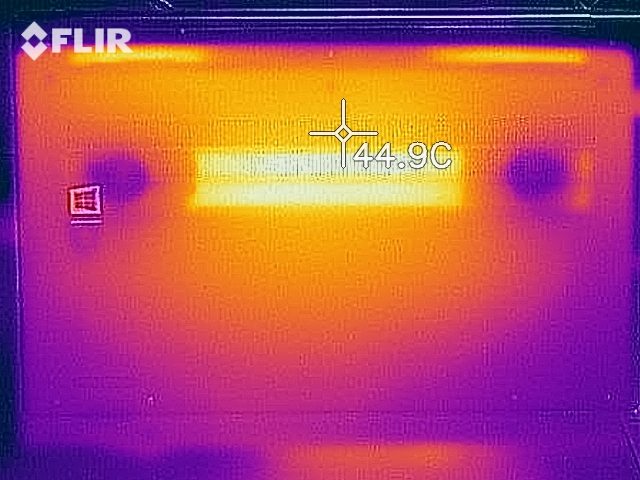
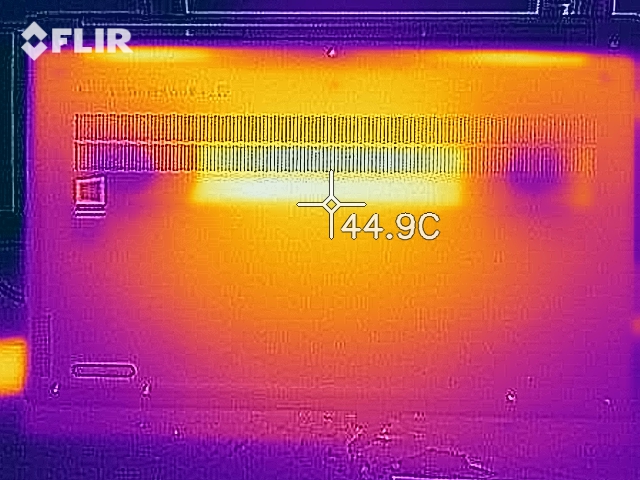
Das Gerät erwärmt sich bestenfalls moderat. Während des Stresstests registrieren wir nur an zwei Messpunkten Temperaturen im oberen 30-Grad-Celsius-Bereich. Etwas geringer fällt die Erwärmung bei der Durchführung des Witcher-3-Tests aus. Im Alltagsbetrieb bewegen sich die Temperaturen im grünen Bereich.
(+) Die maximale Temperatur auf der Oberseite ist 39.8 °C. Im Vergleich liegt der Klassendurchschnitt bei 36.8 °C (von 21 bis 71 °C für die Klasse Multimedia).
(+) Auf der Unterseite messen wir eine maximalen Wert von 36.5 °C (im Vergleich zum Durchschnitt von 39.1 °C).
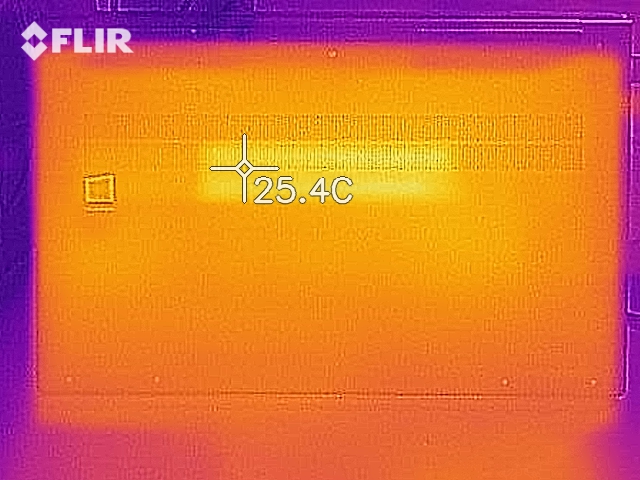
(+) Ohne Last messen wir eine durchschnittliche Temperatur von 22.3 °C auf der Oberseite. Der Klassendurchschnitt erreicht 31.3 °C.
(±) Beim längeren Spielen von The Witcher 3 erhitzt sich das Gerät durchschnittlich auf 32.6 °C. Der Durchschnitt der Klasse ist derzeit 31.3 °C.
(+) Die Handballen und der Touchpad-Bereich sind mit gemessenen 29.2 °C kühler als die typische Hauttemperatur und fühlen sich dadurch kühl an.
(±) Die durchschnittliche Handballen-Temperatur anderer getesteter Geräte war 28.7 °C (-0.5 °C).
| Lenovo Yoga Creator 7 15IMH05 82DS000VGE i7-10750H, GeForce GTX 1650 Mobile | Asus ZenBook UX535-M01440 i7-10750H, GeForce GTX 1650 Ti Max-Q | HP Envy 15-ep0098nr i7-10750H, GeForce RTX 2060 Max-Q | Schenker Vision 15 i7-1165G7, Iris Xe G7 96EUs | Dell XPS 15 9500 Core i7 4K UHD i7-10875H, GeForce GTX 1650 Ti Mobile | MSI Summit E15 A11SCST i7-1185G7, GeForce GTX 1650 Ti Max-Q | Durchschnittliche NVIDIA GeForce GTX 1650 Mobile | Durchschnitt der Klasse Multimedia | |
|---|---|---|---|---|---|---|---|---|
| Hitze | -15% | -31% | -12% | -33% | -34% | -25% | -16% | |
| Last oben max * (°C) | 39.8 | 37.8 5% | 47.6 -20% | 42.4 -7% | 44 -11% | 56 -41% | 46 ? -16% | 41.1 ? -3% |
| Last unten max * (°C) | 36.5 | 44.2 -21% | 52 -42% | 46.8 -28% | 48.8 -34% | 60 -64% | 49.2 ? -35% | 43.7 ? -20% |
| Idle oben max * (°C) | 22.9 | 28.1 -23% | 28.6 -25% | 24.6 -7% | 33 -44% | 26 -14% | 28.3 ? -24% | 27 ? -18% |
| Idle unten max * (°C) | 23 | 27.7 -20% | 31 -35% | 24.4 -6% | 32.4 -41% | 27 -17% | 28.9 ? -26% | 28 ? -22% |
* ... kleinere Werte sind besser
Lautsprecher
Lenovo verbaut im Yoga Creator ein 2.1-Lautsprechersystem, das einen sehr ordentlichen Klang produziert, aber mehr Bass vertragen könnte. Die Maximallautstärke fällt verhältnismäßig gering aus. Dolby Atmos wird unterstützt.
Lenovo Yoga Creator 7 15IMH05 82DS000VGE Audio Analyse
(-) | Nicht sonderlich laut spielende Lautsprecher (71.4 dB)
Bass 100 - 315 Hz
(±) | abgesenkter Bass - 12% geringer als der Median
(±) | durchschnittlich lineare Bass-Wiedergabe (11.3% Delta zum Vorgänger)
Mitteltöne 400 - 2000 Hz
(+) | ausgeglichene Mitten, vom Median nur 3.9% abweichend
(±) | Linearität der Mitten ist durchschnittlich (7.9% Delta zum Vorgänger)
Hochtöne 2 - 16 kHz
(+) | ausgeglichene Hochtöne, vom Median nur 2% abweichend
(±) | durchschnittlich lineare Hochtöne (8% Delta zum Vorgänger)
Gesamt im hörbaren Bereich 100 - 16.000 Hz
(+) | hörbarer Bereich ist sehr linear (11.9% Abstand zum Median
Im Vergleich zu allen Geräten derselben Klasse
» 20% aller getesteten Geräte dieser Klasse waren besser, 4% vergleichbar, 76% schlechter
» Das beste Gerät hat einen Delta-Wert von 5%, durchschnittlich ist 17%, das schlechteste Gerät hat 45%
Im Vergleich zu allen Geräten im Test
» 9% aller getesteten Geräte waren besser, 2% vergleichbar, 89% schlechter
» Das beste Gerät hat einen Delta-Wert von 4%, durchschnittlich ist 23%, das schlechteste Gerät hat 134%
Energieverwaltung - Lenovo Notebook liefert sehr gute Akkulaufzeiten
Energieaufnahme
Der Energiebedarf bewegt sich über den gesamten Lastbereich hinweg auf einem normalen Niveau für die hier verbaute Hardware. Im Leerlauf messen wir eine maximale Leistungsaufnahme von 12,6 Watt. Unter Last steigt der Bedarf auf bis zu 134 Watt (Stresstest) bzw. durchschnittlich 75 Watt (70 bis 88 Watt; Witcher-3-Test). Die Nennleistung des Netzteils beträgt 135 Watt.
| Aus / Standby | |
| Idle | |
| Last |
|
Legende:
min: | |
| Lenovo Yoga Creator 7 15IMH05 82DS000VGE i7-10750H, GeForce GTX 1650 Mobile | Asus ZenBook UX535-M01440 i7-10750H, GeForce GTX 1650 Ti Max-Q | HP Envy 15-ep0098nr i7-10750H, GeForce RTX 2060 Max-Q | Schenker Vision 15 i7-1165G7, Iris Xe G7 96EUs | Dell XPS 15 9500 Core i7 4K UHD i7-10875H, GeForce GTX 1650 Ti Mobile | MSI Summit E15 A11SCST i7-1185G7, GeForce GTX 1650 Ti Max-Q | Durchschnittliche NVIDIA GeForce GTX 1650 Mobile | Durchschnitt der Klasse Multimedia | |
|---|---|---|---|---|---|---|---|---|
| Stromverbrauch | 9% | -42% | 45% | -20% | 7% | 8% | 14% | |
| Idle min * (Watt) | 6.9 | 4.4 36% | 9.2 -33% | 3.5 49% | 5.7 17% | 6 13% | 4.96 ? 28% | 5.65 ? 18% |
| Idle avg * (Watt) | 10 | 9.8 2% | 14.5 -45% | 6.3 37% | 13.5 -35% | 10 -0% | 8.61 ? 14% | 10 ? -0% |
| Idle max * (Watt) | 12.6 | 14.5 -15% | 18 -43% | 6.8 46% | 19.6 -56% | 16 -27% | 14.8 ? -17% | 12.3 ? 2% |
| Last avg * (Watt) | 96 | 83 14% | 110.9 -16% | 43.2 55% | 114.1 -19% | 84 12% | 81.7 ? 15% | 65.1 ? 32% |
| Witcher 3 ultra * (Watt) | 75 | 67 11% | 125.5 -67% | 52 31% | 93 -24% | 69 8% | ||
| Last max * (Watt) | 134 | 123 8% | 194.6 -45% | 67.7 49% | 135.2 -1% | 90 33% | 131.9 ? 2% | 112.5 ? 16% |
* ... kleinere Werte sind besser
Akkulaufzeit
Lenovos 15,6-Zöller erreicht im WLAN-Test (Aufruf von Webseiten mittels eines Skripts) bzw. Videotest (Kurzfilm Big Buck Bunny (H.264-Kodierung, FHD) läuft in einer Schleife) Laufzeiten von 8:59 h bzw. 13:34 h. Während beider Tests sind die Energiesparfunktionen des Notebooks deaktiviert und die Displayhelligkeit wird auf etwa 150 cd/m² geregelt. Zur Durchführung des Videotests wird zudem das Funkmodul abgeschaltet.

| Lenovo Yoga Creator 7 15IMH05 82DS000VGE i7-10750H, GeForce GTX 1650 Mobile, 70 Wh | Asus ZenBook UX535-M01440 i7-10750H, GeForce GTX 1650 Ti Max-Q, 96 Wh | HP Envy 15-ep0098nr i7-10750H, GeForce RTX 2060 Max-Q, 83 Wh | Schenker Vision 15 i7-1165G7, Iris Xe G7 96EUs, 73 Wh | Dell XPS 15 9500 Core i7 4K UHD i7-10875H, GeForce GTX 1650 Ti Mobile, 86 Wh | MSI Summit E15 A11SCST i7-1185G7, GeForce GTX 1650 Ti Max-Q, 80.25 Wh | Durchschnitt der Klasse Multimedia | |
|---|---|---|---|---|---|---|---|
| Akkulaufzeit | 17% | -5% | 45% | 30% | 8% | 29% | |
| Idle (h) | 25.7 | 18.3 -29% | 15 -42% | 23 -11% | 19.5 -24% | 25.2 ? -2% | |
| H.264 (h) | 13.9 | 11.9 -14% | 18.7 35% | 10.1 -27% | 16.2 ? 17% | ||
| WLAN (h) | 9 | 10.1 12% | 6 -33% | 15.2 69% | 9.1 1% | 9.1 1% | 12 ? 33% |
| Last (h) | 1 | 2 100% | 1.6 60% | 1.3 30% | 2 100% | 1.8 80% | 1.669 ? 67% |
Pro
Contra
Fazit
Die Kombination aus verhältnismäßig geringem Gewicht (1,7 kg) und einem 70-Wh-Akku ergibt ein sehr mobiles Notebook. Das Yoga Creator 7 erreicht praxisnahe Laufzeiten von 9 bis 13 h. Energie kann über das mitgelieferte, proprietäre Netzteil oder - dank Thunderbolt-3-Steckplatz - per USB-C-Ladegerät (min. 45 Watt) nachgefüllt werden.
Das Lenovo Yoga Creator 7 15IMH05 stellt ein rundes Multimedia-Allround-Notebook dar, das sich keine gravierenden Schwächen leistet.
Core-i7-10750H-Prozessor, GeForce-GTX-1650-GPU, 16 GB Arbeitsspeicher (Dual-Channel-Modus; nicht erweiterbar) und 1-TB-NVMe-SSD rüsten das Gerät für alle gängigen Einsatzszenarien. Office, Internet, Videoschnitt, Bildbearbeitung, Streaming und Gaming bewältigt der Rechner anstandslos. Gut: Wärme- und Lärmentwicklung halten sich in Grenzen.
Der GTX-1650-Grafikkern bleibt hinter seinen Möglichkeiten zurück, da die TGP auf 40 Watt (Standard-TGP: 50 Watt) begrenzt wurde. Somit liegt die GPU leistungsmäßig nah an der GTX-1650-Max-Q-GPU (TGP: 35 Watt). Wird mehr Grafikleistung benötigt, ermöglicht der Thunderbolt-3-Steckplatz das Anstöpseln einer externen GPU.
Der Bildschirm (FHD, IPS, Dolby Vision) wartet mit matter Oberfläche, stabilen Blickwinkeln, schnellen Reaktionszeiten und sehr ordentlicher Farbraumabdeckung auf. Helligkeit und Kontrast erfüllen das Soll. Die beleuchtete Tastatur hat einen guten Eindruck hinterlassen. Nicht unerwähnt bleiben soll die dreijährige Vor-Ort-Garantie, die Lenovo dem Rechner gewährt.
Preis und Verfügbarkeit
Das Lenovo Yoga Creator 7 15IMH05 ist aktuell in der von uns getesteten Ausstattung (Core i7-10750H, Geforce GTX 1650, 16 GB RAM, 1 TB SSD, Windows 10 Pro) zu einem Preis von etwa 1.549 Euro bei Cyberport.de, Notebooksbilliger.de und Amazon.de zu bekommen.
Lenovo Yoga Creator 7 15IMH05 82DS000VGE
- 04.04.2021 v7 (old)
Sascha Mölck
Preisvergleich
