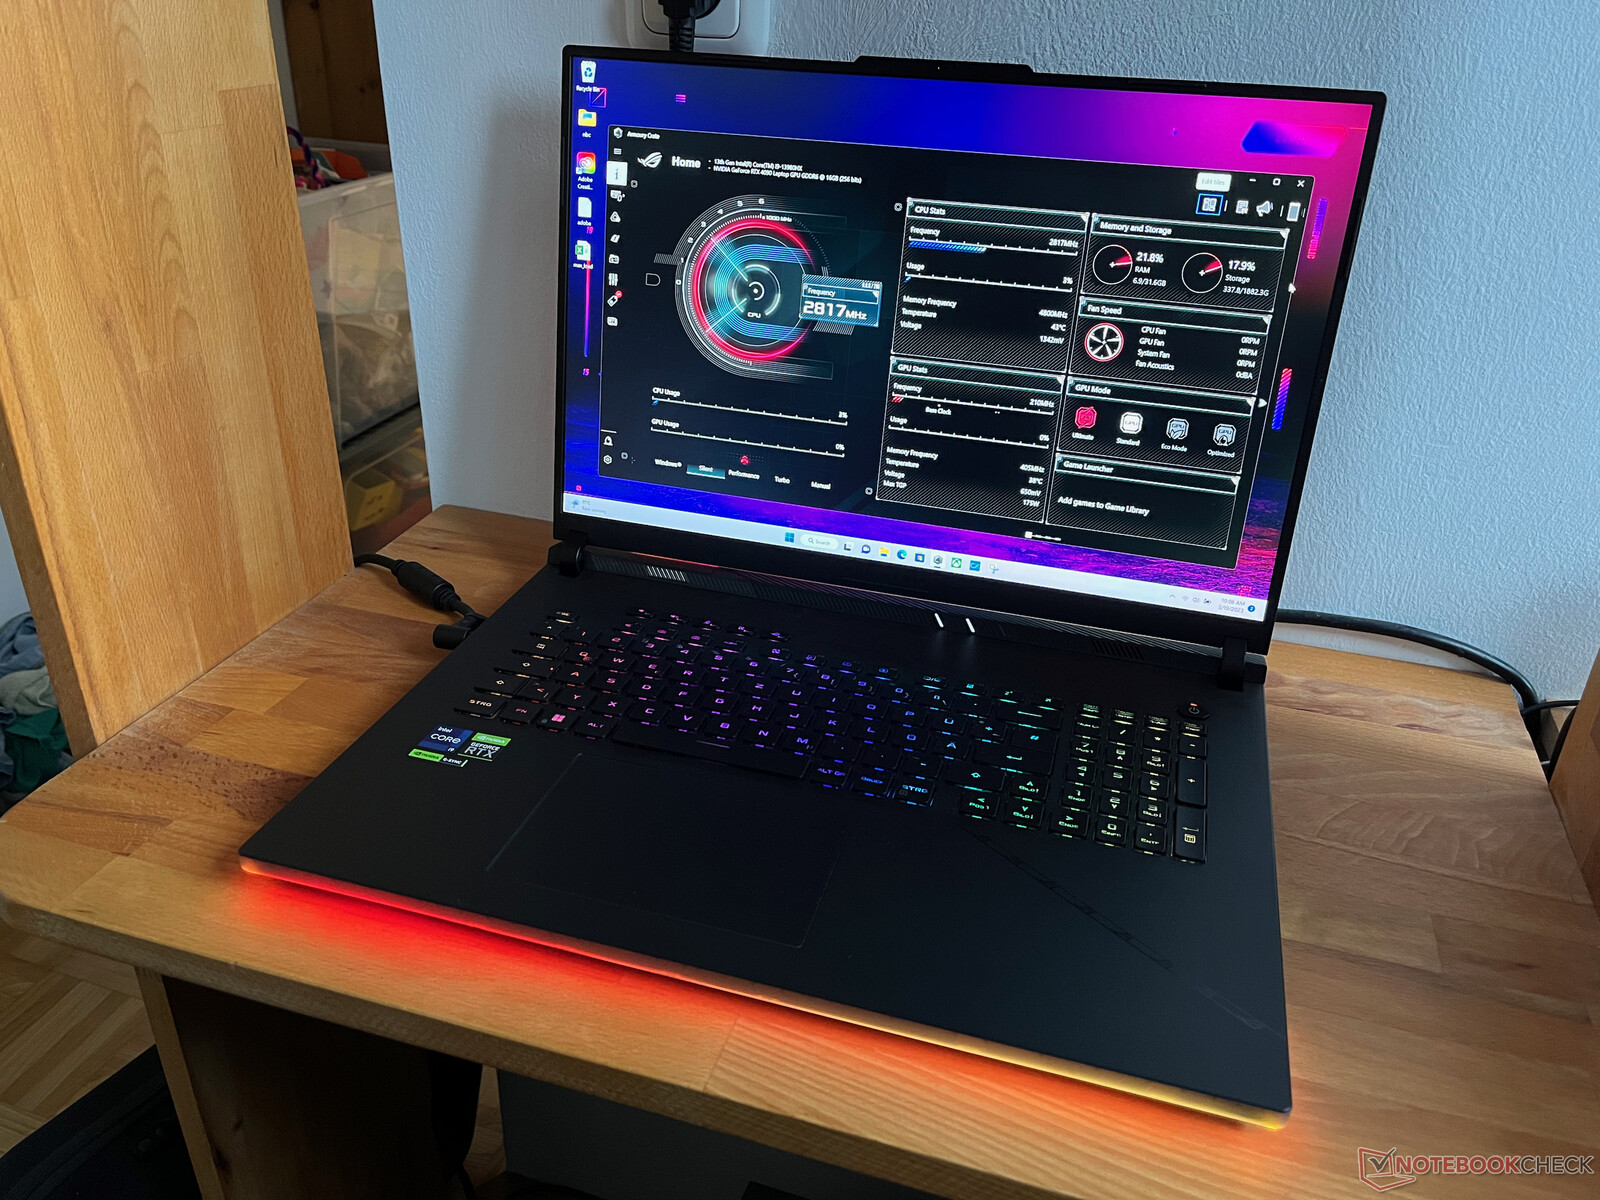
Test Asus ROG Strix Scar 18 2023 G834JY - Gaming Notebook mit RTX 4090
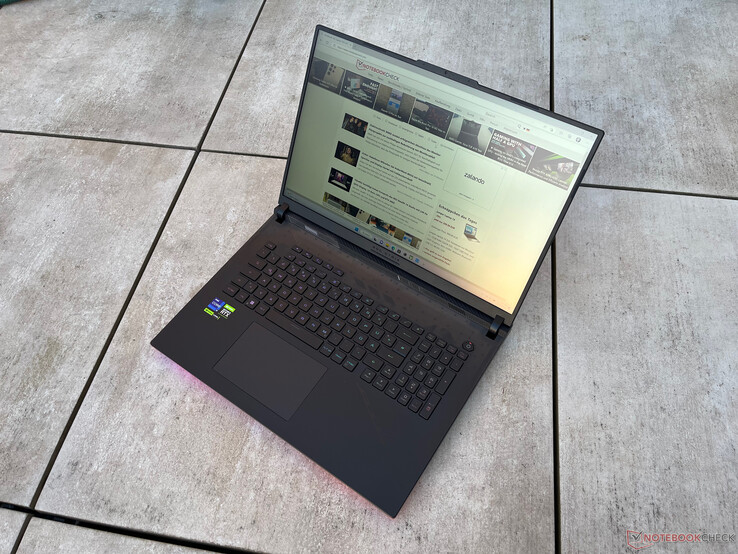
Mit dem ROG Strix Scar 18 beteiligt sich auch Asus am Trend der wiederkehrenden 18-Zoll-Gaming-Monster. Zum Launch gibt es das neue Chassis mit der RTX 4080 und der in unserem Testgerät verbauten RTX 4090 Laptop GPU. Bei den CPUs setzt Asus auf die neue HX-Serie, wodurch man aktuell die schnellsten Notebook-Komponenten auf dem Markt erhält. Das große Gehäuse wird nicht nur durch das 18-Zoll-QHD+ Display genutzt, sondern beinhaltet auch ein neues Kühlungssystem mit drei Lüftern. Damit sollen die stromhungrigen Komponenten im Zaum gehalten werden. In folgendem Test sehen wir uns das aktuell in England erhältliche G834JY-N6005W mit RTX 4090, 32 GB GDDR5 und 2x 1 TB SSD genau an.
mögliche Konkurrenten im Vergleich
Bew. | Datum | Modell | Gewicht | Dicke | Größe | Auflösung | Preis ab |
|---|---|---|---|---|---|---|---|
| 86.6 % v7 (old) | 02 / 2023 | Asus ROG Strix Scar 18 2023 G834JY-N6005W i9-13980HX, GeForce RTX 4090 Laptop GPU | 3.1 kg | 30.8 mm | 18.00" | 2560x1600 | |
| 89 % v7 (old) | 02 / 2023 | MSI Titan GT77 HX 13VI i9-13950HX, GeForce RTX 4090 Laptop GPU | 3.5 kg | 23 mm | 17.30" | 3840x2160 | |
| 89.4 % v7 (old) | 02 / 2023 | Lenovo Legion Pro 7 16IRX8H i9-13900HX, GeForce RTX 4080 Laptop GPU | 2.7 kg | 26 mm | 16.00" | 2560x1600 | |
| 91.2 % v7 (old) | 02 / 2023 | Razer Blade 16 Early 2023 i9-13950HX, GeForce RTX 4080 Laptop GPU | 2.4 kg | 21.99 mm | 16.00" | 2560x1600 | |
| 86.9 % v7 (old) | 11 / 2022 | Asus ROG Strix Scar 17 SE G733CX-LL014W i9-12950HX, GeForce RTX 3080 Ti Laptop GPU | 2.9 kg | 28.3 mm | 17.30" | 2560x1440 | |
| 88.3 % v7 (old) | 08 / 2022 | MSI Titan GT77 12UHS i9-12900HX, GeForce RTX 3080 Ti Laptop GPU | 3.3 kg | 23 mm | 17.30" | 1920x1080 | |
| 85.4 % v7 (old) | 03 / 2023 | HP Omen 17-ck2097ng i9-13900HX, GeForce RTX 4080 Laptop GPU | 2.8 kg | 27 mm | 17.30" | 2560x1440 |
Gehäuse
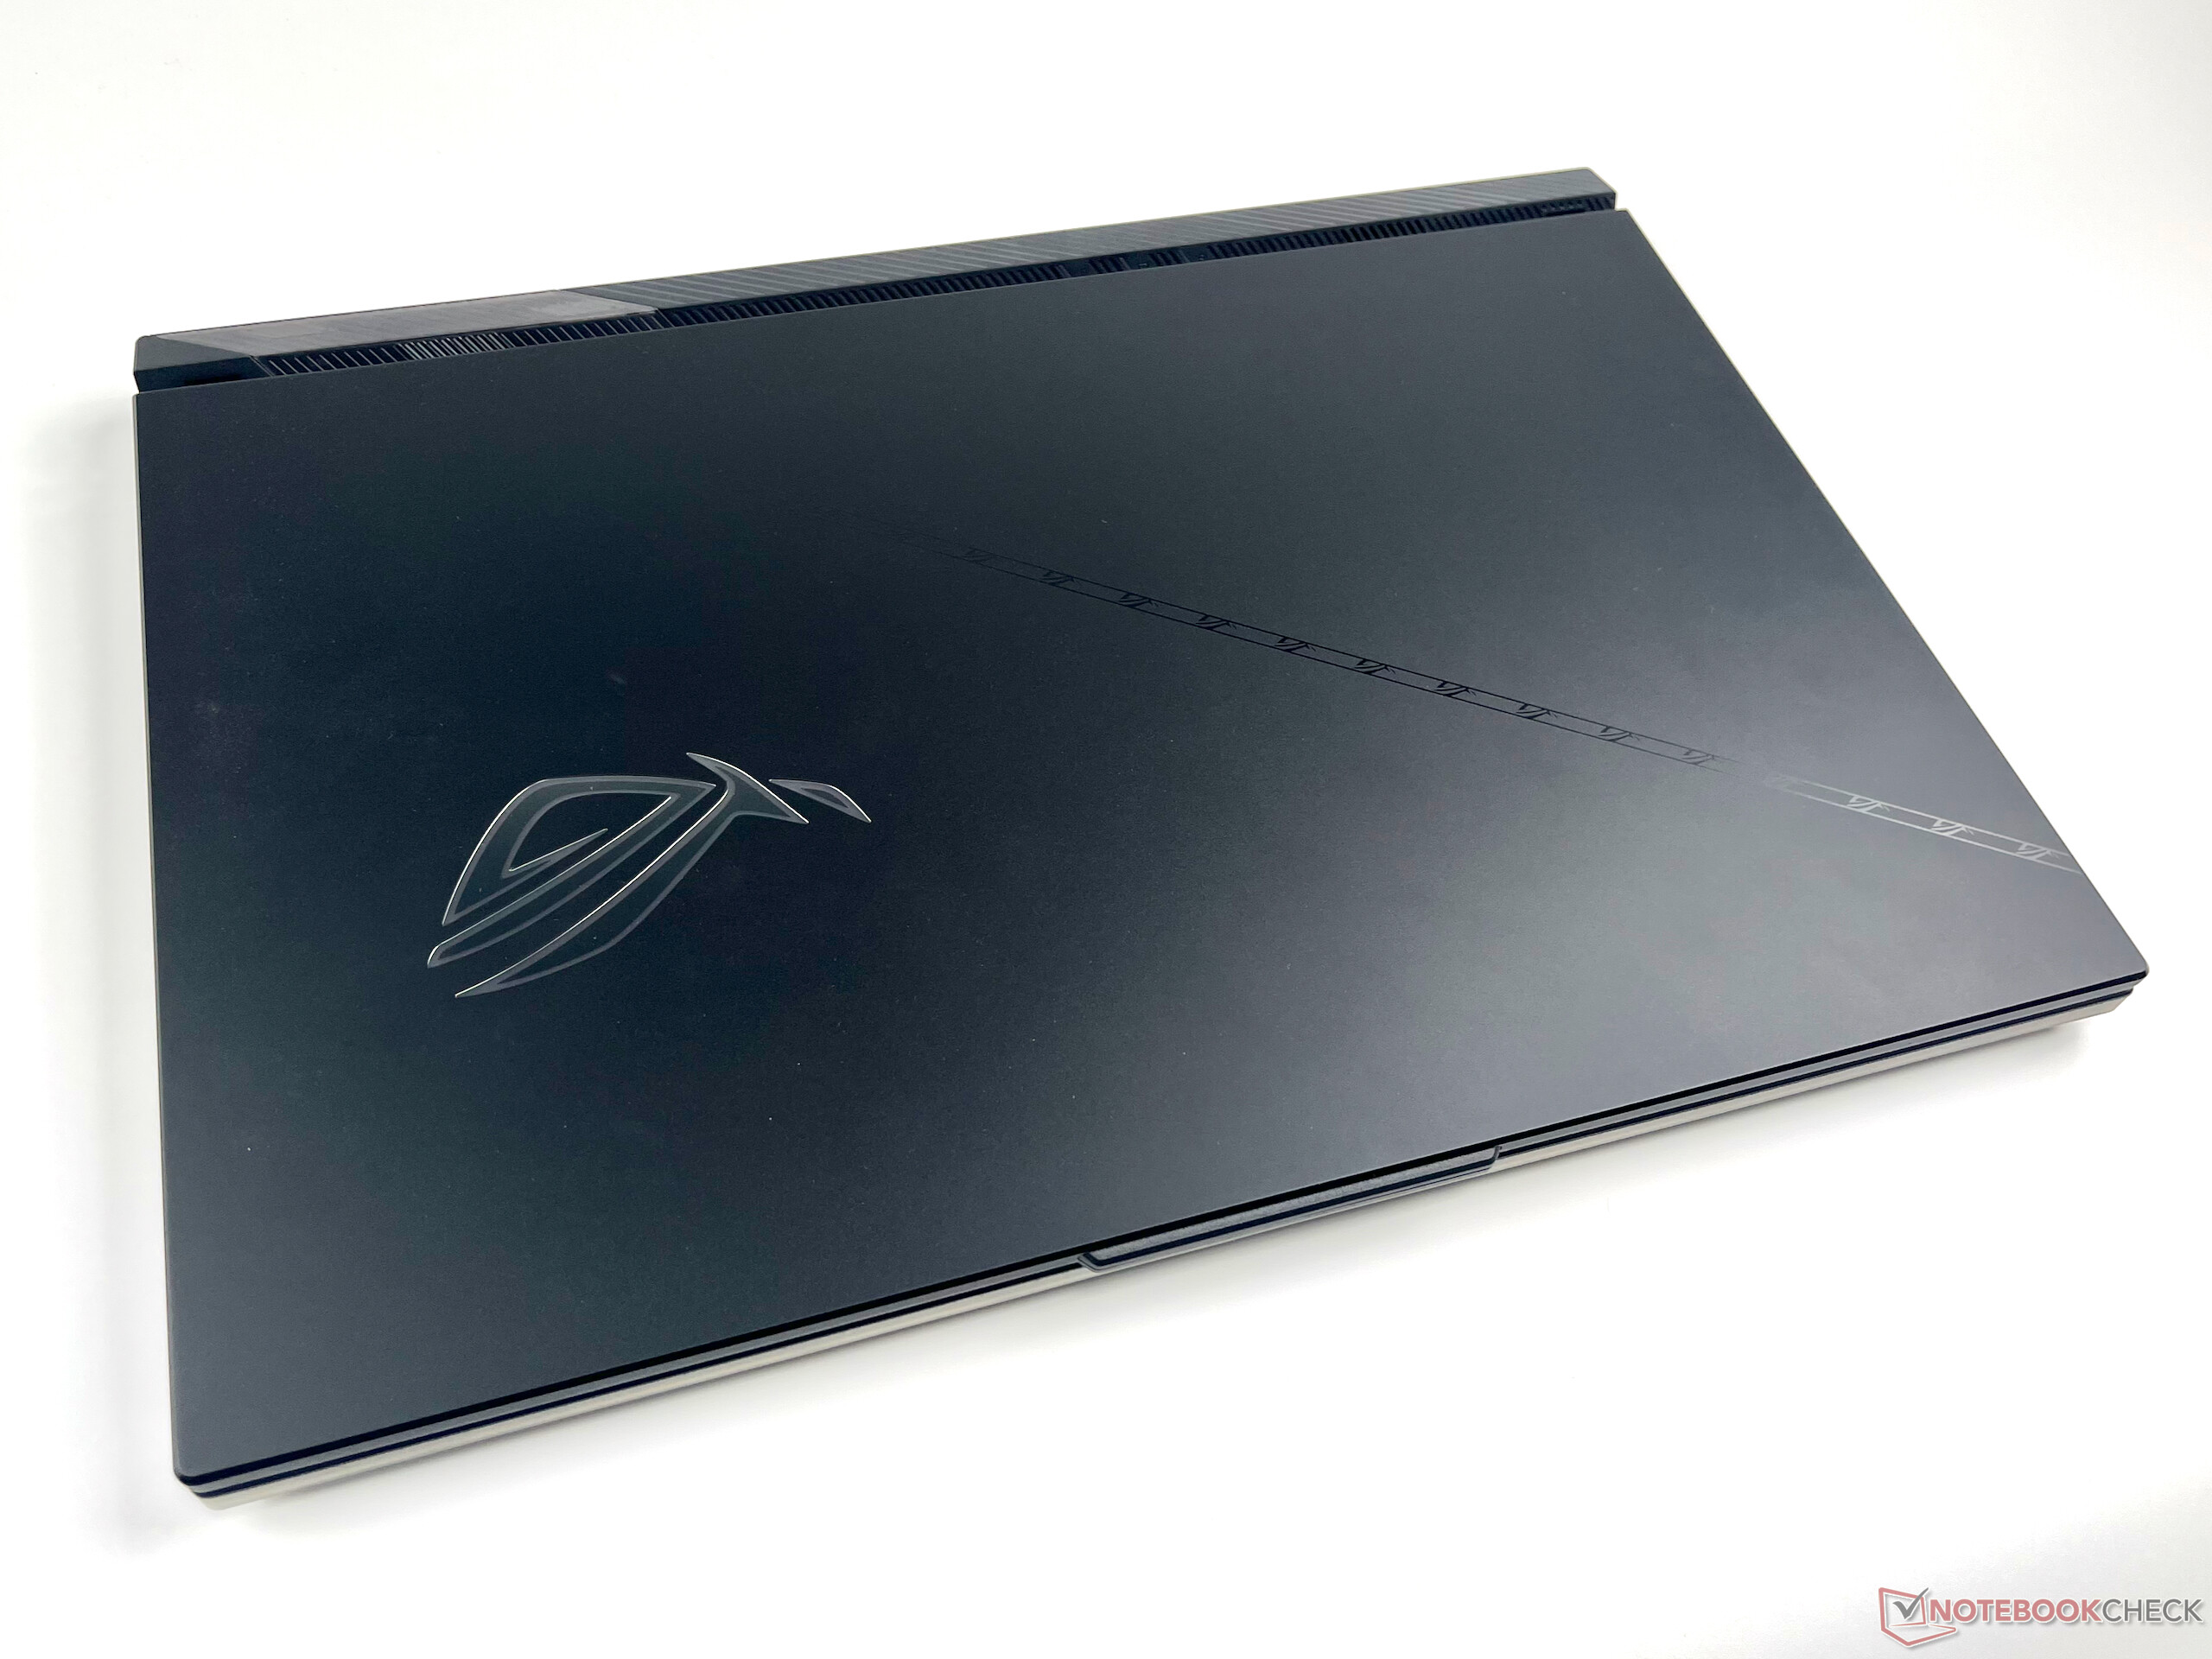
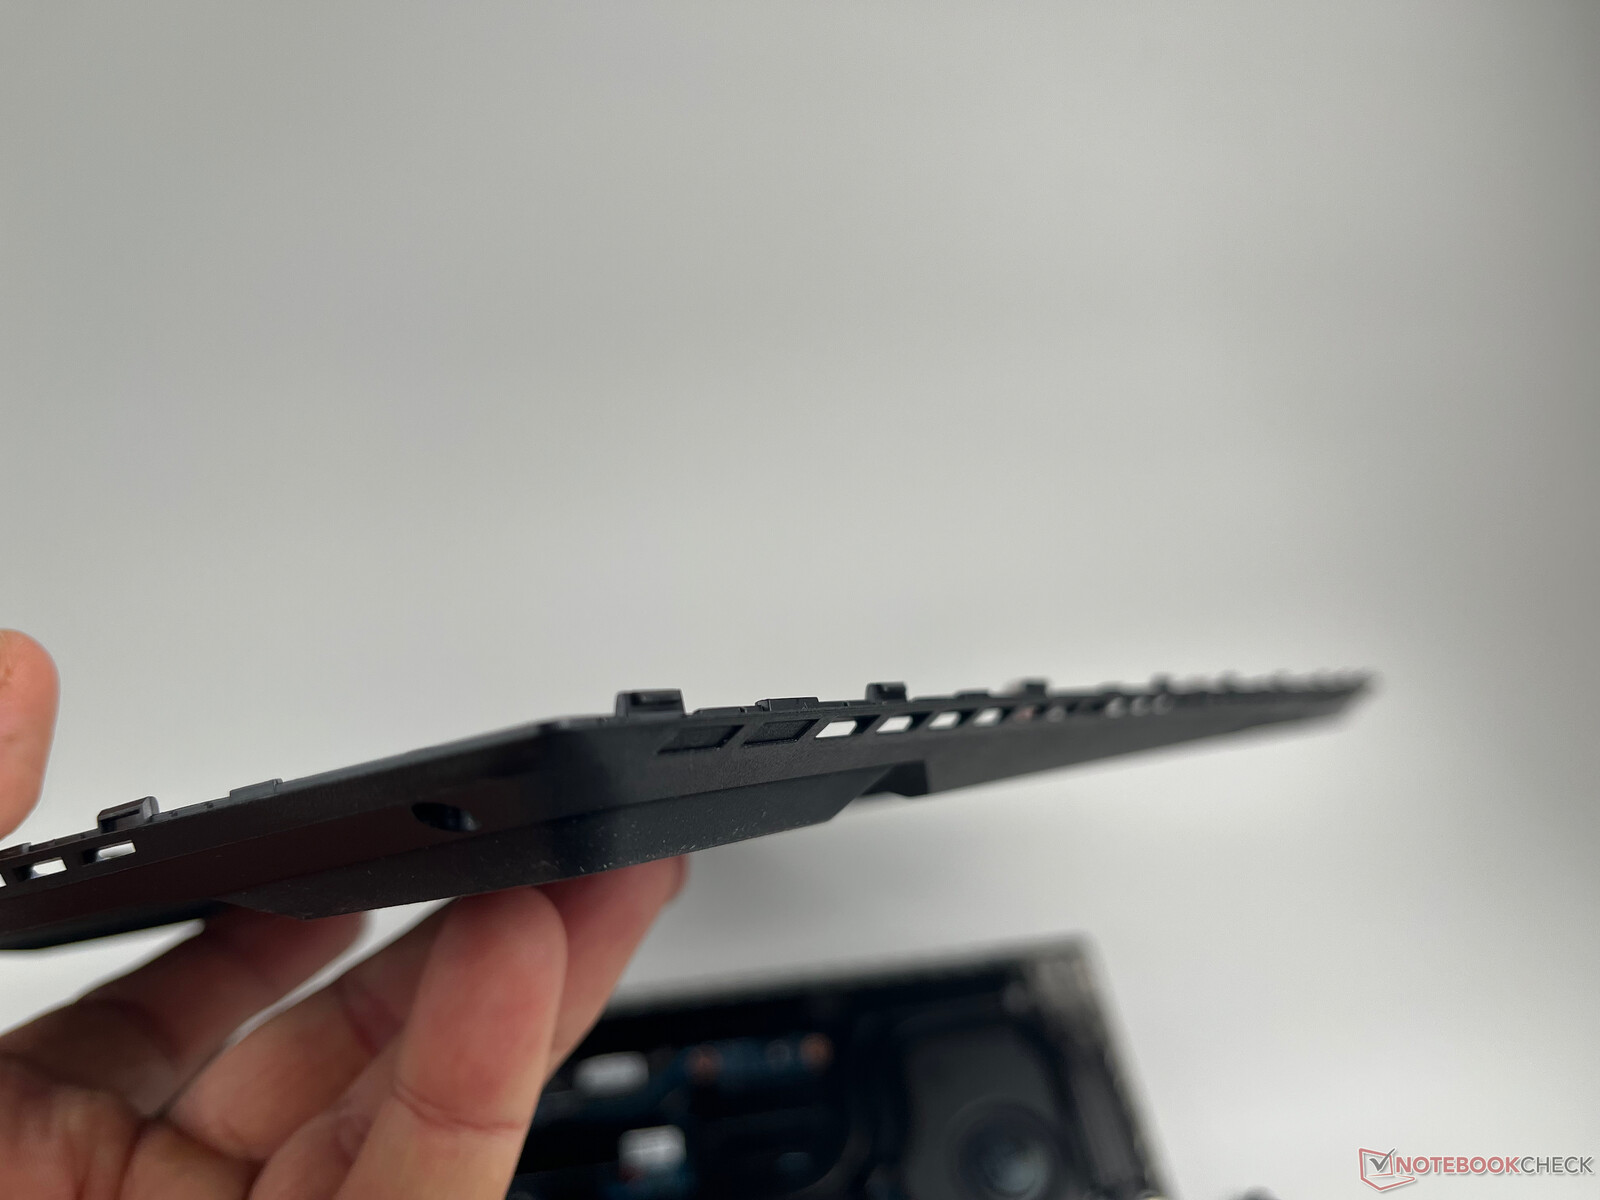
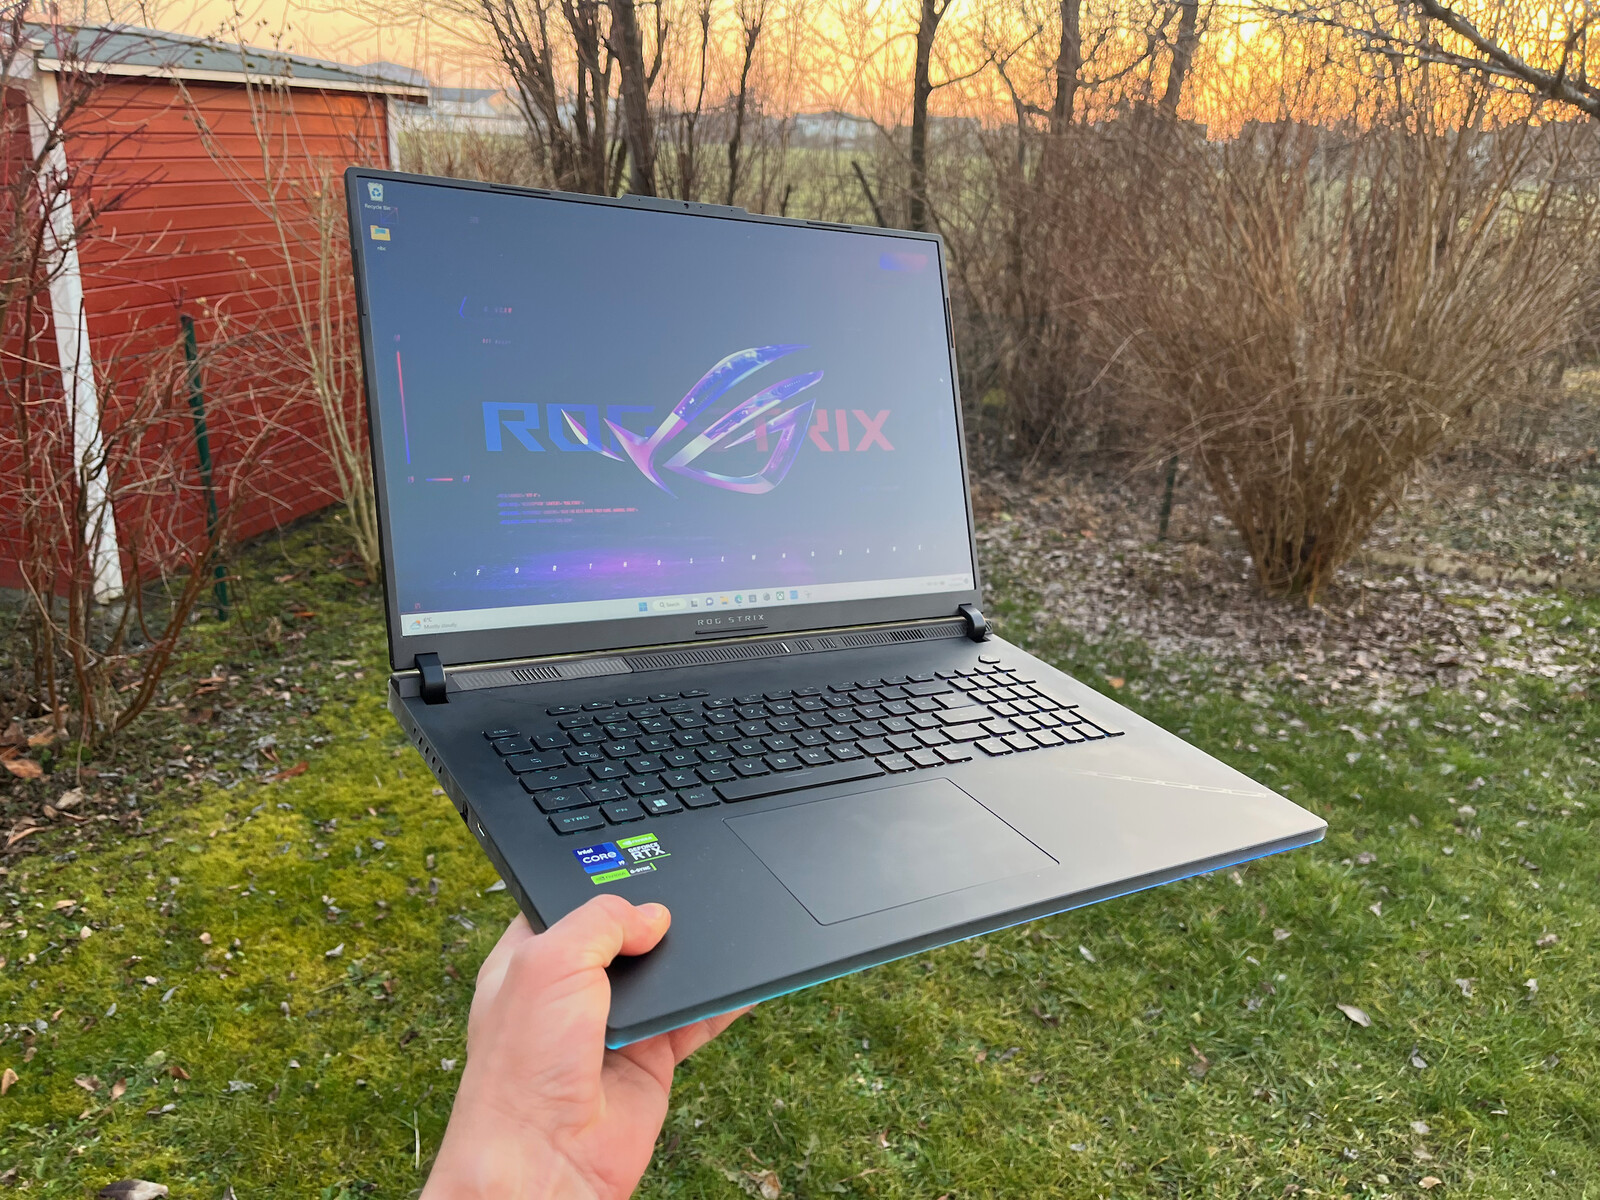
Das Gehäuse soll mit massivem RGB-LED-Einsatz und transluzenten Gehäuseteilen punkten. Das grundsätzliche Design ist dennoch relativ dezent und kann durchaus gefallen. Die transparenten Oberflächen auf den Seiten wirken jedoch etwas billig. Die Baseunit selbst ist aus Kunststoff gefertigt und fühlt sich nicht sehr hochwertig an. Beim Anheben verwindet sie sich auch leicht. Der Displaydeckel aus Aluminium ist deutlich stabiler und schützt das Display auch ausreichend.
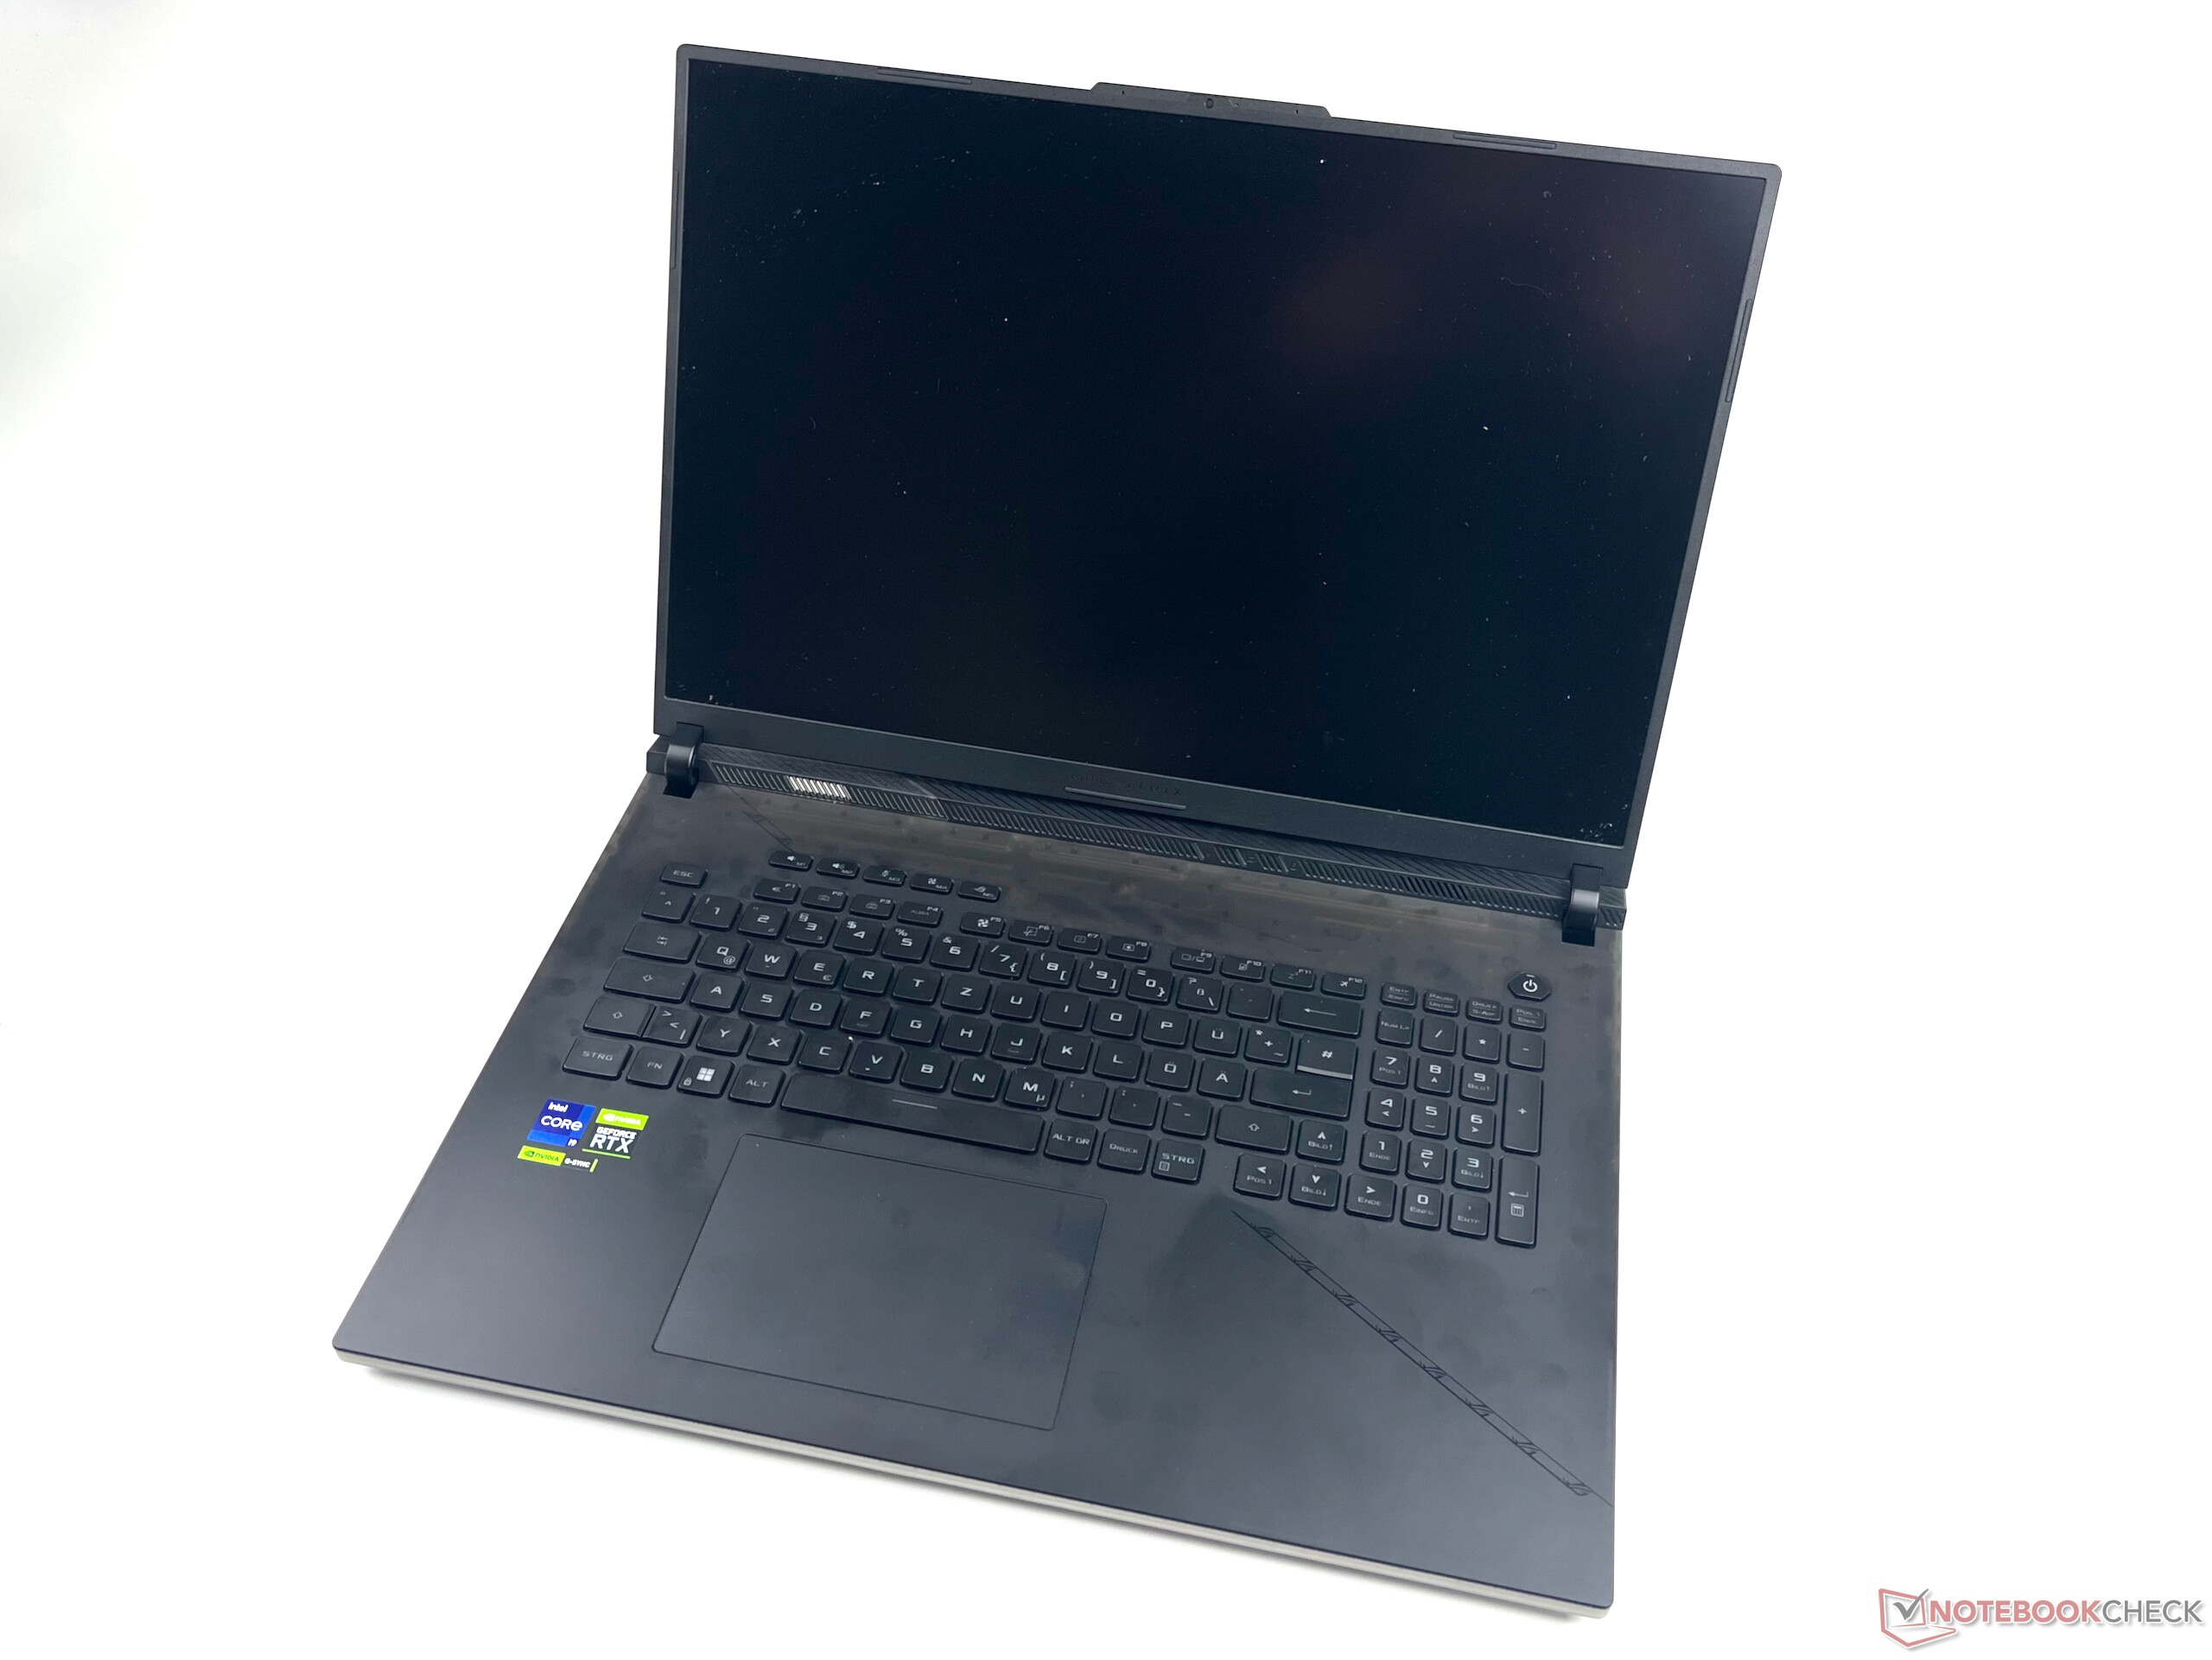

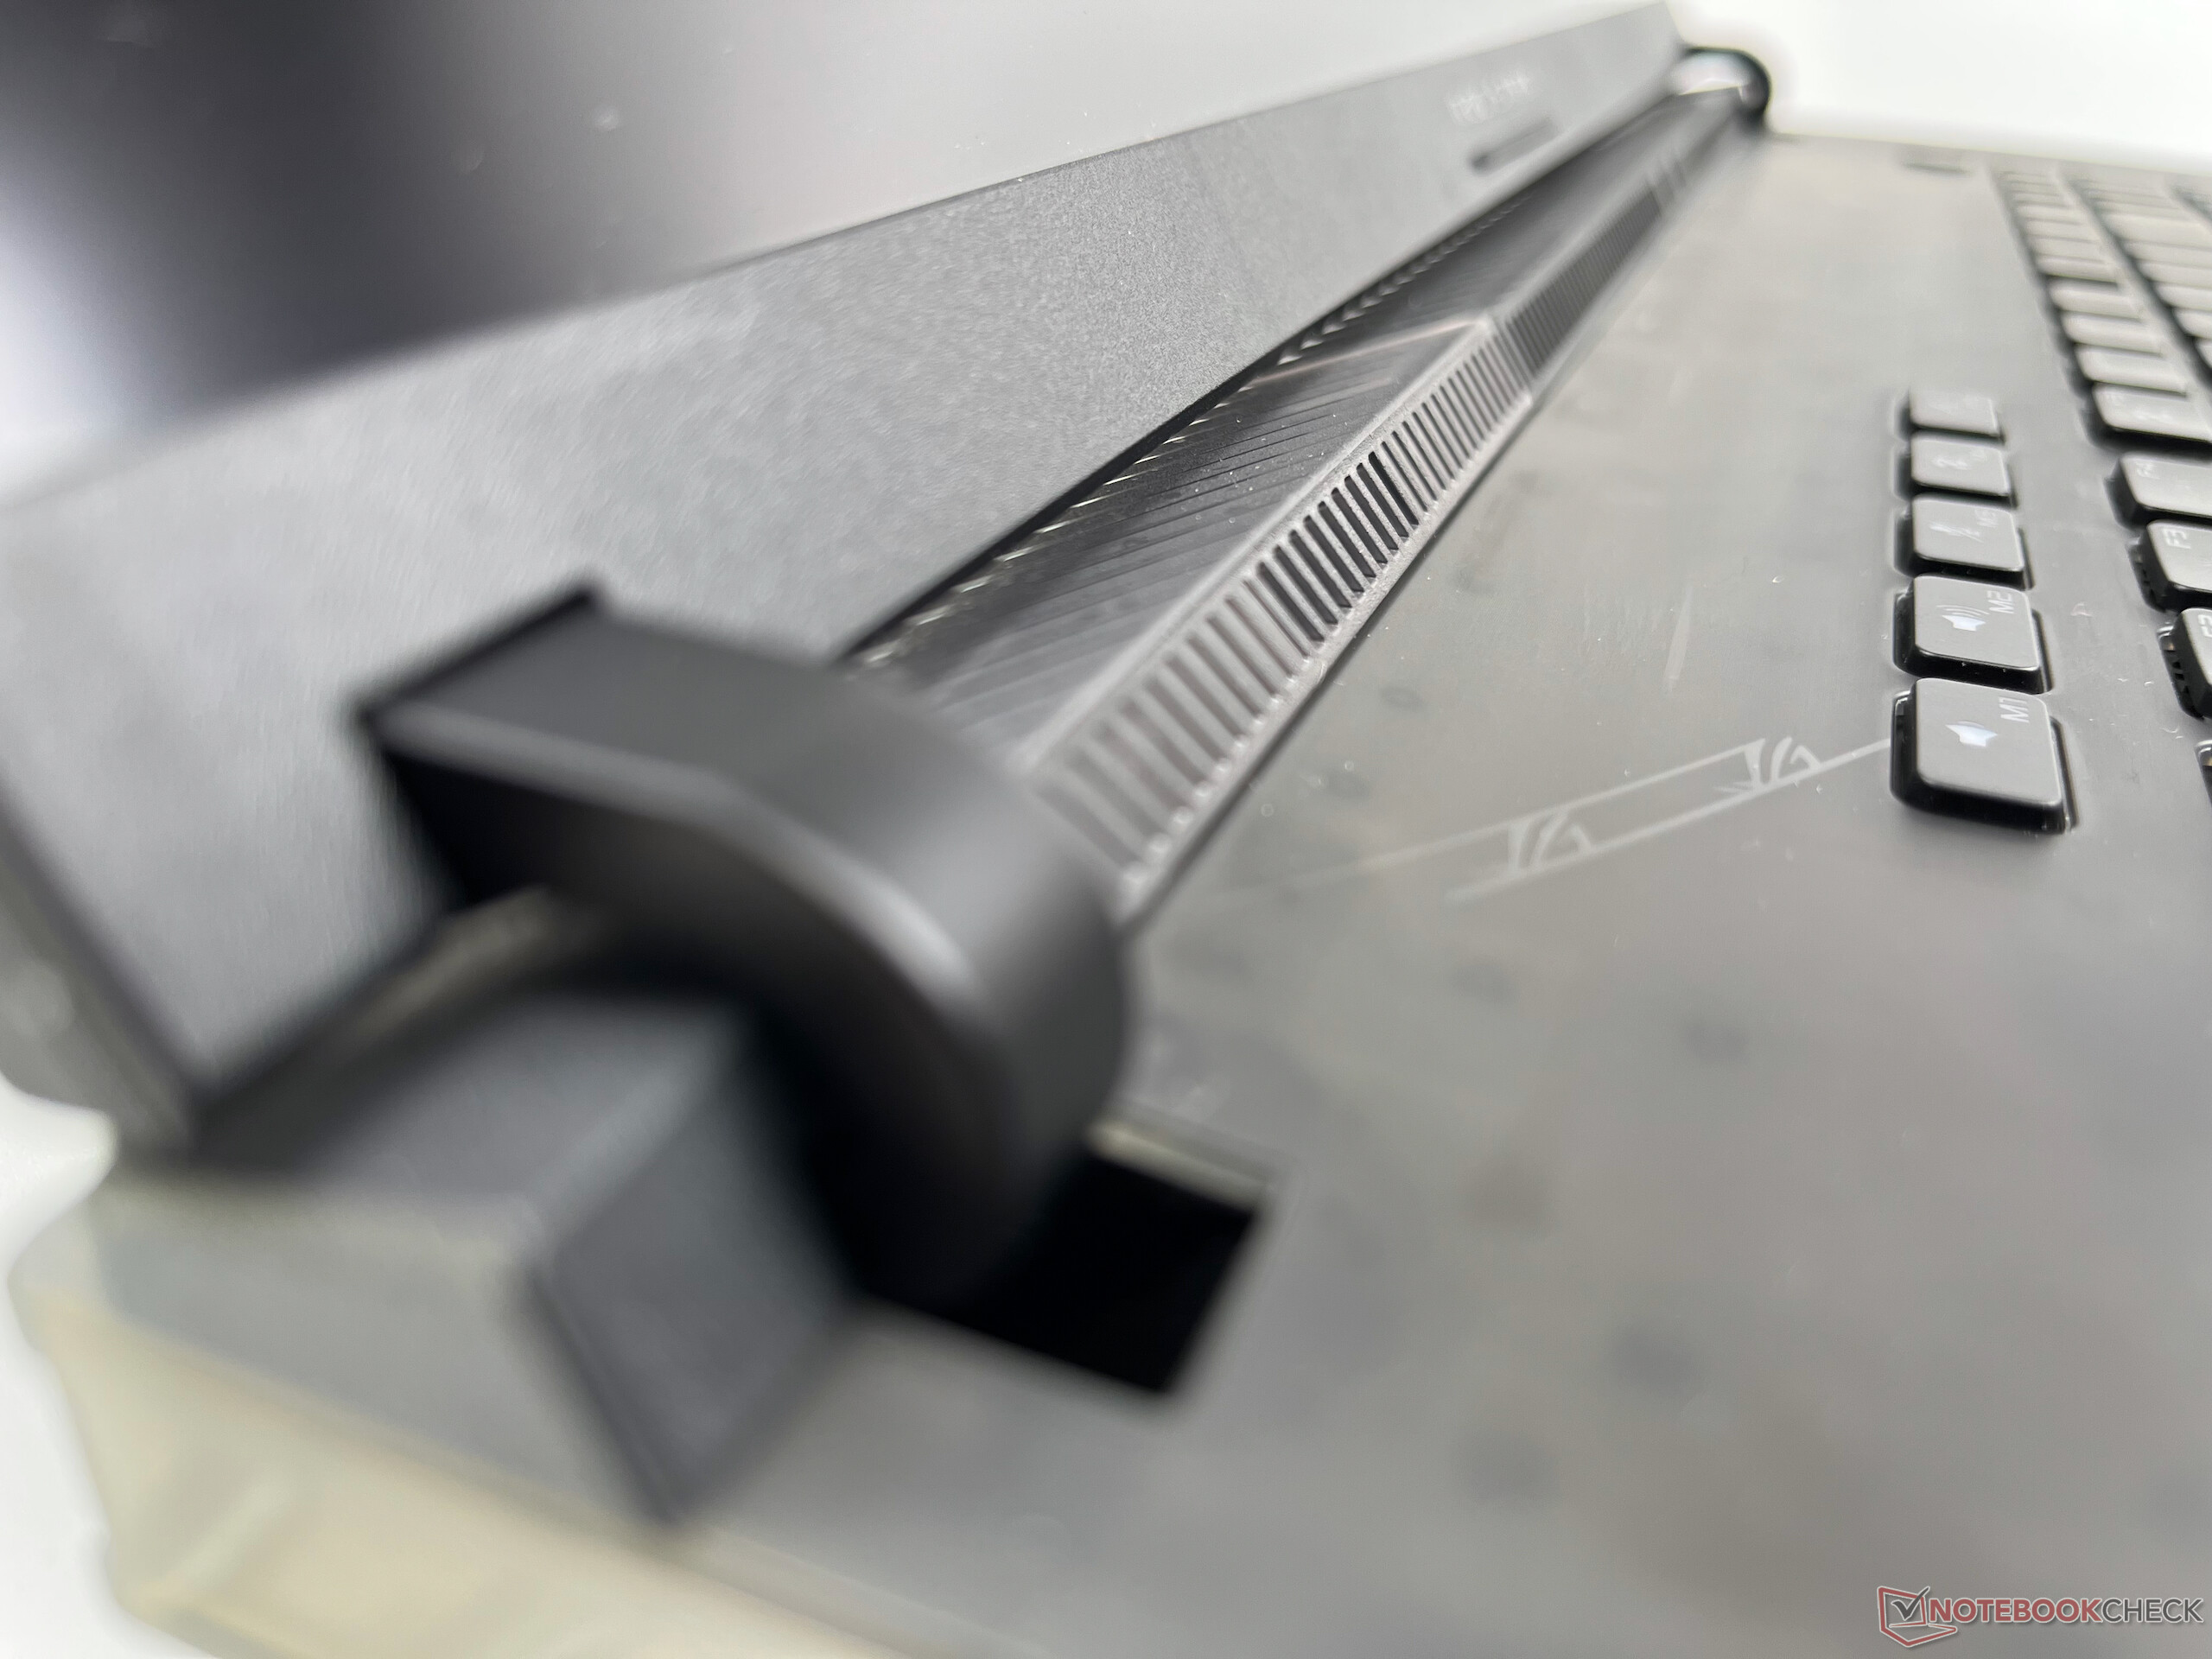
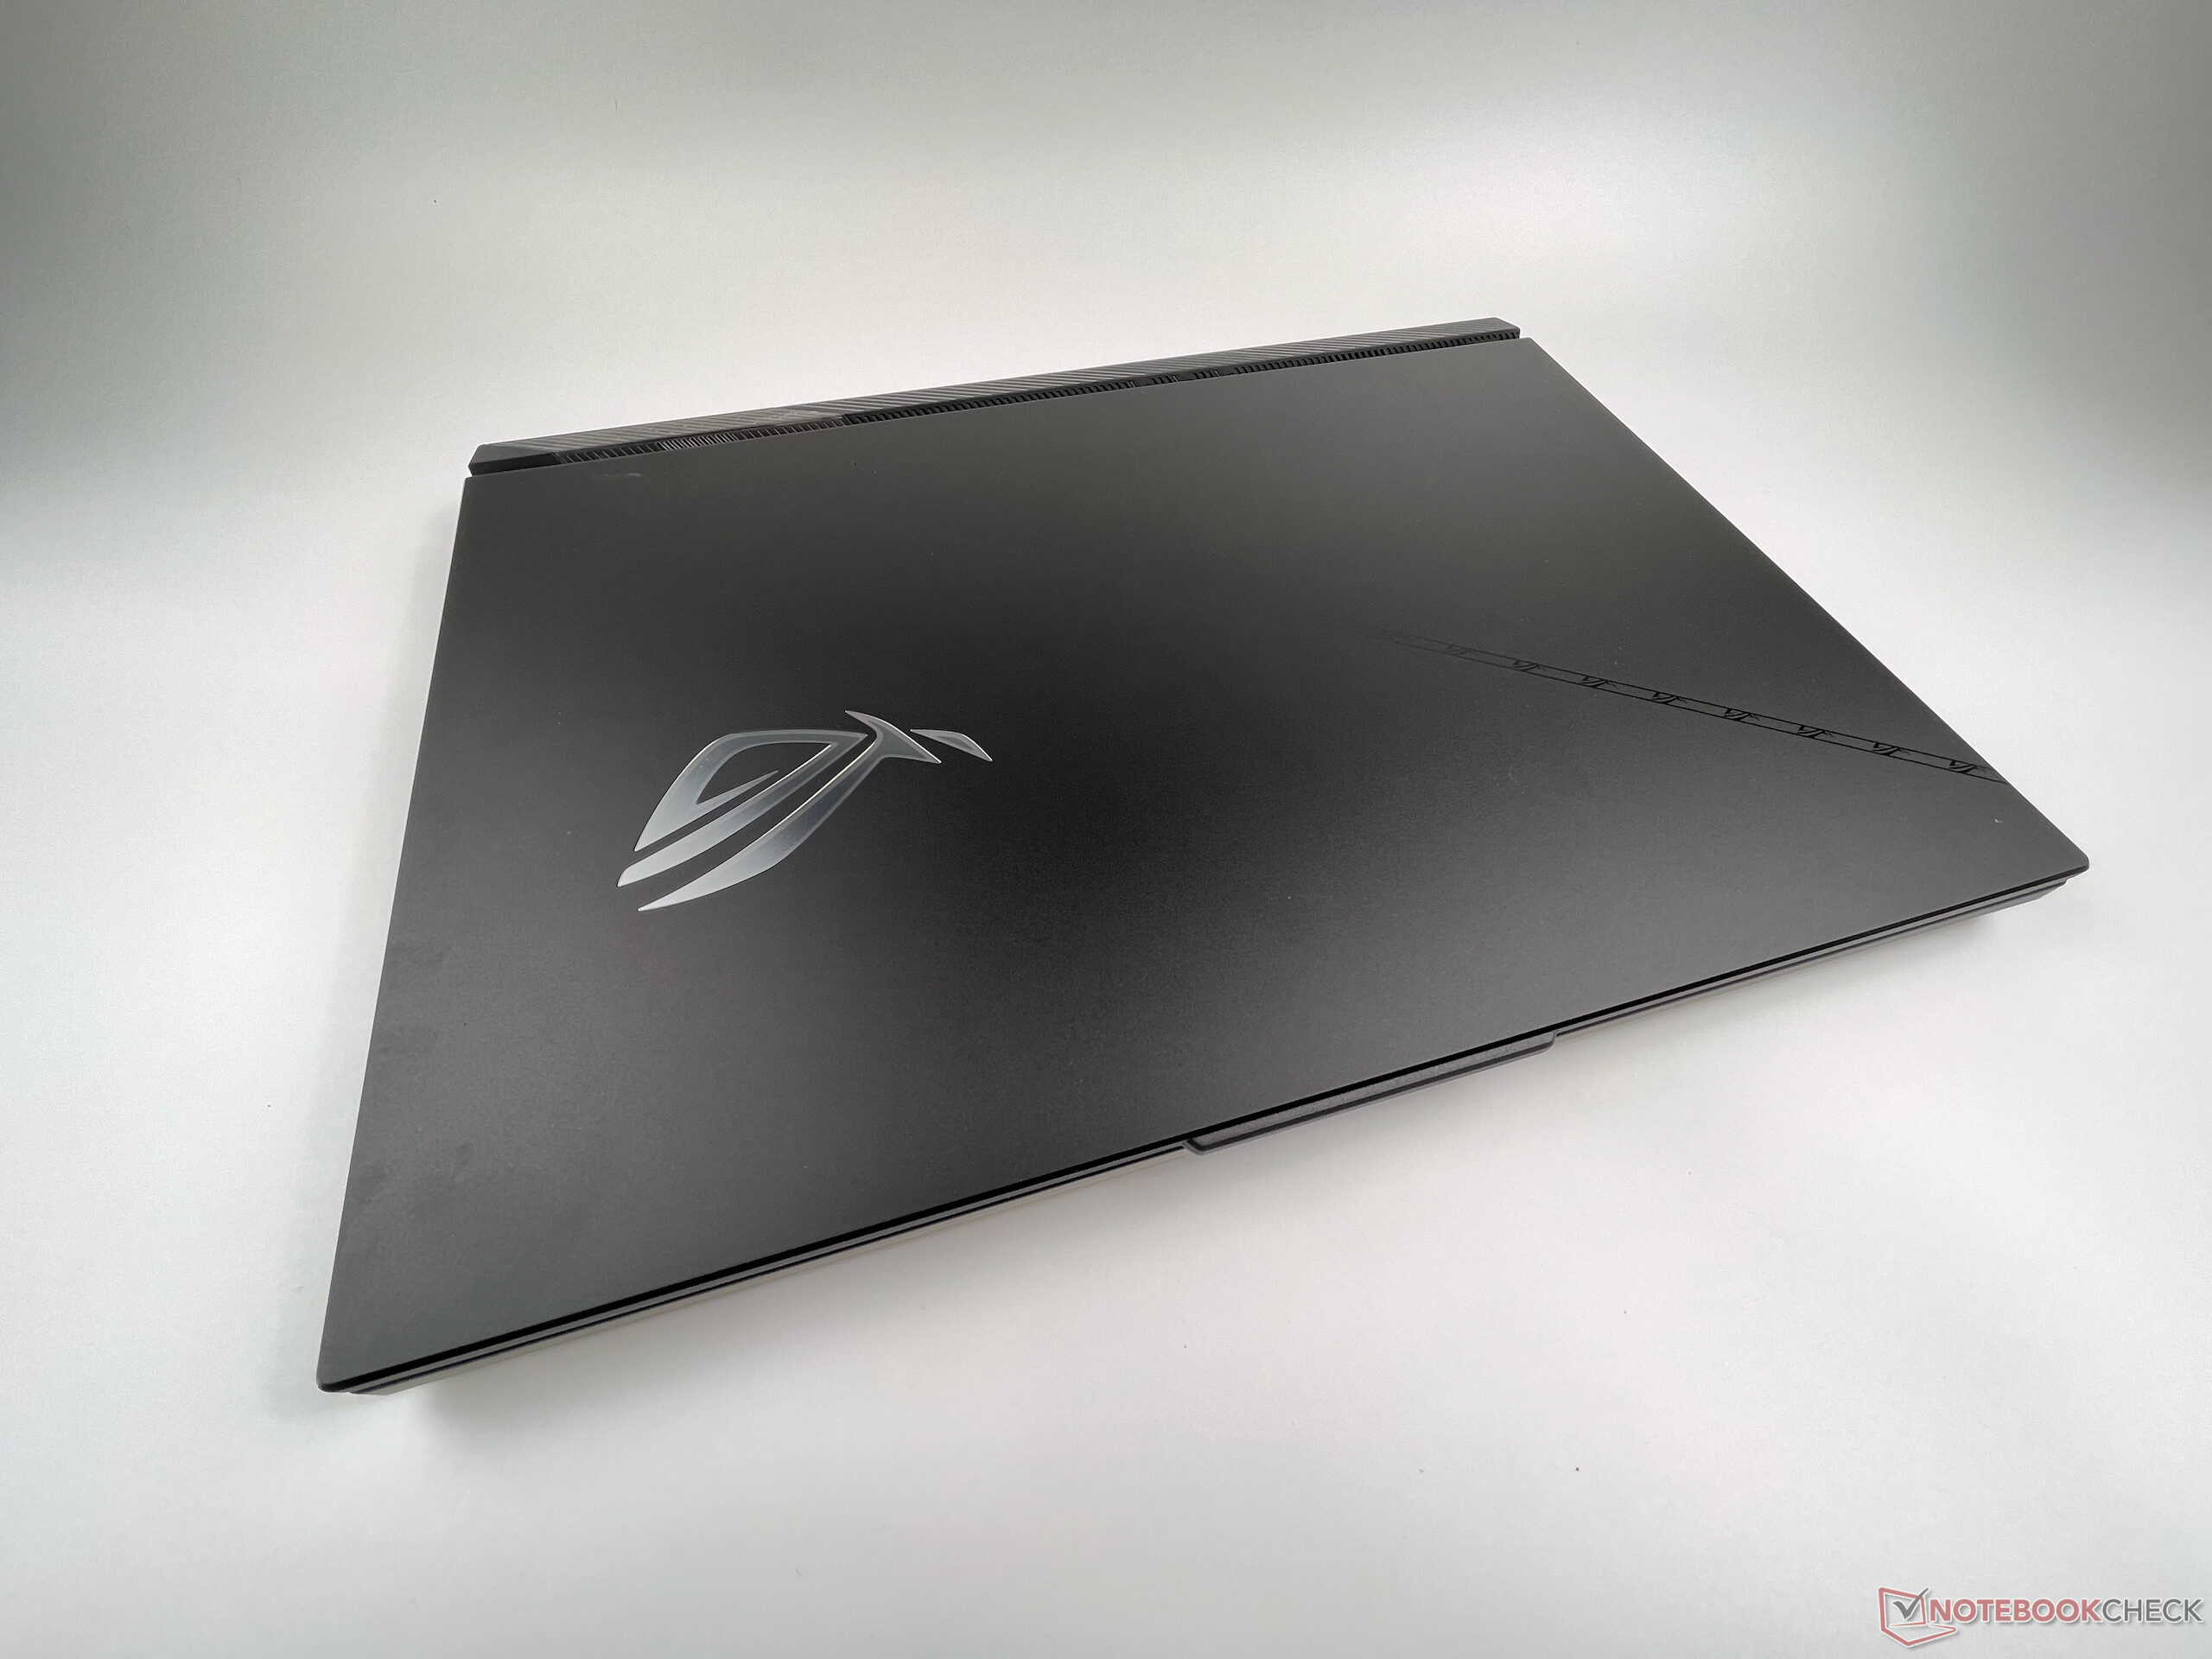
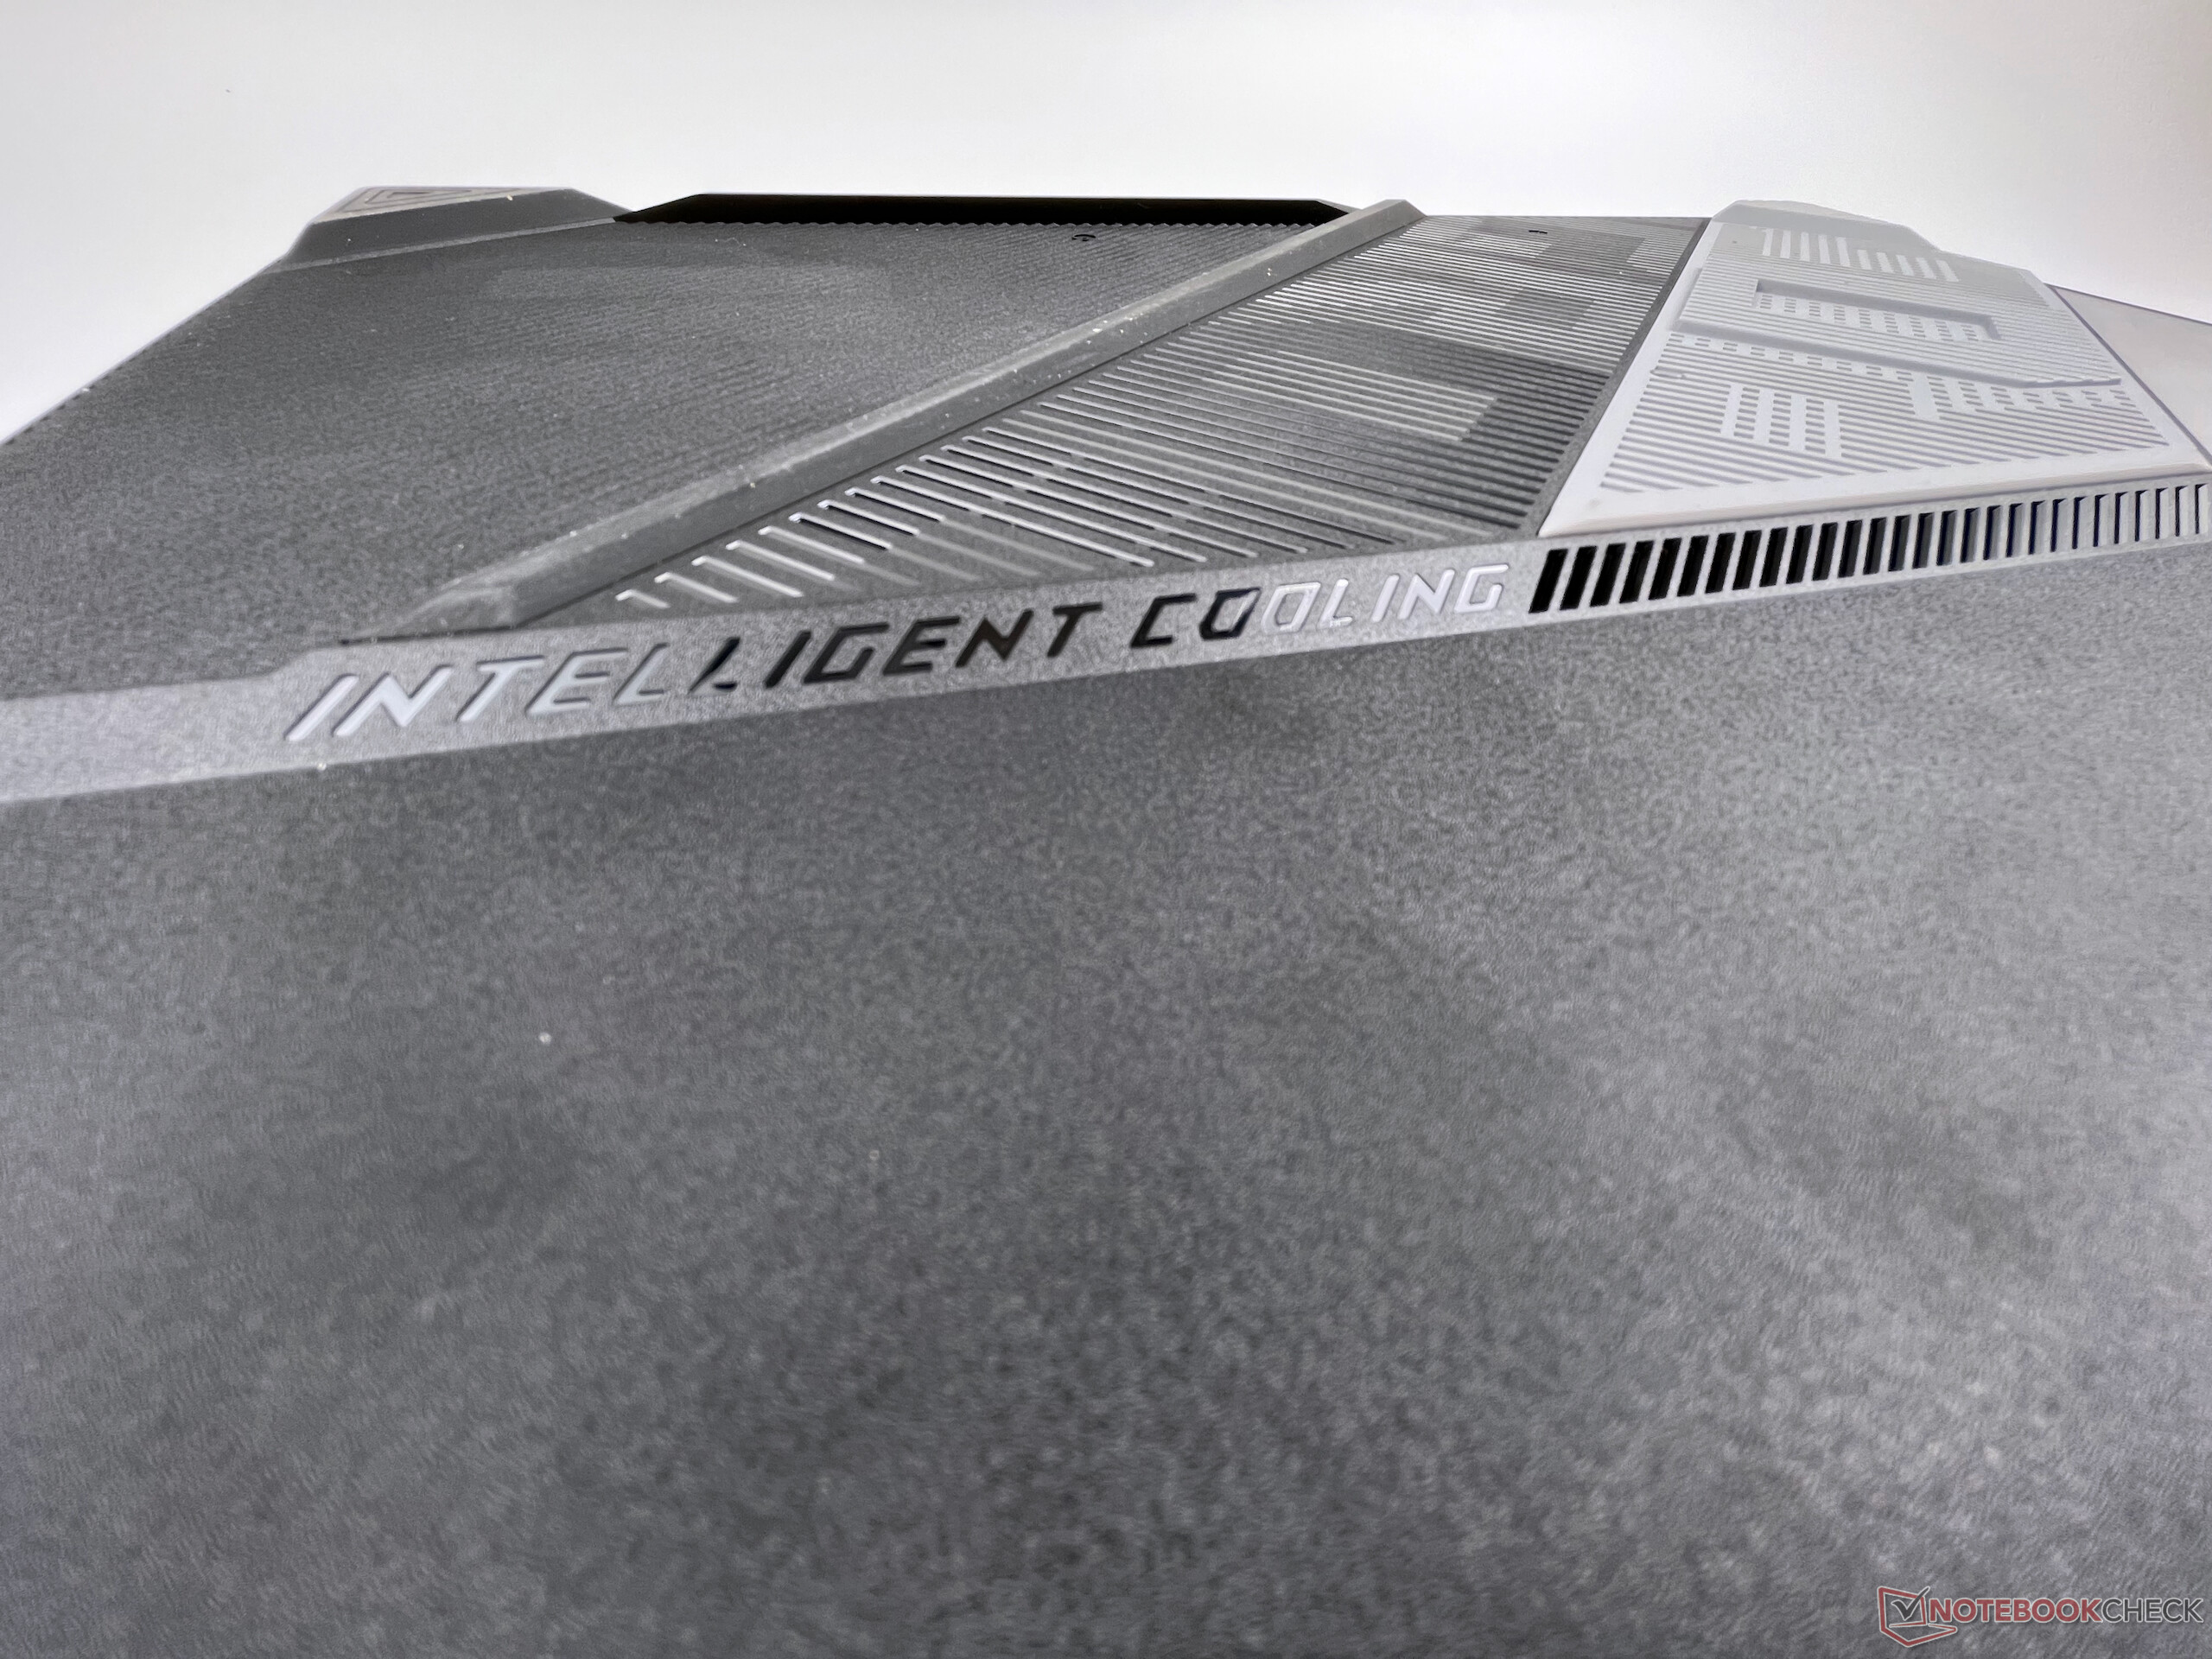
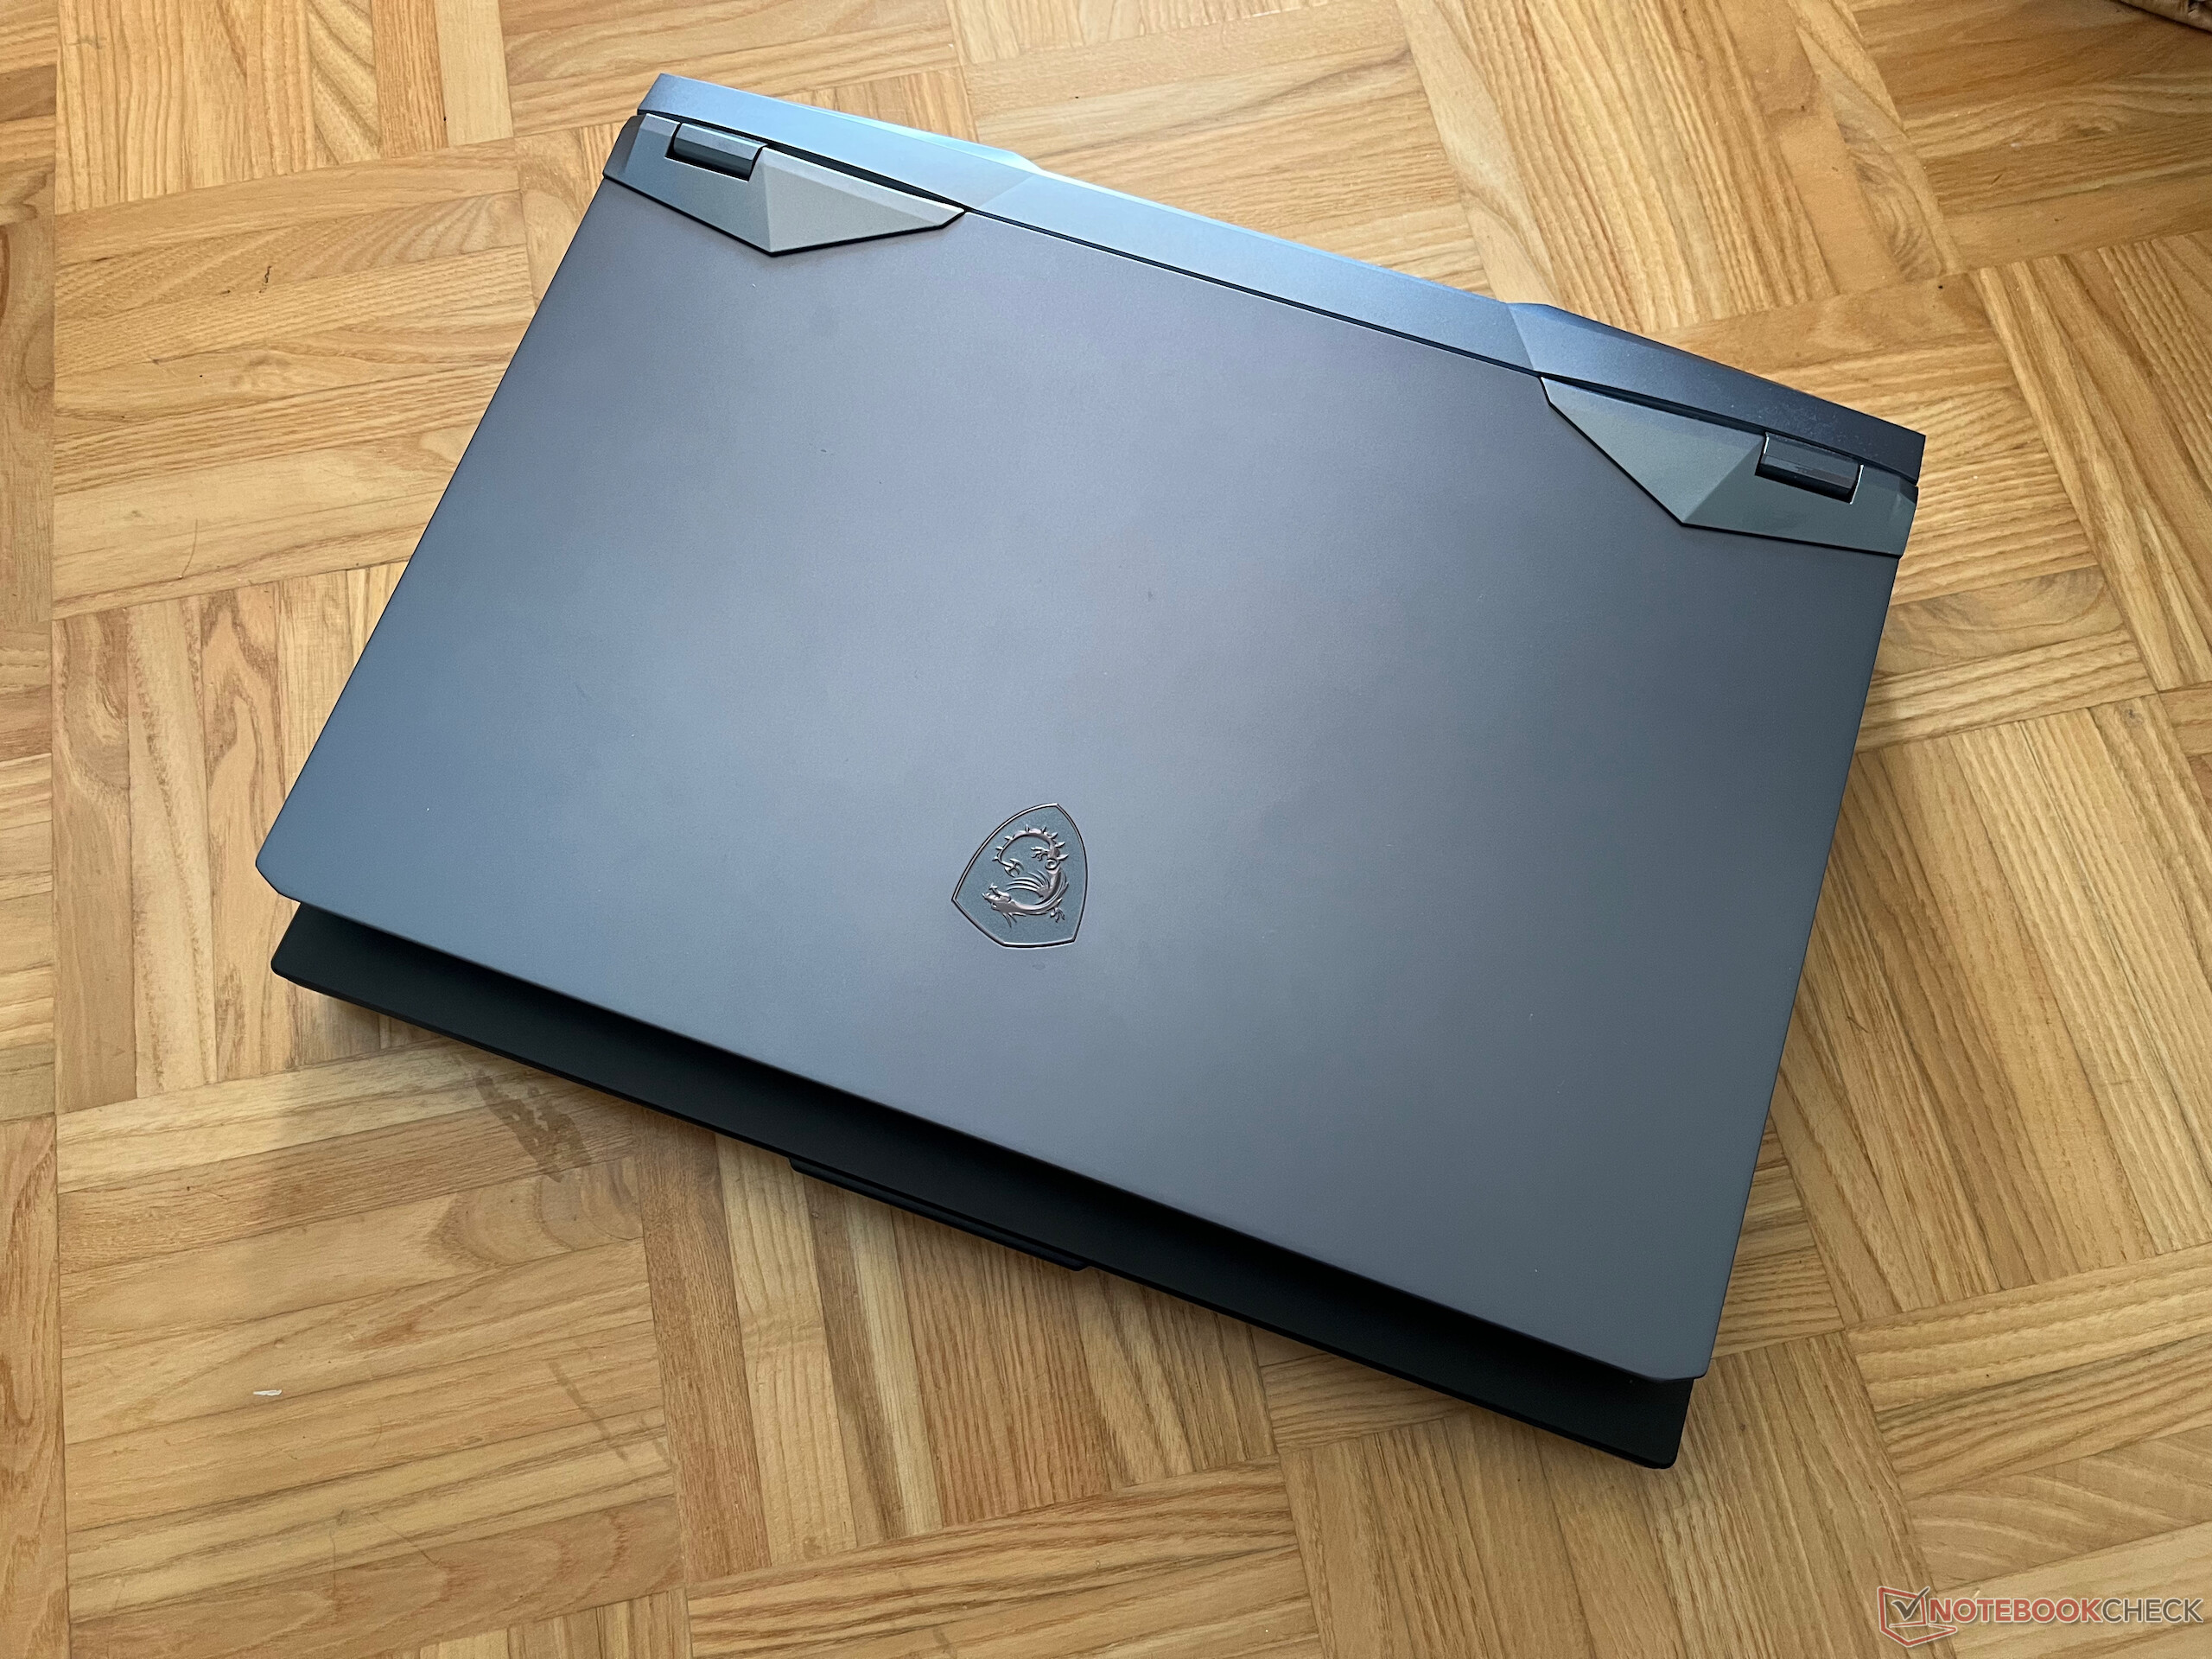
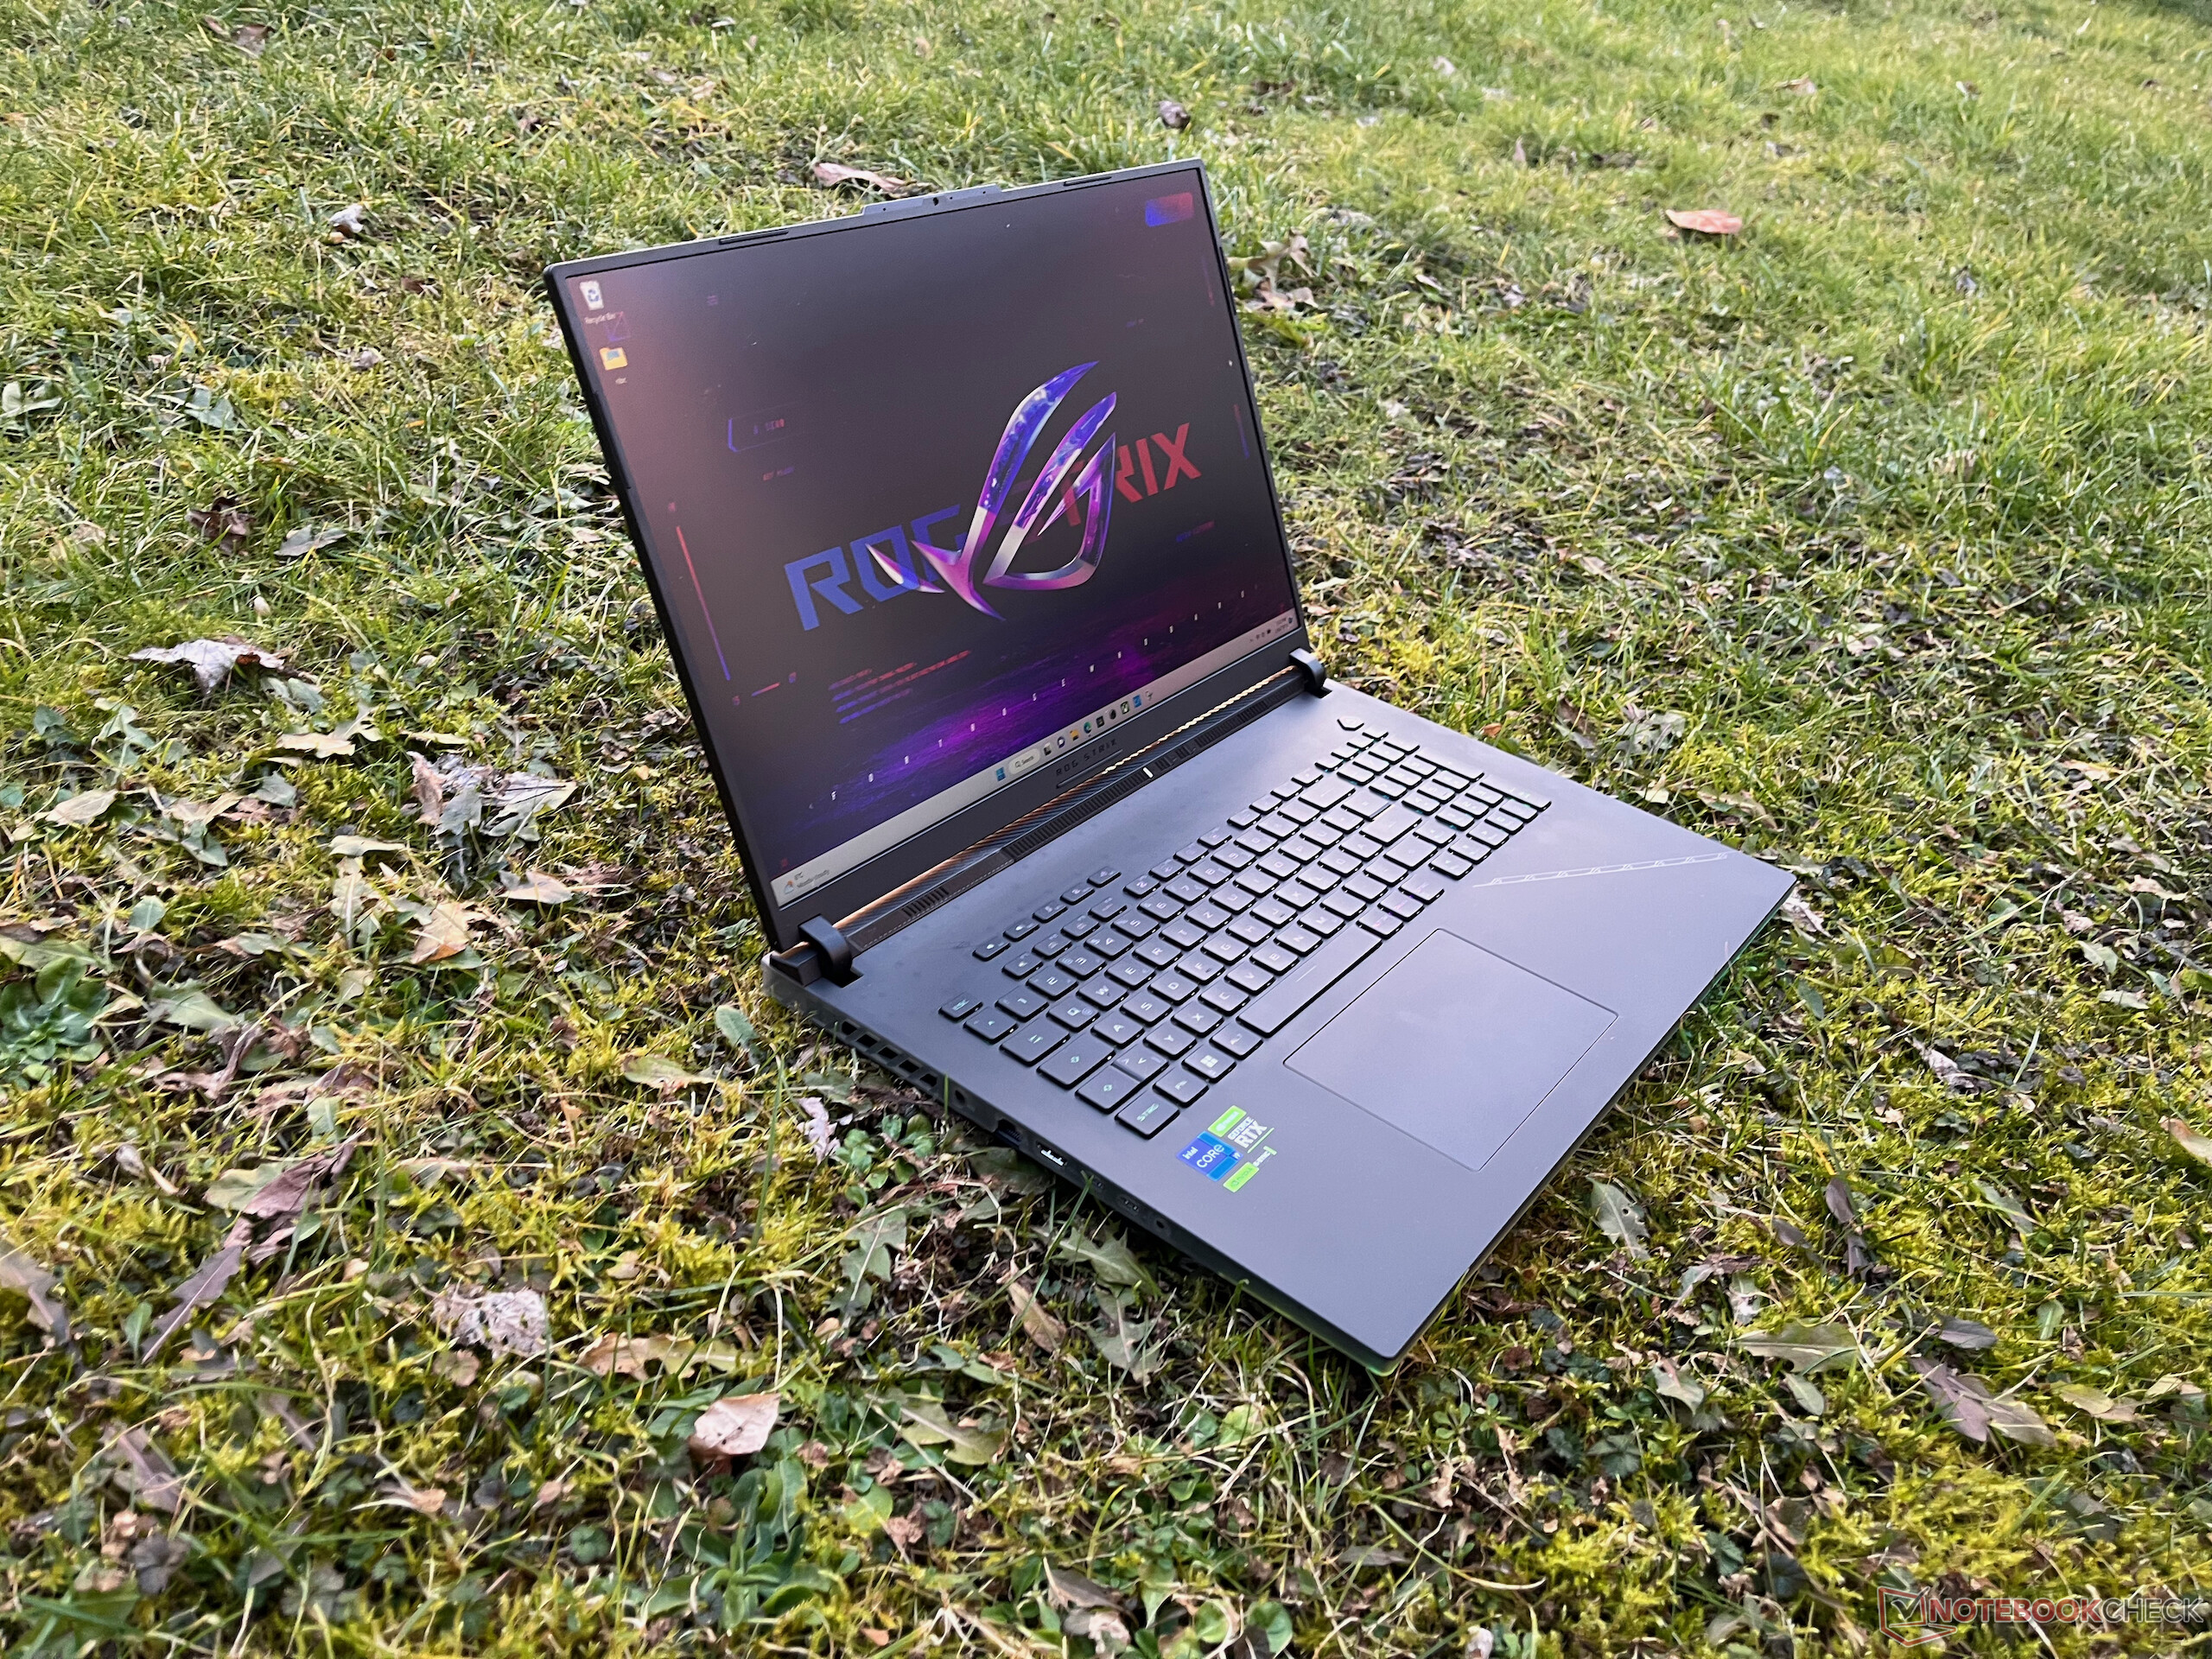
Die Gehäusegröße wird vom riesigen 18-Zoll-Display vorgegeben und übertrifft die meisten 17-Zoll-Notebooks deutlich. Die Baseunit ist jedoch nicht ganz so massiv, wodurch das Notebook etwas kleiner wirkt als es ist.
Ausstattung
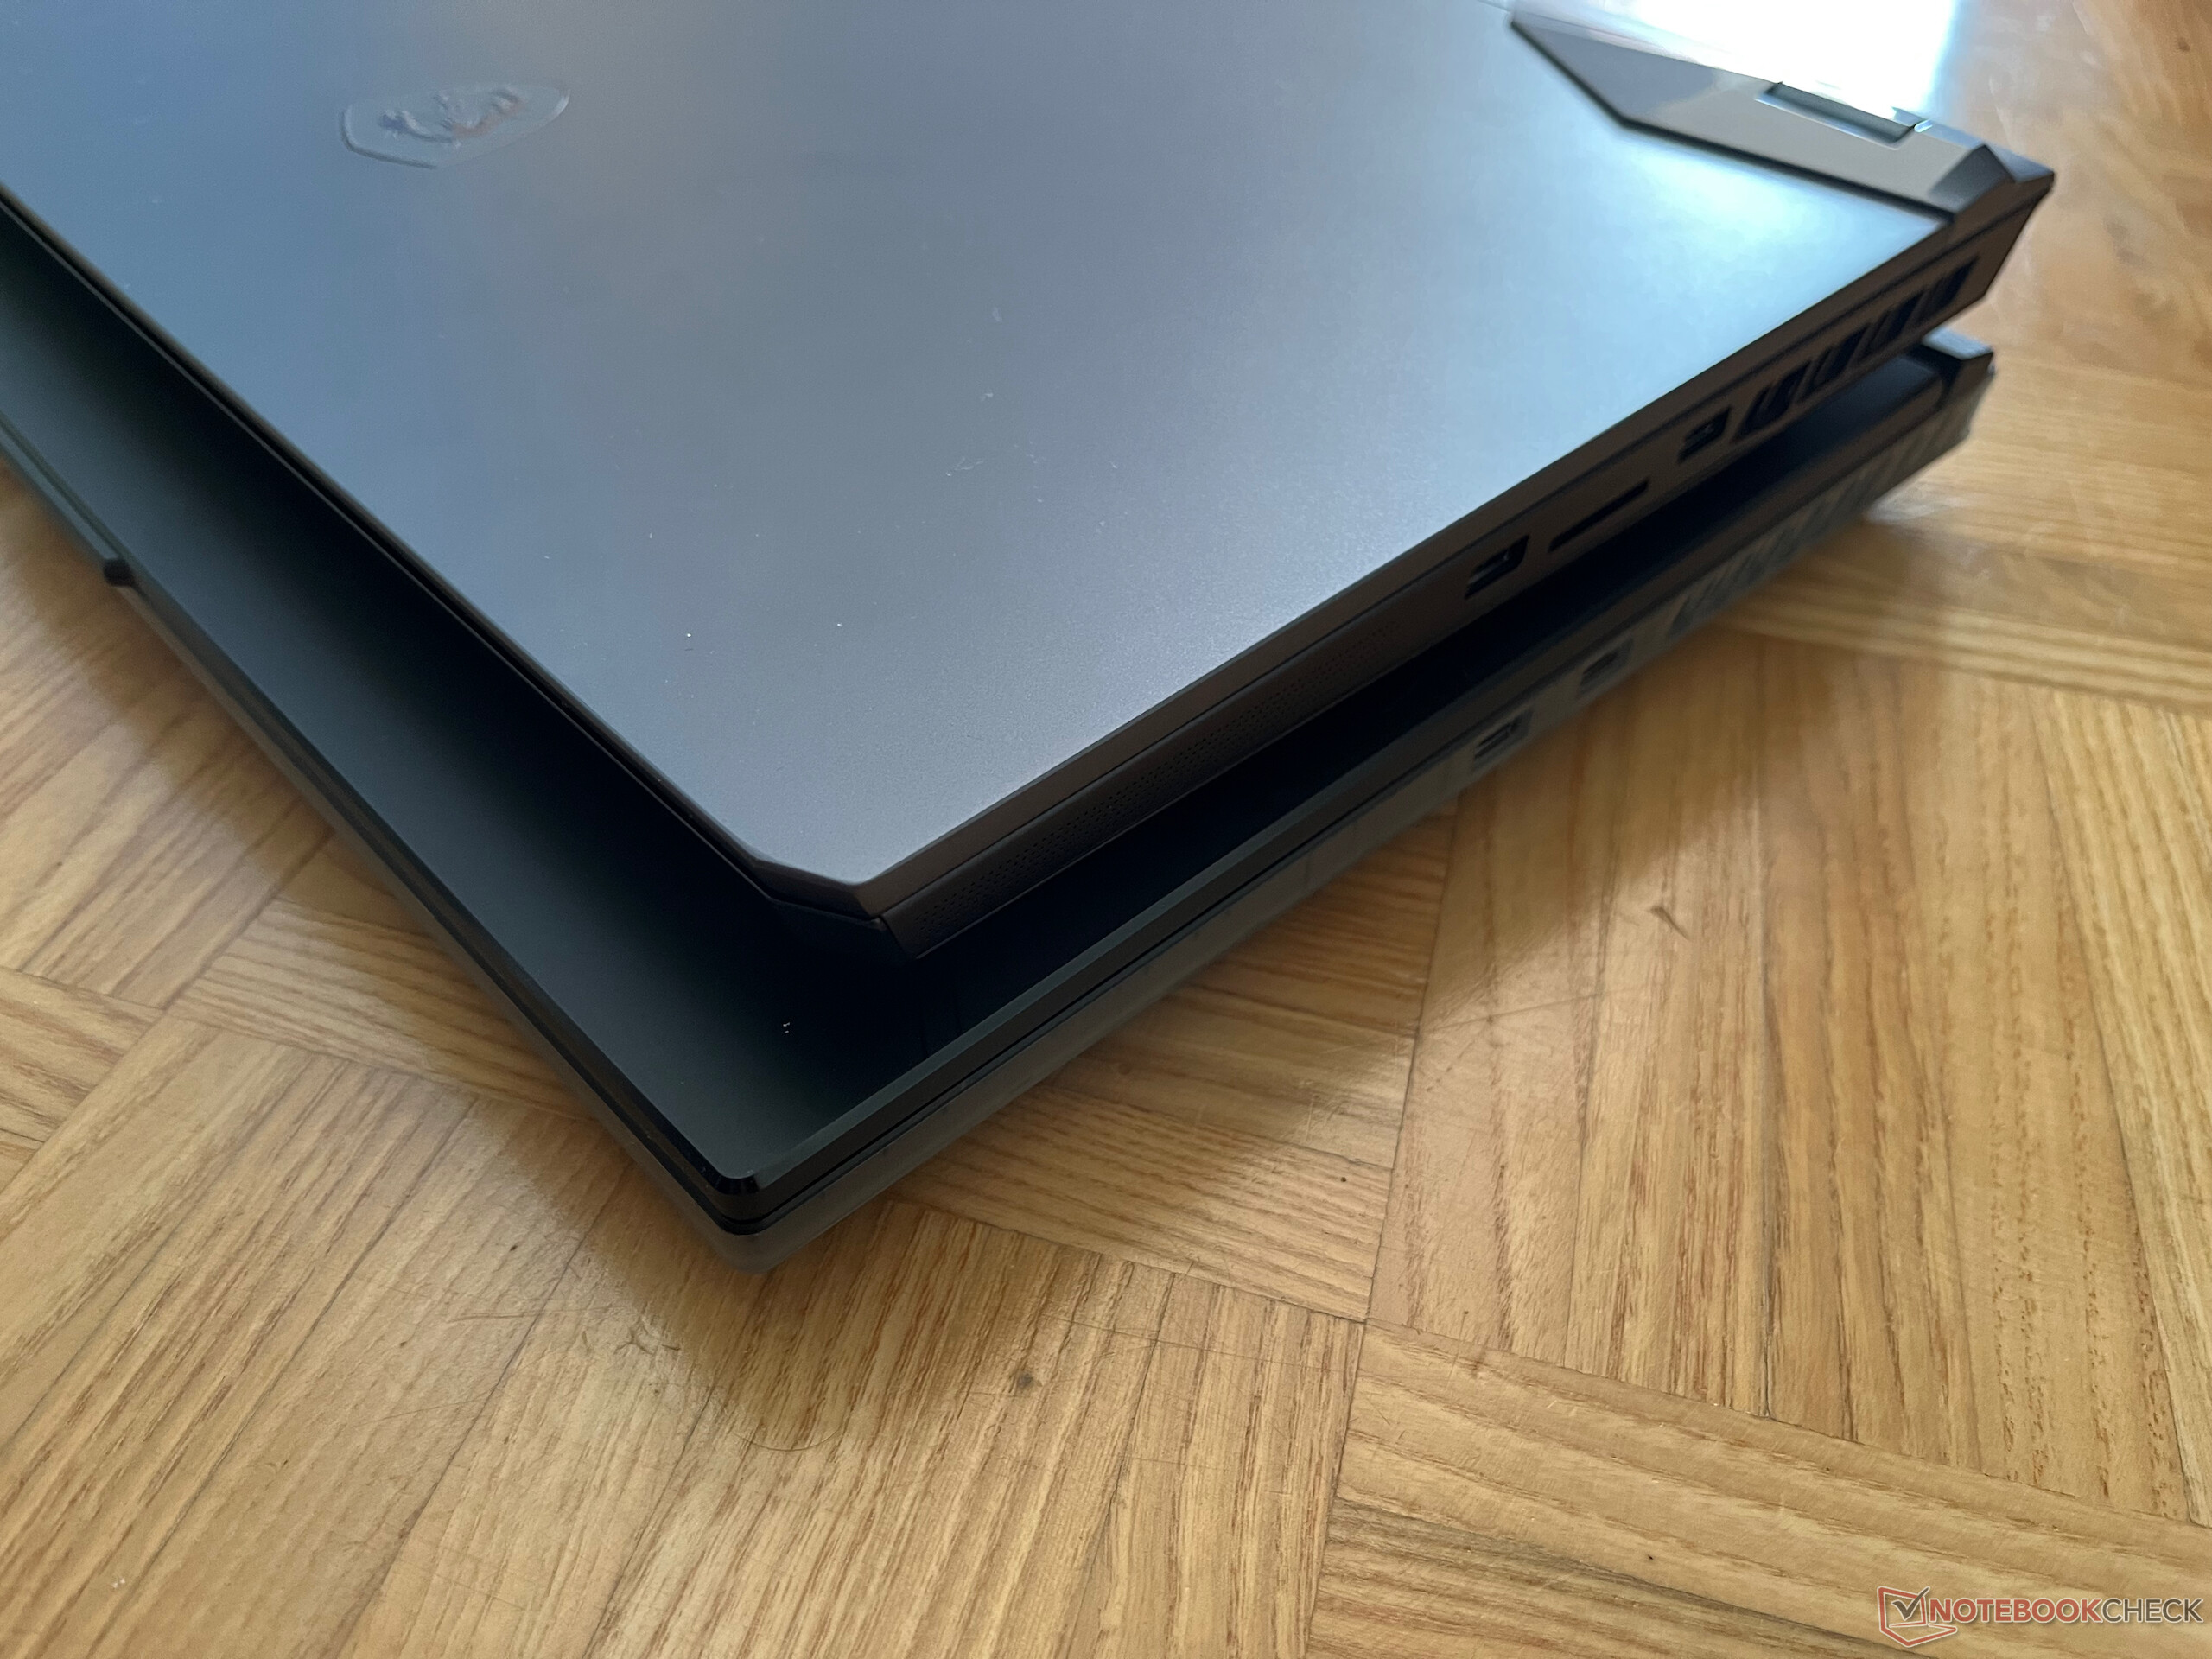
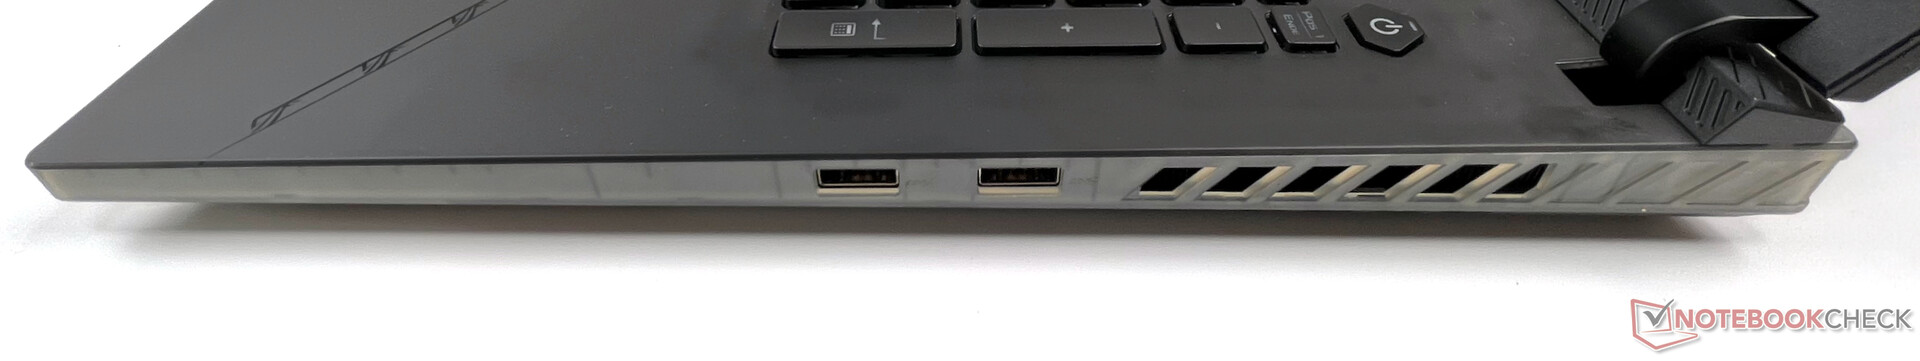
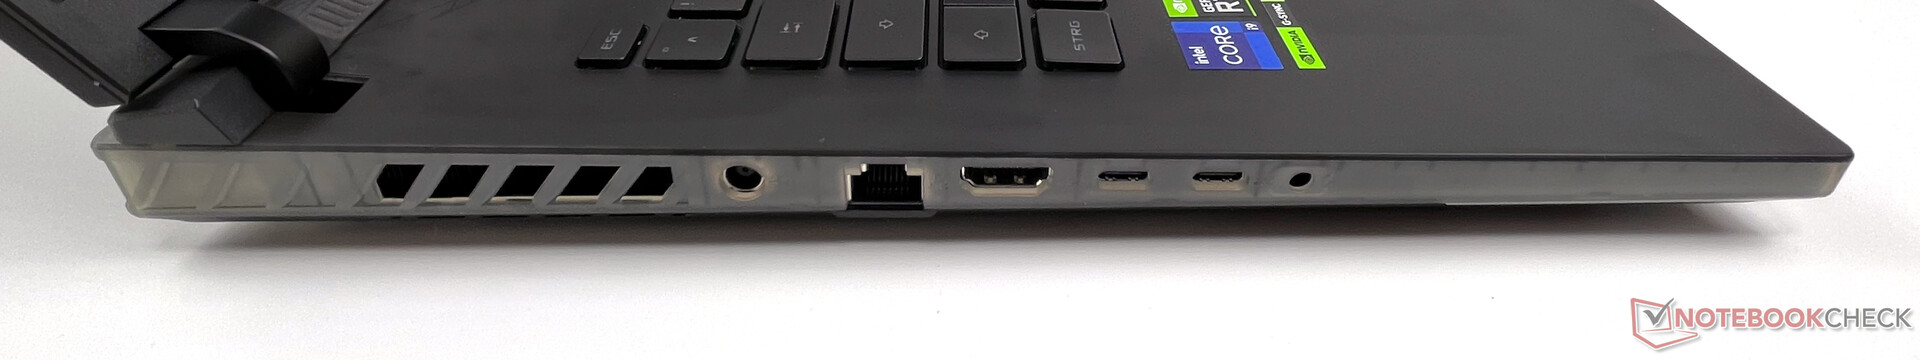
Alle Ports befinden sich auf der linken und rechten Seite das Gehäuses. Dies ist im Desktop-Betrieb leider nicht optimal, da man Kabel immer im sichtbaren Bereich hat. Weiters sind beide USB-A-Anschlüsse an der rechten Seite mittig, wodurch die Kabelführung für Mäuse bei Rechtshänder nicht ideal ist. Für Linkshänder wäre das Netzwerkkabel störend im Weg.
Auch bei der Ausstattung haben wir etwas zu bemängeln. Nur einer der beiden USB-C-Ports unterstützt Thunderbolt, dafür unterstützt der andere eingeschränkt Power Delivery. Im Test ludt das MacBook Air M1 Netzteil das Notebook mit 30 Watt aber ohne Bestätigung in Windows. Das 45 Watt Anker Nano 2 übertrug jedoch keinen Strom. Immer positiv ist aber der 2.5-GBit-Netzwerkanschluss zu erwähnen.
Kommunikation
Bei den Kommunikationsmöglichkeiten bietet Asus eine schnelle Intel Wi-Fi 6E AX211 Karte im M.2-Format für drahtlose Verbindungen und einen Realtek RTL8125 Chip für drahtgebundene 2.5 GBit LAN Anschlüsse. Beide funktionierten im Test ohne Störungen, die AX211-Karte fand jedoch kein 6-GHz-Netz unseres Asus ROG Rapture GT-AX11000 Routers. Leider ist Wi-Fi 6E im Test immer noch Hit und Miss beim Auffinden des Netzes.
Die Datenraten im Wi-Fi-6-Netz sind jedoch hervorragend und ohne Einbrüche.
Webcam
Die verbaute 720p-HD-Webcam genügt leider nur den geringsten Anforderungen an die Videotelefonie. Wichtig sind gute Lichtverhältnisse, da bei Gegenlicht oder im Dunkeln kaum brauchbare Ergebnisse zu erzielen sind.


")
")
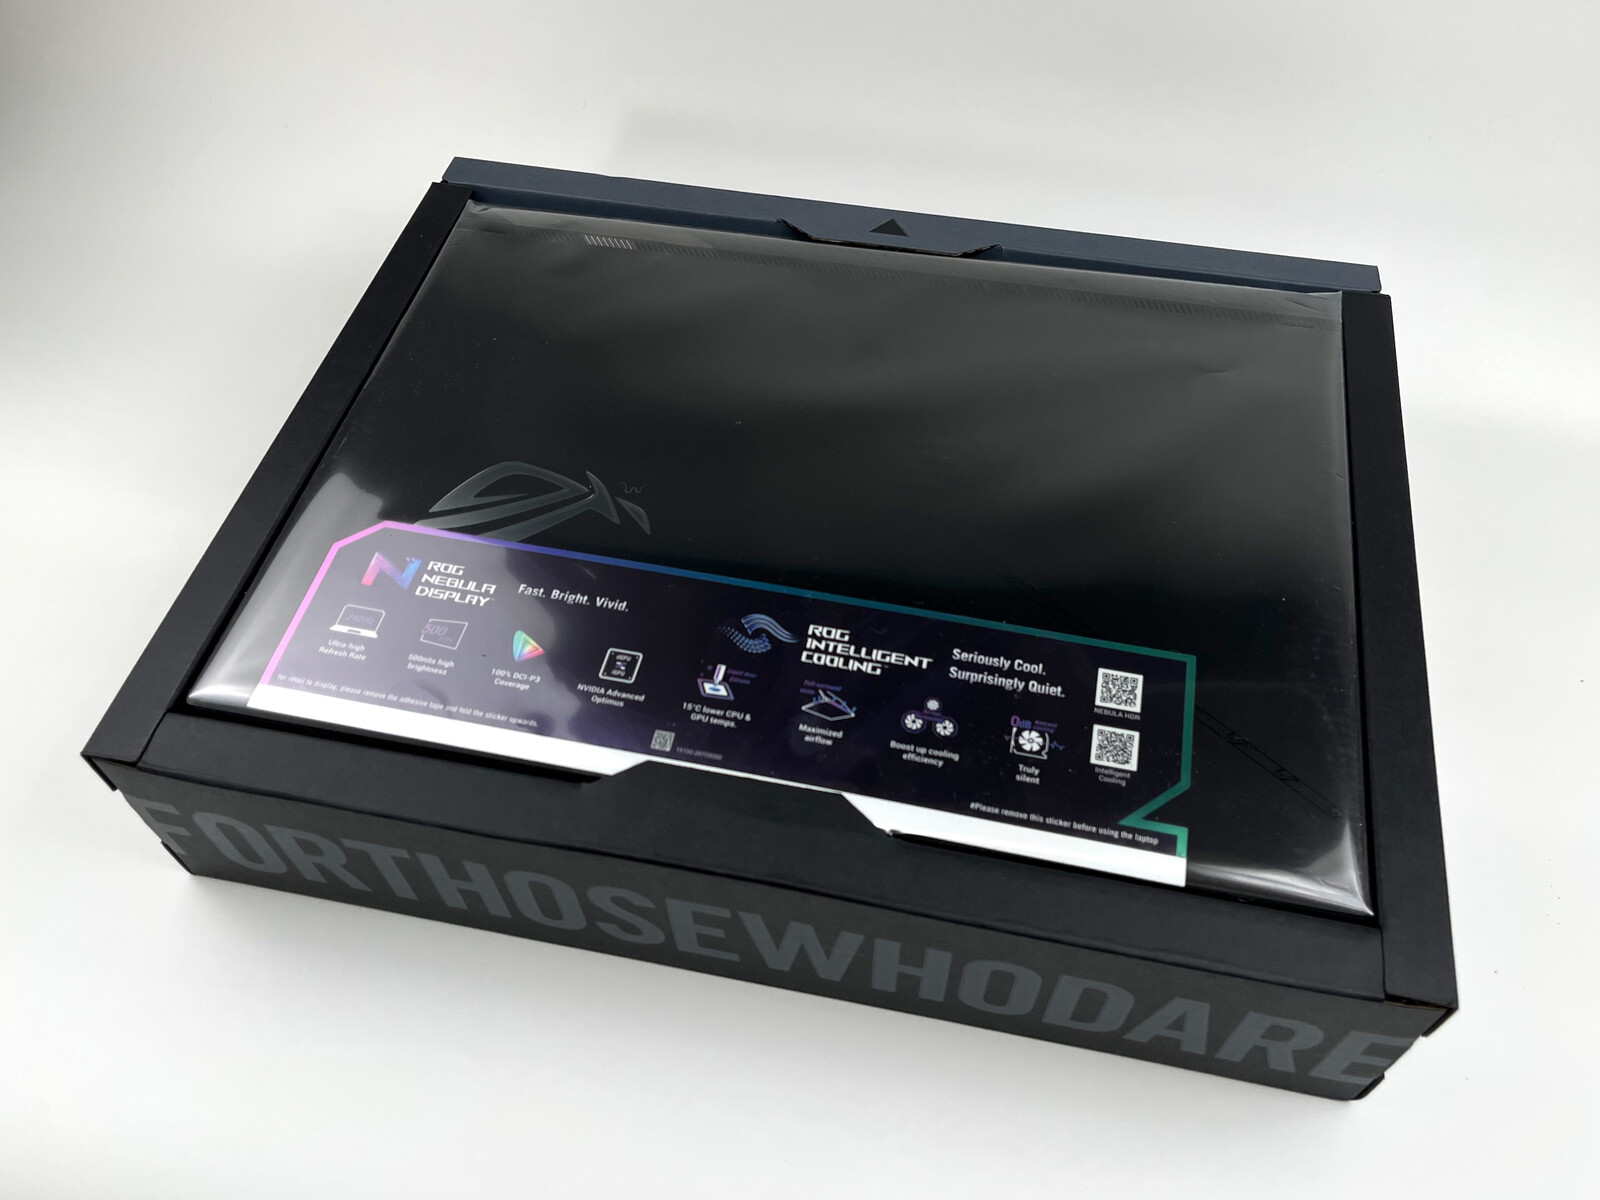
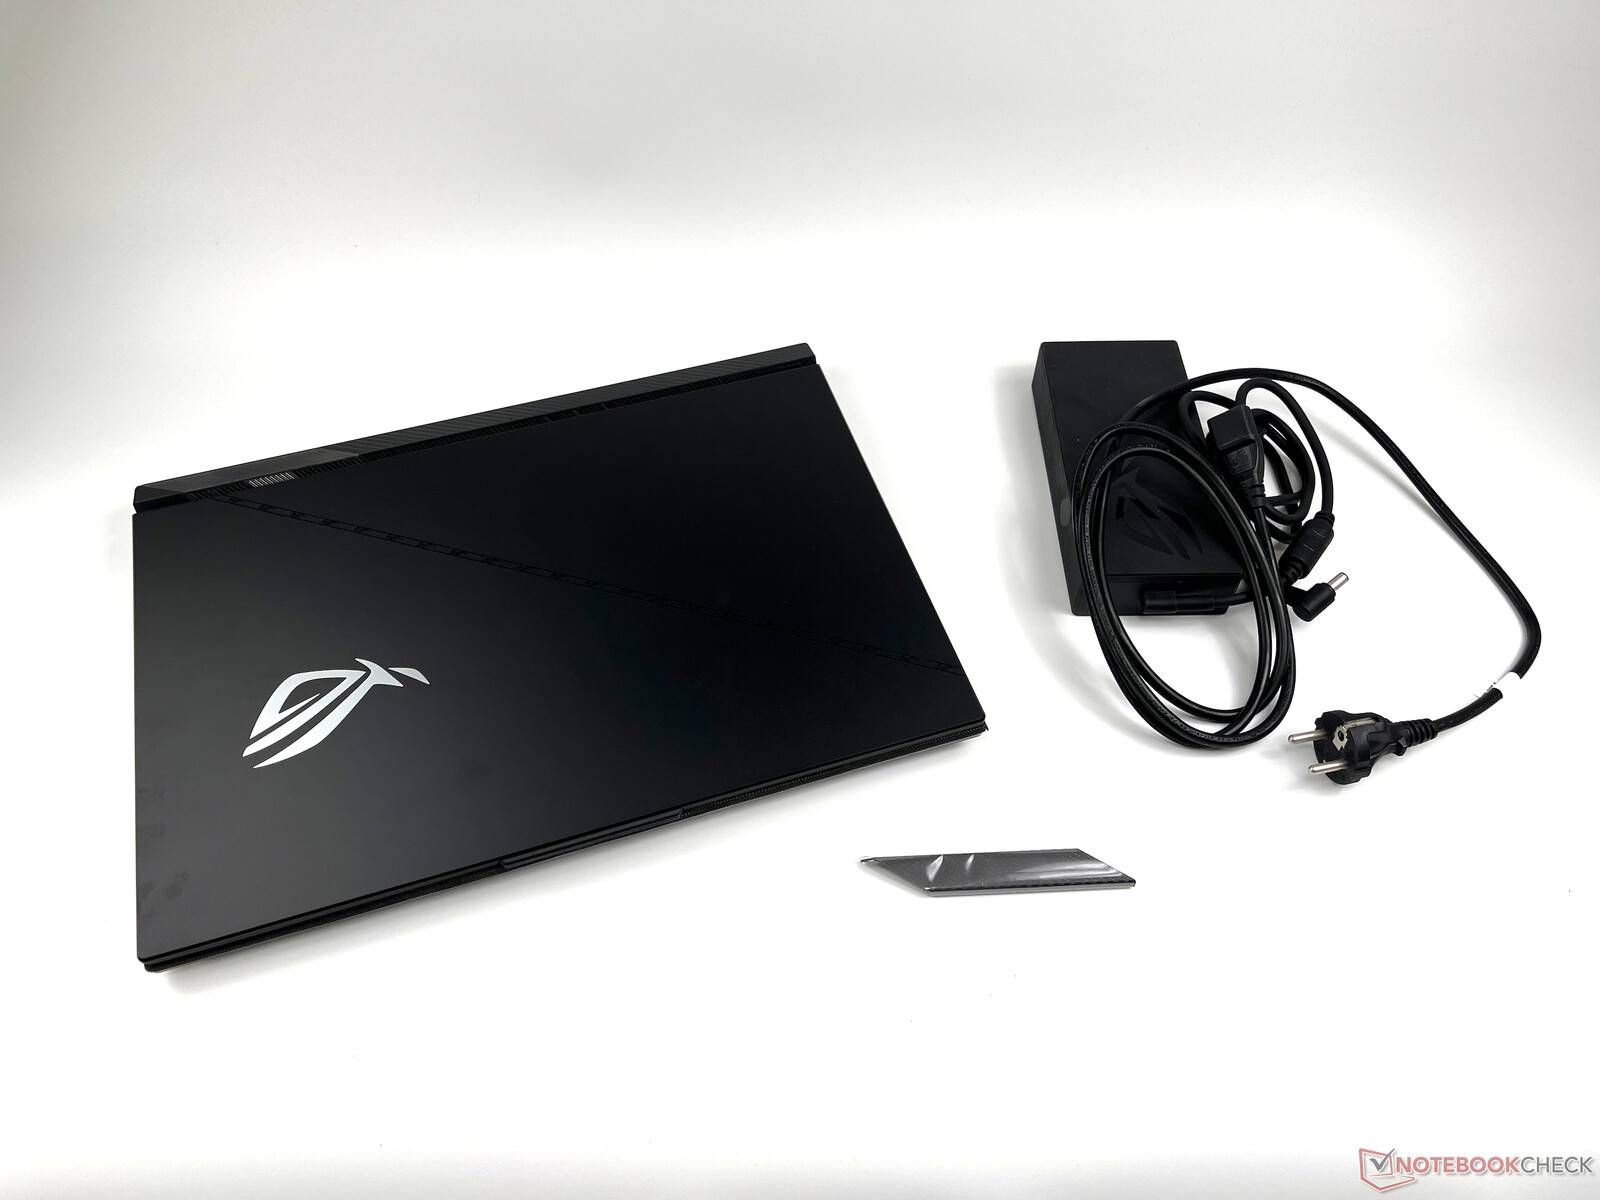
Zubehör
In der Verpackung findet man nur eine zusätzliche "Armor Cap", welche links unterhalb des Displays getauscht werden kann. Diese Abdeckung ist magnetisch befestigt und soll wohl die Möglichkeit bieten das Gerät zu personalisieren.
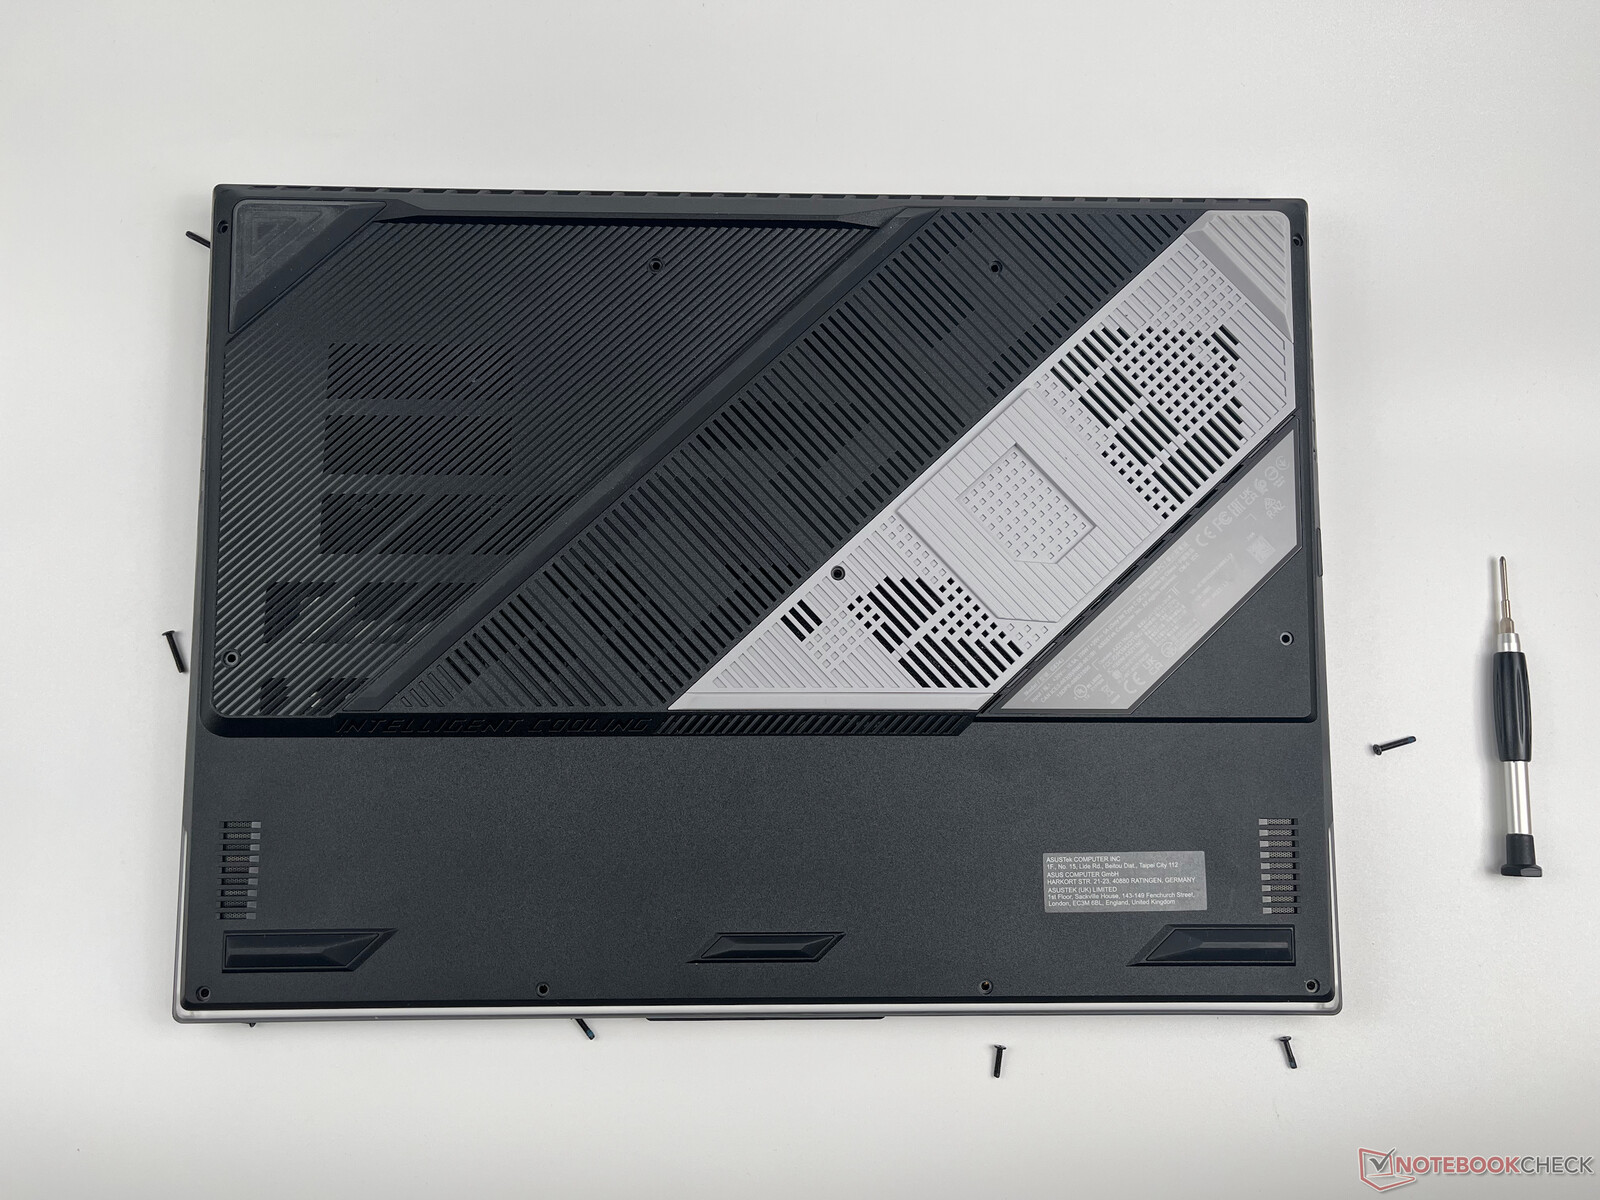
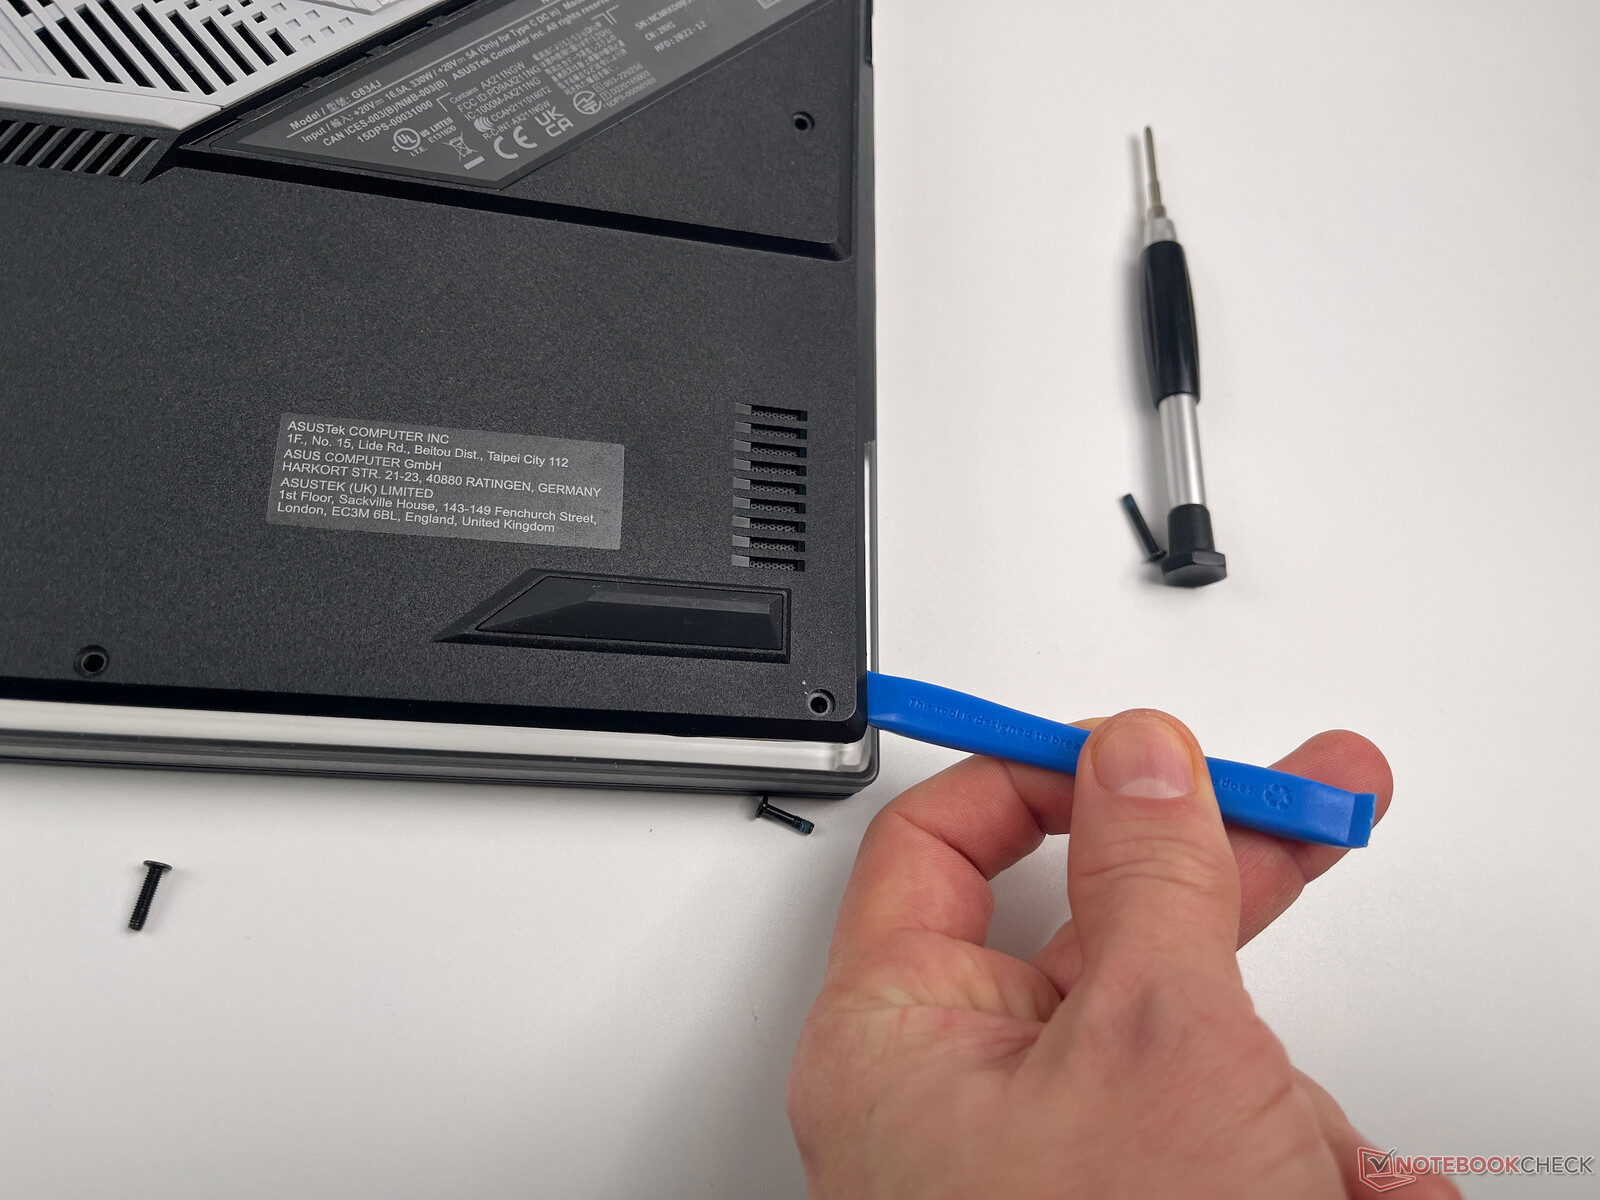
Wartung
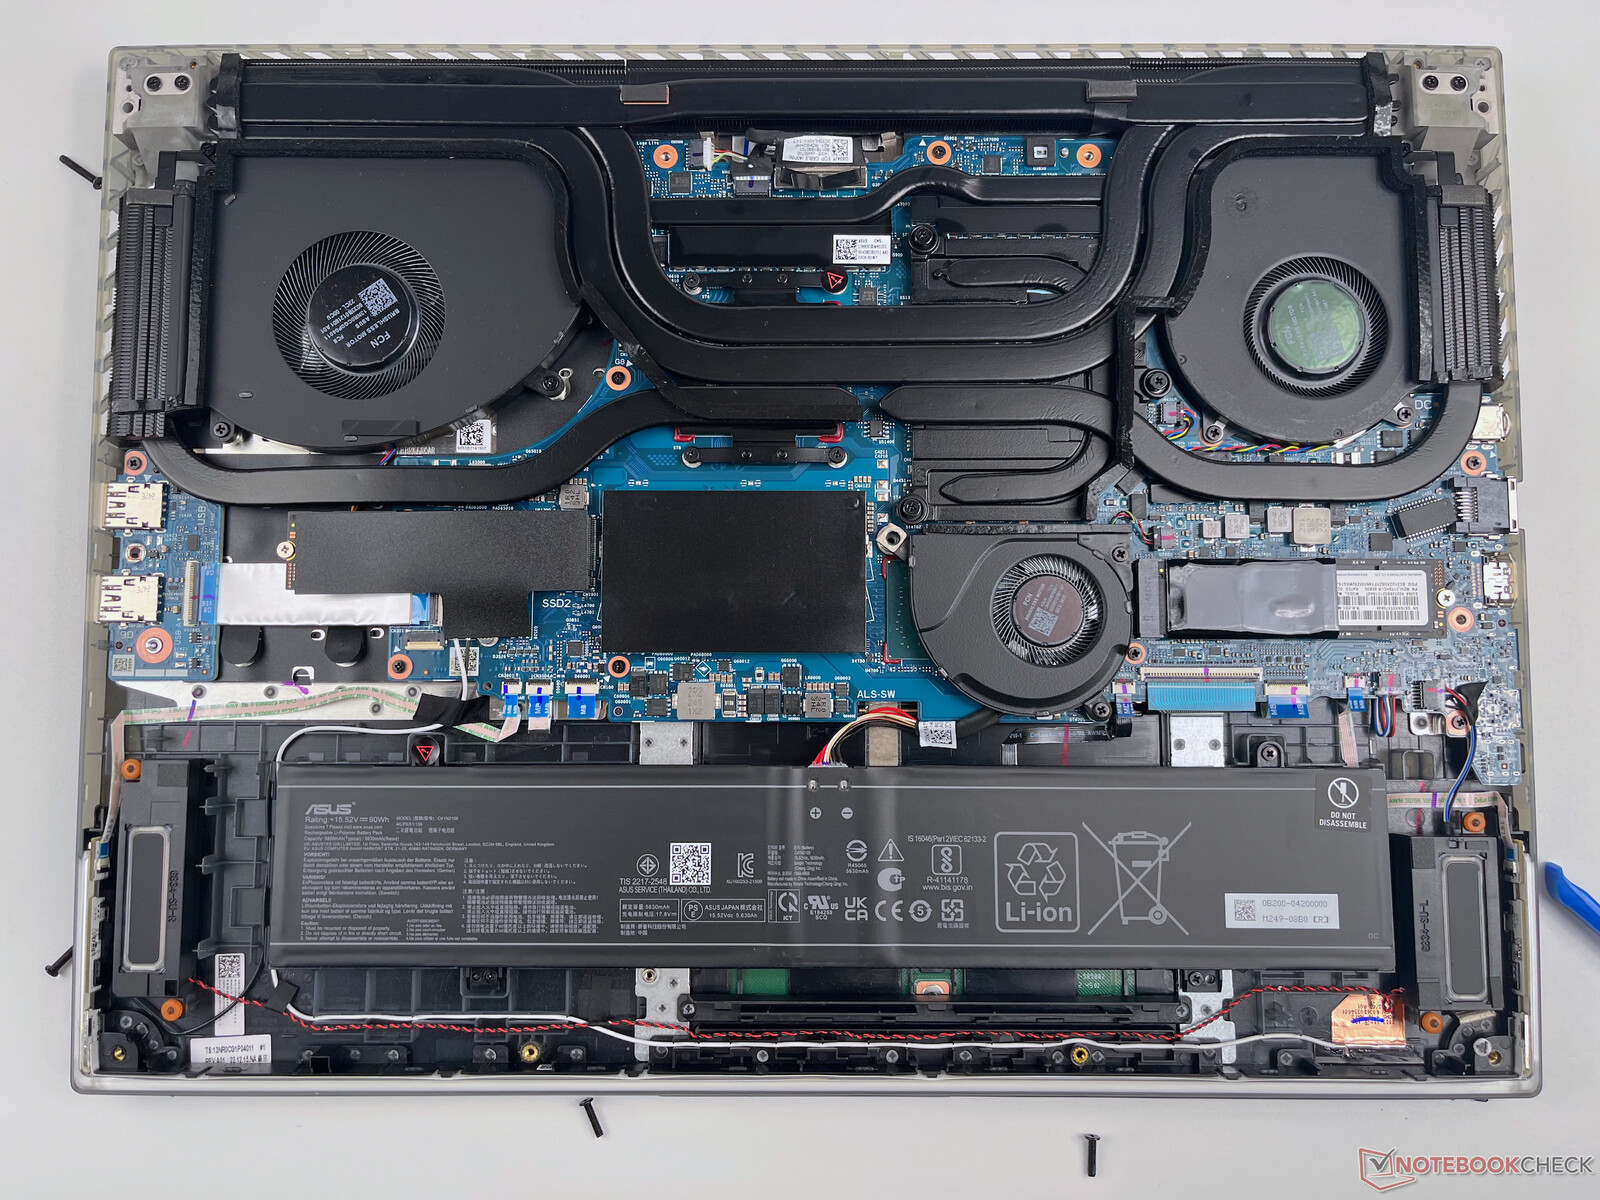
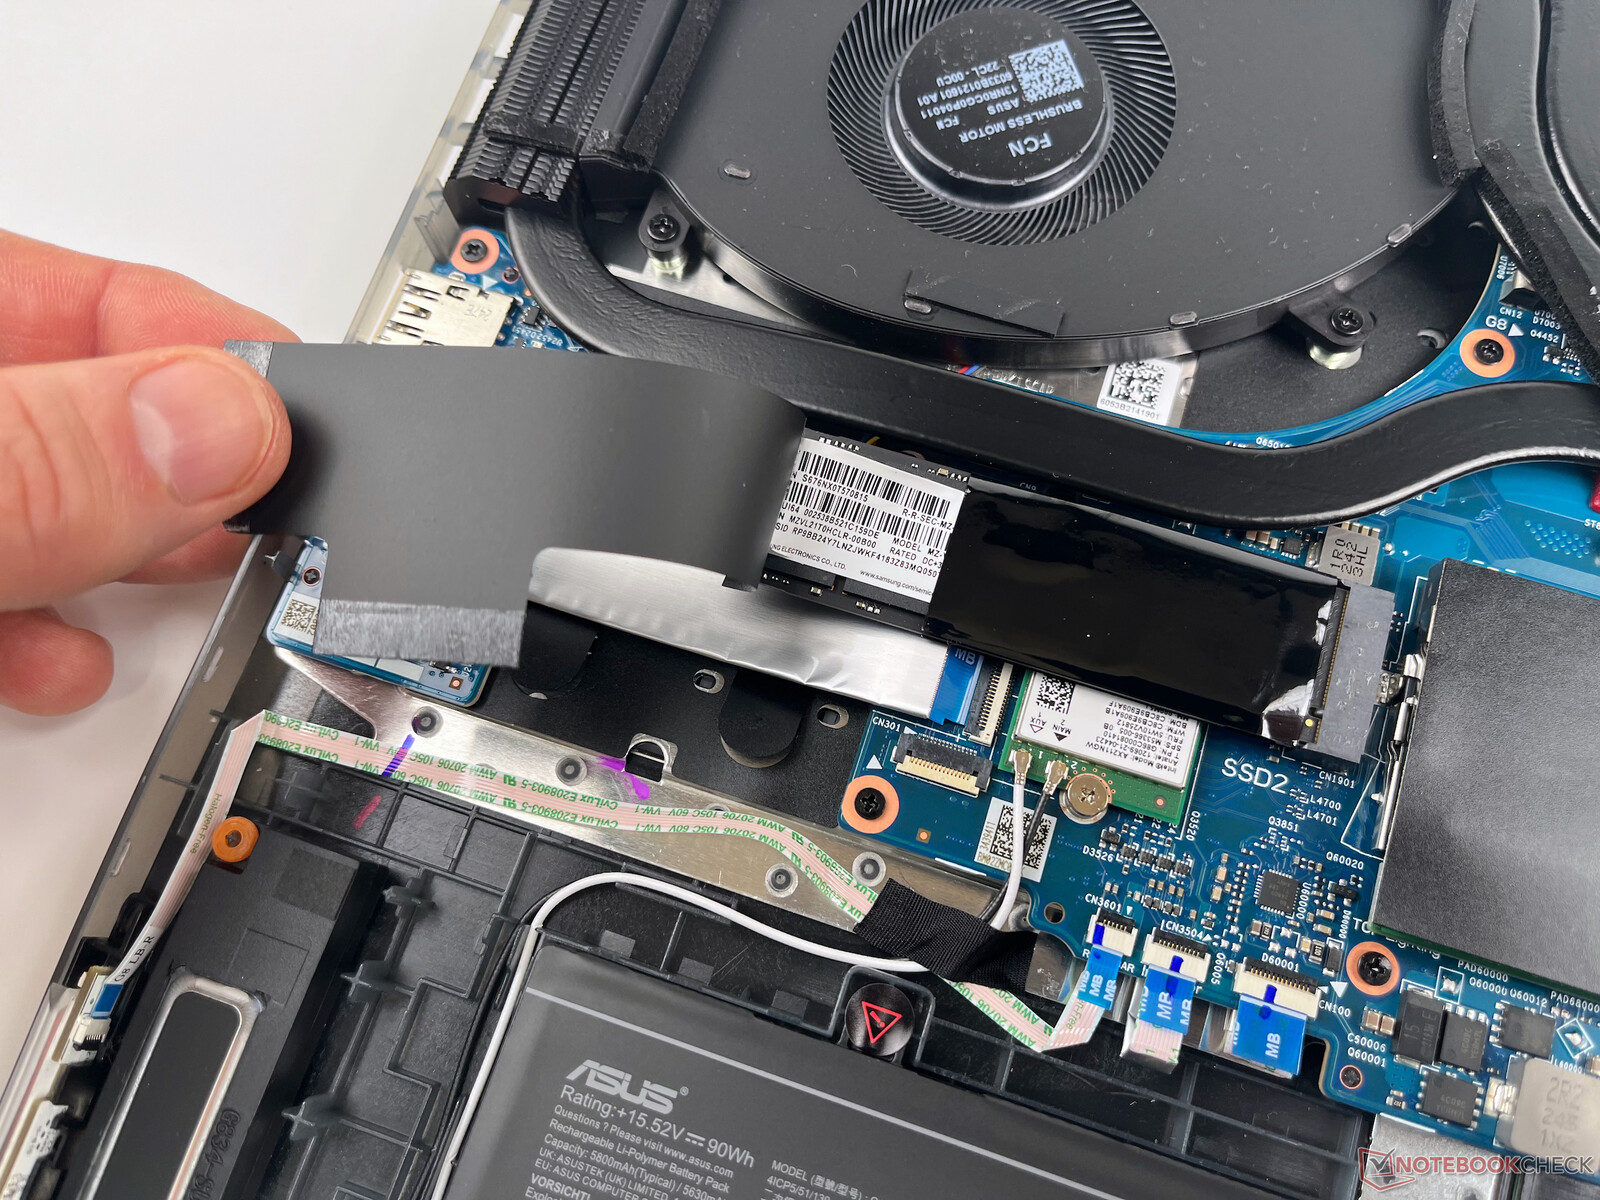
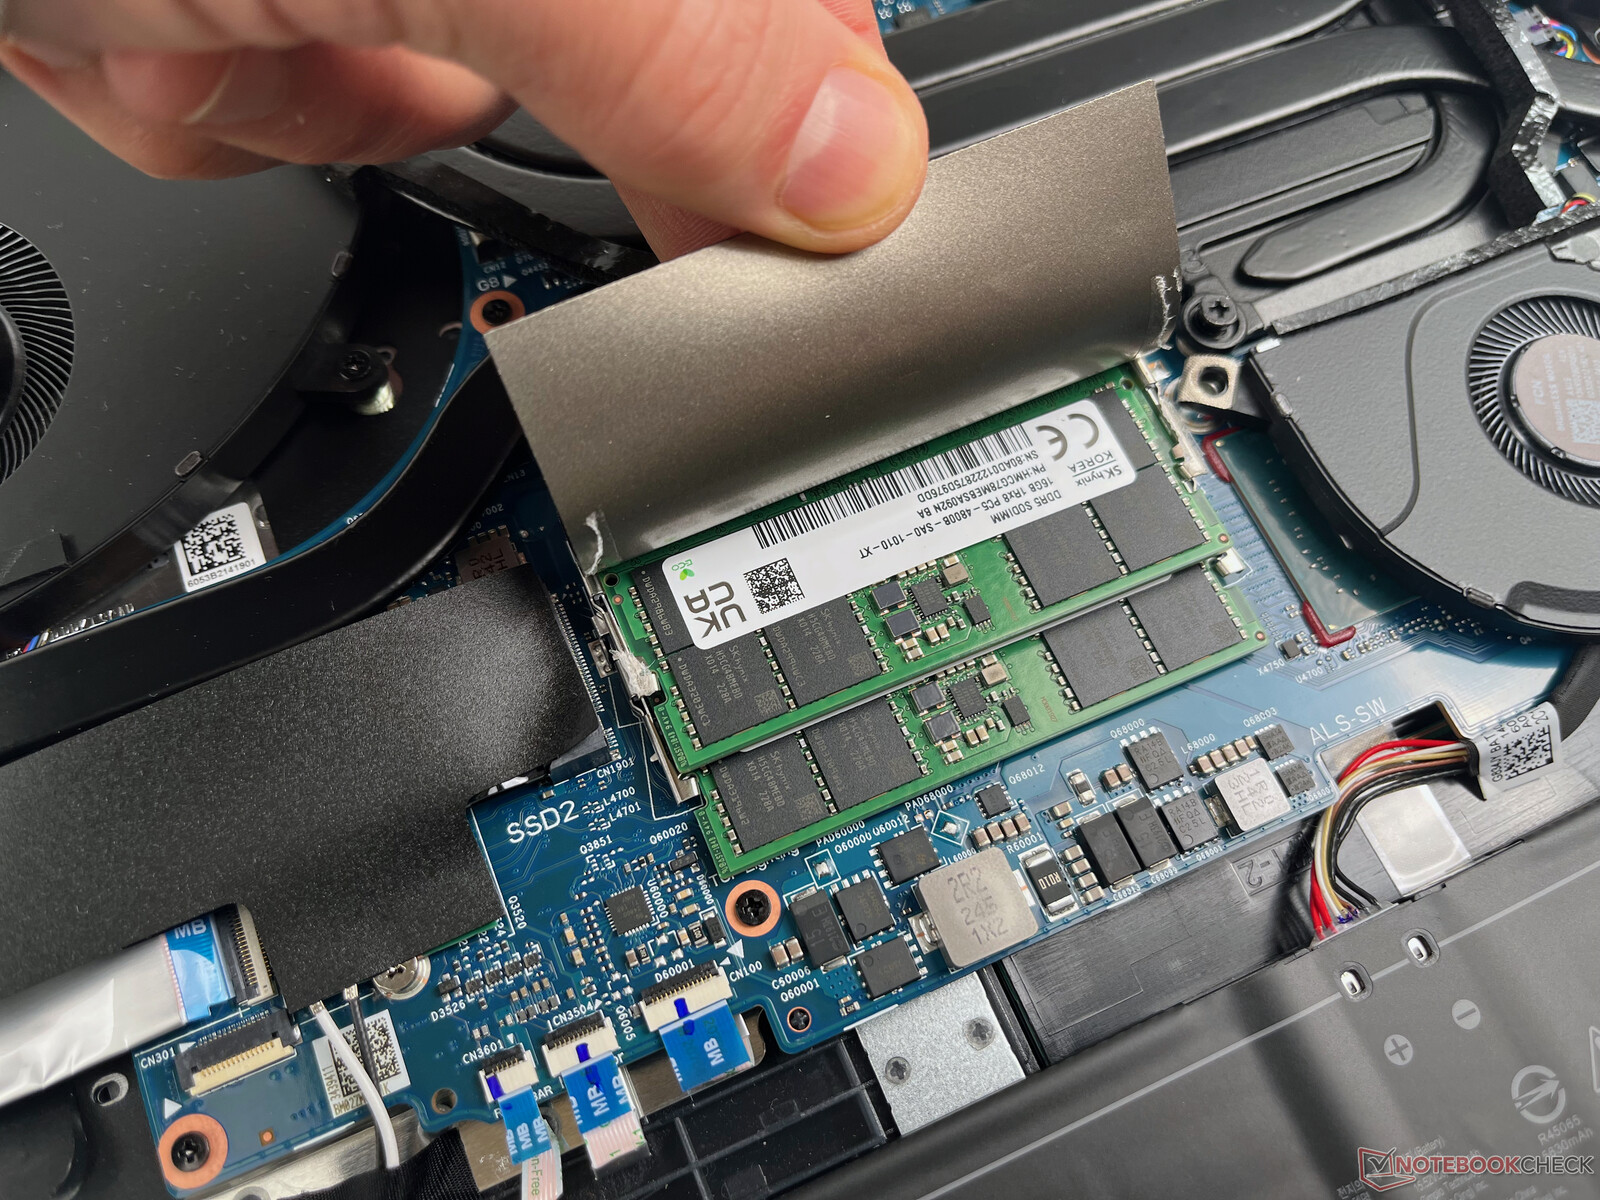
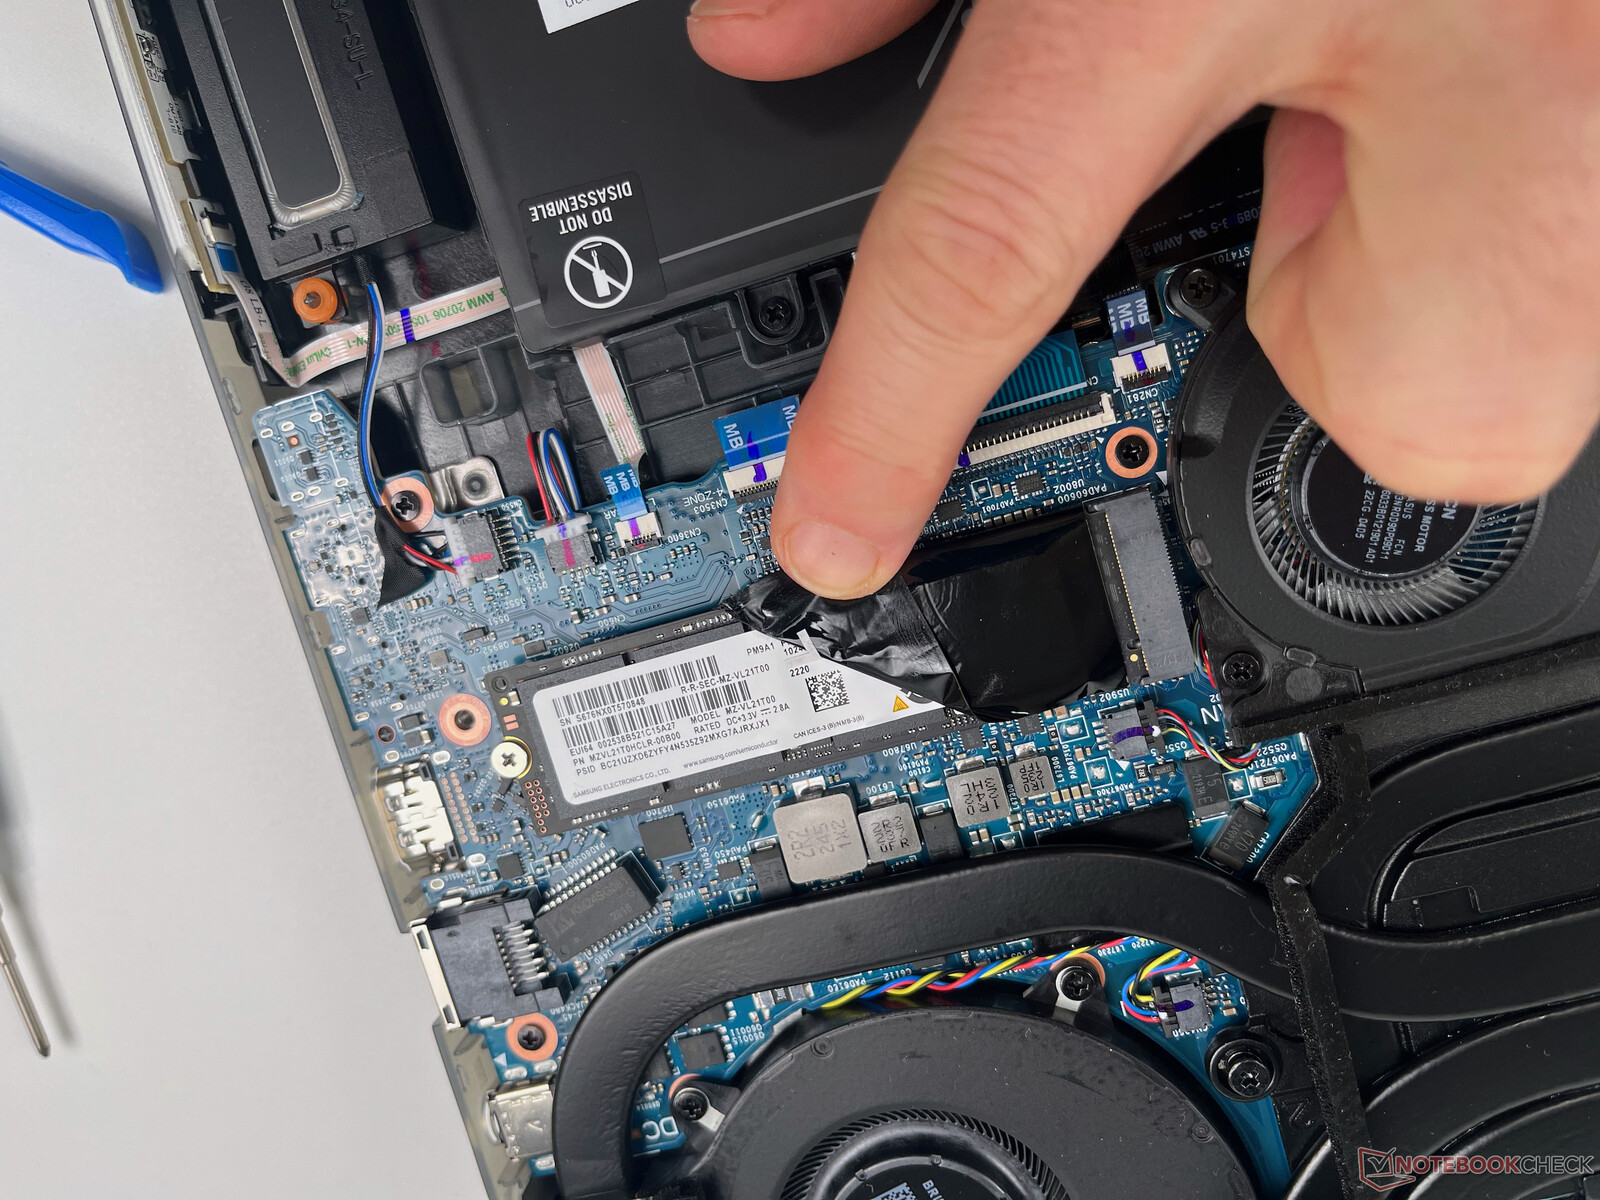
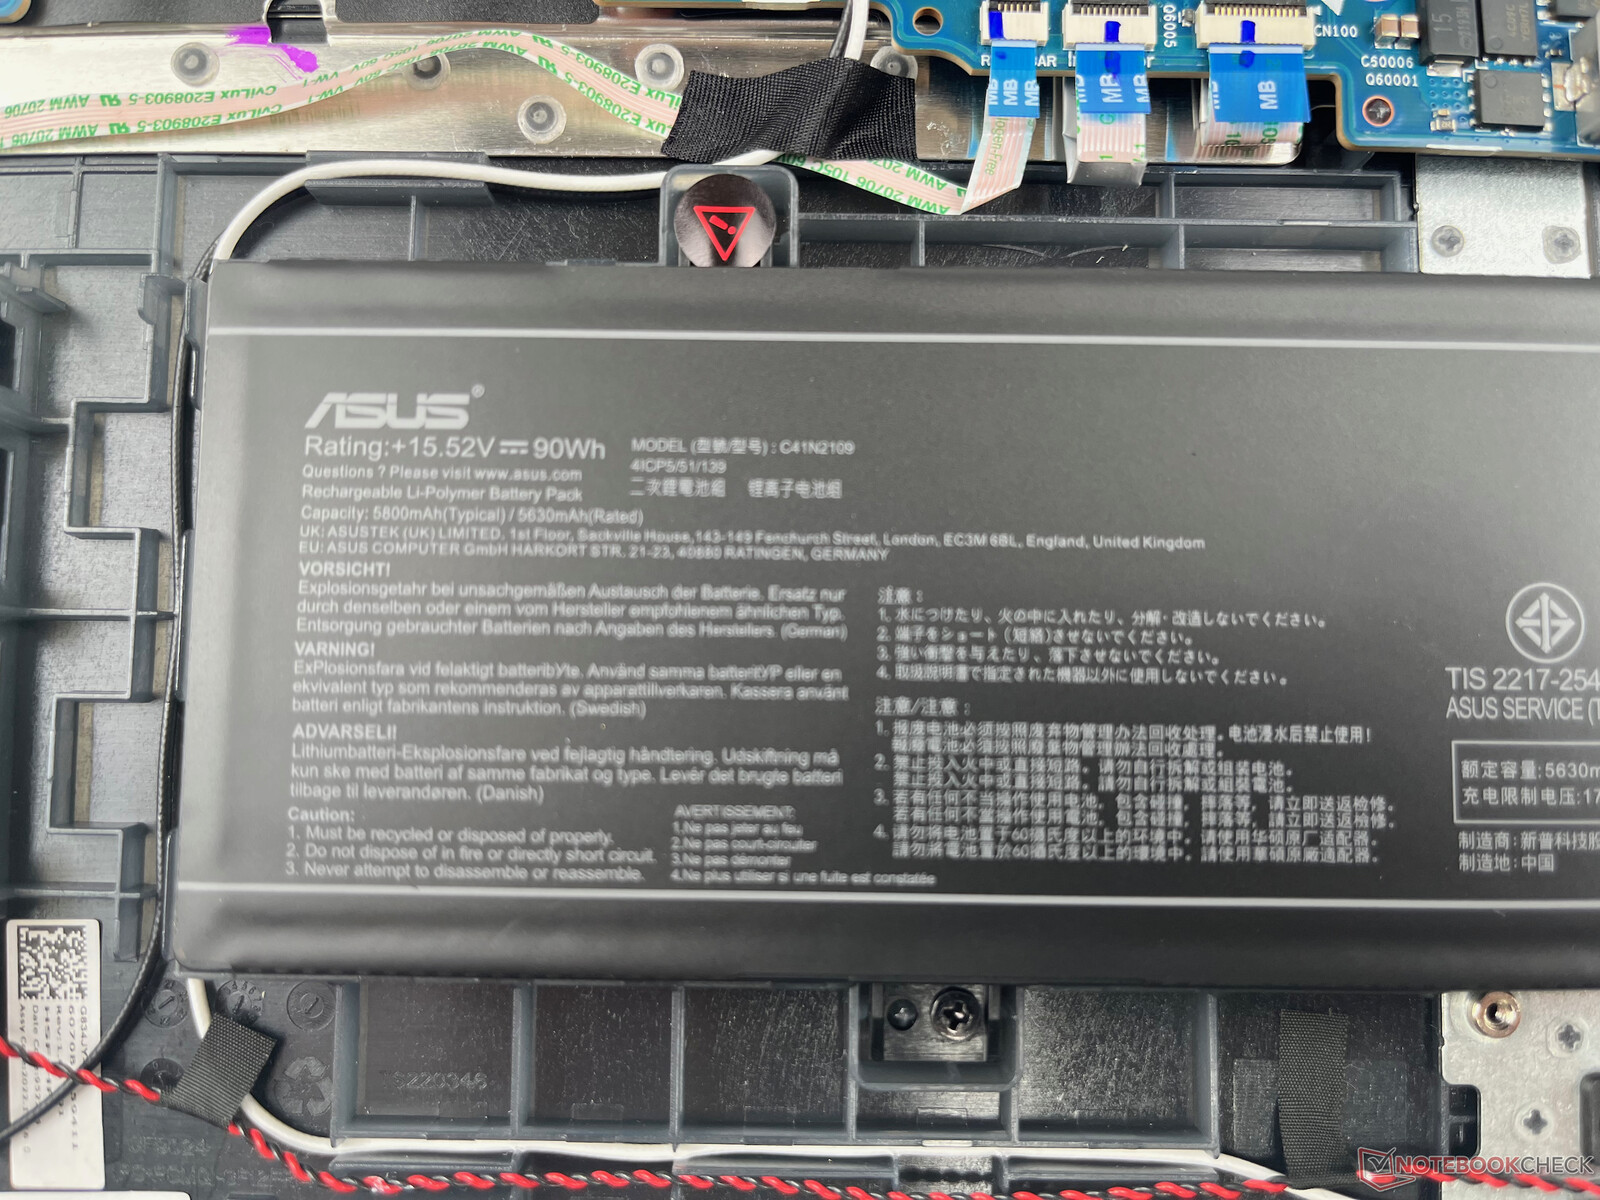
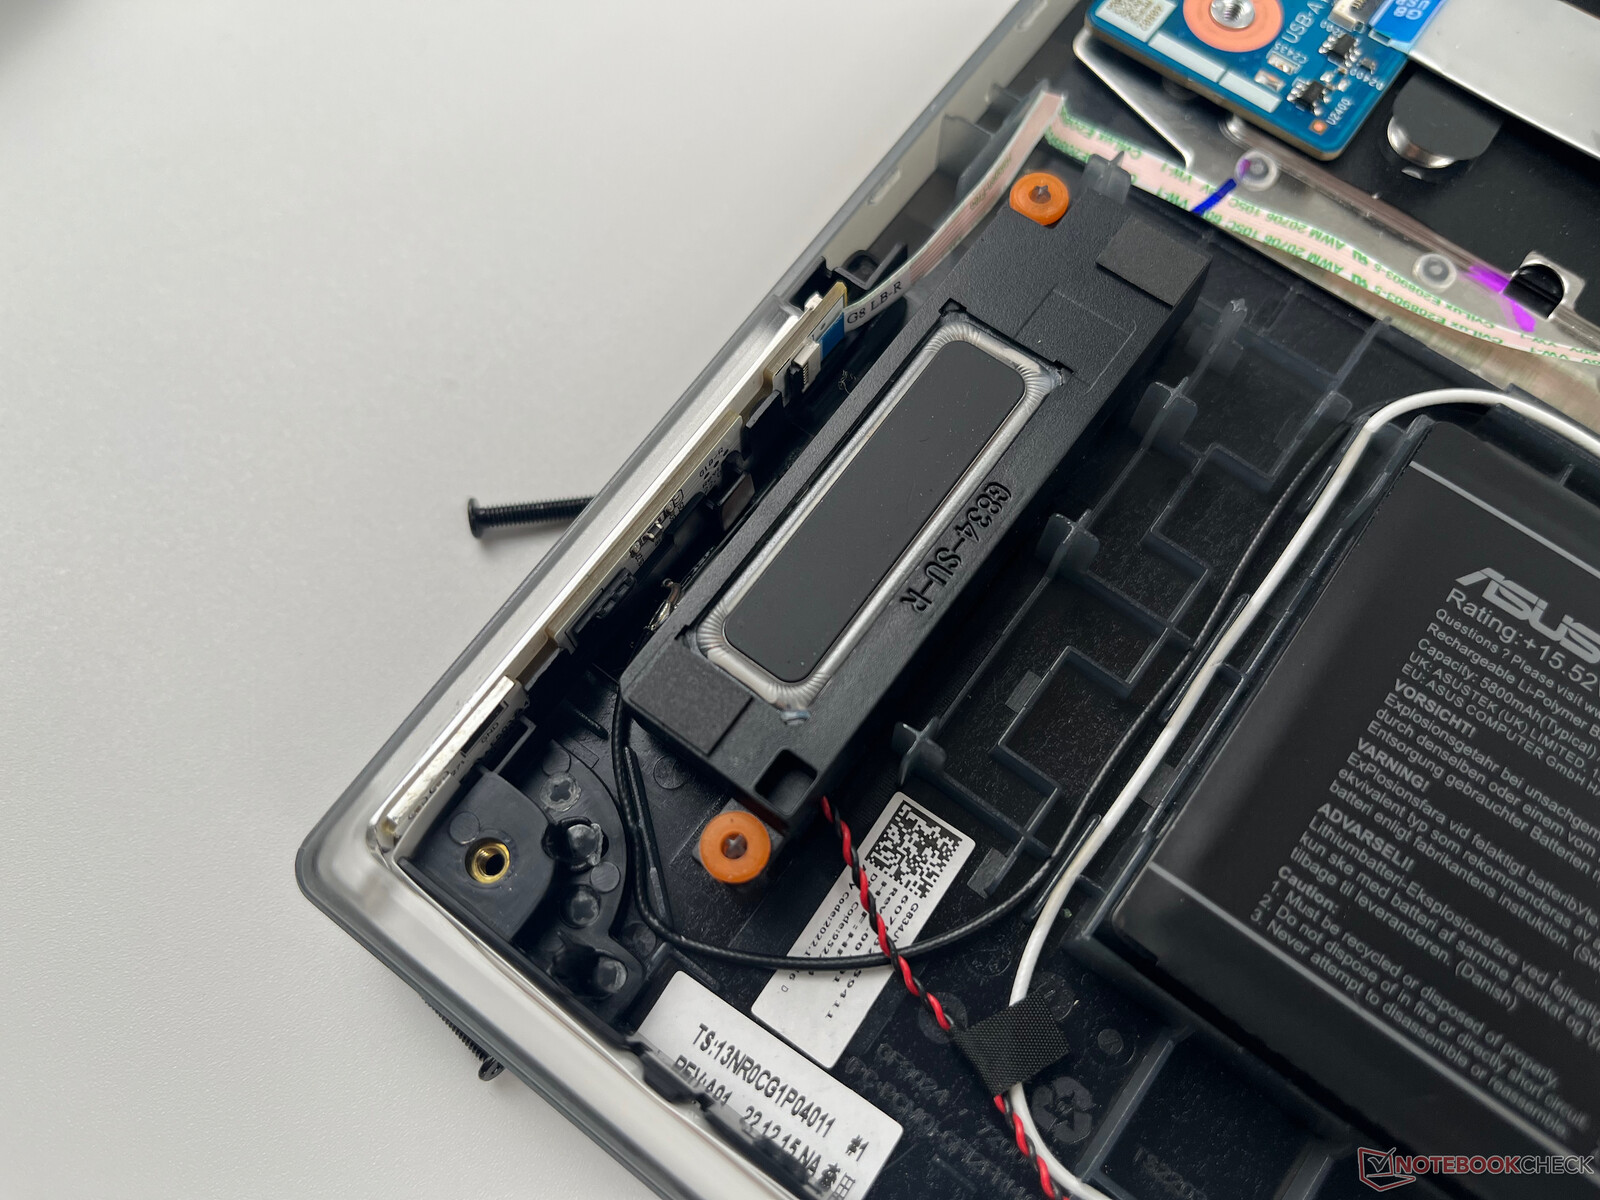
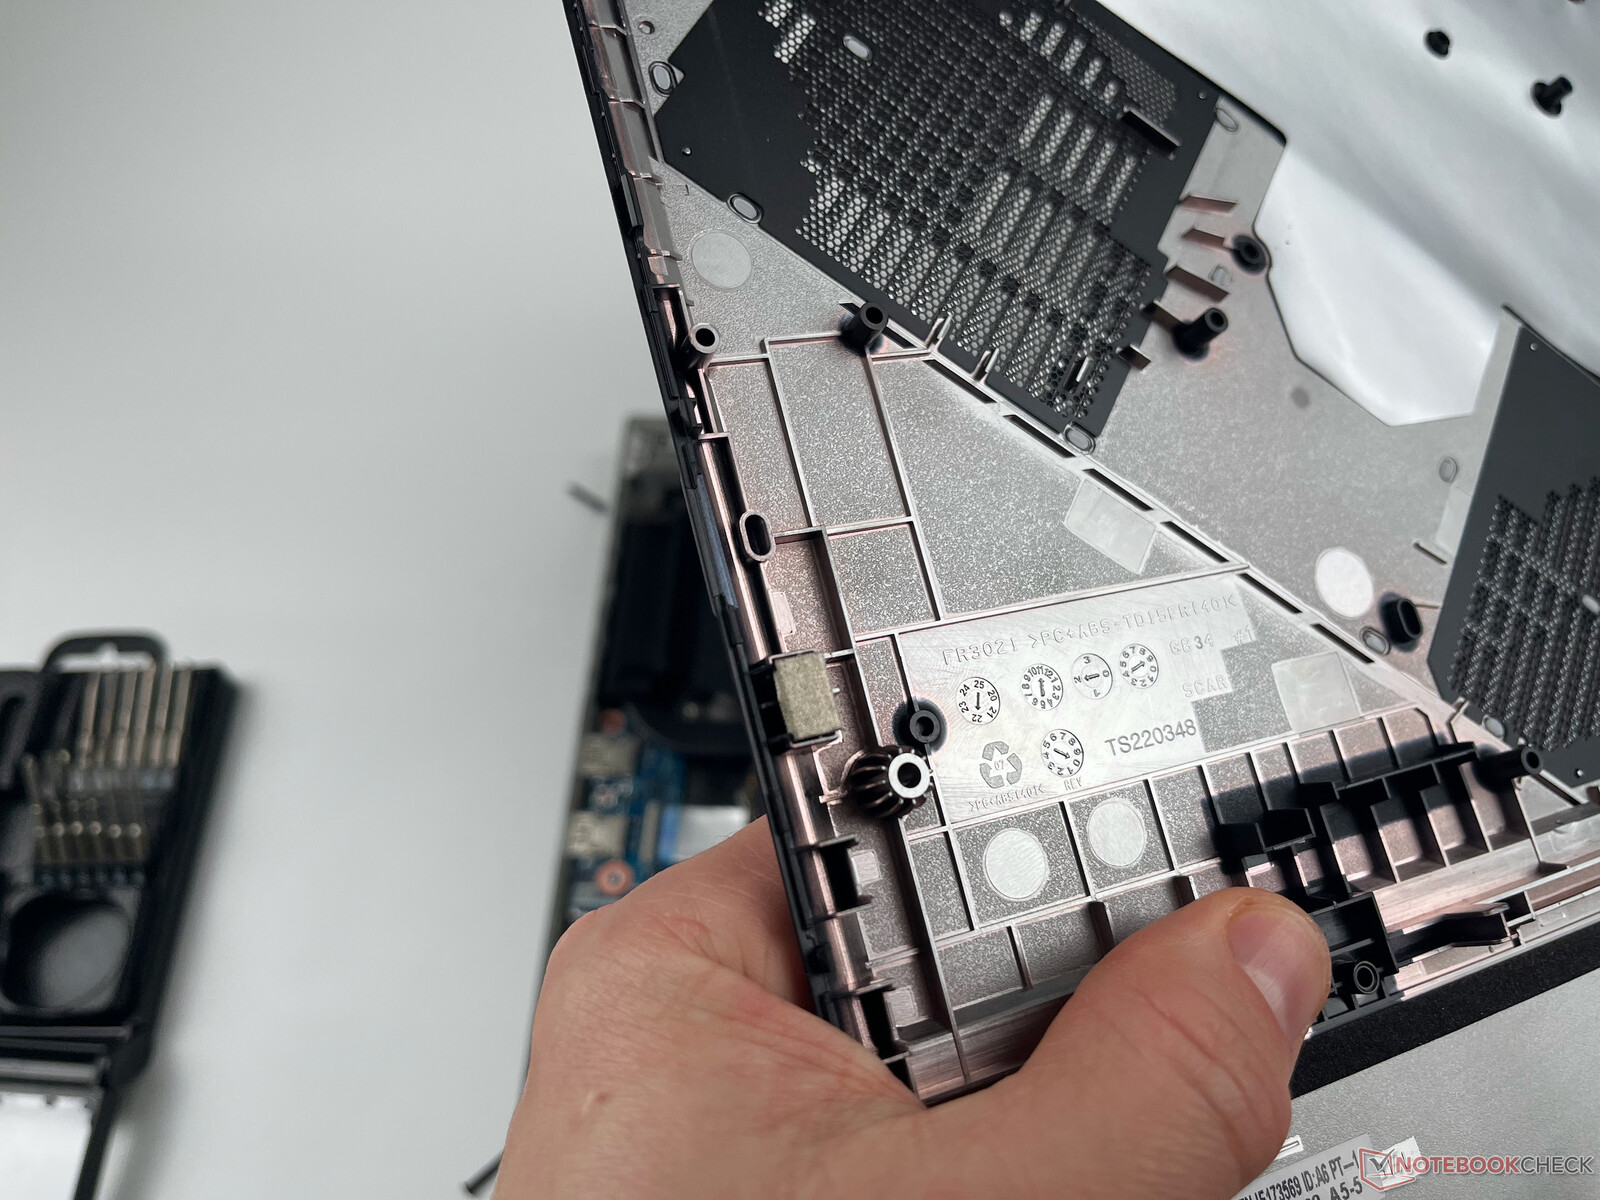
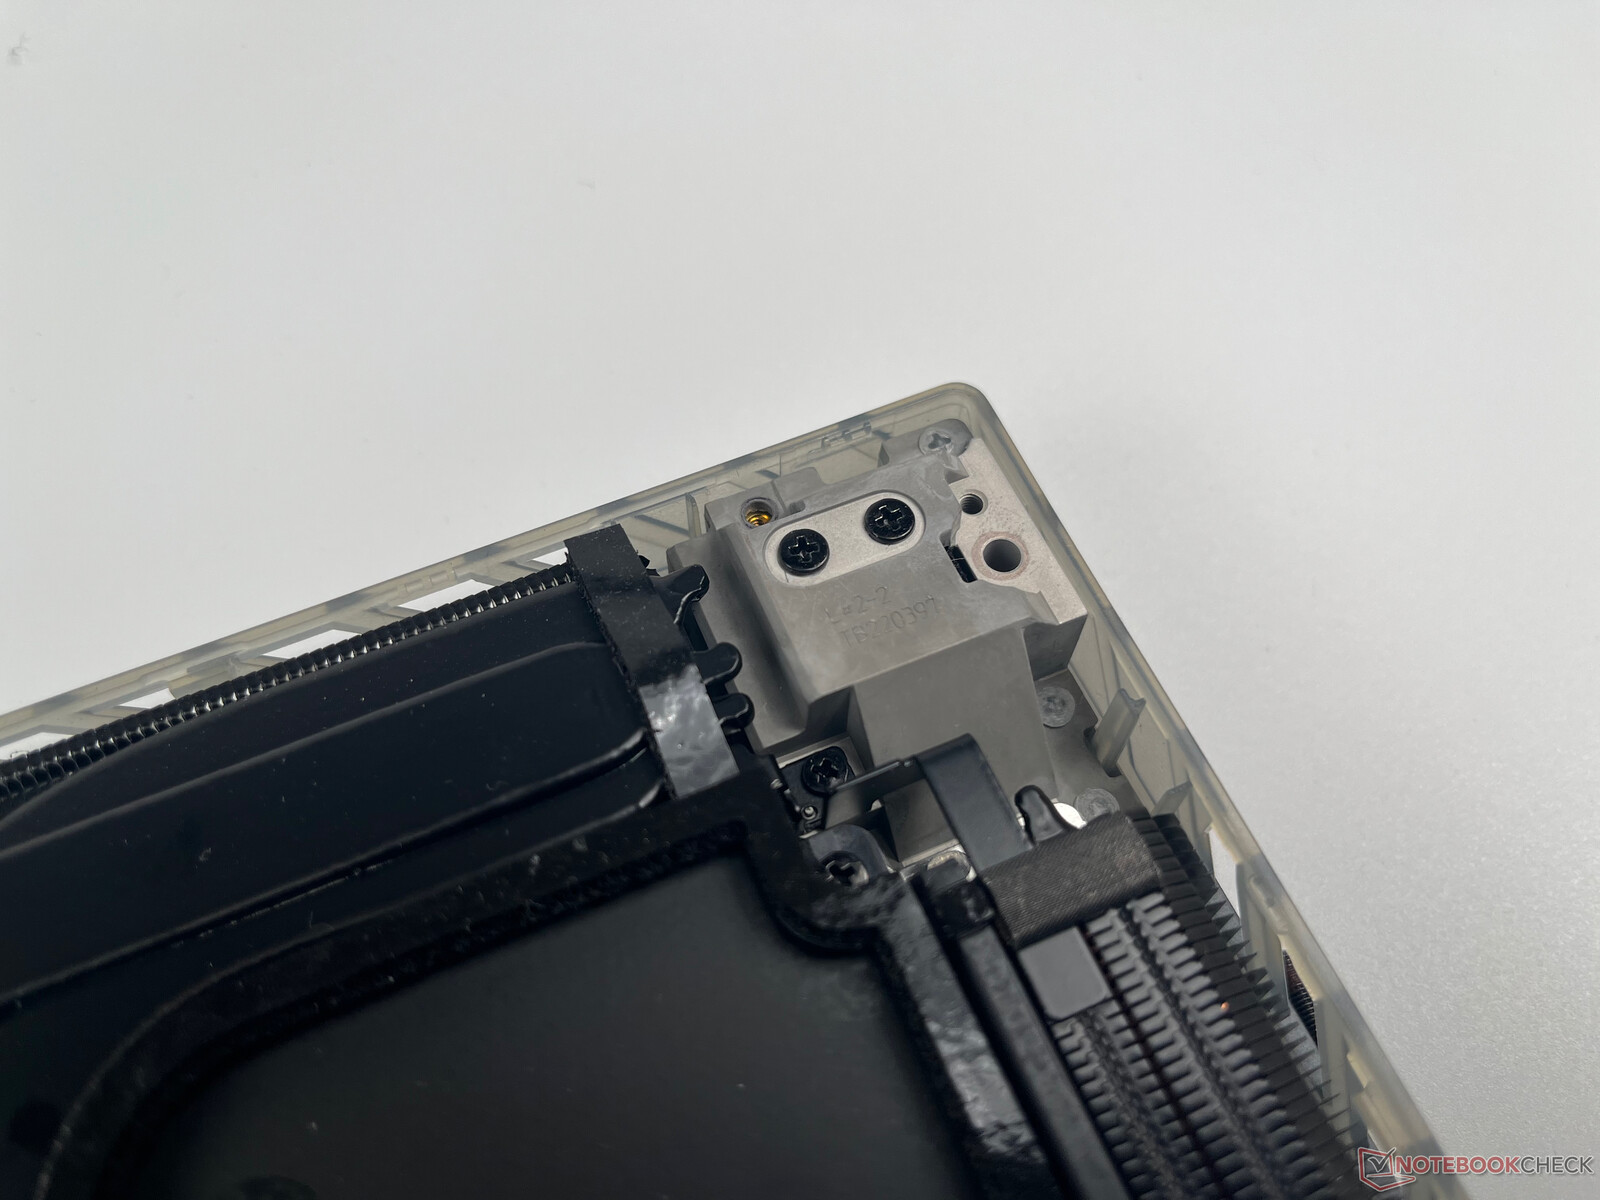
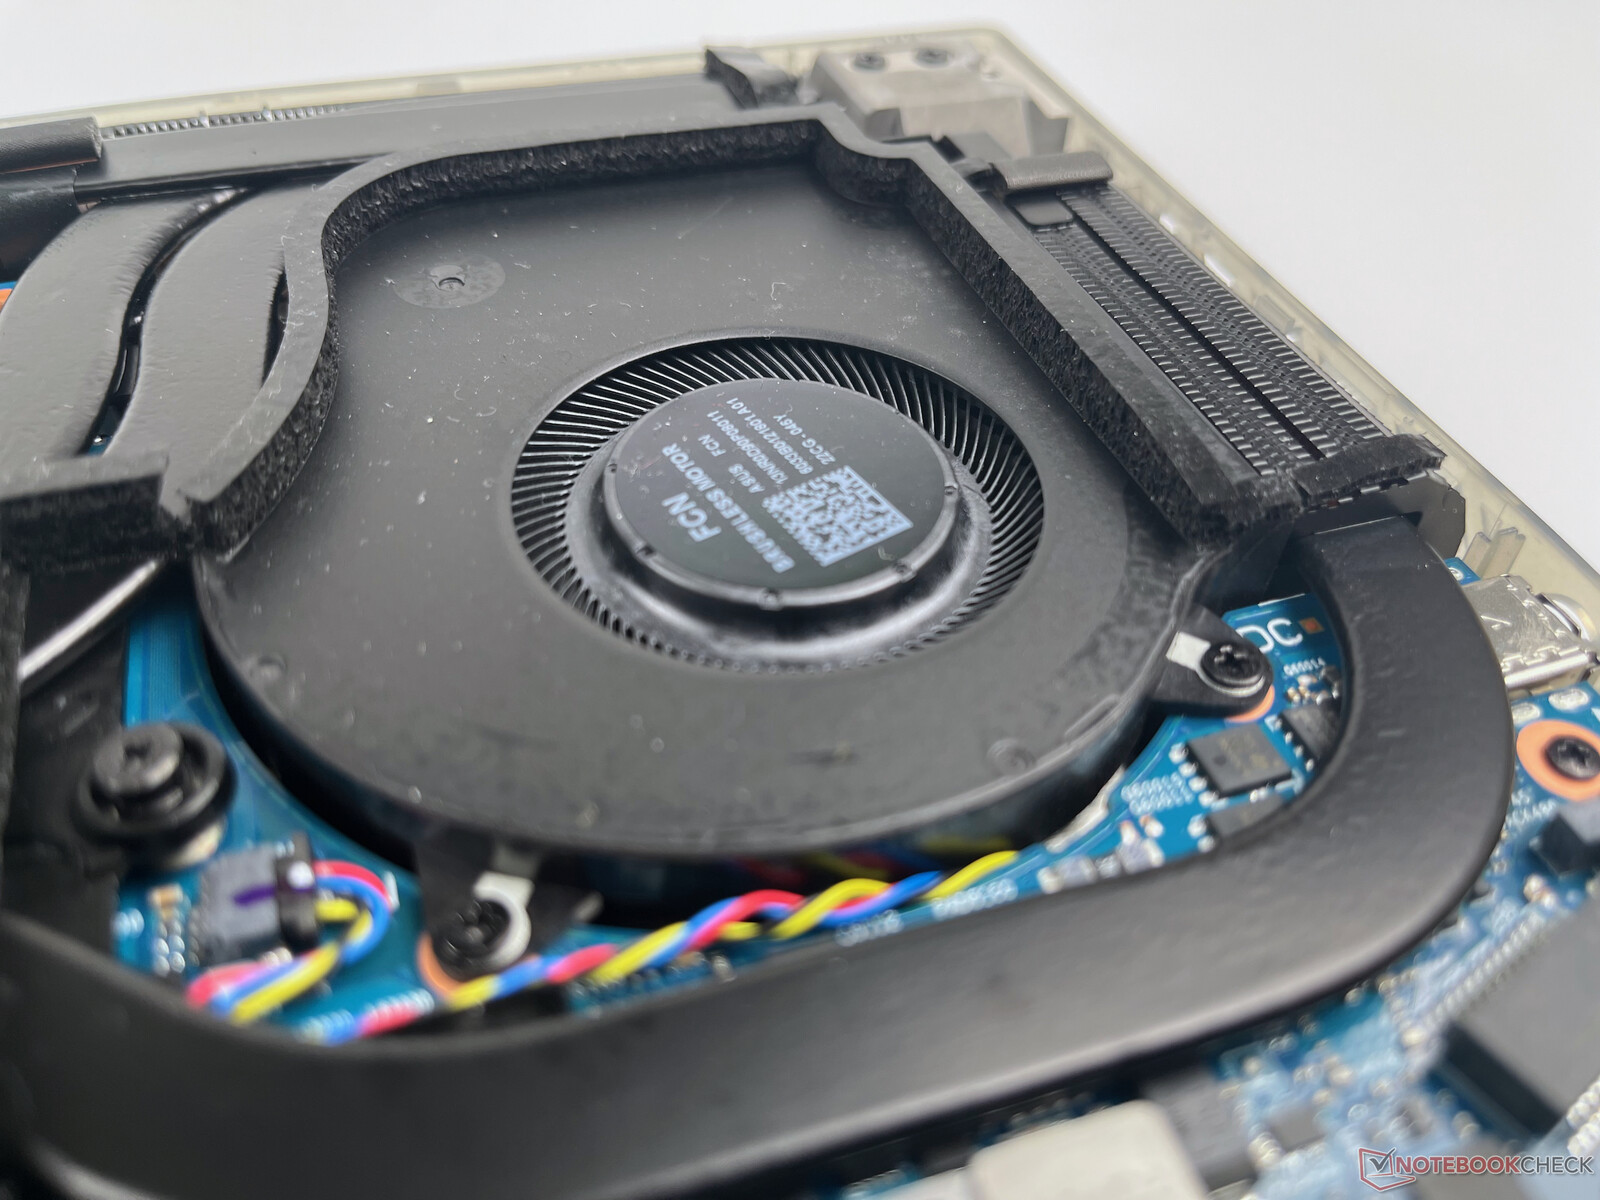
Die Innereien der ROG Strix G18 Serie sind relativ einfach über die Unterseite zu erreichen. Hierzu muss man zuerst die zahlreichen Philips-Schrauben lösen und dann mit einem Spudger die Kunststoffhaken am Rand lösen. Dies war bei unserem Sample relativ einfach möglich (an den vorderen Ecken angesetzt), glücklicher Weise brach auch keine der Plastiknasen bei der Öffnung ab.
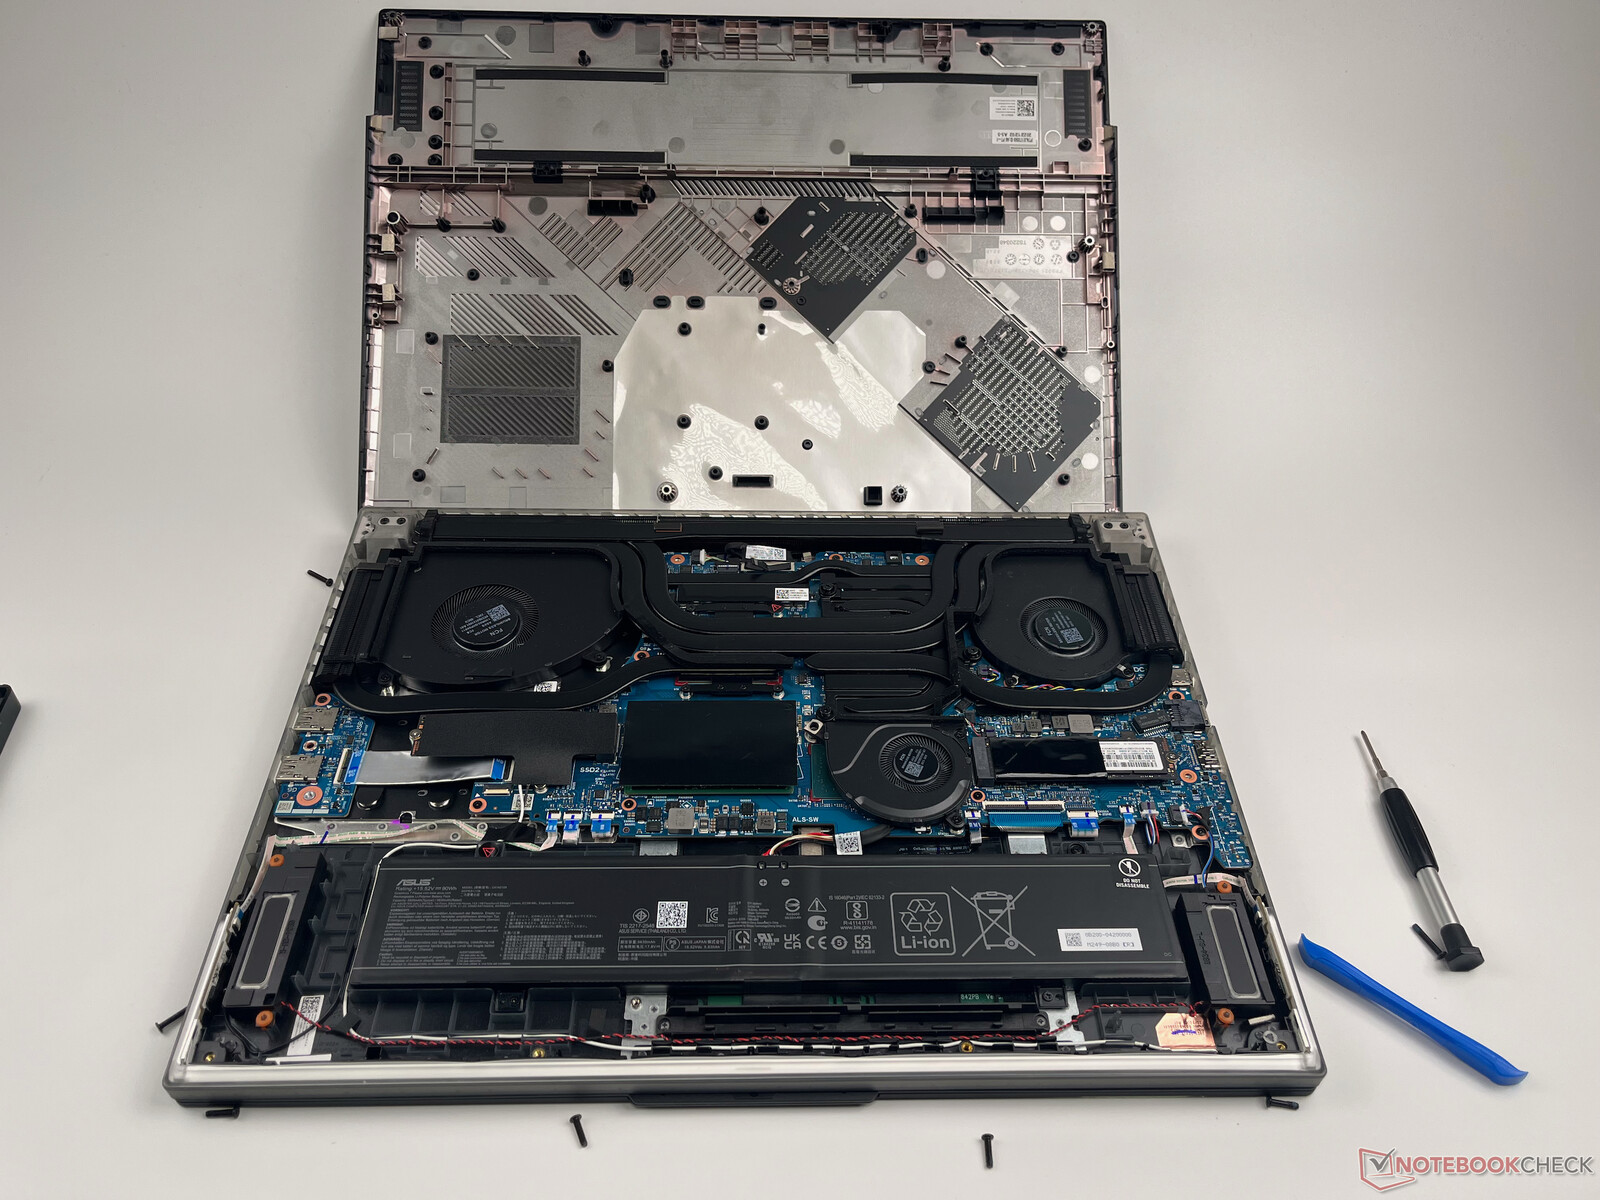
Im Inneren finden wir dann zwei M.2-2280-Slots für PCIe-SSDs (beide für den RAID-0-Verbund besetzt), einen M.2-Slot für die WLAN-Karte und zwei Speicherslots (ebenfalls beide bestückt) für maximal 64 GB GDDR5-RAM. Die Lüfter sind ebenfalls alle zugänglich und können einfach gereinigt werden. Die verbaute Batterie ist im Gehäuse verschraubt und sollte daher auch relativ einfach gewechselt werden können.
Garantie
Asus bietet nur die übliche Garantie von einem Jahr (zwei Jahre für in Deutschland angebotene Modelle). Eine garantierte Ersatzteilversorung oder ähnliches wird nicht erwähnt.
Eingabegeräte
Tastatur
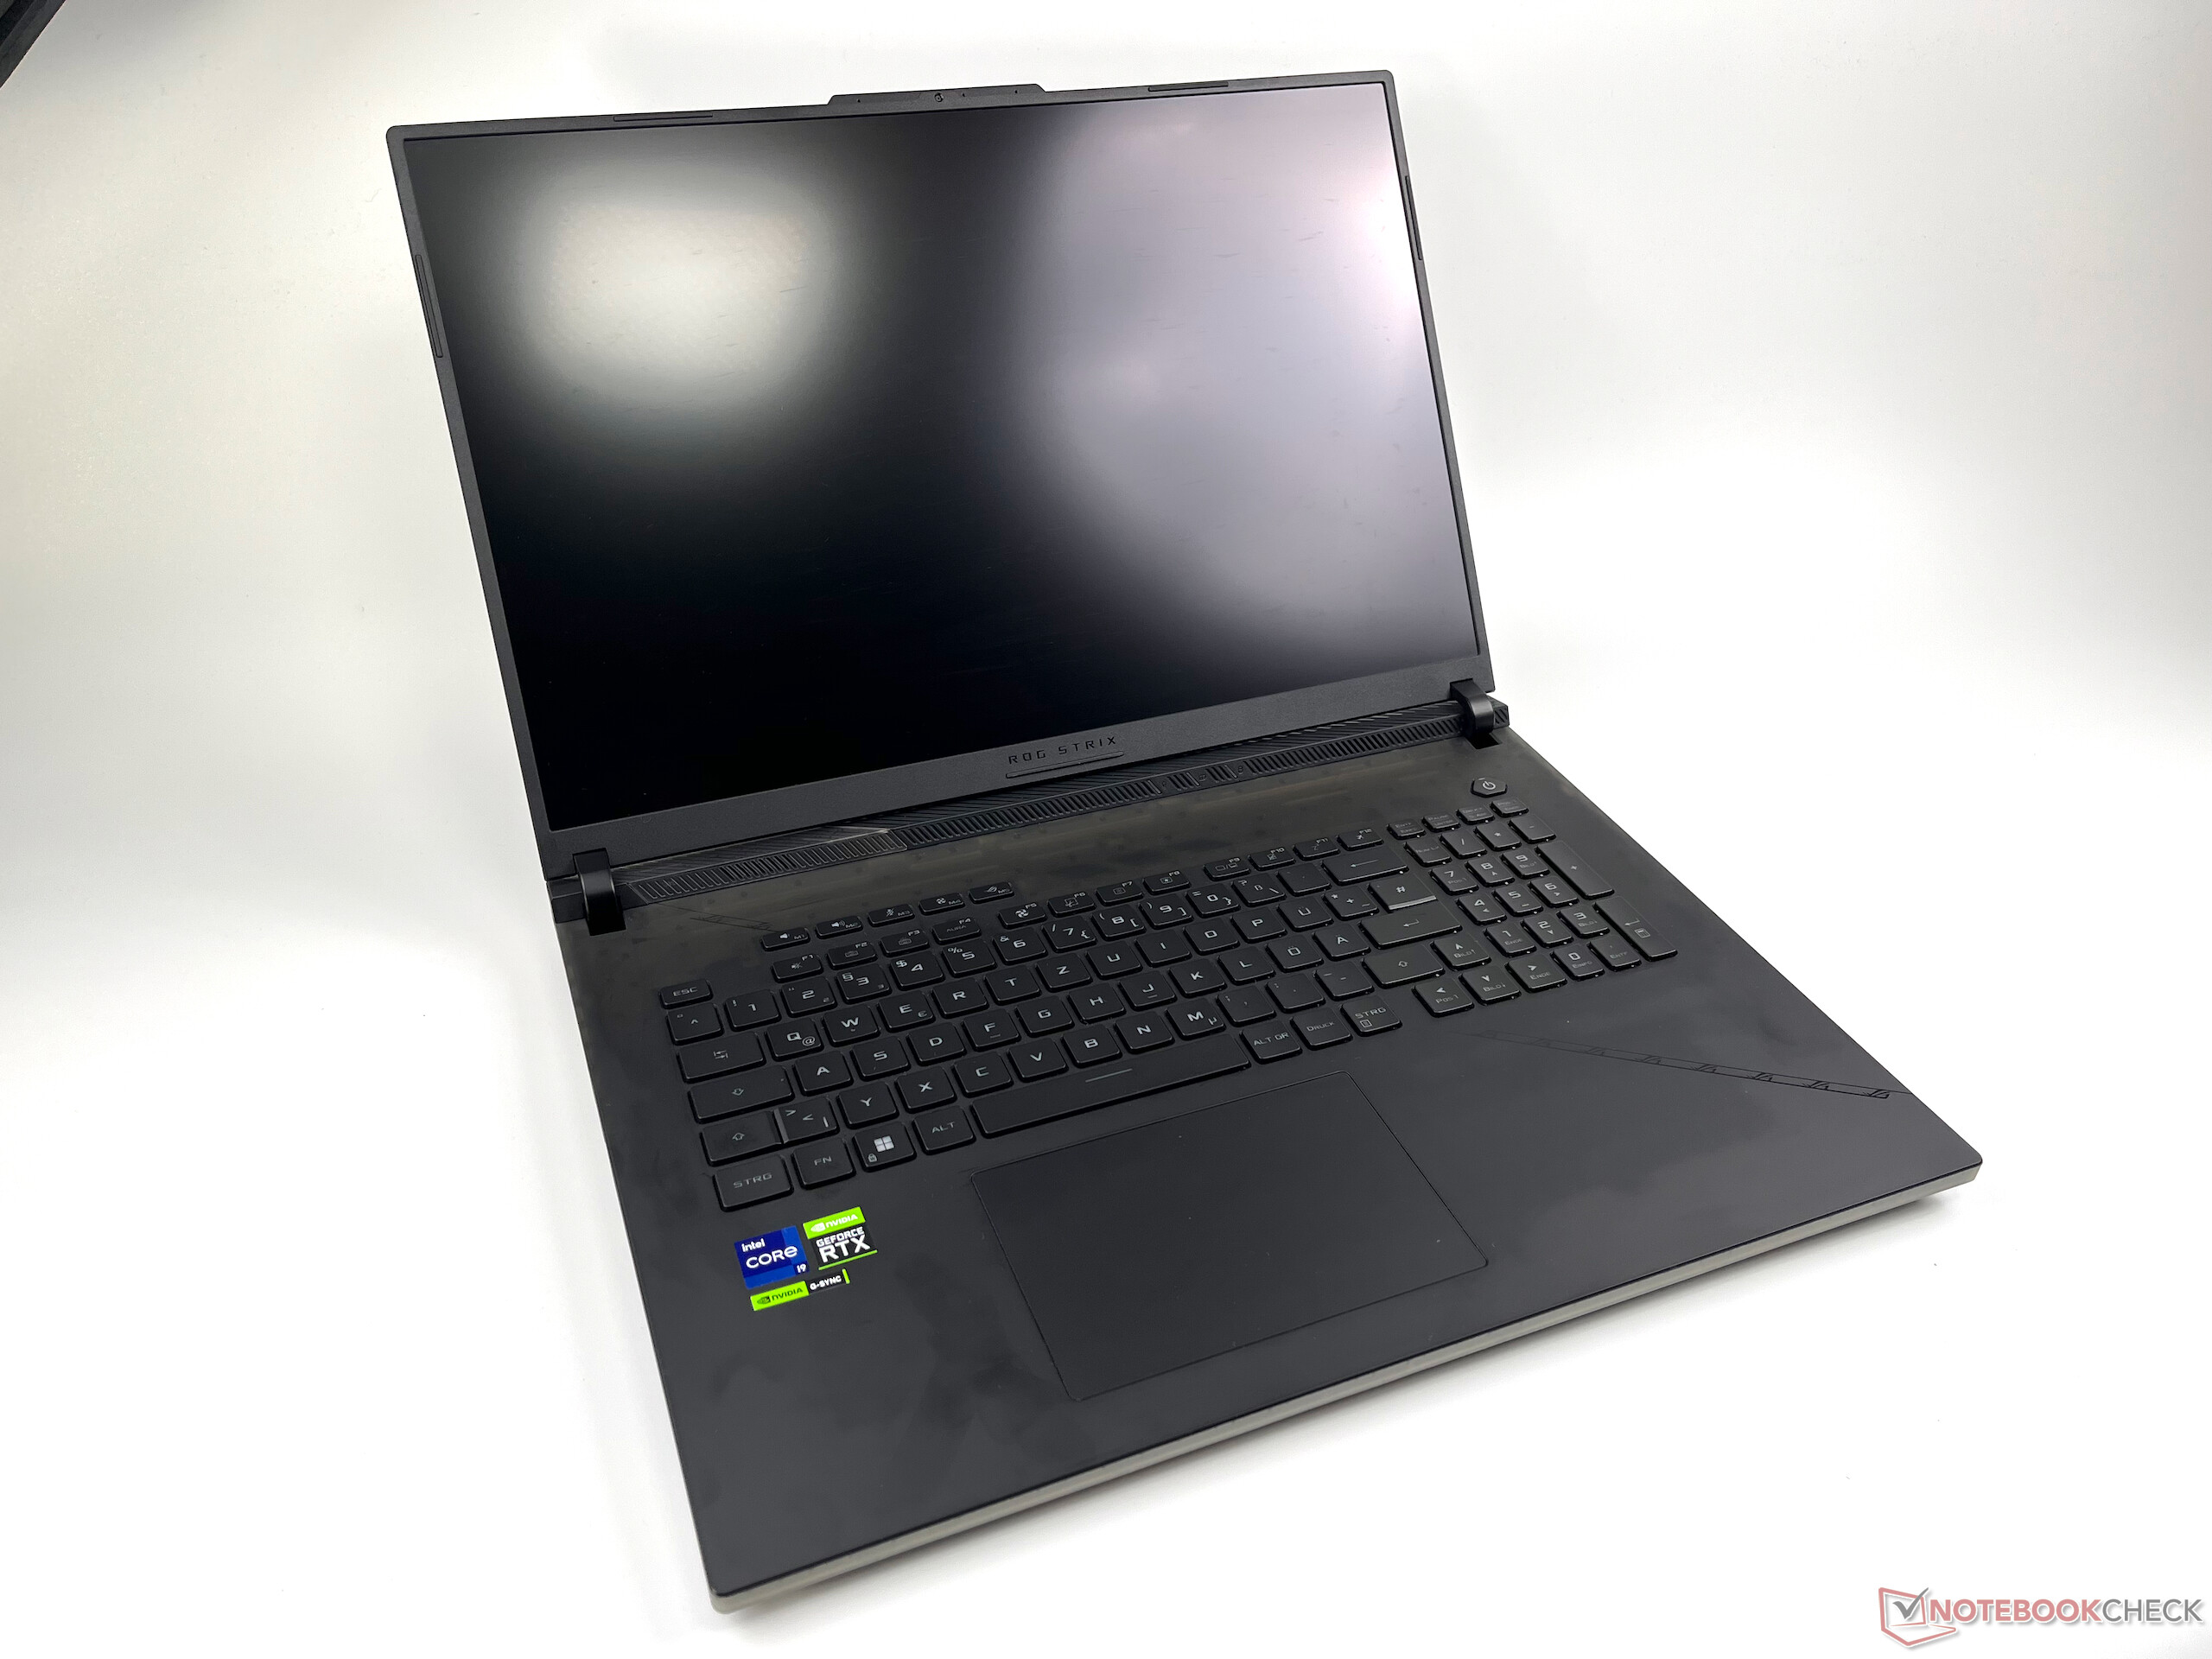
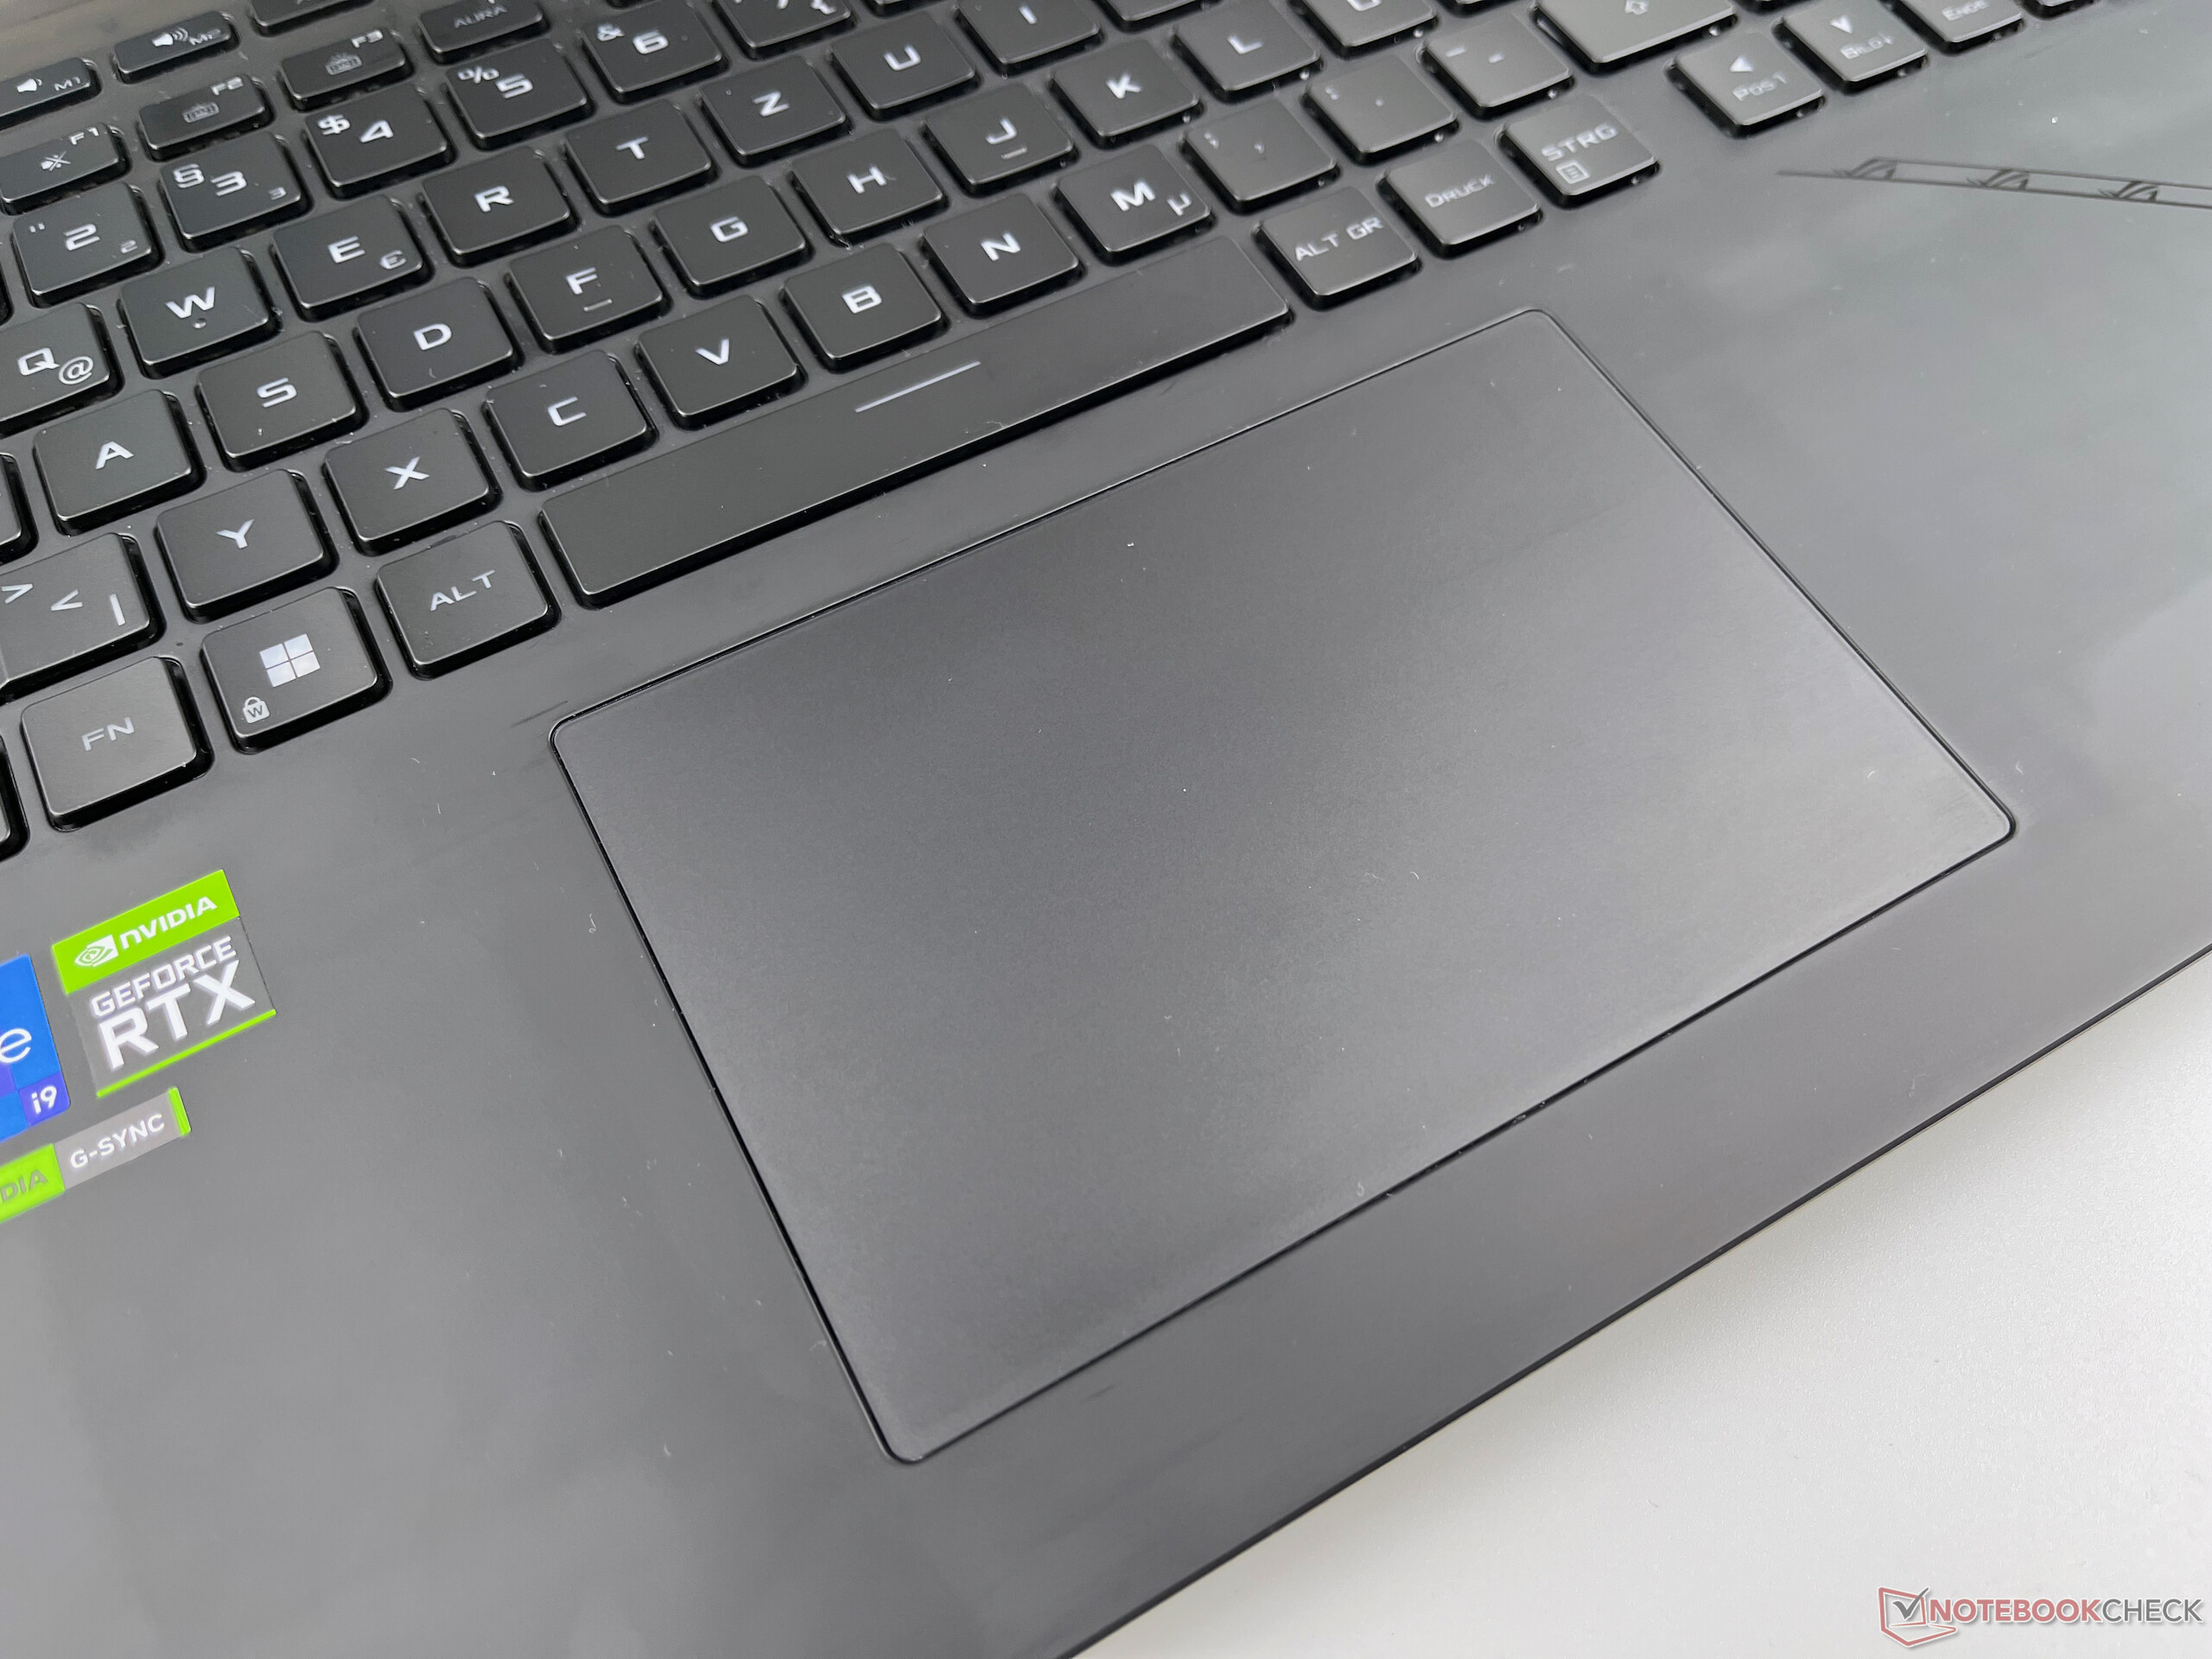
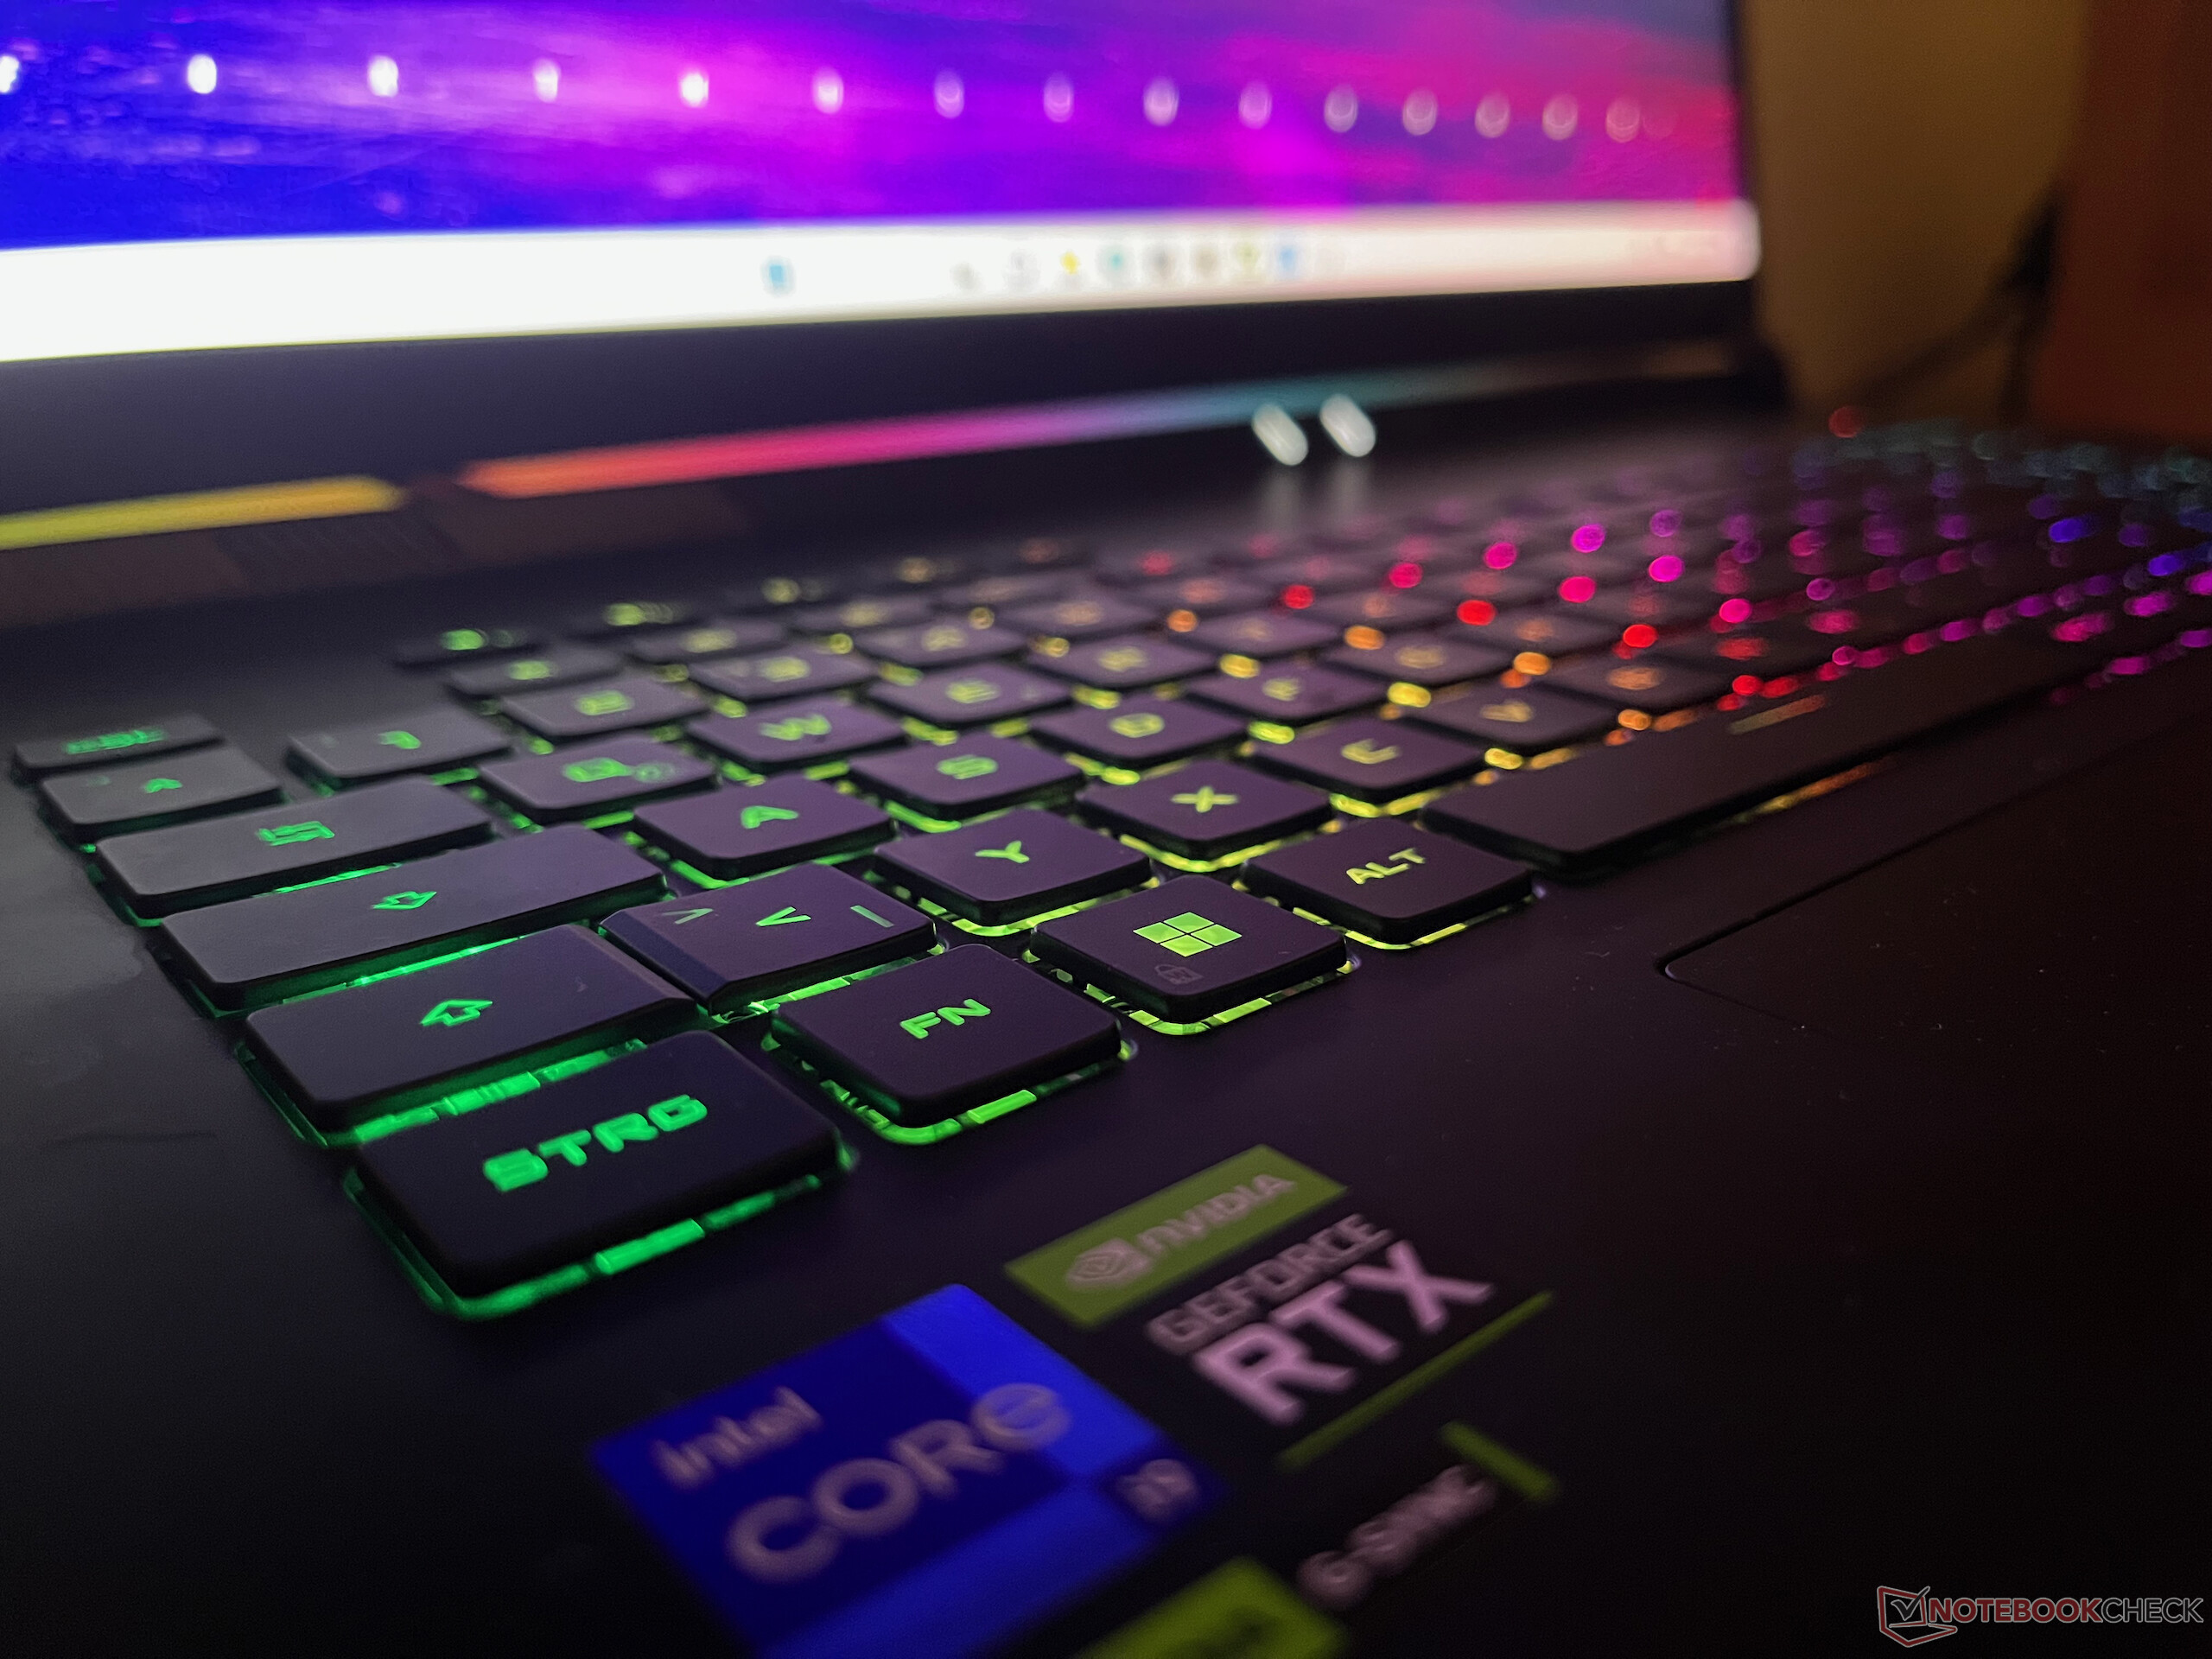
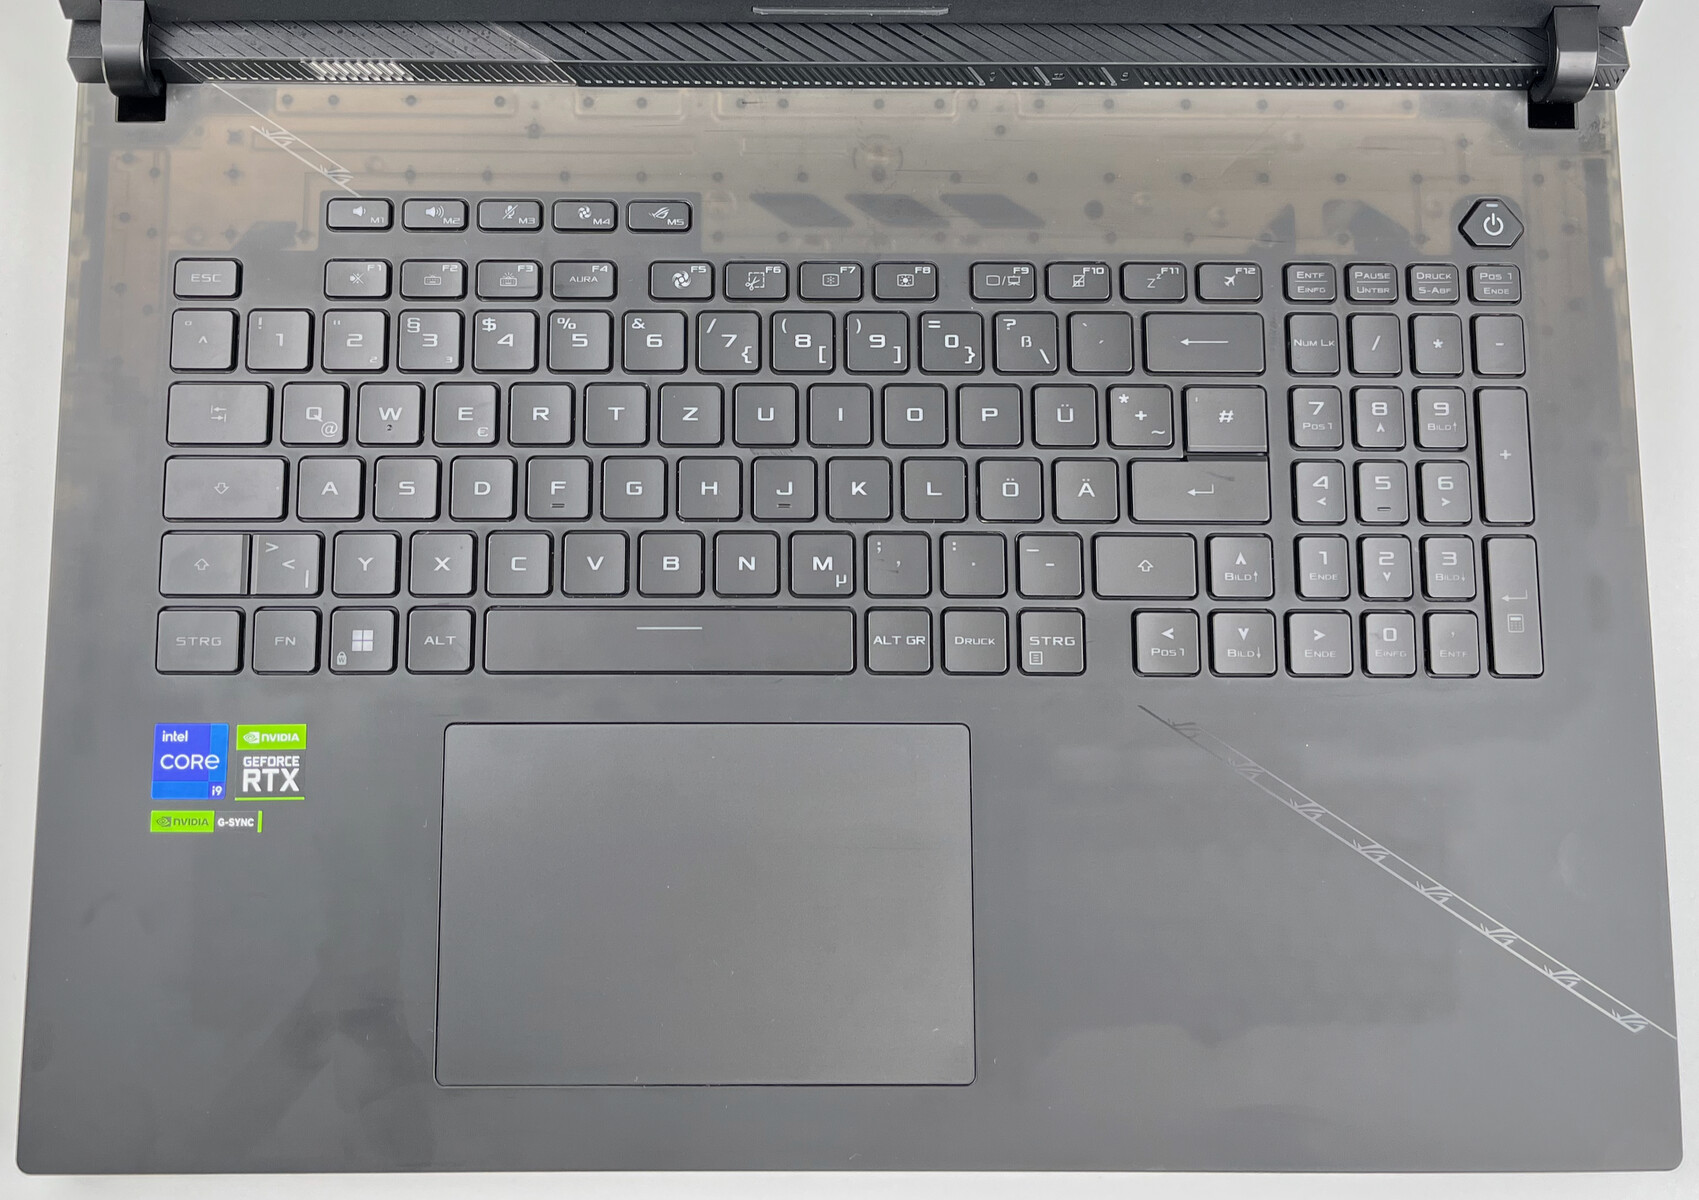
Die verbaute Full-Size-Tastatur bietet neben dem Nummernblock auch noch 5 Sondertasten oberhalb der doppelt genutzten F1-F12-Reihe. Die Chicklet-Tasten haben einen ausreichenden Hub und bieten einen leisen Anschlag. Beim ersten Tipp-Test erreichte der Autor gute 85 WPM mit 96% Genauigkeit. Das verbaute RGB Backlight der einzelnen Tasten lässt sich mit zahlreichen Animationen personalisieren. Beim n-key-rollover-Test sehen wir keinerlei Einschränkungen (24 gleichzeitige Tasten als Maximum erreicht).
Touchpad
Das große Touchpad nutzt eine Oberfläche aus Glas und bietet hervorragende Gleiteigenschaften. Multitouch funktionierte im Test einwandfrei und die unteren 4/5 der Fläche sind auch angenehm klickbar. Jedoch wird der Klick im rechten unteren Eck sehr oft als "rechte Maustaste" erkannt und kann daher zu Fehleingaben führen.
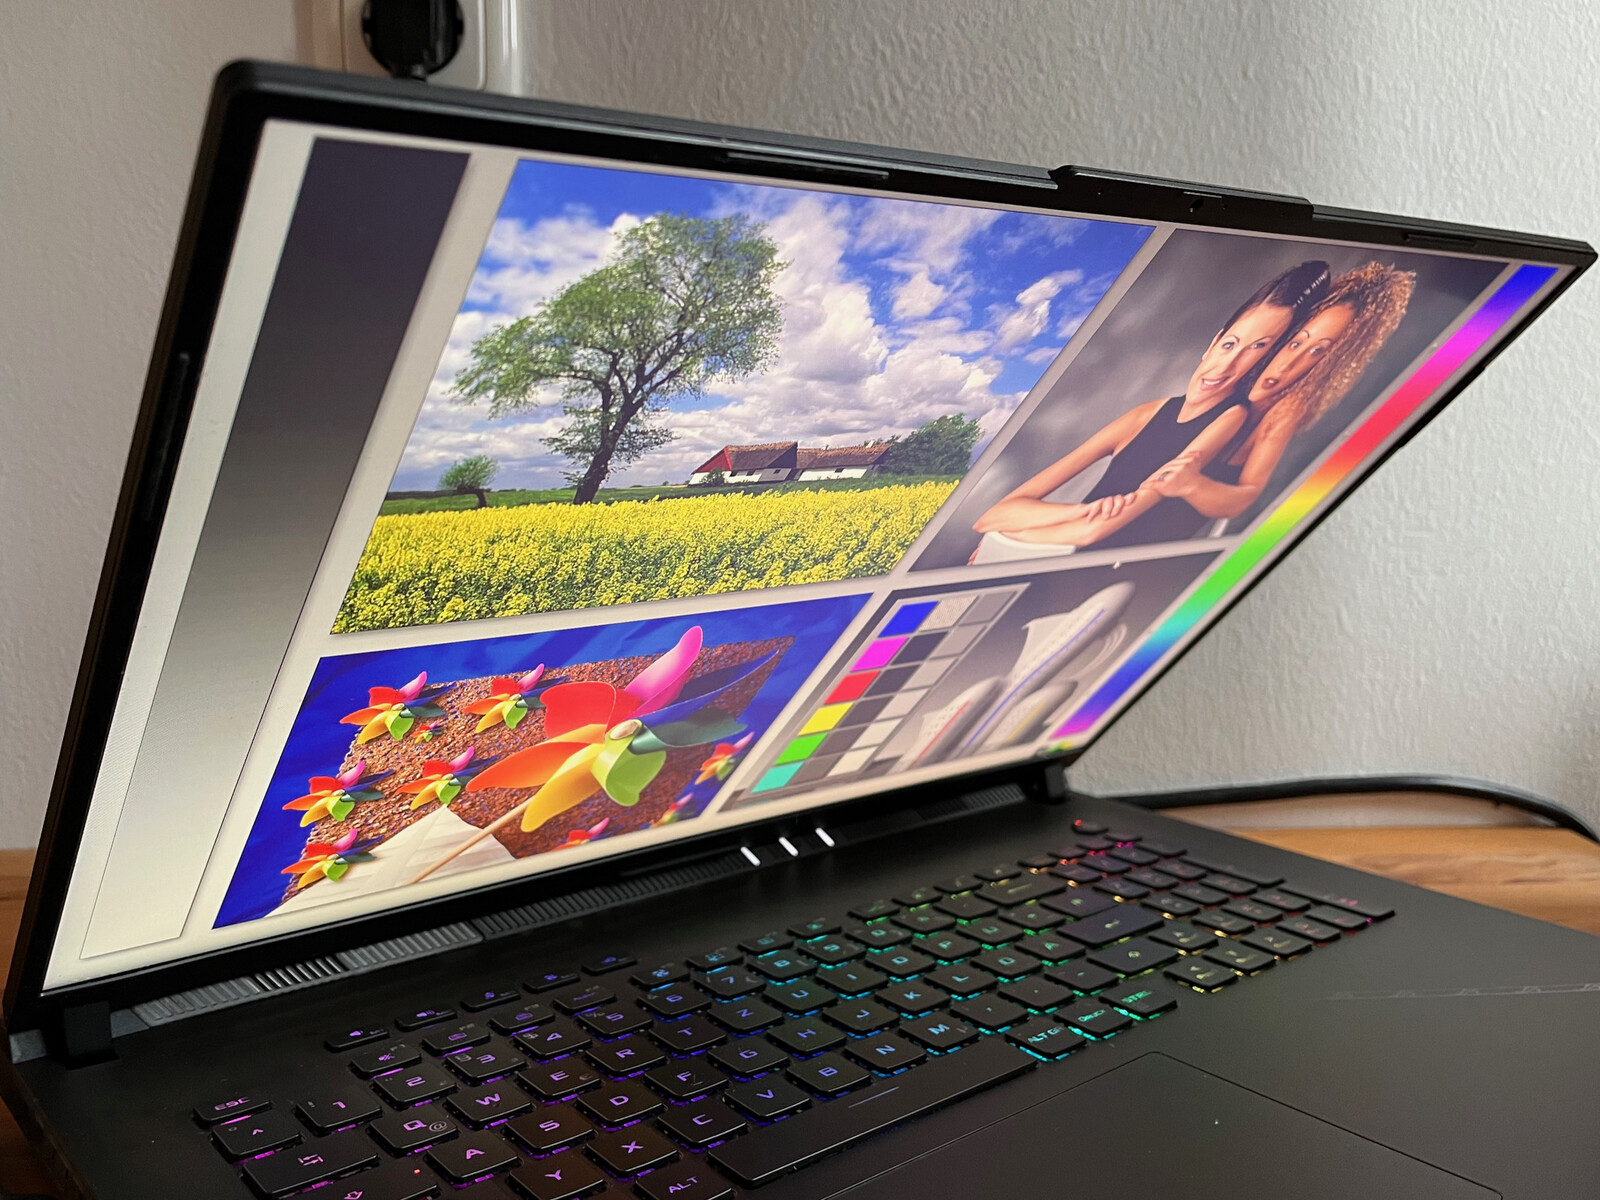
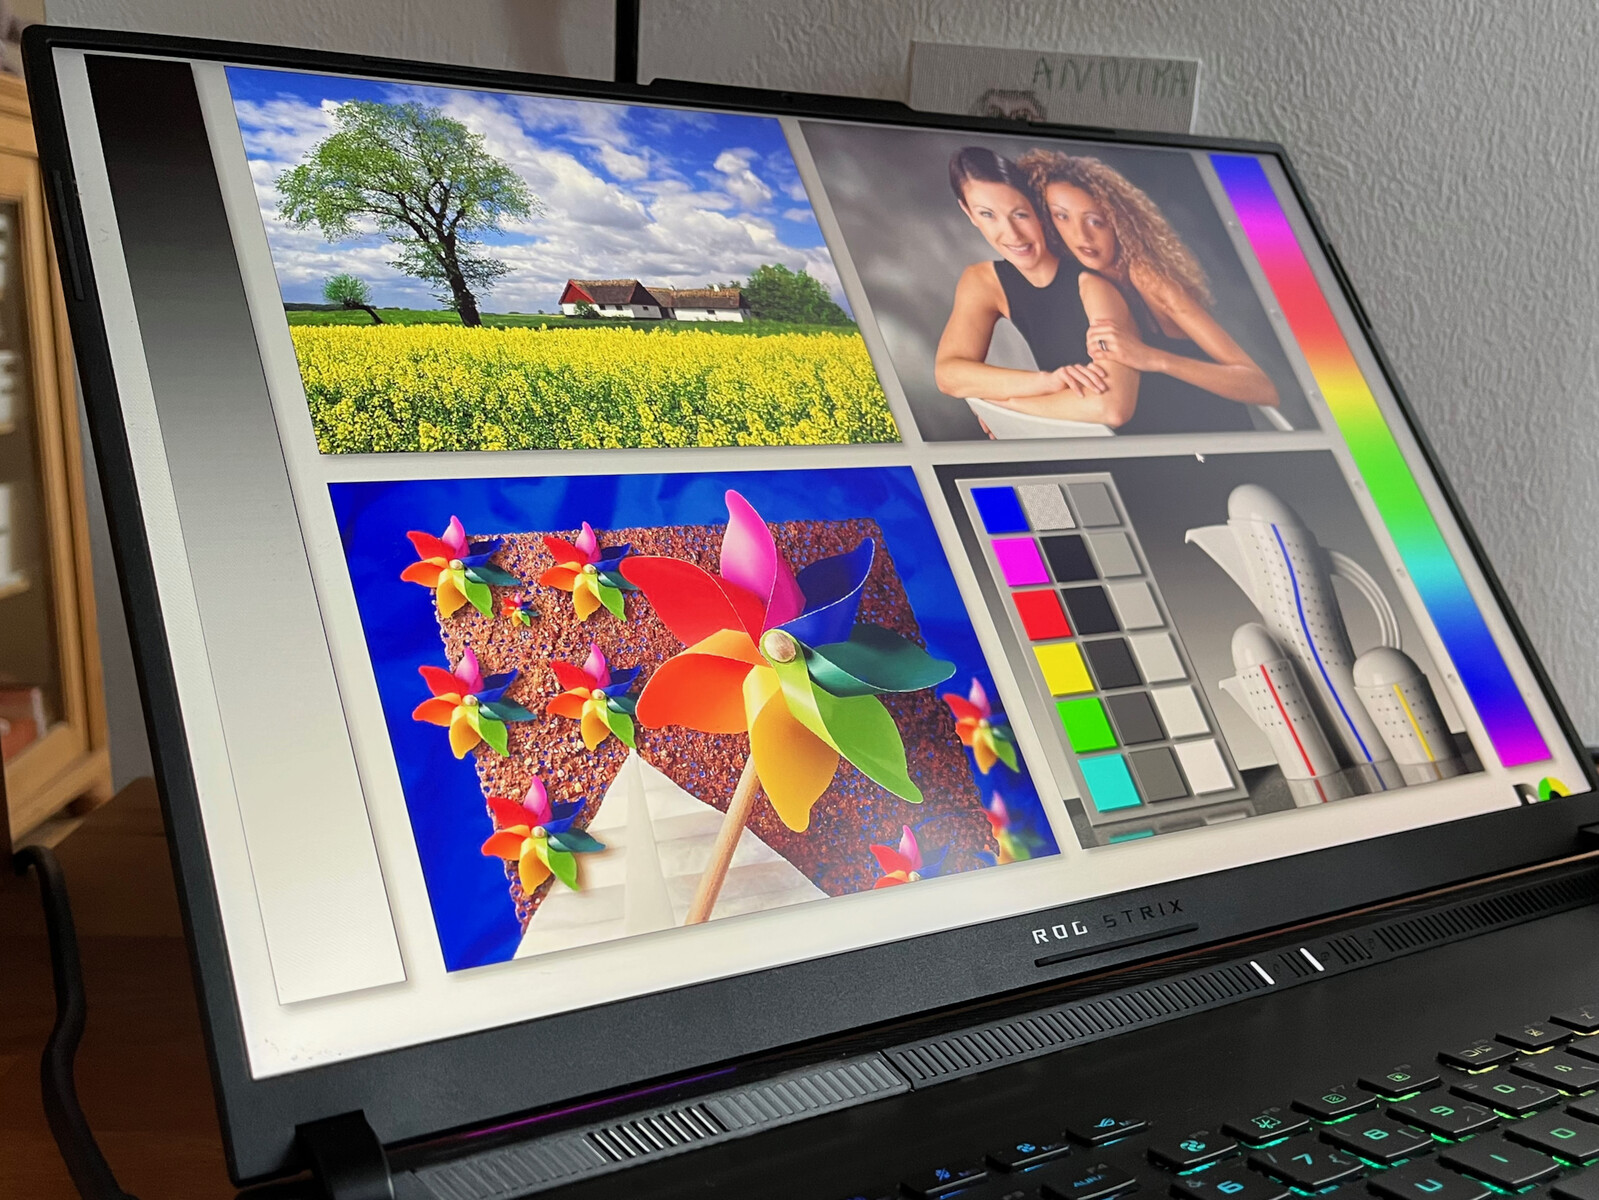
Display
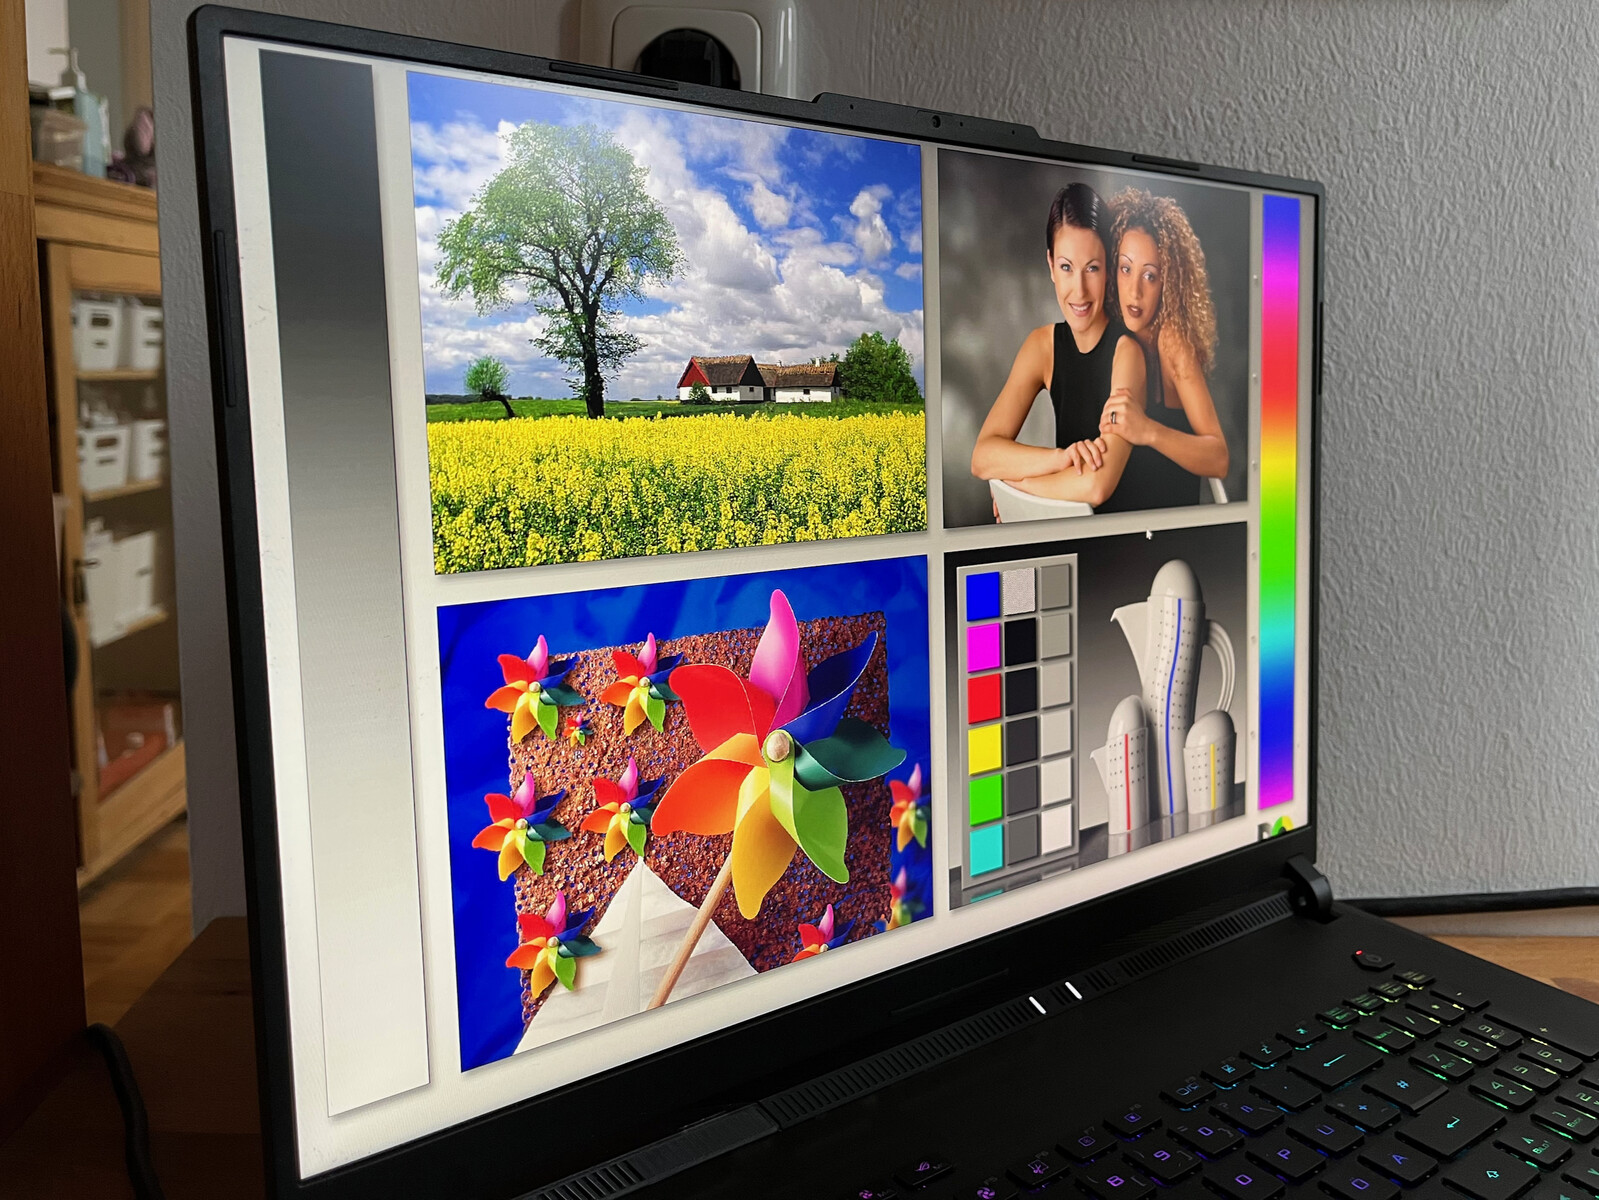
Das neue 18-Zoll-Display punktet mit zahlreichen Features wie G-Sync, 240 Hz, QHD+, schnellen 3 ms Response Times und DCI-P3 Farbraumabdeckung auf dem Datenblatt. Bei der Helligkeit erreicht der große 18-Zoll-Bildschirm die versprochenen 500 Nits nicht ganz. Für Innenräume ist die Helligkeit jedoch auf alle Fälle ausreichend und auch die Ausleuchtung ist mit 86 % gut. Sichtbares Backlight-Bleeding gab es bei unserem Testgerät nicht.
| |||||||||||||||||||||||||
Ausleuchtung: 86 %
Helligkeit Akku: 490 cd/m²
Kontrast: 907:1 (Schwarzwert: 0.54 cd/m²)
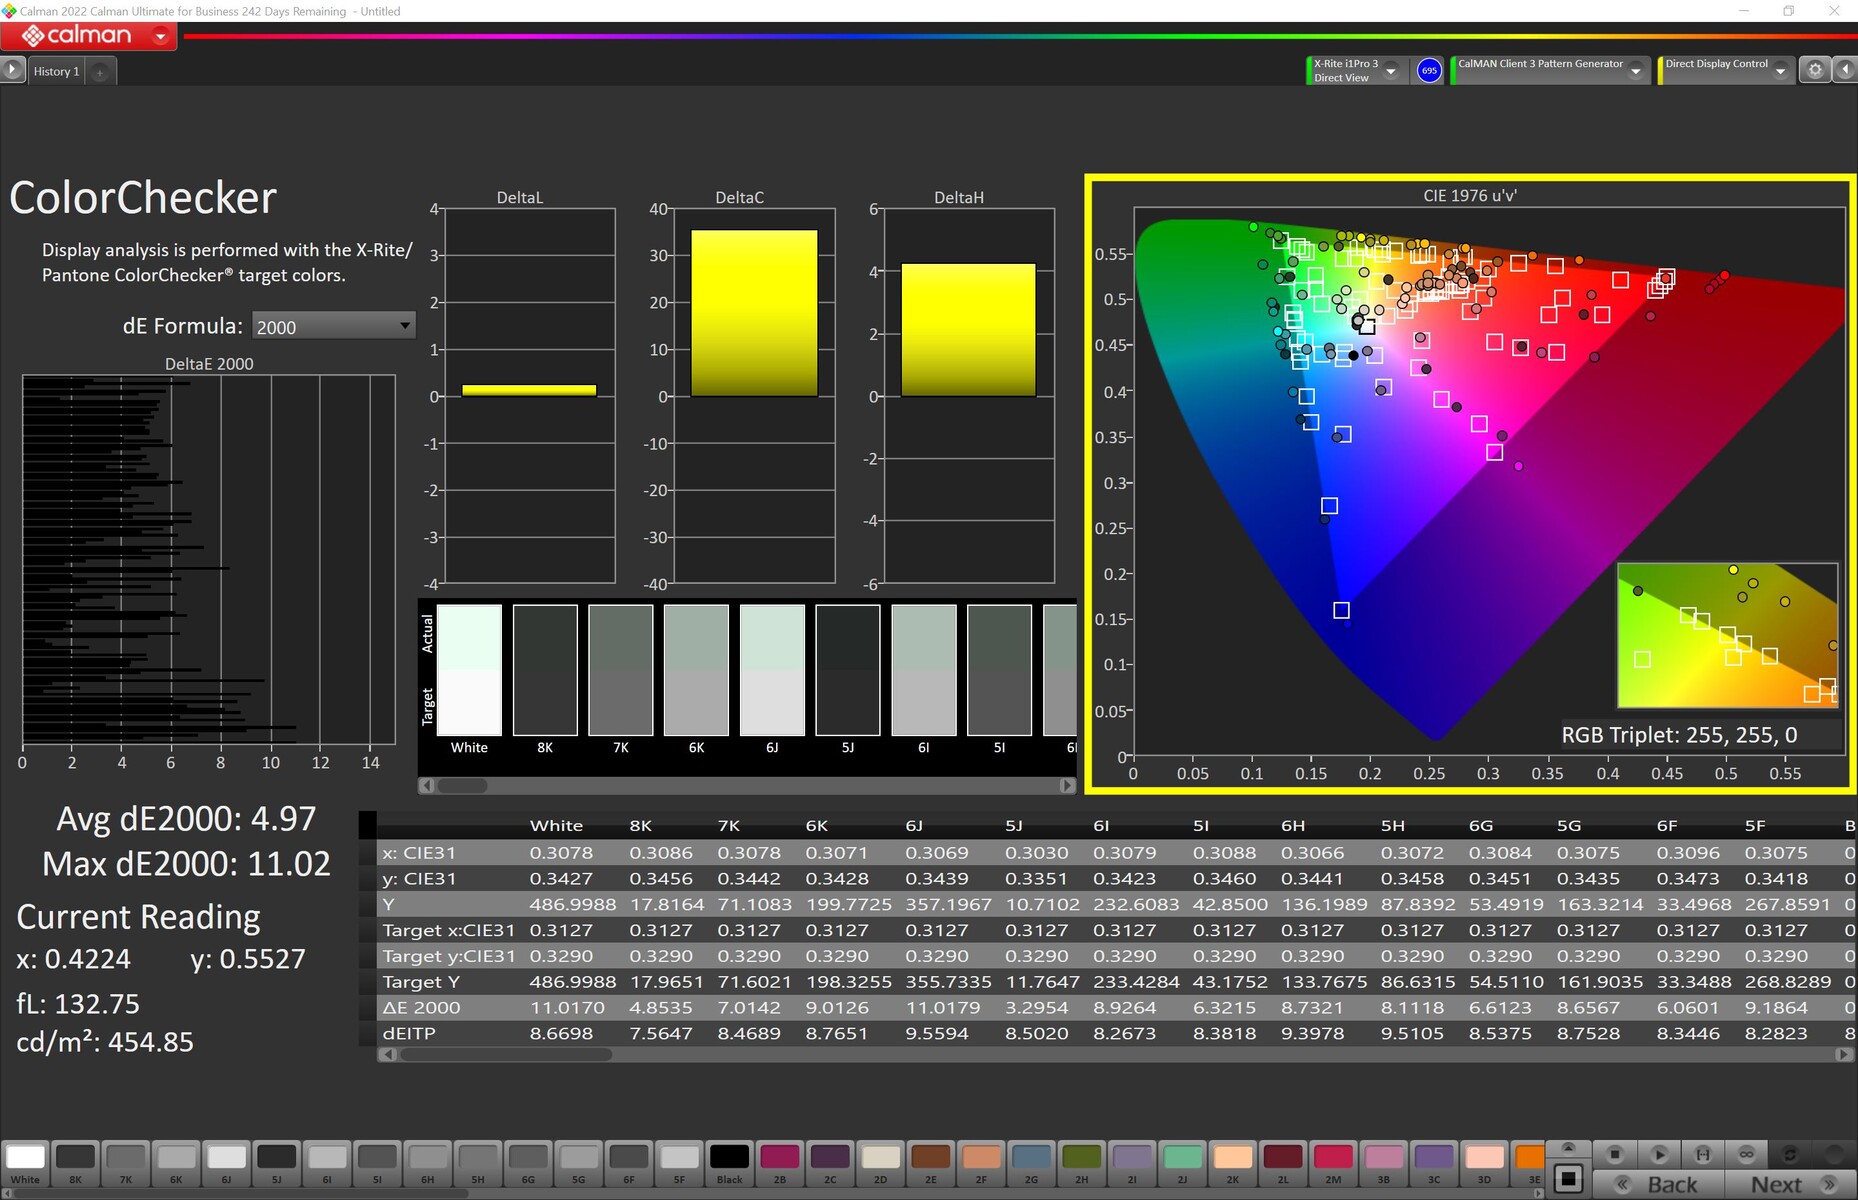
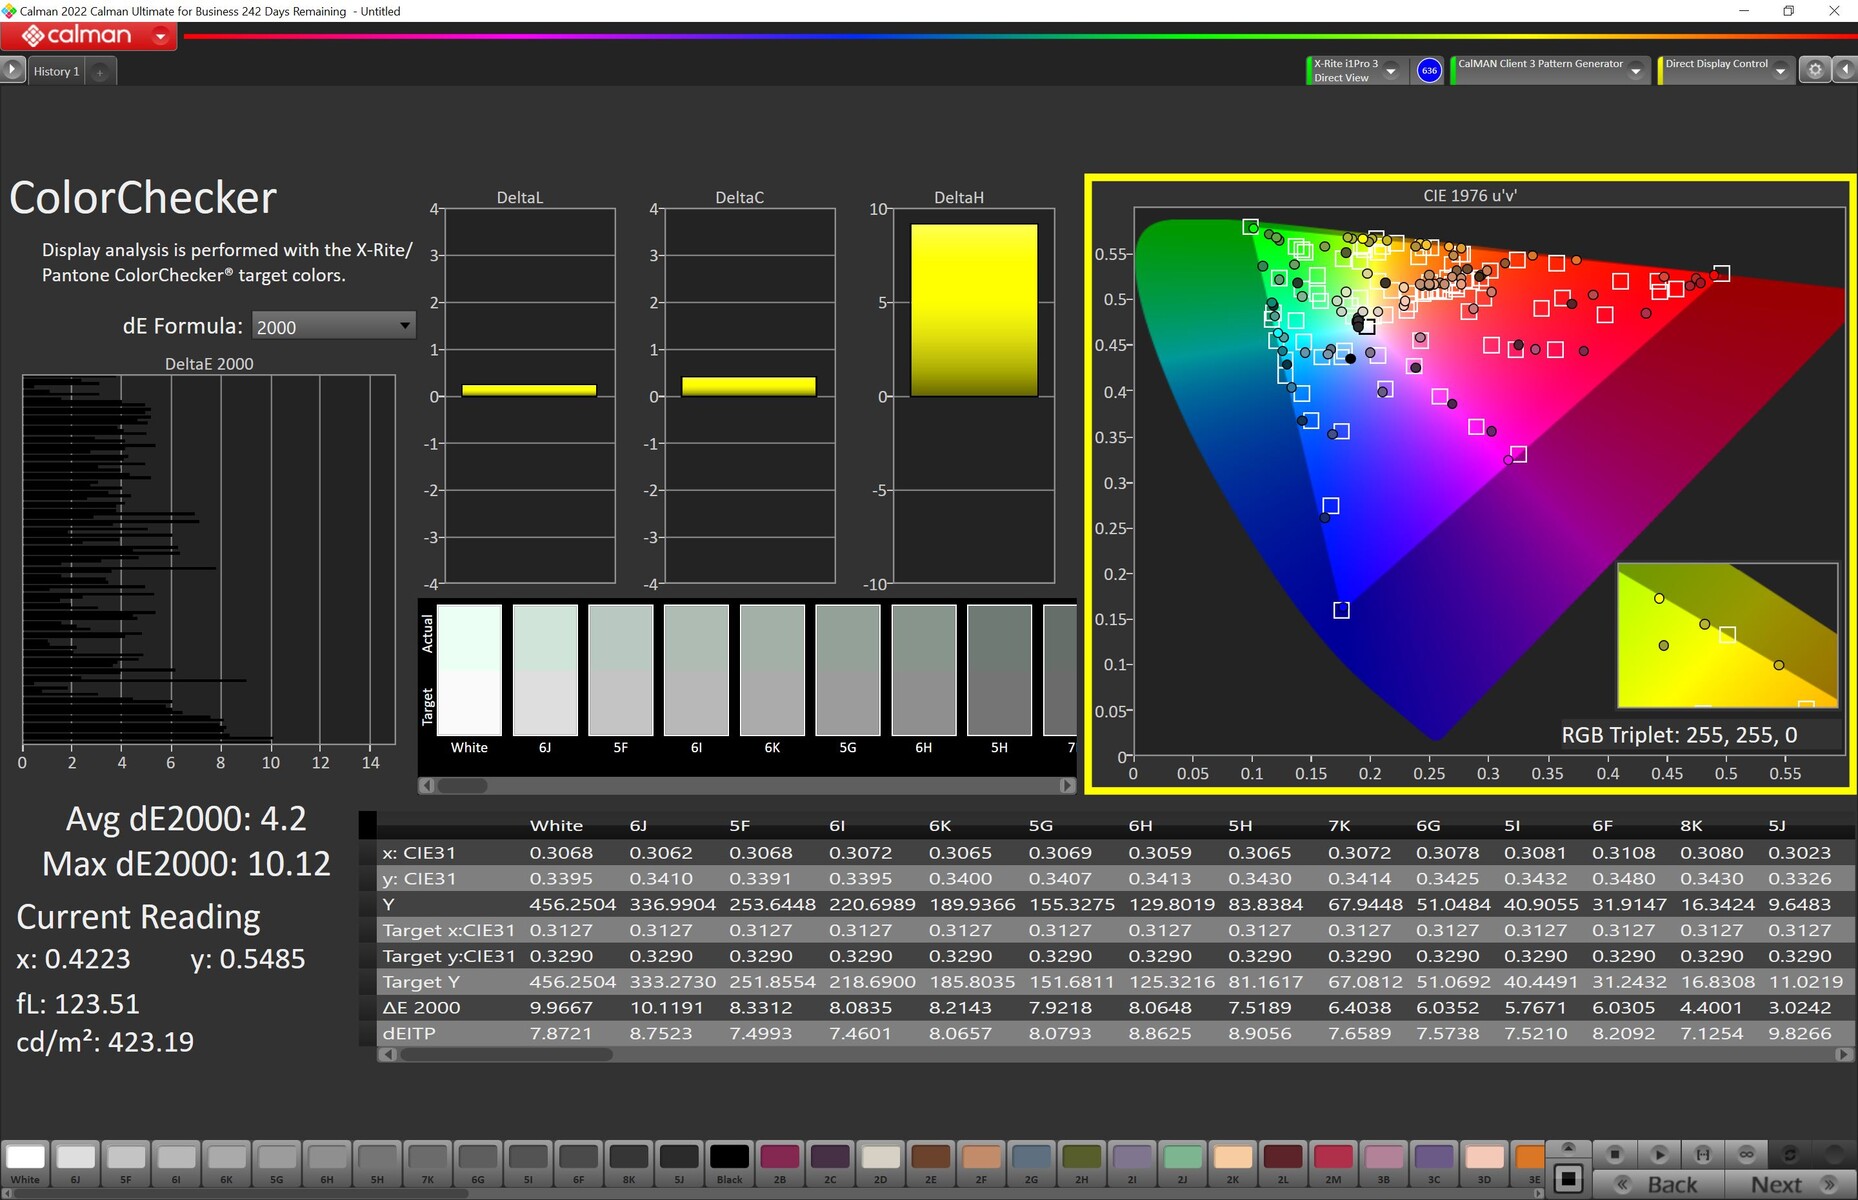
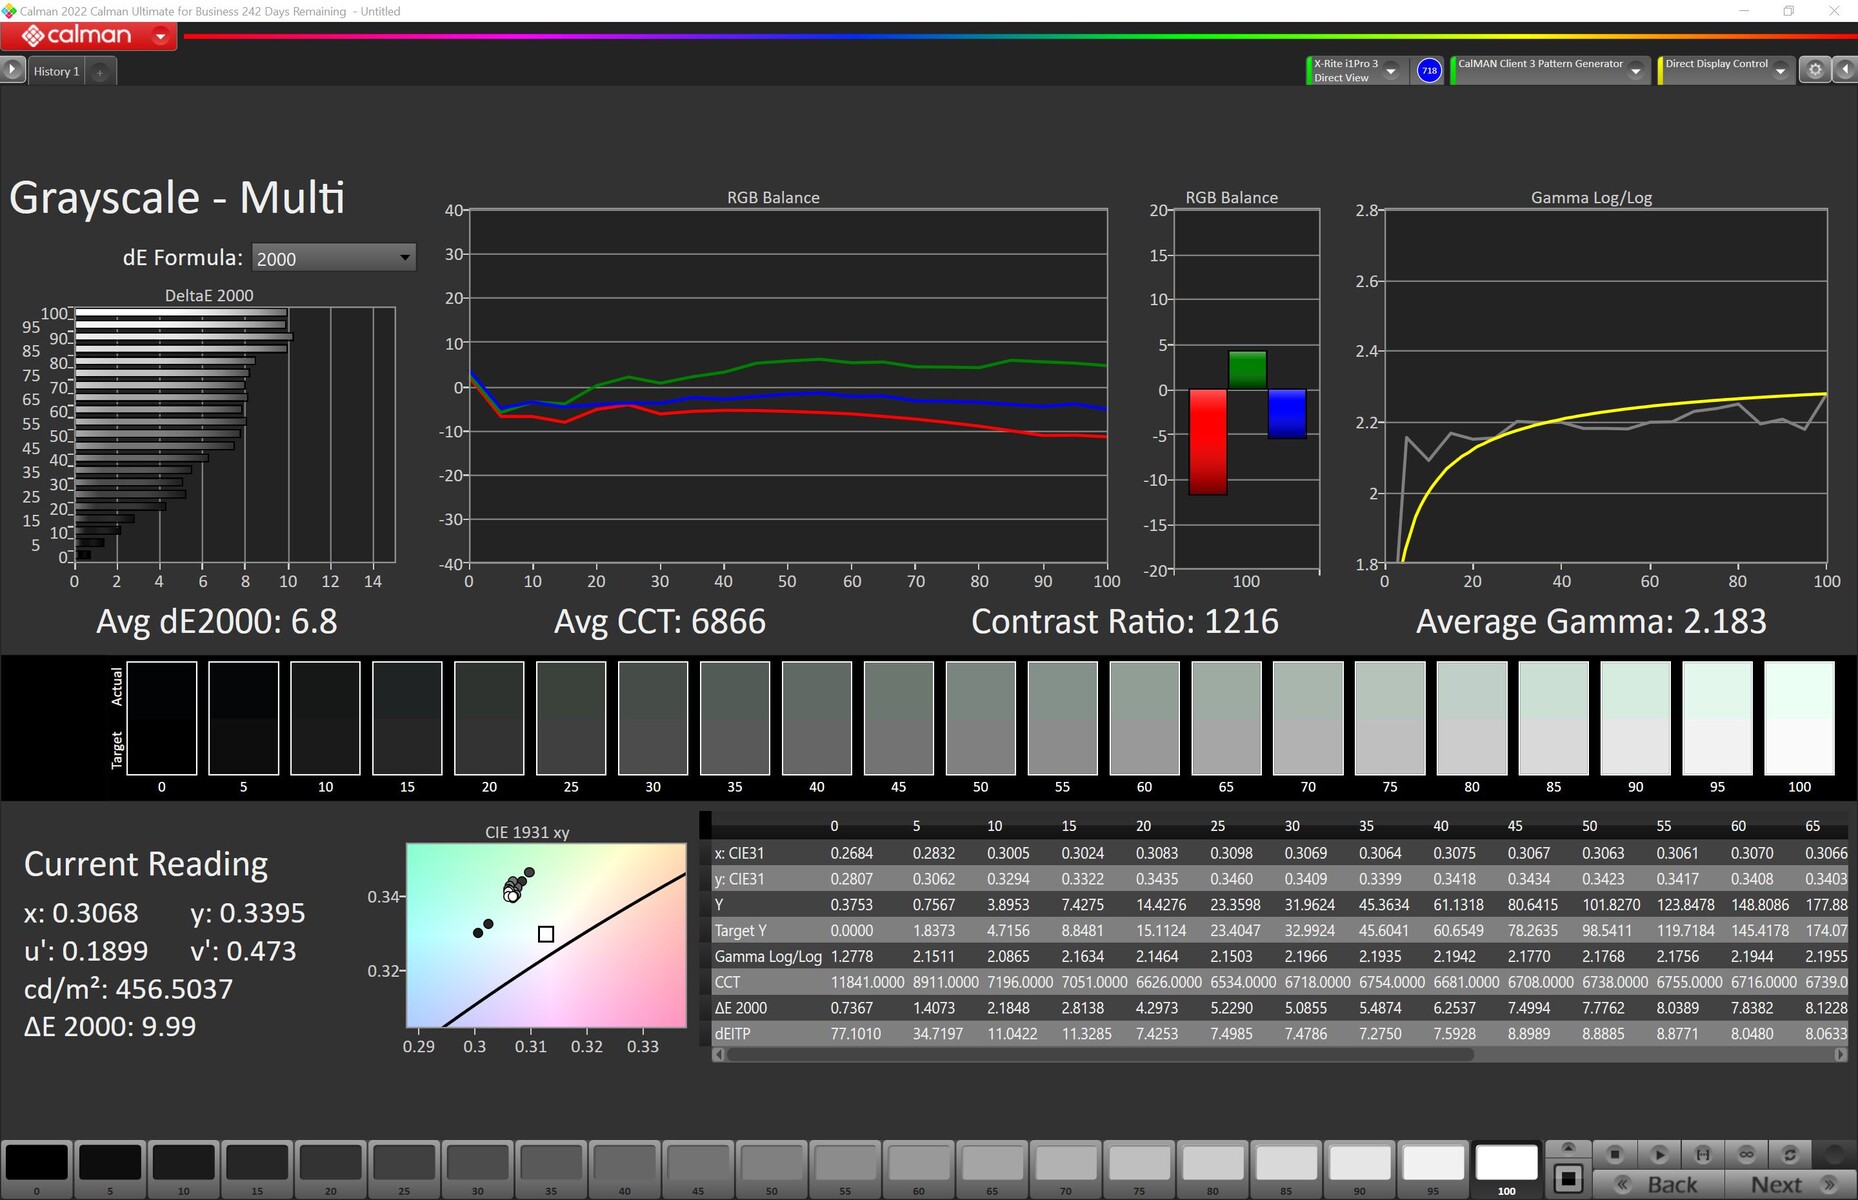
ΔE ColorChecker Calman: 4.97 | ∀{0.5-29.43 Ø4.73}
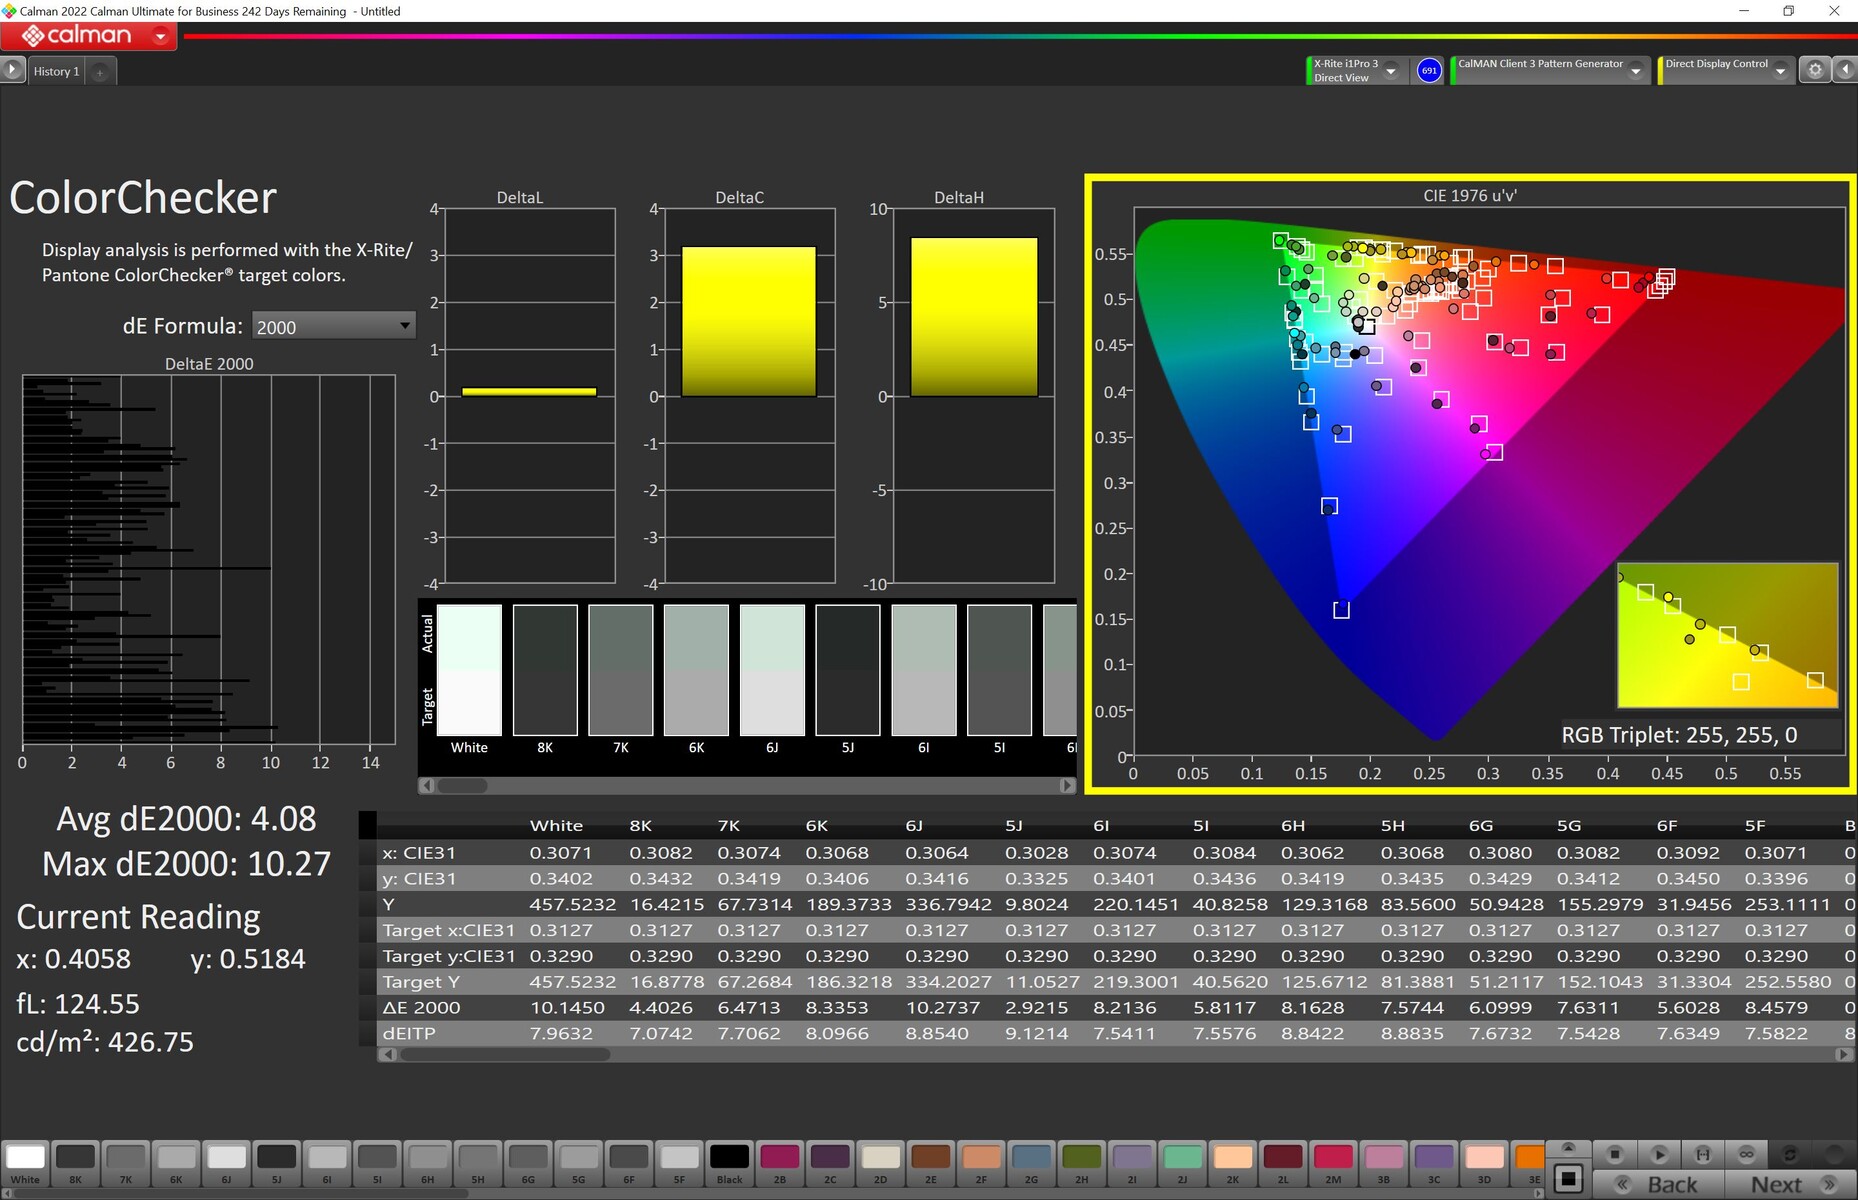
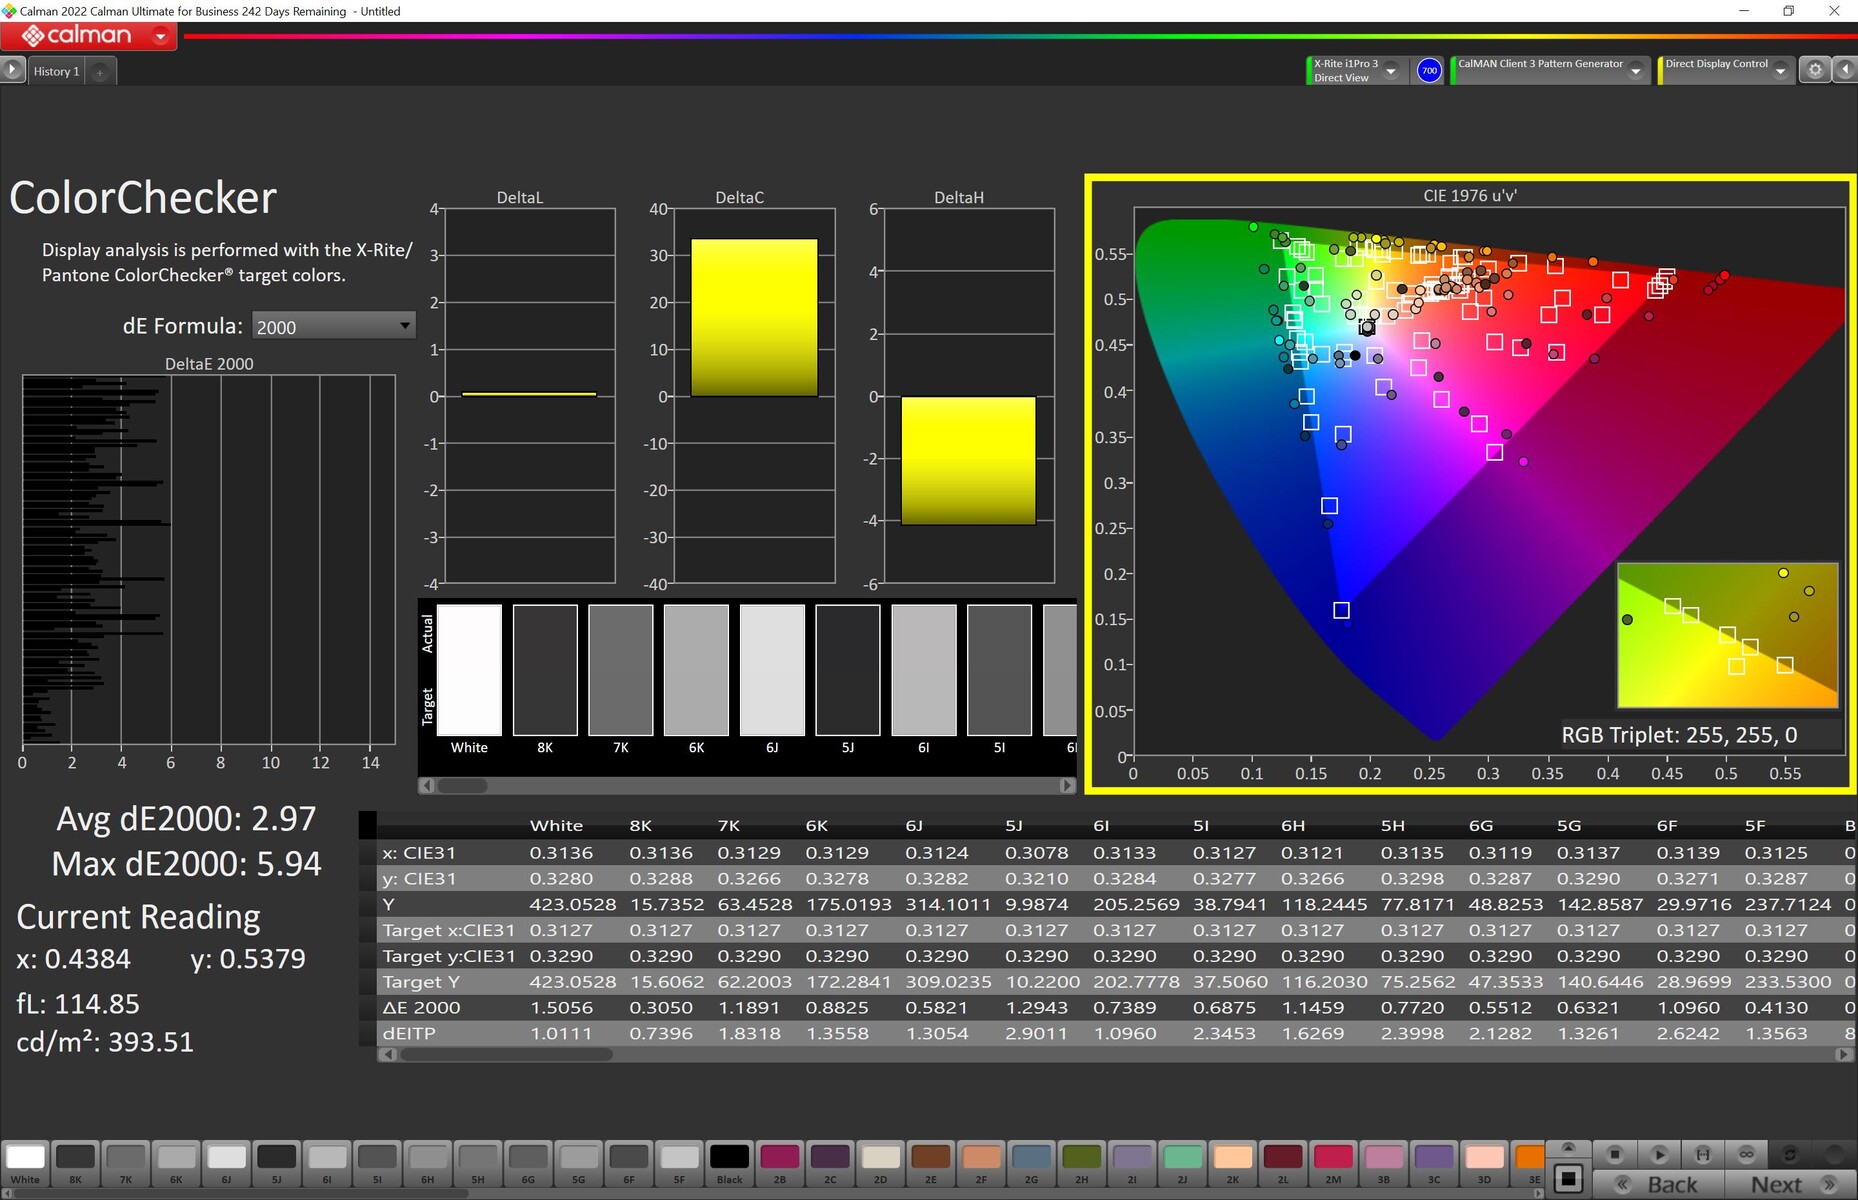
calibrated: 2.97
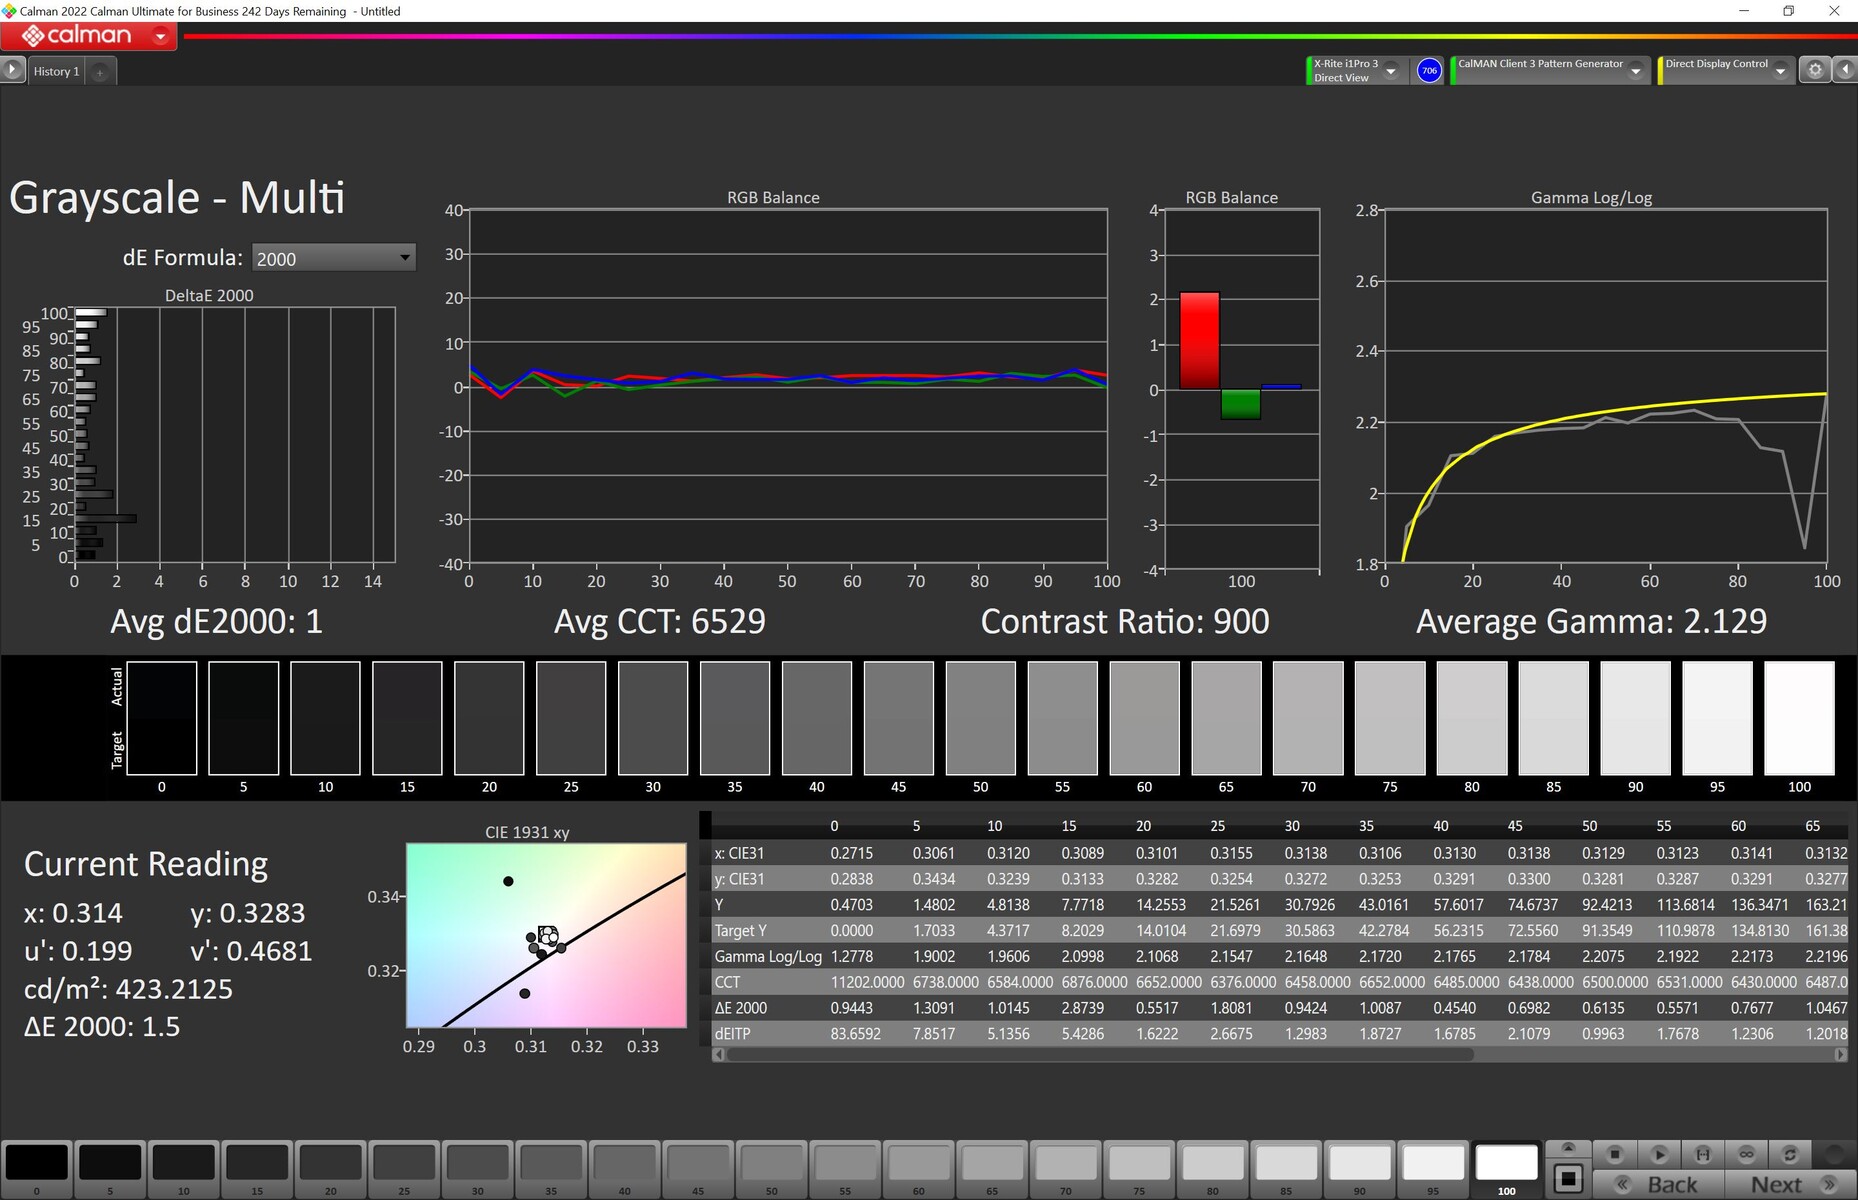
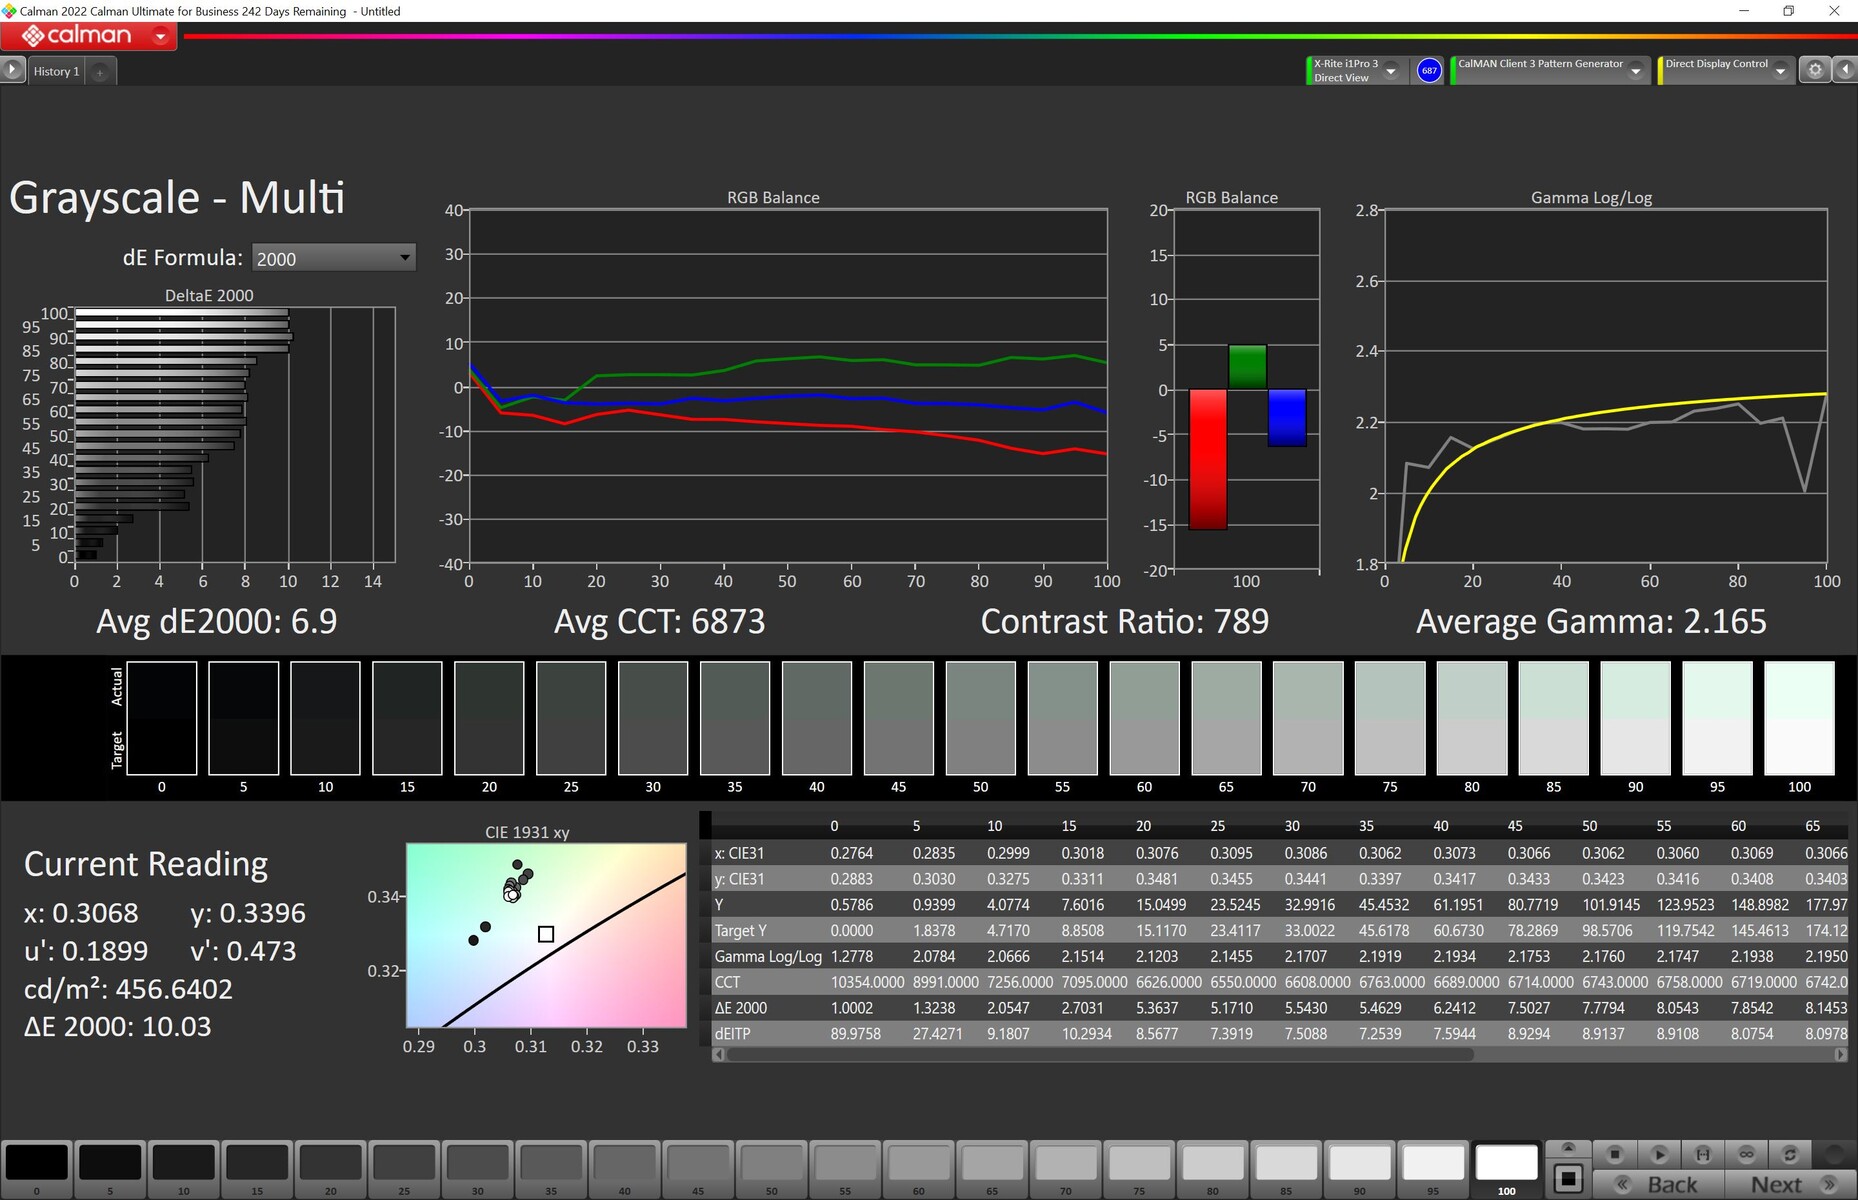
ΔE Greyscale Calman: 7.2 | ∀{0.09-98 Ø4.97}
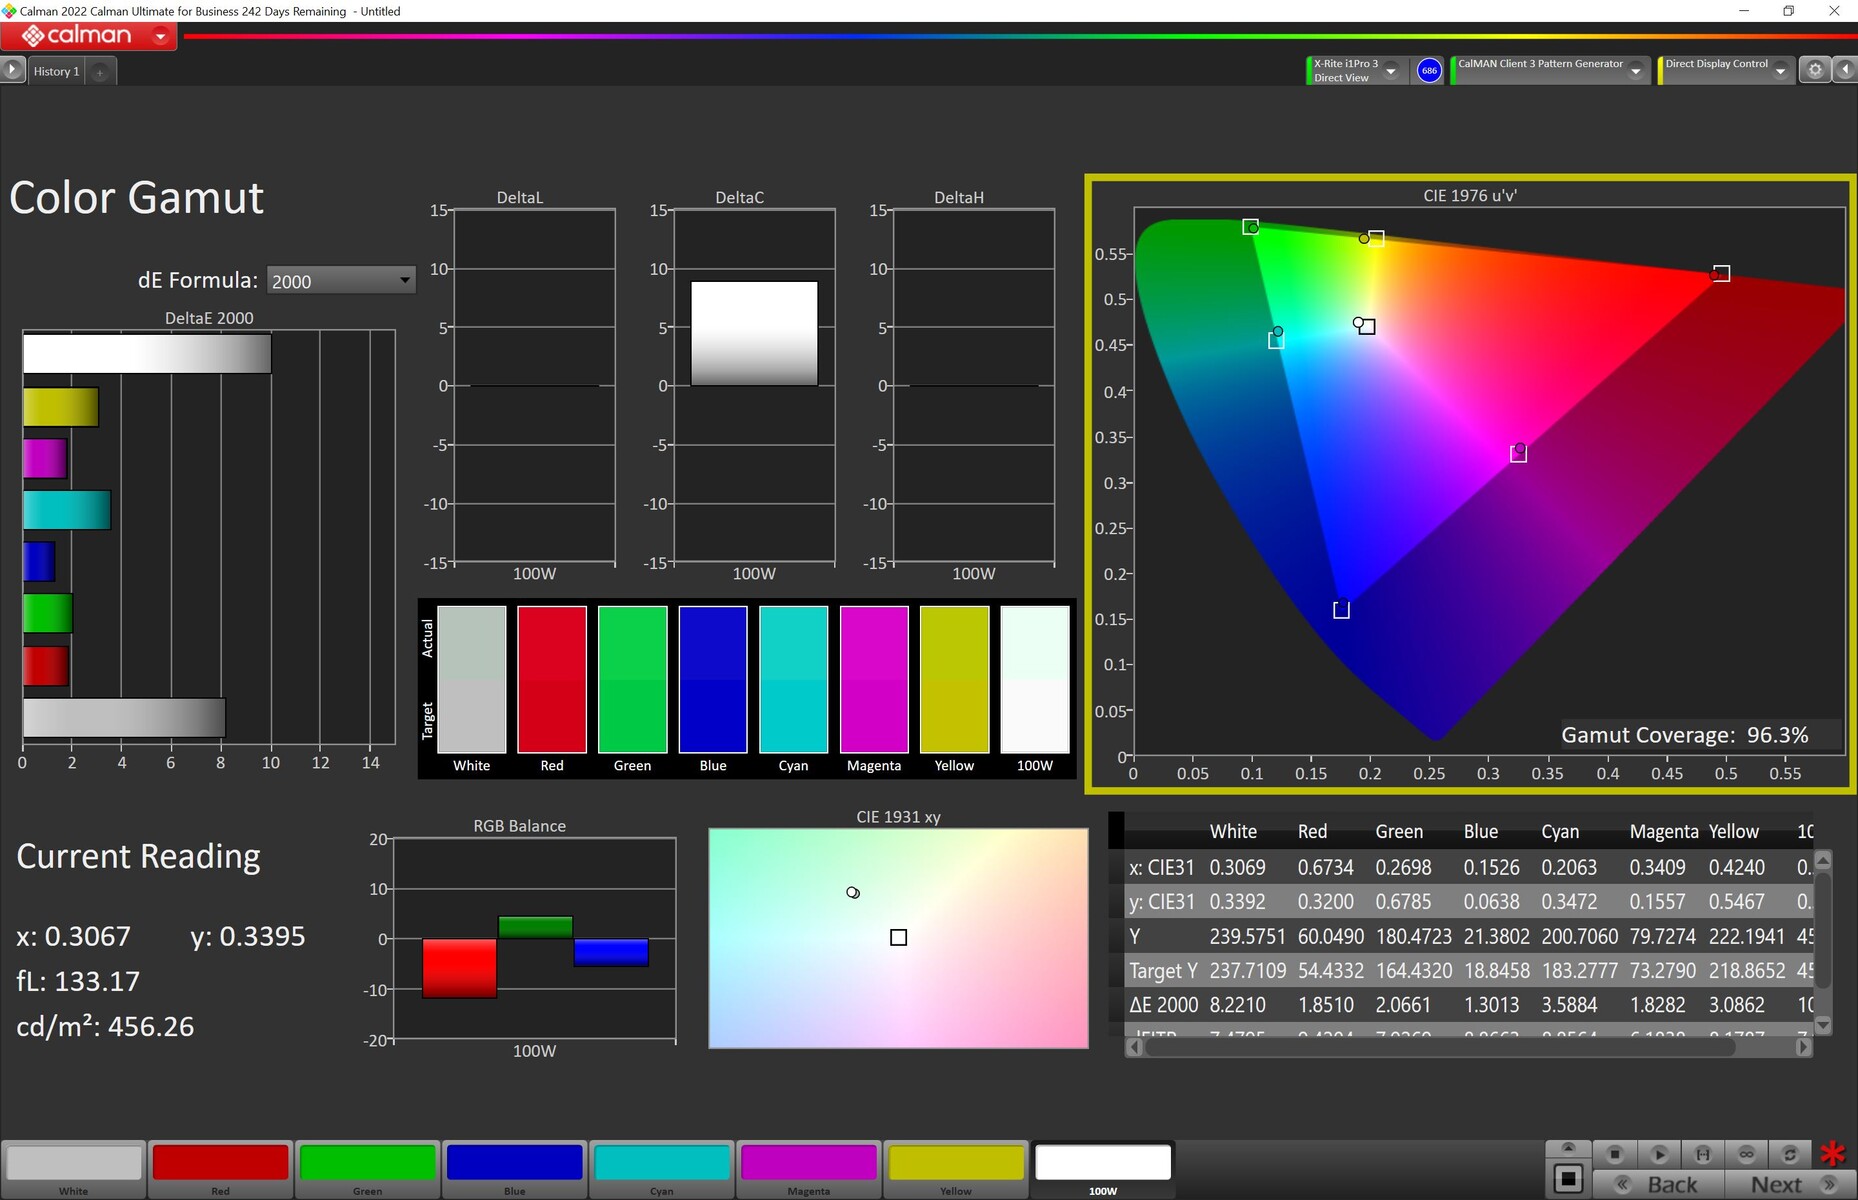
100% sRGB (Calman 2D)
84.9% AdobeRGB 1998 (Argyll 3D)
99.9% sRGB (Argyll 3D)
97.2% Display P3 (Argyll 3D)
Gamma: 2.161
CCT: 6515 K
| Asus ROG Strix Scar 18 2023 G834JY-N6005W NE180QDM-NZ2, IPS, 2560x1600, 18" | Razer Blade 18 RTX 4070 AU Optronics B180QAN01.0, IPS, 2560x1600, 18" | MSI Titan GT77 HX 13VI B173ZAN06.C, Mini-LED, 3840x2160, 17.3" | Asus ROG Strix Scar 17 SE G733CX-LL014W NE173QHM-NZ2, IPS, 2560x1440, 17.3" | |
|---|---|---|---|---|
| Display | 0% | 2% | 0% | |
| Display P3 Coverage (%) | 97.2 | 96.9 0% | 94.9 -2% | 97.1 0% |
| sRGB Coverage (%) | 99.9 | 99.8 0% | 99.9 0% | 99.9 0% |
| AdobeRGB 1998 Coverage (%) | 84.9 | 85.3 0% | 92.4 9% | 84.8 0% |
| Response Times | 15% | -410% | -11% | |
| Response Time Grey 50% / Grey 80% * (ms) | 5.41 ? | 4.2 ? 22% | 38.4 ? -610% | 5.7 ? -5% |
| Response Time Black / White * (ms) | 8.62 ? | 8 ? 7% | 26.6 ? -209% | 10.1 ? -17% |
| PWM Frequency (Hz) | 2380 ? | |||
| Bildschirm | 22% | 74253% | 29% | |
| Helligkeit Bildmitte (cd/m²) | 490 | 549.6 12% | 606 24% | 320 -35% |
| Brightness (cd/m²) | 468 | 524 12% | 602 29% | 303 -35% |
| Brightness Distribution (%) | 86 | 89 3% | 93 8% | 87 1% |
| Schwarzwert * (cd/m²) | 0.54 | 0.53 2% | 0.0001 100% | 0.3 44% |
| Kontrast (:1) | 907 | 1037 14% | 6060000 668037% | 1067 18% |
| Delta E Colorchecker * | 4.97 | 3.32 33% | 4.8 3% | 1.1 78% |
| Colorchecker dE 2000 max. * | 11.02 | 6.63 40% | 8.2 26% | 2.7 75% |
| Colorchecker dE 2000 calibrated * | 2.97 | 2.7 9% | 1.8 39% | |
| Delta E Graustufen * | 7.2 | 2 72% | 6.5 10% | 1.1 85% |
| Gamma | 2.161 102% | 2.29 96% | 2.63 84% | 2.13 103% |
| CCT | 6515 100% | 6319 103% | 6596 99% | 6599 98% |
| Durchschnitt gesamt (Programm / Settings) | 12% /
16% | 24615% /
47676% | 6% /
16% |
* ... kleinere Werte sind besser
Der gemessene Farbraum deckt den Display-P3-Farbraum zu 97 % ab und ist damit auch für anspruchsvollere Arbeiten (nach Kalibrierung) geeignet. Bei der Farbtreue ist das Ergebnis etwas abhängig vom verwendeten Preset. Asus bietet im Armory Crate Tool unter GameVisual vier verschiedene Modi: Native, sRGB, DCI-P3 und Display P3. Im Native-Modus hatte das Display bei unserem Testgerät einen leicht sichtbaren und messbaren Blau-Stich, der sich auch im ΔE-Wert von knapp 5 manifestierte. Durch eine Kalibration mit unserem i1Pro 3 erzielten wir ein deutlich besseres Ergebnis - besonders auch bei den Extremwerten. Danach eignet sich das Display auch für Fotobearbeitung.

Die Displayhelligkeit wird beim verbauten NE180QDM-NZ2 Panel nicht per PWM geregelt und auch Flackern konnten wir mit unserer Messsonde nicht feststellen (über alle Helligkeitsbereiche). Die versprochenen 3 ms Response Times können wir beim Grauwechsel bestätigen. Hierzu nutzt Asus ein minimales Overdrive, das uns aber nicht störend aufgefallen wäre. In Verbindung mit der 240 Hz Bildwiederholungsrate ist das Display daher ideal für Spieler geeignet.
Reaktionszeiten (Response Times) des Displays
| ↔ Reaktionszeiten Schwarz zu Weiß | ||
|---|---|---|
| 8.62 ms ... steigend ↗ und fallend ↘ kombiniert | ↗ 3.68 ms steigend | 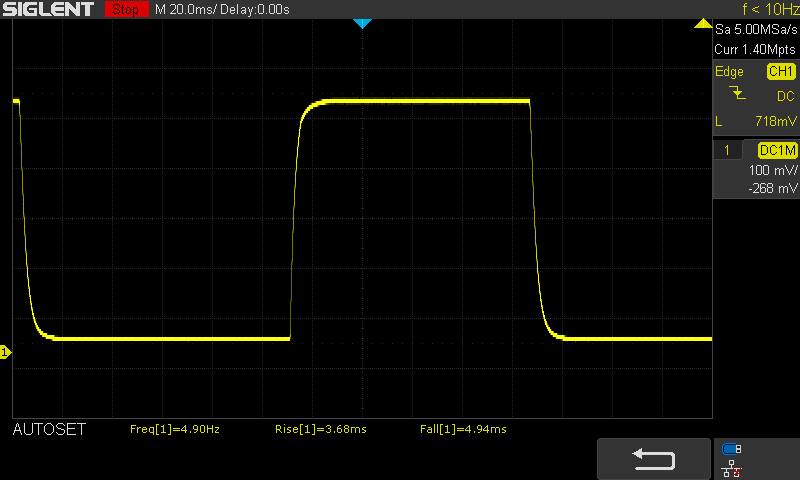 |
| ↘ 4.94 ms fallend | ||
| Die gemessenen Reaktionszeiten sind kurz wodurch sich der Bildschirm auch für Spiele gut eignen sollte. Im Vergleich rangierten die bei uns getesteten Geräte von 0.1 (Minimum) zu 240 (Maximum) ms. » 24 % aller Screens waren schneller als der getestete. Daher sind die gemessenen Reaktionszeiten besser als der Durchschnitt aller vermessenen Geräte (19.9 ms). | ||
| ↔ Reaktionszeiten 50% Grau zu 80% Grau | ||
| 5.41 ms ... steigend ↗ und fallend ↘ kombiniert | ↗ 2.57 ms steigend | 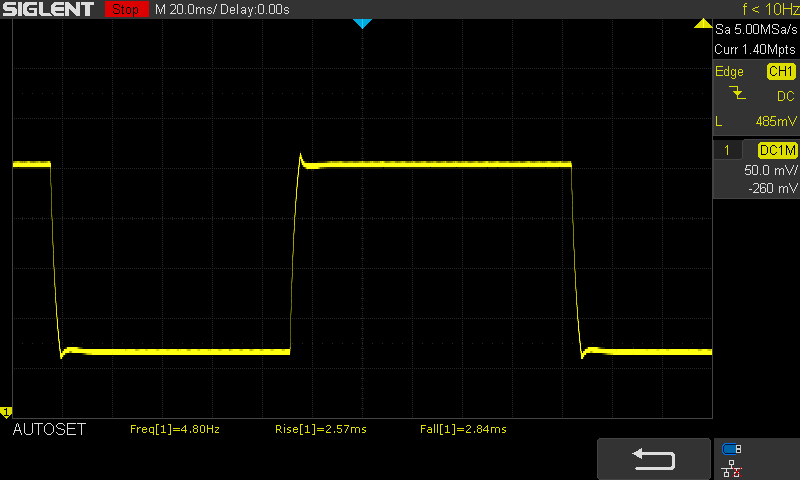 |
| ↘ 2.84 ms fallend | ||
| Die gemessenen Reaktionszeiten sind sehr kurz, wodurch sich der Bildschirm auch für schnelle 3D Spiele eignen sollte. Im Vergleich rangierten die bei uns getesteten Geräte von 0.165 (Minimum) zu 636 (Maximum) ms. » 18 % aller Screens waren schneller als der getestete. Daher sind die gemessenen Reaktionszeiten besser als der Durchschnitt aller vermessenen Geräte (31.1 ms). | ||
Bildschirm-Flackern / PWM (Pulse-Width Modulation)
| Flackern / PWM nicht festgestellt |  | ||
Im Vergleich: 52 % aller getesteten Geräte nutzten kein PWM um die Helligkeit zu reduzieren. Wenn PWM eingesetzt wurde, dann bei einer Frequenz von durchschnittlich 7798 (Minimum 5, Maximum 343500) Hz. | |||
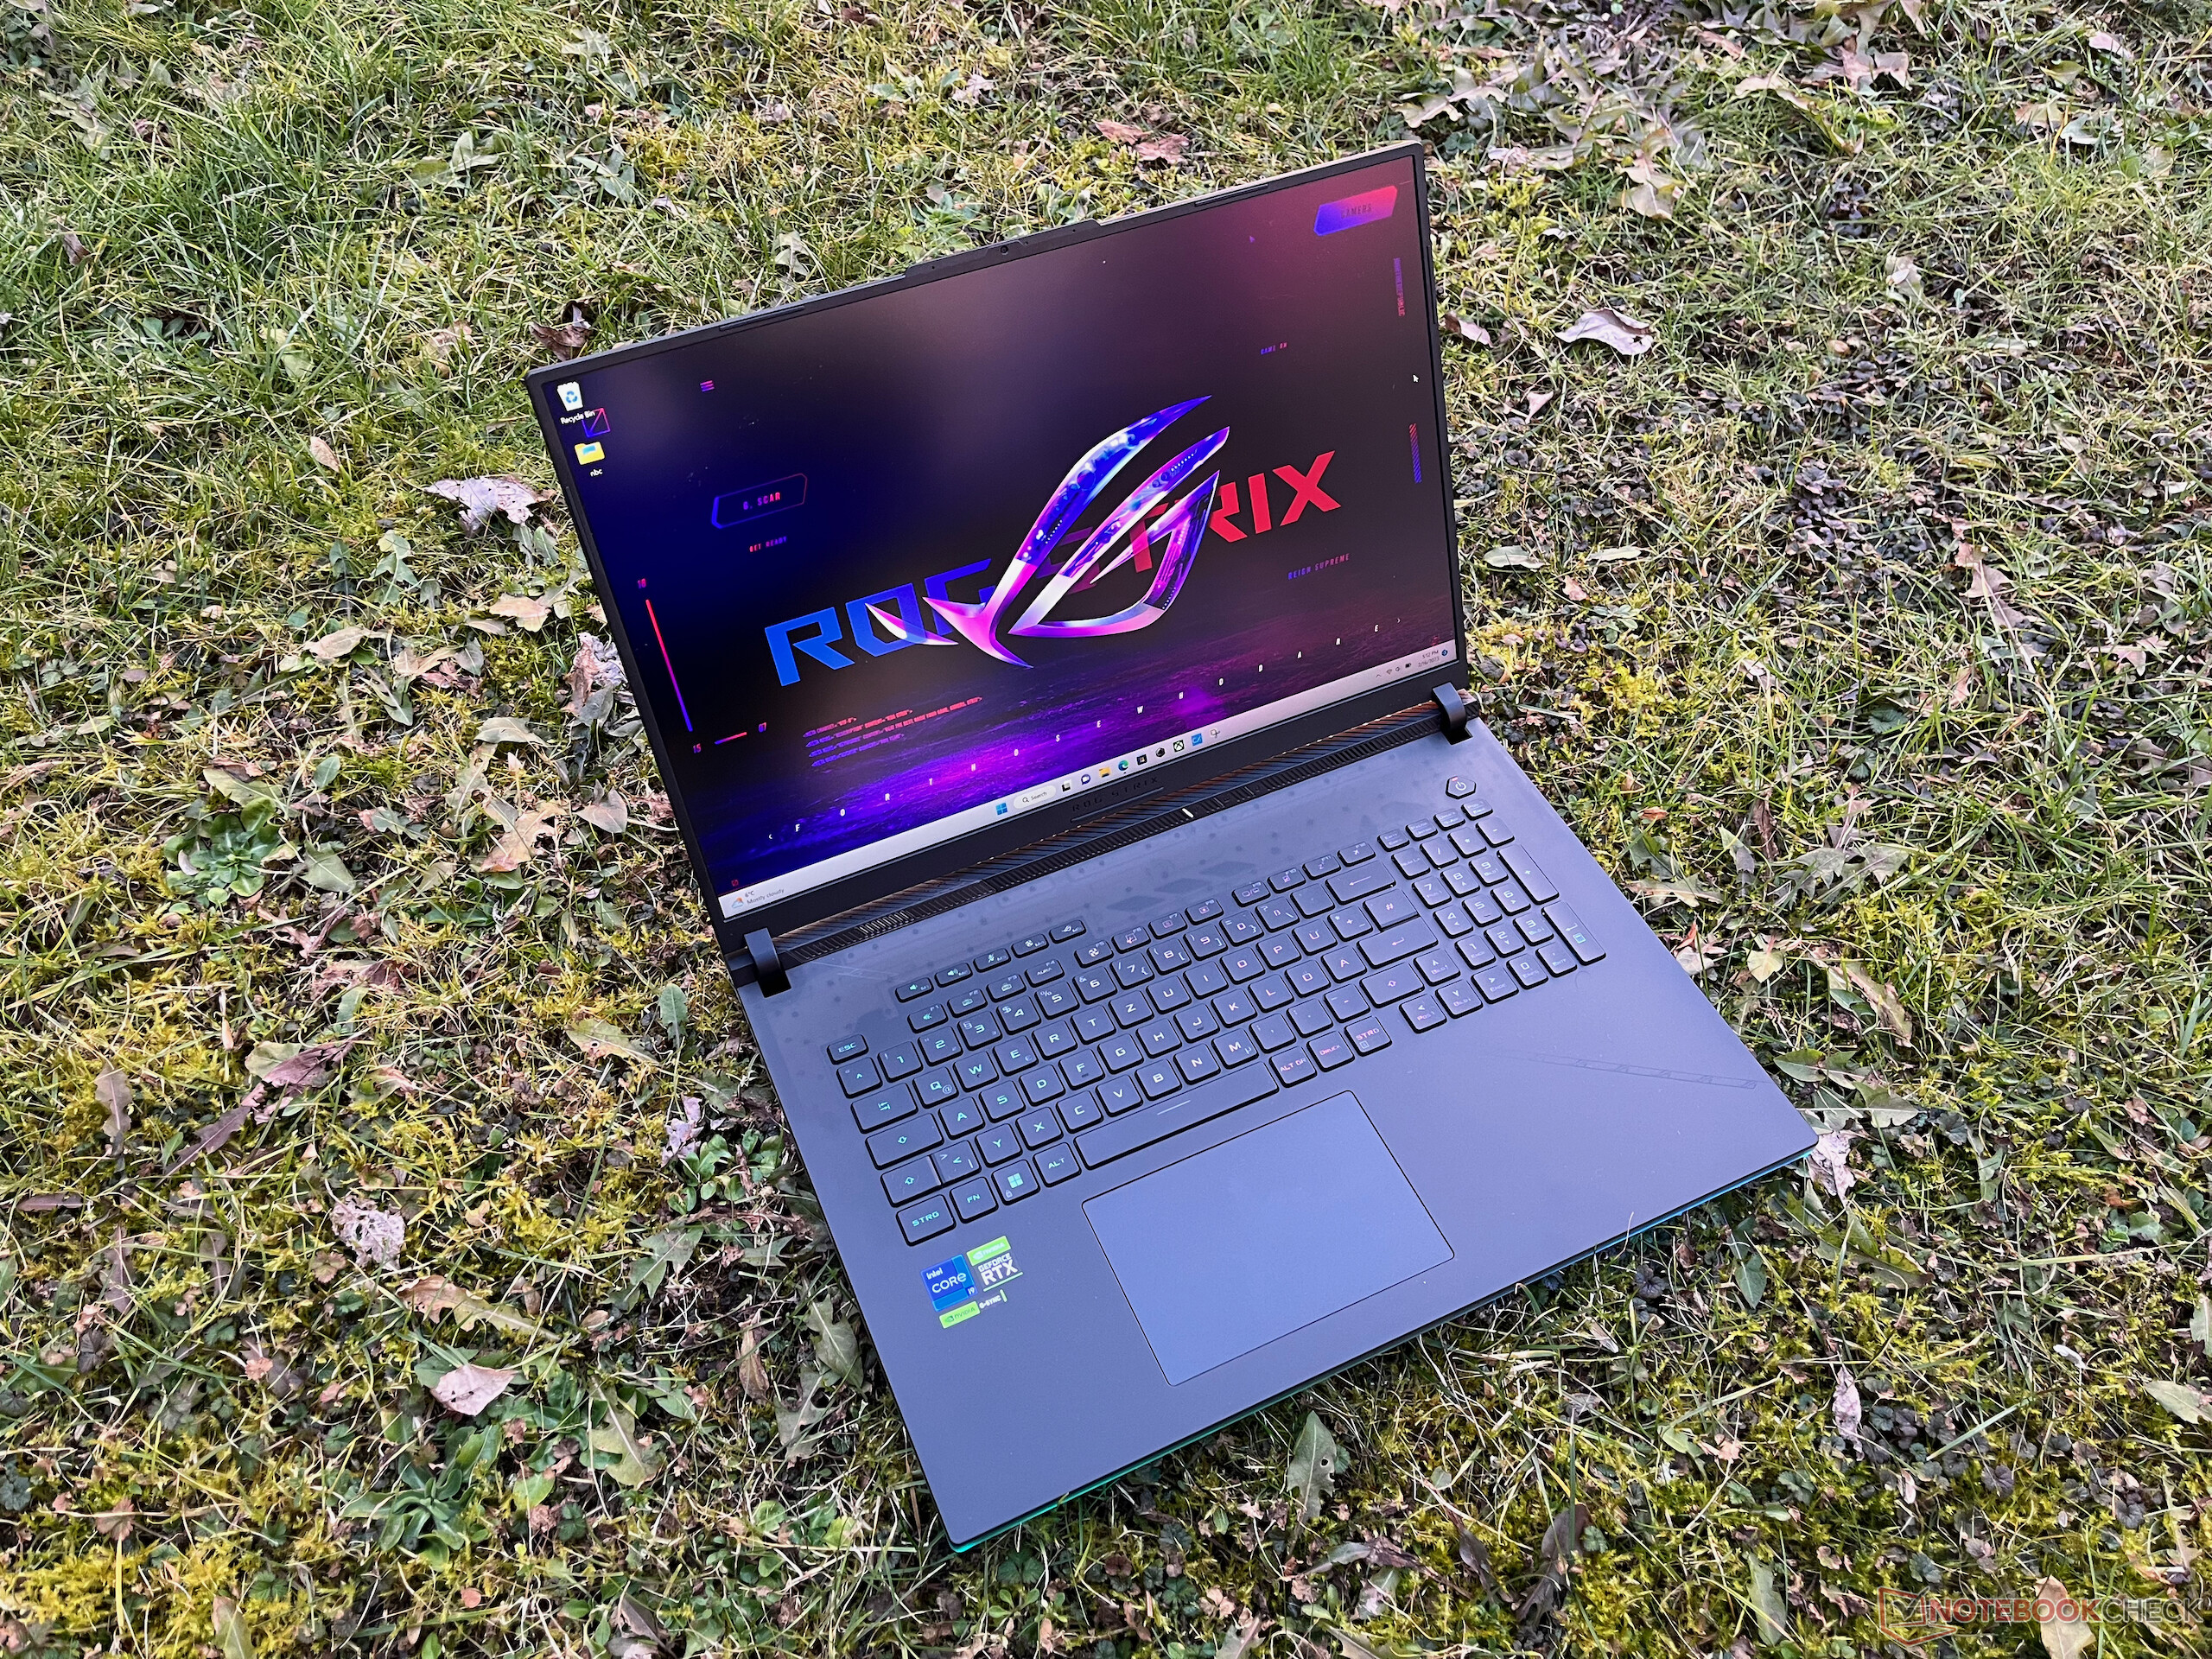
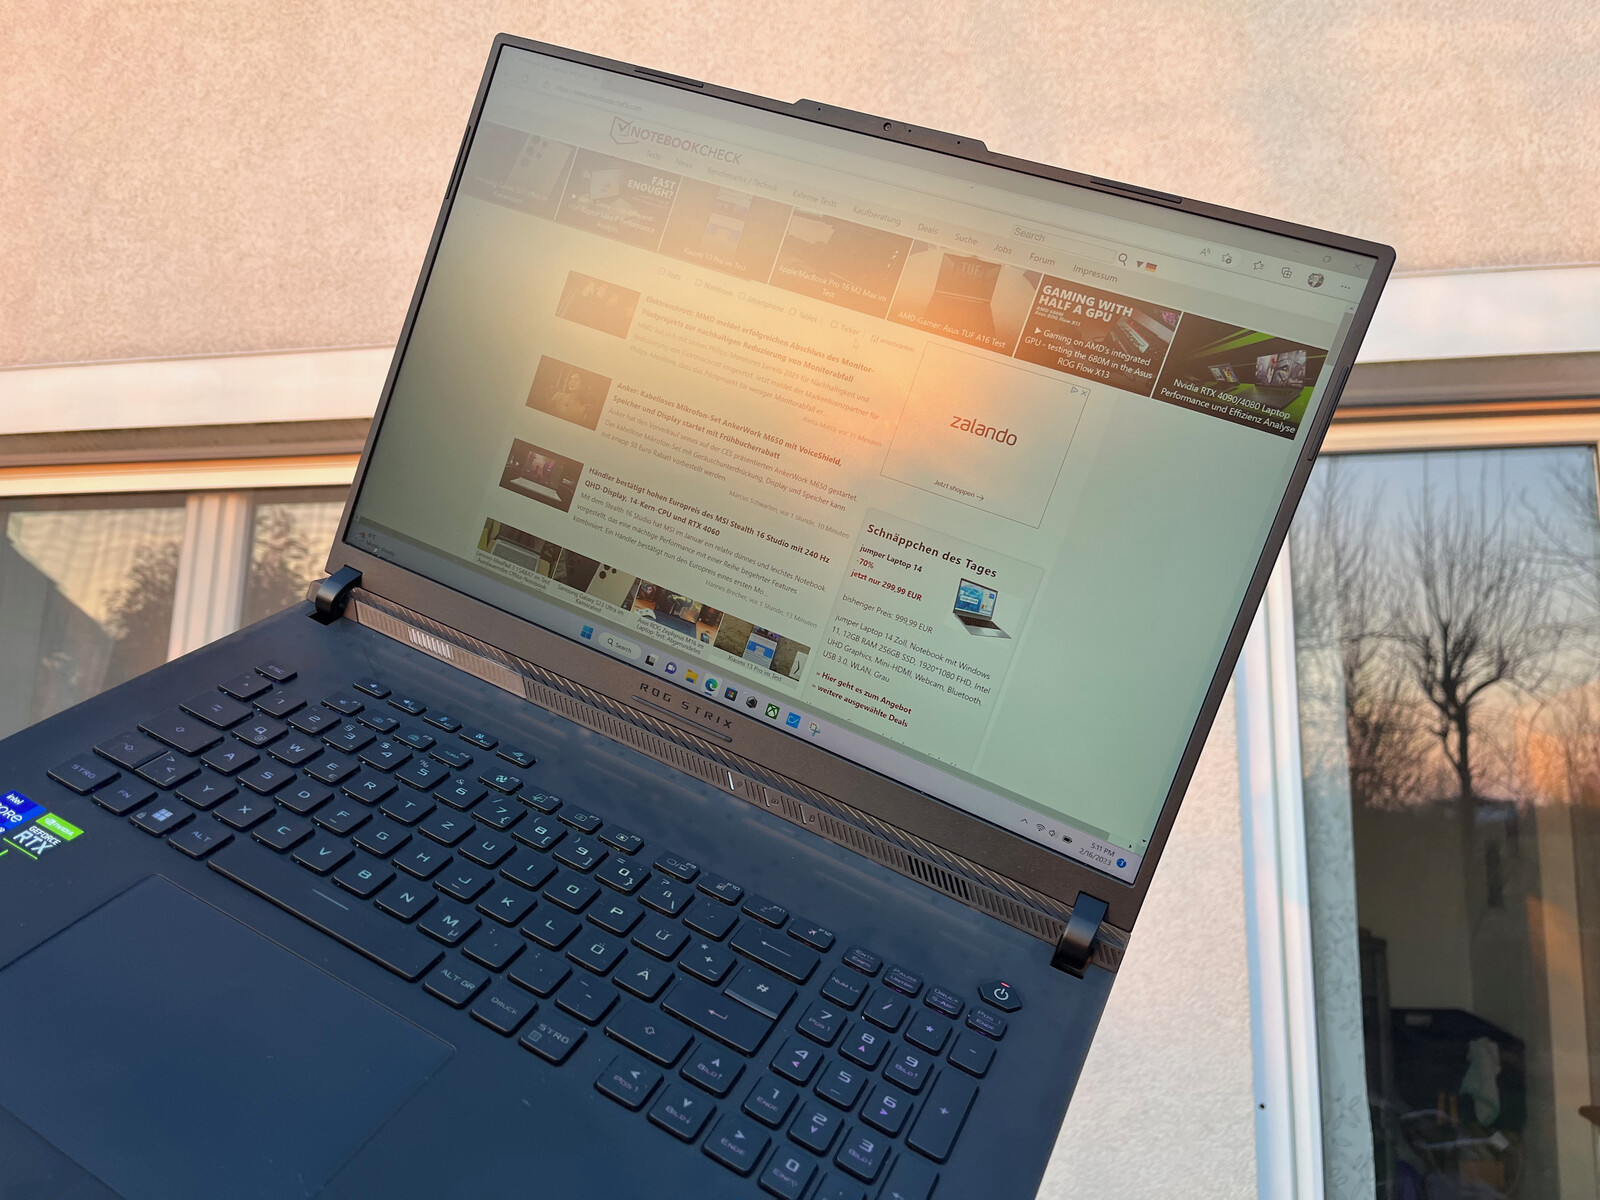
Dank matter Displayoberfläche und guter maximaler Helligkeit lässt sich das ROG Strix Scar 18 theoretisch auch im Freien gut nutzen. Für die direkte Sommersonne reichen die knapp 500 Nits zwar nicht aus, aber im Schatten oder wie im Foto bei abendlicher Sonne ist es durchaus brauchbar.
Die Blickwinkel sind danke "IPS-Level"-Panel hervorragend. Der Helligkeitsverlust bei spitzen Blickwinkeln hält sich im Rahmen und Farbverfälschungen sind subjektiv nicht wahrnehmbar.

Leistung
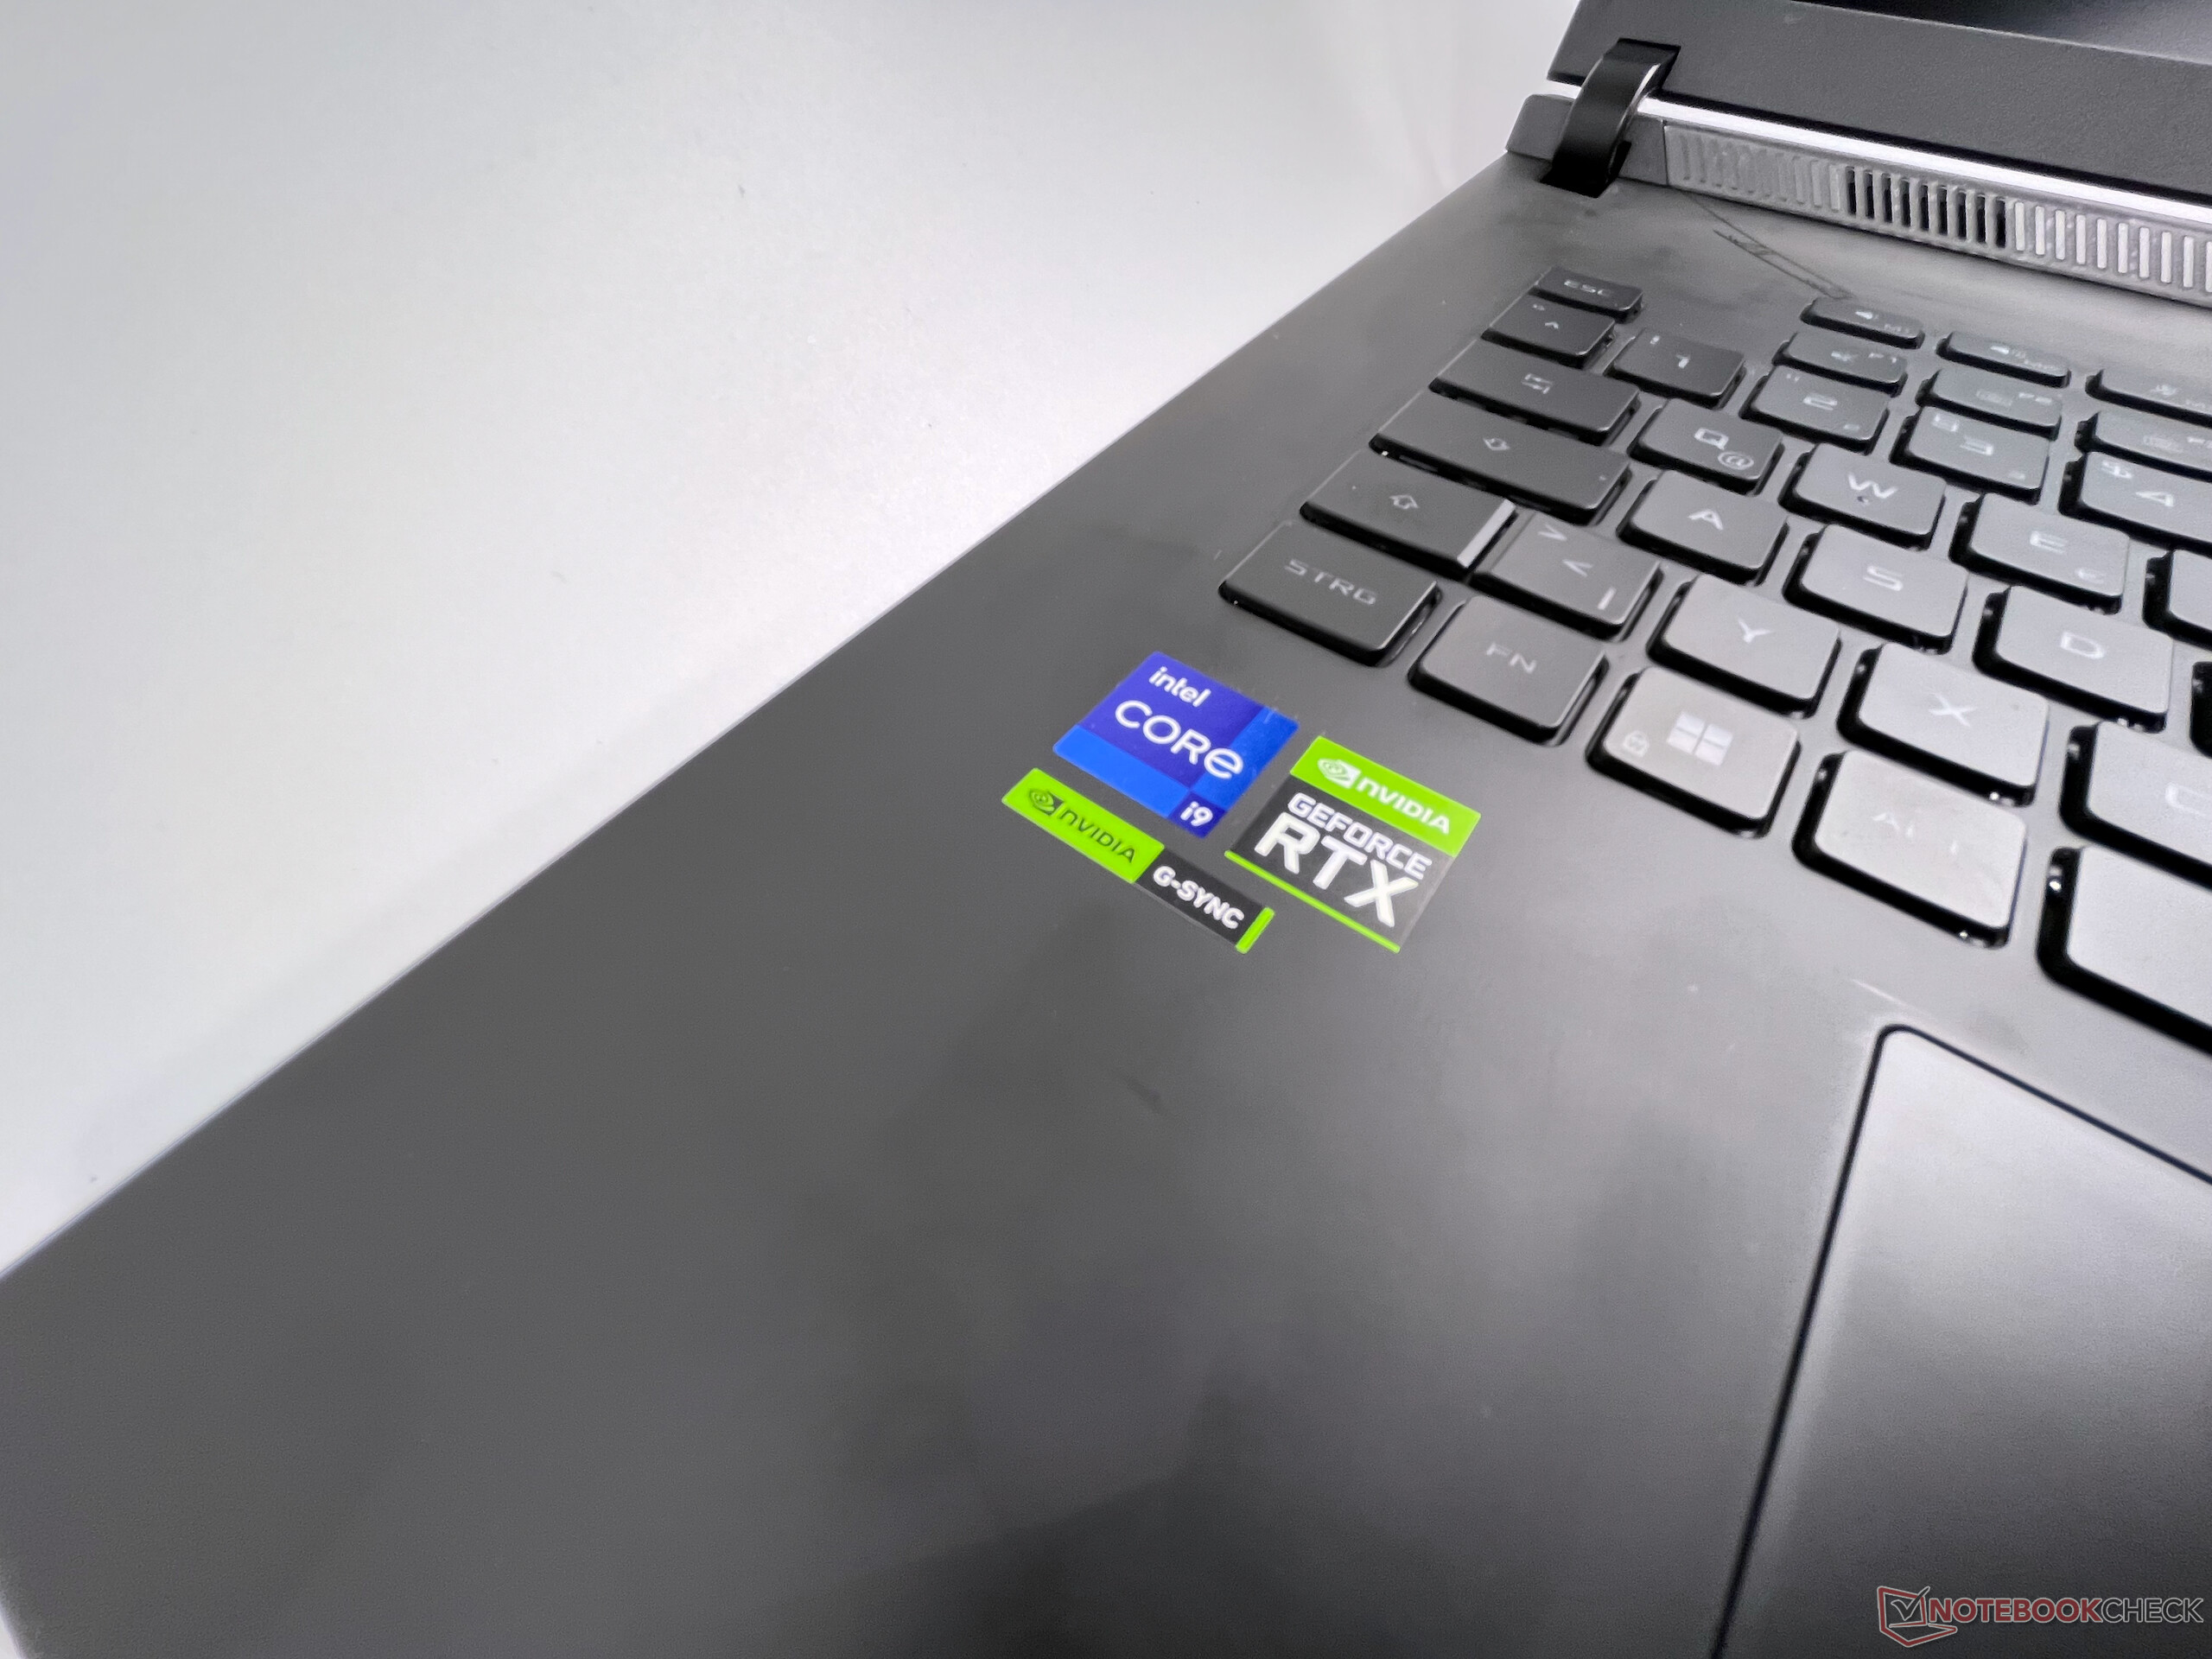
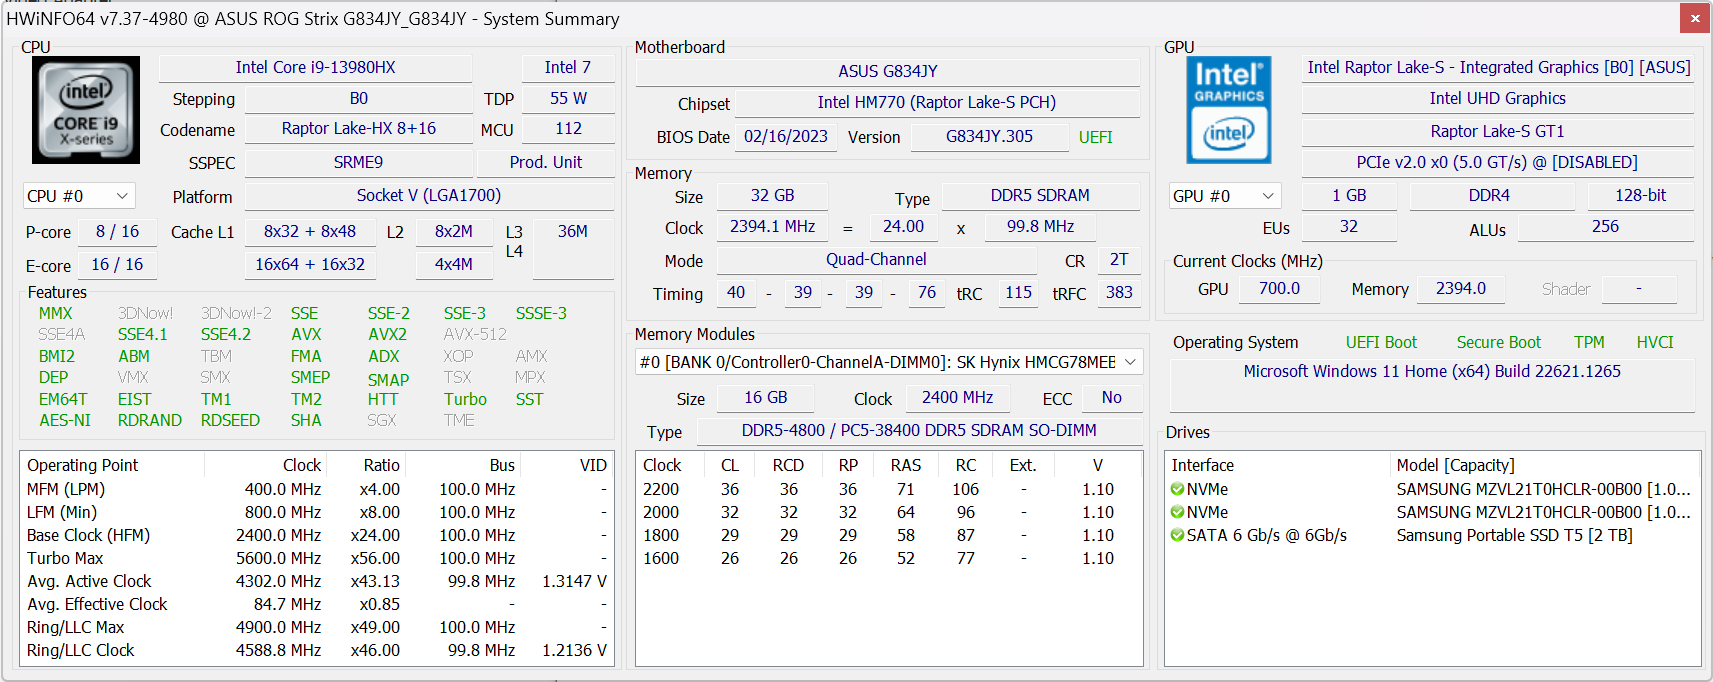
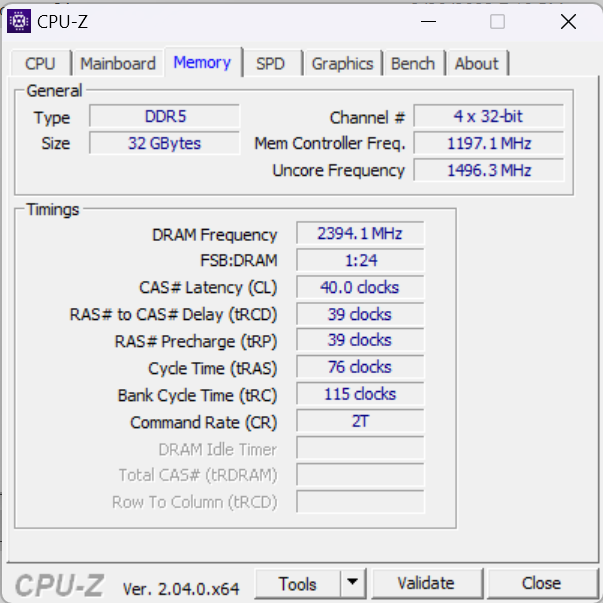
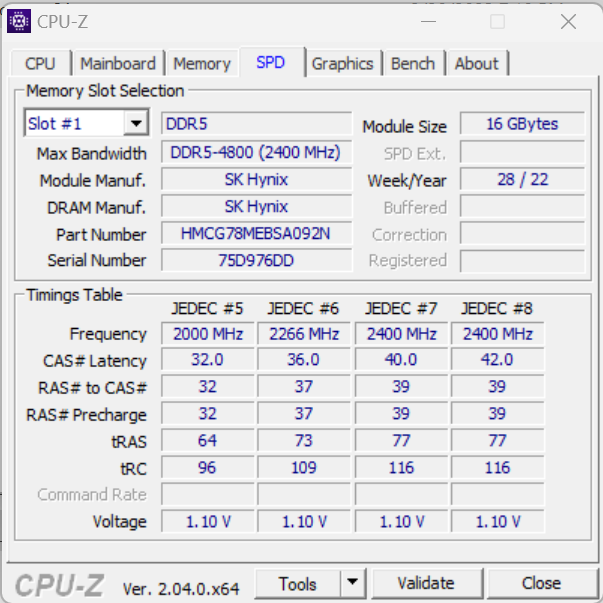
Bei den Leistungsdaten kann unser Testmodell des Scar 18 mehrfach punkten. Asus verbaut die aktuell schnellste mobile Grafikkarte - die GeForce RTX 4090 - und erlaubt ihr mit 175 Watt auch die maximale Stromaufnahme. Auch beim Prozessor hat Asus nicht gespart und das mobile Topmodell von Intel verbaut. Der Intel Core i9-13980HX basiert auf die neue Raptor-Lake-Serie und bietet 24 Kerne und einen maximalen Boost von beachtlichen 5,6 GHz. Auch bei der Speichermenge wurde nicht gespart und 32 GB DDR5 RAM eingesetzt. Die Speichergeschwindigkeit ist mit 4800 MT/s jedoch etwas geringer als bei manchen Konkurrenzmodellen. Zu guter Letzt werden noch zwei 1TB-SSDs im RAID 0 Verbund verbaut.
Testbedingungen
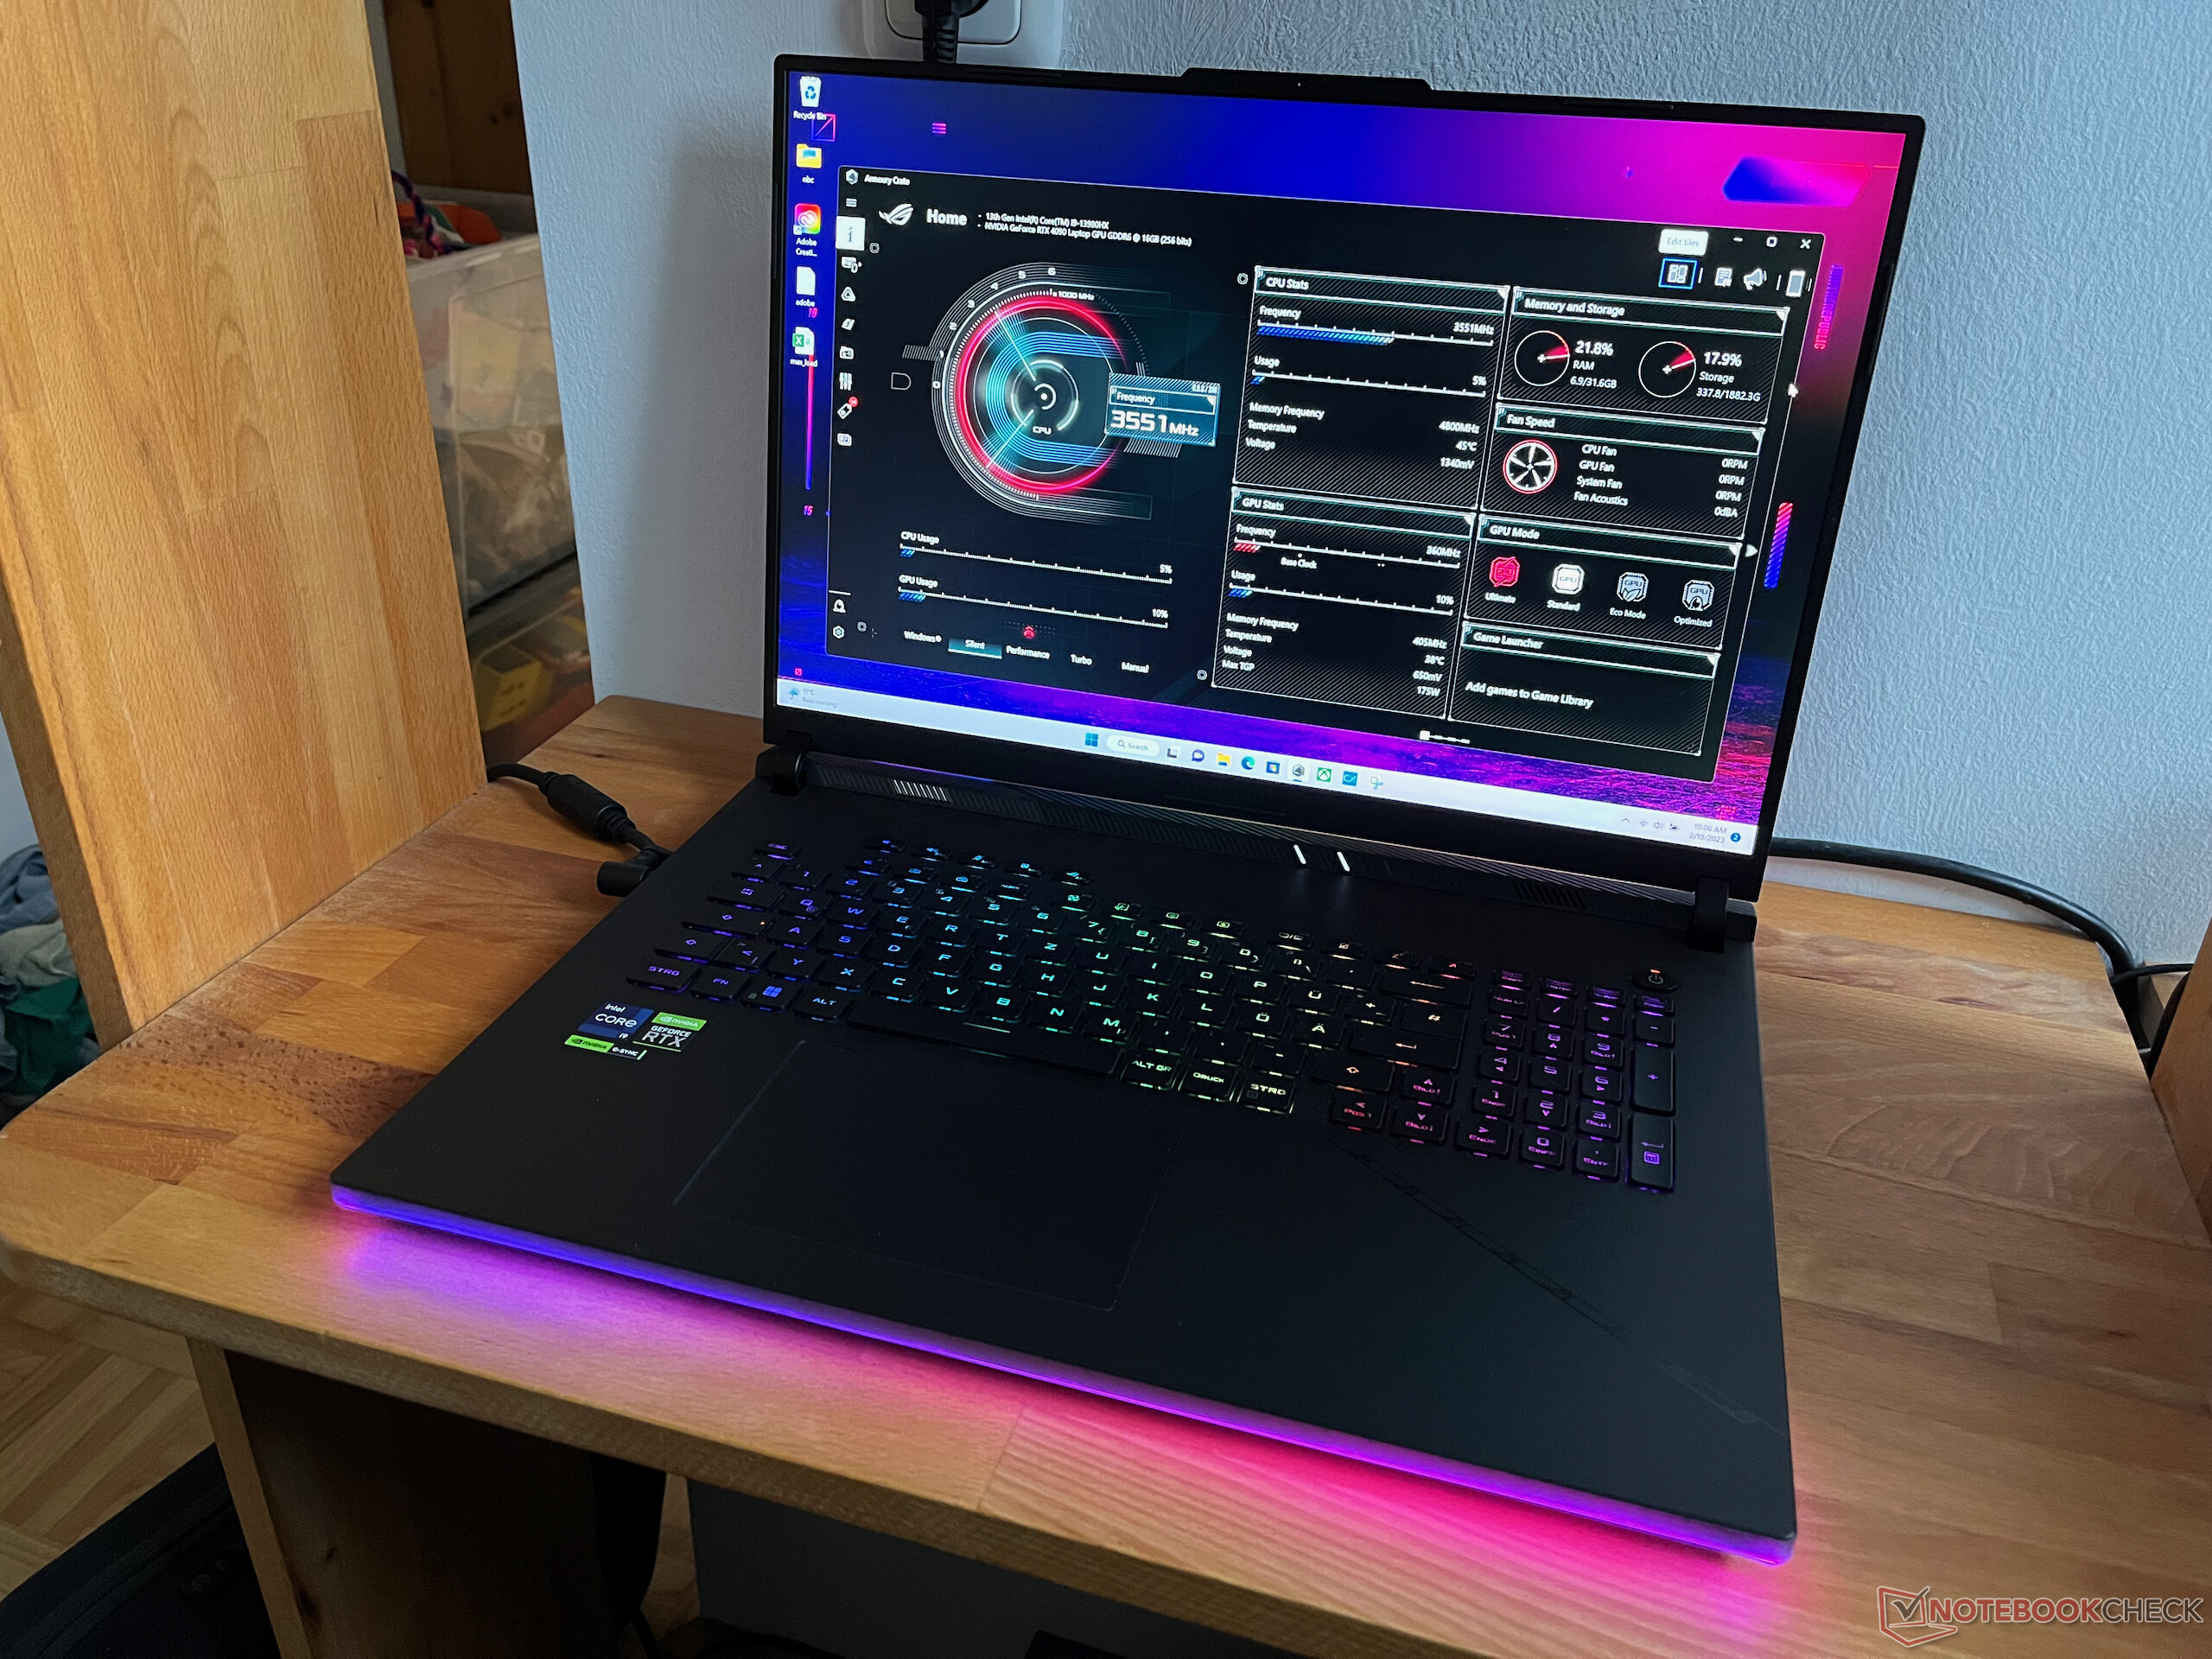
Unsere Performance-Tests haben wir im Turbo-Modus und Ultimate GPU Mode ausgeführt. Hier wird die RTX 4090 per MUX fix verdrahtet und um 50 MHz minimal übertaktet. Weiters haben wir noch den Performance-Modus (Standard bei Auslieferung) und "Standard" GPU Mode getestet (MSHybrid Optimus Umschaltung).
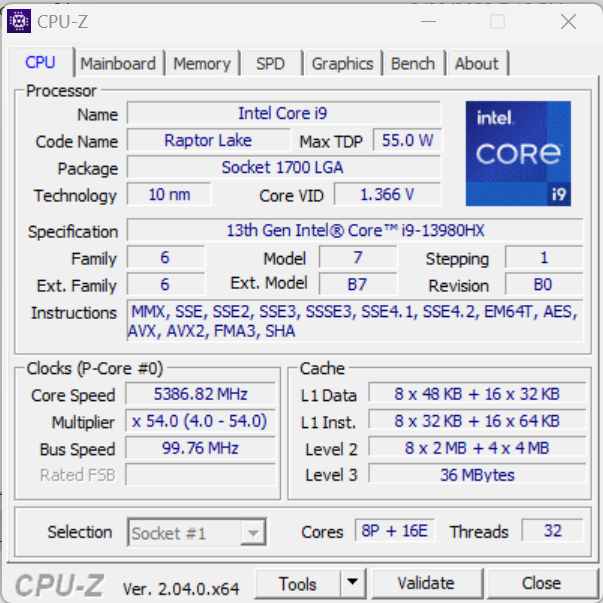
Prozessor
Der Intel Core i9-13980HX ist das aktuelle Spitzenmodell von Intel für Notebooks. Er basiert auf die neue Raptor-Lake-Serie und ist technisch vergleichbar mit dem Core i9-13900K Desktop-Prozessor. Die CPU bietet 8 Raptor Cove Performance-Kerne mit HyperThreading und bis zu 5,6 GHz Taktfrequenz. Die kleineren Gracemont Effizenz-Kerne bieten kein HyperThreading und takten mit bis zu 4 GHz. Gemeinsam kann die CPU 32 MB Level 2 Cache nutzen und ist von Intel mit 157 (PL2) / 55 Watt TDP (PL1) spezifiziert. Asus gibt an die CPU mit 65 Watt (PL1) zu betreiben, die PL1 und PL2-Werte in HWInfo64 weisen aber 175 Watt aus. In Benchmarks startet die CPU mit 175 Watt und läuft dann in das thermale Limit mit 96°C, dann verrringert sich der TDP auf 135 Watt. Im Silent-Modus ist der TDP auf 100W / 65W reduziert wodurch auch die Performance deutlich verringert ist.
In unseren Prozessorbenchmarks kann sich der i9-13980HX im ROG Strix 18 auch knapp vor die 13900HX und 13950HX CPUs der Konkurrenz setzen. Dies trifft aber nur auf den Turbo-Modus zu, im Performance-Modus zeigt sich das Strix Scar 18 nur noch im Mittelfeld der neuen 13000HX-CPUs. Die älteren Geräte mit i9-12950HX können aber selbst dann noch deutlich abgehängt werden.
Cinebench R15 Multi Dauertest
Cinebench R23: Multi Core | Single Core
Cinebench R20: CPU (Multi Core) | CPU (Single Core)
Cinebench R15: CPU Multi 64Bit | CPU Single 64Bit
Blender: v2.79 BMW27 CPU
7-Zip 18.03: 7z b 4 | 7z b 4 -mmt1
Geekbench 5.5: Multi-Core | Single-Core
HWBOT x265 Benchmark v2.2: 4k Preset
LibreOffice : 20 Documents To PDF
R Benchmark 2.5: Overall mean
| CPU Performance Rating | |
| Intel Core i9-13900K @253W | |
| Intel NUC13 Raptor Canyon | |
| Asus ROG Strix Scar 18 2023 G834JY-N6005W | |
| MSI Titan GT77 HX 13VI | |
| Lenovo Legion Pro 7 16IRX8H | |
| Durchschnittliche Intel Core i9-13980HX | |
| Razer Blade 18 RTX 4070 | |
| Schenker XMG Neo 16 Raptor Lake | |
| Asus ROG Strix Scar 18 2023 G834JY-N6005W | |
| Razer Blade 16 Early 2023 | |
| Durchschnitt der Klasse Gaming | |
| MSI Raider GE77 HX 12UHS | |
| Asus ROG Strix Scar 17 SE G733CX-LL014W | |
| Dell Precision 7000 7670 Performance | |
| Cinebench R23 / Multi Core | |
| Intel Core i9-13900K @253W | |
| MSI Titan GT77 HX 13VI | |
| Intel NUC13 Raptor Canyon | |
| Asus ROG Strix Scar 18 2023 G834JY-N6005W | |
| Durchschnittliche Intel Core i9-13980HX (28301 - 33052, n=11) | |
| Lenovo Legion Pro 7 16IRX8H | |
| Schenker XMG Neo 16 Raptor Lake | |
| Schenker XMG Neo 16 Raptor Lake | |
| Schenker XMG Neo 16 Raptor Lake | |
| Razer Blade 18 RTX 4070 | |
| Asus ROG Strix Scar 18 2023 G834JY-N6005W | |
| Razer Blade 16 Early 2023 | |
| Durchschnitt der Klasse Gaming (10488 - 40970, n=113, der letzten 2 Jahre) | |
| MSI Raider GE77 HX 12UHS | |
| Asus ROG Strix Scar 17 SE G733CX-LL014W | |
| Dell Precision 7000 7670 Performance | |
| Cinebench R23 / Single Core | |
| Intel Core i9-13900K @253W | |
| Intel NUC13 Raptor Canyon | |
| Asus ROG Strix Scar 18 2023 G834JY-N6005W | |
| MSI Titan GT77 HX 13VI | |
| Asus ROG Strix Scar 18 2023 G834JY-N6005W | |
| Durchschnittliche Intel Core i9-13980HX (1825 - 2169, n=9) | |
| Razer Blade 18 RTX 4070 | |
| Schenker XMG Neo 16 Raptor Lake | |
| Lenovo Legion Pro 7 16IRX8H | |
| Razer Blade 16 Early 2023 | |
| Durchschnitt der Klasse Gaming (1166 - 2356, n=113, der letzten 2 Jahre) | |
| MSI Raider GE77 HX 12UHS | |
| Asus ROG Strix Scar 17 SE G733CX-LL014W | |
| Dell Precision 7000 7670 Performance | |
| Cinebench R20 / CPU (Multi Core) | |
| Intel Core i9-13900K @253W | |
| Intel NUC13 Raptor Canyon | |
| MSI Titan GT77 HX 13VI | |
| Asus ROG Strix Scar 18 2023 G834JY-N6005W | |
| Durchschnittliche Intel Core i9-13980HX (10353 - 12437, n=10) | |
| Lenovo Legion Pro 7 16IRX8H | |
| Schenker XMG Neo 16 Raptor Lake | |
| Razer Blade 18 RTX 4070 | |
| Asus ROG Strix Scar 18 2023 G834JY-N6005W | |
| Durchschnitt der Klasse Gaming (4029 - 16108, n=112, der letzten 2 Jahre) | |
| MSI Raider GE77 HX 12UHS | |
| Razer Blade 16 Early 2023 | |
| Asus ROG Strix Scar 17 SE G733CX-LL014W | |
| Dell Precision 7000 7670 Performance | |
| Cinebench R20 / CPU (Single Core) | |
| Intel Core i9-13900K @253W | |
| Intel NUC13 Raptor Canyon | |
| Asus ROG Strix Scar 18 2023 G834JY-N6005W | |
| MSI Titan GT77 HX 13VI | |
| Asus ROG Strix Scar 18 2023 G834JY-N6005W | |
| Razer Blade 18 RTX 4070 | |
| Durchschnittliche Intel Core i9-13980HX (717 - 825, n=10) | |
| Lenovo Legion Pro 7 16IRX8H | |
| Durchschnitt der Klasse Gaming (442 - 895, n=112, der letzten 2 Jahre) | |
| Schenker XMG Neo 16 Raptor Lake | |
| MSI Raider GE77 HX 12UHS | |
| Razer Blade 16 Early 2023 | |
| Asus ROG Strix Scar 17 SE G733CX-LL014W | |
| Dell Precision 7000 7670 Performance | |
| Cinebench R15 / CPU Multi 64Bit | |
| Intel Core i9-13900K @253W | |
| Intel NUC13 Raptor Canyon | |
| MSI Titan GT77 HX 13VI | |
| Schenker XMG Neo 16 Raptor Lake | |
| Schenker XMG Neo 16 Raptor Lake | |
| Lenovo Legion Pro 7 16IRX8H | |
| Asus ROG Strix Scar 18 2023 G834JY-N6005W | |
| Durchschnittliche Intel Core i9-13980HX (4358 - 5172, n=11) | |
| Razer Blade 16 Early 2023 | |
| Razer Blade 18 RTX 4070 | |
| Asus ROG Strix Scar 18 2023 G834JY-N6005W | |
| Durchschnitt der Klasse Gaming (1578 - 6271, n=113, der letzten 2 Jahre) | |
| MSI Raider GE77 HX 12UHS | |
| Asus ROG Strix Scar 17 SE G733CX-LL014W | |
| Dell Precision 7000 7670 Performance | |
| Cinebench R15 / CPU Single 64Bit | |
| Intel Core i9-13900K @253W | |
| Intel NUC13 Raptor Canyon | |
| Asus ROG Strix Scar 18 2023 G834JY-N6005W | |
| Asus ROG Strix Scar 18 2023 G834JY-N6005W | |
| Durchschnittliche Intel Core i9-13980HX (289 - 312, n=11) | |
| Lenovo Legion Pro 7 16IRX8H | |
| MSI Titan GT77 HX 13VI | |
| Razer Blade 18 RTX 4070 | |
| Schenker XMG Neo 16 Raptor Lake | |
| Schenker XMG Neo 16 Raptor Lake | |
| Durchschnitt der Klasse Gaming (188.8 - 343, n=112, der letzten 2 Jahre) | |
| MSI Raider GE77 HX 12UHS | |
| Asus ROG Strix Scar 17 SE G733CX-LL014W | |
| Razer Blade 16 Early 2023 | |
| Dell Precision 7000 7670 Performance | |
| Blender / v2.79 BMW27 CPU | |
| Dell Precision 7000 7670 Performance | |
| Asus ROG Strix Scar 17 SE G733CX-LL014W | |
| Durchschnitt der Klasse Gaming (80 - 330, n=110, der letzten 2 Jahre) | |
| MSI Raider GE77 HX 12UHS | |
| Razer Blade 16 Early 2023 | |
| Asus ROG Strix Scar 18 2023 G834JY-N6005W | |
| Schenker XMG Neo 16 Raptor Lake | |
| Razer Blade 18 RTX 4070 | |
| Durchschnittliche Intel Core i9-13980HX (97 - 136, n=10) | |
| Lenovo Legion Pro 7 16IRX8H | |
| Asus ROG Strix Scar 18 2023 G834JY-N6005W | |
| Intel NUC13 Raptor Canyon | |
| MSI Titan GT77 HX 13VI | |
| Intel Core i9-13900K @253W | |
| 7-Zip 18.03 / 7z b 4 | |
| Intel Core i9-13900K @253W | |
| MSI Titan GT77 HX 13VI | |
| Intel NUC13 Raptor Canyon | |
| Asus ROG Strix Scar 18 2023 G834JY-N6005W | |
| Lenovo Legion Pro 7 16IRX8H | |
| Schenker XMG Neo 16 Raptor Lake | |
| Durchschnittliche Intel Core i9-13980HX (104616 - 129804, n=10) | |
| Razer Blade 18 RTX 4070 | |
| Asus ROG Strix Scar 18 2023 G834JY-N6005W | |
| Razer Blade 16 Early 2023 | |
| Durchschnitt der Klasse Gaming (33491 - 148086, n=111, der letzten 2 Jahre) | |
| MSI Raider GE77 HX 12UHS | |
| Asus ROG Strix Scar 17 SE G733CX-LL014W | |
| Dell Precision 7000 7670 Performance | |
| 7-Zip 18.03 / 7z b 4 -mmt1 | |
| Intel Core i9-13900K @253W | |
| Intel NUC13 Raptor Canyon | |
| Asus ROG Strix Scar 18 2023 G834JY-N6005W | |
| Lenovo Legion Pro 7 16IRX8H | |
| Asus ROG Strix Scar 18 2023 G834JY-N6005W | |
| Durchschnittliche Intel Core i9-13980HX (6230 - 7163, n=10) | |
| MSI Titan GT77 HX 13VI | |
| Razer Blade 18 RTX 4070 | |
| Schenker XMG Neo 16 Raptor Lake | |
| Razer Blade 16 Early 2023 | |
| Durchschnitt der Klasse Gaming (4199 - 7436, n=111, der letzten 2 Jahre) | |
| MSI Raider GE77 HX 12UHS | |
| Asus ROG Strix Scar 17 SE G733CX-LL014W | |
| Dell Precision 7000 7670 Performance | |
| Geekbench 5.5 / Multi-Core | |
| Intel Core i9-13900K @253W | |
| Intel NUC13 Raptor Canyon | |
| Lenovo Legion Pro 7 16IRX8H | |
| Asus ROG Strix Scar 18 2023 G834JY-N6005W | |
| Schenker XMG Neo 16 Raptor Lake | |
| MSI Titan GT77 HX 13VI | |
| Durchschnittliche Intel Core i9-13980HX (18475 - 22200, n=10) | |
| Razer Blade 18 RTX 4070 | |
| Asus ROG Strix Scar 18 2023 G834JY-N6005W | |
| Razer Blade 16 Early 2023 | |
| Durchschnitt der Klasse Gaming (6460 - 27010, n=111, der letzten 2 Jahre) | |
| MSI Raider GE77 HX 12UHS | |
| Asus ROG Strix Scar 17 SE G733CX-LL014W | |
| Dell Precision 7000 7670 Performance | |
| Geekbench 5.5 / Single-Core | |
| Intel Core i9-13900K @253W | |
| Asus ROG Strix Scar 18 2023 G834JY-N6005W | |
| Intel NUC13 Raptor Canyon | |
| Asus ROG Strix Scar 18 2023 G834JY-N6005W | |
| Durchschnittliche Intel Core i9-13980HX (1796 - 2139, n=10) | |
| MSI Titan GT77 HX 13VI | |
| Durchschnitt der Klasse Gaming (986 - 2474, n=111, der letzten 2 Jahre) | |
| Razer Blade 18 RTX 4070 | |
| Lenovo Legion Pro 7 16IRX8H | |
| Schenker XMG Neo 16 Raptor Lake | |
| MSI Raider GE77 HX 12UHS | |
| Dell Precision 7000 7670 Performance | |
| Asus ROG Strix Scar 17 SE G733CX-LL014W | |
| Razer Blade 16 Early 2023 | |
| HWBOT x265 Benchmark v2.2 / 4k Preset | |
| Intel Core i9-13900K @253W | |
| Intel NUC13 Raptor Canyon | |
| Asus ROG Strix Scar 18 2023 G834JY-N6005W | |
| MSI Titan GT77 HX 13VI | |
| Lenovo Legion Pro 7 16IRX8H | |
| Durchschnittliche Intel Core i9-13980HX (27 - 33.4, n=9) | |
| Razer Blade 18 RTX 4070 | |
| Schenker XMG Neo 16 Raptor Lake | |
| Asus ROG Strix Scar 18 2023 G834JY-N6005W | |
| Razer Blade 16 Early 2023 | |
| Durchschnitt der Klasse Gaming (11.5 - 44.3, n=111, der letzten 2 Jahre) | |
| MSI Raider GE77 HX 12UHS | |
| Asus ROG Strix Scar 17 SE G733CX-LL014W | |
| Dell Precision 7000 7670 Performance | |
| LibreOffice / 20 Documents To PDF | |
| Durchschnitt der Klasse Gaming (19 - 88.8, n=111, der letzten 2 Jahre) | |
| Razer Blade 16 Early 2023 | |
| MSI Titan GT77 HX 13VI | |
| Schenker XMG Neo 16 Raptor Lake | |
| Lenovo Legion Pro 7 16IRX8H | |
| Dell Precision 7000 7670 Performance | |
| Razer Blade 18 RTX 4070 | |
| Durchschnittliche Intel Core i9-13980HX (35 - 51.4, n=10) | |
| MSI Raider GE77 HX 12UHS | |
| Intel NUC13 Raptor Canyon | |
| Asus ROG Strix Scar 18 2023 G834JY-N6005W | |
| Asus ROG Strix Scar 18 2023 G834JY-N6005W | |
| Asus ROG Strix Scar 17 SE G733CX-LL014W | |
| Intel Core i9-13900K @253W | |
| R Benchmark 2.5 / Overall mean | |
| Dell Precision 7000 7670 Performance | |
| Durchschnitt der Klasse Gaming (0.3439 - 0.759, n=112, der letzten 2 Jahre) | |
| Asus ROG Strix Scar 17 SE G733CX-LL014W | |
| MSI Raider GE77 HX 12UHS | |
| Razer Blade 16 Early 2023 | |
| MSI Titan GT77 HX 13VI | |
| Lenovo Legion Pro 7 16IRX8H | |
| Durchschnittliche Intel Core i9-13980HX (0.3793 - 0.4462, n=10) | |
| Razer Blade 18 RTX 4070 | |
| Asus ROG Strix Scar 18 2023 G834JY-N6005W | |
| Intel NUC13 Raptor Canyon | |
| Schenker XMG Neo 16 Raptor Lake | |
| Asus ROG Strix Scar 18 2023 G834JY-N6005W | |
| Intel Core i9-13900K @253W | |
Cinebench R23: Multi Core | Single Core
Cinebench R20: CPU (Multi Core) | CPU (Single Core)
Cinebench R15: CPU Multi 64Bit | CPU Single 64Bit
Blender: v2.79 BMW27 CPU
7-Zip 18.03: 7z b 4 | 7z b 4 -mmt1
Geekbench 5.5: Multi-Core | Single-Core
HWBOT x265 Benchmark v2.2: 4k Preset
LibreOffice : 20 Documents To PDF
R Benchmark 2.5: Overall mean
* ... kleinere Werte sind besser
AIDA64: FP32 Ray-Trace | FPU Julia | CPU SHA3 | CPU Queen | FPU SinJulia | FPU Mandel | CPU AES | CPU ZLib | FP64 Ray-Trace | CPU PhotoWorxx
| Performance Rating | |
| Intel Core i9-13900K @253W | |
| Intel NUC13 Raptor Canyon | |
| Asus ROG Strix Scar 18 2023 G834JY-N6005W | |
| MSI Titan GT77 HX 13VI | |
| Lenovo Legion Pro 7 16IRX8H | |
| Durchschnittliche Intel Core i9-13980HX | |
| Schenker XMG Neo 16 Raptor Lake | |
| Razer Blade 18 RTX 4070 | |
| Asus ROG Strix Scar 18 2023 G834JY-N6005W | |
| Durchschnitt der Klasse Gaming | |
| Razer Blade 16 Early 2023 | |
| MSI Raider GE77 HX 12UHS | |
| Asus ROG Strix Scar 17 SE G733CX-LL014W | |
| Dell Precision 7000 7670 Performance | |
| AIDA64 / FP32 Ray-Trace | |
| Intel Core i9-13900K @253W | |
| Durchschnitt der Klasse Gaming (10227 - 85542, n=110, der letzten 2 Jahre) | |
| MSI Titan GT77 HX 13VI | |
| Asus ROG Strix Scar 18 2023 G834JY-N6005W | |
| Intel NUC13 Raptor Canyon | |
| Schenker XMG Neo 16 Raptor Lake | |
| Lenovo Legion Pro 7 16IRX8H | |
| Durchschnittliche Intel Core i9-13980HX (21332 - 29553, n=9) | |
| Razer Blade 18 RTX 4070 | |
| Razer Blade 16 Early 2023 | |
| Razer Blade 16 Early 2023 | |
| Razer Blade 16 Early 2023 | |
| Asus ROG Strix Scar 18 2023 G834JY-N6005W | |
| MSI Raider GE77 HX 12UHS | |
| Asus ROG Strix Scar 17 SE G733CX-LL014W | |
| Dell Precision 7000 7670 Performance | |
| AIDA64 / FPU Julia | |
| Intel Core i9-13900K @253W | |
| MSI Titan GT77 HX 13VI | |
| Intel NUC13 Raptor Canyon | |
| Asus ROG Strix Scar 18 2023 G834JY-N6005W | |
| Durchschnitt der Klasse Gaming (51376 - 238426, n=110, der letzten 2 Jahre) | |
| Lenovo Legion Pro 7 16IRX8H | |
| Durchschnittliche Intel Core i9-13980HX (108001 - 148168, n=9) | |
| Razer Blade 18 RTX 4070 | |
| Schenker XMG Neo 16 Raptor Lake | |
| Asus ROG Strix Scar 18 2023 G834JY-N6005W | |
| Razer Blade 16 Early 2023 | |
| Razer Blade 16 Early 2023 | |
| Razer Blade 16 Early 2023 | |
| MSI Raider GE77 HX 12UHS | |
| Asus ROG Strix Scar 17 SE G733CX-LL014W | |
| Dell Precision 7000 7670 Performance | |
| AIDA64 / CPU SHA3 | |
| Intel Core i9-13900K @253W | |
| MSI Titan GT77 HX 13VI | |
| Asus ROG Strix Scar 18 2023 G834JY-N6005W | |
| Intel NUC13 Raptor Canyon | |
| Lenovo Legion Pro 7 16IRX8H | |
| Schenker XMG Neo 16 Raptor Lake | |
| Durchschnittliche Intel Core i9-13980HX (5264 - 7142, n=9) | |
| Razer Blade 16 Early 2023 | |
| Razer Blade 16 Early 2023 | |
| Razer Blade 16 Early 2023 | |
| Razer Blade 18 RTX 4070 | |
| Asus ROG Strix Scar 18 2023 G834JY-N6005W | |
| Durchschnitt der Klasse Gaming (2180 - 9817, n=110, der letzten 2 Jahre) | |
| MSI Raider GE77 HX 12UHS | |
| Asus ROG Strix Scar 17 SE G733CX-LL014W | |
| Dell Precision 7000 7670 Performance | |
| AIDA64 / CPU Queen | |
| Intel Core i9-13900K @253W | |
| Intel NUC13 Raptor Canyon | |
| Asus ROG Strix Scar 18 2023 G834JY-N6005W | |
| Asus ROG Strix Scar 18 2023 G834JY-N6005W | |
| MSI Titan GT77 HX 13VI | |
| Durchschnittliche Intel Core i9-13980HX (126758 - 143409, n=9) | |
| Razer Blade 18 RTX 4070 | |
| Schenker XMG Neo 16 Raptor Lake | |
| Razer Blade 16 Early 2023 | |
| Razer Blade 16 Early 2023 | |
| Lenovo Legion Pro 7 16IRX8H | |
| Durchschnitt der Klasse Gaming (49785 - 173351, n=101, der letzten 2 Jahre) | |
| Asus ROG Strix Scar 17 SE G733CX-LL014W | |
| Dell Precision 7000 7670 Performance | |
| MSI Raider GE77 HX 12UHS | |
| AIDA64 / FPU SinJulia | |
| Intel Core i9-13900K @253W | |
| Intel NUC13 Raptor Canyon | |
| Asus ROG Strix Scar 18 2023 G834JY-N6005W | |
| MSI Titan GT77 HX 13VI | |
| Schenker XMG Neo 16 Raptor Lake | |
| Durchschnittliche Intel Core i9-13980HX (13785 - 17117, n=9) | |
| Razer Blade 18 RTX 4070 | |
| Asus ROG Strix Scar 18 2023 G834JY-N6005W | |
| Razer Blade 16 Early 2023 | |
| Razer Blade 16 Early 2023 | |
| Razer Blade 16 Early 2023 | |
| Lenovo Legion Pro 7 16IRX8H | |
| Durchschnitt der Klasse Gaming (4424 - 33636, n=110, der letzten 2 Jahre) | |
| MSI Raider GE77 HX 12UHS | |
| Asus ROG Strix Scar 17 SE G733CX-LL014W | |
| Dell Precision 7000 7670 Performance | |
| AIDA64 / FPU Mandel | |
| Intel Core i9-13900K @253W | |
| MSI Titan GT77 HX 13VI | |
| Asus ROG Strix Scar 18 2023 G834JY-N6005W | |
| Intel NUC13 Raptor Canyon | |
| Durchschnitt der Klasse Gaming (25115 - 128721, n=110, der letzten 2 Jahre) | |
| Lenovo Legion Pro 7 16IRX8H | |
| Durchschnittliche Intel Core i9-13980HX (53398 - 73758, n=9) | |
| Schenker XMG Neo 16 Raptor Lake | |
| Razer Blade 18 RTX 4070 | |
| Asus ROG Strix Scar 18 2023 G834JY-N6005W | |
| Razer Blade 16 Early 2023 | |
| Razer Blade 16 Early 2023 | |
| Razer Blade 16 Early 2023 | |
| MSI Raider GE77 HX 12UHS | |
| Asus ROG Strix Scar 17 SE G733CX-LL014W | |
| Dell Precision 7000 7670 Performance | |
| AIDA64 / CPU AES | |
| Intel Core i9-13900K @253W | |
| MSI Raider GE77 HX 12UHS | |
| Asus ROG Strix Scar 17 SE G733CX-LL014W | |
| Razer Blade 16 Early 2023 | |
| Razer Blade 16 Early 2023 | |
| Razer Blade 16 Early 2023 | |
| MSI Titan GT77 HX 13VI | |
| Asus ROG Strix Scar 18 2023 G834JY-N6005W | |
| Intel NUC13 Raptor Canyon | |
| Lenovo Legion Pro 7 16IRX8H | |
| Durchschnittliche Intel Core i9-13980HX (105169 - 136520, n=9) | |
| Schenker XMG Neo 16 Raptor Lake | |
| Razer Blade 18 RTX 4070 | |
| Asus ROG Strix Scar 18 2023 G834JY-N6005W | |
| Durchschnitt der Klasse Gaming (39258 - 247074, n=110, der letzten 2 Jahre) | |
| Dell Precision 7000 7670 Performance | |
| AIDA64 / CPU ZLib | |
| Intel Core i9-13900K @253W | |
| MSI Titan GT77 HX 13VI | |
| Asus ROG Strix Scar 18 2023 G834JY-N6005W | |
| Intel NUC13 Raptor Canyon | |
| Lenovo Legion Pro 7 16IRX8H | |
| Durchschnittliche Intel Core i9-13980HX (1513 - 2039, n=9) | |
| Schenker XMG Neo 16 Raptor Lake | |
| Razer Blade 16 Early 2023 | |
| Razer Blade 16 Early 2023 | |
| Razer Blade 16 Early 2023 | |
| Razer Blade 18 RTX 4070 | |
| Asus ROG Strix Scar 18 2023 G834JY-N6005W | |
| Durchschnitt der Klasse Gaming (574 - 2531, n=110, der letzten 2 Jahre) | |
| MSI Raider GE77 HX 12UHS | |
| Asus ROG Strix Scar 17 SE G733CX-LL014W | |
| Dell Precision 7000 7670 Performance | |
| AIDA64 / FP64 Ray-Trace | |
| Intel Core i9-13900K @253W | |
| Durchschnitt der Klasse Gaming (5509 - 45446, n=110, der letzten 2 Jahre) | |
| MSI Titan GT77 HX 13VI | |
| Asus ROG Strix Scar 18 2023 G834JY-N6005W | |
| Intel NUC13 Raptor Canyon | |
| Lenovo Legion Pro 7 16IRX8H | |
| Durchschnittliche Intel Core i9-13980HX (11431 - 16325, n=9) | |
| Schenker XMG Neo 16 Raptor Lake | |
| Razer Blade 18 RTX 4070 | |
| Razer Blade 16 Early 2023 | |
| Razer Blade 16 Early 2023 | |
| Razer Blade 16 Early 2023 | |
| Asus ROG Strix Scar 18 2023 G834JY-N6005W | |
| MSI Raider GE77 HX 12UHS | |
| Asus ROG Strix Scar 17 SE G733CX-LL014W | |
| Dell Precision 7000 7670 Performance | |
| AIDA64 / CPU PhotoWorxx | |
| Razer Blade 16 Early 2023 | |
| Razer Blade 16 Early 2023 | |
| Razer Blade 16 Early 2023 | |
| Razer Blade 18 RTX 4070 | |
| Intel Core i9-13900K @253W | |
| Lenovo Legion Pro 7 16IRX8H | |
| MSI Raider GE77 HX 12UHS | |
| Durchschnittliche Intel Core i9-13980HX (37069 - 52949, n=9) | |
| Intel NUC13 Raptor Canyon | |
| Schenker XMG Neo 16 Raptor Lake | |
| Durchschnitt der Klasse Gaming (12271 - 89891, n=110, der letzten 2 Jahre) | |
| Asus ROG Strix Scar 18 2023 G834JY-N6005W | |
| Asus ROG Strix Scar 18 2023 G834JY-N6005W | |
| Dell Precision 7000 7670 Performance | |
| Asus ROG Strix Scar 17 SE G733CX-LL014W | |
| MSI Titan GT77 HX 13VI | |
AIDA64: FP32 Ray-Trace | FPU Julia | CPU SHA3 | CPU Queen | FPU SinJulia | FPU Mandel | CPU AES | CPU ZLib | FP64 Ray-Trace | CPU PhotoWorxx
System Performance
Auch bei der generellen Systemperformance kann die starke Hardware punkten. Im PCMark 10 erreicht das Scar 18 einen Spitzenplatz und wird derzeit nur von potenten Desktops und dem MSI Titan GT77 HX 13VI knapp geschlagen. Im CrossMark ist das Ergebnis ebenfalls in der Spitzenklasse. Hier können sich zwar einzelne Notebooks vor das Strix Scar 18 setzen, der Abstand ist mit maximal 4 % aber sehr gering (MSI Titan GT77 12UHS als schnellstes Notebook derzeit, der schnellste Desktop kann ein 24% höheres Ergebnis erzielen).
Beim Speicherbenchmark sieht man gut den Einfluss des DDR5-4800 Speichers. Die Systeme mit schnelleren DDR5-5600 Hauptspeicher, wie das Razer Blade 16, können noch einen deutlichen Vorsprung herausholen. Dies ist einer der wenigen Punkte, wo Asus nicht auf die schnellsten erhältlichen Komponenten setzt. Der Einfluss in der Praxis ist aber relativ gering.
CrossMark: Overall | Productivity | Creativity | Responsiveness
| PCMark 10 / Score | |
| Intel NUC13 Raptor Canyon | |
| MSI Titan GT77 HX 13VI | |
| Durchschnittliche Intel Core i9-13980HX, NVIDIA GeForce RTX 4090 Laptop GPU (8650 - 9068, n=4) | |
| Asus ROG Strix Scar 18 2023 G834JY-N6005W | |
| Durchschnitt der Klasse Gaming (5828 - 11574, n=96, der letzten 2 Jahre) | |
| Razer Blade 16 Early 2023 | |
| Lenovo Legion Pro 7 16IRX8H | |
| Razer Blade 18 RTX 4070 | |
| Asus ROG Strix Scar 17 SE G733CX-LL014W | |
| MSI Raider GE77 HX 12UHS | |
| Dell Precision 7000 7670 Performance | |
| PCMark 10 / Essentials | |
| MSI Titan GT77 HX 13VI | |
| Lenovo Legion Pro 7 16IRX8H | |
| Razer Blade 18 RTX 4070 | |
| Intel NUC13 Raptor Canyon | |
| Dell Precision 7000 7670 Performance | |
| Durchschnittliche Intel Core i9-13980HX, NVIDIA GeForce RTX 4090 Laptop GPU (11215 - 11644, n=3) | |
| Razer Blade 16 Early 2023 | |
| Durchschnitt der Klasse Gaming (8810 - 12600, n=100, der letzten 2 Jahre) | |
| Asus ROG Strix Scar 17 SE G733CX-LL014W | |
| MSI Raider GE77 HX 12UHS | |
| PCMark 10 / Productivity | |
| Intel NUC13 Raptor Canyon | |
| Lenovo Legion Pro 7 16IRX8H | |
| Durchschnitt der Klasse Gaming (6845 - 18766, n=98, der letzten 2 Jahre) | |
| Durchschnittliche Intel Core i9-13980HX, NVIDIA GeForce RTX 4090 Laptop GPU (10125 - 11067, n=3) | |
| Asus ROG Strix Scar 17 SE G733CX-LL014W | |
| MSI Titan GT77 HX 13VI | |
| MSI Raider GE77 HX 12UHS | |
| Razer Blade 18 RTX 4070 | |
| Razer Blade 16 Early 2023 | |
| Dell Precision 7000 7670 Performance | |
| PCMark 10 / Digital Content Creation | |
| MSI Titan GT77 HX 13VI | |
| Intel NUC13 Raptor Canyon | |
| Durchschnittliche Intel Core i9-13980HX, NVIDIA GeForce RTX 4090 Laptop GPU (15052 - 16012, n=3) | |
| Razer Blade 16 Early 2023 | |
| Durchschnitt der Klasse Gaming (7602 - 19657, n=98, der letzten 2 Jahre) | |
| Razer Blade 18 RTX 4070 | |
| Lenovo Legion Pro 7 16IRX8H | |
| Asus ROG Strix Scar 17 SE G733CX-LL014W | |
| MSI Raider GE77 HX 12UHS | |
| Dell Precision 7000 7670 Performance | |
| CrossMark / Overall | |
| Intel Core i9-13900K @253W | |
| Intel NUC13 Raptor Canyon | |
| MSI Raider GE77 HX 12UHS | |
| MSI Titan GT77 HX 13VI | |
| Razer Blade 18 RTX 4070 | |
| Asus ROG Strix Scar 17 SE G733CX-LL014W | |
| Asus ROG Strix Scar 18 2023 G834JY-N6005W | |
| Durchschnittliche Intel Core i9-13980HX, NVIDIA GeForce RTX 4090 Laptop GPU (1935 - 2176, n=4) | |
| Asus ROG Strix Scar 18 2023 G834JY-N6005W | |
| Schenker XMG Neo 16 Raptor Lake | |
| Durchschnitt der Klasse Gaming (1366 - 2409, n=98, der letzten 2 Jahre) | |
| Dell Precision 7000 7670 Performance | |
| Razer Blade 16 Early 2023 | |
| CrossMark / Productivity | |
| Intel Core i9-13900K @253W | |
| Intel NUC13 Raptor Canyon | |
| MSI Raider GE77 HX 12UHS | |
| MSI Titan GT77 HX 13VI | |
| Razer Blade 18 RTX 4070 | |
| Asus ROG Strix Scar 17 SE G733CX-LL014W | |
| Asus ROG Strix Scar 18 2023 G834JY-N6005W | |
| Durchschnittliche Intel Core i9-13980HX, NVIDIA GeForce RTX 4090 Laptop GPU (1764 - 2005, n=4) | |
| Asus ROG Strix Scar 18 2023 G834JY-N6005W | |
| Durchschnitt der Klasse Gaming (1386 - 2254, n=98, der letzten 2 Jahre) | |
| Schenker XMG Neo 16 Raptor Lake | |
| Dell Precision 7000 7670 Performance | |
| Razer Blade 16 Early 2023 | |
| CrossMark / Creativity | |
| Intel Core i9-13900K @253W | |
| Intel NUC13 Raptor Canyon | |
| Asus ROG Strix Scar 18 2023 G834JY-N6005W | |
| MSI Titan GT77 HX 13VI | |
| Durchschnittliche Intel Core i9-13980HX, NVIDIA GeForce RTX 4090 Laptop GPU (2267 - 2469, n=4) | |
| Razer Blade 18 RTX 4070 | |
| Asus ROG Strix Scar 18 2023 G834JY-N6005W | |
| Schenker XMG Neo 16 Raptor Lake | |
| Asus ROG Strix Scar 17 SE G733CX-LL014W | |
| MSI Raider GE77 HX 12UHS | |
| Durchschnitt der Klasse Gaming (1343 - 2729, n=98, der letzten 2 Jahre) | |
| Dell Precision 7000 7670 Performance | |
| Razer Blade 16 Early 2023 | |
| CrossMark / Responsiveness | |
| Intel Core i9-13900K @253W | |
| MSI Raider GE77 HX 12UHS | |
| Asus ROG Strix Scar 17 SE G733CX-LL014W | |
| Intel NUC13 Raptor Canyon | |
| Razer Blade 18 RTX 4070 | |
| MSI Titan GT77 HX 13VI | |
| Durchschnitt der Klasse Gaming (1226 - 2334, n=98, der letzten 2 Jahre) | |
| Durchschnittliche Intel Core i9-13980HX, NVIDIA GeForce RTX 4090 Laptop GPU (1556 - 1904, n=4) | |
| Asus ROG Strix Scar 18 2023 G834JY-N6005W | |
| Asus ROG Strix Scar 18 2023 G834JY-N6005W | |
| Schenker XMG Neo 16 Raptor Lake | |
| Dell Precision 7000 7670 Performance | |
| Razer Blade 16 Early 2023 | |
CrossMark: Overall | Productivity | Creativity | Responsiveness
| PCMark 10 Score | 8764 Punkte | |
Hilfe | ||
| AIDA64 / Memory Copy | |
| Razer Blade 16 Early 2023 | |
| Razer Blade 16 Early 2023 | |
| Razer Blade 16 Early 2023 | |
| Lenovo Legion Pro 7 16IRX8H | |
| Razer Blade 18 RTX 4070 | |
| Intel Core i9-13900K @253W | |
| Durchschnitt der Klasse Gaming (21750 - 129946, n=110, der letzten 2 Jahre) | |
| Durchschnittliche Intel Core i9-13980HX (62189 - 80776, n=9) | |
| MSI Raider GE77 HX 12UHS | |
| Intel NUC13 Raptor Canyon | |
| Asus ROG Strix Scar 18 2023 G834JY-N6005W | |
| Schenker XMG Neo 16 Raptor Lake | |
| Asus ROG Strix Scar 18 2023 G834JY-N6005W | |
| Dell Precision 7000 7670 Performance | |
| MSI Titan GT77 HX 13VI | |
| Asus ROG Strix Scar 17 SE G733CX-LL014W | |
| AIDA64 / Memory Read | |
| Razer Blade 16 Early 2023 | |
| Razer Blade 16 Early 2023 | |
| Razer Blade 16 Early 2023 | |
| Razer Blade 18 RTX 4070 | |
| Lenovo Legion Pro 7 16IRX8H | |
| Intel Core i9-13900K @253W | |
| Durchschnittliche Intel Core i9-13980HX (62624 - 89096, n=9) | |
| Schenker XMG Neo 16 Raptor Lake | |
| Asus ROG Strix Scar 18 2023 G834JY-N6005W | |
| Asus ROG Strix Scar 18 2023 G834JY-N6005W | |
| Durchschnitt der Klasse Gaming (22956 - 118858, n=110, der letzten 2 Jahre) | |
| Intel NUC13 Raptor Canyon | |
| MSI Raider GE77 HX 12UHS | |
| Asus ROG Strix Scar 17 SE G733CX-LL014W | |
| Dell Precision 7000 7670 Performance | |
| MSI Titan GT77 HX 13VI | |
| AIDA64 / Memory Write | |
| Razer Blade 16 Early 2023 | |
| Razer Blade 16 Early 2023 | |
| Razer Blade 16 Early 2023 | |
| Durchschnitt der Klasse Gaming (22297 - 135096, n=110, der letzten 2 Jahre) | |
| Razer Blade 18 RTX 4070 | |
| Intel Core i9-13900K @253W | |
| Lenovo Legion Pro 7 16IRX8H | |
| Durchschnittliche Intel Core i9-13980HX (59912 - 79917, n=9) | |
| Intel NUC13 Raptor Canyon | |
| Schenker XMG Neo 16 Raptor Lake | |
| Asus ROG Strix Scar 18 2023 G834JY-N6005W | |
| MSI Raider GE77 HX 12UHS | |
| Asus ROG Strix Scar 18 2023 G834JY-N6005W | |
| Asus ROG Strix Scar 17 SE G733CX-LL014W | |
| Dell Precision 7000 7670 Performance | |
| MSI Titan GT77 HX 13VI | |
| AIDA64 / Memory Latency | |
| Durchschnitt der Klasse Gaming (75.3 - 259, n=110, der letzten 2 Jahre) | |
| Razer Blade 16 Early 2023 | |
| Razer Blade 16 Early 2023 | |
| Razer Blade 16 Early 2023 | |
| Intel NUC13 Raptor Canyon | |
| MSI Titan GT77 HX 13VI | |
| Schenker XMG Neo 16 Raptor Lake | |
| Asus ROG Strix Scar 18 2023 G834JY-N6005W | |
| Asus ROG Strix Scar 18 2023 G834JY-N6005W | |
| Durchschnittliche Intel Core i9-13980HX (79.4 - 93.2, n=9) | |
| Asus ROG Strix Scar 17 SE G733CX-LL014W | |
| Dell Precision 7000 7670 Performance | |
| Razer Blade 18 RTX 4070 | |
| MSI Raider GE77 HX 12UHS | |
| Lenovo Legion Pro 7 16IRX8H | |
| Intel Core i9-13900K @253W | |
* ... kleinere Werte sind besser
DPC-Latenzen
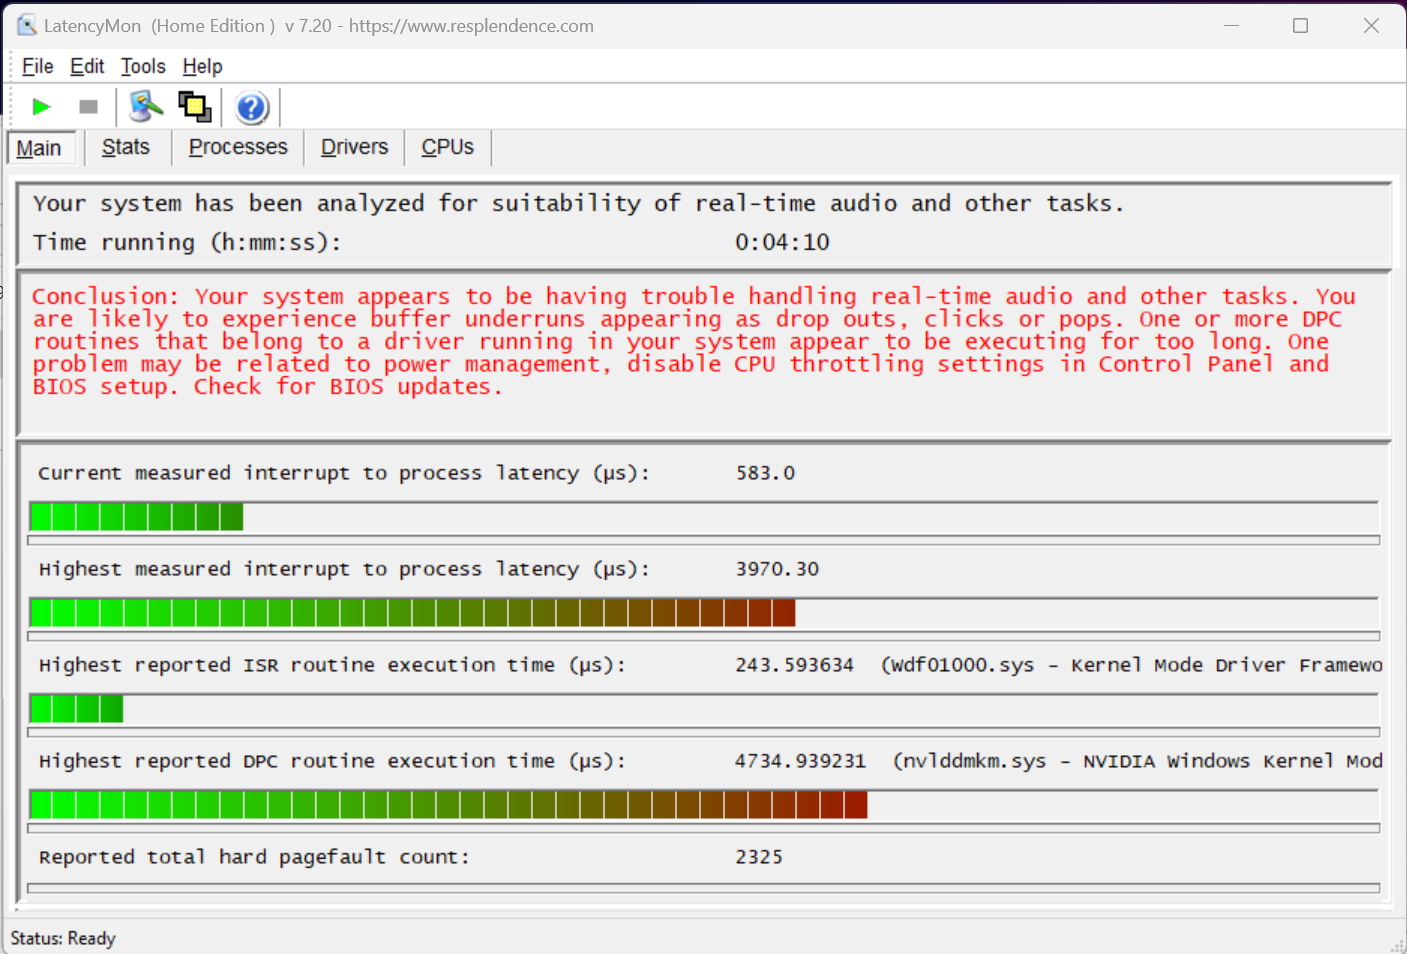
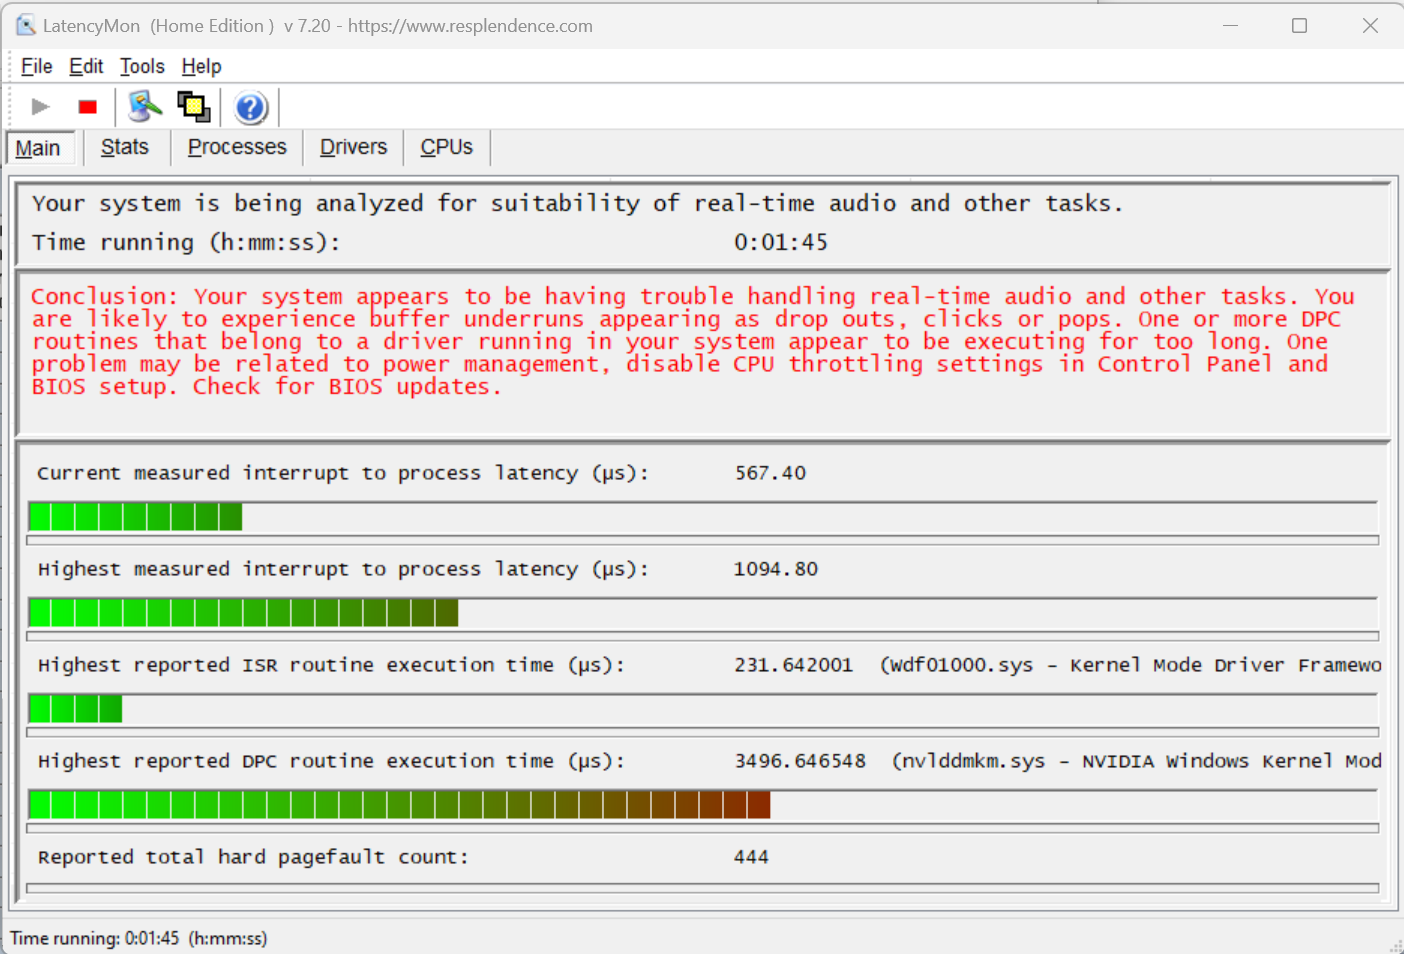
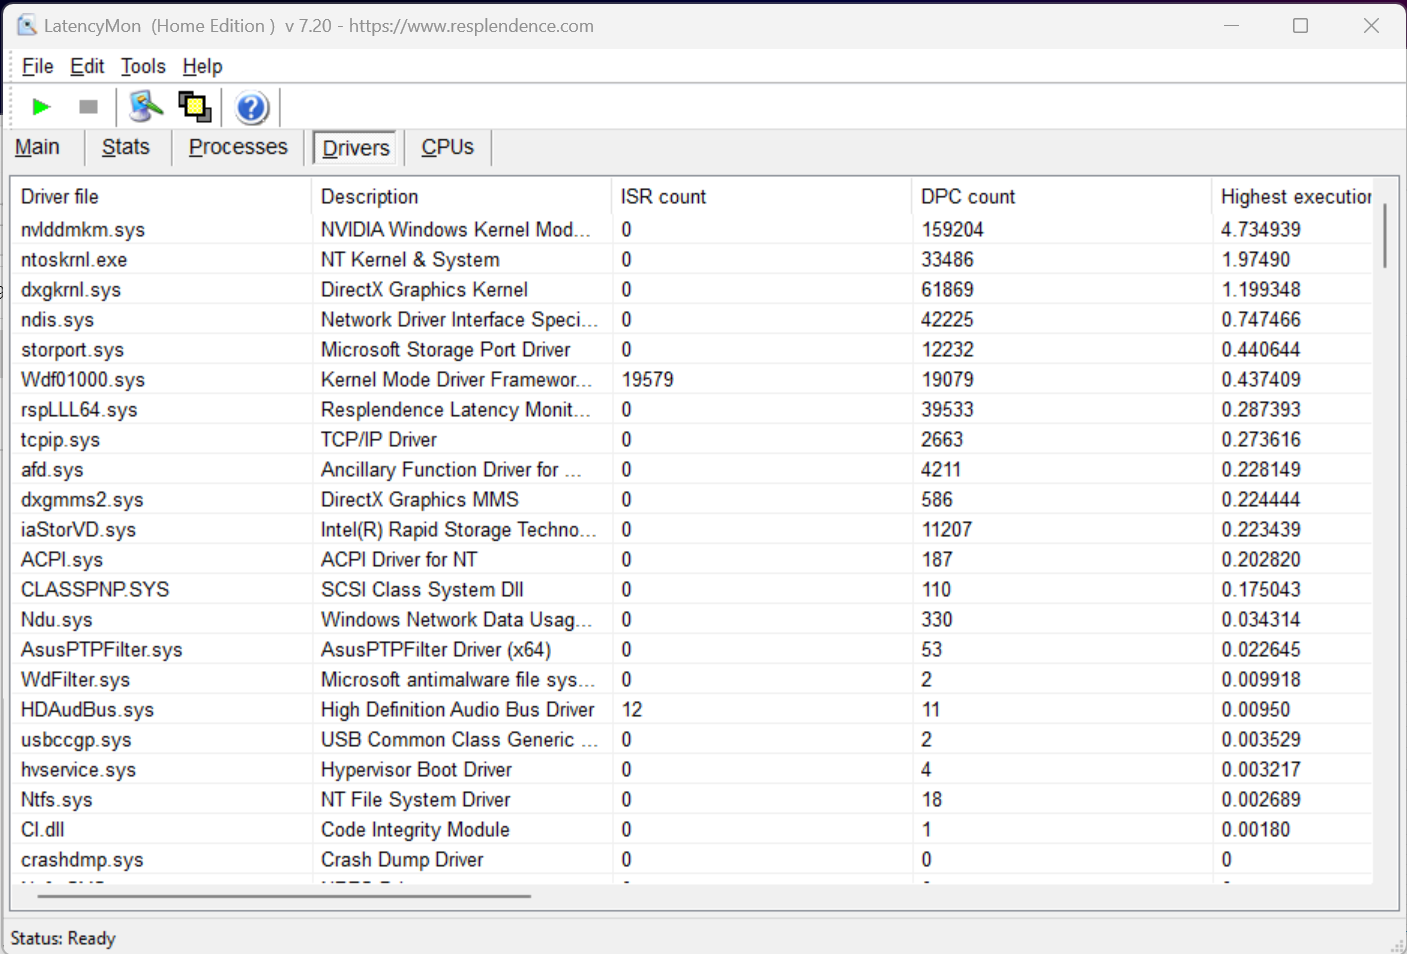
Bei den DPC-Latenzen reiht sich das Asus-Notebook nur im Mittelfeld aller getesteten Notebooks ein. Hier ist laut LatencyMon der Nvidia-Treiber als Schuldiger auszumachen, welcher bei Echtzeitanwendungen Probleme machen kann. Wir haben im Turbo Modus mit Ultimate GPU (kein Optimus) getestet - also theoretisch bereits besser geeignet als der Hybridmodus oder Stromsparmodi. Leider ist die schwache DPC-Performance in dieser Geräteklasse keine Ausnahme.
| DPC Latencies / LatencyMon - interrupt to process latency (max), Web, Youtube, Prime95 | |
| MSI Titan GT77 HX 13VI | |
| Asus ROG Strix Scar 17 SE G733CX-LL014W | |
| Razer Blade 16 Early 2023 | |
| Dell Precision 7000 7670 Performance | |
| MSI Raider GE77 HX 12UHS | |
| Razer Blade 18 RTX 4070 | |
| Asus ROG Strix Scar 18 2023 G834JY-N6005W | |
| Lenovo Legion Pro 7 16IRX8H | |
* ... kleinere Werte sind besser
Massenspeicher
Asus verbaut im Scar 18 G834JY-N6005W zwei schnelle Samsung PM9A1 SSDs mit jeweils 1 TB Speicher im RAID-0-Verbund. Damit erhöht man zwar die Geschwindigkeit etwas, aber auch die Ausfallwahrscheinlichkeit und der Stromverbrauch steigen. Im Vergleich zum Legion 5 Pro 16IAH7H mit selbem RAID-Verbund muss sich das Asus Scar aber geschlagen geben - sogar deutlich. Thermale Probleme sind es aber nicht, unter Dauerlast bleibt die Leseleistung konstant.

| Drive Performance Rating - Percent | |
| Asus ROG Strix Scar 17 SE G733CX-LL014W | |
| Lenovo Legion 5 Pro 16IAH7H | |
| MSI Raider GE77 HX 12UHS | |
| Lenovo Legion Pro 7 16IRX8H | |
| Razer Blade 18 RTX 4070 | |
| MSI Titan GT77 HX 13VI | |
| Intel NUC13 Raptor Canyon | |
| Durchschnitt der Klasse Gaming | |
| Durchschnittliche 2x Samsung PM9A1 MZVL21T0HCLR (RAID 0) | |
| Razer Blade 16 Early 2023 | |
| Intel Core i9-13900K @253W -11! | |
| Asus ROG Strix Scar 18 2023 G834JY-N6005W | |
| Asus ROG Strix Scar 18 2023 G834JY-N6005W | |
| Dell Precision 7000 7670 Performance | |
| Schenker XMG Neo 16 Raptor Lake -11! | |
* ... kleinere Werte sind besser
Dauerleistung Lesen: DiskSpd Read Loop, Queue Depth 8
Grafikkarte
Prunkstück im Asus ROG Strix Scar 18 ist ganz klar die Nvidia GeForce RTX 4090 Laptop GPU. Obwohl der Name eine Ähnlichkeit mit der RTX 4090 Desktop GPU nahelegt, ist die mobile Variante mit der Desktop RTX 4080 verwandt (selber Chip) und die Leistung unterhalb einer Desktop RTX 4070 Ti angesiedelt. Asus bietet immerhin die schnellste Variante der RTX 4090 Mobile mit 175 Watt TGP (150 Watt + 25 Watt Dynamic Boost) und übertaktet die GPU sogar noch geringfügig um 50 MHz.
Im Vergleich zur RTX 4090 im MSI Titan GT77 HX 13VI muss sich das Strix G18 trotz Übertaktung knapp dahinter einreihen. Die RTX 4080 Laptops bleiben ebenso hinten an und Notebooks mit dem alten Topmodell RTX 3080 Ti Laptop GPU sind deutlich abgeschlagen.
| 3DMark Performance Rating - Percent | |
| MSI Titan GT77 HX 13VI | |
| Schenker XMG Neo 16 Raptor Lake | |
| Asus ROG Strix Scar 18 2023 G834JY-N6005W | |
| Durchschnittliche NVIDIA GeForce RTX 4090 Laptop GPU | |
| Asus ROG Strix Scar 18 2023 G834JY-N6005W | |
| Intel NUC13 Raptor Canyon | |
| Intel Core i9-13900K @253W | |
| Lenovo Legion Pro 7 16IRX8H | |
| Razer Blade 16 Early 2023 | |
| Durchschnitt der Klasse Gaming | |
| Asus ROG Strix Scar 17 SE G733CX-LL014W | |
| MSI Raider GE77 HX 12UHS | |
| Razer Blade 18 RTX 4070 | |
| Dell Precision 7000 7670 Performance | |
| 3DMark 11 - 1280x720 Performance GPU | |
| Schenker XMG Neo 16 Raptor Lake | |
| MSI Titan GT77 HX 13VI | |
| Durchschnittliche NVIDIA GeForce RTX 4090 Laptop GPU (54073 - 73027, n=42) | |
| Asus ROG Strix Scar 18 2023 G834JY-N6005W | |
| Asus ROG Strix Scar 18 2023 G834JY-N6005W | |
| Lenovo Legion Pro 7 16IRX8H | |
| Intel NUC13 Raptor Canyon | |
| Intel Core i9-13900K @253W | |
| Razer Blade 16 Early 2023 | |
| Durchschnitt der Klasse Gaming (21841 - 80022, n=109, der letzten 2 Jahre) | |
| MSI Raider GE77 HX 12UHS | |
| Asus ROG Strix Scar 17 SE G733CX-LL014W | |
| Razer Blade 18 RTX 4070 | |
| Dell Precision 7000 7670 Performance | |
| 3DMark 06 Standard Score | 67702 Punkte | |
| 3DMark 11 Performance | 46985 Punkte | |
| 3DMark Ice Storm Standard Score | 277937 Punkte | |
| 3DMark Cloud Gate Standard Score | 70984 Punkte | |
| 3DMark Fire Strike Score | 36408 Punkte | |
| 3DMark Fire Strike Extreme Score | 24278 Punkte | |
| 3DMark Time Spy Score | 20166 Punkte | |
Hilfe | ||
| Blender - v3.3 Classroom OPTIX/RTX | |
| Dell Precision 7000 7670 Performance | |
| MSI Raider GE77 HX 12UHS | |
| Asus ROG Strix Scar 17 SE G733CX-LL014W | |
| Razer Blade 18 RTX 4070 | |
| Durchschnitt der Klasse Gaming (9 - 32, n=112, der letzten 2 Jahre) | |
| Intel NUC13 Raptor Canyon | |
| Razer Blade 16 Early 2023 | |
| Lenovo Legion Pro 7 16IRX8H | |
| Intel Core i9-13900K @253W | |
| Durchschnittliche NVIDIA GeForce RTX 4090 Laptop GPU (9 - 19, n=39) | |
| Asus ROG Strix Scar 18 2023 G834JY-N6005W | |
| MSI Titan GT77 HX 13VI | |
| Schenker XMG Neo 16 Raptor Lake | |
| Asus ROG Strix Scar 18 2023 G834JY-N6005W | |
| V-Ray Benchmark Next 4.10 - GPU | |
| Asus ROG Strix Scar 18 2023 G834JY-N6005W | |
| MSI Titan GT77 HX 13VI | |
| Asus ROG Strix Scar 18 2023 G834JY-N6005W | |
| Durchschnittliche NVIDIA GeForce RTX 4090 Laptop GPU (873 - 1334, n=30) | |
| Schenker XMG Neo 16 Raptor Lake | |
| Lenovo Legion Pro 7 16IRX8H | |
| Intel Core i9-13900K @253W | |
| Intel NUC13 Raptor Canyon | |
| Durchschnitt der Klasse Gaming (427 - 1333, n=106, der letzten 2 Jahre) | |
| MSI Raider GE77 HX 12UHS | |
| Asus ROG Strix Scar 17 SE G733CX-LL014W | |
| V-Ray 5 Benchmark | |
| GPU RTX | |
| Schenker XMG Neo 16 Raptor Lake | |
| Asus ROG Strix Scar 18 2023 G834JY-N6005W | |
| Asus ROG Strix Scar 18 2023 G834JY-N6005W | |
| MSI Titan GT77 HX 13VI | |
| Durchschnittliche NVIDIA GeForce RTX 4090 Laptop GPU (1982 - 3824, n=29) | |
| Intel Core i9-13900K @253W | |
| Intel NUC13 Raptor Canyon | |
| Razer Blade 16 Early 2023 | |
| Durchschnitt der Klasse Gaming (1146 - 4363, n=38, der letzten 2 Jahre) | |
| Asus ROG Strix Scar 17 SE G733CX-LL014W | |
| MSI Raider GE77 HX 12UHS | |
| Razer Blade 18 RTX 4070 | |
| GPU CUDA | |
| Asus ROG Strix Scar 18 2023 G834JY-N6005W | |
| Schenker XMG Neo 16 Raptor Lake | |
| MSI Titan GT77 HX 13VI | |
| Asus ROG Strix Scar 18 2023 G834JY-N6005W | |
| Durchschnittliche NVIDIA GeForce RTX 4090 Laptop GPU (1454 - 2797, n=29) | |
| Intel Core i9-13900K @253W | |
| Intel NUC13 Raptor Canyon | |
| Durchschnitt der Klasse Gaming (887 - 3288, n=38, der letzten 2 Jahre) | |
| Razer Blade 16 Early 2023 | |
| MSI Raider GE77 HX 12UHS | |
| Asus ROG Strix Scar 17 SE G733CX-LL014W | |
| Razer Blade 18 RTX 4070 | |
* ... kleinere Werte sind besser
Gaming Performance
Wie schon bei den synthetischen Benchmarks zeigt sich bei den Spiele-Benchmarks ein ähnliches Bild. Als Besonderheit bietet die RTX 4000 Serie nun auch Support für DLSS 3 mit Frame Generation. Bei unterstützten Spielen kann die RTX 4090 hier noch einen deutlichen Boost bei den Frameraten herausholen. Dadurch sind auch Raytracing Effekte in 4K in flüssigen Frameraten möglich. Die 240 Hz des Displays können aber nur bei anspruchslosen Spielen in der nativen Auflösung von 2.560x1.600 ausgenutzt werden.
| Performance Rating - Percent | |
| Intel NUC13 Raptor Canyon | |
| Asus ROG Strix Scar 18 2023 G834JY-N6005W | |
| MSI Titan GT77 HX 13VI | |
| Asus ROG Strix Scar 18 2023 G834JY-N6005W | |
| Schenker XMG Neo 16 Raptor Lake | |
| Razer Blade 16 Early 2023 | |
| Lenovo Legion Pro 7 16IRX8H | |
| MSI Raider GE77 HX 12UHS | |
| Razer Blade 18 RTX 4070 | |
| Durchschnitt der Klasse Gaming | |
| Asus ROG Strix Scar 17 SE G733CX-LL014W | |
| Dell Precision 7000 7670 Performance | |
| GTA V - 1920x1080 Highest AA:4xMSAA + FX AF:16x | |
| Intel NUC13 Raptor Canyon | |
| Lenovo Legion Pro 7 16IRX8H | |
| Asus ROG Strix Scar 18 2023 G834JY-N6005W | |
| Asus ROG Strix Scar 18 2023 G834JY-N6005W | |
| MSI Titan GT77 HX 13VI | |
| Razer Blade 16 Early 2023 | |
| Schenker XMG Neo 16 Raptor Lake | |
| MSI Raider GE77 HX 12UHS | |
| Durchschnitt der Klasse Gaming (48.3 - 186.9, n=103, der letzten 2 Jahre) | |
| Asus ROG Strix Scar 17 SE G733CX-LL014W | |
| Razer Blade 18 RTX 4070 | |
| Dell Precision 7000 7670 Performance | |
| Final Fantasy XV Benchmark - 1920x1080 High Quality | |
| MSI Titan GT77 HX 13VI | |
| Schenker XMG Neo 16 Raptor Lake | |
| Intel NUC13 Raptor Canyon | |
| Asus ROG Strix Scar 18 2023 G834JY-N6005W | |
| Asus ROG Strix Scar 18 2023 G834JY-N6005W | |
| Lenovo Legion Pro 7 16IRX8H | |
| Razer Blade 16 Early 2023 | |
| Durchschnitt der Klasse Gaming (41 - 215, n=104, der letzten 2 Jahre) | |
| MSI Raider GE77 HX 12UHS | |
| Asus ROG Strix Scar 17 SE G733CX-LL014W | |
| Razer Blade 18 RTX 4070 | |
| Dell Precision 7000 7670 Performance | |
| Strange Brigade - 1920x1080 ultra AA:ultra AF:16 | |
| MSI Titan GT77 HX 13VI | |
| Asus ROG Strix Scar 18 2023 G834JY-N6005W | |
| Intel NUC13 Raptor Canyon | |
| Schenker XMG Neo 16 Raptor Lake | |
| Asus ROG Strix Scar 18 2023 G834JY-N6005W | |
| Razer Blade 16 Early 2023 | |
| Lenovo Legion Pro 7 16IRX8H | |
| Durchschnitt der Klasse Gaming (76.3 - 456, n=94, der letzten 2 Jahre) | |
| Asus ROG Strix Scar 17 SE G733CX-LL014W | |
| MSI Raider GE77 HX 12UHS | |
| Razer Blade 18 RTX 4070 | |
| Dell Precision 7000 7670 Performance | |
| Dota 2 Reborn - 1920x1080 ultra (3/3) best looking | |
| Intel NUC13 Raptor Canyon | |
| Razer Blade 16 Early 2023 | |
| Asus ROG Strix Scar 18 2023 G834JY-N6005W | |
| Asus ROG Strix Scar 18 2023 G834JY-N6005W | |
| MSI Titan GT77 HX 13VI | |
| Lenovo Legion Pro 7 16IRX8H | |
| Razer Blade 18 RTX 4070 | |
| Schenker XMG Neo 16 Raptor Lake | |
| Asus ROG Strix Scar 17 SE G733CX-LL014W | |
| MSI Raider GE77 HX 12UHS | |
| Dell Precision 7000 7670 Performance | |
| Durchschnitt der Klasse Gaming (84.8 - 248, n=113, der letzten 2 Jahre) | |
| X-Plane 11.11 - 1920x1080 high (fps_test=3) | |
| Intel NUC13 Raptor Canyon | |
| Asus ROG Strix Scar 18 2023 G834JY-N6005W | |
| Asus ROG Strix Scar 18 2023 G834JY-N6005W | |
| Razer Blade 18 RTX 4070 | |
| Razer Blade 16 Early 2023 | |
| Schenker XMG Neo 16 Raptor Lake | |
| Schenker XMG Neo 16 Raptor Lake | |
| Schenker XMG Neo 16 Raptor Lake | |
| MSI Titan GT77 HX 13VI | |
| MSI Titan GT77 HX 13VI | |
| Lenovo Legion Pro 7 16IRX8H | |
| MSI Raider GE77 HX 12UHS | |
| Asus ROG Strix Scar 17 SE G733CX-LL014W | |
| Dell Precision 7000 7670 Performance | |
| Durchschnitt der Klasse Gaming (52.1 - 143.5, n=116, der letzten 2 Jahre) | |
In unserem Lasttest mit The Witcher 3 und auch 3DMark Time Spy Stress Test zeigt das Asus G834JY eine stabile Performance ohne Einbrüche. Die sichtbaren Fluktuationen bei The Witcher 3 sind durch die Nacht- und Tagwechsel bedingt.
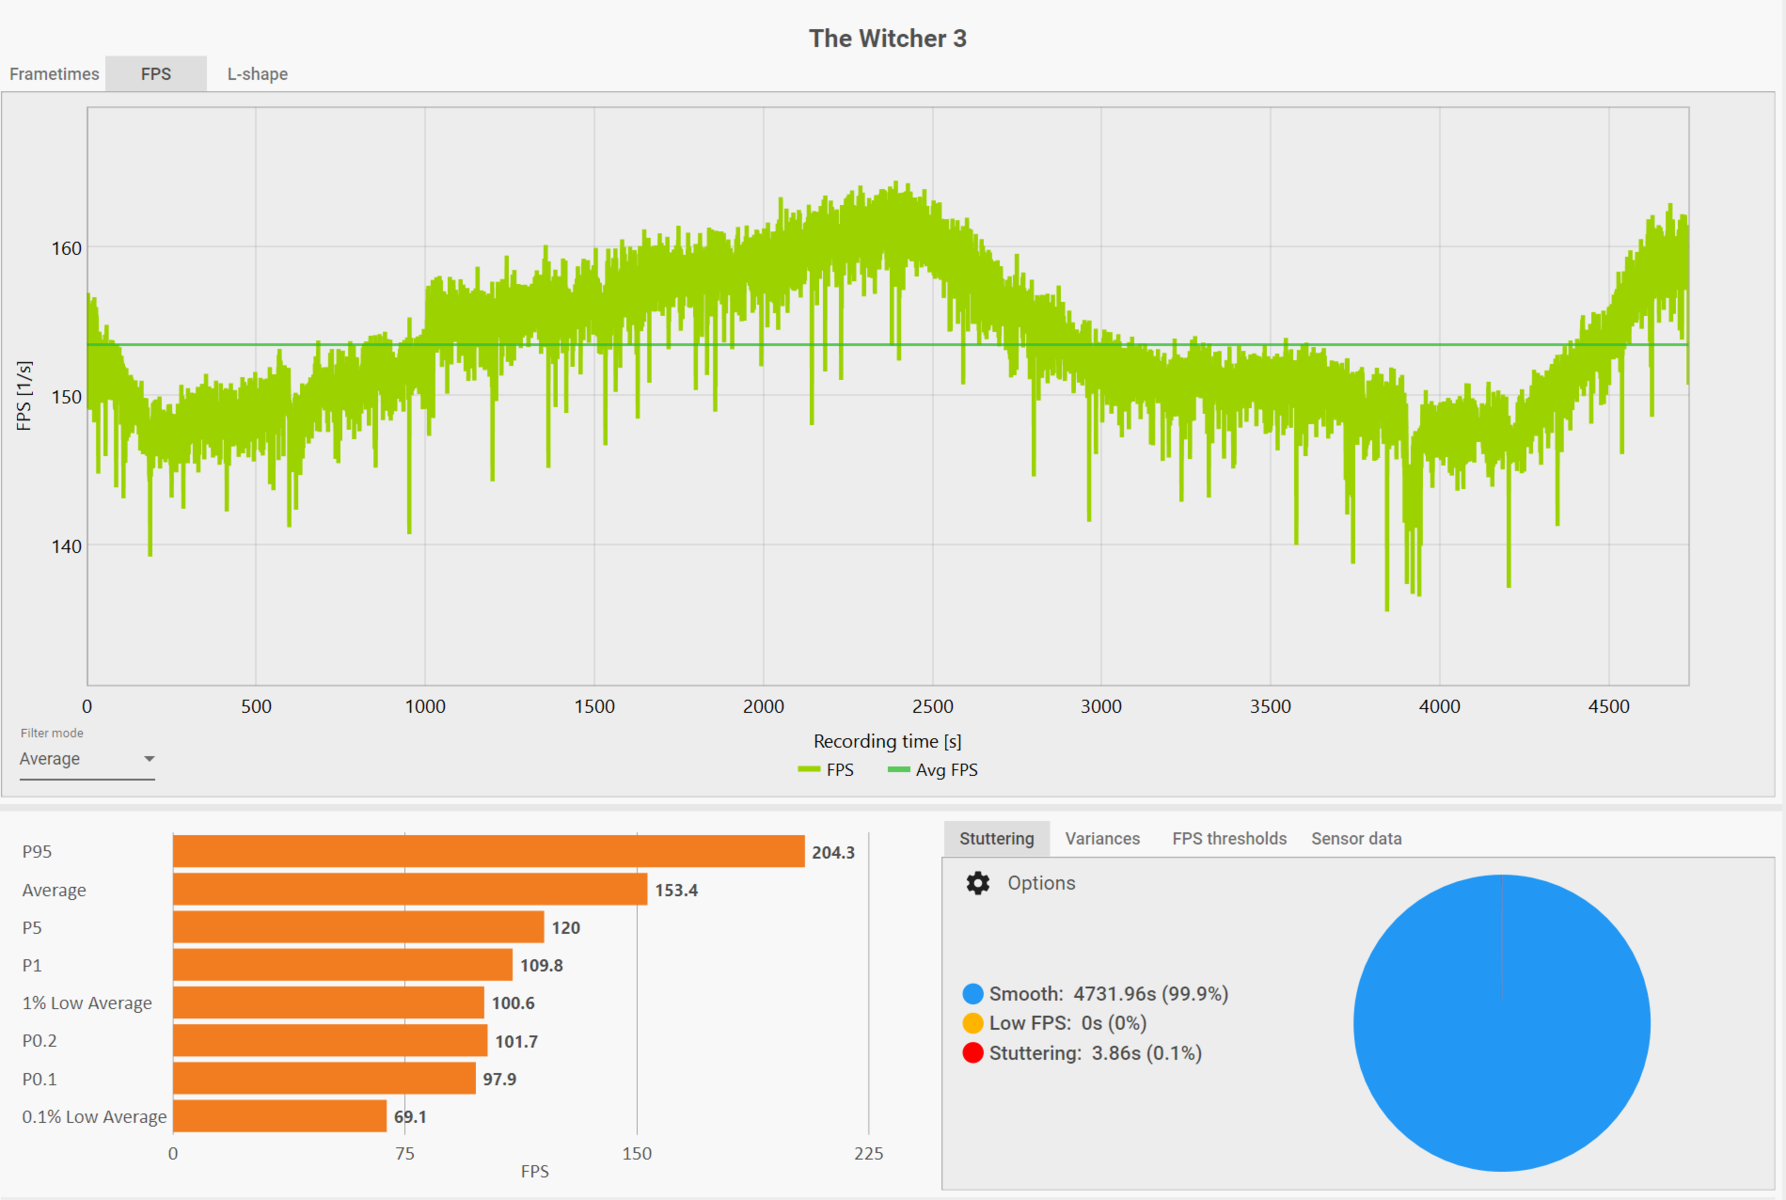
Witcher 3 FPS-Diagramm
| min. | mittel | hoch | max. | QHD | 4K DLSS | 4K | |
|---|---|---|---|---|---|---|---|
| Counter-Strike: GO (2012) | 516 | 314 | |||||
| GTA V (2015) | 187.4 | 185.7 | 184.8 | 141.3 | 139.1 | 175.7 | |
| Dota 2 Reborn (2015) | 237 | 207.7 | 201.75 | 190.2 | 178.6 | ||
| Deus Ex Mankind Divided (2016) | 169 | ||||||
| Final Fantasy XV Benchmark (2018) | 224 | 208 | 177.6 | 146.7 | 90.1 | ||
| X-Plane 11.11 (2018) | 211 | 186.8 | 142.8 | ||||
| Far Cry 5 (2018) | 197 | 181 | 172 | 158 | 153 | 107 | |
| Strange Brigade (2018) | 496 | 403 | 386 | 366 | 292 | 154.7 | |
| Shadow of the Tomb Raider (2018) | 143.7 | 121.2 | 87.3 | ||||
| Control (2019) | 184.4 | 123.2 | 72.6 | ||||
| Horizon Zero Dawn (2020) | 184 | 154 | 145 | 127 | 92 | ||
| Flight Simulator 2020 (2020) | 74 | 74 | 96.8 | 51.2 | |||
| Battlefield 2042 (2021) | 172.6 | 138.9 | 85.4 | ||||
| Halo Infinite (2021) | 128.9 | 77 | 57.3 | ||||
| Elden Ring (2022) | 60 | 60 | 60 | 60 | 60 | 60 | |
| Cyberpunk 2077 1.6 (2022) | 119.7 | 94.5 | |||||
| Vampire Bloodhunt (2022) | 290 | 242 | 138.3 | ||||
| F1 22 (2022) | 319 | 308 | 273 | 124.5 | 75 | 42.4 | |
| FIFA 23 (2022) | 183.7 | 182.6 | 162.4 | ||||
| A Plague Tale Requiem (2022) | 96.8 | 72 | 82.3 | 41 | |||
| Uncharted Legacy of Thieves Collection (2022) | 108.2 | 103.1 | 62.9 | ||||
| Call of Duty Modern Warfare 2 2022 (2022) | 170 | 127 | 112 | 81 | |||
| Spider-Man Miles Morales (2022) | 109.1 | 103.8 | 73.2 | ||||
| Need for Speed Unbound (2022) | 124.2 | 111.8 | 84.3 | ||||
| High On Life (2023) | 180.3 | 120.2 | 52 | ||||
| The Witcher 3 v4 (2023) | 137.6 | 96.6 | 49 |
Emissionen
Geräuschemissionen
Die drei verbauten Lüfter haben unter Last hörbar mit den starken Komponenten zu kämpfen. Die Geräuschcharakteristik bleibt zwar sehr angenehm, die bis zu 55,8 dB (Lüfter mit 4900, 5500 und 6400 RPM) sind aber sehr laut. Beim Spielen werden die guten Lautsprecher hier schon etwas in den Hintergrund gedrängt und man wird zu Kopfhörern genötigt. Nutzt man das 240 Hz Display bei Spielen und erreicht hohe Frameraten, kommt es bei unserem Sample leider zu einem deutlich hörbaren Spulenfiepen. Hörbar ist dies ab 100 fps und kann je nach Spiel durchaus etwas nerven.
Im Idle Betrieb können die drei Lüfter auch längere Zeit aus bleiben, jedoch nur im Silent Modus und bei Nutzung der integrierten GPU. Ganz aus bleiben sie beim Surfen aber meistens nicht, die geringsten Lüfterstufen mit 2000 - 3000 RPM sind mit unter 33 dB(A) aber angenehm leise.
Lautstärkediagramm
| Idle |
| 23.9 / 32.6 / 32.6 dB(A) |
| Last |
| 35.9 / 55.8 dB(A) |
 | ||
30 dB leise 40 dB(A) deutlich hörbar 50 dB(A) störend |
||
min: | ||
| Asus ROG Strix Scar 18 2023 G834JY-N6005W GeForce RTX 4090 Laptop GPU, i9-13980HX, 2x Samsung PM9A1 MZVL21T0HCLR (RAID 0) | Razer Blade 18 RTX 4070 GeForce RTX 4070 Laptop GPU, i9-13950HX, SSSTC CA6-8D1024 | Lenovo Legion Pro 7 16IRX8H GeForce RTX 4080 Laptop GPU, i9-13900HX, Samsung PM9A1 MZVL21T0HCLR | Razer Blade 16 Early 2023 GeForce RTX 4080 Laptop GPU, i9-13950HX, SSSTC CA6-8D1024 | MSI Titan GT77 HX 13VI GeForce RTX 4090 Laptop GPU, i9-13950HX, Samsung PM9A1 MZVL22T0HBLB | MSI Raider GE77 HX 12UHS GeForce RTX 3080 Ti Laptop GPU, i9-12900HX, Samsung PM9A1 MZVL22T0HBLB | Asus ROG Strix Scar 17 SE G733CX-LL014W GeForce RTX 3080 Ti Laptop GPU, i9-12950HX, Samsung PM9A1 MZVL22T0HBLB | |
|---|---|---|---|---|---|---|---|
| Geräuschentwicklung | 8% | -5% | 11% | -9% | -17% | 13% | |
| aus / Umgebung * (dB) | 23.9 | 23.5 2% | 24 -0% | 23 4% | 24.6 -3% | 26 -9% | 23.9 -0% |
| Idle min * (dB) | 23.9 | 23.8 -0% | 26 -9% | 23 4% | 29.2 -22% | 26 -9% | 23.9 -0% |
| Idle avg * (dB) | 32.6 | 23.8 27% | 28 14% | 23 29% | 29.2 10% | 34 -4% | 23.9 27% |
| Idle max * (dB) | 32.6 | 26.8 18% | 34 -4% | 23.6 28% | 29.2 10% | 46 -41% | 23.9 27% |
| Last avg * (dB) | 35.9 | 37.3 -4% | 47 -31% | 39 -9% | 50.7 -41% | 50 -39% | 34.3 4% |
| Last max * (dB) | 55.8 | 53.5 4% | 56 -0% | 51.3 8% | 61 -9% | 57 -2% | 45.9 18% |
| Witcher 3 ultra * (dB) | 48 | 55 | 51.6 | 53.3 | 55 |
* ... kleinere Werte sind besser
Temperatur
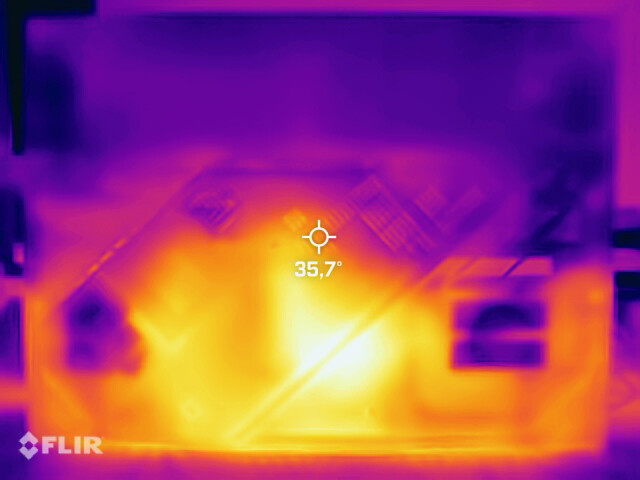
Bei den Temperaturen gibt es zwiespältige Ergebnisse. Die relevanten Berührungspunkte am Gehäuse wie Handballenauflagen und die Tastatur bleiben angenehm kühl - auch bei langen Stress-Szenarien. Der Hotspot im oberen Bereich des Gehäuses erwärmt sich bei Spielen mit bis zu 55 °C allerdings relativ stark.
(-) Die maximale Temperatur auf der Oberseite ist 54 °C. Im Vergleich liegt der Klassendurchschnitt bei 40.4 °C (von 21.2 bis 68.8 °C für die Klasse Gaming).
(-) Auf der Unterseite messen wir eine maximalen Wert von 46 °C (im Vergleich zum Durchschnitt von 43.2 °C).
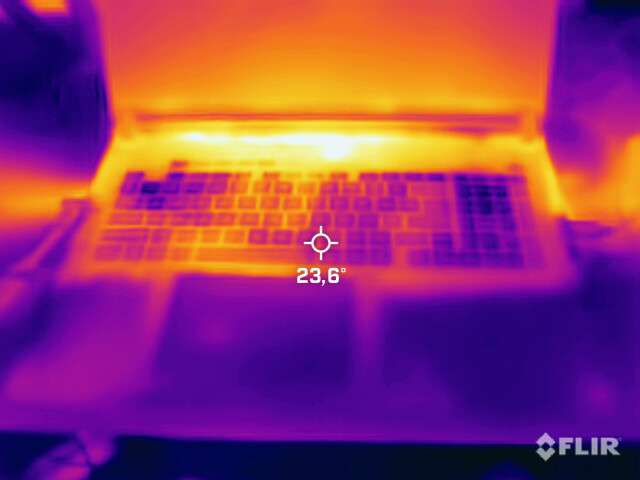
(+) Ohne Last messen wir eine durchschnittliche Temperatur von 27.2 °C auf der Oberseite. Der Klassendurchschnitt erreicht 33.9 °C.
(±) Beim längeren Spielen von The Witcher 3 erhitzt sich das Gerät durchschnittlich auf 36 °C. Der Durchschnitt der Klasse ist derzeit 33.9 °C.
(+) Die Handballen und der Touchpad-Bereich sind mit gemessenen 28 °C kühler als die typische Hauttemperatur und fühlen sich dadurch kühl an.
(±) Die durchschnittliche Handballen-Temperatur anderer getesteter Geräte war 28.8 °C (+0.8 °C).
| Asus ROG Strix Scar 18 2023 G834JY-N6005W Intel Core i9-13980HX, NVIDIA GeForce RTX 4090 Laptop GPU | Razer Blade 16 Early 2023 Intel Core i9-13950HX, NVIDIA GeForce RTX 4080 Laptop GPU | MSI Titan GT77 HX 13VI Intel Core i9-13950HX, NVIDIA GeForce RTX 4090 Laptop GPU | MSI Raider GE77 HX 12UHS Intel Core i9-12900HX, NVIDIA GeForce RTX 3080 Ti Laptop GPU | Asus ROG Strix Scar 17 SE G733CX-LL014W Intel Core i9-12950HX, NVIDIA GeForce RTX 3080 Ti Laptop GPU | |
|---|---|---|---|---|---|
| Hitze | 9% | 13% | -23% | -4% | |
| Last oben max * (°C) | 54 | 40 26% | 40.6 25% | 53 2% | 48.8 10% |
| Last unten max * (°C) | 46 | 37.6 18% | 41.1 11% | 58 -26% | 52.4 -14% |
| Idle oben max * (°C) | 30 | 32.4 -8% | 26.2 13% | 38 -27% | 30.4 -1% |
| Idle unten max * (°C) | 31 | 31.4 -1% | 30.3 2% | 43 -39% | 34.1 -10% |
* ... kleinere Werte sind besser
Stresstest
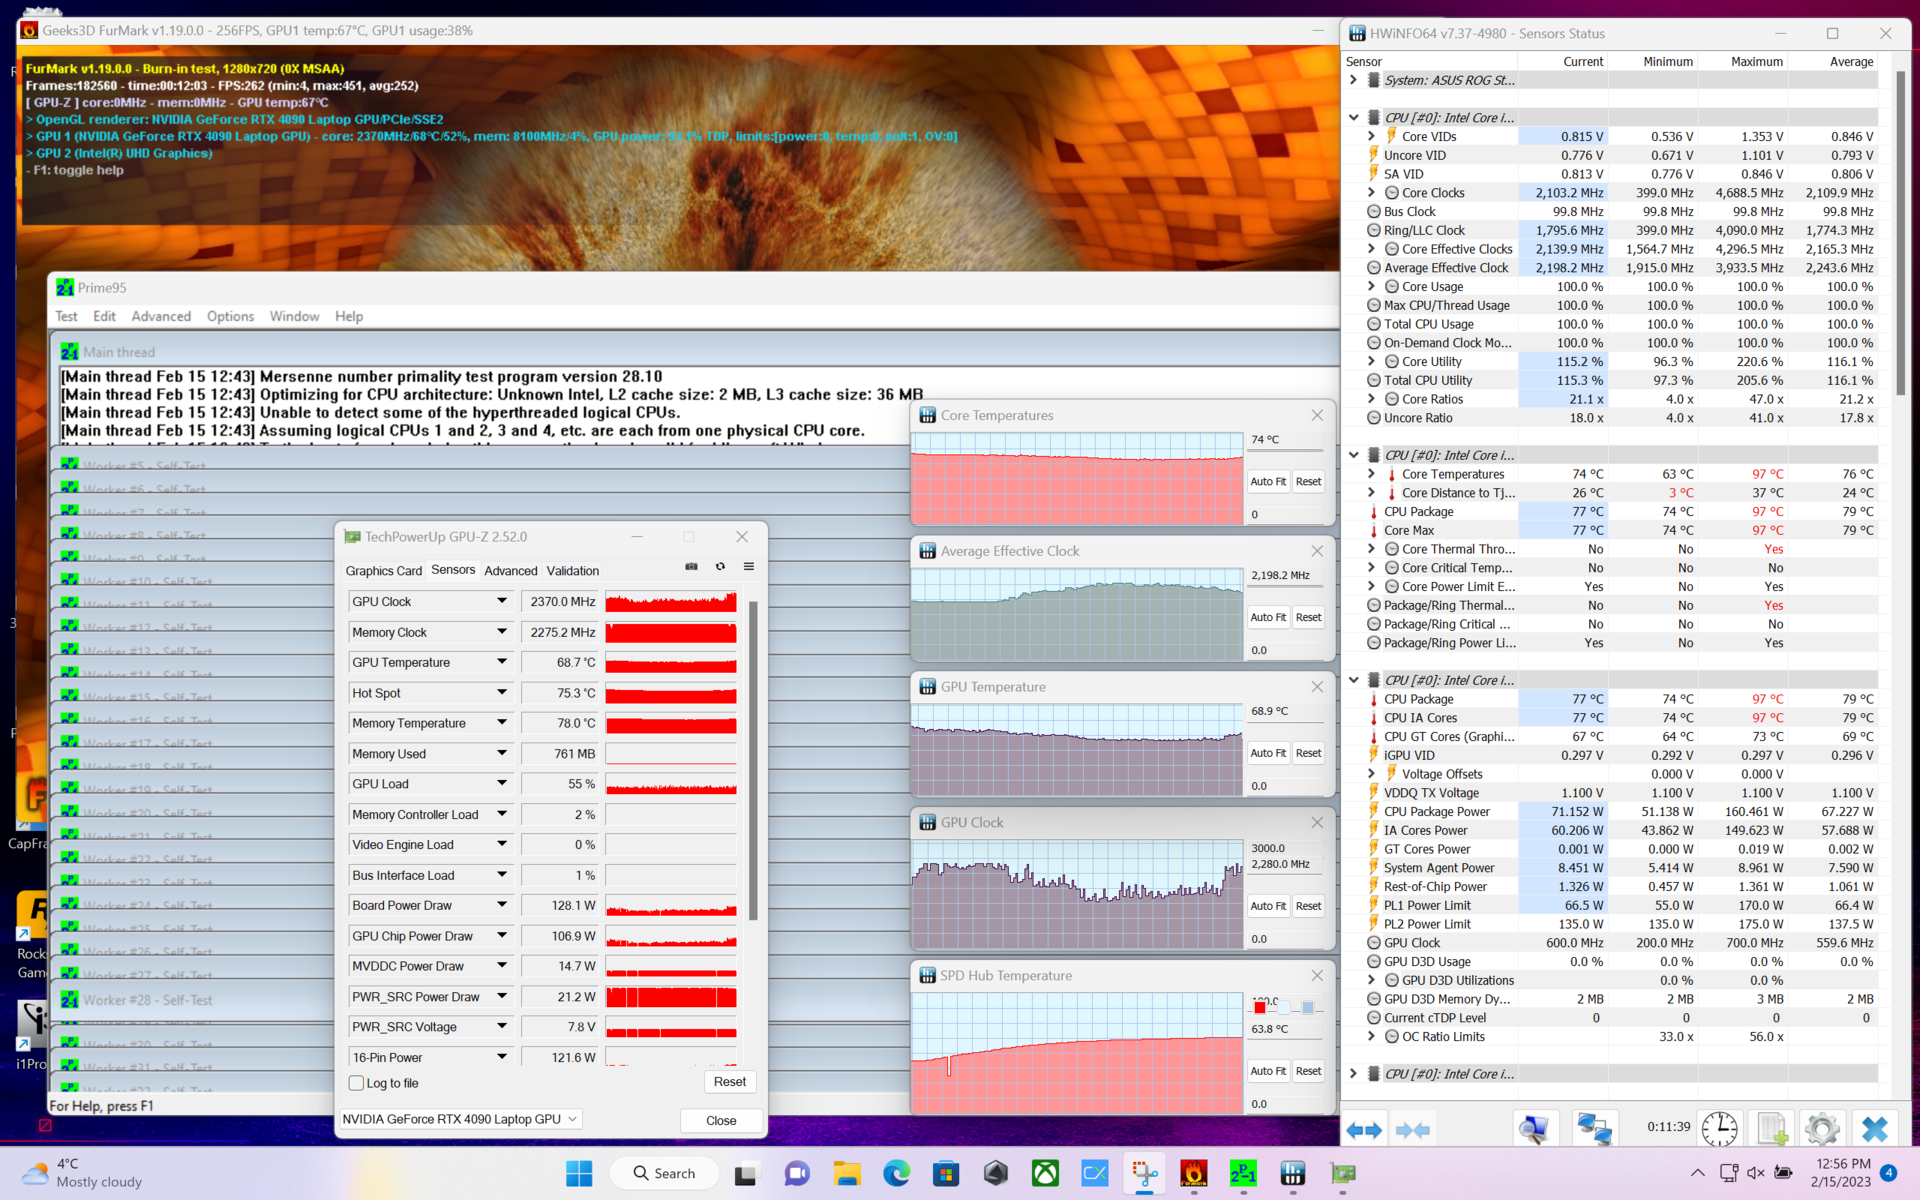
Die internen Temperaturen der CPU schwanken im Stresstest stark. Dies ist auf die laufend angepassten Taktraten zurückzuführen, die die CPU immer wieder an der 100-°C-Marke heranführen. Bei der GPU ist die Lage deutlich unkritischer, hier erreicht die RTX 4090 nur maximal 70 °C.
In Spielen bleibt die CPU-Temperatur etwas gemäßigter. Wir messen zwischen 81 °C (Cyberpunk 2077) bis 90 °C (The Witcher 3). Die GPU wird dafür etwas wärmer als im Stresstest mit 72 °C (Cyberpunk 2077) bis 77 °C (The Witcher 3).
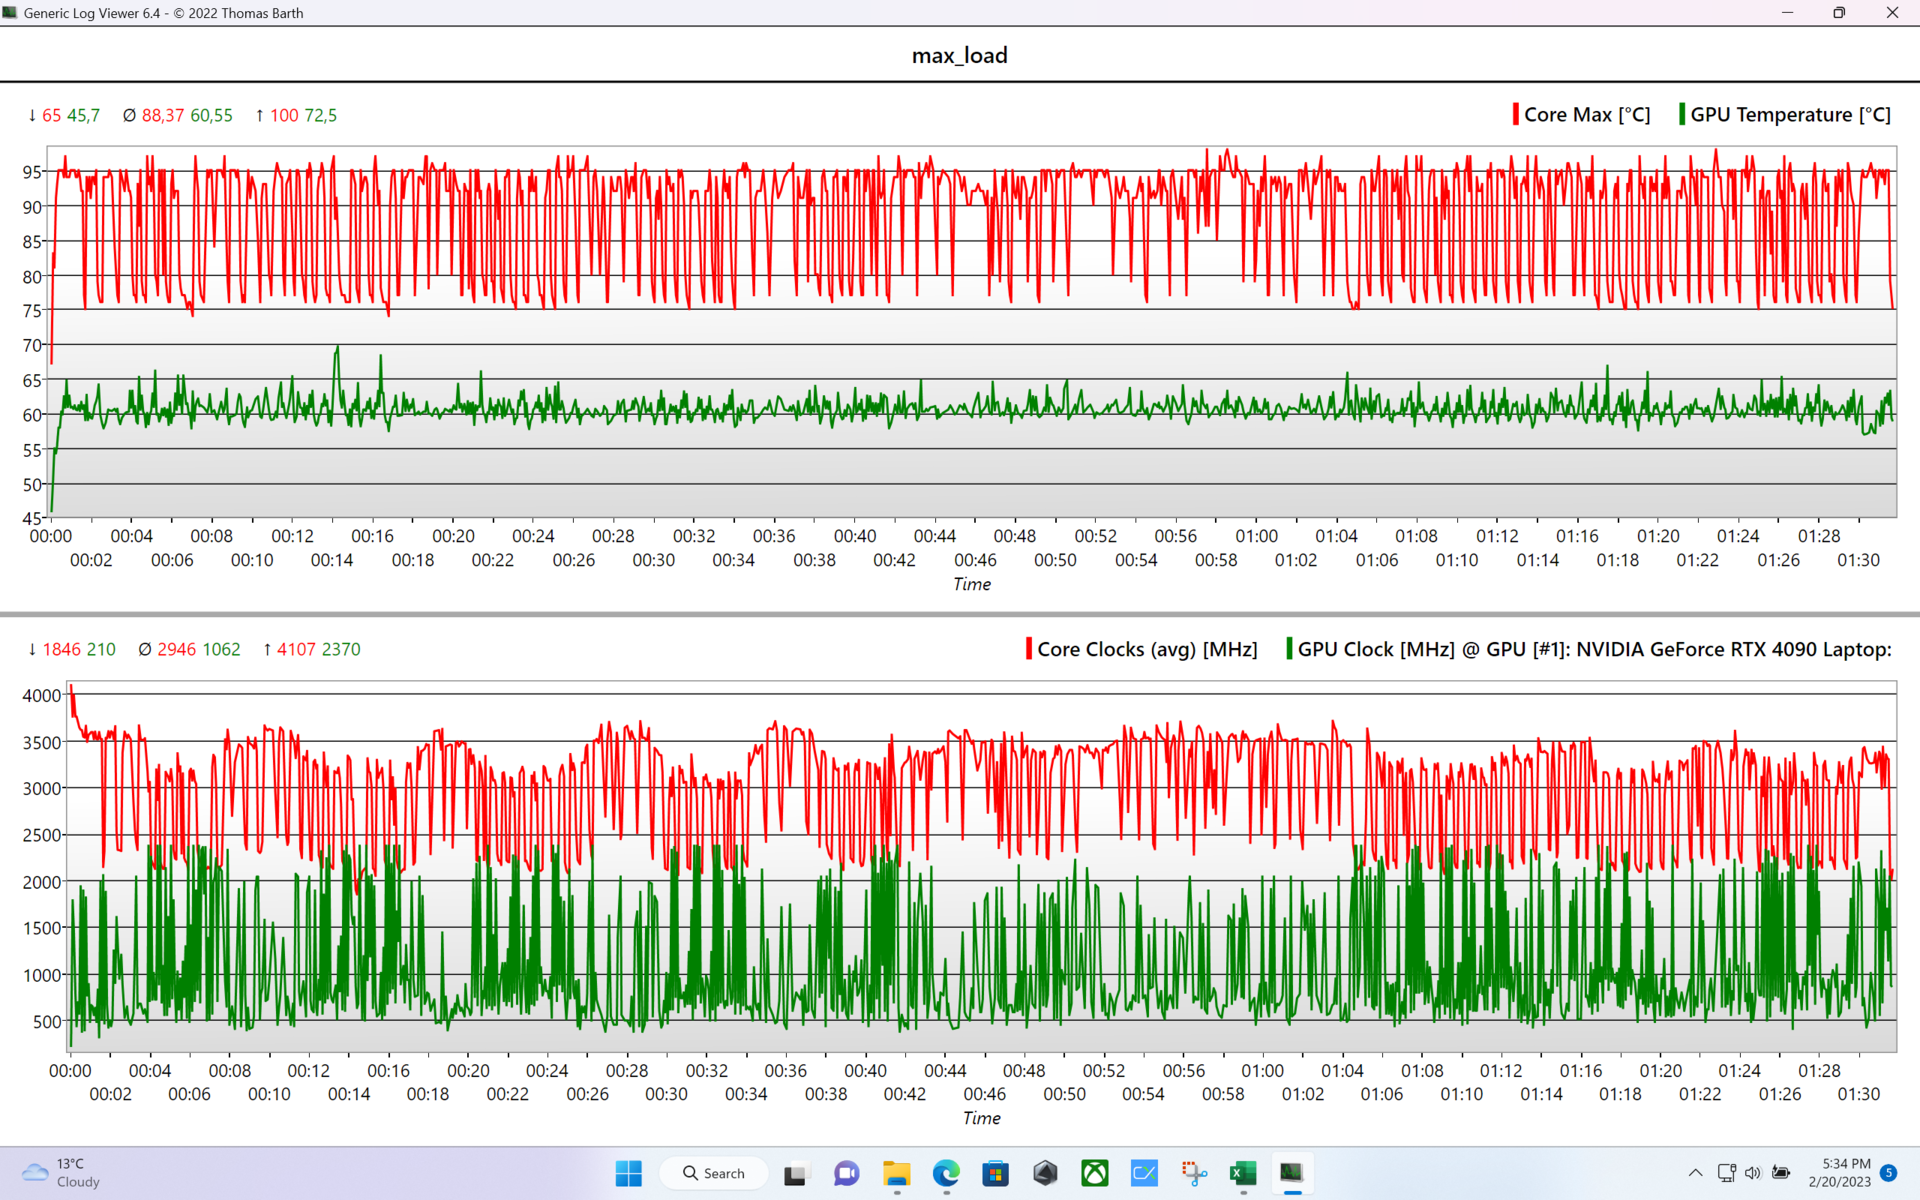
| E-Cores CPU Clock (GHz) | P-Cores CPU Clock (GHz) | GPU Clock (MHz) | Average CPU Temperature (°C) | Average GPU Temperature (°C) | |
| System Idle (Silent) | 1,4 | 1,8 | 0 | 42 | 0 |
| System Idle (Turbo) | 1,6 | 2,1 | 210 | 44 | 39 |
| Prime95 Stress (Turbo) | 3 | 3,5 | 210 | 92 | 56 |
| Prime95 + FurMark Stress (Turbo) | 1.6 | 2.1 | 2260 | 80 | 73 |
| Witcher 3 Stress | 3.7 | 4.6 | 1995 | 90 | 77 |
Lautsprecher
Die verbauten Lautsprecher sind relativ basslastig, bieten aber subjektiv eine ansprechende Performance passend zur Gamingausrichtung des Notebooks. Die maximale Lautstärke ist unter Alltagsbedingungen ebenfalls laut genug.
Asus ROG Strix Scar 18 2023 G834JY-N6005W Audio Analyse
(+) | Die Lautsprecher können relativ laut spielen (82.7 dB)
Bass 100 - 315 Hz
(+) | guter Bass - nur 4.8% Abweichung vom Median
(±) | durchschnittlich lineare Bass-Wiedergabe (7% Delta zum Vorgänger)
Mitteltöne 400 - 2000 Hz
(±) | zu hohe Mitten, vom Median 9% abweichend
(+) | lineare Mitten (5% Delta zum Vorgänger)
Hochtöne 2 - 16 kHz
(+) | ausgeglichene Hochtöne, vom Median nur 3.7% abweichend
(+) | sehr lineare Hochtöne (6.1% Delta zum Vorgänger)
Gesamt im hörbaren Bereich 100 - 16.000 Hz
(±) | hörbarer Bereich ist durchschnittlich linear (19% Abstand zum Median)
Im Vergleich zu allen Geräten derselben Klasse
» 63% aller getesteten Geräte dieser Klasse waren besser, 8% vergleichbar, 29% schlechter
» Das beste Gerät hat einen Delta-Wert von 6%, durchschnittlich ist 18%, das schlechteste Gerät hat 132%
Im Vergleich zu allen Geräten im Test
» 45% aller getesteten Geräte waren besser, 7% vergleichbar, 48% schlechter
» Das beste Gerät hat einen Delta-Wert von 4%, durchschnittlich ist 24%, das schlechteste Gerät hat 134%
Apple MacBook Pro 16 2021 M1 Pro Audio Analyse
(+) | Die Lautsprecher können relativ laut spielen (84.7 dB)
Bass 100 - 315 Hz
(+) | guter Bass - nur 3.8% Abweichung vom Median
(+) | lineare Bass-Wiedergabe (5.2% Delta zum Vorgänger)
Mitteltöne 400 - 2000 Hz
(+) | ausgeglichene Mitten, vom Median nur 1.3% abweichend
(+) | lineare Mitten (2.1% Delta zum Vorgänger)
Hochtöne 2 - 16 kHz
(+) | ausgeglichene Hochtöne, vom Median nur 1.9% abweichend
(+) | sehr lineare Hochtöne (2.7% Delta zum Vorgänger)
Gesamt im hörbaren Bereich 100 - 16.000 Hz
(+) | hörbarer Bereich ist sehr linear (4.6% Abstand zum Median
Im Vergleich zu allen Geräten derselben Klasse
» 0% aller getesteten Geräte dieser Klasse waren besser, 0% vergleichbar, 100% schlechter
» Das beste Gerät hat einen Delta-Wert von 5%, durchschnittlich ist 17%, das schlechteste Gerät hat 45%
Im Vergleich zu allen Geräten im Test
» 0% aller getesteten Geräte waren besser, 0% vergleichbar, 100% schlechter
» Das beste Gerät hat einen Delta-Wert von 4%, durchschnittlich ist 24%, das schlechteste Gerät hat 134%
Energieverwaltung
Energieaufnahme
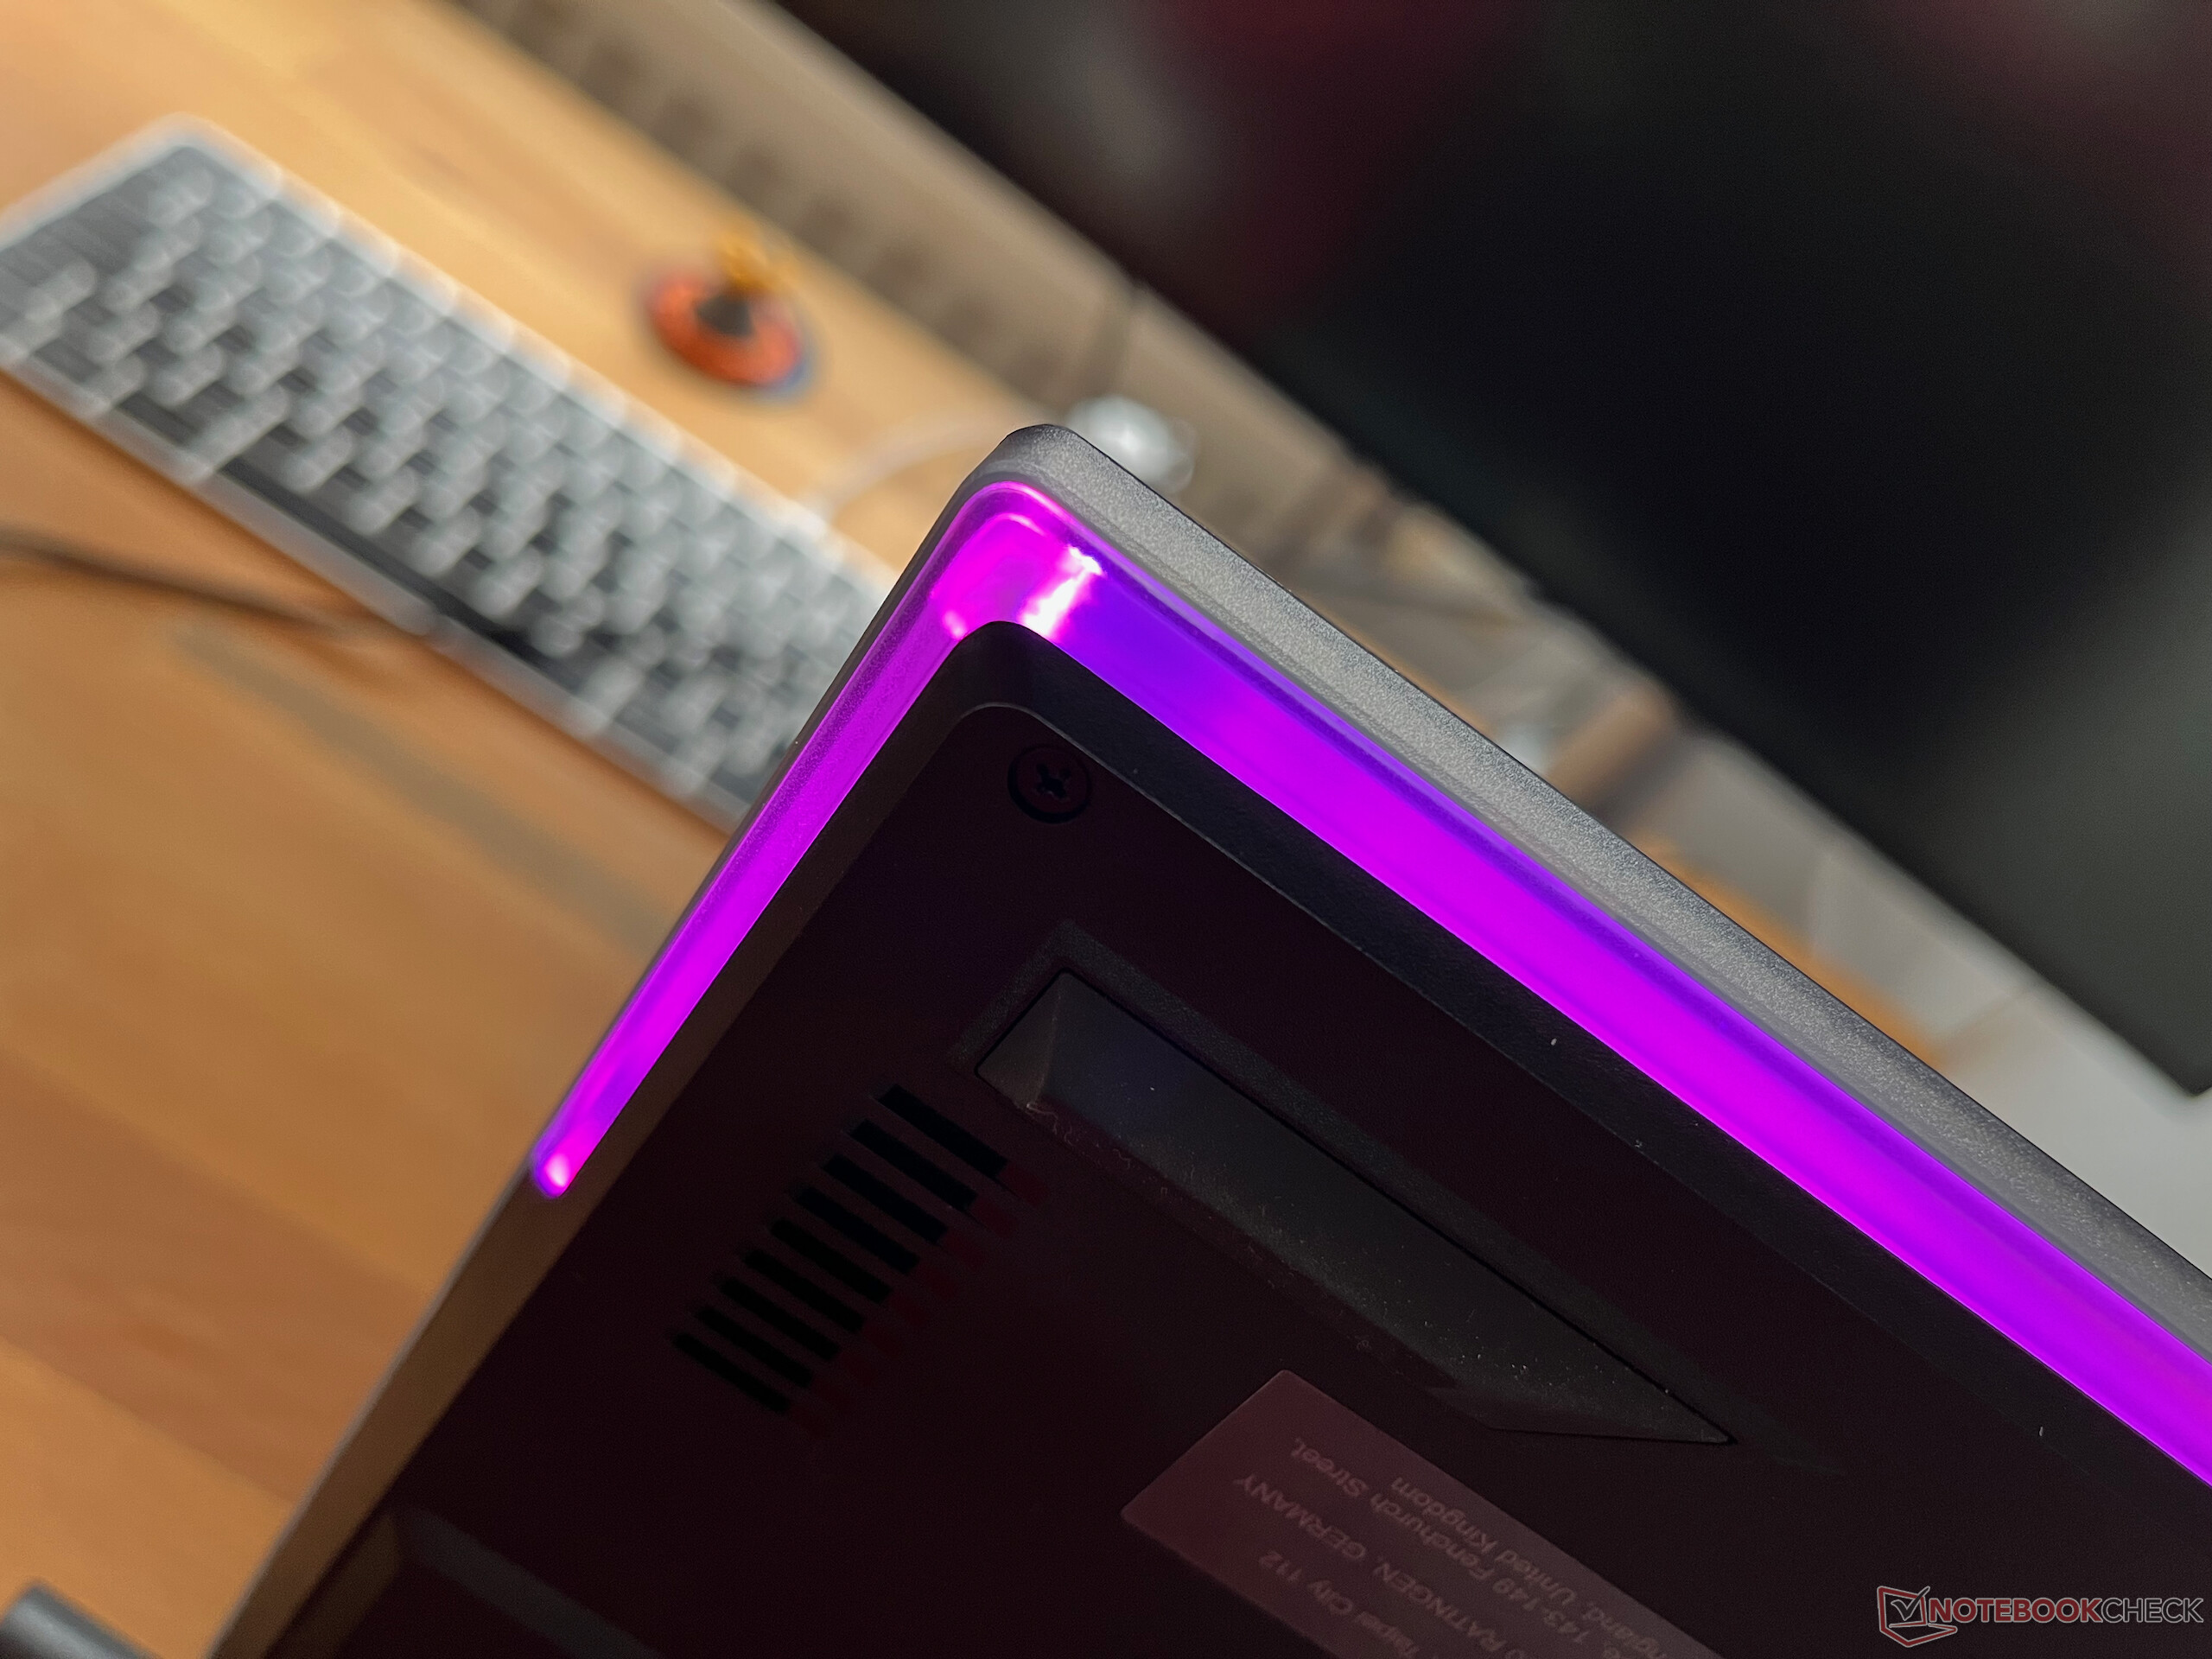
Der Energieverbrauch des Systems ist aufgrund der starken Hardware sehr hoch. Auffallend war der sehr hohe Standby-Verbrauch der immer zwischen 5 und 10 Watt alterniert. Hier dürfte teilweise auch die LED Beleuchtung mit Animation im Standby Schuld sein.
| Aus / Standby | |
| Idle | |
| Last |
|
Legende:
min: | |
| Asus ROG Strix Scar 18 2023 G834JY-N6005W i9-13980HX, GeForce RTX 4090 Laptop GPU, 2x Samsung PM9A1 MZVL21T0HCLR (RAID 0), IPS, 2560x1600, 18" | Razer Blade 16 Early 2023 i9-13950HX, GeForce RTX 4080 Laptop GPU, SSSTC CA6-8D1024, IPS, 2560x1600, 16" | MSI Titan GT77 HX 13VI i9-13950HX, GeForce RTX 4090 Laptop GPU, Samsung PM9A1 MZVL22T0HBLB, Mini-LED, 3840x2160, 17.3" | MSI Raider GE77 HX 12UHS i9-12900HX, GeForce RTX 3080 Ti Laptop GPU, Samsung PM9A1 MZVL22T0HBLB, IPS, 3840x2160, 17.3" | Asus ROG Strix Scar 17 SE G733CX-LL014W i9-12950HX, GeForce RTX 3080 Ti Laptop GPU, Samsung PM9A1 MZVL22T0HBLB, IPS, 2560x1440, 17.3" | Durchschnitt der Klasse Gaming | |
|---|---|---|---|---|---|---|
| Stromverbrauch | 9% | 13% | 15% | 6% | 28% | |
| Idle min * (Watt) | 17.3 | 15.2 12% | 14 19% | 13 25% | 19.3 -12% | 13.3 ? 23% |
| Idle avg * (Watt) | 27 | 22.8 16% | 21.6 20% | 19 30% | 26.5 2% | 19 ? 30% |
| Idle max * (Watt) | 46 | 49.8 -8% | 24.8 46% | 29 37% | 27.1 41% | 24.5 ? 47% |
| Last avg * (Watt) | 133 | 121.2 9% | 122.5 8% | 143 -8% | 141 -6% | 108.1 ? 19% |
| Last max * (Watt) | 329 | 273.7 17% | 418 -27% | 352 -7% | 307.9 6% | 254 ? 23% |
| Witcher 3 ultra * (Watt) | 242 | 265 | 247 | 225 |
* ... kleinere Werte sind besser
Energieaufnahme Witcher 3 / Stresstest
Energieaufnahme mit externem Monitor
Akkulaufzeit
Der 90 Wh fassende Akku kann aufgrund der stromhungrigen Komponenten keine Rekordwerte liefern. Im Optimus-Modus (deaktiverte GPU), Silent Profil und verringerte Helligkeit auf 150 cd/m² kann man jedoch auch einige Stunden "Off-Grid" arbeiten. Unser WLAN-Test lief in diesem Modus knapp über 7 Stunden. Wenn man jedoch im Akkubetrieb spielen möchte, dann muss man nicht nur mit einer deutlich verringerten Leistung leben, auch bei den Akkulaufzeiten bleibt nur noch rund eine Stunde in unserem Test (ohne Framelimitierung) mit The Witcher 3 übrig.
Aufgeladen war der Akku wieder nach 1h 40min (ausgeschaltet), bzw. 1h 45min im Idle. Maximal zog das Netzteil dabei 117 Watt.
| Asus ROG Strix Scar 18 2023 G834JY-N6005W i9-13980HX, GeForce RTX 4090 Laptop GPU, 90 Wh | Razer Blade 16 Early 2023 i9-13950HX, GeForce RTX 4080 Laptop GPU, 95.2 Wh | MSI Titan GT77 HX 13VI i9-13950HX, GeForce RTX 4090 Laptop GPU, 99.9 Wh | MSI Raider GE77 HX 12UHS i9-12900HX, GeForce RTX 3080 Ti Laptop GPU, 99.99 Wh | Asus ROG Strix Scar 17 SE G733CX-LL014W i9-12950HX, GeForce RTX 3080 Ti Laptop GPU, 90 Wh | Durchschnitt der Klasse Gaming | |
|---|---|---|---|---|---|---|
| Akkulaufzeit | 21% | 6% | 30% | -41% | 27% | |
| H.264 (h) | 7 | 6 -14% | 6.5 -7% | 8.26 ? 18% | ||
| WLAN (h) | 7.1 | 6.1 -14% | 5.3 -25% | 5.4 -24% | 4.2 -41% | 7.01 ? -1% |
| Witcher 3 ultra (h) | 0.9 | |||||
| Last (h) | 0.9 | 1.4 56% | 1.4 56% | 2 122% | 1.47 ? 63% | |
| Idle (h) | 8.9 | 9.8 | 8.71 ? |
Pro
Contra
Fazit
Das Asus ROG Strix SCAR 18 (2023) G834JY ist ein High-End-Gaming-Notebook, welches Asus mit den aktuell stärksten erhältlichen Mobil-Komponenten ausstattet. Das große Gehäuse beinhaltet ein sehr gutes 18-Zoll-Display das Gamer schnelle Reaktionszeiten, G-SYNC und eine gute Bildqualität liefert. Highlight des G834JY ist aber sicherlich die potente Hardware mit Core i9-13980HX, GeForce RTX 4090 Laptop GPU (175 W TGP) und RAID-0-NVMe-SSD. Diese Komponenten erzeugen unter Last massiv Abwärme, die Asus mit dem Triple-Fan-Kühler, großem Heatsink und Liquid-Metal-Paste jedoch gut im Griff hat.
Das ROG Strix SCAR 18 ist ein rundes Gesamtpaket mit beeindruckenden Leistungsdaten zum stolzen Preis.
Zu bemängeln haben wir nur Kleinigkeiten, wie das Transistorpfeifen unseres Samples bei hohen Frameraten, die schlechte Webcam oder die unter Umständen ungünstige Portanordnung.
Als Alternativen bieten sich die 18-Zoll-Modelle mir RTX 4090 GPU von Alienware (m18 R1) und Razer (Blade 18). MSI bietet das minimal schnellere Titan GT77 HX 13VI mit 17-Zoll-Display. Wer auf etwas Leistung verzichten kann, ist mit RTX 4080 basierten Modellen deutlich günstiger unterwegs. Hier könnte die G834JZ-Variante des Scar 18 eine interessante Alternative darstellen.
Preis und Verfügbarkeit
Das von uns getestete G834JY-N6000W ist aktuell nur in England für 3999,99 Pfund (Listenpreis) erhältlich. Das G834JY-N6047W mit 64GB RAM ist z.B. bei Notebooksbilliger aktuell für 4799,- Euro zu bekommen. Bei Amazon ist derzeit nur die RTX-4080-Version namens G834JZ mit 1 TB SSD um 3730 Euro erhältlich.
Asus ROG Strix Scar 18 2023 G834JY-N6005W
- 07.03.2023 v7 (old)
Klaus Hinum
Transparenz
Die Auswahl der zu testenden Geräte erfolgt innerhalb der Redaktion. Das vorliegende Testmuster wurde dem Autor vom Hersteller oder einem Shop zu Testzwecken leihweise zur Verfügung gestellt. Eine Einflussnahme des Leihstellers auf den Testbericht gab es nicht, der Hersteller erhielt keine Version des Reviews vor der Veröffentlichung. Es bestand keine Verpflichtung zur Publikation. Als eigenständiges, unabhängiges Unternehmen unterliegt Notebookcheck keiner Diktion von Herstellern, Shops und Verlagen.
So testet Notebookcheck
Pro Jahr werden von Notebookcheck hunderte Laptops und Smartphones unabhängig in von uns standardisierten technischen Verfahren getestet, um eine Vergleichbarkeit aller Testergebnisse zu gewährleisten. Seit rund 20 Jahren entwickeln wir diese Testmethoden kontinuierlich weiter und setzen damit Branchenstandards. In unseren Testlaboren kommt ausschließlich hochwertiges Messequipment in die Hände erfahrener Techniker und Redakteure. Die Tests unterliegen einer mehrstufigen Kontrolle. Unsere komplexe Gesamtbewertung basiert auf hunderten fundierten Messergebnissen und Benchmarks, womit Ihnen Objektivität garantiert ist. Weitere Informationen zu unseren Testmethoden gibt es hier.
Preisvergleich
