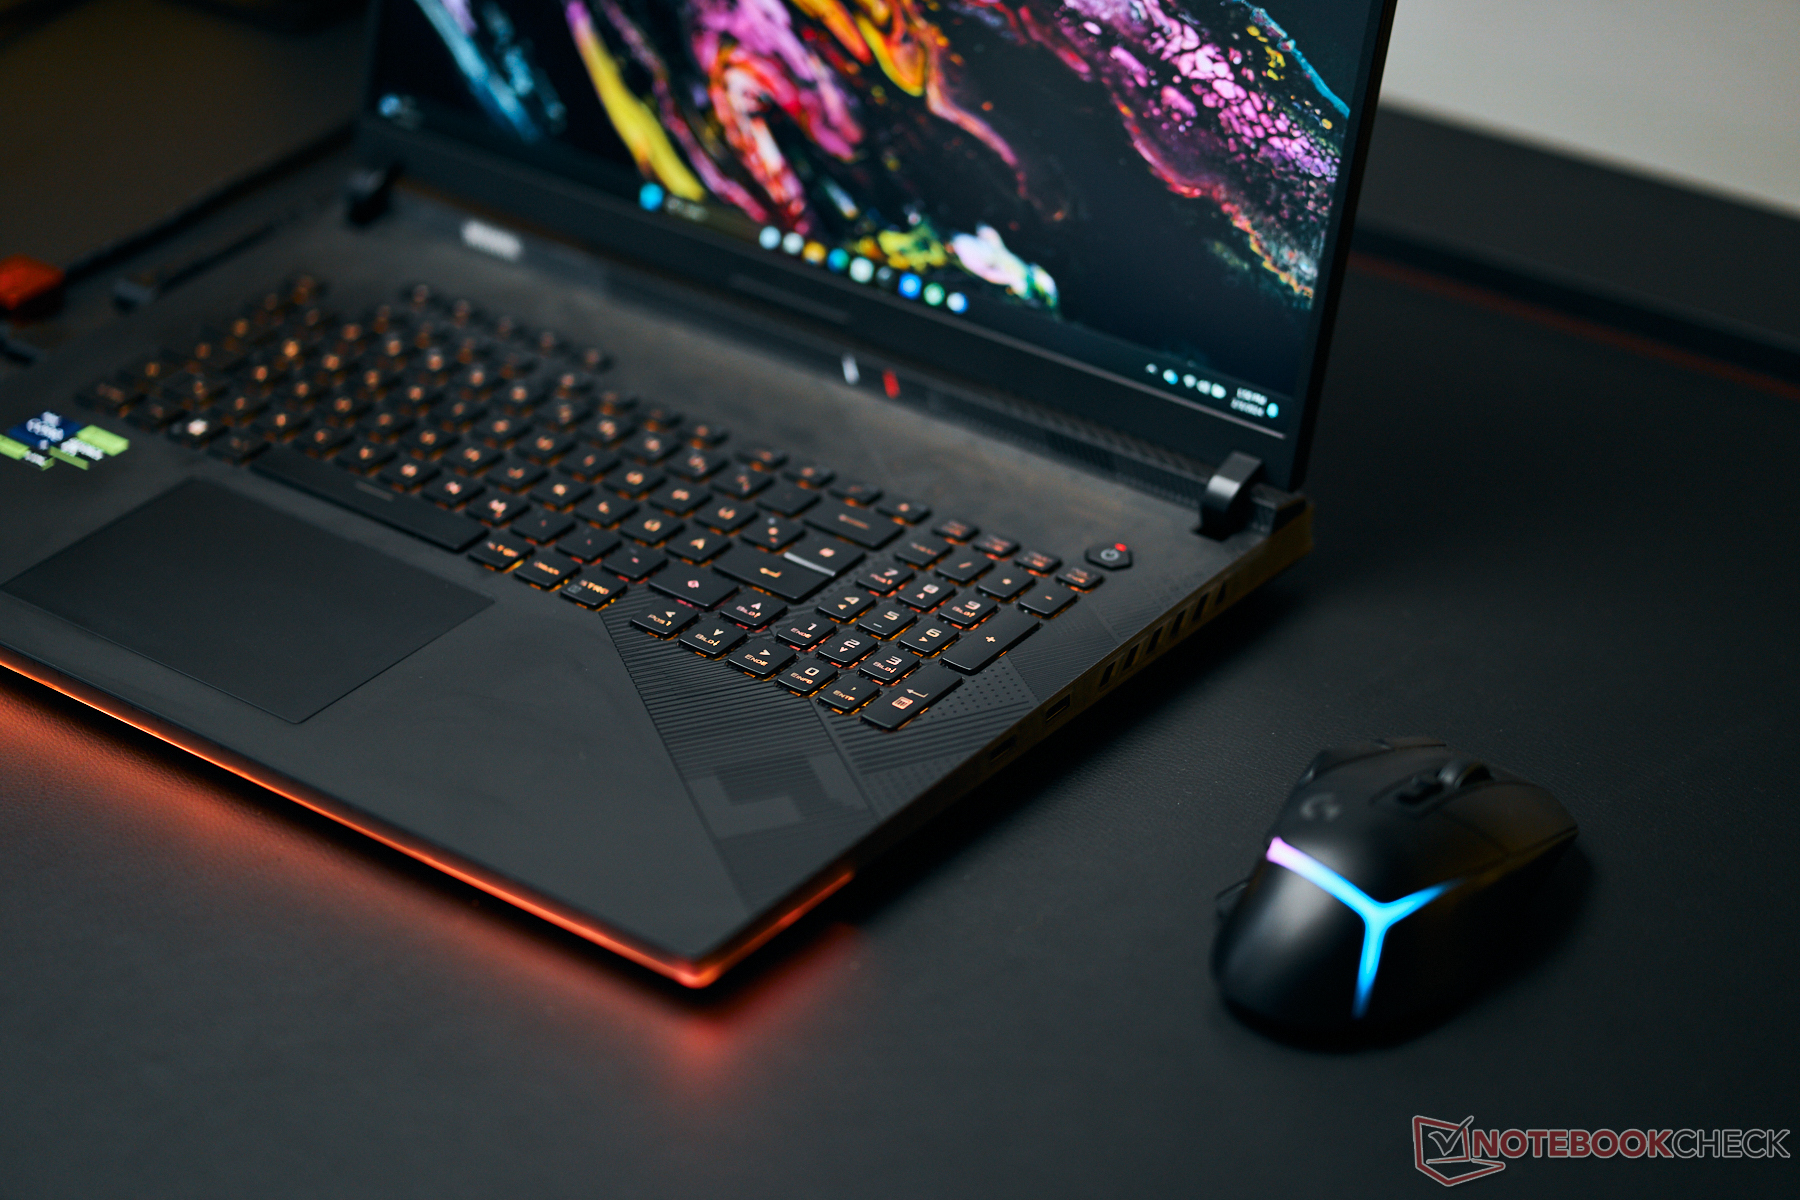
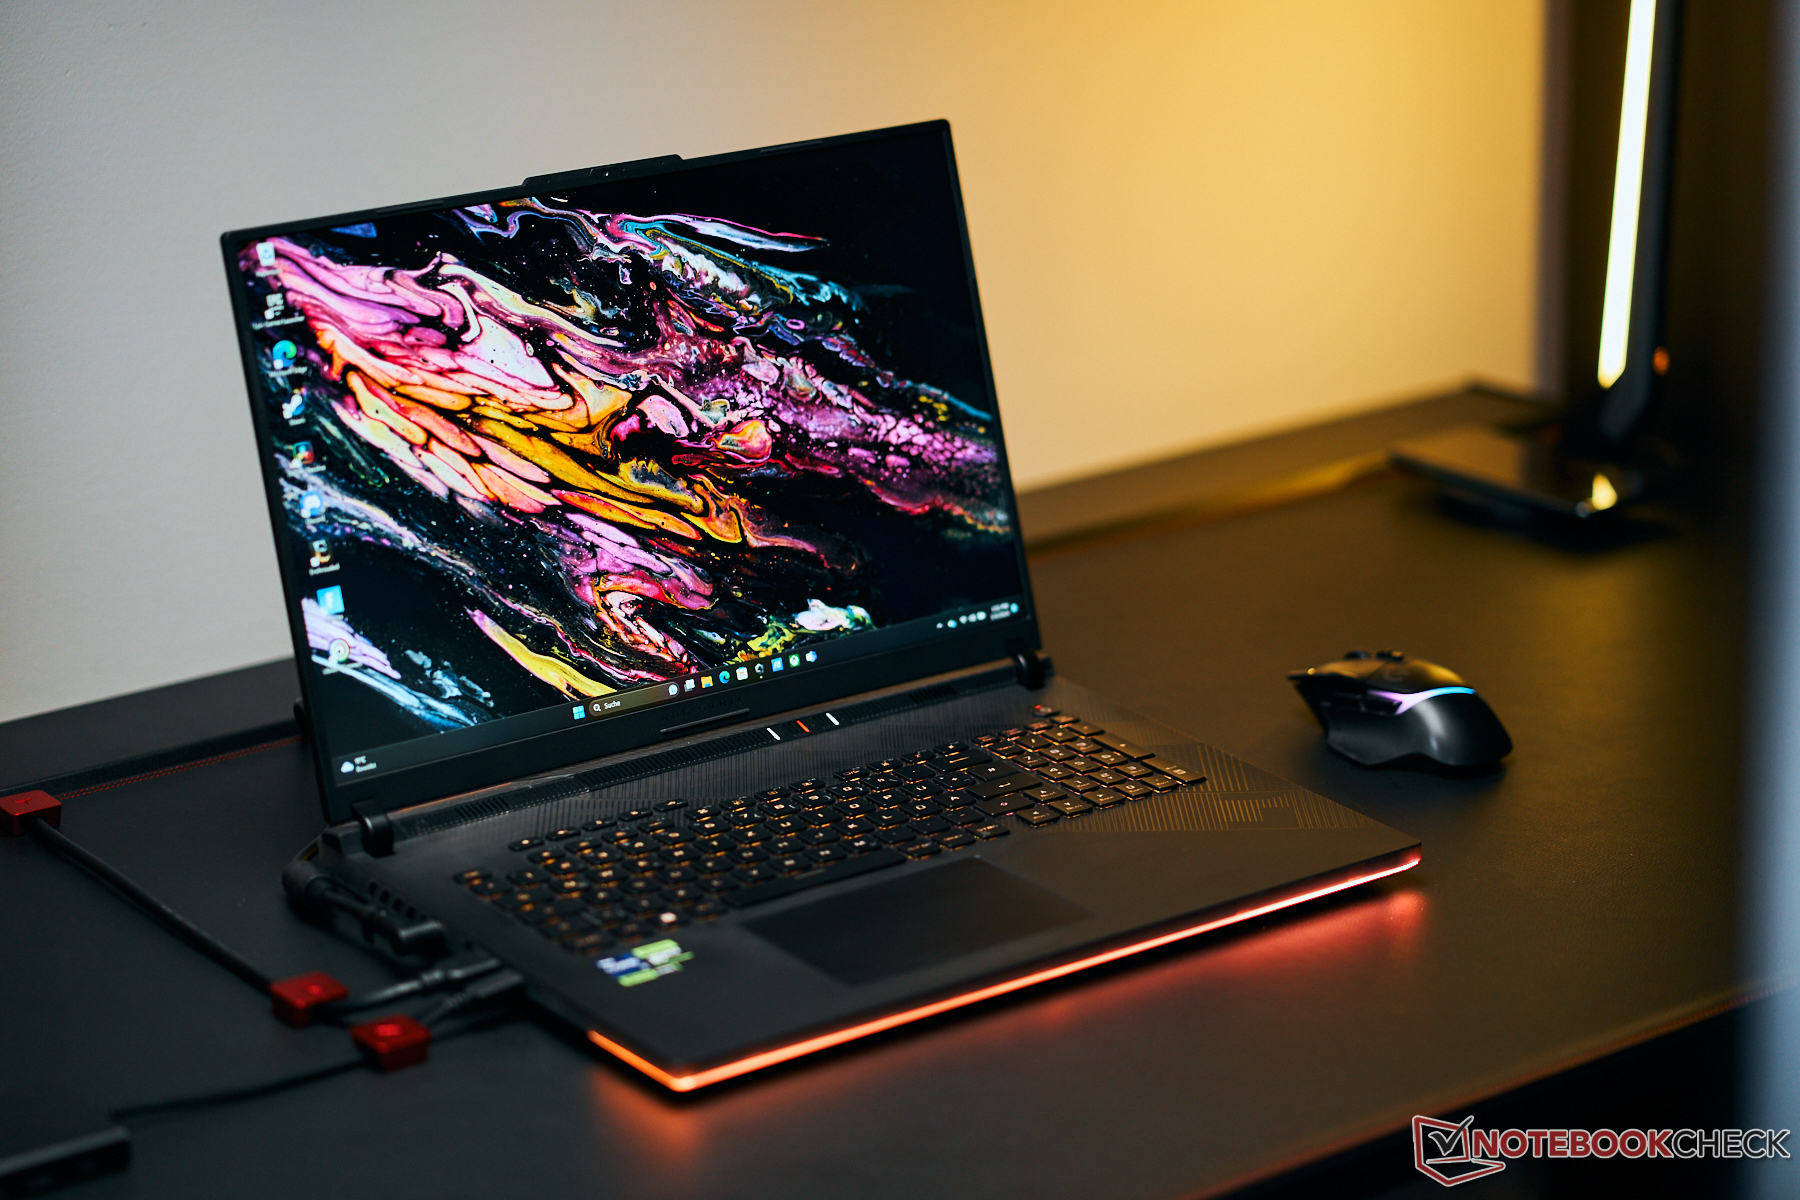
Asus ROG Strix Scar 18 (2024) im Test: Gaming-Laptop mit RTX 4090 und Mini-LED-Panel
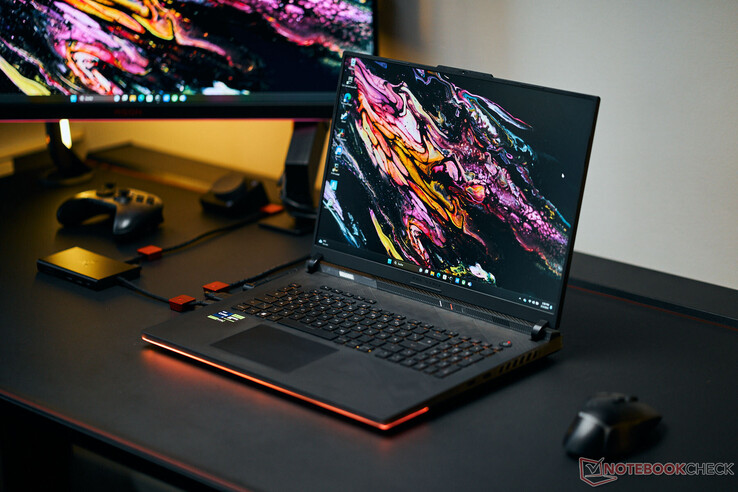
Asus zielt mit dem ROG Strix Scar 18 auf Gamer und Creator, denen es nicht am nötigen Kleingeld mangelt: Ab etwa 4.500 Euro ist die vorliegende Inkarnation des High-End-Boliden zu haben. Potente Hardware und ein sehr helles, farbtreues Mini-LED-Display im 16:10-Format mit einer Diagonale von satten 18 Zoll treiben den Preis in die Höhe. Zur Konkurrenz zählen Geräte wie das Alienware m18 R1, das Acer Predator Helios 18, das Razer Blade 18, das MSI Titan 18 HX A14VIG.
Es handelt sich hier um das baugleiche Schwestermodell des bereits letztjährig getesteten Scar 18. Neben dem Display stellt die CPU-Generation die einzige Neuerung dar: Raptor Lake Refresh ersetzt Raptor Lake.
Mögliche Konkurrenten im Vergleich
Bew. | Datum | Modell | Gewicht | Dicke | Größe | Auflösung | Preis ab |
|---|---|---|---|---|---|---|---|
| 88.3 % v7 (old) | 02 / 2024 | Asus ROG Strix Scar 18 G834JYR (2024) i9-14900HX, GeForce RTX 4090 Laptop GPU | 3.1 kg | 30.8 mm | 18.00" | 2560x1600 | |
| 89.2 % v7 (old) | 11 / 2023 | Alienware m18 R1 AMD R9 7945HX, Radeon RX 7900M | 3.9 kg | 26.7 mm | 18.00" | 1920x1200 | |
| 90.7 % v7 (old) | 04 / 2023 | Alienware m18 R1 i9-13980HX, GeForce RTX 4090 Laptop GPU | 3.9 kg | 26.7 mm | 18.00" | 1920x1200 | |
| 88.3 % v7 (old) | 10 / 2023 | Acer Predator Helios 18 N23Q2 i9-13900HX, GeForce RTX 4080 Laptop GPU | 3.2 kg | 29.15 mm | 18.00" | 2560x1600 | |
| 91.4 % v7 (old) | 02 / 2023 | Razer Blade 18 RTX 4070 i9-13950HX, GeForce RTX 4070 Laptop GPU | 3 kg | 21.9 mm | 18.00" | 2560x1600 | |
| 88.8 % v7 (old) | 01 / 2024 | MSI Titan 18 HX A14VIG i9-14900HX, GeForce RTX 4090 Laptop GPU | 3.6 kg | 32.1 mm | 18.00" | 3840x2400 |
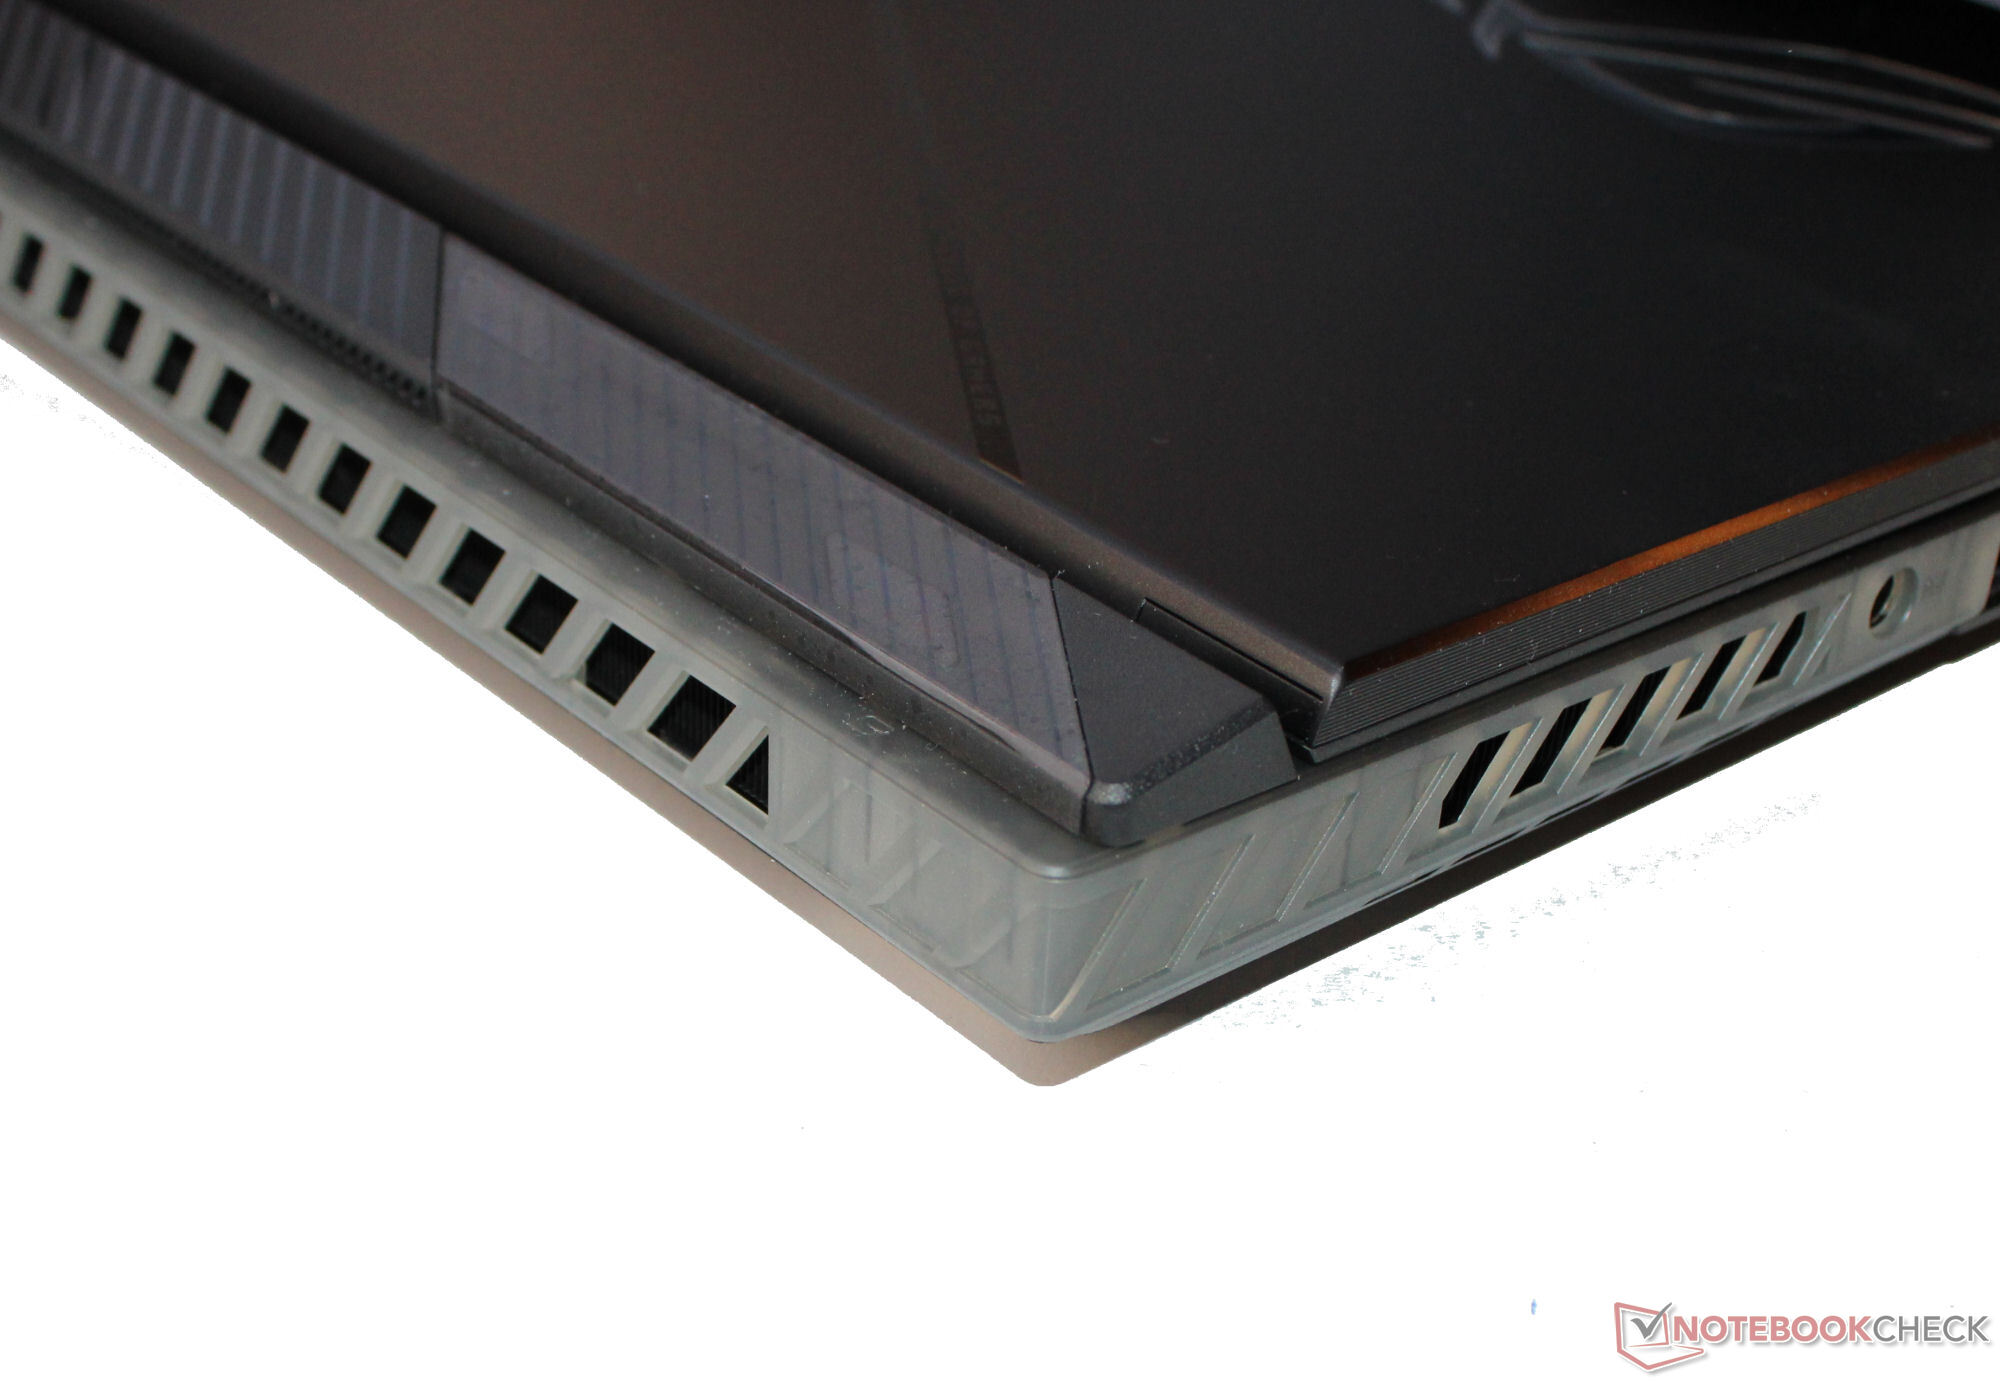
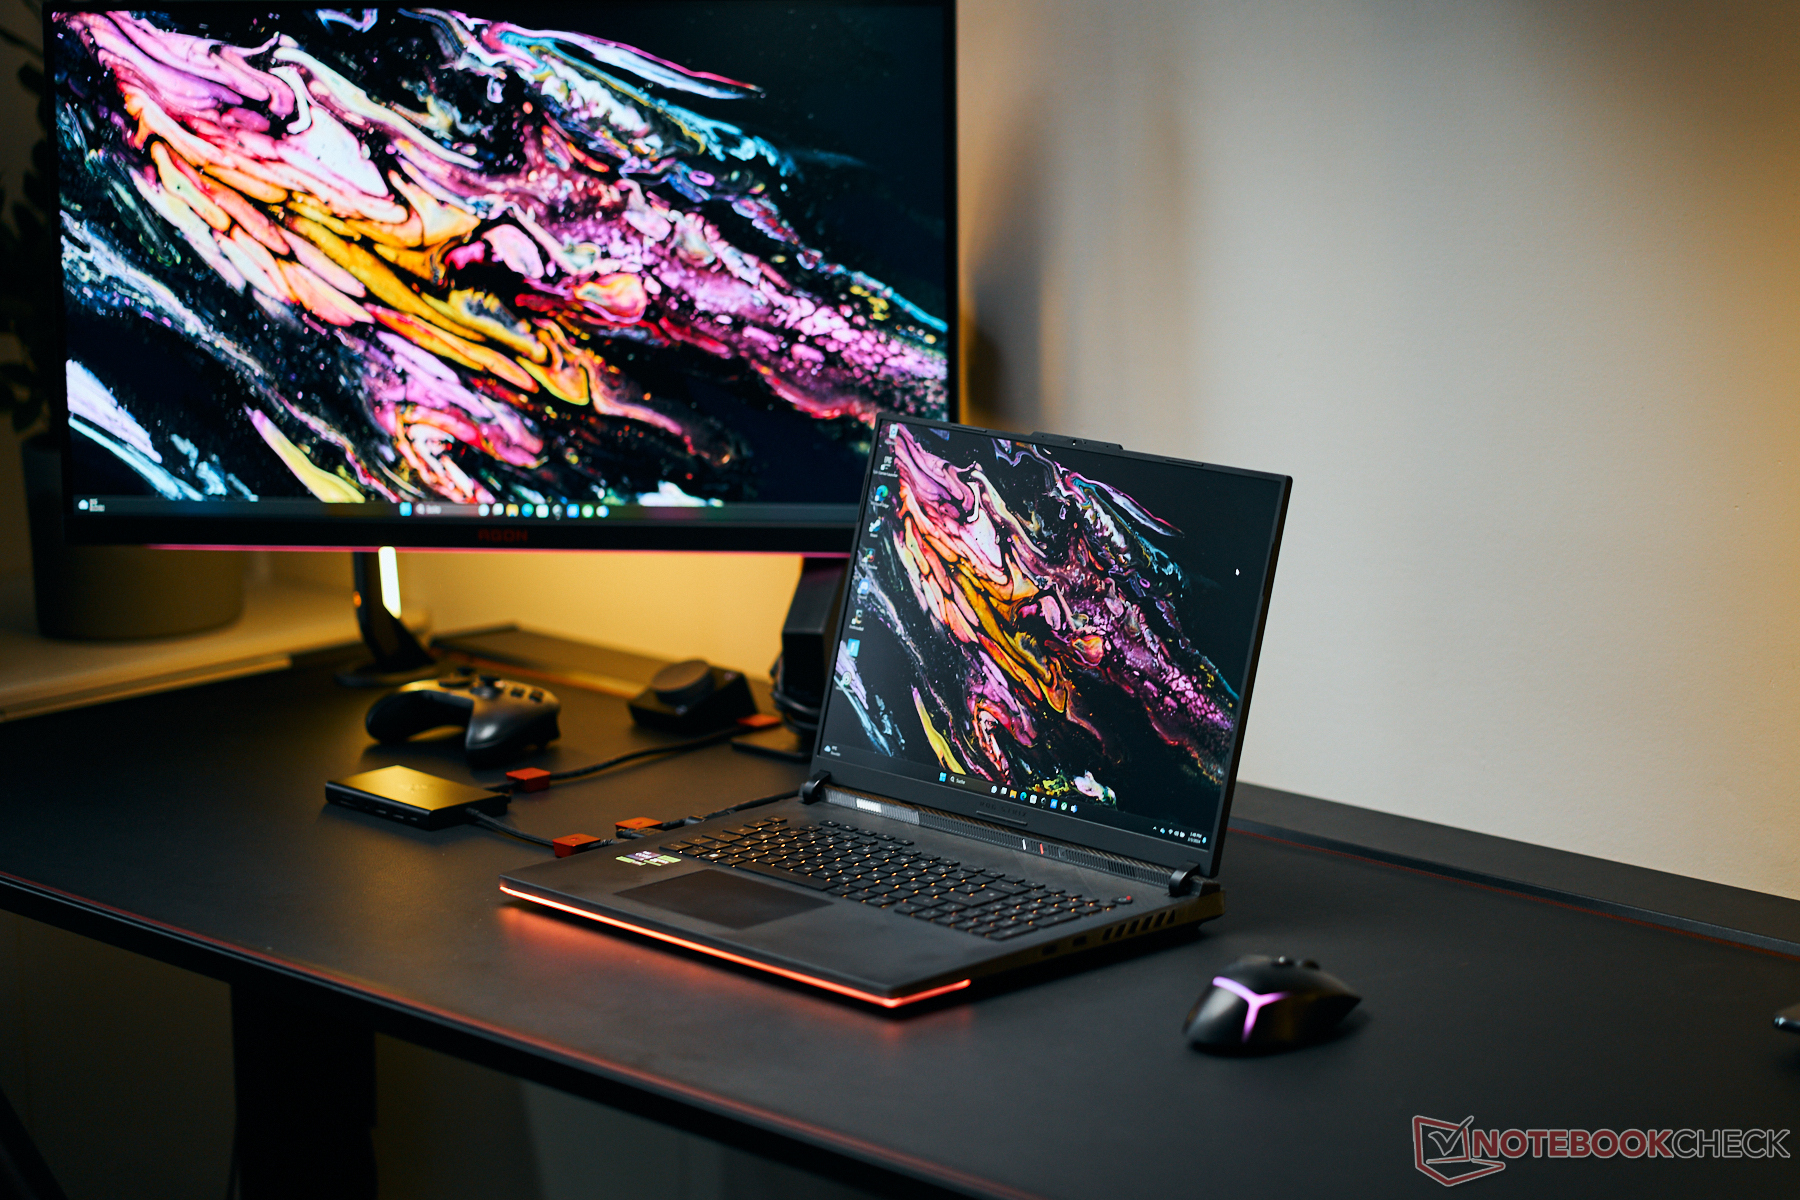
Gehäuse - Viel Plastik, wenig Aluminium
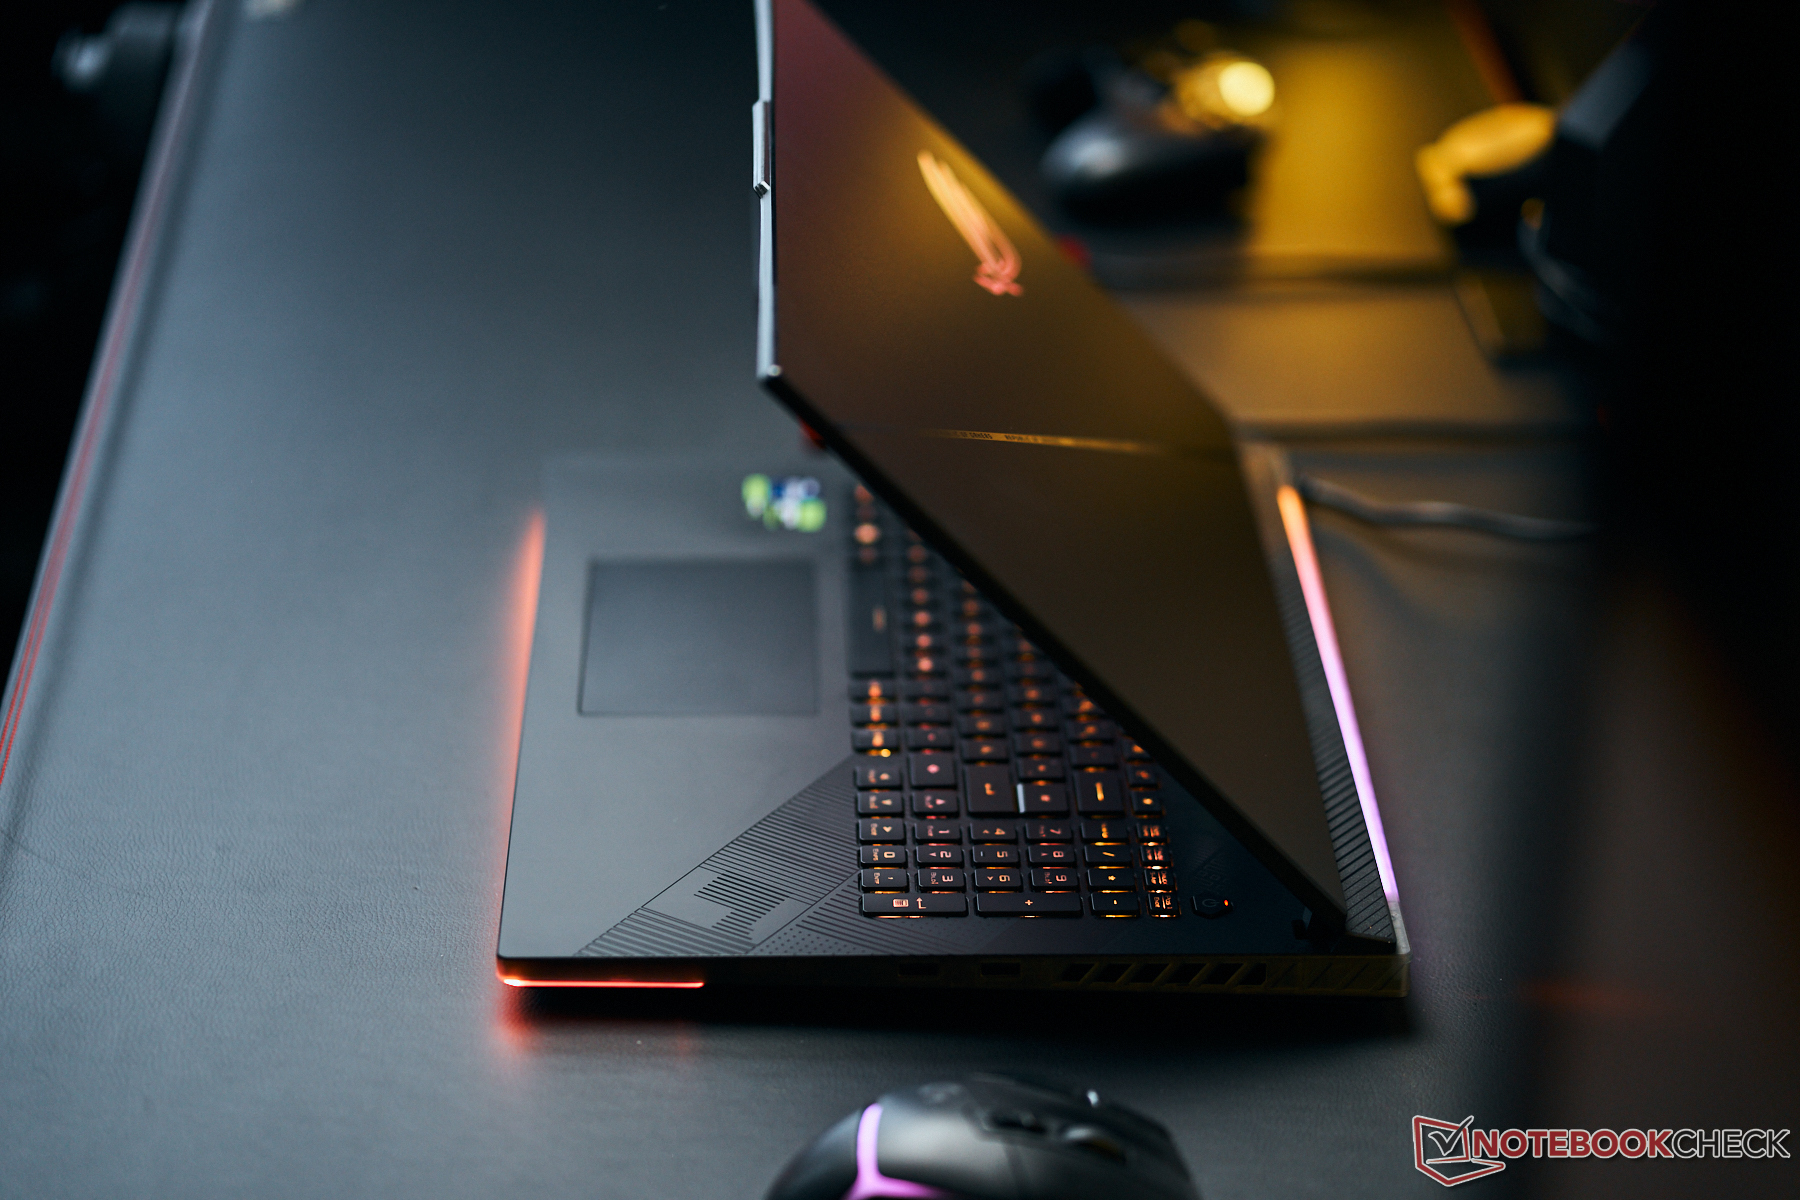
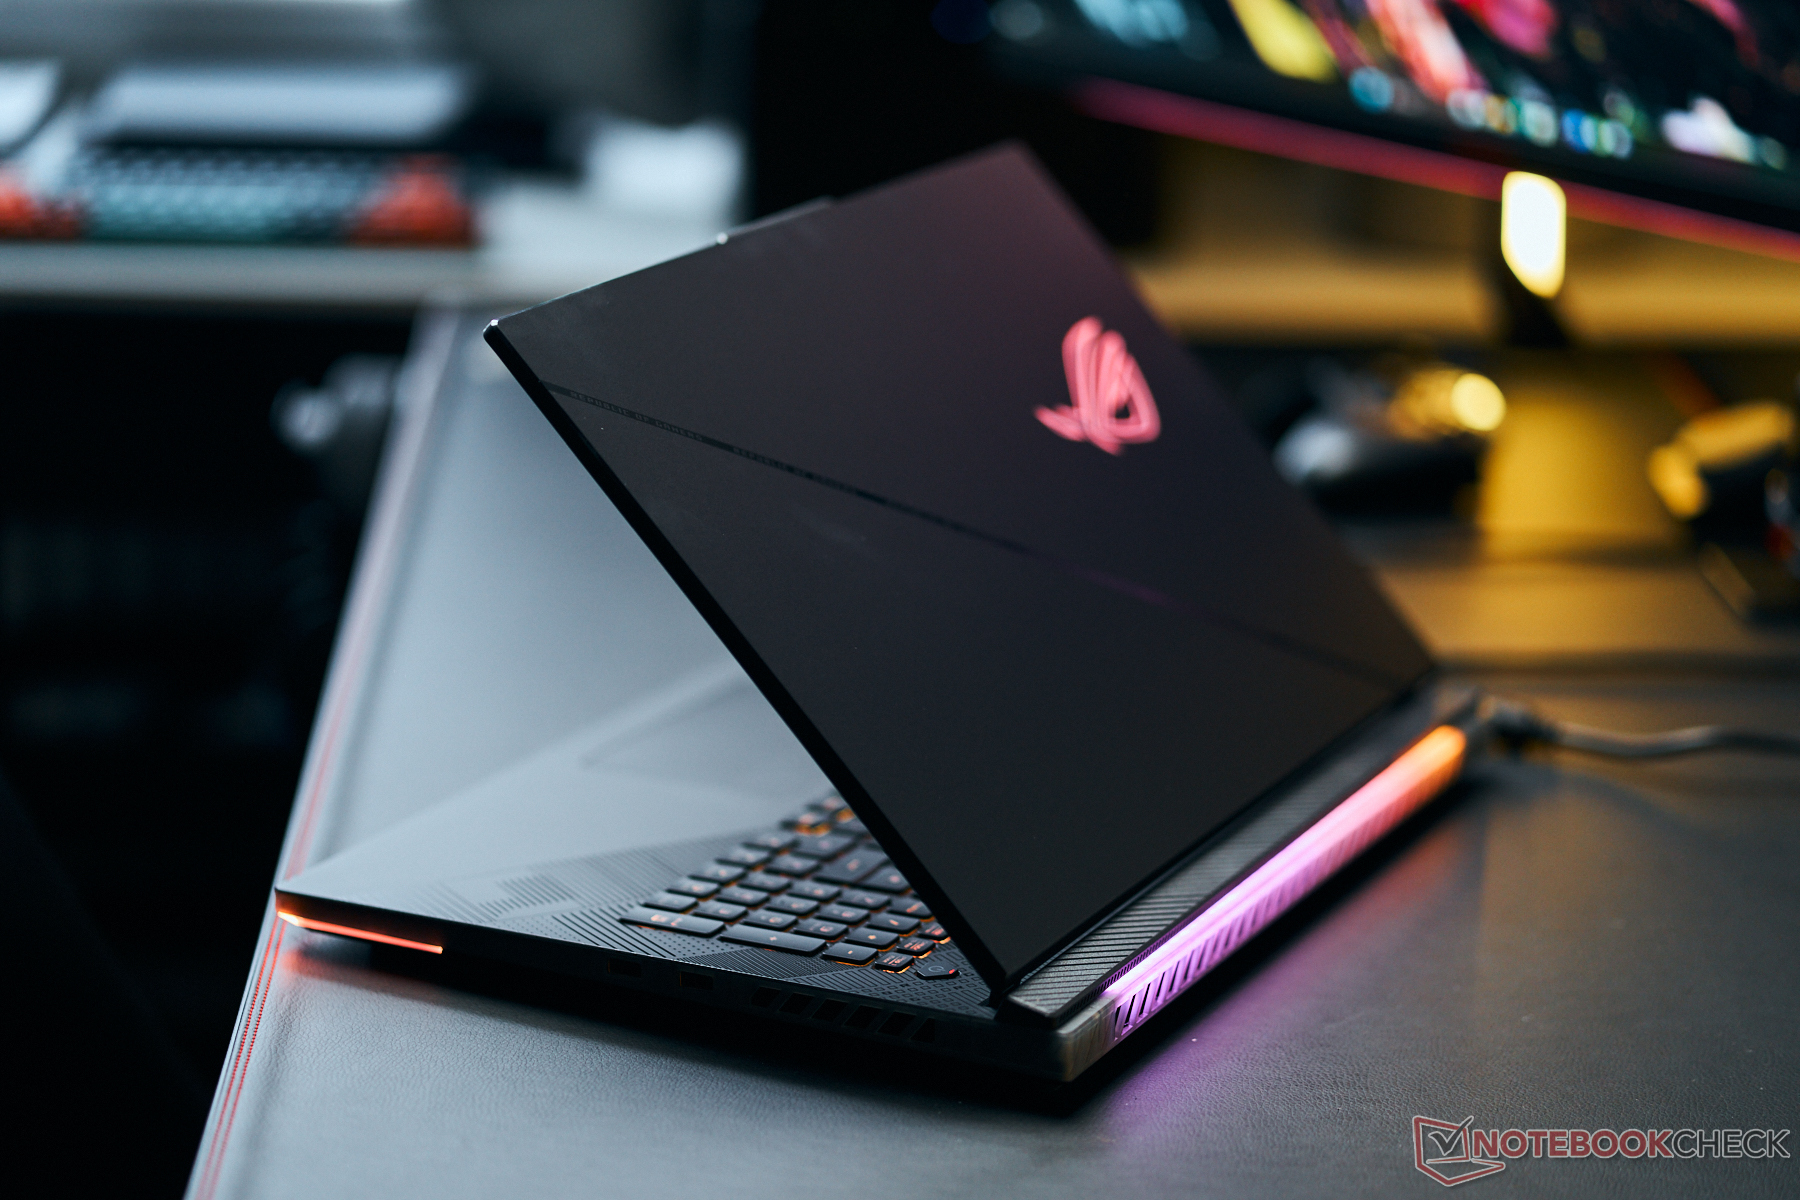
Trotz eines stolzen Preisniveaus hält sich der Einsatz von hochwertigen Baumaterialien in Grenzen: Lediglich die Deckelrückseite des Scar ist aus Aluminium gefertigt, die übrigen Komponenten aus Kunststoff. Letzterer ist teilweise (oberhalb der Tastatur, schmale Seiten) lichtdurchlässig angelegt. Für farbliche Auflockerung des schwarzen Chassis sorgen LED-Bänder an der Vorder- und Rückseite sowie ein beleuchtetes Logo auf der Deckelrückseite.
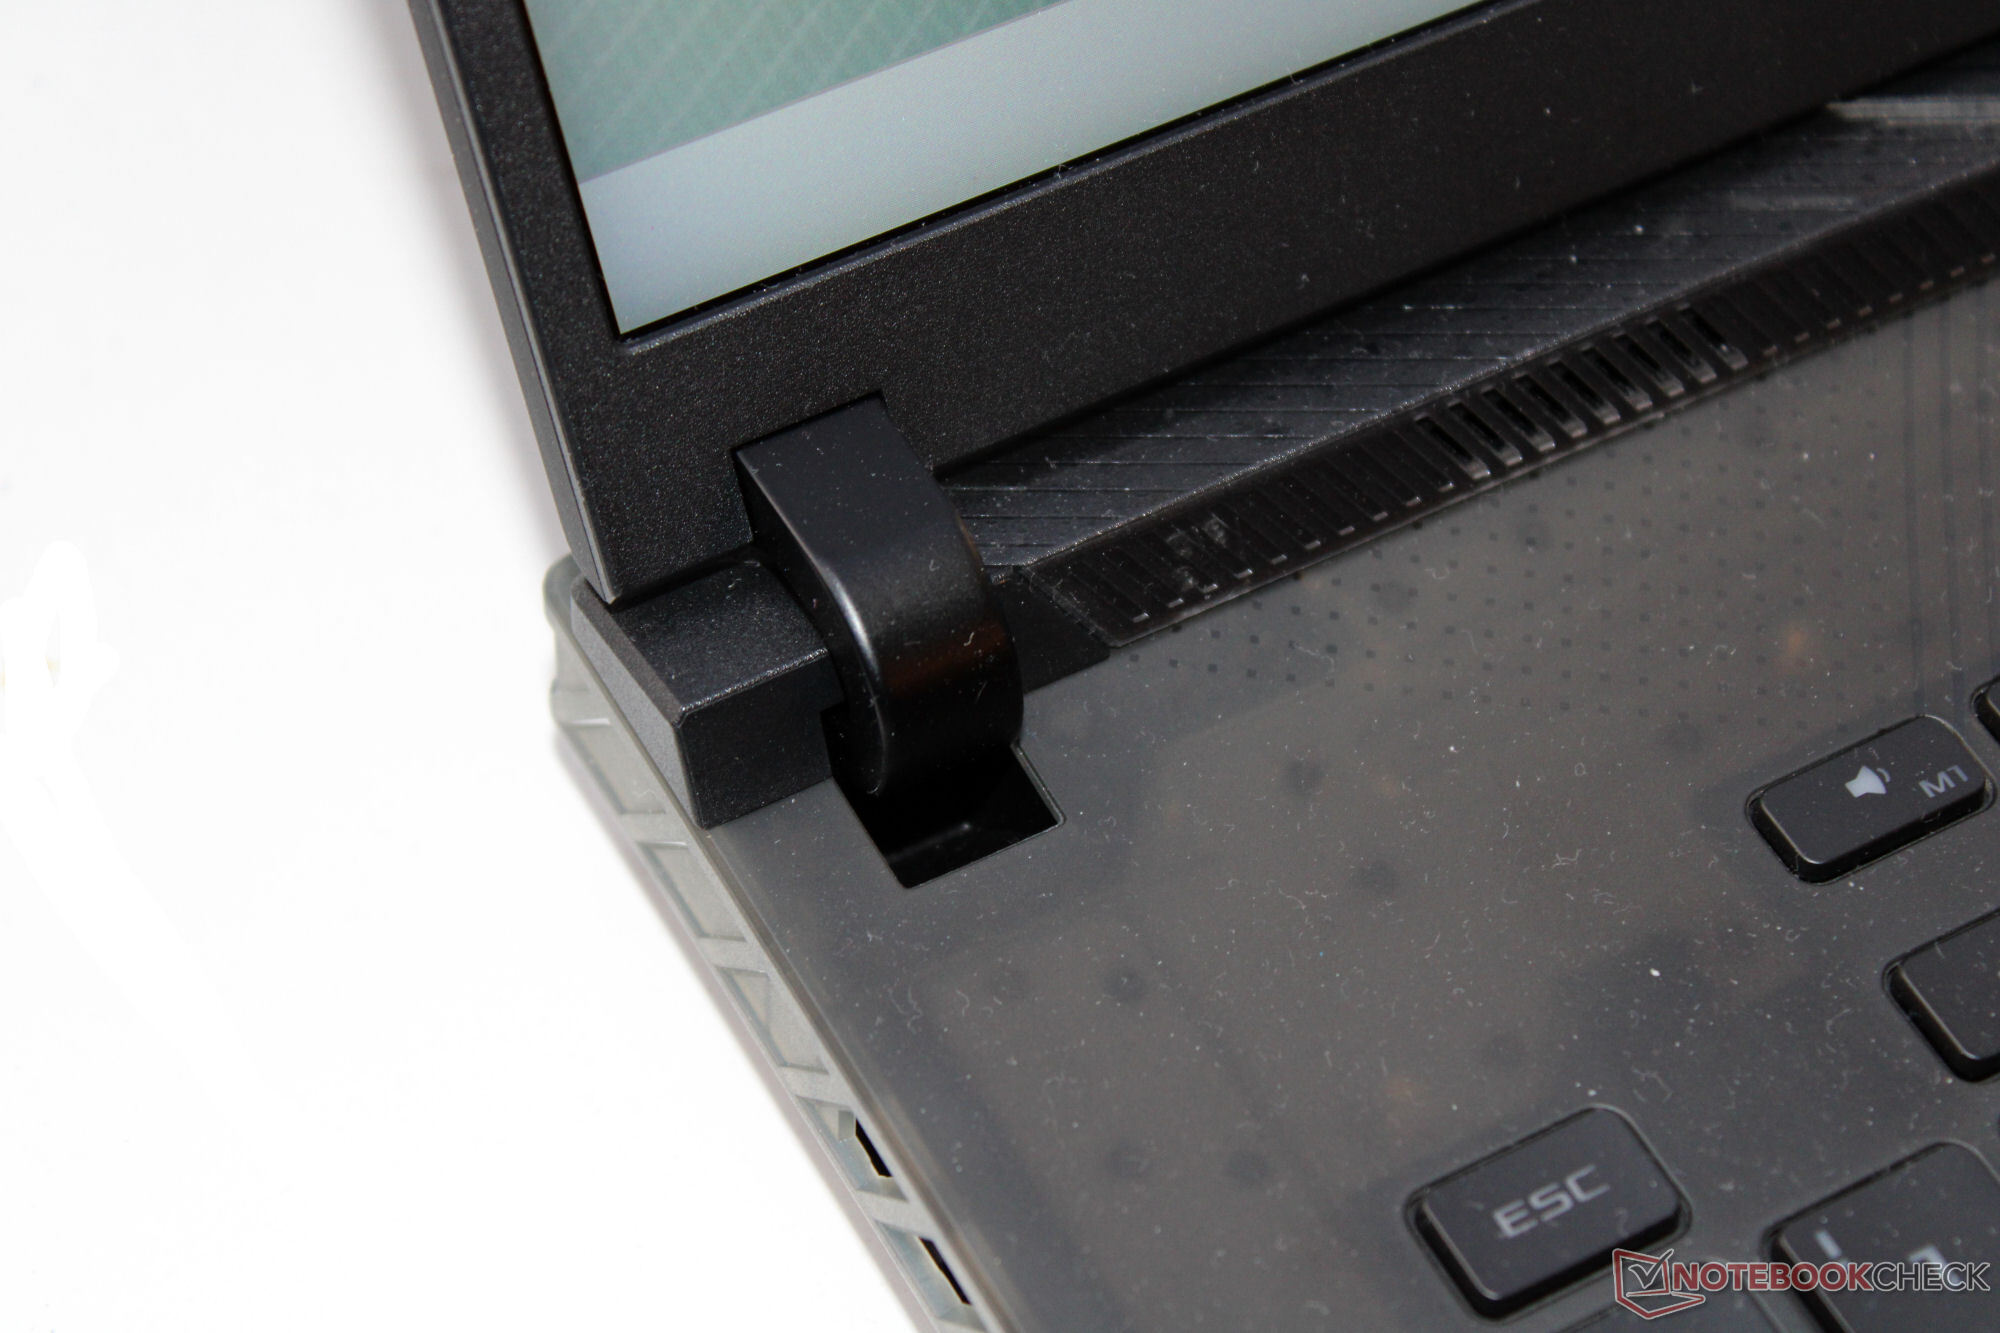
Verarbeitungsmängel fallen nicht ins Auge, die Spaltmaße stimmen. Der Deckel kann nur in geringem Maße verdreht werden, die Baseunit etwas zu deutlich. Ein mehrere tausend Euro teurer Laptop muss hier mehr bieten. Druck auf die Deckelrückseite bewirkt keine Bildveränderungen. Die Scharniere halten den Deckel fest in Position, wippen aber etwas nach. Der maximale Öffnungswinkel beträgt 130 Grad. Eine Ein-Hand-Öffnung ist möglich.
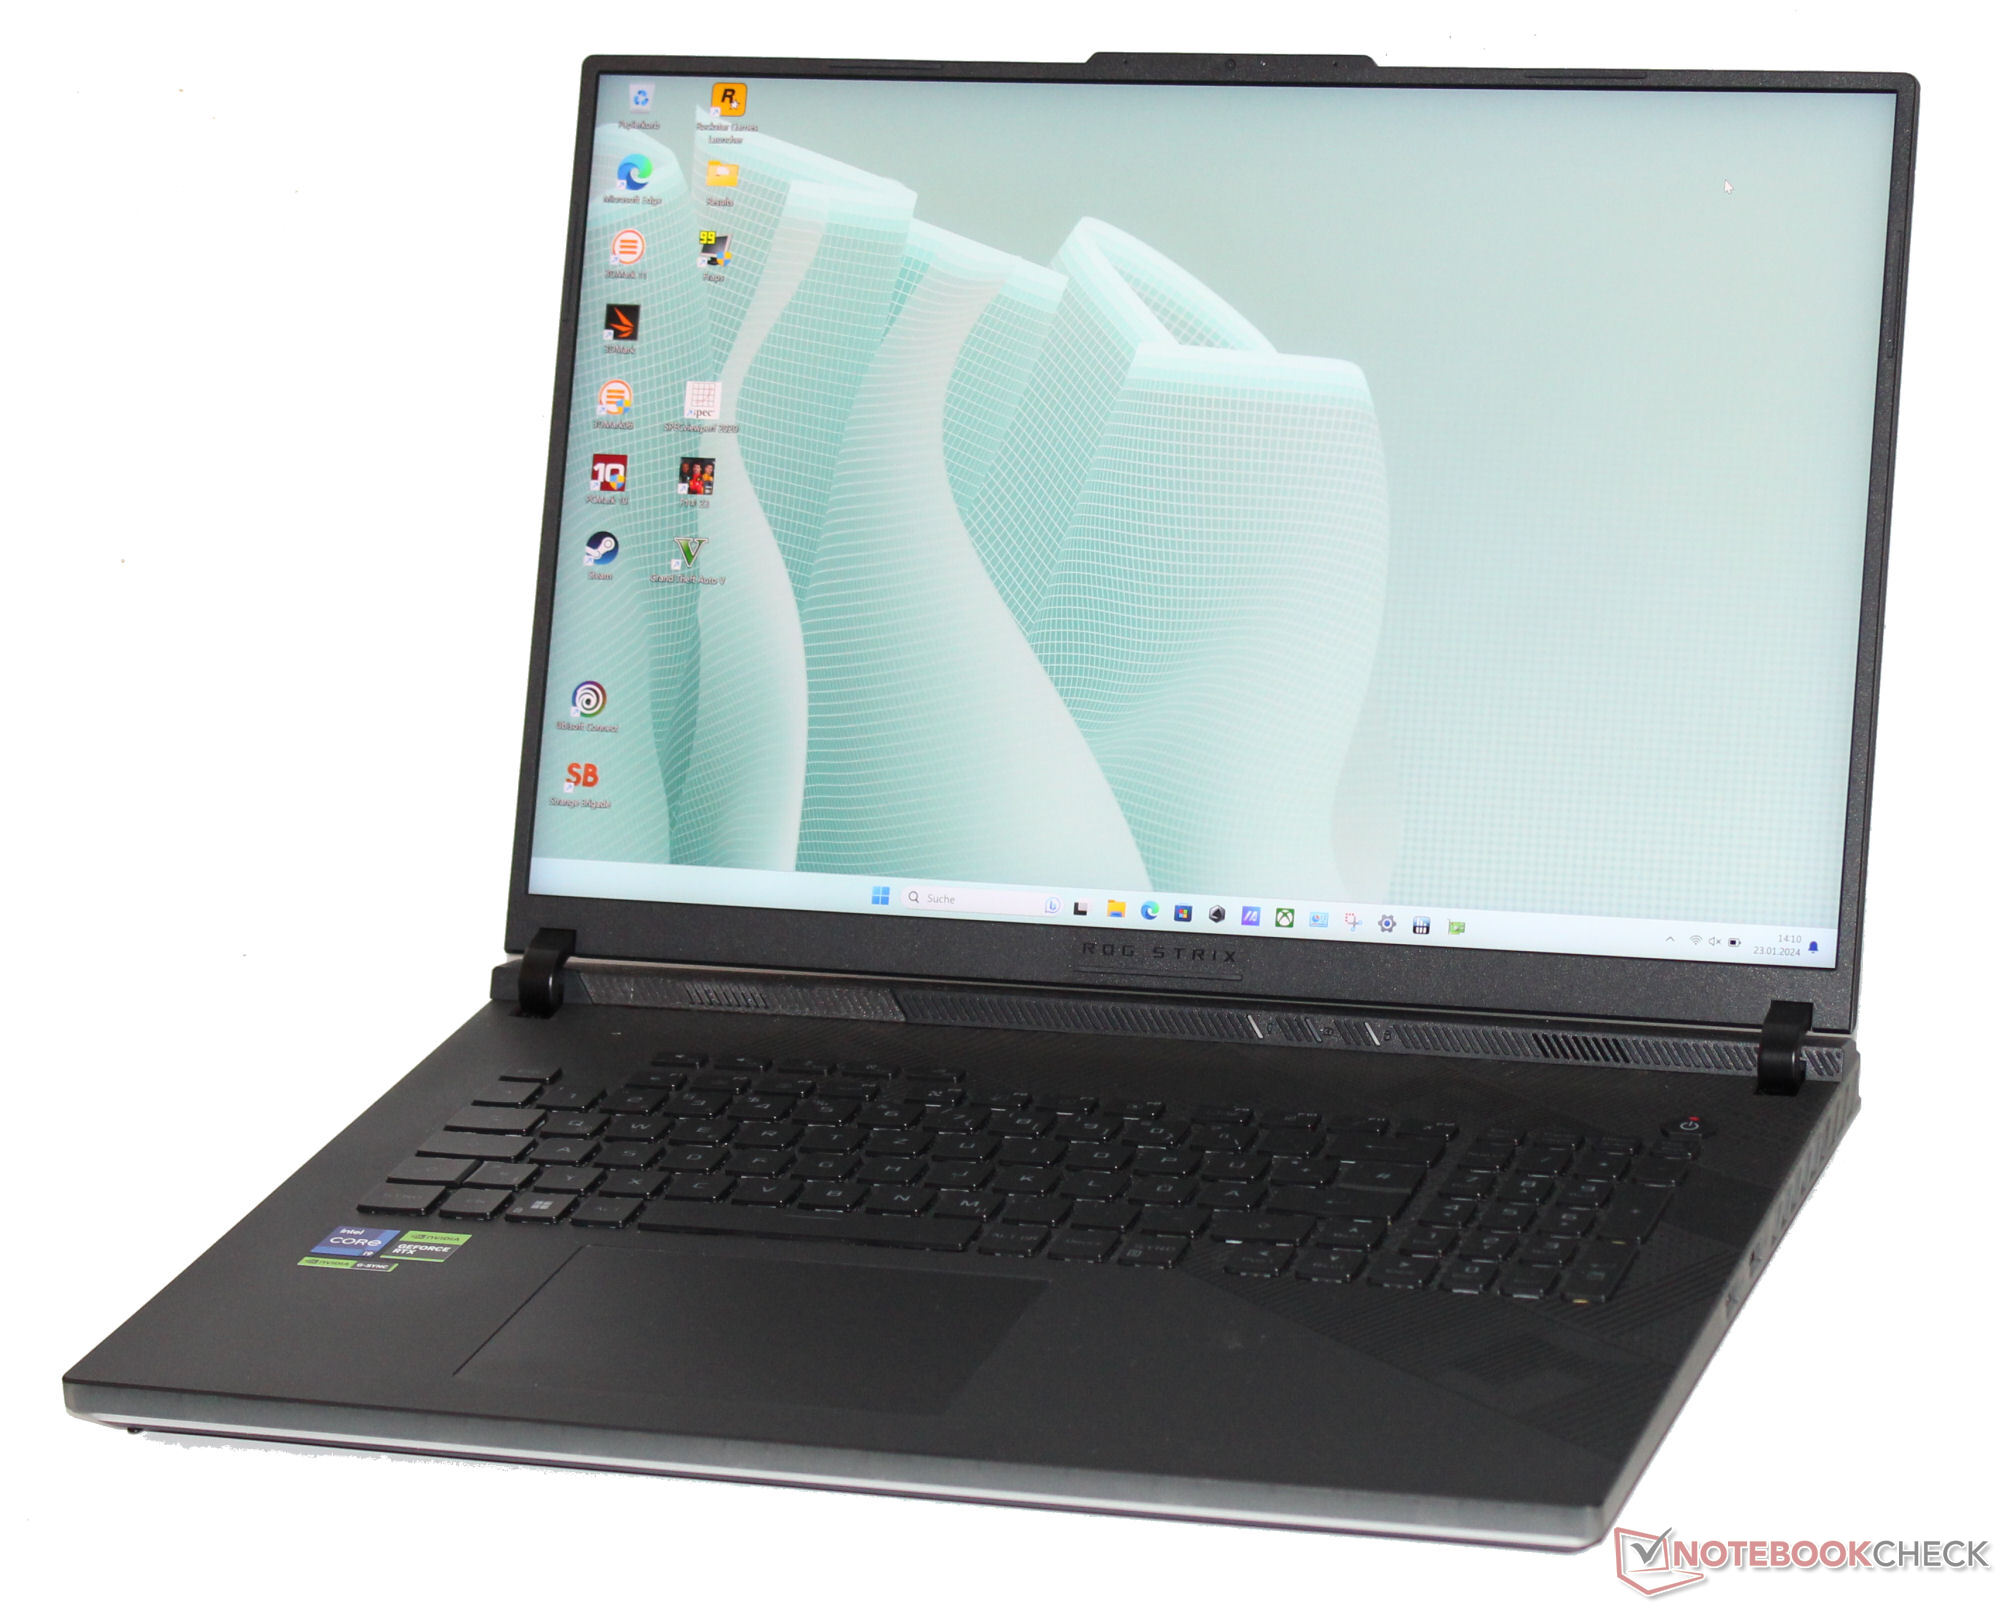
Innerhalb des Vergleichsfeldes stellt das Scar 18 eines der kompaktesten, leichtesten Geräte dar und muss sich nur dem Blade 18 geschlagen geben.
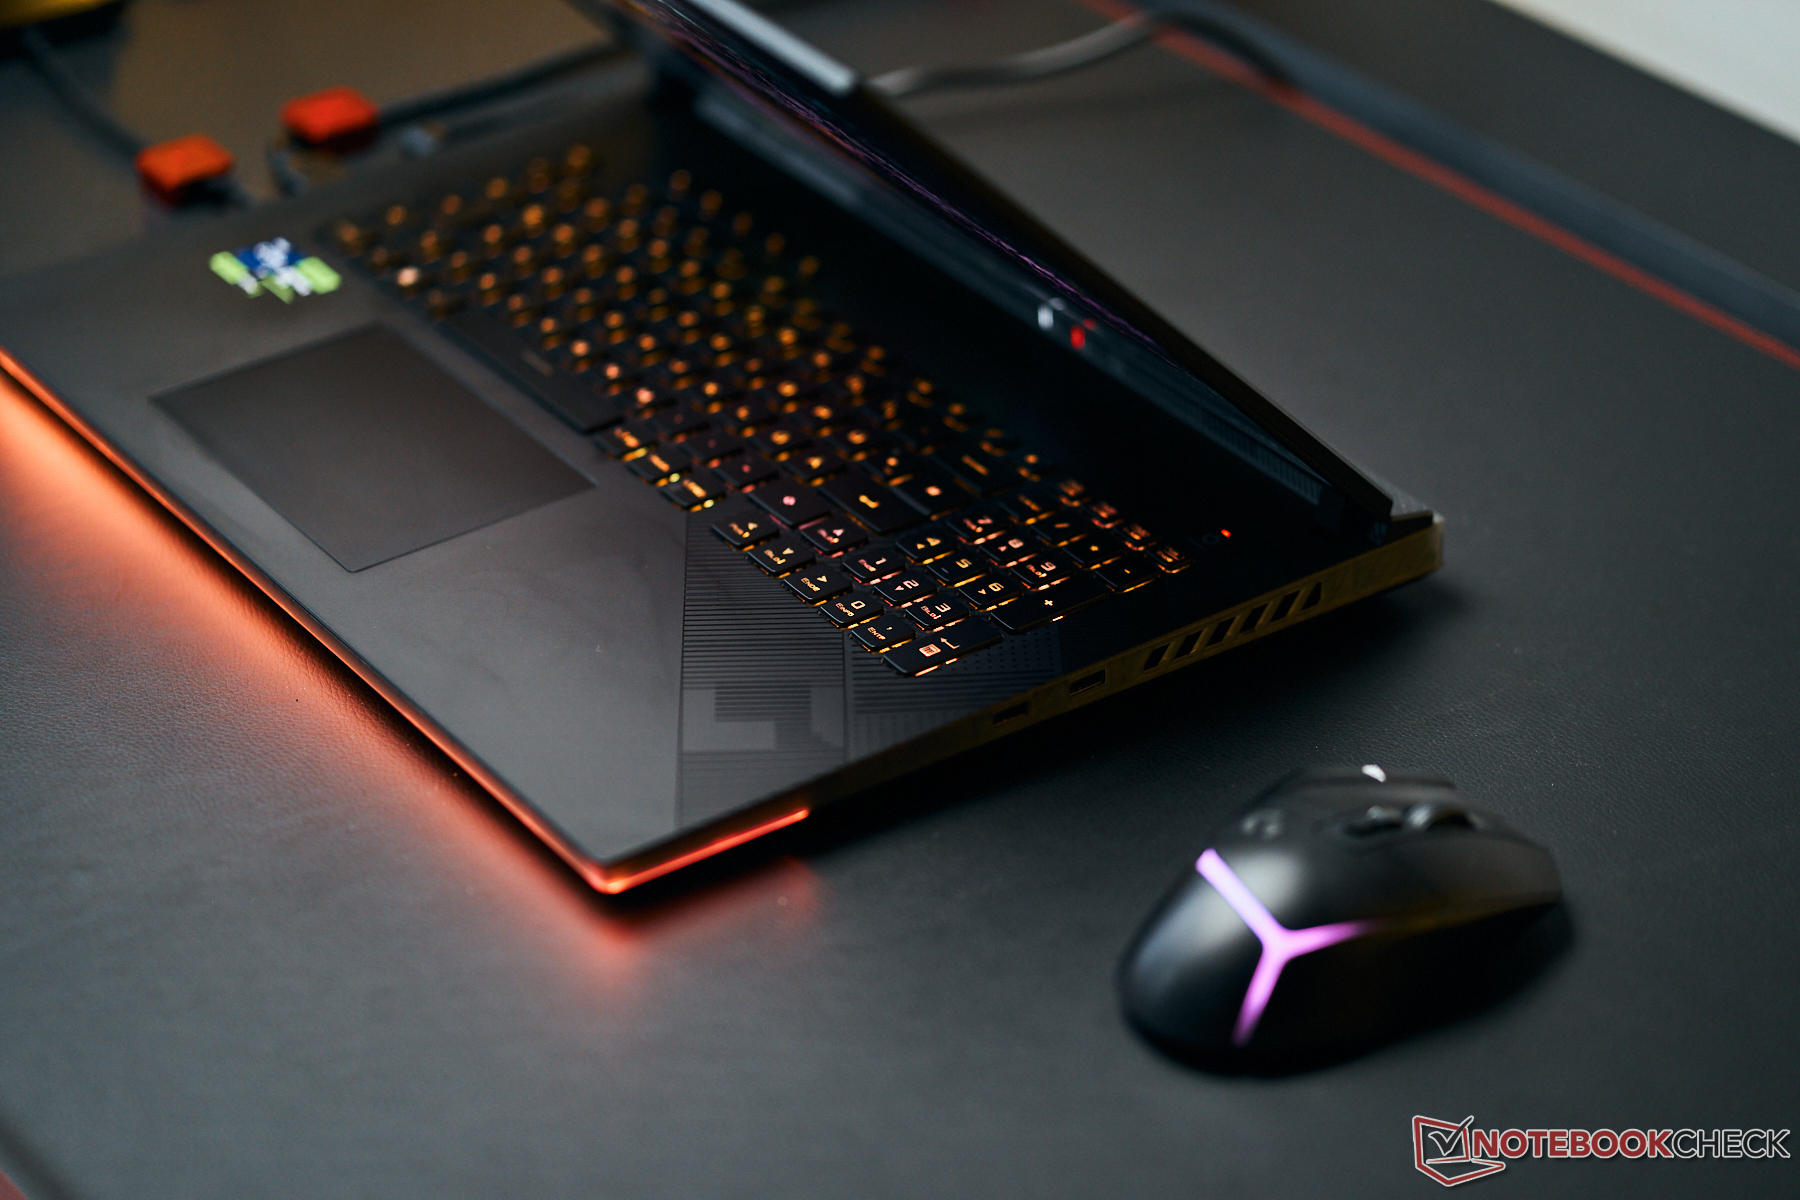
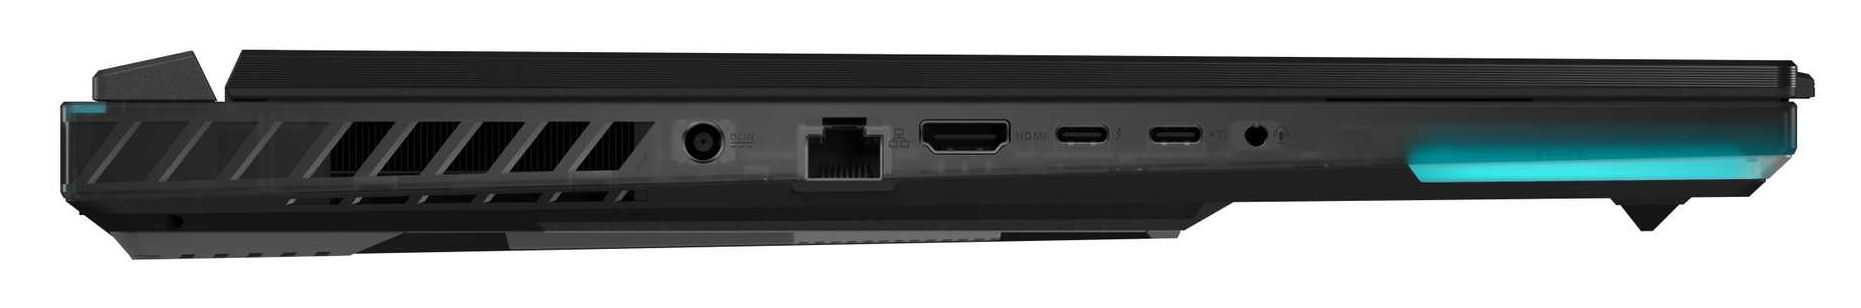
Ausstattung - Asus Strix bietet Thunderbolt 4
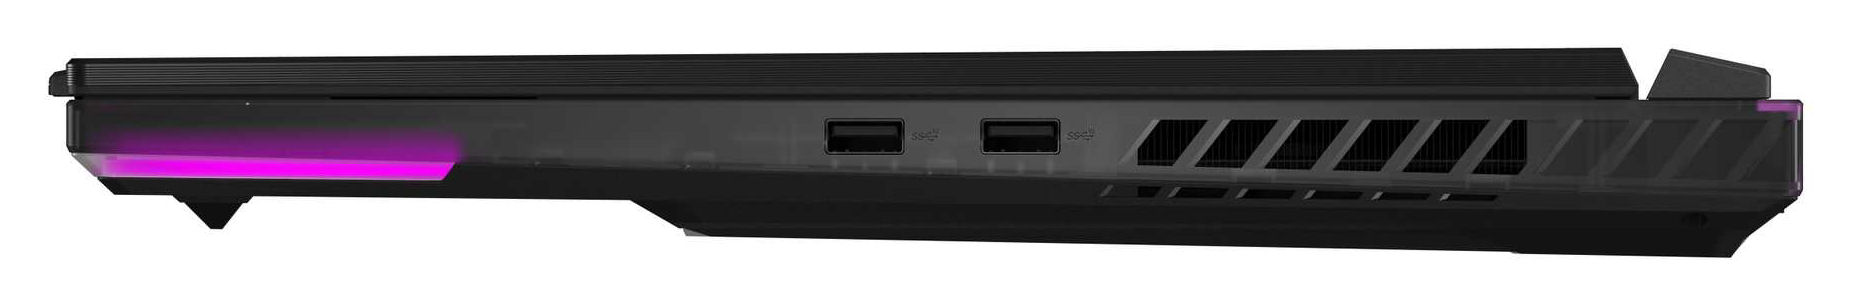
Das Asus Notebook hält zwei USB-A-Buchsen (USB 3.2 Gen 2) und zwei USB-C-Ports (1x Thunderbolt 4, 1x USB 3.2 Gen 2) bereit. Beide USB-C-Ausgänge können ein Displayport-Signal ausgeben, der USB-3.2-Gen-2-Port unterstützt zudem Power Delivery. Ein HDMI-Ausgang, eine Audiobuchse und ein Gigabit-Ethernet-Port runden das Angebot ab. Einen Speicherkartenleser hat der Rechner nicht an Bord.
Die Rückseite des Laptops beherbergt keine Ports. Die Anschlüsse verteilen sich auf die rechte und linke Gehäuseseite. Nach hinten weggeführte Kabel blockieren teilweise die seitlichen Luftauslässe des Notebooks - das ist beispielsweise beim Netzkabel (gewinkelter Stecker) der Fall. Rechtshänder dürften sich an den lediglich rechtsseitig angebrachten USB-A-Ports stören.
Kommunikation
Unter optimalen Bedingungen (keine WiFi-Geräte in der näheren Umgebung, geringer Abstand zwischen Laptop und Server-PC) werden gute bis sehr gute WiFi-Datenraten erreicht. Das Strix nutzt einen WiFi-6E-Chip (Intel AX211). Drahtgebundene Verbindungen wickelt ein Controller (RTL8125; 2,5 GBit/s) der Firma Realtek ab.
Webcam
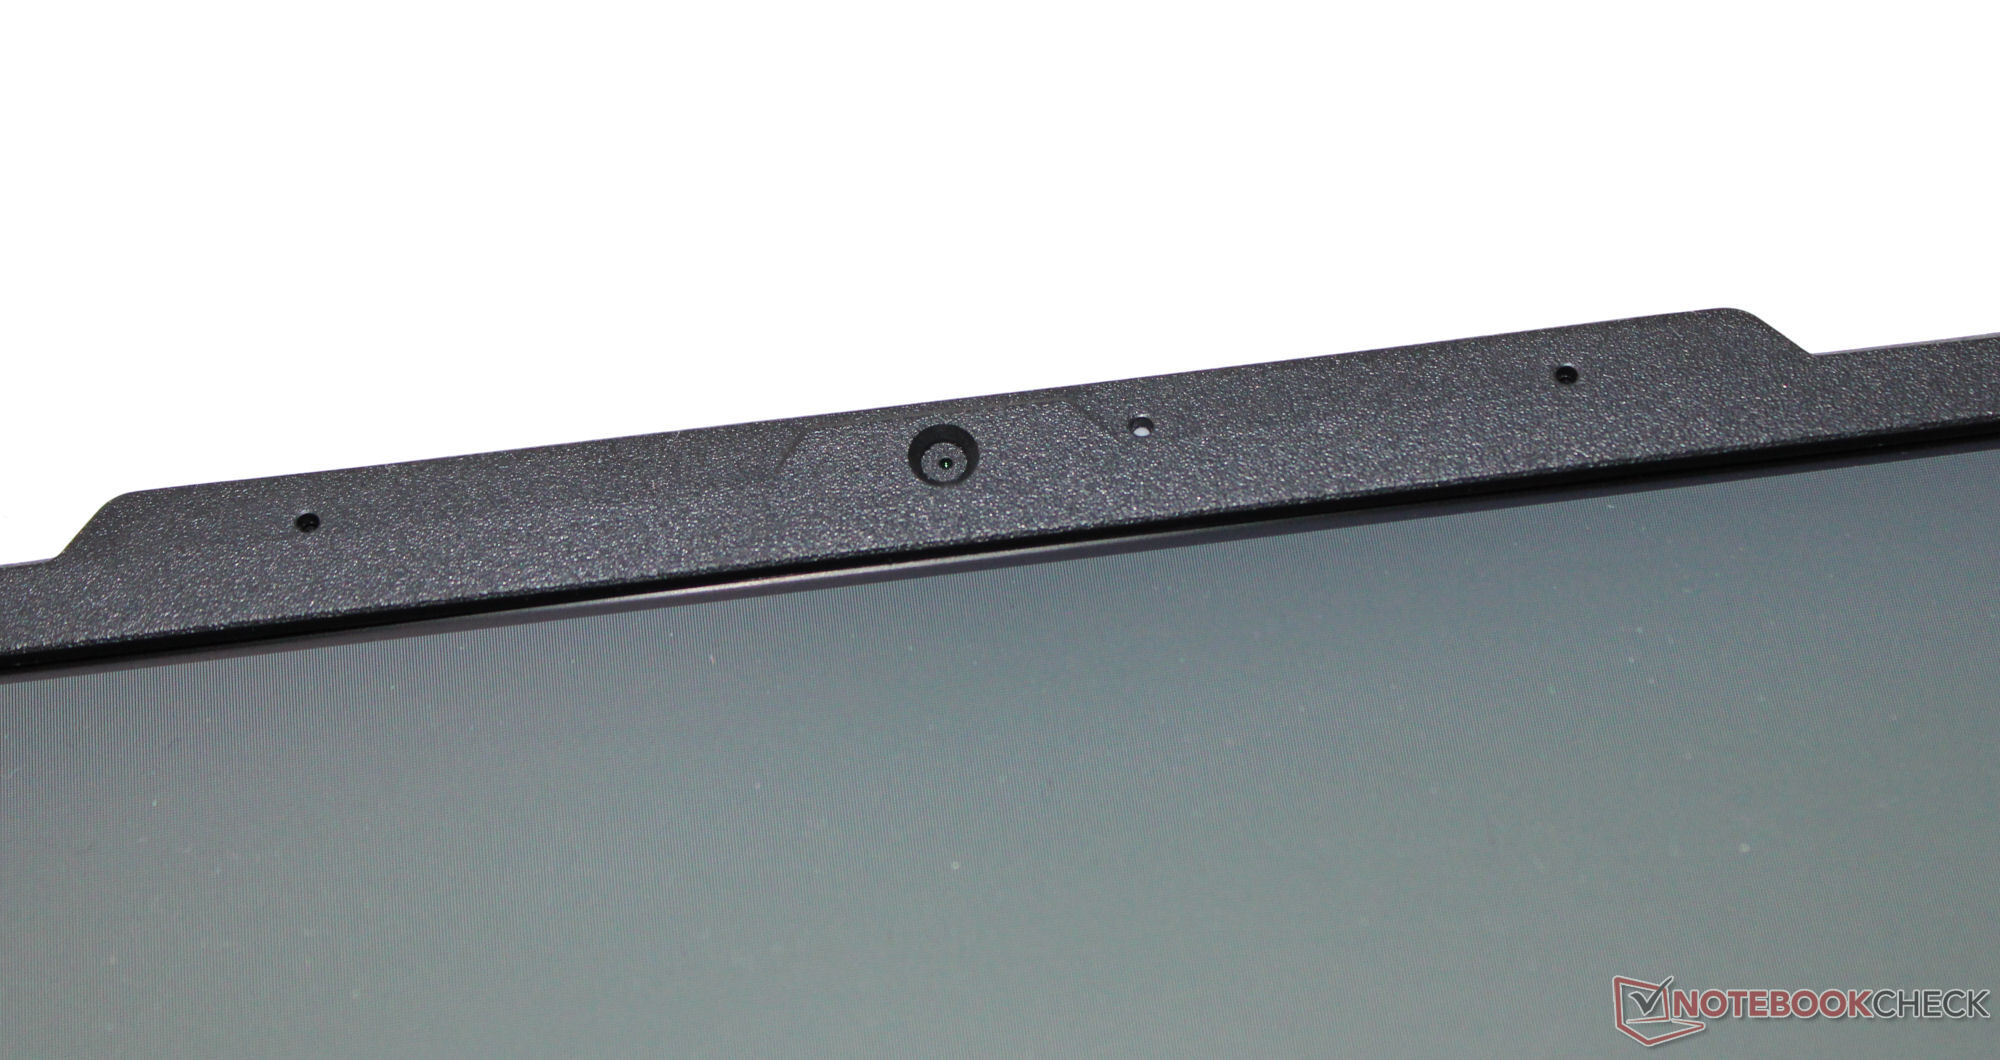
Asus setzt weitgehend auf Hardware aus dem oberen Regal, eine Ausnahme stellt die Webcam dar: Es kommt lediglich ein schnödes 0,9-MP-Modell (max. 1.280 x 720 Pixel) zum Einsatz. Qualitativ überzeugt sie nicht. Immerhin: Eine Farbabweichung von etwa 8 (Soll: DeltaE < 3) geht noch in Ordnung. Einen Verschluss bietet die Kamera nicht.

 GeForce RTX 4090 Laptop GPU, i9-14900HX, Samsung PM9A1a MZVL22T0HDLB")
 GeForce RTX 4090 Laptop GPU, i9-14900HX, Samsung PM9A1a MZVL22T0HDLB")
Zubehör
Neben den üblichen Dokumenten liegt dem Laptop kein weiteres Zubehör bei.
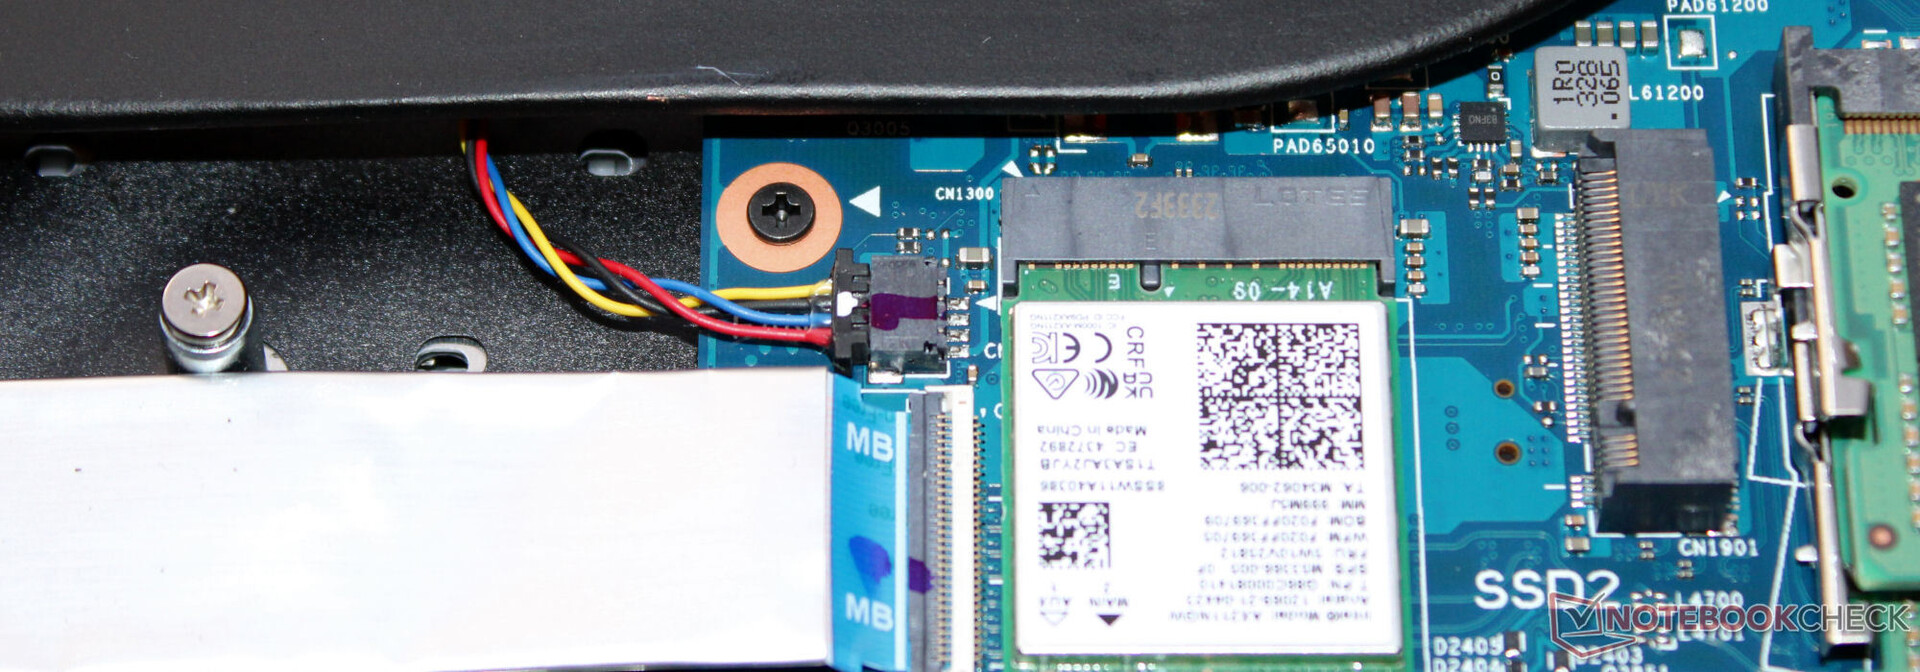
Wartung
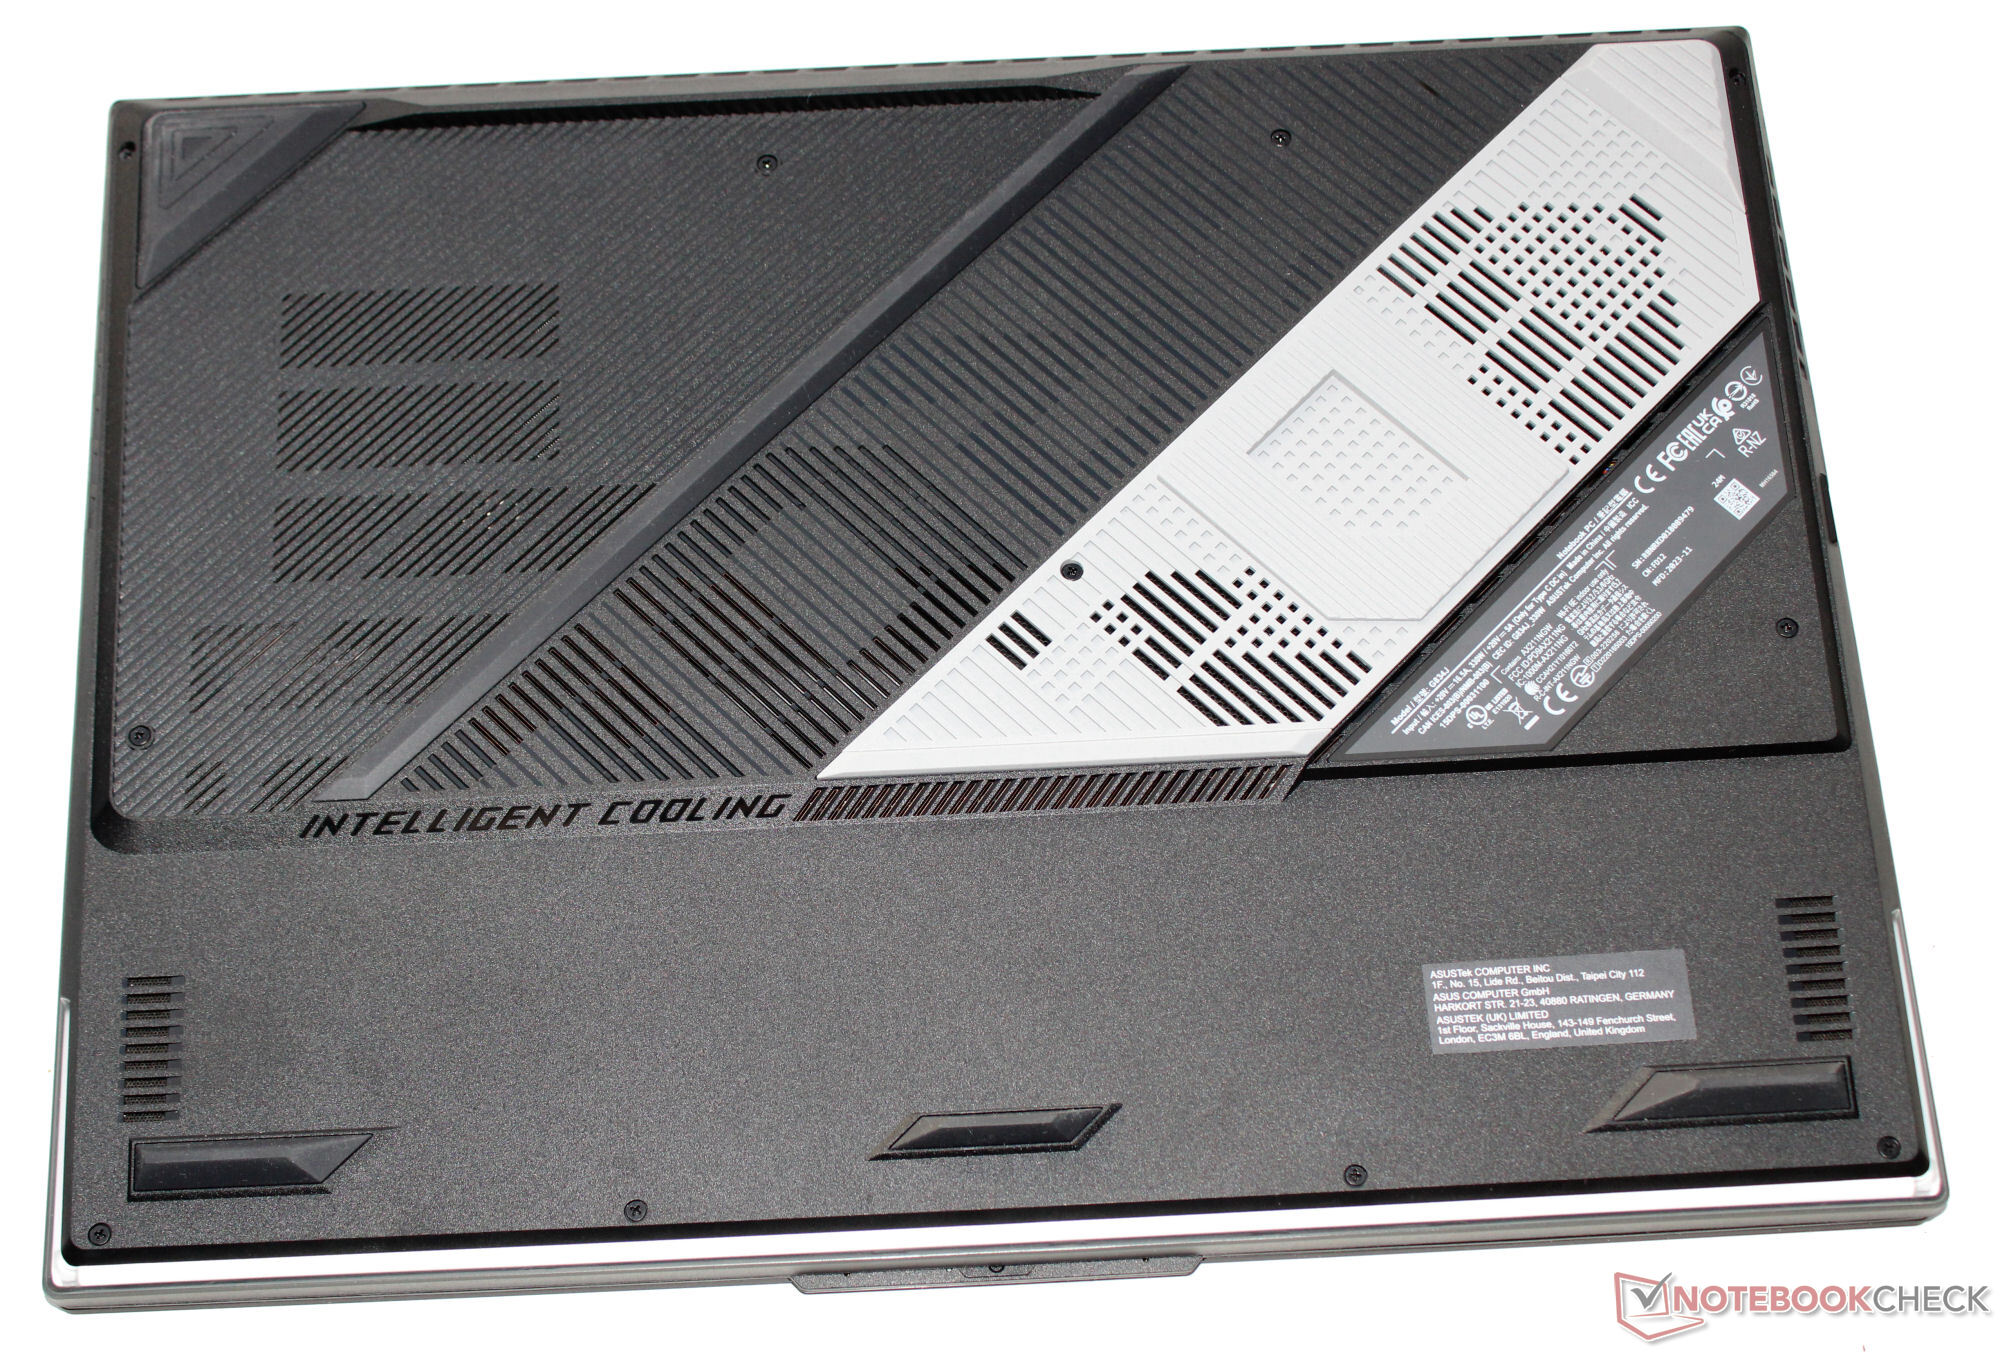
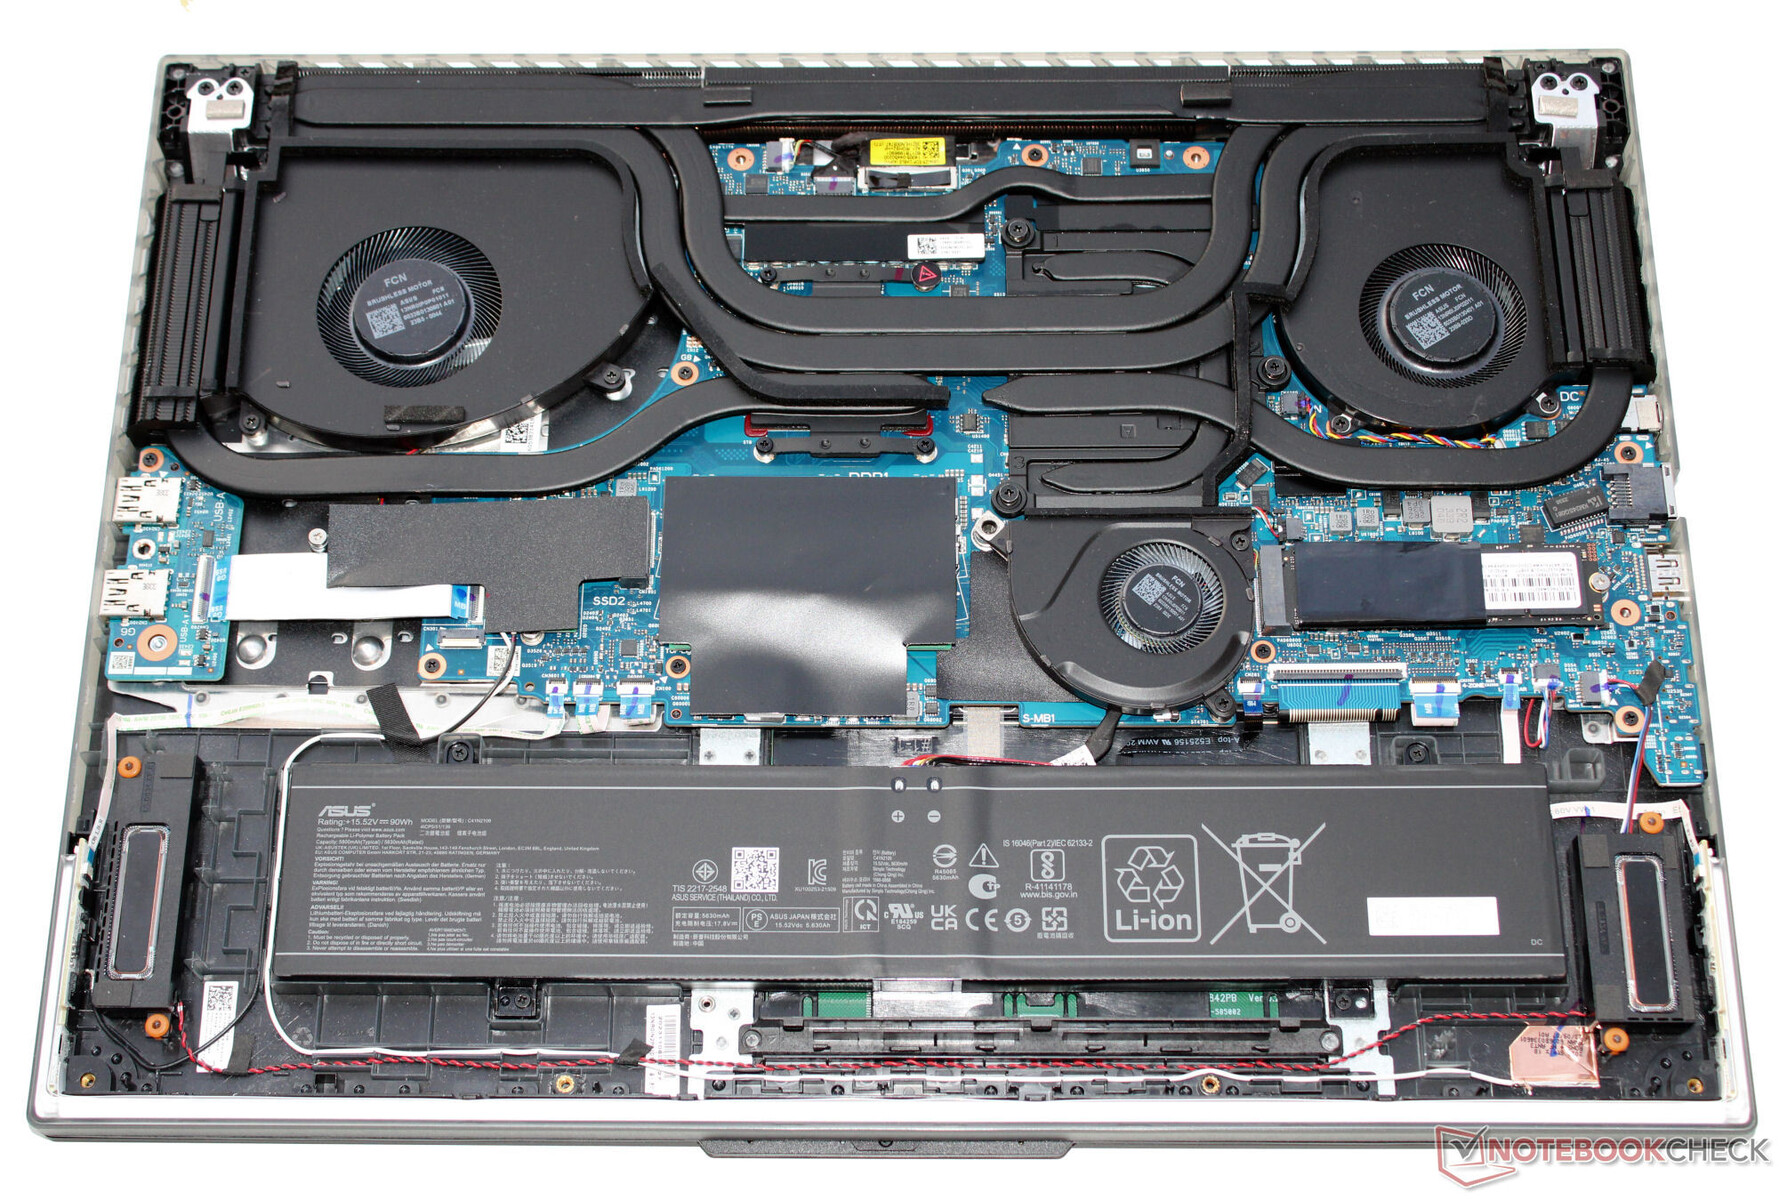
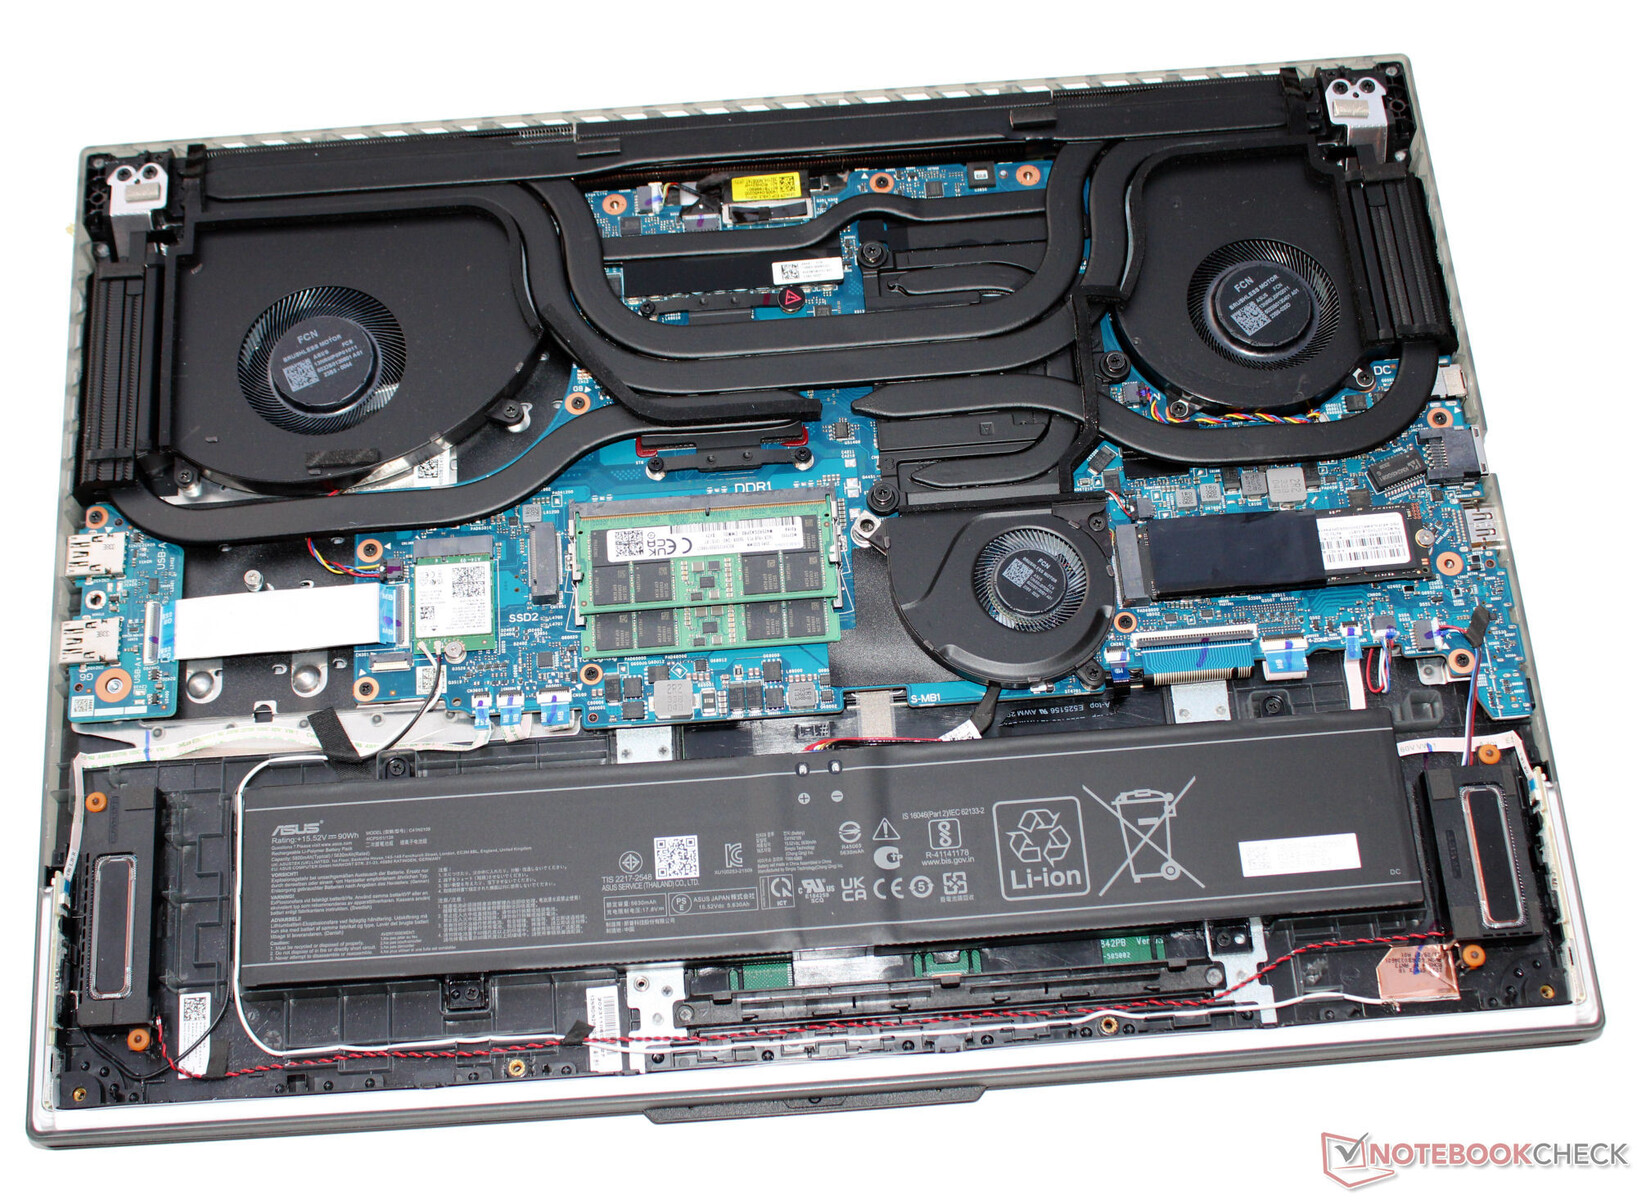
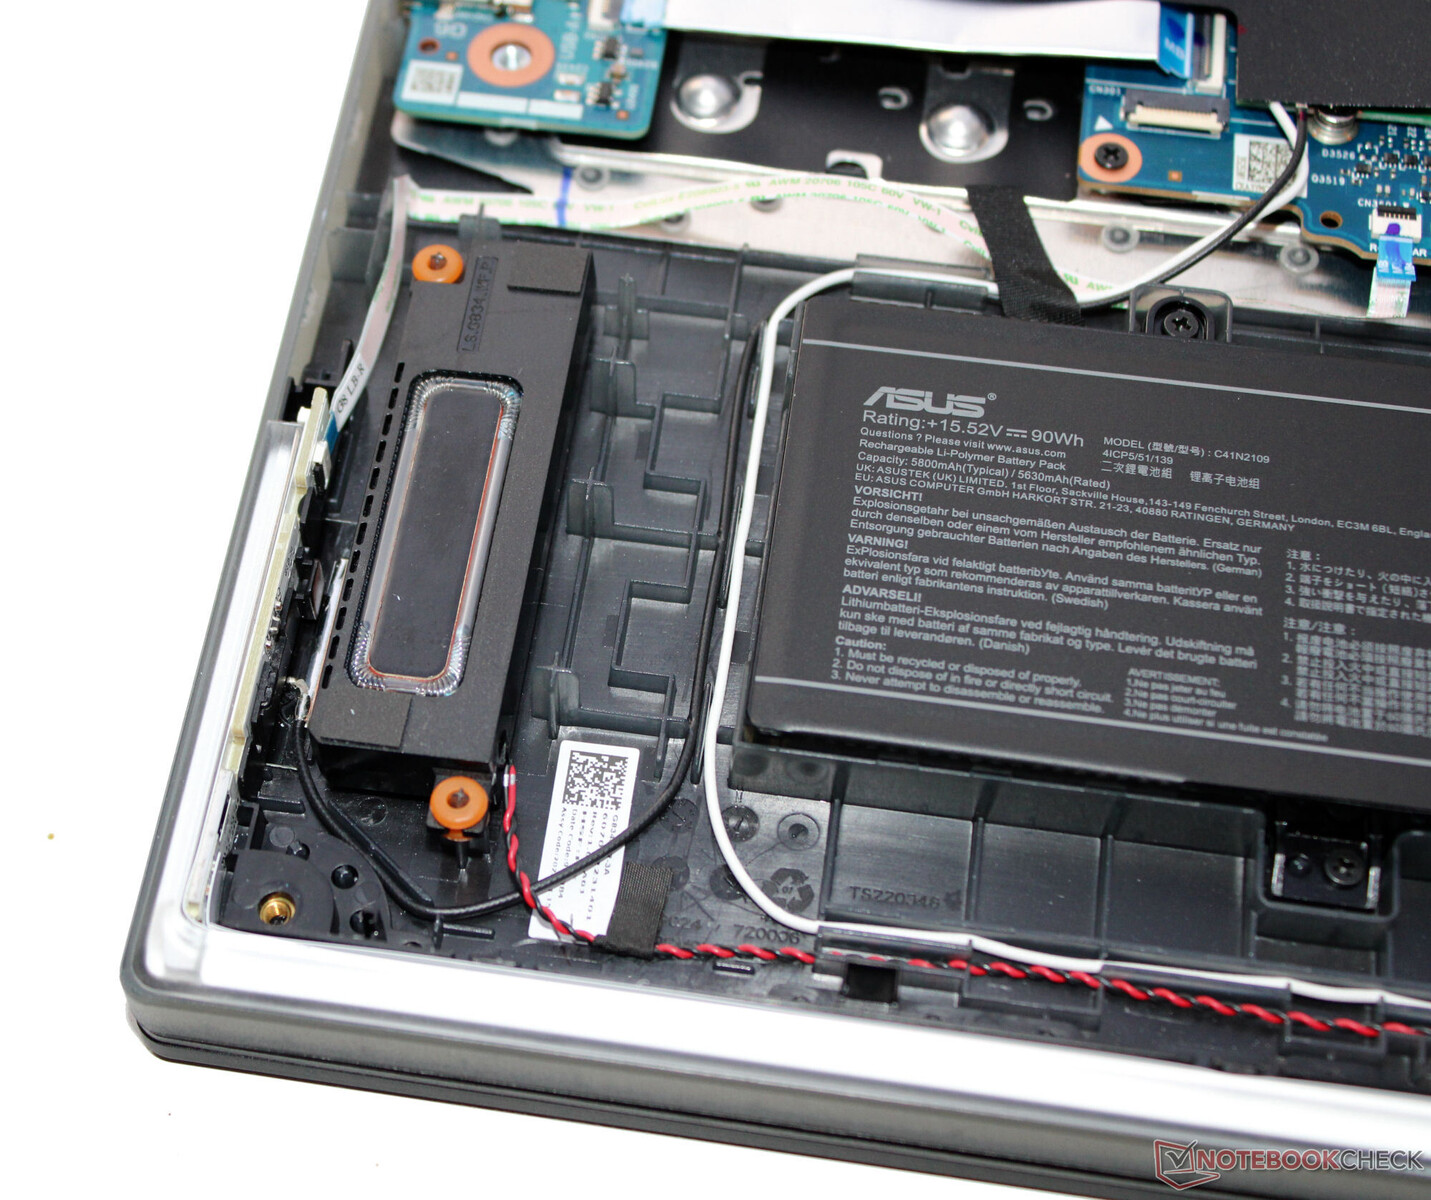
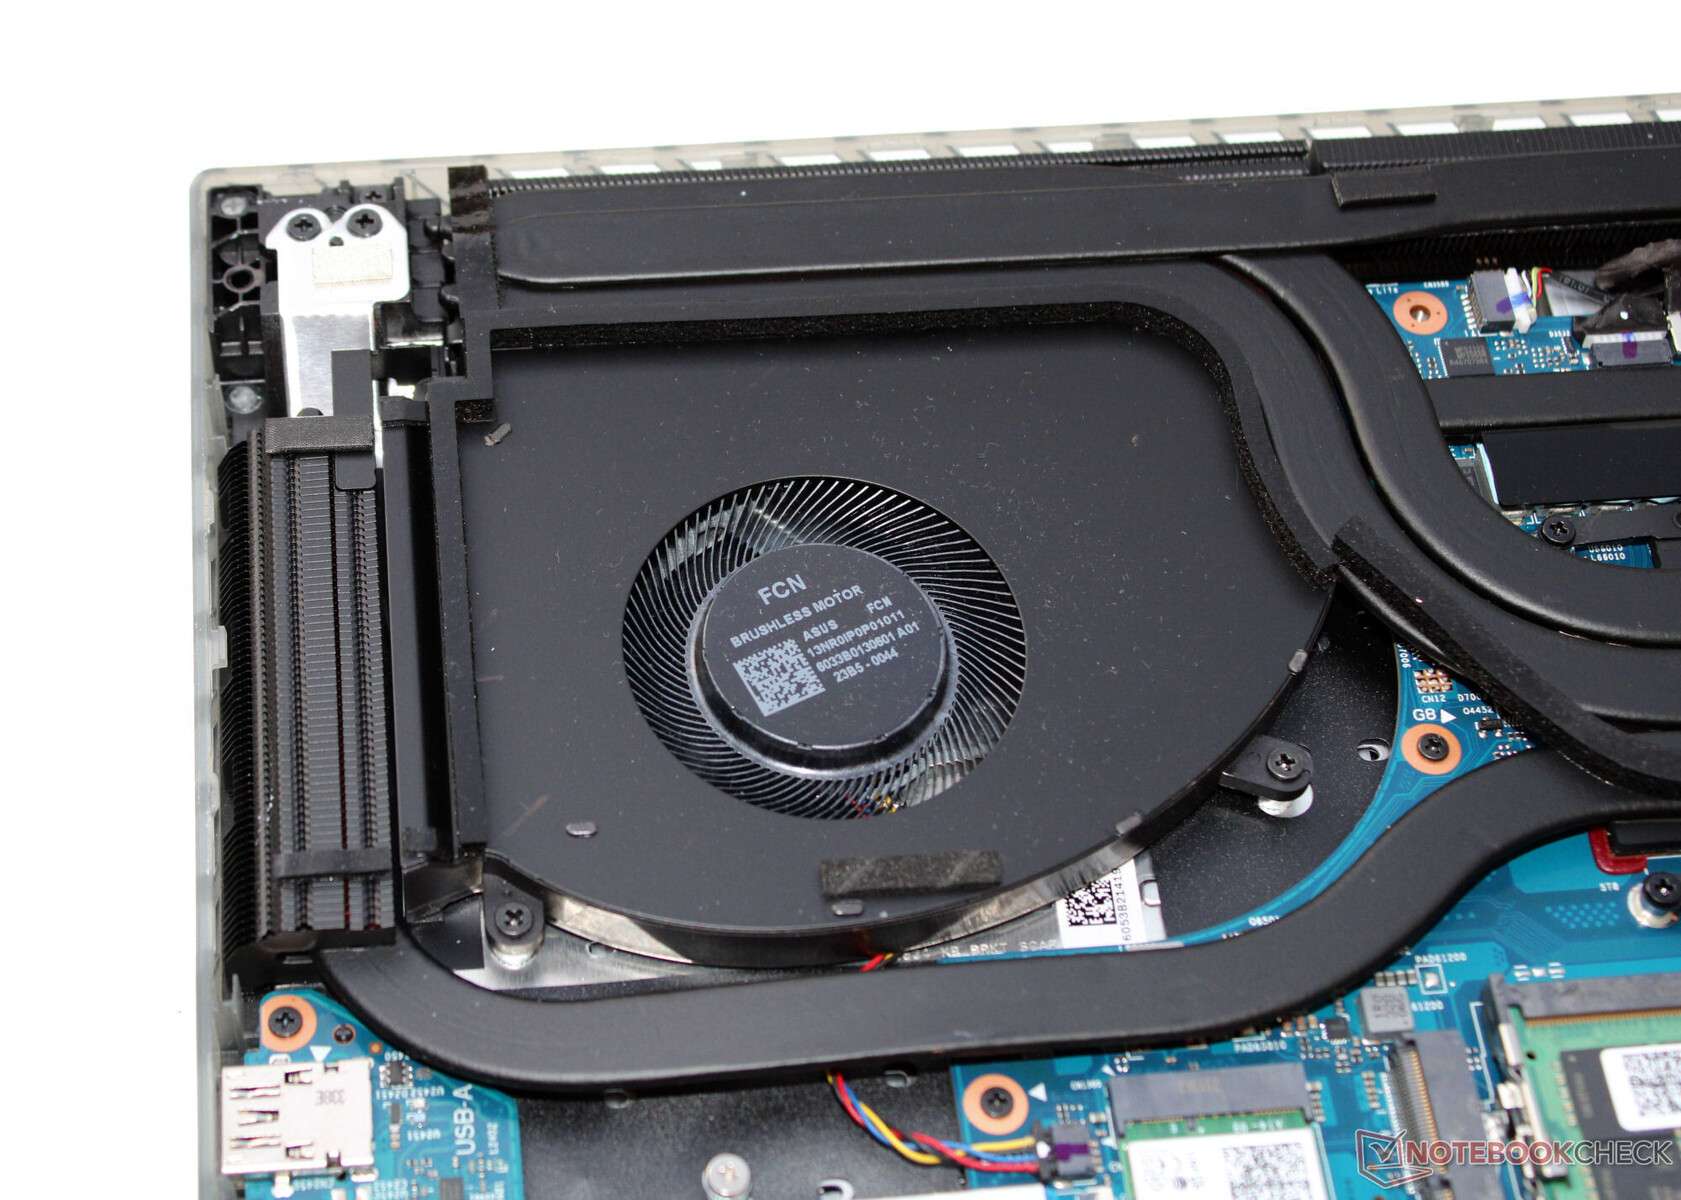
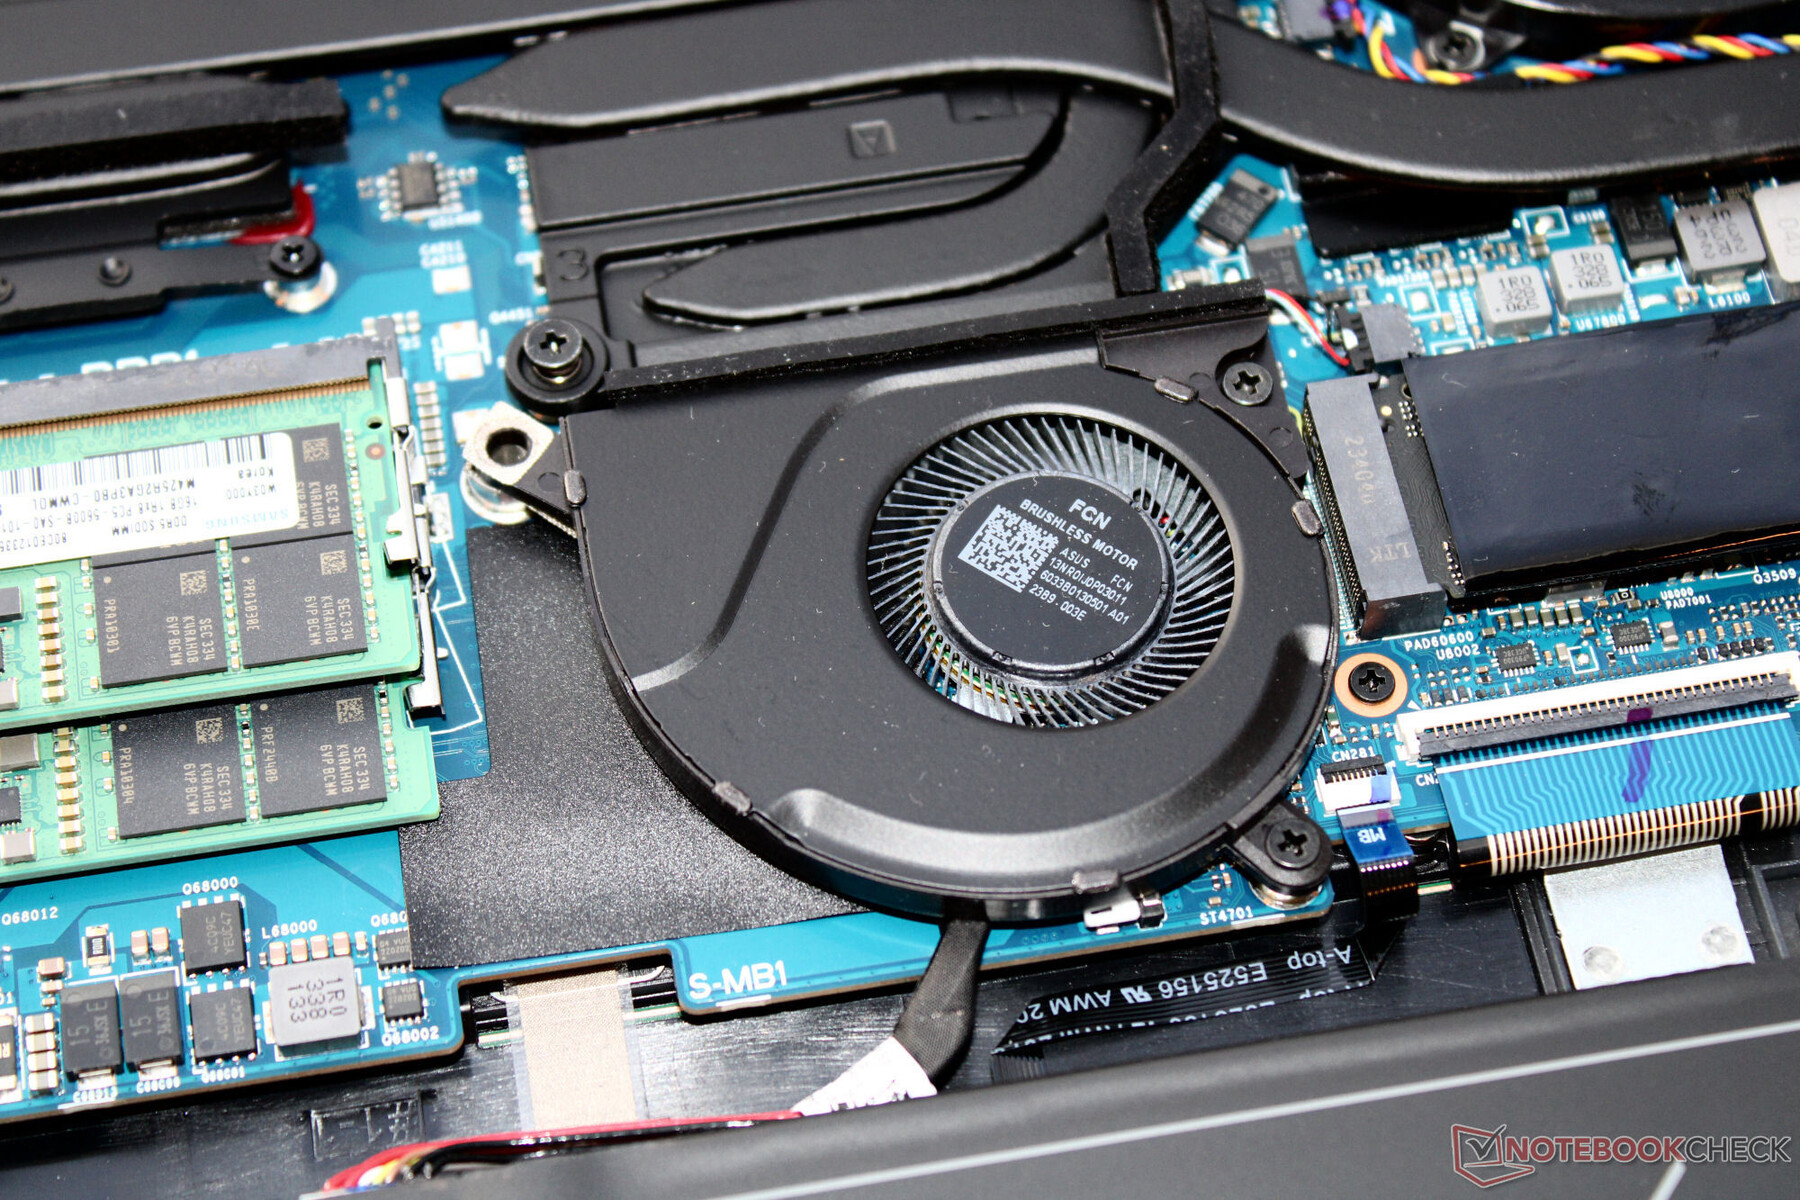
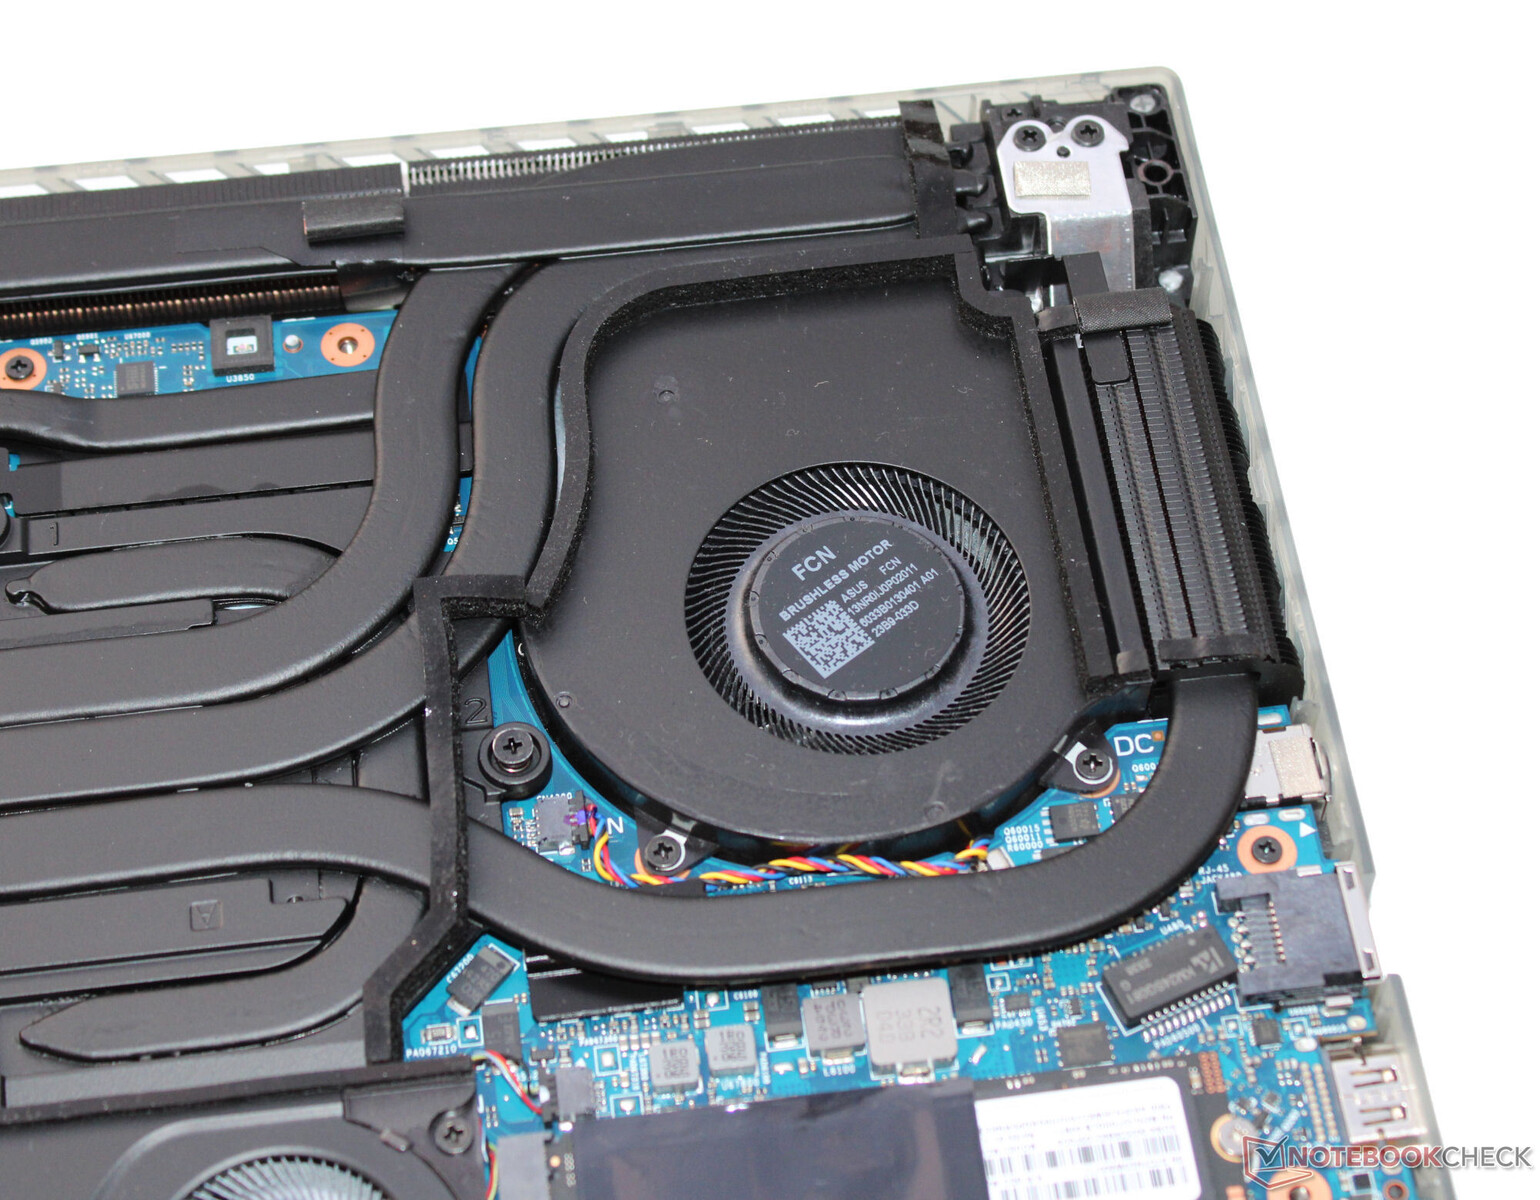
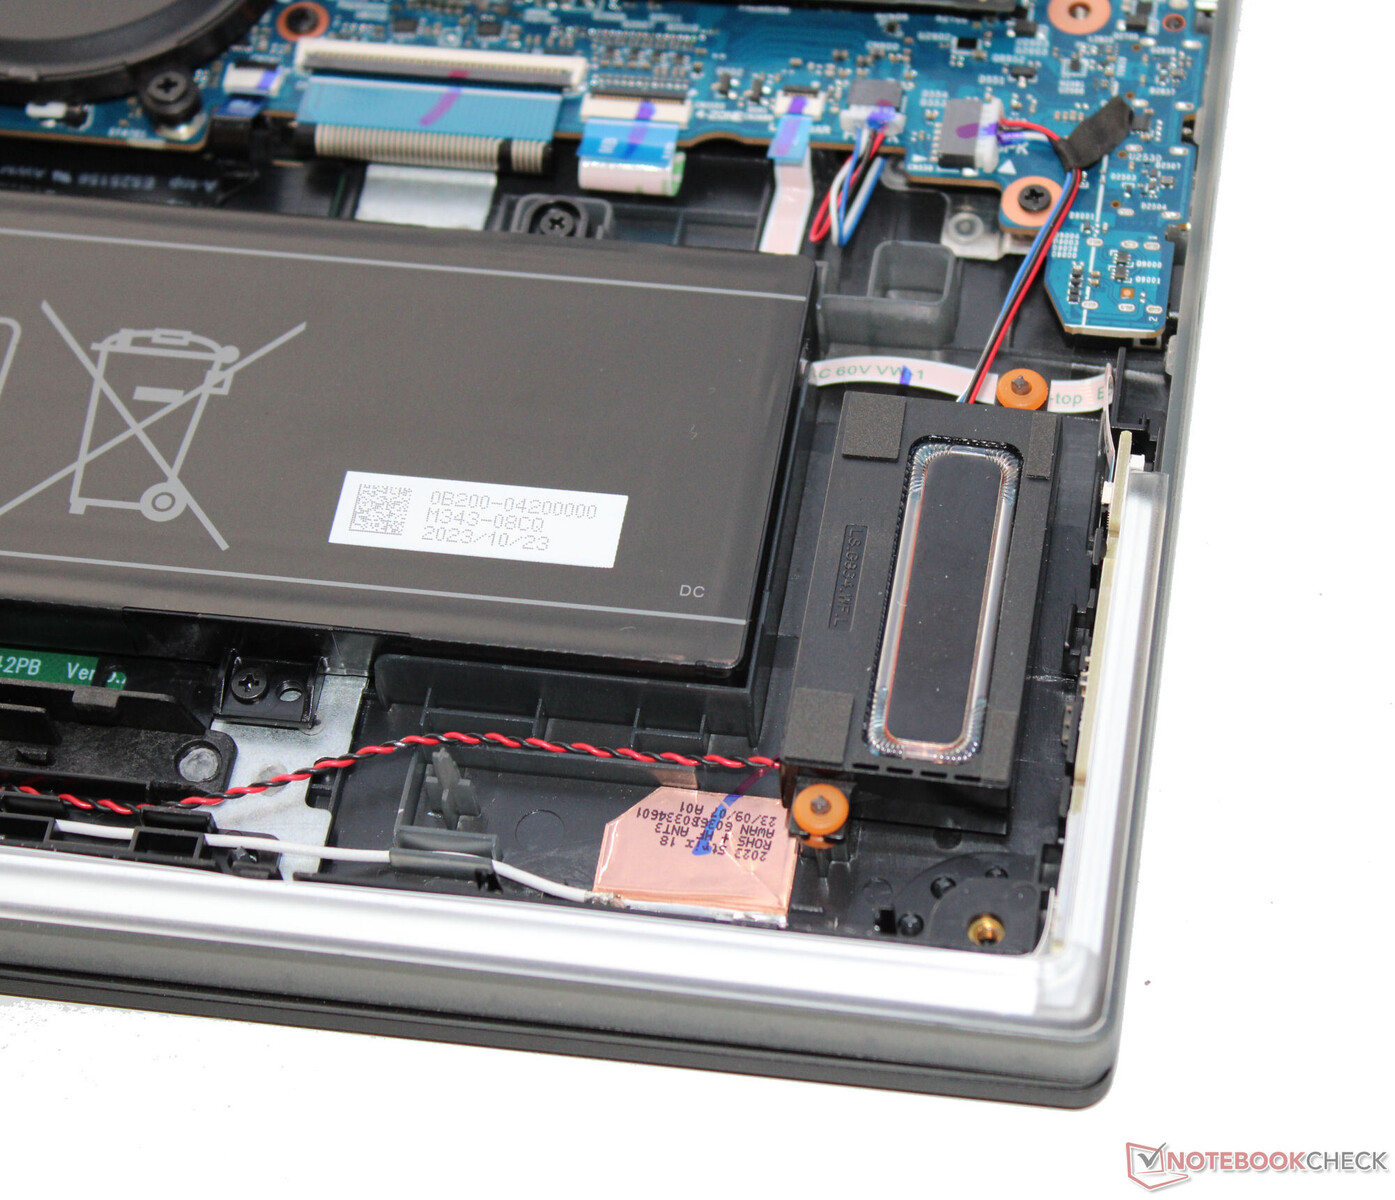
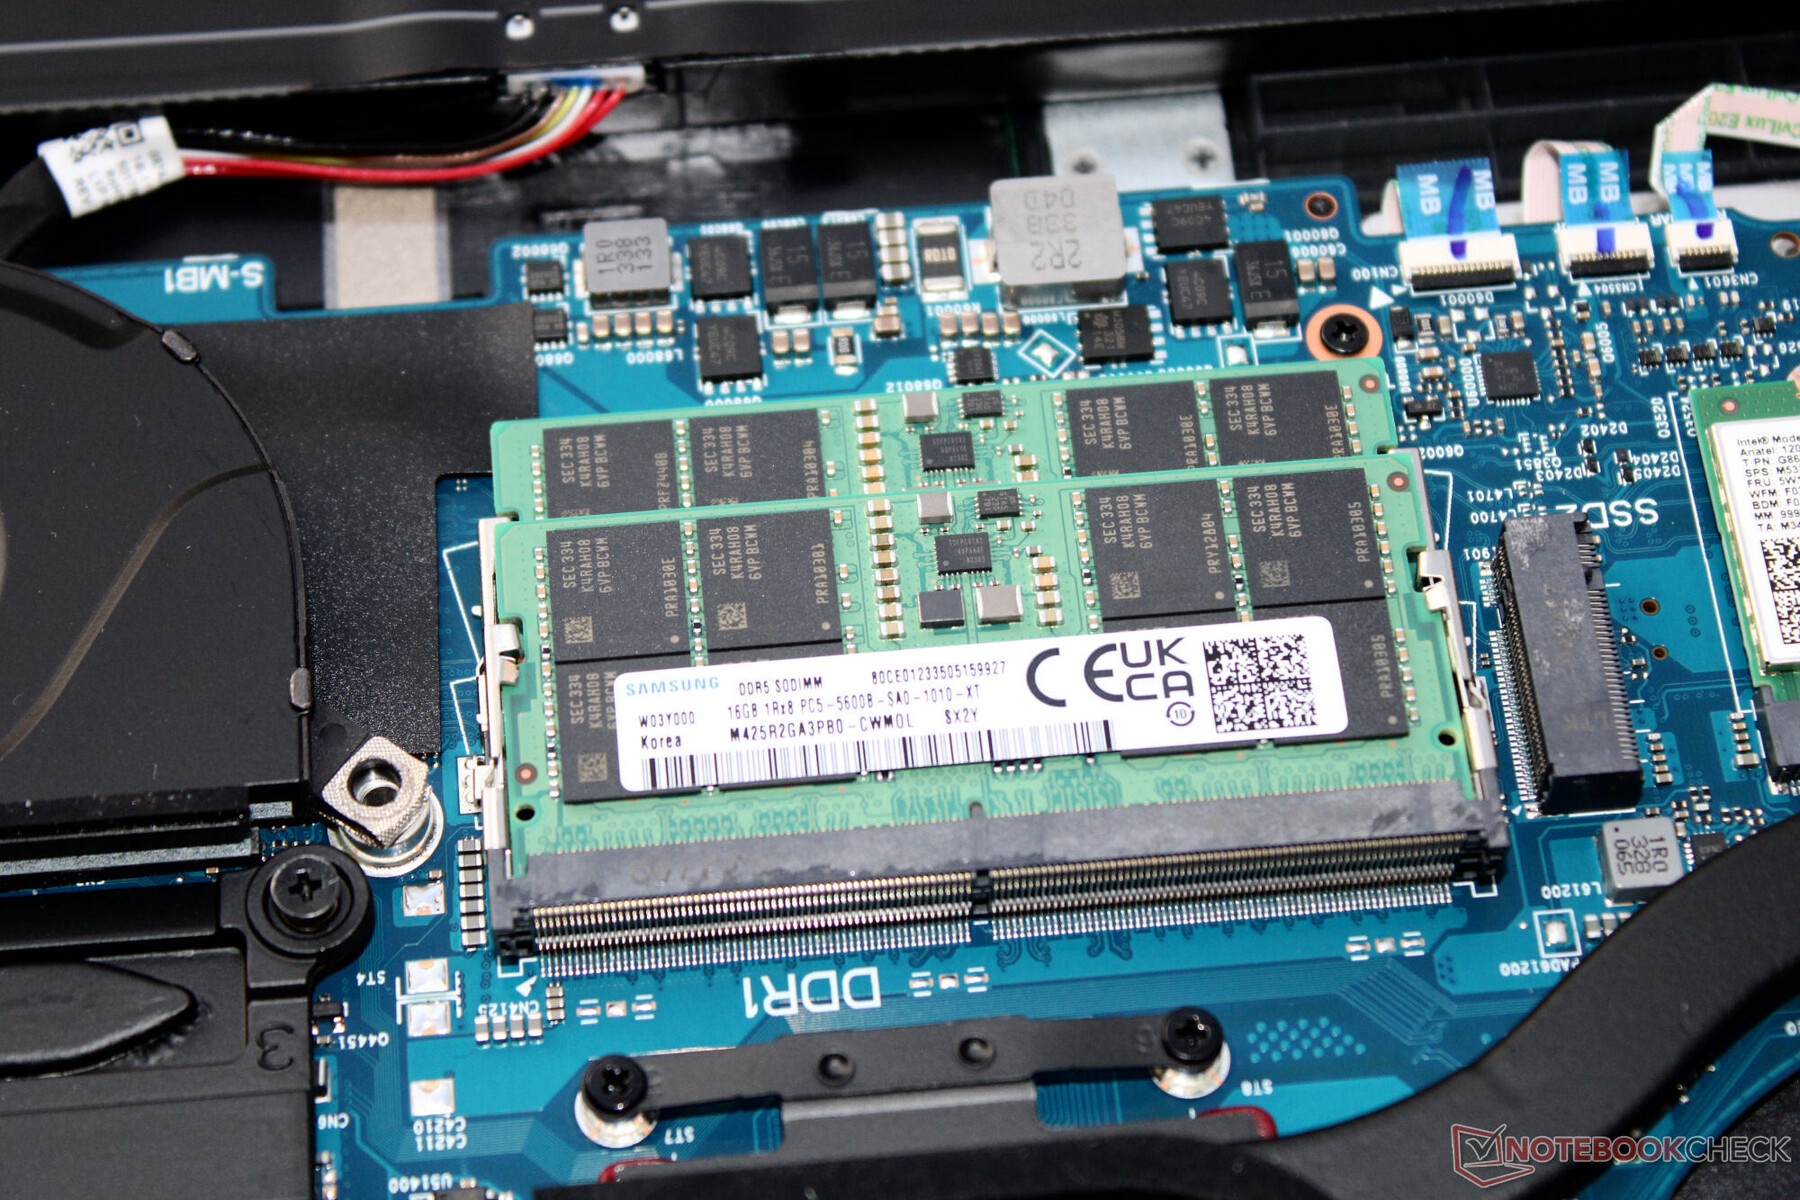
Nach der Demontage der Bodenplatte besteht Zugriff auf die Speicherbänke (belegt), die SSD (PCIe 4, M.2-2280), den zweiten SSD-Steckplatz (PCIe 4, M.2-2280), das WLAN-Modul, die BIOS-Batterie, die Lüfter und den Akku (verschraubt, nicht verklebt). Es müssen alle Schrauben auf der Geräteunterseite entfernt werden. Danach kann die Unterschale mittels eines Spatels oder eines Plektrums abgelöst werden.
Die Tastatur könnte nicht ohne weiteres getauscht werden. Hierzu müsste die Oberschale ersetzt werden, was eine komplette Demontage des Laptops erfordern würde.


Garantie
Asus gewährt dem 18-Zöller in Deutschland eine zweijährige Garantie. Eine Erweiterung auf drei Jahre schlüge mit etwa 200 Euro zu Buche.
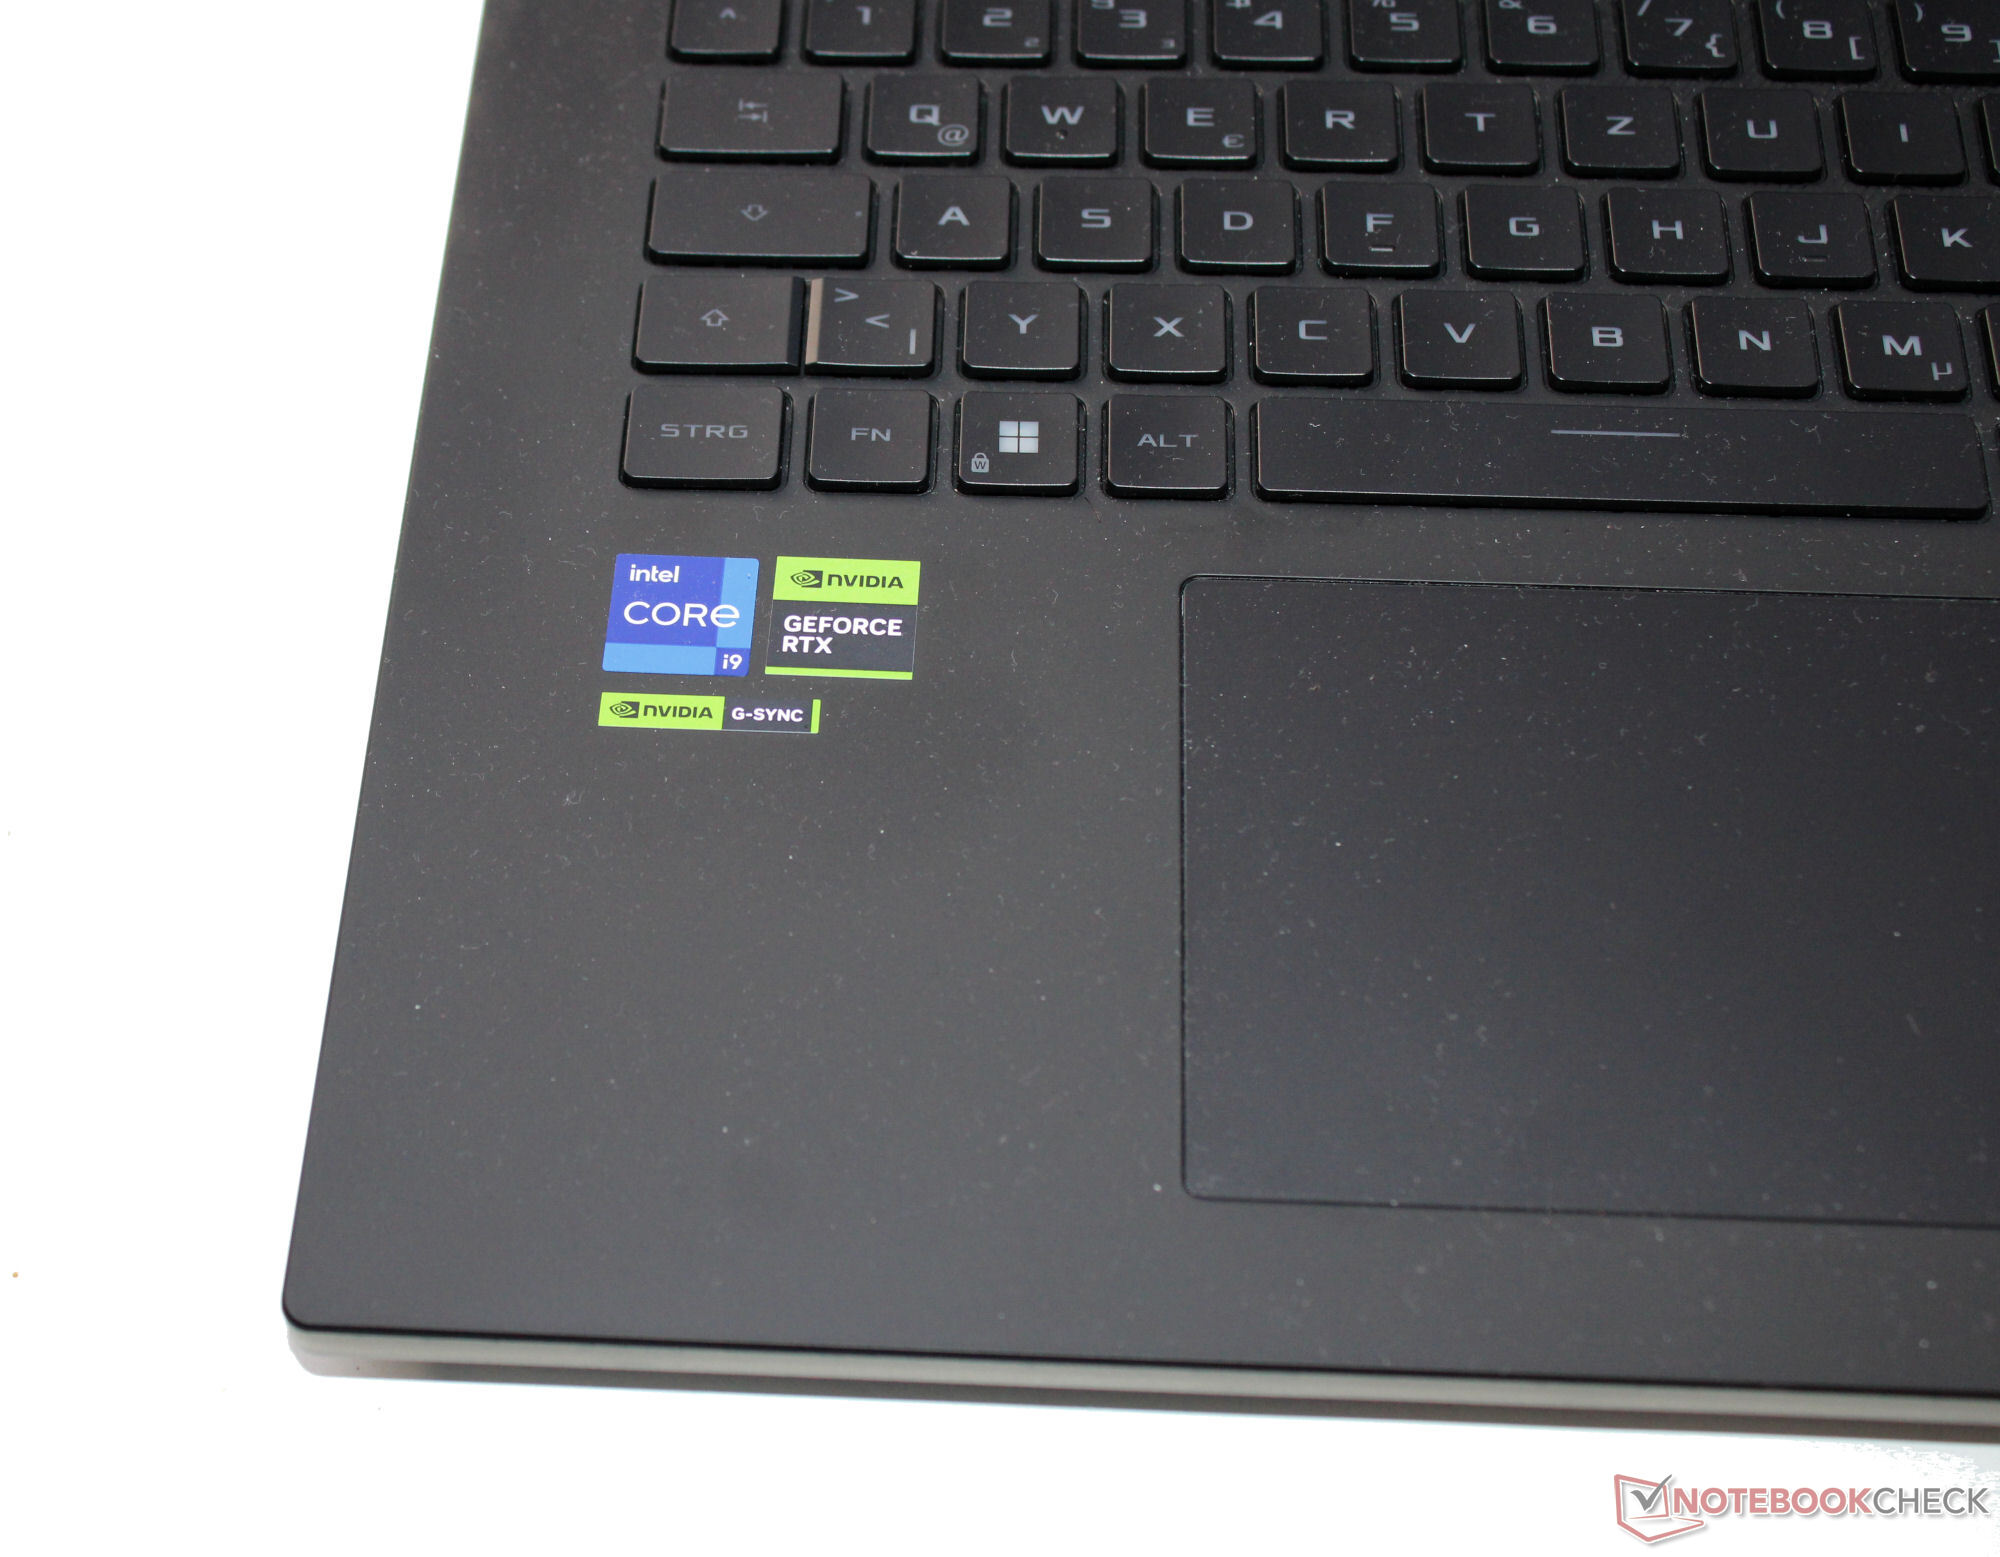
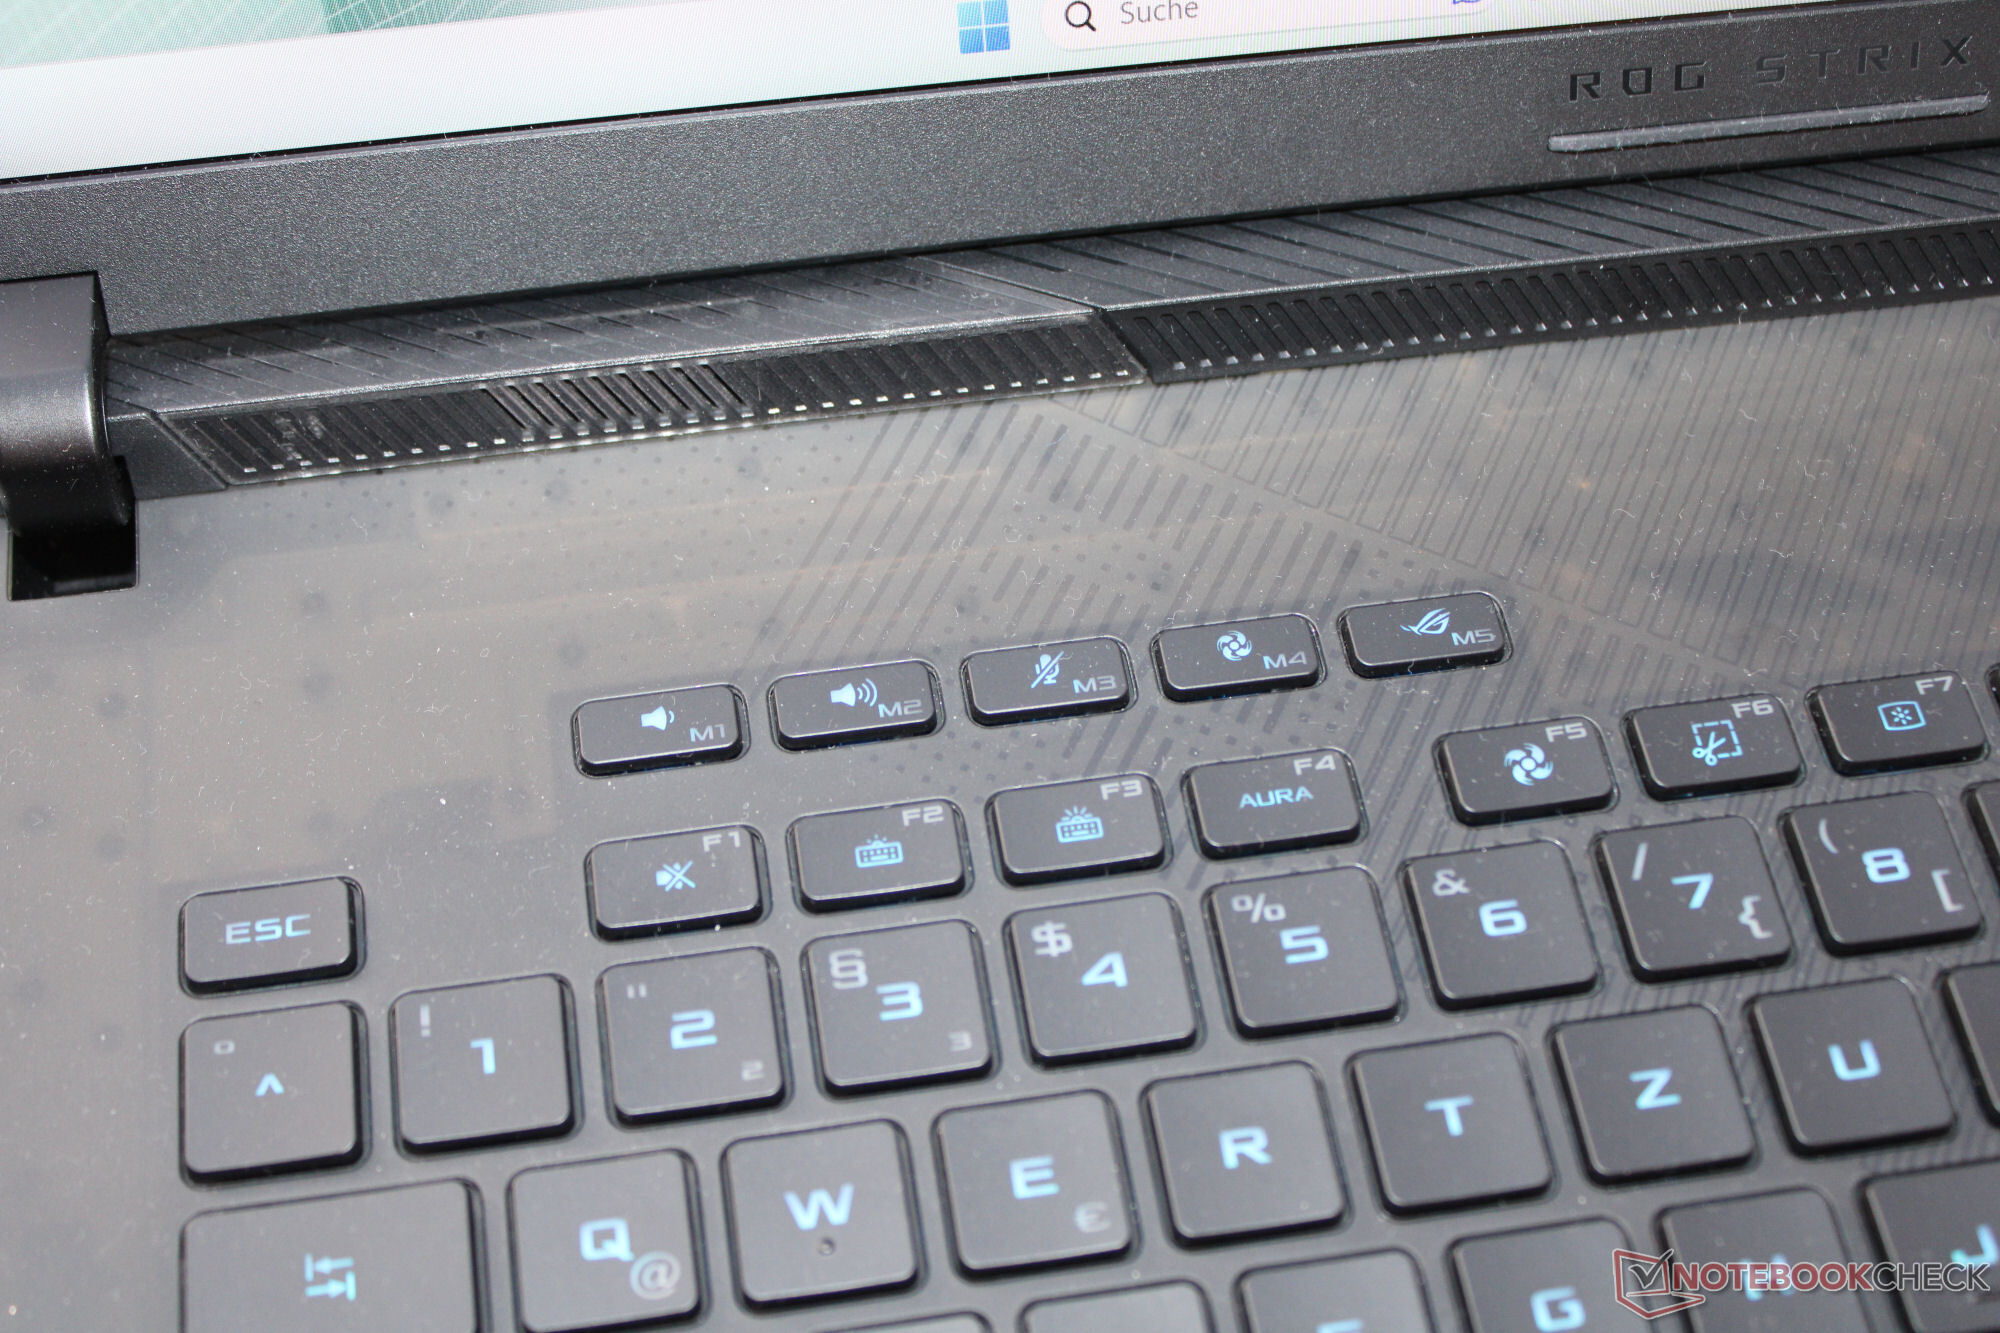
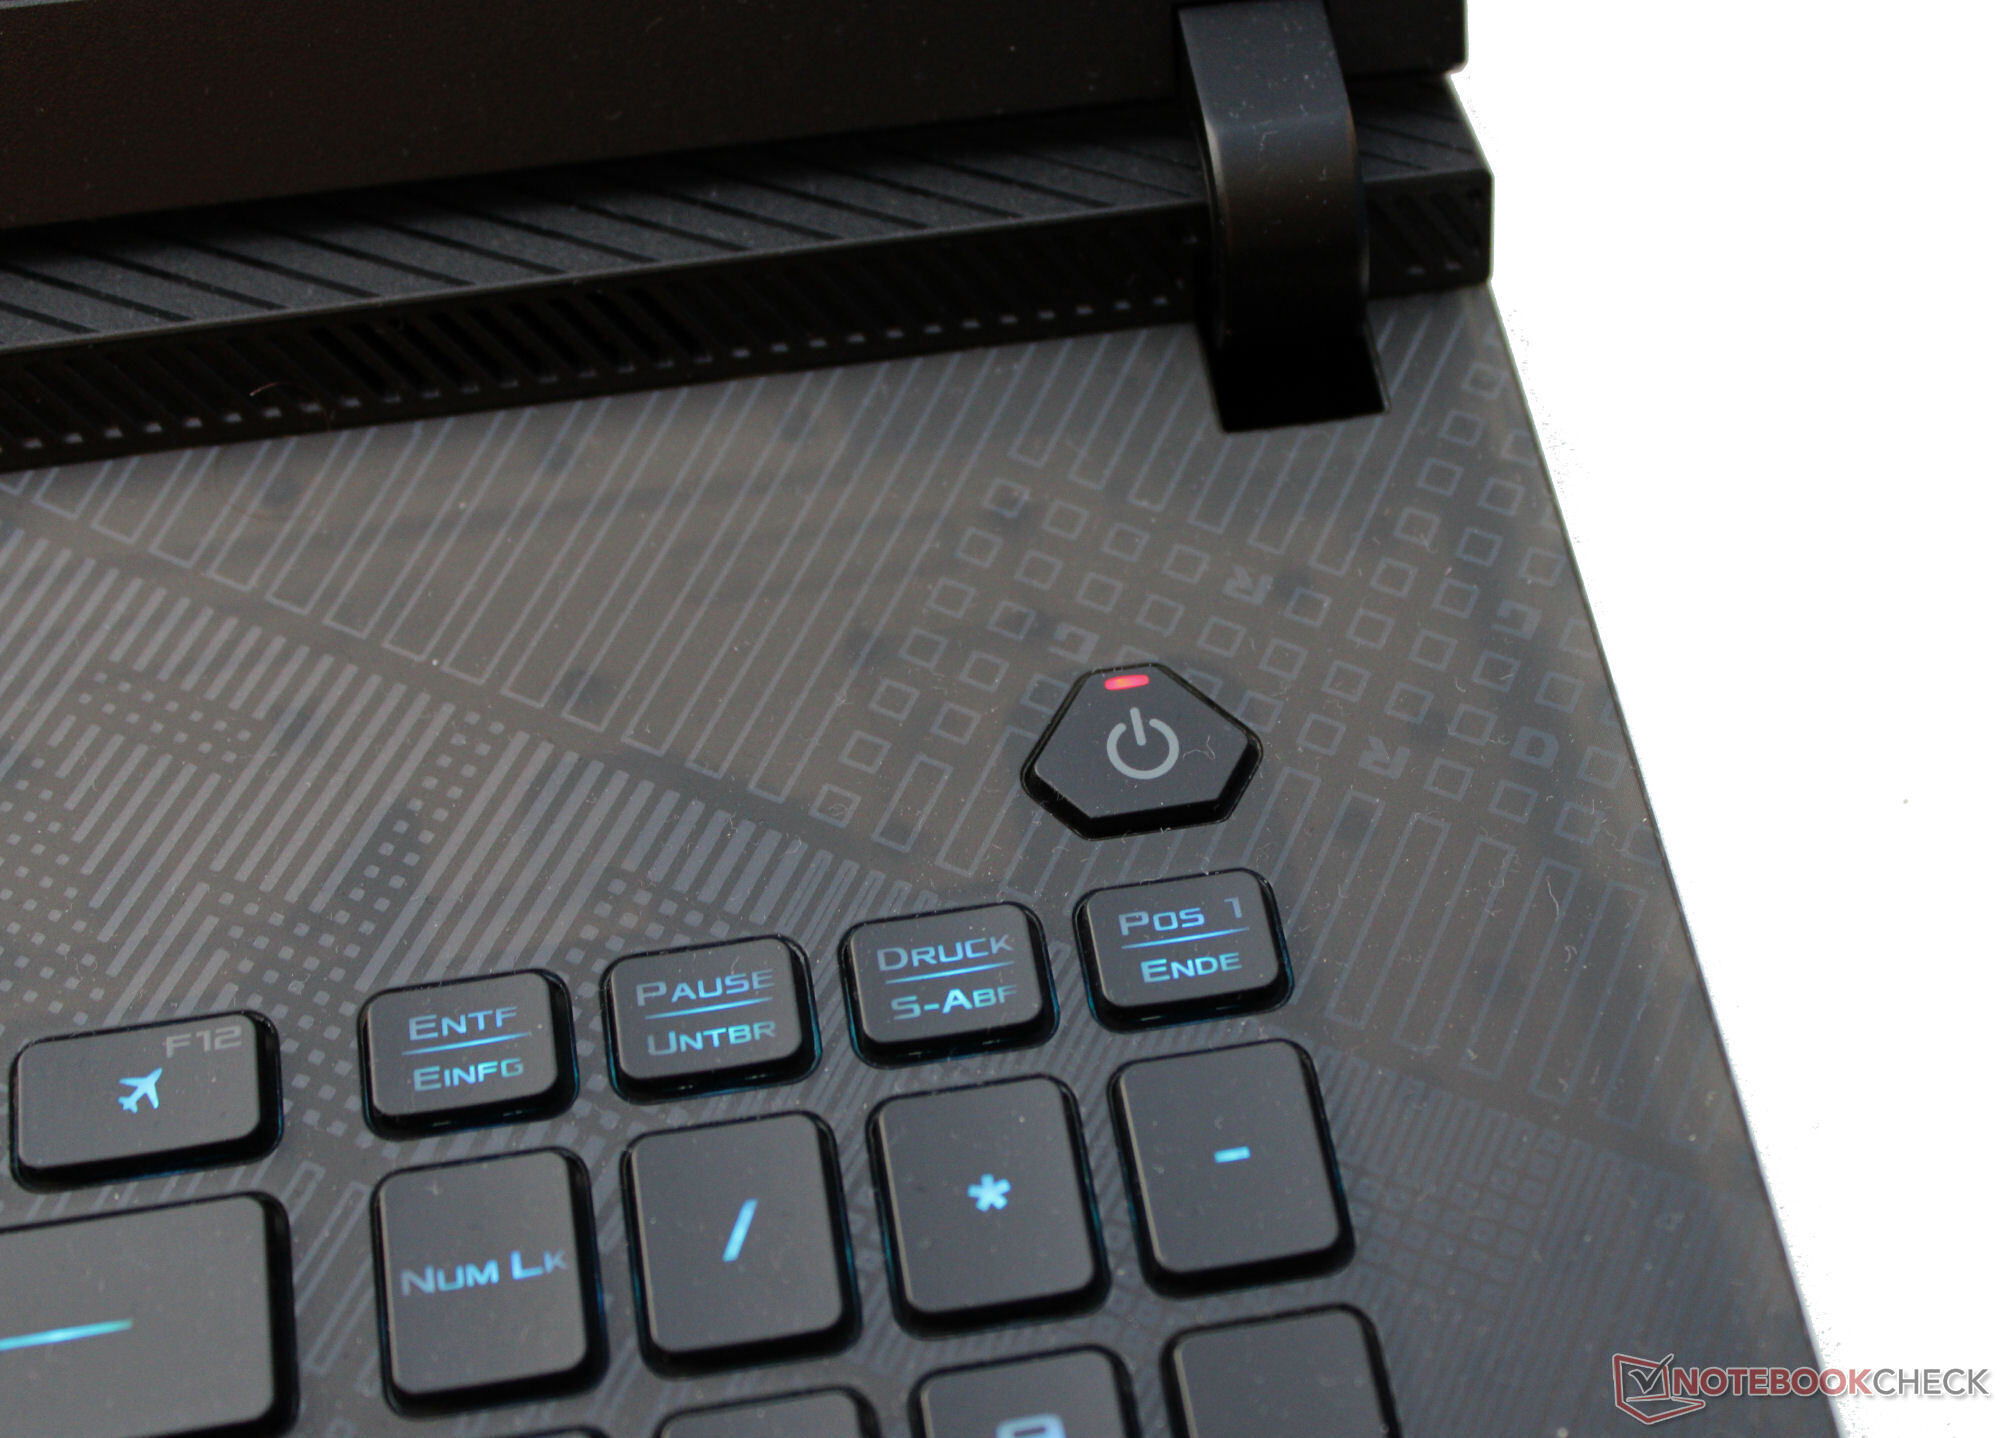
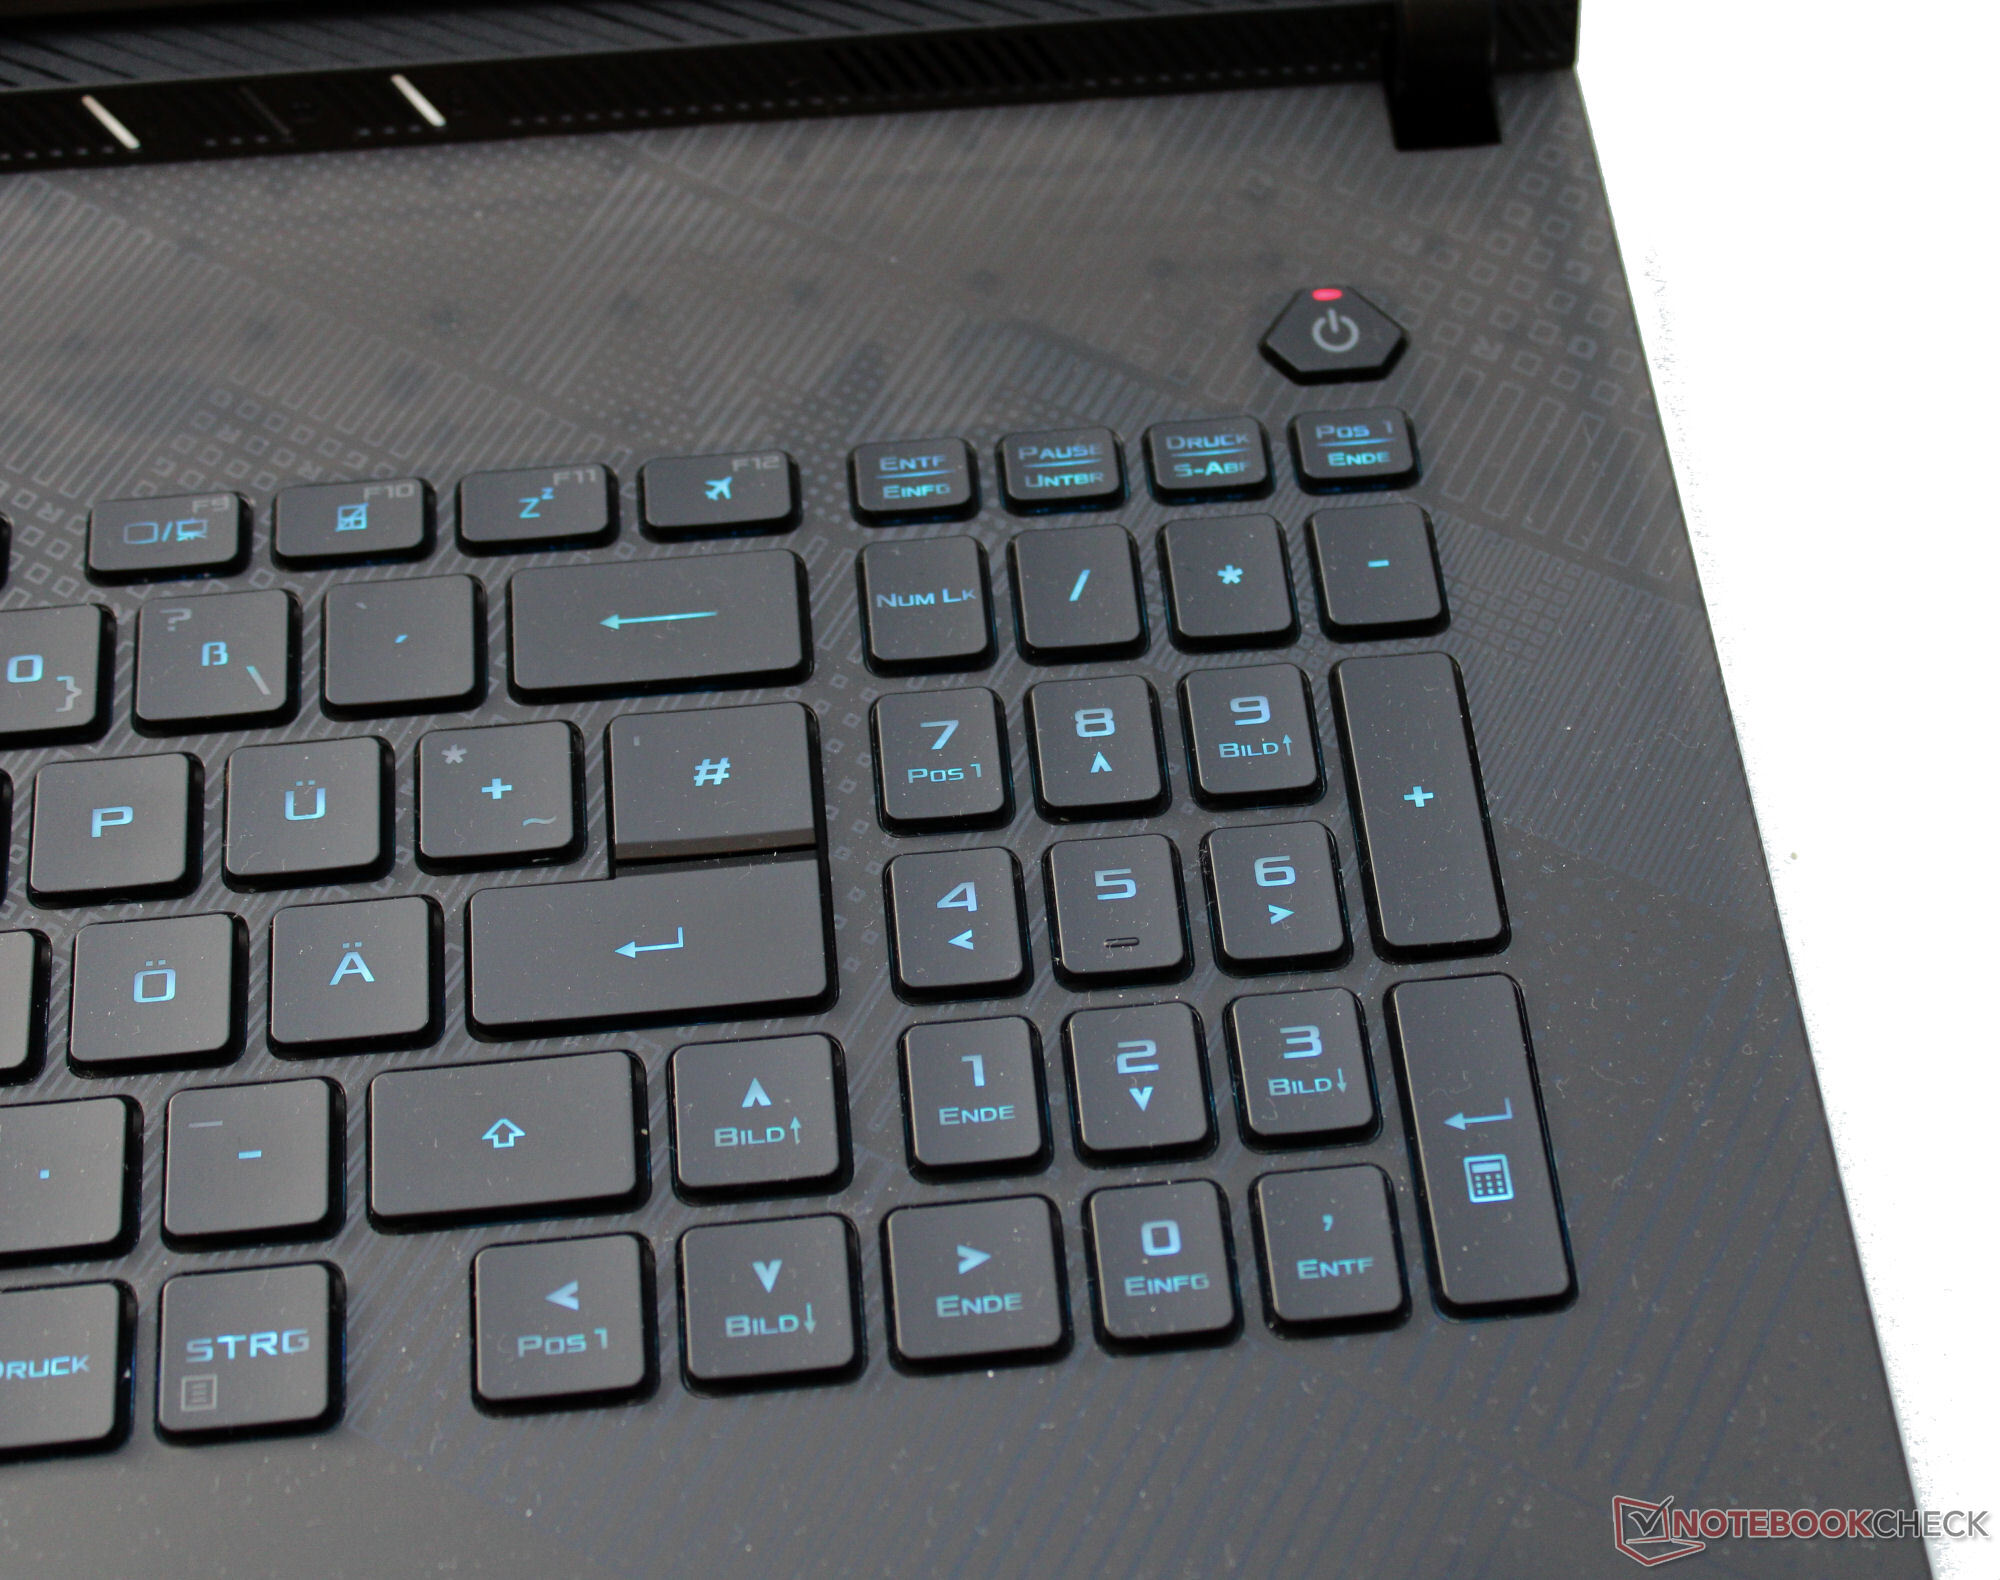
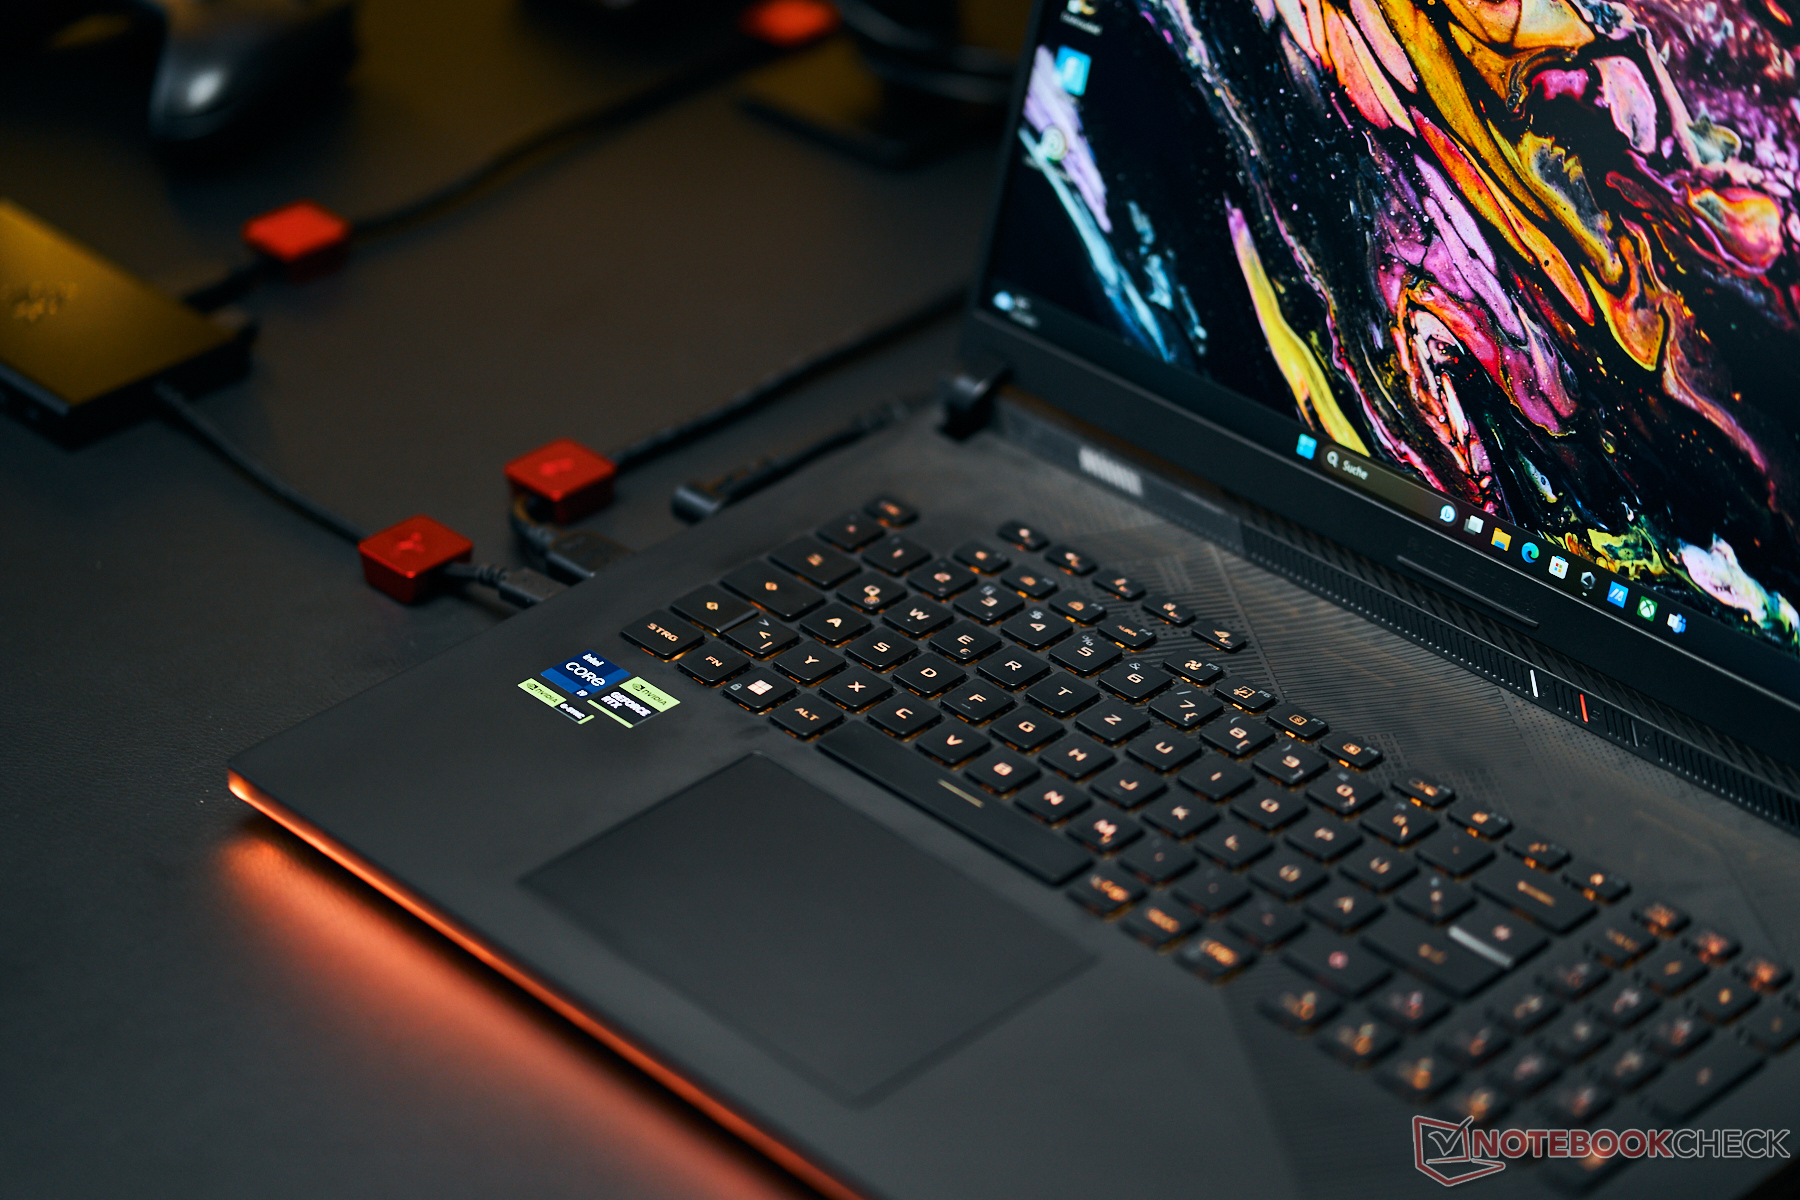
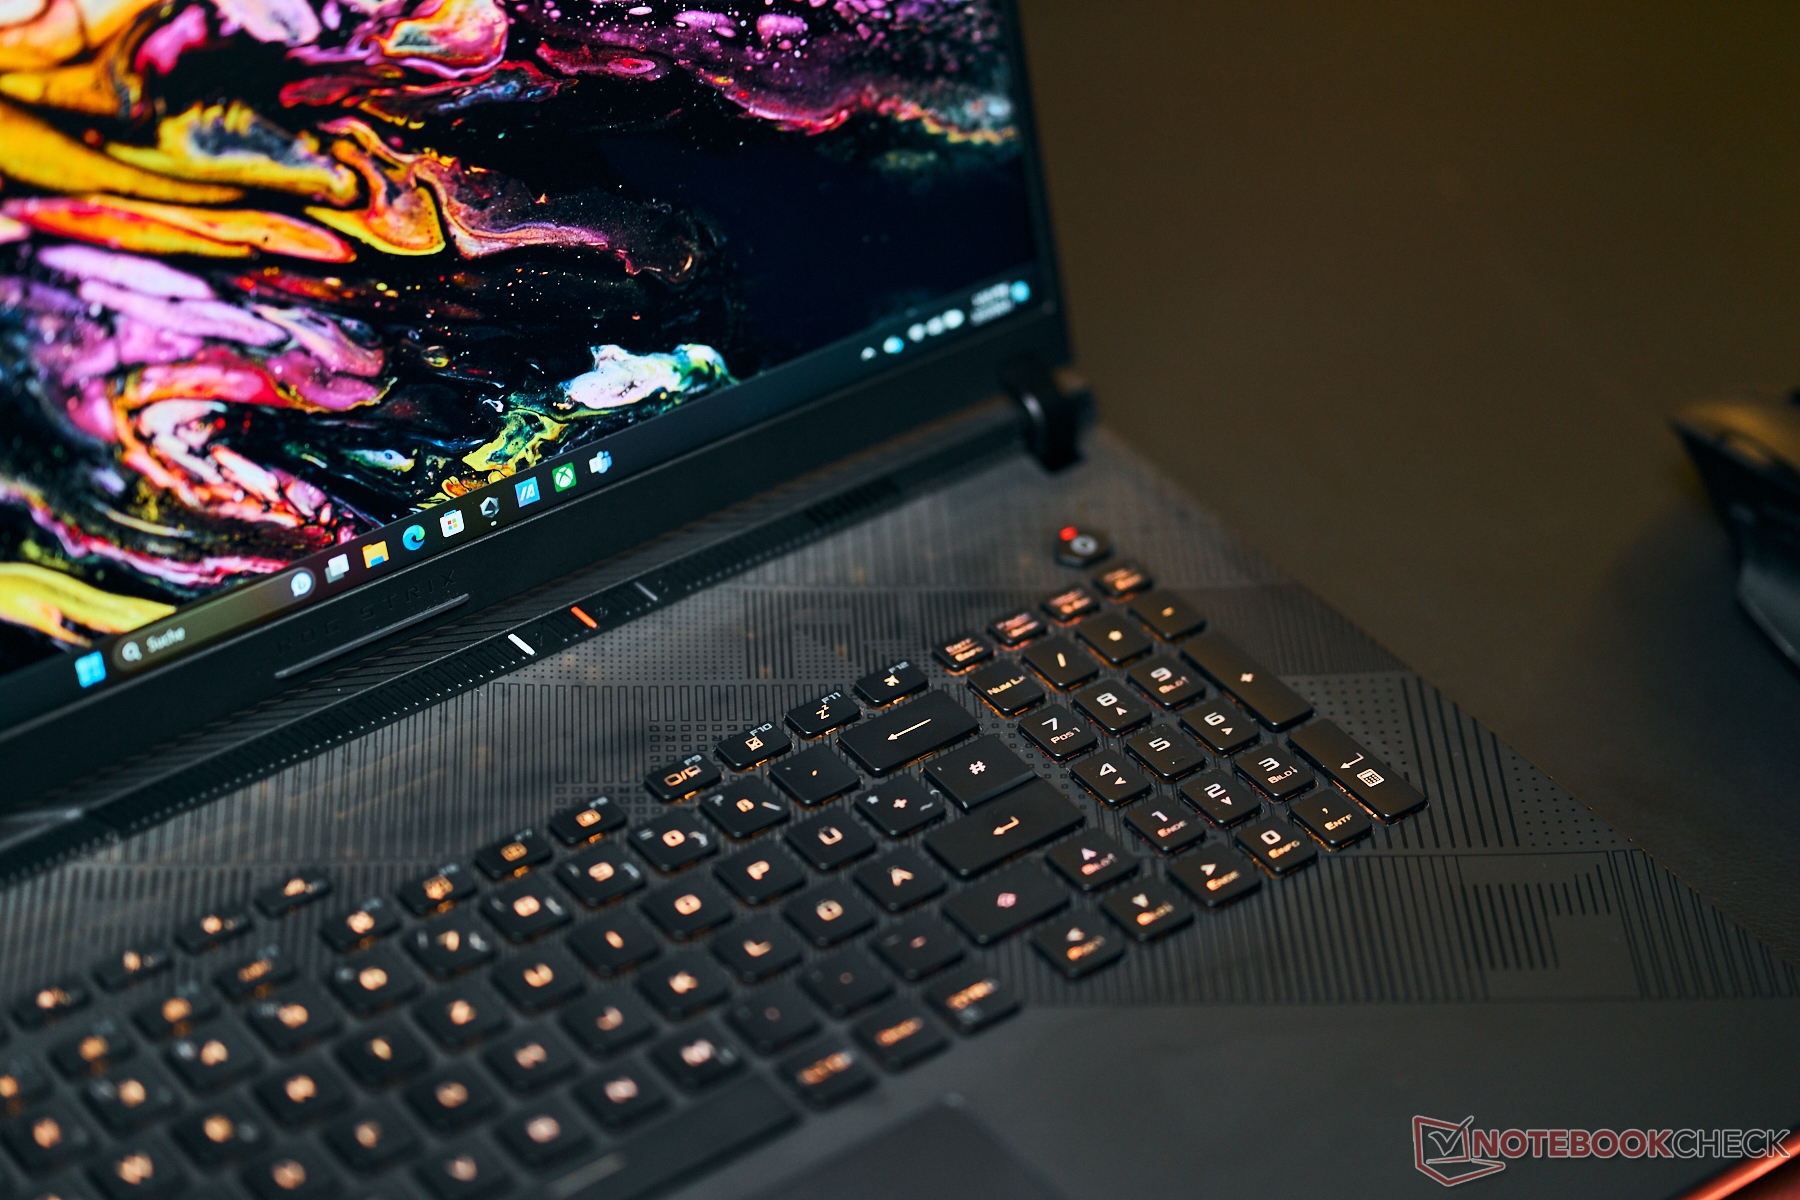
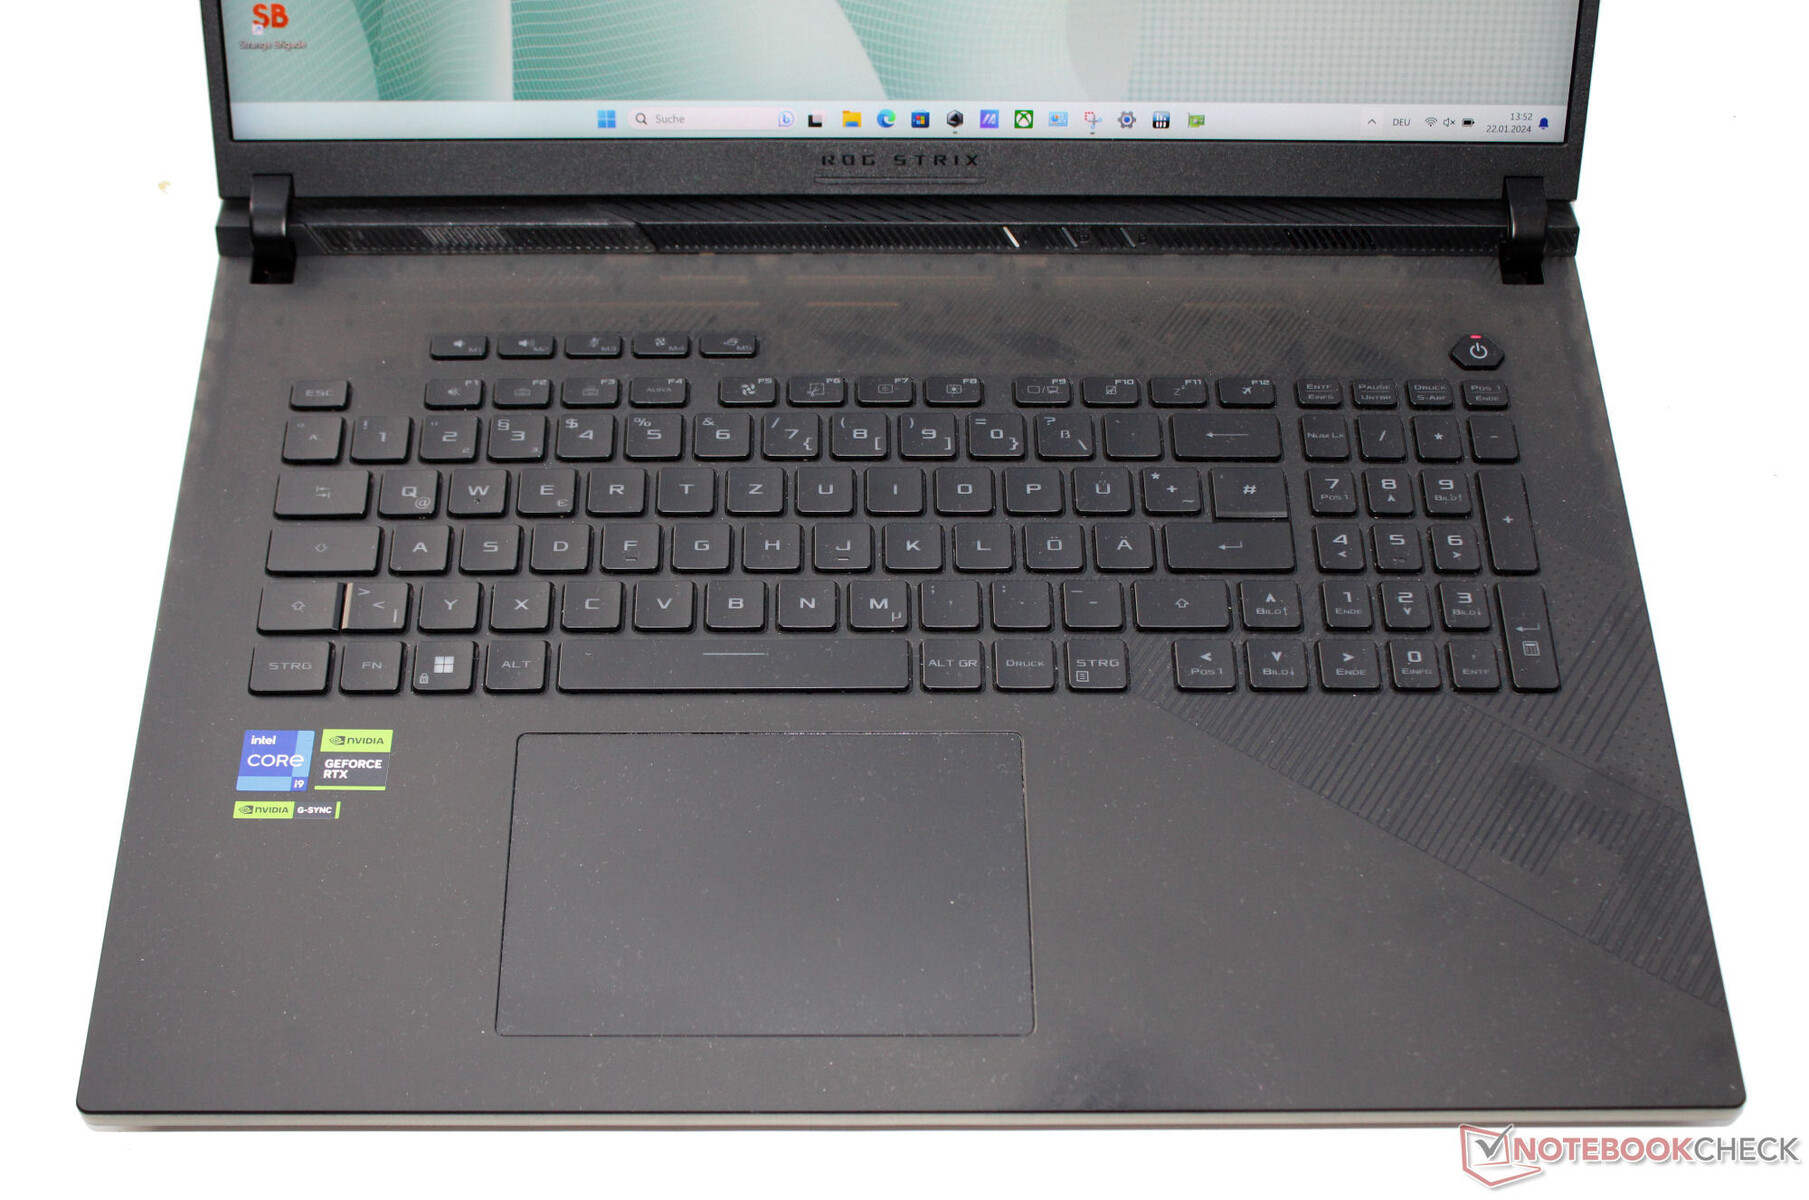
Eingabegeräte - Asus Computer mit RGB-Einzeltastenbeleuchtung
Tastatur
Die konkav gewölbten Tasten der beleuchteten Chiclet-Tastatur bieten einen mittleren Hub und einen klaren Druckpunkt. Der Tastenwiderstand geht grundsätzlich in Ordnung, dürfte rein subjektiv aber noch etwas knackiger ausfallen. Während des Tippens gibt die rechte Hälfte der Tastatur bestenfalls minimal nach. Als störend hat es sich nicht erwiesen. Positiv: Alle vier Pfeiltasten liegen in normaler Größe vor. Insgesamt liefert Asus hier eine alltagstaugliche Tastatur.
Touchpad
Als Mausersatz dient ein Clickpad (ca. 13 x 8,5 cm) dessen glatte Glas-Oberfläche den Fingern das Gleiten leicht macht. Es bietet einen kurzen Hub und einen deutlichen Druckpunkt.
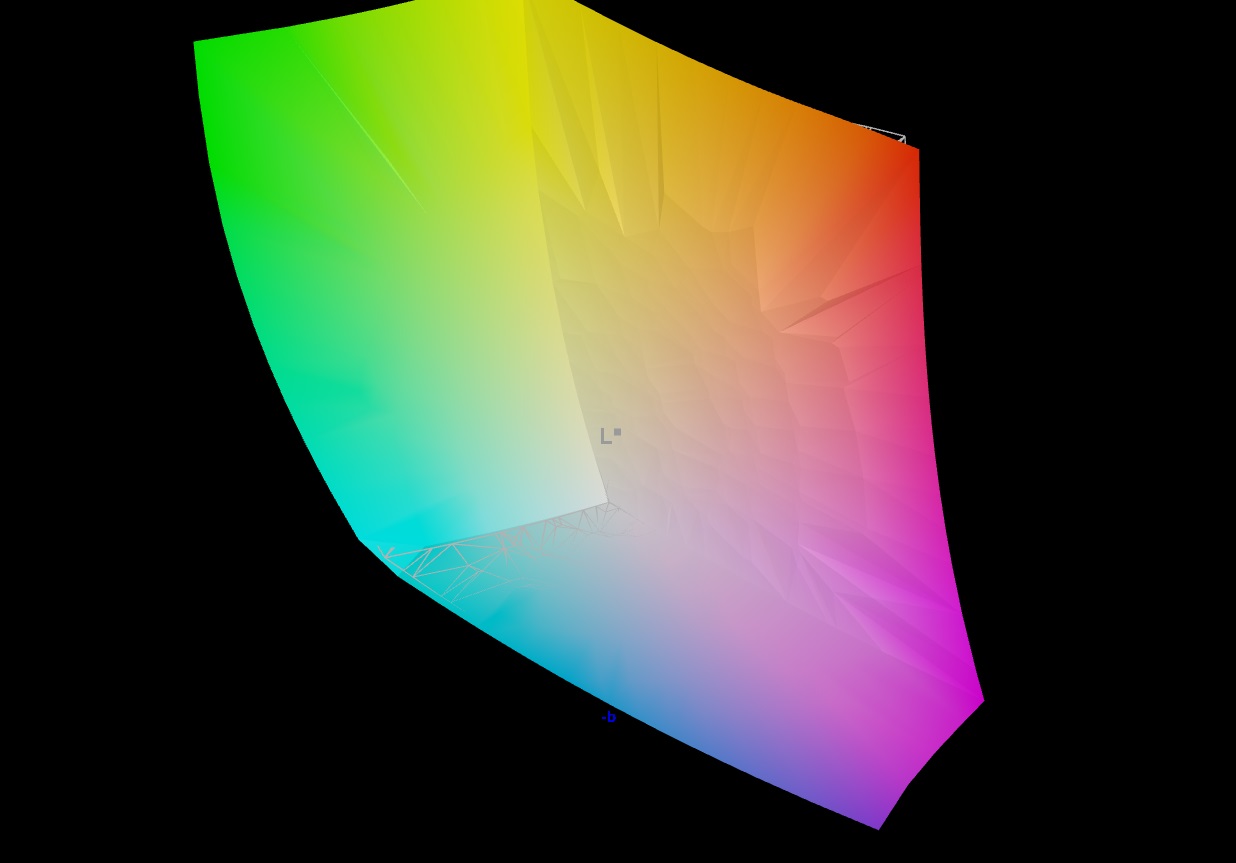
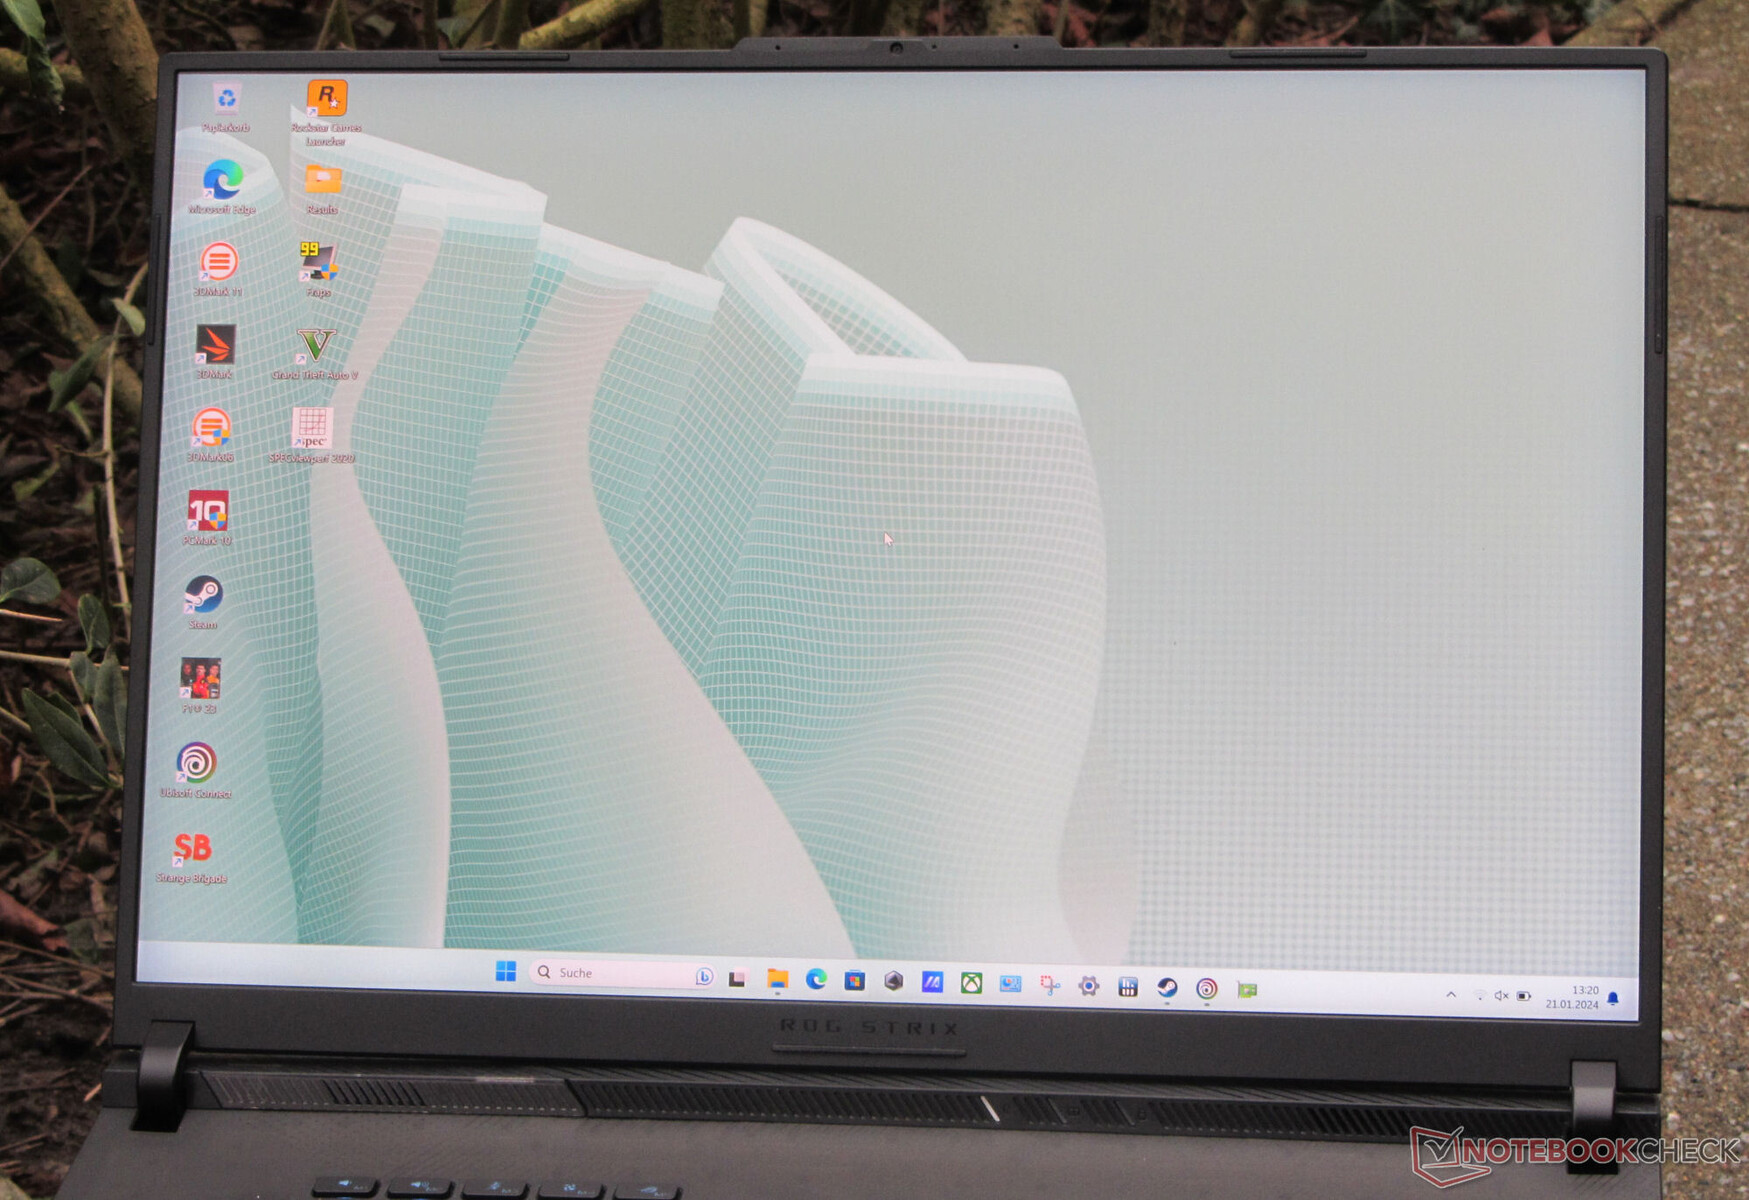
Display - Mini-LED mit DCI-P3-Abdeckung
Das Scar 18 verfügt über einen Mini-LED-Bildschirm (2.560 x 1.600 Pixel) im 18-Zoll-Format bei einem Seitenverhältnis von 16:10. Auf der Habenseite stehen eine große Helligkeit, ein hervorragender Kontrast bzw. Schwarzwert und eine matte Oberfläche. Das flinke 240-Hz-Panel unterstützt zudem HDR und G-Sync.
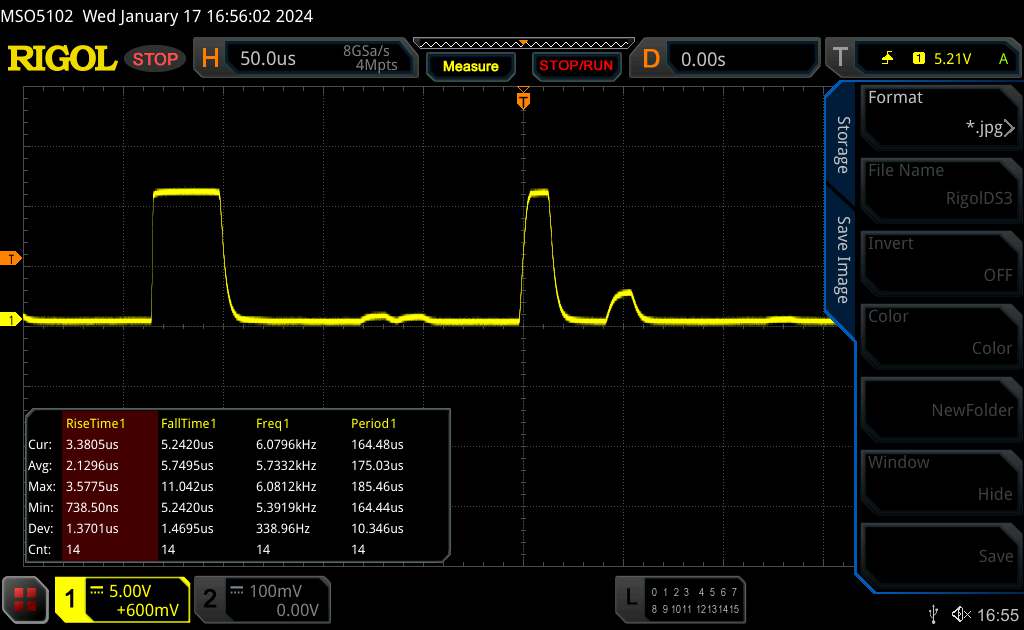
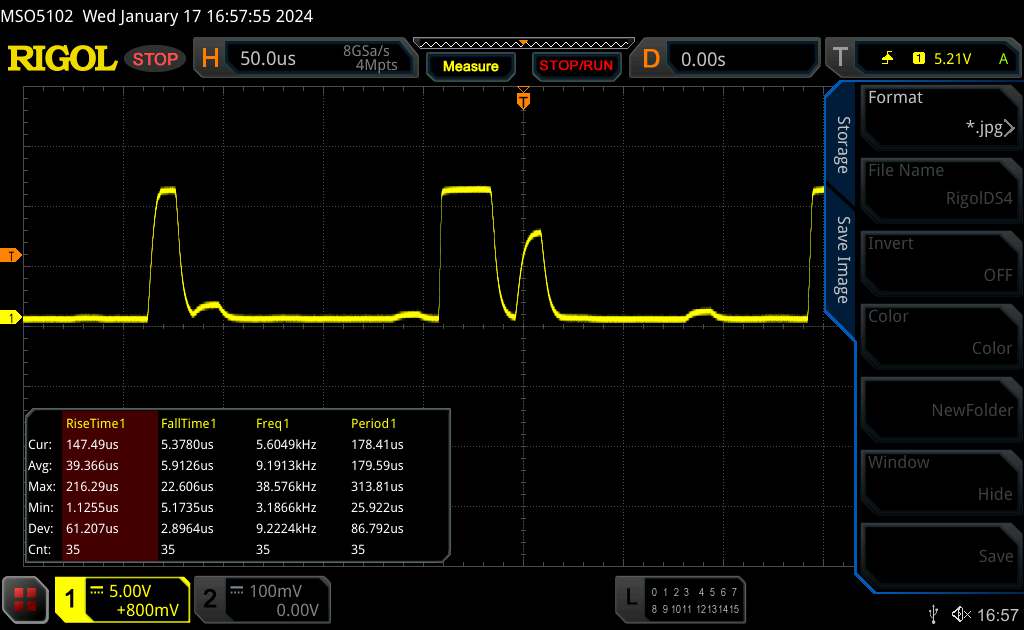
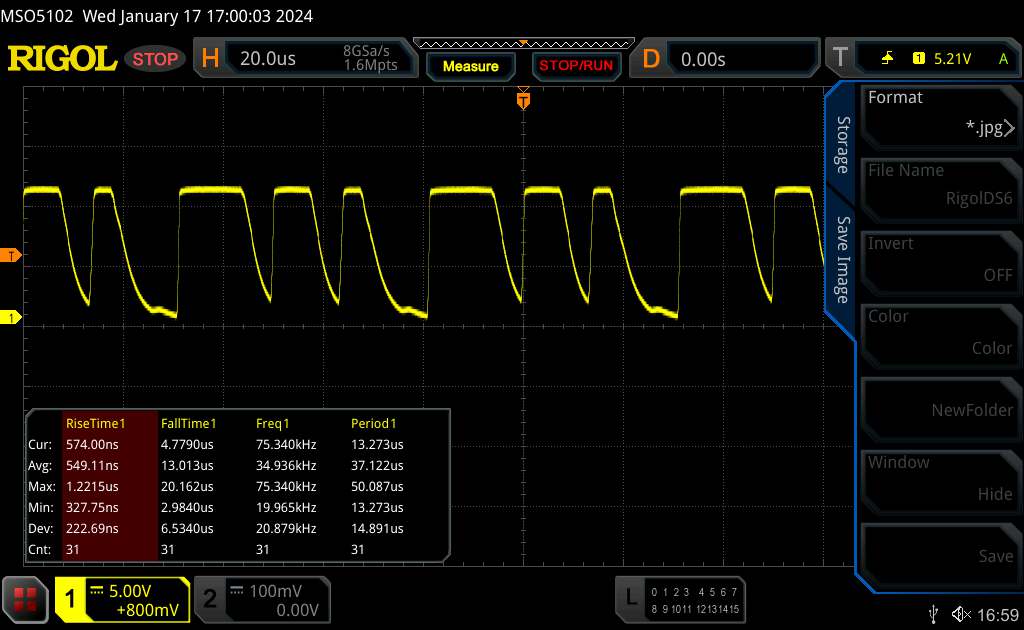
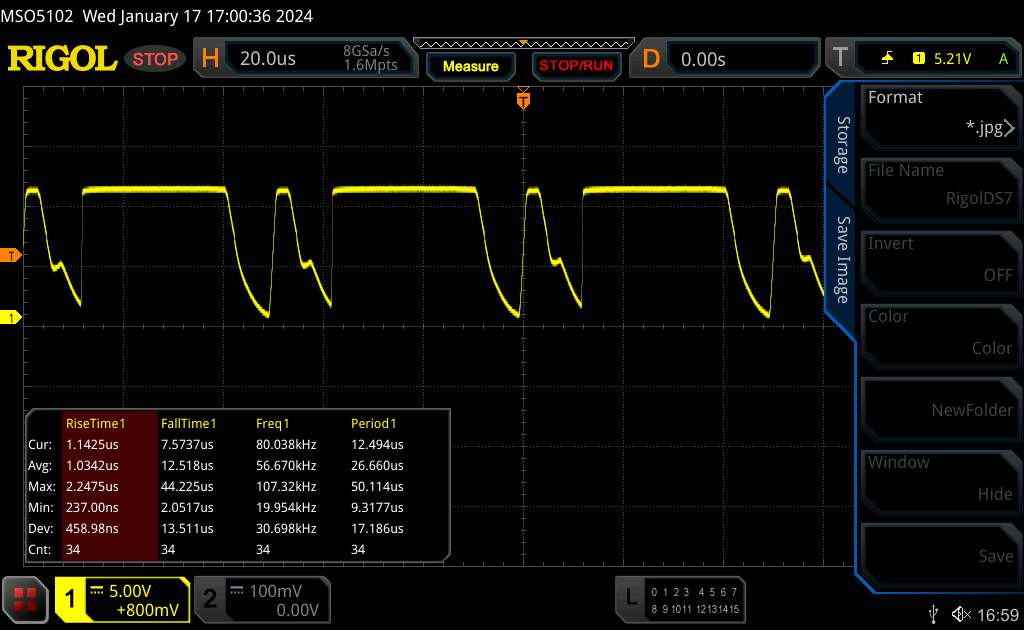
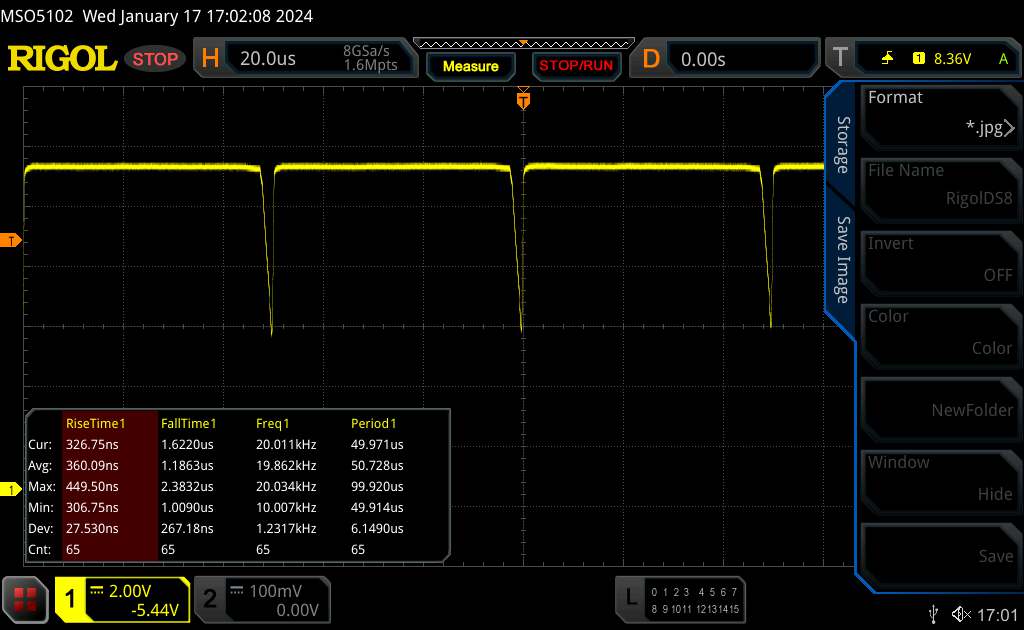
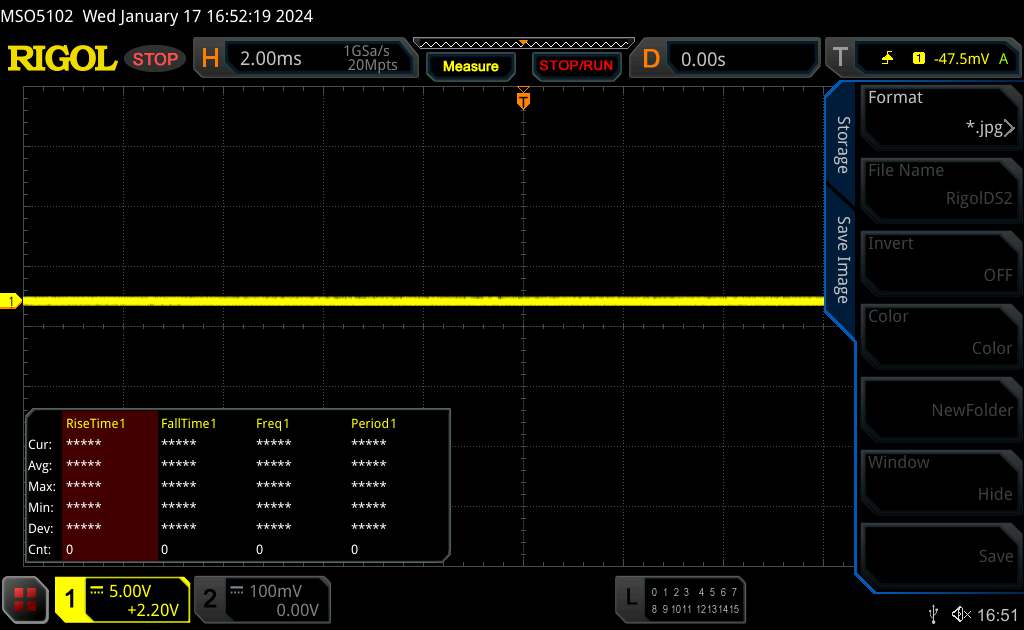
Gänzlich frei von PWM-Flimmern ist das Display nicht, es dürfte im täglichen Betrieb aber wohl keine Rolle spielen: So tritt bei Helligkeitswerten ≤ 94 cd/m² ein hochfrequentes Flacken (5.733 Hz) auf.
| |||||||||||||||||||||||||
Ausleuchtung: 89 %
Helligkeit Akku: 937 cd/m²
Kontrast: 14197:1 (Schwarzwert: 0.066 cd/m²)
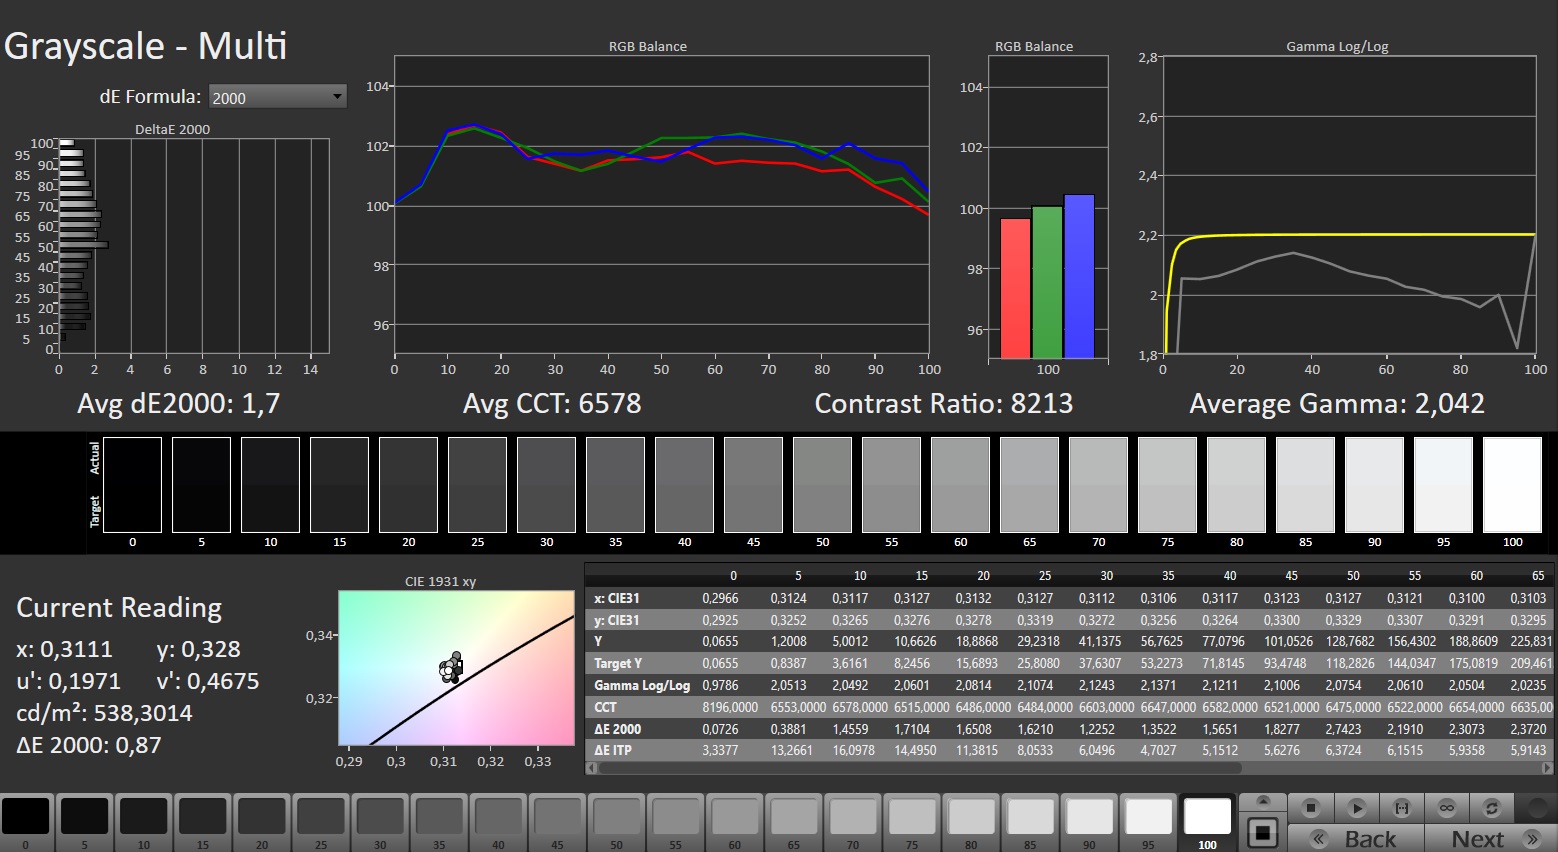
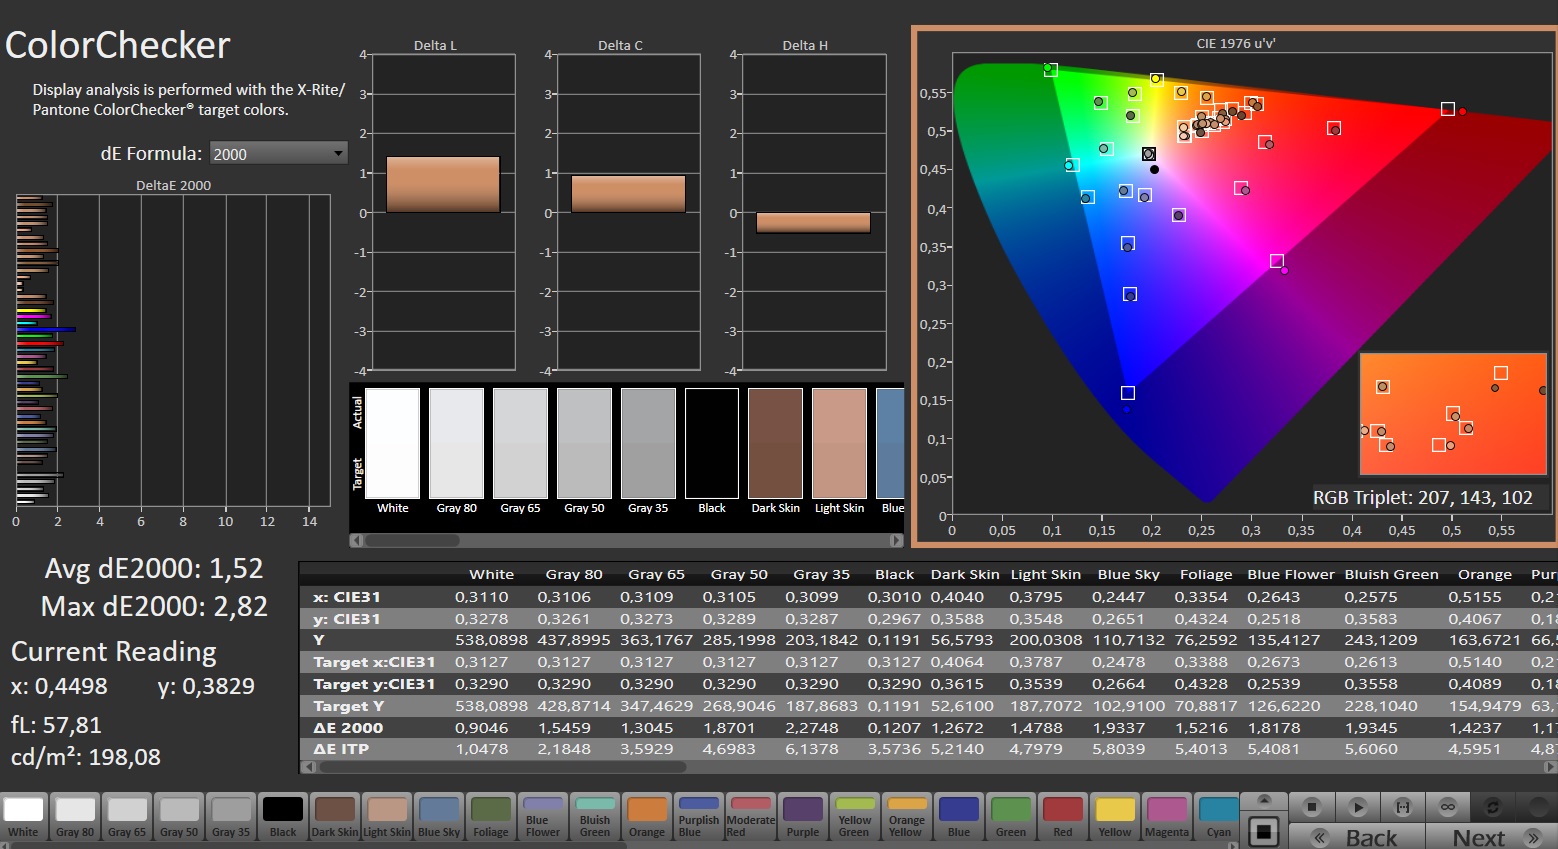
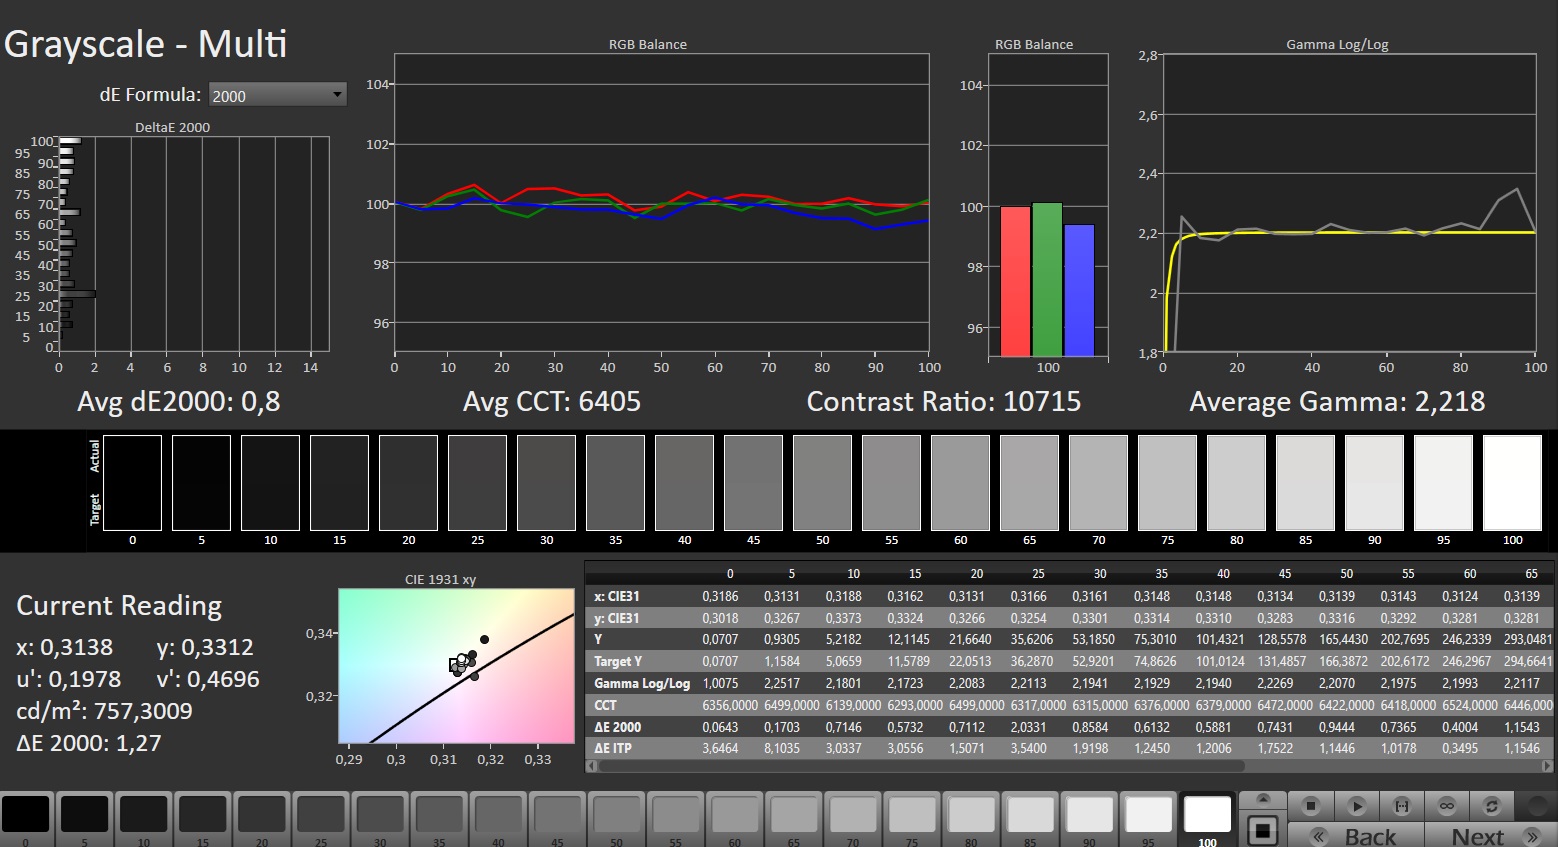
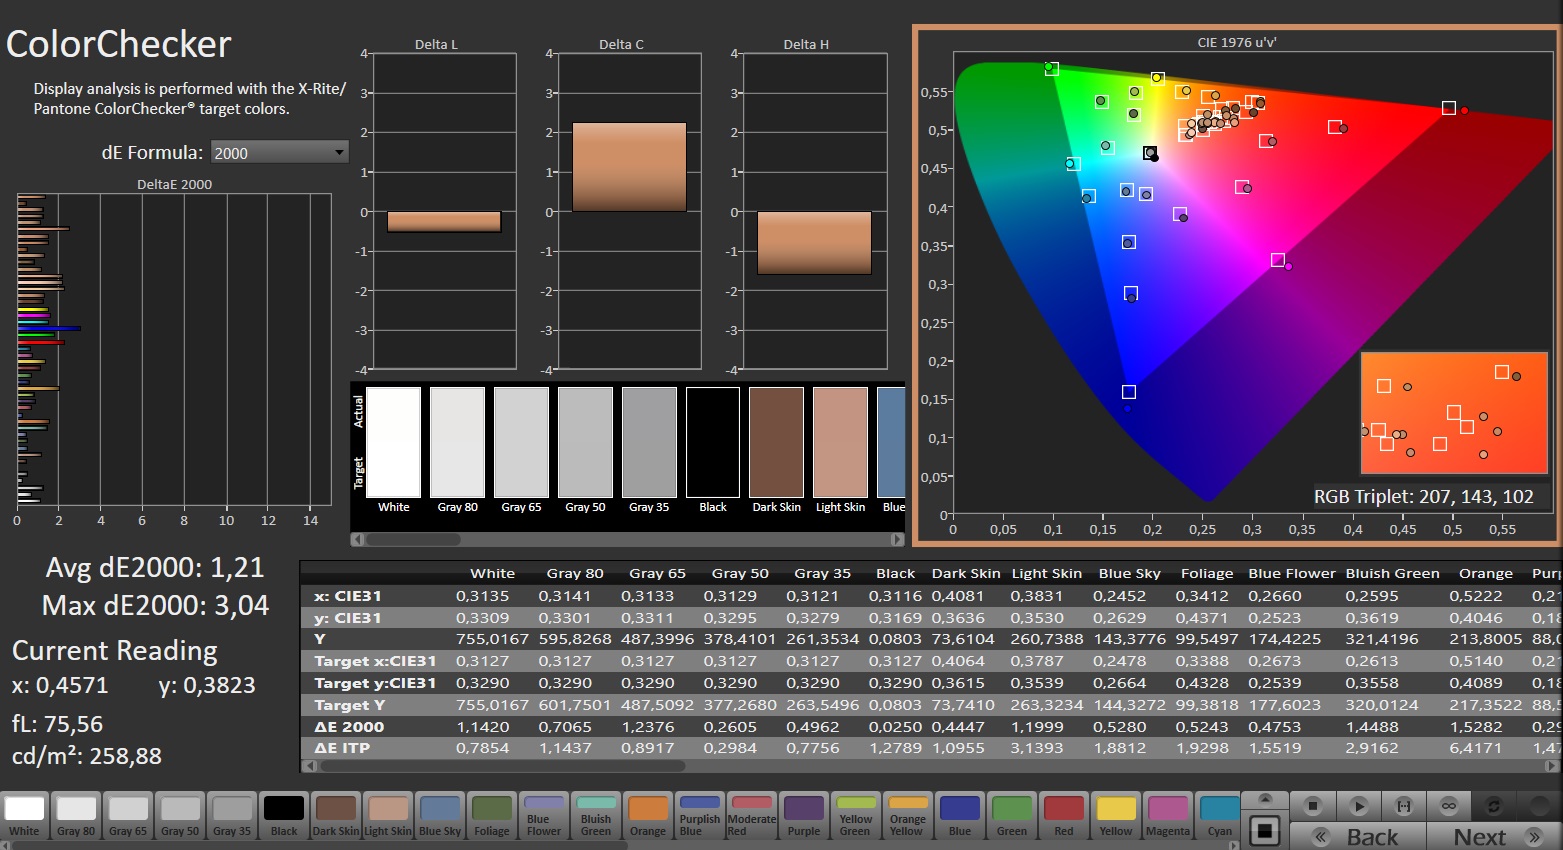
ΔE ColorChecker Calman: 1.52 | ∀{0.5-29.43 Ø4.71}
calibrated: 1.21
ΔE Greyscale Calman: 1.7 | ∀{0.09-98 Ø4.96}
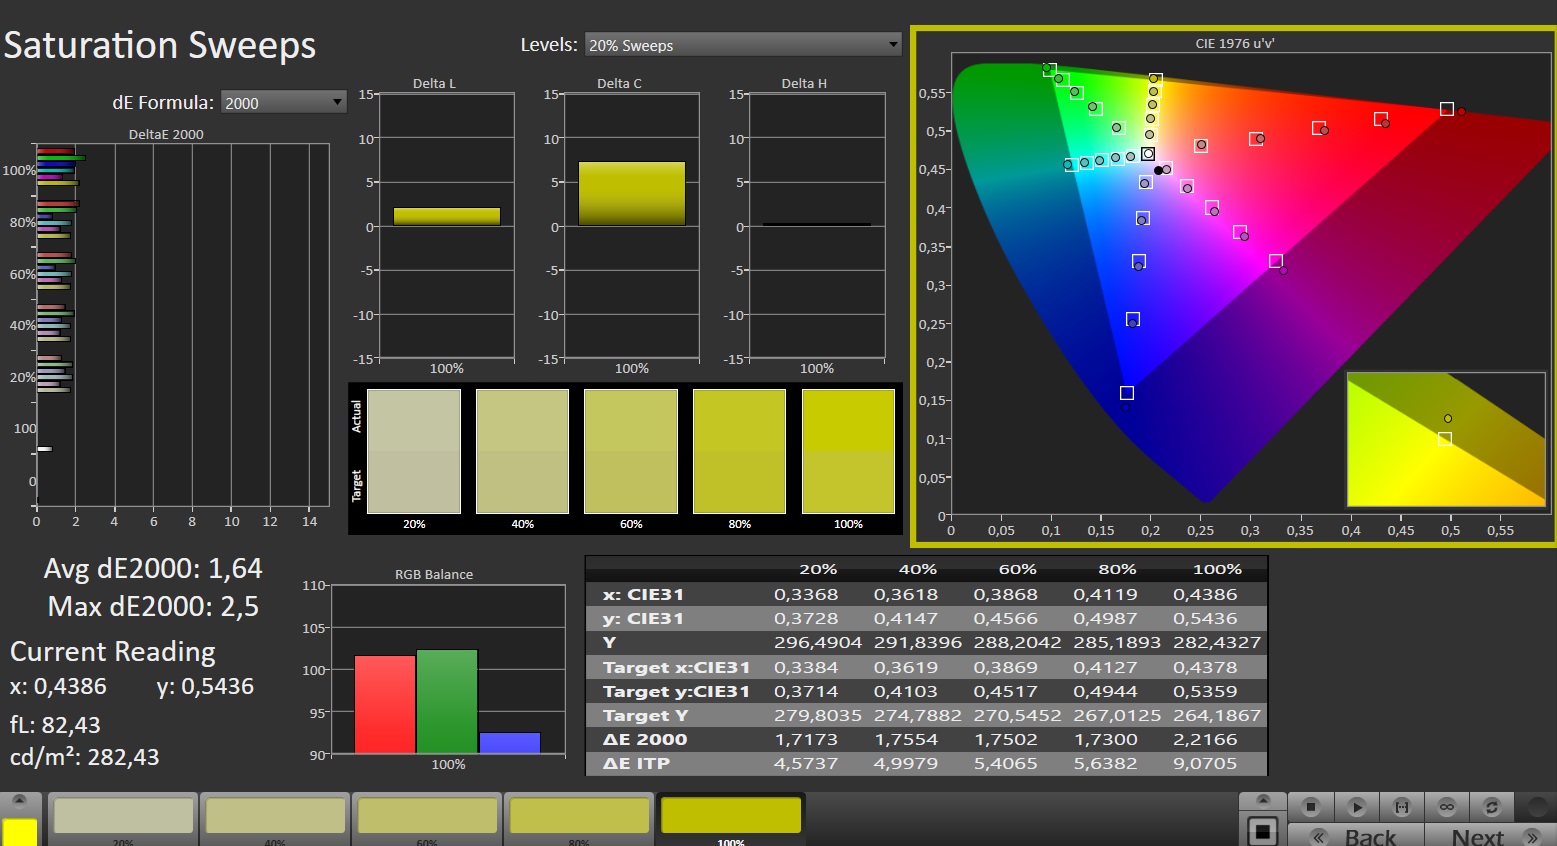
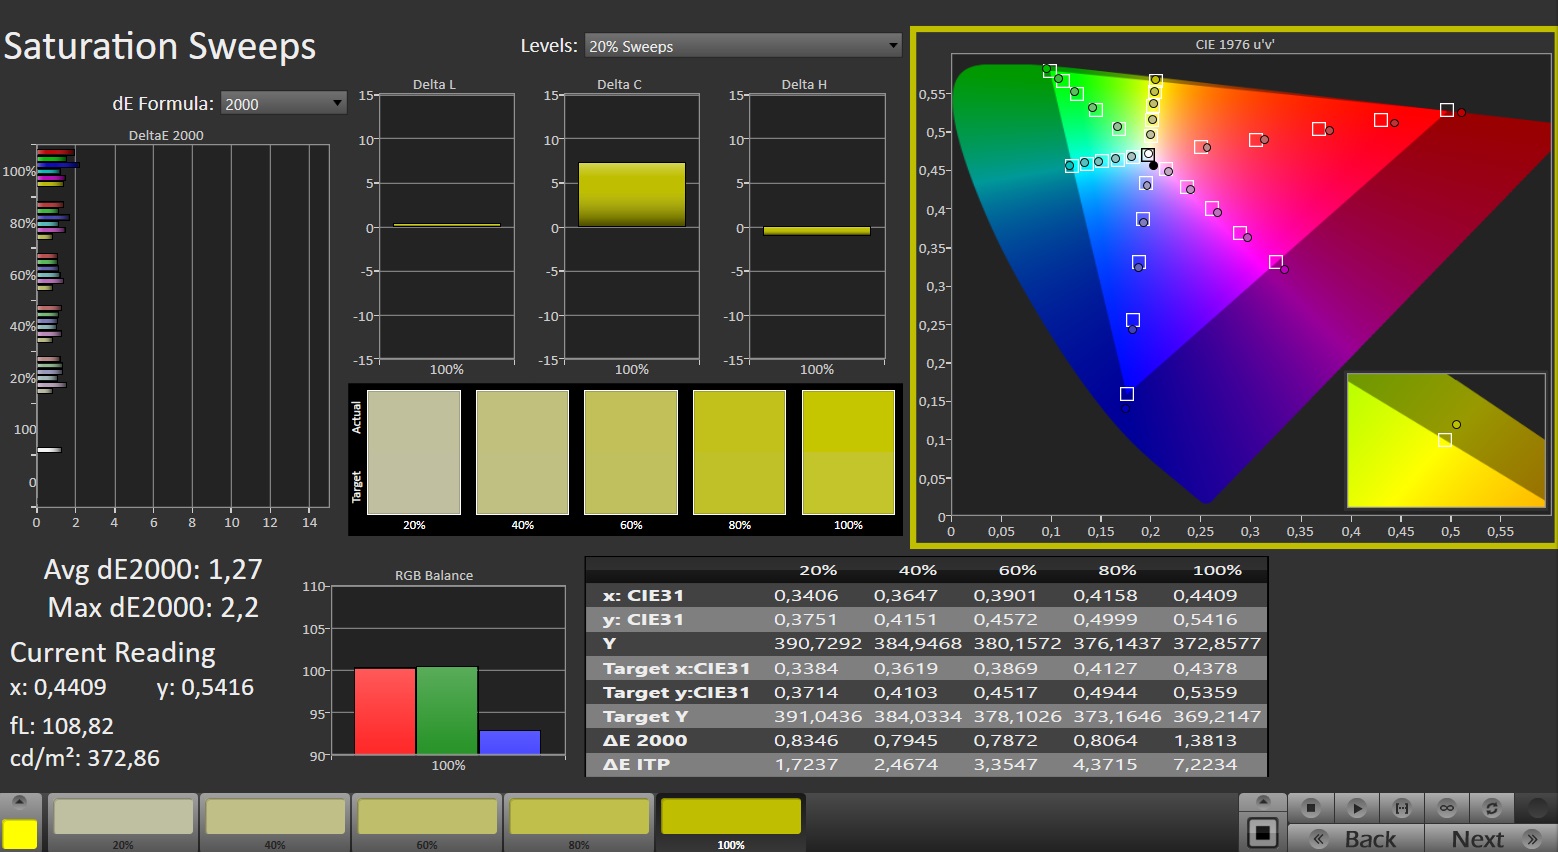
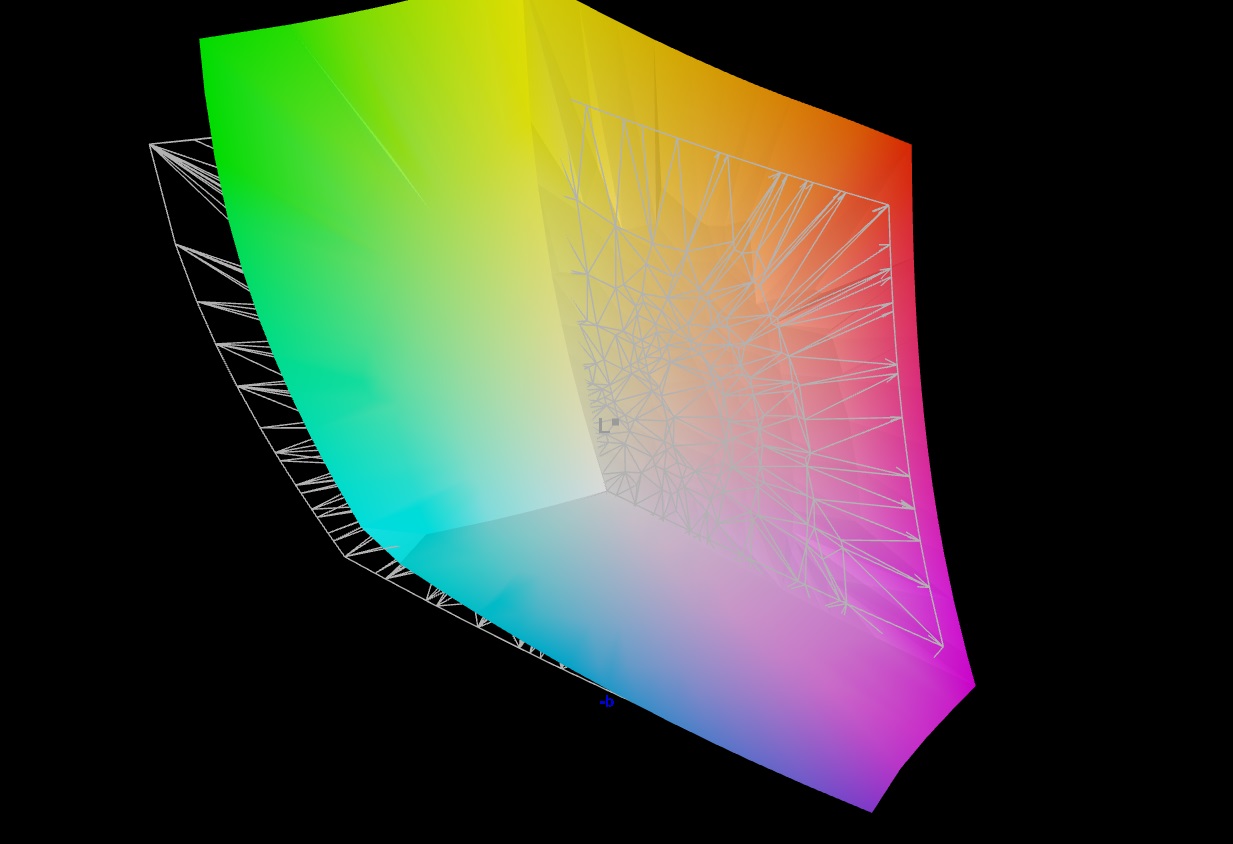
90% AdobeRGB 1998 (Argyll 3D)
100% sRGB (Argyll 3D)
99.9% Display P3 (Argyll 3D)
Gamma: 2.042
CCT: 6578 K
| Asus ROG Strix Scar 18 G834JYR (2024) BOE NE180QDM-NM1, Mini LED, 2560x1600, 18" | Alienware m18 R1 AMD BOE NE18NZ1, IPS, 1920x1200, 18" | Alienware m18 R1 Chi Mei 180JME, IPS, 1920x1200, 18" | Acer Predator Helios 18 N23Q2 AUO45A8 (B180QAN01.2), IPS, 2560x1600, 18" | Razer Blade 18 RTX 4070 AU Optronics B180QAN01.0, IPS, 2560x1600, 18" | MSI Titan 18 HX A14VIG AU Optronics B180ZAN01.0, Mini-LED, 3840x2400, 18" | Asus ROG Strix Scar 18 2023 G834JY-N6005W NE180QDM-NZ2, IPS, 2560x1600, 18" | |
|---|---|---|---|---|---|---|---|
| Display | -1% | -1% | 1% | -3% | -2% | -3% | |
| Display P3 Coverage (%) | 99.9 | 98.5 -1% | 97.7 -2% | 99.8 0% | 96.9 -3% | 98.1 -2% | 97.2 -3% |
| sRGB Coverage (%) | 100 | 99.7 0% | 100 0% | 100 0% | 99.8 0% | 99.8 0% | 99.9 0% |
| AdobeRGB 1998 Coverage (%) | 90 | 88.7 -1% | 89.8 0% | 91.8 2% | 85.3 -5% | 86.2 -4% | 84.9 -6% |
| Response Times | 44% | 41% | -15% | 45% | -318% | 37% | |
| Response Time Grey 50% / Grey 80% * (ms) | 12 ? | 2.8 ? 77% | 3 ? 75% | 7.6 ? 37% | 4.2 ? 65% | 8.6 ? 28% | 5.41 ? 55% |
| Response Time Black / White * (ms) | 10.7 ? | 9.6 ? 10% | 9.9 ? 7% | 17.8 ? -66% | 8 ? 25% | 81.8 ? -664% | 8.62 ? 19% |
| PWM Frequency (Hz) | 5733 ? | 2509 | 2592 ? | ||||
| Bildschirm | -42% | -64% | -114% | -142% | -85% | -211% | |
| Helligkeit Bildmitte (cd/m²) | 937 | 319.6 -66% | 372.8 -60% | 360 -62% | 549.6 -41% | 467.5 -50% | 490 -48% |
| Brightness (cd/m²) | 934 | 304 -67% | 367 -61% | 355 -62% | 524 -44% | 459 -51% | 468 -50% |
| Brightness Distribution (%) | 89 | 87 -2% | 97 9% | 92 3% | 89 0% | 90 1% | 86 -3% |
| Schwarzwert * (cd/m²) | 0.066 | 0.25 -279% | 0.32 -385% | 0.21 -218% | 0.53 -703% | 0.54 -718% | |
| Kontrast (:1) | 14197 | 1278 -91% | 1165 -92% | 1714 -88% | 1037 -93% | 907 -94% | |
| Delta E Colorchecker * | 1.52 | 1.22 20% | 1.92 -26% | 3.82 -151% | 3.32 -118% | 3.77 -148% | 4.97 -227% |
| Colorchecker dE 2000 max. * | 2.82 | 3.1 -10% | 3.65 -29% | 7.38 -162% | 6.63 -135% | 6.12 -117% | 11.02 -291% |
| Colorchecker dE 2000 calibrated * | 1.21 | 0.47 61% | 0.51 58% | 2.24 -85% | 2.7 -123% | 2.94 -143% | 2.97 -145% |
| Delta E Graustufen * | 1.7 | 0.8 53% | 1.5 12% | 5.06 -198% | 2 -18% | 3.2 -88% | 7.2 -324% |
| Gamma | 2.042 108% | 2.23 99% | 2.34 94% | 2.52 87% | 2.29 96% | 2.43 91% | 2.161 102% |
| CCT | 6578 99% | 6471 100% | 6607 98% | 5657 115% | 6319 103% | 6478 100% | 6515 100% |
| Durchschnitt gesamt (Programm / Settings) | 0% /
-21% | -8% /
-35% | -43% /
-75% | -33% /
-85% | -135% /
-103% | -59% /
-131% |
* ... kleinere Werte sind besser
Farbtreue ist gegeben: Der sRGB- und der DCI-P3-Farbraum werden komplett, der Adobe-RGB-Raum zu 90 % abgebildet. Dank Pantone-Zertifizierung fällt die Farbdarstellung bereits ab Werk sehr gut aus: Mit einer Abweichung von 1,52 wird das Soll (DeltaE < 3) voll erfüllt. Eine Kalibrierung bewirkt noch eine leichte Verbesserung, sorgt primär aber für ausgewogenere Graustufen.

Reaktionszeiten (Response Times) des Displays
| ↔ Reaktionszeiten Schwarz zu Weiß | ||
|---|---|---|
| 10.7 ms ... steigend ↗ und fallend ↘ kombiniert | ↗ 7.6 ms steigend | 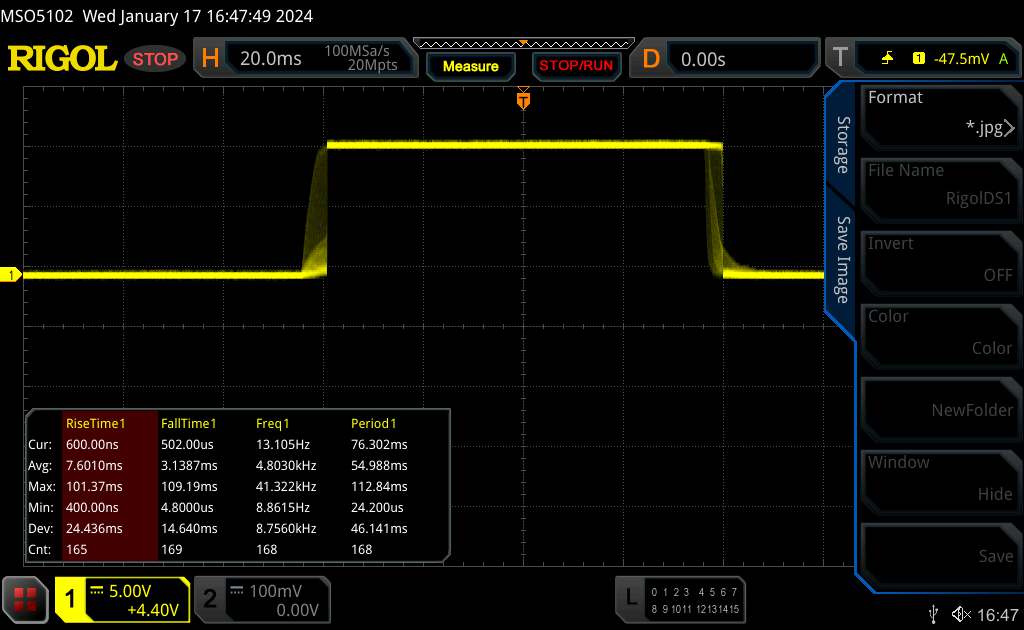 |
| ↘ 3.1 ms fallend | ||
| Die gemessenen Reaktionszeiten sind gut, für anspruchsvolle Spieler könnten der Bildschirm jedoch zu langsam sein. Im Vergleich rangierten die bei uns getesteten Geräte von 0.1 (Minimum) zu 240 (Maximum) ms. » 29 % aller Screens waren schneller als der getestete. Daher sind die gemessenen Reaktionszeiten besser als der Durchschnitt aller vermessenen Geräte (19.8 ms). | ||
| ↔ Reaktionszeiten 50% Grau zu 80% Grau | ||
| 12 ms ... steigend ↗ und fallend ↘ kombiniert | ↗ 8 ms steigend | |
| ↘ 4 ms fallend | ||
| Die gemessenen Reaktionszeiten sind gut, für anspruchsvolle Spieler könnten der Bildschirm jedoch zu langsam sein. Im Vergleich rangierten die bei uns getesteten Geräte von 0.165 (Minimum) zu 636 (Maximum) ms. » 25 % aller Screens waren schneller als der getestete. Daher sind die gemessenen Reaktionszeiten besser als der Durchschnitt aller vermessenen Geräte (30.9 ms). | ||
Bildschirm-Flackern / PWM (Pulse-Width Modulation)
| Flackern / PWM festgestellt | 5733 Hz | |
| ≤ 94 cd/m² Helligkeit | ||
Das Display flackert mit 5733 Hz (im schlimmsten Fall, eventuell durch Pulsweitenmodulation PWM) bei einer eingestellten Helligkeit von 94 cd/m² und darunter. Darüber sollte es zu keinem Flackern kommen. Die Frequenz von 5733 Hz ist sehr hoch und sollte daher auch bei empfindlichen Personen zu keinen Problemen führen. Die Helligkeitsschwankungen traten im Test nur bei relativ geringer Helligkeit auf, daher kann es z.B. in dunklen Innenräumen zu Problemen kommen. Im Vergleich: 52 % aller getesteten Geräte nutzten kein PWM um die Helligkeit zu reduzieren. Wenn PWM eingesetzt wurde, dann bei einer Frequenz von durchschnittlich 7744 (Minimum 5, Maximum 343500) Hz. | ||
Das blickwinkelstabile IPS-Panel ist aus jeder Position heraus ablesbar. Im Freien ist ein Ablesen des Bildschirms aufgrund der hohen Maximalhelligkeit möglich.

Leistung - Das Scar 18 hat High-End-Hardware an Bord
Das Asus ROG Strix Scar 18 stellt ein High-End-Notebook im 18-Zoll-Format dar. Die nötige Rechenleistung liefern Raptor Lake Refresh und Ada Lovelace. Das vorliegende Testgerät ist ab etwa 4.500 Euro zu haben. Die Preise beginnen bei 3.600 Euro.

Testbedingungen
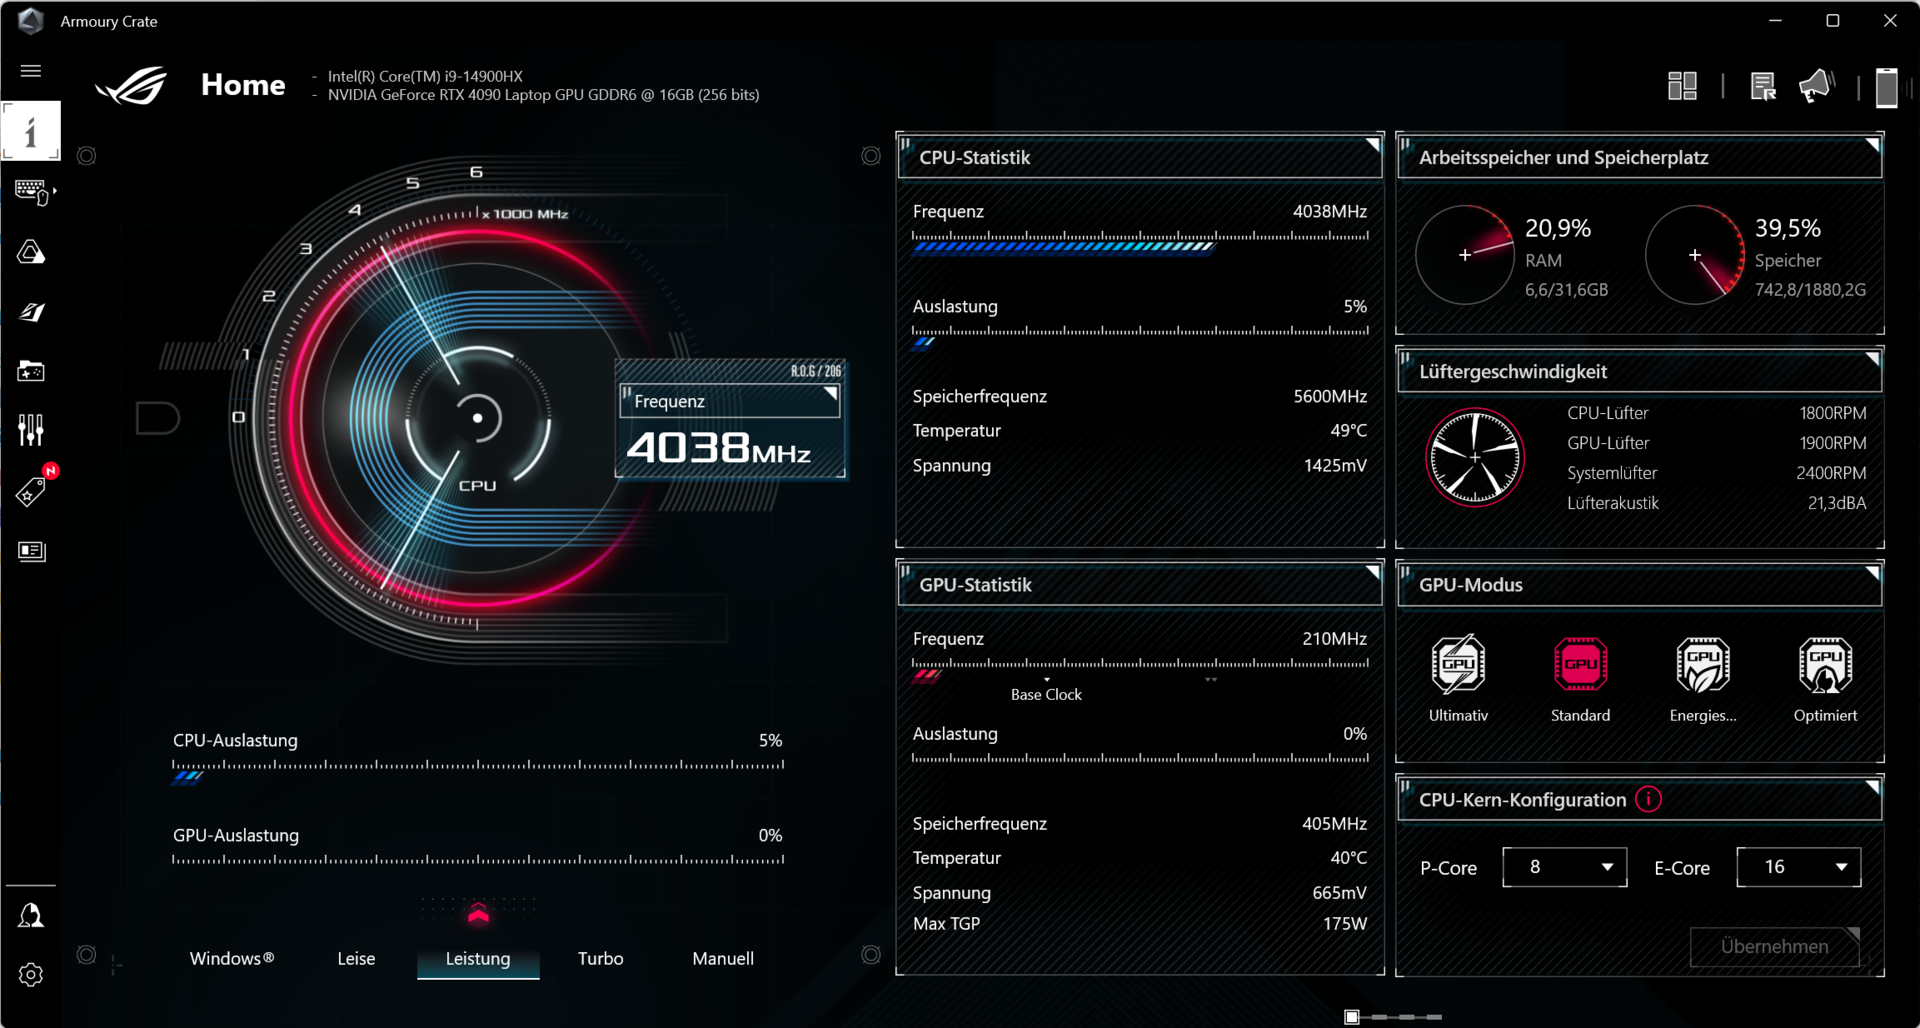
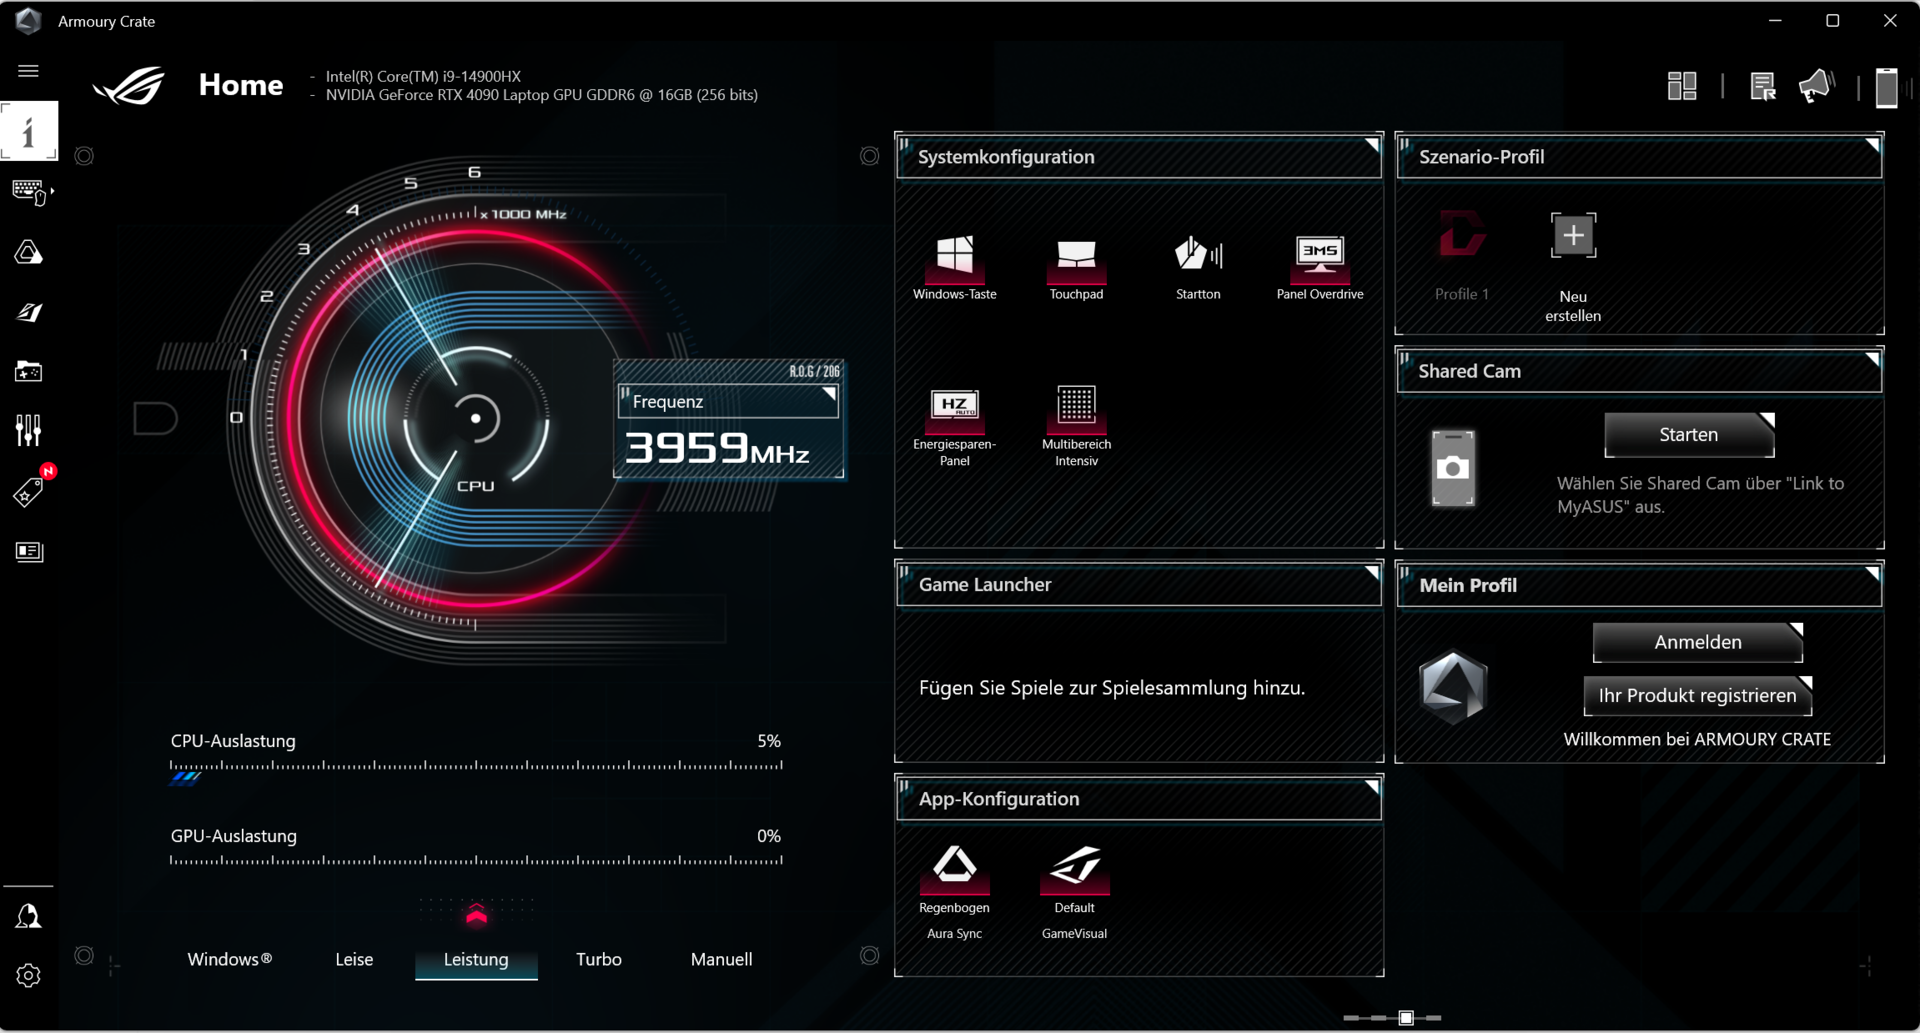
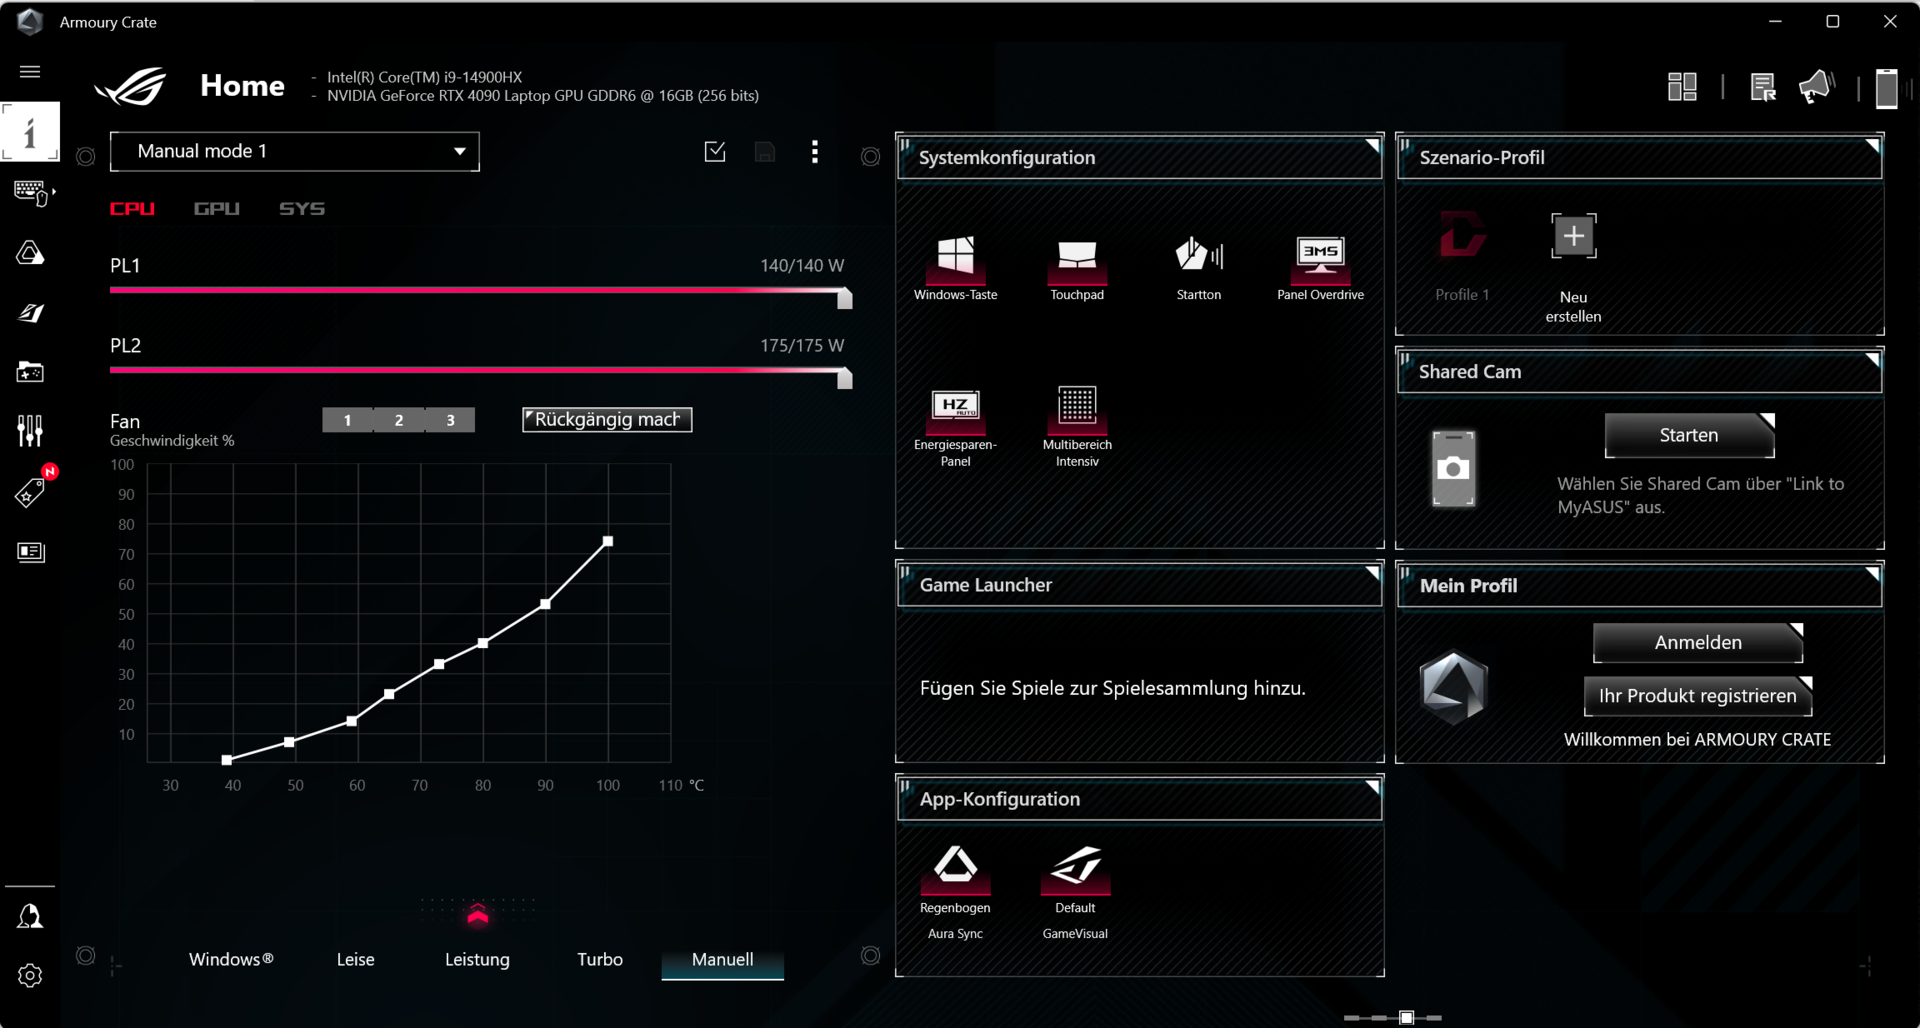
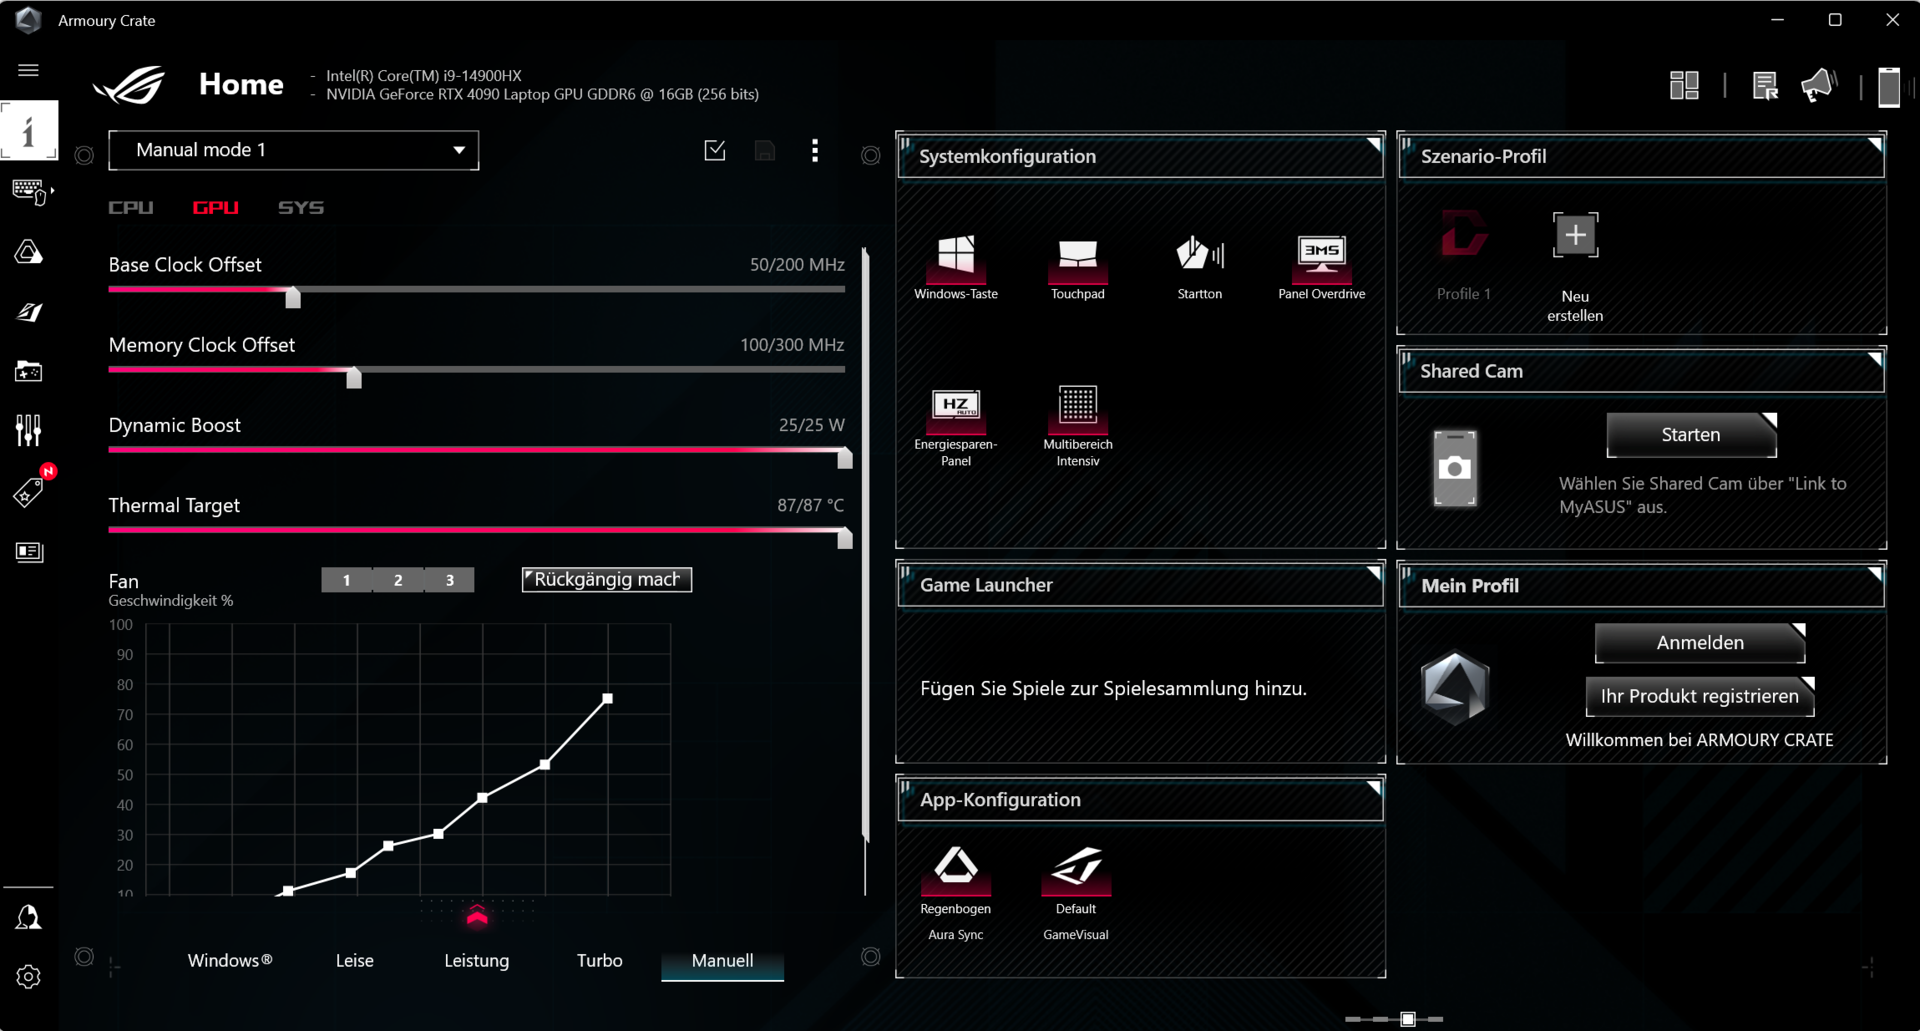
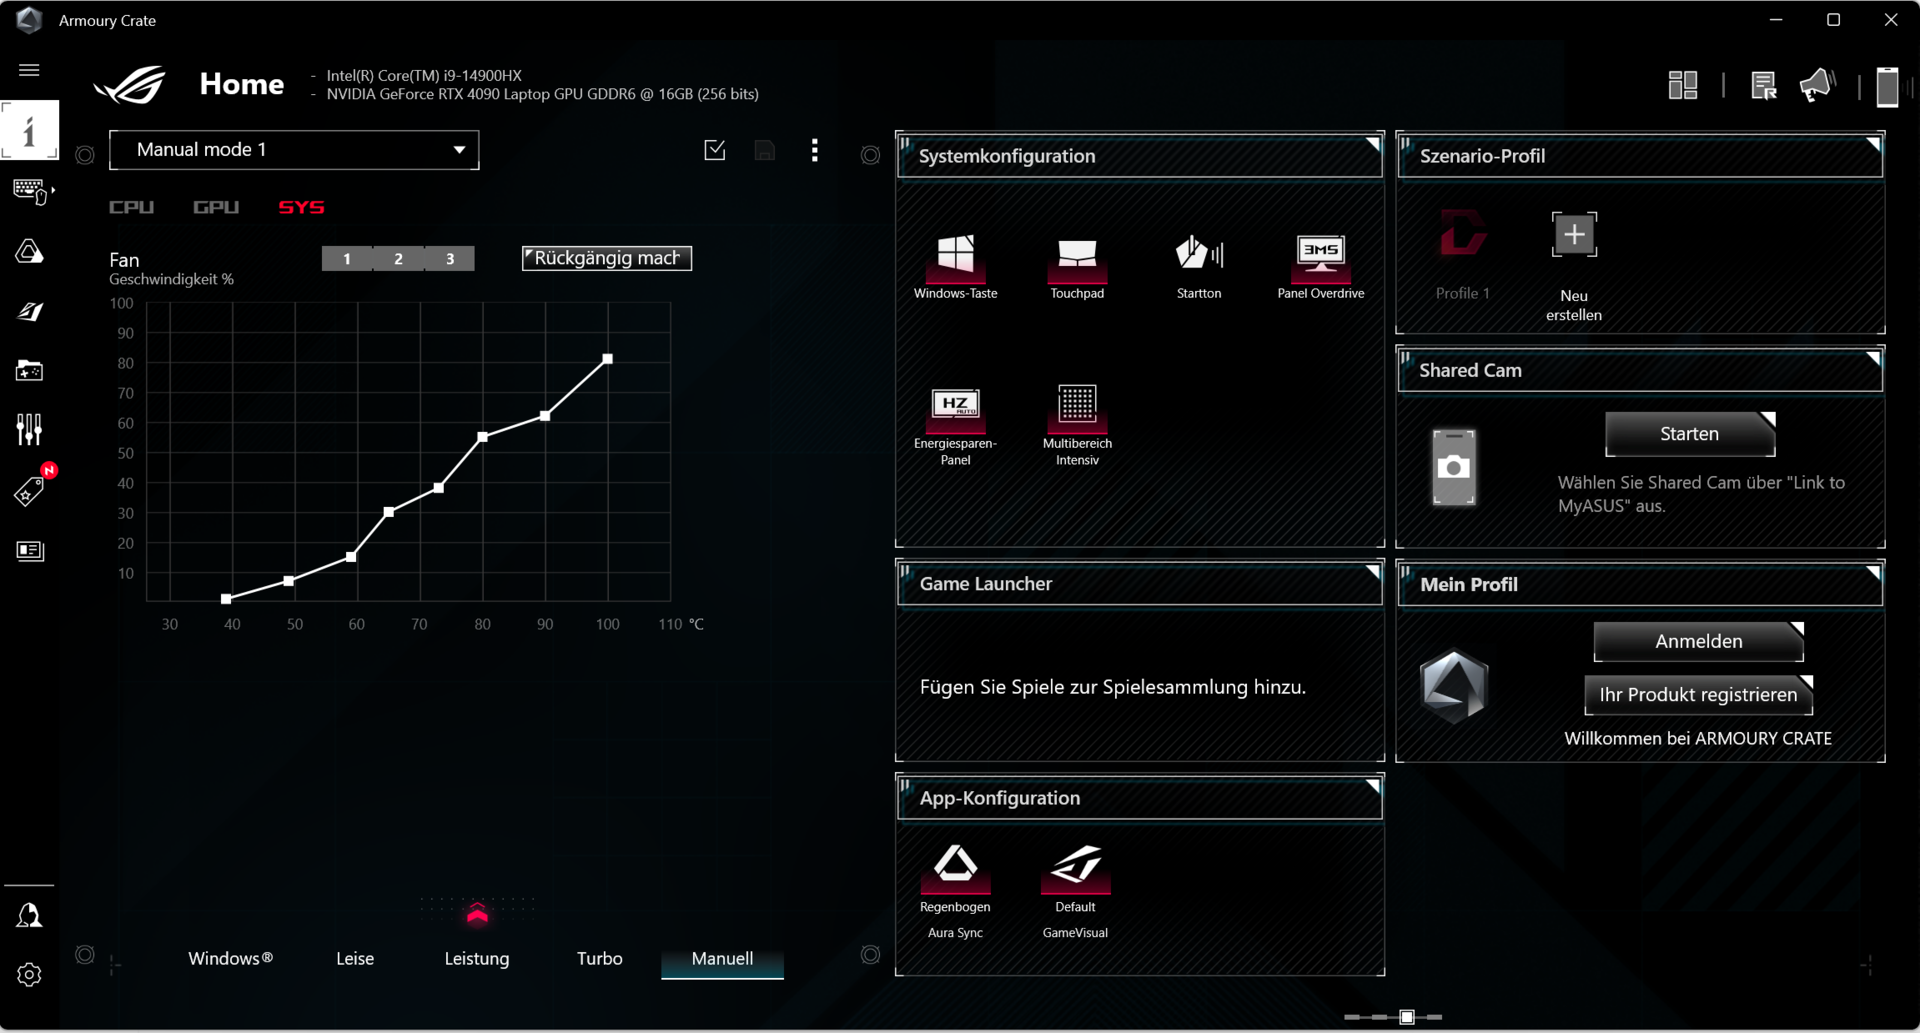
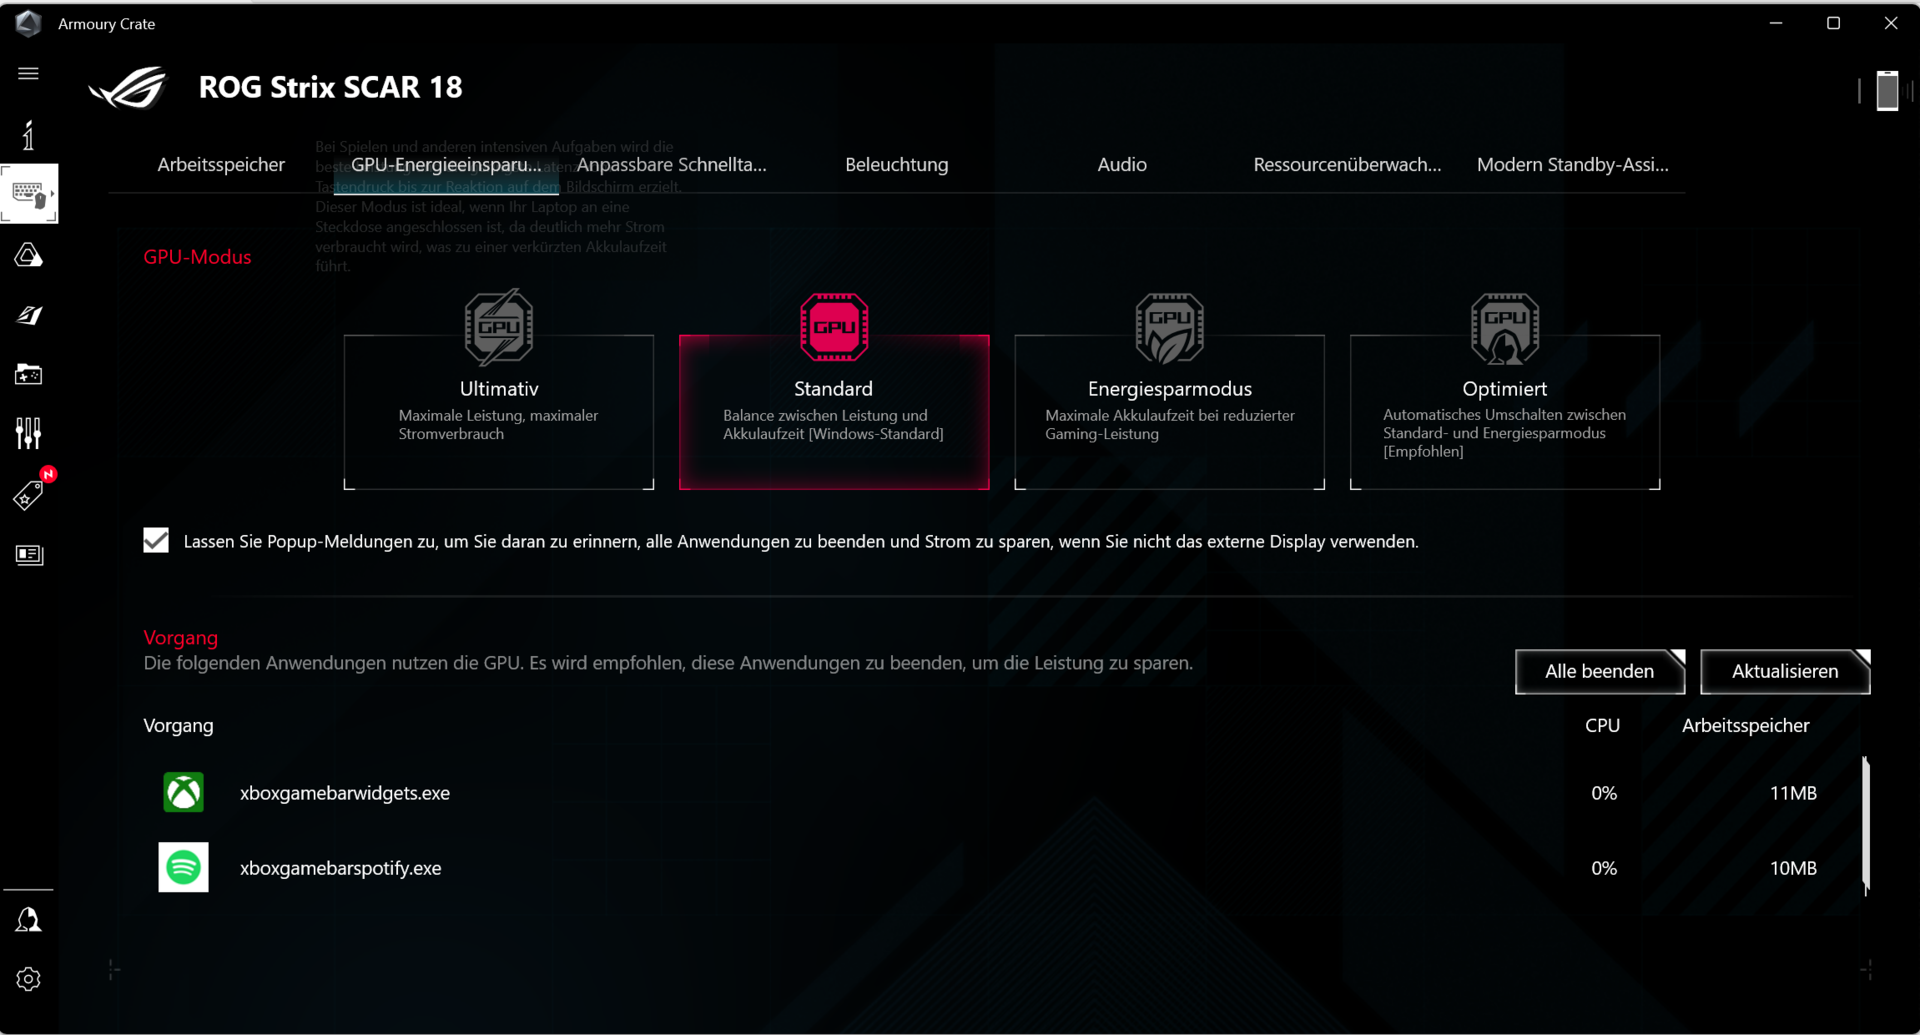
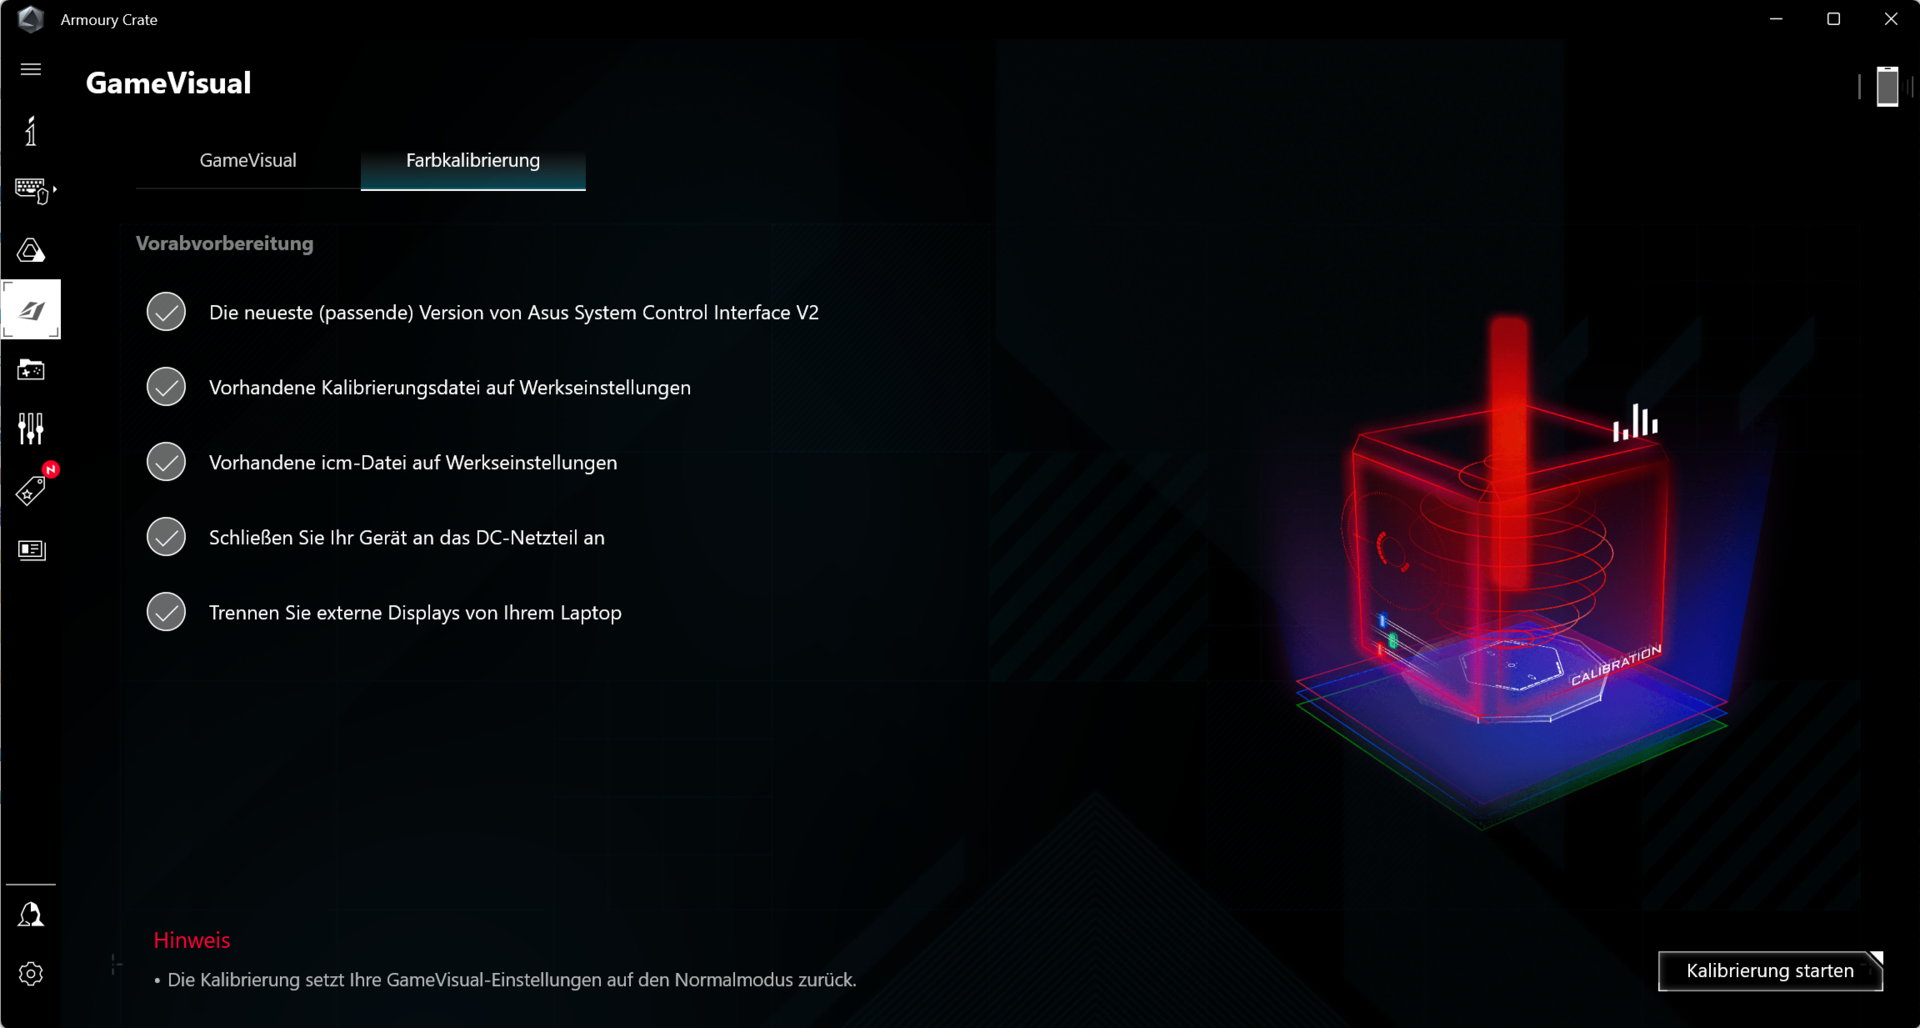
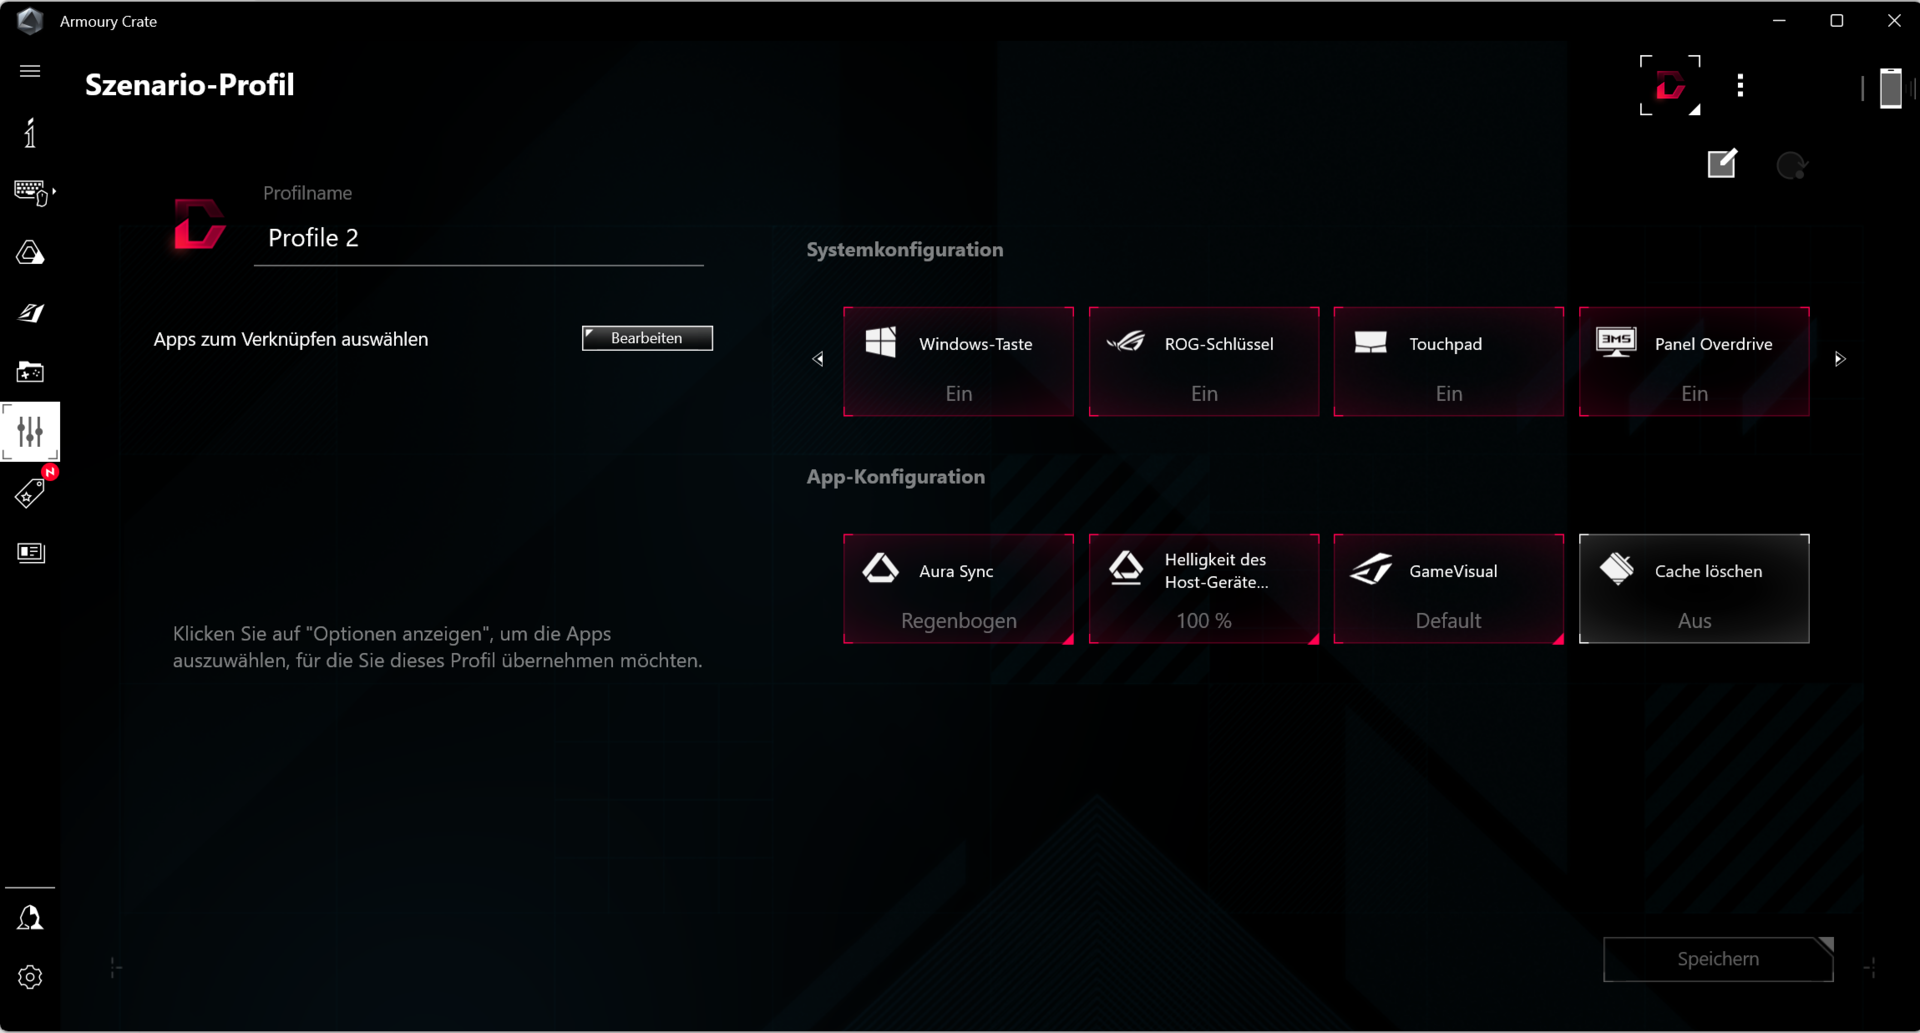
Drei Asus-eigene Leistungsmodi (siehe Tabelle) stehen zur Verfügung; das Umschalten erfolgt per Tastenkombination (Fn + F5). "Leistung" (Benchmarks) und "Leise" (Akkutests) wurden von uns genutzt. Der GPU-Modus war auf "Standard" gesetzt. Das Kontrollcenter ("Armoury Crate") des Laptops erlaubt das Anlegen individueller Profile ("Manuell") samt Festlegung der Power Limits, des Dynamic Boosts und der Lüfterkurven.
| Leistung | Turbo | Leise | |
|---|---|---|---|
| Power Limit 1 (HWInfo) | 110 Watt | 175 Watt | 65 Watt |
| Power Limit 2 (HWInfo) | 120 Watt | 175 Watt | 100 Watt |
| Noise (Witcher 3) | 50 dB(A) | 56 dB(A) | 35 dB(A) |
| Performance (Witcher 3) | ~188 fps | ~183 fps | ~68 fps |

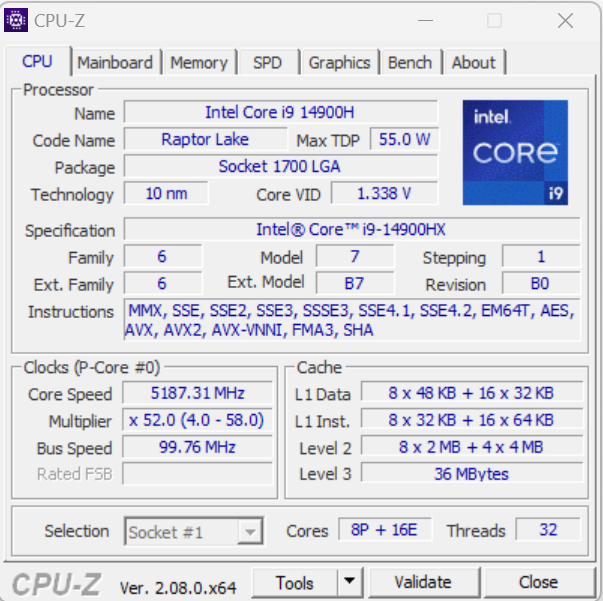
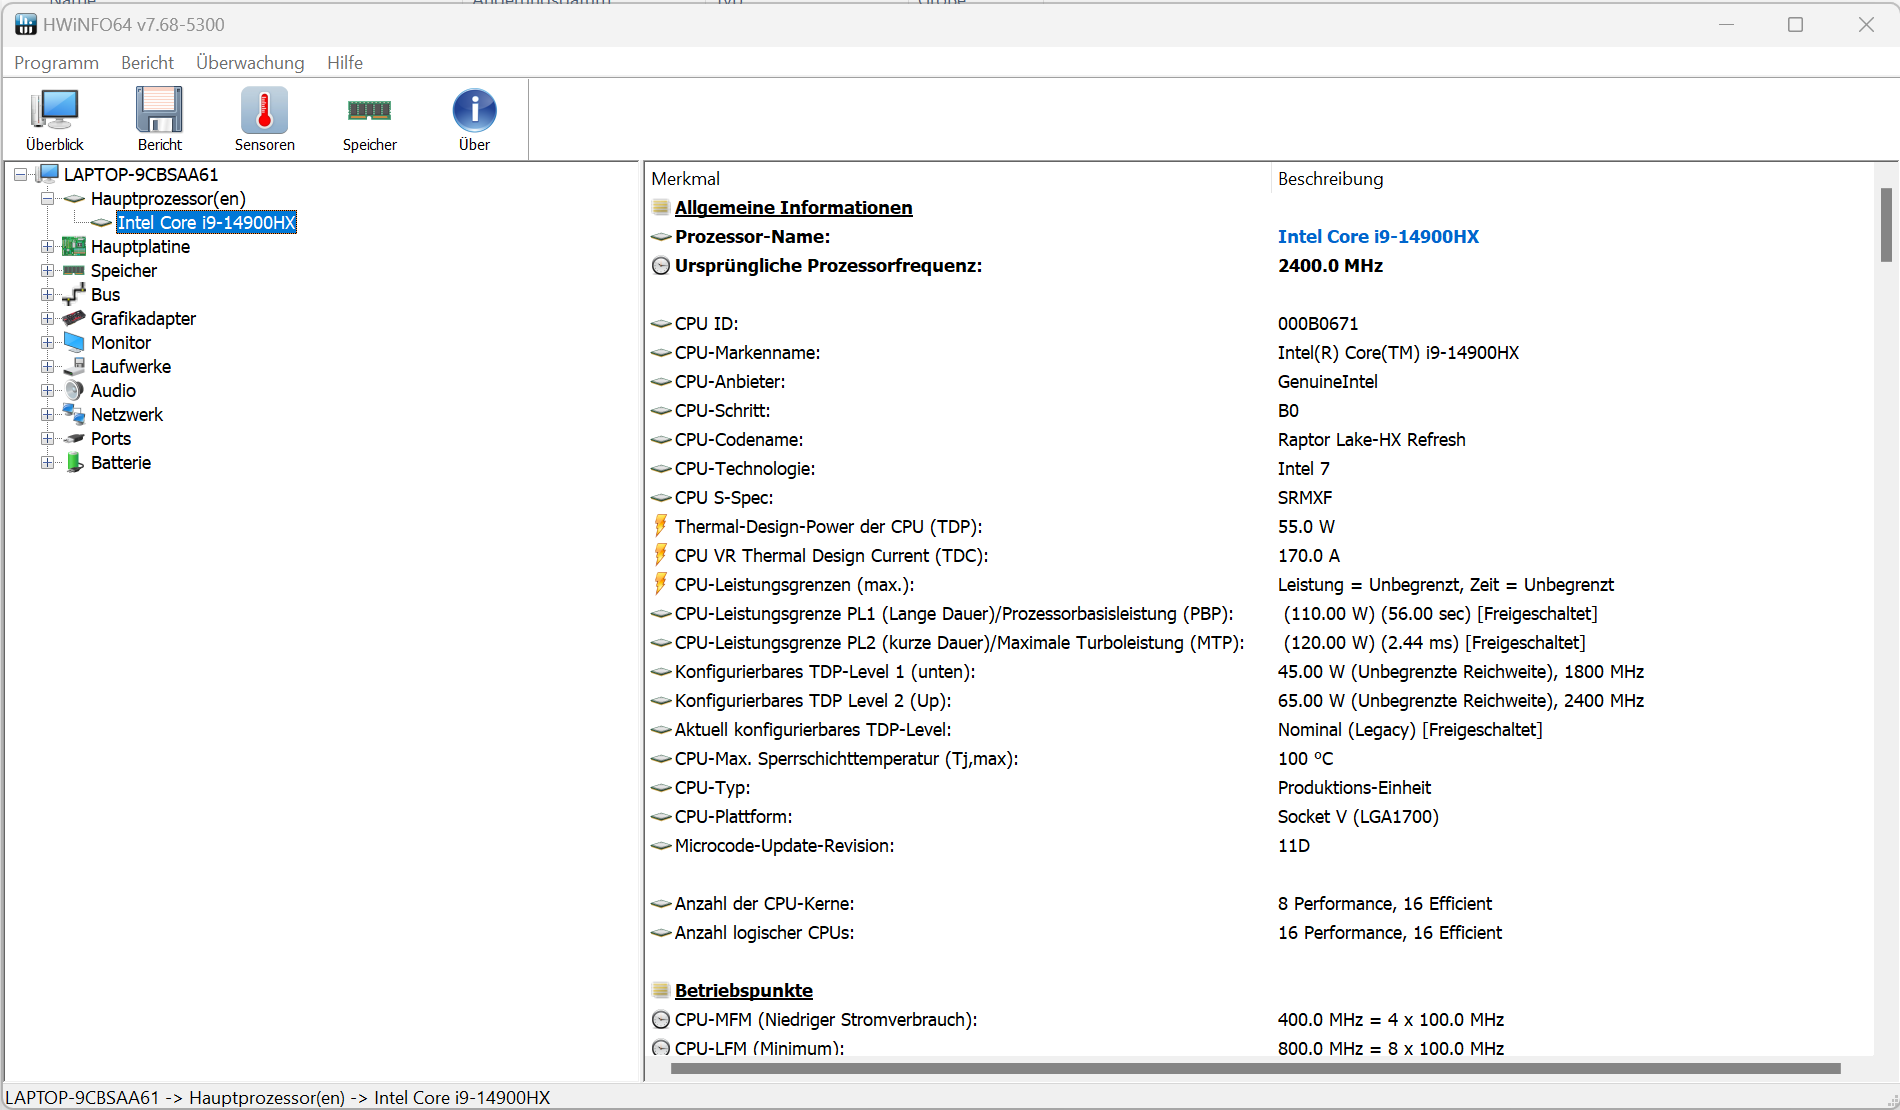
Prozessor
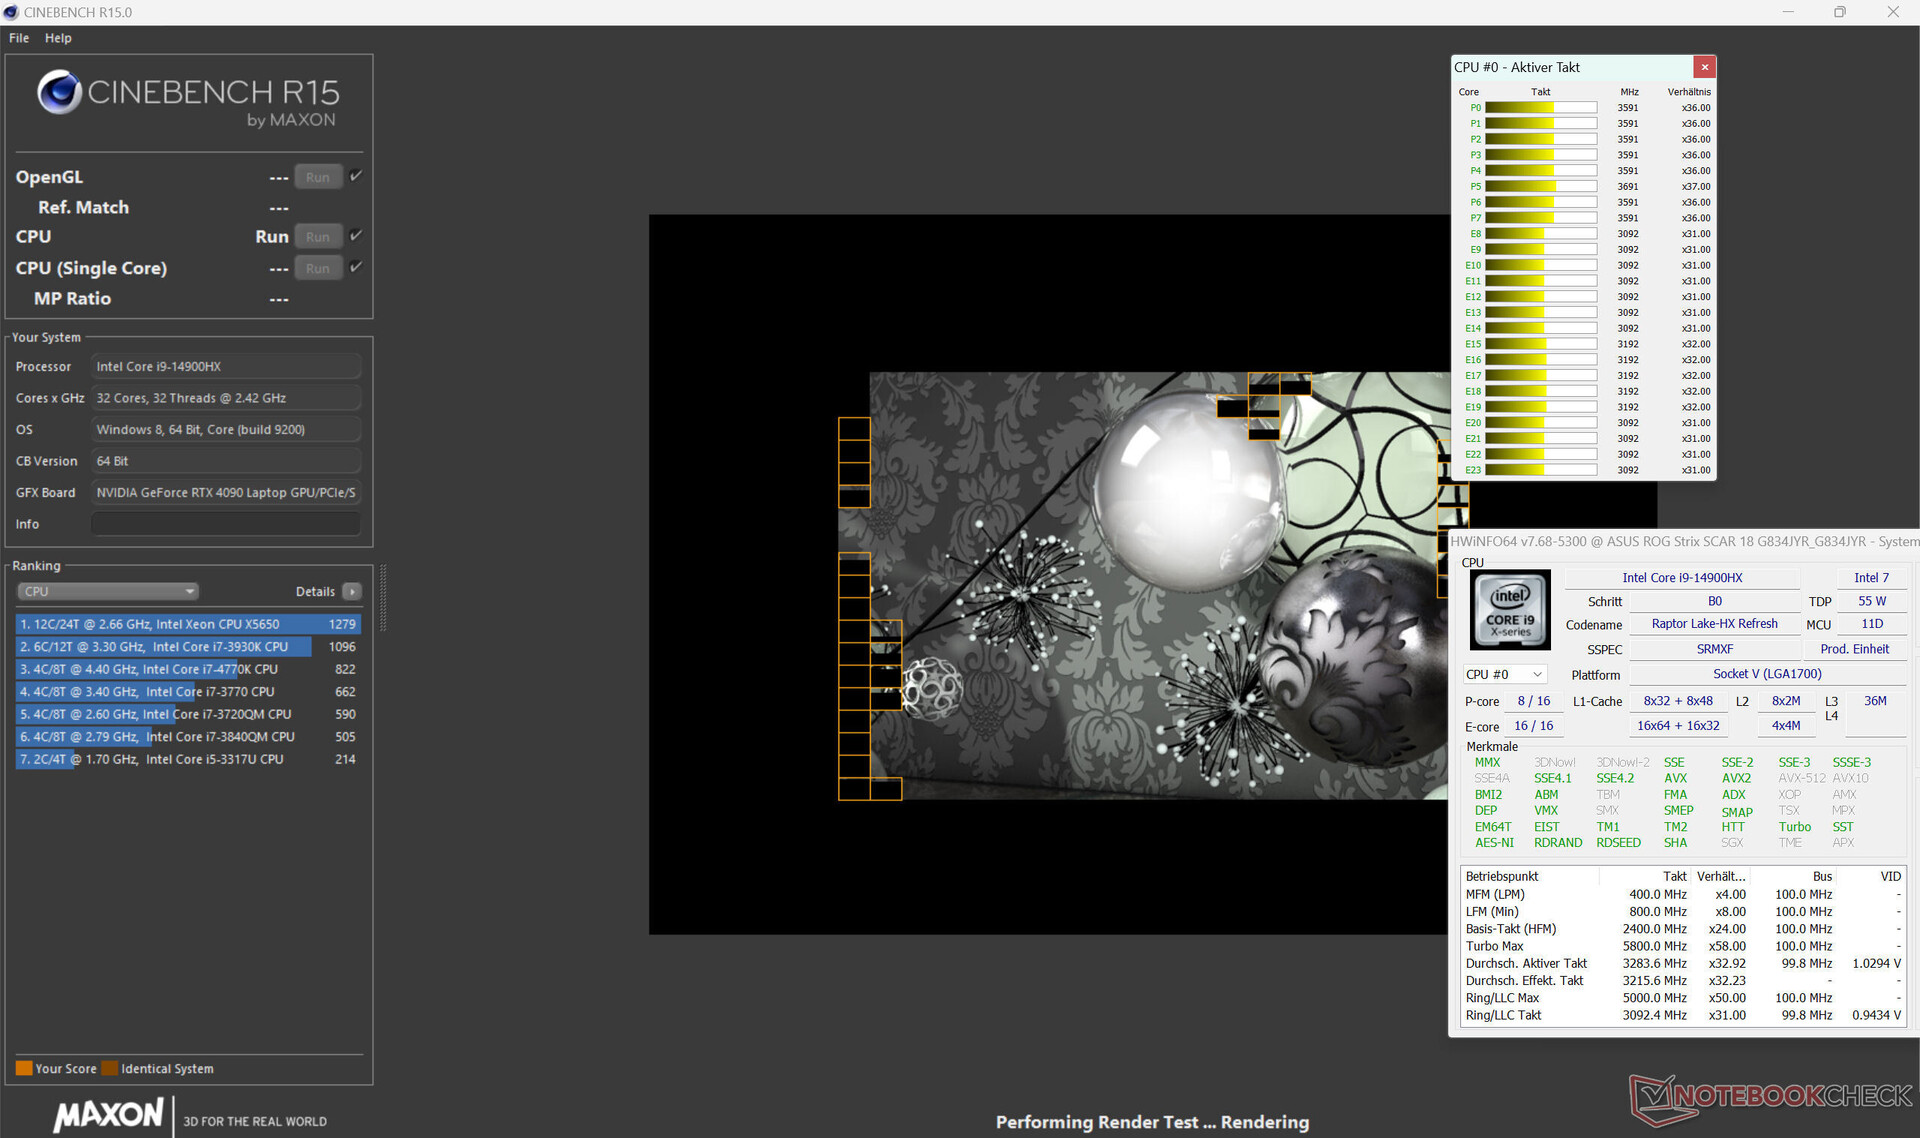
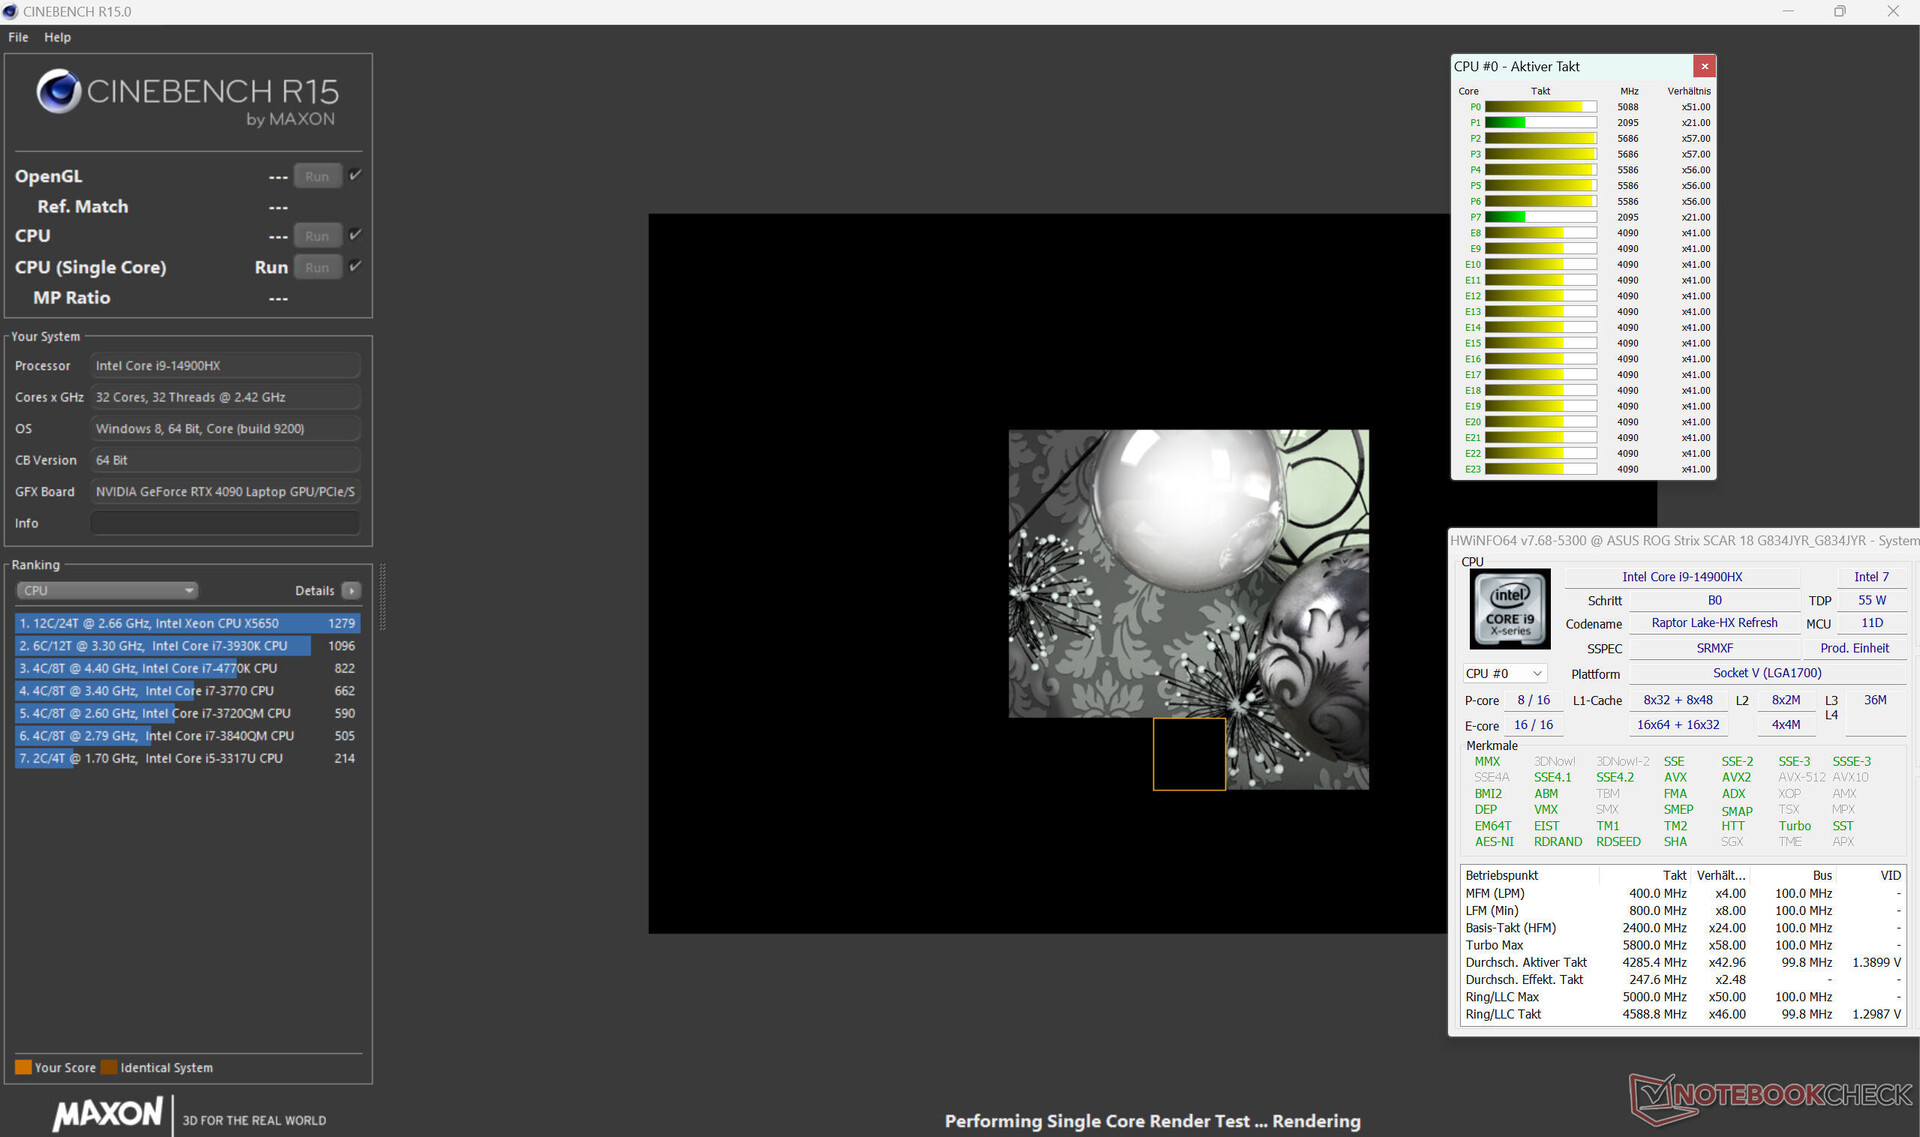
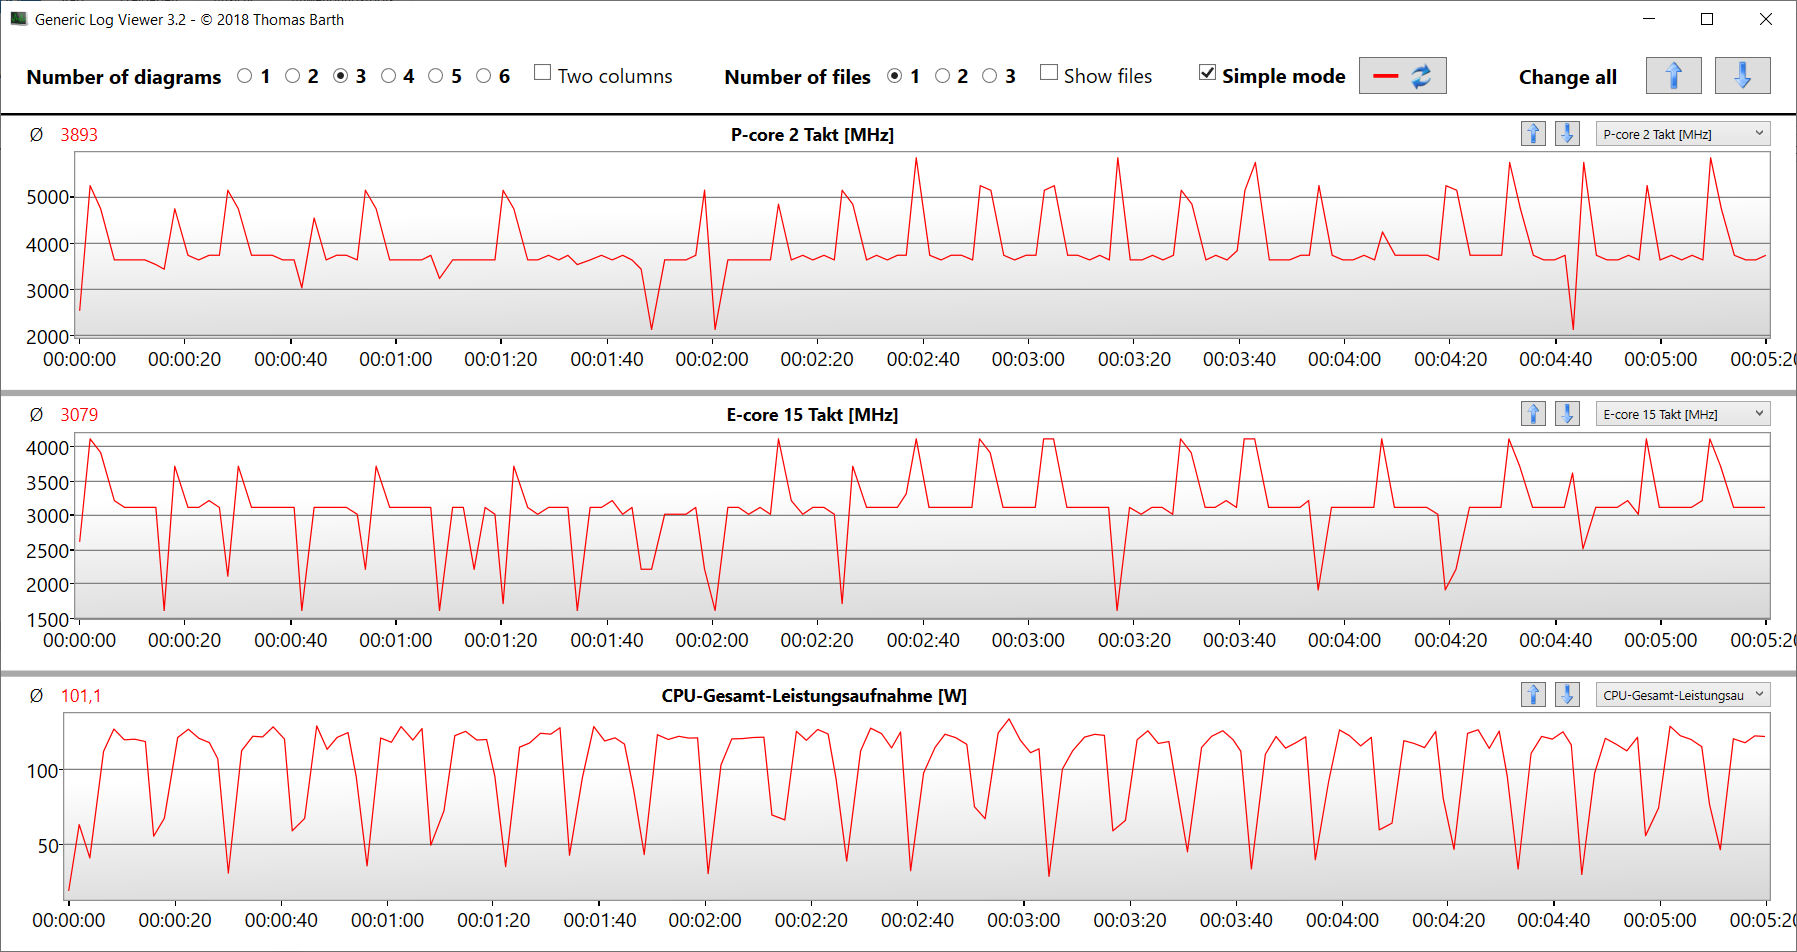
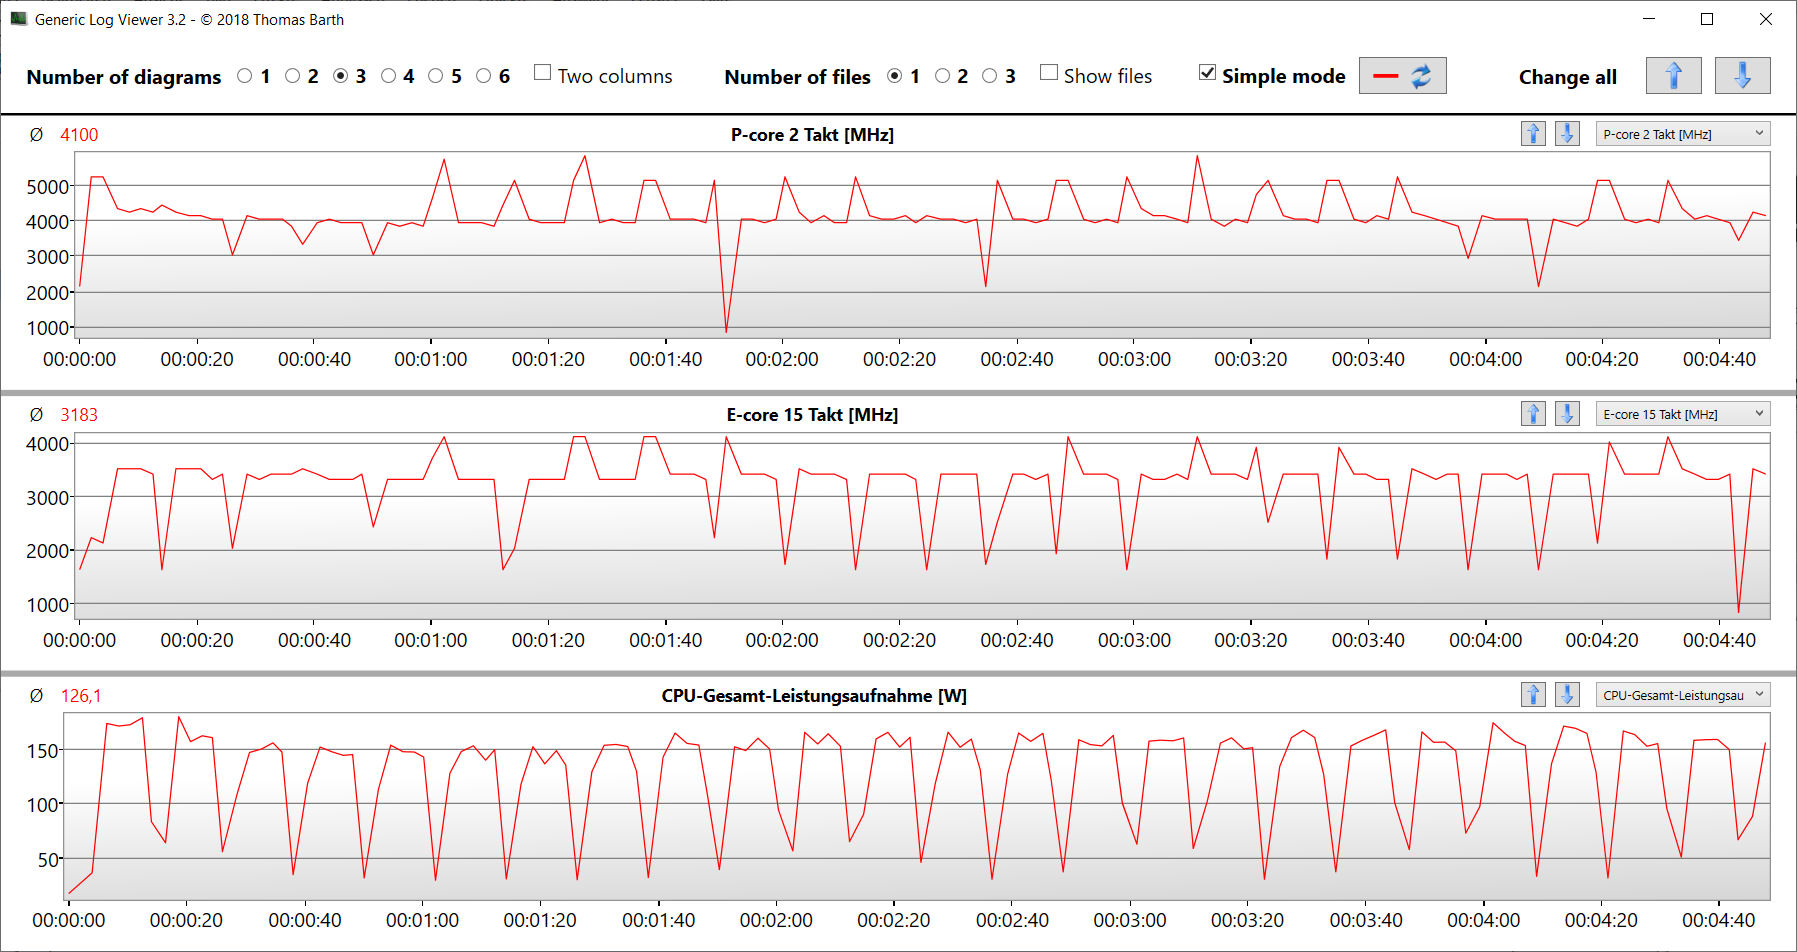
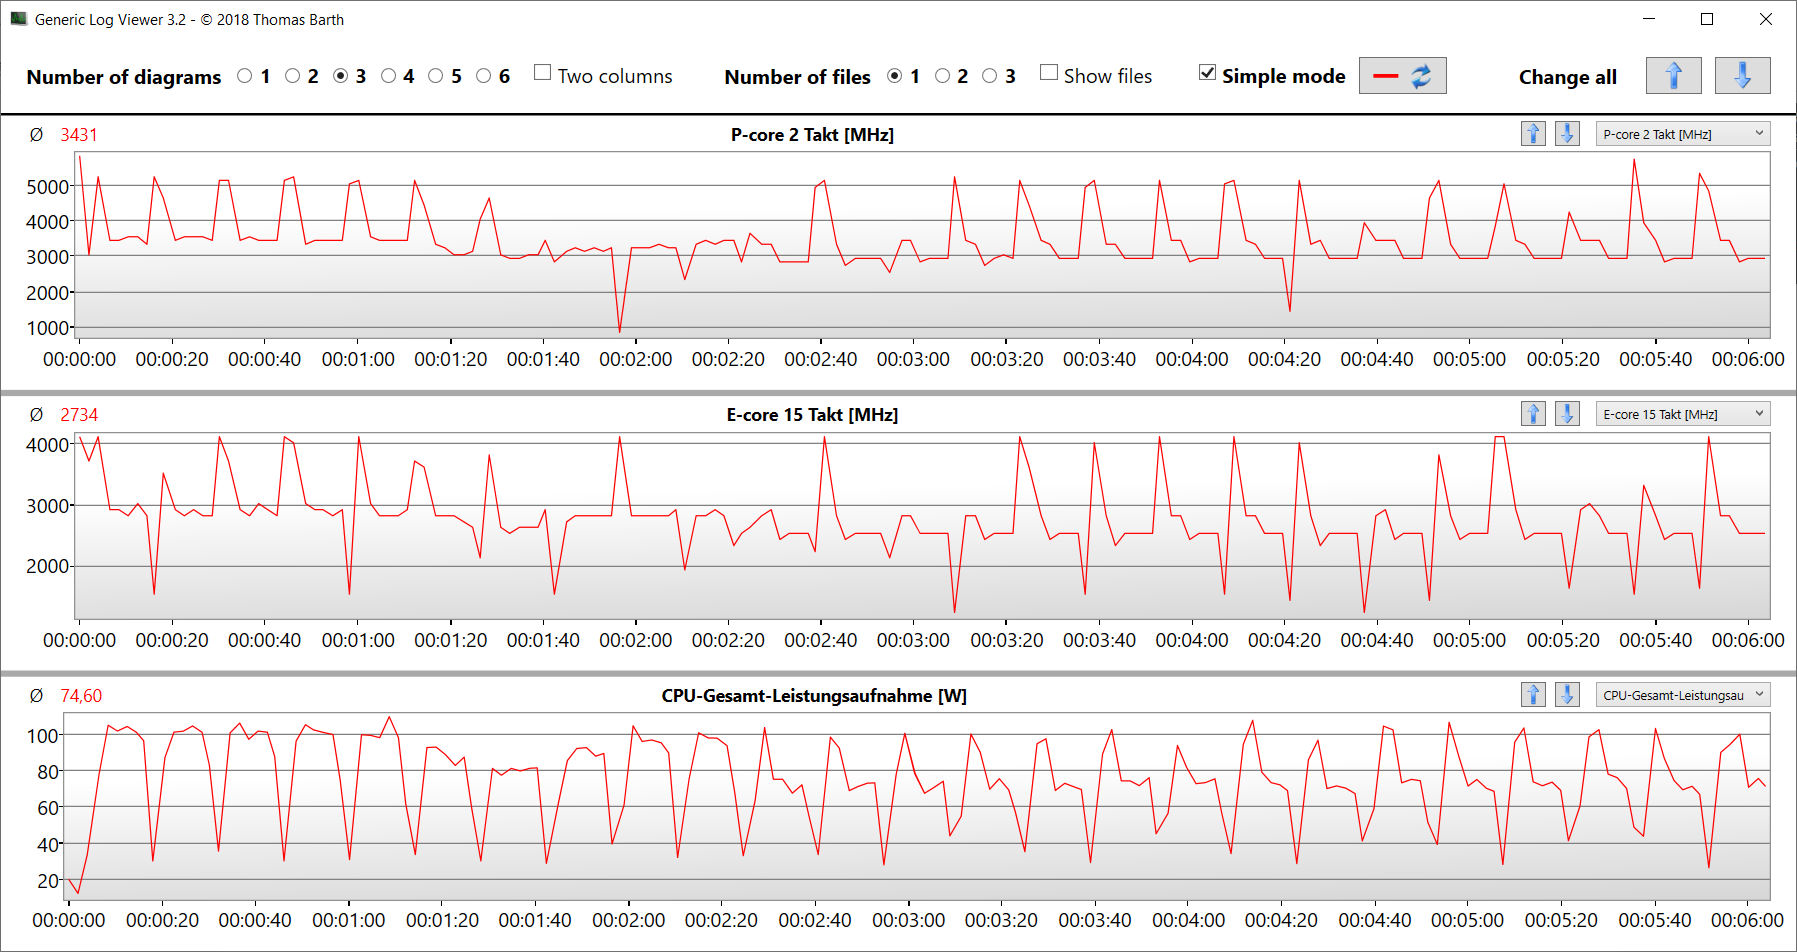
Die 24 CPU-Kerne (8P + 16E = 32 Threads) des Core i9-14900HX (Raptor Lake) erreichen Maximaltakte von 5,8 GHz (P) bzw. 4,1 GHz (E). Dauerhafte Multi-Thread-Last (CB15 Loop) quittiert die CPU mit einem konstant hohen Turbo-Takt. Mehr Informationen zum Core i9 liefert unser Analyse-Artikel.
Die Wahl des Energieprofils beeinflusst die Single-Thread-Leistung nur in geringem Maße, stärker hingegen die Multi-Thread-Leistung. "Leistung" sorgt für Benchmarkwerte unter dem bisherigen CPU-Durchschnitt, "Turbo" hebt die Resultate leicht darüber. Die für den Alltag relevantere Single-Thread-Leistung bewegt sich im Netz- und im Akkubetrieb auf gleicher Höhe, die Multi-Thread-Leistung sackt im Akkubetrieb deutlich ab.
Cinebench R15 Multi Dauertest
| CPU Performance Rating - Percent | |
| Alienware m18 R1 AMD | |
| Asus ROG Strix Scar 18 G834JYR (2024) | |
| Asus ROG Strix Scar 18 2023 G834JY-N6005W -2! | |
| Alienware m18 R1 -2! | |
| MSI Titan 18 HX A14VIG | |
| Acer Predator Helios 18 N23Q2 | |
| Asus ROG Strix Scar 18 G834JYR (2024) | |
| Durchschnittliche Intel Core i9-14900HX | |
| Razer Blade 18 RTX 4070 -2! | |
| Durchschnitt der Klasse Gaming | |
| Blender - v2.79 BMW27 CPU | |
| Durchschnitt der Klasse Gaming (79 - 330, n=101, der letzten 2 Jahre) | |
| Durchschnittliche Intel Core i9-14900HX (91 - 206, n=37) | |
| Asus ROG Strix Scar 18 G834JYR (2024) | |
| Razer Blade 18 RTX 4070 | |
| Asus ROG Strix Scar 18 G834JYR (2024) (Turbo) | |
| Acer Predator Helios 18 N23Q2 | |
| MSI Titan 18 HX A14VIG | |
| Asus ROG Strix Scar 18 2023 G834JY-N6005W | |
| Alienware m18 R1 | |
| Alienware m18 R1 AMD | |
| Geekbench 6.7 | |
| Multi-Core | |
| Asus ROG Strix Scar 18 G834JYR (2024) (6.2.1, Turbo) | |
| Acer Predator Helios 18 N23Q2 | |
| Asus ROG Strix Scar 18 G834JYR (2024) (6.2.1) | |
| Durchschnittliche Intel Core i9-14900HX (13158 - 19665, n=37) | |
| MSI Titan 18 HX A14VIG (6.2.1) | |
| Alienware m18 R1 AMD | |
| Durchschnitt der Klasse Gaming (6625 - 22850, n=103, der letzten 2 Jahre) | |
| Single-Core | |
| Asus ROG Strix Scar 18 G834JYR (2024) (6.2.1, Turbo) | |
| Asus ROG Strix Scar 18 G834JYR (2024) (6.2.1) | |
| Durchschnittliche Intel Core i9-14900HX (2419 - 3129, n=37) | |
| Acer Predator Helios 18 N23Q2 | |
| Alienware m18 R1 AMD | |
| Durchschnitt der Klasse Gaming (1982 - 3259, n=103, der letzten 2 Jahre) | |
| MSI Titan 18 HX A14VIG (6.2.1) | |
| HWBOT x265 Benchmark v2.2 - 4k Preset | |
| Alienware m18 R1 AMD | |
| Asus ROG Strix Scar 18 2023 G834JY-N6005W | |
| Alienware m18 R1 | |
| Asus ROG Strix Scar 18 G834JYR (2024) (Turbo) | |
| Razer Blade 18 RTX 4070 | |
| MSI Titan 18 HX A14VIG | |
| Acer Predator Helios 18 N23Q2 | |
| Durchschnittliche Intel Core i9-14900HX (16.8 - 38.9, n=37) | |
| Durchschnitt der Klasse Gaming (11.5 - 44.4, n=102, der letzten 2 Jahre) | |
| Asus ROG Strix Scar 18 G834JYR (2024) | |
| LibreOffice - 20 Documents To PDF | |
| Durchschnitt der Klasse Gaming (33.2 - 88.8, n=102, der letzten 2 Jahre) | |
| Acer Predator Helios 18 N23Q2 | |
| Alienware m18 R1 | |
| MSI Titan 18 HX A14VIG (6.3.4.2) | |
| Asus ROG Strix Scar 18 G834JYR (2024) (6.3.4.2) | |
| Razer Blade 18 RTX 4070 | |
| Durchschnittliche Intel Core i9-14900HX (19 - 85.1, n=37) | |
| Alienware m18 R1 AMD (6.3.4.2) | |
| Asus ROG Strix Scar 18 G834JYR (2024) (6.3.4.2, Turbo) | |
| Asus ROG Strix Scar 18 2023 G834JY-N6005W | |
| R Benchmark 2.5 - Overall mean | |
| Durchschnitt der Klasse Gaming (0.3439 - 0.59, n=102, der letzten 2 Jahre) | |
| Alienware m18 R1 AMD | |
| Acer Predator Helios 18 N23Q2 | |
| Razer Blade 18 RTX 4070 | |
| Asus ROG Strix Scar 18 G834JYR (2024) | |
| Alienware m18 R1 | |
| MSI Titan 18 HX A14VIG | |
| Durchschnittliche Intel Core i9-14900HX (0.3604 - 0.4859, n=37) | |
| Asus ROG Strix Scar 18 2023 G834JY-N6005W | |
| Asus ROG Strix Scar 18 G834JYR (2024) (Turbo) | |
* ... kleinere Werte sind besser
AIDA64: FP32 Ray-Trace | FPU Julia | CPU SHA3 | CPU Queen | FPU SinJulia | FPU Mandel | CPU AES | CPU ZLib | FP64 Ray-Trace | CPU PhotoWorxx
| Performance Rating | |
| Alienware m18 R1 AMD | |
| Acer Predator Helios 18 N23Q2 | |
| Alienware m18 R1 | |
| MSI Titan 18 HX A14VIG | |
| Asus ROG Strix Scar 18 2023 G834JY-N6005W | |
| Asus ROG Strix Scar 18 G834JYR (2024) | |
| Durchschnitt der Klasse Gaming | |
| Razer Blade 18 RTX 4070 | |
| Asus ROG Strix Scar 18 G834JYR (2024) | |
| Durchschnittliche Intel Core i9-14900HX | |
| AIDA64 / FP32 Ray-Trace | |
| Alienware m18 R1 AMD (v6.85.6300) | |
| Durchschnitt der Klasse Gaming (10227 - 85542, n=102, der letzten 2 Jahre) | |
| Alienware m18 R1 (v6.85.6300) | |
| MSI Titan 18 HX A14VIG (v6.92.6600) | |
| Asus ROG Strix Scar 18 2023 G834JY-N6005W (v6.85.6300) | |
| Acer Predator Helios 18 N23Q2 (v6.85.6300) | |
| Asus ROG Strix Scar 18 G834JYR (2024) (v6.92.6600, Turbo) | |
| Razer Blade 18 RTX 4070 (v6.85.6300) | |
| Asus ROG Strix Scar 18 G834JYR (2024) (v6.92.6600) | |
| Durchschnittliche Intel Core i9-14900HX (13098 - 33474, n=36) | |
| AIDA64 / FPU Julia | |
| Alienware m18 R1 AMD (v6.85.6300) | |
| MSI Titan 18 HX A14VIG (v6.92.6600) | |
| Alienware m18 R1 (v6.85.6300) | |
| Durchschnitt der Klasse Gaming (51376 - 372155, n=102, der letzten 2 Jahre) | |
| Asus ROG Strix Scar 18 2023 G834JY-N6005W (v6.85.6300) | |
| Asus ROG Strix Scar 18 G834JYR (2024) (v6.92.6600, Turbo) | |
| Acer Predator Helios 18 N23Q2 (v6.85.6300) | |
| Razer Blade 18 RTX 4070 (v6.85.6300) | |
| Asus ROG Strix Scar 18 G834JYR (2024) (v6.92.6600) | |
| Durchschnittliche Intel Core i9-14900HX (67573 - 166040, n=36) | |
| AIDA64 / CPU SHA3 | |
| Alienware m18 R1 AMD (v6.85.6300) | |
| MSI Titan 18 HX A14VIG (v6.92.6600) | |
| Alienware m18 R1 (v6.85.6300) | |
| Asus ROG Strix Scar 18 2023 G834JY-N6005W (v6.85.6300) | |
| Acer Predator Helios 18 N23Q2 (v6.85.6300) | |
| Asus ROG Strix Scar 18 G834JYR (2024) (v6.92.6600, Turbo) | |
| Durchschnitt der Klasse Gaming (2180 - 10115, n=102, der letzten 2 Jahre) | |
| Razer Blade 18 RTX 4070 (v6.85.6300) | |
| Asus ROG Strix Scar 18 G834JYR (2024) (v6.92.6600) | |
| Durchschnittliche Intel Core i9-14900HX (3589 - 7979, n=36) | |
| AIDA64 / CPU Queen | |
| Alienware m18 R1 AMD (v6.85.6300) | |
| MSI Titan 18 HX A14VIG (v6.92.6600) | |
| Alienware m18 R1 (v6.85.6300) | |
| Asus ROG Strix Scar 18 G834JYR (2024) (v6.92.6600) | |
| Asus ROG Strix Scar 18 G834JYR (2024) (v6.92.6600, Turbo) | |
| Asus ROG Strix Scar 18 2023 G834JY-N6005W (v6.85.6300) | |
| Durchschnittliche Intel Core i9-14900HX (118405 - 148966, n=36) | |
| Razer Blade 18 RTX 4070 (v6.85.6300) | |
| Acer Predator Helios 18 N23Q2 (v6.85.6300) | |
| Durchschnitt der Klasse Gaming (49785 - 173351, n=86, der letzten 2 Jahre) | |
| AIDA64 / FPU SinJulia | |
| Alienware m18 R1 AMD (v6.85.6300) | |
| MSI Titan 18 HX A14VIG (v6.92.6600) | |
| Asus ROG Strix Scar 18 2023 G834JY-N6005W (v6.85.6300) | |
| Alienware m18 R1 (v6.85.6300) | |
| Asus ROG Strix Scar 18 G834JYR (2024) (v6.92.6600, Turbo) | |
| Asus ROG Strix Scar 18 G834JYR (2024) (v6.92.6600) | |
| Razer Blade 18 RTX 4070 (v6.85.6300) | |
| Acer Predator Helios 18 N23Q2 (v6.85.6300) | |
| Durchschnittliche Intel Core i9-14900HX (10475 - 18517, n=36) | |
| Durchschnitt der Klasse Gaming (4424 - 33636, n=102, der letzten 2 Jahre) | |
| AIDA64 / FPU Mandel | |
| Alienware m18 R1 AMD (v6.85.6300) | |
| Durchschnitt der Klasse Gaming (25115 - 196829, n=102, der letzten 2 Jahre) | |
| Alienware m18 R1 (v6.85.6300) | |
| MSI Titan 18 HX A14VIG (v6.92.6600) | |
| Asus ROG Strix Scar 18 2023 G834JY-N6005W (v6.85.6300) | |
| Acer Predator Helios 18 N23Q2 (v6.85.6300) | |
| Asus ROG Strix Scar 18 G834JYR (2024) (v6.92.6600, Turbo) | |
| Razer Blade 18 RTX 4070 (v6.85.6300) | |
| Asus ROG Strix Scar 18 G834JYR (2024) (v6.92.6600) | |
| Durchschnittliche Intel Core i9-14900HX (32543 - 83662, n=36) | |
| AIDA64 / CPU AES | |
| Acer Predator Helios 18 N23Q2 (v6.85.6300) | |
| Alienware m18 R1 AMD (v6.85.6300) | |
| Durchschnittliche Intel Core i9-14900HX (86964 - 241777, n=36) | |
| MSI Titan 18 HX A14VIG (v6.92.6600) | |
| Alienware m18 R1 (v6.85.6300) | |
| Asus ROG Strix Scar 18 2023 G834JY-N6005W (v6.85.6300) | |
| Asus ROG Strix Scar 18 G834JYR (2024) (v6.92.6600, Turbo) | |
| Asus ROG Strix Scar 18 G834JYR (2024) (v6.92.6600) | |
| Razer Blade 18 RTX 4070 (v6.85.6300) | |
| Durchschnitt der Klasse Gaming (39258 - 247074, n=102, der letzten 2 Jahre) | |
| AIDA64 / CPU ZLib | |
| Alienware m18 R1 AMD (v6.85.6300) | |
| MSI Titan 18 HX A14VIG (v6.92.6600) | |
| Asus ROG Strix Scar 18 2023 G834JY-N6005W (v6.85.6300) | |
| Alienware m18 R1 (v6.85.6300) | |
| Acer Predator Helios 18 N23Q2 (v6.85.6300) | |
| Asus ROG Strix Scar 18 G834JYR (2024) (v6.92.6600, Turbo) | |
| Razer Blade 18 RTX 4070 (v6.85.6300) | |
| Durchschnittliche Intel Core i9-14900HX (1054 - 2292, n=36) | |
| Asus ROG Strix Scar 18 G834JYR (2024) | |
| Durchschnitt der Klasse Gaming (574 - 2531, n=102, der letzten 2 Jahre) | |
| AIDA64 / FP64 Ray-Trace | |
| Alienware m18 R1 AMD (v6.85.6300) | |
| Durchschnitt der Klasse Gaming (5509 - 45446, n=102, der letzten 2 Jahre) | |
| Alienware m18 R1 (v6.85.6300) | |
| MSI Titan 18 HX A14VIG (v6.92.6600) | |
| Asus ROG Strix Scar 18 2023 G834JY-N6005W (v6.85.6300) | |
| Acer Predator Helios 18 N23Q2 (v6.85.6300) | |
| Asus ROG Strix Scar 18 G834JYR (2024) (v6.92.6600, Turbo) | |
| Razer Blade 18 RTX 4070 (v6.85.6300) | |
| Asus ROG Strix Scar 18 G834JYR (2024) (v6.92.6600) | |
| Durchschnittliche Intel Core i9-14900HX (6809 - 18349, n=36) | |
| AIDA64 / CPU PhotoWorxx | |
| Alienware m18 R1 (v6.85.6300) | |
| Acer Predator Helios 18 N23Q2 (v6.85.6300) | |
| Asus ROG Strix Scar 18 G834JYR (2024) (v6.92.6600) | |
| Asus ROG Strix Scar 18 G834JYR (2024) (v6.92.6600, Turbo) | |
| Razer Blade 18 RTX 4070 (v6.85.6300) | |
| Durchschnittliche Intel Core i9-14900HX (23903 - 54702, n=36) | |
| Durchschnitt der Klasse Gaming (12271 - 89891, n=102, der letzten 2 Jahre) | |
| Asus ROG Strix Scar 18 2023 G834JY-N6005W (v6.85.6300) | |
| Alienware m18 R1 AMD (v6.85.6300) | |
| MSI Titan 18 HX A14VIG (v6.92.6600) | |
System Performance
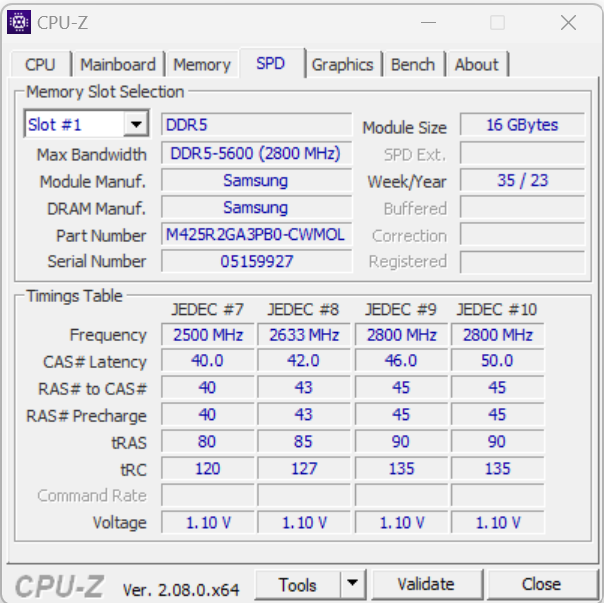
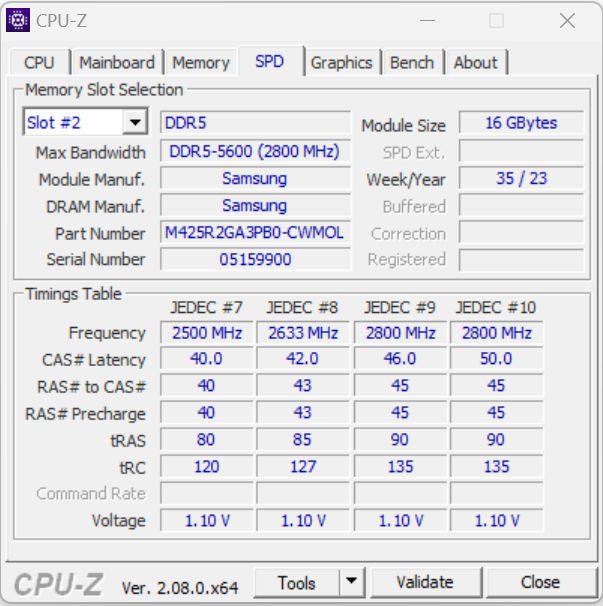
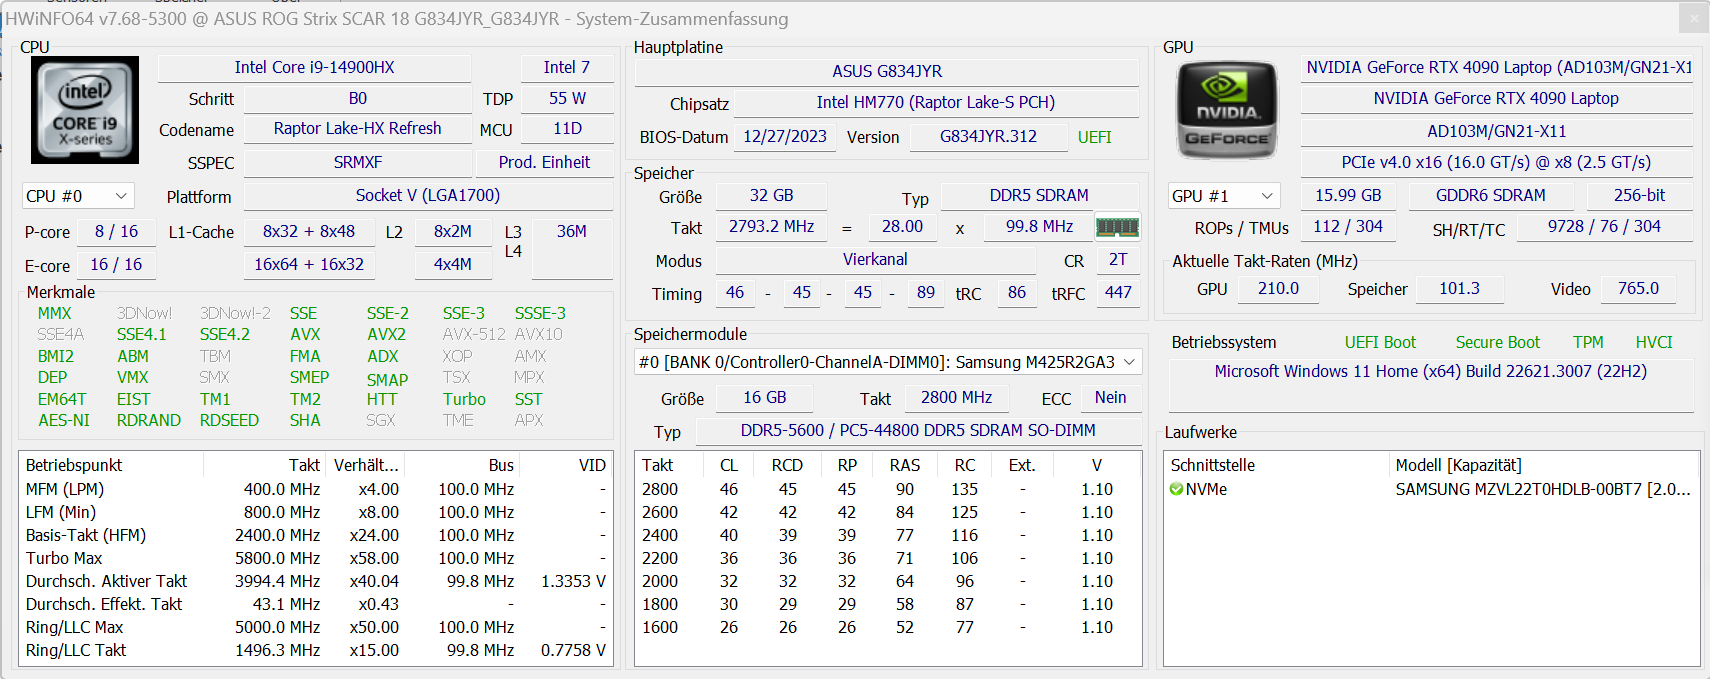
An Rechenleistung mangelt es dem flüssig laufenden System nicht. Gaming und Rendering etc. bewältigt der Rechner anstandslos. Die Transferraten des Arbeitsspeichers bewegen sich auf einem normalen Niveau für DDR5-5600-RAM.
CrossMark: Overall | Productivity | Creativity | Responsiveness
WebXPRT 3: Overall
WebXPRT 4: Overall
Mozilla Kraken 1.1: Total
| PCMark 10 / Score | |
| Alienware m18 R1 AMD | |
| MSI Titan 18 HX A14VIG | |
| Asus ROG Strix Scar 18 G834JYR (2024) | |
| Asus ROG Strix Scar 18 2023 G834JY-N6005W | |
| Alienware m18 R1 | |
| Durchschnittliche Intel Core i9-14900HX, NVIDIA GeForce RTX 4090 Laptop GPU (8230 - 9234, n=13) | |
| Acer Predator Helios 18 N23Q2 | |
| Durchschnitt der Klasse Gaming (5828 - 12414, n=93, der letzten 2 Jahre) | |
| Razer Blade 18 RTX 4070 | |
| PCMark 10 / Essentials | |
| Alienware m18 R1 AMD | |
| Razer Blade 18 RTX 4070 | |
| MSI Titan 18 HX A14VIG | |
| Asus ROG Strix Scar 18 G834JYR (2024) | |
| Alienware m18 R1 | |
| Durchschnittliche Intel Core i9-14900HX, NVIDIA GeForce RTX 4090 Laptop GPU (10778 - 11628, n=13) | |
| Acer Predator Helios 18 N23Q2 | |
| Durchschnitt der Klasse Gaming (8810 - 11935, n=97, der letzten 2 Jahre) | |
| PCMark 10 / Productivity | |
| Alienware m18 R1 AMD | |
| Durchschnitt der Klasse Gaming (6845 - 25323, n=95, der letzten 2 Jahre) | |
| Durchschnittliche Intel Core i9-14900HX, NVIDIA GeForce RTX 4090 Laptop GPU (9458 - 11759, n=13) | |
| Asus ROG Strix Scar 18 G834JYR (2024) | |
| Acer Predator Helios 18 N23Q2 | |
| MSI Titan 18 HX A14VIG | |
| Alienware m18 R1 | |
| Razer Blade 18 RTX 4070 | |
| PCMark 10 / Digital Content Creation | |
| Alienware m18 R1 AMD | |
| MSI Titan 18 HX A14VIG | |
| Alienware m18 R1 | |
| Asus ROG Strix Scar 18 G834JYR (2024) | |
| Durchschnittliche Intel Core i9-14900HX, NVIDIA GeForce RTX 4090 Laptop GPU (13219 - 16462, n=13) | |
| Acer Predator Helios 18 N23Q2 | |
| Durchschnitt der Klasse Gaming (7602 - 19954, n=95, der letzten 2 Jahre) | |
| Razer Blade 18 RTX 4070 | |
| CrossMark / Overall | |
| Asus ROG Strix Scar 18 G834JYR (2024) | |
| Acer Predator Helios 18 N23Q2 | |
| Alienware m18 R1 | |
| Razer Blade 18 RTX 4070 | |
| Durchschnittliche Intel Core i9-14900HX, NVIDIA GeForce RTX 4090 Laptop GPU (1877 - 2344, n=10) | |
| Asus ROG Strix Scar 18 2023 G834JY-N6005W | |
| Durchschnitt der Klasse Gaming (1366 - 2409, n=94, der letzten 2 Jahre) | |
| Alienware m18 R1 AMD | |
| MSI Titan 18 HX A14VIG | |
| CrossMark / Productivity | |
| Acer Predator Helios 18 N23Q2 | |
| Asus ROG Strix Scar 18 G834JYR (2024) | |
| Alienware m18 R1 | |
| Razer Blade 18 RTX 4070 | |
| Durchschnittliche Intel Core i9-14900HX, NVIDIA GeForce RTX 4090 Laptop GPU (1738 - 2162, n=10) | |
| Asus ROG Strix Scar 18 2023 G834JY-N6005W | |
| Durchschnitt der Klasse Gaming (1386 - 2254, n=94, der letzten 2 Jahre) | |
| Alienware m18 R1 AMD | |
| MSI Titan 18 HX A14VIG | |
| CrossMark / Creativity | |
| Asus ROG Strix Scar 18 G834JYR (2024) | |
| Alienware m18 R1 | |
| Asus ROG Strix Scar 18 2023 G834JY-N6005W | |
| Acer Predator Helios 18 N23Q2 | |
| Razer Blade 18 RTX 4070 | |
| Durchschnittliche Intel Core i9-14900HX, NVIDIA GeForce RTX 4090 Laptop GPU (2195 - 2660, n=10) | |
| Durchschnitt der Klasse Gaming (1343 - 2786, n=94, der letzten 2 Jahre) | |
| Alienware m18 R1 AMD | |
| MSI Titan 18 HX A14VIG | |
| CrossMark / Responsiveness | |
| Acer Predator Helios 18 N23Q2 | |
| Asus ROG Strix Scar 18 G834JYR (2024) | |
| Alienware m18 R1 | |
| Razer Blade 18 RTX 4070 | |
| Durchschnittliche Intel Core i9-14900HX, NVIDIA GeForce RTX 4090 Laptop GPU (1478 - 2327, n=10) | |
| Durchschnitt der Klasse Gaming (1226 - 2334, n=94, der letzten 2 Jahre) | |
| Asus ROG Strix Scar 18 2023 G834JY-N6005W | |
| Alienware m18 R1 AMD | |
| MSI Titan 18 HX A14VIG | |
| WebXPRT 3 / Overall | |
| Alienware m18 R1 AMD | |
| Razer Blade 18 RTX 4070 | |
| Alienware m18 R1 | |
| Asus ROG Strix Scar 18 2023 G834JY-N6005W | |
| MSI Titan 18 HX A14VIG | |
| Durchschnittliche Intel Core i9-14900HX, NVIDIA GeForce RTX 4090 Laptop GPU (279 - 339, n=10) | |
| Asus ROG Strix Scar 18 G834JYR (2024) | |
| Acer Predator Helios 18 N23Q2 | |
| Durchschnitt der Klasse Gaming (220 - 532, n=98, der letzten 2 Jahre) | |
| WebXPRT 4 / Overall | |
| Asus ROG Strix Scar 18 2023 G834JY-N6005W | |
| Alienware m18 R1 | |
| Asus ROG Strix Scar 18 G834JYR (2024) | |
| Razer Blade 18 RTX 4070 | |
| Alienware m18 R1 AMD | |
| Durchschnittliche Intel Core i9-14900HX, NVIDIA GeForce RTX 4090 Laptop GPU (246 - 309, n=8) | |
| MSI Titan 18 HX A14VIG | |
| Durchschnitt der Klasse Gaming (165 - 354, n=98, der letzten 2 Jahre) | |
| Mozilla Kraken 1.1 / Total | |
| Razer Blade 18 RTX 4070 | |
| Alienware m18 R1 AMD | |
| Durchschnitt der Klasse Gaming (391 - 590, n=100, der letzten 2 Jahre) | |
| Alienware m18 R1 | |
| Acer Predator Helios 18 N23Q2 | |
| Durchschnittliche Intel Core i9-14900HX, NVIDIA GeForce RTX 4090 Laptop GPU (428 - 535, n=11) | |
| MSI Titan 18 HX A14VIG | |
| Asus ROG Strix Scar 18 G834JYR (2024) | |
| Asus ROG Strix Scar 18 2023 G834JY-N6005W | |
* ... kleinere Werte sind besser
| PCMark 10 Score | 8801 Punkte | |
Hilfe | ||
| AIDA64 / Memory Copy | |
| Asus ROG Strix Scar 18 G834JYR (2024) | |
| Alienware m18 R1 | |
| Acer Predator Helios 18 N23Q2 | |
| Razer Blade 18 RTX 4070 | |
| Durchschnittliche Intel Core i9-14900HX (38028 - 83392, n=36) | |
| Durchschnitt der Klasse Gaming (21750 - 129946, n=102, der letzten 2 Jahre) | |
| Asus ROG Strix Scar 18 2023 G834JY-N6005W | |
| MSI Titan 18 HX A14VIG | |
| Alienware m18 R1 AMD | |
| AIDA64 / Memory Read | |
| Alienware m18 R1 | |
| Asus ROG Strix Scar 18 G834JYR (2024) | |
| Acer Predator Helios 18 N23Q2 | |
| Razer Blade 18 RTX 4070 | |
| Durchschnittliche Intel Core i9-14900HX (43306 - 87568, n=36) | |
| Asus ROG Strix Scar 18 2023 G834JY-N6005W | |
| Durchschnitt der Klasse Gaming (22956 - 118858, n=102, der letzten 2 Jahre) | |
| Alienware m18 R1 AMD | |
| MSI Titan 18 HX A14VIG | |
| AIDA64 / Memory Write | |
| Alienware m18 R1 | |
| Asus ROG Strix Scar 18 G834JYR (2024) | |
| Durchschnitt der Klasse Gaming (22297 - 135096, n=102, der letzten 2 Jahre) | |
| Razer Blade 18 RTX 4070 | |
| Acer Predator Helios 18 N23Q2 | |
| Durchschnittliche Intel Core i9-14900HX (37146 - 80589, n=36) | |
| Asus ROG Strix Scar 18 2023 G834JY-N6005W | |
| Alienware m18 R1 AMD | |
| MSI Titan 18 HX A14VIG | |
| AIDA64 / Memory Latency | |
| MSI Titan 18 HX A14VIG | |
| Durchschnitt der Klasse Gaming (75.3 - 165.4, n=102, der letzten 2 Jahre) | |
| Alienware m18 R1 AMD | |
| Asus ROG Strix Scar 18 2023 G834JY-N6005W | |
| Durchschnittliche Intel Core i9-14900HX (76.1 - 105, n=36) | |
| Razer Blade 18 RTX 4070 | |
| Acer Predator Helios 18 N23Q2 | |
| Asus ROG Strix Scar 18 G834JYR (2024) | |
| Alienware m18 R1 | |
* ... kleinere Werte sind besser
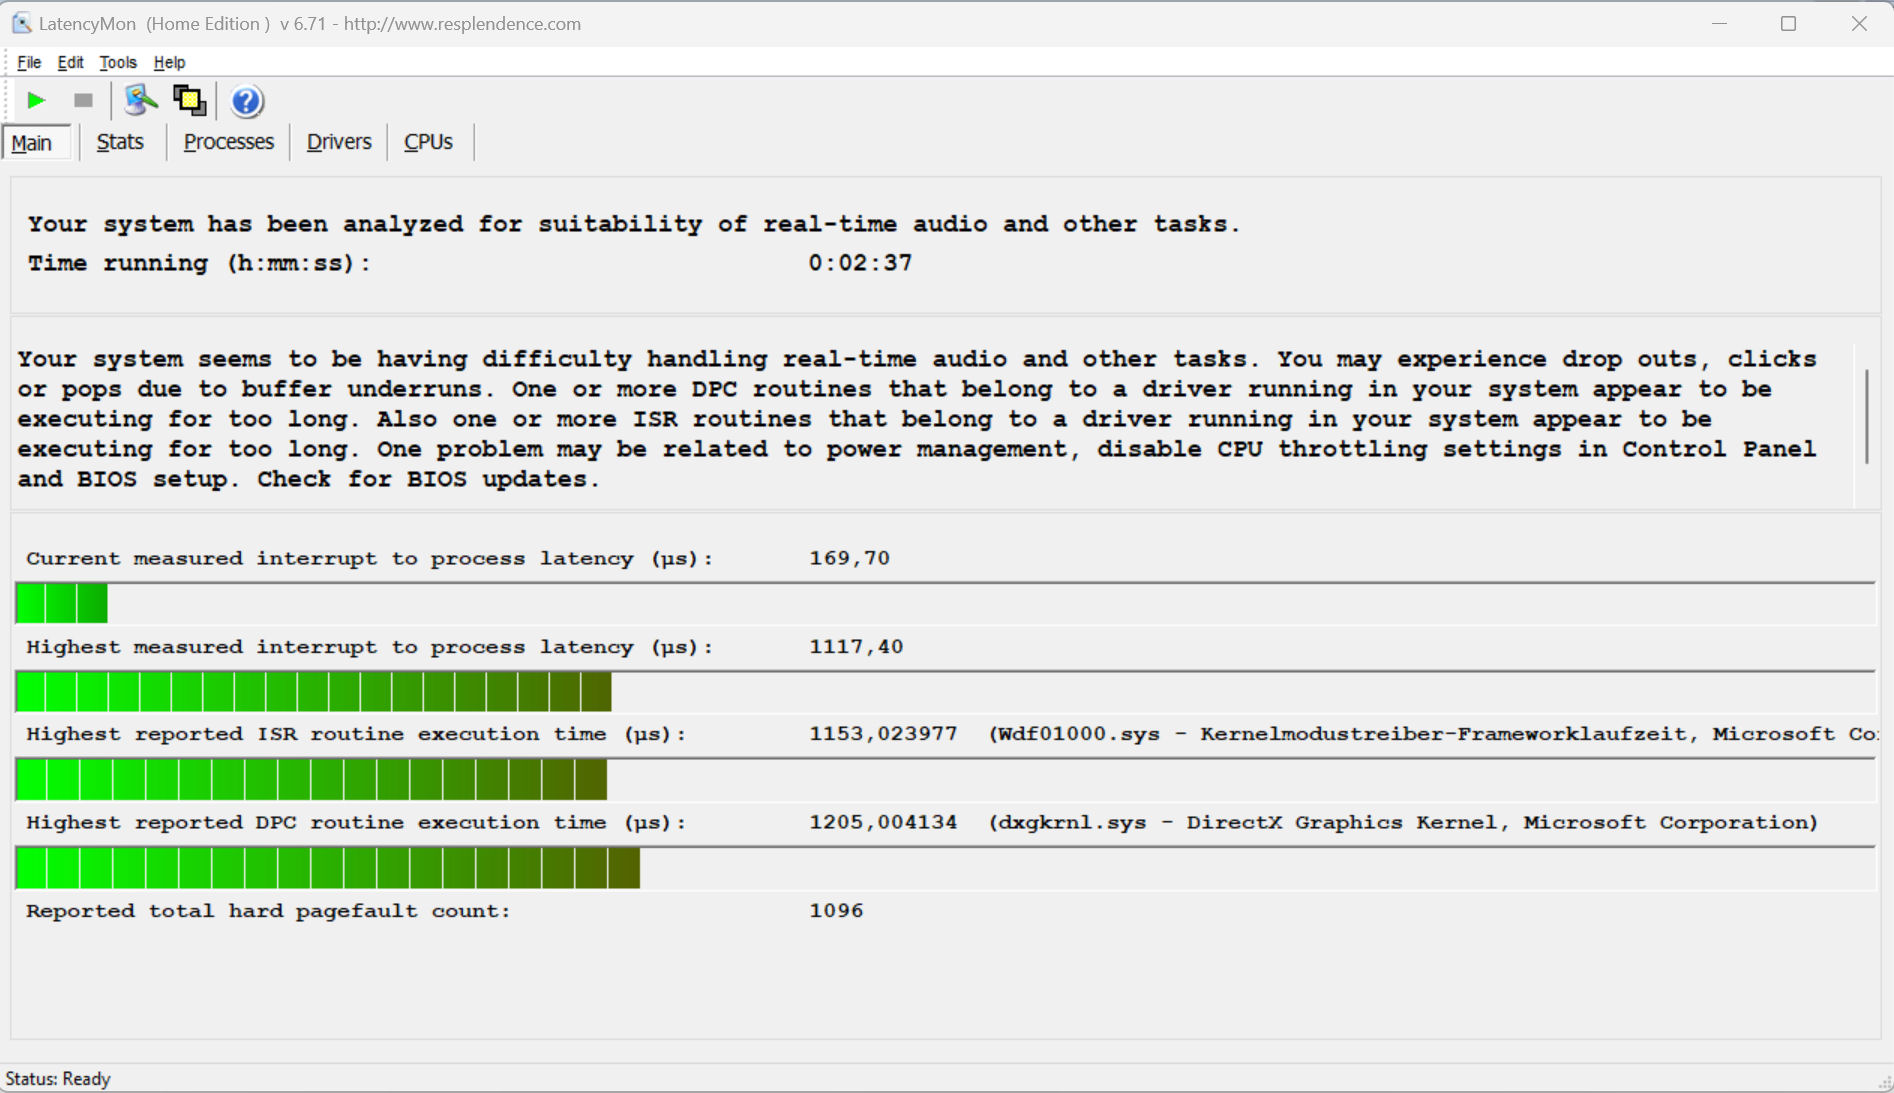
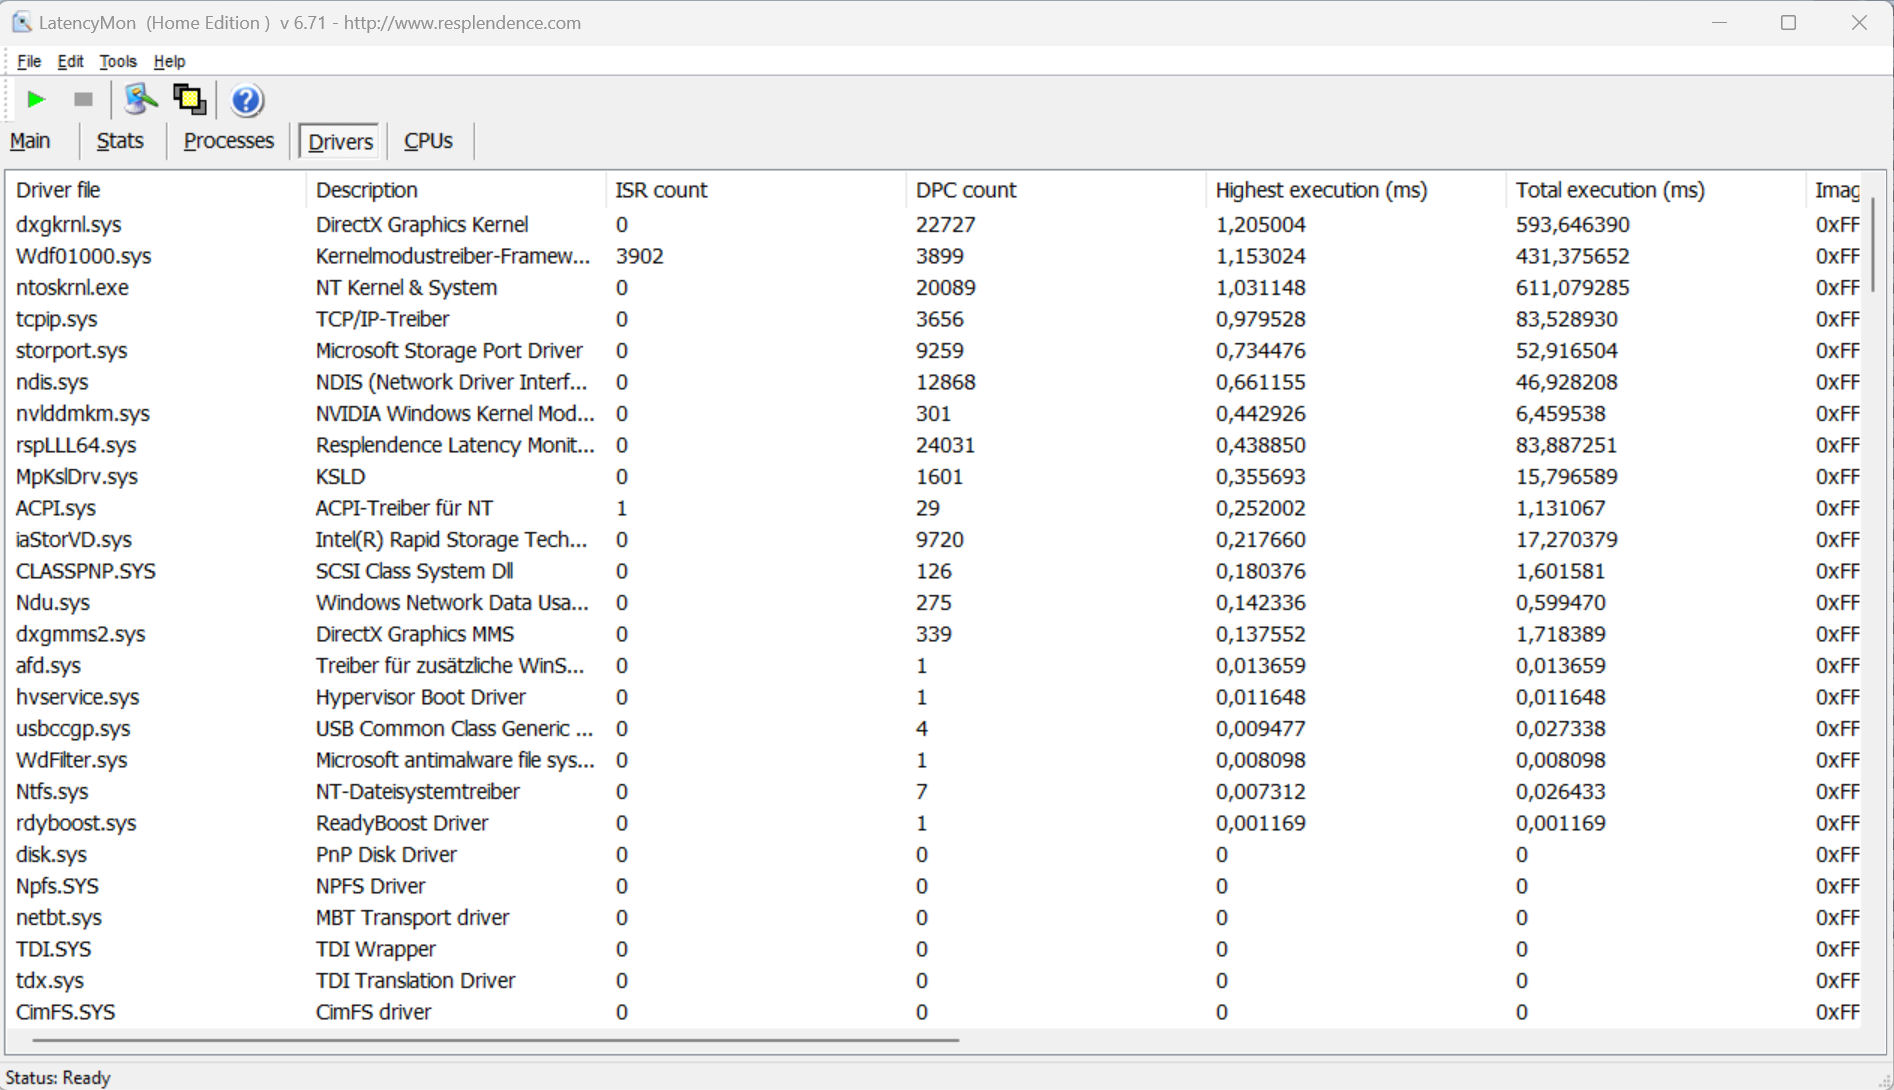
DPC-Latenzen
Der standardisierte Latency-Monitor-Test (Websurfen, 4k-Videowiedergabe, Prime95 High-Load) hat Auffälligkeiten offenbart. Das System scheint nicht für Video- und Audiobearbeitung in Echtzeit geeignet zu sein. Zukünftige Software-Updates könnten zu Verbesserungen oder auch Verschlechterungen führen.
| DPC Latencies / LatencyMon - interrupt to process latency (max), Web, Youtube, Prime95 | |
| Acer Predator Helios 18 N23Q2 | |
| Alienware m18 R1 | |
| MSI Titan 18 HX A14VIG | |
| Razer Blade 18 RTX 4070 | |
| Alienware m18 R1 AMD | |
| Asus ROG Strix Scar 18 G834JYR (2024) | |
| Asus ROG Strix Scar 18 2023 G834JY-N6005W | |
* ... kleinere Werte sind besser
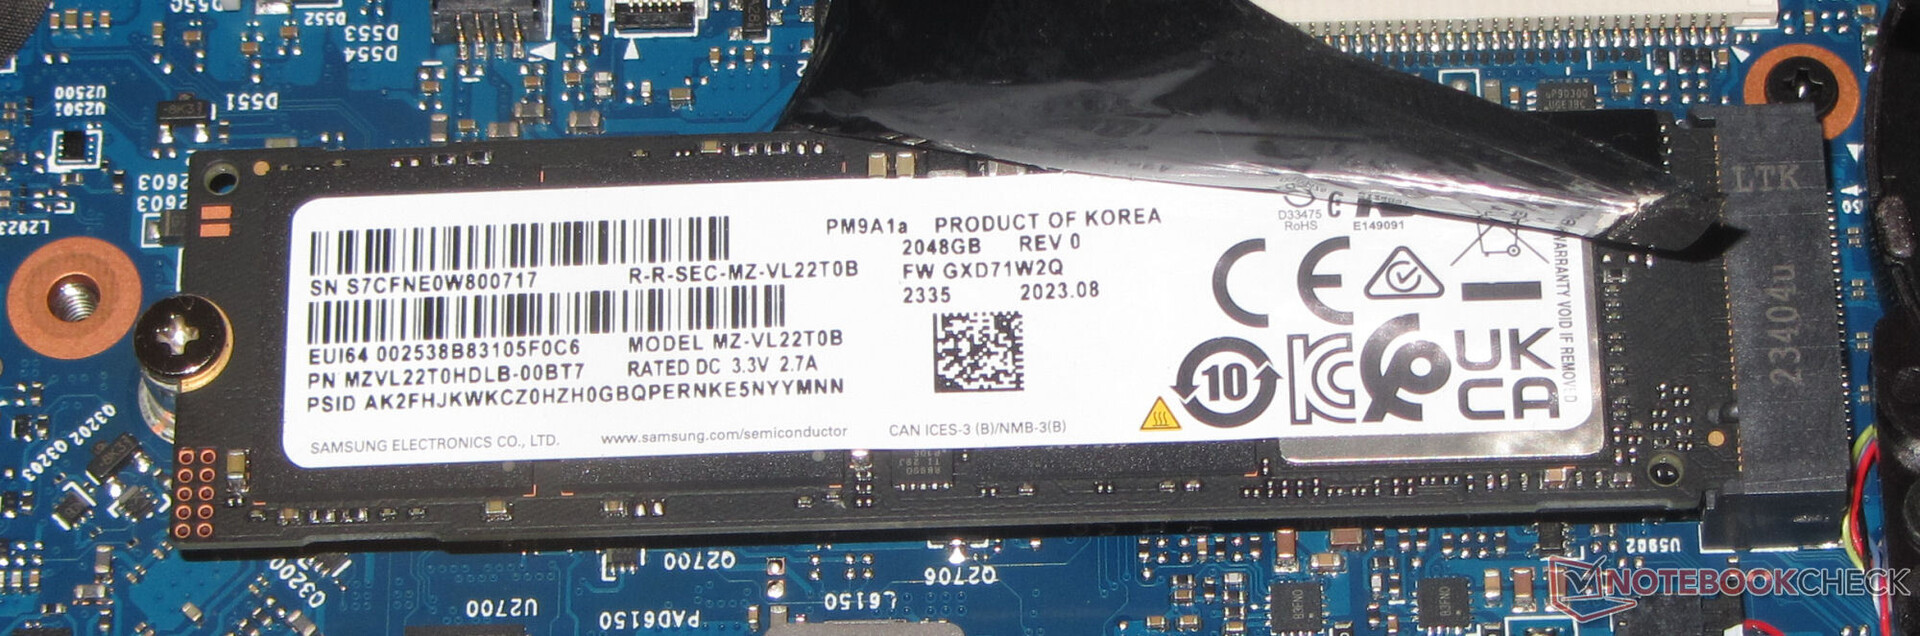
Massenspeicher
Das Scar 18 kann insgesamt zwei PCIe-4-SSDs im M.2-2280-Format aufnehmen. RAID-0 wird unterstützt. Die Samsung-SSD (2 TB) des Testgeräts liefert hervorragende Datenraten. Positiv: Eine thermisch bedingte Drosselung trat nicht auf.

* ... kleinere Werte sind besser
Dauerleistung Lesen: DiskSpd Read Loop, Queue Depth 8
Grafikkarte
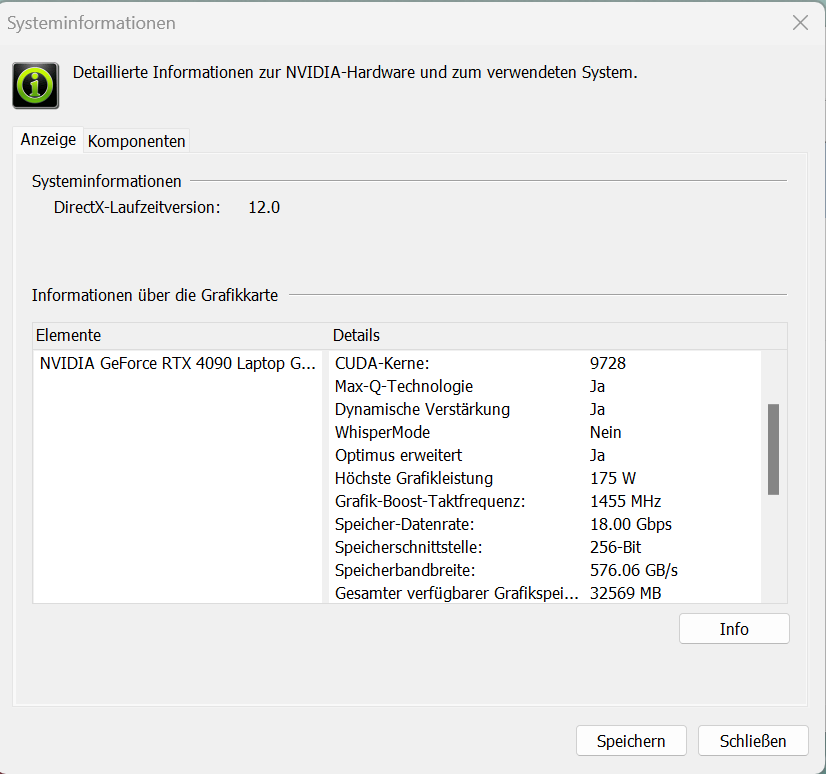
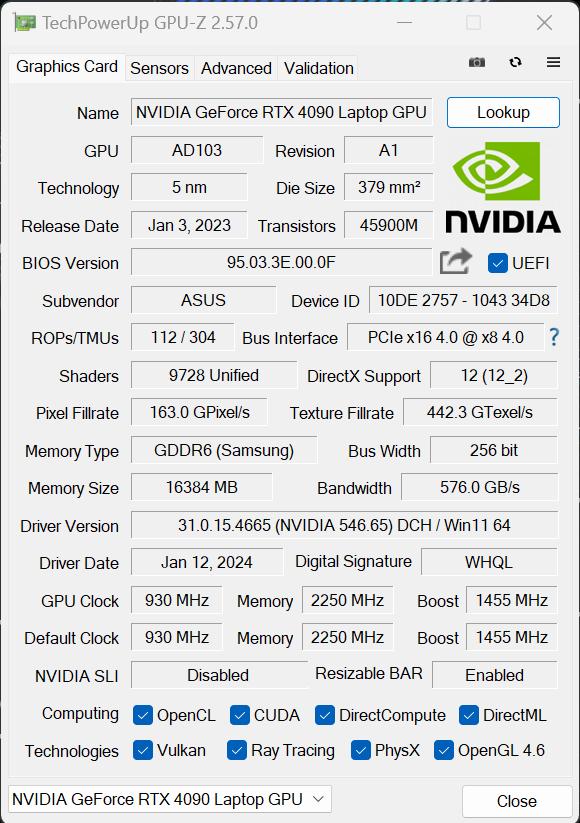
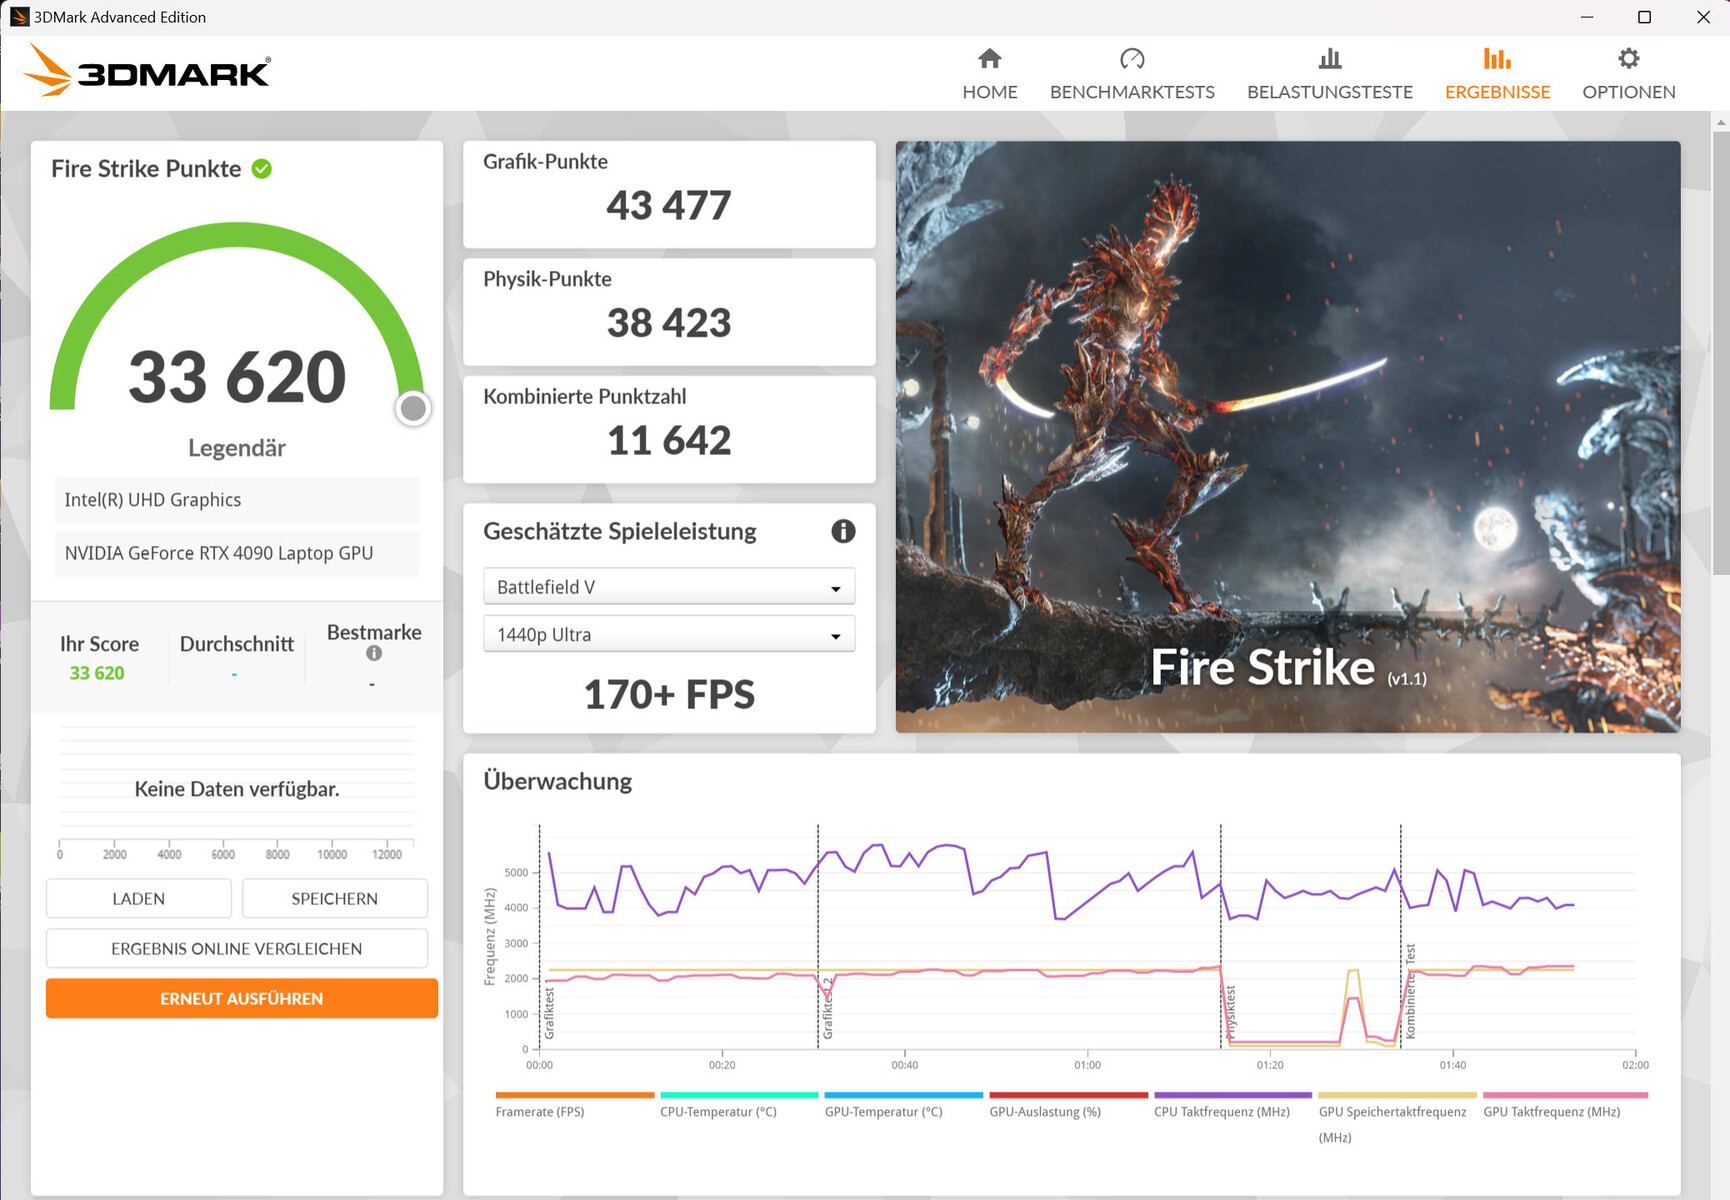
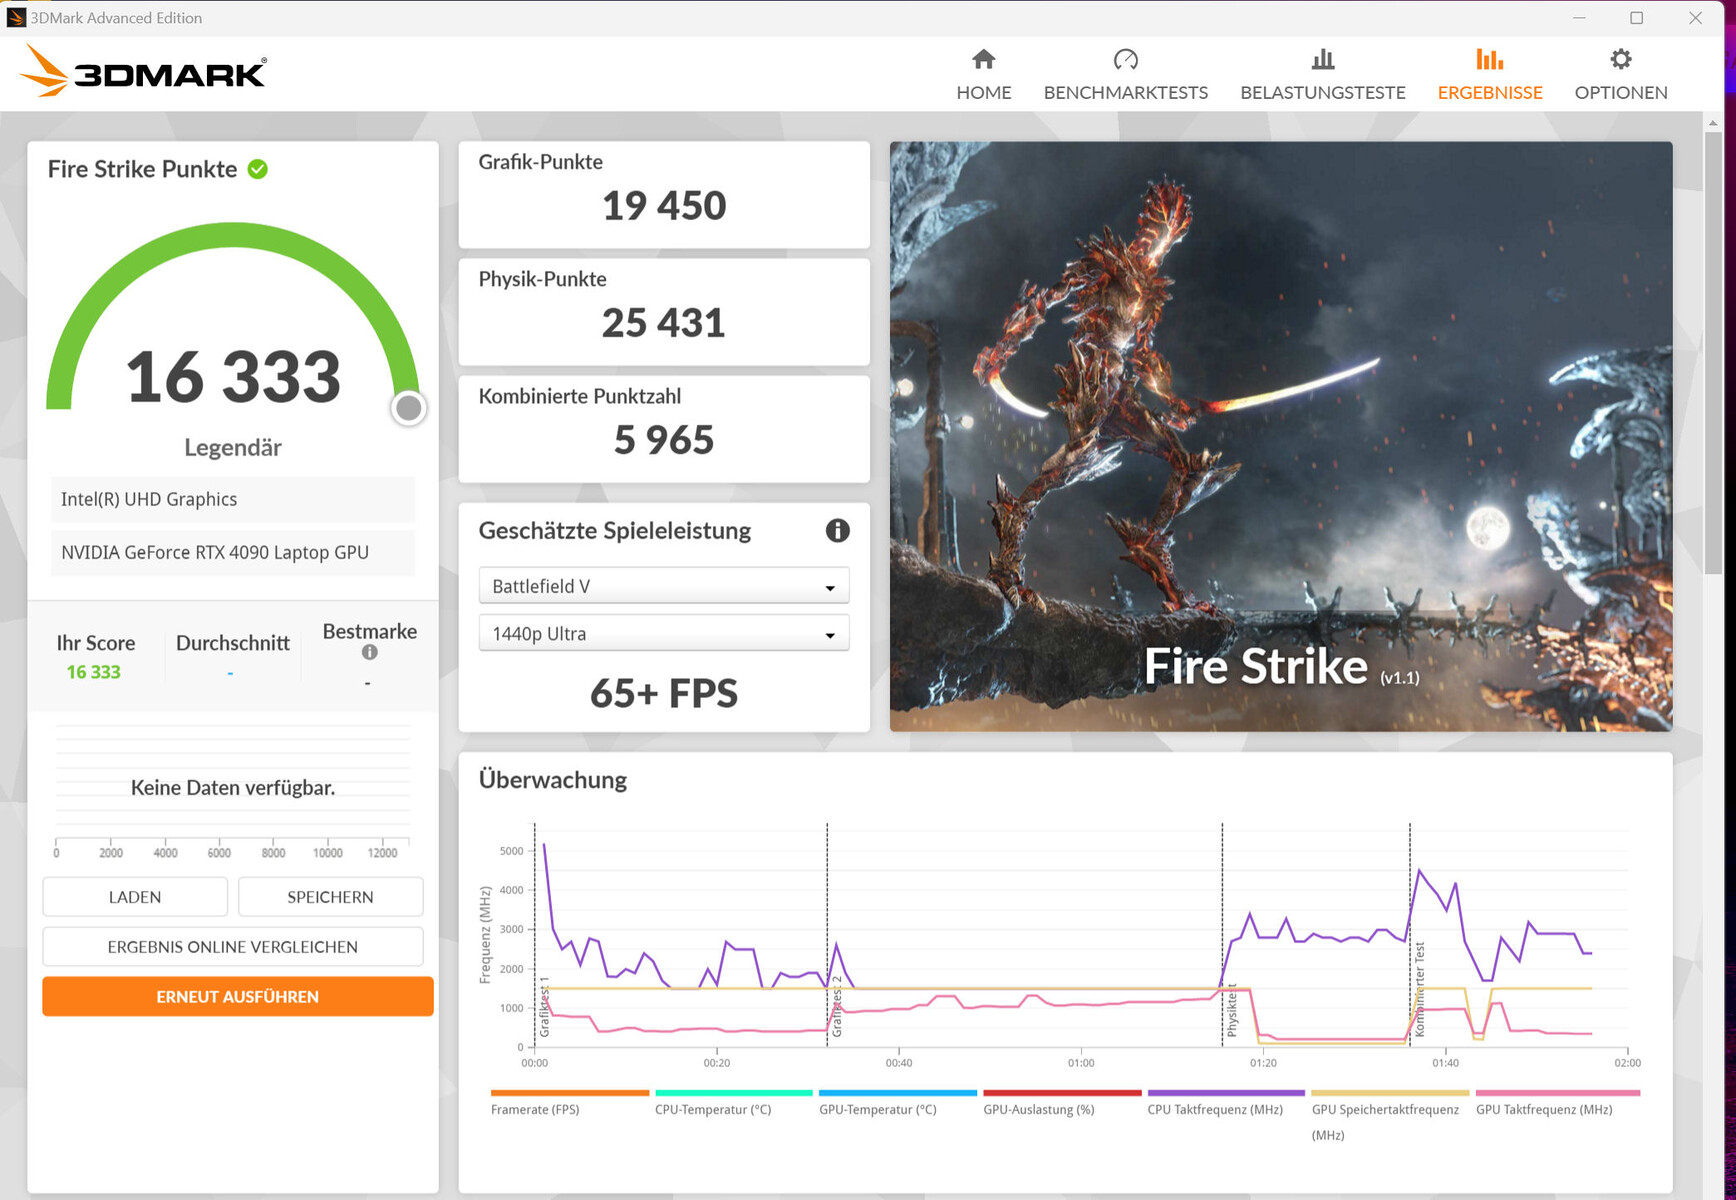
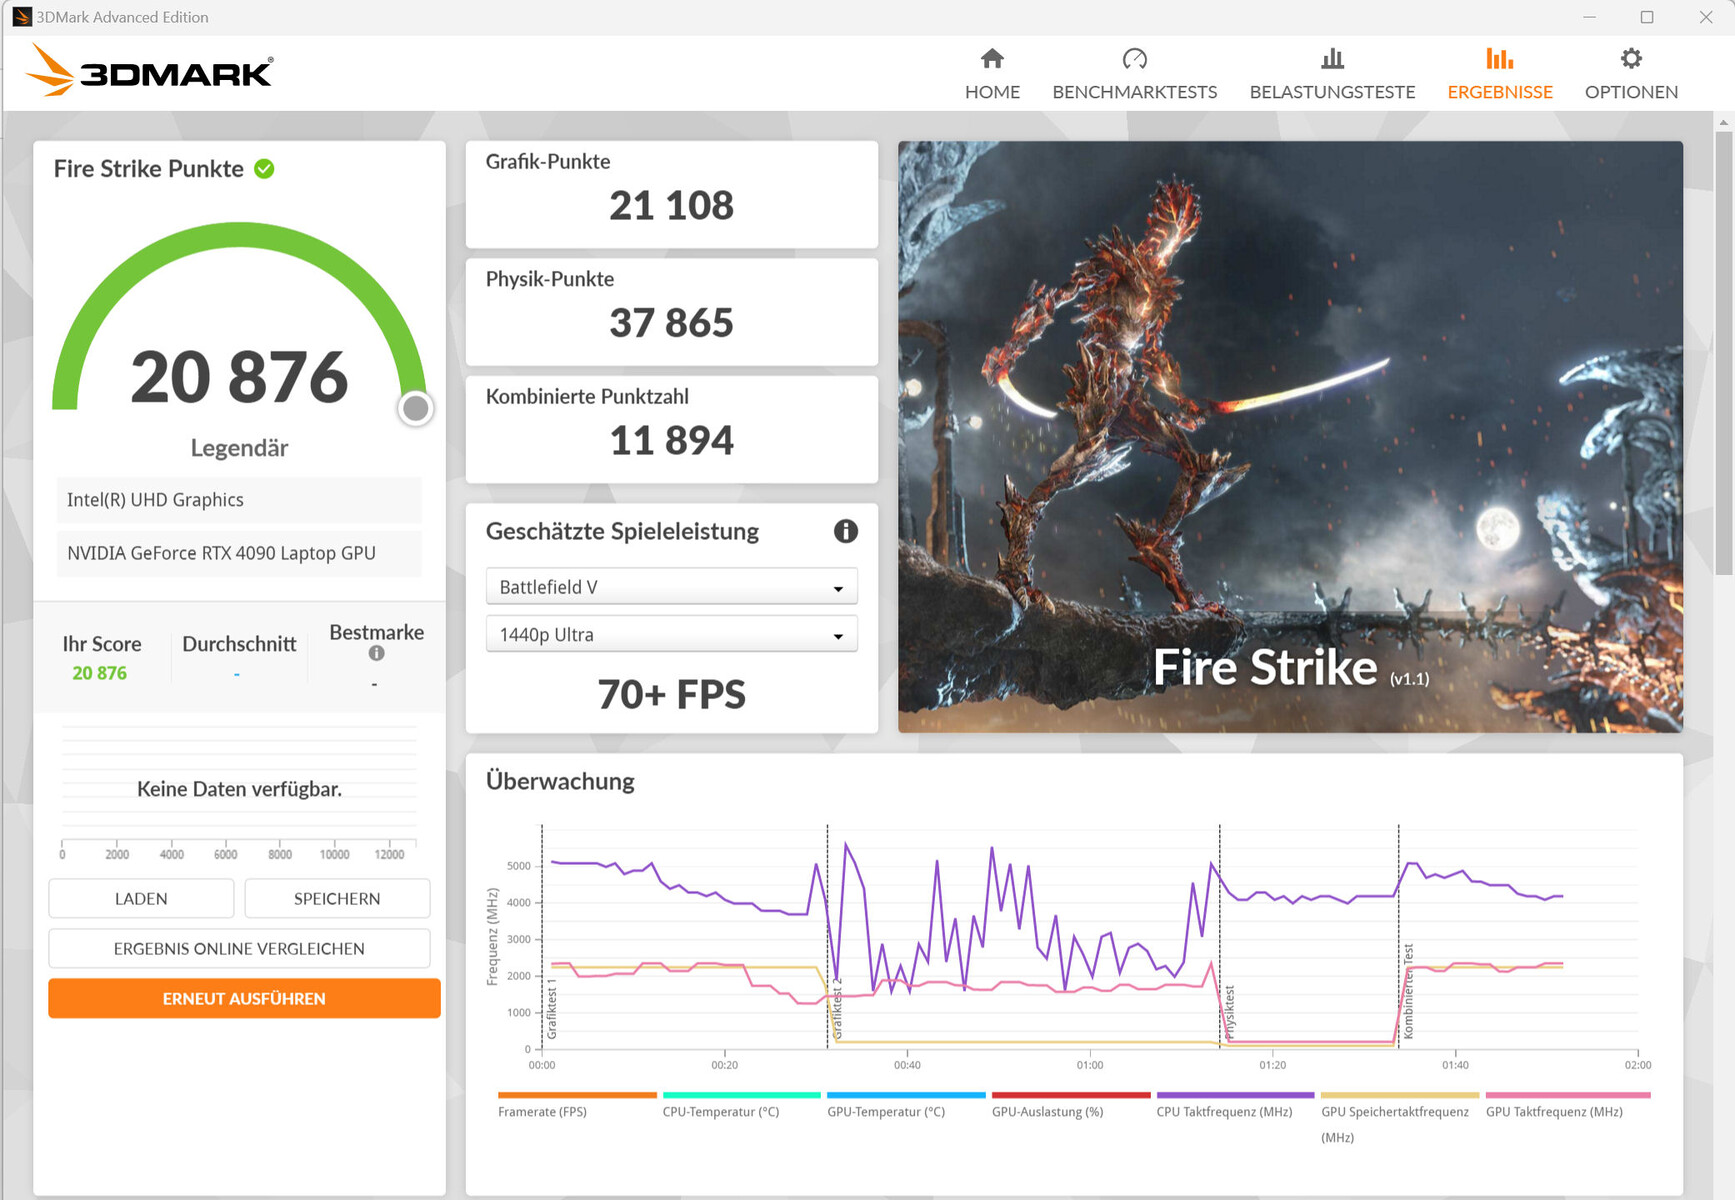
Asus verbaut mit der GeForce RTX 4090 Nvidias aktuelles Top-Modell unter den Mobil-GPUs. Sie verfügt über 9.728 Shader, einen 256 Bit breiten Speicherbus und kann auf schnellen GDDR6-Speicher (16.384 MB) zurückgreifen. Der RTX 4090 wird eine maximale TGP von 175 Watt (150 Watt + 25 Watt Dynamic Boost) gewährt - mehr geht nicht.
Die Benchmarkresultate bewegen sich unterhalb des bisherigen RTX-4090-Durchschnitts ("Leistung"). "Turbo" sorgt für Werte auf Höhe des Durchschnitts. Advanced Optimus wird unterstützt. Die Umschaltung zwischen dGPU und Optimus erfordert keinen Neustart.

| 3DMark 11 Performance | 42985 Punkte | |
| 3DMark Cloud Gate Standard Score | 65110 Punkte | |
| 3DMark Fire Strike Score | 33620 Punkte | |
| 3DMark Time Spy Score | 19507 Punkte | |
Hilfe | ||
* ... kleinere Werte sind besser
Gaming Performance
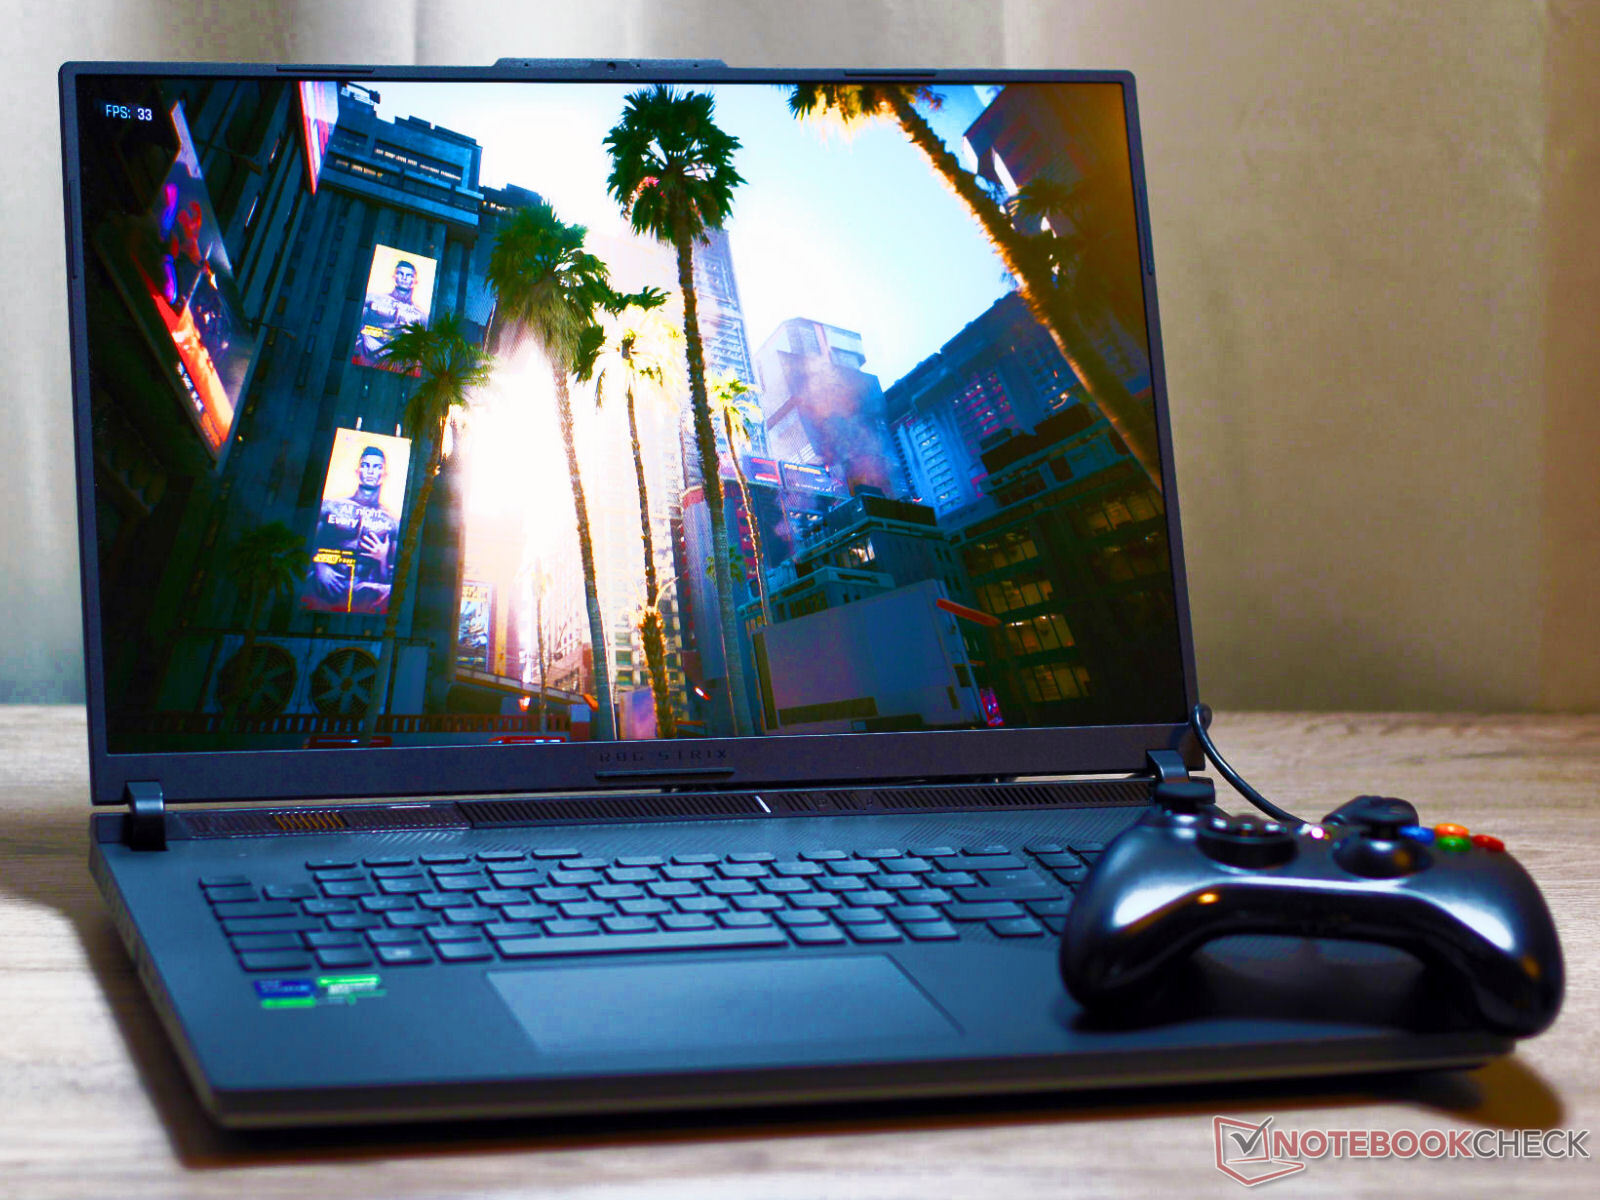
Das G834JYR ermöglicht QHD+-Gaming bei maximalen Settings. Höhere Auflösungen wären bei Anschluss eines entsprechenden Monitors nutzbar. Spiele mit Unterstützung für DLSS 3 und Frame Generation erlauben bei 4k-Auflösung maximale Settings und zusätzliche Raytracing-Effekte.
Die Bildwiederholraten der getesteten Titel bewegen sich unterhalb des bisherigen RTX-4090-Durchschnitts ("Leistung"). "Turbo" kann eine leichte Steigerung bewirken, gleiches gilt für den GPU-Modus "Ultimativ".
| The Witcher 3 - 1920x1080 Ultra Graphics & Postprocessing (HBAO+) | |
| Alienware m18 R1 | |
| MSI Titan 18 HX A14VIG | |
| Durchschnittliche NVIDIA GeForce RTX 4090 Laptop GPU (139.2 - 216, n=35) | |
| Durchschnitt der Klasse Gaming (104.7 - 240, n=7, der letzten 2 Jahre) | |
| Asus ROG Strix Scar 18 G834JYR (2024) | |
| Acer Predator Helios 18 N23Q2 | |
| Alienware m18 R1 AMD | |
| Razer Blade 18 RTX 4070 | |
| Call of Duty Modern Warfare 3 2023 | |
| 1920x1080 Extreme Preset | |
| Durchschnittliche NVIDIA GeForce RTX 4090 Laptop GPU (148 - 205, n=7) | |
| Asus ROG Strix Scar 18 G834JYR (2024) | |
| Durchschnitt der Klasse Gaming (n=1der letzten 2 Jahre) | |
| 2560x1440 Extreme Preset | |
| Asus ROG Strix Scar 18 G834JYR (2024) | |
| Durchschnittliche NVIDIA GeForce RTX 4090 Laptop GPU (113 - 162, n=7) | |
| The Finals | |
| 1920x1080 Epic Preset | |
| Asus ROG Strix Scar 18 G834JYR (2024) | |
| Durchschnittliche NVIDIA GeForce RTX 4090 Laptop GPU (174.1 - 211, n=2) | |
| Durchschnitt der Klasse Gaming (n=1der letzten 2 Jahre) | |
| 2560x1440 Epic Preset | |
| Asus ROG Strix Scar 18 G834JYR (2024) | |
| Durchschnittliche NVIDIA GeForce RTX 4090 Laptop GPU (137.2 - 147.4, n=2) | |
| Durchschnitt der Klasse Gaming (n=1der letzten 2 Jahre) | |
| 1920x1080 Epic Preset + Epic RTX Global Illumination | |
| Asus ROG Strix Scar 18 G834JYR (2024) | |
| Durchschnittliche NVIDIA GeForce RTX 4090 Laptop GPU (159.8 - 190.8, n=2) | |
| Palworld | |
| 1920x1080 Epic Preset AA:TSR | |
| Asus ROG Strix Scar 18 G834JYR (2024) | |
| Durchschnittliche NVIDIA GeForce RTX 4090 Laptop GPU (138.8 - 150.9, n=2) | |
| Durchschnitt der Klasse Gaming (n=1der letzten 2 Jahre) | |
| 2560x1440 Epic Preset AA:TSR | |
| Asus ROG Strix Scar 18 G834JYR (2024) | |
| Durchschnittliche NVIDIA GeForce RTX 4090 Laptop GPU (110.5 - 119.8, n=2) | |
| Enshrouded | |
| 1920x1080 Max. Quality AA:FX | |
| Durchschnittliche NVIDIA GeForce RTX 4090 Laptop GPU (79 - 101.5, n=3) | |
| Asus ROG Strix Scar 18 G834JYR (2024) | |
| Durchschnitt der Klasse Gaming (n=1der letzten 2 Jahre) | |
| 2560x1440 Max. Quality AA:FX | |
| Asus ROG Strix Scar 18 G834JYR (2024) | |
| Durchschnittliche NVIDIA GeForce RTX 4090 Laptop GPU (61.8 - 76, n=3) | |
Um zu überprüfen, ob die Bildwiederholraten über einen längeren Zeitraum weitgehend konstant bleiben, lassen wir das Spiel "The Witcher 3" für etwa 60 Minuten mit Full-HD-Auflösung und maximalen Qualitätseinstellungen laufen. Die Spielfigur wird nicht bewegt. Ein Einbruch der Bildwiederholraten ist nicht festzustellen.
Witcher 3 FPS-Diagramm
| min. | mittel | hoch | max. | QHD | |
|---|---|---|---|---|---|
| GTA V (2015) | 187.5 | 187.1 | 181.2 | 136 | 129.6 |
| The Witcher 3 (2015) | 579.6 | 501.7 | 342.8 | 189.4 | 151.5 |
| Dota 2 Reborn (2015) | 219 | 194.5 | 173.9 | 161.3 | |
| Final Fantasy XV Benchmark (2018) | 221 | 198.1 | 166.1 | 143.6 | |
| X-Plane 11.11 (2018) | 197.9 | 172.4 | 136.8 | ||
| Far Cry 5 (2018) | 176 | 163 | 156 | 145 | 145 |
| Strange Brigade (2018) | 429 | 350 | 341 | 331 | 279 |
| Starfield (2023) | 112.7 | 100 | 84.2 | 78.4 | 66 |
| Cyberpunk 2077 (2023) | 134.8 | 121.5 | 117.7 | 112.1 | 83.8 |
| Call of Duty Modern Warfare 3 2023 (2023) | 229 | 210 | 169 | 162 | 162 |
| The Finals (2023) | 228 | 216 | 214 | 211 | 147.4 |
| Palworld (2024) | 211 | 180.9 | 151.3 | 150.9 | 119.8 |
| Enshrouded (2024) | 135.2 | 120.1 | 100.8 | 87.6 | 68.9 |
Emissionen - Das G834JYR kann leise arbeiten
Geräuschemissionen
Der Schalldruckpegel steigt unter Volllast auf bis zu 52 dB(A) ("Leistung"). "Turbo" sorgt für einen noch etwas höheren Wert - wie ein Vergleich mit dem 2023-Scar-18 zeigt. Es ginge generell leiser: Der Verzicht auf Leistung lässt den Pegel auf 35 dB(A) ("Leise") sinken. Im Leerlauf und im Alltagsbetrieb (Office, Internet) arbeitet oftmals einer der zwei Lüfter, gelegentlich stehen beide still - insbesondere bei Nutzung des "Leise"-Profils.
Lautstärkediagramm
| Idle |
| 27 / 28 / 32 dB(A) |
| Last |
| 50 / 52 dB(A) |
 | ||
30 dB leise 40 dB(A) deutlich hörbar 50 dB(A) störend |
||
min: | ||
| Asus ROG Strix Scar 18 G834JYR (2024) i9-14900HX, GeForce RTX 4090 Laptop GPU | Alienware m18 R1 AMD R9 7945HX, Radeon RX 7900M | Alienware m18 R1 i9-13980HX, GeForce RTX 4090 Laptop GPU | Acer Predator Helios 18 N23Q2 i9-13900HX, GeForce RTX 4080 Laptop GPU | Razer Blade 18 RTX 4070 i9-13950HX, GeForce RTX 4070 Laptop GPU | MSI Titan 18 HX A14VIG i9-14900HX, GeForce RTX 4090 Laptop GPU | Asus ROG Strix Scar 18 2023 G834JY-N6005W i9-13980HX, GeForce RTX 4090 Laptop GPU | |
|---|---|---|---|---|---|---|---|
| Geräuschentwicklung | 8% | 12% | 6% | 10% | 5% | 2% | |
| aus / Umgebung * (dB) | 24 | 22.4 7% | 22.8 5% | 23 4% | 23.5 2% | 22.8 5% | 23.9 -0% |
| Idle min * (dB) | 27 | 23 15% | 23 15% | 23 15% | 23.8 12% | 23.8 12% | 23.9 11% |
| Idle avg * (dB) | 28 | 23.4 16% | 23 18% | 23 18% | 23.8 15% | 23.8 15% | 32.6 -16% |
| Idle max * (dB) | 32 | 33.5 -5% | 23 28% | 23 28% | 26.8 16% | 28 12% | 32.6 -2% |
| Last avg * (dB) | 50 | 33.5 33% | 35.6 29% | 45.26 9% | 37.3 25% | 38 24% | 35.9 28% |
| Witcher 3 ultra * (dB) | 50 | 53.6 -7% | 51.3 -3% | 59.82 -20% | 48 4% | 57.3 -15% | |
| Last max * (dB) | 52 | 53.6 -3% | 56.7 -9% | 59.94 -15% | 53.5 -3% | 62.8 -21% | 55.8 -7% |
* ... kleinere Werte sind besser
Temperatur
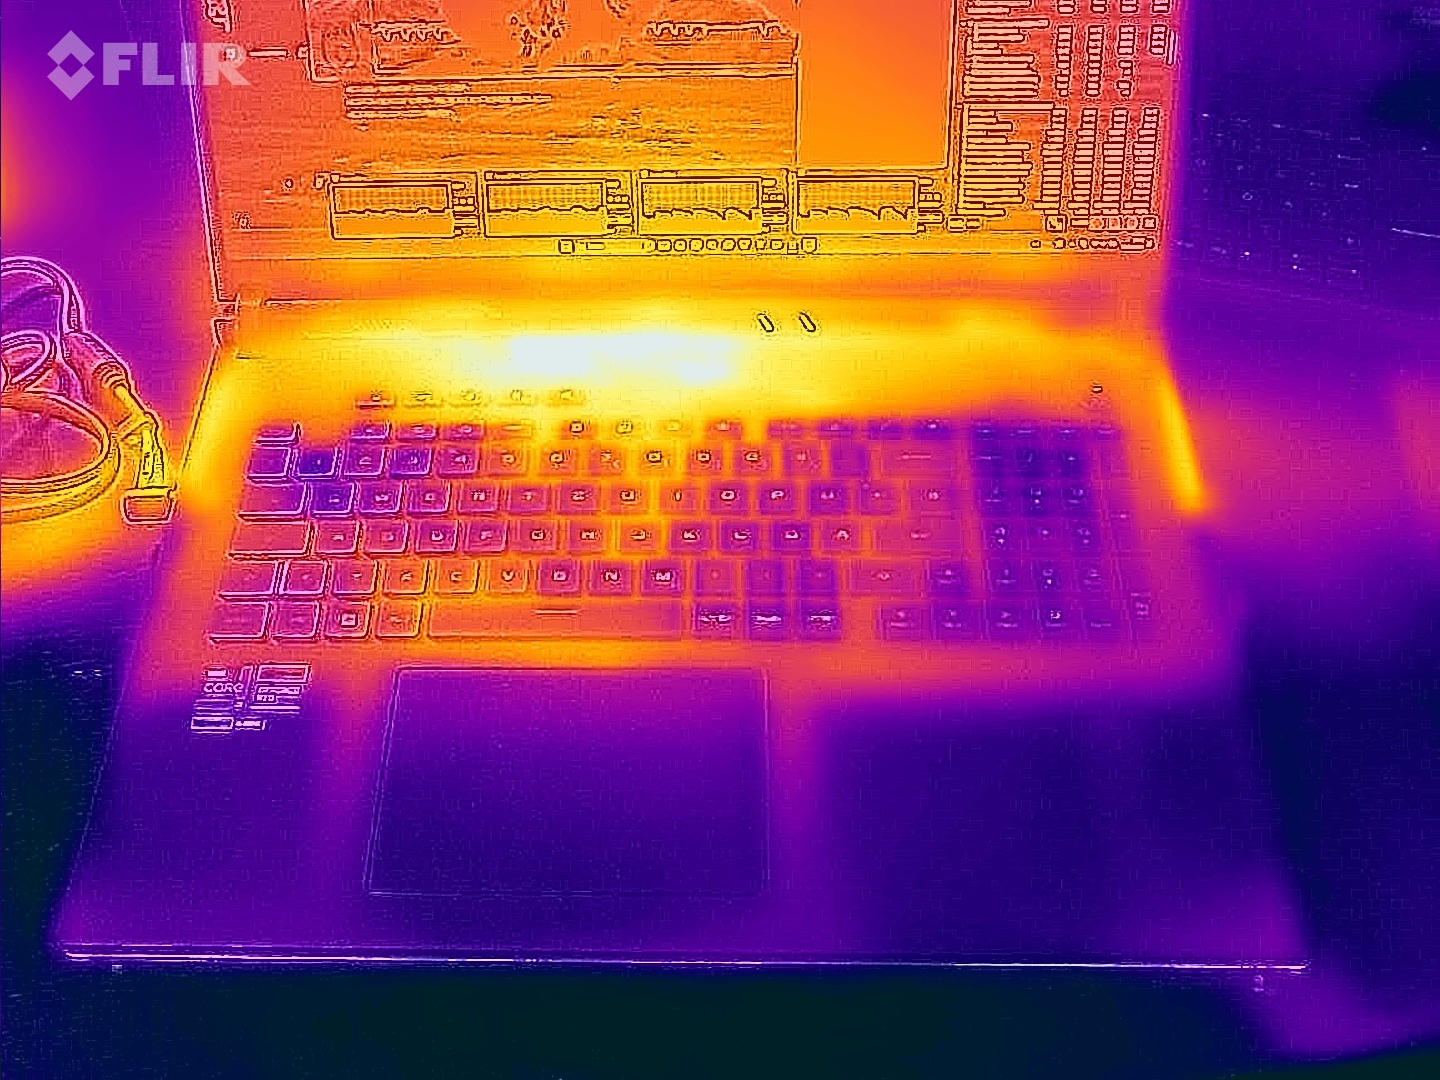
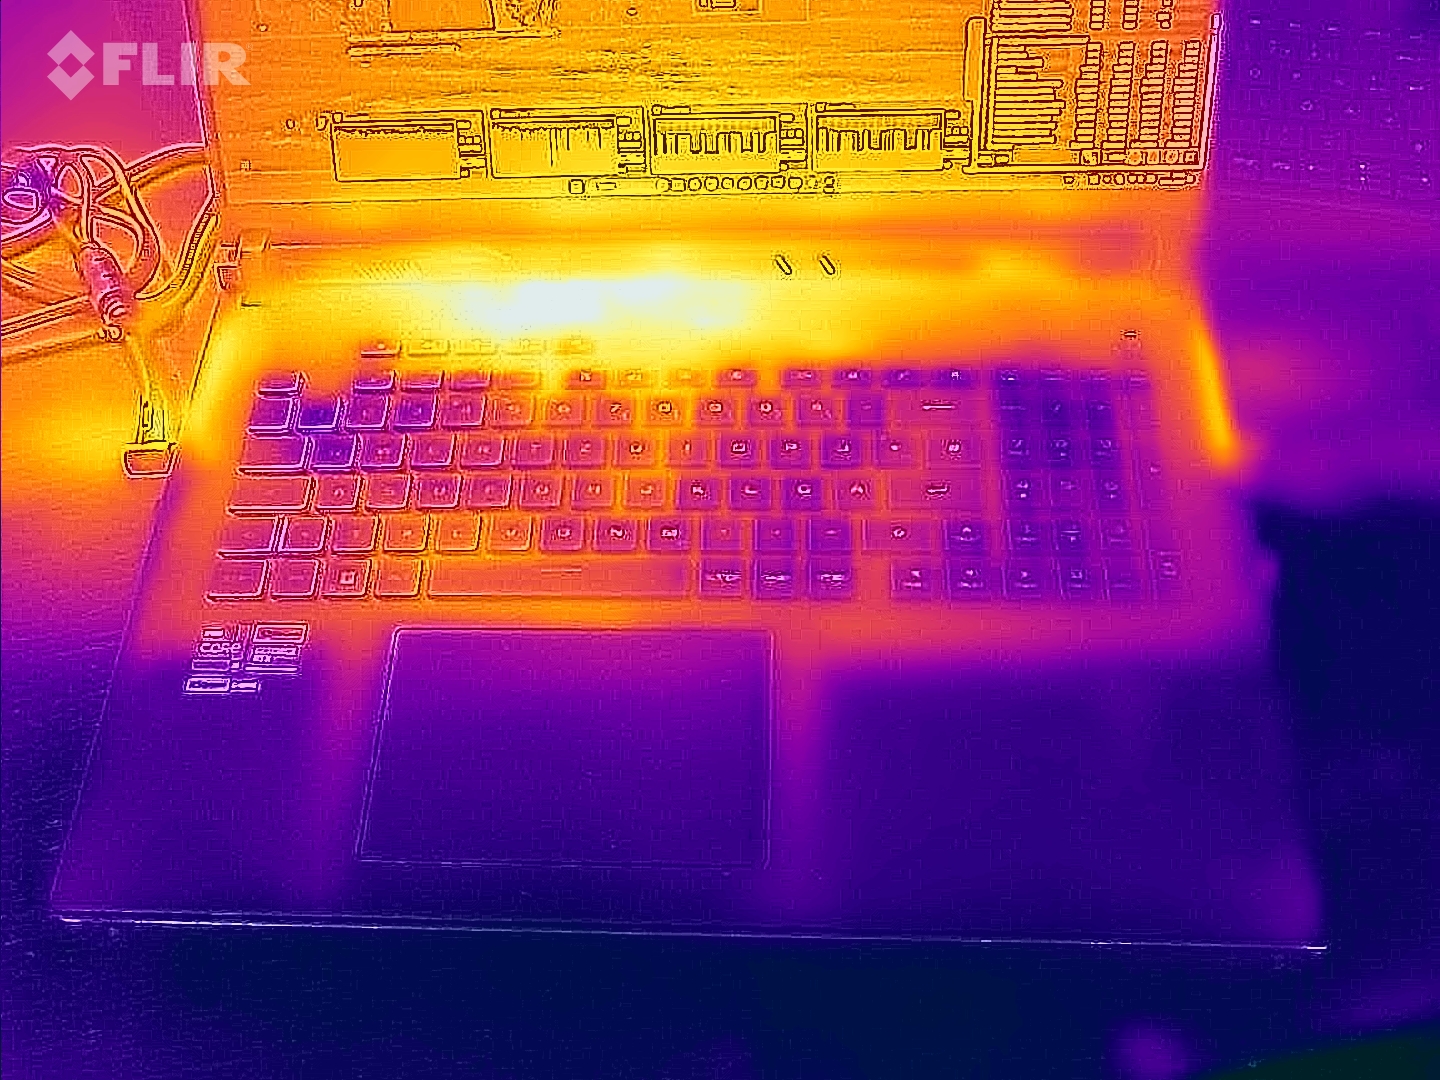
Stresstest und Witcher-3-Test sorgen für eine spürbare, aber keine übermäßig starke Erwärmung des Notebooks. Punktuell werden Werte jenseits von 50 Grad Celsius erreicht. Im Alltag (Office, Internet) verbleiben die Werte im grünen Bereich.
(-) Die maximale Temperatur auf der Oberseite ist 49 °C. Im Vergleich liegt der Klassendurchschnitt bei 40.4 °C (von 21.2 bis 68.8 °C für die Klasse Gaming).
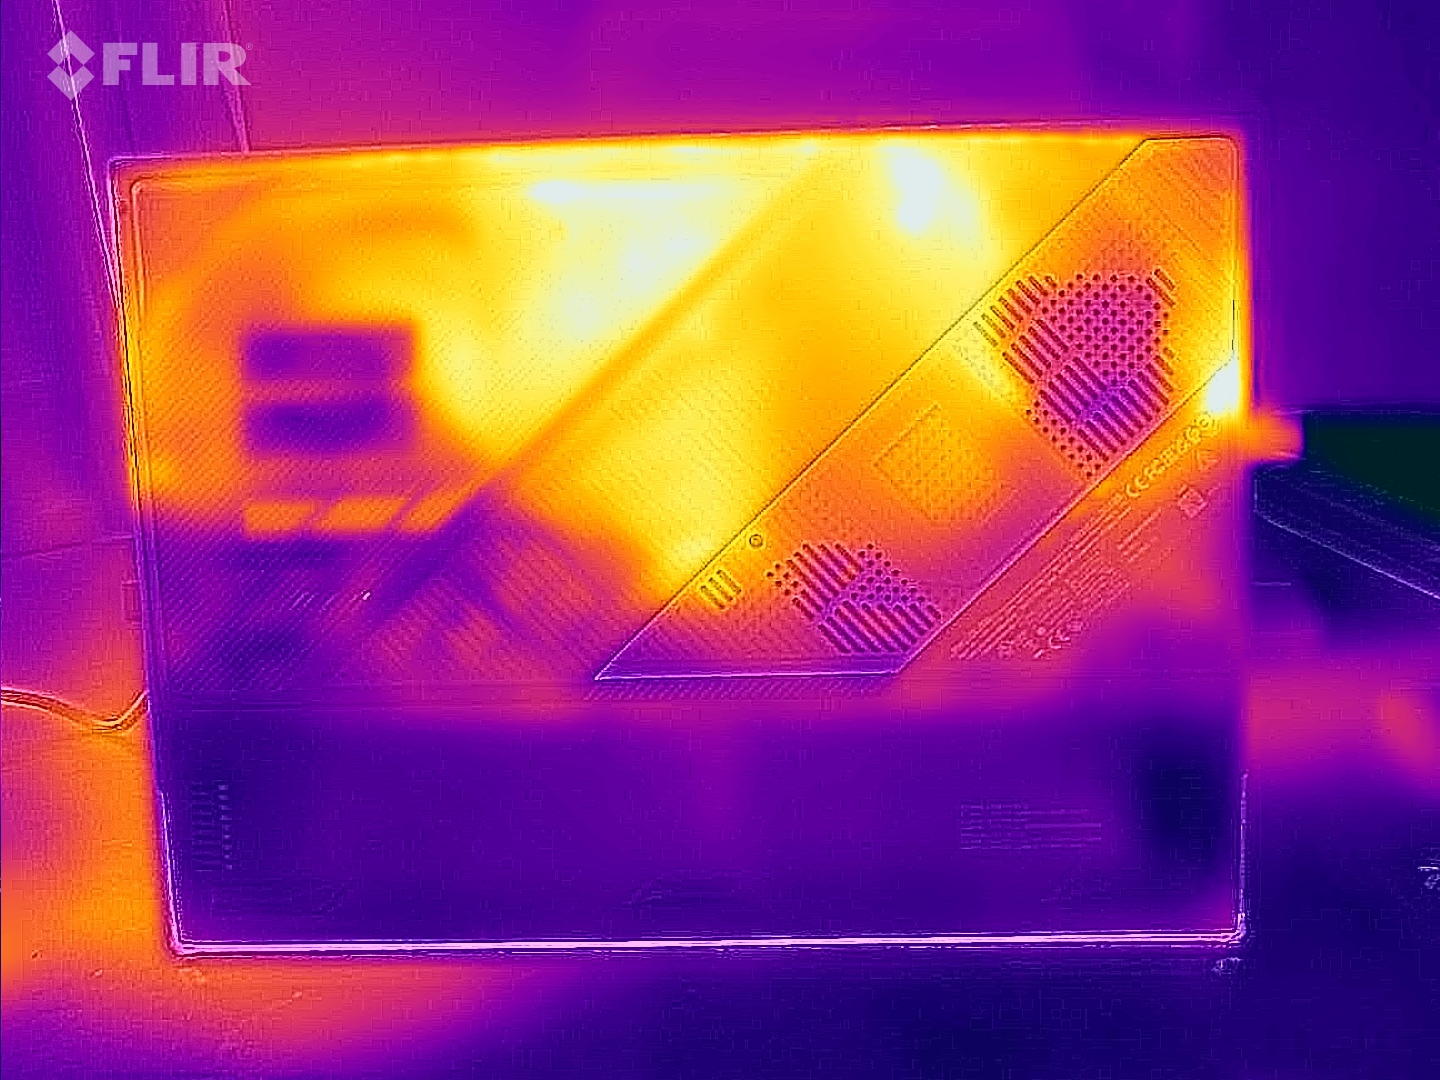
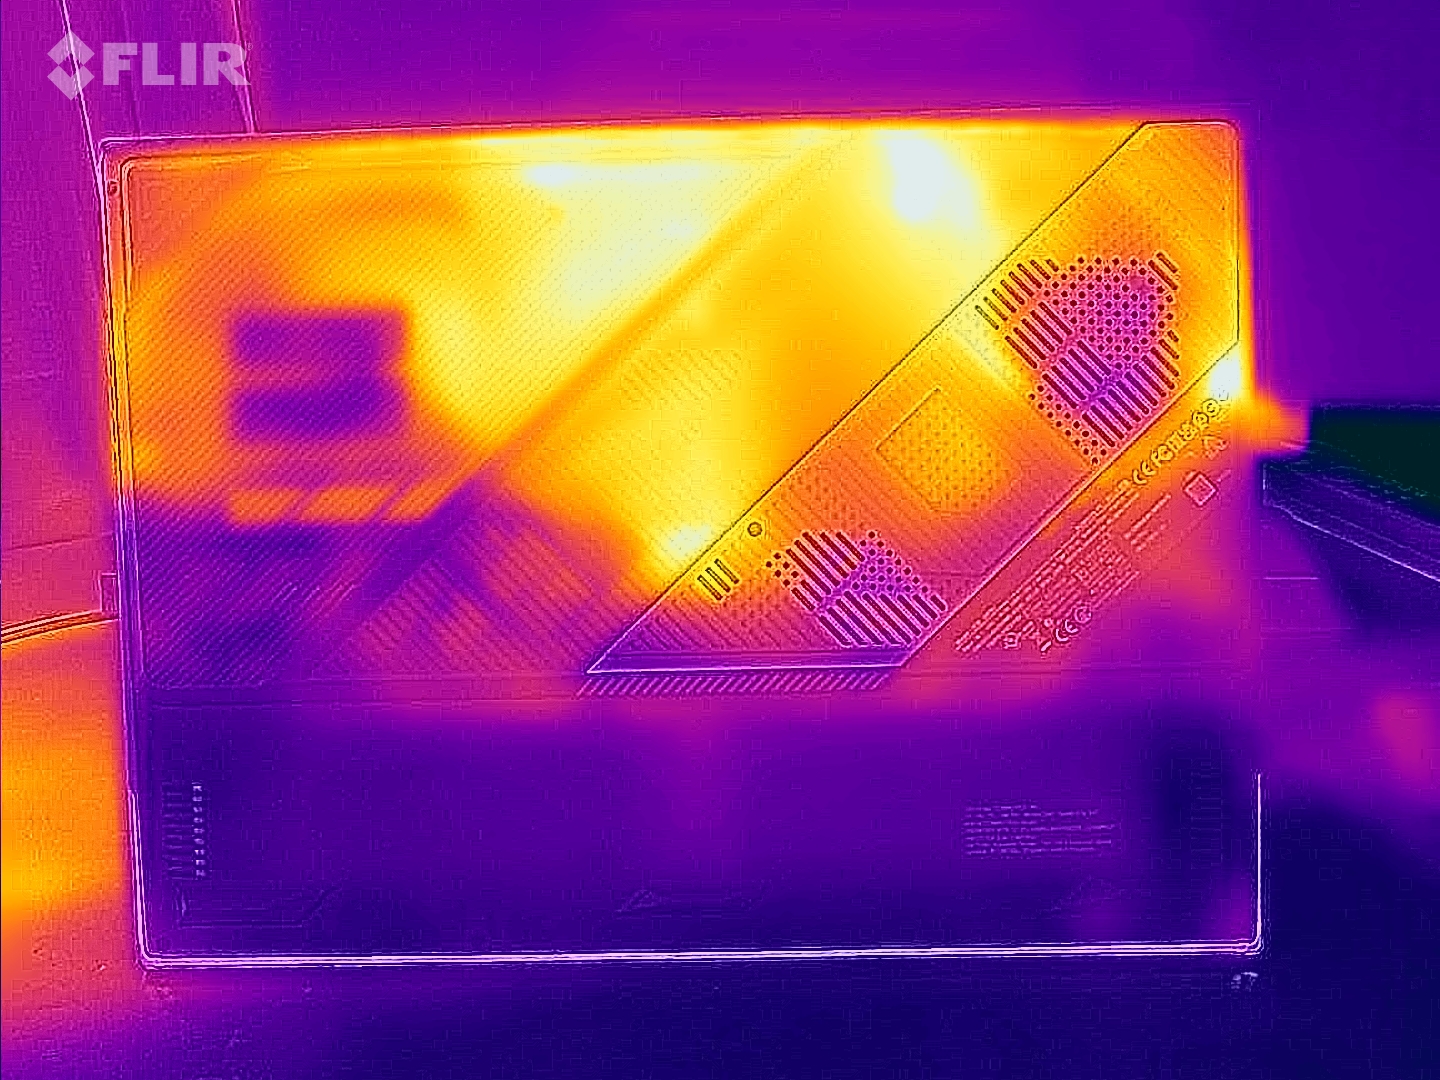
(-) Auf der Unterseite messen wir eine maximalen Wert von 47 °C (im Vergleich zum Durchschnitt von 43.2 °C).
(+) Ohne Last messen wir eine durchschnittliche Temperatur von 27.3 °C auf der Oberseite. Der Klassendurchschnitt erreicht 33.9 °C.
(-) Beim längeren Spielen von The Witcher 3 erhitzt sich das Gerät durchschnittlich auf 39.1 °C. Der Durchschnitt der Klasse ist derzeit 33.9 °C.
(+) Die Handballen und der Touchpad-Bereich erreichen maximal 35 °C und damit die typische Hauttemperatur und fühlen sich daher nicht heiß an.
(-) Die durchschnittliche Handballen-Temperatur anderer getesteter Geräte war 28.8 °C (-6.2 °C).
| Asus ROG Strix Scar 18 G834JYR (2024) Intel Core i9-14900HX, NVIDIA GeForce RTX 4090 Laptop GPU | Alienware m18 R1 AMD AMD Ryzen 9 7945HX, AMD Radeon RX 7900M | Alienware m18 R1 Intel Core i9-13980HX, NVIDIA GeForce RTX 4090 Laptop GPU | Acer Predator Helios 18 N23Q2 Intel Core i9-13900HX, NVIDIA GeForce RTX 4080 Laptop GPU | Razer Blade 18 RTX 4070 Intel Core i9-13950HX, NVIDIA GeForce RTX 4070 Laptop GPU | MSI Titan 18 HX A14VIG Intel Core i9-14900HX, NVIDIA GeForce RTX 4090 Laptop GPU | Asus ROG Strix Scar 18 2023 G834JY-N6005W Intel Core i9-13980HX, NVIDIA GeForce RTX 4090 Laptop GPU | |
|---|---|---|---|---|---|---|---|
| Hitze | 8% | 13% | -8% | 7% | 2% | -3% | |
| Last oben max * (°C) | 49 | 40.2 18% | 39 20% | 35 29% | 39.2 20% | 37.8 23% | 54 -10% |
| Last unten max * (°C) | 47 | 37.4 20% | 36.4 23% | 56 -19% | 35.6 24% | 37.6 20% | 46 2% |
| Idle oben max * (°C) | 29 | 31.6 -9% | 29.2 -1% | 34 -17% | 31.8 -10% | 34.8 -20% | 30 -3% |
| Idle unten max * (°C) | 31 | 30.6 1% | 27.8 10% | 39 -26% | 33.2 -7% | 36 -16% | 31 -0% |
* ... kleinere Werte sind besser
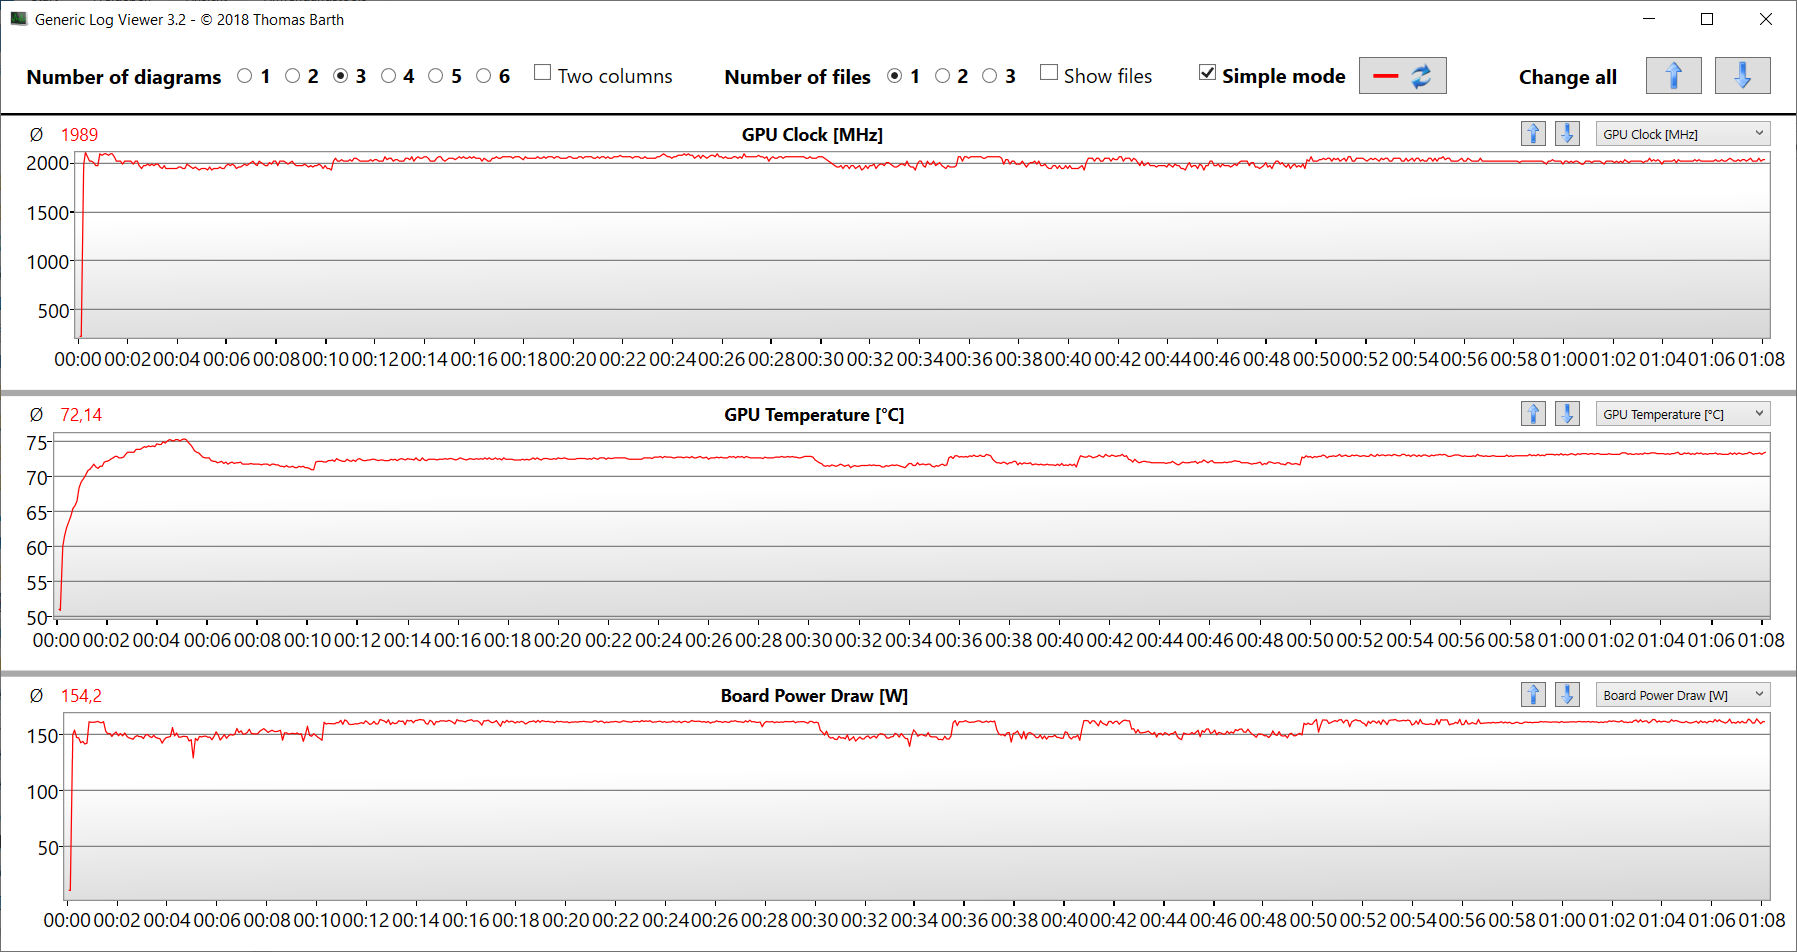
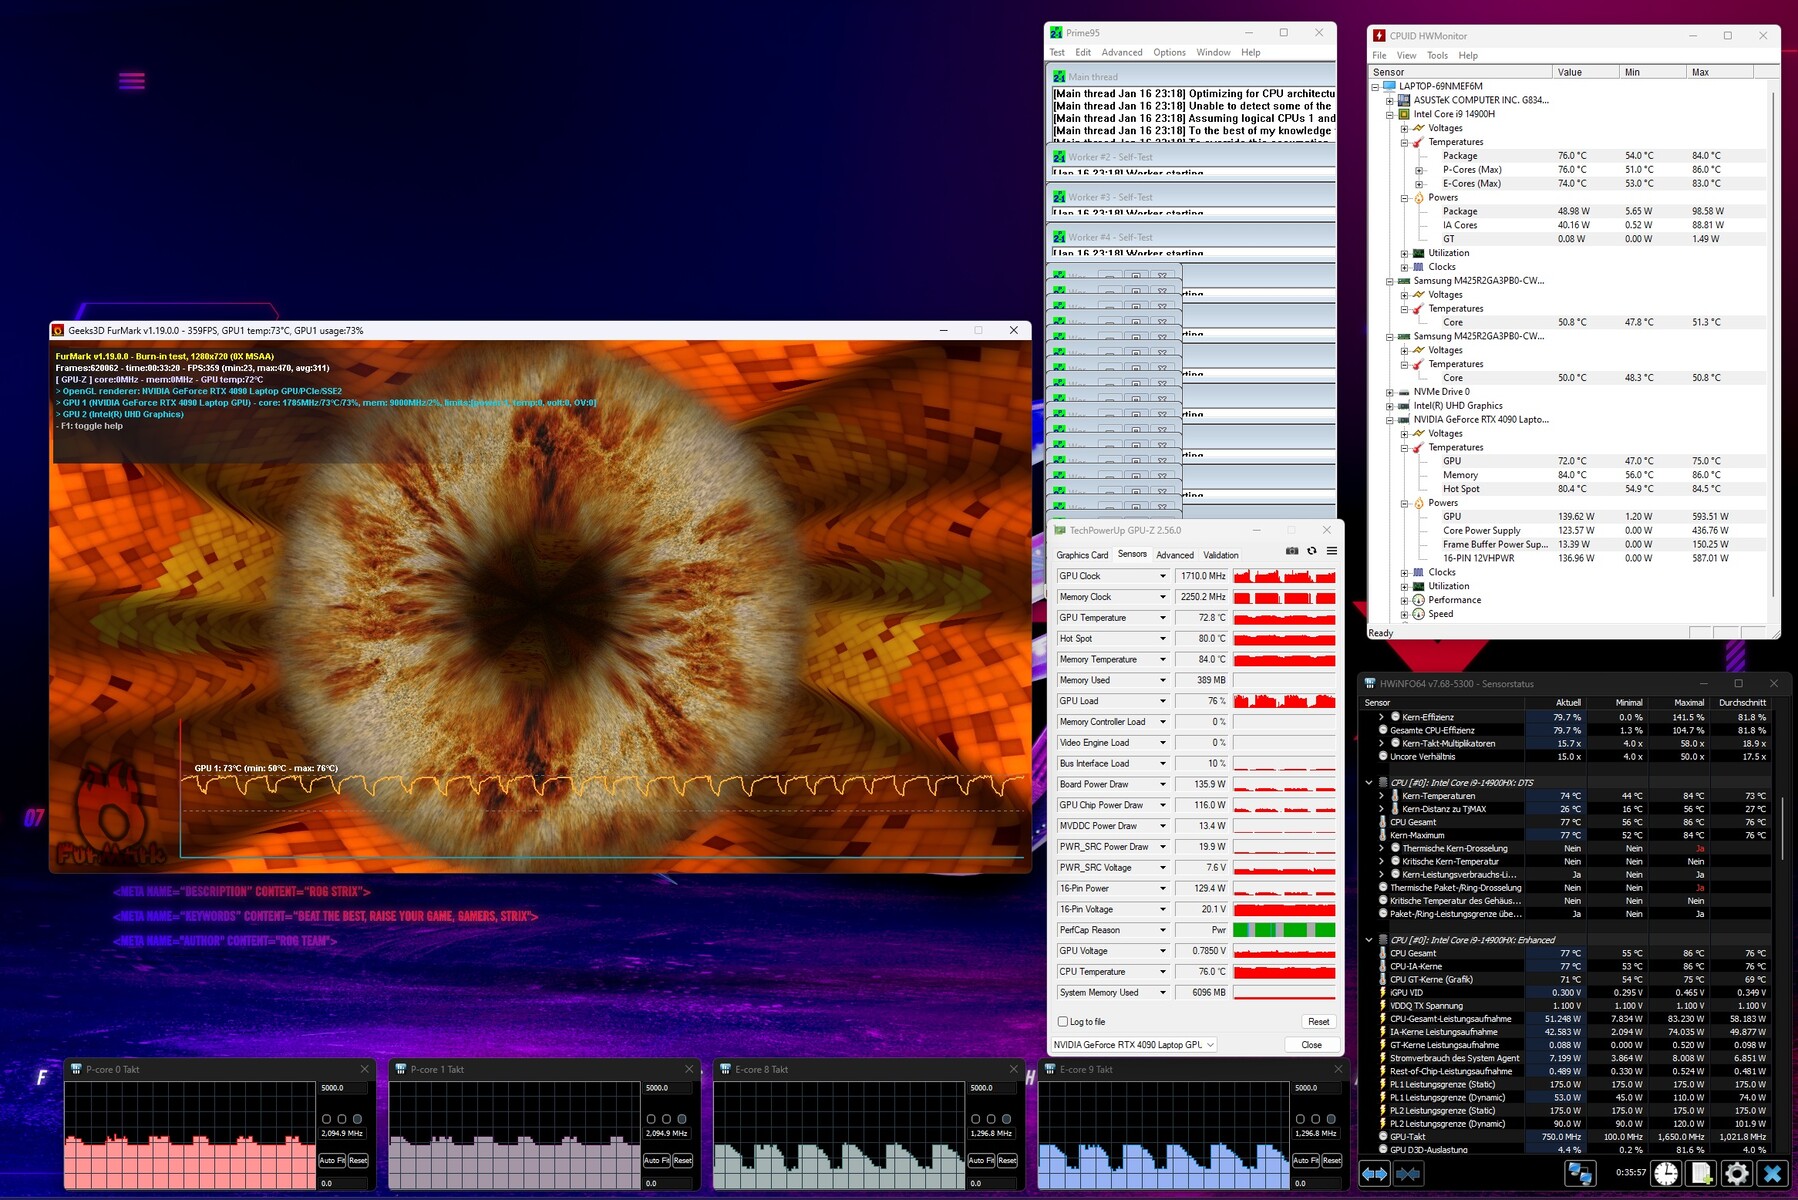
Stresstest
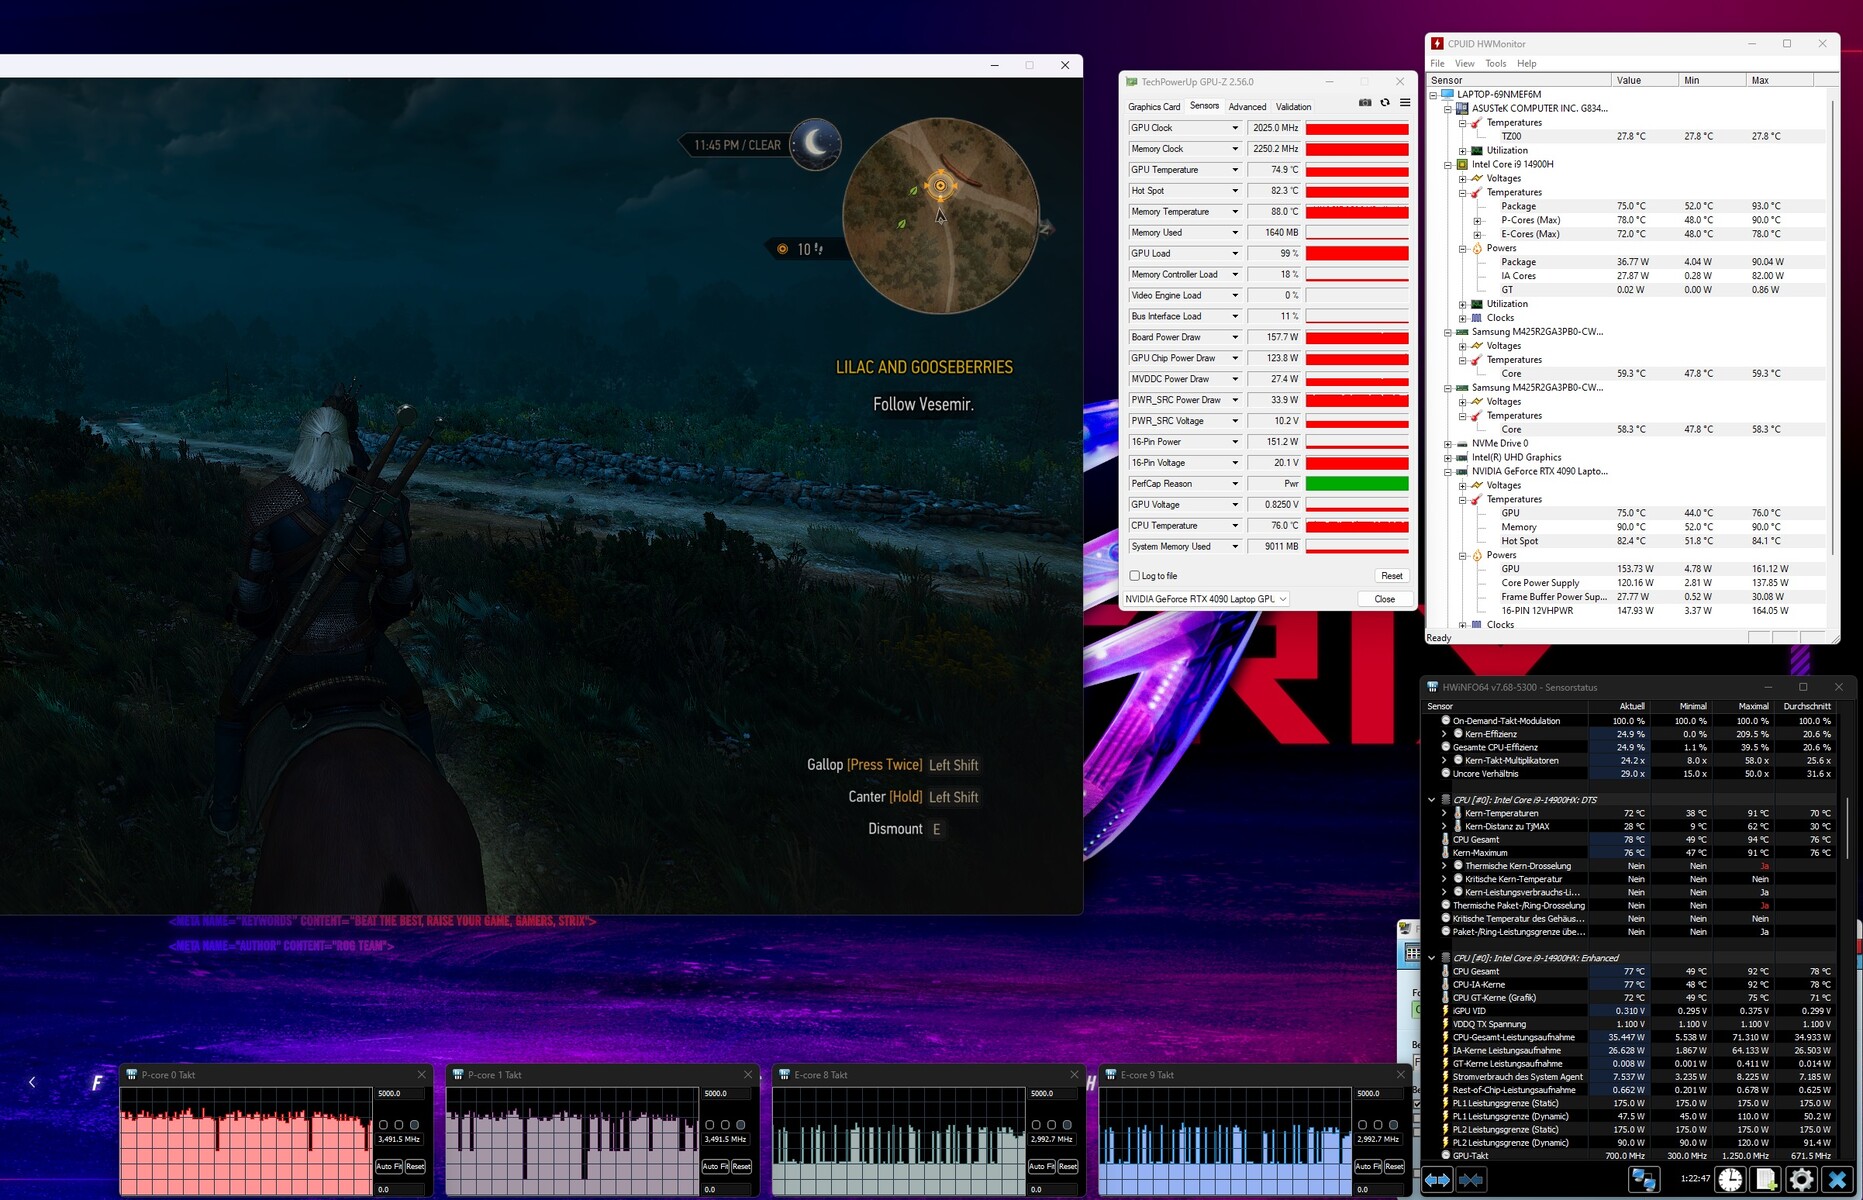
Der Stresstest (Prime95 und Furmark im Dauerbetrieb) stellt ein Extremszenario zur Überprüfung der Systemstabilität unter Volllast dar. Die CPU erreicht Maximaltakte von 2,5 bis 2,6 GHz (P) bzw. 2,2 bis 2,3 GHz (E). Die GPU (1,9 bis 2 GHz) beginnt den Test nahezu mit voller Kraft. Im weiteren Verlauf sinkt der Takt etwas. Zudem wird die GPU regelmäßig stark abgebremst.
Lautsprecher
Die vier Lautsprecher produzieren in Summe einen sehr ordentlichen Klang. Für ein besseres Klangerlebnis empfiehlt sich die Nutzung von Kopfhörern oder externen Lautsprechern.
Asus ROG Strix Scar 18 G834JYR (2024) Audio Analyse
(+) | Die Lautsprecher können relativ laut spielen (82 dB)
Bass 100 - 315 Hz
(±) | abgesenkter Bass - 5.6% geringer als der Median
(+) | lineare Bass-Wiedergabe (6.8% Delta zum Vorgänger)
Mitteltöne 400 - 2000 Hz
(±) | zu hohe Mitten, vom Median 5.7% abweichend
(+) | lineare Mitten (2.8% Delta zum Vorgänger)
Hochtöne 2 - 16 kHz
(±) | verringerte Hochtöne, 7.2% geringer als der Median
(±) | durchschnittlich lineare Hochtöne (7.2% Delta zum Vorgänger)
Gesamt im hörbaren Bereich 100 - 16.000 Hz
(+) | hörbarer Bereich ist sehr linear (13% Abstand zum Median
Im Vergleich zu allen Geräten derselben Klasse
» 18% aller getesteten Geräte dieser Klasse waren besser, 3% vergleichbar, 79% schlechter
» Das beste Gerät hat einen Delta-Wert von 6%, durchschnittlich ist 18%, das schlechteste Gerät hat 132%
Im Vergleich zu allen Geräten im Test
» 13% aller getesteten Geräte waren besser, 2% vergleichbar, 85% schlechter
» Das beste Gerät hat einen Delta-Wert von 4%, durchschnittlich ist 23%, das schlechteste Gerät hat 134%
MSI Titan 18 HX A14VIG Audio Analyse
(+) | Die Lautsprecher können relativ laut spielen (89.2 dB)
Bass 100 - 315 Hz
(-) | kaum Bass - 17.6% niedriger als der Median
(±) | durchschnittlich lineare Bass-Wiedergabe (8% Delta zum Vorgänger)
Mitteltöne 400 - 2000 Hz
(+) | ausgeglichene Mitten, vom Median nur 1.8% abweichend
(+) | lineare Mitten (3.7% Delta zum Vorgänger)
Hochtöne 2 - 16 kHz
(+) | ausgeglichene Hochtöne, vom Median nur 1.2% abweichend
(+) | sehr lineare Hochtöne (2% Delta zum Vorgänger)
Gesamt im hörbaren Bereich 100 - 16.000 Hz
(+) | hörbarer Bereich ist sehr linear (9.9% Abstand zum Median
Im Vergleich zu allen Geräten derselben Klasse
» 5% aller getesteten Geräte dieser Klasse waren besser, 2% vergleichbar, 94% schlechter
» Das beste Gerät hat einen Delta-Wert von 6%, durchschnittlich ist 18%, das schlechteste Gerät hat 132%
Im Vergleich zu allen Geräten im Test
» 4% aller getesteten Geräte waren besser, 1% vergleichbar, 95% schlechter
» Das beste Gerät hat einen Delta-Wert von 4%, durchschnittlich ist 23%, das schlechteste Gerät hat 134%
Energieverwaltung - Das Asus ROG erreicht recht gute Laufzeiten
Energieaufnahme
Der Witcher-3-Test wird mit konstanter Leistungsaufnahme auf erwartbarer Höhe durchlaufen. Während des Stresstests schwankt der Bedarf. Letzteres ist auf eine regelmäßige, deutliche Reduzierung des GPU-Takts zurückzuführen. Das Netzteil (330 Watt) ist ausreichend dimensioniert.
| Aus / Standby | |
| Idle | |
| Last |
|
Legende:
min: | |
| Asus ROG Strix Scar 18 G834JYR (2024) i9-14900HX, GeForce RTX 4090 Laptop GPU | Alienware m18 R1 AMD R9 7945HX, Radeon RX 7900M | Alienware m18 R1 i9-13980HX, GeForce RTX 4090 Laptop GPU | Acer Predator Helios 18 N23Q2 i9-13900HX, GeForce RTX 4080 Laptop GPU | Razer Blade 18 RTX 4070 i9-13950HX, GeForce RTX 4070 Laptop GPU | MSI Titan 18 HX A14VIG i9-14900HX, GeForce RTX 4090 Laptop GPU | Asus ROG Strix Scar 18 2023 G834JY-N6005W i9-13980HX, GeForce RTX 4090 Laptop GPU | Durchschnitt der Klasse Gaming | |
|---|---|---|---|---|---|---|---|---|
| Stromverbrauch | -112% | -48% | -4% | -40% | -40% | -35% | 5% | |
| Idle min * (Watt) | 14 | 30.3 -116% | 21.6 -54% | 16 -14% | 24.5 -75% | 13.2 6% | 17.3 -24% | 13.1 ? 6% |
| Idle avg * (Watt) | 17 | 55.6 -227% | 25.2 -48% | 19 -12% | 34.1 -101% | 25.4 -49% | 27 -59% | 19 ? -12% |
| Idle max * (Watt) | 24 | 101.1 -321% | 56.7 -136% | 21.3 11% | 47.7 -99% | 53.5 -123% | 46 -92% | 24.6 ? -3% |
| Last avg * (Watt) | 143 | 160.3 -12% | 164.1 -15% | 124 13% | 140 2% | 151.4 -6% | 133 7% | 111.3 ? 22% |
| Witcher 3 ultra * (Watt) | 251 | 216 14% | 311 -24% | 289 -15% | 202 20% | 336 -34% | ||
| Last max * (Watt) | 302 | 332.1 -10% | 338.9 -12% | 319 -6% | 261 14% | 395.2 -31% | 329 -9% | 260 ? 14% |
* ... kleinere Werte sind besser
Energieaufnahme Witcher 3 / Stresstest
Energieaufnahme mit externem Monitor
Akkulaufzeit
Der 18-Zöller erreicht im WLAN-Test (Aufruf von Webseiten mittels eines Skripts) bzw. Videotest (Kurzfilm Big Buck Bunny (H.264-Kodierung, FHD) in einer Schleife) Laufzeiten von 7:41 h bzw. 7:27 h. Alles in allem liefert das Scar 18 sehr gute Werte und kann die Konkurrenz teils deutlich hinter sich lassen - trotz teilweise größerer Akkukapazitäten.
| Asus ROG Strix Scar 18 G834JYR (2024) i9-14900HX, GeForce RTX 4090 Laptop GPU, 90 Wh | Alienware m18 R1 AMD R9 7945HX, Radeon RX 7900M, 97 Wh | Alienware m18 R1 i9-13980HX, GeForce RTX 4090 Laptop GPU, 97 Wh | Acer Predator Helios 18 N23Q2 i9-13900HX, GeForce RTX 4080 Laptop GPU, 90 Wh | Razer Blade 18 RTX 4070 i9-13950HX, GeForce RTX 4070 Laptop GPU, 91.7 Wh | MSI Titan 18 HX A14VIG i9-14900HX, GeForce RTX 4090 Laptop GPU, 99.9 Wh | Asus ROG Strix Scar 18 2023 G834JY-N6005W i9-13980HX, GeForce RTX 4090 Laptop GPU, 90 Wh | Durchschnitt der Klasse Gaming | |
|---|---|---|---|---|---|---|---|---|
| Akkulaufzeit | -61% | -45% | -16% | -26% | -32% | -15% | -2% | |
| Idle (h) | 10.2 | 4.5 -56% | 5.6 -45% | 7 -31% | 5.9 -42% | 7.84 ? -23% | ||
| H.264 (h) | 7.5 | 4.8 -36% | 7 -7% | 8.27 ? 10% | ||||
| WLAN (h) | 7.7 | 1.4 -82% | 4.3 -44% | 4.4 -43% | 4 -48% | 4.2 -45% | 7.1 -8% | 7.08 ? -8% |
| Last (h) | 1.3 | 0.7 -46% | 0.7 -46% | 1.7 31% | 1.3 0% | 1.2 -8% | 0.9 -31% | 1.496 ? 15% |
| Witcher 3 ultra (h) | 0.9 |
Pro
Contra
Fazit - Luft nach oben
Video- und Bildbearbeitung, Streaming, Rendering, Gaming zählen zu den Haupteinsatzgebieten des Laptops. GeForce RTX 4090 und Core i9-14900HX liefern die nötige Leistung, setzen aber keine neuen Bestmarken. Die Emissionen bewegen sich auf klassenüblich hohem Niveau.
Asus liefert mit dem ROG Strix Scar 18 (2024) ein leistungsstarkes High-End-Notebook zu einem stolzen Preis.
Das Aushängeschild des Rechners stellt der Mini-LED-Bildschirm (2.560 x 1.600 Pixel, DCI-P3, Dolby Vision, 240 Hz) im 16:10-Format mit einer Diagonale von 18 Zoll dar. Auf der Habenseite stehen u.a. eine Maximalhelligkeit von fast 1.000 cd/m², ein sehr guter Schwarzwert sowie eine hohe Farbgenauigkeit.
Die USB-C-Ports (1x USB 3.2 Gen 2, 1x Thunderbolt 4) erleichtern eine Integration in bestehende Arbeitsplatz-Setups und eröffnen Erweiterungsoptionen (externe GPU, Docking). Beide Ausgänge können ein Displayport-Signal ausgeben, der USB-3.2-Gen-2-Port unterstützt zudem Power Delivery. Dazu gesellen sich sehr gute Laufzeiten.
Eine Alternative wäre das MSI Titan 18 HX A14VIG. Der Rechner holt etwas mehr Leistung aus der gleichen CPU-GPU-Kombinationen heraus, kann einen 4k-Mini-LED-Bildschirm vorweisen und punktet mit zwei TB4-Ports. An die Laufzeiten des Strix reicht das MSI Notebook nicht heran.
Preis und Verfügbarkeit
Das Asus ROG Strix Scar 18 (2024) ist zu einem Preis von knapp 4.800 Euro im Asus-Store zu bekommen. Cyberport.de verlangt knapp 4500 Euro für das Gerät.
Asus ROG Strix Scar 18 G834JYR (2024)
- 07.02.2024 v7 (old)
Sascha Mölck
Transparenz
Die Auswahl der zu testenden Geräte erfolgt innerhalb der Redaktion. Das vorliegende Testmuster wurde dem Autor vom Hersteller oder einem Shop zu Testzwecken leihweise zur Verfügung gestellt. Eine Einflussnahme des Leihstellers auf den Testbericht gab es nicht, der Hersteller erhielt keine Version des Reviews vor der Veröffentlichung. Es bestand keine Verpflichtung zur Publikation. Als eigenständiges, unabhängiges Unternehmen unterliegt Notebookcheck keiner Diktion von Herstellern, Shops und Verlagen.
So testet Notebookcheck
Pro Jahr werden von Notebookcheck hunderte Laptops und Smartphones unabhängig in von uns standardisierten technischen Verfahren getestet, um eine Vergleichbarkeit aller Testergebnisse zu gewährleisten. Seit rund 20 Jahren entwickeln wir diese Testmethoden kontinuierlich weiter und setzen damit Branchenstandards. In unseren Testlaboren kommt ausschließlich hochwertiges Messequipment in die Hände erfahrener Techniker und Redakteure. Die Tests unterliegen einer mehrstufigen Kontrolle. Unsere komplexe Gesamtbewertung basiert auf hunderten fundierten Messergebnissen und Benchmarks, womit Ihnen Objektivität garantiert ist. Weitere Informationen zu unseren Testmethoden gibt es hier.
Preisvergleich
