Notebookcheck Logo

Intel Raptor Lake-HX Refresh in der Analyse - Core i9-14900HX mit mehr Single-Core-Leistung

Leistung vor Effizienz. Intel bringt mit Raptor Lake-HX Refresh ein Update für seine schnellsten Mobilprozessoren, die in leistungsstarken Multimedia- und Gaming-Laptops zum Einsatz kommen und verspricht dabei mehr Leistung beim Spielen sowie Single-Core-Szenarios. Wir testen den neuen Core i9-14900HX und vergleichen ihn mit dem alten Core i9-13900HX sowie dem AMD Ryzen 9 7945HX. Update: CPU-Benchmarks des Core i7-14650HX

Im Dezember hat Intel die brandneuen Core-Ultra-Mobilprozessoren der Meteor-Lake-Generation vorgestellt (hier im Test), die erstmalig auf ein Tile/Chiplet-Design setzen und im Bereich von 28-115 Watt arbeiten. Für die stärkeren HX-Mobilprozessoren setzt Intel allerdings noch einmal auf die bekannte Raptor-Lake-Generation und nennt die neuen Chips einfach Raptor Lake Refresh, wobei die bisherige Bezeichnung mit Core i9-14xxxHX bestehen bleibt. Grundsätzlich hat sich an der Architektur und der Konfiguration der Kerne nichts verändert, doch der maximale Turbo-Takt wurde erhöht. Intel verspricht neben mehr Single-Core-Leistung auch eine gesteigerte Performance bei gemischter Single/Multi-Core-Last, was vor allem beim Spielen häufig der Fall ist. Wir wollen das natürlich überprüfen und vergleichen den neuen Core i9-14900HX mit den alten Prozessoren der 13. Generation (Core i9-13900HX, Core i9-13950HX, Core i9-13980HX) sowie den beiden AMD-Flaggschiffen Ryzen 9 7945HX sowie dem Ryzen 9 7945HX3D.

Update 11.01.2024: Weitere Gaming-Benchmarks hinzugefügt.

Update 18.01.2024: CPU-Benchmarks des Core i7-14650HX hinzugefügt.

Übersicht Raptor Lake-HX 14. Generation

Intel hat das Line-Up der Raptor-Lake-HX-Modelle der 14. Generation etwas überarbeitet, denn zunächst ist der Core i9-14900HX das neue Flaggschiff der Mobilprozessoren. Es ist aktuell zudem der einzige HX-Chip mit insgesamt 24 Kernen (32 Threads), denn Nachfolger für die beiden Modelle Core i9-13950HX sowie Core i9-13980HX gibt es aktuell nicht und wir haben auch keine Informationen darüber, ob es Nachfolger geben wird. Beim Takt hat sich aber was getan, denn die acht P-Kerne erreichen nun bis zu 5,8 GHz (bei einem oder zwei aktiven Kernen, ansonsten maximal 5,2 GHz) und übertreffen damit selbst den Core i9-13980HX um 200 MHz, den Core i9-13900HX sogar um 400 MHz. Der maximale Takt der 16 E-Kerne liegt nun bei bis zu 4,1 GHz (vorher maximal 4,0 GHz). Die Größe des Caches liegt nach wie vor bei 36 MB und Intel gibt weiterhin eine Base Power von 55 Watt sowie einen maximalen Verbrauch von 157 Watt an, wobei wir hier aus der Vergangenheit wissen, dass die HX-Modelle der 13. Generation noch mehr verbrauchen können.

Raptor Lake-HX SKUs (Quelle: Intel)
Raptor Lake-HX Plattform-Features (Quelle: Intel)

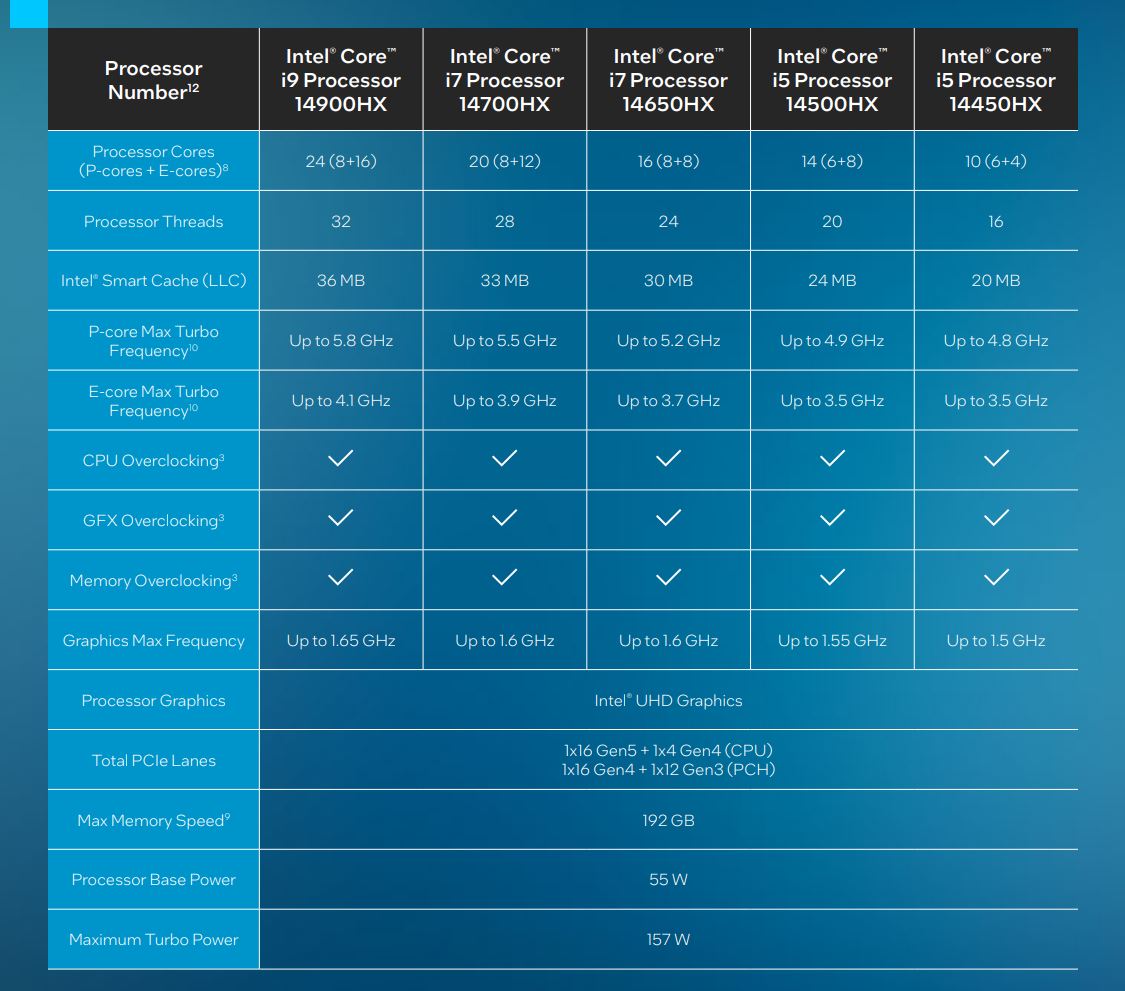
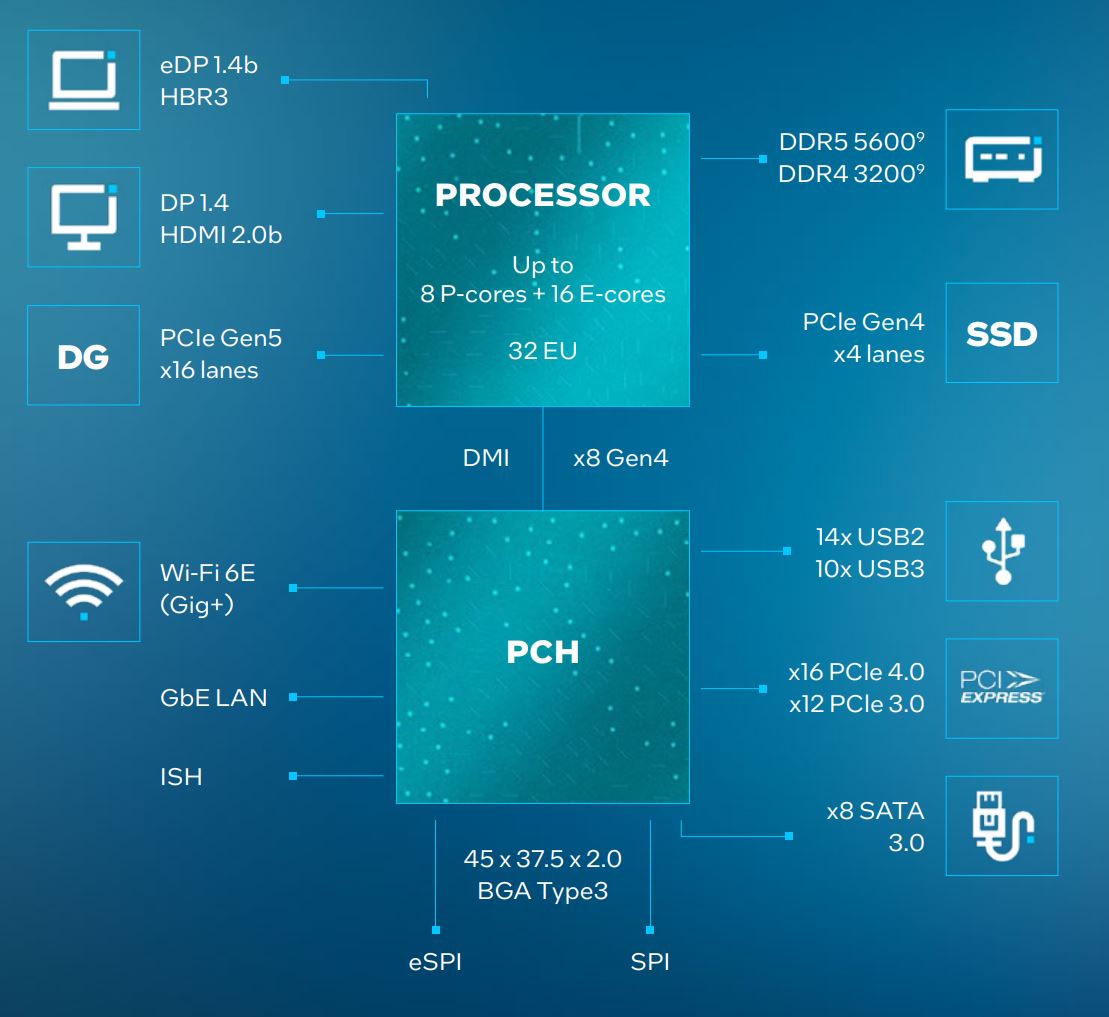
Der Core i7-14700HX bekommt vier zusätzliche E-Kerne spendiert, was die Anzahl der Kerne von 16 auf insgesamt 20 erhöht (28 Threads). Zudem wurden auch hier die Takte angehoben. Das Line-Up wir komplettiert vom Core i7-14650HX, dem Core i5-14500HX sowie dem Core i5-14450HX. Insgesamt wurde die Anzahl der HX-Prozessoren also von neun auf fünf reduziert. Maximal unterstützen die neuen HX-Modelle 192 GB RAM (DDR5-5600).

Raptor Lake-HX optional mit Wi-Fi 7
Thunderbolt 5 mit 240-Watt-Laden via USB-C ist optional kompatibel.

Auch bei der Konnektivität werden die neuesten Features wir Wi-Fi 7 oder Thunderbolt 5 unterstützt, allerdings nur optional. Hier liegt es wieder an der jeweiligen Implementierung der Hersteller, welches Funktion dann letztendlich für den Nutzer verfügbar sind. Zudem können alle HX-Modelle übertaktet werden, was mit Intels eigener XTU-Software auch sehr komfortabel möglich ist.

PosModellCodenameL2 Cache + L3 CacheTDP WattMHz - TurboKerne / ThreadsCinebench R23 Single CoreCinebench R23 Multi CoreBlender v3.3 Classroom CPU(-)Geekbench 6.2 Single-CoreGeekbench 6.2 Multi-Core
Intel Core i9-14900HXRaptor Lake-HX Refresh32MB + 36MB551600 ‑ 580024/32
2190.5n22
29985n22
205n23
3020.5n22
17738n22
Intel Core i9-13980HXRaptor Lake-HX32MB + 36MB551600 ‑ 560024/32
2110n9
30273n10
190n9
2881.5n2
17564n2
Intel Core i9-13950HXRaptor Lake-HX32MB + 36MB551600 ‑ 550024/32
2096n7
28681n7
196n7
2919.5n2
16927.5n2
Intel Core i9-13900HXRaptor Lake-HX32MB + 36MB551600 ‑ 540024/32
2055n19
27844n22
202n21
2720n2
16522.5n2
Intel Core i7-14700HXRaptor Lake-HX Refresh24MB + 30MB553900 ‑ 550020/28
2103
23207
245
2975
17292
Intel Core i7-13850HXRaptor Lake-HX24MB + 30MB551500 ‑ 530020/28
2700
16782
Intel Core i7-14650HXRaptor Lake-HX Refresh24MB + 30MB551600 ‑ 520016/24
1963
24455
247
2761
16010
Intel Core i7-13700HXRaptor Lake-HX24MB + 30MB551500 ‑ 500016/24
1882n10
20997.5n10
270.5n10
2593n3
14402n3
Intel Core i5-14500HXRaptor Lake-HX Refresh + 24MB551800 ‑ 500014/20
Intel Core i7-13650HXRaptor Lake-HX + 24MB551900 ‑ 490014/20
1857.5n4
20774.5n4
280.5n4
2533.5n2
13632.5n2
Intel Core i5-13600HXRaptor Lake-HX + 24MB551900 ‑ 480014/20
2920
15910
Intel Core i5-13500HXRaptor Lake-HX + 24MB551800 ‑ 470014/20
1730.5n2
18334n3
336n3
2478
13404
Intel Core i5-14450HXRaptor Lake-HX Refresh + 20MB551800 ‑ 480010/16
Intel Core i5-13450HXRaptor Lake-HX + 20MB551800 ‑ 460010/16
1766
16575
387
2448
12619
(-) * Geringere Werte sind besser. / n123 Anzahl der Benchmarks die zu diesem Wert beitragen / * Geschätzte Position

Testsystem - XMG Neo 17 (E24)

XMG Neo 17 (E24)
XMG Neo 17 (E24)

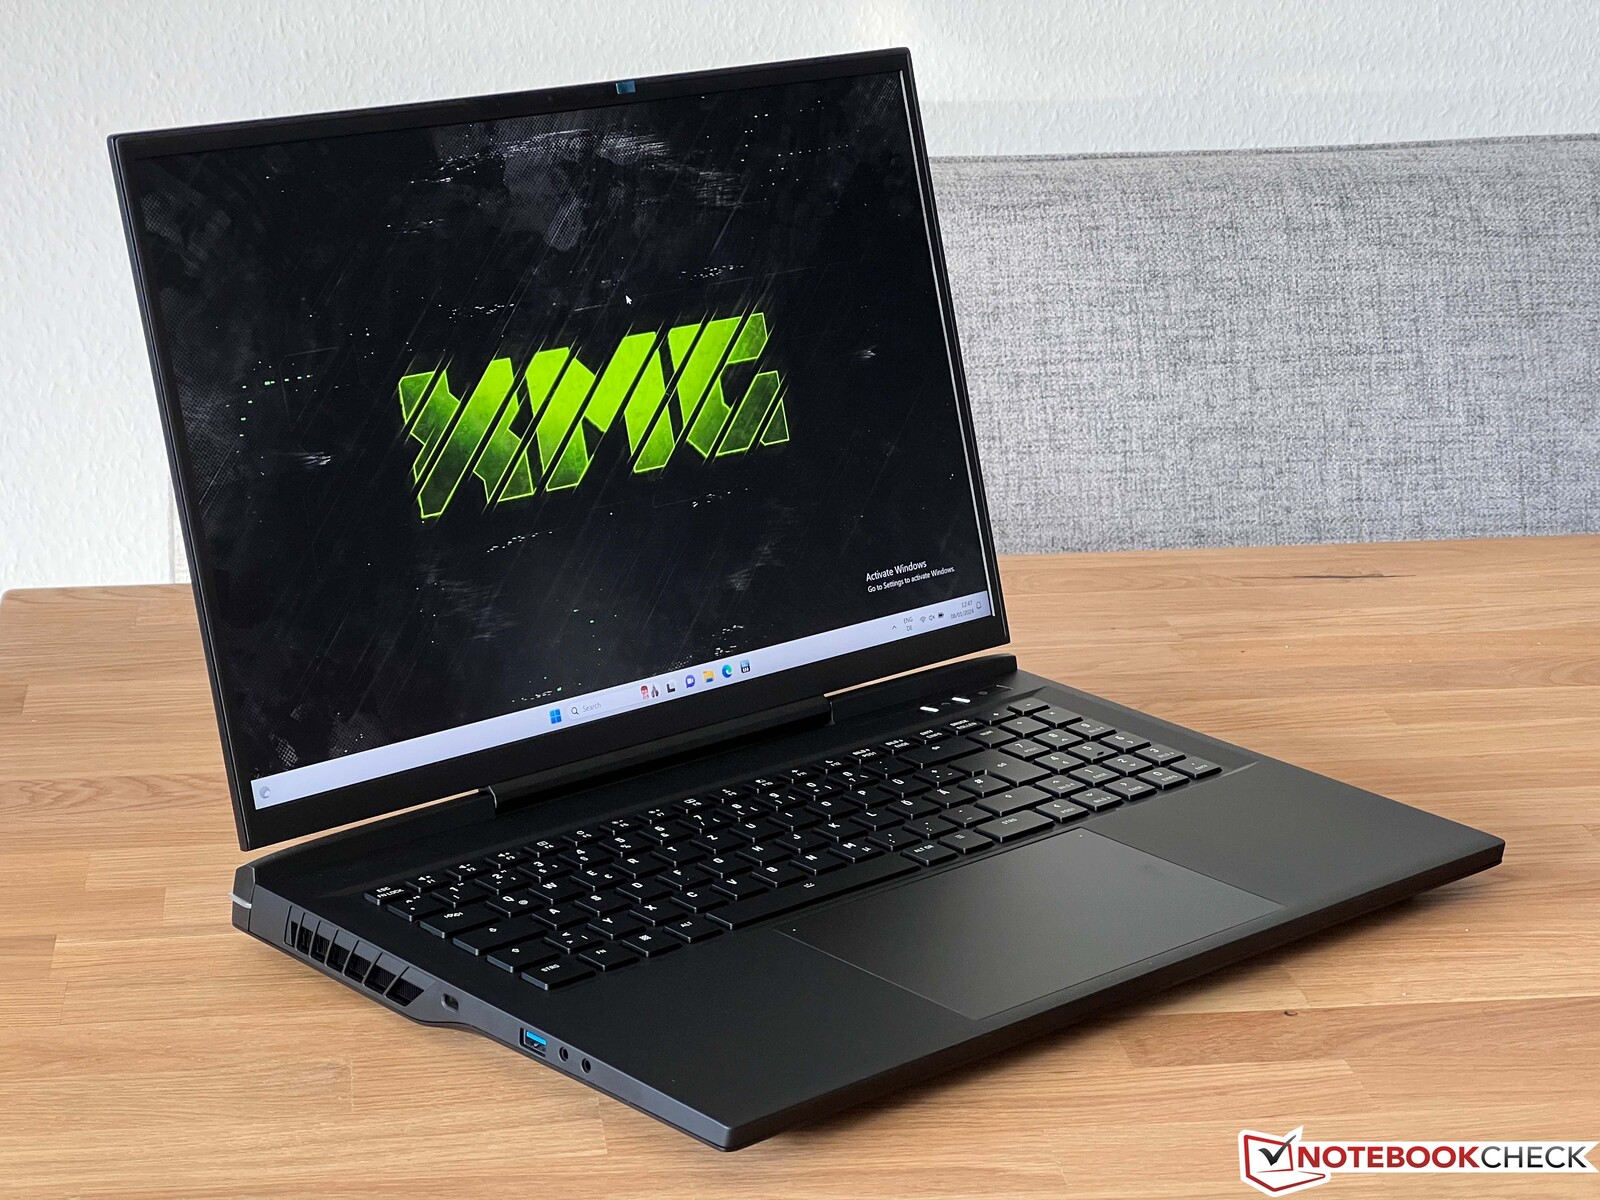
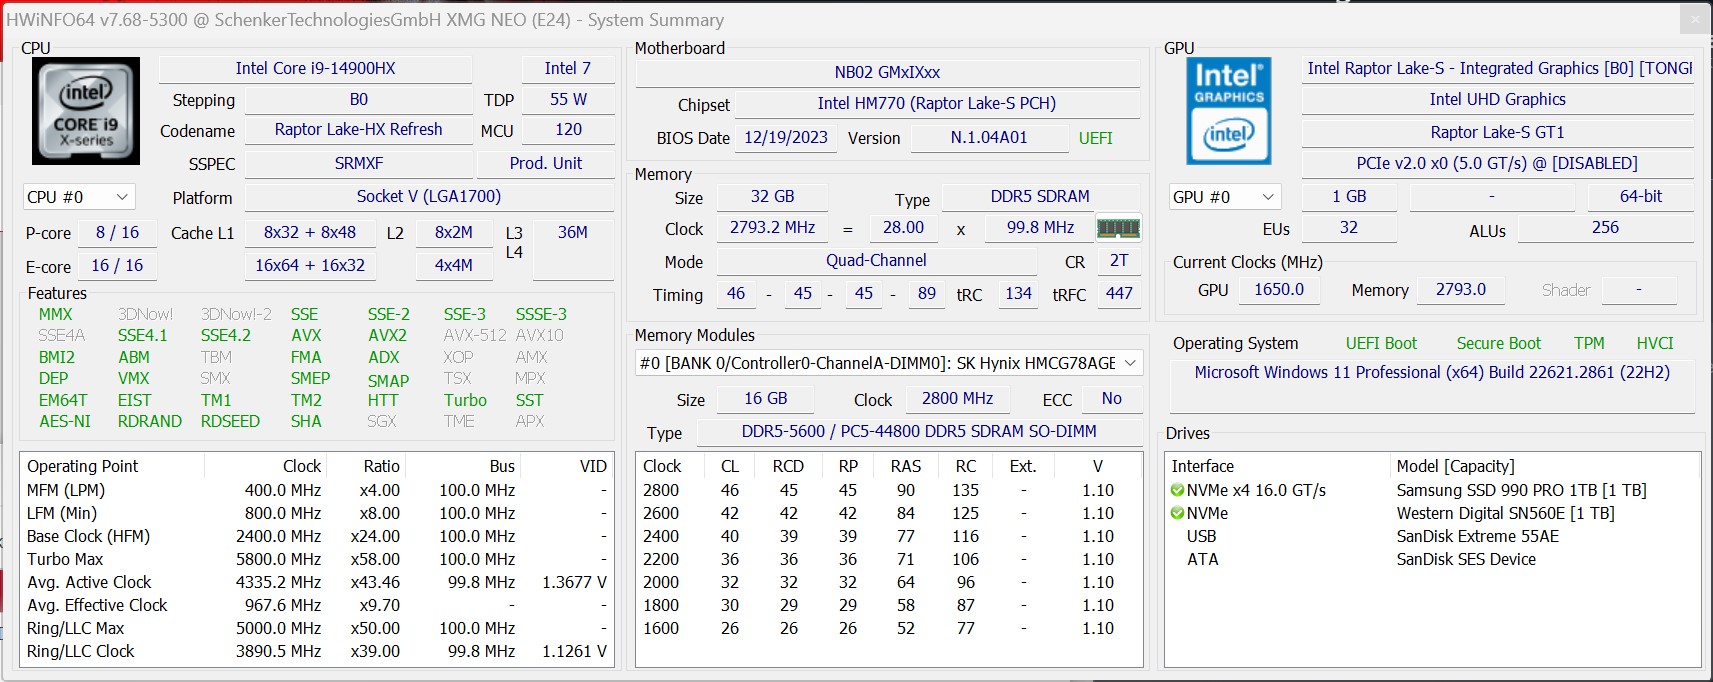
Als Testsystem steht uns ein Early Sample des neuen XMG Neo 17 (E24) zur Verfügung, das mit dem Core i9-14900HX, der dedizierten Nvidia GeForce RTX 4090 Laptop sowie 32 GB DDR5-5600-RAM ausgestattet ist. Das neue XMG Neo 17 (E24) verwendet das gleiche Gehäuse wie bei der 2023er-Version, im Inneren gibt es aber einige Unterschiede. Unter anderem gibt es nun einen reinen iGPU-Modus, der Akku kann via USB-C geladen werden (100 Watt) und die Heatpipe für die Oasis-Wasserkühlung deck nun auch den CPU-Bereich besser ab. Im BIOS bietet das Neo 17 zudem die Möglichkeit, die Spannung der CPU zu reduzieren (Undervolting).

Als Display kommt weiterhin ein G-Sync kompatibles 17-Zoll-IPS-Panel mit der Auflösung von 2.560 x 1.600 Pixeln im Format 16:10 sowie der Frequenz von 240 Hz zum Einsatz. Bei der Tastatur hat man die Wahl zwischen einer leisen Membran-Tastatur sowie der optionalen mechanischen Tastatur (Cherry MX Ultra Low Profile Tactile Switches).

HWiNFO XMG Neo 17 (E24)

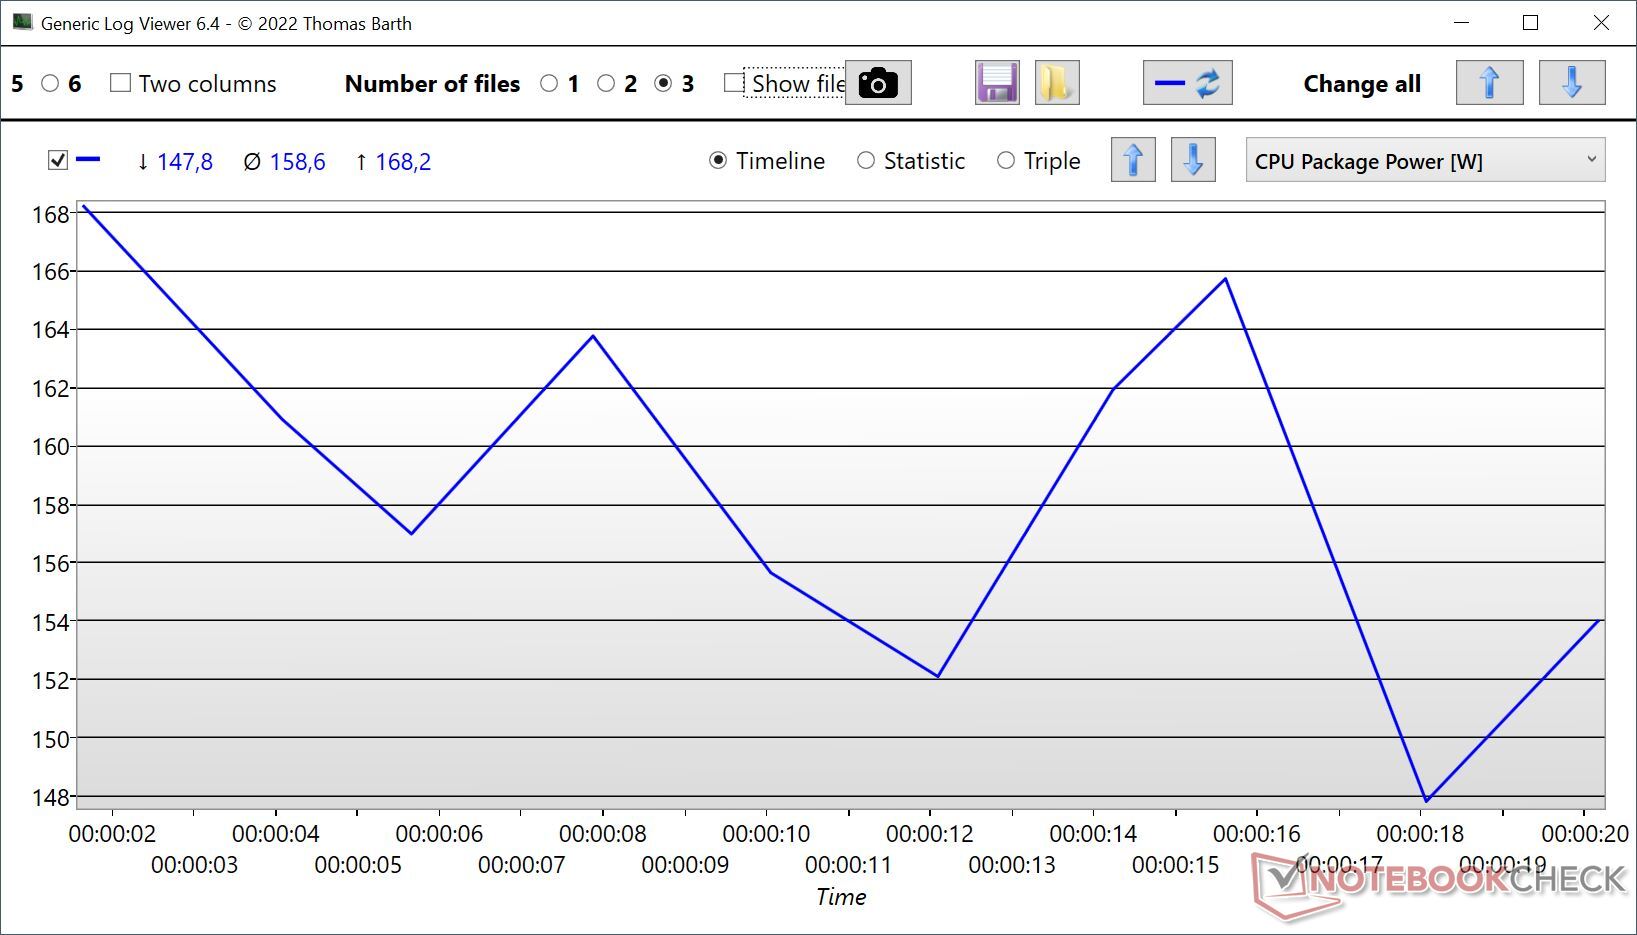
Die GPU kann maximal wieder 150 Watt (+25 Watt Dynamic Boost) verbrauchen, während der Prozessor dauerhaft mit maximal 160 Watt betrieben wird (PL4 liegt bei 250 Watt), wobei wir bei unseren Tests bis zu 170 Watt beobachten konnten. Wir haben die nachfolgenden Benchmarks ohne die zusätzliche Oasis-Wasserkühlung durchgeführt. Ein vollständiger Test des neuen XMG Neo 17 E24 wird demnächst veröffentlicht.

Hinweis: Bei den Energiemessungen am externen Bildschirm war die dedizierte Grafikkarte aktiv, was aber auch bei einigen der Vergleichssysteme der Fall war. Die Konfiguration der Videoausgänge hängt von der Konfiguration der jeweiligen Laptop-Hersteller ab, beim XMG Neo 17 (E24) sind sowohl der HDMI-Ausgang als auch der USB-C-Anschluss direkt mit der dGPU verbunden.

Lenovo Legion 5 16IRX G9

Update 18.01.2024: Mit dem neuen Lenovo Legion 5 16IRX G9 haben wir nun das erste Gaming-Notebook in der Redaktion, das mit dem neuen Core i7-14650HX ausgestattet ist. Dieser bietet 8 Performance-Kerne ink. Hyperthreading sowie 8 Efficiency-Kerne, entspricht von der Kernkonfiguration her also dem alten Core i7-13700HX, allerdings sind die maximalen Takte etwas höher (P-Kerne: max. 5,2 vs. 5,0 GHz; E-Kerne: max. 3,7 GHz bei beiden). Der neue Core i7-14700HX hingegen bietet vier zusätzliche E-Kerne und kann daher maximal 28 Threads gleichzeitig bearbeiten. Der neue Core i7-14650HX kann bis zu 157 Watt verbrauchen und diese Werte sehen wir beim neuen Legion 5 16 G9 auch. Der vollständige Testbericht des neuen Lenovo Legion 5 wird in wenigen Tagen veröffentlicht.

Single-Core-Leistung & Effizienz

Dank des höheren Turbo-Taktes von bis zu 5,8 GHz konnte Intel die Single-Core-Leistung noch einmal steigern und der neue Core i9-14900HX positioniert sich in Cinebench R23 3 % vor dem Core i9-13980HX und 9 % vor dem schnellsten Core i9-13900HX. Apples neuer M3 Max (16 CPU-Kerne) wird hier um 13 % überboten, kann sich allerdings sowohl in Geekbench 6.2 als als dem neuen Cinebench 2024 vor dem neuen Core i9-14900HX positionieren. AMDs Ryzen 9 7945HX wird um 15 % überboten.

Update 18.01.2024: Der Core i7-14650HX kann sich in den Single-Core-Tests durchgehend vor dem alten Core i7-13700HX platzieren und bewegt sich in etwa auf Augenhöhe mit den HX-CPUs von AMD. Apples M3 Max ist in der Regel etwas schneller, was auch für den alten Core i9-13900HX gilt, riesig sind die Abstände aber nicht.

Cinebench R23: Single Core
Cinebench R20: CPU (Single Core)
Cinebench R15: CPU Single 64Bit
7-Zip 18.03: 7z b 4 -mmt1
Geekbench 5.5: Single-Core
Geekbench 6.2: Single-Core
Cinebench 2024: CPU Single Core
Cinebench R23 / Single Core
Intel Core i9-14900HX
SCHENKER XMG Neo 17 2024 Engineering Sample
2232 Points
Intel Core i9-13980HX
MSI Titan GT77 HX 13VI
2169 Points -3%
Intel Core i9-13950HX
MSI Titan GT77 HX 13VI
2100 Points -6%
Intel Core i9-13900HX
SCHENKER XMG Neo 16 Raptor Lake
2055 Points -8%
Intel Core i9-13900HX
Lenovo Legion Pro 7 16IRX8H
2043 Points -8%
Intel Core i9-13950HX
Razer Blade 16 Early 2023
2029 Points -9%
Apple M3 Max 16-Core
Apple MacBook Pro 16 2023 M3 Max
1968 Points -12%
Intel Core i7-14650HX
Lenovo Legion 5 16IRX G9
1963 Points -12%
AMD Ryzen 9 7945HX
Asus Zephyrus Duo 16 GX650PY-NM006W
1940 Points -13%
AMD Ryzen 9 7945HX
Asus ROG Strix G17 G713PI (Turbo Mode)
1936 Points -13%
AMD Ryzen 9 7945HX3D
Asus ROG Strix Scar 17 G733PYV-LL053X
1935 Points -13%
Intel Core i7-13700HX
Alienware m16 R1 Intel
1933 Points -13%
Intel Core i9-12900HX
MSI Titan GT77 12UHS
1913 Points -14%
AMD Ryzen 9 7945HX
Asus ROG Strix G17 G713PI
1863 Points -17%
AMD Ryzen 9 6900HX
Asus ROG Zephyrus Duo 16 GX650RX
1566 Points -30%
AMD Ryzen 9 6900HX
SCHENKER XMG Neo 17 M22
1557 Points -30%
Cinebench R20 / CPU (Single Core)
Intel Core i9-14900HX
SCHENKER XMG Neo 17 2024 Engineering Sample
859 Points
Intel Core i9-13980HX
MSI Titan GT77 HX 13VI
825 Points -4%
Intel Core i9-13950HX
MSI Titan GT77 HX 13VI
803 Points -7%
Intel Core i9-13900HX
Lenovo Legion Pro 7 16IRX8H
788 Points -8%
Intel Core i9-13900HX
SCHENKER XMG Neo 16 Raptor Lake
756 Points -12%
AMD Ryzen 9 7945HX
Asus Zephyrus Duo 16 GX650PY-NM006W
756 Points -12%
AMD Ryzen 9 7945HX3D
Asus ROG Strix Scar 17 G733PYV-LL053X
755 Points -12%
Intel Core i7-14650HX
Lenovo Legion 5 16IRX G9
754 Points -12%
AMD Ryzen 9 7945HX
Asus ROG Strix G17 G713PI (Turbo Mode)
753 Points -12%
Intel Core i9-13950HX
Razer Blade 16 Early 2023
742 Points -14%
Intel Core i9-12900HX
MSI Titan GT77 12UHS
738 Points -14%
Intel Core i7-13700HX
Alienware m16 R1 Intel
738 Points -14%
AMD Ryzen 9 7945HX
Asus ROG Strix G17 G713PI
712 Points -17%
AMD Ryzen 9 6900HX
SCHENKER XMG Neo 17 M22
605 Points -30%
AMD Ryzen 9 6900HX
Asus ROG Zephyrus Duo 16 GX650RX
595 Points -31%
Apple M3 Max 16-Core
Apple MacBook Pro 16 2023 M3 Max
497 Points -42%
Cinebench R15 / CPU Single 64Bit
Intel Core i9-14900HX
SCHENKER XMG Neo 17 2024 Engineering Sample
320 Points
Intel Core i9-13980HX
MSI Titan GT77 HX 13VI
312 Points -2%
AMD Ryzen 9 7945HX3D
Asus ROG Strix Scar 17 G733PYV-LL053X
311 Points -3%
AMD Ryzen 9 7945HX
Asus Zephyrus Duo 16 GX650PY-NM006W
307 Points -4%
Intel Core i9-13900HX
Lenovo Legion Pro 7 16IRX8H
301 Points -6%
AMD Ryzen 9 7945HX
Asus ROG Strix G17 G713PI (Turbo Mode)
301 Points -6%
Intel Core i9-13950HX
MSI Titan GT77 HX 13VI
300 Points -6%
Intel Core i9-13900HX
SCHENKER XMG Neo 16 Raptor Lake
295 Points -8%
Intel Core i9-13900HX
SCHENKER XMG Neo 16 Raptor Lake
294 Points -8%
AMD Ryzen 9 7945HX
Asus ROG Strix G17 G713PI
294 Points -8%
Intel Core i7-14650HX
Lenovo Legion 5 16IRX G9
287 Points -10%
Intel Core i9-12900HX
MSI Titan GT77 12UHS
278 Points -13%
Intel Core i7-13700HX
Alienware m16 R1 Intel
277 Points -13%
Intel Core i9-13950HX
Razer Blade 16 Early 2023
274 Points -14%
Apple M3 Max 16-Core
Apple MacBook Pro 16 2023 M3 Max
269 Points -16%
AMD Ryzen 9 6900HX
Asus ROG Zephyrus Duo 16 GX650RX
249 Points -22%
AMD Ryzen 9 6900HX
SCHENKER XMG Neo 17 M22
248 Points -22%
7-Zip 18.03 / 7z b 4 -mmt1
AMD Ryzen 9 7945HX3D
Asus ROG Strix Scar 17 G733PYV-LL053X
7573 MIPS +2%
Intel Core i9-14900HX
SCHENKER XMG Neo 17 2024 Engineering Sample
7405 MIPS
AMD Ryzen 9 7945HX
Asus ROG Strix G17 G713PI (Turbo Mode)
7379 MIPS 0%
AMD Ryzen 9 7945HX
Asus ROG Strix G17 G713PI
7332 MIPS -1%
AMD Ryzen 9 7945HX
Asus Zephyrus Duo 16 GX650PY-NM006W
7319 MIPS -1%
Intel Core i9-13900HX
Lenovo Legion Pro 7 16IRX8H
7035 MIPS -5%
Intel Core i9-13980HX
MSI Titan GT77 HX 13VI
7018 MIPS -5%
Intel Core i9-13950HX
MSI Titan GT77 HX 13VI
6897 MIPS -7%
Intel Core i9-13900HX
SCHENKER XMG Neo 16 Raptor Lake
6800 MIPS -8%
Intel Core i7-14650HX
Lenovo Legion 5 16IRX G9
6695 MIPS -10%
Intel Core i9-13950HX
Razer Blade 16 Early 2023
6445 MIPS -13%
Intel Core i7-13700HX
Alienware m16 R1 Intel
6409 MIPS -13%
Intel Core i9-12900HX
MSI Titan GT77 12UHS
6256 MIPS -16%
AMD Ryzen 9 6900HX
SCHENKER XMG Neo 17 M22
5872 MIPS -21%
AMD Ryzen 9 6900HX
Asus ROG Zephyrus Duo 16 GX650RX
5727 MIPS -23%
Geekbench 5.5 / Single-Core
Apple M3 Max 16-Core
Apple MacBook Pro 16 2023 M3 Max
2331 Points +7%
Intel Core i9-14900HX
SCHENKER XMG Neo 17 2024 Engineering Sample
2184 Points
Intel Core i9-13980HX
MSI Titan GT77 HX 13VI
2139 Points -2%
AMD Ryzen 9 7945HX3D
Asus ROG Strix Scar 17 G733PYV-LL053X
2133 Points -2%
AMD Ryzen 9 7945HX
Asus Zephyrus Duo 16 GX650PY-NM006W
2132 Points -2%
AMD Ryzen 9 7945HX
Asus ROG Strix G17 G713PI (Turbo Mode)
2103 Points -4%
AMD Ryzen 9 7945HX
Asus ROG Strix G17 G713PI
2053 Points -6%
Intel Core i9-13950HX
MSI Titan GT77 HX 13VI
2043 Points -6%
Intel Core i9-13900HX
Lenovo Legion Pro 7 16IRX8H
2025 Points -7%
Intel Core i9-13900HX
SCHENKER XMG Neo 16 Raptor Lake
2023 Points -7%
Intel Core i7-14650HX
Lenovo Legion 5 16IRX G9
1933 Points -11%
Intel Core i9-12900HX
MSI Titan GT77 12UHS
1923 Points -12%
Intel Core i7-13700HX
Alienware m16 R1 Intel
1845 Points -16%
Intel Core i9-13950HX
Razer Blade 16 Early 2023
1805 Points -17%
AMD Ryzen 9 6900HX
Asus ROG Zephyrus Duo 16 GX650RX
1594 Points -27%
AMD Ryzen 9 6900HX
SCHENKER XMG Neo 17 M22
1590 Points -27%
Geekbench 6.2 / Single-Core
Apple M3 Max 16-Core
Apple MacBook Pro 16 2023 M3 Max
3096 Points +2%
Intel Core i9-14900HX
SCHENKER XMG Neo 17 2024 Engineering Sample (6.2.1)
3045 Points
AMD Ryzen 9 7945HX3D
Asus ROG Strix Scar 17 G733PYV-LL053X
2916 Points -4%
Intel Core i7-14650HX
Lenovo Legion 5 16IRX G9 (6.2.1)
2761 Points -9%
Intel Core i7-13700HX
Alienware m16 R1 Intel
2638 Points -13%
Cinebench 2024 / CPU Single Core
Apple M3 Max 16-Core
Apple MacBook Pro 16 2023 M3 Max
139 Points +7%
Intel Core i9-14900HX
SCHENKER XMG Neo 17 2024 Engineering Sample
130 Points
Intel Core i7-14650HX
Lenovo Legion 5 16IRX G9
117 Points -10%
AMD Ryzen 9 7945HX3D
Asus ROG Strix Scar 17 G733PYV-LL053X
115 Points -12%
Cinebench R23: Single Core
Cinebench R20: CPU (Single Core)
Cinebench R15: CPU Single 64Bit
7-Zip 18.03: 7z b 4 -mmt1
Geekbench 5.5: Single-Core
Geekbench 6.2: Single-Core
Cinebench 2024: CPU Single Core
Package-Power Core i9-14900HX Cinebench R23 Single

Wenn wir uns nun den Stromverbrauch ansehen, ändert sich das Bild jedoch. Während der Performance-Kern der letztjährigen Raptor-Lake-CPUs etwa 34-36 Watt verbraucht haben, sind es beim neuen Core i9-14900HX aufgrund des noch einmal höheren Turbo-Taktes von 5,8 GHz sogar rund 38 Watt (für die IA-Kerne, Package Power ist noch höher) bei reiner Single-Core-Last. Die reine CPU-Effizienz ist bei AMD also deutlich besser, die Testergebnisse werden bei den AMD-Modellen und auch beim neuen Core i9-14900HX etwas verfälscht, da bei unseren Strommessungen die dedizierte GPU aktiv ist und wir den Verbrauch des gesamten Systems messen. Bei den alten Raptor-Lake-HX-Modellen war hingegen nur die iGPU aktiv. Gegen die Effizienz von Apples aktuellem M3 Max (~5,5 Watt bei Single-Core-Last) haben allerdings weder Intel noch AMD eine Chance.

Power Consumption / Cinebench R23 Single Power Efficiency - external Monitor
Apple M3 Max 16-Core
Apple MacBook Pro 16 2023 M3 Max
113.8 Points per Watt +338%
Intel Core i9-13950HX
MSI Titan GT77 HX 13VI
28.5 Points per Watt +10%
AMD Ryzen 9 7945HX
Asus ROG Strix G17 G713PI
28.2 Points per Watt +8%
Intel Core i9-12900HX
MSI Titan GT77 12UHS
27.8 Points per Watt +7%
AMD Ryzen 9 7945HX3D
Asus ROG Strix Scar 17 G733PYV-LL053X
26.9 Points per Watt +3%
AMD Ryzen 9 7945HX
Asus ROG Strix G17 G713PI
26.8 Points per Watt +3%
AMD Ryzen 9 7945HX
Asus Zephyrus Duo 16 GX650PY-NM006W
26.4 Points per Watt +2%
Intel Core i9-14900HX
SCHENKER XMG Neo 17 2024 Engineering Sample
26 Points per Watt
Power Consumption / Cinebench R23 Single (external Monitor)
Intel Core i9-14900HX
SCHENKER XMG Neo 17 2024 Engineering Sample
85.8 (78.3min, 81.4P1 - 168.8max) Watt *
Intel Core i9-13950HX
MSI Titan GT77 HX 13VI
73.8 (69.8min, 70.2P1 - 100.2max) Watt * +14%
AMD Ryzen 9 7945HX
Asus Zephyrus Duo 16 GX650PY-NM006W
73.4 (69.8min, 69.9P1 - 99.9max) Watt * +14%
AMD Ryzen 9 7945HX
Asus ROG Strix G17 G713PI (Turbo Mode)
72.2 (62.6min, 63.8P1 - 92.5max) Watt * +16%
AMD Ryzen 9 7945HX3D
Asus ROG Strix Scar 17 G733PYV-LL053X
71.9 (70.8min, 71P1 - 86max) Watt * +16%
Intel Core i9-12900HX
MSI Titan GT77 12UHS
68.7 (63.7min, 64.8P1 - 87.6max) Watt * +20%
AMD Ryzen 9 7945HX
Asus ROG Strix G17 G713PI
66.1 (57.7min, 58.2P1 - 93.6max) Watt * +23%
Apple M3 Max 16-Core
Apple MacBook Pro 16 2023 M3 Max
17.3 (16.2min, 16.2P1 - 21.4max) Watt * +80%

* ... kleinere Werte sind besser

Multi-Core-Leistung

Die Multi-Core-Leistung von Raptor Lake-HX Refresh hat sich praktisch nicht verändert und die tatsächliche Leistung des Core i9-14900HX hängt vor allem von den Power Limits des jeweiligen Laptops ab. Im Fall des XMG Neo 17 (E24) beobachten wir während der Benchmarks eine Package Power von durchschnittlich 160 Watt, was auch den leichten Vorteil gegenüber dem Core i9-13900HX erklärt. Die beiden Varianten Core i9-13950HX sowie Core i9-13980HX im MSI Titan GT77 HX haben einen Vorteil, da sie zu Beginn der Benchmarks mehr als 200 Watt verbrauchen dürfen. Die AMD-Modelle Ryzen 9 7945HX und Ryzen 9 7945HX3D sind ebenfalls etwas schneller.

Update 18.01.2024: Auch in den Multi-Core-Tests kann sich der neue Core i7-14650HX klar vom alten Core i7-13700HX absetzen und wir sehen in den Benchmarks einen Vorsprung von etwa 12-19 % und er ist auch knapp vor dem alten Core i9-12900HX, der Core i9-13900HX ist aber noch schneller, wobei der Vorsprung hier auch von den Power Limits des jeweiligen Notebookmodells abhängt.

Cinebench R23: Multi Core
Cinebench R20: CPU (Multi Core)
Cinebench R15: CPU Multi 64Bit
Blender: v2.79 BMW27 CPU | v3.3 Classroom CPU
7-Zip 18.03: 7z b 4
Geekbench 5.5: Multi-Core
Cinebench 2024: CPU Multi Core
Geekbench 6.2: Multi-Core
Cinebench R23 / Multi Core
AMD Ryzen 9 7945HX
Asus Zephyrus Duo 16 GX650PY-NM006W
34521 (32987.6min - 34521.3max) Points +7%
AMD Ryzen 9 7945HX
Asus ROG Strix G17 G713PI (Turbo Mode)
34202 Points +6%
Intel Core i9-13950HX
MSI Titan GT77 HX 13VI
33277 Points +3%
Intel Core i9-13980HX
MSI Titan GT77 HX 13VI
33052 Points +2%
AMD Ryzen 9 7945HX3D
Asus ROG Strix Scar 17 G733PYV-LL053X
32782 Points +1%
AMD Ryzen 9 7945HX
Asus ROG Strix G17 G713PI
32379 Points 0%
Intel Core i9-14900HX
SCHENKER XMG Neo 17 2024 Engineering Sample
32336 Points
Intel Core i9-13900HX
Lenovo Legion Pro 7 16IRX8H
30162 Points -7%
Intel Core i9-13900HX
SCHENKER XMG Neo 16 Raptor Lake
28707 (26191.7min - 28706.8max) Points -11%
Intel Core i9-13900HX
SCHENKER XMG Neo 16 Raptor Lake
28010 (26406.1min - 28009.8max) Points -13%
Intel Core i9-13900HX
SCHENKER XMG Neo 16 Raptor Lake
26703 Points -17%
Intel Core i9-13950HX
Razer Blade 16 Early 2023
26736 (22394.1min - 26736.1max) Points -17%
Intel Core i7-14650HX
Lenovo Legion 5 16IRX G9
24455 Points -24%
Apple M3 Max 16-Core
Apple MacBook Pro 16 2023 M3 Max
24024 Points -26%
Intel Core i9-12900HX
MSI Titan GT77 12UHS
22982 Points -29%
Intel Core i7-13700HX
Alienware m16 R1 Intel
21889 Points -32%
AMD Ryzen 9 6900HX
Asus ROG Zephyrus Duo 16 GX650RX
14085 Points -56%
Cinebench R20 / CPU (Multi Core)
AMD Ryzen 9 7945HX
Asus ROG Strix G17 G713PI (Turbo Mode)
13769 Points +13%
AMD Ryzen 9 7945HX
Asus Zephyrus Duo 16 GX650PY-NM006W
13457 Points +10%
AMD Ryzen 9 7945HX3D
Asus ROG Strix Scar 17 G733PYV-LL053X
13033 Points +7%
Intel Core i9-13950HX
MSI Titan GT77 HX 13VI
12648 Points +3%
Intel Core i9-13980HX
MSI Titan GT77 HX 13VI
12437 Points +2%
Intel Core i9-14900HX
SCHENKER XMG Neo 17 2024 Engineering Sample
12233 Points
Intel Core i9-13900HX
Lenovo Legion Pro 7 16IRX8H
11500 Points -6%
Intel Core i9-13900HX
SCHENKER XMG Neo 16 Raptor Lake
11289 Points -8%
AMD Ryzen 9 7945HX
Asus ROG Strix G17 G713PI
10025 Points -18%
Intel Core i7-14650HX
Lenovo Legion 5 16IRX G9
9349 Points -24%
Intel Core i9-13950HX
Razer Blade 16 Early 2023
8697 Points -29%
Intel Core i9-12900HX
MSI Titan GT77 12UHS
8667 Points -29%
Intel Core i7-13700HX
Alienware m16 R1 Intel
8062 Points -34%
Apple M3 Max 16-Core
Apple MacBook Pro 16 2023 M3 Max
6327 Points -48%
AMD Ryzen 9 6900HX
Asus ROG Zephyrus Duo 16 GX650RX
5489 Points -55%
Cinebench R15 / CPU Multi 64Bit
AMD Ryzen 9 7945HX
Asus ROG Strix G17 G713PI (Turbo Mode)
5663 Points +16%
AMD Ryzen 9 7945HX3D
Asus ROG Strix Scar 17 G733PYV-LL053X
5600 (5177.32min - 5599.89max) Points +15%
AMD Ryzen 9 7945HX
Asus Zephyrus Duo 16 GX650PY-NM006W
5554 (5255.55min - 5554.01max) Points +14%
Intel Core i9-13950HX
MSI Titan GT77 HX 13VI
5227 (4889.98min - 5226.71max) Points +7%
AMD Ryzen 9 7945HX
Asus ROG Strix G17 G713PI
5205 (4749.47min - 5204.94max) Points +7%
Intel Core i9-13980HX
MSI Titan GT77 HX 13VI
5172 (4917.63min - 5171.97max) Points +6%
Intel Core i9-13900HX
SCHENKER XMG Neo 16 Raptor Lake
4913 Points +1%
Intel Core i9-13900HX
SCHENKER XMG Neo 16 Raptor Lake
4875 (4298.3min - 4875.08max) Points 0%
Intel Core i9-14900HX
SCHENKER XMG Neo 17 2024 Engineering Sample
4875 (4783.54min - 4875.08max) Points
Intel Core i9-13900HX
Lenovo Legion Pro 7 16IRX8H
4819 (4429.68min - 4819.28max) Points -1%
Intel Core i9-13950HX
Razer Blade 16 Early 2023
4529 (4463.29min - 4528.99max) Points -7%
Intel Core i7-14650HX
Lenovo Legion 5 16IRX G9
3799 (3409.19min - 3799.39max) Points -22%
Intel Core i9-12900HX
MSI Titan GT77 12UHS
3570 (3259.45min - 3569.52max) Points -27%
Apple M3 Max 16-Core
Apple MacBook Pro 16 2023 M3 Max
3401 (3260min - 3401max) Points -30%
Intel Core i7-13700HX
Alienware m16 R1 Intel
3183 Points -35%
AMD Ryzen 9 6900HX
Asus ROG Zephyrus Duo 16 GX650RX
2292 Points -53%
Blender / v2.79 BMW27 CPU
AMD Ryzen 9 6900HX
Asus ROG Zephyrus Duo 16 GX650RX
220 Seconds * -116%
Apple M3 Max 16-Core
Apple MacBook Pro 16 2023 M3 Max
215 Seconds * -111%
Intel Core i7-13700HX
Alienware m16 R1 Intel
159 Seconds * -56%
Intel Core i9-12900HX
MSI Titan GT77 12UHS
147 Seconds * -44%
Intel Core i7-14650HX
Lenovo Legion 5 16IRX G9
141 Seconds * -38%
Intel Core i9-13950HX
Razer Blade 16 Early 2023
114 Seconds * -12%
Intel Core i9-13900HX
SCHENKER XMG Neo 16 Raptor Lake
111 Seconds * -9%
Intel Core i9-13900HX
Lenovo Legion Pro 7 16IRX8H
105 Seconds * -3%
Intel Core i9-14900HX
SCHENKER XMG Neo 17 2024 Engineering Sample
102 Seconds *
Intel Core i9-13980HX
MSI Titan GT77 HX 13VI
101 Seconds * +1%
Intel Core i9-13950HX
MSI Titan GT77 HX 13VI
100 Seconds * +2%
AMD Ryzen 9 7945HX
Asus ROG Strix G17 G713PI
100 Seconds * +2%
AMD Ryzen 9 7945HX
Asus ROG Strix G17 G713PI (Turbo Mode)
95 Seconds * +7%
AMD Ryzen 9 7945HX3D
Asus ROG Strix Scar 17 G733PYV-LL053X
95 Seconds * +7%
AMD Ryzen 9 7945HX
Asus Zephyrus Duo 16 GX650PY-NM006W
93 Seconds * +9%
Blender / v3.3 Classroom CPU
Intel Core i9-12900HX
MSI Titan GT77 12UHS
263 Seconds * -47%
Intel Core i7-13700HX
Alienware m16 R1 Intel (3.3.3)
255 Seconds * -42%
Intel Core i7-14650HX
Lenovo Legion 5 16IRX G9 (3.3.3)
247 Seconds * -38%
Intel Core i9-13950HX
Razer Blade 16 Early 2023 (3.3.3)
207 Seconds * -16%
Intel Core i9-13900HX
SCHENKER XMG Neo 16 Raptor Lake (3.3.3)
200 Seconds * -12%
Apple M3 Max 16-Core
Apple MacBook Pro 16 2023 M3 Max
194 Seconds * -8%
Intel Core i9-13900HX
Lenovo Legion Pro 7 16IRX8H (3.3.3)
192 Seconds * -7%
Intel Core i9-14900HX
SCHENKER XMG Neo 17 2024 Engineering Sample (3.3.3)
179 Seconds *
Intel Core i9-13980HX
MSI Titan GT77 HX 13VI (3.3.3)
176 Seconds * +2%
Intel Core i9-13950HX
MSI Titan GT77 HX 13VI (3.3.3)
175 Seconds * +2%
AMD Ryzen 9 7945HX
Asus ROG Strix G17 G713PI
158 Seconds * +12%
AMD Ryzen 9 7945HX3D
Asus ROG Strix Scar 17 G733PYV-LL053X (3.3.3)
150 Seconds * +16%
AMD Ryzen 9 7945HX
Asus Zephyrus Duo 16 GX650PY-NM006W (3.3.3)
147 Seconds * +18%
7-Zip 18.03 / 7z b 4
AMD Ryzen 9 7945HX
Asus ROG Strix G17 G713PI (Turbo Mode)
140471 MIPS +11%
AMD Ryzen 9 7945HX3D
Asus ROG Strix Scar 17 G733PYV-LL053X
136201 MIPS +7%
AMD Ryzen 9 7945HX
Asus Zephyrus Duo 16 GX650PY-NM006W
135927 MIPS +7%
Intel Core i9-13950HX
MSI Titan GT77 HX 13VI
127295 MIPS 0%
Intel Core i9-14900HX
SCHENKER XMG Neo 17 2024 Engineering Sample
127108 MIPS
Intel Core i9-13980HX
MSI Titan GT77 HX 13VI
125720 MIPS -1%
AMD Ryzen 9 7945HX
Asus ROG Strix G17 G713PI
123364 MIPS -3%
Intel Core i9-13900HX
Lenovo Legion Pro 7 16IRX8H
122254 MIPS -4%
Intel Core i9-13900HX
SCHENKER XMG Neo 16 Raptor Lake
118715 MIPS -7%
Intel Core i9-13950HX
Razer Blade 16 Early 2023
109330 MIPS -14%
Intel Core i7-14650HX
Lenovo Legion 5 16IRX G9
93686 MIPS -26%
Intel Core i9-12900HX
MSI Titan GT77 12UHS
86234 MIPS -32%
Intel Core i7-13700HX
Alienware m16 R1 Intel
83449 MIPS -34%
AMD Ryzen 9 6900HX
Asus ROG Zephyrus Duo 16 GX650RX
64457 MIPS -49%
Geekbench 5.5 / Multi-Core
Apple M3 Max 16-Core
Apple MacBook Pro 16 2023 M3 Max
22816 Points +6%
Intel Core i9-14900HX
SCHENKER XMG Neo 17 2024 Engineering Sample
21606 Points
Intel Core i9-13900HX
Lenovo Legion Pro 7 16IRX8H
21058 Points -3%
Intel Core i9-13900HX
SCHENKER XMG Neo 16 Raptor Lake
20784 Points -4%
Intel Core i9-13950HX
MSI Titan GT77 HX 13VI
20634 Points -4%
Intel Core i9-13980HX
MSI Titan GT77 HX 13VI
20329 Points -6%
AMD Ryzen 9 7945HX
Asus ROG Strix G17 G713PI (Turbo Mode)
19954 Points -8%
AMD Ryzen 9 7945HX3D
Asus ROG Strix Scar 17 G733PYV-LL053X
19875 Points -8%
AMD Ryzen 9 7945HX
Asus Zephyrus Duo 16 GX650PY-NM006W
19583 Points -9%
AMD Ryzen 9 7945HX
Asus ROG Strix G17 G713PI
18372 Points -15%
Intel Core i9-13950HX
Razer Blade 16 Early 2023
18152 Points -16%
Intel Core i7-14650HX
Lenovo Legion 5 16IRX G9
16810 Points -22%
Intel Core i9-12900HX
MSI Titan GT77 12UHS
16250 Points -25%
Intel Core i7-13700HX
Alienware m16 R1 Intel
14448 Points -33%
AMD Ryzen 9 6900HX
Asus ROG Zephyrus Duo 16 GX650RX
10167 Points -53%
Cinebench 2024 / CPU Multi Core
Intel Core i9-14900HX
SCHENKER XMG Neo 17 2024 Engineering Sample
1780 Points
AMD Ryzen 9 7945HX3D
Asus ROG Strix Scar 17 G733PYV-LL053X
1772 Points 0%
Apple M3 Max 16-Core
Apple MacBook Pro 16 2023 M3 Max
1612 Points -9%
Intel Core i7-14650HX
Lenovo Legion 5 16IRX G9
1235 Points -31%
Geekbench 6.2 / Multi-Core
Apple M3 Max 16-Core
Apple MacBook Pro 16 2023 M3 Max
21243 Points +14%
Intel Core i9-14900HX
SCHENKER XMG Neo 17 2024 Engineering Sample (6.2.1)
18643 Points
AMD Ryzen 9 7945HX3D
Asus ROG Strix Scar 17 G733PYV-LL053X
16957 Points -9%
Intel Core i7-14650HX
Lenovo Legion 5 16IRX G9 (6.2.1)
16010 Points -14%
Intel Core i7-13700HX
Alienware m16 R1 Intel
14402 Points -23%
Cinebench R23: Multi Core
Cinebench R20: CPU (Multi Core)
Cinebench R15: CPU Multi 64Bit
Blender: v2.79 BMW27 CPU | v3.3 Classroom CPU
7-Zip 18.03: 7z b 4
Geekbench 5.5: Multi-Core
Cinebench 2024: CPU Multi Core
Geekbench 6.2: Multi-Core

* ... kleinere Werte sind besser

Package-Power Core i9-14900HX Cinebench R23 Multi

Bei der Betrachtung der Effizienz muss man erneut berücksichtigen, dass die dedizierte GPU aktiv war. Aufgrund der höheren Gesamtverbräuche ist der Einfluss hier aber natürlich geringer als bei den Single-Core-Tests. Hierbei kann sich der Core i9-14900HX zwar knapp vor den meisten seiner Intel-Geschwistern platzieren, doch AMD liegt mit dem Dragon Range Ryzen 9 7945HX weiterhin deutlich vorne, wenn es um die Effizienz geht. Dass Apple bei der Effizienz vorne liegt ist wenig überraschend, allerdings kann der neue M3 Max nun zum ersten Mal auch in die Leistungsregionen der kleineren HX-Prozessoren (Core i7) vordringen. 

Power Consumption / Cinebench R23 Multi Power Efficiency - external Monitor
Apple M3 Max 16-Core
Apple MacBook Pro 16 2023 M3 Max
306 Points per Watt +111%
AMD Ryzen 9 7945HX3D
Asus ROG Strix Scar 17 G733PYV-LL053X
207 Points per Watt +43%
AMD Ryzen 9 7945HX
Asus Zephyrus Duo 16 GX650PY-NM006W
194.4 Points per Watt +34%
AMD Ryzen 9 7945HX
Asus ROG Strix G17 G713PI
191.1 Points per Watt +32%
Intel Core i9-13980HX
Asus ROG Strix Scar 18 2023 G834JY-N6005W
160.9 Points per Watt +11%
Intel Core i9-14900HX
SCHENKER XMG Neo 17 2024 Engineering Sample
145 Points per Watt
Intel Core i9-13950HX
Razer Blade 16 Early 2023 RTX 4090
144.1 Points per Watt -1%
Intel Core i9-13900HX
Lenovo Legion Pro 7 RTX4090
141.4 Points per Watt -2%
Intel Core i9-13950HX
MSI Titan GT77 HX 13VI
135.3 Points per Watt -7%
Intel Core i9-12900HX
MSI Titan GT77 12UHS
122.6 Points per Watt -15%
Power Consumption / Cinebench R23 Multi (external Monitor)
Intel Core i9-13950HX
MSI Titan GT77 HX 13VI
246 (227min, 227P1 - 264max) Watt * -10%
Intel Core i9-14900HX
SCHENKER XMG Neo 17 2024 Engineering Sample
223 (216min, 216P1 - 229max) Watt *
Intel Core i9-13900HX
Lenovo Legion Pro 7 RTX4090
220 (215min, 215P1 - 224max) Watt * +1%
Intel Core i9-13950HX
Razer Blade 16 Early 2023 RTX 4090
197.3 (191.9min, 192.7P1 - 200max) Watt * +12%
Intel Core i9-12900HX
MSI Titan GT77 12UHS
187.5 (166.8min, 167.1P1 - 230max) Watt * +16%
Intel Core i9-13900HX
SCHENKER XMG Neo 16 E23
182.4 (172.3min, 172.3P1 - 207max) Watt * +18%
AMD Ryzen 9 7945HX
Asus ROG Strix G17 G713PI (Turbo Mode)
179 (171.5min, 171.8P1 - 181.3max) Watt * +20%
AMD Ryzen 9 7945HX
Asus Zephyrus Duo 16 GX650PY-NM006W
177.6 (166.7min, 166.8P1 - 187.3max) Watt * +20%
Intel Core i9-13980HX
Asus ROG Strix Scar 18 2023 G834JY-N6005W
175.9 (93.7min, 95.8P1 - 193.7max) Watt * +21%
AMD Ryzen 9 7945HX3D
Asus ROG Strix Scar 17 G733PYV-LL053X
158.5 (149.9min, 150.4P1 - 171.1max) Watt * +29%
Intel Core i7-13700HX
Aorus 15X ASF
148.3 (116.3min, 116.3P1 - 185.2max) Watt * +33%
Apple M3 Max 16-Core
Apple MacBook Pro 16 2023 M3 Max
78.6 (71.7min, 73.3P1 - 80.2max) Watt * +65%

* ... kleinere Werte sind besser

Leistung bei geringeren Power Limits

Wie schon in früheren Analyse-Artikeln haben wir uns zusätzlich auch die Leistung bei geringeren Power Limits angesehen und in der nachfolgenden Tabelle haben wir die Werte zusammengetragen. Hierbei werden schnell zwei Dinge klar. Zunächst einmal ist der Core i9-14900HX im Endeffekt ein Core i9-13900HX mit höherem Turbo-Takt und bei geringeren Power Limits nehmen sich die beiden Chips auch nur wenig. Zweitens sieht man hier ganz klar, dass AMD die gleiche Multi-Core-Leistung mit deutlich weniger Energie zur Verfügung stellen kann. Auch der Apple M3 Max beeindruckt und ist bei vergleichbarem Power Limit rund 32 % schneller als der Core i9-14900HX.

Cinebench R23 Multi
Power Limit Core i9-14900HX Core i9-13900HX Core i9-13950HX Core i9-13980HX Ryzen 9 7945HX Ryzen 9 7945HX3D M3 Max 16-Core
170 Watt 31.958 31.903
150 Watt 30.308 30.655 30.623
130 Watt 28.933 28.239 29.141 29.281 34.202
115 Watt 27.750 27.369 28.199 28.073 33.361
100 Watt 26.323 25.942 26.653 26.507 32.947 32.977
80 Watt 23.334 23.216 23.950 23.766 30.907 30.804
55 Watt 18.258 18.843 19.772 19.478 26.045 24.024

Stromverbrauch im Leerlauf

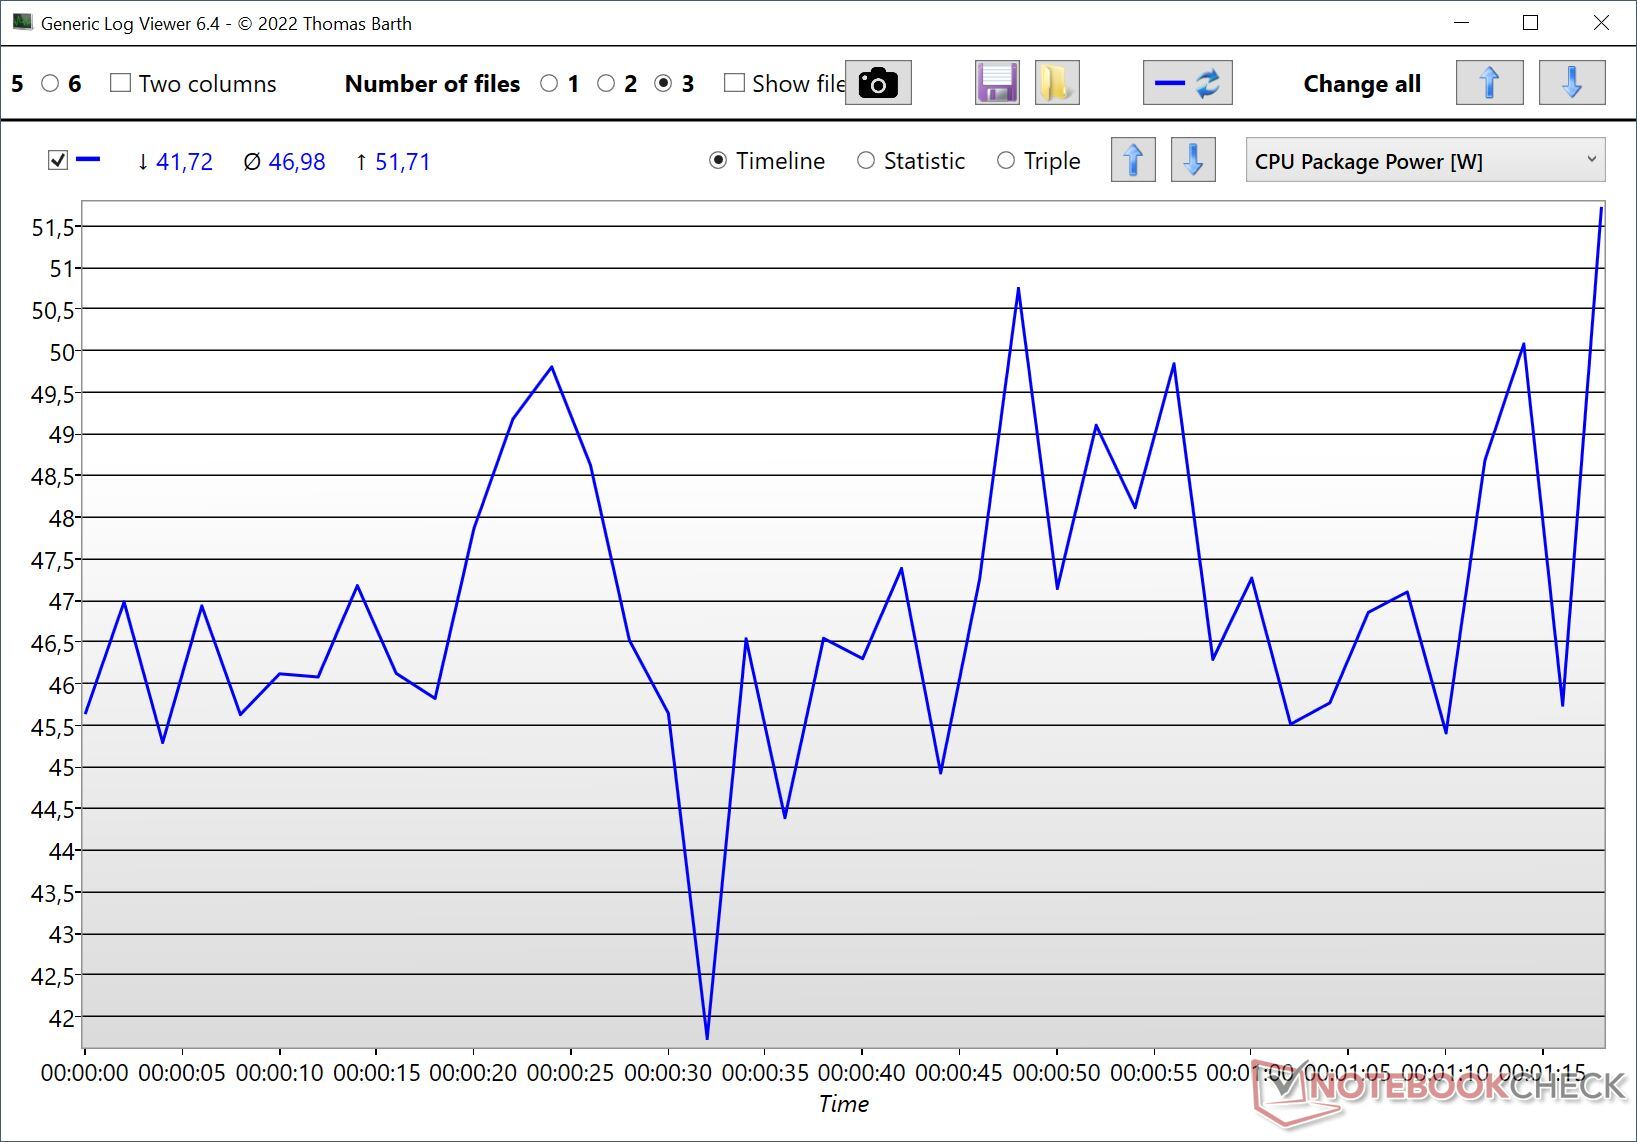
Wir haben den Stromverbrauch des neuen Core i9-14900HX auch im Leerlauf mit dem AMD Ryzen 9 7945HX3D verglichen, wobei die Leistungseinstellungen bei beiden Modellen möglichst identisch waren. Hier sehen wir einen leichten Vorteil für den Core i9-14900HX, der sich im Idealfall bei etwa 7 Watt einpendelt. Der Ryzen 9 7945HX3D mit seinem Chiplet-Design hingegen benötigt mit durchschnittlich 8,9 Watt etwas mehr Energie im Leerlauf.

CPU Package Power im Leerlauf (Blau: Core i9-14900HX, Rot: Ryzen 9 7945HX3D)

Gaming Performance

Im Gegensatz zu den CPU-Benchmarks wird der Prozessor beim Spielen natürlich nicht immer vollständig ausgelastet, stattdessen gibt es hier vielmehr ein Mix aus Single-/Multi-Core-Last, was vor allem beim Spielen häufig der Fall ist. Ein Indikator hierfür ist der CPU-Score der 3DMark-Tests und beim Vergleich der Time-Spy-Ergebnisse sehen wir Vorteil von mehr als 10 % gegenüber dem Core i9-13900HX und der neue Core i9-14900HX ist auf dem Niveau des letztjährigen Core i9-13980HX.

3DMark - 2560x1440 Time Spy CPU
Lenovo Legion 9 16IRX8
Intel Core i9-13980HX, NVIDIA GeForce RTX 4090 Laptop GPU
17712 Points +4%
Alienware m18 R1
Intel Core i9-13980HX, NVIDIA GeForce RTX 4090 Laptop GPU
17525 Points +3%
MSI Raider GE78 HX 13VI
Intel Core i9-13980HX, NVIDIA GeForce RTX 4090 Laptop GPU
17026 Points 0%
SCHENKER XMG Neo 17 2024 Engineering Sample
Intel Core i9-14900HX, NVIDIA GeForce RTX 4090 Laptop GPU
16982 Points
Asus ROG Strix Scar 18 2023 G834JY-N6005W
Intel Core i9-13980HX, NVIDIA GeForce RTX 4090 Laptop GPU
15908 Points -6%
MSI Titan GT77 HX 13VI
Intel Core i9-13950HX, NVIDIA GeForce RTX 4090 Laptop GPU
15403 Points -9%
Lenovo Legion Pro 7 RTX4090
Intel Core i9-13900HX, NVIDIA GeForce RTX 4090 Laptop GPU
15066 Points -11%
Asus ROG Strix Scar 17 G733PYV-LL053X
AMD Ryzen 9 7945HX3D, NVIDIA GeForce RTX 4090 Laptop GPU
14131 Points -17%
SCHENKER Key 17 Pro (Early 23)
Intel Core i9-13900HX, NVIDIA GeForce RTX 4090 Laptop GPU
14048 Points -17%
Asus ROG Strix Scar 17 G733PY-XS96
AMD Ryzen 9 7945HX, NVIDIA GeForce RTX 4090 Laptop GPU
13140 Points -23%
Lenovo Legion Pro 5 16ARX8
AMD Ryzen 7 7745HX, NVIDIA GeForce RTX 4070 Laptop GPU
11477 Points -32%
Durchschnitt der Klasse
  (353 - 23721, n=2291)
7397 Points -56%

Gaming-Performance 1080p

Die Gaming-Performance eines Prozessors anhand von verschiedenen Laptops zu bewerten ist natürlich nicht ideal, denn es gibt immer leichte Unterschiede bei den Konfigurationen der Power Limits, sowohl beim Prozessor als auch der Grafikkarten. Intel gibt es den Presseunterlagen die Ergebnisse mit hohen Details in 1080p an, was unserer Meinung nach aber nicht besonders realistisch ist. Wenn es schon die 1080p-Auflösung sein soll, dann aber zumindest auch mit den maximalen Details, denn kein HX-Prozessor wird ohne eine leistungsstarke dedizierte Grafikkarte angeboten. Grundsätzlich ist die Leistung des Core i9-14900HX sehr gut, aber auch nicht wirklich besser als bei den Vorgängermodellen. Ein Upgrade von einem Core-i9-HX-Prozessor der letzten Generation lohnt sich auf gar keinen Fall. In einigen Titeln hat der AMD Ryzen 9 7945HX3D mit seinem 3D-Cache einen deutlichen Vorteil und ist damit insgesamt weiterhin die beste Gaming-CPU im mobilen Bereich.

The Witcher 3 - 1920x1080 Ultra Graphics & Postprocessing (HBAO+)
Alienware m18 R1
Intel Core i9-13980HX, NVIDIA GeForce RTX 4090 Laptop GPU
213.9 (205min) fps +9%
MSI Raider GE78 HX 13VI
Intel Core i9-13980HX, NVIDIA GeForce RTX 4090 Laptop GPU
213.4 (72.4P0.1, 144.6P1) fps +9%
Lenovo Legion 9 16IRX8
Intel Core i9-13980HX, NVIDIA GeForce RTX 4090 Laptop GPU
208.7 (191min) fps +7%
Asus ROG Strix Scar 17 G733PYV-LL053X
AMD Ryzen 9 7945HX3D, NVIDIA GeForce RTX 4090 Laptop GPU
207 fps +6%
SCHENKER Key 17 Pro (Early 23)
Intel Core i9-13900HX, NVIDIA GeForce RTX 4090 Laptop GPU
206 (176min) fps +5%
Asus ROG Strix Scar 17 G733PY-XS96
AMD Ryzen 9 7945HX, NVIDIA GeForce RTX 4090 Laptop GPU
203.8 (186min) fps +4%
Lenovo Legion Pro 7 RTX4090
Intel Core i9-13900HX, NVIDIA GeForce RTX 4090 Laptop GPU
200 (174min) fps +2%
MSI Titan GT77 HX 13VI
Intel Core i9-13950HX, NVIDIA GeForce RTX 4090 Laptop GPU
198.9 (190min, 191P1) fps +2%
SCHENKER XMG Neo 17 2024 Engineering Sample
Intel Core i9-14900HX, NVIDIA GeForce RTX 4090 Laptop GPU
195.8 (176min, 187P1) fps
Lenovo Legion Pro 5 16ARX8
AMD Ryzen 7 7745HX, NVIDIA GeForce RTX 4070 Laptop GPU
119.8 (114min) fps -39%
Durchschnitt der Klasse
  (1.2 - 328, n=2206)
59.1 fps -70%
GTA V - 1920x1080 Highest Settings possible AA:4xMSAA + FX AF:16x
Asus ROG Strix Scar 17 G733PYV-LL053X
AMD Ryzen 9 7945HX3D, NVIDIA GeForce RTX 4090 Laptop GPU
167.7 (1.87min, 111.1P1) fps +10%
SCHENKER XMG Neo 17 2024 Engineering Sample
Intel Core i9-14900HX, NVIDIA GeForce RTX 4090 Laptop GPU
151.8 (3.32min, 111.1P1) fps
Lenovo Legion 9 16IRX8
Intel Core i9-13980HX, NVIDIA GeForce RTX 4090 Laptop GPU
150.7 (3min, 111.1P1) fps -1%
Alienware m18 R1
Intel Core i9-13980HX, NVIDIA GeForce RTX 4090 Laptop GPU
149 (3.13min, 111.1P1) fps -2%
Lenovo Legion Pro 7 RTX4090
Intel Core i9-13900HX, NVIDIA GeForce RTX 4090 Laptop GPU
143.6 (4.39min, 100P1) fps -5%
SCHENKER Key 17 Pro (Early 23)
Intel Core i9-13900HX, NVIDIA GeForce RTX 4090 Laptop GPU
142.3 (4.44min, 100P1) fps -6%
MSI Raider GE78 HX 13VI
Intel Core i9-13980HX, NVIDIA GeForce RTX 4090 Laptop GPU
142 (2.92min, 90.9P1) fps -6%
Asus ROG Strix Scar 18 2023 G834JY-N6005W
Intel Core i9-13980HX, NVIDIA GeForce RTX 4090 Laptop GPU
141.3 (4.69min, 100P1) fps -7%
MSI Titan GT77 HX 13VI
Intel Core i9-13950HX, NVIDIA GeForce RTX 4090 Laptop GPU
140.9 (3.54min, 83.3P1) fps -7%
Lenovo Legion Pro 5 16ARX8
AMD Ryzen 7 7745HX, NVIDIA GeForce RTX 4070 Laptop GPU
119.9 (3.81min, 76.9P1) fps -21%
Asus ROG Strix Scar 17 G733PY-XS96
AMD Ryzen 9 7945HX, NVIDIA GeForce RTX 4090 Laptop GPU
112.6 (4.54min, 71.4P1) fps -26%
Durchschnitt der Klasse
  (2.1 - 182, n=1313)
62.6 fps -59%
Final Fantasy XV Benchmark - 1920x1080 High Quality
Alienware m18 R1
Intel Core i9-13980HX, NVIDIA GeForce RTX 4090 Laptop GPU
194.8 fps +7%
MSI Titan GT77 HX 13VI
Intel Core i9-13950HX, NVIDIA GeForce RTX 4090 Laptop GPU
187.4 fps +2%
MSI Raider GE78 HX 13VI
Intel Core i9-13980HX, NVIDIA GeForce RTX 4090 Laptop GPU
183.3 fps 0%
SCHENKER Key 17 Pro (Early 23)
Intel Core i9-13900HX, NVIDIA GeForce RTX 4090 Laptop GPU
183.1 fps 0%
SCHENKER XMG Neo 17 2024 Engineering Sample
Intel Core i9-14900HX, NVIDIA GeForce RTX 4090 Laptop GPU
182.9 fps
Lenovo Legion 9 16IRX8
Intel Core i9-13980HX, NVIDIA GeForce RTX 4090 Laptop GPU
181.3 fps -1%
Lenovo Legion Pro 7 RTX4090
Intel Core i9-13900HX, NVIDIA GeForce RTX 4090 Laptop GPU
181.2 fps -1%
Asus ROG Strix Scar 17 G733PYV-LL053X
AMD Ryzen 9 7945HX3D, NVIDIA GeForce RTX 4090 Laptop GPU
180 fps -2%
Asus ROG Strix Scar 18 2023 G834JY-N6005W
Intel Core i9-13980HX, NVIDIA GeForce RTX 4090 Laptop GPU
177.6 fps -3%
Asus ROG Strix Scar 17 G733PY-XS96
AMD Ryzen 9 7945HX, NVIDIA GeForce RTX 4090 Laptop GPU
163.9 fps -10%
Lenovo Legion Pro 5 16ARX8
AMD Ryzen 7 7745HX, NVIDIA GeForce RTX 4070 Laptop GPU
119.9 fps -34%
Durchschnitt der Klasse
  (0.84 - 237, n=1445)
63.8 fps -65%
Strange Brigade - 1920x1080 ultra AA:ultra AF:16
Asus ROG Strix Scar 17 G733PYV-LL053X
AMD Ryzen 9 7945HX3D, NVIDIA GeForce RTX 4090 Laptop GPU
420 (64.7min, 302P1) fps +12%
Lenovo Legion 9 16IRX8
Intel Core i9-13980HX, NVIDIA GeForce RTX 4090 Laptop GPU
387 (23.7min, 277P1) fps +3%
SCHENKER Key 17 Pro (Early 23)
Intel Core i9-13900HX, NVIDIA GeForce RTX 4090 Laptop GPU
378 (20.6min, 257P1) fps +1%
MSI Raider GE78 HX 13VI
Intel Core i9-13980HX, NVIDIA GeForce RTX 4090 Laptop GPU
378 (54.7min, 251P1) fps +1%
SCHENKER XMG Neo 17 2024 Engineering Sample
Intel Core i9-14900HX, NVIDIA GeForce RTX 4090 Laptop GPU
376 (106.6min, 279P1) fps
MSI Titan GT77 HX 13VI
Intel Core i9-13950HX, NVIDIA GeForce RTX 4090 Laptop GPU
373 (29.9min, 272P1) fps -1%
Alienware m18 R1
Intel Core i9-13980HX, NVIDIA GeForce RTX 4090 Laptop GPU
373 (73.3min, 273P1) fps -1%
Asus ROG Strix Scar 18 2023 G834JY-N6005W
Intel Core i9-13980HX, NVIDIA GeForce RTX 4090 Laptop GPU
366 (29.1min, 263P1) fps -3%
Lenovo Legion Pro 7 RTX4090
Intel Core i9-13900HX, NVIDIA GeForce RTX 4090 Laptop GPU
347 (87.7min, 252P1) fps -8%
Lenovo Legion Pro 5 16ARX8
AMD Ryzen 7 7745HX, NVIDIA GeForce RTX 4070 Laptop GPU
223 (89min, 167.8P1) fps -41%
Durchschnitt der Klasse
  (9.7 - 602, n=1185)
123.1 fps -67%
Dota 2 Reborn - 1920x1080 ultra (3/3) best looking
Asus ROG Strix Scar 17 G733PYV-LL053X
AMD Ryzen 9 7945HX3D, NVIDIA GeForce RTX 4090 Laptop GPU
220 (175min) fps +23%
Alienware m18 R1
Intel Core i9-13980HX, NVIDIA GeForce RTX 4090 Laptop GPU
194.2 (157.6min) fps +9%
Lenovo Legion 9 16IRX8
Intel Core i9-13980HX, NVIDIA GeForce RTX 4090 Laptop GPU
193.1 (162.4min) fps +8%
Asus ROG Strix Scar 18 2023 G834JY-N6005W
Intel Core i9-13980HX, NVIDIA GeForce RTX 4090 Laptop GPU
190.2 (160.9min) fps +6%
MSI Titan GT77 HX 13VI
Intel Core i9-13950HX, NVIDIA GeForce RTX 4090 Laptop GPU
185.9 (157.5min) fps +4%
SCHENKER Key 17 Pro (Early 23)
Intel Core i9-13900HX, NVIDIA GeForce RTX 4090 Laptop GPU
182.5 (149.3min) fps +2%
Lenovo Legion Pro 7 RTX4090
Intel Core i9-13900HX, NVIDIA GeForce RTX 4090 Laptop GPU
182.1 (154.2min) fps +2%
Lenovo Legion Pro 5 16ARX8
AMD Ryzen 7 7745HX, NVIDIA GeForce RTX 4070 Laptop GPU
182 (152.8min) fps +2%
MSI Raider GE78 HX 13VI
Intel Core i9-13980HX, NVIDIA GeForce RTX 4090 Laptop GPU
178.8 (148.8min) fps 0%
SCHENKER XMG Neo 17 2024 Engineering Sample
Intel Core i9-14900HX, NVIDIA GeForce RTX 4090 Laptop GPU
178.8 (152.1min) fps
Asus ROG Strix Scar 17 G733PY-XS96
AMD Ryzen 9 7945HX, NVIDIA GeForce RTX 4090 Laptop GPU
139 (118.5min) fps -22%
Durchschnitt der Klasse
  (4.6 - 268, n=1989)
86.1 fps -52%
X-Plane 11.11 - 1920x1080 high (fps_test=3)
Asus ROG Strix Scar 17 G733PYV-LL053X
AMD Ryzen 9 7945HX3D, NVIDIA GeForce RTX 4090 Laptop GPU
166.2 fps +23%
Alienware m18 R1
Intel Core i9-13980HX, NVIDIA GeForce RTX 4090 Laptop GPU
143.5 fps +6%
Asus ROG Strix Scar 18 2023 G834JY-N6005W
Intel Core i9-13980HX, NVIDIA GeForce RTX 4090 Laptop GPU
142.8 fps +6%
Lenovo Legion 9 16IRX8
Intel Core i9-13980HX, NVIDIA GeForce RTX 4090 Laptop GPU
140.1 fps +4%
SCHENKER Key 17 Pro (Early 23)
Intel Core i9-13900HX, NVIDIA GeForce RTX 4090 Laptop GPU
136.6 fps +1%
Lenovo Legion Pro 7 RTX4090
Intel Core i9-13900HX, NVIDIA GeForce RTX 4090 Laptop GPU
136.4 fps +1%
SCHENKER XMG Neo 17 2024 Engineering Sample
Intel Core i9-14900HX, NVIDIA GeForce RTX 4090 Laptop GPU
135.3 fps
MSI Titan GT77 HX 13VI
Intel Core i9-13950HX, NVIDIA GeForce RTX 4090 Laptop GPU
134.2 fps -1%
MSI Titan GT77 HX 13VI
Intel Core i9-13950HX, NVIDIA GeForce RTX 4090 Laptop GPU
134.1 fps -1%
MSI Raider GE78 HX 13VI
Intel Core i9-13980HX, NVIDIA GeForce RTX 4090 Laptop GPU
126.4 fps -7%
Lenovo Legion Pro 5 16ARX8
AMD Ryzen 7 7745HX, NVIDIA GeForce RTX 4070 Laptop GPU
117.8 fps -13%
Asus ROG Strix Scar 17 G733PY-XS96
AMD Ryzen 9 7945HX, NVIDIA GeForce RTX 4090 Laptop GPU
94.3 fps -30%
Durchschnitt der Klasse
  (2.65 - 188.1, n=1900)
58.5 fps -57%
Shadow of the Tomb Raider - 1920x1080 Highest Preset AA:T
Asus ROG Strix Scar 17 G733PYV-LL053X
AMD Ryzen 9 7945HX3D, NVIDIA GeForce RTX 4090 Laptop GPU
271 fps +28%
Asus ROG Strix Scar 17 G733PY-XS96
AMD Ryzen 9 7945HX, NVIDIA GeForce RTX 4090 Laptop GPU
228 fps +8%
MSI Raider GE78 HX 13VI
Intel Core i9-13980HX, NVIDIA GeForce RTX 4090 Laptop GPU
219 fps +3%
MSI Titan GT77 HX 13VI
Intel Core i9-13950HX, NVIDIA GeForce RTX 4090 Laptop GPU
214 fps +1%
SCHENKER XMG Neo 17 2024 Engineering Sample
Intel Core i9-14900HX, NVIDIA GeForce RTX 4090 Laptop GPU
212 fps
Lenovo Legion Pro 5 16ARX8
AMD Ryzen 7 7745HX, NVIDIA GeForce RTX 4070 Laptop GPU
168 fps -21%
Asus ROG Strix Scar 18 2023 G834JY-N6005W
Intel Core i9-13980HX, NVIDIA GeForce RTX 4090 Laptop GPU
143.7 fps -32%
Durchschnitt der Klasse
  (6 - 375, n=611)
100.8 fps -52%
F1 22 - 1920x1080 Ultra High Preset AA:T AF:16x
Alienware m18 R1
Intel Core i9-13980HX, NVIDIA GeForce RTX 4090 Laptop GPU
144.7 (124min, 94P1) fps +15%
MSI Titan GT77 HX 13VI
Intel Core i9-13950HX, NVIDIA GeForce RTX 4090 Laptop GPU
138.2 (118min, 84P1) fps +9%
MSI Raider GE78 HX 13VI
Intel Core i9-13980HX, NVIDIA GeForce RTX 4090 Laptop GPU
137.1 (115min, 79P1) fps +9%
Asus ROG Strix Scar 17 G733PYV-LL053X
AMD Ryzen 9 7945HX3D, NVIDIA GeForce RTX 4090 Laptop GPU
135.9 (118min, 98P1) fps +8%
Lenovo Legion 9 16IRX8
Intel Core i9-13980HX, NVIDIA GeForce RTX 4090 Laptop GPU
130.8 (95min, 78P1) fps +4%
Lenovo Legion Pro 7 RTX4090
Intel Core i9-13900HX, NVIDIA GeForce RTX 4090 Laptop GPU
129.2 (105min, 83P1) fps +2%
SCHENKER XMG Neo 17 2024 Engineering Sample
Intel Core i9-14900HX, NVIDIA GeForce RTX 4090 Laptop GPU
126.3 (109min, 83P1) fps
Asus ROG Strix Scar 18 2023 G834JY-N6005W
Intel Core i9-13980HX, NVIDIA GeForce RTX 4090 Laptop GPU
124.5 (107min, 87P1) fps -1%
Asus ROG Strix Scar 17 G733PY-XS96
AMD Ryzen 9 7945HX, NVIDIA GeForce RTX 4090 Laptop GPU
116.3 (86min, 73P1) fps -8%
Lenovo Legion Pro 5 16ARX8
AMD Ryzen 7 7745HX, NVIDIA GeForce RTX 4070 Laptop GPU
84.1 (71min, 59P1) fps -33%
Durchschnitt der Klasse
  (5.09 - 221, n=481)
60.8 fps -52%
F1 23 - 1920x1080 Ultra High Preset AA:T AF:16x
Asus ROG Strix Scar 17 G733PYV-LL053X
AMD Ryzen 9 7945HX3D, NVIDIA GeForce RTX 4090 Laptop GPU
132 (107min, 102P1) fps +11%
MSI Raider GE78 HX 13VI
Intel Core i9-13980HX, NVIDIA GeForce RTX 4090 Laptop GPU
129.8 (104min, 98P1) fps +9%
SCHENKER XMG Neo 17 2024 Engineering Sample
Intel Core i9-14900HX, NVIDIA GeForce RTX 4090 Laptop GPU
119.3 (95min, 90P1) fps
Durchschnitt der Klasse
  (5 - 226, n=199)
57.5 fps -52%
Far Cry 5 - 1920x1080 Ultra Preset AA:T
Asus ROG Strix Scar 17 G733PYV-LL053X
AMD Ryzen 9 7945HX3D, NVIDIA GeForce RTX 4090 Laptop GPU
218 fps +35%
SCHENKER XMG Neo 17 2024 Engineering Sample
Intel Core i9-14900HX, NVIDIA GeForce RTX 4090 Laptop GPU
162 fps
MSI Titan GT77 HX 13VI
Intel Core i9-13950HX, NVIDIA GeForce RTX 4090 Laptop GPU
160 fps -1%
Asus ROG Strix Scar 18 2023 G834JY-N6005W
Intel Core i9-13980HX, NVIDIA GeForce RTX 4090 Laptop GPU
158 (117min) fps -2%
Lenovo Legion 9 16IRX8
Intel Core i9-13980HX, NVIDIA GeForce RTX 4090 Laptop GPU
158 (102min) fps -2%
Asus ROG Strix Scar 17 G733PY-XS96
AMD Ryzen 9 7945HX, NVIDIA GeForce RTX 4090 Laptop GPU
145 (106min) fps -10%
Durchschnitt der Klasse
  (1 - 278, n=1011)
83.8 fps -48%
Far Cry 6 - 1920x1080 Ultra Graphics Quality + HD Textures AA:T
Asus ROG Strix Scar 17 G733PYV-LL053X
AMD Ryzen 9 7945HX3D, NVIDIA GeForce RTX 4090 Laptop GPU
167 fps +7%
SCHENKER XMG Neo 17 2024 Engineering Sample
Intel Core i9-14900HX, NVIDIA GeForce RTX 4090 Laptop GPU
156 fps
MSI Titan GT77 HX 13VI
Intel Core i9-13950HX, NVIDIA GeForce RTX 4090 Laptop GPU
144 fps -8%
Asus ROG Strix Scar 17 G733PY-XS96
AMD Ryzen 9 7945HX, NVIDIA GeForce RTX 4090 Laptop GPU
112 (91min) fps -28%
Lenovo Legion Pro 5 16ARX8
AMD Ryzen 7 7745HX, NVIDIA GeForce RTX 4070 Laptop GPU
110 (74min) fps -29%
Durchschnitt der Klasse
  (4.67 - 223, n=284)
95.4 fps -39%
Call of Duty Modern Warfare 2 2022 - 1920x1080 Extreme Quality Preset AA:T2X Filmic SM
Asus ROG Strix Scar 17 G733PYV-LL053X
AMD Ryzen 9 7945HX3D, NVIDIA GeForce RTX 4090 Laptop GPU
182 fps +8%
Asus ROG Strix Scar 17 G733PY-XS96
AMD Ryzen 9 7945HX, NVIDIA GeForce RTX 4090 Laptop GPU
180 (103min) fps +7%
MSI Raider GE78 HX 13VI
Intel Core i9-13980HX, NVIDIA GeForce RTX 4090 Laptop GPU
177 (102min) fps +5%
MSI Titan GT77 HX 13VI
Intel Core i9-13950HX, NVIDIA GeForce RTX 4090 Laptop GPU
176 fps +5%
Asus ROG Strix Scar 18 2023 G834JY-N6005W
Intel Core i9-13980HX, NVIDIA GeForce RTX 4090 Laptop GPU
170 (98P1) fps +1%
SCHENKER XMG Neo 17 2024 Engineering Sample
Intel Core i9-14900HX, NVIDIA GeForce RTX 4090 Laptop GPU
168 fps
Lenovo Legion Pro 5 16ARX8
AMD Ryzen 7 7745HX, NVIDIA GeForce RTX 4070 Laptop GPU
108 (61min) fps -36%
Durchschnitt der Klasse
  (12 - 285, n=120)
105.1 fps -37%
Cyberpunk 2077 1.6 - 1920x1080 Ultra Preset
Asus ROG Strix Scar 17 G733PYV-LL053X
AMD Ryzen 9 7945HX3D, NVIDIA GeForce RTX 4090 Laptop GPU
157 fps +21%
MSI Raider GE78 HX 13VI
Intel Core i9-13980HX, NVIDIA GeForce RTX 4090 Laptop GPU
135.14 (44.88min) fps +4%
MSI Titan GT77 HX 13VI
Intel Core i9-13950HX, NVIDIA GeForce RTX 4090 Laptop GPU
135 fps +4%
Asus ROG Strix Scar 17 G733PY-XS96
AMD Ryzen 9 7945HX, NVIDIA GeForce RTX 4090 Laptop GPU
133.8 (57.7min) fps +3%
Lenovo Legion 9 16IRX8
Intel Core i9-13980HX, NVIDIA GeForce RTX 4090 Laptop GPU
131.4 (23.8min) fps +1%
SCHENKER XMG Neo 17 2024 Engineering Sample
Intel Core i9-14900HX, NVIDIA GeForce RTX 4090 Laptop GPU
130 fps
Alienware m18 R1
Intel Core i9-13980HX, NVIDIA GeForce RTX 4090 Laptop GPU
127.92 (32.4min) fps -2%
Asus ROG Strix Scar 18 2023 G834JY-N6005W
Intel Core i9-13980HX, NVIDIA GeForce RTX 4090 Laptop GPU
119.7 (69min) fps -8%
Lenovo Legion Pro 5 16ARX8
AMD Ryzen 7 7745HX, NVIDIA GeForce RTX 4070 Laptop GPU
98.9 (35.5min) fps -24%
Durchschnitt der Klasse
  (5 - 241, n=374)
73.2 fps -44%
Cyberpunk 2077 2.0 Phantom Liberty - 1920x1080 Ultra Preset (FSR off)
Asus ROG Strix Scar 17 G733PYV-LL053X
AMD Ryzen 9 7945HX3D, NVIDIA GeForce RTX 4090 Laptop GPU
142.8 fps +16%
Lenovo Legion 9 16IRX8
Intel Core i9-13980HX, NVIDIA GeForce RTX 4090 Laptop GPU
131.22 (31.65min) fps +7%
MSI Raider GE78 HX 13VI
Intel Core i9-13980HX, NVIDIA GeForce RTX 4090 Laptop GPU
127 (36.47min) fps +4%
SCHENKER XMG Neo 17 2024 Engineering Sample
Intel Core i9-14900HX, NVIDIA GeForce RTX 4090 Laptop GPU
122.7 (16.4min) fps
Durchschnitt der Klasse
  (2.3 - 216, n=180)
72.2 fps -41%
Assassin's Creed Mirage - 1920x1080 Ultra High Preset (Adaptive Quality Off)
SCHENKER XMG Neo 17 2024 Engineering Sample
Intel Core i9-14900HX, NVIDIA GeForce RTX 4090 Laptop GPU
153 fps
MSI Raider GE78 HX 13VI
Intel Core i9-13980HX, NVIDIA GeForce RTX 4090 Laptop GPU
149 (5min) fps -3%
Durchschnitt der Klasse
  (14 - 202, n=90)
92.6 fps -39%
Avatar Frontiers of Pandora - 1920x1080 Ultra Preset AA:T
Lenovo Legion 9 16IRX8
Intel Core i9-13980HX, NVIDIA GeForce RTX 4090 Laptop GPU
100 (65min) fps +3%
SCHENKER XMG Neo 17 2024 Engineering Sample
Intel Core i9-14900HX, NVIDIA GeForce RTX 4090 Laptop GPU
97 fps
Durchschnitt der Klasse
  (8 - 170, n=86)
57.9 fps -40%
Call of Duty Modern Warfare 3 2023 - 1920x1080 Extreme Preset
SCHENKER XMG Neo 17 2024 Engineering Sample
Intel Core i9-14900HX, NVIDIA GeForce RTX 4090 Laptop GPU
171 fps
Durchschnitt der Klasse
  (27 - 276, n=70)
116.7 fps -32%
Total War Pharaoh - 1920x1080 Ultra Preset
SCHENKER XMG Neo 17 2024 Engineering Sample
Intel Core i9-14900HX, NVIDIA GeForce RTX 4090 Laptop GPU
178 fps
Durchschnitt der Klasse
  (11 - 234, n=104)
92.5 fps -48%

Gaming-Performance QHD

In der QHD-Auflösung wird der Einfluss des Prozessors noch einmal etwas geringer und die GPU ist hier viel entscheidender. Auch hier nehmen sich die HX-Prozessoren von Intel nicht viel und alle i9-Modelle eignen sich alle sehr gut zum Spielen. Auch hier bietet der Ryzen 9 7945HX3D in einigen Titeln wieder deutlich mehr Leistung im zweistelligen Prozentbereich, beispielsweise Far Cry 5, GTA V oder F1 2023.

Shadow of the Tomb Raider - 2560x1440 Highest Preset AA:T
Asus ROG Strix Scar 17 G733PYV-LL053X
NVIDIA GeForce RTX 4090 Laptop GPU, R9 7945HX3D, SK hynix PC801 HFS001TEJ9X101N
199 fps +13%
Asus ROG Strix Scar 17 G733PY-XS96
NVIDIA GeForce RTX 4090 Laptop GPU, R9 7945HX, SK hynix PC801 HFS001TEJ9X101N
190 fps +8%
MSI Titan GT77 HX 13VI
NVIDIA GeForce RTX 4090 Laptop GPU, i9-13950HX, Samsung PM9A1 MZVL22T0HBLB
187 fps +6%
Lenovo Legion Pro 7 RTX4090
NVIDIA GeForce RTX 4090 Laptop GPU, i9-13900HX, Samsung PM9A1 MZVL21T0HCLR
185 fps +5%
SCHENKER XMG Neo 17 2024 Engineering Sample
NVIDIA GeForce RTX 4090 Laptop GPU, i9-14900HX
176 fps
Alienware M18 R1 QHD
NVIDIA GeForce RTX 4090 Laptop GPU, i9-13900HX
175 fps -1%
Asus ROG Strix Scar 18 2023 G834JY-N6005W
NVIDIA GeForce RTX 4090 Laptop GPU, i9-13980HX, 2x Samsung PM9A1 MZVL21T0HCLR (RAID 0)
121.2 fps -31%
Lenovo Legion Pro 5 16ARX8
NVIDIA GeForce RTX 4070 Laptop GPU, R7 7745HX, Samsung PM9A1 MZVL21T0HCLR
110 fps -37%
Far Cry 5 - 2560x1440 Ultra Preset AA:T
Asus ROG Strix Scar 17 G733PYV-LL053X
NVIDIA GeForce RTX 4090 Laptop GPU, R9 7945HX3D, SK hynix PC801 HFS001TEJ9X101N
194 fps +24%
MSI Titan GT77 HX 13VI
NVIDIA GeForce RTX 4090 Laptop GPU, i9-13950HX, Samsung PM9A1 MZVL22T0HBLB
159 fps +1%
Lenovo Legion 9 16IRX8
NVIDIA GeForce RTX 4090 Laptop GPU, i9-13980HX, 2x SK Hynix HFS001TEJ9X115N (RAID 0)
157 (111min - 208max) fps 0%
SCHENKER XMG Neo 17 2024 Engineering Sample
NVIDIA GeForce RTX 4090 Laptop GPU, i9-14900HX
157 fps
Asus ROG Strix Scar 18 2023 G834JY-N6005W
NVIDIA GeForce RTX 4090 Laptop GPU, i9-13980HX, 2x Samsung PM9A1 MZVL21T0HCLR (RAID 0)
153 (107min - 197max) fps -3%
Asus ROG Strix Scar 17 G733PY-XS96
NVIDIA GeForce RTX 4090 Laptop GPU, R9 7945HX, SK hynix PC801 HFS001TEJ9X101N
142 (104min - 189max) fps -10%
Far Cry 6 - 2560x1440 Ultra Graphics Quality + HD Textures AA:T
Asus ROG Strix Scar 17 G733PYV-LL053X
NVIDIA GeForce RTX 4090 Laptop GPU, R9 7945HX3D, SK hynix PC801 HFS001TEJ9X101N
146 fps +4%
SCHENKER XMG Neo 17 2024 Engineering Sample
NVIDIA GeForce RTX 4090 Laptop GPU, i9-14900HX
141 fps
MSI Titan GT77 HX 13VI
NVIDIA GeForce RTX 4090 Laptop GPU, i9-13950HX, Samsung PM9A1 MZVL22T0HBLB
135 fps -4%
Alienware M18 R1 QHD
NVIDIA GeForce RTX 4090 Laptop GPU, i9-13900HX
128 (104min - 155max) fps -9%
Asus ROG Strix Scar 17 G733PY-XS96
NVIDIA GeForce RTX 4090 Laptop GPU, R9 7945HX, SK hynix PC801 HFS001TEJ9X101N
109 (88min - 120max) fps -23%
Lenovo Legion Pro 5 16ARX8
NVIDIA GeForce RTX 4070 Laptop GPU, R7 7745HX, Samsung PM9A1 MZVL21T0HCLR
88 (57min - 99max) fps -38%
Final Fantasy XV Benchmark - 2560x1440 High Quality
MSI Titan GT77 HX 13VI
NVIDIA GeForce RTX 4090 Laptop GPU, i9-13950HX, Samsung PM9A1 MZVL22T0HBLB
162.9 fps +6%
Alienware m18 R1
NVIDIA GeForce RTX 4090 Laptop GPU, i9-13980HX, SK hynix PC801 HFS001TEJ9X101N
159.5 fps +4%
Lenovo Legion 9 16IRX8
NVIDIA GeForce RTX 4090 Laptop GPU, i9-13980HX, 2x SK Hynix HFS001TEJ9X115N (RAID 0)
158.4 fps +3%
SCHENKER Key 17 Pro (Early 23)
NVIDIA GeForce RTX 4090 Laptop GPU, i9-13900HX, Samsung 990 Pro 2 TB MZVL72T0HDLB
156.4 fps +2%
Lenovo Legion Pro 7 RTX4090
NVIDIA GeForce RTX 4090 Laptop GPU, i9-13900HX, Samsung PM9A1 MZVL21T0HCLR
154 fps 0%
SCHENKER XMG Neo 17 2024 Engineering Sample
NVIDIA GeForce RTX 4090 Laptop GPU, i9-14900HX
153.5 fps
Asus ROG Strix Scar 17 G733PYV-LL053X
NVIDIA GeForce RTX 4090 Laptop GPU, R9 7945HX3D, SK hynix PC801 HFS001TEJ9X101N
151.2 fps -1%
Asus ROG Strix Scar 17 G733PY-XS96
NVIDIA GeForce RTX 4090 Laptop GPU, R9 7945HX, SK hynix PC801 HFS001TEJ9X101N
151 fps -2%
Asus ROG Strix Scar 18 2023 G834JY-N6005W
NVIDIA GeForce RTX 4090 Laptop GPU, i9-13980HX, 2x Samsung PM9A1 MZVL21T0HCLR (RAID 0)
146.7 fps -4%
Lenovo Legion Pro 5 16ARX8
NVIDIA GeForce RTX 4070 Laptop GPU, R7 7745HX, Samsung PM9A1 MZVL21T0HCLR
119.9 fps -22%
GTA V - 2560x1440 Highest Settings possible AA:4xMSAA + FX AF:16x
Asus ROG Strix Scar 17 G733PYV-LL053X
NVIDIA GeForce RTX 4090 Laptop GPU, R9 7945HX3D, SK hynix PC801 HFS001TEJ9X101N
160.6 (2.82min, 111.1P1 - 363max) fps +11%
Alienware m18 R1
NVIDIA GeForce RTX 4090 Laptop GPU, i9-13980HX, SK hynix PC801 HFS001TEJ9X101N
145.5 (2.46min, 111.1P1 - 281max) fps 0%
Lenovo Legion 9 16IRX8
NVIDIA GeForce RTX 4090 Laptop GPU, i9-13980HX, 2x SK Hynix HFS001TEJ9X115N (RAID 0)
145.3 (4.06min, 100P1 - 332max) fps 0%
SCHENKER XMG Neo 17 2024 Engineering Sample
NVIDIA GeForce RTX 4090 Laptop GPU, i9-14900HX
145.2 (2.65min, 100P1 - 265max) fps
SCHENKER Key 17 Pro (Early 23)
NVIDIA GeForce RTX 4090 Laptop GPU, i9-13900HX, Samsung 990 Pro 2 TB MZVL72T0HDLB
141.5 (28.6min, 100P1 - 268max) fps -3%
Asus ROG Strix Scar 18 2023 G834JY-N6005W
NVIDIA GeForce RTX 4090 Laptop GPU, i9-13980HX, 2x Samsung PM9A1 MZVL21T0HCLR (RAID 0)
139.1 (3.59min, 90.9P1 - 238max) fps -4%
MSI Titan GT77 HX 13VI
NVIDIA GeForce RTX 4090 Laptop GPU, i9-13950HX, Samsung PM9A1 MZVL22T0HBLB
138.5 (3.45min, 76.9P1 - 256max) fps -5%
Lenovo Legion Pro 7 RTX4090
NVIDIA GeForce RTX 4090 Laptop GPU, i9-13900HX, Samsung PM9A1 MZVL21T0HCLR
137.7 (3.84min, 90.9P1 - 304max) fps -5%
Asus ROG Strix Scar 17 G733PY-XS96
NVIDIA GeForce RTX 4090 Laptop GPU, R9 7945HX, SK hynix PC801 HFS001TEJ9X101N
114.8 (5.12min, 71.4P1 - 204max) fps -21%
Lenovo Legion Pro 5 16ARX8
NVIDIA GeForce RTX 4070 Laptop GPU, R7 7745HX, Samsung PM9A1 MZVL21T0HCLR
93.2 (3.72min, 62.5P1 - 175.2max) fps -36%
F1 22 - 2560x1440 Ultra High Preset AA:T AF:16x
Alienware m18 R1
NVIDIA GeForce RTX 4090 Laptop GPU, i9-13980HX, SK hynix PC801 HFS001TEJ9X101N
92.2 (79min, 74P1 - 106max) fps +4%
Asus ROG Strix Scar 17 G733PY-XS96
NVIDIA GeForce RTX 4090 Laptop GPU, R9 7945HX, SK hynix PC801 HFS001TEJ9X101N
92.1 (75min, 60P1 - 107max) fps +4%
Asus ROG Strix Scar 17 G733PYV-LL053X
NVIDIA GeForce RTX 4090 Laptop GPU, R9 7945HX3D, SK hynix PC801 HFS001TEJ9X101N
91.8 (78min, 76P1 - 105max) fps +3%
Lenovo Legion 9 16IRX8
NVIDIA GeForce RTX 4090 Laptop GPU, i9-13980HX, 2x SK Hynix HFS001TEJ9X115N (RAID 0)
90.9 (76min, 56P1 - 105max) fps +2%
Alienware M18 R1 QHD
NVIDIA GeForce RTX 4090 Laptop GPU, i9-13900HX
90.6 (77min, 72P1 - 106max) fps +2%
MSI Titan GT77 HX 13VI
NVIDIA GeForce RTX 4090 Laptop GPU, i9-13950HX, Samsung PM9A1 MZVL22T0HBLB
90.1 (78min, 71P1 - 104max) fps +2%
SCHENKER XMG Neo 17 2024 Engineering Sample
NVIDIA GeForce RTX 4090 Laptop GPU, i9-14900HX
88.7 (77min, 67P1 - 104max) fps
Lenovo Legion Pro 7 RTX4090
NVIDIA GeForce RTX 4090 Laptop GPU, i9-13900HX, Samsung PM9A1 MZVL21T0HCLR
85.2 (72min, 40P1 - 96max) fps -4%
Asus ROG Strix Scar 18 2023 G834JY-N6005W
NVIDIA GeForce RTX 4090 Laptop GPU, i9-13980HX, 2x Samsung PM9A1 MZVL21T0HCLR (RAID 0)
75 (23min, 32P1 - 96max) fps -15%
Lenovo Legion Pro 5 16ARX8
NVIDIA GeForce RTX 4070 Laptop GPU, R7 7745HX, Samsung PM9A1 MZVL21T0HCLR
54.8 (47min, 45P1 - 65max) fps -38%
F1 23 - 2560x1440 Ultra High Preset AA:T AF:16x
Asus ROG Strix Scar 17 G733PYV-LL053X
NVIDIA GeForce RTX 4090 Laptop GPU, R9 7945HX3D, SK hynix PC801 HFS001TEJ9X101N
85.1 (67min, 67P1 - 100max) fps +11%
SCHENKER XMG Neo 17 2024 Engineering Sample
NVIDIA GeForce RTX 4090 Laptop GPU, i9-14900HX
76.9 (59min, 61P1 - 94max) fps
Call of Duty Modern Warfare 2 2022 - 2560x1440 Extreme Quality Preset AA:T2X Filmic SM
Asus ROG Strix Scar 17 G733PYV-LL053X
NVIDIA GeForce RTX 4090 Laptop GPU, R9 7945HX3D, SK hynix PC801 HFS001TEJ9X101N
136 fps +10%
MSI Titan GT77 HX 13VI
NVIDIA GeForce RTX 4090 Laptop GPU, i9-13950HX, Samsung PM9A1 MZVL22T0HBLB
135 fps +9%
Asus ROG Strix Scar 17 G733PY-XS96
NVIDIA GeForce RTX 4090 Laptop GPU, R9 7945HX, SK hynix PC801 HFS001TEJ9X101N
135 (69min) fps +9%
Lenovo Legion Pro 7 RTX4090
NVIDIA GeForce RTX 4090 Laptop GPU, i9-13900HX, Samsung PM9A1 MZVL21T0HCLR
132 (67min) fps +6%
Alienware M18 R1 QHD
NVIDIA GeForce RTX 4090 Laptop GPU, i9-13900HX
132 (69min) fps +6%
Asus ROG Strix Scar 18 2023 G834JY-N6005W
NVIDIA GeForce RTX 4090 Laptop GPU, i9-13980HX, 2x Samsung PM9A1 MZVL21T0HCLR (RAID 0)
127 (65P1) fps +2%
SCHENKER XMG Neo 17 2024 Engineering Sample
NVIDIA GeForce RTX 4090 Laptop GPU, i9-14900HX
124 fps
Lenovo Legion Pro 5 16ARX8
NVIDIA GeForce RTX 4070 Laptop GPU, R7 7745HX, Samsung PM9A1 MZVL21T0HCLR
77 (39min) fps -38%
Cyberpunk 2077 1.6 - 2560x1440 Ultra Preset
Asus ROG Strix Scar 17 G733PYV-LL053X
NVIDIA GeForce RTX 4090 Laptop GPU, R9 7945HX3D, SK hynix PC801 HFS001TEJ9X101N
116 fps +22%
Asus ROG Strix Scar 17 G733PY-XS96
NVIDIA GeForce RTX 4090 Laptop GPU, R9 7945HX, SK hynix PC801 HFS001TEJ9X101N
104.3 (34.5min - 159.2max) fps +9%
Alienware m18 R1
NVIDIA GeForce RTX 4090 Laptop GPU, i9-13980HX, SK hynix PC801 HFS001TEJ9X101N
102.16 (48.9min - 193.9max) fps +7%
Alienware M18 R1 QHD
NVIDIA GeForce RTX 4090 Laptop GPU, i9-13900HX
102.16 (41.4min - 165.62max) fps +7%
Lenovo Legion Pro 7 RTX4090
NVIDIA GeForce RTX 4090 Laptop GPU, i9-13900HX, Samsung PM9A1 MZVL21T0HCLR
100.93 (30.73min - 162.33max) fps +6%
Lenovo Legion 9 16IRX8
NVIDIA GeForce RTX 4090 Laptop GPU, i9-13980HX, 2x SK Hynix HFS001TEJ9X115N (RAID 0)
98.8 (28.3min - 147.2max) fps +4%
MSI Titan GT77 HX 13VI
NVIDIA GeForce RTX 4090 Laptop GPU, i9-13950HX, Samsung PM9A1 MZVL22T0HBLB
98 fps +3%
SCHENKER XMG Neo 17 2024 Engineering Sample
NVIDIA GeForce RTX 4090 Laptop GPU, i9-14900HX
95.3 fps
Asus ROG Strix Scar 18 2023 G834JY-N6005W
NVIDIA GeForce RTX 4090 Laptop GPU, i9-13980HX, 2x Samsung PM9A1 MZVL21T0HCLR (RAID 0)
94.5 (72min - 127max) fps -1%
Lenovo Legion Pro 5 16ARX8
NVIDIA GeForce RTX 4070 Laptop GPU, R7 7745HX, Samsung PM9A1 MZVL21T0HCLR
58.1 (37.8min - 93.4max) fps -39%
Cyberpunk 2077 2.0 Phantom Liberty - 2560x1440 Ultra Preset (FSR off)
Asus ROG Strix Scar 17 G733PYV-LL053X
NVIDIA GeForce RTX 4090 Laptop GPU, R9 7945HX3D, SK hynix PC801 HFS001TEJ9X101N
93.4 fps +6%
Lenovo Legion 9 16IRX8
NVIDIA GeForce RTX 4090 Laptop GPU, i9-13980HX, 2x SK Hynix HFS001TEJ9X115N (RAID 0)
89.55 (28.01min - 139.33max) fps +2%
SCHENKER XMG Neo 17 2024 Engineering Sample
NVIDIA GeForce RTX 4090 Laptop GPU, i9-14900HX
88.2 (17.8min - 124.4max) fps
Call of Duty Modern Warfare 3 2023 - 2560x1440 Extreme Preset
SCHENKER XMG Neo 17 2024 Engineering Sample
NVIDIA GeForce RTX 4090 Laptop GPU, i9-14900HX
123 fps
Assassin's Creed Mirage - 1920x1080 Ultra High Preset (Adaptive Quality Off)
SCHENKER XMG Neo 17 2024 Engineering Sample
NVIDIA GeForce RTX 4090 Laptop GPU, i9-14900HX
153 fps
Avatar Frontiers of Pandora - 2560x1440 Ultra Preset AA:T
Lenovo Legion 9 16IRX8
NVIDIA GeForce RTX 4090 Laptop GPU, i9-13980HX, 2x SK Hynix HFS001TEJ9X115N (RAID 0)
69 (53min - 87max) fps +5%
SCHENKER XMG Neo 17 2024 Engineering Sample
NVIDIA GeForce RTX 4090 Laptop GPU, i9-14900HX
66 fps
Total War Pharaoh - 2560x1440 Ultra Preset
SCHENKER XMG Neo 17 2024 Engineering Sample
NVIDIA GeForce RTX 4090 Laptop GPU, i9-14900HX
160 fps
min. mittel hoch max.QHD
GTA V (2015) 184.1 151.8 145.2
The Witcher 3 (2015) 195.8
Dota 2 Reborn (2015) 230 204 192.4 178.8
Final Fantasy XV Benchmark (2018) 216 182.9 153.5
X-Plane 11.11 (2018) 192 171 135.3
Far Cry 5 (2018) 179 162 157
Strange Brigade (2018) 398 376 294
Shadow of the Tomb Raider (2018) 212 176
F1 2021 (2021) 374 208 176.7
Far Cry 6 (2021) 156 141
Cyberpunk 2077 1.6 (2022) 130 95.3
F1 22 (2022) 309 126.3 88.7
Call of Duty Modern Warfare 2 2022 (2022) 168 124
F1 23 (2023) 313 119.3 76.9
Cyberpunk 2077 2.0 Phantom Liberty (2023) 132.4 122.7 88.2
Assassin's Creed Mirage (2023) 197 153 129
Total War Pharaoh (2023) 235 178 160
Call of Duty Modern Warfare 3 2023 (2023) 180 171 123
Avatar Frontiers of Pandora (2023) 125 97 66

Fazit - Core i9-14900HX ist nur ein kleines Update

Im Test: Intel Core i9-14900HX im Schenker XMG Neo 17 (E24). Testgerät zur Verfügung gestellt von Schenker Technologies.

Intel spendiert seinen HX-Mobilprozessoren ein kleines Update für 2024, doch große Veränderungen oder Verbesserungen gibt es bei den neuen Raptor-Lake-HX-Refresh-Modellen nicht. Grundsätzlich wurde das Line-Up etwas verschlankt, denn der Hersteller hat die Zahl der HX-Modelle von neun bei der 13. Generation jetzt auf fünf Modelle reduziert und mit dem Core i9-14900HX gibt es nur noch ein Top-Modell mit 24 Kernen/32 Threads. Der maximale Turbo-Boost wurde auf 5,8 GHz gesteigert, weshalb sich auch die Single-Core-Leistung verbessert hat und Intel sich die Leistungskrone in einigen Tests von Apple zurückholen kann. Allerdings wird die höhere Leistung recht simpel mit einem gesteigerten Verbrauch erkauft, weshalb die Effizienz nach wie vor nicht besonders gut ausfällt.

Bei der Multi-Core-Leistung hängt es hingegen hauptsächlich von den eingestellten Power Limits der jeweiligen Laptop-Modelle ab, grundsätzlich nehmen sich die alten Core-i9-HX-Modelle der 13. Generation und der neue Core i9-14900HX aber nicht viel. Beim Spielen profitiert der neue Raptor-Lake-HX-Refresh in einigen Titeln ebenfalls von der verbesserten Single-Core-Leistung, doch im Endeffekt gibt es hier kaum Unterschiede, vor allem mit maximalen Qualitätseinstellungen und hohen Auflösungen. Hier haben die Power Limits des Prozessors und der Grafikkarte weiterhin einen größeren Einfluss. AMDs Ryzen 9 7945HX3D mit dem 3D V-Cache ist bei manchen Titeln nach wie vor deutlich schneller und bleibt damit insgesamt auch die beste mobile HX-CPU, wenn es um die Effizienz und Gaming-Performance insgesamt geht.

Intel erhöht den maximalen Turbo-Takt des neuen Core i9-14900HX und verbessert damit vor allem die Single-Core-Leistung. Weitere Verbesserungen bietet der Raptor Lake-HX Refresh nicht, muss er angesichts der katastrophalen Verfügbarkeit der HX-CPUs von AMD aber auch nicht.  

Das ist zumindest die Theorie, denn es gibt praktisch keine Laptops auf dem Markt, die mit dem Ryzen 9 7945HX3D ausgestattet sind. Der Core i9-14900HX wird in den kommenden Wochen hingegen in jedem High-End Gaming/Multimedia-Laptop verfügbar sein und daher den Markt im Jahr 2024 problemlos dominieren. Der Prozessor ist keinesfalls schlecht, aber Intel muss sich in diesem Segment aktuell auch nicht wirklich anstrengen und große Fortschritte bieten. Ein Upgrade von einem Core-i9-HX-Modell der 13. Generation macht überhaupt keinen Sinn, der Wechsel von einem Alder-Lake-Chip wie dem Core i9-12900HX schon eher, da hier auch noch die alte RTX-3000er-Generation von Nvidia zum Einsatz kam. 

Alle 6 Beträge lesen / Antworten
static version load dynamic
Die Kommentare zum Artikel werden geladen
Diesen Artikel kommentieren / Antworten
Teilen Sie diesen Artikel, um uns zu unterstützen. Jeder Link hilft!
> Notebook Test, Laptop Test und News > Tests > Sonstige Tests > Intel Raptor Lake-HX Refresh in der Analyse - Core i9-14900HX mit mehr Single-Core-Leistung
Autor: Andreas Osthoff,  9.01.2024 (Update: 22.01.2024)