Asus ROG Strix Scar 17 G733PY Laptop Test: Intel ist nicht mehr König

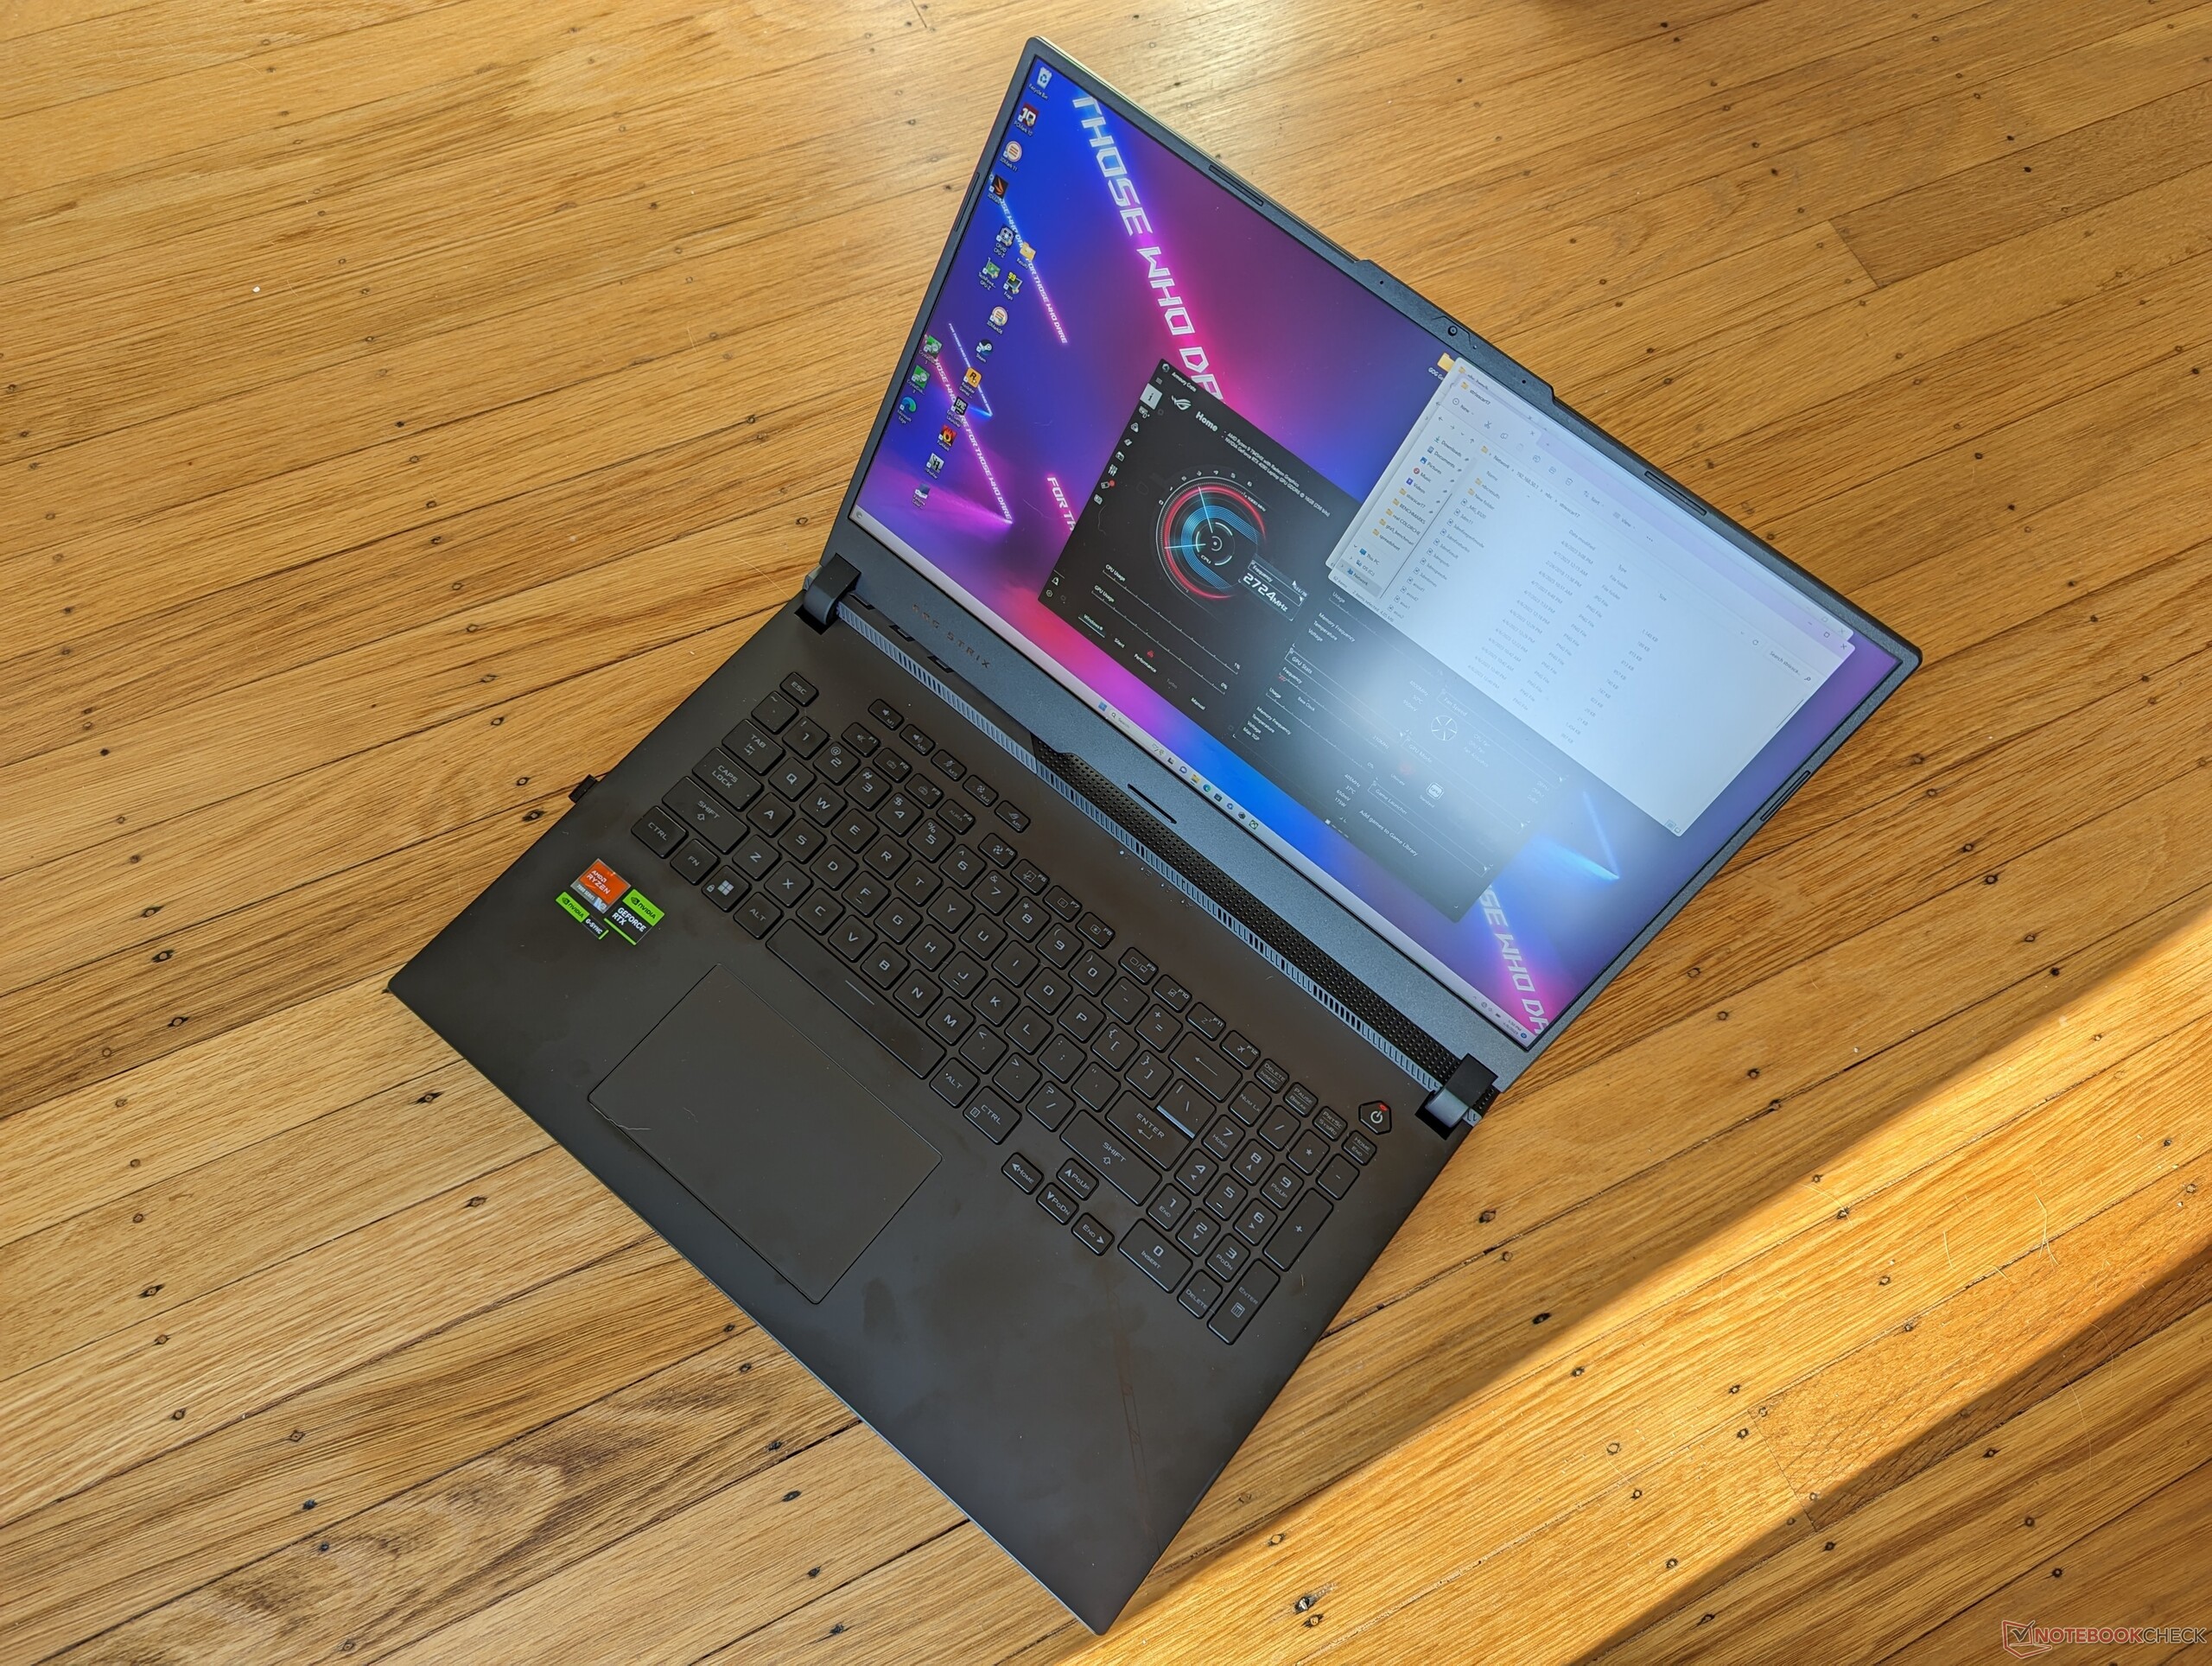
Auf der CES 2023 hat Asus seine 17,3-Zoll-Top-Serie ROG Strix Scar 17 mit den neuesten Intel CPUs der 13. Generation, Zen-4-CPUs von AMD und Nvidia-Ada-Lovelace-GPUs aufgefrischt, um das Line-up des letzten Jahres zu ersetzen. Abgesehen von diesen internen Upgrades bleibt das äußere Gehäuse-Design im Vergleich zum Vorjahr jedoch nahezu identisch. Wir empfehlen einen Blick auf unsere bestehenden Testberichte über das ROG Strix Scar 17 aus dem Jahr 2022 zu werfen, um mehr über die physischen Eigenschaften des 2023er Modells zu erfahren. Alle Unterschiede zwischen den beiden Modellen werden weiter unten erwähnt.
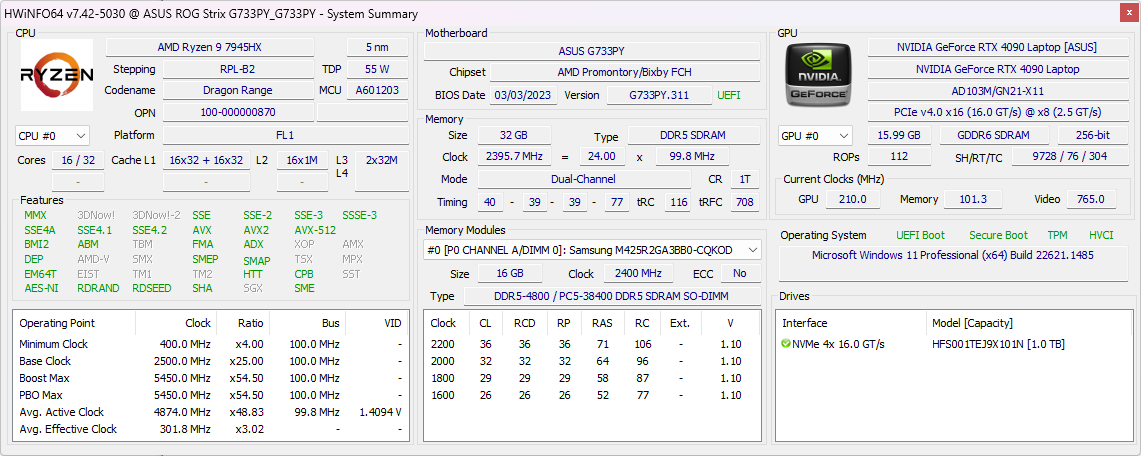
Unsere Konfiguration im Test ist die höchste SKU, die mit der Ryzen-9-7945HX-CPU und 175-W-GeForce-RTX-4090-GPU ausgestattet ist. Andere SKUs sind bis hinunter zur RTX 4060 erhältlich, aber sie alle verfügen über das gleiche 240-Hz-1.440p-IPS-Panel (Stand zum jetzigen Zeitpunkt).
Zu den Konkurrenten des Strix Scar 17 gehören andere 17-Zoll-Gaming-Laptops der Spitzenklasse wie das Razer Blade 17, Alienware m17, MSI GE77 oder Aorus 17.
Mehr Asus Bewertungen:
Mögliche Konkurrenten im Vergleich
Bew. | Datum | Modell | Gewicht | Dicke | Größe | Auflösung | Preis ab |
|---|---|---|---|---|---|---|---|
| 88.3 % v7 (old) | 04 / 2023 | Asus ROG Strix Scar 17 G733PY-XS96 R9 7945HX, GeForce RTX 4090 Laptop GPU | 2.9 kg | 28.3 mm | 17.30" | 2560x1440 | |
| 88.3 % v7 (old) | 04 / 2023 | MSI GE78HX 13VH-070US i9-13950HX, GeForce RTX 4080 Laptop GPU | 3 kg | 23 mm | 17.00" | 2560x1600 | |
| 89.9 % v7 (old) | Eluktronics Mech-17 GP2 i9-13900HX, GeForce RTX 4090 Laptop GPU | 2.9 kg | 27 mm | 17.00" | 2560x1600 | ||
| 88.4 % v7 (old) | 04 / 2023 | Asus ROG Strix G17 G713PI R9 7945HX, GeForce RTX 4070 Laptop GPU | 2.8 kg | 30.7 mm | 17.30" | 2560x1440 | |
| 83.7 % v7 (old) | 08 / 2022 | Aorus 17X XES i9-12900HX, GeForce RTX 3070 Ti Laptop GPU | 2.7 kg | 30 mm | 17.30" | 1920x1080 | |
| 86.1 % v7 (old) | 01 / 2023 | Alienware m17 R5 (R9 6900HX, RX 6850M XT) R9 6900HX, Radeon RX 6850M XT | 3.4 kg | 26.7 mm | 17.00" | 3840x2160 |
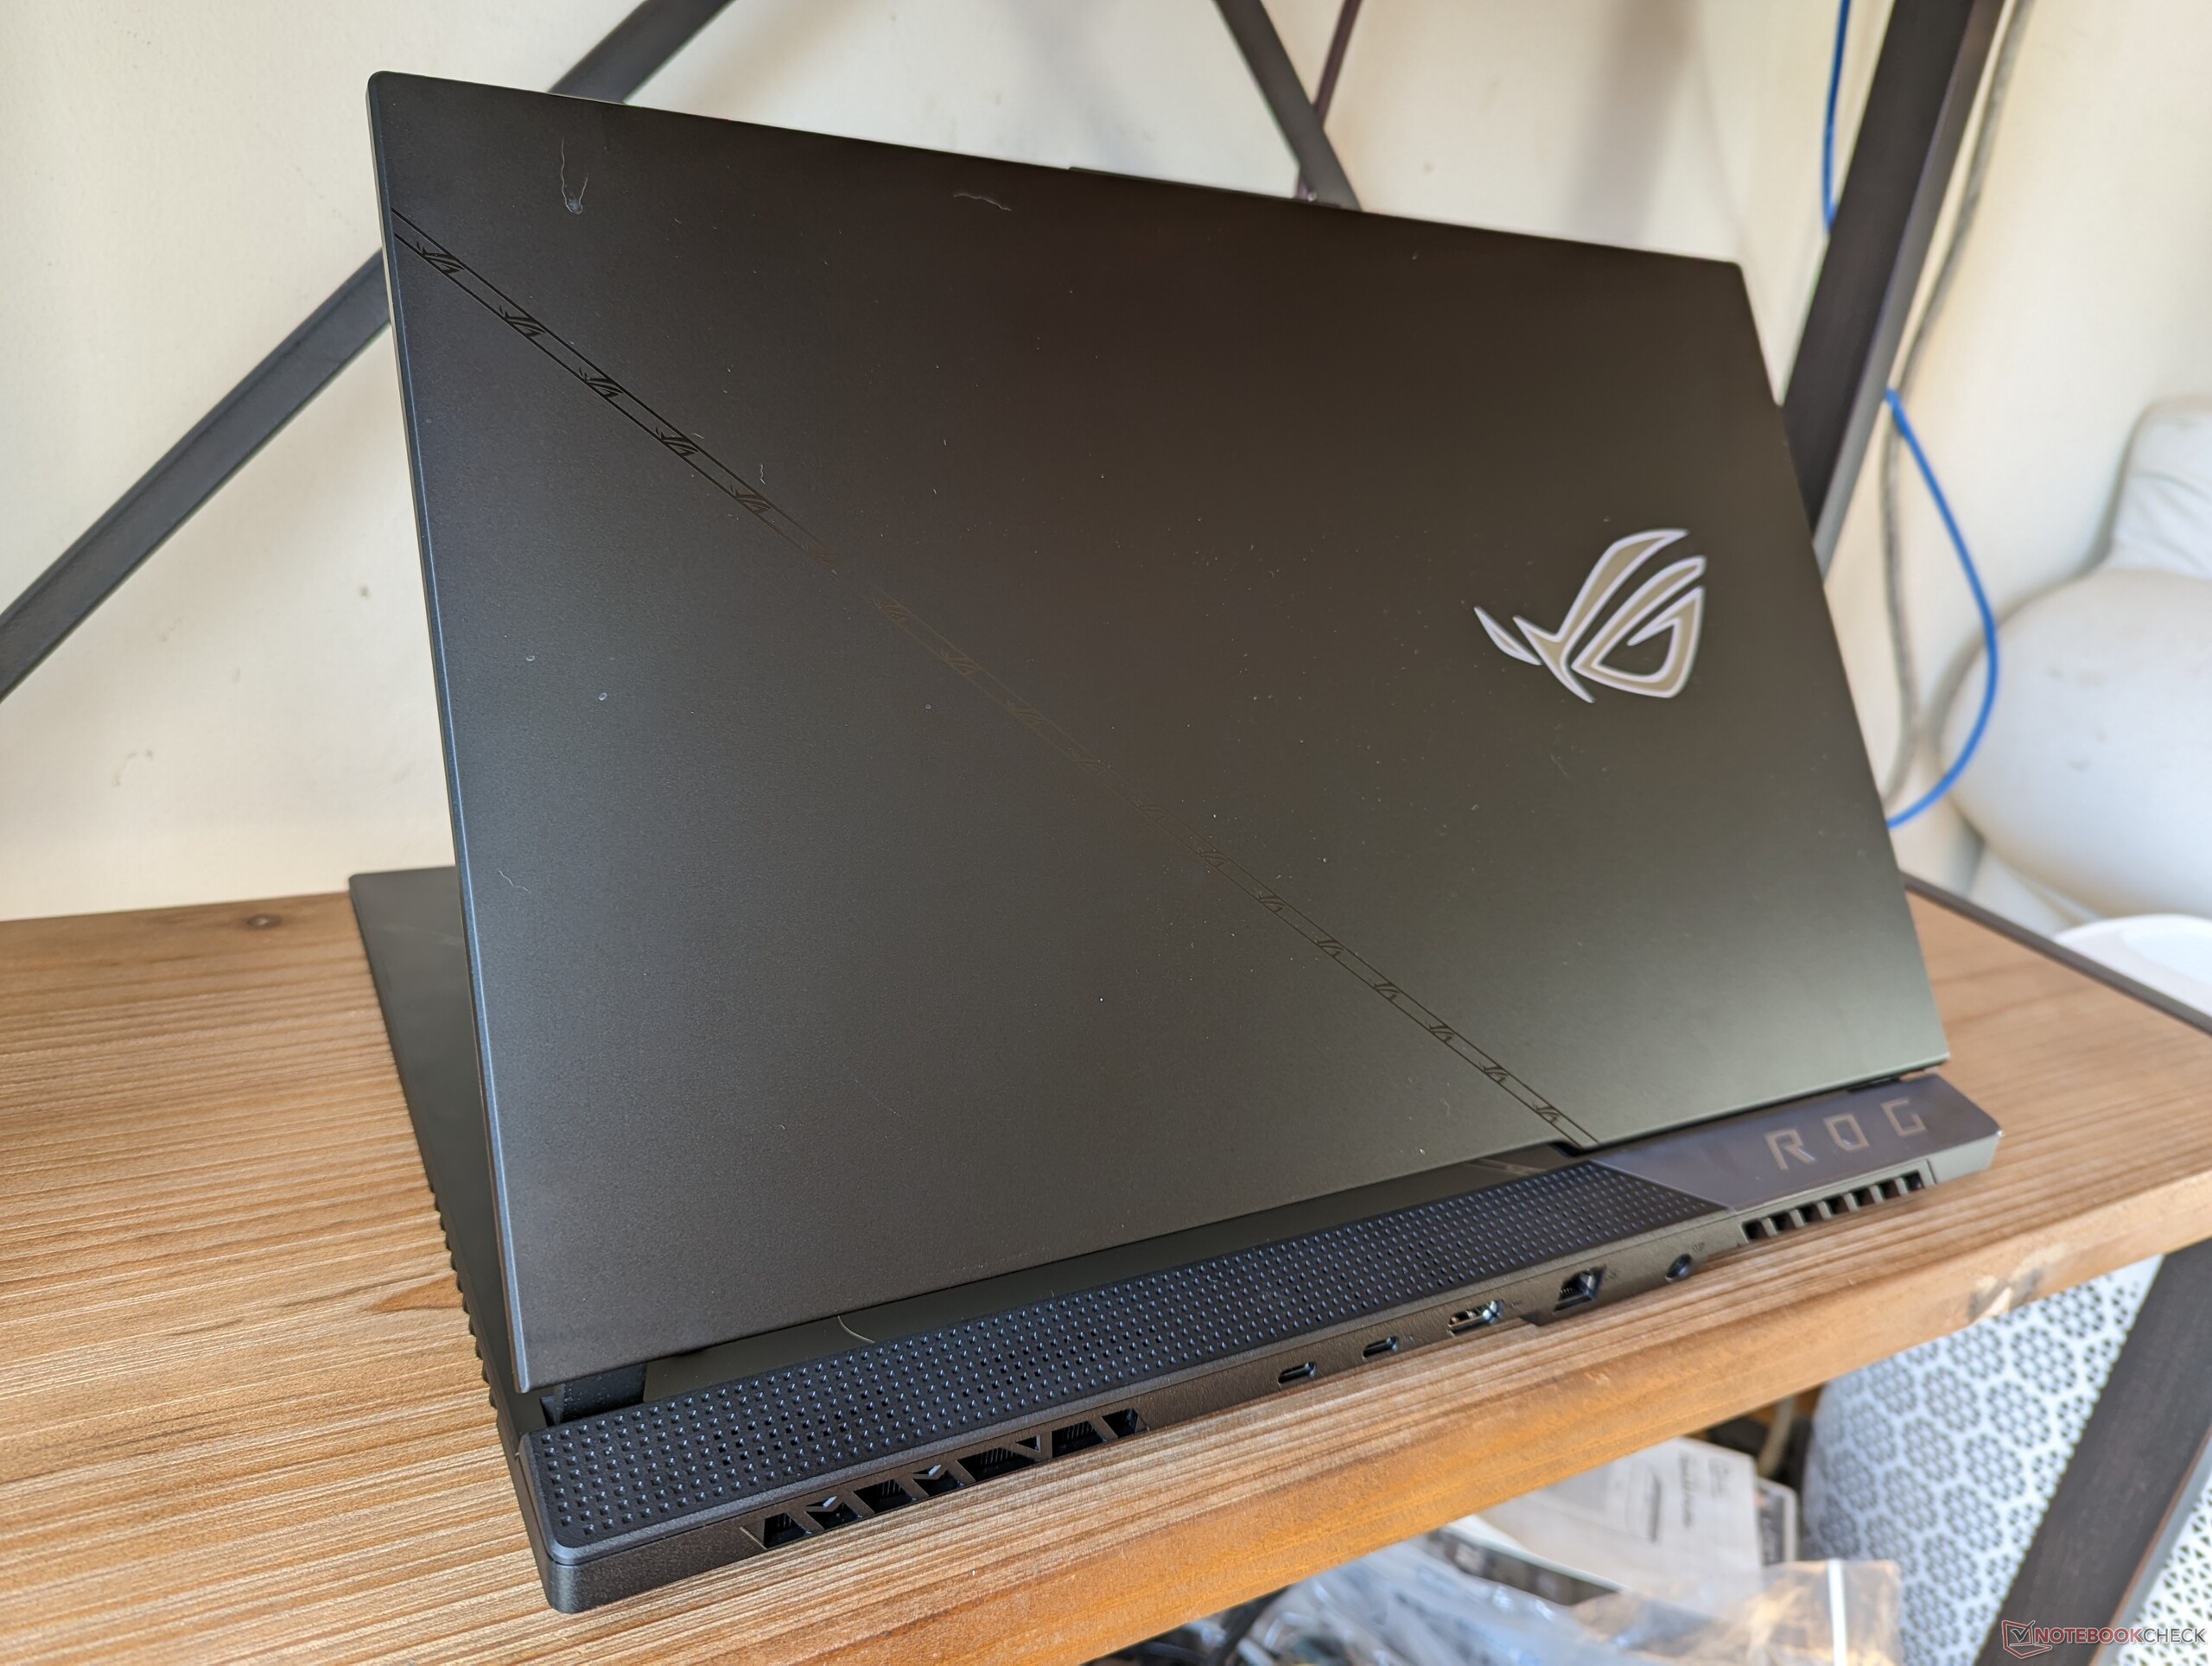
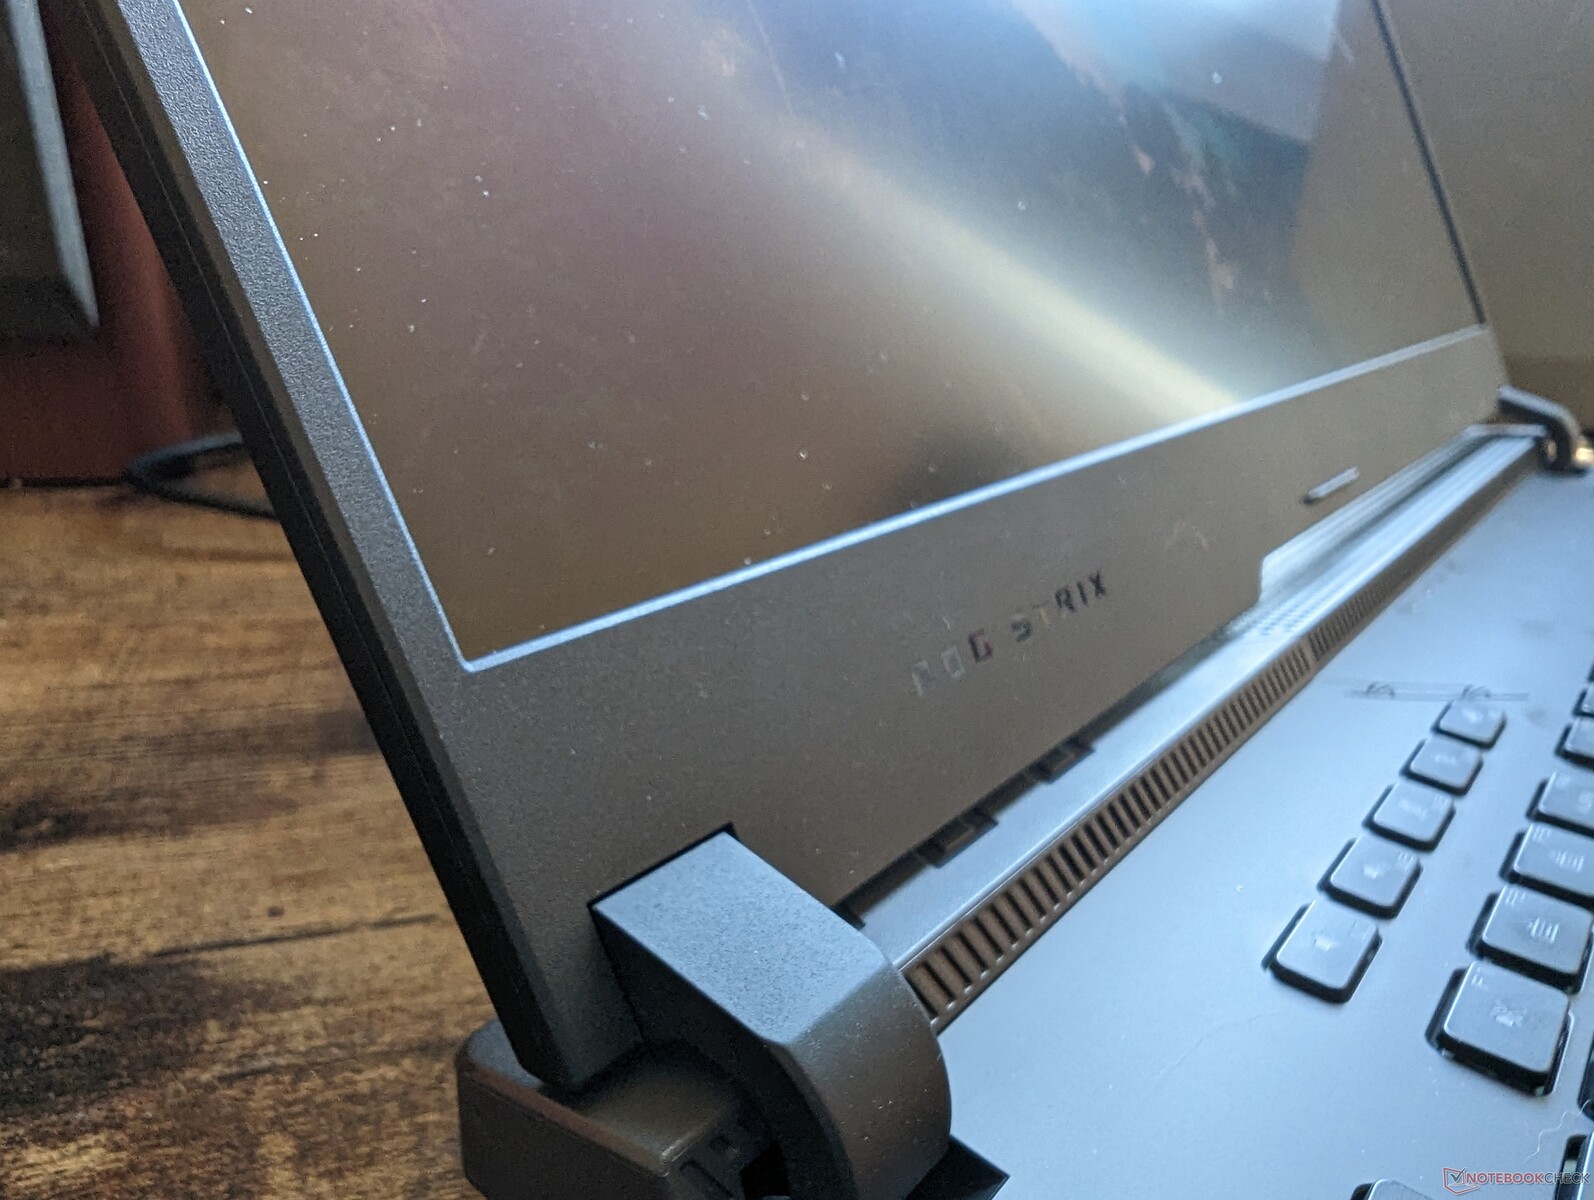
Gehäuse - Keine Änderungen... beinahe!
Es gibt drei wichtige Unterschiede zwischen den Modellen 2023 und 2022:
- Asus Keystone wird nicht mehr unterstützt. Der Hersteller hat wahrscheinlich erkannt, dass nur sehr wenige Besitzer diese Funktion überhaupt nutzen.
- Neue Webcam. Es gibt jetzt eine integrierte Webcam, während sie beim letztjährigen Modell komplett fehlte.
- Neue oberflächliche Markierungen auf den Handballenablagen und dem Außendeckel.
Das Gesamtbild des Gehäuses ist ansonsten identisch mit dem des Vorjahres.
Kommunikation
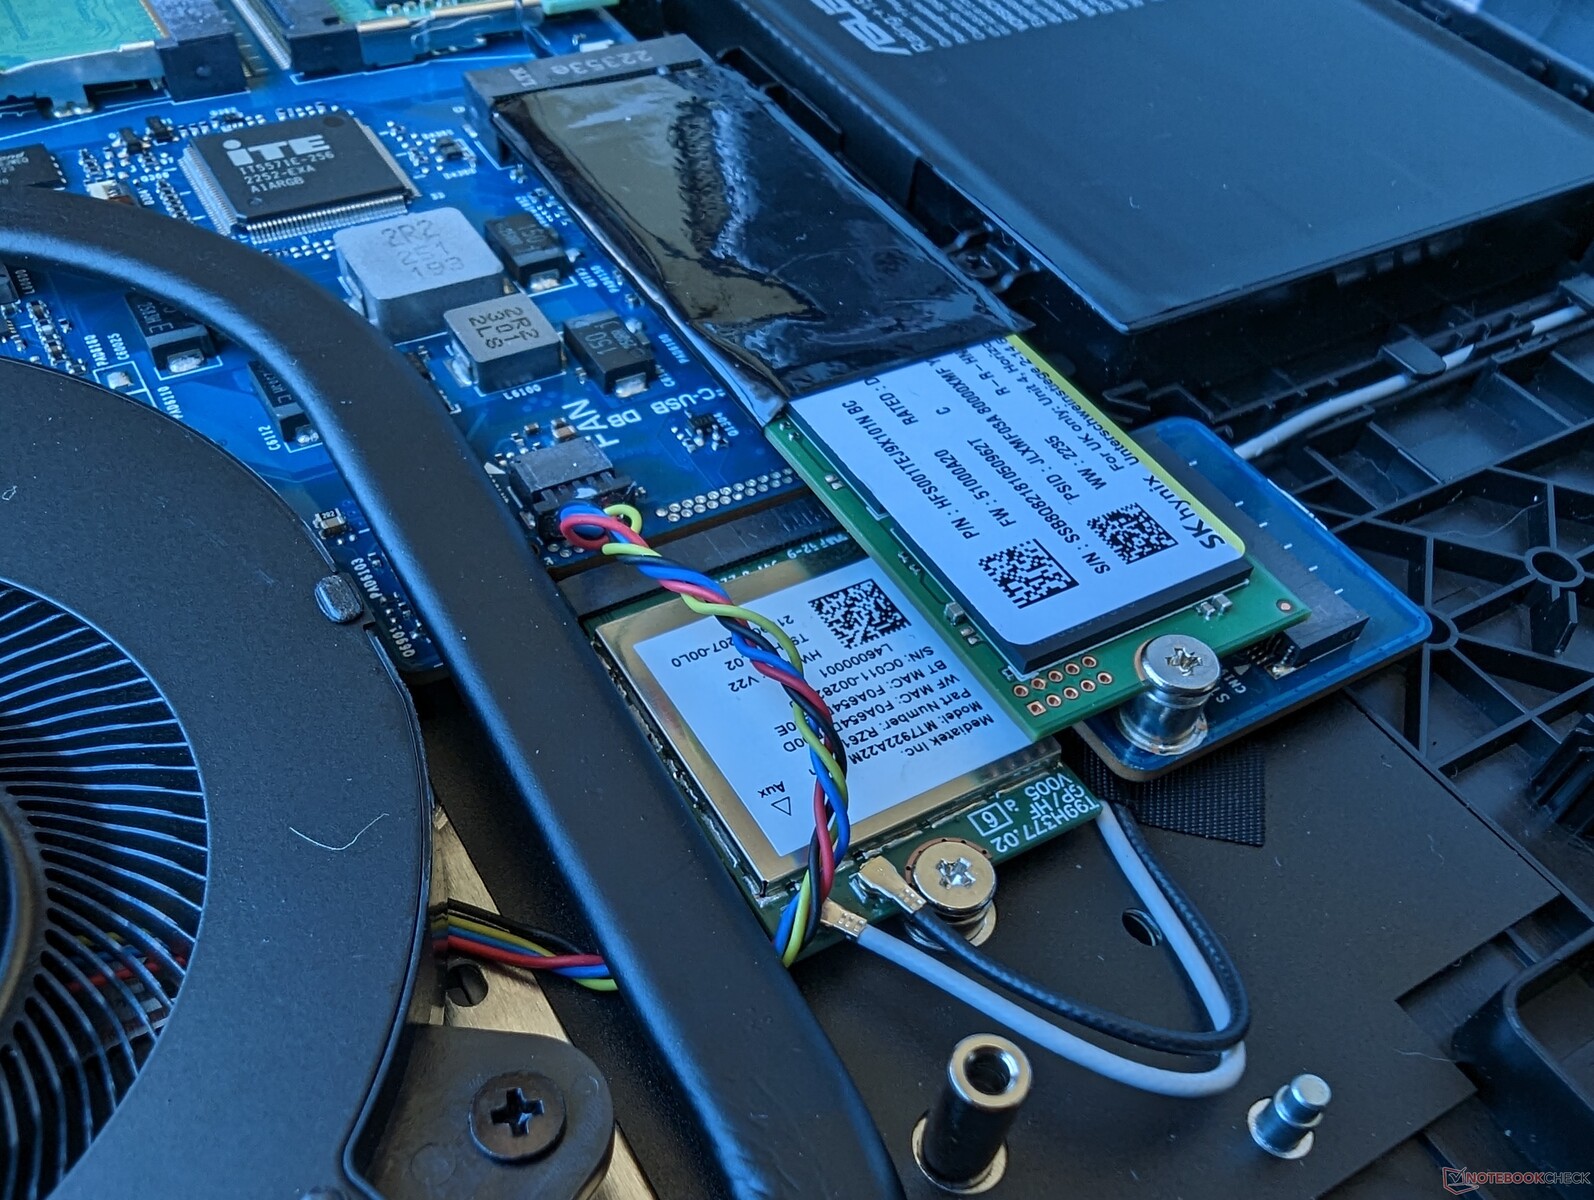
Wi-Fi 6E wird von einem MediaTek MT7922 anstelle des häufigeren Intel AX211 bereitgestellt, wahrscheinlich weil dies ein AMD-Nvidia-fokussiertes Design ist. Die Übertragungsraten und die Leistung sind dennoch stabil und zuverlässig, wenn es mit unserem Asus-AXE11000-Test-Router gekoppelt ist.
| Networking | |
| iperf3 transmit AXE11000 | |
| Asus ROG Strix G17 G713PI | |
| Eluktronics Mech-17 GP2 | |
| MSI GE78HX 13VH-070US | |
| Alienware m17 R5 (R9 6900HX, RX 6850M XT) | |
| Asus ROG Strix Scar 17 G733PY-XS96 | |
| iperf3 receive AXE11000 | |
| Asus ROG Strix G17 G713PI | |
| Eluktronics Mech-17 GP2 | |
| Asus ROG Strix Scar 17 G733PY-XS96 | |
| MSI GE78HX 13VH-070US | |
| Alienware m17 R5 (R9 6900HX, RX 6850M XT) | |
| iperf3 transmit AXE11000 6GHz | |
| Aorus 17X XES | |
| Asus ROG Strix Scar 17 G733PY-XS96 | |
| MSI GE78HX 13VH-070US | |
| iperf3 receive AXE11000 6GHz | |
| Aorus 17X XES | |
| MSI GE78HX 13VH-070US | |
| Asus ROG Strix Scar 17 G733PY-XS96 | |
Webcam
Obwohl eine Webcam besser ist als gar keine Webcam, hat sich Asus für den kleinsten gemeinsamen Nenner entschieden und einen 1-MP-Sensor statt eines 2-MP- oder 5-MP-Sensors eingebaut. Andere Gaming-Laptops wie das Alienware m17 R1 oder Razer Blade haben im Vergleich dazu Webcams mit höherer Auflösung. IR wird von dem Asus nicht unterstützt.


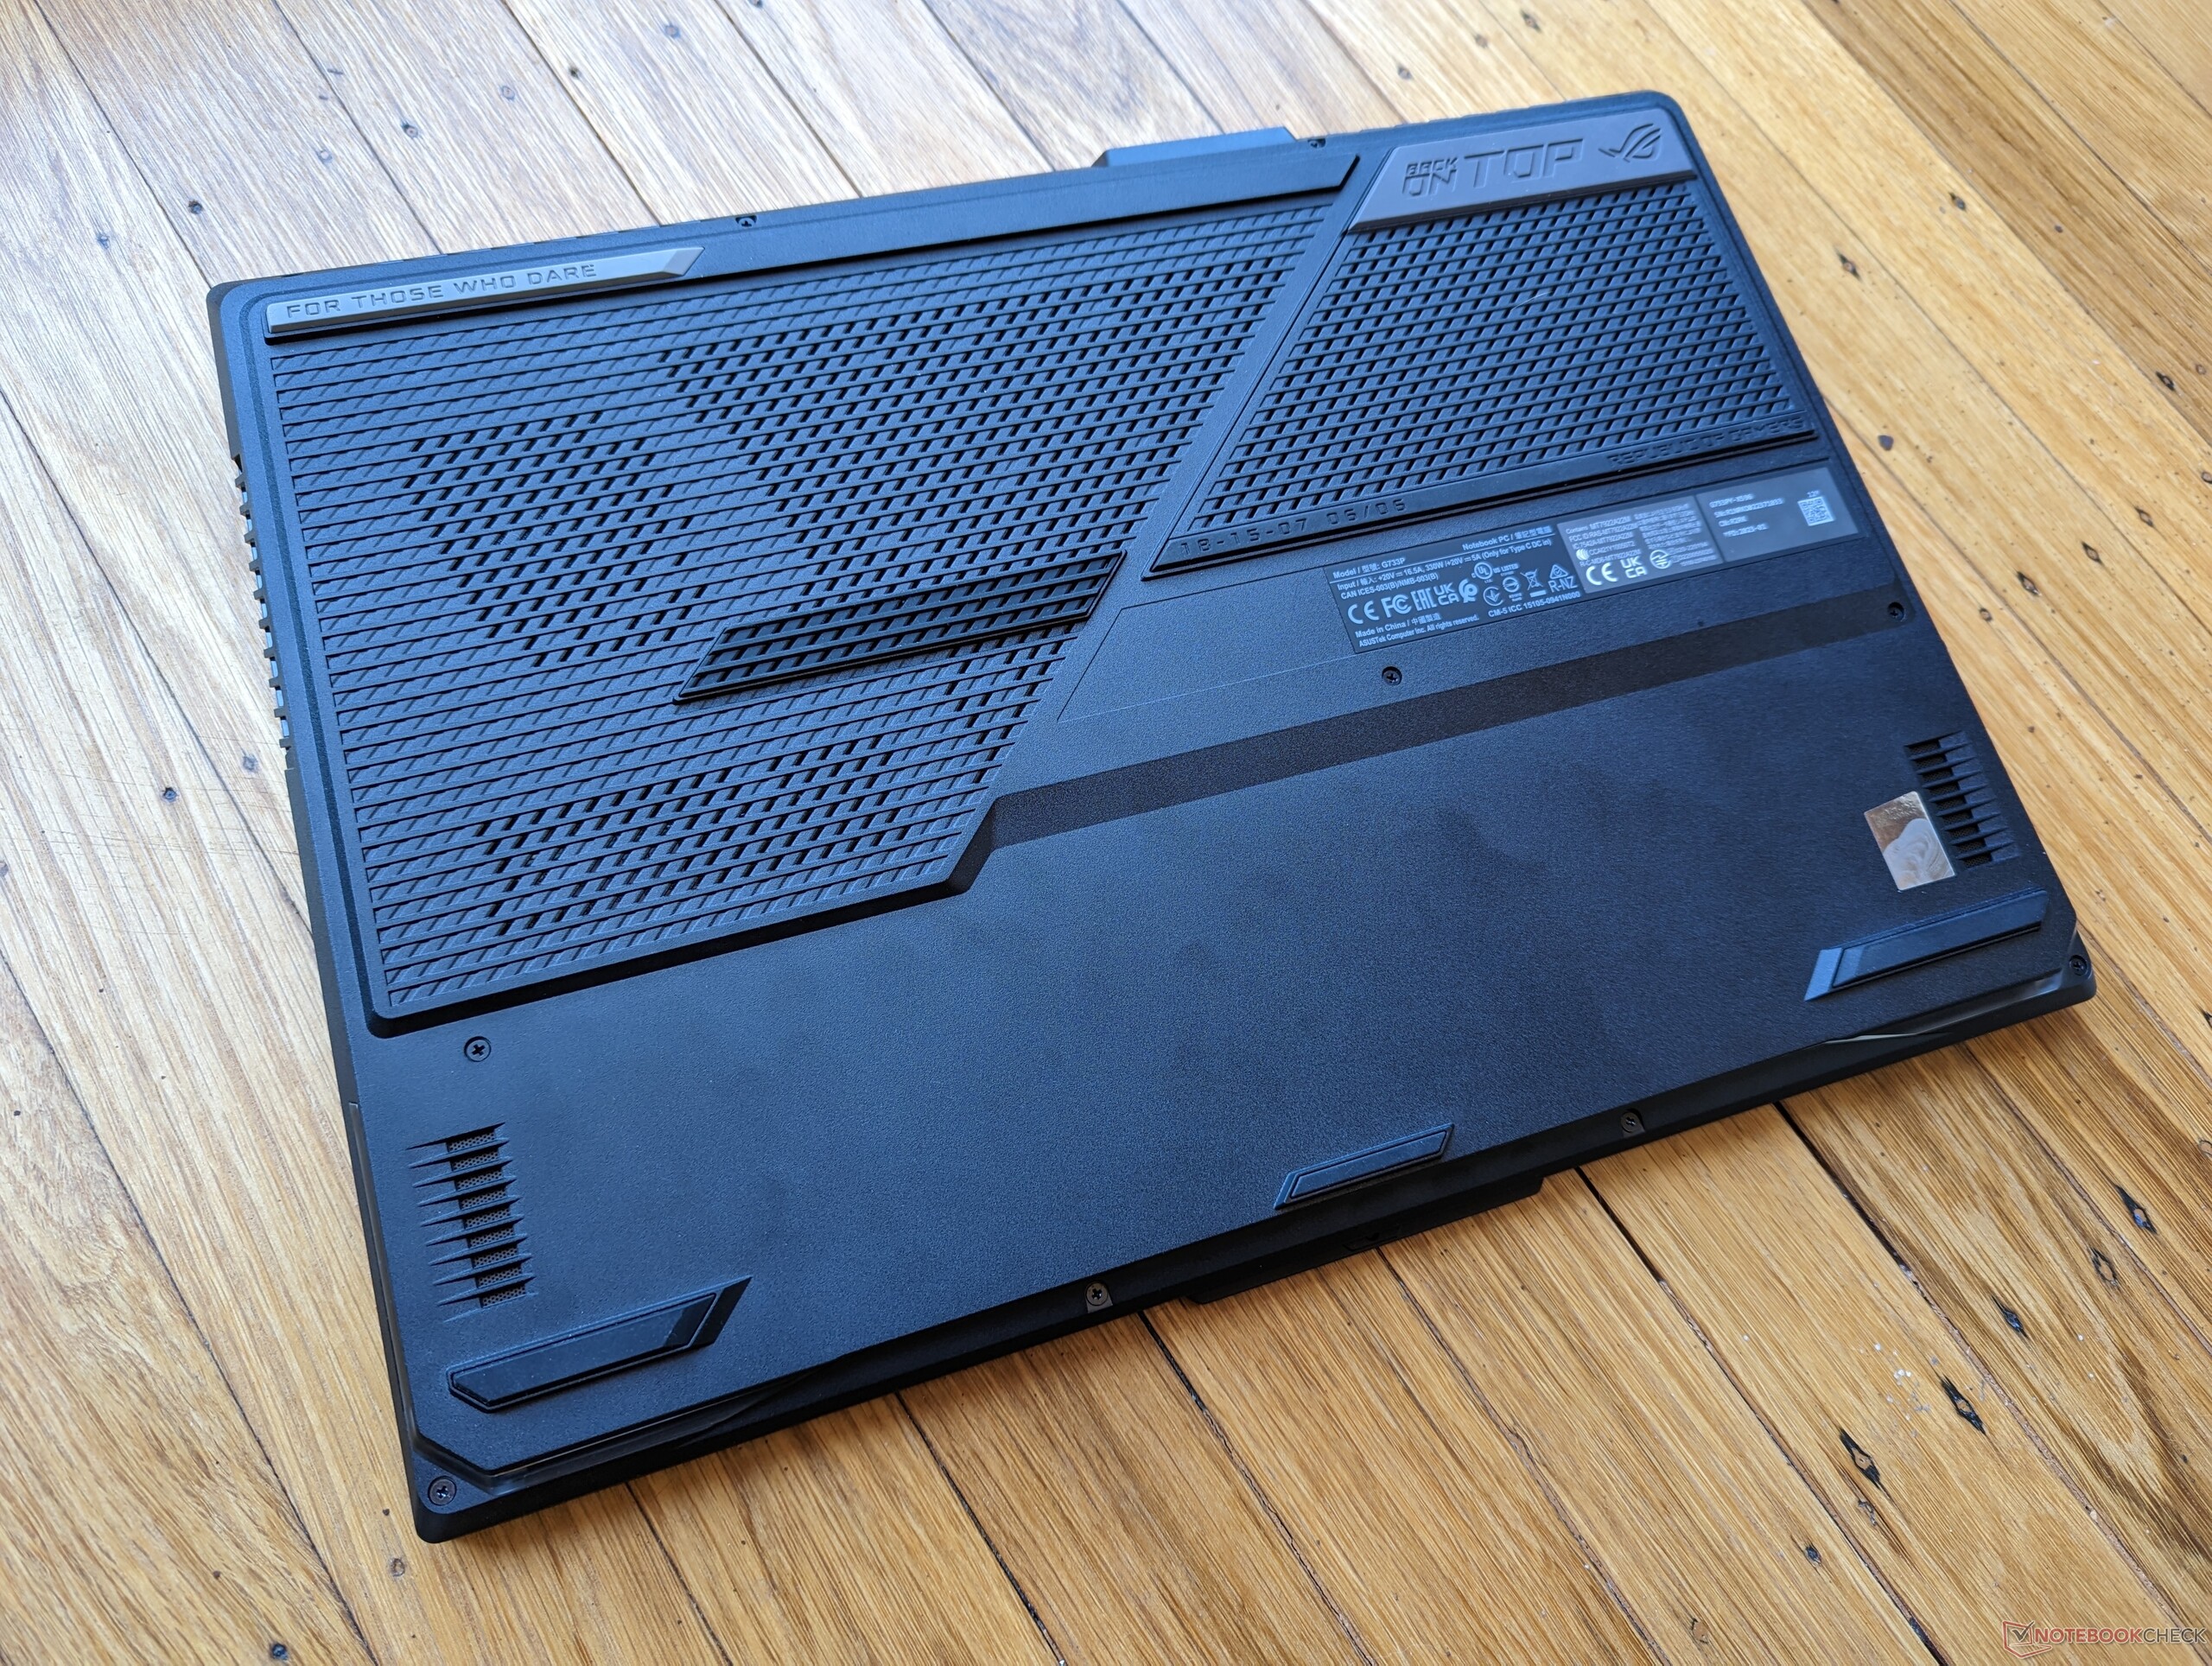
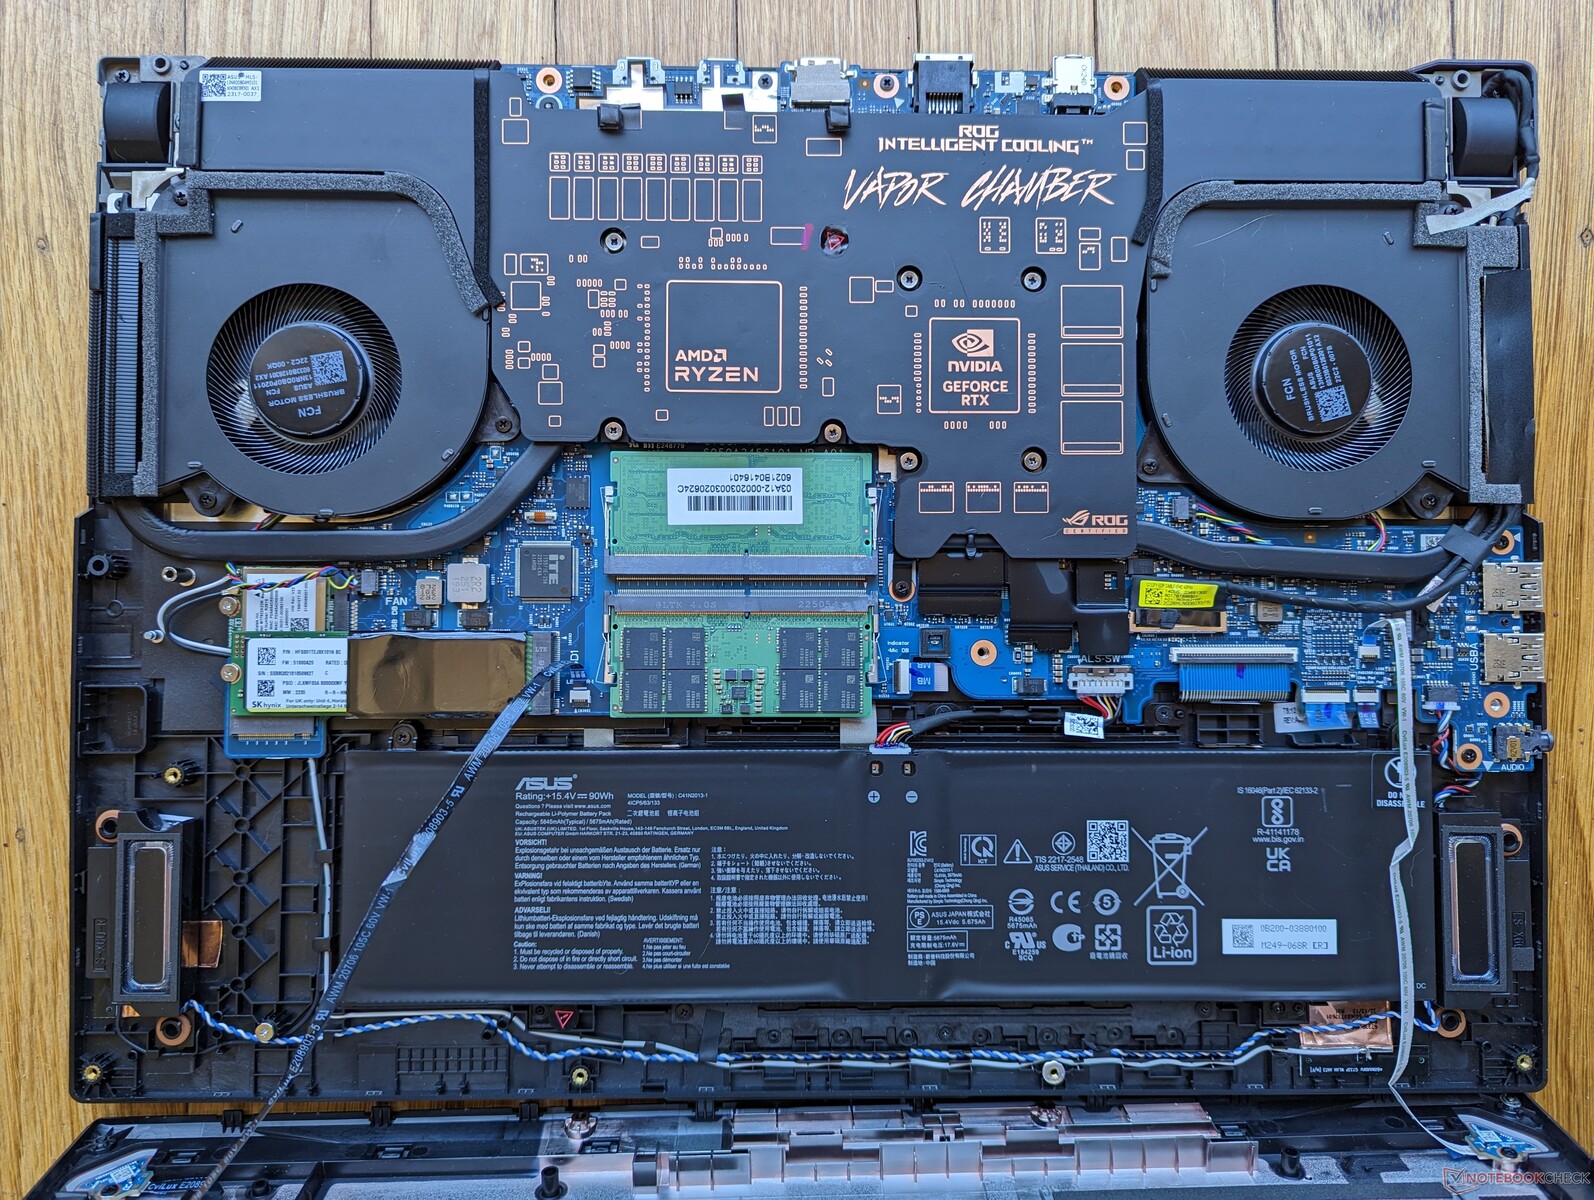
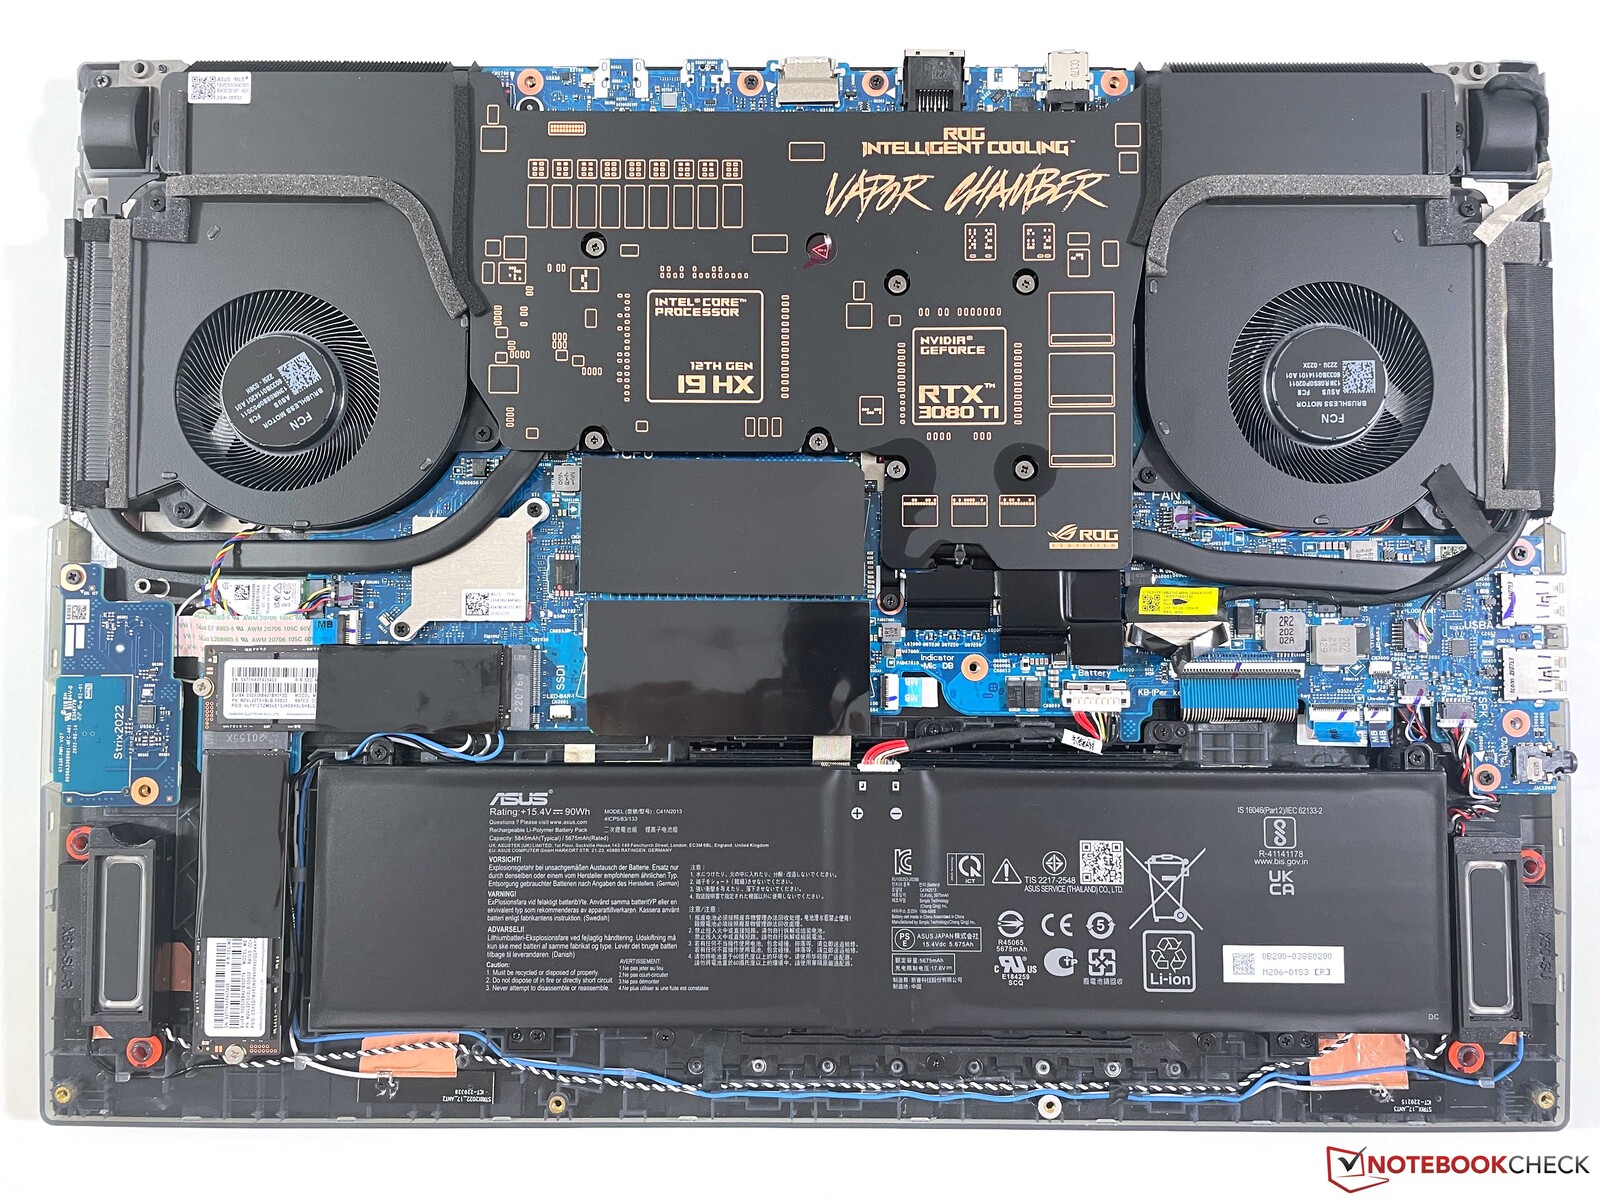
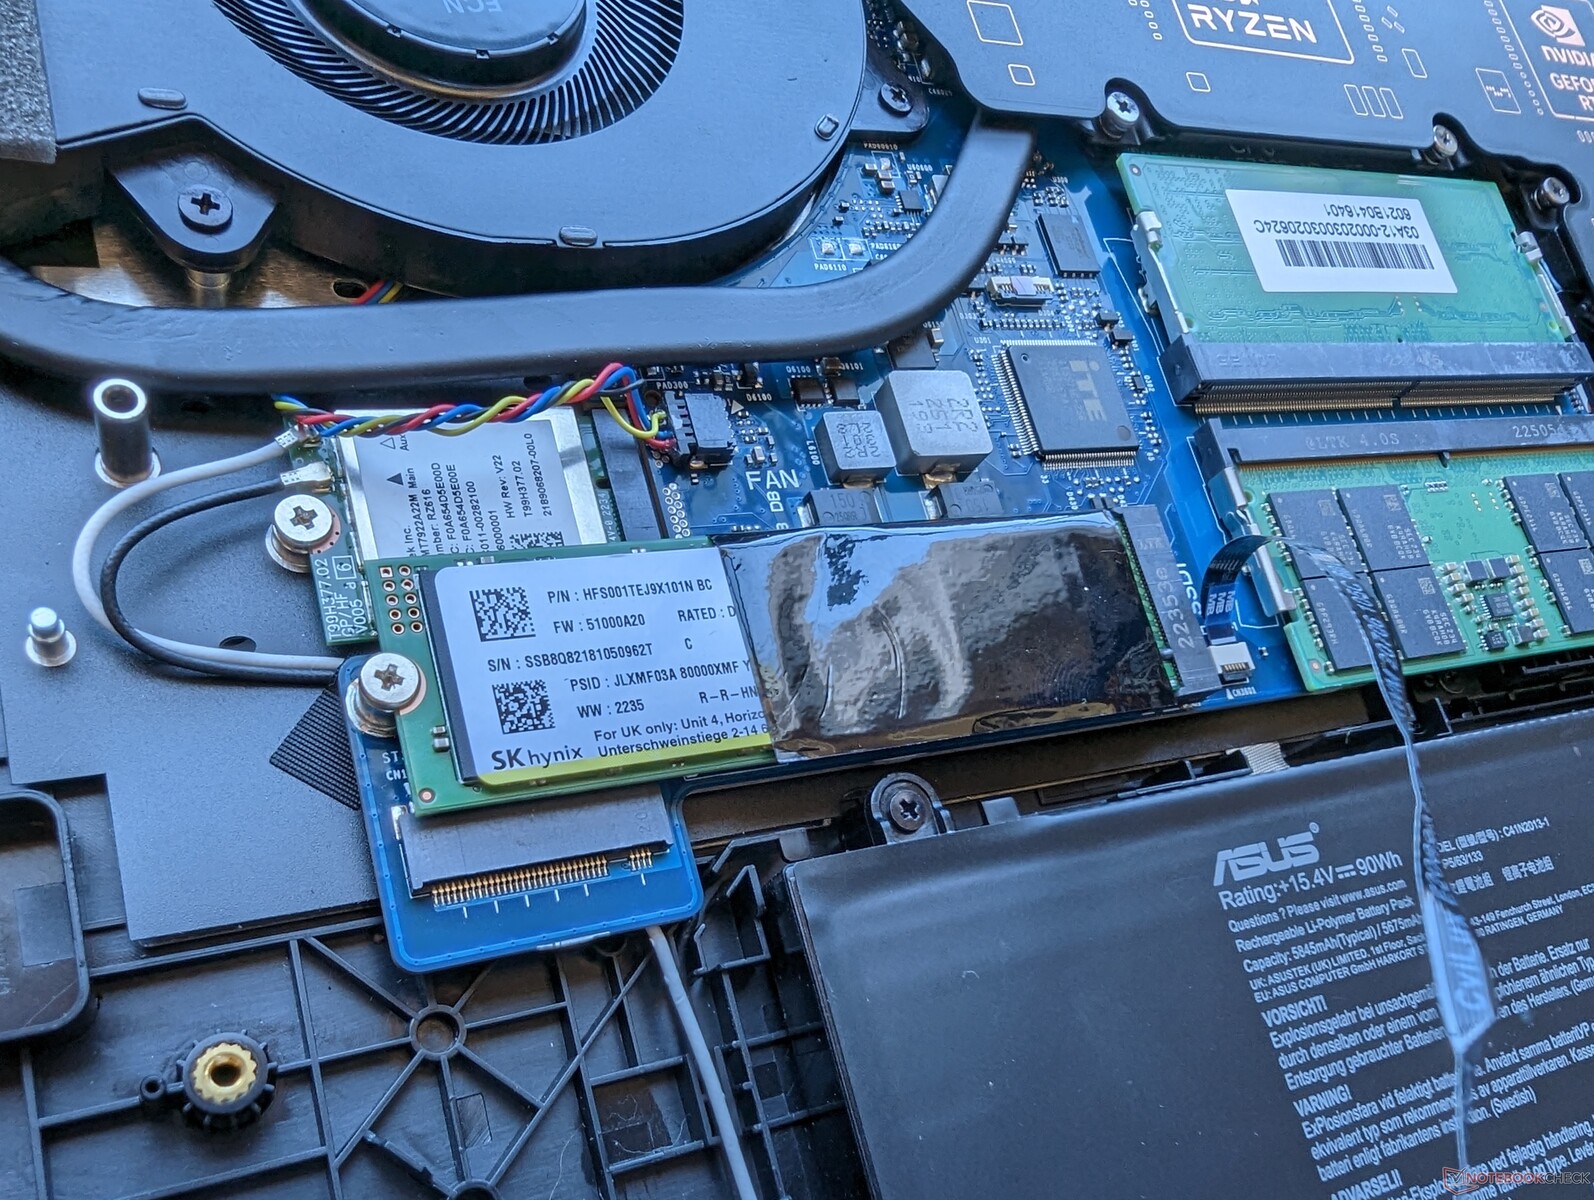
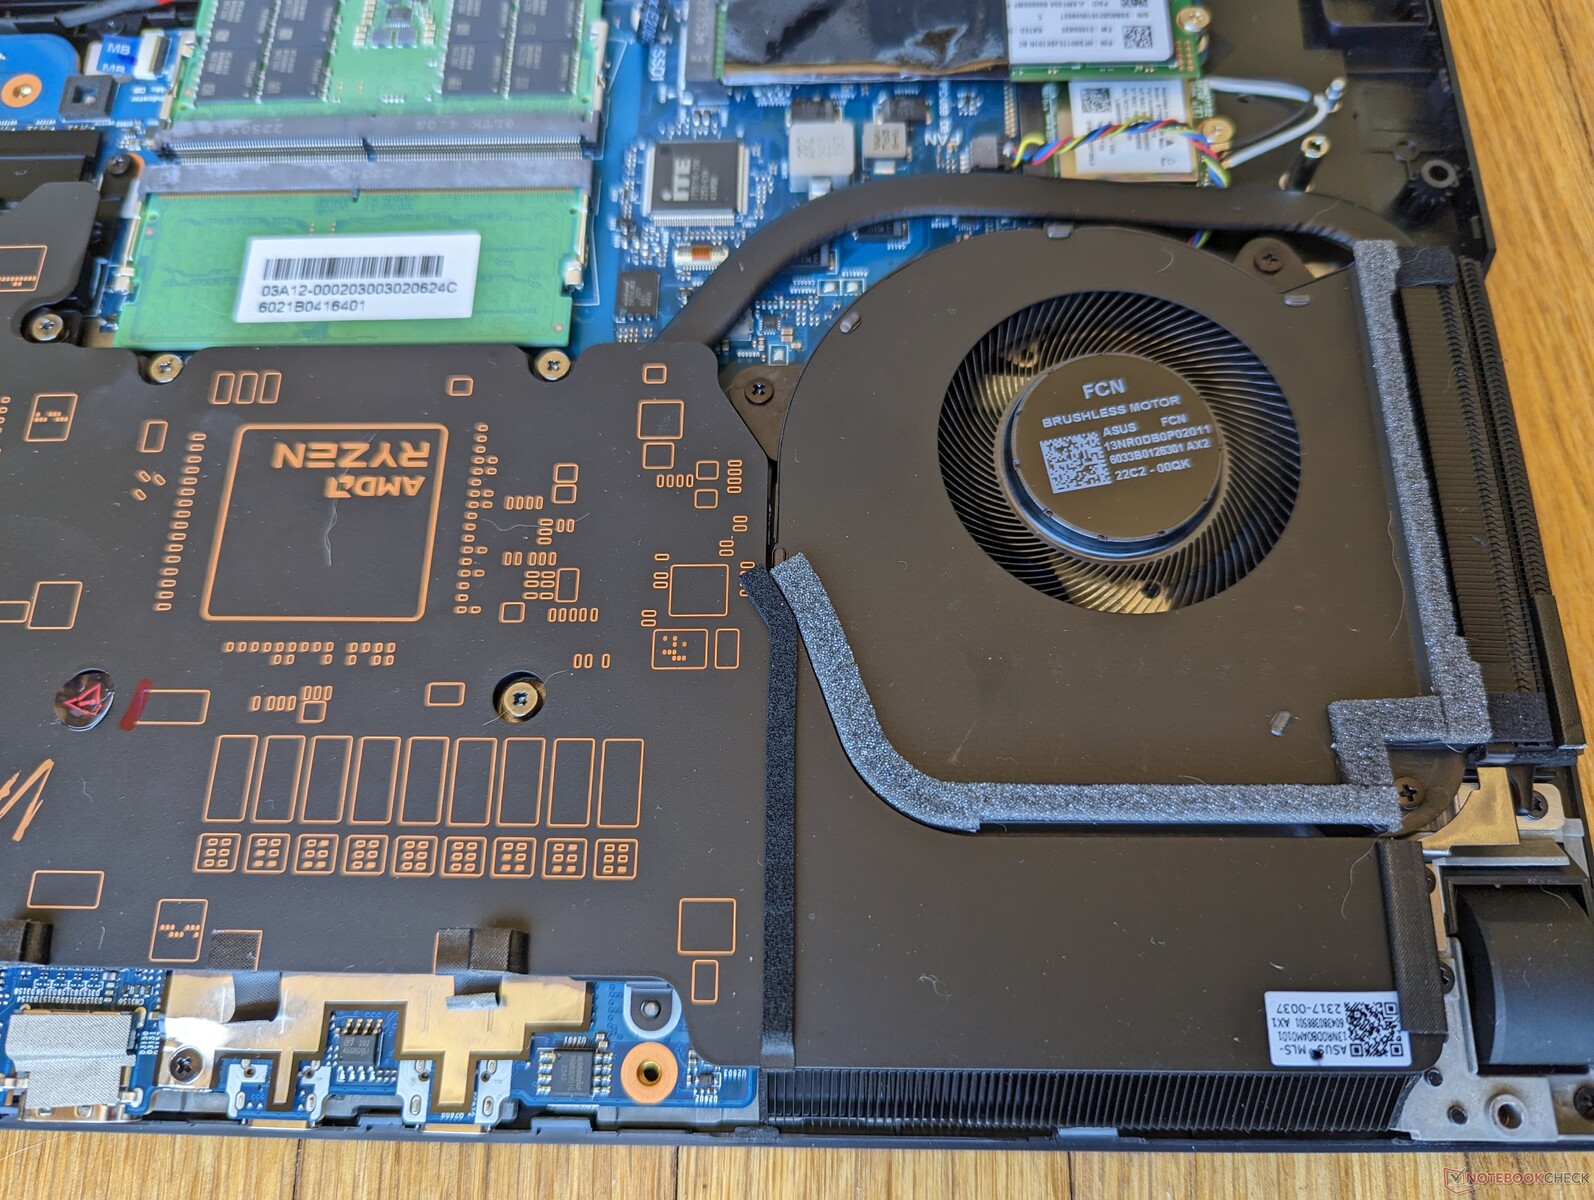
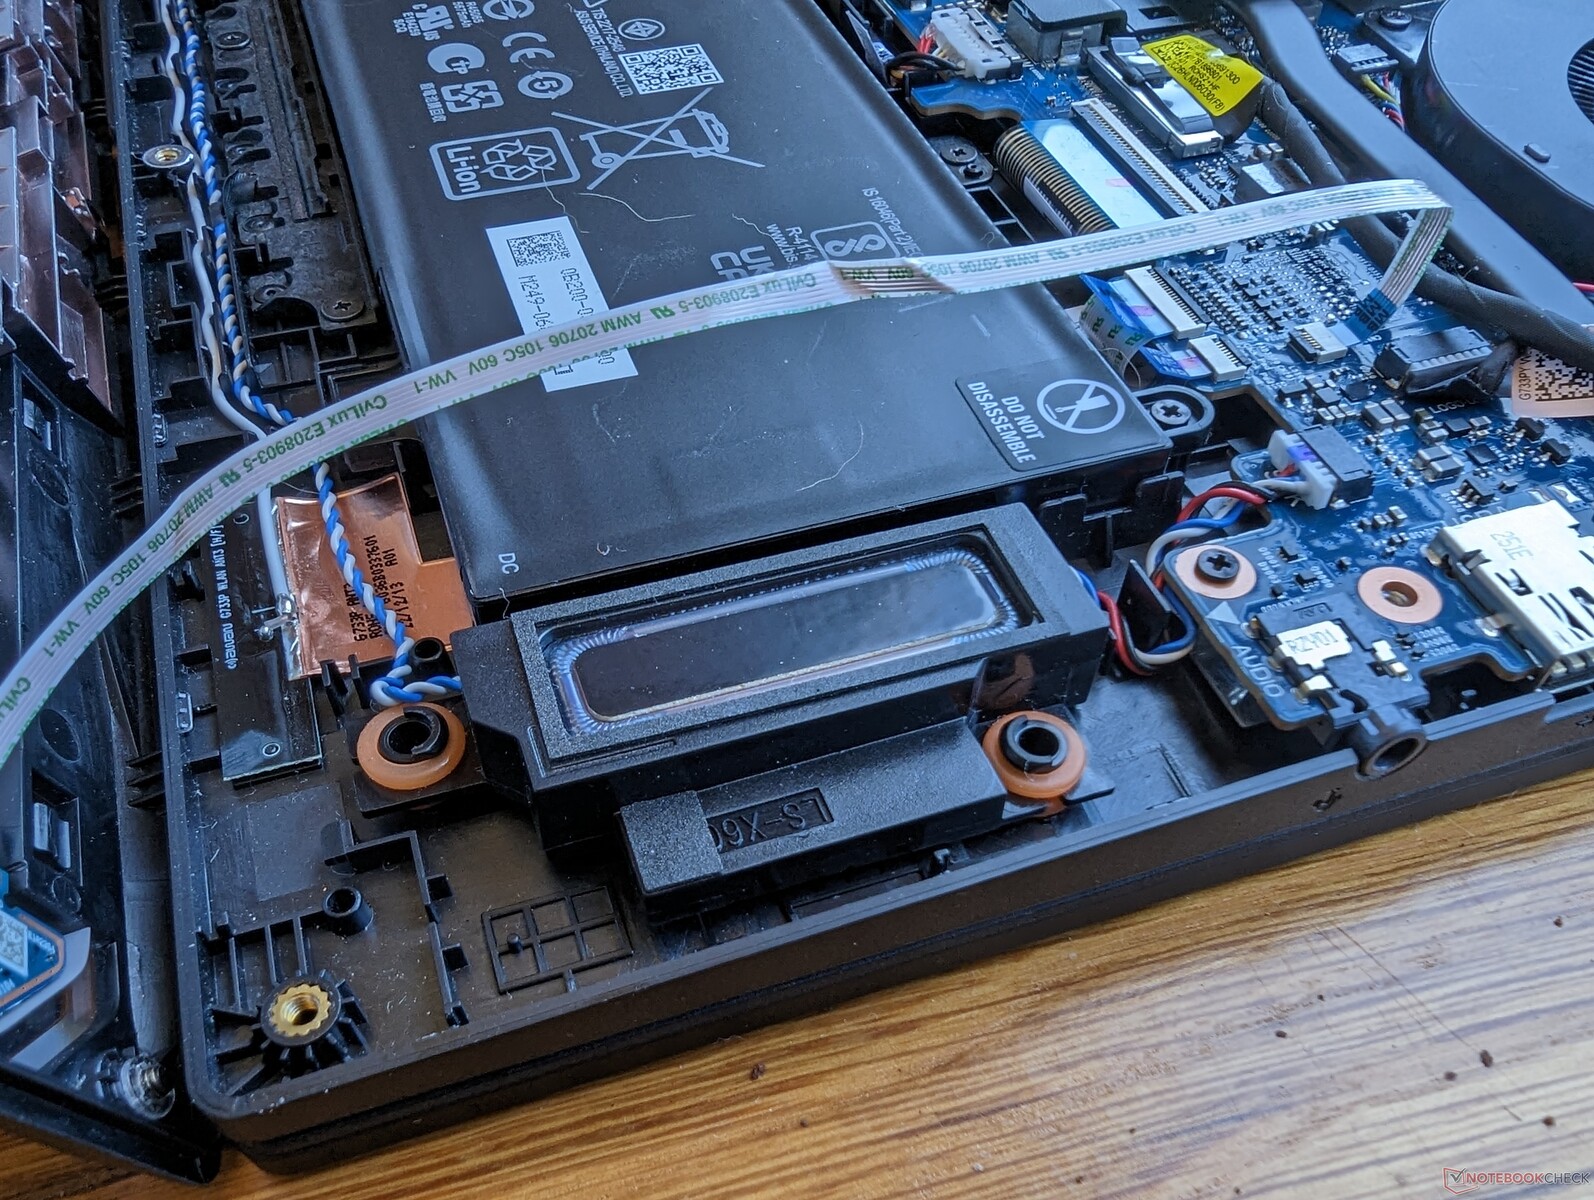
Wartung
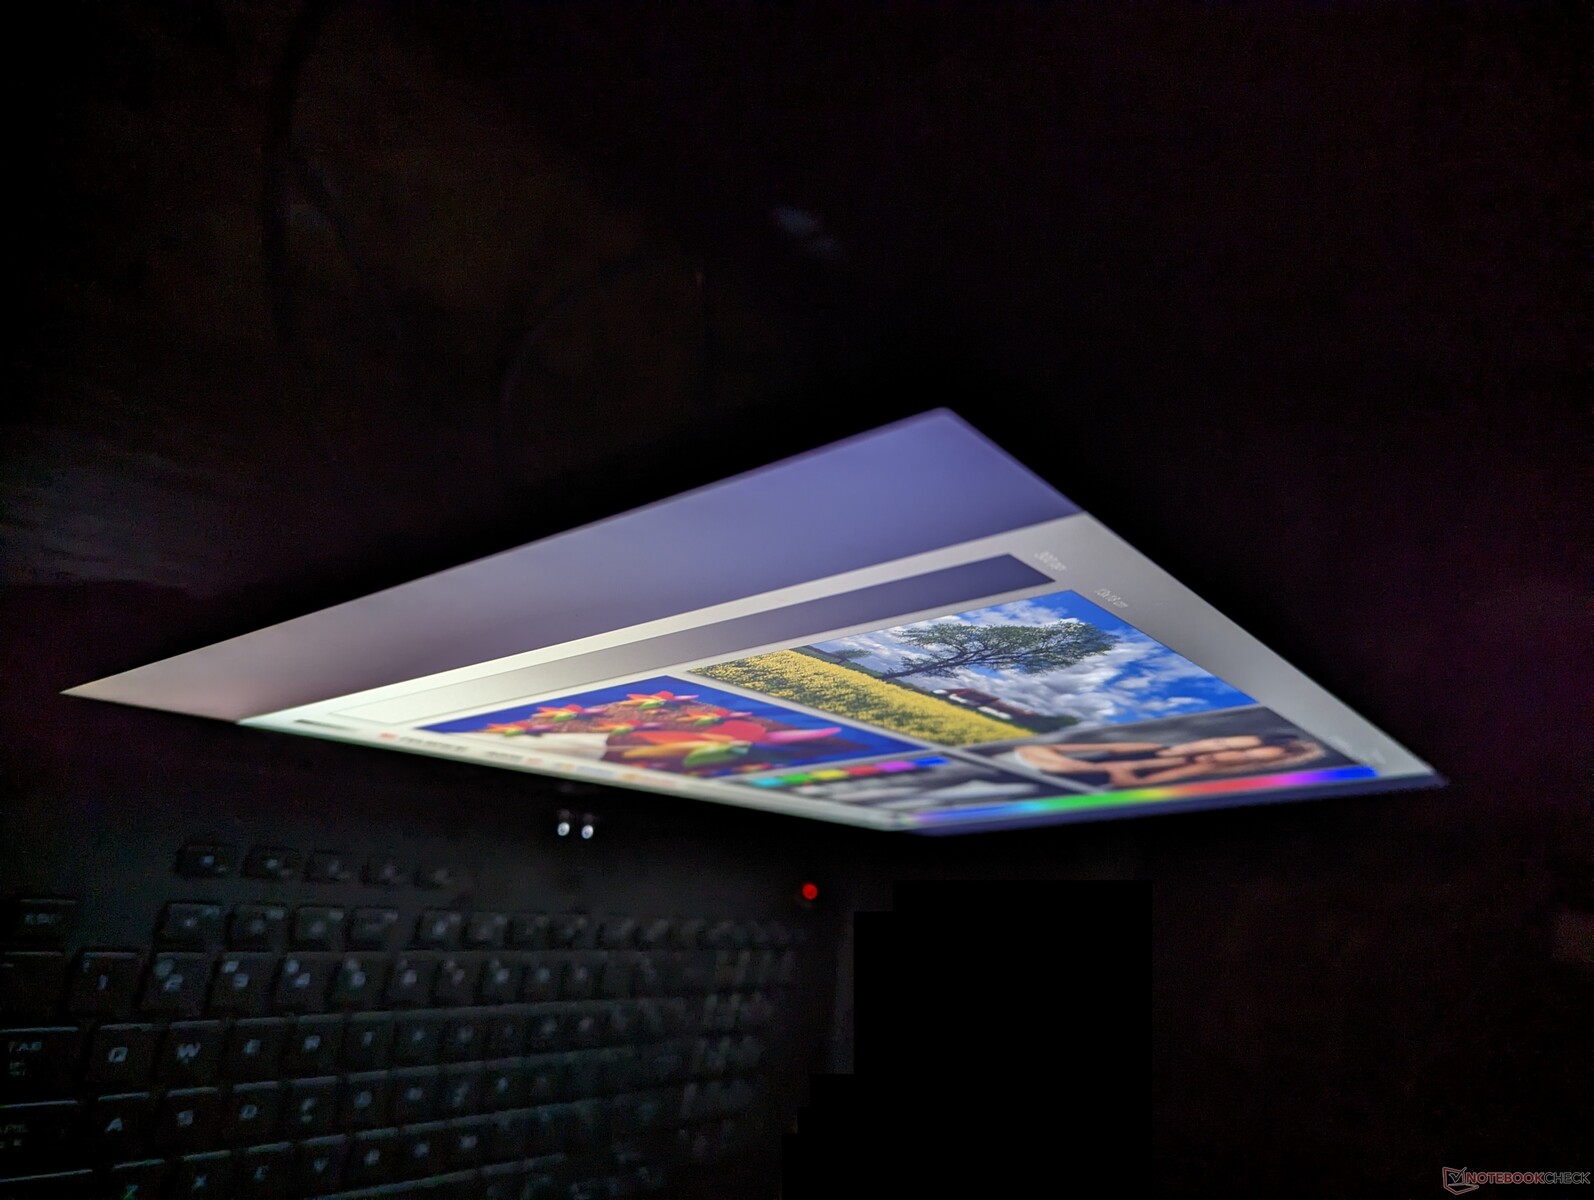
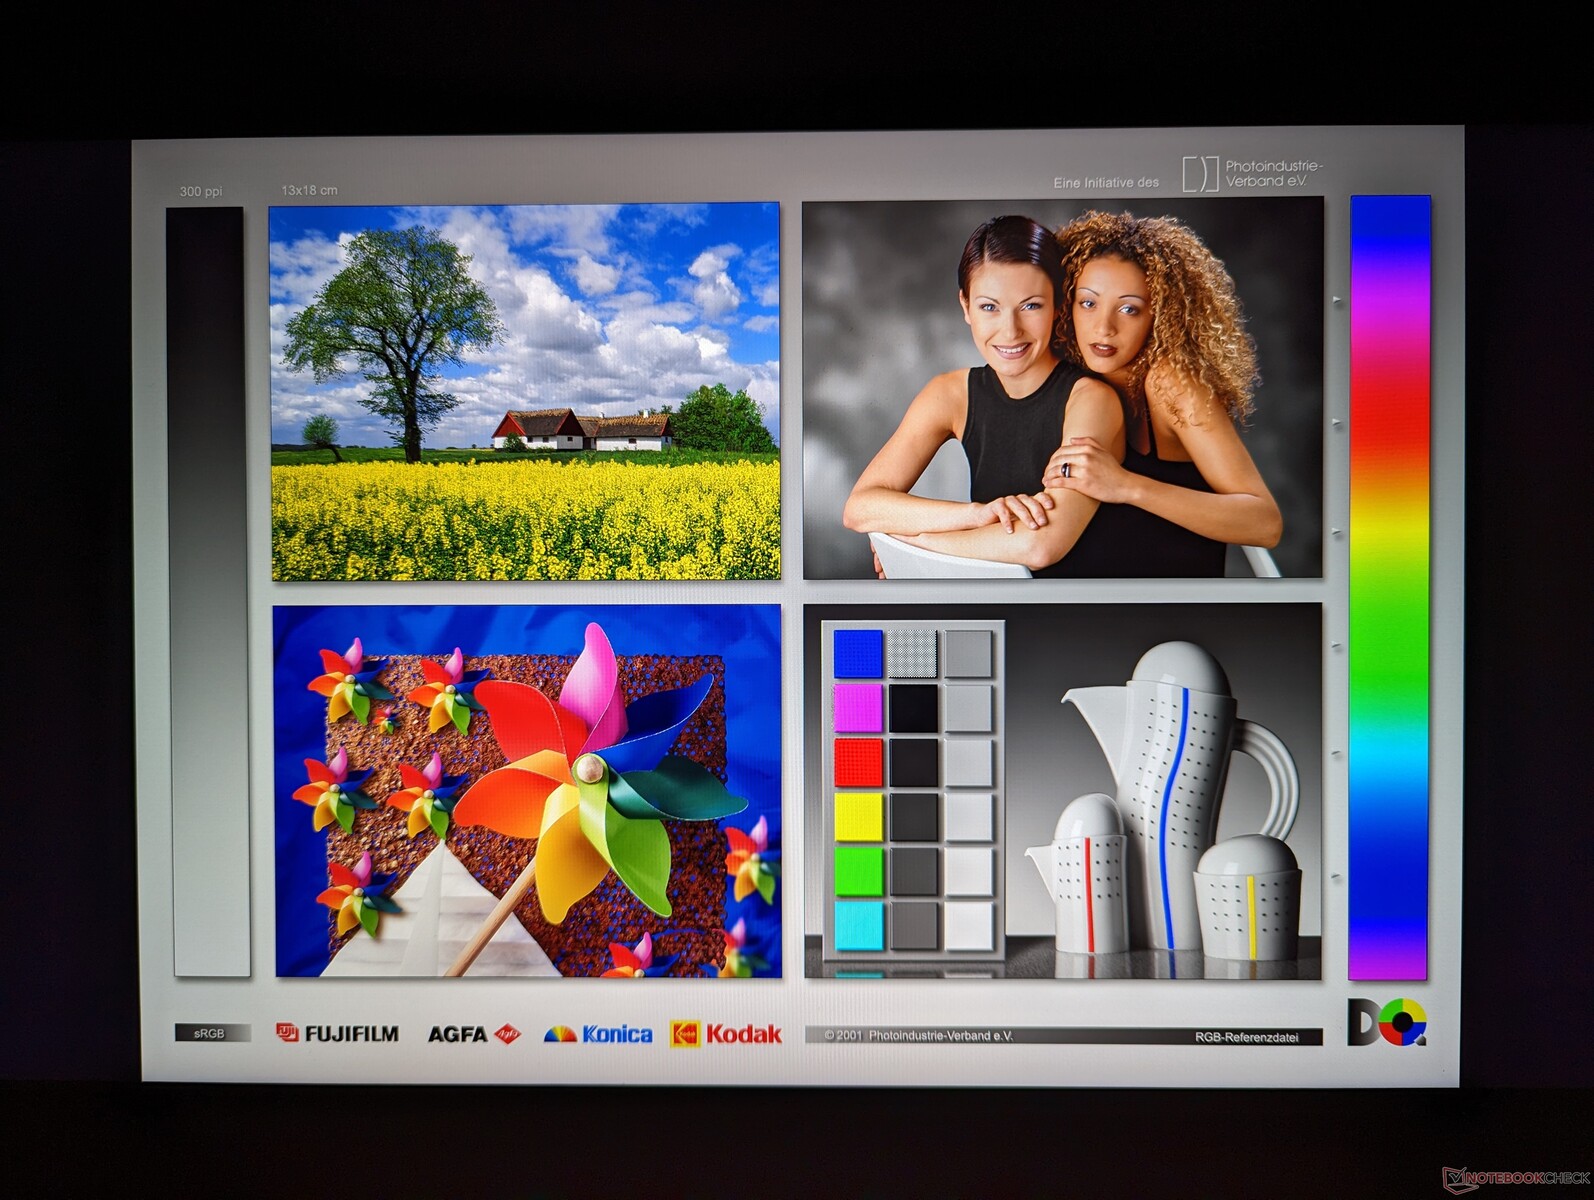
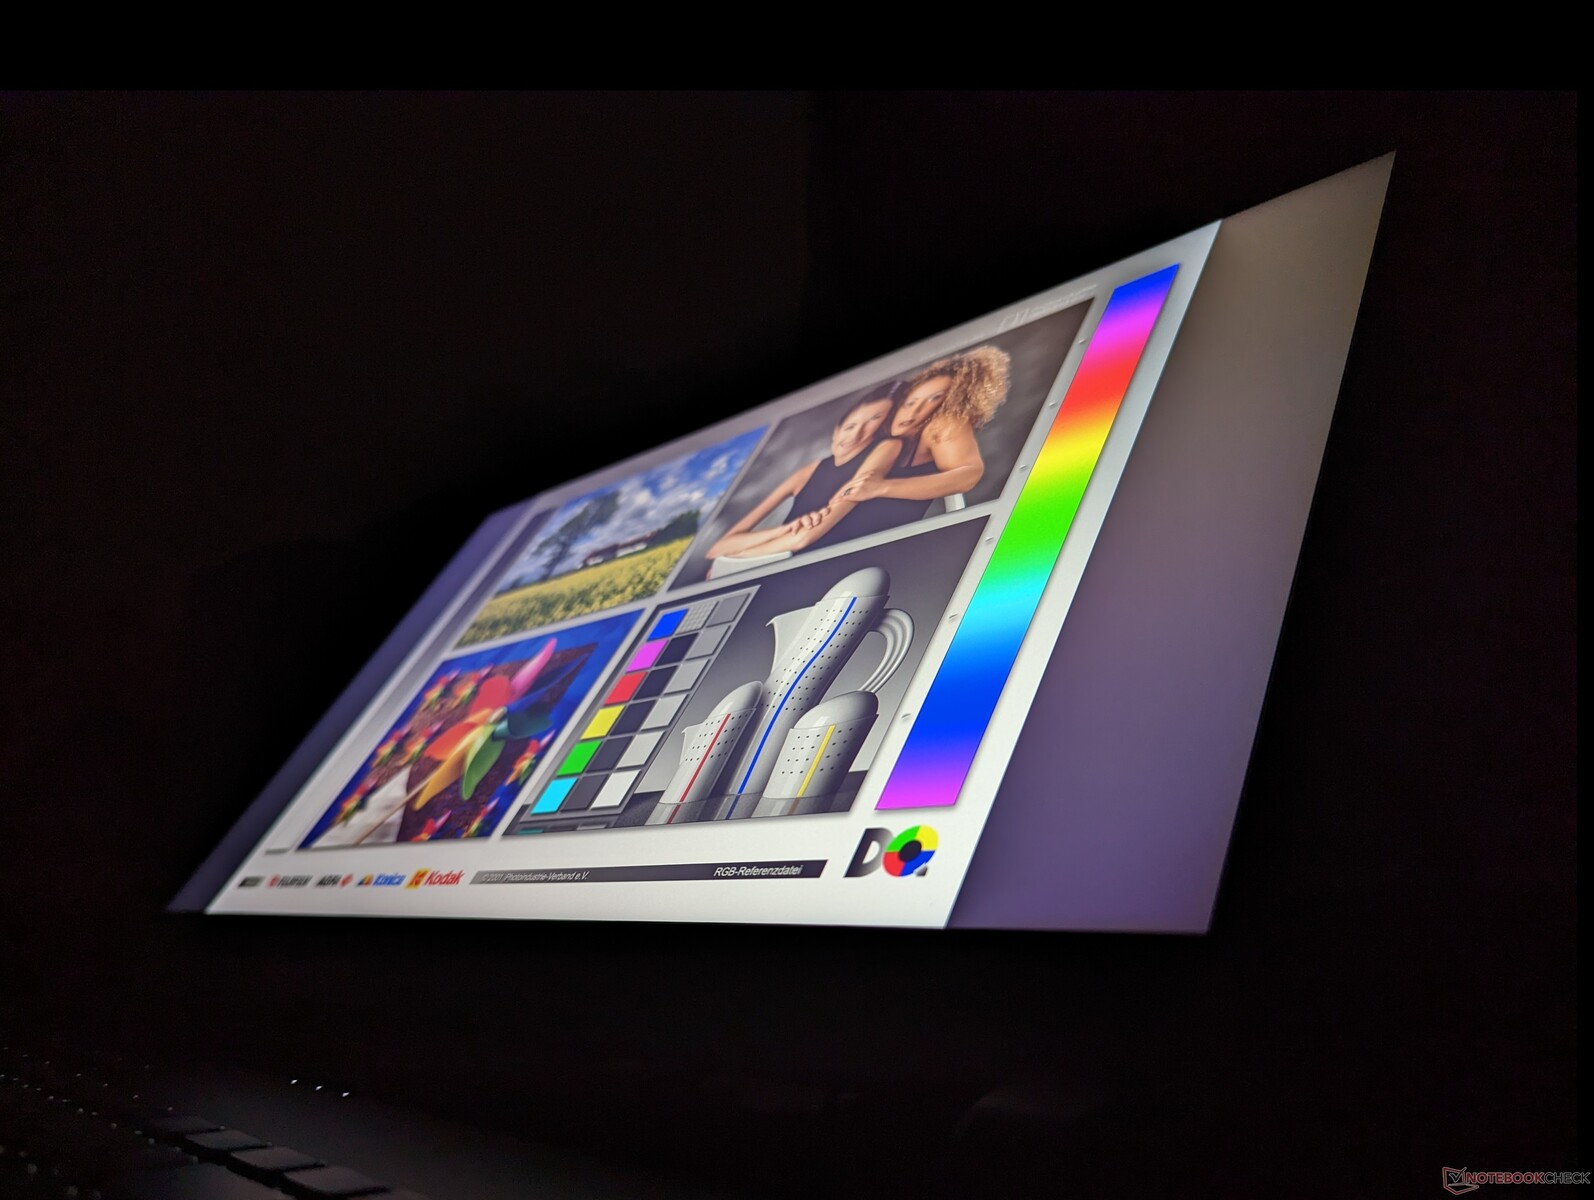
Display - 1.440p Sweet Spot
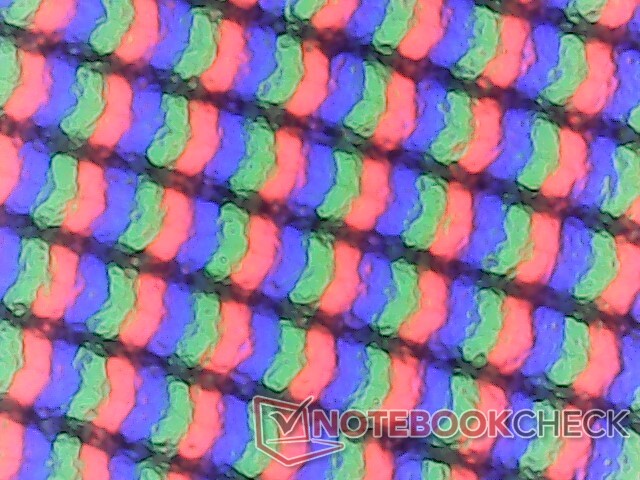
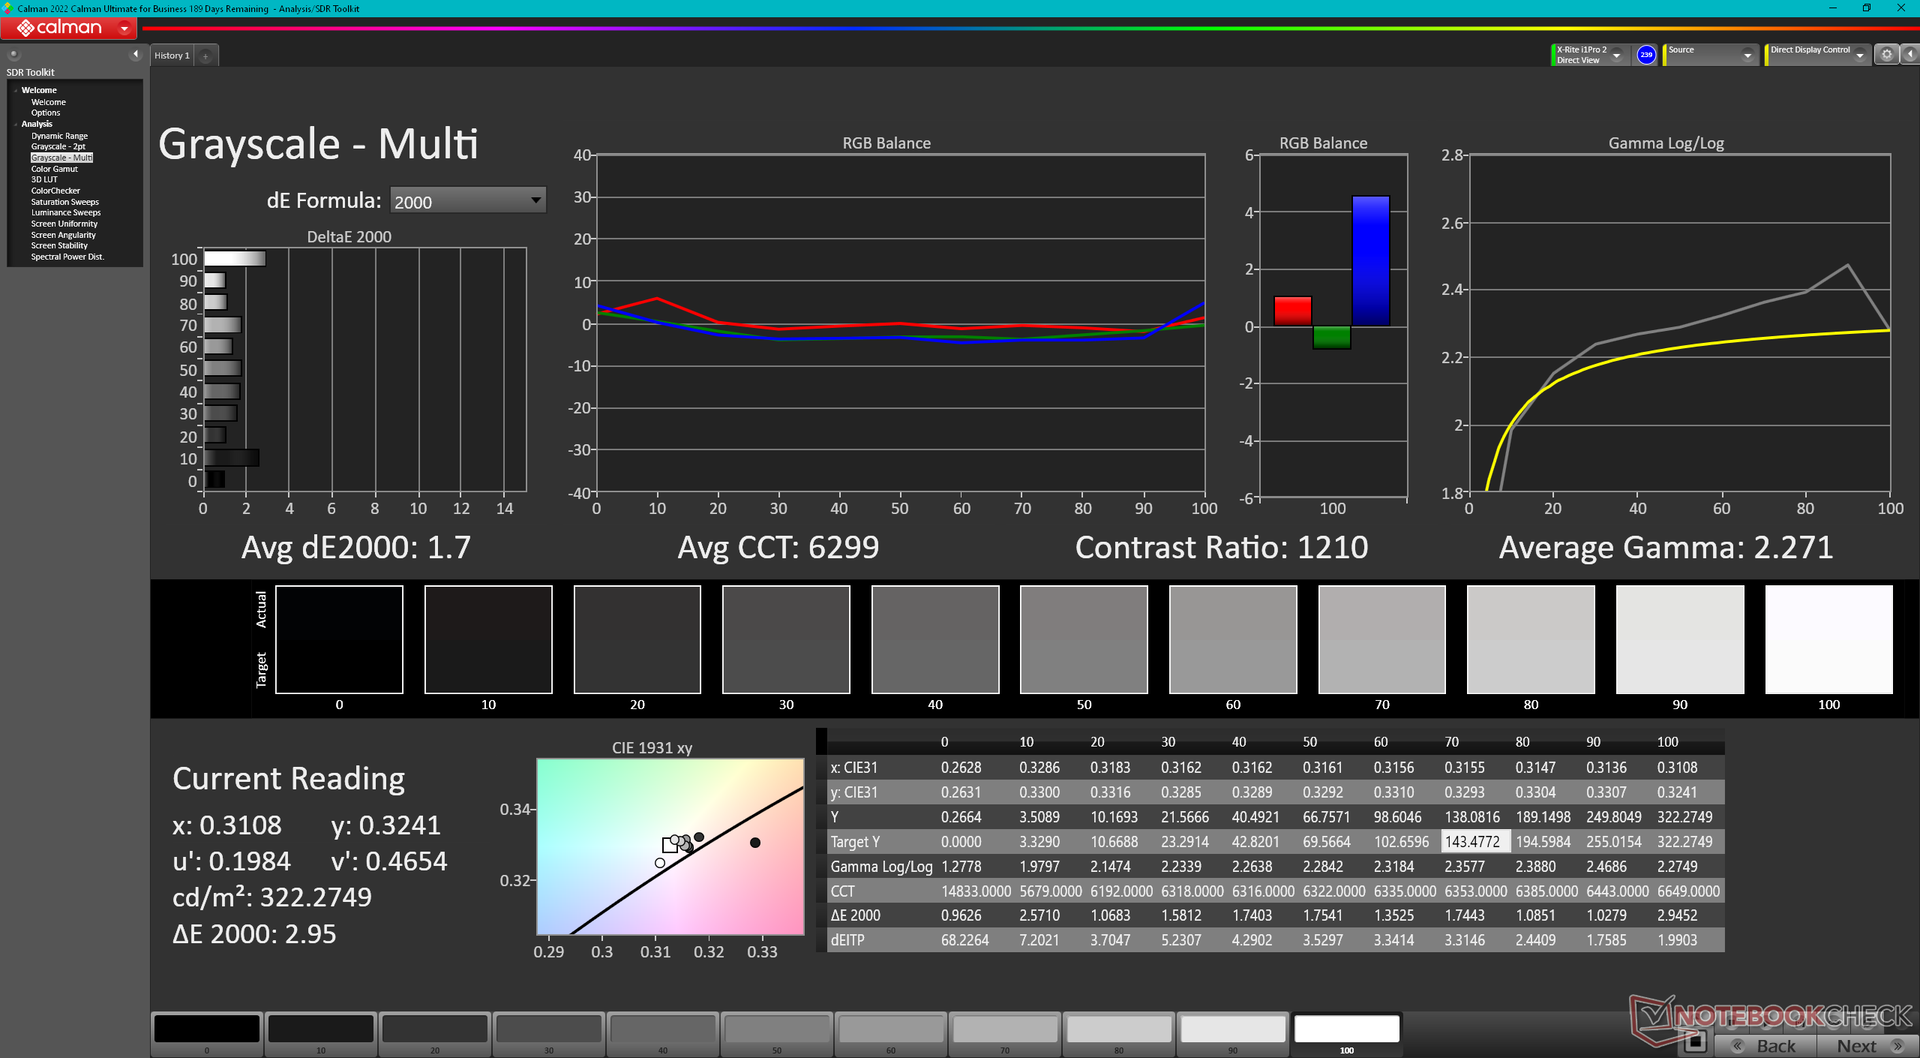
Das Modell 2023 verwendet das gleiche 240-Hz-BOE-NE173QHM-NZ2-IPS-Panel wie das Modell 2022. Unsere Messungen unten sind daher fast identisch mit denen des Vorjahres. Das ist nicht unbedingt eine schlechte Sache, da das Panel sehr schnelle Reaktionszeiten, volle DCI-P3-Farben und ein gutes Kontrastverhältnis bietet, um sowohl für Grafikbearbeitung als auch für Spiele geeignet zu sein. Nutzer, die auf der Suche nach 4K- oder OLED-Optionen sind, haben jedoch im Moment kein Glück.
| |||||||||||||||||||||||||
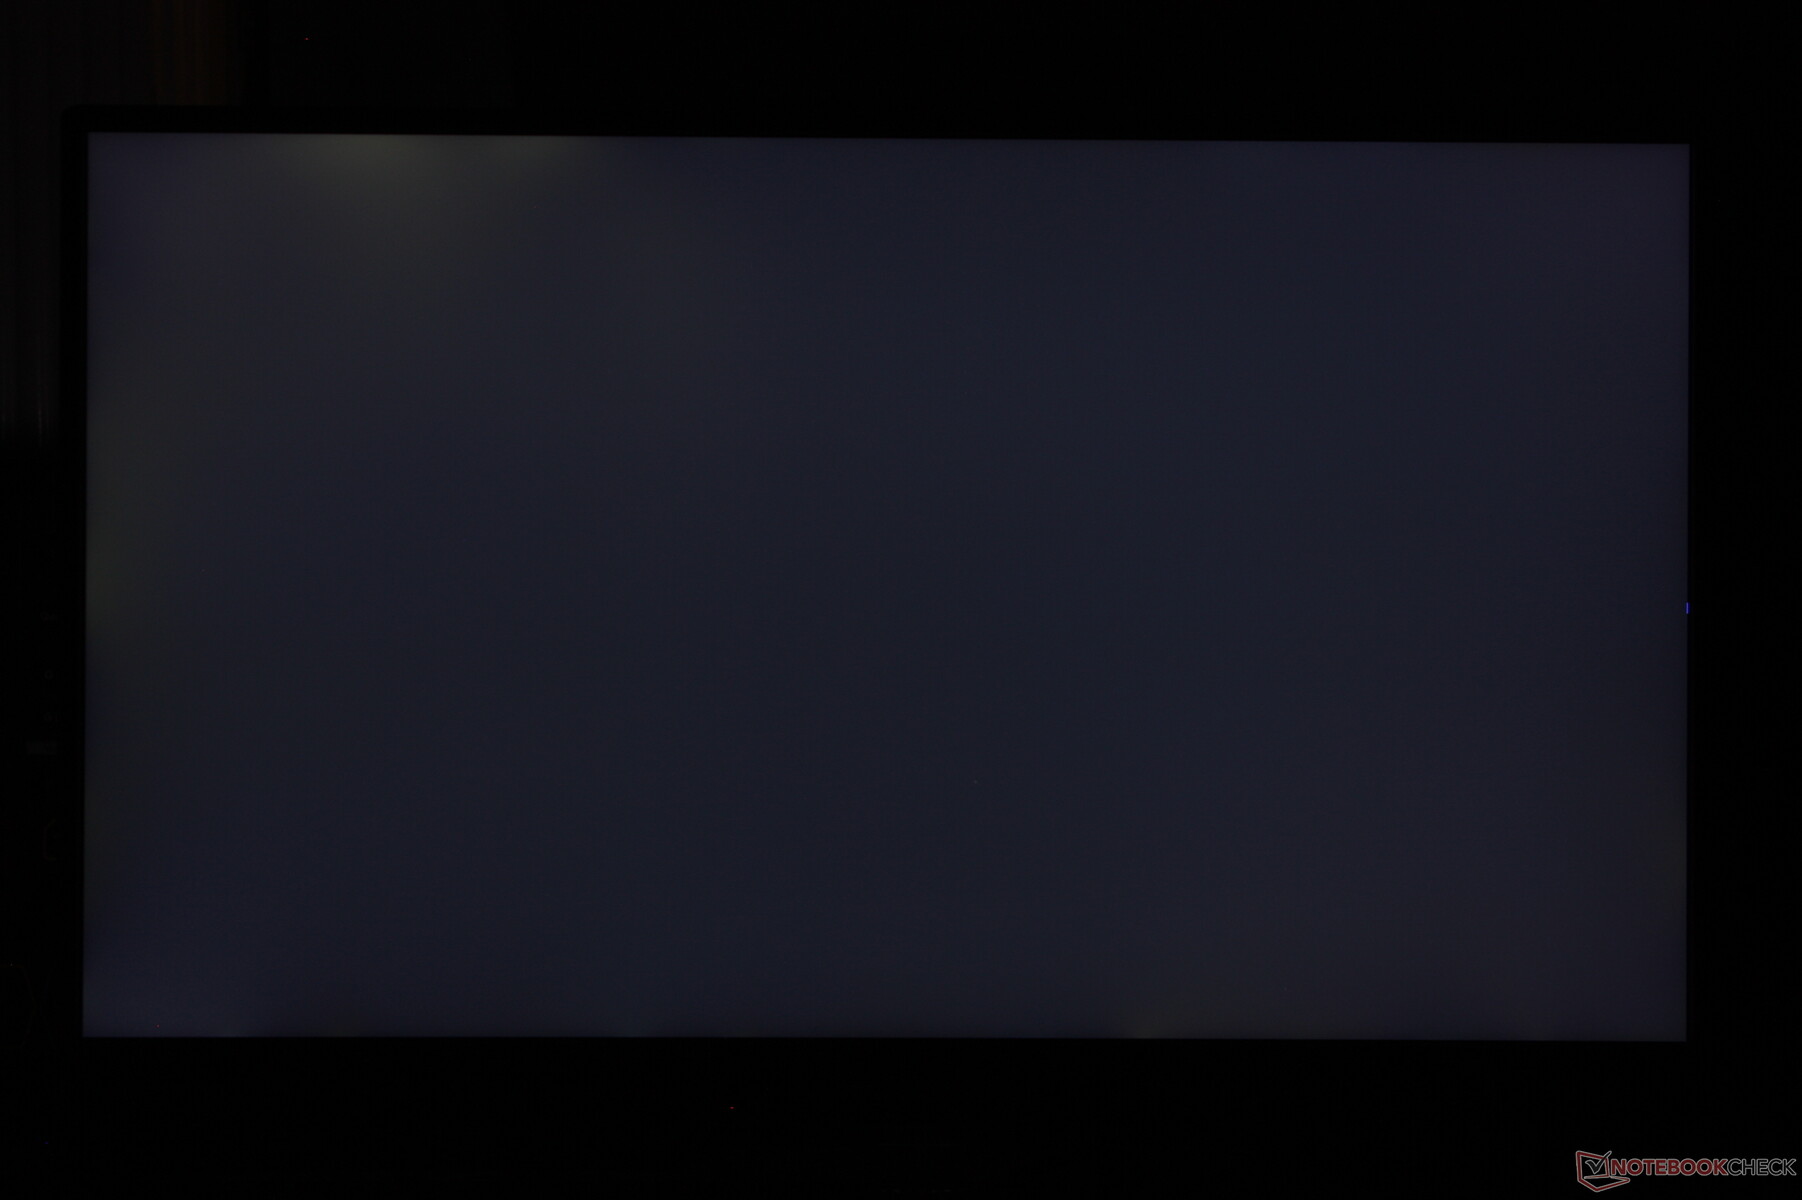
Ausleuchtung: 86 %
Helligkeit Akku: 322.5 cd/m²
Kontrast: 1112:1 (Schwarzwert: 0.29 cd/m²)
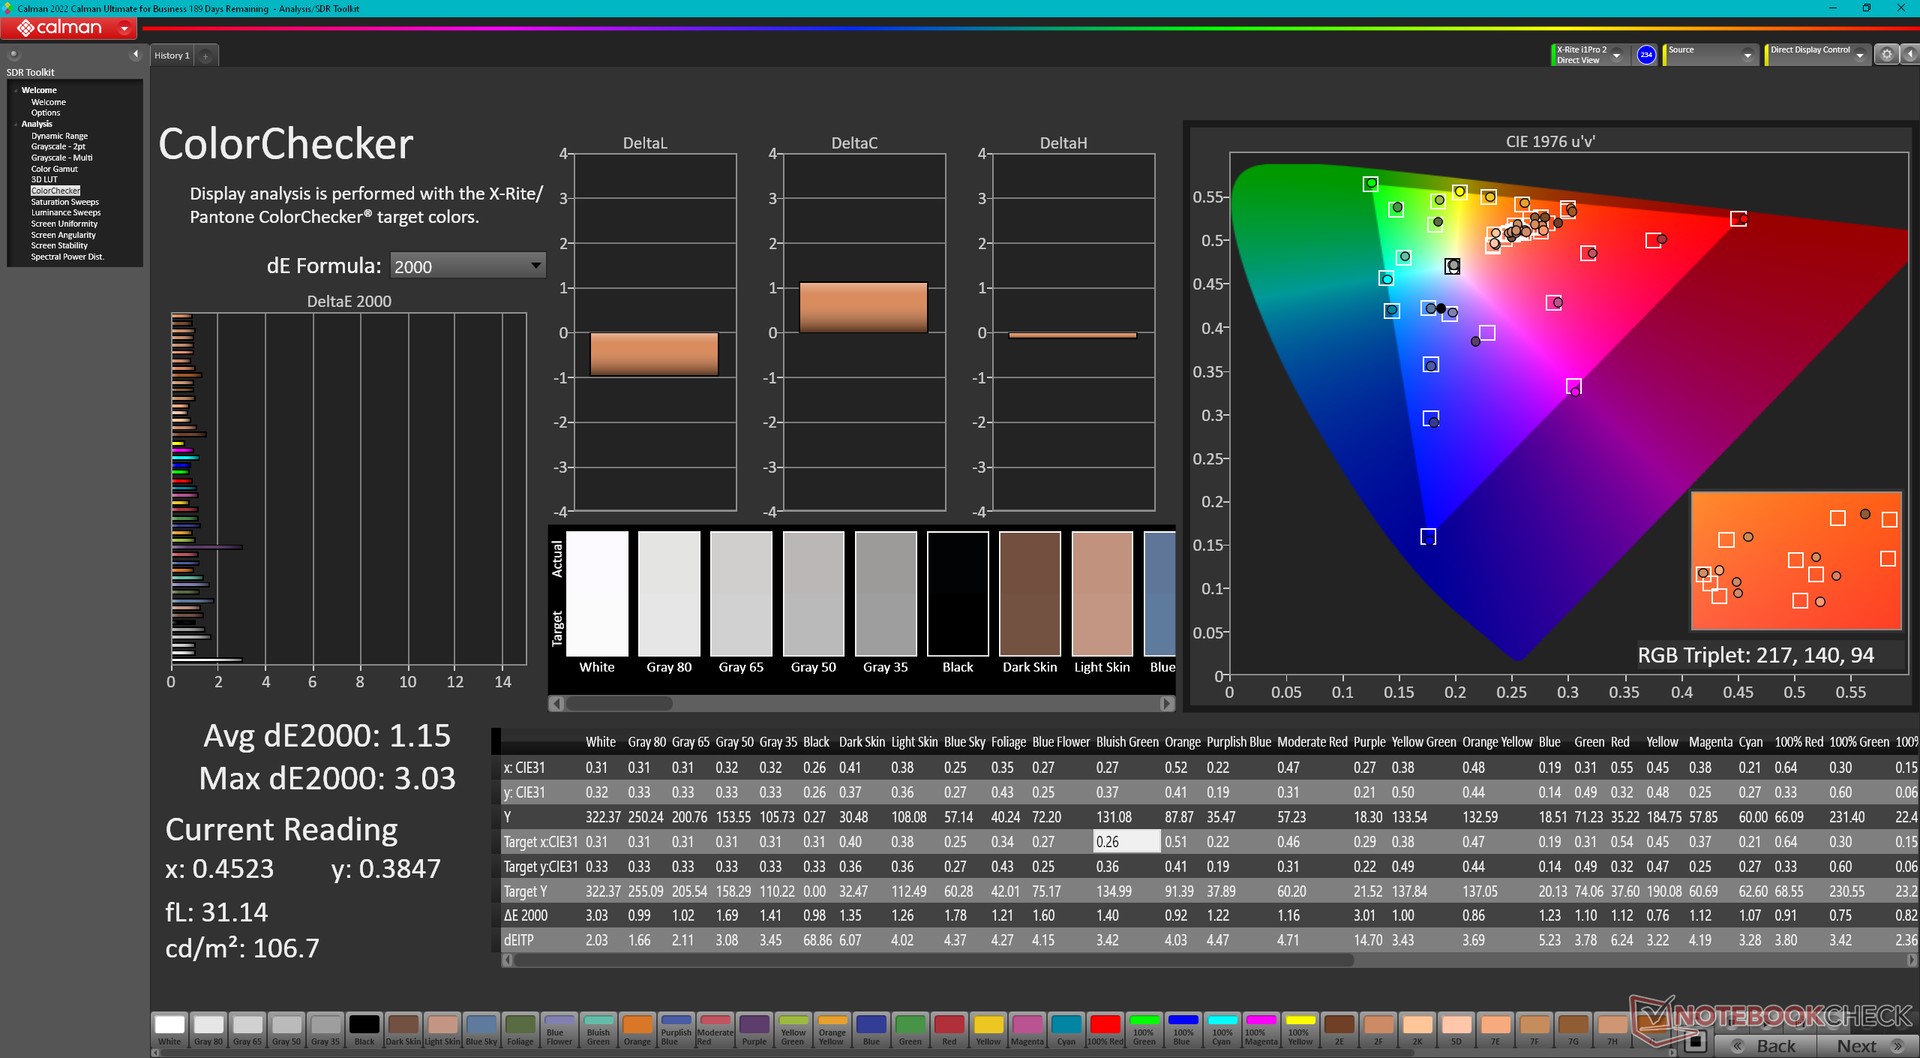
ΔE ColorChecker Calman: 1.15 | ∀{0.5-29.43 Ø4.71}
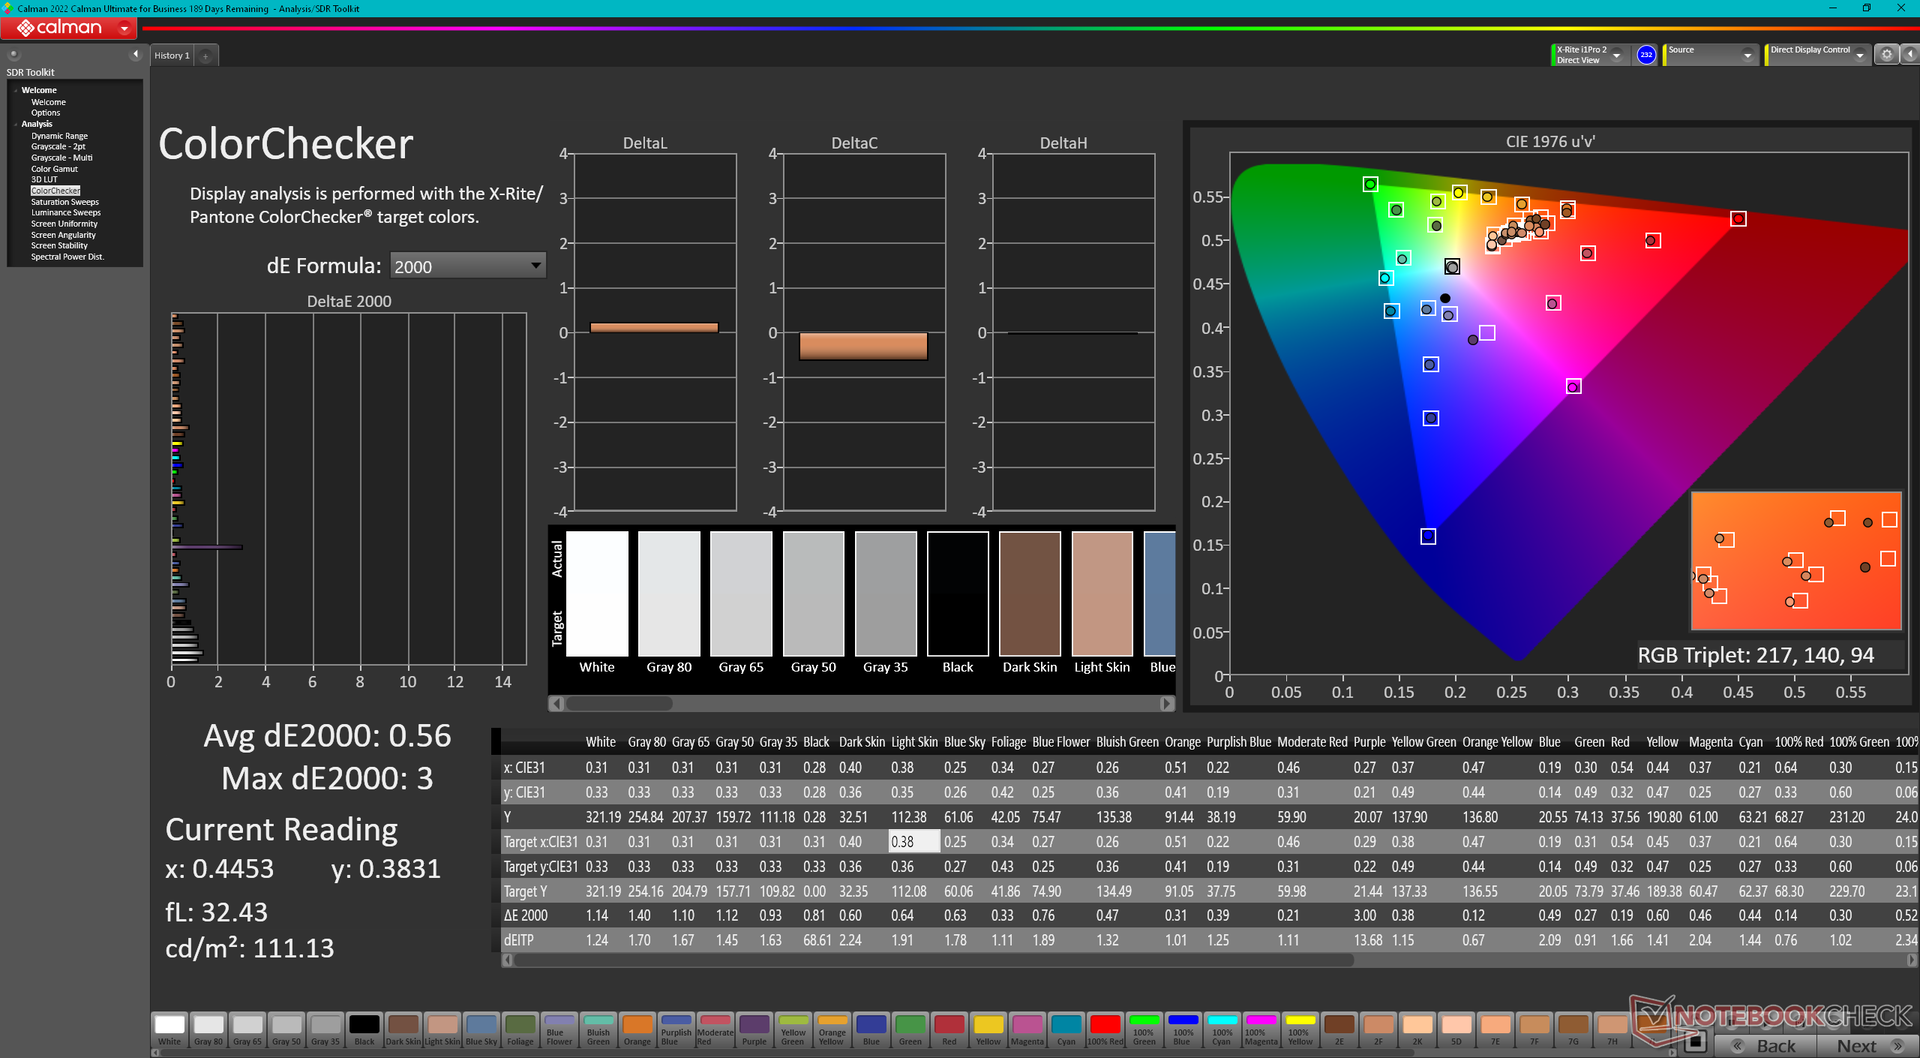
calibrated: 0.56
ΔE Greyscale Calman: 1.7 | ∀{0.09-98 Ø4.96}
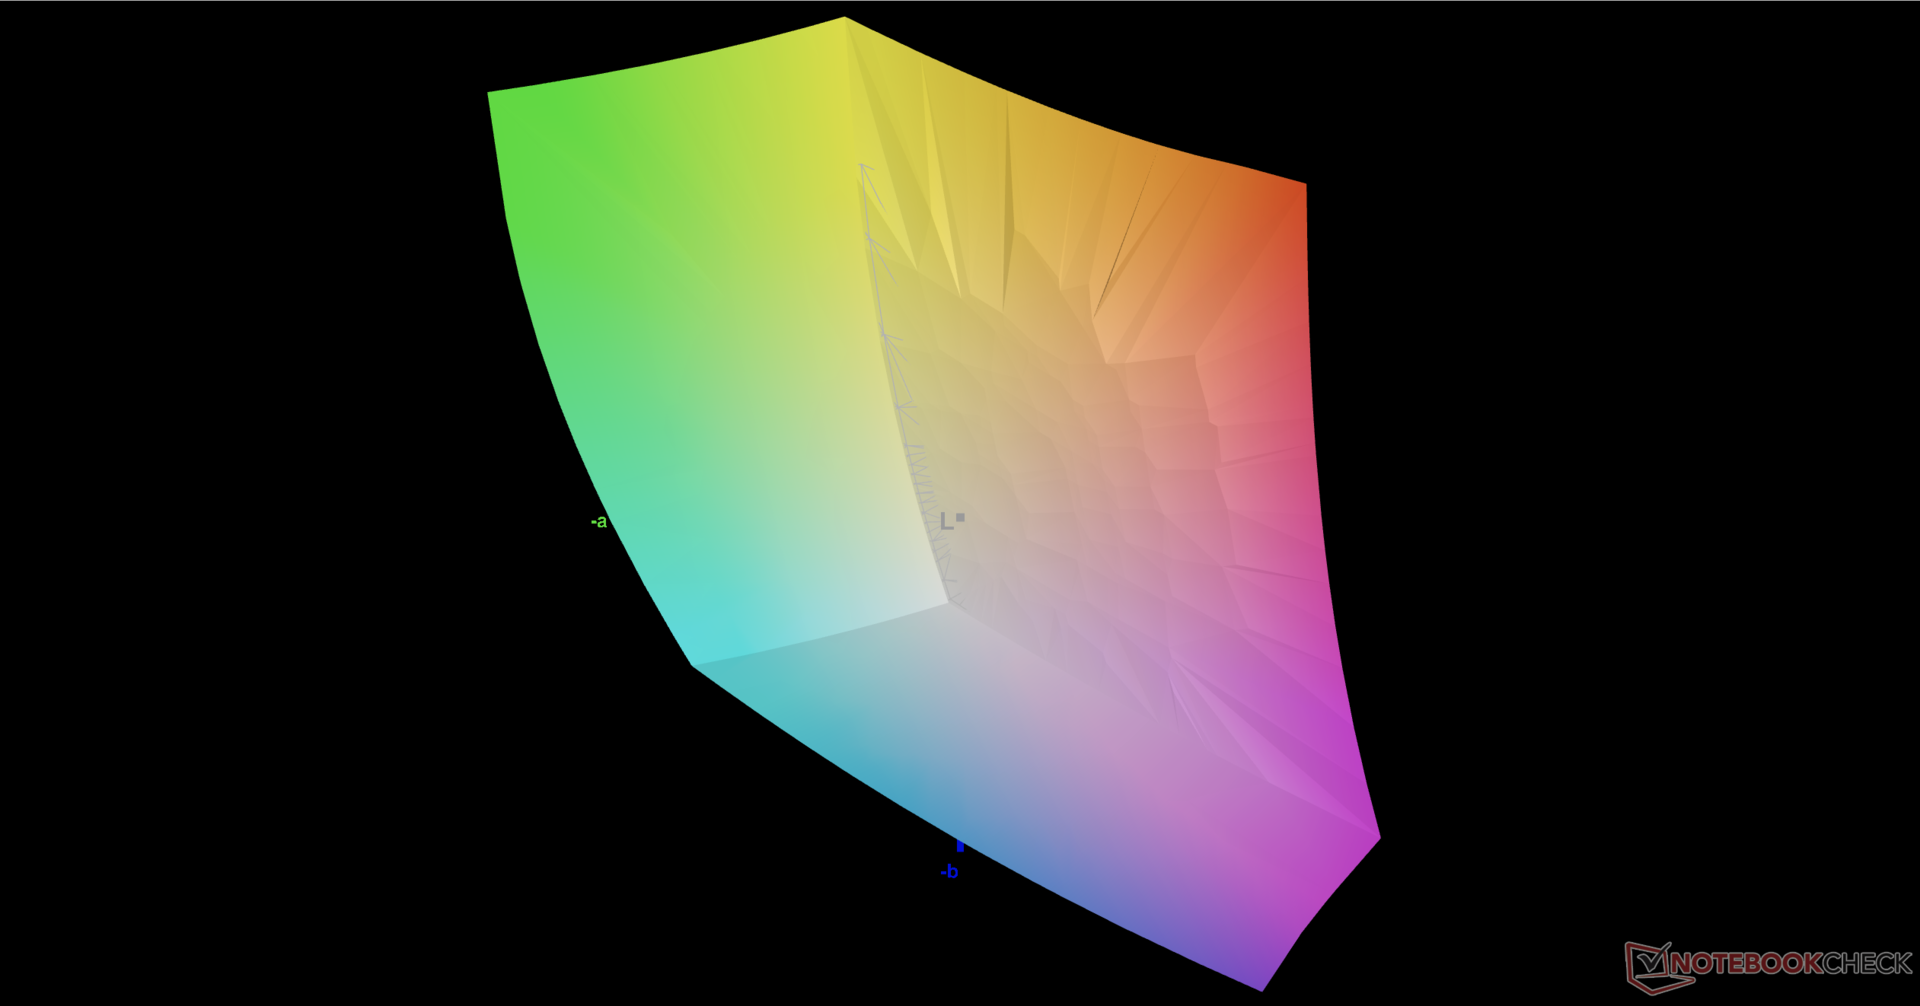
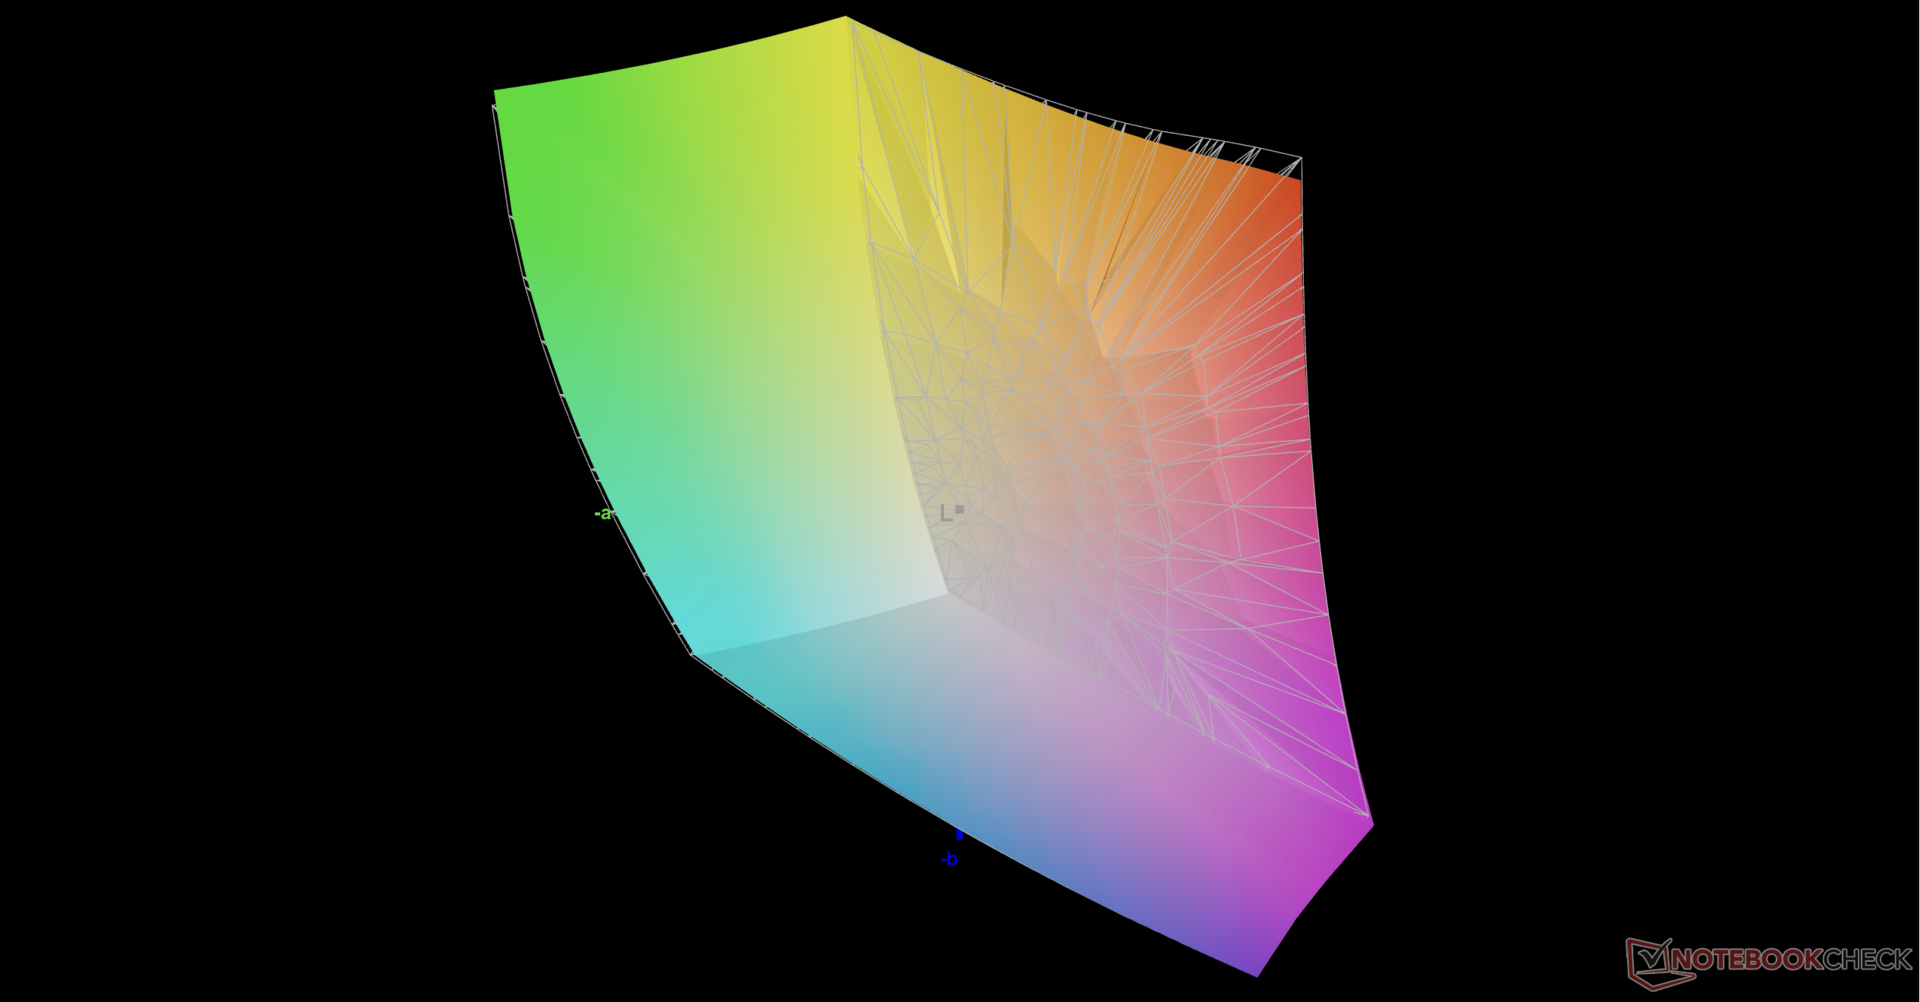
85.6% AdobeRGB 1998 (Argyll 3D)
100% sRGB (Argyll 3D)
98% Display P3 (Argyll 3D)
Gamma: 2.27
CCT: 6299 K
| Asus ROG Strix Scar 17 G733PY-XS96 NE173QHM-NZ2, IPS, 2560x1440, 17.3" | Asus ROG Strix Scar 17 SE G733CX-LL014W NE173QHM-NZ2, IPS, 2560x1440, 17.3" | MSI GE78HX 13VH-070US AU Optronics B170QAN01.2, IPS, 2560x1600, 17" | Eluktronics Mech-17 GP2 BOE NE170QDM-NZ1, IPS, 2560x1600, 17" | Aorus 17X XES Sharp SHP1563, IPS, 1920x1080, 17.3" | Alienware m17 R5 (R9 6900HX, RX 6850M XT) AU Optronics AUODBA3, IPS, 3840x2160, 17" | |
|---|---|---|---|---|---|---|
| Display | -1% | 0% | -16% | -15% | 1% | |
| Display P3 Coverage (%) | 98 | 97.1 -1% | 97.6 0% | 69.1 -29% | 70.1 -28% | 97.2 -1% |
| sRGB Coverage (%) | 100 | 99.9 0% | 99.9 0% | 99.7 0% | 99.9 0% | 99.6 0% |
| AdobeRGB 1998 Coverage (%) | 85.6 | 84.8 -1% | 86.5 1% | 69.8 -18% | 71.9 -16% | 88.4 3% |
| Response Times | 10% | 38% | -38% | 47% | -84% | |
| Response Time Grey 50% / Grey 80% * (ms) | 6.2 ? | 5.7 ? 8% | 4.2 ? 32% | 12 ? -94% | 3.4 ? 45% | 16.4 ? -165% |
| Response Time Black / White * (ms) | 11.4 ? | 10.1 ? 11% | 6.4 ? 44% | 9.4 ? 18% | 5.8 ? 49% | 11.6 ? -2% |
| PWM Frequency (Hz) | ||||||
| Bildschirm | 5% | -93% | -20% | -102% | -161% | |
| Helligkeit Bildmitte (cd/m²) | 322.5 | 320 -1% | 398.6 24% | 417.3 29% | 278 -14% | 484 50% |
| Brightness (cd/m²) | 317 | 303 -4% | 384 21% | 387 22% | 273 -14% | 449 42% |
| Brightness Distribution (%) | 86 | 87 1% | 89 3% | 87 1% | 79 -8% | 87 1% |
| Schwarzwert * (cd/m²) | 0.29 | 0.3 -3% | 0.46 -59% | 0.42 -45% | 0.26 10% | 0.55 -90% |
| Kontrast (:1) | 1112 | 1067 -4% | 867 -22% | 994 -11% | 1069 -4% | 880 -21% |
| Delta E Colorchecker * | 1.15 | 1.1 4% | 4.05 -252% | 2.14 -86% | 3.96 -244% | 4.8 -317% |
| Colorchecker dE 2000 max. * | 3.03 | 2.7 11% | 8.68 -186% | 4.09 -35% | 10.78 -256% | 7.48 -147% |
| Colorchecker dE 2000 calibrated * | 0.56 | 1.02 -82% | 0.42 25% | 1.07 -91% | 4.74 -746% | |
| Delta E Graustufen * | 1.7 | 1.1 35% | 6.5 -282% | 3.1 -82% | 6.8 -300% | 5.5 -224% |
| Gamma | 2.27 97% | 2.13 103% | 2.11 104% | 2.19 100% | 2.224 99% | 2.42 91% |
| CCT | 6299 103% | 6599 98% | 7518 86% | 6040 108% | 7651 85% | 6148 106% |
| Durchschnitt gesamt (Programm / Settings) | 5% /
4% | -18% /
-54% | -25% /
-22% | -23% /
-62% | -81% /
-116% |
* ... kleinere Werte sind besser
Das Display wird vorkalibriert geliefert ab Werk mit sehr niedrigen durchschnittlichen Graustufen- und Farb-DeltaE-Werten von nur 1,7 bzw. 1,15. Eine Kalibrierung durch den Endbenutzer ist daher nicht erforderlich.


Reaktionszeiten (Response Times) des Displays
| ↔ Reaktionszeiten Schwarz zu Weiß | ||
|---|---|---|
| 11.4 ms ... steigend ↗ und fallend ↘ kombiniert | ↗ 5.9 ms steigend | 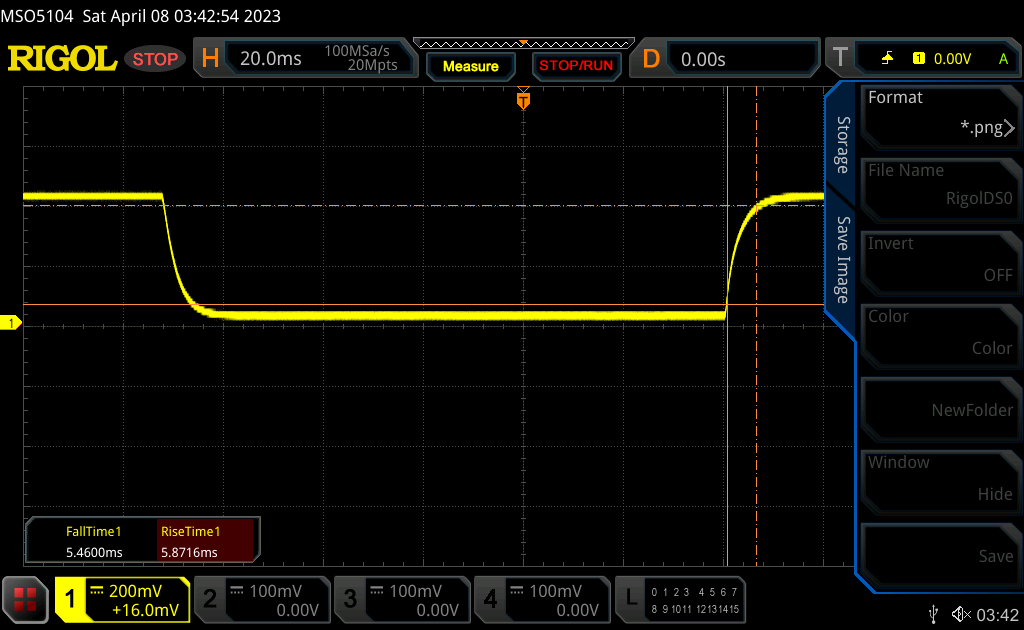 |
| ↘ 5.5 ms fallend | ||
| Die gemessenen Reaktionszeiten sind gut, für anspruchsvolle Spieler könnten der Bildschirm jedoch zu langsam sein. Im Vergleich rangierten die bei uns getesteten Geräte von 0.1 (Minimum) zu 240 (Maximum) ms. » 31 % aller Screens waren schneller als der getestete. Daher sind die gemessenen Reaktionszeiten besser als der Durchschnitt aller vermessenen Geräte (19.8 ms). | ||
| ↔ Reaktionszeiten 50% Grau zu 80% Grau | ||
| 6.2 ms ... steigend ↗ und fallend ↘ kombiniert | ↗ 2.8 ms steigend | 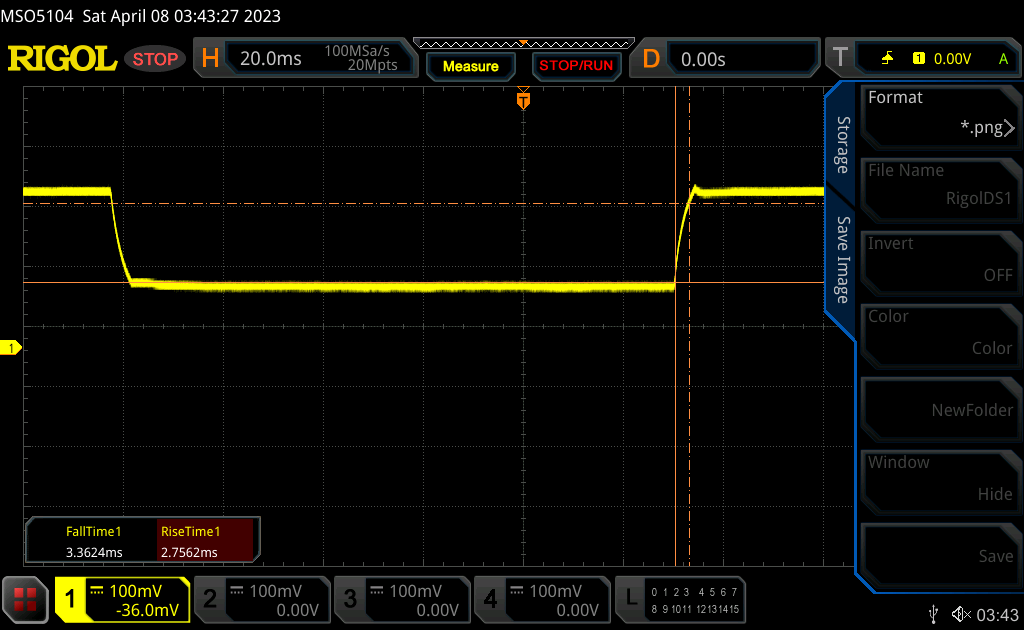 |
| ↘ 3.4 ms fallend | ||
| Die gemessenen Reaktionszeiten sind sehr kurz, wodurch sich der Bildschirm auch für schnelle 3D Spiele eignen sollte. Im Vergleich rangierten die bei uns getesteten Geräte von 0.165 (Minimum) zu 636 (Maximum) ms. » 19 % aller Screens waren schneller als der getestete. Daher sind die gemessenen Reaktionszeiten besser als der Durchschnitt aller vermessenen Geräte (31 ms). | ||
Bildschirm-Flackern / PWM (Pulse-Width Modulation)
| Flackern / PWM nicht festgestellt | 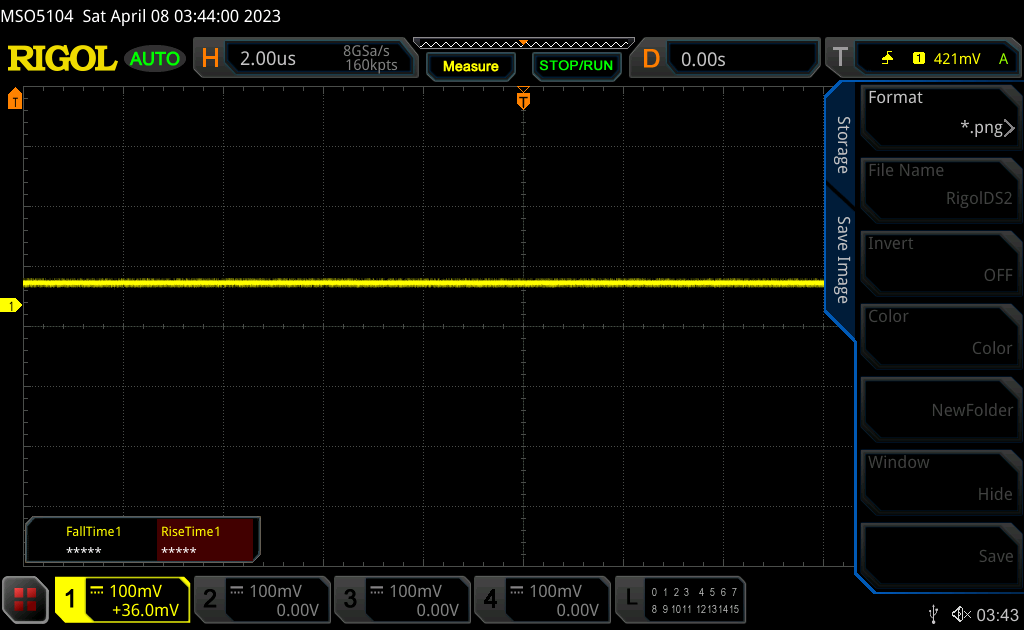 | ||
Im Vergleich: 52 % aller getesteten Geräte nutzten kein PWM um die Helligkeit zu reduzieren. Wenn PWM eingesetzt wurde, dann bei einer Frequenz von durchschnittlich 7757 (Minimum 5, Maximum 343500) Hz. | |||
Performance - Aufsteigender Ryzen
Testbedingungen
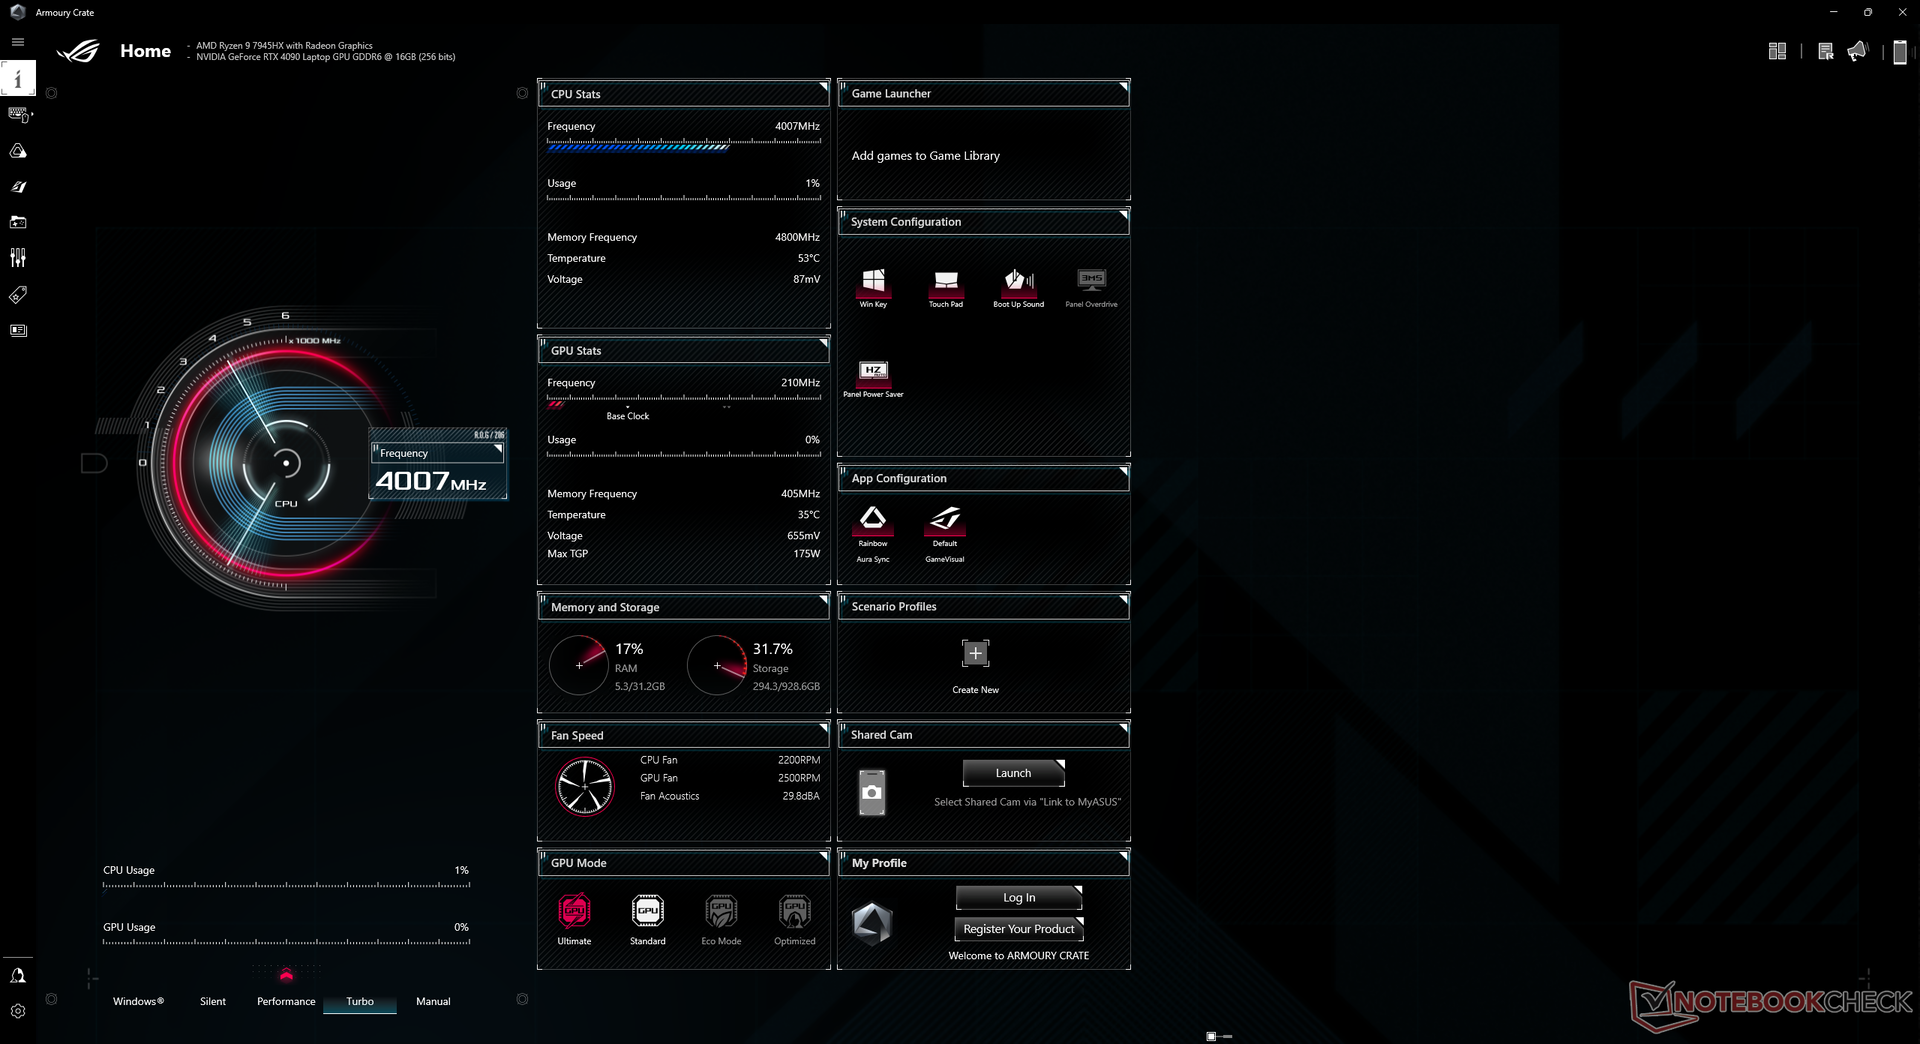
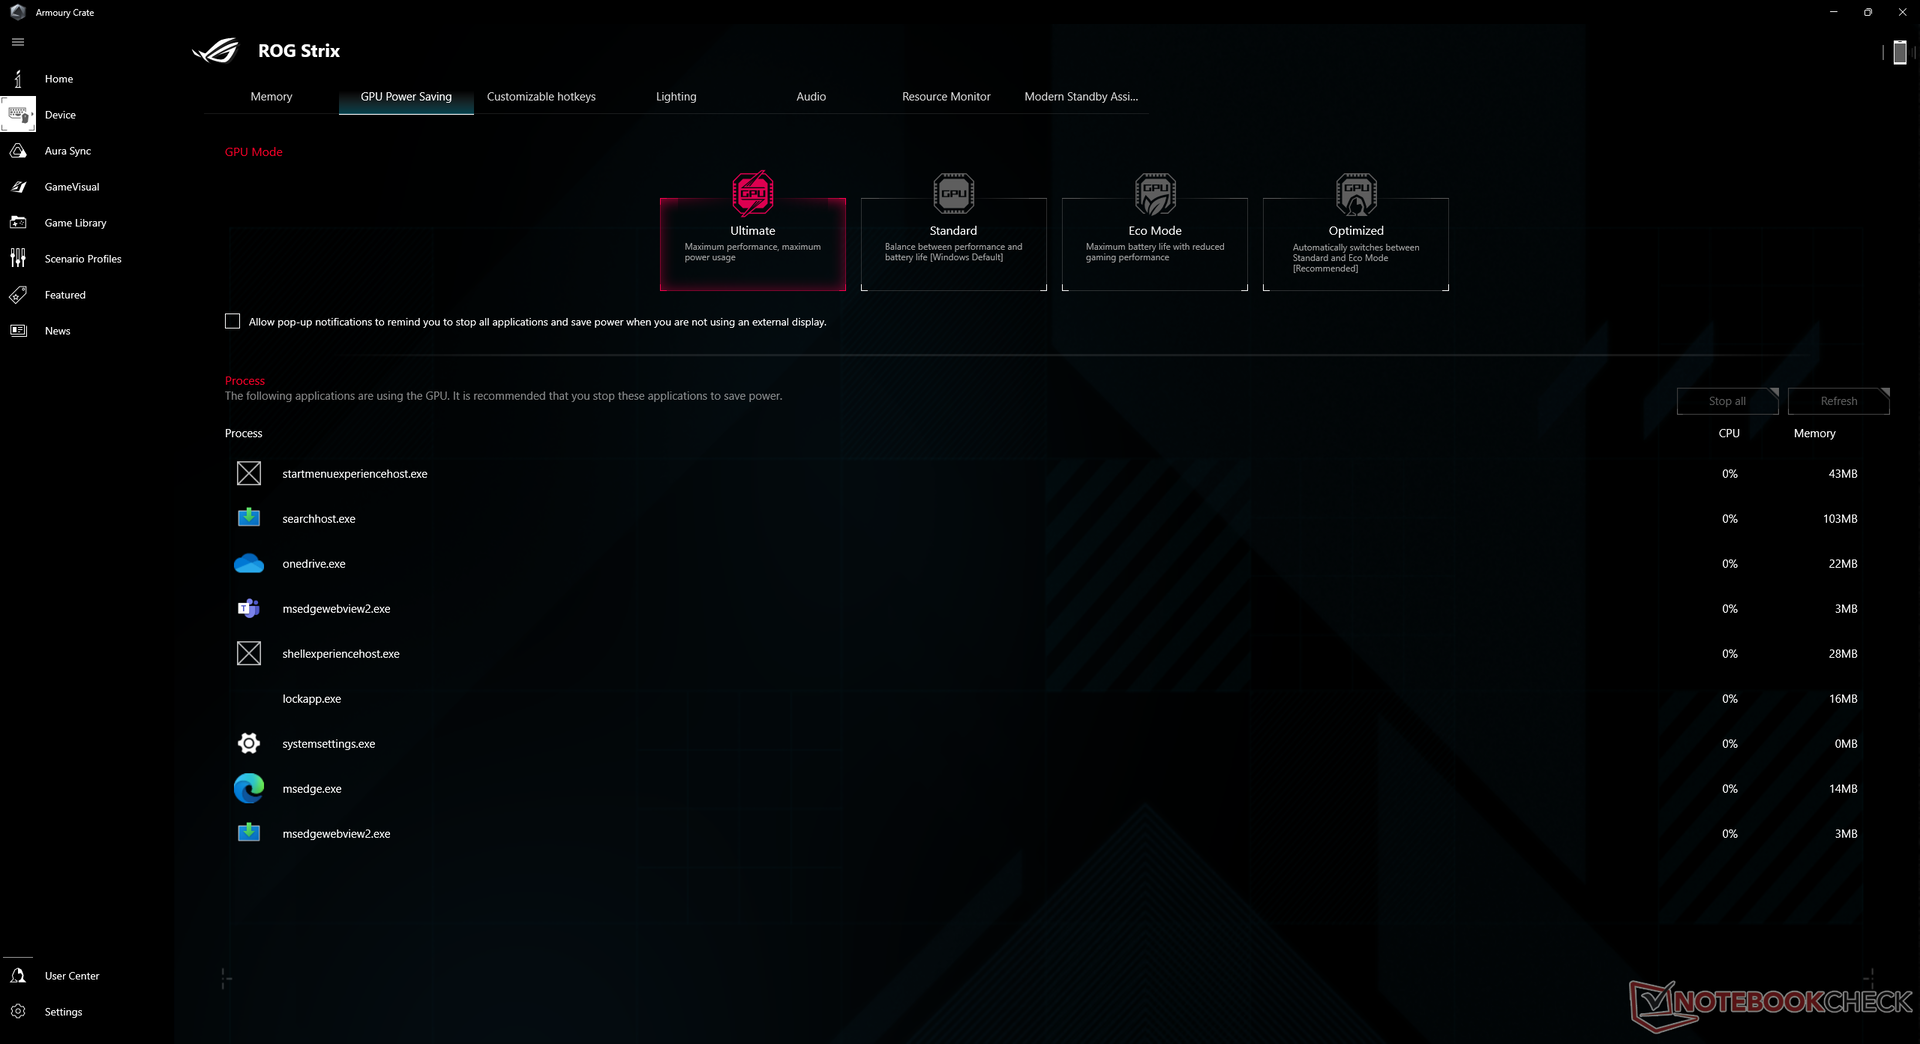
Wir haben unser Gerät über die Asus Armoury Crate in den Turbo-Modus und den diskreten GPU-Modus versetzt, bevor wir die folgenden Benchmarks durchgeführt haben. Besitzer sollten sich mit der Armoury Crate vertraut machen, da sie die Schaltzentrale für Energiemodi, MUX, Asus Aura und andere modellspezifische Funktionen und Updates ist.
Es ist erwähnenswert, dass wir bei unserem Testgerät einige Probleme hatten. Beim Umschalten zwischen Optimus- und dGPU-Modus konnte das System manchmal nicht geladen werden, wenn es neu gestartet wurde. Ein harter Neustart war dann erforderlich.
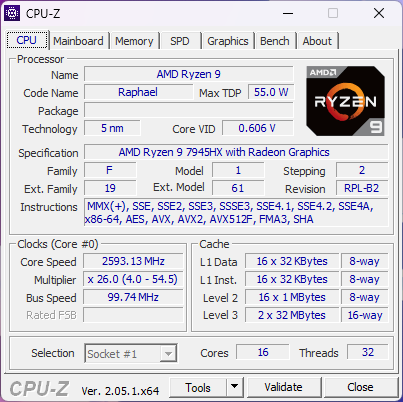
Prozessor
Die Prozessorleistung ist eine der schnellsten, die es auf einem Laptop gibt, wie in unserem Test des Ryzen 9 7945HX zu sehen ist. Nichtsdestotrotz liegt der Prozessor immer noch hinter dem konkurrierenden Core i9-13950HX oder i9-13900HX zurück, wenn es um Single-Thread-Operationen geht.
Cinebench R15 Multi Loop
Cinebench R23: Multi Core | Single Core
Cinebench R20: CPU (Multi Core) | CPU (Single Core)
Cinebench R15: CPU Multi 64Bit | CPU Single 64Bit
Blender: v2.79 BMW27 CPU
7-Zip 18.03: 7z b 4 | 7z b 4 -mmt1
Geekbench 5.5: Multi-Core | Single-Core
HWBOT x265 Benchmark v2.2: 4k Preset
LibreOffice : 20 Documents To PDF
R Benchmark 2.5: Overall mean
| CPU Performance Rating | |
| Intel Core i9-13900K @253W | |
| Asus ROG Strix Scar 17 G733PY-XS96 | |
| Eluktronics Mech-17 GP2 | |
| MSI GE78HX 13VH-070US | |
| Durchschnittliche AMD Ryzen 9 7945HX | |
| Uniwill GM6PX7X RTX 4070 | |
| Asus ROG Strix Scar 17 SE G733CX-LL014W | |
| Aorus 17X XES | |
| MSI Pulse GL76 12UGK | |
| Asus ROG Zephyrus S17 GX703HSD | |
| Alienware m17 R5 (R9 6900HX, RX 6850M XT) | |
| MSI Delta 15 A5EFK | |
| Lenovo Legion C7 15IMH05 82EH0030GE | |
| Cinebench R23 / Multi Core | |
| Intel Core i9-13900K @253W | |
| Asus ROG Strix Scar 17 G733PY-XS96 | |
| Durchschnittliche AMD Ryzen 9 7945HX (30783 - 34613, n=9) | |
| MSI GE78HX 13VH-070US | |
| Eluktronics Mech-17 GP2 | |
| Uniwill GM6PX7X RTX 4070 | |
| Asus ROG Strix Scar 17 SE G733CX-LL014W | |
| Aorus 17X XES | |
| MSI Pulse GL76 12UGK | |
| Alienware m17 R5 (R9 6900HX, RX 6850M XT) | |
| Asus ROG Zephyrus S17 GX703HSD | |
| MSI Delta 15 A5EFK | |
| Lenovo Legion C7 15IMH05 82EH0030GE | |
| Cinebench R23 / Single Core | |
| Intel Core i9-13900K @253W | |
| MSI GE78HX 13VH-070US | |
| Eluktronics Mech-17 GP2 | |
| Aorus 17X XES | |
| Durchschnittliche AMD Ryzen 9 7945HX (1861 - 1957, n=9) | |
| Asus ROG Strix Scar 17 SE G733CX-LL014W | |
| Asus ROG Strix Scar 17 G733PY-XS96 | |
| Uniwill GM6PX7X RTX 4070 | |
| MSI Pulse GL76 12UGK | |
| Asus ROG Zephyrus S17 GX703HSD | |
| Alienware m17 R5 (R9 6900HX, RX 6850M XT) | |
| MSI Delta 15 A5EFK | |
| Lenovo Legion C7 15IMH05 82EH0030GE | |
| Cinebench R20 / CPU (Multi Core) | |
| Intel Core i9-13900K @253W | |
| Asus ROG Strix Scar 17 G733PY-XS96 | |
| Durchschnittliche AMD Ryzen 9 7945HX (10025 - 13769, n=9) | |
| MSI GE78HX 13VH-070US | |
| Eluktronics Mech-17 GP2 | |
| Uniwill GM6PX7X RTX 4070 | |
| Asus ROG Strix Scar 17 SE G733CX-LL014W | |
| Aorus 17X XES | |
| MSI Pulse GL76 12UGK | |
| Alienware m17 R5 (R9 6900HX, RX 6850M XT) | |
| Asus ROG Zephyrus S17 GX703HSD | |
| MSI Delta 15 A5EFK | |
| Lenovo Legion C7 15IMH05 82EH0030GE | |
| Cinebench R20 / CPU (Single Core) | |
| Intel Core i9-13900K @253W | |
| MSI GE78HX 13VH-070US | |
| Eluktronics Mech-17 GP2 | |
| Durchschnittliche AMD Ryzen 9 7945HX (712 - 760, n=9) | |
| Asus ROG Strix Scar 17 SE G733CX-LL014W | |
| Aorus 17X XES | |
| Asus ROG Strix Scar 17 G733PY-XS96 | |
| Uniwill GM6PX7X RTX 4070 | |
| MSI Pulse GL76 12UGK | |
| Alienware m17 R5 (R9 6900HX, RX 6850M XT) | |
| Asus ROG Zephyrus S17 GX703HSD | |
| MSI Delta 15 A5EFK | |
| Lenovo Legion C7 15IMH05 82EH0030GE | |
| Cinebench R15 / CPU Multi 64Bit | |
| Intel Core i9-13900K @253W | |
| Asus ROG Strix Scar 17 G733PY-XS96 | |
| Durchschnittliche AMD Ryzen 9 7945HX (4998 - 5663, n=10) | |
| MSI GE78HX 13VH-070US | |
| Eluktronics Mech-17 GP2 | |
| Uniwill GM6PX7X RTX 4070 | |
| Asus ROG Strix Scar 17 SE G733CX-LL014W | |
| Aorus 17X XES | |
| MSI Pulse GL76 12UGK | |
| Alienware m17 R5 (R9 6900HX, RX 6850M XT) | |
| Asus ROG Zephyrus S17 GX703HSD | |
| MSI Delta 15 A5EFK | |
| Lenovo Legion C7 15IMH05 82EH0030GE | |
| Cinebench R15 / CPU Single 64Bit | |
| Intel Core i9-13900K @253W | |
| Asus ROG Strix Scar 17 G733PY-XS96 | |
| Durchschnittliche AMD Ryzen 9 7945HX (290 - 311, n=10) | |
| MSI GE78HX 13VH-070US | |
| Eluktronics Mech-17 GP2 | |
| Aorus 17X XES | |
| Asus ROG Strix Scar 17 SE G733CX-LL014W | |
| Uniwill GM6PX7X RTX 4070 | |
| MSI Pulse GL76 12UGK | |
| Alienware m17 R5 (R9 6900HX, RX 6850M XT) | |
| Asus ROG Zephyrus S17 GX703HSD | |
| MSI Delta 15 A5EFK | |
| Lenovo Legion C7 15IMH05 82EH0030GE | |
| Blender / v2.79 BMW27 CPU | |
| Lenovo Legion C7 15IMH05 82EH0030GE | |
| MSI Delta 15 A5EFK | |
| Asus ROG Zephyrus S17 GX703HSD | |
| Alienware m17 R5 (R9 6900HX, RX 6850M XT) | |
| Aorus 17X XES | |
| MSI Pulse GL76 12UGK | |
| Asus ROG Strix Scar 17 SE G733CX-LL014W | |
| Uniwill GM6PX7X RTX 4070 | |
| Eluktronics Mech-17 GP2 | |
| MSI GE78HX 13VH-070US | |
| Durchschnittliche AMD Ryzen 9 7945HX (87 - 100, n=9) | |
| Asus ROG Strix Scar 17 G733PY-XS96 | |
| Intel Core i9-13900K @253W | |
| 7-Zip 18.03 / 7z b 4 | |
| Intel Core i9-13900K @253W | |
| Asus ROG Strix Scar 17 G733PY-XS96 | |
| Durchschnittliche AMD Ryzen 9 7945HX (123364 - 140932, n=9) | |
| Eluktronics Mech-17 GP2 | |
| MSI GE78HX 13VH-070US | |
| Uniwill GM6PX7X RTX 4070 | |
| Asus ROG Strix Scar 17 SE G733CX-LL014W | |
| Aorus 17X XES | |
| MSI Pulse GL76 12UGK | |
| Alienware m17 R5 (R9 6900HX, RX 6850M XT) | |
| MSI Delta 15 A5EFK | |
| Asus ROG Zephyrus S17 GX703HSD | |
| Lenovo Legion C7 15IMH05 82EH0030GE | |
| 7-Zip 18.03 / 7z b 4 -mmt1 | |
| Asus ROG Strix Scar 17 G733PY-XS96 | |
| Intel Core i9-13900K @253W | |
| Durchschnittliche AMD Ryzen 9 7945HX (7319 - 7711, n=9) | |
| MSI GE78HX 13VH-070US | |
| Eluktronics Mech-17 GP2 | |
| Aorus 17X XES | |
| Asus ROG Strix Scar 17 SE G733CX-LL014W | |
| Uniwill GM6PX7X RTX 4070 | |
| Asus ROG Zephyrus S17 GX703HSD | |
| MSI Delta 15 A5EFK | |
| Alienware m17 R5 (R9 6900HX, RX 6850M XT) | |
| MSI Pulse GL76 12UGK | |
| Lenovo Legion C7 15IMH05 82EH0030GE | |
| Geekbench 5.5 / Multi-Core | |
| Intel Core i9-13900K @253W | |
| MSI GE78HX 13VH-070US | |
| Eluktronics Mech-17 GP2 | |
| Durchschnittliche AMD Ryzen 9 7945HX (18372 - 20394, n=9) | |
| Asus ROG Strix Scar 17 G733PY-XS96 | |
| Uniwill GM6PX7X RTX 4070 | |
| Asus ROG Strix Scar 17 SE G733CX-LL014W | |
| Aorus 17X XES | |
| MSI Pulse GL76 12UGK | |
| Alienware m17 R5 (R9 6900HX, RX 6850M XT) | |
| Asus ROG Zephyrus S17 GX703HSD | |
| MSI Delta 15 A5EFK | |
| Lenovo Legion C7 15IMH05 82EH0030GE | |
| Geekbench 5.5 / Single-Core | |
| Intel Core i9-13900K @253W | |
| MSI GE78HX 13VH-070US | |
| Durchschnittliche AMD Ryzen 9 7945HX (1960 - 2158, n=9) | |
| Eluktronics Mech-17 GP2 | |
| Asus ROG Strix Scar 17 G733PY-XS96 | |
| Aorus 17X XES | |
| Asus ROG Strix Scar 17 SE G733CX-LL014W | |
| Uniwill GM6PX7X RTX 4070 | |
| MSI Pulse GL76 12UGK | |
| Asus ROG Zephyrus S17 GX703HSD | |
| Alienware m17 R5 (R9 6900HX, RX 6850M XT) | |
| MSI Delta 15 A5EFK | |
| Lenovo Legion C7 15IMH05 82EH0030GE | |
| HWBOT x265 Benchmark v2.2 / 4k Preset | |
| Intel Core i9-13900K @253W | |
| Asus ROG Strix Scar 17 G733PY-XS96 | |
| Durchschnittliche AMD Ryzen 9 7945HX (33.8 - 37.6, n=8) | |
| MSI GE78HX 13VH-070US | |
| Eluktronics Mech-17 GP2 | |
| Uniwill GM6PX7X RTX 4070 | |
| Asus ROG Strix Scar 17 SE G733CX-LL014W | |
| Aorus 17X XES | |
| MSI Pulse GL76 12UGK | |
| Alienware m17 R5 (R9 6900HX, RX 6850M XT) | |
| Asus ROG Zephyrus S17 GX703HSD | |
| MSI Delta 15 A5EFK | |
| Lenovo Legion C7 15IMH05 82EH0030GE | |
| LibreOffice / 20 Documents To PDF | |
| Alienware m17 R5 (R9 6900HX, RX 6850M XT) | |
| Lenovo Legion C7 15IMH05 82EH0030GE | |
| MSI Delta 15 A5EFK | |
| MSI GE78HX 13VH-070US | |
| MSI Pulse GL76 12UGK | |
| Durchschnittliche AMD Ryzen 9 7945HX (35.5 - 60.4, n=8) | |
| Asus ROG Zephyrus S17 GX703HSD | |
| Uniwill GM6PX7X RTX 4070 | |
| Aorus 17X XES | |
| Asus ROG Strix Scar 17 G733PY-XS96 | |
| Asus ROG Strix Scar 17 SE G733CX-LL014W | |
| Eluktronics Mech-17 GP2 | |
| Intel Core i9-13900K @253W | |
| R Benchmark 2.5 / Overall mean | |
| Lenovo Legion C7 15IMH05 82EH0030GE | |
| Asus ROG Zephyrus S17 GX703HSD | |
| MSI Delta 15 A5EFK | |
| Alienware m17 R5 (R9 6900HX, RX 6850M XT) | |
| MSI Pulse GL76 12UGK | |
| Uniwill GM6PX7X RTX 4070 | |
| Asus ROG Strix Scar 17 SE G733CX-LL014W | |
| Aorus 17X XES | |
| Durchschnittliche AMD Ryzen 9 7945HX (0.3884 - 0.4159, n=8) | |
| Asus ROG Strix Scar 17 G733PY-XS96 | |
| MSI GE78HX 13VH-070US | |
| Eluktronics Mech-17 GP2 | |
| Intel Core i9-13900K @253W | |
Cinebench R23: Multi Core | Single Core
Cinebench R20: CPU (Multi Core) | CPU (Single Core)
Cinebench R15: CPU Multi 64Bit | CPU Single 64Bit
Blender: v2.79 BMW27 CPU
7-Zip 18.03: 7z b 4 | 7z b 4 -mmt1
Geekbench 5.5: Multi-Core | Single-Core
HWBOT x265 Benchmark v2.2: 4k Preset
LibreOffice : 20 Documents To PDF
R Benchmark 2.5: Overall mean
* ... kleinere Werte sind besser
AIDA64: FP32 Ray-Trace | FPU Julia | CPU SHA3 | CPU Queen | FPU SinJulia | FPU Mandel | CPU AES | CPU ZLib | FP64 Ray-Trace | CPU PhotoWorxx
| Performance Rating | |
| Asus ROG Strix Scar 17 G733PY-XS96 | |
| Durchschnittliche AMD Ryzen 9 7945HX | |
| Asus ROG Strix G17 G713PI | |
| Eluktronics Mech-17 GP2 | |
| MSI GE78HX 13VH-070US | |
| Aorus 17X XES | |
| Alienware m17 R5 (R9 6900HX, RX 6850M XT) | |
| AIDA64 / FP32 Ray-Trace | |
| Asus ROG Strix Scar 17 G733PY-XS96 | |
| Durchschnittliche AMD Ryzen 9 7945HX (50388 - 60169, n=7) | |
| Asus ROG Strix G17 G713PI | |
| MSI GE78HX 13VH-070US | |
| Eluktronics Mech-17 GP2 | |
| Alienware m17 R5 (R9 6900HX, RX 6850M XT) | |
| Aorus 17X XES | |
| AIDA64 / FPU Julia | |
| Asus ROG Strix Scar 17 G733PY-XS96 | |
| Asus ROG Strix G17 G713PI | |
| Durchschnittliche AMD Ryzen 9 7945HX (201874 - 252486, n=7) | |
| MSI GE78HX 13VH-070US | |
| Eluktronics Mech-17 GP2 | |
| Alienware m17 R5 (R9 6900HX, RX 6850M XT) | |
| Aorus 17X XES | |
| AIDA64 / CPU SHA3 | |
| Asus ROG Strix Scar 17 G733PY-XS96 | |
| Durchschnittliche AMD Ryzen 9 7945HX (8525 - 10389, n=7) | |
| Asus ROG Strix G17 G713PI | |
| Eluktronics Mech-17 GP2 | |
| MSI GE78HX 13VH-070US | |
| Aorus 17X XES | |
| Alienware m17 R5 (R9 6900HX, RX 6850M XT) | |
| AIDA64 / CPU Queen | |
| Asus ROG Strix Scar 17 G733PY-XS96 | |
| Durchschnittliche AMD Ryzen 9 7945HX (175041 - 200651, n=7) | |
| Asus ROG Strix G17 G713PI | |
| Eluktronics Mech-17 GP2 | |
| MSI GE78HX 13VH-070US | |
| Alienware m17 R5 (R9 6900HX, RX 6850M XT) | |
| Aorus 17X XES | |
| AIDA64 / FPU SinJulia | |
| Asus ROG Strix Scar 17 G733PY-XS96 | |
| Durchschnittliche AMD Ryzen 9 7945HX (28794 - 32988, n=7) | |
| Asus ROG Strix G17 G713PI | |
| Eluktronics Mech-17 GP2 | |
| MSI GE78HX 13VH-070US | |
| Alienware m17 R5 (R9 6900HX, RX 6850M XT) | |
| Aorus 17X XES | |
| AIDA64 / FPU Mandel | |
| Asus ROG Strix Scar 17 G733PY-XS96 | |
| Durchschnittliche AMD Ryzen 9 7945HX (105740 - 134044, n=7) | |
| Asus ROG Strix G17 G713PI | |
| MSI GE78HX 13VH-070US | |
| Eluktronics Mech-17 GP2 | |
| Alienware m17 R5 (R9 6900HX, RX 6850M XT) | |
| Aorus 17X XES | |
| AIDA64 / CPU AES | |
| Eluktronics Mech-17 GP2 | |
| Durchschnittliche AMD Ryzen 9 7945HX (126790 - 325960, n=7) | |
| Asus ROG Strix Scar 17 G733PY-XS96 | |
| Asus ROG Strix G17 G713PI | |
| MSI GE78HX 13VH-070US | |
| Aorus 17X XES | |
| Alienware m17 R5 (R9 6900HX, RX 6850M XT) | |
| AIDA64 / CPU ZLib | |
| Asus ROG Strix Scar 17 G733PY-XS96 | |
| Durchschnittliche AMD Ryzen 9 7945HX (2022 - 2409, n=7) | |
| Asus ROG Strix G17 G713PI | |
| MSI GE78HX 13VH-070US | |
| Eluktronics Mech-17 GP2 | |
| Aorus 17X XES | |
| Alienware m17 R5 (R9 6900HX, RX 6850M XT) | |
| AIDA64 / FP64 Ray-Trace | |
| Asus ROG Strix Scar 17 G733PY-XS96 | |
| Durchschnittliche AMD Ryzen 9 7945HX (26875 - 31796, n=7) | |
| Asus ROG Strix G17 G713PI | |
| MSI GE78HX 13VH-070US | |
| Eluktronics Mech-17 GP2 | |
| Alienware m17 R5 (R9 6900HX, RX 6850M XT) | |
| Aorus 17X XES | |
| AIDA64 / CPU PhotoWorxx | |
| MSI GE78HX 13VH-070US | |
| Eluktronics Mech-17 GP2 | |
| Aorus 17X XES | |
| Durchschnittliche AMD Ryzen 9 7945HX (31421 - 40095, n=7) | |
| Asus ROG Strix Scar 17 G733PY-XS96 | |
| Asus ROG Strix G17 G713PI | |
| Alienware m17 R5 (R9 6900HX, RX 6850M XT) | |
System Performance
CrossMark: Overall | Productivity | Creativity | Responsiveness
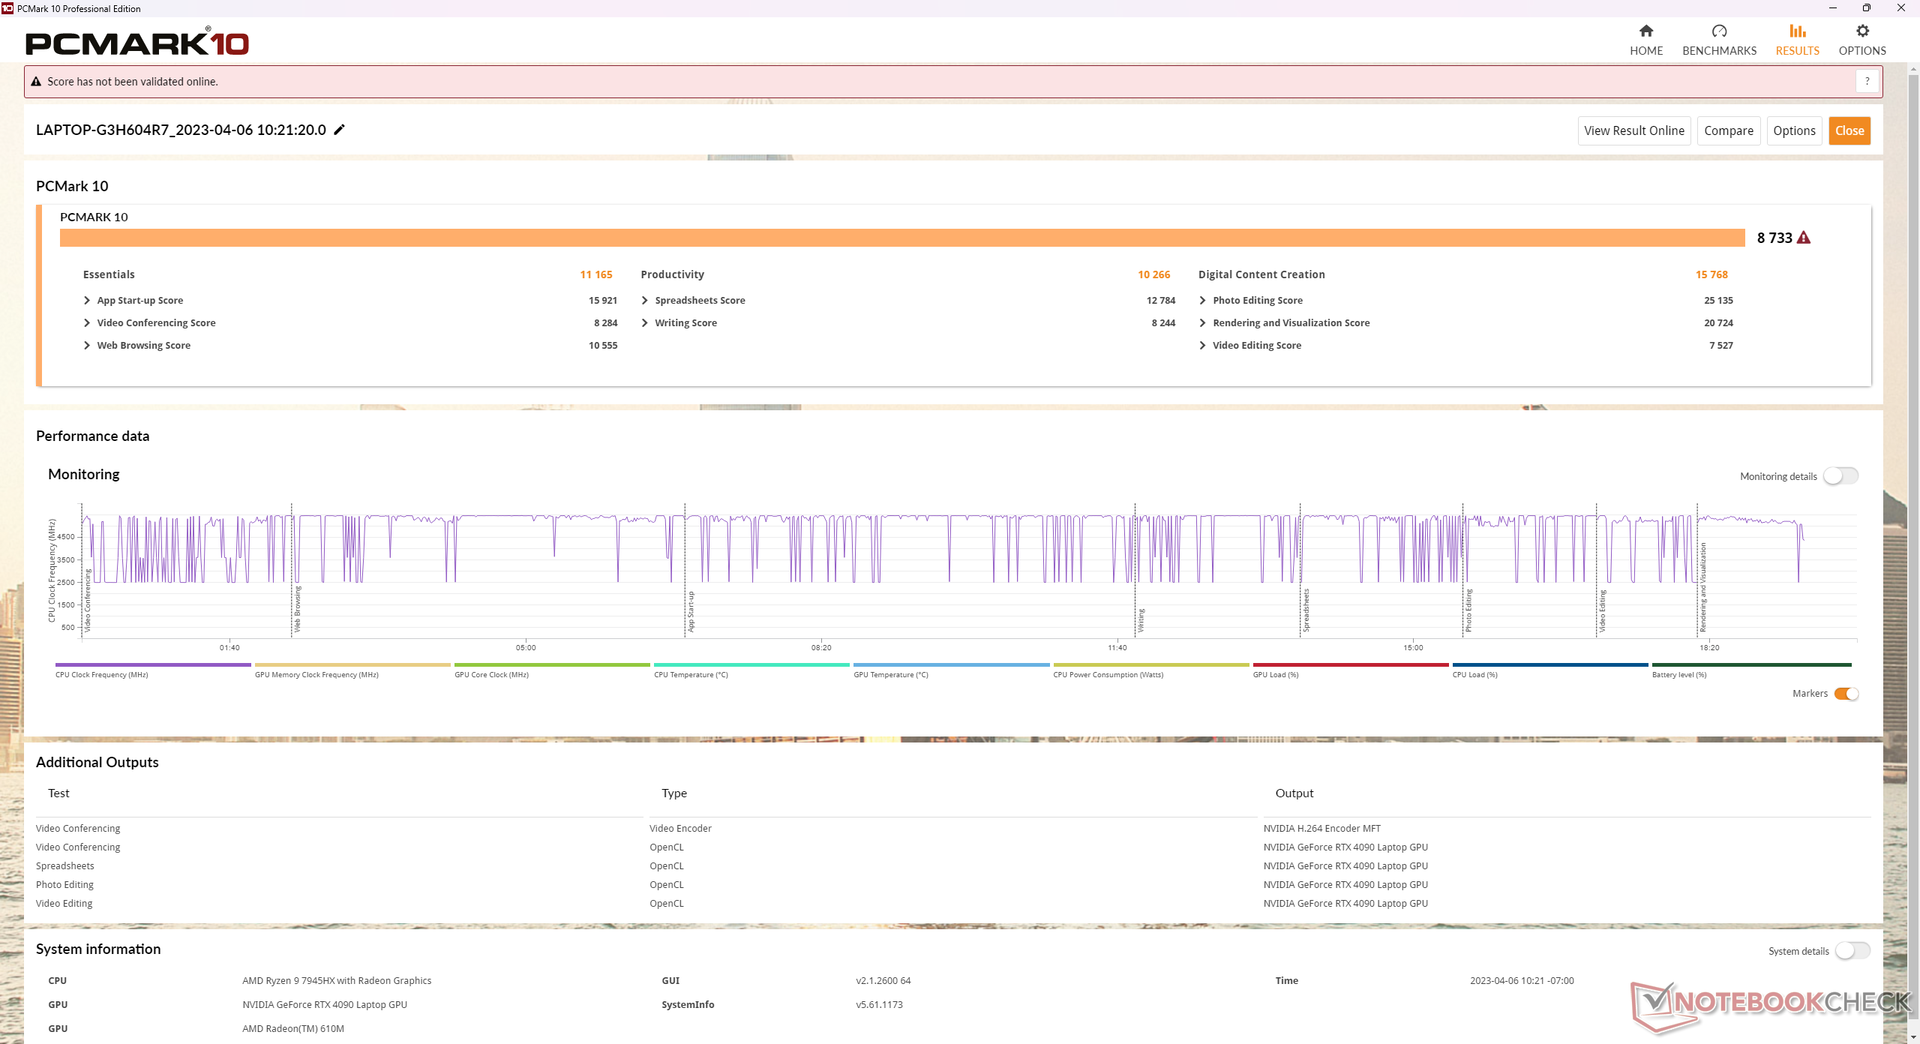
| PCMark 10 / Score | |
| Eluktronics Mech-17 GP2 | |
| Durchschnittliche AMD Ryzen 9 7945HX, NVIDIA GeForce RTX 4090 Laptop GPU (8733 - 9151, n=2) | |
| MSI GE78HX 13VH-070US | |
| Asus ROG Strix Scar 17 G733PY-XS96 | |
| Aorus 17X XES | |
| Asus ROG Strix G17 G713PI | |
| Alienware m17 R5 (R9 6900HX, RX 6850M XT) | |
| Asus ROG Strix Scar 17 SE G733CX-LL014W | |
| PCMark 10 / Essentials | |
| Eluktronics Mech-17 GP2 | |
| Durchschnittliche AMD Ryzen 9 7945HX, NVIDIA GeForce RTX 4090 Laptop GPU (11165 - 12176, n=2) | |
| MSI GE78HX 13VH-070US | |
| Asus ROG Strix G17 G713PI | |
| Asus ROG Strix Scar 17 G733PY-XS96 | |
| Aorus 17X XES | |
| Asus ROG Strix Scar 17 SE G733CX-LL014W | |
| Alienware m17 R5 (R9 6900HX, RX 6850M XT) | |
| PCMark 10 / Productivity | |
| Asus ROG Strix G17 G713PI | |
| Durchschnittliche AMD Ryzen 9 7945HX, NVIDIA GeForce RTX 4090 Laptop GPU (10266 - 11833, n=2) | |
| Eluktronics Mech-17 GP2 | |
| MSI GE78HX 13VH-070US | |
| Asus ROG Strix Scar 17 G733PY-XS96 | |
| Aorus 17X XES | |
| Asus ROG Strix Scar 17 SE G733CX-LL014W | |
| Alienware m17 R5 (R9 6900HX, RX 6850M XT) | |
| PCMark 10 / Digital Content Creation | |
| Asus ROG Strix Scar 17 G733PY-XS96 | |
| Eluktronics Mech-17 GP2 | |
| MSI GE78HX 13VH-070US | |
| Durchschnittliche AMD Ryzen 9 7945HX, NVIDIA GeForce RTX 4090 Laptop GPU (14432 - 15768, n=2) | |
| Aorus 17X XES | |
| Alienware m17 R5 (R9 6900HX, RX 6850M XT) | |
| Asus ROG Strix Scar 17 SE G733CX-LL014W | |
| Asus ROG Strix G17 G713PI | |
| CrossMark / Overall | |
| Eluktronics Mech-17 GP2 | |
| Aorus 17X XES | |
| Asus ROG Strix Scar 17 SE G733CX-LL014W | |
| Asus ROG Strix G17 G713PI | |
| Durchschnittliche AMD Ryzen 9 7945HX, NVIDIA GeForce RTX 4090 Laptop GPU (1993 - 2078, n=2) | |
| Asus ROG Strix Scar 17 G733PY-XS96 | |
| MSI GE78HX 13VH-070US | |
| Alienware m17 R5 (R9 6900HX, RX 6850M XT) | |
| CrossMark / Productivity | |
| Eluktronics Mech-17 GP2 | |
| Aorus 17X XES | |
| Asus ROG Strix Scar 17 SE G733CX-LL014W | |
| Asus ROG Strix G17 G713PI | |
| Durchschnittliche AMD Ryzen 9 7945HX, NVIDIA GeForce RTX 4090 Laptop GPU (1838 - 1946, n=2) | |
| MSI GE78HX 13VH-070US | |
| Asus ROG Strix Scar 17 G733PY-XS96 | |
| Alienware m17 R5 (R9 6900HX, RX 6850M XT) | |
| CrossMark / Creativity | |
| Eluktronics Mech-17 GP2 | |
| Durchschnittliche AMD Ryzen 9 7945HX, NVIDIA GeForce RTX 4090 Laptop GPU (2334 - 2377, n=2) | |
| Asus ROG Strix Scar 17 SE G733CX-LL014W | |
| Asus ROG Strix Scar 17 G733PY-XS96 | |
| Asus ROG Strix G17 G713PI | |
| Aorus 17X XES | |
| MSI GE78HX 13VH-070US | |
| Alienware m17 R5 (R9 6900HX, RX 6850M XT) | |
| CrossMark / Responsiveness | |
| Aorus 17X XES | |
| Asus ROG Strix Scar 17 SE G733CX-LL014W | |
| Eluktronics Mech-17 GP2 | |
| MSI GE78HX 13VH-070US | |
| Asus ROG Strix G17 G713PI | |
| Durchschnittliche AMD Ryzen 9 7945HX, NVIDIA GeForce RTX 4090 Laptop GPU (1584 - 1689, n=2) | |
| Asus ROG Strix Scar 17 G733PY-XS96 | |
| Alienware m17 R5 (R9 6900HX, RX 6850M XT) | |
| PCMark 10 Score | 8733 Punkte | |
Hilfe | ||
| AIDA64 / Memory Copy | |
| MSI GE78HX 13VH-070US | |
| Eluktronics Mech-17 GP2 | |
| Aorus 17X XES | |
| Durchschnittliche AMD Ryzen 9 7945HX (48948 - 57953, n=7) | |
| Alienware m17 R5 (R9 6900HX, RX 6850M XT) | |
| Asus ROG Strix Scar 17 G733PY-XS96 | |
| Asus ROG Strix G17 G713PI | |
| AIDA64 / Memory Read | |
| MSI GE78HX 13VH-070US | |
| Eluktronics Mech-17 GP2 | |
| Aorus 17X XES | |
| Durchschnittliche AMD Ryzen 9 7945HX (56910 - 67753, n=7) | |
| Asus ROG Strix G17 G713PI | |
| Asus ROG Strix Scar 17 G733PY-XS96 | |
| Alienware m17 R5 (R9 6900HX, RX 6850M XT) | |
| AIDA64 / Memory Write | |
| MSI GE78HX 13VH-070US | |
| Eluktronics Mech-17 GP2 | |
| Durchschnittliche AMD Ryzen 9 7945HX (58602 - 70063, n=7) | |
| Aorus 17X XES | |
| Asus ROG Strix Scar 17 G733PY-XS96 | |
| Asus ROG Strix G17 G713PI | |
| Alienware m17 R5 (R9 6900HX, RX 6850M XT) | |
| AIDA64 / Memory Latency | |
| Alienware m17 R5 (R9 6900HX, RX 6850M XT) | |
| Eluktronics Mech-17 GP2 | |
| Aorus 17X XES | |
| Asus ROG Strix G17 G713PI | |
| MSI GE78HX 13VH-070US | |
| Durchschnittliche AMD Ryzen 9 7945HX (77.1 - 91.3, n=7) | |
| Asus ROG Strix Scar 17 G733PY-XS96 | |
* ... kleinere Werte sind besser
DPC-Latenzzeit
LatencyMon zeigte keine DPC-Probleme an, wenn sich mehrere Browser Tabs unserer Homepage öffneten. Die Ausführung von Prime95 führte jedoch zu einer hohen Unterbrechungslatenz. Bei der Wiedergabe unseres einminütigen 4K60-Testvideos konnten wir zwei unterbrochene Bilder aufzeichnen.
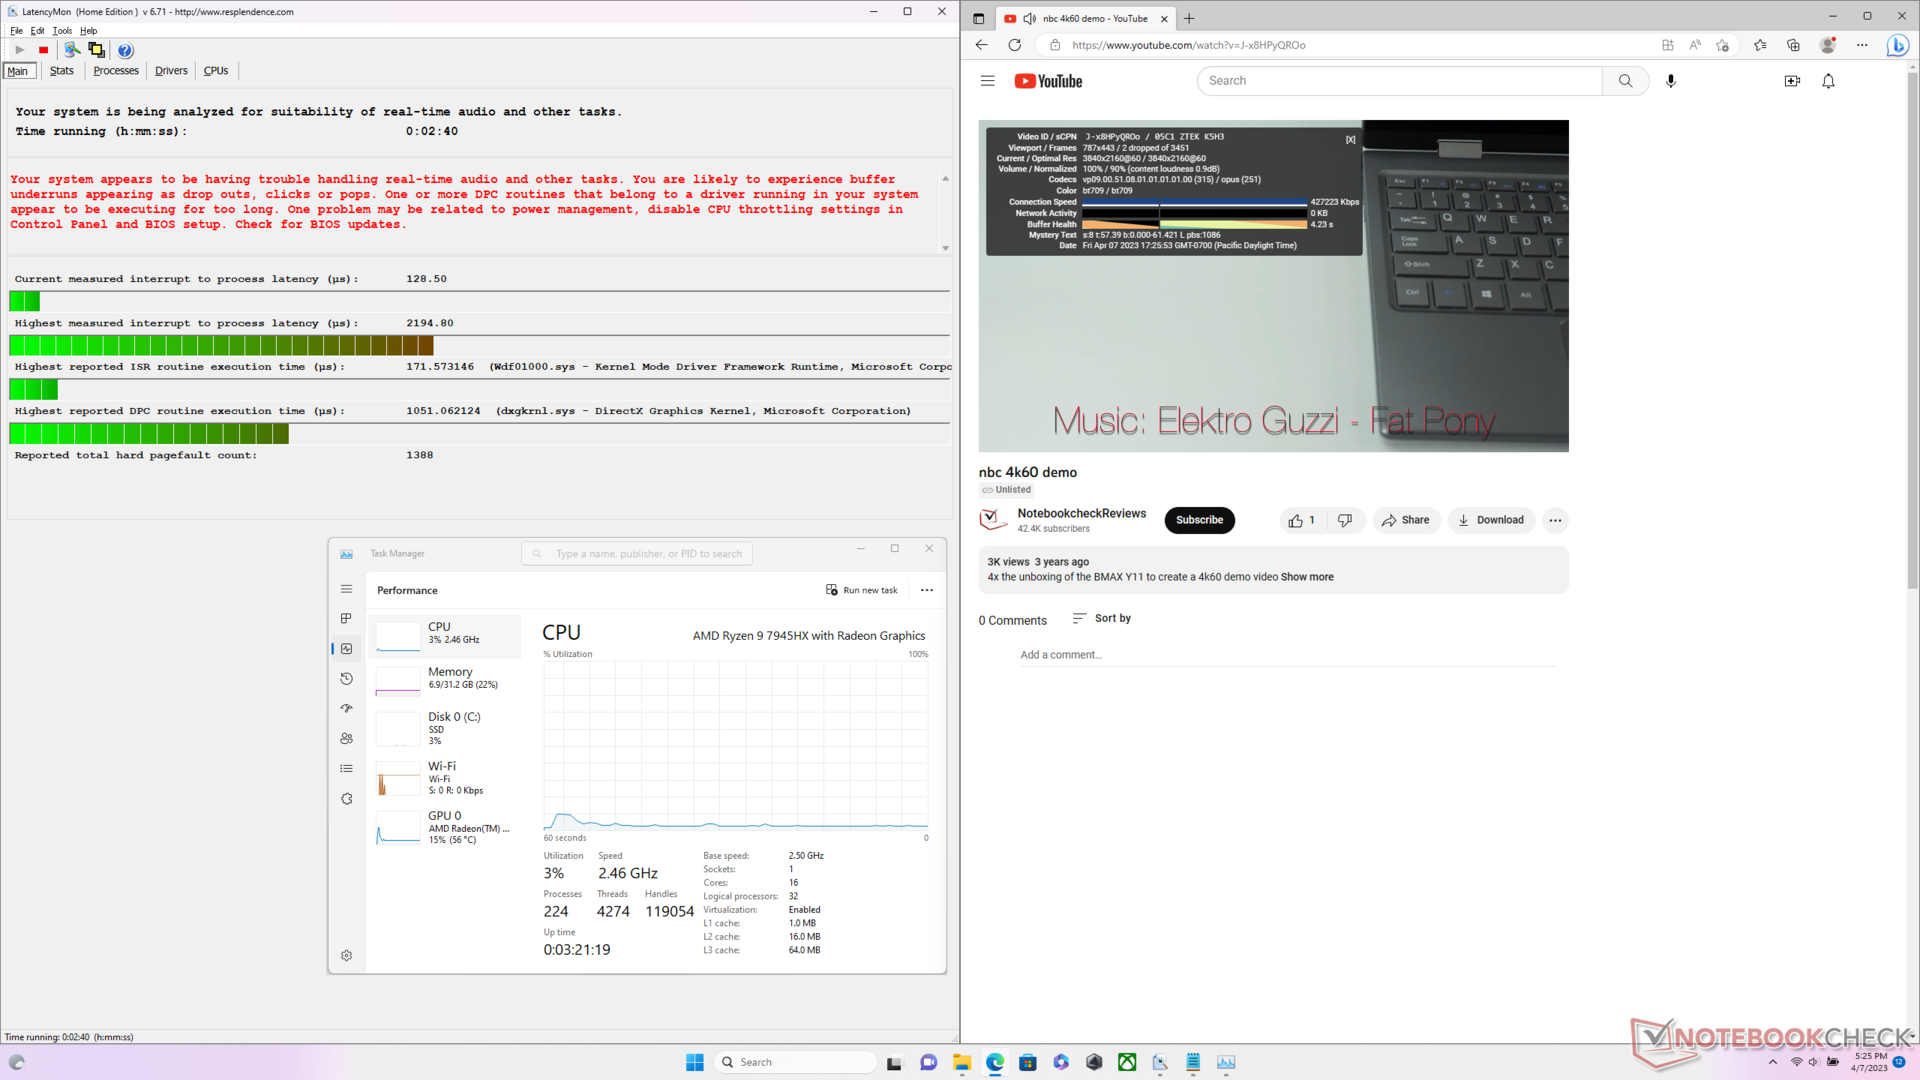
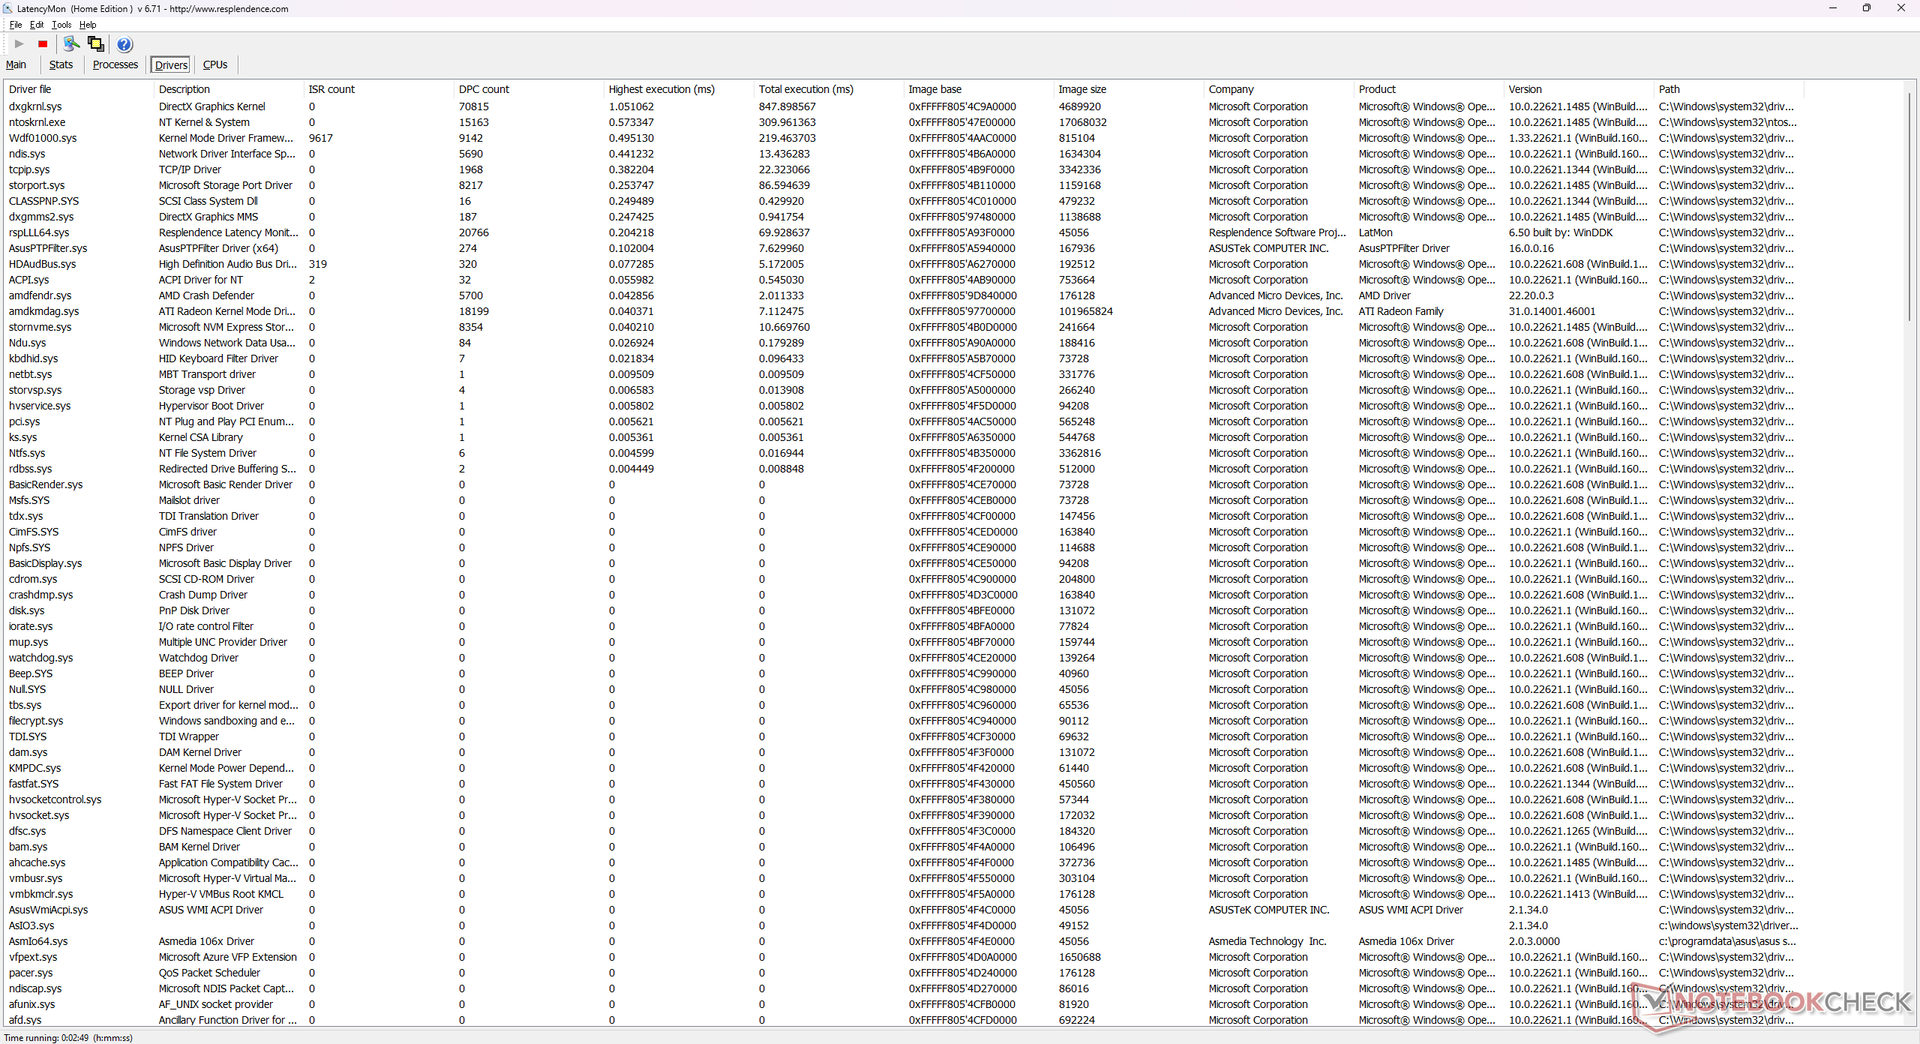
| DPC Latencies / LatencyMon - interrupt to process latency (max), Web, Youtube, Prime95 | |
| MSI GE78HX 13VH-070US | |
| Asus ROG Strix Scar 17 SE G733CX-LL014W | |
| Asus ROG Strix Scar 17 G733PY-XS96 | |
| Asus ROG Strix G17 G713PI | |
| Alienware m17 R5 (R9 6900HX, RX 6850M XT) | |
| Eluktronics Mech-17 GP2 | |
* ... kleinere Werte sind besser
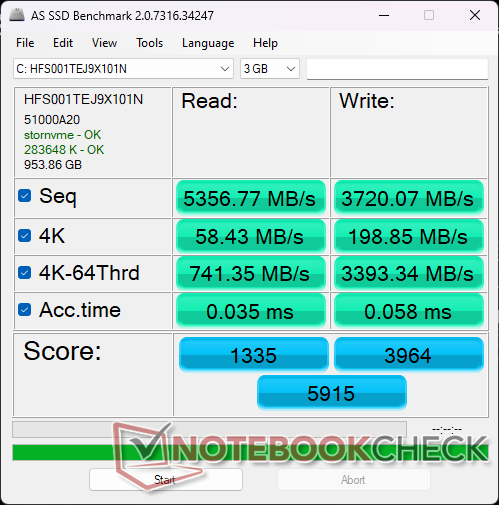
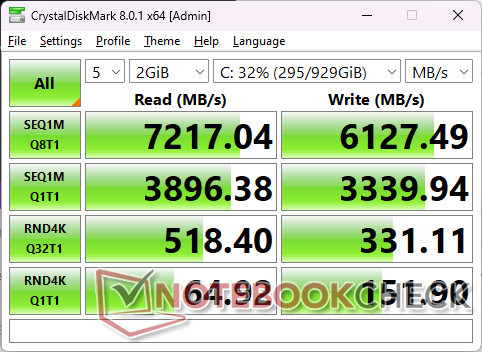
Speichergeräte - Performance-Drosselung erkannt
Unser Gerät wird mit einer 1 TB SK hynix PC801 für sequenzielle Lese- und Schreibgeschwindigkeiten von etwa 7.200 MB/s bzw. 6.200 MB/s ausgeliefert. Das Laufwerk in unserem Gerät wies jedoch nach etwa vier Minuten eine Leistungsdrosselung auf Stress auf, wie unser Diagramm unten zeigt. Die SSDs verfügen nicht über einen Wärmeableiter oder ein Wärmepolster zur Unterstützung der Wärmeableitung.

| Drive Performance Rating - Percent | |
| Aorus 17X XES | |
| MSI GE78HX 13VH-070US | |
| Asus ROG Strix Scar 17 G733PY-XS96 | |
| Eluktronics Mech-17 GP2 | |
| Alienware m17 R5 (R9 6900HX, RX 6850M XT) | |
| Asus ROG Strix G17 G713PI | |
* ... kleinere Werte sind besser
Disk Throttling: DiskSpd Read Loop, Queue Depth 8
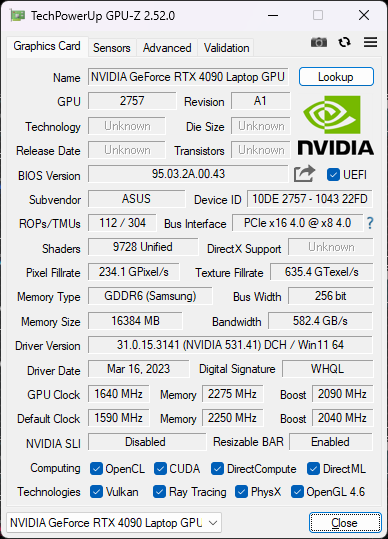
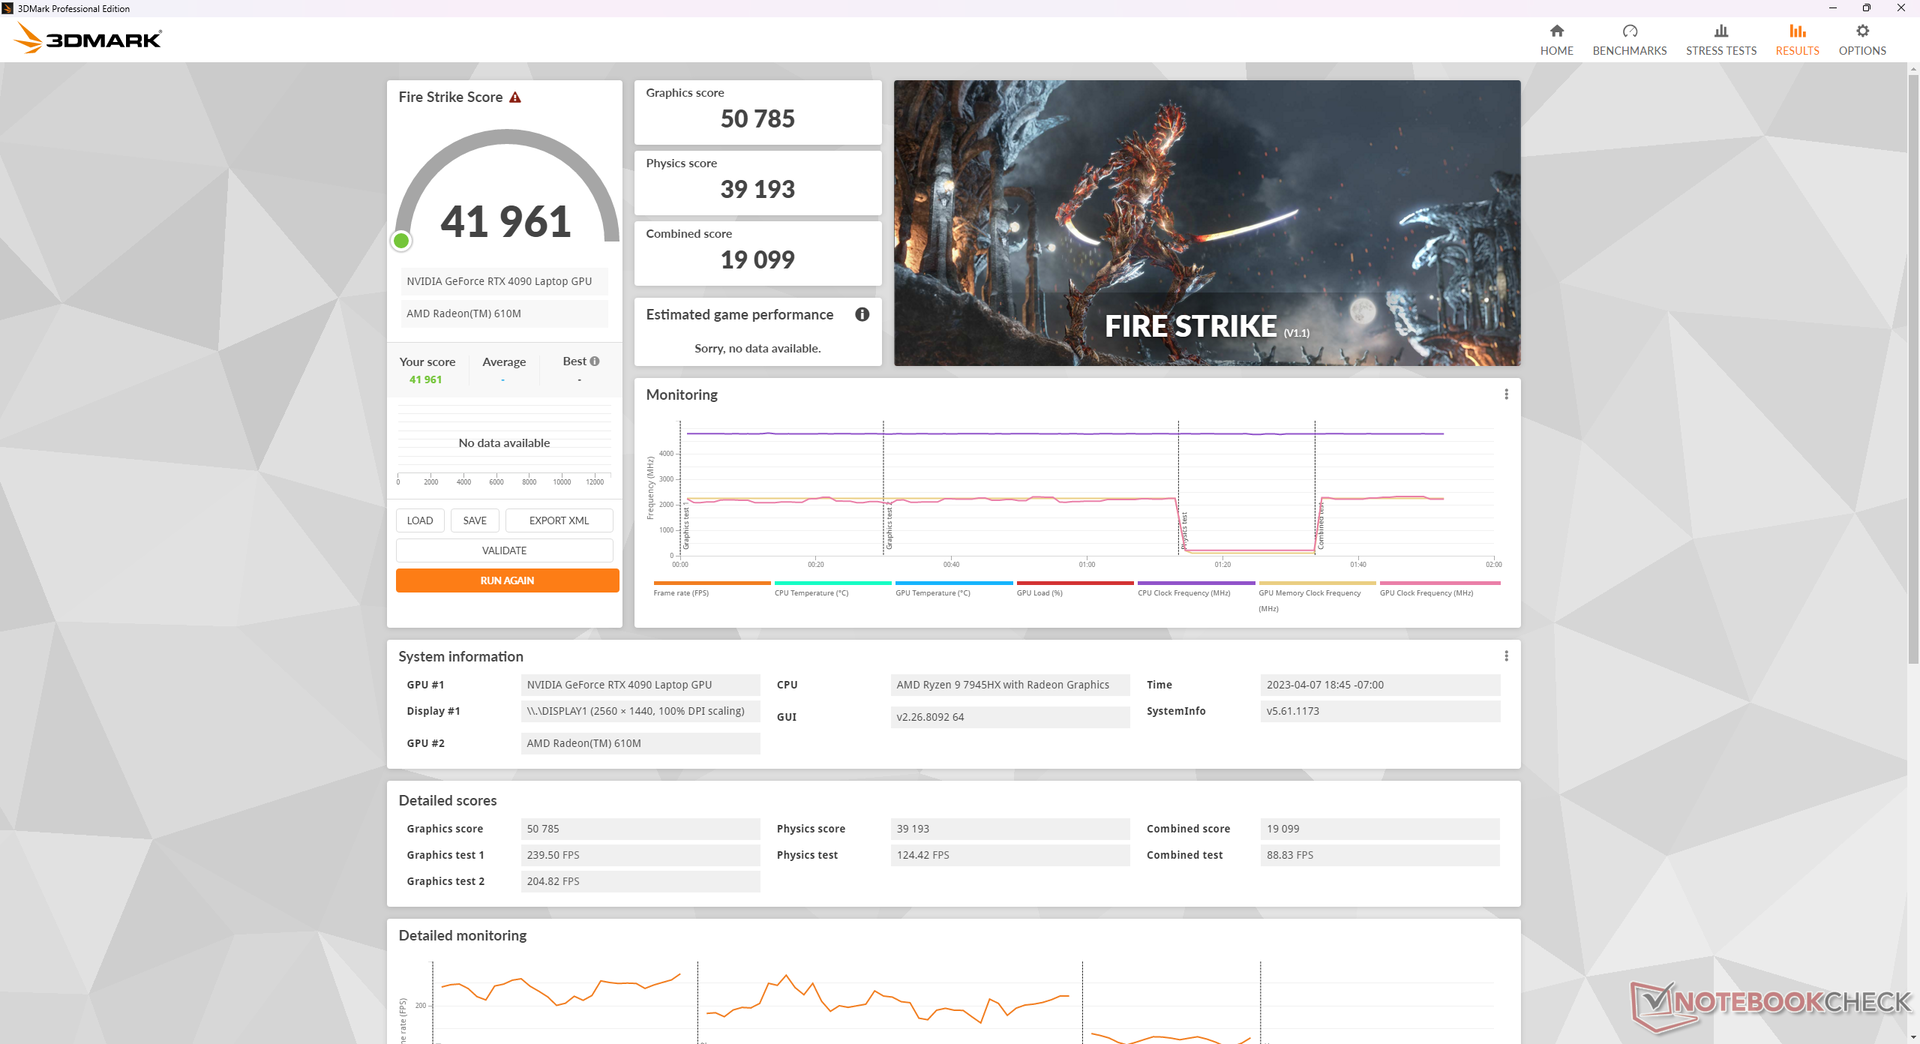
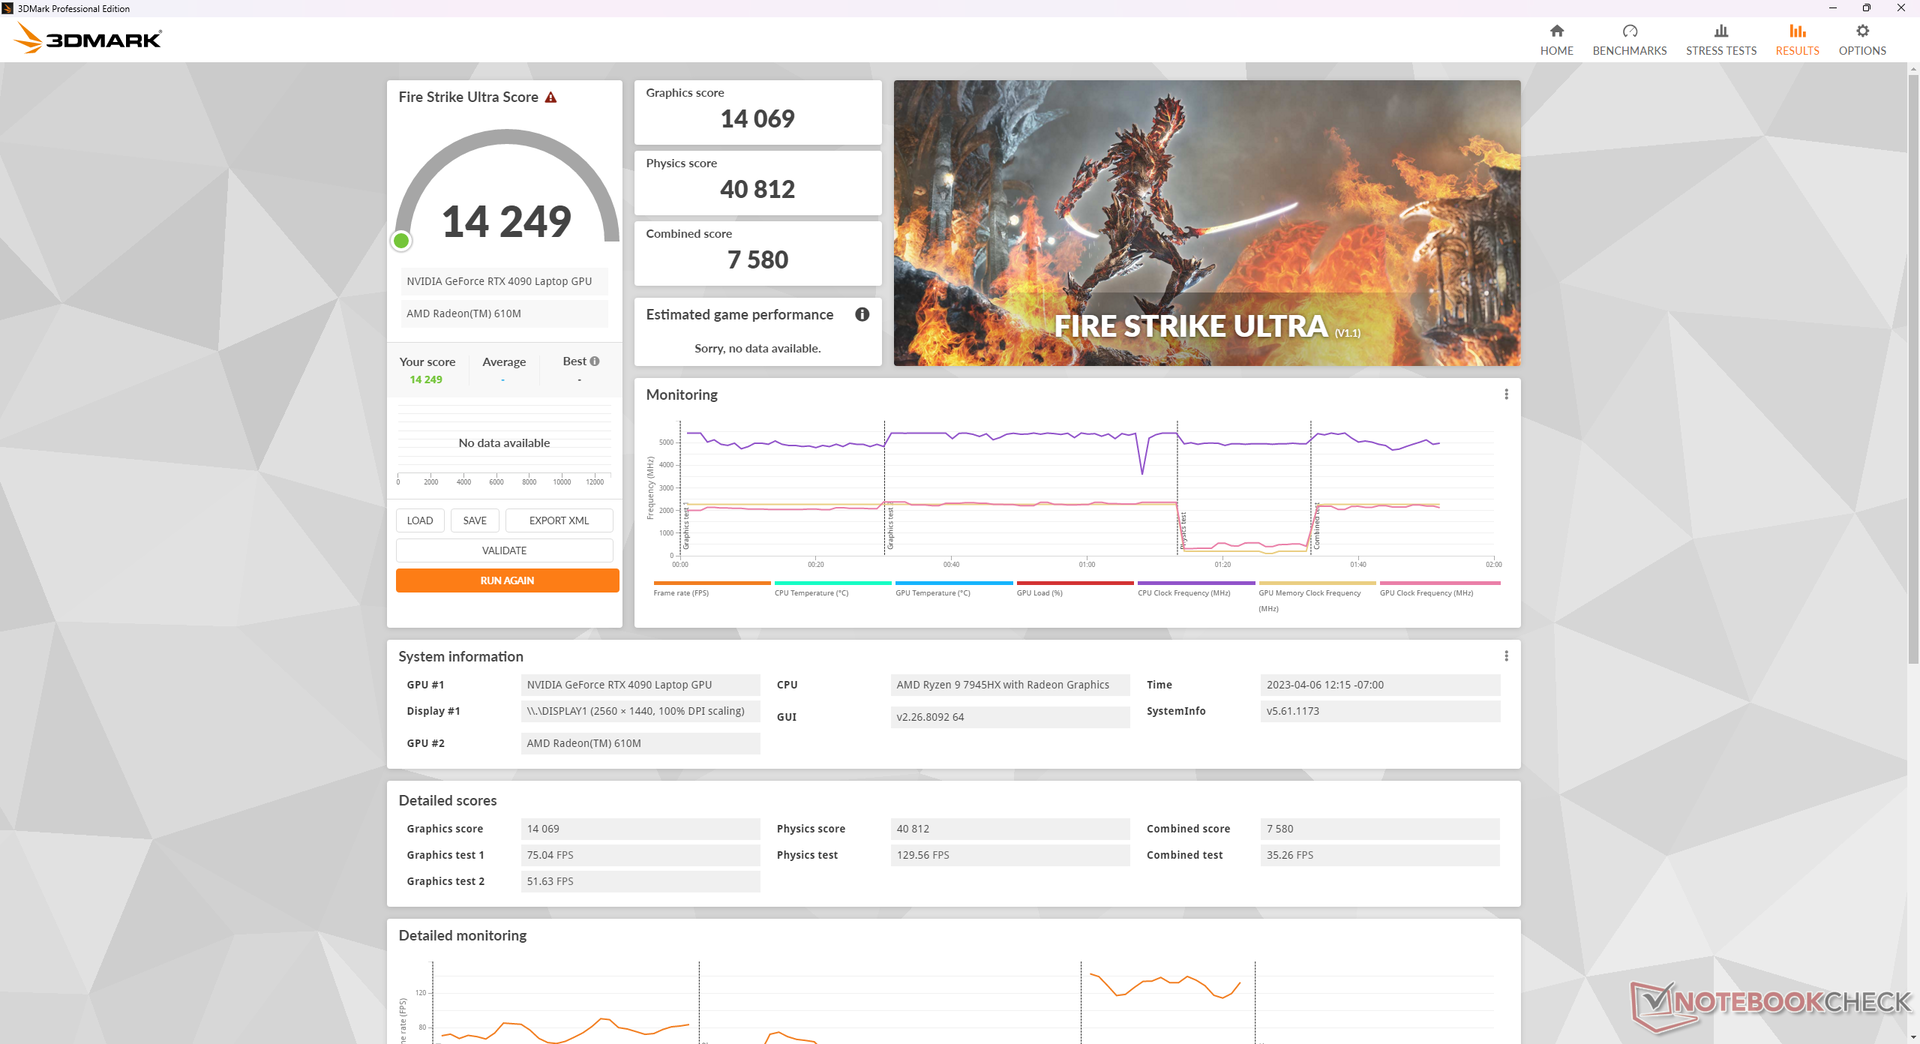
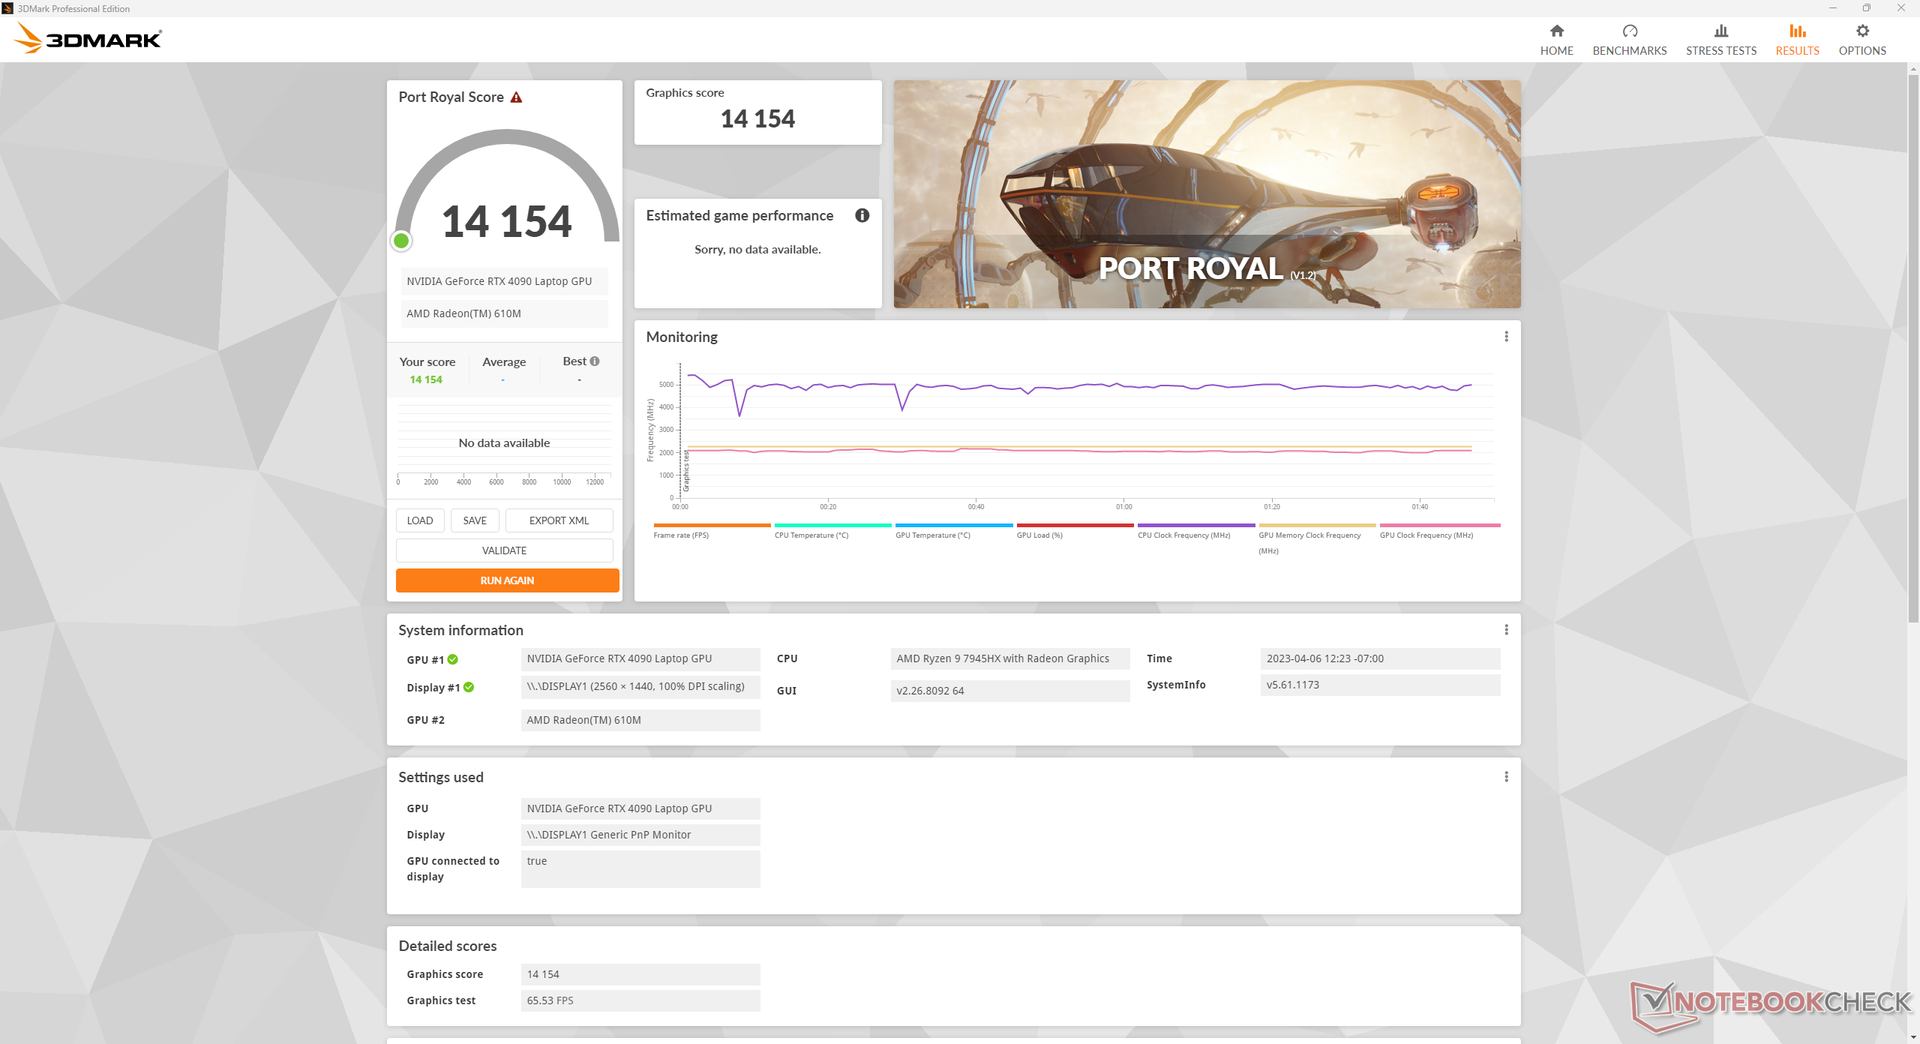
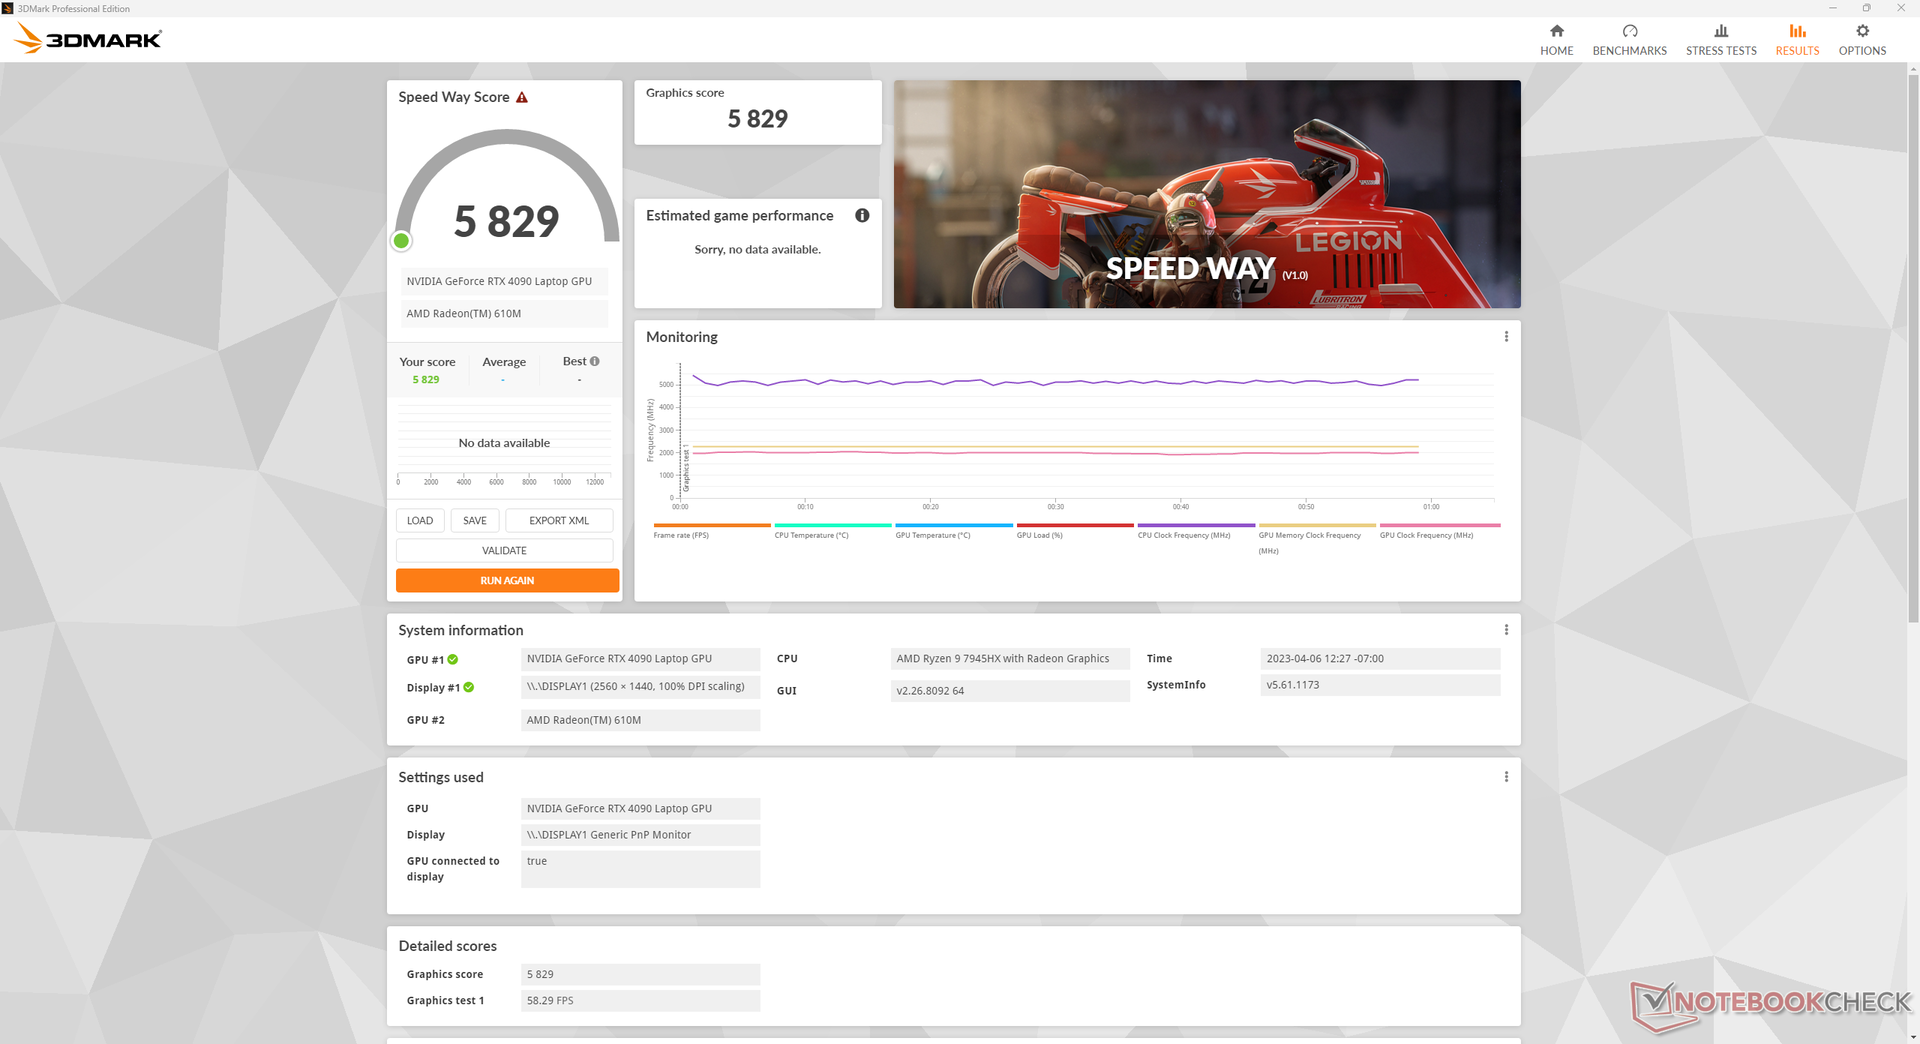
GPU Performance - 175-W-GeForce-RTX-4090
Die mobile GeForce RTX 4090 bietet 60 bis 80 Prozent mehr Leistung als die mobile RTX 3080 Ti im letztjährigen ROG Strix Scar 17 G733. Somit ist der Leistungsunterschied im Vergleich zum Vorjahr ziemlich signifikant. Ein Downgrade auf die RTX-4080- oder -4070-SKUs wird sich voraussichtlich um 15 bis 20 Prozent bzw. 40 bis 50 Prozent auf die GPU-Leistung auswirken. Enthusiasten sollten daher die mobile RTX 4070 vermeiden, da der Leistungsabfall von der mobilen RTX 4080 zur mobilen RTX 4070 viel größer ist als der von der mobilen RTX 4090 zur mobilen RTX 4080.
Die Ausführung im Performance-Modus anstelle des Turbo-Modus wirkt sich leicht auf die Leistung aus: Ein Fire Strike Test im Performance-Modus führt zu einem Rückgang von 4 bis 5 Prozent in der Grafikleistung. Unser Stress-Testabschnitt unten untersucht diese beiden Modi genauer.

| 3DMark Performance Rating - Percent | |
| KFA2 GeForce RTX 4090 SG | |
| Asus ROG Strix Scar 17 G733PY-XS96 | |
| Durchschnittliche NVIDIA GeForce RTX 4090 Laptop GPU | |
| MSI GE78HX 13VH-070US | |
| Alienware m17 R5 (R9 6900HX, RX 6850M XT) -2! | |
| Asus ROG Strix Scar 17 SE G733CX-LL014W | |
| Uniwill GM6PX7X RTX 4070 | |
| Asus ROG Zephyrus S17 GX703HSD -2! | |
| MSI Delta 15 A5EFK -2! | |
| Aorus 17X XES -2! | |
| MSI Pulse GL76 12UGK | |
| Lenovo Legion C7 15IMH05 82EH0030GE -1! | |
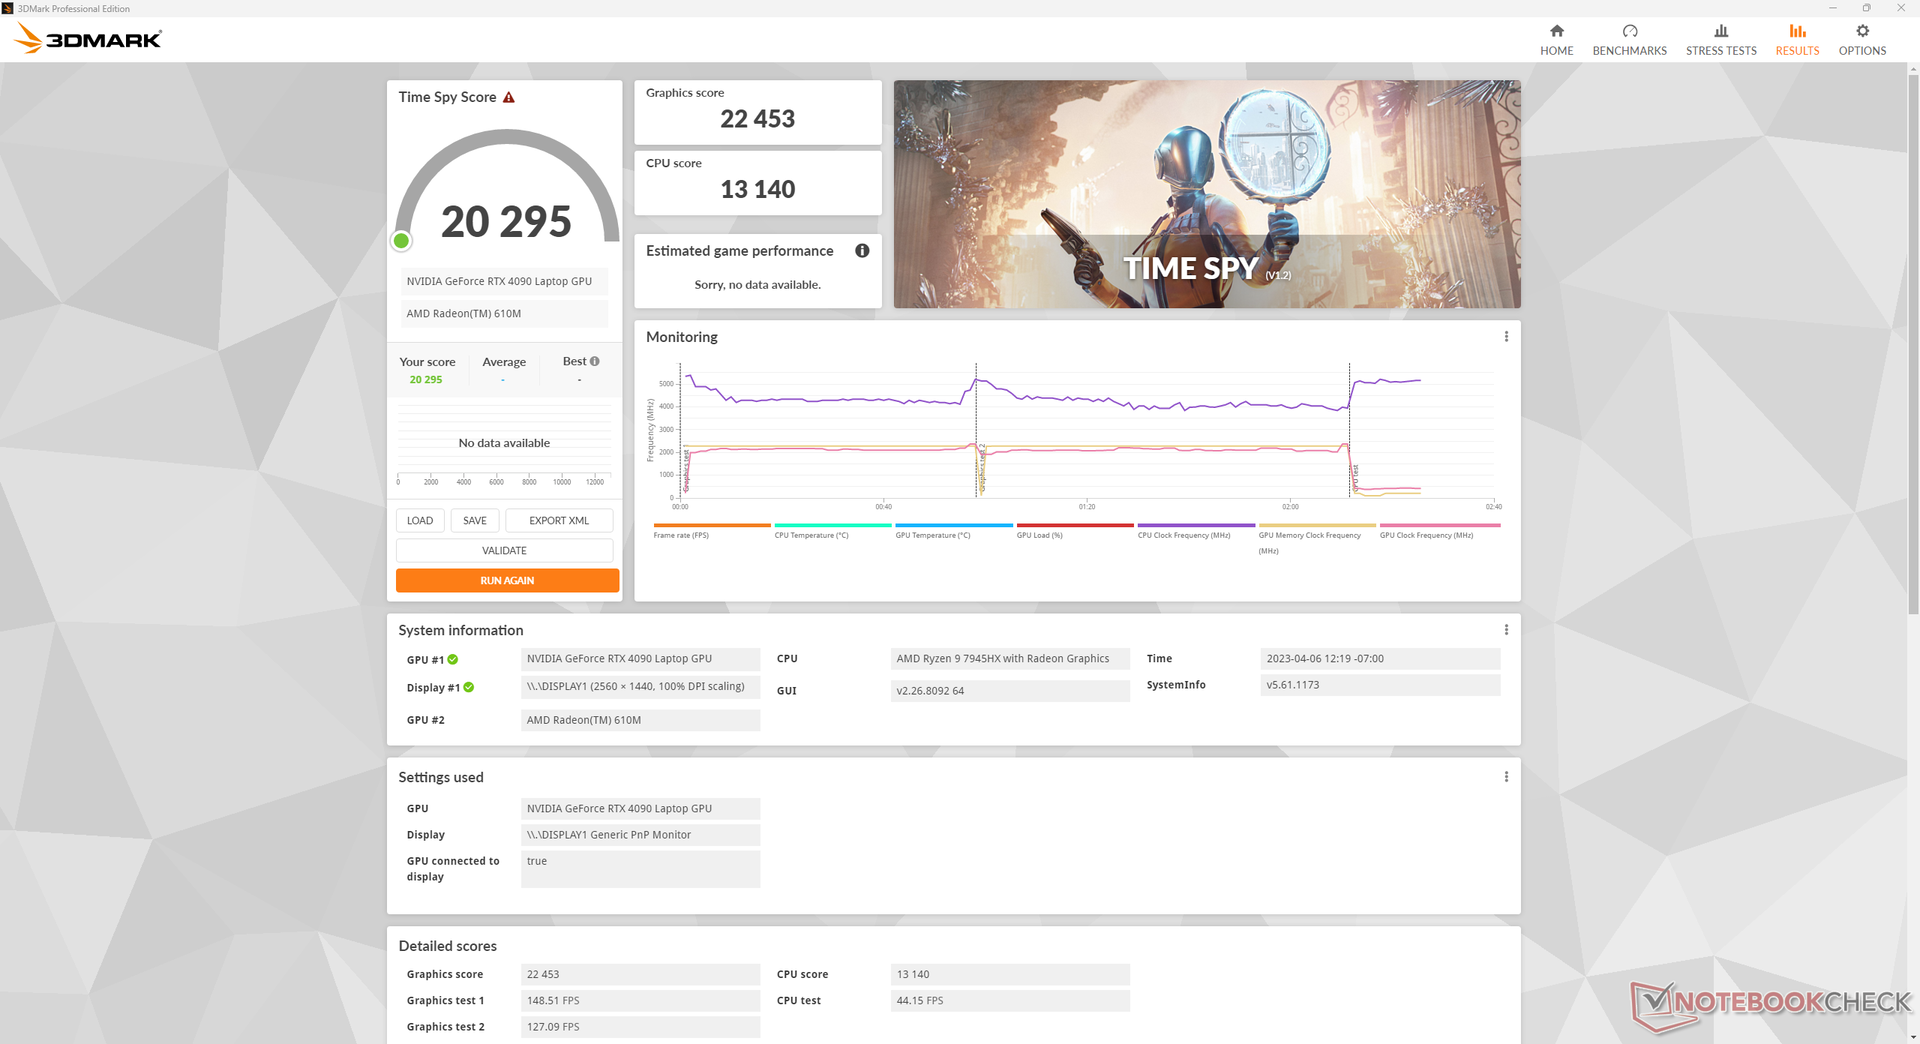
| 3DMark 11 Performance | 46484 Punkte | |
| 3DMark Fire Strike Score | 43163 Punkte | |
| 3DMark Time Spy Score | 20295 Punkte | |
Hilfe | ||
| Blender | |
| v3.3 Classroom HIP/AMD | |
| Alienware m17 R5 (R9 6900HX, RX 6850M XT) | |
| v3.3 Classroom OPTIX/RTX | |
| MSI Pulse GL76 12UGK | |
| Aorus 17X XES | |
| Asus ROG Strix Scar 17 SE G733CX-LL014W | |
| Uniwill GM6PX7X RTX 4070 | |
| MSI GE78HX 13VH-070US | |
| Durchschnittliche NVIDIA GeForce RTX 4090 Laptop GPU (9 - 19, n=39) | |
| Asus ROG Strix Scar 17 G733PY-XS96 | |
| v3.3 Classroom CUDA | |
| MSI Pulse GL76 12UGK | |
| Aorus 17X XES | |
| Asus ROG Strix Scar 17 SE G733CX-LL014W | |
| Uniwill GM6PX7X RTX 4070 | |
| MSI GE78HX 13VH-070US | |
| Durchschnittliche NVIDIA GeForce RTX 4090 Laptop GPU (16 - 24, n=39) | |
| Asus ROG Strix Scar 17 G733PY-XS96 | |
| v3.3 Classroom CPU | |
| Alienware m17 R5 (R9 6900HX, RX 6850M XT) | |
| Aorus 17X XES | |
| MSI Pulse GL76 12UGK | |
| Asus ROG Strix Scar 17 SE G733CX-LL014W | |
| Uniwill GM6PX7X RTX 4070 | |
| Durchschnittliche NVIDIA GeForce RTX 4090 Laptop GPU (144 - 305, n=39) | |
| MSI GE78HX 13VH-070US | |
| Asus ROG Strix Scar 17 G733PY-XS96 | |
| KFA2 GeForce RTX 4090 SG | |
* ... kleinere Werte sind besser
| Performance Rating - Percent | |
| KFA2 GeForce RTX 4090 SG | |
| Asus ROG Strix Scar 17 G733PY-XS96 -1! | |
| MSI GE78HX 13VH-070US | |
| Uniwill GM6PX7X RTX 4070 | |
| Asus ROG Strix Scar 17 SE G733CX-LL014W | |
| Asus ROG Zephyrus S17 GX703HSD -1! | |
| Aorus 17X XES | |
| MSI Pulse GL76 12UGK | |
| Lenovo Legion C7 15IMH05 82EH0030GE -3! | |
| Alienware m17 R5 (R9 6900HX, RX 6850M XT) | |
| MSI Delta 15 A5EFK -1! | |
| The Witcher 3 - 1920x1080 Ultra Graphics & Postprocessing (HBAO+) | |
| KFA2 GeForce RTX 4090 SG | |
| Asus ROG Strix Scar 17 G733PY-XS96 | |
| MSI GE78HX 13VH-070US | |
| Alienware m17 R5 (R9 6900HX, RX 6850M XT) | |
| Uniwill GM6PX7X RTX 4070 | |
| Asus ROG Strix Scar 17 SE G733CX-LL014W | |
| Asus ROG Zephyrus S17 GX703HSD | |
| MSI Delta 15 A5EFK | |
| Aorus 17X XES | |
| MSI Pulse GL76 12UGK | |
| Lenovo Legion C7 15IMH05 82EH0030GE | |
| GTA V - 1920x1080 Highest AA:4xMSAA + FX AF:16x | |
| KFA2 GeForce RTX 4090 SG | |
| Asus ROG Strix Scar 17 SE G733CX-LL014W | |
| Uniwill GM6PX7X RTX 4070 | |
| Asus ROG Strix Scar 17 G733PY-XS96 | |
| Asus ROG Zephyrus S17 GX703HSD | |
| Aorus 17X XES | |
| MSI Pulse GL76 12UGK | |
| MSI GE78HX 13VH-070US | |
| Alienware m17 R5 (R9 6900HX, RX 6850M XT) | |
| MSI Delta 15 A5EFK | |
| Final Fantasy XV Benchmark - 1920x1080 High Quality | |
| KFA2 GeForce RTX 4090 SG | |
| Asus ROG Strix Scar 17 G733PY-XS96 | |
| MSI GE78HX 13VH-070US | |
| Uniwill GM6PX7X RTX 4070 | |
| Asus ROG Strix Scar 17 SE G733CX-LL014W | |
| Alienware m17 R5 (R9 6900HX, RX 6850M XT) | |
| Aorus 17X XES | |
| MSI Pulse GL76 12UGK | |
| MSI Delta 15 A5EFK | |
| Strange Brigade - 1920x1080 ultra AA:ultra AF:16 | |
| KFA2 GeForce RTX 4090 SG | |
| MSI GE78HX 13VH-070US | |
| Alienware m17 R5 (R9 6900HX, RX 6850M XT) | |
| Uniwill GM6PX7X RTX 4070 | |
| Asus ROG Strix Scar 17 SE G733CX-LL014W | |
| Asus ROG Zephyrus S17 GX703HSD | |
| MSI Delta 15 A5EFK | |
| MSI Pulse GL76 12UGK | |
| Aorus 17X XES | |
| Dota 2 Reborn - 1920x1080 ultra (3/3) best looking | |
| KFA2 GeForce RTX 4090 SG | |
| Uniwill GM6PX7X RTX 4070 | |
| Asus ROG Strix Scar 17 SE G733CX-LL014W | |
| Aorus 17X XES | |
| MSI GE78HX 13VH-070US | |
| Asus ROG Strix Scar 17 G733PY-XS96 | |
| Asus ROG Zephyrus S17 GX703HSD | |
| MSI Pulse GL76 12UGK | |
| Lenovo Legion C7 15IMH05 82EH0030GE | |
| MSI Delta 15 A5EFK | |
| Alienware m17 R5 (R9 6900HX, RX 6850M XT) | |
| X-Plane 11.11 - 1920x1080 high (fps_test=3) | |
| KFA2 GeForce RTX 4090 SG | |
| Uniwill GM6PX7X RTX 4070 | |
| MSI GE78HX 13VH-070US | |
| Aorus 17X XES | |
| Asus ROG Strix Scar 17 SE G733CX-LL014W | |
| Asus ROG Zephyrus S17 GX703HSD | |
| MSI Pulse GL76 12UGK | |
| Asus ROG Strix Scar 17 G733PY-XS96 | |
| Lenovo Legion C7 15IMH05 82EH0030GE | |
| Alienware m17 R5 (R9 6900HX, RX 6850M XT) | |
| Tiny Tina's Wonderlands | |
| 1920x1080 Low Preset (DX12) | |
| KFA2 GeForce RTX 4090 SG | |
| Durchschnittliche NVIDIA GeForce RTX 4090 Laptop GPU (268 - 378, n=8) | |
| Asus ROG Strix Scar 17 G733PY-XS96 | |
| 1920x1080 Medium Preset (DX12) | |
| KFA2 GeForce RTX 4090 SG | |
| Durchschnittliche NVIDIA GeForce RTX 4090 Laptop GPU (230 - 302, n=8) | |
| Asus ROG Strix Scar 17 G733PY-XS96 | |
| 1920x1080 High Preset (DX12) | |
| KFA2 GeForce RTX 4090 SG | |
| Durchschnittliche NVIDIA GeForce RTX 4090 Laptop GPU (168 - 233, n=9) | |
| Asus ROG Strix Scar 17 G733PY-XS96 | |
| 1920x1080 Badass Preset (DX12) | |
| KFA2 GeForce RTX 4090 SG | |
| Asus ROG Strix Scar 17 G733PY-XS96 | |
| Durchschnittliche NVIDIA GeForce RTX 4090 Laptop GPU (141.1 - 189.4, n=14) | |
| 2560x1440 Badass Preset (DX12) | |
| KFA2 GeForce RTX 4090 SG | |
| Asus ROG Strix Scar 17 G733PY-XS96 | |
| Durchschnittliche NVIDIA GeForce RTX 4090 Laptop GPU (103.4 - 137.8, n=14) | |
| 3840x2160 Badass Preset (DX12) | |
| KFA2 GeForce RTX 4090 SG | |
| Asus ROG Strix Scar 17 G733PY-XS96 | |
| Durchschnittliche NVIDIA GeForce RTX 4090 Laptop GPU (53.3 - 73.7, n=12) | |
Witcher 3 FPS Chart
| min. | mittel | hoch | max. | QHD DLSS | QHD FSR | QHD | 4K DLSS | 4K FSR | 4K | |
|---|---|---|---|---|---|---|---|---|---|---|
| GTA V (2015) | 185 | 180.4 | 175.2 | 112.6 | 114.8 | 170.5 | ||||
| The Witcher 3 (2015) | 490.1 | 405.6 | 370.3 | 203.8 | 154.8 | |||||
| Dota 2 Reborn (2015) | 165.6 | 150.5 | 154.2 | 139 | 135.4 | |||||
| Final Fantasy XV Benchmark (2018) | 214 | 205 | 163.9 | 151 | 93.3 | |||||
| X-Plane 11.11 (2018) | 132.2 | 118 | 94.3 | 78.5 | ||||||
| Far Cry 5 (2018) | 157 | 145 | 142 | 108 | ||||||
| Shadow of the Tomb Raider (2018) | 238 | 228 | 190 | 104 | ||||||
| Borderlands 3 (2019) | 121.4 | |||||||||
| Doom Eternal (2020) | 441 | 362 | 200 | |||||||
| Valorant (2020) | 485 | |||||||||
| Assassin´s Creed Valhalla (2020) | 187 | 169 | 135 | 79 | ||||||
| Far Cry 6 (2021) | 117 | 112 | 109 | 82 | ||||||
| Cyberpunk 2077 1.6 (2022) | 146.4 | 140.5 | 132.6 | 133.8 | 104.3 | 48.6 | ||||
| Tiny Tina's Wonderlands (2022) | 267.7 | 230 | 194.6 | 176.2 | 134.2 | 71.9 | ||||
| F1 22 (2022) | 266 | 243 | 221 | 116.3 | 92.1 | 45.8 | ||||
| Call of Duty Modern Warfare 2 2022 (2022) | 188 | 180 | 135 | 82 | ||||||
| Star Wars Jedi Survivor (2023) | 105.6 | 103.1 | 88.4 | 43 | ||||||
| Black Myth: Wukong (2024) | 153 | 117 | 93 | 41 | 43 | 24 | ||||
| Final Fantasy XVI (2024) | 91.6 | 71.2 | 77.5 | |||||||
| God of War Ragnarök (2024) | 138 | 127.1 | 113.9 | 82.8 | ||||||
| Call of Duty Black Ops 6 (2024) | 130 | 126 | 92 | 76 | 72 | 76 | ||||
| Stalker 2 (2024) | 64.2 | 113.2 | 58.6 | 78.2 | 38.9 | |||||
| Marvel Rivals (2024) | 146 | 122 | 101 | 90 | 71 | |||||
| Kingdom Come Deliverance 2 (2025) | 112.5 | 110.4 | 86.7 | 70.8 | 48.4 | |||||
| Monster Hunter Wilds (2025) | 89.2 | 84.7 | 78.1 | 74.7 | 66.6 | 58 | 42.8 | |||
| Civilization 7 (2025) | 161.3 | 155.4 | 154.9 | |||||||
| The Elder Scrolls IV Oblivion Remastered (2025) | 56.8 | 53.7 | 43.1 | 26.4 | ||||||
| Doom: The Dark Ages (2025) | 123.4 | 115 | 105.5 | 95.2 | 95.3 | 73.1 | 57.1 | 39.7 | ||
| F1 25 (2025) | 227 | 216 | 203 | 53.8 | 57.8 | 32.4 | 28.8 | 15 | ||
| Borderlands 4 (2025) | 83.2 | 70 | 54.8 | 37.9 | ||||||
| Battlefield 6 (2025) | 126.8 | 113.7 | 89.9 | 50.9 | ||||||
| The Outer Worlds 2 (2025) | 77.2 | 41.8 | 51.5 | 27.2 | ||||||
| ARC Raiders (2025) | 226 | 205 | 196.7 | 116.5 | 87.7 | 50 | ||||
| Anno 117: Pax Romana (2025) | 96.4 | 59.9 | 59 | 44.4 | 25.9 | |||||
| Call of Duty Black Ops 7 (2025) | 76 | 52 | 27 | |||||||
| Resident Evil Requiem (2026) | 72.4 | 55.6 | 28.3 | |||||||
| Death Stranding 2 (2026) | 88.5 | 82.6 | 68.1 | 63.4 | 42.4 | |||||
| Crimson Desert (2026) | 73.3 | 68.1 | 57.3 | 51.1 | 43.1 | |||||
| Pragmata (2026) | 110.7 | 104.6 | 85.5 | 82.6 | 58.6 | |||||
| War Thunder (2026) | 123 | 85 | 50 | |||||||
| Forza Horizon 6 (2026) | 94 | 61 | 50 | 31 | ||||||
| 007 First Light (2026) | 75.8 | 79.4 | 67.3 | 63.4 | 35.7 |
Emissionen - Performance-Modus leiser als bei Turbo
System-Rauschen
Das Lüftergeräusch ist unabhängig von der Leistungseinstellung mit 23 bis 27 dB(A) gegenüber einem leisen Hintergrund von 22,7 dB(A) stets präsent. Glücklicherweise ist dieser Bereich leise genug, um nicht aufzufallen, und die Lüfter leisten gute Arbeit, um unter 30 dB(A) zu bleiben, wenn etwas höhere Lasten wie Webbrowsing oder Streaming laufen.
Gaming im Performance-Modus ist leiser als im Turbo-Modus. Das Lüftergeräusch bei Betrieb von Witcher 3 im Performance-Modus liegt bei 46,4 dB(A) gegenüber 51,4 bis 54 dB(A) im Turbomodus. Daher sollten Nutzer die fünf Prozent Einbußen bei der Grafikleistung in Kauf nehmen, um den leiseren Geräuschpegel des Performance-Modus zu genießen.
Lautstärkediagramm
| Idle |
| 23.5 / 27.7 / 27.7 dB(A) |
| Last |
| 30.5 / 54.1 dB(A) |
 | ||
30 dB leise 40 dB(A) deutlich hörbar 50 dB(A) störend |
||
min: | ||
| Asus ROG Strix Scar 17 G733PY-XS96 GeForce RTX 4090 Laptop GPU, R9 7945HX, SK hynix PC801 HFS001TEJ9X101N | MSI GE78HX 13VH-070US GeForce RTX 4080 Laptop GPU, i9-13950HX, Samsung PM9A1 MZVL22T0HBLB | Eluktronics Mech-17 GP2 GeForce RTX 4090 Laptop GPU, i9-13900HX, Samsung PM9A1 MZVL21T0HCLR | Asus ROG Strix G17 G713PI GeForce RTX 4070 Laptop GPU, R9 7945HX, WD PC SN560 SDDPNQE-1T00 | Aorus 17X XES GeForce RTX 3070 Ti Laptop GPU, i9-12900HX, Gigabyte AG470S1TB-SI B10 | Alienware m17 R5 (R9 6900HX, RX 6850M XT) Radeon RX 6850M XT, R9 6900HX, SSSTC CA6-8D1024 | |
|---|---|---|---|---|---|---|
| Geräuschentwicklung | -10% | -10% | -9% | -24% | 1% | |
| aus / Umgebung * (dB) | 22.7 | 23.4 -3% | 25.2 -11% | 25 -10% | 26 -15% | 23 -1% |
| Idle min * (dB) | 23.5 | 24.2 -3% | 28 -19% | 26 -11% | 28 -19% | 23 2% |
| Idle avg * (dB) | 27.7 | 25.6 8% | 28 -1% | 29 -5% | 32 -16% | 28.11 -1% |
| Idle max * (dB) | 27.7 | 31 -12% | 30.4 -10% | 30 -8% | 38 -37% | 28.11 -1% |
| Last avg * (dB) | 30.5 | 43.3 -42% | 41 -34% | 46 -51% | 53 -74% | 30.62 -0% |
| Witcher 3 ultra * (dB) | 51.4 | 56.3 -10% | 50.7 1% | 46 11% | 54 -5% | 49.75 3% |
| Last max * (dB) | 54.1 | 59.1 -9% | 52.6 3% | 47 13% | 55 -2% | 50.17 7% |
* ... kleinere Werte sind besser
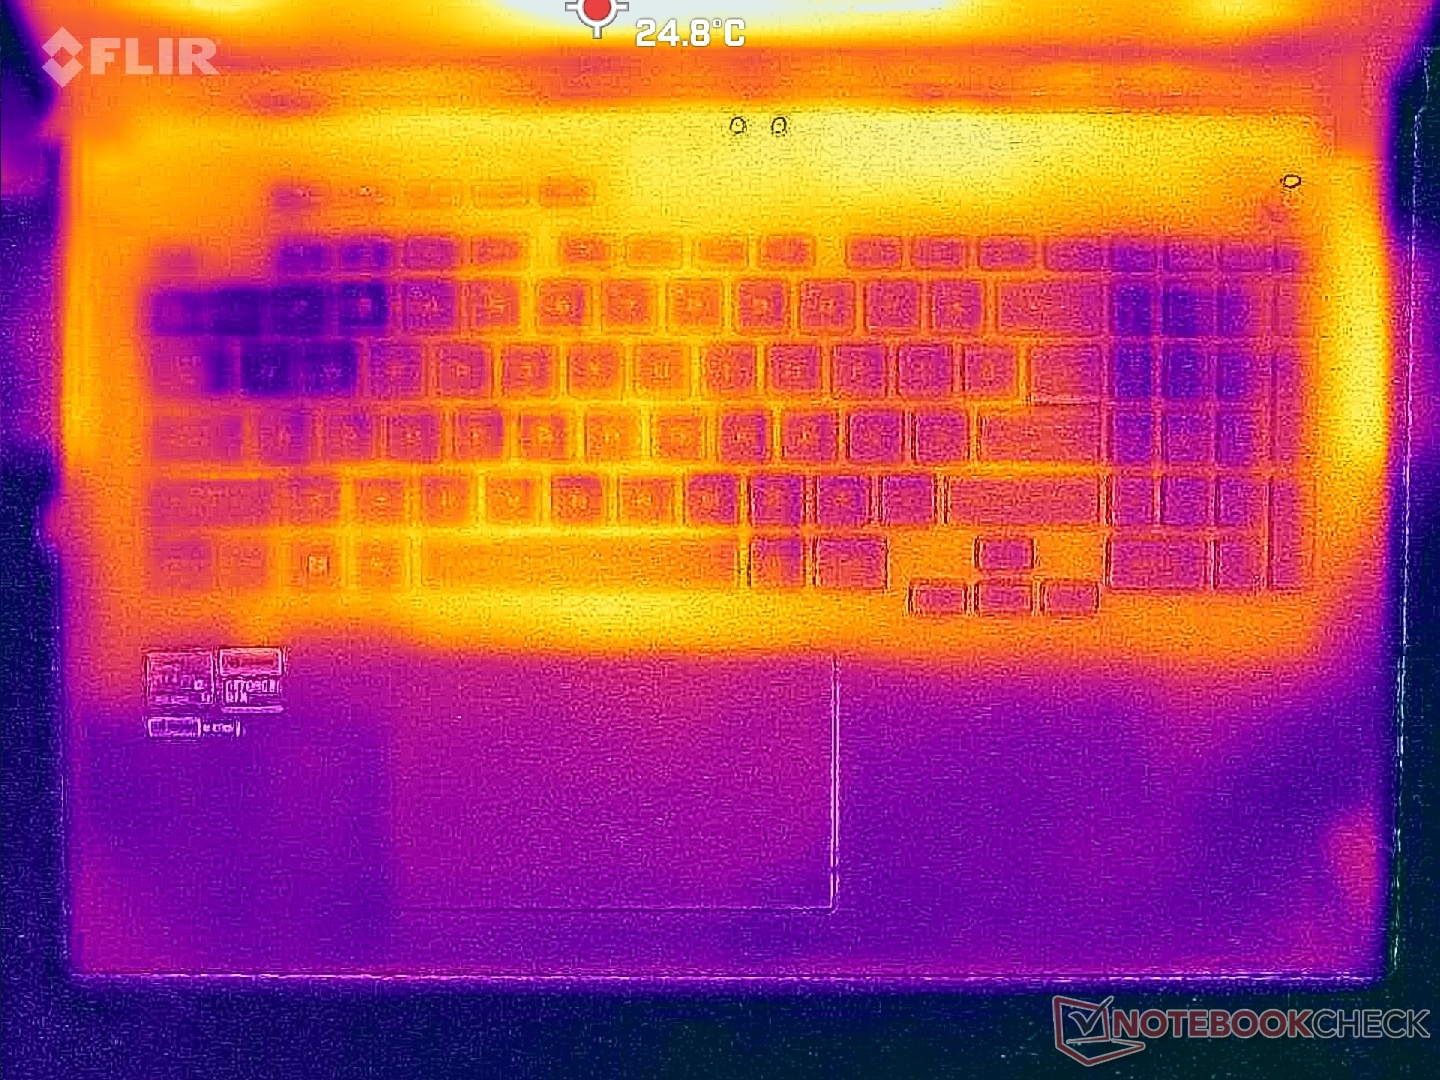
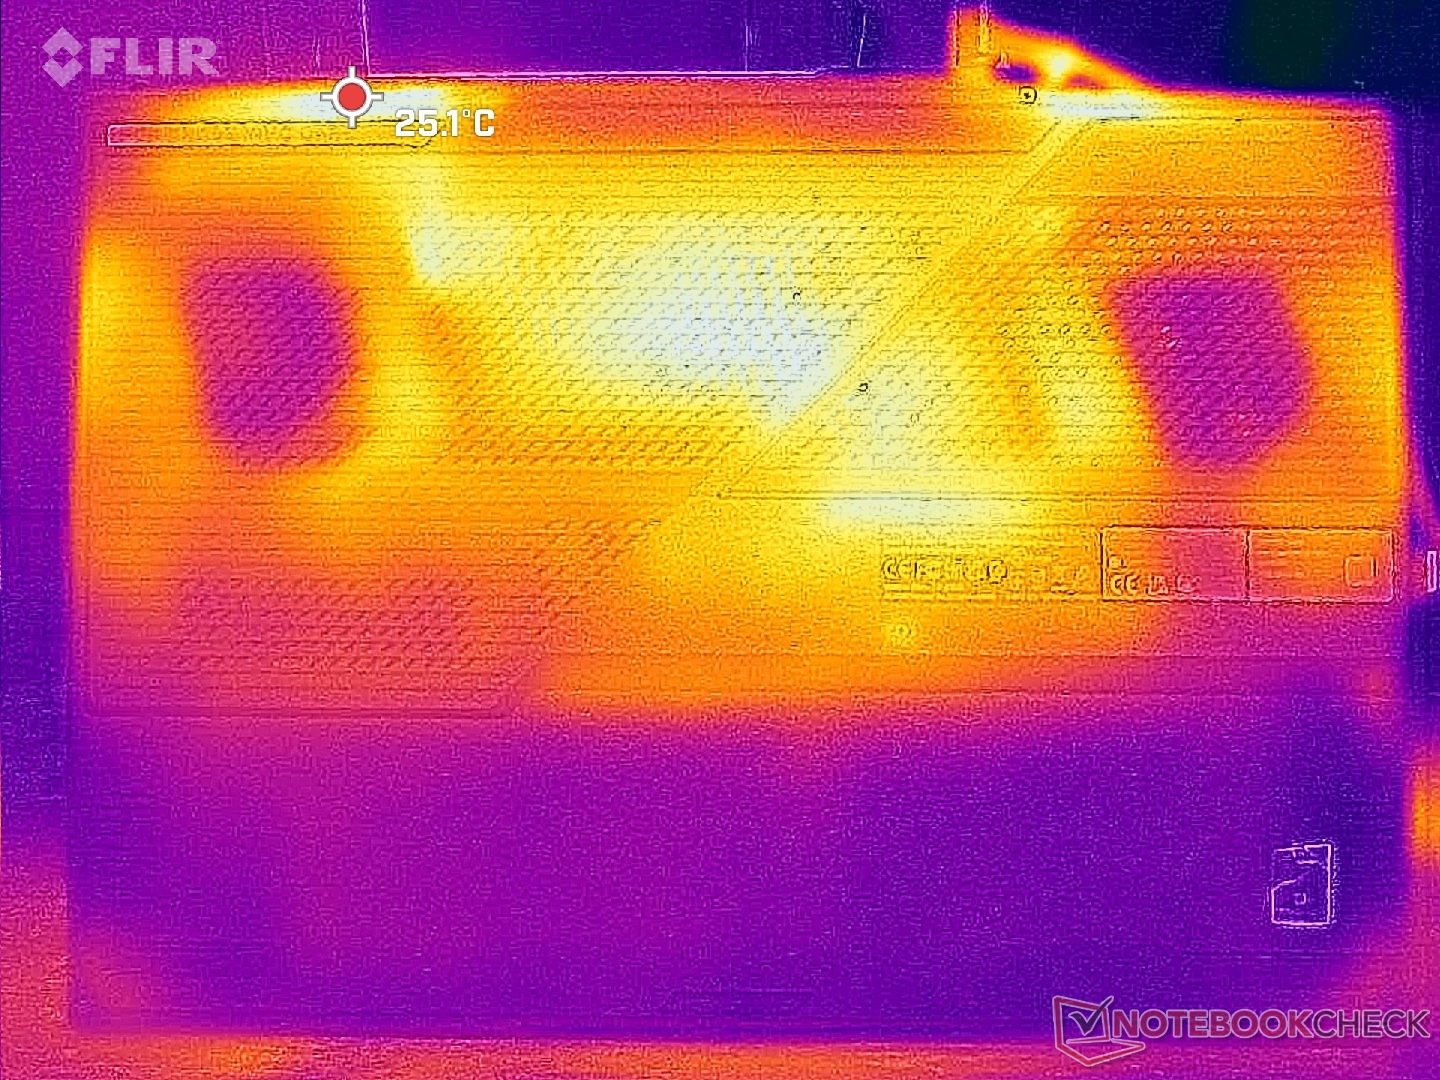
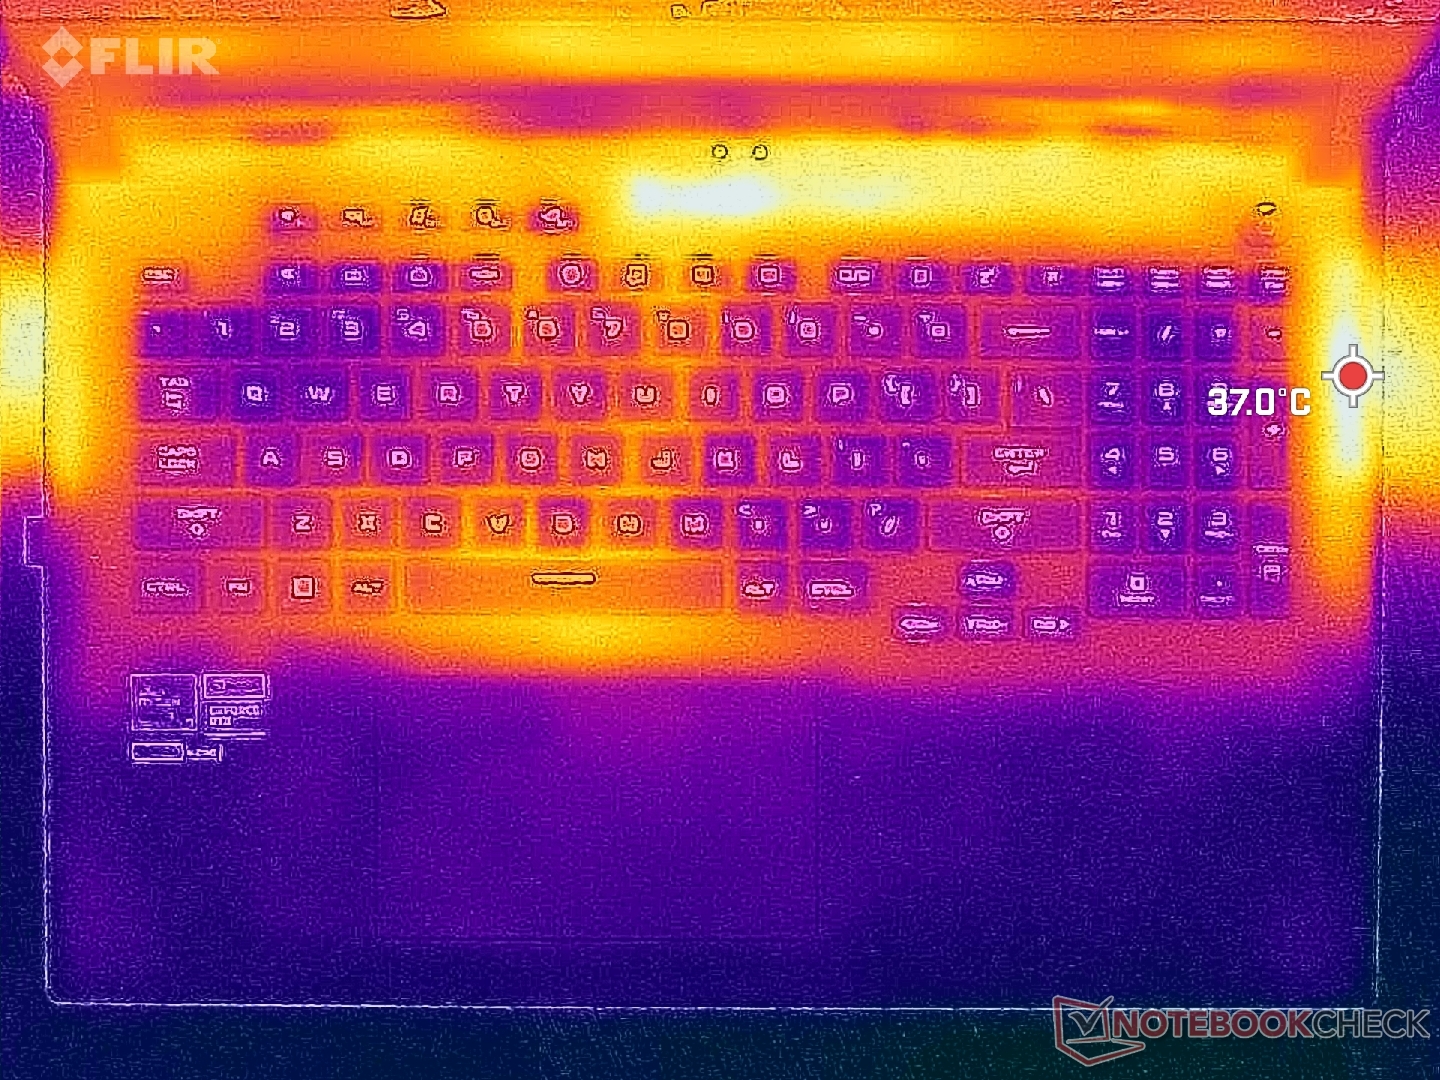
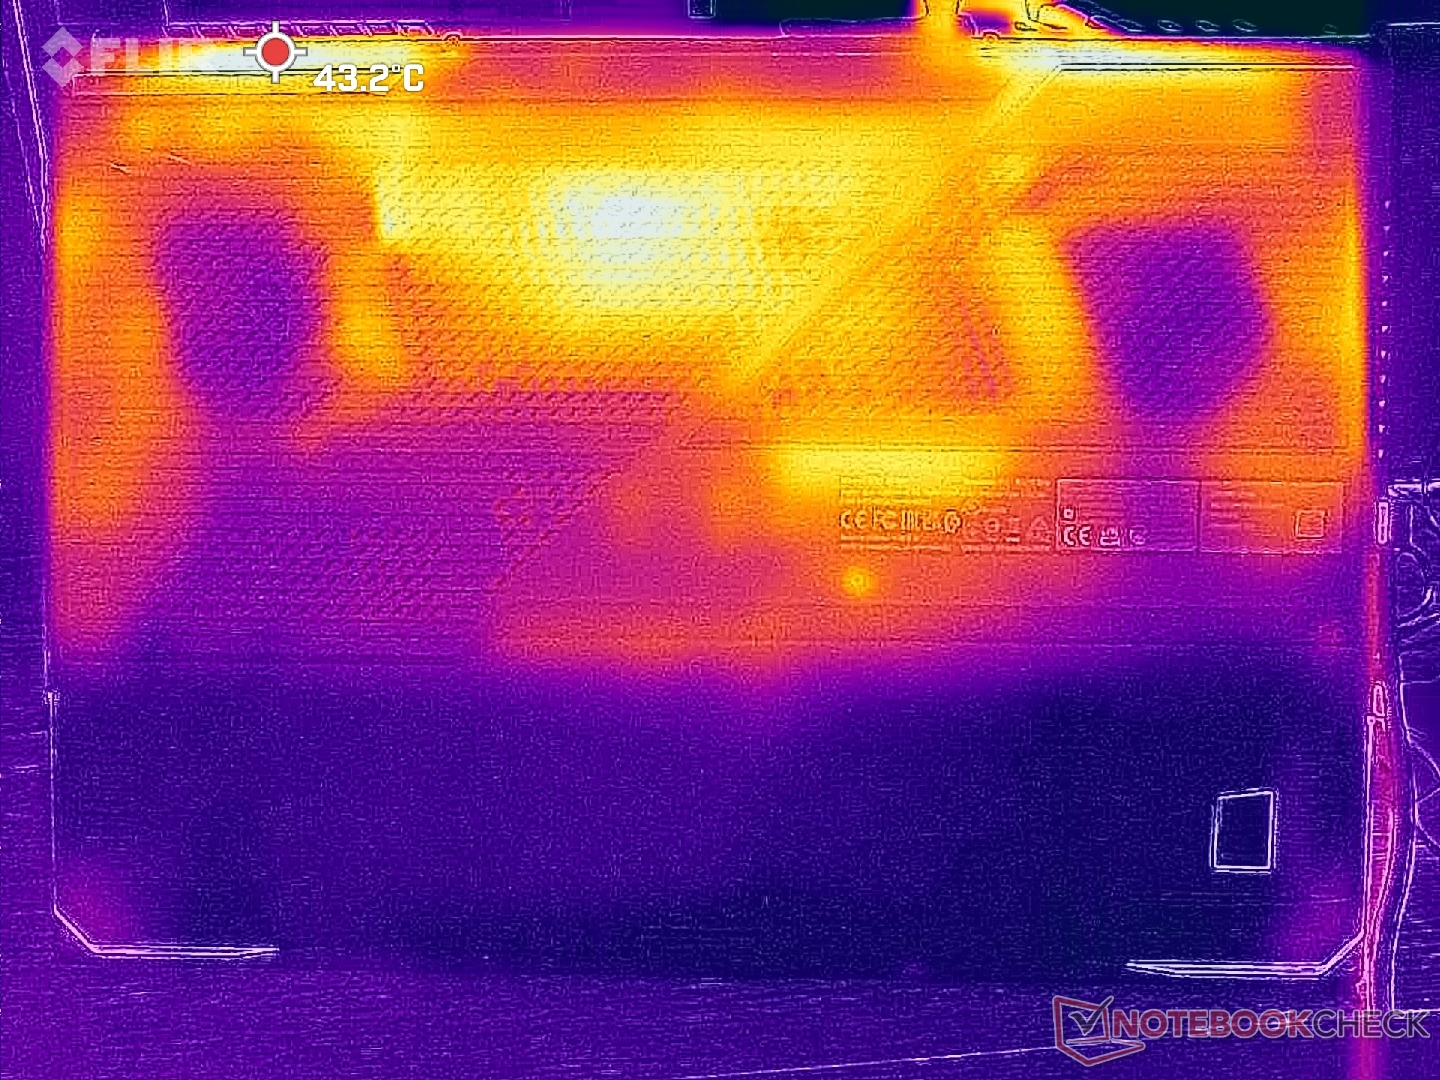
Temperatur
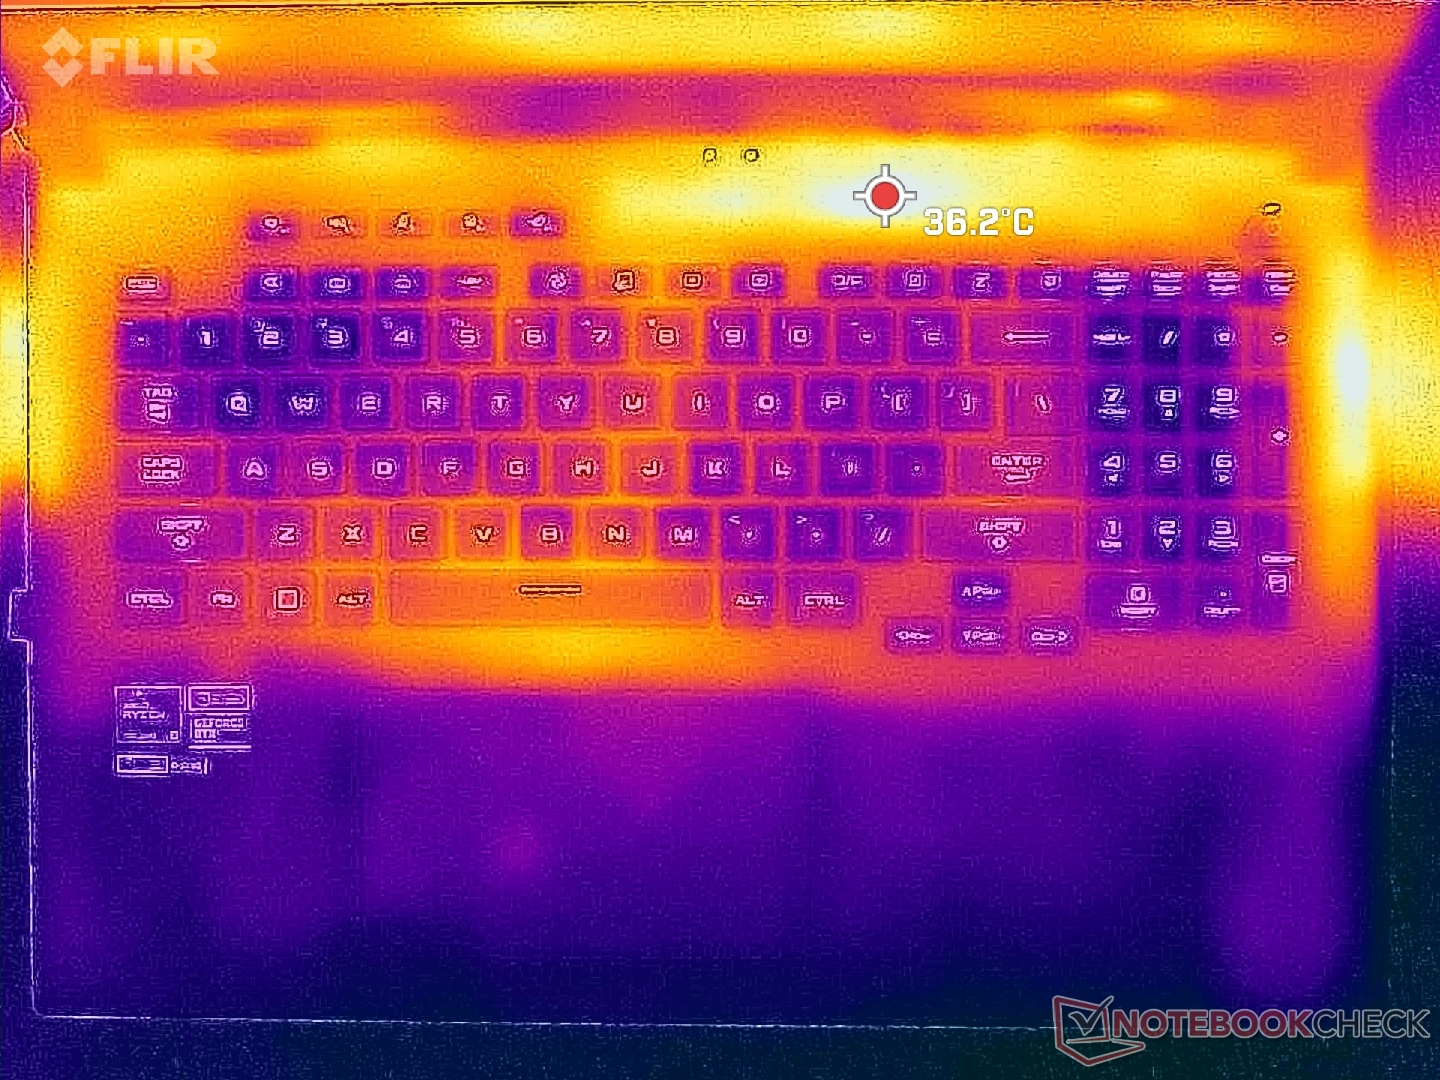
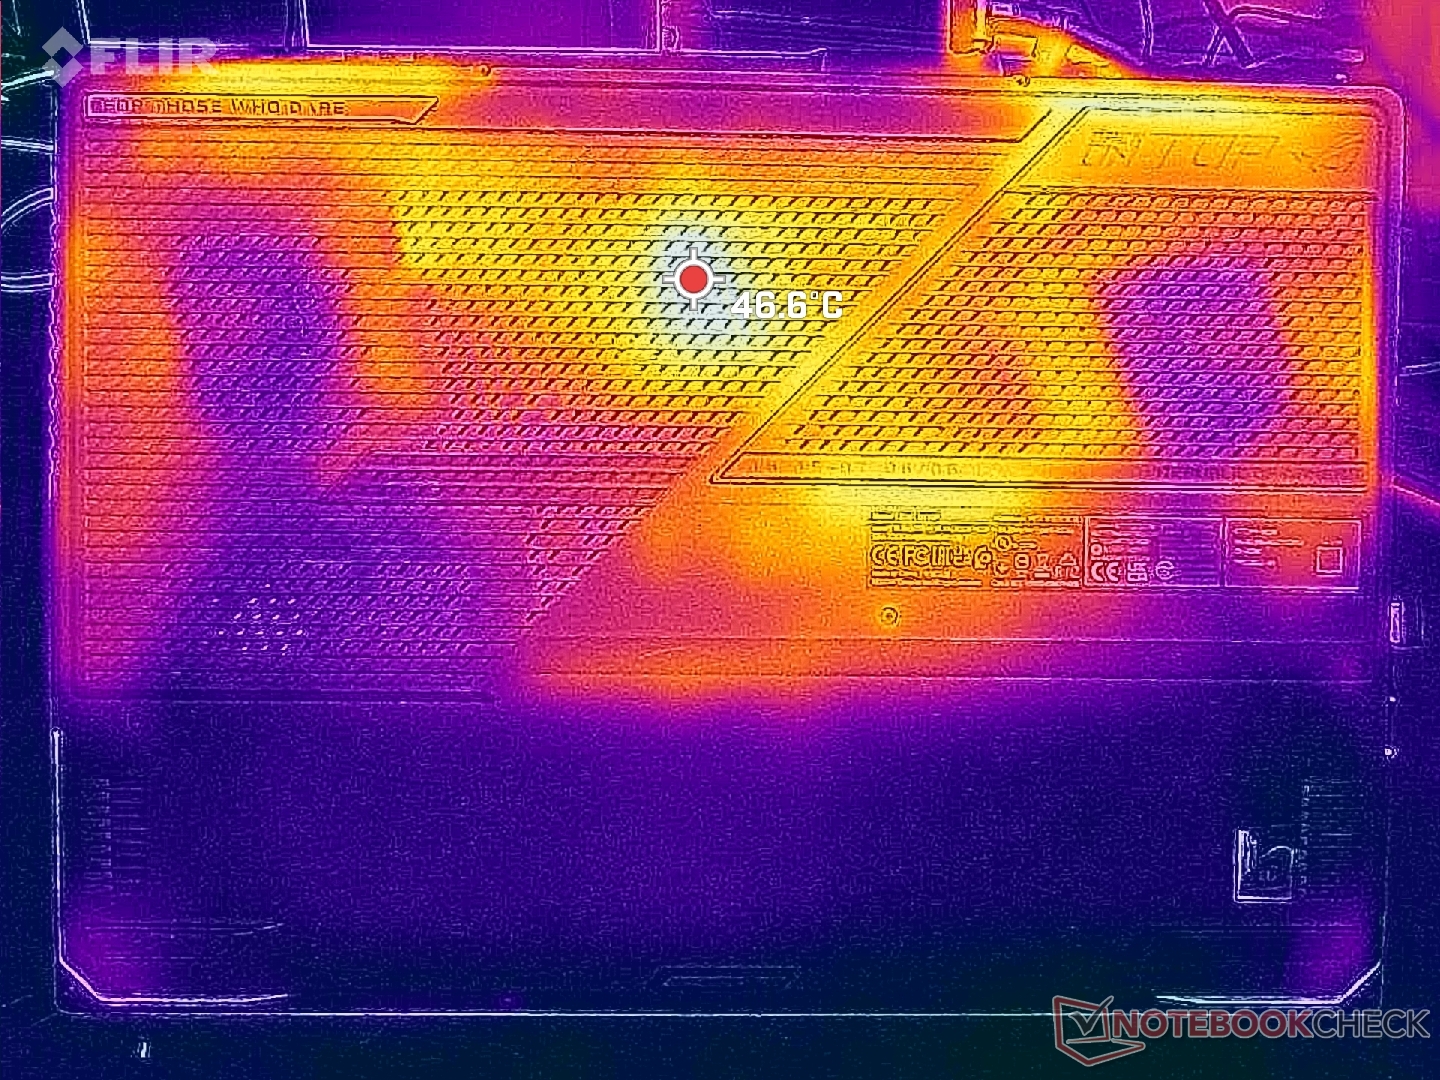
Ein Großteil der Tastatur und der Handballenablagen bleibt beim Spielen kühl. Heiße Stellen befinden sich stattdessen an den Rändern des Decks, womit die Finger seltener in Berührung kommen.
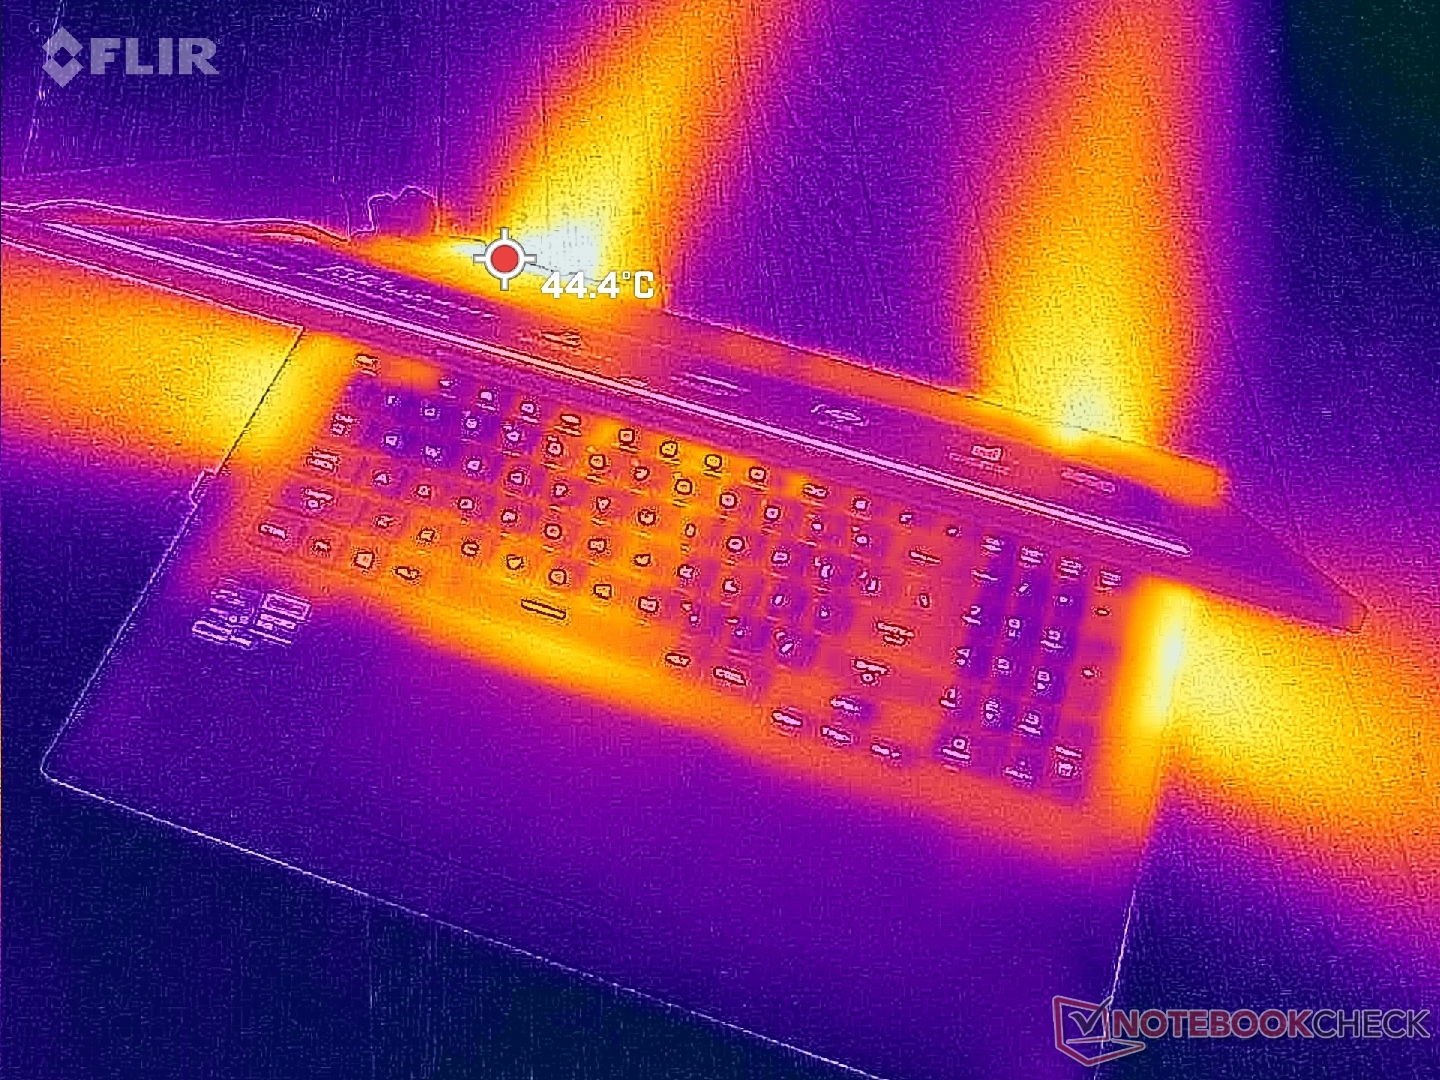
(+) Die maximale Temperatur auf der Oberseite ist 34.6 °C. Im Vergleich liegt der Klassendurchschnitt bei 40.4 °C (von 21.2 bis 68.8 °C für die Klasse Gaming).
(+) Auf der Unterseite messen wir eine maximalen Wert von 35.6 °C (im Vergleich zum Durchschnitt von 43.2 °C).
(+) Ohne Last messen wir eine durchschnittliche Temperatur von 23.2 °C auf der Oberseite. Der Klassendurchschnitt erreicht 33.9 °C.
(+) Beim längeren Spielen von The Witcher 3 erhitzt sich das Gerät durchschnittlich auf 27.3 °C. Der Durchschnitt der Klasse ist derzeit 33.9 °C.
(+) Die Handballen und der Touchpad-Bereich sind mit gemessenen 20.8 °C kühler als die typische Hauttemperatur und fühlen sich dadurch kühl an.
(+) Die durchschnittliche Handballen-Temperatur anderer getesteter Geräte war 28.8 °C (+8 °C).
| Asus ROG Strix Scar 17 G733PY-XS96 AMD Ryzen 9 7945HX, NVIDIA GeForce RTX 4090 Laptop GPU | MSI GE78HX 13VH-070US Intel Core i9-13950HX, NVIDIA GeForce RTX 4080 Laptop GPU | Eluktronics Mech-17 GP2 Intel Core i9-13900HX, NVIDIA GeForce RTX 4090 Laptop GPU | Asus ROG Strix G17 G713PI AMD Ryzen 9 7945HX, NVIDIA GeForce RTX 4070 Laptop GPU | Aorus 17X XES Intel Core i9-12900HX, NVIDIA GeForce RTX 3070 Ti Laptop GPU | Alienware m17 R5 (R9 6900HX, RX 6850M XT) AMD Ryzen 9 6900HX, AMD Radeon RX 6850M XT | |
|---|---|---|---|---|---|---|
| Hitze | -13% | -13% | -18% | -46% | -29% | |
| Last oben max * (°C) | 34.6 | 37.4 -8% | 39 -13% | 42 -21% | 54 -56% | 53 -53% |
| Last unten max * (°C) | 35.6 | 45 -26% | 44 -24% | 41 -15% | 58 -63% | 56 -57% |
| Idle oben max * (°C) | 27.2 | 29.8 -10% | 31 -14% | 33 -21% | 37 -36% | 30 -10% |
| Idle unten max * (°C) | 30 | 32.4 -8% | 29.8 1% | 34 -13% | 39 -30% | 29 3% |
* ... kleinere Werte sind besser
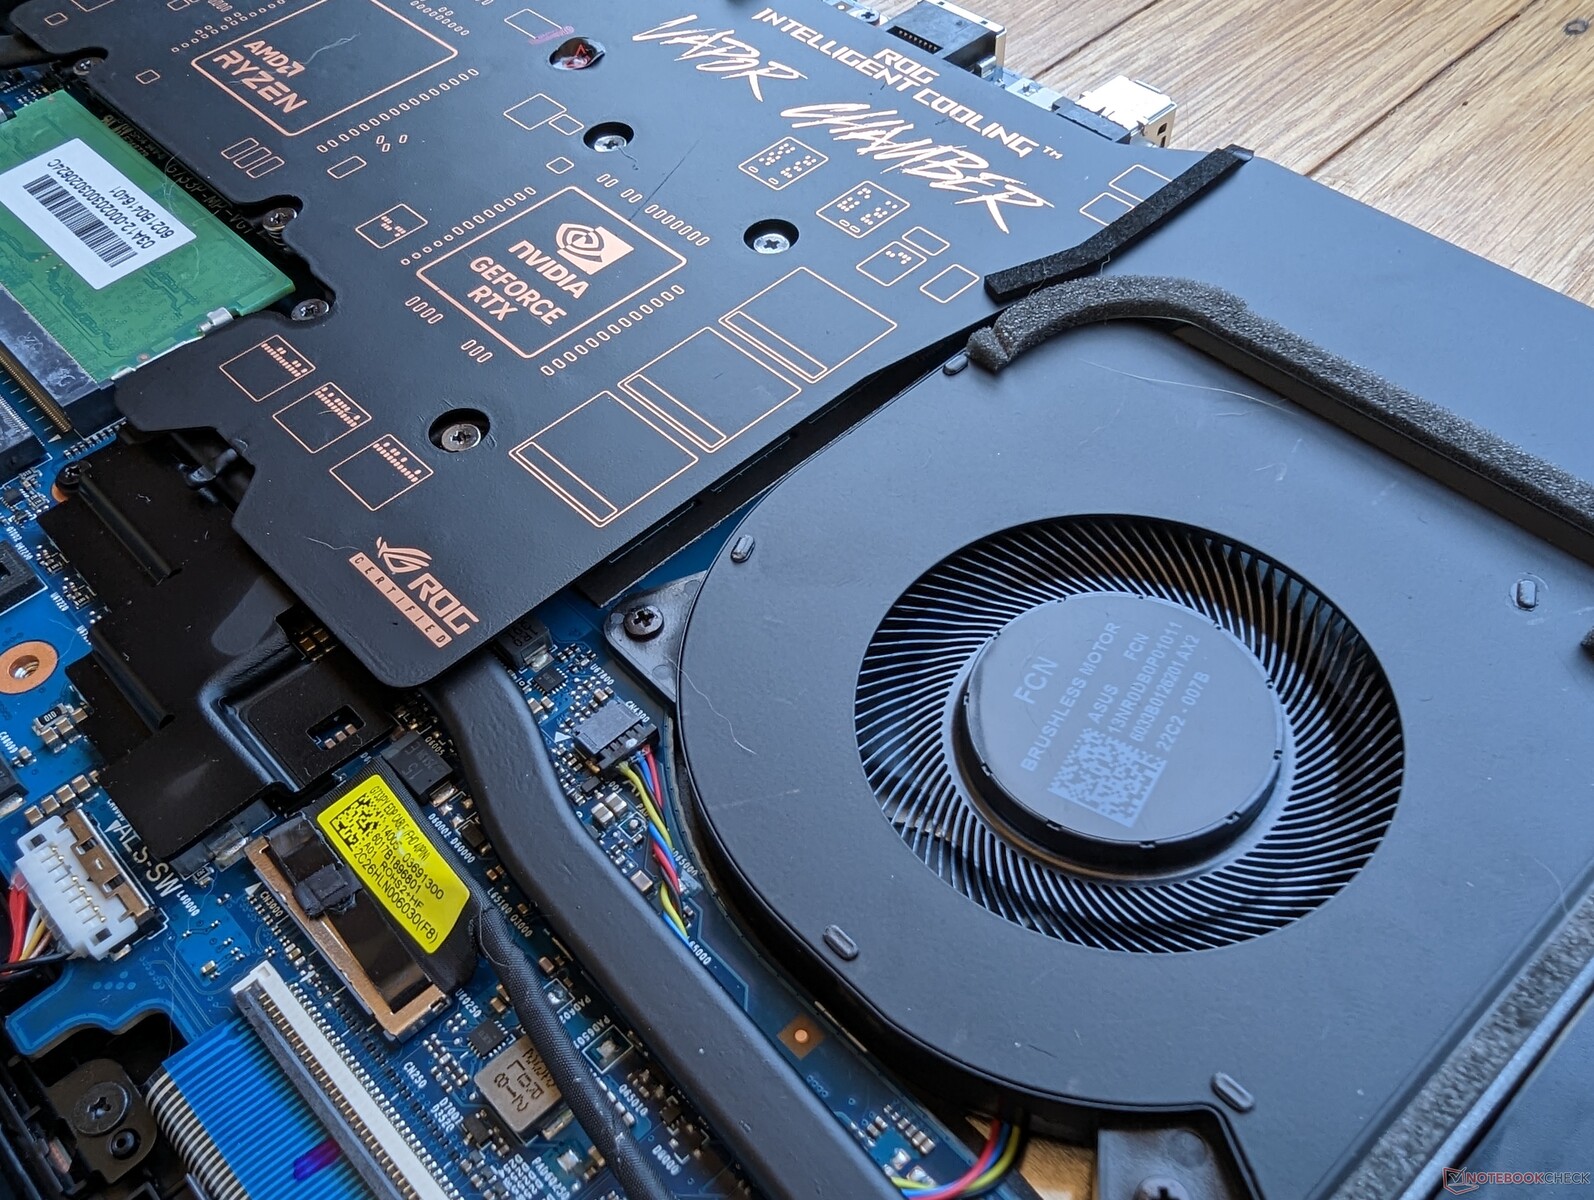
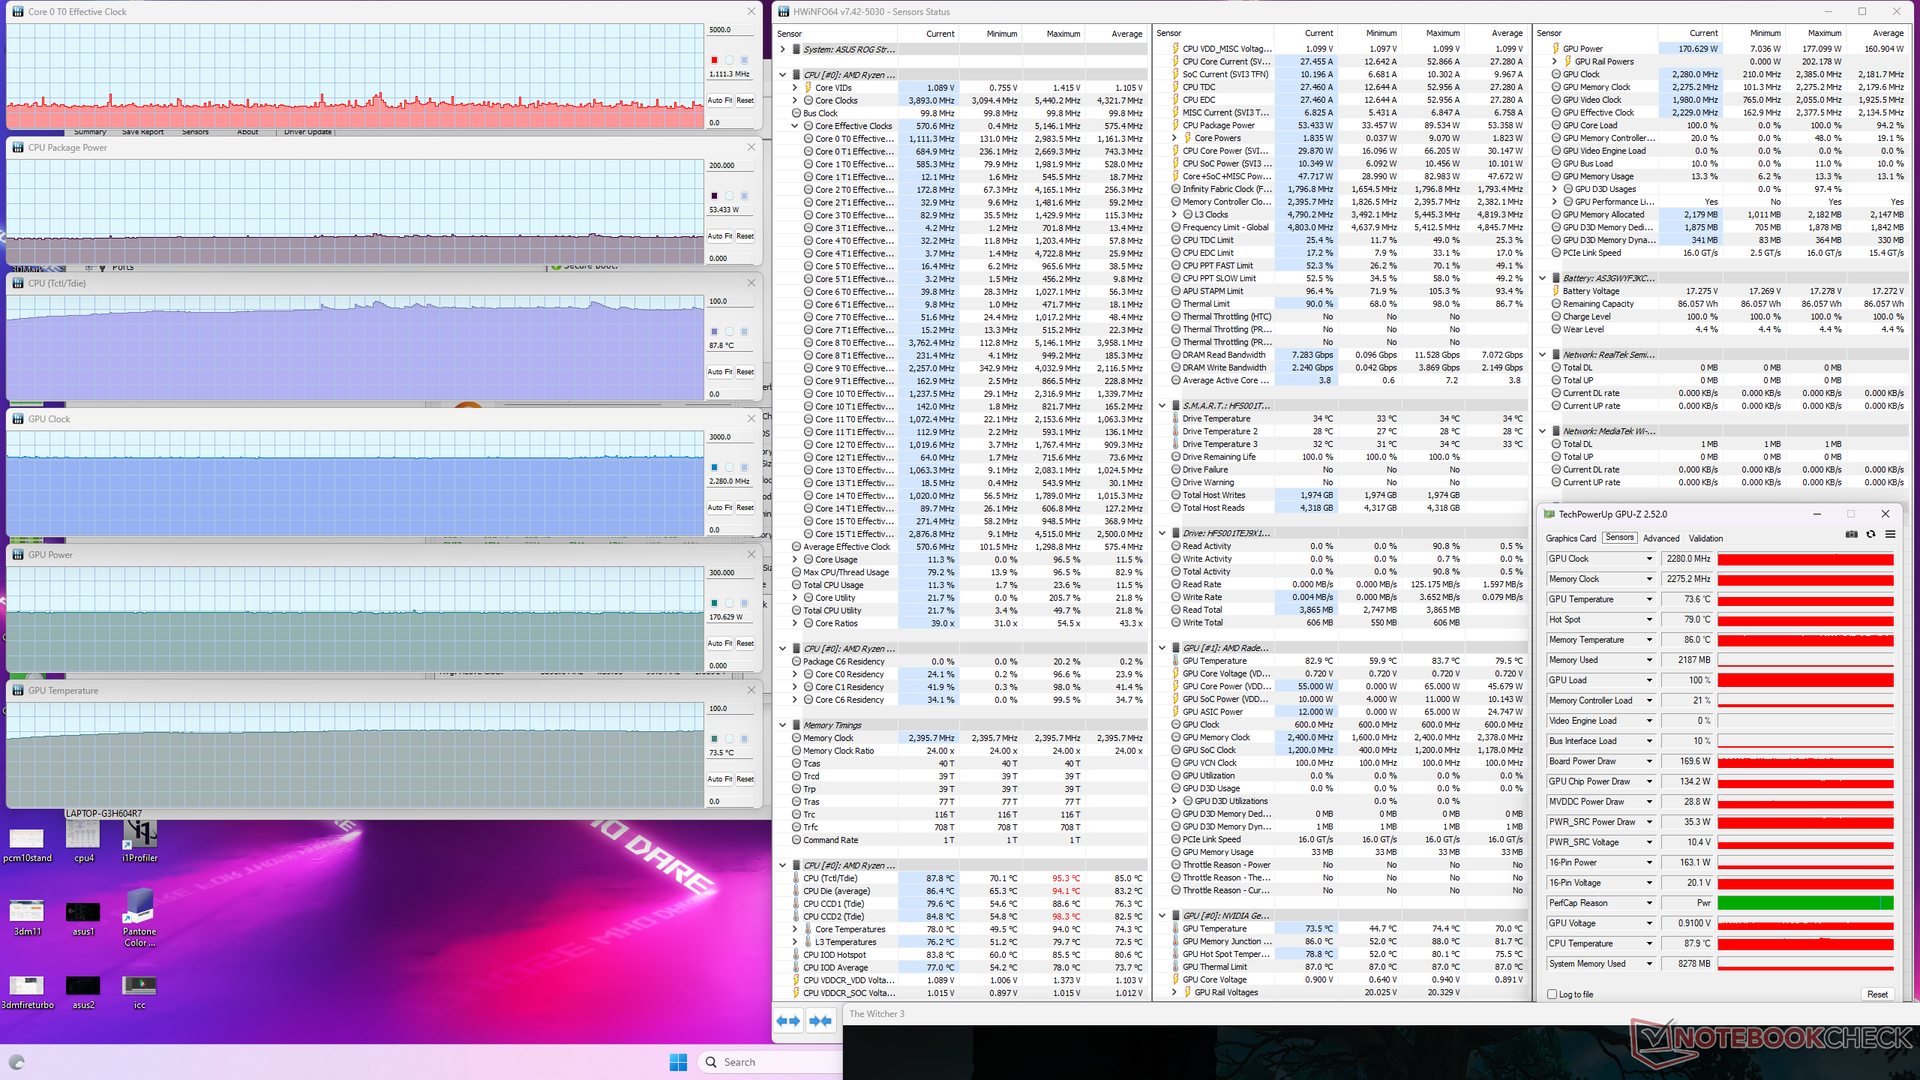
Stresstest - Warme Kerntemperatur
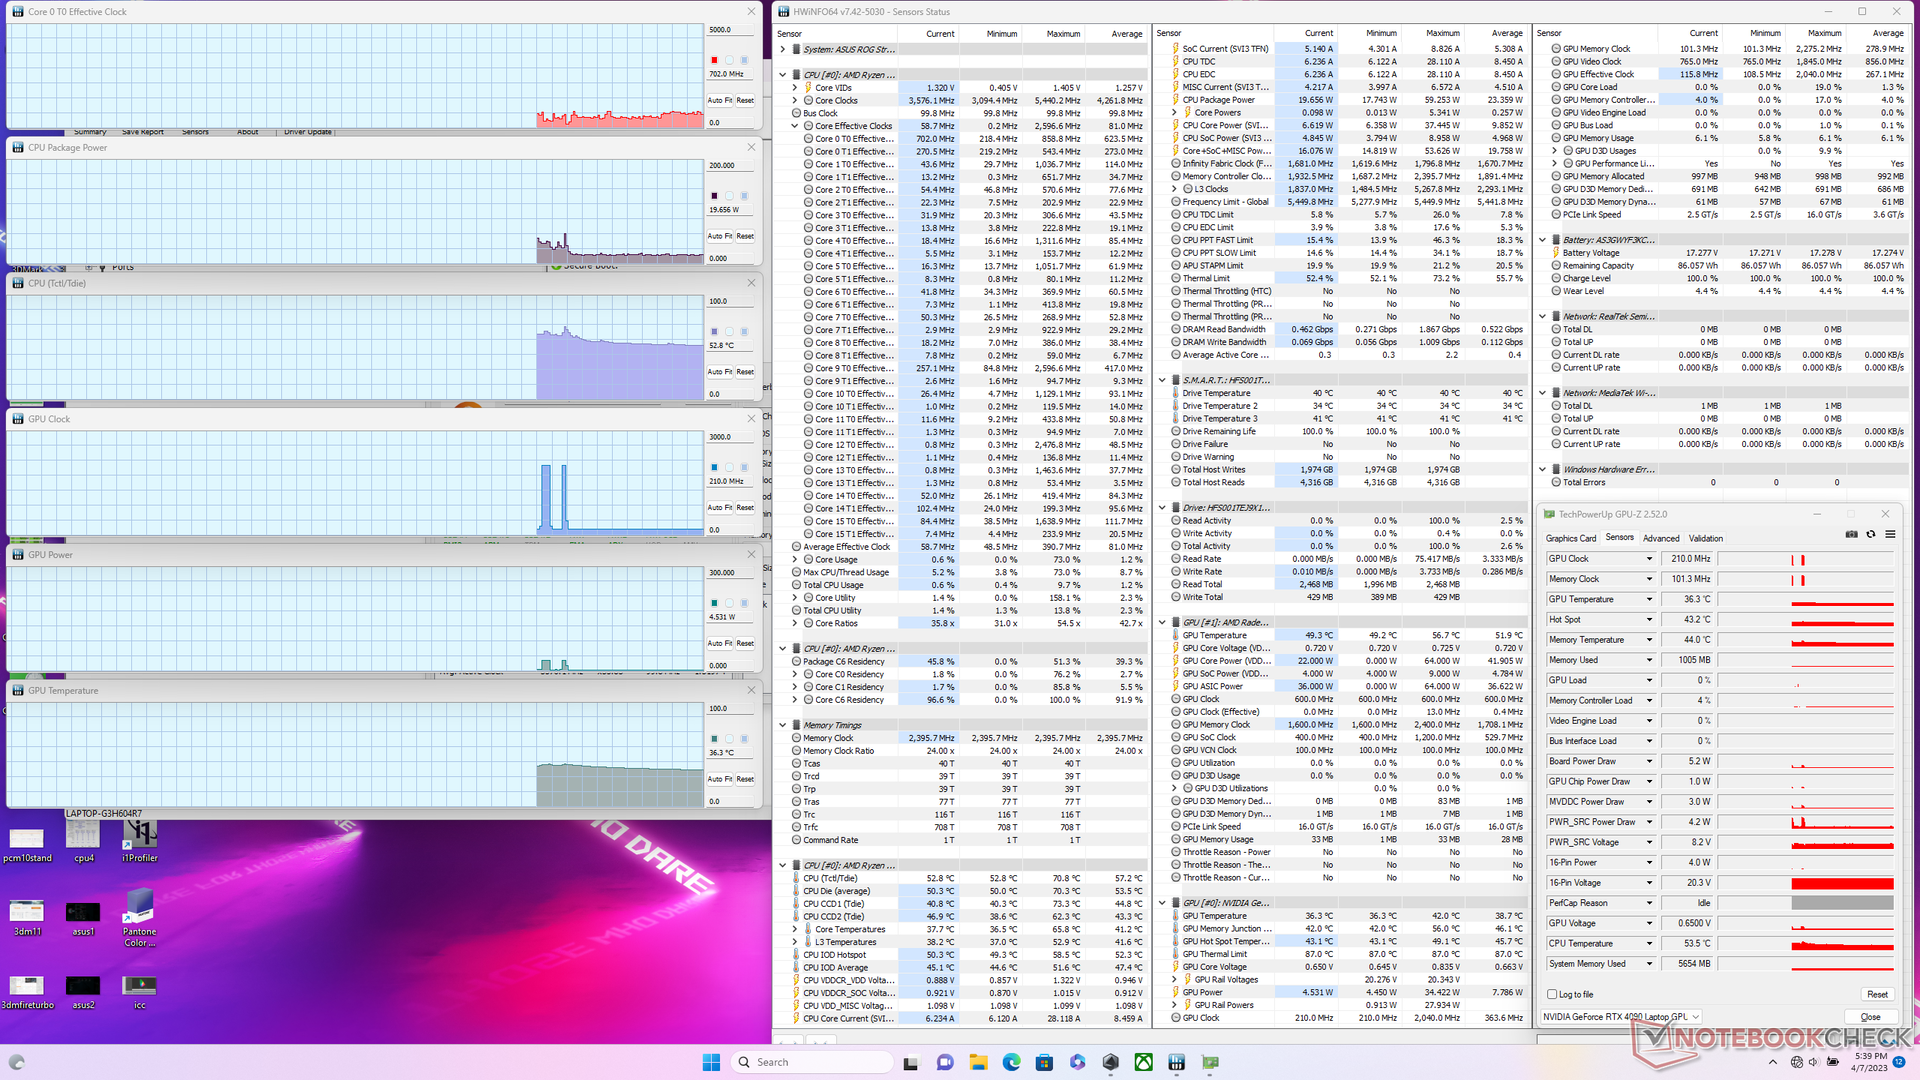
Unter Prime95 tastet die CPU zwischen 4,2 und 4,9 GHz und behält dabei eine CPU-Gehäuseleistung zwischen 114 und 128 W bei. Die Kerntemperatur ist jedoch mit über 90 °C sehr hoch.
Die GPU-Taktrate, der Speichertakt, die Temperatur und die Leistungsaufnahme des Boards stabilisieren sich bei 2.055 MHz, 2.250 MHz, 79 °C bzw. 149 W, wenn Witcher 3 im Performance-Modus läuft. Diese Werte ändern sich auf 2.280 MHz, 2.275 MHz, 74 °C und 170 W, sobald der Turbo-Modus aktiviert wird. Der Turbo-Modus ist also erforderlich, wenn man näher an die beworbenen 175 W TGP der mobilen RTX 4090 herankommen möchte.
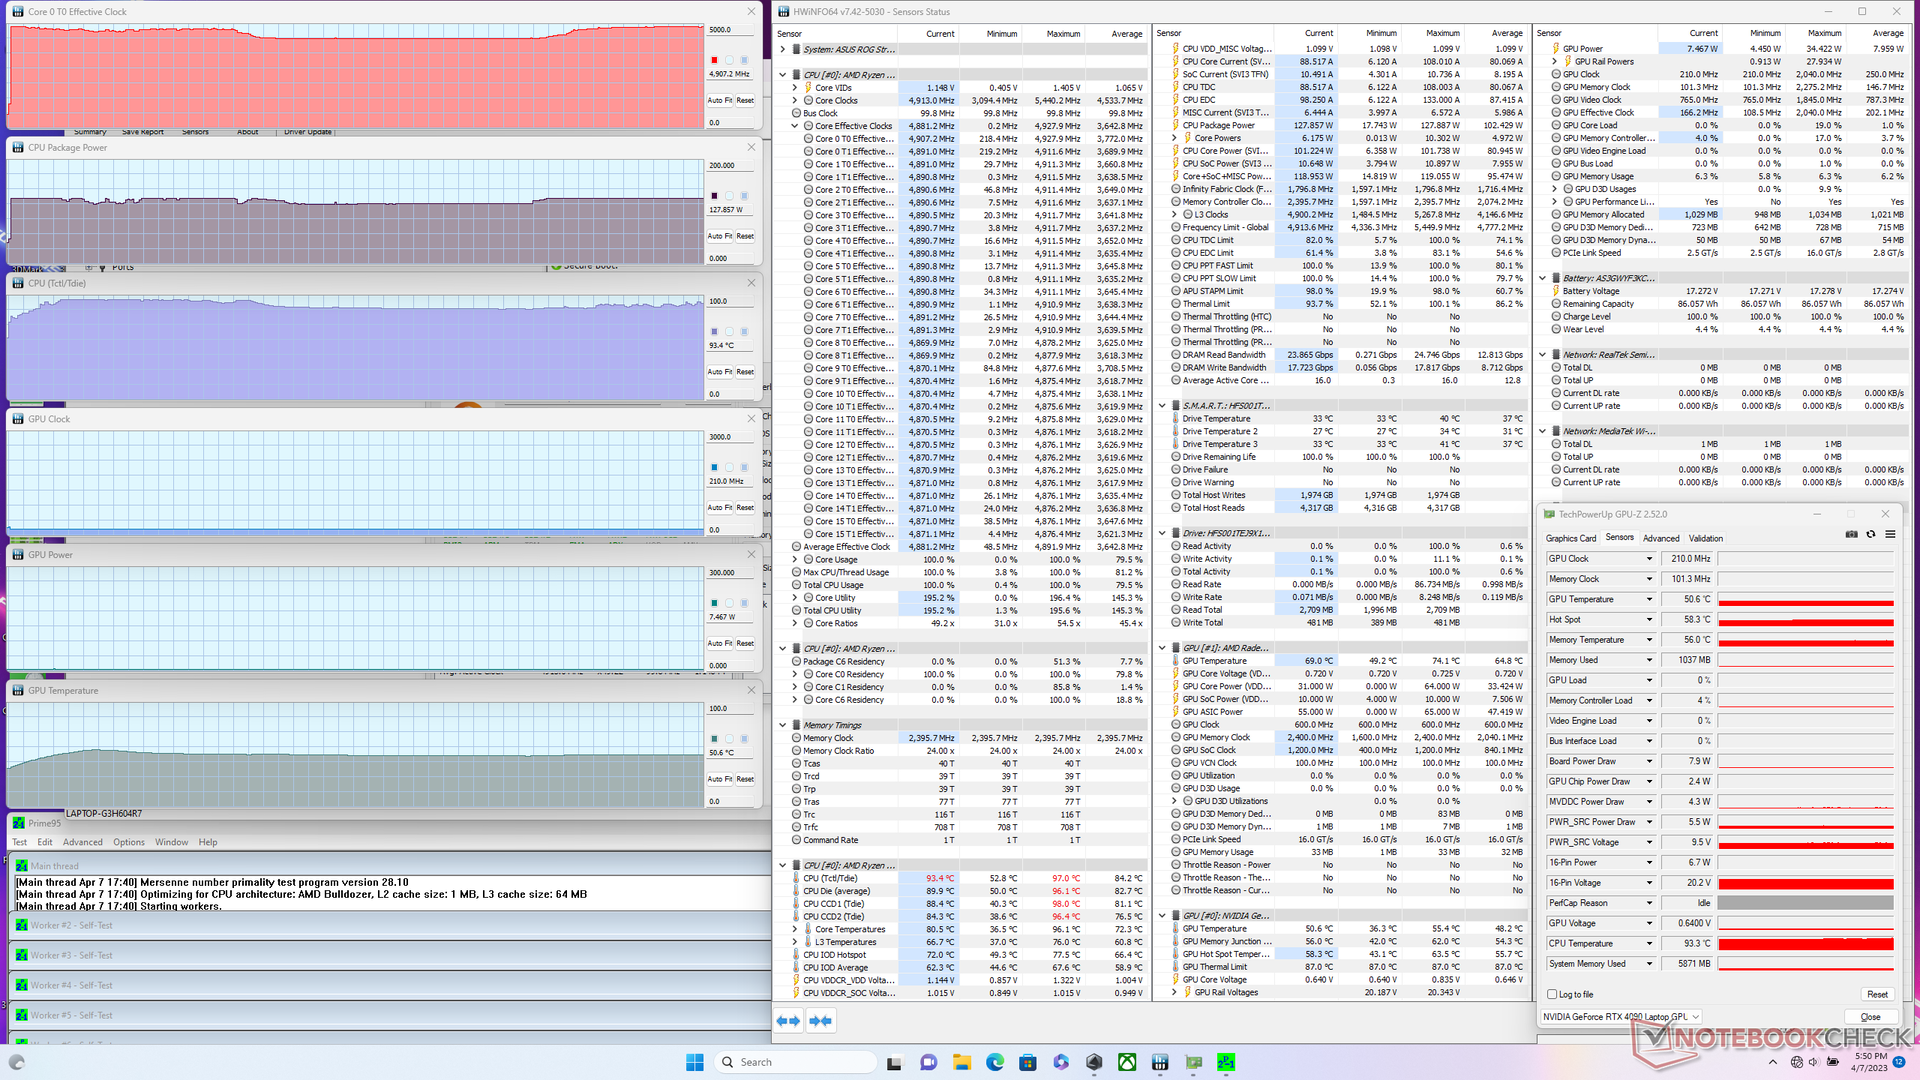
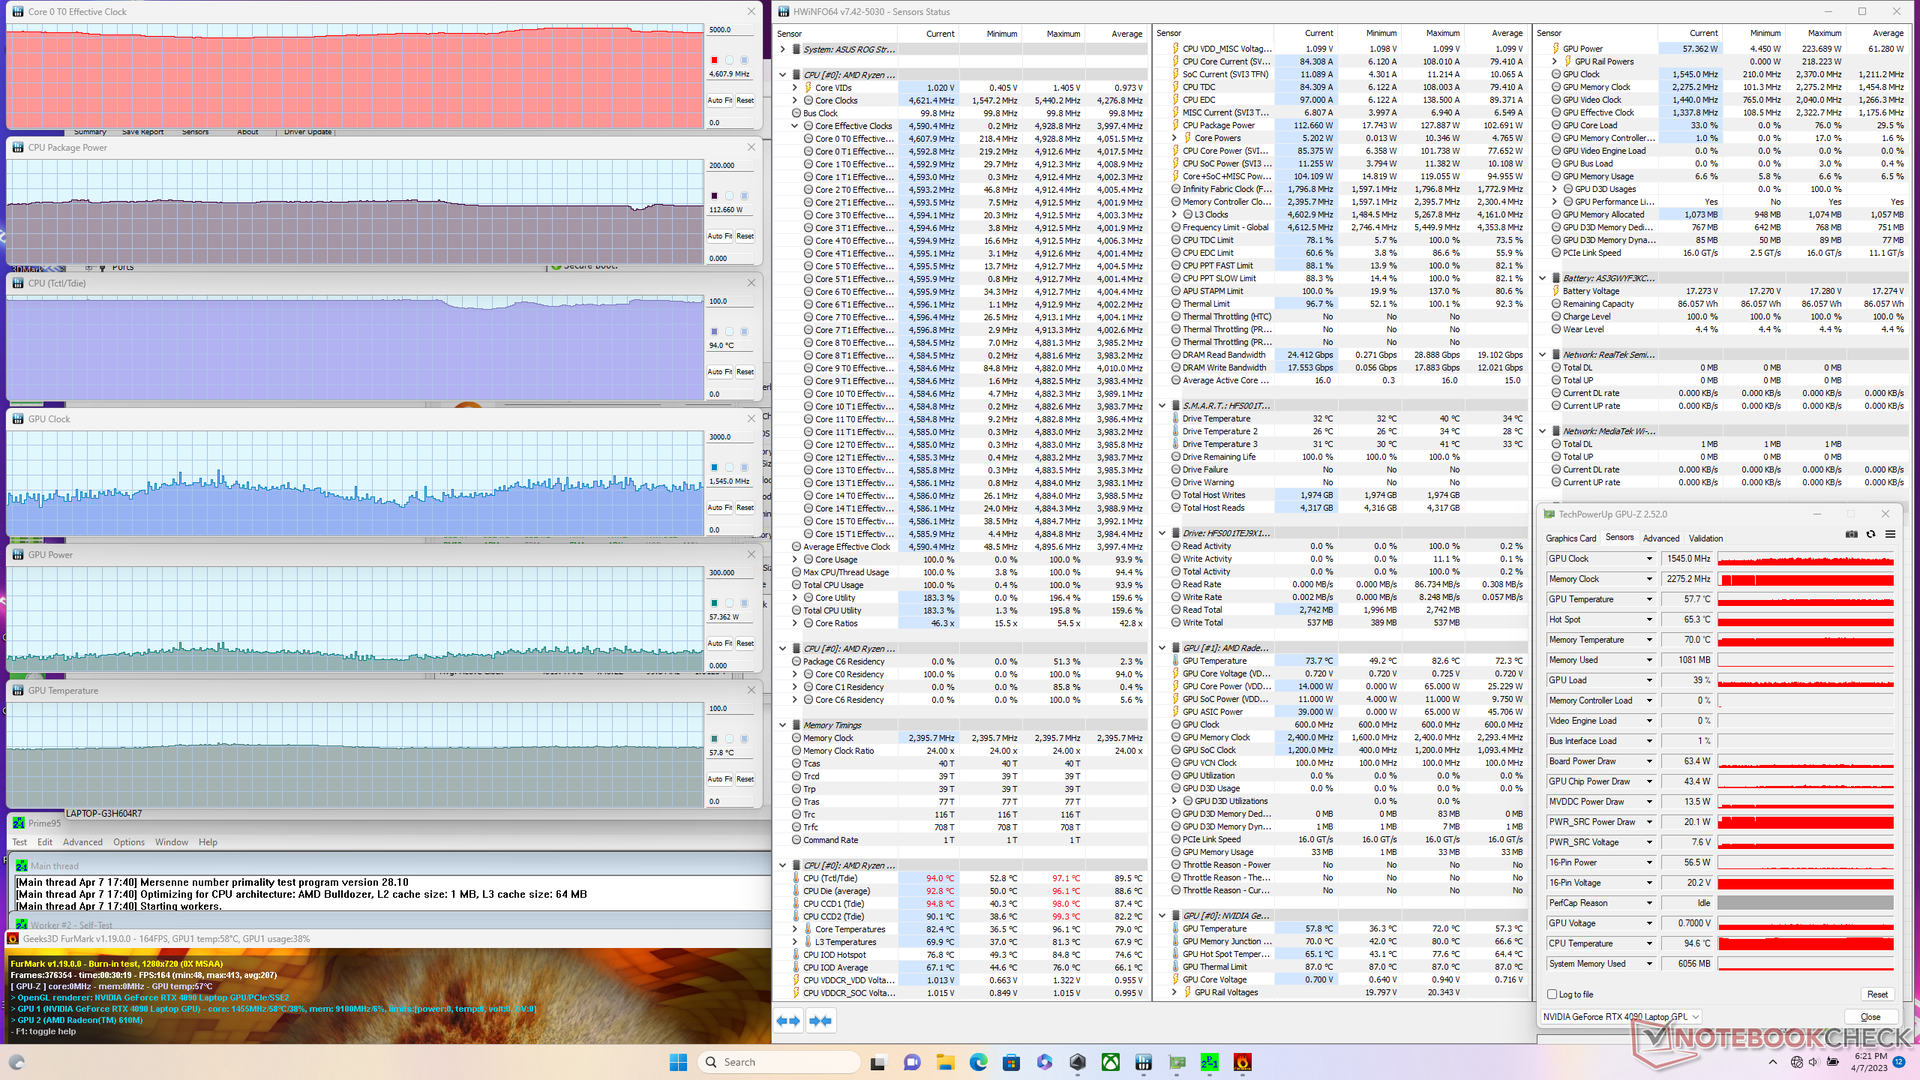
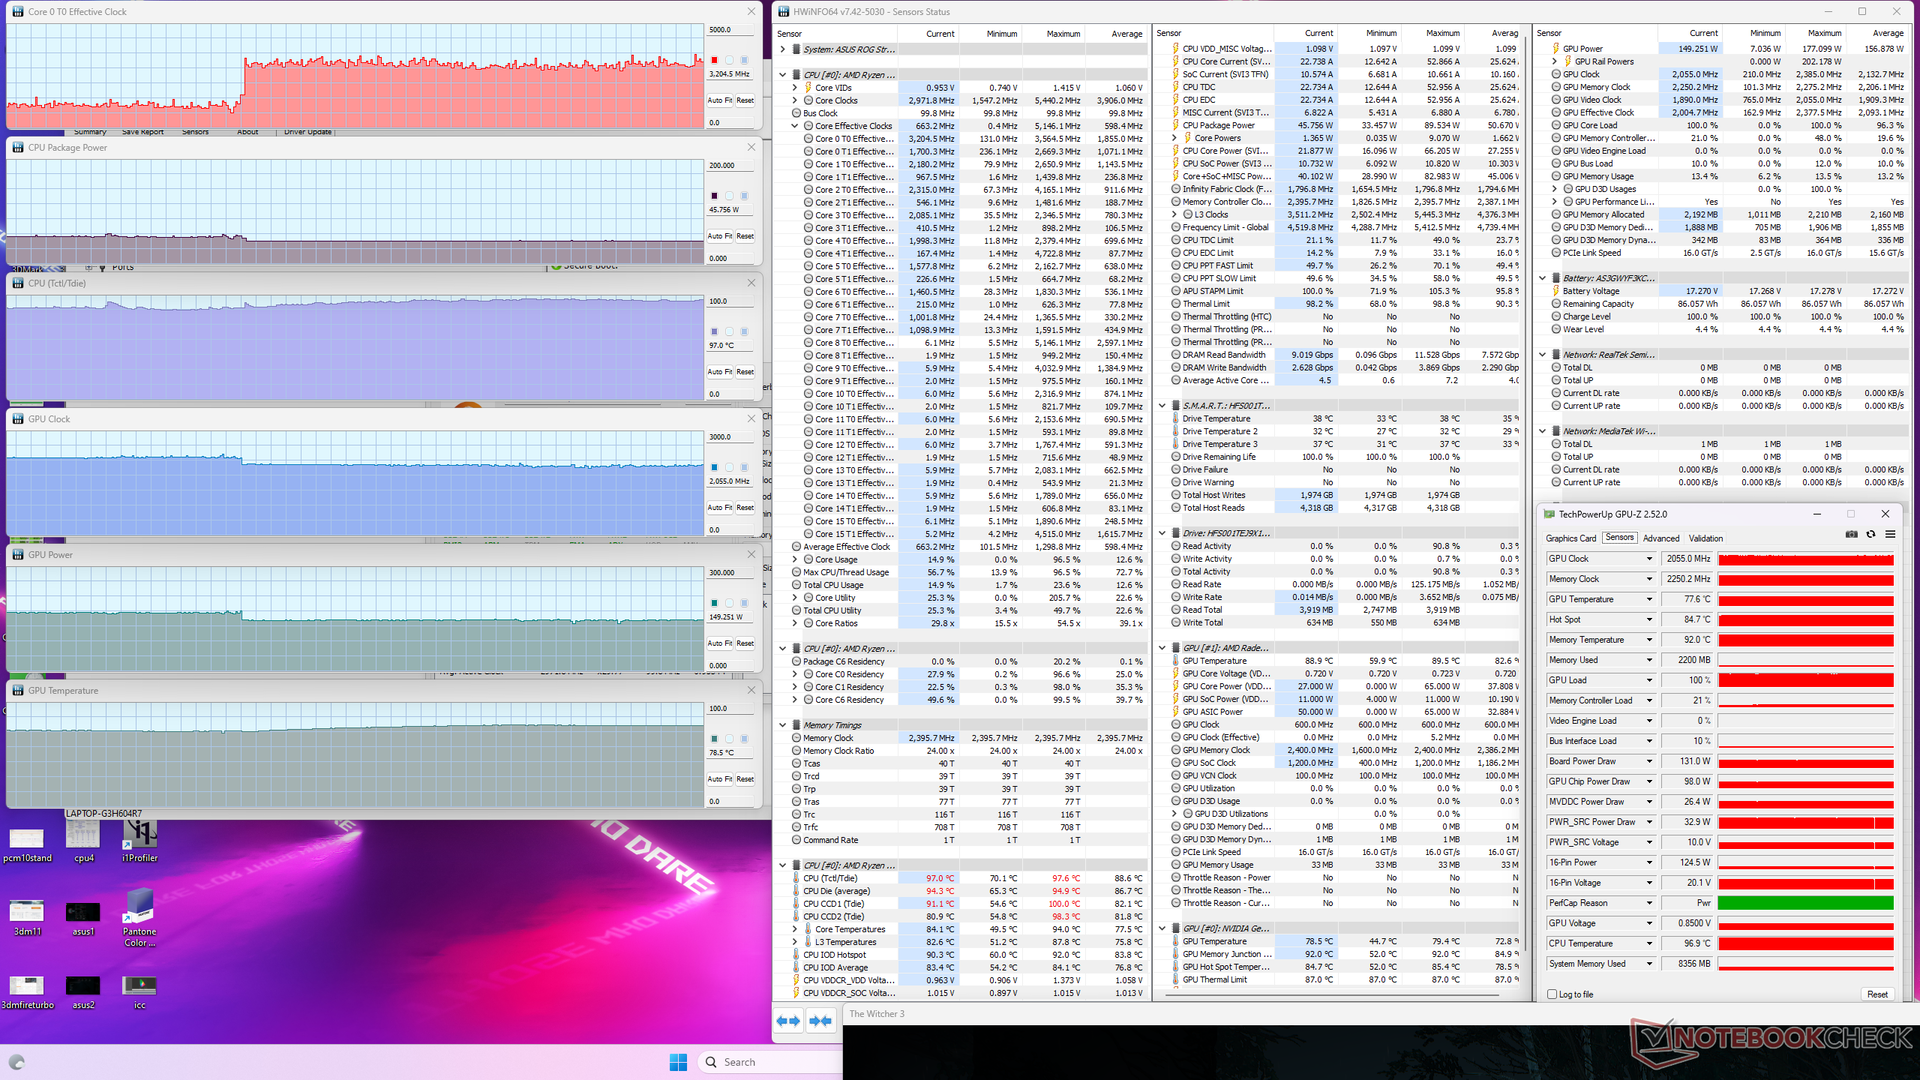
| CPU-Takt (GHz) | GPU-Takt (MHz) | durchschnittliche CPU-Temperatur (°C) | durchschnittliche GPU-Temperatur (°C) | |
| System Leerlauf | -- | -- | 53 | 36 |
| Prime95, Stress | 4,2-4,9 | -- | 90-94 | 51 |
| Prime95 + FurMark, Stress | 4,2-4.8 | ~850-1.545 | 94 | 58 |
| Witcher 3 Stress (Performance-Modus) | ~3,2 | 2.055 | 97 | 79 |
| Witcher 3 Stress (Turbo-Modus) | ~1,1 | 2.280 | 88 | 74 |
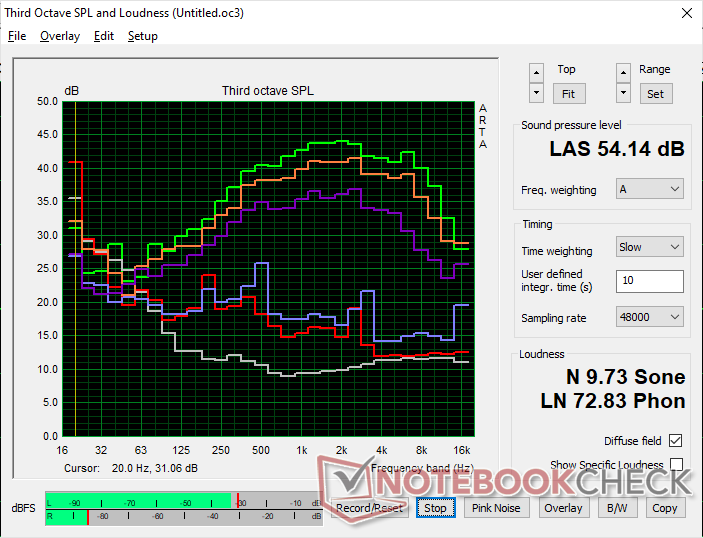
Lautsprecher
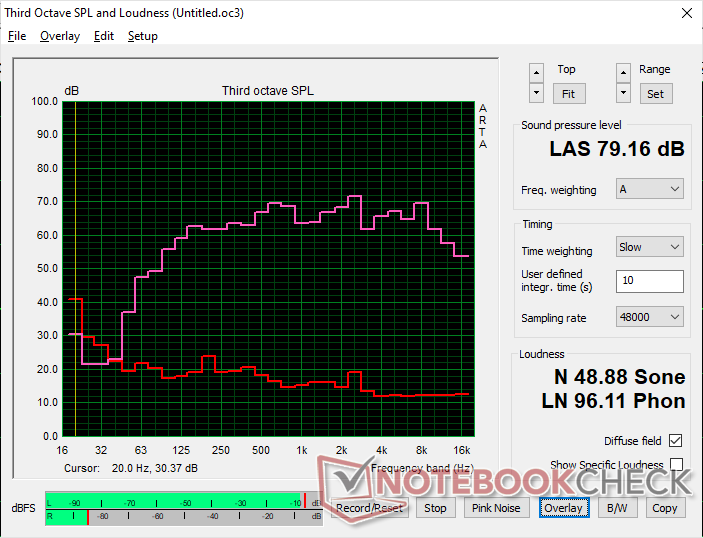
Asus ROG Strix Scar 17 G733PY-XS96 Audio Analyse
(±) | Mittelmäßig laut spielende Lautsprecher (79.2 dB)
Bass 100 - 315 Hz
(+) | guter Bass - nur 2.8% Abweichung vom Median
(+) | lineare Bass-Wiedergabe (5.6% Delta zum Vorgänger)
Mitteltöne 400 - 2000 Hz
(+) | ausgeglichene Mitten, vom Median nur 2.9% abweichend
(+) | lineare Mitten (4.7% Delta zum Vorgänger)
Hochtöne 2 - 16 kHz
(+) | ausgeglichene Hochtöne, vom Median nur 3.5% abweichend
(±) | durchschnittlich lineare Hochtöne (10% Delta zum Vorgänger)
Gesamt im hörbaren Bereich 100 - 16.000 Hz
(+) | hörbarer Bereich ist sehr linear (9.3% Abstand zum Median
Im Vergleich zu allen Geräten derselben Klasse
» 3% aller getesteten Geräte dieser Klasse waren besser, 2% vergleichbar, 95% schlechter
» Das beste Gerät hat einen Delta-Wert von 6%, durchschnittlich ist 18%, das schlechteste Gerät hat 132%
Im Vergleich zu allen Geräten im Test
» 3% aller getesteten Geräte waren besser, 1% vergleichbar, 96% schlechter
» Das beste Gerät hat einen Delta-Wert von 4%, durchschnittlich ist 23%, das schlechteste Gerät hat 134%
Apple MacBook Pro 16 2021 M1 Pro Audio Analyse
(+) | Die Lautsprecher können relativ laut spielen (84.7 dB)
Bass 100 - 315 Hz
(+) | guter Bass - nur 3.8% Abweichung vom Median
(+) | lineare Bass-Wiedergabe (5.2% Delta zum Vorgänger)
Mitteltöne 400 - 2000 Hz
(+) | ausgeglichene Mitten, vom Median nur 1.3% abweichend
(+) | lineare Mitten (2.1% Delta zum Vorgänger)
Hochtöne 2 - 16 kHz
(+) | ausgeglichene Hochtöne, vom Median nur 1.9% abweichend
(+) | sehr lineare Hochtöne (2.7% Delta zum Vorgänger)
Gesamt im hörbaren Bereich 100 - 16.000 Hz
(+) | hörbarer Bereich ist sehr linear (4.6% Abstand zum Median
Im Vergleich zu allen Geräten derselben Klasse
» 0% aller getesteten Geräte dieser Klasse waren besser, 0% vergleichbar, 100% schlechter
» Das beste Gerät hat einen Delta-Wert von 5%, durchschnittlich ist 17%, das schlechteste Gerät hat 45%
Im Vergleich zu allen Geräten im Test
» 0% aller getesteten Geräte waren besser, 0% vergleichbar, 100% schlechter
» Das beste Gerät hat einen Delta-Wert von 4%, durchschnittlich ist 23%, das schlechteste Gerät hat 134%
Energieverwaltung - Anspruchsvolle Maschine
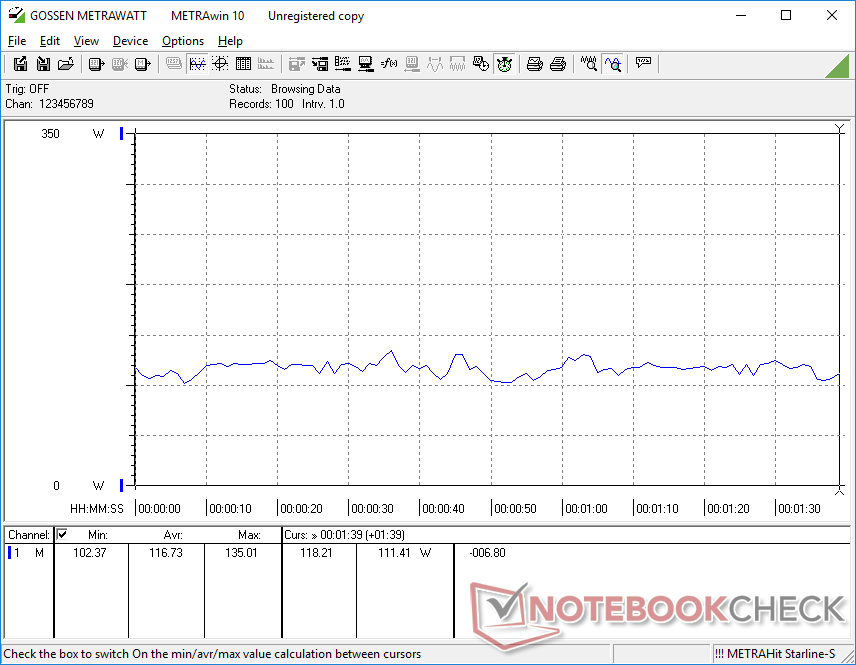
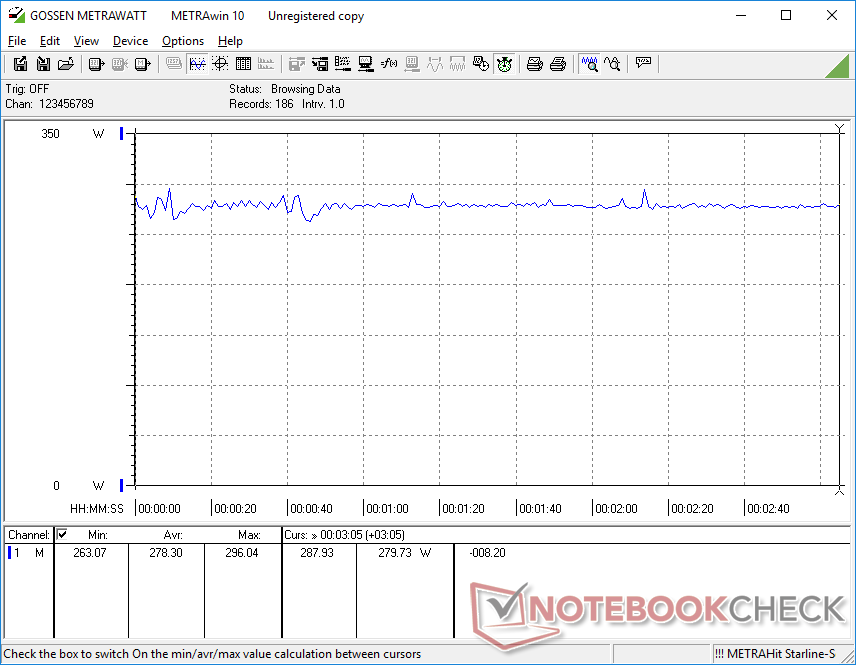
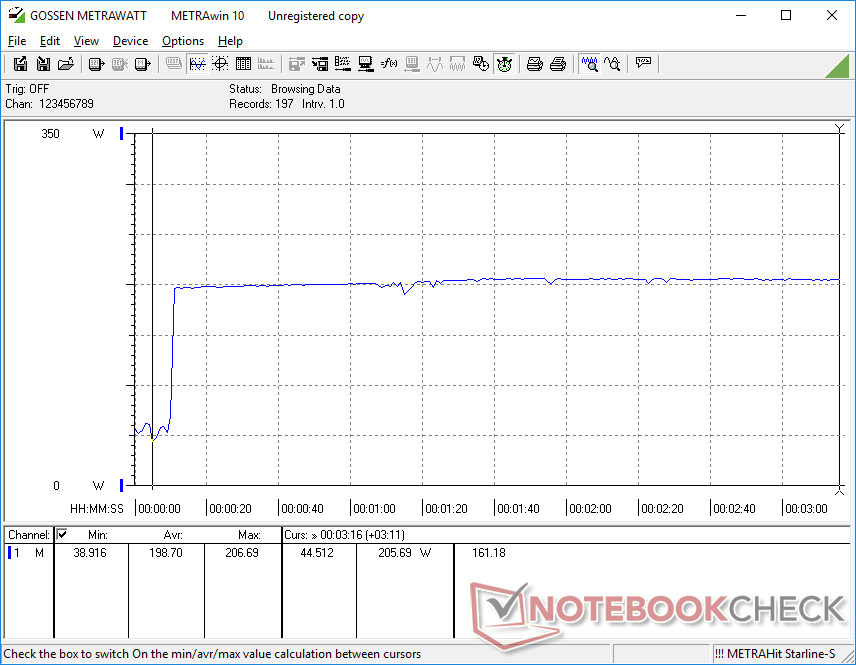
Stromverbrauch
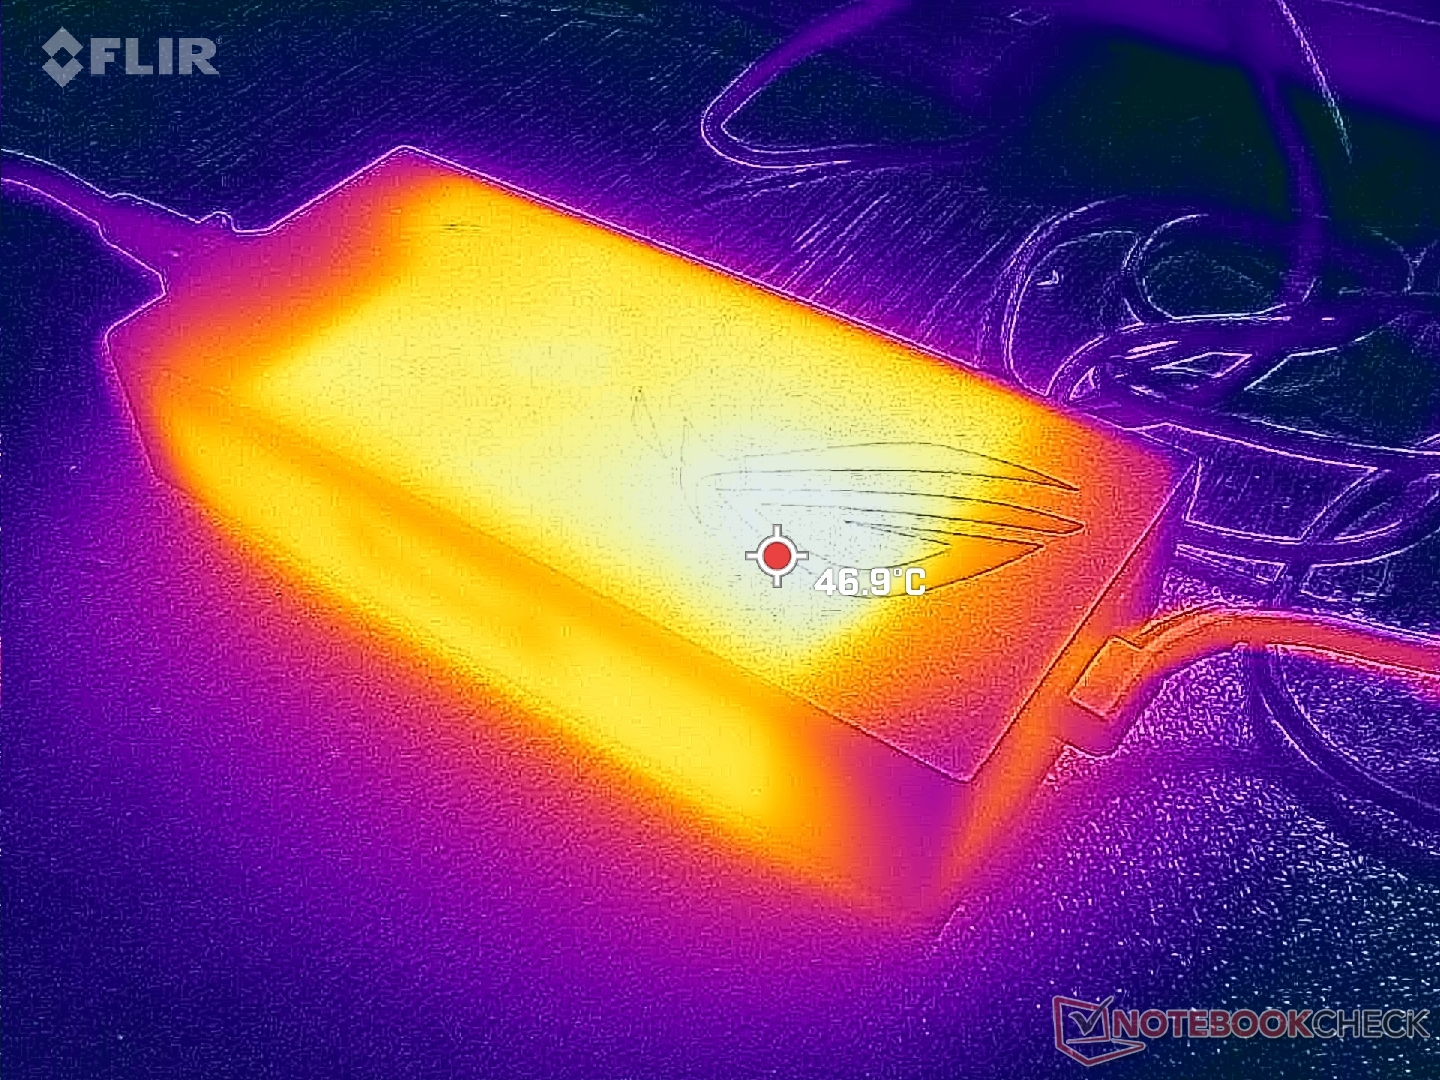
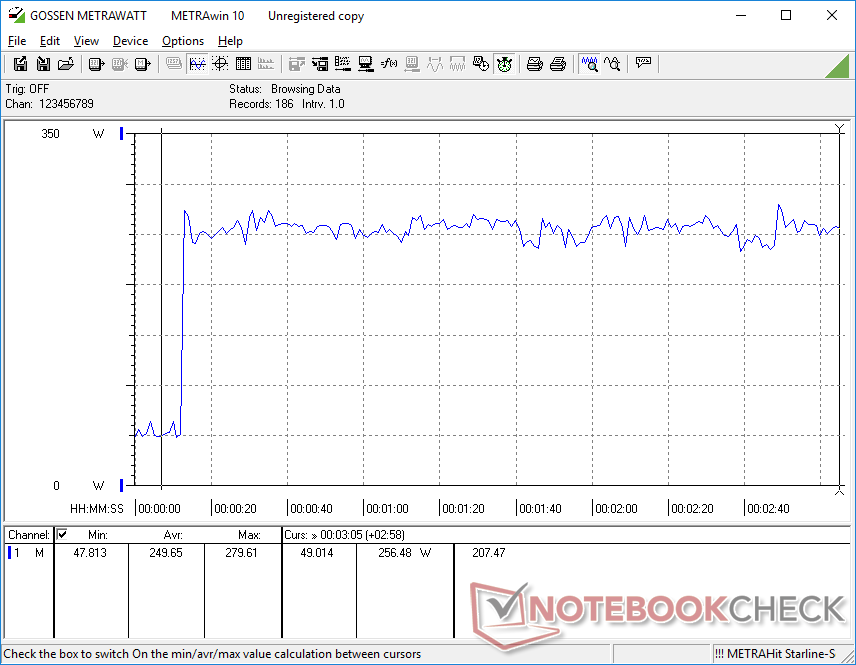
Unser 2023er-Modell ist generell stromhungriger als das Intel basierte 2022er-Modell. Bei der Ausführung von Prime95 beispielsweise stabilisiert sich der Stromverbrauch bei 205 W im Vergleich zu nur 117 W bei der i9-12950HX-Konfiguration des letzten Jahres. Ähnlich verhält es sich bei der Ausführung von Witcher 3, wenn etwa 24 Prozent mehr Strom verbraucht wird als bei der älteren RTX-3080-Ti-Konfiguration. Die Performance mag zwar von Generation zu Generation schneller sein, aber der Verbrauch ist ebenfalls gestiegen.
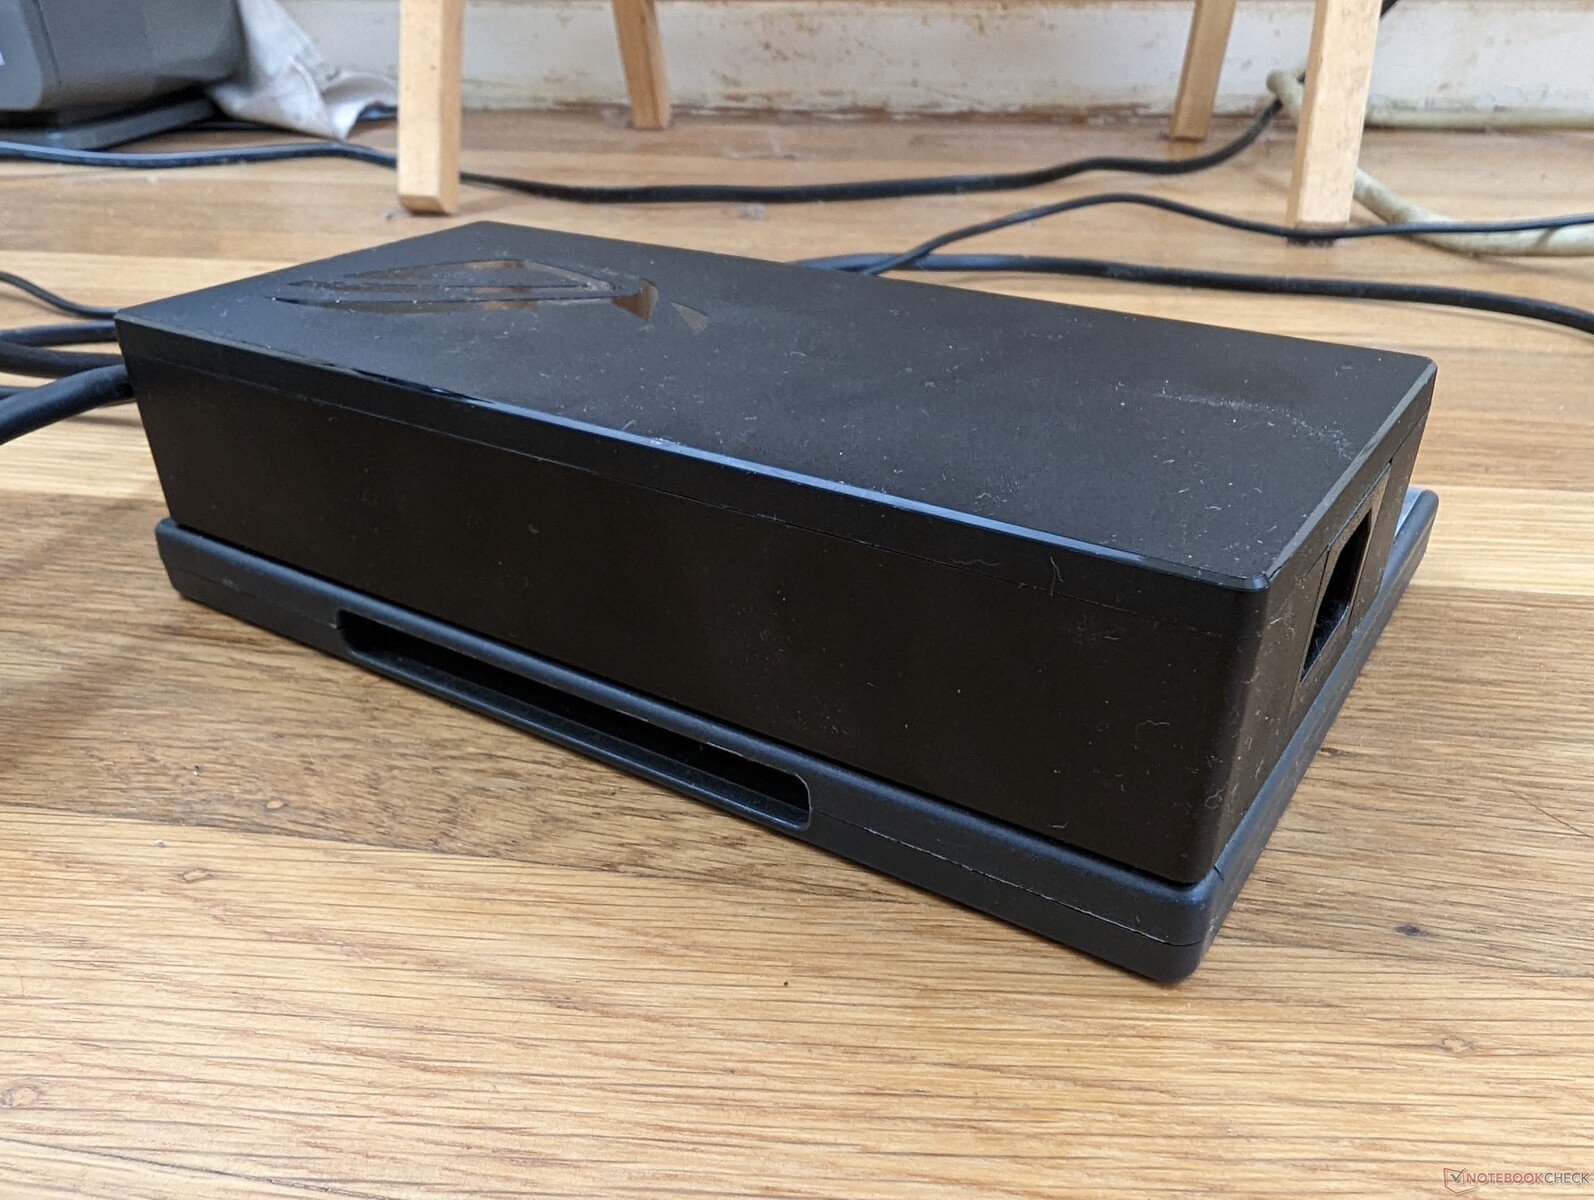
Wir konnten eine maximale Leistungsaufnahme von 280 W aus dem großen (~18,4 x 8,4 x 3,6 cm) 330-W-Netzteil aufzeichnen.
| Aus / Standby | |
| Idle | |
| Last |
|
Legende:
min: | |
| Asus ROG Strix Scar 17 G733PY-XS96 R9 7945HX, GeForce RTX 4090 Laptop GPU, SK hynix PC801 HFS001TEJ9X101N, IPS, 2560x1440, 17.3" | MSI GE78HX 13VH-070US i9-13950HX, GeForce RTX 4080 Laptop GPU, Samsung PM9A1 MZVL22T0HBLB, IPS, 2560x1600, 17" | Eluktronics Mech-17 GP2 i9-13900HX, GeForce RTX 4090 Laptop GPU, Samsung PM9A1 MZVL21T0HCLR, IPS, 2560x1600, 17" | Asus ROG Strix G17 G713PI R9 7945HX, GeForce RTX 4070 Laptop GPU, WD PC SN560 SDDPNQE-1T00, IPS, 2560x1440, 17.3" | Aorus 17X XES i9-12900HX, GeForce RTX 3070 Ti Laptop GPU, Gigabyte AG470S1TB-SI B10, IPS, 1920x1080, 17.3" | Alienware m17 R5 (R9 6900HX, RX 6850M XT) R9 6900HX, Radeon RX 6850M XT, SSSTC CA6-8D1024, IPS, 3840x2160, 17" | |
|---|---|---|---|---|---|---|
| Stromverbrauch | -3% | -1% | 13% | -9% | 23% | |
| Idle min * (Watt) | 14.5 | 16.1 -11% | 14 3% | 15 -3% | 18 -24% | 13 10% |
| Idle avg * (Watt) | 21.1 | 24 -14% | 19.3 9% | 20 5% | 28 -33% | 16.5 22% |
| Idle max * (Watt) | 42.8 | 34 21% | 36.8 14% | 29 32% | 36 16% | 17 60% |
| Last avg * (Watt) | 116.7 | 123.6 -6% | 117.2 -0% | 121 -4% | 153 -31% | 93 20% |
| Witcher 3 ultra * (Watt) | 278 | 286 -3% | 304 -9% | 179.8 35% | 221 21% | 239 14% |
| Last max * (Watt) | 279.6 | 285.7 -2% | 342.5 -22% | 246 12% | 290 -4% | 251 10% |
* ... kleinere Werte sind besser
Power Consumption Witcher 3 / Stresstest
Power Consumption external Monitor
Akkulaufzeit
Die WLAN-Laufzeit ist mit vier Stunden im Profil "Ausbalanciert" mit aktivem Optimus und iGPU etwa durchschnittlich. Andere 17-Zoll-Gaming-Laptops wie das ROG Strix G17 G713PI oder Aorus 17X XES liefern ähnliche Ergebnisse.
Das System kann über USB-C-Adapter von Drittanbietern aufgeladen werden. Einige Adapter funktionieren jedoch nicht. Unser 135-W-Lenovo-USB-C-Ladegerät funktionierte problemlos, während unser 130-W-USB-C-Ladegerät von Dell XPS überhaupt nicht aufladen konnte.
| Asus ROG Strix Scar 17 G733PY-XS96 R9 7945HX, GeForce RTX 4090 Laptop GPU, 90 Wh | MSI GE78HX 13VH-070US i9-13950HX, GeForce RTX 4080 Laptop GPU, 99 Wh | Eluktronics Mech-17 GP2 i9-13900HX, GeForce RTX 4090 Laptop GPU, 99 Wh | Asus ROG Strix G17 G713PI R9 7945HX, GeForce RTX 4070 Laptop GPU, 90 Wh | Aorus 17X XES i9-12900HX, GeForce RTX 3070 Ti Laptop GPU, 99 Wh | Alienware m17 R5 (R9 6900HX, RX 6850M XT) R9 6900HX, Radeon RX 6850M XT, 97 Wh | |
|---|---|---|---|---|---|---|
| Akkulaufzeit | 49% | 24% | 5% | 7% | 17% | |
| WLAN (h) | 4.1 | 6.1 49% | 5.1 24% | 4.3 5% | 4.4 7% | 4.8 17% |
| Idle (h) | 7.3 | |||||
| Last (h) | 1.5 | 1 | 1.4 | 1.8 | ||
| H.264 (h) | 2.8 | 3.8 | 4.9 | |||
| Witcher 3 ultra (h) | 1.1 |
Pro
Contra
Fazit - Hervorragende Performance mit alterndem Aussehen
Für das Jahr 2022 hatten AMD und Nvidia die Zen-3+- und die mobile GeForce-30-Ti-Serie eingeführt, welche die Zen-3- bzw. Non-Ti-Optionen von 2021 ablösten. Die Upgrades erwiesen sich jedoch als relativ geringfügig, da die neueren Optionen auf architektonischer Ebene nichts Neues brachten. Für 2023 haben die Zen-4- und die mobile GeForce-RTX-40-Serie endlich die signifikanten Leistungssteigerungen gebracht, auf die Laptop-Gamer gewartet haben. Der Stromverbrauch mag zwar höher sein, aber der Zuwachs an Leistung macht das wieder wett, zumal der Ryzen 9 7945HX sowohl etwas schneller als auch energieeffizienter ist als der konkurrierende Core i9-13950HX der 13. Generation.
Das 2023 ROG Strix Scar 17 zeigt den Ryzen 9 7945HX und die GeForce RTX 4090 von ihrer besten Seite. Einige äußere Designmerkmale könnten jedoch ein Update vertragen.
Während die Prozessoren dieses Jahr beeindruckend sind, könnte das gesamte äußere Design des ROG Strix Scar 17 eine größere Auffrischung vertragen. Die CPU-Temperatur beim Spielen ist zum Beispiel höher als erwartet, während die PCIe4-x4-SSD nach ein paar Minuten intensiver Nutzung gedrosselt wird. Der kleine Ziffernblock und die Pfeiltasten sind immer noch eng, und einige sekundäre Beschriftungen auf den Tastaturtasten leuchten immer noch nicht, wenn die Hintergrundbeleuchtung aktiv ist. Einige konkurrierende Modelle wie das dünnere MSI GE78 sind ebenfalls zu 16:10 übergegangen, während die Strix-Scar-17-Serie weiterhin 16:9 ist. Das Modell läuft Gefahr, schneller alt auszusehen und sich alt zu fühlen, obwohl seine Leistung alles andere als langsam ist.
Preis und Verfügbarkeit
Das Asus ROG Strix Scar 17 G733PY ist ab sofort bei CaseKing und MediaMarkt für 3.999 Euro in der Konfiguration mit Ryzen 9 7945HX, 32 GB RAM, 1-TB-SSD und GeForce RTX 4090 erhältlich. Eine niedrigere SKU mit der RTX 4080 ist zum Beispiel bei Amazon für unter 3.400 Euro erhältlich.
Asus ROG Strix Scar 17 G733PY-XS96
- 10.04.2023 v7 (old)
Allen Ngo
Transparenz
Die Auswahl der zu testenden Geräte erfolgt innerhalb der Redaktion. Das vorliegende Testmuster wurde dem Autor vom Hersteller oder einem Shop zu Testzwecken leihweise zur Verfügung gestellt. Eine Einflussnahme des Leihstellers auf den Testbericht gab es nicht, der Hersteller erhielt keine Version des Reviews vor der Veröffentlichung. Es bestand keine Verpflichtung zur Publikation. Als eigenständiges, unabhängiges Unternehmen unterliegt Notebookcheck keiner Diktion von Herstellern, Shops und Verlagen.
So testet Notebookcheck
Pro Jahr werden von Notebookcheck hunderte Laptops und Smartphones unabhängig in von uns standardisierten technischen Verfahren getestet, um eine Vergleichbarkeit aller Testergebnisse zu gewährleisten. Seit rund 20 Jahren entwickeln wir diese Testmethoden kontinuierlich weiter und setzen damit Branchenstandards. In unseren Testlaboren kommt ausschließlich hochwertiges Messequipment in die Hände erfahrener Techniker und Redakteure. Die Tests unterliegen einer mehrstufigen Kontrolle. Unsere komplexe Gesamtbewertung basiert auf hunderten fundierten Messergebnissen und Benchmarks, womit Ihnen Objektivität garantiert ist. Weitere Informationen zu unseren Testmethoden gibt es hier.
Preisvergleich

