Notebookcheck Logo

KFA2 GeForce RTX 4090 SG im Test: Kompromissloses 4K-Gaming mit dem neuen Nvidia-Flaggschiff

Konkurrenzlos schnell! Nvidias aktuelle GeForce RTX 4090 Grafikkarte bietet eine bislang nie dagewesene Leistung und übertrifft das bisherige Topmodell deutlich. In diesem Review widmen wir uns der KFA2 GeForce RTX 4090 SG. Dabei vergleichen wir auch die Leistung der verschiedenen RTX-4090er-Modelle miteinander.
KFA2 GeForce RTX 4090 Serious Gaming
Die externen Anschlüsse der KFA2 GeForce RTX 4090 SG

Nvidias aktuelles Topmodell liefert eine beeindruckende Leistung. Davon konnten wir uns bereits in Form der Palit GeForce RTX 4090 GameRock OC und der Nvidia GeForce RTX 4090 Founders Edition überzeugen. Mit dem Modell aus dem Hause KFA2 schauen wir uns ein weiteres Modell der aktuellen High-End-Klasse an. 

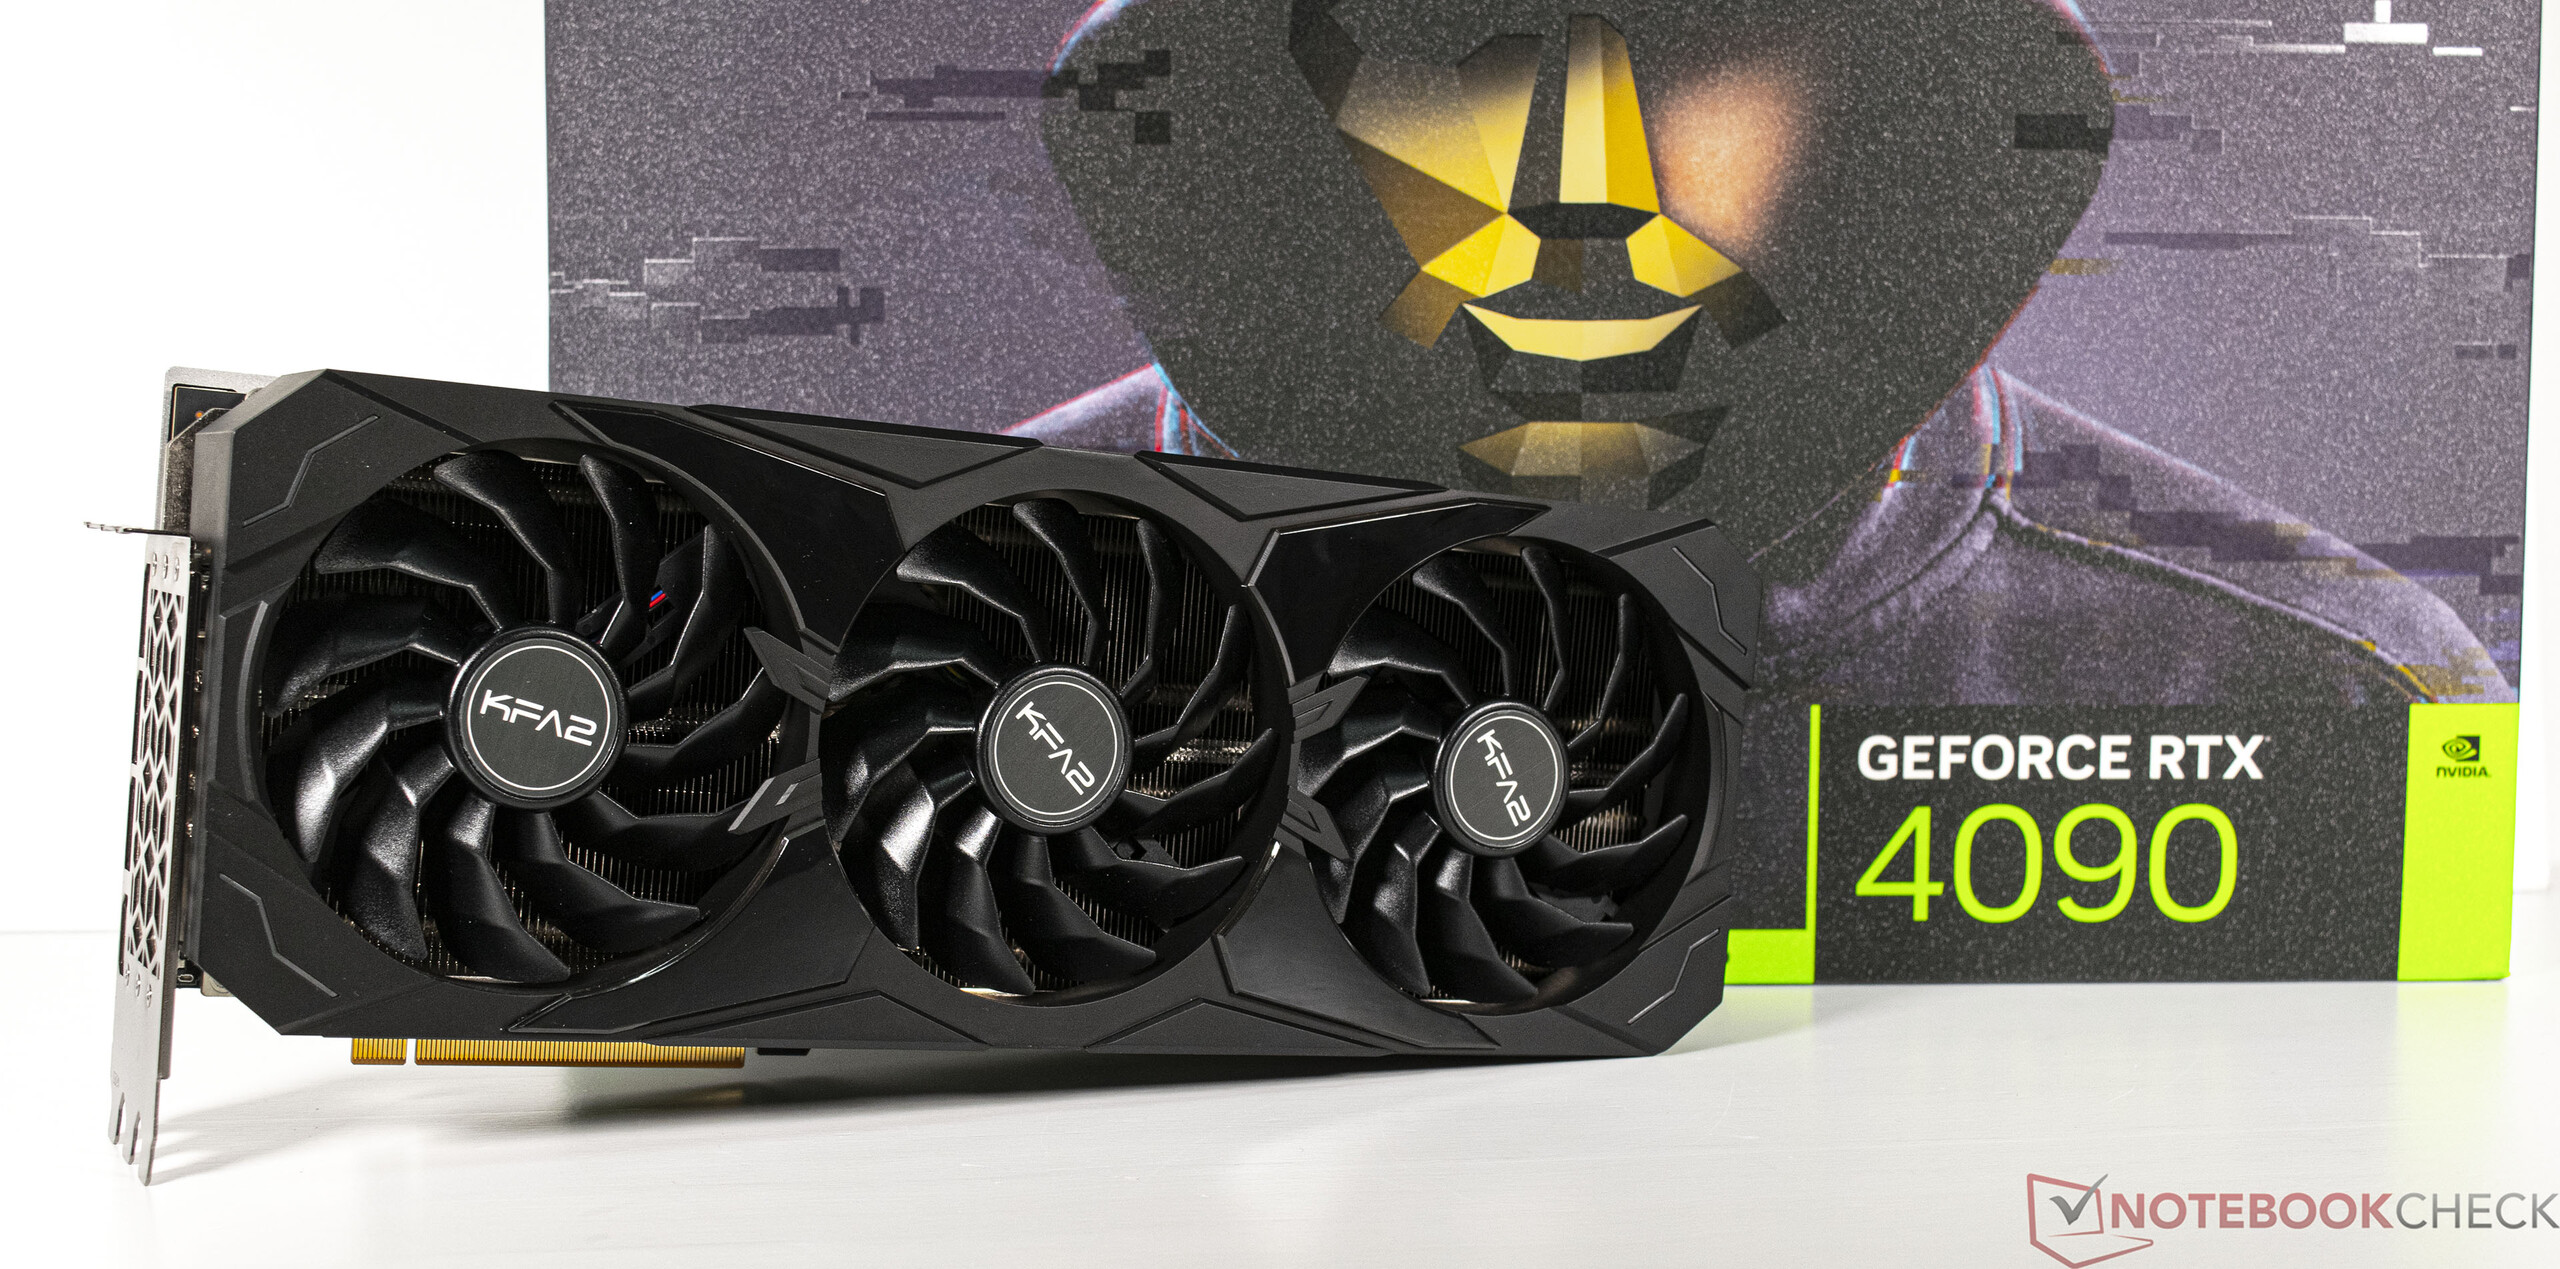
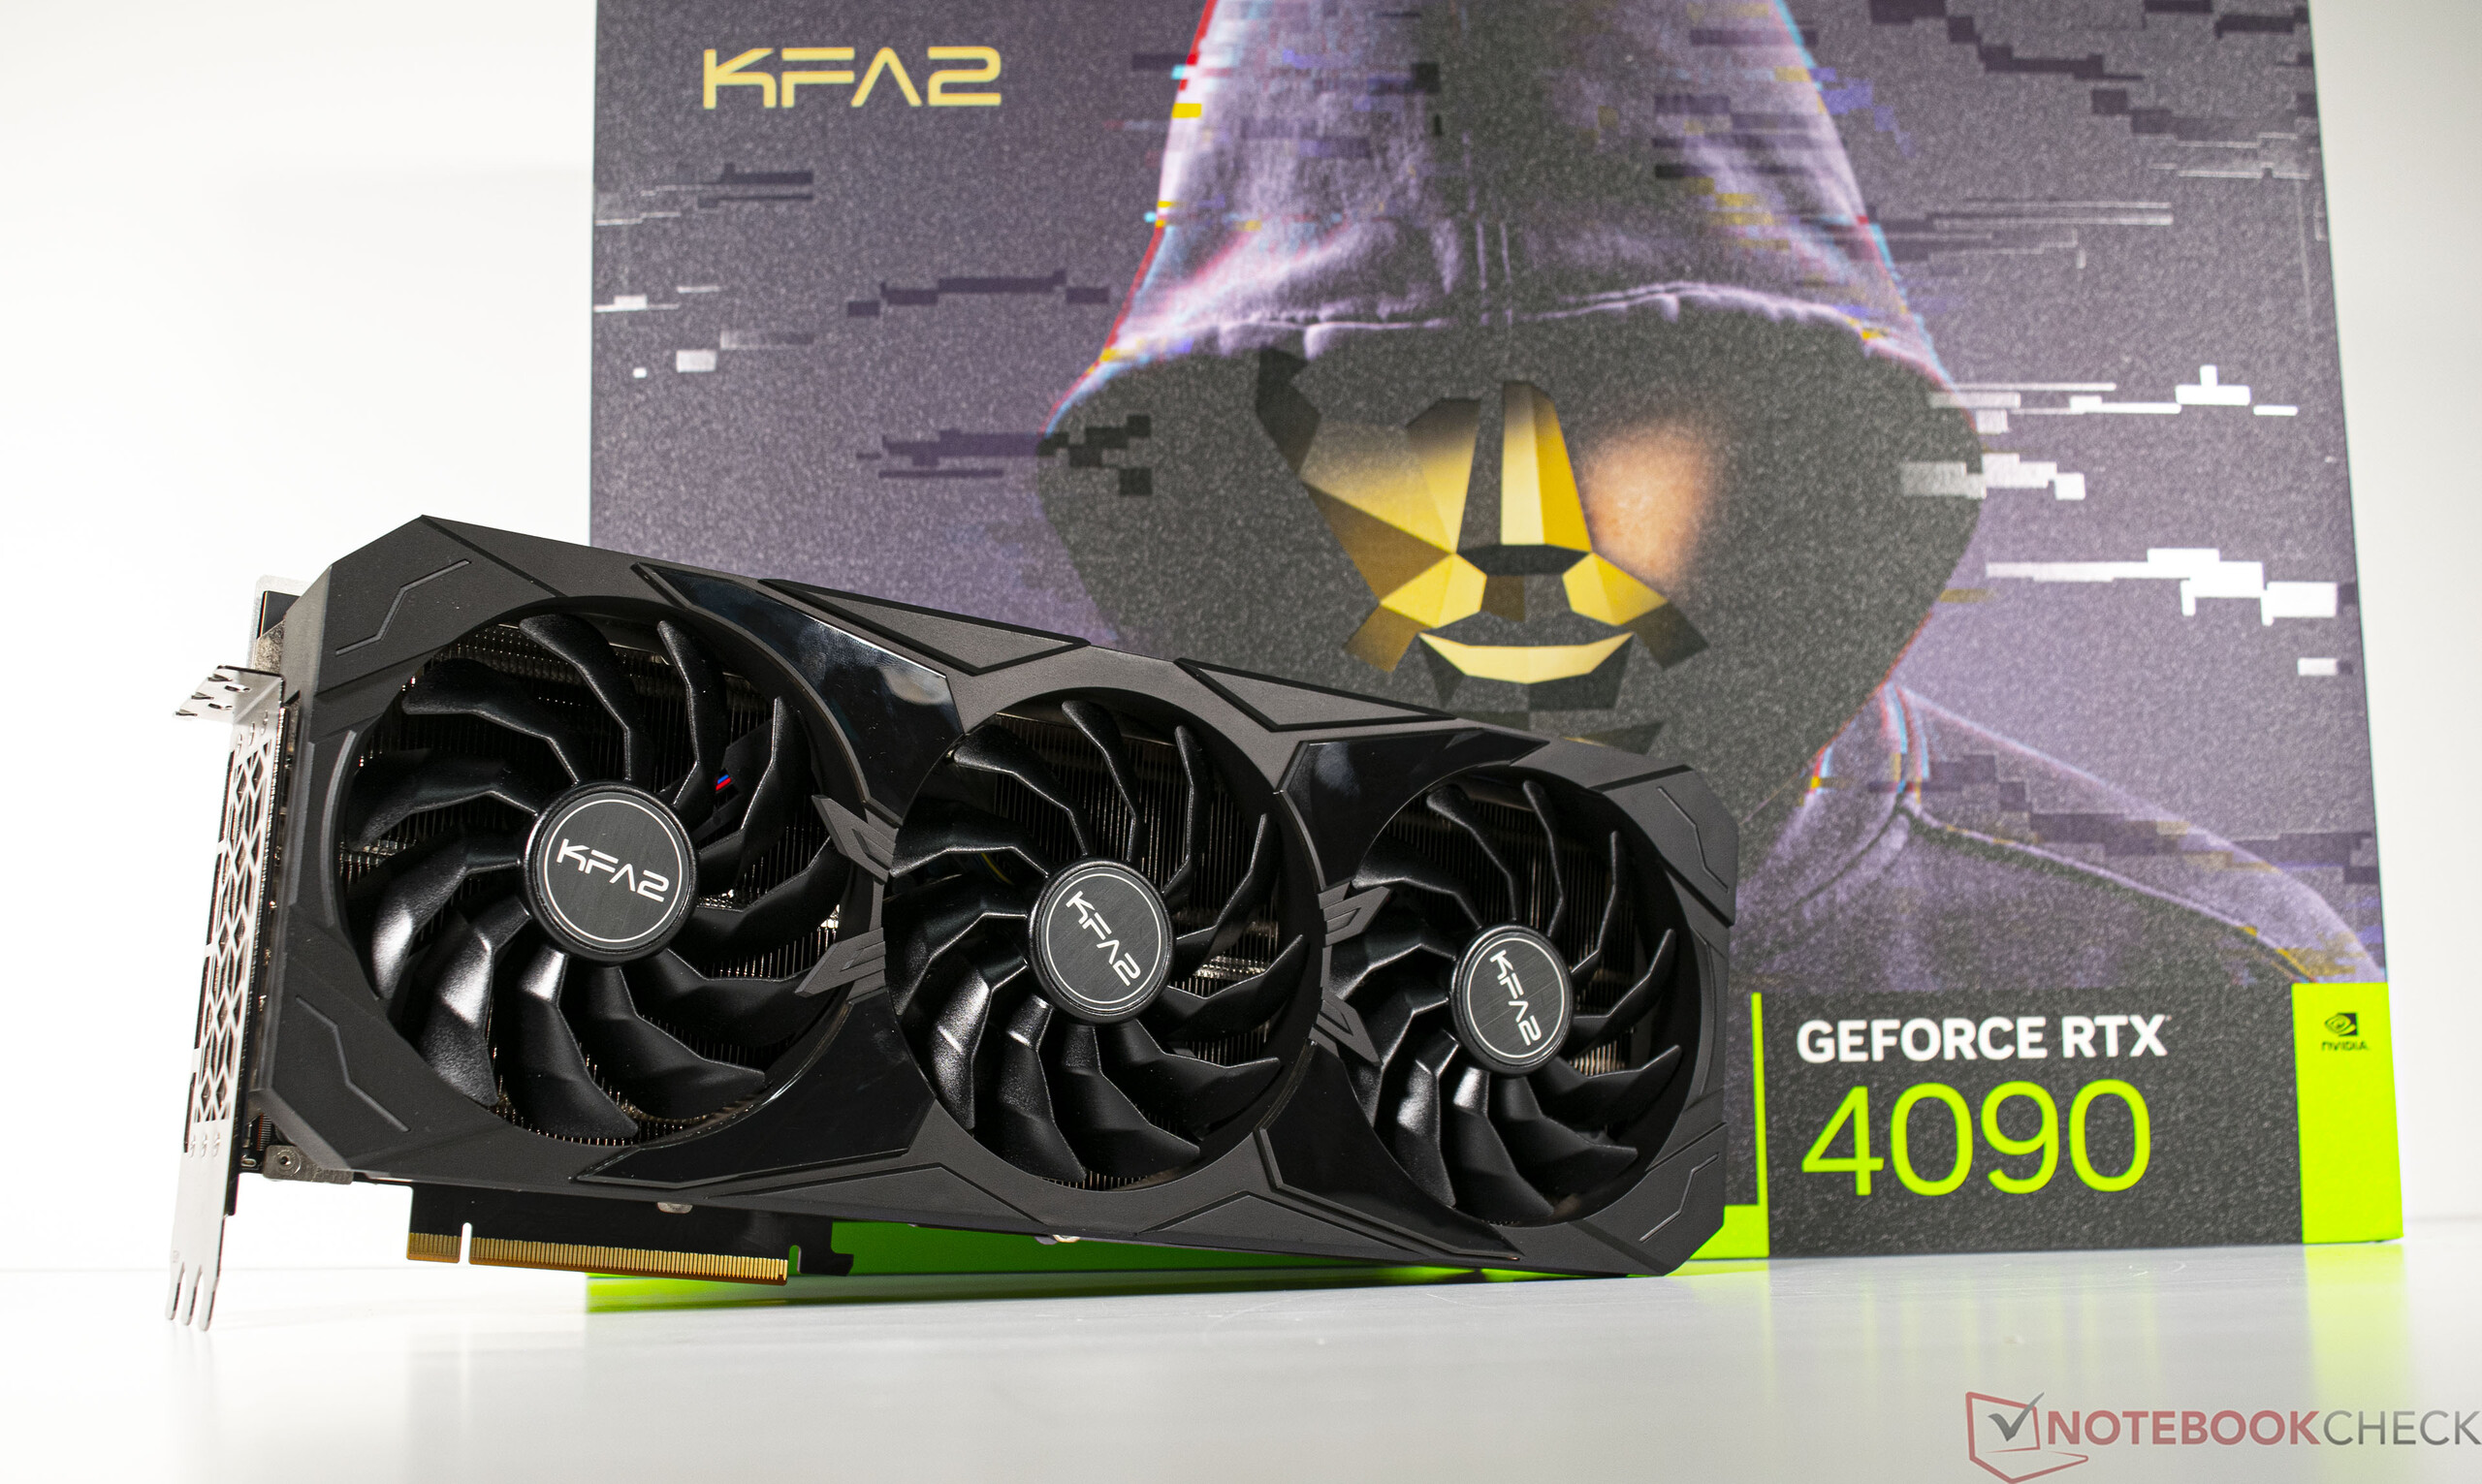
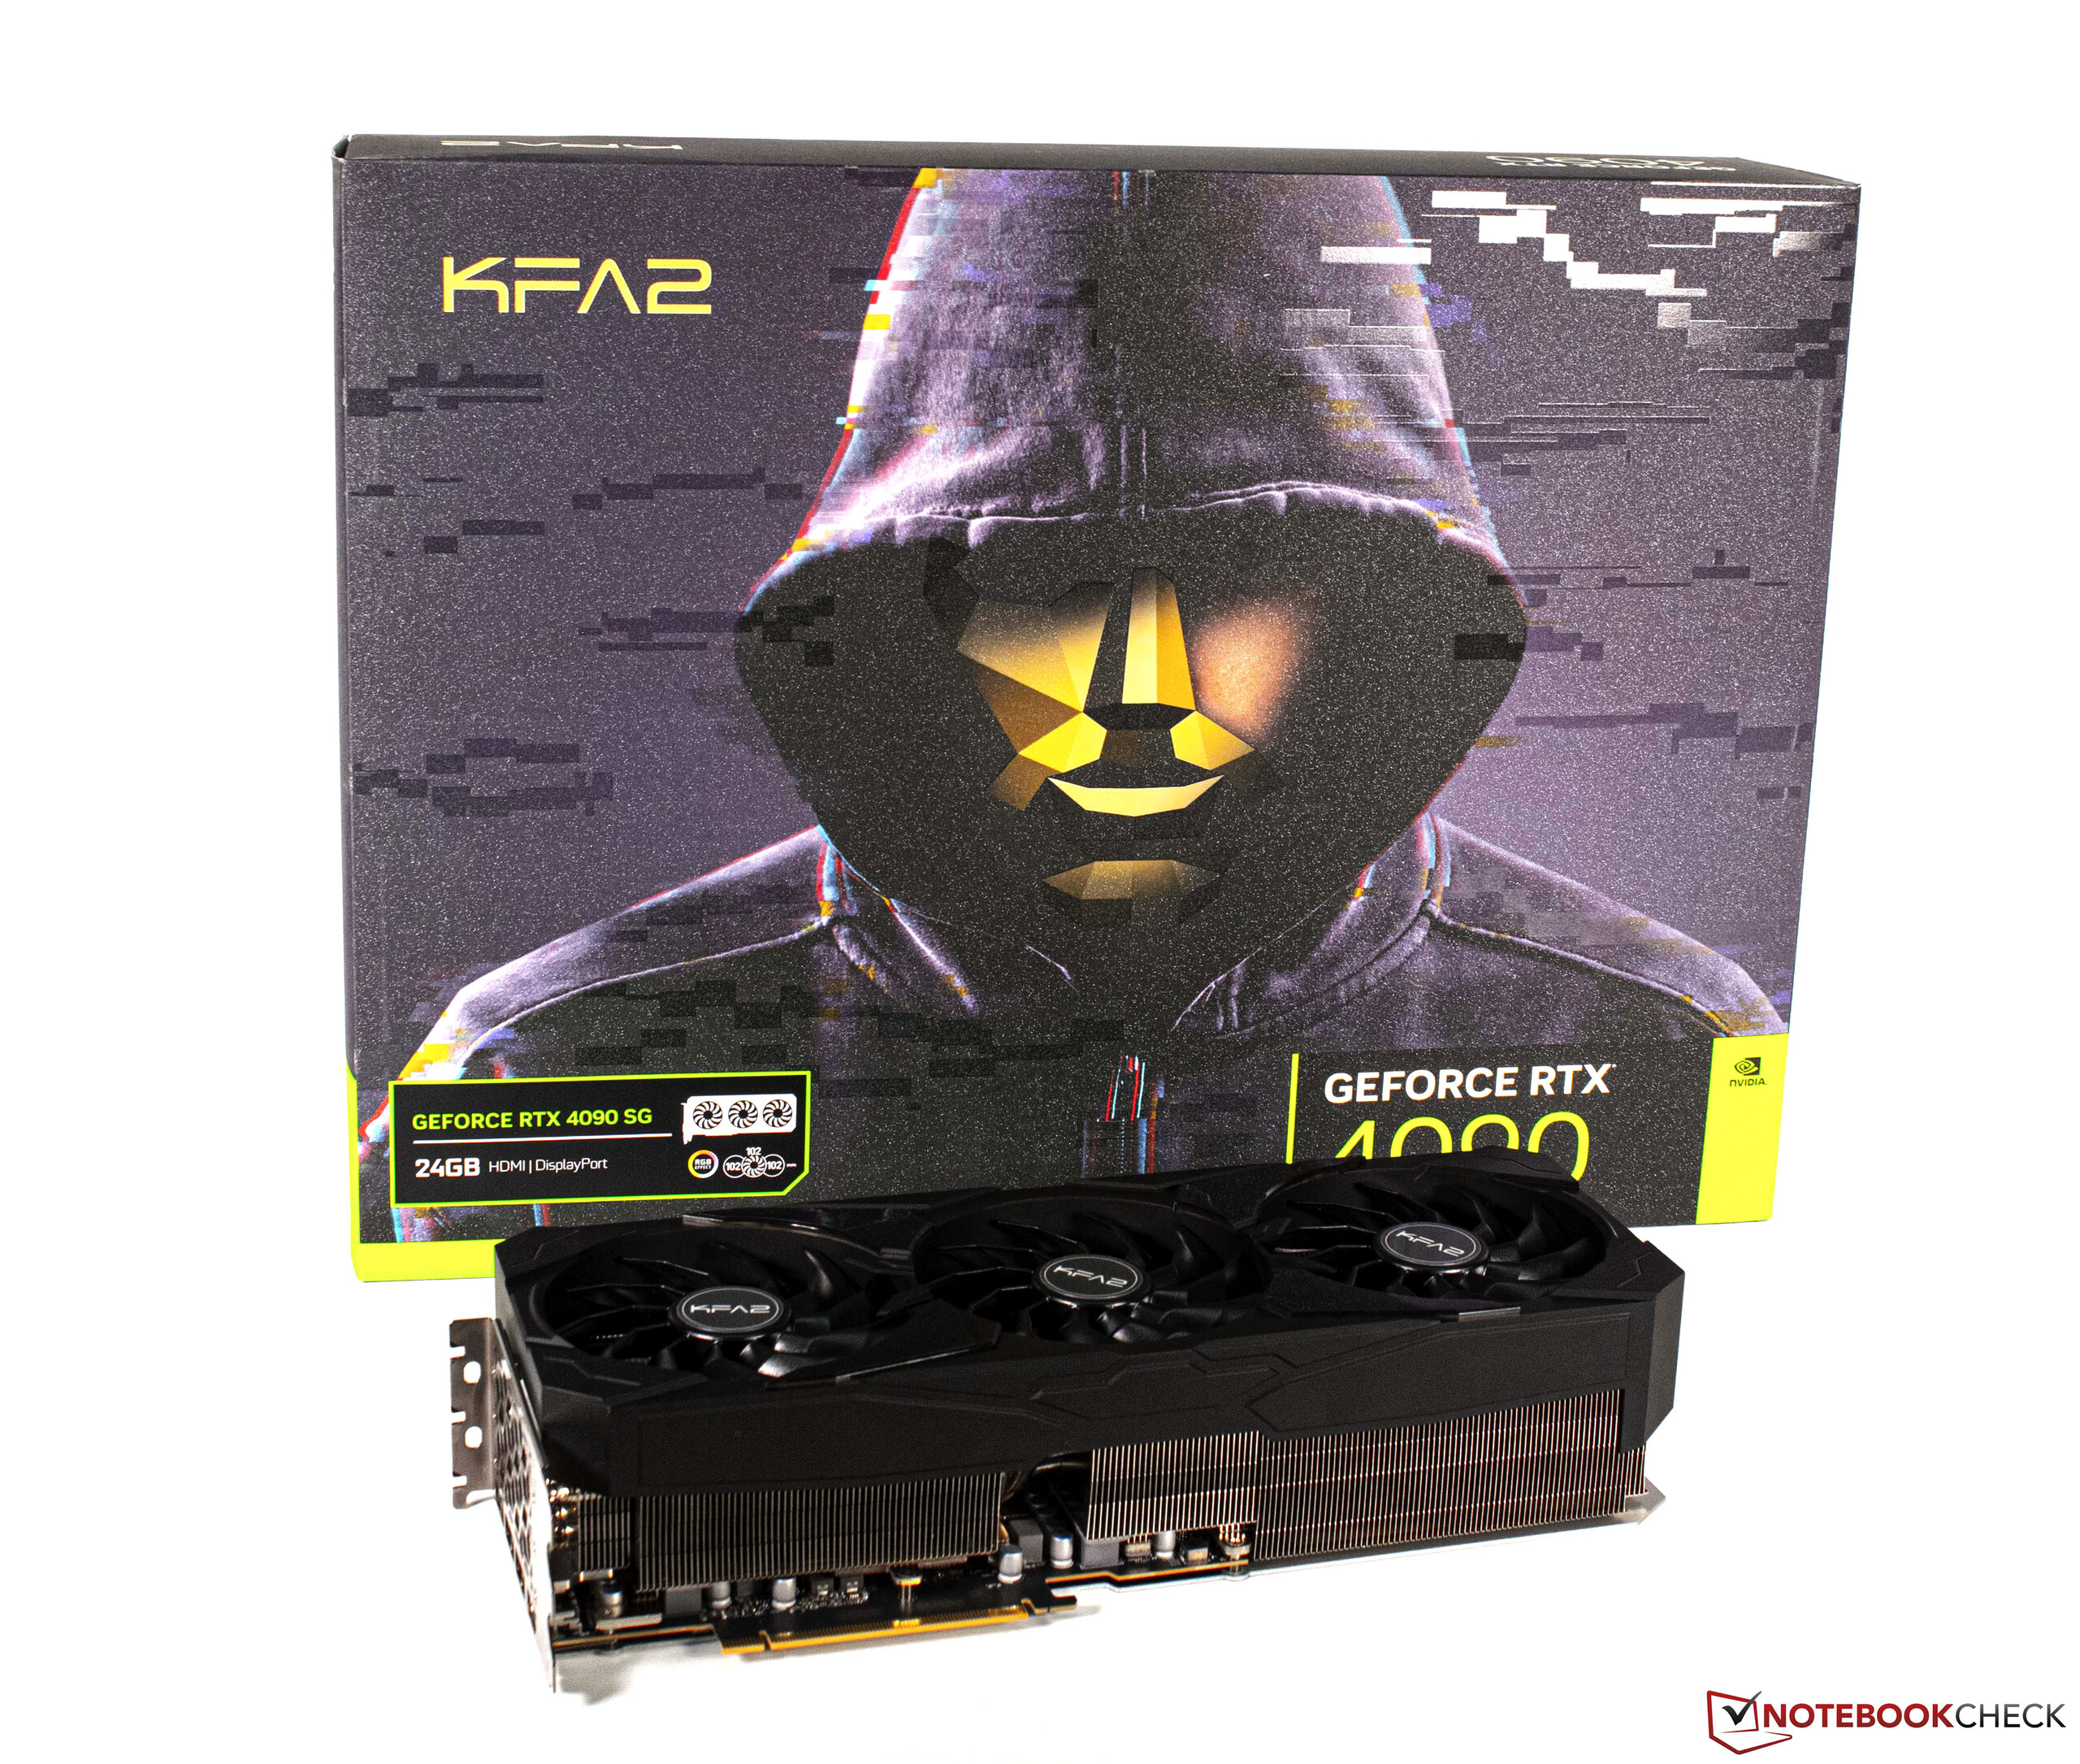
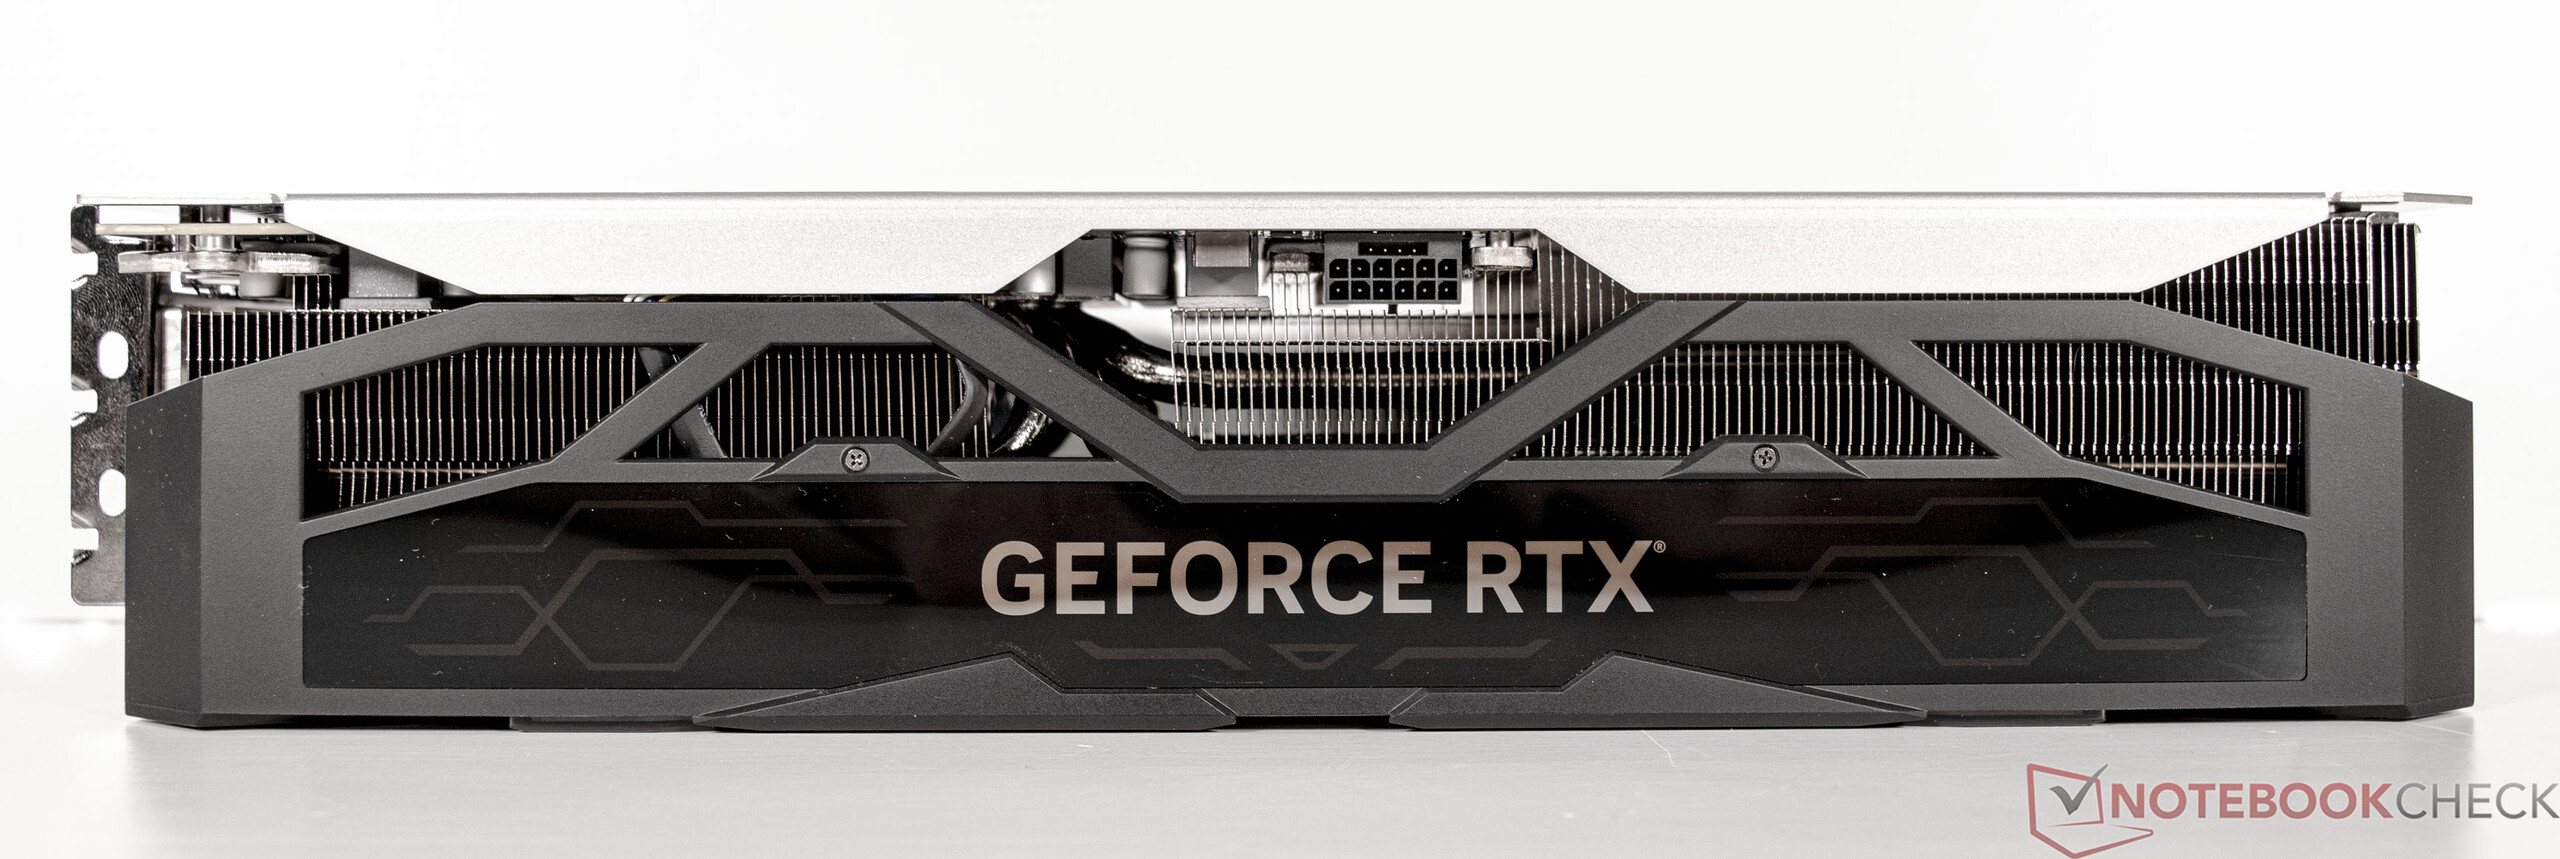
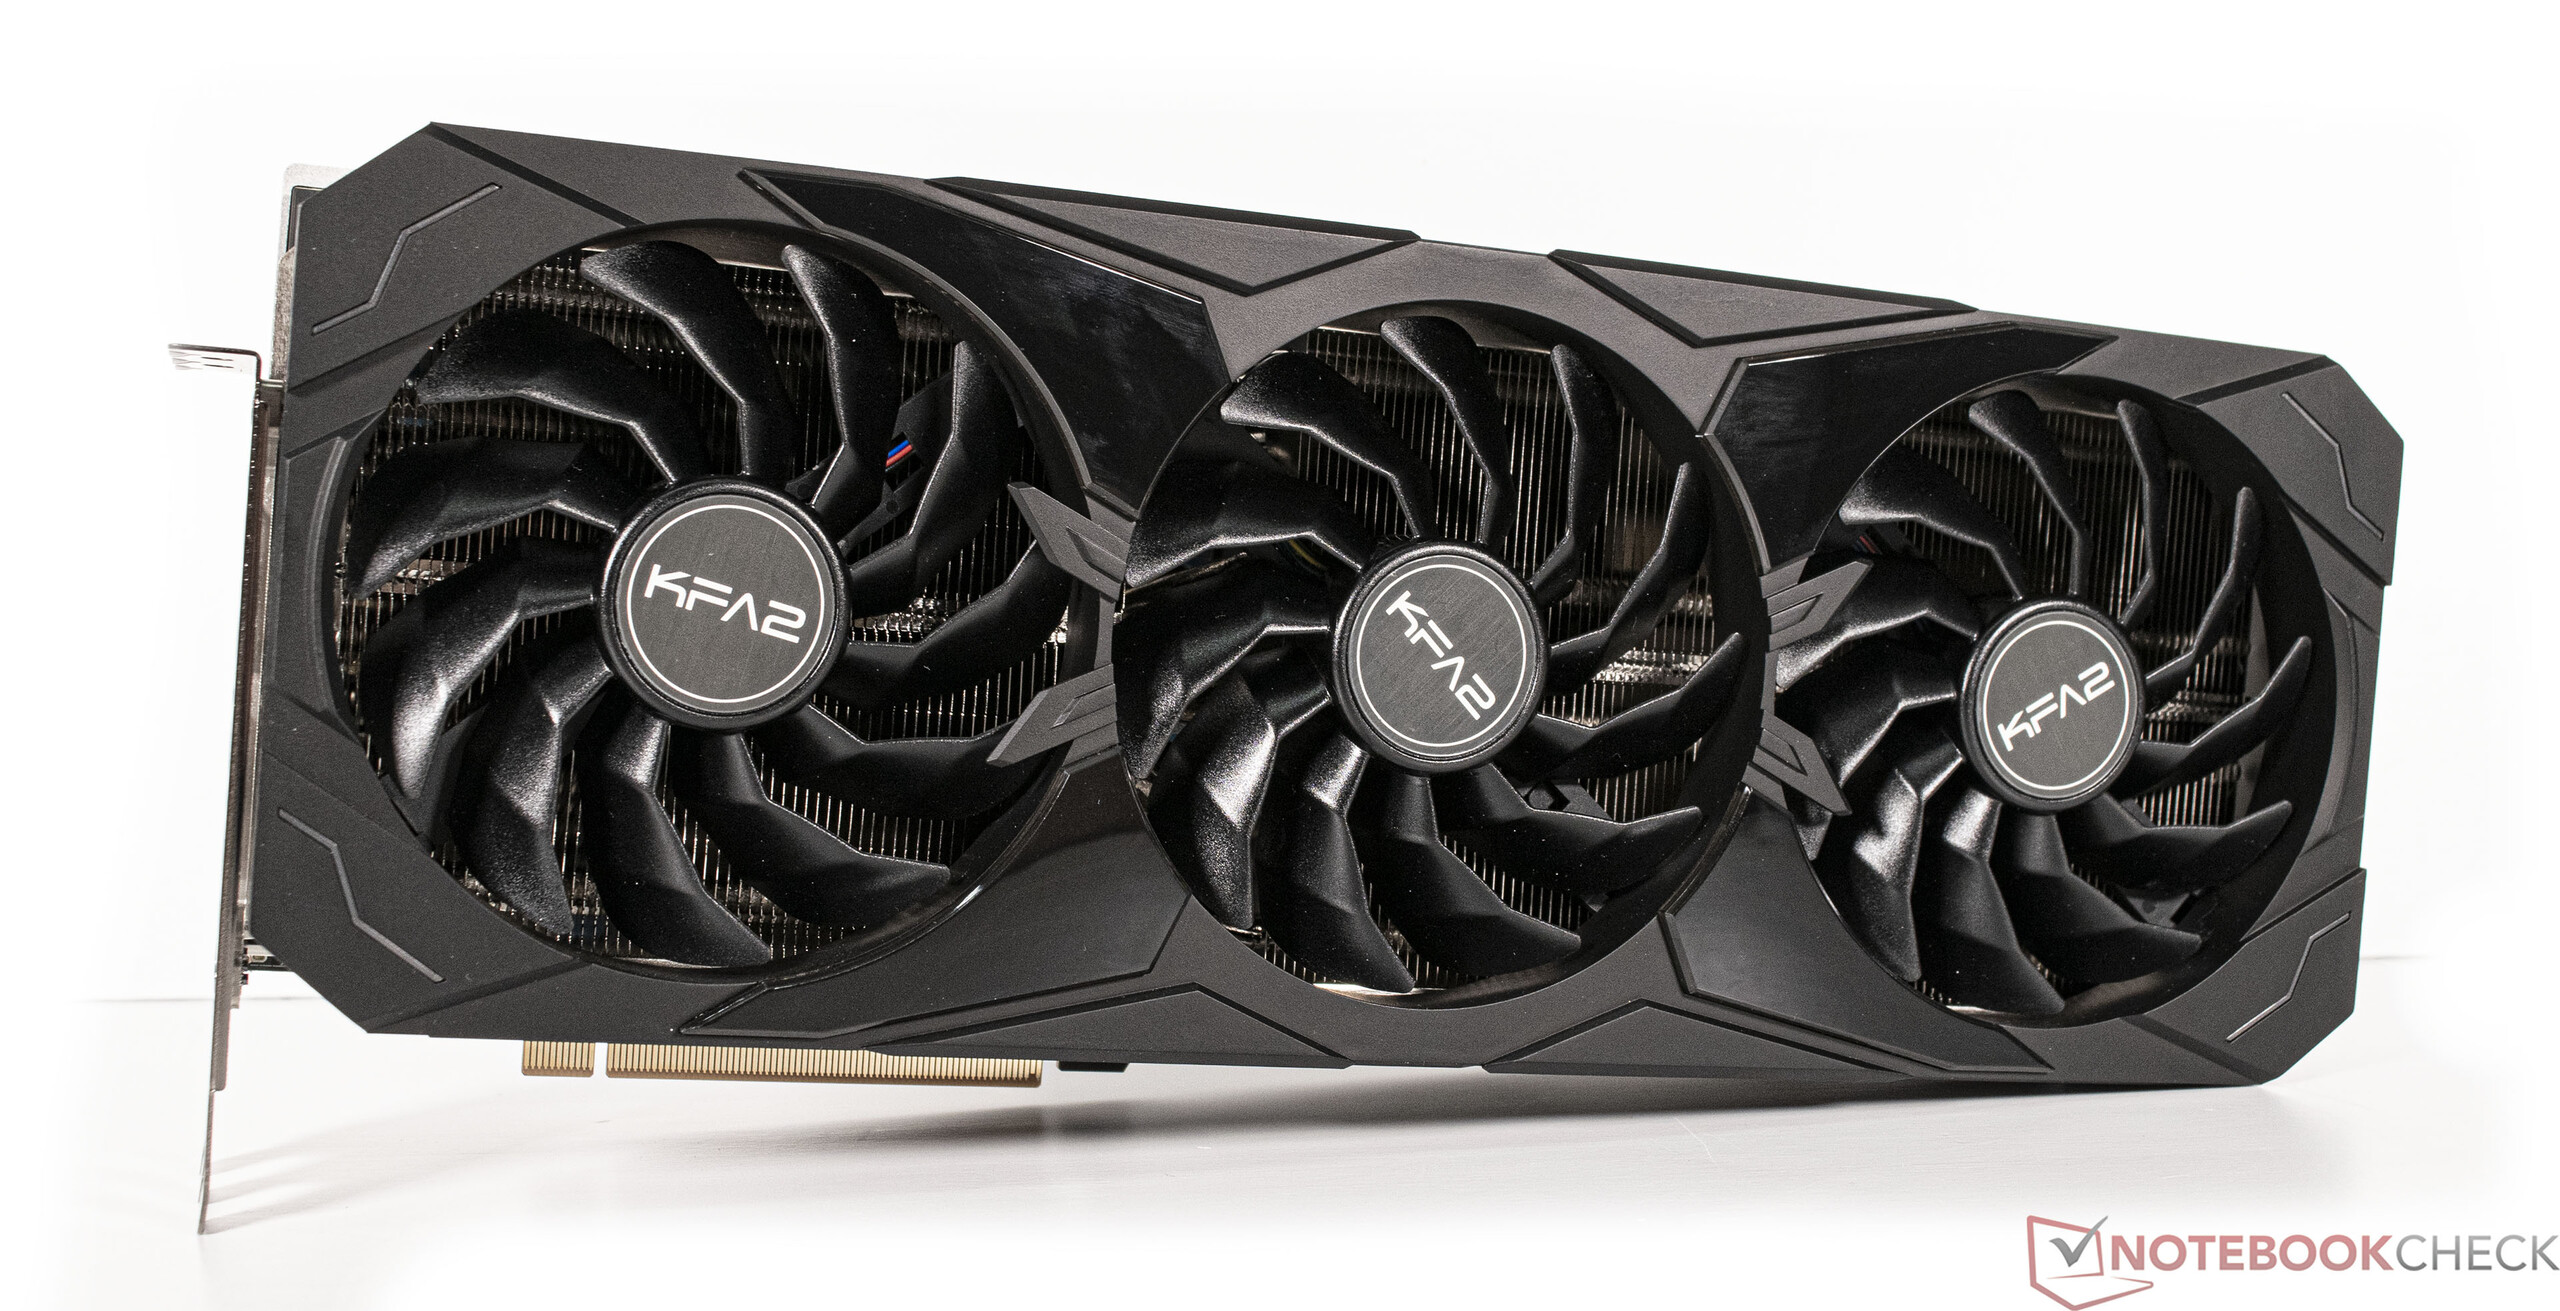
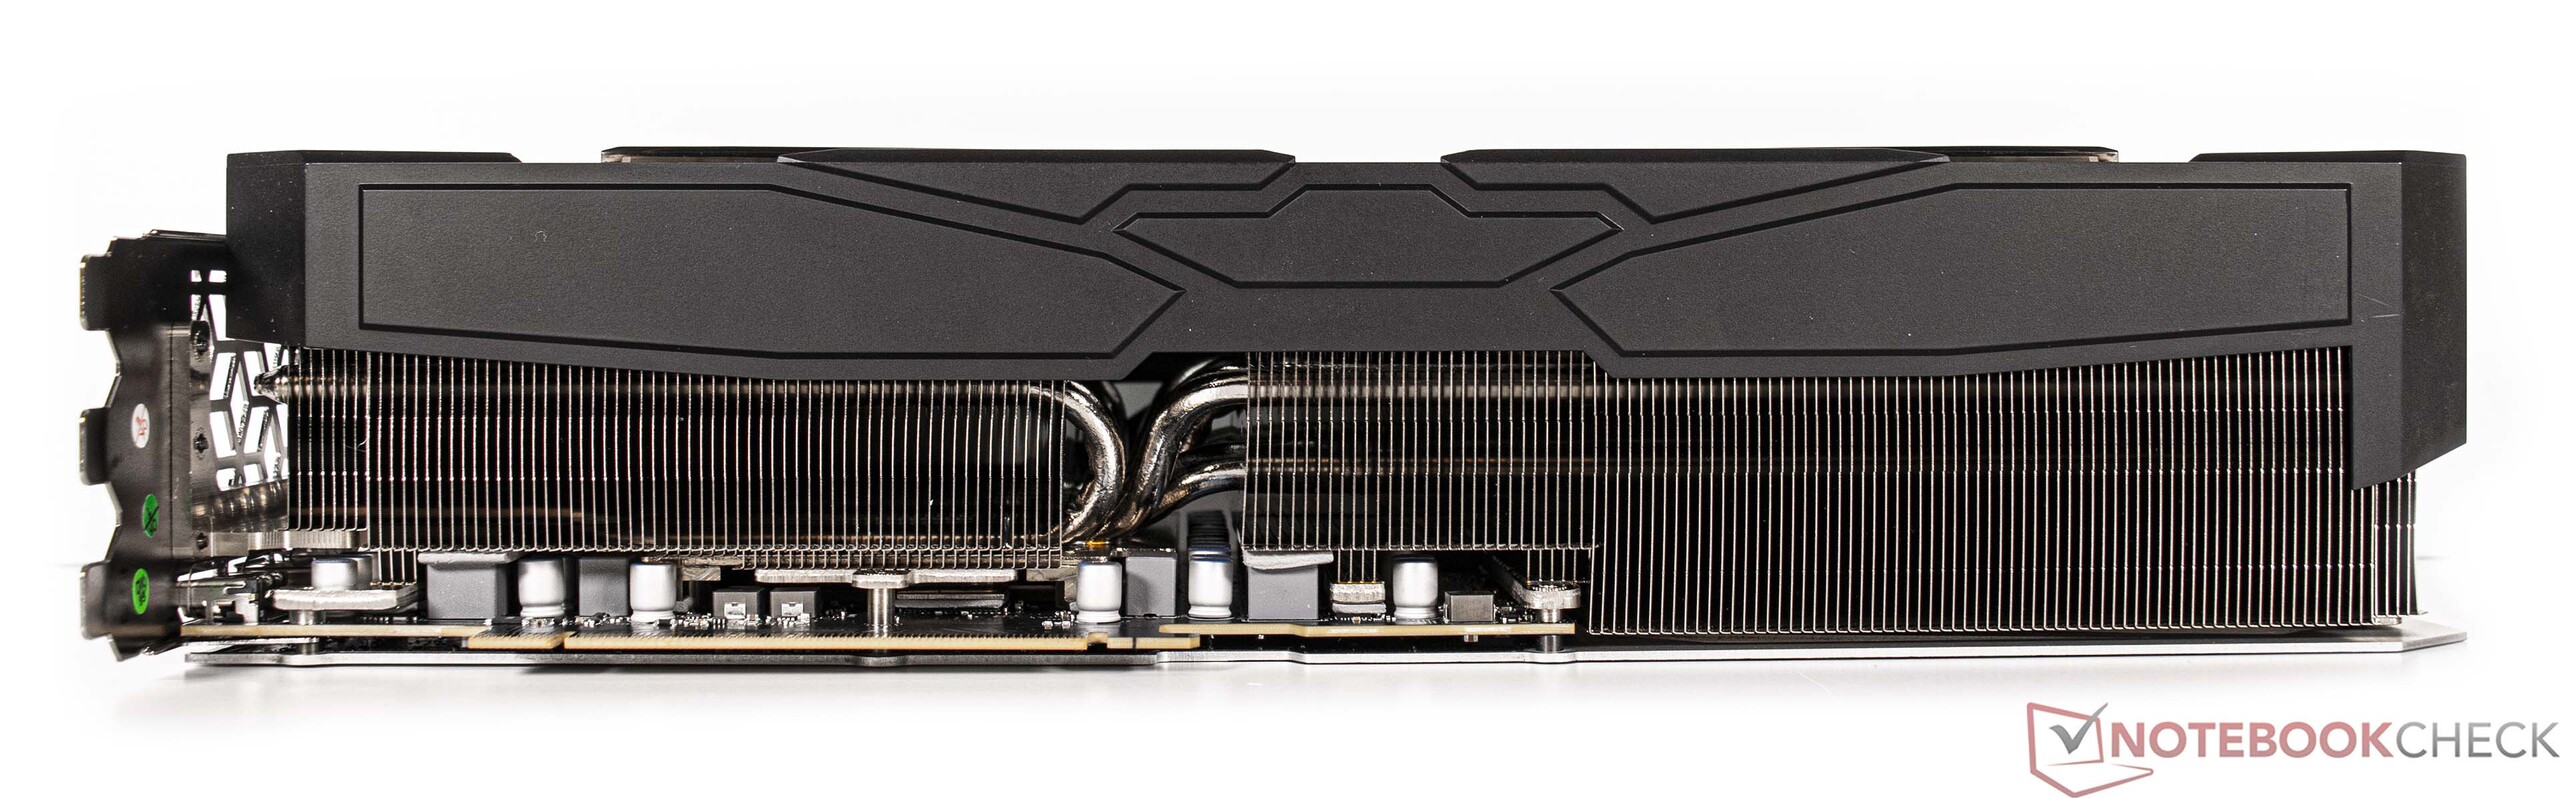
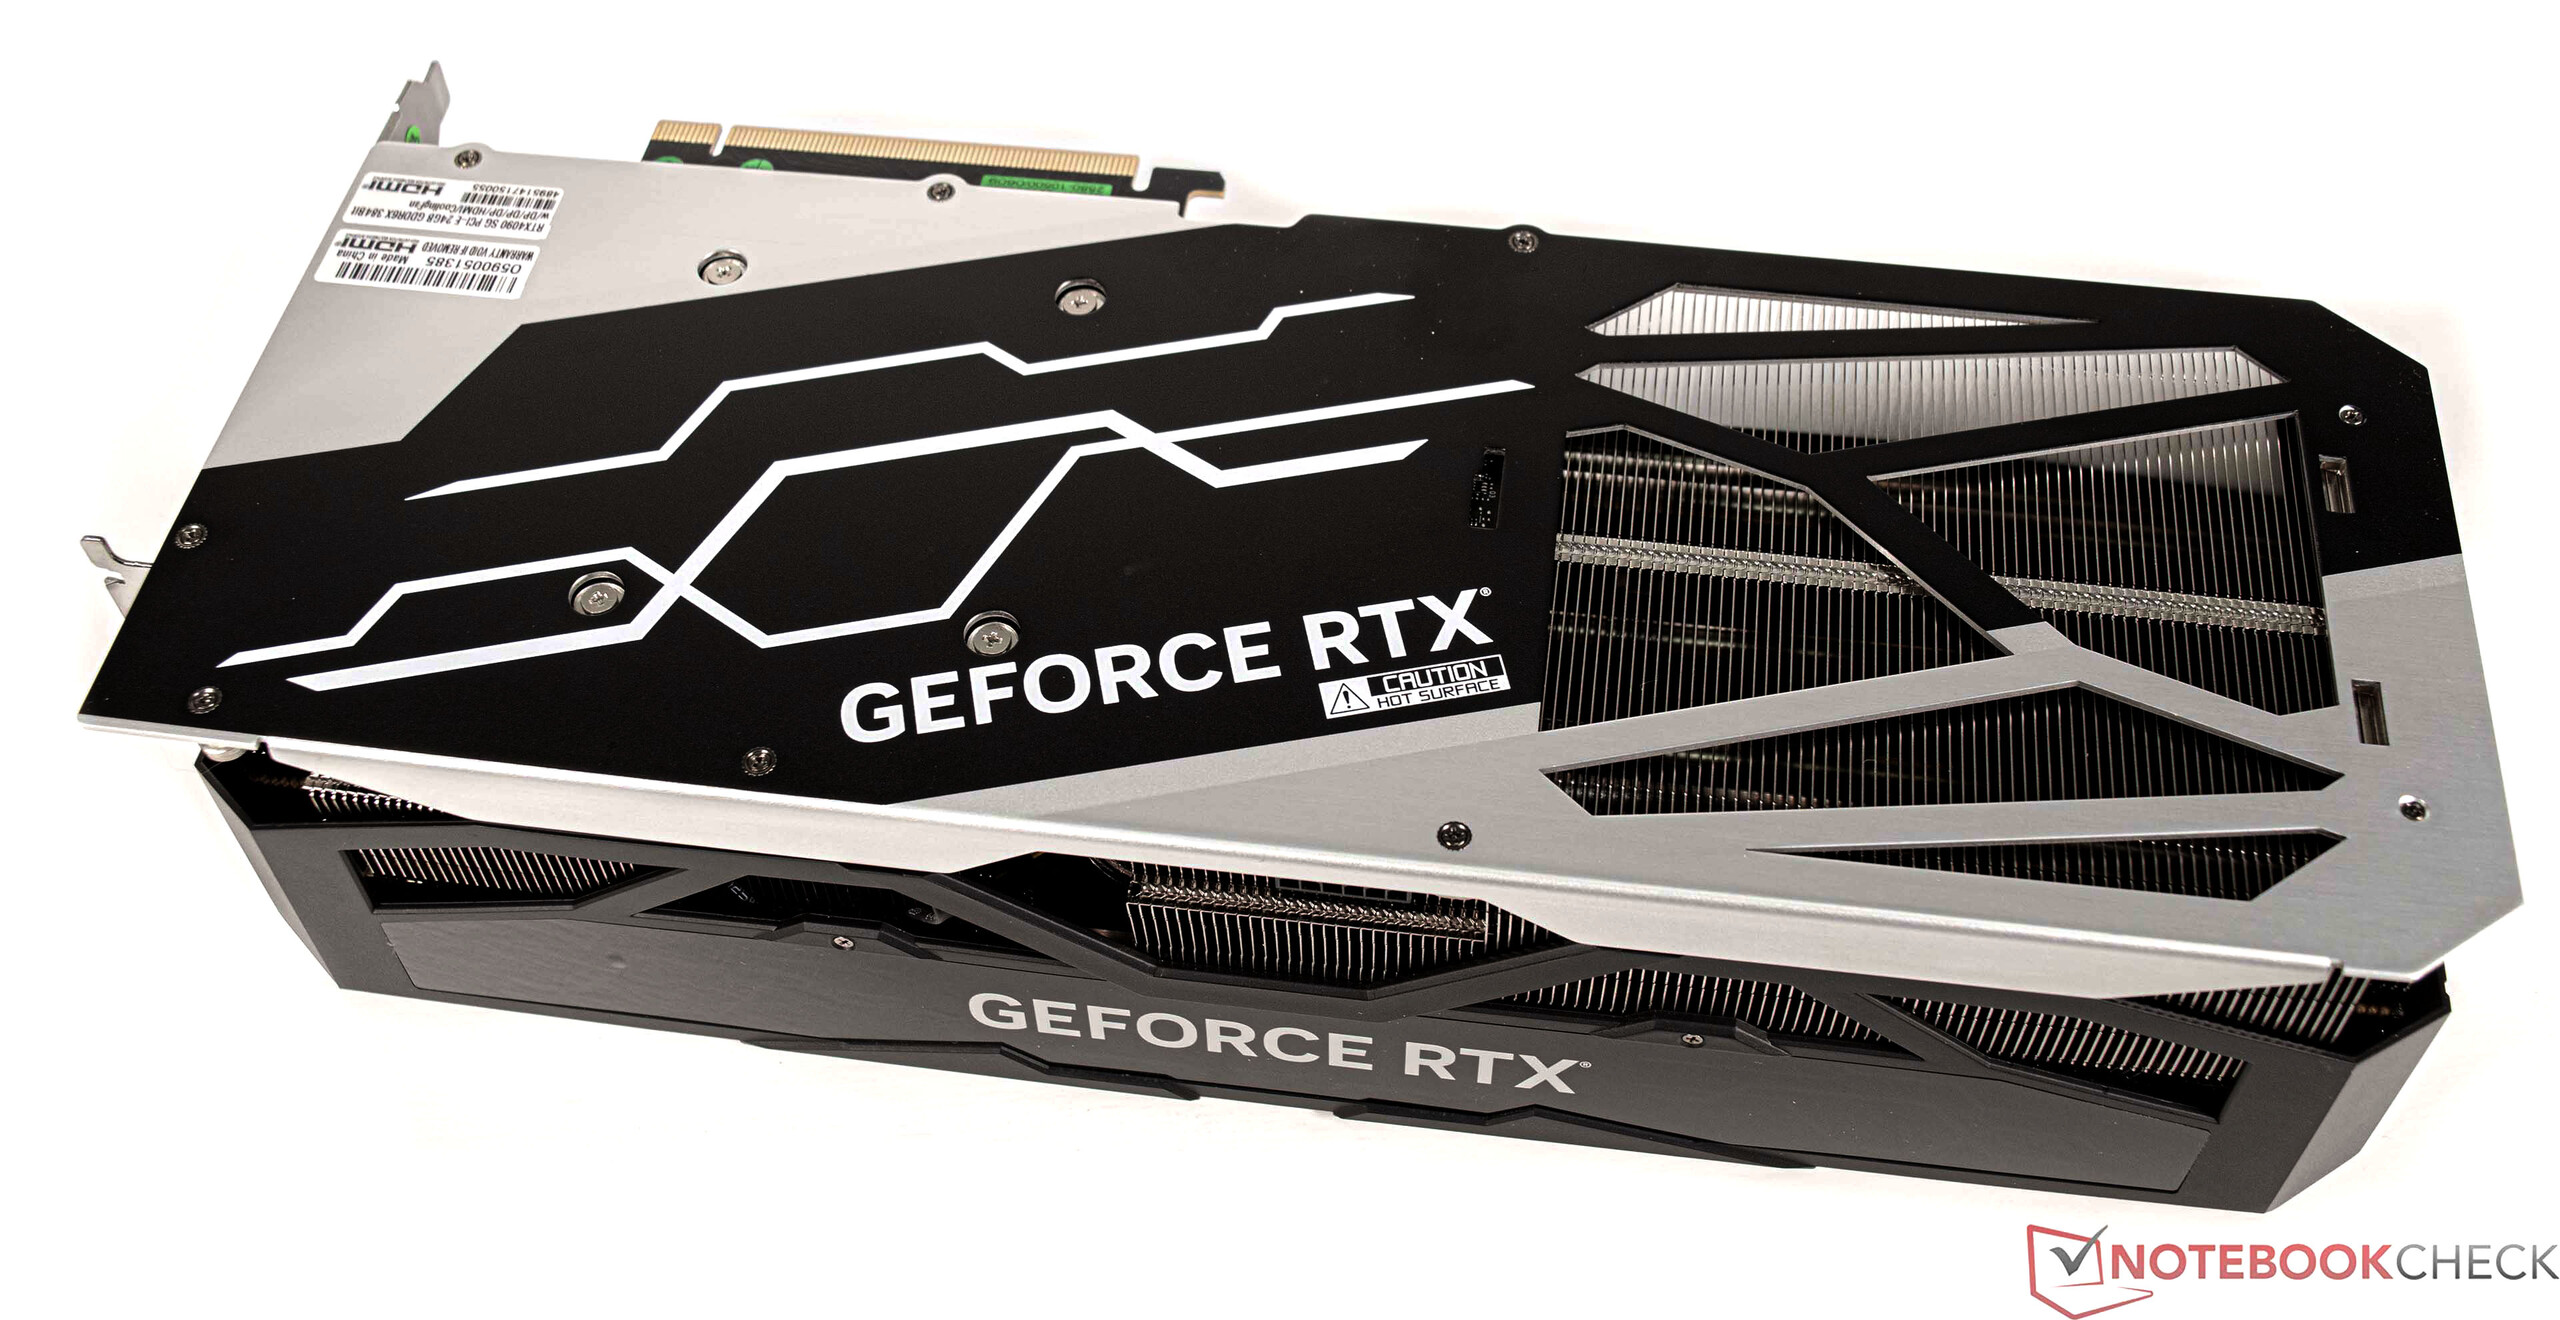
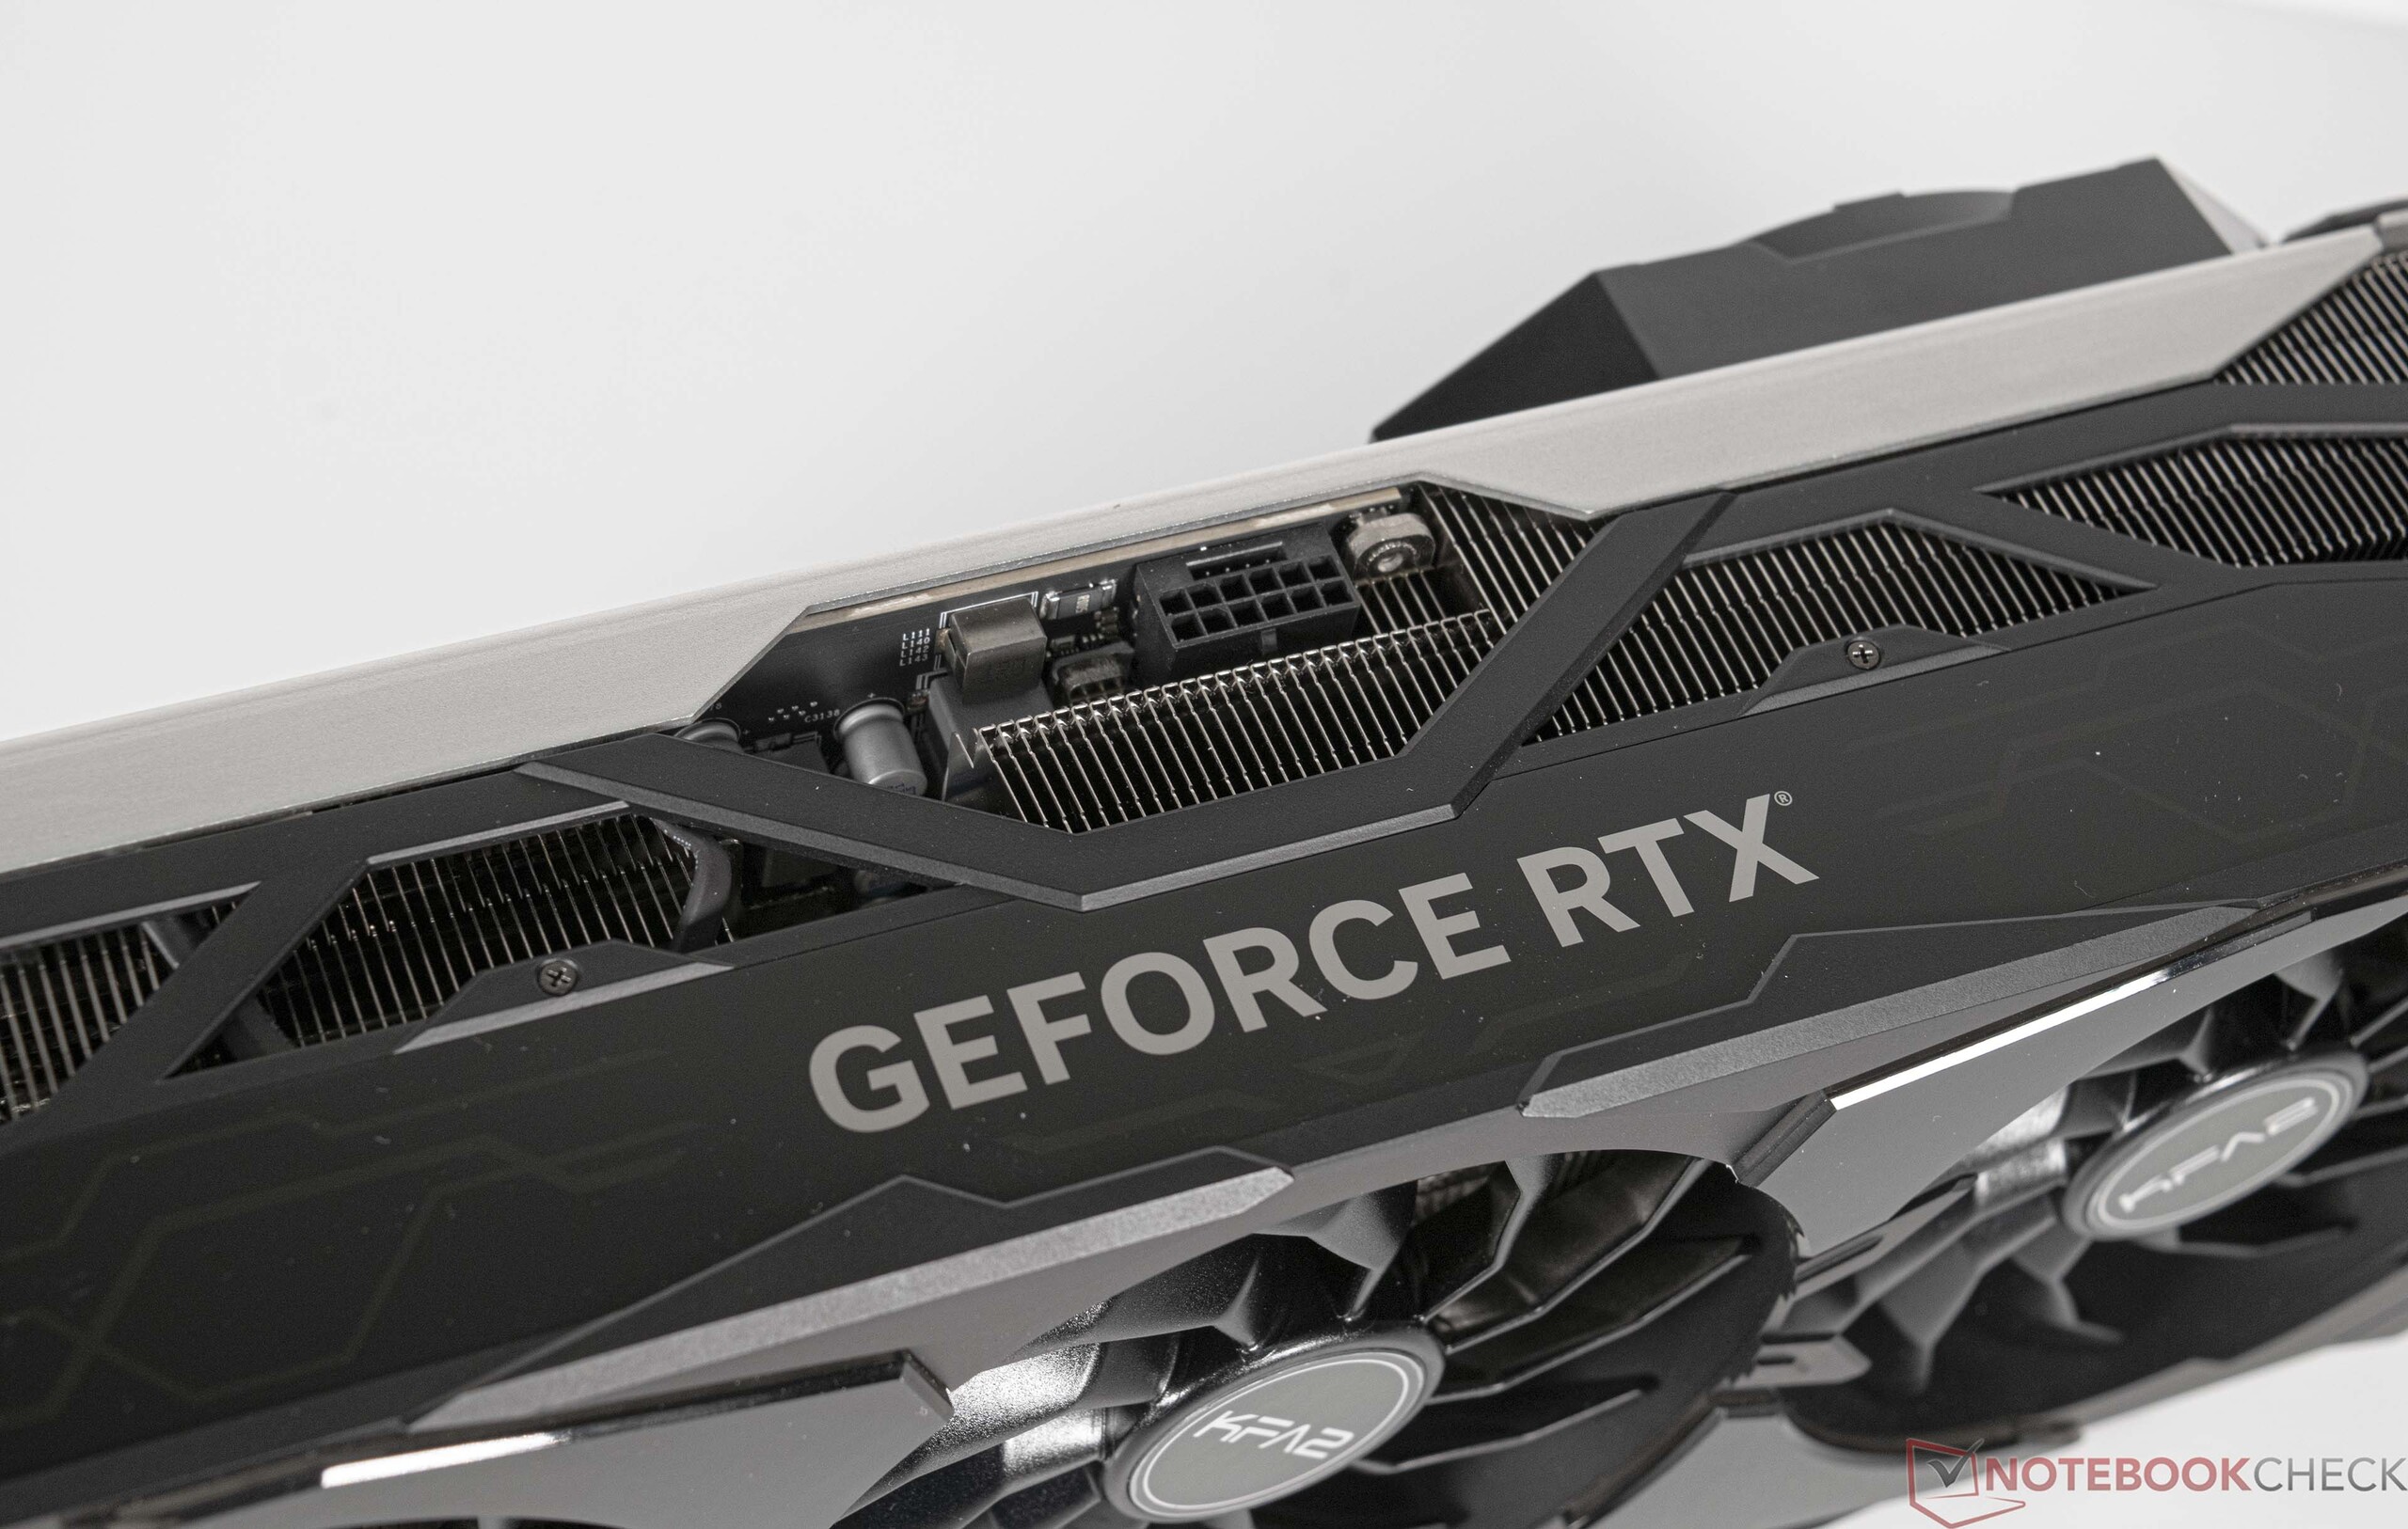
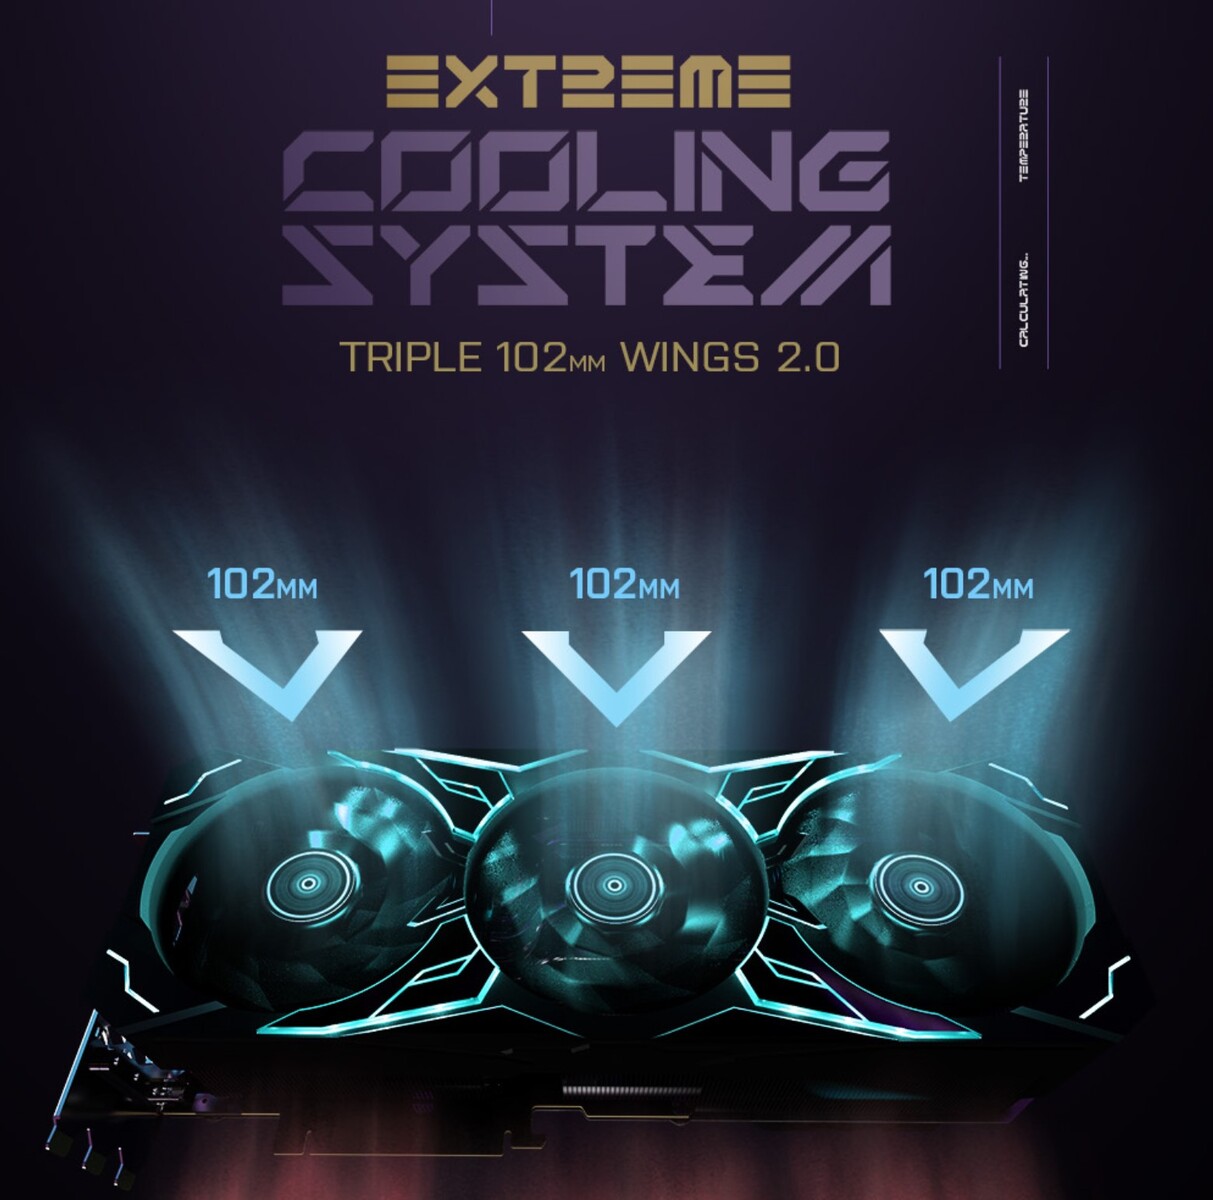
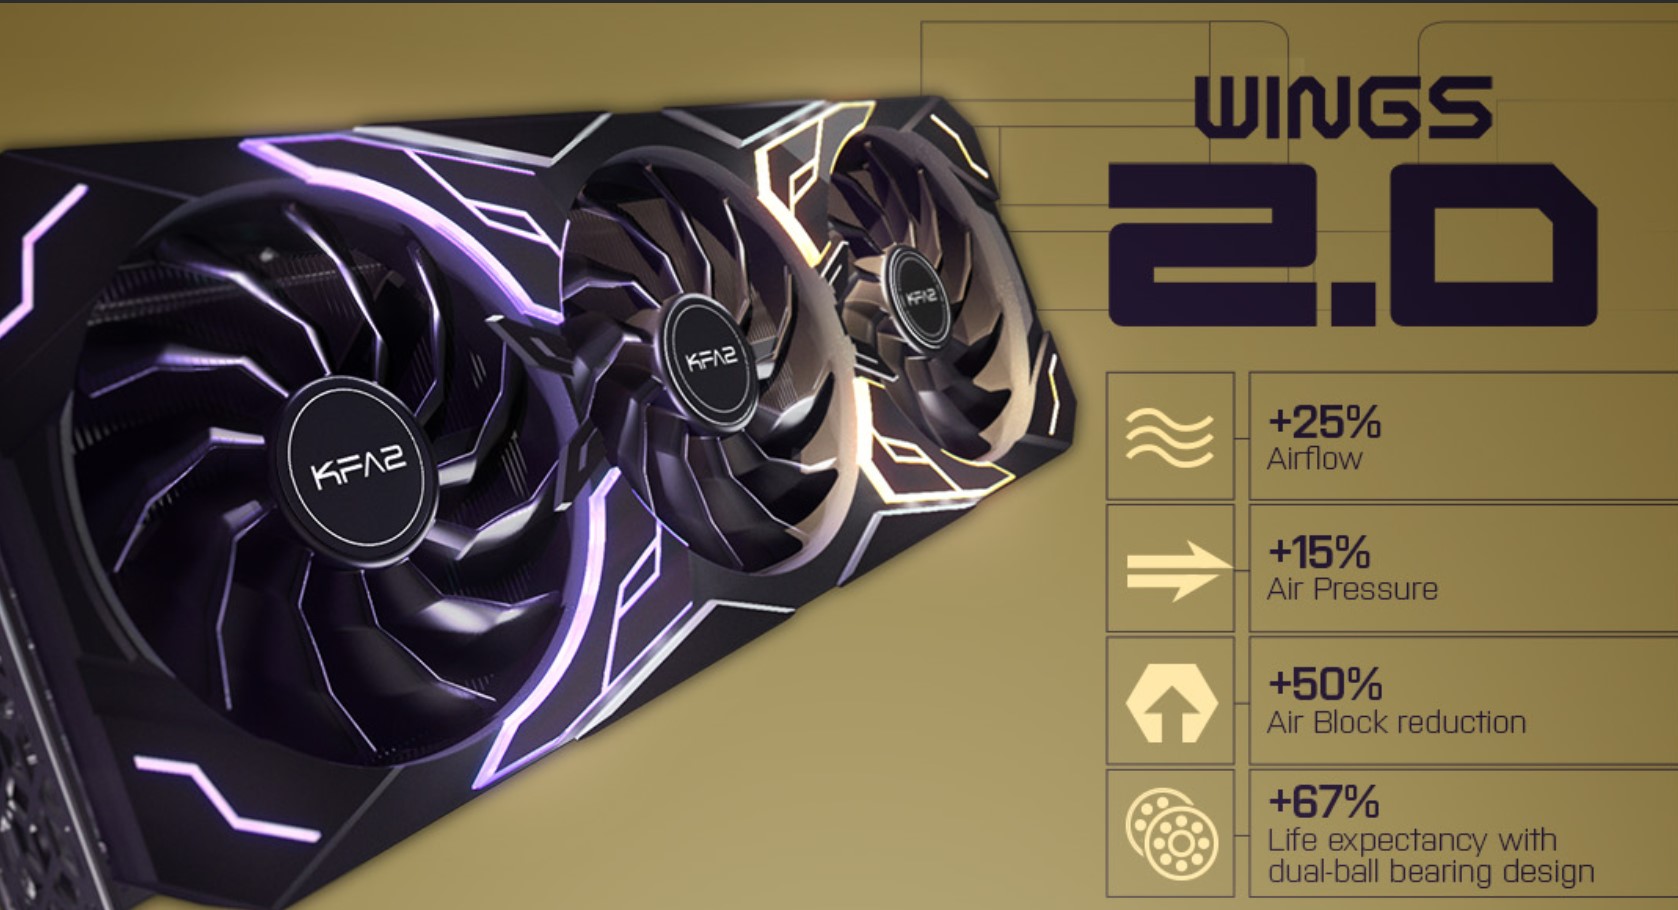
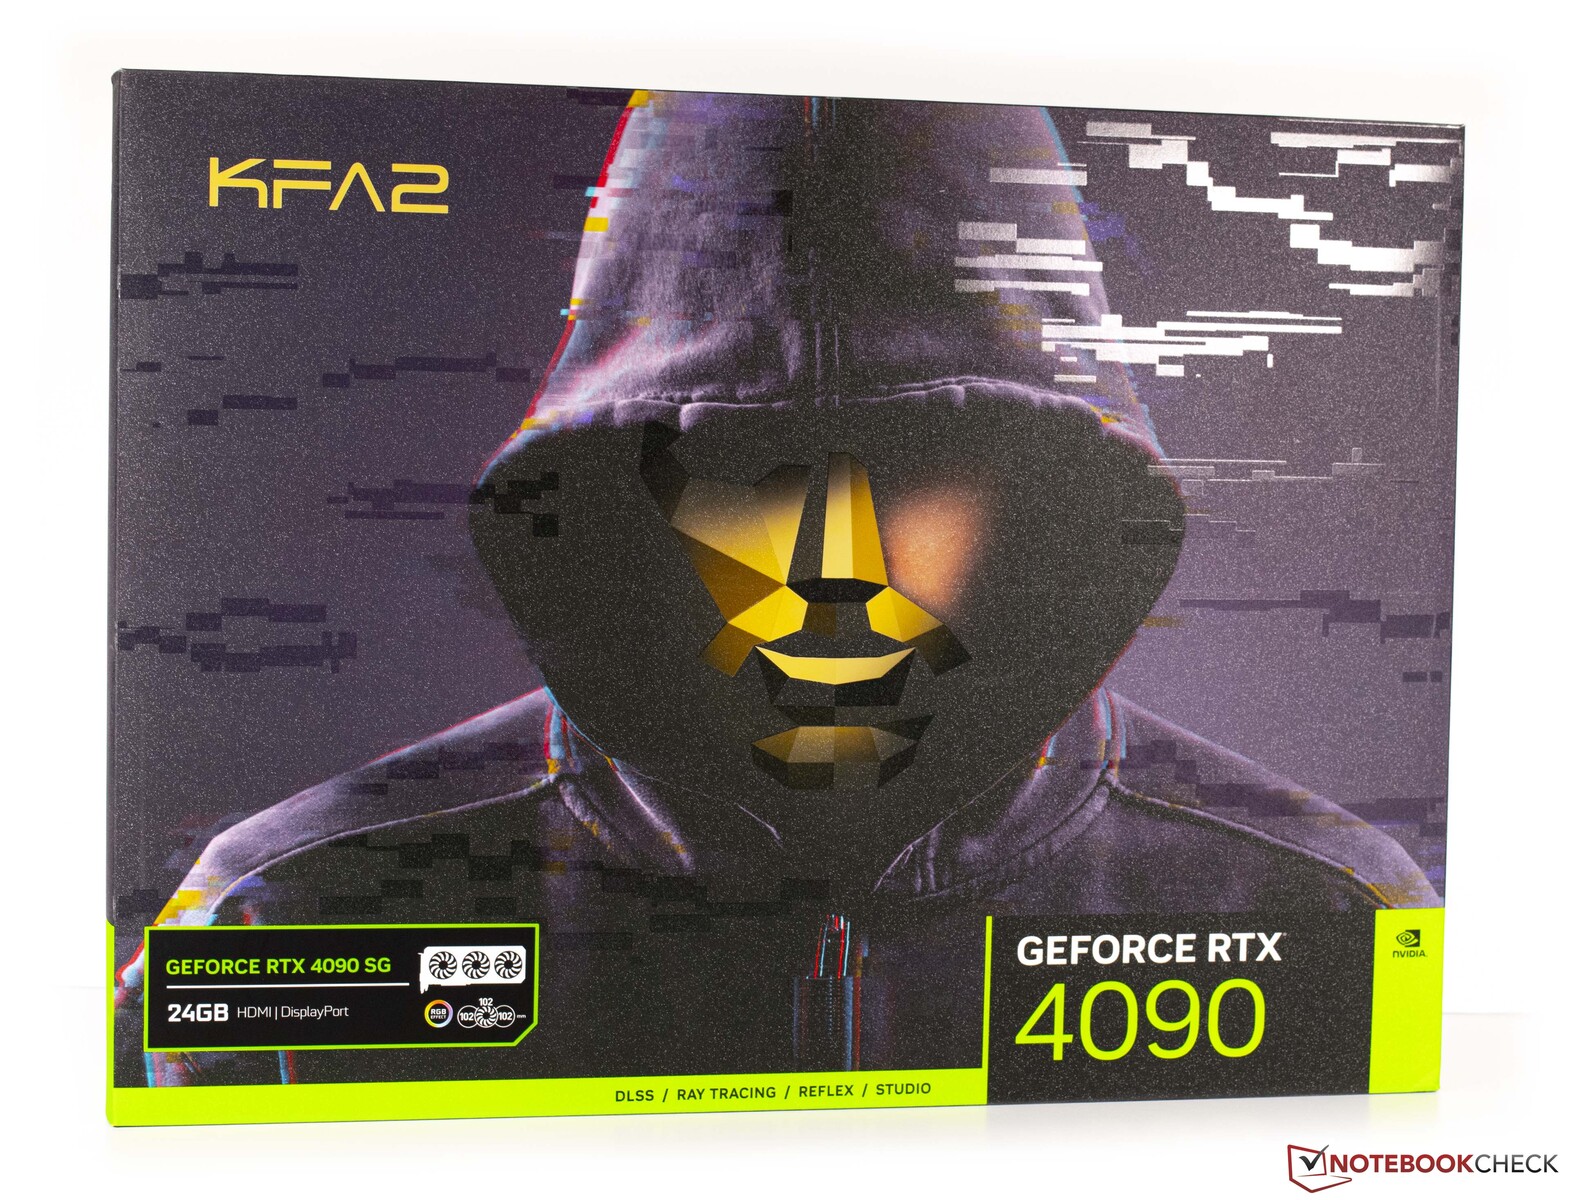
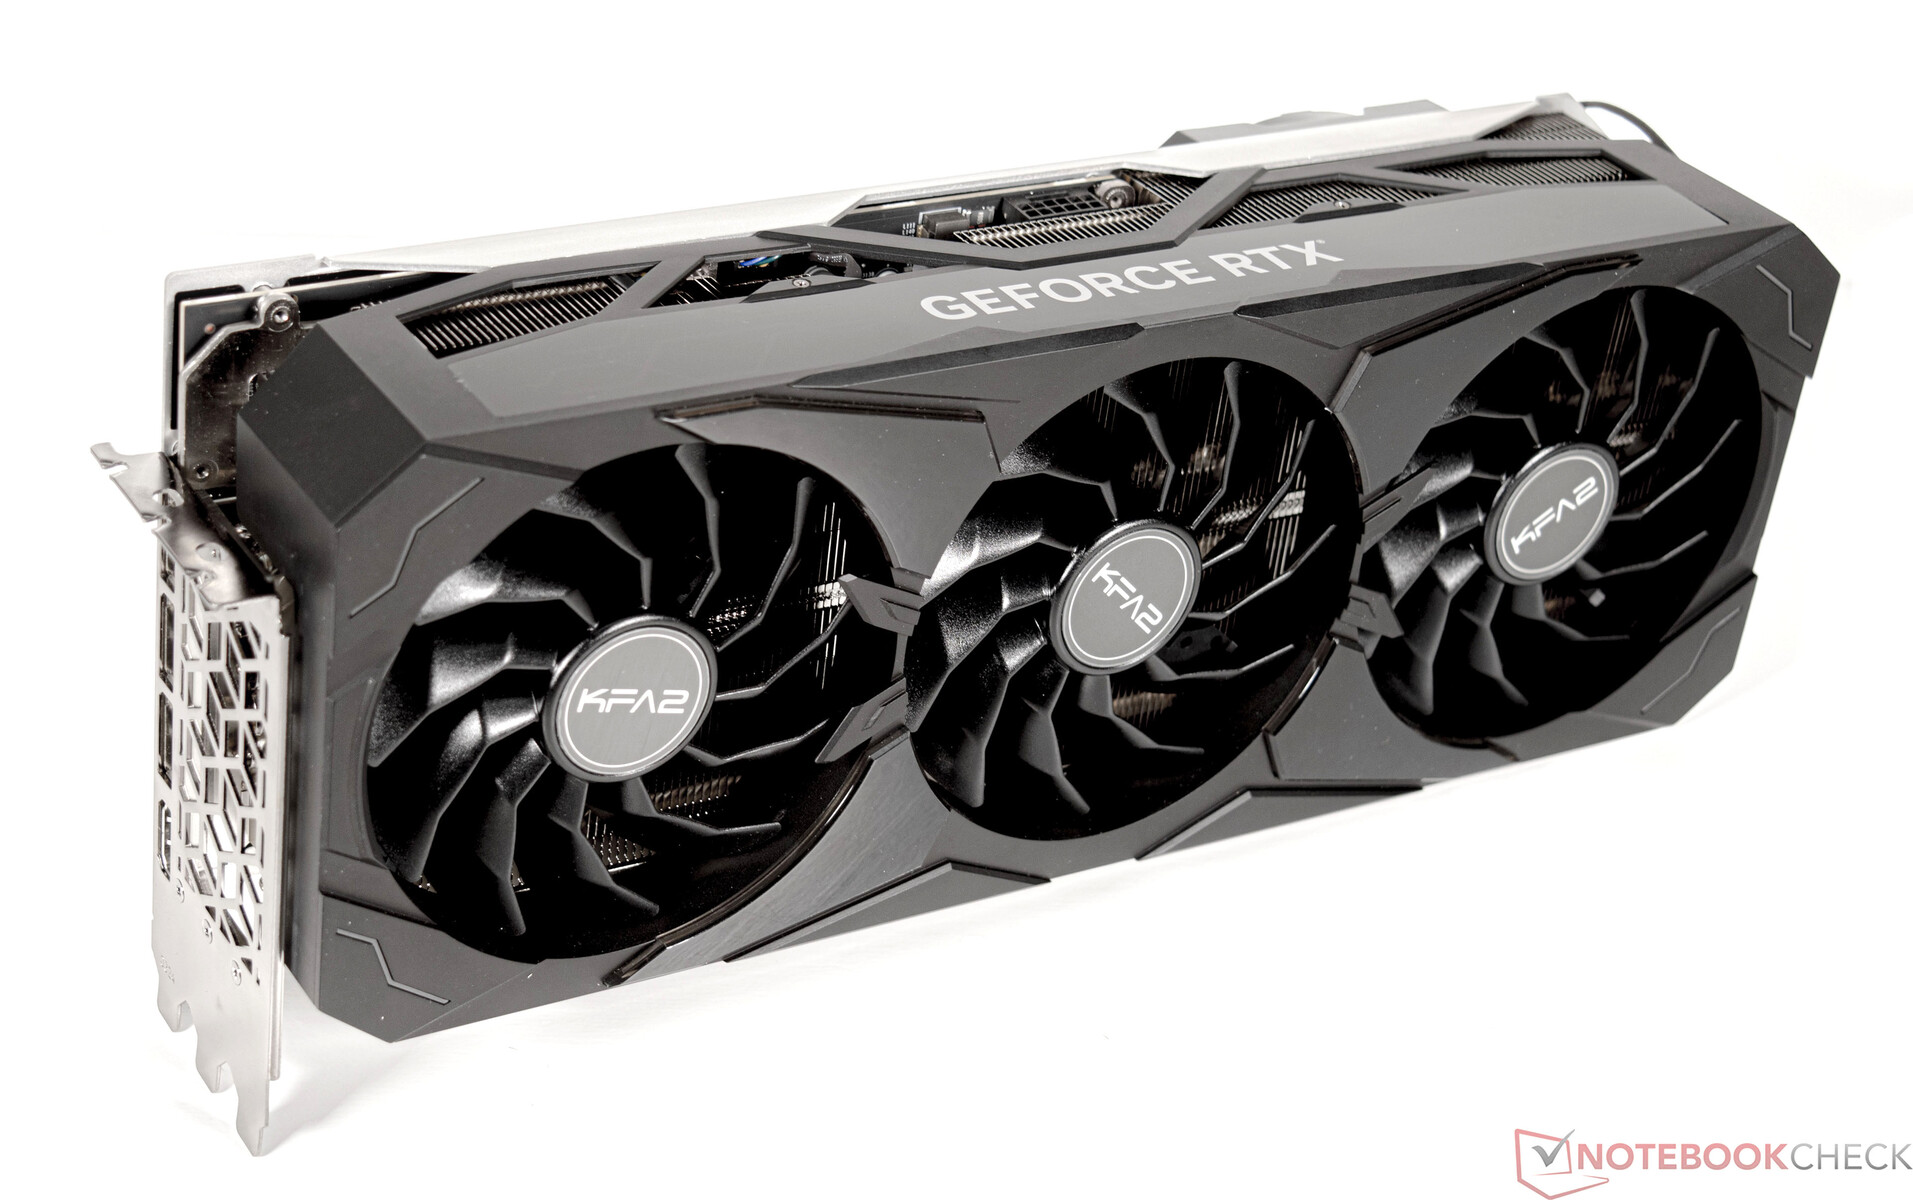
Für diesen Test nutzen wir die KFA2 GeForce RTX 4090 SG. Der Hersteller selbst sieht die Grafikkarte auf einem Level mit der Asus GeForce RTX 4090 Strix und der MSI GeForce RTX 4090 Suprime X. Beide Modelle sind die Topmodelle der jeweiligen Hersteller. Einen direkten Schlagabtausch zwischen den genannten Vertretern und der KFA2 GeForce RTX 4090 SG können wir leider nicht bieten, da wir bislang keines der Modelle in den Händen hatten. Das KFA2-Modell ist sehr groß, was eigentlich auf alle Modelle der RTX 4090 zutrifft. Das Quad-Slot-Design benötigt sehr viel Platz im Gehäuse und verspricht eine leise Grafikkarte unter Last. Bei den Lüftern vertraut der Hersteller auf drei große Axial-Lüfter mit 102 Millimetern im Durchmesser. Diese wurden überarbeitet und bieten bis zu 25 Prozent mehr Luftdurchsatz. Die Leistungsaufnahme beträgt 450 Watt und richtet sich somit nach dem Referenzmodell von Nvidia. Für die Stromversorgung kommt wie bei allen Modellen der GeForce RTX 4090 Grafikkarten der neue 12VHPWR-Anschluss zum Einsatz. Im Lieferumfang befindet sich ein passender Adapter auf 4x 6 + 2 Pin PCIe.

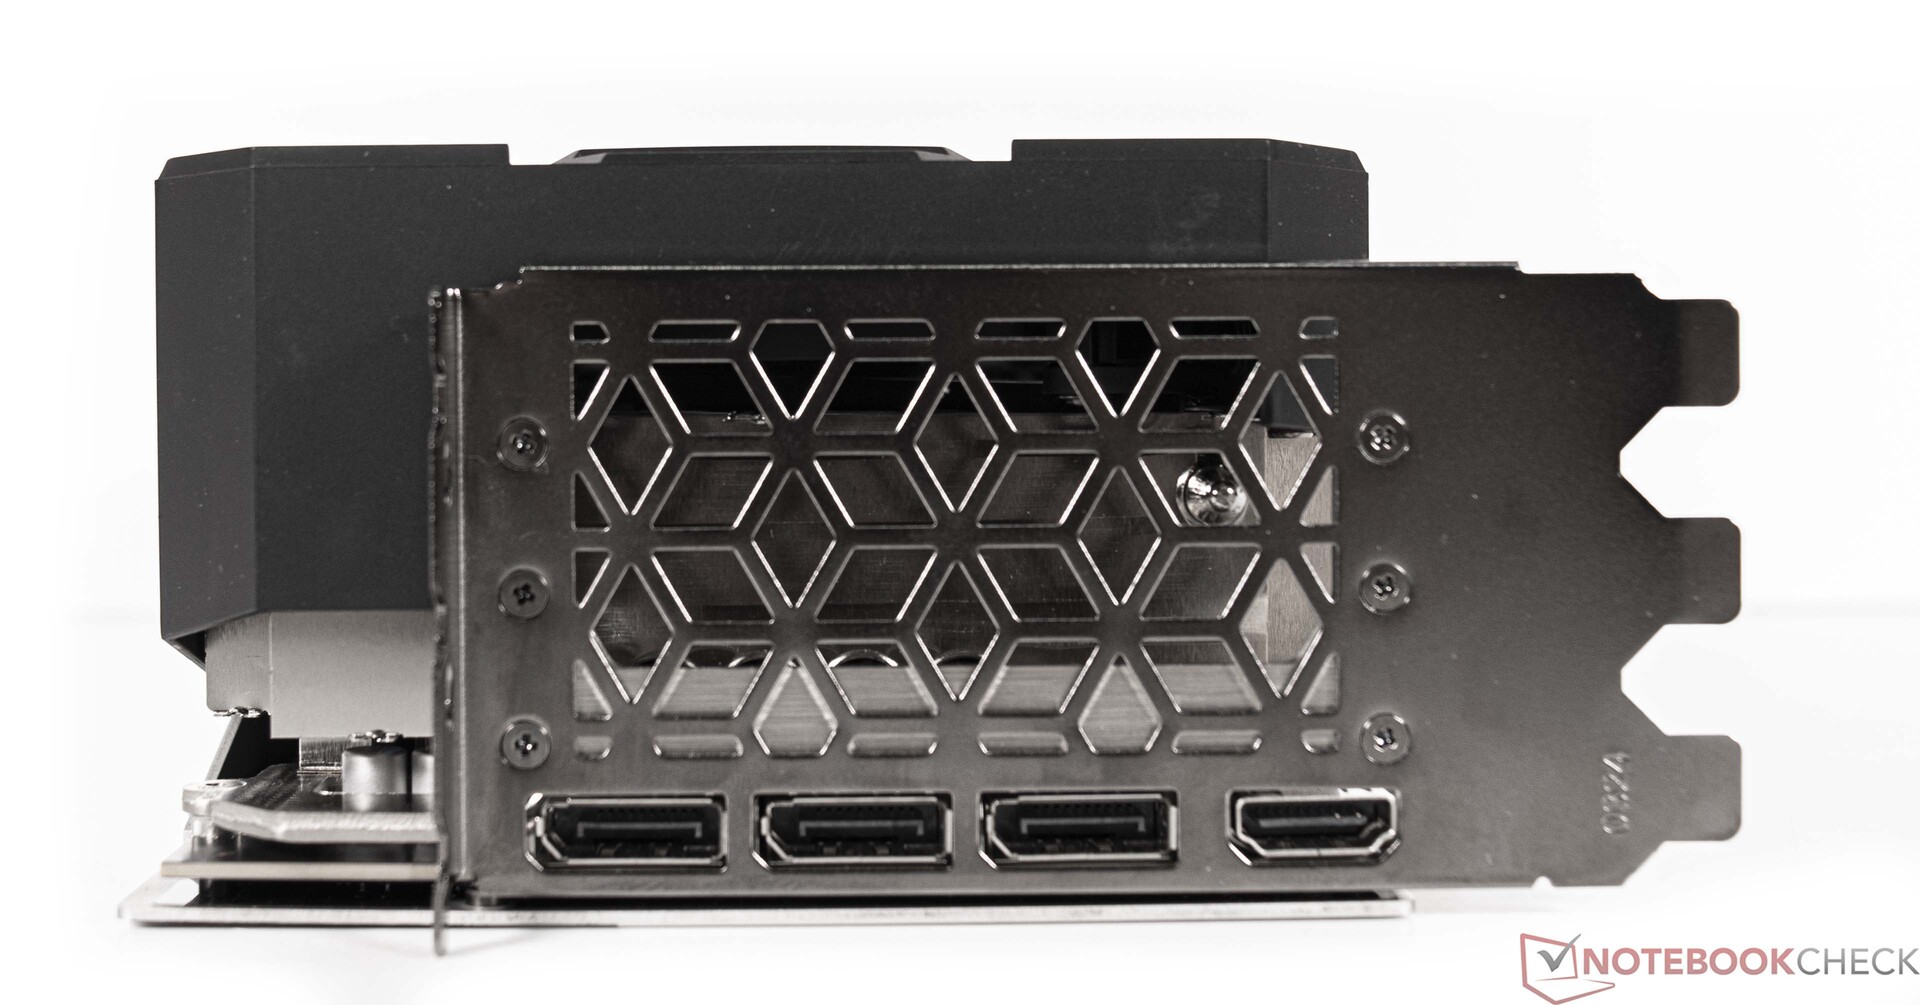
Extern bietet die KFA2 GeForce RTX 4090 SG 1x HDMI 2.1a und 3x DisplayPort 1.4a.

KFA2 GeForce RTX 4090 SG
GPU Halter für die KFA2 GeForce RTX 4090 SG mit RGB
KFA2 GeForce RTX 4090 SG vs. Waage

Die Specs der GeForce-Grafikkarten im Vergleich

Ausstattung RTX 4090 (FE) RTX 4080 RTX 3090 Ti RTX 3090 (FE) RTX 3080 Ti (FE) RTX 3080 (FE) Titan RTX
Chip AD102 AD103 GA102 GA102 GA102 GA102 TU102
FinFET Prozess 4 nm 4 nm 8 nm 8 nm 8 nm 8 nm 12 nm
CUDA Cores 16.384 9.728 10.752 10.496 10.240 8.704 4.608
Texture Units 512 304 336 328 320 272 288
Tensor Cores 512 4. Gen. 304 4. Gen. 336 3. Gen. 328 3. Gen. 320 3. Gen. 272 3. Gen. 576 2. Gen.
RT Cores 128 76 84 82 80 68 72
GPU Base Clock 2.235 MHz 2.205 MHz 1.560 MHz 1.395 MHz 1.365 MHz 1.440 MHz 1.350 MHz
GPU Boost Clock 2.520 MHz 2.505 MHz 1.860 MHz 1.695 MHz 1.665 MHz 1.710 MHz 1.770 MHz
Memory Bus 384 bit 256 Bit 384 bit 384 bit 384 bit 320 bit 384-bit
Memory Bandwidth 1.008 GB/s 716.8 GB/s 1.008 GB/s 936 GB/s 912.4 GB/s 760 GB/s 672 GB/s
Video Memory 24 GB GDDR6X 16 GB GDDR6X 24 GB GDDR6X 24 GB GDDR6X 12 GB GDDR6X 10 GB GDDR6X 24 GB GDDR6
Energieverbrauch 450 W 320 W 450 W 350 W 350 W 320 W 280 W

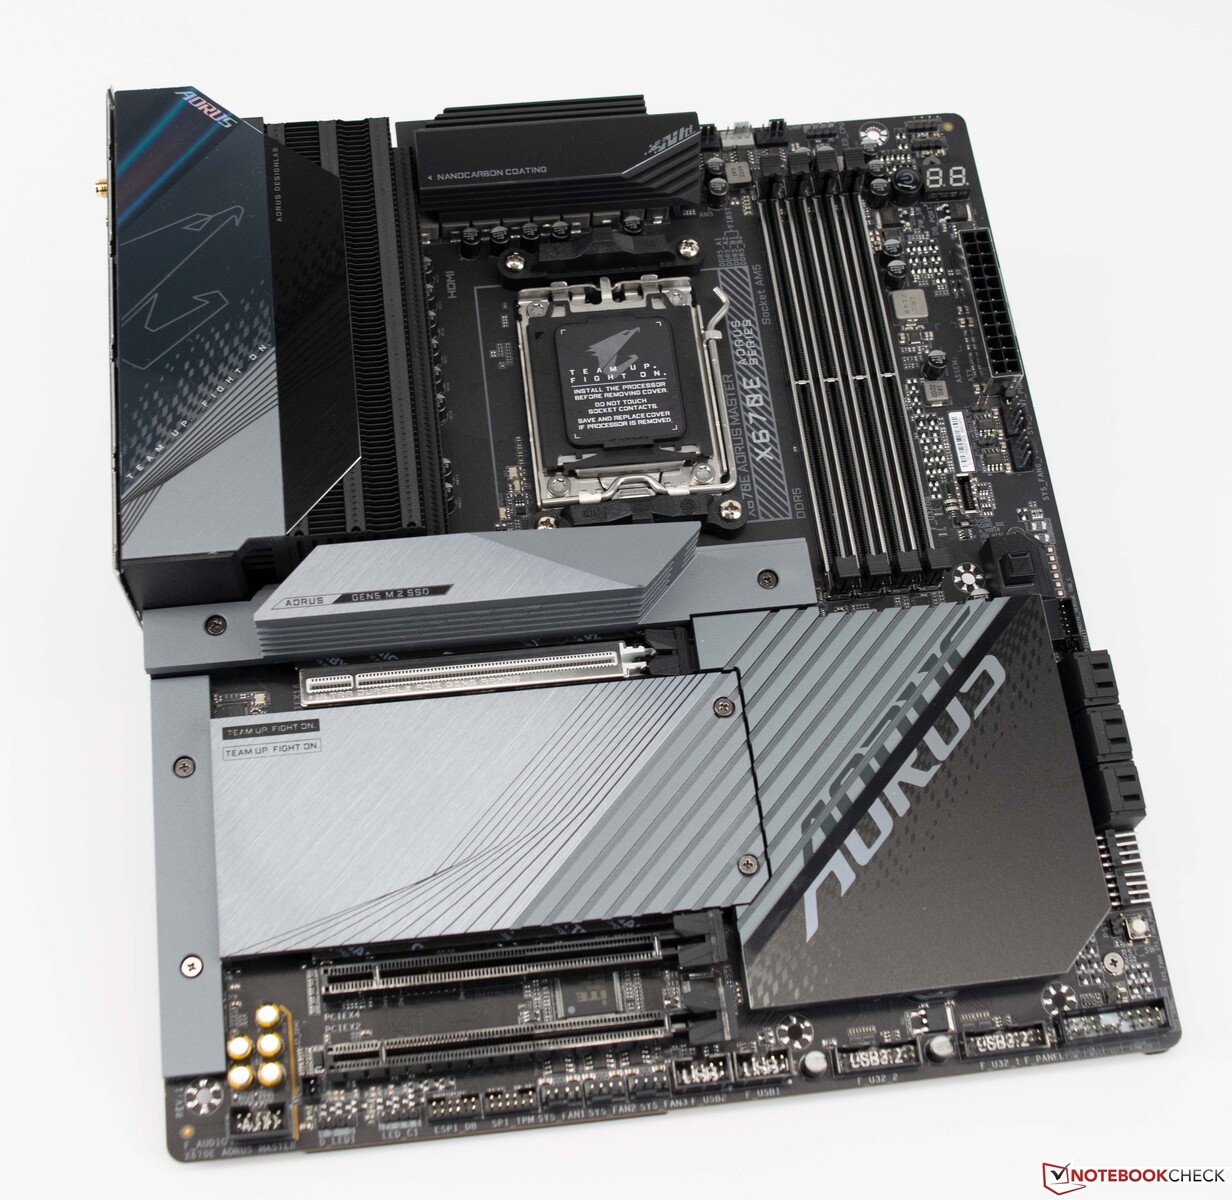
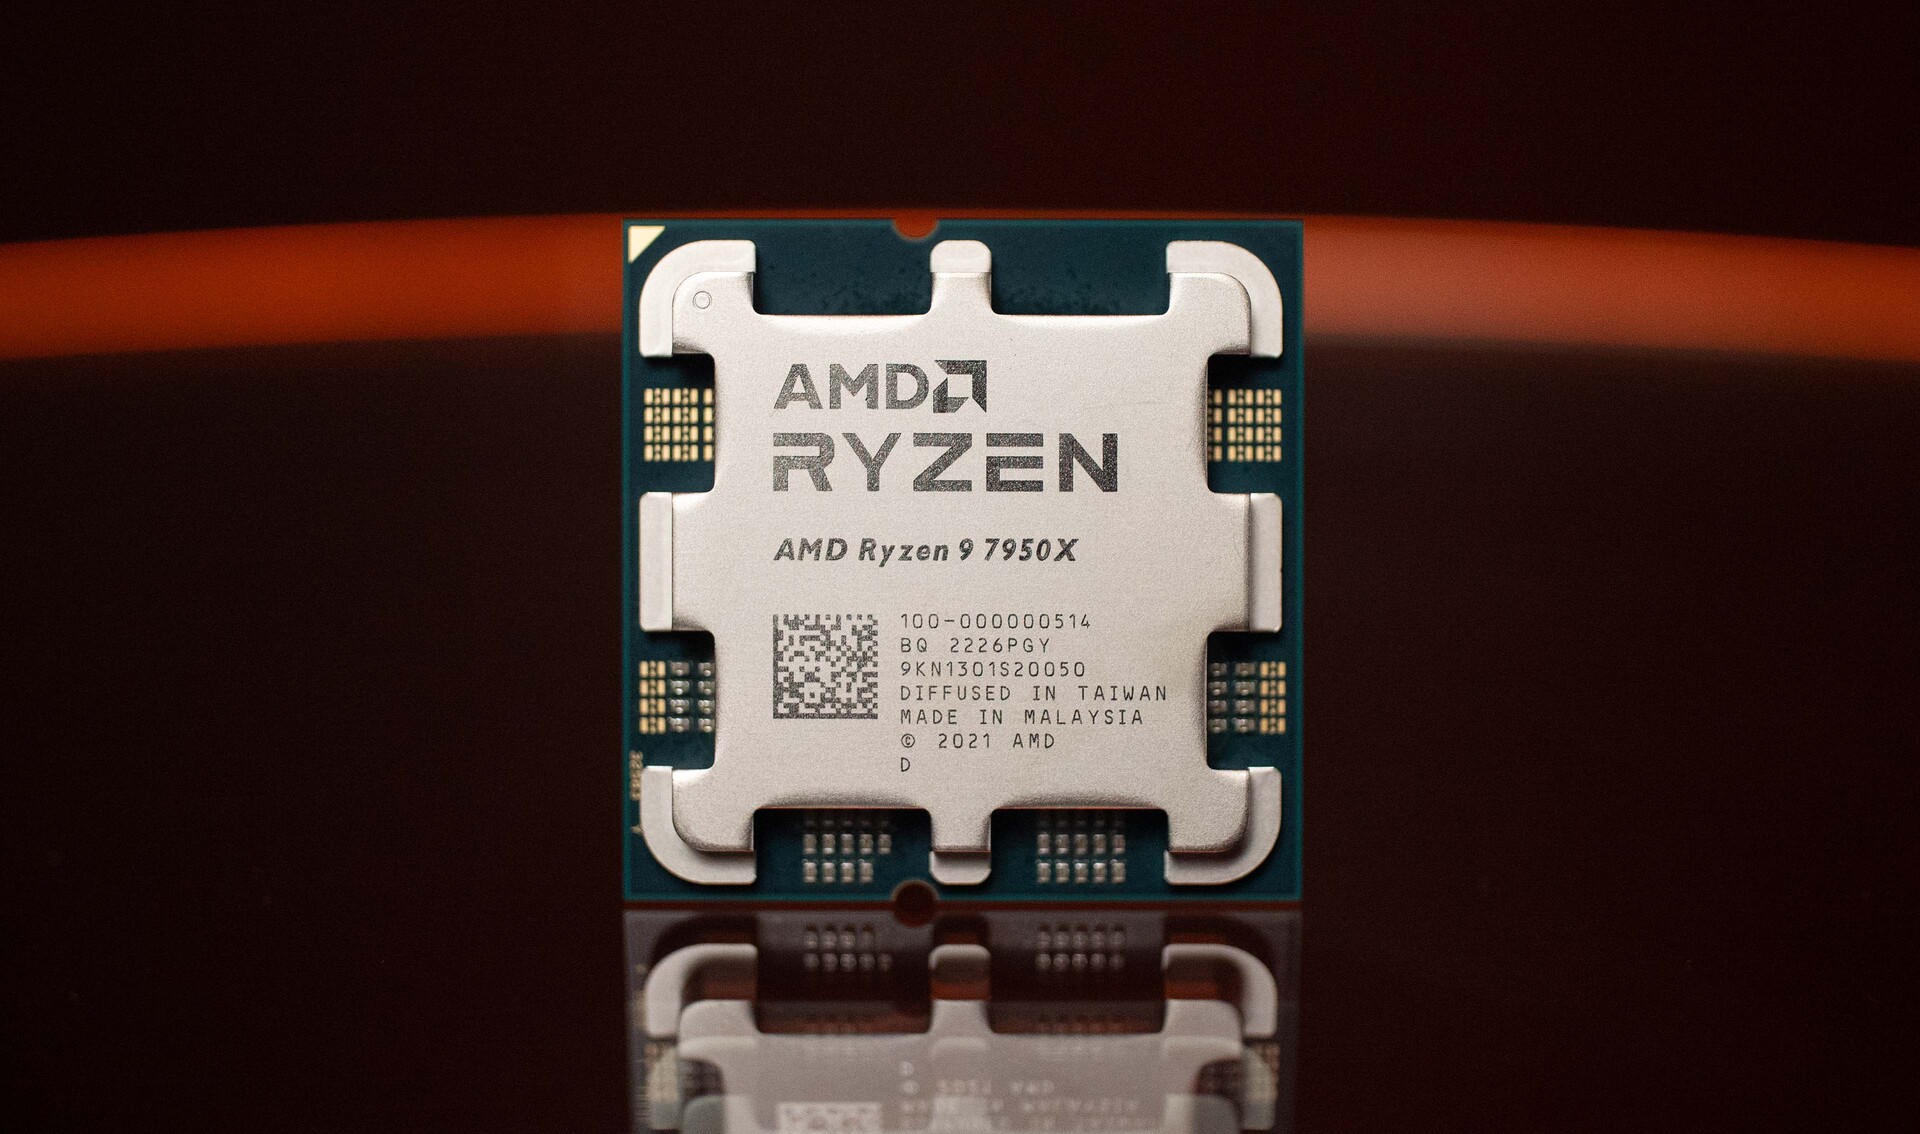
Unser Testsystem mit AMD Ryzen 9 7950X als Basis

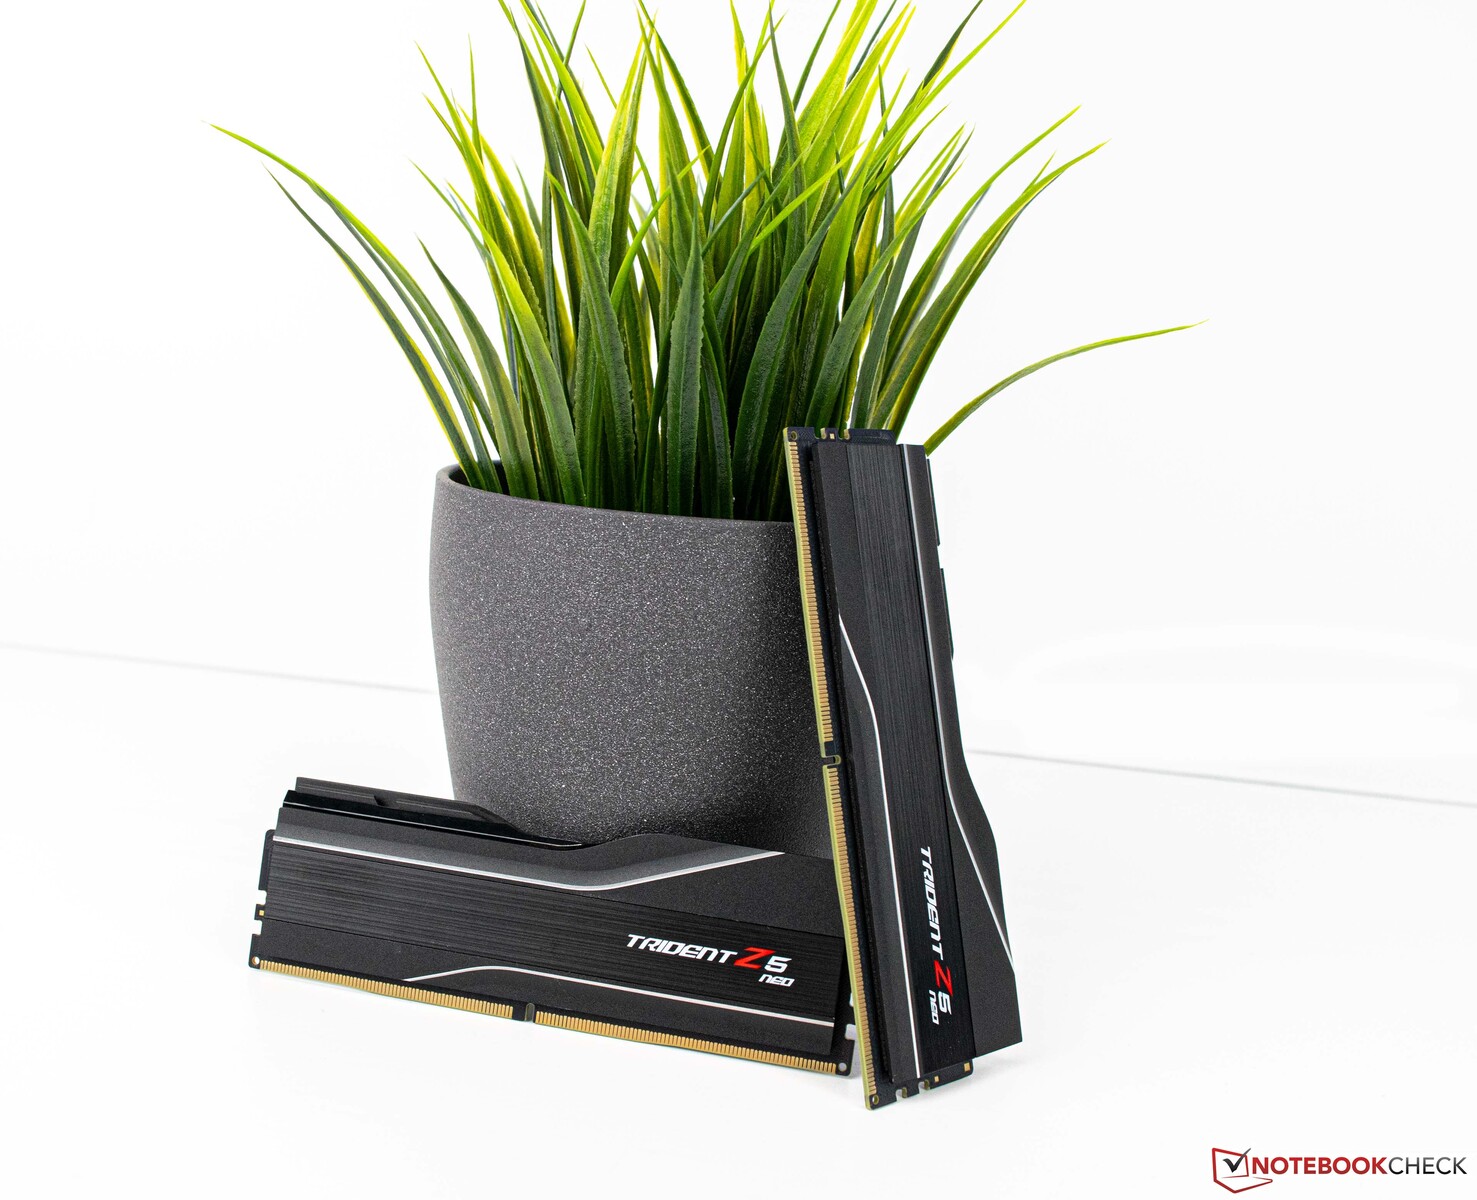
Als Testsystem dient eine aktuelle AMD-Plattform auf Basis des Gigabyte X670E Aorus Master. Die CPU (AMD Ryzen 9 7950X) bietet eine gute Leistung und als Kühlung nutzen wir eine AiO-Lösung von Alphacool (Alphacool Eisbear Aurora 360 mm). Der 32-GB-Arbeitsspeicher stammt von G.Skill und wird mit dem passenden EXPO-Profil betrieben. Als Monitor hatten wir den Gigabyte M32U in Verwendung.

Gigabyte X670E Aorus Master
AMD Ryzen 9 7950X
AMD Ryzen 9 7950X
G.Skill Trident Z5 Neo

Das Testsystem im Detail

Für die folgenden Benchmarks und Tests nutzen wir folgendes System:

  • Lian-Li O11 Dynamic
  • AMD Ryzen 9 7950X
  • Gigabyte X670E Aorus Master, BIOS: F8a
  • Alphacool Eisbear 360 AiO
  • Corsair RM 1000x Netzteil
  • G.Skill Trident Z5 Neo DDR5-6000 2x 16 GB, EXPO (DDR5-6000 CL30-38-38-96)
  • Corsair MP600 2 TB
  • Crucial MX500 2 TB
  • Microsoft Windows 11 Professional 64-Bit (Version 22H2)

Details zur KFA2 GeForce RTX 4090 SG

GPU-Z
GPU-Z
GPU-Z - 1-Click-OC
GPU-Z - 1-Click-OC

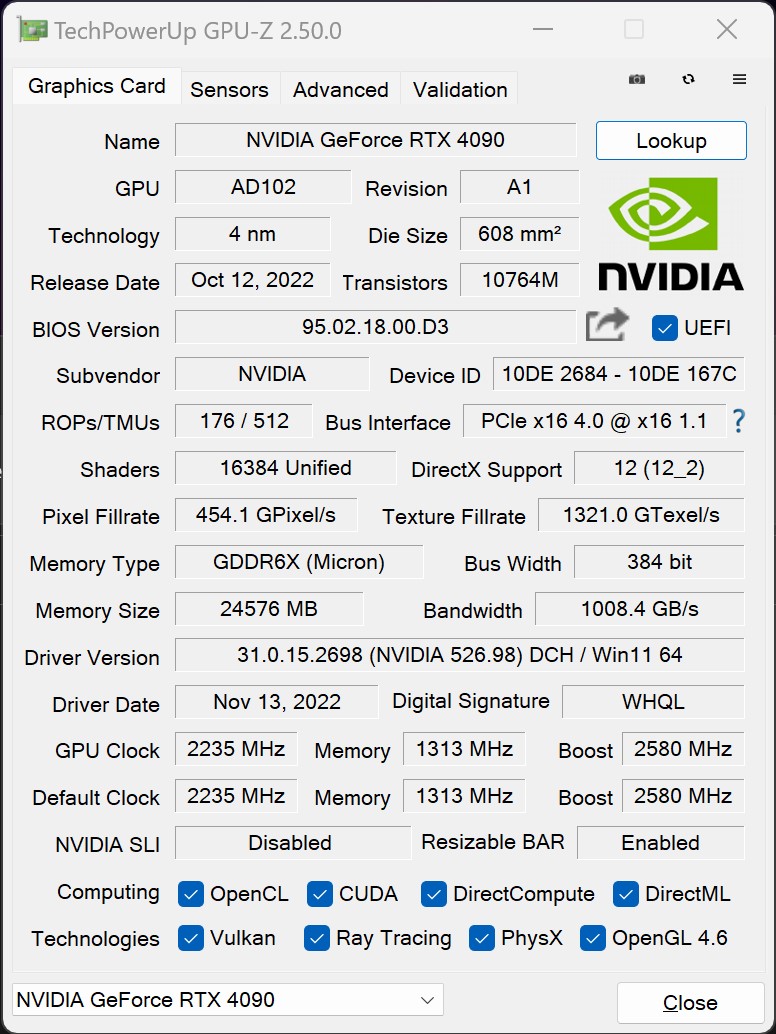
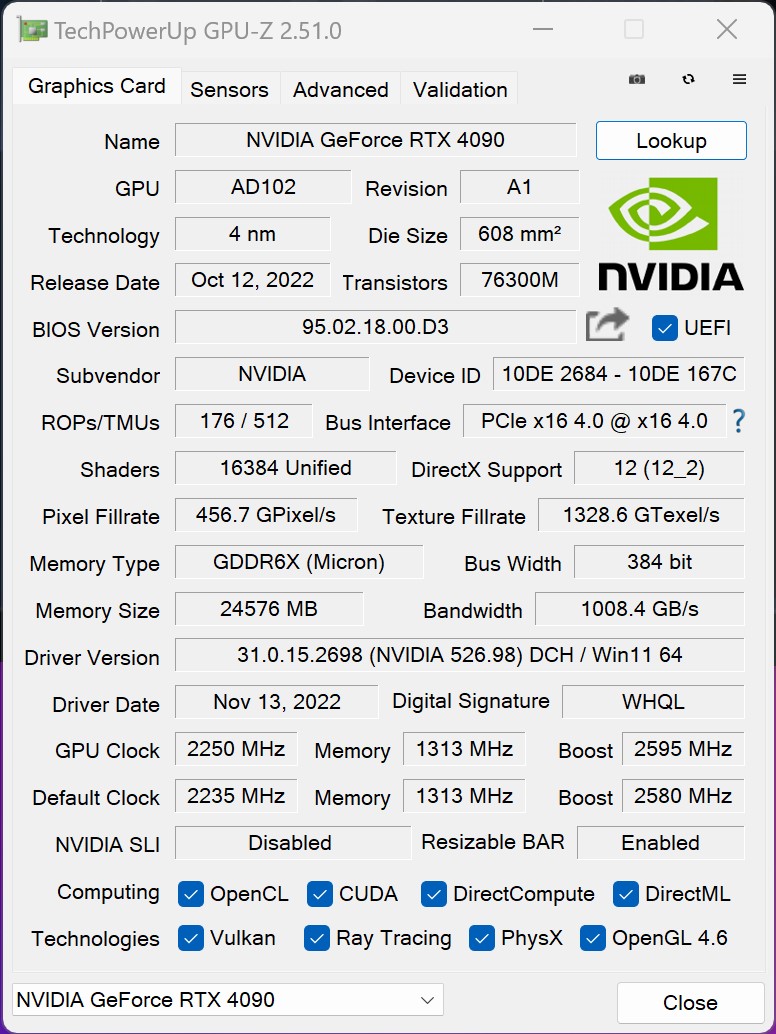
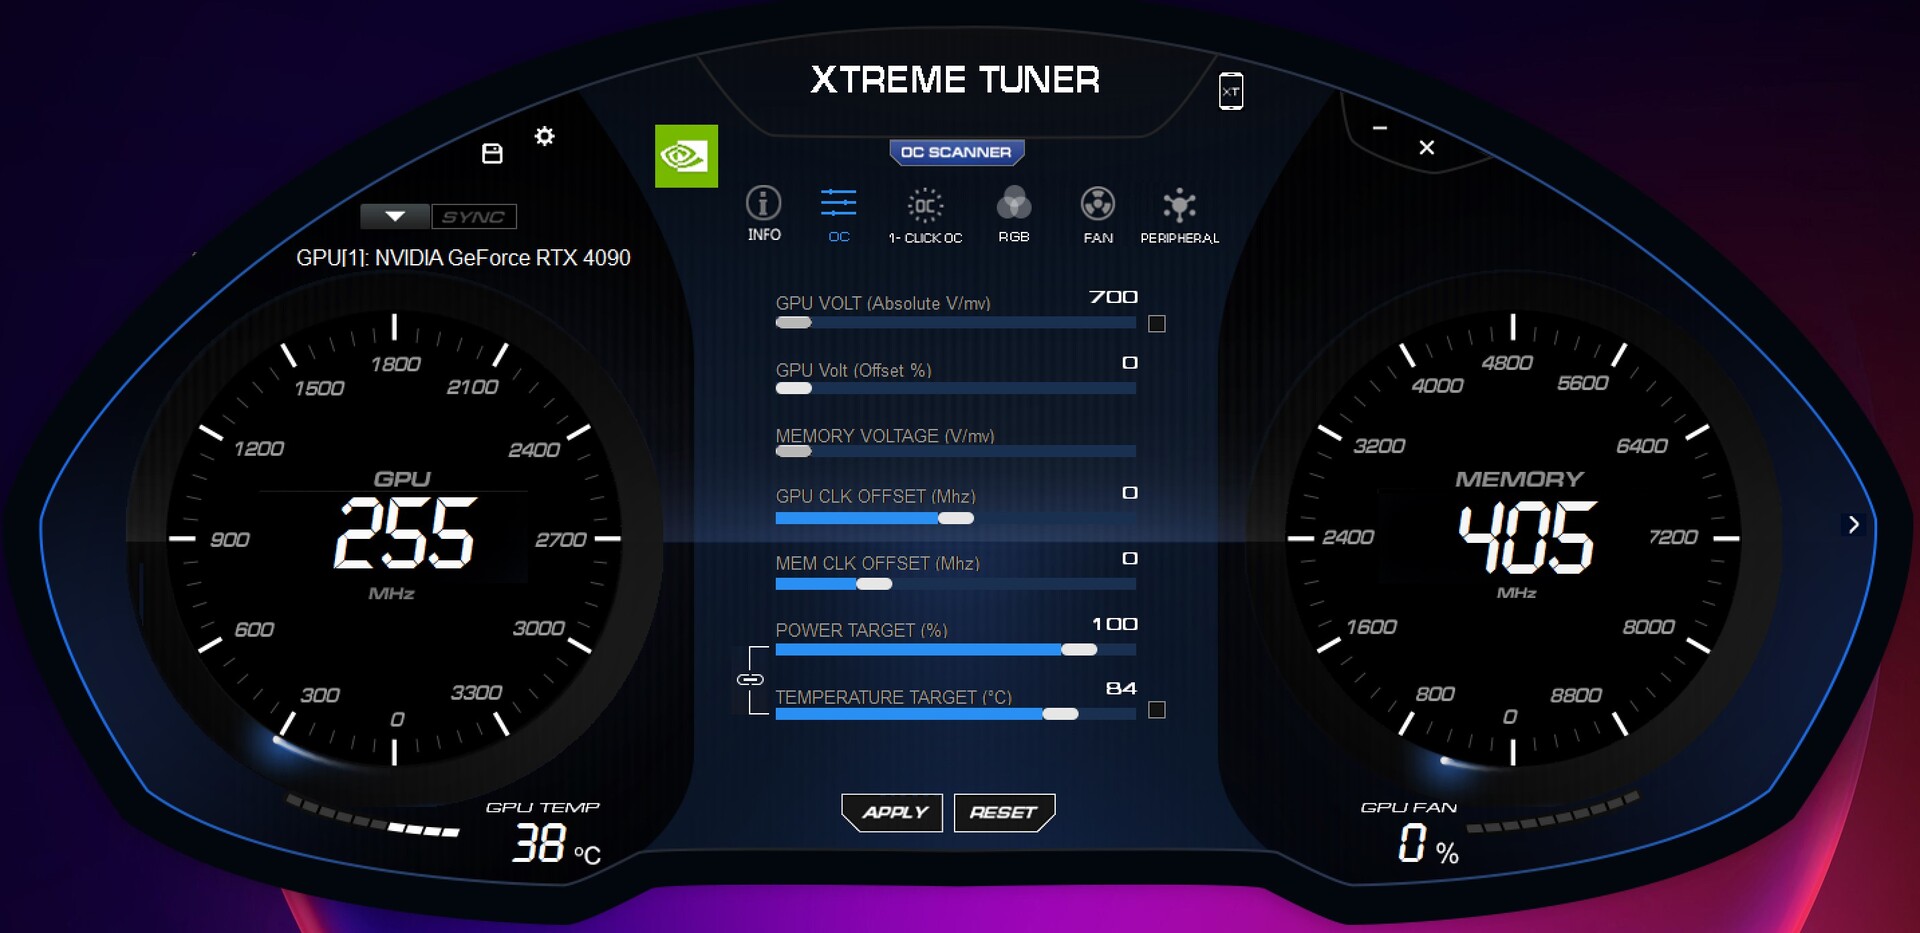
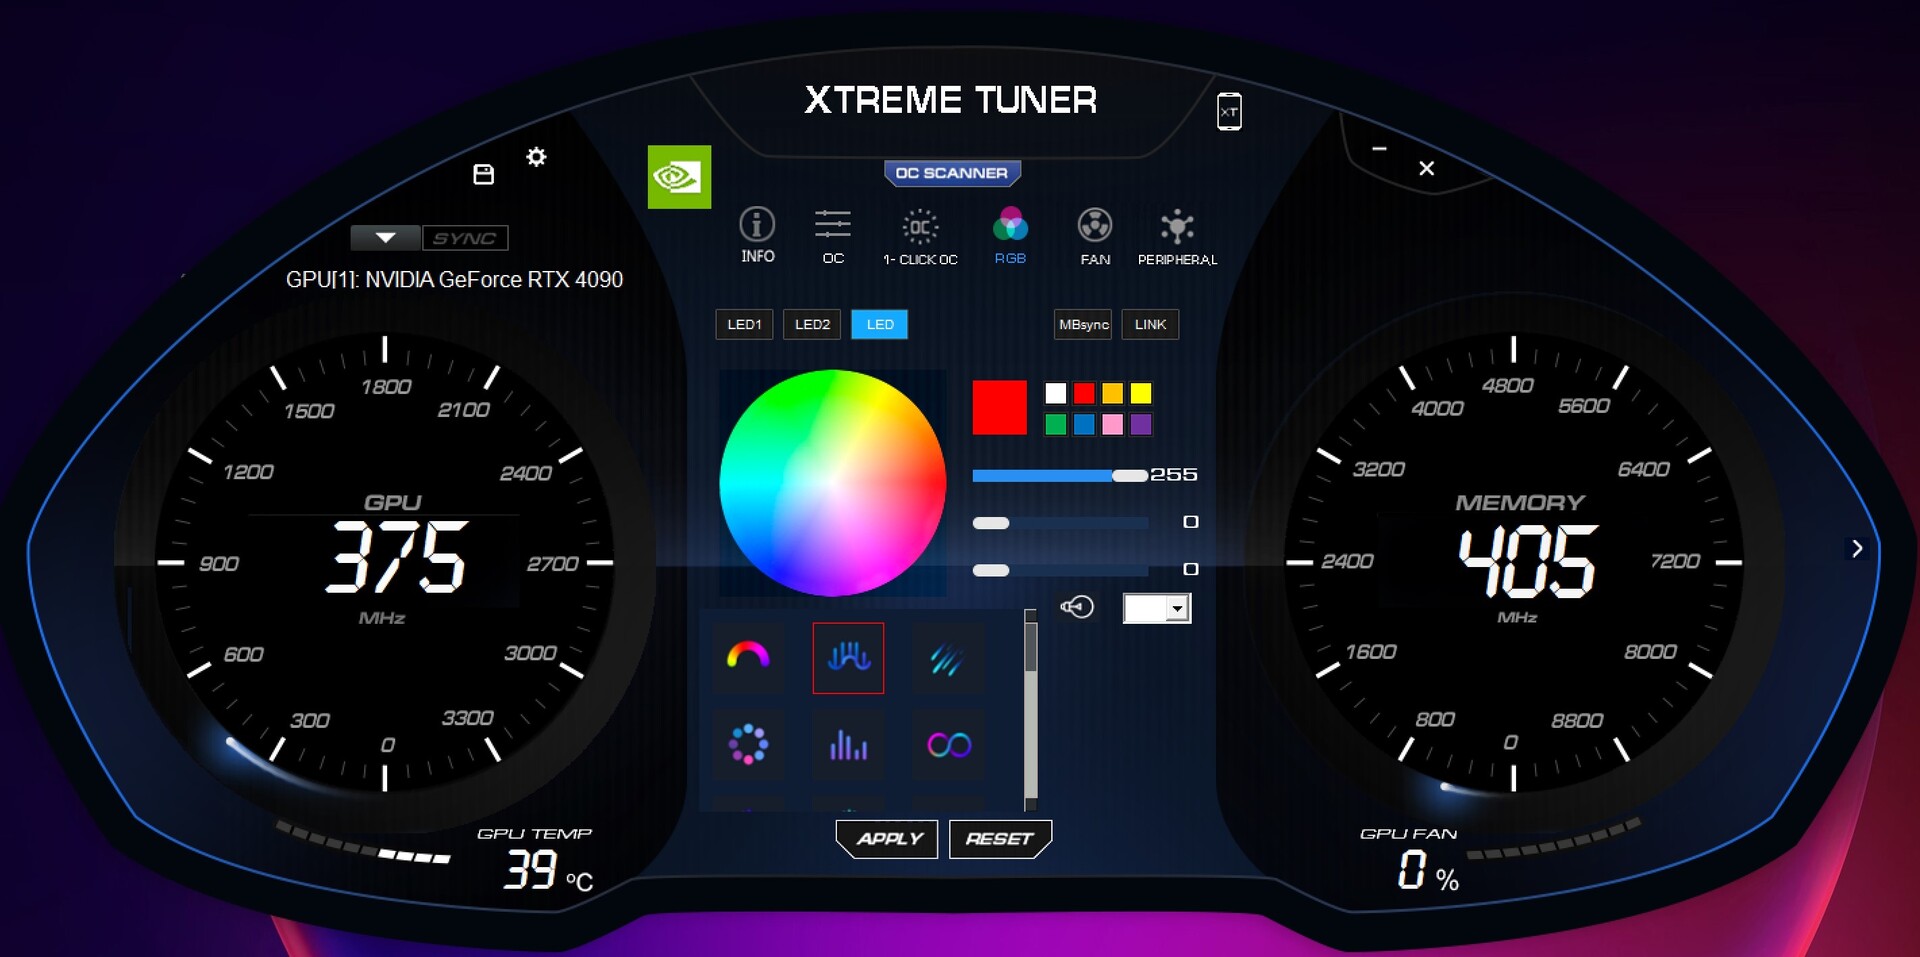
Bei den Taktraten hält sich KFA2 bei der GeForce RTX 4090 SG genau an die Herstellervorgaben. Somit stehen im Boost bis zu 2.580 MHz für die GPU auf dem Papier. Dies ist allerdings nur ein Richtwert. In der Praxis sehen wir bei unseren Spieletests durchweg deutlich höherer Taktraten. Mit 2.730 - 2.760 MHz arbeitet der AD102 der KFA2 GeForce RTX 4090 SG mehrheitlich über dem angegebenen Boost-Takt. Der Hersteller bietet mit dem Xtreme-Tuner ein kleines Tool, um alle wichtigen Werte der Grafikkarte auszulesen. So lässt sich beispielsweise die Beleuchtung steuern oder die Lüfterkurve anpassen. Für den Test haben wir die vordefinierten Einstellungen nicht verändert. Das 1-Click-OC-Feature welches bei KFA2-Modellen oft zum Einsatz kommt, ist jedoch mehr Schein als Sein. Nur 15 MHz mehr Takt bei der GPU machen in der Praxis keinen Unterschied. Für dieses Features wünschen wir uns eine deutlichere Divergenz.

Xtreme Tuner (Hauptmenü)
Xtreme Tuner (RGB-Steuerung)

Synthetische Benchmarks

Bei den synthetischen Tests sehen wir eine fast identische Leistung im Vergleich zur Palit GeForce RTX 4090 GameRock OC. Dennoch muss sich unser Testsample hinter der Palit-Grafikakrte einsortieren. Subjektiv bewertet sind aber beide Modelle gleich schnell. Der Leistungszuwachs im direkten Vergleich zur Nvidia GeForce RTX 3090 ist mit 57 sehr groß. Gleichwohl schneidet die Nvidia Titan RTX recht gut ab. Hier kann die Grafikkarte in Anlehnung an die Quadro-Serie bei den Rendertests aufgrund der Treiberoptimierungen eine deutlich bessere Leistung erzielen.

Gegenüber AMD hat die KFA2 GeForce RTX 4090 SG ebenfalls leichtes Spiel. Der Vergleich mit der Sapphire AMD Radeon RX 6950 XT zeigt einen Leistungsvorsprung von 53 Prozent im Durchschnitt. Allerdings steht mit der AMD Radeon RX 7900 XTX der Nachfolger schon in den Startlöchern. Mitte Dezember soll es dann so weit sein und der nächste Schlagabtausch zwischen dem roten und dem grünen Lager kann beginnen.

Performance Rating - Percent
Palit GeForce RTX 4090 GameRock OC
90.9 pt
KFA2 GeForce RTX 4090 SG
89.9 pt
Nvidia Titan RTX
60.4 pt
Sapphire AMD Radeon RX 6950 XT Nitro+ Pure
58.7 pt
NVIDIA GeForce RTX 3090 Founders Edition
57.1 pt
KFA2 GeForce RTX 3080 SG
47 pt
3DMark
2560x1440 Time Spy Graphics
Palit GeForce RTX 4090 GameRock OC
36836 Points +2%
KFA2 GeForce RTX 4090 SG
36252 Points
Sapphire AMD Radeon RX 6950 XT Nitro+ Pure
21719 Points -40%
NVIDIA GeForce RTX 3090 Founders Edition
19467 Points -46%
KFA2 GeForce RTX 3080 SG
17956 Points -50%
Nvidia Titan RTX
15106 Points -58%
Fire Strike Extreme Graphics
Palit GeForce RTX 4090 GameRock OC
46270 Points +2%
KFA2 GeForce RTX 4090 SG
45470 Points
Sapphire AMD Radeon RX 6950 XT Nitro+ Pure
29704 Points -35%
NVIDIA GeForce RTX 3090 Founders Edition
24730 Points -46%
KFA2 GeForce RTX 3080 SG
22078 Points -51%
Nvidia Titan RTX
17759 Points -61%
3840x2160 Fire Strike Ultra Graphics
Palit GeForce RTX 4090 GameRock OC
25018 Points +2%
KFA2 GeForce RTX 4090 SG
24633 Points
Sapphire AMD Radeon RX 6950 XT Nitro+ Pure
14978 Points -39%
NVIDIA GeForce RTX 3090 Founders Edition
12587 Points -49%
KFA2 GeForce RTX 3080 SG
11340 Points -54%
Nvidia Titan RTX
8755 Points -64%
1920x1080 Fire Strike Graphics
Palit GeForce RTX 4090 GameRock OC
72678 Points +1%
KFA2 GeForce RTX 4090 SG
72165 Points
Sapphire AMD Radeon RX 6950 XT Nitro+ Pure
60092 Points -17%
NVIDIA GeForce RTX 3090 Founders Edition
48831 Points -32%
KFA2 GeForce RTX 3080 SG
44533 Points -38%
Nvidia Titan RTX
37257 Points -48%
Unigine Superposition
7680x4320 8k Optimized
Palit GeForce RTX 4090 GameRock OC
13082 Points +1%
KFA2 GeForce RTX 4090 SG
12979 Points
NVIDIA GeForce RTX 3090 Founders Edition
7051 Points -46%
Sapphire AMD Radeon RX 6950 XT Nitro+ Pure
6645 Points -49%
KFA2 GeForce RTX 3080 SG
6548 Points -50%
Nvidia Titan RTX
5402 Points -58%
3840x2160 4k Optimized
Palit GeForce RTX 4090 GameRock OC
33943 Points +1%
KFA2 GeForce RTX 4090 SG
33581 Points
Sapphire AMD Radeon RX 6950 XT Nitro+ Pure
17725 Points -47%
NVIDIA GeForce RTX 3090 Founders Edition
16188 Points -52%
KFA2 GeForce RTX 3080 SG
14986 Points -55%
Nvidia Titan RTX
12050 Points -64%
1920x1080 1080p Extreme
Palit GeForce RTX 4090 GameRock OC
21824 Points +3%
KFA2 GeForce RTX 4090 SG
21288 Points
Sapphire AMD Radeon RX 6950 XT Nitro+ Pure
12079 Points -43%
NVIDIA GeForce RTX 3090 Founders Edition
12059 Points -43%
KFA2 GeForce RTX 3080 SG
11424 Points -46%
Nvidia Titan RTX
9014 Points -58%
1920x1080 1080p High
Palit GeForce RTX 4090 GameRock OC
46814 Points +3%
KFA2 GeForce RTX 4090 SG
45619 Points
Sapphire AMD Radeon RX 6950 XT Nitro+ Pure
28478 Points -38%
NVIDIA GeForce RTX 3090 Founders Edition
26320 Points -42%
KFA2 GeForce RTX 3080 SG
24051 Points -47%
Nvidia Titan RTX
20335 Points -55%
1280x720 720p Low
Palit GeForce RTX 4090 GameRock OC
51741 Points +2%
Nvidia Titan RTX
50876 Points 0%
KFA2 GeForce RTX 4090 SG
50650 Points
NVIDIA GeForce RTX 3090 Founders Edition
50487 Points 0%
KFA2 GeForce RTX 3080 SG
38209 Points -25%
Sapphire AMD Radeon RX 6950 XT Nitro+ Pure
33955 Points -33%
Unigine Heaven 4.0
Extreme Preset DX11
Palit GeForce RTX 4090 GameRock OC
491.5 fps +1%
KFA2 GeForce RTX 4090 SG
486.9 fps
NVIDIA GeForce RTX 3090 Founders Edition
309.7 fps -36%
Sapphire AMD Radeon RX 6950 XT Nitro+ Pure
293.8 fps -40%
KFA2 GeForce RTX 3080 SG
274.3 fps -44%
Nvidia Titan RTX
248.1 fps -49%
Extreme Preset OpenGL
Palit GeForce RTX 4090 GameRock OC
450.4 fps +1%
KFA2 GeForce RTX 4090 SG
447.1 fps
NVIDIA GeForce RTX 3090 Founders Edition
274.7 fps -39%
KFA2 GeForce RTX 3080 SG
251.4 fps -44%
Sapphire AMD Radeon RX 6950 XT Nitro+ Pure
222.7 fps -50%
Nvidia Titan RTX
218 fps -51%
Unigine Valley 1.0
1920x1080 Extreme HD DirectX AA:x8
KFA2 GeForce RTX 4090 SG
276 fps
Palit GeForce RTX 4090 GameRock OC
270.7 fps -2%
NVIDIA GeForce RTX 3090 Founders Edition
235.4 fps -15%
Sapphire AMD Radeon RX 6950 XT Nitro+ Pure
209.2 fps -24%
KFA2 GeForce RTX 3080 SG
203.8 fps -26%
Nvidia Titan RTX
191.4 fps -31%
1920x1080 Extreme HD Preset OpenGL AA:x8
Palit GeForce RTX 4090 GameRock OC
288 fps 0%
KFA2 GeForce RTX 4090 SG
288 fps
NVIDIA GeForce RTX 3090 Founders Edition
205.8 fps -29%
KFA2 GeForce RTX 3080 SG
186.1 fps -35%
Sapphire AMD Radeon RX 6950 XT Nitro+ Pure
176.9 fps -39%
Nvidia Titan RTX
160.8 fps -44%
3DMark 11
1280x720 Performance GPU
Palit GeForce RTX 4090 GameRock OC
107723 Points +1%
KFA2 GeForce RTX 4090 SG
106709 Points
Sapphire AMD Radeon RX 6950 XT Nitro+ Pure
70480 Points -34%
NVIDIA GeForce RTX 3090 Founders Edition
62735 Points -41%
KFA2 GeForce RTX 3080 SG
56634 Points -47%
Nvidia Titan RTX
50900 Points -52%
1280x720 Performance
Palit GeForce RTX 4090 GameRock OC
69323 Points 0%
KFA2 GeForce RTX 4090 SG
69012 Points
NVIDIA GeForce RTX 3090 Founders Edition
48185 Points -30%
Nvidia Titan RTX
44979 Points -35%
Sapphire AMD Radeon RX 6950 XT Nitro+ Pure
44827 Points -35%
KFA2 GeForce RTX 3080 SG
41410 Points -40%
SPECviewperf 12
1900x1060 Solidworks (sw-03)
Nvidia Titan RTX
207 fps +63%
Sapphire AMD Radeon RX 6950 XT Nitro+ Pure
157 fps +24%
KFA2 GeForce RTX 4090 SG
127 fps
Palit GeForce RTX 4090 GameRock OC
126 fps -1%
NVIDIA GeForce RTX 3090 Founders Edition
105 fps -17%
KFA2 GeForce RTX 3080 SG
73.8 fps -42%
1900x1060 Siemens NX (snx-02)
Nvidia Titan RTX
283 fps +972%
Sapphire AMD Radeon RX 6950 XT Nitro+ Pure
49.4 fps +87%
Palit GeForce RTX 4090 GameRock OC
27.1 fps +3%
KFA2 GeForce RTX 4090 SG
26.4 fps
NVIDIA GeForce RTX 3090 Founders Edition
16.4 fps -38%
KFA2 GeForce RTX 3080 SG
12 fps -55%
1900x1060 Showcase (showcase-01)
Palit GeForce RTX 4090 GameRock OC
457 fps +2%
KFA2 GeForce RTX 4090 SG
448 fps
Sapphire AMD Radeon RX 6950 XT Nitro+ Pure
308 fps -31%
NVIDIA GeForce RTX 3090 Founders Edition
262 fps -42%
KFA2 GeForce RTX 3080 SG
226 fps -50%
Nvidia Titan RTX
197 fps -56%
1900x1060 Medical (medical-01)
Palit GeForce RTX 4090 GameRock OC
119 fps +1%
KFA2 GeForce RTX 4090 SG
118 fps
Nvidia Titan RTX
101 fps -14%
NVIDIA GeForce RTX 3090 Founders Edition
85.8 fps -27%
Sapphire AMD Radeon RX 6950 XT Nitro+ Pure
58.3 fps -51%
KFA2 GeForce RTX 3080 SG
40.3 fps -66%
1900x1060 Maya (maya-04)
Palit GeForce RTX 4090 GameRock OC
317 fps 0%
KFA2 GeForce RTX 4090 SG
316 fps
NVIDIA GeForce RTX 3090 Founders Edition
302 fps -4%
Nvidia Titan RTX
260 fps -18%
KFA2 GeForce RTX 3080 SG
139 fps -56%
Sapphire AMD Radeon RX 6950 XT Nitro+ Pure
90.7 fps -71%
1900x1060 Energy (energy-01)
Palit GeForce RTX 4090 GameRock OC
54.7 fps +1%
KFA2 GeForce RTX 4090 SG
54.2 fps
Nvidia Titan RTX
28.8 fps -47%
NVIDIA GeForce RTX 3090 Founders Edition
25.6 fps -53%
Sapphire AMD Radeon RX 6950 XT Nitro+ Pure
23 fps -58%
KFA2 GeForce RTX 3080 SG
17.2 fps -68%
1900x1060 Creo (creo-01)
Nvidia Titan RTX
197 fps +73%
Sapphire AMD Radeon RX 6950 XT Nitro+ Pure
115 fps +1%
Palit GeForce RTX 4090 GameRock OC
115 fps +1%
KFA2 GeForce RTX 4090 SG
114 fps
NVIDIA GeForce RTX 3090 Founders Edition
93.7 fps -18%
KFA2 GeForce RTX 3080 SG
74.4 fps -35%
1900x1060 Catia (catia-04)
Nvidia Titan RTX
332 fps +31%
Palit GeForce RTX 4090 GameRock OC
257 fps +1%
KFA2 GeForce RTX 4090 SG
254 fps
Sapphire AMD Radeon RX 6950 XT Nitro+ Pure
199 fps -22%
NVIDIA GeForce RTX 3090 Founders Edition
167 fps -34%
KFA2 GeForce RTX 3080 SG
79.1 fps -69%
1900x1060 3ds Max (3dsmax-05)
Palit GeForce RTX 4090 GameRock OC
571 fps +2%
KFA2 GeForce RTX 4090 SG
561 fps
Sapphire AMD Radeon RX 6950 XT Nitro+ Pure
484 fps -14%
NVIDIA GeForce RTX 3090 Founders Edition
389 fps -31%
KFA2 GeForce RTX 3080 SG
334 fps -40%
Nvidia Titan RTX
315 fps -44%
SPECviewperf 13
Solidworks (sw-04)
Nvidia Titan RTX
218 fps +20%
Sapphire AMD Radeon RX 6950 XT Nitro+ Pure
210 fps +15%
Palit GeForce RTX 4090 GameRock OC
186 fps +2%
KFA2 GeForce RTX 4090 SG
182 fps
NVIDIA GeForce RTX 3090 Founders Edition
151 fps -17%
KFA2 GeForce RTX 3080 SG
108 fps -41%
Siemens NX (snx-03)
Nvidia Titan RTX
512 fps +969%
Sapphire AMD Radeon RX 6950 XT Nitro+ Pure
89.7 fps +87%
Palit GeForce RTX 4090 GameRock OC
49.1 fps +3%
KFA2 GeForce RTX 4090 SG
47.9 fps
NVIDIA GeForce RTX 3090 Founders Edition
29.7 fps -38%
KFA2 GeForce RTX 3080 SG
26.3 fps -45%
Showcase (showcase-02)
Palit GeForce RTX 4090 GameRock OC
455 fps +2%
KFA2 GeForce RTX 4090 SG
448 fps
Sapphire AMD Radeon RX 6950 XT Nitro+ Pure
312 fps -30%
NVIDIA GeForce RTX 3090 Founders Edition
262 fps -42%
KFA2 GeForce RTX 3080 SG
228 fps -49%
Nvidia Titan RTX
198 fps -56%
Medical (medical-02)
Palit GeForce RTX 4090 GameRock OC
186 fps +2%
KFA2 GeForce RTX 4090 SG
182 fps
Sapphire AMD Radeon RX 6950 XT Nitro+ Pure
157 fps -14%
NVIDIA GeForce RTX 3090 Founders Edition
106 fps -42%
KFA2 GeForce RTX 3080 SG
102 fps -44%
Nvidia Titan RTX
92 fps -49%
Maya (maya-05)
Palit GeForce RTX 4090 GameRock OC
715 fps 0%
KFA2 GeForce RTX 4090 SG
715 fps
NVIDIA GeForce RTX 3090 Founders Edition
556 fps -22%
Nvidia Titan RTX
499 fps -30%
KFA2 GeForce RTX 3080 SG
460 fps -36%
Sapphire AMD Radeon RX 6950 XT Nitro+ Pure
372 fps -48%
Energy (energy-02)
Palit GeForce RTX 4090 GameRock OC
126 fps +2%
KFA2 GeForce RTX 4090 SG
123 fps
Sapphire AMD Radeon RX 6950 XT Nitro+ Pure
60.3 fps -51%
Nvidia Titan RTX
51.8 fps -58%
NVIDIA GeForce RTX 3090 Founders Edition
43.8 fps -64%
KFA2 GeForce RTX 3080 SG
37.6 fps -69%
Creo (creo-02)
Palit GeForce RTX 4090 GameRock OC
552 fps +1%
KFA2 GeForce RTX 4090 SG
544 fps
NVIDIA GeForce RTX 3090 Founders Edition
392 fps -28%
Nvidia Titan RTX
386 fps -29%
KFA2 GeForce RTX 3080 SG
324 fps -40%
Sapphire AMD Radeon RX 6950 XT Nitro+ Pure
323 fps -41%
Catia (catia-05)
Nvidia Titan RTX
534 fps +35%
Sapphire AMD Radeon RX 6950 XT Nitro+ Pure
450 fps +14%
Palit GeForce RTX 4090 GameRock OC
402 fps +2%
KFA2 GeForce RTX 4090 SG
396 fps
NVIDIA GeForce RTX 3090 Founders Edition
252 fps -36%
KFA2 GeForce RTX 3080 SG
206 fps -48%
3ds Max (3dsmax-06)
Palit GeForce RTX 4090 GameRock OC
563 fps +1%
KFA2 GeForce RTX 4090 SG
558 fps
Sapphire AMD Radeon RX 6950 XT Nitro+ Pure
483 fps -13%
NVIDIA GeForce RTX 3090 Founders Edition
387 fps -31%
KFA2 GeForce RTX 3080 SG
334 fps -40%
Nvidia Titan RTX
321 fps -42%
SPECviewperf 2020
3840x2160 3ds Max (3dsmax-07)
KFA2 GeForce RTX 4090 SG
231 fps
Palit GeForce RTX 4090 GameRock OC
228 fps -1%
Sapphire AMD Radeon RX 6950 XT Nitro+ Pure
144 fps -38%
NVIDIA GeForce RTX 3090 Founders Edition
141 fps -39%
KFA2 GeForce RTX 3080 SG
128 fps -45%
Nvidia Titan RTX
118 fps -49%
3840x2160 CATIA (catia-06)
Palit GeForce RTX 4090 GameRock OC
95.3 fps +1%
KFA2 GeForce RTX 4090 SG
94.7 fps
Nvidia Titan RTX
90.9 fps -4%
NVIDIA GeForce RTX 3090 Founders Edition
58.5 fps -38%
KFA2 GeForce RTX 3080 SG
53.7 fps -43%
Sapphire AMD Radeon RX 6950 XT Nitro+ Pure
53 fps -44%
3840x2160 Creo (creo-03)
Nvidia Titan RTX
135 fps +2%
Palit GeForce RTX 4090 GameRock OC
133 fps 0%
KFA2 GeForce RTX 4090 SG
133 fps
NVIDIA GeForce RTX 3090 Founders Edition
115 fps -14%
KFA2 GeForce RTX 3080 SG
90 fps -32%
Sapphire AMD Radeon RX 6950 XT Nitro+ Pure
73.1 fps -45%
3840x2160 Energy (energy-03)
Palit GeForce RTX 4090 GameRock OC
141 fps +3%
KFA2 GeForce RTX 4090 SG
137 fps
NVIDIA GeForce RTX 3090 Founders Edition
96.6 fps -29%
Nvidia Titan RTX
93.9 fps -31%
Sapphire AMD Radeon RX 6950 XT Nitro+ Pure
47.6 fps -65%
KFA2 GeForce RTX 3080 SG
37.2 fps -73%
3840x2160 Maya (maya-06)
KFA2 GeForce RTX 4090 SG
525 fps
Palit GeForce RTX 4090 GameRock OC
498 fps -5%
NVIDIA GeForce RTX 3090 Founders Edition
356 fps -32%
KFA2 GeForce RTX 3080 SG
314 fps -40%
Sapphire AMD Radeon RX 6950 XT Nitro+ Pure
296 fps -44%
Nvidia Titan RTX
274 fps -48%
3840x2160 Medical (medical-03)
Palit GeForce RTX 4090 GameRock OC
45.9 fps +2%
KFA2 GeForce RTX 4090 SG
44.8 fps
Sapphire AMD Radeon RX 6950 XT Nitro+ Pure
34.4 fps -23%
NVIDIA GeForce RTX 3090 Founders Edition
20 fps -55%
KFA2 GeForce RTX 3080 SG
18.8 fps -58%
Nvidia Titan RTX
16.5 fps -63%
3840x2160 Siemens NX (snx-04)
Nvidia Titan RTX
375 fps +812%
Sapphire AMD Radeon RX 6950 XT Nitro+ Pure
88.6 fps +116%
Palit GeForce RTX 4090 GameRock OC
41.3 fps 0%
KFA2 GeForce RTX 4090 SG
41.1 fps
NVIDIA GeForce RTX 3090 Founders Edition
24.7 fps -40%
KFA2 GeForce RTX 3080 SG
21.8 fps -47%
ComputeMark v2.1
1024x600 Normal, QJuliaRayTrace
Palit GeForce RTX 4090 GameRock OC
34332 Points +3%
KFA2 GeForce RTX 4090 SG
33298 Points
NVIDIA GeForce RTX 3090 Founders Edition
17713 Points -47%
KFA2 GeForce RTX 3080 SG
15594 Points -53%
Sapphire AMD Radeon RX 6950 XT Nitro+ Pure
13580 Points -59%
Nvidia Titan RTX
10129 Points -70%
1024x600 Normal, Mandel Scalar
Palit GeForce RTX 4090 GameRock OC
22889 Points +2%
KFA2 GeForce RTX 4090 SG
22402 Points
Sapphire AMD Radeon RX 6950 XT Nitro+ Pure
11854 Points -47%
NVIDIA GeForce RTX 3090 Founders Edition
11270 Points -50%
KFA2 GeForce RTX 3080 SG
9698 Points -57%
Nvidia Titan RTX
6406 Points -71%
1024x600 Normal, Mandel Vector
Palit GeForce RTX 4090 GameRock OC
17336 Points +2%
KFA2 GeForce RTX 4090 SG
16935 Points
NVIDIA GeForce RTX 3090 Founders Edition
9861 Points -42%
Sapphire AMD Radeon RX 6950 XT Nitro+ Pure
9555 Points -44%
KFA2 GeForce RTX 3080 SG
8326 Points -51%
Nvidia Titan RTX
5440 Points -68%
1024x600 Normal, Fluid 2DTexArr
Palit GeForce RTX 4090 GameRock OC
6891 Points +1%
KFA2 GeForce RTX 4090 SG
6792 Points
NVIDIA GeForce RTX 3090 Founders Edition
4517 Points -33%
Sapphire AMD Radeon RX 6950 XT Nitro+ Pure
4455 Points -34%
KFA2 GeForce RTX 3080 SG
4175 Points -39%
Nvidia Titan RTX
3828 Points -44%
1024x600 Normal, Fluid 3DTex
Palit GeForce RTX 4090 GameRock OC
10724 Points +1%
KFA2 GeForce RTX 4090 SG
10589 Points
Sapphire AMD Radeon RX 6950 XT Nitro+ Pure
5515 Points -48%
NVIDIA GeForce RTX 3090 Founders Edition
5501 Points -48%
KFA2 GeForce RTX 3080 SG
4900 Points -54%
Nvidia Titan RTX
4027 Points -62%
1024x600 Normal, Score
Palit GeForce RTX 4090 GameRock OC
92171 Points +2%
KFA2 GeForce RTX 4090 SG
90016 Points
NVIDIA GeForce RTX 3090 Founders Edition
48862 Points -46%
Sapphire AMD Radeon RX 6950 XT Nitro+ Pure
44959 Points -50%
KFA2 GeForce RTX 3080 SG
42692 Points -53%
Nvidia Titan RTX
29830 Points -67%
LuxMark v2.0 64Bit
Sala GPUs-only
Sapphire AMD Radeon RX 6950 XT Nitro+ Pure
31954 Samples/s +20%
Palit GeForce RTX 4090 GameRock OC
27201 Samples/s +2%
KFA2 GeForce RTX 4090 SG
26576 Samples/s
NVIDIA GeForce RTX 3090 Founders Edition
14990 Samples/s -44%
KFA2 GeForce RTX 3080 SG
14204 Samples/s -47%
Nvidia Titan RTX
10996 Samples/s -59%
Room GPUs-only
Palit GeForce RTX 4090 GameRock OC
12316 Samples/s +1%
KFA2 GeForce RTX 4090 SG
12190 Samples/s
NVIDIA GeForce RTX 3090 Founders Edition
5948 Samples/s -51%
KFA2 GeForce RTX 3080 SG
5768 Samples/s -53%
Sapphire AMD Radeon RX 6950 XT Nitro+ Pure
5097 Samples/s -58%
Nvidia Titan RTX
4703 Samples/s -61%

Compute-Benchmarks und professionelle Anwendungen

ComputeMark v2.1
1024x600 Normal, QJuliaRayTrace
NVIDIA GeForce RTX 4090
34332 Points +3%
KFA2 GeForce RTX 4090 SG
33298 Points
NVIDIA GeForce RTX 3090
17713 Points -47%
NVIDIA GeForce RTX 3080 12 GB
15594 Points -53%
AMD Radeon RX 6950 XT
13580 Points -59%
AMD Radeon RX 6900 XT
12255 Points -63%
NVIDIA Titan RTX
10129 Points -70%
1024x600 Normal, Mandel Scalar
NVIDIA GeForce RTX 4090
22889 Points +2%
KFA2 GeForce RTX 4090 SG
22402 Points
AMD Radeon RX 6950 XT
11854 Points -47%
NVIDIA GeForce RTX 3090
11270 Points -50%
AMD Radeon RX 6900 XT
10834 Points -52%
NVIDIA GeForce RTX 3080 12 GB
9698 Points -57%
NVIDIA Titan RTX
6406 Points -71%
1024x600 Normal, Mandel Vector
NVIDIA GeForce RTX 4090
17336 Points +2%
KFA2 GeForce RTX 4090 SG
16935 Points
NVIDIA GeForce RTX 3090
9861 Points -42%
AMD Radeon RX 6950 XT
9555 Points -44%
AMD Radeon RX 6900 XT
8690 Points -49%
NVIDIA GeForce RTX 3080 12 GB
8326 Points -51%
NVIDIA Titan RTX
5440 Points -68%
1024x600 Normal, Fluid 2DTexArr
NVIDIA GeForce RTX 4090
6891 Points +1%
KFA2 GeForce RTX 4090 SG
6792 Points
NVIDIA GeForce RTX 3090
4517 Points -33%
AMD Radeon RX 6950 XT
4455 Points -34%
NVIDIA GeForce RTX 3080 12 GB
4175 Points -39%
AMD Radeon RX 6900 XT
3924 Points -42%
NVIDIA Titan RTX
3828 Points -44%
1024x600 Normal, Fluid 3DTex
NVIDIA GeForce RTX 4090
10724 Points +1%
KFA2 GeForce RTX 4090 SG
10589 Points
AMD Radeon RX 6950 XT
5515 Points -48%
NVIDIA GeForce RTX 3090
5501 Points -48%
AMD Radeon RX 6900 XT
5154 Points -51%
NVIDIA GeForce RTX 3080 12 GB
4900 Points -54%
NVIDIA Titan RTX
4027 Points -62%
1024x600 Normal, Score
NVIDIA GeForce RTX 4090
92171 Points +2%
KFA2 GeForce RTX 4090 SG
90016 Points
NVIDIA GeForce RTX 3090
48862 Points -46%
AMD Radeon RX 6950 XT
44959 Points -50%
NVIDIA GeForce RTX 3080 12 GB
42692 Points -53%
AMD Radeon RX 6900 XT
40857 Points -55%
NVIDIA Titan RTX
29830 Points -67%
LuxMark v2.0 64Bit
Sala GPUs-only
AMD Radeon RX 6950 XT
31954 Samples/s +20%
AMD Radeon RX 6900 XT
31400 Samples/s +18%
NVIDIA GeForce RTX 4090
27201 Samples/s +2%
KFA2 GeForce RTX 4090 SG
26576 Samples/s
NVIDIA GeForce RTX 3090
14990 Samples/s -44%
NVIDIA GeForce RTX 3080 12 GB
14204 Samples/s -47%
NVIDIA Titan RTX
10996 Samples/s -59%
Room GPUs-only
NVIDIA GeForce RTX 4090
12316 Samples/s +1%
KFA2 GeForce RTX 4090 SG
12190 Samples/s
NVIDIA GeForce RTX 3090
5948 Samples/s -51%
NVIDIA GeForce RTX 3080 12 GB
5768 Samples/s -53%
AMD Radeon RX 6950 XT
5097 Samples/s -58%
AMD Radeon RX 6900 XT
5084 Samples/s -58%
NVIDIA Titan RTX
4703 Samples/s -61%
SPECviewperf 2020
3840x2160 3ds Max (3dsmax-07)
KFA2 GeForce RTX 4090 SG
231 fps
NVIDIA GeForce RTX 4090
228 fps -1%
NVIDIA GeForce RTX 3090 Ti
145 fps -37%
AMD Radeon RX 6950 XT
144 fps -38%
NVIDIA GeForce RTX 3090
141 fps -39%
NVIDIA GeForce RTX 3080 12 GB
128 fps -45%
AMD Radeon RX 6900 XT
121 fps -48%
NVIDIA Titan RTX
118 fps -49%
3840x2160 CATIA (catia-06)
NVIDIA GeForce RTX 4090
95.3 fps +1%
KFA2 GeForce RTX 4090 SG
94.7 fps
NVIDIA Titan RTX
90.9 fps -4%
NVIDIA GeForce RTX 3090 Ti
58.6 fps -38%
NVIDIA GeForce RTX 3090
58.5 fps -38%
NVIDIA GeForce RTX 3080 12 GB
53.7 fps -43%
AMD Radeon RX 6950 XT
53 fps -44%
AMD Radeon RX 6900 XT
44.6 fps -53%
3840x2160 Creo (creo-03)
NVIDIA Titan RTX
135 fps +2%
NVIDIA GeForce RTX 4090
133 fps 0%
KFA2 GeForce RTX 4090 SG
133 fps
NVIDIA GeForce RTX 3090
115 fps -14%
NVIDIA GeForce RTX 3080 12 GB
90 fps -32%
NVIDIA GeForce RTX 3090 Ti
84.5 fps -36%
AMD Radeon RX 6950 XT
73.1 fps -45%
AMD Radeon RX 6900 XT
65.4 fps -51%
3840x2160 Energy (energy-03)
NVIDIA GeForce RTX 4090
141 fps +3%
KFA2 GeForce RTX 4090 SG
137 fps
NVIDIA GeForce RTX 3090
96.6 fps -29%
NVIDIA Titan RTX
93.9 fps -31%
AMD Radeon RX 6950 XT
47.6 fps -65%
NVIDIA GeForce RTX 3080 12 GB
37.2 fps -73%
AMD Radeon RX 6900 XT
32.6 fps -76%
NVIDIA GeForce RTX 3090 Ti
31.6 fps -77%
3840x2160 Maya (maya-06)
KFA2 GeForce RTX 4090 SG
525 fps
NVIDIA GeForce RTX 4090
498 fps -5%
NVIDIA GeForce RTX 3090
356 fps -32%
NVIDIA GeForce RTX 3090 Ti
353 fps -33%
NVIDIA GeForce RTX 3080 12 GB
314 fps -40%
AMD Radeon RX 6950 XT
296 fps -44%
NVIDIA Titan RTX
274 fps -48%
AMD Radeon RX 6900 XT
266 fps -49%
3840x2160 Medical (medical-03)
NVIDIA GeForce RTX 4090
45.9 fps +2%
KFA2 GeForce RTX 4090 SG
44.8 fps
AMD Radeon RX 6950 XT
34.4 fps -23%
AMD Radeon RX 6900 XT
30.4 fps -32%
NVIDIA GeForce RTX 3090 Ti
22.2 fps -50%
NVIDIA GeForce RTX 3090
20 fps -55%
NVIDIA GeForce RTX 3080 12 GB
18.8 fps -58%
NVIDIA Titan RTX
16.5 fps -63%
3840x2160 Siemens NX (snx-04)
NVIDIA Titan RTX
375 fps +812%
AMD Radeon RX 6950 XT
88.6 fps +116%
AMD Radeon RX 6900 XT
85 fps +107%
NVIDIA GeForce RTX 4090
41.3 fps 0%
KFA2 GeForce RTX 4090 SG
41.1 fps
NVIDIA GeForce RTX 3090
24.7 fps -40%
NVIDIA GeForce RTX 3090 Ti
23.7 fps -42%
NVIDIA GeForce RTX 3080 12 GB
21.8 fps -47%
3840x2160 Solidworks (solidworks-05)
NVIDIA GeForce RTX 3090 Ti
197 fps
NVIDIA GeForce RTX 3090
189 fps
NVIDIA GeForce RTX 3080 12 GB
175 fps
NVIDIA Titan RTX
158 fps
AMD Radeon RX 6950 XT
125 fps
AMD Radeon RX 6900 XT
112 fps
SPECviewperf 13
Solidworks (sw-04)
NVIDIA Titan RTX
218 fps +20%
AMD Radeon RX 6900 XT
214 fps +18%
AMD Radeon RX 6950 XT
210 fps +15%
NVIDIA GeForce RTX 4090
186 fps +2%
KFA2 GeForce RTX 4090 SG
182 fps
NVIDIA GeForce RTX 3090
151 fps -17%
NVIDIA GeForce RTX 3090 Ti
118 fps -35%
NVIDIA GeForce RTX 3080 12 GB
108 fps -41%
Siemens NX (snx-03)
NVIDIA Titan RTX
512 fps +969%
AMD Radeon RX 6950 XT
89.7 fps +87%
AMD Radeon RX 6900 XT
85.8 fps +79%
NVIDIA GeForce RTX 4090
49.1 fps +3%
KFA2 GeForce RTX 4090 SG
47.9 fps
NVIDIA GeForce RTX 3090
29.7 fps -38%
NVIDIA GeForce RTX 3090 Ti
28 fps -42%
NVIDIA GeForce RTX 3080 12 GB
26.3 fps -45%
Showcase (showcase-02)
NVIDIA GeForce RTX 4090
455 fps +2%
KFA2 GeForce RTX 4090 SG
448 fps
AMD Radeon RX 6950 XT
312 fps -30%
NVIDIA GeForce RTX 3090 Ti
265 fps -41%
NVIDIA GeForce RTX 3090
262 fps -42%
AMD Radeon RX 6900 XT
241 fps -46%
NVIDIA GeForce RTX 3080 12 GB
228 fps -49%
NVIDIA Titan RTX
198 fps -56%
Medical (medical-02)
NVIDIA GeForce RTX 4090
186 fps +2%
KFA2 GeForce RTX 4090 SG
182 fps
AMD Radeon RX 6950 XT
157 fps -14%
AMD Radeon RX 6900 XT
148 fps -19%
NVIDIA GeForce RTX 3090 Ti
113 fps -38%
NVIDIA GeForce RTX 3090
106 fps -42%
NVIDIA GeForce RTX 3080 12 GB
102 fps -44%
NVIDIA Titan RTX
92 fps -49%
Maya (maya-05)
NVIDIA GeForce RTX 4090
715 fps 0%
KFA2 GeForce RTX 4090 SG
715 fps
NVIDIA GeForce RTX 3090
556 fps -22%
NVIDIA Titan RTX
499 fps -30%
NVIDIA GeForce RTX 3090 Ti
493 fps -31%
NVIDIA GeForce RTX 3080 12 GB
460 fps -36%
AMD Radeon RX 6900 XT
395 fps -45%
AMD Radeon RX 6950 XT
372 fps -48%
Energy (energy-02)
NVIDIA GeForce RTX 4090
126 fps +2%
KFA2 GeForce RTX 4090 SG
123 fps
AMD Radeon RX 6900 XT
60.6 fps -51%
AMD Radeon RX 6950 XT
60.3 fps -51%
NVIDIA Titan RTX
51.8 fps -58%
NVIDIA GeForce RTX 3090 Ti
48.4 fps -61%
NVIDIA GeForce RTX 3090
43.8 fps -64%
NVIDIA GeForce RTX 3080 12 GB
37.6 fps -69%
Creo (creo-02)
NVIDIA GeForce RTX 4090
552 fps +1%
KFA2 GeForce RTX 4090 SG
544 fps
NVIDIA GeForce RTX 3090
392 fps -28%
NVIDIA Titan RTX
386 fps -29%
NVIDIA GeForce RTX 3090 Ti
353 fps -35%
NVIDIA GeForce RTX 3080 12 GB
324 fps -40%
AMD Radeon RX 6950 XT
323 fps -41%
AMD Radeon RX 6900 XT
292 fps -46%
Catia (catia-05)
NVIDIA Titan RTX
534 fps +35%
AMD Radeon RX 6900 XT
468 fps +18%
AMD Radeon RX 6950 XT
450 fps +14%
NVIDIA GeForce RTX 4090
402 fps +2%
KFA2 GeForce RTX 4090 SG
396 fps
NVIDIA GeForce RTX 3090
252 fps -36%
NVIDIA GeForce RTX 3090 Ti
230 fps -42%
NVIDIA GeForce RTX 3080 12 GB
206 fps -48%
3ds Max (3dsmax-06)
NVIDIA GeForce RTX 4090
563 fps +1%
KFA2 GeForce RTX 4090 SG
558 fps
AMD Radeon RX 6950 XT
483 fps -13%
NVIDIA GeForce RTX 3090
387 fps -31%
NVIDIA GeForce RTX 3090 Ti
373 fps -33%
NVIDIA GeForce RTX 3080 12 GB
334 fps -40%
NVIDIA Titan RTX
321 fps -42%
AMD Radeon RX 6900 XT
317 fps -43%
SPECviewperf 12
1900x1060 Solidworks (sw-03)
NVIDIA Titan RTX
207 fps +63%
AMD Radeon RX 6900 XT
167 fps +31%
AMD Radeon RX 6950 XT
157 fps +24%
KFA2 GeForce RTX 4090 SG
127 fps
NVIDIA GeForce RTX 4090
126 fps -1%
NVIDIA GeForce RTX 3090
105 fps -17%
NVIDIA GeForce RTX 3090 Ti
85.7 fps -33%
NVIDIA GeForce RTX 3080 12 GB
73.8 fps -42%
1900x1060 Siemens NX (snx-02)
NVIDIA Titan RTX
283 fps +972%
AMD Radeon RX 6950 XT
49.4 fps +87%
AMD Radeon RX 6900 XT
47.7 fps +81%
NVIDIA GeForce RTX 4090
27.1 fps +3%
KFA2 GeForce RTX 4090 SG
26.4 fps
NVIDIA GeForce RTX 3090
16.4 fps -38%
NVIDIA GeForce RTX 3090 Ti
15.6 fps -41%
NVIDIA GeForce RTX 3080 12 GB
12 fps -55%
1900x1060 Showcase (showcase-01)
NVIDIA GeForce RTX 4090
457 fps +2%
KFA2 GeForce RTX 4090 SG
448 fps
AMD Radeon RX 6950 XT
308 fps -31%
NVIDIA GeForce RTX 3090 Ti
265 fps -41%
NVIDIA GeForce RTX 3090
262 fps -42%
AMD Radeon RX 6900 XT
241 fps -46%
NVIDIA GeForce RTX 3080 12 GB
226 fps -50%
NVIDIA Titan RTX
197 fps -56%
1900x1060 Medical (medical-01)
NVIDIA GeForce RTX 4090
119 fps +1%
KFA2 GeForce RTX 4090 SG
118 fps
NVIDIA Titan RTX
101 fps -14%
AMD Radeon RX 6900 XT
88.4 fps -25%
NVIDIA GeForce RTX 3090 Ti
87.1 fps -26%
NVIDIA GeForce RTX 3090
85.8 fps -27%
AMD Radeon RX 6950 XT
58.3 fps -51%
NVIDIA GeForce RTX 3080 12 GB
40.3 fps -66%
1900x1060 Maya (maya-04)
NVIDIA GeForce RTX 4090
317 fps 0%
KFA2 GeForce RTX 4090 SG
316 fps
NVIDIA GeForce RTX 3090
302 fps -4%
NVIDIA Titan RTX
260 fps -18%
NVIDIA GeForce RTX 3090 Ti
197 fps -38%
AMD Radeon RX 6900 XT
151 fps -52%
NVIDIA GeForce RTX 3080 12 GB
139 fps -56%
AMD Radeon RX 6950 XT
90.7 fps -71%
1900x1060 Energy (energy-01)
NVIDIA GeForce RTX 4090
54.7 fps +1%
KFA2 GeForce RTX 4090 SG
54.2 fps
AMD Radeon RX 6900 XT
30.8 fps -43%
NVIDIA Titan RTX
28.8 fps -47%
NVIDIA GeForce RTX 3090 Ti
27.6 fps -49%
NVIDIA GeForce RTX 3090
25.6 fps -53%
AMD Radeon RX 6950 XT
23 fps -58%
NVIDIA GeForce RTX 3080 12 GB
17.2 fps -68%
1900x1060 Creo (creo-01)
NVIDIA Titan RTX
197 fps +73%
AMD Radeon RX 6900 XT
127 fps +11%
AMD Radeon RX 6950 XT
115 fps +1%
NVIDIA GeForce RTX 4090
115 fps +1%
KFA2 GeForce RTX 4090 SG
114 fps
NVIDIA GeForce RTX 3090
93.7 fps -18%
NVIDIA GeForce RTX 3090 Ti
76.4 fps -33%
NVIDIA GeForce RTX 3080 12 GB
74.4 fps -35%
1900x1060 Catia (catia-04)
NVIDIA Titan RTX
332 fps +31%
AMD Radeon RX 6900 XT
292 fps +15%
NVIDIA GeForce RTX 4090
257 fps +1%
KFA2 GeForce RTX 4090 SG
254 fps
AMD Radeon RX 6950 XT
199 fps -22%
NVIDIA GeForce RTX 3090
167 fps -34%
NVIDIA GeForce RTX 3090 Ti
150 fps -41%
NVIDIA GeForce RTX 3080 12 GB
79.1 fps -69%
1900x1060 3ds Max (3dsmax-05)
NVIDIA GeForce RTX 4090
571 fps +2%
KFA2 GeForce RTX 4090 SG
561 fps
AMD Radeon RX 6950 XT
484 fps -14%
NVIDIA GeForce RTX 3090
389 fps -31%
NVIDIA GeForce RTX 3090 Ti
371 fps -34%
NVIDIA GeForce RTX 3080 12 GB
334 fps -40%
AMD Radeon RX 6900 XT
318 fps -43%
NVIDIA Titan RTX
315 fps -44%
Blender - v3.3 Classroom CUDA
NVIDIA Titan RTX
31 Seconds *
Geekbench 5.5
OpenCL Score
NVIDIA GeForce RTX 4090
354266 Points +1%
KFA2 GeForce RTX 4090 SG
351918 Points
NVIDIA GeForce RTX 3090 Ti
242815 Points -31%
NVIDIA GeForce RTX 3090
214334 Points -39%
NVIDIA GeForce RTX 3080 12 GB
201306 Points -43%
AMD Radeon RX 6950 XT
190428 Points -46%
AMD Radeon RX 6900 XT
172661 Points -51%
NVIDIA Titan RTX
145407 Points -59%
Vulkan Score
NVIDIA GeForce RTX 3090 Ti
160904 Points +44%
NVIDIA GeForce RTX 4090
139130 Points +24%
KFA2 GeForce RTX 4090 SG
112022 Points
NVIDIA Titan RTX
94363 Points -16%
NVIDIA GeForce RTX 3090
91596 Points -18%
AMD Radeon RX 6900 XT
88587 Points -21%
AMD Radeon RX 6950 XT
87497 Points -22%
NVIDIA GeForce RTX 3080 12 GB
62742 Points -44%
V-Ray 5 Benchmark
GPU CUDA
NVIDIA GeForce RTX 4090
4393 mpaths +1%
KFA2 GeForce RTX 4090 SG
4332 mpaths
NVIDIA GeForce RTX 3090
2102 mpaths -51%
NVIDIA GeForce RTX 3080 12 GB
383 mpaths -91%
AMD Radeon RX 6950 XT
383 mpaths -91%
GPU RTX
NVIDIA GeForce RTX 4090
6053 mpaths +1%
KFA2 GeForce RTX 4090 SG
6010 mpaths
NVIDIA GeForce RTX 3090
2979 mpaths -50%

* ... kleinere Werte sind besser

Spielebenchmarks

Die hohe Leistung bei den synthetischen Benchmarks kann die KFA2 GeForce RTX 4090 SG auch in eine sehr hohe Spieleleistung ummünzen. Wenn die CPU nicht limitiert, ist ein Leistungszuwachs von über 80 Prozent im Vergleich zur Nvidia GeForce RTX 3090 möglich. Solch einen hohen Performancegewinn zwischen zwei GPU-Architekturen haben wir in der Vergangenheit nur selten gesehen. KFA2 und Palit sind hier wieder auf Augenhöhe und nennenswerte Unterschiede zwischen den beiden Vertretern können wir hier nicht feststellen.

Die speziellen RTX-4000-Features, wie DLSS 3.0 inklusive Frame Generation (FG) sorgt bei vielen Spielen für einen zusätzlichen Boost. Als Beispiel sei Cyberpunk 2077 zu nennen. In nativer 4K-Auflösung und dem Raytracing-Ultra-Preset erreicht selbst die KFA2 GeForce RTX 4090 SG nur 44 FPS im Durchschnitt. Mit aktiviertem DLSS sind dann über 100 FPS kein Problem mehr. Damit hat Nvidia ein tolles Feature, welches in naher Zukunft durchaus den Unterschied bei der Kaufentscheidung machen kann. AMD hat seinerseits mit FSR ein ähnliches Feature am Start. Schlussendlich hängt es auch an den Spieleherstellern, diese Features in ihren Games zu integrieren. Eine Liste mit Spielen, die schon DLSS 3.0 unterstützen oder zukünftig mit diesem Feature ausgestattet werden, finden Sie hier.

GTA V - 3840x2160 High/On (Advanced Graphics Off) AA:FX AF:8x
KFA2 GeForce RTX 4090 SG
187.8 (4.41min, 200P1 - 611max) fps
Palit GeForce RTX 4090 GameRock OC
187.5 (2.97min, 200P1 - 593max) fps 0%
NVIDIA GeForce RTX 3090 Founders Edition
182.5 (2.85min, 142.9P1 - 284max) fps -3%
Sapphire AMD Radeon RX 6950 XT Nitro+ Pure
173.1 (2.93min, 100P1 - 384max) fps -8%
KFA2 GeForce RTX 3080 SG
169.6 (14.8min, 125P1 - 411max) fps -10%
Nvidia Titan RTX
140.8 (6.17min, 100P1 - 320max) fps -25%
The Witcher 3 - 3840x2160 High Graphics & Postprocessing (Nvidia HairWorks Off)
KFA2 GeForce RTX 4090 SG
286 (92.1min, 181.2P0.1, 243P1 - 863max) fps
Palit GeForce RTX 4090 GameRock OC
284 (88.3min, 166.6P0.1, 240P1 - 831max) fps -1%
NVIDIA GeForce RTX 3090 Founders Edition
155.5 (28min, 94.5P0.1, 133.8P1 - 704max) fps -46%
Sapphire AMD Radeon RX 6950 XT Nitro+ Pure
139.7 (10.4min, 105.6P0.1, 118.6P1 - 388max) fps -51%
KFA2 GeForce RTX 3080 SG
131.8 (48.2min, 72.3P0.1, 107.3P1 - 454max) fps -54%
AMD Radeon RX 6900 XT
122 (105min, 105P1 - 134max) fps -57%
Nvidia Titan RTX
107.1 (11min, 80.3P0.1, 94.1P1 - 583max) fps -63%
Final Fantasy XV Benchmark - 3840x2160 High Quality
Palit GeForce RTX 4090 GameRock OC
161.1 fps +3%
KFA2 GeForce RTX 4090 SG
156.7 fps
NVIDIA GeForce RTX 3090 Founders Edition
87.1 fps -44%
Sapphire AMD Radeon RX 6950 XT Nitro+ Pure
86 fps -45%
KFA2 GeForce RTX 3080 SG
76.7 fps -51%
Nvidia Titan RTX
65.2 fps -58%
Strange Brigade - 3840x2160 ultra AA:ultra AF:16
Palit GeForce RTX 4090 GameRock OC
281 (31.7min, 239P1 - 482max) fps +1%
KFA2 GeForce RTX 4090 SG
277 (59.7min, 234P1 - 631max) fps
Sapphire AMD Radeon RX 6950 XT Nitro+ Pure
168.6 (37.6min, 139.6P1 - 268max) fps -39%
NVIDIA GeForce RTX 3090 Founders Edition
163.2 (60.1min, 136.1P1 - 584max) fps -41%
KFA2 GeForce RTX 3080 SG
141.5 (44.1min, 113.4P1 - 188.6max) fps -49%
Nvidia Titan RTX
115 (67.4min, 100P1 - 517max) fps -58%
Far Cry 5 - 3840x2160 Ultra Preset AA:T
Palit GeForce RTX 4090 GameRock OC
175 (140min - 212max) fps 0%
KFA2 GeForce RTX 4090 SG
175 (135min - 211max) fps
Sapphire AMD Radeon RX 6950 XT Nitro+ Pure
121 (106min - 147max) fps -31%
NVIDIA GeForce RTX 3090 Founders Edition
107 (96min - 128max) fps -39%
KFA2 GeForce RTX 3080 SG
102 (93min - 121max) fps -42%
Nvidia Titan RTX
82 (73min - 99max) fps -53%
Far Cry New Dawn - 3840x2160 Ultra Preset
Palit GeForce RTX 4090 GameRock OC
145 (104min - 215max) fps 0%
KFA2 GeForce RTX 4090 SG
145 (105min - 214max) fps
Sapphire AMD Radeon RX 6950 XT Nitro+ Pure
111 (75min - 167max) fps -23%
NVIDIA GeForce RTX 3090 Founders Edition
108 (93min - 129max) fps -26%
AMD Radeon RX 6900 XT
101 (79min - 135max) fps -30%
KFA2 GeForce RTX 3080 SG
98 (79min - 122max) fps -32%
Nvidia Titan RTX
83 (70min - 100max) fps -43%
Far Cry 6 - 3840x2160 Ultra Graphics Quality + HD Textures AA:T
Palit GeForce RTX 4090 GameRock OC
136.9 (122min - 148max) fps +1%
KFA2 GeForce RTX 4090 SG
134.9 (118min - 147max) fps
Sapphire AMD Radeon RX 6950 XT Nitro+ Pure
86.5 (78min - 100max) fps -36%
NVIDIA GeForce RTX 3090 Founders Edition
84.9 (78min - 92max) fps -37%
Nvidia Titan RTX
63.6 (56min - 69max) fps -53%
KFA2 GeForce RTX 3080 SG
57.2 (28min - 69max) fps -58%
Metro Exodus - 3840x2160 Ultra Quality AF:16x
Palit GeForce RTX 4090 GameRock OC
139.7 (76.95min - 229.15max) fps +1%
KFA2 GeForce RTX 4090 SG
138.5 (77.47min - 228.36max) fps
NVIDIA GeForce RTX 3090 Founders Edition
75.9 (48.64min - 130.4max) fps -45%
Sapphire AMD Radeon RX 6950 XT Nitro+ Pure
75 (50.07min - 98.87max) fps -46%
AMD Radeon RX 6900 XT
66.7 (42.71min - 92.25max) fps -52%
KFA2 GeForce RTX 3080 SG
65.2 (41.36min - 117.12max) fps -53%
Nvidia Titan RTX
56.8 (35.78min - 93.88max) fps -59%
F1 2020 - 3840x2160 Ultra High Preset AA:T AF:16x
Palit GeForce RTX 4090 GameRock OC
286 (245min - 335max) fps 0%
KFA2 GeForce RTX 4090 SG
285 (240min - 333max) fps
Sapphire AMD Radeon RX 6950 XT Nitro+ Pure
150.1 (119min - 178max) fps -47%
NVIDIA GeForce RTX 3090 Founders Edition
143.6 (121min - 170max) fps -50%
AMD Radeon RX 6900 XT
137 (109min - 165max) fps -52%
AMD Radeon RX 6900 XT
136 (110min - 161max) fps -52%
KFA2 GeForce RTX 3080 SG
124.6 (107min - 145max) fps -56%
Nvidia Titan RTX
103.4 (89min - 121max) fps -64%
F1 2021 - 3840x2160 Ultra High Preset + Raytracing AA:T AF:16x
Palit GeForce RTX 4090 GameRock OC
199.1 (168min, 166P1 - 223max) fps +2%
KFA2 GeForce RTX 4090 SG
195.1 (165min, 163P1 - 220max) fps
NVIDIA GeForce RTX 3090 Founders Edition
102.7 (90min, 89P1 - 116max) fps -47%
Sapphire AMD Radeon RX 6950 XT Nitro+ Pure
99.7 (85min, 85P1 - 113max) fps -49%
KFA2 GeForce RTX 3080 SG
93.5 (82min, 82P1 - 105max) fps -52%
Nvidia Titan RTX
73.2 (64min, 64P1 - 84max) fps -62%
F1 22 - 3840x2160 Ultra High Preset AA:T AF:16x
Palit GeForce RTX 4090 GameRock OC
82.5 (72min, 71P1 - 96max) fps 0%
KFA2 GeForce RTX 4090 SG
82.5 (70min, 71P1 - 95max) fps
NVIDIA GeForce RTX 3090 Founders Edition
42.6 (36min, 28P1 - 49max) fps -48%
Sapphire AMD Radeon RX 6950 XT Nitro+ Pure
35.8 (24min, 25P1 - 47max) fps -57%
Nvidia Titan RTX
29.3 (25min, 24P1 - 34max) fps -64%
Borderlands 3 - 3840x2160 Badass Overall Quality (DX11)
Palit GeForce RTX 4090 GameRock OC
135 fps +1%
KFA2 GeForce RTX 4090 SG
134.1 fps
NVIDIA GeForce RTX 3090 Founders Edition
72.8 fps -46%
KFA2 GeForce RTX 3080 SG
59.9 fps -55%
Sapphire AMD Radeon RX 6950 XT Nitro+ Pure
59.9 fps -55%
AMD Radeon RX 6900 XT
59.8 fps -55%
AMD Radeon RX 6900 XT
57.1 fps -57%
Nvidia Titan RTX
49.7 fps -63%
Cyberpunk 2077 1.6 - 3840x2160 Ultra Preset
KFA2 GeForce RTX 4090 SG
83.7 (69.6min - 112.6max) fps
Palit GeForce RTX 4090 GameRock OC
78 (48.3min - 106.8max) fps -7%
Sapphire AMD Radeon RX 6950 XT Nitro+ Pure
43.2 fps -48%
Metro Exodus - 1920x1080 Ultra Quality DXR AF:16x
KFA2 GeForce RTX 4090 SG
158.3 (96.3min - 221.34max) fps
Palit GeForce RTX 4090 GameRock OC
157.3 (96.47min - 223.46max) fps -1%
NVIDIA GeForce RTX 3090 Founders Edition
121 (68.44min - 191.24max) fps -24%
KFA2 GeForce RTX 3080 SG
101.5 (53.72min - 159.41max) fps -36%
Nvidia Titan RTX
91.8 (51.42min - 144.89max) fps -42%
AMD Radeon RX 6900 XT
90.5 (55.53min - 126.79max) fps -43%
Far Cry 6 - 1920x1080 Ultra Graphics Quality + HD Textures + DXR AA:T
KFA2 GeForce RTX 4090 SG
136.4 (112min - 201max) fps
Palit GeForce RTX 4090 GameRock OC
133.4 (108min - 196max) fps -2%
NVIDIA GeForce RTX 3090 Founders Edition
127.5 (109min - 159max) fps -7%
Nvidia Titan RTX
109.3 (98min - 132max) fps -20%
Sapphire AMD Radeon RX 6950 XT Nitro+ Pure
101.6 (24min - 161max) fps -26%
Cyberpunk 2077 1.6
1920x1080 Ray Tracing Ultra Preset (DLSS off)
KFA2 GeForce RTX 4090 SG
125.6 (59.2min - 164.5max) fps
Palit GeForce RTX 4090 GameRock OC
118.6 (69.3min - 161.9max) fps -6%
3840x2160 Ray Tracing Ultra Preset (DLSS off)
KFA2 GeForce RTX 4090 SG
43.5 (33.1min - 56.5max) fps
Palit GeForce RTX 4090 GameRock OC
42.5 (31.9min - 56.3max) fps -2%
min. mittel hoch max.QHD4K
GTA V (2015) 188.2 188.4 187.1 163.3 166 187.8
The Witcher 3 (2015) 809 730 629 306 286
Dota 2 Reborn (2015) 294 260 255 233 234
Rise of the Tomb Raider (2016) 493 395 374 376 244
Final Fantasy XV Benchmark (2018) 234 234 226 219 156.7
X-Plane 11.11 (2018) 210 193.6 145.1 126
Far Cry 5 (2018) 246 216 208 191 189 175
Strange Brigade (2018) 710 582 568 562 504 277
Shadow of the Tomb Raider (2018) 350 317 319 308 282 186.4
Far Cry New Dawn (2019) 201 176 170 153 152 145
Metro Exodus (2019) 305 265 231 195.3 183.2 138.5
Borderlands 3 (2019) 238 215 198.7 189.4 184.3 134.1
F1 2020 (2020) 120 119.6 475 423 409 285
Dirt 5 (2020) 381 349 222 198 194 159
F1 2021 (2021) 672 637 521 274 263 195.1
Far Cry 6 (2021) 227 197.8 177.3 168.6 162.5 134.9
Forza Horizon 5 (2021) 328 259 253 194 184 159
God of War (2022) 277 274 248 204 177.1 125
GRID Legends (2022) 355 318 283 267 266 198.6
Cyberpunk 2077 1.6 (2022) 225 222 214 211 164.5 83.7
Tiny Tina's Wonderlands (2022) 430 355 308 285 227 129.5
F1 22 (2022) 440 418 409 207 156.2 82.5
The Quarry (2022) 425 334 284 252 192.4 75.3
FIFA 23 (2022) 304 303 300 302 302 299
A Plague Tale Requiem (2022) 179.2 173.6 165 155.3 125 73.5
Uncharted Legacy of Thieves Collection (2022) 151 152.3 146 149.2 145.2 100.5
Call of Duty Modern Warfare 2 2022 (2022) 315 285 246 245 194 131
Spider-Man Miles Morales (2022) 198.2 187.2 178.9 176.8 172.5 126.2

Emissionen der KFA2 GeForce RTX 4090 SG

3x 10² Millimeter für die KFA2 GeForce RTX 4090 SG
KFA2 GeForce RTX 4090 SG überarbeitetes Lüfterdesign
Optionaler Lüfter für die Rückseite

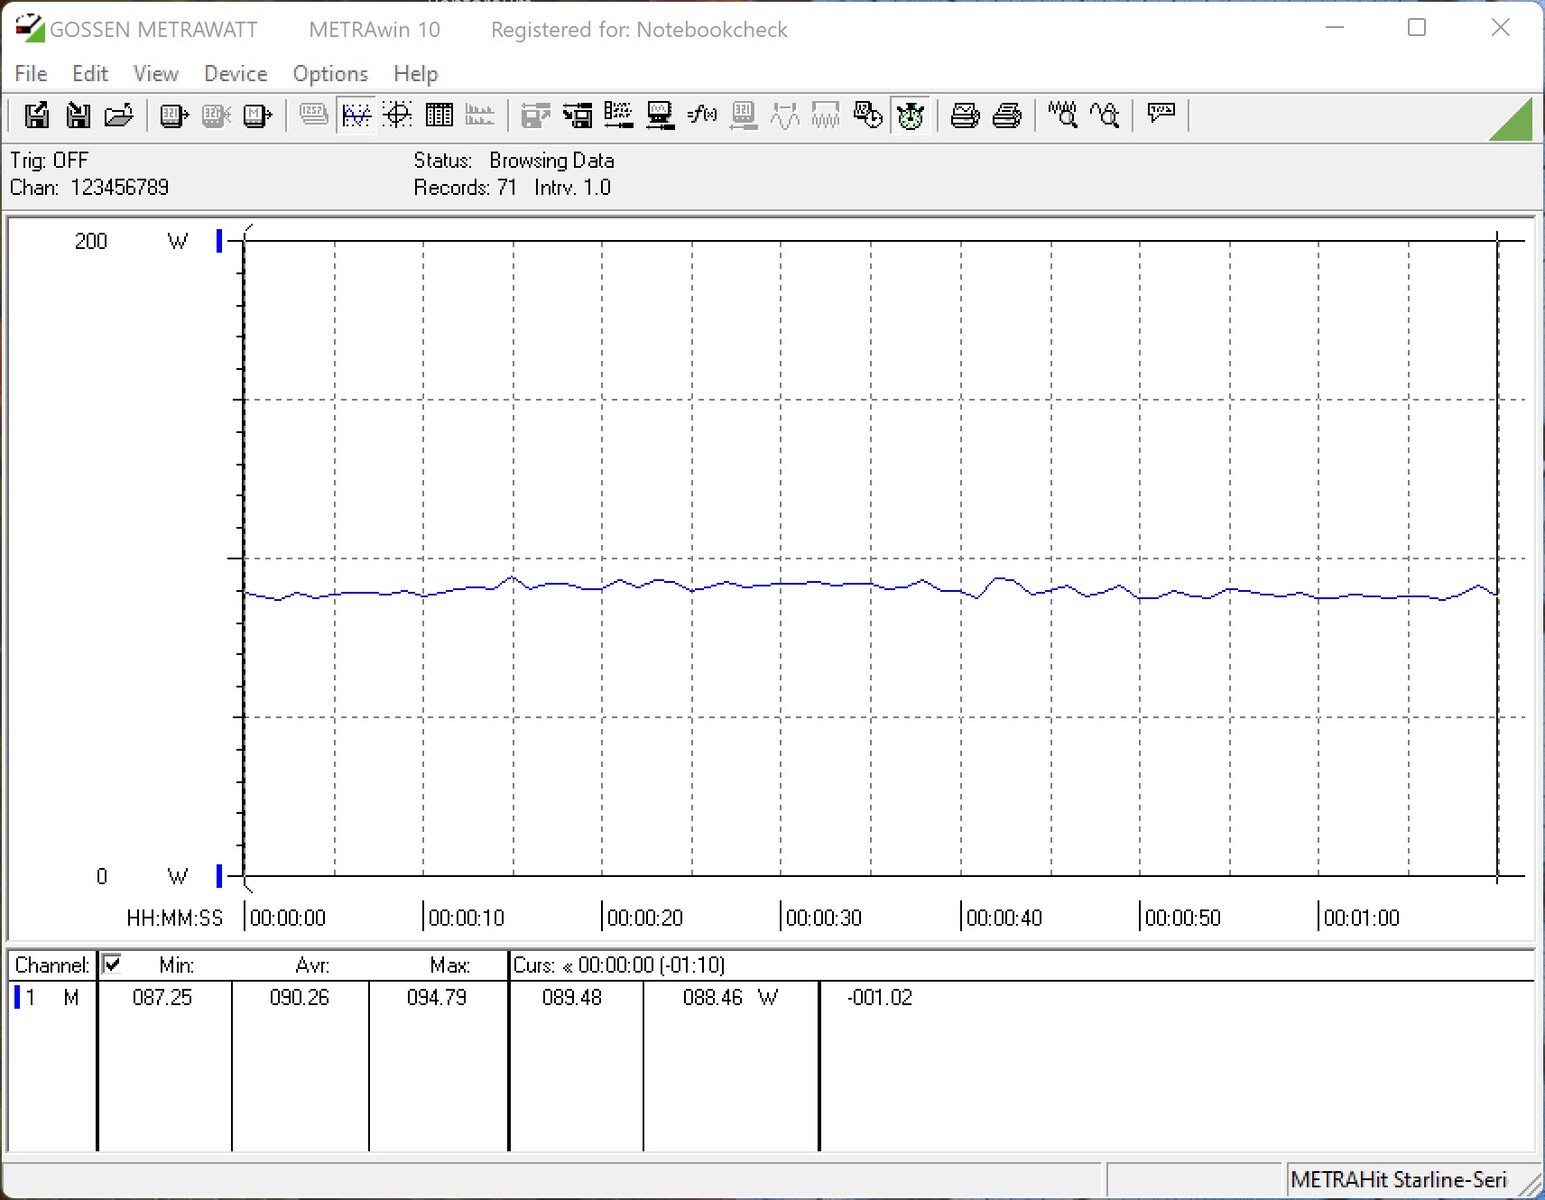
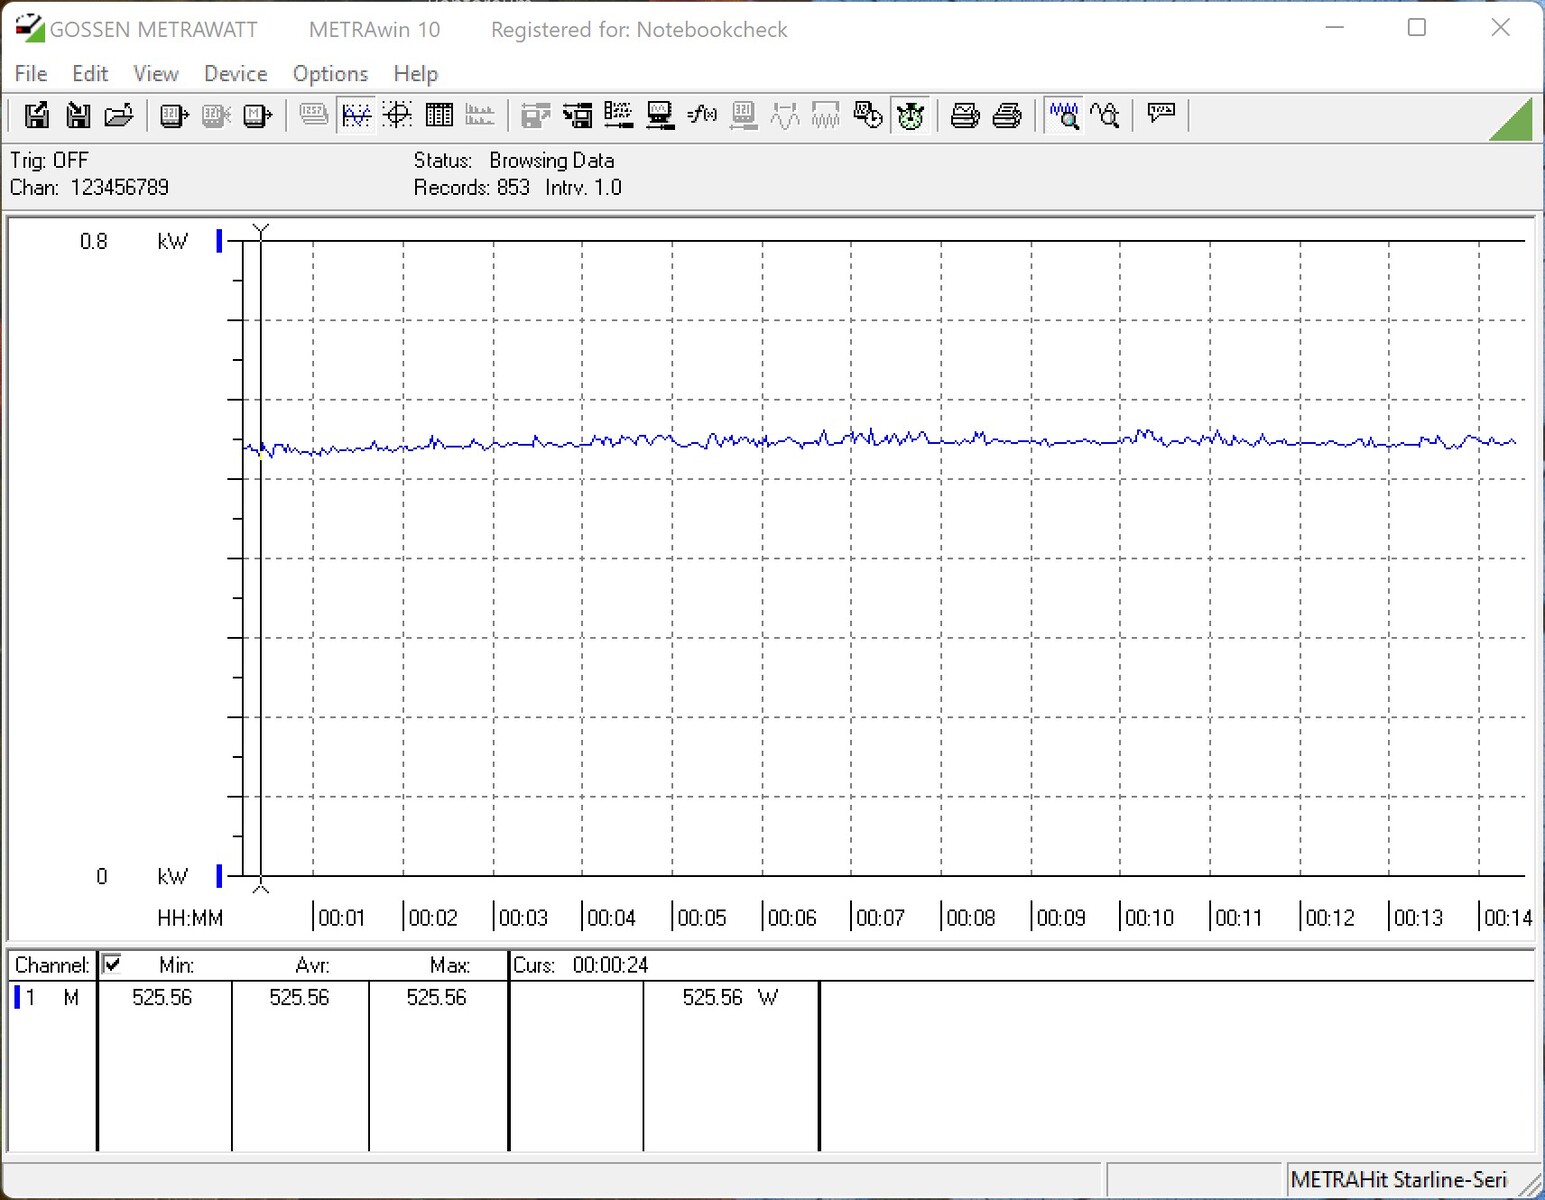
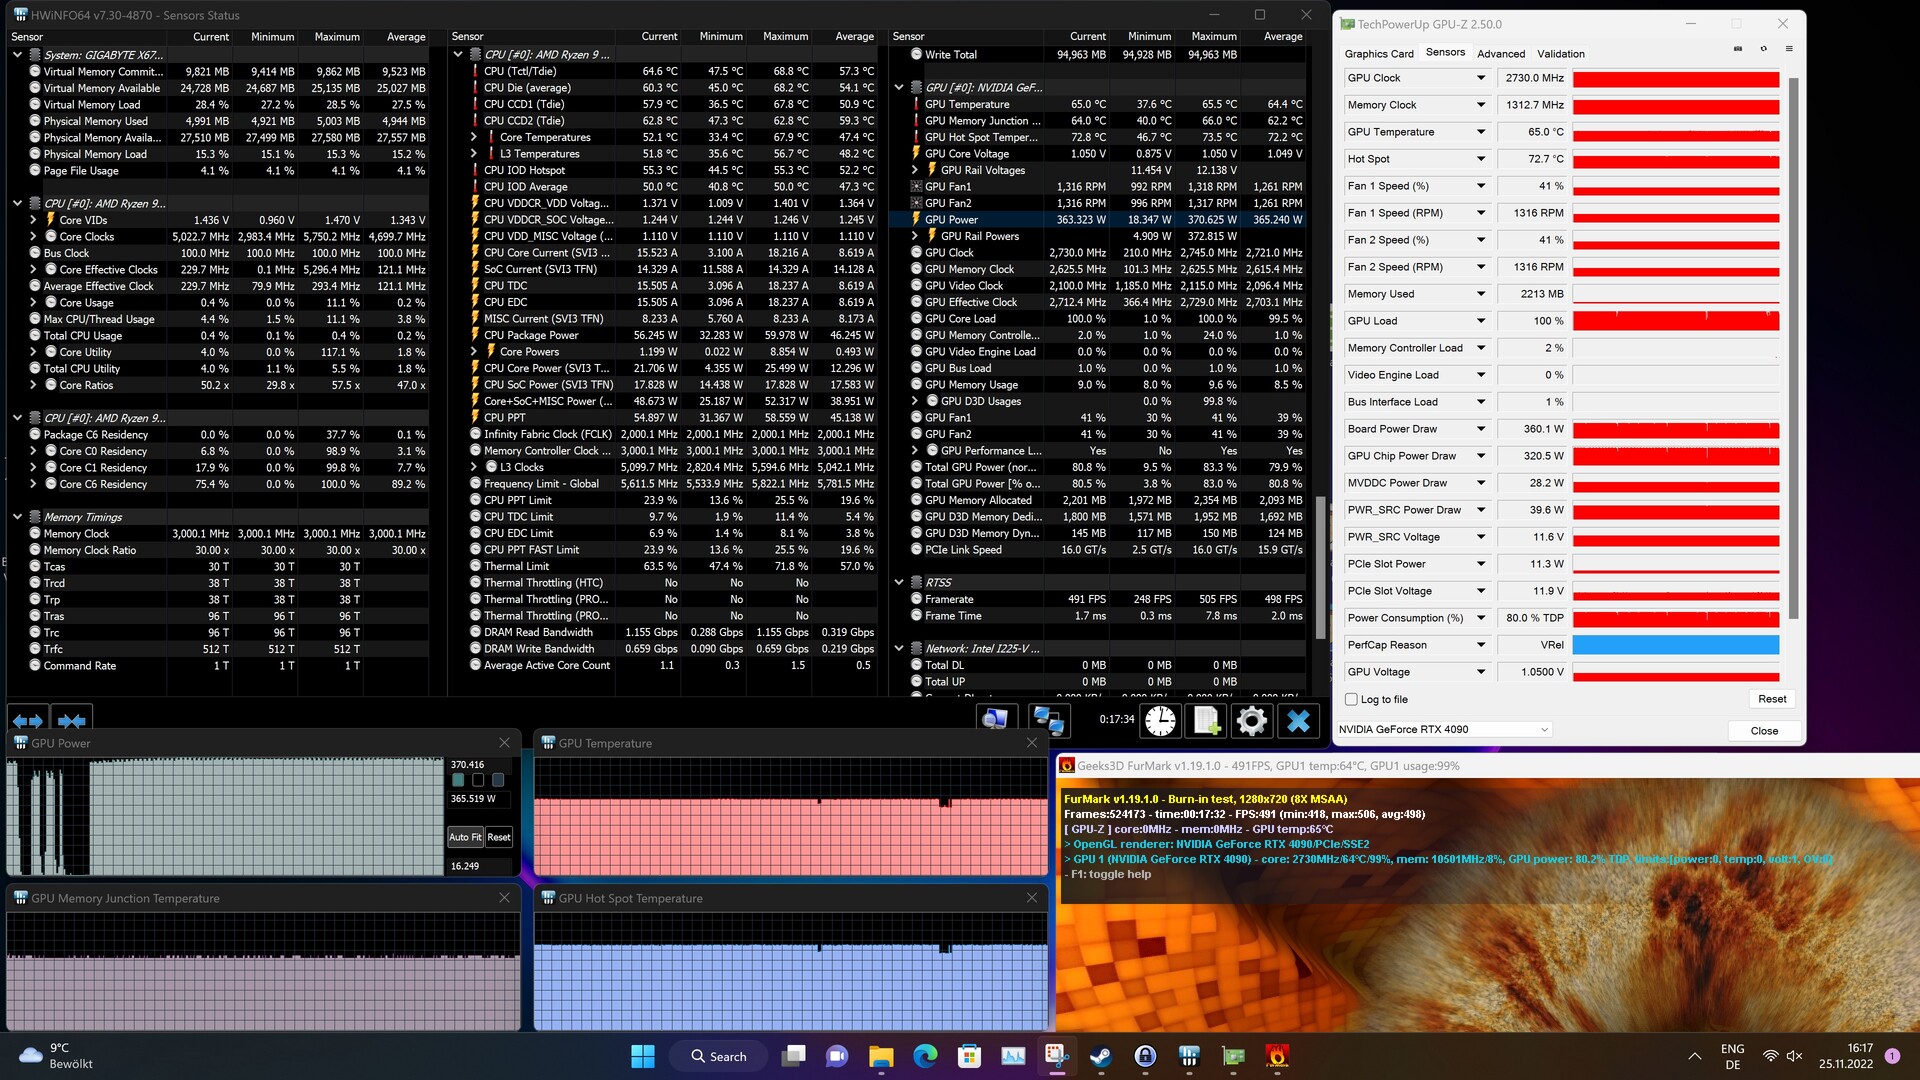
Beim Energiebedarf ist die KFA2 GeForce RTX 4090 SG keine Ausnahme im Vergleich zu anderen GeForce RTX-4090-Modellen. Mit 450 Watt ist das Standard-Power-Limit genauso hoch, wie bei anderen RTX-4090-Modellen. Beim optionalen Power-Target gibt es hingegen Abweichungen unter den verschiedenen Modellen. Mit Plus 13 Prozent kann man das Power-Limit der KFA2 GeForce RTX 4090 SG auf etwa 510 Watt erhöhen. Nvidias Founders Edition lässt sogar bis zu 600 Watt zu und die Palit GeForce RTX 4090 GameRock OC sogar nur 500 Watt. In der Praxis ist dies jedoch eher zweitrangig, da selbst das Power-Limit von 450 Watt nur in den seltensten Fällen erreicht wird. Etwas über 370 Watt liegen beim FurMark-Stresstest an. Dabei liegt die GPU-Temperatur bei kühlen 65 °C und die Lüfter rotieren mit lediglich 1.300 Umdrehungen pro Minute. Mit 39 dB(A) ist die Grafikkarte dabei leise hörbar.

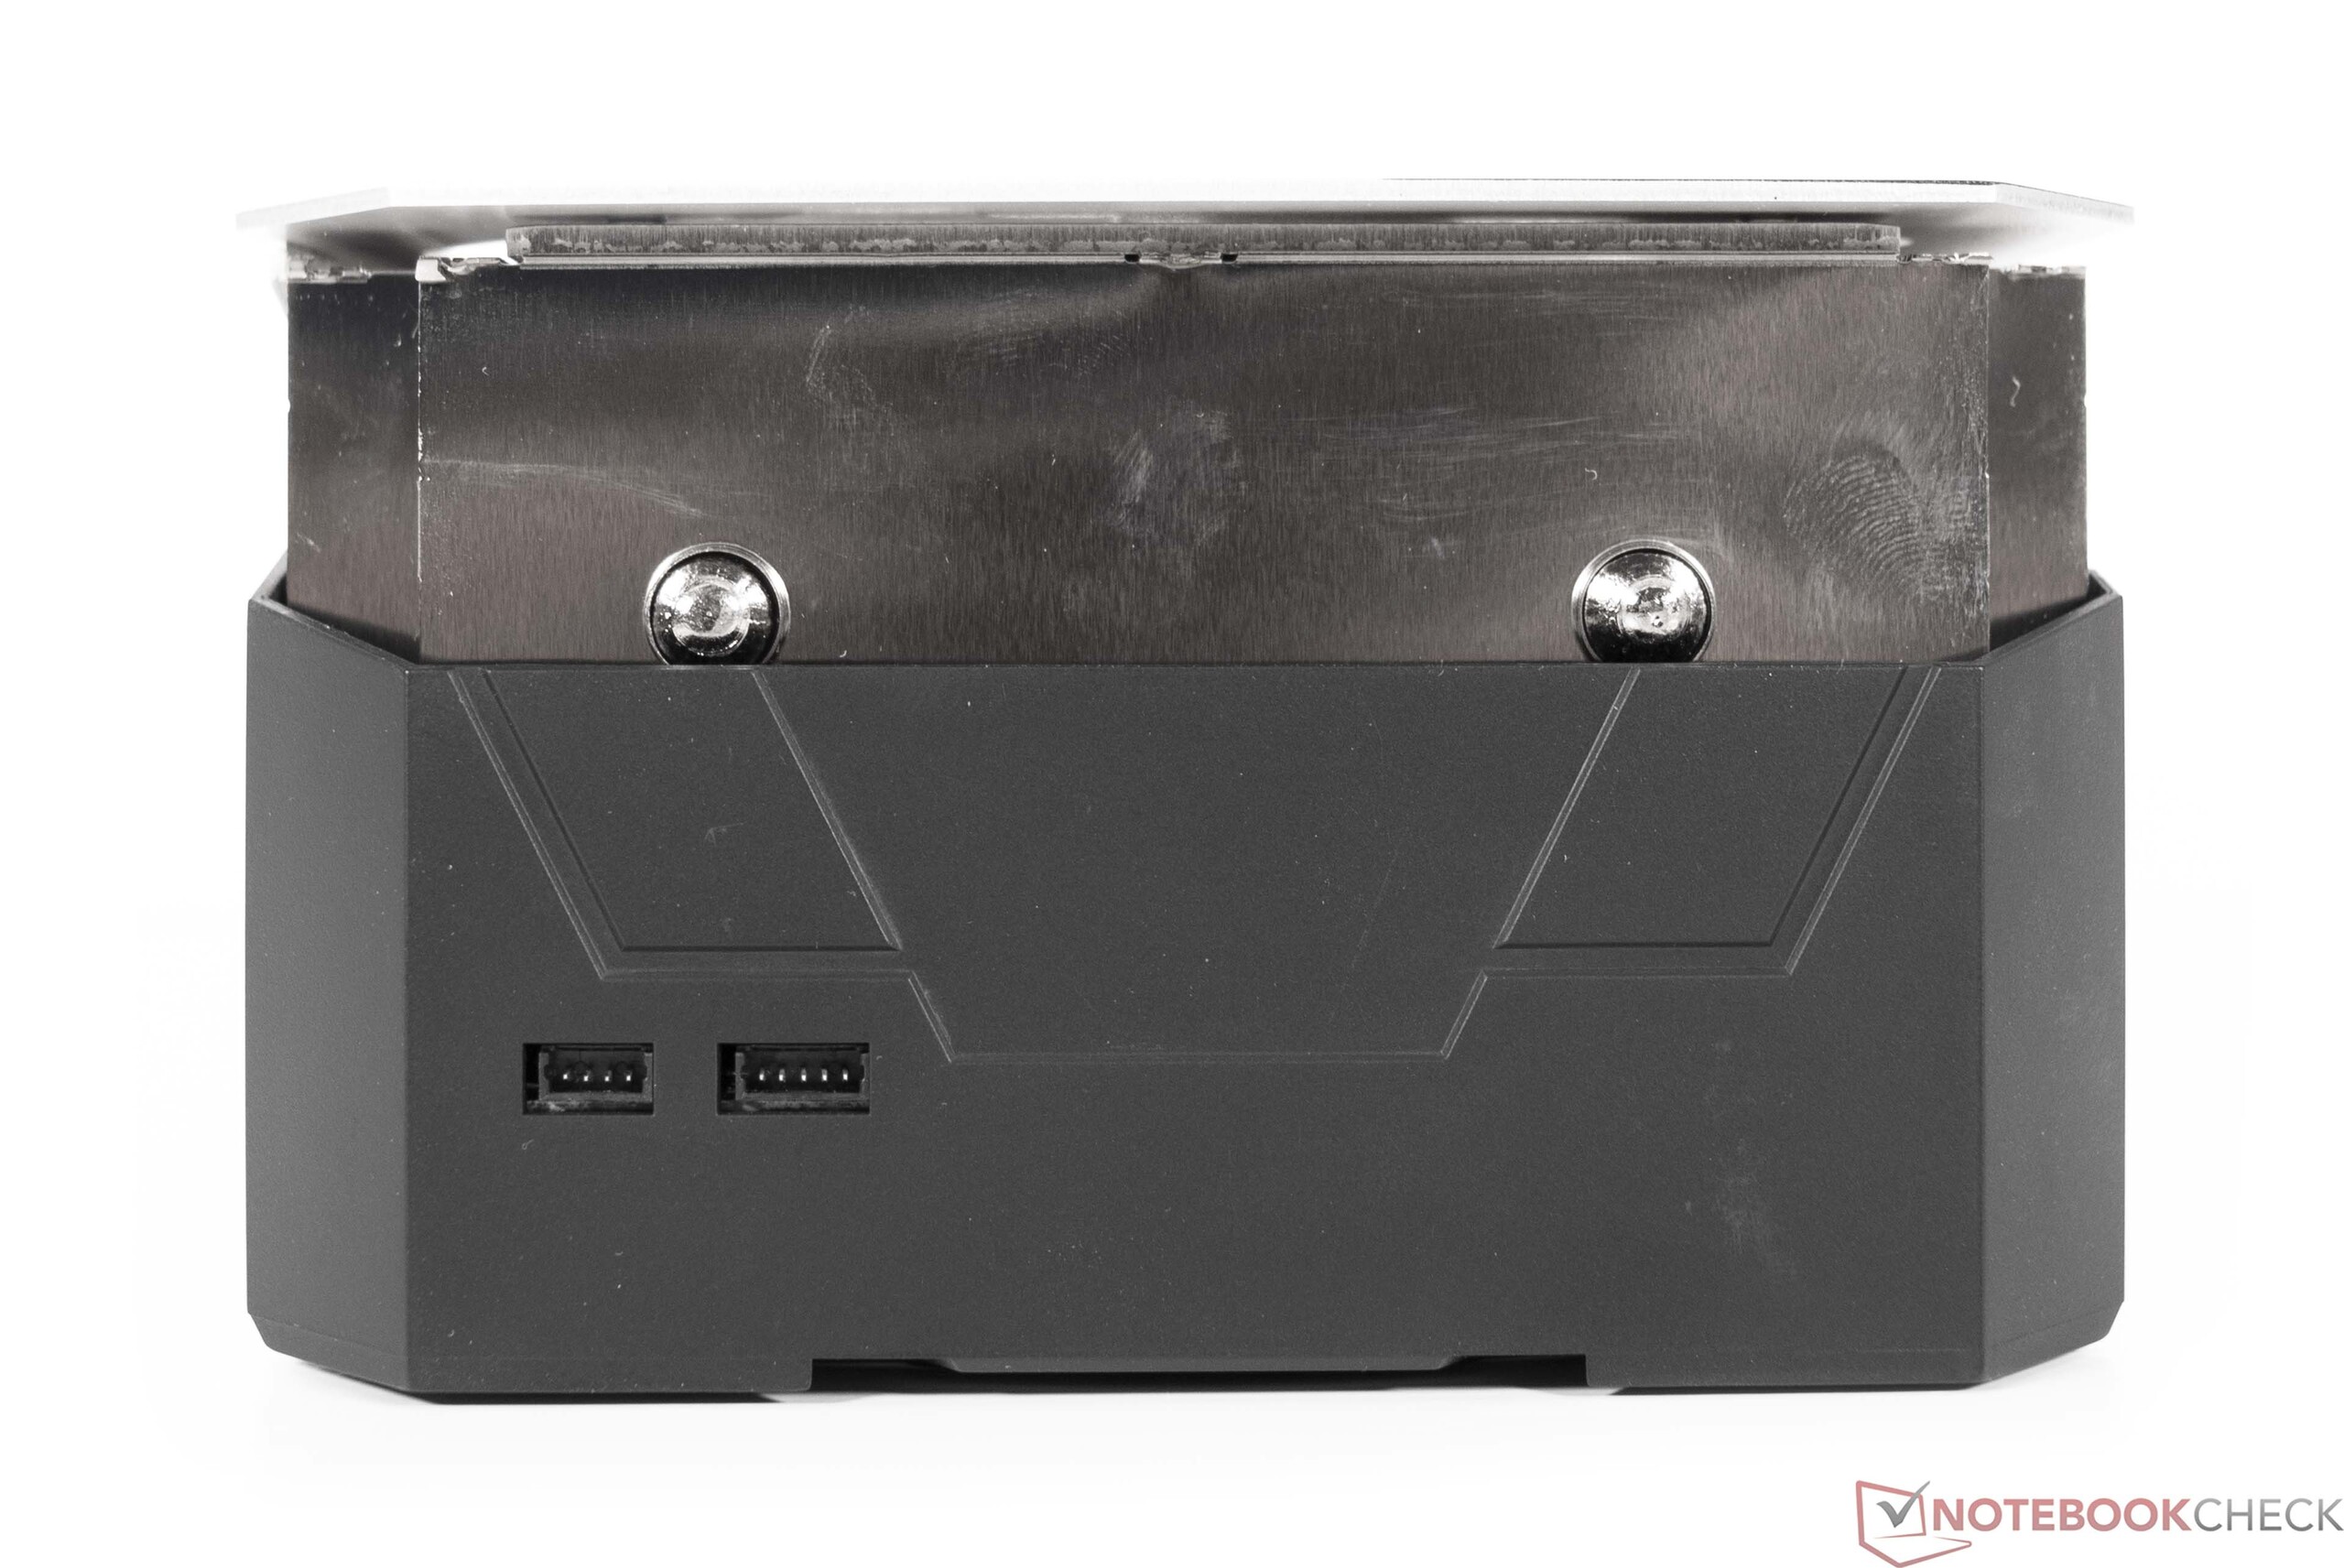
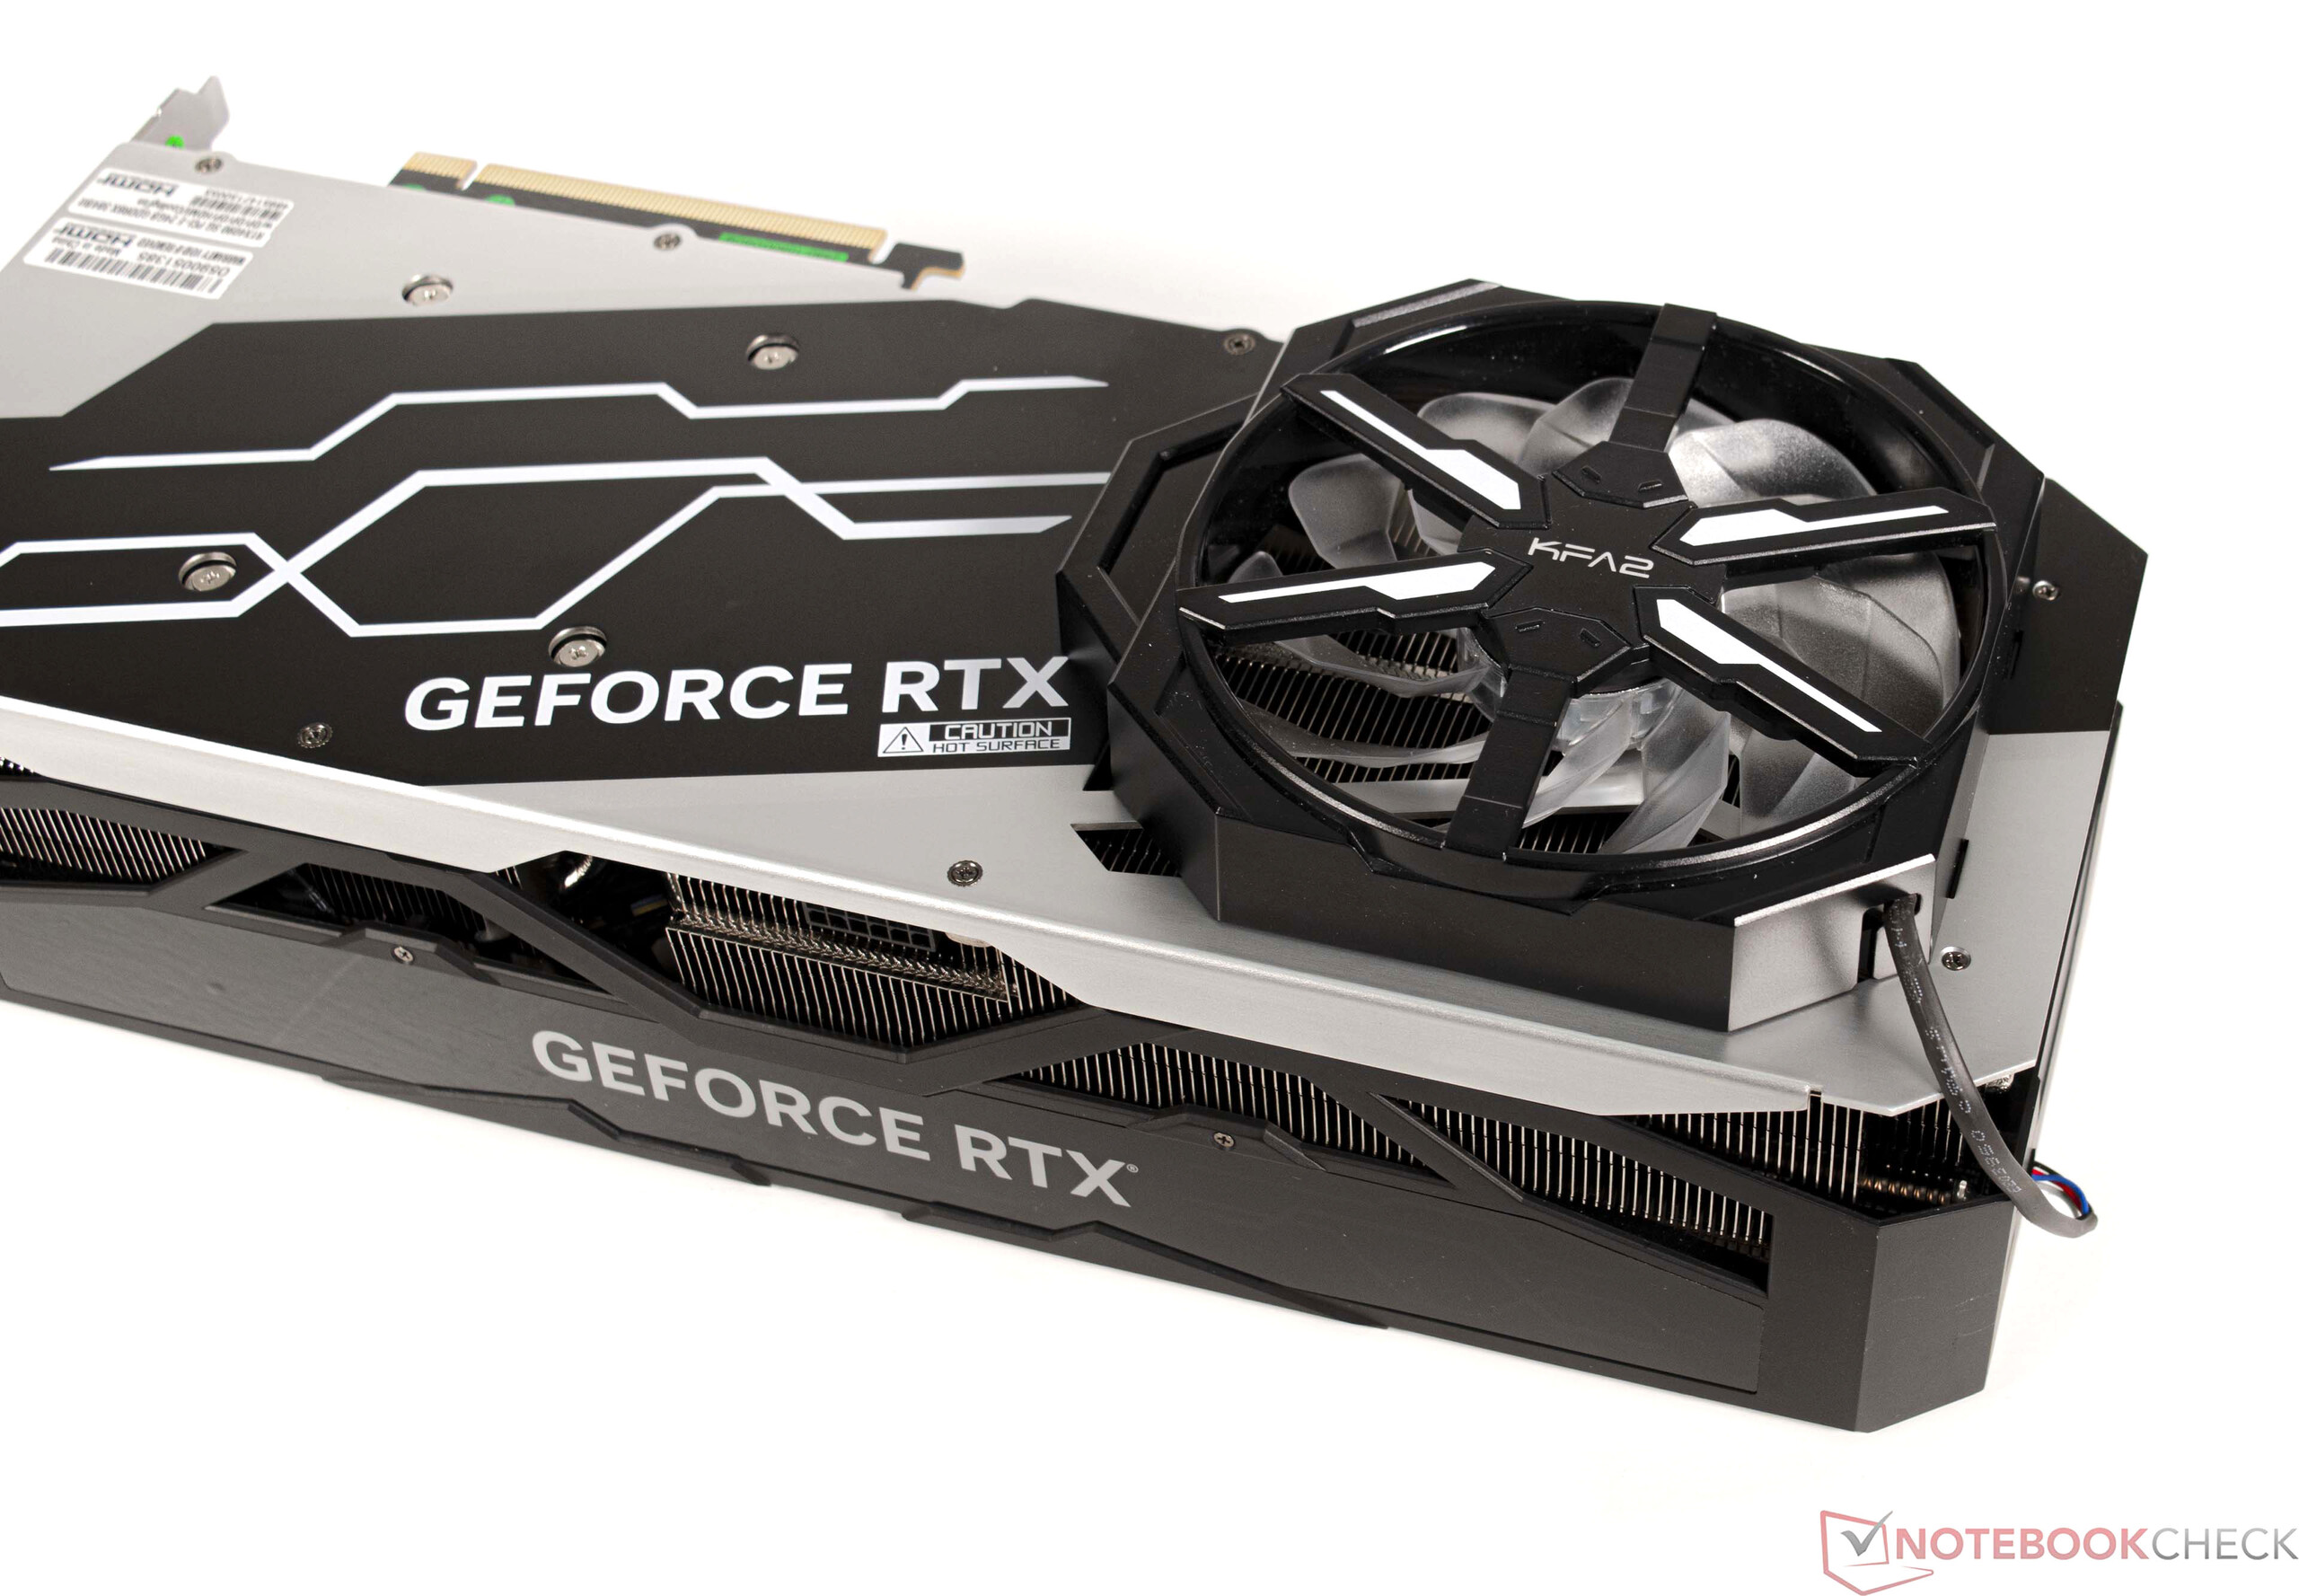
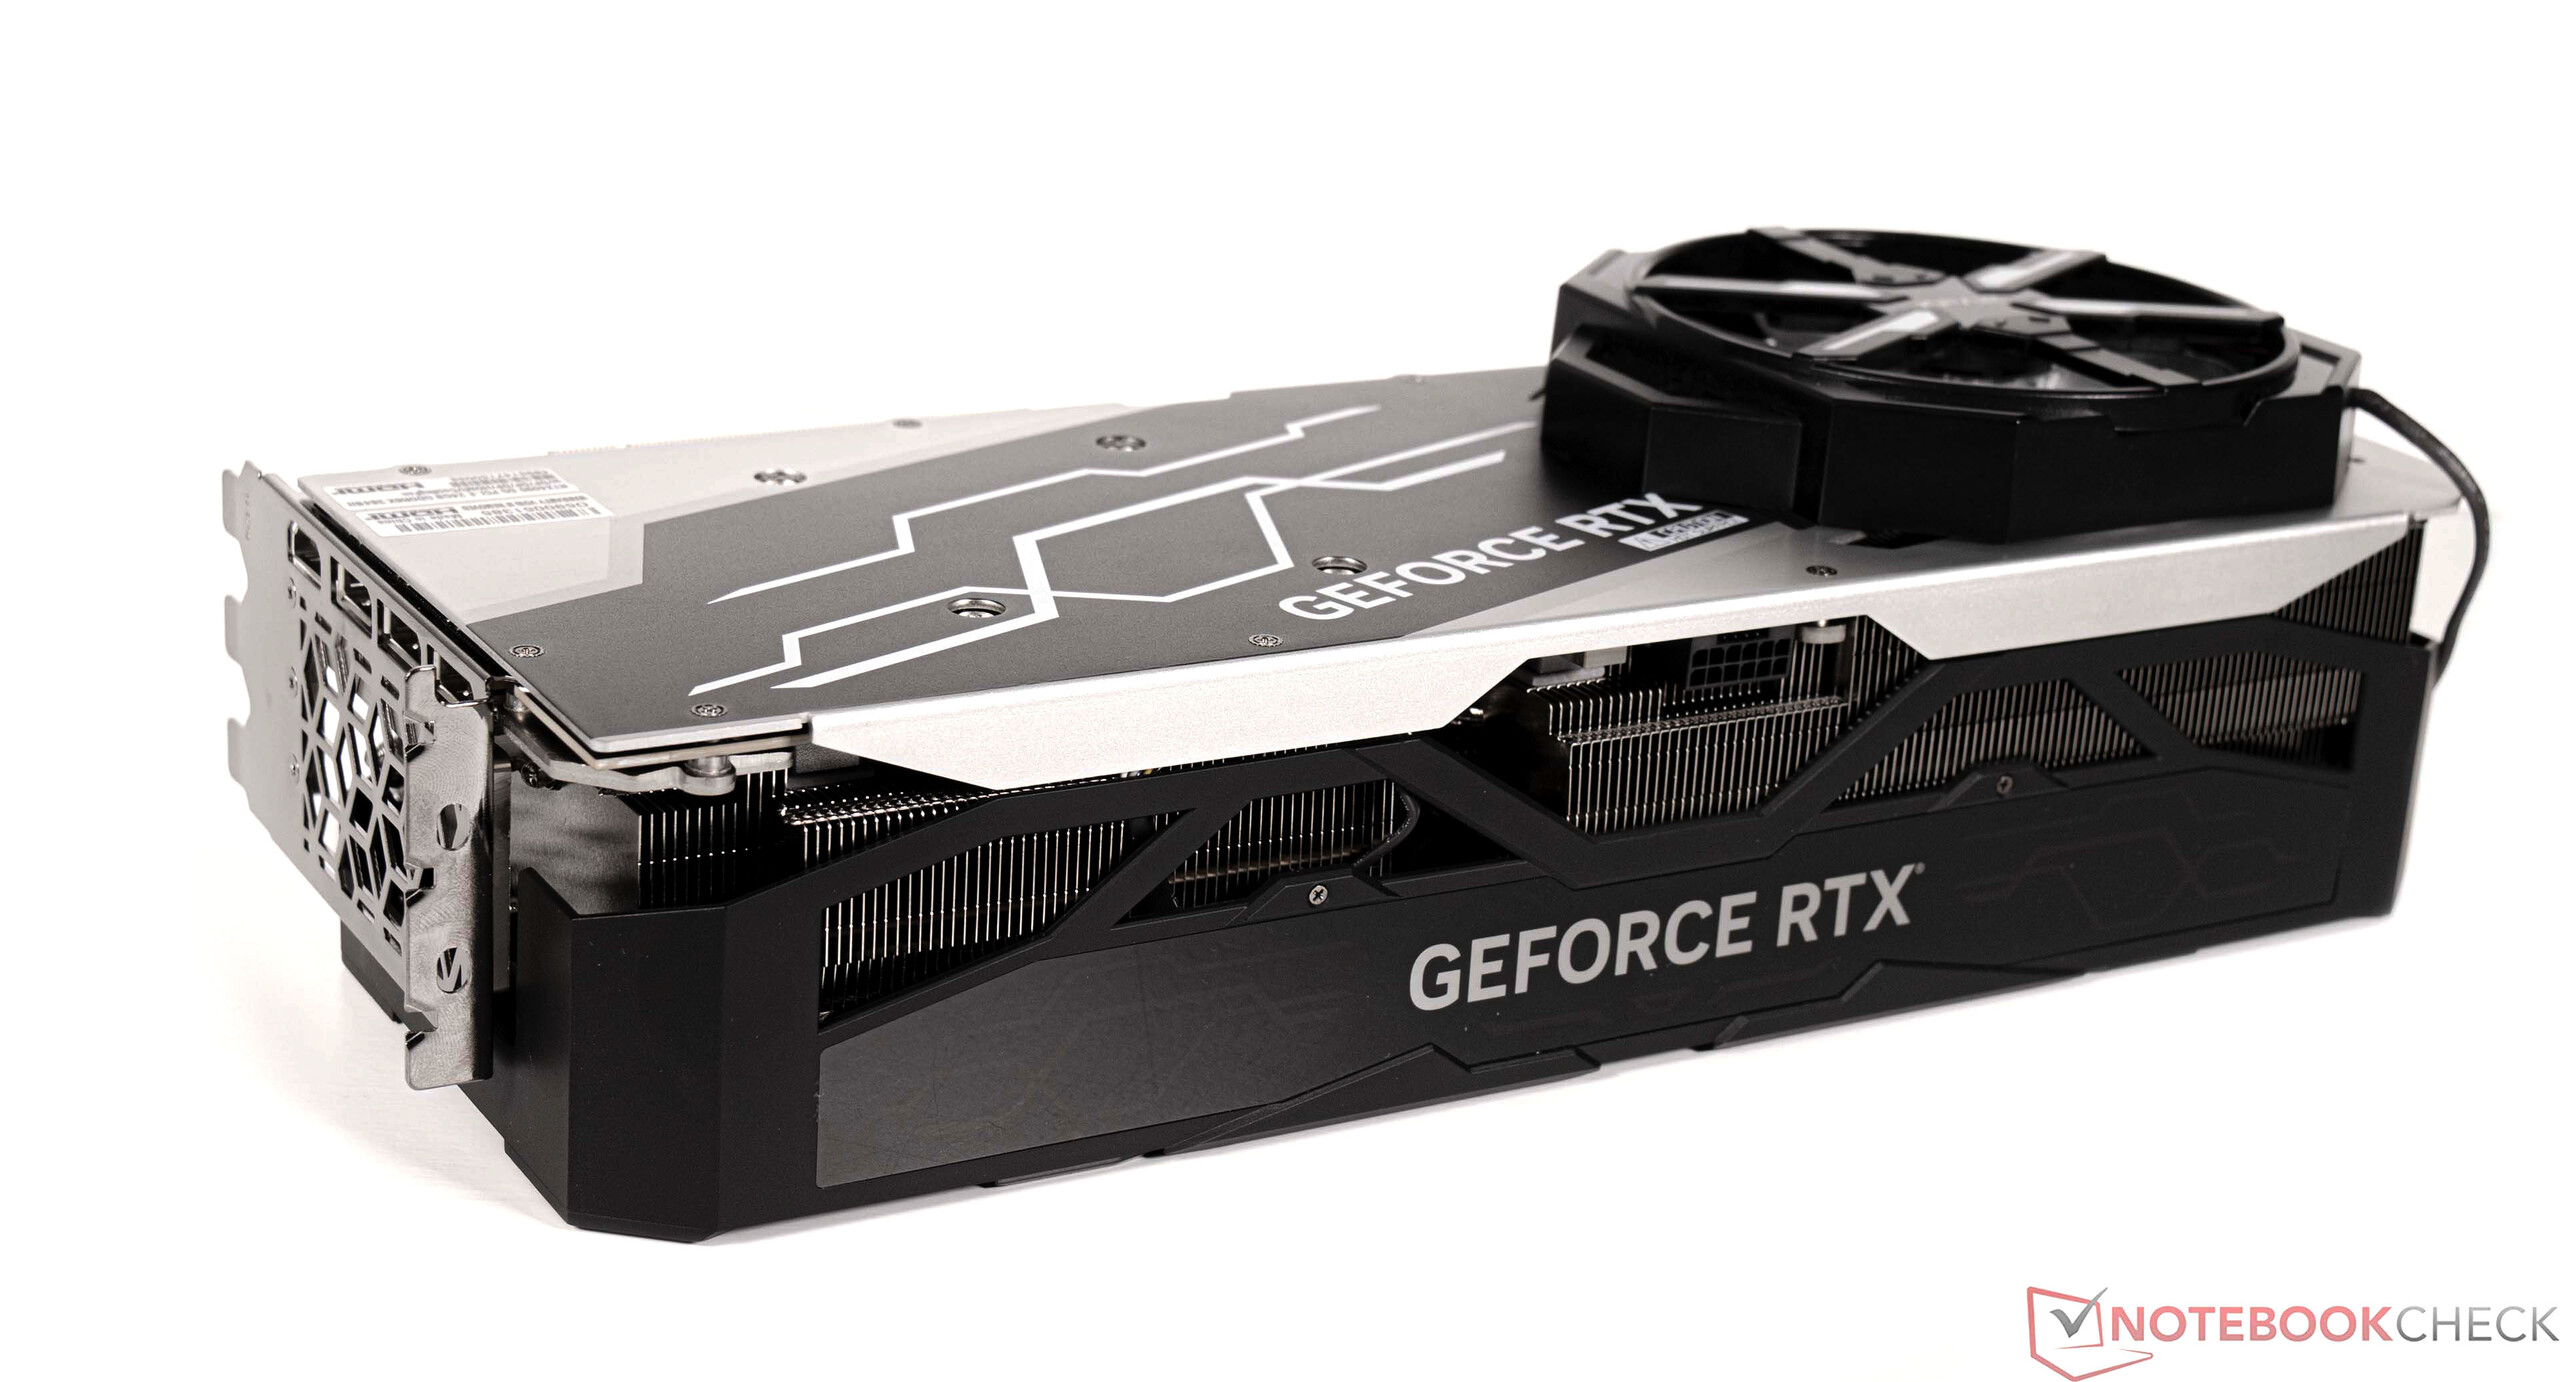
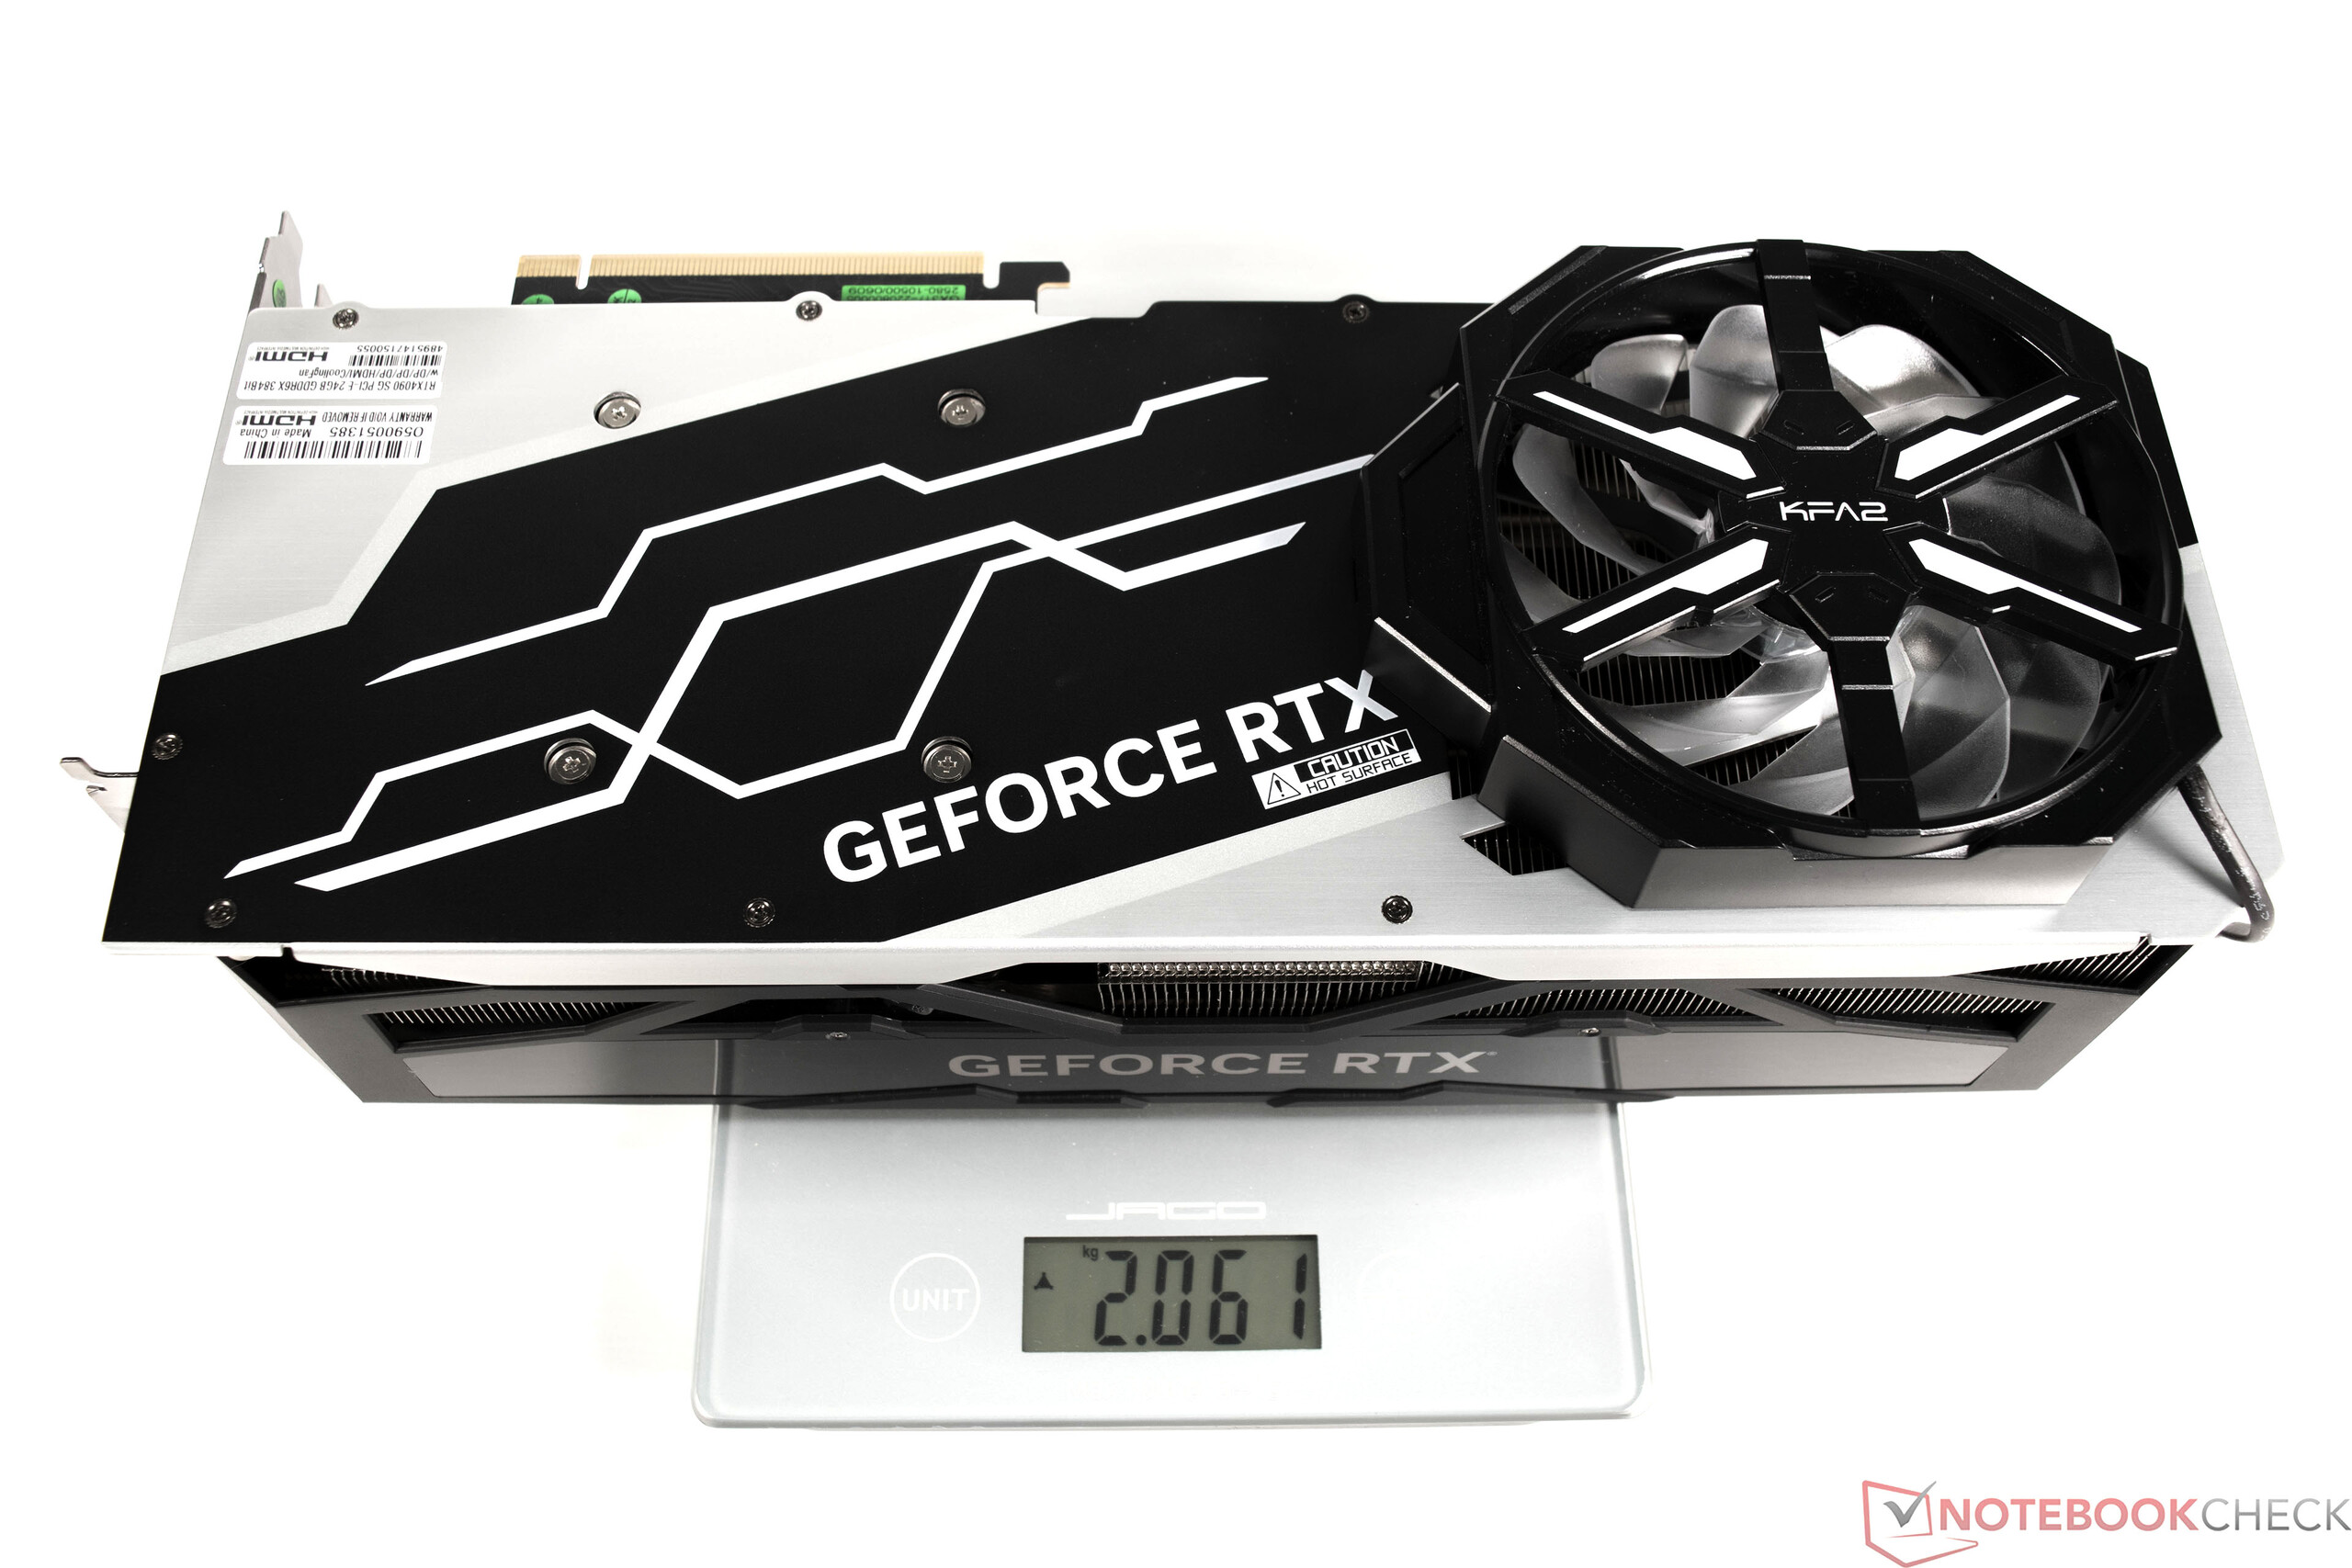
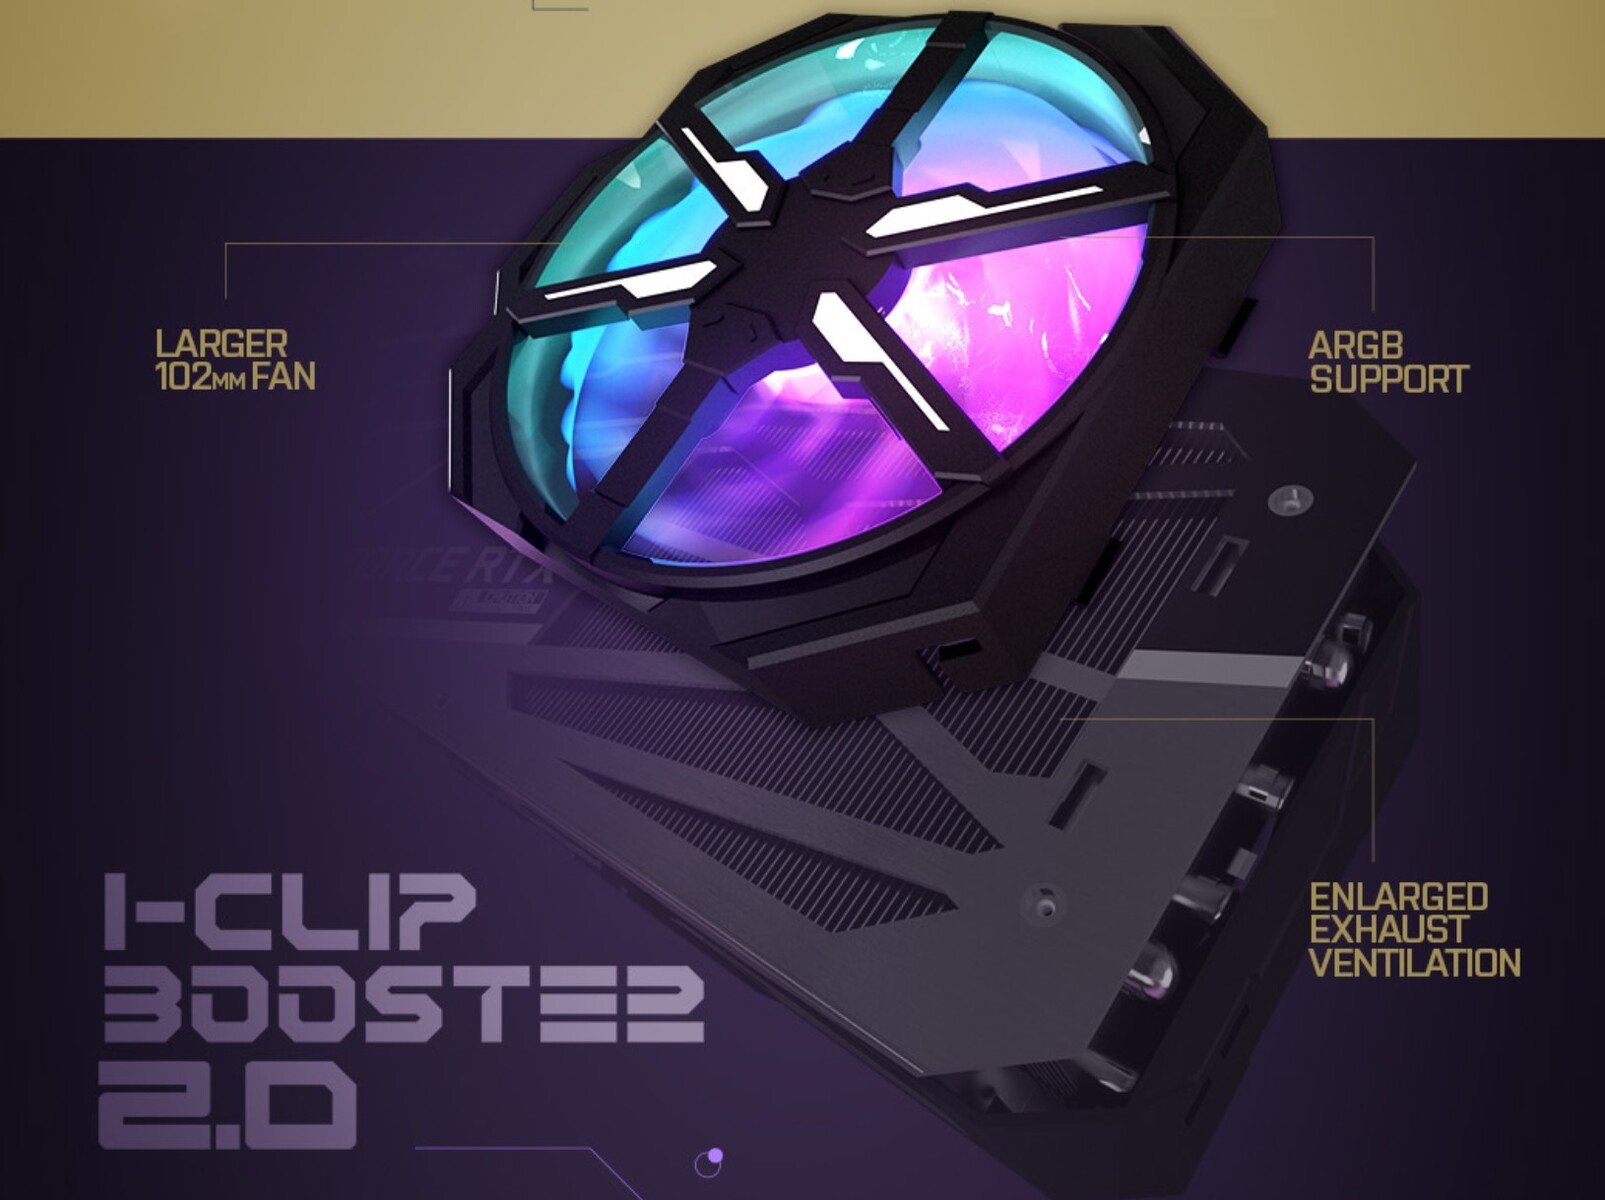
Die KFA2 GeForce RTX 4090 SG vertraut auf einen massigen Kühlkörper mit drei großen 102 Millimetern Axiallüftern. Optional lässt sich auf der Rückseite noch ein weiterer 102-Millimeter-Lüfter installieren. Hier ist aber auf die Kompatibilität mit dem verwendeten Mainboard zu achten. In unserem Fall konnte der zusätzliche Lüfter nicht installiert werden, denn die RAM-Bänke des Gigabyte X670E Aorus Master verhinderten dies.

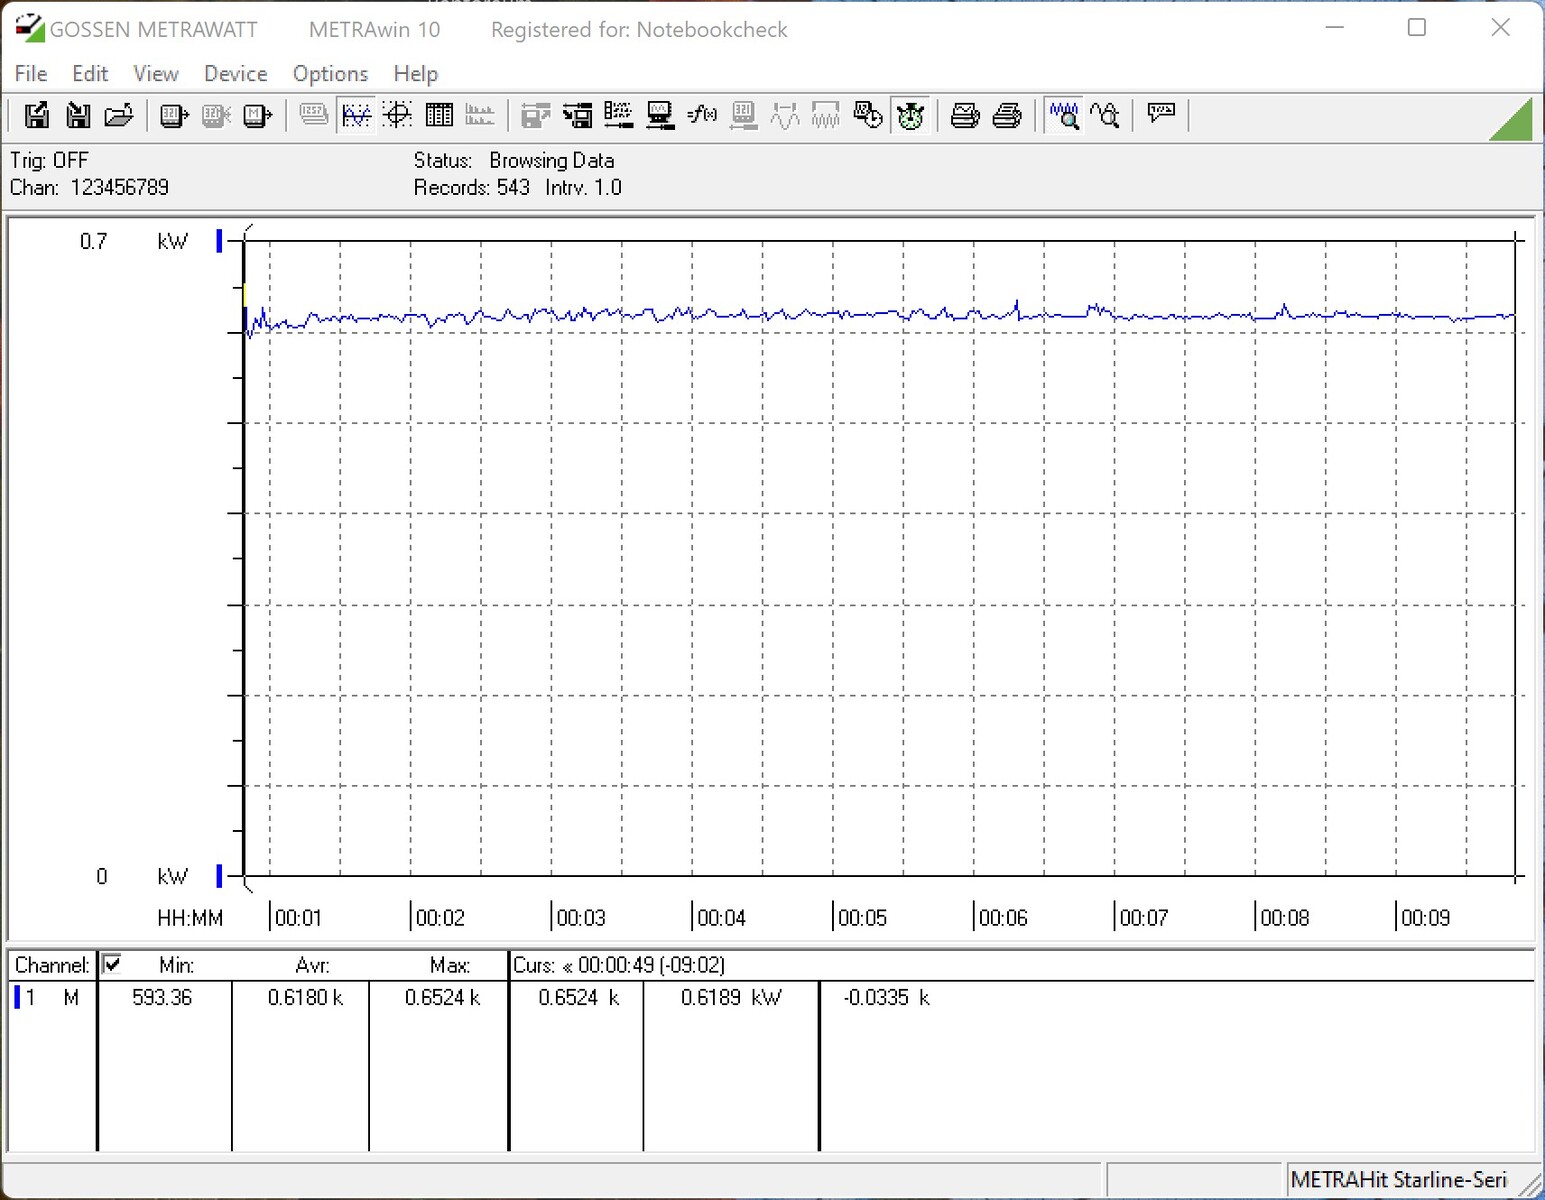
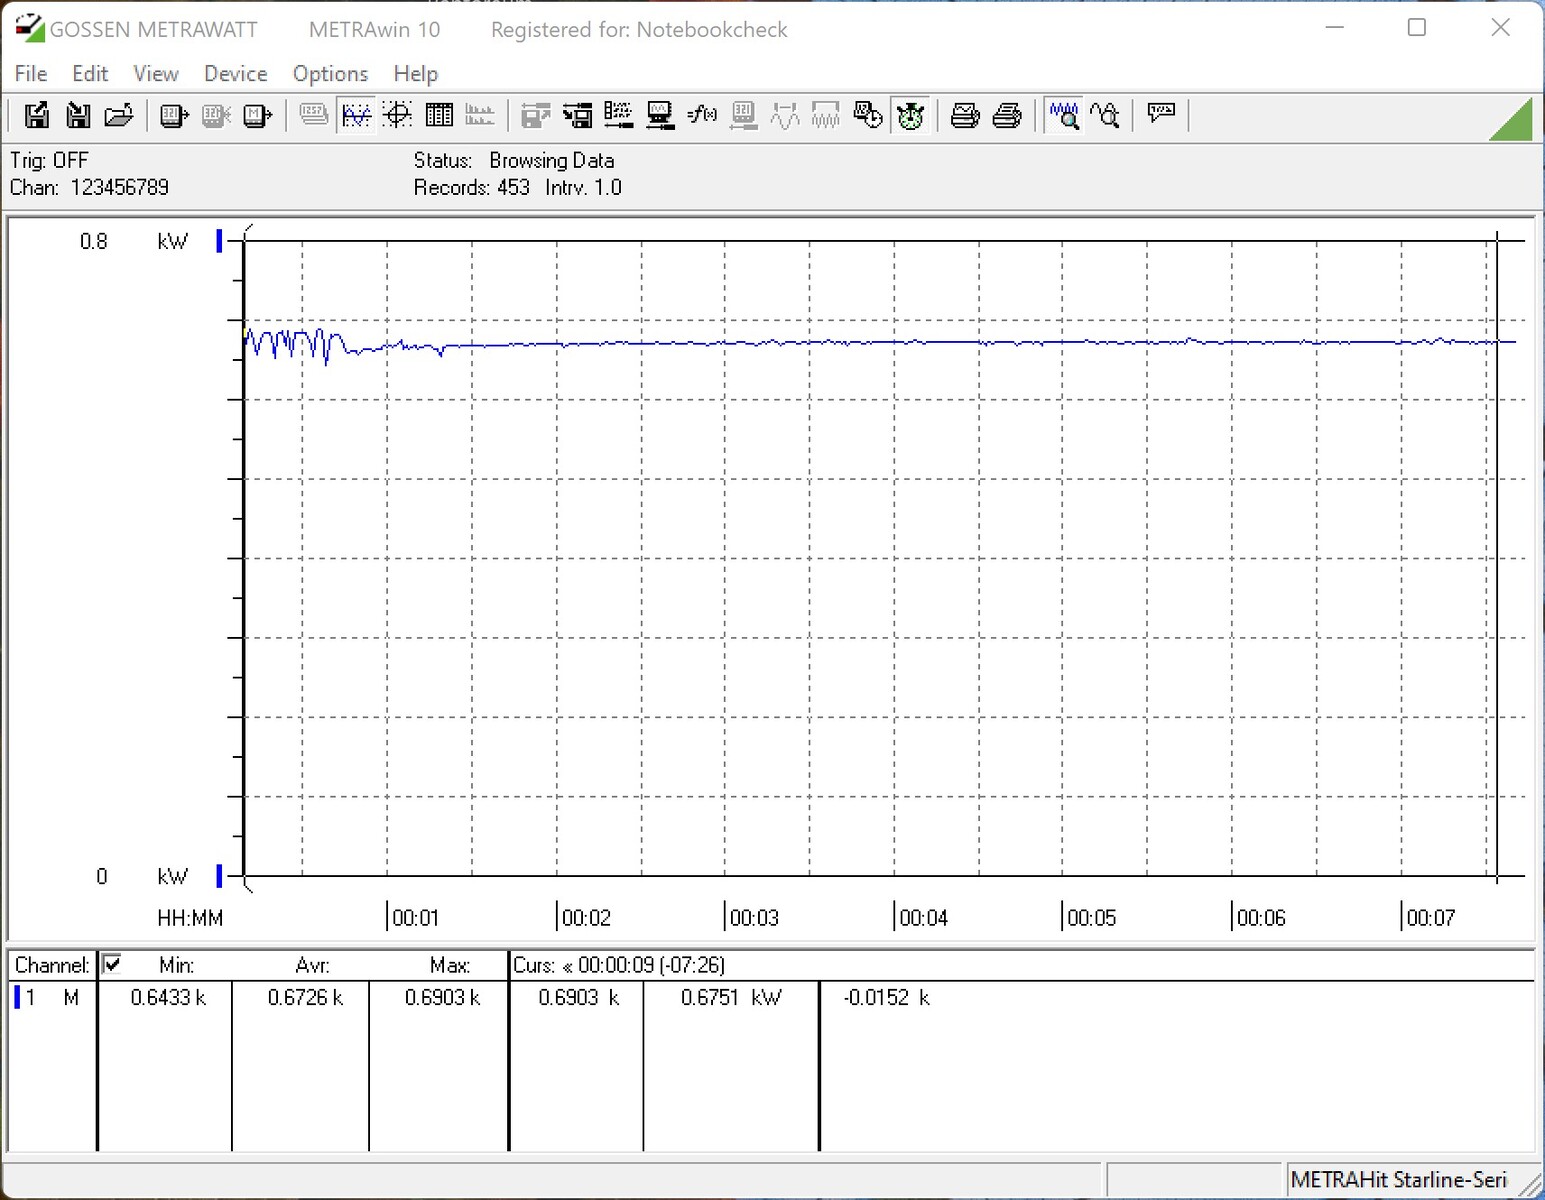
Vergleichen wir die Leistungsaufnahme des gesamten Testsystems, so beträgt dieser beim Spielen etwa 546 Watt. Das ist nur geringfügig mehr als im Vergleich zur Nvidia GeForce RTX 3090 Founders Edition. Dennoch verzeichnen wir einen deutlichen Leistungszuwachs, womit die GeForce RTX 4090 in puncto Leitung pro Watt einen enormen Schritt nach vorne macht. Dennoch verzeichnen wir auch Lastspitzen bis zu 700 Watt für unser Testsystem. KFA2 gibt für die GeForce RTX 4090 SG eine Netzteilleistung von mindestens 850 Watt an. Einige andere Hersteller setzen hingegen mindestens 1.000 Watt an, was unserer Ansicht nach etwas zu hoch ist.

Was die Thematik mit dem 12VHPWR-Anschluss angeht, weisen wir an dieser Stelle einmal darauf hin, genau darauf zu achten, dass der Stecker richtig und komplett in der Buchse steckt. Bei alles RTX-4090-Modellen, die wir bislang im Test hatten und aktuell noch haben, gibt es keine Probleme.

dB(A) 0102030405060708090Deep BassMiddle BassHigh BassLower RangeMidsHigher MidsLower HighsMid HighsUpper HighsSuper Highs2038.736.136.634.638.72542.243.143.137.942.23136.73936.236.936.74031.131.930.135.531.1503131.829.933.6316329.630.828.629.929.6803133.327.9283110028.831.926.926.528.81252931.324.723.72916029.932.525.324.529.920030.232.423.923.130.225028.337.6222228.331537.33821.221.637.340030.2362120.630.250027.132.72019.627.163024.230.619.51924.28002530.718.819.125100021.32618.518.921.3125020.224.818.218.120.2160019.42417.71819.4200018.72217.717.418.7250019.119.517.717.419.1315020.918.717.617.520.9400018.918.81817.818.9500020.220.217.917.820.2630019.418.818.117.919.4800019.51918.418.119.51000020.419.218.718.420.41250019.419.218.818.819.41600020.22020.119.120.2SPL35.839.430.730.535.8N2.43.11.51.42.4median 20.9median 24.8median 18.8median 18.9median 20.9Delta3.96.521.23.9hearing rangehide median Fan NoiseKFA2 GeForce RTX 4090 SG
Stromverbrauch Testsystem (Idle)
Stromverbrauch Testsystem (FurMark PT 100 Prozent)
Stromverbrauch Testsystem (FurMark PT 113 Prozent)
Stromverbrauch Testsystem (beim Spielen - The Witcher 3 Ultra Preset)
Stresstest FurMark (PT 100 Prozent)
Power Consumption / The Witcher 3 ultra (external Monitor)
Sapphire AMD Radeon RX 6950 XT Nitro+ Pure
Sapphire AMD Radeon RX 6950 XT Nitro+ Pure, AMD Ryzen 9 5900X
589 (583min, 584P1 - 598max) Watt * -8%
AMD Ryzen 7 5800X3D
AMD Ryzen 7 5800X3D, AMD Ryzen 7 5800X3D (Idle: 102 W)
561 (533min, 542P1 - 582max) Watt * -3%
KFA2 GeForce RTX 4090 SG
KFA2 GeForce RTX 4090 SG, AMD Ryzen 9 7950X
546 (526min, 532P1 - 564max) Watt *
NVIDIA GeForce RTX 3090 Founders Edition
NVIDIA GeForce RTX 3090 Founders Edition, AMD Ryzen 9 7950X
538 (532min, 532P1 - 570max) Watt * +1%
Palit GeForce RTX 4090 GameRock OC
Palit GeForce RTX 4090 GameRock OC, AMD Ryzen 9 7950X
531.8 (520min - 571max) Watt * +3%
KFA2 GeForce RTX 3080 SG
KFA2 GeForce RTX 3080 SG, AMD Ryzen 9 5900X
518 (509min, 510P1 - 539max) Watt * +5%
AMD Radeon RX 6900 XT
AMD Radeon RX 6900 XT, AMD Ryzen 9 5950X (Idle: 99.15 W)
488.3 (459.99min - 512.79max) Watt * +11%
Power Consumption / FurMark 1.19 GPU Stress Test (external Monitor)
KFA2 GeForce RTX 4090 SG
KFA2 GeForce RTX 4090 SG, AMD Ryzen 9 7950X
618 (593min, 605P1 - 652max) Watt *
Palit GeForce RTX 4090 GameRock OC
Palit GeForce RTX 4090 GameRock OC, AMD Ryzen 9 7950X
611 (597.78min - 648.9max) Watt * +1%
Sapphire AMD Radeon RX 6950 XT Nitro+ Pure
Sapphire AMD Radeon RX 6950 XT Nitro+ Pure, AMD Ryzen 9 5900X
564 (525min, 551P1 - 601max) Watt * +9%
NVIDIA GeForce RTX 3090 Founders Edition
NVIDIA GeForce RTX 3090 Founders Edition, AMD Ryzen 9 7950X
516 (512min, 514P1 - 541max) Watt * +17%
KFA2 GeForce RTX 3080 SG
KFA2 GeForce RTX 3080 SG, AMD Ryzen 9 5900X
487 (475min, 477P1 - 501max) Watt * +21%
AMD Radeon RX 6900 XT
AMD Radeon RX 6900 XT, AMD Ryzen 9 5950X (Idle: 99.15 W)
456.8 (378.13min - 484.67max) Watt * +26%

* ... kleinere Werte sind besser

Energieaufnahme mit externem Monitor

03570105140175210245280315350385420455490525560595630Tooltip
KFA2 GeForce RTX 4090 SG; 1280x720 FurMark 1.19 GPU Stress Test (external Monitor): Ø618 (593-652)
KFA2 GeForce RTX 4090 SG; 1920x1080 The Witcher 3 ultra (external Monitor): Ø546 (526-564)
KFA2 GeForce RTX 4090 SG; Idle 1min (external Monitor): Ø90.2 (87.3-94.8)

Pro

+ extreme 3D-Performance
+ moderne 4 nm Architektur
+ 24-GB-VRAM + DLSS + Raytracing in der neuesten Revision
+ Fan-Stop-Mode
+ ansprechendes Design
+ extrem großer und leistungssarkter Kühler
+ optionaler 4. Lüfter
+ stabiler GPU-Halter mit RGB-Beleuchtung

Contra

- hoher Energiebedarf
- ungünstige Position des Stromanschlusses
- sehr groß (Gehäusekompatibilität beachten)
- kein DisplayPort 2.1
- extrem teuer

Fazit - Extrem leistungsstark, leise und kühl

KFA2 GeForce RTX 4090 SG im Test: zur Verfügung gestellt von KFA2 Deutschland

Wer auf der Suche nach der schnellsten Grafikkarte ist, kommt aktuell an einer Nvidia GeForce RTX 4090 nicht vorbei. Nur selten gab es zwischen zwei aufeinanderfolgenden Gennationen einen derart großen Leistungszuwachs. Dabei hebt Nvidia die Leistungsaufnahme um 100 Watt an, was der des bisherigen Topmodels, der Nvidia GeForce RTX 3090 Ti, entspricht. Dennoch haben wir die maximalen 450 Watt bei der GPU nur selten gesehen, was bedeutet, dass die GeForce RTX 4090 aktuell nicht in allen Spielen zu 100 Prozent ausgereizt wird. Die KFA2 GeForce RTX 4090 SG macht da keine Ausnahme und bietet die gleiche Leistung als unser Dauertestgerät, die Palit GeForce RTX 4090 GameRock OC. Aufgrund des sehr ausladenden Kühlers und der drei großen Lüfter sind die Temperaturen immer im grünen Bereich. Spielereien wie RGB sind mit dabei und lassen sich über die hauseigene Software sehr gut steuern. Gleiches gilt für die Lüfter, die zudem im 2D-Betrieb und bei geringer Last sogar ganz stillstehen.

Die KFA2 GeForce RTX 4090 SG ist eine sehr gute Grafikkarte und überzeugt durchweg mit einer sehr hohen Spieleleistung. Ein extrem großer Kühler, bis zu vier Lüfter und viel RGB-Beleuchtung ziehen die Blicke des KFA2-Modells auf sich.

Das Thema Spulenfiepen ist etwas präsent und im subjektiven Vergleich mehr zu hören als beim Kontrahenten aus dem Hause Palit. Als störend würden wir dieses aber noch nicht bezeichnen. Beim verwendeten 12VHPWR-Anschluss kann man geteilter Meinung sein, aber wir konnten bis dato keine Probleme feststellen. Die Positionierung des 12VHPWR-Anschlusses ist nicht optimal, denn durch den großen Adapter, welcher nicht direkt an der Grafikakte geknickt werden sollte, sorgt für Platzprobleme in vielen Gehäusen.

Eine direkte Konkurrenz gibt es für die RTX 4090 aktuell nicht. Somit konkurrieren aktuell nur die verschiedenen Hersteller untereinander. Mit der hier getesteten Grafikkarte tritt KFA2 man nach eigenen Aussagen in den Konkurrenzkampf mit Asus (Strix-Modell) und MSI (Suprim X Modell). Schaut man sich aber einmal die direkten Leistungsdaten an, so gibt es leistungstechnisch hier keine nennenswerten Vorteile. Somit kann man aktuell nur über den Leistungsumfang, die Optik und den Preis auf sich aufmerksam machen. AMD kann aktuell mit seinem Topmodell nicht mithalten und wir müssen uns auf den Start der AMD Radeon RX 7900 XTX gedulden.

Preise und Verfügbarkeit

Die Verfügbarkeit der Grafikkarten ist aktuell gegeben, wenngleich die Preise im Vergleich zur UVP von Nvidia (1.949 Euro) weit übertroffen werden. Die KFA2 GeForce RTX 4090 SG gibt es etwa aktuell für 2.749 Euro bei Amazon. 

Transparenz

Notebookcheck wurde die KFA2 GeForce RTX 4090 SG für diesen Test als Leihstellung zur Verfügung gestellt. Des Weiteren hat der Hersteller keine Version des fertigen Reviews vor der Veröffentlichung erhalten.

Alle 3 Beträge lesen / Antworten
static version load dynamic
Die Kommentare zum Artikel werden geladen
Diesen Artikel kommentieren / Antworten
Teilen Sie diesen Artikel, um uns zu unterstützen. Jeder Link hilft!
> Notebook Test, Laptop Test und News > Tests > Sonstige Tests > KFA2 GeForce RTX 4090 SG im Test: Kompromissloses 4K-Gaming mit dem neuen Nvidia-Flaggschiff
Autor: Sebastian Bade, 29.11.2022 (Update: 30.12.2022)