Leistungsdebüt der Ryzen 7 7745HX: Lenovo Legion Pro 5 16 Gen 8 Laptop Test

Der Lenovo Legion Pro 5 16ARX8 ist die AMD Version des Intel Legion Pro 5 16IRX8. Beide Modelle verwenden das gleiche Legion-Pro-5-16-Gen-8-Gehäuse und sind ansonsten optisch identisch. Wir empfehlen einen Blick auf unsere bestehenden Test über den Legion Pro 5 16IRX8 zu lesen, um mehr über die physikalischen Eigenschaften des Modells zu erfahren, da viele unserer Kommentare auch für das Legion Pro 5 16ARX8 gelten.
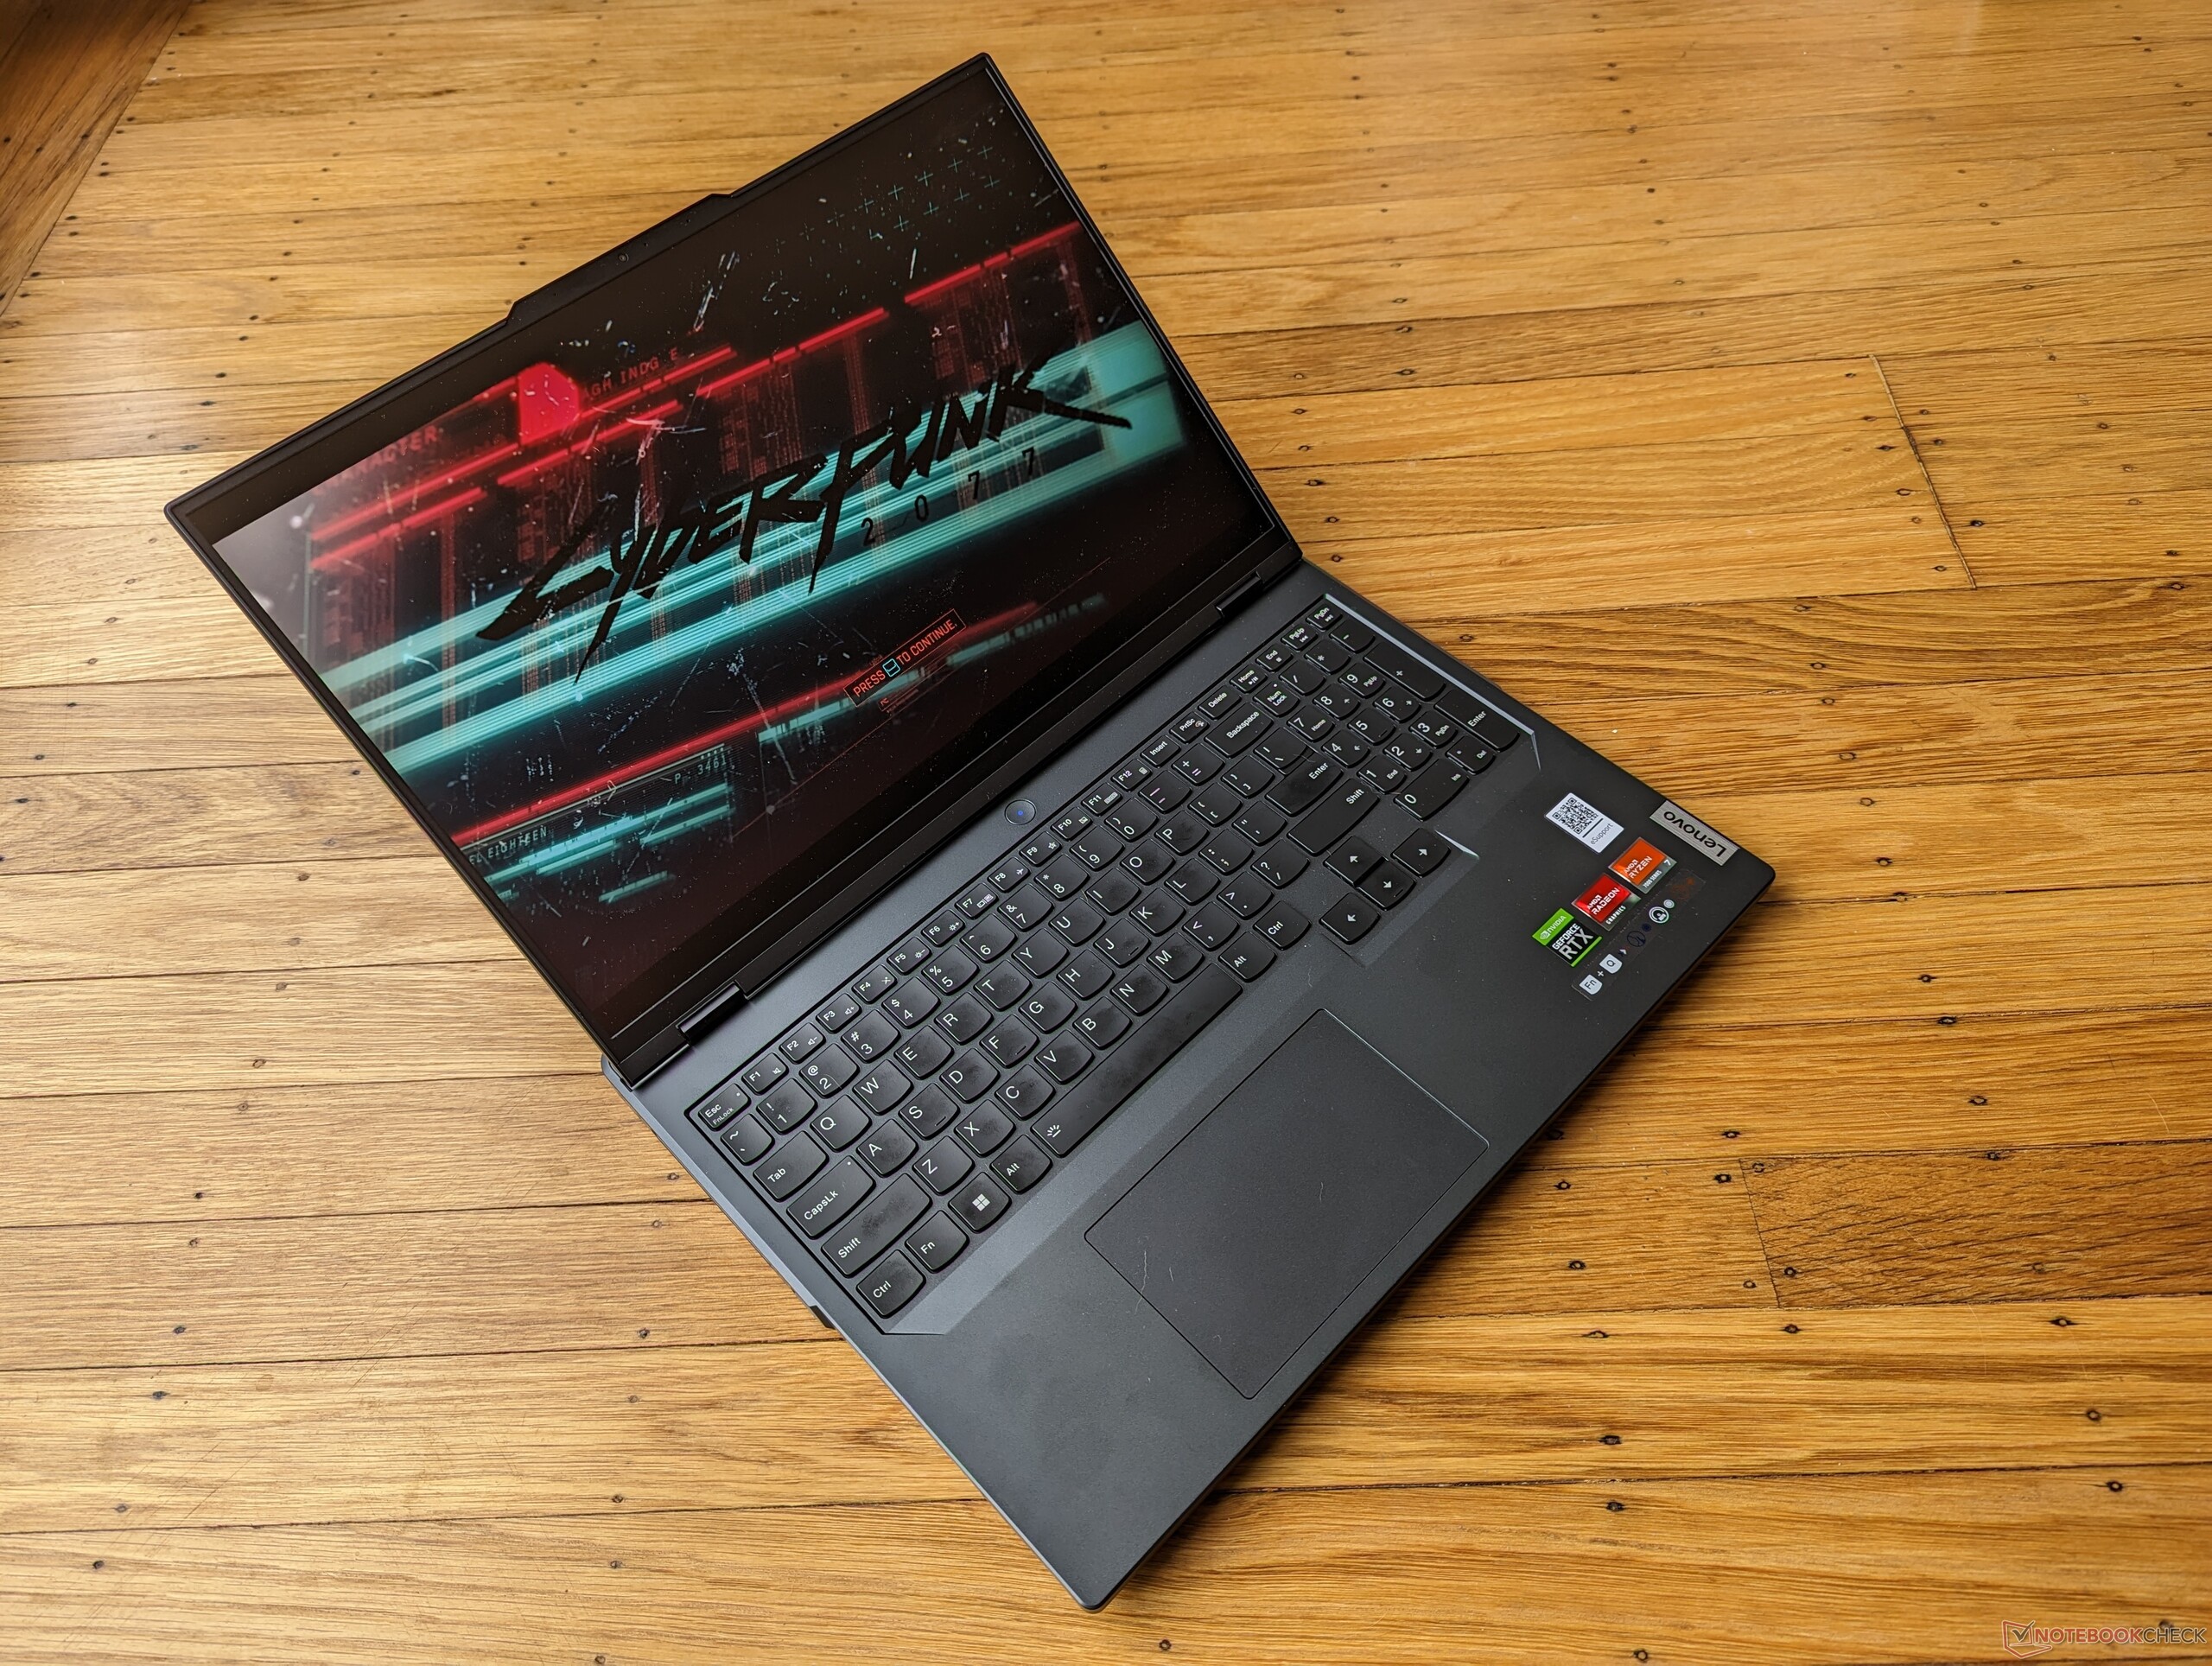
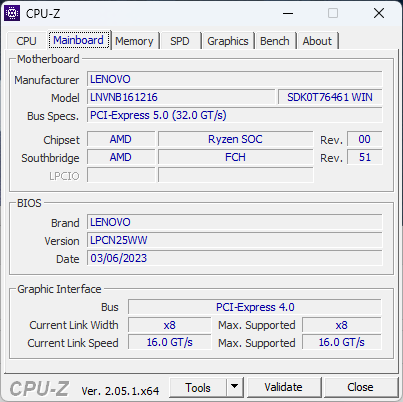
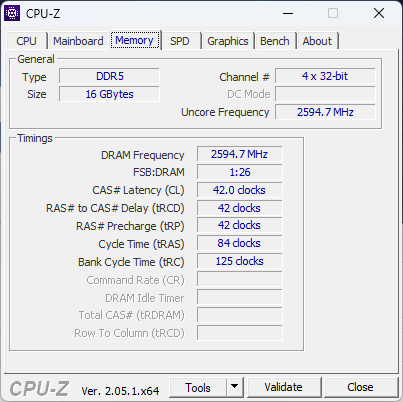
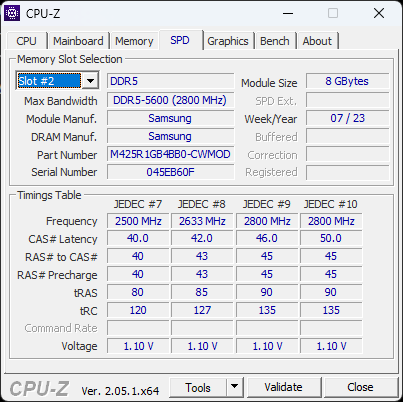
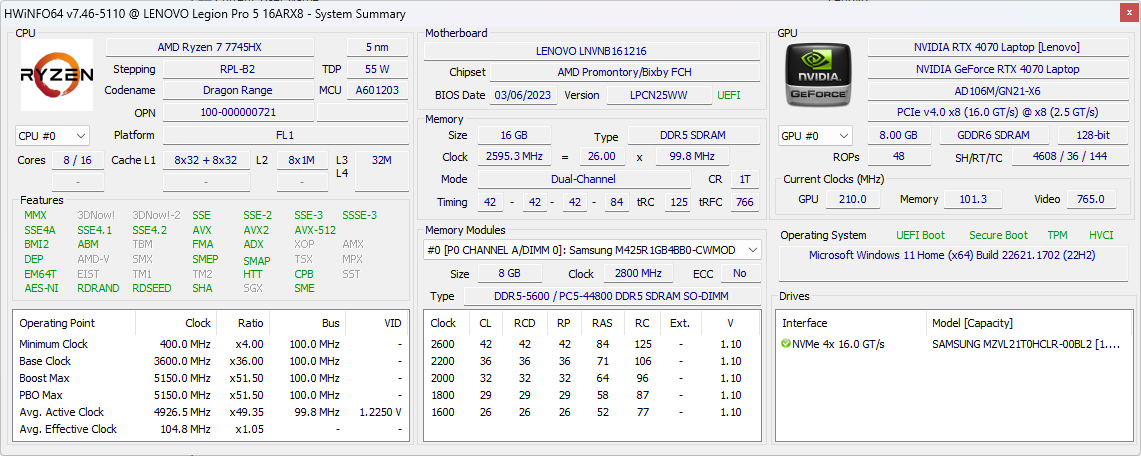
Bei unserem Testgerät handelt es sich um eine High-End-Konfiguration mit Zen-4-Ryzen-7-7745HX-CPU, 140-W-GeForce-RTX-4070-GPU und 165-Hz-1.600p-IPS-Display zum Preis von ca. 1600 US-Dollar. Andere SKUs können den Ryzen 5 7645HX, GeForce RTX 4050 oder ein 240-Hz-IPS-Display beinhalten. Dieses Modell ist eines der ersten, das mit dem Mittelklasse-Ryzen-7-7745HX ausgeliefert wird, während frühere Zen-4-Notebooks nur mit dem teureren Ryzen 9 7945HX erhältlich waren.
Zu den Konkurrenten in diesem Bereich gehören andere Mittelklasse- bis High-End-Gaming-Laptops wie das Asus ROG Strix G16, Razer Blade 16, Uniwill GM6PX7X oder MSI Pulse GL76. Die Legion-7-Serie ist eine Stufe über unserem Legion Pro 5 mit viel schnelleren CPU- und GPU-Optionen zur Auswahl.
Mehr Lenovo Testberichte:
Mögliche Konkurrenten im Vergleich
Bew. | Datum | Modell | Gewicht | Dicke | Größe | Auflösung | Preis ab |
|---|---|---|---|---|---|---|---|
| 88.4 % v7 (old) | 06 / 2023 | Lenovo Legion Pro 5 16ARX8 R7 7745HX, GeForce RTX 4070 Laptop GPU | 2.5 kg | 26.8 mm | 16.00" | 2560x1600 | |
| 87.9 % v7 (old) | 05 / 2023 | Lenovo Legion Pro 5 16IRX8 i7-13700HX, GeForce RTX 4060 Laptop GPU | 2.5 kg | 26.8 mm | 16.00" | 2560x1600 | |
| 88.2 % v7 (old) | Uniwill GM6PX7X RTX 4070 i7-13700HX, GeForce RTX 4070 Laptop GPU | 2.2 kg | 22 mm | 16.00" | 2560x1600 | ||
| 87.7 % v7 (old) | 03 / 2023 | Schenker XMG Neo 16 E23 i9-13900HX, GeForce RTX 4090 Laptop GPU | 2.5 kg | 29.9 mm | 16.00" | 2560x1600 | |
| 88.4 % v7 (old) | 03 / 2023 | Asus ROG Strix G16 G614JZ i9-13980HX, GeForce RTX 4080 Laptop GPU | 2.4 kg | 30.4 mm | 16.00" | 2560x1600 | |
| 88 % v7 (old) | 04 / 2023 | Asus Zephyrus Duo 16 GX650PY-NM006W R9 7945HX, GeForce RTX 4090 Laptop GPU | 2.7 kg | 29.7 mm | 16.00" | 2560x1600 |
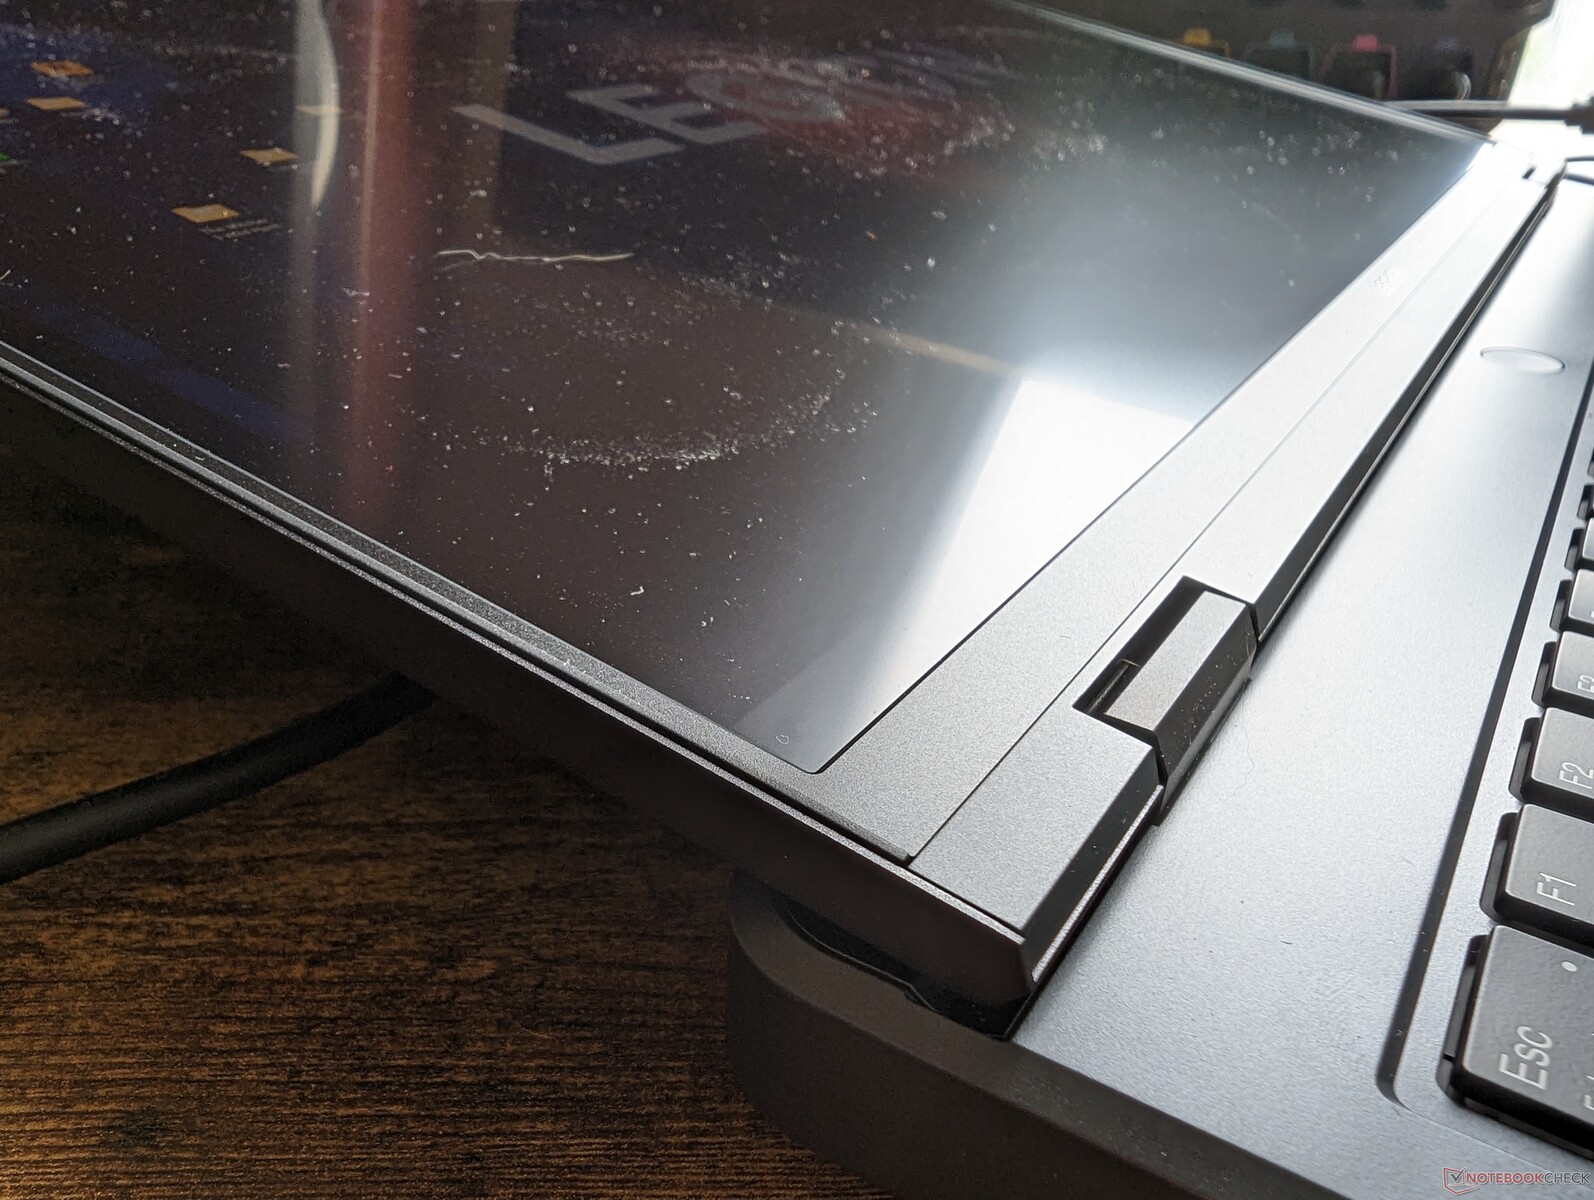
Gehäuse - Gleiches Aussehen mit identischen Ports
Das AMD Legion Pro 5 16ARX8 hat das gleiche Gehäuse wie das Intel Legion Pro 5 16IRX8. Während es normalerweise ein paar Unterschiede zwischen den meisten AMD- und Intel Varianten gibt, existieren zwischen diesen beiden Modellen keine, denn Lenovo hat sich dafür entschieden, sowohl USB 4 als auch Thunderbolt-Unterstützung bei allen Legion-5-Pro-SKUs unabhängig von der CPU-Option auszuschließen. Dies kann als ein Weg gesehen werden, um Benutzer zu zwingen, stattdessen zur teureren Legion-7-Serie zu greifen, die standardmäßig Thunderbolt-Unterstützung bietet.
Kommunikation
Das AMD Modell tauscht den üblichen Intel AX211 gegen den weniger verbreiteten MediaTek MT7922 aus. Die Performance ist ansonsten stabil und zuverlässig, wenn das Gerät mit unserem 6-GHz-Netzwerk verbunden ist.
| Networking | |
| iperf3 transmit AXE11000 | |
| Schenker XMG Neo 16 E23 | |
| Asus ROG Strix G16 G614JZ | |
| Lenovo Legion Pro 5 16ARX8 | |
| Uniwill GM6PX7X RTX 4070 | |
| Lenovo Legion Pro 5 16IRX8 | |
| iperf3 receive AXE11000 | |
| Schenker XMG Neo 16 E23 | |
| Asus ROG Strix G16 G614JZ | |
| Lenovo Legion Pro 5 16ARX8 | |
| Uniwill GM6PX7X RTX 4070 | |
| Lenovo Legion Pro 5 16IRX8 | |
| iperf3 transmit AXE11000 6GHz | |
| Asus Zephyrus Duo 16 GX650PY-NM006W | |
| Lenovo Legion Pro 5 16ARX8 | |
| Lenovo Legion Pro 5 16IRX8 | |
| iperf3 receive AXE11000 6GHz | |
| Asus Zephyrus Duo 16 GX650PY-NM006W | |
| Lenovo Legion Pro 5 16ARX8 | |
| Lenovo Legion Pro 5 16IRX8 | |
Webcam


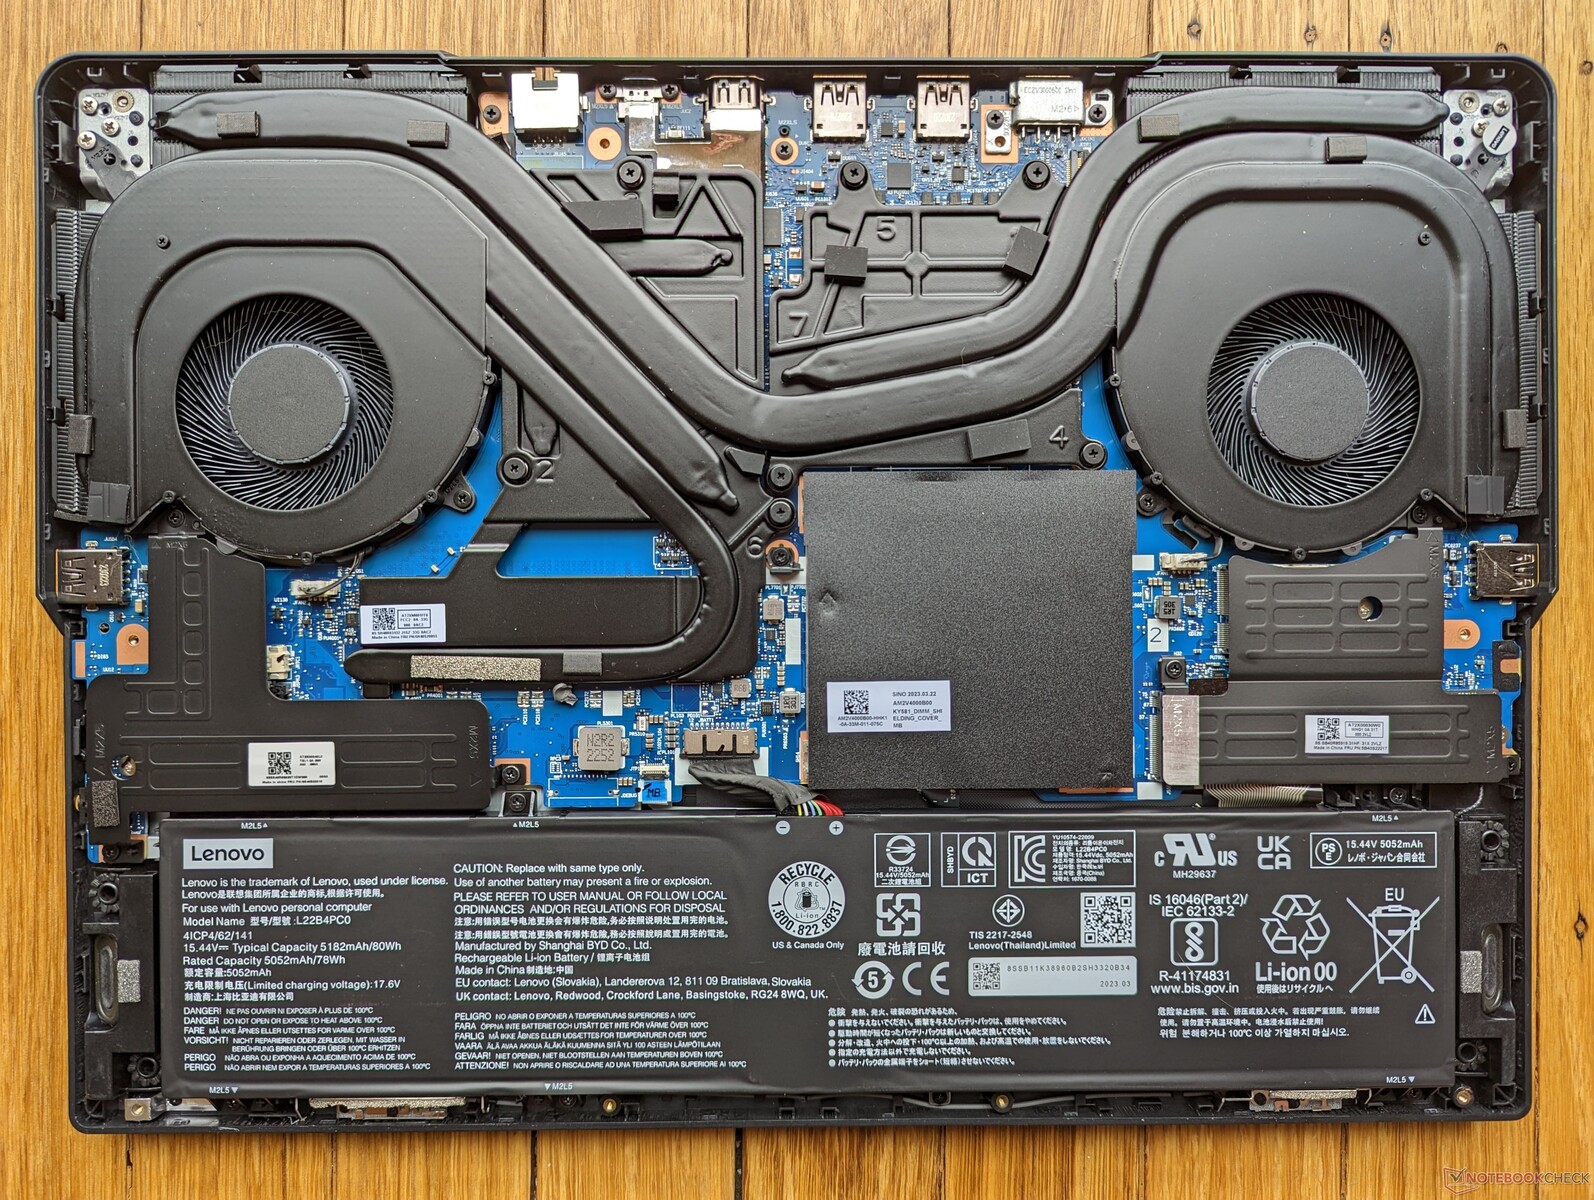
Wartung
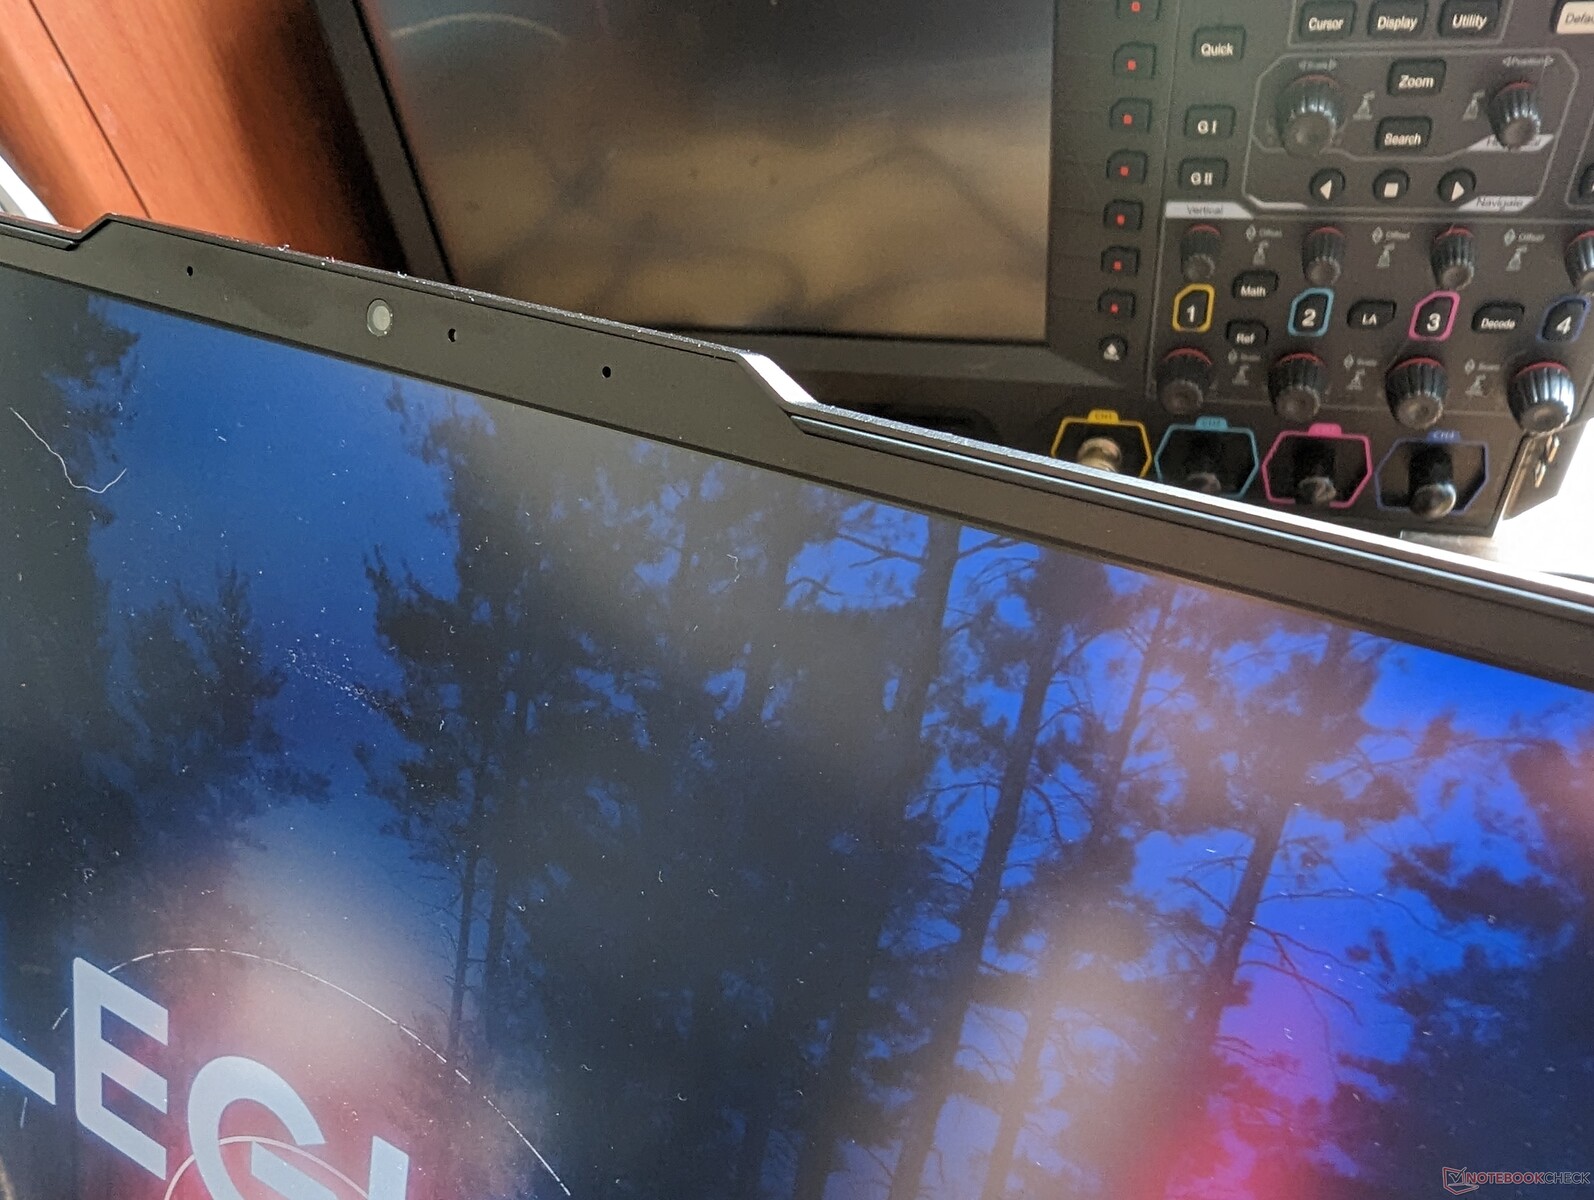
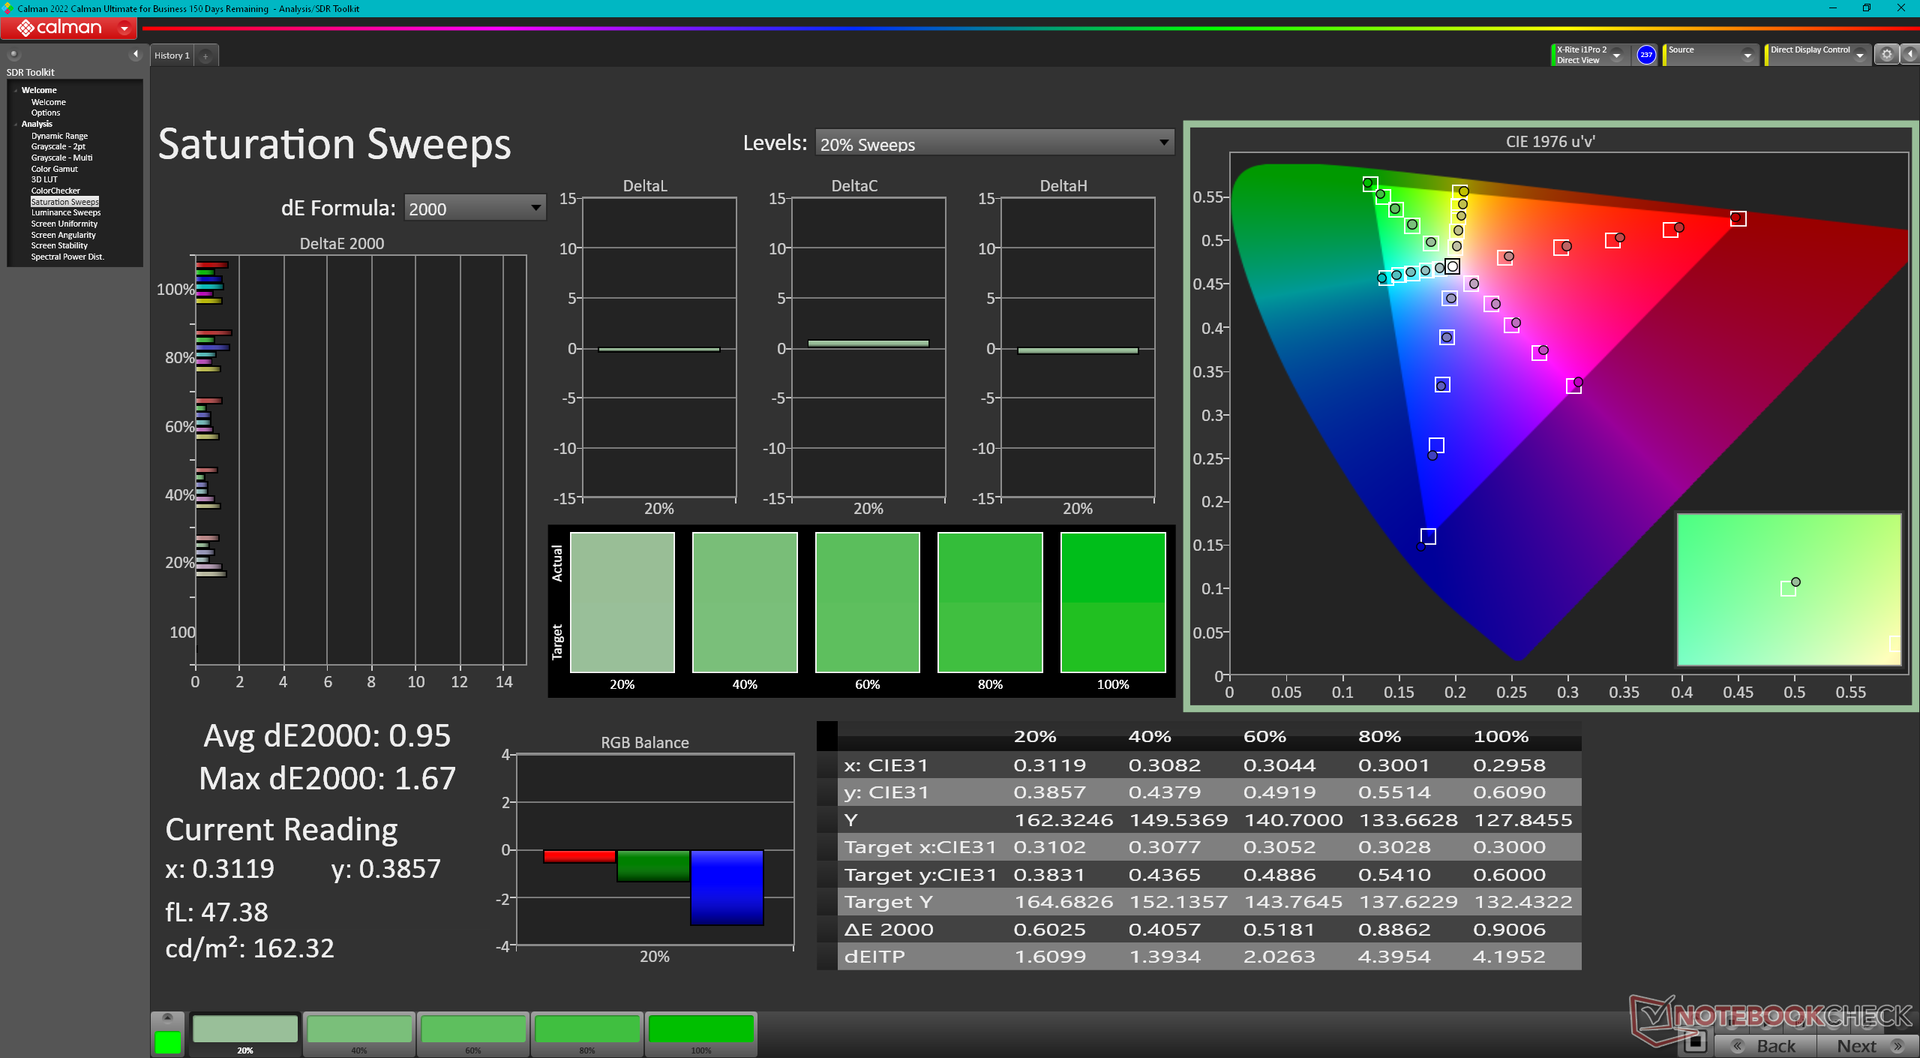
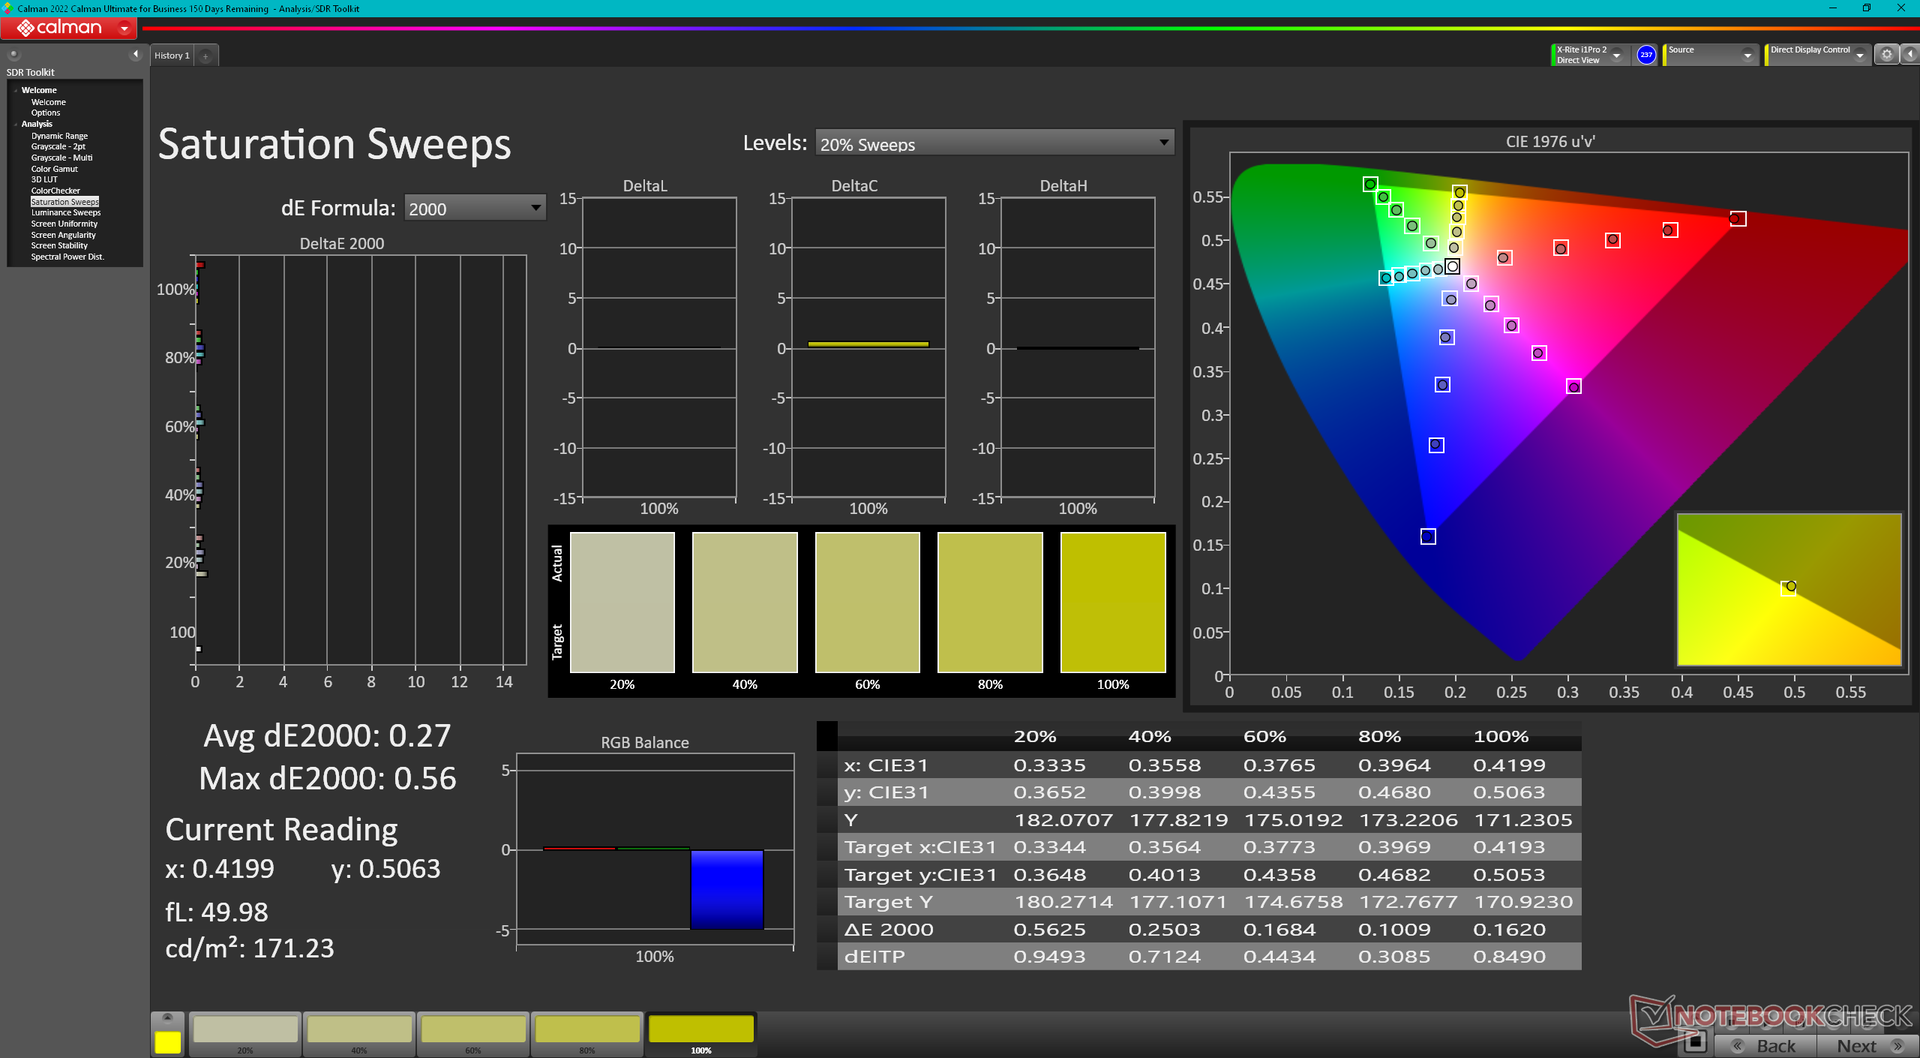
Display - 165 Hz, 1.600p und volles sRGB
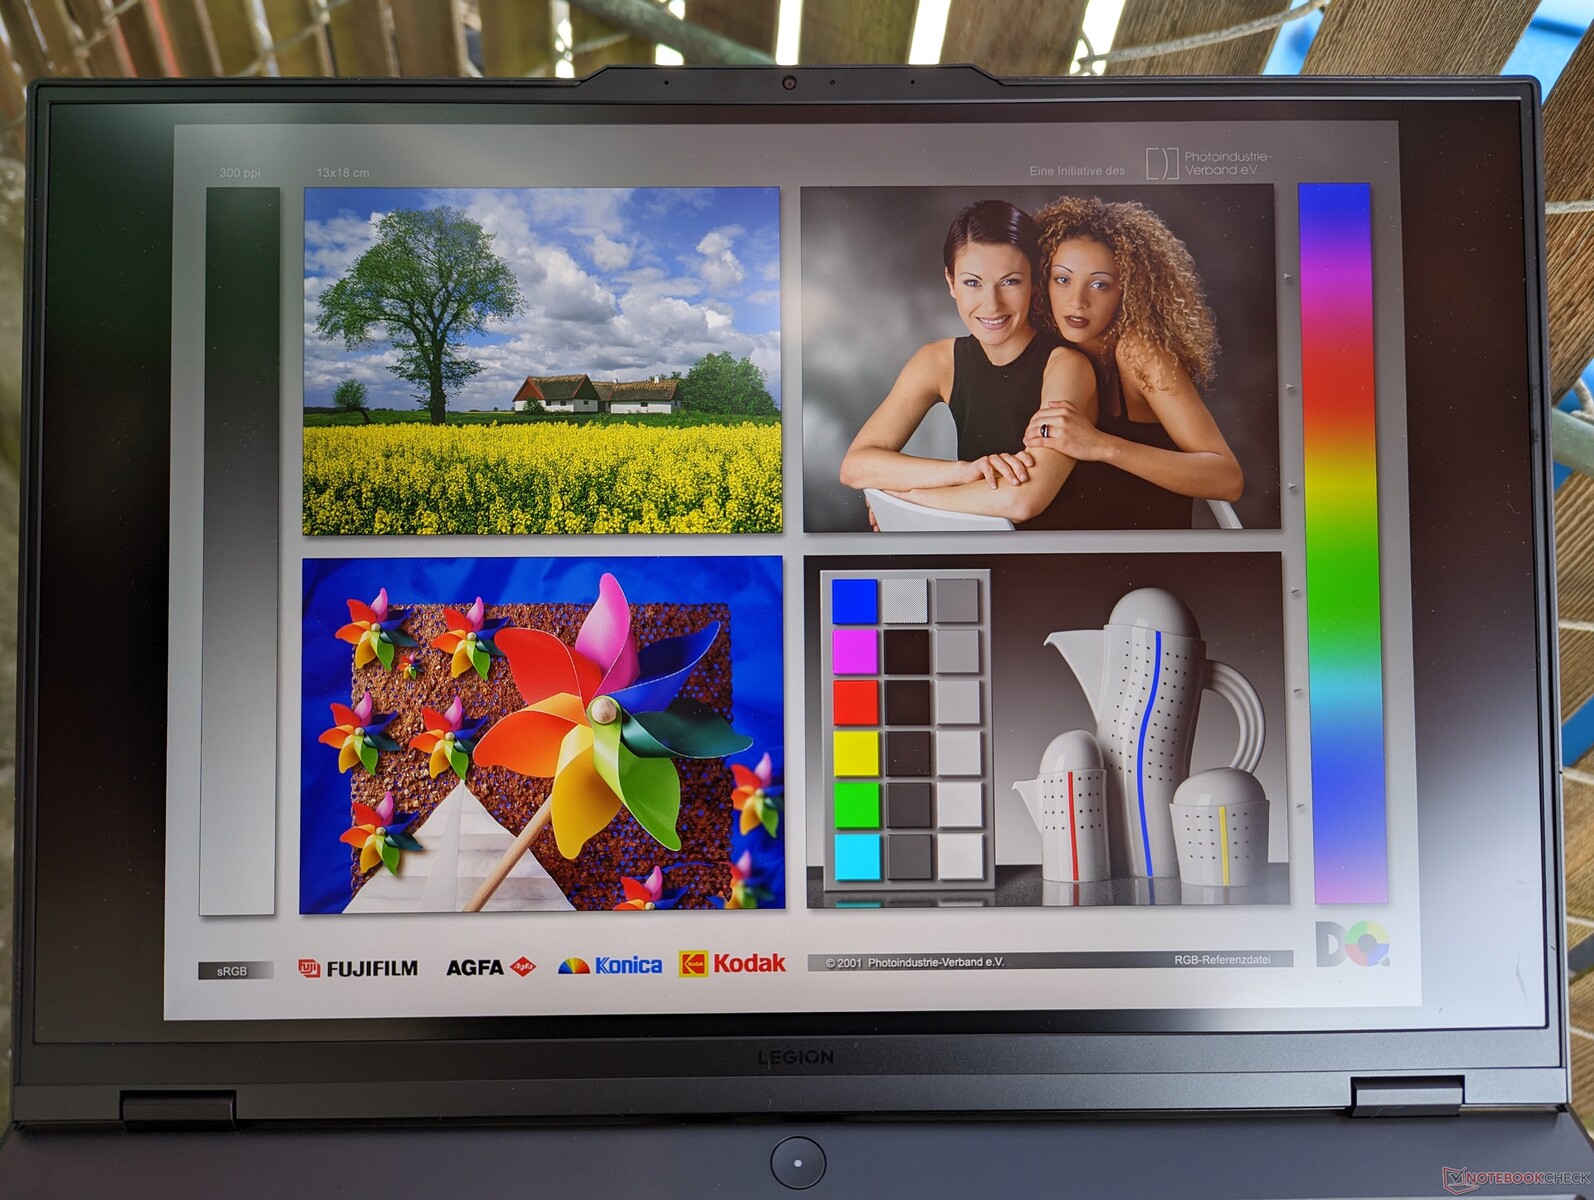
Interessanterweise verwendet unser AMD Legion Pro 5 16ARX8 ein anderes IPS-Panel als das Intel Legion Pro 5 16IRX8 (CSOT MNG007DA1-Q vs. AU Optronics B160QAN03.1), obwohl beide Panels eine ähnliche native Bildwiederholrate von 165 Hz, eine native 1.600p-Auflösung, ein Kontrastverhältnis von ~1.000:1 und eine 100-%ige sRGB-Abdeckung haben. Das CSOT-Panel hat eine etwas schnellere Schwarz-Weiß- und Grau-Reaktionszeit, aber die Unterschiede sind bestenfalls marginal für ein im Wesentlichen identisches Seherlebnis.
Ein zweites Panel ist erhältlich, das eine noch hellere Hintergrundbeleuchtung mit 500 Nits und eine schnellere Bildwiederholfrequenz von 240 Hz verspricht. Unsere Messungen unten beziehen sich nur auf das Basis-Panel mit 165 Hz.

| |||||||||||||||||||||||||
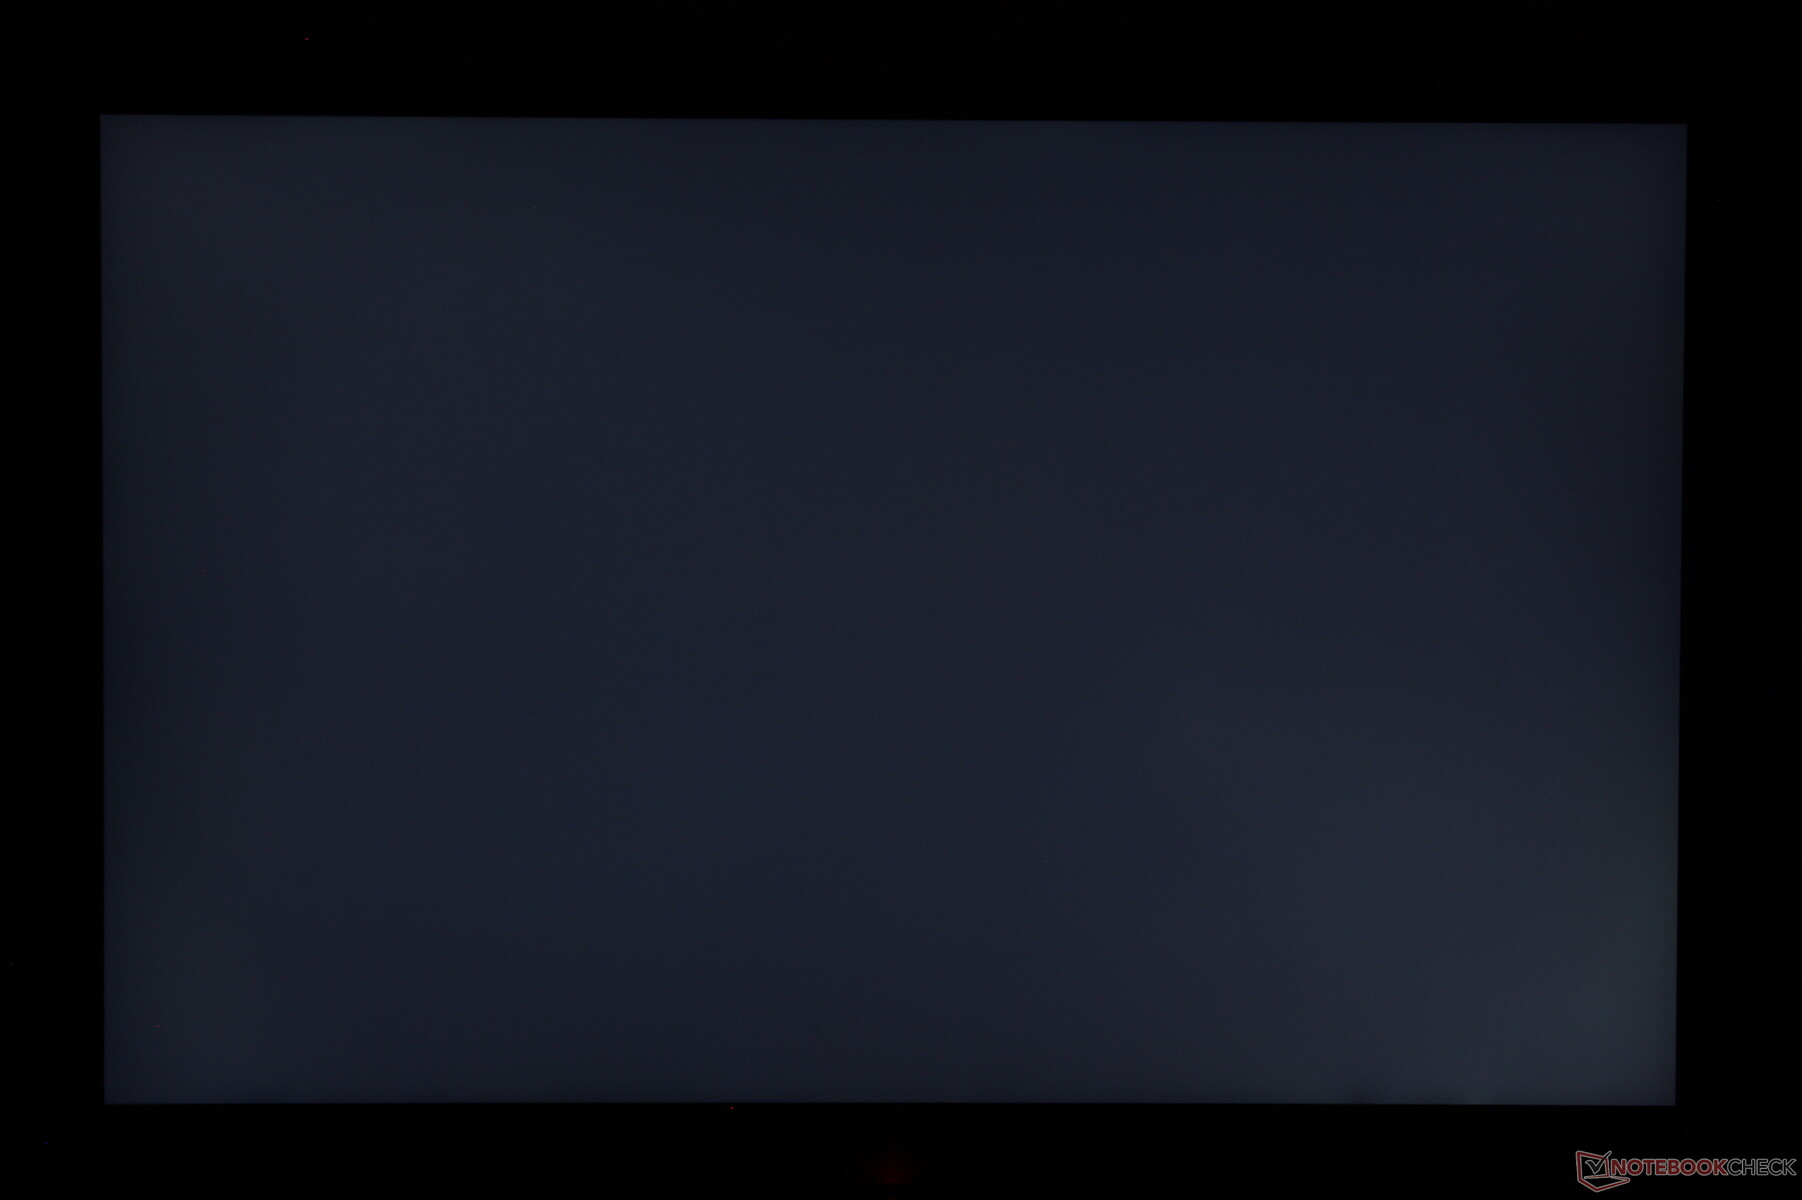
Ausleuchtung: 91 %
Helligkeit Akku: 355.3 cd/m²
Kontrast: 1110:1 (Schwarzwert: 0.32 cd/m²)
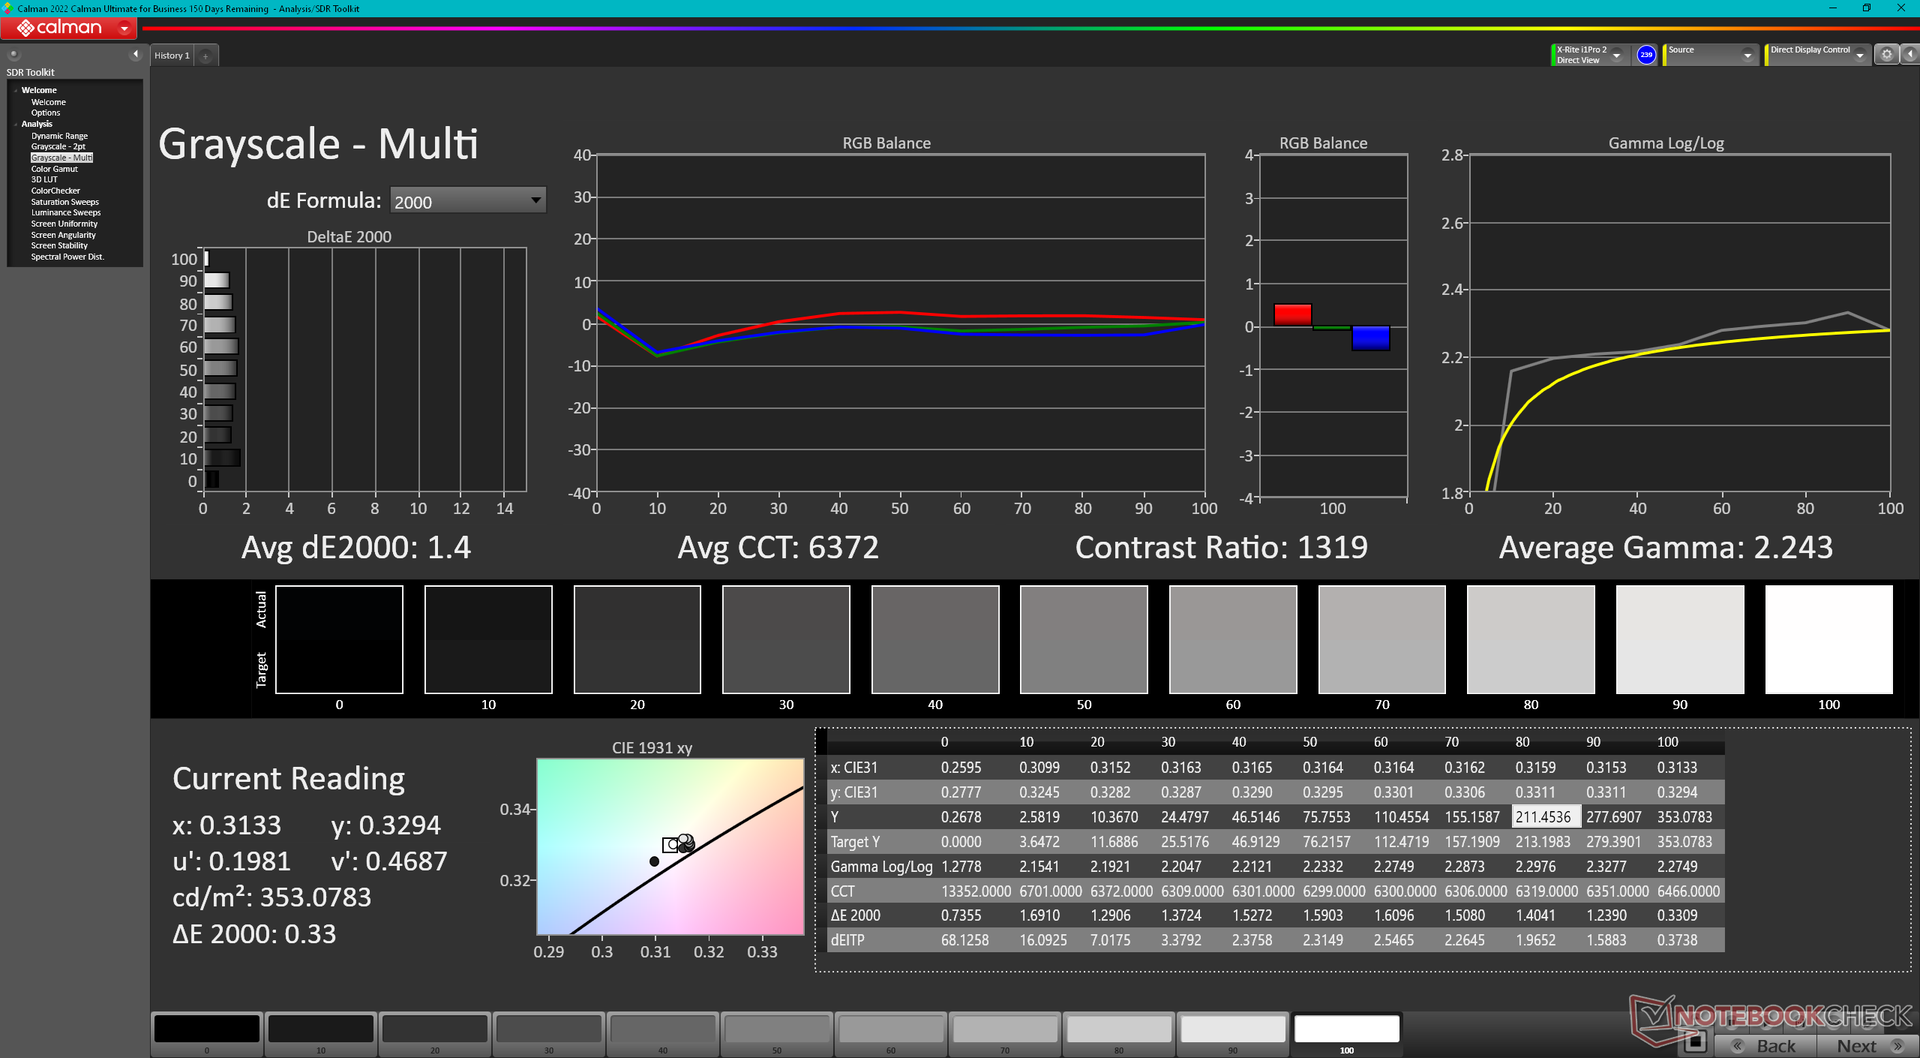
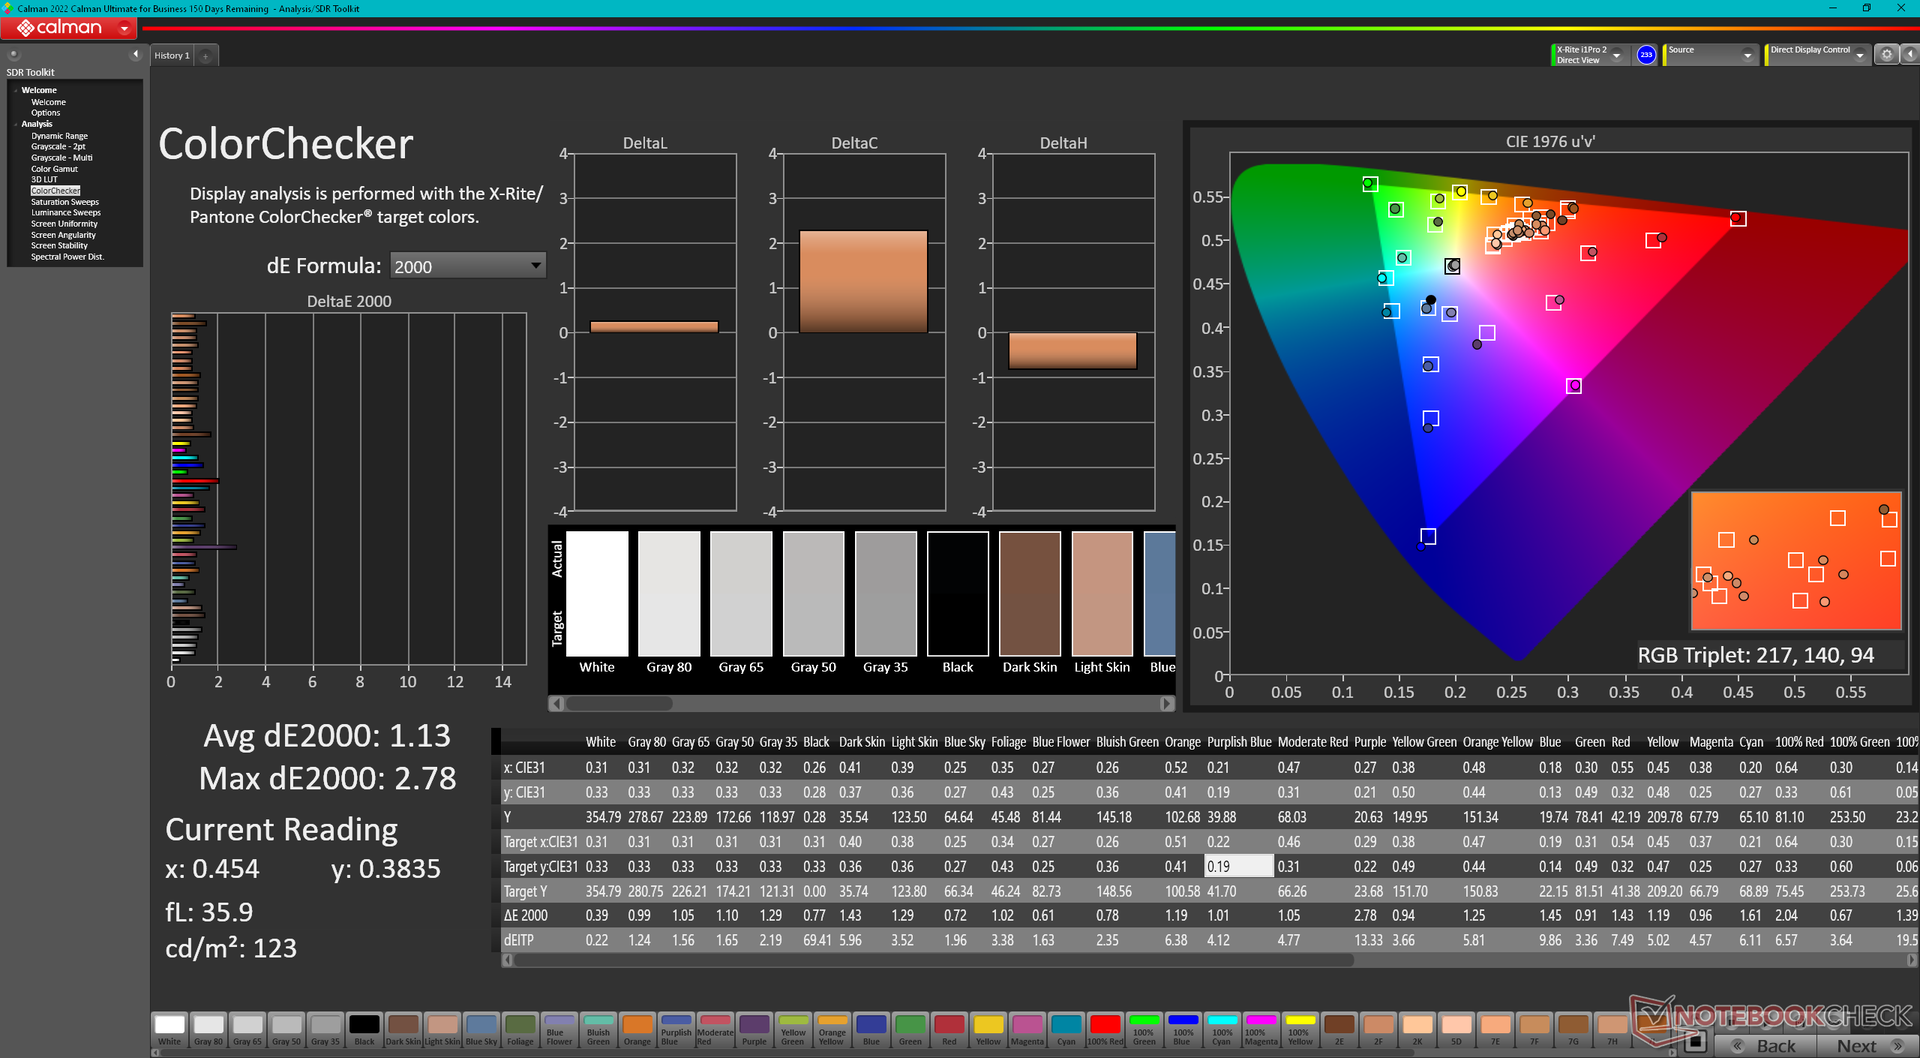
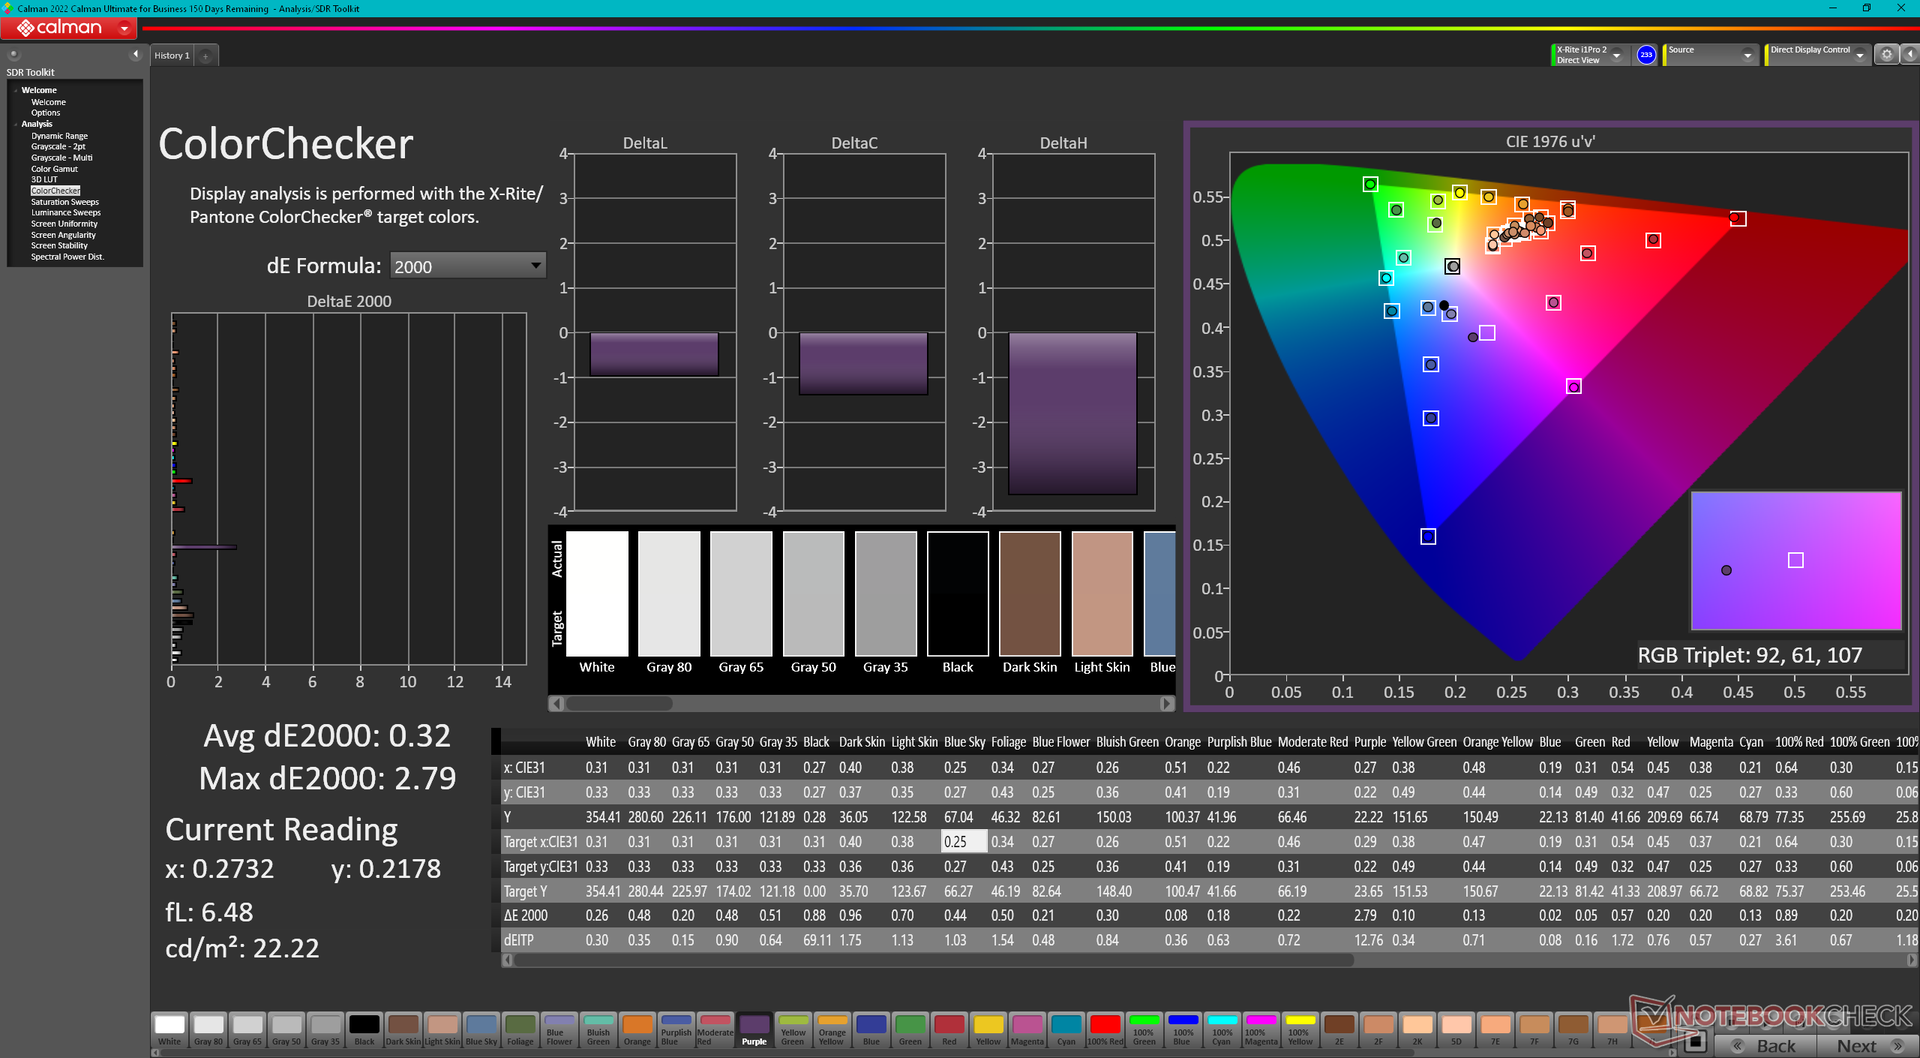
ΔE ColorChecker Calman: 1.13 | ∀{0.5-29.43 Ø4.72}
calibrated: 0.32
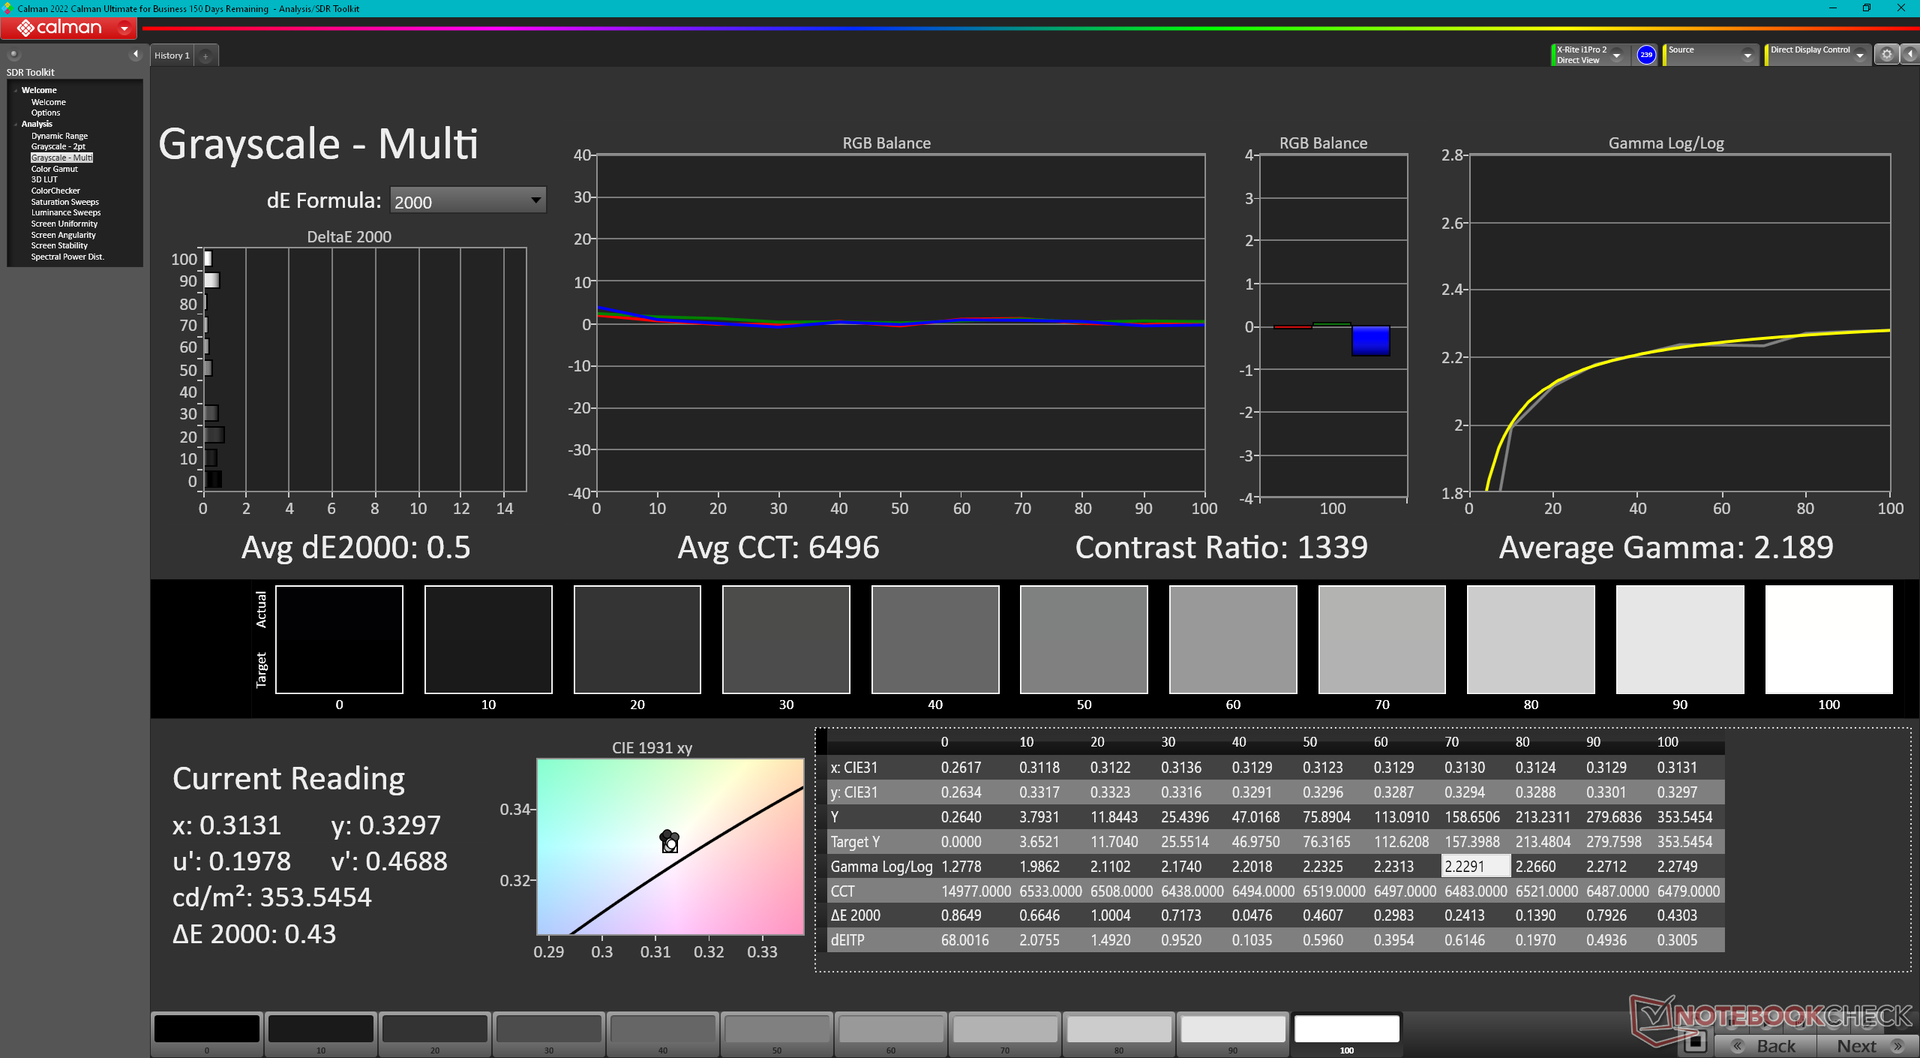
ΔE Greyscale Calman: 1.4 | ∀{0.09-98 Ø4.97}
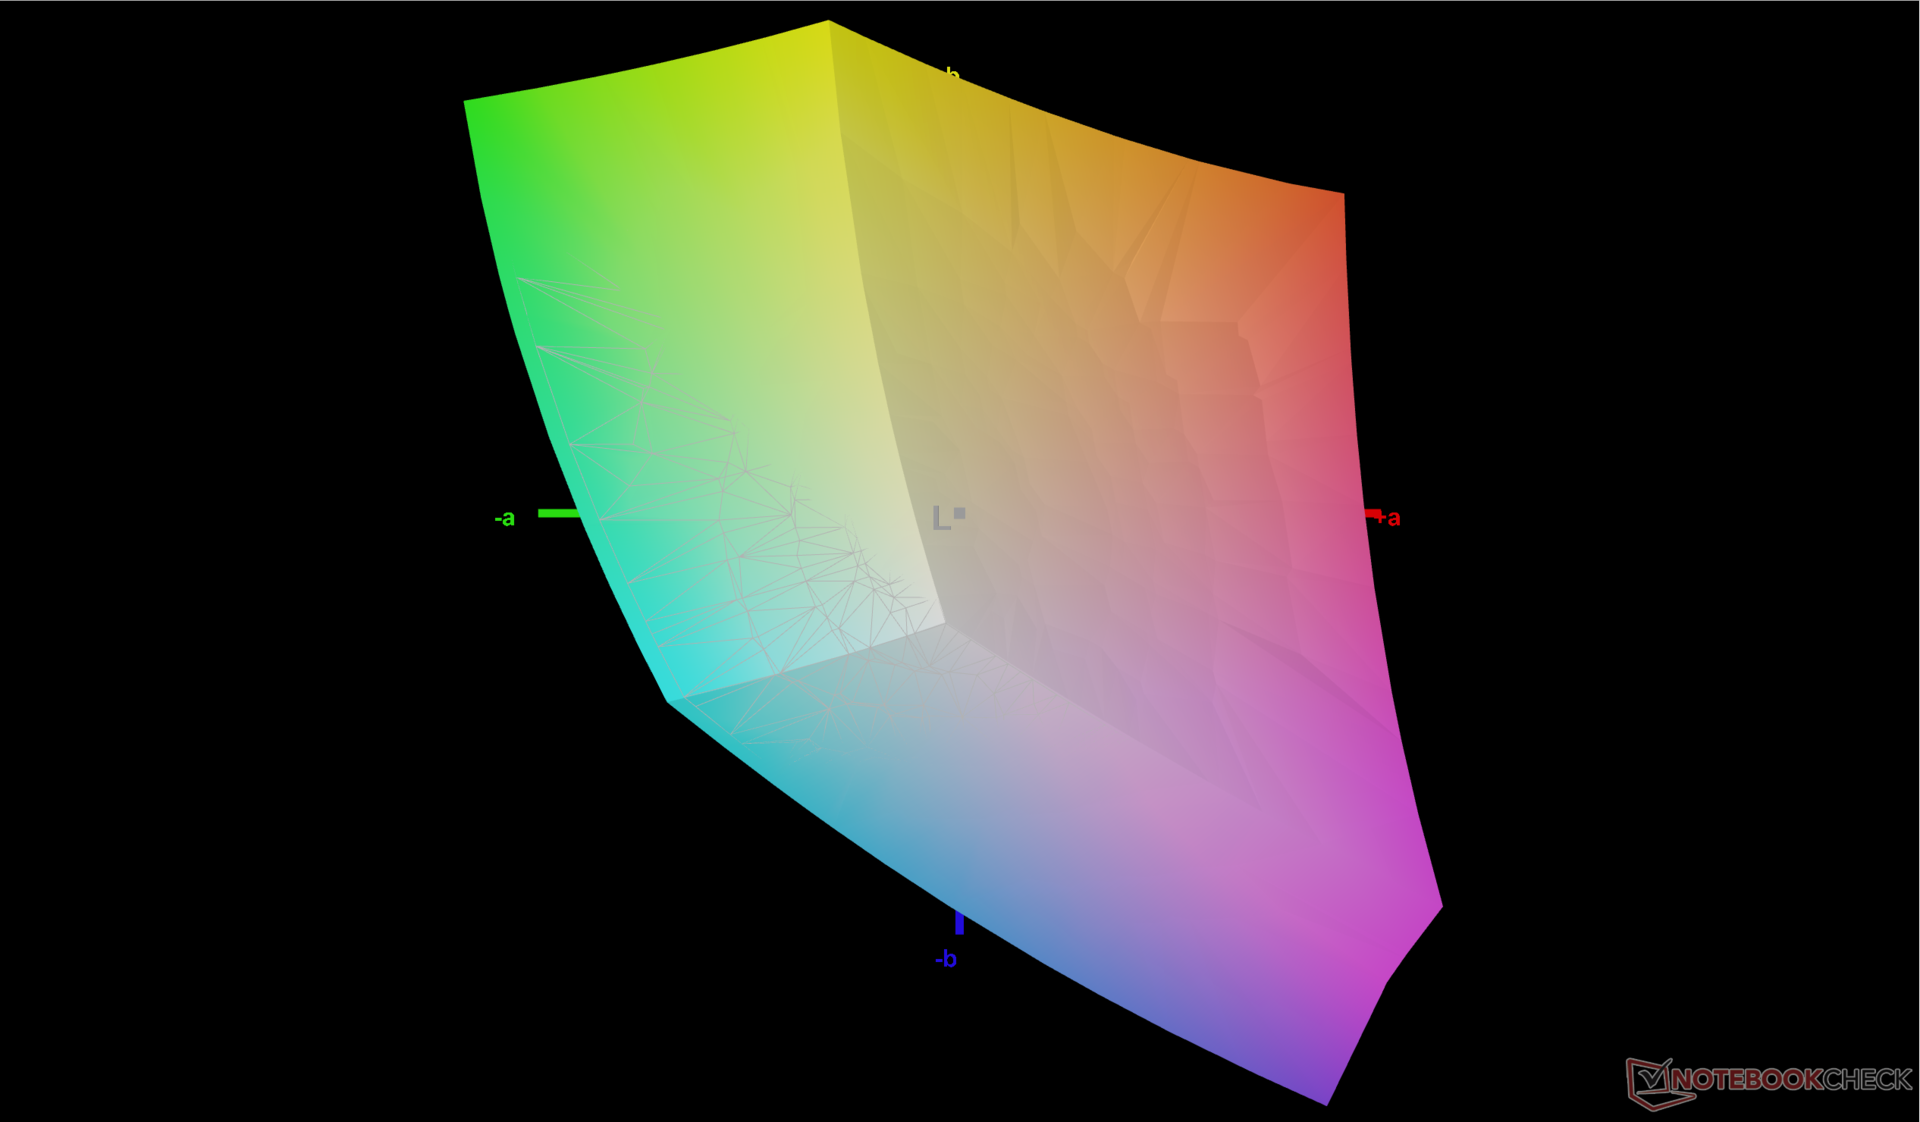
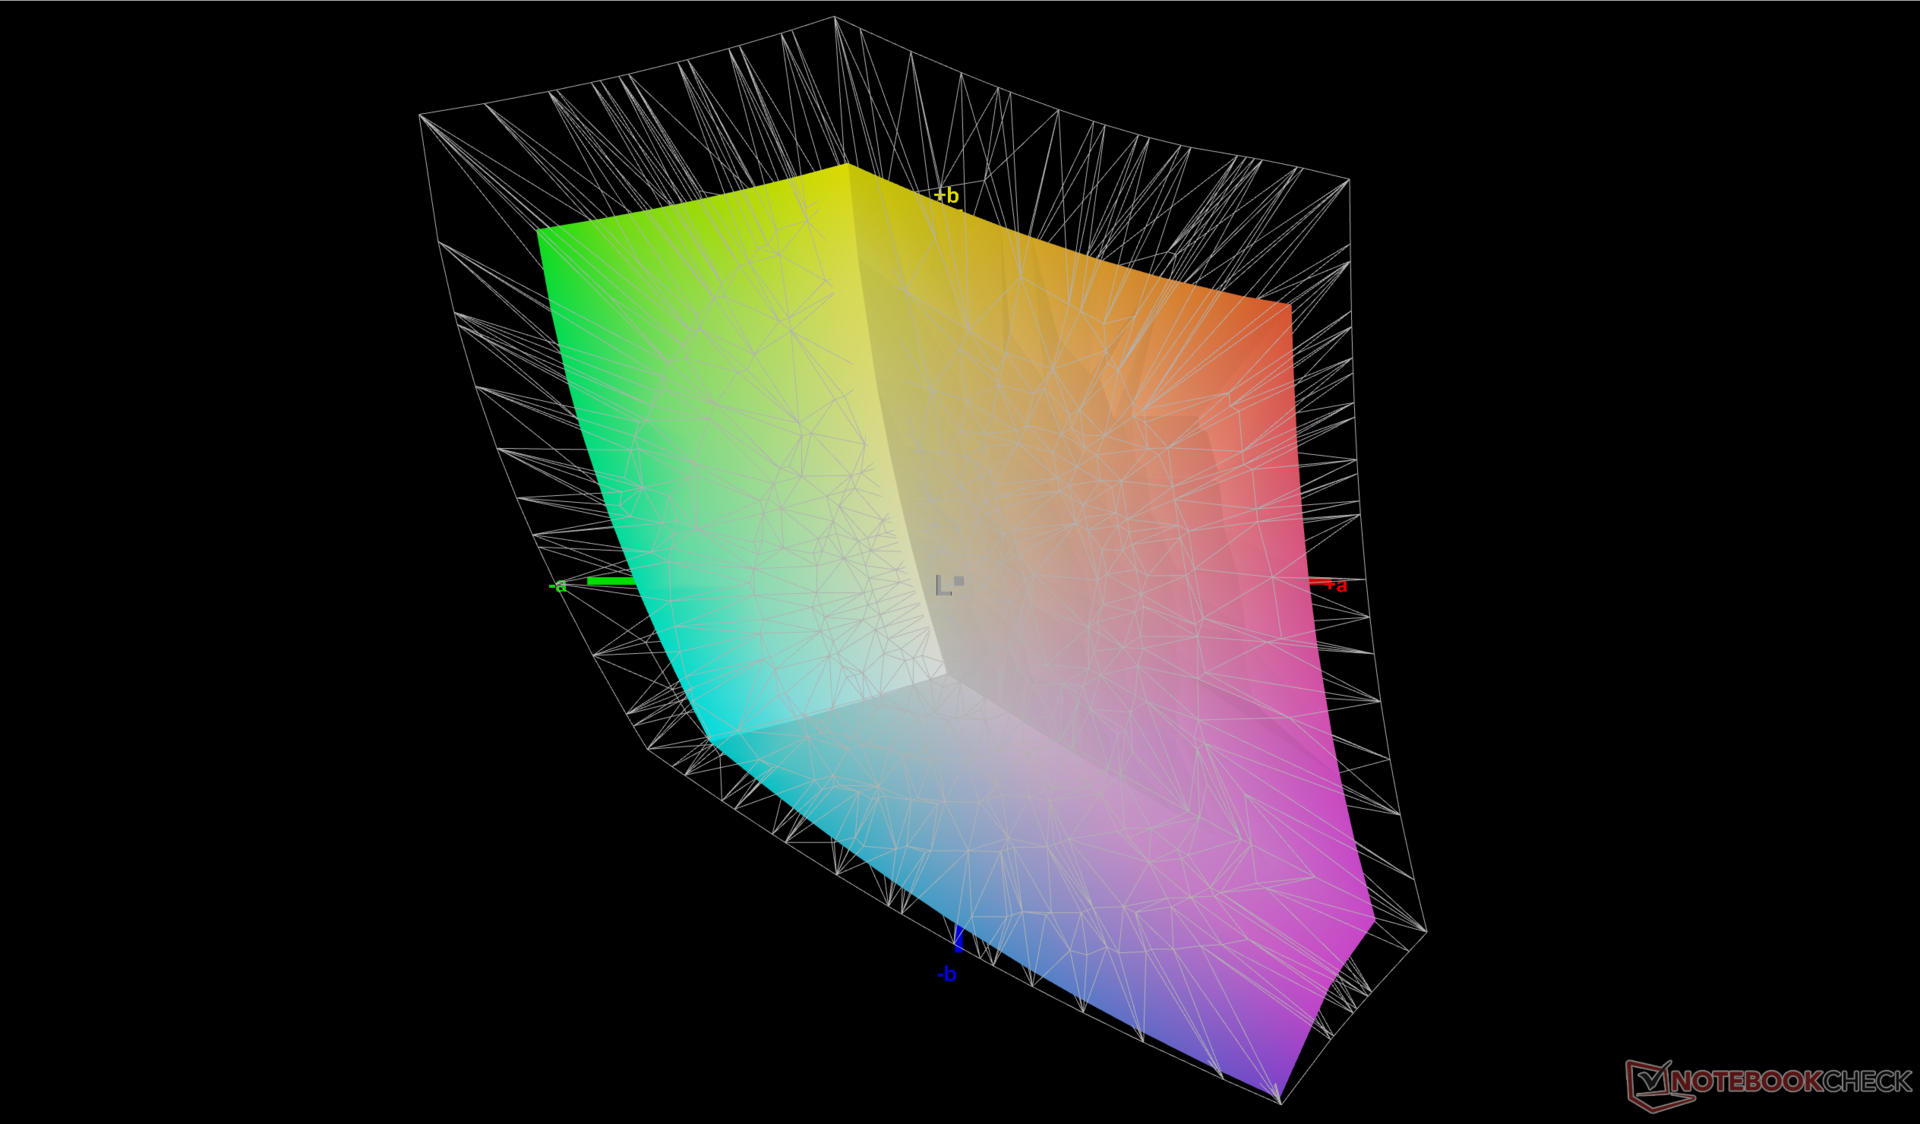
72.6% AdobeRGB 1998 (Argyll 3D)
99.6% sRGB (Argyll 3D)
70.4% Display P3 (Argyll 3D)
Gamma: 2.24
CCT: 6372 K
| Lenovo Legion Pro 5 16ARX8 CSOT T3 MNG007DA1-Q, IPS, 2560x1600, 16" | Lenovo Legion Pro 5 16IRX8 AU Optronics B160QAN03.1, IPS, 2560x1600, 16" | Uniwill GM6PX7X RTX 4070 BOE CQ NE160QDM-NZ1, IPS, 2560x1600, 16" | Schenker XMG Neo 16 E23 BOE0AF0 NE160QDM-NZ1, IPS, 2560x1600, 16" | Asus ROG Strix G16 G614JZ TL160ADMP03-0, IPS, 2560x1600, 16" | Asus Zephyrus Duo 16 GX650PY-NM006W NE160QDM-NM4, MiniLED, 2560x1600, 16" | |
|---|---|---|---|---|---|---|
| Display | 0% | -4% | -4% | 18% | 22% | |
| Display P3 Coverage (%) | 70.4 | 71.2 1% | 67.5 -4% | 67.3 -4% | 97 38% | 99.4 41% |
| sRGB Coverage (%) | 99.6 | 98.8 -1% | 96.4 -3% | 96.7 -3% | 99.9 0% | 100 0% |
| AdobeRGB 1998 Coverage (%) | 72.6 | 73.3 1% | 68.6 -6% | 68.9 -5% | 84.9 17% | 90.8 25% |
| Response Times | -61% | -44% | -51% | 27% | -113% | |
| Response Time Grey 50% / Grey 80% * (ms) | 7 ? | 14.5 ? -107% | 12.6 ? -80% | 14.5 ? -107% | 5.1 ? 27% | 15.2 ? -117% |
| Response Time Black / White * (ms) | 9.1 ? | 10.4 ? -14% | 9.8 ? -8% | 8.6 ? 5% | 6.6 ? 27% | 19 ? -109% |
| PWM Frequency (Hz) | 12000 ? | |||||
| Bildschirm | -17% | -69% | -54% | -39% | 71% | |
| Helligkeit Bildmitte (cd/m²) | 355.3 | 405.7 14% | 338.6 -5% | 372 5% | 470 32% | 712 100% |
| Brightness (cd/m²) | 340 | 368 8% | 328 -4% | 349 3% | 459 35% | 703 107% |
| Brightness Distribution (%) | 91 | 87 -4% | 89 -2% | 88 -3% | 93 2% | 95 4% |
| Schwarzwert * (cd/m²) | 0.32 | 0.38 -19% | 0.32 -0% | 0.32 -0% | 0.42 -31% | 0.07 78% |
| Kontrast (:1) | 1110 | 1068 -4% | 1058 -5% | 1163 5% | 1119 1% | 10171 816% |
| Delta E Colorchecker * | 1.13 | 1.65 -46% | 2.18 -93% | 2.06 -82% | 1.86 -65% | 1.7 -50% |
| Colorchecker dE 2000 max. * | 2.78 | 4.2 -51% | 7.14 -157% | 3 -8% | 3.87 -39% | 4 -44% |
| Colorchecker dE 2000 calibrated * | 0.32 | 0.53 -66% | 0.93 -191% | 1.5 -369% | 0.93 -191% | 1.2 -275% |
| Delta E Graustufen * | 1.4 | 1.2 14% | 3.7 -164% | 1.9 -36% | 2.7 -93% | 2.8 -100% |
| Gamma | 2.24 98% | 2.3 96% | 2.18 101% | 2.312 95% | 2.246 98% | 2.21 100% |
| CCT | 6372 102% | 6453 101% | 7245 90% | 6747 96% | 6711 97% | 6978 93% |
| Durchschnitt gesamt (Programm / Settings) | -26% /
-20% | -39% /
-52% | -36% /
-43% | 2% /
-17% | -7% /
34% |
* ... kleinere Werte sind besser
Das Display wird vorkalibriert geliefert ab Werk mit hervorragenden durchschnittlichen Graustufen- und Farb-DeltaE-Werten von nur 1,4 bzw. 1,13. Der Versuch, das Display mit unserem X-Rite-Kolorimeter noch weiter zu kalibrieren, verbessert die Graustufen- und Farb-DeltaE-Werte sogar auf jeweils nur <0,5. Dennoch ist eine Endbenutzerkalibrierung im Allgemeinen nicht erforderlich, wenn die DeltaE-Werte bereits <2 sind.
Reaktionszeiten (Response Times) des Displays
| ↔ Reaktionszeiten Schwarz zu Weiß | ||
|---|---|---|
| 9.1 ms ... steigend ↗ und fallend ↘ kombiniert | ↗ 4.9 ms steigend | 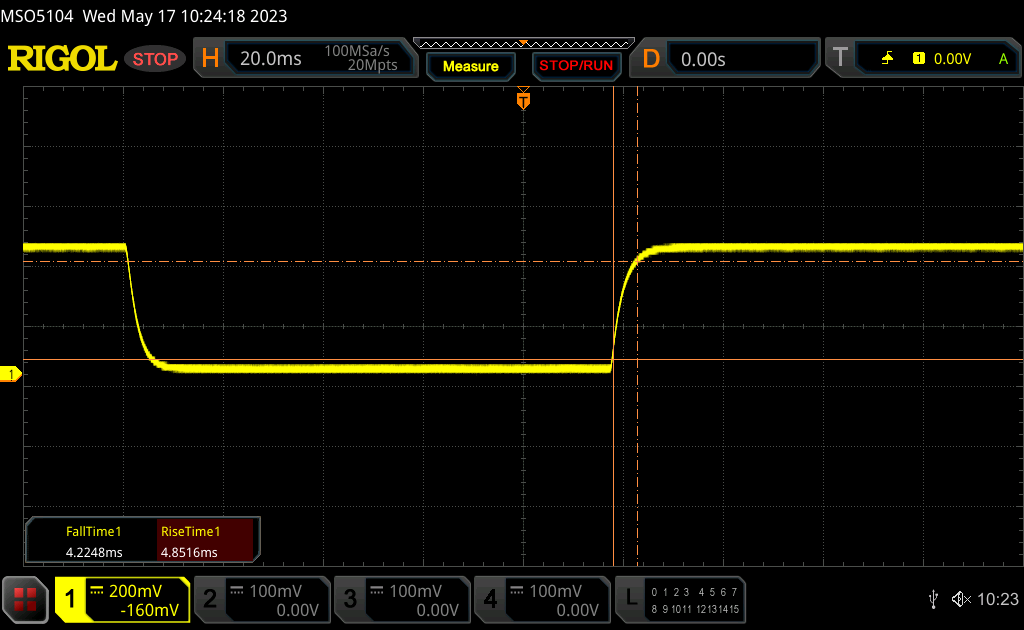 |
| ↘ 4.2 ms fallend | ||
| Die gemessenen Reaktionszeiten sind kurz wodurch sich der Bildschirm auch für Spiele gut eignen sollte. Im Vergleich rangierten die bei uns getesteten Geräte von 0.1 (Minimum) zu 240 (Maximum) ms. » 26 % aller Screens waren schneller als der getestete. Daher sind die gemessenen Reaktionszeiten besser als der Durchschnitt aller vermessenen Geräte (19.8 ms). | ||
| ↔ Reaktionszeiten 50% Grau zu 80% Grau | ||
| 7 ms ... steigend ↗ und fallend ↘ kombiniert | ↗ 3.2 ms steigend | 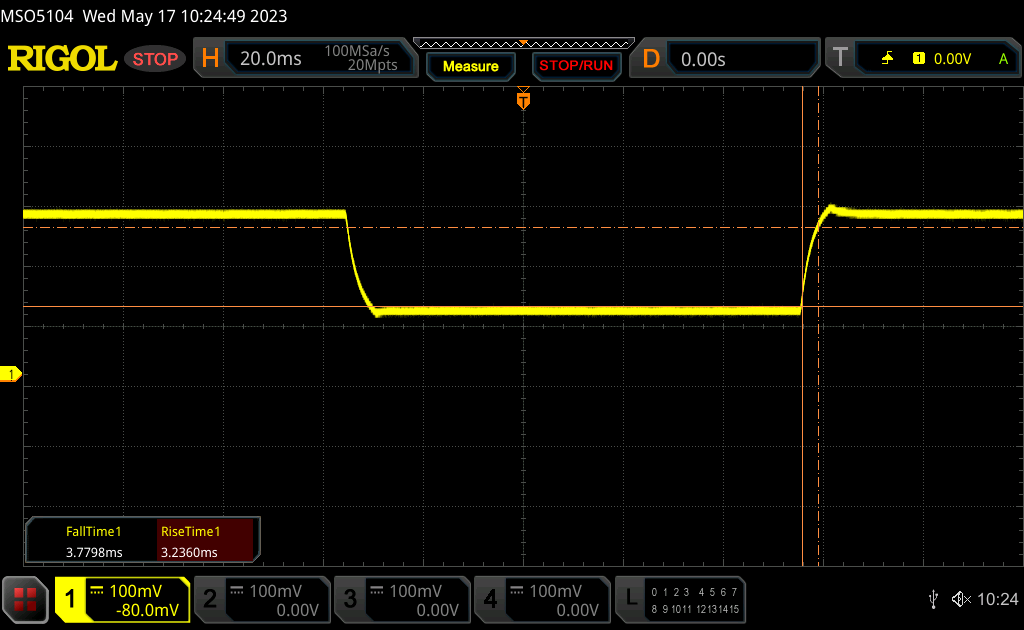 |
| ↘ 3.8 ms fallend | ||
| Die gemessenen Reaktionszeiten sind sehr kurz, wodurch sich der Bildschirm auch für schnelle 3D Spiele eignen sollte. Im Vergleich rangierten die bei uns getesteten Geräte von 0.165 (Minimum) zu 636 (Maximum) ms. » 20 % aller Screens waren schneller als der getestete. Daher sind die gemessenen Reaktionszeiten besser als der Durchschnitt aller vermessenen Geräte (31 ms). | ||
Bildschirm-Flackern / PWM (Pulse-Width Modulation)
| Flackern / PWM nicht festgestellt | 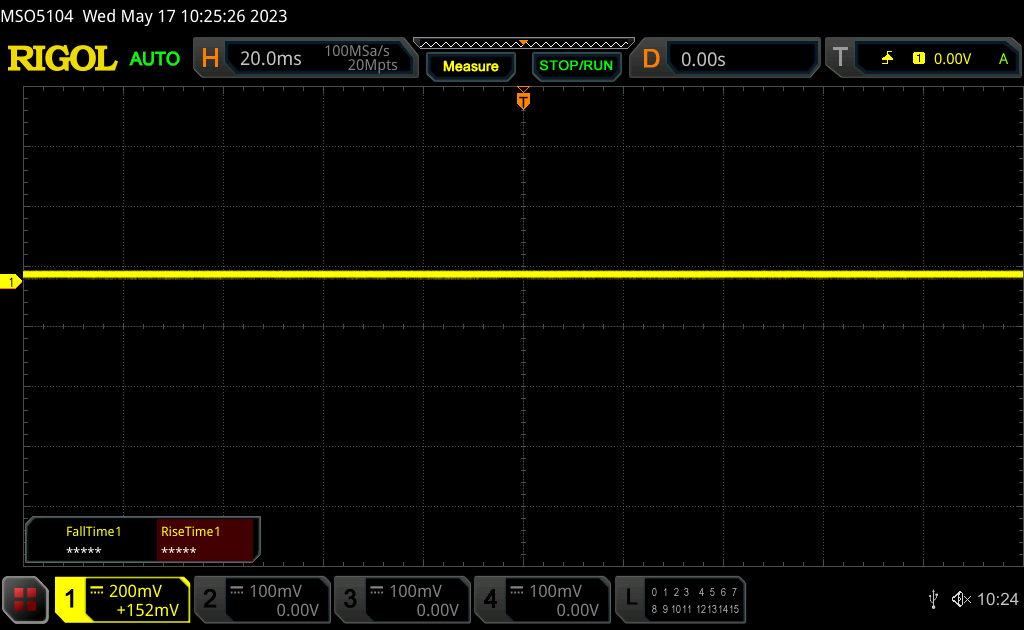 | ||
Im Vergleich: 52 % aller getesteten Geräte nutzten kein PWM um die Helligkeit zu reduzieren. Wenn PWM eingesetzt wurde, dann bei einer Frequenz von durchschnittlich 7763 (Minimum 5, Maximum 343500) Hz. | |||
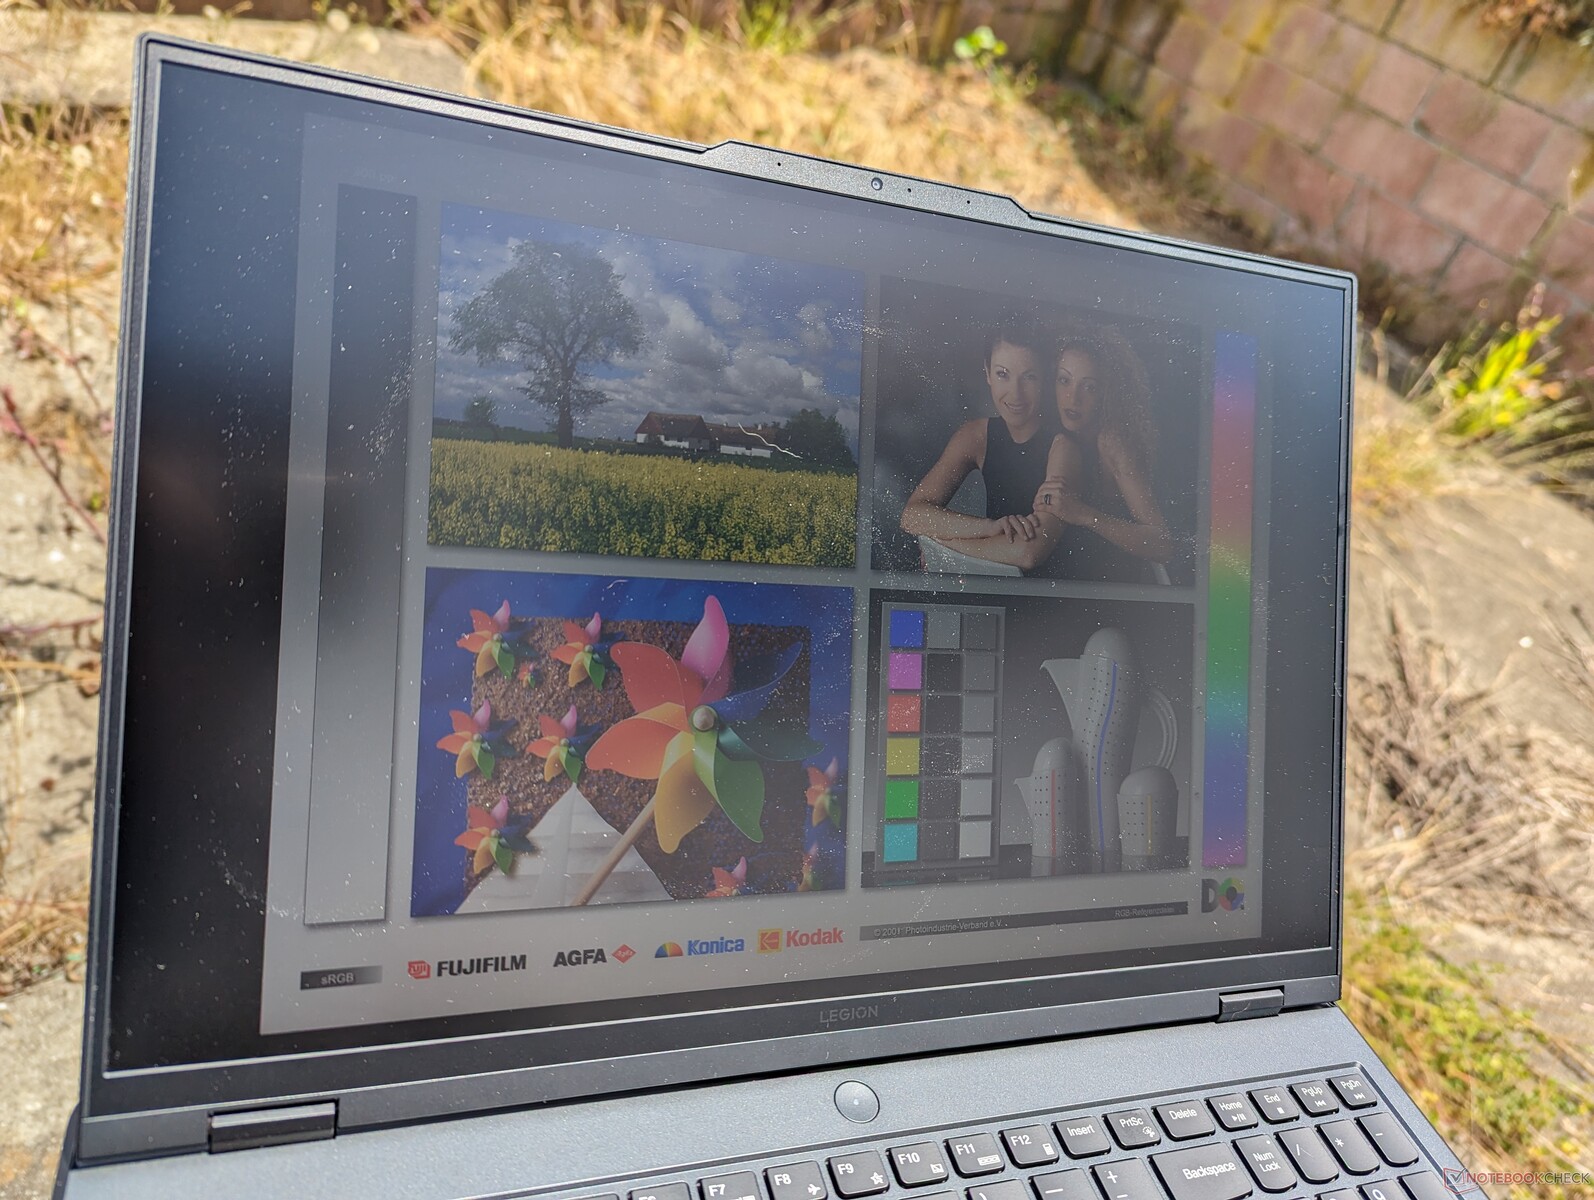
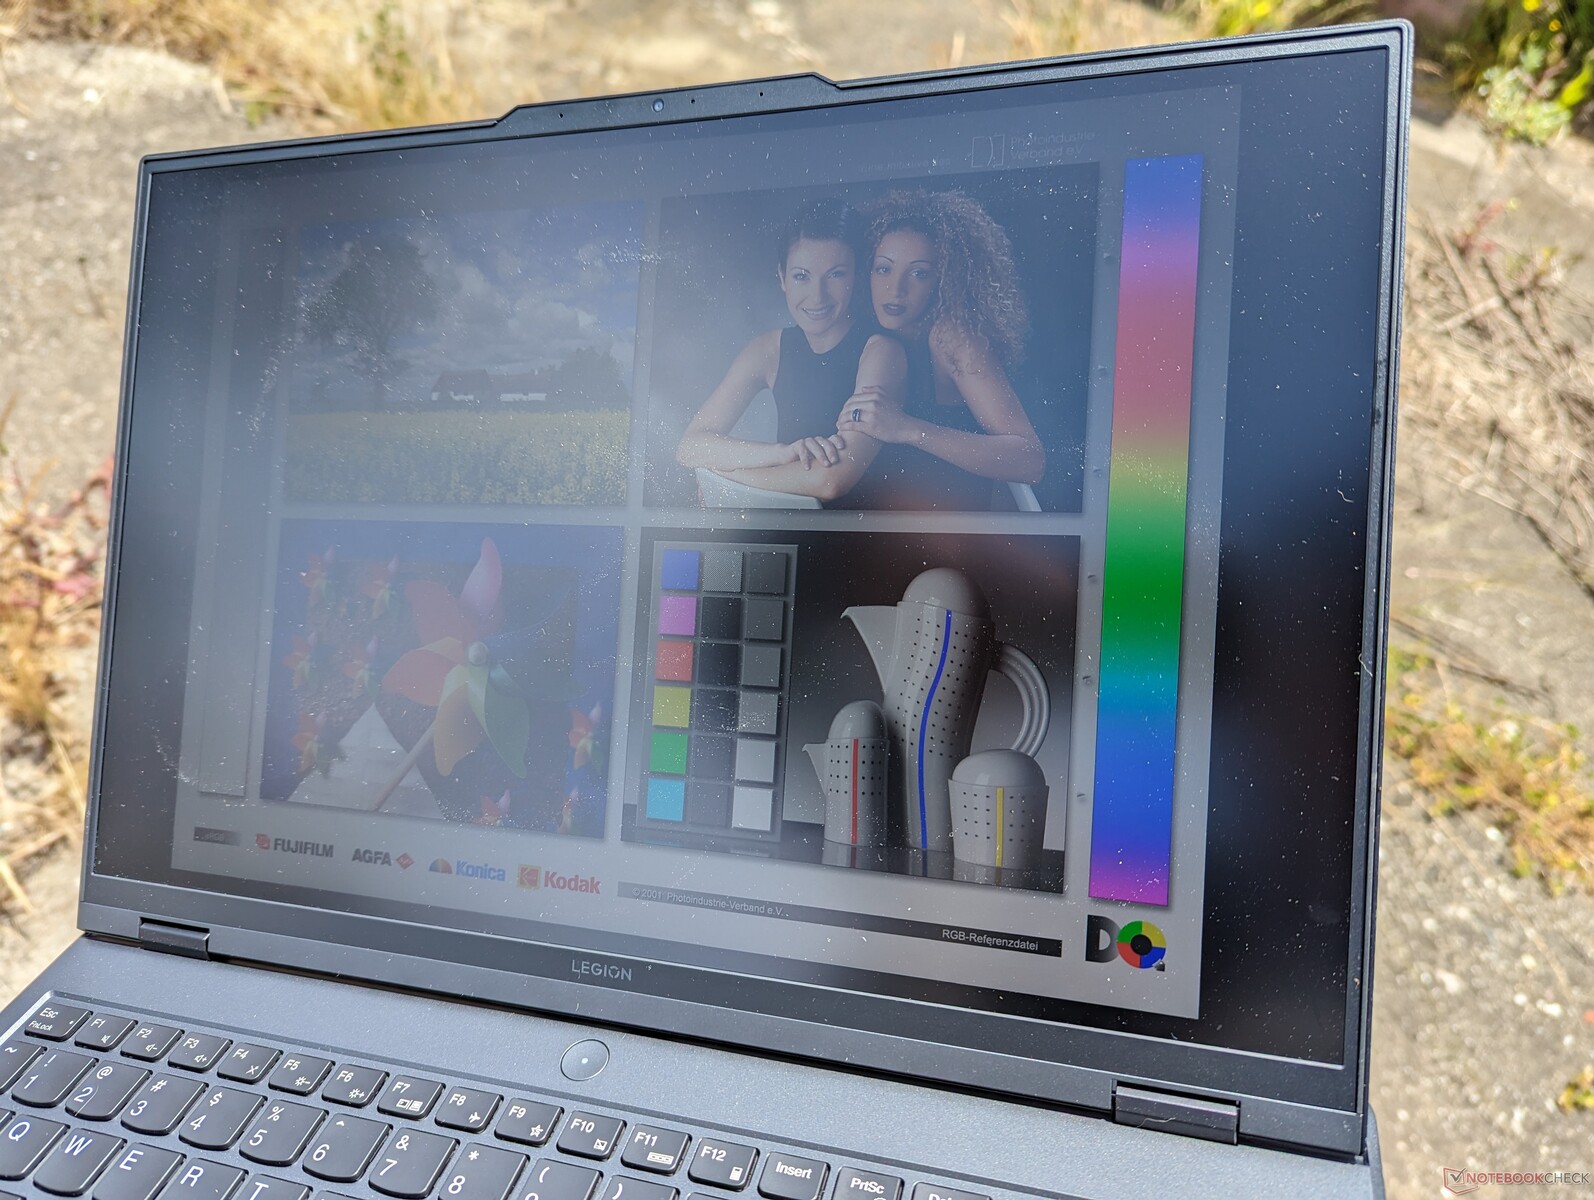
Die Sichtbarkeit im Freien ist für die Kategorie durchschnittlich, da die Displays der meisten Gaming-Laptops typischerweise zwischen 300 und 400 Nits liegen. Die 240-Hz-Panel-Option verspricht 500 Nits oder etwa 200 Nits heller als unser 165-Hz-Panel zu sein, was die Sichtbarkeit im Freien verbessern sollte, falls dies ein Problem ist. Trotzdem sollten Sie, wann immer möglich, im Schatten arbeiten, um Blendeffekte zu minimieren und Farben zu erhalten.

Performance - Mittelklasse-Zen-4-Ryzen-7

Testbedingungen
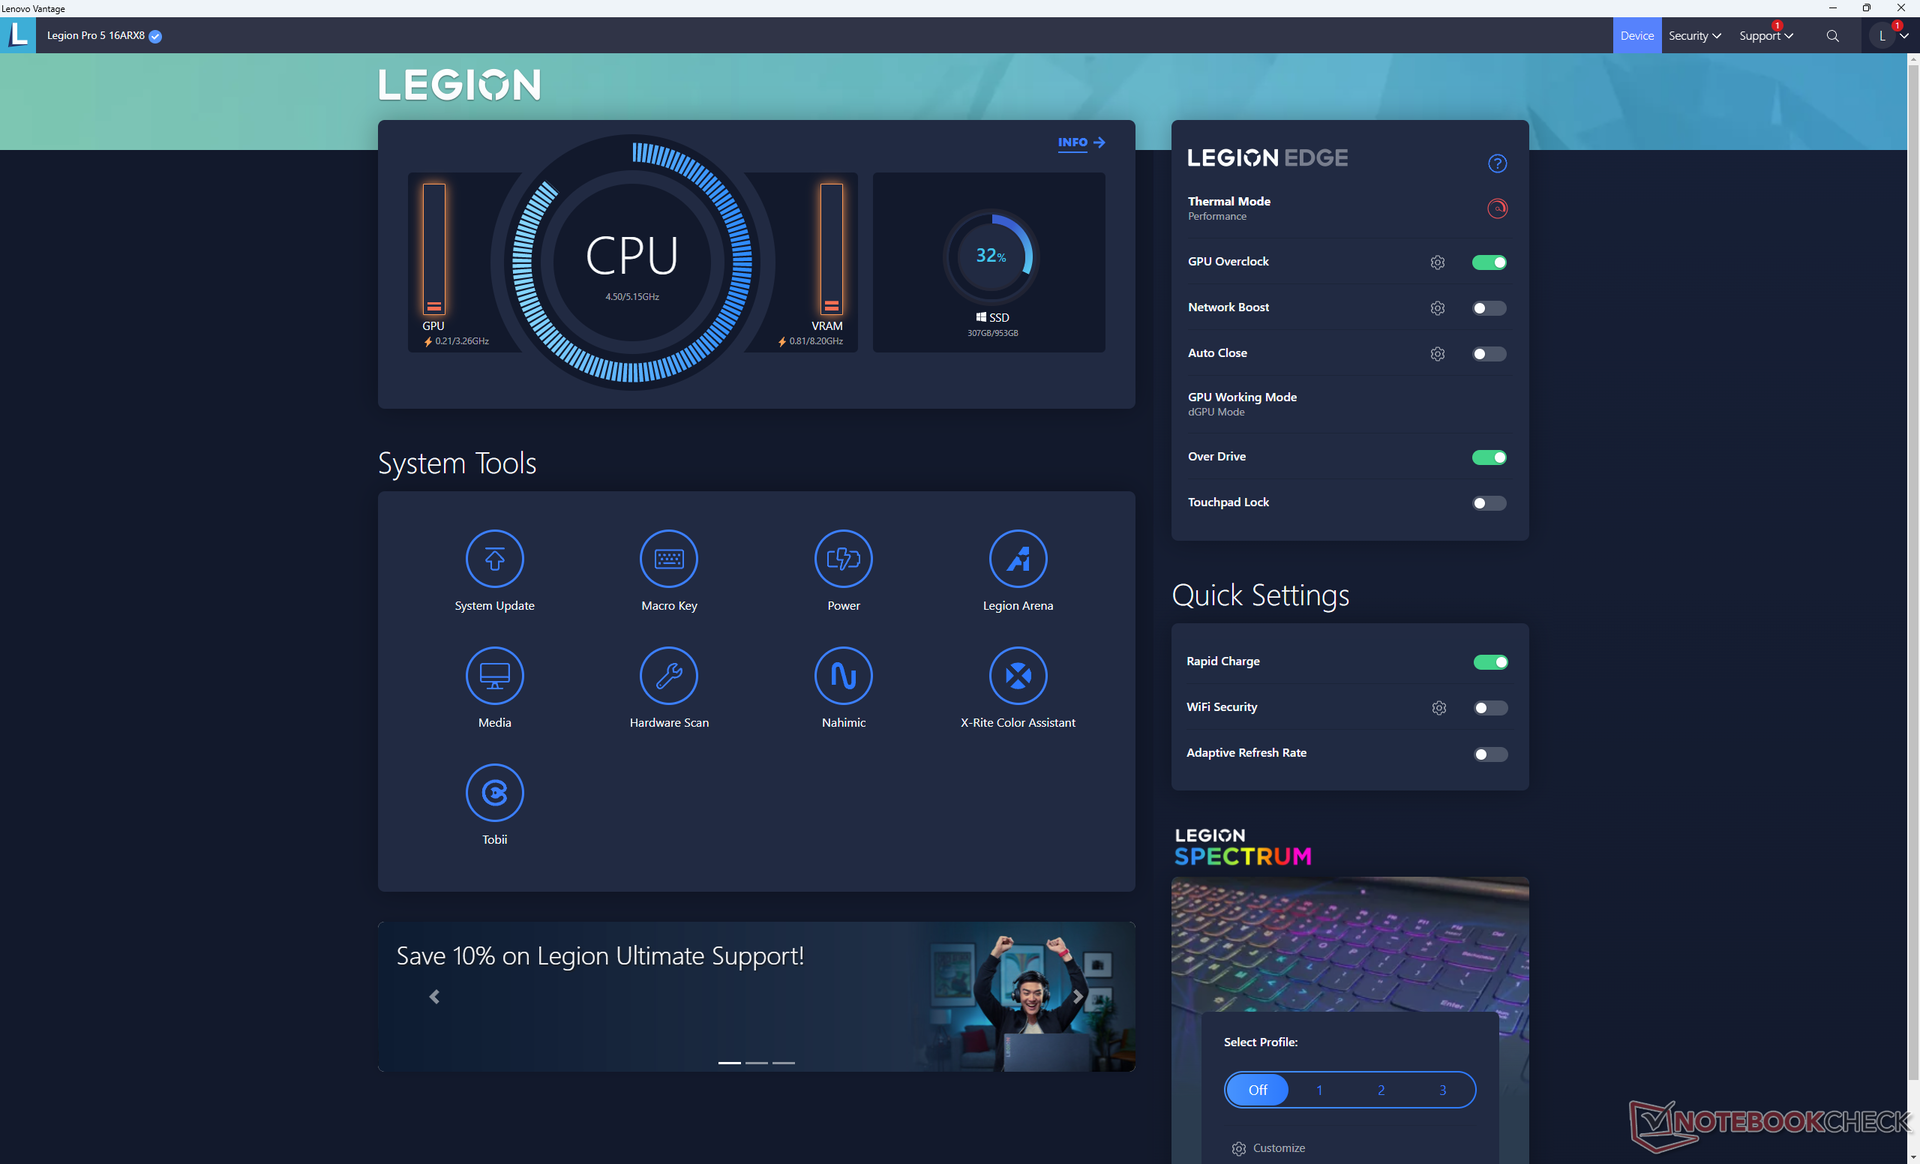
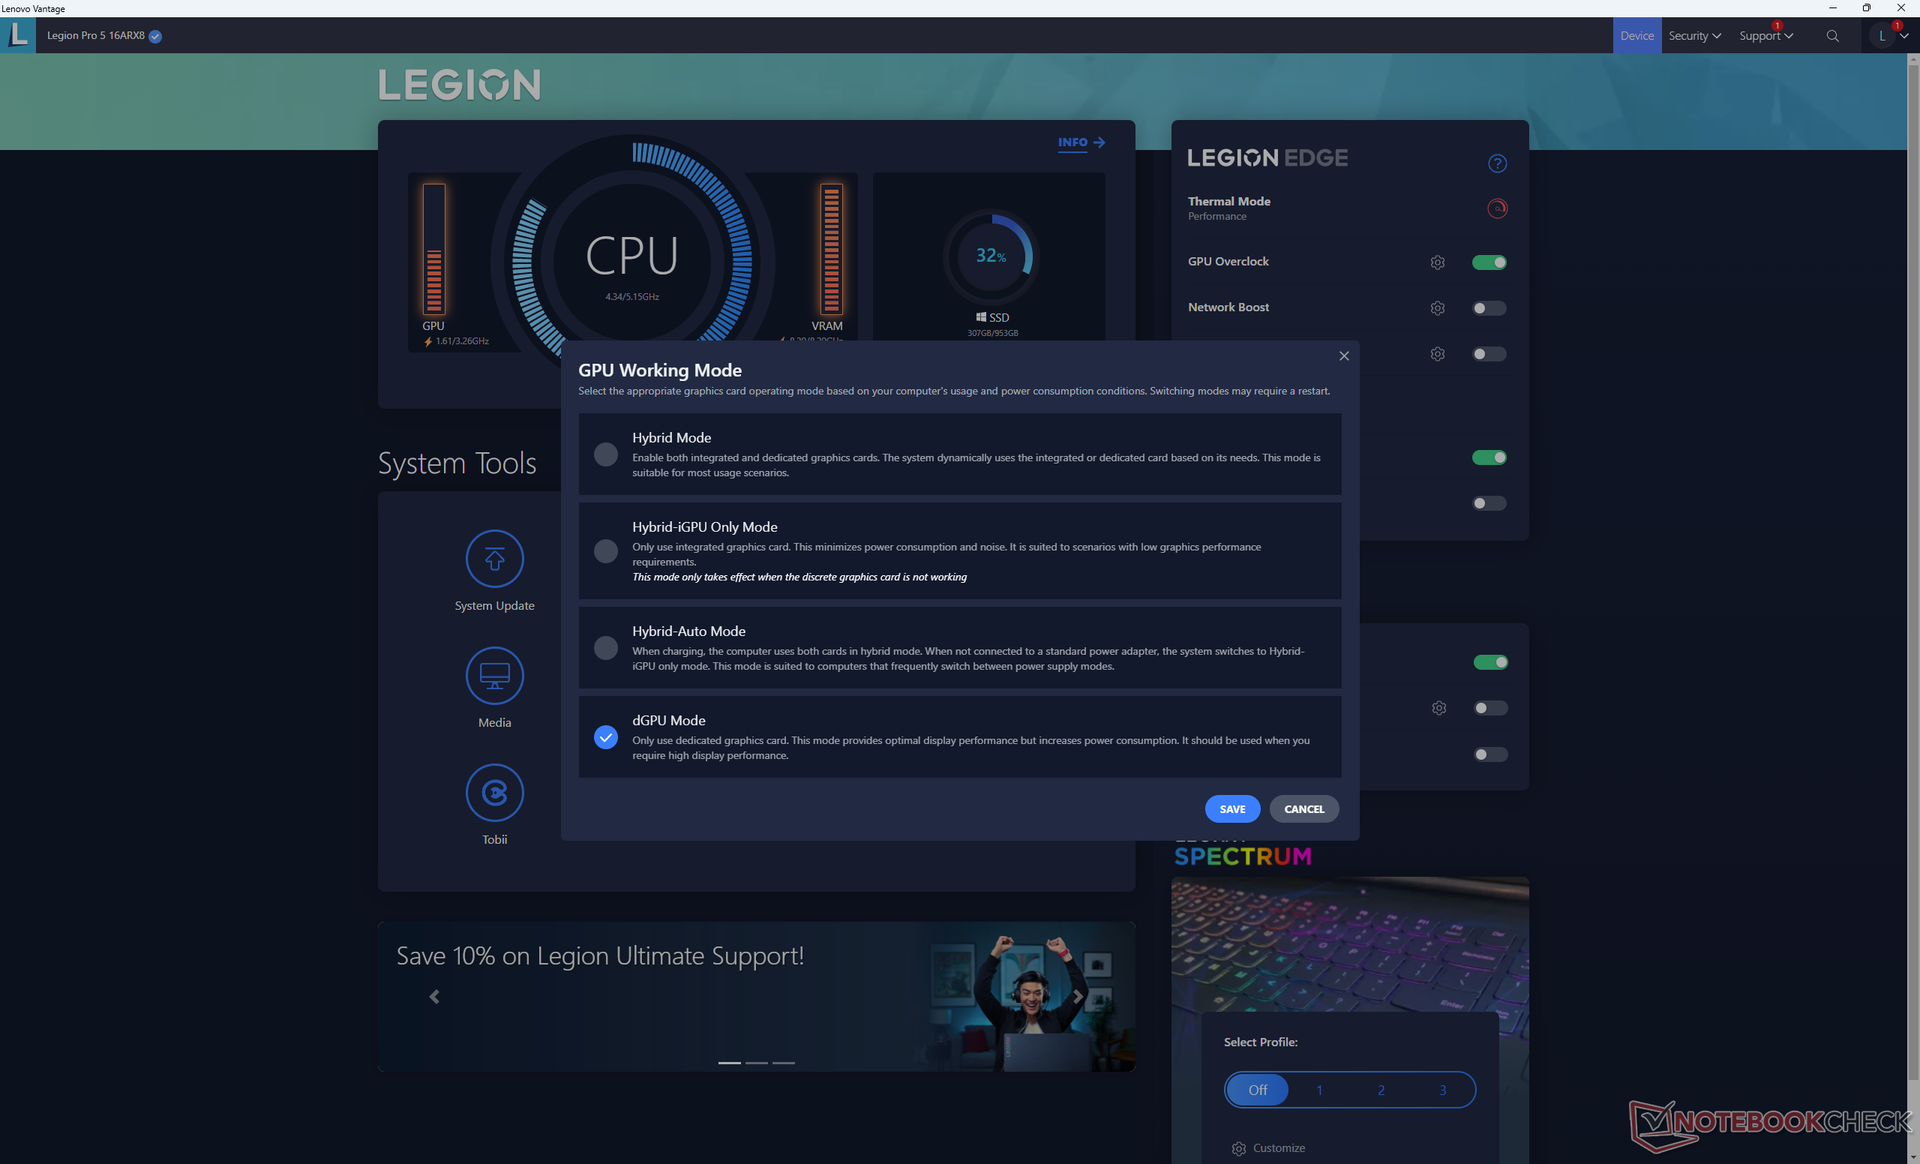
Wir haben unser Gerät sowohl über Windows als auch über die Lenovo Vantage Software in den Performance-Modus versetzt, bevor wir die folgenden Benchmarks durchgeführt haben. Außerdem haben wir darauf geachtet, die Grafikkarte auf den dGPU-Modus einzustellen, wobei die voreingestellte GPU-Übertaktungsfunktion aktiv ist. Es ist empfehlenswert, sich mit Vantage vertraut zu machen, da es die Hauptschnittstelle für die Steuerung der Tastaturbeleuchtung, Lenovo spezifischer Updates, des GPU-Verhaltens und mehr ist.
MUX wird unterstützt, um zwischen Optimus (iGPU+dGPU) oder nur dGPU zu wechseln. G-Sync wird auf dem internen Display nur im dGPU-Modus unterstützt. Ein Neustart ist erforderlich, wenn zwischen Optimus- und dGPU-Modus gewechselt wird, da Advanced Optimus nicht unterstützt wird. Ärgerlicherweise dauert der Neustart beim Wechsel zwischen den Grafikmodi viel länger als ein normaler Neustart.
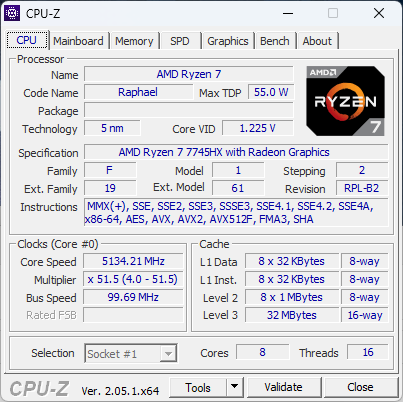
Prozessor
Nach den Erfahrungen mit dem unglaublichen Zen 4 Ryzen 9 7945HX wurden wir von dem wenig überzeugenden Zen 3 Ryzen 7 7735HS enttäuscht und waren nicht sicher, was wir vom Zen 4 Ryzen 7 7745HX erwarten durften. Glücklicherweise sind die Ergebnisse für eine Mittelklasse-CPU mit Single- und Multi-Thread-Leistungswerten, die 15 Prozent bzw. 30 Prozent über denen des Ryzen 7 7735HS liegen, hervorragend. Der Ryzen 7 7745HX liegt damit in Reichweite des konkurrierenden Core i7-13700HX in den meisten Benchmarks, einschließlich LibreOffice und HWBOT x265 4K, um nur 5 bis 15 Prozent. Es ist definitiv ein vernünftiges Upgrade gegenüber dem letztjährigen Ryzen 7 6800H oder Ryzen 9 6900HX im Vergleich zum Ryzen 7 7735HX.
Lenovo bietet eine langsamere Ryzen-5-7645HX-Option mit weniger Kernen als der Ryzen 7 7745HX (6 vs. 8). Allerdings haben wir den Ryzen 5 7645HX noch nicht persönlich getestet, daher sind die Leistungsunterschiede zwischen den beiden Optionen noch nicht bekannt.
Cinebench R15 Multi Loop
Cinebench R23: Multi Core | Single Core
Cinebench R20: CPU (Multi Core) | CPU (Single Core)
Cinebench R15: CPU Multi 64Bit | CPU Single 64Bit
Blender: v2.79 BMW27 CPU
7-Zip 18.03: 7z b 4 | 7z b 4 -mmt1
Geekbench 5.5: Multi-Core | Single-Core
HWBOT x265 Benchmark v2.2: 4k Preset
LibreOffice : 20 Documents To PDF
R Benchmark 2.5: Overall mean
| Cinebench R20 / CPU (Multi Core) | |
| Schenker XMG SECTOR, i9 13900K, RTX 4090 | |
| Alienware m18 R1 | |
| Schenker XMG Neo 16 E23 | |
| MSI GE67 HX 12UGS | |
| Durchschnittliche AMD Ryzen 7 7745HX (7072 - 7399, n=2) | |
| Lenovo Legion Pro 5 16ARX8 | |
| Lenovo Legion Pro 5 16IRX8 | |
| MSI Pulse GL76 12UGK | |
| Schenker XMG Core 15 (M22) | |
| Asus TUF Gaming A16 FA617 | |
| Asus ROG Strix G15 G513RW | |
| MSI Alpha 15 B5EEK-008 | |
| Cinebench R20 / CPU (Single Core) | |
| Schenker XMG SECTOR, i9 13900K, RTX 4090 | |
| Alienware m18 R1 | |
| Schenker XMG Neo 16 E23 | |
| Durchschnittliche AMD Ryzen 7 7745HX (717 - 719, n=2) | |
| Lenovo Legion Pro 5 16ARX8 | |
| MSI GE67 HX 12UGS | |
| MSI Pulse GL76 12UGK | |
| Lenovo Legion Pro 5 16IRX8 | |
| Asus TUF Gaming A16 FA617 | |
| Schenker XMG Core 15 (M22) | |
| Asus ROG Strix G15 G513RW | |
| MSI Alpha 15 B5EEK-008 | |
| Cinebench R15 / CPU Multi 64Bit | |
| Schenker XMG SECTOR, i9 13900K, RTX 4090 | |
| Alienware m18 R1 | |
| Schenker XMG Neo 16 E23 | |
| MSI GE67 HX 12UGS | |
| Lenovo Legion Pro 5 16IRX8 | |
| Durchschnittliche AMD Ryzen 7 7745HX (2978 - 2994, n=2) | |
| Lenovo Legion Pro 5 16ARX8 | |
| MSI Pulse GL76 12UGK | |
| Schenker XMG Core 15 (M22) | |
| Asus TUF Gaming A16 FA617 | |
| Asus ROG Strix G15 G513RW | |
| MSI Alpha 15 B5EEK-008 | |
| Cinebench R15 / CPU Single 64Bit | |
| Schenker XMG SECTOR, i9 13900K, RTX 4090 | |
| Alienware m18 R1 | |
| Schenker XMG Neo 16 E23 | |
| Durchschnittliche AMD Ryzen 7 7745HX (294 - 295, n=2) | |
| Lenovo Legion Pro 5 16ARX8 | |
| Lenovo Legion Pro 5 16IRX8 | |
| MSI GE67 HX 12UGS | |
| MSI Pulse GL76 12UGK | |
| Schenker XMG Core 15 (M22) | |
| Asus TUF Gaming A16 FA617 | |
| Asus ROG Strix G15 G513RW | |
| MSI Alpha 15 B5EEK-008 | |
| HWBOT x265 Benchmark v2.2 / 4k Preset | |
| Schenker XMG SECTOR, i9 13900K, RTX 4090 | |
| Alienware m18 R1 | |
| Schenker XMG Neo 16 E23 | |
| MSI GE67 HX 12UGS | |
| Lenovo Legion Pro 5 16IRX8 | |
| Durchschnittliche AMD Ryzen 7 7745HX (23.2 - 24.1, n=2) | |
| Lenovo Legion Pro 5 16ARX8 | |
| MSI Pulse GL76 12UGK | |
| Schenker XMG Core 15 (M22) | |
| Asus TUF Gaming A16 FA617 | |
| Asus ROG Strix G15 G513RW | |
| MSI Alpha 15 B5EEK-008 | |
| LibreOffice / 20 Documents To PDF | |
| Schenker XMG Core 15 (M22) | |
| Asus ROG Strix G15 G513RW | |
| Asus TUF Gaming A16 FA617 | |
| MSI Alpha 15 B5EEK-008 | |
| Alienware m18 R1 | |
| MSI Pulse GL76 12UGK | |
| MSI GE67 HX 12UGS | |
| Durchschnittliche AMD Ryzen 7 7745HX (37.9 - 41.4, n=2) | |
| Lenovo Legion Pro 5 16ARX8 | |
| Schenker XMG Neo 16 E23 | |
| Schenker XMG SECTOR, i9 13900K, RTX 4090 | |
| Lenovo Legion Pro 5 16IRX8 | |
* ... kleinere Werte sind besser
AIDA64: FP32 Ray-Trace | FPU Julia | CPU SHA3 | CPU Queen | FPU SinJulia | FPU Mandel | CPU AES | CPU ZLib | FP64 Ray-Trace | CPU PhotoWorxx
| Performance Rating | |
| Asus ROG Strix G16 G614JZ | |
| Schenker XMG Neo 16 E23 | |
| Durchschnittliche AMD Ryzen 7 7745HX | |
| Lenovo Legion Pro 5 16ARX8 | |
| Uniwill GM6PX7X RTX 4070 | |
| Lenovo Legion Pro 5 16IRX8 | |
| AIDA64 / FP32 Ray-Trace | |
| Lenovo Legion Pro 5 16ARX8 | |
| Durchschnittliche AMD Ryzen 7 7745HX (29066 - 29656, n=2) | |
| Asus ROG Strix G16 G614JZ | |
| Schenker XMG Neo 16 E23 | |
| Uniwill GM6PX7X RTX 4070 | |
| Lenovo Legion Pro 5 16IRX8 | |
| AIDA64 / FPU Julia | |
| Asus ROG Strix G16 G614JZ | |
| Durchschnittliche AMD Ryzen 7 7745HX (120974 - 123689, n=2) | |
| Lenovo Legion Pro 5 16ARX8 | |
| Schenker XMG Neo 16 E23 | |
| Uniwill GM6PX7X RTX 4070 | |
| Lenovo Legion Pro 5 16IRX8 | |
| AIDA64 / CPU SHA3 | |
| Asus ROG Strix G16 G614JZ | |
| Schenker XMG Neo 16 E23 | |
| Durchschnittliche AMD Ryzen 7 7745HX (4974 - 5204, n=2) | |
| Lenovo Legion Pro 5 16ARX8 | |
| Uniwill GM6PX7X RTX 4070 | |
| Lenovo Legion Pro 5 16IRX8 | |
| AIDA64 / CPU Queen | |
| Asus ROG Strix G16 G614JZ | |
| Schenker XMG Neo 16 E23 | |
| Durchschnittliche AMD Ryzen 7 7745HX (126954 - 128143, n=2) | |
| Lenovo Legion Pro 5 16ARX8 | |
| Lenovo Legion Pro 5 16IRX8 | |
| Uniwill GM6PX7X RTX 4070 | |
| AIDA64 / FPU SinJulia | |
| Asus ROG Strix G16 G614JZ | |
| Durchschnittliche AMD Ryzen 7 7745HX (15887 - 16221, n=2) | |
| Lenovo Legion Pro 5 16ARX8 | |
| Schenker XMG Neo 16 E23 | |
| Lenovo Legion Pro 5 16IRX8 | |
| Uniwill GM6PX7X RTX 4070 | |
| AIDA64 / FPU Mandel | |
| Asus ROG Strix G16 G614JZ | |
| Durchschnittliche AMD Ryzen 7 7745HX (64255 - 64969, n=2) | |
| Lenovo Legion Pro 5 16ARX8 | |
| Schenker XMG Neo 16 E23 | |
| Uniwill GM6PX7X RTX 4070 | |
| Lenovo Legion Pro 5 16IRX8 | |
| AIDA64 / CPU AES | |
| Schenker XMG Neo 16 E23 | |
| Uniwill GM6PX7X RTX 4070 | |
| Asus ROG Strix G16 G614JZ | |
| Lenovo Legion Pro 5 16IRX8 | |
| Durchschnittliche AMD Ryzen 7 7745HX (71191 - 95481, n=2) | |
| Lenovo Legion Pro 5 16ARX8 | |
| AIDA64 / CPU ZLib | |
| Asus ROG Strix G16 G614JZ | |
| Schenker XMG Neo 16 E23 | |
| Uniwill GM6PX7X RTX 4070 | |
| Lenovo Legion Pro 5 16IRX8 | |
| Durchschnittliche AMD Ryzen 7 7745HX (1147 - 1176, n=2) | |
| Lenovo Legion Pro 5 16ARX8 | |
| AIDA64 / FP64 Ray-Trace | |
| Durchschnittliche AMD Ryzen 7 7745HX (15975 - 16358, n=2) | |
| Lenovo Legion Pro 5 16ARX8 | |
| Asus ROG Strix G16 G614JZ | |
| Schenker XMG Neo 16 E23 | |
| Lenovo Legion Pro 5 16IRX8 | |
| Uniwill GM6PX7X RTX 4070 | |
| AIDA64 / CPU PhotoWorxx | |
| Schenker XMG Neo 16 E23 | |
| Uniwill GM6PX7X RTX 4070 | |
| Asus ROG Strix G16 G614JZ | |
| Lenovo Legion Pro 5 16IRX8 | |
| Durchschnittliche AMD Ryzen 7 7745HX (28499 - 33304, n=2) | |
| Lenovo Legion Pro 5 16ARX8 | |
System Performance
CrossMark: Overall | Productivity | Creativity | Responsiveness
| PCMark 10 / Score | |
| Asus Zephyrus Duo 16 GX650PY-NM006W | |
| Uniwill GM6PX7X RTX 4070 | |
| Schenker XMG Neo 16 E23 | |
| Lenovo Legion Pro 5 16ARX8 | |
| Lenovo Legion Pro 5 16IRX8 | |
| Asus ROG Strix G16 G614JZ | |
| PCMark 10 / Essentials | |
| Asus Zephyrus Duo 16 GX650PY-NM006W | |
| Asus ROG Strix G16 G614JZ | |
| Uniwill GM6PX7X RTX 4070 | |
| Lenovo Legion Pro 5 16ARX8 | |
| Schenker XMG Neo 16 E23 | |
| Lenovo Legion Pro 5 16IRX8 | |
| PCMark 10 / Productivity | |
| Asus Zephyrus Duo 16 GX650PY-NM006W | |
| Uniwill GM6PX7X RTX 4070 | |
| Lenovo Legion Pro 5 16ARX8 | |
| Schenker XMG Neo 16 E23 | |
| Lenovo Legion Pro 5 16IRX8 | |
| Asus ROG Strix G16 G614JZ | |
| PCMark 10 / Digital Content Creation | |
| Schenker XMG Neo 16 E23 | |
| Asus Zephyrus Duo 16 GX650PY-NM006W | |
| Uniwill GM6PX7X RTX 4070 | |
| Lenovo Legion Pro 5 16ARX8 | |
| Lenovo Legion Pro 5 16IRX8 | |
| Asus ROG Strix G16 G614JZ | |
| CrossMark / Overall | |
| Asus ROG Strix G16 G614JZ | |
| Schenker XMG Neo 16 E23 | |
| Asus Zephyrus Duo 16 GX650PY-NM006W | |
| Lenovo Legion Pro 5 16ARX8 | |
| Uniwill GM6PX7X RTX 4070 | |
| Lenovo Legion Pro 5 16IRX8 | |
| CrossMark / Productivity | |
| Asus ROG Strix G16 G614JZ | |
| Schenker XMG Neo 16 E23 | |
| Asus Zephyrus Duo 16 GX650PY-NM006W | |
| Lenovo Legion Pro 5 16ARX8 | |
| Uniwill GM6PX7X RTX 4070 | |
| Lenovo Legion Pro 5 16IRX8 | |
| CrossMark / Creativity | |
| Schenker XMG Neo 16 E23 | |
| Asus ROG Strix G16 G614JZ | |
| Asus Zephyrus Duo 16 GX650PY-NM006W | |
| Lenovo Legion Pro 5 16ARX8 | |
| Uniwill GM6PX7X RTX 4070 | |
| Lenovo Legion Pro 5 16IRX8 | |
| CrossMark / Responsiveness | |
| Asus ROG Strix G16 G614JZ | |
| Lenovo Legion Pro 5 16ARX8 | |
| Uniwill GM6PX7X RTX 4070 | |
| Schenker XMG Neo 16 E23 | |
| Asus Zephyrus Duo 16 GX650PY-NM006W | |
| Lenovo Legion Pro 5 16IRX8 | |
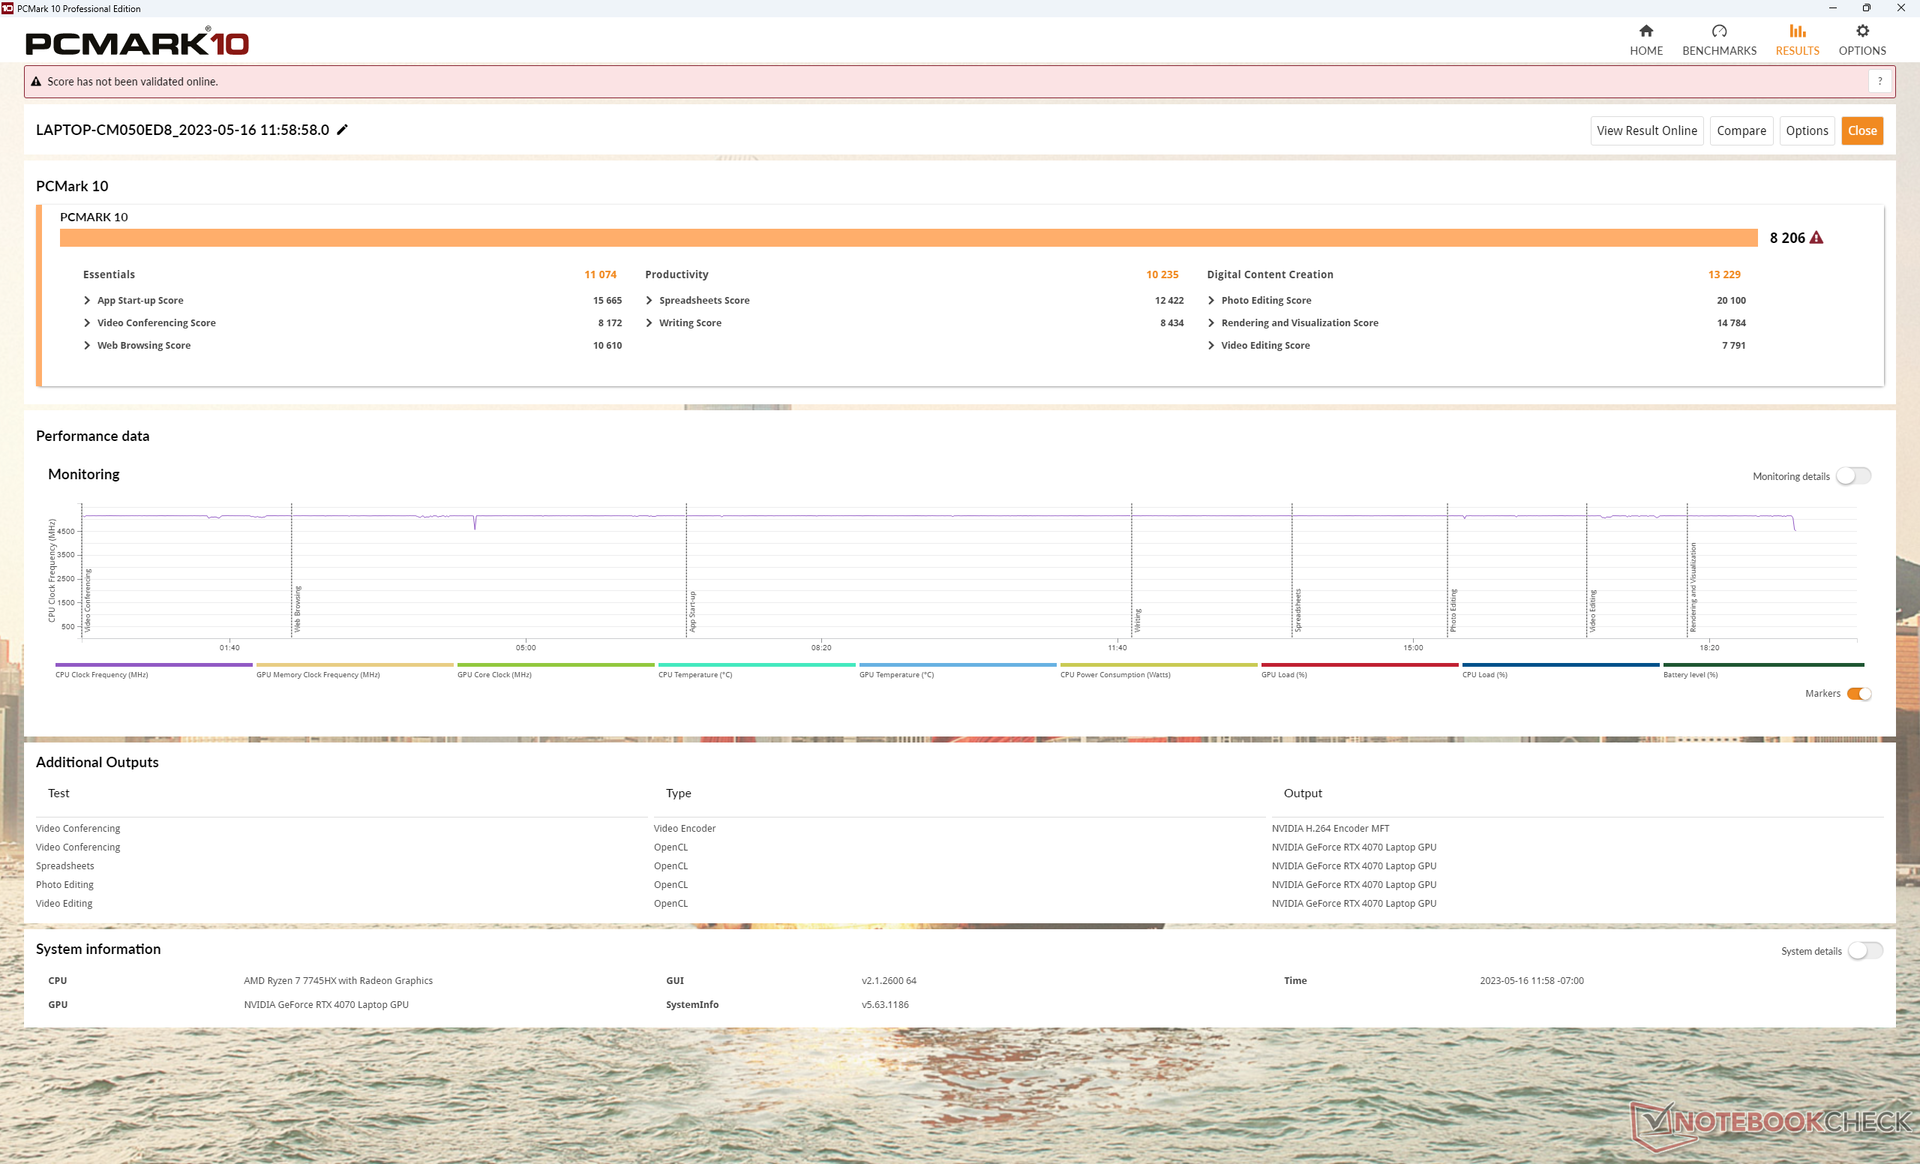
| PCMark 10 Score | 8206 Punkte | |
Hilfe | ||
| AIDA64 / Memory Copy | |
| Schenker XMG Neo 16 E23 | |
| Uniwill GM6PX7X RTX 4070 | |
| Asus ROG Strix G16 G614JZ | |
| Lenovo Legion Pro 5 16IRX8 | |
| Durchschnittliche AMD Ryzen 7 7745HX (50007 - 53867, n=2) | |
| Lenovo Legion Pro 5 16ARX8 | |
| AIDA64 / Memory Read | |
| Schenker XMG Neo 16 E23 | |
| Asus ROG Strix G16 G614JZ | |
| Uniwill GM6PX7X RTX 4070 | |
| Lenovo Legion Pro 5 16IRX8 | |
| Durchschnittliche AMD Ryzen 7 7745HX (50703 - 54278, n=2) | |
| Lenovo Legion Pro 5 16ARX8 | |
| AIDA64 / Memory Write | |
| Schenker XMG Neo 16 E23 | |
| Lenovo Legion Pro 5 16IRX8 | |
| Uniwill GM6PX7X RTX 4070 | |
| Durchschnittliche AMD Ryzen 7 7745HX (54587 - 70803, n=2) | |
| Asus ROG Strix G16 G614JZ | |
| Lenovo Legion Pro 5 16ARX8 | |
| AIDA64 / Memory Latency | |
| Asus ROG Strix G16 G614JZ | |
| Uniwill GM6PX7X RTX 4070 | |
| Lenovo Legion Pro 5 16ARX8 | |
| Schenker XMG Neo 16 E23 | |
| Durchschnittliche AMD Ryzen 7 7745HX (80.7 - 86.5, n=2) | |
| Lenovo Legion Pro 5 16IRX8 | |
* ... kleinere Werte sind besser
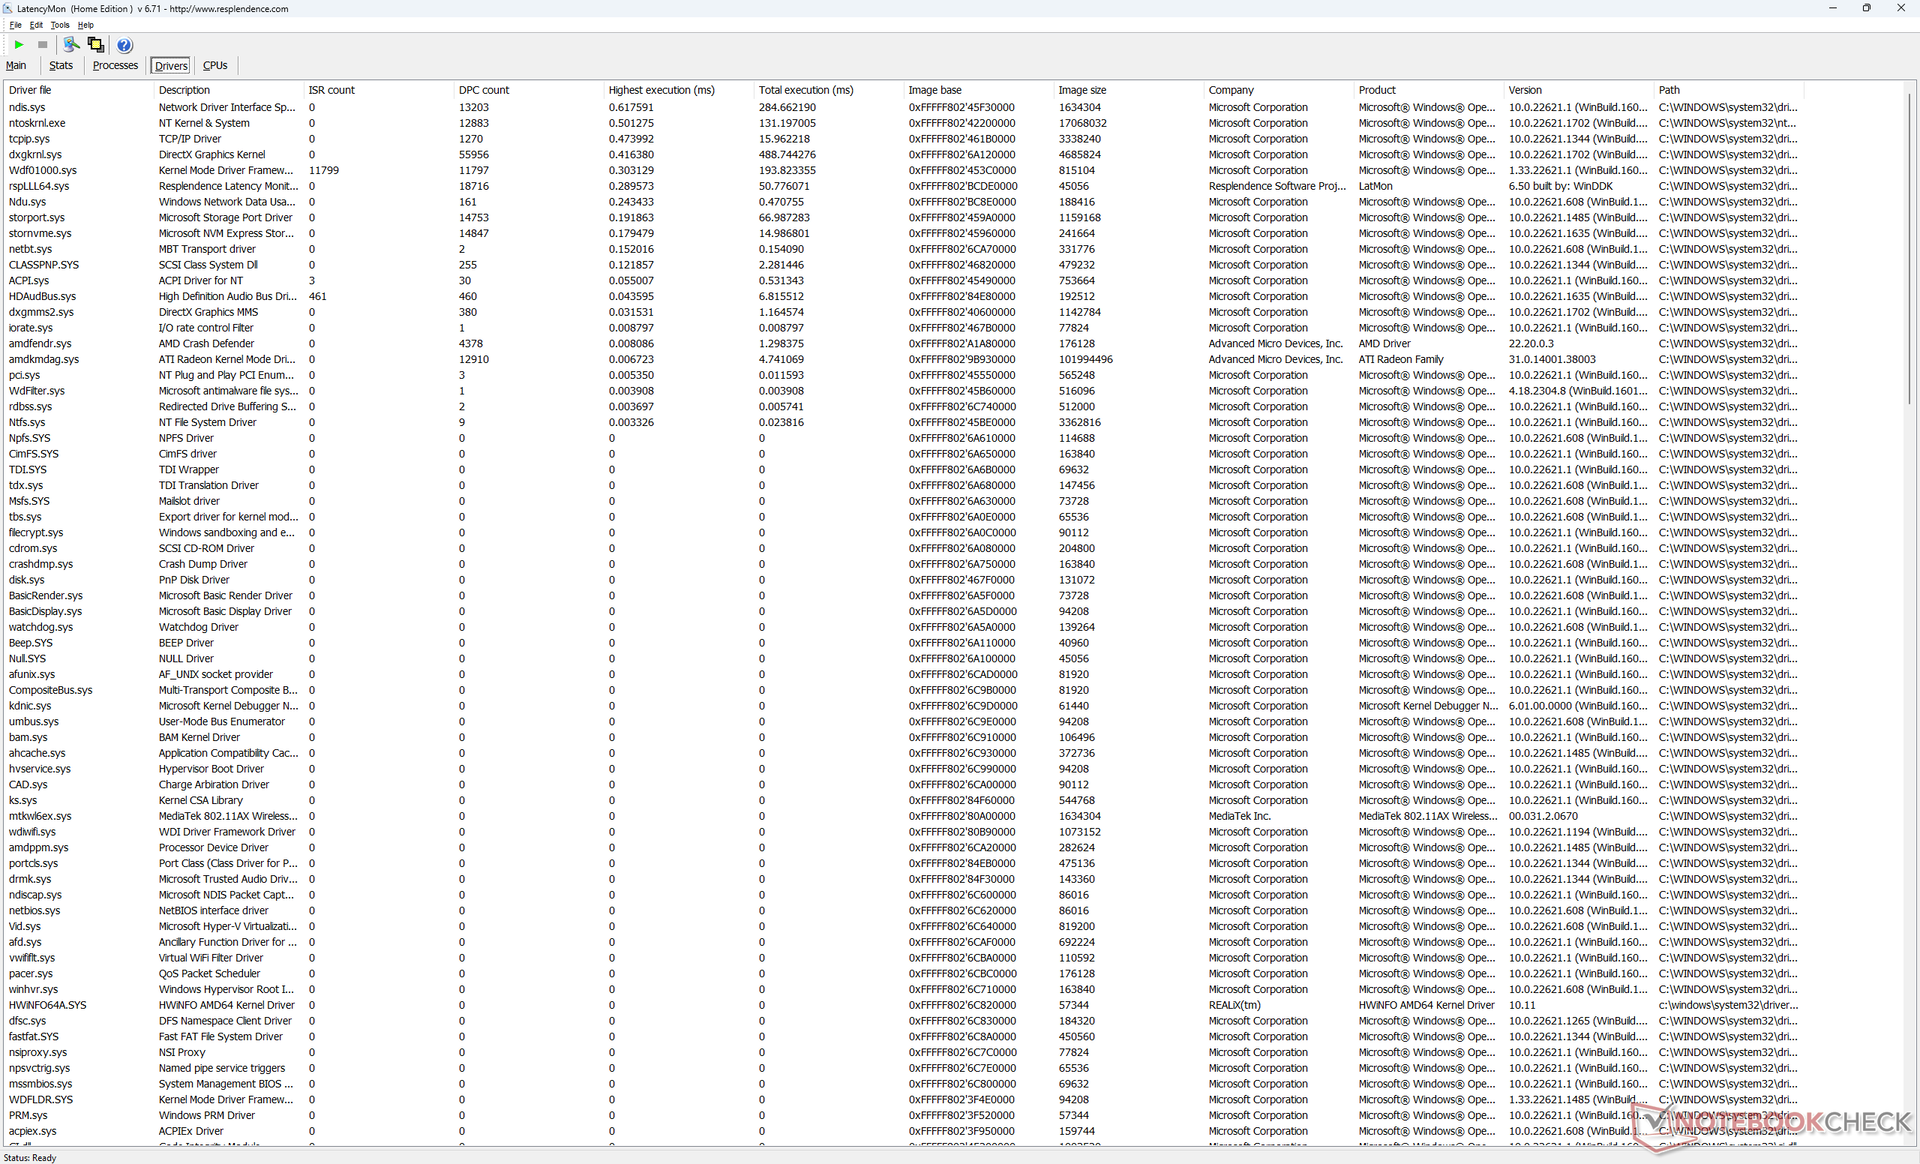
DPC-Latenzzeit
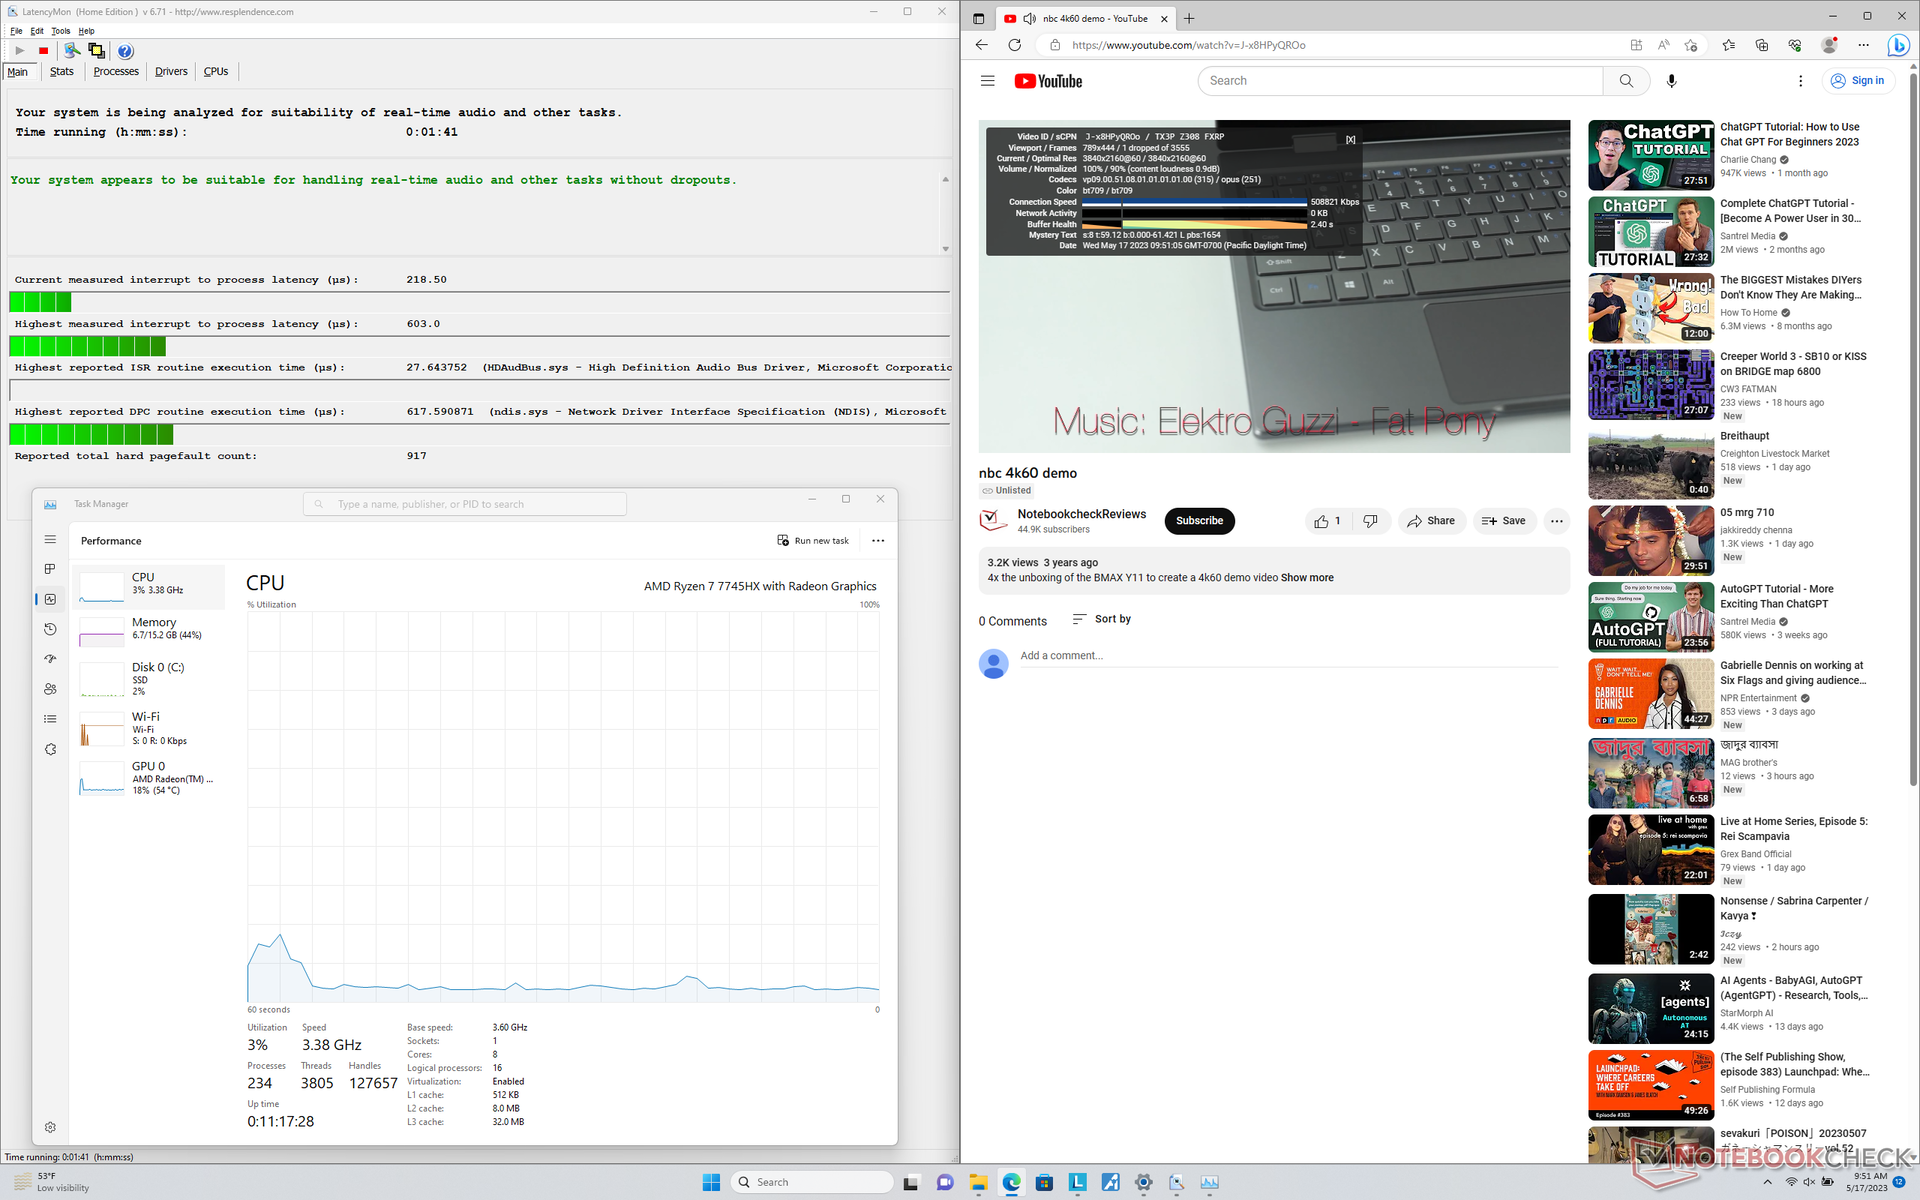
LatencyMon zeigt keine größeren DPC-Probleme beim Öffnen mehrerer Browser Tabs unserer Homepage oder bei der Ausführung von Prime95 Stress. Die 4K-Videowiedergabe bei 60 fps ist hervorragend - mit nur einem Frame-Verlust während unseres Testvideos.
| DPC Latencies / LatencyMon - interrupt to process latency (max), Web, Youtube, Prime95 | |
| Asus Zephyrus Duo 16 GX650PY-NM006W | |
| Schenker XMG Neo 16 E23 | |
| Asus ROG Strix G16 G614JZ | |
| Uniwill GM6PX7X RTX 4070 | |
| Lenovo Legion Pro 5 16IRX8 | |
| Lenovo Legion Pro 5 16ARX8 | |
* ... kleinere Werte sind besser
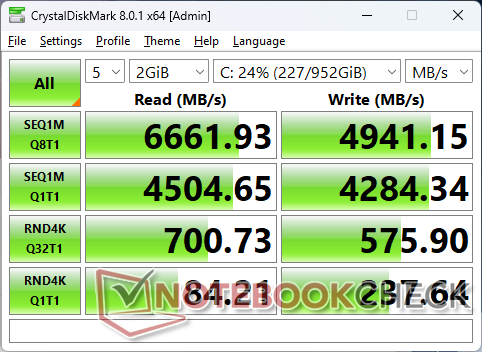
Speichergeräte - Bis zu zwei PCIe4-x4-Laufwerke
Unser Gerät wird mit einer 1-TB-Samsung-PM9A1-NVMe-SSD ausgeliefert, die eine der schnellsten PCIe4-x4-SSDs für Verbraucher ist. Die Übertragungsraten erreichen einen Spitzenwert von etwa 6.600 MB/s, aber die Leistung wurde bereits nach wenigen Minuten in unserem Stresstest auf 3.300 MB/s gedrosselt, wie die Grafik unten zeigt. Die Ergebnisse deuten darauf hin, dass die SSD im Lenovo nicht richtig gekühlt wird, da die gleiche SSD in anderen Laptops wie dem Uniwill GM6PX7X höhere Übertragungsraten über einen viel längeren Zeitraum aufrechterhalten kann.


| Drive Performance Rating - Percent | |
| Lenovo Legion Pro 5 16ARX8 | |
| Lenovo Legion Pro 5 16IRX8 | |
| Uniwill GM6PX7X RTX 4070 | |
| Asus Zephyrus Duo 16 GX650PY-NM006W | |
| Asus ROG Strix G16 G614JZ | |
| Schenker XMG Neo 16 E23 | |
* ... kleinere Werte sind besser
Disk Throttling: DiskSpd Read Loop, Queue Depth 8
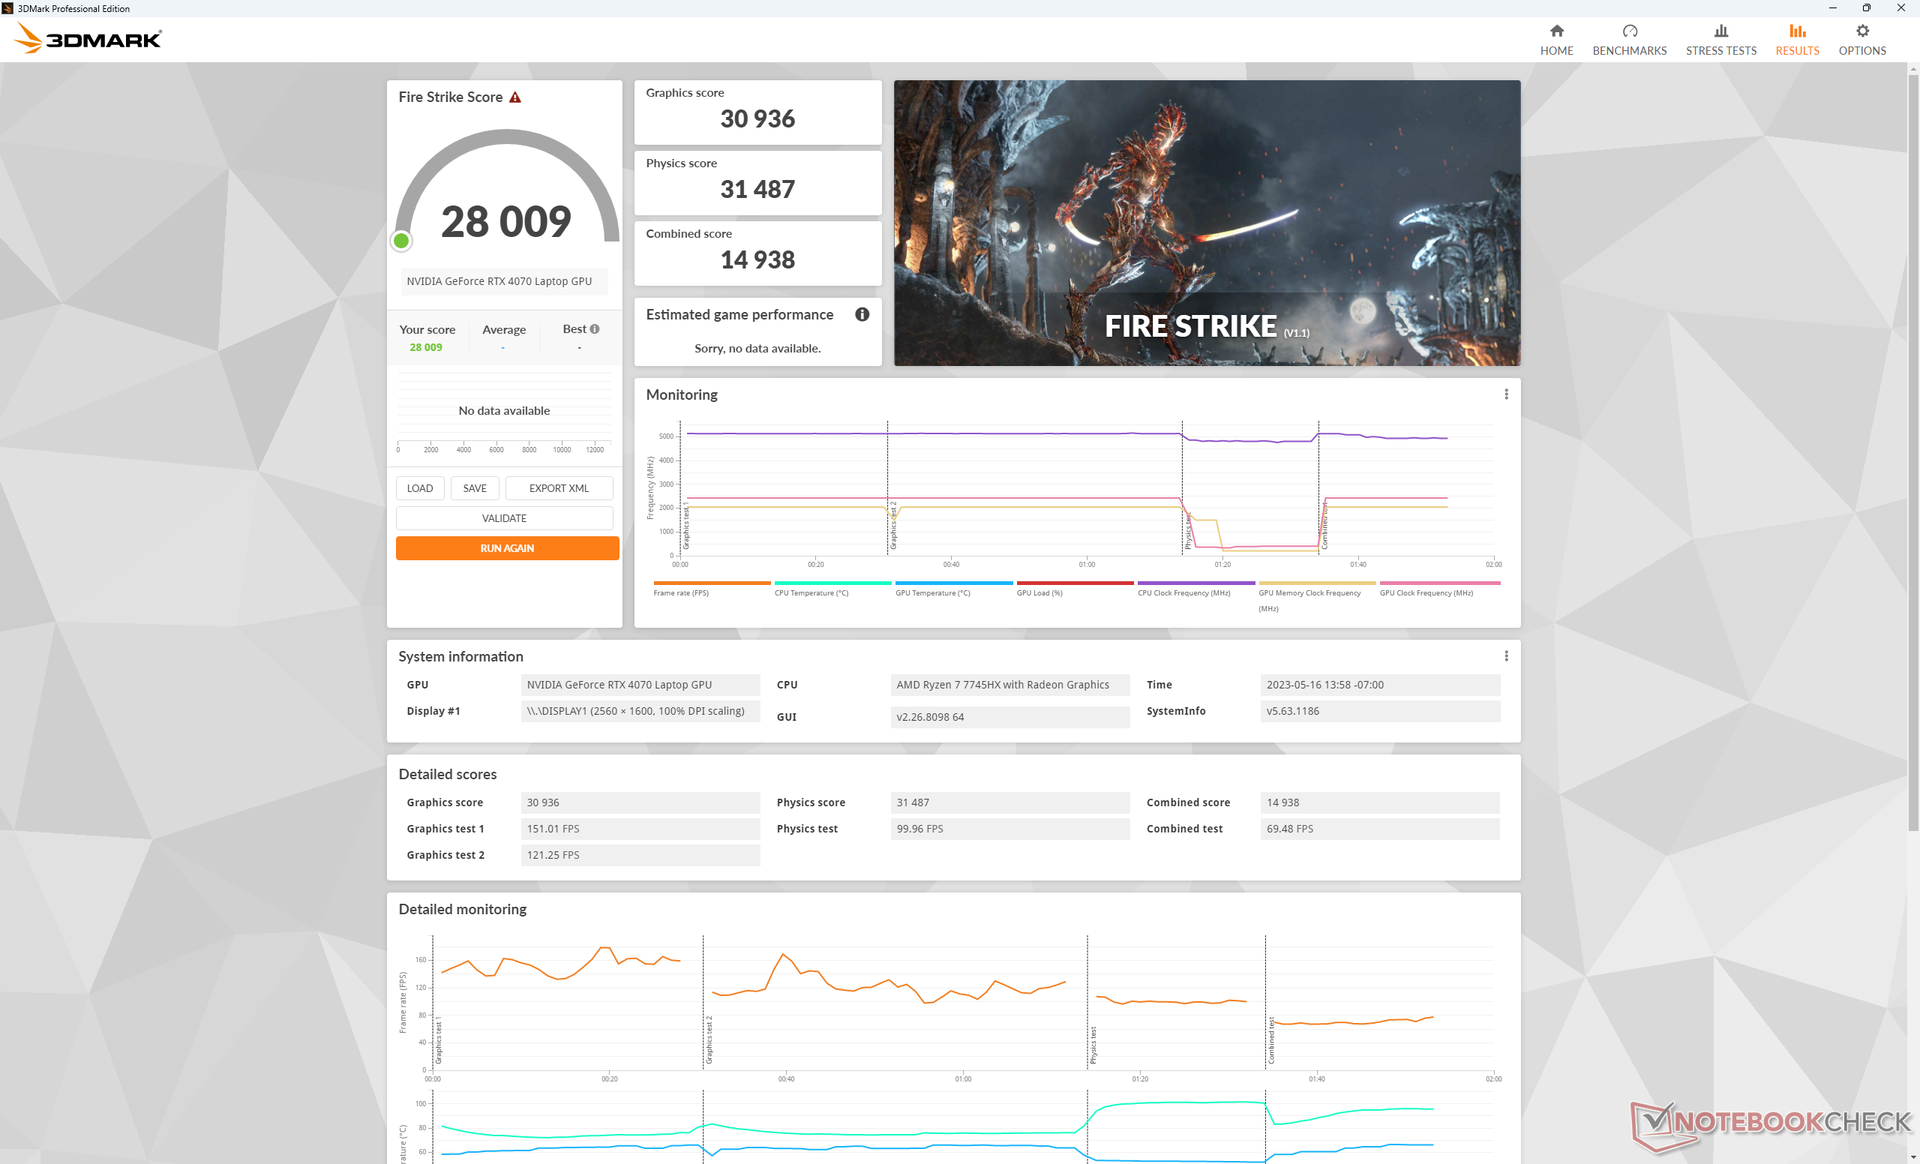
GPU-Performance - Eine Grafikkarte der oberen Mittelklasse
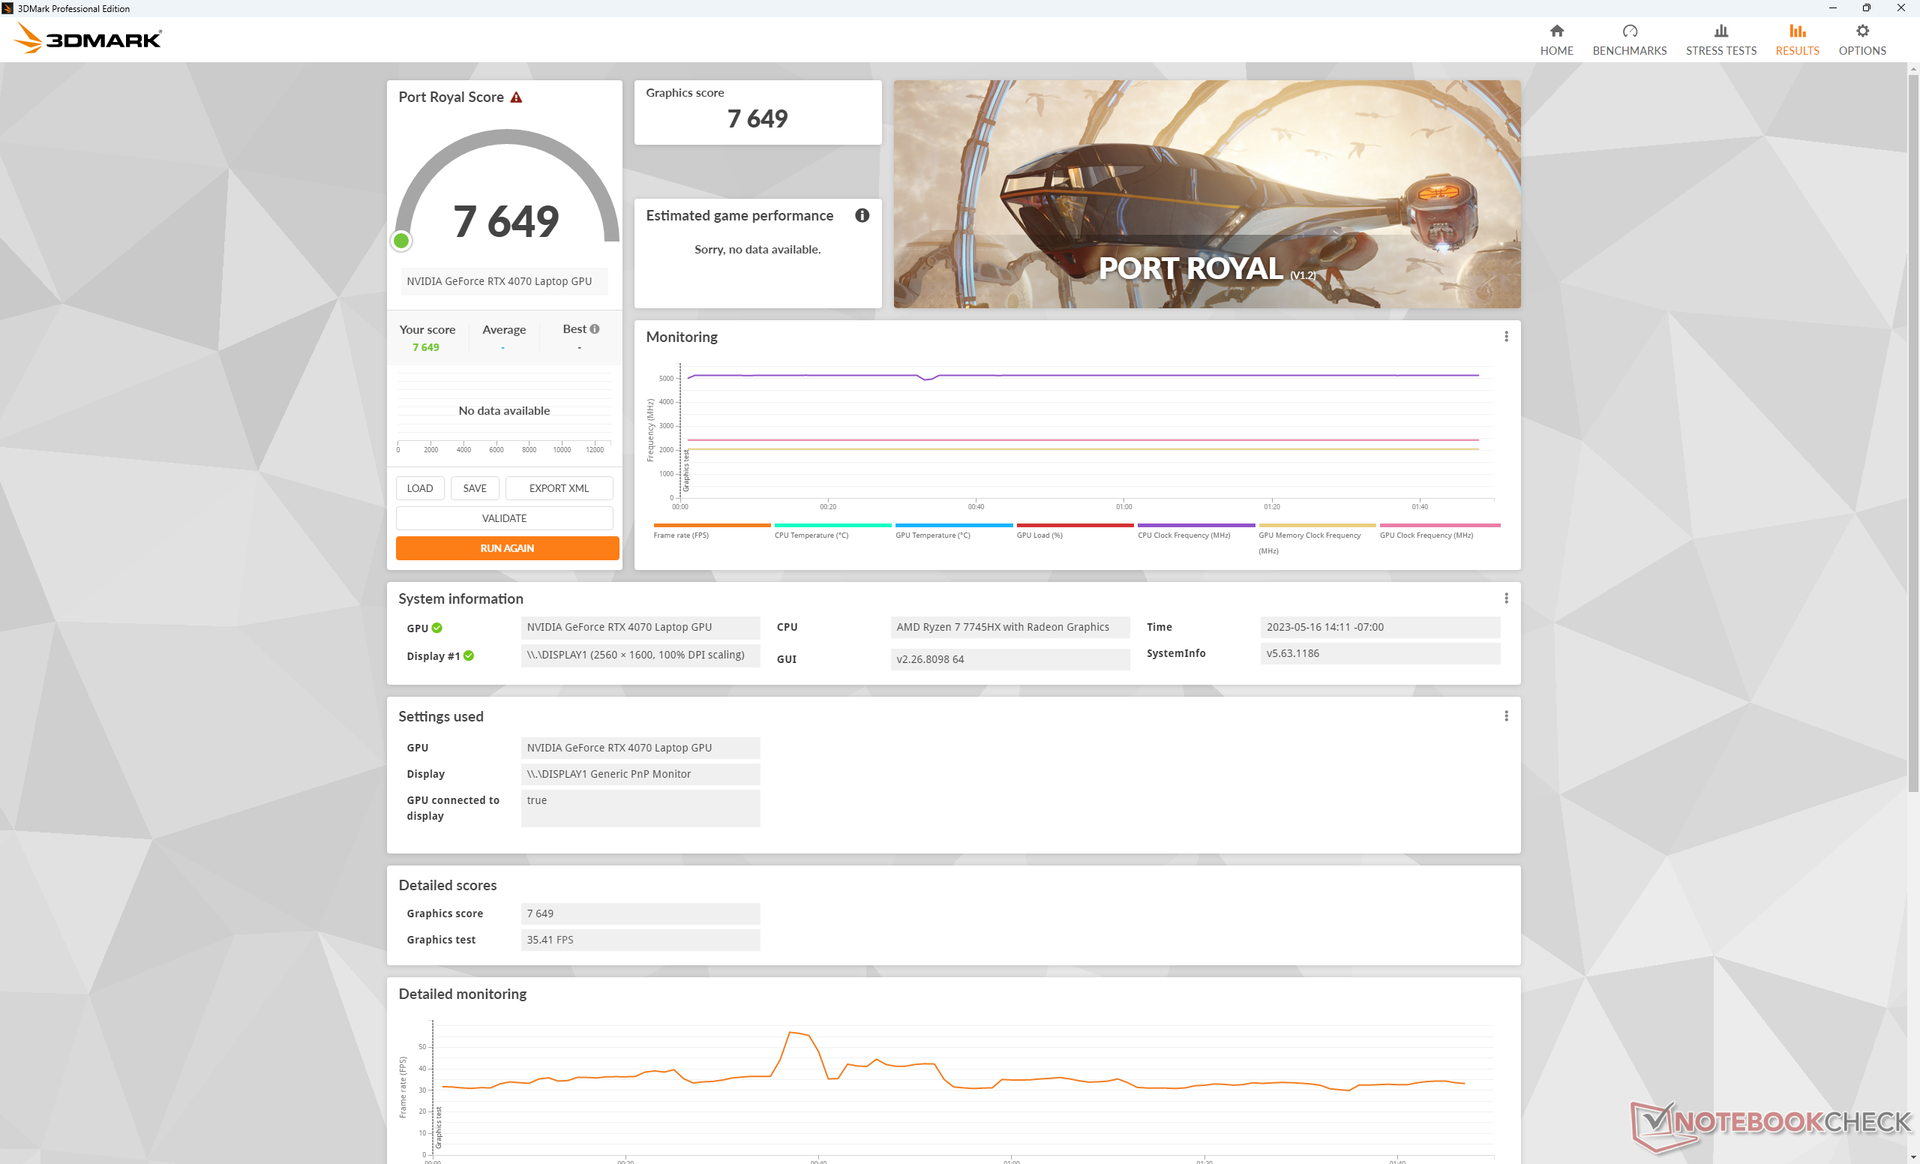
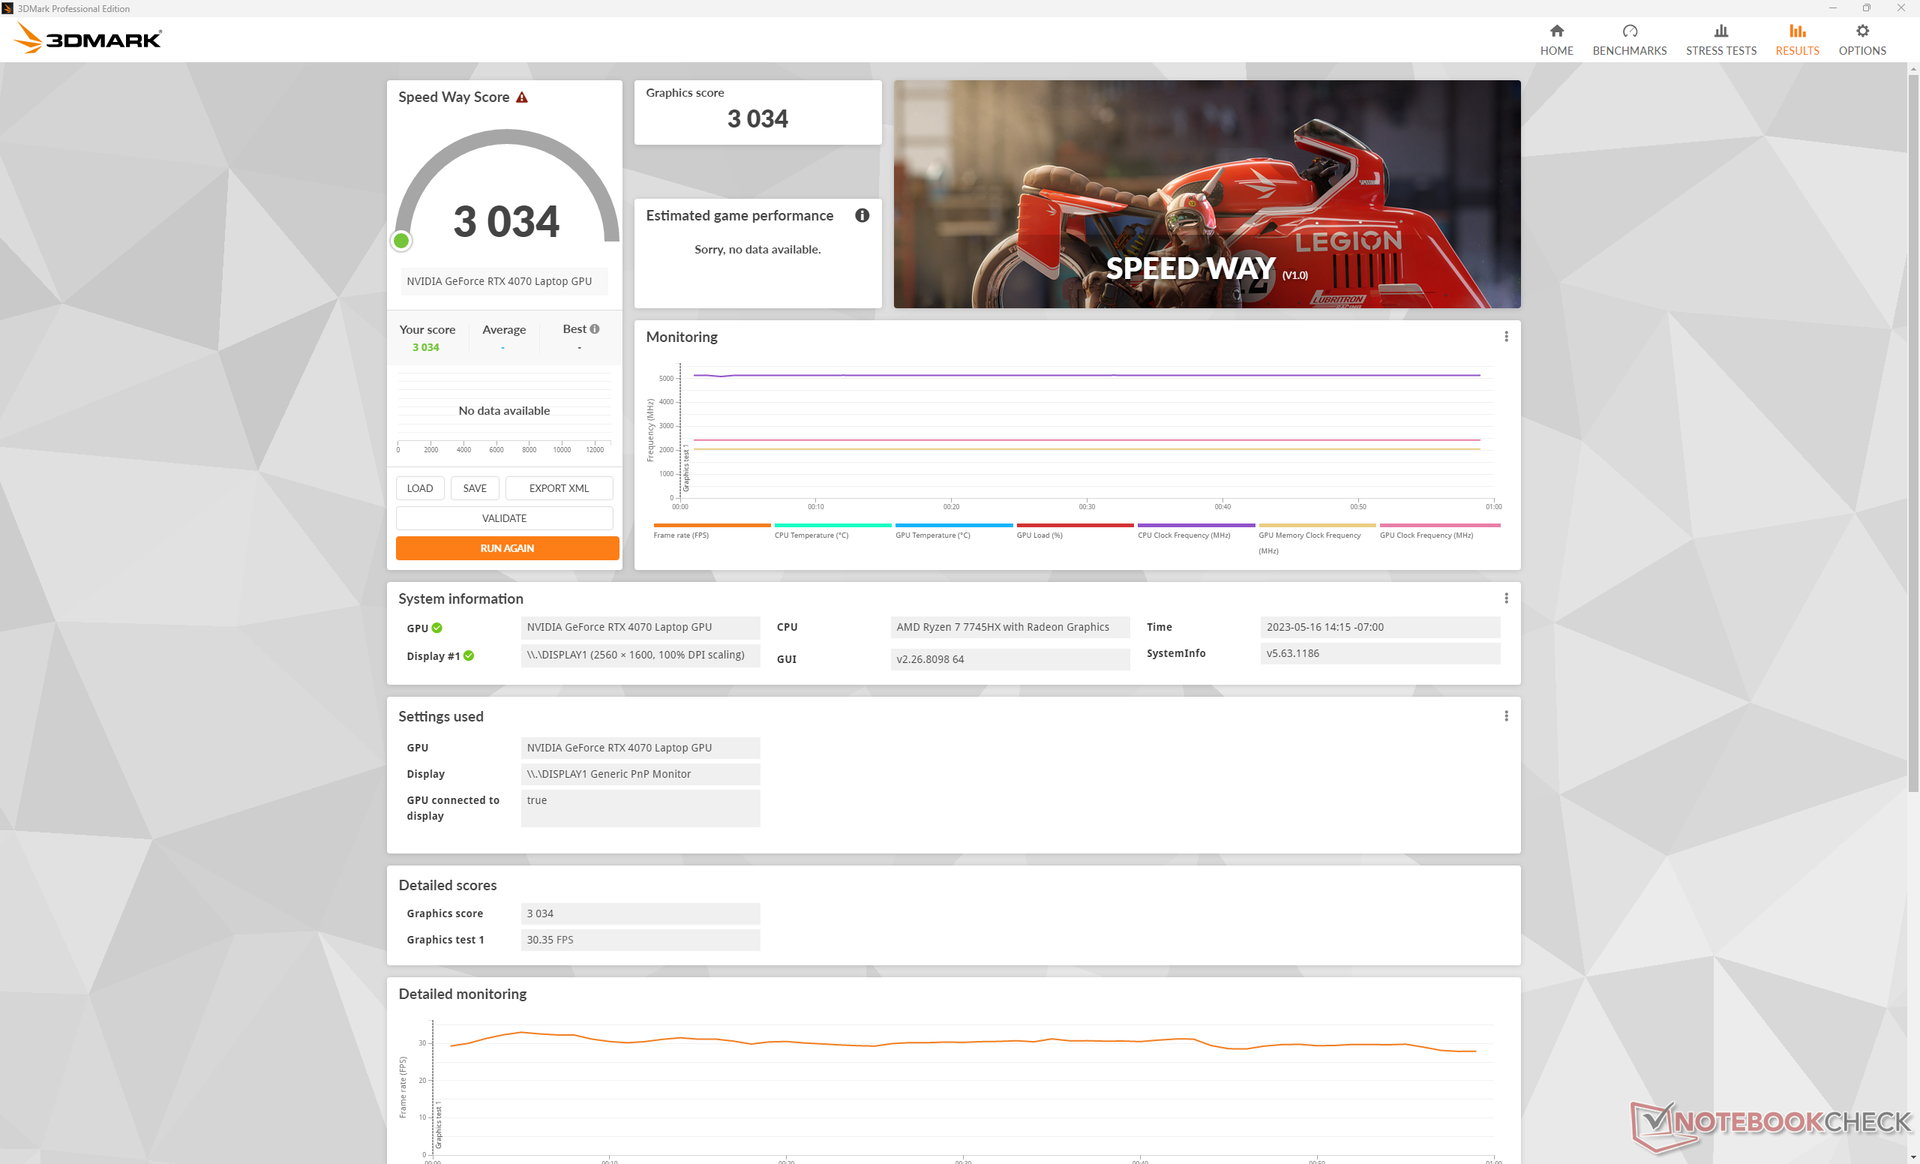
Die rohe Grafikleistung ist vergleichbar mit der der letztjährigen mobilen eForce RTX 3070 Ti. Das 140-W-TGP-Ziel ermöglicht es der mobilen RTX 4070 im Lenovo, die meisten anderen Laptops mit dergleichen GPU leicht zu übertreffen.
Ein Downgrade auf SKUs mit der mobilen RTX 4060 oder der mobilen RTX 4050 wird die Leistung voraussichtlich um 15 bzw. 20 Prozent sinken. Leider gibt es keine Option mit mobiler RTX 4080, welche die Leistung gegenüber unserer mobilen RTX 4070 deutlich um 40 bis 50 Prozent gesteigert hätte. Stattdessen sind solche High-End-GPU-Optionen für Lenovos Top-End-Legion-7-Serie reserviert.
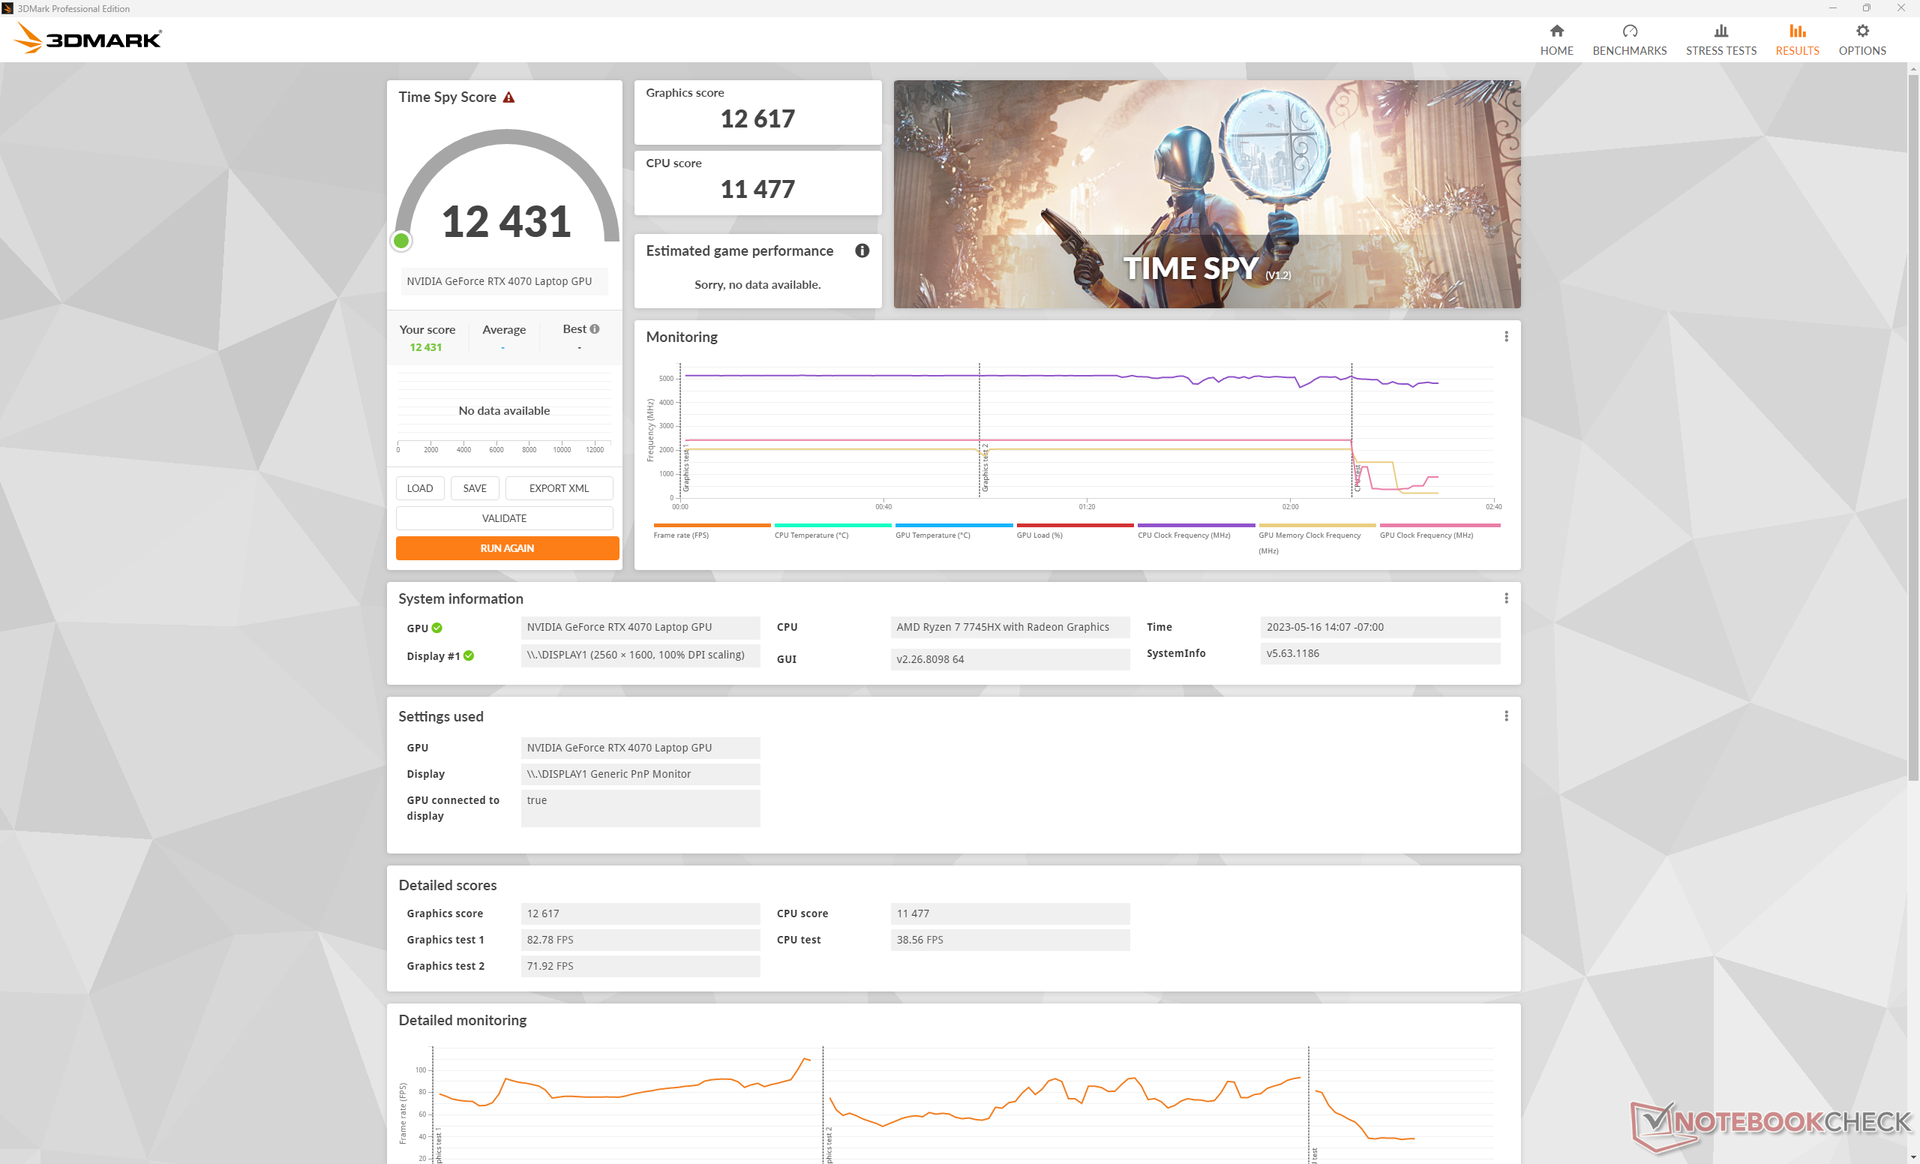
Der Betrieb der dGPU im ausgeglichenen Energieprofil ohne Übertaktung verringert die Grafikleistung laut 3DMark Time Spy um etwa 13 Prozent.
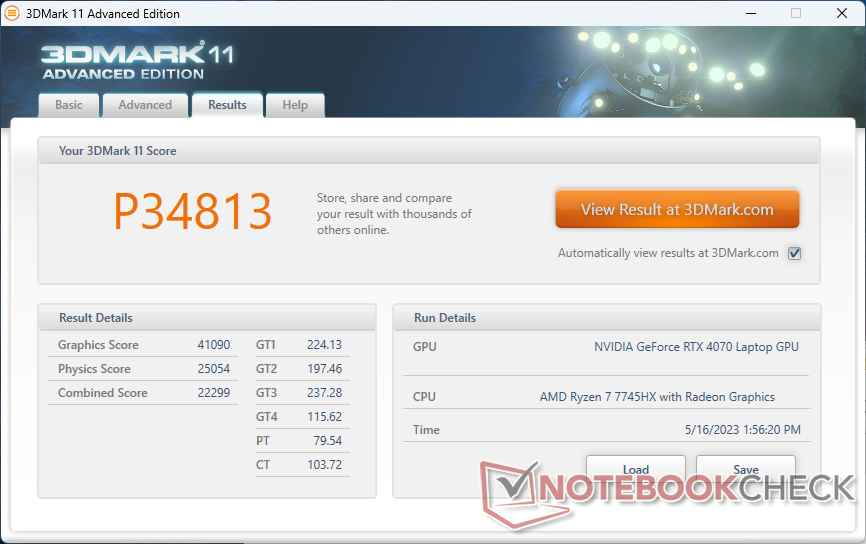
| 3DMark 11 Performance | 34813 Punkte | |
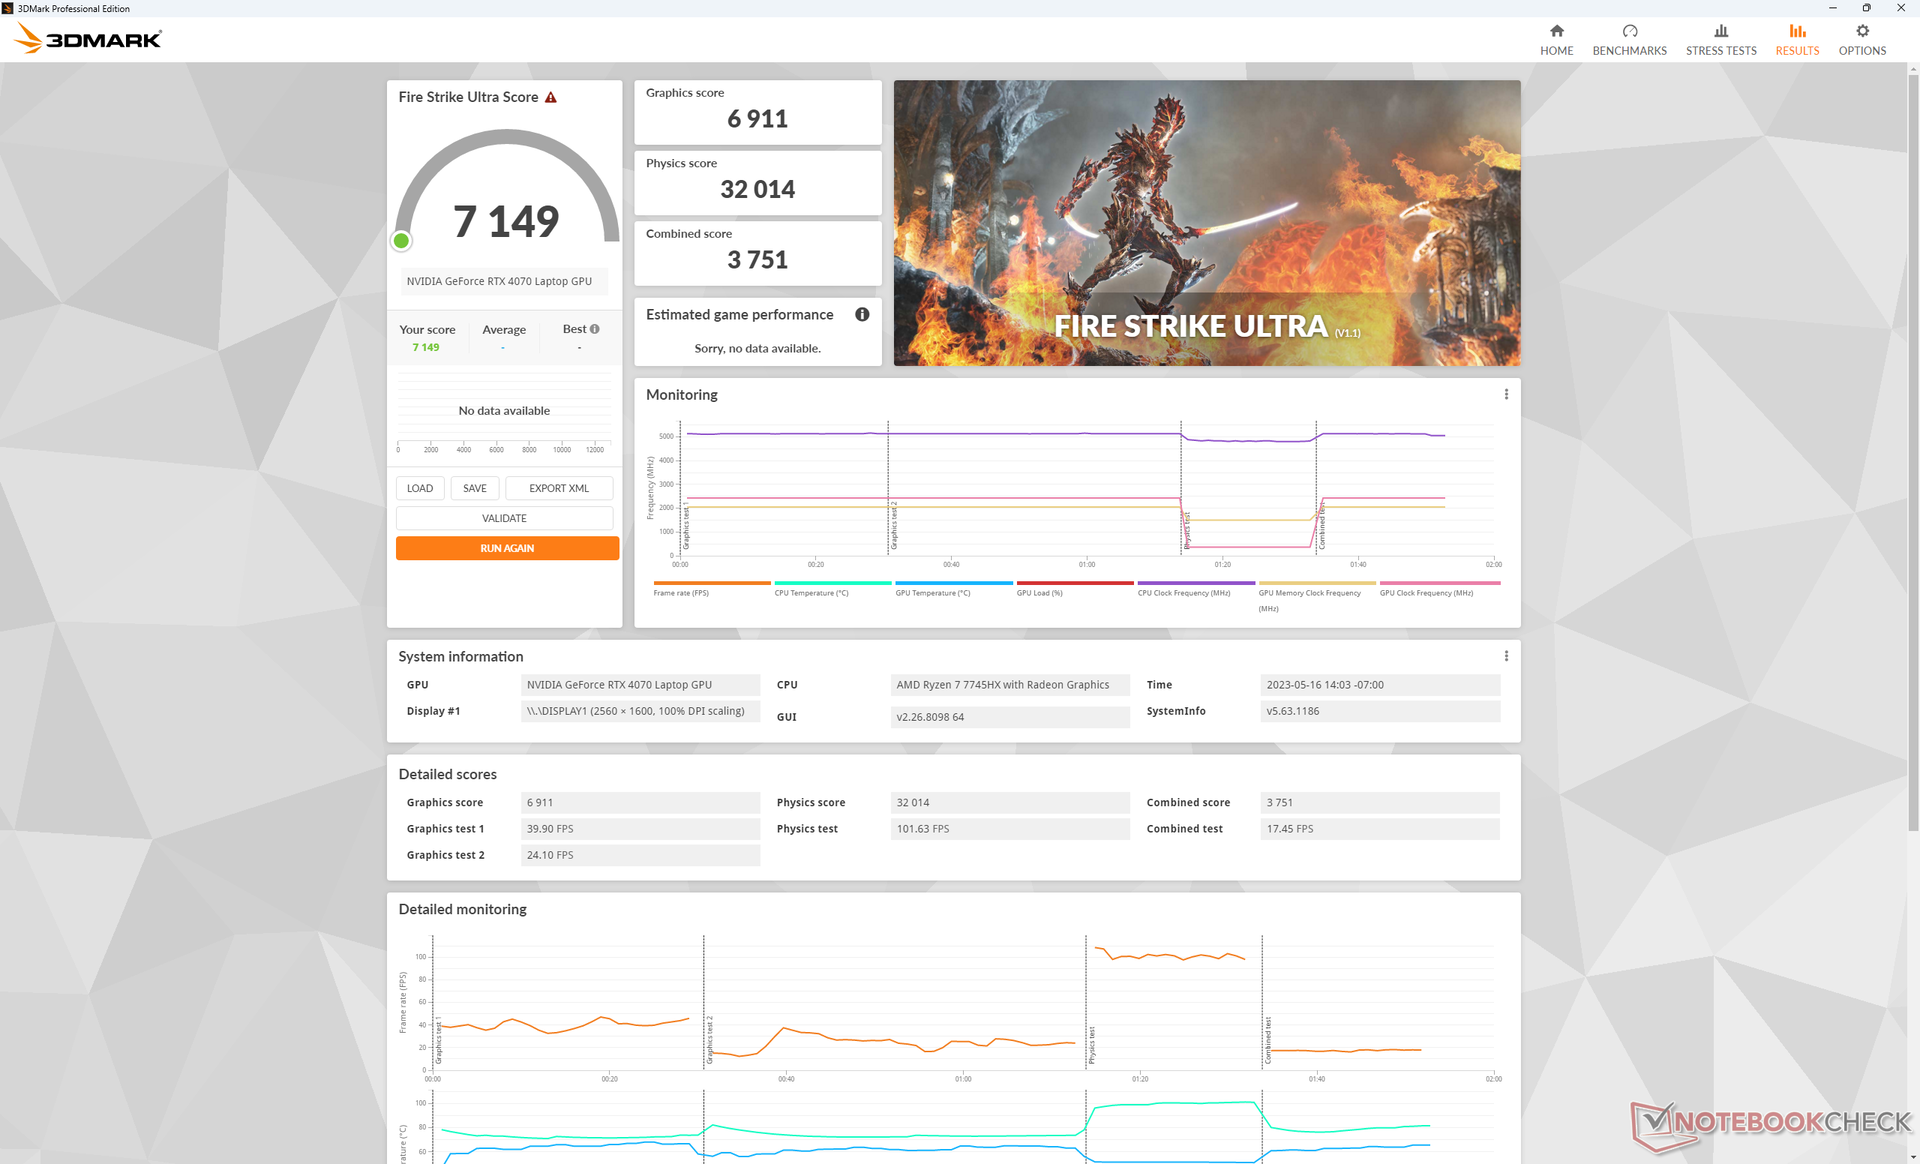
| 3DMark Fire Strike Score | 28009 Punkte | |
| 3DMark Time Spy Score | 12431 Punkte | |
Hilfe | ||
* ... kleinere Werte sind besser
Spiele-Performance
Unser AMD-betriebenes RTX-4070-Modell würde im schlimmsten Fall ungefähr dieselbe Leistung wie das Intel-betriebene RTX-4060-Modell erbringen und im besten Fall bis zu 20 Prozent schneller sein. Wie zu erwarten, vergrößert sich der Leistungsunterschied zwischen den beiden GPUs tendenziell, wenn man anspruchsvollere Titel bei höheren Auflösungen und Einstellungen spielt. Zum Beispiel laufen F1 22 und Returnal auf unserem AMD-Legion-Modell etwa 15 bis 20 Prozent schneller, während ältere Titel wie GTA V kleinere Frame-Raten-Vorteile von nur 5 bis 10 Prozent aufweisen. Man sollte also eher neuere Titel spielen, um die mobile RTX 4070 besser auszunutzen.
Im Allgemeinen harmoniert die mobile RTX 4070 gut mit dem nativen Display mit einer Auflösung von 2.560x1.600, zumal G-Sync unterstützt wird. Obwohl die mobile Version um etwa 30 Prozent schwächer ist als die Desktop-Version, ist sie immer noch leistungsfähig genug, um die neuesten Spiele mit 1.600p und 60+ fps auf hohen Einstellungen zu spielen. Spieler, die sich nicht an den Nachteilen der Frame-Generierung stören, können DLSS3 bei unterstützten Titeln aktivieren, um noch höhere Bildraten zu erzielen.
Witcher 3 FPS Chart
| min. | mittel | hoch | max. | QHD | 4K | |
|---|---|---|---|---|---|---|
| GTA V (2015) | 185.8 | 185.1 | 178.6 | 119.9 | 93.2 | 93.7 |
| The Witcher 3 (2015) | 597 | 415.1 | 257.3 | 119.8 | 76.2 | |
| Dota 2 Reborn (2015) | 238 | 203 | 191.8 | 182 | 151.5 | |
| Final Fantasy XV Benchmark (2018) | 229 | 172.5 | 119.9 | 119.9 | 49.2 | |
| X-Plane 11.11 (2018) | 186.3 | 155.2 | 117.8 | 99.5 | ||
| Strange Brigade (2018) | 636 | 334 | 260 | 223 | 146.4 | 76.8 |
| Shadow of the Tomb Raider (2018) | 168 | 110 | 53 | |||
| Far Cry 6 (2021) | 110 | 88 | 43 | |||
| Cyberpunk 2077 1.6 (2022) | 185.8 | 157.6 | 121.3 | 98.9 | 58.1 | 24.7 |
| Tiny Tina's Wonderlands (2022) | 263.6 | 217.3 | 144.5 | 112.1 | 76.9 | 39.7 |
| F1 22 (2022) | 311 | 300 | 235 | 84.1 | 54.8 | 26.4 |
| Call of Duty Modern Warfare 2 2022 (2022) | 108 | 77 | 44 | |||
| Returnal (2023) | 93 | 90 | 85 | 77 | 55 | 29 |
| Star Wars Jedi Survivor (2023) | 77.9 | 50.4 | 24.2 |
Emissionen
Systemgeräusch - etwa 50 dB(A) beim Spielen
Das Lüftergeräusch beim Spielen ist bei AMD- und Intel Modellen mit rund 48 dB(A) etwa gleich laut. Wird die CPU jedoch deutlich stärker belastet, kann das Lüftergeräusch maximal 54 dB(A) erreichen. Der niedrige 50-dB(A)-Bereich ist typisch für die meisten Gaming-Notebooks, so auch für das Asus ROG Strix G16 oder Razer Blade 16.
Interessanterweise ist das Lüftergeräusch etwas leiser und pulsiert weniger häufig, wenn es um anspruchslose Aufgaben wie Büroarbeit oder Videowiedergabe geht. Die AMD CPU verbraucht beim Boosten weniger Strom als die Intel CPU, was zu dem gleichmäßigeren Lüftergeräusch beitragen kann.
Lautstärkediagramm
| Idle |
| 23.2 / 23.2 / 26.2 dB(A) |
| Last |
| 31.4 / 53.8 dB(A) |
 | ||
30 dB leise 40 dB(A) deutlich hörbar 50 dB(A) störend |
||
min: | ||
| Lenovo Legion Pro 5 16ARX8 GeForce RTX 4070 Laptop GPU, R7 7745HX, Samsung PM9A1 MZVL21T0HCLR | Lenovo Legion Pro 5 16IRX8 GeForce RTX 4060 Laptop GPU, i7-13700HX, SK hynix PC801 HFS512GEJ9X115N | Uniwill GM6PX7X RTX 4070 GeForce RTX 4070 Laptop GPU, i7-13700HX, Samsung PM9A1 MZVL2512HCJQ | Schenker XMG Neo 16 E23 GeForce RTX 4090 Laptop GPU, i9-13900HX, Crucial P5 Plus 1TB CT1000P5PSSD8 | Asus ROG Strix G16 G614JZ GeForce RTX 4080 Laptop GPU, i9-13980HX, WD PC SN560 SDDPNQE-1T00 | Asus Zephyrus Duo 16 GX650PY-NM006W GeForce RTX 4090 Laptop GPU, R9 7945HX, SK hynix PC801 HFS002TEJ9X101N | |
|---|---|---|---|---|---|---|
| Geräuschentwicklung | -2% | -9% | -37% | -15% | -19% | |
| aus / Umgebung * (dB) | 23.2 | 23 1% | 22.4 3% | 25 -8% | 25 -8% | 23.9 -3% |
| Idle min * (dB) | 23.2 | 23.1 -0% | 22.9 1% | 31 -34% | 26 -12% | 23.9 -3% |
| Idle avg * (dB) | 23.2 | 23.1 -0% | 29 -25% | 33 -42% | 28 -21% | 32.9 -42% |
| Idle max * (dB) | 26.2 | 26.6 -2% | 29 -11% | 42 -60% | 30 -15% | 36.5 -39% |
| Last avg * (dB) | 31.4 | 34.7 -11% | 40.2 -28% | 58 -85% | 48 -53% | 42.9 -37% |
| Witcher 3 ultra * (dB) | 48.4 | 47.6 2% | 48.7 -1% | 57 -18% | 49 -1% | 51.2 -6% |
| Last max * (dB) | 53.8 | 54.8 -2% | 55 -2% | 59 -10% | 52 3% | 56 -4% |
* ... kleinere Werte sind besser
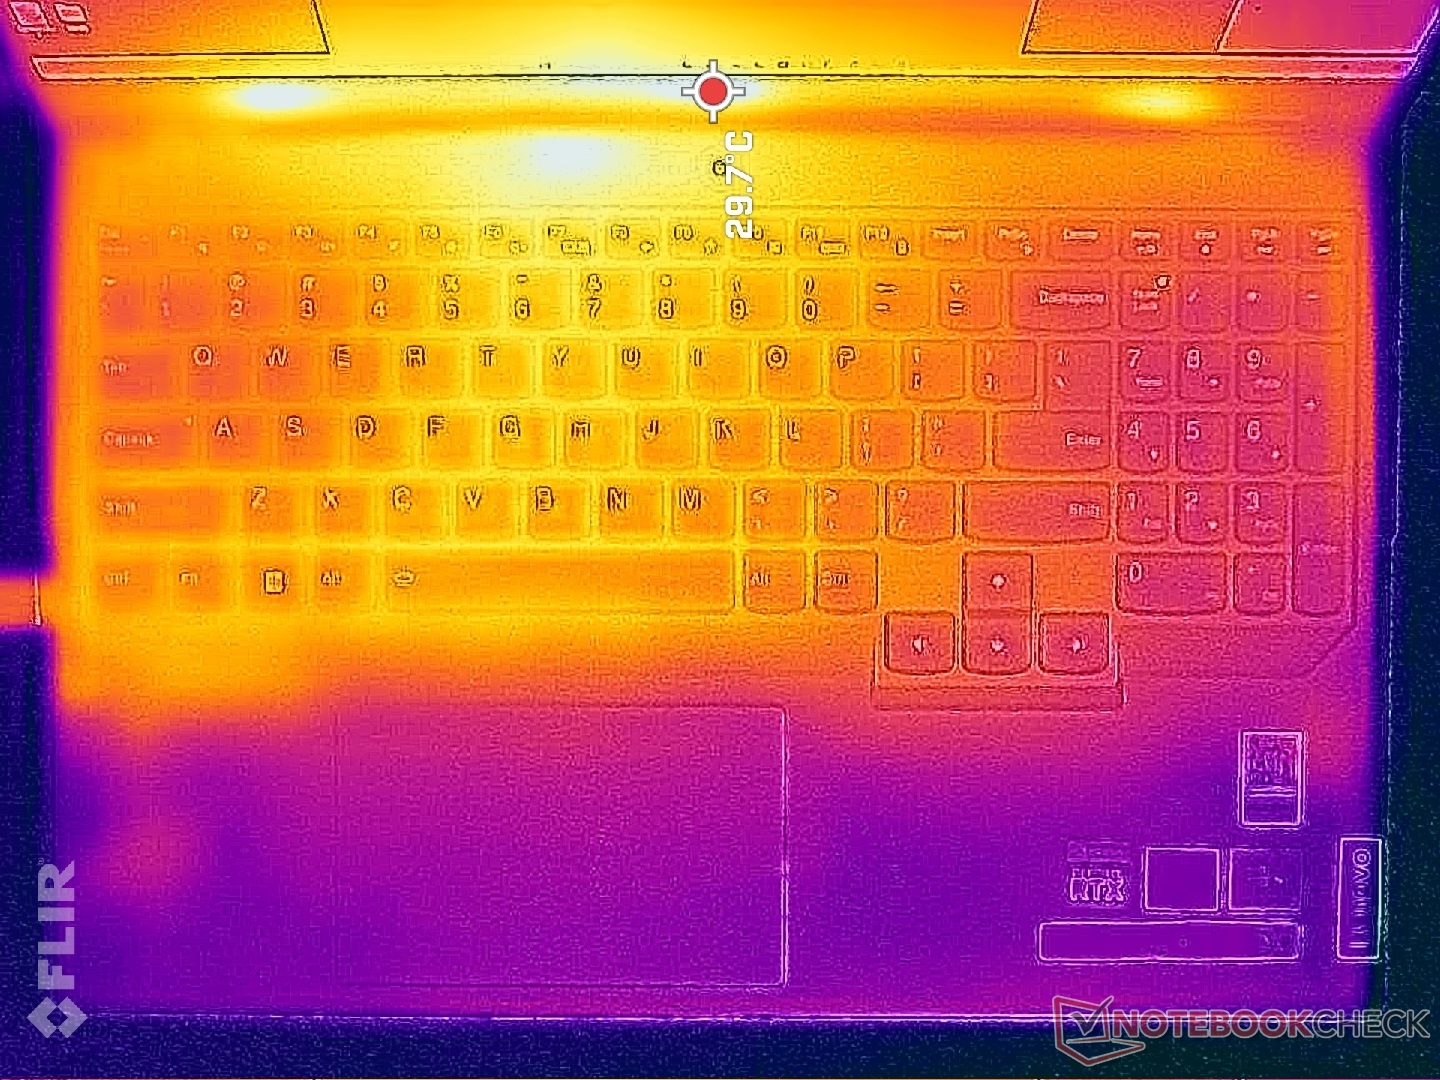
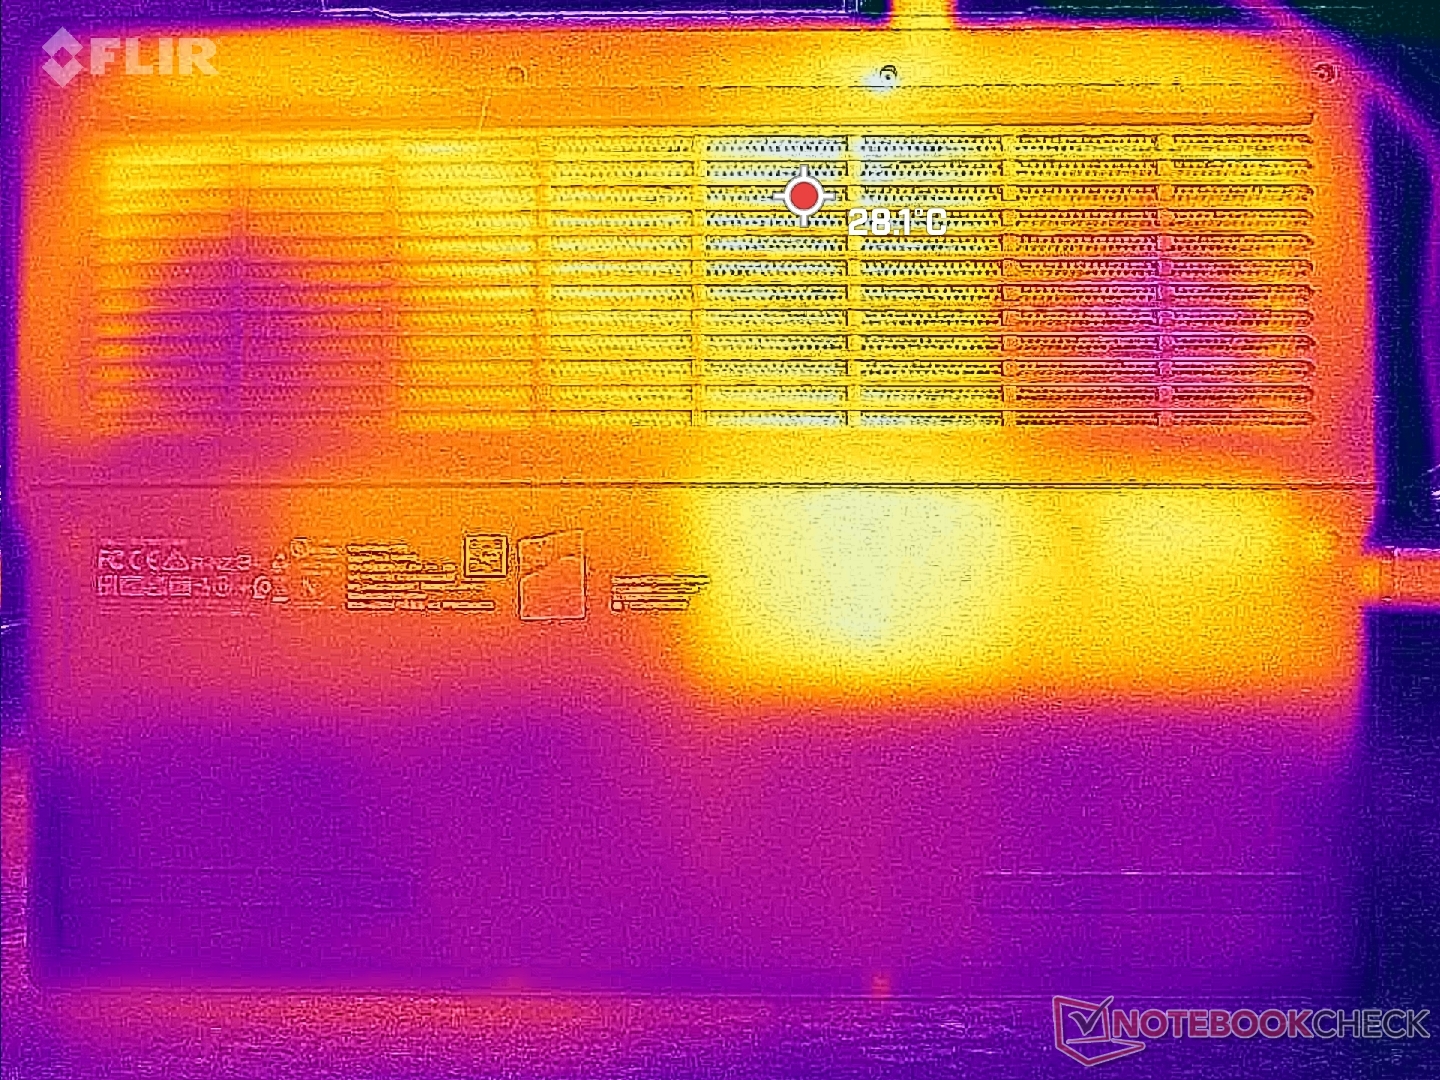
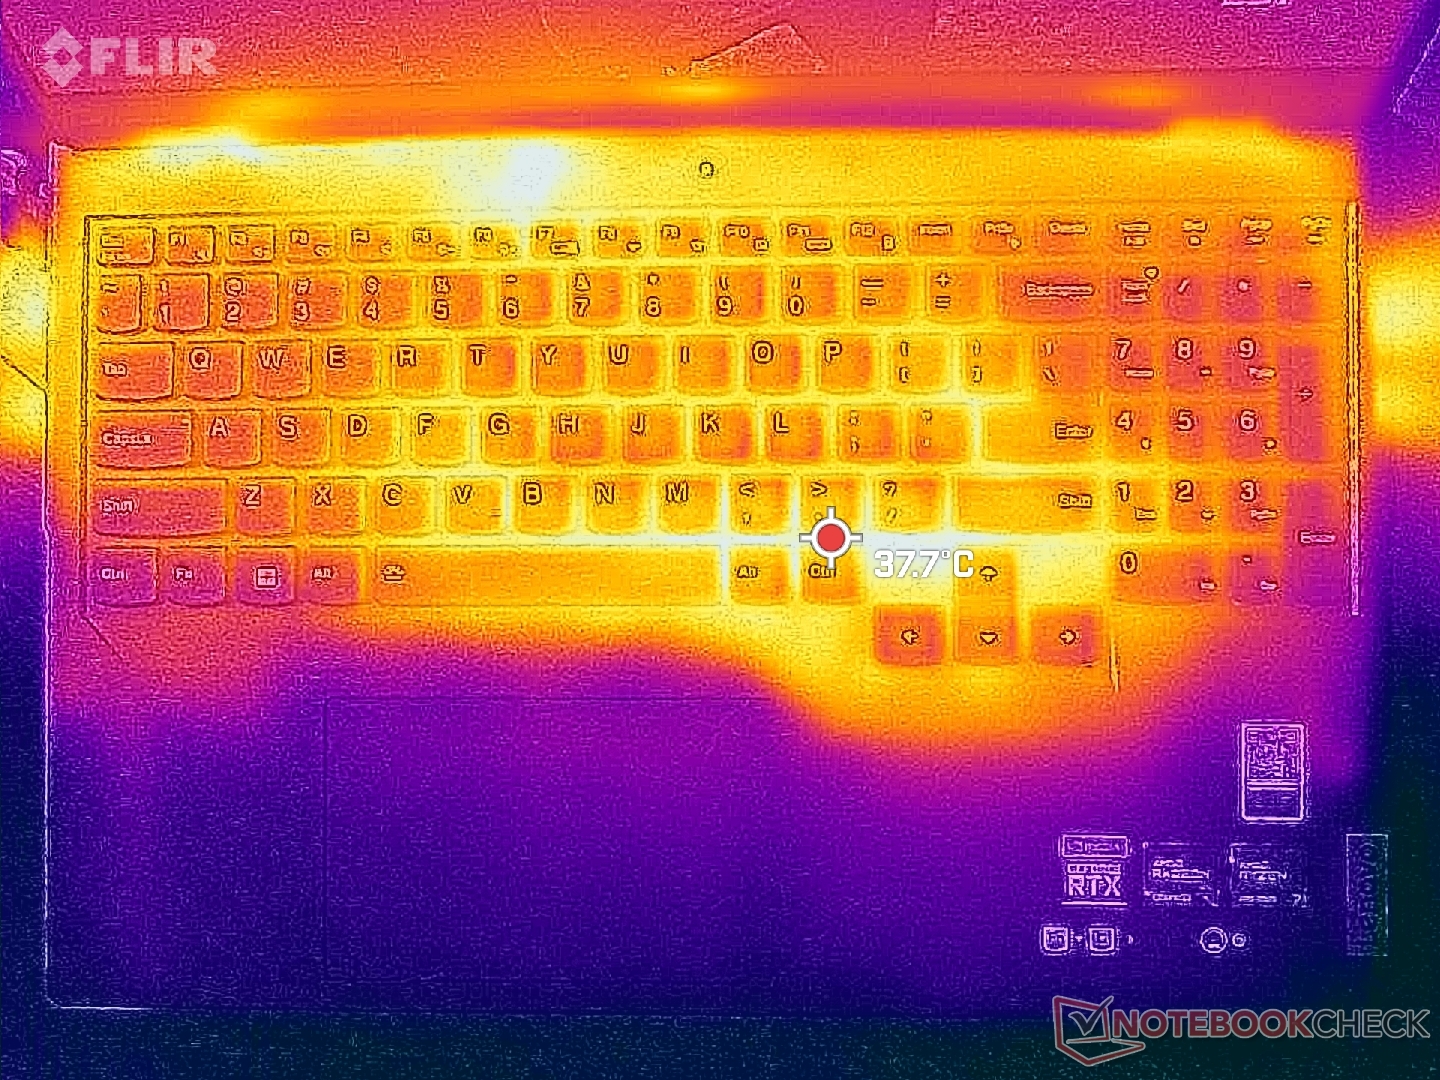
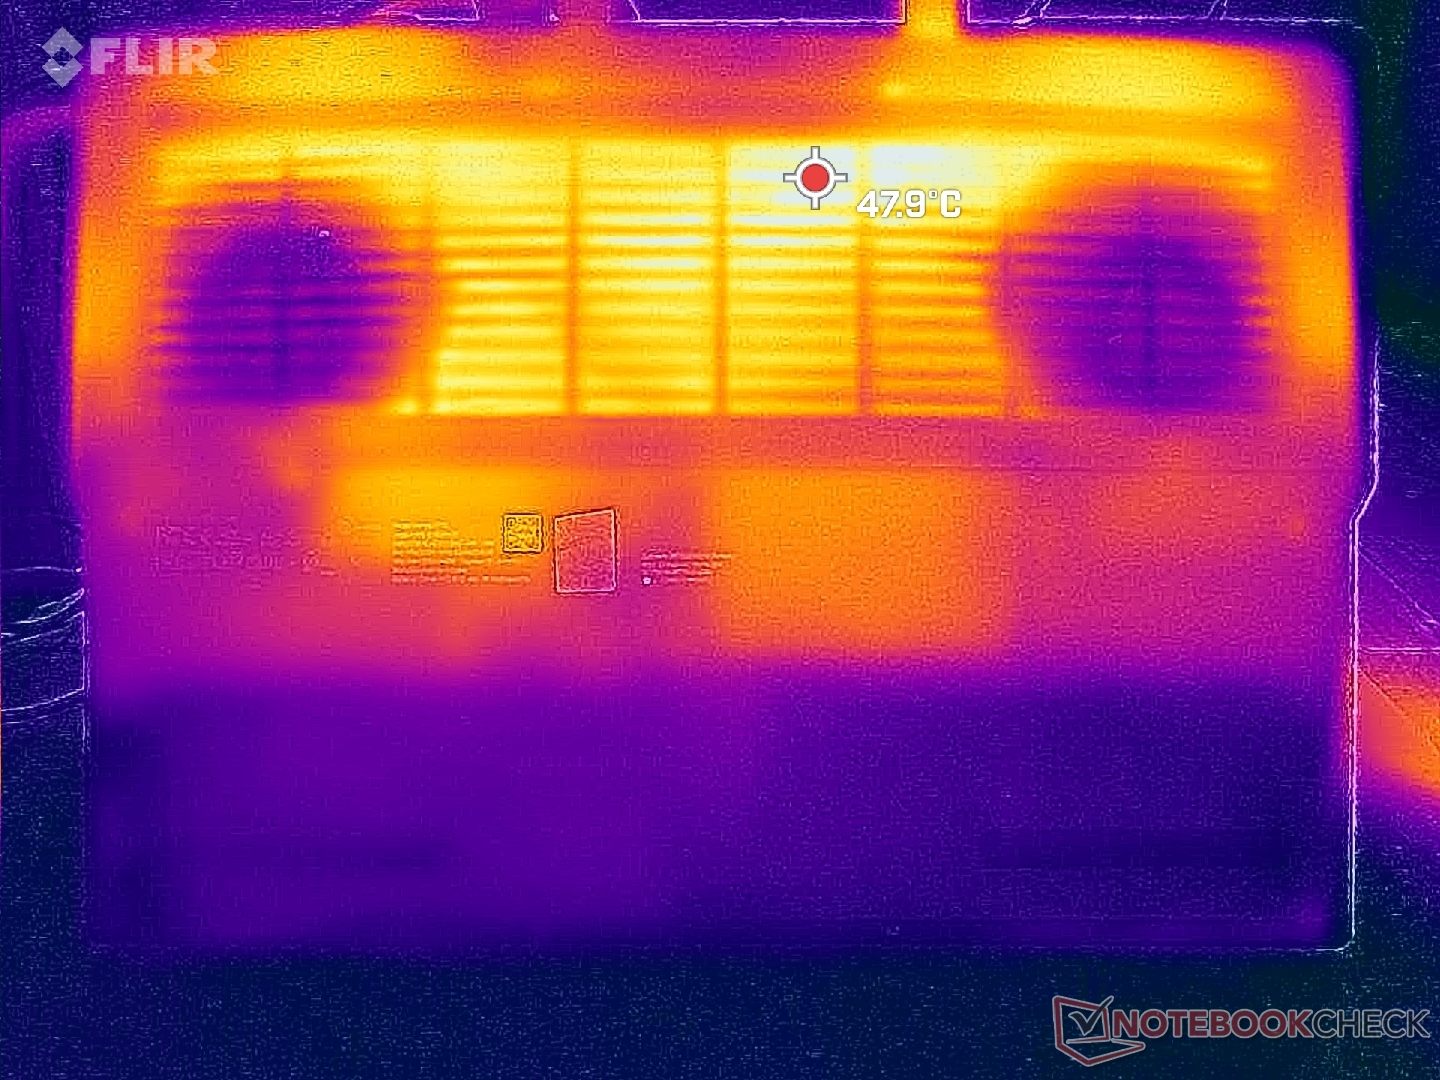
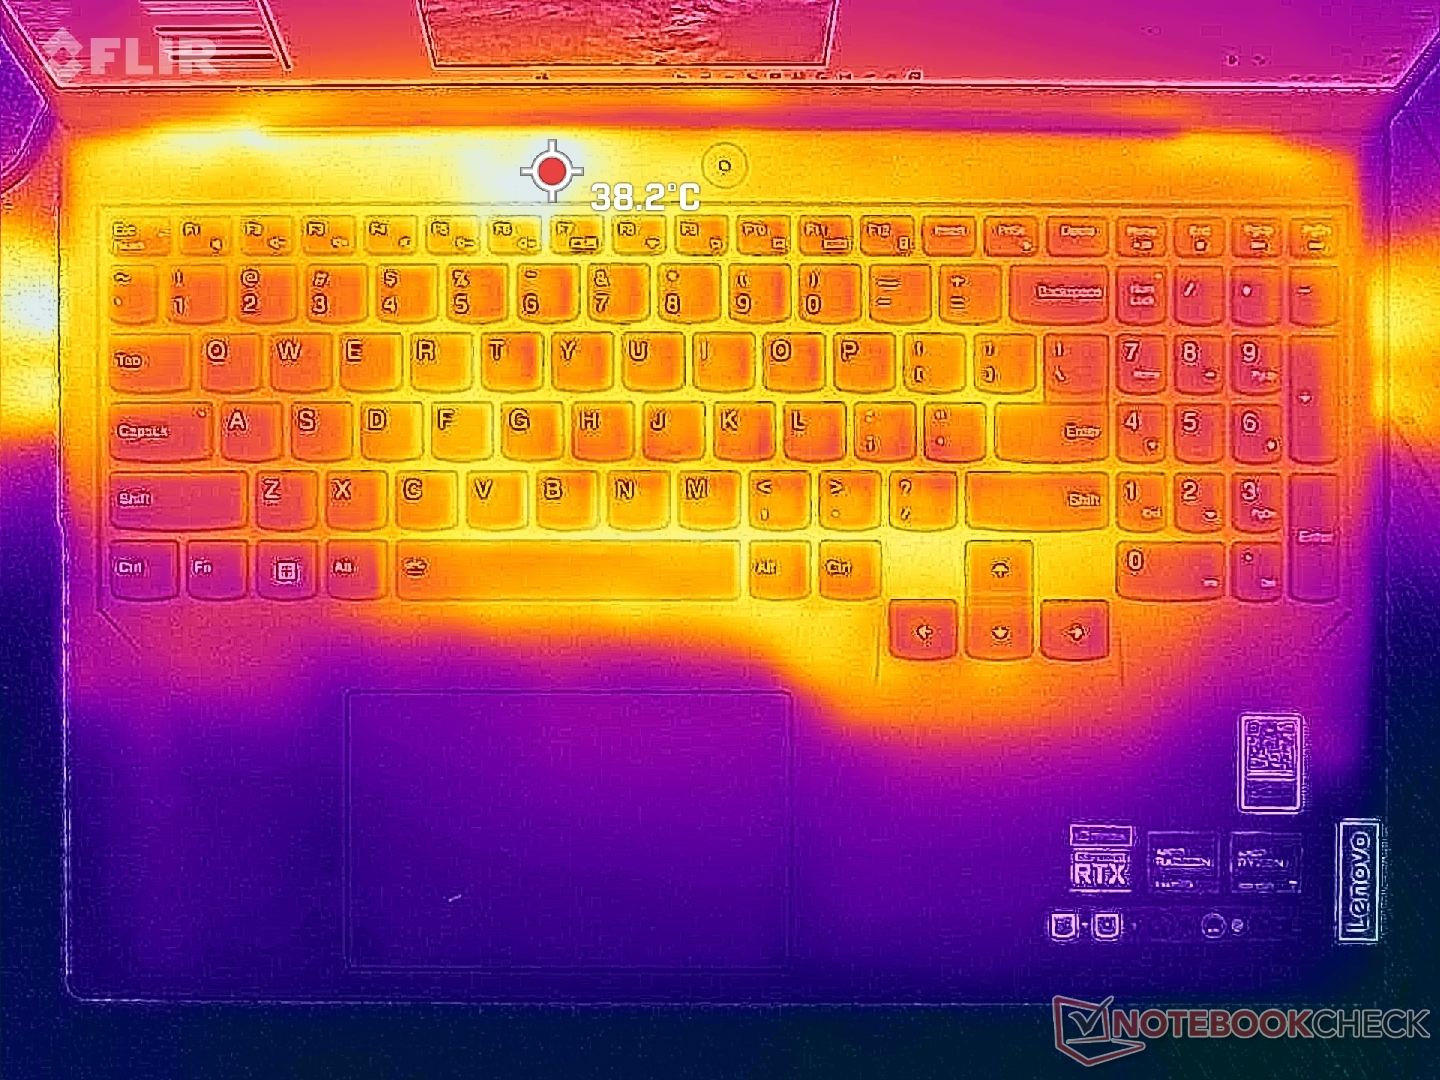
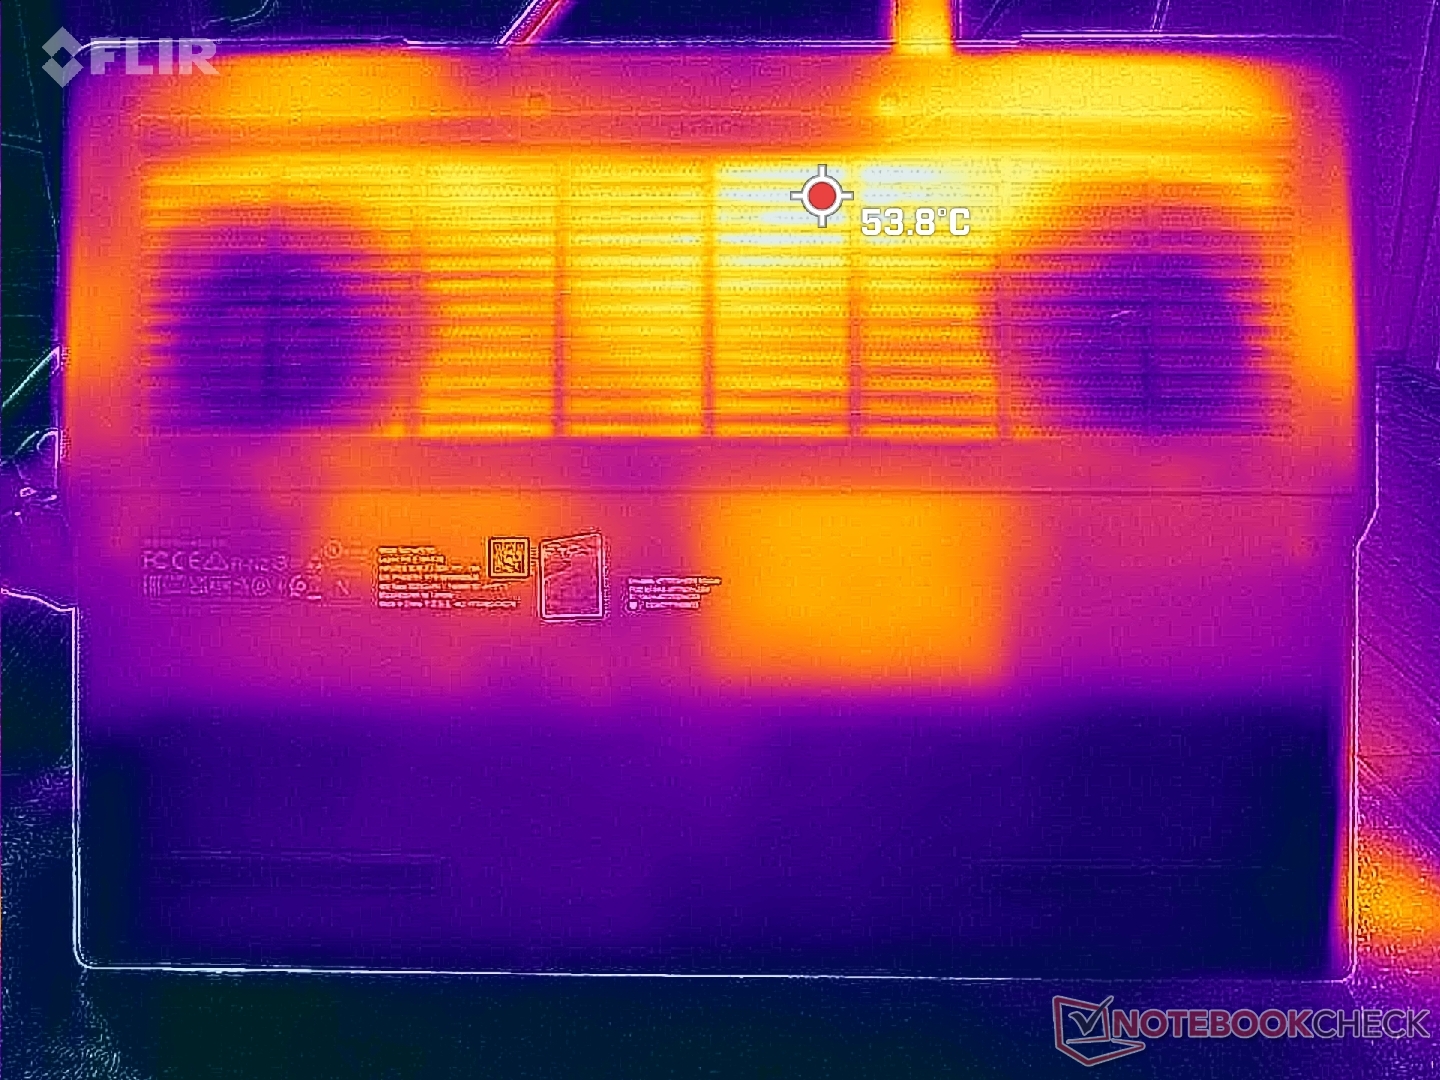
Temperatur
Die Oberflächentemperaturen sind in der Mitte und auf der Rückseite des Gehäuse am wärmsten, wo beim Spielen Temperaturen von knapp über 40 °C erreicht werden können. Konkurrierende Modelle wie das Asus ROG Zephyrus M16 werden unter ähnlichen Testbedingungen mit knapp über 50 °C noch wärmer. Es besteht kein Zweifel daran, dass die vergleichsweise größeren Lüftungsgitter des Legion Designs für die besseren Temperaturen mitverantwortlich sind.
Die Handballenablagen erwärmen sich unabhängig von der Bildschirmlast kaum, sodass die Hände beim Spielen nicht unangenehm heiß werden.
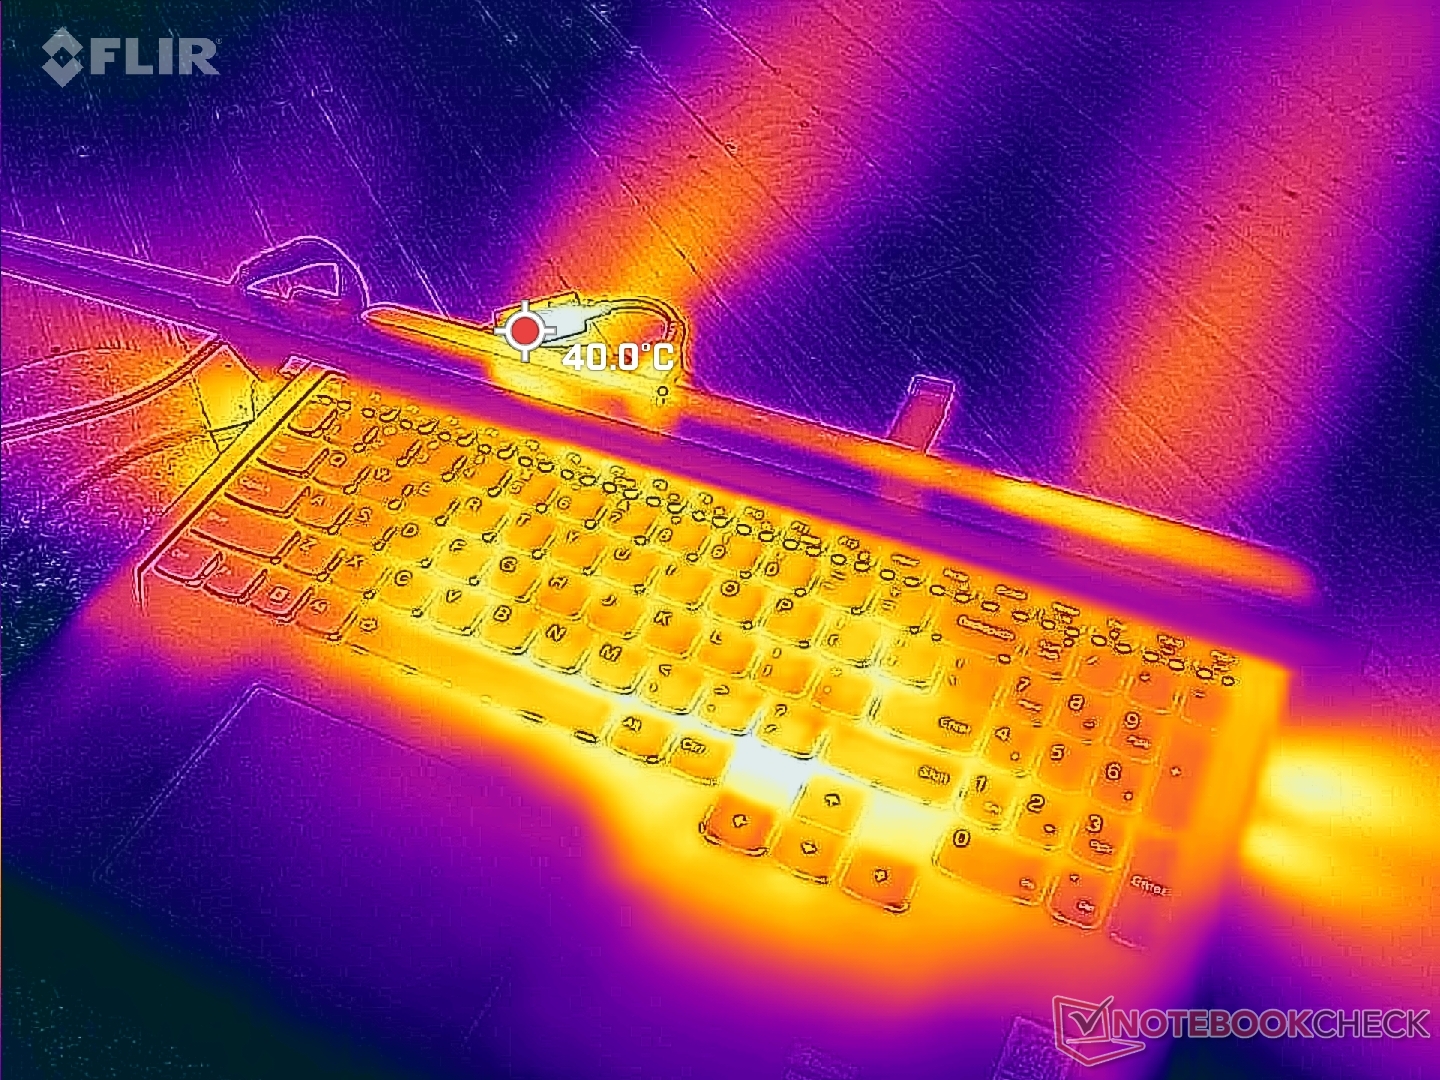
(±) Die maximale Temperatur auf der Oberseite ist 41.8 °C. Im Vergleich liegt der Klassendurchschnitt bei 40.4 °C (von 21.2 bis 68.8 °C für die Klasse Gaming).
(±) Auf der Unterseite messen wir eine maximalen Wert von 41.4 °C (im Vergleich zum Durchschnitt von 43.2 °C).
(+) Ohne Last messen wir eine durchschnittliche Temperatur von 26.2 °C auf der Oberseite. Der Klassendurchschnitt erreicht 33.9 °C.
(±) Beim längeren Spielen von The Witcher 3 erhitzt sich das Gerät durchschnittlich auf 34.2 °C. Der Durchschnitt der Klasse ist derzeit 33.9 °C.
(+) Die Handballen und der Touchpad-Bereich sind mit gemessenen 30.4 °C kühler als die typische Hauttemperatur und fühlen sich dadurch kühl an.
(±) Die durchschnittliche Handballen-Temperatur anderer getesteter Geräte war 28.8 °C (-1.6 °C).
| Lenovo Legion Pro 5 16ARX8 AMD Ryzen 7 7745HX, NVIDIA GeForce RTX 4070 Laptop GPU | Lenovo Legion Pro 5 16IRX8 Intel Core i7-13700HX, NVIDIA GeForce RTX 4060 Laptop GPU | Uniwill GM6PX7X RTX 4070 Intel Core i7-13700HX, NVIDIA GeForce RTX 4070 Laptop GPU | Schenker XMG Neo 16 E23 Intel Core i9-13900HX, NVIDIA GeForce RTX 4090 Laptop GPU | Asus ROG Strix G16 G614JZ Intel Core i9-13980HX, NVIDIA GeForce RTX 4080 Laptop GPU | Asus Zephyrus Duo 16 GX650PY-NM006W AMD Ryzen 9 7945HX, NVIDIA GeForce RTX 4090 Laptop GPU | |
|---|---|---|---|---|---|---|
| Hitze | -9% | -12% | -7% | -18% | -5% | |
| Last oben max * (°C) | 41.8 | 42.8 -2% | 38.2 9% | 50 -20% | 54 -29% | 44.2 -6% |
| Last unten max * (°C) | 41.4 | 50 -21% | 45 -9% | 51 -23% | 55 -33% | 46.8 -13% |
| Idle oben max * (°C) | 29 | 29.6 -2% | 33.6 -16% | 28 3% | 29 -0% | 29.2 -1% |
| Idle unten max * (°C) | 30.4 | 34 -12% | 39.6 -30% | 26 14% | 33 -9% | 30.2 1% |
* ... kleinere Werte sind besser
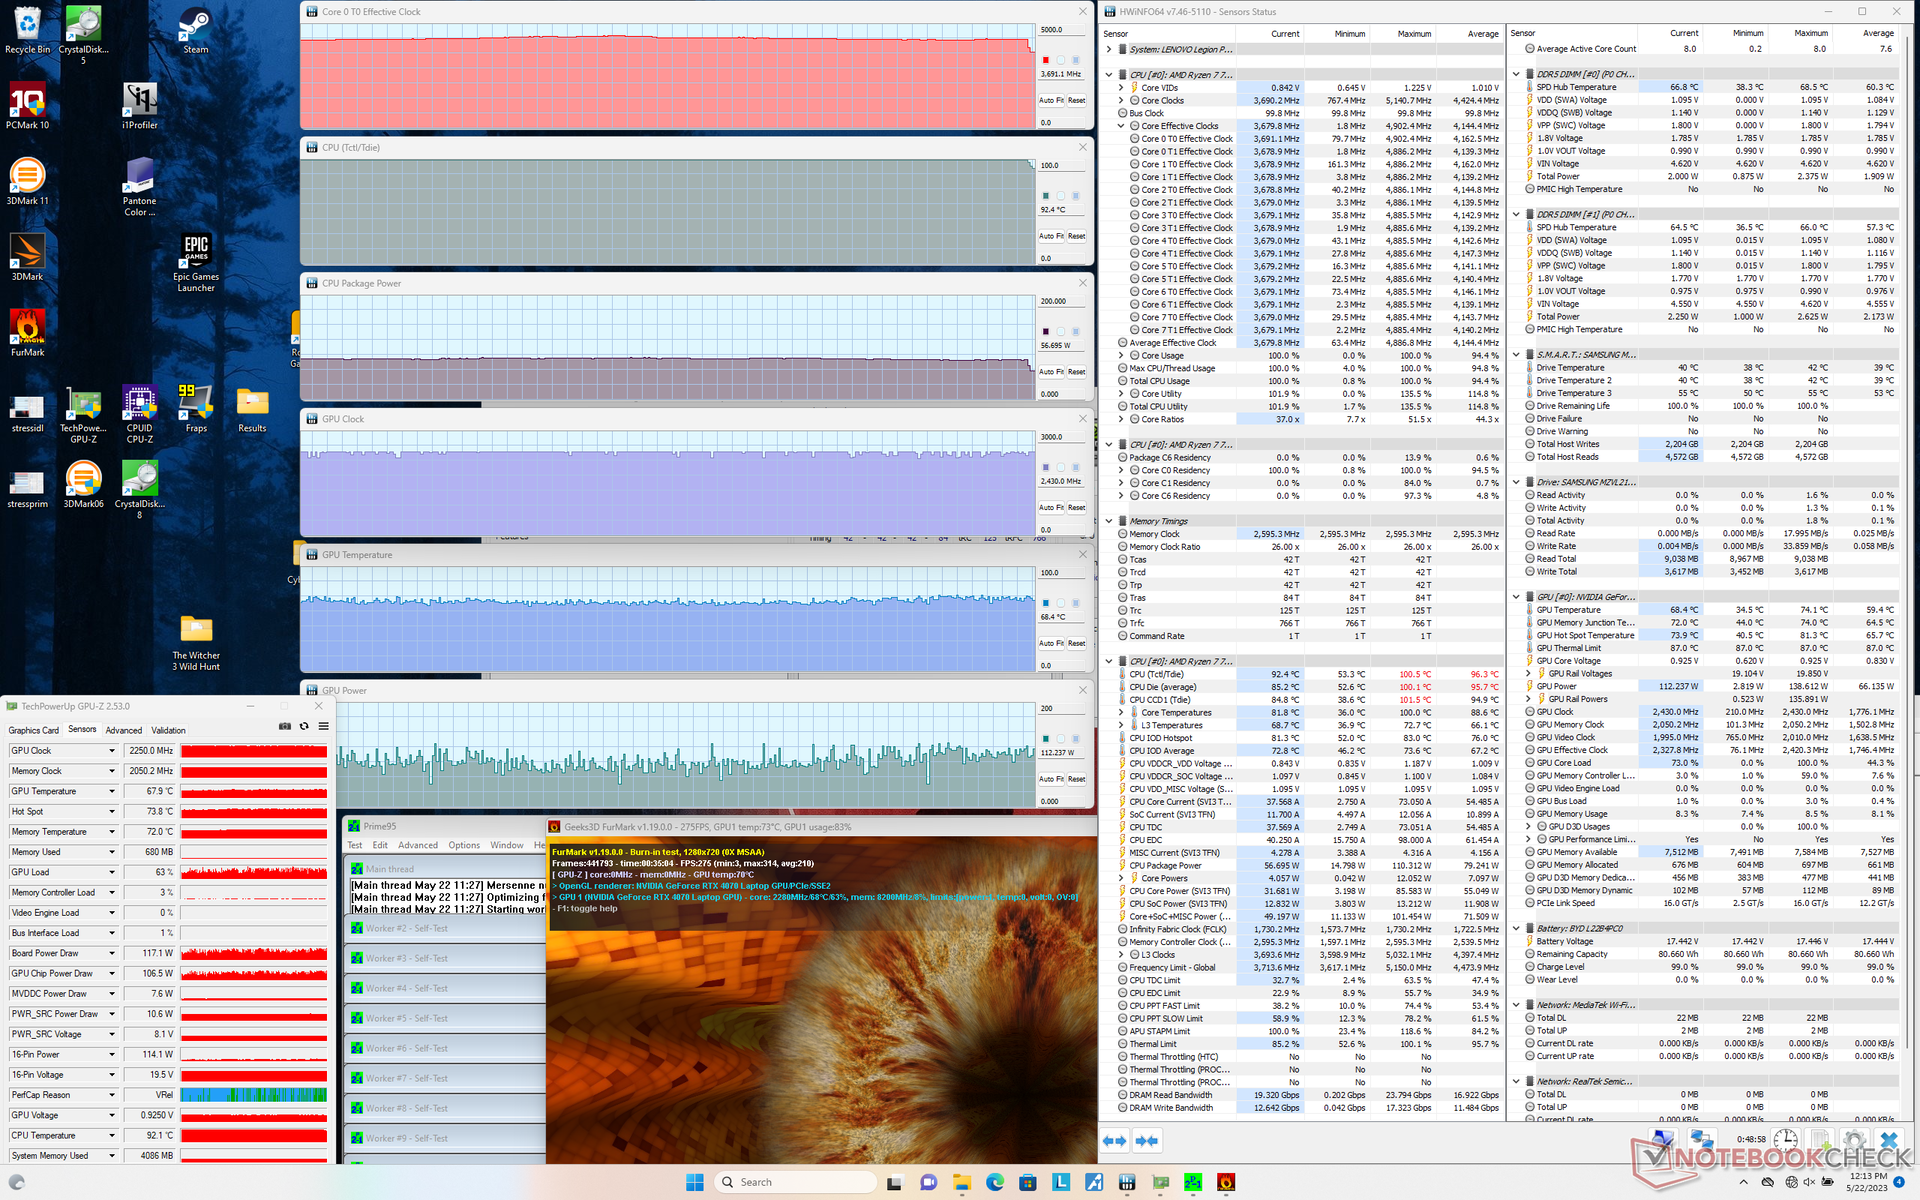
Stresstest - eine heiße CPU

Bei der Ausführung von Prime95 auf Stress stiegen die Taktraten und die Leistungsaufnahme des Boards auf 4,9 GHz bzw. 110 W, bevor sie nur wenige Sekunden später auf 4,6 GHz und 90 W sanken. Die Kerntemperatur stabilisierte sich im sehr hohen Bereich von 90 bis 100 °C, was sogar noch ein paar Grad wärmer ist als der bereits warme Core i7-13700HX im Alternativmodell von Intel Legion. Es ist klar, dass die Ryzen-7-CPU an die Grenzen der Gehäusekühllösung stößt, und dass eine schnellere Ryzen-9-Lösung Kompromisse erfordert hätte.
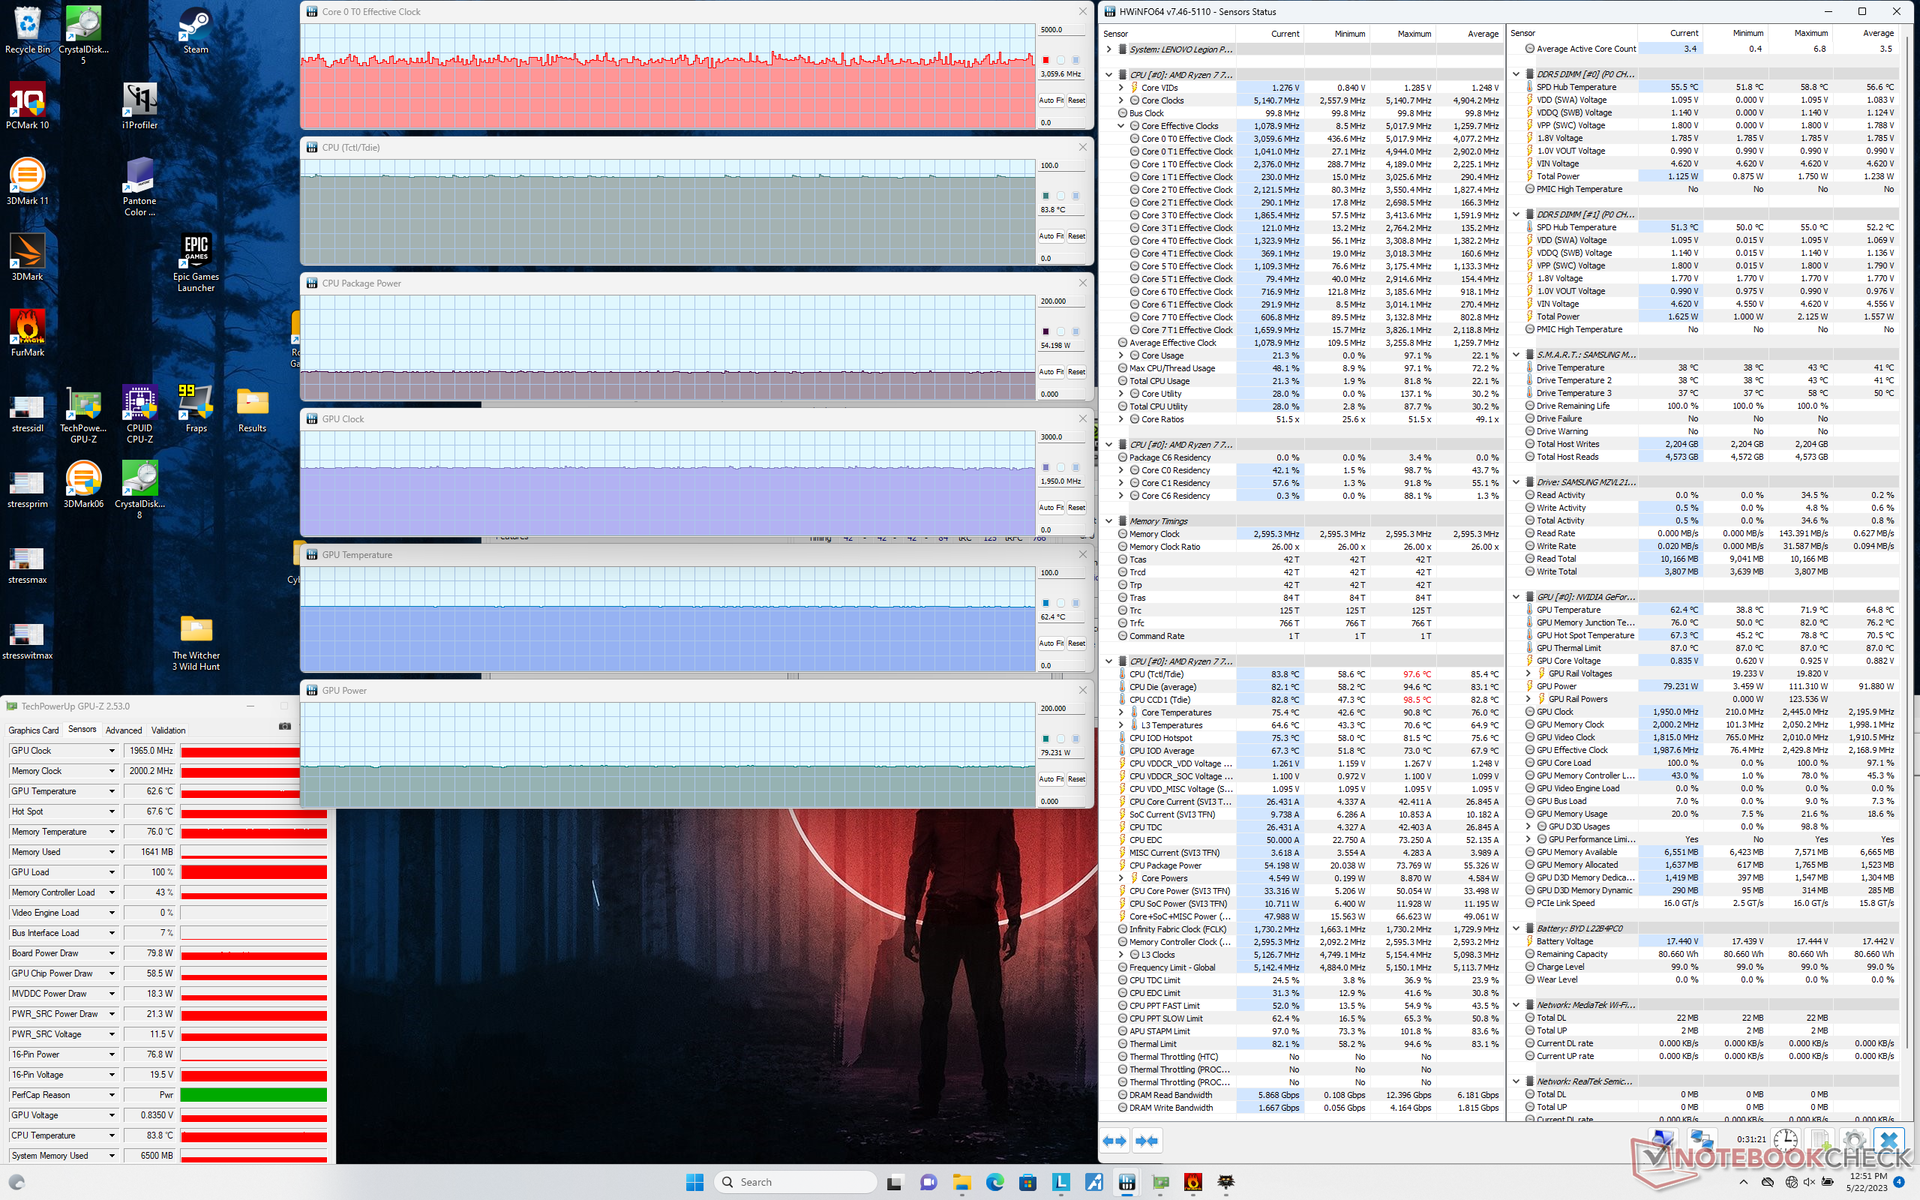
Die dGPU stabilisiert sich bei einem Kerntakt von 2.430 MHz, einem Arbeitsspeicher von 2.050 MHz, einer Temperatur von 67 ˚C und einer Leistung von 105 W gegenüber einem TGP-Ziel von 140 W stabilisieren, wenn man Witcher 3 im Performance-Modus laufen lässt. Die RTX 4060 im Intel-Legion-Modell stabilisiert sich ebenfalls zwischen 105 und 110 W, da beide GPUs trotz ihrer Leistungsunterschiede unter einem ähnlichen Leistungsrahmen liegen. Spielen im Balanced-Modus mit deaktivierter GPU-Overclock-Funktion führt zu einem langsameren GPU-Takt von 1.965 MHz und einer viel geringeren Leistungsaufnahme von nur 80 W. Das Leistungsdefizit zwischen den Modi Balanced und Performance beträgt wie oben erwähnt etwa 10 bis 15 Prozent.
Beim Akkubetrieb verringert sich die Leistung. Ein Fire-Strike-Test im Akkubetrieb liefert Physik- und Grafik-Scores von 10.865 bzw. 9.334 Punkte, verglichen mit 11.477 und 12.617 Punkte im Netzbetrieb.
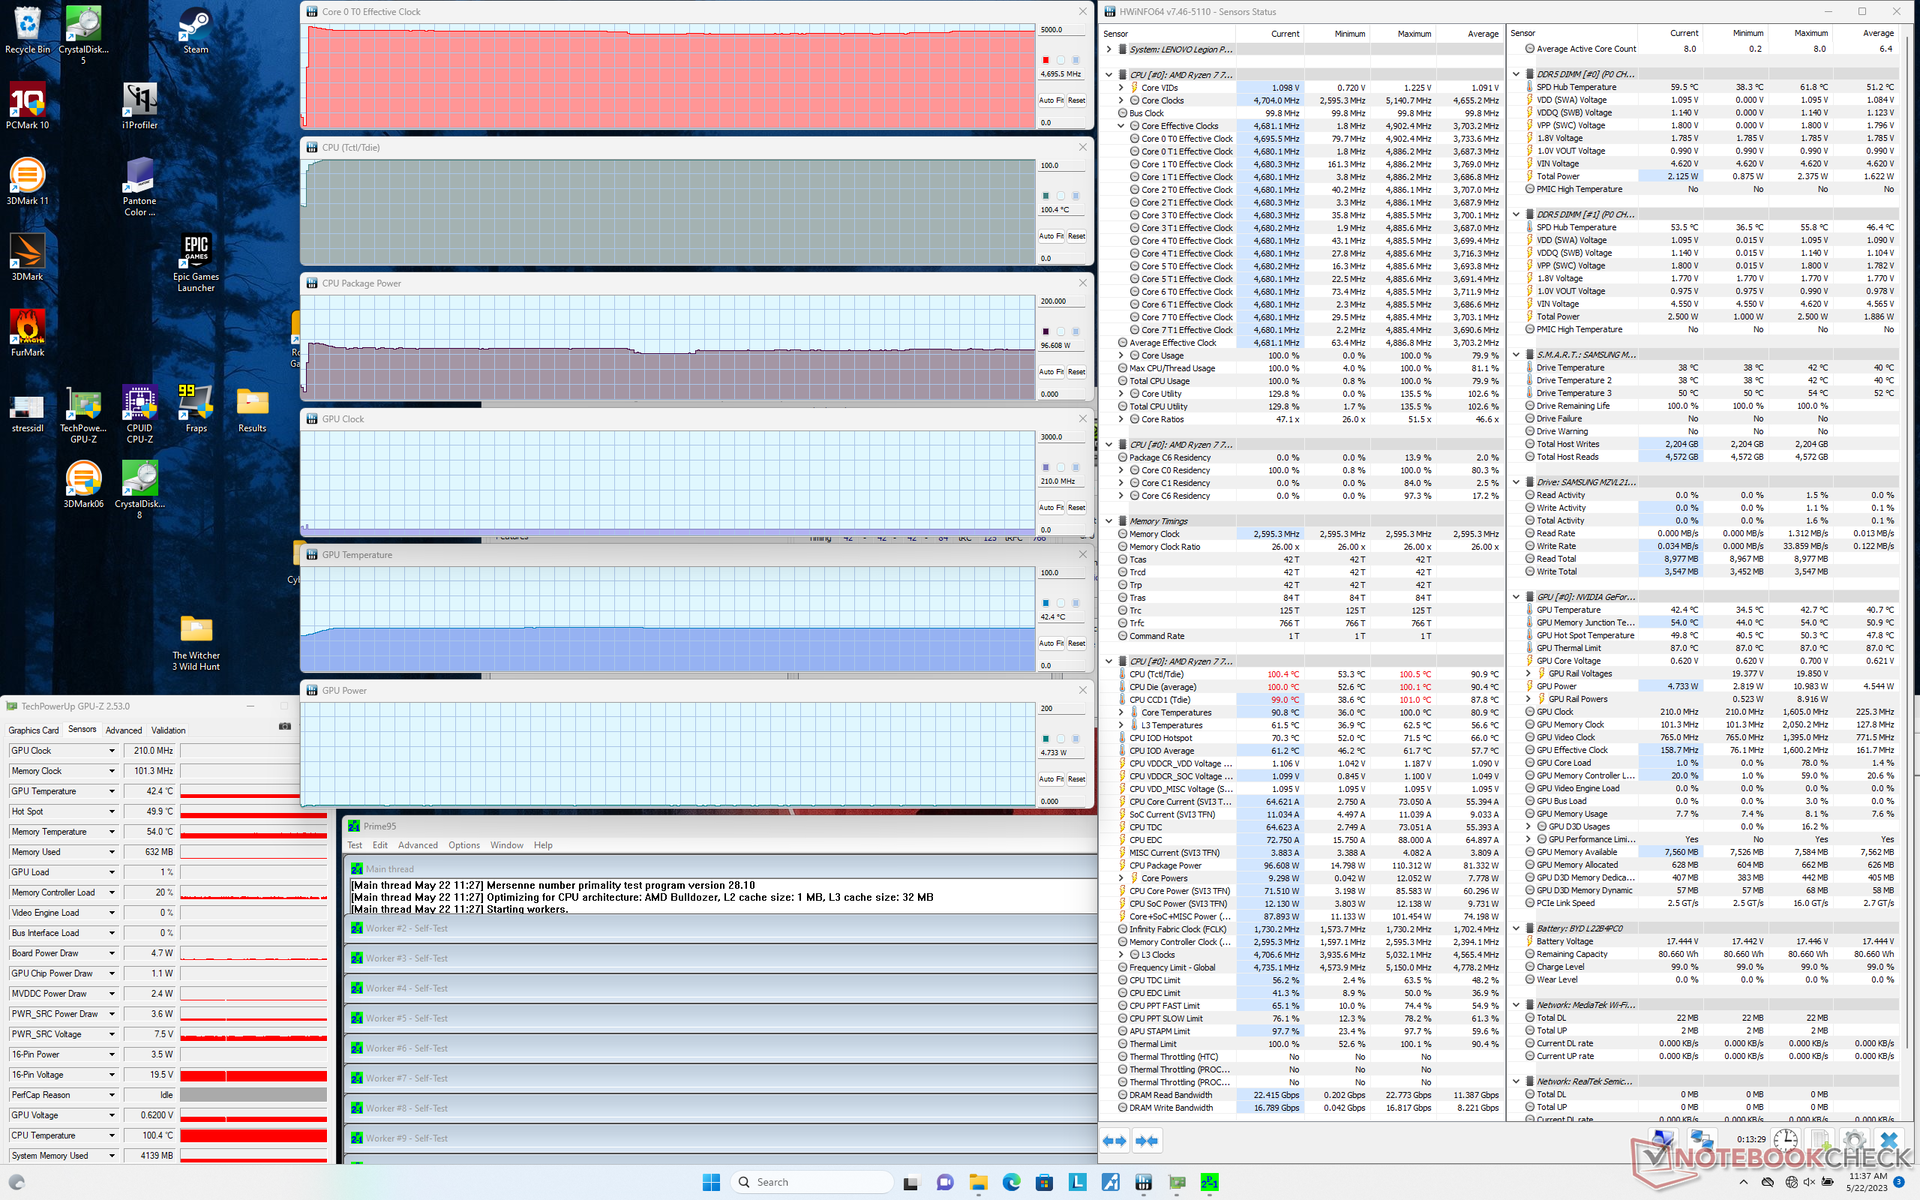
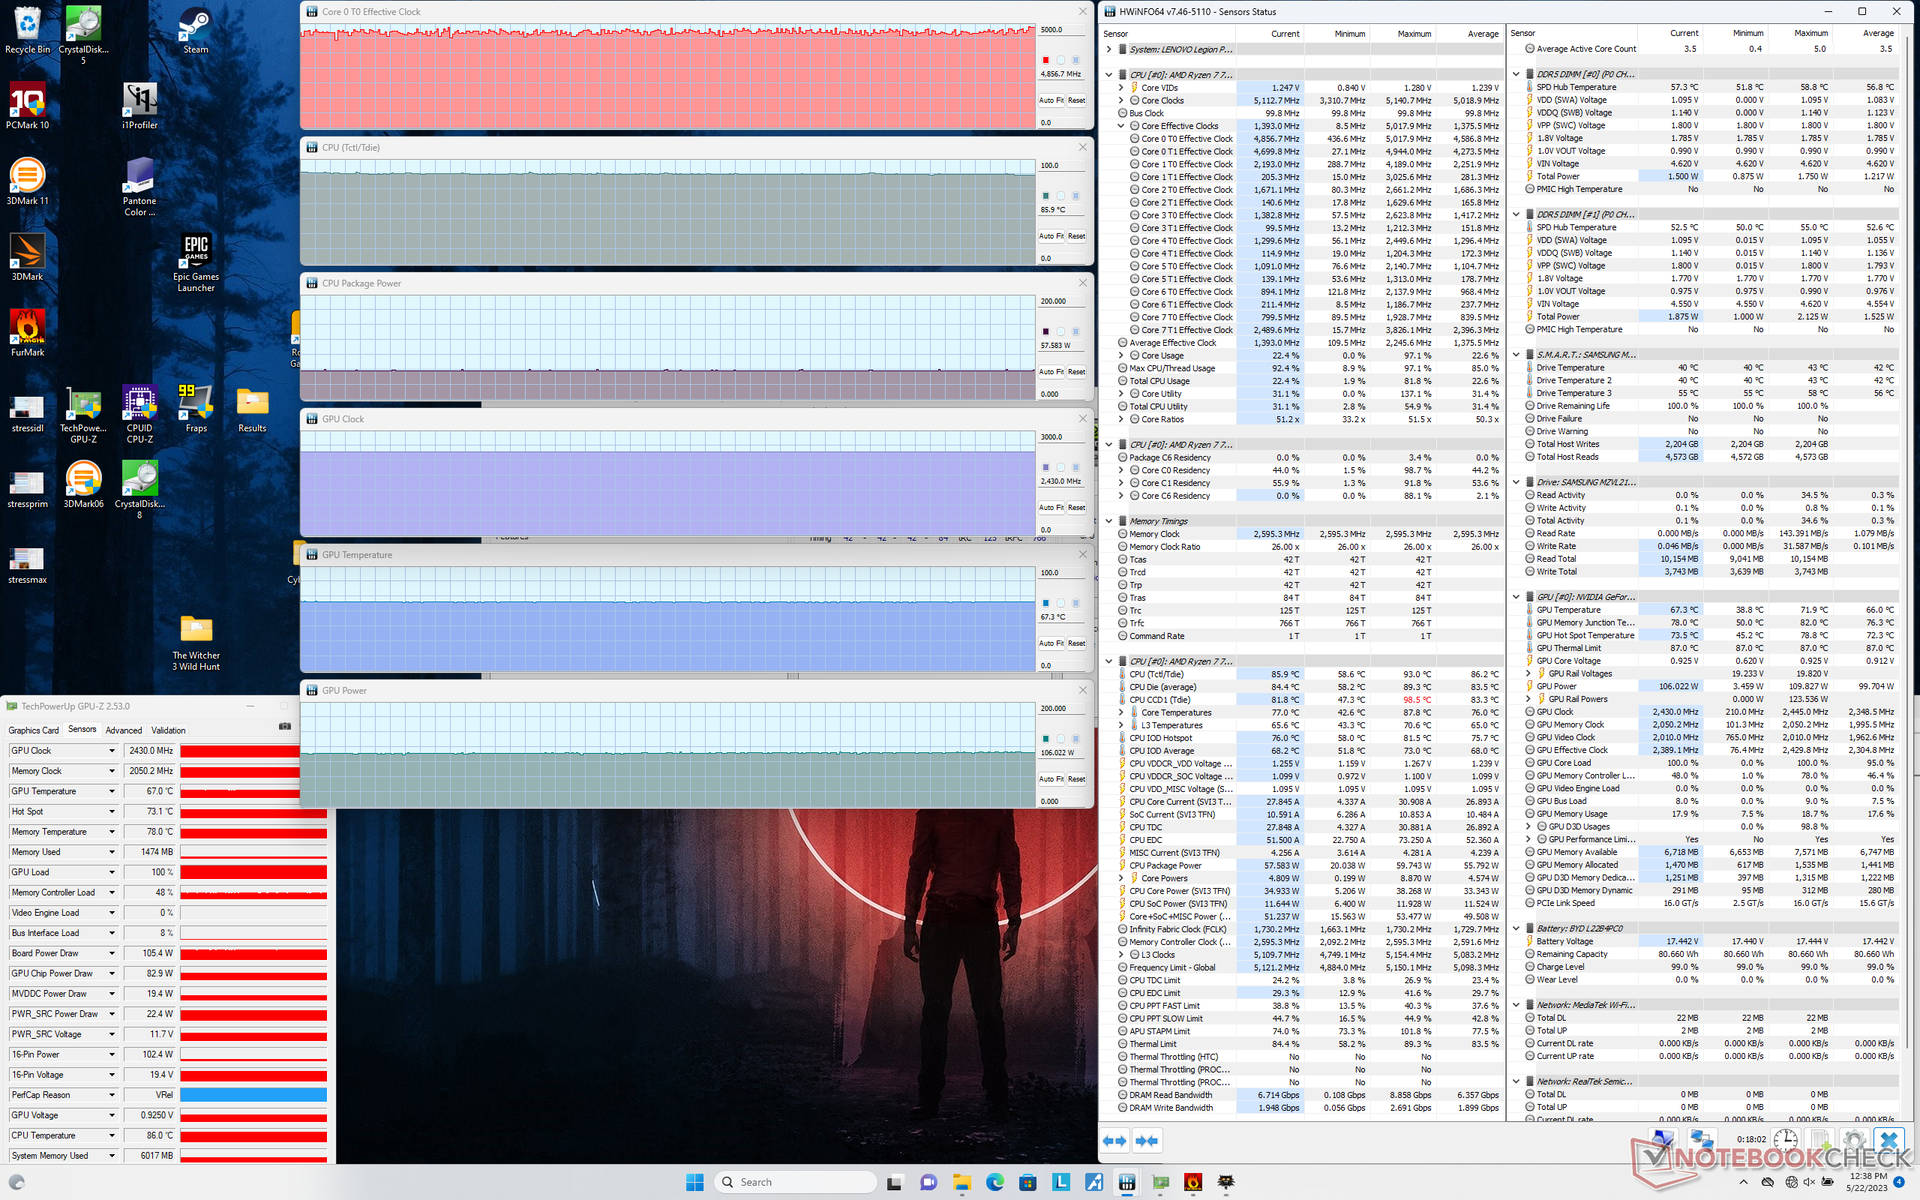
| CPU-Takt (GHz) | GPU-Takt (MHz) | durchschnittliche CPU-Temperatur (°C) | durchschnittliche GPU-Temperatur (°C) | |
| System Leerlauf | -- | -- | 53 | 35 |
| Prime95, Stress | 4,6 - 4,7 | -- | 100 | 42 |
| Prime95 + FurMark, Stress | 3,7 - 4,3 | 2.250 | 92 - 100 | 69 |
| Witcher 3, Stress (Performance-Modus) | 4,9 | 2.430 | 86 | 67 |
| Witcher 3, Stress (Ausgewogener Modus) | 3.1 | 1.965 | 84 | 62 |
Lautsprecher
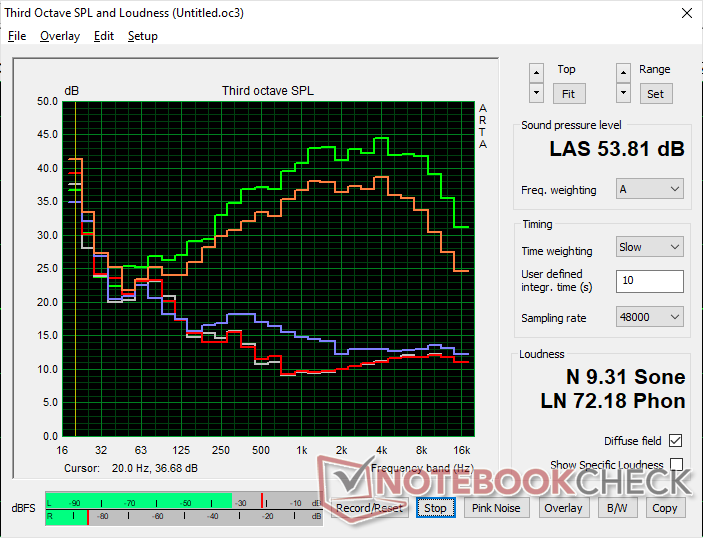
Lenovo Legion Pro 5 16ARX8 Audio Analyse
(±) | Mittelmäßig laut spielende Lautsprecher (80.9 dB)
Bass 100 - 315 Hz
(-) | kaum Bass - 24% niedriger als der Median
(±) | durchschnittlich lineare Bass-Wiedergabe (13.4% Delta zum Vorgänger)
Mitteltöne 400 - 2000 Hz
(+) | ausgeglichene Mitten, vom Median nur 4.7% abweichend
(+) | lineare Mitten (6.2% Delta zum Vorgänger)
Hochtöne 2 - 16 kHz
(+) | ausgeglichene Hochtöne, vom Median nur 2.5% abweichend
(+) | sehr lineare Hochtöne (6.2% Delta zum Vorgänger)
Gesamt im hörbaren Bereich 100 - 16.000 Hz
(±) | hörbarer Bereich ist durchschnittlich linear (21.9% Abstand zum Median)
Im Vergleich zu allen Geräten derselben Klasse
» 79% aller getesteten Geräte dieser Klasse waren besser, 6% vergleichbar, 16% schlechter
» Das beste Gerät hat einen Delta-Wert von 6%, durchschnittlich ist 18%, das schlechteste Gerät hat 132%
Im Vergleich zu allen Geräten im Test
» 63% aller getesteten Geräte waren besser, 7% vergleichbar, 30% schlechter
» Das beste Gerät hat einen Delta-Wert von 4%, durchschnittlich ist 24%, das schlechteste Gerät hat 134%
Apple MacBook Pro 16 2021 M1 Pro Audio Analyse
(+) | Die Lautsprecher können relativ laut spielen (84.7 dB)
Bass 100 - 315 Hz
(+) | guter Bass - nur 3.8% Abweichung vom Median
(+) | lineare Bass-Wiedergabe (5.2% Delta zum Vorgänger)
Mitteltöne 400 - 2000 Hz
(+) | ausgeglichene Mitten, vom Median nur 1.3% abweichend
(+) | lineare Mitten (2.1% Delta zum Vorgänger)
Hochtöne 2 - 16 kHz
(+) | ausgeglichene Hochtöne, vom Median nur 1.9% abweichend
(+) | sehr lineare Hochtöne (2.7% Delta zum Vorgänger)
Gesamt im hörbaren Bereich 100 - 16.000 Hz
(+) | hörbarer Bereich ist sehr linear (4.6% Abstand zum Median
Im Vergleich zu allen Geräten derselben Klasse
» 0% aller getesteten Geräte dieser Klasse waren besser, 0% vergleichbar, 100% schlechter
» Das beste Gerät hat einen Delta-Wert von 5%, durchschnittlich ist 17%, das schlechteste Gerät hat 45%
Im Vergleich zu allen Geräten im Test
» 0% aller getesteten Geräte waren besser, 0% vergleichbar, 100% schlechter
» Das beste Gerät hat einen Delta-Wert von 4%, durchschnittlich ist 24%, das schlechteste Gerät hat 134%
Energieverwaltung
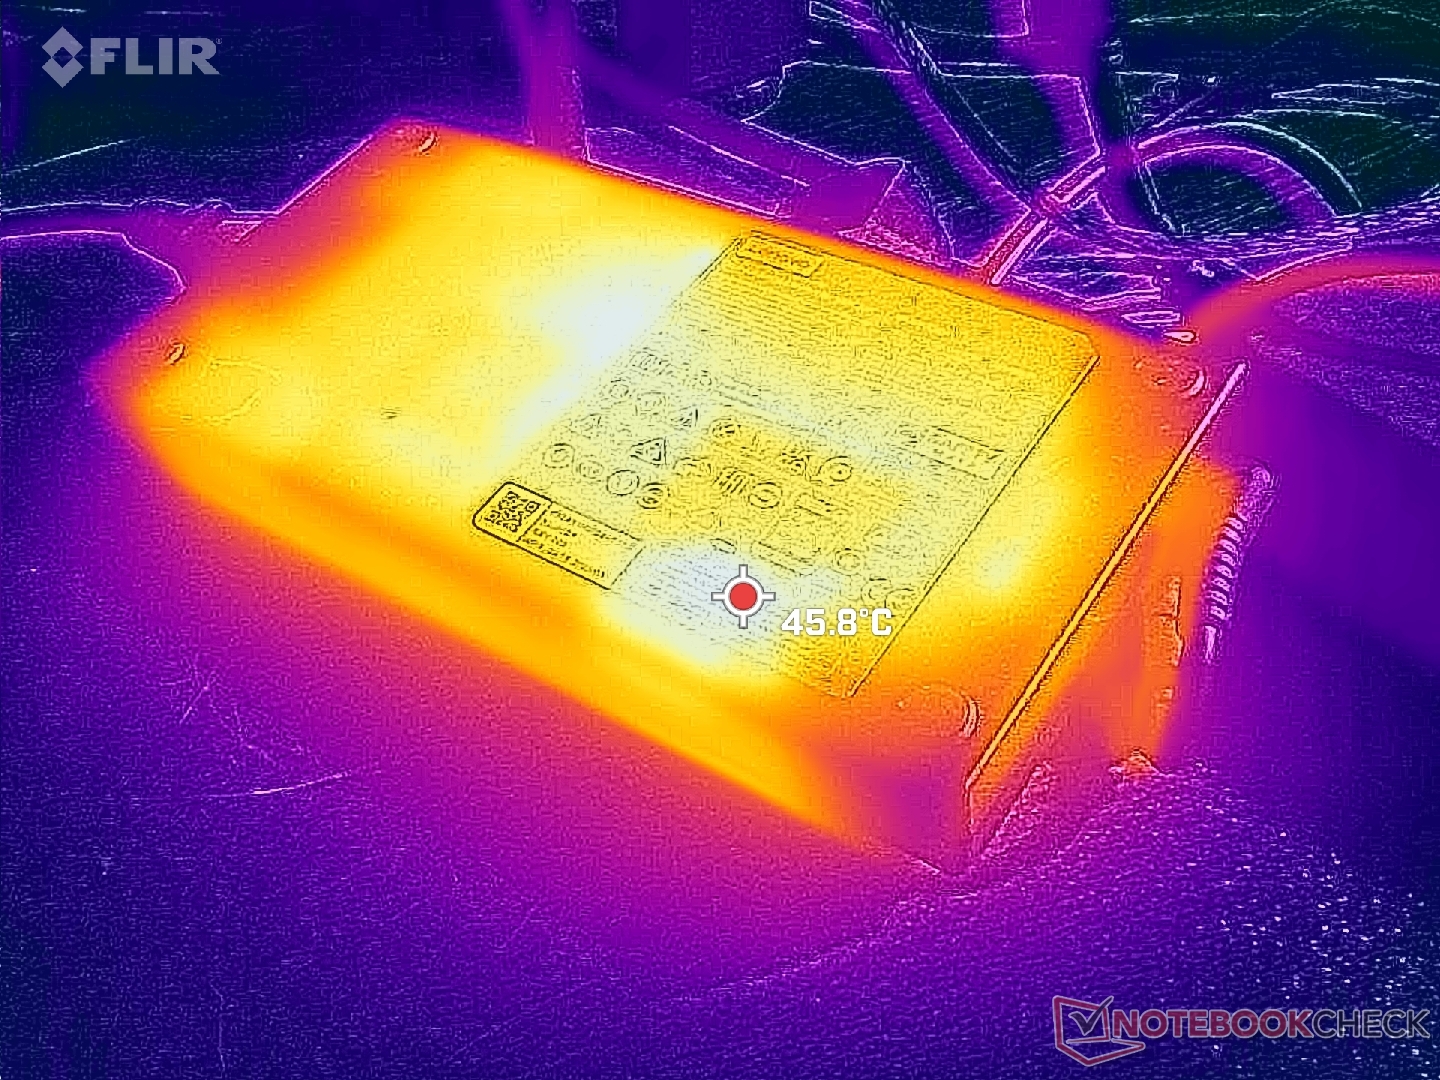
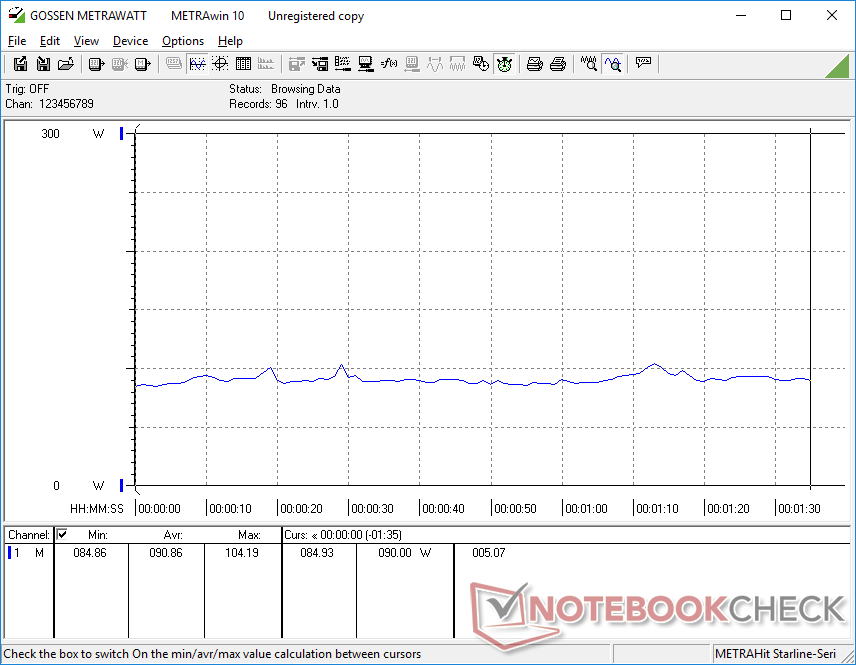
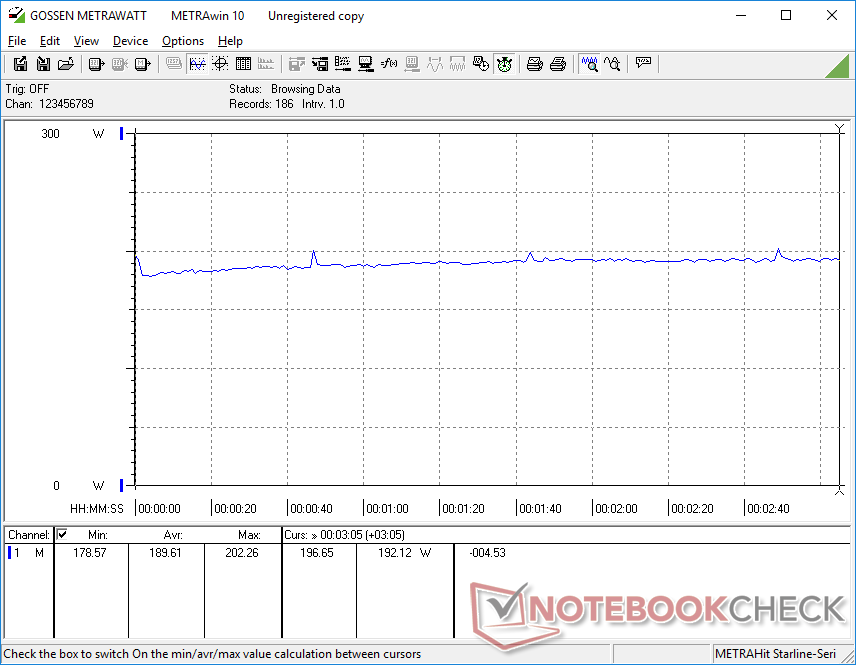
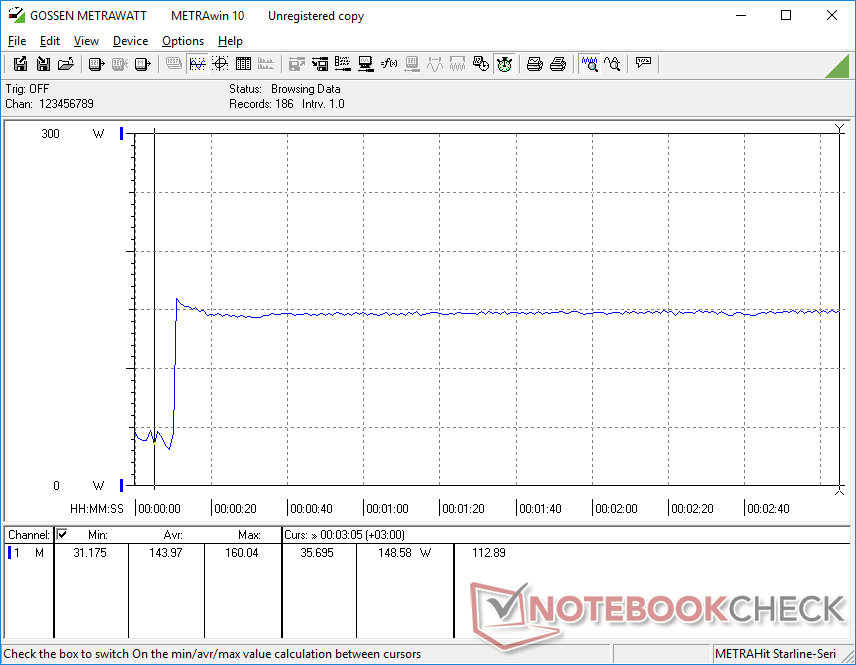
Stromverbrauch - Geringerer CPU-Boost als beim Core i7-13700HX
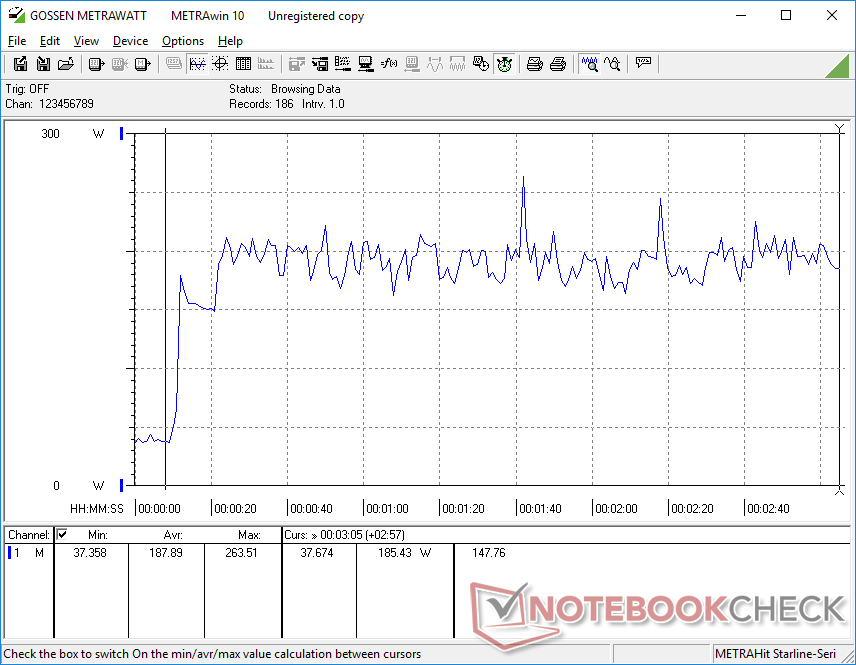
Das AMD Modell ist im Leerlauf auf dem Desktop stromsparender als das Intel Modell. Ansonsten verbrauchen beide Modelle etwa gleich viel Strom, wenn höhere Lasten wie Spiele ausgeführt werden. Beide Modelle werden mit dem gleichen 300-W-Netzteil ausgeliefert, das mehr als genug Reserven für die ~140-W-GPU und ~100-W-CPU bietet.
Es ist erwähnenswert, dass der Core i7-13700HX im Intel Modell eine Leistungsaufnahme von 159 W erreichen kann, verglichen mit nur 110 W bei unserem Ryzen 7 7745HX, was zum Teil den Leistungsvorsprung gegenüber der AMD CPU erklären würde. Wenn sich die Turbo-Boost-Taktraten nach ein paar Minuten Stress einpendeln, nähert sich der Stromverbrauch zwischen den beiden Modellen jedoch stark an, wie die folgenden Vergleichsgrafiken zeigen. Beispielsweise stabilisieren sich die Intel- und AMD Modelle bei der Ausführung von Prime95 für ein paar Minuten bei 158 bzw. 149 W, obwohl das Intel Modell zu Beginn des Tests bis zu 220 W erreichen kann.
| Aus / Standby | |
| Idle | |
| Last |
|
Legende:
min: | |
| Lenovo Legion Pro 5 16ARX8 R7 7745HX, GeForce RTX 4070 Laptop GPU, Samsung PM9A1 MZVL21T0HCLR, IPS, 2560x1600, 16" | Lenovo Legion Pro 5 16IRX8 i7-13700HX, GeForce RTX 4060 Laptop GPU, SK hynix PC801 HFS512GEJ9X115N, IPS, 2560x1600, 16" | Uniwill GM6PX7X RTX 4070 i7-13700HX, GeForce RTX 4070 Laptop GPU, Samsung PM9A1 MZVL2512HCJQ, IPS, 2560x1600, 16" | Schenker XMG Neo 16 E23 i9-13900HX, GeForce RTX 4090 Laptop GPU, Crucial P5 Plus 1TB CT1000P5PSSD8, IPS, 2560x1600, 16" | Asus ROG Strix G16 G614JZ i9-13980HX, GeForce RTX 4080 Laptop GPU, WD PC SN560 SDDPNQE-1T00, IPS, 2560x1600, 16" | Asus Zephyrus Duo 16 GX650PY-NM006W R9 7945HX, GeForce RTX 4090 Laptop GPU, SK hynix PC801 HFS002TEJ9X101N, MiniLED, 2560x1600, 16" | |
|---|---|---|---|---|---|---|
| Stromverbrauch | -46% | -13% | -23% | -17% | -51% | |
| Idle min * (Watt) | 8.1 | 24.5 -202% | 12.6 -56% | 8 1% | 10 -23% | 19.2 -137% |
| Idle avg * (Watt) | 15.9 | 29.2 -84% | 17.7 -11% | 18 -13% | 16 -1% | 29.7 -87% |
| Idle max * (Watt) | 37.2 | 34.3 8% | 31.8 15% | 28 25% | 27 27% | 30.8 17% |
| Last avg * (Watt) | 90.9 | 98.7 -9% | 101.4 -12% | 133 -46% | 129 -42% | 126 -39% |
| Witcher 3 ultra * (Watt) | 189.6 | 178.6 6% | 185.3 2% | 294 -55% | 247 -30% | 258 -36% |
| Last max * (Watt) | 263.5 | 249.6 5% | 298 -13% | 399 -51% | 342 -30% | 330 -25% |
* ... kleinere Werte sind besser
Power Consumption Witcher 3 / Stresstest
Power Consumption external Monitor
Akkulaufzeit
Die WLAN-Laufzeit ist nur geringfügig länger als bei der Intel Version, nämlich um etwa 30 Minuten, wenn das Profil "Ausgeglichene Leistung" mit aktiver iGPU eingestellt ist. Für ein Gaming-Notebook ist das zwar nicht schlecht, Alternativen wie das Schenker XMG Neo 16 oder Asus ROG Strix G16 verfügen über größere Akkukapazitäten und längere Laufzeiten von jeweils über zwei Stunden.
Das Aufladen von der leeren zur vollen Kapazität mit dem mitgelieferten Netzteil ist mit etwa 1 bis 1,5 Stunden schnell. Rapid Charge ist standardmäßig aktiviert, anders als bei älteren Legion- oder Yoga Modellen, wo es deaktiviert sein kann. Das Aufladen mit USB-C-Adaptern von Drittanbietern wird nur über den USB-C-Anschluss an der Rückseite unterstützt.
| Lenovo Legion Pro 5 16ARX8 R7 7745HX, GeForce RTX 4070 Laptop GPU, 80 Wh | Lenovo Legion Pro 5 16IRX8 i7-13700HX, GeForce RTX 4060 Laptop GPU, 80 Wh | Uniwill GM6PX7X RTX 4070 i7-13700HX, GeForce RTX 4070 Laptop GPU, 62 Wh | Schenker XMG Neo 16 E23 i9-13900HX, GeForce RTX 4090 Laptop GPU, 99 Wh | Asus ROG Strix G16 G614JZ i9-13980HX, GeForce RTX 4080 Laptop GPU, 90 Wh | Asus Zephyrus Duo 16 GX650PY-NM006W R9 7945HX, GeForce RTX 4090 Laptop GPU, 90 Wh | |
|---|---|---|---|---|---|---|
| Akkulaufzeit | -14% | 0% | 68% | 76% | 0% | |
| Idle (h) | 6.5 | 6.7 3% | ||||
| WLAN (h) | 4 | 3.4 -15% | 4 0% | 6.7 68% | 9.7 142% | 4 0% |
| Last (h) | 1 | 0.7 -30% | 1.1 10% | 1 0% | ||
| H.264 (h) | 5.8 | 3.8 | ||||
| Witcher 3 ultra (h) | 1.4 |
Pro
Contra
Fazit - AMD ist die bessere Option für Gamer
Lenovo bietet hier zwei sehr interessante Optionen an: Den Intel Core i7-13700HX Legion Pro 5 16 mit RTX-4060-Grafik für 1.600 US-Dollar oder den AMD Ryzen 7 7745HX Legion Pro 5 16 mit RTX-4070-Grafik - ebenfalls für 1.600 US-Dollar. Ersteres bietet etwa 10 Prozent schnellere CPU-Leistung auf Kosten einer 15 Prozent langsameren GPU-Leistung, während bei Letzterem das Gegenteil zu beobachten ist. Fast alles andere an den beiden Optionen ist identisch, da sie beide das gleiche Gehäusedesign haben. Benutzer, die mehr Wert auf die CPU-Leistung als auf die GPU legen, sollten daher die Intel Option wählen, während User, die mehr Wert auf die GPU legen, die AMD Option wählen sollten.
Das AMD Legion Pro 5 16 bietet die schnellere GeForce-RTX-4070-GPU zum gleichen Preis wie die Intel Version, die nur mit der RTX 4060 ausgestattet ist. Für Gaming-Zwecke sollten Sie sich auf jeden Fall für die AMD Version des Legion Modells entscheiden.
Da das Legion Pro 5 16 in erster Linie ein Gaming-Notebook ist, werden die meisten Nutzer die AMD Option für die schnellere RTX-4070-Grafik wählen wollen. Nahezu alle aktuellen Spiele sind GPU-gebunden, sodass zusätzliche CPU-Leistungsvorteile gegenüber dem Ryzen 7 7745HX nur minimale Auswirkungen auf das Spielerlebnis haben. In diesem Szenario ist der relativ hohe Preis von 1.600 US-Dollar eher gerechtfertigt, da die Nutzer eine RTX 4070 anstelle der langsameren RTX 4060 erhalten.
Preis und Verfügbarkeit
Lenovo liefert sein Legion Pro 5 16 Gen 8 derzeit ab 1.549 Euro für die Basiskonfiguration mit Ryzen5/RTX 4050 und ab 2.099 Euro für unsere Konfiguration mit Ryzen 7/RTX 4070 aus. Letztere ist zum selben Preis auch bei Cyberport erhältlich.
Lenovo Legion Pro 5 16ARX8
- 24.05.2023 v7 (old)
Allen Ngo
Transparenz
Die Auswahl der zu testenden Geräte erfolgt innerhalb der Redaktion. Das vorliegende Testmuster wurde dem Autor vom Hersteller oder einem Shop zu Testzwecken leihweise zur Verfügung gestellt. Eine Einflussnahme des Leihstellers auf den Testbericht gab es nicht, der Hersteller erhielt keine Version des Reviews vor der Veröffentlichung. Es bestand keine Verpflichtung zur Publikation. Als eigenständiges, unabhängiges Unternehmen unterliegt Notebookcheck keiner Diktion von Herstellern, Shops und Verlagen.
So testet Notebookcheck
Pro Jahr werden von Notebookcheck hunderte Laptops und Smartphones unabhängig in von uns standardisierten technischen Verfahren getestet, um eine Vergleichbarkeit aller Testergebnisse zu gewährleisten. Seit rund 20 Jahren entwickeln wir diese Testmethoden kontinuierlich weiter und setzen damit Branchenstandards. In unseren Testlaboren kommt ausschließlich hochwertiges Messequipment in die Hände erfahrener Techniker und Redakteure. Die Tests unterliegen einer mehrstufigen Kontrolle. Unsere komplexe Gesamtbewertung basiert auf hunderten fundierten Messergebnissen und Benchmarks, womit Ihnen Objektivität garantiert ist. Weitere Informationen zu unseren Testmethoden gibt es hier.
Preisvergleich

