
Fazit - Wie gerechtfertigt sind 500 Euro Aufpreis?
Das RTX-5070-Ti-Schwestermodell war einer der schnellsten Vertreter mit dieser GPU und das Gleiche kann vom 5070er Modell behauptet werden, wenngleich der Unterschied zur Konkurrenz nicht ganz so groß ausfällt und das Alienware 16X Aurora sogar nochmals etwas schneller ist.
Zwischen beiden Legion-Modellen liegen ca. 500 bis 700 Euro, dafür muss man mit einem GPU-Leistungsunterschied von bis zu 25 Prozent rechnen. Was sich zunächst nach viel anhört, kann in der Praxis je nach Spiel stark variieren. Zusätzlich profitiert man bei der schnelleren Variante von mehr Video-RAM, was für mehr Zukunftssicherheit sorgt. Dafür hat das "kleinere" Modell ganz eigene Vorteile beim Verbrauch, Lautstärke und Temperatur.
Unabhängig vom GPU-Unterschied haben wir hier einen sehr guten, starken und qualitativ hochwertigen Gaming-Laptop zu einem vergleichsweise moderaten Preis.
Pro
Contra
Inhaltsverzeichnis
- Fazit - Wie gerechtfertigt sind 500 Euro Aufpreis?
- Spezifikationen
- Gehäuse & Ausstattung - Eleganter Fingerabdruckmagnet
- Eingabegeräte - Gut, für einen Gamer
- Display - Brillanter OLED
- Leistung - Legion auch mit RTX 5070 schnell
- Emissionen & Energie - Leiser, kühler, sparsamer
- Notebookcheck Gesamtbewertung
- Mögliche Alternativen im Vergleich
Neben der RTX 5070 Ti bringt Lenovo das Legion Pro 5 16 auch mit RTX 5070 heraus, aber merken Kunden überhaupt den Unterschied abseits des größeren Lochs in ihrem Geldbeutel? Wie nahe beieinander sind sich das Legion Pro 5 mit RTX 5070 Ti und RTX 5070? Wir testen nach. Da sonst alles unverändert bleibt, verweisen wir für die Abschnitte Gehäuse, Eingabegeräte usw. auf unseren Originaltest.
Spezifikationen
Gehäuse & Ausstattung - Eleganter Fingerabdruckmagnet


Eingabegeräte - Gut, für einen Gamer


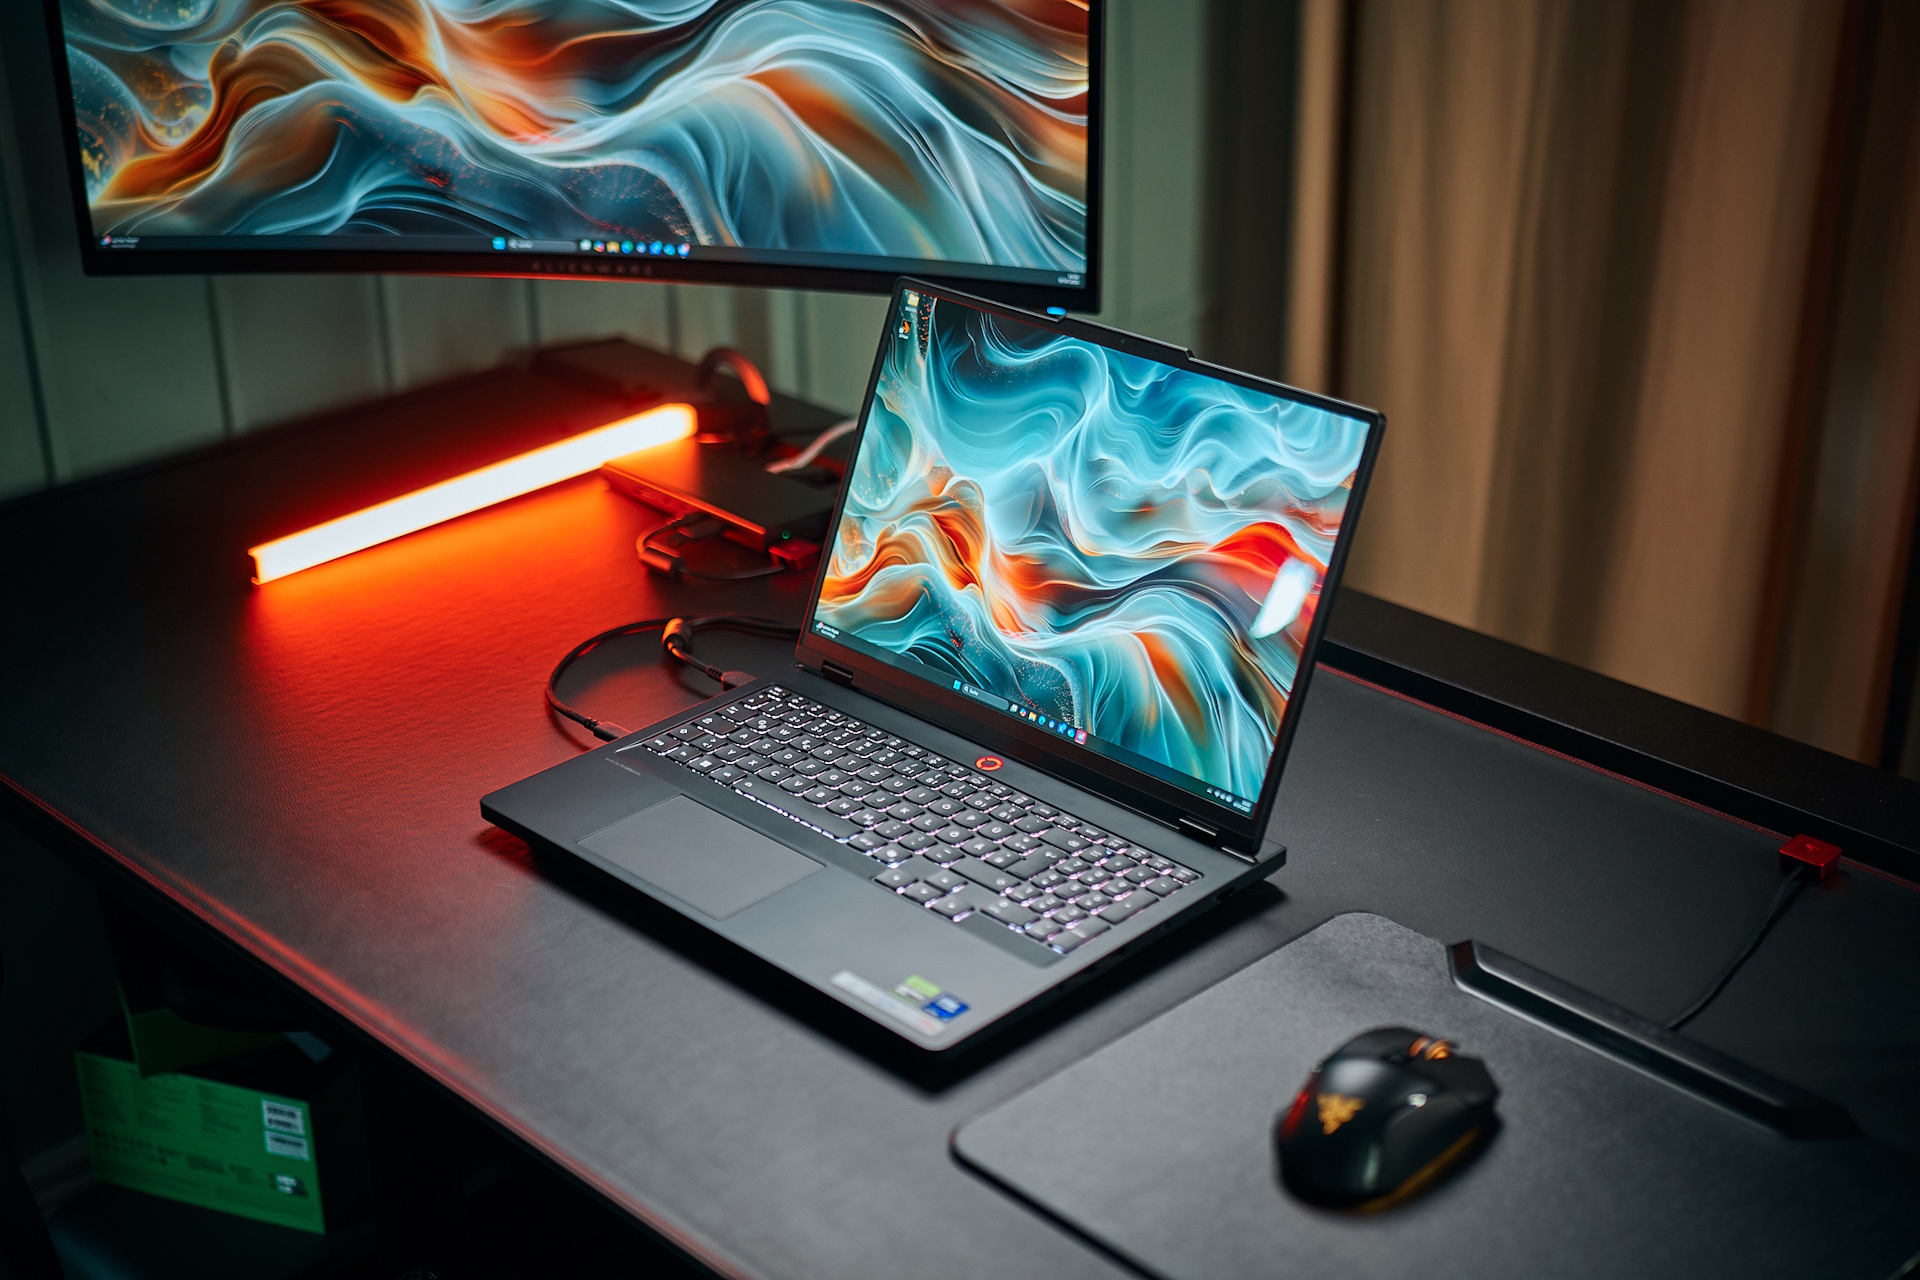
Display - Brillanter OLED

Der 16-Zoll-OLED mit 2.560 x 1.600 Pixel, DisplayHDR True Black 1000, Dolby Vision sowie G-SYNC ist eines der Highlights im Legion Pro 5.
Gegenüber der Konkurrenz hat das OLED-Legion eines der besten Displays. über 500 Nits, schnelle Reaktionszeiten und eine tolle Farbraumabdeckung, dazu tiefe Kontraste bieten in dieser Preisklasse die wenigsten Gamer.
| |||||||||||||||||||||||||
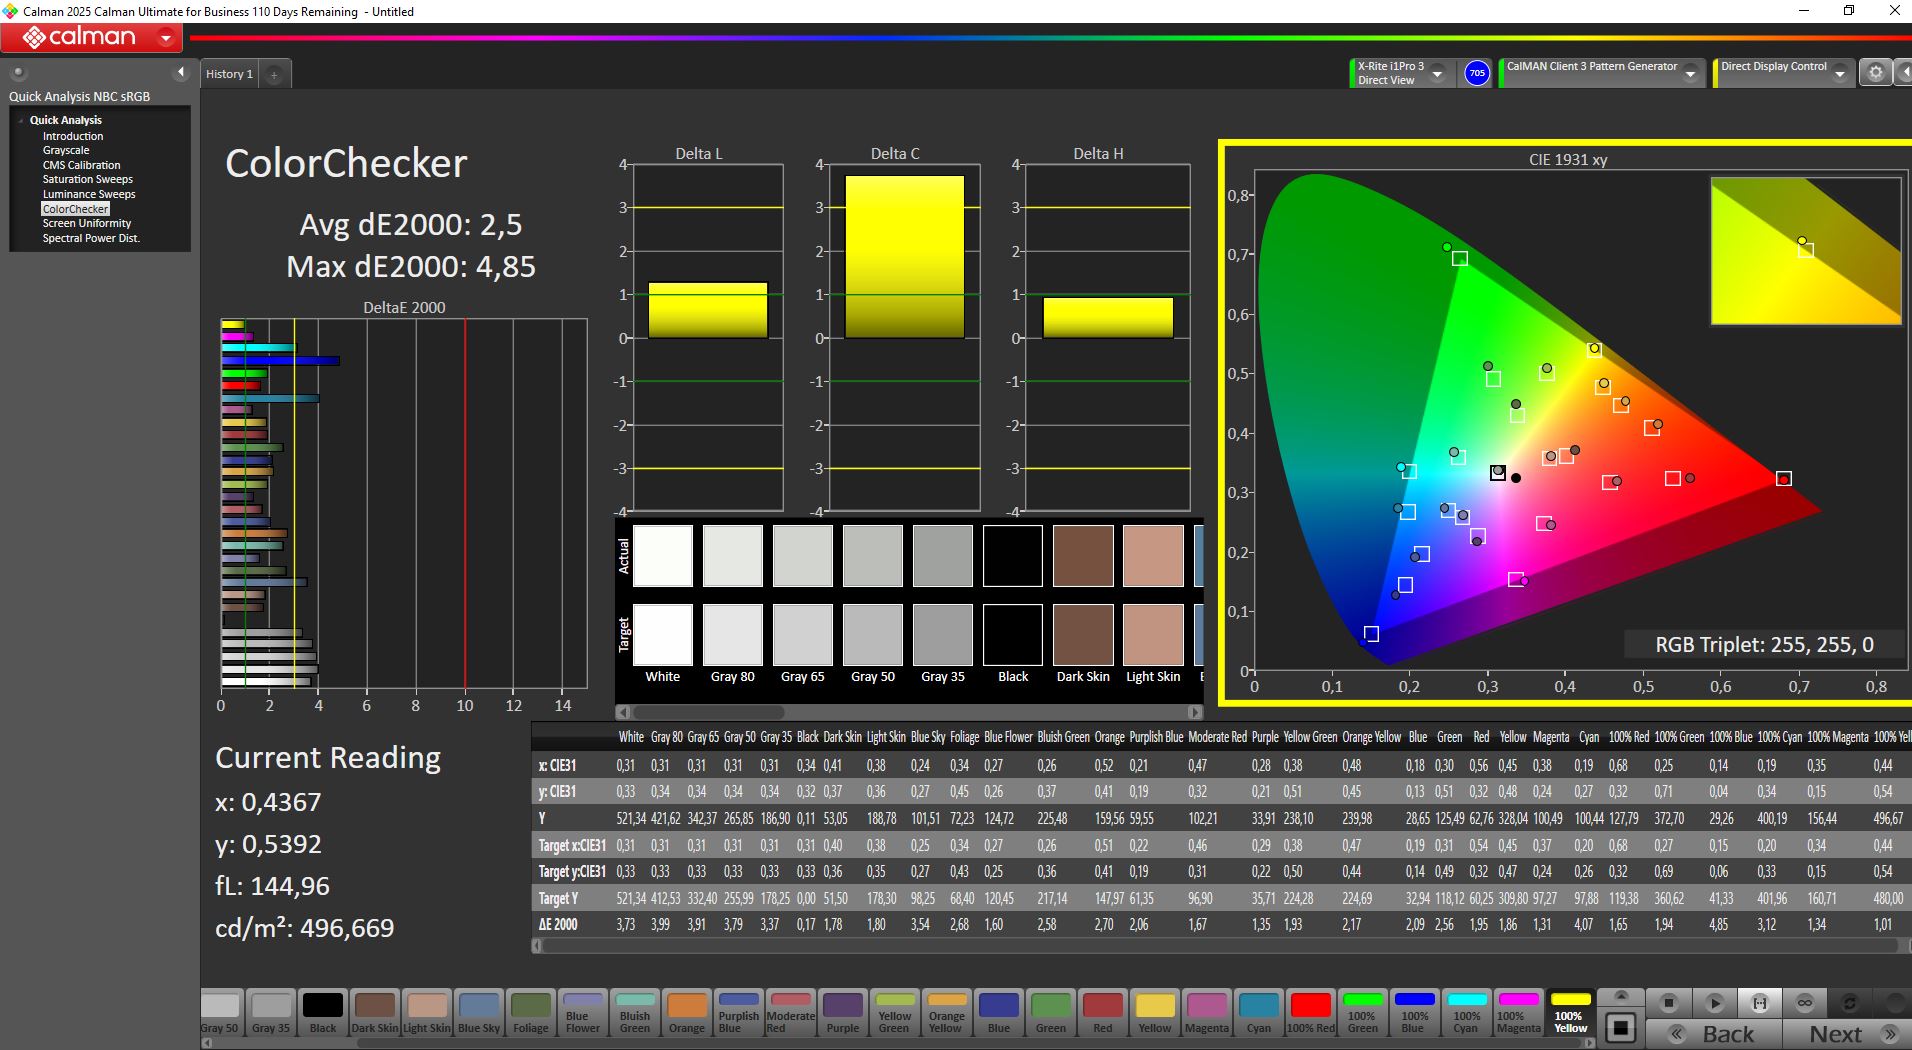
Ausleuchtung: 98 %
Helligkeit Akku: 521 cd/m²
Kontrast: 6947:1 (Schwarzwert: 0.075 cd/m²)
ΔE ColorChecker Calman: 2.5 | ∀{0.5-29.43 Ø4.72}
calibrated: 2.5
ΔE Greyscale Calman: 3.17 | ∀{0.09-98 Ø4.97}
93.9% AdobeRGB 1998 (Argyll 3D)
100% sRGB (Argyll 3D)
99.3% Display P3 (Argyll 3D)
Gamma: 2.35
CCT: 6454 K
| Lenovo Legion Pro 5 16IAX10, RTX 5070 ATNA60HS01-0 (Samsung SDC420A), OLED, 2650x1600, 16", 165 Hz | Lenovo Legion 5 Pro 16IAX10H ATNA60HS01-0 (Samsung SDC420A), OLED, 2560x1600, 16", 165 Hz | Alienware 16X Aurora, RTX 5070 LG Philips 160WQG, IPS, 2560x1600, 16", 240 Hz | Gigabyte Aero X16 1WH MNG007DA5-1, IPS, 2560x1600, 16", 165 Hz | Asus TUF Gaming A16 FA608UP MNG007DA5-3, IPS, 2560x1600, 16", 165 Hz | Schenker XMG Core 16 M25 MNG007DA6-4, IPS, 2560x1600, 16", 300 Hz | Gigabyte Gaming A16 GA6H NE160QDM-NYJ (BOE0C80), IPS, 2560x1600, 16", 165 Hz | |
|---|---|---|---|---|---|---|---|
| Display | 0% | -2% | -20% | -19% | -2% | -18% | |
| Display P3 Coverage (%) | 99.3 | 99.9 1% | 96.9 -2% | 68.7 -31% | 69.4 -30% | 98.8 -1% | 69.4 -30% |
| sRGB Coverage (%) | 100 | 100 0% | 99.8 0% | 96.1 -4% | 97.2 -3% | 100 0% | 99.5 0% |
| AdobeRGB 1998 Coverage (%) | 93.9 | 94.1 0% | 89.7 -4% | 71.2 -24% | 71.9 -23% | 88.4 -6% | 71.6 -24% |
| Response Times | 0% | -318% | -400% | -229% | -343% | -508% | |
| Response Time Grey 50% / Grey 80% * (ms) | 2 ? | 2 ? -0% | 4.3 ? -115% | 12 ? -500% | 6.3 ? -215% | 10.7 ? -435% | 14.3 ? -615% |
| Response Time Black / White * (ms) | 1.4 ? | 1.4 ? -0% | 8.7 ? -521% | 5.6 ? -300% | 4.8 ? -243% | 4.9 ? -250% | 7 ? -400% |
| PWM Frequency (Hz) | 1300 | 1300 | |||||
| PWM Amplitude * (%) | 16.7 | 16.7 -0% | |||||
| Bildschirm | 1% | -78% | -31% | -26% | -53% | -81% | |
| Helligkeit Bildmitte (cd/m²) | 521 | 518 -1% | 493.2 -5% | 395 -24% | 480 -8% | 512 -2% | 432 -17% |
| Brightness (cd/m²) | 519 | 522 1% | 477 -8% | 398 -23% | 456 -12% | 483 -7% | 425 -18% |
| Brightness Distribution (%) | 98 | 97 -1% | 93 -5% | 97 -1% | 91 -7% | 91 -7% | 91 -7% |
| Schwarzwert * (cd/m²) | 0.075 | 0.5 -567% | 0.32 -327% | 0.32 -327% | 0.43 -473% | 0.37 -393% | |
| Kontrast (:1) | 6947 | 986 -86% | 1234 -82% | 1500 -78% | 1191 -83% | 1168 -83% | |
| Delta E Colorchecker * | 2.5 | 2.49 -0% | 3.57 -43% | 1.3 48% | 1.4 44% | 2.4 4% | 4.76 -90% |
| Colorchecker dE 2000 max. * | 4.85 | 5.25 -8% | 7.03 -45% | 2.8 42% | 2.5 48% | 3.8 22% | 8.59 -77% |
| Colorchecker dE 2000 calibrated * | 2.5 | 2.15 14% | 0.68 73% | 1.4 44% | 1.3 48% | 0.9 64% | 1.18 53% |
| Delta E Graustufen * | 3.17 | 3.02 5% | 3.7 -17% | 1.8 43% | 1.2 62% | 3.1 2% | 6.2 -96% |
| Gamma | 2.35 94% | 2.37 93% | 2.16 102% | 2.2 100% | 2.16 102% | 2.41 91% | 2.079 106% |
| CCT | 6454 101% | 6426 101% | 5876 111% | 6842 95% | 6620 98% | 6534 99% | 6690 97% |
| Durchschnitt gesamt (Programm / Settings) | 0% /
1% | -133% /
-96% | -150% /
-81% | -91% /
-53% | -133% /
-84% | -202% /
-128% |
* ... kleinere Werte sind besser
Die Werkskalibrierung holt bereits nahezu das Maximum aus dem Panel, unser manueller Versuch drückt die Graustufen nochmals minimal, die Farbabweichungen bleiben auf einem niedrigen bis mittleren Niveau.


Reaktionszeiten (Response Times) des Displays
| ↔ Reaktionszeiten Schwarz zu Weiß | ||
|---|---|---|
| 1.4 ms ... steigend ↗ und fallend ↘ kombiniert | ↗ 0.8 ms steigend | 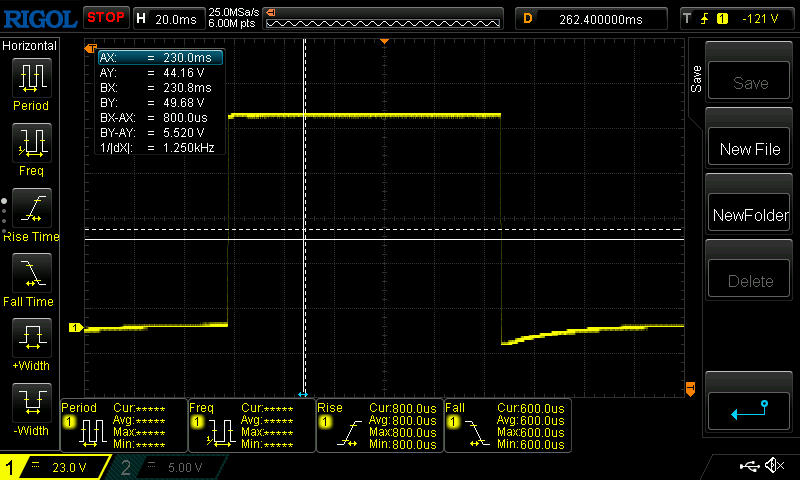 |
| ↘ 0.6 ms fallend | ||
| Die gemessenen Reaktionszeiten sind sehr kurz, wodurch sich der Bildschirm auch für schnelle 3D Spiele eignen sollte. Im Vergleich rangierten die bei uns getesteten Geräte von 0.1 (Minimum) zu 240 (Maximum) ms. » 8 % aller Screens waren schneller als der getestete. Daher sind die gemessenen Reaktionszeiten besser als der Durchschnitt aller vermessenen Geräte (19.8 ms). | ||
| ↔ Reaktionszeiten 50% Grau zu 80% Grau | ||
| 2 ms ... steigend ↗ und fallend ↘ kombiniert | ↗ 1 ms steigend | 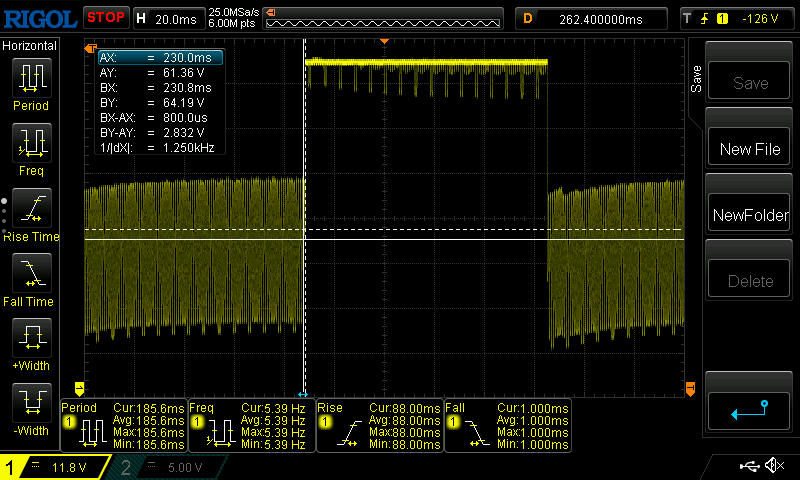 |
| ↘ 1 ms fallend | ||
| Die gemessenen Reaktionszeiten sind sehr kurz, wodurch sich der Bildschirm auch für schnelle 3D Spiele eignen sollte. Im Vergleich rangierten die bei uns getesteten Geräte von 0.165 (Minimum) zu 636 (Maximum) ms. » 10 % aller Screens waren schneller als der getestete. Daher sind die gemessenen Reaktionszeiten besser als der Durchschnitt aller vermessenen Geräte (31 ms). | ||
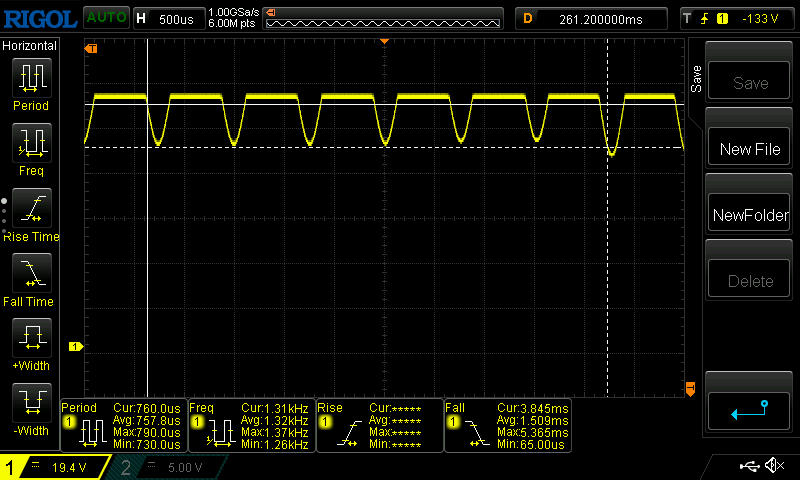
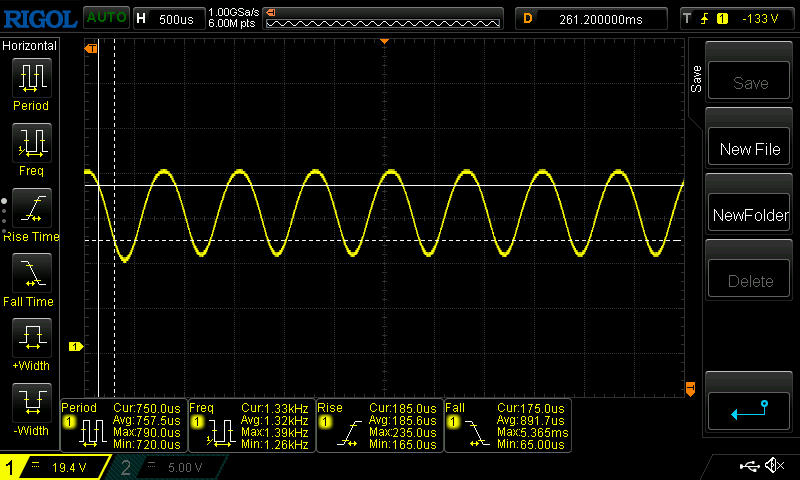
Bildschirm-Flackern / PWM (Pulse-Width Modulation)
| Flackern / PWM festgestellt | 1300 Hz Amplitude: 16.7 % |  | |
Das Display flackert mit 1300 Hz (im schlimmsten Fall, eventuell durch Pulsweitenmodulation PWM) . Die Frequenz von 1300 Hz ist sehr hoch und sollte daher auch bei empfindlichen Personen zu keinen Problemen führen. Im Vergleich: 52 % aller getesteten Geräte nutzten kein PWM um die Helligkeit zu reduzieren. Wenn PWM eingesetzt wurde, dann bei einer Frequenz von durchschnittlich 7763 (Minimum 5, Maximum 343500) Hz. | |||


Im Freien sind 500 Nits hilfreich, ein spiegelndes Panel weniger. Solange man im Schatten bleibt und auf eine gute Direktsicht achtet, klappt die Verwendung im Freien.


Leistung - Legion auch mit RTX 5070 schnell
Mit RTX 5070, Core Ultra 7 255HX und 32 GB RAM outet sich das Legion Pro 5 vor allem als Mittelklassegamer, der dank des guten Displays, der Leistung und des nicht allzu auffälligen Äußeren eventuell auch für Creators interessant sein könnte.


Testbedingungen
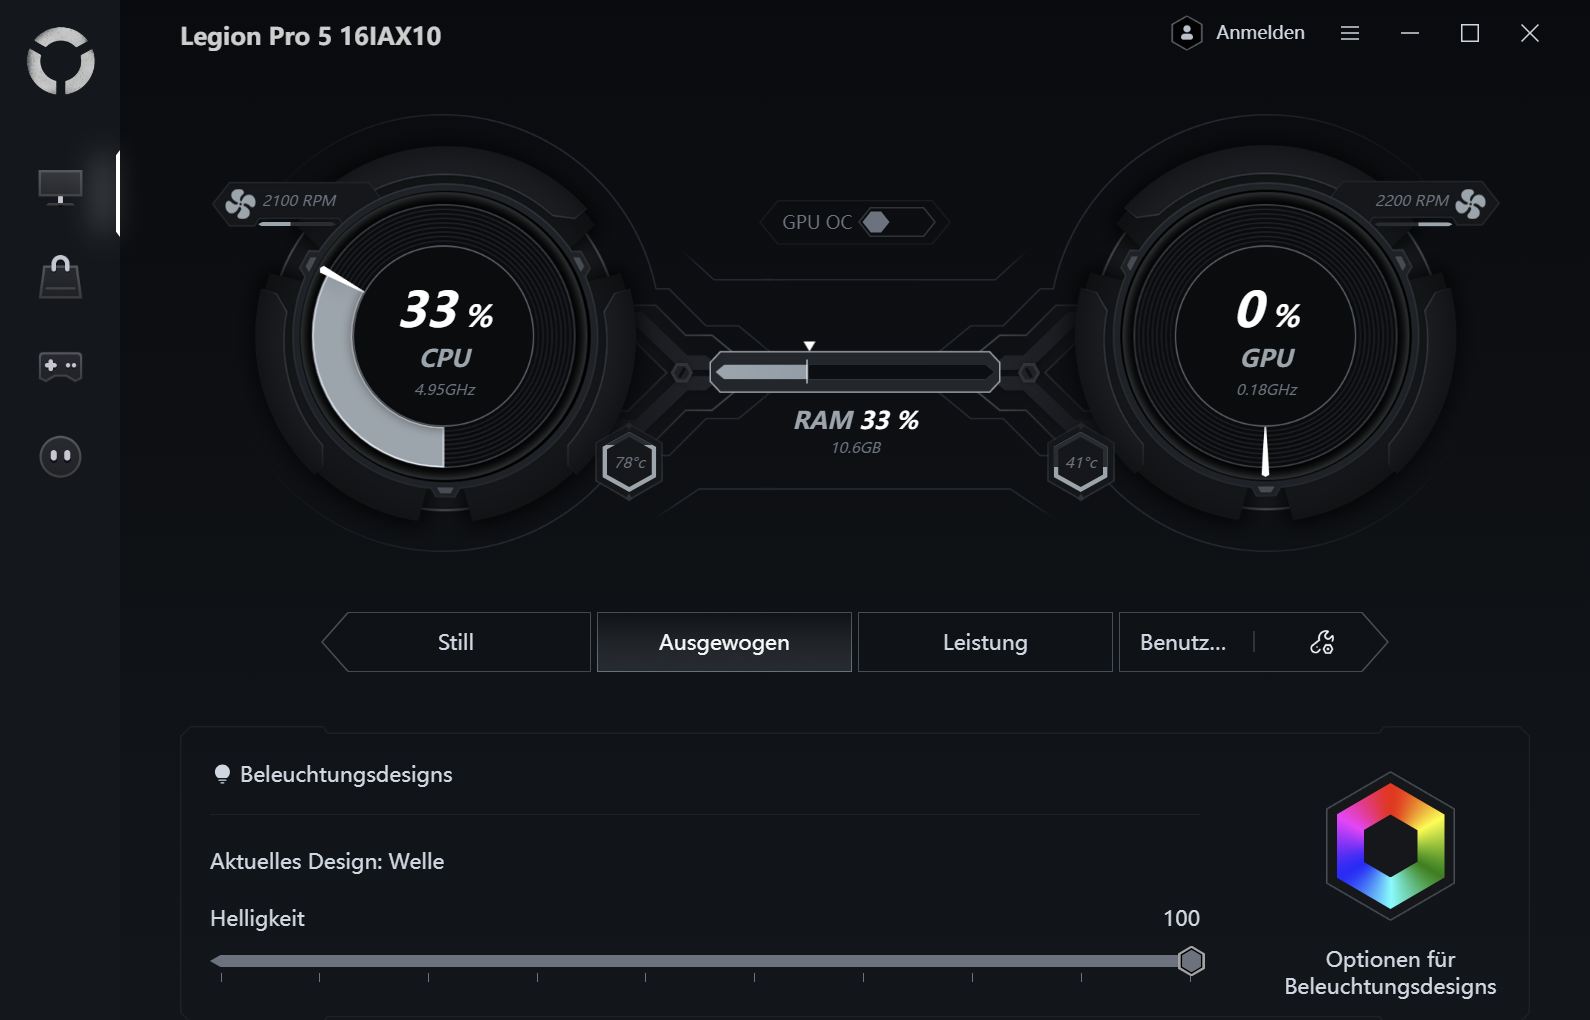
Die App Lenovo Vantage ist für Service, Hardwarescans und allgemeine Geräteeinstellungen vorinstalliert, während Lenovo LegionSpace den Gaming-Hub inklusive Leistungsmodi und Mux mimt. Beide Apps enthalten Werbung, Vantage nervt zudem mit regelmäßigen Pop-Ups. Nahezu ausschließlich aus Werbung besteht Lenovo Now, diese App sollte man deinstallieren. Wir verwenden den Leistungsmodus für unsere Tests.

| Leistungsmodus | Cinebench R15 | CPU-Leistungsaufnahme | Cyberpunk 2077 Ultra | GPU-Leistungsaufnahme | Lautstärke Cyberpunk |
|---|---|---|---|---|---|
| Leistung | 5.190 | 194, dann 183 W | 107 fps | 103 W | 50.27 dB |
| Ausbalanciert | 4.463 | 135, dann 75 W | 94.2 fps | 93 W | 47.34 dB |
| Still | 3.731 | 65 W | 72 fps | 55 W | 38.44 dB |
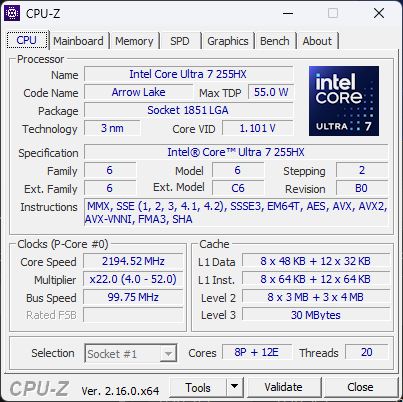
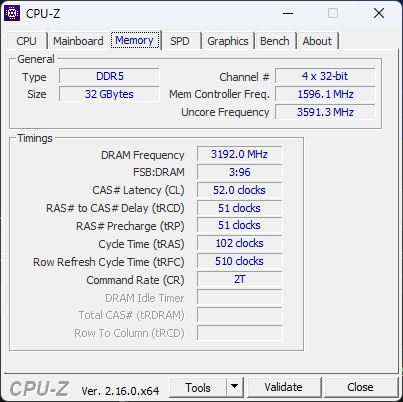
Prozessor
Der Intel Core Ultra 7 255HX hat 4 E-Kerne weniger als der Ultra 9 275HX und taktet etwas niedriger.
Über alle CPU-Tests performt die CPU leicht überdurchschnittlich und liegt nur wenige Prozent hinter dem Ultra 9 275HX. Im Cinebench-Loop zeigt sich eine recht konstante Leistung mit nur leichtem Rückgang über die Zeit (ca. 7 Prozent).
Im Akkumodus gehen etwa 43 Prozent an CPU-Leistung verloren.


Cinebench R15 Multi Dauertest
Cinebench R23: Multi Core | Single Core
Cinebench R20: CPU (Multi Core) | CPU (Single Core)
Cinebench R15: CPU Multi 64Bit | CPU Single 64Bit
Blender: v2.79 BMW27 CPU
7-Zip 18.03: 7z b 4 | 7z b 4 -mmt1
Geekbench 6.7: Multi-Core | Single-Core
Geekbench 5.5: Multi-Core | Single-Core
HWBOT x265 Benchmark v2.2: 4k Preset
LibreOffice : 20 Documents To PDF
R Benchmark 2.5: Overall mean
| CPU Performance Rating | |
| Lenovo Legion 5 Pro 16IAX10H | |
| Alienware 16X Aurora, RTX 5070 | |
| Lenovo Legion Pro 5 16IAX10, RTX 5070 | |
| Durchschnittliche Intel Core Ultra 7 255HX | |
| Durchschnitt der Klasse Gaming | |
| Schenker XMG Core 16 M25 | |
| Gigabyte Aero X16 1WH | |
| Asus TUF Gaming A16 FA608UP | |
| Gigabyte Gaming A16 GA6H | |
| Cinebench R23 / Multi Core | |
| Lenovo Legion 5 Pro 16IAX10H | |
| Alienware 16X Aurora, RTX 5070 | |
| Lenovo Legion Pro 5 16IAX10, RTX 5070 | |
| Durchschnittliche Intel Core Ultra 7 255HX (27129 - 34005, n=5) | |
| Durchschnitt der Klasse Gaming (10488 - 40970, n=110, der letzten 2 Jahre) | |
| Schenker XMG Core 16 M25 | |
| Gigabyte Aero X16 1WH | |
| Asus TUF Gaming A16 FA608UP | |
| Gigabyte Gaming A16 GA6H | |
| Cinebench R23 / Single Core | |
| Lenovo Legion 5 Pro 16IAX10H | |
| Alienware 16X Aurora, RTX 5070 | |
| Lenovo Legion Pro 5 16IAX10, RTX 5070 | |
| Durchschnittliche Intel Core Ultra 7 255HX (2111 - 2171, n=5) | |
| Schenker XMG Core 16 M25 | |
| Durchschnitt der Klasse Gaming (1166 - 2356, n=110, der letzten 2 Jahre) | |
| Gigabyte Aero X16 1WH | |
| Gigabyte Gaming A16 GA6H | |
| Asus TUF Gaming A16 FA608UP | |
| Cinebench R20 / CPU (Multi Core) | |
| Lenovo Legion 5 Pro 16IAX10H | |
| Alienware 16X Aurora, RTX 5070 | |
| Lenovo Legion Pro 5 16IAX10, RTX 5070 | |
| Durchschnittliche Intel Core Ultra 7 255HX (10626 - 13056, n=5) | |
| Durchschnitt der Klasse Gaming (4029 - 16108, n=109, der letzten 2 Jahre) | |
| Schenker XMG Core 16 M25 | |
| Asus TUF Gaming A16 FA608UP | |
| Gigabyte Aero X16 1WH | |
| Gigabyte Gaming A16 GA6H | |
| Cinebench R20 / CPU (Single Core) | |
| Lenovo Legion 5 Pro 16IAX10H | |
| Alienware 16X Aurora, RTX 5070 | |
| Lenovo Legion Pro 5 16IAX10, RTX 5070 | |
| Durchschnittliche Intel Core Ultra 7 255HX (822 - 835, n=5) | |
| Schenker XMG Core 16 M25 | |
| Durchschnitt der Klasse Gaming (442 - 895, n=109, der letzten 2 Jahre) | |
| Gigabyte Aero X16 1WH | |
| Gigabyte Gaming A16 GA6H | |
| Asus TUF Gaming A16 FA608UP | |
| Cinebench R15 / CPU Multi 64Bit | |
| Lenovo Legion 5 Pro 16IAX10H | |
| Alienware 16X Aurora, RTX 5070 | |
| Lenovo Legion Pro 5 16IAX10, RTX 5070 | |
| Durchschnittliche Intel Core Ultra 7 255HX (4114 - 5190, n=5) | |
| Durchschnitt der Klasse Gaming (1578 - 6271, n=108, der letzten 2 Jahre) | |
| Schenker XMG Core 16 M25 | |
| Asus TUF Gaming A16 FA608UP | |
| Gigabyte Aero X16 1WH | |
| Gigabyte Gaming A16 GA6H | |
| Cinebench R15 / CPU Single 64Bit | |
| Lenovo Legion 5 Pro 16IAX10H | |
| Alienware 16X Aurora, RTX 5070 | |
| Lenovo Legion Pro 5 16IAX10, RTX 5070 | |
| Durchschnittliche Intel Core Ultra 7 255HX (322 - 328, n=5) | |
| Durchschnitt der Klasse Gaming (188.8 - 343, n=109, der letzten 2 Jahre) | |
| Asus TUF Gaming A16 FA608UP | |
| Gigabyte Gaming A16 GA6H | |
| Gigabyte Aero X16 1WH | |
| Schenker XMG Core 16 M25 | |
| Blender / v2.79 BMW27 CPU | |
| Gigabyte Gaming A16 GA6H | |
| Gigabyte Aero X16 1WH | |
| Asus TUF Gaming A16 FA608UP | |
| Durchschnitt der Klasse Gaming (80 - 330, n=107, der letzten 2 Jahre) | |
| Schenker XMG Core 16 M25 | |
| Durchschnittliche Intel Core Ultra 7 255HX (104 - 122, n=5) | |
| Lenovo Legion Pro 5 16IAX10, RTX 5070 | |
| Alienware 16X Aurora, RTX 5070 | |
| Lenovo Legion 5 Pro 16IAX10H | |
| 7-Zip 18.03 / 7z b 4 | |
| Lenovo Legion 5 Pro 16IAX10H | |
| Alienware 16X Aurora, RTX 5070 | |
| Lenovo Legion Pro 5 16IAX10, RTX 5070 | |
| Durchschnittliche Intel Core Ultra 7 255HX (87806 - 104055, n=5) | |
| Durchschnitt der Klasse Gaming (33491 - 148086, n=108, der letzten 2 Jahre) | |
| Schenker XMG Core 16 M25 | |
| Asus TUF Gaming A16 FA608UP | |
| Gigabyte Aero X16 1WH | |
| Gigabyte Gaming A16 GA6H | |
| 7-Zip 18.03 / 7z b 4 -mmt1 | |
| Lenovo Legion 5 Pro 16IAX10H | |
| Alienware 16X Aurora, RTX 5070 | |
| Lenovo Legion Pro 5 16IAX10, RTX 5070 | |
| Durchschnittliche Intel Core Ultra 7 255HX (6407 - 6576, n=5) | |
| Schenker XMG Core 16 M25 | |
| Durchschnitt der Klasse Gaming (4199 - 7436, n=108, der letzten 2 Jahre) | |
| Asus TUF Gaming A16 FA608UP | |
| Gigabyte Aero X16 1WH | |
| Gigabyte Gaming A16 GA6H | |
| Geekbench 6.7 / Multi-Core | |
| Lenovo Legion 5 Pro 16IAX10H | |
| Lenovo Legion Pro 5 16IAX10, RTX 5070 | |
| Alienware 16X Aurora, RTX 5070 | |
| Durchschnittliche Intel Core Ultra 7 255HX (16396 - 19623, n=6) | |
| Schenker XMG Core 16 M25 | |
| Durchschnitt der Klasse Gaming (6625 - 22104, n=109, der letzten 2 Jahre) | |
| Gigabyte Aero X16 1WH | |
| Asus TUF Gaming A16 FA608UP | |
| Gigabyte Gaming A16 GA6H | |
| Geekbench 6.7 / Single-Core | |
| Lenovo Legion 5 Pro 16IAX10H | |
| Alienware 16X Aurora, RTX 5070 | |
| Lenovo Legion Pro 5 16IAX10, RTX 5070 | |
| Durchschnittliche Intel Core Ultra 7 255HX (2917 - 3028, n=6) | |
| Schenker XMG Core 16 M25 | |
| Gigabyte Aero X16 1WH | |
| Durchschnitt der Klasse Gaming (1490 - 3259, n=109, der letzten 2 Jahre) | |
| Asus TUF Gaming A16 FA608UP | |
| Gigabyte Gaming A16 GA6H | |
| Geekbench 5.5 / Multi-Core | |
| Lenovo Legion 5 Pro 16IAX10H | |
| Alienware 16X Aurora, RTX 5070 | |
| Lenovo Legion Pro 5 16IAX10, RTX 5070 | |
| Durchschnittliche Intel Core Ultra 7 255HX (18263 - 21014, n=5) | |
| Durchschnitt der Klasse Gaming (6460 - 27010, n=108, der letzten 2 Jahre) | |
| Schenker XMG Core 16 M25 | |
| Gigabyte Aero X16 1WH | |
| Asus TUF Gaming A16 FA608UP | |
| Gigabyte Gaming A16 GA6H | |
| Geekbench 5.5 / Single-Core | |
| Lenovo Legion 5 Pro 16IAX10H | |
| Alienware 16X Aurora, RTX 5070 | |
| Lenovo Legion Pro 5 16IAX10, RTX 5070 | |
| Durchschnittliche Intel Core Ultra 7 255HX (2112 - 2211, n=5) | |
| Gigabyte Aero X16 1WH | |
| Schenker XMG Core 16 M25 | |
| Durchschnitt der Klasse Gaming (986 - 2474, n=108, der letzten 2 Jahre) | |
| Asus TUF Gaming A16 FA608UP | |
| Gigabyte Gaming A16 GA6H | |
| HWBOT x265 Benchmark v2.2 / 4k Preset | |
| Lenovo Legion 5 Pro 16IAX10H | |
| Alienware 16X Aurora, RTX 5070 | |
| Lenovo Legion Pro 5 16IAX10, RTX 5070 | |
| Durchschnittliche Intel Core Ultra 7 255HX (30.4 - 36.9, n=5) | |
| Schenker XMG Core 16 M25 | |
| Durchschnitt der Klasse Gaming (11.5 - 44.3, n=108, der letzten 2 Jahre) | |
| Gigabyte Aero X16 1WH | |
| Asus TUF Gaming A16 FA608UP | |
| Gigabyte Gaming A16 GA6H | |
| LibreOffice / 20 Documents To PDF | |
| Asus TUF Gaming A16 FA608UP | |
| Gigabyte Gaming A16 GA6H | |
| Gigabyte Aero X16 1WH | |
| Schenker XMG Core 16 M25 | |
| Durchschnitt der Klasse Gaming (19 - 88.8, n=108, der letzten 2 Jahre) | |
| Lenovo Legion Pro 5 16IAX10, RTX 5070 | |
| Durchschnittliche Intel Core Ultra 7 255HX (35.4 - 45.9, n=5) | |
| Alienware 16X Aurora, RTX 5070 | |
| Lenovo Legion 5 Pro 16IAX10H | |
| R Benchmark 2.5 / Overall mean | |
| Gigabyte Gaming A16 GA6H | |
| Asus TUF Gaming A16 FA608UP | |
| Durchschnitt der Klasse Gaming (0.3439 - 0.759, n=109, der letzten 2 Jahre) | |
| Lenovo Legion Pro 5 16IAX10, RTX 5070 | |
| Durchschnittliche Intel Core Ultra 7 255HX (0.4209 - 0.4287, n=5) | |
| Alienware 16X Aurora, RTX 5070 | |
| Lenovo Legion 5 Pro 16IAX10H | |
| Gigabyte Aero X16 1WH | |
| Schenker XMG Core 16 M25 | |
* ... kleinere Werte sind besser
AIDA64: FP32 Ray-Trace | FPU Julia | CPU SHA3 | CPU Queen | FPU SinJulia | FPU Mandel | CPU AES | CPU ZLib | FP64 Ray-Trace | CPU PhotoWorxx
| Performance Rating | |
| Lenovo Legion 5 Pro 16IAX10H | |
| Lenovo Legion Pro 5 16IAX10, RTX 5070 | |
| Alienware 16X Aurora, RTX 5070 | |
| Schenker XMG Core 16 M25 | |
| Durchschnittliche Intel Core Ultra 7 255HX | |
| Durchschnitt der Klasse Gaming | |
| Asus TUF Gaming A16 FA608UP | |
| Gigabyte Aero X16 1WH | |
| Gigabyte Gaming A16 GA6H | |
| AIDA64 / FP32 Ray-Trace | |
| Schenker XMG Core 16 M25 | |
| Lenovo Legion 5 Pro 16IAX10H | |
| Lenovo Legion Pro 5 16IAX10, RTX 5070 | |
| Alienware 16X Aurora, RTX 5070 | |
| Durchschnitt der Klasse Gaming (10227 - 85542, n=107, der letzten 2 Jahre) | |
| Durchschnittliche Intel Core Ultra 7 255HX (27732 - 34250, n=5) | |
| Asus TUF Gaming A16 FA608UP | |
| Gigabyte Aero X16 1WH | |
| Gigabyte Gaming A16 GA6H | |
| AIDA64 / FPU Julia | |
| Lenovo Legion 5 Pro 16IAX10H | |
| Lenovo Legion Pro 5 16IAX10, RTX 5070 | |
| Alienware 16X Aurora, RTX 5070 | |
| Durchschnittliche Intel Core Ultra 7 255HX (140290 - 167758, n=5) | |
| Schenker XMG Core 16 M25 | |
| Durchschnitt der Klasse Gaming (51376 - 238426, n=107, der letzten 2 Jahre) | |
| Asus TUF Gaming A16 FA608UP | |
| Gigabyte Aero X16 1WH | |
| Gigabyte Gaming A16 GA6H | |
| AIDA64 / CPU SHA3 | |
| Lenovo Legion 5 Pro 16IAX10H | |
| Alienware 16X Aurora, RTX 5070 | |
| Lenovo Legion Pro 5 16IAX10, RTX 5070 | |
| Durchschnittliche Intel Core Ultra 7 255HX (6445 - 7694, n=5) | |
| Durchschnitt der Klasse Gaming (2180 - 9817, n=107, der letzten 2 Jahre) | |
| Schenker XMG Core 16 M25 | |
| Asus TUF Gaming A16 FA608UP | |
| Gigabyte Aero X16 1WH | |
| Gigabyte Gaming A16 GA6H | |
| AIDA64 / CPU Queen | |
| Lenovo Legion 5 Pro 16IAX10H | |
| Lenovo Legion Pro 5 16IAX10, RTX 5070 | |
| Alienware 16X Aurora, RTX 5070 | |
| Durchschnittliche Intel Core Ultra 7 255HX (115802 - 135237, n=5) | |
| Asus TUF Gaming A16 FA608UP | |
| Durchschnitt der Klasse Gaming (49785 - 173351, n=94, der letzten 2 Jahre) | |
| Schenker XMG Core 16 M25 | |
| Gigabyte Aero X16 1WH | |
| Gigabyte Gaming A16 GA6H | |
| AIDA64 / FPU SinJulia | |
| Schenker XMG Core 16 M25 | |
| Asus TUF Gaming A16 FA608UP | |
| Durchschnitt der Klasse Gaming (4424 - 33636, n=107, der letzten 2 Jahre) | |
| Lenovo Legion 5 Pro 16IAX10H | |
| Gigabyte Aero X16 1WH | |
| Alienware 16X Aurora, RTX 5070 | |
| Lenovo Legion Pro 5 16IAX10, RTX 5070 | |
| Durchschnittliche Intel Core Ultra 7 255HX (11066 - 12286, n=5) | |
| Gigabyte Gaming A16 GA6H | |
| AIDA64 / FPU Mandel | |
| Lenovo Legion 5 Pro 16IAX10H | |
| Lenovo Legion Pro 5 16IAX10, RTX 5070 | |
| Alienware 16X Aurora, RTX 5070 | |
| Durchschnittliche Intel Core Ultra 7 255HX (72938 - 87947, n=5) | |
| Schenker XMG Core 16 M25 | |
| Durchschnitt der Klasse Gaming (25115 - 128721, n=107, der letzten 2 Jahre) | |
| Asus TUF Gaming A16 FA608UP | |
| Gigabyte Aero X16 1WH | |
| Gigabyte Gaming A16 GA6H | |
| AIDA64 / CPU AES | |
| Lenovo Legion 5 Pro 16IAX10H | |
| Alienware 16X Aurora, RTX 5070 | |
| Schenker XMG Core 16 M25 | |
| Lenovo Legion Pro 5 16IAX10, RTX 5070 | |
| Durchschnittliche Intel Core Ultra 7 255HX (96832 - 116158, n=5) | |
| Durchschnitt der Klasse Gaming (39258 - 247074, n=107, der letzten 2 Jahre) | |
| Asus TUF Gaming A16 FA608UP | |
| Gigabyte Aero X16 1WH | |
| Gigabyte Gaming A16 GA6H | |
| AIDA64 / CPU ZLib | |
| Lenovo Legion 5 Pro 16IAX10H | |
| Alienware 16X Aurora, RTX 5070 | |
| Lenovo Legion Pro 5 16IAX10, RTX 5070 | |
| Durchschnittliche Intel Core Ultra 7 255HX (1510 - 1850, n=5) | |
| Durchschnitt der Klasse Gaming (574 - 2531, n=107, der letzten 2 Jahre) | |
| Schenker XMG Core 16 M25 | |
| Gigabyte Aero X16 1WH | |
| Asus TUF Gaming A16 FA608UP | |
| Gigabyte Gaming A16 GA6H | |
| AIDA64 / FP64 Ray-Trace | |
| Schenker XMG Core 16 M25 | |
| Lenovo Legion 5 Pro 16IAX10H | |
| Lenovo Legion Pro 5 16IAX10, RTX 5070 | |
| Alienware 16X Aurora, RTX 5070 | |
| Durchschnittliche Intel Core Ultra 7 255HX (15137 - 18315, n=5) | |
| Durchschnitt der Klasse Gaming (5509 - 45446, n=107, der letzten 2 Jahre) | |
| Asus TUF Gaming A16 FA608UP | |
| Gigabyte Aero X16 1WH | |
| Gigabyte Gaming A16 GA6H | |
| AIDA64 / CPU PhotoWorxx | |
| Lenovo Legion Pro 5 16IAX10, RTX 5070 | |
| Schenker XMG Core 16 M25 | |
| Lenovo Legion 5 Pro 16IAX10H | |
| Alienware 16X Aurora, RTX 5070 | |
| Durchschnittliche Intel Core Ultra 7 255HX (39697 - 54070, n=5) | |
| Durchschnitt der Klasse Gaming (12271 - 89891, n=107, der letzten 2 Jahre) | |
| Gigabyte Aero X16 1WH | |
| Asus TUF Gaming A16 FA608UP | |
| Gigabyte Gaming A16 GA6H | |
System Performance
Das Legion Pro 5 16 zeigt eine exzellente Systemleistung, führt die Konkurrenz an und liegt nur knapp hinter dem etwas besseren Schwestermodell.
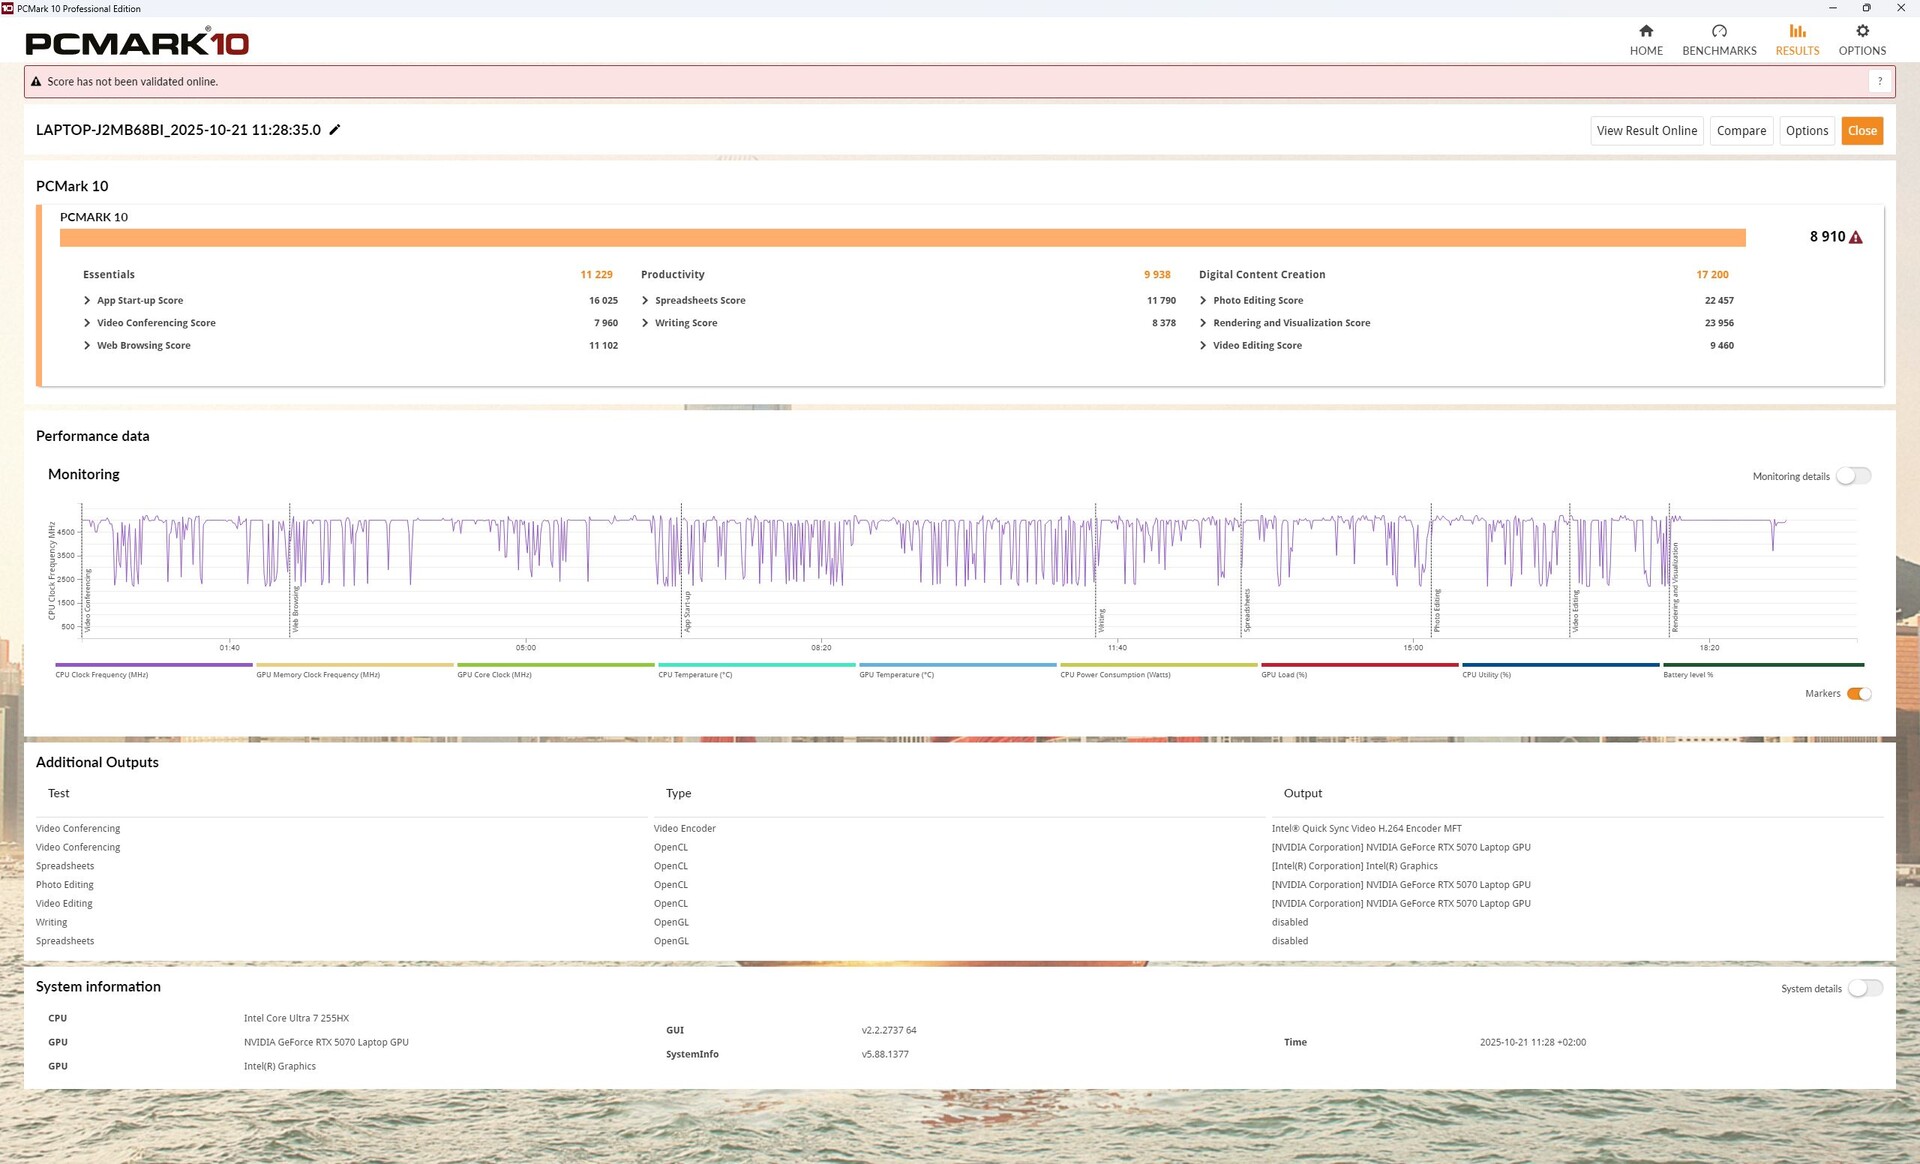
PCMark 10: Score | Essentials | Productivity | Digital Content Creation
CrossMark: Overall | Productivity | Creativity | Responsiveness
WebXPRT 3: Overall
WebXPRT 4: Overall
Mozilla Kraken 1.1: Total
| Performance Rating | |
| Lenovo Legion 5 Pro 16IAX10H | |
| Lenovo Legion Pro 5 16IAX10, RTX 5070 | |
| Durchschnittliche Intel Core Ultra 7 255HX, NVIDIA GeForce RTX 5070 Laptop | |
| Alienware 16X Aurora, RTX 5070 -4! | |
| Durchschnitt der Klasse Gaming | |
| Schenker XMG Core 16 M25 -4! | |
| Gigabyte Aero X16 1WH | |
| Gigabyte Gaming A16 GA6H | |
| Asus TUF Gaming A16 FA608UP -4! | |
| PCMark 10 / Score | |
| Lenovo Legion Pro 5 16IAX10, RTX 5070 | |
| Durchschnittliche Intel Core Ultra 7 255HX, NVIDIA GeForce RTX 5070 Laptop (n=1) | |
| Durchschnitt der Klasse Gaming (5828 - 11574, n=95, der letzten 2 Jahre) | |
| Lenovo Legion 5 Pro 16IAX10H | |
| Gigabyte Aero X16 1WH | |
| Gigabyte Gaming A16 GA6H | |
| PCMark 10 / Essentials | |
| Lenovo Legion Pro 5 16IAX10, RTX 5070 | |
| Durchschnittliche Intel Core Ultra 7 255HX, NVIDIA GeForce RTX 5070 Laptop (n=1) | |
| Lenovo Legion 5 Pro 16IAX10H | |
| Durchschnitt der Klasse Gaming (8810 - 12600, n=99, der letzten 2 Jahre) | |
| Gigabyte Aero X16 1WH | |
| Gigabyte Gaming A16 GA6H | |
| PCMark 10 / Productivity | |
| Durchschnitt der Klasse Gaming (6845 - 21327, n=97, der letzten 2 Jahre) | |
| Gigabyte Aero X16 1WH | |
| Lenovo Legion Pro 5 16IAX10, RTX 5070 | |
| Durchschnittliche Intel Core Ultra 7 255HX, NVIDIA GeForce RTX 5070 Laptop (n=1) | |
| Lenovo Legion 5 Pro 16IAX10H | |
| Gigabyte Gaming A16 GA6H | |
| PCMark 10 / Digital Content Creation | |
| Lenovo Legion Pro 5 16IAX10, RTX 5070 | |
| Durchschnittliche Intel Core Ultra 7 255HX, NVIDIA GeForce RTX 5070 Laptop (n=1) | |
| Lenovo Legion 5 Pro 16IAX10H | |
| Durchschnitt der Klasse Gaming (7602 - 19657, n=97, der letzten 2 Jahre) | |
| Gigabyte Aero X16 1WH | |
| Gigabyte Gaming A16 GA6H | |
| CrossMark / Overall | |
| Alienware 16X Aurora, RTX 5070 | |
| Lenovo Legion 5 Pro 16IAX10H | |
| Lenovo Legion Pro 5 16IAX10, RTX 5070 | |
| Durchschnittliche Intel Core Ultra 7 255HX, NVIDIA GeForce RTX 5070 Laptop (n=1) | |
| Schenker XMG Core 16 M25 | |
| Durchschnitt der Klasse Gaming (1366 - 2409, n=96, der letzten 2 Jahre) | |
| Gigabyte Gaming A16 GA6H | |
| Gigabyte Aero X16 1WH | |
| Asus TUF Gaming A16 FA608UP | |
| CrossMark / Productivity | |
| Alienware 16X Aurora, RTX 5070 | |
| Lenovo Legion 5 Pro 16IAX10H | |
| Lenovo Legion Pro 5 16IAX10, RTX 5070 | |
| Durchschnittliche Intel Core Ultra 7 255HX, NVIDIA GeForce RTX 5070 Laptop (n=1) | |
| Durchschnitt der Klasse Gaming (1386 - 2254, n=96, der letzten 2 Jahre) | |
| Schenker XMG Core 16 M25 | |
| Gigabyte Gaming A16 GA6H | |
| Gigabyte Aero X16 1WH | |
| Asus TUF Gaming A16 FA608UP | |
| CrossMark / Creativity | |
| Lenovo Legion 5 Pro 16IAX10H | |
| Schenker XMG Core 16 M25 | |
| Alienware 16X Aurora, RTX 5070 | |
| Lenovo Legion Pro 5 16IAX10, RTX 5070 | |
| Durchschnittliche Intel Core Ultra 7 255HX, NVIDIA GeForce RTX 5070 Laptop (n=1) | |
| Durchschnitt der Klasse Gaming (1343 - 2729, n=96, der letzten 2 Jahre) | |
| Gigabyte Aero X16 1WH | |
| Asus TUF Gaming A16 FA608UP | |
| Gigabyte Gaming A16 GA6H | |
| CrossMark / Responsiveness | |
| Alienware 16X Aurora, RTX 5070 | |
| Lenovo Legion 5 Pro 16IAX10H | |
| Gigabyte Gaming A16 GA6H | |
| Lenovo Legion Pro 5 16IAX10, RTX 5070 | |
| Durchschnittliche Intel Core Ultra 7 255HX, NVIDIA GeForce RTX 5070 Laptop (n=1) | |
| Durchschnitt der Klasse Gaming (1226 - 2334, n=96, der letzten 2 Jahre) | |
| Schenker XMG Core 16 M25 | |
| Gigabyte Aero X16 1WH | |
| Asus TUF Gaming A16 FA608UP | |
| WebXPRT 3 / Overall | |
| Lenovo Legion 5 Pro 16IAX10H | |
| Alienware 16X Aurora, RTX 5070 | |
| Schenker XMG Core 16 M25 | |
| Gigabyte Aero X16 1WH | |
| Lenovo Legion Pro 5 16IAX10, RTX 5070 | |
| Durchschnittliche Intel Core Ultra 7 255HX, NVIDIA GeForce RTX 5070 Laptop (n=1) | |
| Durchschnitt der Klasse Gaming (220 - 532, n=100, der letzten 2 Jahre) | |
| Asus TUF Gaming A16 FA608UP | |
| Gigabyte Gaming A16 GA6H | |
| WebXPRT 4 / Overall | |
| Schenker XMG Core 16 M25 | |
| Alienware 16X Aurora, RTX 5070 | |
| Lenovo Legion Pro 5 16IAX10, RTX 5070 | |
| Durchschnittliche Intel Core Ultra 7 255HX, NVIDIA GeForce RTX 5070 Laptop (n=1) | |
| Lenovo Legion 5 Pro 16IAX10H | |
| Durchschnitt der Klasse Gaming (165 - 354, n=101, der letzten 2 Jahre) | |
| Gigabyte Aero X16 1WH | |
| Gigabyte Gaming A16 GA6H | |
| Asus TUF Gaming A16 FA608UP | |
| Mozilla Kraken 1.1 / Total | |
| Asus TUF Gaming A16 FA608UP | |
| Gigabyte Gaming A16 GA6H | |
| Durchschnitt der Klasse Gaming (391 - 590, n=104, der letzten 2 Jahre) | |
| Gigabyte Aero X16 1WH | |
| Lenovo Legion Pro 5 16IAX10, RTX 5070 | |
| Durchschnittliche Intel Core Ultra 7 255HX, NVIDIA GeForce RTX 5070 Laptop (n=1) | |
| Schenker XMG Core 16 M25 | |
| Lenovo Legion 5 Pro 16IAX10H | |
| Alienware 16X Aurora, RTX 5070 | |
* ... kleinere Werte sind besser
| PCMark 10 Score | 8910 Punkte | |
Hilfe | ||
| AIDA64 / Memory Copy | |
| Lenovo Legion Pro 5 16IAX10, RTX 5070 | |
| Durchschnittliche Intel Core Ultra 7 255HX (68939 - 104987, n=5) | |
| Lenovo Legion 5 Pro 16IAX10H | |
| Alienware 16X Aurora, RTX 5070 | |
| Schenker XMG Core 16 M25 | |
| Gigabyte Aero X16 1WH | |
| Durchschnitt der Klasse Gaming (21750 - 129946, n=107, der letzten 2 Jahre) | |
| Asus TUF Gaming A16 FA608UP | |
| Gigabyte Gaming A16 GA6H | |
| AIDA64 / Memory Read | |
| Lenovo Legion Pro 5 16IAX10, RTX 5070 | |
| Durchschnittliche Intel Core Ultra 7 255HX (82336 - 95821, n=5) | |
| Lenovo Legion 5 Pro 16IAX10H | |
| Alienware 16X Aurora, RTX 5070 | |
| Schenker XMG Core 16 M25 | |
| Durchschnitt der Klasse Gaming (22956 - 118858, n=107, der letzten 2 Jahre) | |
| Gigabyte Aero X16 1WH | |
| Asus TUF Gaming A16 FA608UP | |
| Gigabyte Gaming A16 GA6H | |
| AIDA64 / Memory Write | |
| Durchschnittliche Intel Core Ultra 7 255HX (66479 - 133486, n=5) | |
| Asus TUF Gaming A16 FA608UP | |
| Gigabyte Aero X16 1WH | |
| Lenovo Legion Pro 5 16IAX10, RTX 5070 | |
| Schenker XMG Core 16 M25 | |
| Alienware 16X Aurora, RTX 5070 | |
| Lenovo Legion 5 Pro 16IAX10H | |
| Durchschnitt der Klasse Gaming (22297 - 135096, n=107, der letzten 2 Jahre) | |
| Gigabyte Gaming A16 GA6H | |
| AIDA64 / Memory Latency | |
| Alienware 16X Aurora, RTX 5070 | |
| Lenovo Legion 5 Pro 16IAX10H | |
| Durchschnitt der Klasse Gaming (75.3 - 259, n=107, der letzten 2 Jahre) | |
| Durchschnittliche Intel Core Ultra 7 255HX (104.2 - 110, n=5) | |
| Lenovo Legion Pro 5 16IAX10, RTX 5070 | |
| Gigabyte Gaming A16 GA6H | |
| Gigabyte Aero X16 1WH | |
| Asus TUF Gaming A16 FA608UP | |
| Schenker XMG Core 16 M25 | |
* ... kleinere Werte sind besser
DPC-Latenzen
Erste kleinere Latenzen gibt es beim Starten des Browsers, das Öffnen mehrerer Tabs scheint den Wert nicht weiter zu erhöhen. Wohl aber die Wiedergabe unseres YouTube-Testvideos, bei dem gleich 30 Bilder ausgelassen werden. Der Latenz-Endwert liegt vergleichstechnisch jedoch eher im niedrigeren Bereich.


| DPC Latencies / LatencyMon - interrupt to process latency (max), Web, Youtube, Prime95 | |
| Gigabyte Gaming A16 GA6H | |
| Gigabyte Aero X16 1WH | |
| Alienware 16X Aurora, RTX 5070 | |
| Lenovo Legion 5 Pro 16IAX10H | |
| Lenovo Legion Pro 5 16IAX10, RTX 5070 | |
| Schenker XMG Core 16 M25 | |
| Asus TUF Gaming A16 FA608UP | |
* ... kleinere Werte sind besser
Massenspeicher
Im aktuellen Testmodell speichert eine PCIe-4-SSD von SK Hynix, im Schwestermodell war es eine Western Digital. Das hiesige Modell ist nur minimal schneller, hat jedoch (erst) gegen Ende des Dauerstresstests mit thermischer Drosselung zu kämpfen.


* ... kleinere Werte sind besser
Dauerleistung Lesen: DiskSpd Read Loop, Queue Depth 8
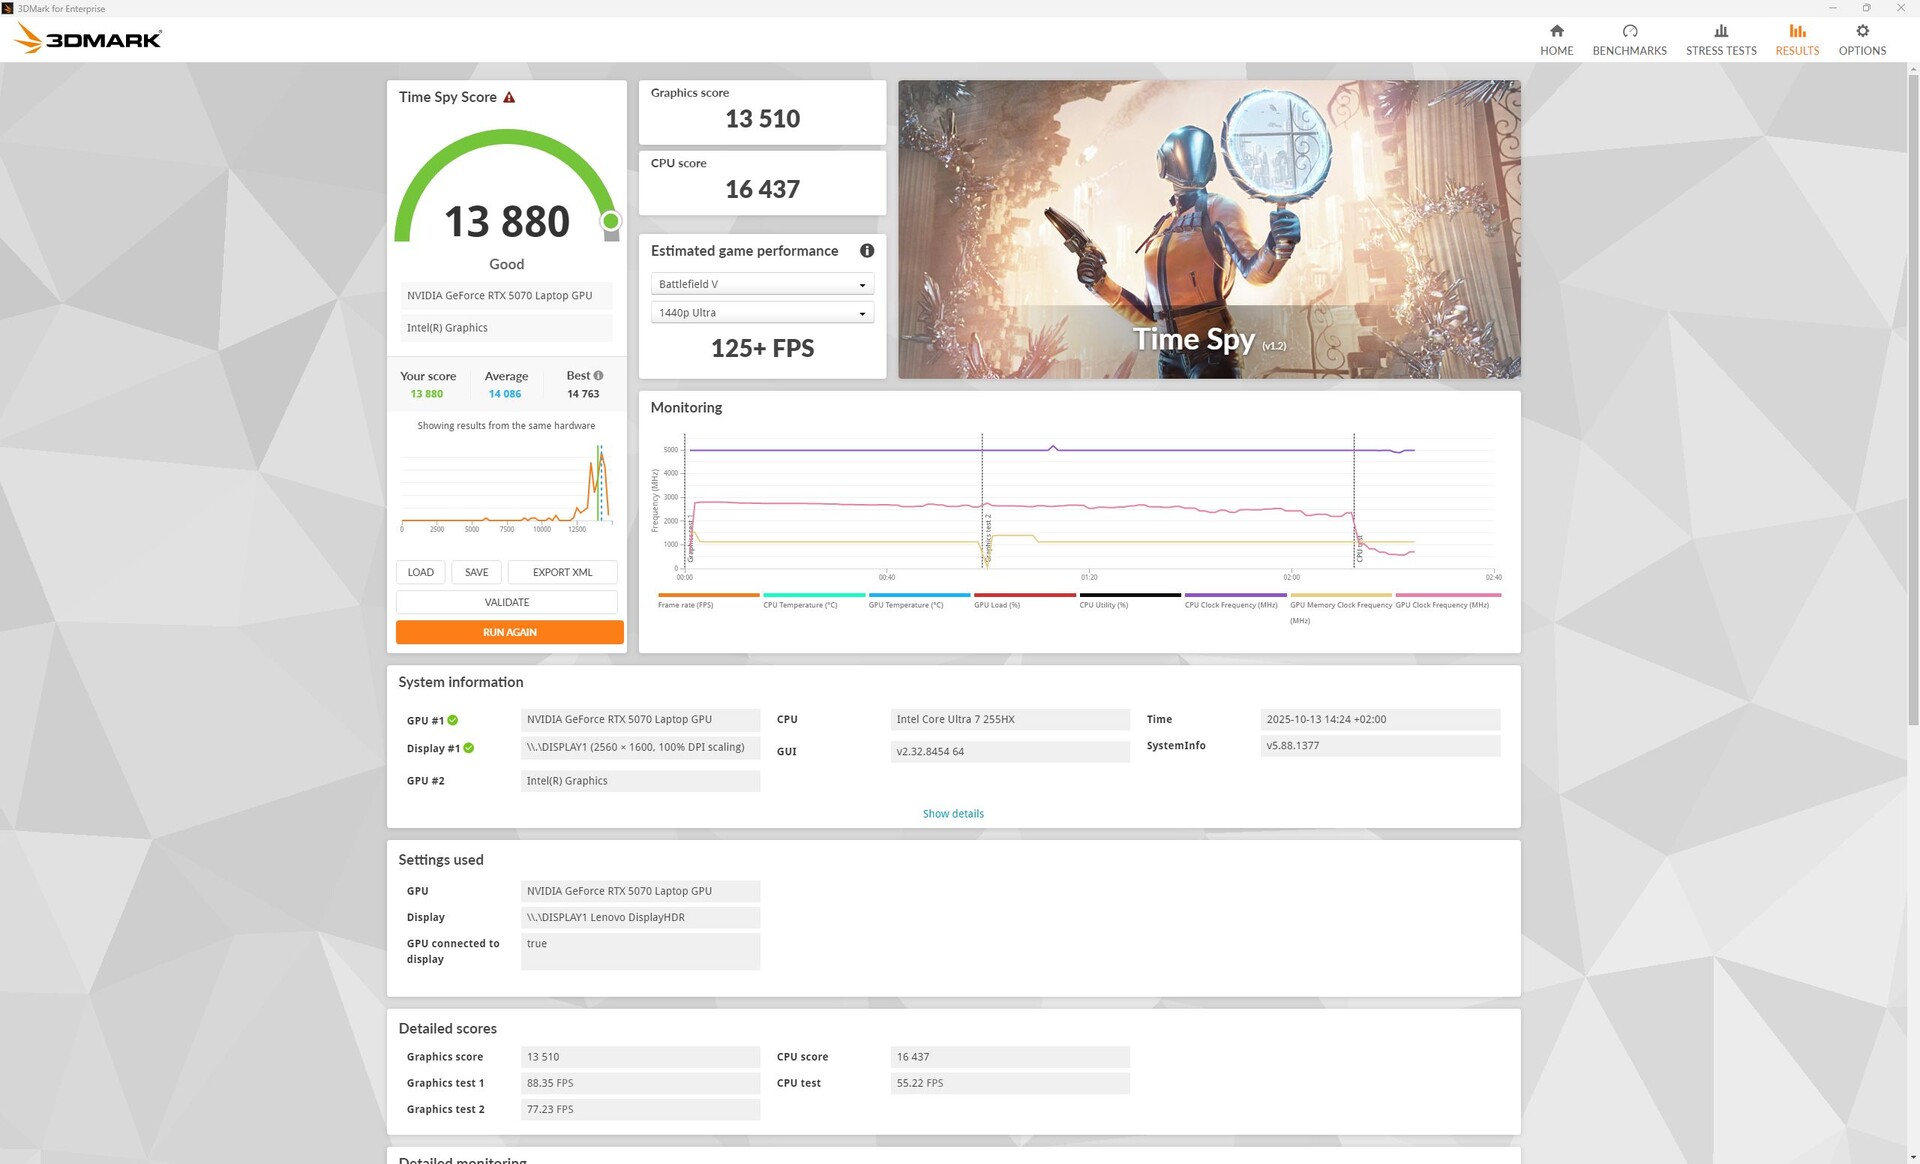
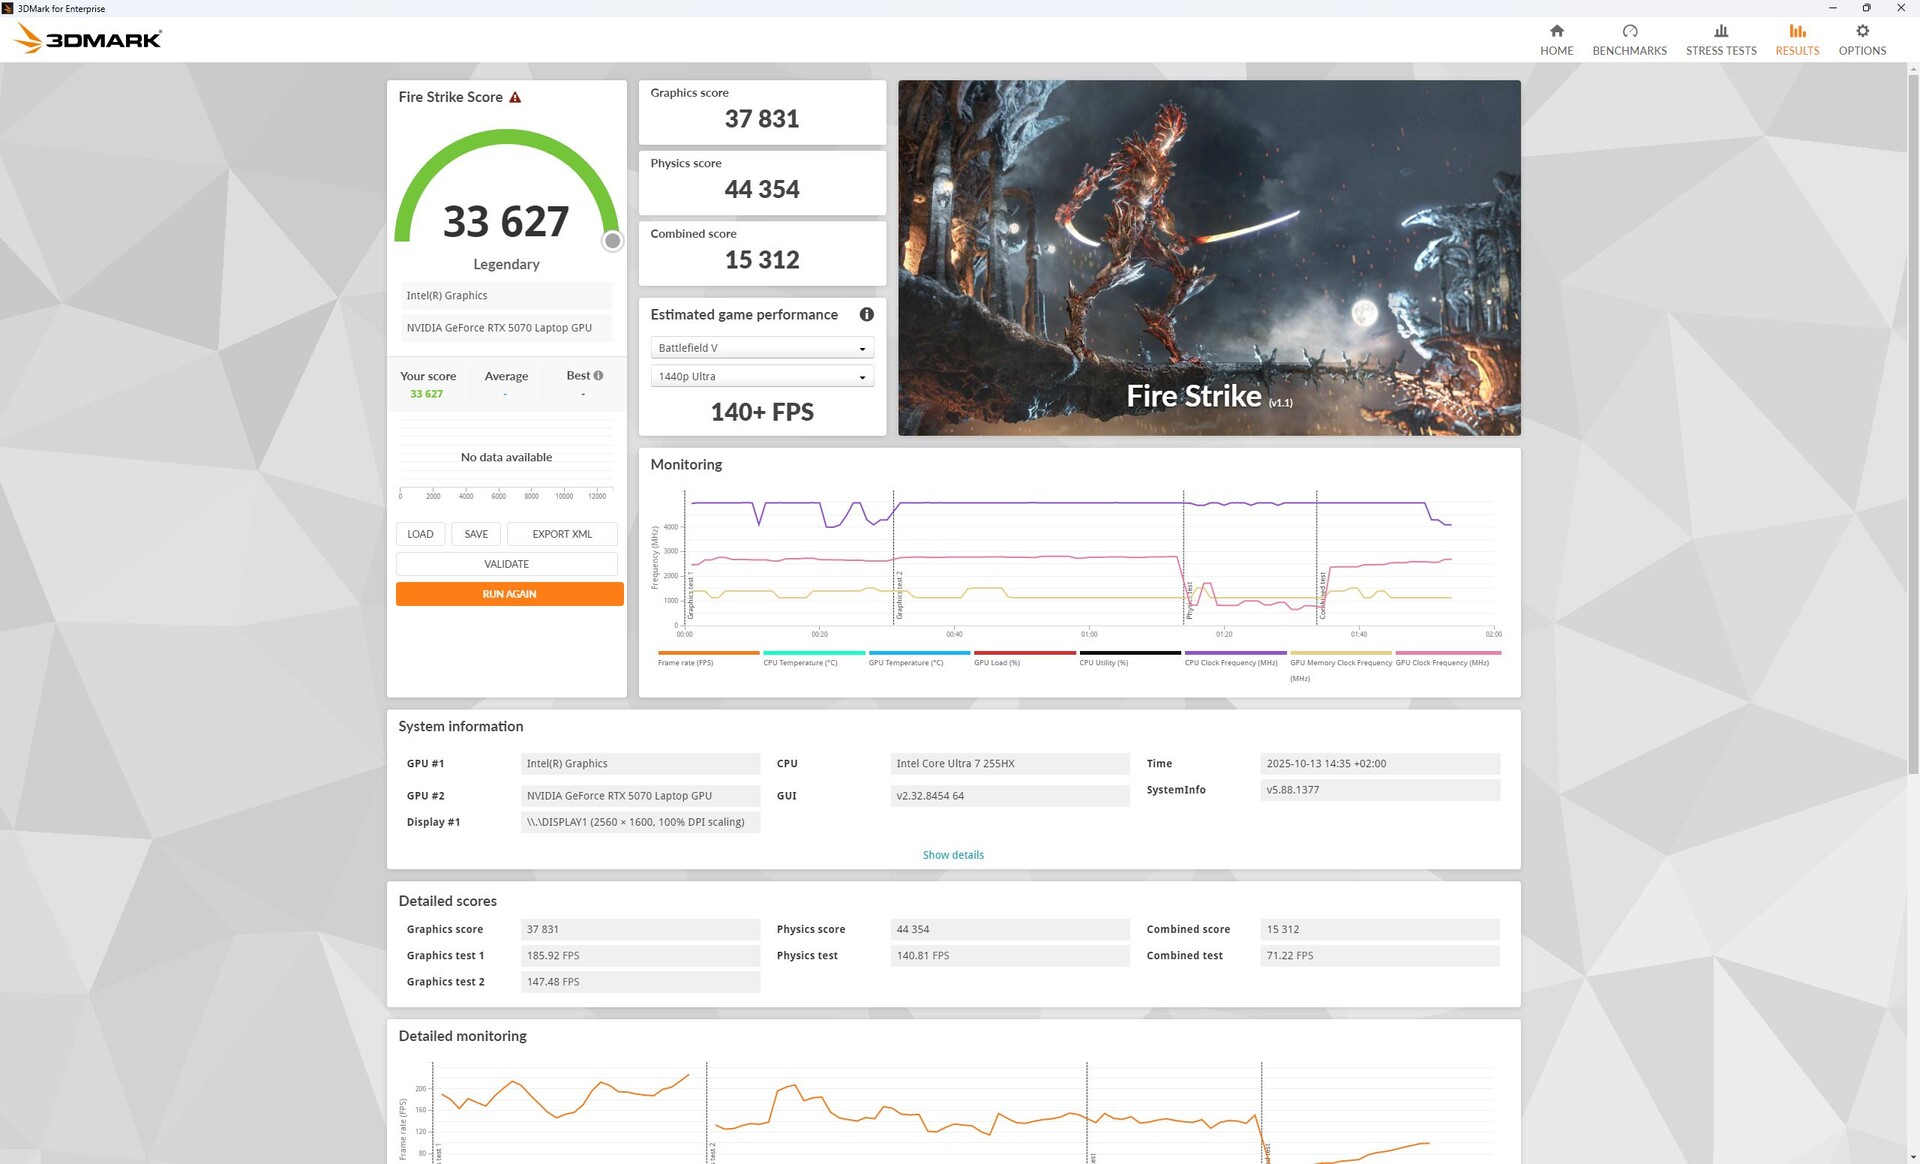
GPU Leistung
DIe RTX 5070 hat gegenüber der RTX 5070 Ti nur 8 statt 12 GB RAM, das kann in einigen Spielen in höheren Auflösungen und Details schon an Grenzen stoßen (s. Screenshot unten). Zu mehr Rucklern hat die leichte Überschreitung in diesem speziellen Fall jedoch nicht geführt, auch die Frametimes waren bis auf eine Ausnahme recht konstant.
Ein anderer Fall ist Indiana Jones: und der große Kreis: Hier wird schon in Full-HD und niedrigen Details angezeigt, dass der VRAM überschritten ist. Bis mittlere Details spielt sich das Game dennoch flüssig, aber ab hohen Details stürzt das Spiel reproduzierbar nach dem Start bei uns ab.
Hinzu kommt der durchaus beachtliche Geschwindigkeitsvorteil von 25 Prozent der Ti-Variante in den synthetischen 3DMark-Tests.
Beim Gaming ist der Vergleich schwieriger, kommt es hier doch stark auf den Titel an: Eher CPU-lastige Games wie Dota 2 Reborn profitieren nur wenig von der stärkeren GPU, was den Gesamtunterschied trügerisch minimiert. In vielen GPU-lastigen Games wie Cyberpunk 2077 oder Strange Brigade sehen wir aber einen ähnlich hohen Vorteil des Ti-Modells wie in den 3DMark-Tests.
Ungeachtet dieses messtechnischen Vorsprungs muss man jedoch ebenfalls sagen, dass auch mit RTX 5070 ohne Ti die meisten Titel in hohen Auflösungen und Details gespielt werden können - in QHD sowieso, in 4K mit Ausnahmen aber ebenfalls. Die Ti-Variante bietet bei sehr anspruchsvollen Spielen nochmal ein paar Frames mehr und ist daher für Titel, die in 4K an der Grenze zur Spielbarkeit wandeln (Beispiel Cyberpunk 2077 ohne DLSS, F1 25) etwas besser gerüstet. Unter 30 fps haben wir keine Settings mehr vermessen, beispielsweise bringt F1 25 in QHD keine flüssig spielbaren Ergebnisse mehr hervor.
Abseits der Steckdose sinkt die 3D-Leistung um satte 82 Prozent (Fire Strike)!


| 3DMark 11 Performance | 40182 Punkte | |
| 3DMark Fire Strike Score | 33627 Punkte | |
| 3DMark Time Spy Score | 13880 Punkte | |
Hilfe | ||
* ... kleinere Werte sind besser
Cyberpunk 2077 ultra FPS-Diagramm
| min. | mittel | hoch | max. | QHD DLSS | QHD | 4K DLSS | 4K | |
|---|---|---|---|---|---|---|---|---|
| GTA V (2015) | 187.6 | 186.4 | 184.1 | 153.2 | 126 | 119 | ||
| Dota 2 Reborn (2015) | 203 | 184.2 | 178.1 | 162.4 | 131 | |||
| Final Fantasy XV Benchmark (2018) | 232 | 191.3 | 144.5 | 106.8 | 59.1 | |||
| X-Plane 11.11 (2018) | 135.5 | 117.6 | 101.6 | 80 | ||||
| Strange Brigade (2018) | 560 | 349 | 295 | 246 | 177.4 | 95.8 | ||
| Baldur's Gate 3 (2023) | 192.4 | 153.1 | 134.6 | 130.6 | 135.8 | 90 | 77.6 | 46 |
| Cyberpunk 2077 (2023) | 171.8 | 146.4 | 122 | 107 | 80.7 | 68.3 | 30.2 | |
| Indiana Jones and the Great Circle (2024) | 131.6 | |||||||
| Assassin's Creed Shadows (2025) | 75 | 70 | 60 | 46 | 45 | 38 | ||
| Doom: The Dark Ages (2025) | 96.2 | 88.4 | 74.2 | 72.2 | 70 | 49.4 | 33.2 | |
| F1 25 (2025) | 242 | 227 | 191.9 | 31.6 |
Emissionen & Energie - Leiser, kühler, sparsamer
Geräuschemissionen
Im Idle sind die Lüfter zwar meist aus, sobald jedoch eine auch nur geringe Last wie Surfen o.ä. dazu kommt, springen sie oft leise an.
Unter Last bleiben die Lüfter etwas leiser als beim Ti-Modell. Die direkte Konkurrenz verzeichnet aber ähnliche Werte. Für 12 Prozent weniger GPU-Leistung drehen die Lüfter in Cyberpunk 2077 nur etwa halb so laut auf (3 dB mehr wirken wie eine Verdopplung der Lautstärke).
Lautstärkediagramm
| Idle |
| 23 / 23 / 23 dB(A) |
| Last |
| 43.85 / 52.9 dB(A) |
 | ||
30 dB leise 40 dB(A) deutlich hörbar 50 dB(A) störend |
||
min: | ||
| Lenovo Legion Pro 5 16IAX10, RTX 5070 Ultra 7 255HX, GeForce RTX 5070 Laptop | Lenovo Legion 5 Pro 16IAX10H Ultra 9 275HX, GeForce RTX 5070 Ti Laptop | Alienware 16X Aurora, RTX 5070 Ultra 9 275HX, GeForce RTX 5070 Laptop | Gigabyte Aero X16 1WH Ryzen AI 7 350, GeForce RTX 5070 Laptop | Asus TUF Gaming A16 FA608UP R7 260, GeForce RTX 5070 Laptop | Schenker XMG Core 16 M25 Ryzen AI 9 HX 370, GeForce RTX 5070 Laptop | Gigabyte Gaming A16 GA6H i7-13620H, GeForce RTX 5070 Laptop | |
|---|---|---|---|---|---|---|---|
| Geräuschentwicklung | -13% | 0% | 2% | -19% | -4% | -11% | |
| aus / Umgebung * (dB) | 23 | 24 -4% | 23.7 -3% | 23.9 -4% | 25.1 -9% | 24.8 -8% | 24 -4% |
| Idle min * (dB) | 23 | 24 -4% | 23.9 -4% | 23.9 -4% | 32.2 -40% | 24.8 -8% | 25 -9% |
| Idle avg * (dB) | 23 | 24 -4% | 23.9 -4% | 23.9 -4% | 32.2 -40% | 24.8 -8% | 26 -13% |
| Idle max * (dB) | 23 | 30.9 -34% | 26.1 -13% | 23.9 -4% | 32.2 -40% | 27.1 -18% | 27 -17% |
| Last avg * (dB) | 43.85 | 55.9 -27% | 26.8 39% | 33.2 24% | 38.1 13% | 40.2 8% | 54 -23% |
| Cyberpunk 2077 ultra * (dB) | 50.27 | 56.72 -13% | 51.8 -3% | 50.2 -0% | 53.9 -7% | 49.2 2% | 54 -7% |
| Last max * (dB) | 52.9 | 56.72 -7% | 58 -10% | 50.2 5% | 57.1 -8% | 49.2 7% | 55 -4% |
* ... kleinere Werte sind besser
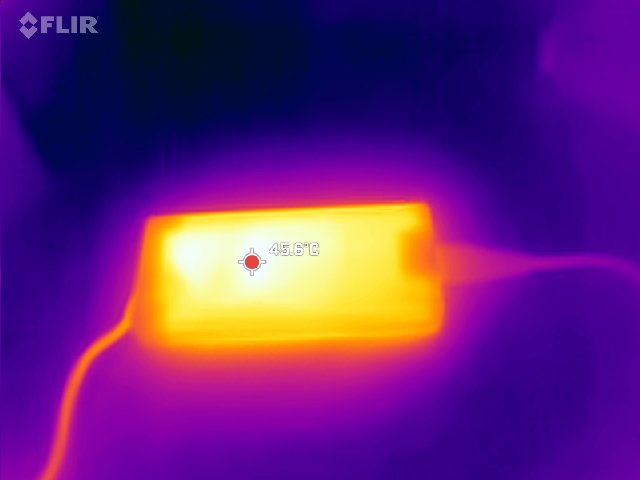
Temperatur
Unser Testmodell erhitzt sich unter Last etwas weniger stark als die Ti-Variante. Wir messen Hot Spots von maximal 44 °C an der Unterseite zum Display hin gegenüber 50 °C des Ti-Modells. Die WASD-Tasten bleiben mit 37 °C kühler, die Handballenauflagen sowieso.
(±) Die maximale Temperatur auf der Oberseite ist 42 °C. Im Vergleich liegt der Klassendurchschnitt bei 40.4 °C (von 21.2 bis 68.8 °C für die Klasse Gaming).
(±) Auf der Unterseite messen wir eine maximalen Wert von 44 °C (im Vergleich zum Durchschnitt von 43.2 °C).
(+) Ohne Last messen wir eine durchschnittliche Temperatur von 29.8 °C auf der Oberseite. Der Klassendurchschnitt erreicht 33.9 °C.
(±) 3: The average temperature for the upper side is 34.3 °C / 94 F, compared to the average of 33.9 °C / 93 F for the class Gaming.
(+) Die Handballen und der Touchpad-Bereich sind mit gemessenen 31 °C kühler als die typische Hauttemperatur und fühlen sich dadurch kühl an.
(-) Die durchschnittliche Handballen-Temperatur anderer getesteter Geräte war 28.8 °C (-2.2 °C).


| Lenovo Legion Pro 5 16IAX10, RTX 5070 Ultra 7 255HX, GeForce RTX 5070 Laptop | Lenovo Legion 5 Pro 16IAX10H Ultra 9 275HX, GeForce RTX 5070 Ti Laptop | Alienware 16X Aurora, RTX 5070 Ultra 9 275HX, GeForce RTX 5070 Laptop | Gigabyte Aero X16 1WH Ryzen AI 7 350, GeForce RTX 5070 Laptop | Asus TUF Gaming A16 FA608UP R7 260, GeForce RTX 5070 Laptop | Schenker XMG Core 16 M25 Ryzen AI 9 HX 370, GeForce RTX 5070 Laptop | Gigabyte Gaming A16 GA6H i7-13620H, GeForce RTX 5070 Laptop | |
|---|---|---|---|---|---|---|---|
| Hitze | -17% | 1% | 5% | 13% | -5% | -9% | |
| Last oben max * (°C) | 42 | 48 -14% | 51 -21% | 43.3 -3% | 39.5 6% | 46.7 -11% | 50 -19% |
| Last unten max * (°C) | 44 | 50 -14% | 45.6 -4% | 50.3 -14% | 45.1 -3% | 58.5 -33% | 49 -11% |
| Idle oben max * (°C) | 33 | 38 -15% | 29.8 10% | 27 18% | 25.7 22% | 28.3 14% | 35 -6% |
| Idle unten max * (°C) | 34 | 42 -24% | 27.4 19% | 28.3 17% | 25.5 25% | 29.9 12% | 34 -0% |
* ... kleinere Werte sind besser
Lautsprecher
Wie im Originaltest erwähnt sind die Speaker des Legion etwas zu leise und geben kaum Bass wieder, lediglich die Höhen sind ausgeglichen. Ein Klinkenport für Headsets, Kopfhörer und andere Audiogeräte steht bereit.
Lenovo Legion Pro 5 16IAX10, RTX 5070 Audio Analyse
(±) | Mittelmäßig laut spielende Lautsprecher (75.73 dB)
Bass 100 - 315 Hz
(-) | kaum Bass - 20% niedriger als der Median
(±) | durchschnittlich lineare Bass-Wiedergabe (9.3% Delta zum Vorgänger)
Mitteltöne 400 - 2000 Hz
(±) | zu hohe Mitten, vom Median 6.1% abweichend
(±) | Linearität der Mitten ist durchschnittlich (7.9% Delta zum Vorgänger)
Hochtöne 2 - 16 kHz
(+) | ausgeglichene Hochtöne, vom Median nur 2.2% abweichend
(+) | sehr lineare Hochtöne (6.3% Delta zum Vorgänger)
Gesamt im hörbaren Bereich 100 - 16.000 Hz
(±) | hörbarer Bereich ist durchschnittlich linear (19.4% Abstand zum Median)
Im Vergleich zu allen Geräten derselben Klasse
» 67% aller getesteten Geräte dieser Klasse waren besser, 7% vergleichbar, 26% schlechter
» Das beste Gerät hat einen Delta-Wert von 6%, durchschnittlich ist 18%, das schlechteste Gerät hat 132%
Im Vergleich zu allen Geräten im Test
» 48% aller getesteten Geräte waren besser, 7% vergleichbar, 45% schlechter
» Das beste Gerät hat einen Delta-Wert von 4%, durchschnittlich ist 24%, das schlechteste Gerät hat 134%
Apple MacBook Pro 16 2021 M1 Pro Audio Analyse
(+) | Die Lautsprecher können relativ laut spielen (84.7 dB)
Bass 100 - 315 Hz
(+) | guter Bass - nur 3.8% Abweichung vom Median
(+) | lineare Bass-Wiedergabe (5.2% Delta zum Vorgänger)
Mitteltöne 400 - 2000 Hz
(+) | ausgeglichene Mitten, vom Median nur 1.3% abweichend
(+) | lineare Mitten (2.1% Delta zum Vorgänger)
Hochtöne 2 - 16 kHz
(+) | ausgeglichene Hochtöne, vom Median nur 1.9% abweichend
(+) | sehr lineare Hochtöne (2.7% Delta zum Vorgänger)
Gesamt im hörbaren Bereich 100 - 16.000 Hz
(+) | hörbarer Bereich ist sehr linear (4.6% Abstand zum Median
Im Vergleich zu allen Geräten derselben Klasse
» 0% aller getesteten Geräte dieser Klasse waren besser, 0% vergleichbar, 100% schlechter
» Das beste Gerät hat einen Delta-Wert von 5%, durchschnittlich ist 17%, das schlechteste Gerät hat 45%
Im Vergleich zu allen Geräten im Test
» 0% aller getesteten Geräte waren besser, 0% vergleichbar, 100% schlechter
» Das beste Gerät hat einen Delta-Wert von 4%, durchschnittlich ist 24%, das schlechteste Gerät hat 134%
Energieaufnahme
Wenig überraschend ist der Stromverbrauch geringer als beim Ti-Modell. Im Vergleich mit der übrigen Konkurrenz verbraucht das Legion Pro 5 aber recht viel beim Gaming, ist dabei aber auch einer der Top-Performer.
Bei Anschluss eines externen Monitors via DisplayPort/Thunderbolt ist die RTX 5070 aktiv, was den Idle-Verbrauch steigen lässt.
| Aus / Standby | |
| Idle | |
| Last |
|
Legende:
min: | |
| Lenovo Legion Pro 5 16IAX10, RTX 5070 Ultra 7 255HX, GeForce RTX 5070 Laptop, SK Hynix HFS001TEJ9X115N, OLED, 2650x1600, 16" | Lenovo Legion 5 Pro 16IAX10H Ultra 9 275HX, GeForce RTX 5070 Ti Laptop, Western Digital PC SN8000S SDEPNRK-1T00, OLED, 2560x1600, 16" | Alienware 16X Aurora, RTX 5070 Ultra 9 275HX, GeForce RTX 5070 Laptop, , IPS, 2560x1600, 16" | Gigabyte Aero X16 1WH Ryzen AI 7 350, GeForce RTX 5070 Laptop, Kingston OM8PGP41024Q-A0, IPS, 2560x1600, 16" | Asus TUF Gaming A16 FA608UP R7 260, GeForce RTX 5070 Laptop, Western Digital PC SN5000S SDEQNSJ-1T00, IPS, 2560x1600, 16" | Schenker XMG Core 16 M25 Ryzen AI 9 HX 370, GeForce RTX 5070 Laptop, Samsung 990 Pro 2 TB MZVL72T0HDLB, IPS, 2560x1600, 16" | Gigabyte Gaming A16 GA6H i7-13620H, GeForce RTX 5070 Laptop, Kingston OM8PGP41024Q-A0, IPS, 2560x1600, 16" | Durchschnittliche NVIDIA GeForce RTX 5070 Laptop | Durchschnitt der Klasse Gaming | |
|---|---|---|---|---|---|---|---|---|---|
| Stromverbrauch | -24% | -40% | 34% | 26% | 10% | 20% | -5% | -22% | |
| Idle min * (Watt) | 10.6 | 14 -32% | 20.1 -90% | 5.8 45% | 4.6 57% | 7.4 30% | 9 15% | 10.8 ? -2% | 13 ? -23% |
| Idle avg * (Watt) | 12.3 | 14.3 -16% | 27.6 -124% | 10.9 11% | 9.8 20% | 14.9 -21% | 11 11% | 15.4 ? -25% | 18.7 ? -52% |
| Idle max * (Watt) | 18.6 | 20.1 -8% | 31.8 -71% | 11.2 40% | 10.2 45% | 15.2 18% | 23 -24% | 21 ? -13% | 24.3 ? -31% |
| Last avg * (Watt) | 104 | 177 -70% | 102.7 1% | 91.3 12% | 76.1 27% | 100.8 3% | 91 12% | 98.7 ? 5% | 108.2 ? -4% |
| Cyberpunk 2077 ultra * (Watt) | 231 | 255 -10% | 217 6% | 123.8 46% | 198.9 14% | 184.8 20% | 132.5 43% | ||
| Cyberpunk 2077 ultra external monitor * (Watt) | 227 | 255 -12% | 192.3 15% | 117.9 48% | 198.1 13% | 181.4 20% | 130 43% | ||
| Last max * (Watt) | 248 | 294 -19% | 292 -18% | 155.3 37% | 235.2 5% | 251.1 -1% | 155 37% | 218 ? 12% | 254 ? -2% |
* ... kleinere Werte sind besser
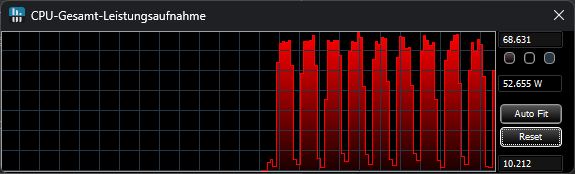
Energieaufnahme Cyberpunk / Stresstest
Energieaufnahme mit externem Monitor
Akkulaufzeit
Mit dem unverändert 80 Wh großen Akku hält das Legion Pro 5 ca. 6 Stunden im WLAN- oder Videotest durch, also grob 1 Stunde länger als das Schwestermodell.
| Lenovo Legion Pro 5 16IAX10, RTX 5070 Ultra 7 255HX, GeForce RTX 5070 Laptop, 80 Wh | Lenovo Legion 5 Pro 16IAX10H Ultra 9 275HX, GeForce RTX 5070 Ti Laptop, 80 Wh | Alienware 16X Aurora, RTX 5070 Ultra 9 275HX, GeForce RTX 5070 Laptop, 96 Wh | Gigabyte Aero X16 1WH Ryzen AI 7 350, GeForce RTX 5070 Laptop, 76 Wh | Asus TUF Gaming A16 FA608UP R7 260, GeForce RTX 5070 Laptop, 90 Wh | Schenker XMG Core 16 M25 Ryzen AI 9 HX 370, GeForce RTX 5070 Laptop, 99.8 Wh | Gigabyte Gaming A16 GA6H i7-13620H, GeForce RTX 5070 Laptop, 76 Wh | Durchschnitt der Klasse Gaming | |
|---|---|---|---|---|---|---|---|---|
| Akkulaufzeit | -16% | -31% | 39% | 110% | 76% | 24% | 14% | |
| H.264 (h) | 6.1 | 4.8 -21% | 8.9 ? 46% | |||||
| WLAN (h) | 6.2 | 4.9 -21% | 4.3 -31% | 8.6 39% | 13 110% | 10.9 76% | 7.7 24% | 7 ? 13% |
| Last (h) | 1.8 | 1.7 -6% | 1.51 ? -16% |
Notebookcheck Gesamtbewertung
Auch mit RTX 5070 ist das Legion Pro 5 16 ein starker Gamer und zudem 500 bis 700 Euro preiswerter als die Ti-Variante.
Lenovo Legion Pro 5 16IAX10, RTX 5070
- 22.10.2025 v8
Christian Hintze
 Total Sustainability Score:
 Mögliche Alternativen im Vergleich
Bild | Modell / Test | Preis ab | Gewicht | Dicke | Display |
|---|---|---|---|---|---|
1. 86.2%  | Lenovo Legion Pro 5 16IAX10, RTX 5070 Intel Core Ultra 7 255HX ⎘ NVIDIA GeForce RTX 5070 Laptop ⎘ 32 GB RAM, 1024 GB SSD | Amazon: Geizhals Suche | 2.3 kg | 25.95 mm | 16.00" 2650x1600 189 PPI OLED |
2. 84.5%  | Lenovo Legion 5 Pro 16IAX10H Intel Core Ultra 9 275HX ⎘ NVIDIA GeForce RTX 5070 Ti Laptop ⎘ 32 GB RAM, 1024 GB SSD | Amazon: 1. 1.999,00 € Lenovo Legion Pro 5 16ADR10 ... 2. 2.775,00 € Lenovo Legion Pro 5 Gaming A... 3. 2.076,78 € Lenovo Legion Pro 5 Gaming L... Listenpreis: 2500 Euro | 2.4 kg | 25.95 mm | 16.00" 2560x1600 189 PPI OLED |
3. 84.9%  | Alienware 16X Aurora, RTX 5070 Intel Core Ultra 9 275HX ⎘ NVIDIA GeForce RTX 5070 Laptop ⎘ 32 GB RAM | Amazon: Geizhals Suche | 2.5 kg | 23.4 mm | 16.00" 2560x1600 189 PPI IPS |
4. 83.7%  | Gigabyte Aero X16 1WH AMD Ryzen AI 7 350 ⎘ NVIDIA GeForce RTX 5070 Laptop ⎘ 32 GB RAM, 1024 GB SSD | Amazon: 2.319,99 € Bestpreis 2279.99€ ONEGAMING 2. 2309.99€ one_gaming 3. 2322.5€ TechpointOnlineshop | 2 kg | 19.9 mm | 16.00" 2560x1600 189 PPI IPS |
5. 83.8%  | Asus TUF Gaming A16 FA608UP AMD Ryzen 7 260 ⎘ NVIDIA GeForce RTX 5070 Laptop ⎘ 32 GB RAM, 1024 GB SSD | Amazon: Bestpreis 2299€ ONE.de | 2.2 kg | 25.7 mm | 16.00" 2560x1600 189 PPI IPS |
6. 86.2%  | Schenker XMG Core 16 M25 AMD Ryzen AI 9 HX 370 ⎘ NVIDIA GeForce RTX 5070 Laptop ⎘ 64 GB RAM, 2048 GB SSD | Amazon: Bestpreis 2619€ Cyberport.de 2. 2619€ computeruniverse.net 3. 2641.01€ computeruniverse.at | 2.1 kg | 23 mm | 16.00" 2560x1600 189 PPI IPS |
7. 80.1%  | Gigabyte Gaming A16 GA6H Intel Core i7-13620H ⎘ NVIDIA GeForce RTX 5070 Laptop ⎘ 16 GB RAM, 1024 GB SSD | Amazon: 1. Gigabyte Gaming A16 Gaming-L... 2. Gigabyte Gaming A16 Laptop �... 3. 1.576,31 € Gigabyte Gaming A16 CWH Gami... Bestpreis 1369€ simac_gmbh 2. 1398.99€ Easynotebooks.de 3. 1399€ Notebook.de | 2.3 kg | 23 mm | 16.00" 2560x1600 189 PPI IPS |
Transparenz
Die Auswahl der zu testenden Geräte erfolgt innerhalb der Redaktion. Das vorliegende Testmuster wurde dem Autor vom Hersteller oder einem Shop zu Testzwecken leihweise zur Verfügung gestellt. Eine Einflussnahme des Leihstellers auf den Testbericht gab es nicht, der Hersteller erhielt keine Version des Reviews vor der Veröffentlichung. Es bestand keine Verpflichtung zur Publikation. Als eigenständiges, unabhängiges Unternehmen unterliegt Notebookcheck keiner Diktion von Herstellern, Shops und Verlagen.
So testet Notebookcheck
Pro Jahr werden von Notebookcheck hunderte Laptops und Smartphones unabhängig in von uns standardisierten technischen Verfahren getestet, um eine Vergleichbarkeit aller Testergebnisse zu gewährleisten. Seit rund 20 Jahren entwickeln wir diese Testmethoden kontinuierlich weiter und setzen damit Branchenstandards. In unseren Testlaboren kommt ausschließlich hochwertiges Messequipment in die Hände erfahrener Techniker und Redakteure. Die Tests unterliegen einer mehrstufigen Kontrolle. Unsere komplexe Gesamtbewertung basiert auf hunderten fundierten Messergebnissen und Benchmarks, womit Ihnen Objektivität garantiert ist. Weitere Informationen zu unseren Testmethoden gibt es hier.
