Fazit - Ausgewogenes Kraftpaket für Arbeit und Gaming
Das Alienware 16X Aurora zeichnet sich durch seine Hochwertigkeit und sein 240 Hz IPS-Display mit P3-Farben in allen aktuellen Konfigurationen aus. Andere Gaming-Notebooks der unteren oder mittleren Preisklasse neigen dazu, mehr Kunststoff zu verwenden oder mit billigeren IPS-Panels zu arbeiten, um Kosten zu sparen. Wir schätzen daher die höheren Standards, die Dell mit dem 16X Aurora setzt. Sogar das günstigere (nicht-X) 16 Aurora verspricht volle sRGB-Farben in der Grundeinstellung.
Ein weiterer Pluspunkt ist, dass die Lüfter nicht pulsieren, wenn sie mit geringer Last laufen. Wir würden uns wünschen, dass dieses Verhalten bei größeren Gaming-Laptops häufiger zu beobachten ist.
Viele der Nachteile des 16X Aurora sind ähnlich wie die des Area-51. Die hochwertigere Konstruktion bedeutet ein höheres Gewicht des Geräts. Auch der Stromverbrauch kann recht hoch ausfallen, was selbst für ein Gaming-Notebook bestenfalls zu einer durchschnittlichen Akkulaufzeit führt. Die GPU-Optionen enden bei der GeForce RTX 5070 anstelle der RTX 5070 Ti, die für 1600p-Gaming viel besser geeignet gewesen wäre. Dell reserviert seine RTX 5070 Ti Optionen wohl für die viel teurere Area-51 Serie als Anreiz für potenzielle Käufer.
Pro
Contra
Preis und Verfügbarkeit
Das 16X Aurora ist direkt bei Dell in verschiedenen Konfigurationen ab 1.800 Euro erhältlich.
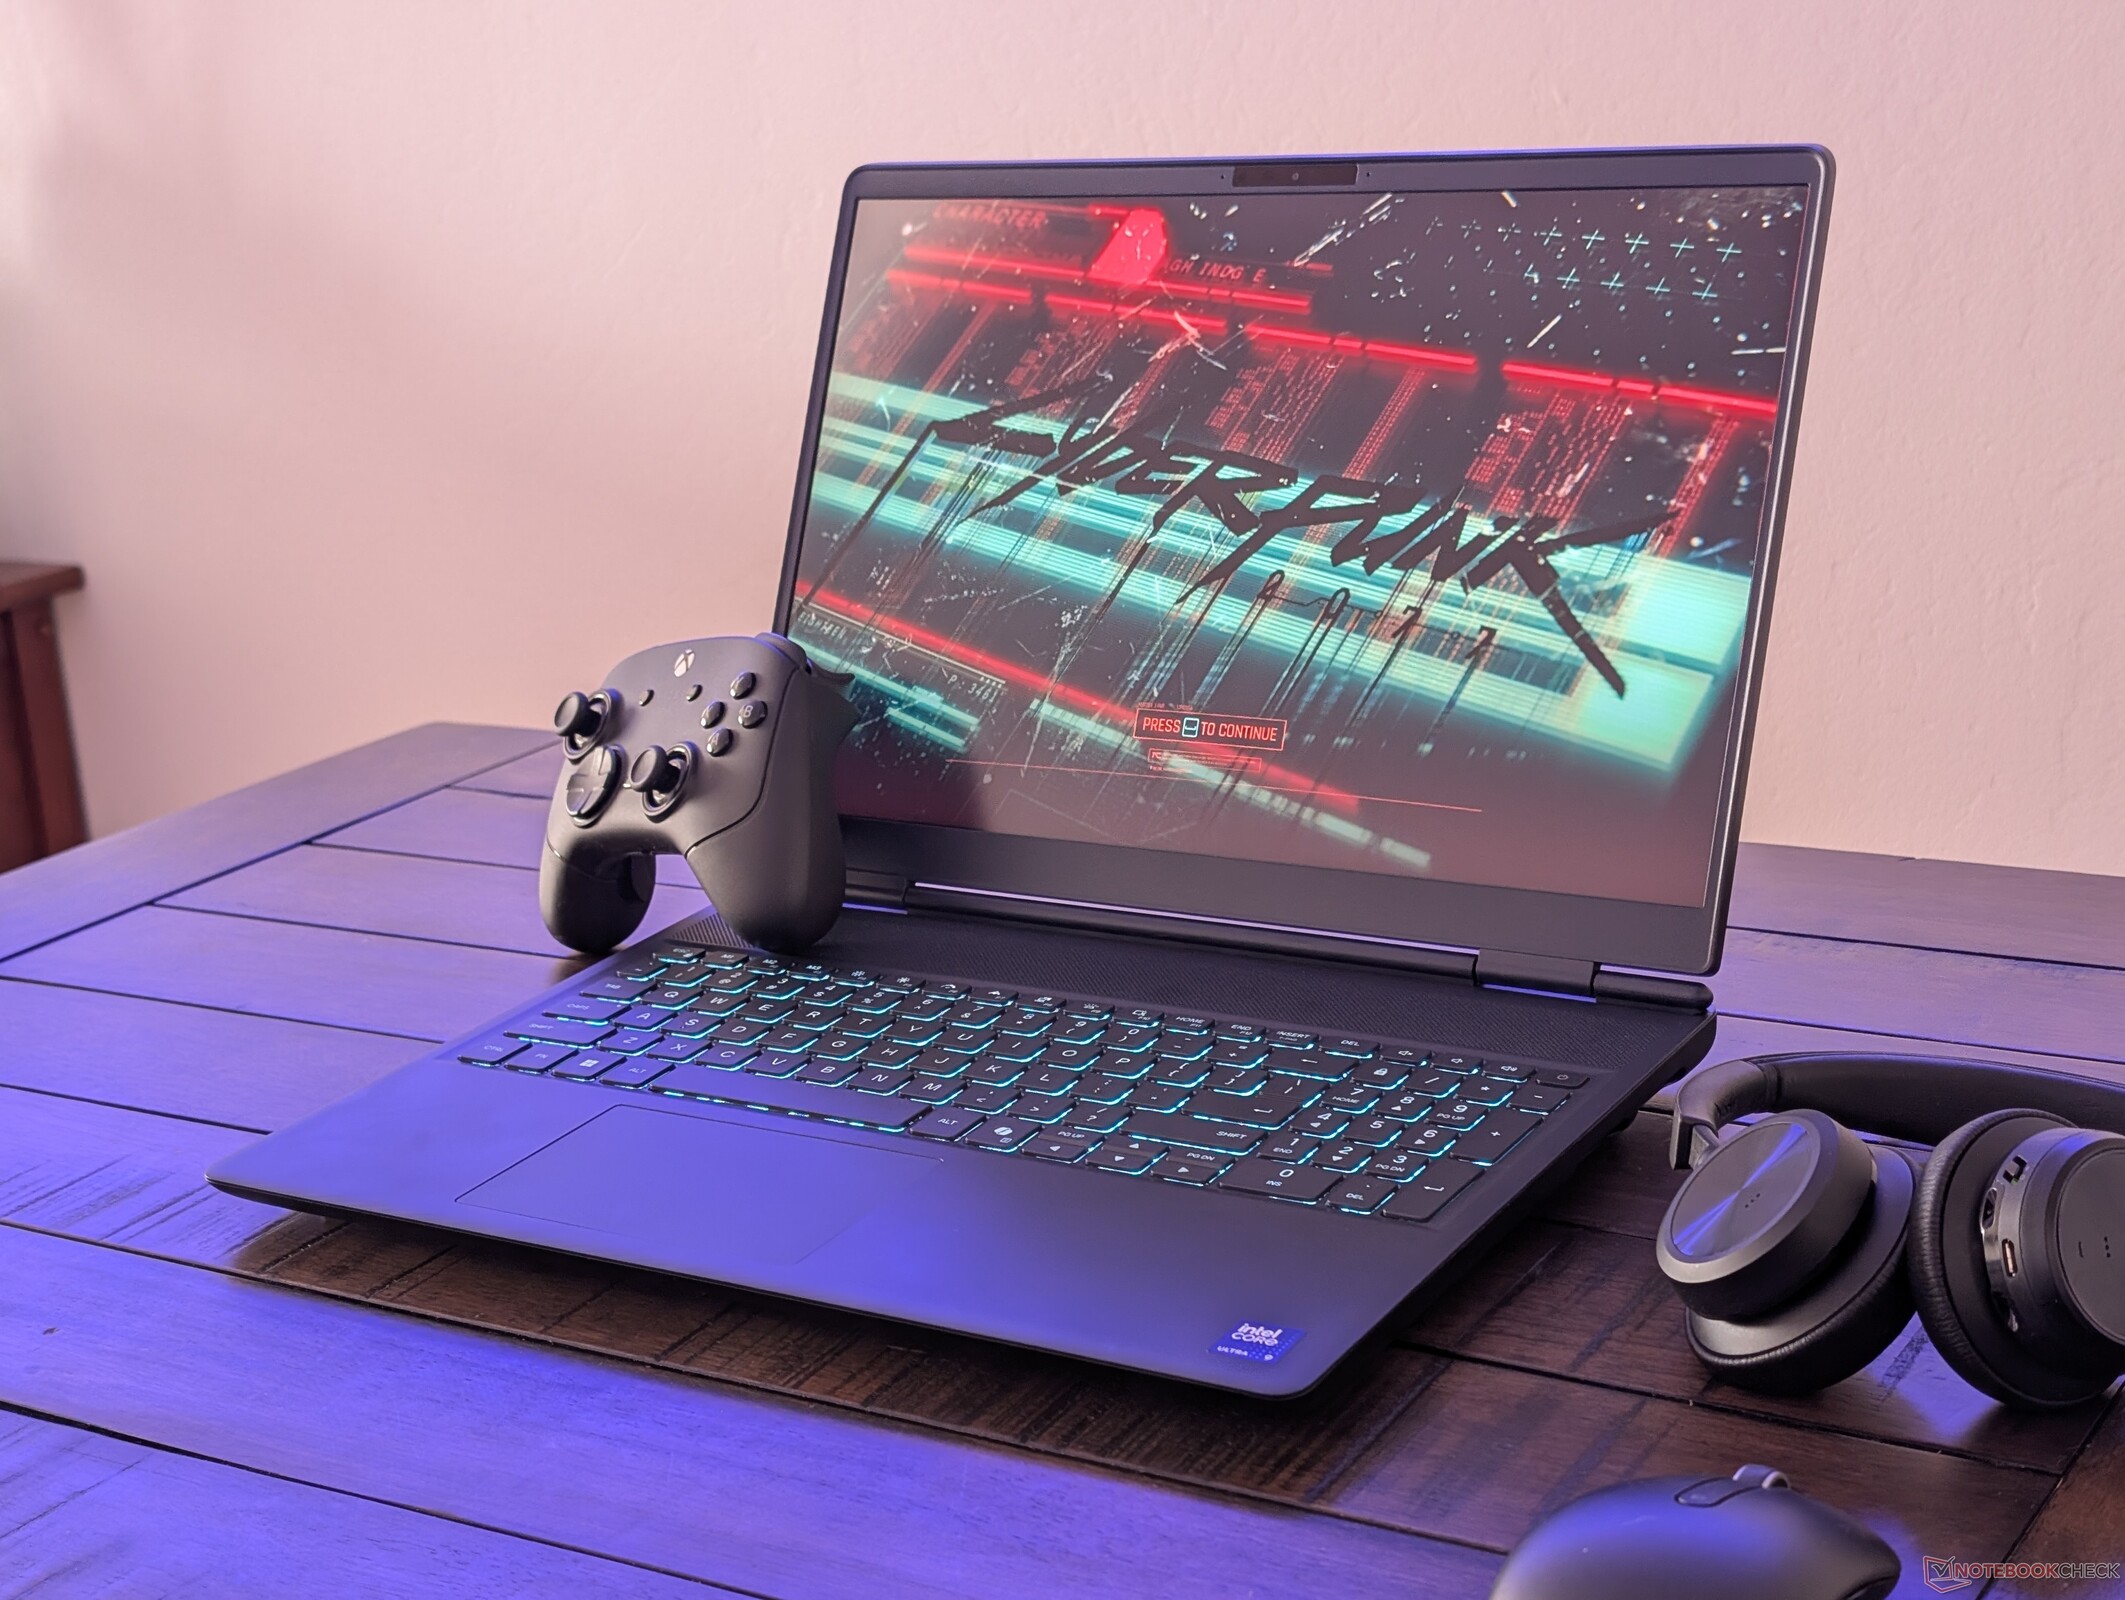
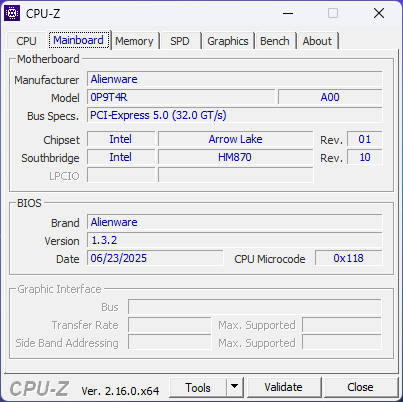
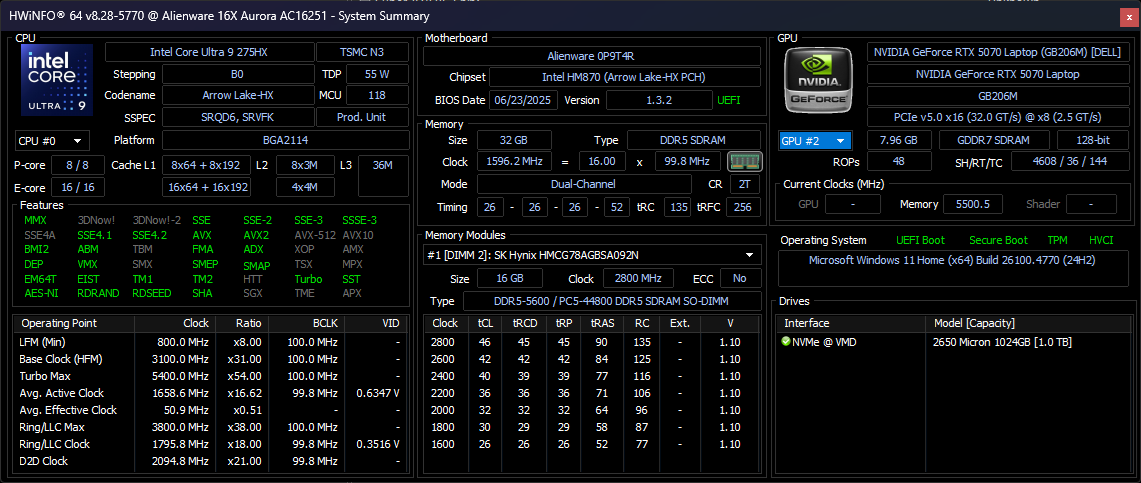
Das Alienware Aurora 16X ist ein Mittelklasse-Gaming-Laptop von Dell, der direkt unter der High-End Alienware Area-51-Serie angesiedelt ist. Es verfügt über die gleichen Intel Arrow Lake-HX-CPUs wie das Area-51, allerdings mit niedrigeren Nvidia Blackwell-Optionen, die mit niedrigeren Leistungsgrenzen laufen, um Kosten zu sparen. Der 16X Aurora kann als Nachfolger der älteren Alienware m16-Serie gesehen werden.
Bei unserem amerikanischen Testgerät handelt es sich um eine High-End-Konfiguration mit Core Ultra 9 275HX CPU, 115 W GeForce RTX 5070 GPU und 1600p240 Hz IPS P3 Display für ca. $1.600 USD. Niedrigere SKUs (genannt Aurora 16) werden mit dem Core Ultra 7 255HX und/oder RTX 5060 mit einem 1600p120 IPS sRGB Display ausgeliefert.
Zu den Alternativen zum Aurora 16X gehören andere 16-Zoll-Gaming-Laptops der Mittelklasse wie MSI Vector 16 HX, Asus TUF Gaming A16 oder Lenovo Legion 5 Pro.
Weitere Dell Testberichte:
Spezifikationen
Gehäuse
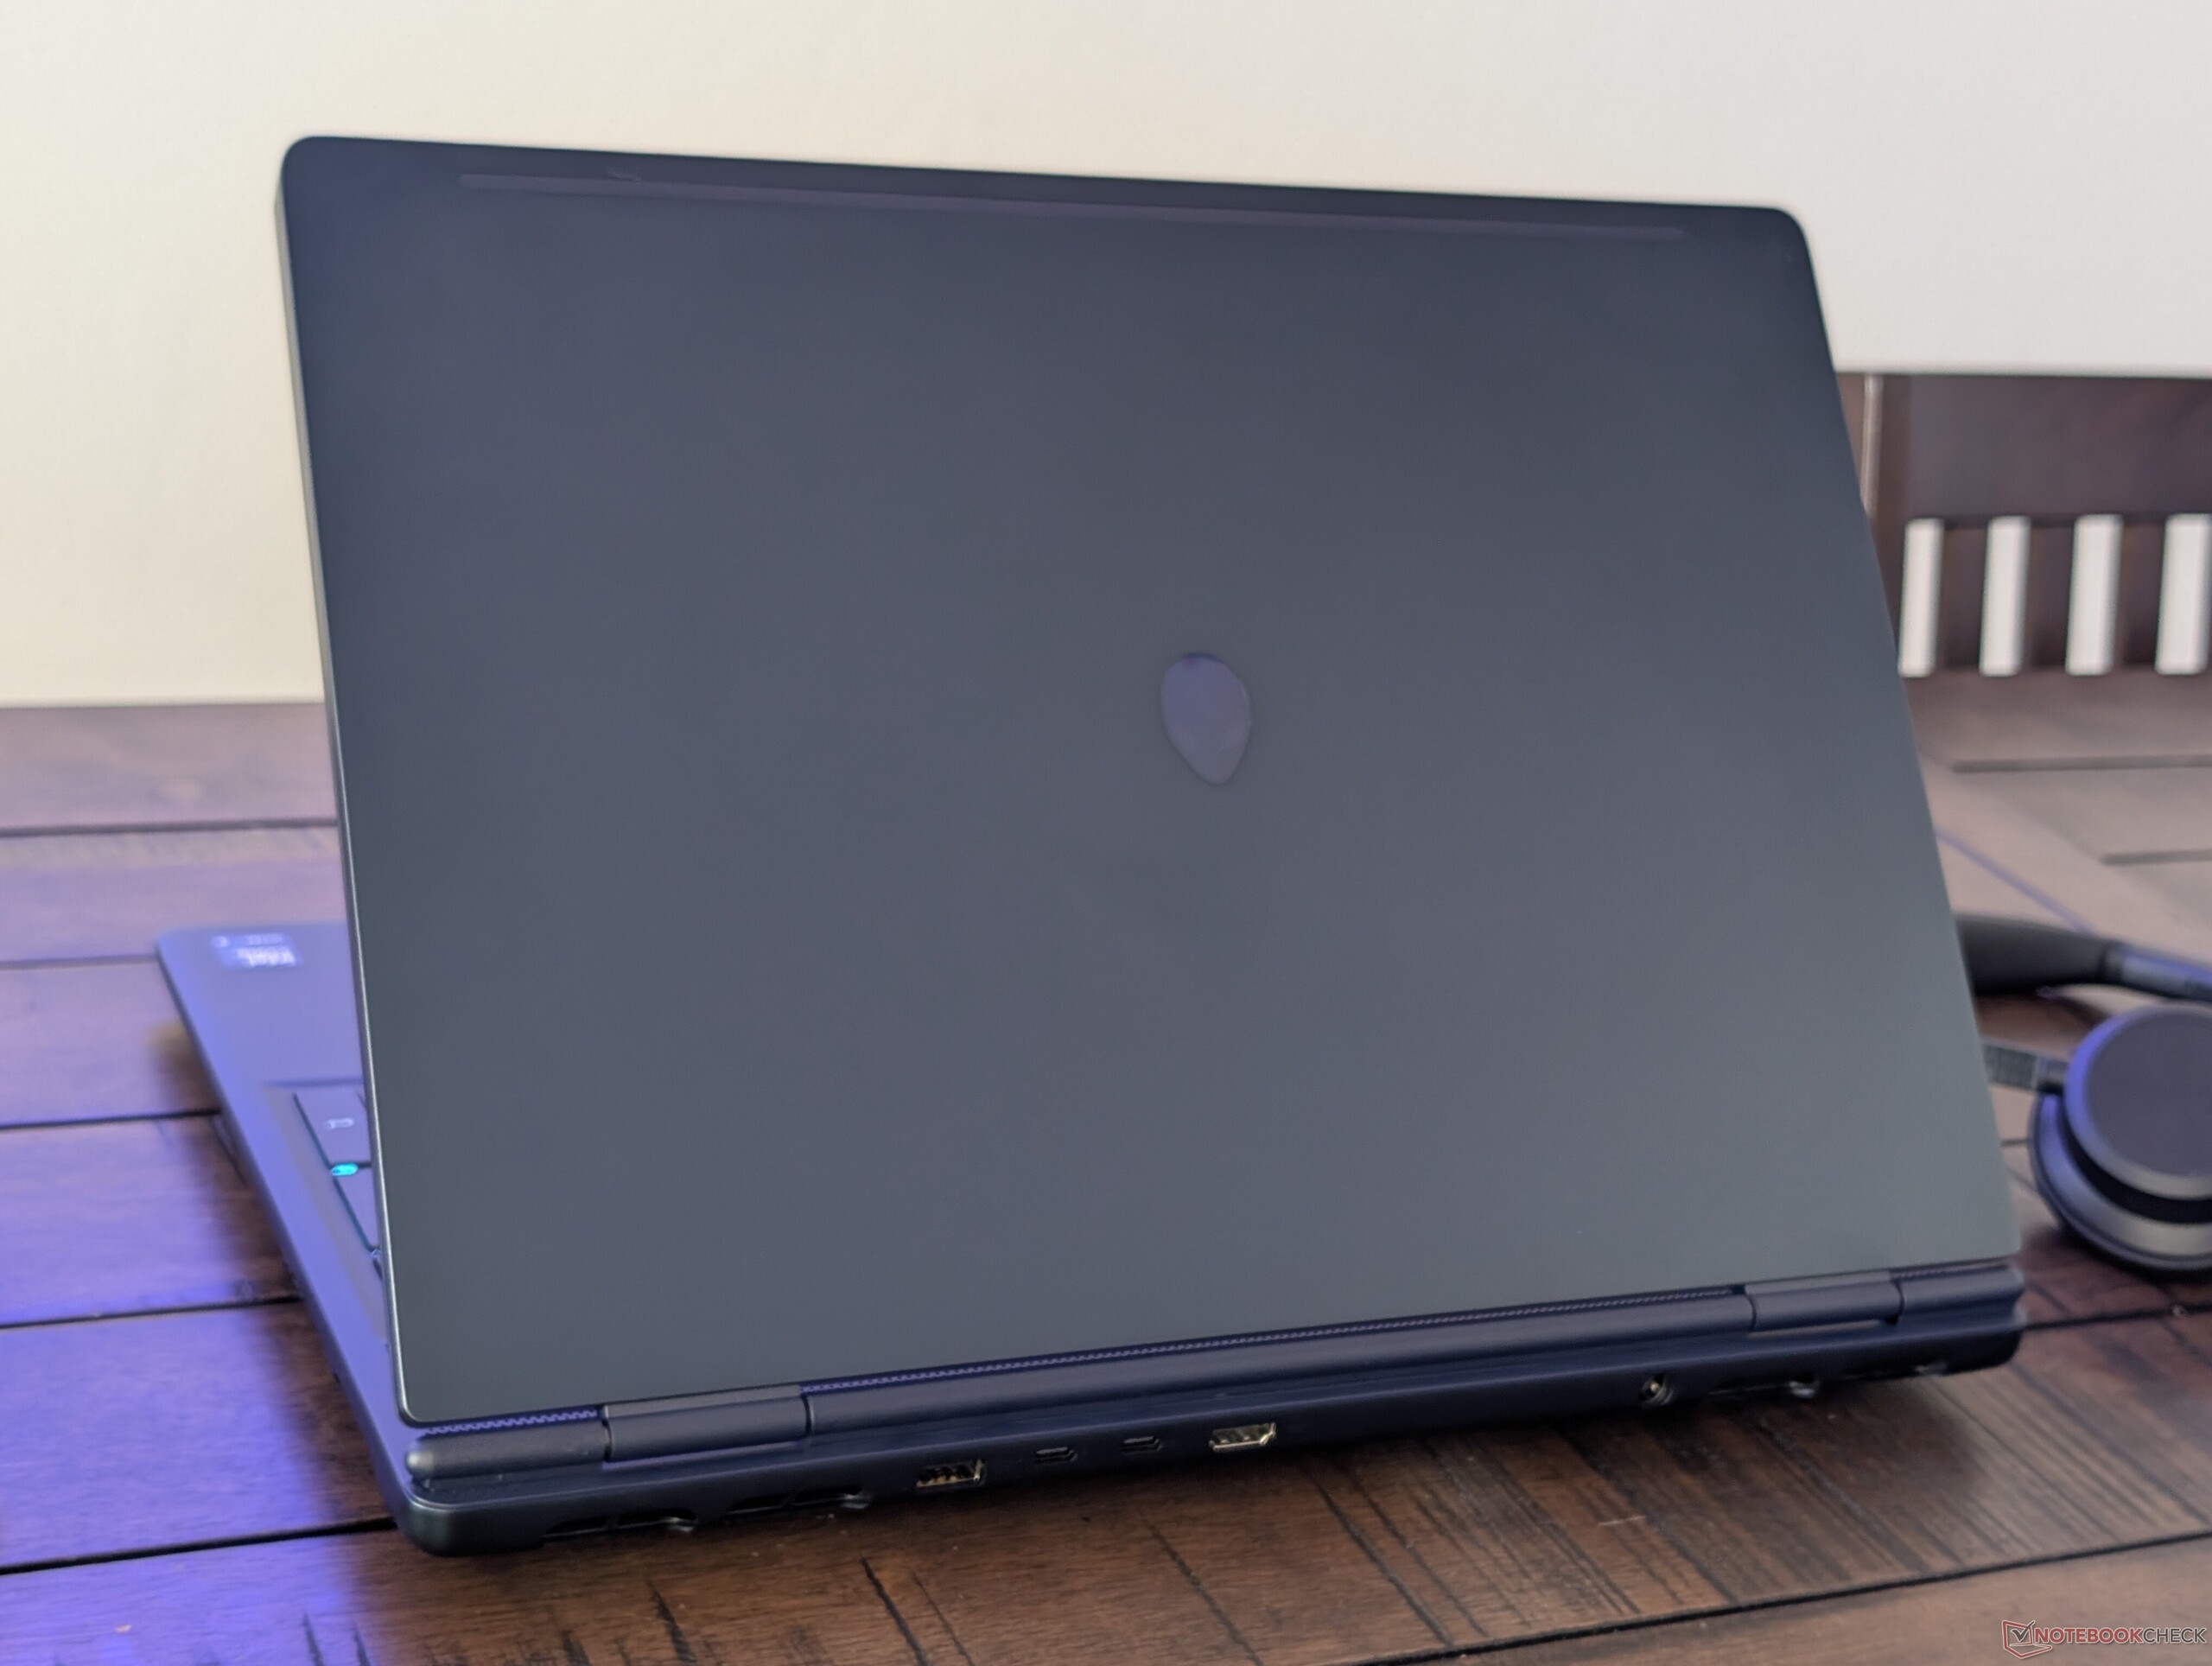
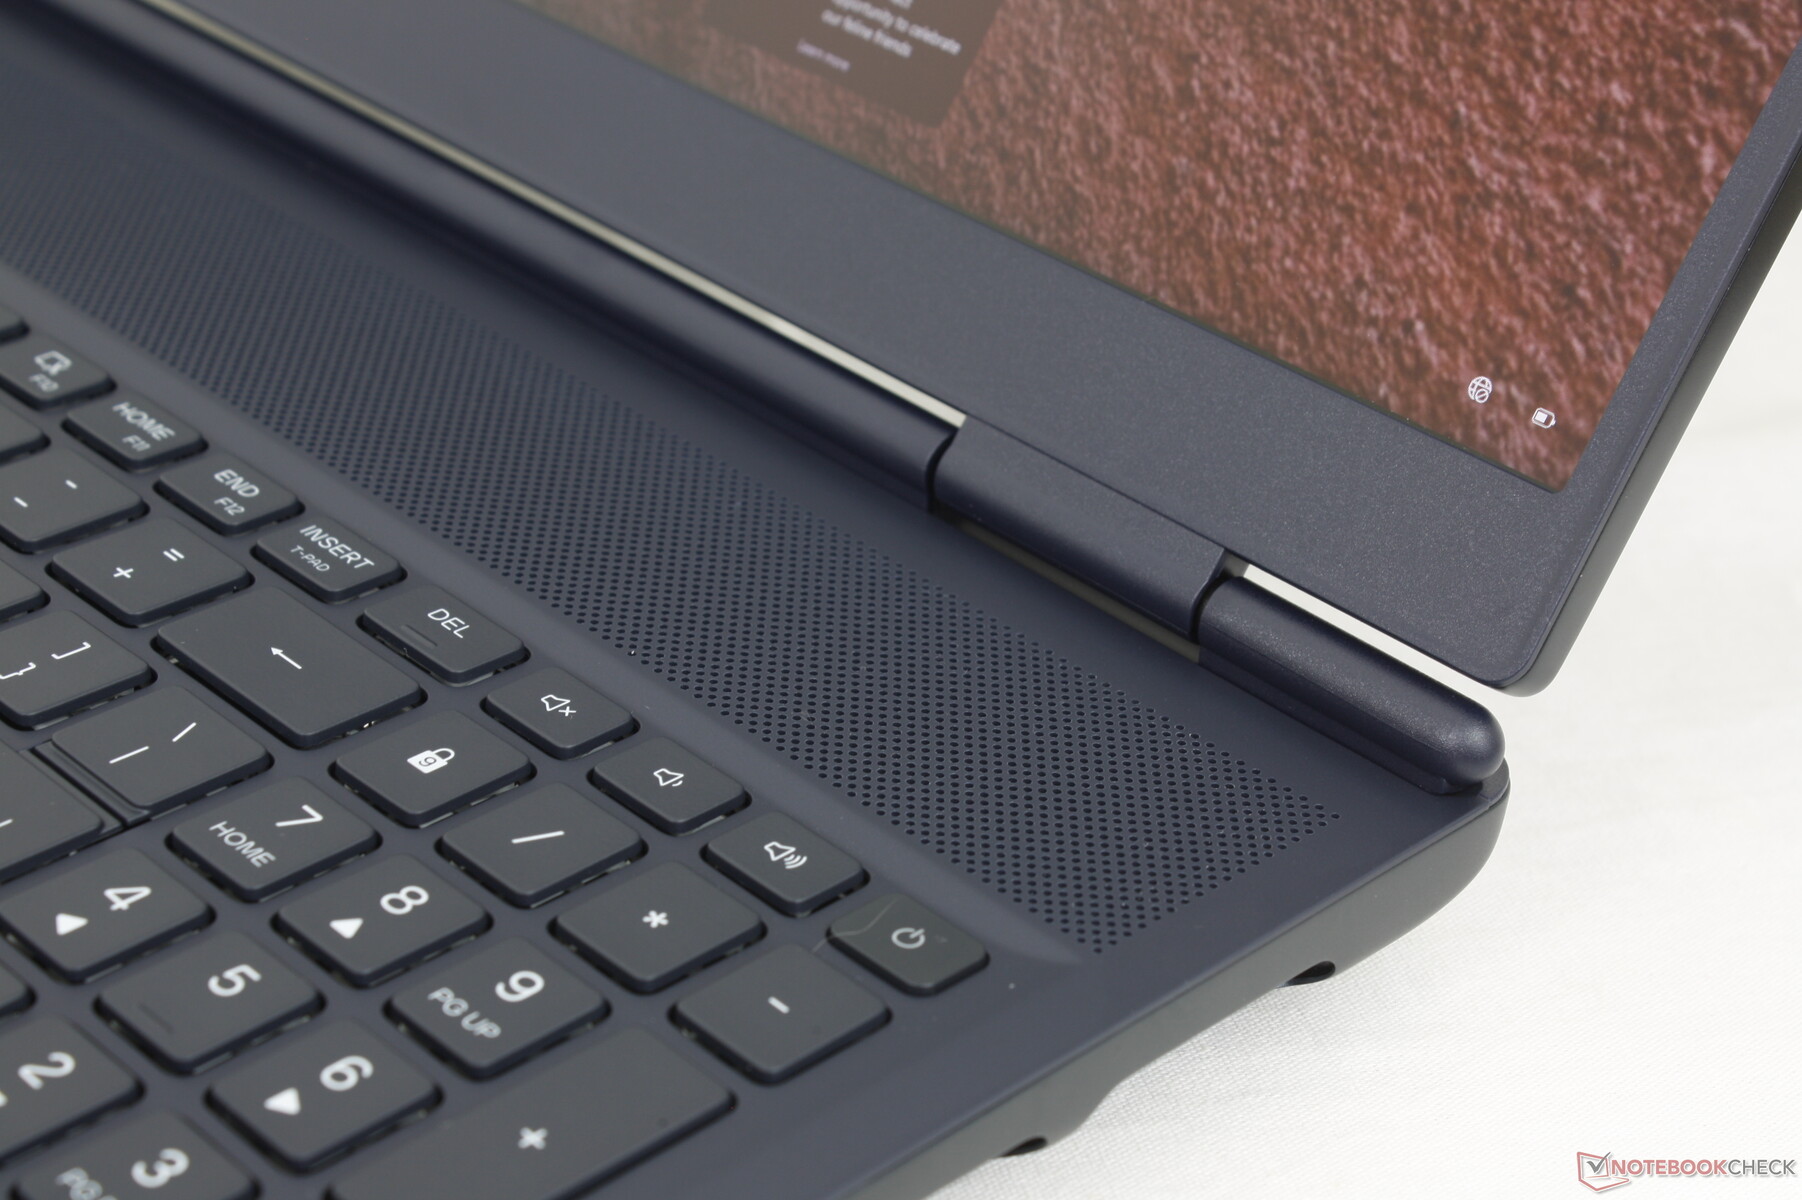
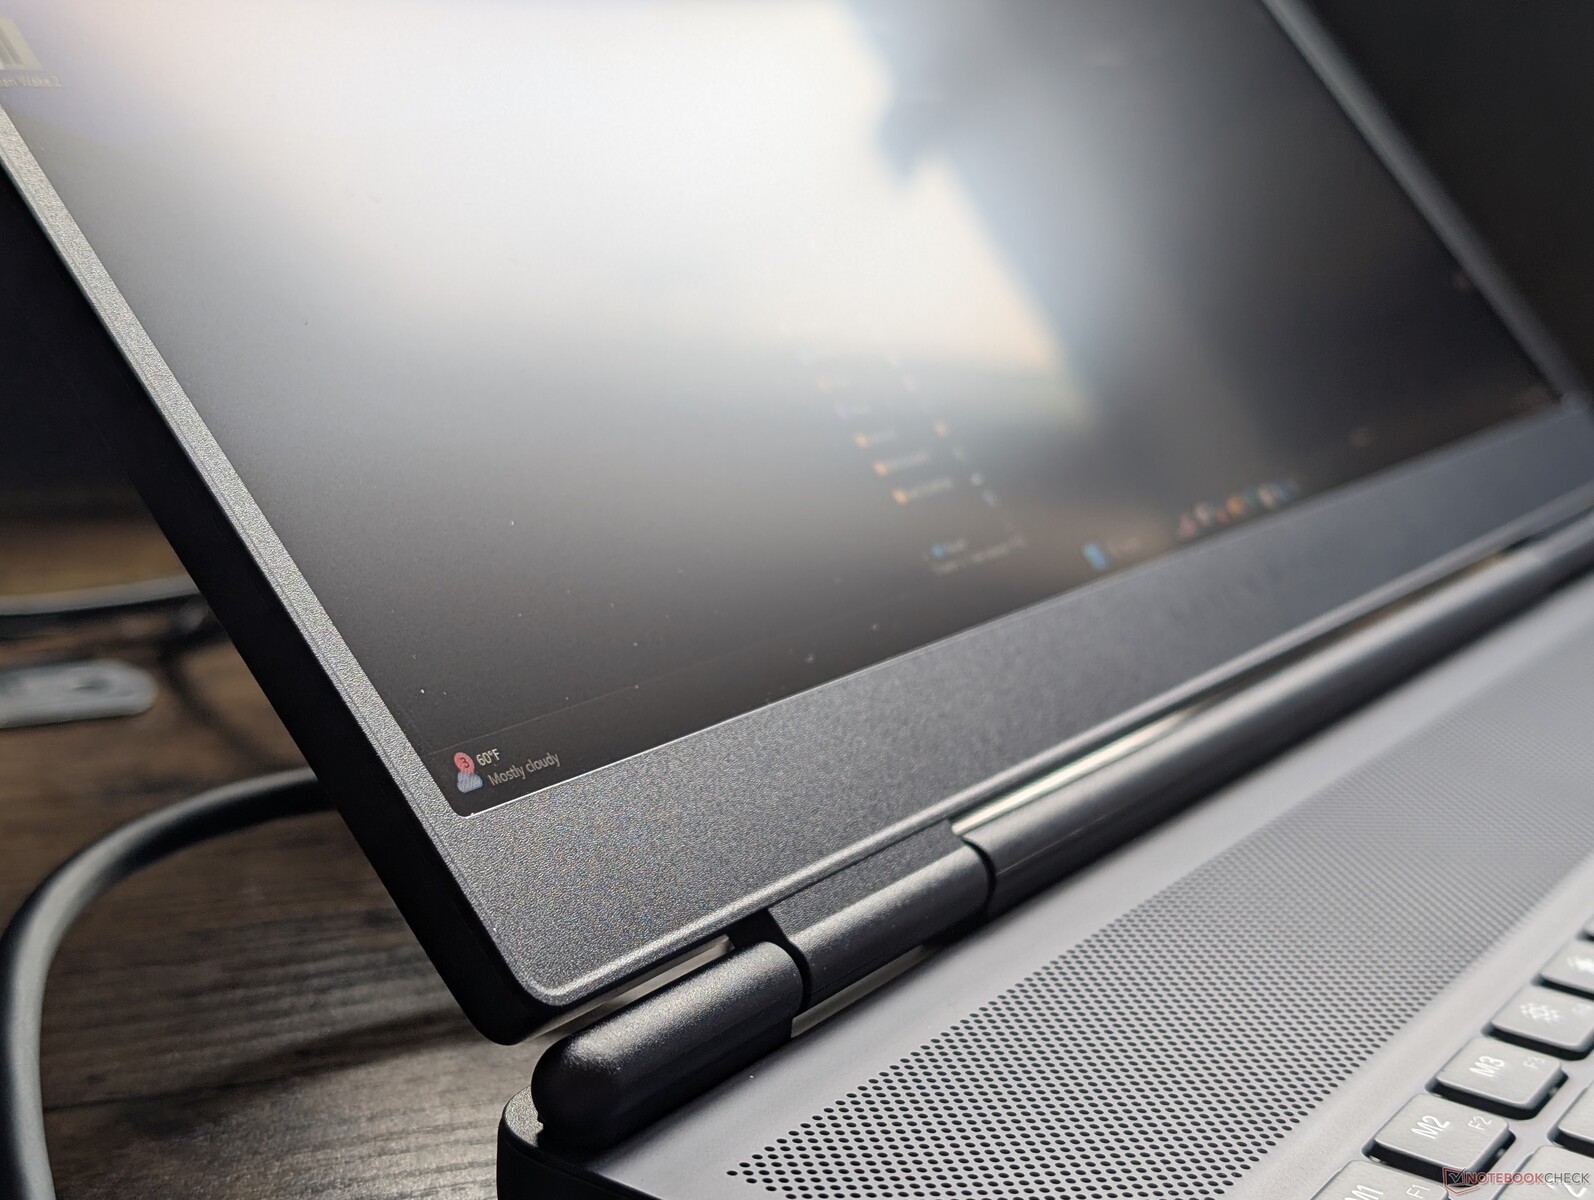
Das Gehäuse lässt sich am besten als abgeschwächte Version des Alienware 16 Area-51 beschreiben. Die RGB-Beleuchtung auf der Rückseite, Gorilla-Glas auf der Unterseite, die RGB-Beleuchtung pro Taste und die zweifarbigen Farboptionen wurden zugunsten eines schlichten, tiefschwarzen Looks gestrichen. Am wichtigsten ist vielleicht, dass der Kunststoffanteil auf ein Minimum reduziert wurde, da ein Großteil des Gehäuses immer noch aus einer Magnesiumlegierung und eloxiertem Aluminium besteht, was bei preisgünstigen bis mittelgroßen Gaming-Laptops nicht immer der Fall ist. Die Steifigkeit fühlt sich für den Preis großartig an.
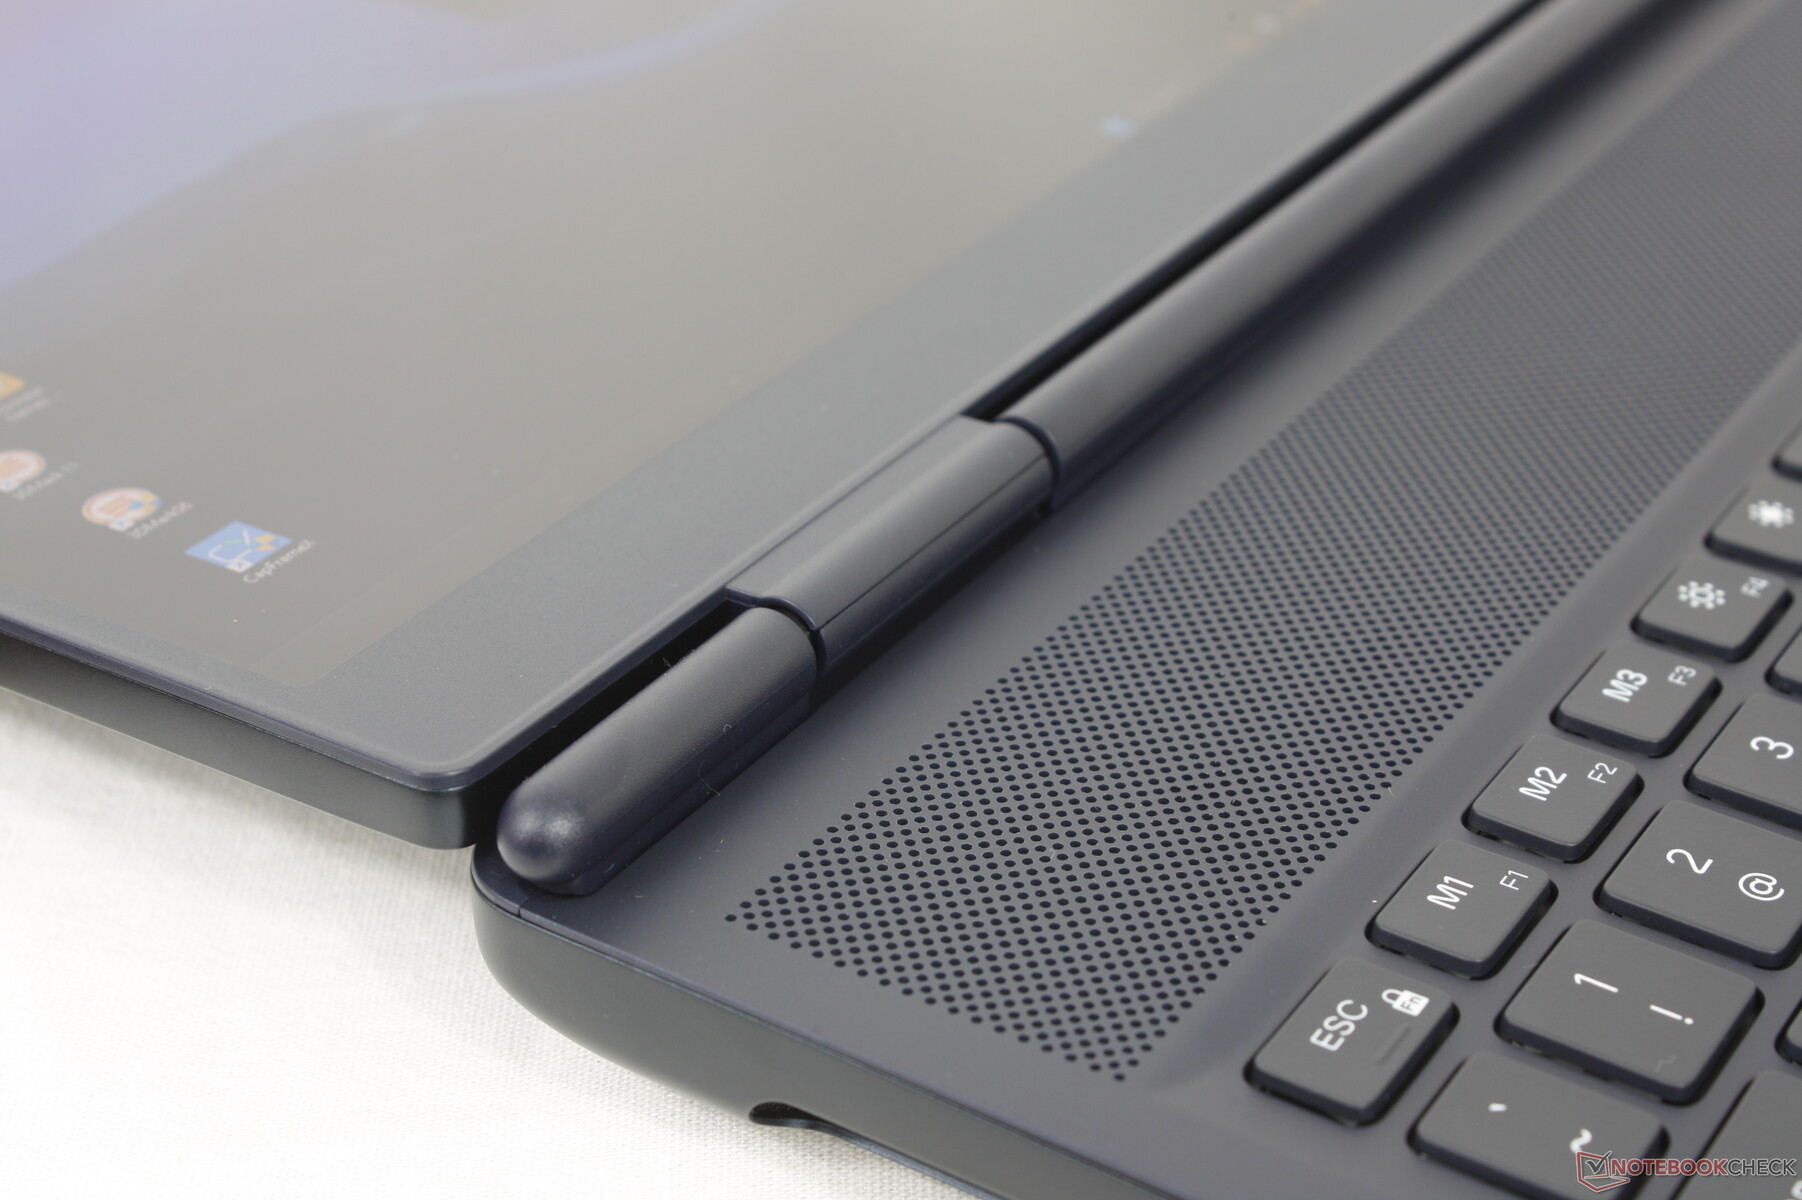
Die Scharniere könnten jedoch ein besseres Gefühl der Langlebigkeit vermitteln, da sie sich im Gegensatz zum Area-51 um 180 Grad öffnen lassen. Stellen Sie sich darauf ein, dass Sie die Handballenablagen und die Tasten häufig reinigen müssen, da sich überall auf dem Gerät Fingerabdrücke ansammeln.
Obwohl das Aurora 16X bei weitem nicht so schwer ist wie das Area-51, ist es für ein 16-Zoll-Gaming-Notebook immer noch ziemlich schwer. Alternativen wie das Asus TUF Gaming A16 oder das Gigabyte Gaming A16 GA6H sind jeweils ein paar hundert Gramm leichter, obwohl die erstgenannte Option etwas dicker ist.
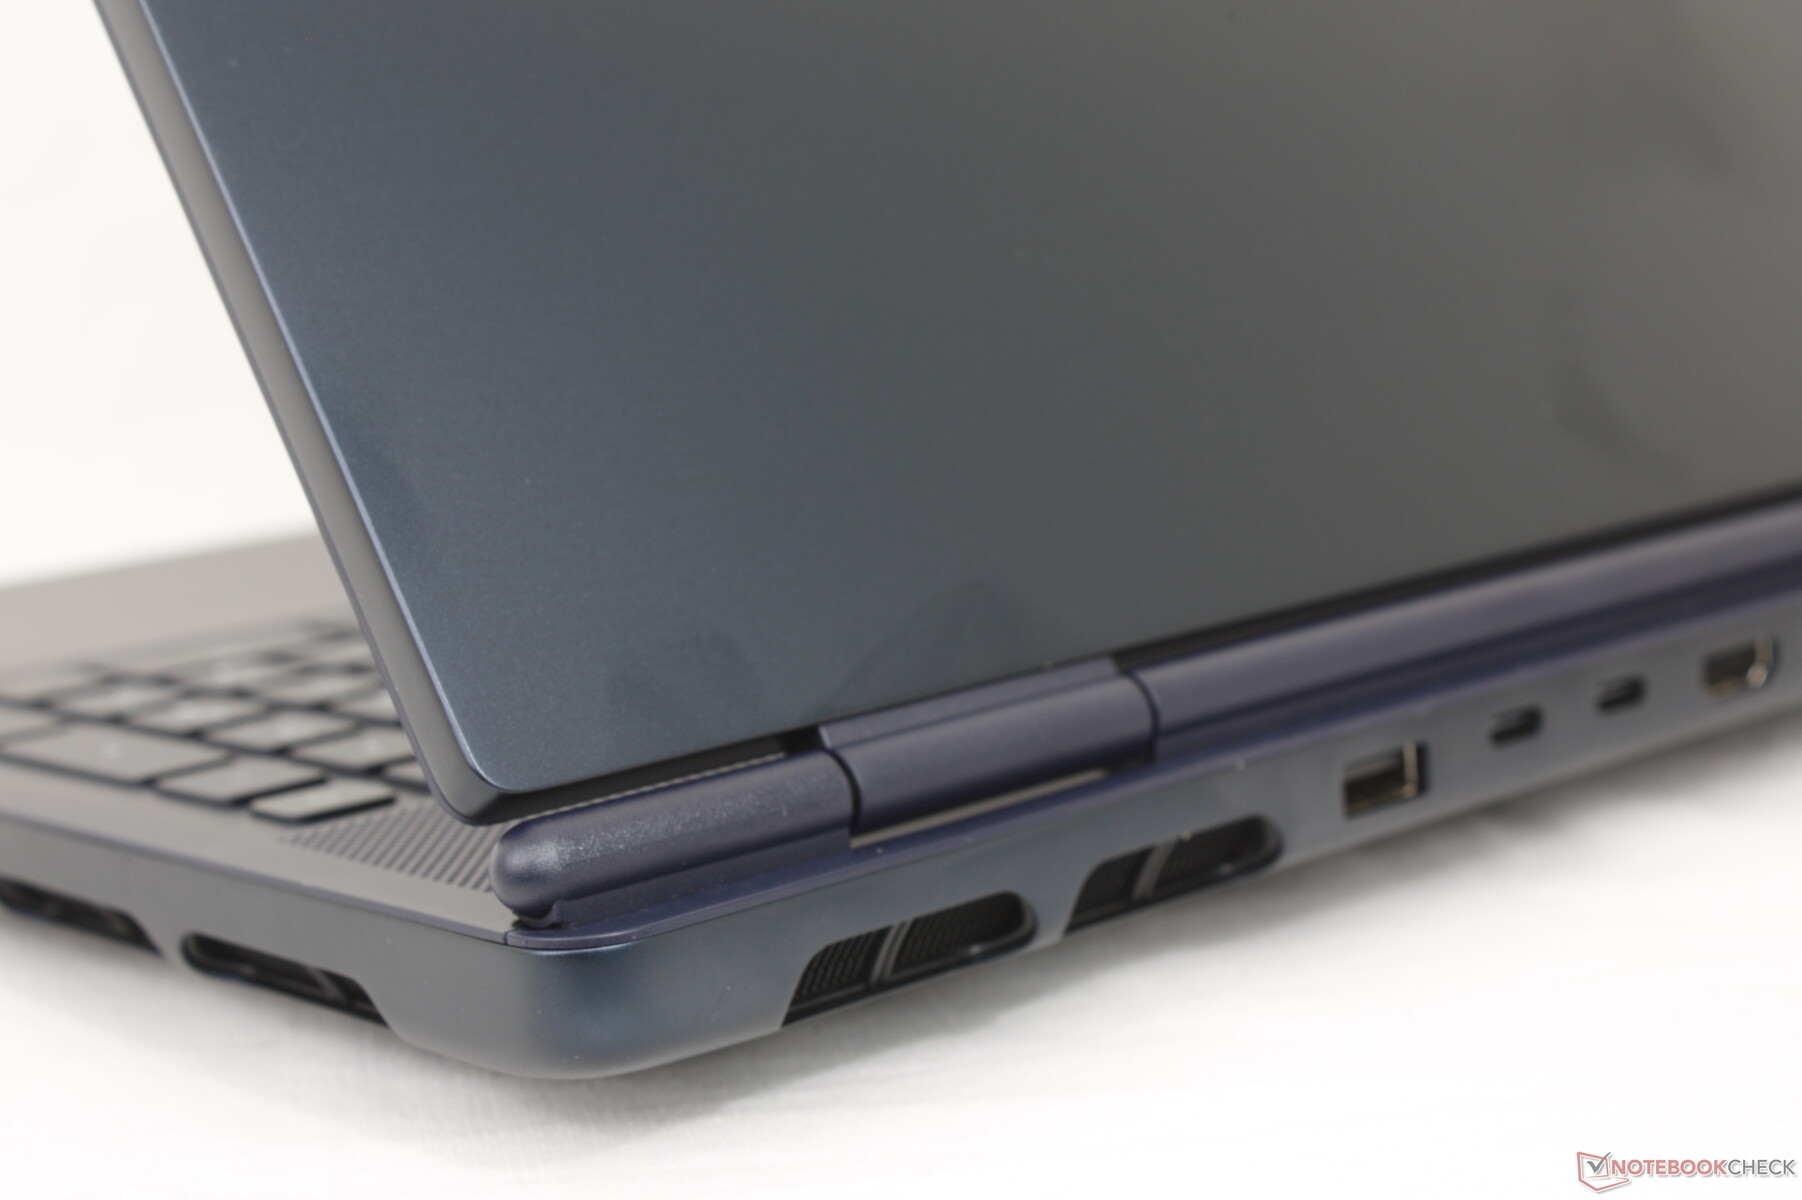
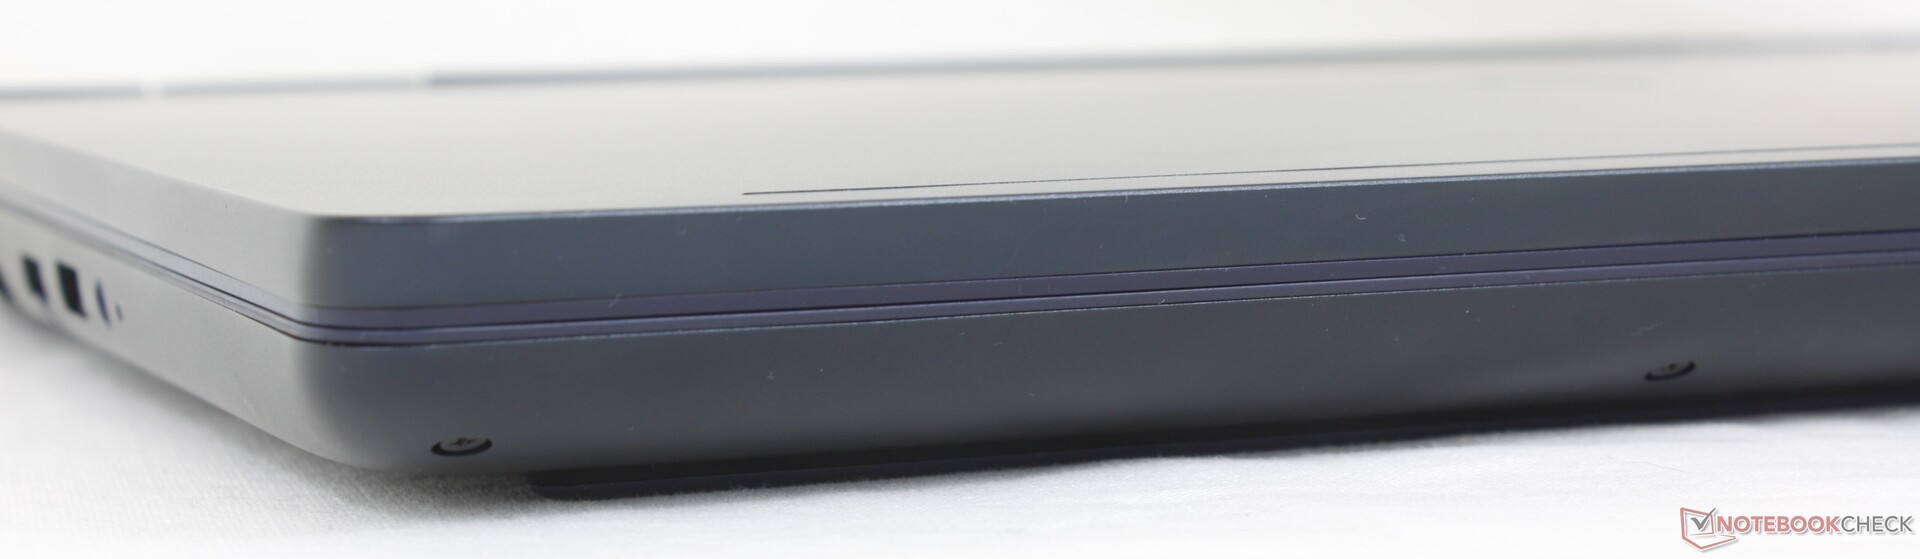
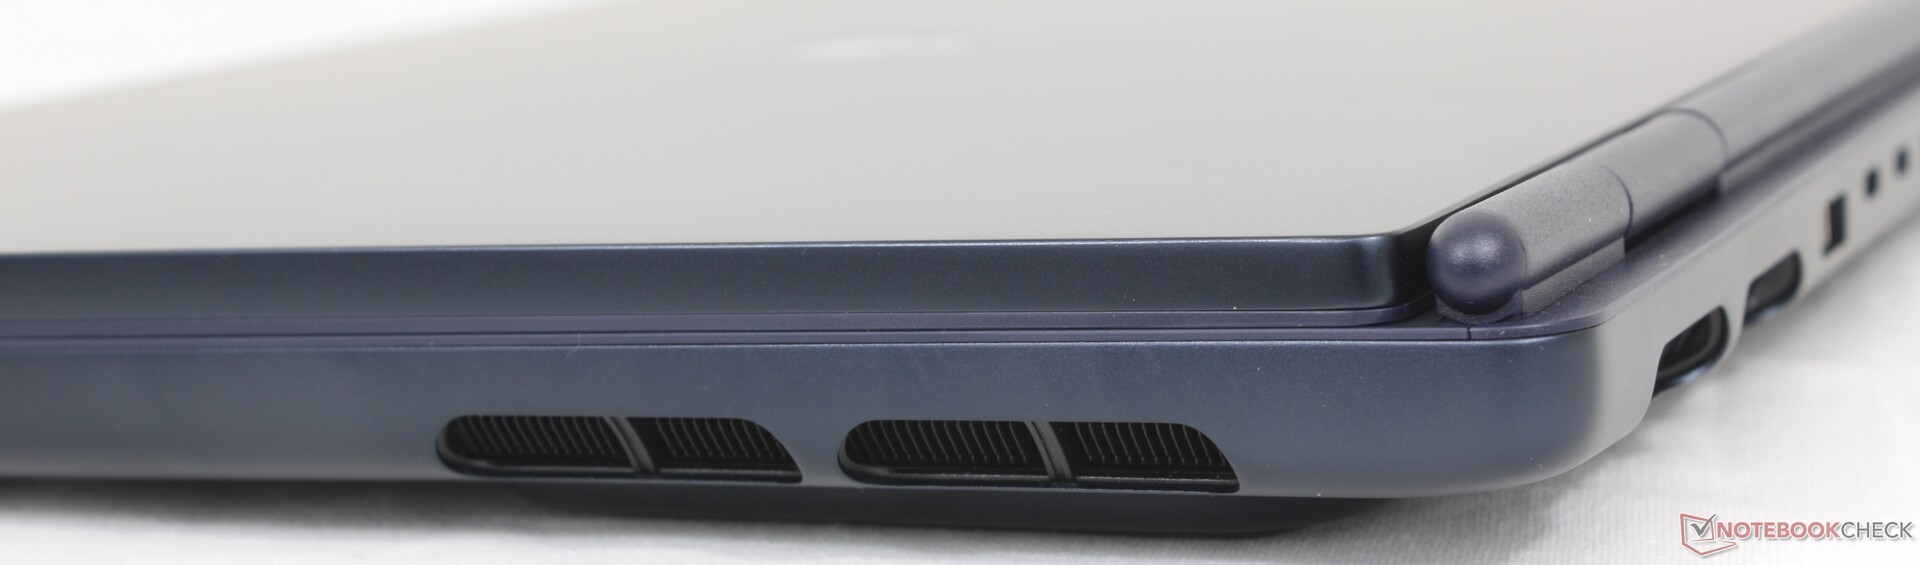
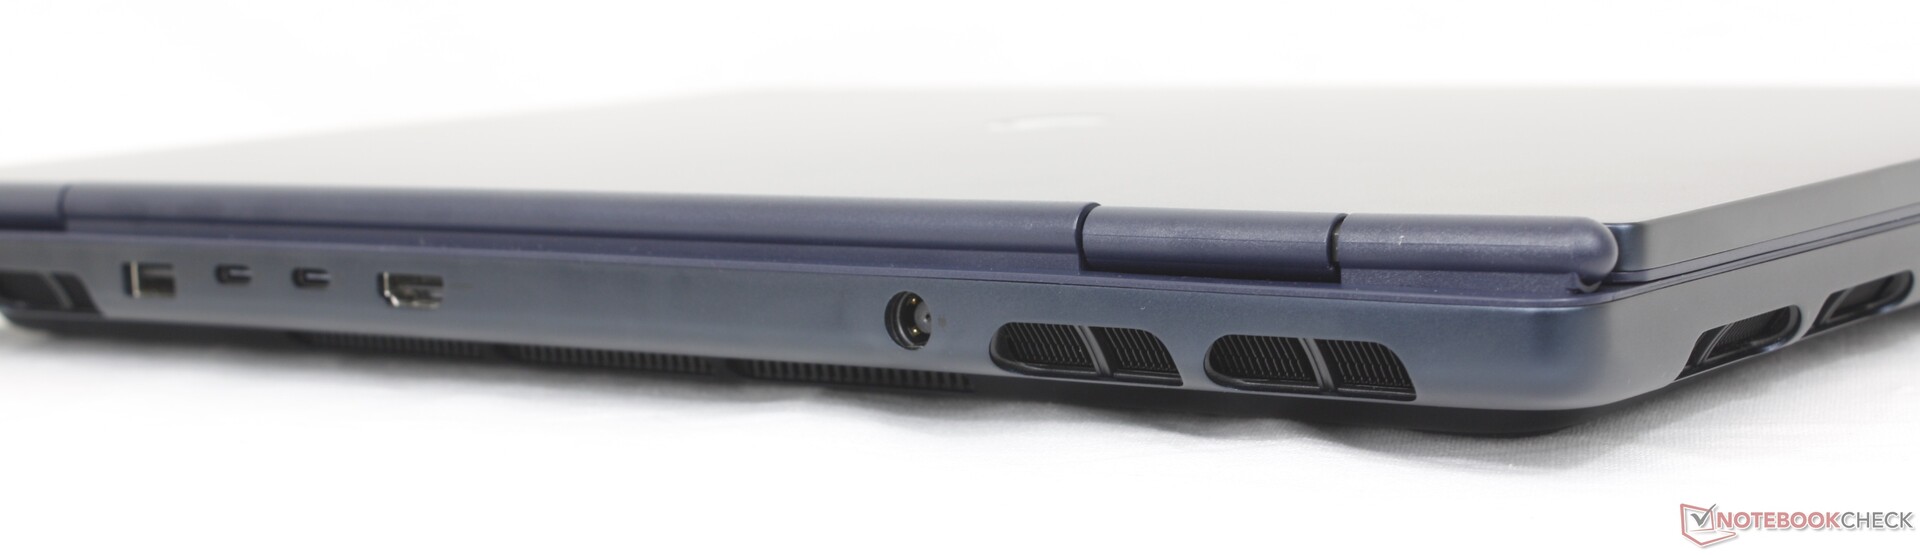
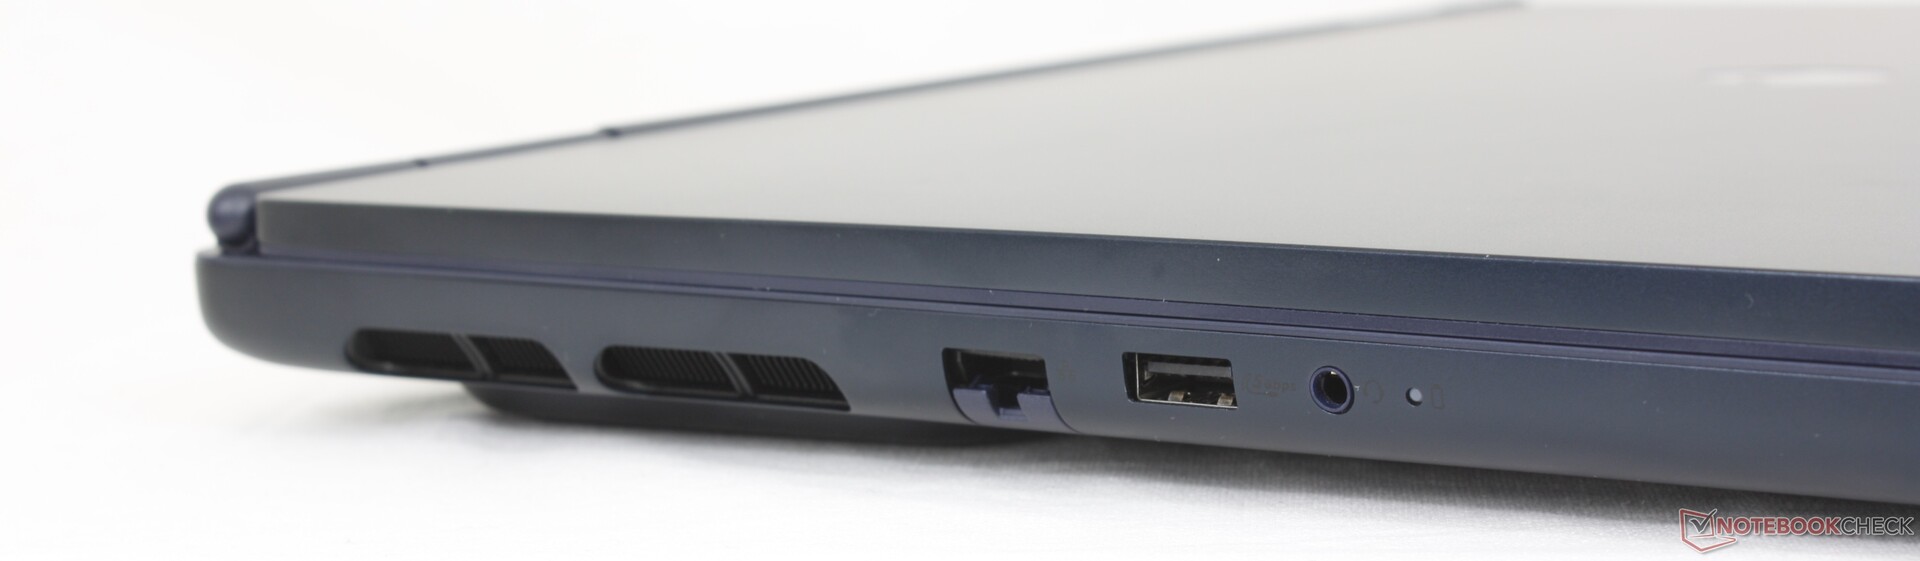
Anschlussausstattung
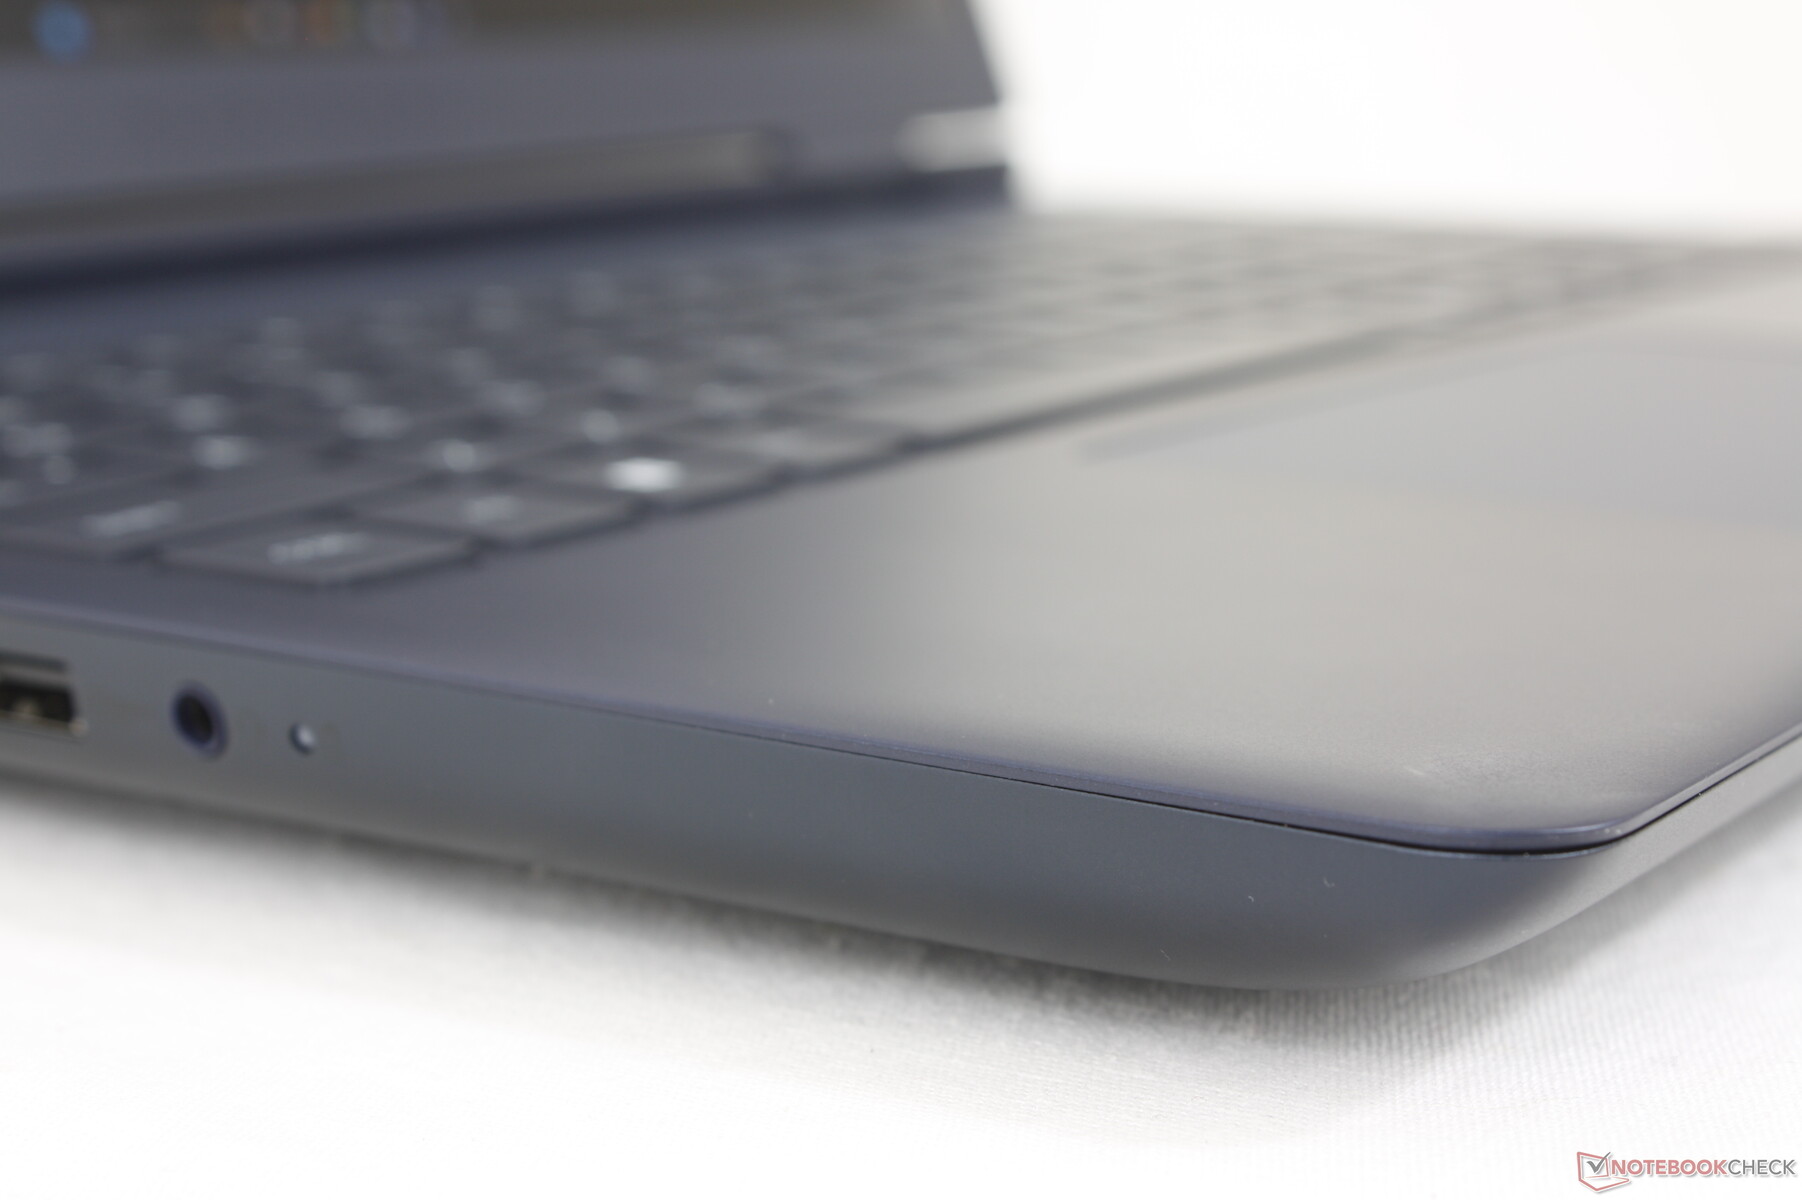
Ein RJ-45-Anschluss ist vorhanden, dieser fehlt beim Alienware Area-51. Dafür verfügt unser Testgerät jedoch über weniger USB-A Ports und keinen SD-Kartenleser, um Kosten zu sparen.
Beachten Sie, dass Power Delivery oder das Aufladen mit USB-C-Netzteilen von Drittanbietern nur über den USB-C 3.2 Gen. 2-Anschluss und nicht über den Thunderbolt 4-Anschluss unterstützt wird.
Kommunikation
| Networking | |
| iperf3 transmit AXE11000 | |
| Asus TUF Gaming A16 FA608WV | |
| Gigabyte Gaming A16 GA6H | |
| Alienware 16 Area-51 | |
| MSI Vector 16 HX AI A2XWHG | |
| Lenovo Legion 5 Pro 16IAX10H | |
| Alienware 16X Aurora, RTX 5070 | |
| iperf3 receive AXE11000 | |
| Asus TUF Gaming A16 FA608WV | |
| MSI Vector 16 HX AI A2XWHG | |
| Gigabyte Gaming A16 GA6H | |
| Alienware 16 Area-51 | |
| Alienware 16X Aurora, RTX 5070 | |
| Lenovo Legion 5 Pro 16IAX10H | |
| iperf3 transmit AXE11000 6GHz | |
| Asus TUF Gaming A16 FA608WV | |
| Alienware 16X Aurora, RTX 5070 | |
| Alienware 16 Area-51 | |
| iperf3 receive AXE11000 6GHz | |
| Asus TUF Gaming A16 FA608WV | |
| Alienware 16X Aurora, RTX 5070 | |
| Alienware 16 Area-51 | |
Webcam
Die 2 MP-Webcam Standard ist mit IR ausgestattet, hat aber keinen Privacy Shutter.


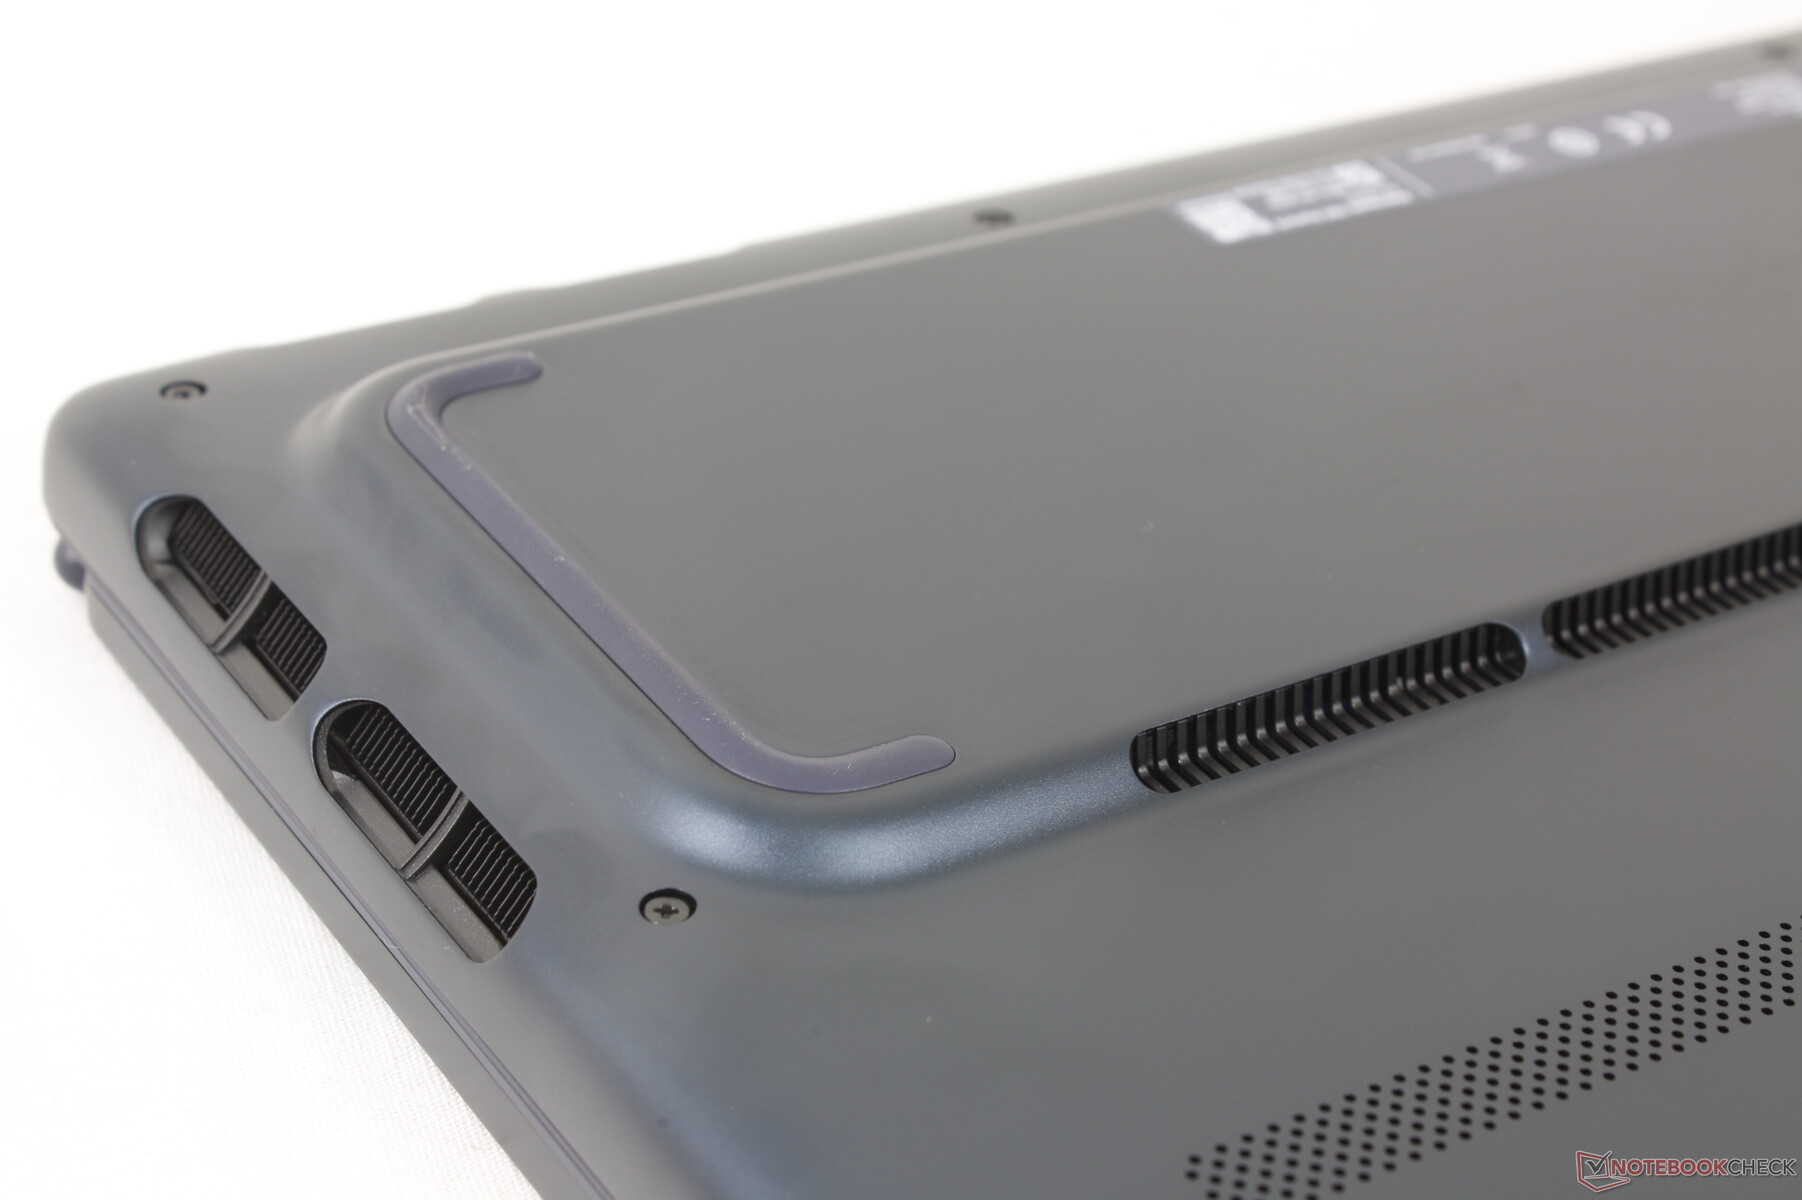
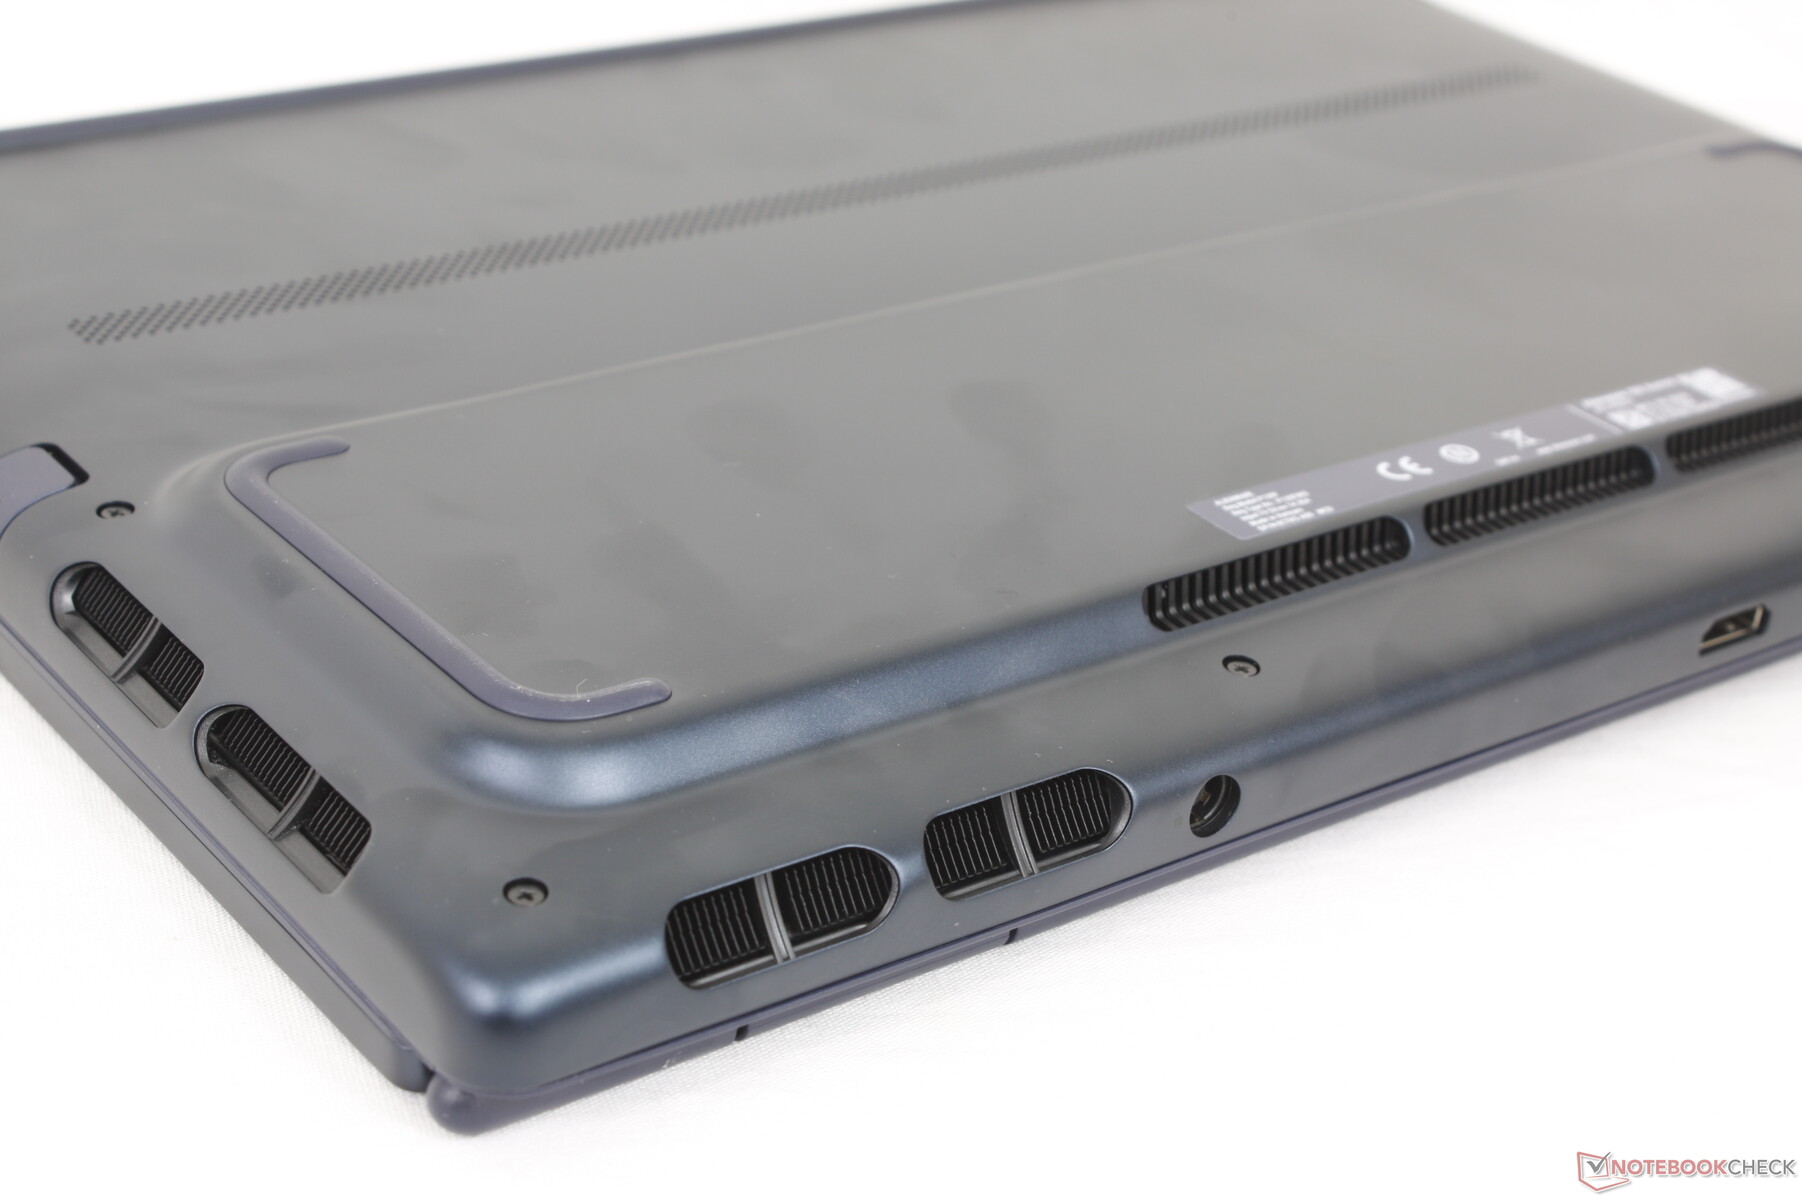
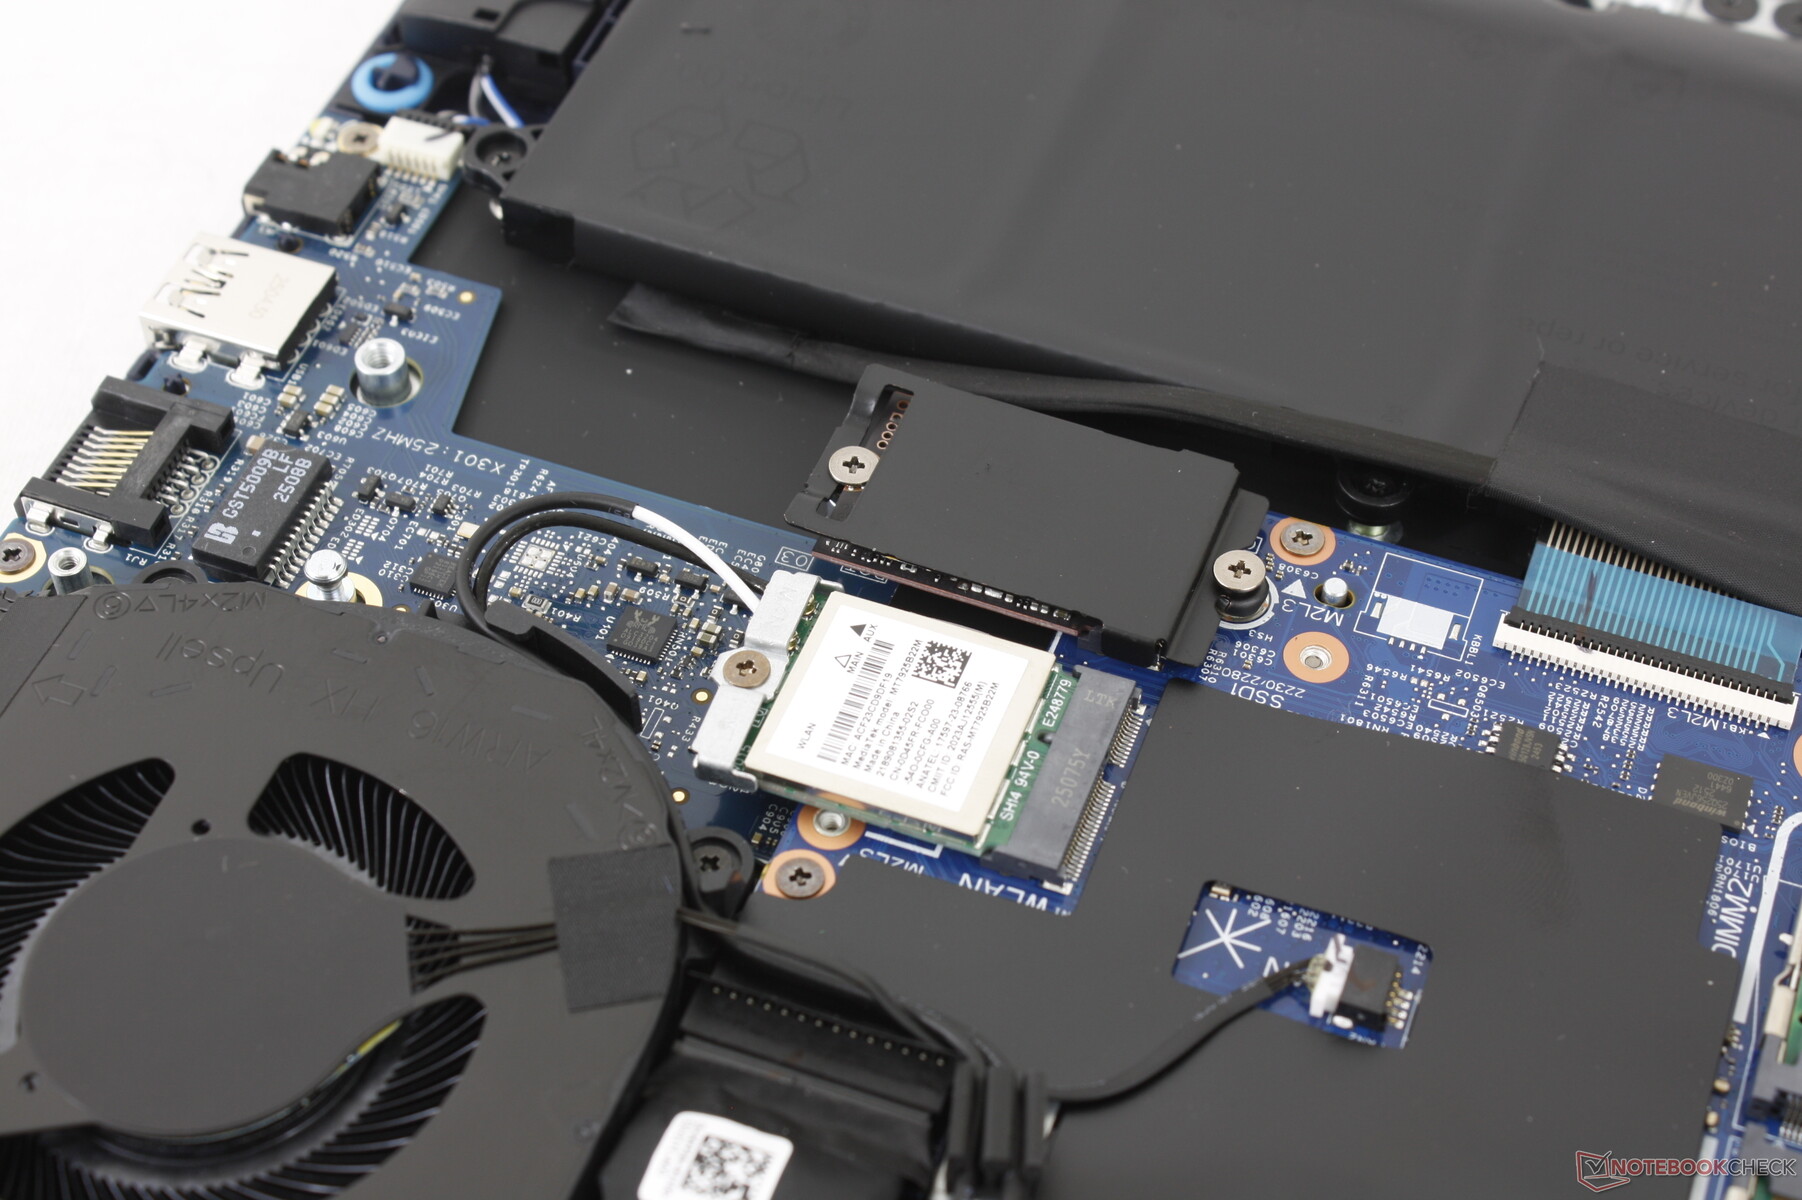
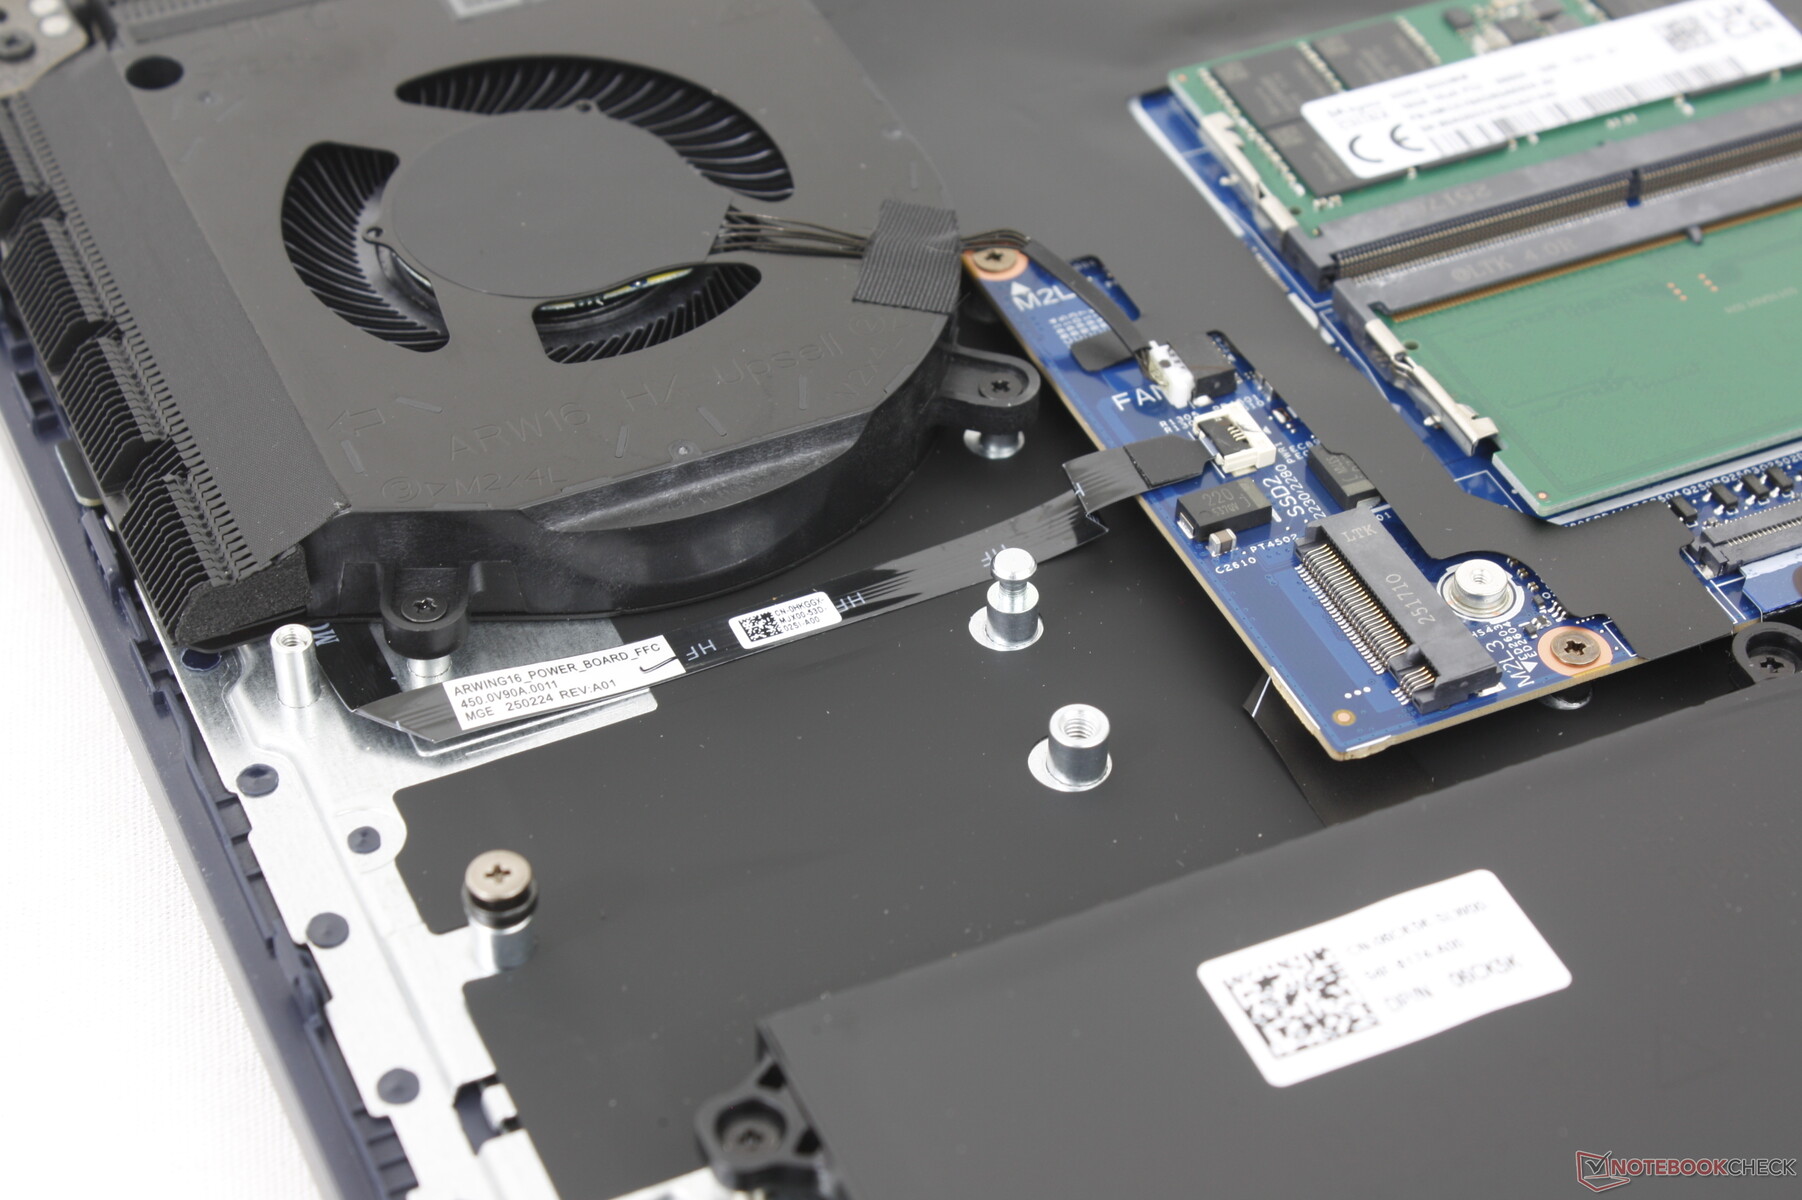
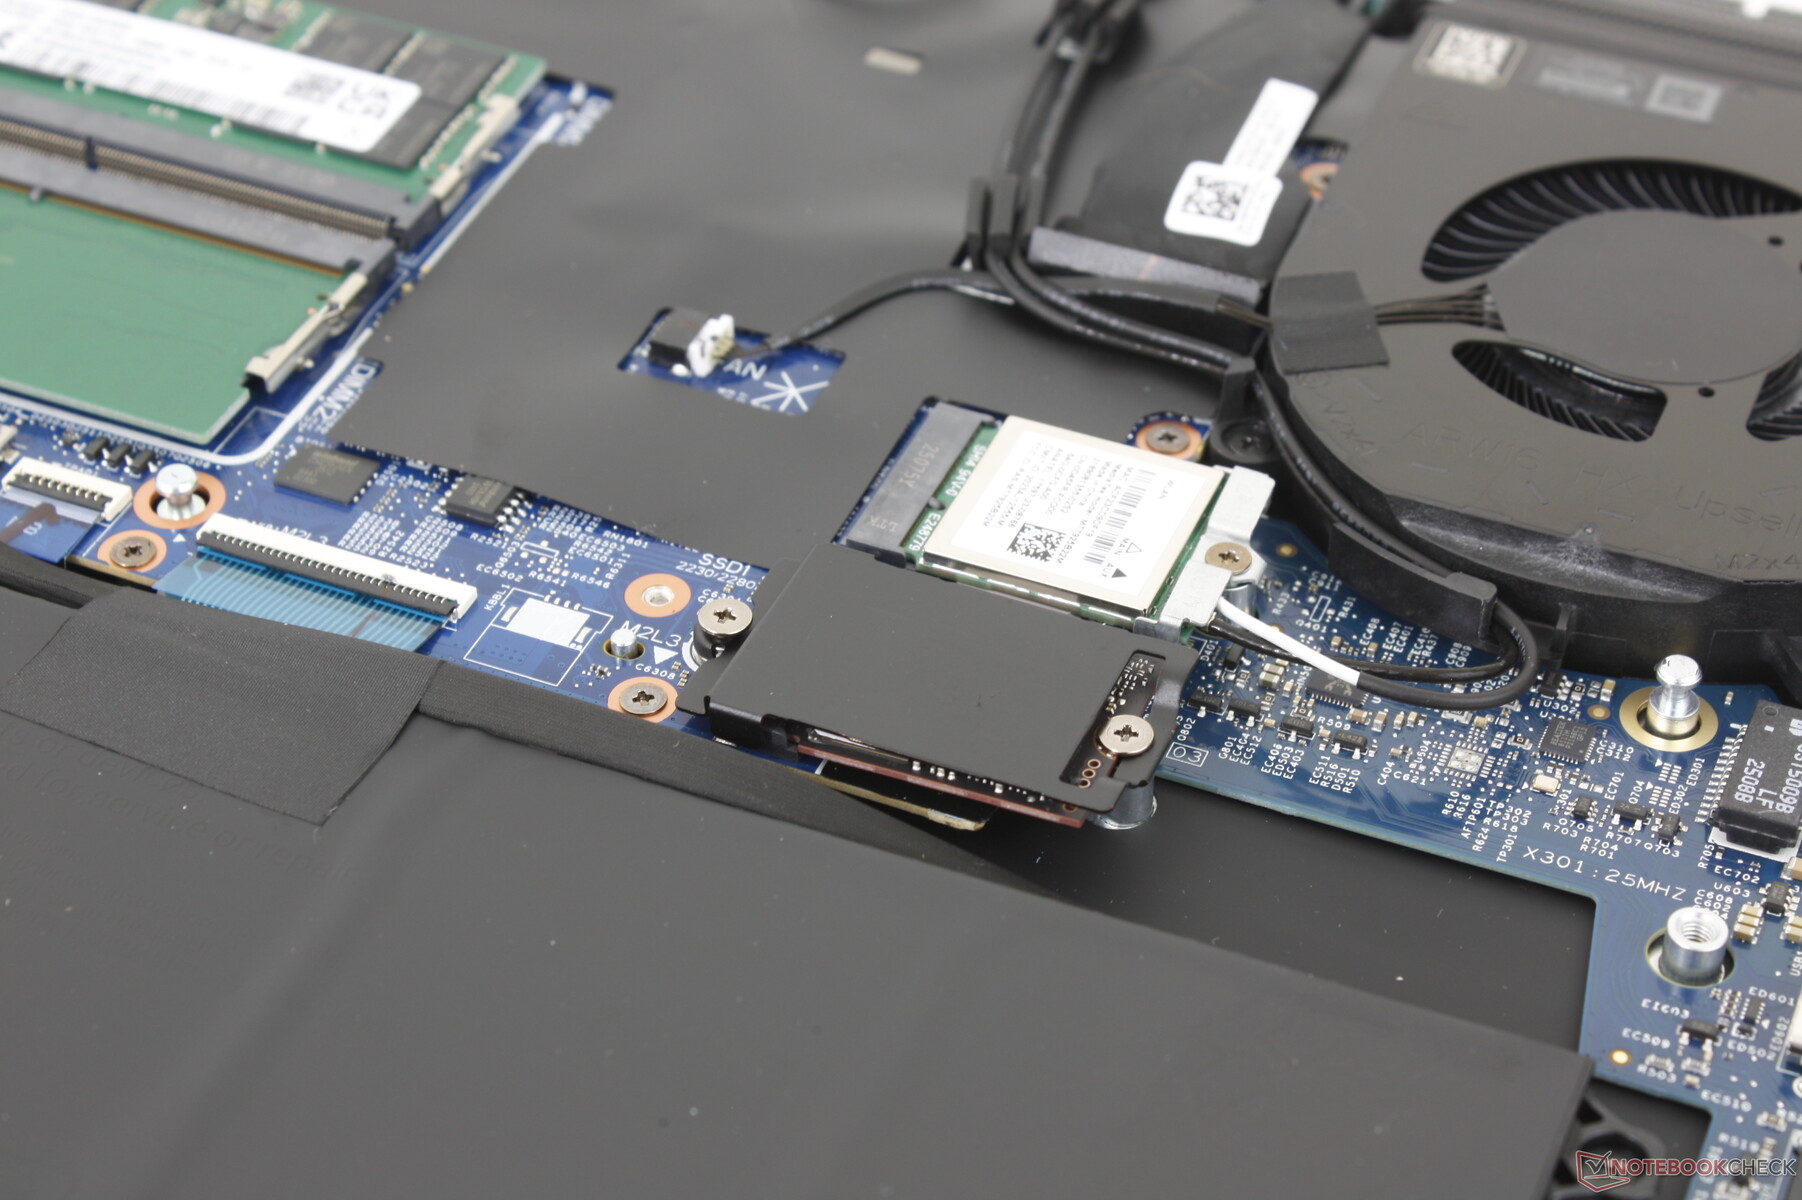
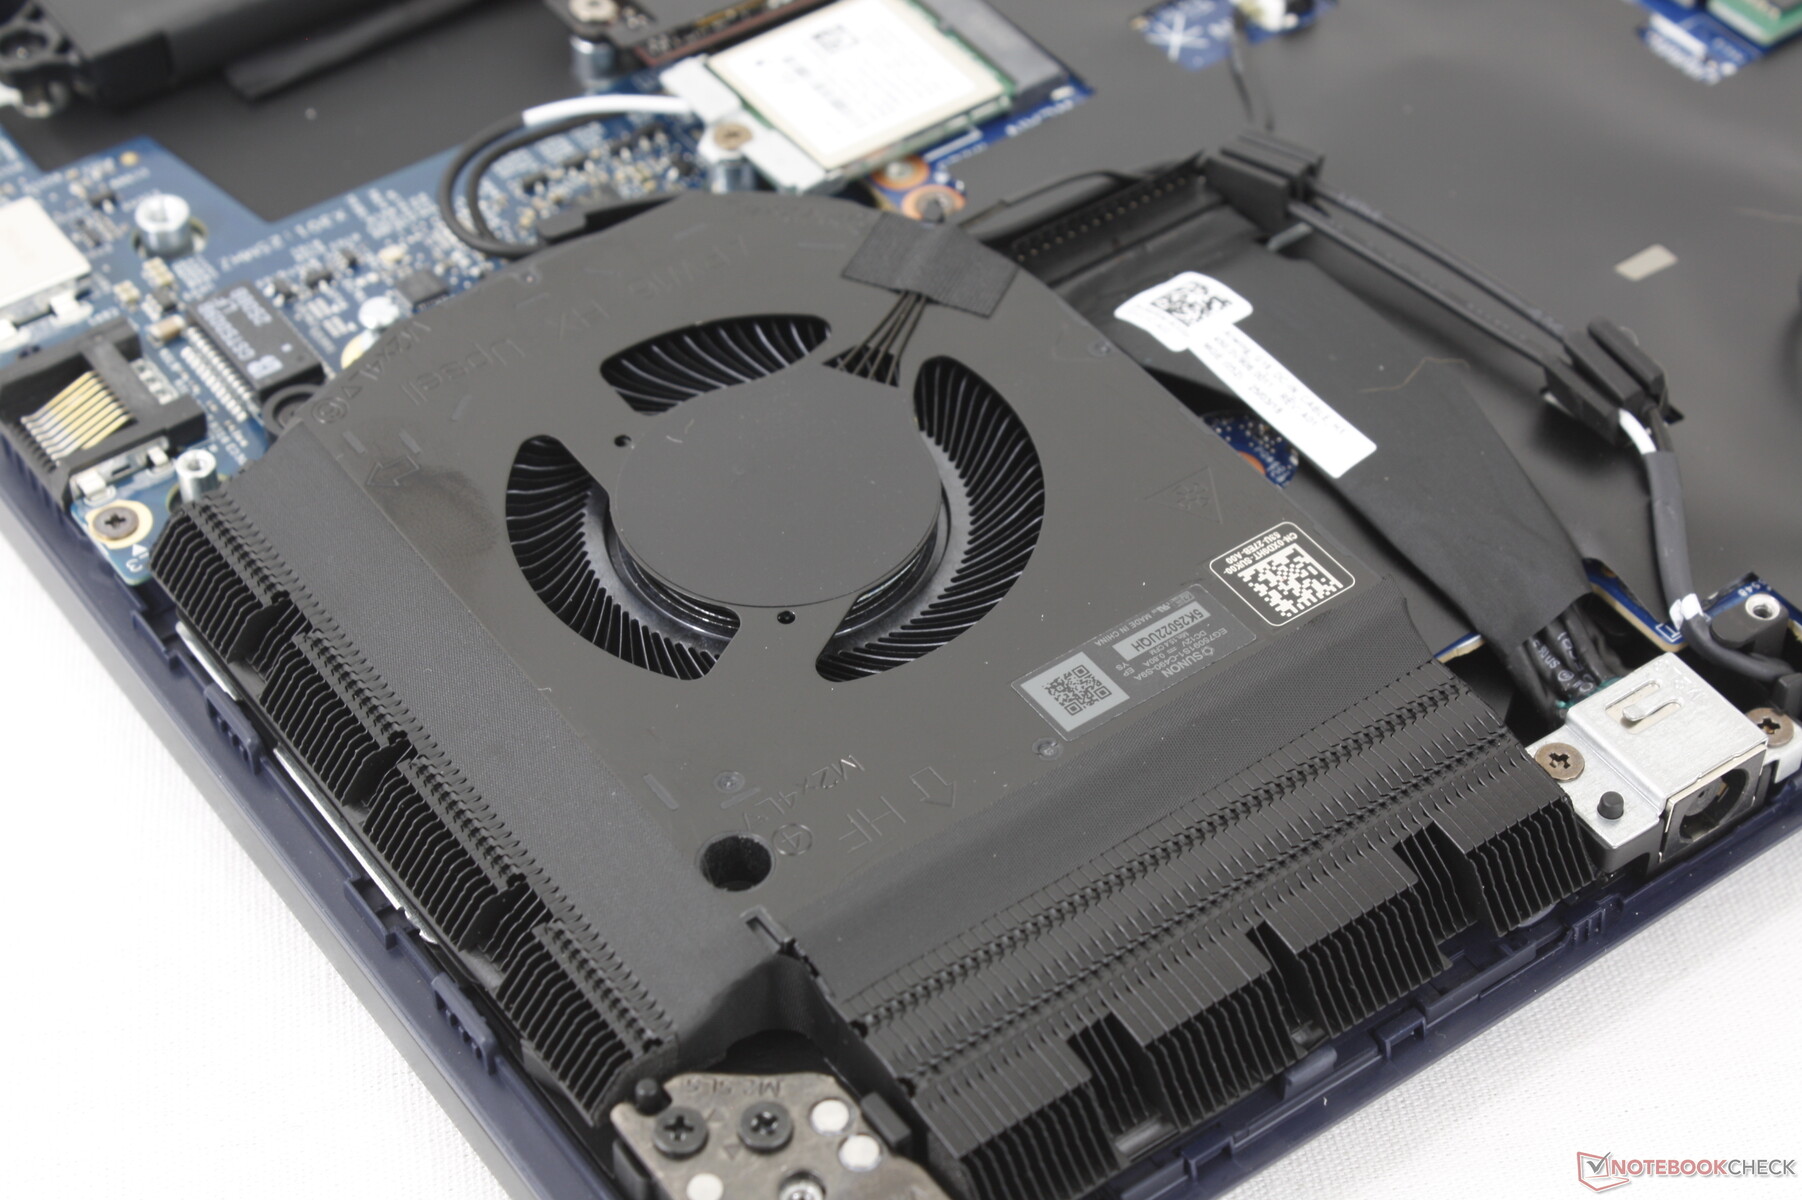
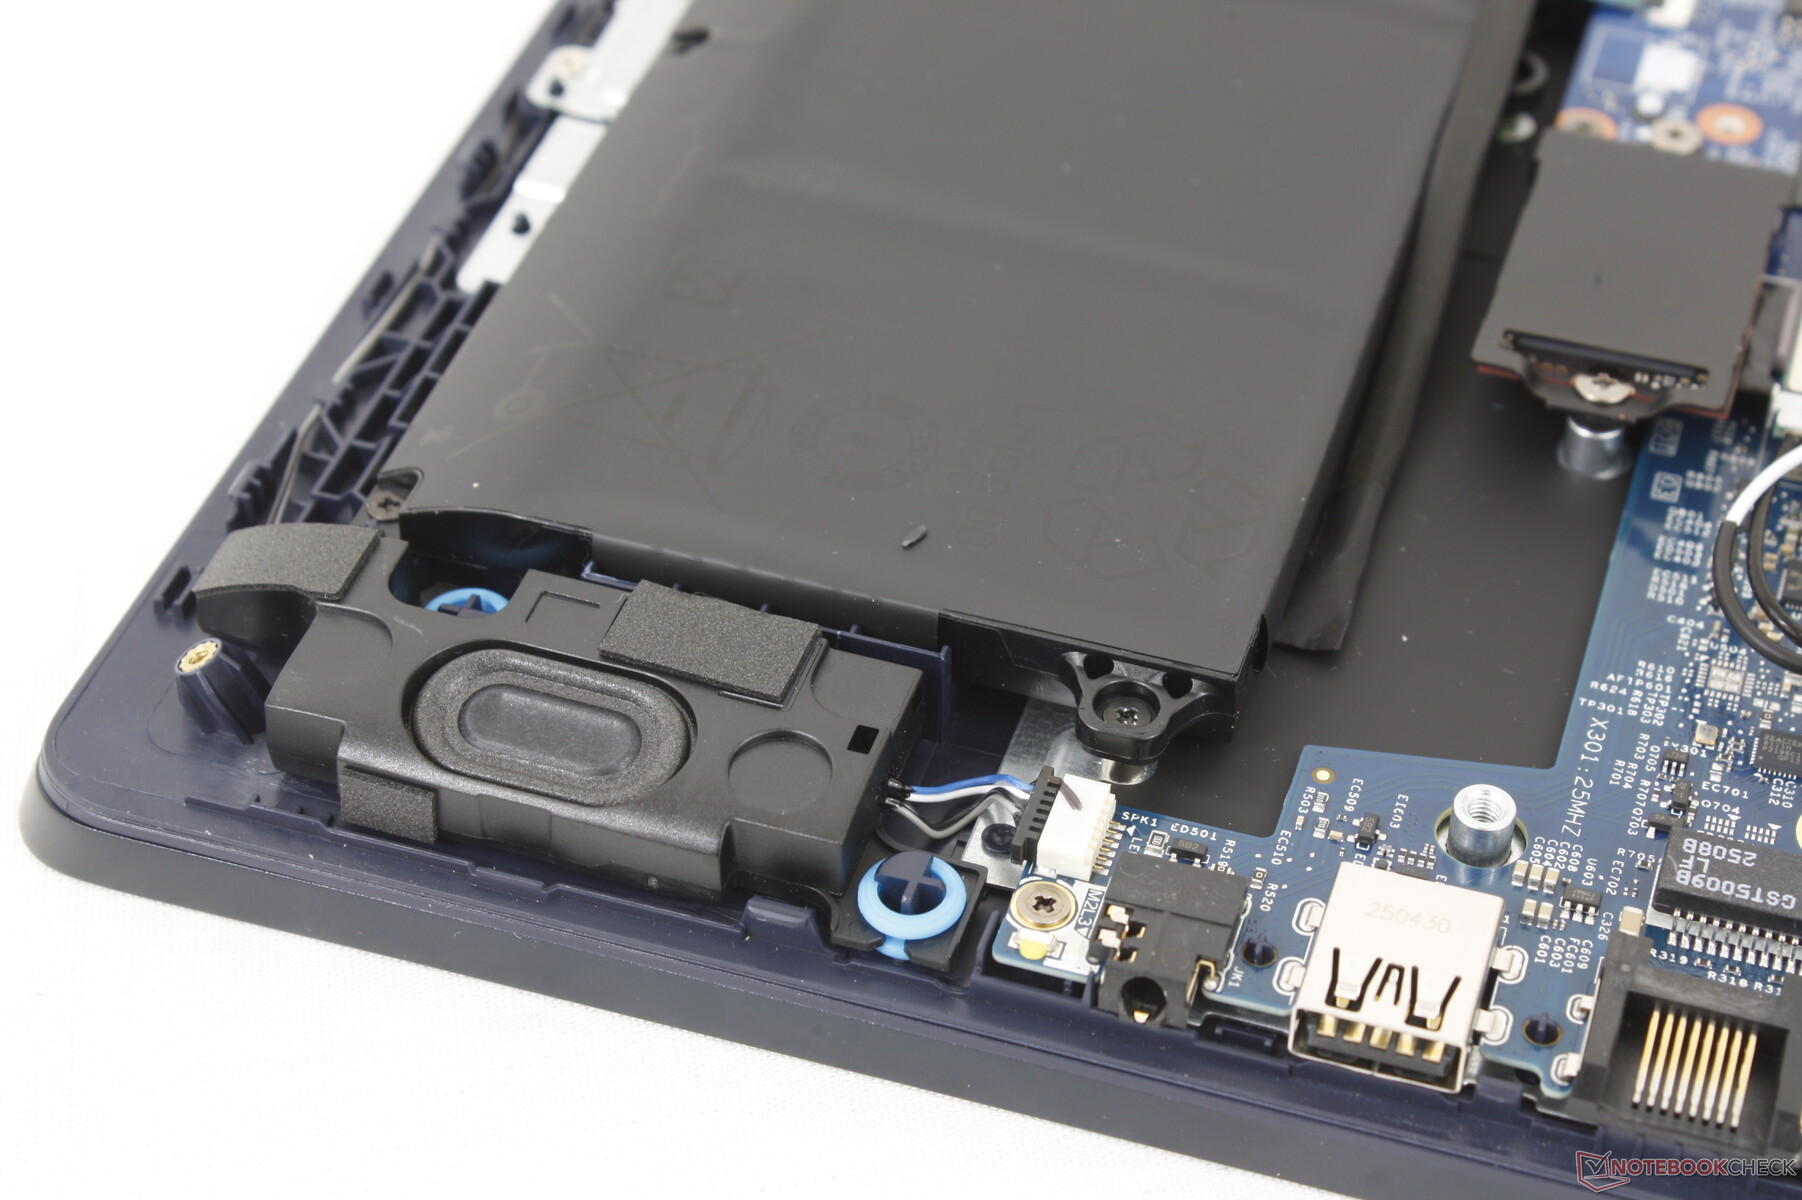
Wartung
Die Unterseite lässt sich mit einem Kreuzschlitzschraubendreher relativ einfach abnehmen. Dem Benutzer stehen zwei M.2 2280 SSD-Steckplätze, zwei DDR5 SODIMM-Steckplätze und das herausnehmbare WLAN-Modul zur Verfügung, was für eine gute Aufrüstbarkeit sorgt.

Nachhaltigkeit
Dell verwendet recycelte Kunststoffe und Metalle für die Herstellung seiner Laptop-Reihe. Allerdings hat Dell den genauen Prozentsatz der recycelten Materialien für die 16X Aurora Serie nicht angegeben. Die Verpackung ist ansonsten vollständig recycelbar und enthält kein Plastik.
Zubehör und Garantie
In der Verpackung befinden sich außer dem Netzadapter und den Unterlagen keine weiteren Extras. Wenn Sie das Gerät in Deutschland kaufen, gilt die übliche Herstellergarantie.
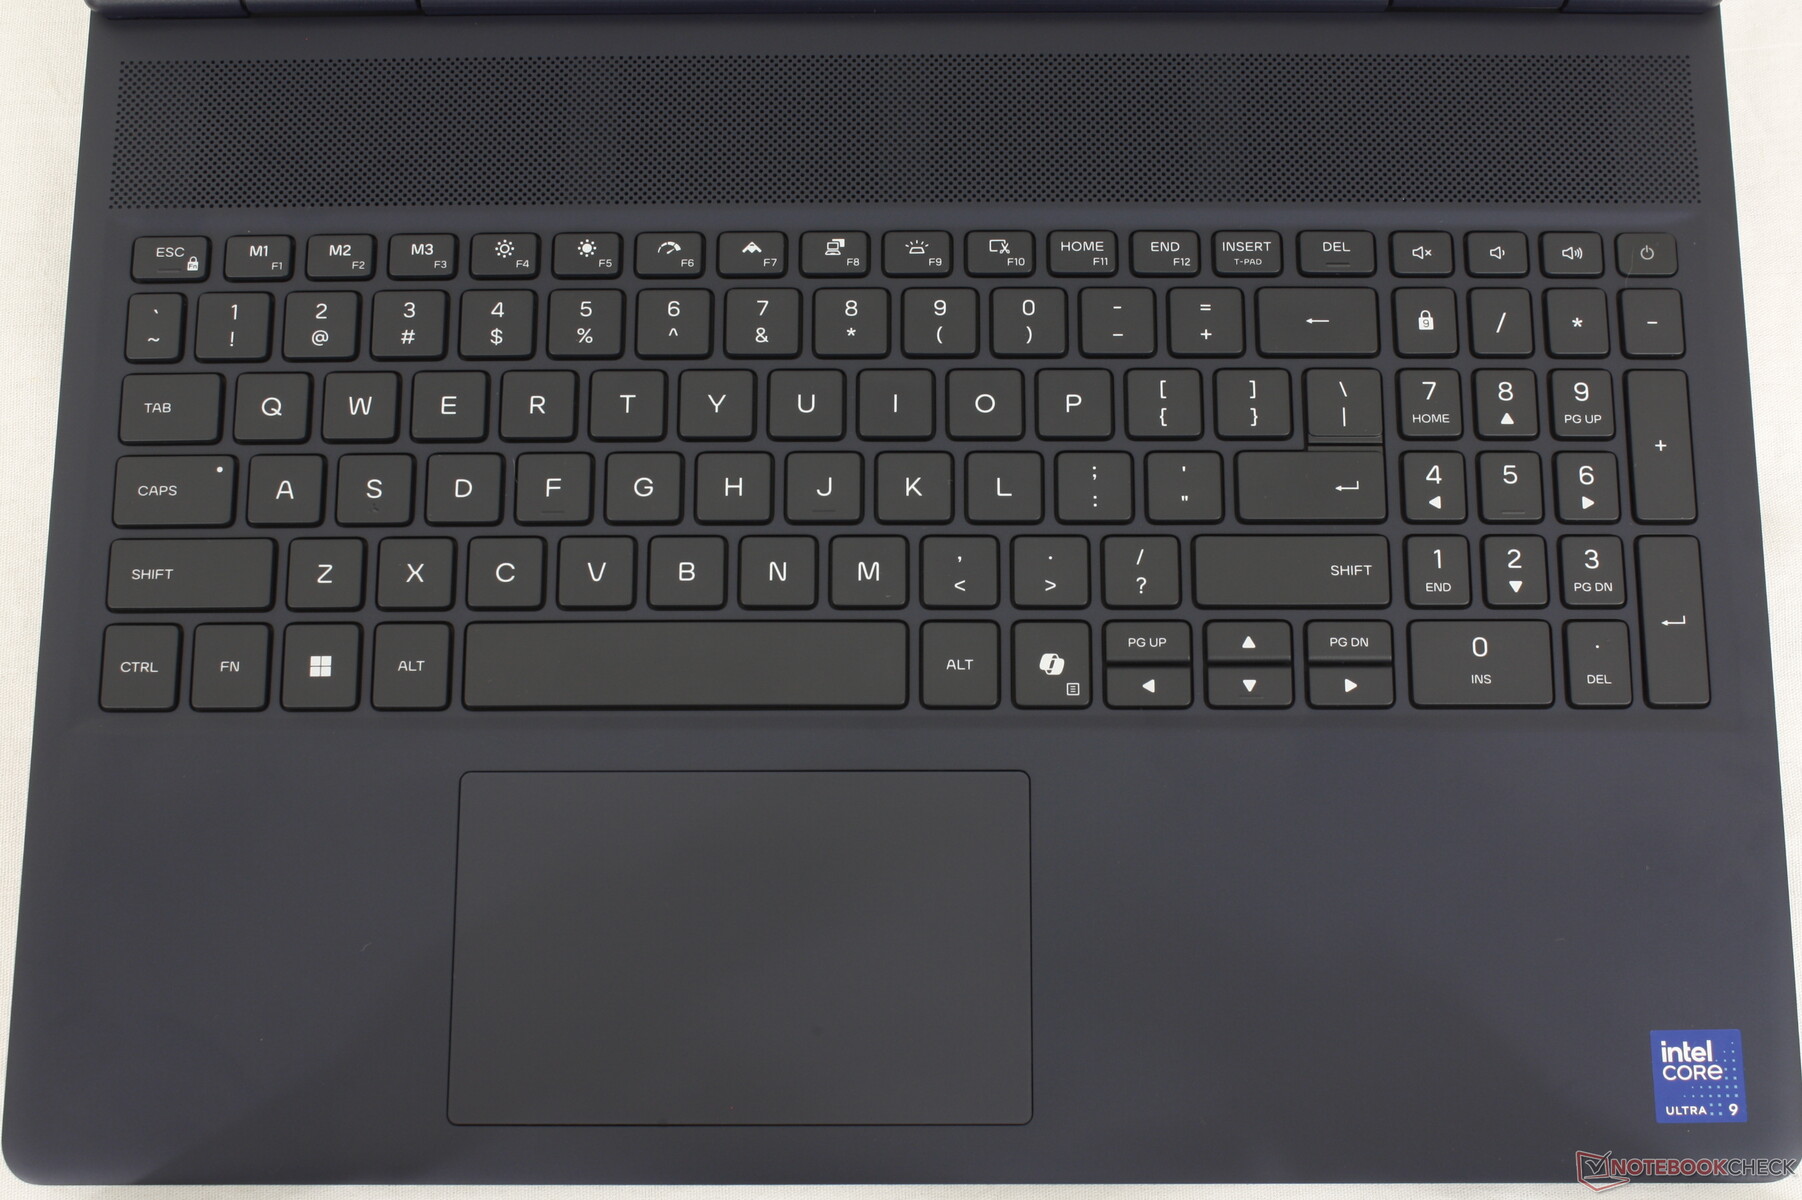
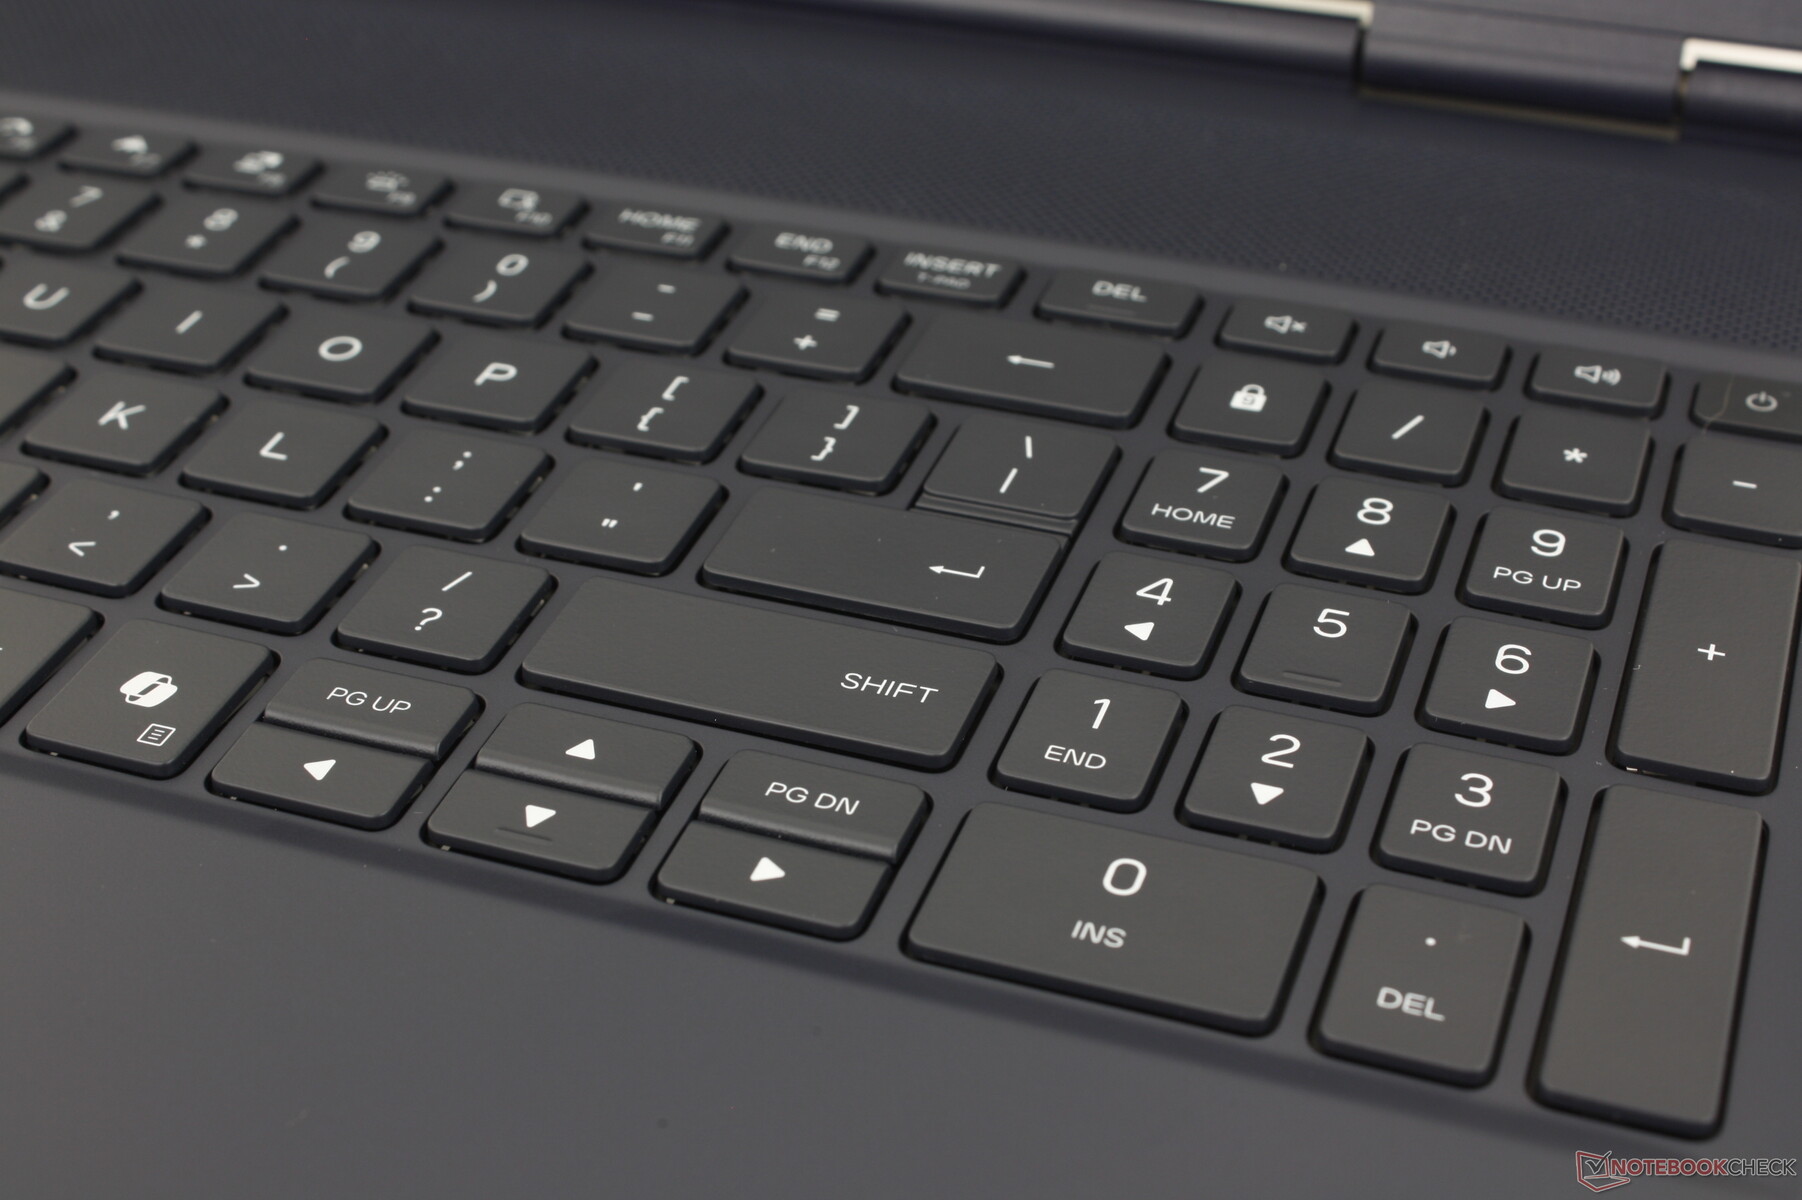
Eingabegeräte
Tastatur
Die Tasten sind leiser als erwartet und bieten ein angemessenes Feedback für ein Ultrabook-ähnliches Tipperlebnis. Insbesondere die leichte Enter-Taste hätte allerdings von einem tieferen und/oder festeren Feedback profitieren können.
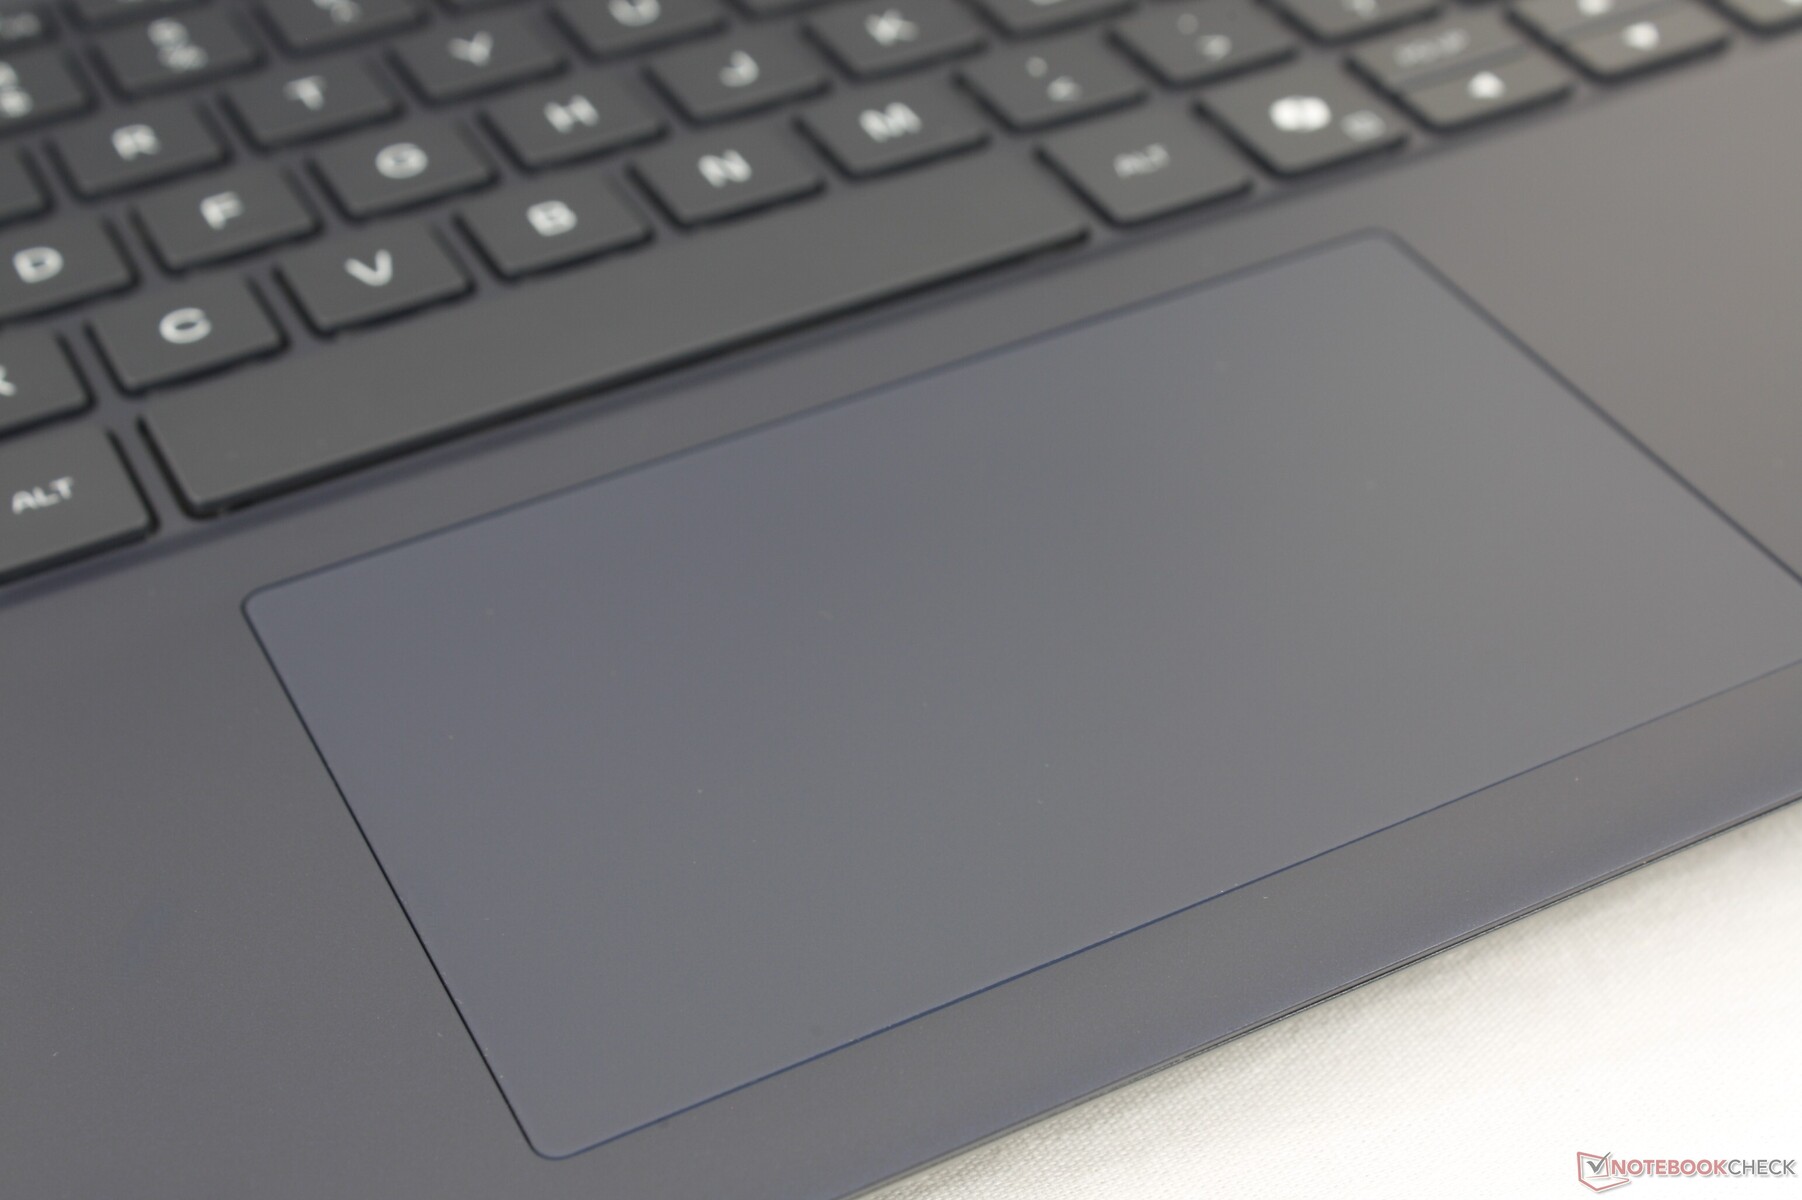
Touchpad
Das Clickpad ist sogar etwas größer als das Clickpad des Alienware Area-51 (11,5 x 7 cm vs. 11,2 x 6,5 cm), dennoch ist es im Vergleich zu Clickpads von Konkurrenten wie dem Gigabyte Aero X16 recht klein. Während die Cursorsteuerung bei allen Geschwindigkeiten reibungslos und zuverlässig funktioniert, ist das Feedback beim Klicken viel zu weich und fühlt sich unbefriedigend schwammig an.

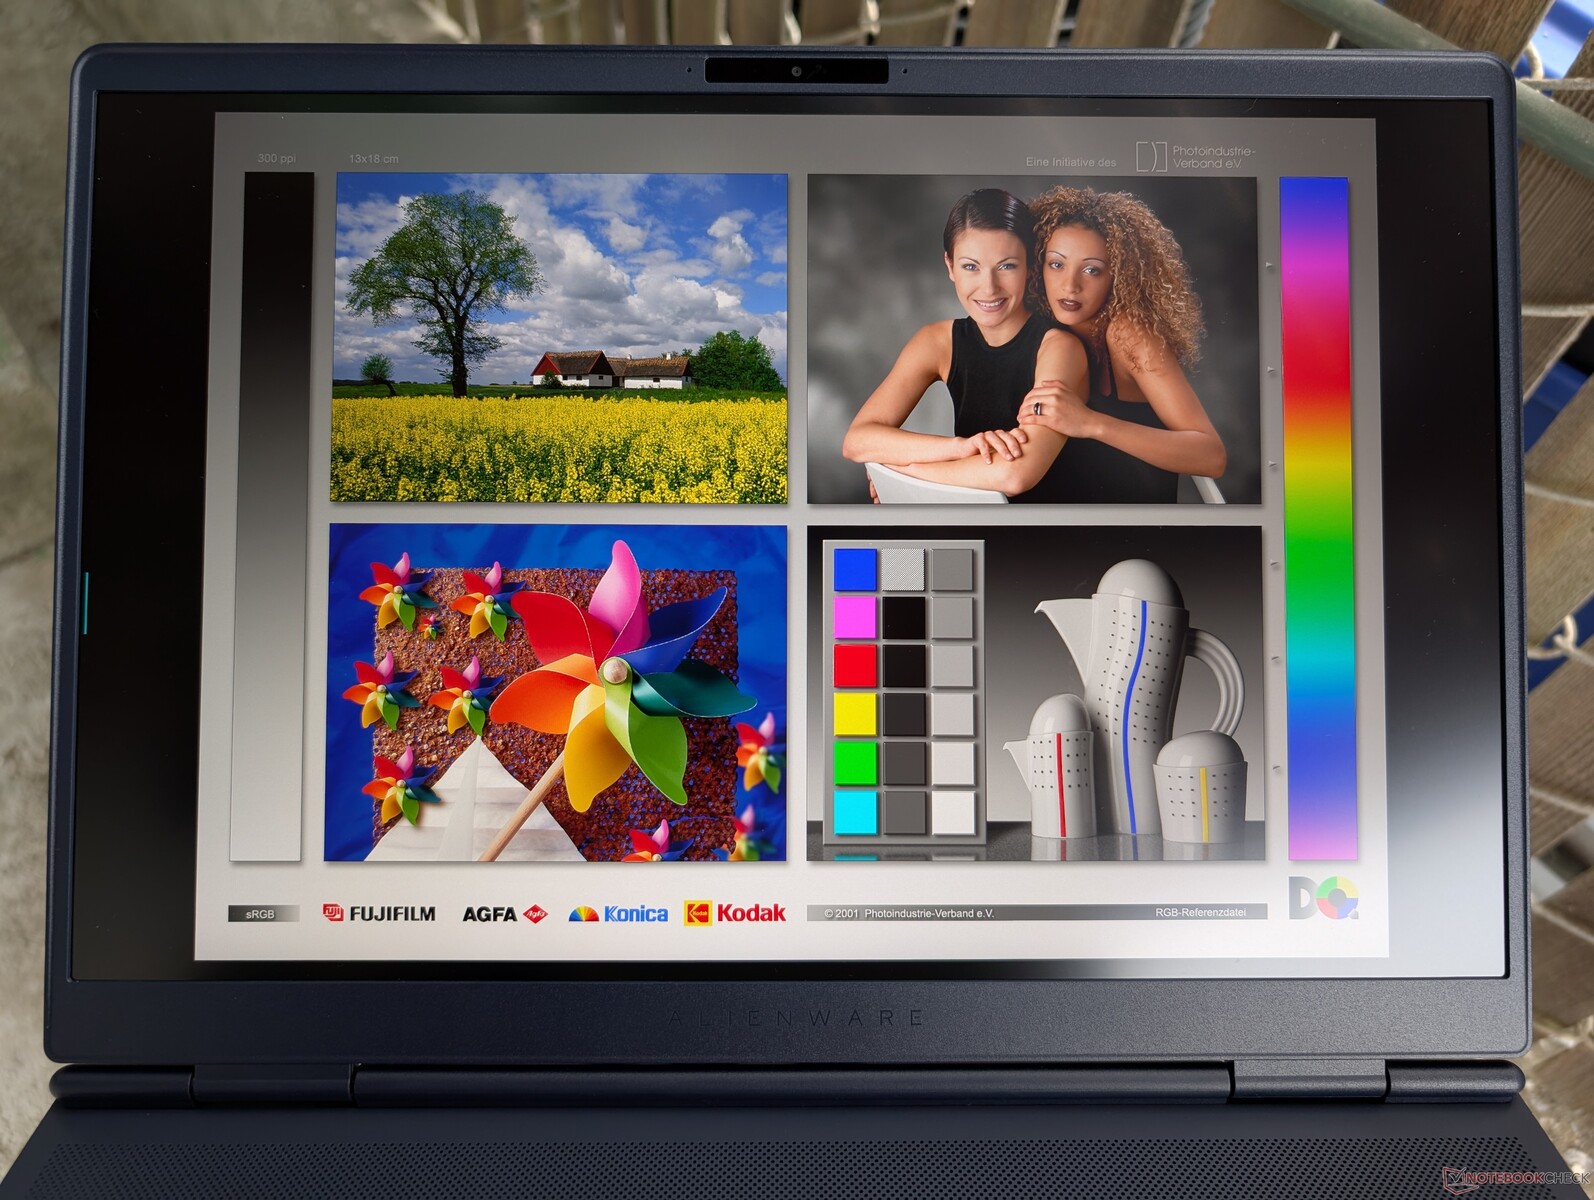
Display - Ziemlich gut für IPS
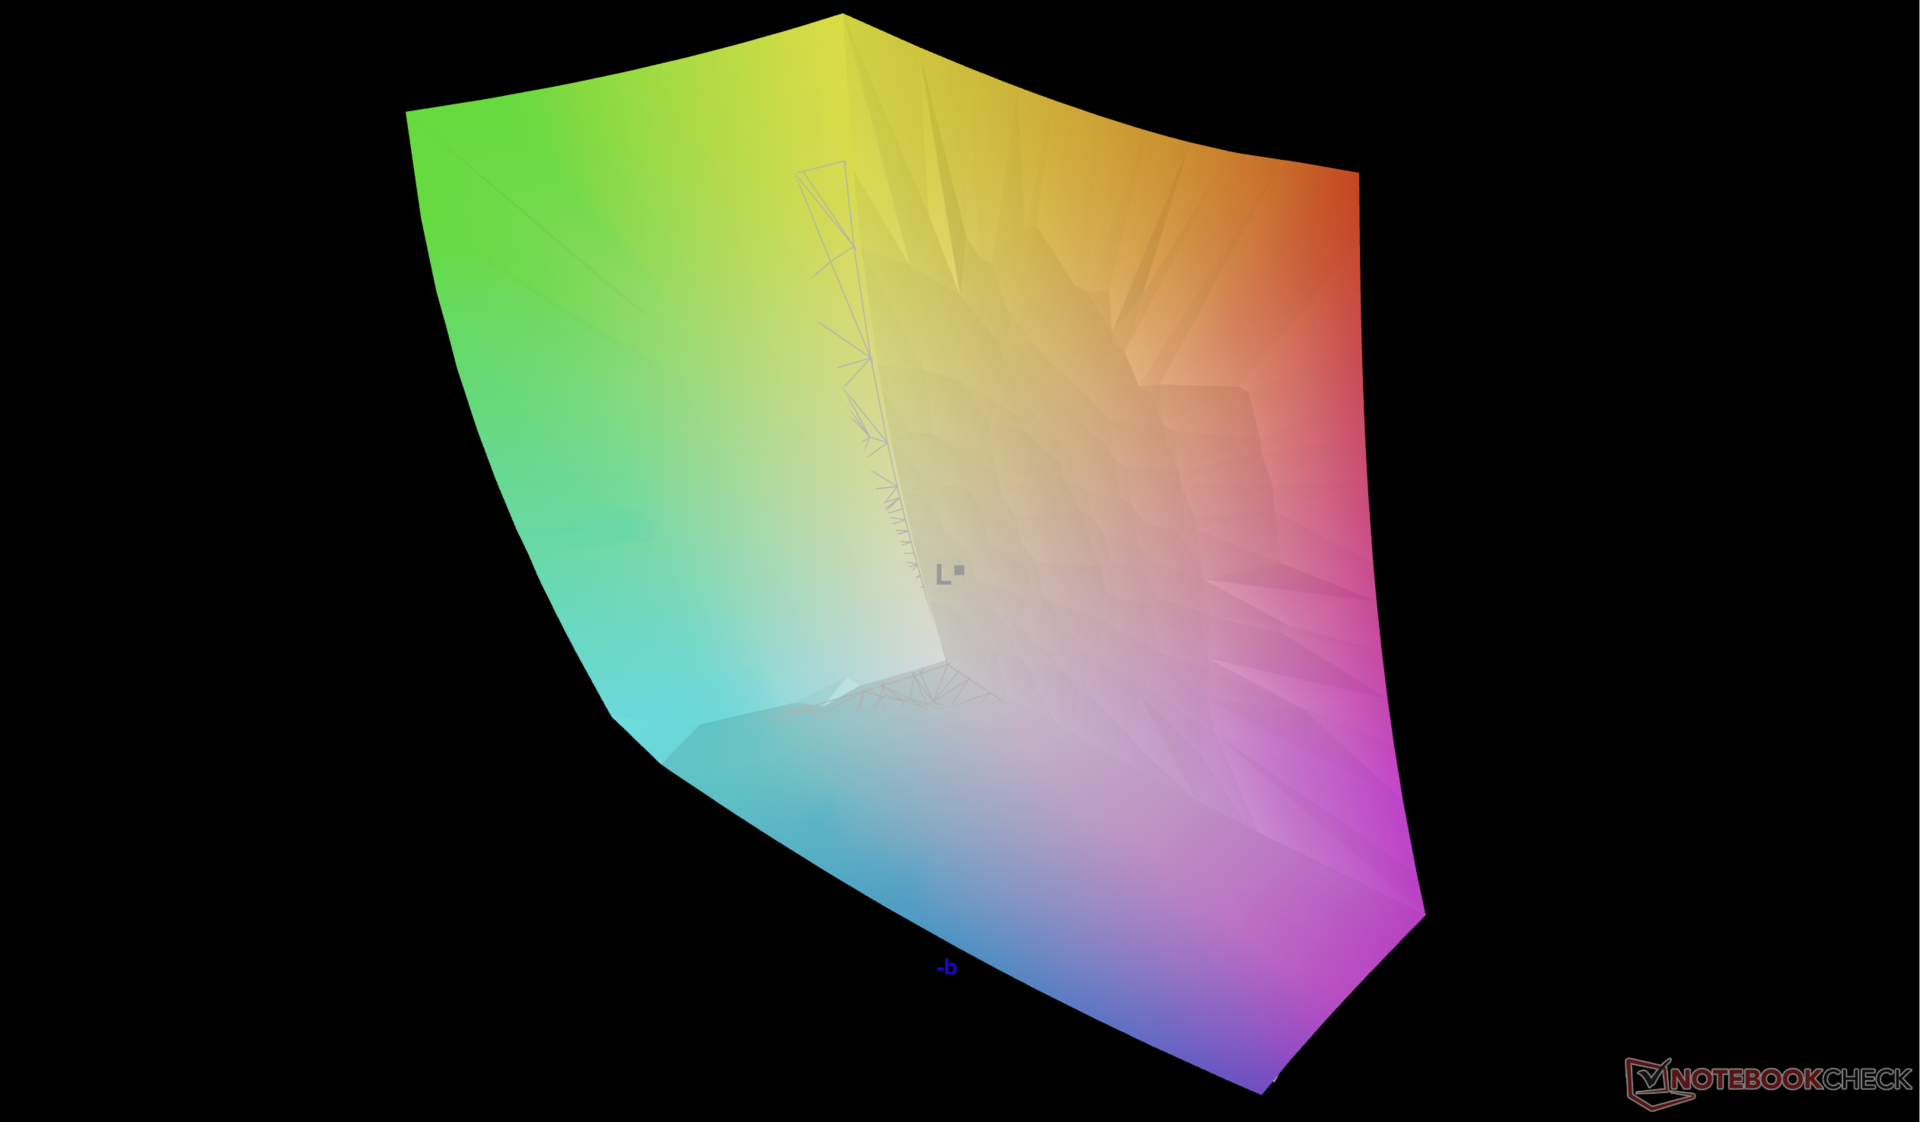
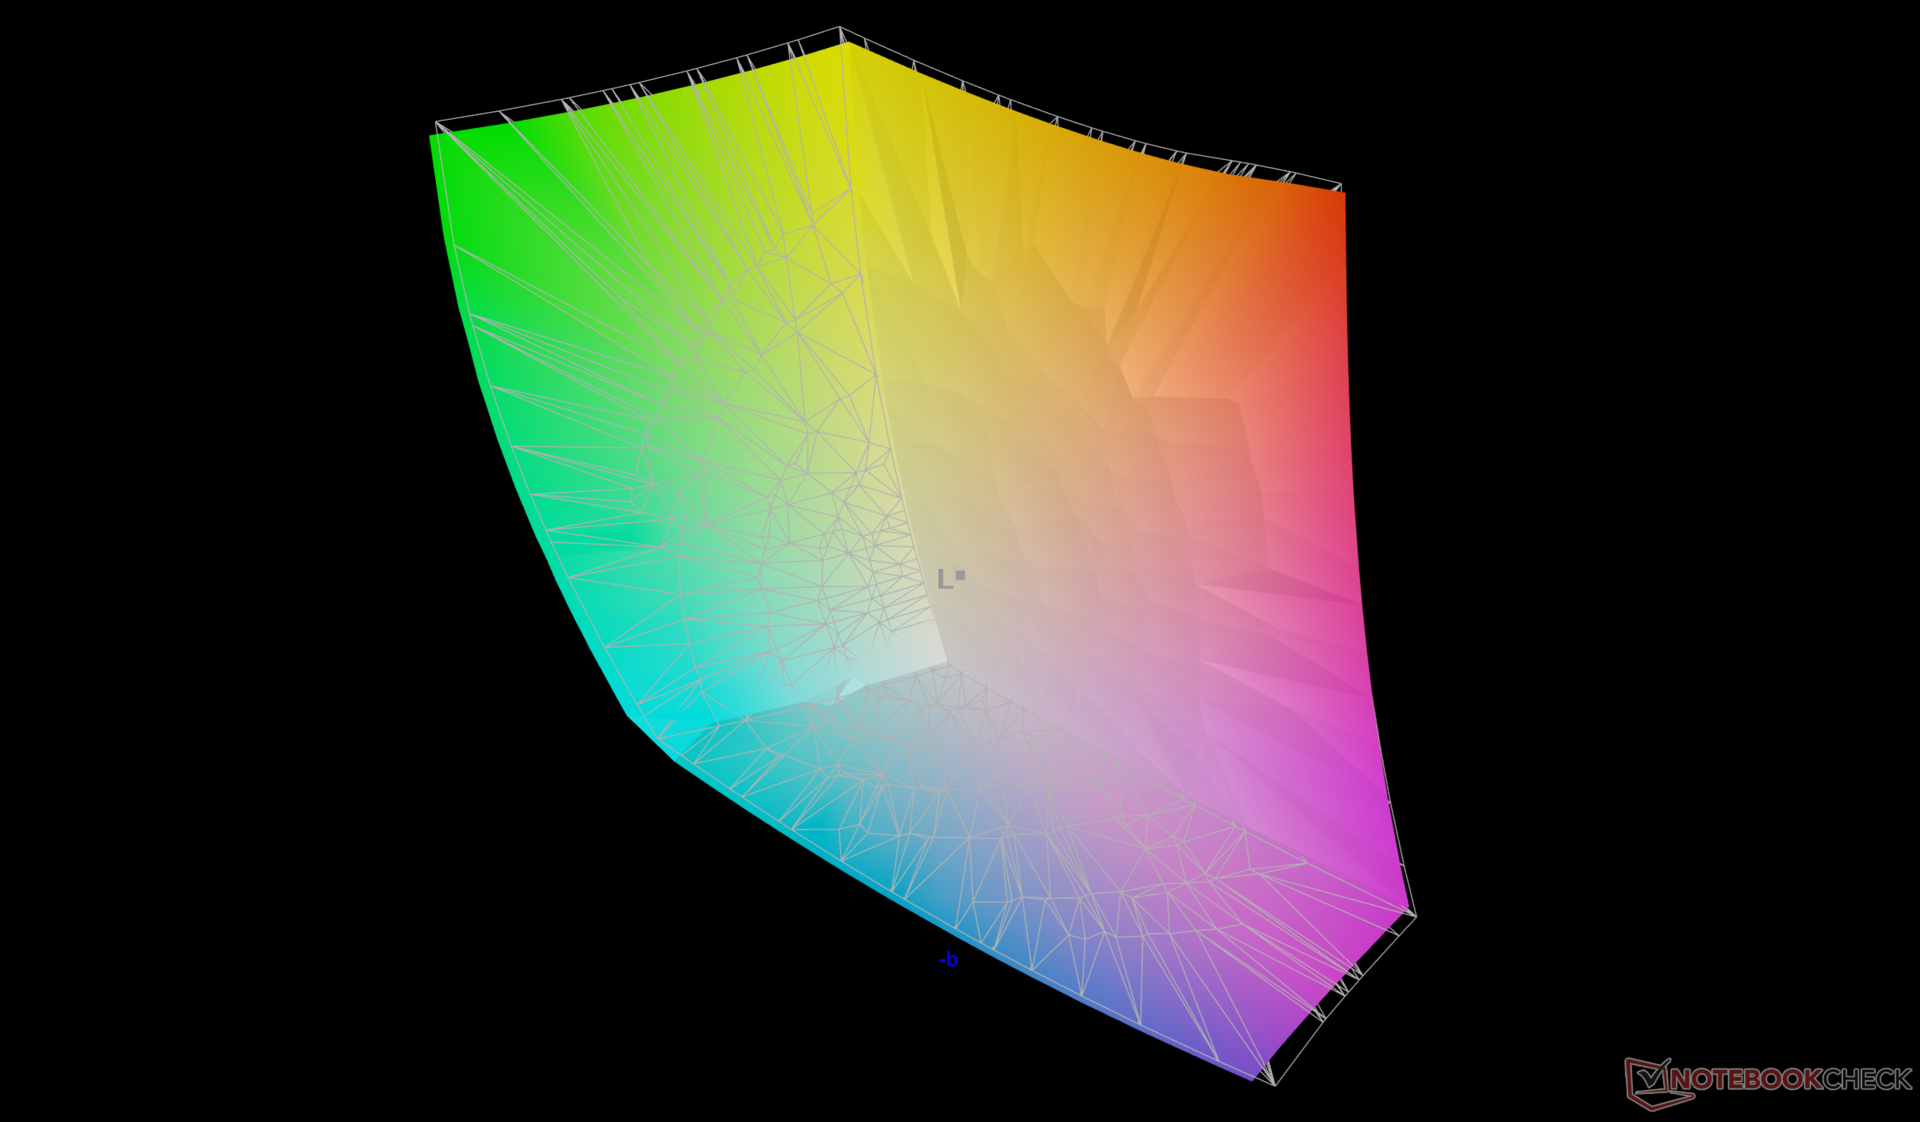
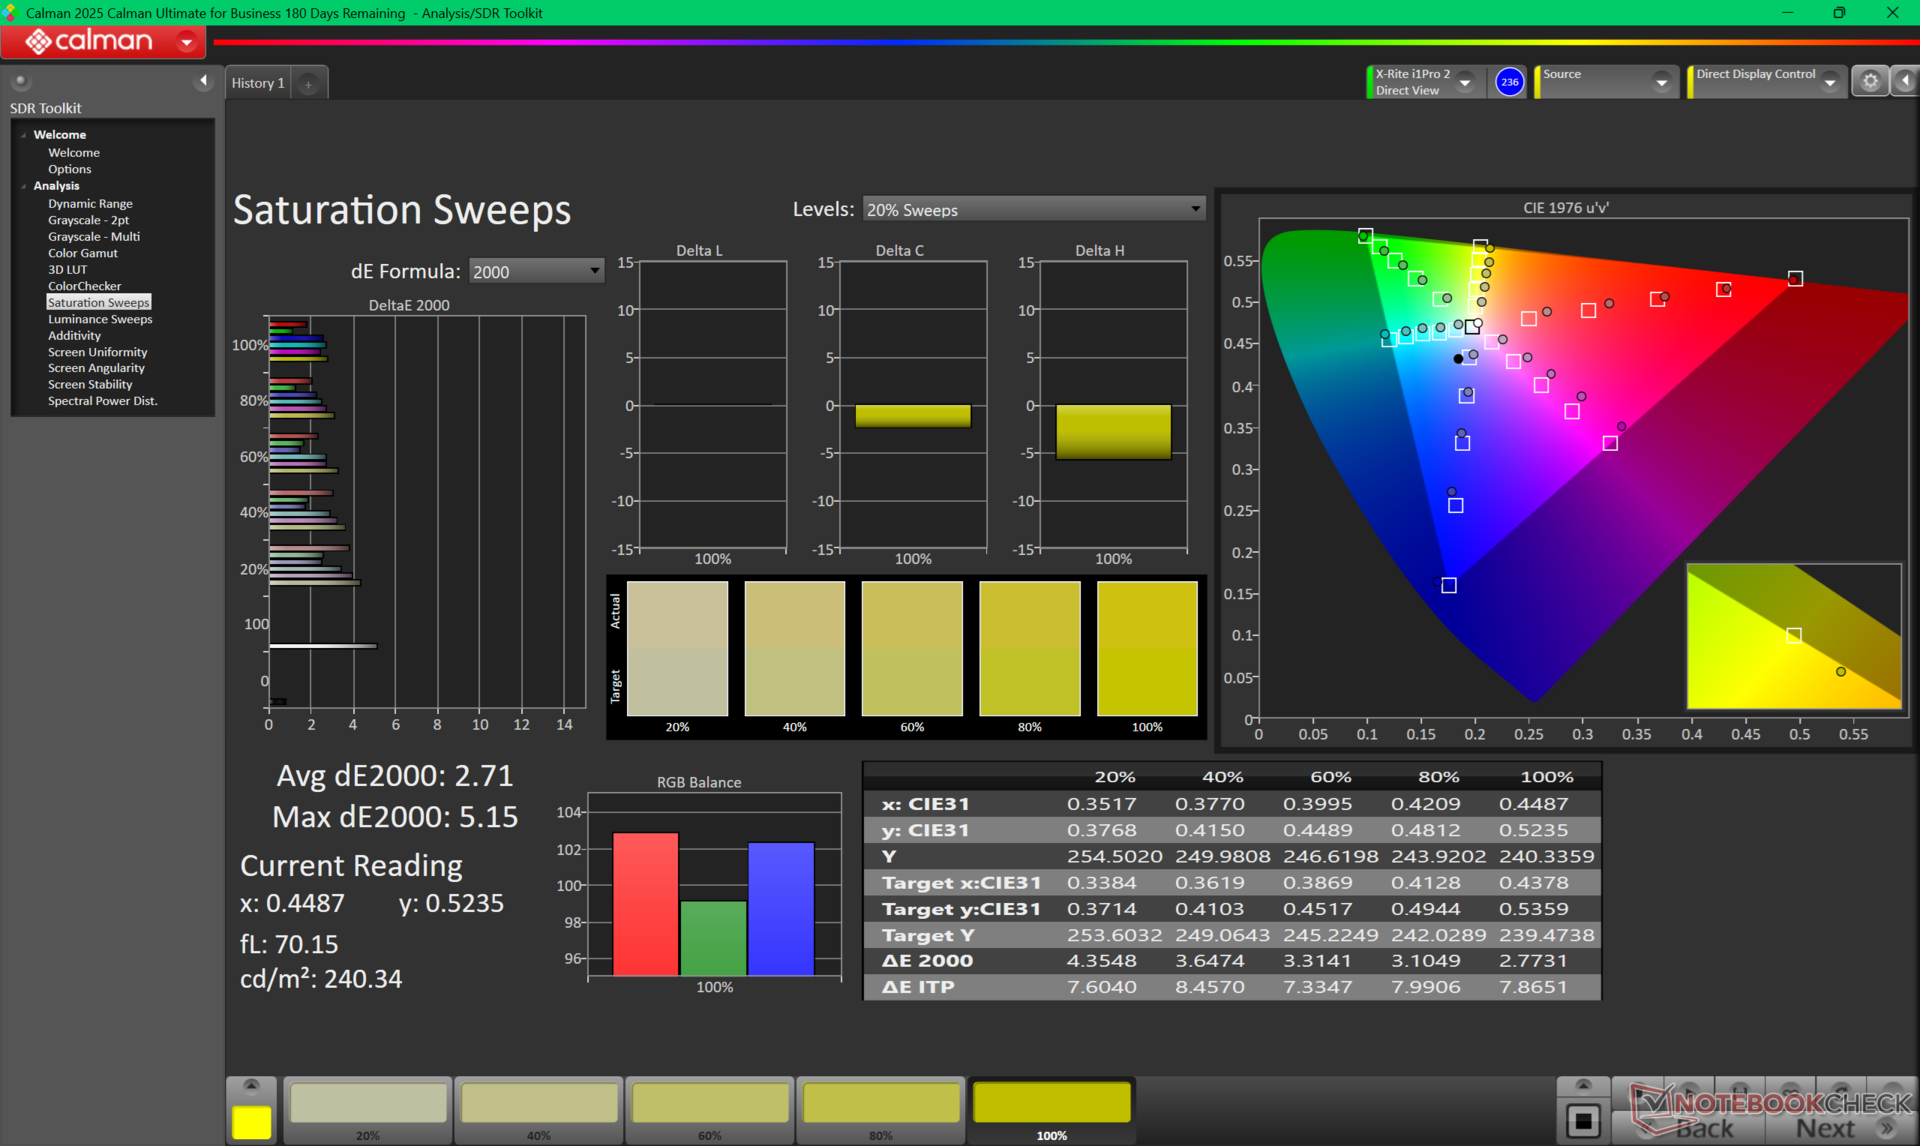
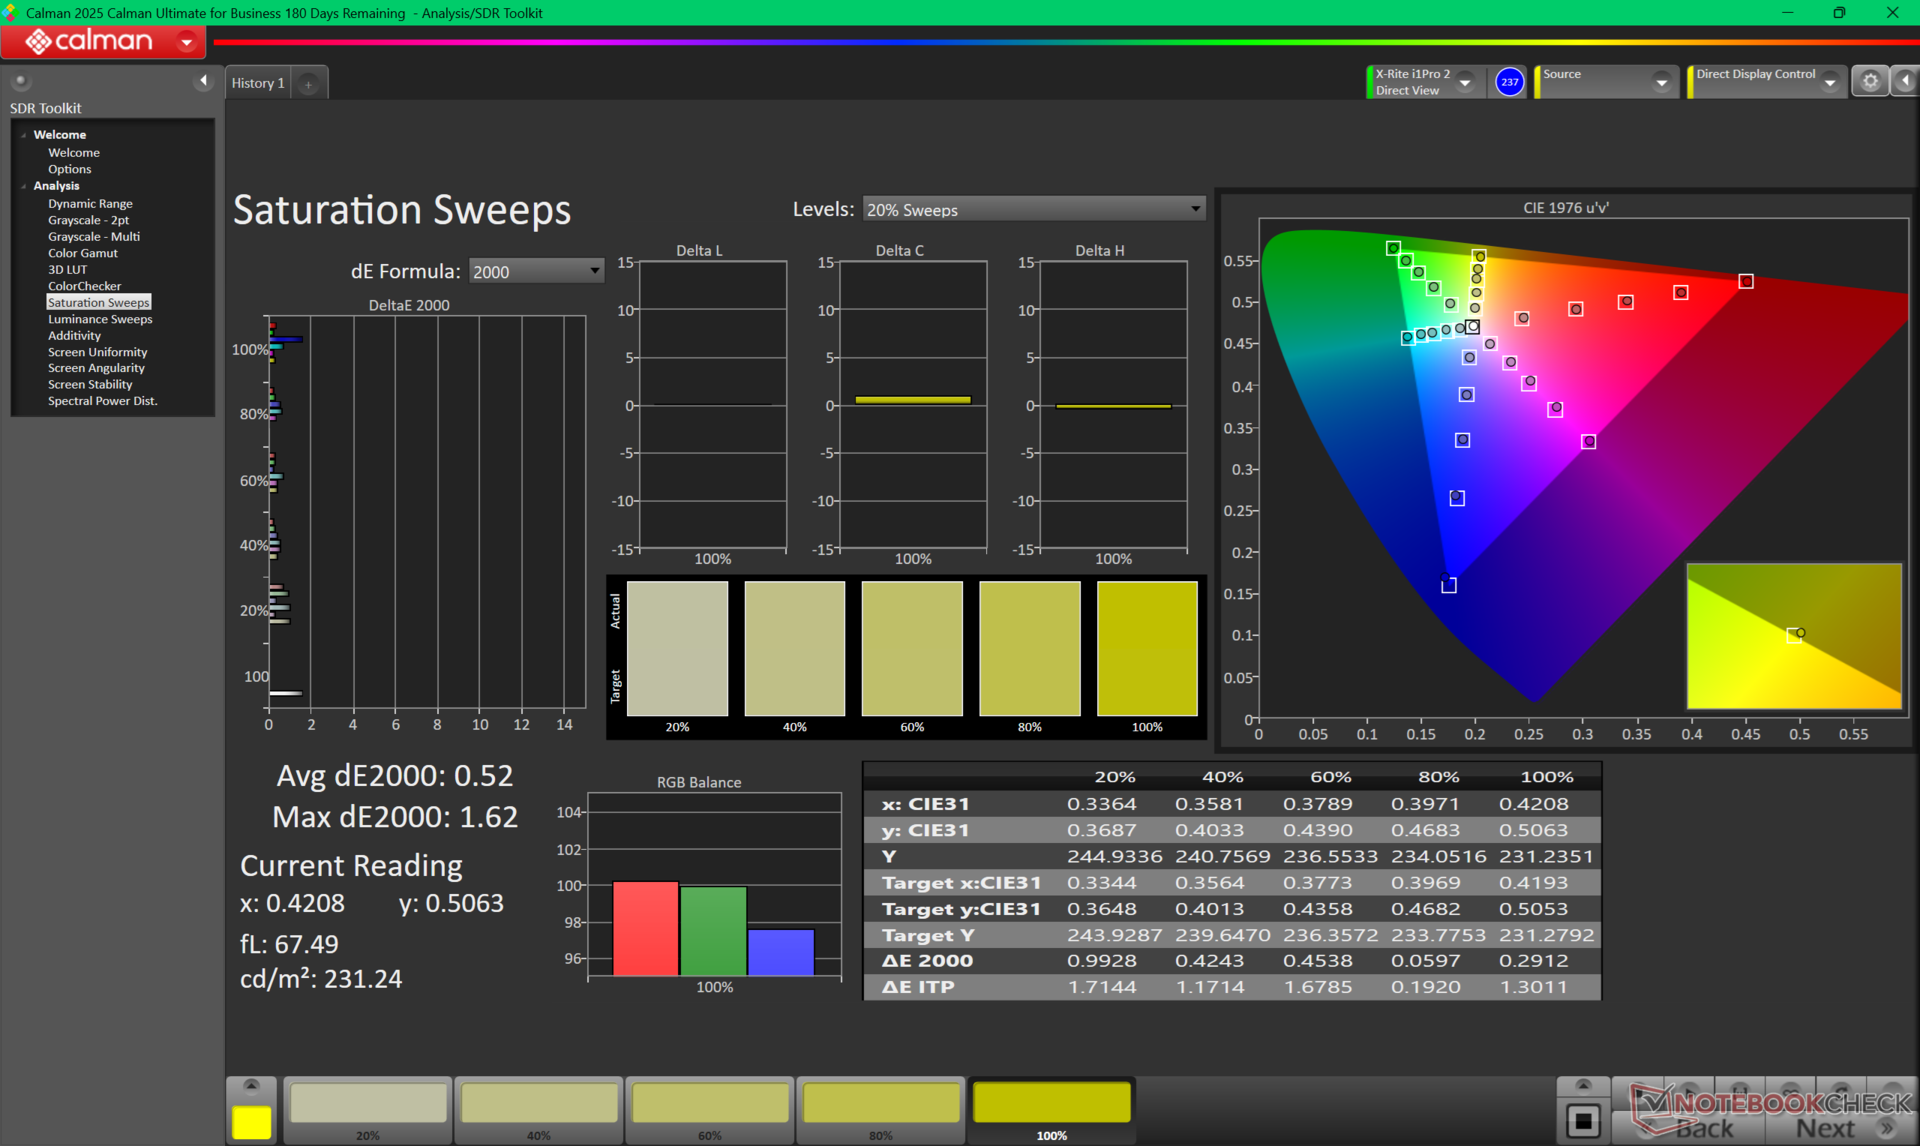
Das QHD+ IPS-Panel bietet volle DCI-P3-Farben, flotte Reaktionszeiten und eine schnelle Bildwiederholrate von 240 Hz, um sowohl für Spiele als auch für Bearbeitungsarbeiten geeignet zu sein. Seine Eigenschaften sind im Wesentlichen identisch mit der AU Optronics 1600p240 Display-Option auf dem Alienware Area-51, obwohl das Panel auf unserem Aurora 16X von LG Philips stammt.
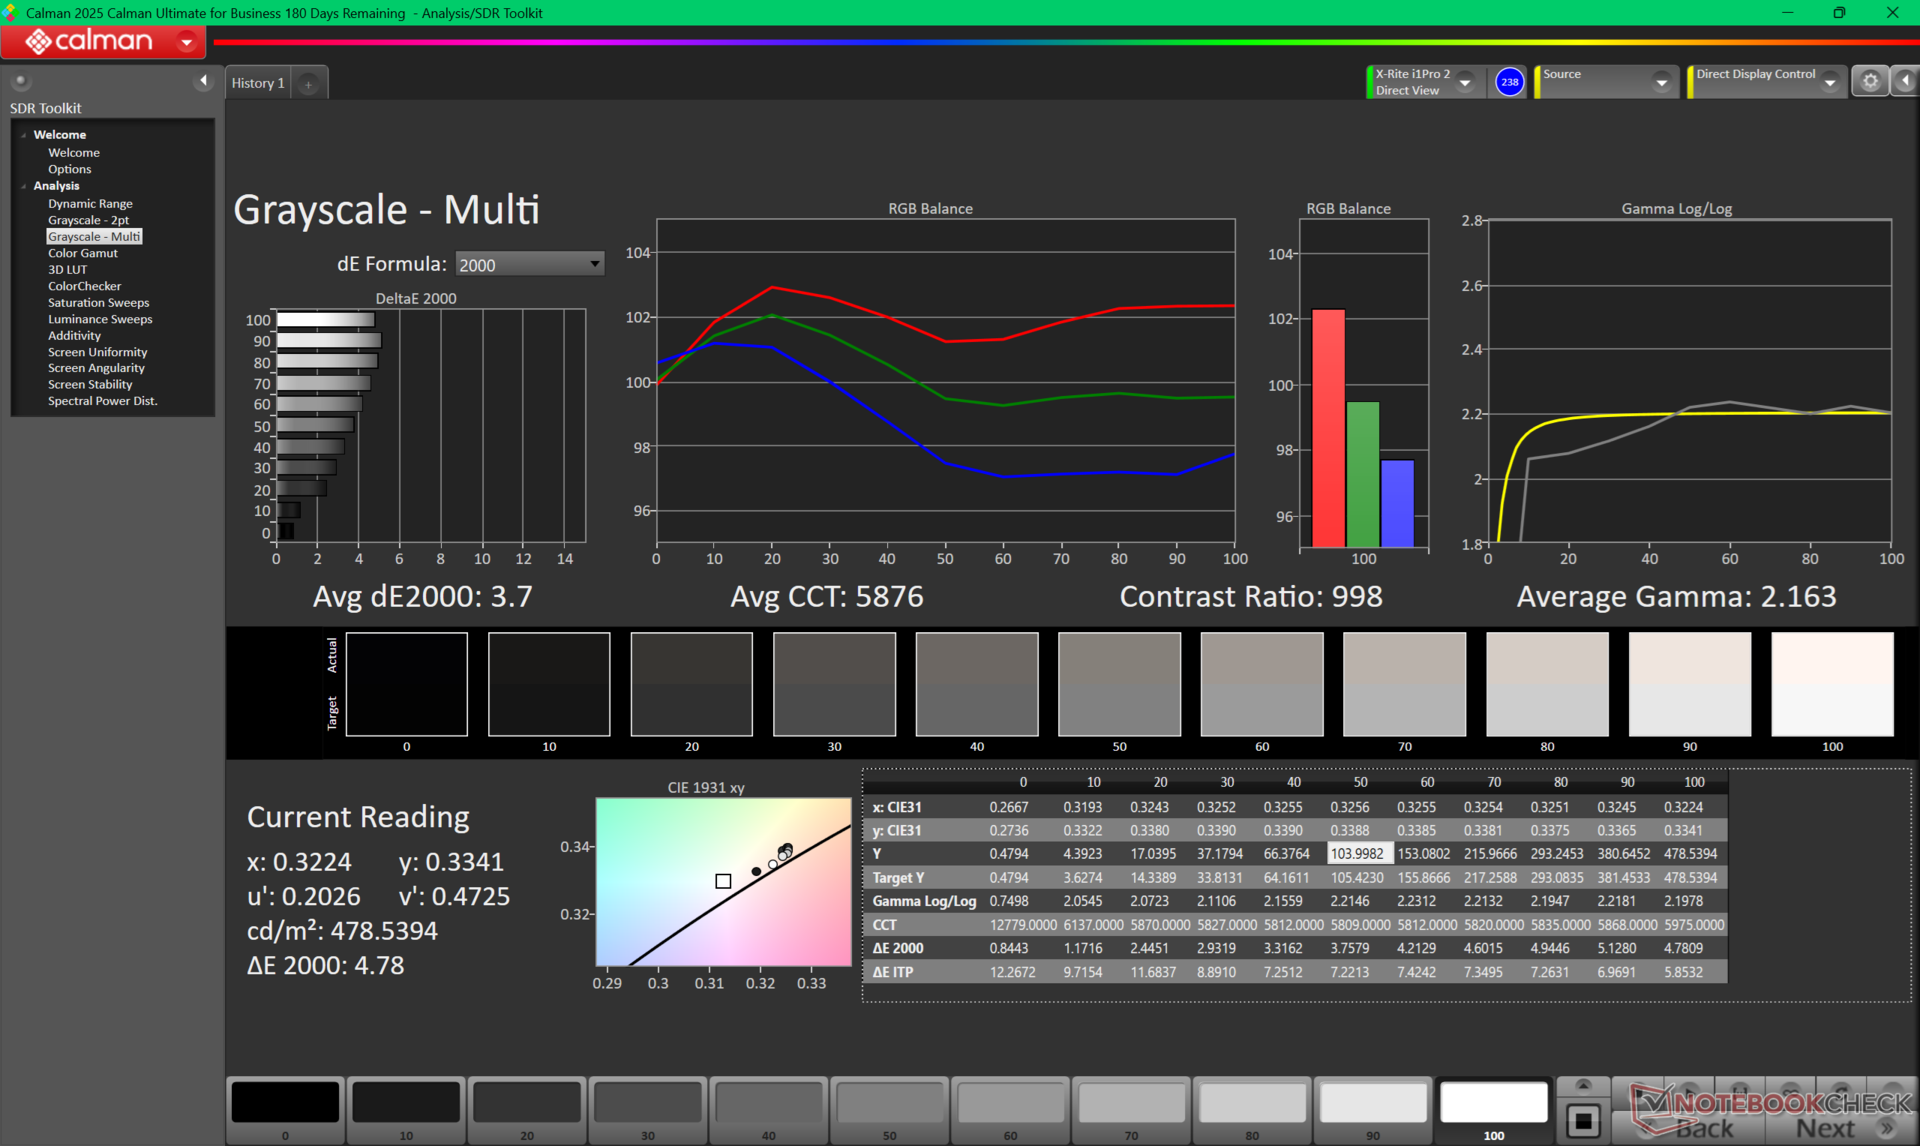
Der wohl schlechteste Aspekt des Bildschirms ist sein niedriges Kontrastverhältnis von nur ~1000:1 für schlechte Schwarzwerte und keine HDR-Unterstützung. Es gibt keine nennenswerten Mini-LED- oder OLED-Optionen, wahrscheinlich um die Kosten für die Aurora 16X-Serie niedrig zu halten.


| |||||||||||||||||||||||||
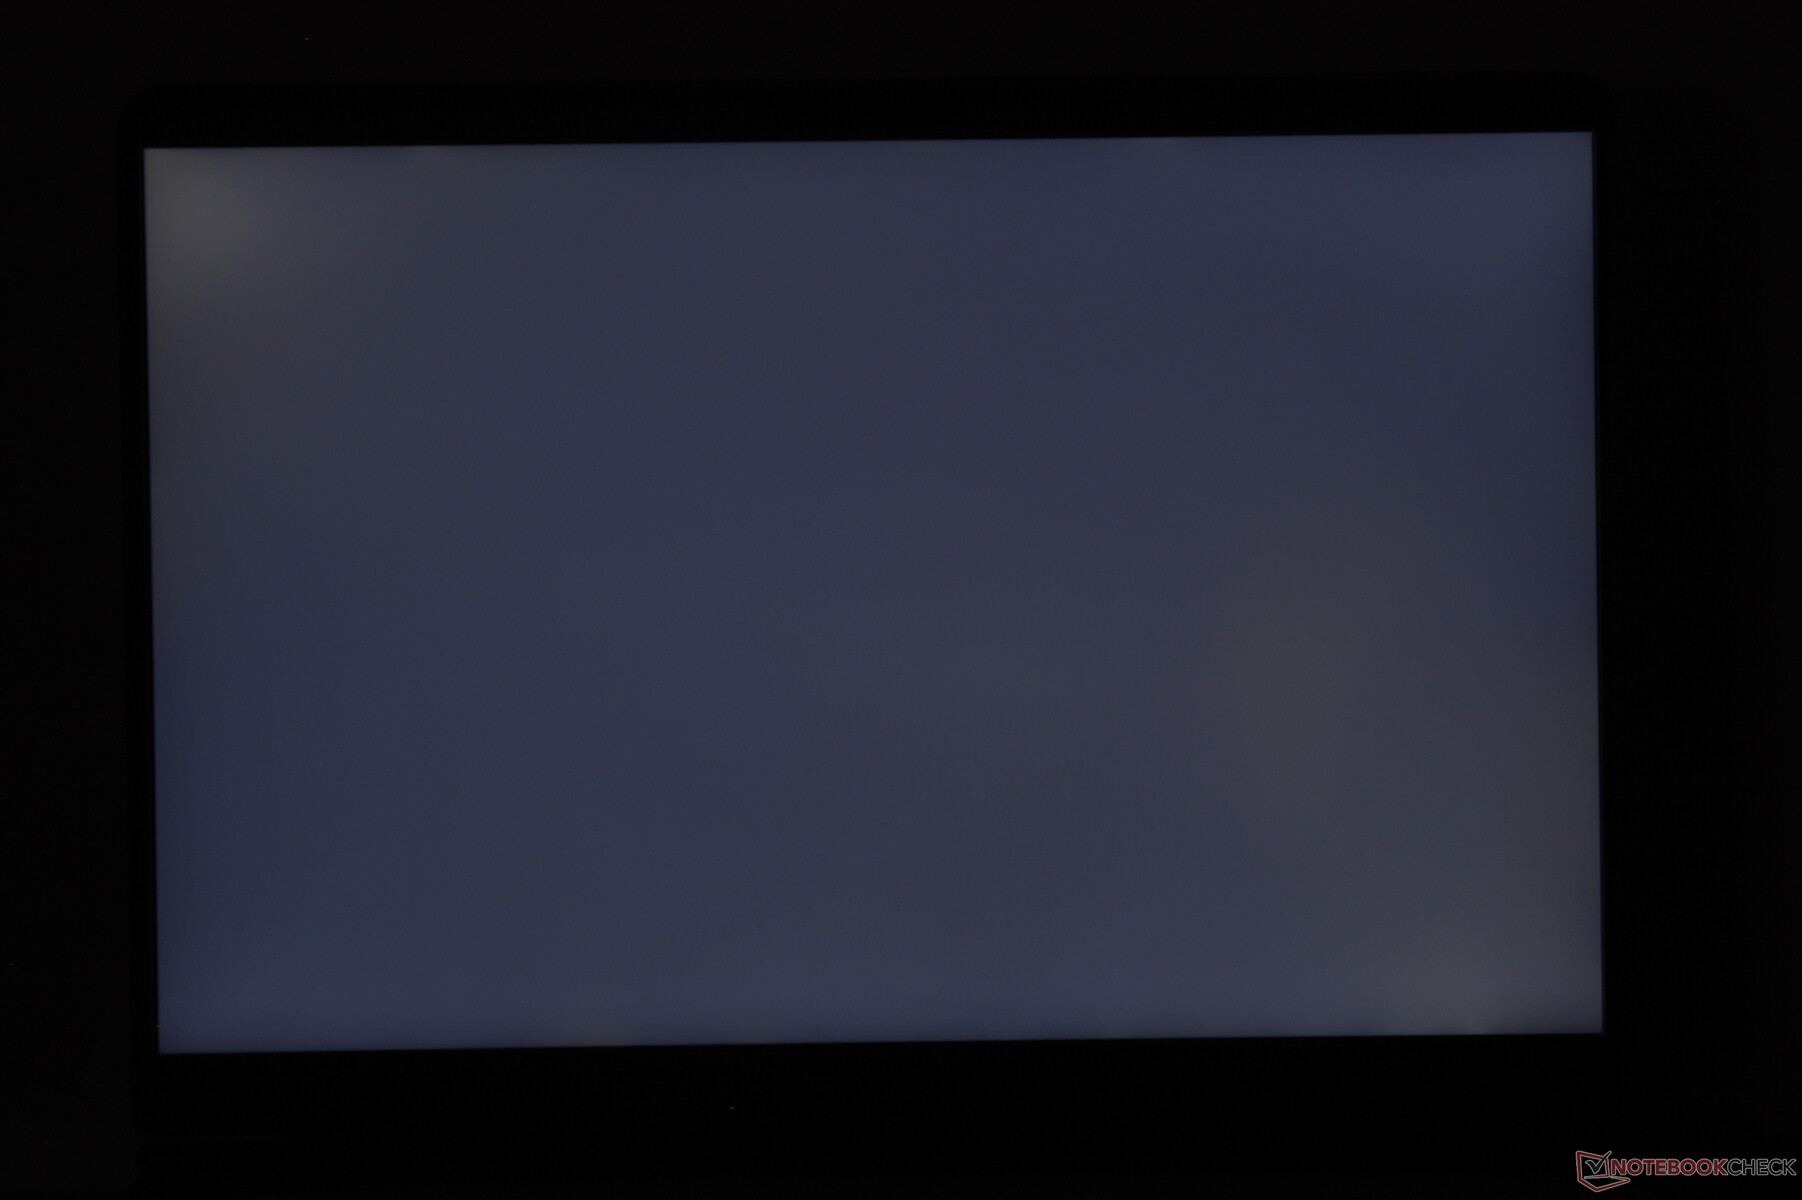
Ausleuchtung: 93 %
Helligkeit Akku: 493.2 cd/m²
Kontrast: 986:1 (Schwarzwert: 0.5 cd/m²)
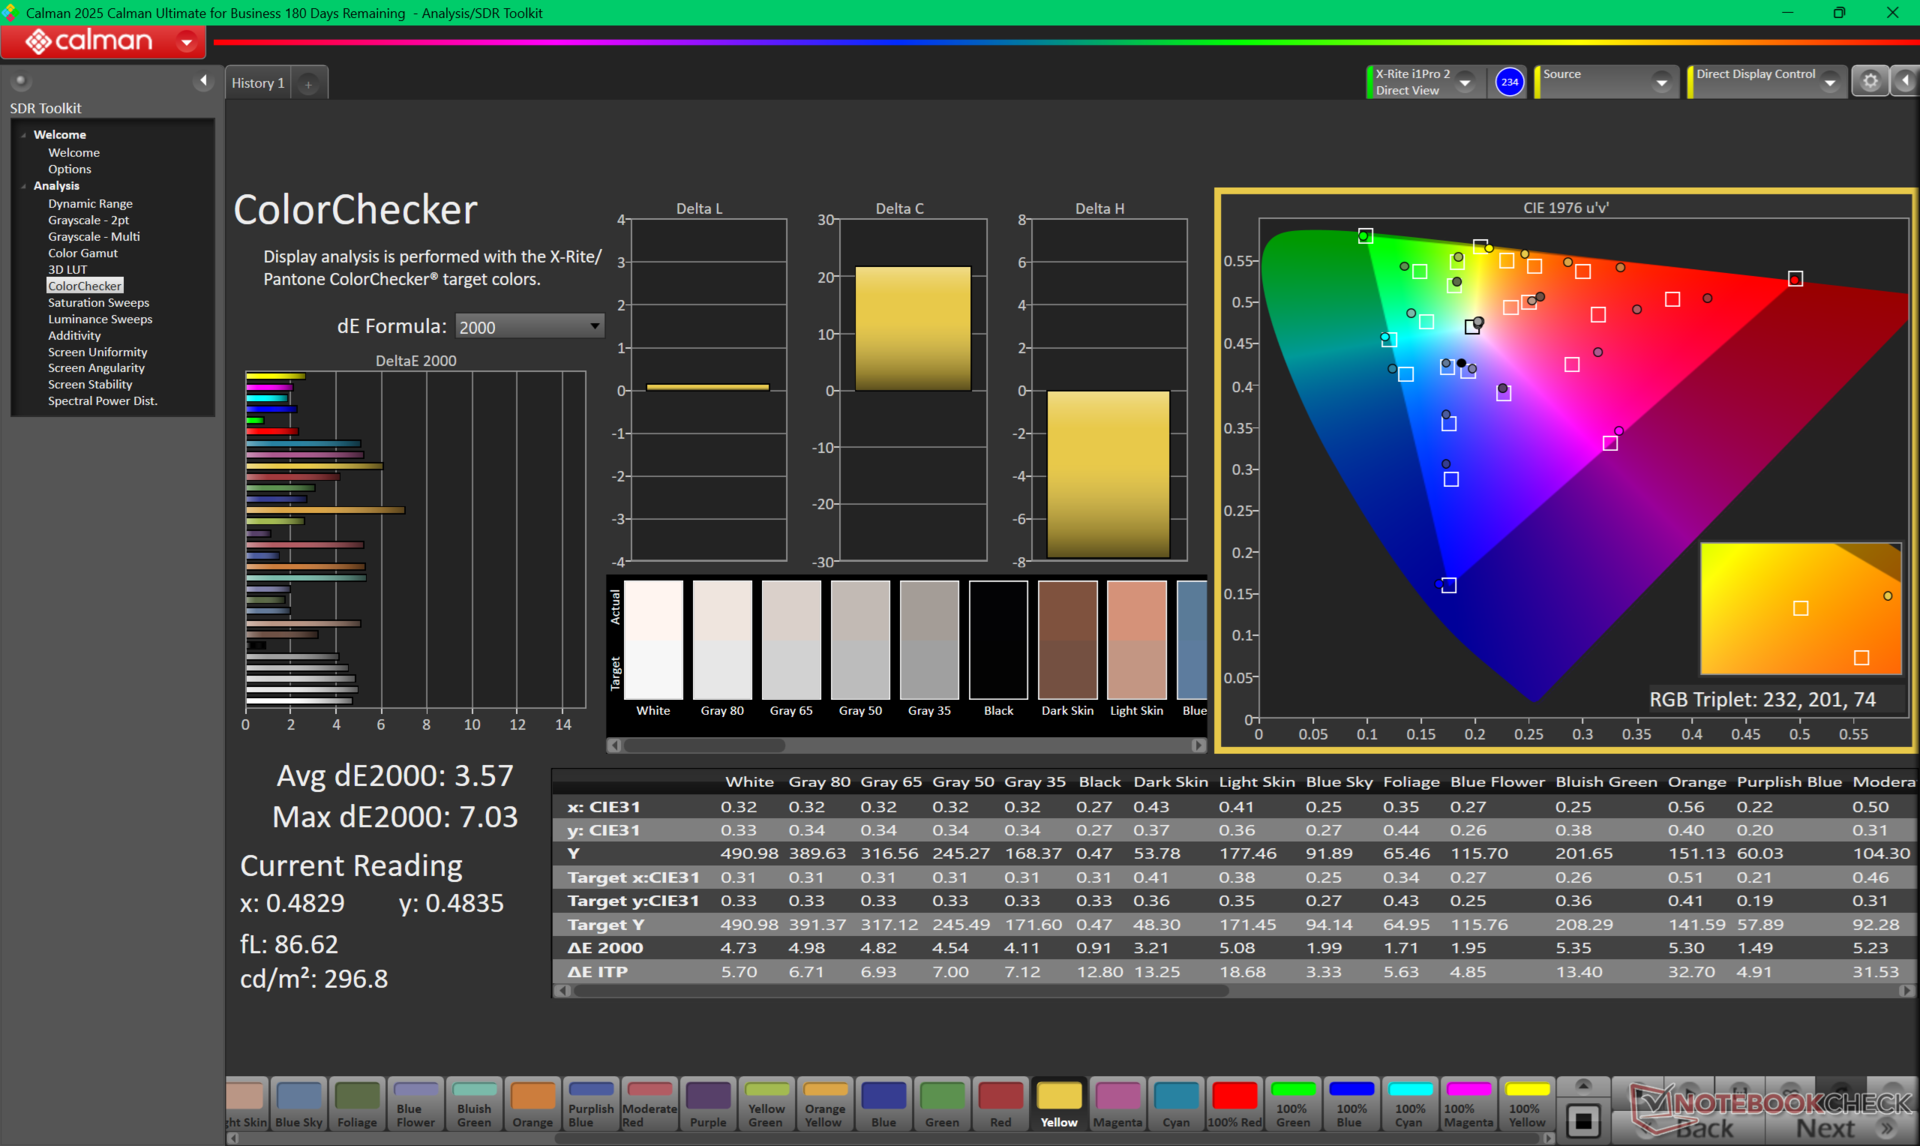
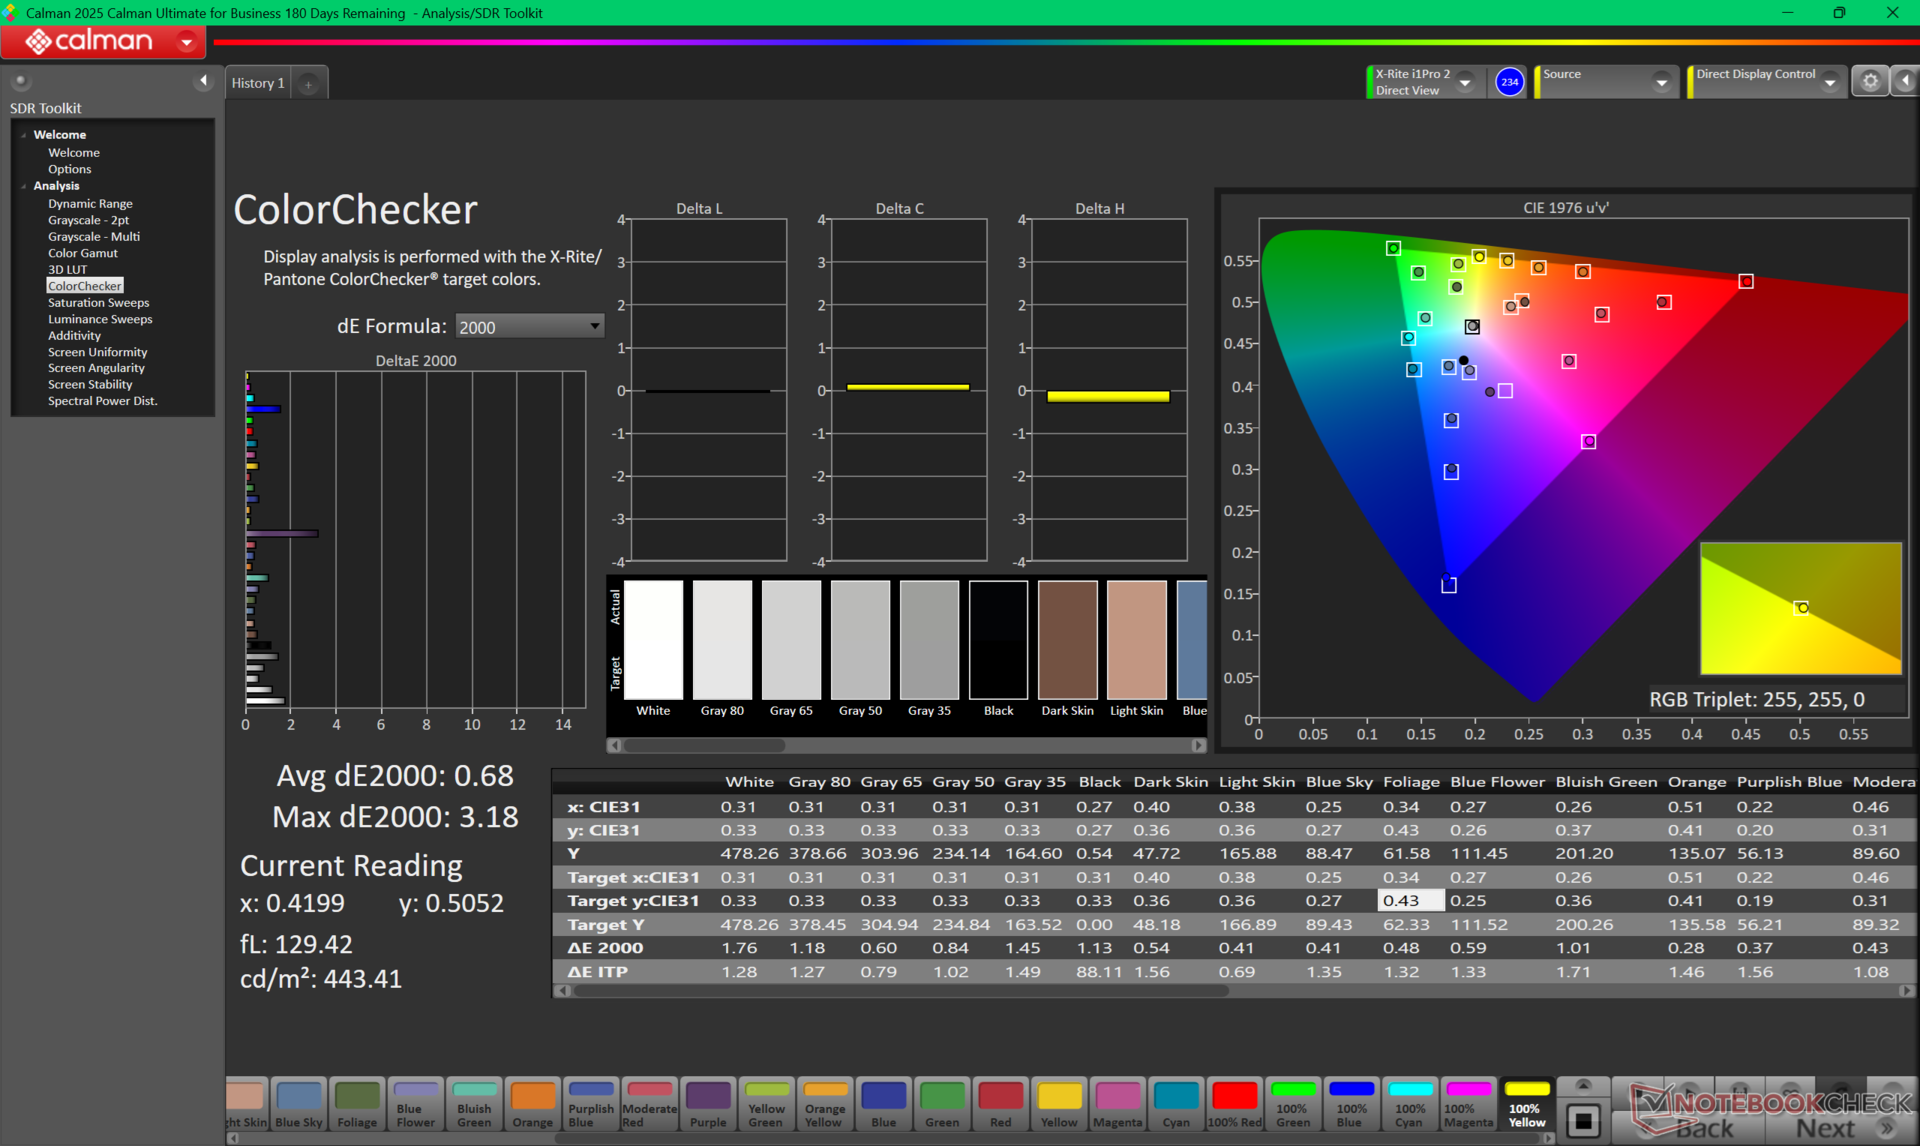
ΔE ColorChecker Calman: 3.57 | ∀{0.5-29.43 Ø4.72}
calibrated: 0.68
ΔE Greyscale Calman: 3.7 | ∀{0.09-98 Ø4.97}
89.7% AdobeRGB 1998 (Argyll 3D)
99.8% sRGB (Argyll 3D)
96.9% Display P3 (Argyll 3D)
Gamma: 2.16
CCT: 5876 K
| Alienware 16X Aurora, RTX 5070 LG Philips 160WQG, IPS, 2560x1600, 16", 240 Hz | Alienware 16 Area-51 AU Optronics B160QAN, IPS, 2560x1600, 16", 240 Hz | Gigabyte Gaming A16 GA6H NE160QDM-NYJ (BOE0C80), IPS, 2560x1600, 16", 165 Hz | MSI Vector 16 HX AI A2XWHG B160QAN02.3 (AUO7DB2), IPS, 2560x1600, 16", 240 Hz | Asus TUF Gaming A16 FA608WV B160UAN08.1 (AUO9BB0), IPS, 1920x1200, 16", 144 Hz | Lenovo Legion 5 Pro 16IAX10H ATNA60HS01-0 (Samsung SDC420A), OLED, 2560x1600, 16", 165 Hz | |
|---|---|---|---|---|---|---|
| Display | -1% | -16% | -2% | -51% | 3% | |
| Display P3 Coverage (%) | 96.9 | 96 -1% | 69.4 -28% | 96.6 0% | 39.8 -59% | 99.9 3% |
| sRGB Coverage (%) | 99.8 | 100 0% | 99.5 0% | 99.8 0% | 59.7 -40% | 100 0% |
| AdobeRGB 1998 Coverage (%) | 89.7 | 89.2 -1% | 71.6 -20% | 84.4 -6% | 41.1 -54% | 94.1 5% |
| Response Times | 3% | -107% | 16% | -107% | 69% | |
| Response Time Grey 50% / Grey 80% * (ms) | 4.3 ? | 4.8 ? -12% | 14.3 ? -233% | 4.3 ? -0% | 13.6 ? -216% | 2 ? 53% |
| Response Time Black / White * (ms) | 8.7 ? | 7.2 ? 17% | 7 ? 20% | 6 ? 31% | 8.4 ? 3% | 1.4 ? 84% |
| PWM Frequency (Hz) | 1300 | |||||
| PWM Amplitude * (%) | 16.7 | |||||
| Bildschirm | 0% | -20% | -9% | -89% | -18% | |
| Helligkeit Bildmitte (cd/m²) | 493.2 | 554 12% | 432 -12% | 473 -4% | 347 -30% | 518 5% |
| Brightness (cd/m²) | 477 | 532 12% | 425 -11% | 426 -11% | 321 -33% | 522 9% |
| Brightness Distribution (%) | 93 | 88 -5% | 91 -2% | 85 -9% | 88 -5% | 97 4% |
| Schwarzwert * (cd/m²) | 0.5 | 0.52 -4% | 0.37 26% | 0.42 16% | 0.3 40% | |
| Kontrast (:1) | 986 | 1065 8% | 1168 18% | 1126 14% | 1157 17% | |
| Delta E Colorchecker * | 3.57 | 2.81 21% | 4.76 -33% | 3.47 3% | 5.89 -65% | 2.49 30% |
| Colorchecker dE 2000 max. * | 7.03 | 8.32 -18% | 8.59 -22% | 7.24 -3% | 19.26 -174% | 5.25 25% |
| Colorchecker dE 2000 calibrated * | 0.68 | 0.65 4% | 1.18 -74% | 1.36 -100% | 4.3 -532% | 2.15 -216% |
| Delta E Graustufen * | 3.7 | 4.7 -27% | 6.2 -68% | 3.1 16% | 4.27 -15% | 3.02 18% |
| Gamma | 2.16 102% | 2.3 96% | 2.079 106% | 2.486 88% | 2.47 89% | 2.37 93% |
| CCT | 5876 111% | 6476 100% | 6690 97% | 6832 95% | 7158 91% | 6426 101% |
| Durchschnitt gesamt (Programm / Settings) | 1% /
0% | -48% /
-31% | 2% /
-4% | -82% /
-83% | 18% /
2% |
* ... kleinere Werte sind besser
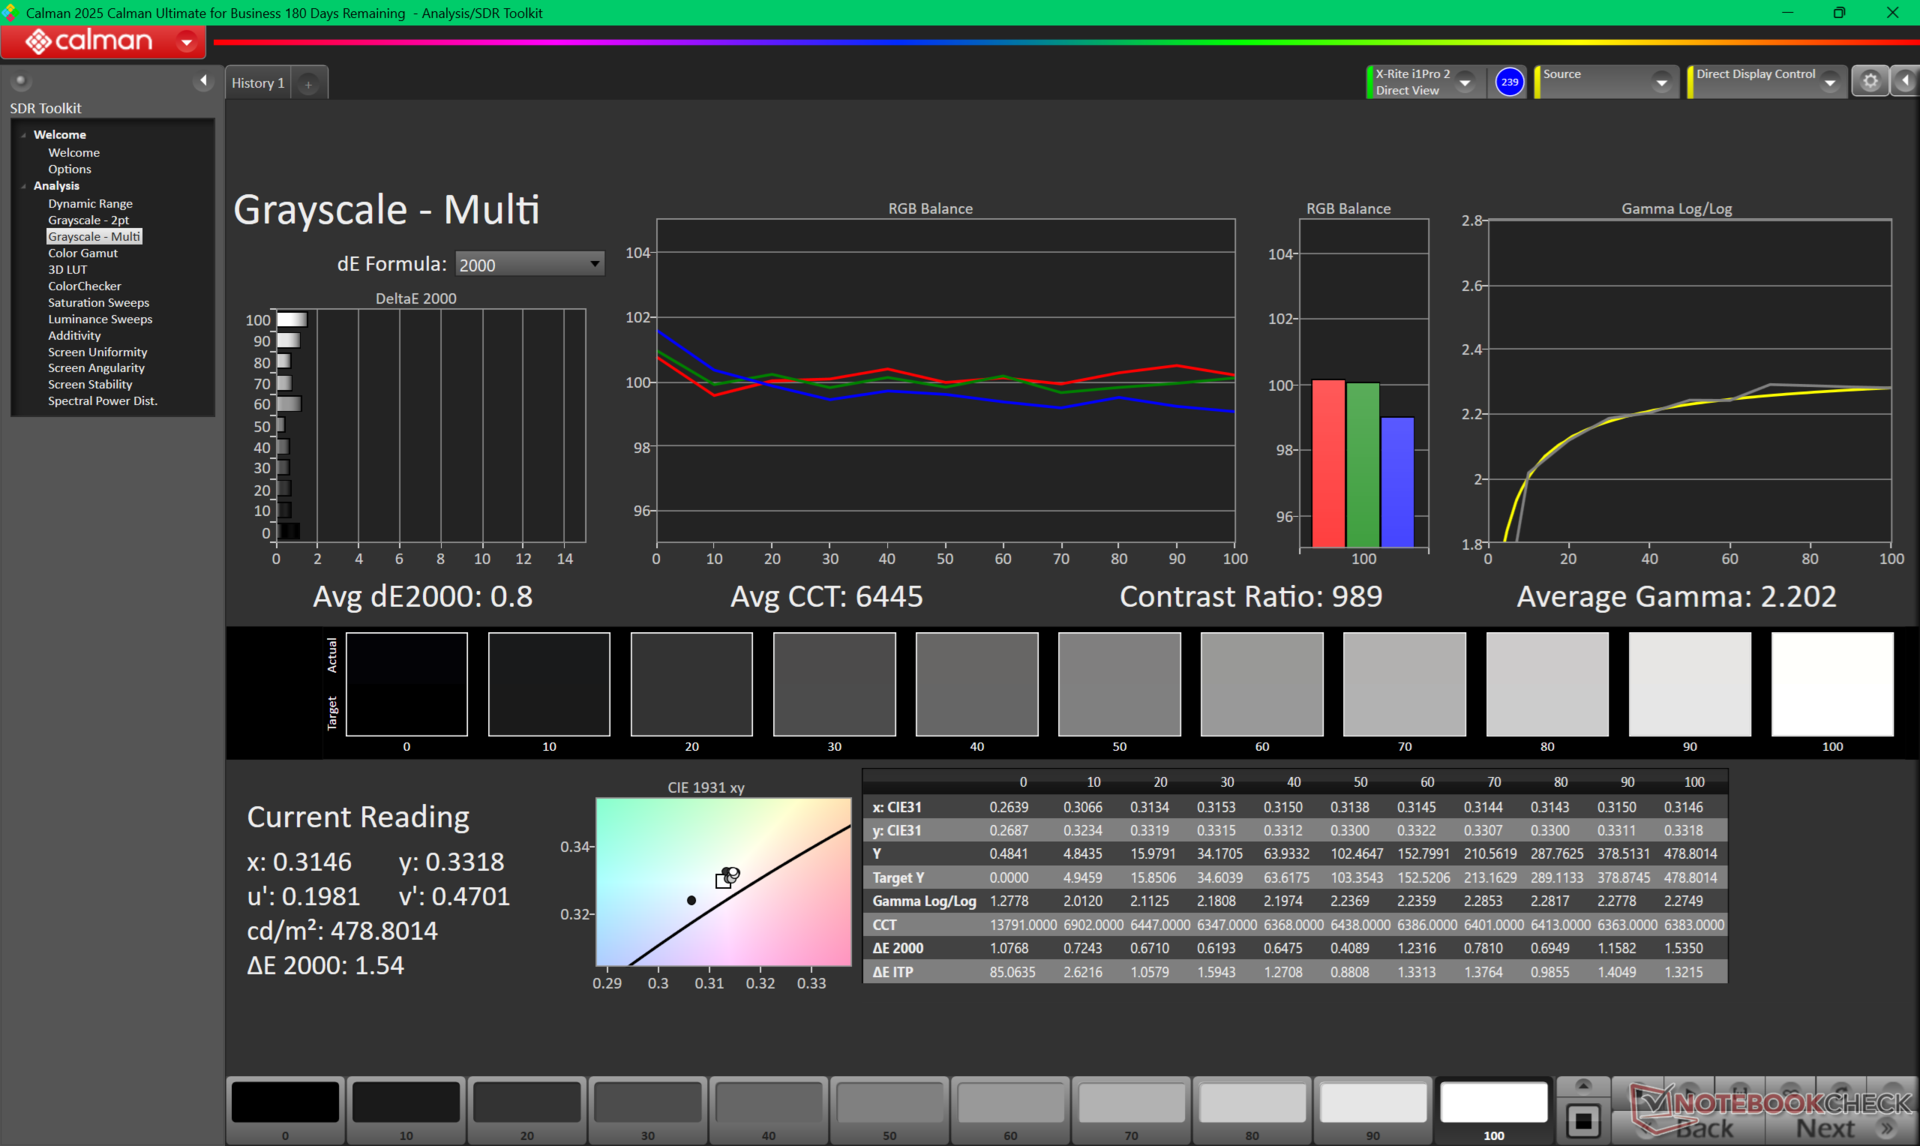
Das Display wird auf P3-Farben kalibriert ausgeliefert, auch wenn Dell keine Werkskalibrierung anbietet. Die Farbtemperatur ist jedoch mit etwa 5900K etwas wärmer, als wir es uns wünschen würden. Unser kalibriertes ICM-Profil steht oben zum kostenlosen Download bereit.
Reaktionszeiten (Response Times) des Displays
| ↔ Reaktionszeiten Schwarz zu Weiß | ||
|---|---|---|
| 8.7 ms ... steigend ↗ und fallend ↘ kombiniert | ↗ 4.6 ms steigend | 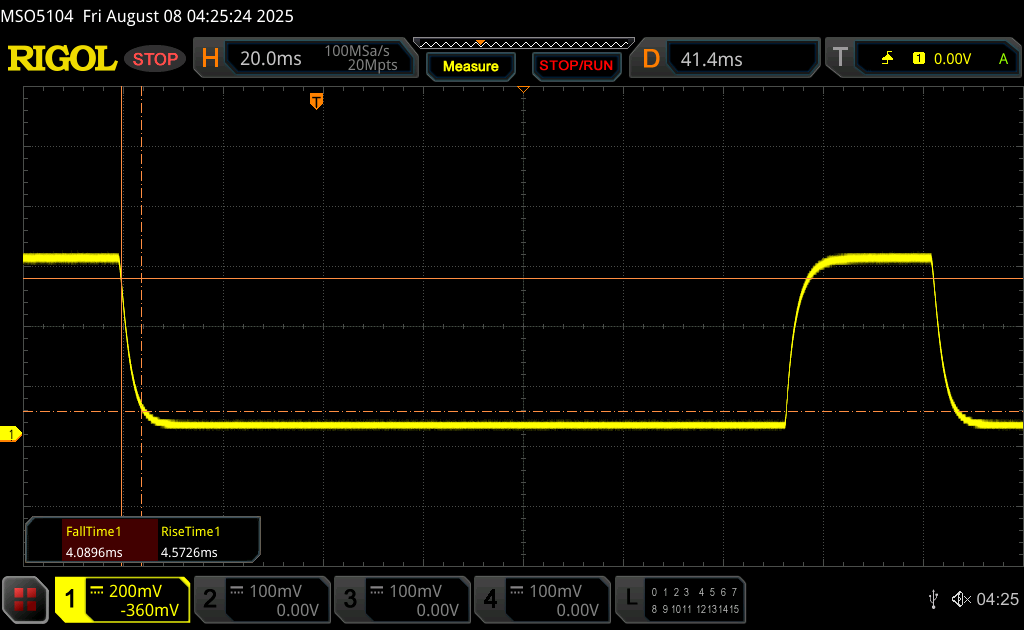 |
| ↘ 4.1 ms fallend | ||
| Die gemessenen Reaktionszeiten sind kurz wodurch sich der Bildschirm auch für Spiele gut eignen sollte. Im Vergleich rangierten die bei uns getesteten Geräte von 0.1 (Minimum) zu 240 (Maximum) ms. » 24 % aller Screens waren schneller als der getestete. Daher sind die gemessenen Reaktionszeiten besser als der Durchschnitt aller vermessenen Geräte (19.8 ms). | ||
| ↔ Reaktionszeiten 50% Grau zu 80% Grau | ||
| 4.3 ms ... steigend ↗ und fallend ↘ kombiniert | ↗ 1.9 ms steigend | 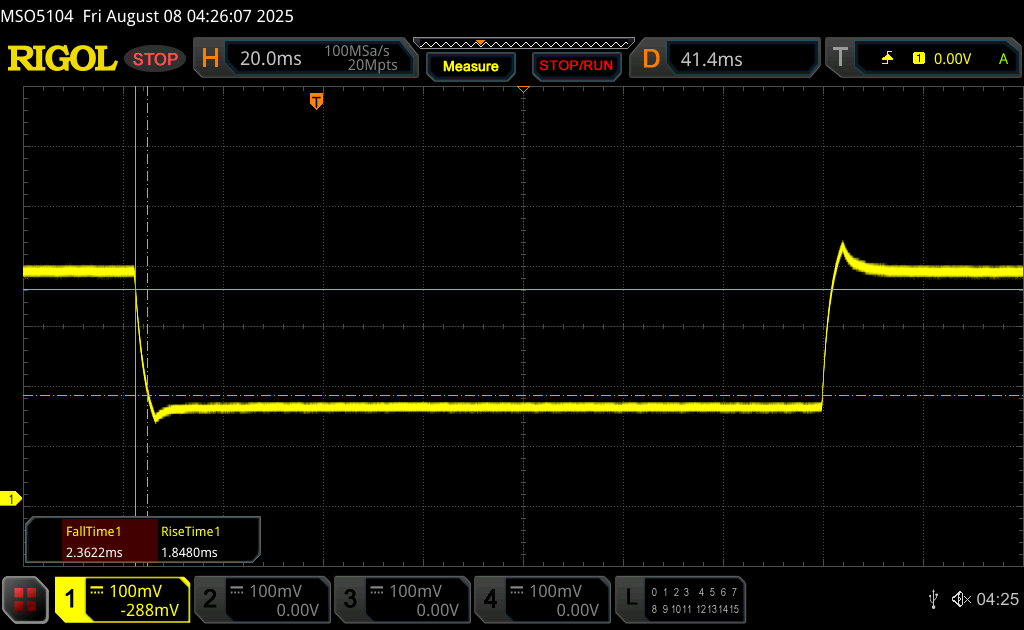 |
| ↘ 2.4 ms fallend | ||
| Die gemessenen Reaktionszeiten sind sehr kurz, wodurch sich der Bildschirm auch für schnelle 3D Spiele eignen sollte. Im Vergleich rangierten die bei uns getesteten Geräte von 0.165 (Minimum) zu 636 (Maximum) ms. » 16 % aller Screens waren schneller als der getestete. Daher sind die gemessenen Reaktionszeiten besser als der Durchschnitt aller vermessenen Geräte (31 ms). | ||
Bildschirm-Flackern / PWM (Pulse-Width Modulation)
| Flackern / PWM nicht festgestellt |  | ||
Im Vergleich: 52 % aller getesteten Geräte nutzten kein PWM um die Helligkeit zu reduzieren. Wenn PWM eingesetzt wurde, dann bei einer Frequenz von durchschnittlich 7781 (Minimum 5, Maximum 343500) Hz. | |||
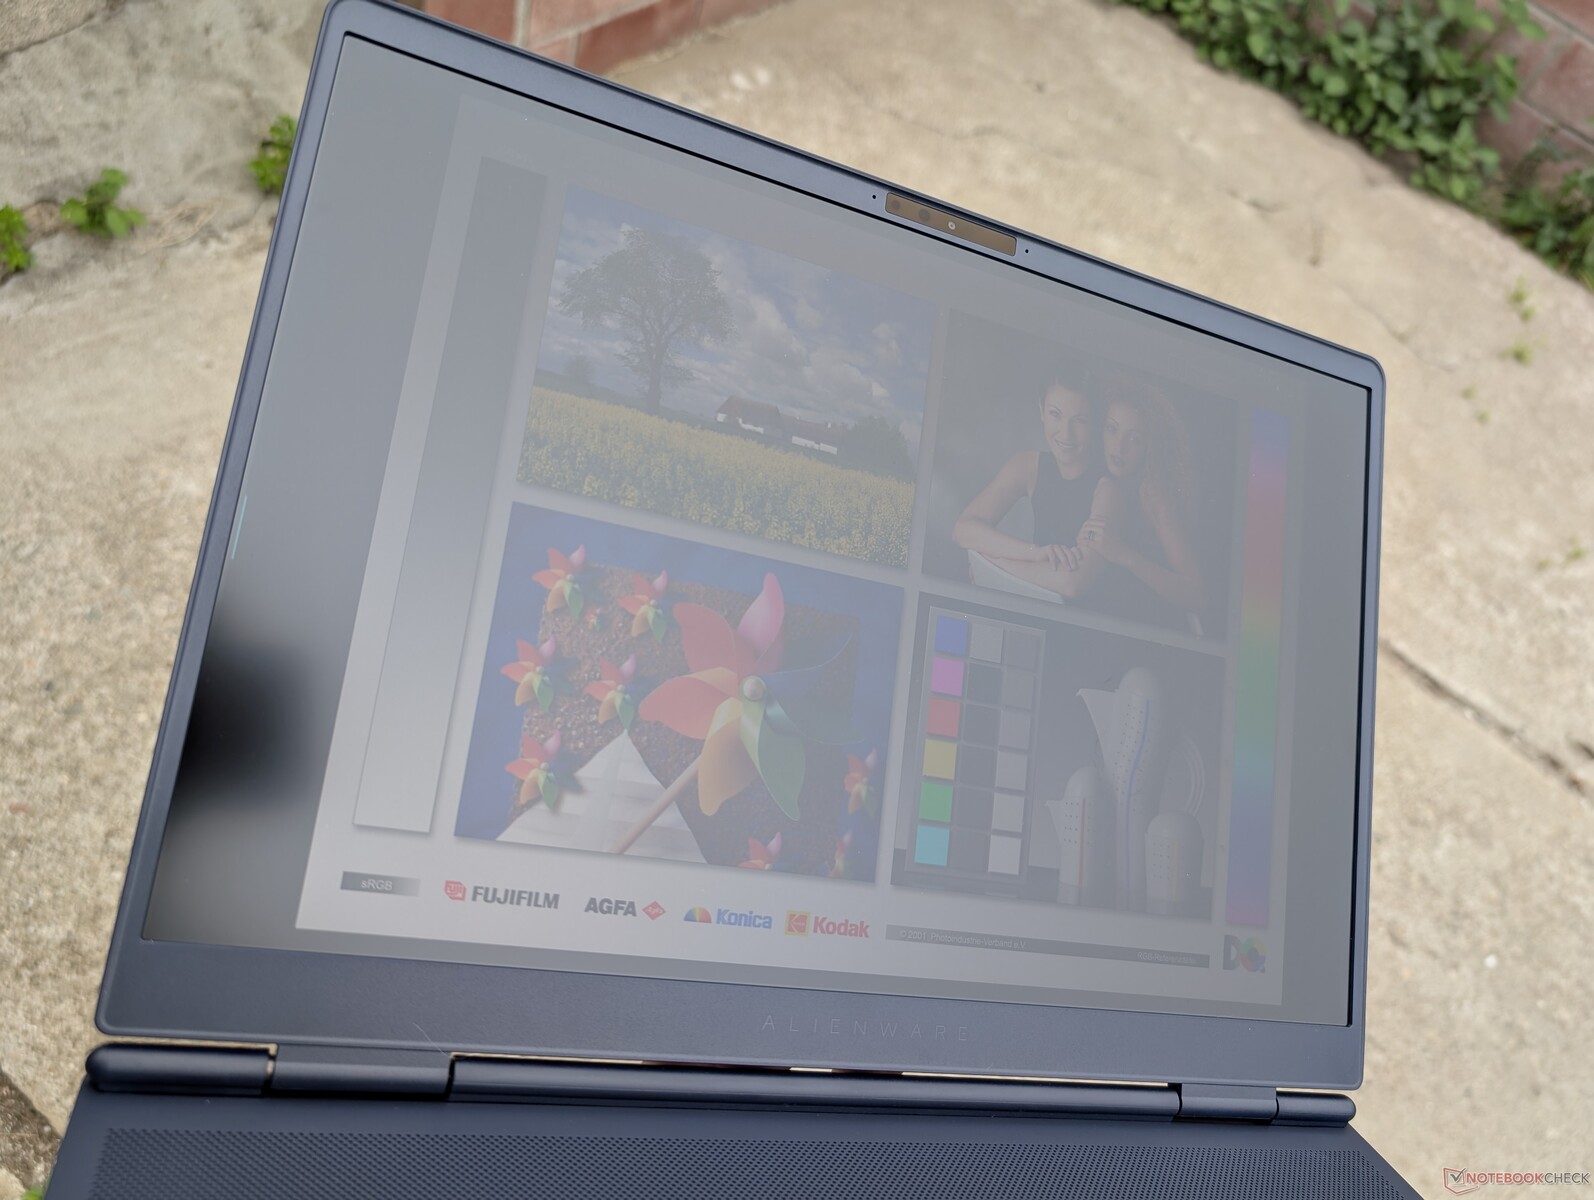
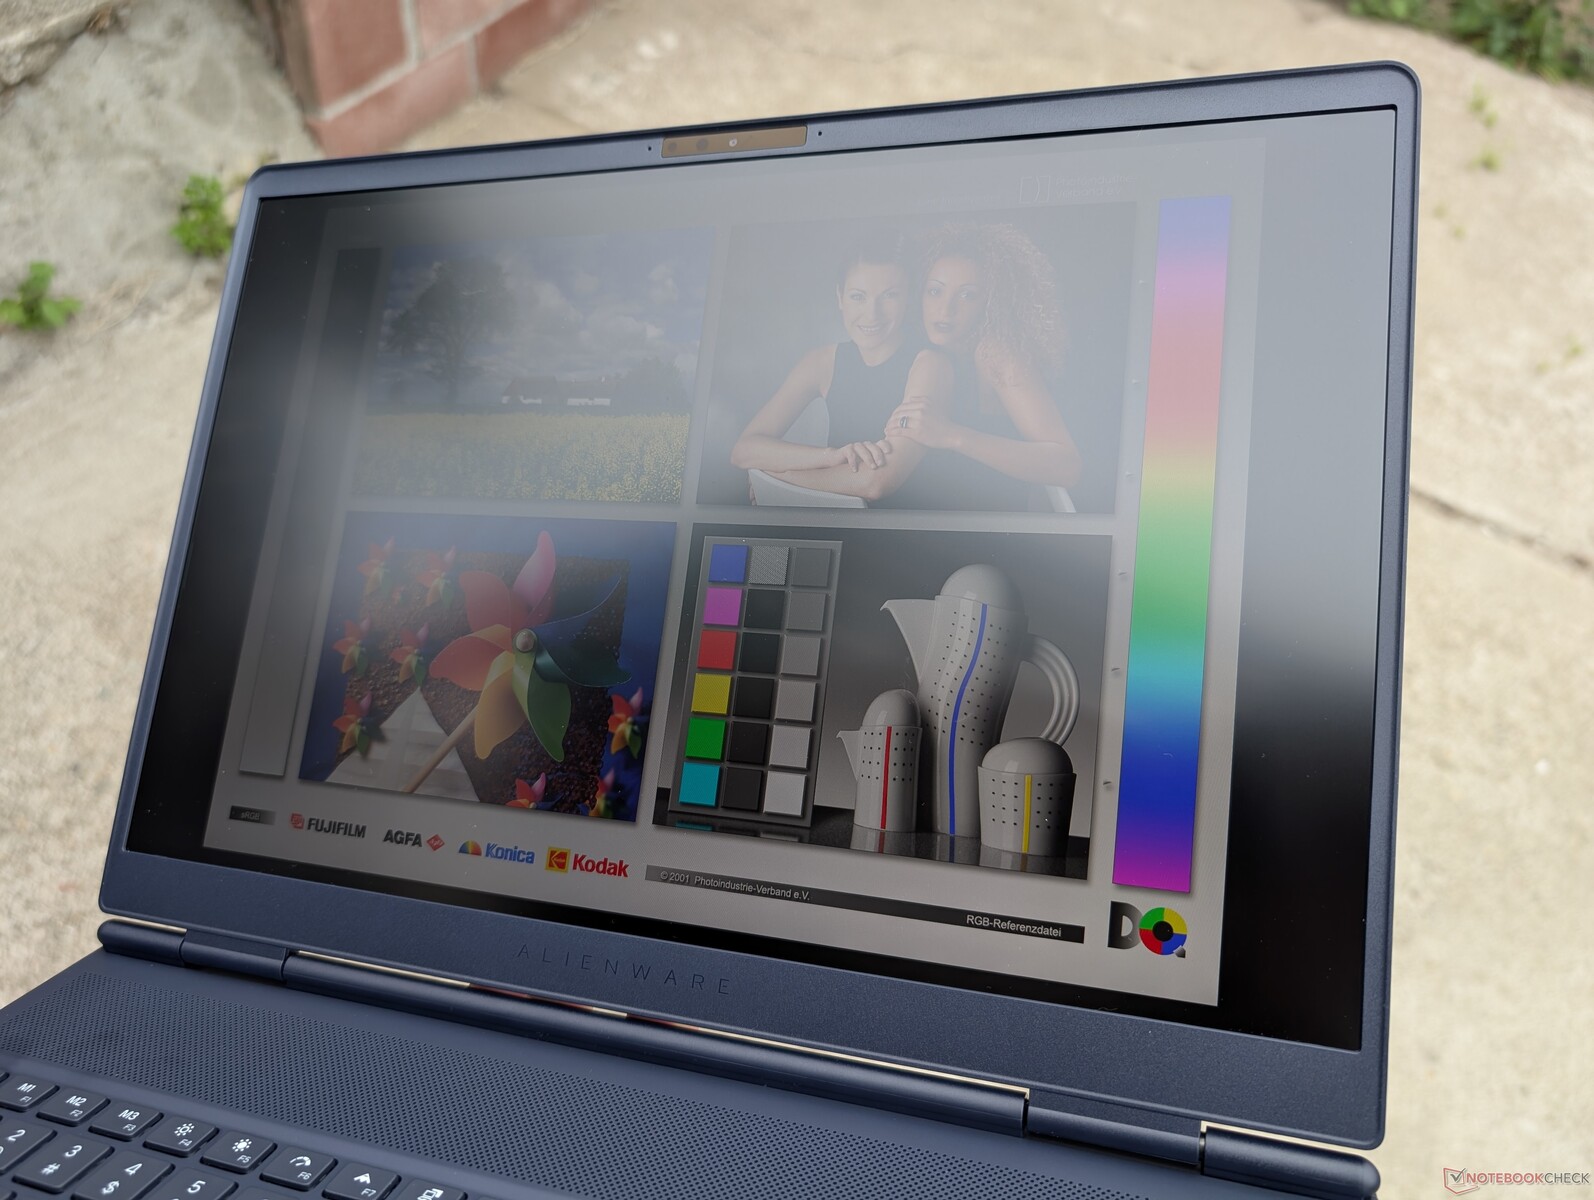
Das Display ist mit fast 500 nits für einen Gaming-Laptop recht hell, verglichen mit nur ~350 nits beim Asus TUF Gaming A16. Die Sichtbarkeit ist anständig, wenn Sie im Schatten arbeiten, aber die Farben werden unter helleren Bedingungen ausgewaschen.

Performance

Testbedingungen
Wir haben sowohl Windows als auch das Alienware Command Center auf den Modus Performance eingestellt, bevor wir die folgenden Benchmarks durchgeführt haben. Es ist ein Overdrive-Modus verfügbar, der die Lautstärke des Lüfters noch weiter erhöht, aber die Leistungsvorteile sind bestenfalls minimal, wie unsere Benchmarks unten zeigen.
Prozessor
Die CPU-Leistung ist ausgezeichnet, aber nicht perfekt. Wenn Sie z. B. CineBench R15 xT in einer Schleife laufen lassen, sinkt die Leistung nach den ersten paar Schleifen um etwa 8 Prozent, was auf eine begrenzte Nachhaltigkeit des Turbo Boosts schließen lässt. Die sehr hohe Kerntemperatur von fast 100 °C bei voller Auslastung der CPU ist ebenfalls ein Zeichen dafür. Insgesamt ist die Multi-Thread-Leistung dennoch um bis zu 25 Prozent schneller als die Core Ultra 7 255HX-Konfiguration oder verglichen mit dem älteren Core Ultra 7 155H im Alienware m16 R2 um fast das Doppelte.
Cinebench R15 Mehrfachschleife
Cinebench R23: Multi Core | Single Core
Cinebench R20: CPU (Multi Core) | CPU (Single Core)
Cinebench R15: CPU Multi 64Bit | CPU Single 64Bit
Blender: v2.79 BMW27 CPU
7-Zip 18.03: 7z b 4 | 7z b 4 -mmt1
Geekbench 6.7: Multi-Core | Single-Core
Geekbench 5.5: Multi-Core | Single-Core
HWBOT x265 Benchmark v2.2: 4k Preset
LibreOffice : 20 Documents To PDF
R Benchmark 2.5: Overall mean
* ... kleinere Werte sind besser
AIDA64: FP32 Ray-Trace | FPU Julia | CPU SHA3 | CPU Queen | FPU SinJulia | FPU Mandel | CPU AES | CPU ZLib | FP64 Ray-Trace | CPU PhotoWorxx
| Performance Rating | |
| Lenovo Legion 5 Pro 16IAX10H | |
| Durchschnittliche Intel Core Ultra 9 275HX | |
| Alienware 16 Area-51 | |
| Alienware 16X Aurora, RTX 5070 | |
| Asus TUF Gaming A16 FA608WV | |
| MSI Vector 16 HX AI A2XWHG | |
| Gigabyte Gaming A16 GA6H | |
| AIDA64 / FP32 Ray-Trace | |
| Asus TUF Gaming A16 FA608WV | |
| Durchschnittliche Intel Core Ultra 9 275HX (28039 - 39895, n=30) | |
| Lenovo Legion 5 Pro 16IAX10H | |
| Alienware 16 Area-51 | |
| Alienware 16X Aurora, RTX 5070 | |
| MSI Vector 16 HX AI A2XWHG | |
| Gigabyte Gaming A16 GA6H | |
| AIDA64 / FPU Julia | |
| Lenovo Legion 5 Pro 16IAX10H | |
| Durchschnittliche Intel Core Ultra 9 275HX (140254 - 200744, n=30) | |
| Alienware 16 Area-51 | |
| Alienware 16X Aurora, RTX 5070 | |
| Asus TUF Gaming A16 FA608WV | |
| MSI Vector 16 HX AI A2XWHG | |
| Gigabyte Gaming A16 GA6H | |
| AIDA64 / CPU SHA3 | |
| Durchschnittliche Intel Core Ultra 9 275HX (6710 - 9817, n=30) | |
| Lenovo Legion 5 Pro 16IAX10H | |
| Alienware 16 Area-51 | |
| Alienware 16X Aurora, RTX 5070 | |
| MSI Vector 16 HX AI A2XWHG | |
| Asus TUF Gaming A16 FA608WV | |
| Gigabyte Gaming A16 GA6H | |
| AIDA64 / CPU Queen | |
| Lenovo Legion 5 Pro 16IAX10H | |
| Alienware 16X Aurora, RTX 5070 | |
| Durchschnittliche Intel Core Ultra 9 275HX (113887 - 140937, n=30) | |
| Alienware 16 Area-51 | |
| MSI Vector 16 HX AI A2XWHG | |
| Asus TUF Gaming A16 FA608WV | |
| Gigabyte Gaming A16 GA6H | |
| AIDA64 / FPU SinJulia | |
| Asus TUF Gaming A16 FA608WV | |
| Lenovo Legion 5 Pro 16IAX10H | |
| Alienware 16 Area-51 | |
| Alienware 16X Aurora, RTX 5070 | |
| Durchschnittliche Intel Core Ultra 9 275HX (11172 - 14425, n=30) | |
| MSI Vector 16 HX AI A2XWHG | |
| Gigabyte Gaming A16 GA6H | |
| AIDA64 / FPU Mandel | |
| Durchschnittliche Intel Core Ultra 9 275HX (72596 - 104508, n=30) | |
| Lenovo Legion 5 Pro 16IAX10H | |
| Alienware 16 Area-51 | |
| Alienware 16X Aurora, RTX 5070 | |
| Asus TUF Gaming A16 FA608WV | |
| MSI Vector 16 HX AI A2XWHG | |
| Gigabyte Gaming A16 GA6H | |
| AIDA64 / CPU AES | |
| Lenovo Legion 5 Pro 16IAX10H | |
| Durchschnittliche Intel Core Ultra 9 275HX (105608 - 247074, n=30) | |
| Alienware 16 Area-51 | |
| Alienware 16X Aurora, RTX 5070 | |
| MSI Vector 16 HX AI A2XWHG | |
| Asus TUF Gaming A16 FA608WV | |
| Gigabyte Gaming A16 GA6H | |
| AIDA64 / CPU ZLib | |
| Lenovo Legion 5 Pro 16IAX10H | |
| Durchschnittliche Intel Core Ultra 9 275HX (1582 - 2263, n=30) | |
| Alienware 16 Area-51 | |
| Alienware 16X Aurora, RTX 5070 | |
| Asus TUF Gaming A16 FA608WV | |
| MSI Vector 16 HX AI A2XWHG | |
| Gigabyte Gaming A16 GA6H | |
| AIDA64 / FP64 Ray-Trace | |
| Asus TUF Gaming A16 FA608WV | |
| Durchschnittliche Intel Core Ultra 9 275HX (14847 - 21854, n=30) | |
| Lenovo Legion 5 Pro 16IAX10H | |
| Alienware 16 Area-51 | |
| Alienware 16X Aurora, RTX 5070 | |
| MSI Vector 16 HX AI A2XWHG | |
| Gigabyte Gaming A16 GA6H | |
| AIDA64 / CPU PhotoWorxx | |
| Alienware 16 Area-51 | |
| Durchschnittliche Intel Core Ultra 9 275HX (37482 - 62916, n=30) | |
| Lenovo Legion 5 Pro 16IAX10H | |
| Alienware 16X Aurora, RTX 5070 | |
| MSI Vector 16 HX AI A2XWHG | |
| Asus TUF Gaming A16 FA608WV | |
| Gigabyte Gaming A16 GA6H | |
Stresstest
Bei der Ausführung von Prime95 steigt die CPU auf 4,1 GHz, 165 W und 102 °C, bevor sie sich kurz darauf bei 3,4 GHz, 102 W und 99 °C stabilisiert. Die Kerntemperatur ist selbst im Overdrive-Modus sehr warm (etwa im Vergleich zum Razer Blade 16, bei dem sich die Kerntemperatur unter ähnlichen Bedingungen bei kühleren 80 °C stabilisiert). Das Aurora 16X legt eindeutig den Schwerpunkt auf die CPU-Leistung, auch wenn dies bedeutet, dass die Kerntemperaturen deutlich höher sind.
Die Leistungsaufnahme des GPU-Boards stabilisiert sich bei 94 W, 111 W bzw. 114 W, wenn Cyberpunk 2077 im Modus Balanced, Performance bzw. Overdrive läuft. Die GPU-Taktraten zwischen den einzelnen Leistungseinstellungen steigen leicht an, wie die Tabelle und die Screenshots unten zeigen. Die CPU- und GPU-Temperaturen pendeln sich beim Spielen im niedrigen 80-C-Bereich ein, was für Gaming-Notebooks typisch ist.
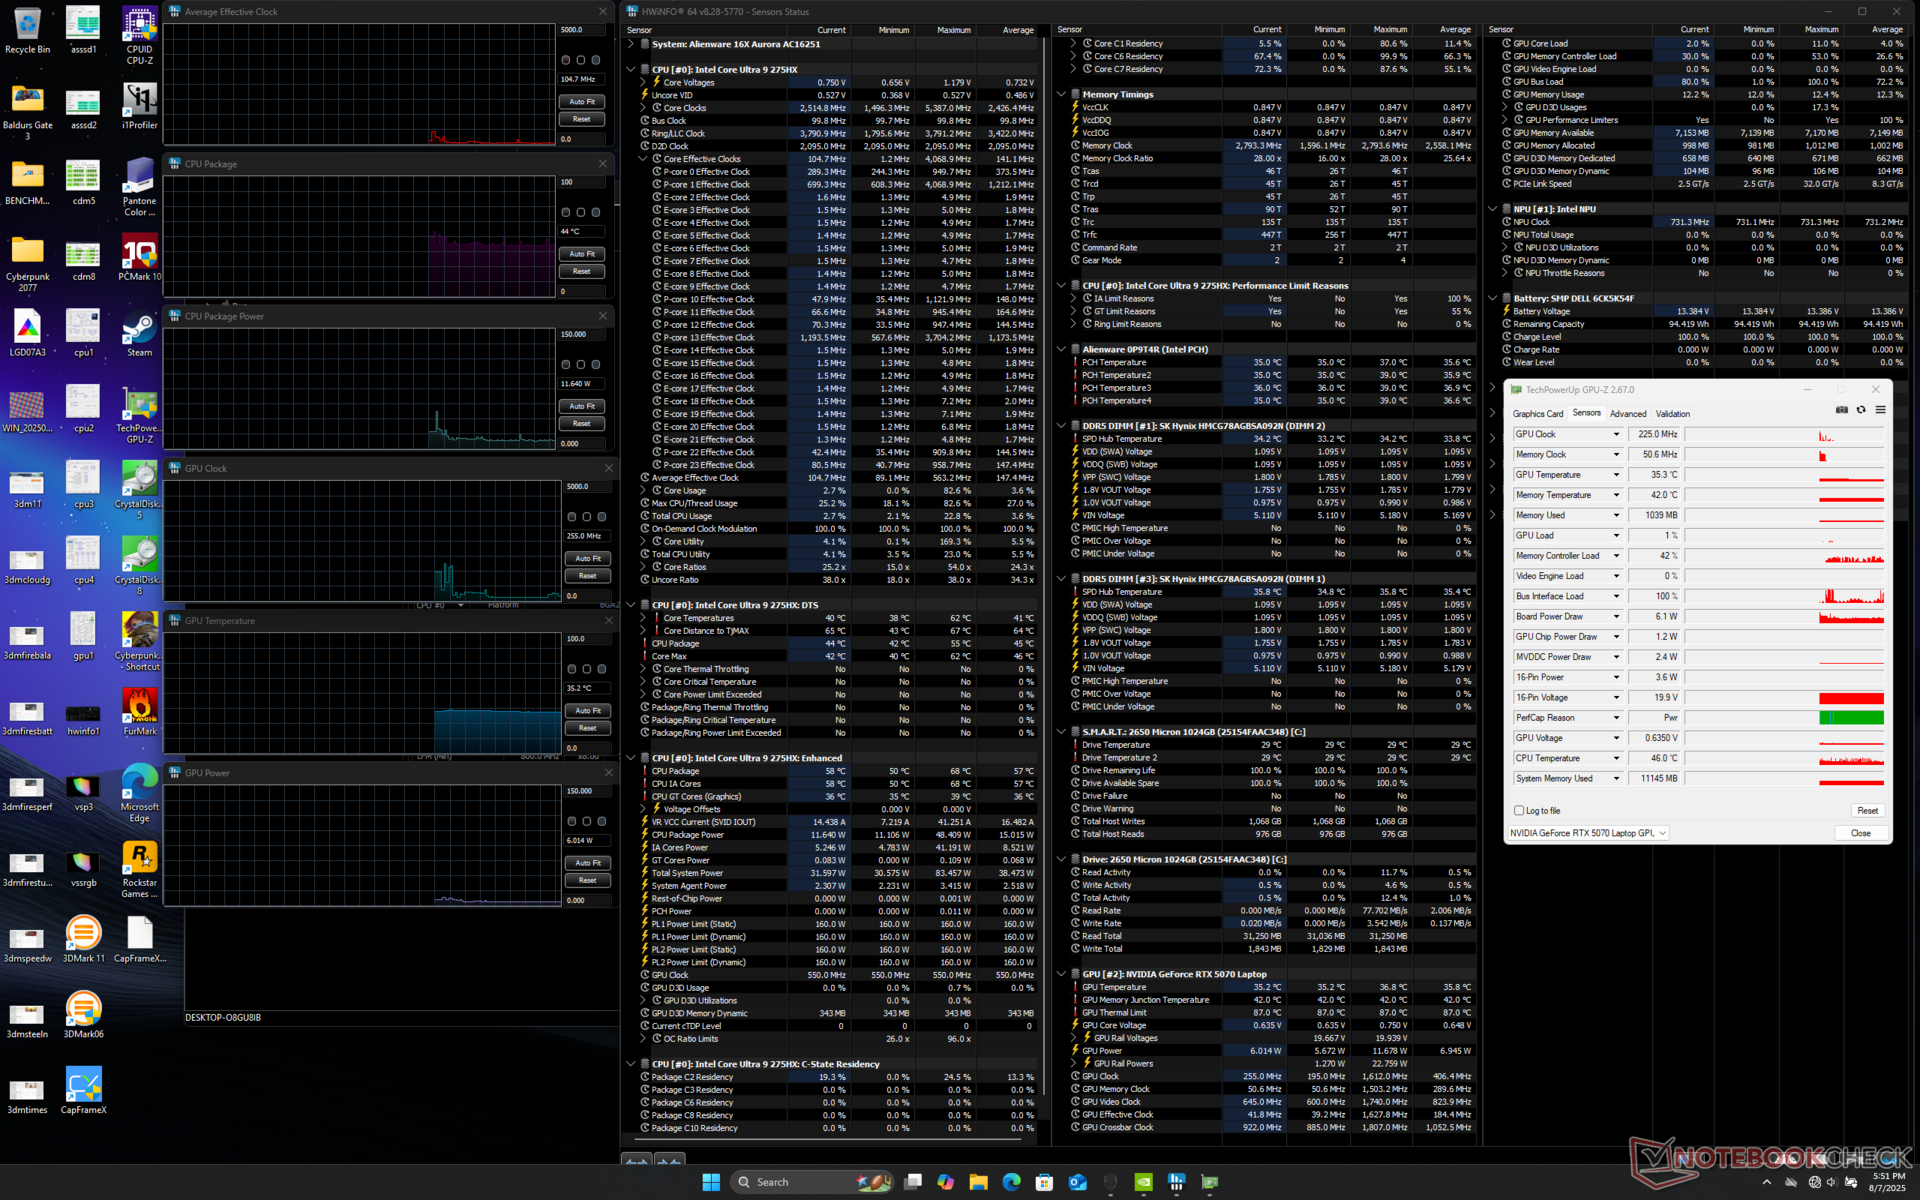
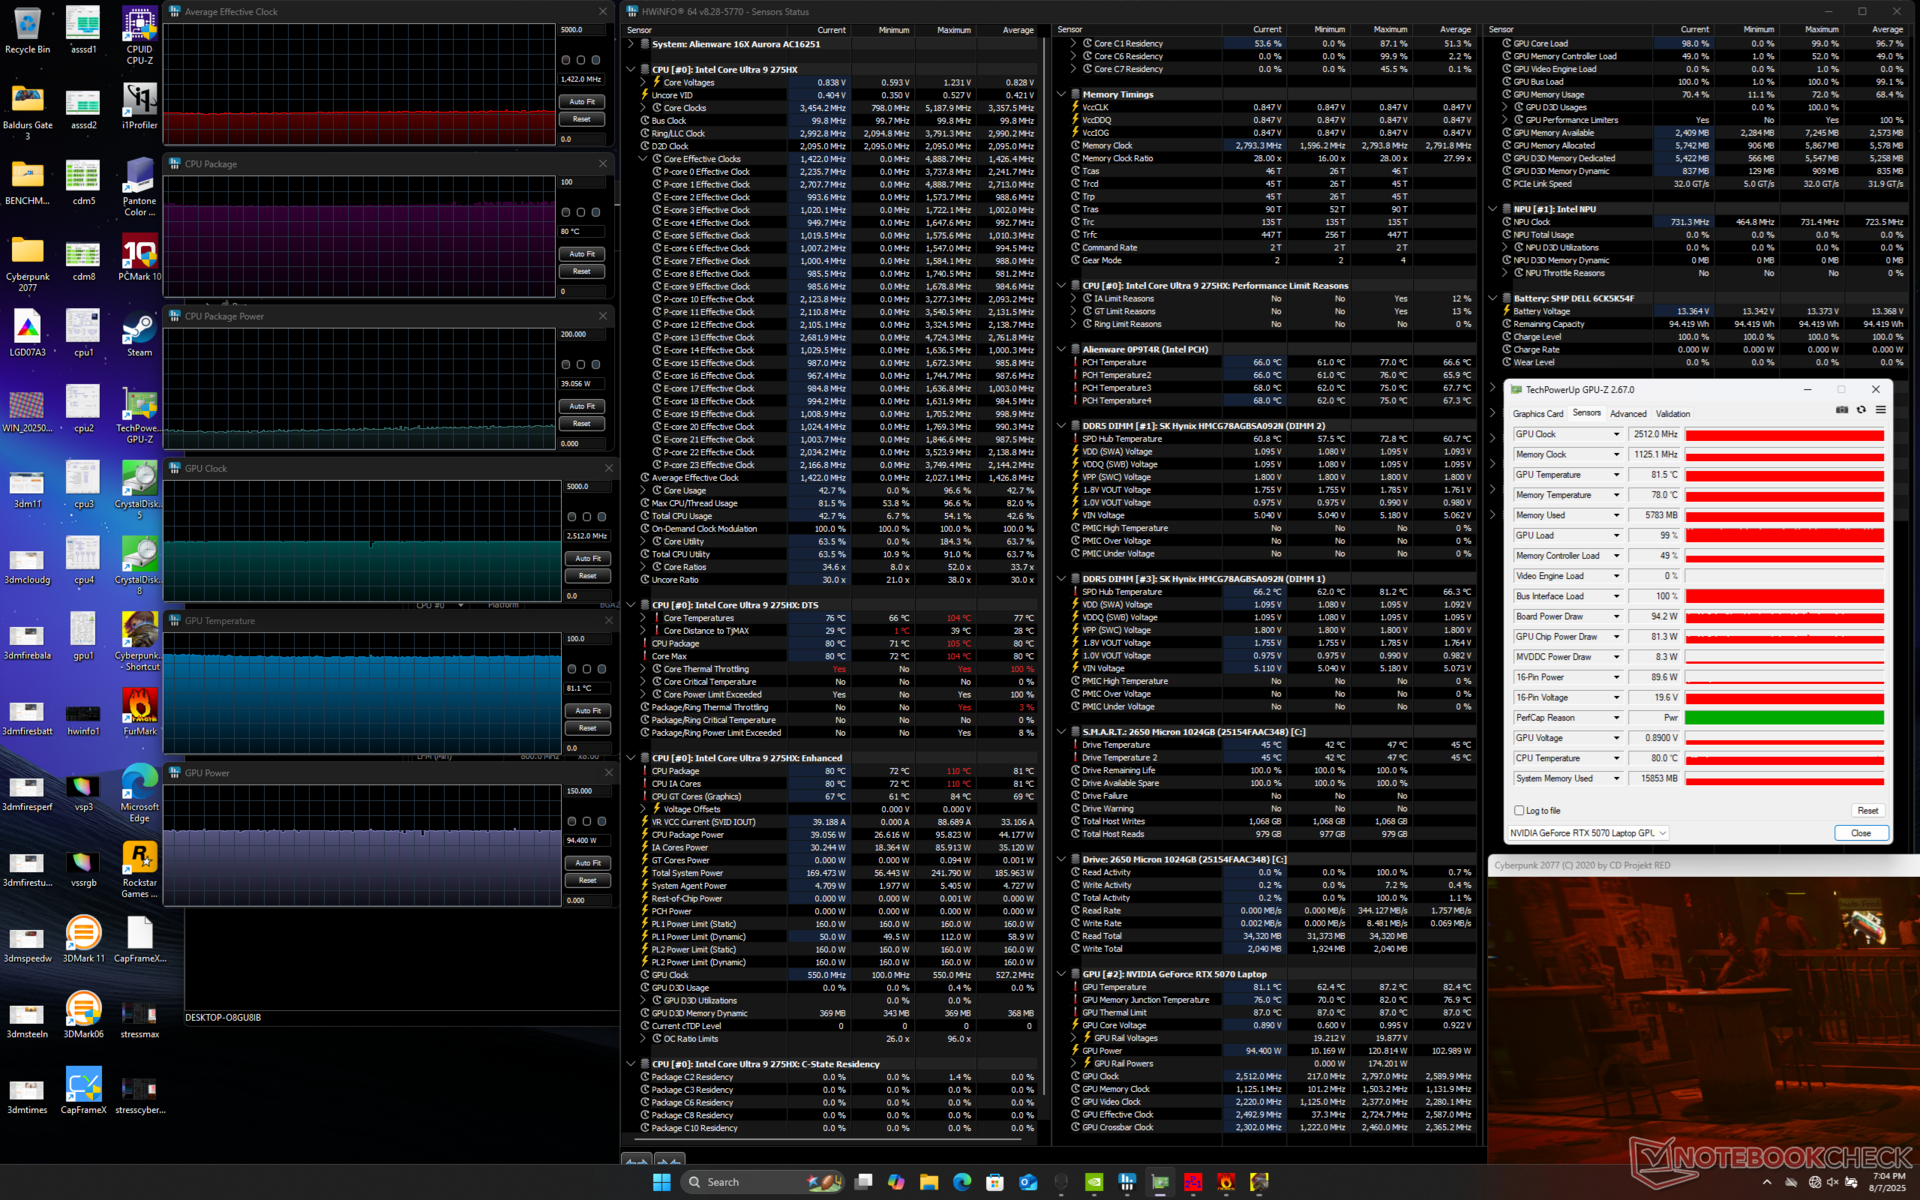

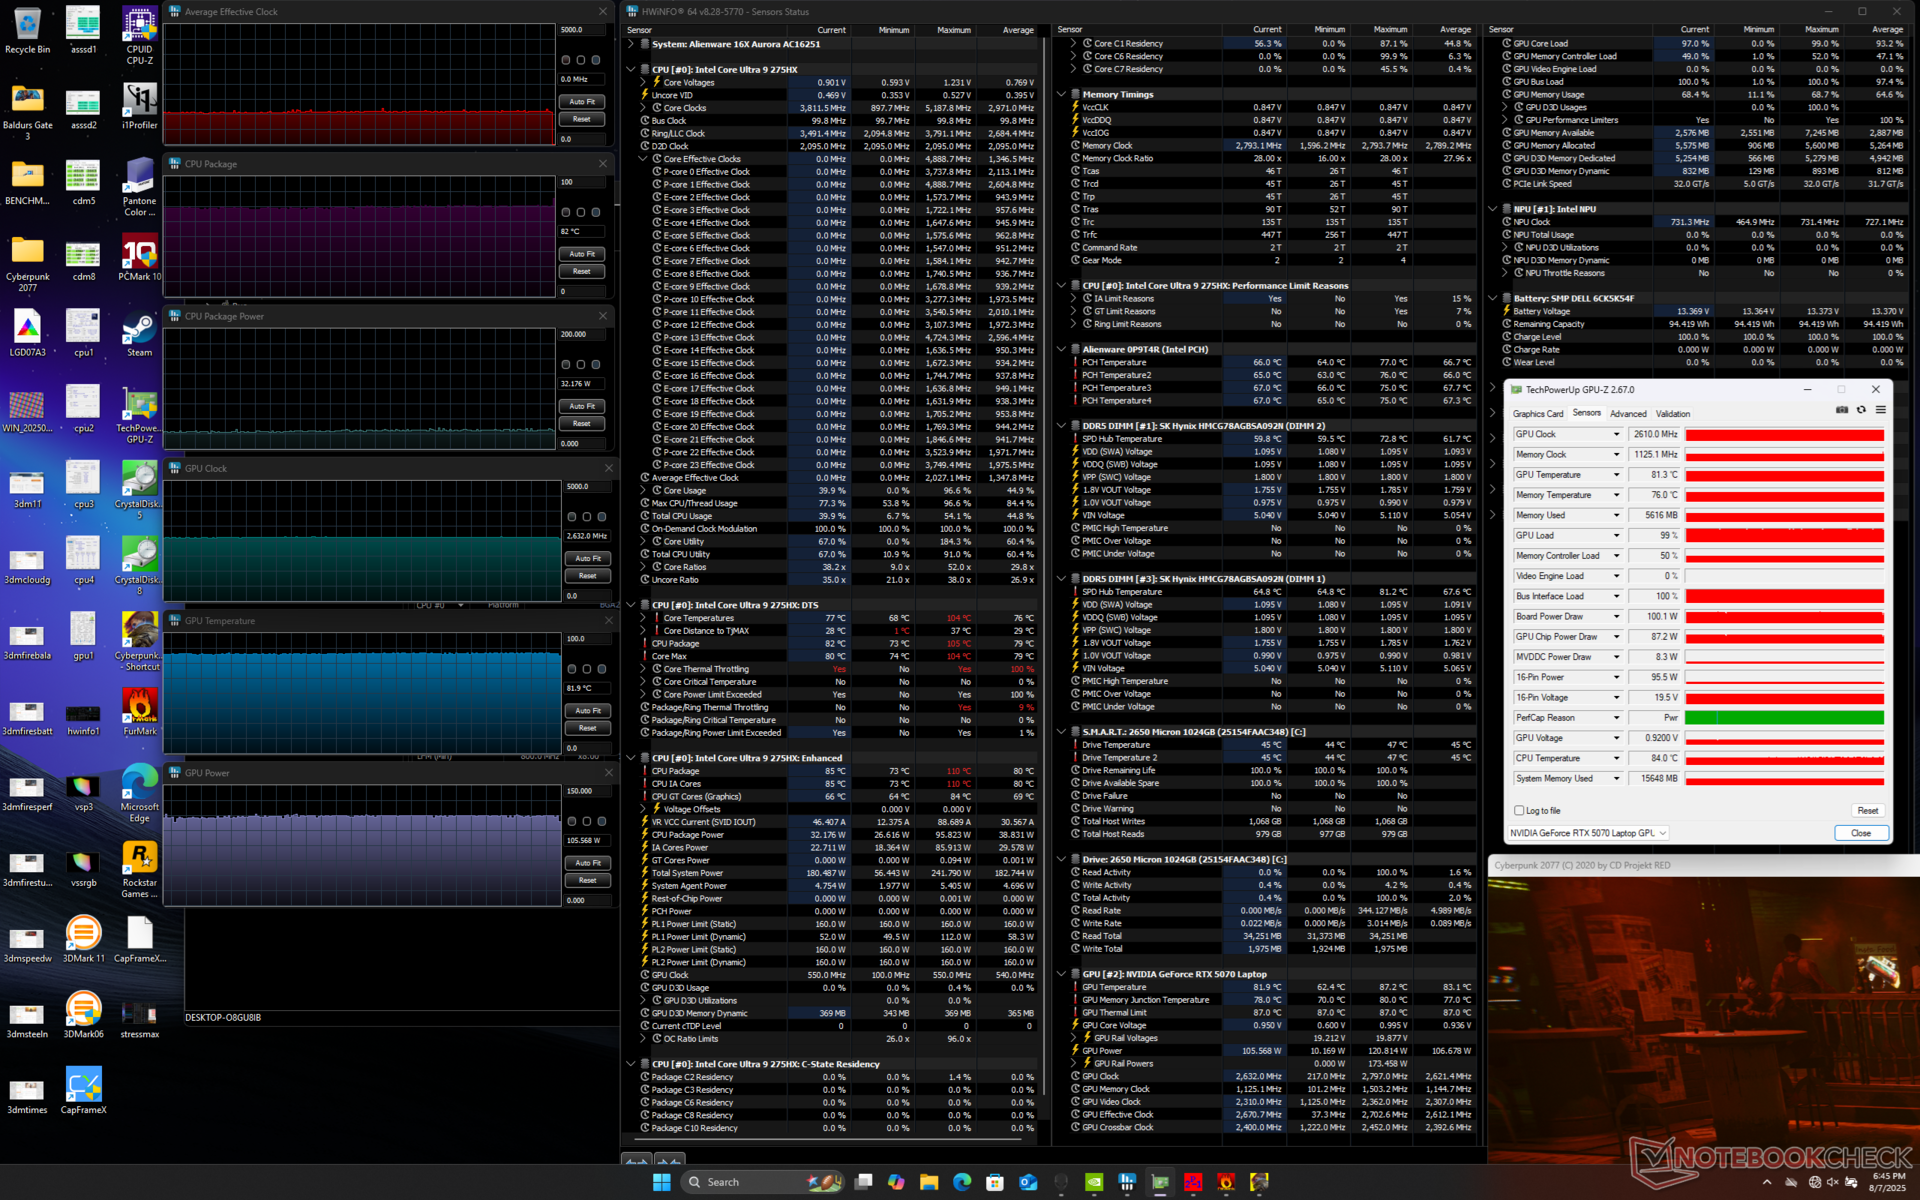
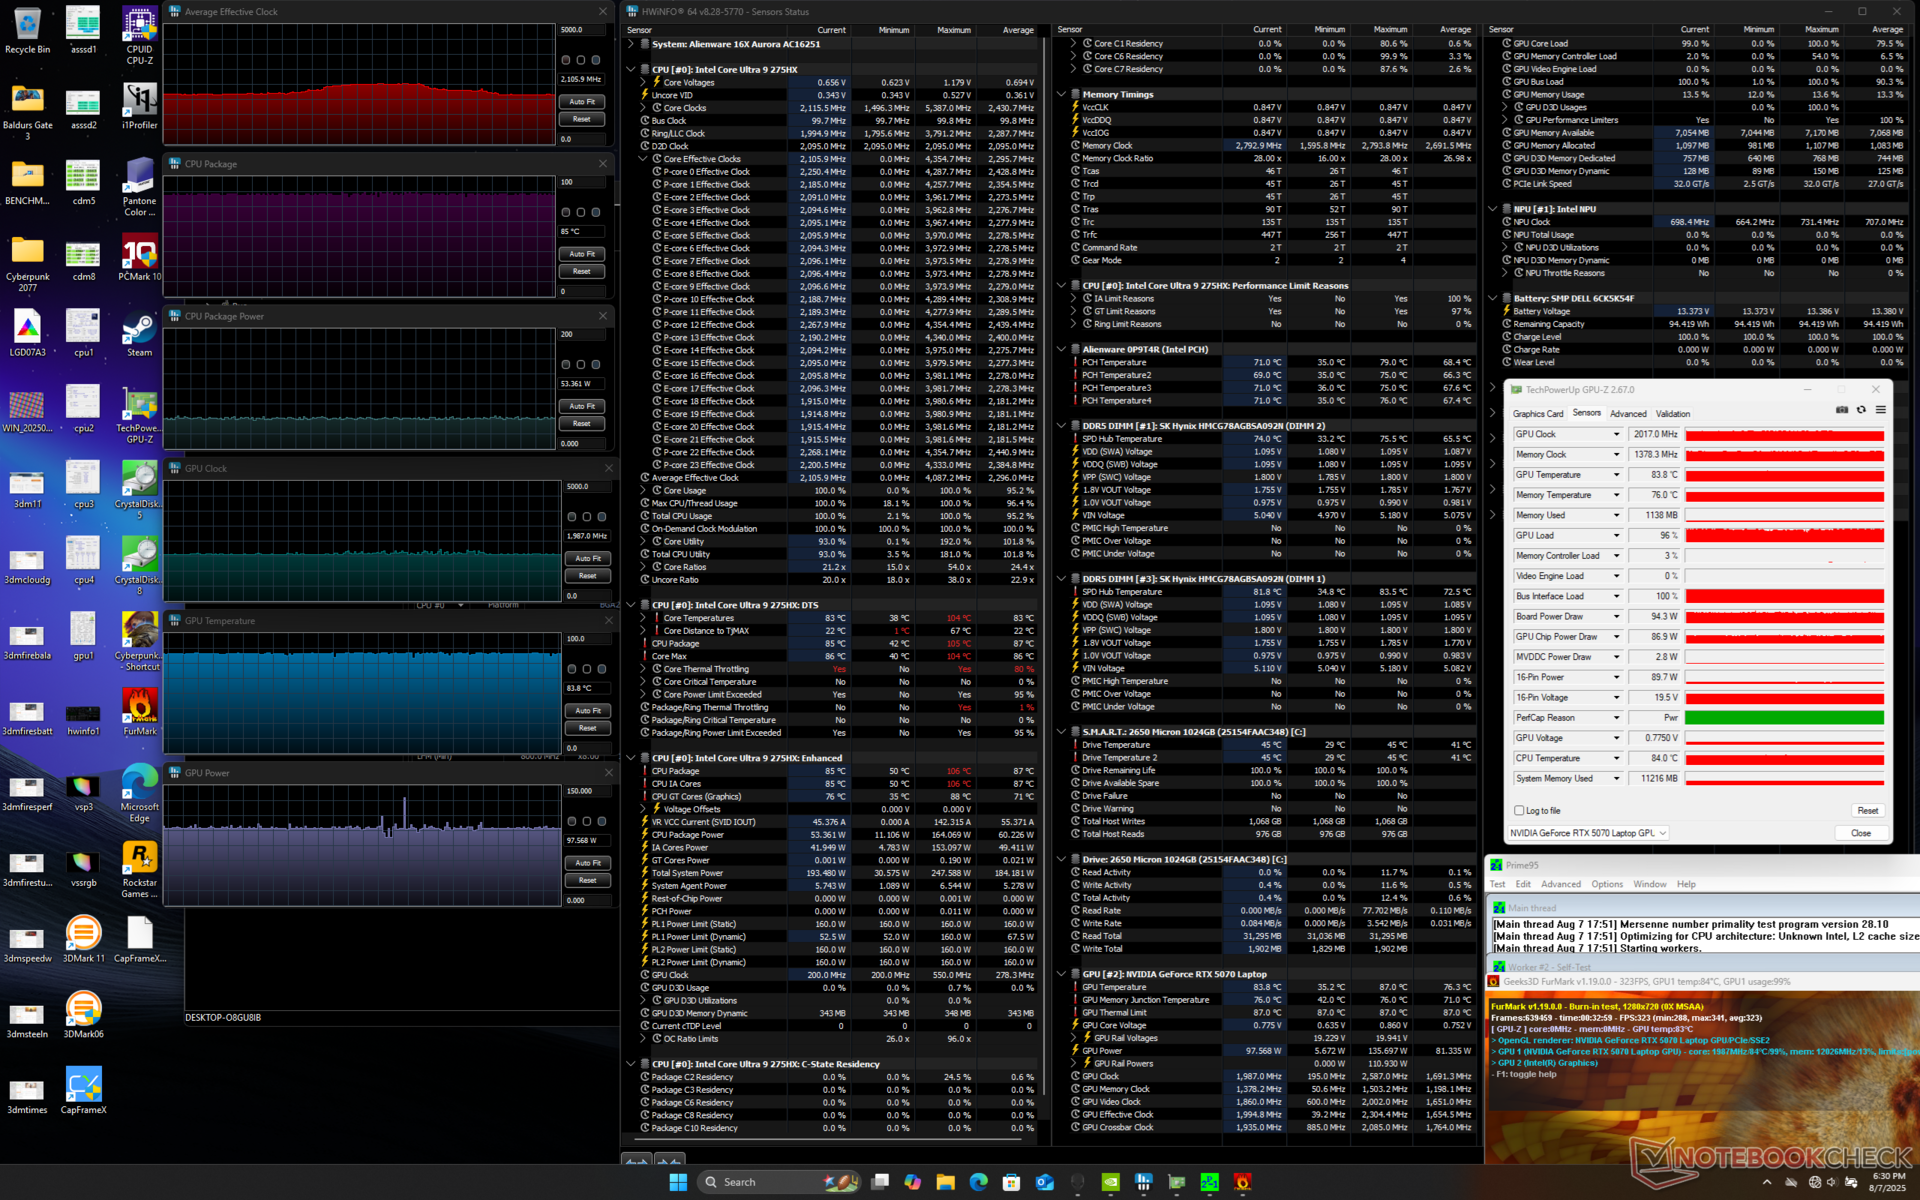
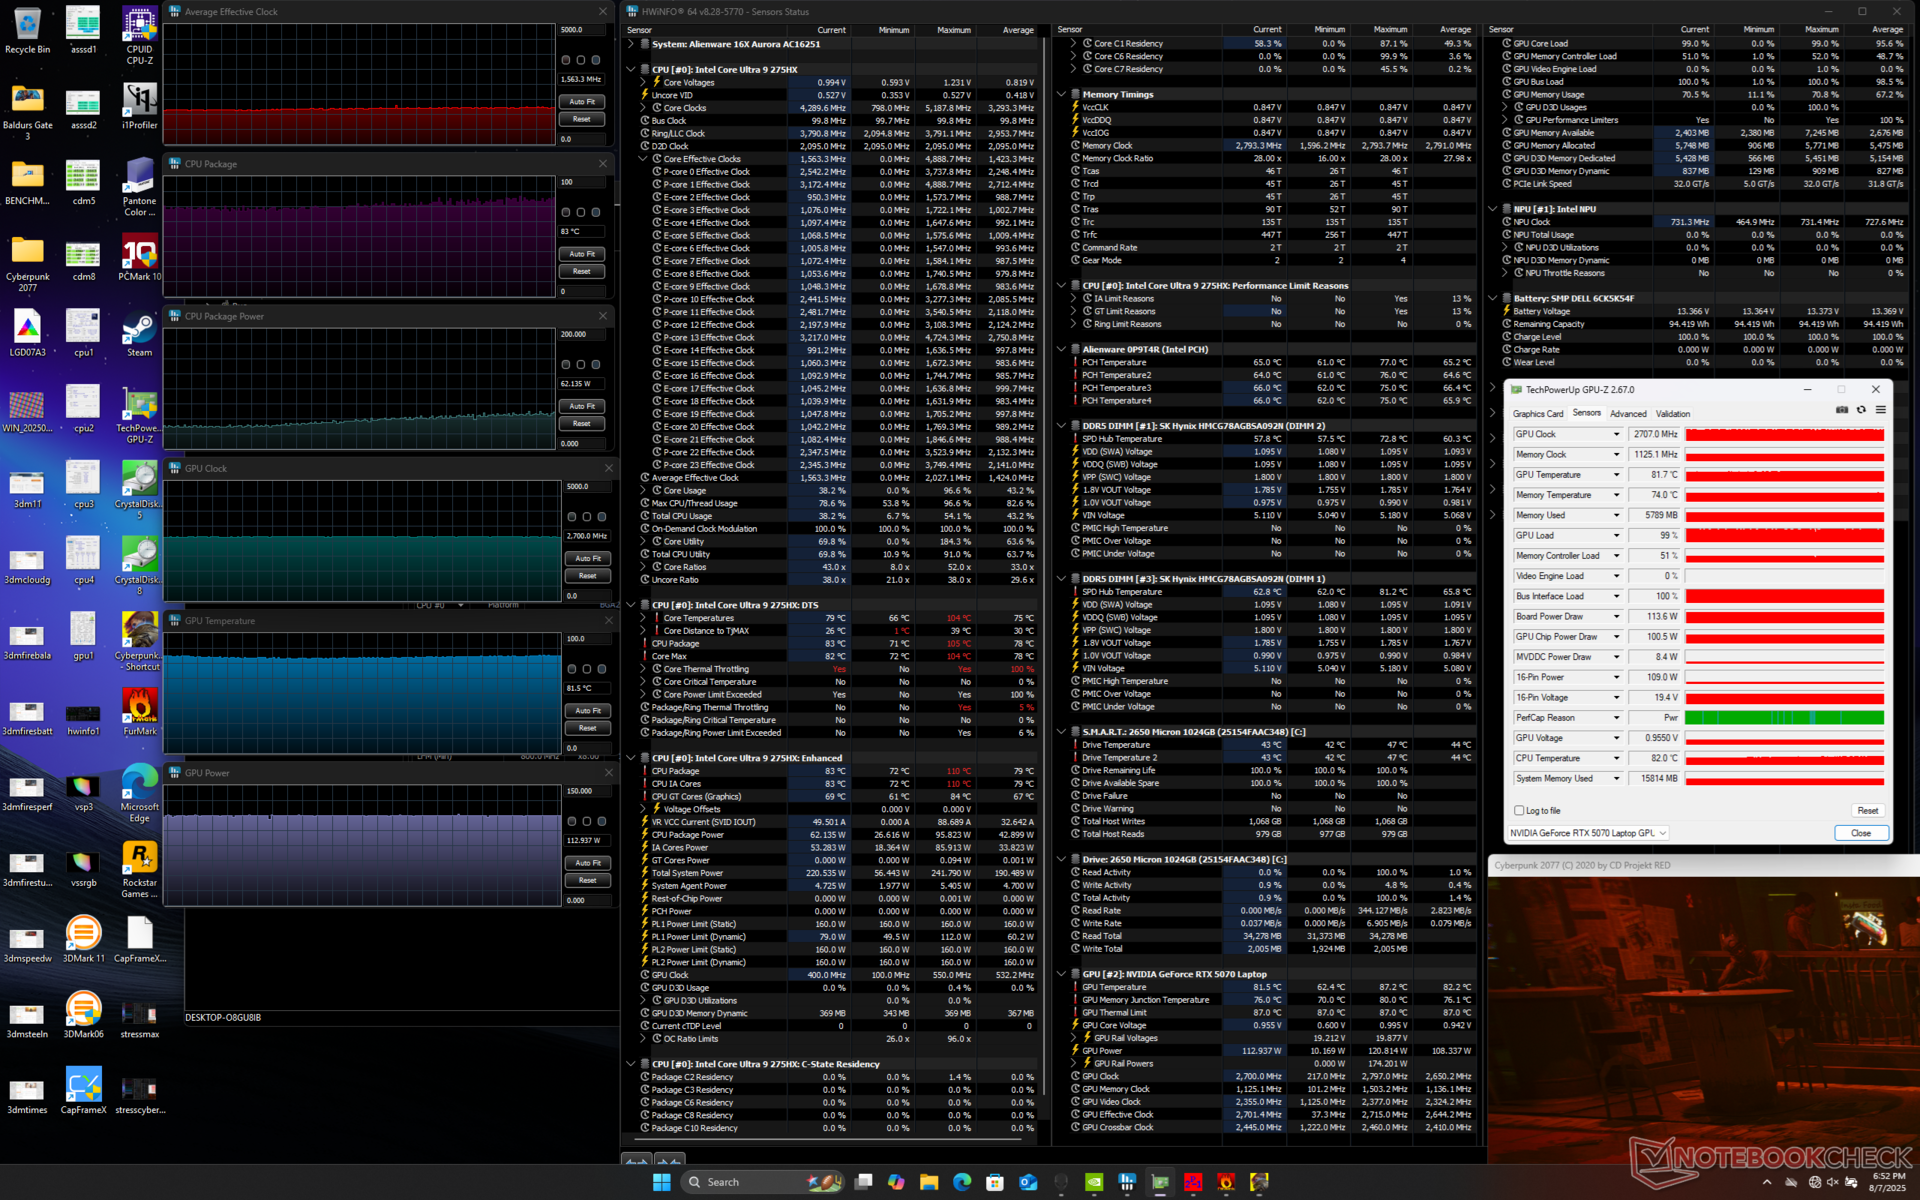
| Durchschnittlicher CPU-Takt (GHz) | GPU-Takt (MHz) | Durchschnittliche CPU-Temperatur (°C) | Durchschnittliche GPU-Temperatur (°C) | |
| System Leerlauf | -- | -- | 44 | 35 |
| Prime95 Stress | 3.3 | -- | 99 | 52 |
| Prime95 + FurMark Stress | 2.1 | 2017 | 85 | 84 |
| Cyberpunk 2077 Stress (Balanced Modus) | 1.4 | 2512 | 80 | 81 |
| Cyberpunk 2077 Stress (Performance Modus) | 1.4 | 2610 | 82 | 82 |
| Cyberpunk 2077 Stress (Overdrive Modus) | 1.6 | 2707 | 83 | 82 |
System Performance
Der PCMark 10 stürzte ständig mit OpenCL-Fehlern ab, selbst nach einer Neuinstallation und mehreren Wiederholungsversuchen. Seine Ergebnisse werden daher hier nicht aufgeführt. Die CrossMark- und AIDA-Ergebnisse liegen ansonsten dort, wo wir sie erwarten, und kommen dem Alienware 16 Area-51 ziemlich nahe.
| AIDA64 / Memory Copy | |
| Asus TUF Gaming A16 FA608WV | |
| Alienware 16 Area-51 | |
| Durchschnittliche Intel Core Ultra 9 275HX (56003 - 94460, n=30) | |
| Lenovo Legion 5 Pro 16IAX10H | |
| Alienware 16X Aurora, RTX 5070 | |
| MSI Vector 16 HX AI A2XWHG | |
| Gigabyte Gaming A16 GA6H | |
| AIDA64 / Memory Read | |
| Asus TUF Gaming A16 FA608WV | |
| Alienware 16 Area-51 | |
| Lenovo Legion 5 Pro 16IAX10H | |
| Alienware 16X Aurora, RTX 5070 | |
| Durchschnittliche Intel Core Ultra 9 275HX (55795 - 97151, n=30) | |
| MSI Vector 16 HX AI A2XWHG | |
| Gigabyte Gaming A16 GA6H | |
| AIDA64 / Memory Write | |
| Asus TUF Gaming A16 FA608WV | |
| Alienware 16 Area-51 | |
| Durchschnittliche Intel Core Ultra 9 275HX (55663 - 116129, n=30) | |
| Alienware 16X Aurora, RTX 5070 | |
| Lenovo Legion 5 Pro 16IAX10H | |
| MSI Vector 16 HX AI A2XWHG | |
| Gigabyte Gaming A16 GA6H | |
| AIDA64 / Memory Latency | |
| Alienware 16 Area-51 | |
| Durchschnittliche Intel Core Ultra 9 275HX (105.8 - 161.6, n=30) | |
| Alienware 16X Aurora, RTX 5070 | |
| Asus TUF Gaming A16 FA608WV | |
| Lenovo Legion 5 Pro 16IAX10H | |
| MSI Vector 16 HX AI A2XWHG | |
| Gigabyte Gaming A16 GA6H | |
* ... kleinere Werte sind besser
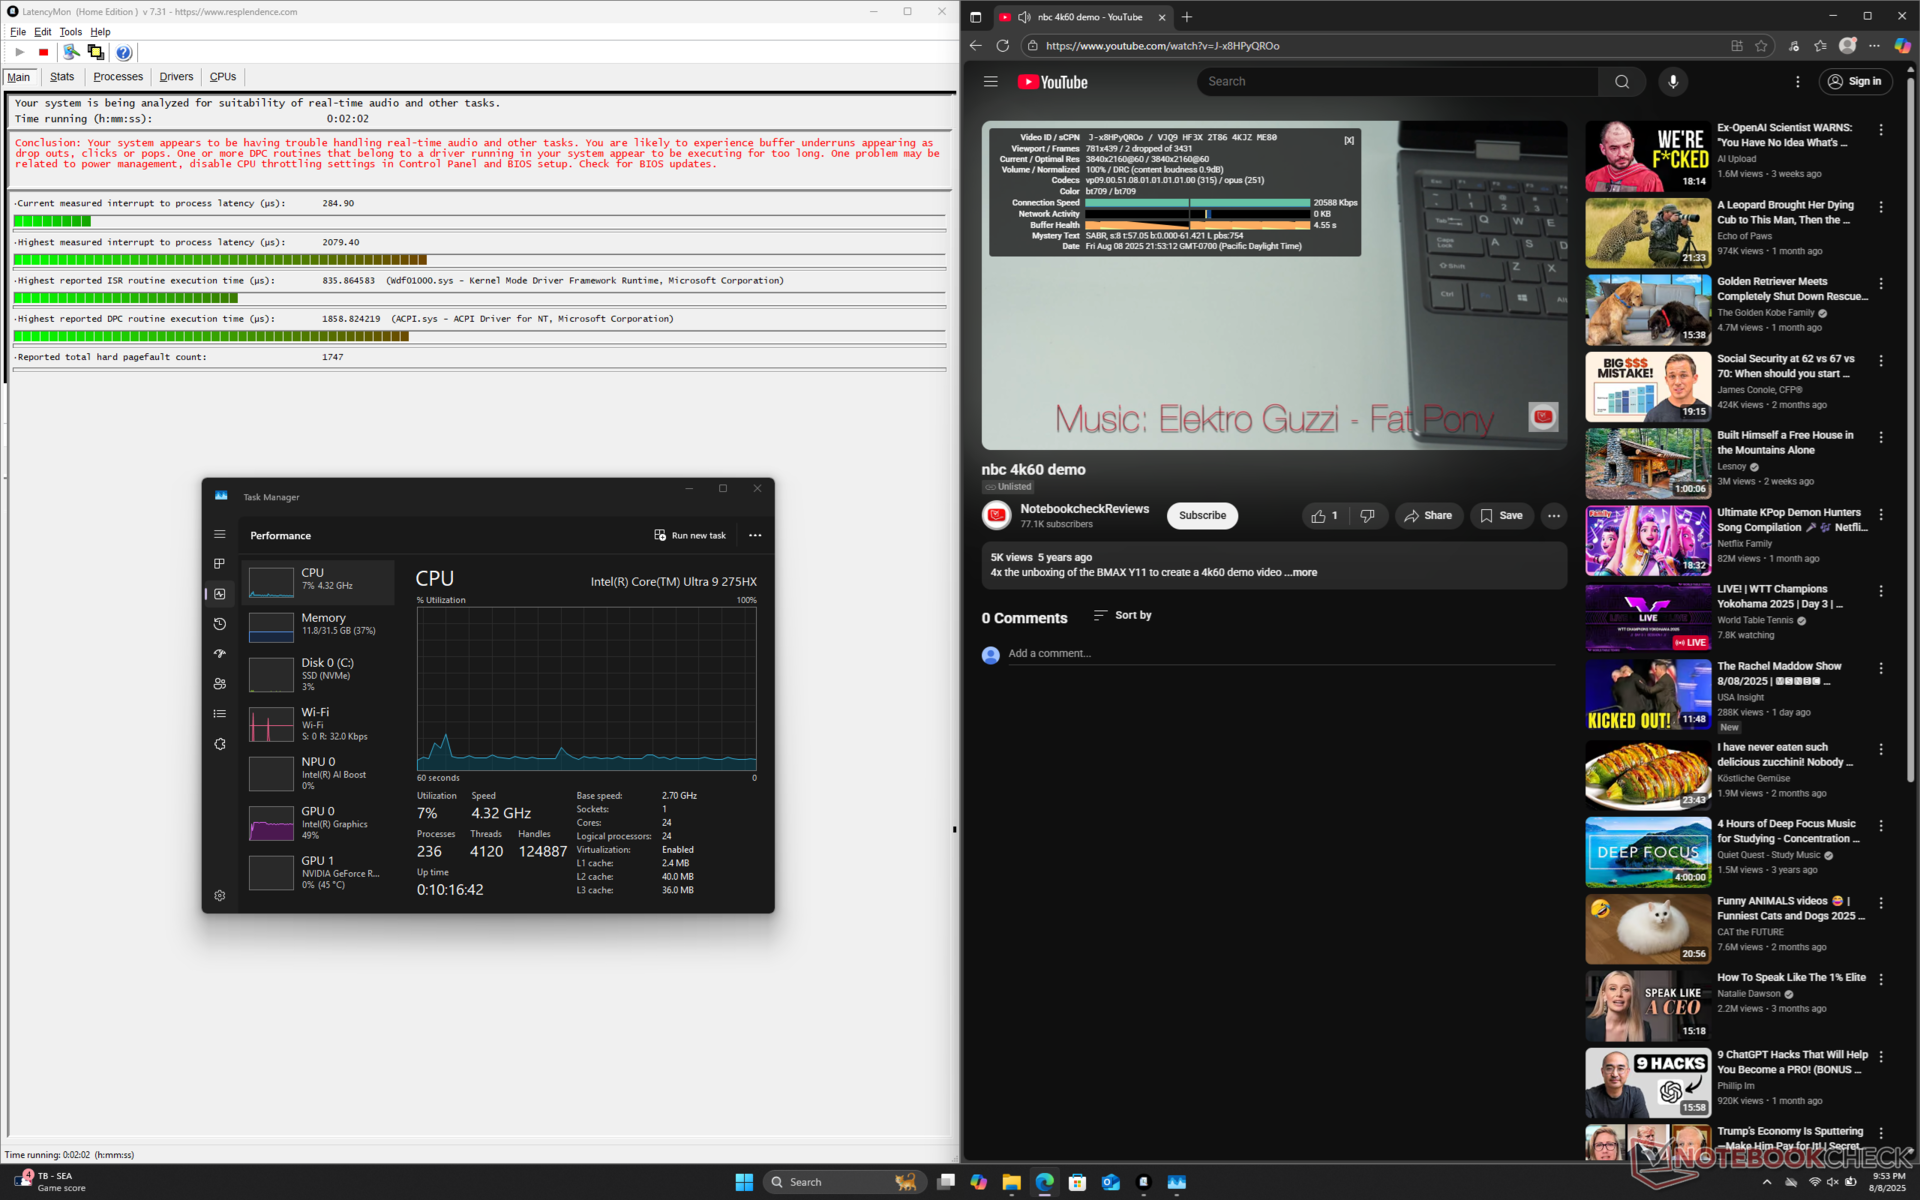
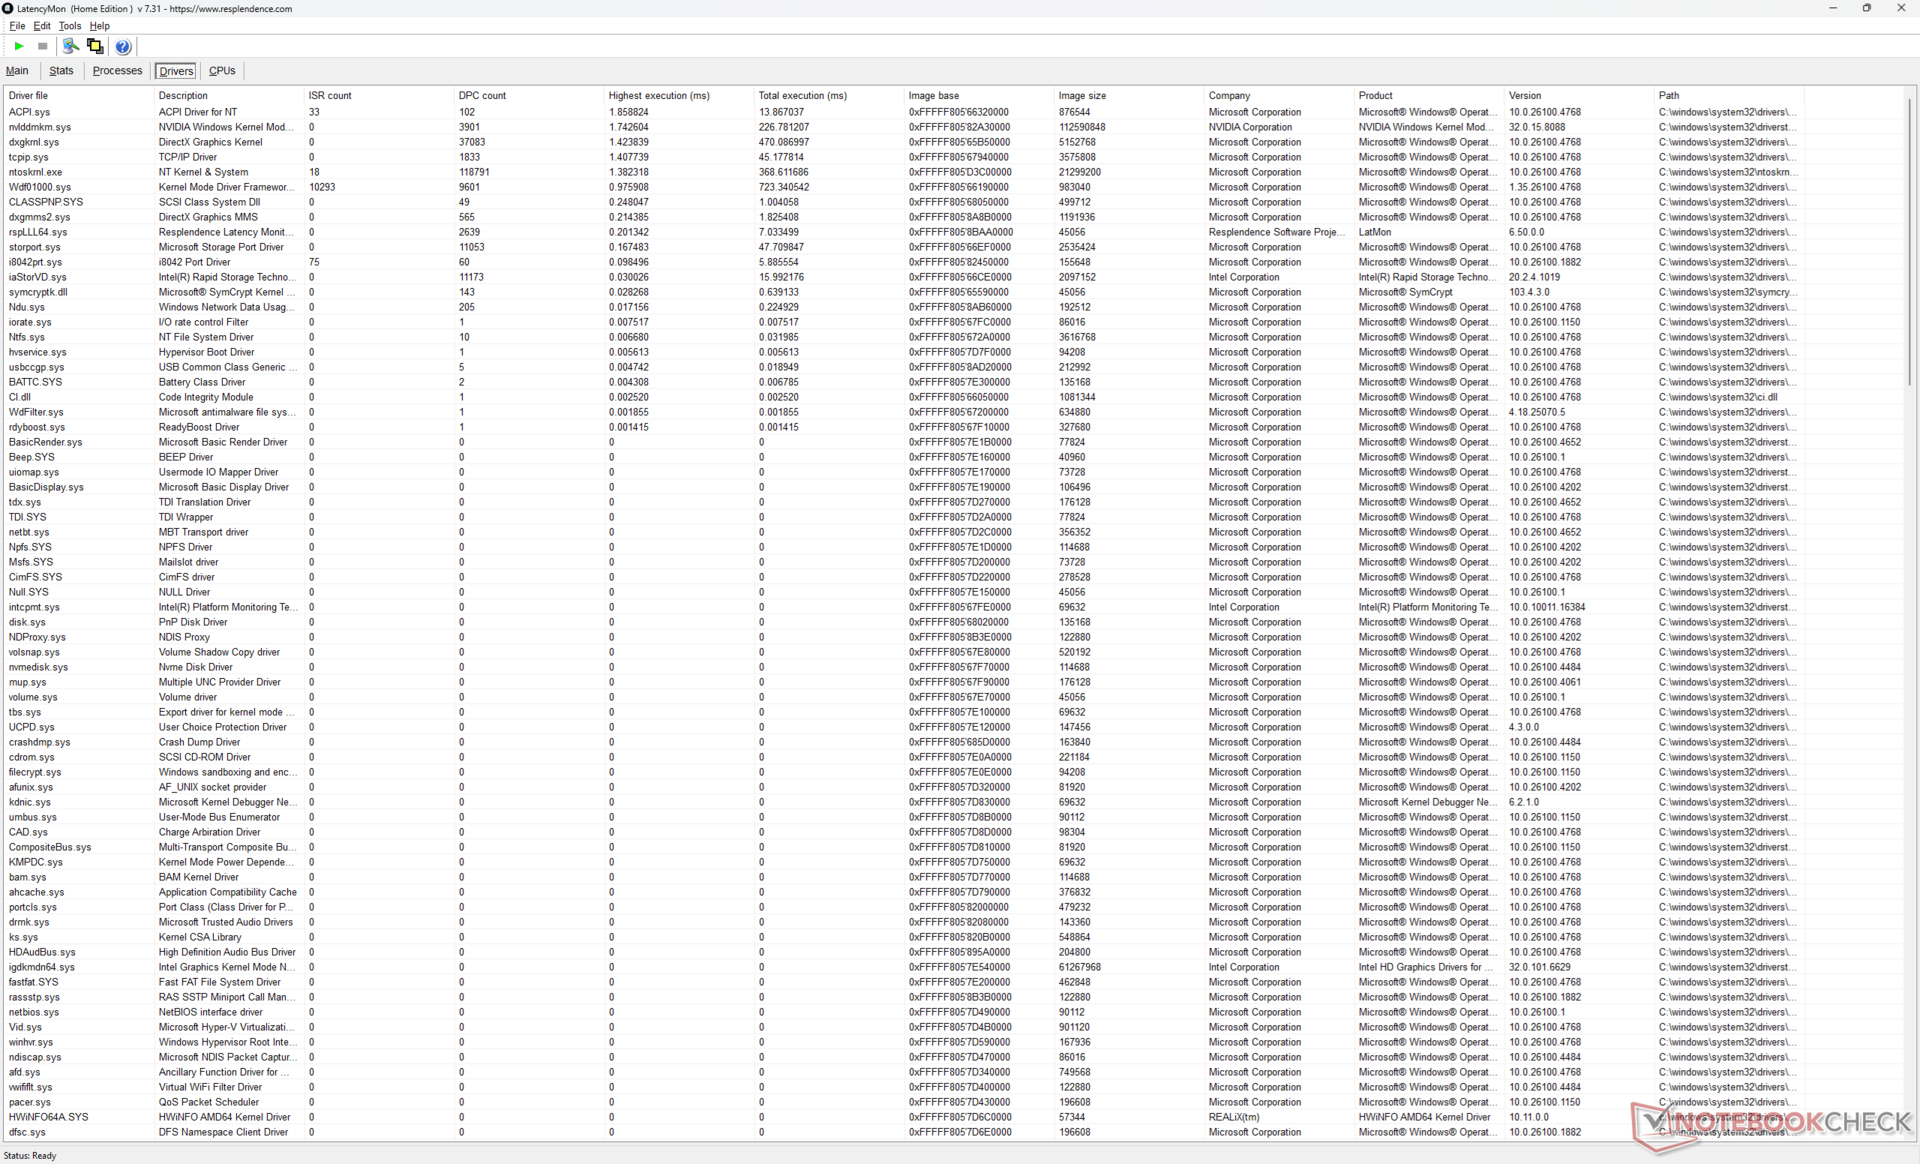
DPC-Latenzzeit
LatencyMon zeigt nur geringfügige DPC-Probleme beim Öffnen mehrerer Tabs unserer Homepage sowie 2 dropped frames beim Abspielen eines 60-sekündigen 4K60-Videos.
| DPC Latencies / LatencyMon - interrupt to process latency (max), Web, Youtube, Prime95 | |
| MSI Vector 16 HX AI A2XWHG | |
| Gigabyte Gaming A16 GA6H | |
| Alienware 16 Area-51 | |
| Alienware 16X Aurora, RTX 5070 | |
| Asus TUF Gaming A16 FA608WV | |
| Lenovo Legion 5 Pro 16IAX10H | |
* ... kleinere Werte sind besser
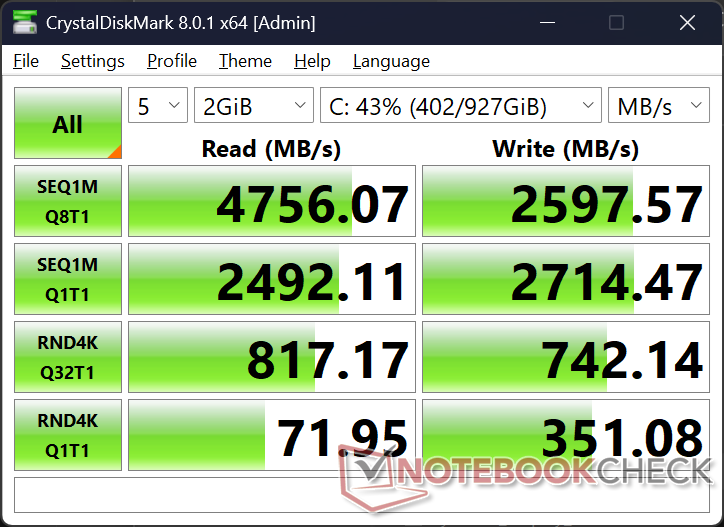
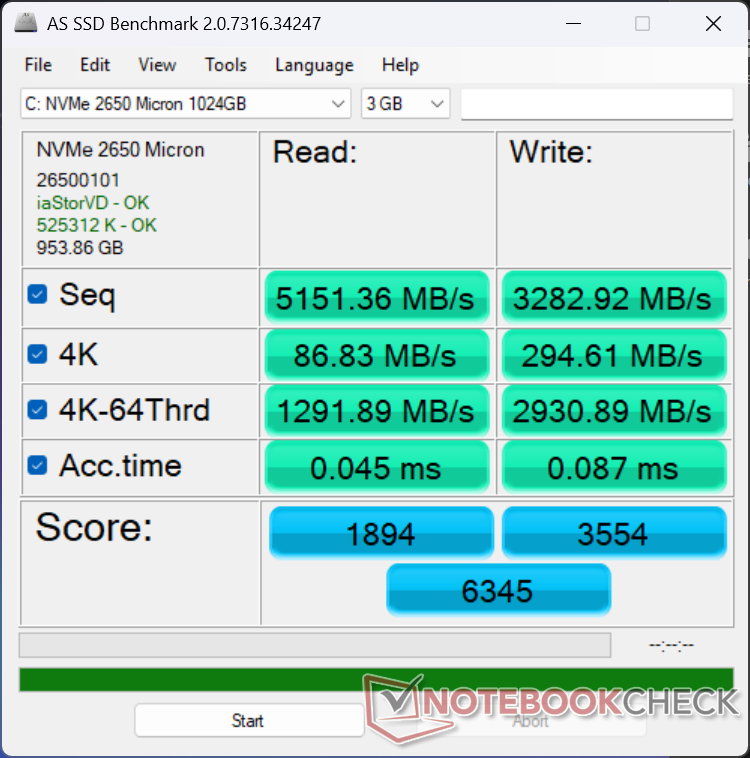
Speichergeräte
Die Micron 2650 PCIe4 x4 NVMe SSD in unserem Gerät bietet Leseraten von bis zu 7000 MB/s, bevor es nach etwa einer Minute in unserem DiskSpd-Schleifentest zu einer Drosselung kommt Stress test. Die Transferraten fielen auf bis zu 3000 MB/s, wie unsere Grafik unten zeigt, während die Samsung PM9C1a im Alienware Area-51 unter ähnlichen Testbedingungen konstant bei 6200 MB/s blieb. Für Spieleszenarien sollte die verzögerte SSD-Drosselung der Aurora 16X jedoch nur minimale bis gar keine Auswirkungen auf das Nutzererlebnis haben.

| Drive Performance Rating - Percent | |
| Alienware 16 Area-51 | |
| Alienware 16X Aurora, RTX 5070 | |
| Lenovo Legion 5 Pro 16IAX10H | |
| Gigabyte Gaming A16 GA6H | |
| MSI Vector 16 HX AI A2XWHG | |
| Asus TUF Gaming A16 FA608WV | |
* ... kleinere Werte sind besser
Drosselung der Festplatte: DiskSpd-Leseschleife, Warteschlangentiefe 8
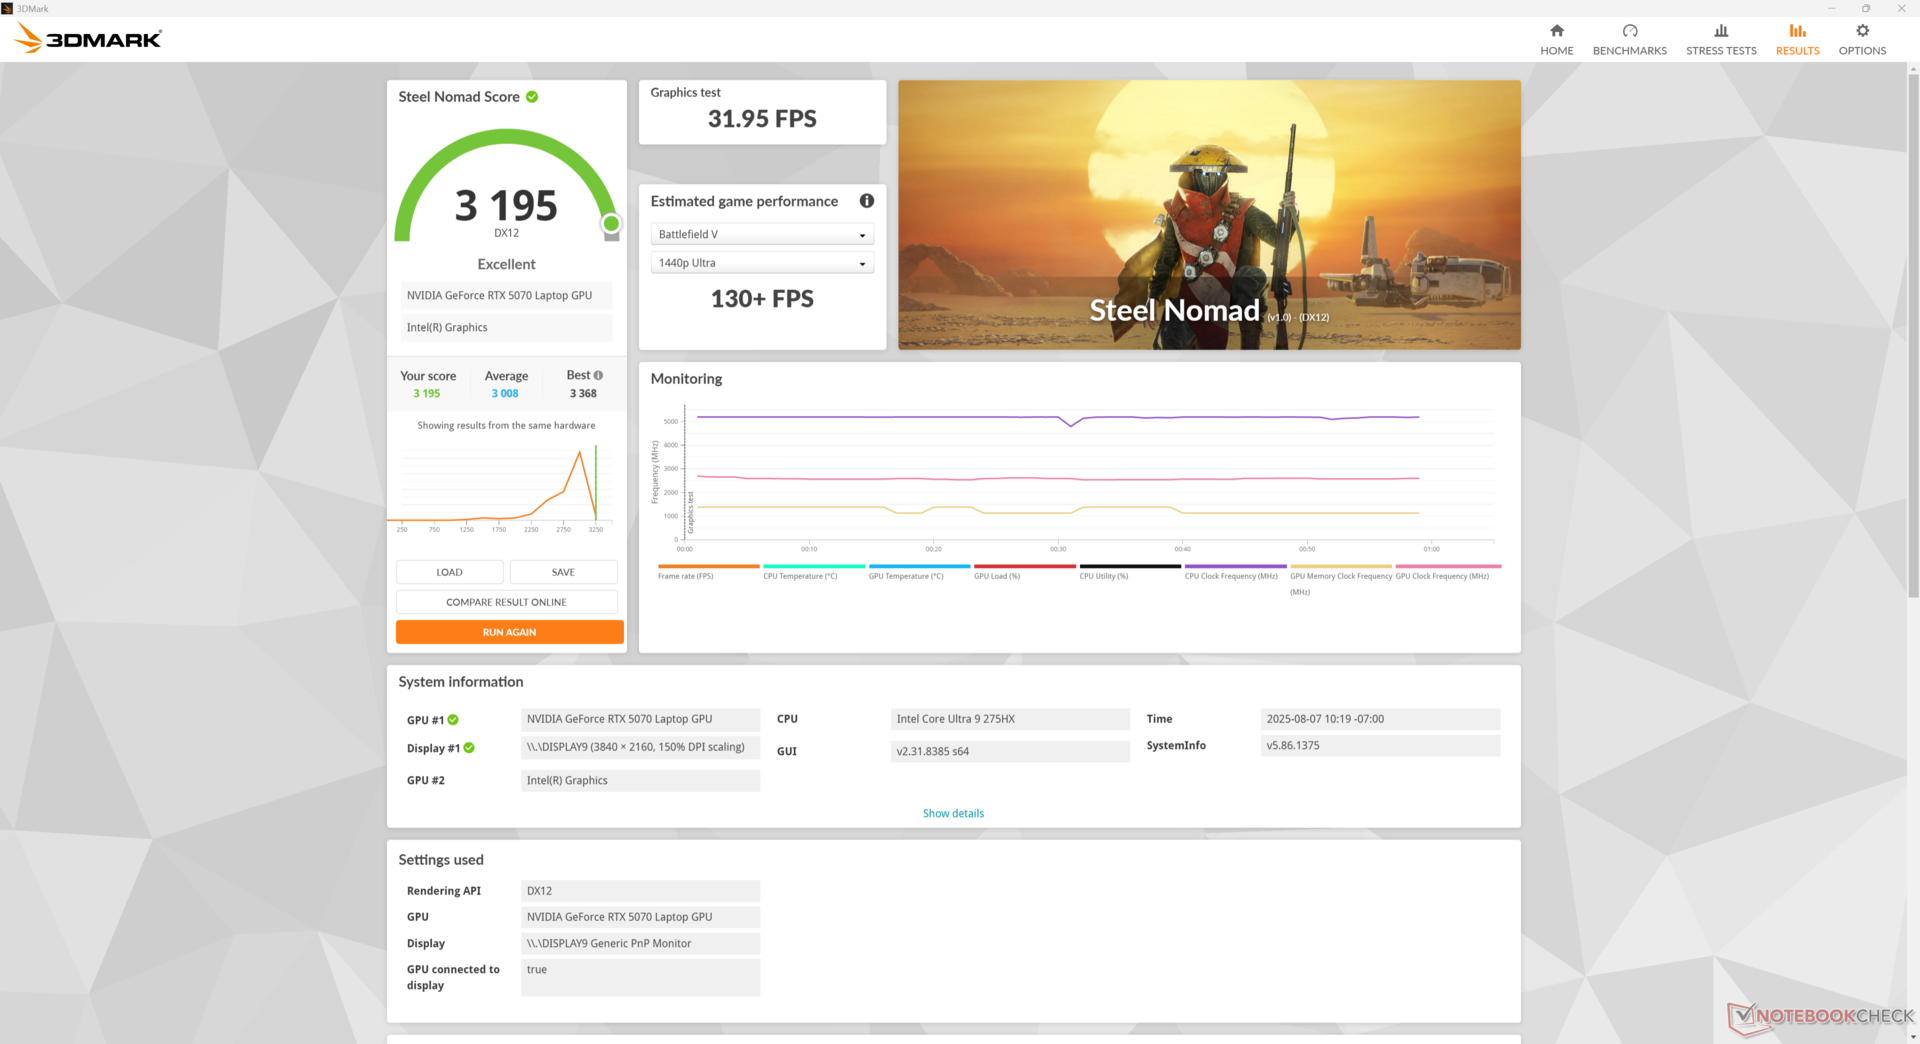
GPU Performance
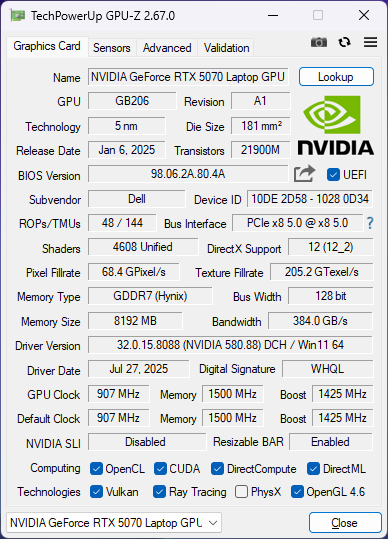
Die mobile RTX 5070 ist etwa 10 Prozent schneller als die mobile RTX 4070 in Bezug auf die reine Rasterisierungsleistung. Darüber hinaus bietet sie weitere Vorteile wie MFG-Unterstützung und 4:2:2-Farbtiefencodierung/-decodierung, die bisher nicht verfügbar waren.
Beachten Sie, dass die mobile RTX 5070 um etwa 35 bis 40 Prozent langsamer ist als die Desktop-RTX 5070 und außerdem über viel weniger VRAM verfügt. Ein Downgrade auf die mobile RTX 5060 Konfiguration würde die Leistung voraussichtlich um etwa 10 Prozent beeinträchtigen.
| Leistungsprofil | Grafik-Score | Physik-Punktzahl | Kombinierte Punktzahl |
| Overdrive-Modus | 36334 | 51210 | 12767 |
| Performance Modus | 35646 (-2%) | 50983 (-0%) | 13658 (-0%) |
| Ausgeglichener Modus | 33459 (-8%) | 50799 (-1%) | 12594 (-1%) |
| Akku-Leistung | 26776 (-26%) | 29665 (-42%) | 9154 (-28%) |
Es gibt keine signifikanten Leistungsunterschiede zwischen den Modi Overdrive und Performance, wie unsere Fire Strike Ergebnistabelle oben zeigt. Beim viel leiseren Energieprofil Balanced sinkt die Grafikleistung um etwa 8 Prozent.
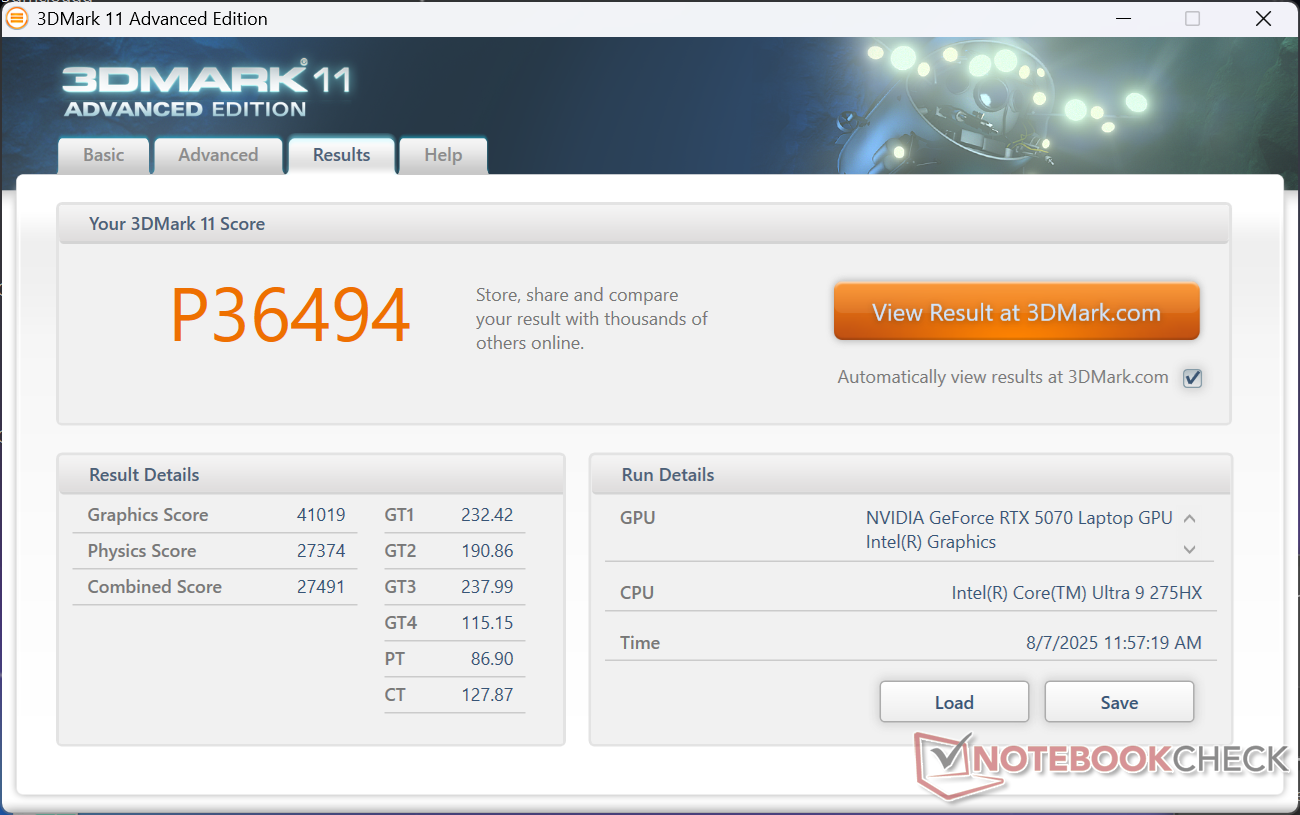
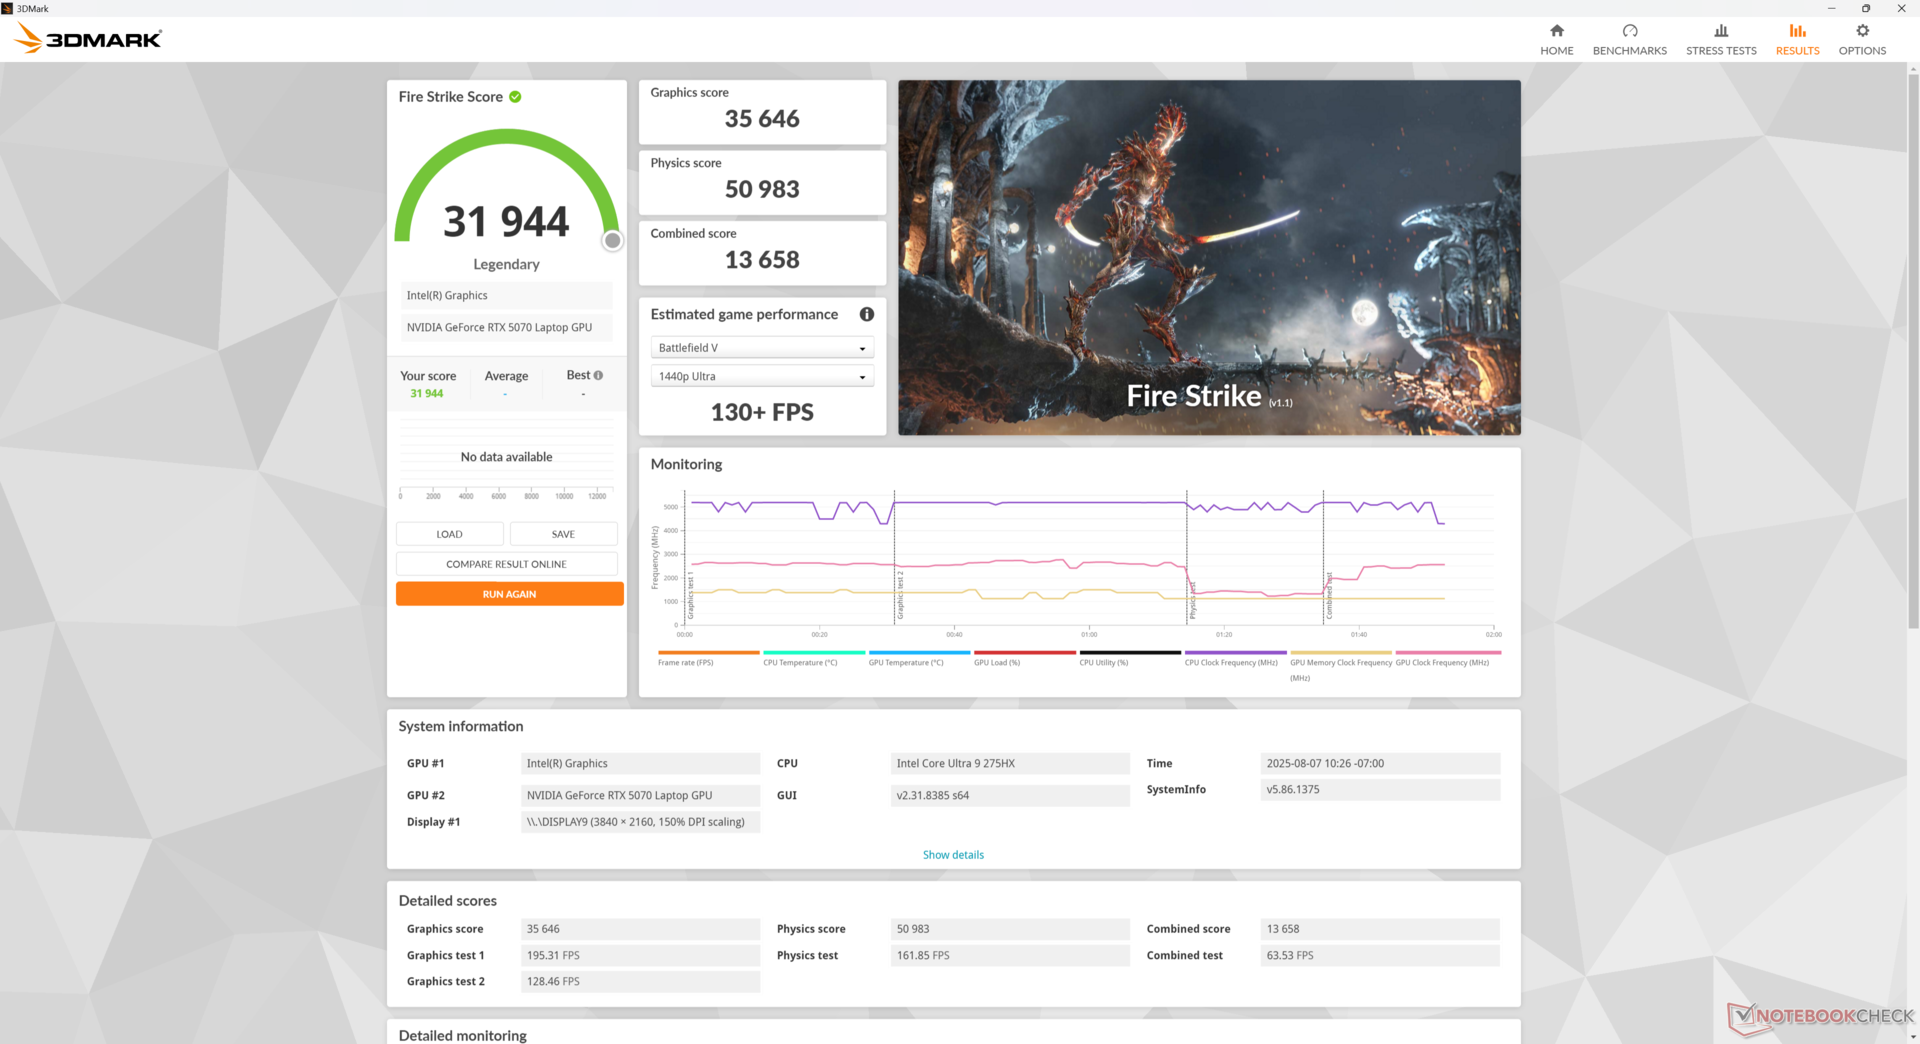
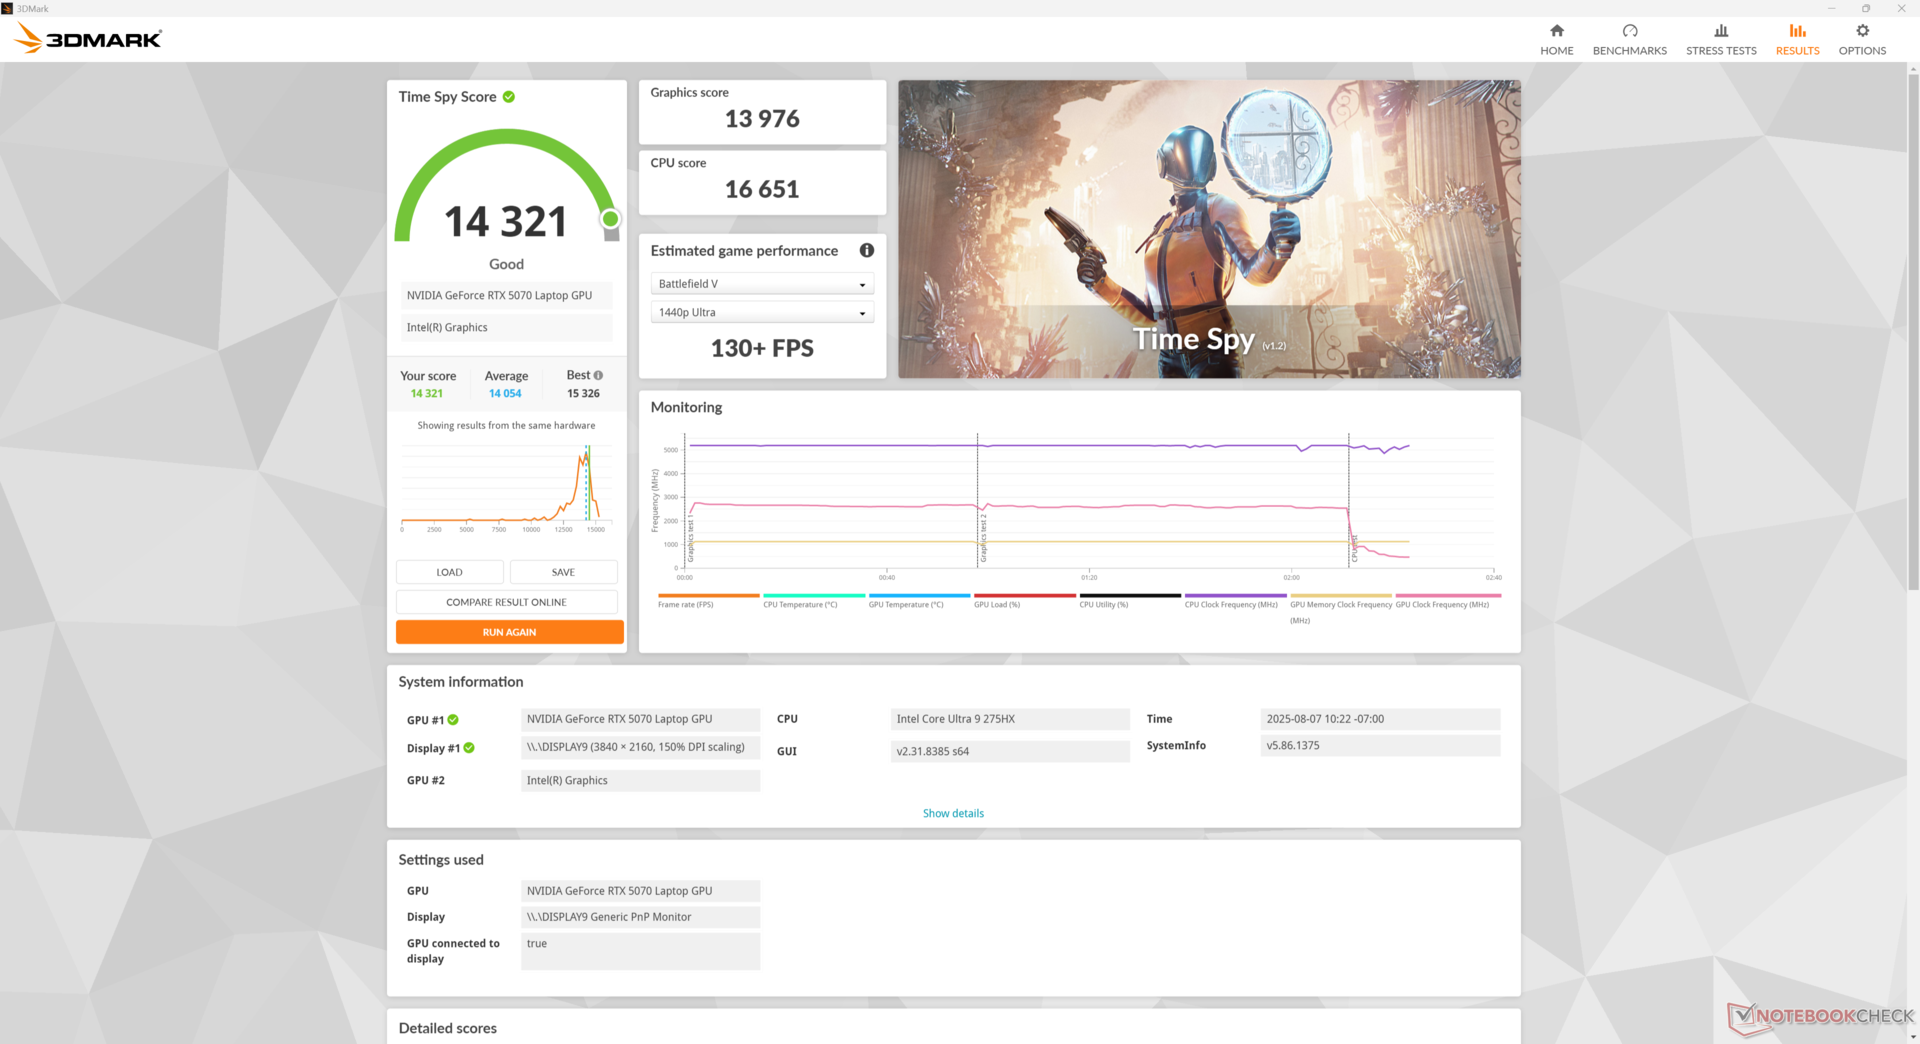
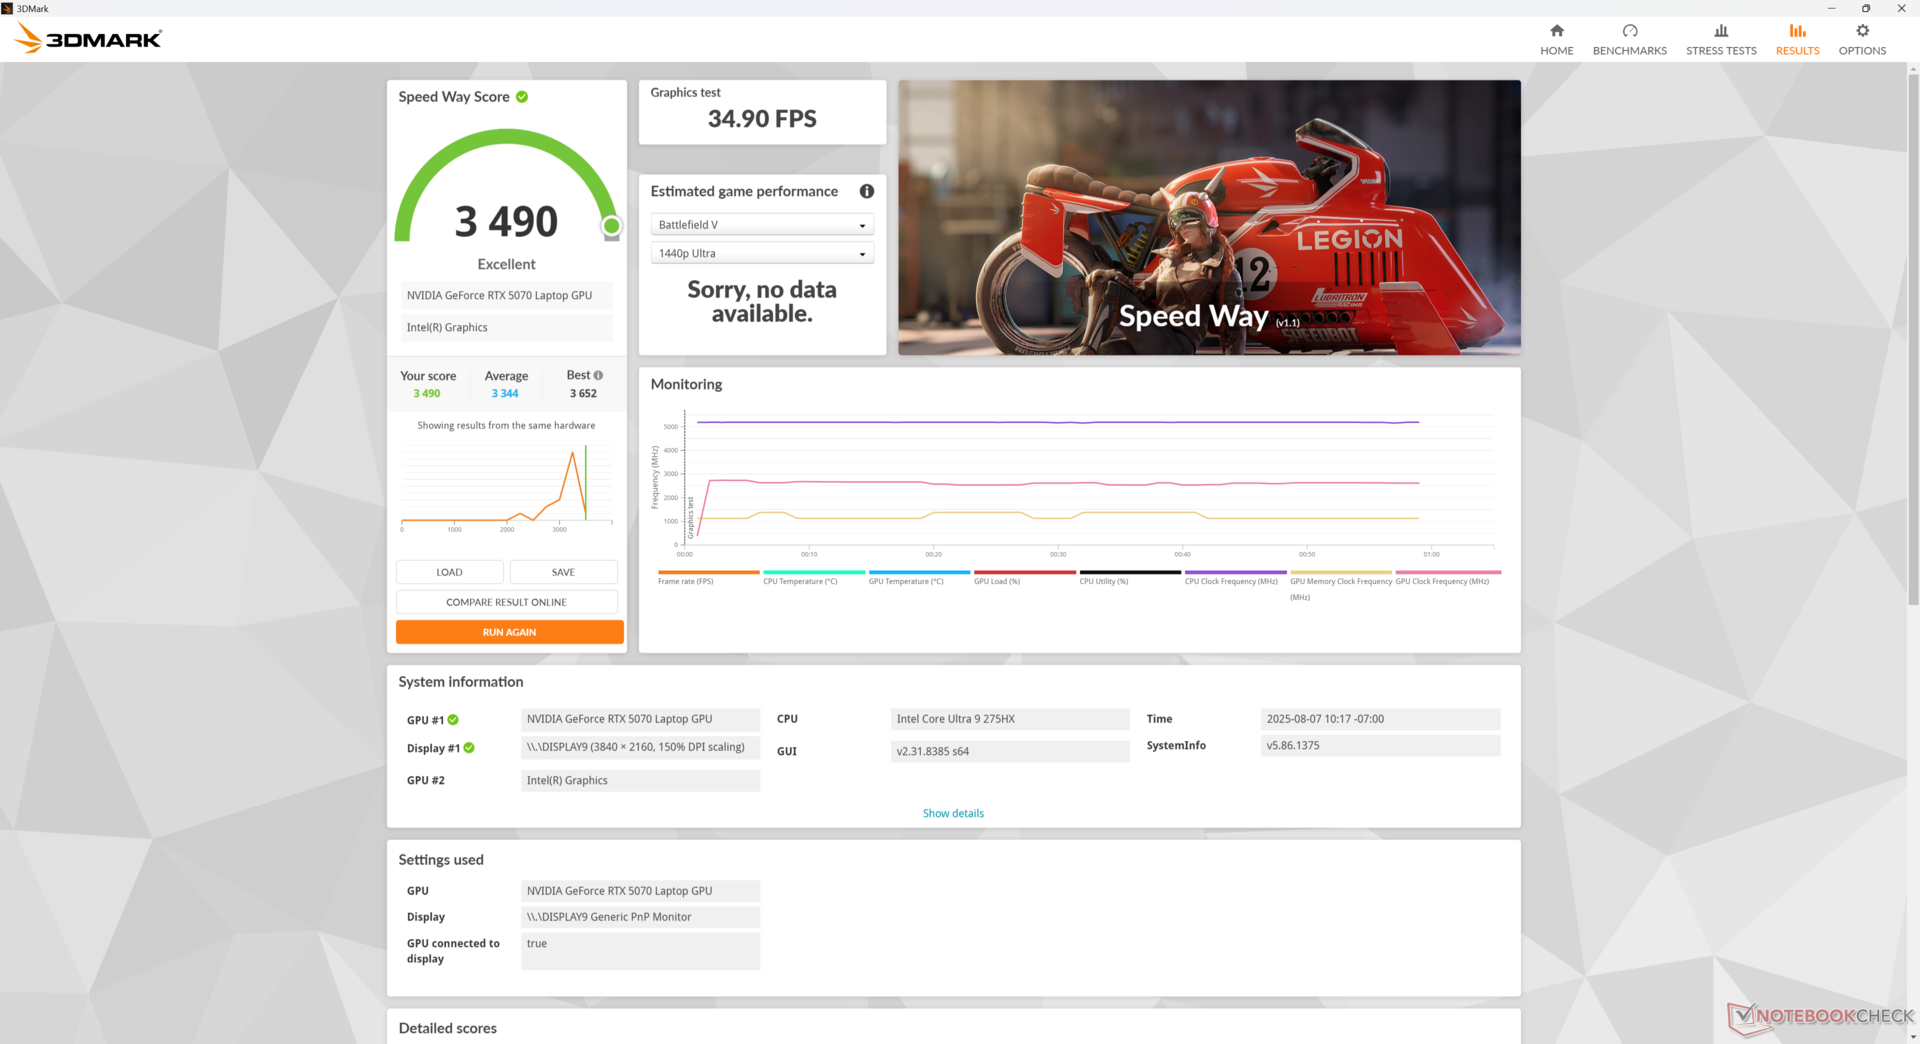
| 3DMark 11 Performance | 36494 Punkte | |
| 3DMark Cloud Gate Standard Score | 71379 Punkte | |
| 3DMark Fire Strike Score | 31944 Punkte | |
| 3DMark Time Spy Score | 14321 Punkte | |
| 3DMark Steel Nomad Score | 3195 Punkte | |
Hilfe | ||
* ... kleinere Werte sind besser
Gaming Performance
Das Spielen mit der mobilen RTX 5070 hinterlässt gemischte Gefühle. Während die Desktop-RTX 5070 die meisten Titel bei maximalen Einstellungen von 1440p bequem ausführen kann, einschließlich anspruchsvoller Titel wie Indiana Jones oder Assassin's Creed Shadows, hat die mobile GPU bei genau diesen Titeln zu kämpfen. Zum Beispiel läuft Alan Wake 2 bei 1440p Ultra-Einstellungen nur mit 45 FPS auf unserer Aurora 16X im Vergleich zu 74 FPS auf unserer Desktop RTX 5070 Referenz. DLSS kann sicherlich dazu beitragen, diese Lücke zu verkleinern, aber wir empfehlen stattdessen, die Gesamteinstellungen auf mittel oder mittelhoch zu senken. Natürlich ist die mobile RTX 5070 viel mobiler als ihr schnelleres Desktop-Pendant.
Die 8 GB VRAM sind auch eine bemerkenswerte Einschränkung. Die Aktivierung fortschrittlicher Funktionen wie Raytracing oder höherer Texturen, die viel VRAM verbrauchen, führte beim Testen von Spielen wie Monster Hunter Wilds, Indiana Jones, Alan Wake 2 oder Black Myth Wukong oft zu einem Absturz. Monster Hunter Wilds zum Beispiel lief über 40 Prozent langsamer als bei einem Laptop mit RTX 5070 Ti-Grafik bei maximalen 1080p-Einstellungen. Auch unsere Indiana Jones-Ergebnisse sind ungewöhnlich niedrig, selbst nach mehreren Wiederholungen und der Aktualisierung auf die neuesten Treiber zum Zeitpunkt der Veröffentlichung.
| Performance Rating - Percent | |
| Alienware 16 Area-51 -1! | |
| Lenovo Legion 5 Pro 16IAX10H | |
| MSI Vector 16 HX AI A2XWHG -1! | |
| Alienware 16X Aurora, RTX 5070 | |
| Gigabyte Gaming A16 GA6H | |
| Asus TUF Gaming A16 FA608WV | |
| Cyberpunk 2077 - 1920x1080 Ultra Preset (FSR off) | |
| Alienware 16 Area-51 | |
| Lenovo Legion 5 Pro 16IAX10H | |
| MSI Vector 16 HX AI A2XWHG | |
| Alienware 16X Aurora, RTX 5070 | |
| Gigabyte Gaming A16 GA6H | |
| Asus TUF Gaming A16 FA608WV | |
| Baldur's Gate 3 - 1920x1080 Ultra Preset AA:T | |
| Alienware 16 Area-51 | |
| MSI Vector 16 HX AI A2XWHG | |
| Alienware 16X Aurora, RTX 5070 | |
| Lenovo Legion 5 Pro 16IAX10H | |
| Gigabyte Gaming A16 GA6H | |
| Asus TUF Gaming A16 FA608WV | |
| GTA V - 1920x1080 Highest AA:4xMSAA + FX AF:16x | |
| Alienware 16X Aurora, RTX 5070 | |
| Lenovo Legion 5 Pro 16IAX10H | |
| MSI Vector 16 HX AI A2XWHG | |
| Asus TUF Gaming A16 FA608WV | |
| Gigabyte Gaming A16 GA6H | |
| Final Fantasy XV Benchmark - 1920x1080 High Quality | |
| Alienware 16 Area-51 | |
| Lenovo Legion 5 Pro 16IAX10H | |
| MSI Vector 16 HX AI A2XWHG | |
| Alienware 16X Aurora, RTX 5070 | |
| Asus TUF Gaming A16 FA608WV | |
| Gigabyte Gaming A16 GA6H | |
| Strange Brigade - 1920x1080 ultra AA:ultra AF:16 | |
| Alienware 16 Area-51 | |
| Lenovo Legion 5 Pro 16IAX10H | |
| Alienware 16X Aurora, RTX 5070 | |
| Gigabyte Gaming A16 GA6H | |
| Asus TUF Gaming A16 FA608WV | |
| Dota 2 Reborn - 1920x1080 ultra (3/3) best looking | |
| Alienware 16X Aurora, RTX 5070 | |
| Lenovo Legion 5 Pro 16IAX10H | |
| MSI Vector 16 HX AI A2XWHG | |
| Alienware 16 Area-51 | |
| Gigabyte Gaming A16 GA6H | |
| Asus TUF Gaming A16 FA608WV | |
| X-Plane 11.11 - 1920x1080 high (fps_test=3) | |
| Alienware 16X Aurora, RTX 5070 | |
| Lenovo Legion 5 Pro 16IAX10H | |
| Alienware 16 Area-51 | |
| MSI Vector 16 HX AI A2XWHG | |
| Gigabyte Gaming A16 GA6H | |
| Asus TUF Gaming A16 FA608WV | |
| Monster Hunter Wilds | |
| 1920x1080 medium, no upscaling | |
| Chuwi Gamebook, R9 9955HX | |
| Alienware 16X Aurora, RTX 5070 | |
| Durchschnittliche NVIDIA GeForce RTX 5070 Laptop (61.6 - 78.2, n=4) | |
| 1920x1080 ultra, RT: high, no upscaling | |
| Alienware 16 Area-51 | |
| Chuwi Gamebook, R9 9955HX | |
| Razer Blade 16 RTX 5080 | |
| Durchschnittliche NVIDIA GeForce RTX 5070 Laptop (39.1 - 44.5, n=3) | |
| Alienware 16X Aurora, RTX 5070 | |
| 2560x1440 ultra, RT: high, no upscaling | |
| Alienware 16 Area-51 | |
| Razer Blade 16 RTX 5080 | |
| Chuwi Gamebook, R9 9955HX | |
| Durchschnittliche NVIDIA GeForce RTX 5070 Laptop (21.1 - 31.7, n=3) | |
| Alienware 16X Aurora, RTX 5070 | |
Cyberpunk 2077 ultra FPS Grafik
| min. | mittel | hoch | max. | QHD DLSS | QHD | 4K DLSS | 4K | |
|---|---|---|---|---|---|---|---|---|
| GTA V (2015) | 156.4 | 129 | 125.6 | |||||
| Dota 2 Reborn (2015) | 239 | 210 | 201 | 184 | 148.8 | |||
| Final Fantasy XV Benchmark (2018) | 150.7 | 107.4 | 58.8 | |||||
| X-Plane 11.11 (2018) | 162.3 | 141.3 | 116.1 | 89.3 | ||||
| Strange Brigade (2018) | 259 | 177.9 | 96.1 | |||||
| Baldur's Gate 3 (2023) | 140.8 | 140 | 96.3 | 83.7 | 49.6 | |||
| Cyberpunk 2077 (2023) | 180.3 | 142.7 | 117.7 | 102.9 | 76.6 | 65.4 | 28.4 | |
| Alan Wake 2 (2023) | 62.6 | 45.1 | 23.8 | |||||
| F1 24 (2024) | 88.3 | 85.8 | 54.7 | 22.7 | 19 | |||
| Black Myth: Wukong (2024) | 66 | 37 | 41 | 27 | 7 | |||
| Indiana Jones and the Great Circle (2024) | 153.8 | 56.1 | 8.3 | 7.6 | ||||
| Monster Hunter Wilds (2025) | 78.2 | 39.1 | 21.1 | |||||
| Assassin's Creed Shadows (2025) | 61 | 38 | 37 | 37 | 29 | 22 |
Emissionen
Lautstärke
Obwohl es den Vaper-Chamber-Kühler des Area-51 gegen einen traditionelleren Ansatz eintauscht, sind die Lüftergeräusche und das Verhalten des Aurora 16X erstaunlich ähnlich. Die beiden Lüfter bleiben während der ersten Benchmark-Szene des 3DMark 06 ruhig, während sie bei den meisten anderen Gaming-Laptops schon früh pulsieren. Das bedeutet, dass die Lüfter des Aurora 16X bei anspruchsloseren Lasten wie Browsen oder Videos gleichmäßiger laufen.
Das Lüftergeräusch erreicht beim Gaming im Modus Balanced, Performance bzw. Overdrive Spitzenwerte von 48,5 dB(A), 51,8 dB(A) bzw. 58 dB(A).Wir empfehlen, im Modus Performance zu spielen, da die Leistungsvorteile des Overdrive-Modus im Vergleich zum extremen Anstieg des Geräuschpegels äußerst gering sind.

Lautstärkediagramm
| Idle |
| 23.9 / 23.9 / 26.1 dB(A) |
| Last |
| 26.8 / 58 dB(A) |
 | ||
30 dB leise 40 dB(A) deutlich hörbar 50 dB(A) störend |
||
min: | ||
| Alienware 16X Aurora, RTX 5070 GeForce RTX 5070 Laptop, Ultra 9 275HX | Alienware 16 Area-51 GeForce RTX 5080 Laptop, Ultra 9 275HX, Samsung PM9C1a MZ9L81T0HDLB | Gigabyte Gaming A16 GA6H GeForce RTX 5070 Laptop, i7-13620H, Kingston OM8PGP41024Q-A0 | MSI Vector 16 HX AI A2XWHG GeForce RTX 5070 Ti Laptop, Ultra 7 255HX, Micron 2400 MTFDKBA512QFM | Asus TUF Gaming A16 FA608WV GeForce RTX 4060 Laptop GPU, Ryzen AI 9 HX 370, Micron 2400 MTFDKBA1T0QFM | Lenovo Legion 5 Pro 16IAX10H GeForce RTX 5070 Ti Laptop, Ultra 9 275HX, Western Digital PC SN8000S SDEPNRK-1T00 | |
|---|---|---|---|---|---|---|
| Geräuschentwicklung | -4% | -17% | -25% | 6% | -19% | |
| aus / Umgebung * (dB) | 23.7 | 23.6 -0% | 24 -1% | 25 -5% | 23 3% | 24 -1% |
| Idle min * (dB) | 23.9 | 25.4 -6% | 25 -5% | 33 -38% | 23 4% | 24 -0% |
| Idle avg * (dB) | 23.9 | 27.8 -16% | 26 -9% | 34 -42% | 23 4% | 24 -0% |
| Idle max * (dB) | 26.1 | 28.1 -8% | 27 -3% | 38 -46% | 29.11 -12% | 30.9 -18% |
| Last avg * (dB) | 26.8 | 28.8 -7% | 54 -101% | 46 -72% | 31 -16% | 55.9 -109% |
| Cyberpunk 2077 ultra * (dB) | 51.8 | 50.4 3% | 54 -4% | 47 9% | 36.23 30% | 56.72 -9% |
| Last max * (dB) | 58 | 56.4 3% | 55 5% | 49 16% | 39.44 32% | 56.72 2% |
* ... kleinere Werte sind besser
Temperatur
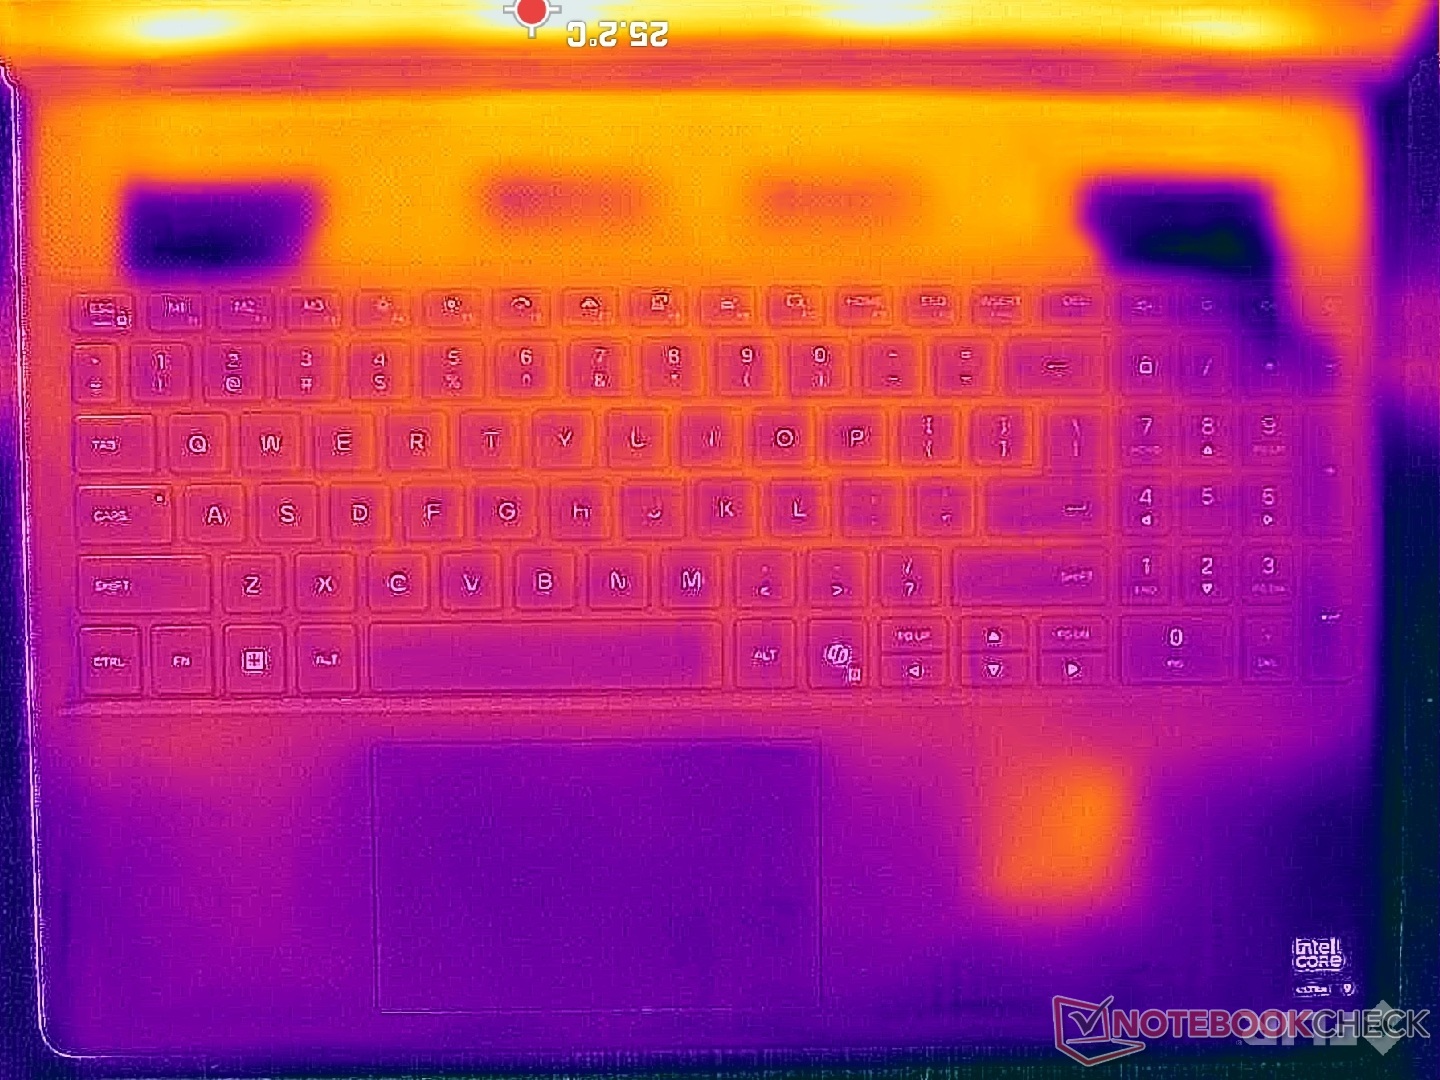
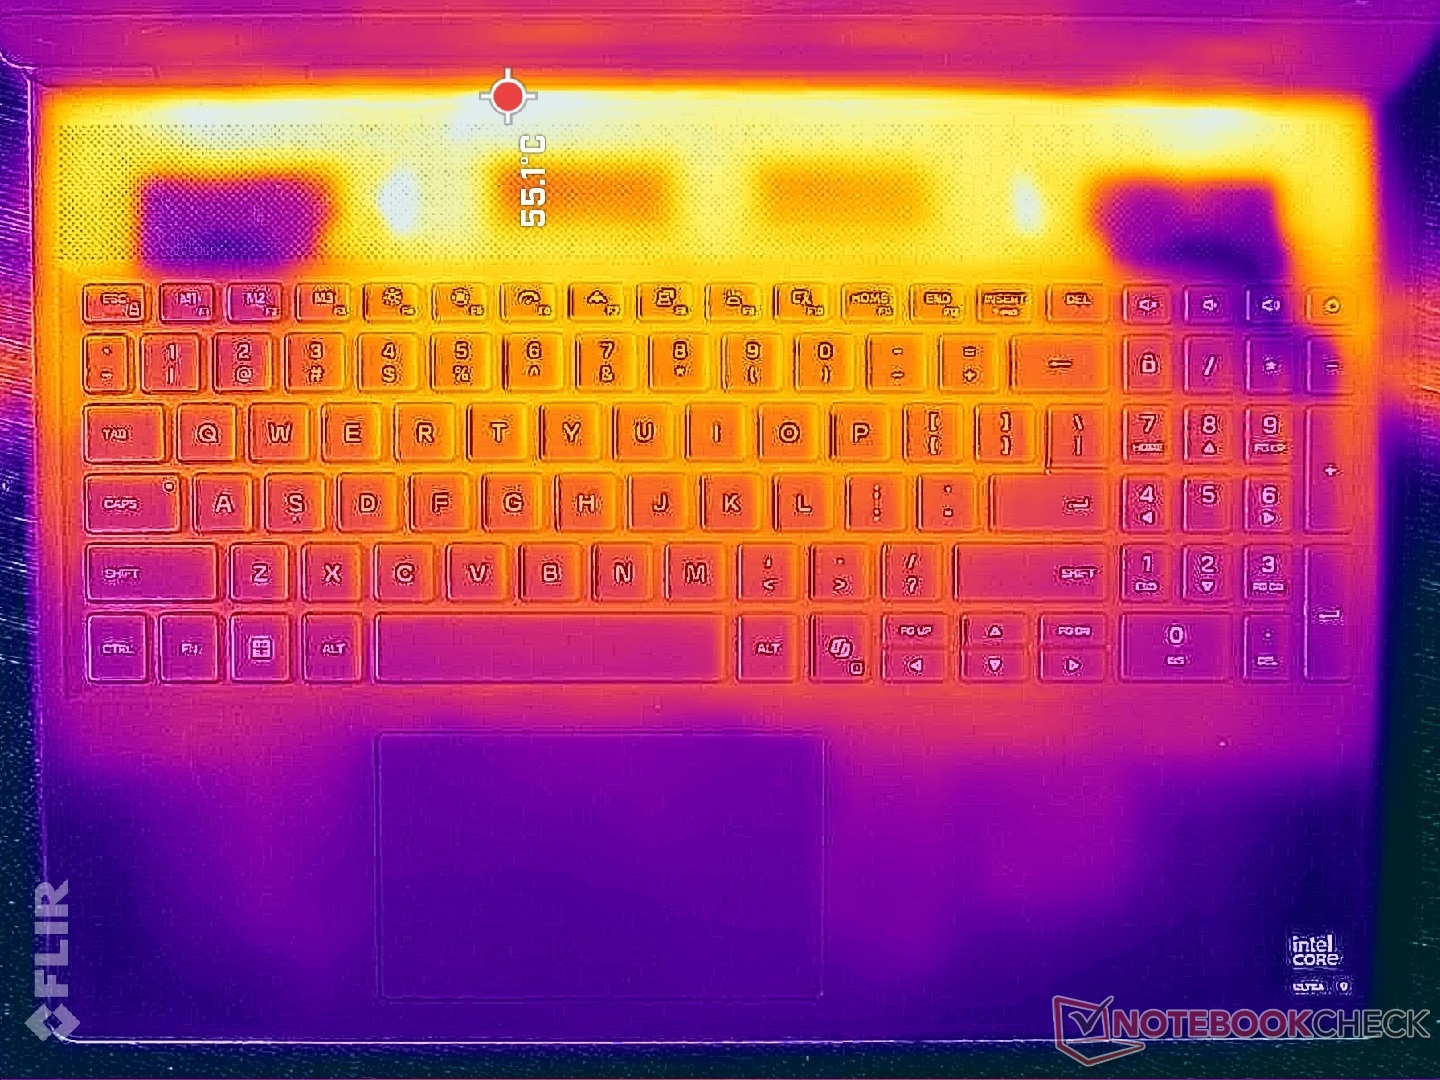
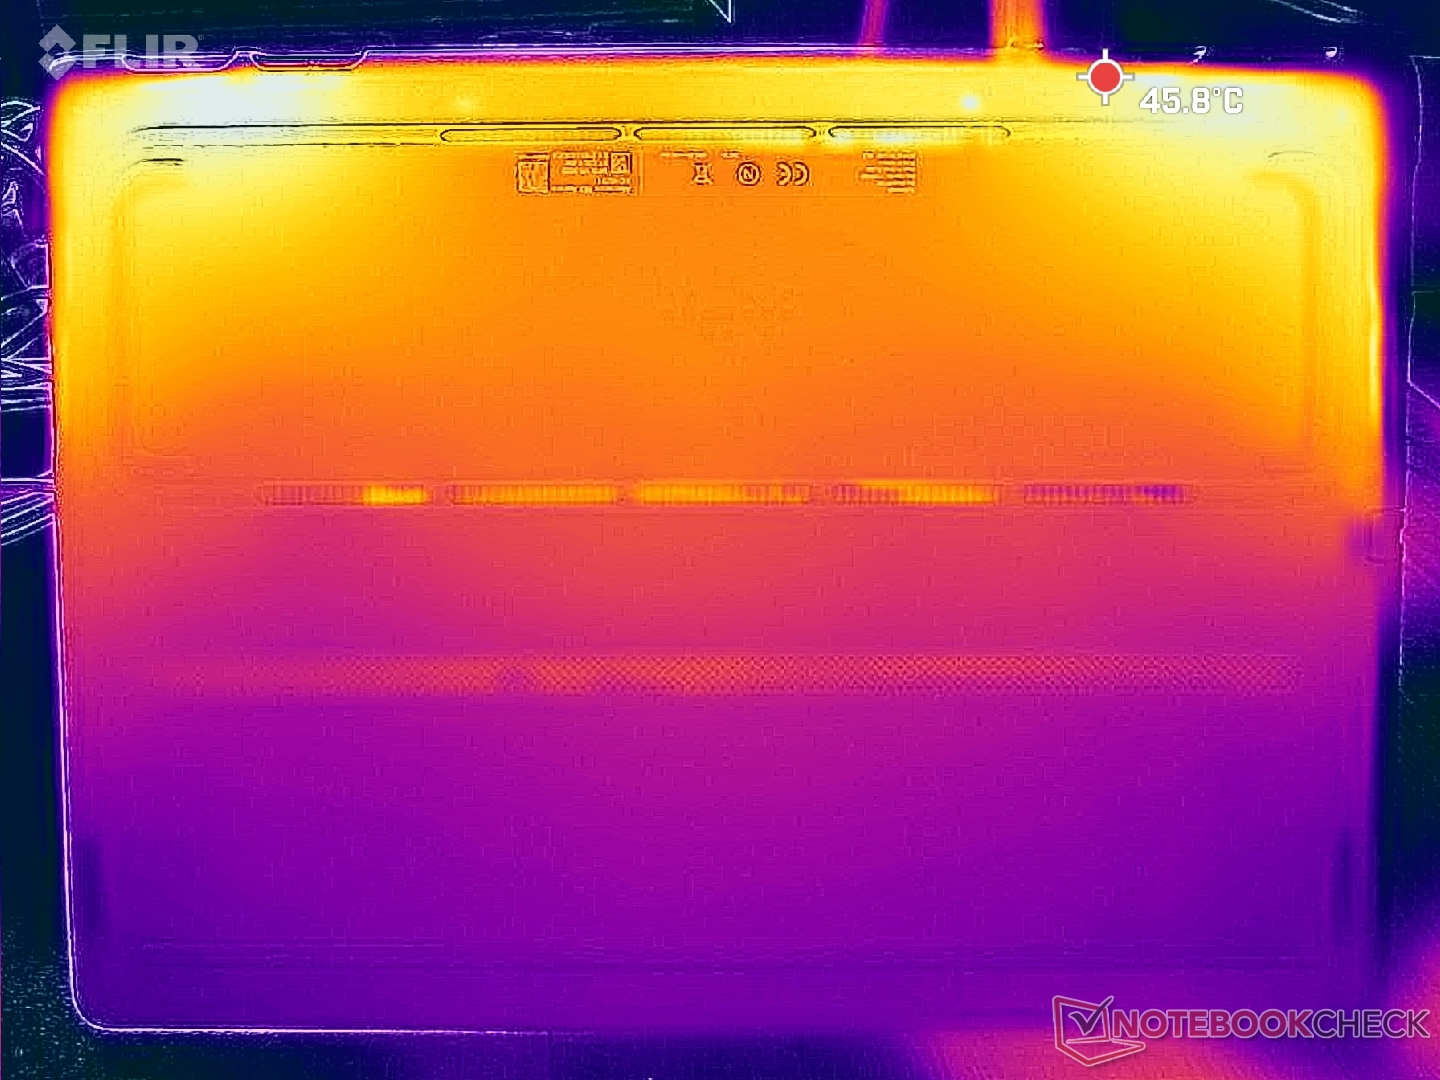
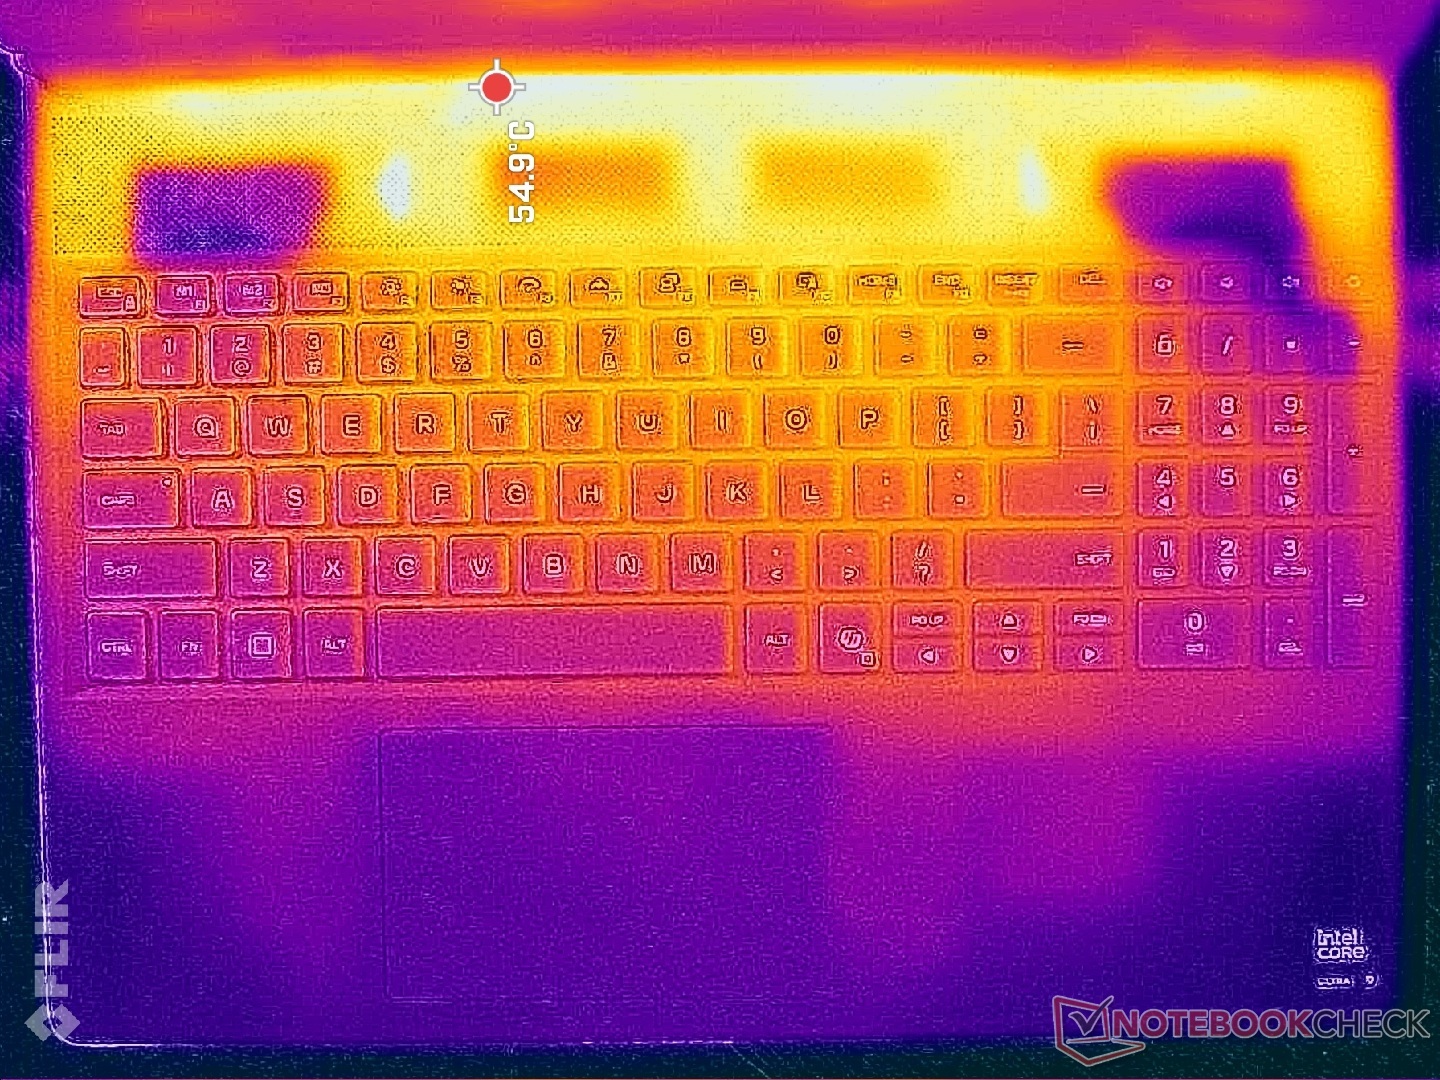
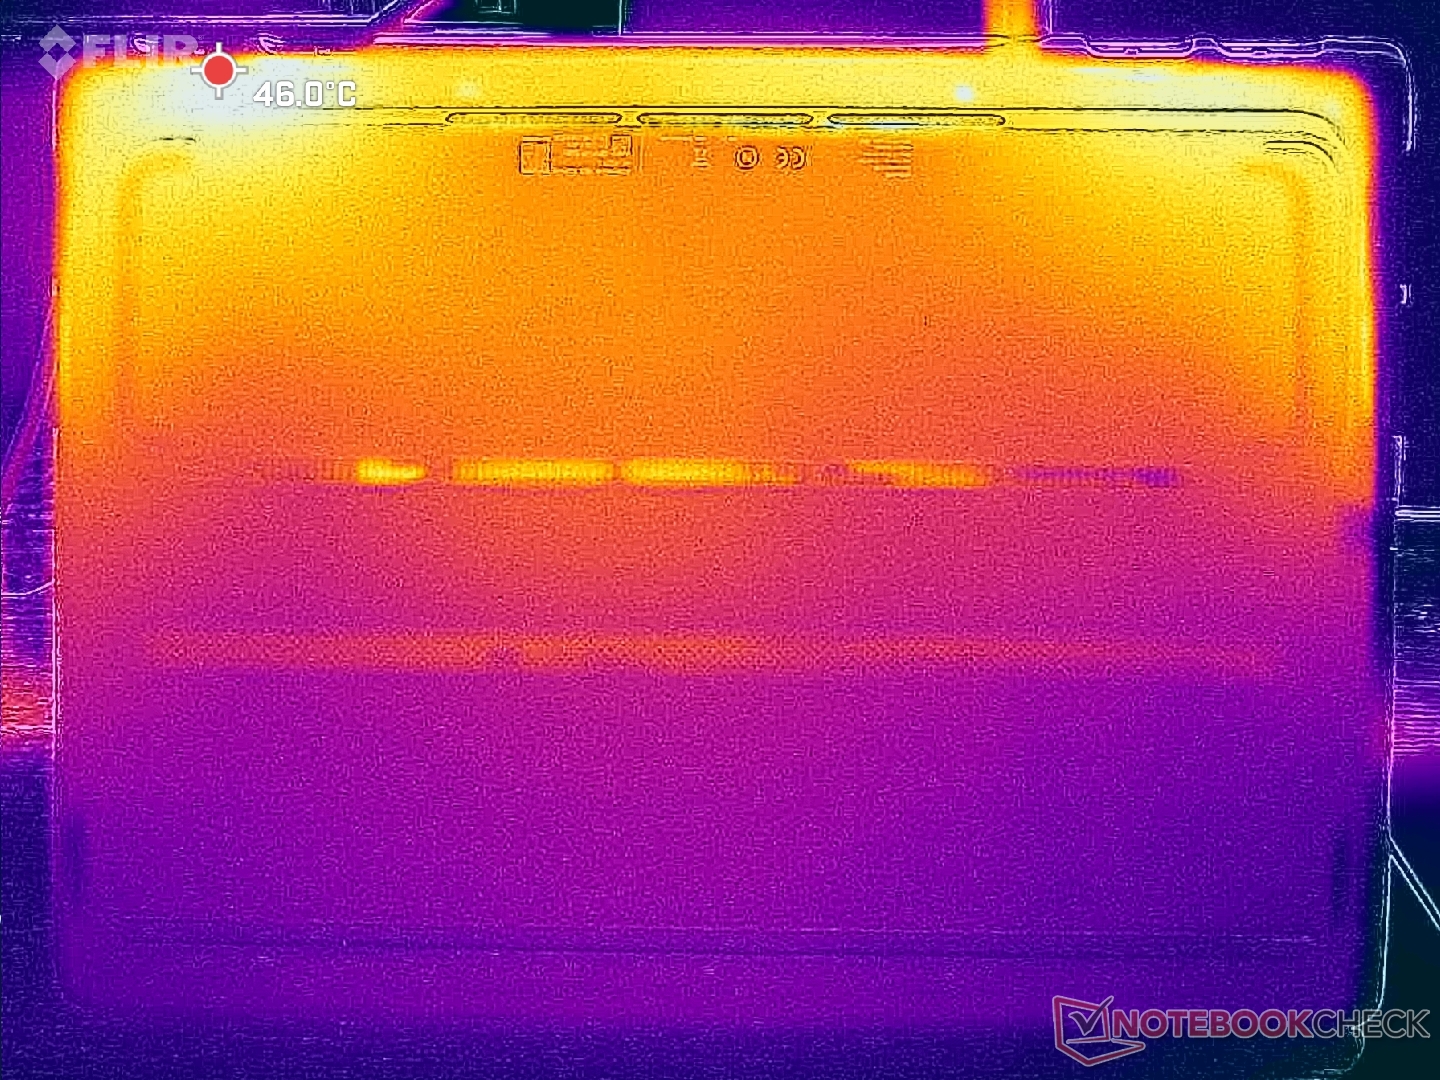
Die Oberflächentemperaturen können selbst bei geringer Belastung recht warm werden. Beim Spielen etwa erreichen die Handballenauflagen bis zu 30 Grad Celsius, ein Großteil der Tastatur sogar bis zu 42 Grad Celsius. Auch wenn es nicht unbedingt unangenehm ist, sind kühlere Handballenauflagen und WASD-Tasten bei längeren Spielesessions sicherlich vorzuziehen. Das konkurrierende MSI Vector 16 HX läuft unter ähnlichen Bedingungen sogar noch wärmer.
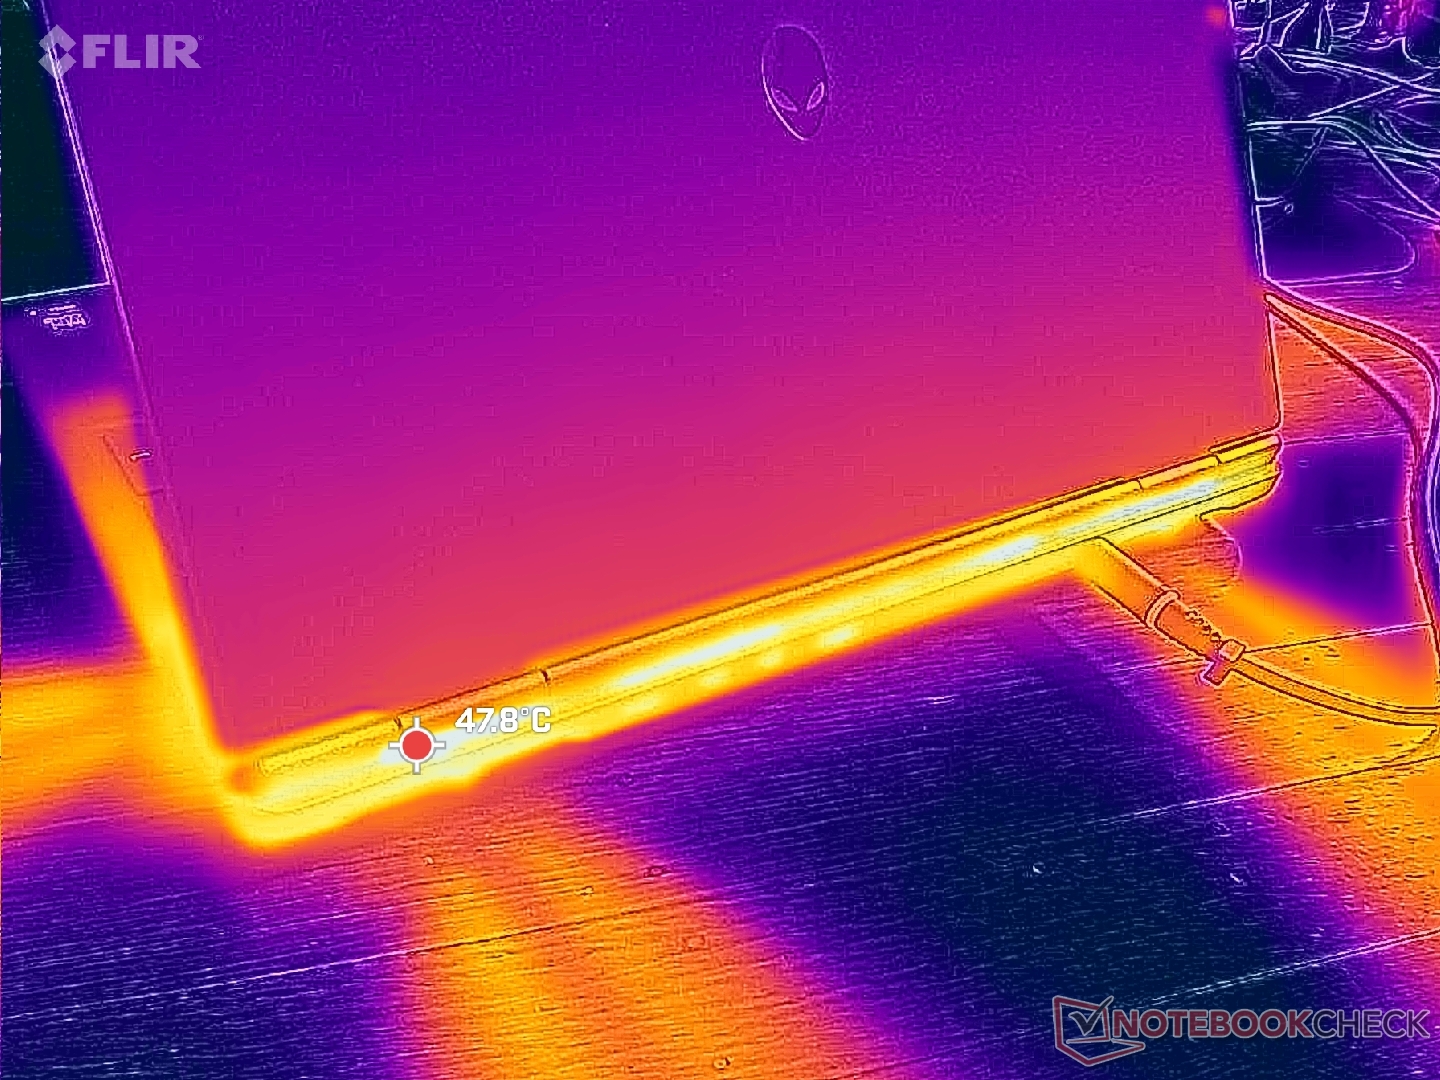
(-) Die maximale Temperatur auf der Oberseite ist 51 °C. Im Vergleich liegt der Klassendurchschnitt bei 40.4 °C (von 21.2 bis 68.8 °C für die Klasse Gaming).
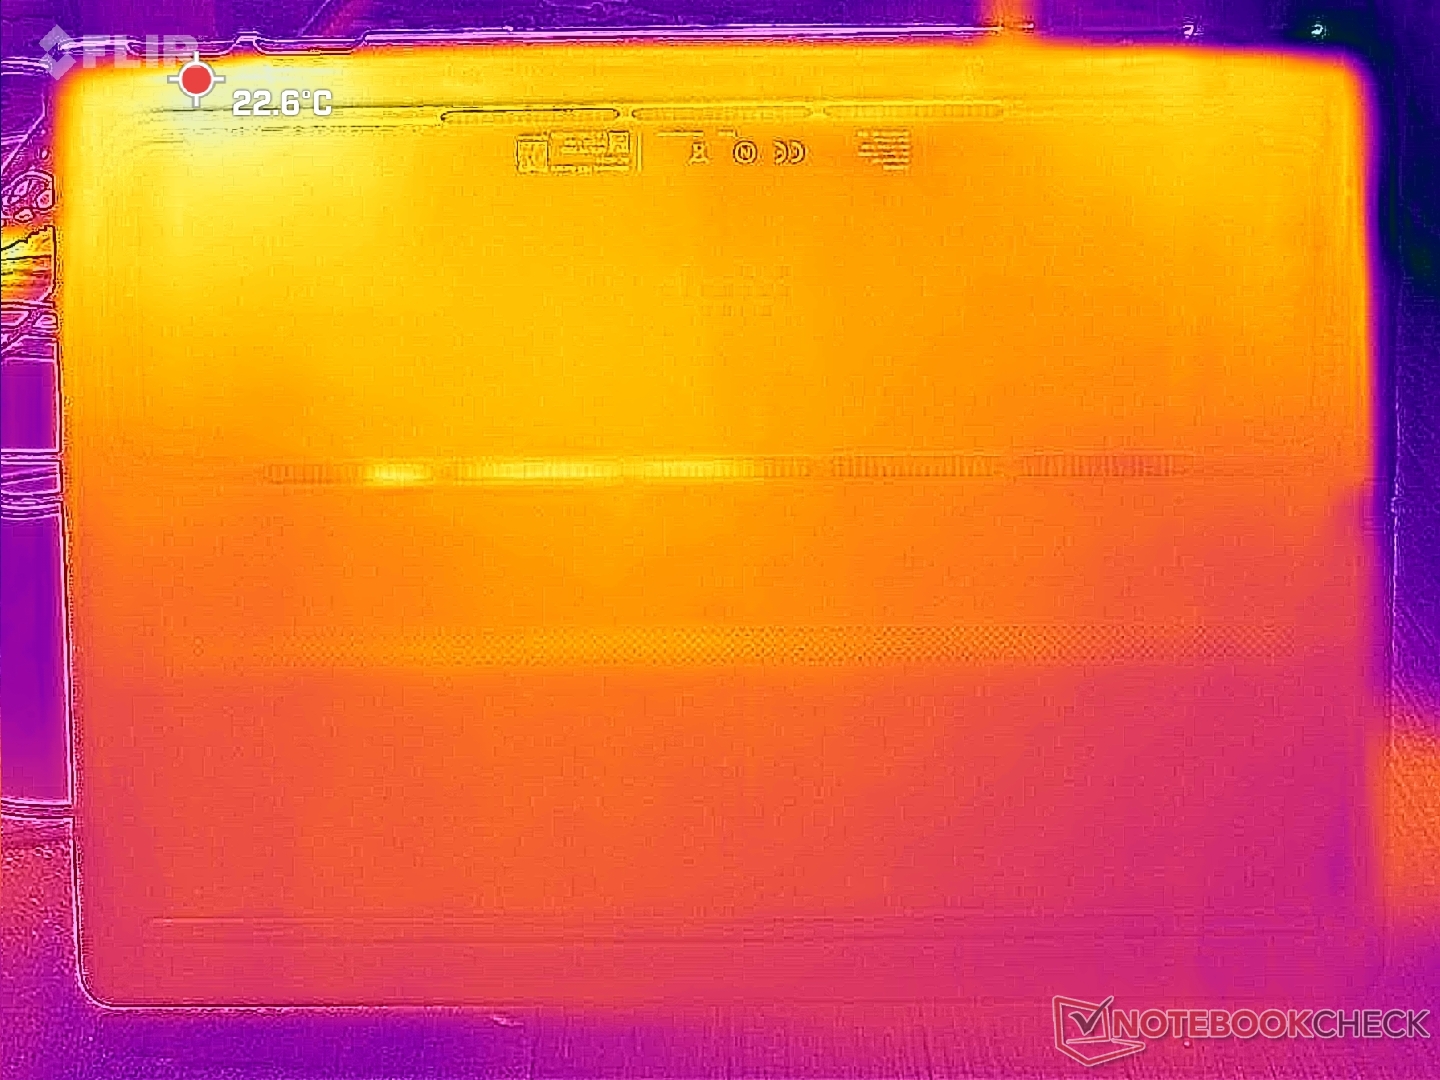
(-) Auf der Unterseite messen wir eine maximalen Wert von 45.6 °C (im Vergleich zum Durchschnitt von 43.2 °C).
(+) Ohne Last messen wir eine durchschnittliche Temperatur von 27.7 °C auf der Oberseite. Der Klassendurchschnitt erreicht 33.9 °C.
(-) 3: The average temperature for the upper side is 41.4 °C / 107 F, compared to the average of 33.9 °C / 93 F for the class Gaming.
(+) Die Handballen und der Touchpad-Bereich erreichen maximal 33.4 °C und damit die typische Hauttemperatur und fühlen sich daher nicht heiß an.
(-) Die durchschnittliche Handballen-Temperatur anderer getesteter Geräte war 28.8 °C (-4.6 °C).
| Alienware 16X Aurora, RTX 5070 Intel Core Ultra 9 275HX, NVIDIA GeForce RTX 5070 Laptop | Alienware 16 Area-51 Intel Core Ultra 9 275HX, NVIDIA GeForce RTX 5080 Laptop | Gigabyte Gaming A16 GA6H Intel Core i7-13620H, NVIDIA GeForce RTX 5070 Laptop | MSI Vector 16 HX AI A2XWHG Intel Core Ultra 7 255HX, NVIDIA GeForce RTX 5070 Ti Laptop | Asus TUF Gaming A16 FA608WV AMD Ryzen AI 9 HX 370, NVIDIA GeForce RTX 4060 Laptop GPU | Lenovo Legion 5 Pro 16IAX10H Intel Core Ultra 9 275HX, NVIDIA GeForce RTX 5070 Ti Laptop | |
|---|---|---|---|---|---|---|
| Hitze | -6% | -12% | -9% | 10% | -21% | |
| Last oben max * (°C) | 51 | 43.8 14% | 50 2% | 53 -4% | 38 25% | 48 6% |
| Last unten max * (°C) | 45.6 | 40 12% | 49 -7% | 52 -14% | 37 19% | 50 -10% |
| Idle oben max * (°C) | 29.8 | 35.8 -20% | 35 -17% | 33 -11% | 28 6% | 38 -28% |
| Idle unten max * (°C) | 27.4 | 35.2 -28% | 34 -24% | 29 -6% | 30 -9% | 42 -53% |
* ... kleinere Werte sind besser
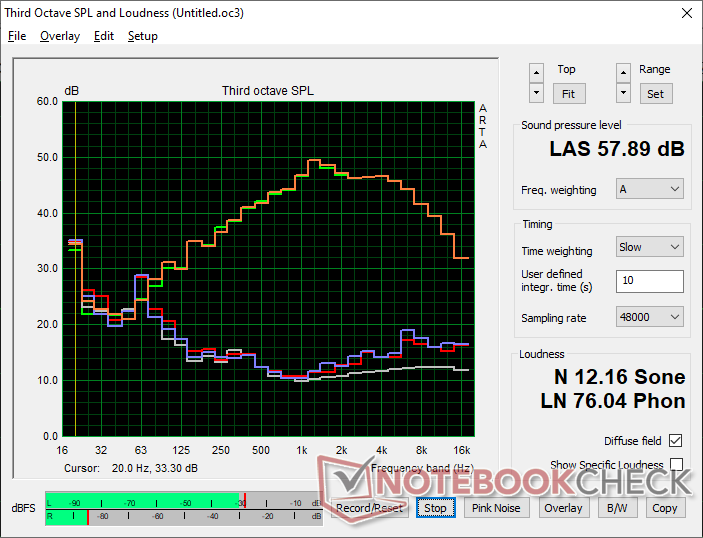
Lautsprecher
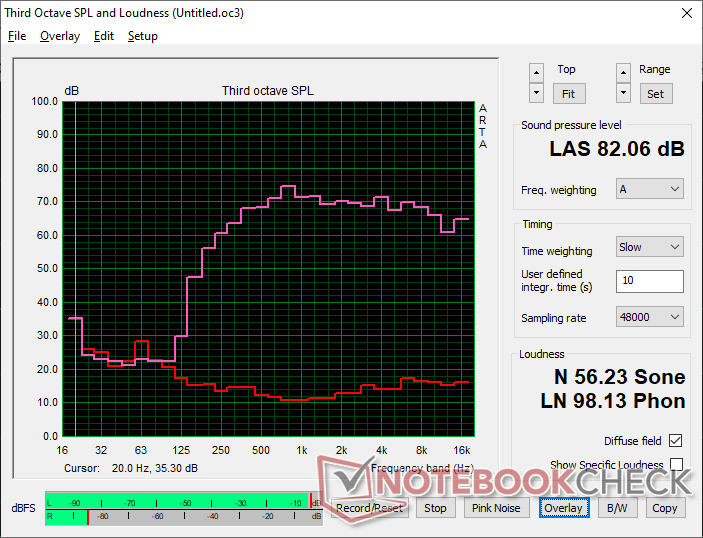
Alienware 16X Aurora, RTX 5070 Audio Analyse
(+) | Die Lautsprecher können relativ laut spielen (82.1 dB)
Bass 100 - 315 Hz
(-) | kaum Bass - 21.6% niedriger als der Median
(±) | durchschnittlich lineare Bass-Wiedergabe (12.9% Delta zum Vorgänger)
Mitteltöne 400 - 2000 Hz
(+) | ausgeglichene Mitten, vom Median nur 2.3% abweichend
(+) | lineare Mitten (4% Delta zum Vorgänger)
Hochtöne 2 - 16 kHz
(+) | ausgeglichene Hochtöne, vom Median nur 1.3% abweichend
(+) | sehr lineare Hochtöne (3.7% Delta zum Vorgänger)
Gesamt im hörbaren Bereich 100 - 16.000 Hz
(+) | hörbarer Bereich ist sehr linear (14.5% Abstand zum Median
Im Vergleich zu allen Geräten derselben Klasse
» 27% aller getesteten Geräte dieser Klasse waren besser, 7% vergleichbar, 66% schlechter
» Das beste Gerät hat einen Delta-Wert von 6%, durchschnittlich ist 18%, das schlechteste Gerät hat 132%
Im Vergleich zu allen Geräten im Test
» 18% aller getesteten Geräte waren besser, 4% vergleichbar, 78% schlechter
» Das beste Gerät hat einen Delta-Wert von 4%, durchschnittlich ist 24%, das schlechteste Gerät hat 134%
Apple MacBook Pro 16 2021 M1 Pro Audio Analyse
(+) | Die Lautsprecher können relativ laut spielen (84.7 dB)
Bass 100 - 315 Hz
(+) | guter Bass - nur 3.8% Abweichung vom Median
(+) | lineare Bass-Wiedergabe (5.2% Delta zum Vorgänger)
Mitteltöne 400 - 2000 Hz
(+) | ausgeglichene Mitten, vom Median nur 1.3% abweichend
(+) | lineare Mitten (2.1% Delta zum Vorgänger)
Hochtöne 2 - 16 kHz
(+) | ausgeglichene Hochtöne, vom Median nur 1.9% abweichend
(+) | sehr lineare Hochtöne (2.7% Delta zum Vorgänger)
Gesamt im hörbaren Bereich 100 - 16.000 Hz
(+) | hörbarer Bereich ist sehr linear (4.6% Abstand zum Median
Im Vergleich zu allen Geräten derselben Klasse
» 0% aller getesteten Geräte dieser Klasse waren besser, 0% vergleichbar, 100% schlechter
» Das beste Gerät hat einen Delta-Wert von 5%, durchschnittlich ist 17%, das schlechteste Gerät hat 45%
Im Vergleich zu allen Geräten im Test
» 0% aller getesteten Geräte waren besser, 0% vergleichbar, 100% schlechter
» Das beste Gerät hat einen Delta-Wert von 4%, durchschnittlich ist 24%, das schlechteste Gerät hat 134%
Energieverwaltung
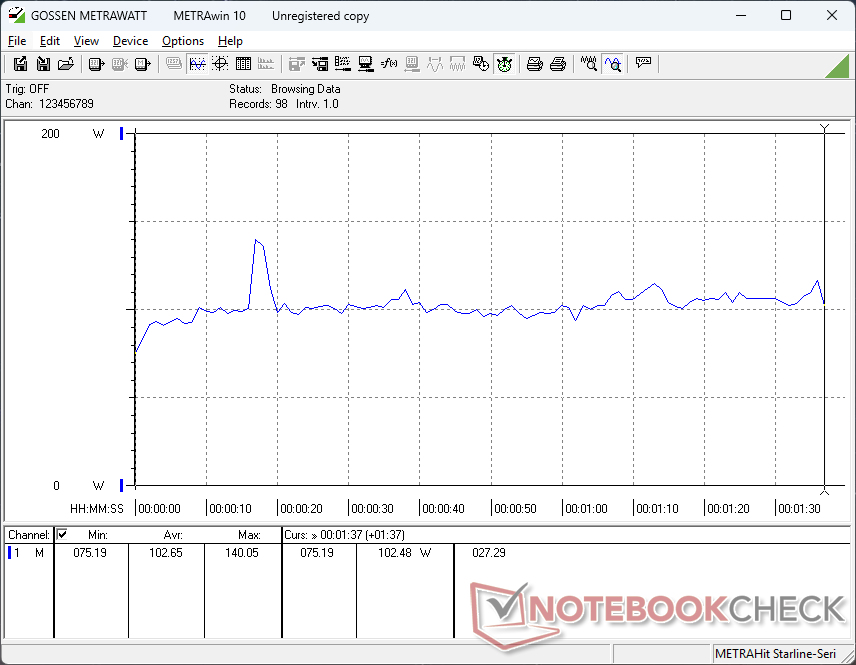
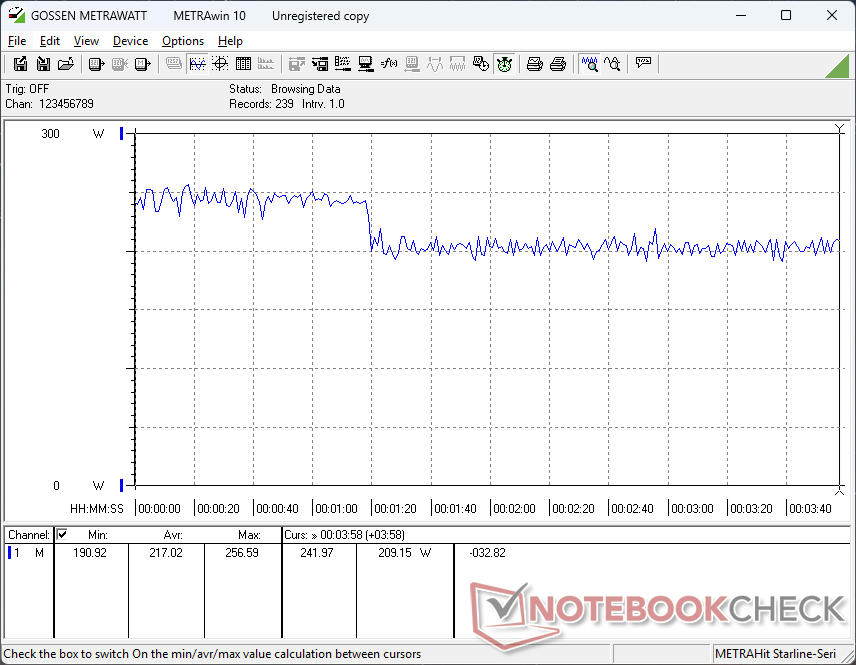
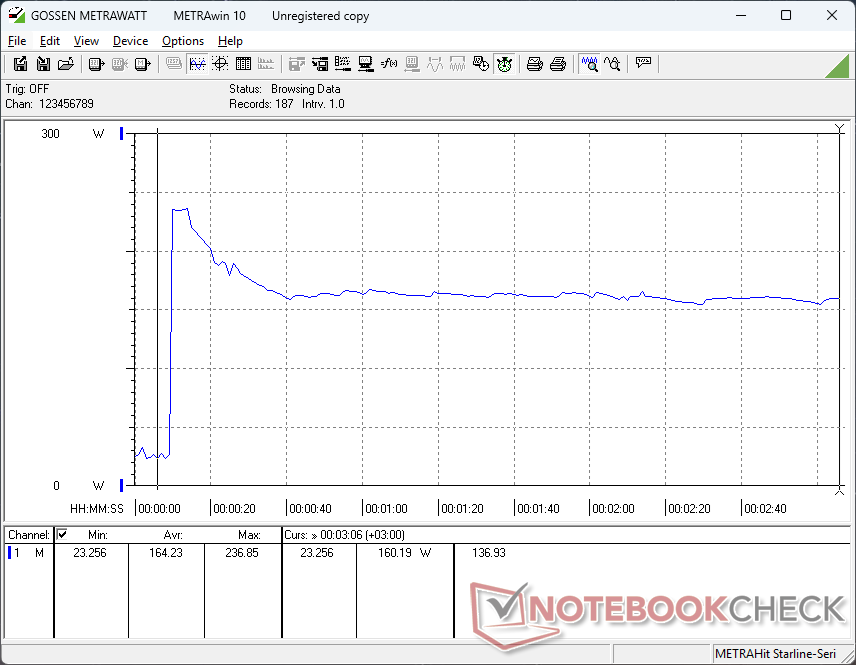
Stromverbrauch
Der Leerlauf auf dem Desktop erfordert je nach Helligkeit und Energieprofil-Einstellung zwischen 20 W und 32 W. Diese Minimalwerte sind höher als bei vielen konkurrierenden Gaming-Laptops, aber vergleichbar mit den meisten anderen Alienware Modellen.
Die Ausführung von Cyberpunk 2077 erfordert 192 W oder 11 Prozent weniger als beim MSI Vector 16 HX mit RTX 5070 Ti Grafik. Wenn man bedenkt, dass die RTX 5070 Ti 25 bis 30 Prozent schneller sein kann als unsere RTX 5070, ist die Leistung pro Watt unserer Aurora 16X-Konfiguration nicht so gut, wie wir es erwartet hatten.
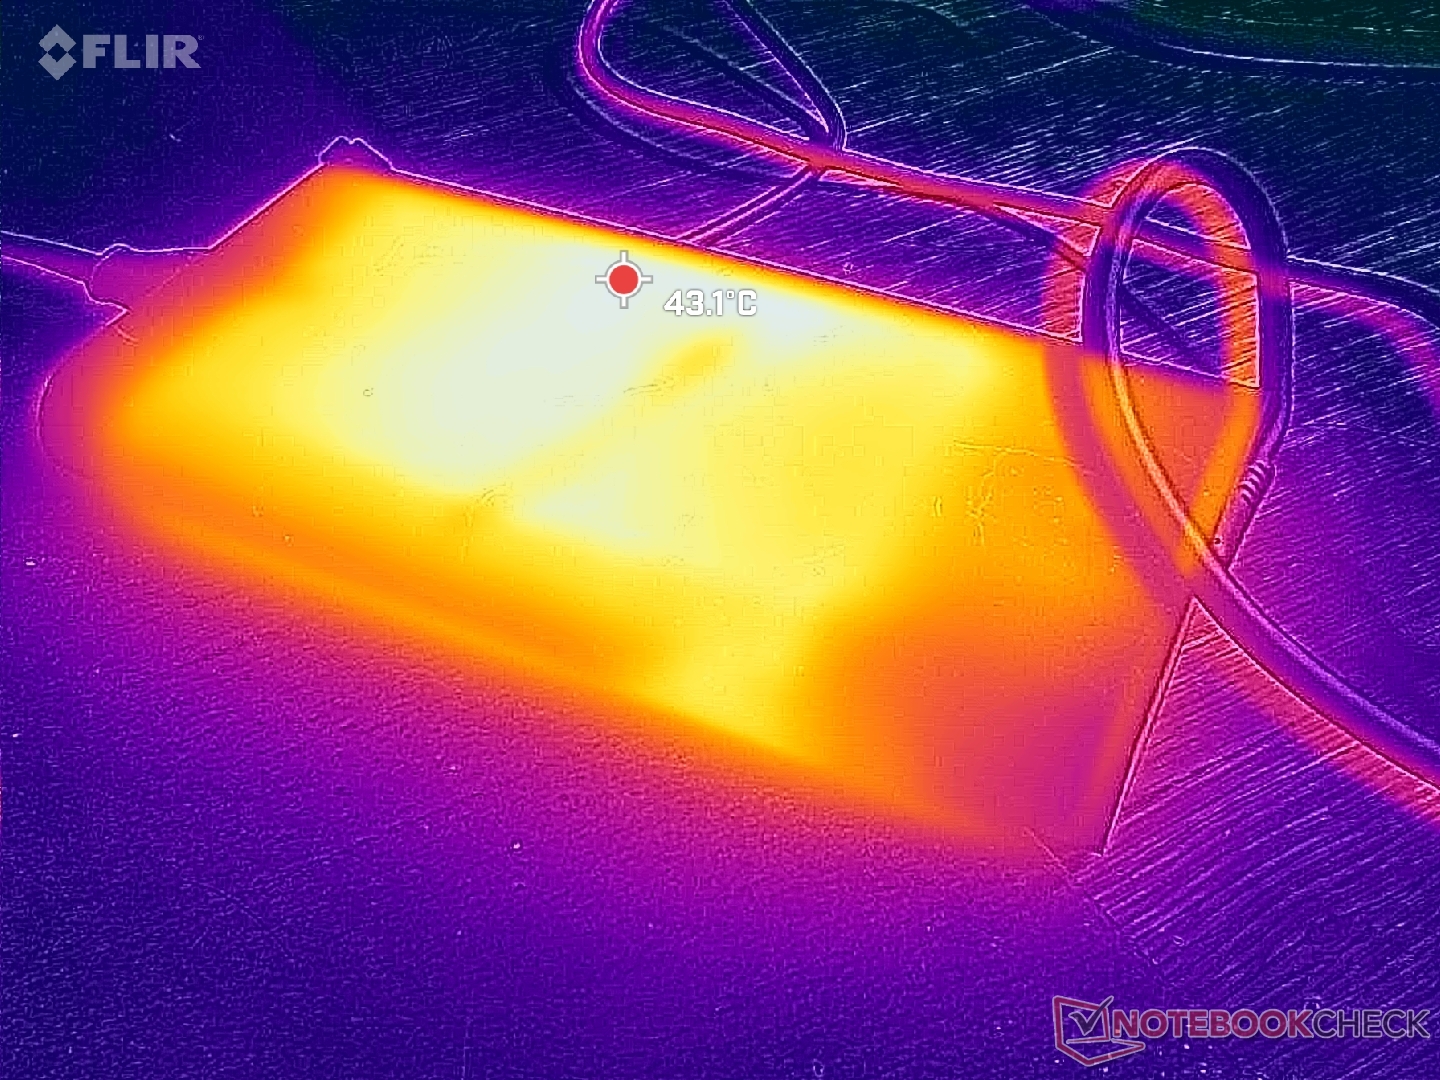
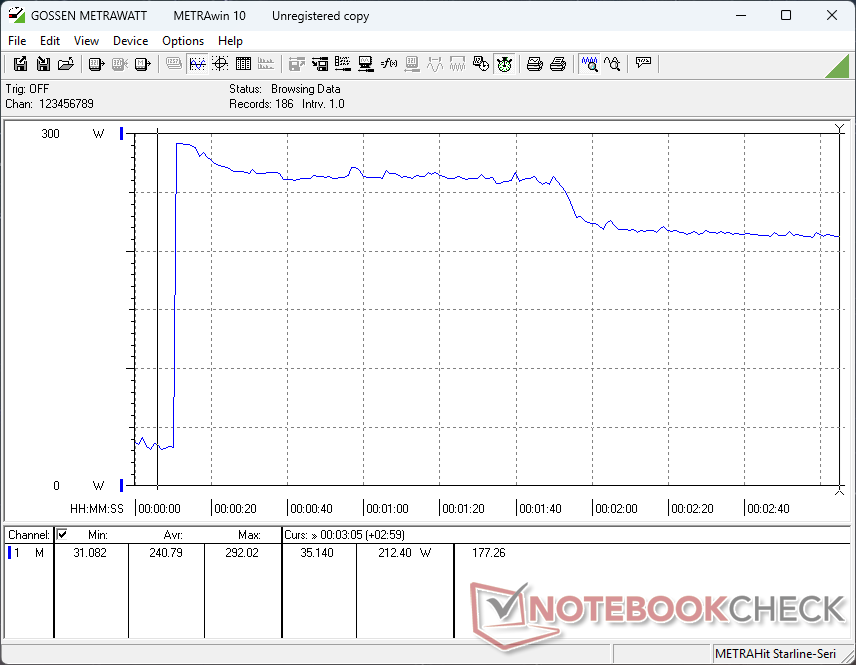
Mit dem relativ großen (~20,5 x 10,5 x 2,5 cm) 280-Watt-Netzteil können wir eine vorübergehende maximale Leistungsaufnahme von 292 W verzeichnen, wenn CPU und GPU jeweils zu 100 Prozent ausgelastet sind.
| Aus / Standby | |
| Idle | |
| Last |
|
Legende:
min: | |
| Alienware 16X Aurora, RTX 5070 Ultra 9 275HX, GeForce RTX 5070 Laptop, , IPS, 2560x1600, 16" | Alienware 16 Area-51 Ultra 9 275HX, GeForce RTX 5080 Laptop, Samsung PM9C1a MZ9L81T0HDLB, IPS, 2560x1600, 16" | Gigabyte Gaming A16 GA6H i7-13620H, GeForce RTX 5070 Laptop, Kingston OM8PGP41024Q-A0, IPS, 2560x1600, 16" | MSI Vector 16 HX AI A2XWHG Ultra 7 255HX, GeForce RTX 5070 Ti Laptop, Micron 2400 MTFDKBA512QFM, IPS, 2560x1600, 16" | Asus TUF Gaming A16 FA608WV Ryzen AI 9 HX 370, GeForce RTX 4060 Laptop GPU, Micron 2400 MTFDKBA1T0QFM, IPS, 1920x1200, 16" | Lenovo Legion 5 Pro 16IAX10H Ultra 9 275HX, GeForce RTX 5070 Ti Laptop, Western Digital PC SN8000S SDEPNRK-1T00, OLED, 2560x1600, 16" | |
|---|---|---|---|---|---|---|
| Stromverbrauch | -26% | 39% | 9% | 40% | -1% | |
| Idle min * (Watt) | 20.1 | 27 -34% | 9 55% | 7.1 65% | 6.8 66% | 14 30% |
| Idle avg * (Watt) | 27.6 | 33.5 -21% | 11 60% | 15.9 42% | 12.7 54% | 14.3 48% |
| Idle max * (Watt) | 31.8 | 41.4 -30% | 23 28% | 29.5 7% | 15.2 52% | 20.1 37% |
| Last avg * (Watt) | 102.7 | 124.7 -21% | 91 11% | 124 -21% | 85 17% | 177 -72% |
| Cyberpunk 2077 ultra external monitor * (Watt) | 192.3 | 249 -29% | 130 32% | 217 -13% | 143 26% | 255 -33% |
| Cyberpunk 2077 ultra * (Watt) | 217 | 256 -18% | 132.5 39% | 222 -2% | 145 33% | 255 -18% |
| Last max * (Watt) | 292 | 367.2 -26% | 155 47% | 336 -15% | 199 32% | 294 -1% |
* ... kleinere Werte sind besser
Stromverbrauch Cyberpunk / Stress Test
Stromverbrauch externer Monitor
Akkulaufzeit
Die Akkukapazität ist dieselbe wie beim Alienware 15 Area-51, obwohl das Aurora 16X preisgünstiger ist. Die Laufzeiten sind dennoch schlecht oder bestenfalls durchschnittlich mit nur 4 Stunden realem WLAN-Browsing bei ausgeglichenem Energieprofil.
Das Aufladen von der leeren auf die volle Kapazität mit dem mitgelieferten Netzadapter dauert fast 2,5 Stunden.
| Alienware 16X Aurora, RTX 5070 Ultra 9 275HX, GeForce RTX 5070 Laptop, 96 Wh | Alienware 16 Area-51 Ultra 9 275HX, GeForce RTX 5080 Laptop, 96 Wh | Gigabyte Gaming A16 GA6H i7-13620H, GeForce RTX 5070 Laptop, 76 Wh | MSI Vector 16 HX AI A2XWHG Ultra 7 255HX, GeForce RTX 5070 Ti Laptop, 90 Wh | Asus TUF Gaming A16 FA608WV Ryzen AI 9 HX 370, GeForce RTX 4060 Laptop GPU, 90 Wh | Lenovo Legion 5 Pro 16IAX10H Ultra 9 275HX, GeForce RTX 5070 Ti Laptop, 80 Wh | |
|---|---|---|---|---|---|---|
| Akkulaufzeit | -35% | 79% | 63% | 230% | 14% | |
| WLAN (h) | 4.3 | 2.8 -35% | 7.7 79% | 7 63% | 14.2 230% | 4.9 14% |
| Idle (h) | 3.1 | |||||
| H.264 (h) | 14.7 | 4.8 | ||||
| Last (h) | 2.1 | 1.7 |
Notebookcheck Bewertung
Alienware 16X Aurora, RTX 5070
- 13.08.2025 v8
Allen Ngo
 Total Sustainability Score:
 Potenzielle Wettbewerber im Vergleich
Bild | Modell / Test | Preis ab | Gewicht | Dicke | Display |
|---|---|---|---|---|---|
1. 84.9%  | Alienware 16X Aurora, RTX 5070 Intel Core Ultra 9 275HX ⎘ NVIDIA GeForce RTX 5070 Laptop ⎘ 32 GB RAM | Amazon: 1.849,00 € Geizhals Suche | 2.5 kg | 23.4 mm | 16.00" 2560x1600 189 PPI IPS |
2. 85.7%  | Alienware 16 Area-51 Intel Core Ultra 9 275HX ⎘ NVIDIA GeForce RTX 5080 Laptop ⎘ 32 GB RAM, 1024 GB SSD | Amazon: 1. 1.577,18 € Alienware 18 Area-51 Gaming ... 2. 1.849,00 € Alienware 16x Aurora Gaming ... 3. 4.749,00 € Alienware 18 Area-51 Gaming ... Geizhals Suche | 3.3 kg | 28.5 mm | 16.00" 2560x1600 189 PPI IPS |
3. 80.1%  | Gigabyte Gaming A16 GA6H Intel Core i7-13620H ⎘ NVIDIA GeForce RTX 5070 Laptop ⎘ 16 GB RAM, 1024 GB SSD | Amazon: 1. Gigabyte Gaming A16 Gaming-L... 2. 1.576,31 € Gigabyte Gaming A16 CWH Gami... 3. Gigabyte Gaming A16 Laptop �... Bestpreis 1369€ simac_gmbh 2. 1450€ Coolblue 3. 1450€ galaxus | 2.3 kg | 23 mm | 16.00" 2560x1600 189 PPI IPS |
4. 84%  | MSI Vector 16 HX AI A2XWHG Intel Core Ultra 7 255HX ⎘ NVIDIA GeForce RTX 5070 Ti Laptop ⎘ 16 GB RAM, 512 GB SSD | Amazon: 2.029,00 € Bestpreis 1898.99€ playox.de 2. 1899€ office-partner.de 3. 1914.95€ playox (AT) | 2.6 kg | 28.6 mm | 16.00" 2560x1600 189 PPI IPS |
5. 83%  | Asus TUF Gaming A16 FA608WV AMD Ryzen AI 9 HX 370 ⎘ NVIDIA GeForce RTX 4060 Laptop GPU ⎘ 16 GB RAM, 1024 GB SSD | Amazon: Bestpreis 1566.55€ expertDeutschland 2. 1649€ expert.de 3. 1799€ nullprozentshop.de | 2.2 kg | 25.7 mm | 16.00" 1920x1200 142 PPI IPS |
6. 84.5%  | Lenovo Legion 5 Pro 16IAX10H Intel Core Ultra 9 275HX ⎘ NVIDIA GeForce RTX 5070 Ti Laptop ⎘ 32 GB RAM, 1024 GB SSD | Amazon: 1. 2.799,00 € Lenovo Legion Pro 5 Gaming A... 2. 1.999,00 € Lenovo Legion Pro 5 16ADR10 ... 3. 2.163,20 € Lenovo Legion Pro 5 Gaming L... Listenpreis: 2500 Euro | 2.4 kg | 25.95 mm | 16.00" 2560x1600 189 PPI OLED |
Transparenz
Die Auswahl der zu testenden Geräte erfolgt innerhalb der Redaktion. Das vorliegende Testmuster wurde dem Autor vom Hersteller oder einem Shop zu Testzwecken leihweise zur Verfügung gestellt. Eine Einflussnahme des Leihstellers auf den Testbericht gab es nicht, der Hersteller erhielt keine Version des Reviews vor der Veröffentlichung. Es bestand keine Verpflichtung zur Publikation. Als eigenständiges, unabhängiges Unternehmen unterliegt Notebookcheck keiner Diktion von Herstellern, Shops und Verlagen.
So testet Notebookcheck
Pro Jahr werden von Notebookcheck hunderte Laptops und Smartphones unabhängig in von uns standardisierten technischen Verfahren getestet, um eine Vergleichbarkeit aller Testergebnisse zu gewährleisten. Seit rund 20 Jahren entwickeln wir diese Testmethoden kontinuierlich weiter und setzen damit Branchenstandards. In unseren Testlaboren kommt ausschließlich hochwertiges Messequipment in die Hände erfahrener Techniker und Redakteure. Die Tests unterliegen einer mehrstufigen Kontrolle. Unsere komplexe Gesamtbewertung basiert auf hunderten fundierten Messergebnissen und Benchmarks, womit Ihnen Objektivität garantiert ist. Weitere Informationen zu unseren Testmethoden gibt es hier.

