
Test der Nvidia GeForce RTX 5070 Founders Edition: Blackwell Qualität für 549 US-Dollar bedroht von der AMD RDNA 4
Blackwell für den Rest von uns.
Die Nvidia GeForce RTX 5070 Founders Edition, die auf der GB205 GPU basiert, bringt mit ihrem Preis von 549 US-Dollar die Blackwell Vorteile für die Massen. Während die RTX 5070 FE als fähige 1.080p- und 1.440p-Gaming-GPU daherkommt, wird ihr Erfolg letztendlich von den Lagerbeständen und dem Preis abhängen und davon, ob sie dem bevorstehenden AMD-RDNA-4-Angriff standhalten kann.Vaidyanathan Subramaniam, 👁 Vaidyanathan Subramaniam, ✓ Stefanie Voigt (übersetzt von DeepL / Ninh Duy) Veröffentlicht am 🇺🇸 🇪🇸 ...
Fazit: Mit Einlösungspotenzial, sofern genügend Aktien zum richtigen Preis vorhanden sind
Update 03/05: Angesichts der Tatsache, dass die RTX 5070 FE laut Nvidia erst Ende März erhältlich sein wird, pausieren wir vorübergehend den Editor's Choice Award für diese Karte bis zur weiteren Verfügbarkeit zur unverbindlichen Preisempfehlung.
Von schmelzenden Steckern über defekte Chips mit fehlender Hardware bis hin zu dürftigen Lieferungen und überhöhten Preisen aufgrund von Scalping - der Start der RTX-50-Serie war alles andere als glänzend. Dennoch bietet die Ankunft der RTX 5070 eine weitere Chance für Nvidia, seinen Kurs zu korrigieren.
Nvidias Pläne für eine RTX 5060 oder eine RTX 5050 in der Zukunft sind zu diesem Zeitpunkt unklar, aber die RTX 5070 ist derzeit der Einstieg in alles, was Blackwell zu bieten beabsichtigt.
In Bezug auf die Leistung schafft es die RTX 5070, die RTX 4070 Ti in synthetischen Benchmarks zu übertreffen, obwohl sie 20 % weniger CUDA-Kerne hat.
Bei Spielen ist die Bilanz jedoch gemischt: Es gibt zwar Titel, die die Speichererweiterungen der RTX 5070 bevorzugen, aber die RTX 4070 Ti hat insgesamt einen winzigen Vorteil.
Der eigentliche Knaller ist jedoch die Unterstützung für die DLSS-4-Multi-Frame-Generation. Die kühnen Behauptungen von Nvidia, dass die Leistung mit der RTX 4090 vergleichbar sei, haben einen gewissen Wahrheitsgehalt, aber sie sind mit einem großen Sternchen versehen.
Seien wir doch mal ehrlich: Eine abgespeckte Blackwell GPU kann niemals mit der Rohleistung einer fast vollständigen Ada Die mithalten. Davon abgesehen kann die RTX 5070 die MFG (Multi-Frame Generation/Bildratenverbesserung) in den wenigen Spielen, die sie unterstützt, gut nutzen, ungeachtet der Latenzprobleme.
Obwohl es sich um eine Einsteigerkarte handelt, enttäuscht die RTX 5070 FE nicht, wenn es um die Grundlagen geht. Die Verarbeitungsqualität ist erstklassig, die Emissionen sind weitgehend unter Kontrolle, abgesehen von den gelegentlich lauten Lüftern, und die Verbesserungen bei der Energieeffizienz im Vergleich zu den Top-Angeboten von Nvidia und AMD sind deutlich spürbar.
Allerdings wird es für Nvidia mit der bevorstehenden Markteinführung der RDNA 4 Radeon RX 9070 XT und der RX 9070 kein Kinderspiel werden, zumal der Preis der RX 9070 ebenfalls bei 549 US-Dollar liegt. Dies ist besonders kritisch, wenn man bedenkt, dass die RTX 5070 nur 12 GB VRAM bietet, was im Vergleich zu den 16 GB, die von der Konkurrenz angeboten werden, verblasst.
Von einem reinen Leistungsstandpunkt aus gesehen, sollte die RTX 5070 keine Probleme haben, eine gute Anzahl von Spielern zu finden, die hauptsächlich eine fähige 1.080p- oder 1.440p-Ultra-GPU benötigen.
Allerdings muss Nvidia sowohl die Verfügbarkeit als auch die Preisgestaltung in den Griff bekommen um zu verhindern, dass sich potenzielle Kunden für Team Red entscheiden.
Deshalb ist Wettbewerb gut.
Pro
Contra
Preis und Verfügbarkeit
Die Nvidia GeForce RTX 5070 Founders Edition hat einen offiziellen Preis von 549 US-Dollar und wird (hoffentlich) zusammen mit ähnlich teuren AiB-Modellen ab morgen erhältlich sein.
- 598,90 €ASUS Dual GeForce RTX 5070 12GB GDDR7 OC Edition Gaming Grafikkarte (NVIDIA Blackwell Architektur und DLSS 4, 2,5-Slot Design, SSF, PCIe 5.0, 3X DisplayPort 2.1b, 1x HDMI 2.1b)
- 1.899,00 €NVIDIA GeForce RTX 5080 Founders Edition
- 1.289,99 €NVIDIA GeForce RTX 4070 SUPER Founders Edition Grafikkarte
Inhaltsverzeichnis
- Fazit: Mit Einlösungspotenzial, sofern genügend Aktien zum richtigen Preis vorhanden sind
- Nahaufnahme der RTX 5070 Founders Edition
- Der Prüfstand: RTX 5070 Ti Ventus 3X OC in Kombination mit dem Core i9-14900K
- Synthetische Benchmarks: Einen Hauch schneller als die RTX 4070 Ti
- KI und Rechenleistung: Der RX 7900 XT auf den Fersen bei KI-Inferencing
- Gaming-Leistung: 4x MFG bringt RTX 5070 FE näher an eine RTX 4090 heran... mit großen Vorbehalten
- Emissionen: Relativ niedrige Oberflächentemperaturen, aber hohes Lüftergeräusch unter Last
- Energiemanagement: Sparsamer Sipper mit einem Effizienzvorteil gegenüber der RX 7900 XT
- Unsere Eindrücke von der GeForce RTX 5070 Founders Edition
Nvidias Blackwell Generation von GPUs, die GeForce RTX 5090, RTX 5080 und die RTX 5070 Ti, hatten eine stürmischen Empfang bisher. Wir sind jetzt bei der Einführung der Einstiegs-GPU von Blackwell, der RTX 5070.
Die RTX 5070 soll der Einstieg in alle Vorzüge der Blackwell Generation sein, einschließlich GDDR7-Speicher, Multi-Frame-Generation, FP4-Quantisierung und NVENC-Verbesserungen.
Im Gegensatz zur RTX 5070 Ti, die nur über Nvidias Add-in-Board-(AiB)-Partner erhältlich ist, gibt es die RTX 5070 in einer Founders-Edition(FE)-Variante, die wir heute testen. Die FE-Karte und eine Reihe von AiB-Modellen, die sowohl bei der UVP als auch darüber liegen, werden ebenfalls ab morgen erhältlich sein.
Mit einem Preis von 549 US-Dollar ist die RTX 5070 FE 50 US-Dollar billiger als die RTX 4070 zum Start. Nvidia hat während seiner CES-2025-Keynote mit der Behauptung für Aufsehen gesorgt, dass die 549 US-Dollar teure RTX 5070 eine vergleichbare Leistung bietet wie die 1.599 US-Dollar teure RTX 4090.
In diesem Test werfen wir einen Blick auf die RTX 5070 Founders Edition und sehen, wie sie sich im Vergleich zu den bisher von uns getesteten Angeboten von Blackwell und Ada schlägt.
Vergleich der GeForce RTX 5070 Founders Edition mit anderen Nvidia GPUs
| Spezifikation | RTX 5090 FE | RTX 5080 FE | MSI RTX 5070 Ti Ventus 3X OC | RTX 5070 FE | RTX 4090 FE | RTX 4080 Super FE | RTX 4080 FE | Asus TUF RTX4070 Ti Super | AorusRTX 4070 Ti Master | RTX 4070 Super FE | RTX 4070 FE | Inno3D RTX 4060 Ti Twin X2 | RTX 3090 Ti FE | RTX 3090 FE | RTX 3080 Ti FE |
|---|---|---|---|---|---|---|---|---|---|---|---|---|---|---|---|
| Chip | GB202 | GB203 | GB203 | GB205 | AD102 | AD103 | AD103 | AD103 | AD104 | AD104 | AD104 | AD106 | GA102 | GA102 | GA102 |
| FinFET-Prozess | Custom 4N | Custom 4N | Custom 4N | Custom 4N | Custom 4N | Custom 4N | Custom 4N | Custom 4N | Custom 4N | Custom 4N | Custom 4N | Custom 4N | 8 nm | 8 nm | 8 nm |
| CUDA Kerne | 21.760 | 10.752 | 8.960 | 6.144 | 16.384 | 10.240 | 9.728 | 8.448 | 7.680 | 7.168 | 5.888 | 4.352 | 10.752 | 10.496 | 10.240 |
| Textureinheiten | 680 | 336 | 280 | 192 | 512 | 320 | 304 | 264 | 240 | 224 | 184 | 136 | 336 | 328 | 320 |
| Tensor Cores | 680 5. Gen. | 336 5. Gen. | 280 5. Gen. | 192 5. Gen. | 512 4. Gen. | 320 4. Gen. | 304 4. Gen. | 264 4. Gen. | 240 4. Gen. | 224 4. Gen. | 184 4. Gen. | 136 4. Gen. | 336 3. Gen. | 328 3. Gen. | 320 3. Gen. |
| RT Cores | 170 4. Gen. | 84 4. Gen. | 70 4. Gen. | 48 4. Gen. | 128 3. Gen. | 80 3. Gen. | 76 3. Gen. | 66 3. Gen. | 60 3. Gen. | 56 3. Gen. | 46 3. Gen. | 34 3. Gen. | 84 2nd Gen. | 82 2nd Gen. | 80 2nd Gen. |
| GPU Base Clock | 2.017 MHz | 2.295 MHz | 2.300 MHz | 2.325 MHz | 2.235 MHz | 2.295 MHz | 2.205 MHz | 2.340 MHz | 2.310 MHz | 1.980 MHz | 1.920 MHz | 2.310 MHz | 1.560 MHz | 1.395 MHz | 1.365 MHz |
| GPU Boost-Takt | 2.407 MHz | 2.617 MHz | 2.482 MHz / 2.497 (OC-Modus) | 2.512 MHz | 2.520 MHz | 2.550 MHz | 2.505 MHz | 2.610 MHz | 2.670 MHz | 2.475 MHz | 2.475 MHz | 2.535 MHz | 1.860 MHz | 1.695 MHz | 1.665 MHz |
| Speicherbus | 512-bit | 256-bit | 256-bit | 192-bit | 384-bit | 256-bit | 256-bit | 256-bit | 192-bit | 192-bit | 192-bit | 128-bit | 384-bit | 384-bit | 384-bit |
| Speicherbandbreite | 1,79 TB/s | 960 GB/s | 896 GB/s | 672GB/s | 1.008 GB/s | 736,3 GB/s | 716,8 GB/s | 672 GB/s | 504 GB/s | 504 GB/s | 504 GB/s | 288 GB/s | 1.008 GB/s | 936 GB/s | 912 GB/s |
| Videospeicher | 32 GB GDDR7 | 16 GB GDDR7 | 16 GB GDDR7 | 12 GB GDDR7 | 24 GB GDDR6X | 16 GB GDDR6X | 16 GB GDDR6X | 16 GB GDDR6X | 12 GB GDDR6X | 12 GB GDDR6X | 12 GB GDDR6X | 8 GB GDDR6 | 24 GB GDDR6X | 24 GB GDDR6X | 12 GB GDDR6X |
| Leistungsaufnahme | 575 W | 360 W | 300 W | 250 W | 450 W | 320 W | 320 W | 285 W | 285 W | 220 W | 200 W | 160 W | 450 W | 350 W | 350 W |
Nahaufnahme der RTX 5070 Founders Edition
Die RTX 5070 FE basiert auf der exakt gleichen Designsprache wie die anderen FE-Karten der RTX-50-Serie. Mit Abmessungen von 24,5 x 10 x 4 cm und einem Gewicht von nur etwa 1,1 kg ist die RTX 5070 FE wesentlich kompakter als die bereits auf einen kleinen Formfaktor ausgelegten RTX 5090 FE und RTX 5080 FE.


Die GPU bietet einen Satz von drei DisplayPort-2.1b-Ausgängen mit UHBR20-Unterstützung und einen einzelnen HDMI-2.1b-Ausgang, die in der Blackwell Generation jetzt Standard sind.
Obwohl es sich um eine 250-W-GPU handelt, nutzt die RTX 5070 FE den neuen 12-V-2x6-Stromanschluss.
Es sollte keine Probleme geben, vorhandene 12VHPWR-Kabel von ATX-3.x-Netzteilen zu verwenden, aber beachten Sie, dass rechtwinklige Stecker nicht in die abgewinkelte Aussparung am GPU-Ende passen werden.
Im Lieferumfang ist ein praktischer 16-poliger-auf-2x8-poliger-Adapter enthalten, mit dem man sein zuverlässiges älteres Netzteil ohne Probleme weiter verwenden kann.
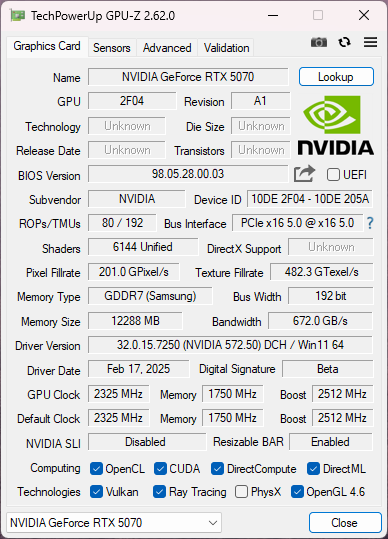
Glücklicherweise sind bei unserer RTX 5070 FE alle 80 ROPs aktiviert (puh!). Die GPU verfügt über 12 GB GDDR7 VRAM auf einer 192-Bit-Speicherschnittstelle, die eine theoretische Bandbreite von 672 GB/s liefern kann.
Die RTX 5070 FE ist in der Lage, mit bis zu 2.512 MHz zu boosten, aber je nach verfügbarer Leistung und thermischem Spielraum sind auch höhere Boost-Takte möglich.
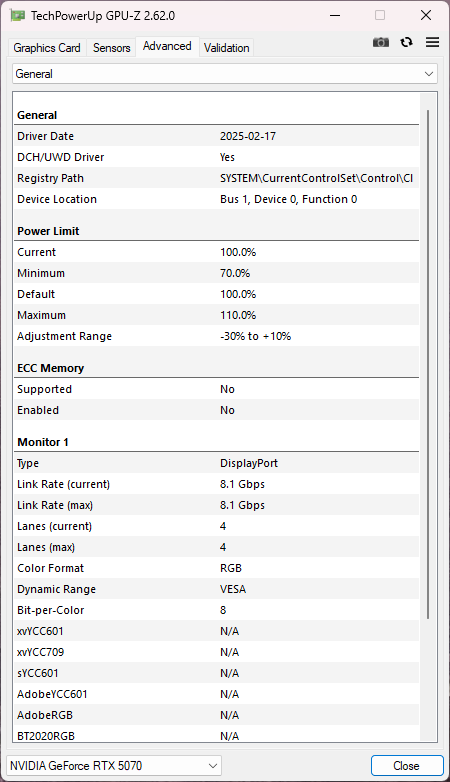
Die Karte ist standardmäßig auf 250 W TGP ausgelegt. Es ist möglich, das Leistungsziel um weitere 10 % zu erhöhen, was zu einem TGP von 275 W führt.
Der Prüfstand: RTX 5070 Ti Ventus 3X OC in Kombination mit dem Core i9-14900K
Unser Prüfstand zur Bewertung der Leistung der RTX 5070 FE besteht aus den folgenden Komponenten:
- Cooler Master MasterFrame 700 offener Prüfstand
- Intel Core i9-14900K mit dem im BIOS eingestellten Intel Extreme Profil
- Gigabyte Z790 Aorus Master Hauptplatine
- Sabrent Rocket 4 Plus Gen4 2 TB NVMe SSD und 2x Crucial MX500 1 TB SATA SSDs für Betriebssystem, Benchmarks und Spiele
- 2x 16 GB Kingston Fury Renegade DDR5-6400 RAM mit Timings 32-39-39-80 bei 1,40 V
- Alienware AW3225QF 4K 240 Hz QD-OLED Monitor
- Thermaltake TH420 V2 Ultra EX ARGB AiO-Kühler
- Cooler Master MVE Gold V2 1250 ATX 3.0 voll modulares Netzteil
Es wurde Windows 11 24H2 mit den neuesten Patches und der Nvidia Game Ready Driver Version 572.50 verwendet, der an die Presse herausgegeben wurde.
Wir bedanken uns bei Cooler Master für die Bereitstellung des Prüfstandes und des Netzteils, bei Gigabyte für das Mainboard, bei Sabrent für die SSD, bei Thermaltake für den AiO-Kühler, bei Kingston für das DDR5-Speicherkit, bei Dell für den QD-OLED-Monitor und schließlich bei Nvidia für die RTX 5070 FE.
Synthetische Benchmarks: Einen Hauch schneller als die RTX 4070 Ti
Die RTX 5070 FE übertrifft leicht die Leistung der Gigabyte Aorus GeForce RTX 4070 Ti Master in kumulativen synthetischen Benchmarks um 4 %, obwohl sie 20 % weniger CUDA Kerne hat. Die MSI GeForce RTX 5070 Ti 16G Ventus 3X OC ist der RTX 5070 FE um deutliche 21% voraus.
Auf der anderen Seite verschafft die höhere Kernzahl der RTX 4070 Ti ihr einen ähnlichen Vorteil in spezifischen Tests wie 3DMark Port Royal, Steel Nomad und Time Spy Graphics.
Bei den Unigine Benchmarks erzielt die RTX 5070 FE bessere Ergebnisse als die RTX 4070 Ti mit einem Vorsprung von bis zu 12 bzw. 7 % bei den Tests Unigine Valley Extreme HD und Superposition 8K Optimized.
| Performance Rating - Percent | |
| NVIDIA GeForce RTX 5090 Founders Edition | |
| NVIDIA GeForce RTX 4090 | |
| Asus Prime GeForce RTX 5080 OC Edition | |
| NVIDIA GeForce RTX 5080 Founders Edition | |
| Sapphire Pulse AMD Radeon RX 7900 XTX | |
| MSI GeForce RTX 5070 Ti 16G Ventus 3X OC | |
| NVIDIA GeForce RTX 4080 Founders Edition | |
| Sapphire Pulse AMD Radeon RX 7900 XT | |
| NVIDIA GeForce RTX 5070 Founders Edition | |
| Gigabyte Aorus GeForce RTX 4070 Ti Master | |
| Inno3D GeForce RTX 4060 Ti Twin X2 | |
| 3DMark | |
| 1920x1080 Fire Strike Graphics | |
| NVIDIA GeForce RTX 5090 Founders Edition | |
| NVIDIA GeForce RTX 4090 | |
| Sapphire Pulse AMD Radeon RX 7900 XTX | |
| Asus Prime GeForce RTX 5080 OC Edition | |
| Sapphire Pulse AMD Radeon RX 7900 XT | |
| NVIDIA GeForce RTX 5080 Founders Edition | |
| NVIDIA GeForce RTX 4080 Founders Edition | |
| MSI GeForce RTX 5070 Ti 16G Ventus 3X OC | |
| NVIDIA GeForce RTX 5070 Founders Edition | |
| Gigabyte Aorus GeForce RTX 4070 Ti Master | |
| Inno3D GeForce RTX 4060 Ti Twin X2 | |
| Fire Strike Extreme Graphics | |
| NVIDIA GeForce RTX 5090 Founders Edition | |
| NVIDIA GeForce RTX 4090 | |
| Asus Prime GeForce RTX 5080 OC Edition | |
| NVIDIA GeForce RTX 5080 Founders Edition | |
| Sapphire Pulse AMD Radeon RX 7900 XTX | |
| MSI GeForce RTX 5070 Ti 16G Ventus 3X OC | |
| Sapphire Pulse AMD Radeon RX 7900 XT | |
| NVIDIA GeForce RTX 4080 Founders Edition | |
| NVIDIA GeForce RTX 5070 Founders Edition | |
| Gigabyte Aorus GeForce RTX 4070 Ti Master | |
| Inno3D GeForce RTX 4060 Ti Twin X2 | |
| 3840x2160 Fire Strike Ultra Graphics | |
| NVIDIA GeForce RTX 5090 Founders Edition | |
| NVIDIA GeForce RTX 4090 | |
| Asus Prime GeForce RTX 5080 OC Edition | |
| NVIDIA GeForce RTX 5080 Founders Edition | |
| Sapphire Pulse AMD Radeon RX 7900 XTX | |
| MSI GeForce RTX 5070 Ti 16G Ventus 3X OC | |
| Sapphire Pulse AMD Radeon RX 7900 XT | |
| NVIDIA GeForce RTX 4080 Founders Edition | |
| NVIDIA GeForce RTX 5070 Founders Edition | |
| Gigabyte Aorus GeForce RTX 4070 Ti Master | |
| Inno3D GeForce RTX 4060 Ti Twin X2 | |
| 2560x1440 Port Royal Graphics | |
| NVIDIA GeForce RTX 5090 Founders Edition | |
| NVIDIA GeForce RTX 4090 | |
| Asus Prime GeForce RTX 5080 OC Edition | |
| NVIDIA GeForce RTX 5080 Founders Edition | |
| MSI GeForce RTX 5070 Ti 16G Ventus 3X OC | |
| NVIDIA GeForce RTX 4080 Founders Edition | |
| Sapphire Pulse AMD Radeon RX 7900 XTX | |
| Gigabyte Aorus GeForce RTX 4070 Ti Master | |
| Sapphire Pulse AMD Radeon RX 7900 XT | |
| NVIDIA GeForce RTX 5070 Founders Edition | |
| Inno3D GeForce RTX 4060 Ti Twin X2 | |
| 2560x1440 Speed Way Score | |
| NVIDIA GeForce RTX 5090 Founders Edition | |
| NVIDIA GeForce RTX 4090 | |
| Asus Prime GeForce RTX 5080 OC Edition | |
| NVIDIA GeForce RTX 5080 Founders Edition | |
| MSI GeForce RTX 5070 Ti 16G Ventus 3X OC | |
| NVIDIA GeForce RTX 4080 Founders Edition | |
| Sapphire Pulse AMD Radeon RX 7900 XTX | |
| NVIDIA GeForce RTX 5070 Founders Edition | |
| Gigabyte Aorus GeForce RTX 4070 Ti Master | |
| Sapphire Pulse AMD Radeon RX 7900 XT | |
| Inno3D GeForce RTX 4060 Ti Twin X2 | |
| Steel Nomad Score | |
| NVIDIA GeForce RTX 5090 Founders Edition | |
| NVIDIA GeForce RTX 4090 | |
| NVIDIA GeForce RTX 5080 Founders Edition | |
| Asus Prime GeForce RTX 5080 OC Edition | |
| Sapphire Pulse AMD Radeon RX 7900 XTX | |
| MSI GeForce RTX 5070 Ti 16G Ventus 3X OC | |
| NVIDIA GeForce RTX 4080 Founders Edition | |
| Sapphire Pulse AMD Radeon RX 7900 XT | |
| Gigabyte Aorus GeForce RTX 4070 Ti Master | |
| NVIDIA GeForce RTX 5070 Founders Edition | |
| Inno3D GeForce RTX 4060 Ti Twin X2 | |
| 2560x1440 Time Spy Graphics | |
| NVIDIA GeForce RTX 5090 Founders Edition | |
| NVIDIA GeForce RTX 4090 | |
| Asus Prime GeForce RTX 5080 OC Edition | |
| NVIDIA GeForce RTX 5080 Founders Edition | |
| Sapphire Pulse AMD Radeon RX 7900 XTX | |
| MSI GeForce RTX 5070 Ti 16G Ventus 3X OC | |
| Sapphire Pulse AMD Radeon RX 7900 XT | |
| NVIDIA GeForce RTX 4080 Founders Edition | |
| Gigabyte Aorus GeForce RTX 4070 Ti Master | |
| NVIDIA GeForce RTX 5070 Founders Edition | |
| Inno3D GeForce RTX 4060 Ti Twin X2 | |
| Unigine Heaven 4.0 - Extreme Preset DX11 | |
| NVIDIA GeForce RTX 5090 Founders Edition | |
| NVIDIA GeForce RTX 4090 | |
| Asus Prime GeForce RTX 5080 OC Edition | |
| NVIDIA GeForce RTX 5080 Founders Edition | |
| Sapphire Pulse AMD Radeon RX 7900 XTX | |
| MSI GeForce RTX 5070 Ti 16G Ventus 3X OC | |
| NVIDIA GeForce RTX 4080 Founders Edition | |
| Sapphire Pulse AMD Radeon RX 7900 XT | |
| NVIDIA GeForce RTX 5070 Founders Edition | |
| Gigabyte Aorus GeForce RTX 4070 Ti Master | |
| Inno3D GeForce RTX 4060 Ti Twin X2 | |
| Unigine Valley 1.0 - 1920x1080 Extreme HD DirectX AA:x8 | |
| Sapphire Pulse AMD Radeon RX 7900 XTX | |
| Sapphire Pulse AMD Radeon RX 7900 XT | |
| Asus Prime GeForce RTX 5080 OC Edition | |
| NVIDIA GeForce RTX 4090 | |
| NVIDIA GeForce RTX 5090 Founders Edition | |
| MSI GeForce RTX 5070 Ti 16G Ventus 3X OC | |
| NVIDIA GeForce RTX 4080 Founders Edition | |
| NVIDIA GeForce RTX 5080 Founders Edition | |
| NVIDIA GeForce RTX 5070 Founders Edition | |
| Gigabyte Aorus GeForce RTX 4070 Ti Master | |
| Inno3D GeForce RTX 4060 Ti Twin X2 | |
| Unigine Superposition | |
| 3840x2160 4k Optimized | |
| NVIDIA GeForce RTX 5090 Founders Edition | |
| NVIDIA GeForce RTX 4090 | |
| Asus Prime GeForce RTX 5080 OC Edition | |
| NVIDIA GeForce RTX 5080 Founders Edition | |
| Sapphire Pulse AMD Radeon RX 7900 XTX | |
| MSI GeForce RTX 5070 Ti 16G Ventus 3X OC | |
| NVIDIA GeForce RTX 4080 Founders Edition | |
| Sapphire Pulse AMD Radeon RX 7900 XT | |
| NVIDIA GeForce RTX 5070 Founders Edition | |
| Gigabyte Aorus GeForce RTX 4070 Ti Master | |
| Inno3D GeForce RTX 4060 Ti Twin X2 | |
| 7680x4320 8k Optimized | |
| NVIDIA GeForce RTX 5090 Founders Edition | |
| NVIDIA GeForce RTX 4090 | |
| Asus Prime GeForce RTX 5080 OC Edition | |
| NVIDIA GeForce RTX 5080 Founders Edition | |
| MSI GeForce RTX 5070 Ti 16G Ventus 3X OC | |
| Sapphire Pulse AMD Radeon RX 7900 XTX | |
| NVIDIA GeForce RTX 4080 Founders Edition | |
| Sapphire Pulse AMD Radeon RX 7900 XT | |
| NVIDIA GeForce RTX 5070 Founders Edition | |
| Gigabyte Aorus GeForce RTX 4070 Ti Master | |
| Inno3D GeForce RTX 4060 Ti Twin X2 | |
| 3DMark Fire Strike Score | 43889 Punkte | |
| 3DMark Fire Strike Extreme Score | 27726 Punkte | |
| 3DMark Time Spy Score | 22190 Punkte | |
| 3DMark Steel Nomad Score | 4957 Punkte | |
Hilfe | ||
KI und Rechenleistung: Der RX 7900 XT auf den Fersen bei KI-Inferencing
Die RTX 5070 FE ist der Radeon RX 7900 XT direkt auf den Fersen, wenn es um KI-Inferencing und Token-Generierung in MLPerf geht. AMD Karten haben traditionell Nachteile in V-Ray, so dass die RTX 5070 FE sowohl gegenüber der Radeon RX 7900 XT als auch gegenüber der RX 7900 XTX nicht überrascht.
Während die RTX 5070 FE in MLPerf, V-Ray und LuxMark ordentliche Verbesserungen gegenüber der RTX 4070 Ti zeigt, hat Letztere erhebliche Vorteile in Blender und ComputeMark.
| MLPerf Client 0.5 - overall generation rate | |
| NVIDIA GeForce RTX 5090 Founders Edition | |
| NVIDIA GeForce RTX 4090 | |
| Asus Prime GeForce RTX 5080 OC Edition | |
| NVIDIA GeForce RTX 5080 Founders Edition | |
| MSI GeForce RTX 5070 Ti 16G Ventus 3X OC | |
| Sapphire Pulse AMD Radeon RX 7900 XTX | |
| NVIDIA GeForce RTX 4080 Founders Edition | |
| Sapphire Pulse AMD Radeon RX 7900 XT | |
| NVIDIA GeForce RTX 5070 Founders Edition | |
| Gigabyte Aorus GeForce RTX 4070 Ti Master | |
| Inno3D GeForce RTX 4060 Ti Twin X2 | |
| Blender | |
| v3.3 Classroom CUDA | |
| Inno3D GeForce RTX 4060 Ti Twin X2 | |
| NVIDIA GeForce RTX 5070 Founders Edition | |
| Gigabyte Aorus GeForce RTX 4070 Ti Master | |
| MSI GeForce RTX 5070 Ti 16G Ventus 3X OC | |
| NVIDIA GeForce RTX 4080 Founders Edition | |
| NVIDIA GeForce RTX 5080 Founders Edition | |
| Asus Prime GeForce RTX 5080 OC Edition | |
| NVIDIA GeForce RTX 4090 | |
| NVIDIA GeForce RTX 5090 Founders Edition | |
| v3.3 Classroom OPTIX/RTX | |
| Inno3D GeForce RTX 4060 Ti Twin X2 | |
| NVIDIA GeForce RTX 5070 Founders Edition | |
| Gigabyte Aorus GeForce RTX 4070 Ti Master | |
| NVIDIA GeForce RTX 4080 Founders Edition | |
| MSI GeForce RTX 5070 Ti 16G Ventus 3X OC | |
| NVIDIA GeForce RTX 5080 Founders Edition | |
| Asus Prime GeForce RTX 5080 OC Edition | |
| NVIDIA GeForce RTX 4090 | |
| NVIDIA GeForce RTX 5090 Founders Edition | |
| V-Ray Benchmark Next 4.10 - GPU | |
| NVIDIA GeForce RTX 5090 Founders Edition | |
| NVIDIA GeForce RTX 4090 | |
| NVIDIA GeForce RTX 5080 Founders Edition | |
| Asus Prime GeForce RTX 5080 OC Edition | |
| NVIDIA GeForce RTX 4080 Founders Edition | |
| MSI GeForce RTX 5070 Ti 16G Ventus 3X OC | |
| NVIDIA GeForce RTX 5070 Founders Edition | |
| Gigabyte Aorus GeForce RTX 4070 Ti Master | |
| Inno3D GeForce RTX 4060 Ti Twin X2 | |
| Sapphire Pulse AMD Radeon RX 7900 XTX | |
| Sapphire Pulse AMD Radeon RX 7900 XT | |
| V-Ray 5 Benchmark | |
| GPU CUDA | |
| NVIDIA GeForce RTX 5090 Founders Edition | |
| NVIDIA GeForce RTX 4090 | |
| Asus Prime GeForce RTX 5080 OC Edition | |
| NVIDIA GeForce RTX 5080 Founders Edition | |
| MSI GeForce RTX 5070 Ti 16G Ventus 3X OC | |
| NVIDIA GeForce RTX 4080 Founders Edition | |
| NVIDIA GeForce RTX 5070 Founders Edition | |
| Gigabyte Aorus GeForce RTX 4070 Ti Master | |
| Inno3D GeForce RTX 4060 Ti Twin X2 | |
| Sapphire Pulse AMD Radeon RX 7900 XTX | |
| Sapphire Pulse AMD Radeon RX 7900 XT | |
| GPU RTX | |
| NVIDIA GeForce RTX 5090 Founders Edition | |
| NVIDIA GeForce RTX 4090 | |
| NVIDIA GeForce RTX 5080 Founders Edition | |
| Asus Prime GeForce RTX 5080 OC Edition | |
| NVIDIA GeForce RTX 4080 Founders Edition | |
| MSI GeForce RTX 5070 Ti 16G Ventus 3X OC | |
| NVIDIA GeForce RTX 5070 Founders Edition | |
| Gigabyte Aorus GeForce RTX 4070 Ti Master | |
| Inno3D GeForce RTX 4060 Ti Twin X2 | |
| ComputeMark v2.1 | |
| 1024x600 Normal, Score | |
| NVIDIA GeForce RTX 5090 Founders Edition | |
| NVIDIA GeForce RTX 4090 | |
| Asus Prime GeForce RTX 5080 OC Edition | |
| NVIDIA GeForce RTX 5080 Founders Edition | |
| Sapphire Pulse AMD Radeon RX 7900 XTX | |
| MSI GeForce RTX 5070 Ti 16G Ventus 3X OC | |
| Sapphire Pulse AMD Radeon RX 7900 XT | |
| NVIDIA GeForce RTX 4080 Founders Edition | |
| Gigabyte Aorus GeForce RTX 4070 Ti Master | |
| NVIDIA GeForce RTX 5070 Founders Edition | |
| Inno3D GeForce RTX 4060 Ti Twin X2 | |
| 1024x600 Normal, Fluid 3DTex | |
| NVIDIA GeForce RTX 5090 Founders Edition | |
| Asus Prime GeForce RTX 5080 OC Edition | |
| NVIDIA GeForce RTX 5080 Founders Edition | |
| NVIDIA GeForce RTX 4090 | |
| Sapphire Pulse AMD Radeon RX 7900 XTX | |
| MSI GeForce RTX 5070 Ti 16G Ventus 3X OC | |
| Sapphire Pulse AMD Radeon RX 7900 XT | |
| NVIDIA GeForce RTX 4080 Founders Edition | |
| NVIDIA GeForce RTX 5070 Founders Edition | |
| Gigabyte Aorus GeForce RTX 4070 Ti Master | |
| Inno3D GeForce RTX 4060 Ti Twin X2 | |
| 1024x600 Normal, Fluid 2DTexArr | |
| NVIDIA GeForce RTX 5090 Founders Edition | |
| Sapphire Pulse AMD Radeon RX 7900 XTX | |
| Sapphire Pulse AMD Radeon RX 7900 XT | |
| Asus Prime GeForce RTX 5080 OC Edition | |
| NVIDIA GeForce RTX 5080 Founders Edition | |
| NVIDIA GeForce RTX 4090 | |
| MSI GeForce RTX 5070 Ti 16G Ventus 3X OC | |
| NVIDIA GeForce RTX 4080 Founders Edition | |
| NVIDIA GeForce RTX 5070 Founders Edition | |
| Gigabyte Aorus GeForce RTX 4070 Ti Master | |
| Inno3D GeForce RTX 4060 Ti Twin X2 | |
| 1024x600 Normal, Mandel Vector | |
| NVIDIA GeForce RTX 5090 Founders Edition | |
| Sapphire Pulse AMD Radeon RX 7900 XTX | |
| NVIDIA GeForce RTX 4090 | |
| Asus Prime GeForce RTX 5080 OC Edition | |
| NVIDIA GeForce RTX 5080 Founders Edition | |
| Sapphire Pulse AMD Radeon RX 7900 XT | |
| MSI GeForce RTX 5070 Ti 16G Ventus 3X OC | |
| NVIDIA GeForce RTX 4080 Founders Edition | |
| Gigabyte Aorus GeForce RTX 4070 Ti Master | |
| NVIDIA GeForce RTX 5070 Founders Edition | |
| Inno3D GeForce RTX 4060 Ti Twin X2 | |
| 1024x600 Normal, Mandel Scalar | |
| NVIDIA GeForce RTX 5090 Founders Edition | |
| NVIDIA GeForce RTX 4090 | |
| Sapphire Pulse AMD Radeon RX 7900 XTX | |
| Asus Prime GeForce RTX 5080 OC Edition | |
| NVIDIA GeForce RTX 5080 Founders Edition | |
| Sapphire Pulse AMD Radeon RX 7900 XT | |
| NVIDIA GeForce RTX 4080 Founders Edition | |
| MSI GeForce RTX 5070 Ti 16G Ventus 3X OC | |
| Gigabyte Aorus GeForce RTX 4070 Ti Master | |
| NVIDIA GeForce RTX 5070 Founders Edition | |
| Inno3D GeForce RTX 4060 Ti Twin X2 | |
| 1024x600 Normal, QJuliaRayTrace | |
| NVIDIA GeForce RTX 5090 Founders Edition | |
| NVIDIA GeForce RTX 4090 | |
| Asus Prime GeForce RTX 5080 OC Edition | |
| NVIDIA GeForce RTX 5080 Founders Edition | |
| NVIDIA GeForce RTX 4080 Founders Edition | |
| MSI GeForce RTX 5070 Ti 16G Ventus 3X OC | |
| Gigabyte Aorus GeForce RTX 4070 Ti Master | |
| Sapphire Pulse AMD Radeon RX 7900 XTX | |
| Sapphire Pulse AMD Radeon RX 7900 XT | |
| NVIDIA GeForce RTX 5070 Founders Edition | |
| Inno3D GeForce RTX 4060 Ti Twin X2 | |
| LuxMark v2.0 64Bit | |
| Room GPUs-only | |
| NVIDIA GeForce RTX 5090 Founders Edition | |
| NVIDIA GeForce RTX 4090 | |
| Asus Prime GeForce RTX 5080 OC Edition | |
| NVIDIA GeForce RTX 5080 Founders Edition | |
| MSI GeForce RTX 5070 Ti 16G Ventus 3X OC | |
| NVIDIA GeForce RTX 4080 Founders Edition | |
| NVIDIA GeForce RTX 5070 Founders Edition | |
| Gigabyte Aorus GeForce RTX 4070 Ti Master | |
| Sapphire Pulse AMD Radeon RX 7900 XTX | |
| Sapphire Pulse AMD Radeon RX 7900 XT | |
| Inno3D GeForce RTX 4060 Ti Twin X2 | |
| Sala GPUs-only | |
| NVIDIA GeForce RTX 5090 Founders Edition | |
| NVIDIA GeForce RTX 4090 | |
| Asus Prime GeForce RTX 5080 OC Edition | |
| NVIDIA GeForce RTX 5080 Founders Edition | |
| NVIDIA GeForce RTX 4080 Founders Edition | |
| MSI GeForce RTX 5070 Ti 16G Ventus 3X OC | |
| NVIDIA GeForce RTX 5070 Founders Edition | |
| Gigabyte Aorus GeForce RTX 4070 Ti Master | |
| Sapphire Pulse AMD Radeon RX 7900 XTX | |
| Sapphire Pulse AMD Radeon RX 7900 XT | |
| Inno3D GeForce RTX 4060 Ti Twin X2 | |
* ... kleinere Werte sind besser
Gaming-Leistung: 4x MFG bringt RTX 5070 FE näher an eine RTX 4090 heran... mit großen Vorbehalten
Die RTX 5070 Founders Edition ist in erster Linie eine 1.440p-Gaming-GPU, und als solche kann sie in modernen AAA-Titeln Probleme haben, den 60-fps-Sweetspot bei 4K Ultra zu erreichen.
Davon abgesehen ist die kumulative 4K Ultra Rasterung Gaming Performance gleichauf mit der RX 7900 XT.
Die Vorteile gegenüber der RTX 4070 Ti in synthetischen Tests übertragen sich nicht auf 4K-Spiele, wobei die RTX 4070 Ti in Avatar: Frontiers of Pandora bei 4K Ultra einen Vorsprung von bis zu 20 % gegenüber der RTX 5070 FE aufweist.
In Titeln wie Indiana Jones and the Great Circle, Black Myth: Wukong und Cyberpunk 2077 2.2 Phantom Liberty schafft es die RTX 5070 FE jedoch, die Lücke entweder zu schließen oder an der RTX 4070 Ti vorbeizuziehen.
Dieser Trend zeigt sich auch in den kumulativen 1.080p- und 2K-Ultra-Benchmarks, wo die RTX 4070 Ti einen spürbaren Vorteil gegenüber der RTX 5070 FE erzielt.
| 4K Performance Rating - Percent | |
| NVIDIA GeForce RTX 5090 Founders Edition | |
| NVIDIA GeForce RTX 4090 | |
| Asus Prime GeForce RTX 5080 OC Edition -1! | |
| NVIDIA GeForce RTX 5080 Founders Edition | |
| MSI GeForce RTX 5070 Ti 16G Ventus 3X OC | |
| Sapphire Pulse AMD Radeon RX 7900 XTX | |
| NVIDIA GeForce RTX 4080 Founders Edition | |
| Gigabyte Aorus GeForce RTX 4070 Ti Master | |
| Sapphire Pulse AMD Radeon RX 7900 XT | |
| NVIDIA GeForce RTX 5070 Founders Edition | |
| Indiana Jones and the Great Circle - 3840x2160 Very Ultra Preset | |
| NVIDIA GeForce RTX 5090 Founders Edition | |
| NVIDIA GeForce RTX 4090 | |
| Asus Prime GeForce RTX 5080 OC Edition | |
| NVIDIA GeForce RTX 5080 Founders Edition | |
| MSI GeForce RTX 5070 Ti 16G Ventus 3X OC | |
| Sapphire Pulse AMD Radeon RX 7900 XTX | |
| NVIDIA GeForce RTX 4080 Founders Edition | |
| Sapphire Pulse AMD Radeon RX 7900 XT | |
| NVIDIA GeForce RTX 5070 Founders Edition | |
| Gigabyte Aorus GeForce RTX 4070 Ti Master | |
| Black Myth: Wukong - 3840x2160 cinematic TSR 100 | |
| NVIDIA GeForce RTX 5090 Founders Edition | |
| NVIDIA GeForce RTX 4090 | |
| NVIDIA GeForce RTX 5080 Founders Edition | |
| Asus Prime GeForce RTX 5080 OC Edition | |
| MSI GeForce RTX 5070 Ti 16G Ventus 3X OC | |
| NVIDIA GeForce RTX 4080 Founders Edition | |
| Sapphire Pulse AMD Radeon RX 7900 XTX | |
| Sapphire Pulse AMD Radeon RX 7900 XT | |
| Gigabyte Aorus GeForce RTX 4070 Ti Master | |
| NVIDIA GeForce RTX 5070 Founders Edition | |
| Alan Wake 2 - 3840x2160 High Preset | |
| NVIDIA GeForce RTX 5090 Founders Edition | |
| NVIDIA GeForce RTX 4090 | |
| Sapphire Pulse AMD Radeon RX 7900 XTX | |
| Asus Prime GeForce RTX 5080 OC Edition | |
| NVIDIA GeForce RTX 5080 Founders Edition | |
| Sapphire Pulse AMD Radeon RX 7900 XT | |
| MSI GeForce RTX 5070 Ti 16G Ventus 3X OC | |
| NVIDIA GeForce RTX 4080 Founders Edition | |
| Gigabyte Aorus GeForce RTX 4070 Ti Master | |
| NVIDIA GeForce RTX 5070 Founders Edition | |
| F1 24 - 3840x2160 Ultra High Preset AA:T AF:16x | |
| NVIDIA GeForce RTX 5090 Founders Edition | |
| NVIDIA GeForce RTX 4090 | |
| Asus Prime GeForce RTX 5080 OC Edition | |
| NVIDIA GeForce RTX 5080 Founders Edition | |
| NVIDIA GeForce RTX 4080 Founders Edition | |
| MSI GeForce RTX 5070 Ti 16G Ventus 3X OC | |
| Gigabyte Aorus GeForce RTX 4070 Ti Master | |
| Sapphire Pulse AMD Radeon RX 7900 XTX | |
| NVIDIA GeForce RTX 5070 Founders Edition | |
| Sapphire Pulse AMD Radeon RX 7900 XT | |
| Assassin's Creed Mirage - 3840x2160 Ultra High Preset (Adaptive Quality Off) | |
| NVIDIA GeForce RTX 5090 Founders Edition | |
| NVIDIA GeForce RTX 4090 | |
| NVIDIA GeForce RTX 5080 Founders Edition | |
| Asus Prime GeForce RTX 5080 OC Edition | |
| Sapphire Pulse AMD Radeon RX 7900 XTX | |
| MSI GeForce RTX 5070 Ti 16G Ventus 3X OC | |
| NVIDIA GeForce RTX 4080 Founders Edition | |
| Sapphire Pulse AMD Radeon RX 7900 XT | |
| Gigabyte Aorus GeForce RTX 4070 Ti Master | |
| NVIDIA GeForce RTX 5070 Founders Edition | |
| Avatar Frontiers of Pandora - 3840x2160 Ultra Preset AA:T | |
| NVIDIA GeForce RTX 5090 Founders Edition | |
| NVIDIA GeForce RTX 4090 | |
| NVIDIA GeForce RTX 5080 Founders Edition | |
| Asus Prime GeForce RTX 5080 OC Edition | |
| Sapphire Pulse AMD Radeon RX 7900 XTX | |
| NVIDIA GeForce RTX 4080 Founders Edition | |
| MSI GeForce RTX 5070 Ti 16G Ventus 3X OC | |
| Gigabyte Aorus GeForce RTX 4070 Ti Master | |
| Sapphire Pulse AMD Radeon RX 7900 XT | |
| NVIDIA GeForce RTX 5070 Founders Edition | |
| Cyberpunk 2077 - 3840x2160 Ultra Preset (FSR off) | |
| NVIDIA GeForce RTX 5090 Founders Edition | |
| NVIDIA GeForce RTX 4090 | |
| NVIDIA GeForce RTX 5080 Founders Edition | |
| Sapphire Pulse AMD Radeon RX 7900 XTX | |
| MSI GeForce RTX 5070 Ti 16G Ventus 3X OC | |
| NVIDIA GeForce RTX 4080 Founders Edition | |
| Sapphire Pulse AMD Radeon RX 7900 XT | |
| NVIDIA GeForce RTX 5070 Founders Edition | |
| Gigabyte Aorus GeForce RTX 4070 Ti Master | |
| X-Plane 11.11 - 3840x2160 high (fps_test=3) | |
| NVIDIA GeForce RTX 5090 Founders Edition | |
| NVIDIA GeForce RTX 4090 | |
| Asus Prime GeForce RTX 5080 OC Edition | |
| NVIDIA GeForce RTX 5080 Founders Edition | |
| NVIDIA GeForce RTX 5070 Founders Edition | |
| Gigabyte Aorus GeForce RTX 4070 Ti Master | |
| MSI GeForce RTX 5070 Ti 16G Ventus 3X OC | |
| NVIDIA GeForce RTX 4080 Founders Edition | |
| Sapphire Pulse AMD Radeon RX 7900 XTX | |
| Sapphire Pulse AMD Radeon RX 7900 XT | |
| 1080p and 2K Performance Rating - Percent | |
| NVIDIA GeForce RTX 5090 Founders Edition | |
| NVIDIA GeForce RTX 4090 | |
| Asus Prime GeForce RTX 5080 OC Edition | |
| NVIDIA GeForce RTX 5080 Founders Edition | |
| Sapphire Pulse AMD Radeon RX 7900 XTX | |
| MSI GeForce RTX 5070 Ti 16G Ventus 3X OC | |
| Gigabyte Aorus GeForce RTX 4070 Ti Master | |
| Sapphire Pulse AMD Radeon RX 7900 XT | |
| NVIDIA GeForce RTX 4080 Founders Edition | |
| NVIDIA GeForce RTX 5070 Founders Edition | |
| Indiana Jones and the Great Circle | |
| 2560x1440 Very Ultra Preset | |
| NVIDIA GeForce RTX 5090 Founders Edition | |
| NVIDIA GeForce RTX 4090 | |
| Asus Prime GeForce RTX 5080 OC Edition | |
| NVIDIA GeForce RTX 5080 Founders Edition | |
| MSI GeForce RTX 5070 Ti 16G Ventus 3X OC | |
| Sapphire Pulse AMD Radeon RX 7900 XTX | |
| Gigabyte Aorus GeForce RTX 4070 Ti Master | |
| Sapphire Pulse AMD Radeon RX 7900 XT | |
| NVIDIA GeForce RTX 5070 Founders Edition | |
| NVIDIA GeForce RTX 4080 Founders Edition | |
| 1920x1080 Very Ultra Preset | |
| NVIDIA GeForce RTX 5090 Founders Edition | |
| NVIDIA GeForce RTX 4090 | |
| Asus Prime GeForce RTX 5080 OC Edition | |
| NVIDIA GeForce RTX 5080 Founders Edition | |
| Sapphire Pulse AMD Radeon RX 7900 XTX | |
| MSI GeForce RTX 5070 Ti 16G Ventus 3X OC | |
| Gigabyte Aorus GeForce RTX 4070 Ti Master | |
| Sapphire Pulse AMD Radeon RX 7900 XT | |
| NVIDIA GeForce RTX 5070 Founders Edition | |
| NVIDIA GeForce RTX 4080 Founders Edition | |
| Black Myth: Wukong | |
| 2560x1440 cinematic TSR 100 | |
| NVIDIA GeForce RTX 5090 Founders Edition | |
| NVIDIA GeForce RTX 4090 | |
| Asus Prime GeForce RTX 5080 OC Edition | |
| NVIDIA GeForce RTX 5080 Founders Edition | |
| MSI GeForce RTX 5070 Ti 16G Ventus 3X OC | |
| Sapphire Pulse AMD Radeon RX 7900 XTX | |
| NVIDIA GeForce RTX 4080 Founders Edition | |
| Sapphire Pulse AMD Radeon RX 7900 XT | |
| Gigabyte Aorus GeForce RTX 4070 Ti Master | |
| NVIDIA GeForce RTX 5070 Founders Edition | |
| 1920x1080 cinematic TSR 100 | |
| NVIDIA GeForce RTX 5090 Founders Edition | |
| NVIDIA GeForce RTX 4090 | |
| Asus Prime GeForce RTX 5080 OC Edition | |
| NVIDIA GeForce RTX 5080 Founders Edition | |
| MSI GeForce RTX 5070 Ti 16G Ventus 3X OC | |
| NVIDIA GeForce RTX 4080 Founders Edition | |
| Sapphire Pulse AMD Radeon RX 7900 XTX | |
| Gigabyte Aorus GeForce RTX 4070 Ti Master | |
| Sapphire Pulse AMD Radeon RX 7900 XT | |
| NVIDIA GeForce RTX 5070 Founders Edition | |
| Alan Wake 2 | |
| 2560x1440 High Preset | |
| NVIDIA GeForce RTX 5090 Founders Edition | |
| Sapphire Pulse AMD Radeon RX 7900 XTX | |
| NVIDIA GeForce RTX 4090 | |
| Asus Prime GeForce RTX 5080 OC Edition | |
| NVIDIA GeForce RTX 5080 Founders Edition | |
| Sapphire Pulse AMD Radeon RX 7900 XT | |
| MSI GeForce RTX 5070 Ti 16G Ventus 3X OC | |
| Gigabyte Aorus GeForce RTX 4070 Ti Master | |
| NVIDIA GeForce RTX 4080 Founders Edition | |
| NVIDIA GeForce RTX 5070 Founders Edition | |
| 1920x1080 High Preset | |
| NVIDIA GeForce RTX 5090 Founders Edition | |
| NVIDIA GeForce RTX 4090 | |
| Sapphire Pulse AMD Radeon RX 7900 XTX | |
| Asus Prime GeForce RTX 5080 OC Edition | |
| NVIDIA GeForce RTX 5080 Founders Edition | |
| Sapphire Pulse AMD Radeon RX 7900 XT | |
| MSI GeForce RTX 5070 Ti 16G Ventus 3X OC | |
| Gigabyte Aorus GeForce RTX 4070 Ti Master | |
| NVIDIA GeForce RTX 5070 Founders Edition | |
| NVIDIA GeForce RTX 4080 Founders Edition | |
| F1 24 | |
| 2560x1440 Ultra High Preset AA:T AF:16x | |
| NVIDIA GeForce RTX 5090 Founders Edition | |
| NVIDIA GeForce RTX 4090 | |
| Asus Prime GeForce RTX 5080 OC Edition | |
| NVIDIA GeForce RTX 5080 Founders Edition | |
| MSI GeForce RTX 5070 Ti 16G Ventus 3X OC | |
| NVIDIA GeForce RTX 4080 Founders Edition | |
| Gigabyte Aorus GeForce RTX 4070 Ti Master | |
| Sapphire Pulse AMD Radeon RX 7900 XTX | |
| NVIDIA GeForce RTX 5070 Founders Edition | |
| Sapphire Pulse AMD Radeon RX 7900 XT | |
| 1920x1080 Ultra High Preset AA:T AF:16x | |
| NVIDIA GeForce RTX 5090 Founders Edition | |
| NVIDIA GeForce RTX 4090 | |
| Asus Prime GeForce RTX 5080 OC Edition | |
| NVIDIA GeForce RTX 5080 Founders Edition | |
| MSI GeForce RTX 5070 Ti 16G Ventus 3X OC | |
| Gigabyte Aorus GeForce RTX 4070 Ti Master | |
| NVIDIA GeForce RTX 4080 Founders Edition | |
| Sapphire Pulse AMD Radeon RX 7900 XTX | |
| NVIDIA GeForce RTX 5070 Founders Edition | |
| Sapphire Pulse AMD Radeon RX 7900 XT | |
| Assassin's Creed Mirage | |
| 2560x1440 Ultra High Preset (Adaptive Quality Off) | |
| NVIDIA GeForce RTX 5090 Founders Edition | |
| Asus Prime GeForce RTX 5080 OC Edition | |
| NVIDIA GeForce RTX 5080 Founders Edition | |
| Sapphire Pulse AMD Radeon RX 7900 XTX | |
| MSI GeForce RTX 5070 Ti 16G Ventus 3X OC | |
| Sapphire Pulse AMD Radeon RX 7900 XT | |
| Gigabyte Aorus GeForce RTX 4070 Ti Master | |
| NVIDIA GeForce RTX 4080 Founders Edition | |
| NVIDIA GeForce RTX 5070 Founders Edition | |
| NVIDIA GeForce RTX 4090 | |
| 1920x1080 Ultra High Preset (Adaptive Quality Off) | |
| NVIDIA GeForce RTX 4090 | |
| NVIDIA GeForce RTX 5090 Founders Edition | |
| NVIDIA GeForce RTX 5080 Founders Edition | |
| Asus Prime GeForce RTX 5080 OC Edition | |
| Sapphire Pulse AMD Radeon RX 7900 XTX | |
| MSI GeForce RTX 5070 Ti 16G Ventus 3X OC | |
| Gigabyte Aorus GeForce RTX 4070 Ti Master | |
| Sapphire Pulse AMD Radeon RX 7900 XT | |
| NVIDIA GeForce RTX 5070 Founders Edition | |
| NVIDIA GeForce RTX 4080 Founders Edition | |
| Avatar Frontiers of Pandora | |
| 2560x1440 Ultra Preset AA:T | |
| NVIDIA GeForce RTX 5090 Founders Edition | |
| NVIDIA GeForce RTX 4090 | |
| NVIDIA GeForce RTX 5080 Founders Edition | |
| Asus Prime GeForce RTX 5080 OC Edition | |
| Sapphire Pulse AMD Radeon RX 7900 XTX | |
| MSI GeForce RTX 5070 Ti 16G Ventus 3X OC | |
| NVIDIA GeForce RTX 4080 Founders Edition | |
| Gigabyte Aorus GeForce RTX 4070 Ti Master | |
| Sapphire Pulse AMD Radeon RX 7900 XT | |
| NVIDIA GeForce RTX 5070 Founders Edition | |
| 1920x1080 Ultra Preset AA:T | |
| NVIDIA GeForce RTX 5090 Founders Edition | |
| NVIDIA GeForce RTX 4090 | |
| NVIDIA GeForce RTX 5080 Founders Edition | |
| Asus Prime GeForce RTX 5080 OC Edition | |
| MSI GeForce RTX 5070 Ti 16G Ventus 3X OC | |
| Sapphire Pulse AMD Radeon RX 7900 XTX | |
| Gigabyte Aorus GeForce RTX 4070 Ti Master | |
| NVIDIA GeForce RTX 4080 Founders Edition | |
| Sapphire Pulse AMD Radeon RX 7900 XT | |
| NVIDIA GeForce RTX 5070 Founders Edition | |
| Cyberpunk 2077 | |
| 2560x1440 Ultra Preset (FSR off) | |
| NVIDIA GeForce RTX 5090 Founders Edition | |
| Asus Prime GeForce RTX 5080 OC Edition | |
| NVIDIA GeForce RTX 5080 Founders Edition | |
| NVIDIA GeForce RTX 4090 | |
| Sapphire Pulse AMD Radeon RX 7900 XTX | |
| MSI GeForce RTX 5070 Ti 16G Ventus 3X OC | |
| Sapphire Pulse AMD Radeon RX 7900 XT | |
| NVIDIA GeForce RTX 4080 Founders Edition | |
| NVIDIA GeForce RTX 5070 Founders Edition | |
| Gigabyte Aorus GeForce RTX 4070 Ti Master | |
| 1920x1080 Ultra Preset (FSR off) | |
| NVIDIA GeForce RTX 5090 Founders Edition | |
| Sapphire Pulse AMD Radeon RX 7900 XTX | |
| NVIDIA GeForce RTX 4090 | |
| Asus Prime GeForce RTX 5080 OC Edition | |
| MSI GeForce RTX 5070 Ti 16G Ventus 3X OC | |
| Sapphire Pulse AMD Radeon RX 7900 XT | |
| NVIDIA GeForce RTX 5080 Founders Edition | |
| NVIDIA GeForce RTX 5070 Founders Edition | |
| Gigabyte Aorus GeForce RTX 4070 Ti Master | |
| NVIDIA GeForce RTX 4080 Founders Edition | |
| X-Plane 11.11 - 1920x1080 high (fps_test=3) | |
| NVIDIA GeForce RTX 5090 Founders Edition | |
| NVIDIA GeForce RTX 5080 Founders Edition | |
| NVIDIA GeForce RTX 4090 | |
| Asus Prime GeForce RTX 5080 OC Edition | |
| MSI GeForce RTX 5070 Ti 16G Ventus 3X OC | |
| NVIDIA GeForce RTX 5070 Founders Edition | |
| Gigabyte Aorus GeForce RTX 4070 Ti Master | |
| NVIDIA GeForce RTX 4080 Founders Edition | |
| Sapphire Pulse AMD Radeon RX 7900 XTX | |
| Sapphire Pulse AMD Radeon RX 7900 XT | |
Raytracing-Leistung
Die RTX 5070 FE stößt bei der Bearbeitung von Raytracing-Aufgaben an ihre Grenzen. Der 12-GB-GDDR7-VRAM erweist sich für 2025 als zu wenig, da VRAM-lastige Titel wie Indiana Jones und der große Kreis trotz DLSS und Frame-Generierungshilfe selbst bei minimal aktiviertem Path Tracing prompt auf dem Desktop abstürzen würden.
Star Wars Outlaws und Black Myth: Wukong können spielbare Frame-Raten bei 1.440p und 4K mit etwas Hilfe von DLSS, Frame Generation und Strahlenrekonstruktionstechniken bieten.
Alan Wake 2 bietet bei 4K-High-Raytracing-Einstellungen eine Diashow, aber durch den Einsatz von DLSS und Frame Generation sind bei 4K anständige Bildraten erreichbar.
In ähnlicher Weise kann es schwierig sein, Cyberpunk 2077 Phantom Liberty mit der RTX 5070 FE in der nativen 4K-Raytracing-Ultra-Voreinstellung zu spielen, obwohl die Karte natives 1.080p-Raytracing recht gut beherrscht.
| Black Myth: Wukong | |
| 3840x2160 cinematic RT: Very High DLSS 68 FG | |
| NVIDIA GeForce RTX 4090 | |
| NVIDIA GeForce RTX 5090 Founders Edition | |
| Asus Prime GeForce RTX 5080 OC Edition | |
| NVIDIA GeForce RTX 5080 Founders Edition | |
| MSI GeForce RTX 5070 Ti 16G Ventus 3X OC | |
| NVIDIA GeForce RTX 4080 Founders Edition | |
| Gigabyte Aorus GeForce RTX 4070 Ti Master | |
| NVIDIA GeForce RTX 5070 Founders Edition | |
| 2560x1440 cinematic RT: Very High DLSS 68 FG | |
| NVIDIA GeForce RTX 5090 Founders Edition | |
| NVIDIA GeForce RTX 4090 | |
| Asus Prime GeForce RTX 5080 OC Edition | |
| NVIDIA GeForce RTX 5080 Founders Edition | |
| MSI GeForce RTX 5070 Ti 16G Ventus 3X OC | |
| NVIDIA GeForce RTX 4080 Founders Edition | |
| Gigabyte Aorus GeForce RTX 4070 Ti Master | |
| NVIDIA GeForce RTX 5070 Founders Edition | |
| Star Wars Outlaws | |
| 3840x2160 cinem. ultra, RT ultra, DLSS, FG RR | |
| NVIDIA GeForce RTX 5090 Founders Edition | |
| NVIDIA GeForce RTX 4090 | |
| Asus Prime GeForce RTX 5080 OC Edition | |
| NVIDIA GeForce RTX 5080 Founders Edition | |
| MSI GeForce RTX 5070 Ti 16G Ventus 3X OC | |
| NVIDIA GeForce RTX 5070 Founders Edition | |
| 2560x1440 cinem. ultra, RT ultra, DLSS, FG RR | |
| NVIDIA GeForce RTX 5090 Founders Edition | |
| NVIDIA GeForce RTX 4090 | |
| Asus Prime GeForce RTX 5080 OC Edition | |
| NVIDIA GeForce RTX 5080 Founders Edition | |
| MSI GeForce RTX 5070 Ti 16G Ventus 3X OC | |
| NVIDIA GeForce RTX 5070 Founders Edition | |
| Alan Wake 2 | |
| 3840x2160 High Preset + High Ray Tracing + Quality DLSS + FG | |
| NVIDIA GeForce RTX 5090 Founders Edition | |
| NVIDIA GeForce RTX 4090 | |
| Asus Prime GeForce RTX 5080 OC Edition | |
| NVIDIA GeForce RTX 5080 Founders Edition | |
| MSI GeForce RTX 5070 Ti 16G Ventus 3X OC | |
| NVIDIA GeForce RTX 4080 Founders Edition | |
| Gigabyte Aorus GeForce RTX 4070 Ti Master | |
| NVIDIA GeForce RTX 5070 Founders Edition | |
| 3840x2160 High Preset + High Ray Tracing | |
| NVIDIA GeForce RTX 5090 Founders Edition | |
| NVIDIA GeForce RTX 4090 | |
| Asus Prime GeForce RTX 5080 OC Edition | |
| NVIDIA GeForce RTX 5080 Founders Edition | |
| MSI GeForce RTX 5070 Ti 16G Ventus 3X OC | |
| NVIDIA GeForce RTX 4080 Founders Edition | |
| Gigabyte Aorus GeForce RTX 4070 Ti Master | |
| Sapphire Pulse AMD Radeon RX 7900 XTX | |
| Sapphire Pulse AMD Radeon RX 7900 XT | |
| NVIDIA GeForce RTX 5070 Founders Edition | |
| 1920x1080 High Preset + High Ray Tracing | |
| NVIDIA GeForce RTX 5090 Founders Edition | |
| NVIDIA GeForce RTX 4090 | |
| Asus Prime GeForce RTX 5080 OC Edition | |
| NVIDIA GeForce RTX 5080 Founders Edition | |
| MSI GeForce RTX 5070 Ti 16G Ventus 3X OC | |
| Gigabyte Aorus GeForce RTX 4070 Ti Master | |
| NVIDIA GeForce RTX 4080 Founders Edition | |
| NVIDIA GeForce RTX 5070 Founders Edition | |
| Sapphire Pulse AMD Radeon RX 7900 XTX | |
| Sapphire Pulse AMD Radeon RX 7900 XT | |
| Cyberpunk 2077 | |
| 3840x2160 Ray Tracing Ultra Preset (DLSS off, no Path Tracing) | |
| NVIDIA GeForce RTX 5090 Founders Edition | |
| NVIDIA GeForce RTX 4090 | |
| NVIDIA GeForce RTX 5080 Founders Edition | |
| Asus Prime GeForce RTX 5080 OC Edition | |
| MSI GeForce RTX 5070 Ti 16G Ventus 3X OC | |
| NVIDIA GeForce RTX 4080 Founders Edition | |
| Gigabyte Aorus GeForce RTX 4070 Ti Master | |
| NVIDIA GeForce RTX 5070 Founders Edition | |
| Sapphire Pulse AMD Radeon RX 7900 XTX | |
| Sapphire Pulse AMD Radeon RX 7900 XT | |
| 1920x1080 Ray Tracing Ultra Preset (DLSS off) | |
| NVIDIA GeForce RTX 5090 Founders Edition | |
| NVIDIA GeForce RTX 4090 | |
| Asus Prime GeForce RTX 5080 OC Edition | |
| NVIDIA GeForce RTX 5080 Founders Edition | |
| MSI GeForce RTX 5070 Ti 16G Ventus 3X OC | |
| NVIDIA GeForce RTX 4080 Founders Edition | |
| Gigabyte Aorus GeForce RTX 4070 Ti Master | |
| NVIDIA GeForce RTX 5070 Founders Edition | |
| Sapphire Pulse AMD Radeon RX 7900 XTX | |
| Sapphire Pulse AMD Radeon RX 7900 XT | |
DLSS-4-Mehrbildgenerierung
Mit der Blackwell Generation debütiert DLSS 4, das ein neues Transformer-Modell verwendet, welches angeblich eine höhere visuelle Wiedergabetreue im Vergleich zum konventionellen neuronalen Netzwerk (CNN) bietet, das bis DLSS 3 in Mode war.
Während DLSS 4 für alle RTX-GPUs verfügbar sein wird, einschließlich derer, die bis zur Turing-Generation zurückreichen, unterstützen nur Blackwell Karten die Multi-Frame-Generierung (MFG).
Die RTX 5070 FE profitiert stark von DLSS 4 MFG in unterstützten Titeln. In Alan Wake 2 zum Beispiel schafft die RTX 5070 FE mit 4x MFG und Ultra-Raytracing-Einstellungen durchschnittlich 90 fps bei 4K und kommt damit ziemlich nah an die 108 fps der RTX 4090 mit Standard Frame Generation in der Einstellung High Raytracing heran.
Bei Star Wars Outlaws erreicht die RTX 5070 FE bei 4K-Ultra-Raytracing-Einstellungen mit 4x MFG einen Durchschnitt von 87 fps und nähert sich damit dem Durchschnitt der RTX 4090 von 90 fps bei konventioneller Bilderzeugung.
Obwohl die RTX 5070 in Bezug auf die schiere Leistung nicht mit einer RTX 4090 mithalten kann, hilft die Multi-Frame-Generierung dabei, flüssigeres Gameplay bei anspruchsvollen Einstellungen zu einem niedrigeren Preis zu bieten.
Es ist möglich, die MFG-Funktionalität über die Nvidia App an unterstützte Titel anzuhängen, auch wenn die Entwickler sie noch nicht im Spiel implementiert haben.
| Alan Wake 2 | |
| 3840x2160 High Preset + Ultra Ray Tracing + Quality DLSS + FG 4x | |
| NVIDIA GeForce RTX 5090 Founders Edition | |
| Asus Prime GeForce RTX 5080 OC Edition | |
| NVIDIA GeForce RTX 5080 Founders Edition | |
| MSI GeForce RTX 5070 Ti 16G Ventus 3X OC | |
| NVIDIA GeForce RTX 5070 Founders Edition | |
| 3840x2160 High Preset + Ultra Ray Tracing + Quality DLSS + FG 2x | |
| NVIDIA GeForce RTX 5090 Founders Edition | |
| Asus Prime GeForce RTX 5080 OC Edition | |
| NVIDIA GeForce RTX 5080 Founders Edition | |
| MSI GeForce RTX 5070 Ti 16G Ventus 3X OC | |
| NVIDIA GeForce RTX 5070 Founders Edition | |
| Cyberpunk 2077 | |
| 3840x2160 Ray Tracing Overdrive Preset + DLSS 4 Transformer Quality + Frame Generation MFG 4x | |
| NVIDIA GeForce RTX 5090 Founders Edition | |
| NVIDIA GeForce RTX 5080 Founders Edition | |
| Asus Prime GeForce RTX 5080 OC Edition | |
| MSI GeForce RTX 5070 Ti 16G Ventus 3X OC | |
| NVIDIA GeForce RTX 5070 Founders Edition | |
| 3840x2160 Ray Tracing Overdrive Preset + DLSS 4 Transformer Quality + Frame Generation (M)FG 2x | |
| NVIDIA GeForce RTX 5090 Founders Edition | |
| NVIDIA GeForce RTX 5080 Founders Edition | |
| Asus Prime GeForce RTX 5080 OC Edition | |
| MSI GeForce RTX 5070 Ti 16G Ventus 3X OC | |
| NVIDIA GeForce RTX 5070 Founders Edition | |
| 2560x1440 Ultra Preset DLSS4 quality no FG | |
| NVIDIA GeForce RTX 5090 Founders Edition | |
| Asus Prime GeForce RTX 5080 OC Edition | |
| MSI GeForce RTX 5070 Ti 16G Ventus 3X OC | |
| NVIDIA GeForce RTX 5070 Founders Edition | |
| Gigabyte Aorus GeForce RTX 4070 Ti Master | |
| Star Wars Outlaws - 3840x2160 cinem. ultra, RT ultra, DLSS, FG 4x, RR | |
| NVIDIA GeForce RTX 5090 Founders Edition | |
| Asus Prime GeForce RTX 5080 OC Edition | |
| NVIDIA GeForce RTX 5080 Founders Edition | |
| MSI GeForce RTX 5070 Ti 16G Ventus 3X OC | |
| NVIDIA GeForce RTX 5070 Founders Edition | |
| min. | mittel | hoch | max. | QHD DLSS | QHD | 4K DLSS | 4K | |
|---|---|---|---|---|---|---|---|---|
| The Witcher 3 (2015) | 211 | 162.7 | 146.2 | |||||
| X-Plane 11.11 (2018) | 150.6 | 120.2 | ||||||
| Baldur's Gate 3 (2023) | 186.8 | 132 | 115.4 | 70.9 | ||||
| Cyberpunk 2077 (2023) | 164.7 | 128.3 | 107.6 | 47.4 | ||||
| Assassin's Creed Mirage (2023) | 163 | 126 | 106 | 78 | ||||
| Alan Wake 2 (2023) | 107.5 | 73.7 | 54.5 | 39 | ||||
| Avatar Frontiers of Pandora (2023) | 94 | 63.2 | 56 | 32.1 | ||||
| F1 24 (2024) | 138.8 | 140 | 90.1 | 77.3 | 45.1 | |||
| Black Myth: Wukong (2024) | 57 | 63 | 43 | 43 | 25 | |||
| Star Wars Outlaws (2024) | 74.5 | 74.7 | 56.2 | 48 | 32.5 | |||
| Stalker 2 (2024) | 81.2 | 128.8 | 61.8 | 77.5 | 37.2 | |||
| Indiana Jones and the Great Circle (2024) | 131 | 103.6 | 54 |
Emissionen: Relativ niedrige Oberflächentemperaturen, aber hohes Lüftergeräusch unter Last
Als Founders-Edition-Karte verfügt die RTX 5070 FE über das gleiche Kühlerdesign wie ihre größeren Vettern, jedoch ohne ein Flüssigmetall-Wärmeleitmaterial.
Die hinteren Lüftungsöffnungen sind für eine effiziente Belüftung leicht angewinkelt. Da die heiße Luft in Richtung der Oberseite des Gehäuses geleitet wird, empfiehlt es sich für diejenigen, die einen All-in-one-Kühler verwenden, den Kühler in Richtung der Gehäuseoberseite zu platzieren.
Stresstest
Die RTX 5070 FE erreicht eine maximale Taktfrequenz von 2.700 MHz und verbraucht 252 W, wenn sie einem FurMark Test bei 1.280 x 720 ohne AA unterzogen wird.
Diese Frequenz wird jedoch nicht lange aufrechterhalten, und die durchschnittlichen Taktraten bewegen sich nahe der 2.500-MHz-Marke bei 250 W, wobei die Kerntemperaturen im Durchschnitt 78,4 °C betragen.
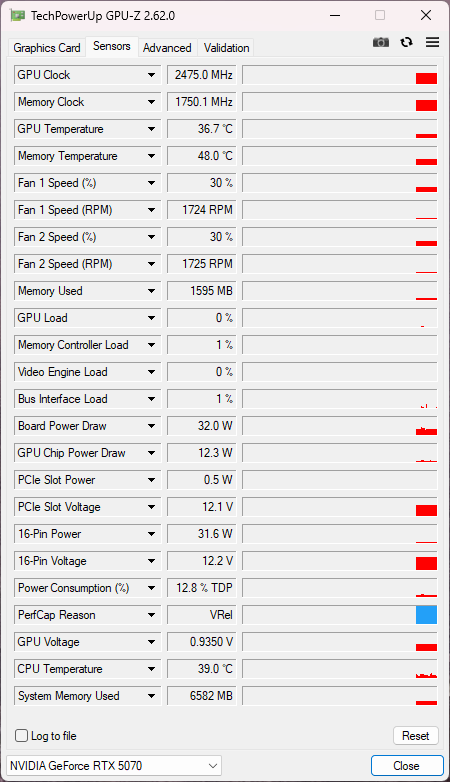
Bei der Belastung mit Cyberpunk 2077 Phantom Liberty in 1.080p Ultra erreicht die RTX 5070 FE einen Boost von bis zu 2.512 MHz bei 209 W.
Die durchschnittlichen Taktraten bewegen sich bei dieser Belastung erneut um 2.500 MHz, aber die Leistungsaufnahme sinkt auf 197 W bei durchschnittlichen Kerntemperaturen von 69 °C.
Eine Erhöhung des Leistungsziels auf 110 % führt zu einem höheren Stromverbrauch und höheren Kerntemperaturen, ohne dass die GPU-Frequenz spürbar ansteigt.
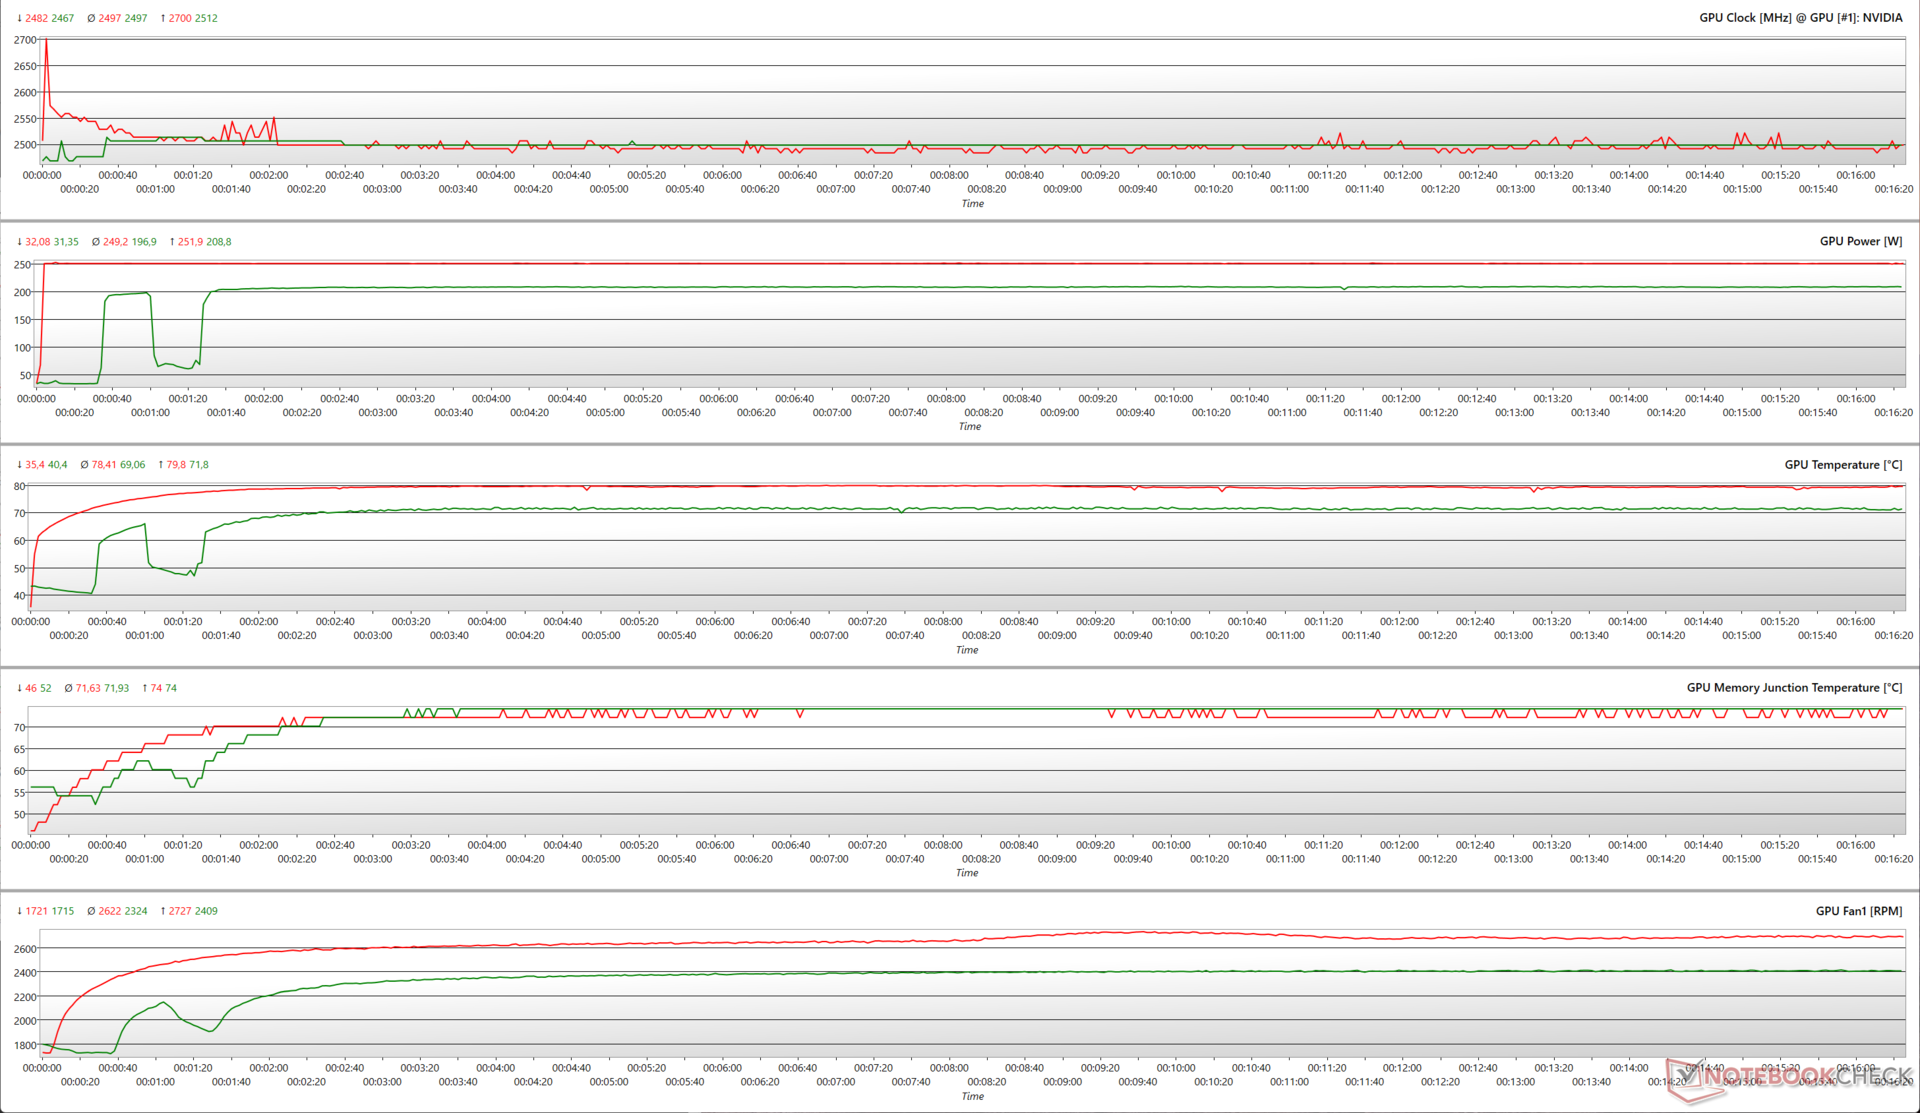
Tabelle Cyberpunk 2077 1.080p Ultra und 4K Ultra fps
Davon abgesehen leistet das Kühlsystem der RTX 5070 FE gute Arbeit, indem es anhaltende Frame-Raten ohne Throttling-Probleme bietet, wie in den Charts zu Cyberpunk 2077 1.080p und 4K Ultra unten zu sehen ist.
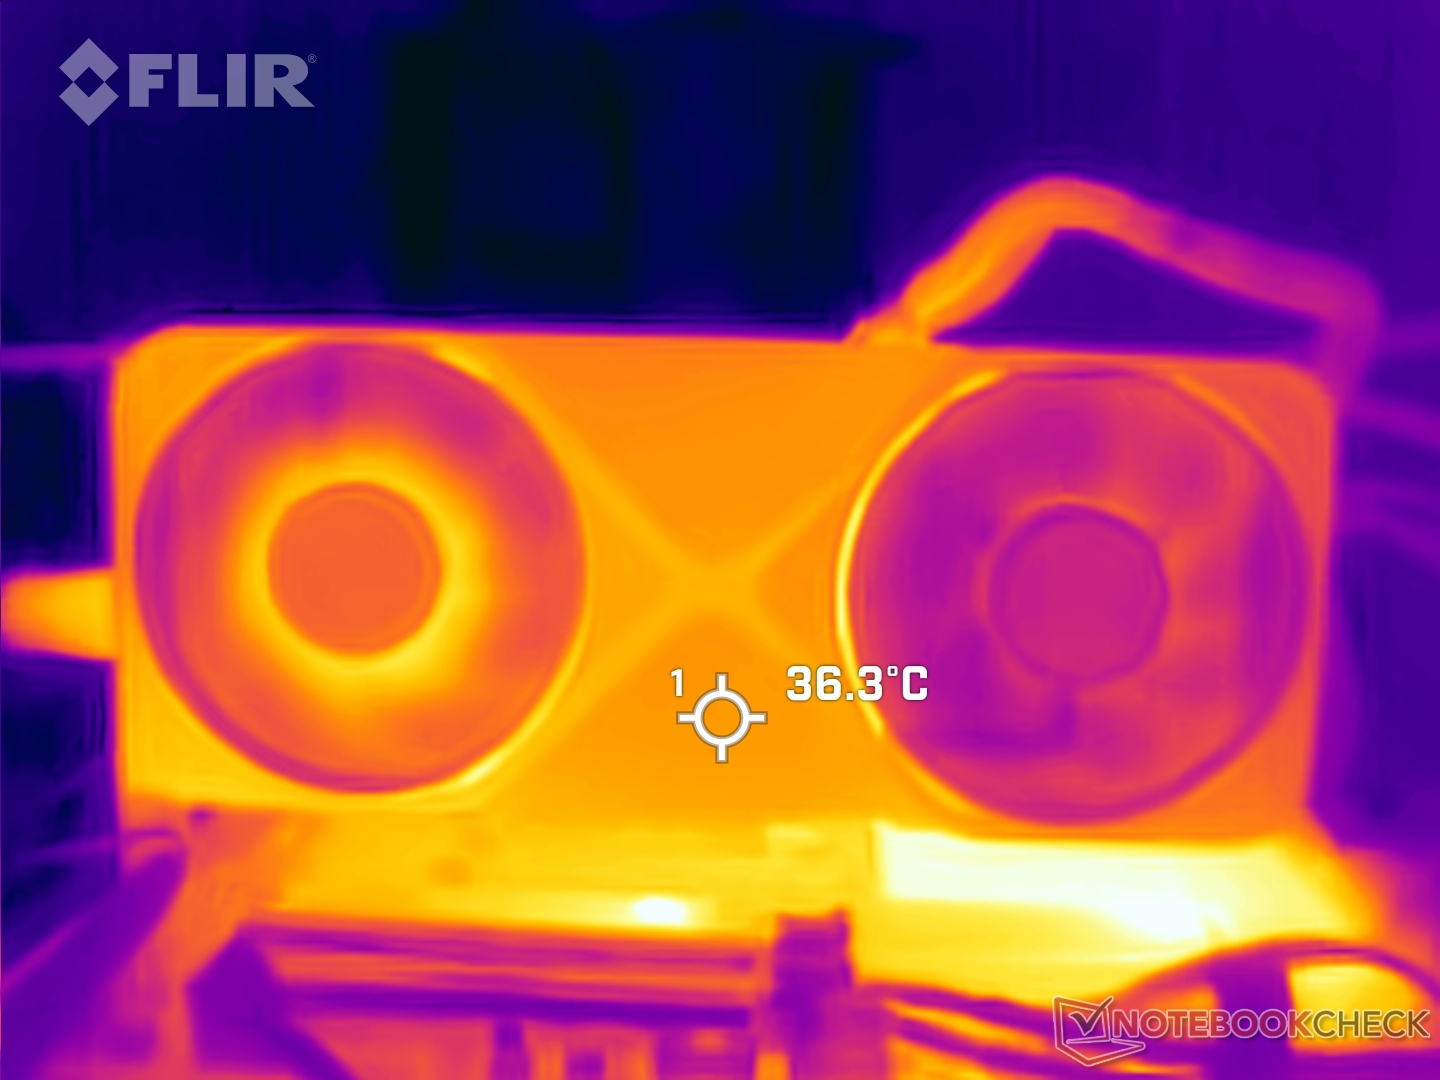
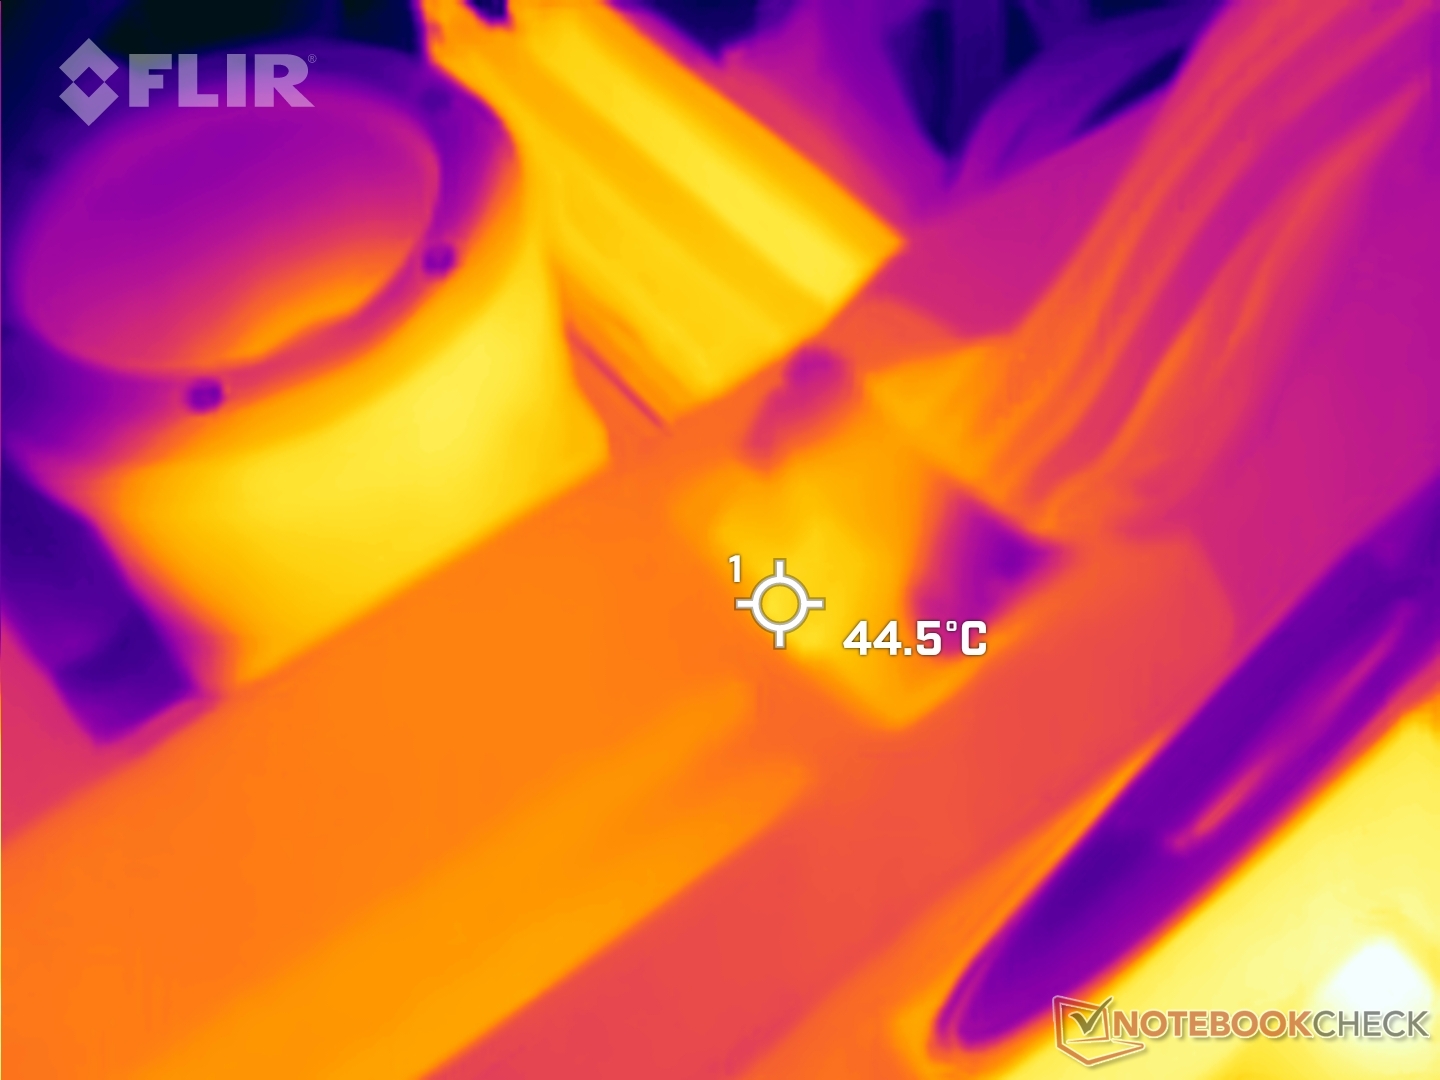
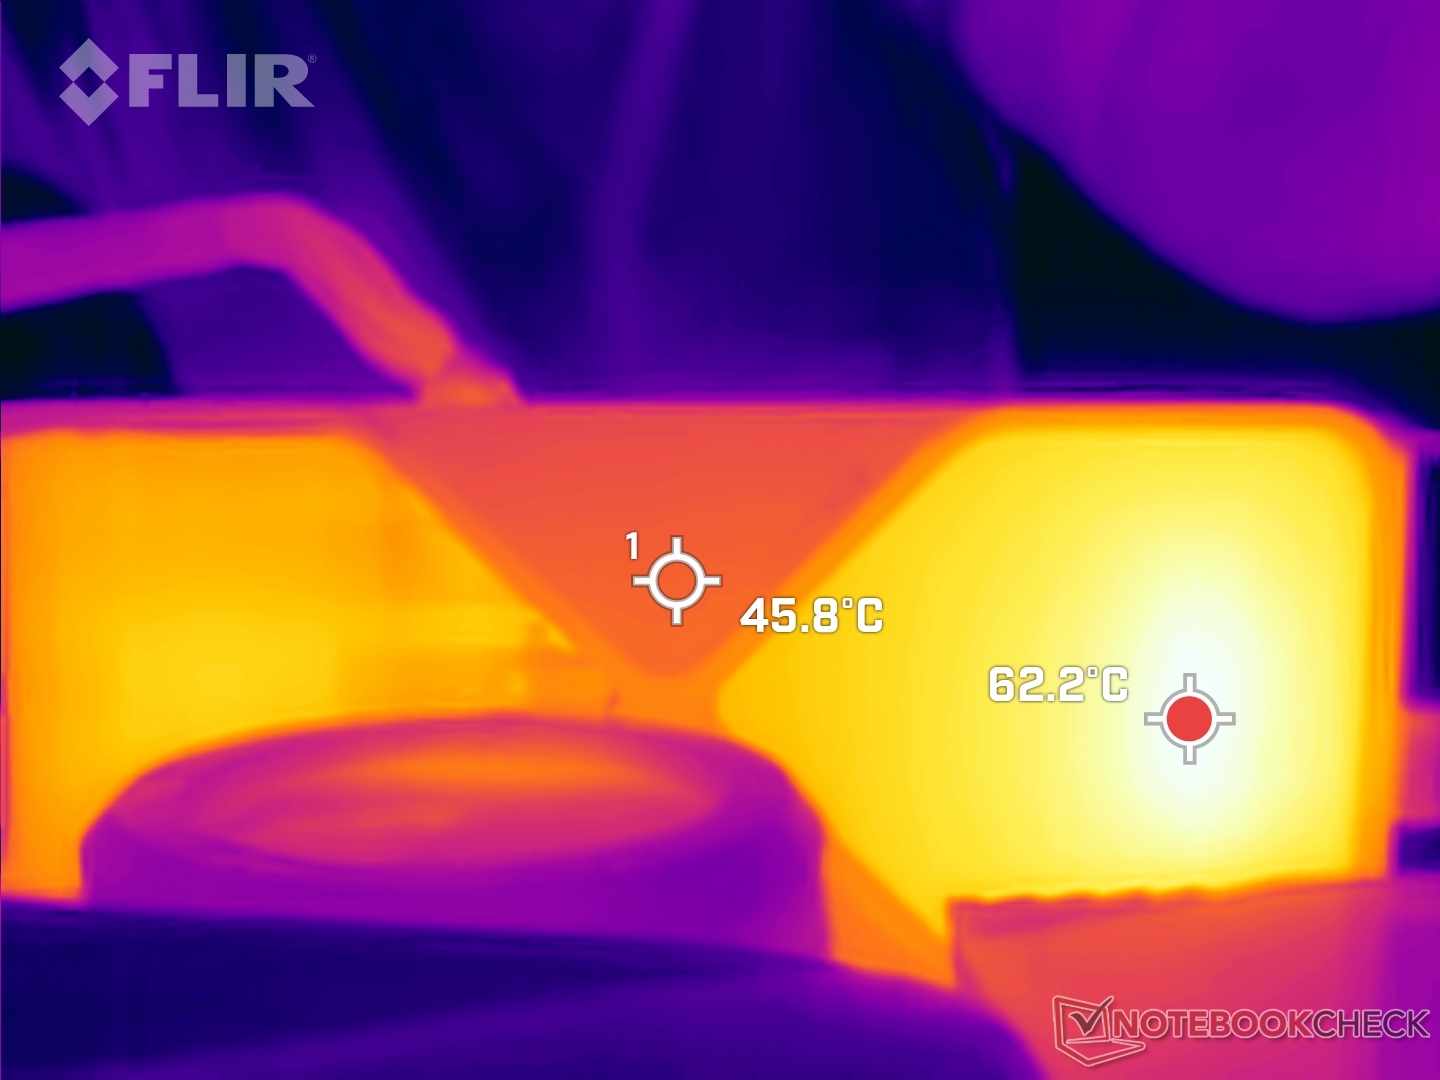
Oberflächentemperaturen
Die Oberflächentemperaturen bleiben unter Umgebungsbedingungen von 23 °C weitgehend überschaubar. Wir haben 36 °C auf der Vorderseite und fast 46 °C auf der Rückseite der Karte gemessen.
Der linke Bereich der Abluftöffnung erwärmte sich jedoch auf 62,2 °C. Trotz der Belastung blieb der Bereich in der Nähe des 12-V-2x6 mit 44,5 °C relativ kühl.
Geräuschpegel

Das kompakte Design der Karte bedeutet, dass die Lüfter je nach Belastung zeitweise besonders hart arbeiten müssen, was zu einem hohen Geräuschpegel führen kann.
Wir haben einen Schalldruckpegel (SPL) von 46,52 db(A) aufgezeichnet, während wir die Karte mit FurMark bei 1.280 x 720 ohne AA und einem Leistungsziel von 100 % belastet haben. Eine Erhöhung des Leistungsziels auf 110 % führt zu einem deutlich höheren SPL von 53,10 dB(A).
Allerdings ist es unwahrscheinlich, dass die meisten Spiele die Lüfter bis an ihre Grenzen bringen. So haben wir bei Cyberpunk 2077 mit 1.080p Ultra bei 100 % bzw. 110 % Leistungsvorgabe relativ niedrige Geräuschpegel von 43,80 db(A) und 45,08 dB(A) beobachtet.
| Stresstest | Leistungsziel | max. Lüfterdrehzahl (RPM) | Lüftergeräusch dB(A) |
|---|---|---|---|
| FurMark 1.280 x 720, ohne AA | 100 % | 2.727 | 46,52 |
| FurMark 1.280 x 720, ohne AA | 110 % | 2.993 | 53,10 |
| Cyberpunk 2077 1.080p Ultra | 100 % | 2.409 | 43,80 |
| Cyberpunk 2077 1.080p Ultra | 110 % | 2.520 | 45,08 |
Energiemanagement: Sparsamer Sipper mit einem Effizienzvorteil gegenüber der RX 7900 XT
Die RTX 5070 FE verbraucht im FurMark 12 % weniger Strom als die Aorus RTX 4070 Ti Master. Der Stromverbrauch bei der Ausführung von Cyberpunk 2077 und The Witcher 3 zeigt ebenfalls ähnliche Trends.
Der GB205-Grafikprozessor ist beim Spielen von Cyberpunk 2077 ebenso stromsparend wie die RTX 5090 und die RX 7900 XT.
Witcher 3 zeigt, dass die RTX 5070 FE die Effizienz der RTX 4090 erreicht und dabei 8 bzw. 19 % effizienter ist als die RTX 4070 Ti Master und die RX 7900 XT.
Power consumption: External monitor
:
| Power Consumption / FurMark 1.19 GPU Stress Test (external Monitor) | |
| NVIDIA GeForce RTX 5090 Founders Edition (Idle: 90 W) | |
| NVIDIA GeForce RTX 4090 (Idle: 82 W) | |
| Sapphire Pulse AMD Radeon RX 7900 XTX (Idle: 74 W) | |
| NVIDIA GeForce RTX 5080 Founders Edition (Idle: 70 W) | |
| Sapphire Pulse AMD Radeon RX 7900 XT (Idle: 94 W) | |
| Asus Prime GeForce RTX 5080 OC Edition (Idle: 78 W) | |
| NVIDIA GeForce RTX 4080 Founders Edition (Idle: 72 W) | |
| MSI GeForce RTX 5070 Ti 16G Ventus 3X OC (Idle: 107 W) | |
| Gigabyte Aorus GeForce RTX 4070 Ti Master (Idle: 120 W) | |
| NVIDIA GeForce RTX 5070 Founders Edition (Idle: 77 W) | |
| Power Consumption / Cyberpunk 2077 FHD ultra no FSR (external Monitor) | |
| Sapphire Pulse AMD Radeon RX 7900 XTX (Idle: 74 W) | |
| Sapphire Pulse AMD Radeon RX 7900 XT (Idle: 94 W) | |
| NVIDIA GeForce RTX 5090 Founders Edition (Idle: 90 ) | |
| NVIDIA GeForce RTX 4090 (Idle: 82 W) | |
| Gigabyte Aorus GeForce RTX 4070 Ti Master (Idle: 120 W) | |
| MSI GeForce RTX 5070 Ti 16G Ventus 3X OC (Idle: 107 W) | |
| Asus Prime GeForce RTX 5080 OC Edition (Idle: 78 W) | |
| NVIDIA GeForce RTX 5080 Founders Edition (Idle: 70 W) | |
| NVIDIA GeForce RTX 5070 Founders Edition (Idle: 77 W) | |
| NVIDIA GeForce RTX 4080 Founders Edition (Idle: 72 W) | |
| Power Consumption / Cyberpunk 2077 ultra Efficiency | |
| Asus Prime GeForce RTX 5080 OC Edition | |
| NVIDIA GeForce RTX 5080 Founders Edition | |
| MSI GeForce RTX 5070 Ti 16G Ventus 3X OC | |
| NVIDIA GeForce RTX 4090 | |
| NVIDIA GeForce RTX 4080 Founders Edition | |
| Gigabyte Aorus GeForce RTX 4070 Ti Master | |
| NVIDIA GeForce RTX 5090 Founders Edition | |
| NVIDIA GeForce RTX 5070 Founders Edition | |
| Sapphire Pulse AMD Radeon RX 7900 XT | |
| Sapphire Pulse AMD Radeon RX 7900 XTX | |
| Power Consumption / The Witcher 3 ultra (external Monitor) | |
| NVIDIA GeForce RTX 5090 Founders Edition (Idle: 90 W) | |
| Sapphire Pulse AMD Radeon RX 7900 XTX (Idle: 74 W) | |
| NVIDIA GeForce RTX 4090 (Idle: 82 W) | |
| Sapphire Pulse AMD Radeon RX 7900 XT (Idle: 94 W) | |
| Asus Prime GeForce RTX 5080 OC Edition (Idle: 78 W) | |
| MSI GeForce RTX 5070 Ti 16G Ventus 3X OC (Idle: 107 W) | |
| NVIDIA GeForce RTX 5080 Founders Edition (Idle: 70 W) | |
| Gigabyte Aorus GeForce RTX 4070 Ti Master (Idle: 120 W) | |
| NVIDIA GeForce RTX 5070 Founders Edition (Idle: 77 W) | |
| NVIDIA GeForce RTX 4080 Founders Edition (Idle: 72 W) | |
| Power Consumption / Witcher 3 ultra Efficiency (external Monitor) | |
| NVIDIA GeForce RTX 5080 Founders Edition | |
| NVIDIA GeForce RTX 4080 Founders Edition | |
| NVIDIA GeForce RTX 4090 | |
| NVIDIA GeForce RTX 5070 Founders Edition | |
| Asus Prime GeForce RTX 5080 OC Edition | |
| MSI GeForce RTX 5070 Ti 16G Ventus 3X OC | |
| Gigabyte Aorus GeForce RTX 4070 Ti Master | |
| NVIDIA GeForce RTX 5090 Founders Edition | |
| Sapphire Pulse AMD Radeon RX 7900 XT | |
| Sapphire Pulse AMD Radeon RX 7900 XTX | |
| 1280x720 FurMark 1.19 GPU Stress Test (external Monitor) | |
| 1920x1080 The Witcher 3 ultra (external Monitor) | |
* ... kleinere Werte sind besser
Unsere Eindrücke von der GeForce RTX 5070 Founders Edition
Die Nvidia GeForce RTX 5070 Founders Edition bietet die Vorteile von Blackwell in einer niedrigeren Preisklasse. Die RTX 5070 FE ist eine brauchbare und erschwingliche 1.440p-Alternative für diejenigen, die nicht bereit sind, mehr für die RTX 5070 Ti zu berappen.
Die Unterstützung für die DLSS-4-Multi-Frame-Generation erhöht das Wertversprechen noch weiter, vorausgesetzt, Sie können sie zum Preis von 549 US-Dollar UVP erwerben.
Transparenz
Die Auswahl der zu testenden Geräte erfolgt innerhalb der Redaktion. Das vorliegende Testmuster wurde dem Autor vom Hersteller oder einem Shop zu Testzwecken leihweise zur Verfügung gestellt. Eine Einflussnahme des Leihstellers auf den Testbericht gab es nicht, der Hersteller erhielt keine Version des Reviews vor der Veröffentlichung. Es bestand keine Verpflichtung zur Publikation. Als eigenständiges, unabhängiges Unternehmen unterliegt Notebookcheck keiner Diktion von Herstellern, Shops und Verlagen.
So testet Notebookcheck
Pro Jahr werden von Notebookcheck hunderte Laptops und Smartphones unabhängig in von uns standardisierten technischen Verfahren getestet, um eine Vergleichbarkeit aller Testergebnisse zu gewährleisten. Seit rund 20 Jahren entwickeln wir diese Testmethoden kontinuierlich weiter und setzen damit Branchenstandards. In unseren Testlaboren kommt ausschließlich hochwertiges Messequipment in die Hände erfahrener Techniker und Redakteure. Die Tests unterliegen einer mehrstufigen Kontrolle. Unsere komplexe Gesamtbewertung basiert auf hunderten fundierten Messergebnissen und Benchmarks, womit Ihnen Objektivität garantiert ist. Weitere Informationen zu unseren Testmethoden gibt es hier.

