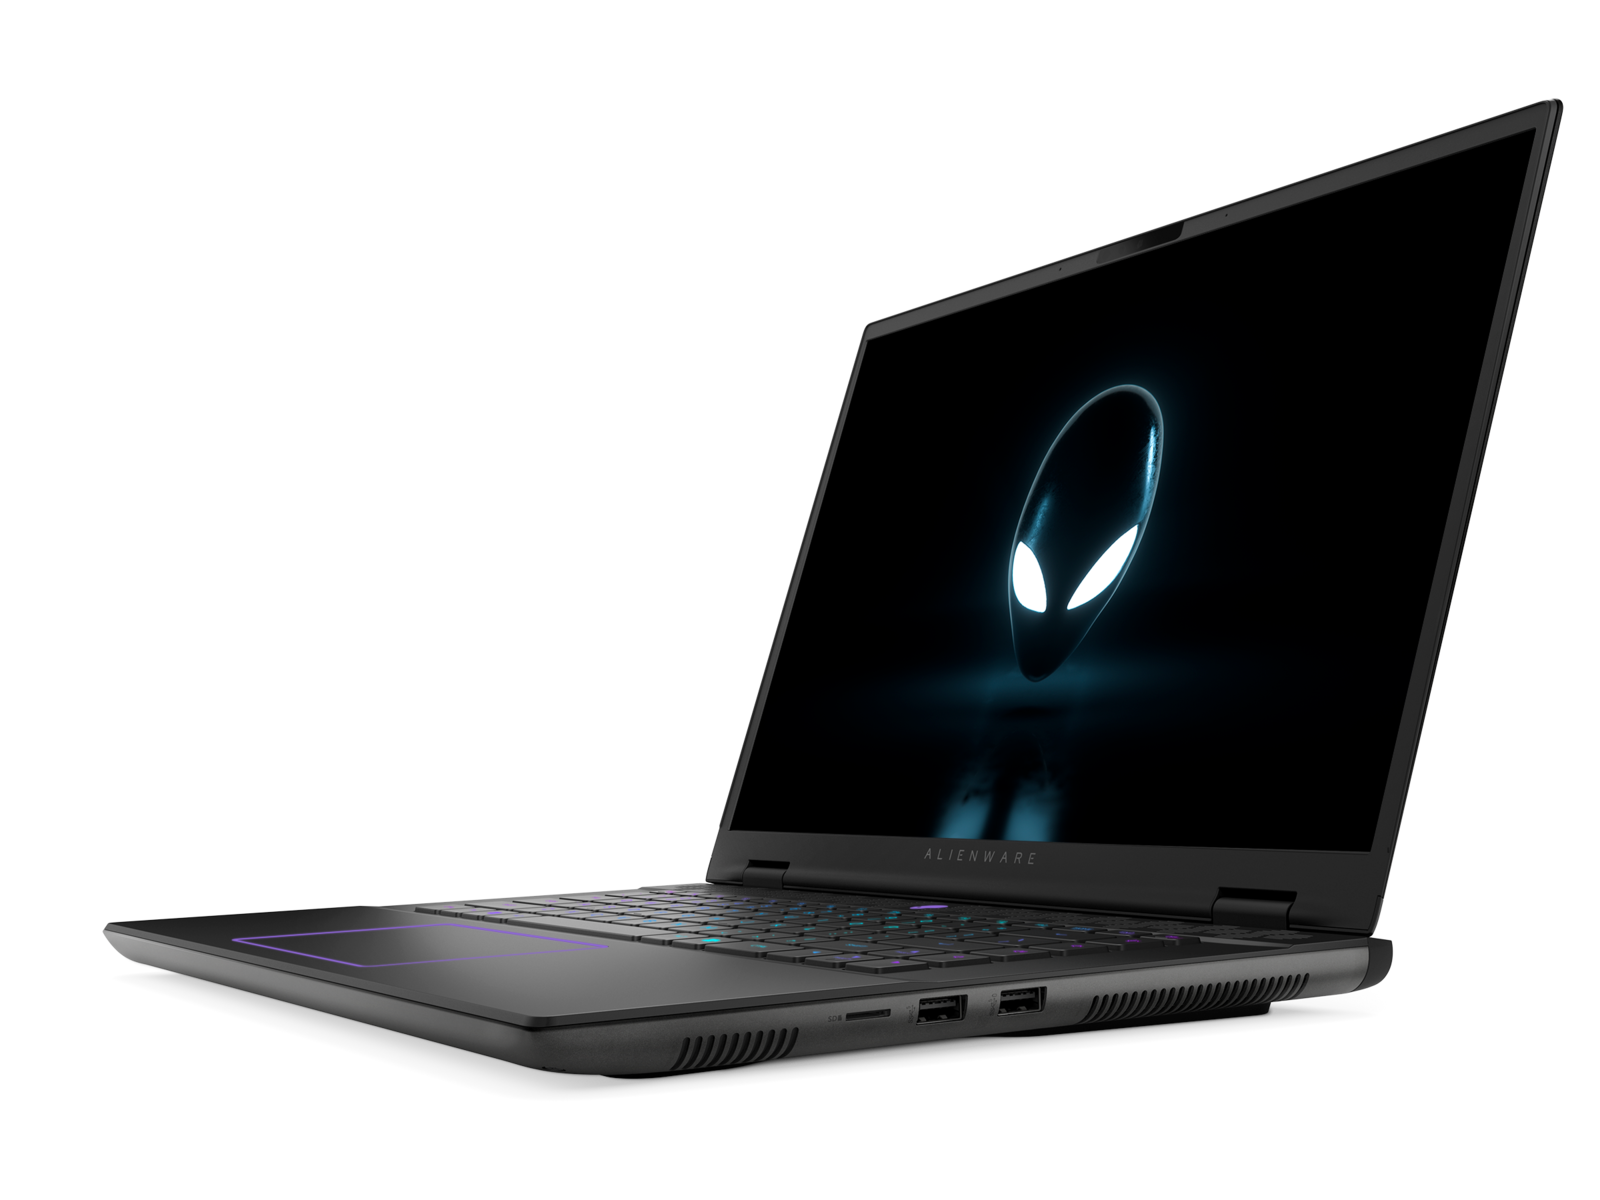
Alienware m16 R2 Laptop im Test: Umfangreiche und gewagte Veränderungen

Das Alienware m16 R2 ist der Nachfolger des m16 R1, jedoch nicht in der erwarteten Weise. Das neue Modell präsentiert sich als komplettes Redesign und Neuausrichtung der m16-Serie. Dabei zielt es darauf ab, sowohl Gamer als auch allgemeine Nutzer anzusprechen, im Gegensatz zu anderen Alienware-Produkten, die sich hauptsächlich an Hardcore-Gamer richten. Diese Neuausrichtung macht das m16 R2 zu einem der interessantesten Alienware-Notebooks der letzten Jahre. Dabei verzichtet es auf einige High-End-CPU- und GPU-Optionen, die beim m16 R1 verfügbar waren, und setzt stattdessen auf ein kompakteres Design.
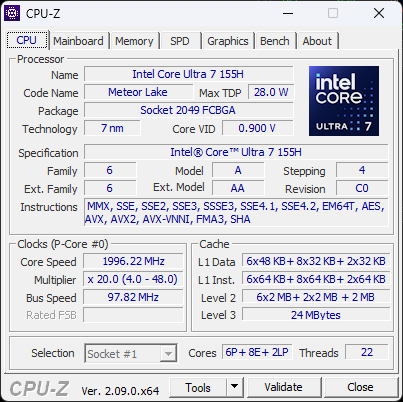
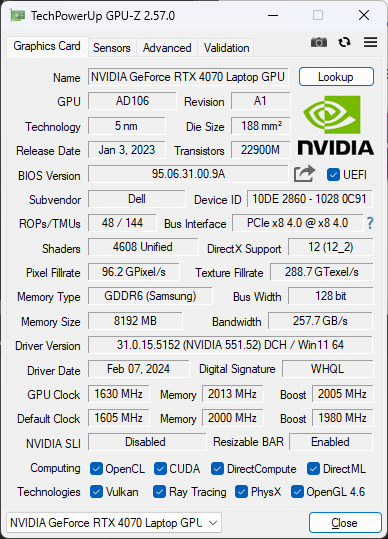
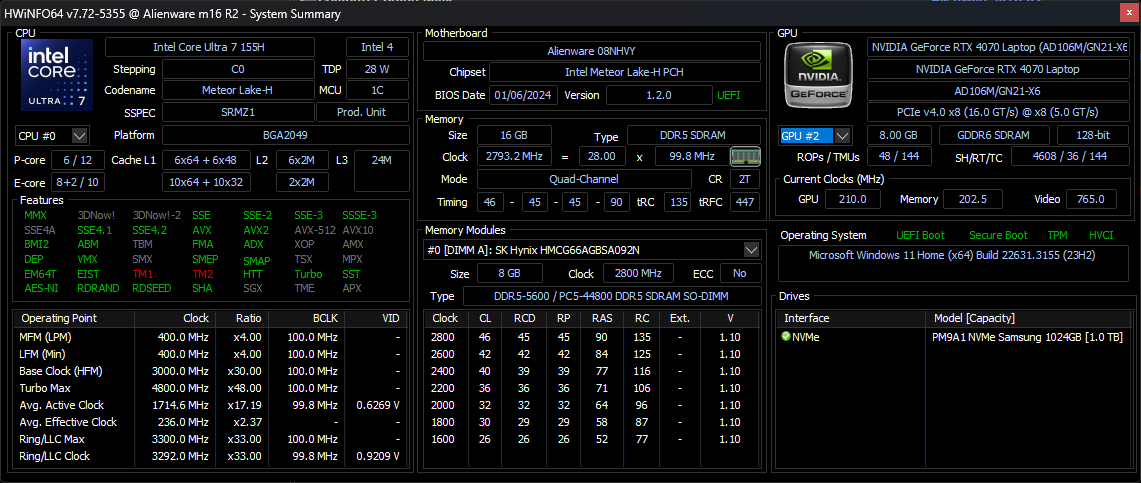
Unser Testgerät ist eine High-End-Konfiguration mit der Meteor Lake-H Core Ultra 7 155H CPU, GeForce RTX 4070 GPU und einem 1600p 240 Hz IPS-Display, das für etwa 2.199 Euro erhältlich ist. Niedrigere SKUs können alternativ mit der RTX 4050 oder 4060 konfiguriert werden, während höherwertige SKUs den Core Ultra 9 beinhalten. Unabhängig von der Konfiguration ist das Display jedoch auf das gleiche 1600p240 IPS-Display beschränkt, und nur die RTX 4070 steht als GPU-Option zur Verfügung.
Als Alternativen zum Alienware m16 R2 kommen andere leistungsstarke 16-Zoll-Notebooks in Frage, wie das Razer Blade 16, HP Omen Transcend 16, Asus ROG Zephyrus G16, oder das Lenovo Legion Slim 7 16.
Weitere Alienware Bewertungen:
Mögliche Konkurrenten im Vergleich
Bew. | Datum | Modell | Gewicht | Dicke | Größe | Auflösung | Preis ab |
|---|---|---|---|---|---|---|---|
| 90.2 % v7 (old) | 03 / 2024 | Alienware m16 R2 Ultra 7 155H, GeForce RTX 4070 Laptop GPU | 2.5 kg | 23.5 mm | 16.00" | 2560x1600 | |
| 88.3 % v7 (old) | 09 / 2023 | Alienware m16 R1 Intel i7-13700HX, GeForce RTX 4060 Laptop GPU | 3 kg | 25.4 mm | 16.00" | 2560x1600 | |
| 88.4 % v7 (old) | 06 / 2023 | Alienware x16 R1 i9-13900HK, GeForce RTX 4080 Laptop GPU | 2.6 kg | 18.57 mm | 16.00" | 2560x1600 | |
| 88.4 % v7 (old) | 02 / 2024 | HP Omen Transcend 16-u1095ng i9-14900HX, GeForce RTX 4070 Laptop GPU | 2.3 kg | 20 mm | 16.00" | 2560x1600 | |
| 92.3 % v7 (old) | 02 / 2024 | Asus ROG Zephyrus G16 2024 GU605M Ultra 7 155H, GeForce RTX 4070 Laptop GPU | 1.8 kg | 16.4 mm | 16.00" | 2560x1600 | |
| 90.4 % v7 (old) | 11 / 2023 | Lenovo Legion Slim 7 16APH8 R7 7840HS, GeForce RTX 4060 Laptop GPU | 2.1 kg | 20 mm | 16.00" | 2560x1600 |
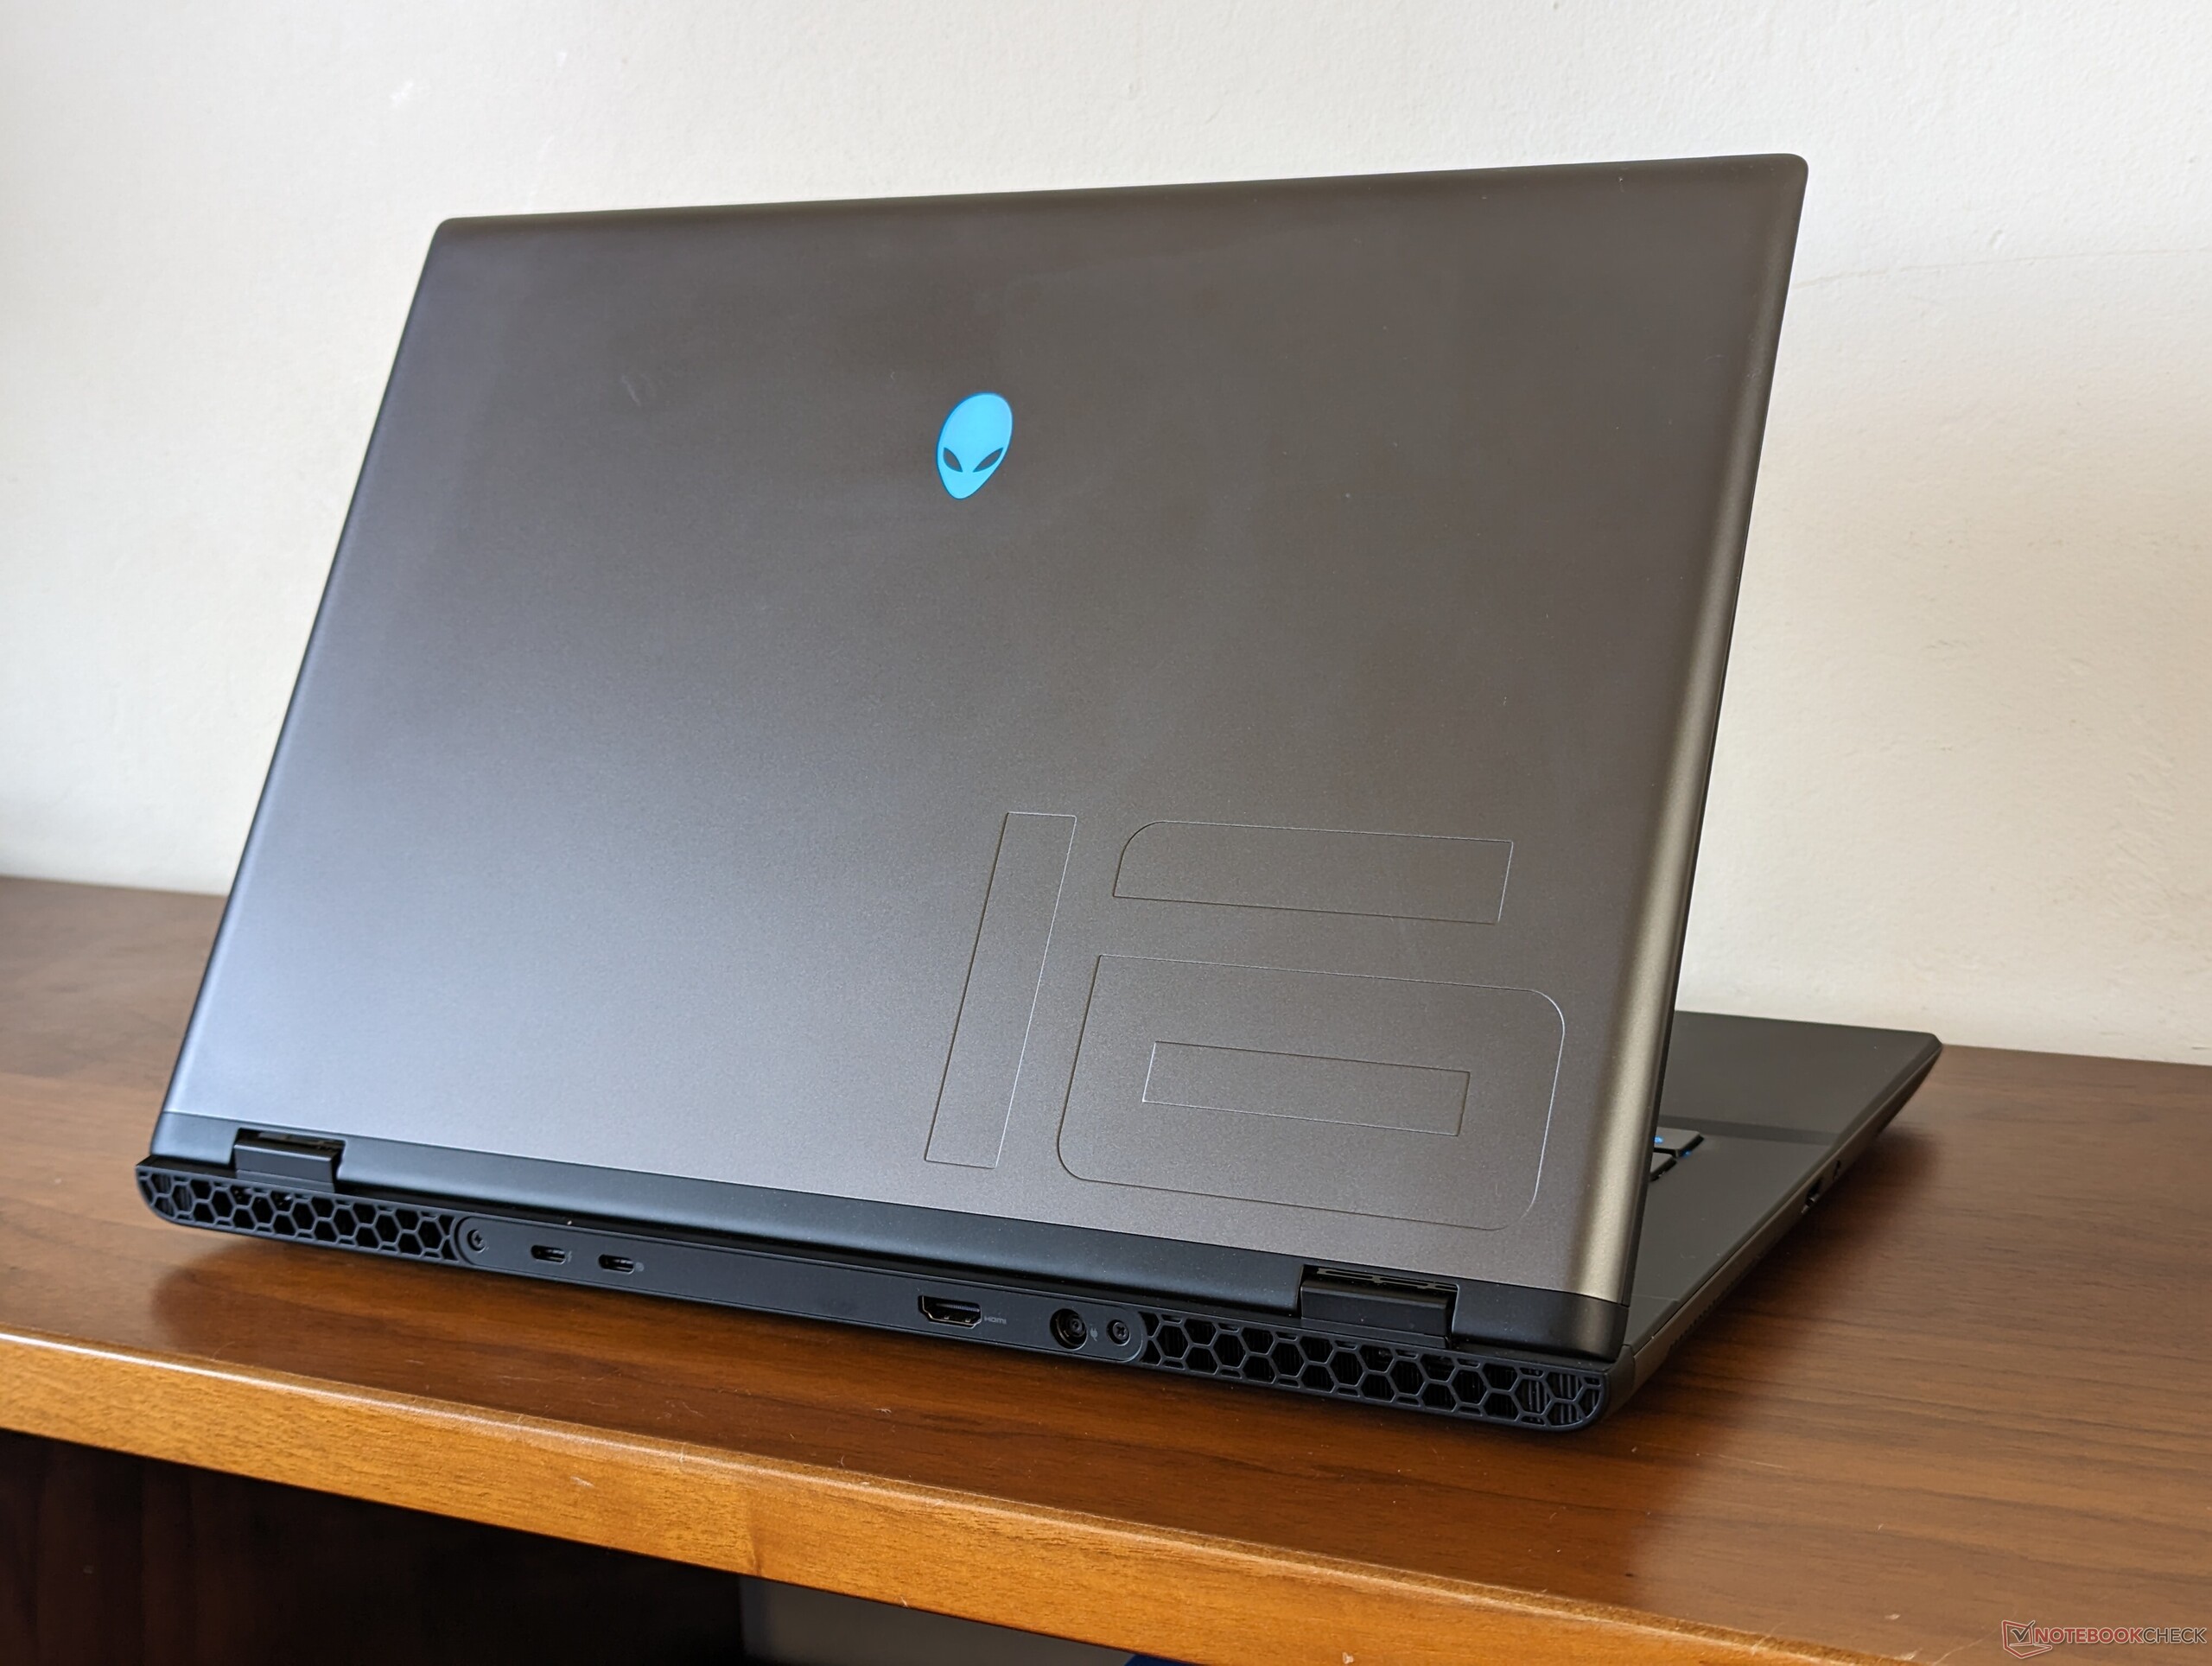
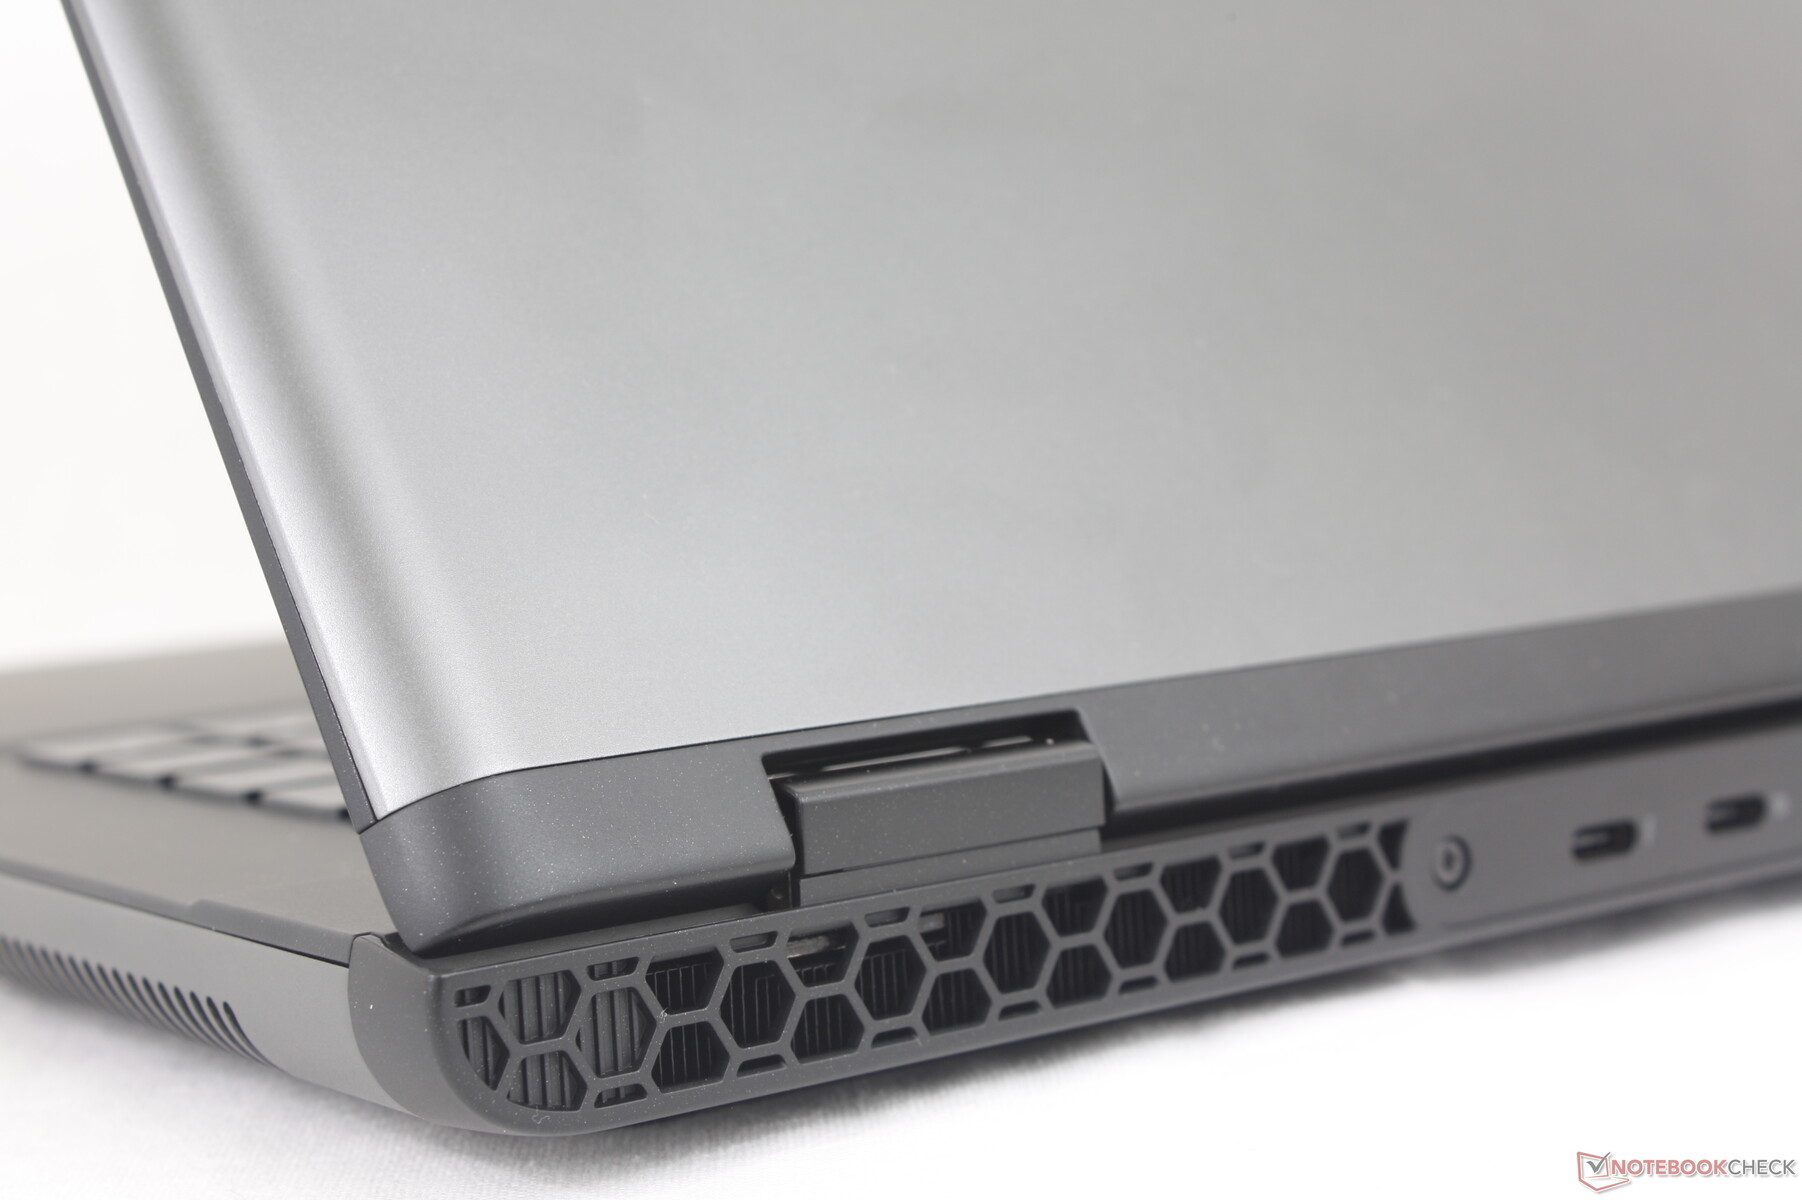
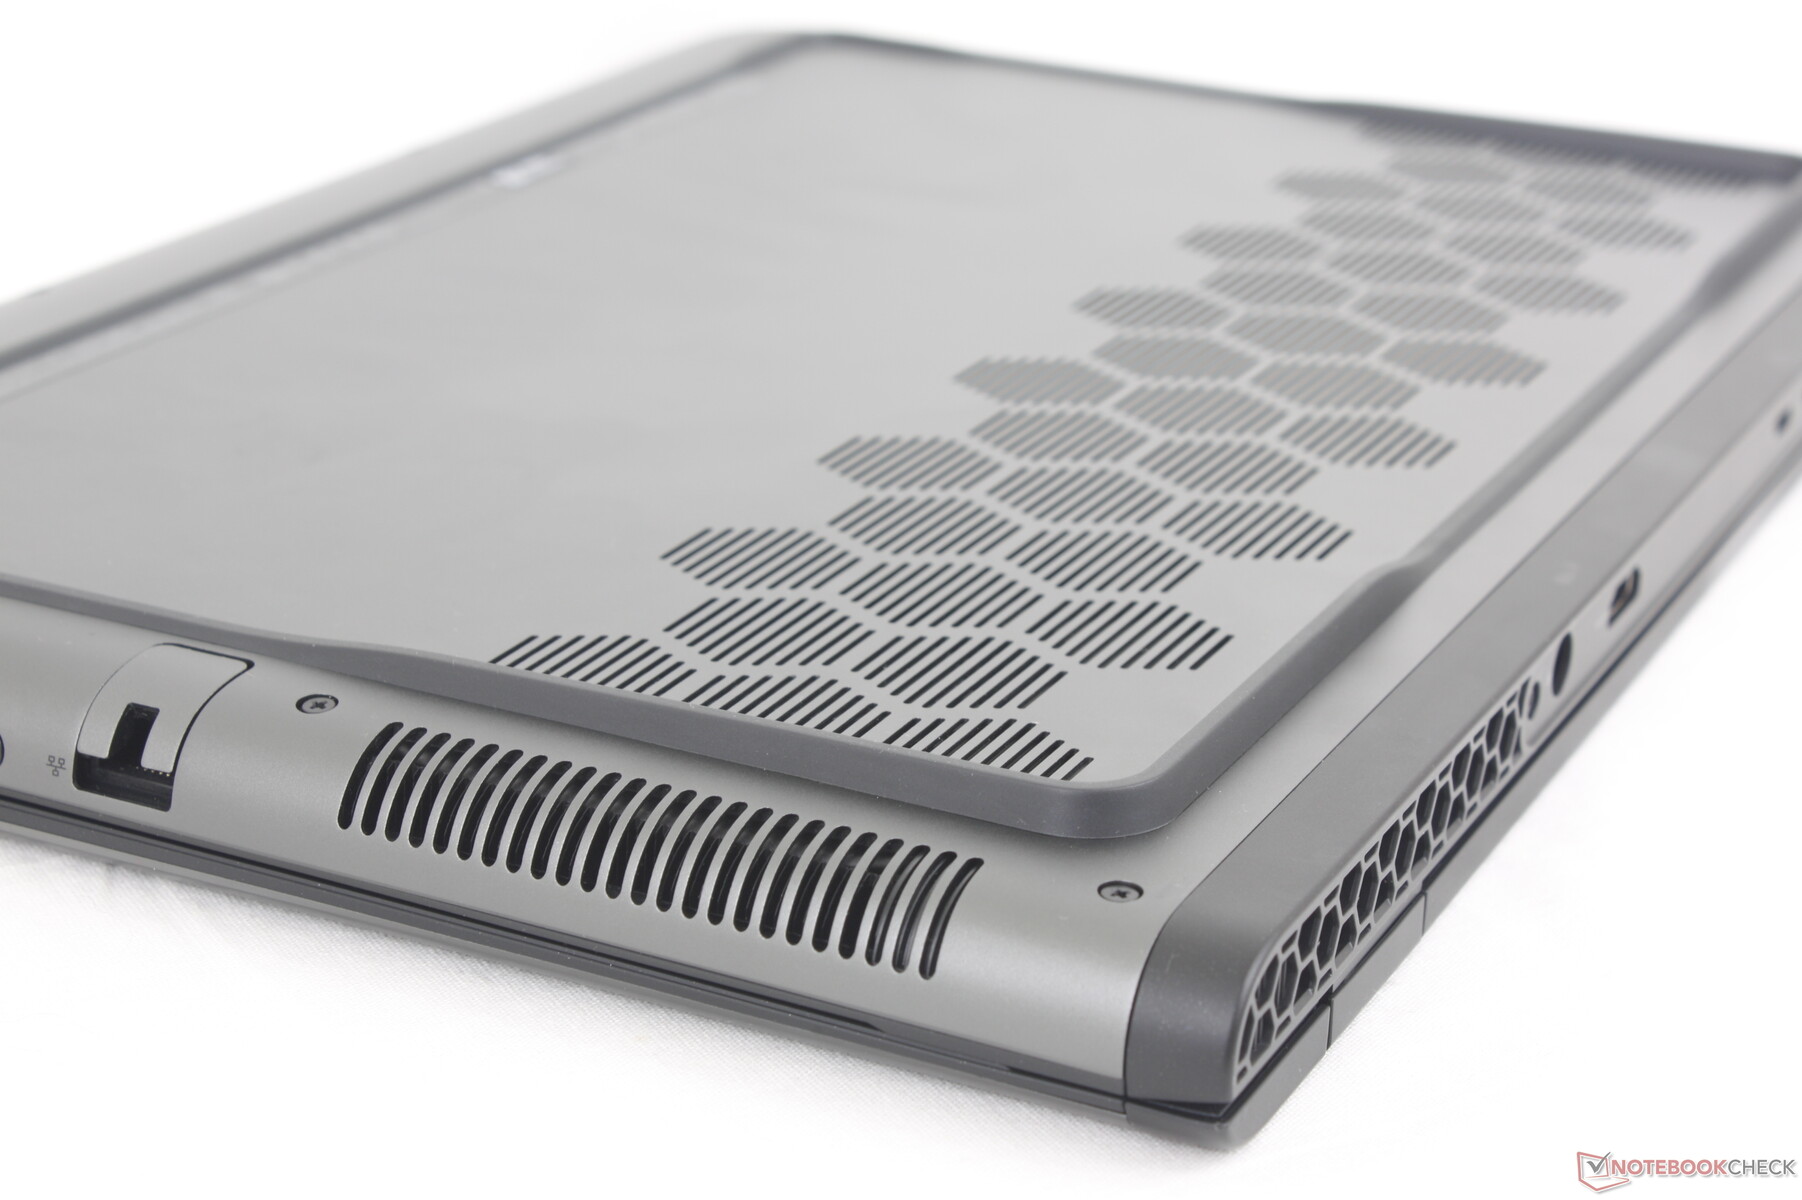
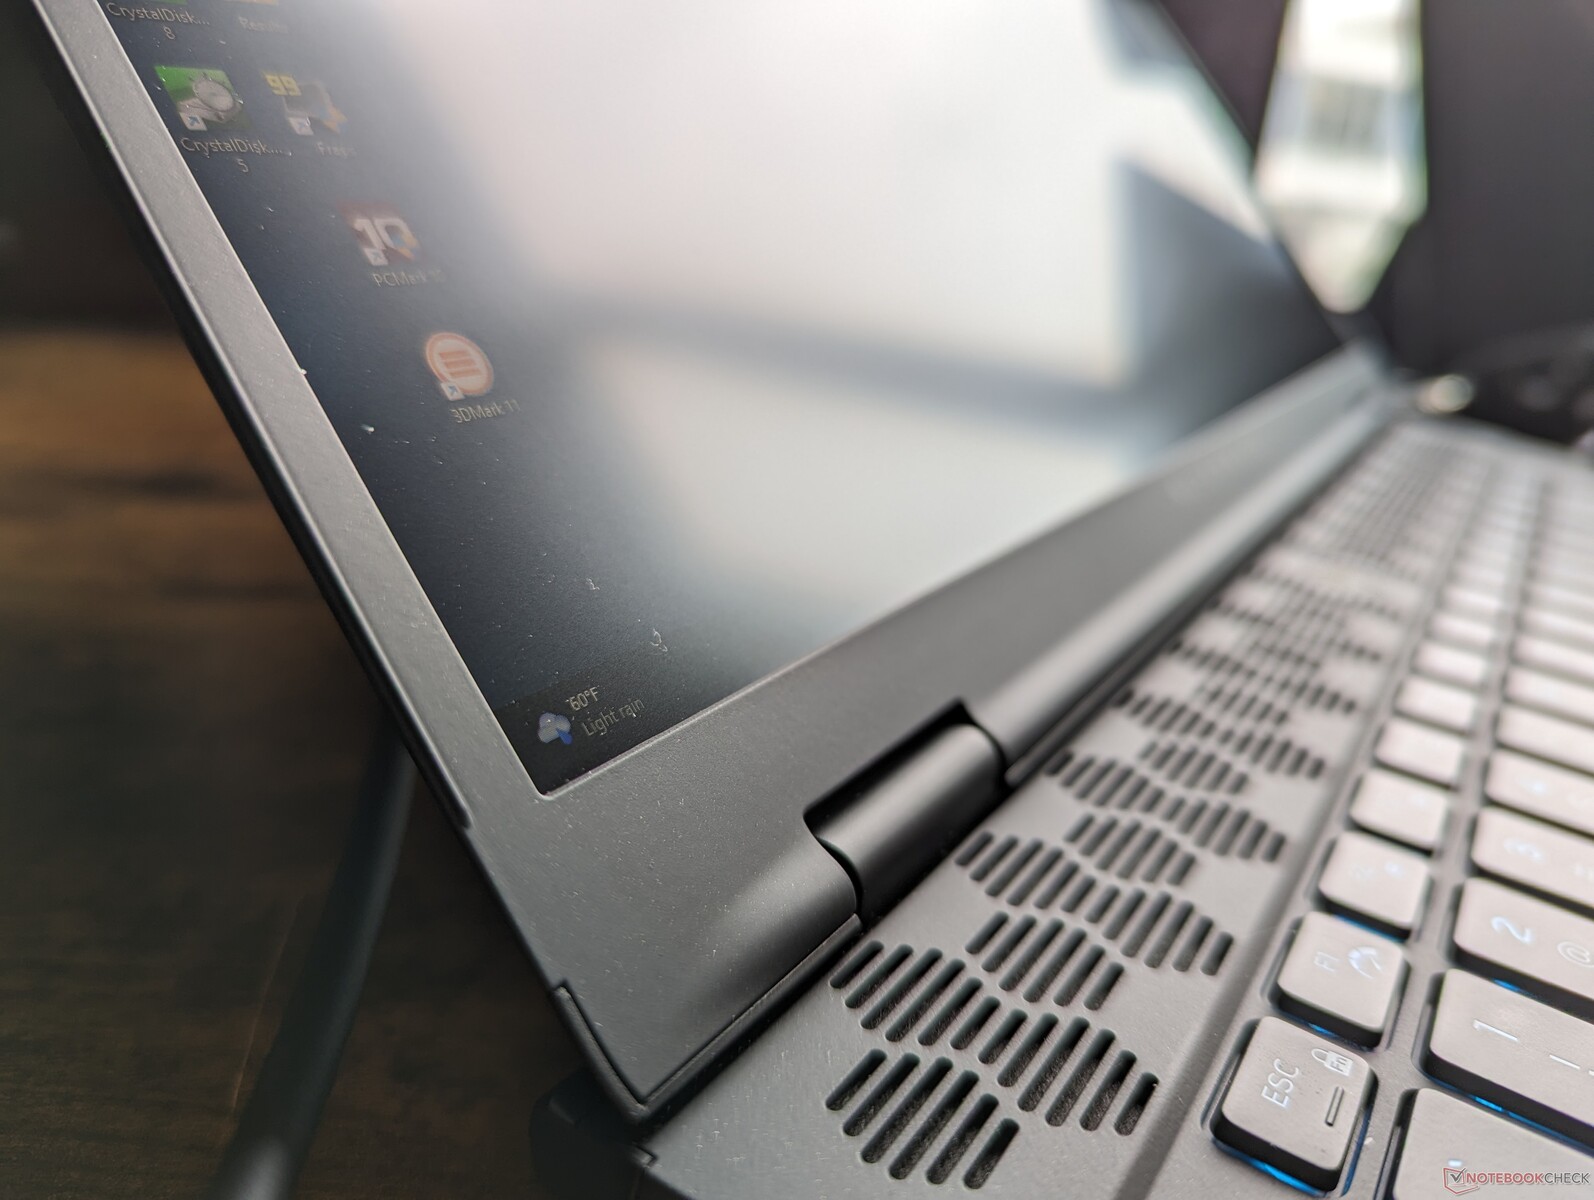
Gehäuse - Legende 3.0 neu definiert
Das Alienware m16 R1 ist noch nicht einmal ein Jahr alt, und dennoch führt Dell mit dem m16 R2 bereits ein überarbeitetes Gehäusedesign ein. Die auffälligste Änderung besteht darin, dass das hervorstehende Wärmedeck auf der Rückseite entfernt wurde, was zu einer deutlich kleineren Grundfläche im Vergleich zum Vorgänger führt. Der RGB-LED-Ring auf der Rückseite ist nun nicht mehr vorhanden, und die Tastatur wurde nach oben verschoben, um Platz für größere Handballenauflagen und ein größeres Clickpad zu schaffen.
Die Gehäusematerialien bleiben ansonsten die gleichen wie zuvor und bieten ähnliche Texturen und Eindrücke. Die Steifigkeit hat sich nicht signifikant verändert, und das Gerät fühlt sich von oben bis unten recht stabil an, ohne größere Knarzgeräusche oder offensichtliche Schwachstellen.
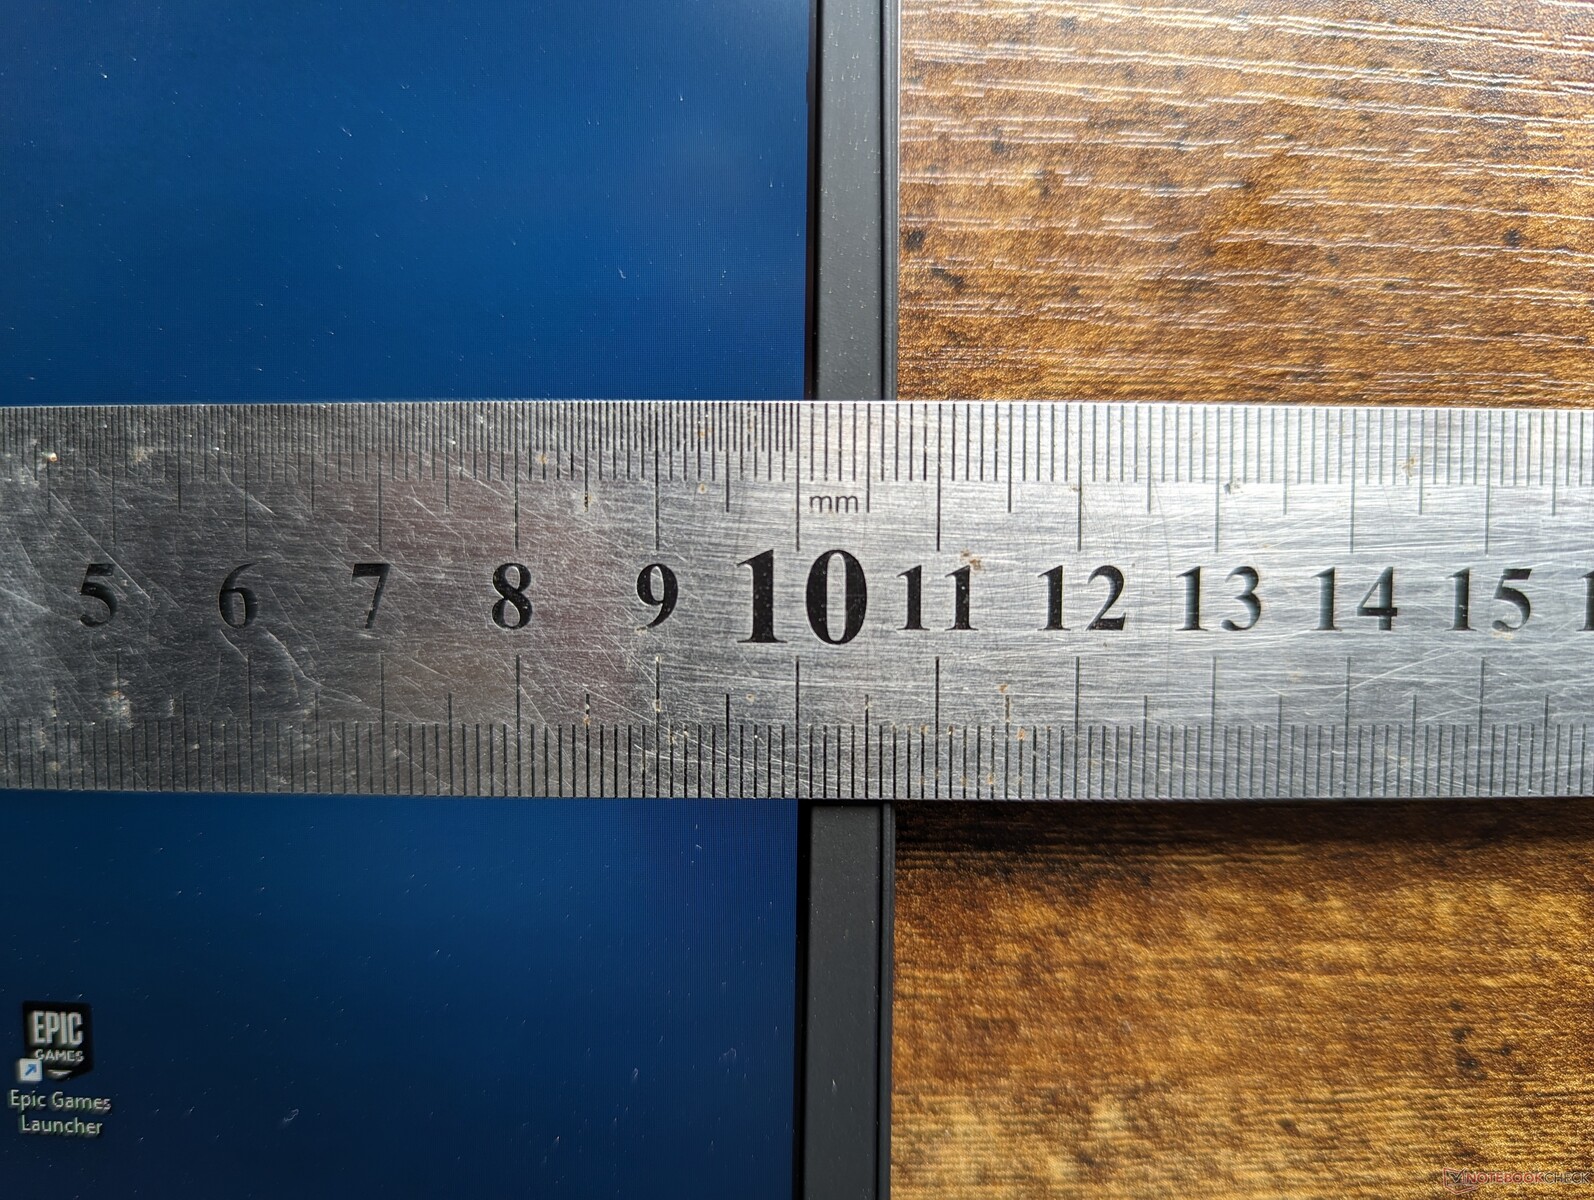
Die signifikanten Änderungen am Gehäuse haben zu erheblichen Einsparungen bei Gewicht und Abmessungen geführt. Das m16 R2 ist etwa 17 Prozent leichter und 22 Prozent kleiner als das m16 R1, was die Tragbarkeit verbessert. Die kleinere Grundfläche ermöglicht es dem System auch, in kleinere Rucksäcke zu passen, da die breiteren Abmessungen des ursprünglichen m16 R1 größere Taschen erfordern würden.
Die Größenreduzierung reicht jedoch nicht ganz aus, um das m16 R2 zum kleinsten System in seiner Kategorie zu machen, da sowohl das Razer Blade 16 als auch das Asus Zephyrus G16 noch leichter und kleiner sind.

Ausstattung — Alle Grundlagen liegen vor
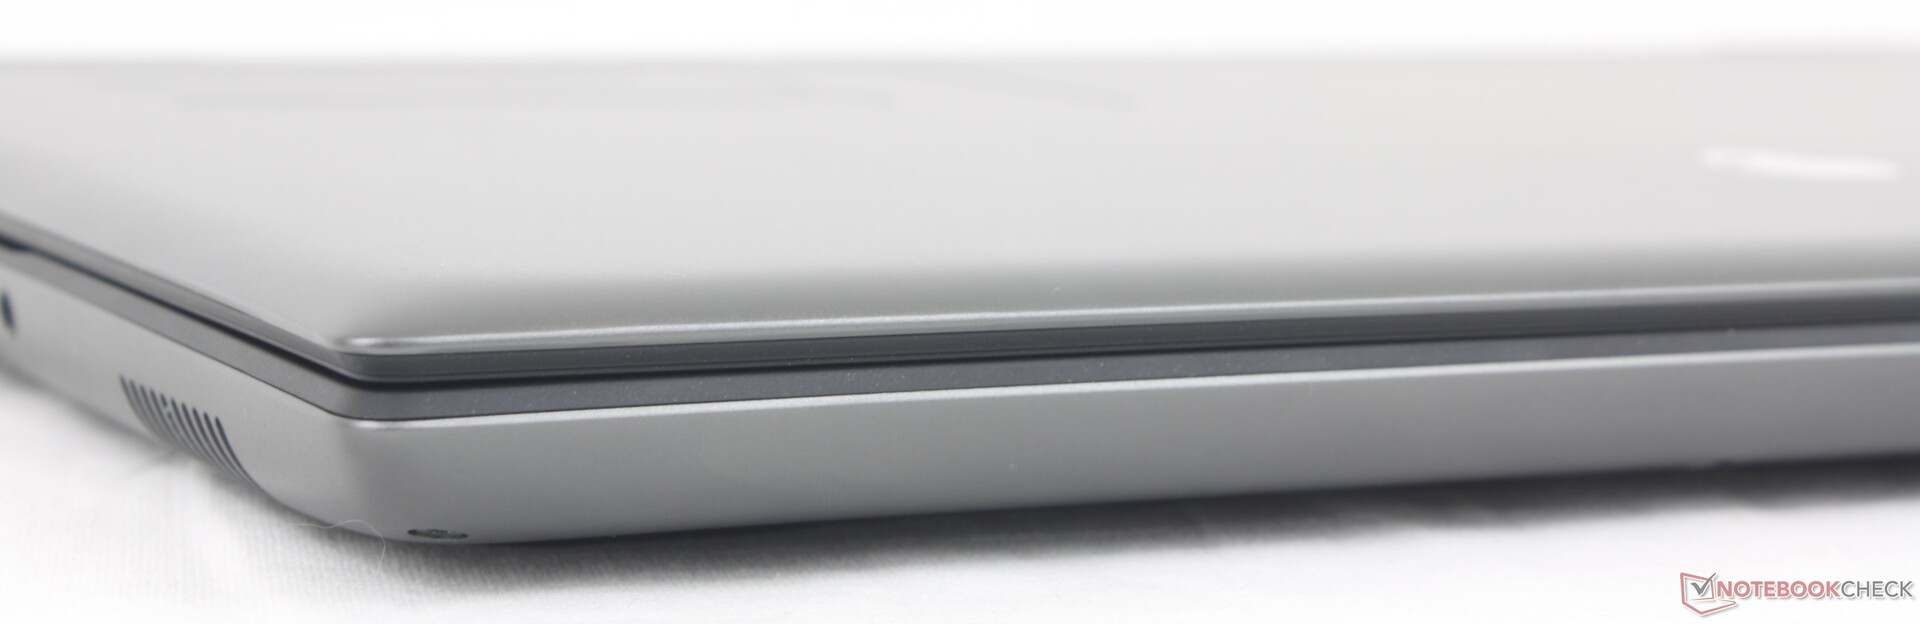
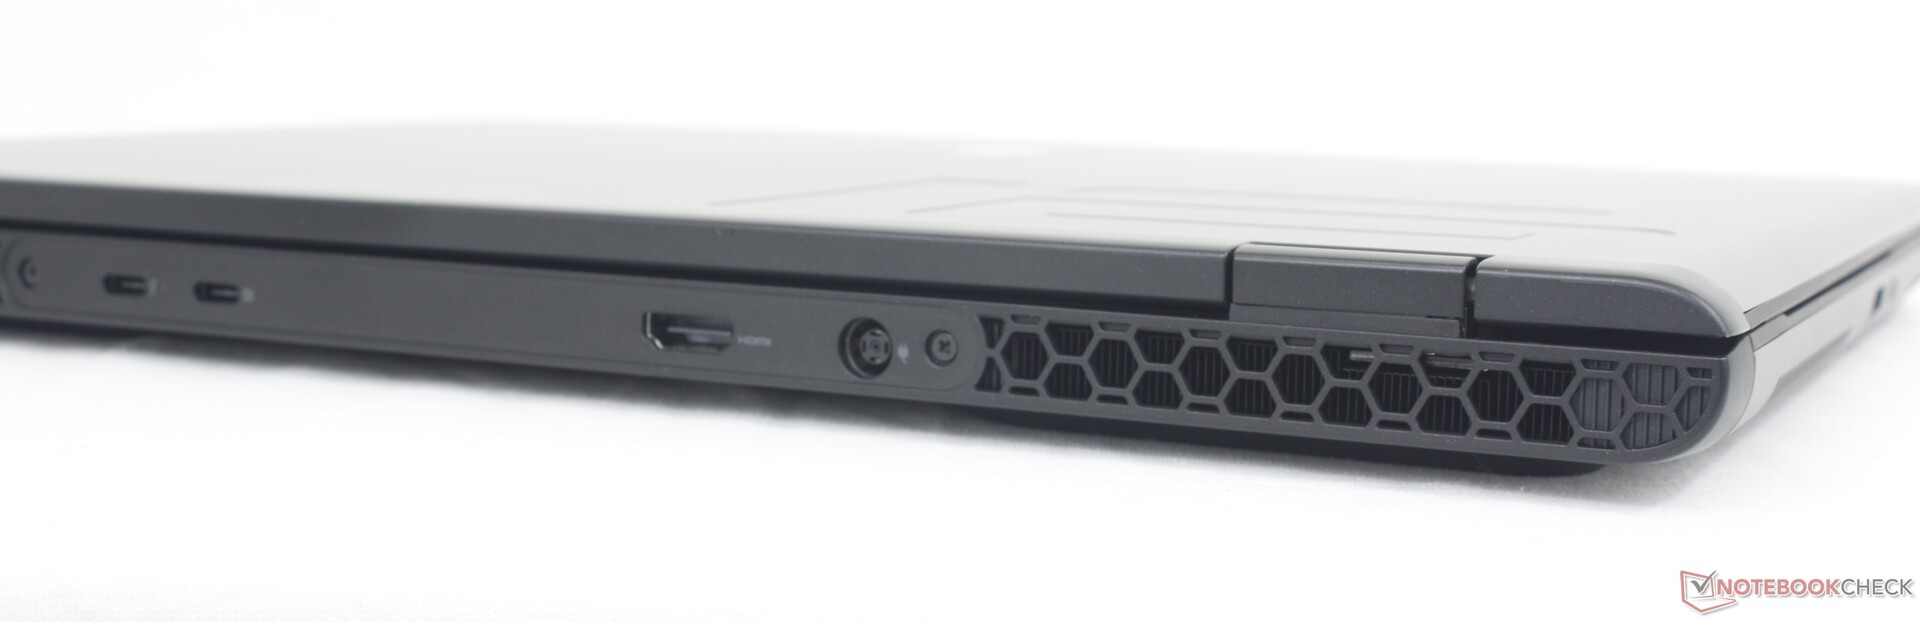
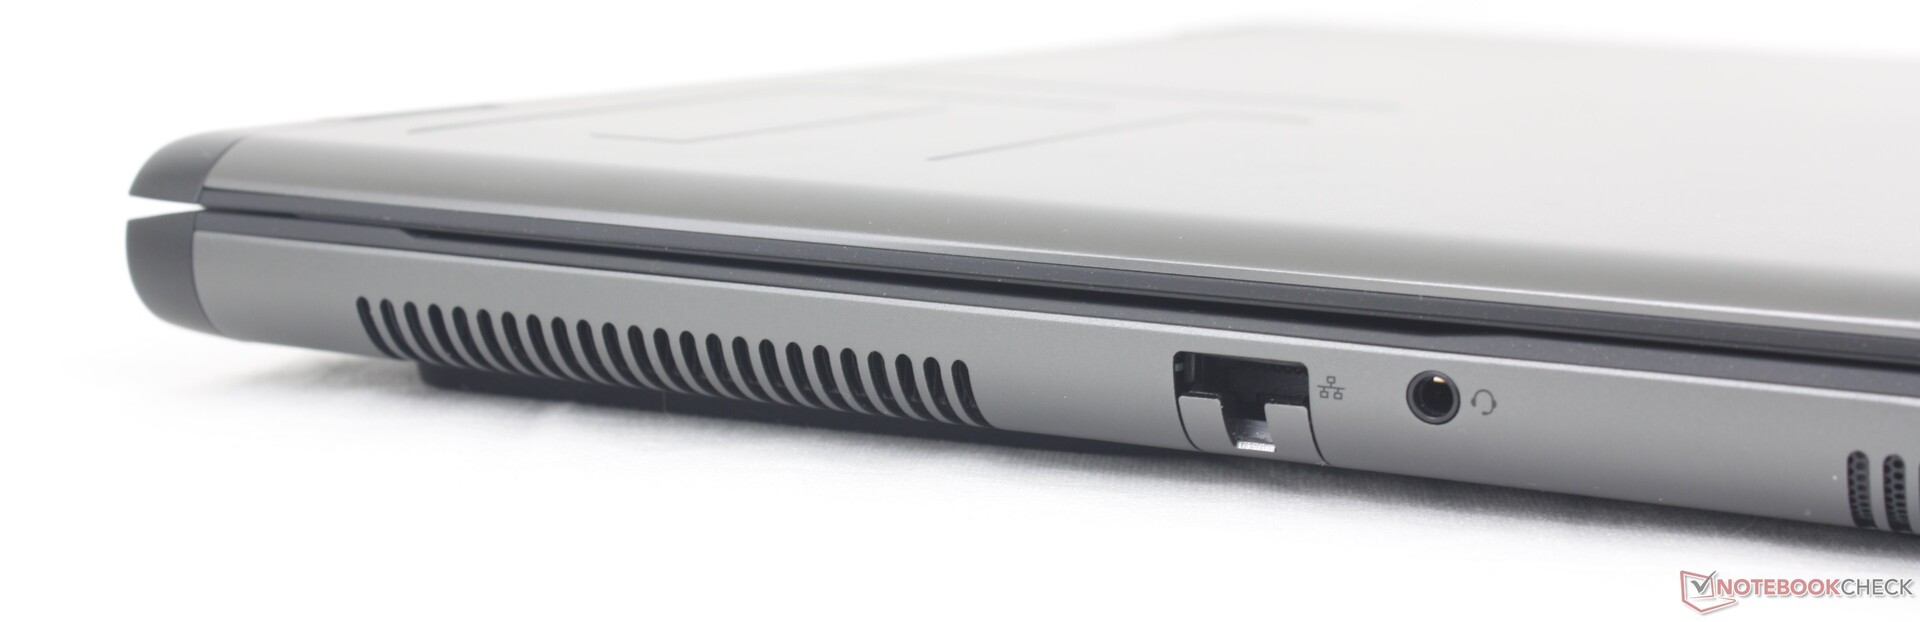
Alle Anschlüsse des m16 R1 aus dem letzten Jahr sind wieder vorhanden, mit Ausnahme des Mini-DisplayPorts. Die Positionierung der Anschlüsse hat sich geändert: RJ-45 und die Audiobuchse wurden an die linke Kante verlegt, während die meisten Anschlüsse des m16 R1 ungünstigerweise an der Rückseite lagen.
Es ist wichtig zu beachten, dass nur einer der beiden USB-C-Anschlüsse Power Delivery unterstützt. Andernfalls sind beide jedoch mit externen Monitoren kompatibel.
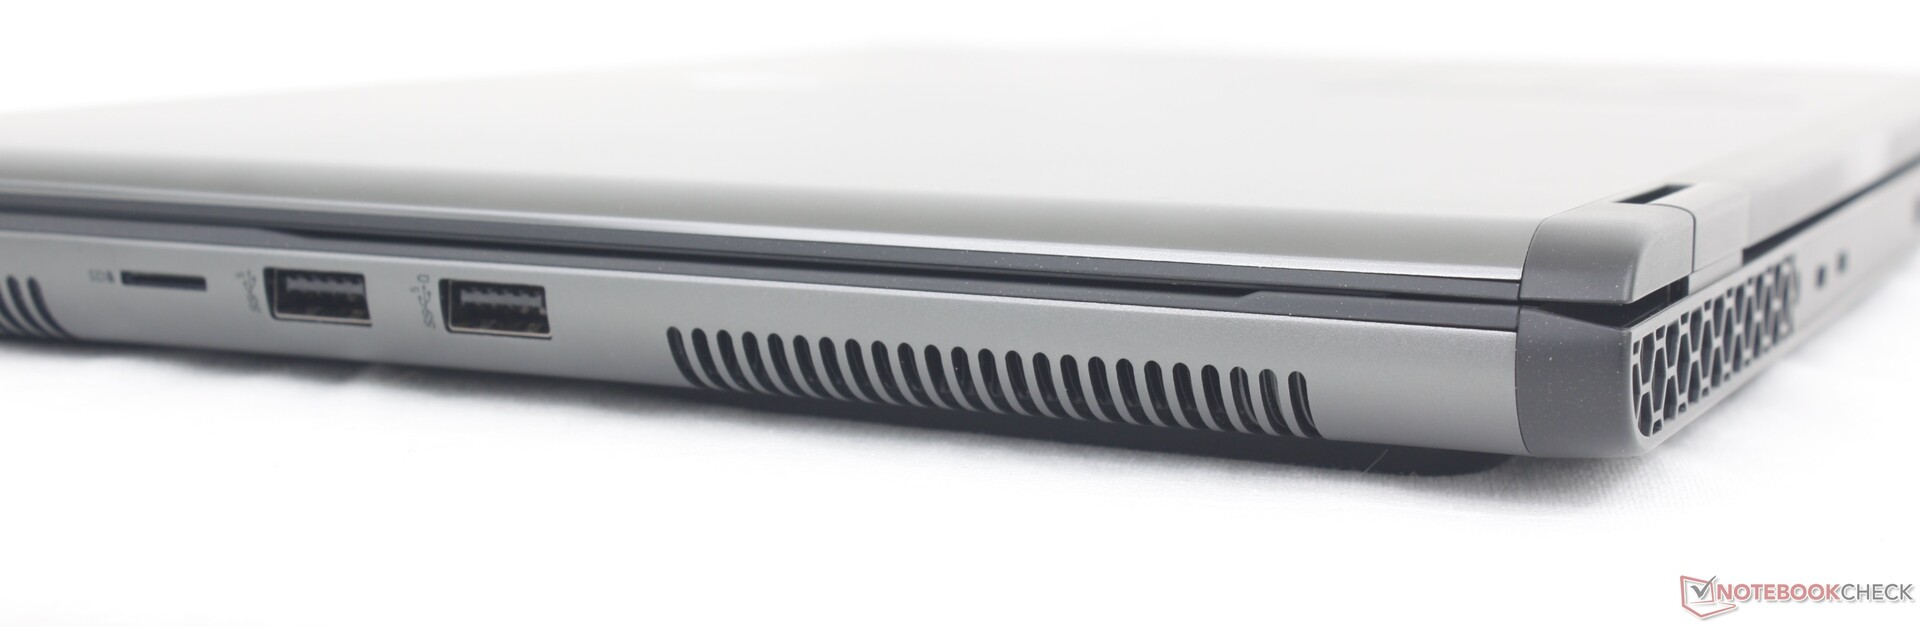
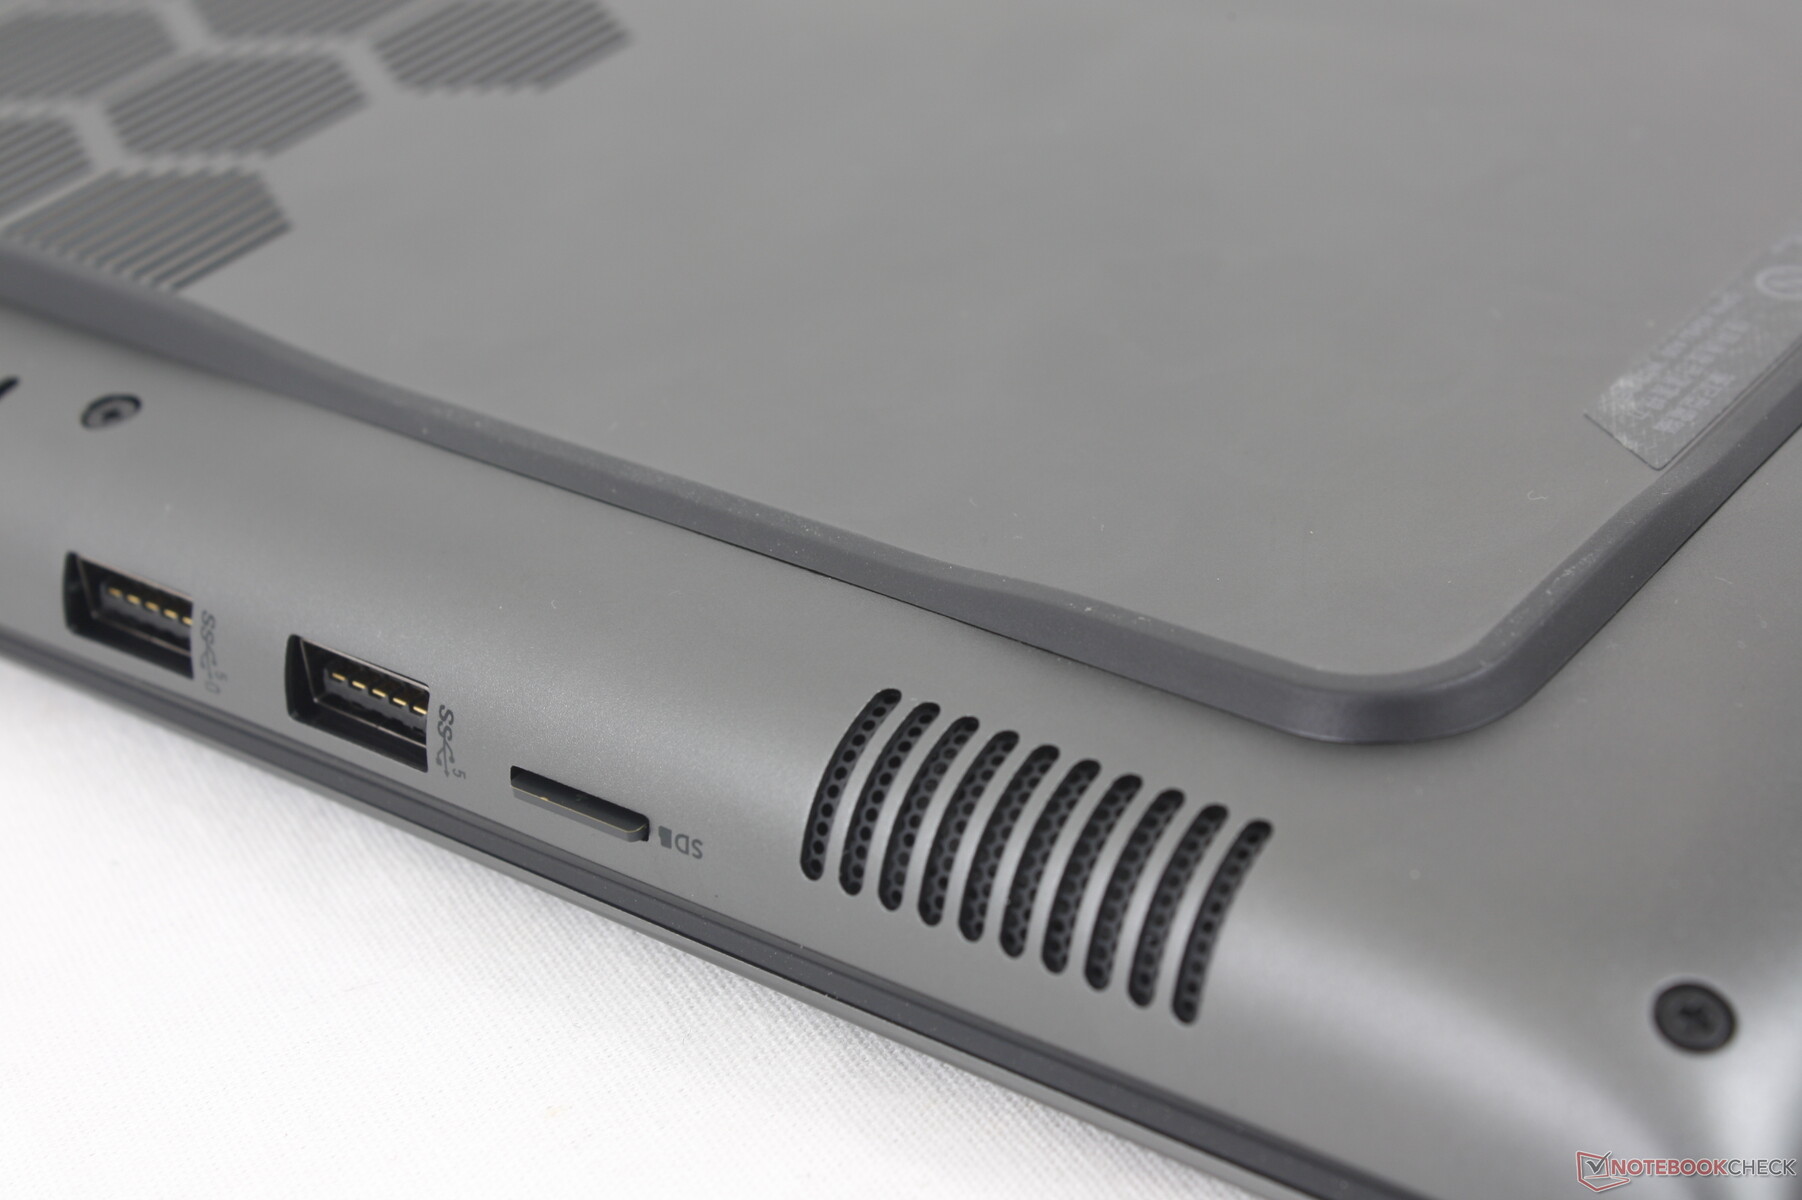
SD Card Reader
Während das m16 R1 über einen SD-Leser in voller Größe verfügte, hat sich das m16 R2 leider auf einen MicroSD-Leser zurückgezogen, was einige Content-Ersteller verärgern könnte. Die Übertragungsraten sind trotz des Wechsels auf MicroSD ungefähr gleich geblieben wie beim m16 R1.
| SD Card Reader | |
| average JPG Copy Test (av. of 3 runs) | |
| Alienware m16 R1 Intel (AV PRO microSD 128 GB V60) | |
| Lenovo Legion Slim 7 16APH8 (AV PRO microSD 128 GB V60) | |
| Asus ROG Zephyrus G16 2024 GU605M | |
| Alienware m16 R2 (AV PRO microSD 128 GB V60) | |
| Alienware x16 R1 (AV PRO microSD 128 GB V60) | |
| maximum AS SSD Seq Read Test (1GB) | |
| Alienware x16 R1 (AV PRO microSD 128 GB V60) | |
| Alienware m16 R2 (AV PRO microSD 128 GB V60) | |
| Alienware m16 R1 Intel (AV PRO microSD 128 GB V60) | |
| Asus ROG Zephyrus G16 2024 GU605M | |
| Lenovo Legion Slim 7 16APH8 (AV PRO microSD 128 GB V60) | |
Kommunikation
Der Intel Killer AX1675 wird standardmäßig mit Wi-Fi 6E-Konnektivität ausgeliefert, wobei ein Upgrade auf den BE202 für Wi-Fi 7-Kompatibilität möglich ist. Bei der Paarung mit unserem Testrouter Asus AXE11000 gab es keine Probleme.
| Networking | |
| iperf3 transmit AXE11000 | |
| Asus ROG Zephyrus G16 2024 GU605M | |
| HP Omen Transcend 16-u1095ng | |
| Alienware m16 R1 Intel | |
| Alienware m16 R2 | |
| Alienware x16 R1 | |
| Lenovo Legion Slim 7 16APH8 | |
| iperf3 receive AXE11000 | |
| Lenovo Legion Slim 7 16APH8 | |
| HP Omen Transcend 16-u1095ng | |
| Alienware m16 R1 Intel | |
| Asus ROG Zephyrus G16 2024 GU605M | |
| Alienware x16 R1 | |
| Alienware m16 R2 | |
| iperf3 transmit AXE11000 6GHz | |
| Alienware m16 R2 | |
| Alienware x16 R1 | |
| iperf3 receive AXE11000 6GHz | |
| Alienware m16 R2 | |
| Alienware x16 R1 | |
Webcam
Eine 2-MP-Webcam mit IR-Unterstützung für Windows Hello ist Teil der Standardausstattung. Es gibt jedoch keine integrierte Privacy Shutter.


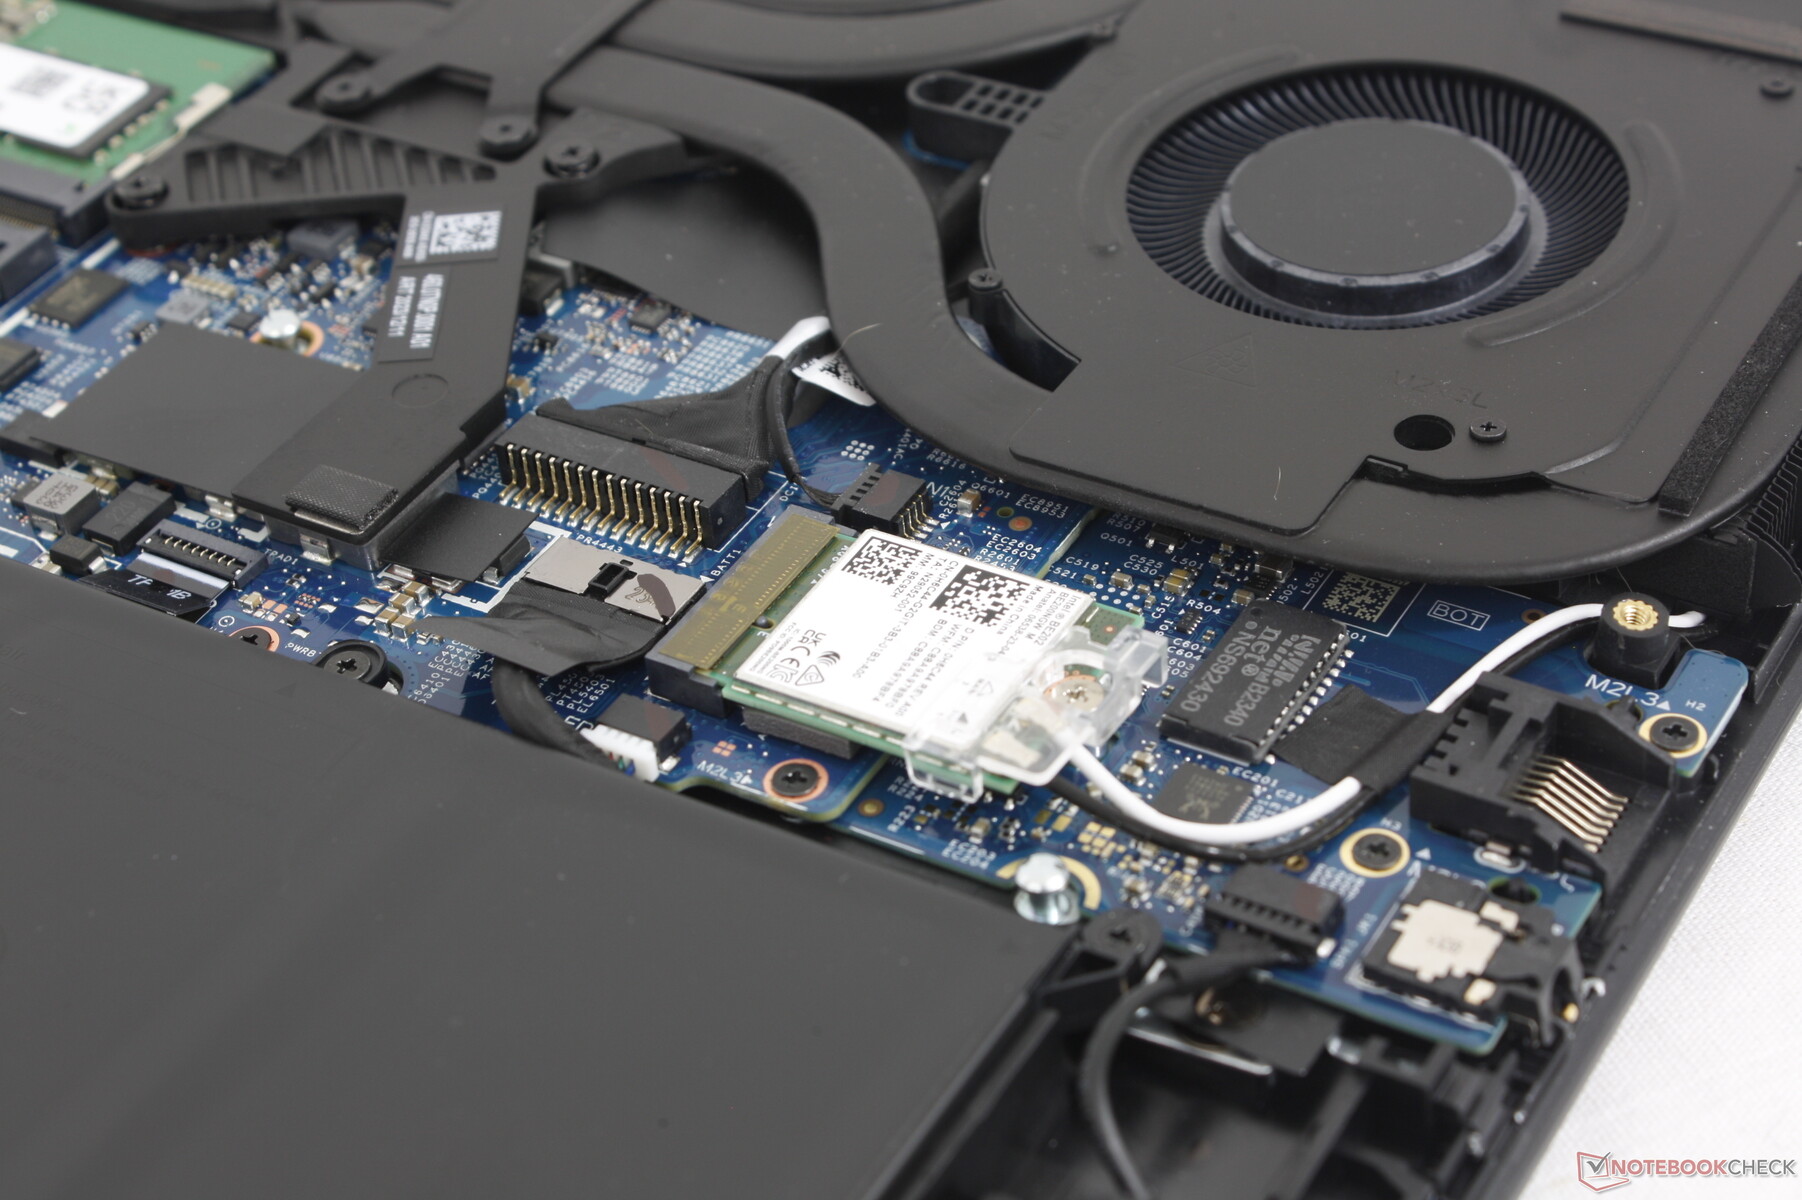
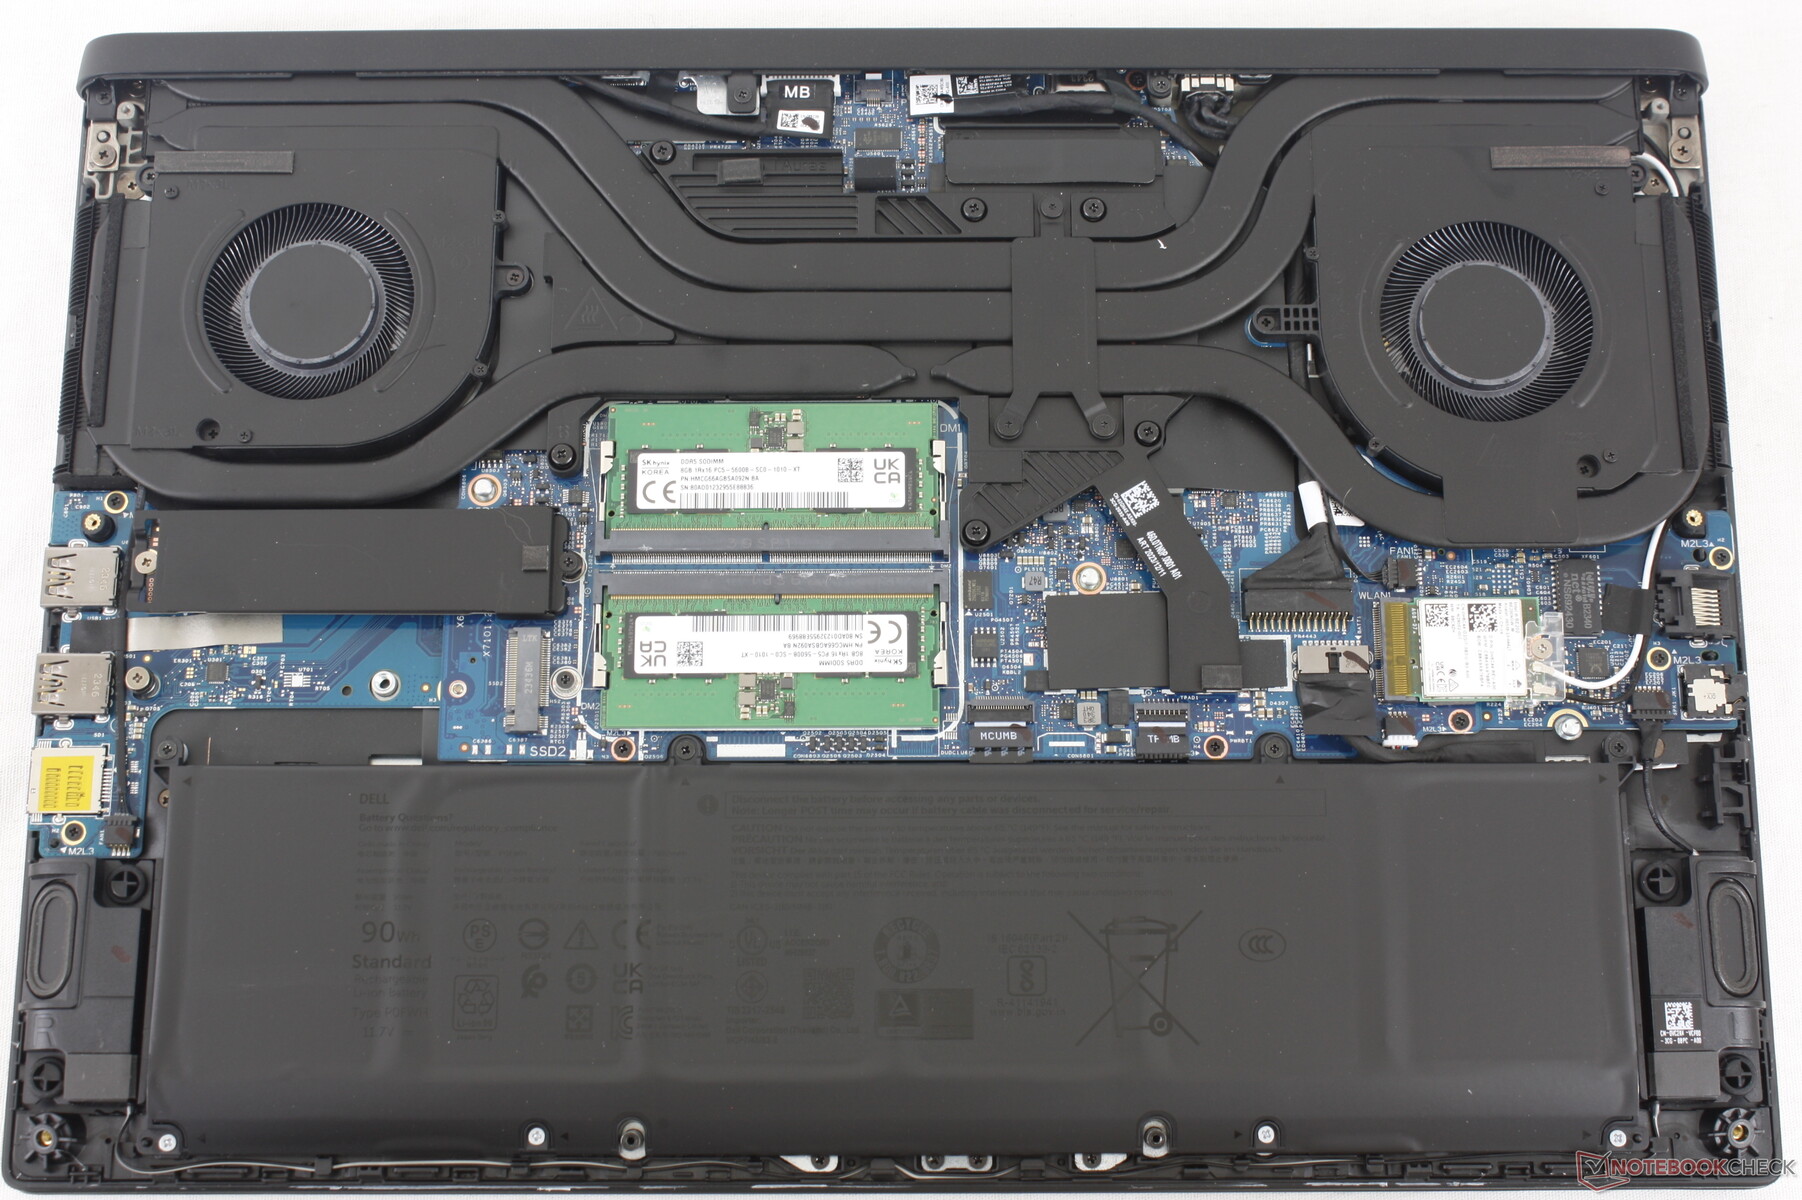
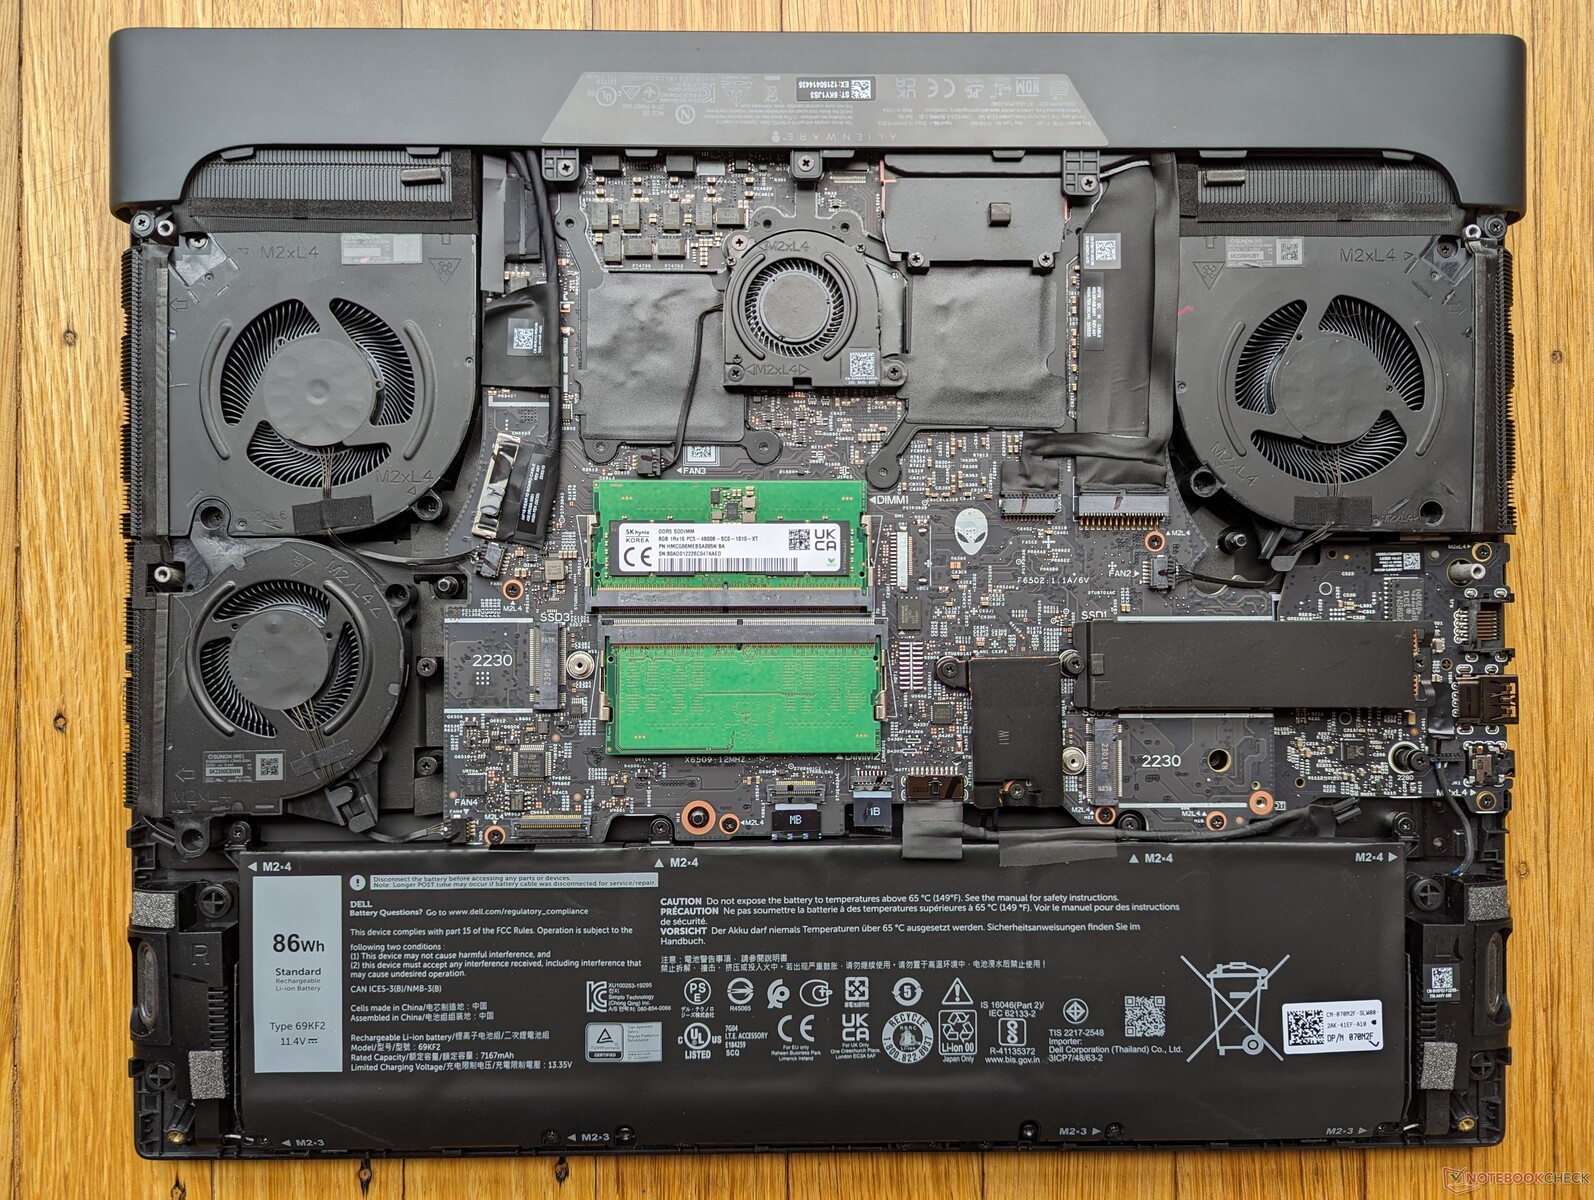
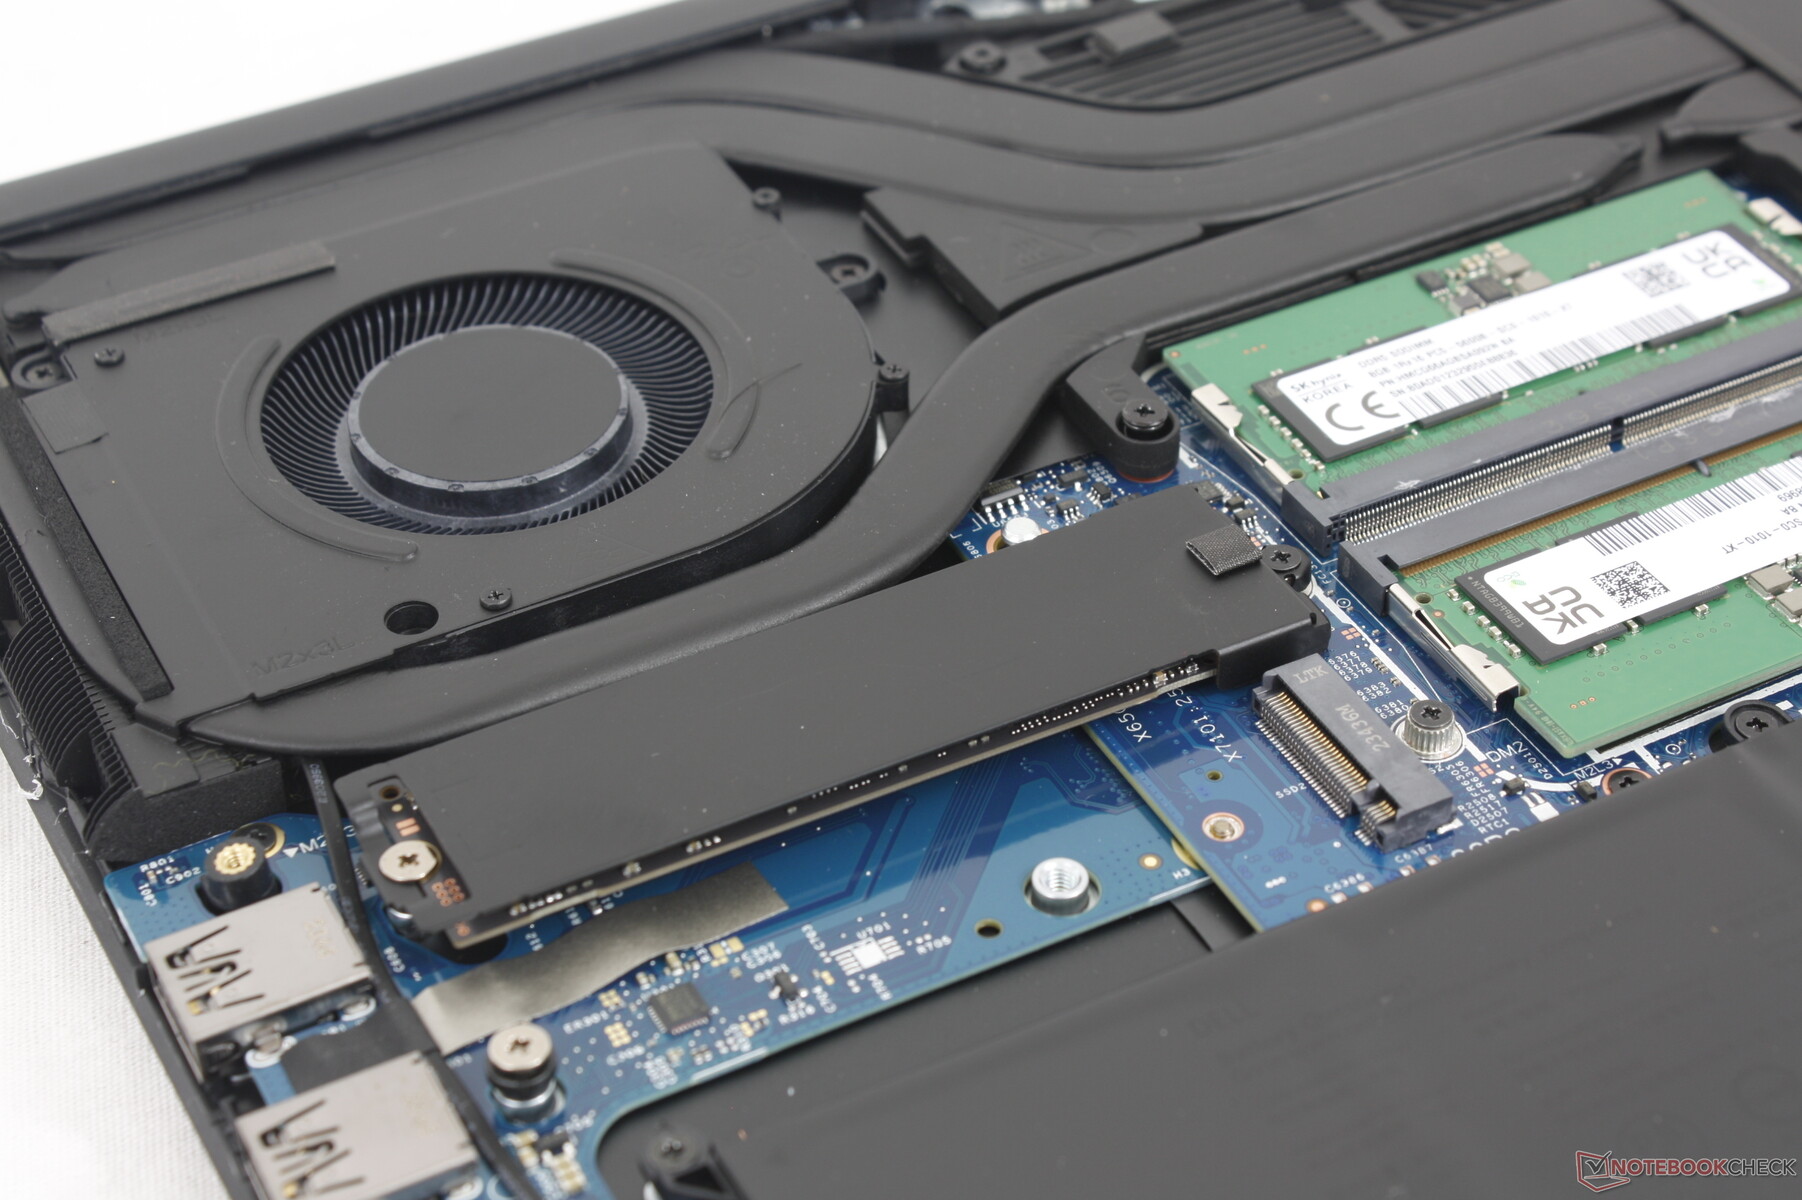
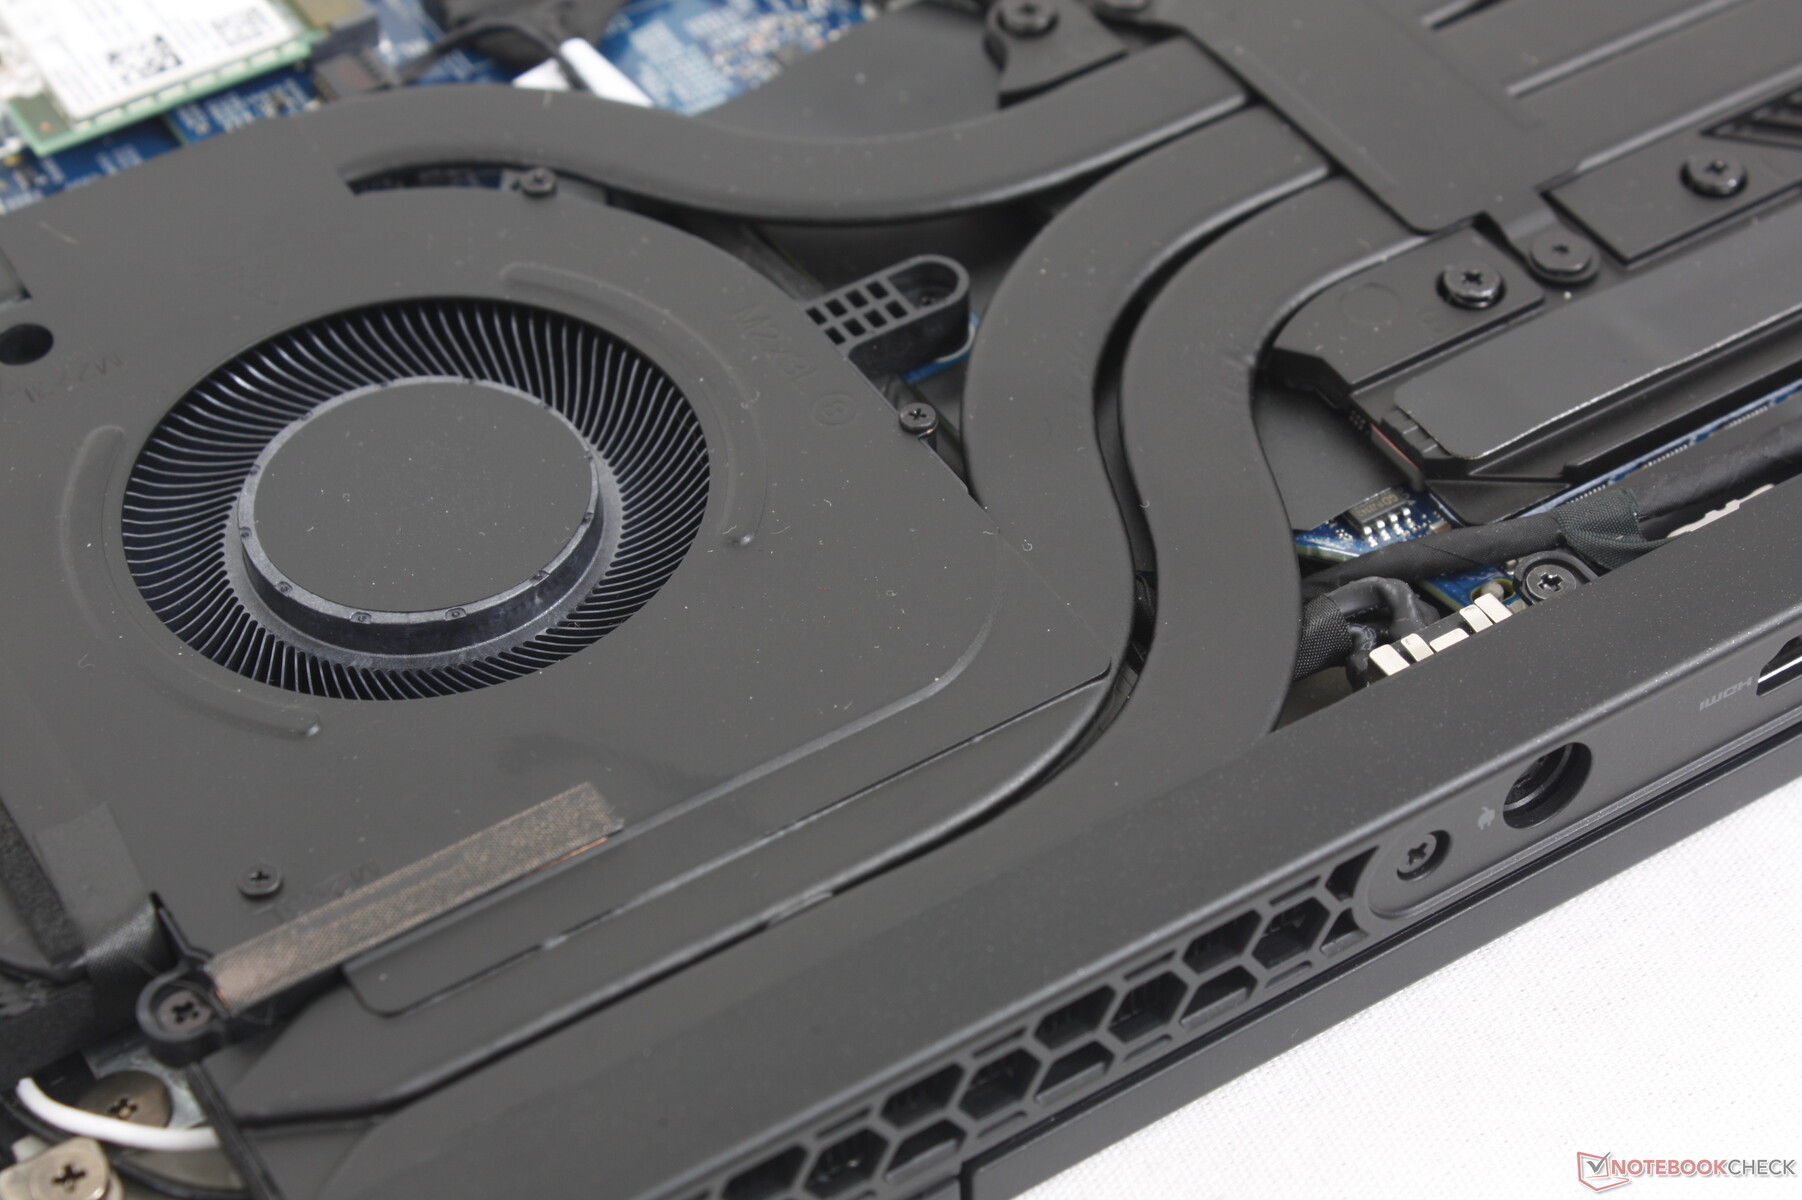
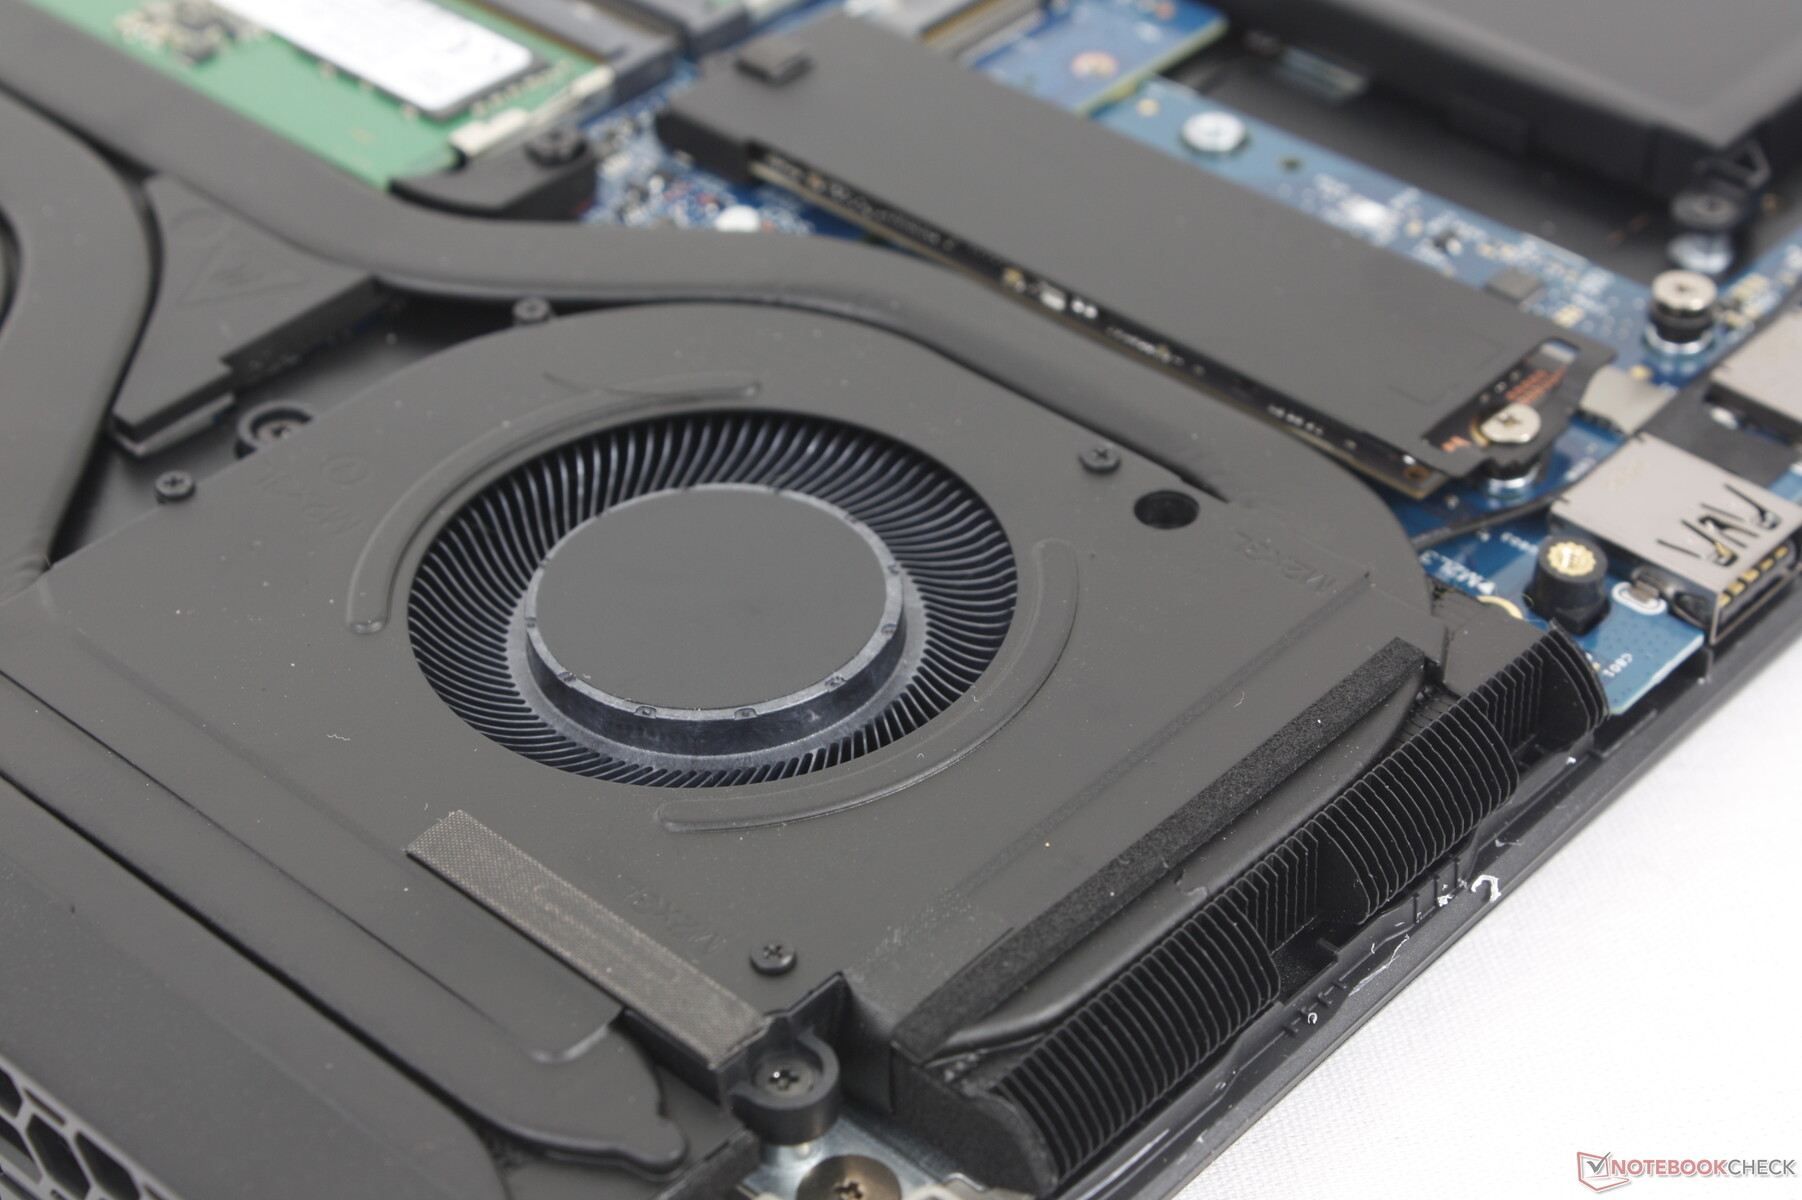
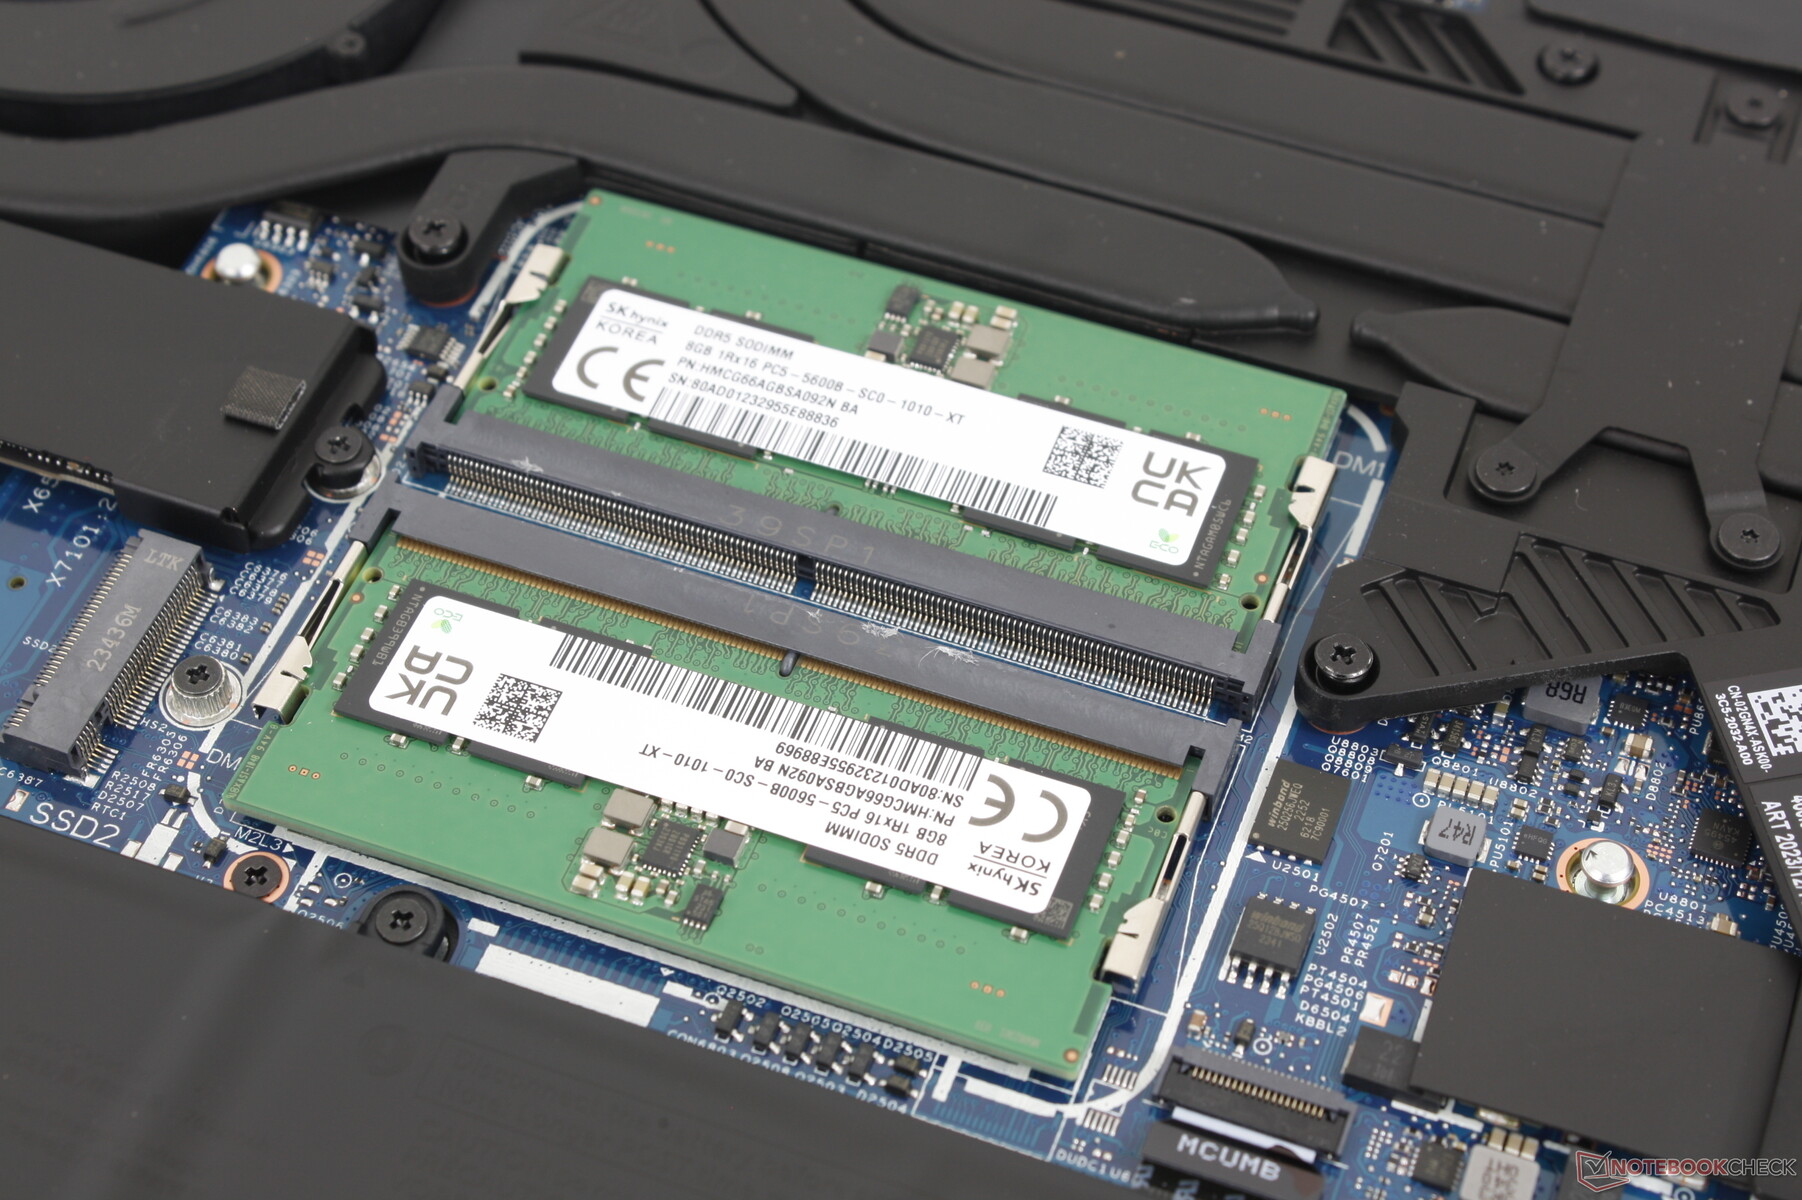
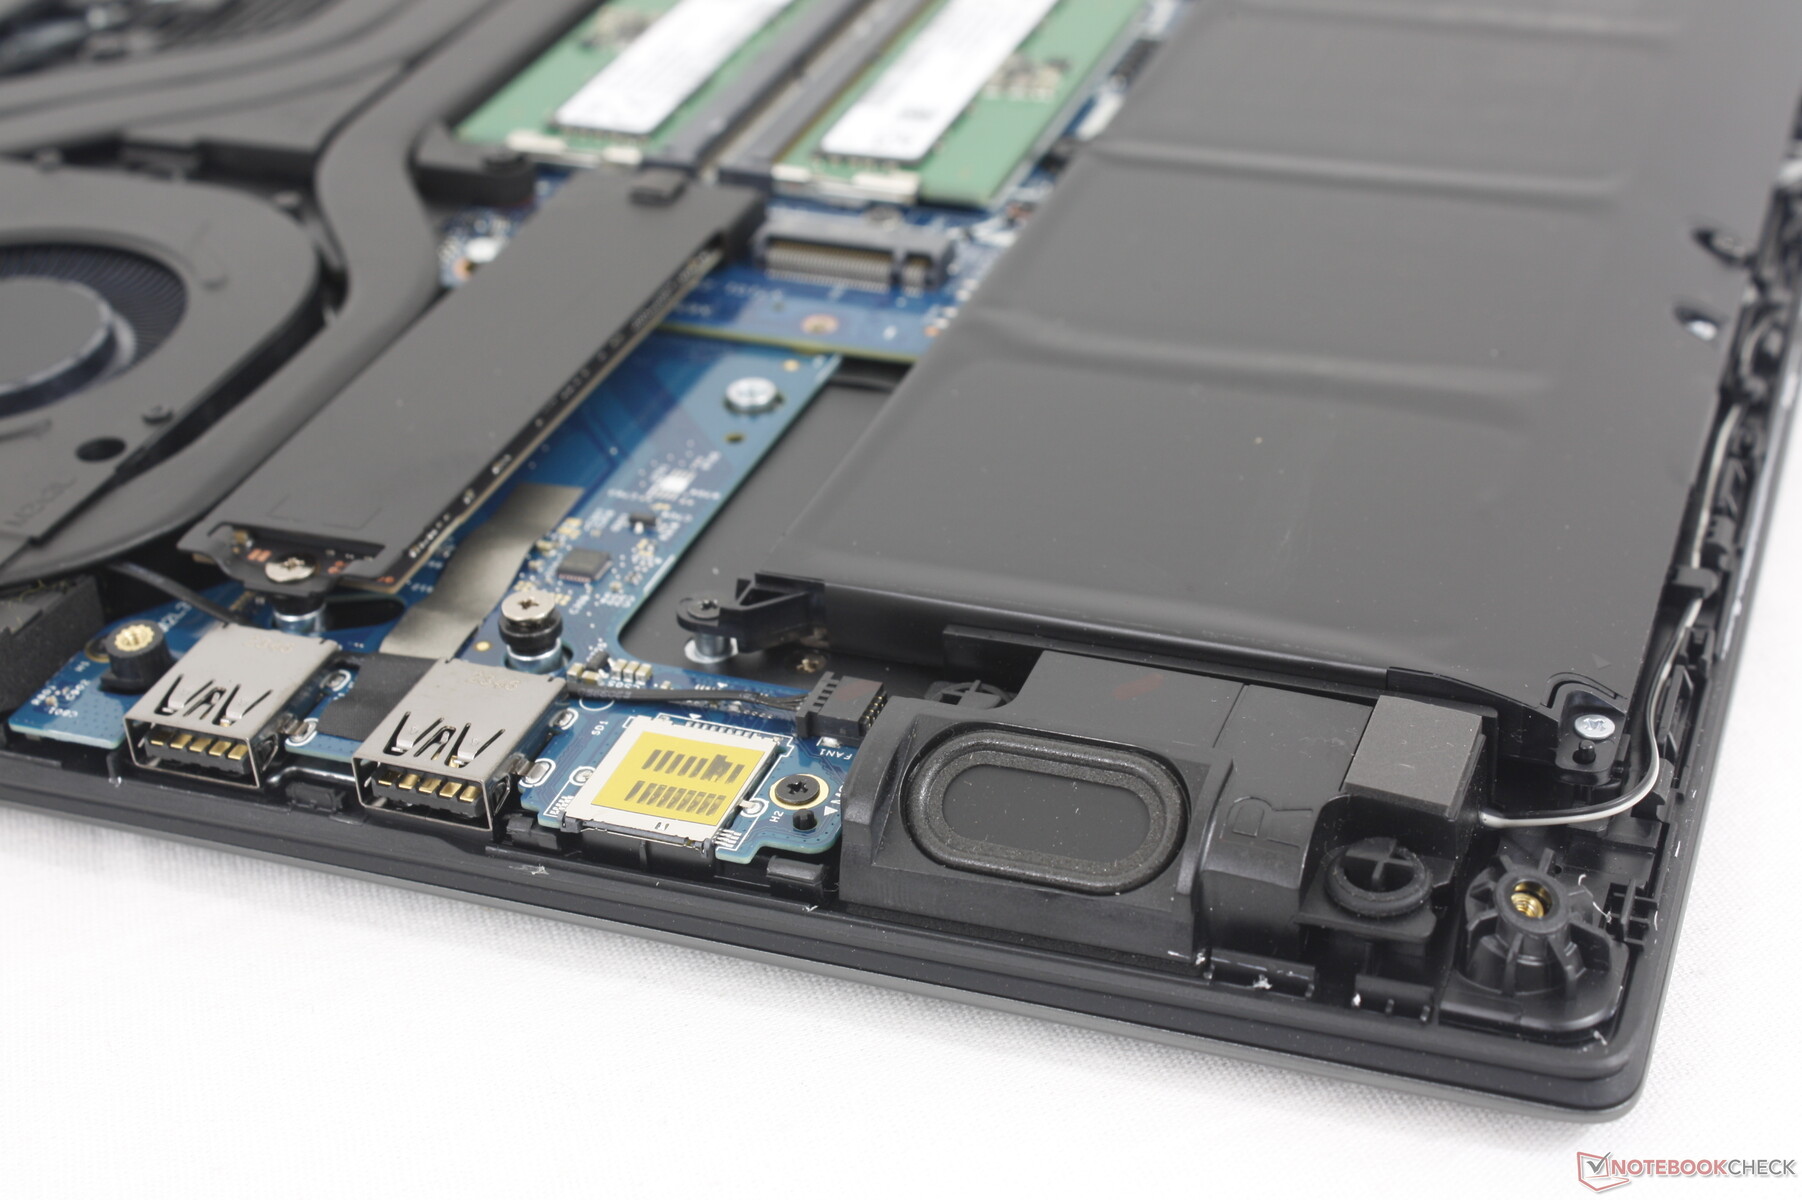
Wartung
Die Unterseite ist mit 8 Phillips-Schrauben gesichert, um die Wartung zu erleichtern. RAM und WLAN sind weiterhin abnehmbar, jedoch hat sich die Speicherkonfiguration geändert. Das System unterstützt nun zwei M.2 2280 SSDs anstelle von einer M.2 2280 und zwei M.2 2230 SSDs im letztjährigen Design.
Zubehör und Garantie
Die Verkaufsverpackung enthält neben dem üblichen Netzteil und Papierkram auch einige Alienware-Logoaufkleber. Standardmäßig ist eine Herstellergarantie von drei Jahren beim Kauf des Geräts in Deutschland enthalten.
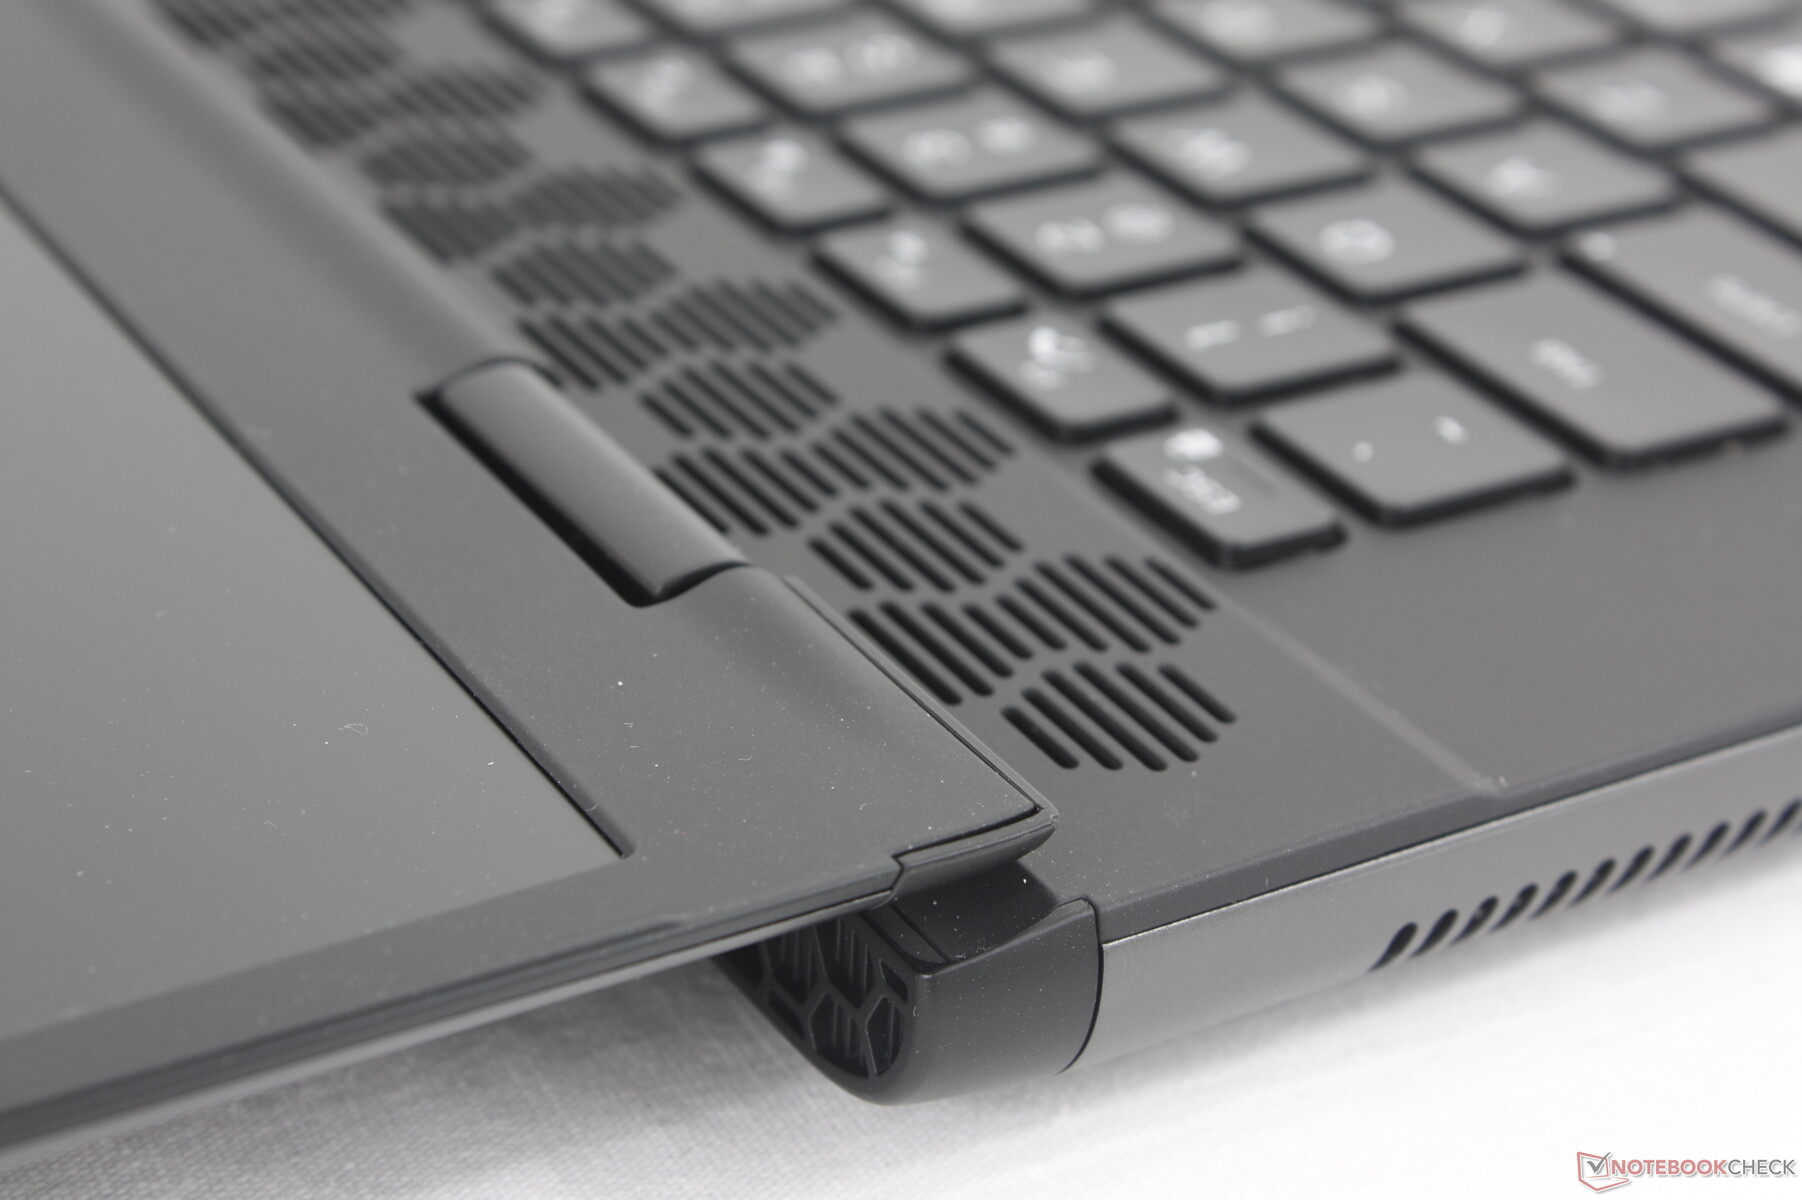
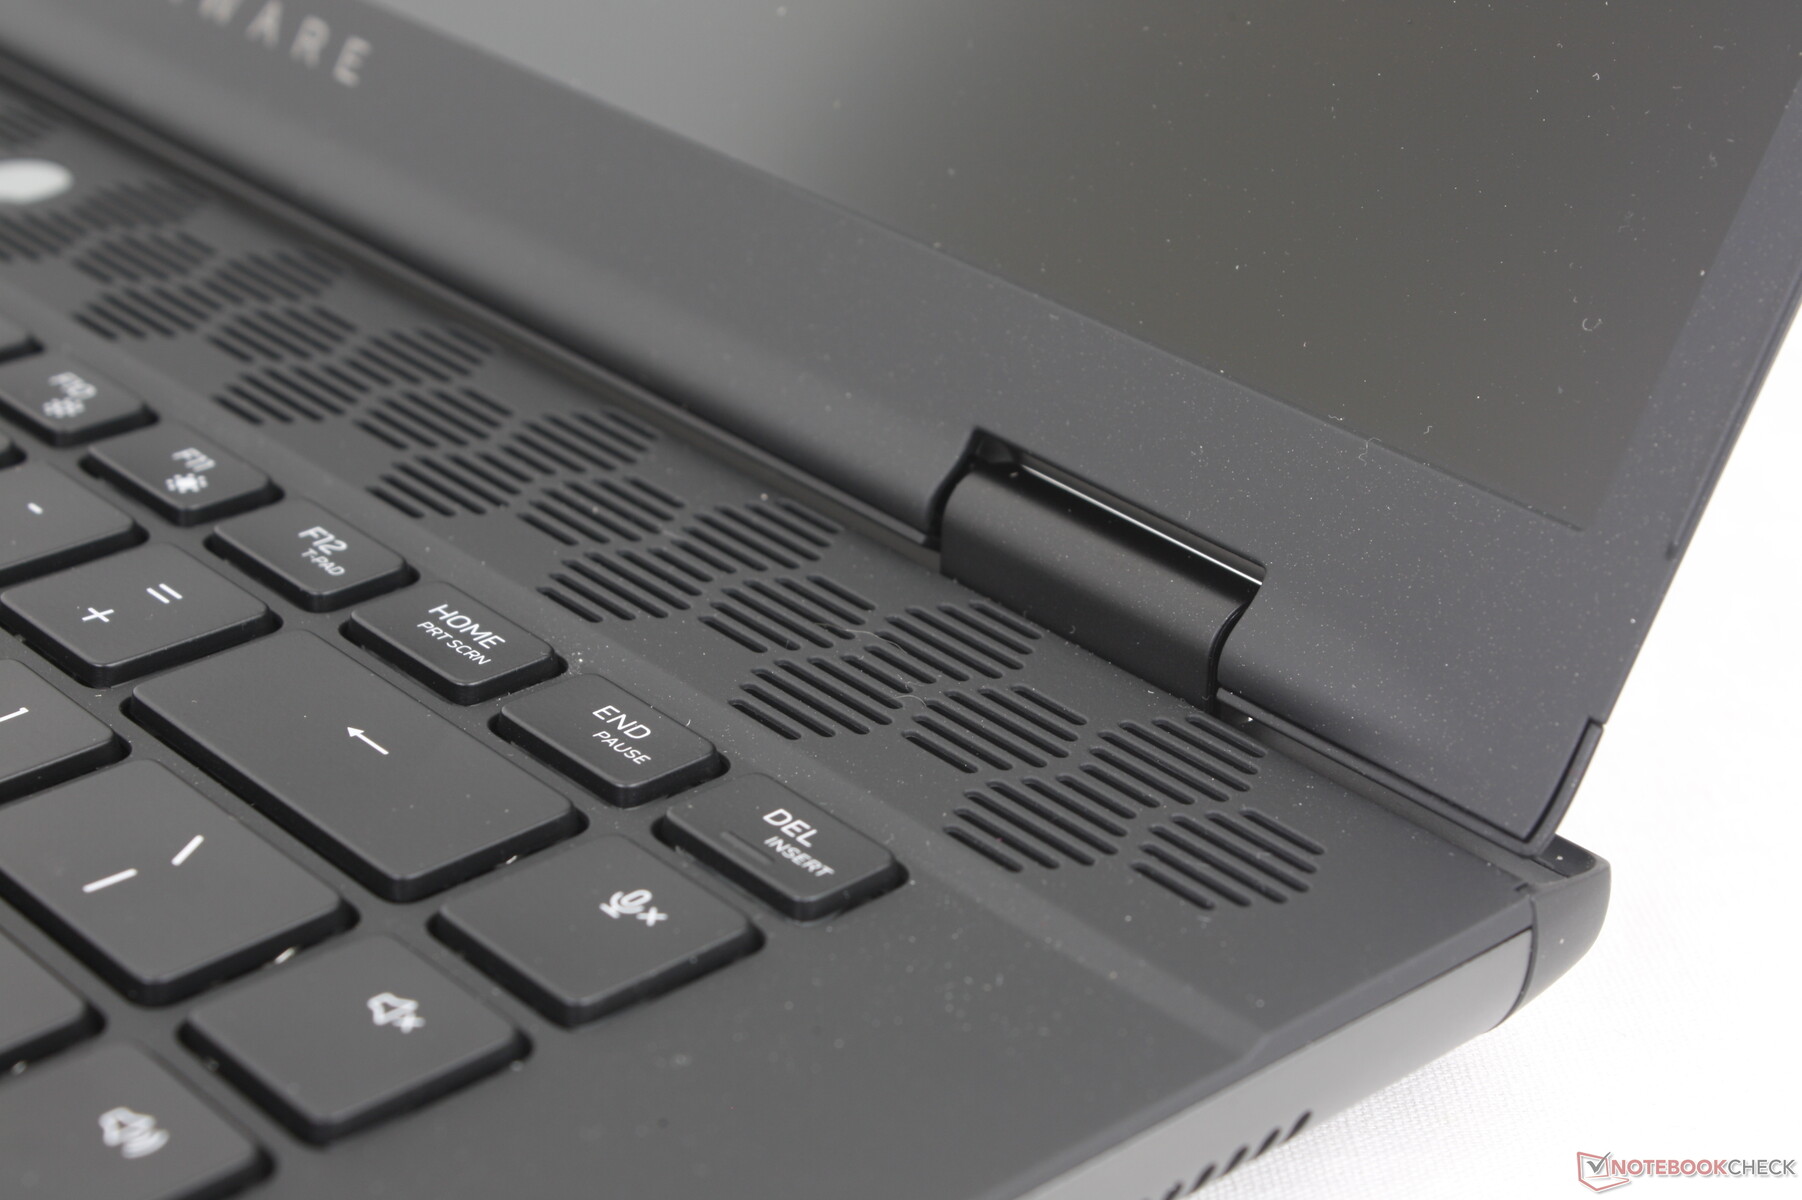
Eingabegeräte - Kein Bedarf an Mechanik
Tastatur
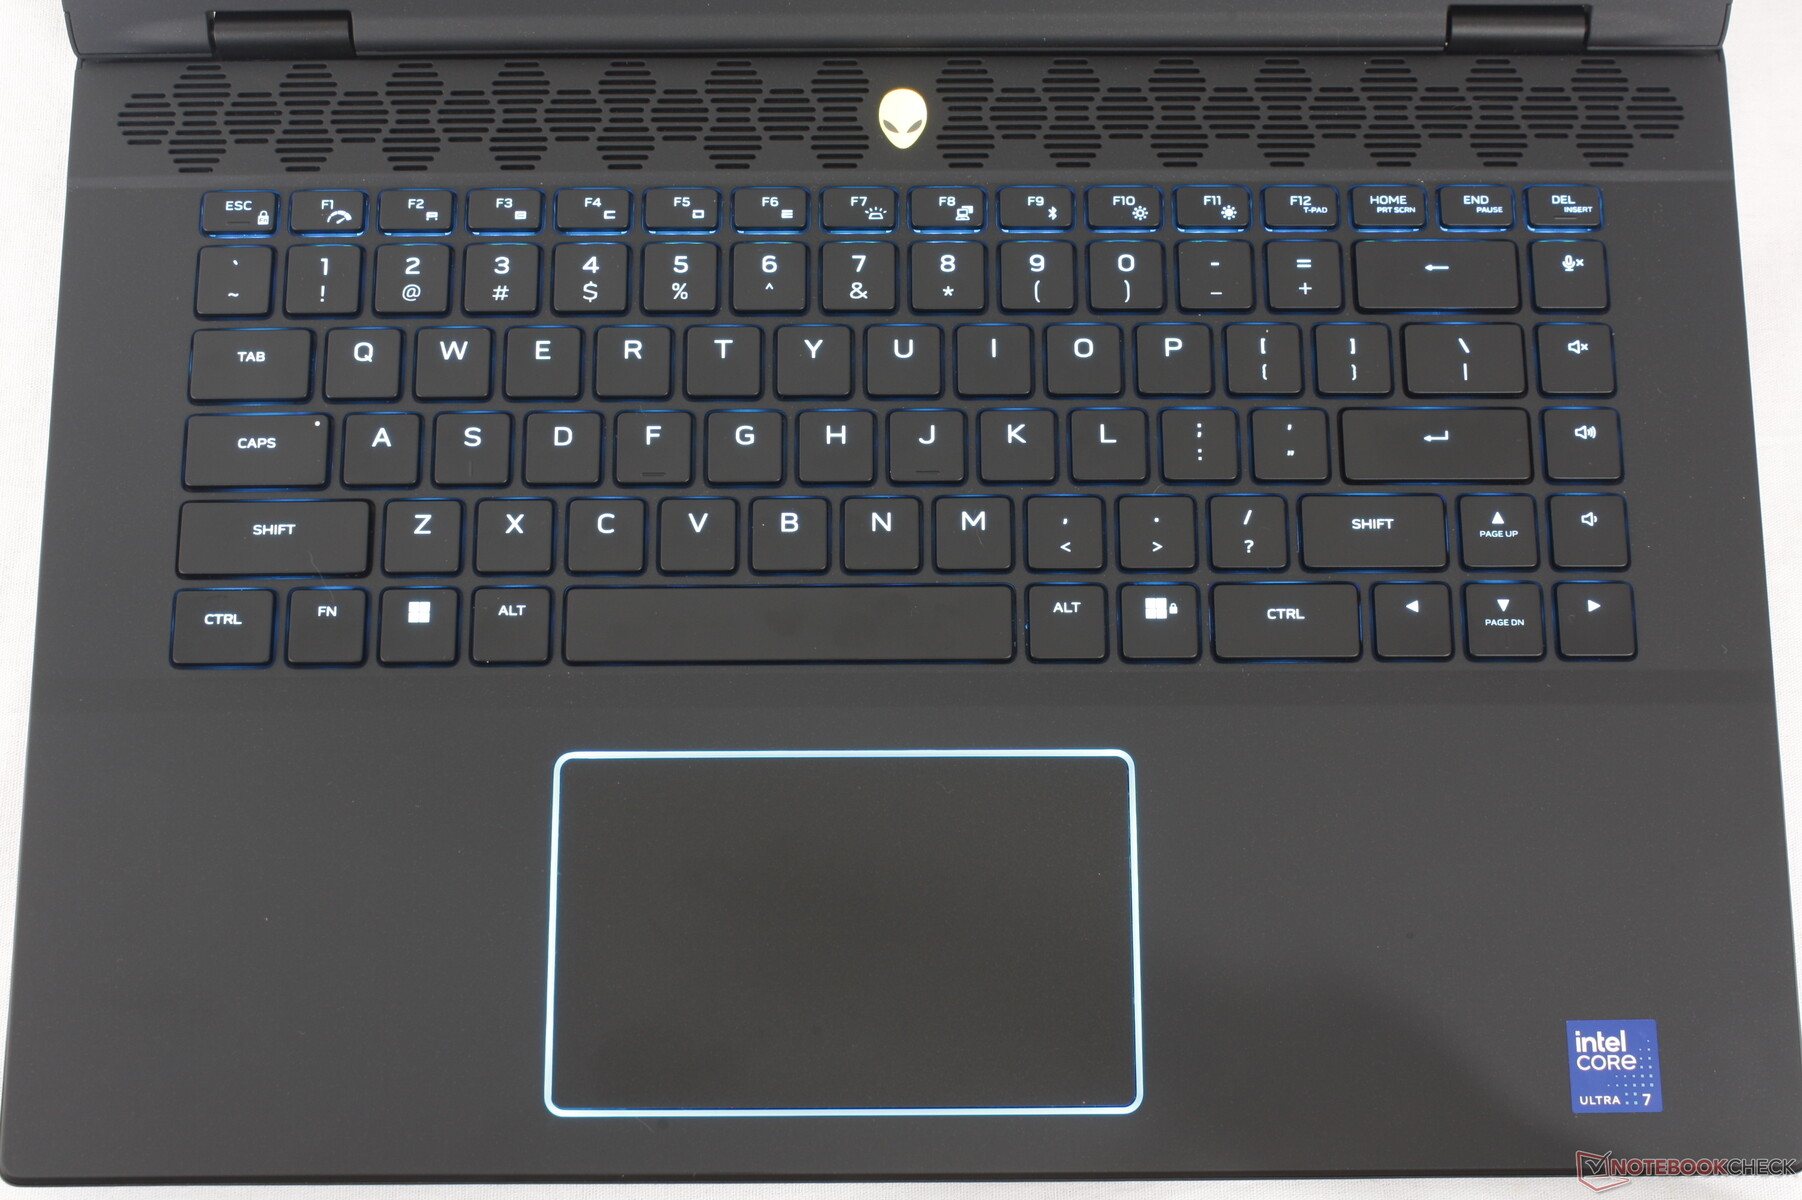
Das System verwendet Membrantasten mit 1,8 mm Hub und keine mechanische Option mehr, um das Gewicht niedrig zu halten und ein breiteres Publikum als Gamer anzusprechen. Im Vergleich zu den Tastaturen der meisten anderen Gaming-Notebooks, wie dem MSI Raider GE68 oder dem HP Omen Transcend 16, sind sie dennoch komfortabel und klackernder als erwartet. Insbesondere die Leertaste und die Eingabetaste sind beim Drücken viel lauter und schärfer als die QWERTZ-Haupttasten.
Neu an der Tastatur ist in diesem Jahr eine praktische "Stealth Mode"-Funktion, die mit der F2-Taste verbunden ist und das System in den Ruhemodus versetzt, ohne dass das Alienware Command Center gestartet werden muss. Ansonsten bleibt das Tastaturlayout das gleiche wie beim ursprünglichen m16 R1.
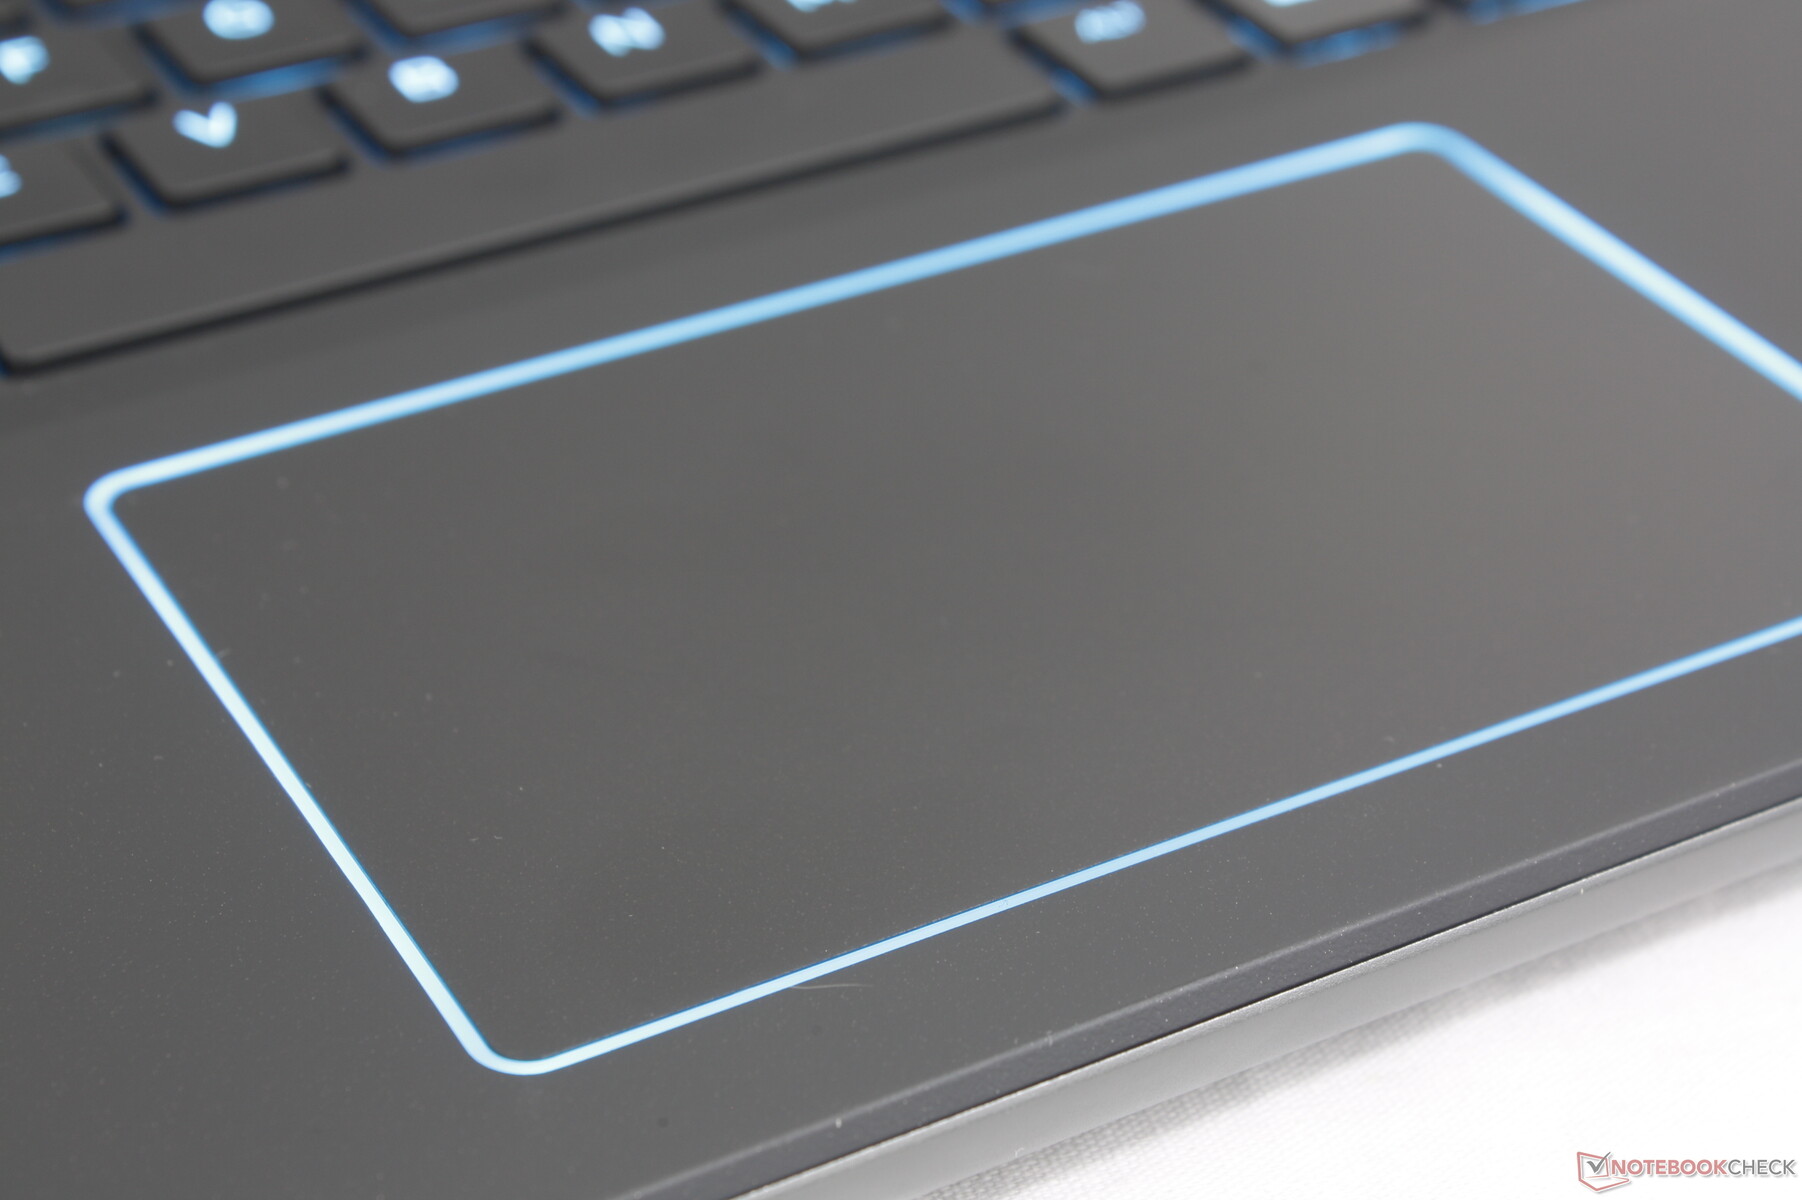
Touchpad
Das Clickpad ist etwas größer als beim letztjährigen Modell (11,5 x 7 cm gegenüber 11,3 x 6,6 cm) und verfügt über eine neue RGB-Beleuchtung am Rand. Das Feedback beim Klicken ist jedoch nach wie vor schwammig und sehr flach, was ein unbefriedigendes Gefühl vermittelt. Die Maus funktioniert zuverlässig genug für einfache Zeiger und Klicks, aber für komplexere Aktionen wie Ziehen und Ablegen wird immer noch eine Maus empfohlen.
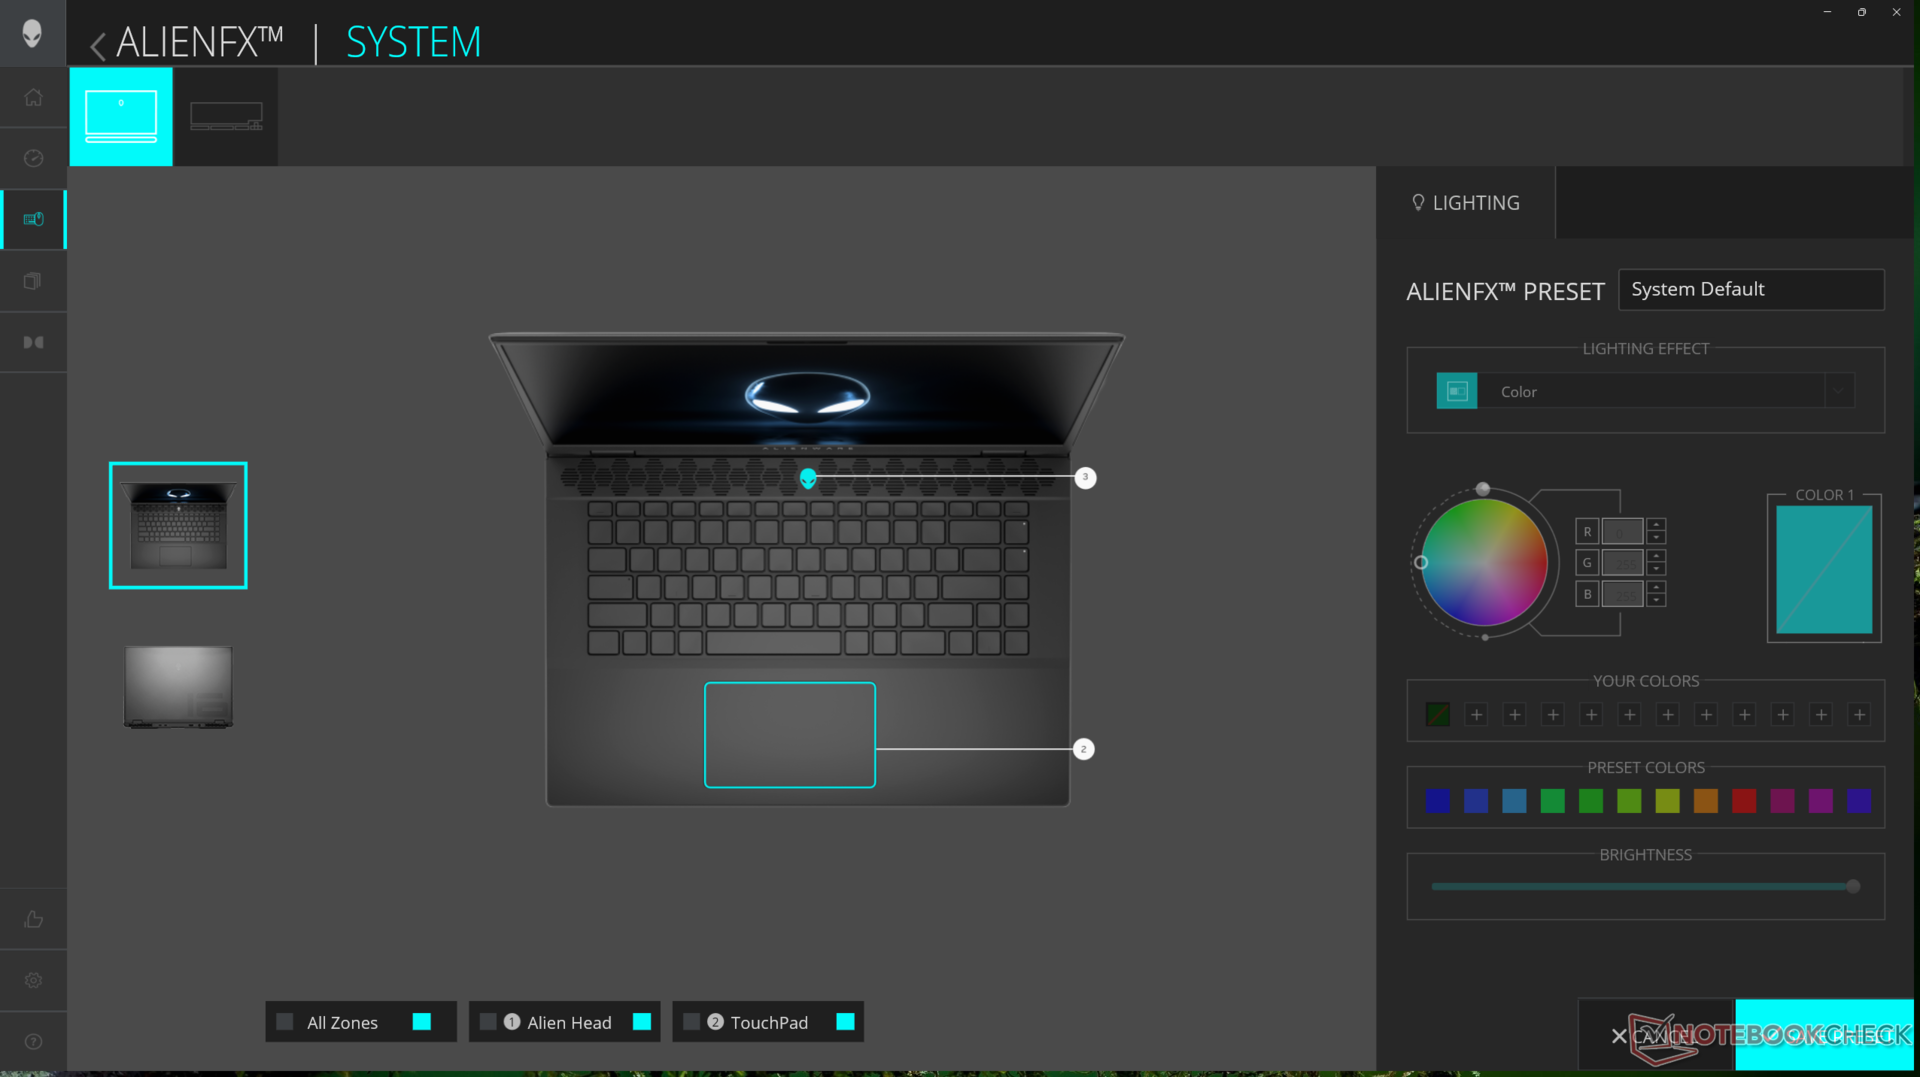
Ärgerlicherweise kann die RGB-Beleuchtung nur über das Alienware Command Center aktiviert oder deaktiviert werden, da es keinen Hotkey gibt, um sie zu aktivieren. Das Anpassen der Helligkeit der RGB-Tasten hat keinen Einfluss auf die Beleuchtung des Clickpads.


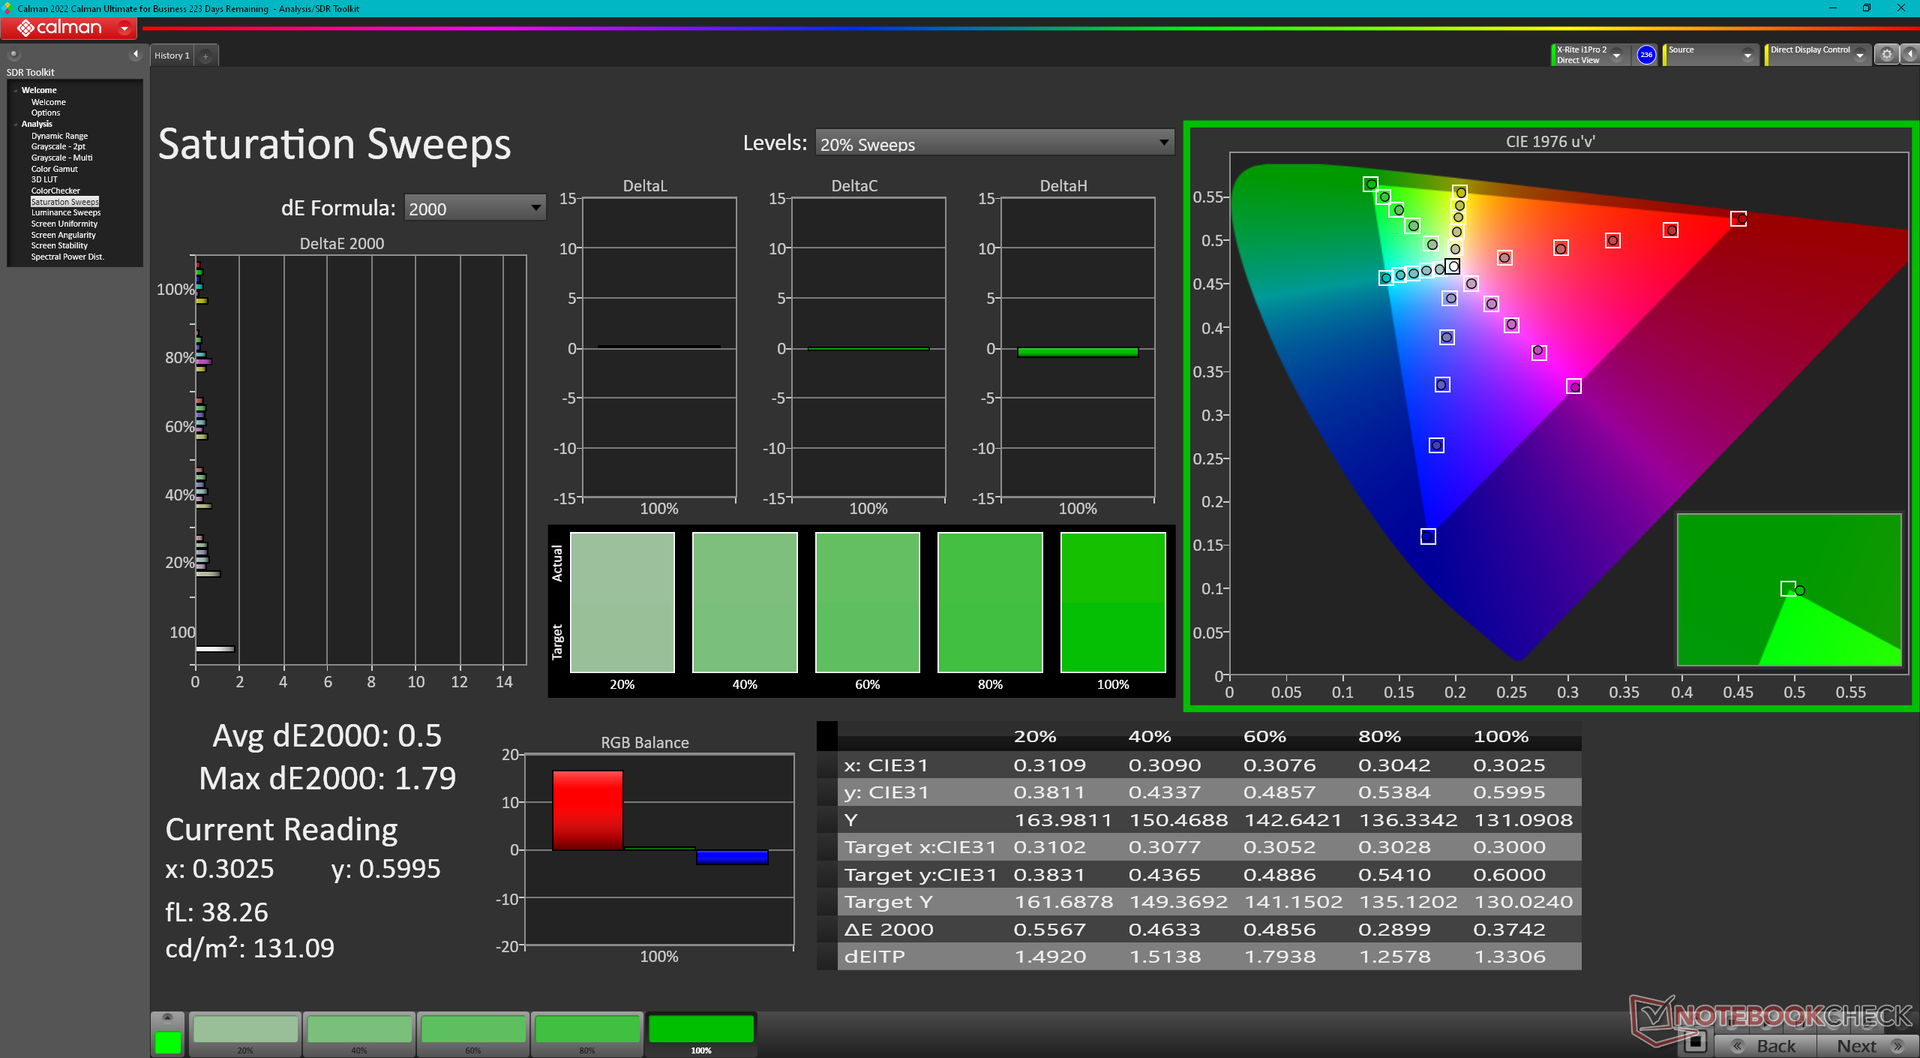
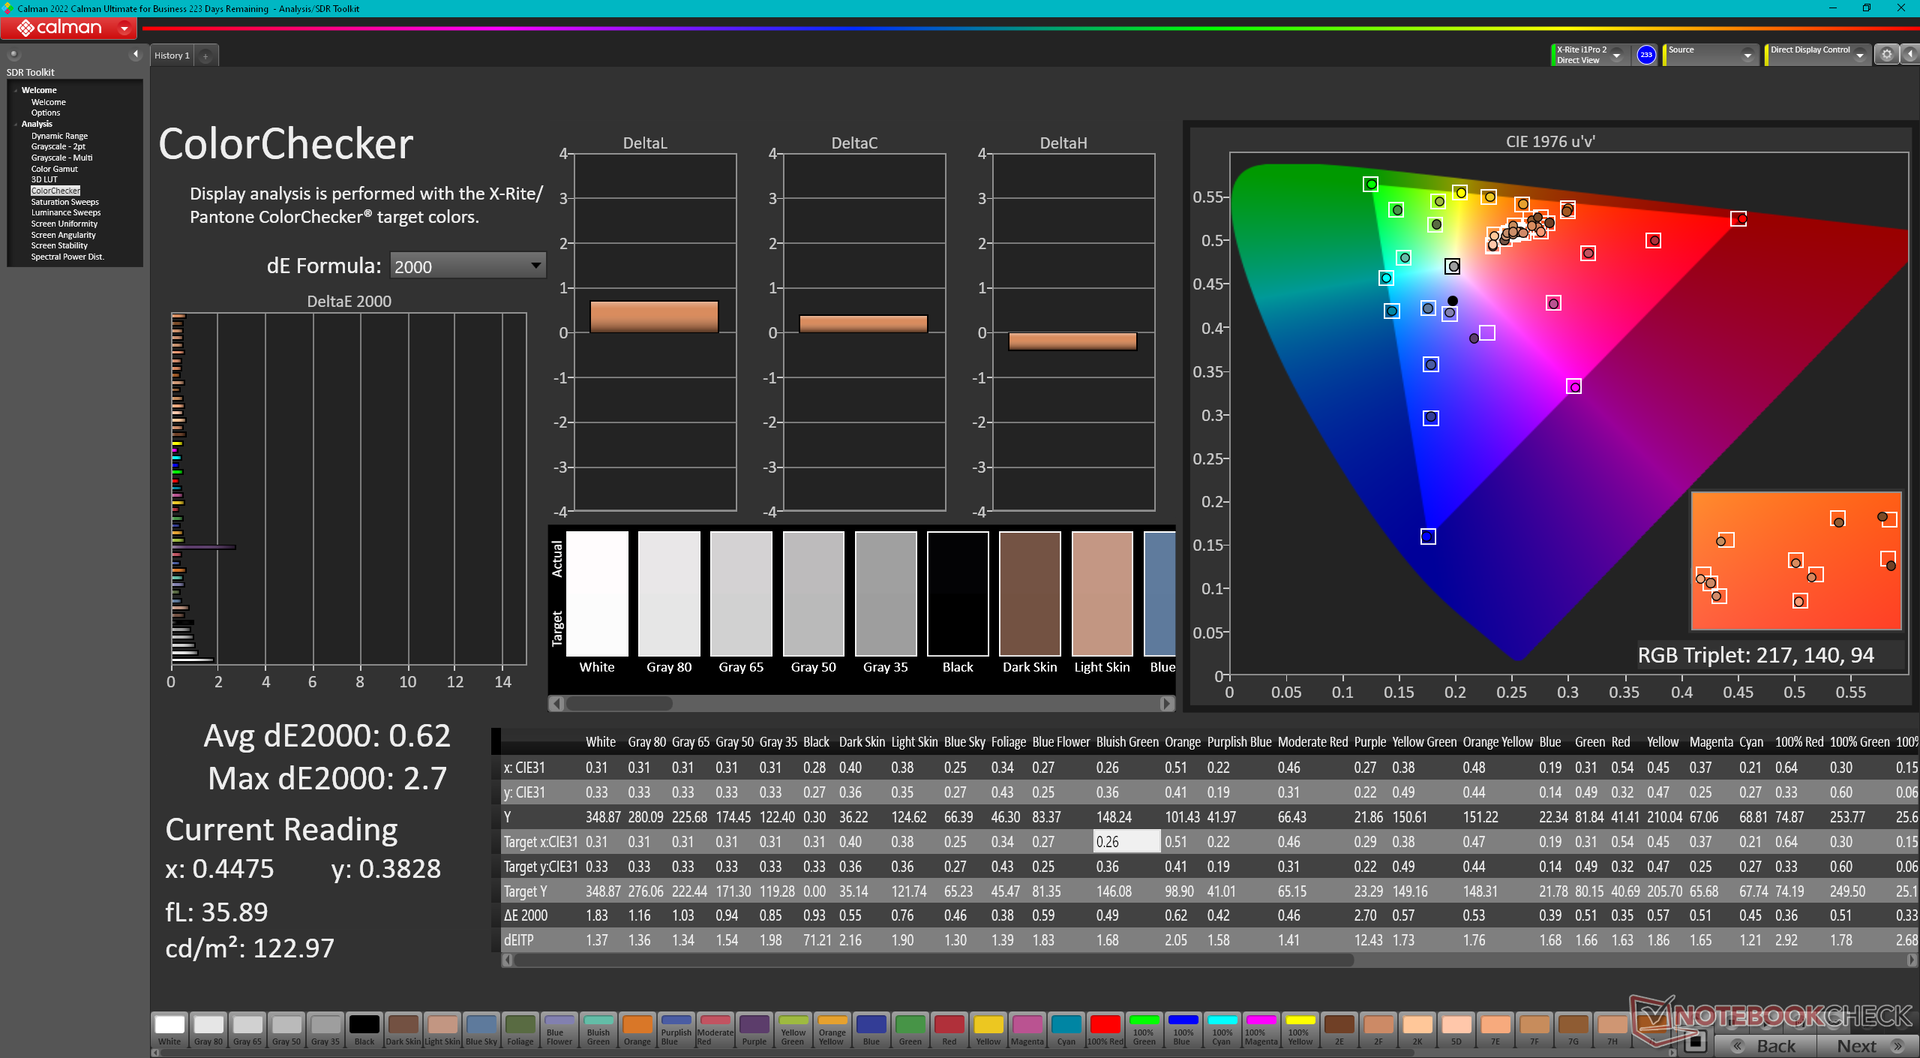
Display - Vollständiges sRGB und 240 Hz sind nun Standard
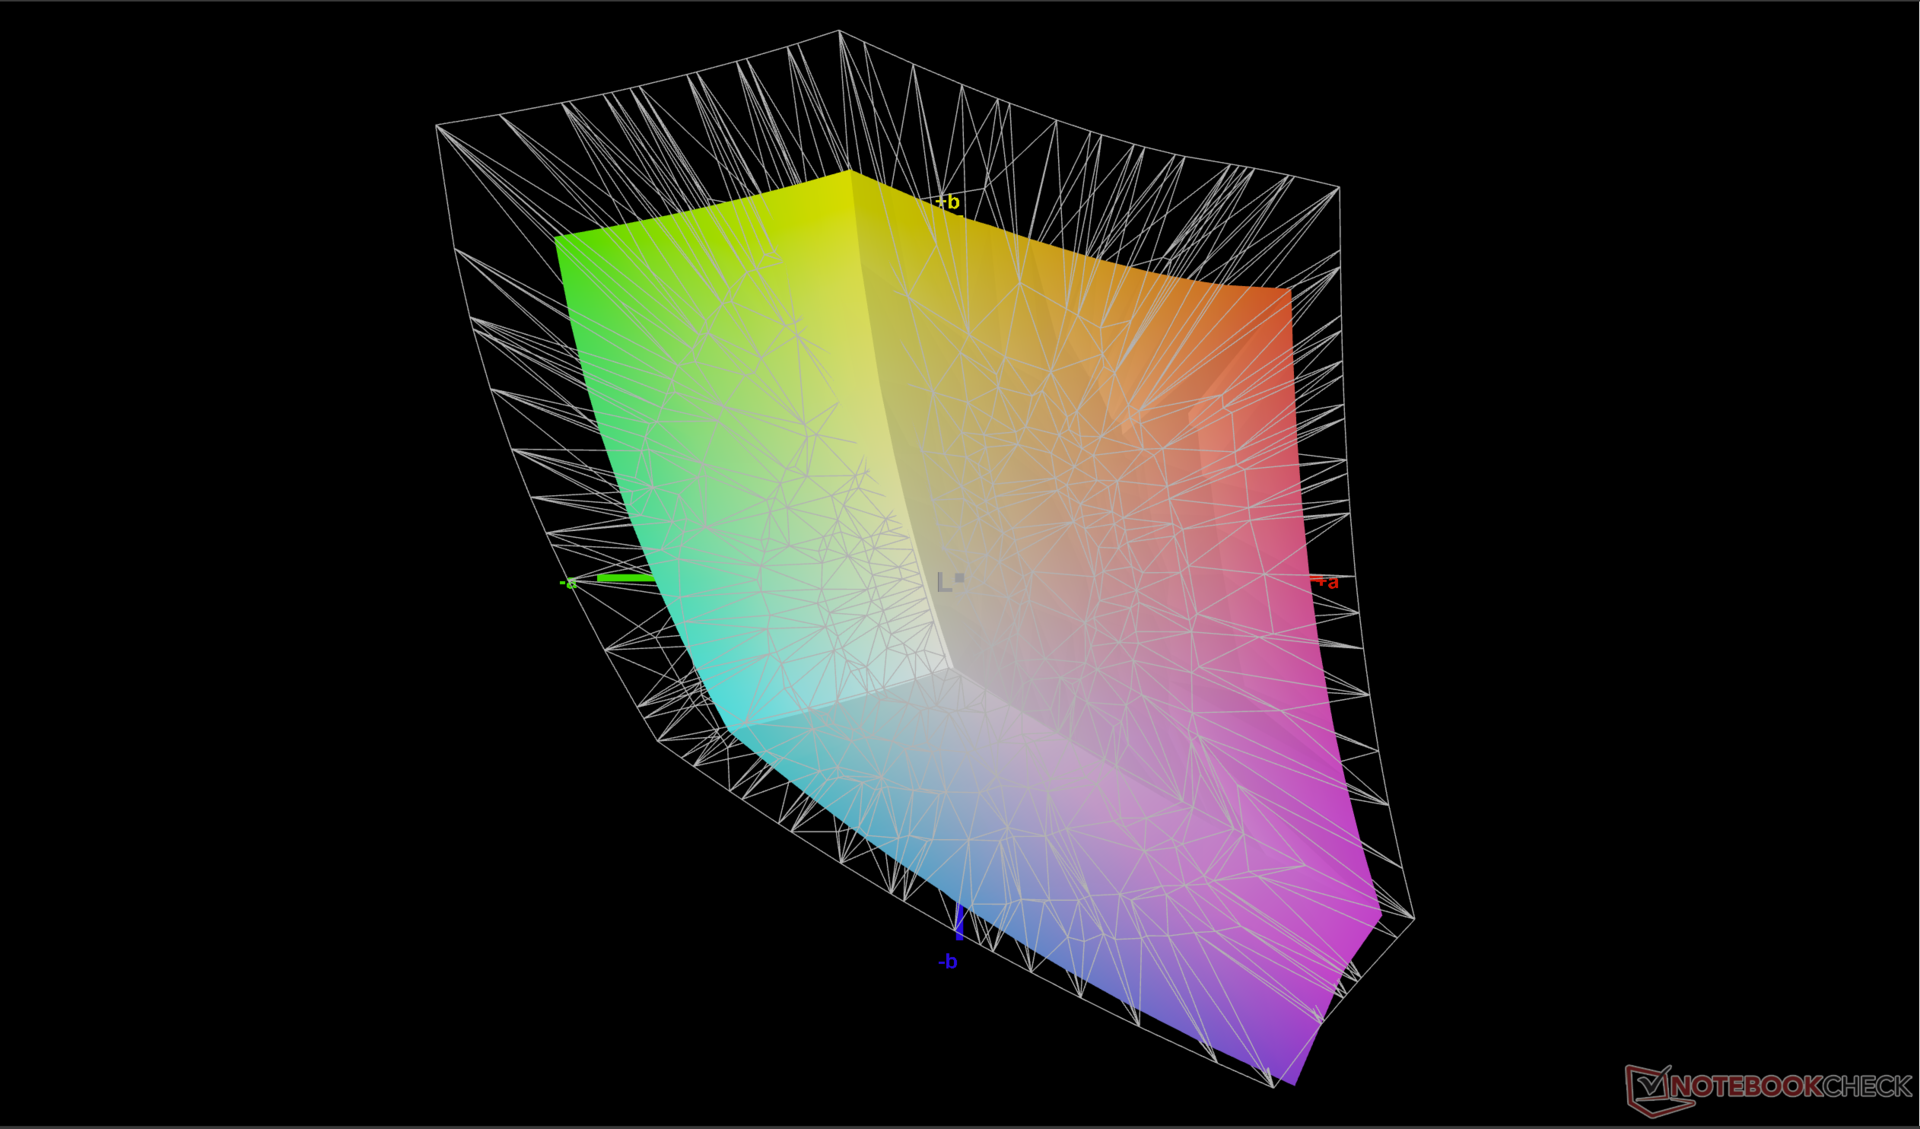
Das Modell verwendet ein BOE NE16NYH-Panel im Gegensatz zum BOE NE16NYB des letztjährigen m16 R1. Das neuere Panel hat eine höhere native Bildwiederholfrequenz (240 Hz gegenüber 165 Hz), während alle anderen Eigenschaften im Wesentlichen gleich bleiben, einschließlich der schnellen Schwarz-Weiß-Reaktionszeiten, des Kontrastverhältnisses von 1000:1, der vollständigen sRGB-Abdeckung und der maximalen Helligkeit von 300 bis 350 Nit. Das Display ist sowohl für Spiele als auch für die Bearbeitung von Amateuren geeignet.
So geschmeidig das neue Panel auch sein mag, ihm fehlen DCI-P3-Farben und die variable Bildwiederholrate von Windows. Ersteres wäre für professionelle Grafikeditoren interessant gewesen, während letzteres die Akkulaufzeit verbessert hätte. Volle DCI-P3-Farben sind auf dem m16 R1, HP Omen Transcend 16 und Asus ROG Zephyrus G16 verfügbar. HDR wird ebenfalls nicht unterstützt, da das Display nicht hell genug ist, um die Voraussetzungen für HDR400+ zu erfüllen.

| |||||||||||||||||||||||||
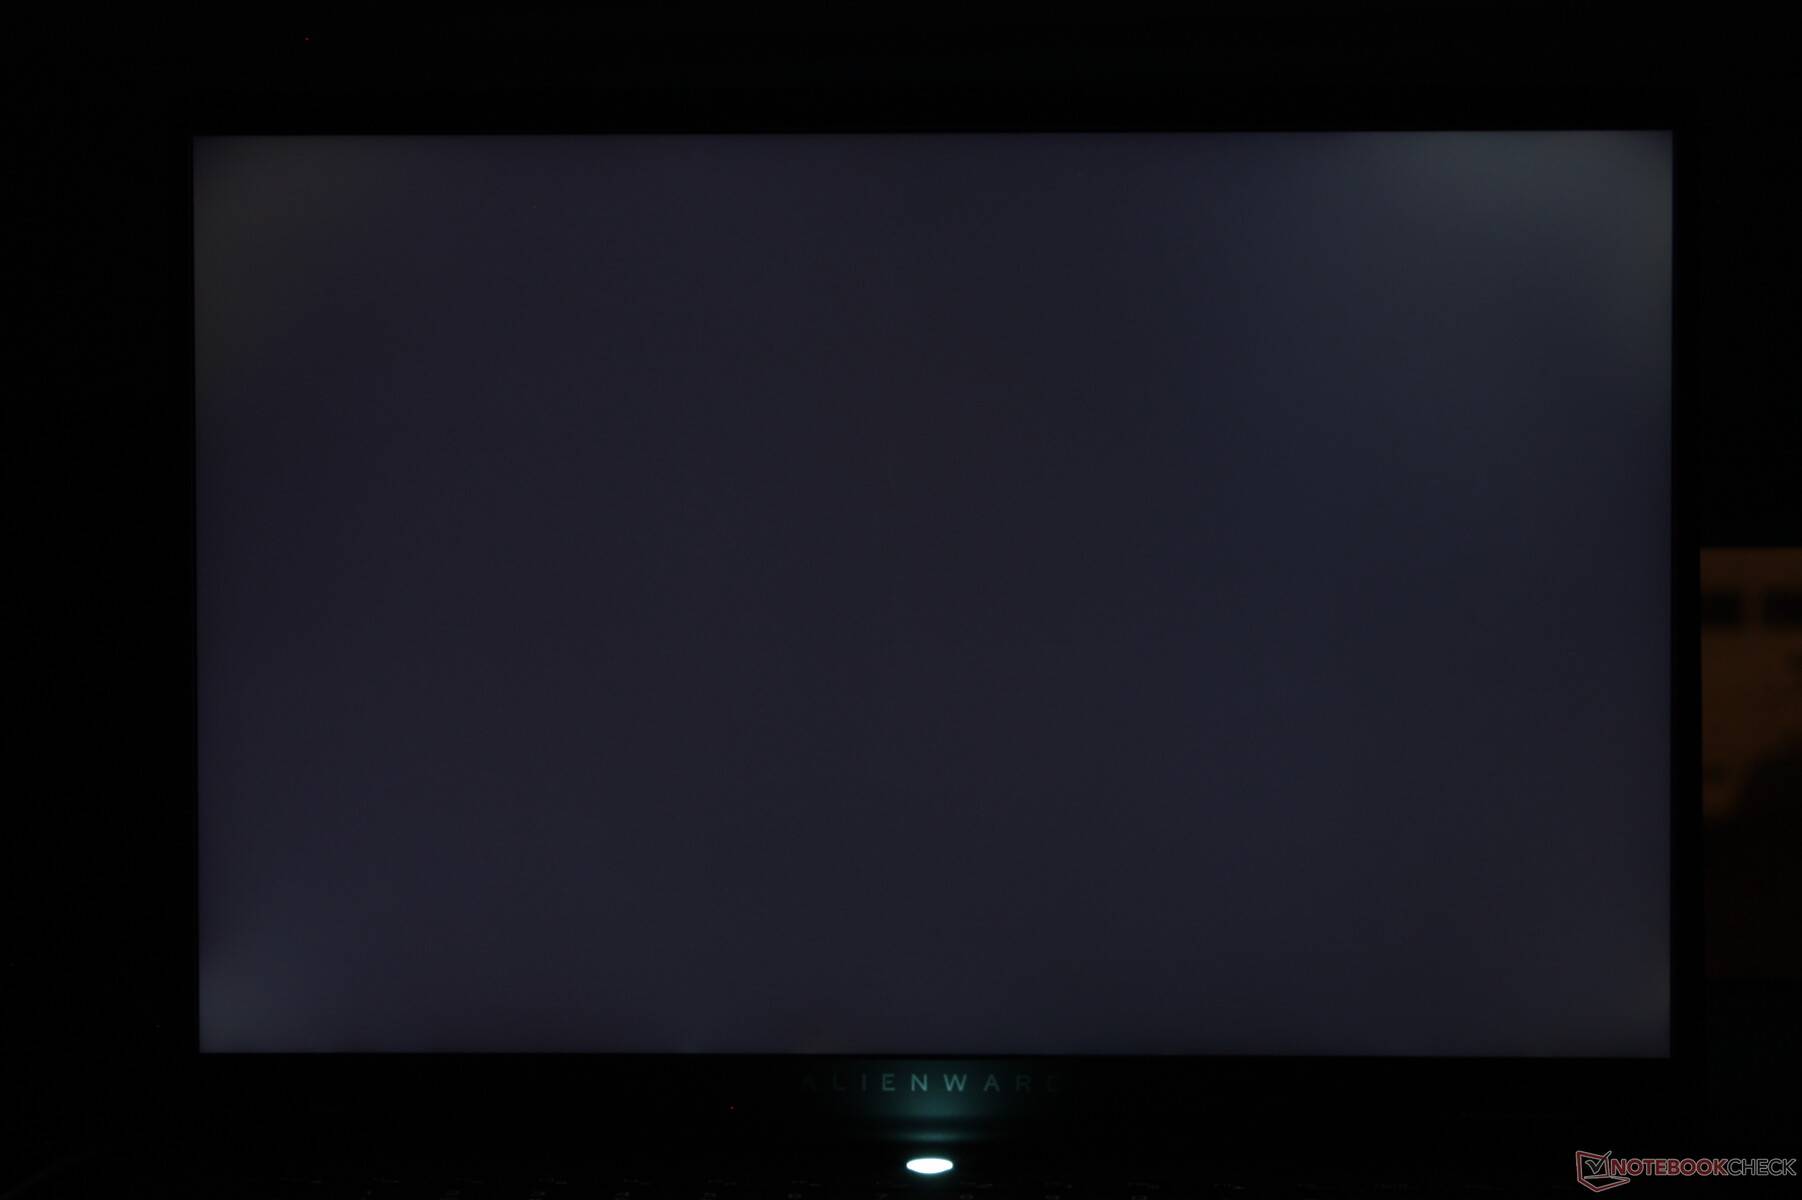
Ausleuchtung: 87 %
Helligkeit Akku: 345.8 cd/m²
Kontrast: 1153:1 (Schwarzwert: 0.3 cd/m²)
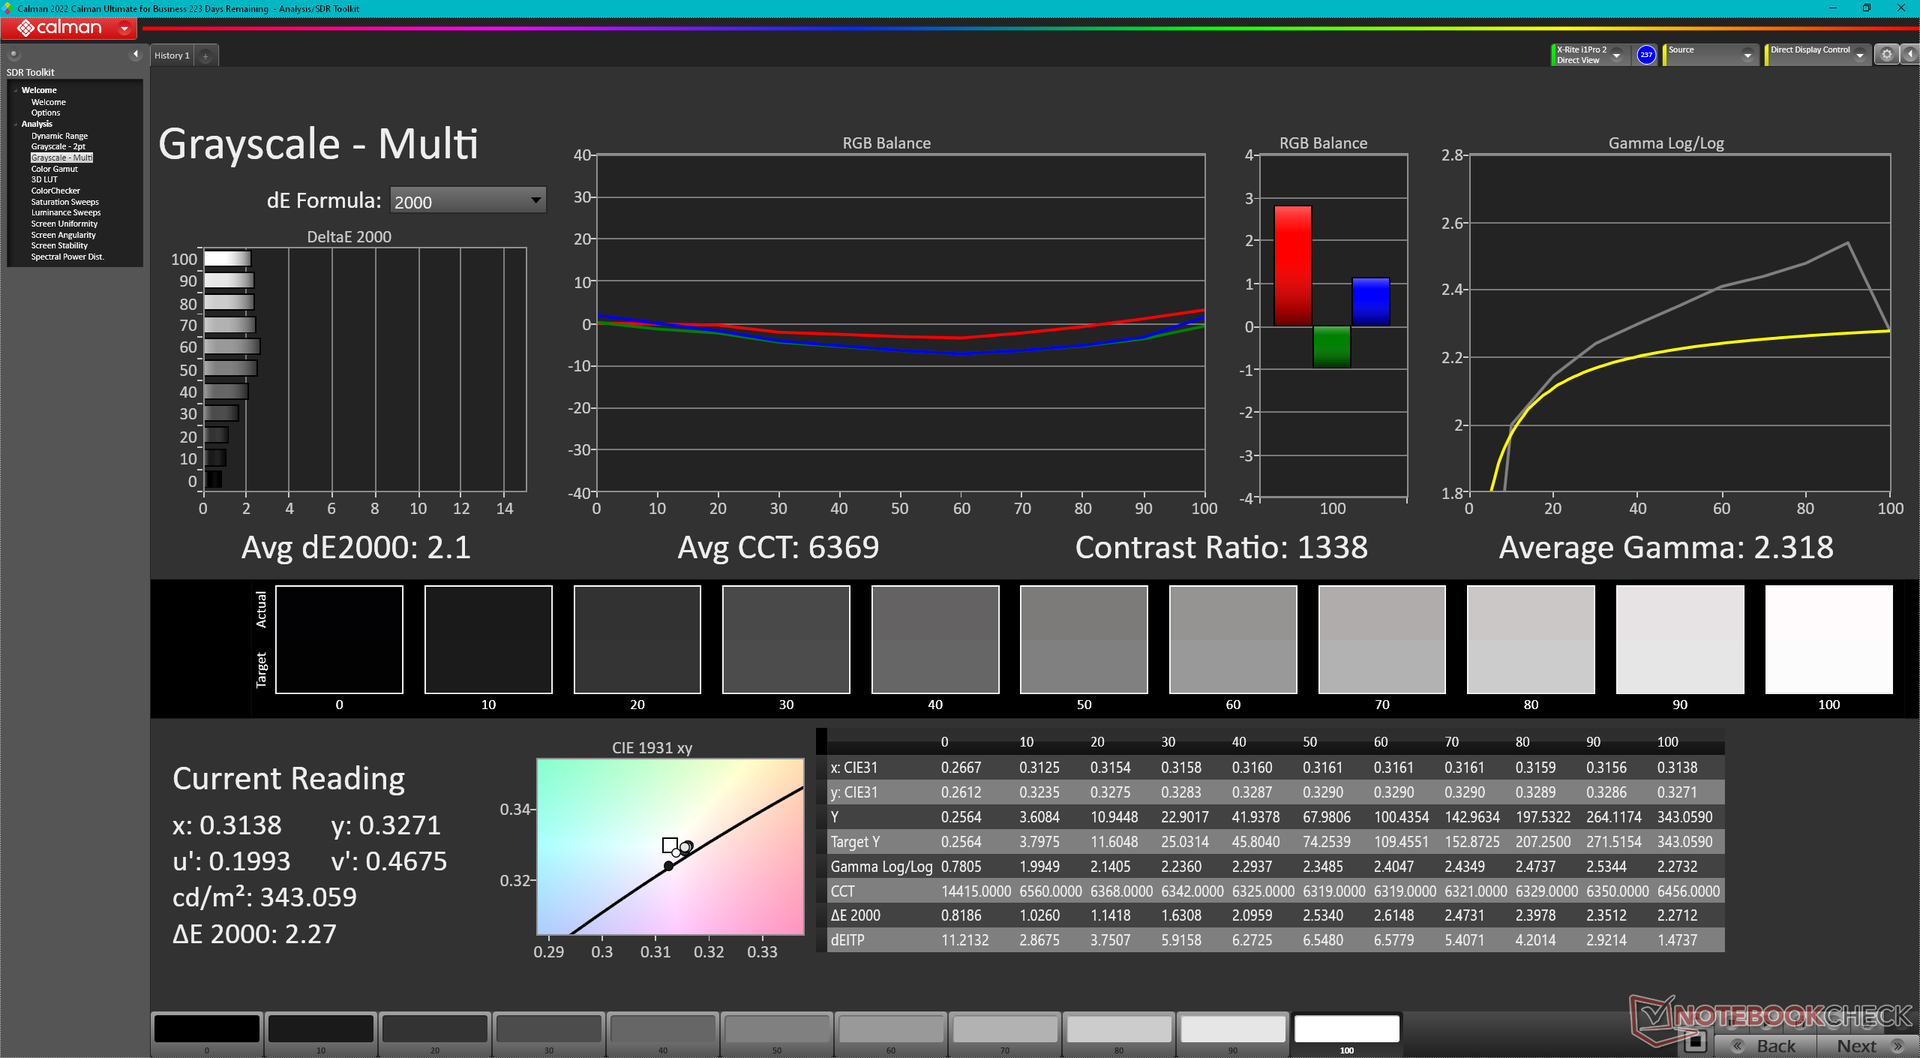
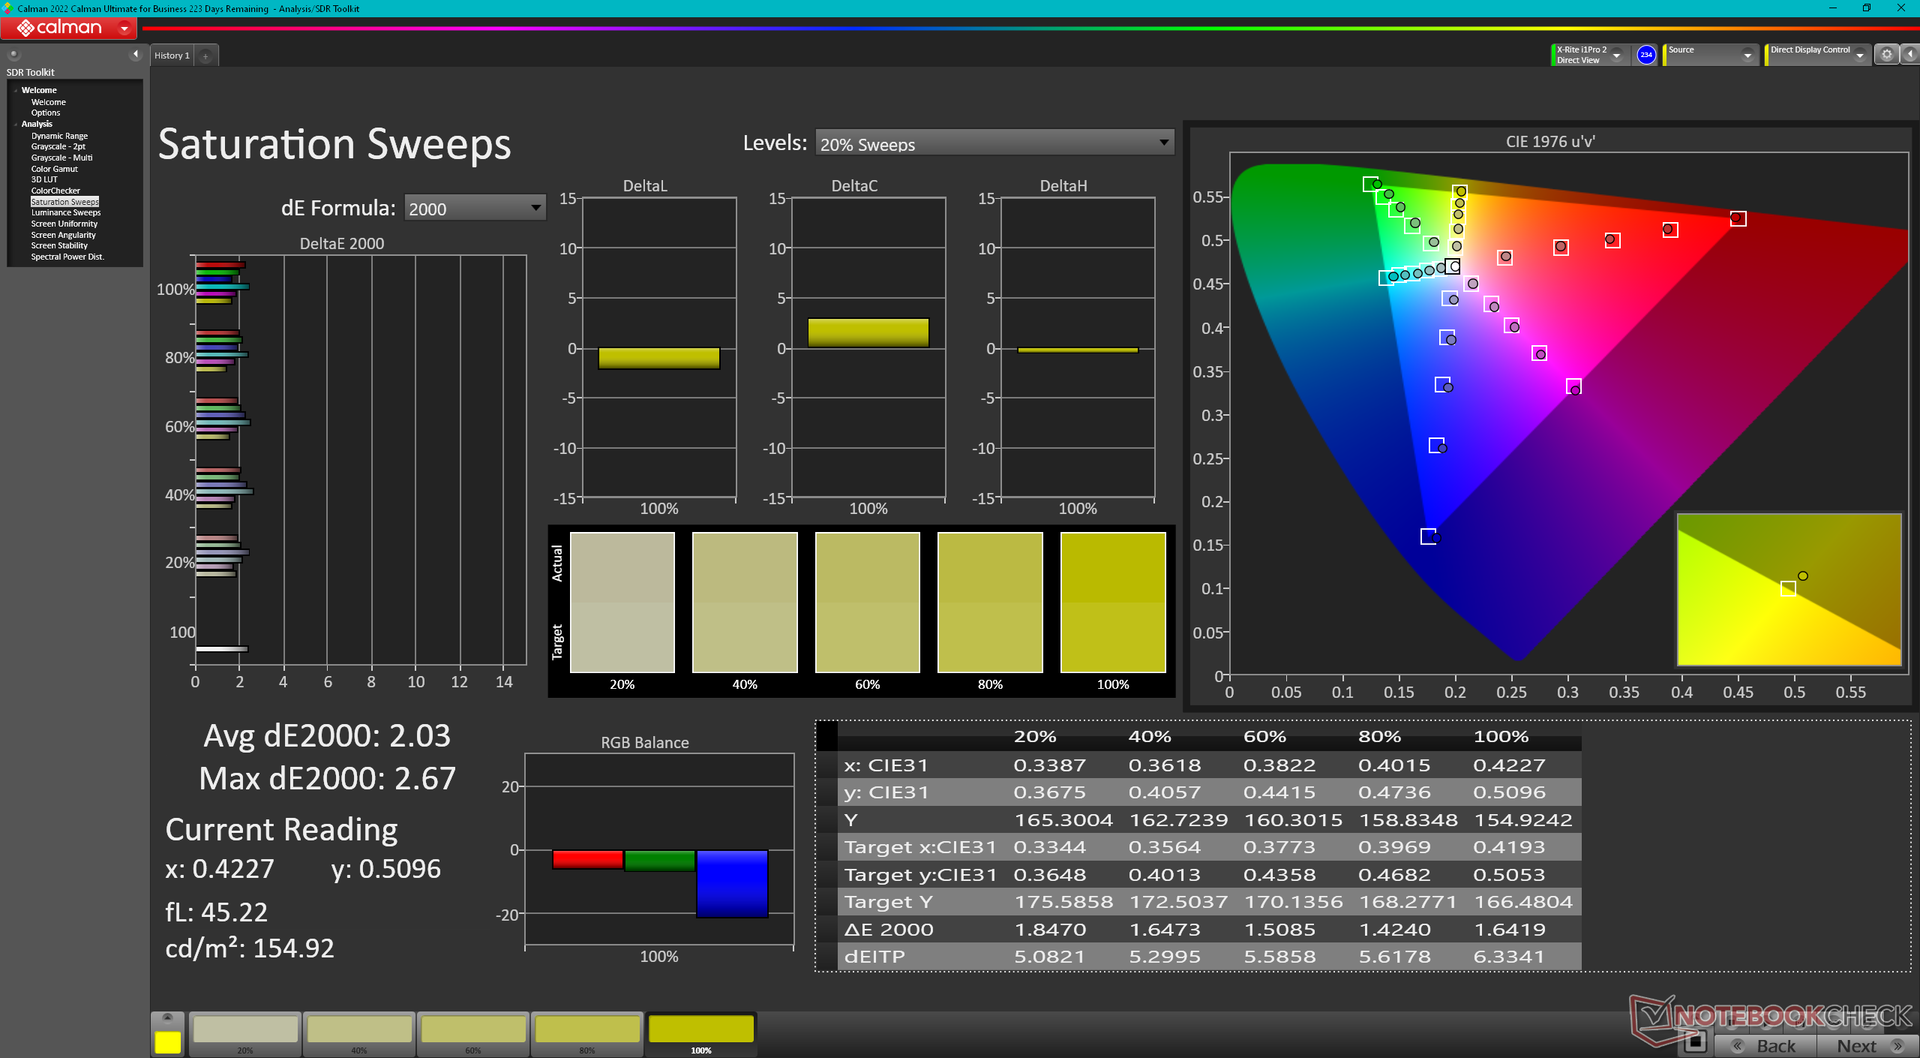
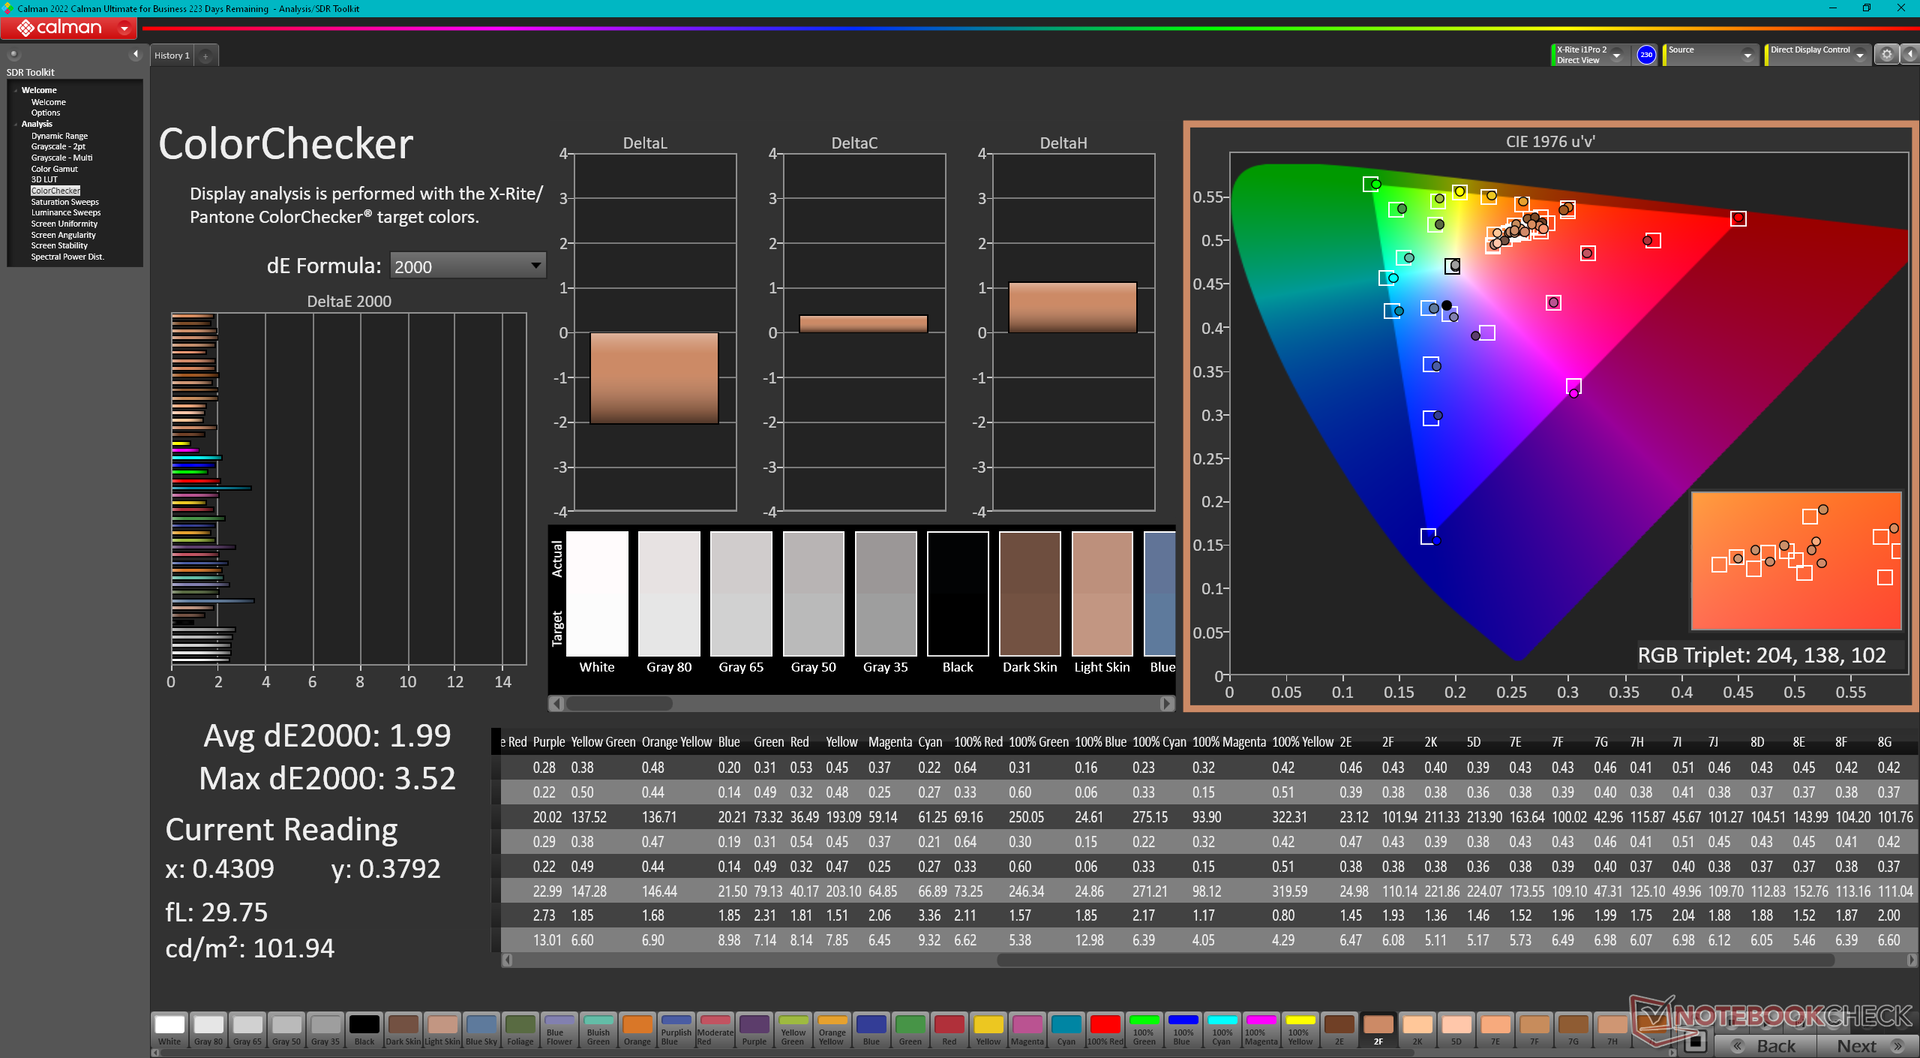
ΔE ColorChecker Calman: 1.99 | ∀{0.5-29.43 Ø4.71}
calibrated: 0.62
ΔE Greyscale Calman: 2.1 | ∀{0.09-98 Ø4.96}
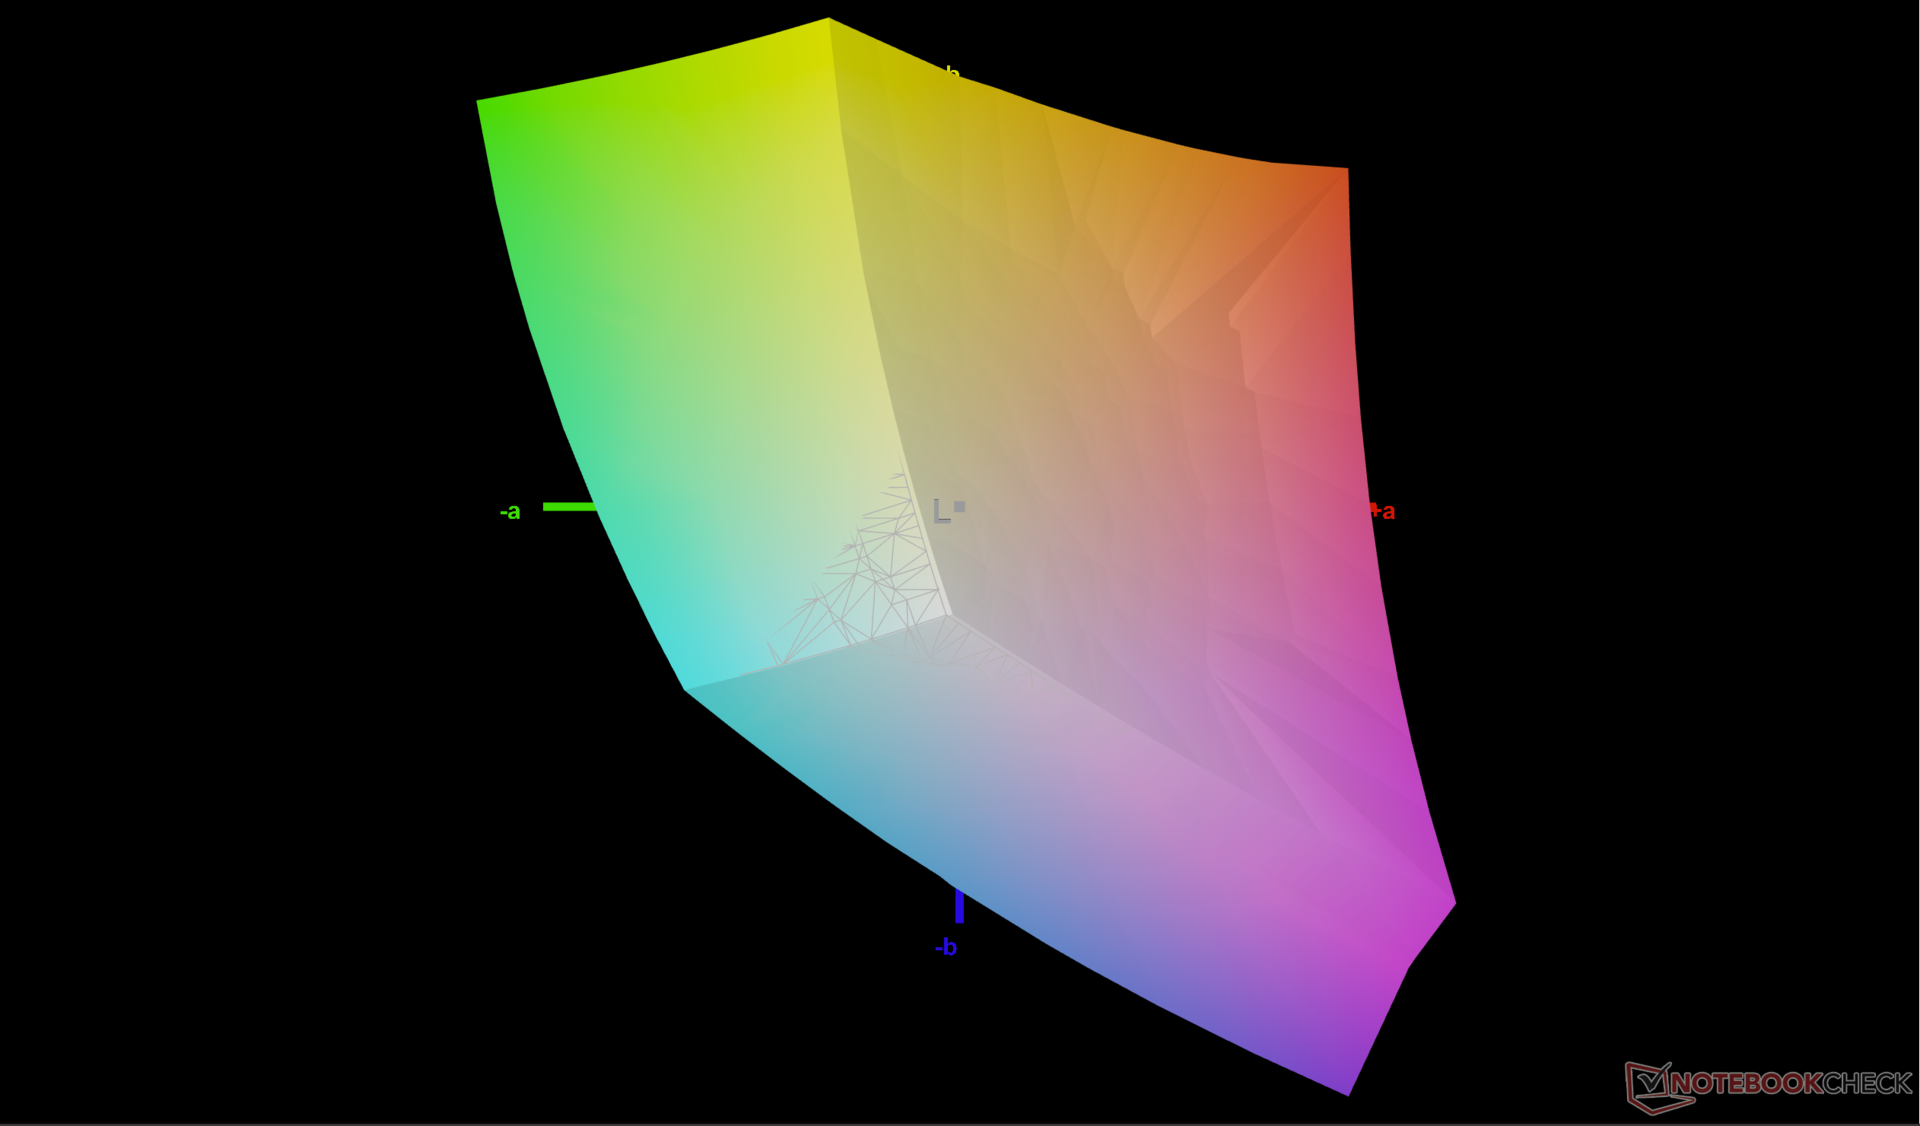
71.4% AdobeRGB 1998 (Argyll 3D)
100% sRGB (Argyll 3D)
71% Display P3 (Argyll 3D)
Gamma: 2.32
CCT: 6369 K
| Alienware m16 R2 BOE NE16NYH, IPS, 2560x1600, 16" | Alienware m16 R1 Intel BOE NE16NYB, IPS, 2560x1600, 16" | Alienware x16 R1 BOE NE16NZ4, IPS, 2560x1600, 16" | HP Omen Transcend 16-u1095ng ATNA60DL02-0 (SDC41A4), OLED, 2560x1600, 16" | Asus ROG Zephyrus G16 2024 GU605M ATNA60DL01-0, OLED, 2560x1600, 16" | Lenovo Legion Slim 7 16APH8 BOE NE160QDM-NZ3, IPS, 2560x1600, 16" | |
|---|---|---|---|---|---|---|
| Display | -3% | 21% | 26% | 26% | 0% | |
| Display P3 Coverage (%) | 71 | 67.7 -5% | 99.2 40% | 99.8 41% | 99.9 41% | 70.3 -1% |
| sRGB Coverage (%) | 100 | 97.2 -3% | 100 0% | 100 0% | 100 0% | 99.6 0% |
| AdobeRGB 1998 Coverage (%) | 71.4 | 70 -2% | 88.6 24% | 97 36% | 96.9 36% | 72.4 1% |
| Response Times | 23% | -4% | 97% | 97% | -45% | |
| Response Time Grey 50% / Grey 80% * (ms) | 5.7 ? | 4 ? 30% | 5.1 ? 11% | 0.2 ? 96% | 0.22 ? 96% | 12.6 ? -121% |
| Response Time Black / White * (ms) | 8.7 ? | 7.3 ? 16% | 10.3 ? -18% | 0.2 ? 98% | 0.25 ? 97% | 5.9 ? 32% |
| PWM Frequency (Hz) | 120 ? | 960 ? | ||||
| Bildschirm | -20% | -13% | 129% | 14% | 5% | |
| Helligkeit Bildmitte (cd/m²) | 345.8 | 306 -12% | 302.2 -13% | 390 13% | 416 20% | 545 58% |
| Brightness (cd/m²) | 337 | 302 -10% | 285 -15% | 392 16% | 418 24% | 502 49% |
| Brightness Distribution (%) | 87 | 89 2% | 89 2% | 98 13% | 96 10% | 82 -6% |
| Schwarzwert * (cd/m²) | 0.3 | 0.3 -0% | 0.26 13% | 0.02 93% | 0.48 -60% | |
| Kontrast (:1) | 1153 | 1020 -12% | 1162 1% | 19500 1591% | 1135 -2% | |
| Delta E Colorchecker * | 1.99 | 2.57 -29% | 1.63 18% | 1.94 3% | 1.6 20% | 1.36 32% |
| Colorchecker dE 2000 max. * | 3.52 | 4.26 -21% | 4.13 -17% | 4.26 -21% | 2.1 40% | 3.11 12% |
| Colorchecker dE 2000 calibrated * | 0.62 | 0.85 -37% | 1.17 -89% | 4.21 -579% | 1.04 -68% | |
| Delta E Graustufen * | 2.1 | 3.3 -57% | 2.5 -19% | 1.5 29% | 2.7 -29% | 1.4 33% |
| Gamma | 2.32 95% | 1.997 110% | 2.23 99% | 2.221 99% | 2.16 102% | 2.253 98% |
| CCT | 6369 102% | 6895 94% | 6590 99% | 6395 102% | 6331 103% | 6631 98% |
| Durchschnitt gesamt (Programm / Settings) | 0% /
-10% | 1% /
-4% | 84% /
102% | 46% /
32% | -13% /
-3% |
* ... kleinere Werte sind besser
Das Display ist bereits im Auslieferungszustand gut kalibriert, mit durchschnittlichen Graustufen- und Farb-DeltaE-Werten von nur 2,1 bzw. 1,99. Die Ergebnisse würden sich noch weiter auf jeweils <1 verbessern, wenn sie mit unserem X-Rite-Kolorimeter kalibriert würden, aber das sollte für die meisten Benutzer nicht notwendig sein. Unser kalibriertes ICM-Profil steht oben zum kostenlosen Download bereit.

Reaktionszeiten (Response Times) des Displays
| ↔ Reaktionszeiten Schwarz zu Weiß | ||
|---|---|---|
| 8.7 ms ... steigend ↗ und fallend ↘ kombiniert | ↗ 4.6 ms steigend | 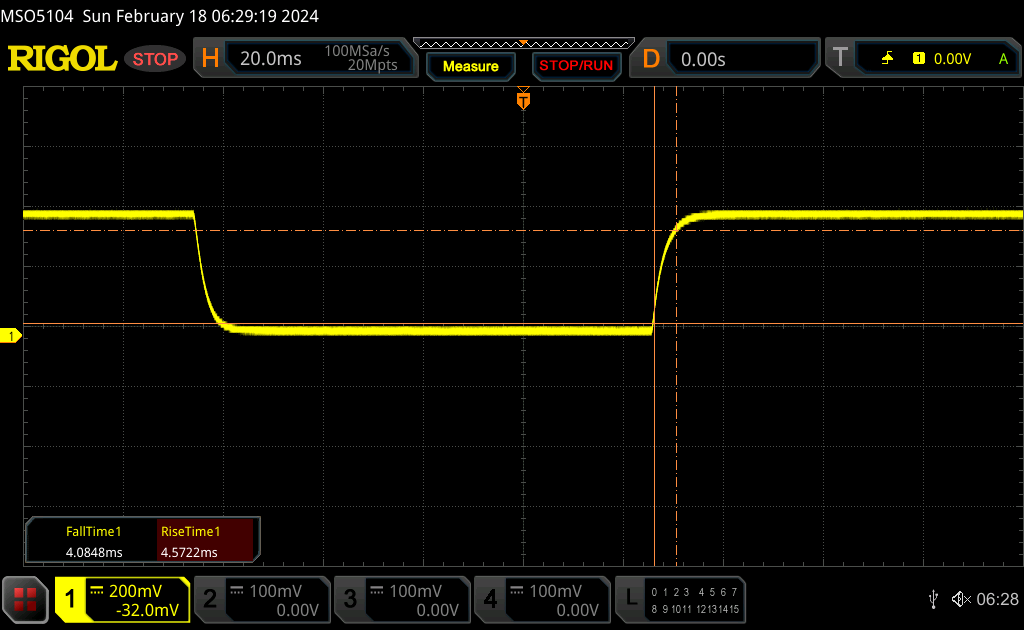 |
| ↘ 4.1 ms fallend | ||
| Die gemessenen Reaktionszeiten sind kurz wodurch sich der Bildschirm auch für Spiele gut eignen sollte. Im Vergleich rangierten die bei uns getesteten Geräte von 0.1 (Minimum) zu 240 (Maximum) ms. » 24 % aller Screens waren schneller als der getestete. Daher sind die gemessenen Reaktionszeiten besser als der Durchschnitt aller vermessenen Geräte (19.8 ms). | ||
| ↔ Reaktionszeiten 50% Grau zu 80% Grau | ||
| 5.7 ms ... steigend ↗ und fallend ↘ kombiniert | ↗ 2.6 ms steigend | 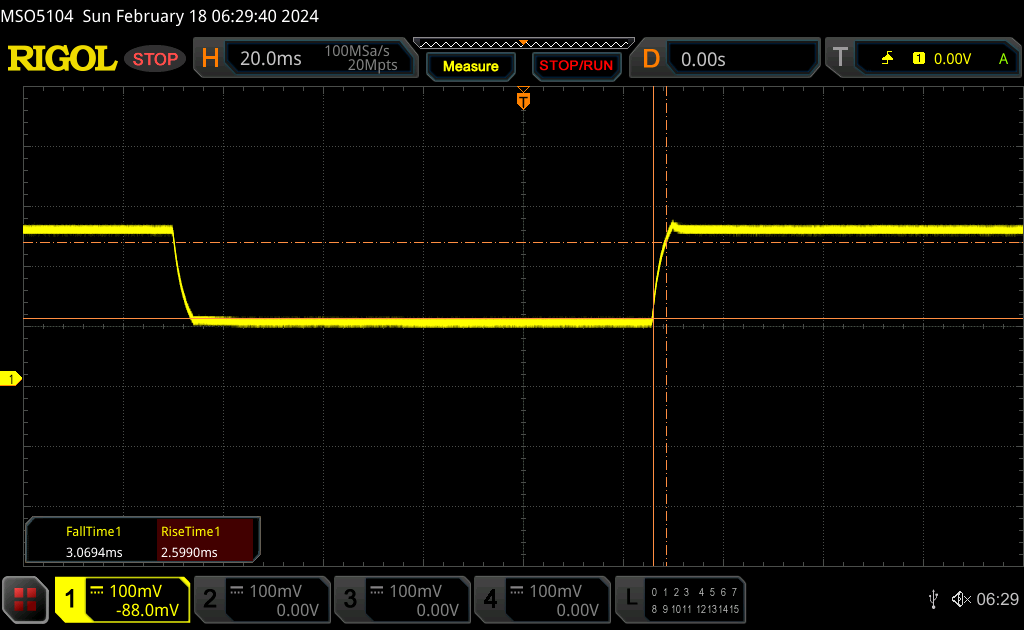 |
| ↘ 3.1 ms fallend | ||
| Die gemessenen Reaktionszeiten sind sehr kurz, wodurch sich der Bildschirm auch für schnelle 3D Spiele eignen sollte. Im Vergleich rangierten die bei uns getesteten Geräte von 0.165 (Minimum) zu 636 (Maximum) ms. » 18 % aller Screens waren schneller als der getestete. Daher sind die gemessenen Reaktionszeiten besser als der Durchschnitt aller vermessenen Geräte (31 ms). | ||
Bildschirm-Flackern / PWM (Pulse-Width Modulation)
| Flackern / PWM nicht festgestellt |  | ||
Im Vergleich: 52 % aller getesteten Geräte nutzten kein PWM um die Helligkeit zu reduzieren. Wenn PWM eingesetzt wurde, dann bei einer Frequenz von durchschnittlich 7747 (Minimum 5, Maximum 343500) Hz. | |||
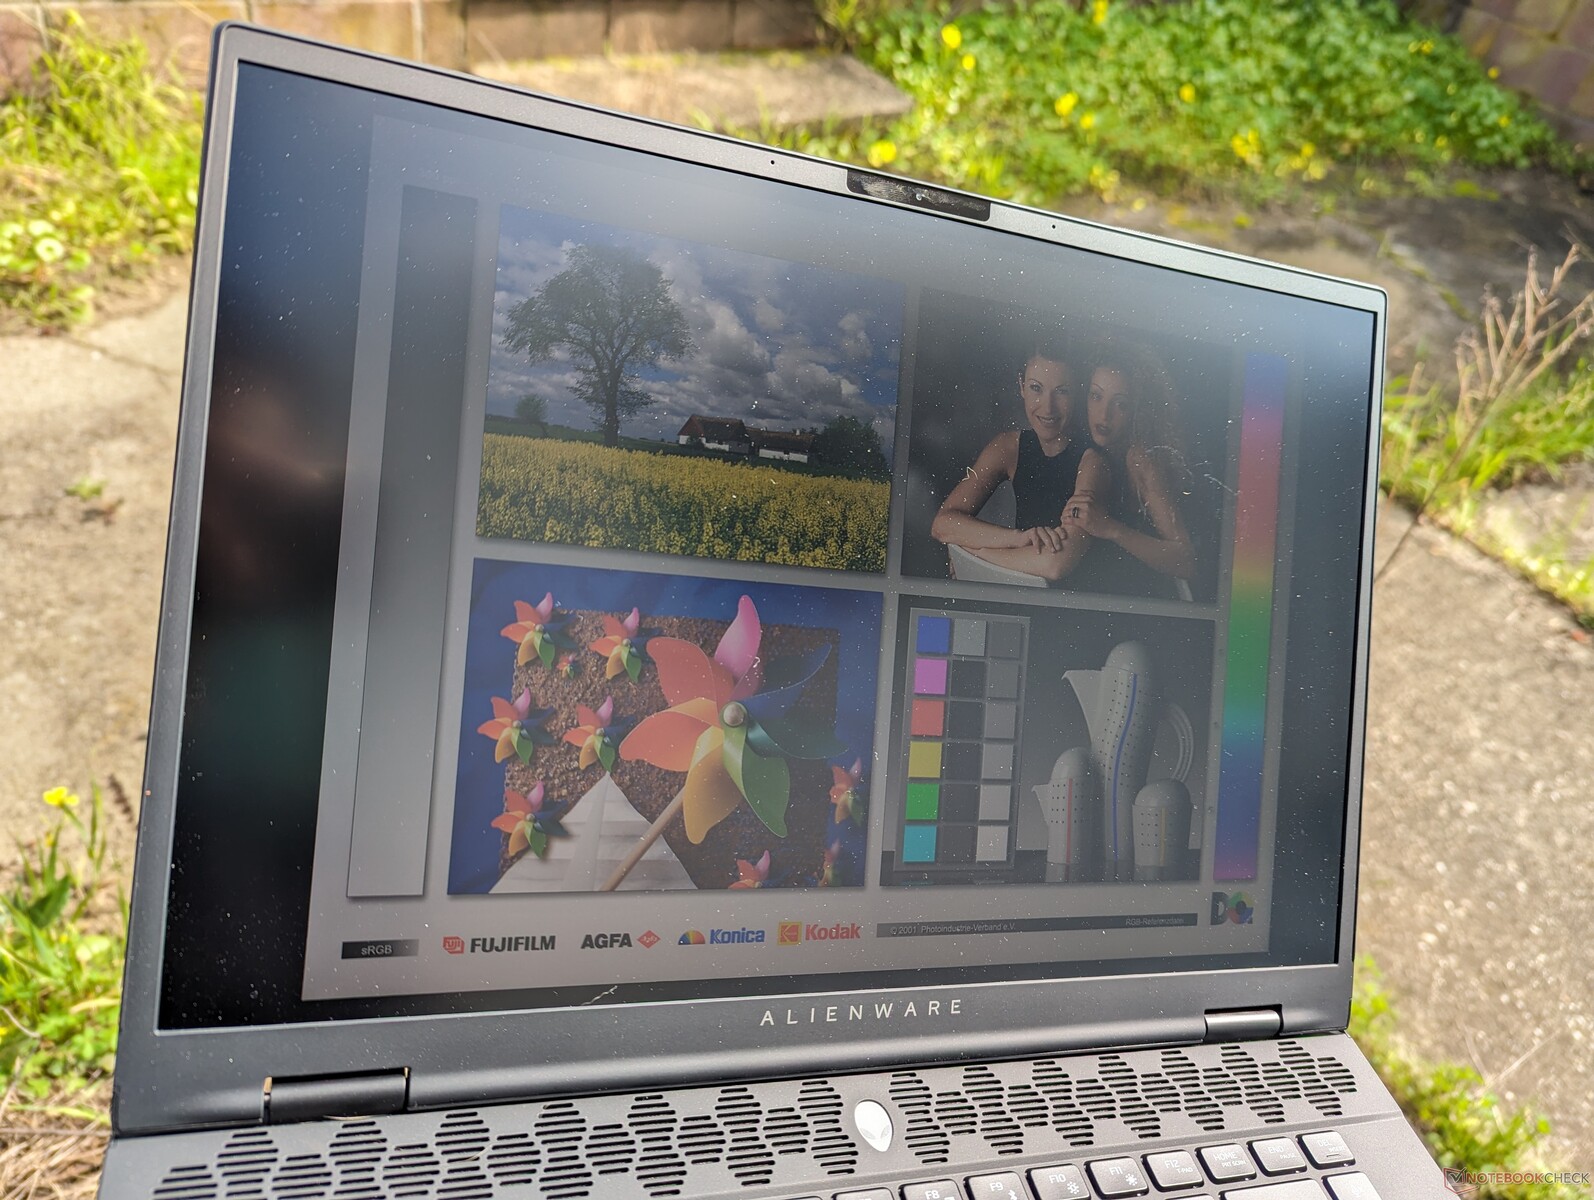
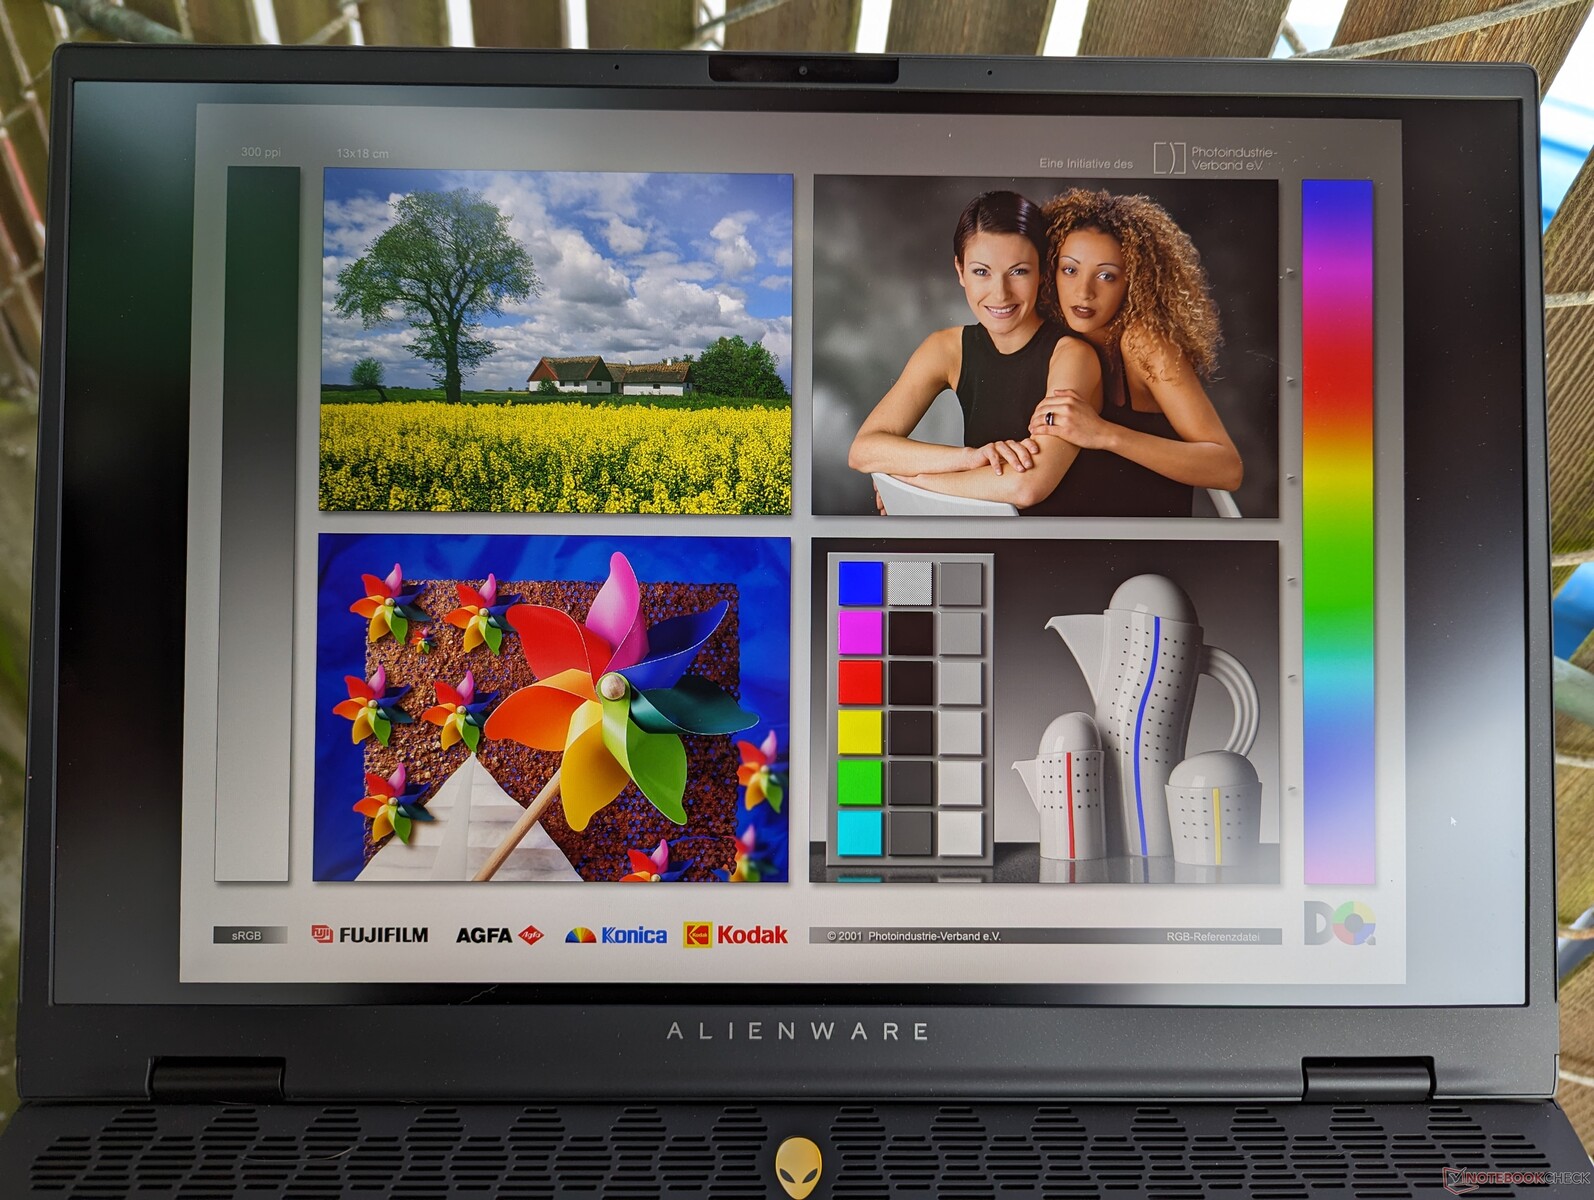
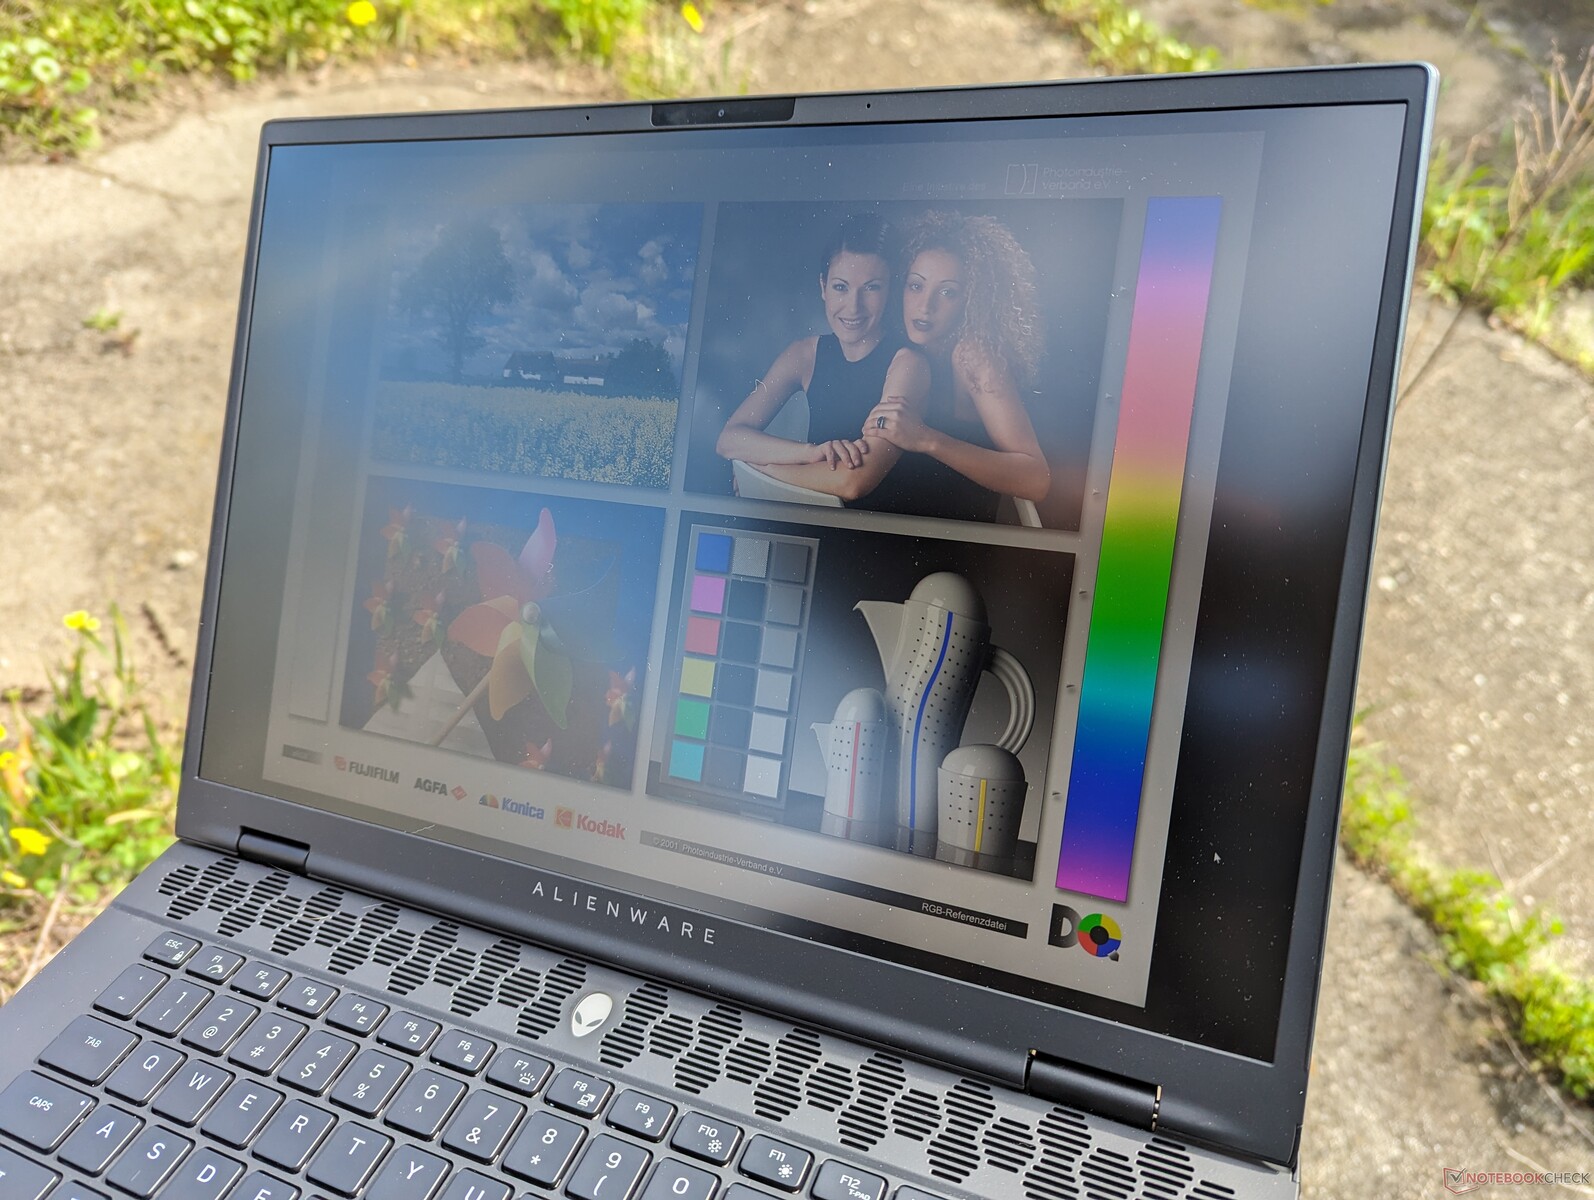
Die Sichtbarkeit im Freien bleibt in etwa gleich wie zuvor, und es wird empfohlen, sich so oft wie möglich im Schatten aufzuhalten, um Blendung zu vermeiden und Farben zu erhalten. Durch das geringere Gewicht und die kleinere Größe ist das System jedoch einfacher zu handhaben.

Performance — Vom Raptor Lake-HX zum Meteor Lake-H
Testbedingungen
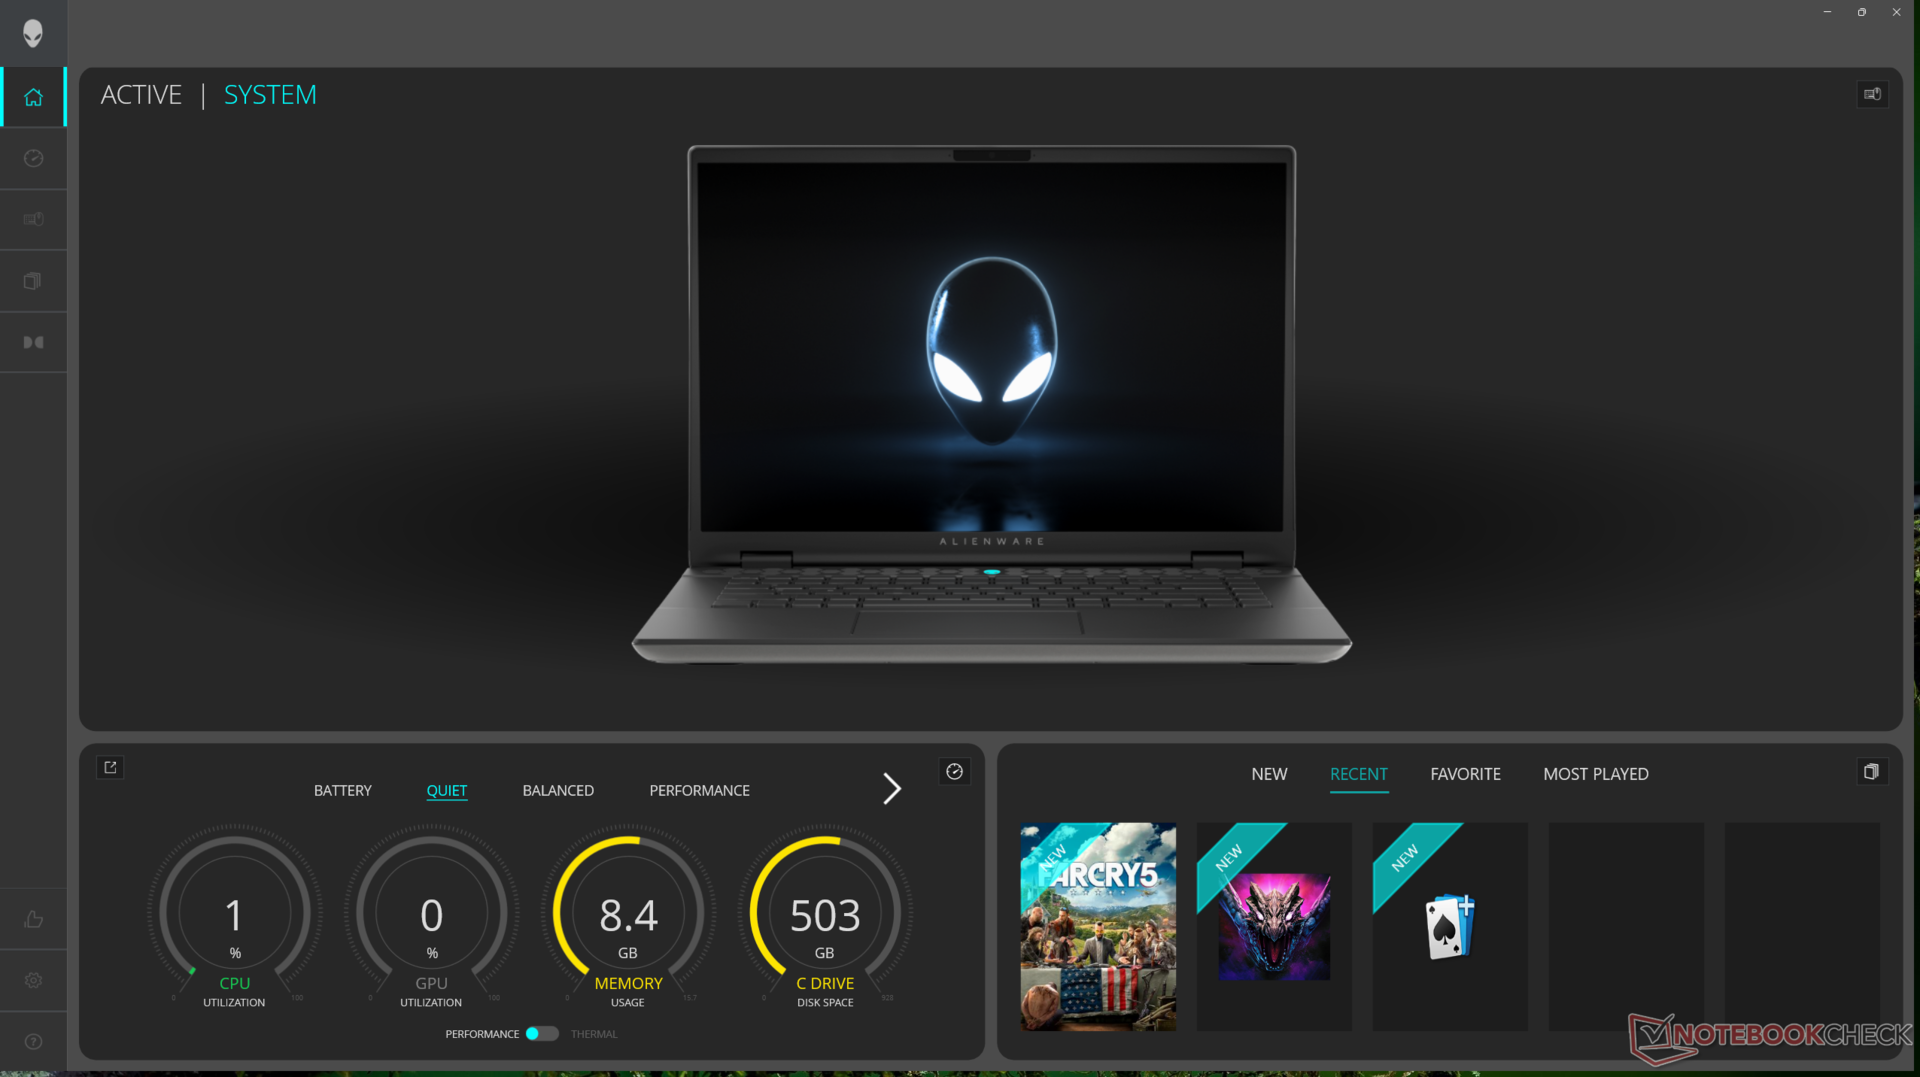
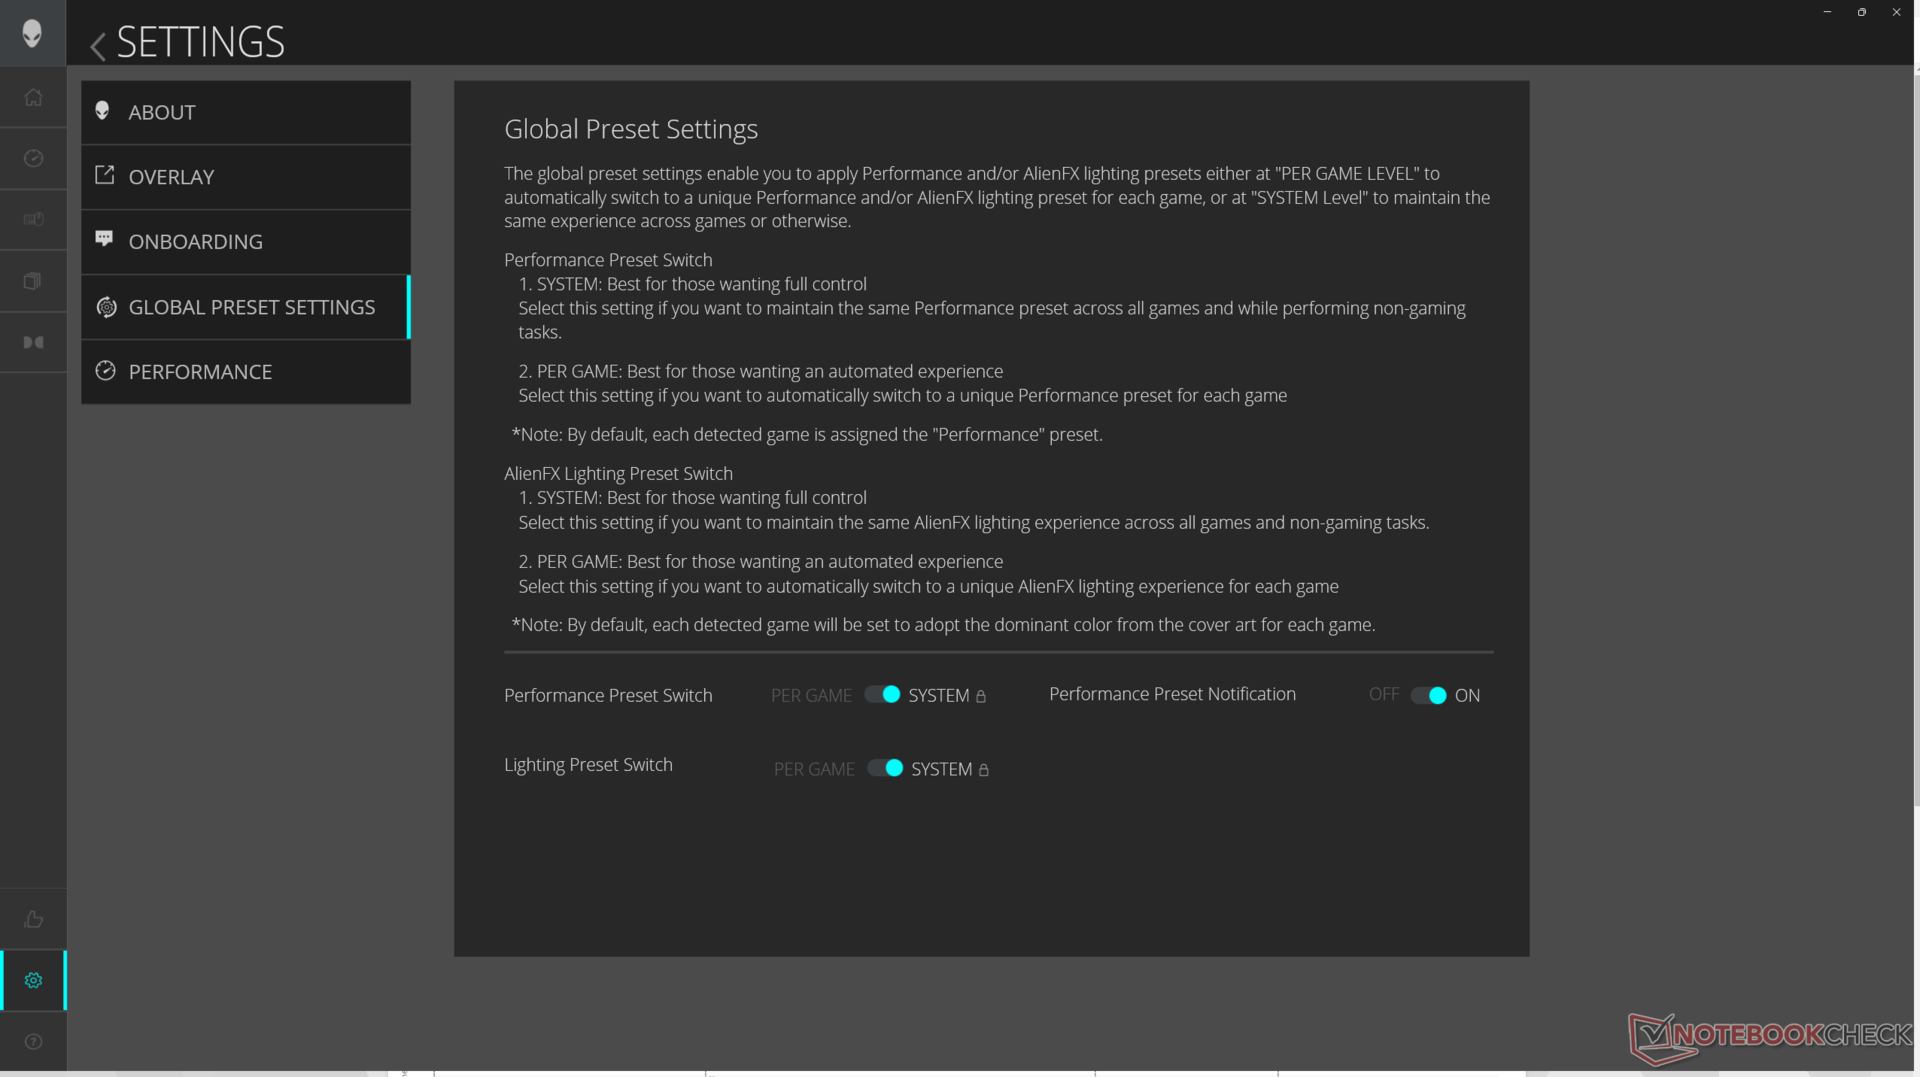
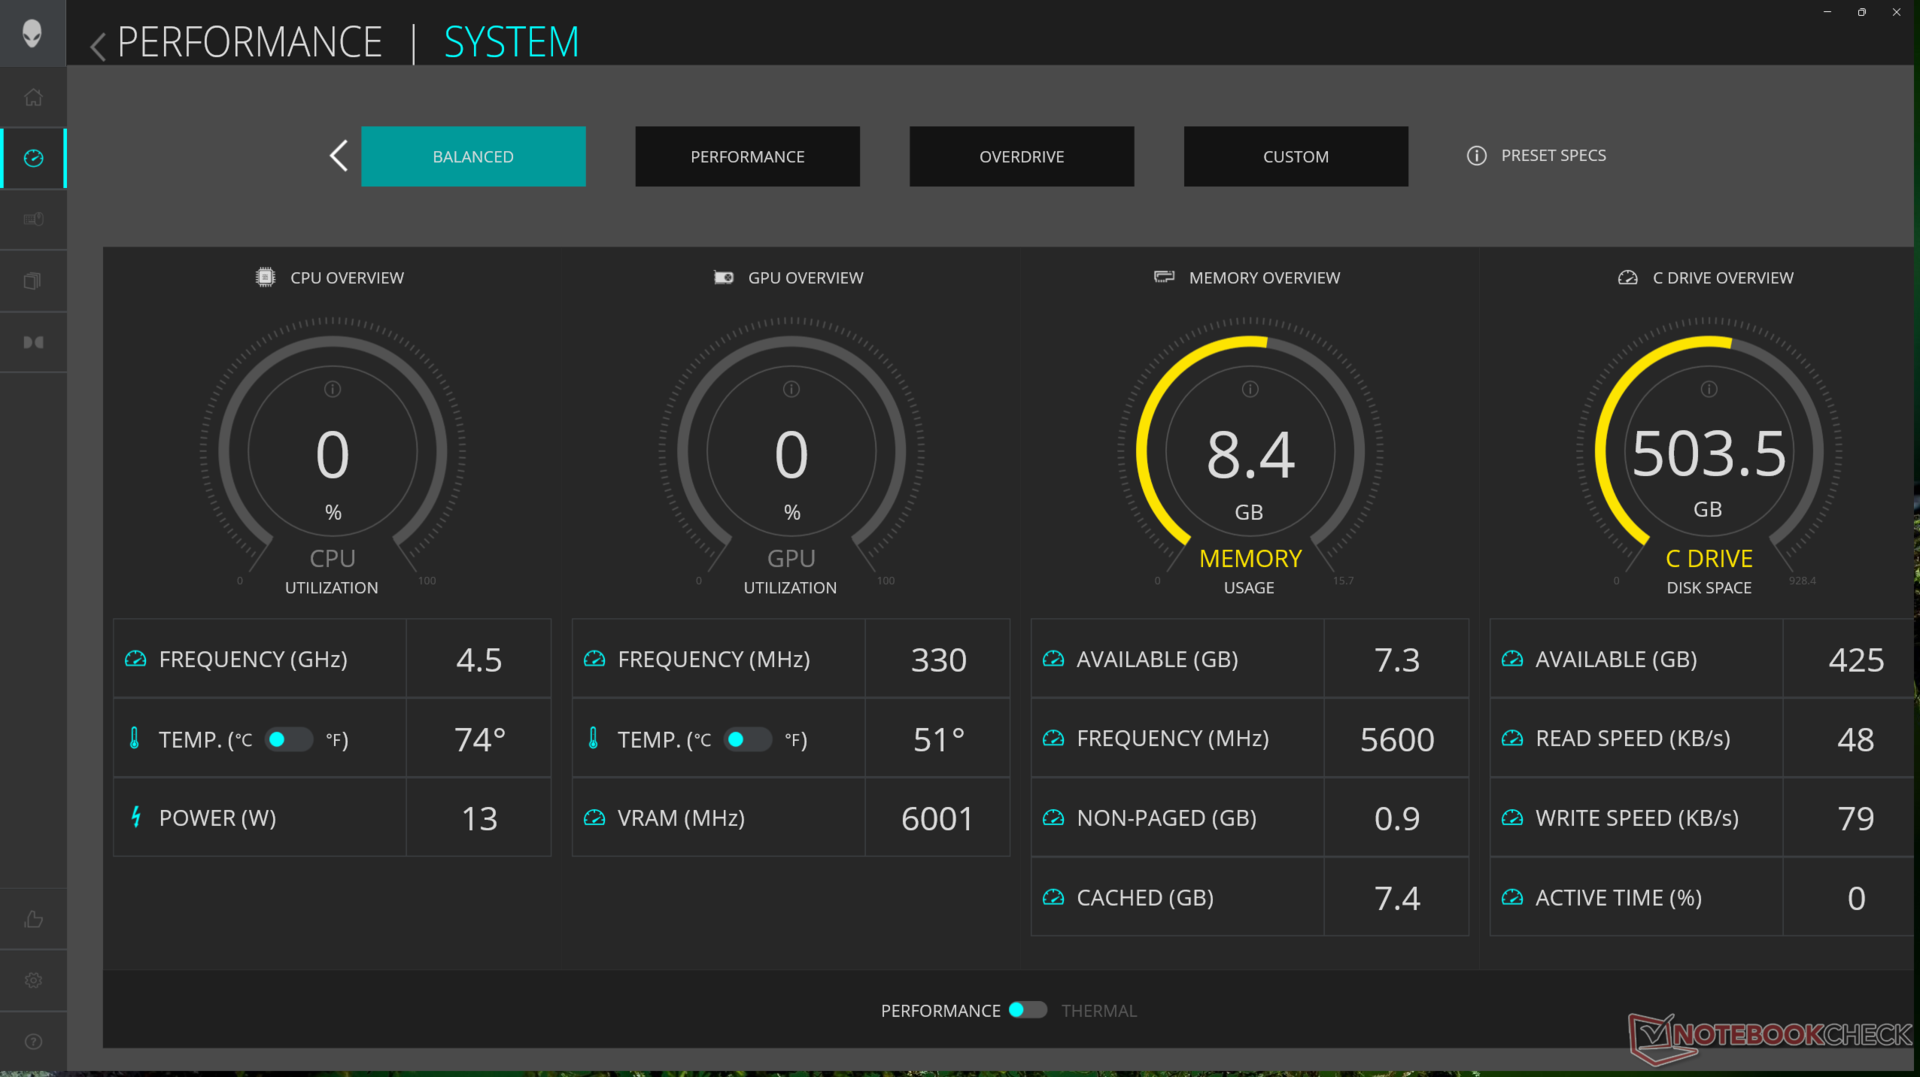
Wir haben das Alienware Command Center (ACC) auf den Overdrive-Modus und das Nvidia Control Panel auf den dGPU-Modus eingestellt, bevor wir die folgenden Benchmarks durchgeführt haben. ACC wurde aktualisiert und läuft nun viel reibungsloser und ohne viele der Probleme, die wir auf dem m16 R1 erlebt haben. Zum Beispiel startet es jetzt fast sofort nach dem Hochfahren, während sich die Lüfterprofilmodi und die AlienFX RGB-Beleuchtung nicht mehr automatisch ändern, ohne dass der Benutzer vorher darüber informiert wird.
Nichtsdestotrotz haben wir einen Fehler festgestellt, bei dem das System manchmal nicht korrekt in den Ruhezustand übergeht, wenn der Deckel geschlossen wird, auch wenn wir die Windows-Energieeinstellungen doppelt überprüft haben. Dies führte zu einem sehr warmen Laptop und einem völlig entladenen Akku nur wenige Stunden später.
Sowohl Advanced Optimus als auch G-Sync werden unterstützt, d. h. der Benutzer kann zwischen iGPU- und dGPU-Modi wechseln, ohne einen Neustart durchführen zu müssen. Beachten Sie, dass das System auf den dGPU-Modus eingestellt sein muss, damit G-Sync funktioniert.
Prozessor
Unser Core Ultra 7 155H ist sowohl im Single- als auch im Multi-Thread-Betrieb etwa 10 bis 15 Prozent langsamer als der Core i7-13700HX auf dem m16 R1 des letzten Jahres. Er ist im Wesentlichen gleichauf mit dem aktuellen Ryzen 9 8945HS. Ähnlich wie bei anderen Meteor Lake CPUs ist im Core Ultra 7 155H eine NPU integriert, um KI-Aufgaben wie Microsoft Co-Pilot zu beschleunigen. Die meisten KI-Anwendungen sind derzeit jedoch Cloud-basiert und können nicht lokal ausgeführt werden, so dass die integrierten KI-Fähigkeiten der neuen CPU derzeit sehr begrenzt sind.
Trotz des Leistungsdefizits gegenüber dem Core i7-13700HX ist das m16 R2 in der Lage, den Core Ultra 7 155H deutlich schneller auszuführen als andere Laptops, die mit demselben Prozessor ausgestattet sind. So läuft der Core Ultra 7 155H im aktuellen MSI Prestige 16 fast 20 Prozent langsamer.
Dell plant, in naher Zukunft eine Ultra 9 185H SKU anzubieten, die dazu beitragen soll, den Leistungsunterschied zum Core i7-13700HX zu verringern. Die anspruchsvolleren Core i7-14700HX oder Core i9-14900HX werden aufgrund von thermischen Beschränkungen nicht angeboten; Dell hat der Maximierung des GPU-TGP Vorrang vor dem CPU-TDP gegeben.
Cinebench R15 Multi Dauertest
Cinebench R23: Multi Core | Single Core
Cinebench R20: CPU (Multi Core) | CPU (Single Core)
Cinebench R15: CPU Multi 64Bit | CPU Single 64Bit
Blender: v2.79 BMW27 CPU
7-Zip 18.03: 7z b 4 | 7z b 4 -mmt1
Geekbench 6.7: Multi-Core | Single-Core
Geekbench 5.5: Multi-Core | Single-Core
HWBOT x265 Benchmark v2.2: 4k Preset
LibreOffice : 20 Documents To PDF
R Benchmark 2.5: Overall mean
| CPU Performance Rating | |
| Lenovo Legion 9 16IRX8 | |
| Lenovo Legion Pro 7 16IRX8H -2! | |
| Alienware m16 R1 AMD | |
| HP Omen Transcend 16-u1095ng | |
| Alienware m16 R1 Intel | |
| Alienware x16 R1 -3! | |
| Lenovo Legion Slim 7i 16 Gen 8 -3! | |
| Razer Blade 14 RZ09-0508 | |
| Framework Laptop 16 | |
| Alienware m16 R2 -1! | |
| Asus ROG Zephyrus G16 2024 GU605M | |
| Lenovo Legion Slim 7 16APH8 | |
| Durchschnittliche Intel Core Ultra 7 155H | |
| Lenovo Legion S7 16ARHA7 -2! | |
| Asus ROG Zephyrus M16 GU603H -4! | |
| Geekbench 6.7 / Multi-Core | |
| Lenovo Legion 9 16IRX8 | |
| HP Omen Transcend 16-u1095ng | |
| Alienware m16 R1 Intel | |
| Razer Blade 14 RZ09-0508 | |
| Asus ROG Zephyrus G16 2024 GU605M | |
| Framework Laptop 16 | |
| Lenovo Legion Slim 7 16APH8 | |
| Alienware m16 R2 | |
| Alienware m16 R1 AMD | |
| Durchschnittliche Intel Core Ultra 7 155H (7732 - 13656, n=55) | |
| Geekbench 6.7 / Single-Core | |
| Lenovo Legion 9 16IRX8 | |
| HP Omen Transcend 16-u1095ng | |
| Alienware m16 R1 AMD | |
| Razer Blade 14 RZ09-0508 | |
| Alienware m16 R1 Intel | |
| Framework Laptop 16 | |
| Lenovo Legion Slim 7 16APH8 | |
| Asus ROG Zephyrus G16 2024 GU605M | |
| Alienware m16 R2 | |
| Durchschnittliche Intel Core Ultra 7 155H (1901 - 2473, n=52) | |
Cinebench R23: Multi Core | Single Core
Cinebench R20: CPU (Multi Core) | CPU (Single Core)
Cinebench R15: CPU Multi 64Bit | CPU Single 64Bit
Blender: v2.79 BMW27 CPU
7-Zip 18.03: 7z b 4 | 7z b 4 -mmt1
Geekbench 6.7: Multi-Core | Single-Core
Geekbench 5.5: Multi-Core | Single-Core
HWBOT x265 Benchmark v2.2: 4k Preset
LibreOffice : 20 Documents To PDF
R Benchmark 2.5: Overall mean
* ... kleinere Werte sind besser
AIDA64: FP32 Ray-Trace | FPU Julia | CPU SHA3 | CPU Queen | FPU SinJulia | FPU Mandel | CPU AES | CPU ZLib | FP64 Ray-Trace | CPU PhotoWorxx
| Performance Rating | |
| Lenovo Legion Slim 7 16APH8 | |
| Alienware m16 R1 Intel | |
| Alienware x16 R1 | |
| HP Omen Transcend 16-u1095ng | |
| Alienware m16 R2 | |
| Asus ROG Zephyrus G16 2024 GU605M | |
| Durchschnittliche Intel Core Ultra 7 155H | |
| AIDA64 / FP32 Ray-Trace | |
| Lenovo Legion Slim 7 16APH8 | |
| Alienware m16 R1 Intel | |
| Alienware m16 R2 | |
| Alienware x16 R1 | |
| HP Omen Transcend 16-u1095ng | |
| Asus ROG Zephyrus G16 2024 GU605M | |
| Durchschnittliche Intel Core Ultra 7 155H (6670 - 18470, n=50) | |
| AIDA64 / FPU Julia | |
| Lenovo Legion Slim 7 16APH8 | |
| Alienware m16 R1 Intel | |
| Alienware m16 R2 | |
| Alienware x16 R1 | |
| HP Omen Transcend 16-u1095ng | |
| Asus ROG Zephyrus G16 2024 GU605M | |
| Durchschnittliche Intel Core Ultra 7 155H (40905 - 93181, n=50) | |
| AIDA64 / CPU SHA3 | |
| Alienware m16 R1 Intel | |
| Lenovo Legion Slim 7 16APH8 | |
| HP Omen Transcend 16-u1095ng | |
| Alienware m16 R2 | |
| Alienware x16 R1 | |
| Asus ROG Zephyrus G16 2024 GU605M | |
| Durchschnittliche Intel Core Ultra 7 155H (1940 - 4436, n=50) | |
| AIDA64 / CPU Queen | |
| HP Omen Transcend 16-u1095ng | |
| Alienware x16 R1 | |
| Lenovo Legion Slim 7 16APH8 | |
| Alienware m16 R1 Intel | |
| Asus ROG Zephyrus G16 2024 GU605M | |
| Alienware m16 R2 | |
| Durchschnittliche Intel Core Ultra 7 155H (64698 - 94181, n=50) | |
| AIDA64 / FPU SinJulia | |
| Lenovo Legion Slim 7 16APH8 | |
| Alienware m16 R1 Intel | |
| HP Omen Transcend 16-u1095ng | |
| Alienware x16 R1 | |
| Asus ROG Zephyrus G16 2024 GU605M | |
| Alienware m16 R2 | |
| Durchschnittliche Intel Core Ultra 7 155H (5639 - 10647, n=50) | |
| AIDA64 / FPU Mandel | |
| Lenovo Legion Slim 7 16APH8 | |
| Alienware m16 R1 Intel | |
| Alienware m16 R2 | |
| Alienware x16 R1 | |
| HP Omen Transcend 16-u1095ng | |
| Asus ROG Zephyrus G16 2024 GU605M | |
| Durchschnittliche Intel Core Ultra 7 155H (18236 - 47685, n=50) | |
| AIDA64 / CPU AES | |
| Alienware m16 R1 Intel | |
| HP Omen Transcend 16-u1095ng | |
| Alienware m16 R2 | |
| Alienware x16 R1 | |
| Asus ROG Zephyrus G16 2024 GU605M | |
| Durchschnittliche Intel Core Ultra 7 155H (45713 - 152179, n=50) | |
| Lenovo Legion Slim 7 16APH8 | |
| AIDA64 / CPU ZLib | |
| Alienware m16 R1 Intel | |
| HP Omen Transcend 16-u1095ng | |
| Alienware x16 R1 | |
| Alienware m16 R2 | |
| Asus ROG Zephyrus G16 2024 GU605M | |
| Lenovo Legion Slim 7 16APH8 | |
| Durchschnittliche Intel Core Ultra 7 155H (557 - 1250, n=50) | |
| AIDA64 / FP64 Ray-Trace | |
| Lenovo Legion Slim 7 16APH8 | |
| Alienware m16 R1 Intel | |
| Alienware x16 R1 | |
| Alienware m16 R2 | |
| HP Omen Transcend 16-u1095ng | |
| Asus ROG Zephyrus G16 2024 GU605M | |
| Durchschnittliche Intel Core Ultra 7 155H (3569 - 9802, n=50) | |
| AIDA64 / CPU PhotoWorxx | |
| Alienware x16 R1 | |
| HP Omen Transcend 16-u1095ng | |
| Asus ROG Zephyrus G16 2024 GU605M | |
| Durchschnittliche Intel Core Ultra 7 155H (32719 - 54223, n=50) | |
| Lenovo Legion Slim 7 16APH8 | |
| Alienware m16 R2 | |
| Alienware m16 R1 Intel | |
Stresstest
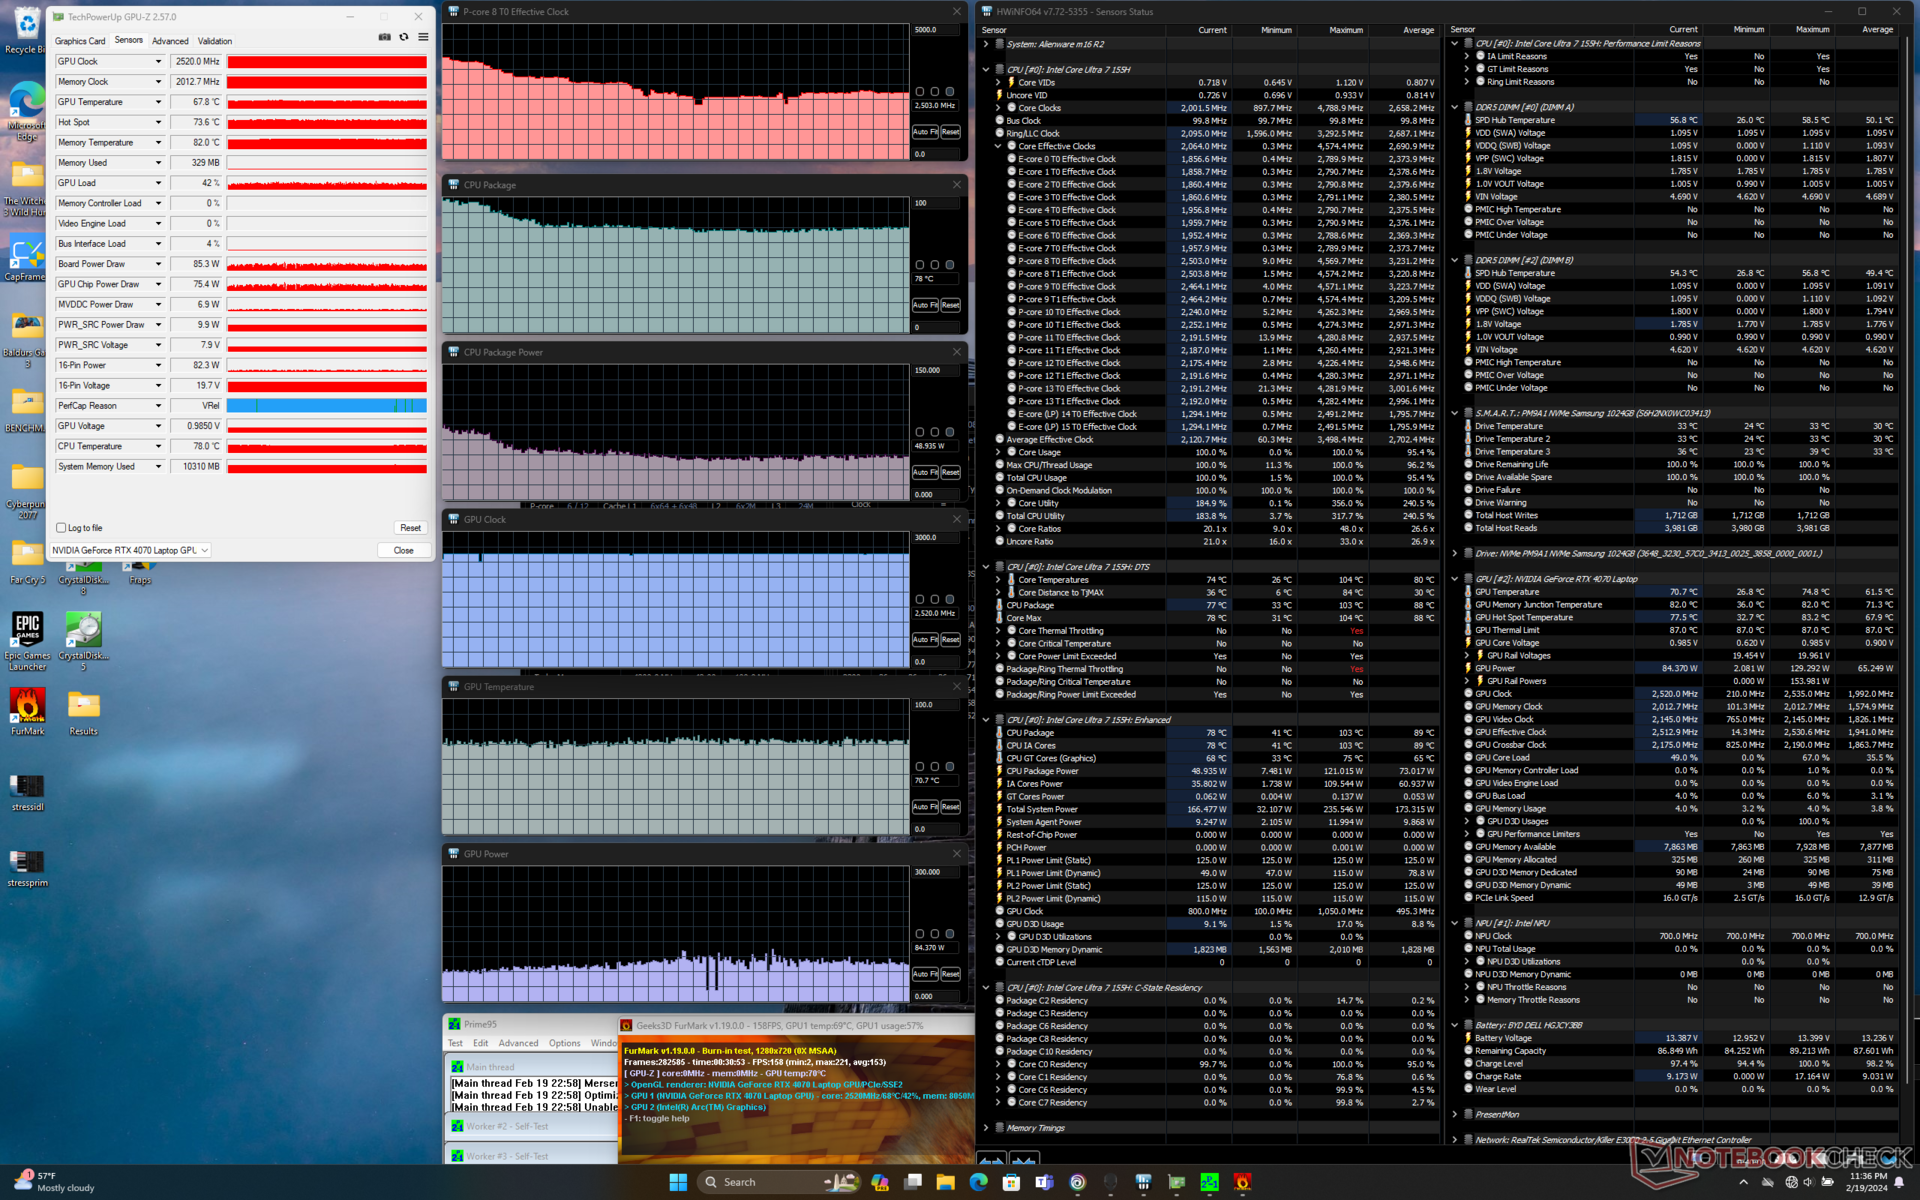
Wenn Prime95 im Overdrive-Modus läuft, steigt die CPU für einige Sekunden auf 4,6 GHz und 115 W, bevor sie stetig abfällt und sich schließlich bei 3,4 GHz und 102 W stabilisiert.
Interessanterweise gibt es fast keine Veränderungen bei den GPU-Taktraten oder der Leistungsaufnahme des Boards, wenn Witcher 3 im Modus Balanced, Performance oder Overdrive läuft, was mit unseren Ergebnissen weiter unten im Abschnitt zur GPU-Leistung korreliert. Stattdessen sinkt die GPU-Temperatur tendenziell im Performance- oder Overdrive-Modus, da die Lüfter in diesen Modi lauter sind. Mit anderen Worten: Taktraten und Echtzeit-TGP bleiben konstant, während sich das Lüftergeräusch ändert. Es kann zu kleinen Änderungen der CPU-Leistung zwischen den Modi kommen, aber die meisten Spiele sind ohnehin nicht CPU-gebunden.
Es ist erwähnenswert, dass die GPU laut Nvidia Control Panel zwar mit 140 W TGP angegeben ist, sich aber beim Spielen bei 106 W einpendelt. Wir konnten ein temporäres Maximum von 121 W erreichen.


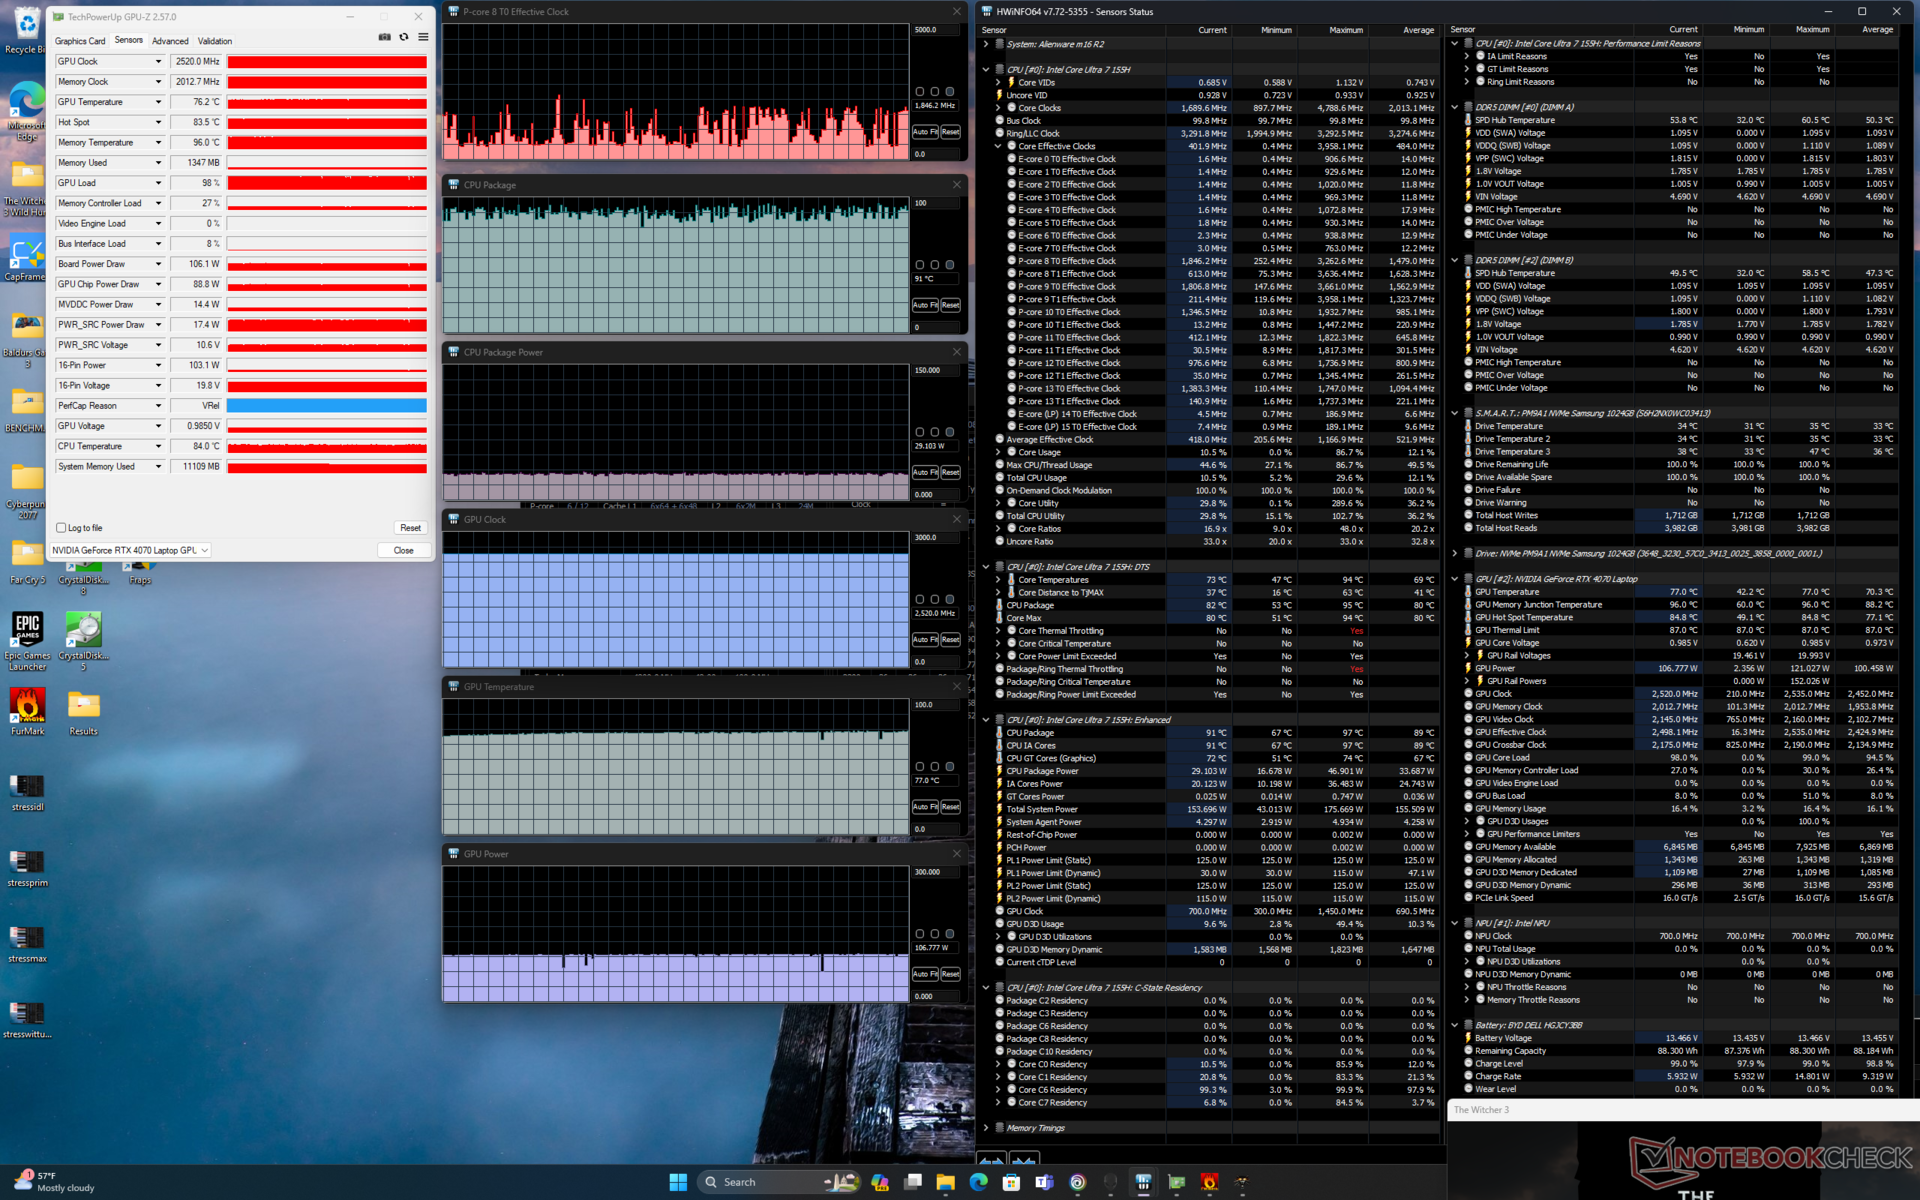
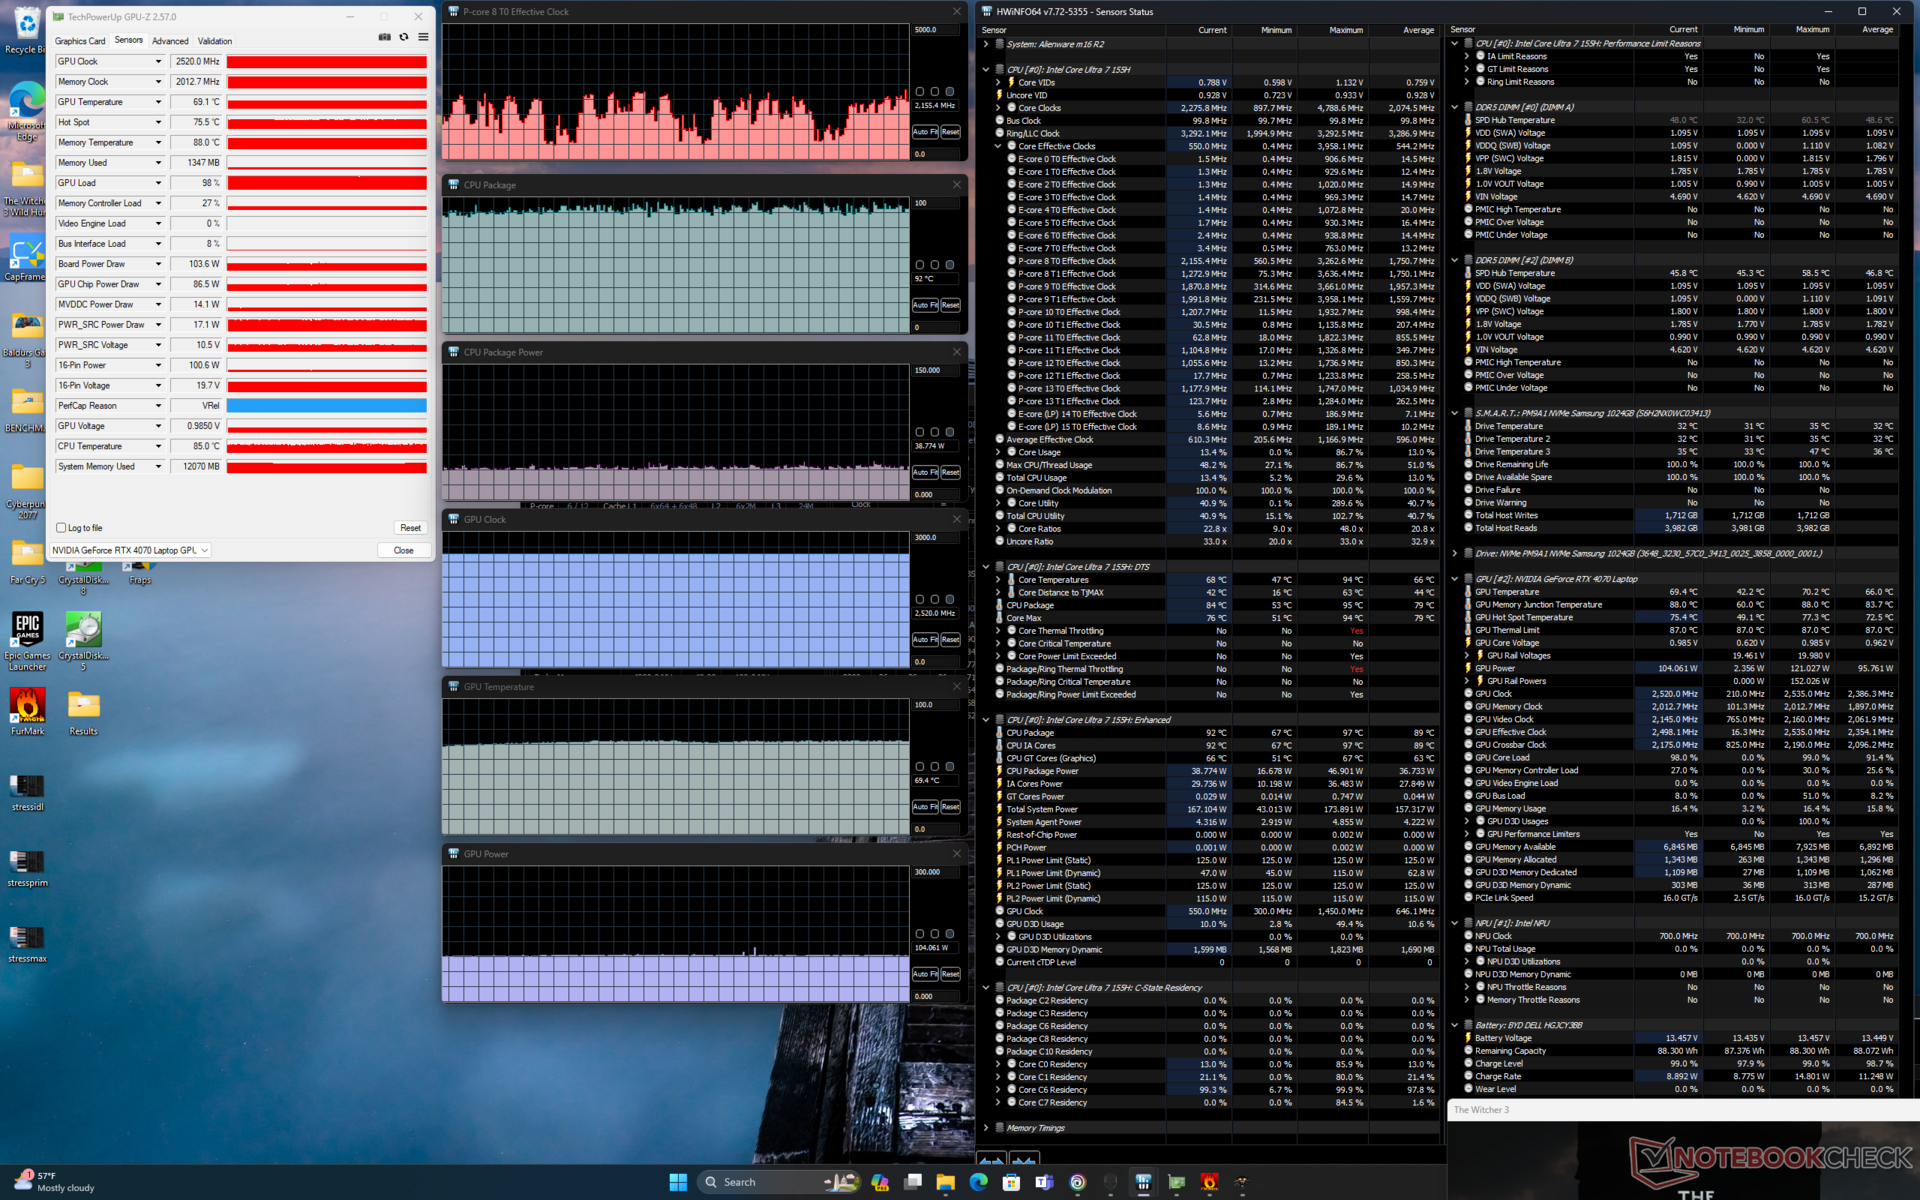
| CPU-Takt (GHz) | GPU-Takt (MHz) | Durchschnittliche CPU-Temperatur (°C) | Durchschnittliche GPU-Temperatur (°C) | |
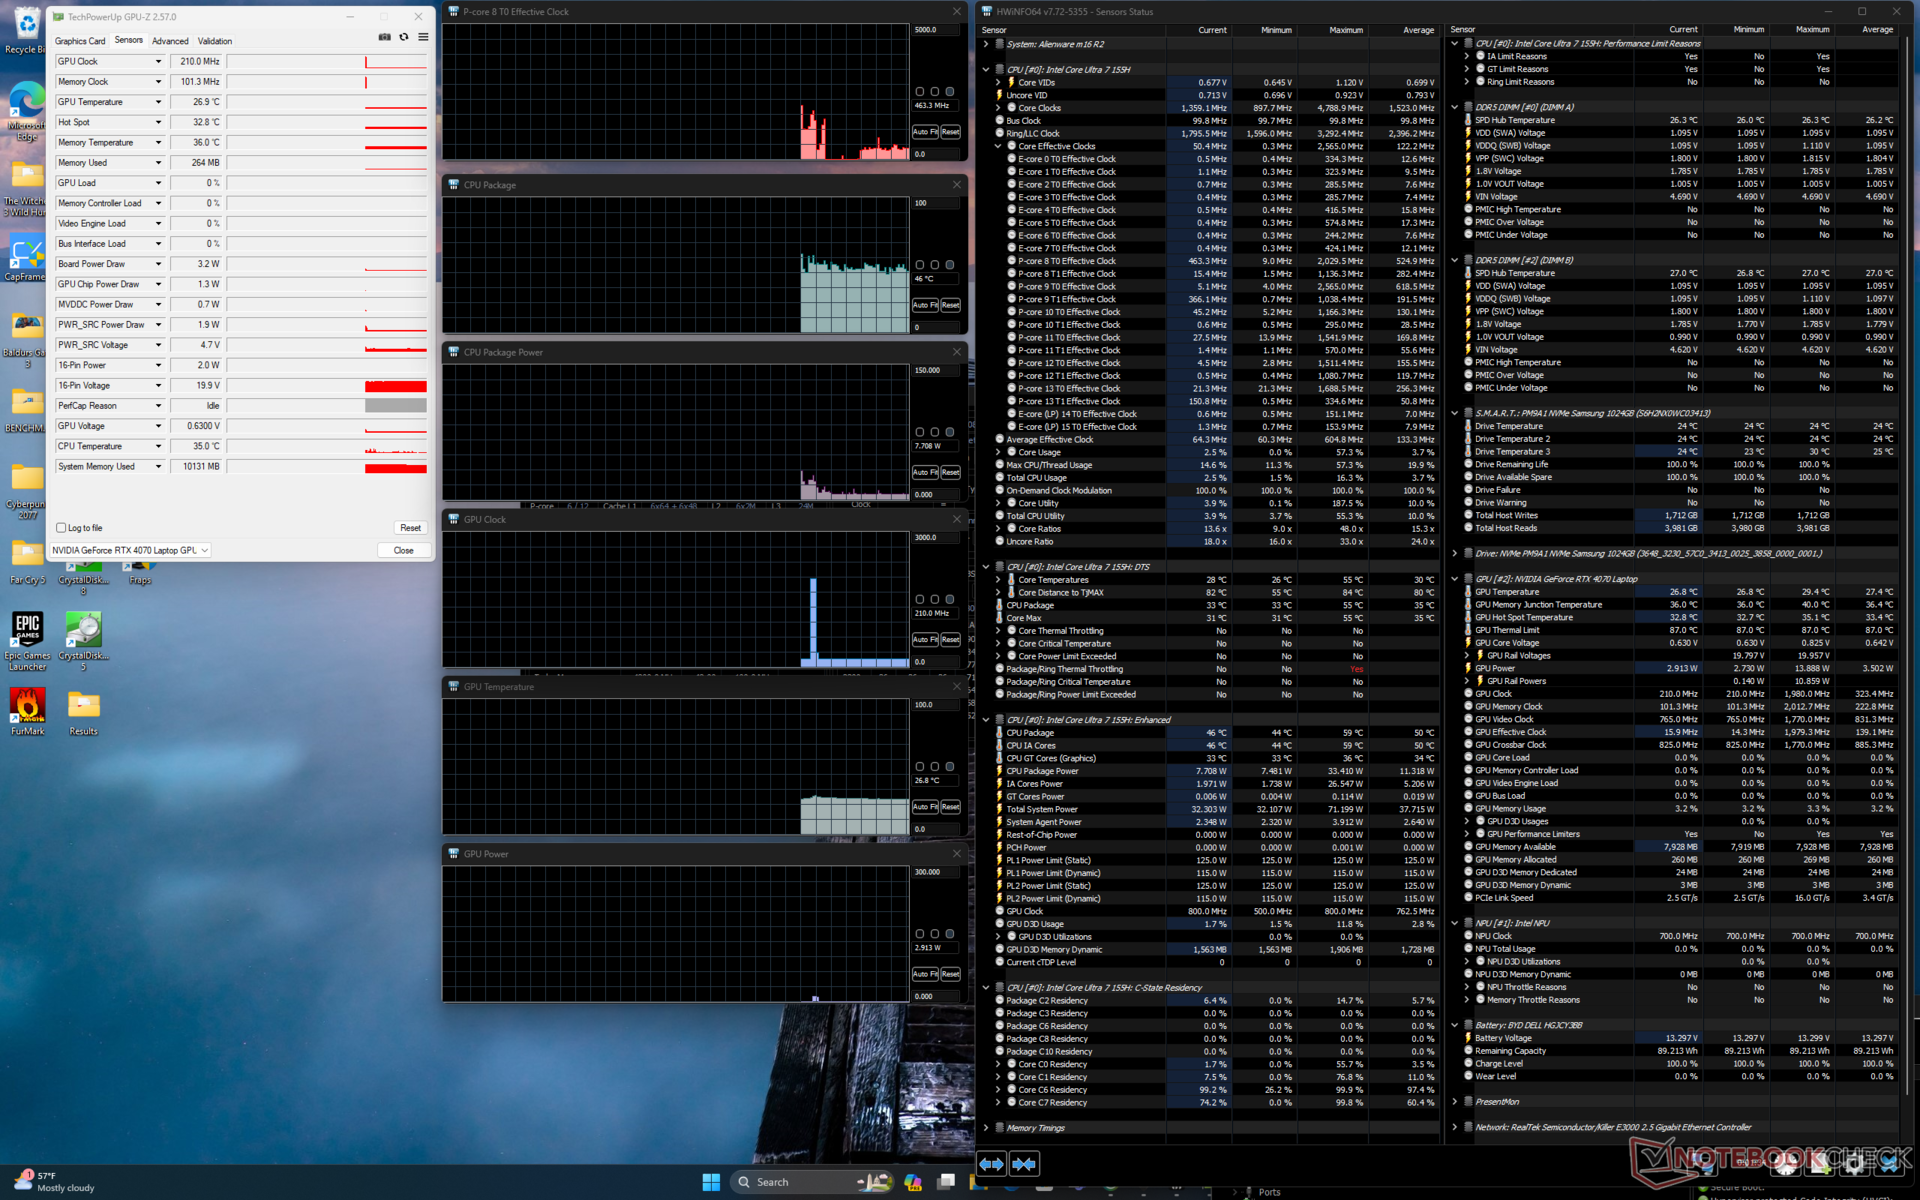
| System im Leerlauf | -- | -- | 46 | 27 |
| Prime95 Stresstest | 3.4 | -- | 100 | 47 |
| Prime95 + FurMark Stresstest | 2.5 | 2520 | 78 | 71 |
| Witcher 3 Stresstest (Balanced-Modus) | ~1.8 | 2502 | 93 | 80 |
| Witcher 3 Stresstest (erformance-Modus) | ~1.8 | 2520 | 91 | 77 |
| Witcher 3 Stresstest (Overdrive-Modus) | ~2.0 | 2520 | 92 | 69 |
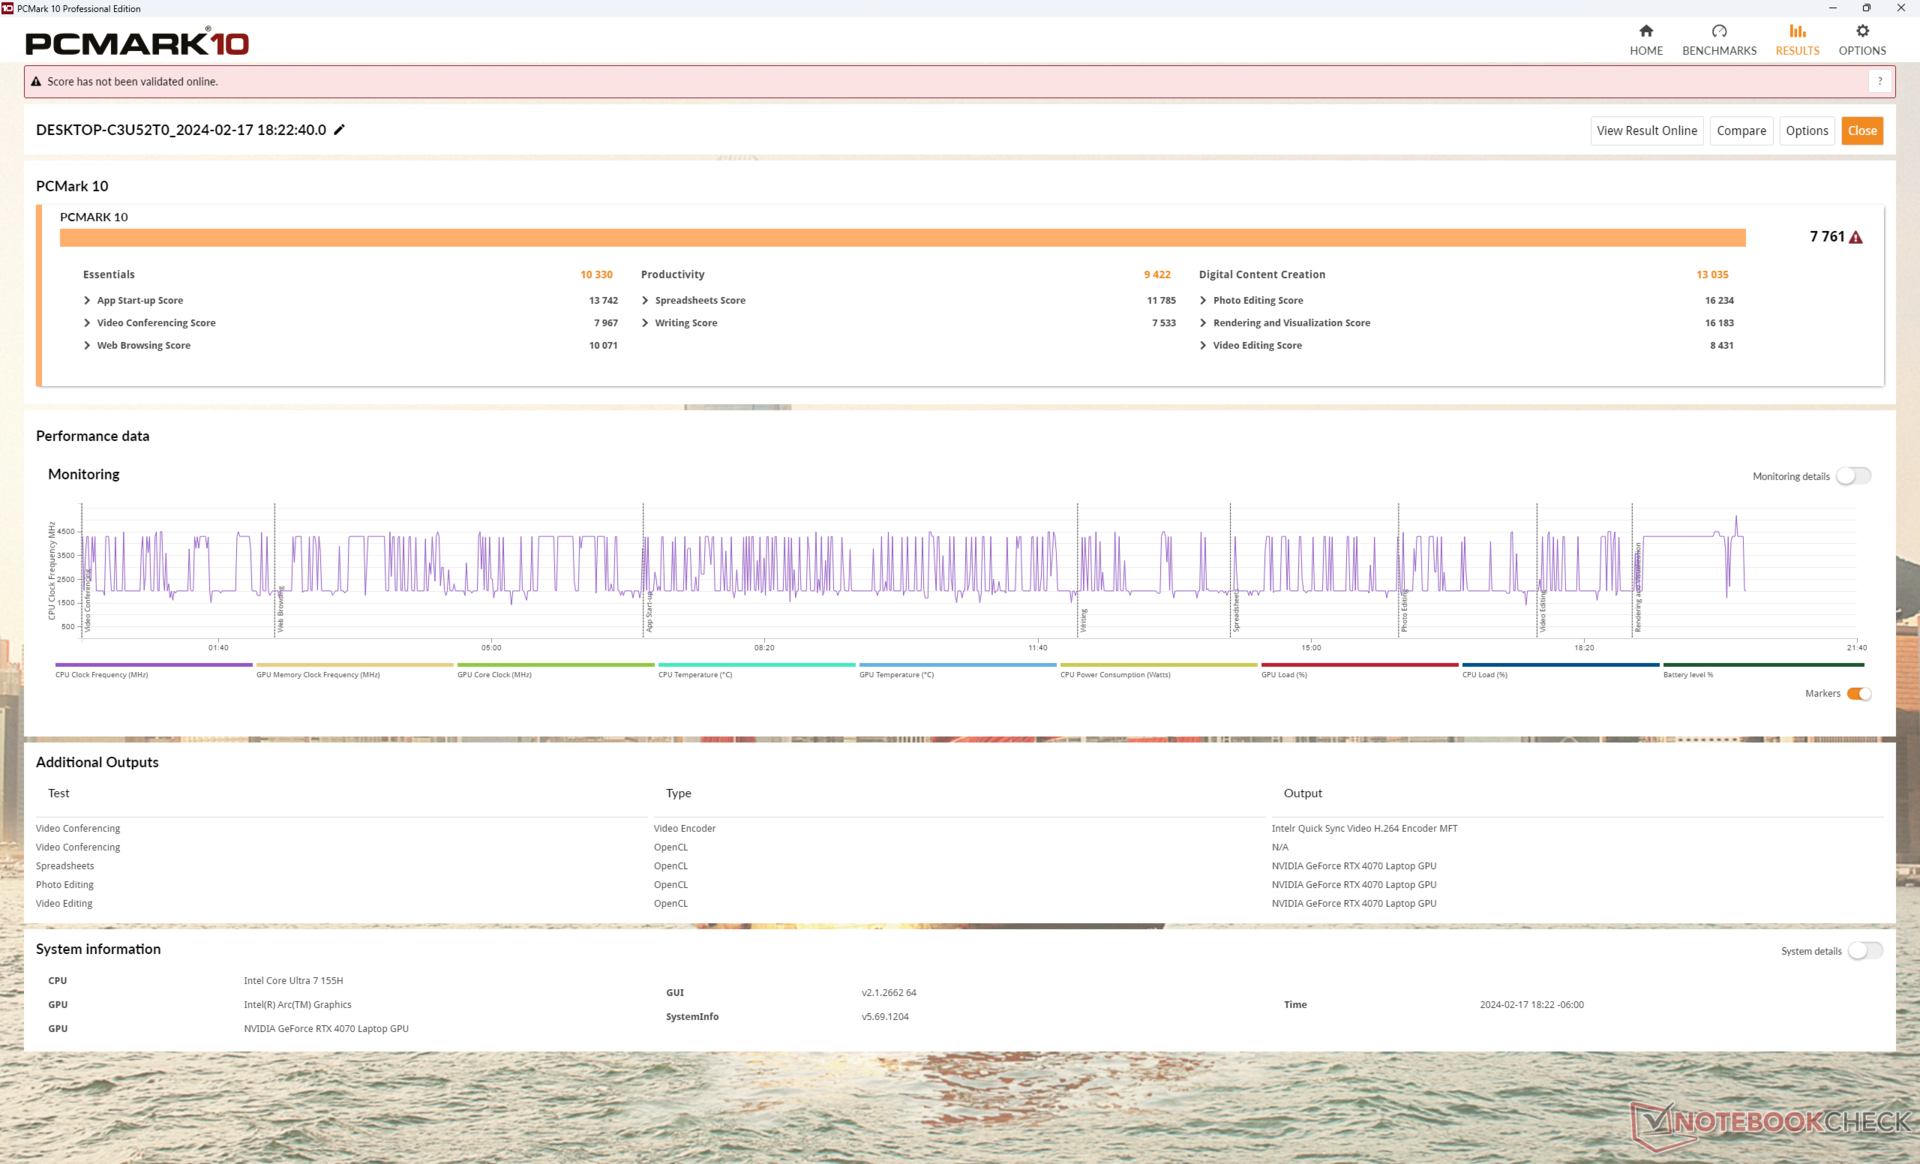
System Performance
Die Ergebnisse des PCMark 10 sind mit denen des m16 R1 vergleichbar, mit Ausnahme unseres niedrigeren Ergebnisses im Subtest "Erstellung digitaler Inhalte", da das m16 R2 mit der langsameren RTX 4070 ausgestattet ist. Die Systemleistung ist ansonsten sehr ähnlich und zeigt trotz der neueren CPU-Generation keine signifikanten Verbesserungen bei den meisten alltäglichen Belastungen.
CrossMark: Overall | Productivity | Creativity | Responsiveness
WebXPRT 3: Overall
WebXPRT 4: Overall
Mozilla Kraken 1.1: Total
| PCMark 10 / Score | |
| Alienware x16 R1 | |
| HP Omen Transcend 16-u1095ng | |
| Alienware m16 R2 | |
| Lenovo Legion Slim 7 16APH8 | |
| Durchschnittliche Intel Core Ultra 7 155H, NVIDIA GeForce RTX 4070 Laptop GPU (7084 - 7761, n=4) | |
| Alienware m16 R1 Intel | |
| Asus ROG Zephyrus G16 2024 GU605M | |
| PCMark 10 / Essentials | |
| Alienware x16 R1 | |
| Alienware m16 R1 Intel | |
| HP Omen Transcend 16-u1095ng | |
| Lenovo Legion Slim 7 16APH8 | |
| Alienware m16 R2 | |
| Durchschnittliche Intel Core Ultra 7 155H, NVIDIA GeForce RTX 4070 Laptop GPU (10038 - 10393, n=4) | |
| Asus ROG Zephyrus G16 2024 GU605M | |
| PCMark 10 / Productivity | |
| HP Omen Transcend 16-u1095ng | |
| Alienware x16 R1 | |
| Lenovo Legion Slim 7 16APH8 | |
| Alienware m16 R1 Intel | |
| Alienware m16 R2 | |
| Durchschnittliche Intel Core Ultra 7 155H, NVIDIA GeForce RTX 4070 Laptop GPU (9192 - 9518, n=4) | |
| Asus ROG Zephyrus G16 2024 GU605M | |
| PCMark 10 / Digital Content Creation | |
| Alienware x16 R1 | |
| Alienware m16 R2 | |
| HP Omen Transcend 16-u1095ng | |
| Durchschnittliche Intel Core Ultra 7 155H, NVIDIA GeForce RTX 4070 Laptop GPU (10100 - 13035, n=4) | |
| Lenovo Legion Slim 7 16APH8 | |
| Asus ROG Zephyrus G16 2024 GU605M | |
| Alienware m16 R1 Intel | |
| CrossMark / Overall | |
| Alienware m16 R1 Intel | |
| Alienware x16 R1 | |
| Alienware m16 R2 | |
| Durchschnittliche Intel Core Ultra 7 155H, NVIDIA GeForce RTX 4070 Laptop GPU (1687 - 1848, n=4) | |
| Asus ROG Zephyrus G16 2024 GU605M | |
| CrossMark / Productivity | |
| Alienware m16 R1 Intel | |
| Alienware x16 R1 | |
| Alienware m16 R2 | |
| Durchschnittliche Intel Core Ultra 7 155H, NVIDIA GeForce RTX 4070 Laptop GPU (1589 - 1750, n=4) | |
| Asus ROG Zephyrus G16 2024 GU605M | |
| CrossMark / Creativity | |
| Alienware m16 R1 Intel | |
| Alienware x16 R1 | |
| Asus ROG Zephyrus G16 2024 GU605M | |
| Durchschnittliche Intel Core Ultra 7 155H, NVIDIA GeForce RTX 4070 Laptop GPU (1860 - 2014, n=4) | |
| Alienware m16 R2 | |
| CrossMark / Responsiveness | |
| Alienware x16 R1 | |
| Alienware m16 R1 Intel | |
| Alienware m16 R2 | |
| Durchschnittliche Intel Core Ultra 7 155H, NVIDIA GeForce RTX 4070 Laptop GPU (1424 - 1683, n=4) | |
| Asus ROG Zephyrus G16 2024 GU605M | |
| WebXPRT 3 / Overall | |
| HP Omen Transcend 16-u1095ng | |
| Alienware m16 R1 Intel | |
| Alienware x16 R1 | |
| Alienware m16 R2 | |
| Asus ROG Zephyrus G16 2024 GU605M | |
| Durchschnittliche Intel Core Ultra 7 155H, NVIDIA GeForce RTX 4070 Laptop GPU (264 - 294, n=4) | |
| WebXPRT 4 / Overall | |
| Alienware m16 R1 Intel | |
| Alienware x16 R1 | |
| Alienware m16 R2 | |
| Asus ROG Zephyrus G16 2024 GU605M | |
| Durchschnittliche Intel Core Ultra 7 155H, NVIDIA GeForce RTX 4070 Laptop GPU (247 - 257, n=4) | |
| Mozilla Kraken 1.1 / Total | |
| Durchschnittliche Intel Core Ultra 7 155H, NVIDIA GeForce RTX 4070 Laptop GPU (546 - 568, n=3) | |
| Asus ROG Zephyrus G16 2024 GU605M | |
| Alienware m16 R2 | |
| Alienware m16 R1 Intel | |
| Alienware x16 R1 | |
| HP Omen Transcend 16-u1095ng | |
* ... kleinere Werte sind besser
| PCMark 10 Score | 7761 Punkte | |
Hilfe | ||
| AIDA64 / Memory Copy | |
| Asus ROG Zephyrus G16 2024 GU605M | |
| Durchschnittliche Intel Core Ultra 7 155H (62397 - 96791, n=50) | |
| HP Omen Transcend 16-u1095ng | |
| Alienware x16 R1 | |
| Lenovo Legion Slim 7 16APH8 | |
| Alienware m16 R2 | |
| Alienware m16 R1 Intel | |
| AIDA64 / Memory Read | |
| Asus ROG Zephyrus G16 2024 GU605M | |
| HP Omen Transcend 16-u1095ng | |
| Durchschnittliche Intel Core Ultra 7 155H (60544 - 90647, n=50) | |
| Alienware m16 R2 | |
| Alienware x16 R1 | |
| Alienware m16 R1 Intel | |
| Lenovo Legion Slim 7 16APH8 | |
| AIDA64 / Memory Write | |
| Lenovo Legion Slim 7 16APH8 | |
| Alienware x16 R1 | |
| HP Omen Transcend 16-u1095ng | |
| Asus ROG Zephyrus G16 2024 GU605M | |
| Durchschnittliche Intel Core Ultra 7 155H (58692 - 93451, n=50) | |
| Alienware m16 R2 | |
| Alienware m16 R1 Intel | |
| AIDA64 / Memory Latency | |
| Durchschnittliche Intel Core Ultra 7 155H (116.2 - 233, n=50) | |
| Asus ROG Zephyrus G16 2024 GU605M | |
| Alienware m16 R2 | |
| Alienware x16 R1 | |
| Lenovo Legion Slim 7 16APH8 | |
| Alienware m16 R1 Intel | |
| HP Omen Transcend 16-u1095ng | |
* ... kleinere Werte sind besser
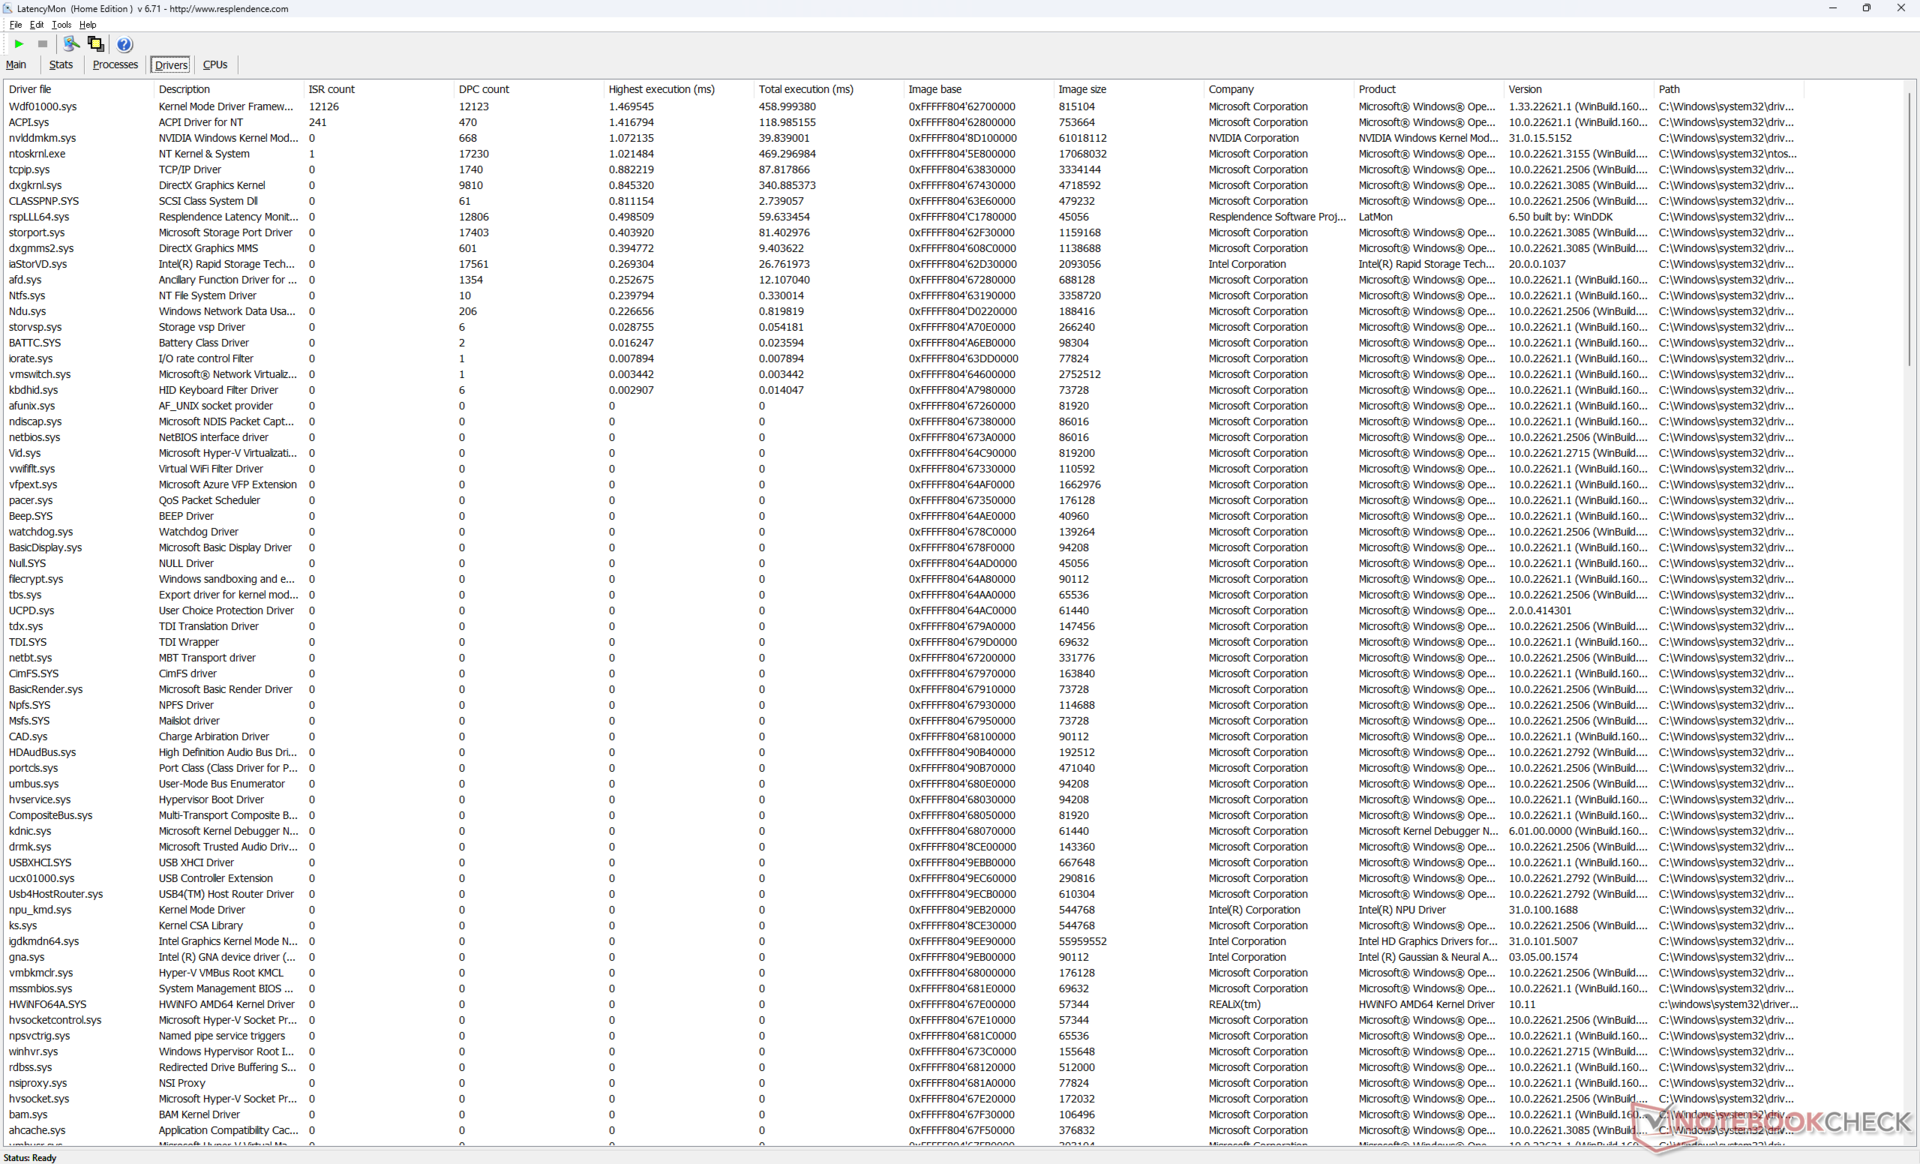
DPC-Latenzen
LatencyMon zeigt DPC-Probleme beim Öffnen mehrerer Tabs unserer Homepage. Die 4K-Videowiedergabe bei 60 FPS ist ansonsten perfekt, es werden keine Bildaussetzer aufgezeichnet.
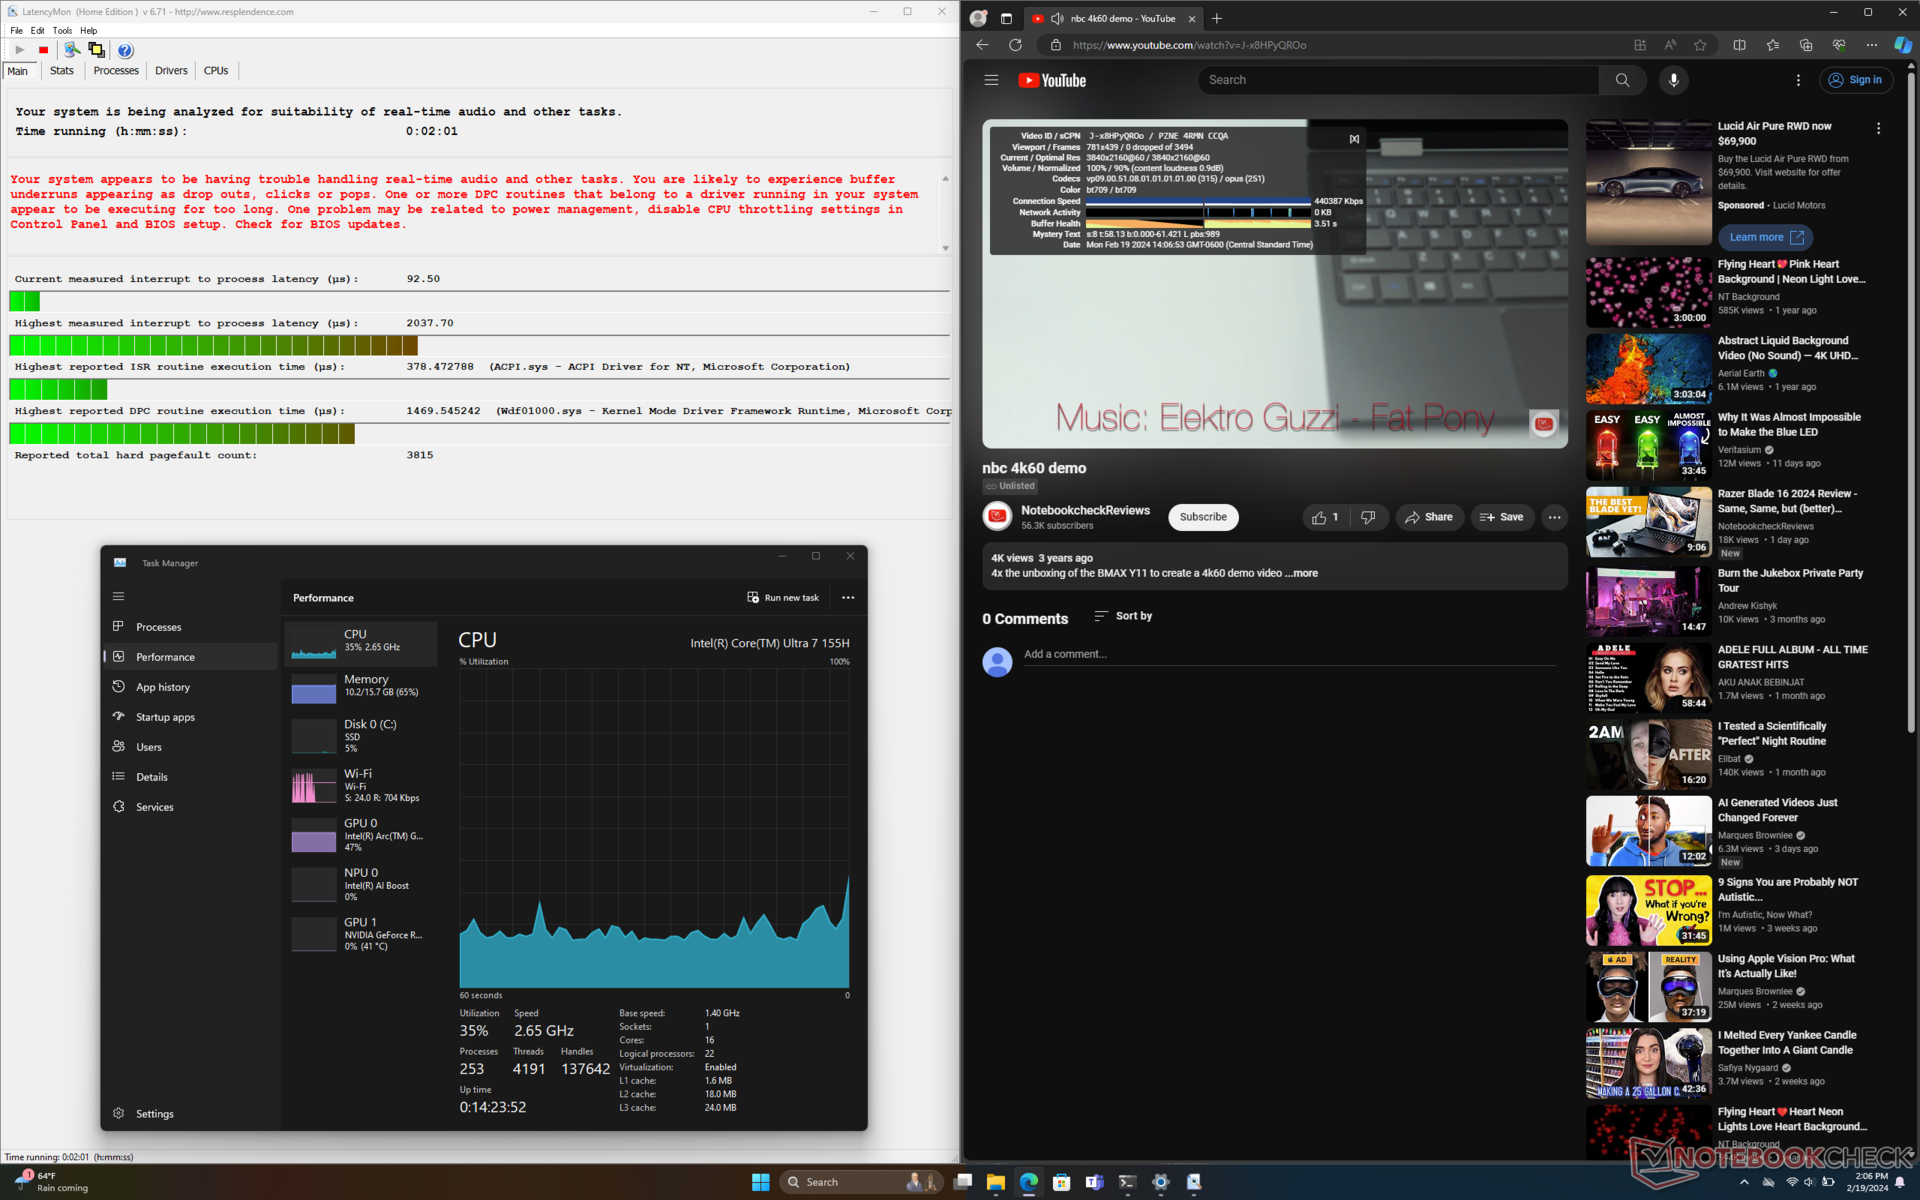
| DPC Latencies / LatencyMon - interrupt to process latency (max), Web, Youtube, Prime95 | |
| Alienware m16 R1 Intel | |
| Asus ROG Zephyrus G16 2024 GU605M | |
| Alienware m16 R2 | |
| HP Omen Transcend 16-u1095ng | |
| Alienware x16 R1 | |
| Lenovo Legion Slim 7 16APH8 | |
* ... kleinere Werte sind besser
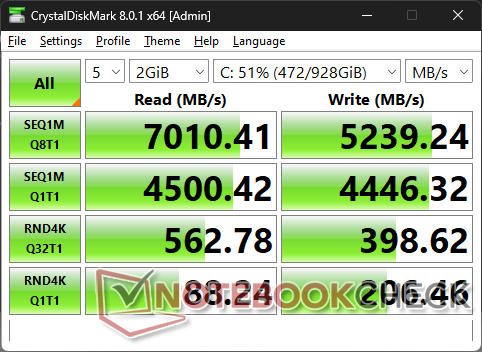
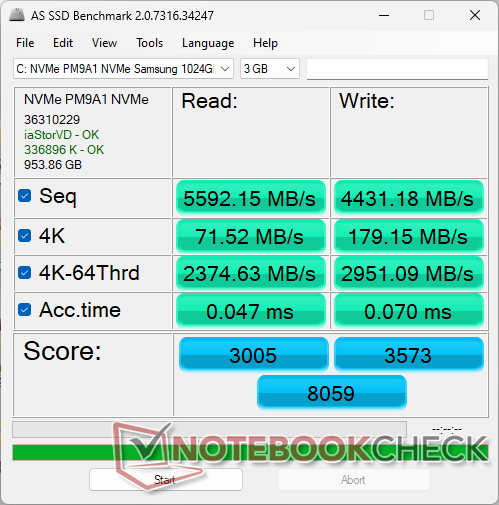
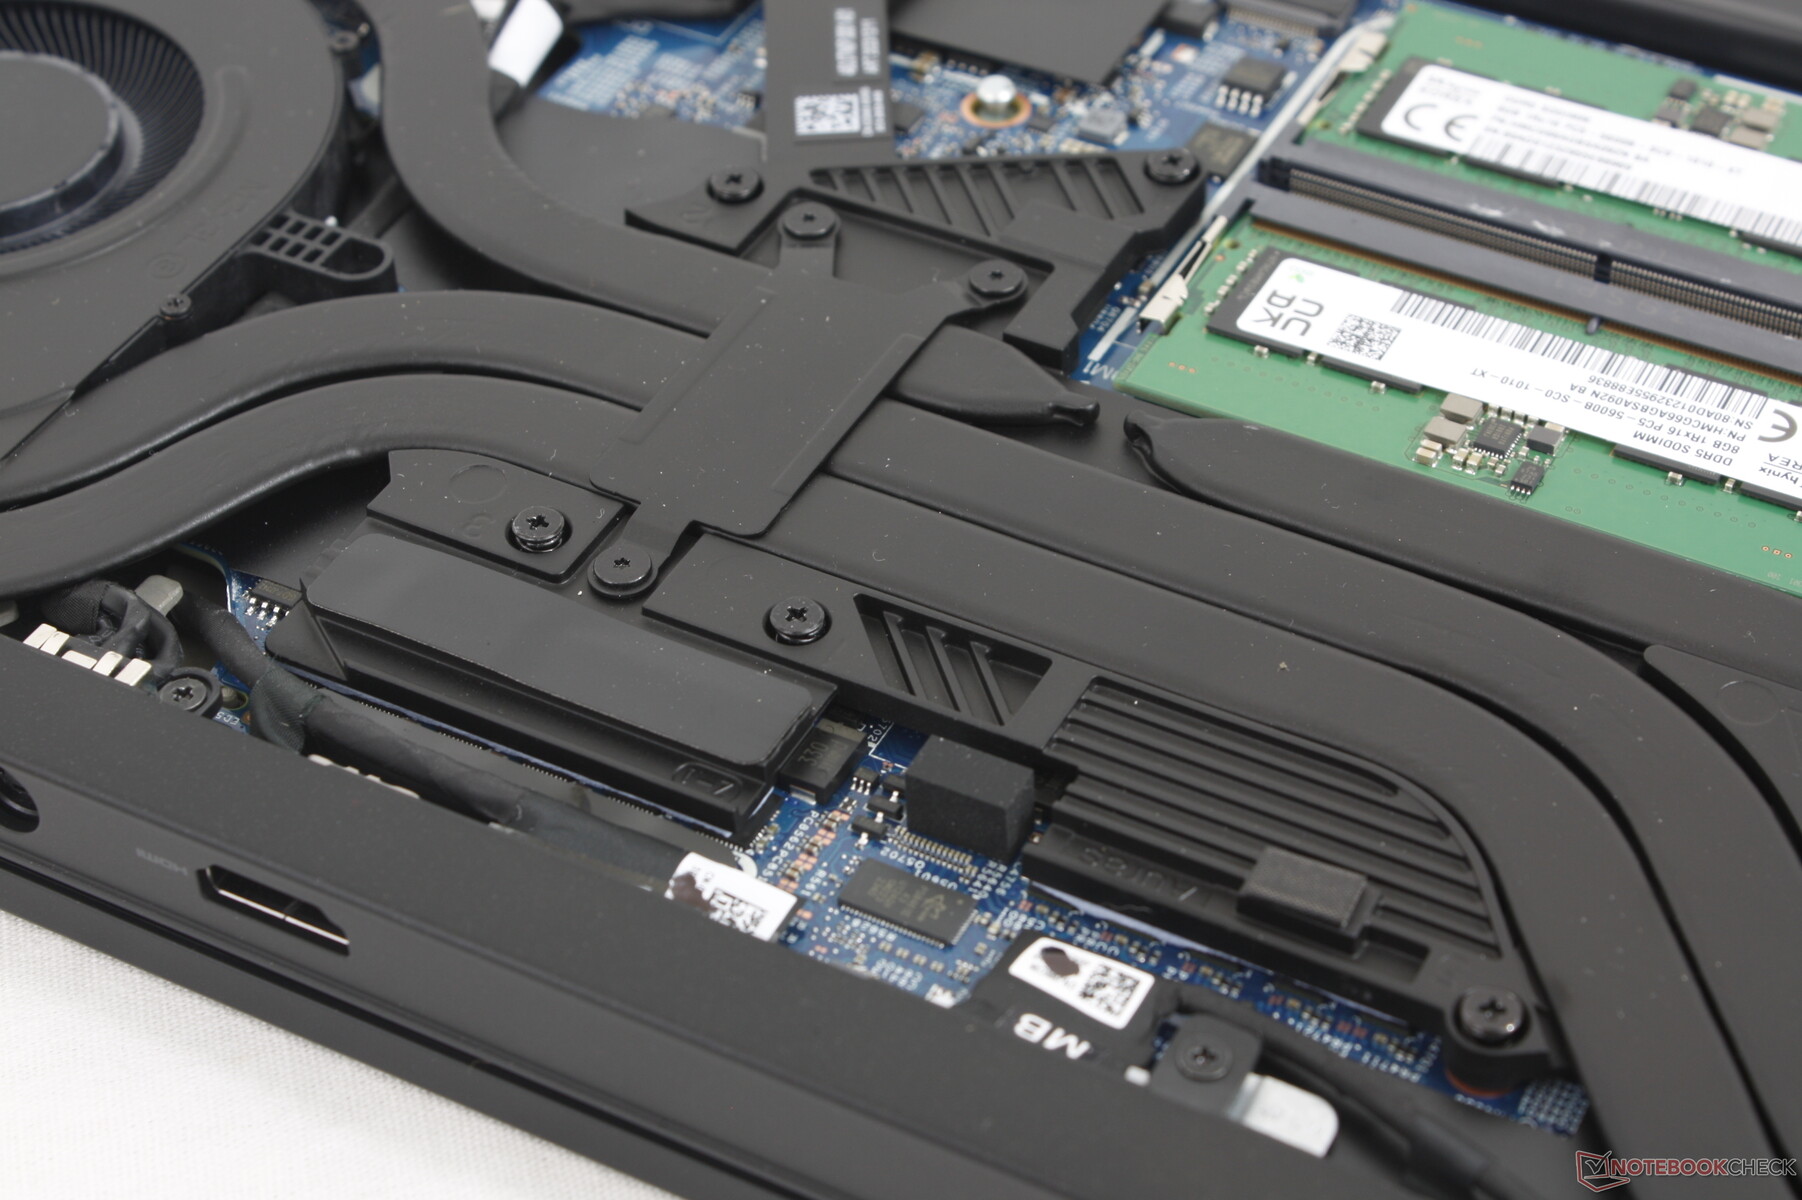
Massenspeicher
Unser Gerät wird mit der Samsung PM9A1 PCIe4 x4 NVMe SSD anstelle der Kioxia des letztjährigen m16 R1 ausgeliefert. Das Laufwerk hat keine Probleme, seine maximale Übertragungsrate von 7000 MB/s über längere Zeiträume aufrechtzuerhalten. Für jeden der beiden M.2 2280-Steckplätze ist ein Wärmeableiter vorgesehen.

| Drive Performance Rating - Percent | |
| Alienware x16 R1 | |
| Alienware m16 R2 | |
| Alienware m16 R1 Intel | |
| Lenovo Legion Slim 7 16APH8 | |
| HP Omen Transcend 16-u1095ng | |
| Asus ROG Zephyrus G16 2024 GU605M | |
* ... kleinere Werte sind besser
Dauerleistung Lesen: DiskSpd Read Loop, Queue Depth 8
GPU Performance
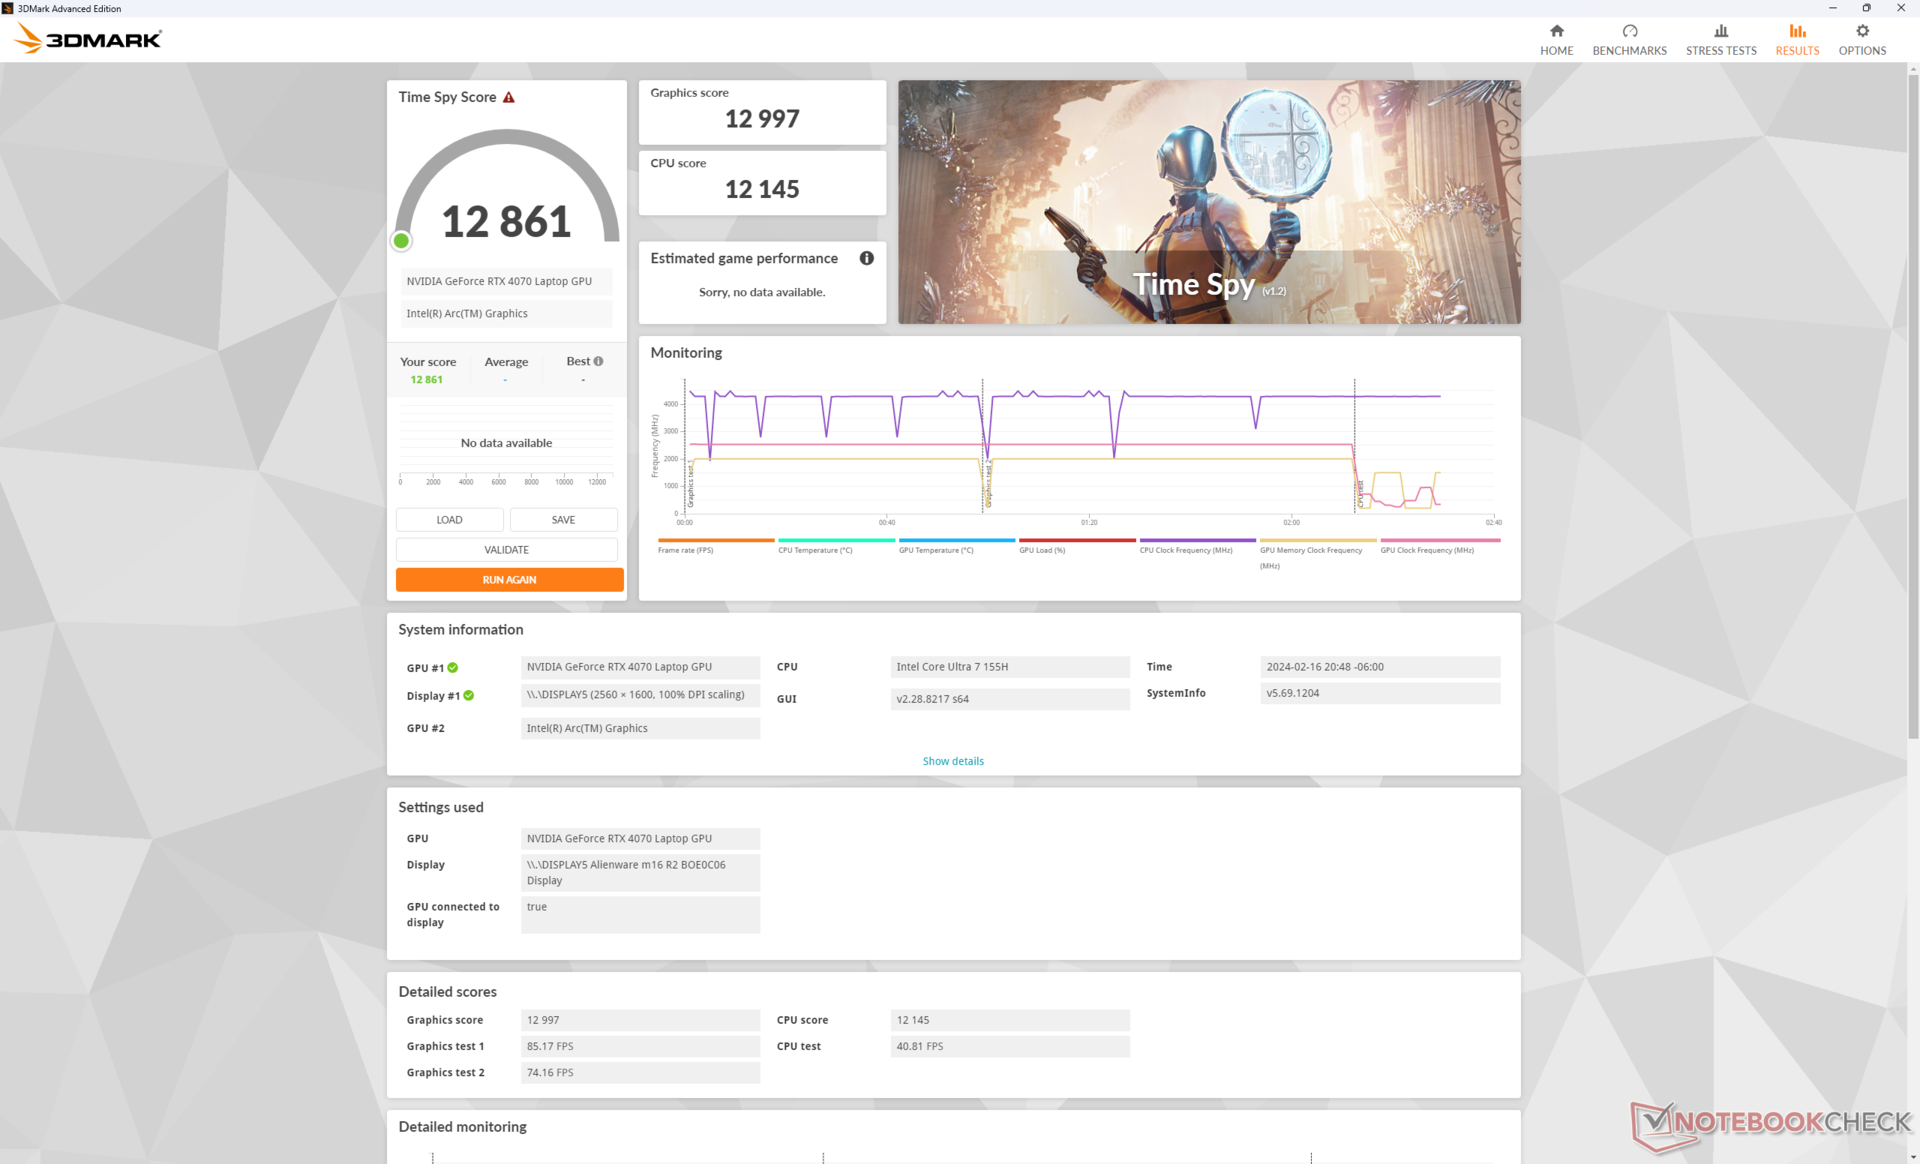
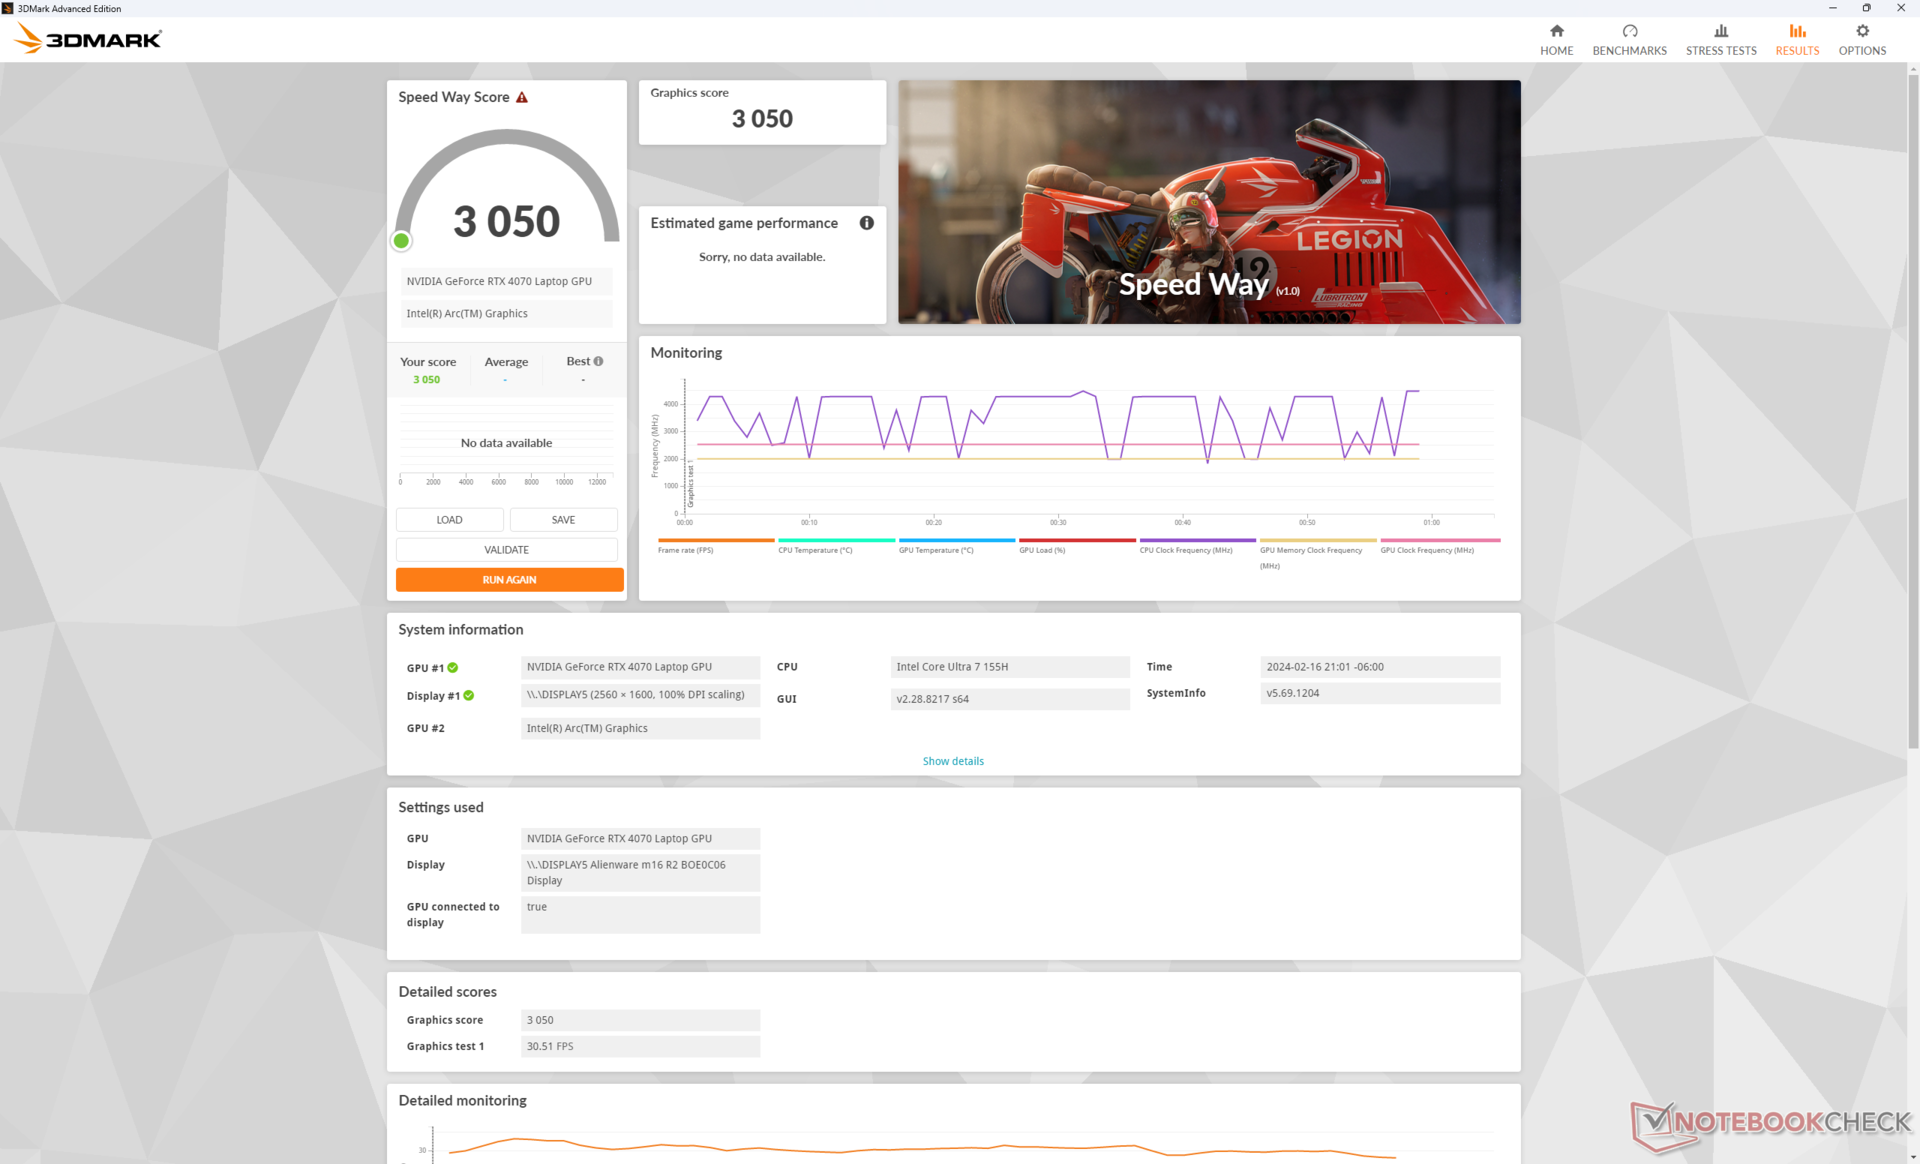
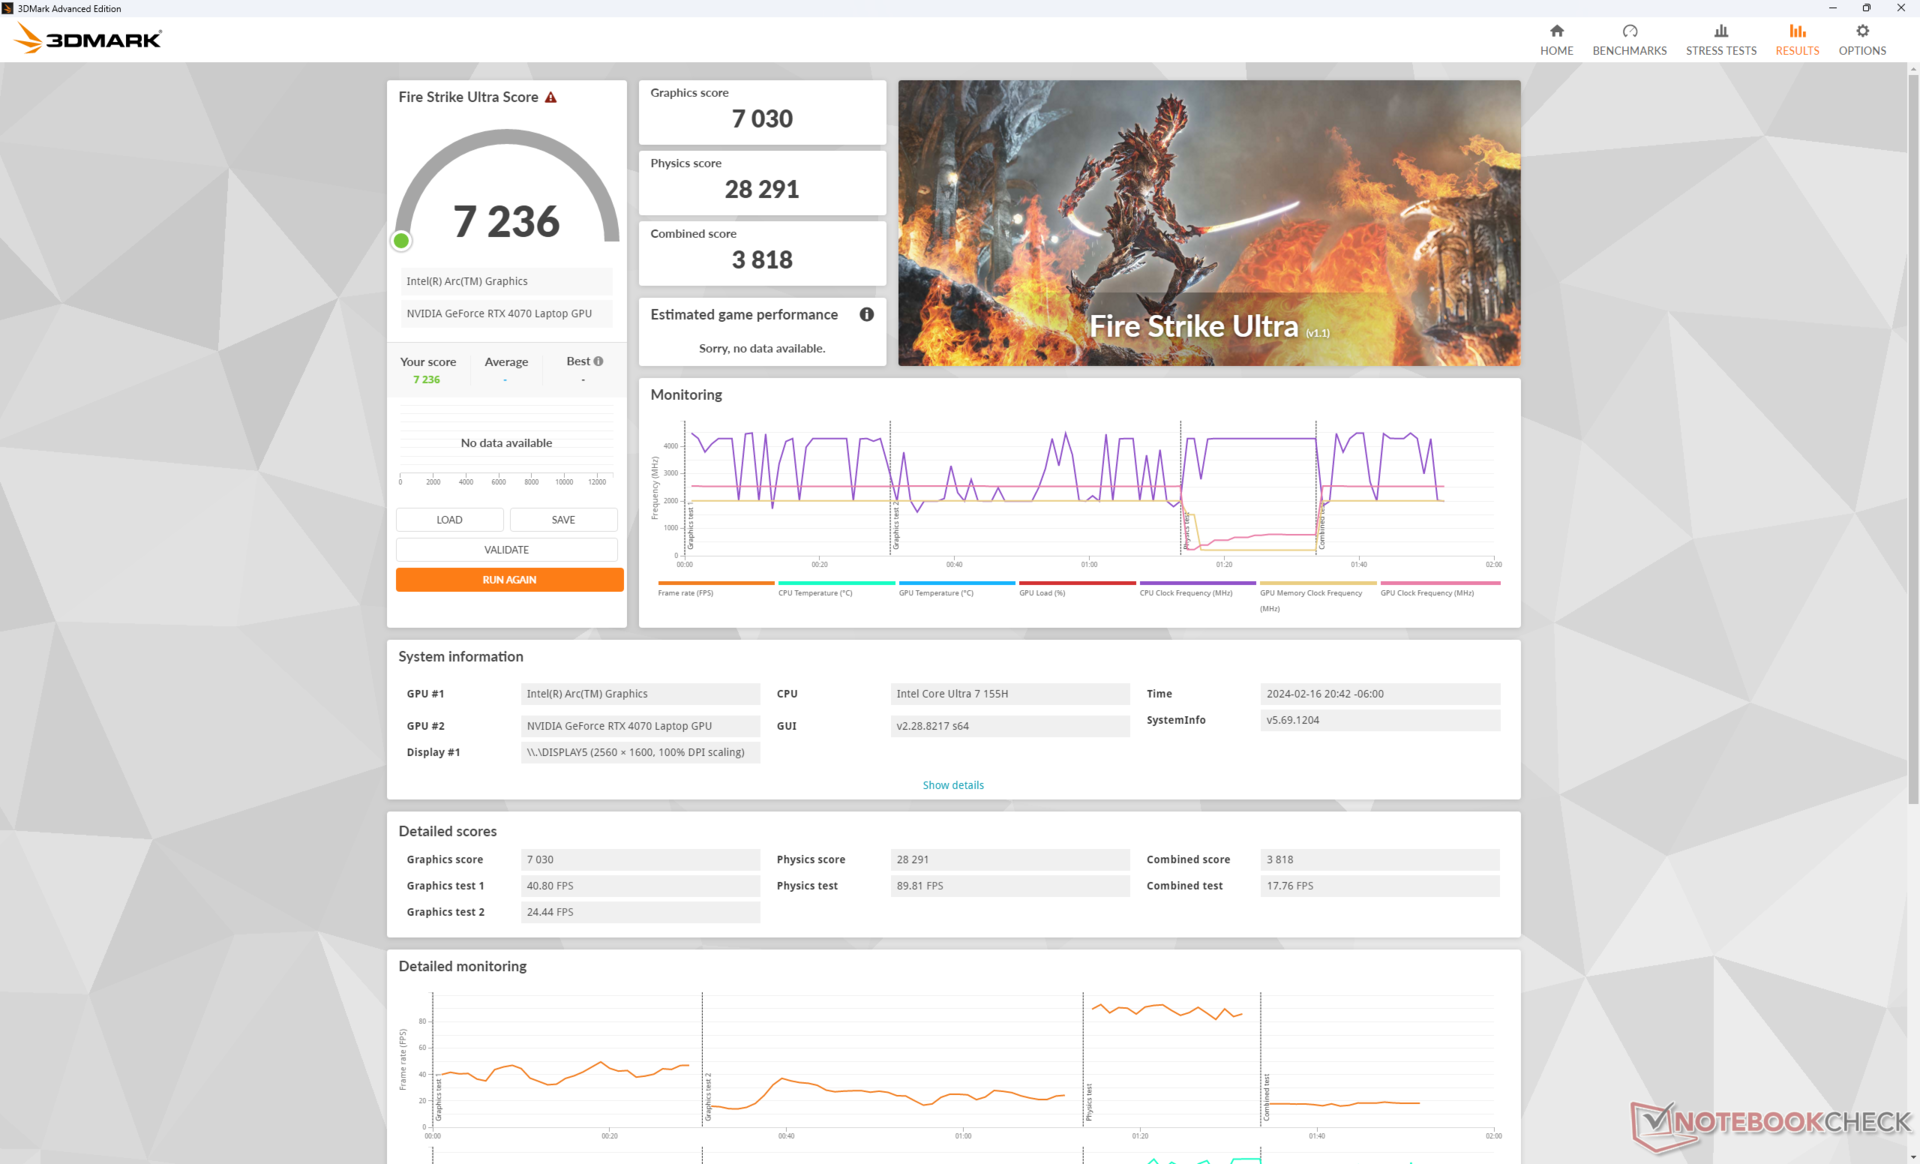
Die Grafikleistung unserer 140 W GeForce RTX 4070 ist etwa 10% schneller als der durchschnittliche Laptop in unserer Datenbank, der mit der gleichen GPU ausgestattet ist. Obwohl das m16 R1 aufgrund der fehlenden RTX 4080 oder 4090-Optionen um 30 bis 45 Prozent langsamer ist, ist es zumindest erfreulich, dass die RTX 4070 hier besser abschneidet als erwartet. Nutzer, die eine RTX 4080 oder 4090 wollen, müssen stattdessen die ältere m16 R1 oder die teurere Alienware x16 Serie in Betracht ziehen.
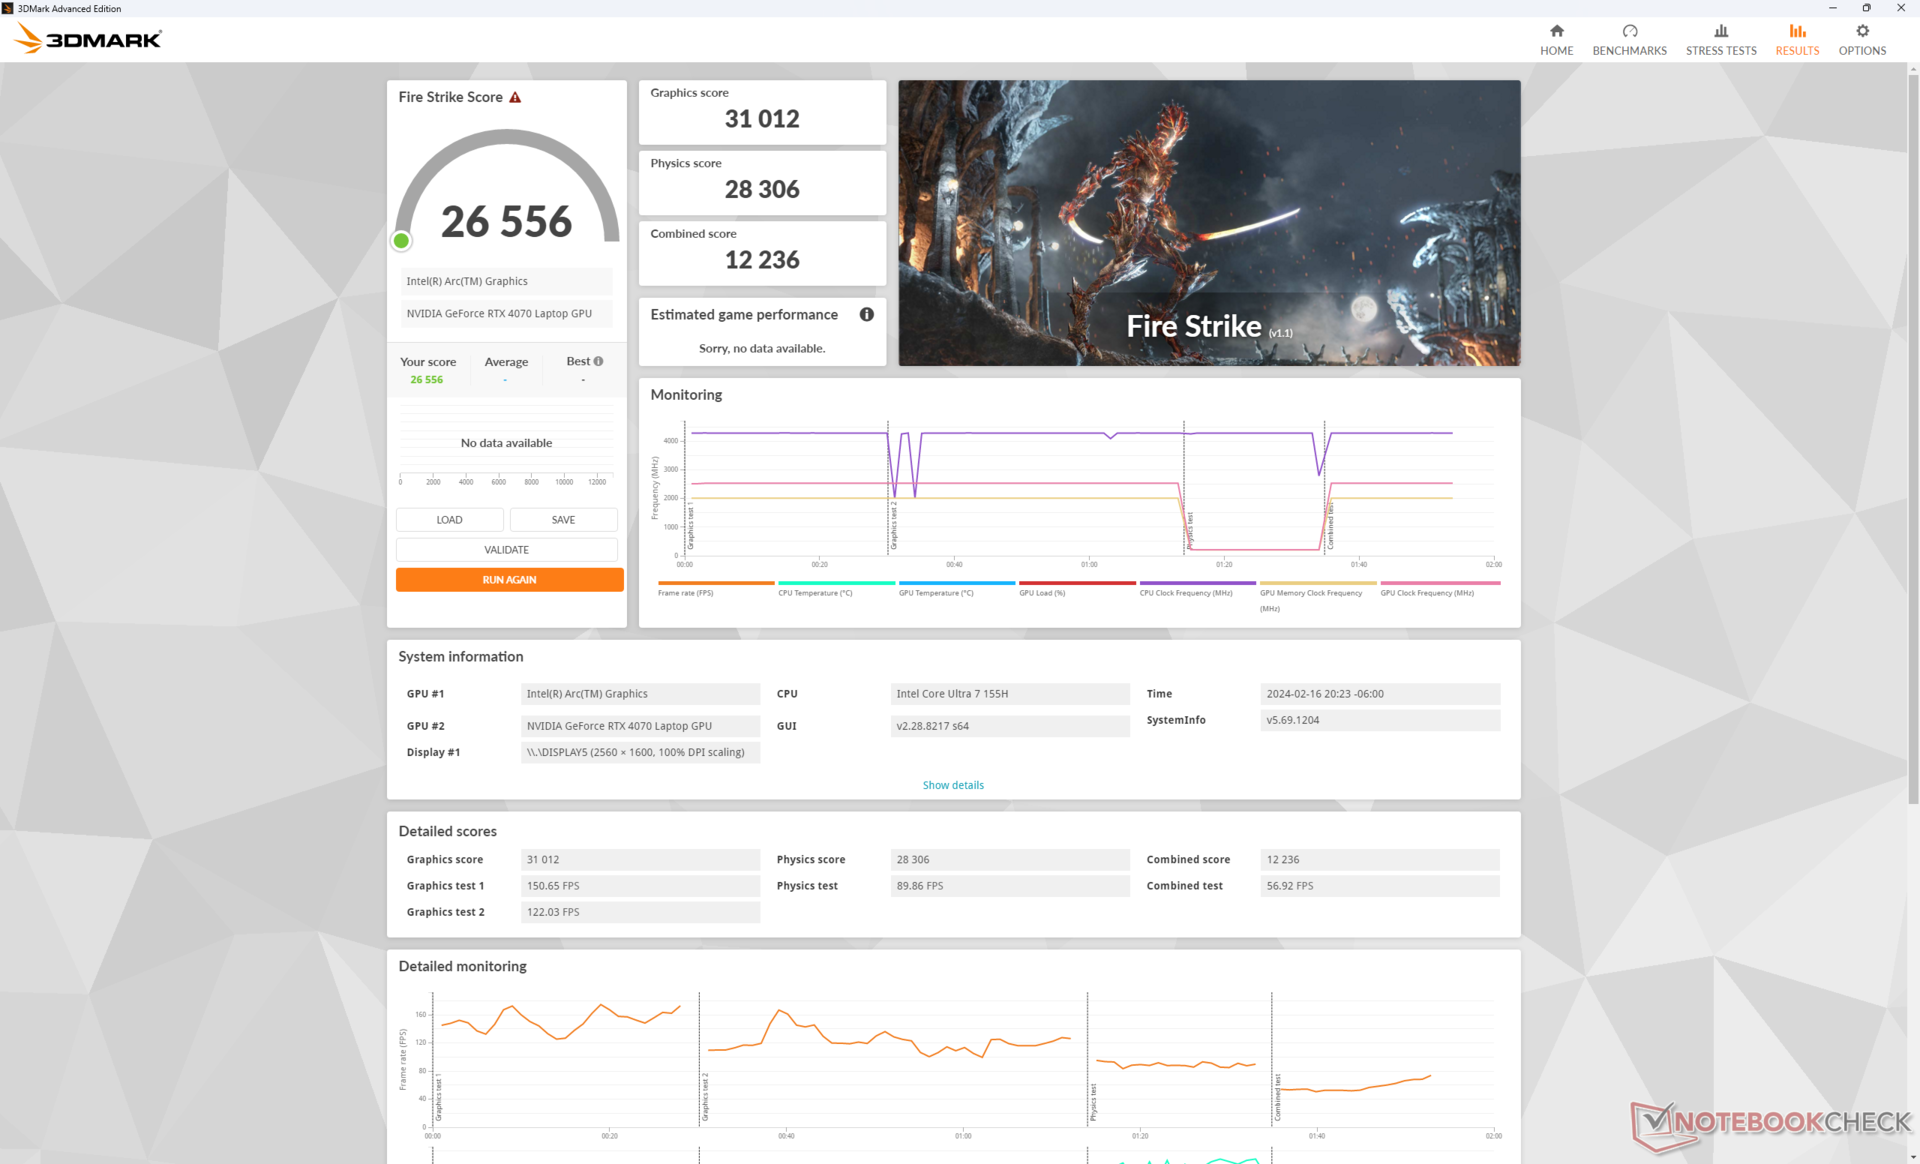
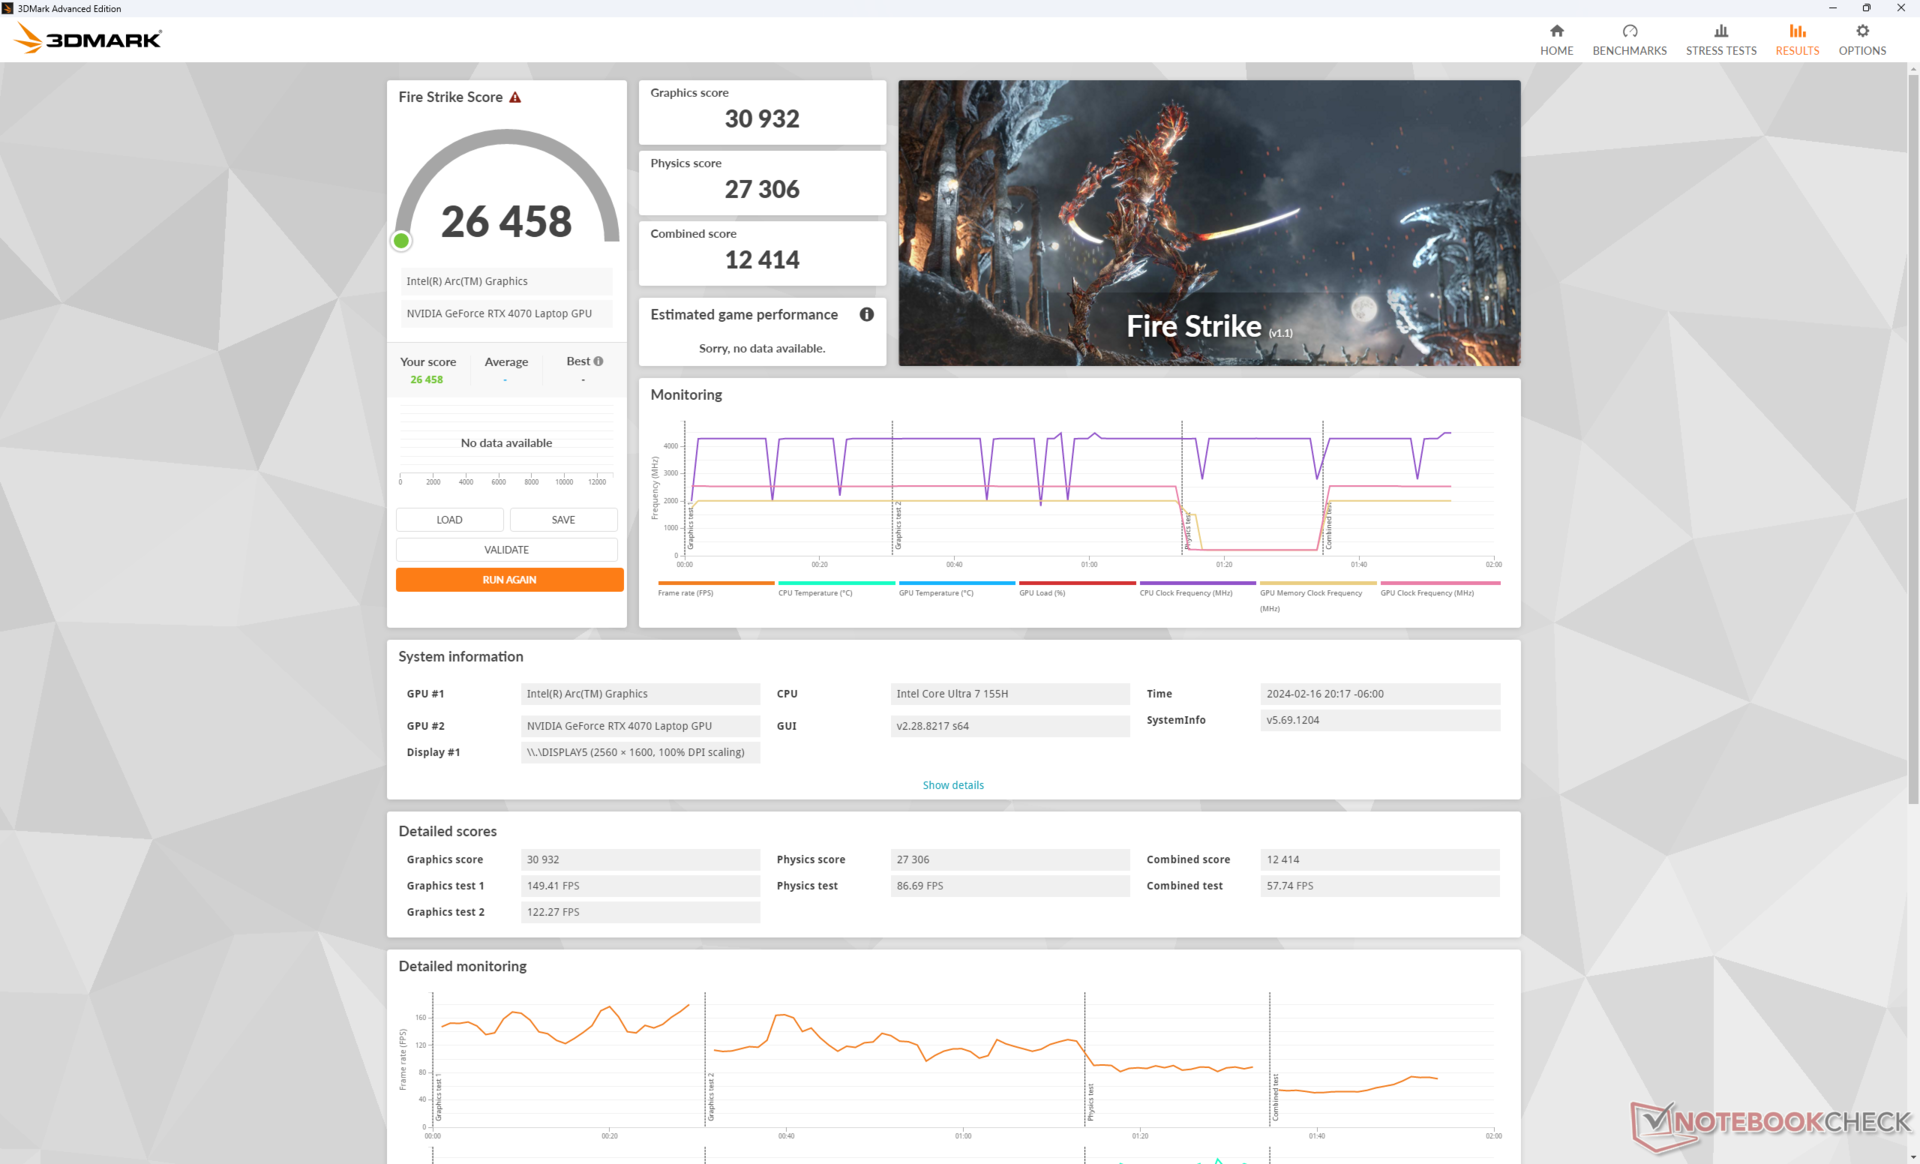
Interessanterweise sind die Leistungsunterschiede zwischen Overdrive-, Performance- und Balanced-Modus bestenfalls gering. Dies ist überraschend, da ein Wechsel in den ausgewogenen Modus bei den meisten anderen Gaming-Notebooks einen Leistungsverlust von 10 bis 30 Prozent mit sich bringt, während die Fire Strike Scores bei unserem Alienware m16 R2 nahezu konstant bleiben. Dell hat bei der Entwicklung dieses Modells definitiv die Lüftergeräuschprofile und das daraus resultierende Leistungsverhalten verändert.
| Energieprofile | Grafikleistung | CPU-Leistung | Gesamtwert |
| Overdrive-Modus | 30932 | 27306 | 12414 |
| Performance-Modus | 31012 (-0%) | 28306 (-0%) | 12236 (-0%) |
| Balanced-Modus | 30603 (-0%) | 28281 (-0%) | 12448 (-0%) |
| Battery Power | 24398 (-21%) | 24684 (-10%) | 10088 (-19%) |
Ein Downgrade auf die RTX 4060-Konfiguration wird die Leistung voraussichtlich um 10 bis 15 Prozent beeinträchtigen.
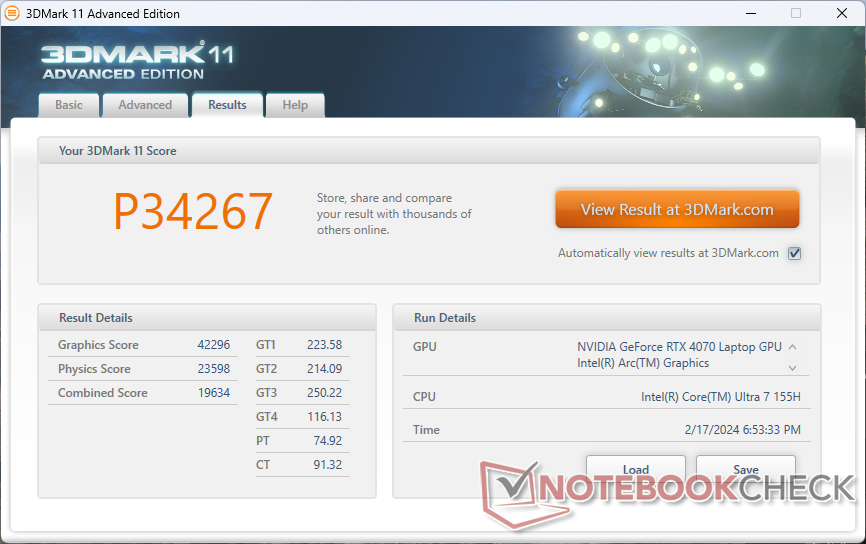
| 3DMark 11 Performance | 34267 Punkte | |
| 3DMark Fire Strike Score | 26458 Punkte | |
| 3DMark Time Spy Score | 12861 Punkte | |
Hilfe | ||
* ... kleinere Werte sind besser
| F1 22 | |
| 1920x1080 Ultra High Preset AA:T AF:16x | |
| Lenovo Legion 9 16IRX8 | |
| Alienware m16 R1 AMD | |
| Alienware m16 R2 | |
| Durchschnittliche NVIDIA GeForce RTX 4070 Laptop GPU (39.2 - 88.7, n=32) | |
| Lenovo Legion 5 16IRX G9 | |
| HP Victus 16-r0076TX | |
| Framework Laptop 16 | |
| 2560x1440 Ultra High Preset AA:T AF:16x | |
| Lenovo Legion 9 16IRX8 | |
| Alienware m16 R1 AMD | |
| Alienware m16 R2 | |
| Durchschnittliche NVIDIA GeForce RTX 4070 Laptop GPU (10.6 - 58.8, n=30) | |
| Lenovo Legion 5 16IRX G9 | |
| Framework Laptop 16 | |
| 3840x2160 Ultra High Preset AA:T AF:16x | |
| Alienware m16 R1 AMD | |
| Alienware m16 R2 | |
| Durchschnittliche NVIDIA GeForce RTX 4070 Laptop GPU (4.7 - 27.6, n=15) | |
| Framework Laptop 16 | |
| The Witcher 3 | |
| 1920x1080 Ultra Graphics & Postprocessing (HBAO+) | |
| Lenovo Legion 9 16IRX8 | |
| Alienware m16 R1 AMD | |
| Alienware m16 R2 | |
| Lenovo Legion 7 16IAX7-82TD004SGE | |
| HP Omen Transcend 16-u1095ng | |
| Durchschnittliche NVIDIA GeForce RTX 4070 Laptop GPU (69.8 - 133.7, n=57) | |
| Asus ROG Zephyrus M16 GU603Z | |
| Lenovo Legion 5 16IRX G9 | |
| HP Victus 16-r0076TX | |
| Lenovo Legion S7 16ARHA7 | |
| Asus ROG Zephyrus M16 GU603H | |
| Dell G16 7620 | |
| Framework Laptop 16 | |
| 3840x2160 High Graphics & Postprocessing (Nvidia HairWorks Off) | |
| Alienware m16 R1 AMD | |
| Alienware m16 R2 | |
| Durchschnittliche NVIDIA GeForce RTX 4070 Laptop GPU (26.5 - 83.5, n=16) | |
| Framework Laptop 16 | |
| Tiny Tina's Wonderlands | |
| 1920x1080 Badass Preset (DX12) | |
| Lenovo Legion 9 16IRX8 | |
| Alienware m16 R1 AMD | |
| Alienware m16 R2 | |
| Durchschnittliche NVIDIA GeForce RTX 4070 Laptop GPU (58.6 - 115.9, n=18) | |
| Framework Laptop 16 | |
| 2560x1440 Badass Preset (DX12) | |
| Lenovo Legion 9 16IRX8 | |
| Alienware m16 R1 AMD | |
| Alienware m16 R2 | |
| Durchschnittliche NVIDIA GeForce RTX 4070 Laptop GPU (49.8 - 79.5, n=17) | |
| Framework Laptop 16 | |
| 3840x2160 Badass Preset (DX12) | |
| Alienware m16 R1 AMD | |
| Durchschnittliche NVIDIA GeForce RTX 4070 Laptop GPU (28.3 - 39.7, n=13) | |
| Alienware m16 R2 | |
| Framework Laptop 16 | |
| Baldur's Gate 3 | |
| 1920x1080 Ultra Preset AA:T | |
| Alienware m16 R2 | |
| Durchschnittliche NVIDIA GeForce RTX 4070 Laptop GPU (66.7 - 128.5, n=30) | |
| Framework Laptop 16 | |
| 2560x1440 Ultra Preset AA:T | |
| Alienware m16 R2 | |
| Durchschnittliche NVIDIA GeForce RTX 4070 Laptop GPU (54.4 - 89.6, n=25) | |
| Framework Laptop 16 | |
| 3840x2160 Ultra Preset AA:T | |
| Alienware m16 R2 | |
| Durchschnittliche NVIDIA GeForce RTX 4070 Laptop GPU (33.4 - 45.2, n=12) | |
| Framework Laptop 16 | |
| Cyberpunk 2077 | |
| 1920x1080 Ultra Preset (FSR off) | |
| Lenovo Legion 9 16IRX8 | |
| Alienware m16 R2 | |
| Lenovo Legion 5 16IRX G9 | |
| Durchschnittliche NVIDIA GeForce RTX 4070 Laptop GPU (30.7 - 90.7, n=40) | |
| Framework Laptop 16 | |
| 2560x1440 Ultra Preset (FSR off) | |
| Lenovo Legion 9 16IRX8 | |
| Alienware m16 R2 | |
| Lenovo Legion 5 16IRX G9 | |
| Durchschnittliche NVIDIA GeForce RTX 4070 Laptop GPU (24.8 - 57.1, n=37) | |
| Framework Laptop 16 | |
| 3840x2160 Ultra Preset (FSR off) | |
| Durchschnittliche NVIDIA GeForce RTX 4070 Laptop GPU (20.2 - 24, n=13) | |
| Alienware m16 R2 | |
| Framework Laptop 16 | |
Witcher 3 FPS-Diagramm
| min. | mittel | hoch | max. | QHD | 4K | |
|---|---|---|---|---|---|---|
| The Witcher 3 (2015) | 399.6 | 344.6 | 240.5 | 121.3 | 72 | |
| Dota 2 Reborn (2015) | 166.8 | 149 | 149.5 | 139.7 | 130.6 | |
| Final Fantasy XV Benchmark (2018) | 184.6 | 165.1 | 119.3 | 85.2 | 48.5 | |
| X-Plane 11.11 (2018) | 132.3 | 116 | 90.8 | 78.2 | ||
| Far Cry 5 (2018) | 146 | 134 | 123 | 115 | 61 | |
| Strange Brigade (2018) | 427 | 308 | 255 | 219 | 141.7 | 73.8 |
| Tiny Tina's Wonderlands (2022) | 244 | 202.8 | 138.3 | 107.6 | 74.6 | 34.8 |
| F1 22 (2022) | 235 | 225 | 217 | 83.6 | 52.9 | 26.6 |
| Baldur's Gate 3 (2023) | 168.7 | 148.9 | 129.3 | 128.5 | 88.3 | 44.3 |
| Cyberpunk 2077 (2023) | 125.7 | 114.1 | 95.6 | 83.1 | 52.7 | 21 |
Emissionen
Geräuschemissionen
Das Lüftergeräuschverhalten hat sich gegenüber dem m16 R1 deutlich verbessert. Beim 3DMark 06 im Balanced-Modus bleibt das m16 R2 beispielsweise mit 32 dB(A) länger leise, während das m16 R1 in der ersten Benchmark-Szene mit 52 dB(A) unnötig laut ist. Damit ist das m16 R2 unter ähnlichen Bedingungen eher mit Konkurrenten wie dem Lenovo Legion Slim 7 vergleichbar.
Beim Spielen hängt das Lüftergeräusch eng mit dem ausgewählten Leistungsprofil zusammen. Beispielsweise pendelt sich das Lüftergeräusch bei 52 dB(A), 54 dB(A) und 62 dB(A) ein, wenn Witcher 3 im Balanced-, Performance- bzw. Overdrive-Modus läuft. Da die Leistungsunterschiede zwischen diesen drei Modi, wie oben erwähnt, sehr gering sind, empfehlen wir für die meisten Szenarien den Performance-Modus zu verwenden und den Overdrive-Modus zu meiden. Der Maximalwert von 62 dB(A) ist viel lauter als das, was wir selbst beim leistungsstärkeren Alienware x16 R1 gemessen haben, aber dieser Modus ist in erster Linie für Übertaktungszwecke von Endbenutzern gedacht; der Performance-Modus ist für Standardeinstellungen ausreichend.

Lautstärkediagramm
| Idle |
| 25.3 / 25.3 / 25.3 dB(A) |
| Last |
| 31.7 / 62 dB(A) |
 | ||
30 dB leise 40 dB(A) deutlich hörbar 50 dB(A) störend |
||
min: | ||
| Alienware m16 R2 GeForce RTX 4070 Laptop GPU, Ultra 7 155H, Samsung PM9A1 MZVL21T0HCLR | Alienware m16 R1 Intel GeForce RTX 4060 Laptop GPU, i7-13700HX, Kioxia KXG70ZNV512G | Alienware x16 R1 GeForce RTX 4080 Laptop GPU, i9-13900HK, SK hynix PC801 HFS001TEJ9X101N | HP Omen Transcend 16-u1095ng GeForce RTX 4070 Laptop GPU, i9-14900HX, Kioxia XG8 KXG80ZNV1T02 | Asus ROG Zephyrus G16 2024 GU605M GeForce RTX 4070 Laptop GPU, Ultra 7 155H, WD PC SN560 SDDPNQE-1T00 | Lenovo Legion Slim 7 16APH8 GeForce RTX 4060 Laptop GPU, R7 7840HS, WDC PC SN810 1TB | |
|---|---|---|---|---|---|---|
| Geräuschentwicklung | -8% | 1% | -8% | 2% | 0% | |
| aus / Umgebung * (dB) | 24.7 | 25 -1% | 22.7 8% | 24 3% | 23.9 3% | 24 3% |
| Idle min * (dB) | 25.3 | 25 1% | 23.1 9% | 29 -15% | 23.9 6% | 25 1% |
| Idle avg * (dB) | 25.3 | 26 -3% | 25.8 -2% | 30 -19% | 27.8 -10% | 28 -11% |
| Idle max * (dB) | 25.3 | 27 -7% | 25.8 -2% | 31 -23% | 30.1 -19% | 31 -23% |
| Last avg * (dB) | 31.7 | 52 -64% | 39.3 -24% | 45 -42% | 34.2 -8% | 33 -4% |
| Witcher 3 ultra * (dB) | 53.8 | 51 5% | 49.9 7% | 44 18% | 46.4 14% | 47 13% |
| Last max * (dB) | 62 | 53 15% | 54.8 12% | 47 24% | 46.4 25% | 49 21% |
* ... kleinere Werte sind besser
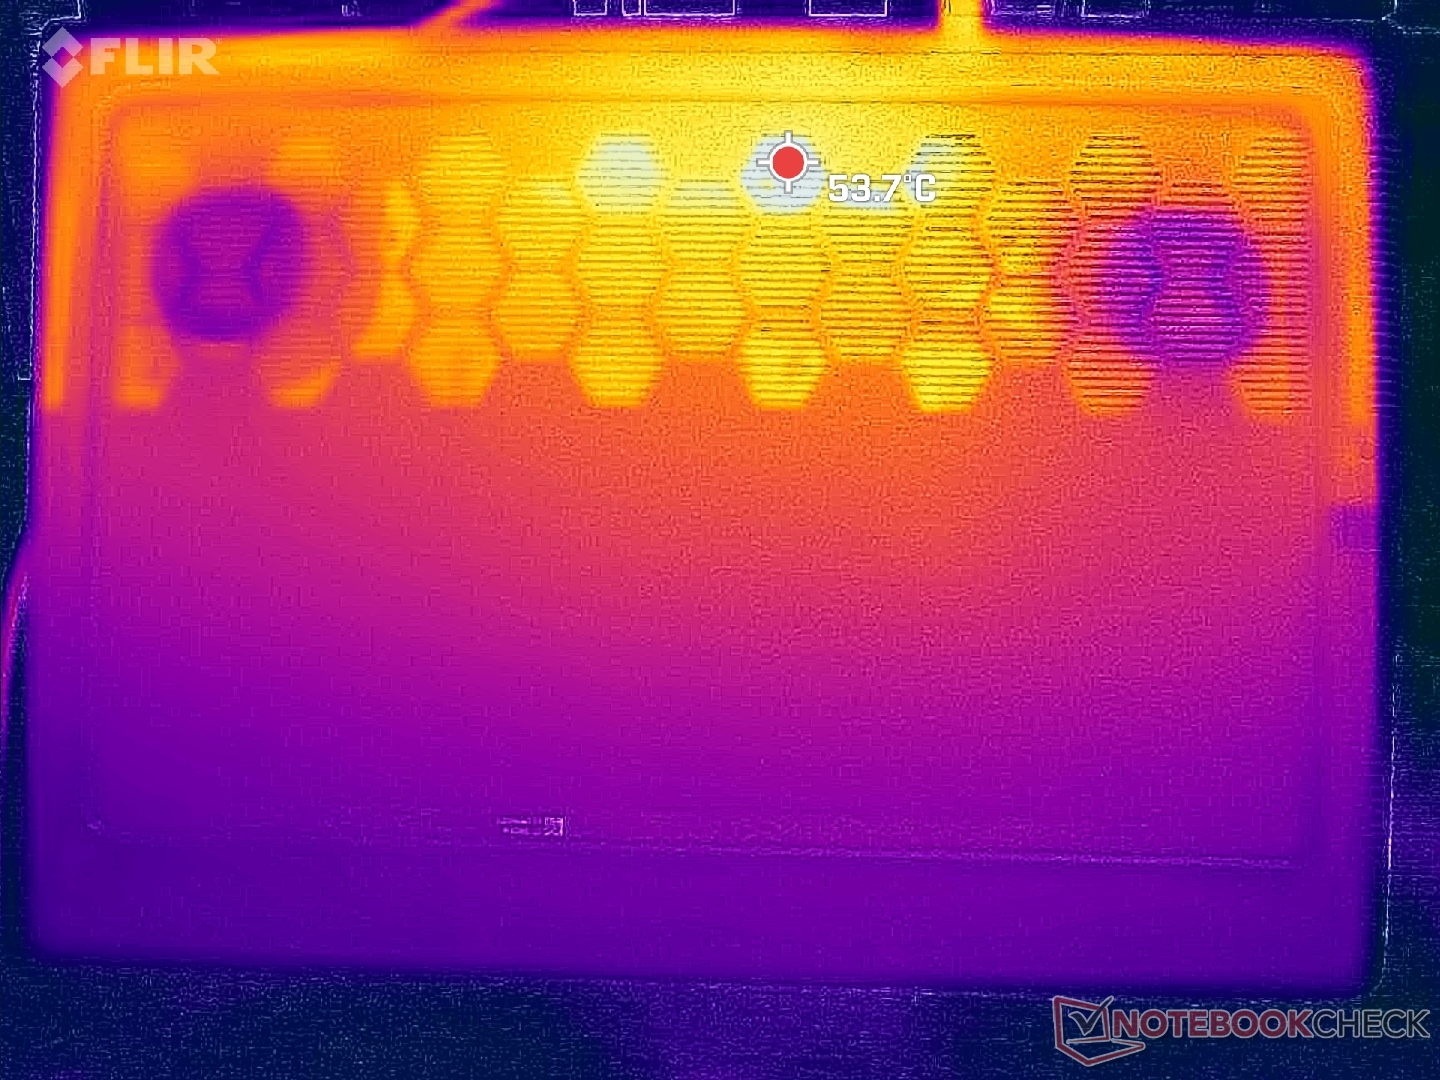
Temperatur
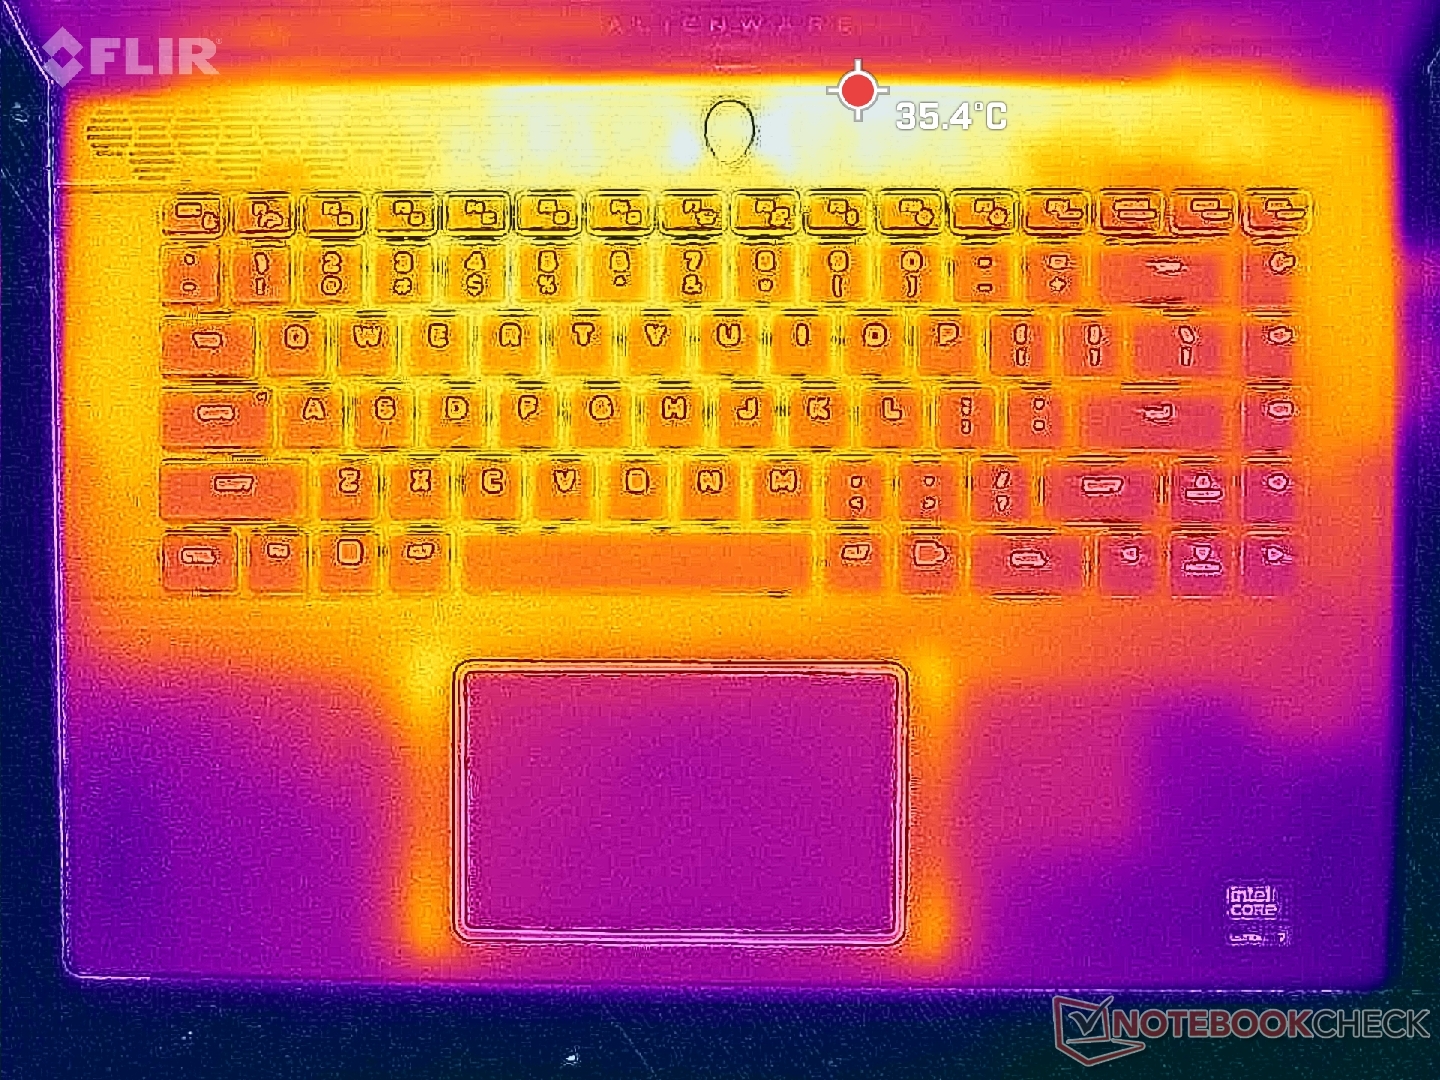
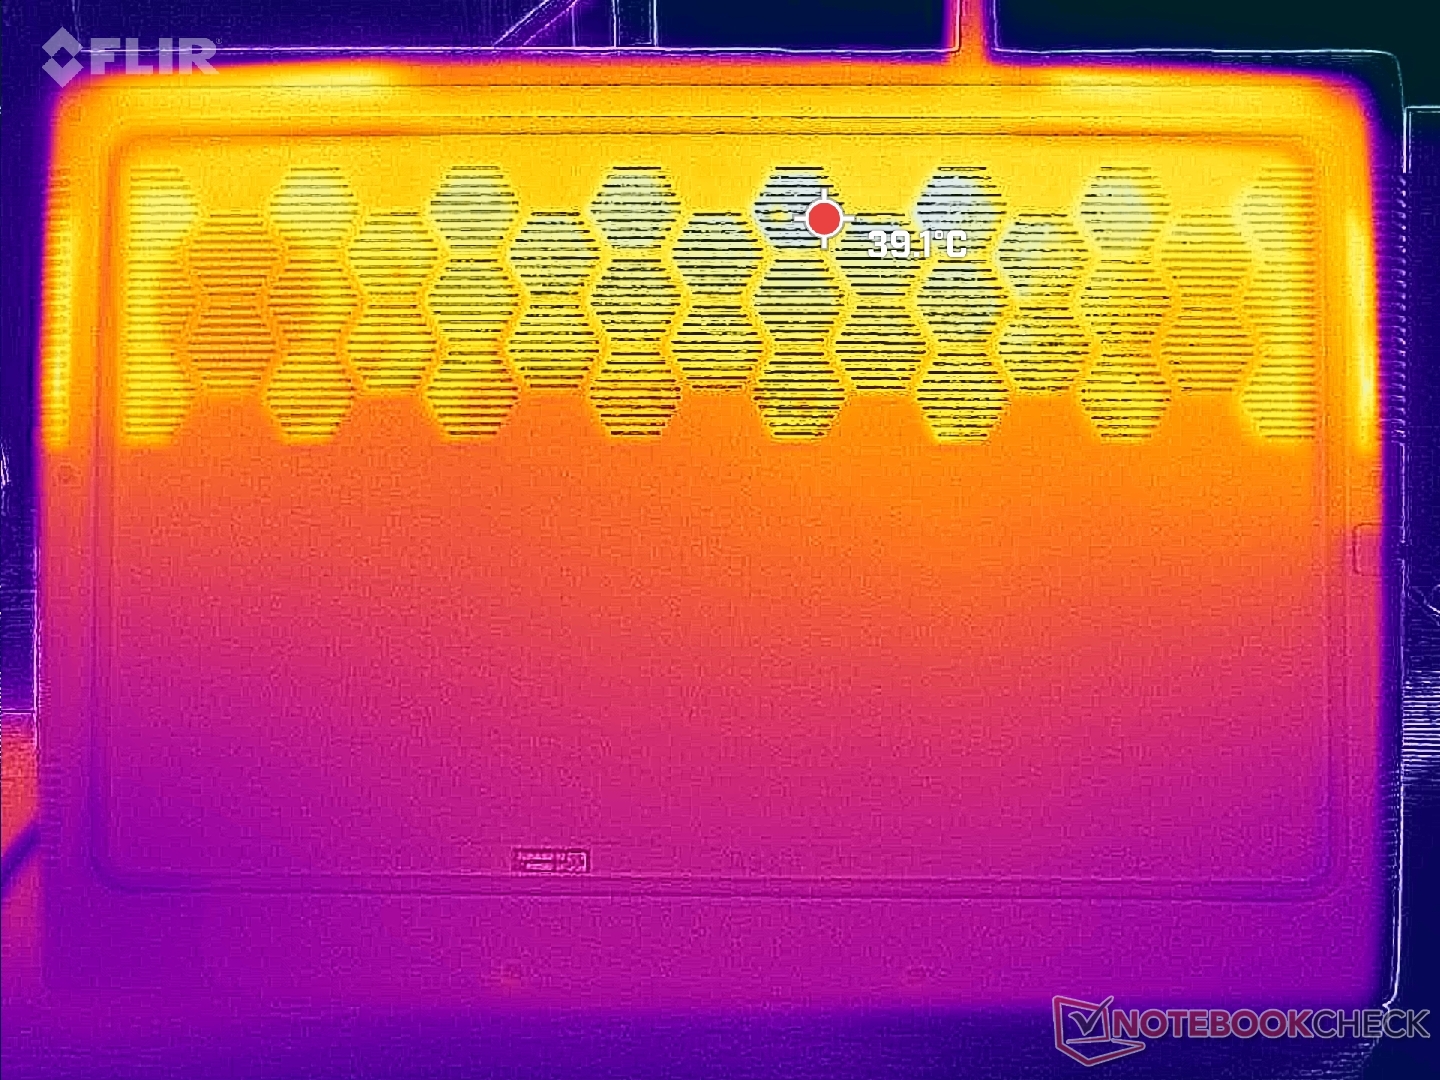
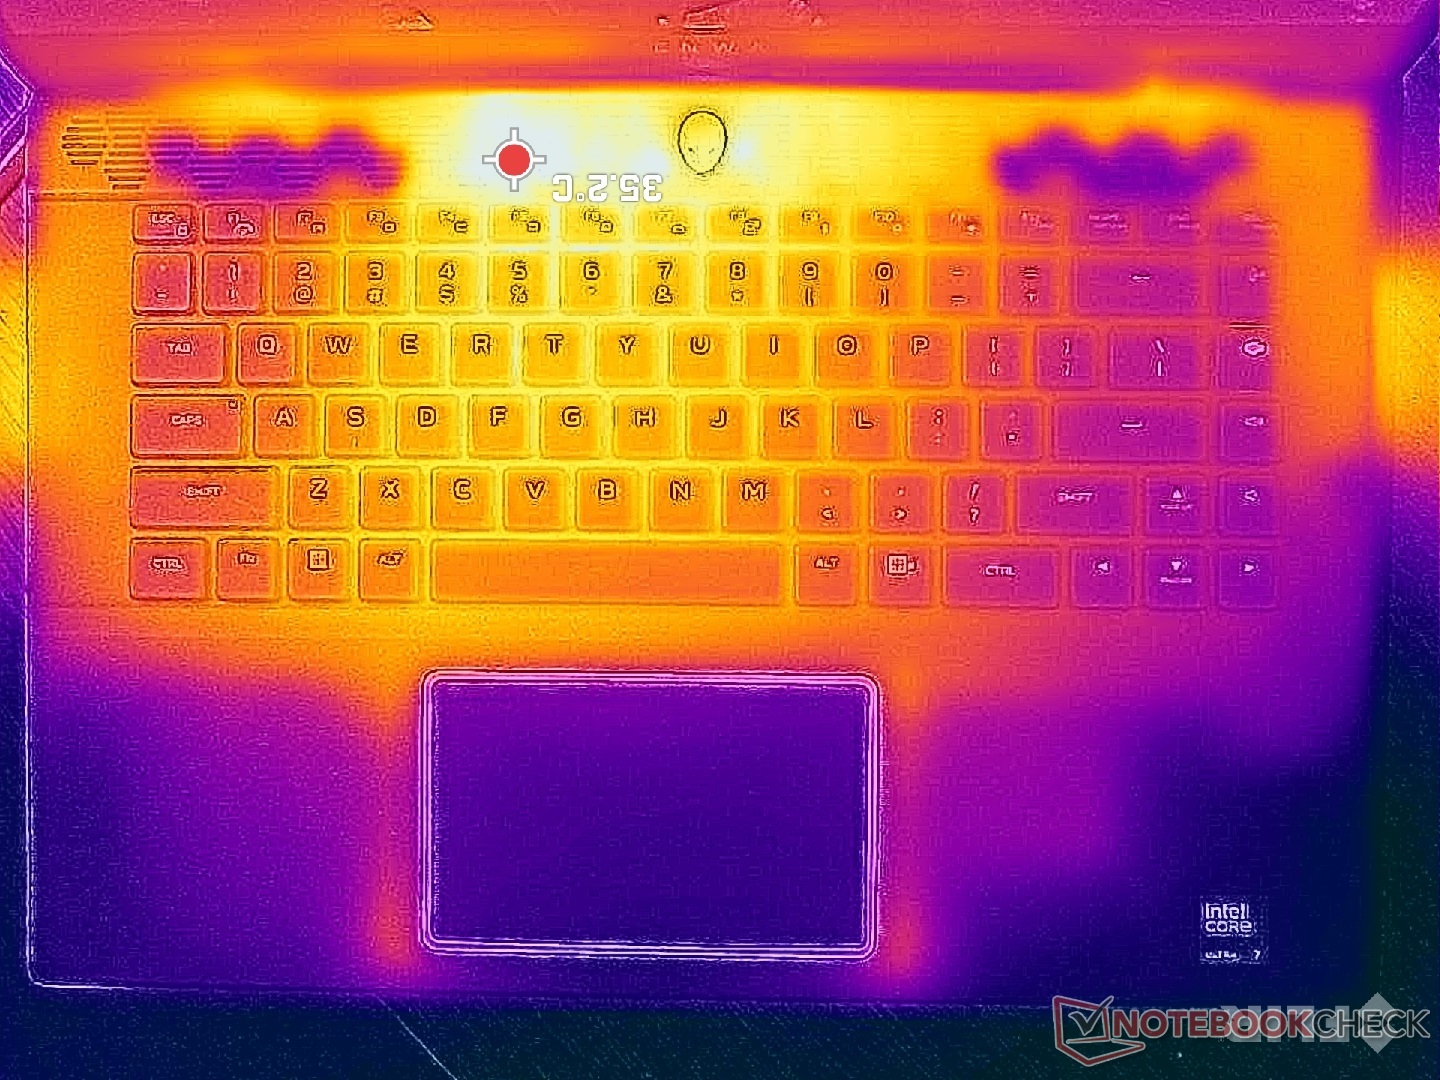
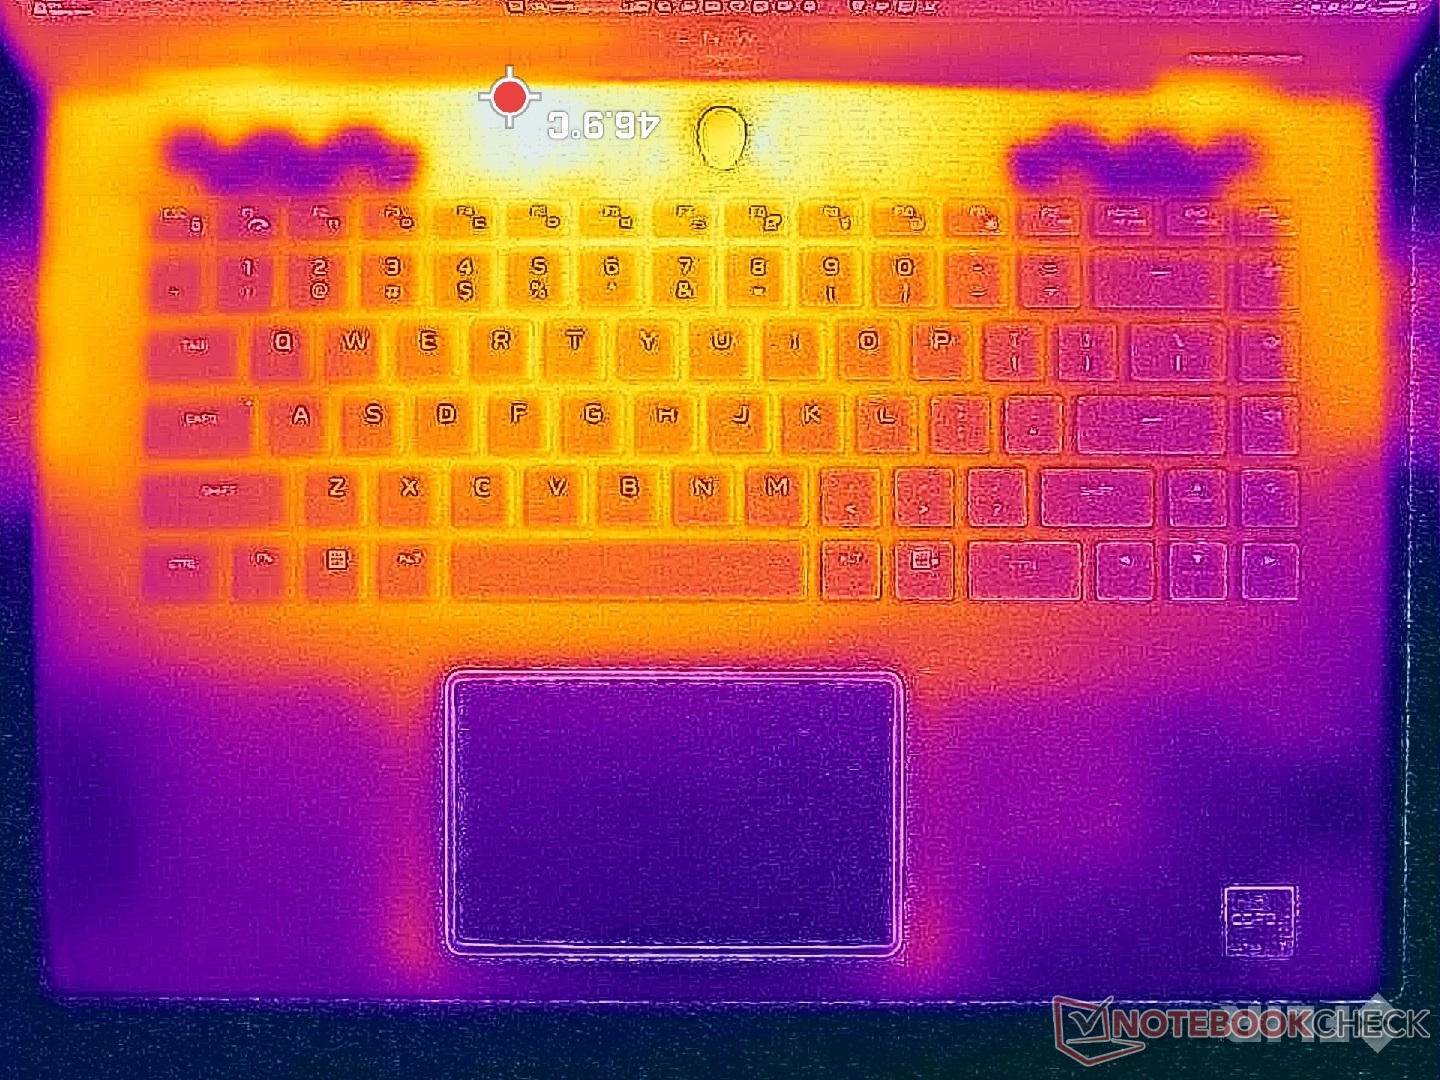
Bei anspruchsvollen Anwendungen wie Spielen konzentrieren sich die heißen Stellen auf die Rückseite des Gehäuses, wo die Hände wahrscheinlich nicht in Berührung kommen werden. Die Handballenablagen und die Tastatur bleiben mit 20 bzw. 30 °C recht kühl, während die Rückseite bis zu 50 °C erreichen kann. Die durchschnittlichen Oberflächentemperaturen sind wärmer als beim Blade 16, aber immer noch kühler als beim HP Omen Transcend, wo bestimmte Bereiche über 60 °C erreichen können.
(±) Die maximale Temperatur auf der Oberseite ist 44.8 °C. Im Vergleich liegt der Klassendurchschnitt bei 40.4 °C (von 21.2 bis 68.8 °C für die Klasse Gaming).
(-) Auf der Unterseite messen wir eine maximalen Wert von 48 °C (im Vergleich zum Durchschnitt von 43.2 °C).
(+) Ohne Last messen wir eine durchschnittliche Temperatur von 30.9 °C auf der Oberseite. Der Klassendurchschnitt erreicht 33.9 °C.
(+) Beim längeren Spielen von The Witcher 3 erhitzt sich das Gerät durchschnittlich auf 28.7 °C. Der Durchschnitt der Klasse ist derzeit 33.9 °C.
(+) Die Handballen und der Touchpad-Bereich sind mit gemessenen 27.2 °C kühler als die typische Hauttemperatur und fühlen sich dadurch kühl an.
(±) Die durchschnittliche Handballen-Temperatur anderer getesteter Geräte war 28.8 °C (+1.6 °C).

| Alienware m16 R2 Intel Core Ultra 7 155H, NVIDIA GeForce RTX 4070 Laptop GPU | Alienware m16 R1 Intel Intel Core i7-13700HX, NVIDIA GeForce RTX 4060 Laptop GPU | Alienware x16 R1 Intel Core i9-13900HK, NVIDIA GeForce RTX 4080 Laptop GPU | HP Omen Transcend 16-u1095ng Intel Core i9-14900HX, NVIDIA GeForce RTX 4070 Laptop GPU | Asus ROG Zephyrus G16 2024 GU605M Intel Core Ultra 7 155H, NVIDIA GeForce RTX 4070 Laptop GPU | Lenovo Legion Slim 7 16APH8 AMD Ryzen 7 7840HS, NVIDIA GeForce RTX 4060 Laptop GPU | |
|---|---|---|---|---|---|---|
| Hitze | -3% | 3% | 3% | 10% | 8% | |
| Last oben max * (°C) | 44.8 | 49 -9% | 47.2 -5% | 49 -9% | 50.3 -12% | 46 -3% |
| Last unten max * (°C) | 48 | 48 -0% | 47.8 -0% | 63 -31% | 48 -0% | 46 4% |
| Idle oben max * (°C) | 37.2 | 40 -8% | 36.8 1% | 30 19% | 28.8 23% | 33 11% |
| Idle unten max * (°C) | 42 | 39 7% | 35.8 15% | 29 31% | 29.8 29% | 34 19% |
* ... kleinere Werte sind besser
Lautsprecher

Alienware m16 R2 Audio Analyse
(+) | Die Lautsprecher können relativ laut spielen (82.4 dB)
Bass 100 - 315 Hz
(-) | kaum Bass - 20.1% niedriger als der Median
(±) | durchschnittlich lineare Bass-Wiedergabe (11.1% Delta zum Vorgänger)
Mitteltöne 400 - 2000 Hz
(+) | ausgeglichene Mitten, vom Median nur 2.2% abweichend
(+) | lineare Mitten (3.1% Delta zum Vorgänger)
Hochtöne 2 - 16 kHz
(+) | ausgeglichene Hochtöne, vom Median nur 2.2% abweichend
(+) | sehr lineare Hochtöne (3.5% Delta zum Vorgänger)
Gesamt im hörbaren Bereich 100 - 16.000 Hz
(+) | hörbarer Bereich ist sehr linear (12.9% Abstand zum Median
Im Vergleich zu allen Geräten derselben Klasse
» 17% aller getesteten Geräte dieser Klasse waren besser, 4% vergleichbar, 79% schlechter
» Das beste Gerät hat einen Delta-Wert von 6%, durchschnittlich ist 18%, das schlechteste Gerät hat 132%
Im Vergleich zu allen Geräten im Test
» 12% aller getesteten Geräte waren besser, 3% vergleichbar, 85% schlechter
» Das beste Gerät hat einen Delta-Wert von 4%, durchschnittlich ist 23%, das schlechteste Gerät hat 134%
Apple MacBook Pro 16 2021 M1 Pro Audio Analyse
(+) | Die Lautsprecher können relativ laut spielen (84.7 dB)
Bass 100 - 315 Hz
(+) | guter Bass - nur 3.8% Abweichung vom Median
(+) | lineare Bass-Wiedergabe (5.2% Delta zum Vorgänger)
Mitteltöne 400 - 2000 Hz
(+) | ausgeglichene Mitten, vom Median nur 1.3% abweichend
(+) | lineare Mitten (2.1% Delta zum Vorgänger)
Hochtöne 2 - 16 kHz
(+) | ausgeglichene Hochtöne, vom Median nur 1.9% abweichend
(+) | sehr lineare Hochtöne (2.7% Delta zum Vorgänger)
Gesamt im hörbaren Bereich 100 - 16.000 Hz
(+) | hörbarer Bereich ist sehr linear (4.6% Abstand zum Median
Im Vergleich zu allen Geräten derselben Klasse
» 0% aller getesteten Geräte dieser Klasse waren besser, 0% vergleichbar, 100% schlechter
» Das beste Gerät hat einen Delta-Wert von 5%, durchschnittlich ist 17%, das schlechteste Gerät hat 45%
Im Vergleich zu allen Geräten im Test
» 0% aller getesteten Geräte waren besser, 0% vergleichbar, 100% schlechter
» Das beste Gerät hat einen Delta-Wert von 4%, durchschnittlich ist 23%, das schlechteste Gerät hat 134%
Energieverwaltung — Effizienter und weniger energieintensiv
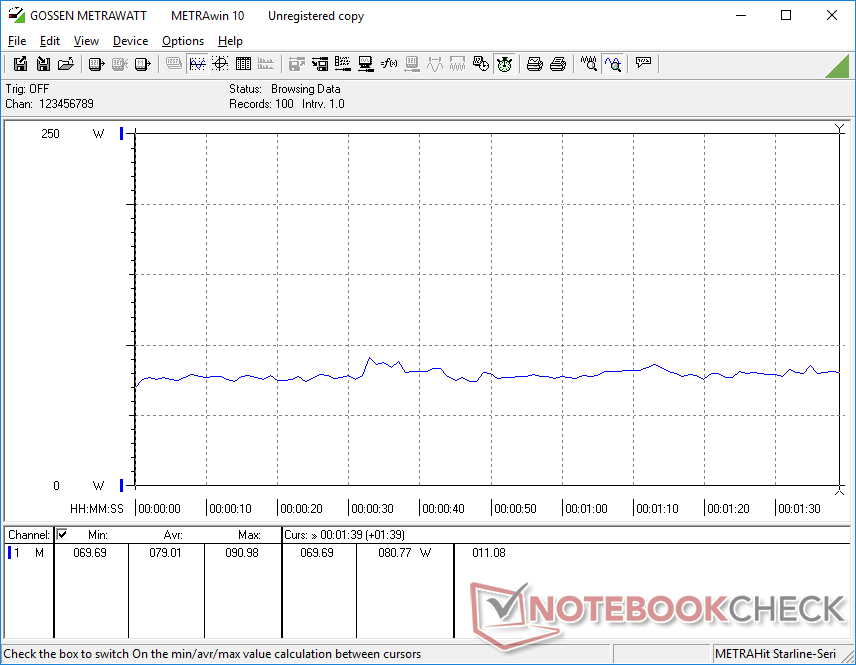
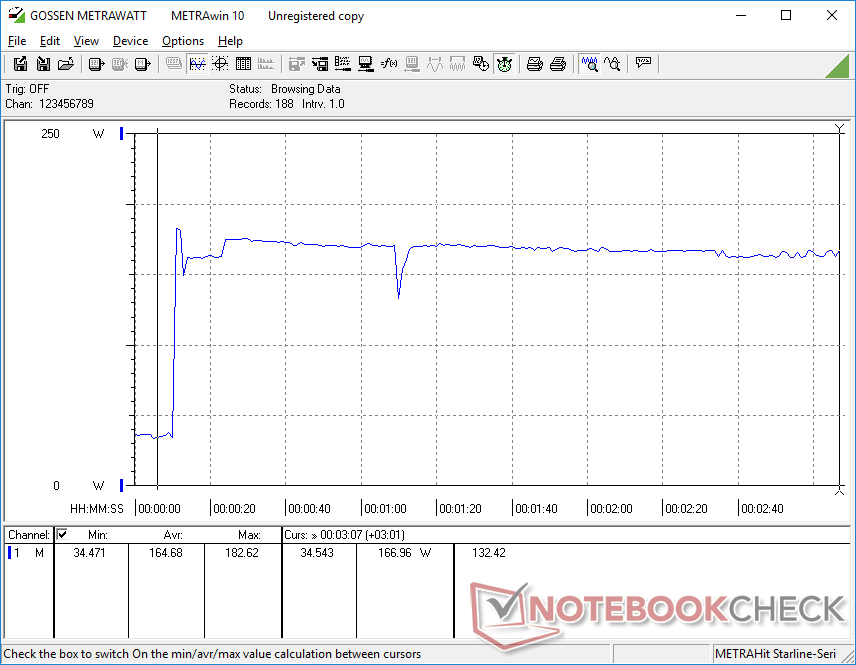
Energieaufnahme
Der Leerlauf auf dem Desktop kann bis zu 8 W betragen, wenn der Quiet-Modus und der iGPU-Modus auf minimale Helligkeit eingestellt sind, oder bis zu 40 W, wenn der Overdrive-Modus und der dGPU-Modus auf maximale Helligkeit eingestellt sind. Wenn Sie die zusätzliche Leistung nicht benötigen, um die Akkulaufzeit zu verlängern, sollten Sie den Balanced-Modus und den iGPU-Modus wählen, wie im nächsten Abschnitt beschrieben.
Beim Spielen oder bei CPU-lastigen Aufgaben entspricht der Gesamtverbrauch in etwa dem, was wir beim RTX 4060-betriebenen m16 R1 aufgezeichnet haben, bei etwas höherer Leistung pro Watt.
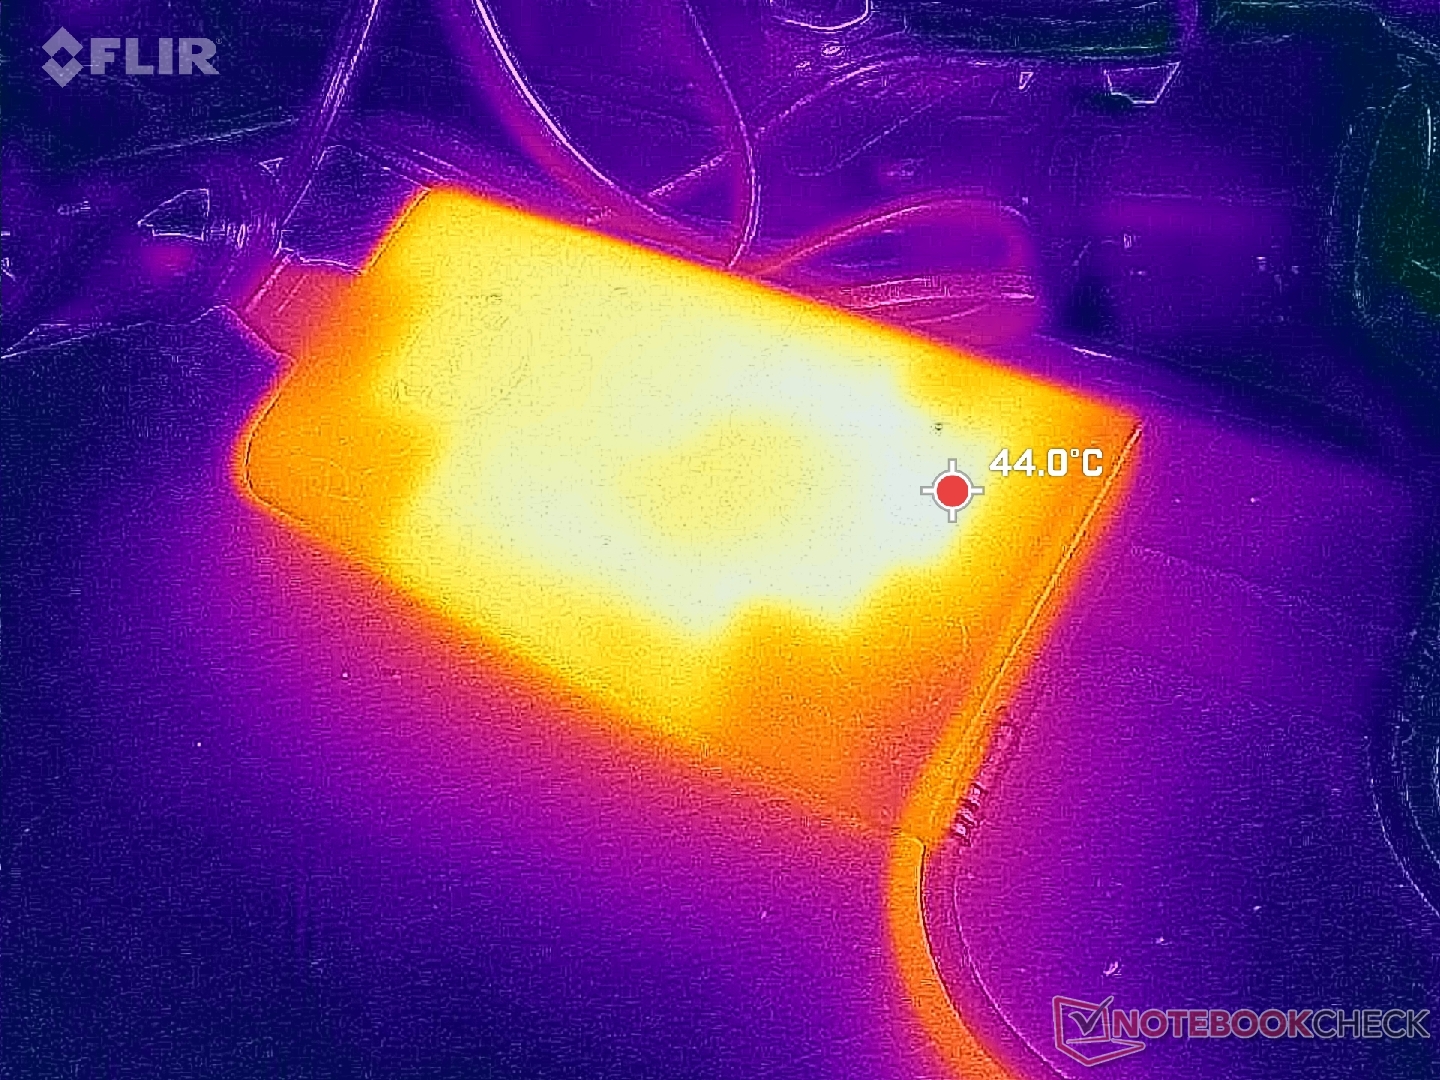
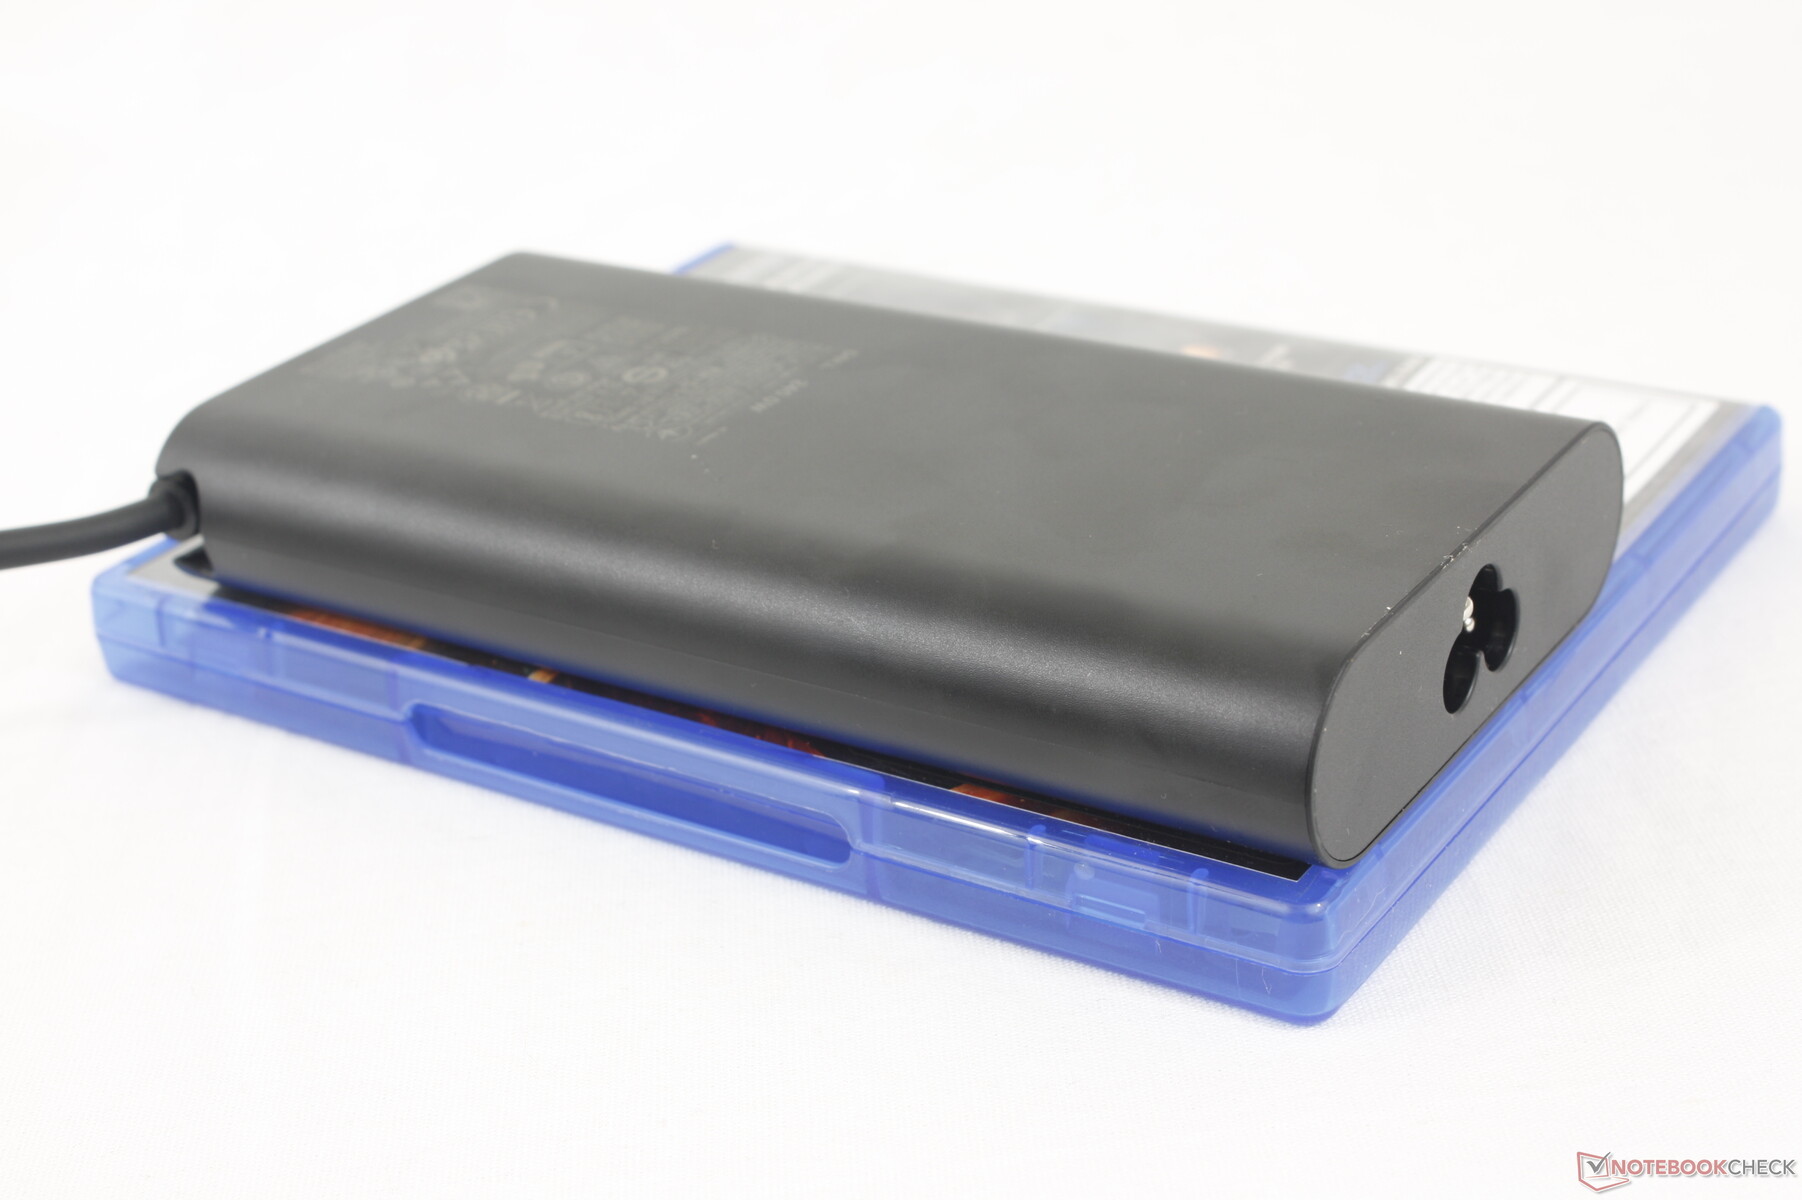
Das m16 R2 kann so konfiguriert werden, dass es mit einem kleinen (~15,2 x 7,7 x 2,3 cm) 240-W-GaN-Netzteil ausgeliefert wird, während das m16 R1 mit einem größeren (~20 x 10 x 4,5 cm) 330-W-Netzteil ausgeliefert wird, um die RTX 4080- und 4090-Konfigurationen aufzunehmen. Einige SKUs wie unsere können stattdessen mit einem 280-W-Netzteil ausgeliefert werden.

| Aus / Standby | |
| Idle | |
| Last |
|
Legende:
min: | |
| Alienware m16 R2 Ultra 7 155H, GeForce RTX 4070 Laptop GPU, Samsung PM9A1 MZVL21T0HCLR, IPS, 2560x1600, 16" | Alienware m16 R1 Intel i7-13700HX, GeForce RTX 4060 Laptop GPU, Kioxia KXG70ZNV512G, IPS, 2560x1600, 16" | Alienware x16 R1 i9-13900HK, GeForce RTX 4080 Laptop GPU, SK hynix PC801 HFS001TEJ9X101N, IPS, 2560x1600, 16" | HP Omen Transcend 16-u1095ng i9-14900HX, GeForce RTX 4070 Laptop GPU, Kioxia XG8 KXG80ZNV1T02, OLED, 2560x1600, 16" | Asus ROG Zephyrus G16 2024 GU605M Ultra 7 155H, GeForce RTX 4070 Laptop GPU, WD PC SN560 SDDPNQE-1T00, OLED, 2560x1600, 16" | Lenovo Legion Slim 7 16APH8 R7 7840HS, GeForce RTX 4060 Laptop GPU, WDC PC SN810 1TB, IPS, 2560x1600, 16" | |
|---|---|---|---|---|---|---|
| Stromverbrauch | -10% | -77% | -13% | 24% | -67% | |
| Idle min * (Watt) | 8.1 | 10 -23% | 25.2 -211% | 10 -23% | 8.3 -2% | 33 -307% |
| Idle avg * (Watt) | 13 | 14 -8% | 29.9 -130% | 18 -38% | 12.5 4% | 35 -169% |
| Idle max * (Watt) | 40.3 | 21 48% | 49.8 -24% | 32 21% | 12.8 68% | 45 -12% |
| Last avg * (Watt) | 79 | 119 -51% | 105.4 -33% | 128 -62% | 71.3 10% | 59 25% |
| Witcher 3 ultra * (Watt) | 188.1 | 186.7 1% | 263 -40% | 148.4 21% | 127.5 32% | 131 30% |
| Last max * (Watt) | 254.9 | 323 -27% | 313.8 -23% | 242 5% | 169.1 34% | 177 31% |
* ... kleinere Werte sind besser
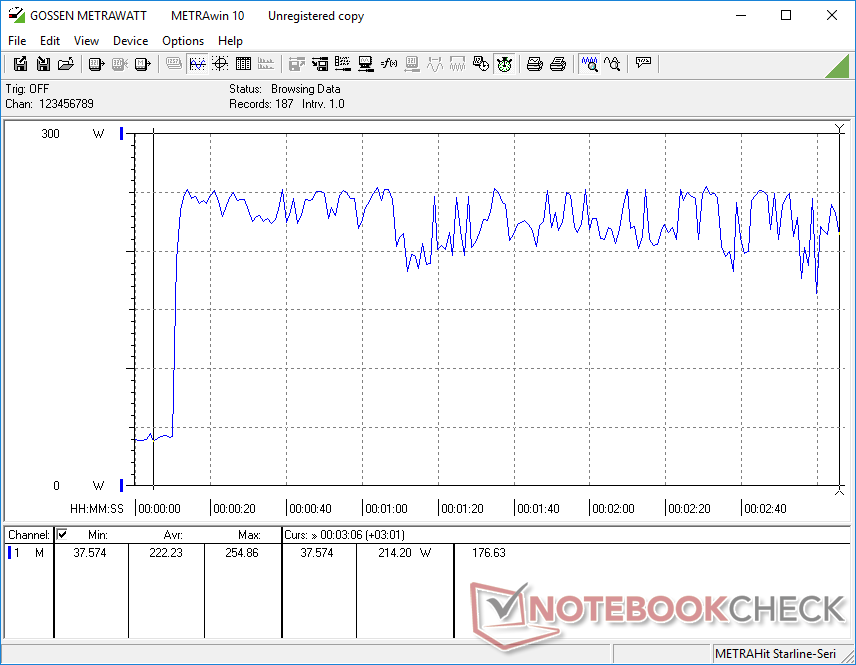
Energieverbrauch Witcher 3 / Stresstest
Energieverbrauch externer Monitor
Akkulaufzeit
Die Akkukapazität dieses Jahres beträgt 90 Wh, obwohl das Gehäuse etwas kleiner ist. Es scheint auch, dass Dell die Probleme mit der Akkulaufzeit behoben hat, die wir bei vielen älteren Alienware-Notebooks erlebt haben. Das Surfen im Internet im Balanced- und Optimus-Modus dauert satte 8 Stunden, während es beim Alienware m16 R1 fast die Hälfte ist. Das System kann sogar das neueste Asus ROG Zephyrus G16 GU605M um fast eine Stunde übertreffen.
Das Aufladen von einer leeren auf eine volle Kapazität dauert etwa 90 Minuten. Alternativ dazu dauert das Aufladen auf 85 Prozent knapp 40 Minuten. Das Modell kann auch über generische USB-C-Adapter aufgeladen werden, wenn auch viel langsamer.
| Alienware m16 R2 Ultra 7 155H, GeForce RTX 4070 Laptop GPU, 90 Wh | Alienware m16 R1 Intel i7-13700HX, GeForce RTX 4060 Laptop GPU, 86 Wh | Alienware x16 R1 i9-13900HK, GeForce RTX 4080 Laptop GPU, 90 Wh | HP Omen Transcend 16-u1095ng i9-14900HX, GeForce RTX 4070 Laptop GPU, 97 Wh | Asus ROG Zephyrus G16 2024 GU605M Ultra 7 155H, GeForce RTX 4070 Laptop GPU, 90 Wh | Lenovo Legion Slim 7 16APH8 R7 7840HS, GeForce RTX 4060 Laptop GPU, 99.9 Wh | |
|---|---|---|---|---|---|---|
| Akkulaufzeit | -30% | -47% | -40% | 5% | -12% | |
| Idle (h) | 12.6 | 6.4 -49% | 7.3 -42% | |||
| WLAN (h) | 8.1 | 4.8 -41% | 2.5 -69% | 4.9 -40% | 7.3 -10% | 7.1 -12% |
| Last (h) | 1 | 1 0% | 0.7 -30% | 1.2 20% | ||
| H.264 (h) | 5.6 | 11.2 |
Pro
Contra
Fazit — Eine neue Balance zwischen Spielen und Hybridarbeit
Das Alienware m16 R2 wurde mit einem klaren Ziel vor Augen entwickelt: Es sollte kleiner sein als das Alienware m16 R1, selbst wenn es zu Leistungskompromissen führt. Das Modell ist definitiv viel portabler als zuvor, aber die Nutzer müssen dabei auf GeForce RTX 4080/4090-Grafik, Core HX-CPUs und mechanische Tasten verzichten. Dell hofft, dass das schlankere m16 R2 durch den Verzicht auf diese Enthusiasten-Features zugunsten eines kleineren Designs ein größeres Publikum von Hybrid-Arbeitern, Studenten und Mainstream-Gamern ansprechen kann, die das "härtere" und weniger reisefreundliche m16 R1 oder x16 R1 vielleicht übersprungen haben.
Das Endergebnis ist ein System, das von der Leistung über die Akkulaufzeit bis hin zur Portabilität alle Fronten sehr gut ausbalanciert, während das m16 R1 sich fast ausschließlich auf die Leistung auf Kosten von Gewicht und Laufzeiten konzentrierte. Sogar der Geräuschpegel und das Verhalten der Lüfter haben sich verbessert, so dass sie in Klassenzimmern oder Büros, in denen die zusätzliche Leistung nicht benötigt wird, besser eingesetzt werden können. Dies ist definitiv das vielseitigste Alienware-Notebook, das wir aufgrund der vielen Hardware- und Software-Änderungen getestet haben.
Wenn Sie sich mit einer GeForce RTX 4060 oder 4070 Grafikkarte zufrieden geben, dann ist das Alienware m16 R2 einfach die beste Allrounder-Option, die Sie in dieser Serie wählen können. Wenn Sie mehr Leistung benötigen und die Portabilität erhalten wollen, dann ist das teurere Blade 16 immer noch die richtige Wahl.
Obwohl das m16 R2 beeindruckend und oft überraschend ist, hat es in der 16-Zoll-Kategorie immer noch starke Konkurrenz. Das Razer Blade 16 zum Beispiel ist immer noch leichter, kleiner und schneller als das m16 R2 und hat tiefere DCI-P3 Farben. Das Asus ROG Zephyrus G16 ist ähnlich leicht und bietet mehr Display-Optionen, aber die GPU-Leistung ist etwas schlechter. In diesem Szenario hat Dell das Alienware m16 R2 preislich so gestaltet, dass es günstiger ist als die Systeme von Razer und Asus.
Preis und Verfügbarkeit
Dell liefert das Alienware m16 R2 ab sofort zu Preisen ab 1.899 Euro für die RTX 4060 und bis zu 2.199 Euro für die RTX 4070-Konfiguration aus.
Alienware m16 R2
- 24.02.2024 v7 (old)
Allen Ngo
Transparenz
Die Auswahl der zu testenden Geräte erfolgt innerhalb der Redaktion. Das vorliegende Testmuster wurde dem Autor vom Hersteller oder einem Shop zu Testzwecken leihweise zur Verfügung gestellt. Eine Einflussnahme des Leihstellers auf den Testbericht gab es nicht, der Hersteller erhielt keine Version des Reviews vor der Veröffentlichung. Es bestand keine Verpflichtung zur Publikation. Als eigenständiges, unabhängiges Unternehmen unterliegt Notebookcheck keiner Diktion von Herstellern, Shops und Verlagen.
So testet Notebookcheck
Pro Jahr werden von Notebookcheck hunderte Laptops und Smartphones unabhängig in von uns standardisierten technischen Verfahren getestet, um eine Vergleichbarkeit aller Testergebnisse zu gewährleisten. Seit rund 20 Jahren entwickeln wir diese Testmethoden kontinuierlich weiter und setzen damit Branchenstandards. In unseren Testlaboren kommt ausschließlich hochwertiges Messequipment in die Hände erfahrener Techniker und Redakteure. Die Tests unterliegen einer mehrstufigen Kontrolle. Unsere komplexe Gesamtbewertung basiert auf hunderten fundierten Messergebnissen und Benchmarks, womit Ihnen Objektivität garantiert ist. Weitere Informationen zu unseren Testmethoden gibt es hier.
Preisvergleich

