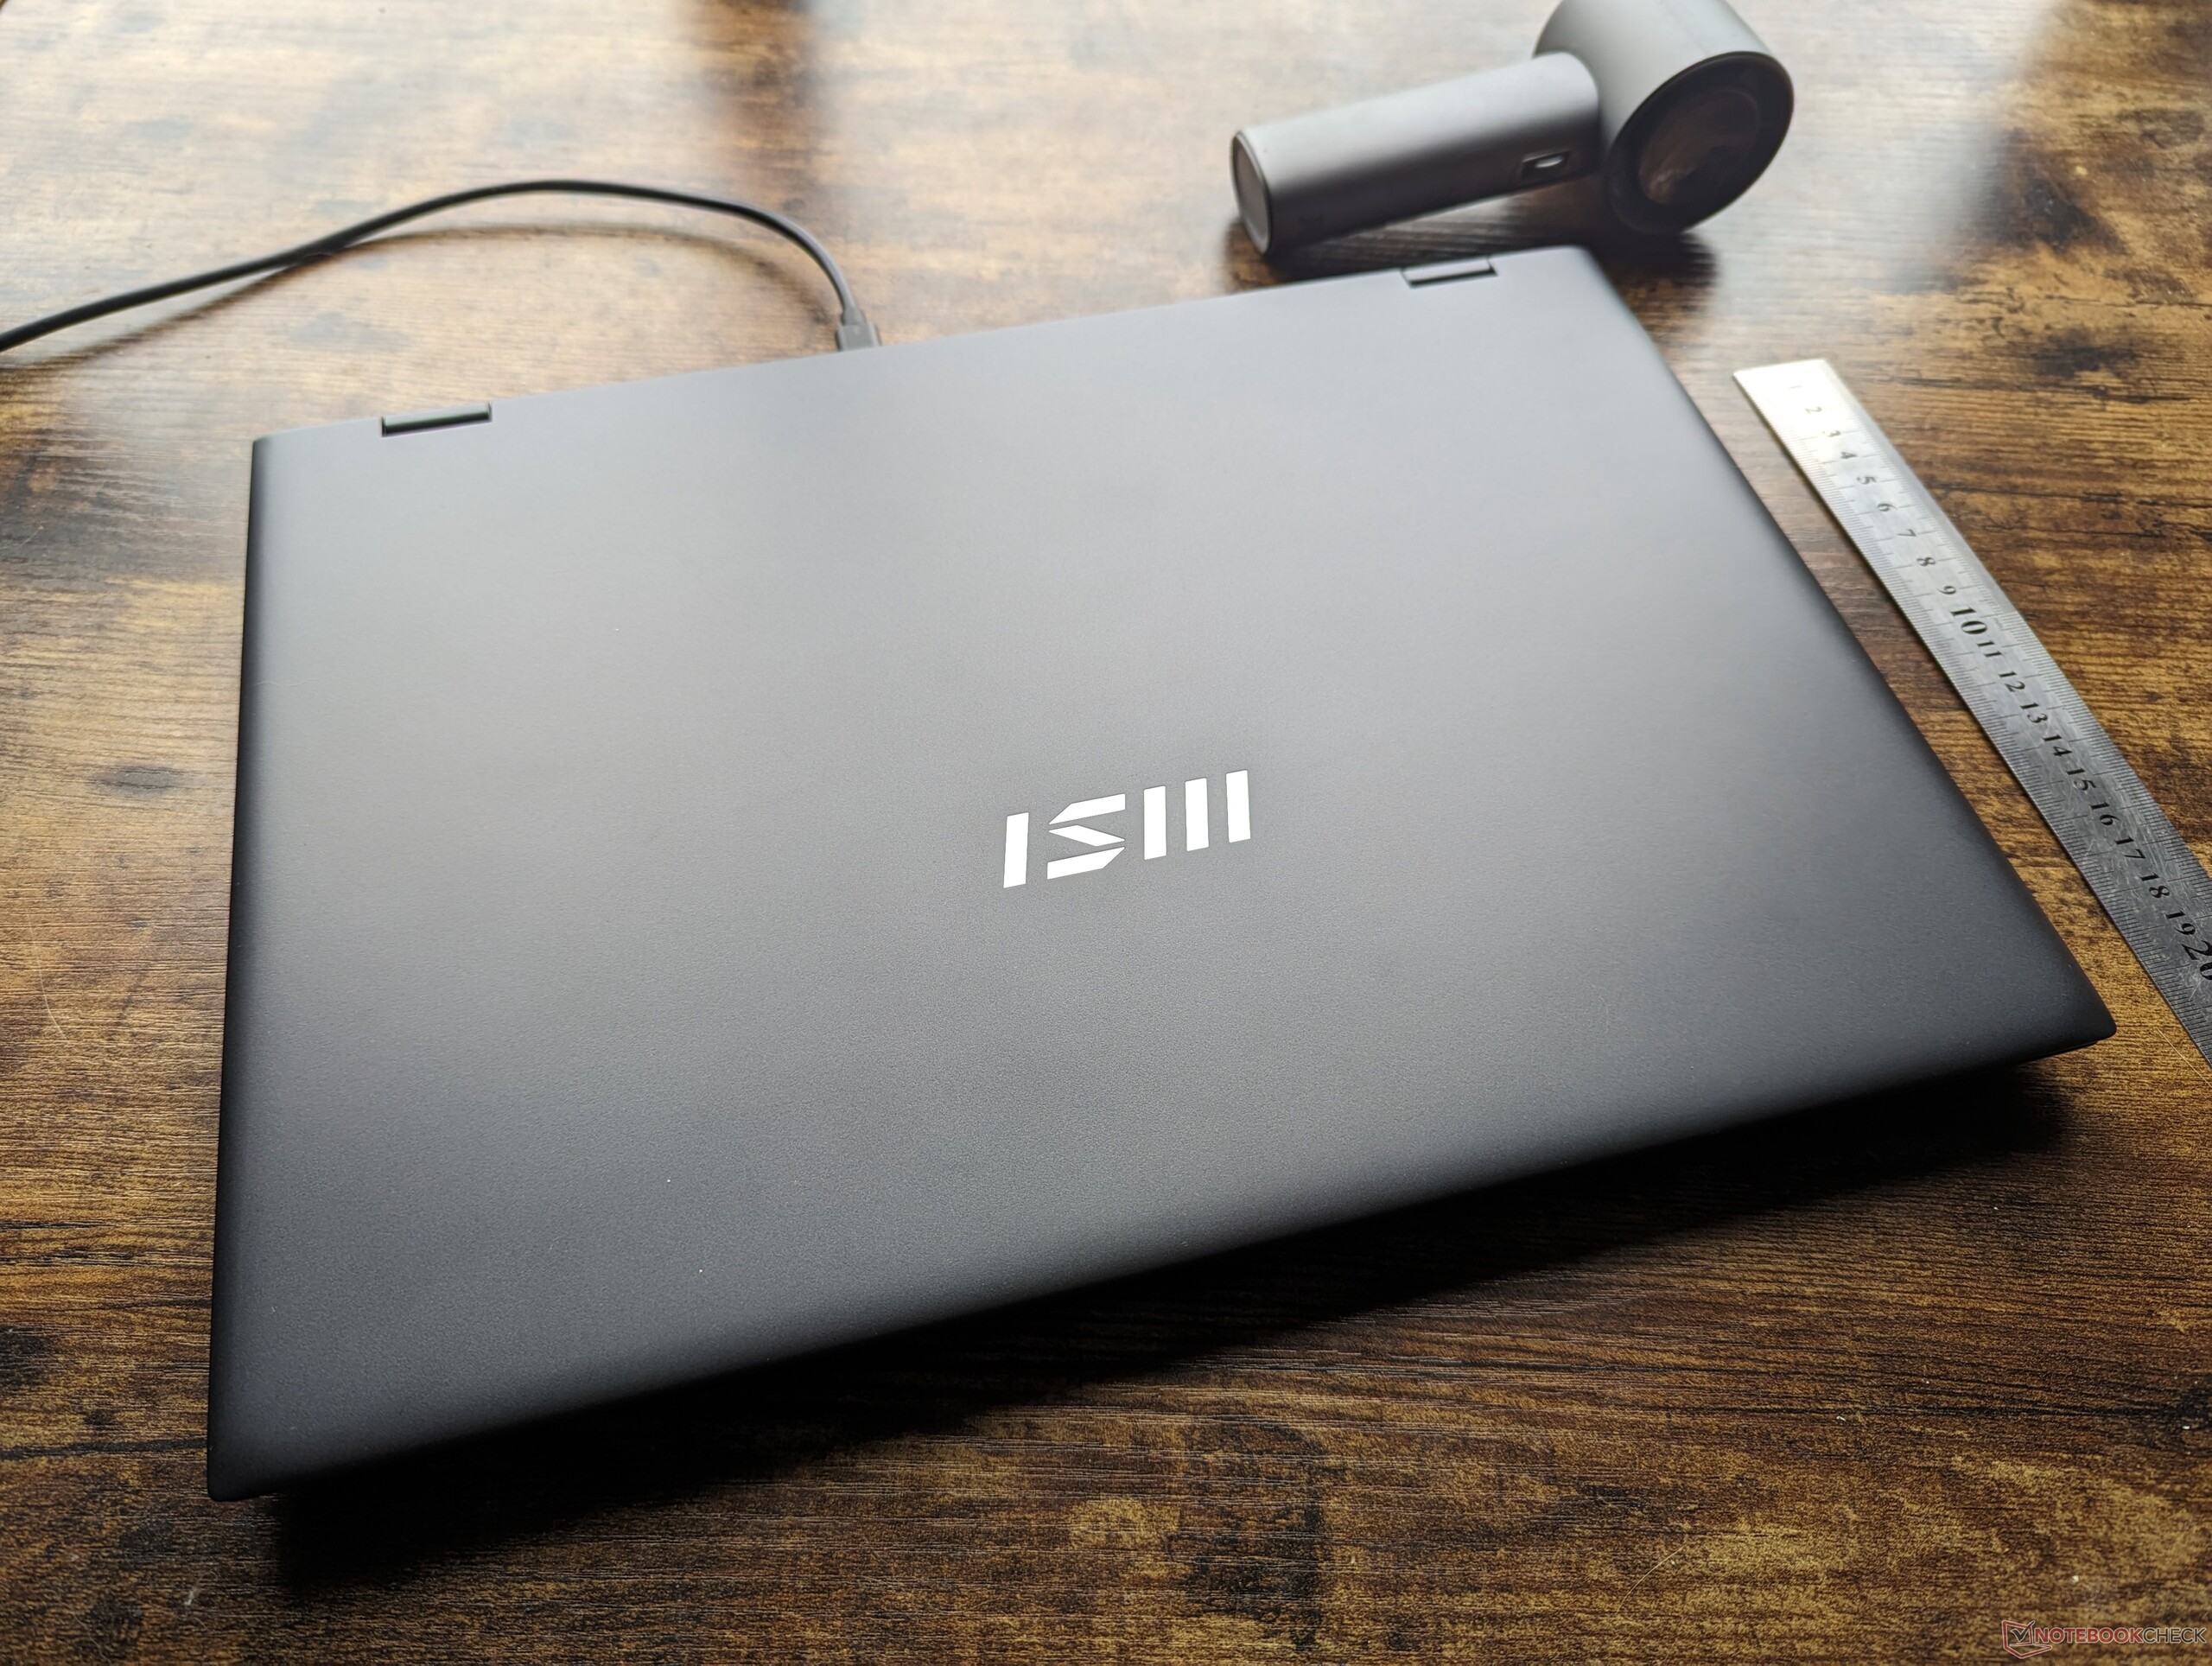
MSI Prestige 16 B1MG Laptop im Test: Vom Core i7 Xe zum Core Ultra 7 Arc

Das 16-Zoll-Notebook MSI Prestige 16 AI B1MG ist eines der ersten Geräte auf dem Markt, das die Core Ultra Meteor Lake CPU-Optionen der 14. Generation bietet. Es tritt in die Fußstapfen des älteren 15,6-Zoll-Notebooks Prestige 15 und verspricht ein völlig neues Nutzererlebnis durch überarbeitete interne und externe Komponenten. Die MSI Prestige-Familie positioniert sich in der oberen Mittelklasse, zwischen der Modern-Familie im unteren Preissegment und der Summit-Familie im höheren Preissegment.
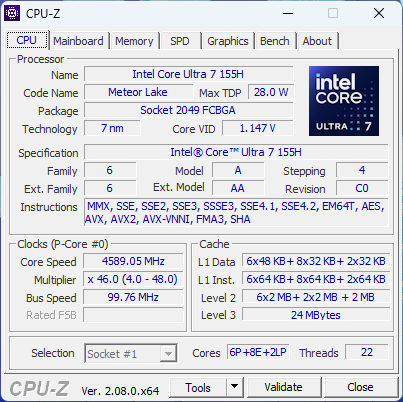
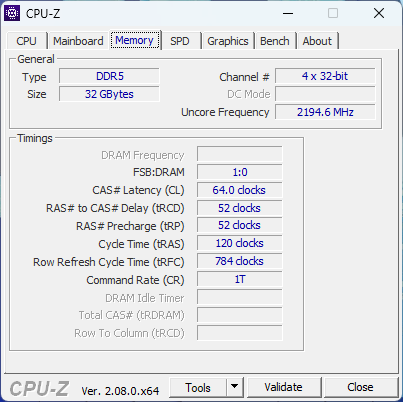
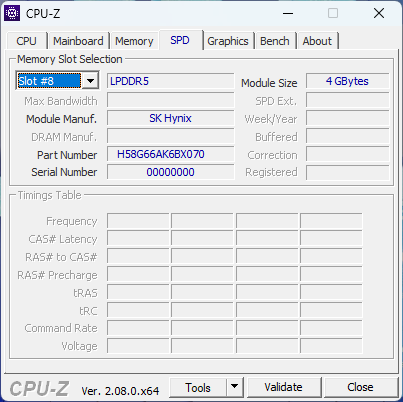
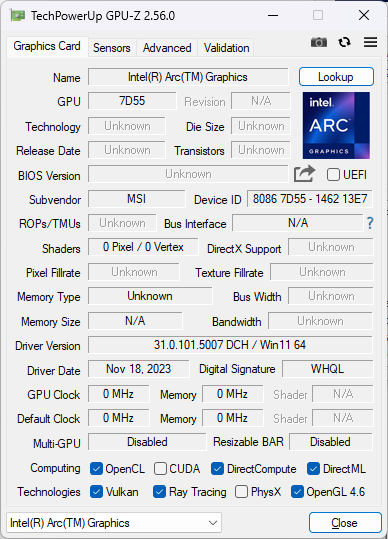
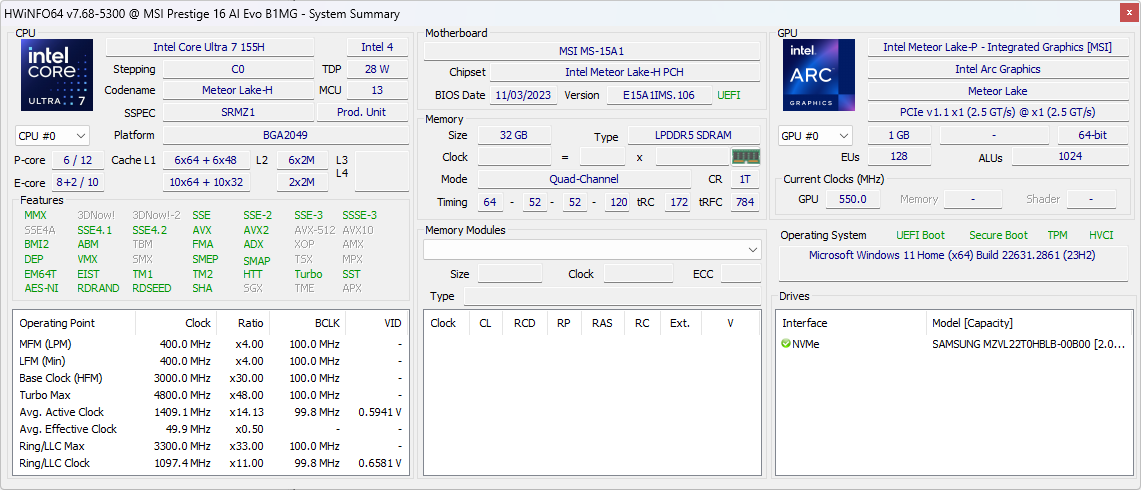
Unsere Testkonfiguration, ein Einzelhandelsgerät für ~1200 Euro, verfügt über eine Core Ultra 7 155H CPU, integrierte Arc 8 Grafik, ein 1600p IPS-Display, 32 GB LPDDR5-6400 MHz RAM und eine 2 TB NVMe SSD. Höherwertige SKUs mit Core Ultra 9 185H, GeForce RTX 4060 oder 4070 Grafik, Arc 370M Grafik und einem 4K (2400p) OLED-Display sind ebenfalls verfügbar.
Zu den Wettbewerbern des Prestige 16 zählen andere schlanke und leichte Multimedia- oder Content-Creator-Notebooks wie die Dell XPS series, das Asus VivoBook Pro 16, das LG Gram 16 2-in-1, oder das Lenovo Yoga Pro 9i 16.
Weitere MSI Bewertungen:
Mögliche Konkurrenten im Vergleich
Bew. | Datum | Modell | Gewicht | Dicke | Größe | Auflösung | Preis ab |
|---|---|---|---|---|---|---|---|
| 88.1 % v7 (old) | 12 / 2023 | MSI Prestige 16 B1MG-001US Ultra 7 155H, Arc 8-Core | 1.6 kg | 19.1 mm | 16.00" | 2560x1600 | |
| 85.4 % v7 (old) | 12 / 2022 | MSI Prestige 15 A12UD-093 i7-1280P, GeForce RTX 3050 Ti Laptop GPU | 1.8 kg | 20.1 mm | 15.60" | 3840x2160 | |
| 85.8 % v7 (old) | 11 / 2023 | LG Gram 2in1 16 16T90R - G.AA78G i7-1360P, Iris Xe G7 96EUs | 1.5 kg | 17.2 mm | 16.00" | 2560x1600 | |
| 85.7 % v7 (old) | 11 / 2023 | Lenovo ThinkBook 16 G6 ABP R5 7530U, Vega 7 | 1.8 kg | 17.5 mm | 16.00" | 1920x1200 | |
| 87.6 % v7 (old) | 11 / 2023 | Asus VivoBook Pro 16 K6602VU i9-13900H, GeForce RTX 4050 Laptop GPU | 1.9 kg | 19 mm | 16.00" | 3200x2000 | |
| 87.1 % v7 (old) | 09 / 2023 | Dell Inspiron 16 Plus 7630 i7-13700H, GeForce RTX 4060 Laptop GPU | 2.2 kg | 19.95 mm | 16.00" | 2560x1600 |
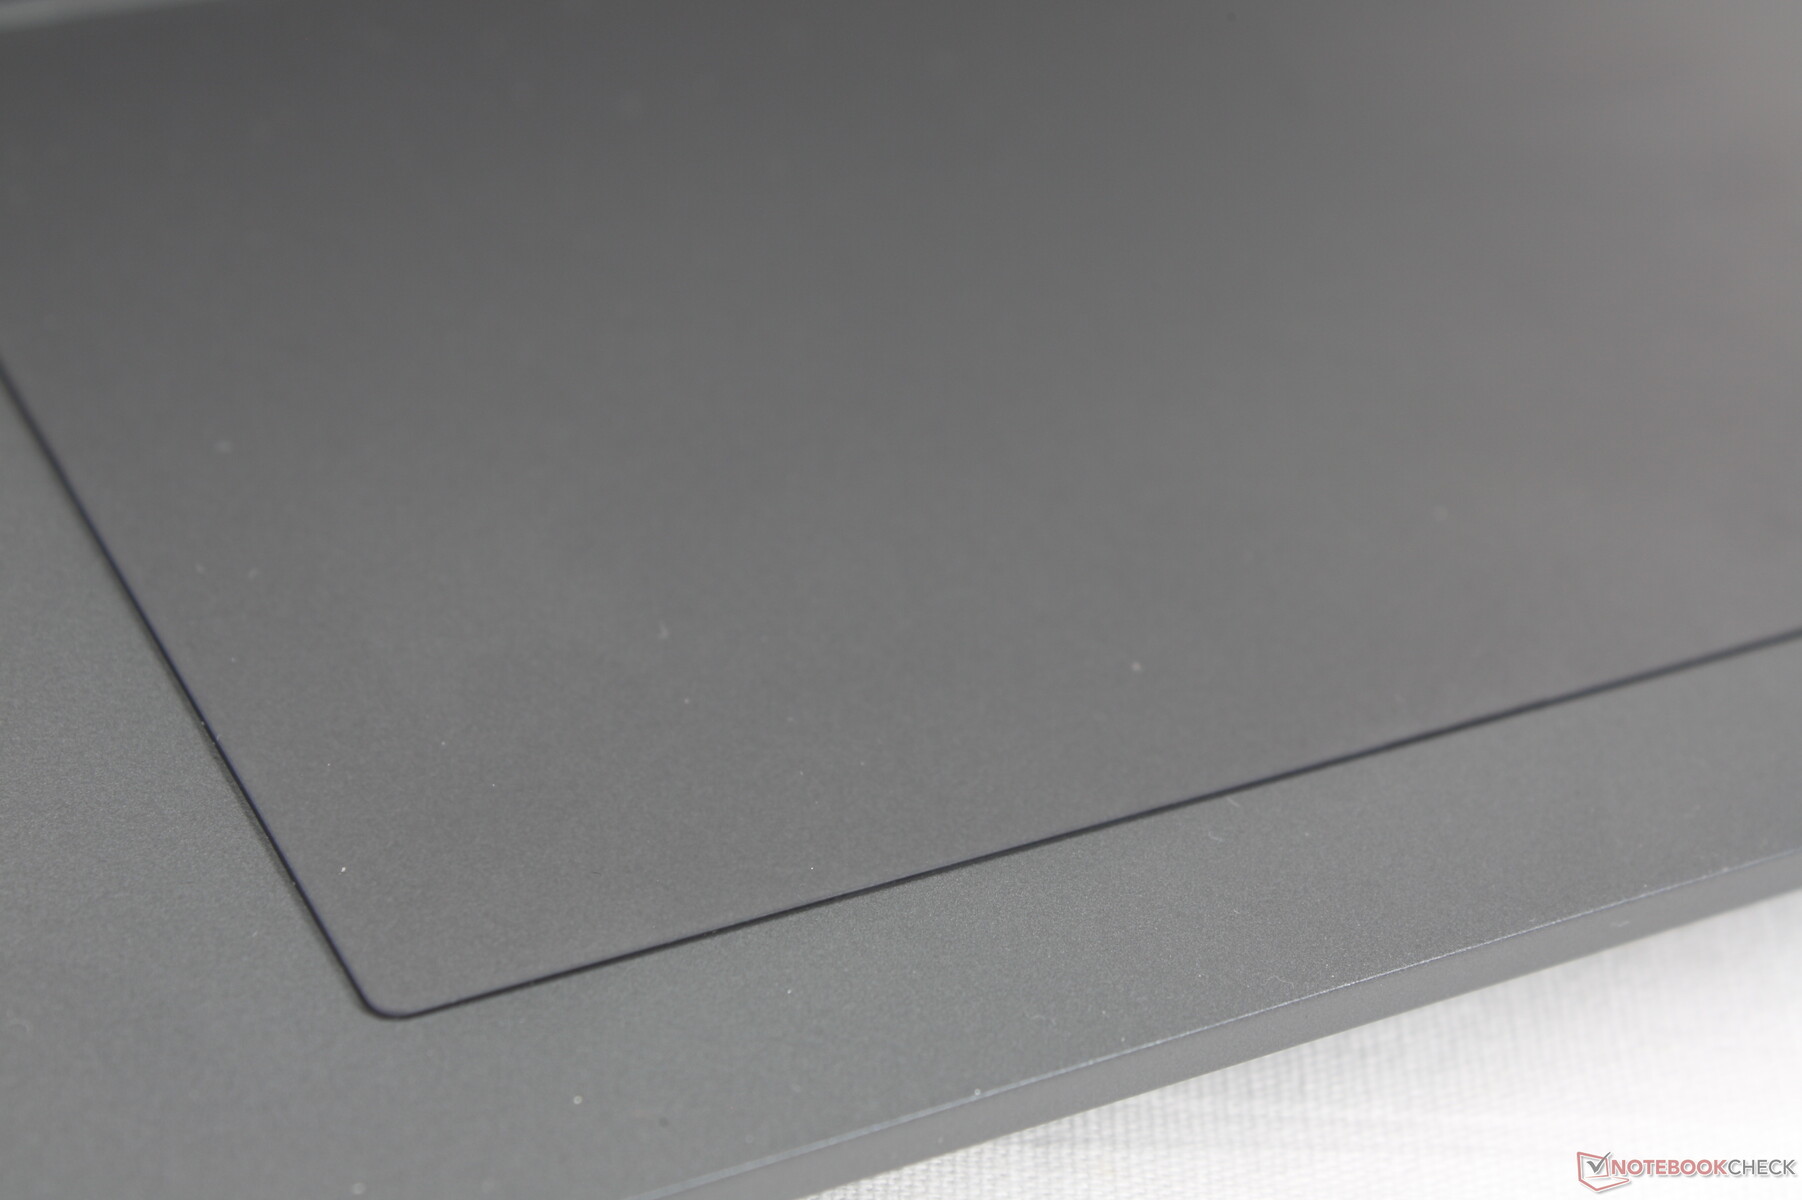
Gehäuse — Schlankes Aussehen, dünne Materialien
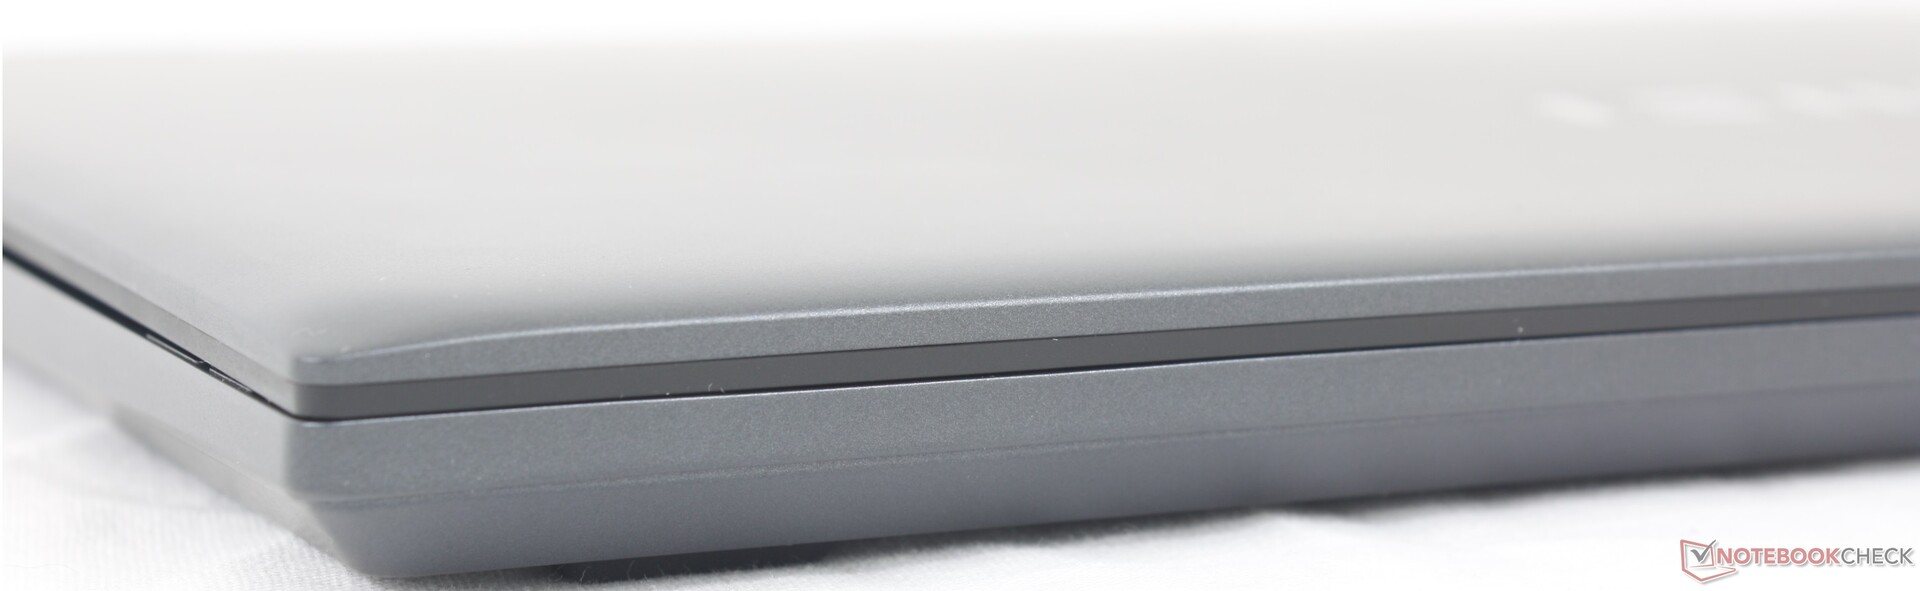
Das Metallgehäuse des MSI Prestige 16 AI B1MG zeigt sich als solide und stabil im Vergleich zu günstigeren Alternativen wie dem MSI Modern oder der Asus VivoBook-Serie. Bei Druck in der Mitte der Tastatur bleibt die Oberfläche nahezu unverwindbar. Der Deckel hingegen neigt eher zu Verwindungen und möglichen Beschädigungen, insbesondere da ihm die Verstärkung durch Gorilla-Glas fehlt. Ein Druck in die Mitte des äußeren Deckels könnte zu einer stärkeren Verformung führen, als wünschenswert ist. In solchen Fällen erweisen sich Alternativen wie das HP Spectre oder das Razer Blade als deutlich stabiler, auch wenn sie etwas schwerer sind.
Dank des quadratischen Seitenverhältnisses von 16:10 bietet der Prestige 16 eine größere Bildschirmfläche im Vergleich zum vorherigen Prestige 15. Trotz dieser Erweiterung gleicht das dünnere Profil und das geringere Gewicht diesen Unterschied aus. Tatsächlich zählt das Prestige 16 zu den leichtesten 16-Zoll-Multimedia-Notebooks und konkurriert in dieser Hinsicht sogar mit dem LG Gram 16 2-in-1. Es ist anzumerken, dass Modelle mit diskreter Grafik wahrscheinlich etwas schwerer ausfallen werden.
Ausstattung— Fit für Wi-Fi 7
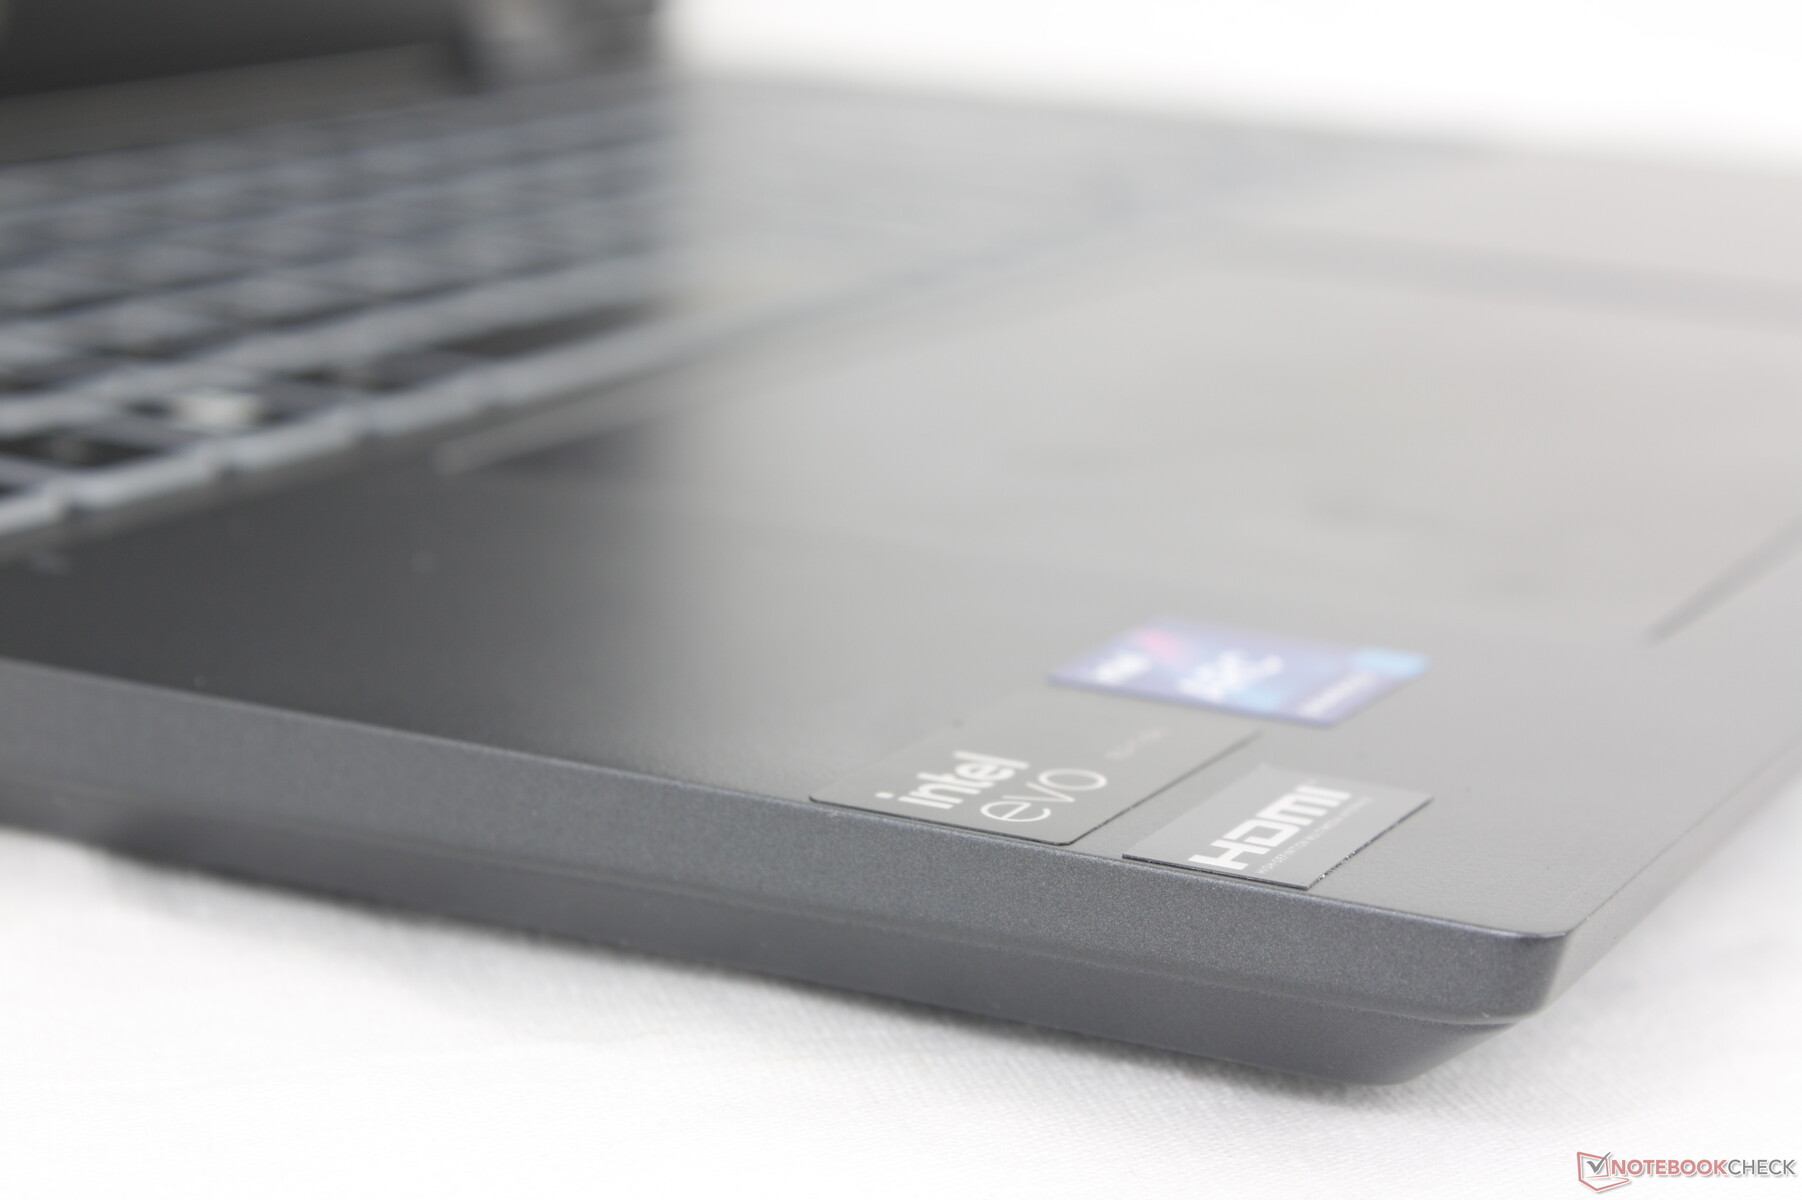
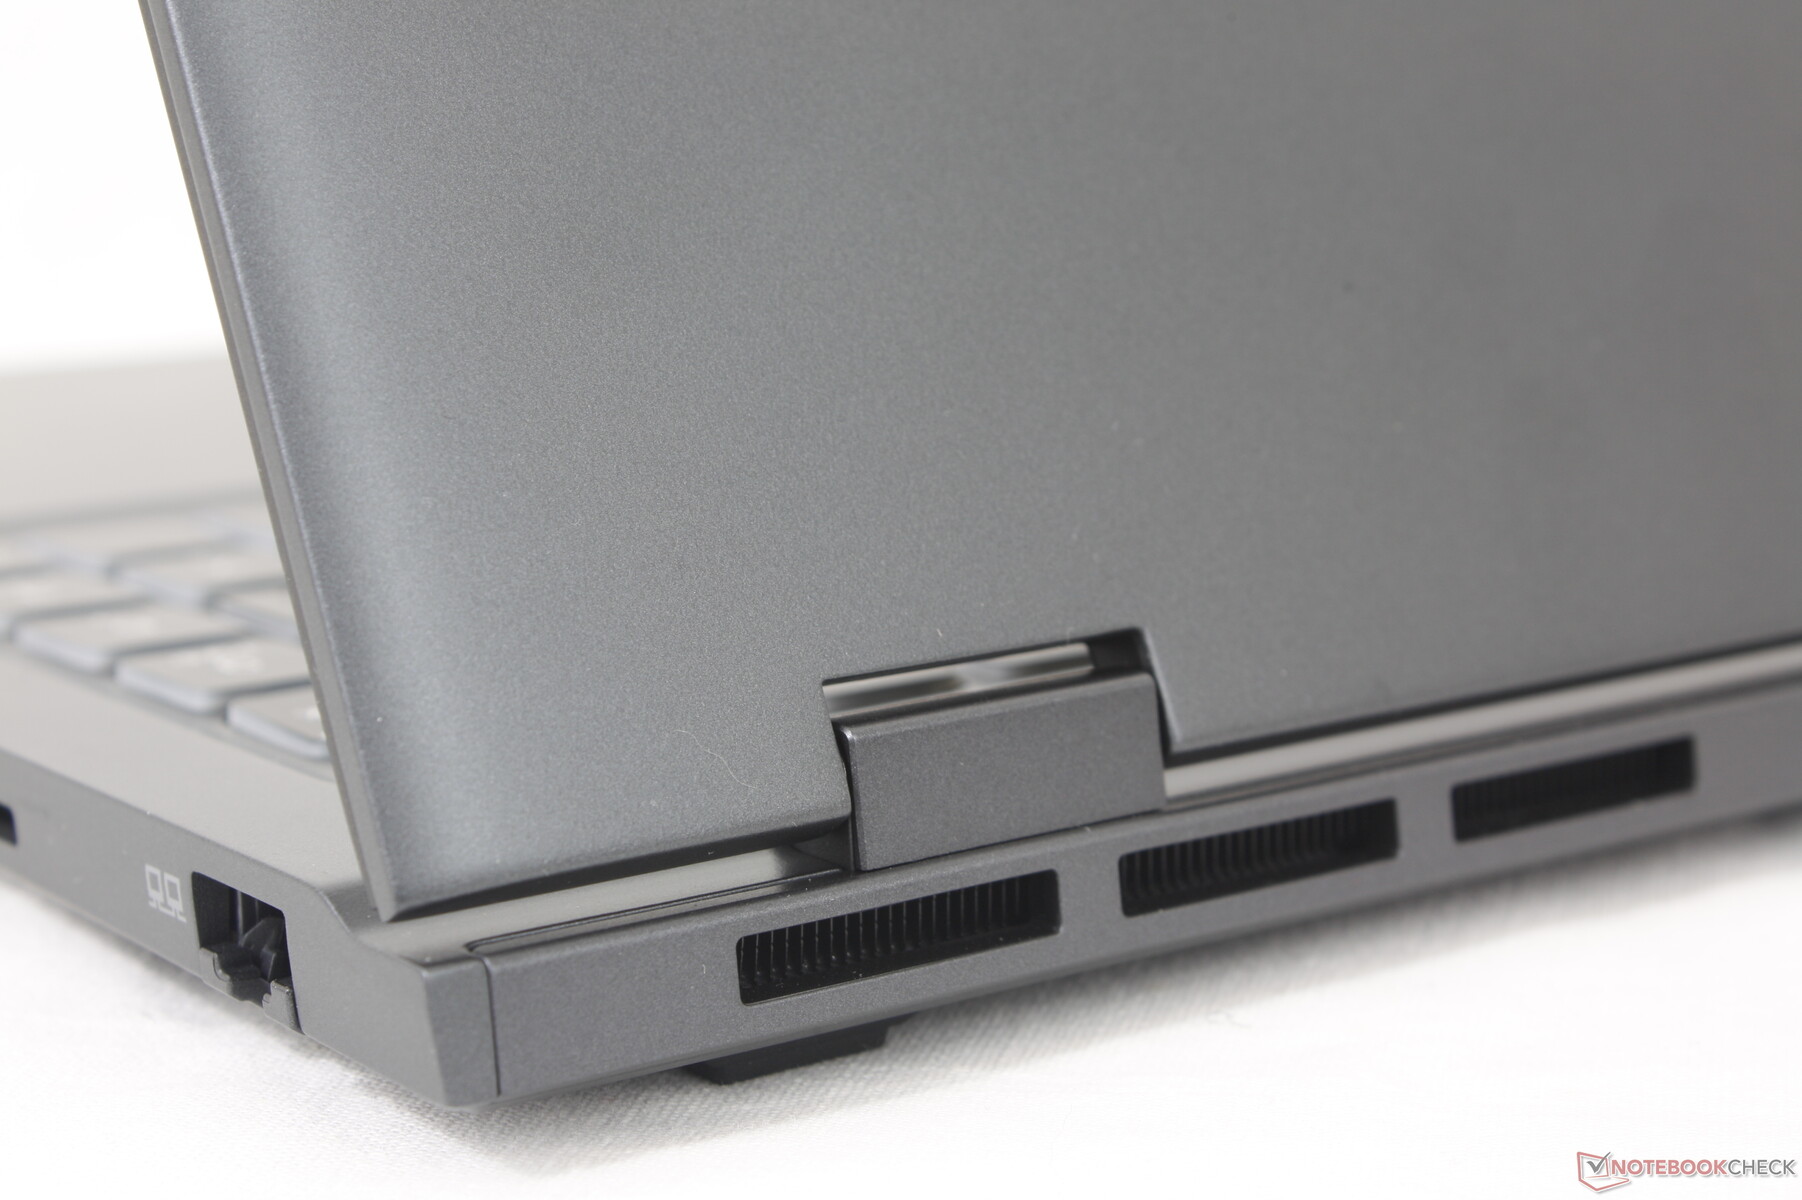
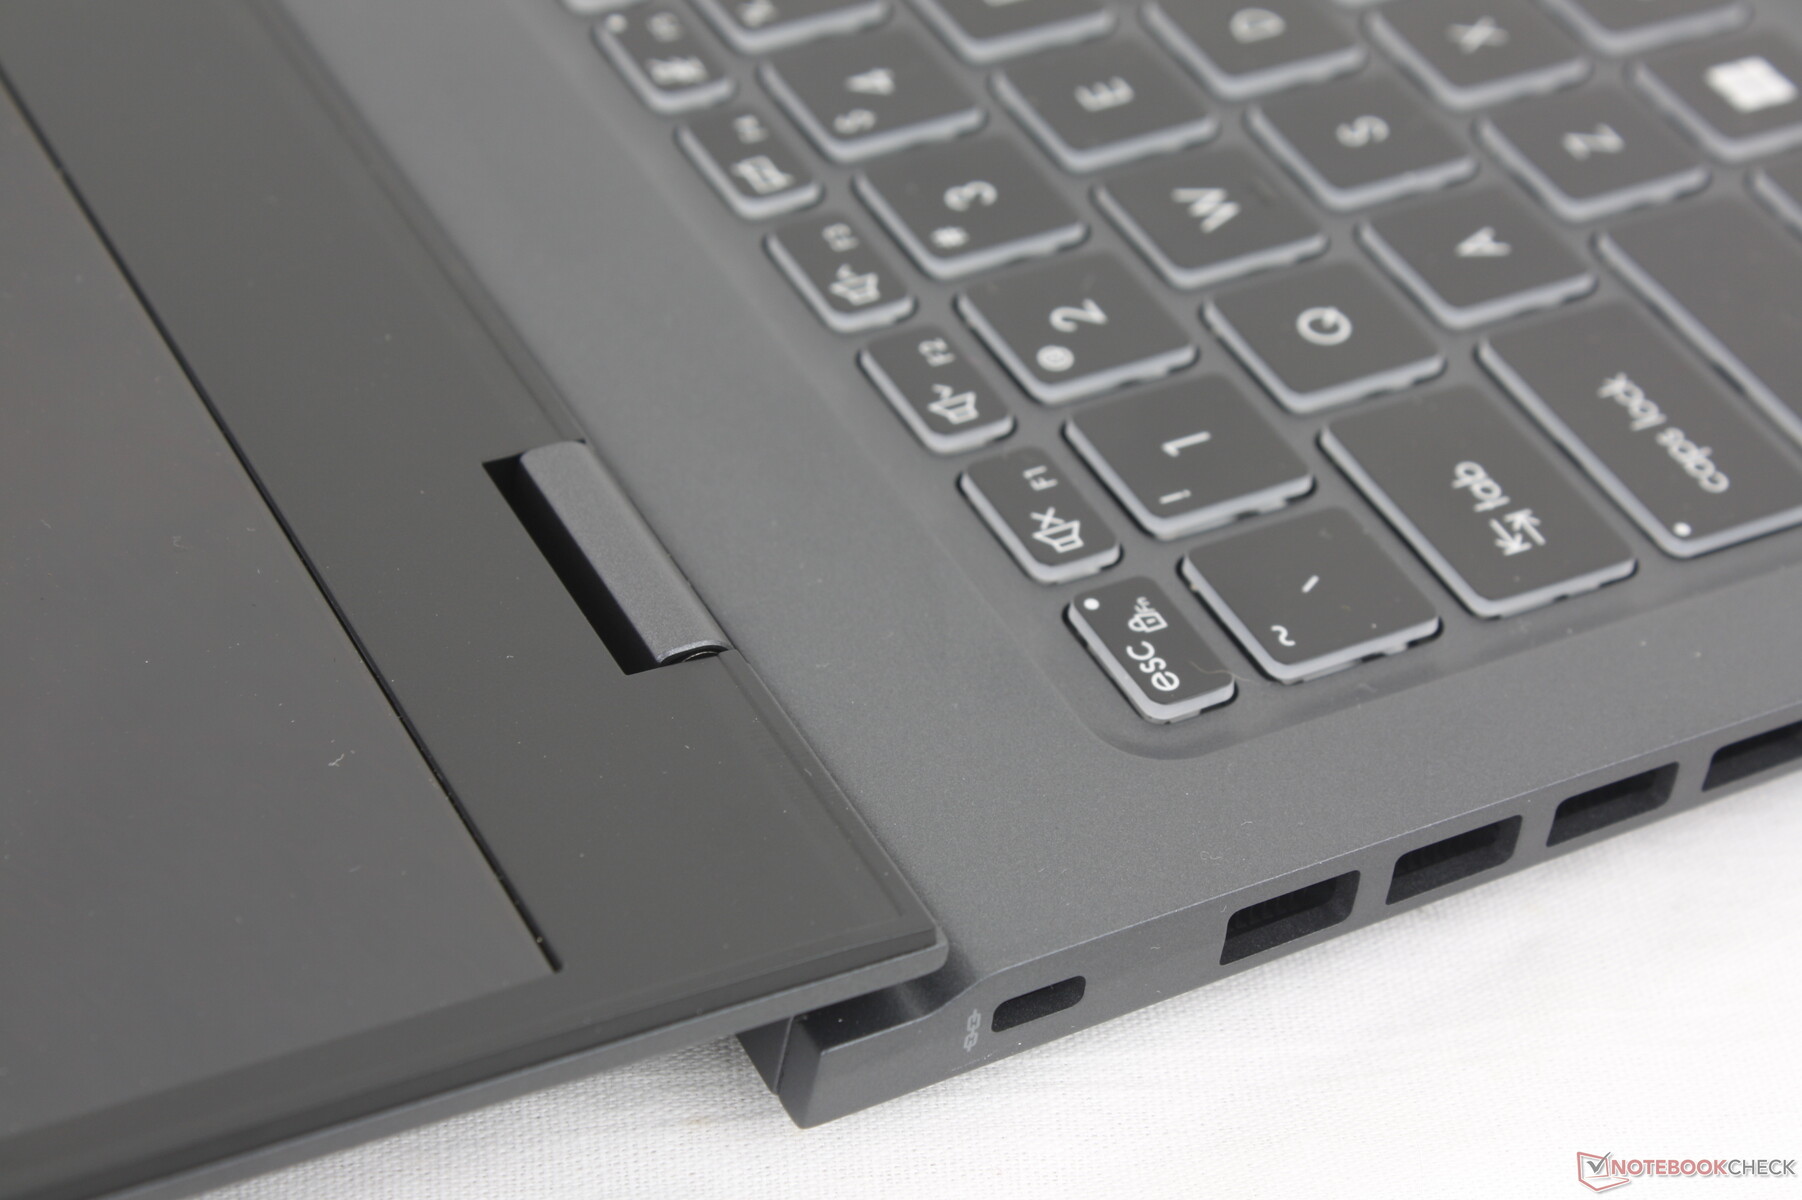
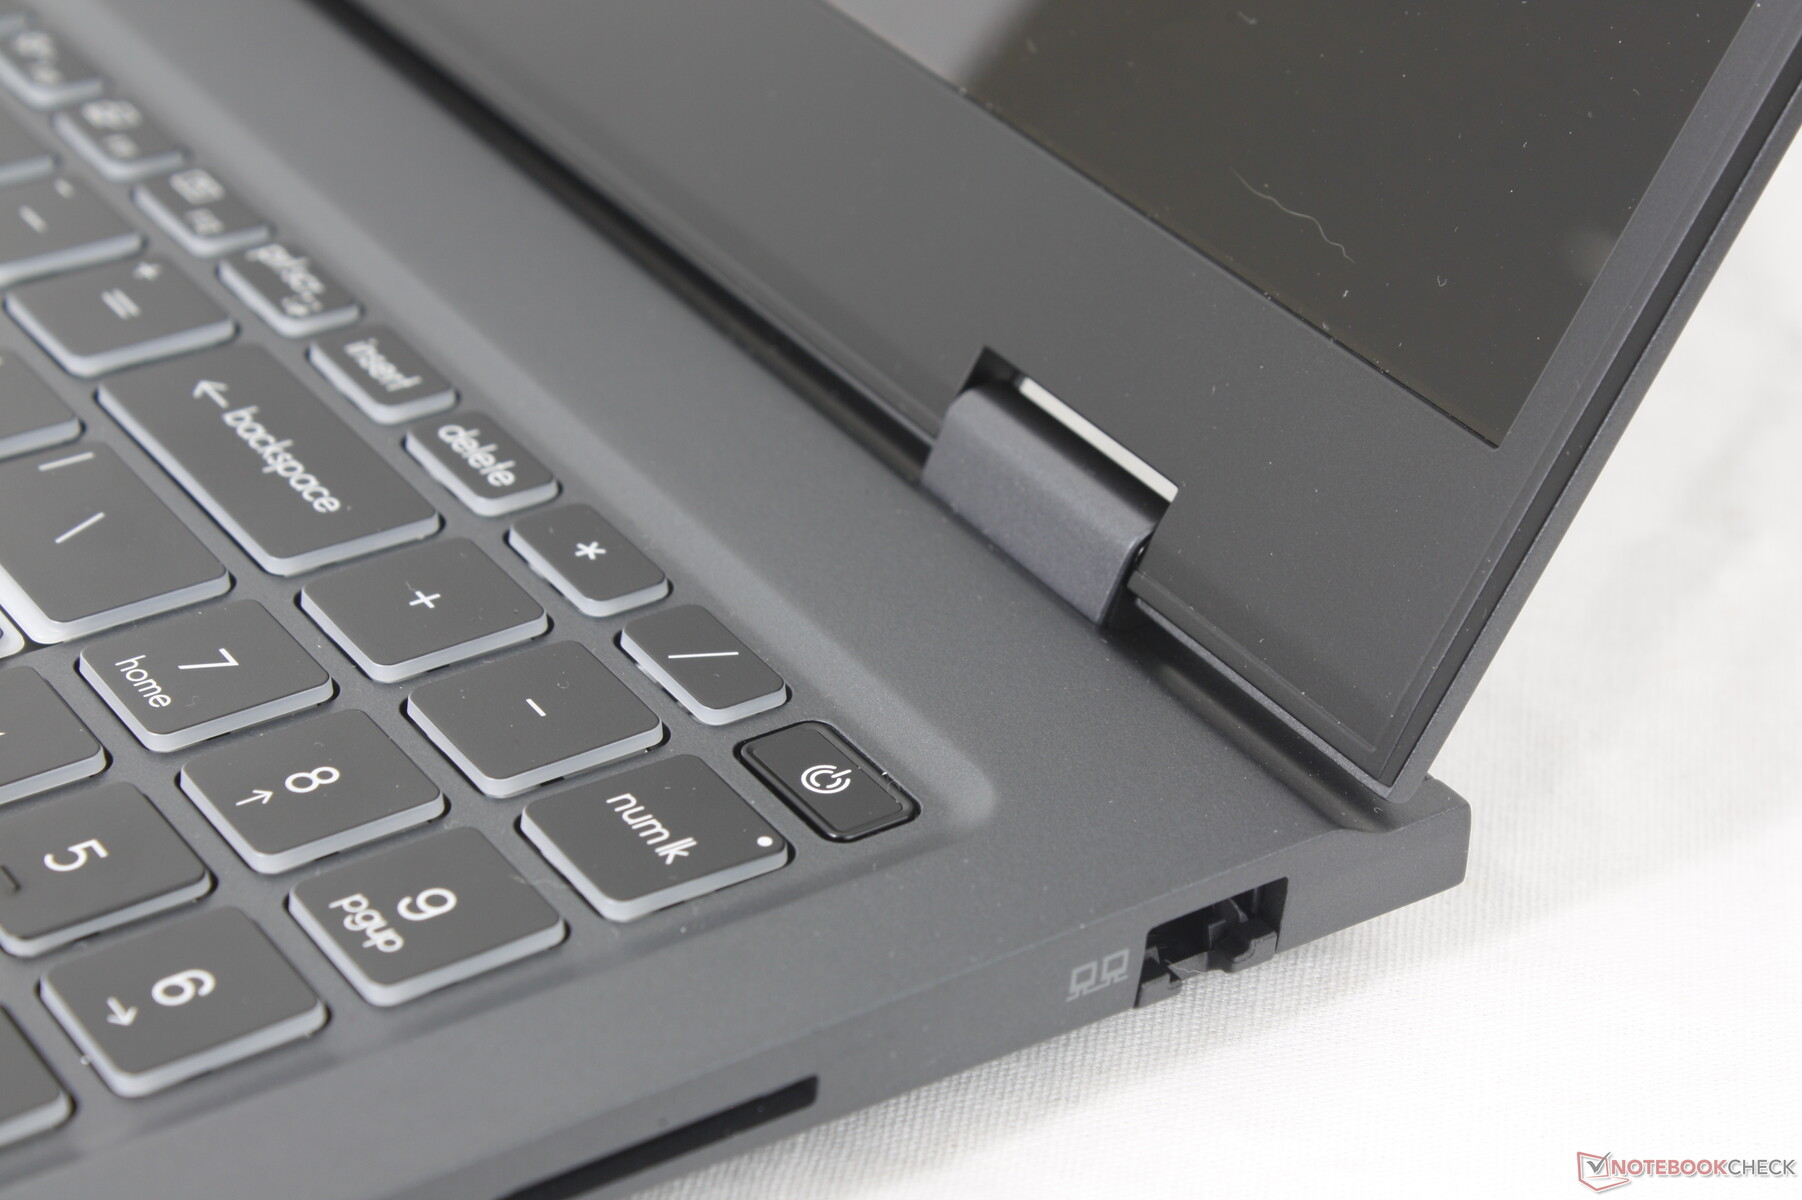
Im Gegensatz zu den meisten anderen Ultrabooks sind die Anschlüsse beim Prestige 16 an der Rückseite statt an den Seiten platziert. Dieser Designansatz fördert eine bessere Belüftung an den Seiten, geht jedoch auf Kosten der Zugänglichkeit der Anschlüsse. Häufig genutzte Anschlüsse wie HDMI, USB-C und sogar USB-A befinden sich alle auf der Rückseite, was für die meisten Nutzer möglicherweise weniger praktisch ist.
Im Vergleich zum Prestige 15 hat das Prestige 16 einen USB-A-Anschluss gegen einen RJ-45-Anschluss ausgetauscht. Die beiden Thunderbolt 4-Anschlüsse bleiben bei SKUs mit nur integrierter Grafik unverändert. Bei Konfigurationen mit diskreter Grafik ist jedoch nur einer der beiden USB-C-Anschlüsse Thunderbolt-kompatibel.
SD Card Reader
Der integrierte SD-Kartenleser wurde verbessert und ist nun erheblich schneller. Die Übertragung von 1 GB Bildern von unserer UHS-II-Testkarte auf den Desktop dauert nur knapp 6 Sekunden, im Vergleich zu 12+ Sekunden beim Prestige 15.
| SD Card Reader | |
| average JPG Copy Test (av. of 3 runs) | |
| MSI Prestige 16 B1MG-001US (Toshiba Exceria Pro SDXC 64 GB UHS-II) | |
| Asus VivoBook Pro 16 K6602VU (Angelbird AV Pro V60) | |
| Lenovo ThinkBook 16 G6 ABP (Angelbird AV Pro V60) | |
| MSI Prestige 15 A12UD-093 (AV Pro SD microSD 128 GB V60) | |
| LG Gram 2in1 16 16T90R - G.AA78G | |
| Dell Inspiron 16 Plus 7630 (AV Pro SD microSD 128 GB V60) | |
| maximum AS SSD Seq Read Test (1GB) | |
| Asus VivoBook Pro 16 K6602VU (Angelbird AV Pro V60) | |
| MSI Prestige 16 B1MG-001US (Toshiba Exceria Pro SDXC 64 GB UHS-II) | |
| Lenovo ThinkBook 16 G6 ABP (Angelbird AV Pro V60) | |
| MSI Prestige 15 A12UD-093 (AV Pro SD microSD 128 GB V60) | |
| Dell Inspiron 16 Plus 7630 (AV Pro SD microSD 128 GB V60) | |
| LG Gram 2in1 16 16T90R - G.AA78G | |
Kommunikation
Das Prestige 16 ist eines der ersten Notebooks, das mit dem Killer BE1750W WLAN-Modul ausgestattet ist, um Wi-Fi 7-Kompatibilität zu ermöglichen. Gegenwärtig sind Wi-Fi 7-Router jedoch noch nicht weit verbreitet, was bedeutet, dass die Integration von Wi-Fi 7 im Moment mehr der Zukunftssicherheit als einem unmittelbaren Nutzen dient. Dennoch konnten wir bei der Kopplung mit unserem Wi-Fi 6E-Testrouter keine Verbindungsprobleme feststellen.
Webcam
Zur Standardausstattung gehört eine 2-MP-Webcam mit IR-Sensor und physischem Privacy Shutter. Es ist anzumerken, dass Alternativen wie das HP Spectre bereits mit höher auflösenden 5-MP-Sensoren ausgestattet sind.


Wartung
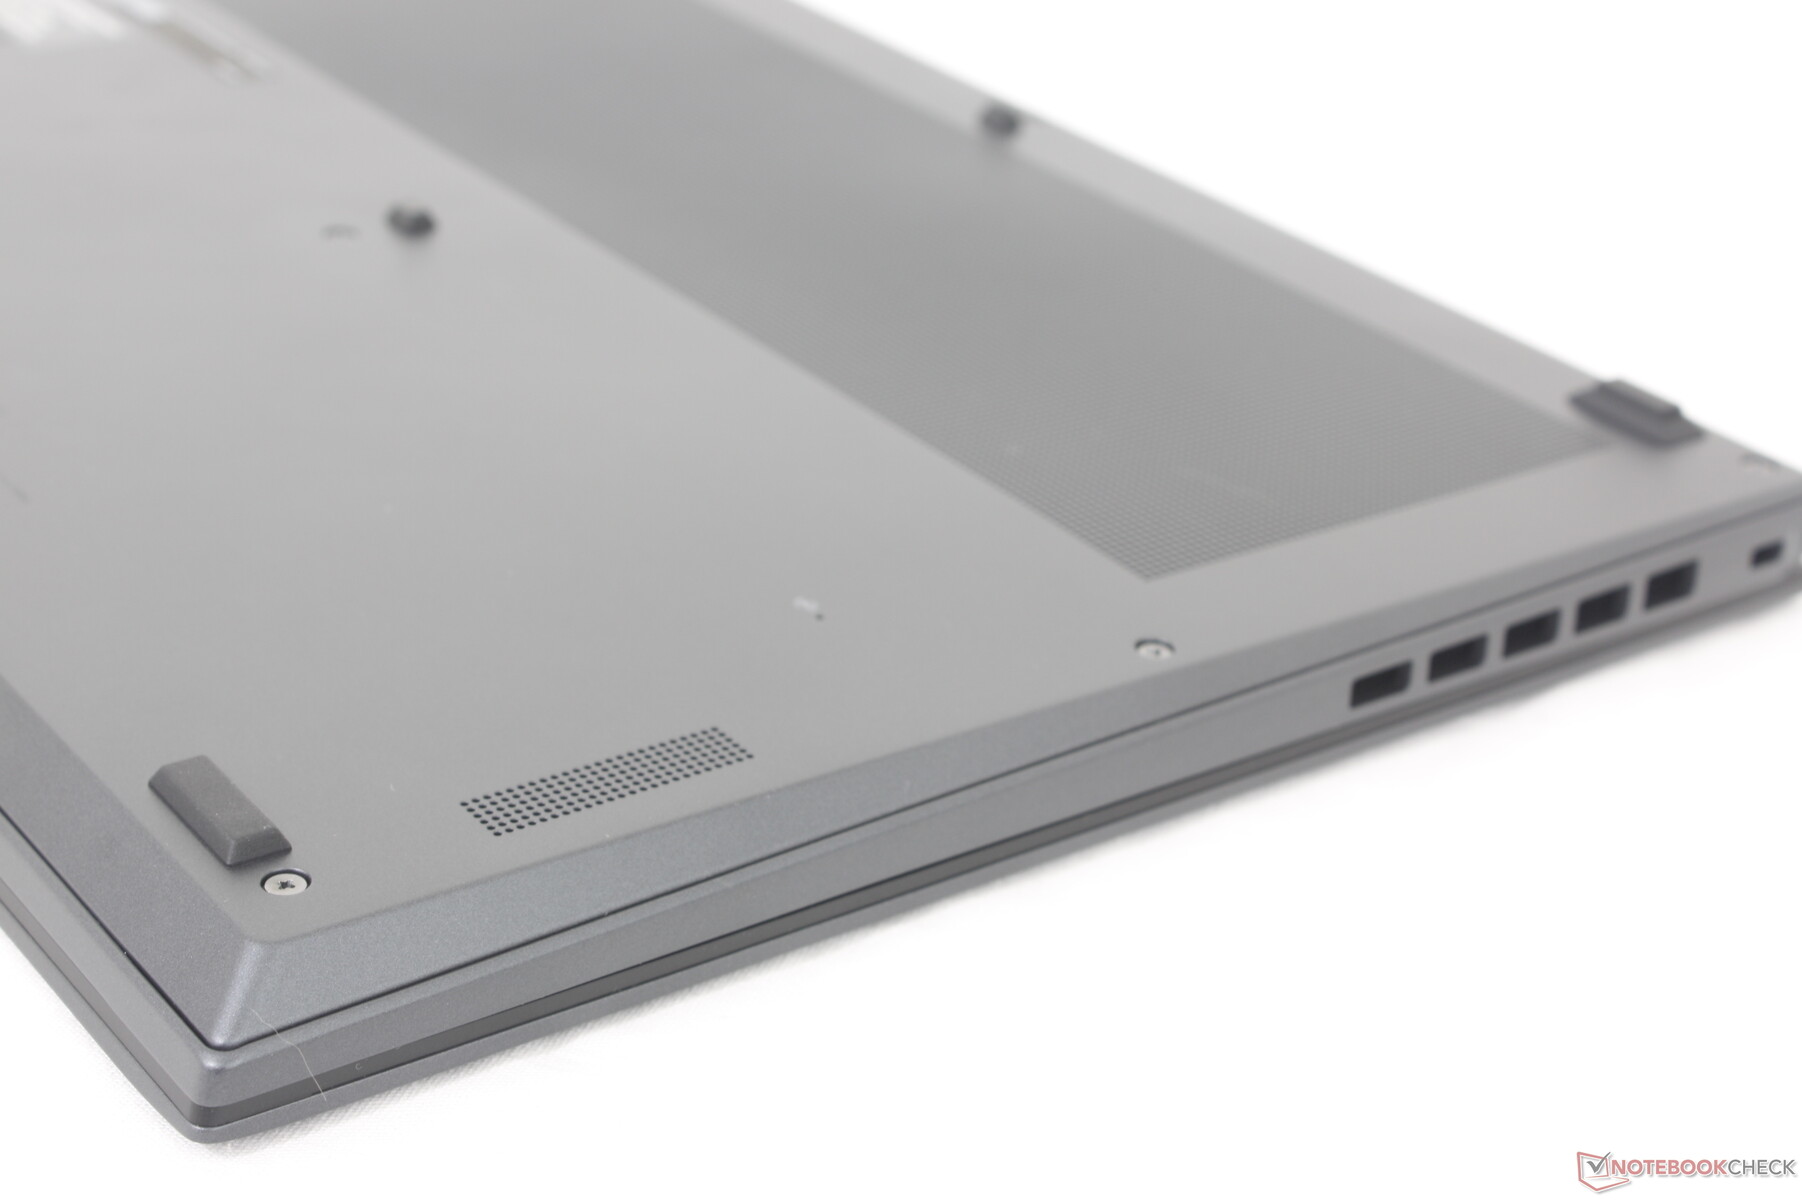
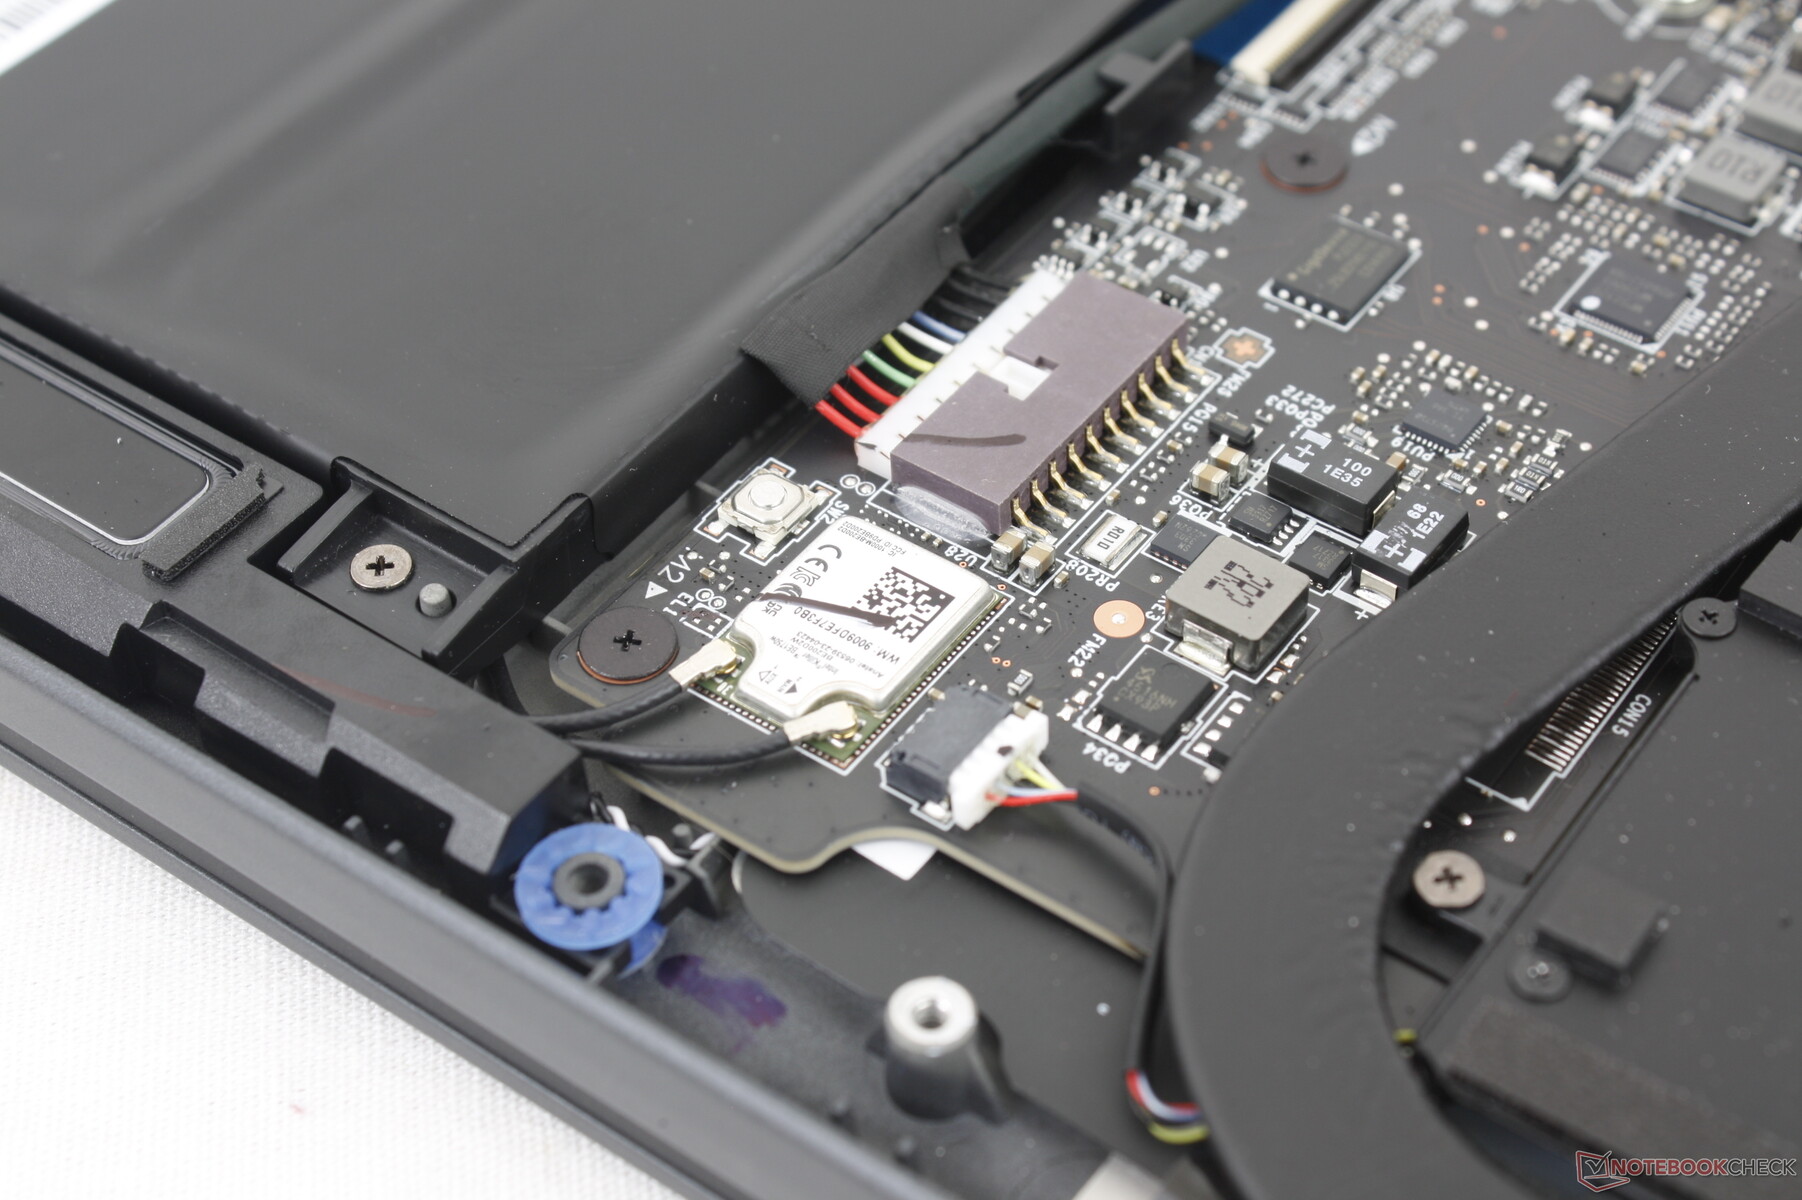
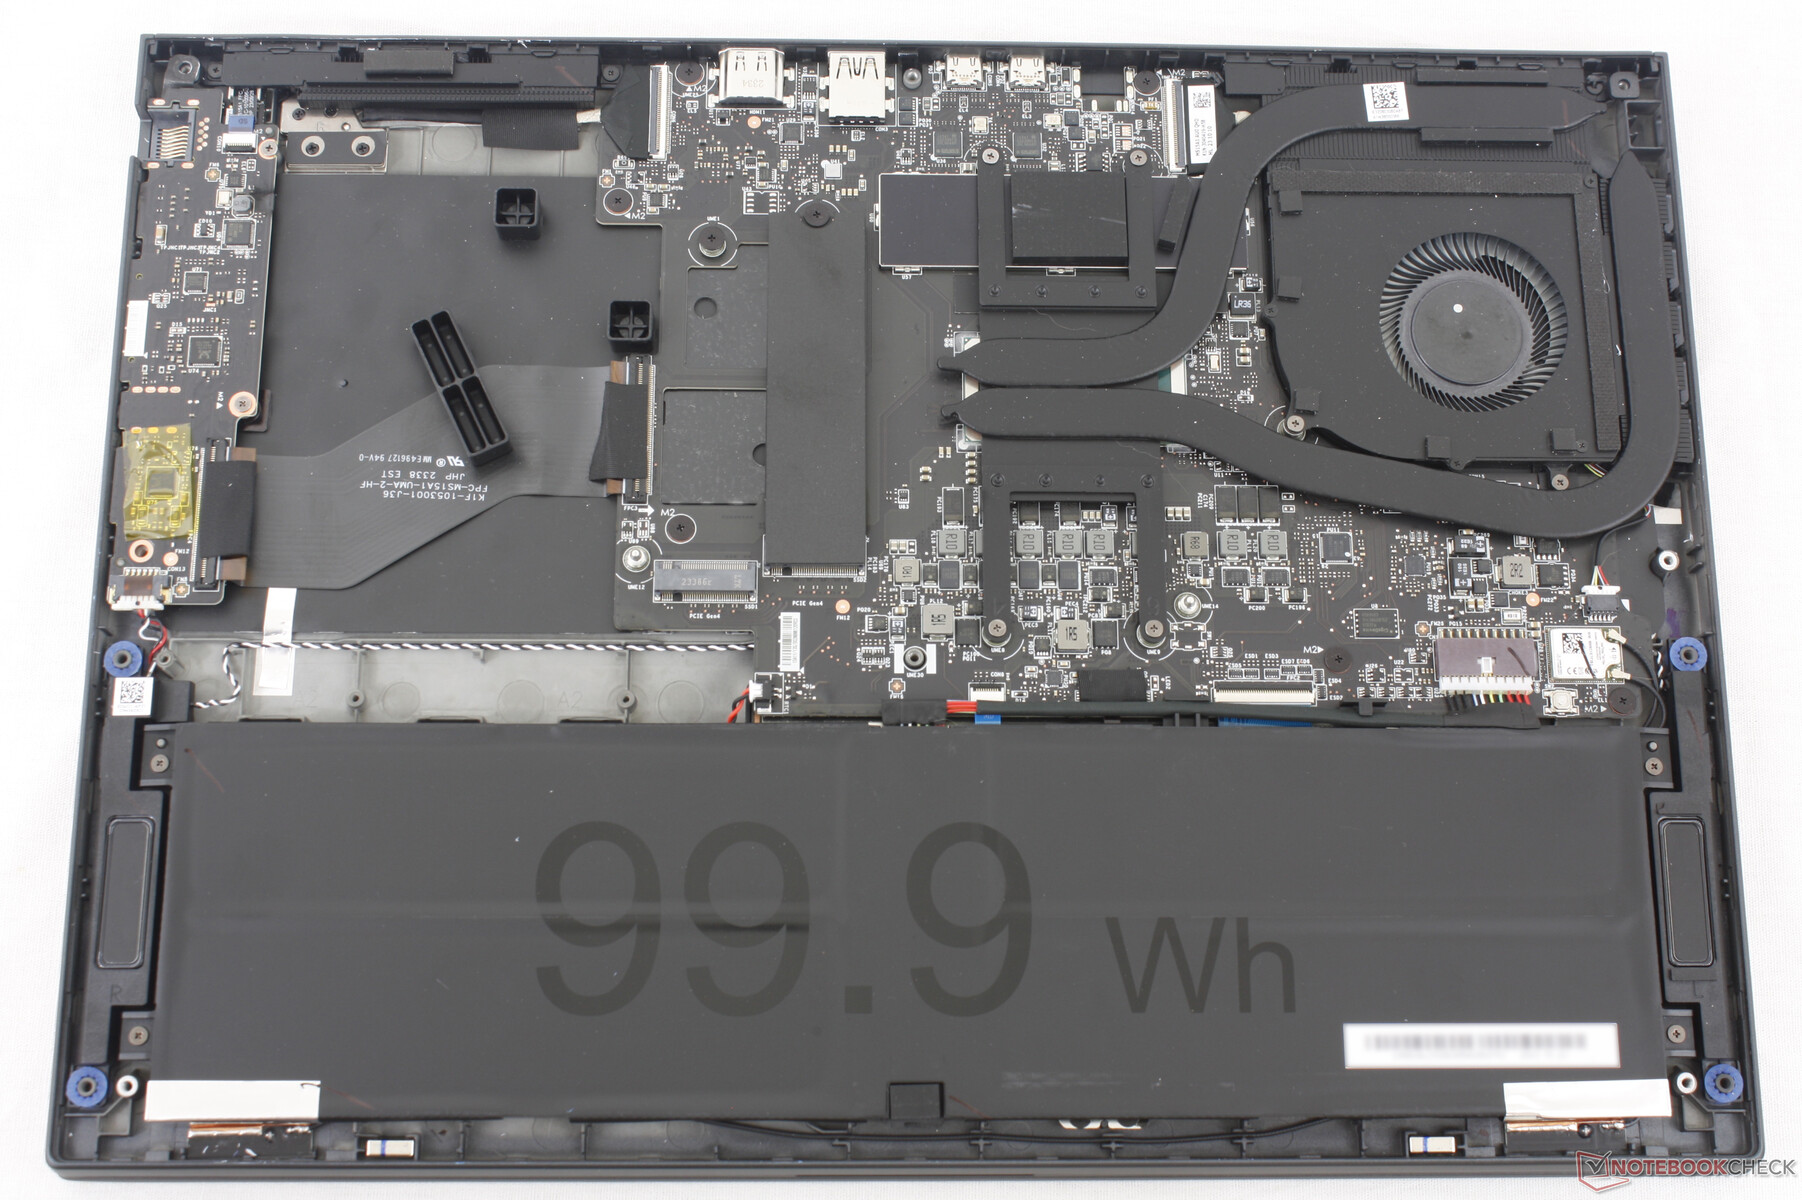
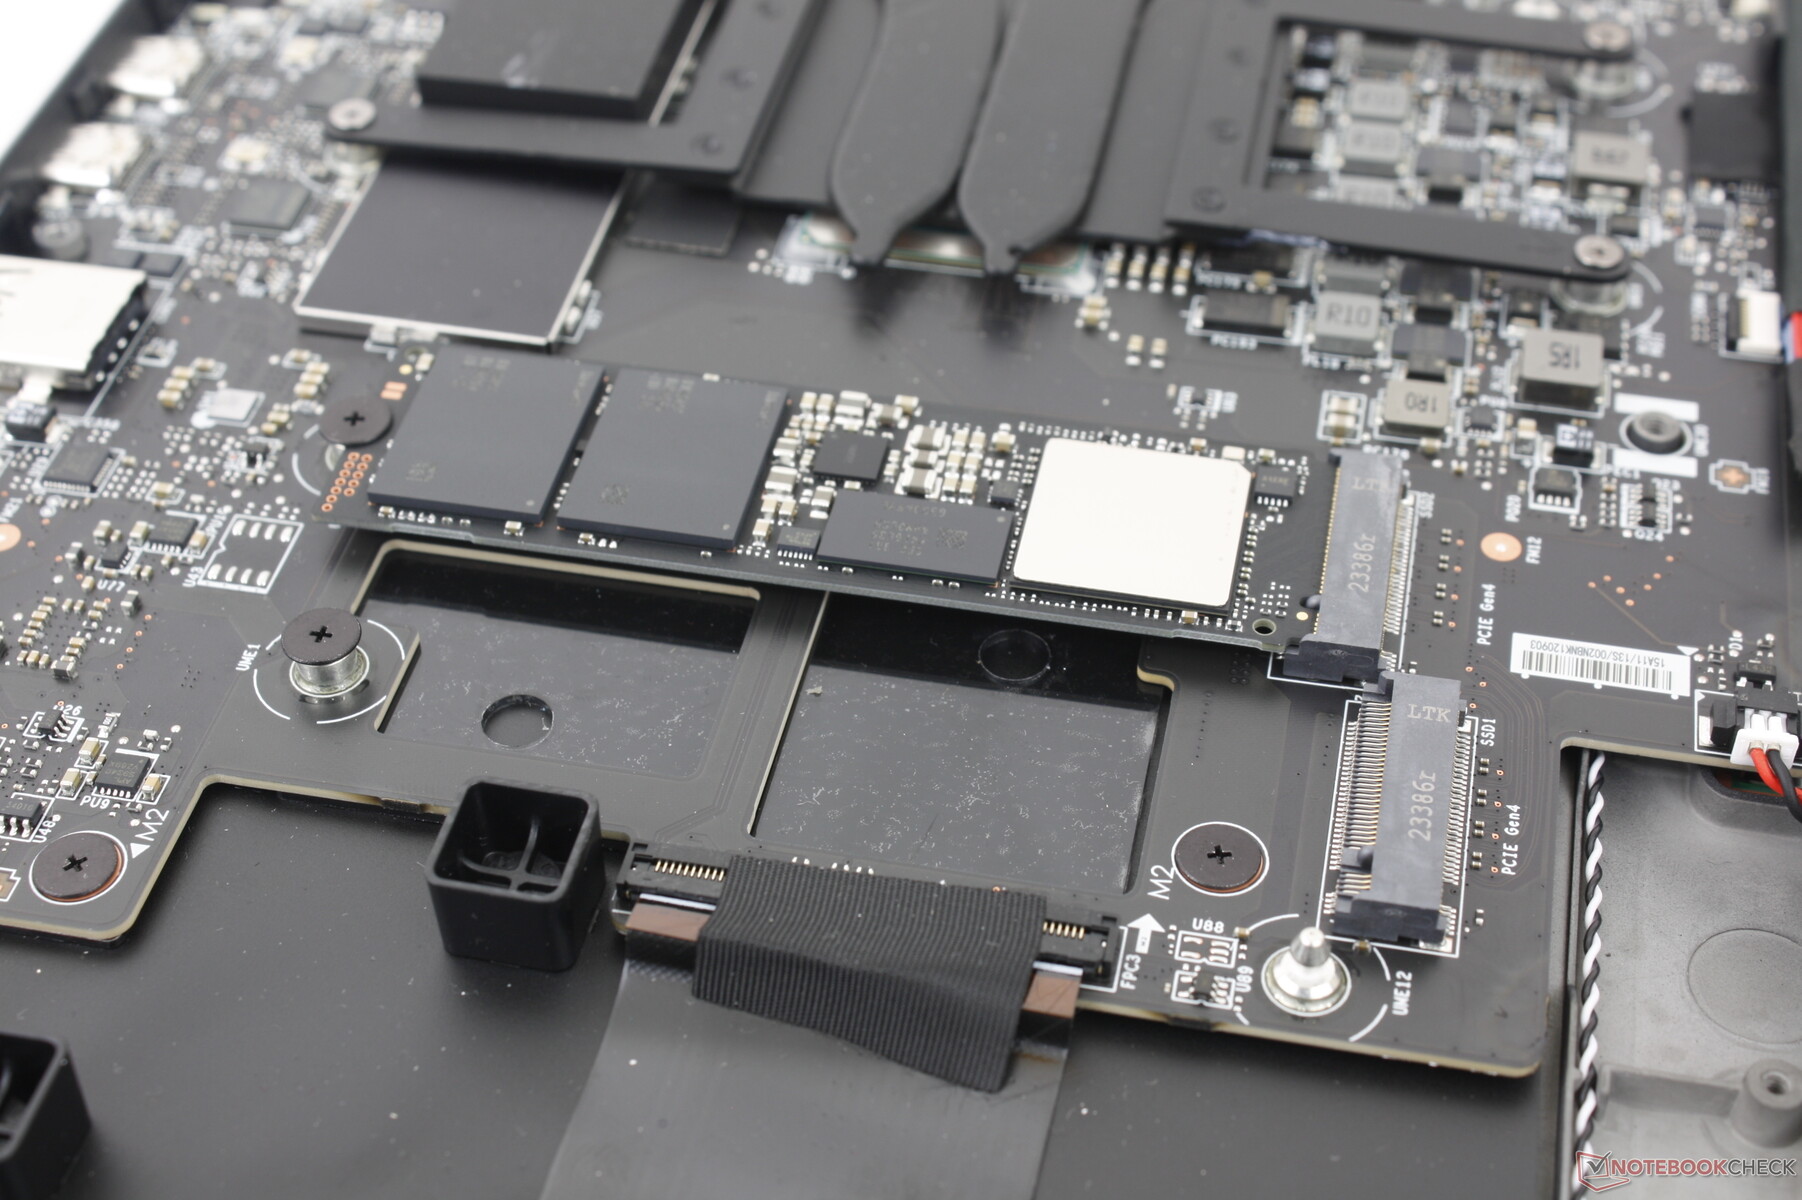
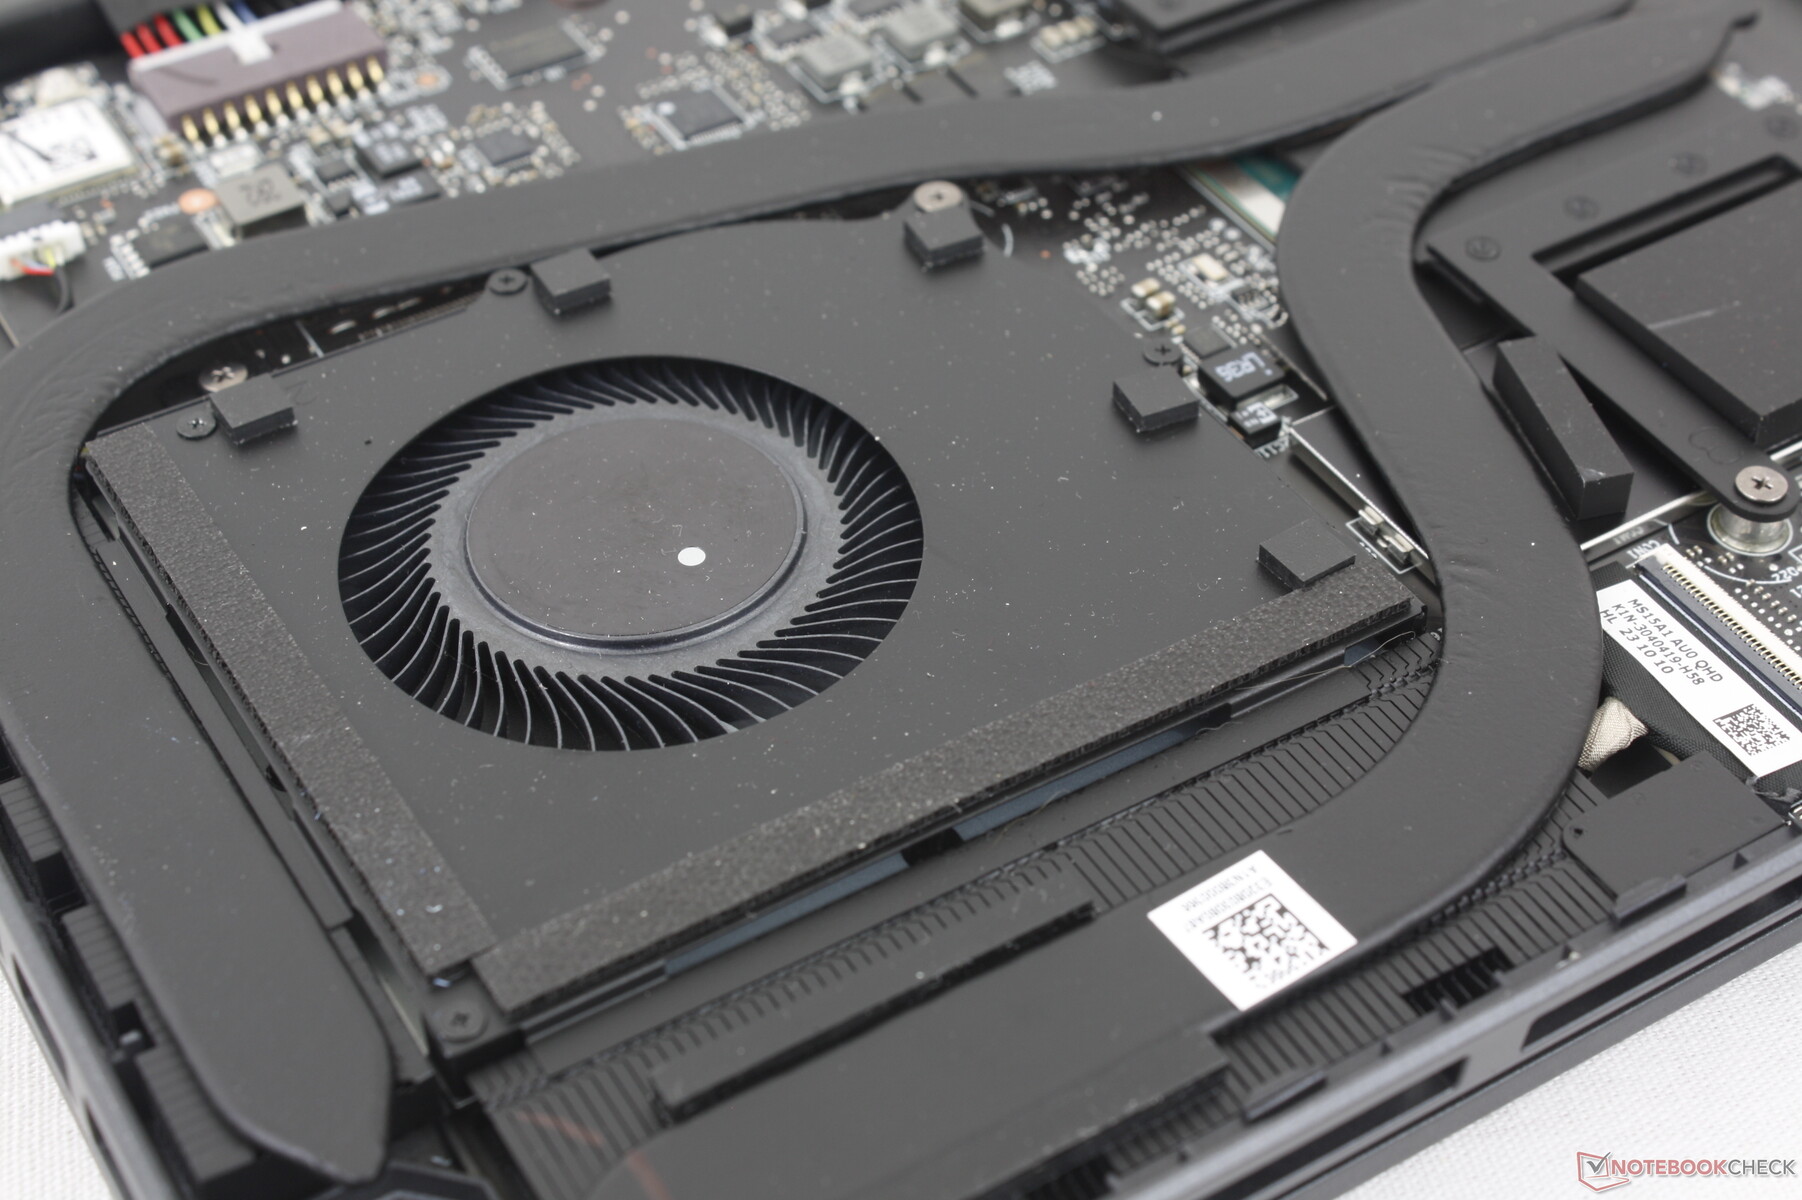
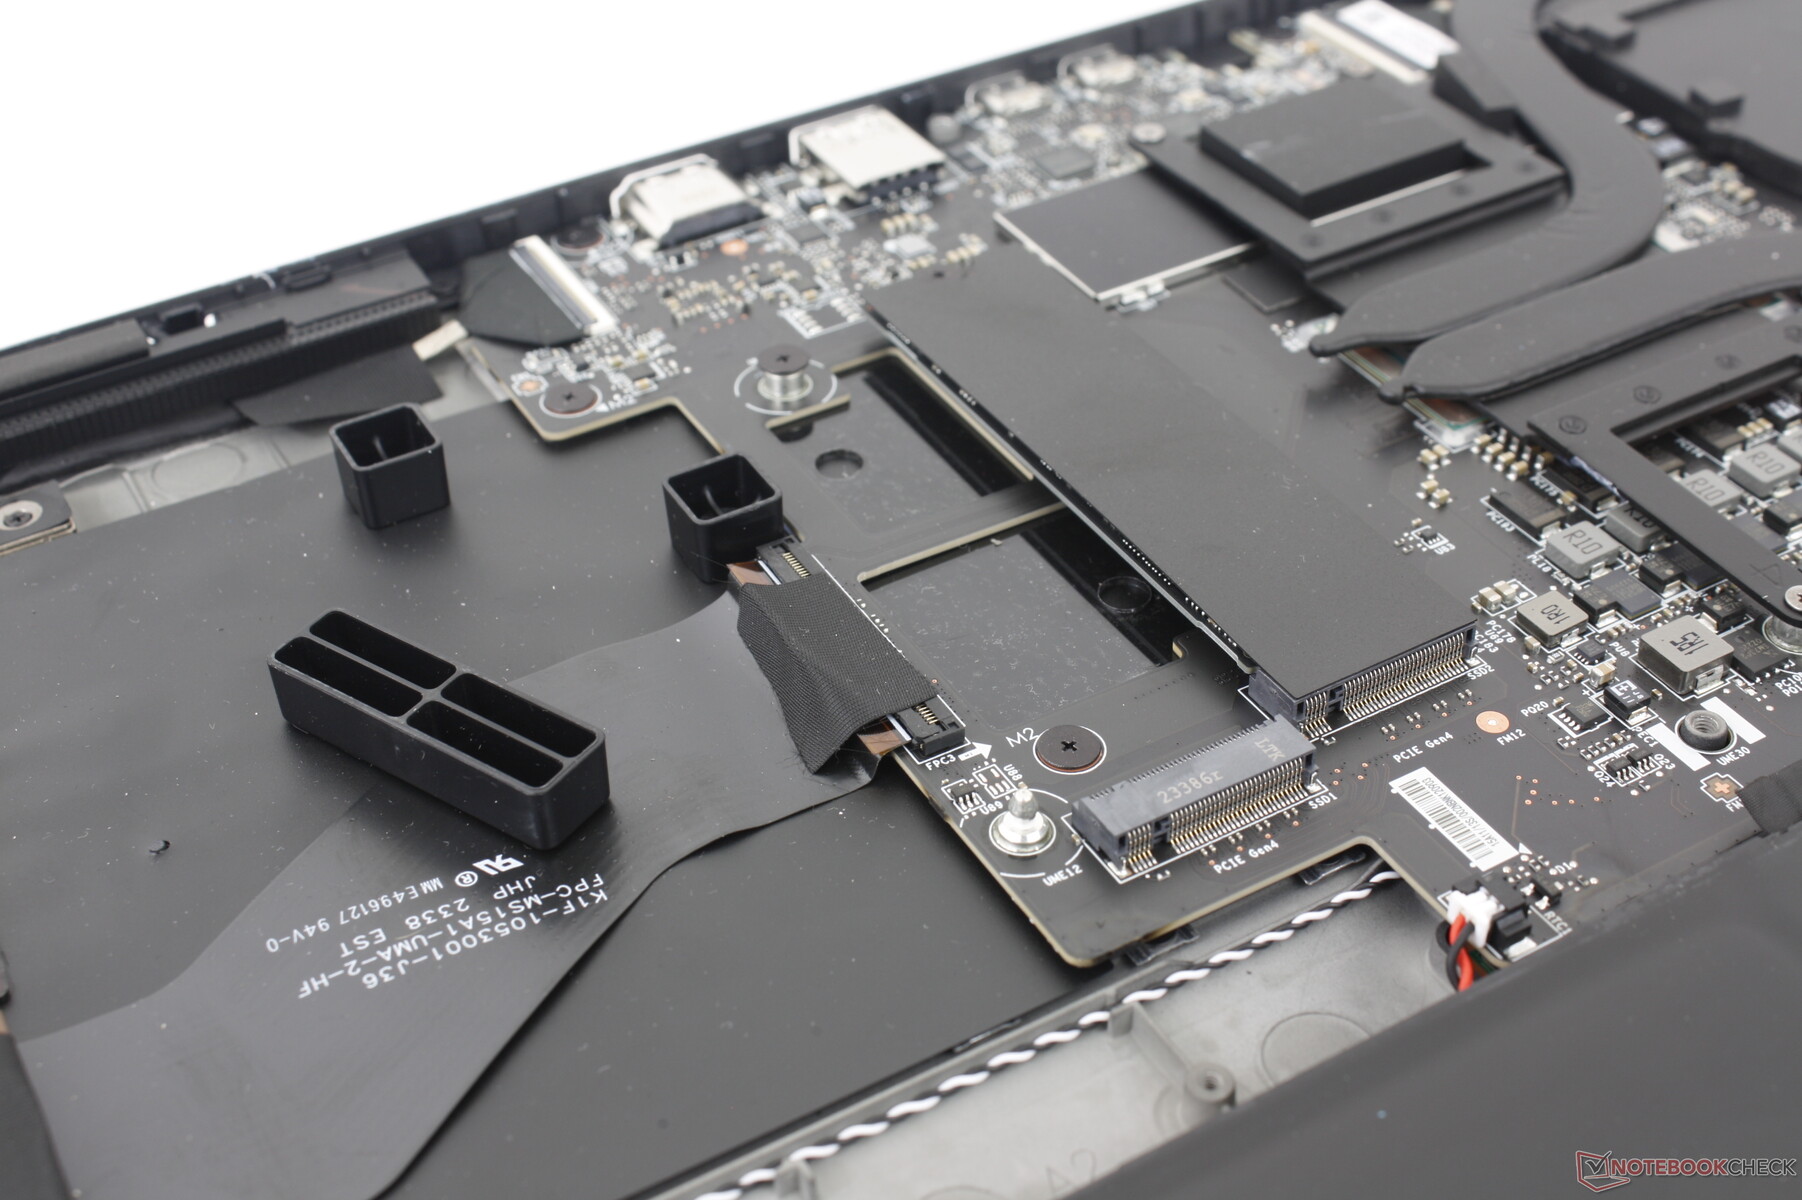
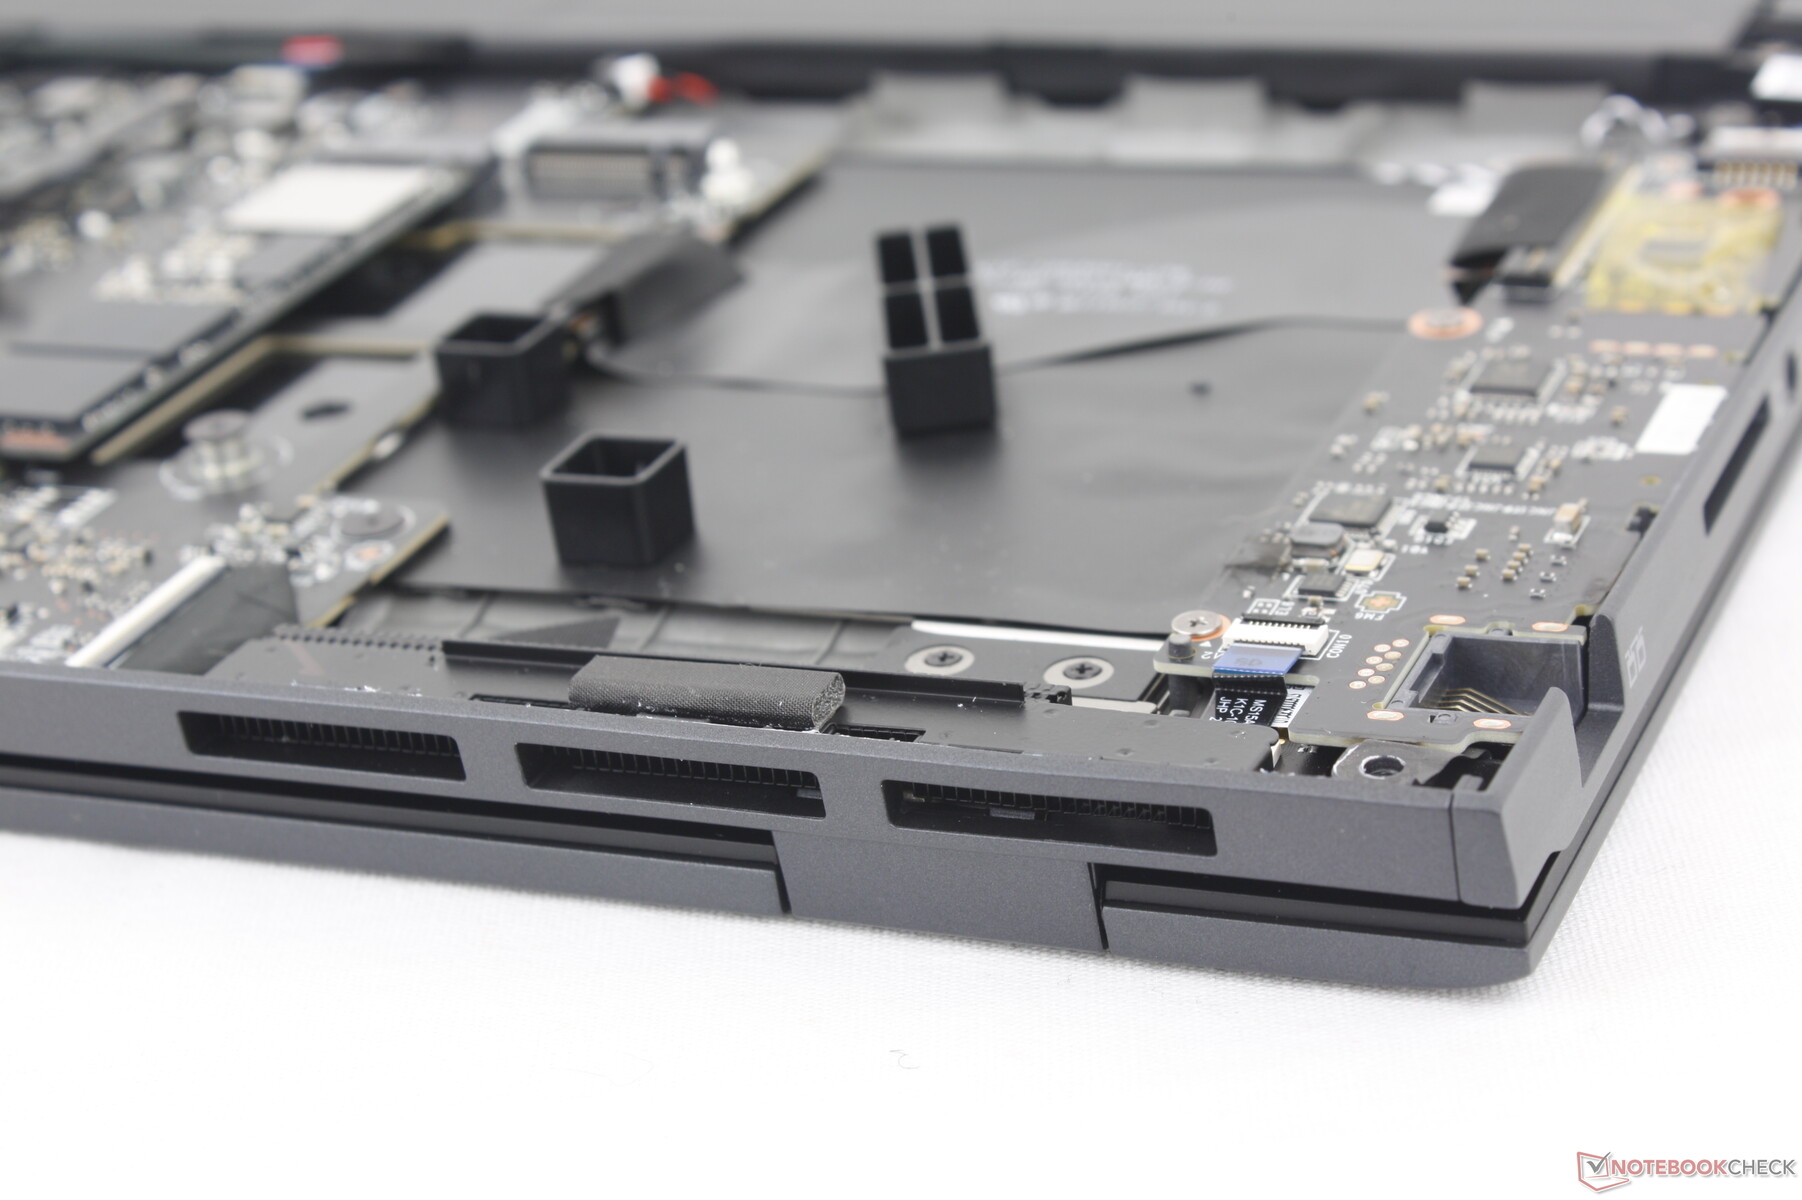
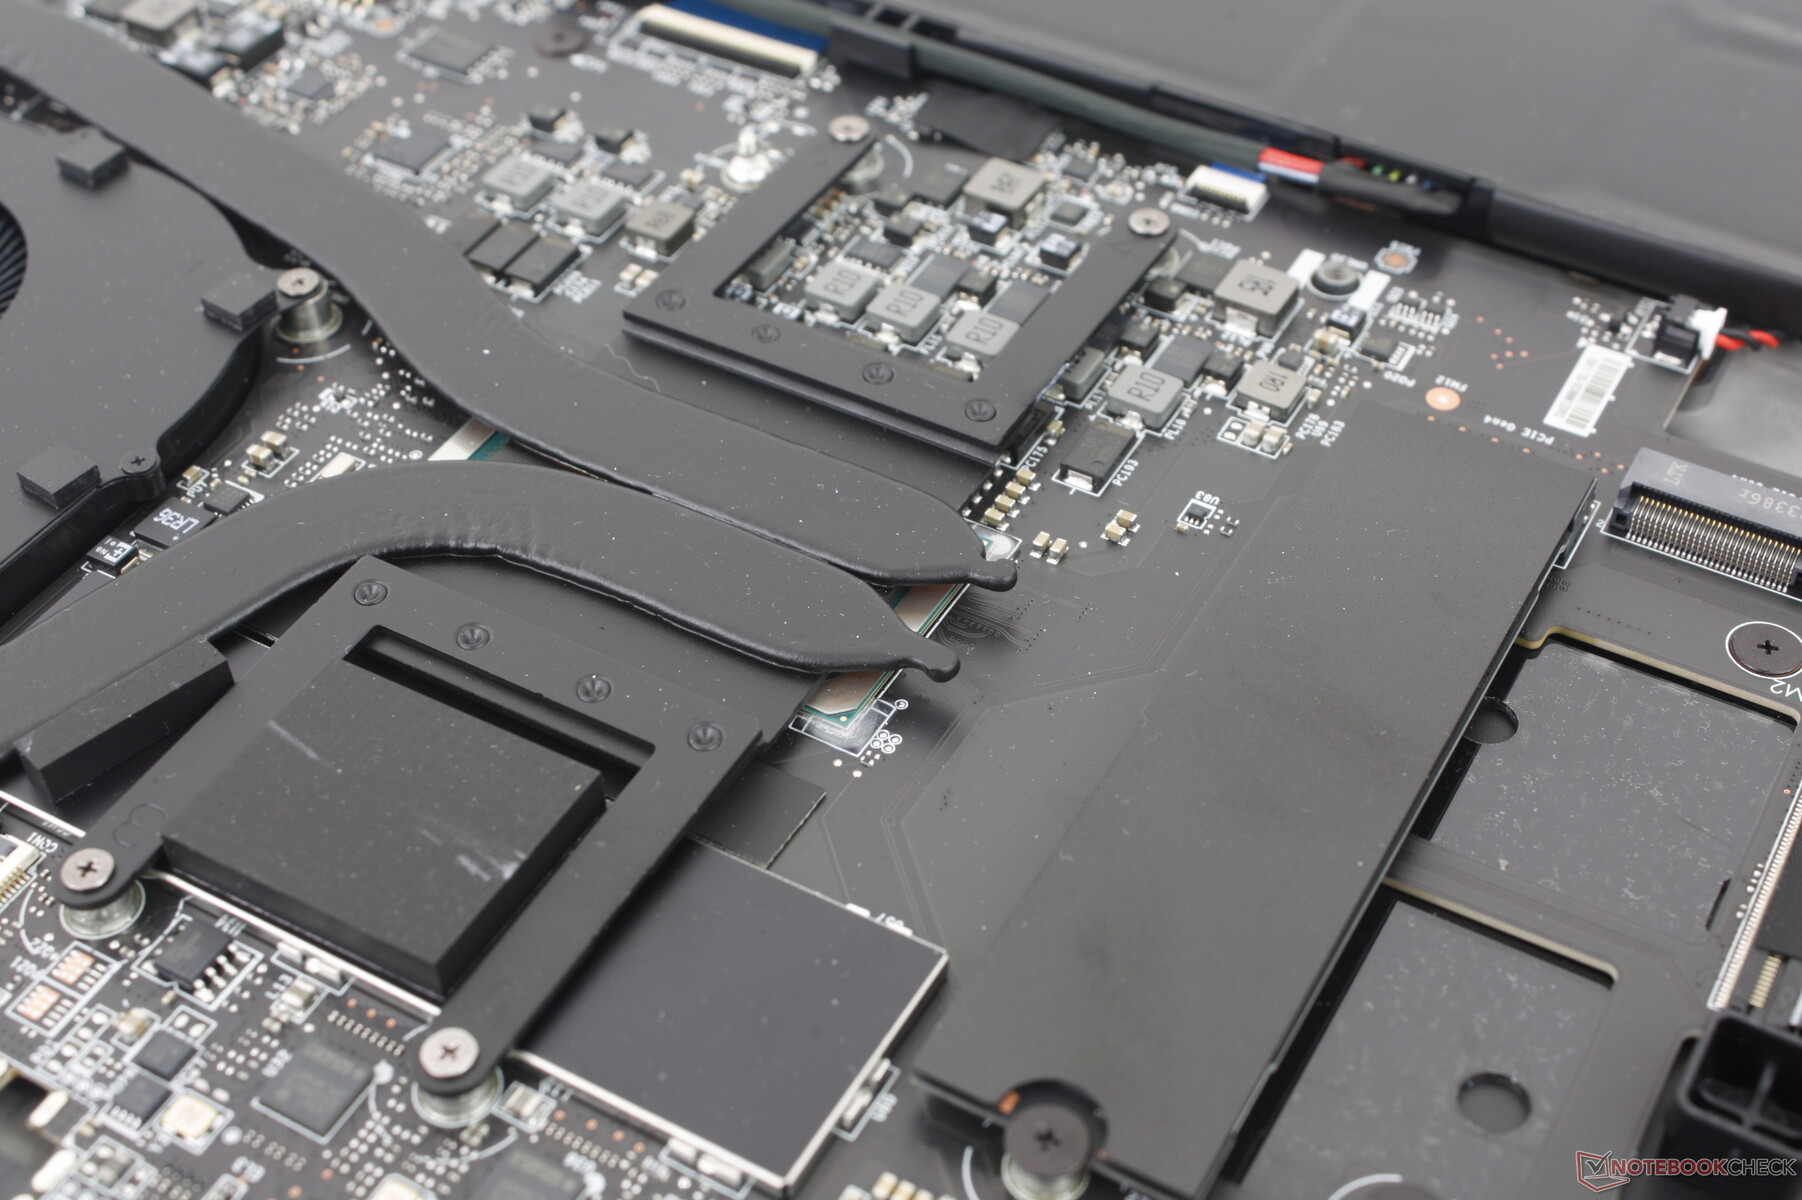
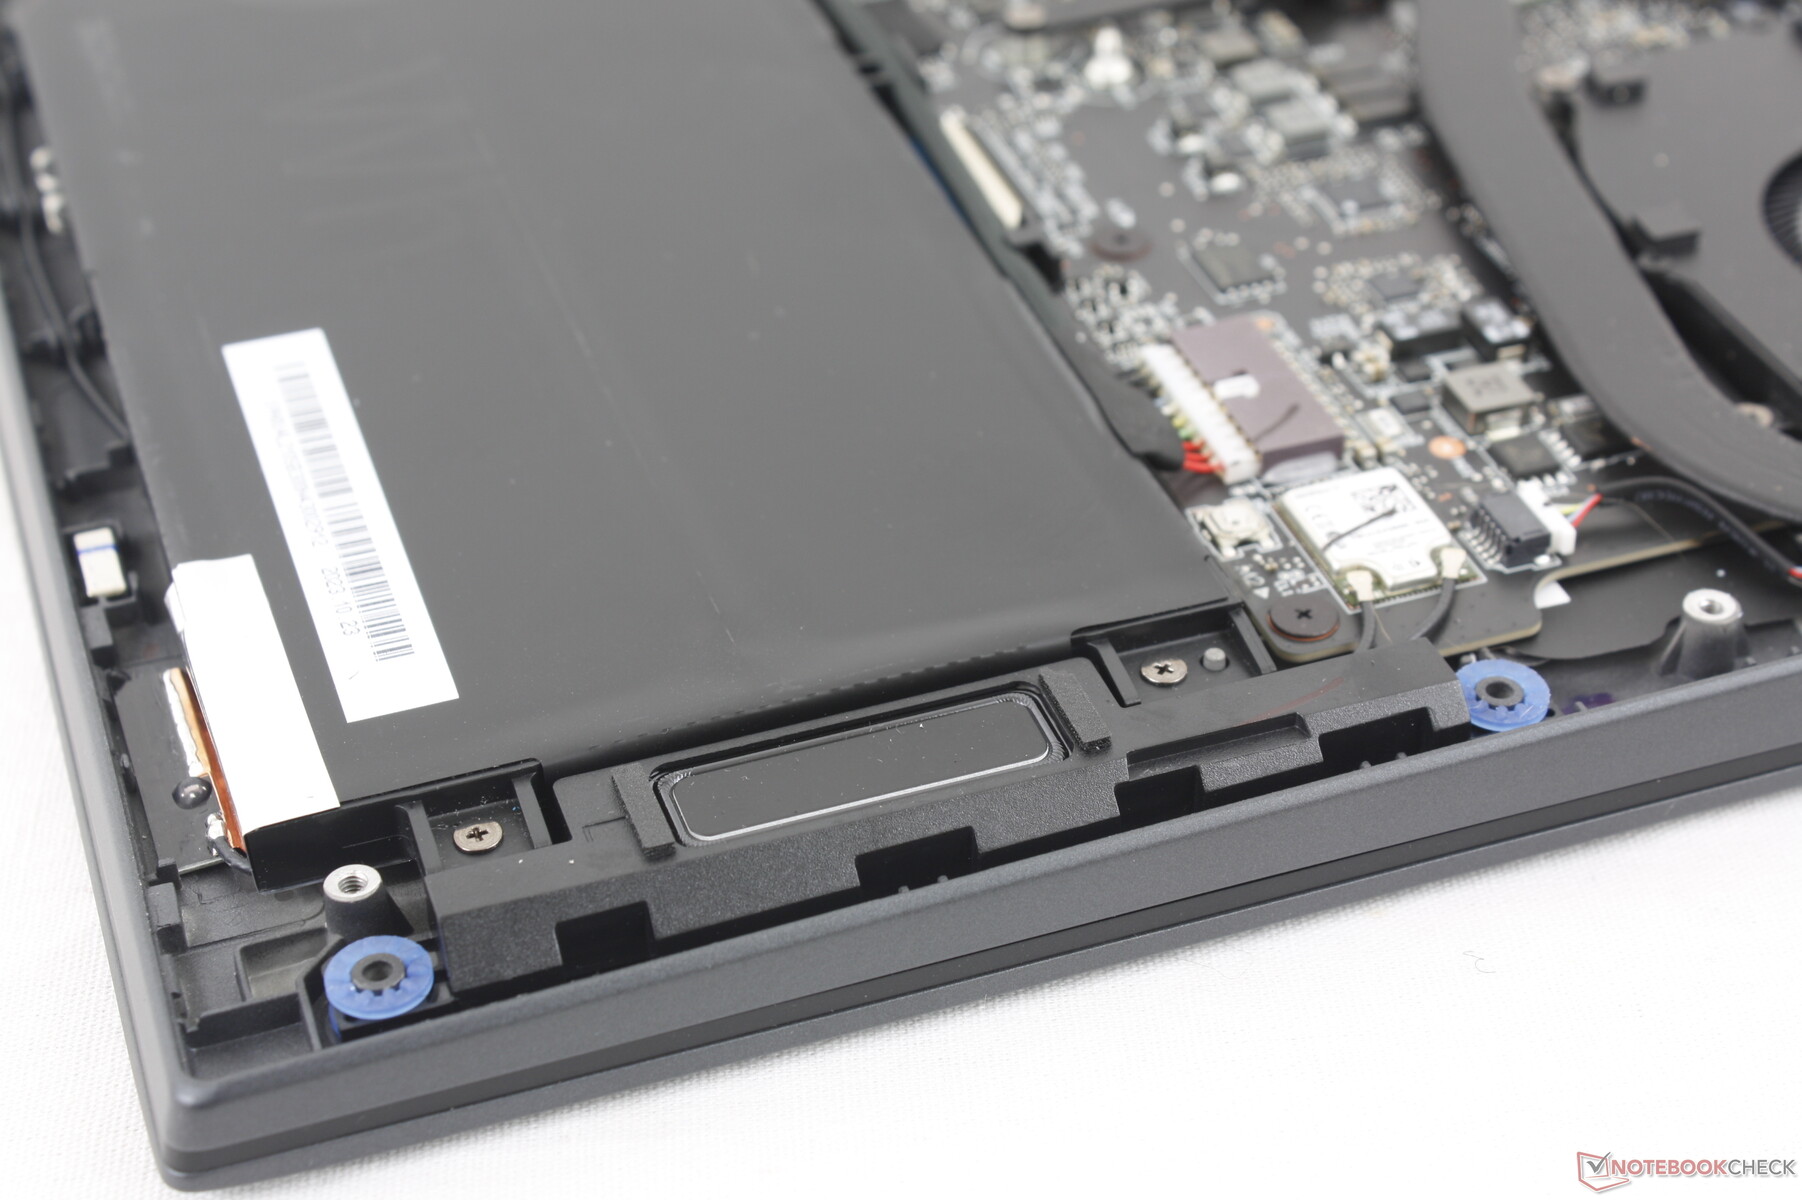
Die Bodenplatte des Notebooks lässt sich nach dem Entfernen der acht Kreuzschlitzschrauben relativ einfach abnehmen. Beachten Sie jedoch, dass der Aufkleber mit dem Werkssiegel aufgebrochen werden muss, um Zugang zu den Innereien zu erhalten.
Im Inneren des Notebooks haben die Nutzer Zugriff auf zwei M.2 2280 PCIe4 x4 NVMe-SSD-Slots, während die RAM- und WLAN-Module fest verlötet sind. Im Vergleich dazu sind all diese Module beim älteren Prestige 15-Design abnehmbar.
Es fällt auf, dass ein beträchtlicher leerer Platz vorhanden ist, der für SKUs mit diskreter Grafik reserviert ist. Das Modell ist entsprechend mit mehr Heatpipes, einem zusätzlichen Lüfter und neu angeordneten M.2-SSDs ausgestattet, wenn es mit einer dedizierten GPU konfiguriert wird.
Zubehör & Garantie
Außer dem Netzteil und den Unterlagen sind keine weiteren Extras in der Verpackung enthalten. Beim Kauf in Deutschland gilt die übliche zweijährige beschränkte Garantie.
Eingabegeräten — Größer als zuvor
Tastatur
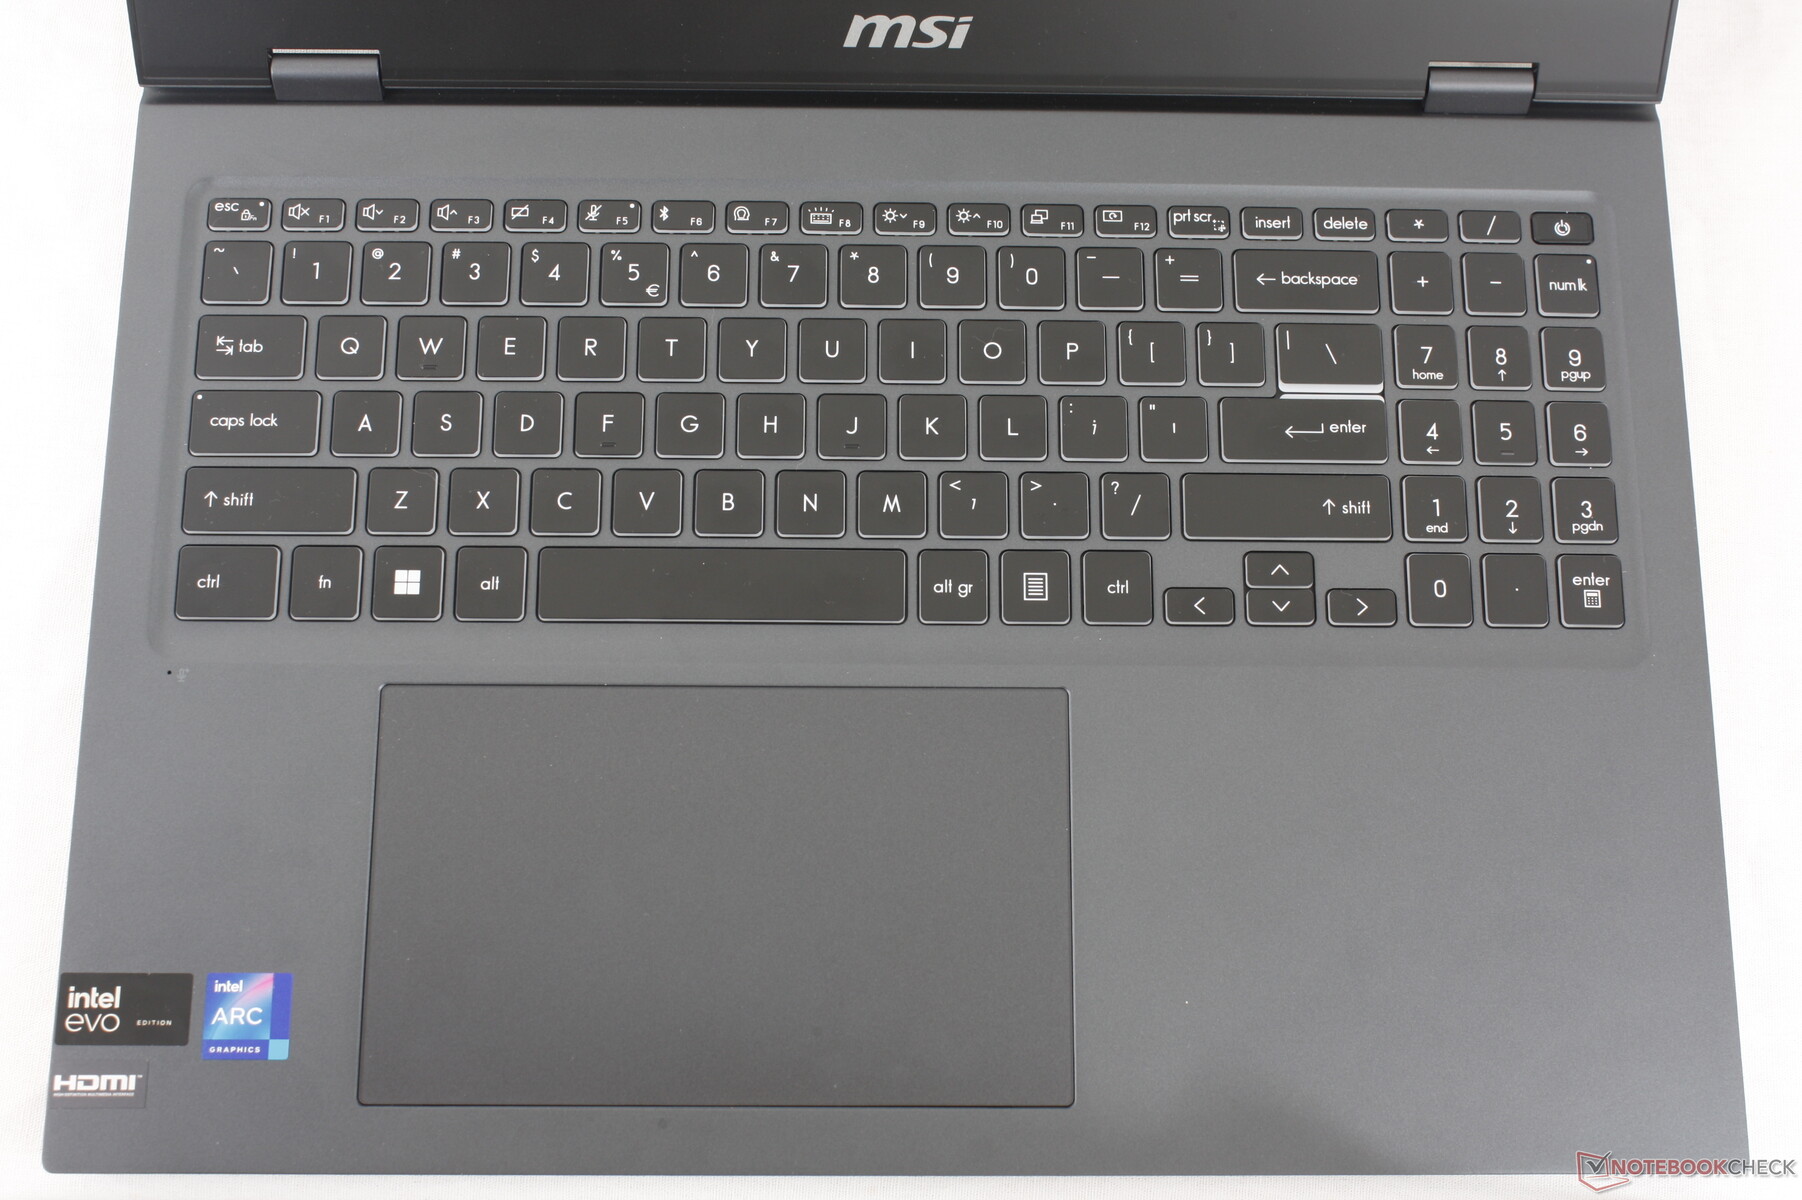
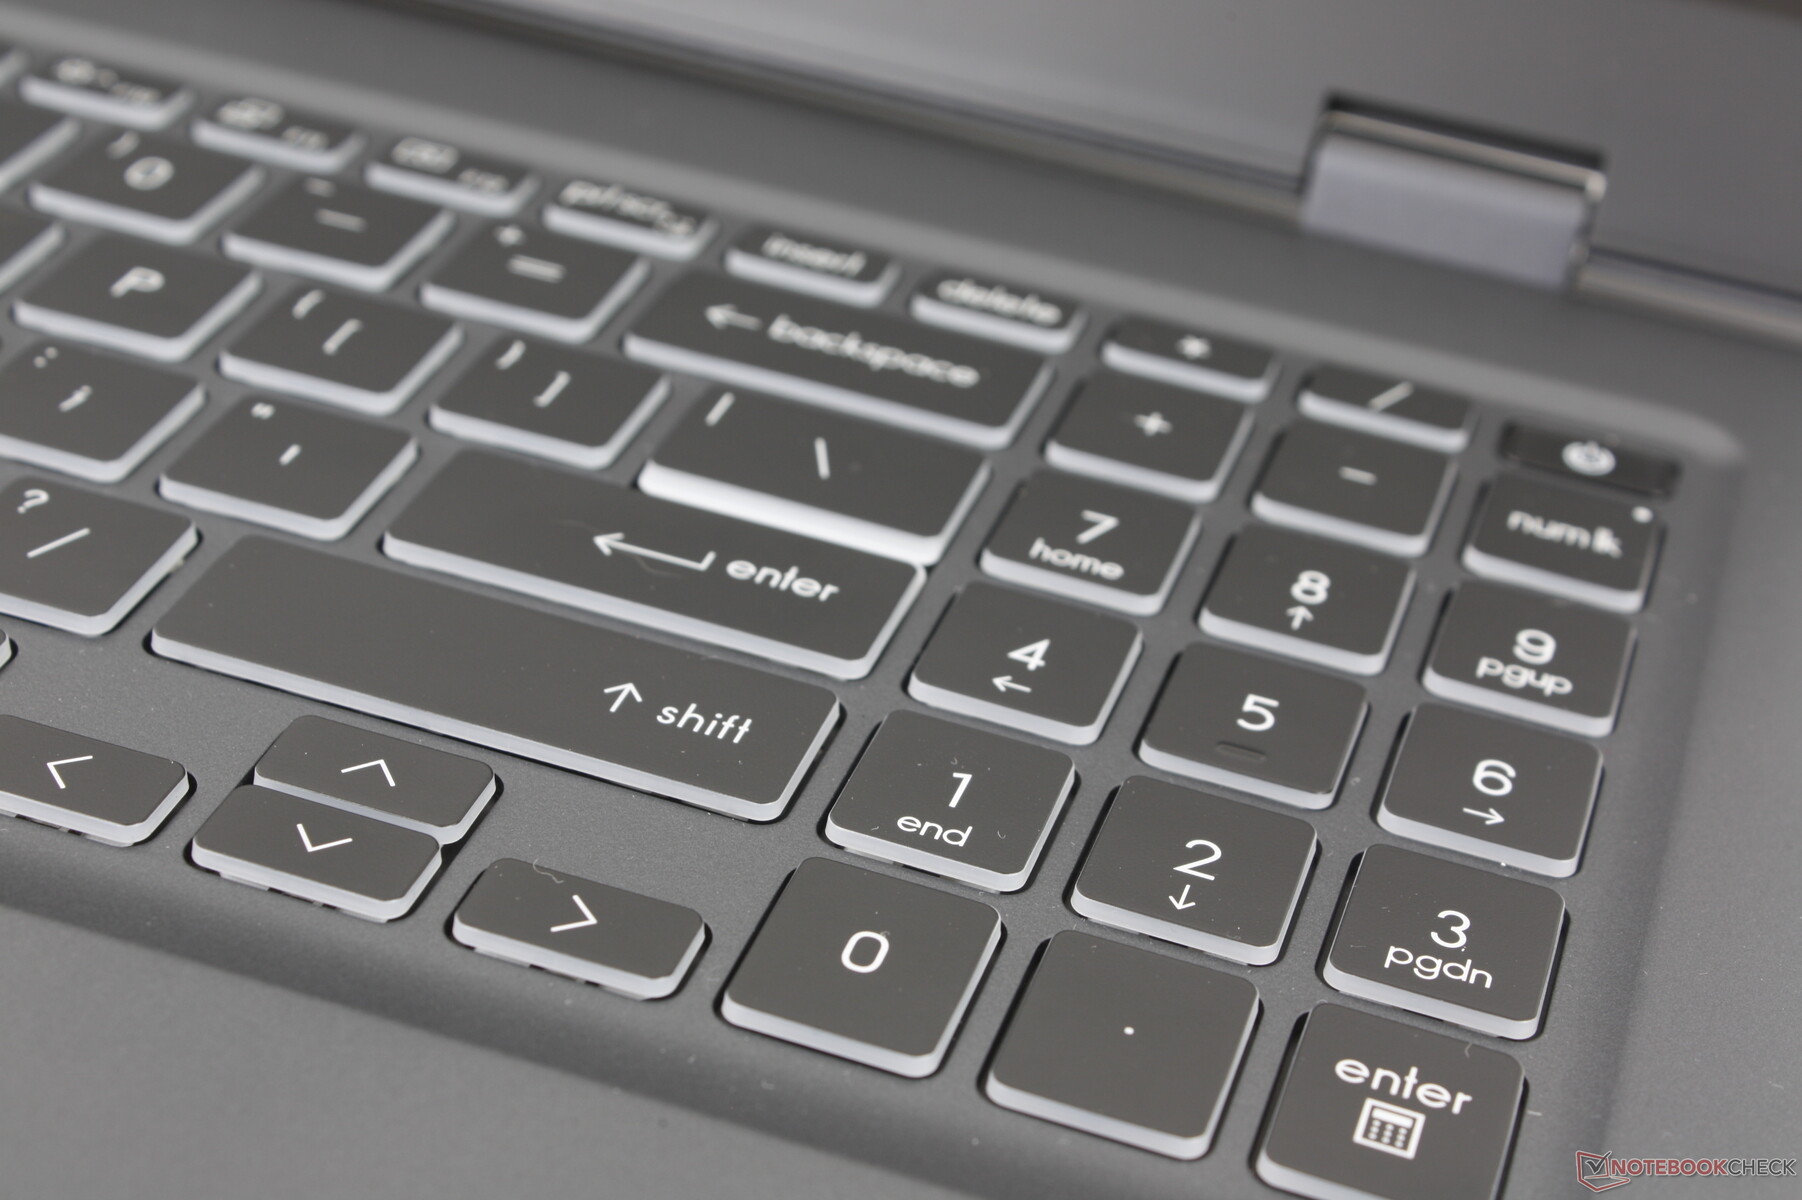
Die Tastatur wurde überarbeitet und verfügt nun über einen integrierten Ziffernblock. Das Tastenfeedback fühlt sich ansonsten genauso an wie beim Prestige 15 und bietet trotz der Layout-Änderungen ein ähnliches Tipperlebnis. Der Tastenhub ist nach wie vor deutlich flacher im Vergleich zu den MSI-Gaming-Notebooks oder der konkurrierenden HP Spectre series. Die Tasten sind nicht übermäßig weich oder unkomfortabel, jedoch könnte ein festeres oder schärferes Feedback bei jedem Druck eine Verbesserung darstellen.
Touchpad
Das Clickpad ist jetzt erheblich größer (15 x 9 cm), um die zuvor unangenehm engen Abmessungen des Clickpads im älteren Prestige 15 design. zu beheben. Die Traktion ist gleichmäßig und zuverlässig, ohne dass es zu einem Verklemmen kommt, selbst bei langsamen Gleitbewegungen.
Das Feedback beim Klicken ist jedoch nur durchschnittlich, wenn nicht sogar ein wenig schwammig. Das Herunterdrücken erfordert eine beträchtliche Fingerkraft, was ohne eine externe Maus ermüdend sein kann.

Display — Vollständige DCI-P3 bei allen SKUs
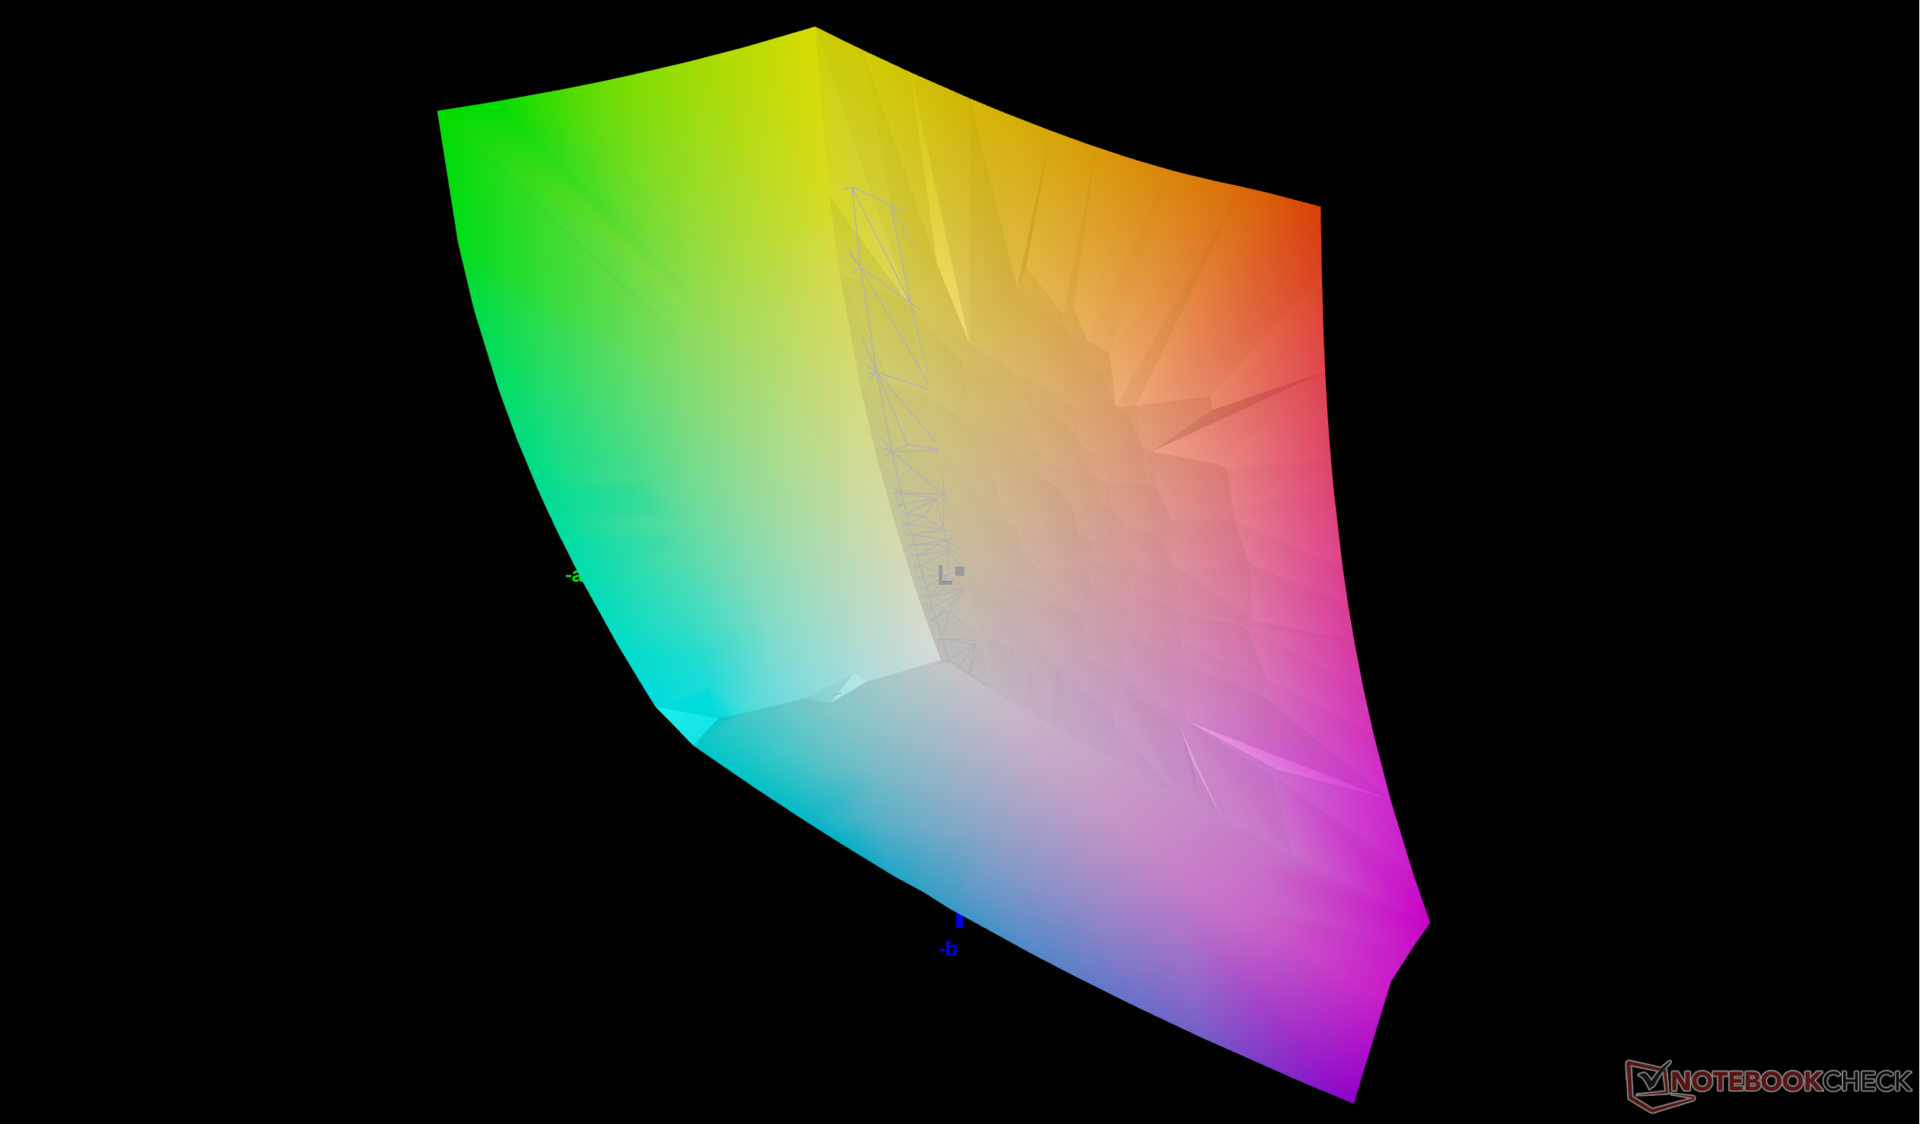
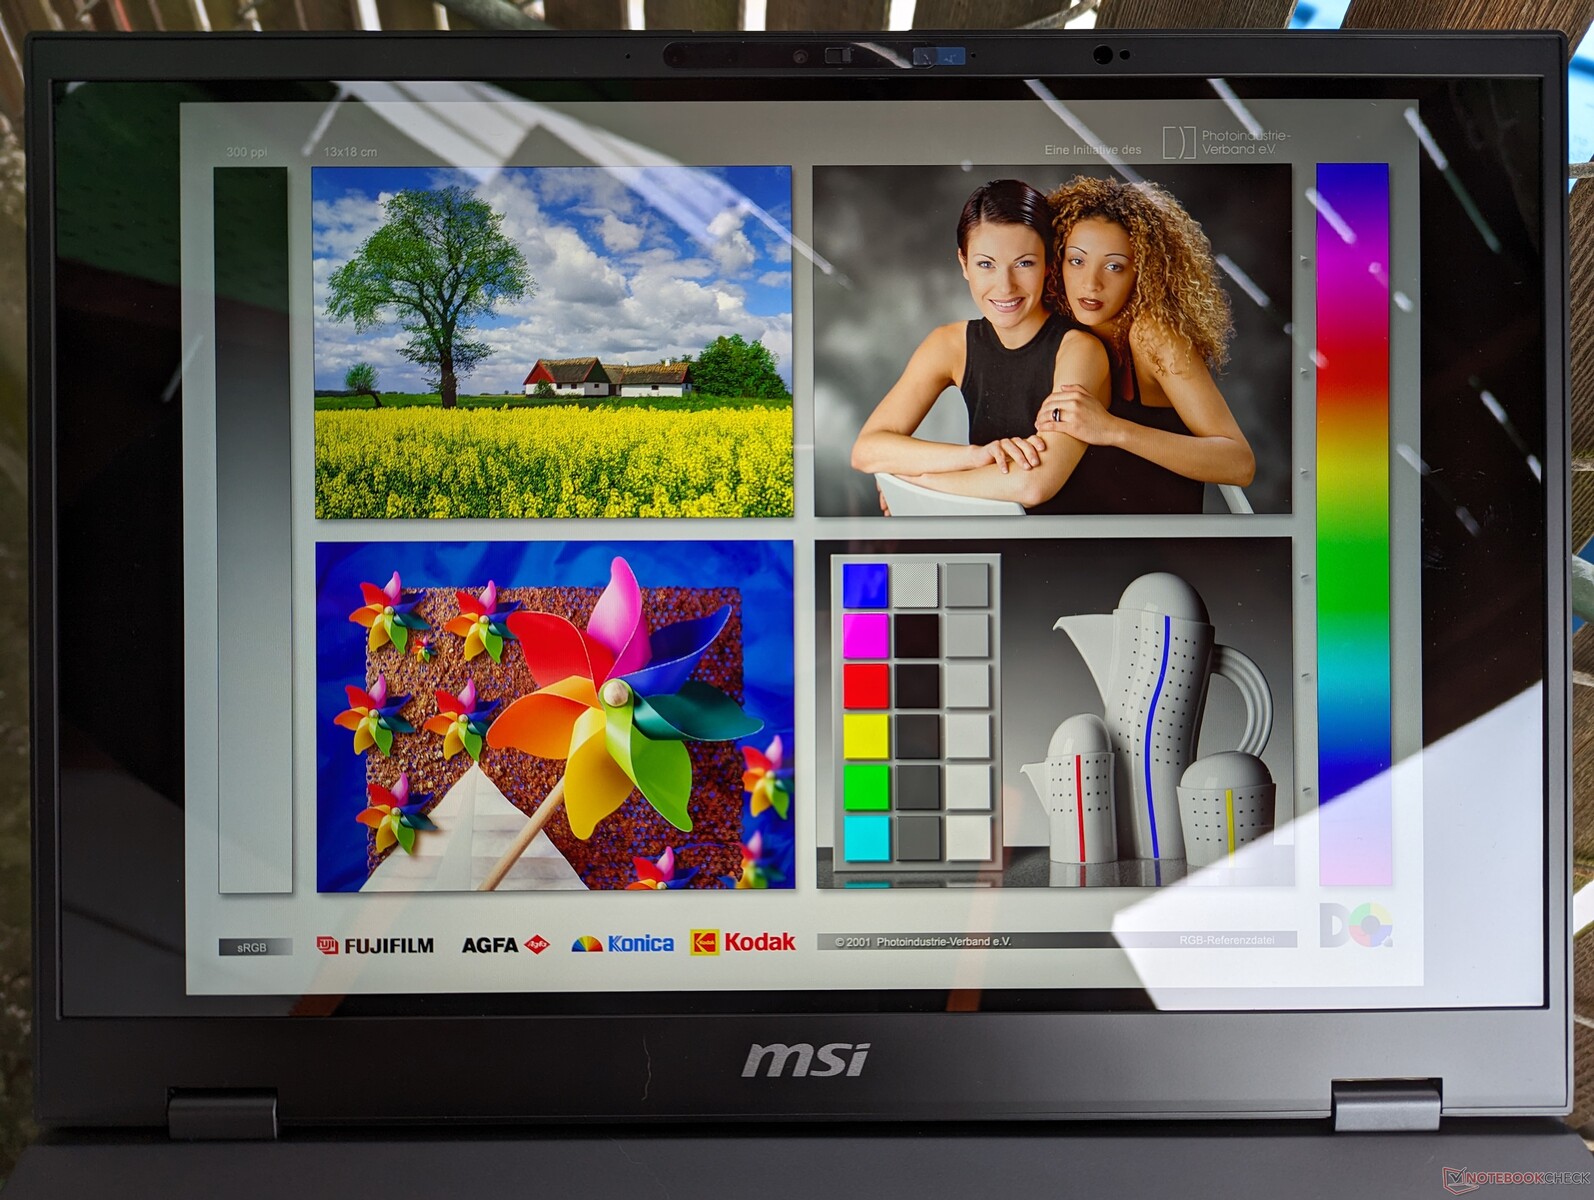
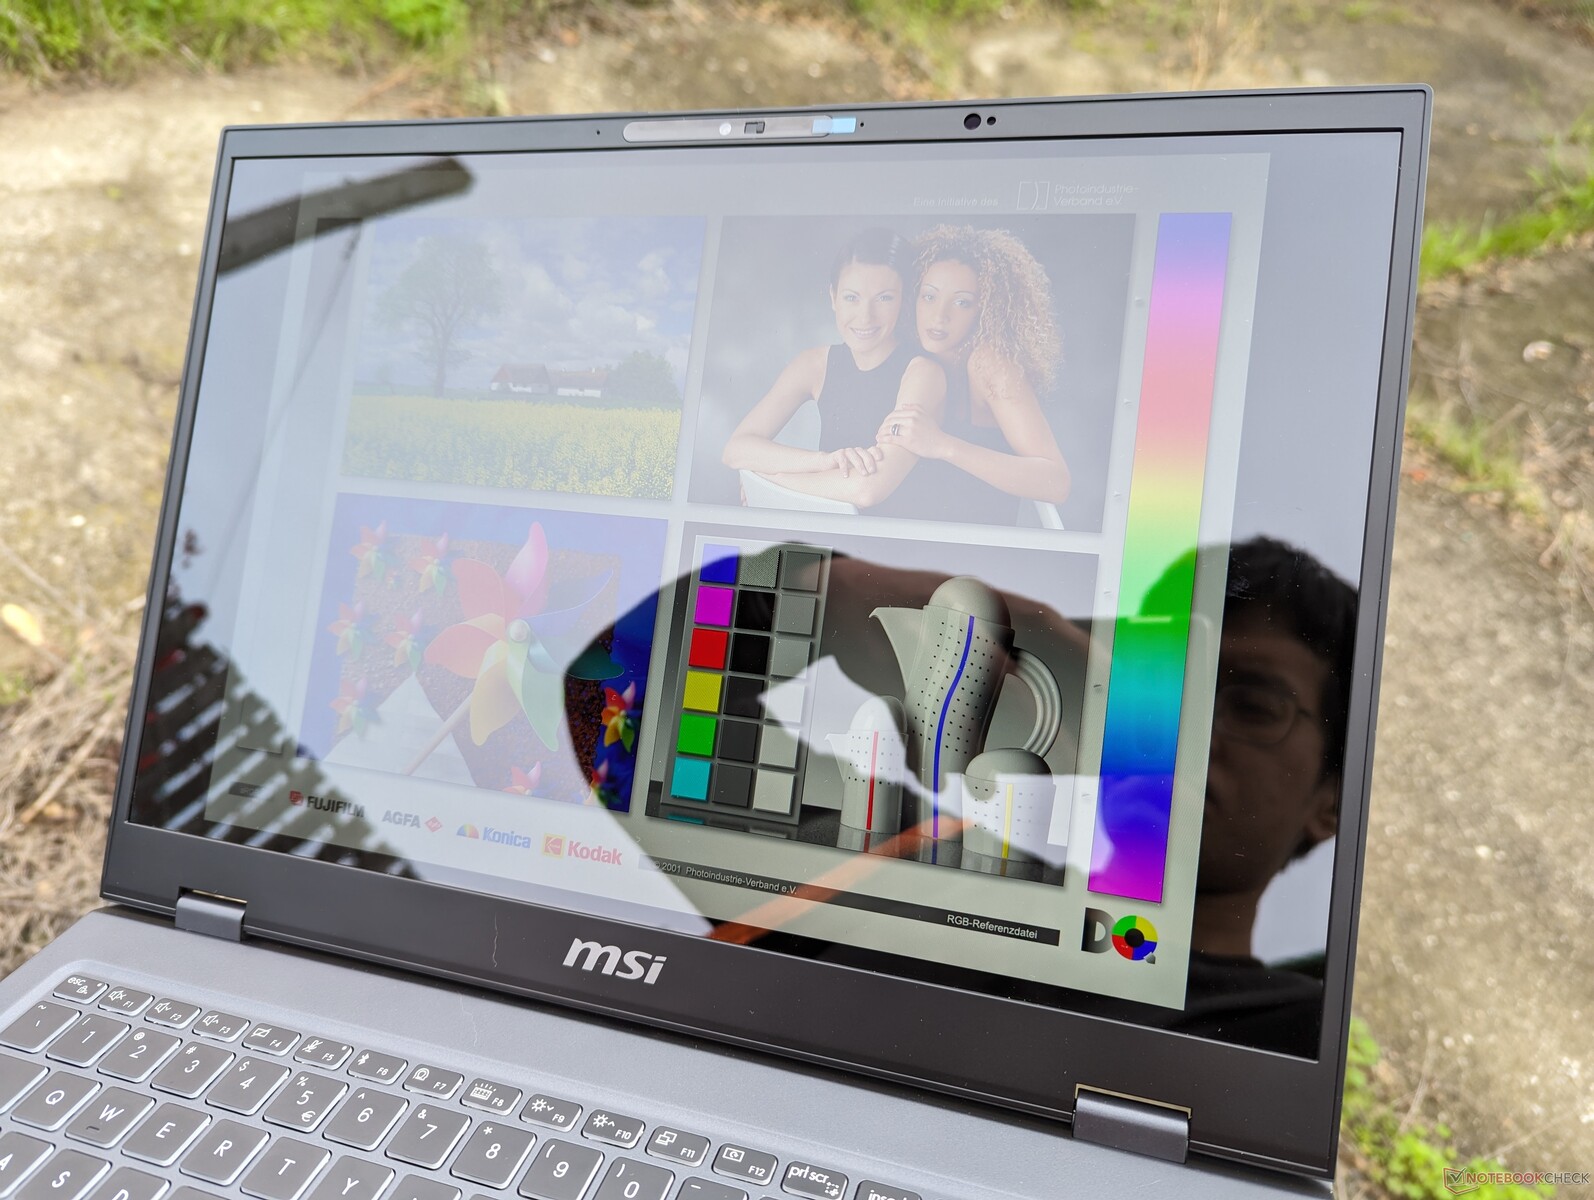
Das Prestige 16 ist das erste Modell in unserer Datenbank, das mit dem AU Optronics B160QAN03.R ausgestattet ist. Dieses helle und glänzende IPS-Panel zeichnet sich durch sehr hohe Qualität aus, bietet volle DCI-P3-Farben und weist keinerlei Probleme mit Körnigkeit auf. Die langsamen Schwarz-Weiß-Reaktionszeiten, das Fehlen einer adaptiven Synchronisation und die bescheidene Bildwiederholfrequenz von 60 Hz machen es jedoch eher für die Grafikbearbeitung als für Spiele geeignet.
Eine zweite Display-Option ist mit OLED und einer höheren nativen Auflösung verfügbar. Es ist zu beachten, dass beide Displays keine Touchscreen-Funktionalität unterstützen.


| |||||||||||||||||||||||||
Ausleuchtung: 87 %
Helligkeit Akku: 473.6 cd/m²
Kontrast: 2493:1 (Schwarzwert: 0.19 cd/m²)
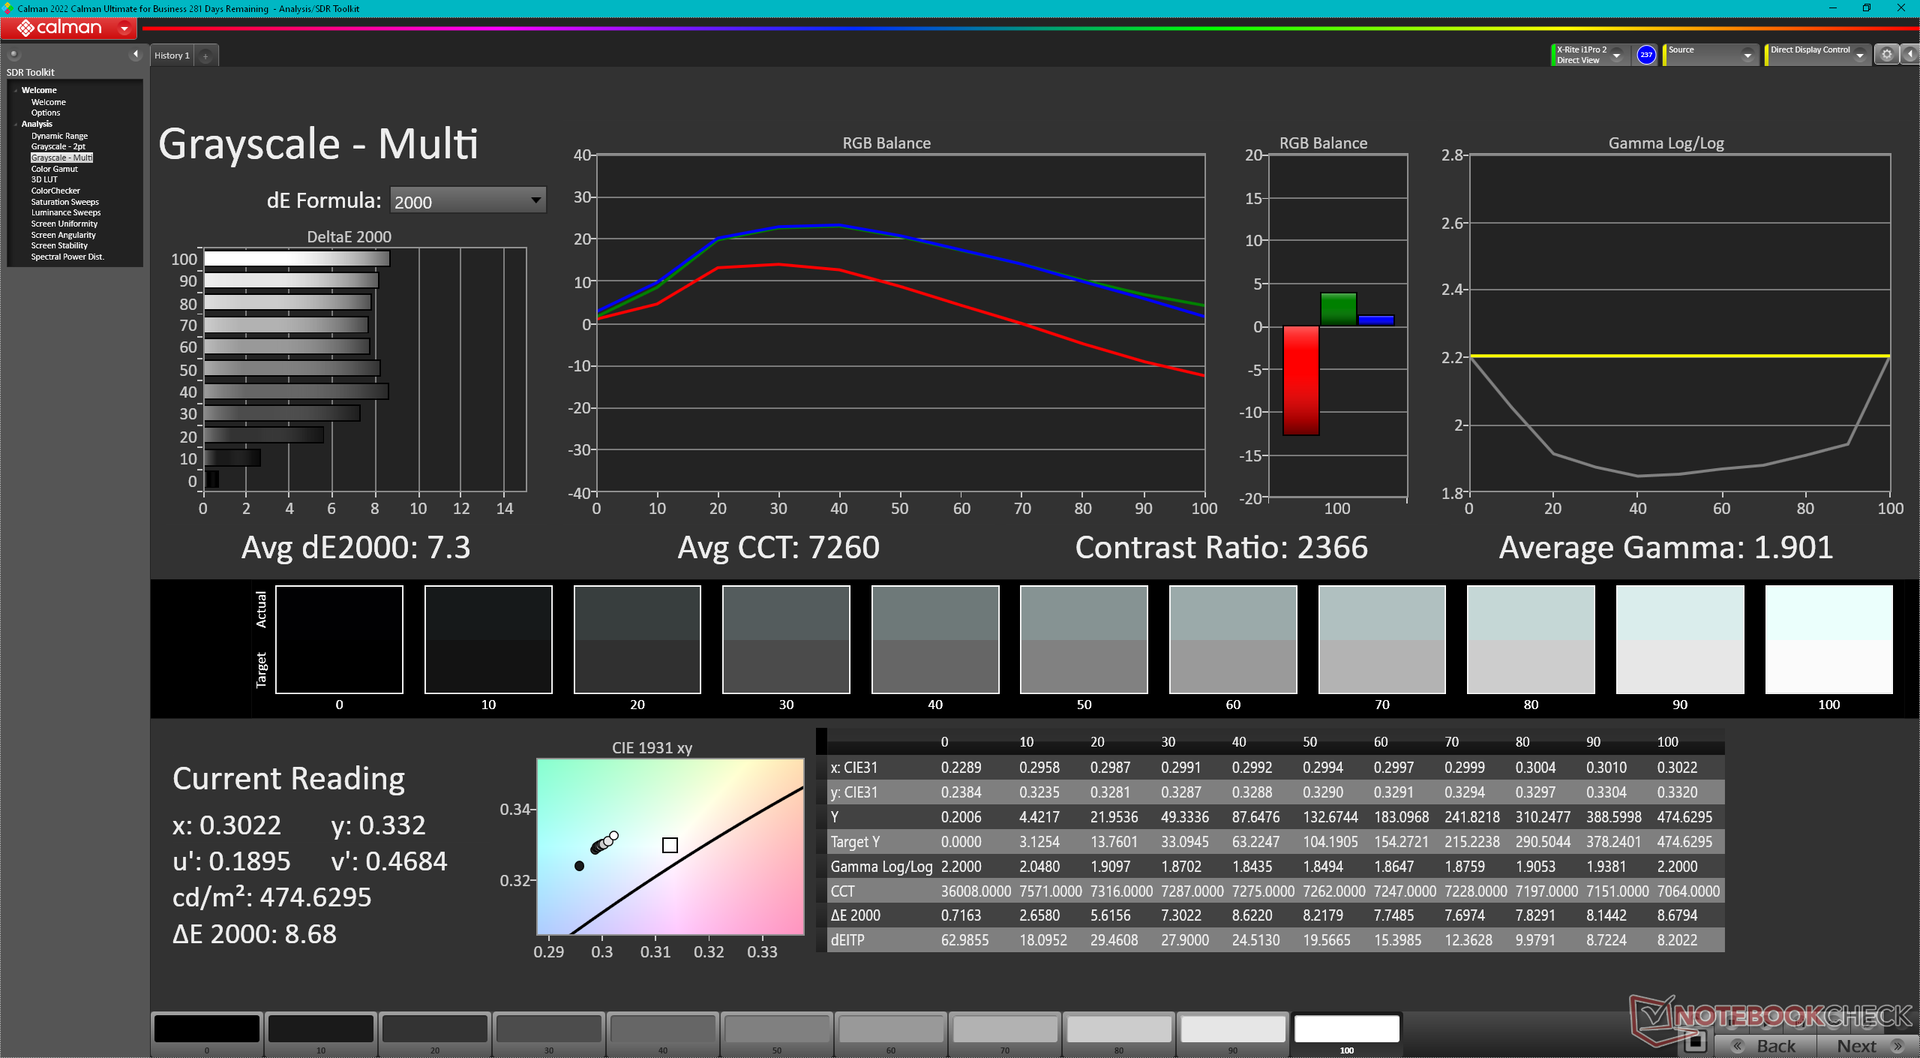
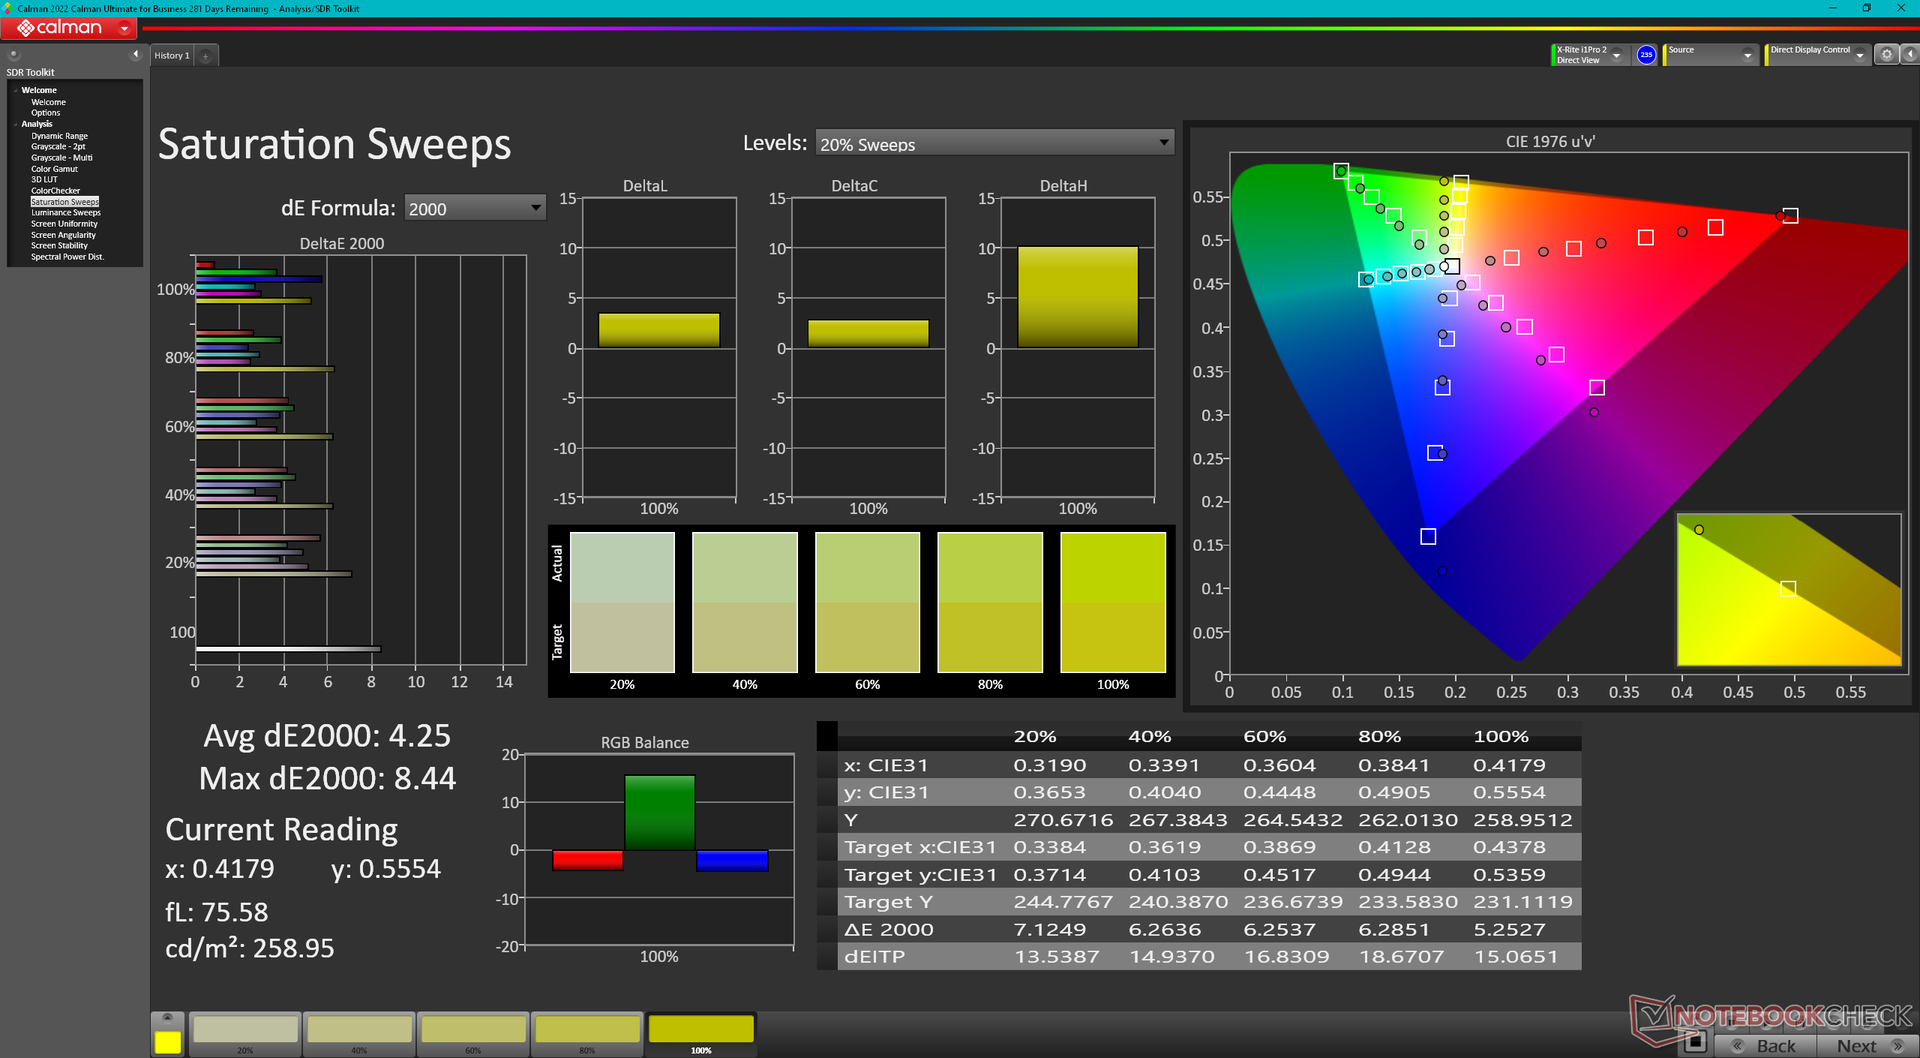
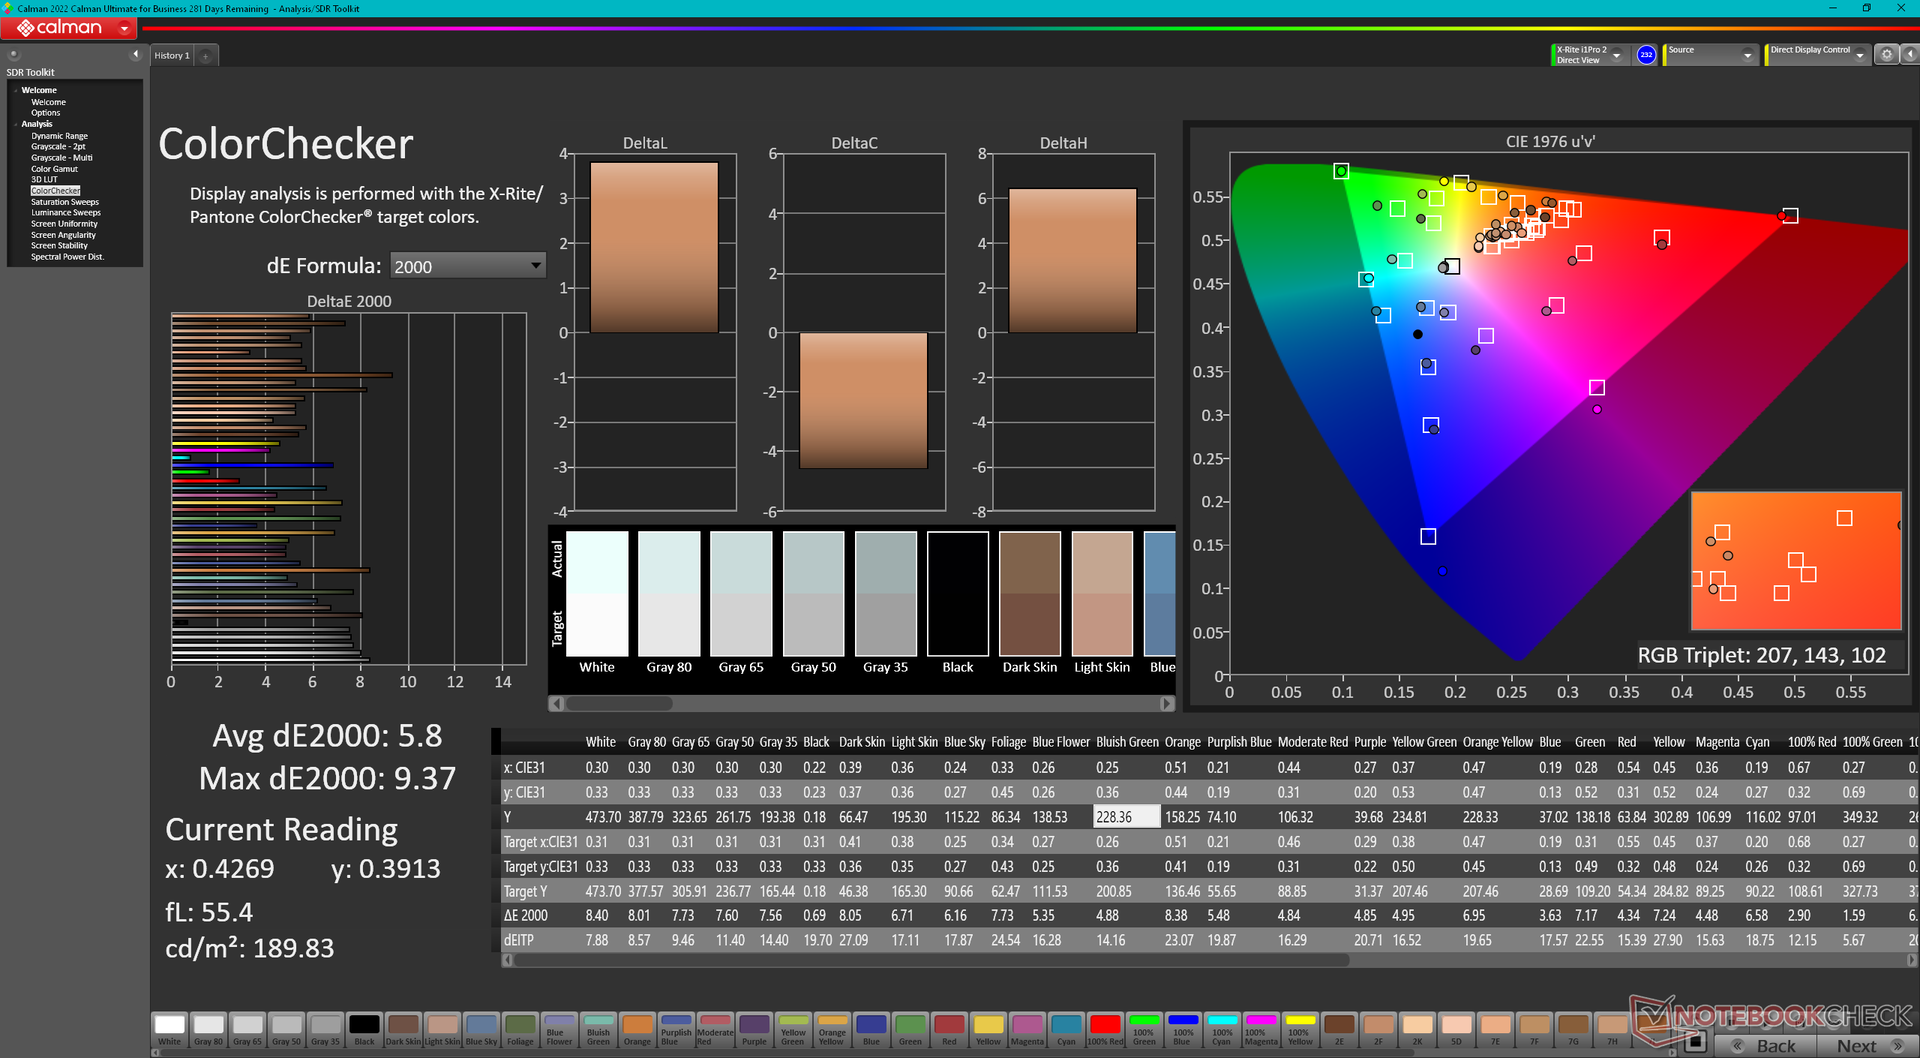
ΔE ColorChecker Calman: 5.9 | ∀{0.5-29.43 Ø4.72}
calibrated: 0.89
ΔE Greyscale Calman: 7.3 | ∀{0.09-98 Ø4.97}
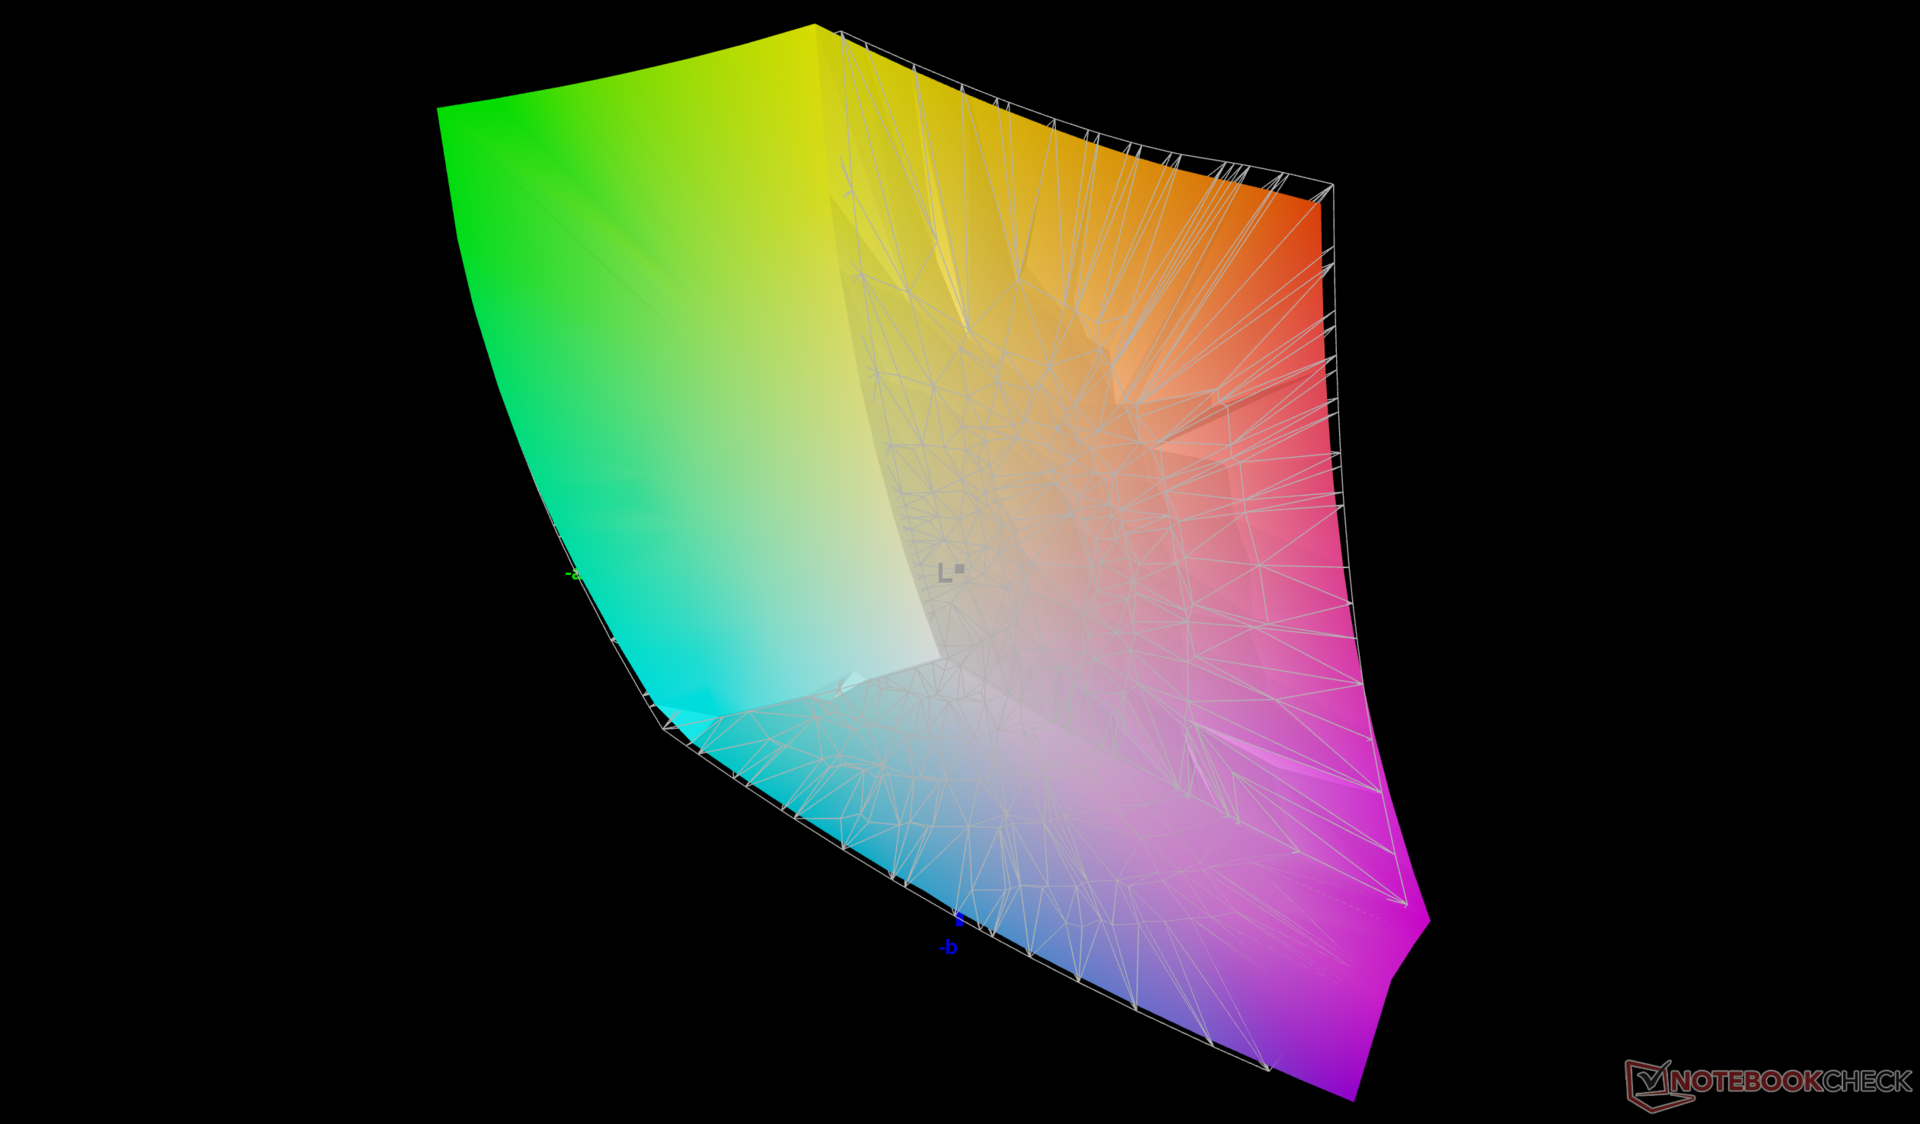
84.6% AdobeRGB 1998 (Argyll 3D)
99.8% sRGB (Argyll 3D)
96.7% Display P3 (Argyll 3D)
Gamma: 1.9
CCT: 7260 K
| MSI Prestige 16 B1MG-001US AU Optronics B160QAN03.R, IPS, 2560x1600, 16" | MSI Prestige 15 A12UD-093 Sharp LQ156D1JW42, IPS, 3840x2160, 15.6" | LG Gram 2in1 16 16T90R - G.AA78G LP160WQ1-SPB2, IPS, 2560x1600, 16" | Lenovo ThinkBook 16 G6 ABP LEN160WUXGA, IPS, 1920x1200, 16" | Asus VivoBook Pro 16 K6602VU Samsung ATNA60BX01-1, OLED, 3200x2000, 16" | Dell Inspiron 16 Plus 7630 LG Philips 160WQ2, IPS, 2560x1600, 16" | |
|---|---|---|---|---|---|---|
| Display | -3% | 0% | -49% | 5% | -14% | |
| Display P3 Coverage (%) | 96.7 | 80.48 -17% | 96.5 0% | 40.4 -58% | 98.7 2% | 70.1 -28% |
| sRGB Coverage (%) | 99.8 | 96.95 -3% | 99.9 0% | 59.8 -40% | 99.7 0% | 99.6 0% |
| AdobeRGB 1998 Coverage (%) | 84.6 | 94.02 11% | 84.6 0% | 42 -50% | 96.5 14% | 72.3 -15% |
| Response Times | 10% | 30% | 32% | 80% | 29% | |
| Response Time Grey 50% / Grey 80% * (ms) | 49.4 ? | 51 ? -3% | 38.4 ? 22% | 32.8 ? 34% | 0.68 ? 99% | 35 ? 29% |
| Response Time Black / White * (ms) | 33.9 ? | 26 ? 23% | 21.4 ? 37% | 23.9 ? 29% | 13.2 ? 61% | 24.2 ? 29% |
| PWM Frequency (Hz) | 240 ? | |||||
| Bildschirm | 27% | -19% | -83% | -13% | 0% | |
| Helligkeit Bildmitte (cd/m²) | 473.6 | 441 -7% | 329 -31% | 310 -35% | 353 -25% | 299.4 -37% |
| Brightness (cd/m²) | 456 | 416 -9% | 310 -32% | 290 -36% | 354 -22% | 290 -36% |
| Brightness Distribution (%) | 87 | 85 -2% | 88 1% | 86 -1% | 98 13% | 92 6% |
| Schwarzwert * (cd/m²) | 0.19 | 0.155 18% | 0.39 -105% | 0.22 -16% | 0.21 -11% | |
| Kontrast (:1) | 2493 | 2845 14% | 844 -66% | 1409 -43% | 1426 -43% | |
| Delta E Colorchecker * | 5.9 | 1.51 74% | 3.52 40% | 6.2 -5% | 4.23 28% | 4.25 28% |
| Colorchecker dE 2000 max. * | 9.37 | 3.56 62% | 6.96 26% | 24.7 -164% | 7.13 24% | 6.71 28% |
| Colorchecker dE 2000 calibrated * | 0.89 | 1.15 -29% | 5.3 -496% | 2.42 -172% | 0.52 42% | |
| Delta E Graustufen * | 7.3 | 2.49 66% | 5.75 21% | 3.8 48% | 2.5 66% | 5.5 25% |
| Gamma | 1.9 116% | 2.17 101% | 2.137 103% | 2.22 99% | 2.4 92% | 2.35 94% |
| CCT | 7260 90% | 6292 103% | 7584 86% | 6011 108% | 6642 98% | 6368 102% |
| Durchschnitt gesamt (Programm / Settings) | 11% /
17% | 4% /
-8% | -33% /
-60% | 24% /
7% | 5% /
1% |
* ... kleinere Werte sind besser
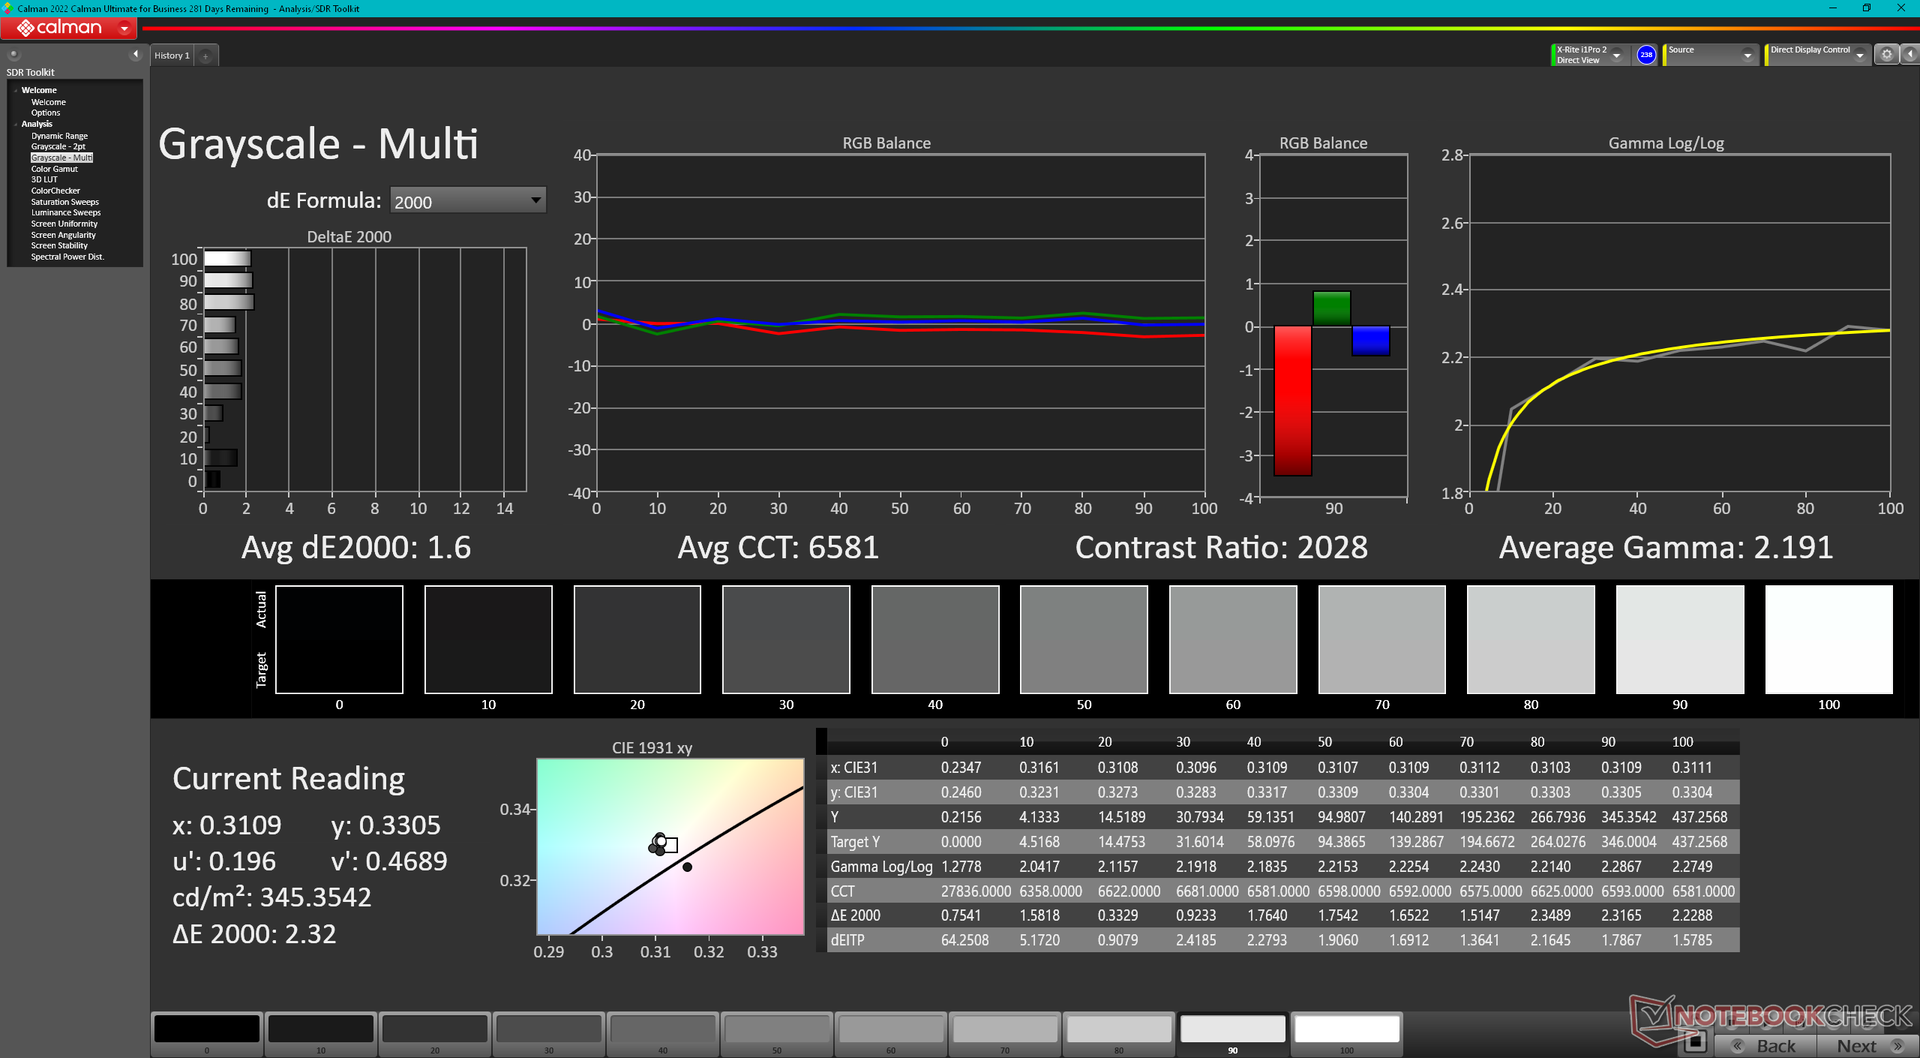
Es ist bedauerlich, dass das Display nicht vorkalibriert geliefert wird, insbesondere da alle SKUs DCI-P3-Farben unterstützen. Die Farbtemperatur ist übermäßig kühl, was zu relativ hohen durchschnittlichen Graustufen- und Farb-DeltaE-Werten von 7,3 bzw. 5,8 führt. Durch eine individuelle Kalibrierung des Panels könnten diese Durchschnittswerte jeweils auf <2 gesenkt werden. Unser kalibriertes ICM-Profil steht oben zum kostenlosen Download bereit.
Reaktionszeiten (Response Times) des Displays
| ↔ Reaktionszeiten Schwarz zu Weiß | ||
|---|---|---|
| 33.9 ms ... steigend ↗ und fallend ↘ kombiniert | ↗ 15.6 ms steigend | 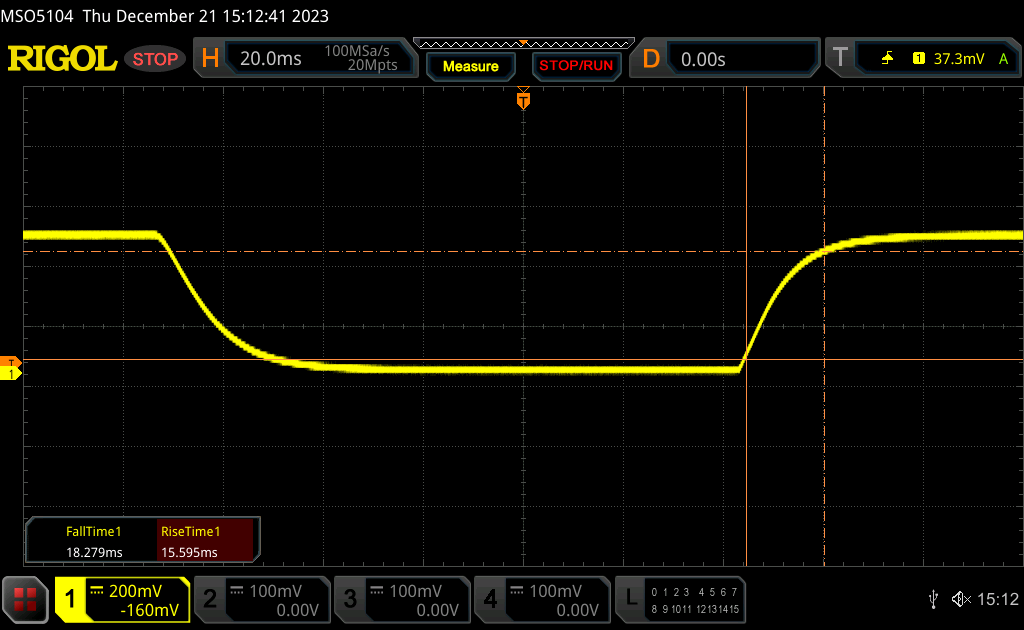 |
| ↘ 18.3 ms fallend | ||
| Die gemessenen Reaktionszeiten sind langsam und dadurch für viele Spieler wahrscheinlich zu langsam. Im Vergleich rangierten die bei uns getesteten Geräte von 0.1 (Minimum) zu 240 (Maximum) ms. » 91 % aller Screens waren schneller als der getestete. Daher sind die gemessenen Reaktionszeiten schlechter als der Durchschnitt aller vermessenen Geräte (19.8 ms). | ||
| ↔ Reaktionszeiten 50% Grau zu 80% Grau | ||
| 49.4 ms ... steigend ↗ und fallend ↘ kombiniert | ↗ 22.6 ms steigend | 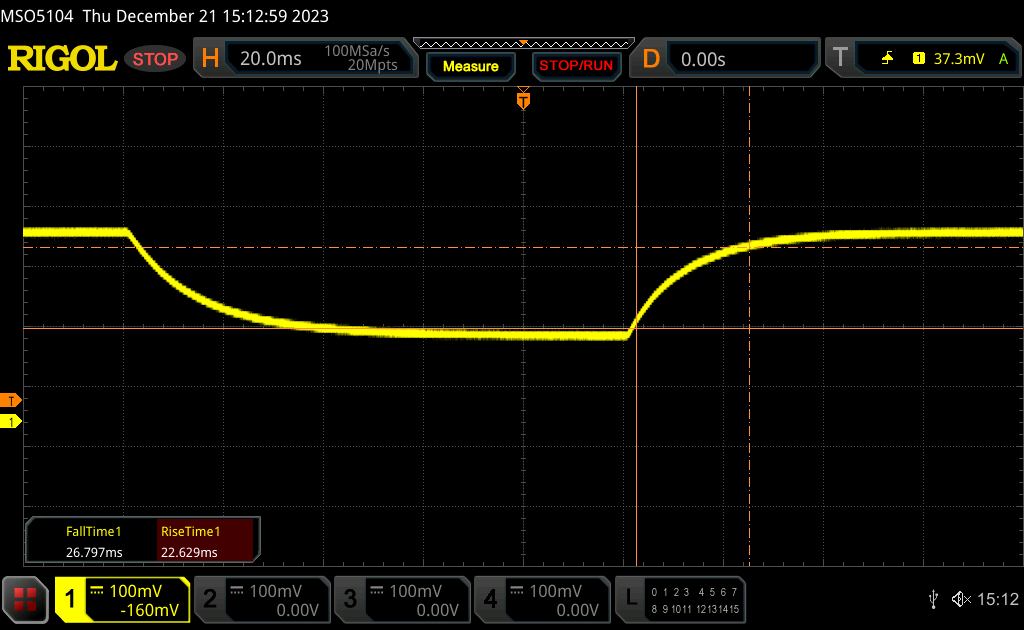 |
| ↘ 26.8 ms fallend | ||
| Die gemessenen Reaktionszeiten sind langsam und dadurch für viele Spieler wahrscheinlich zu langsam. Im Vergleich rangierten die bei uns getesteten Geräte von 0.165 (Minimum) zu 636 (Maximum) ms. » 85 % aller Screens waren schneller als der getestete. Daher sind die gemessenen Reaktionszeiten schlechter als der Durchschnitt aller vermessenen Geräte (31 ms). | ||
Bildschirm-Flackern / PWM (Pulse-Width Modulation)
| Flackern / PWM nicht festgestellt | 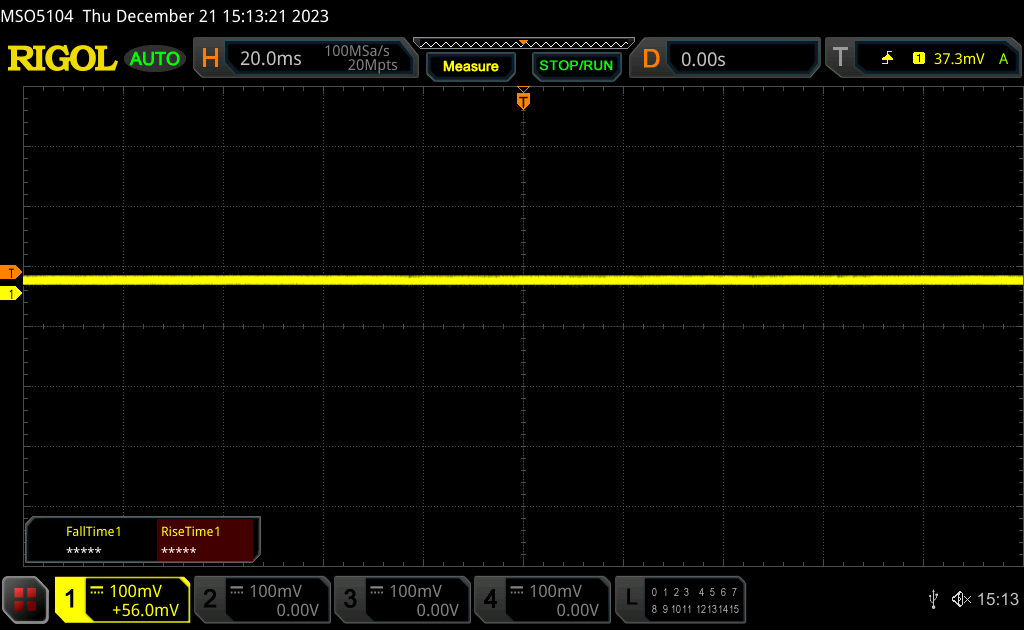 | ||
Im Vergleich: 52 % aller getesteten Geräte nutzten kein PWM um die Helligkeit zu reduzieren. Wenn PWM eingesetzt wurde, dann bei einer Frequenz von durchschnittlich 7778 (Minimum 5, Maximum 343500) Hz. | |||
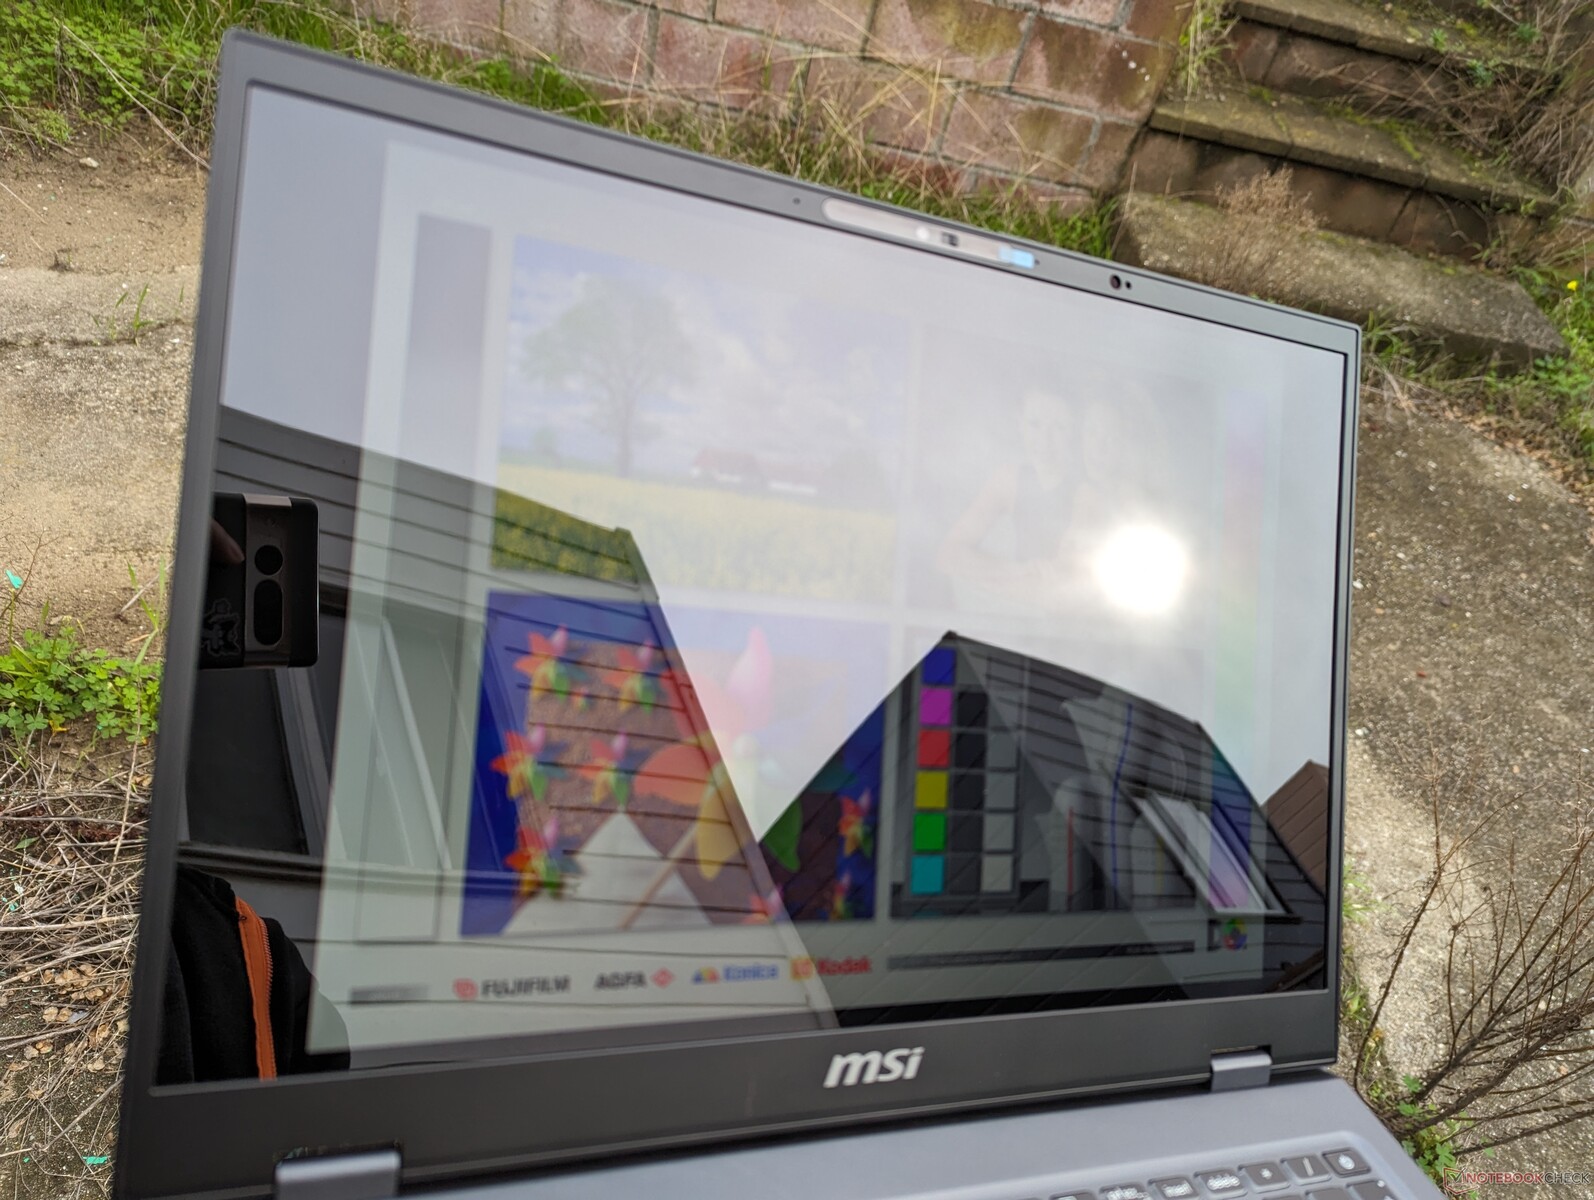
Der superglänzende Bildschirm trägt zweifellos zu einem schärferen Bild bei, bringt jedoch auch in den meisten Nutzungsszenarien, besonders im Freien, eine übermäßige Blendung mit sich. Der Mini-LED-Bildschirm des MacBook Pro 16 ist etwa 30% heller als der unseres MSI und bietet dadurch bei hellem Umgebungslicht eine bessere Sicht.

Leistung - Ein kometenhafter Aufstieg
Testbedingungen
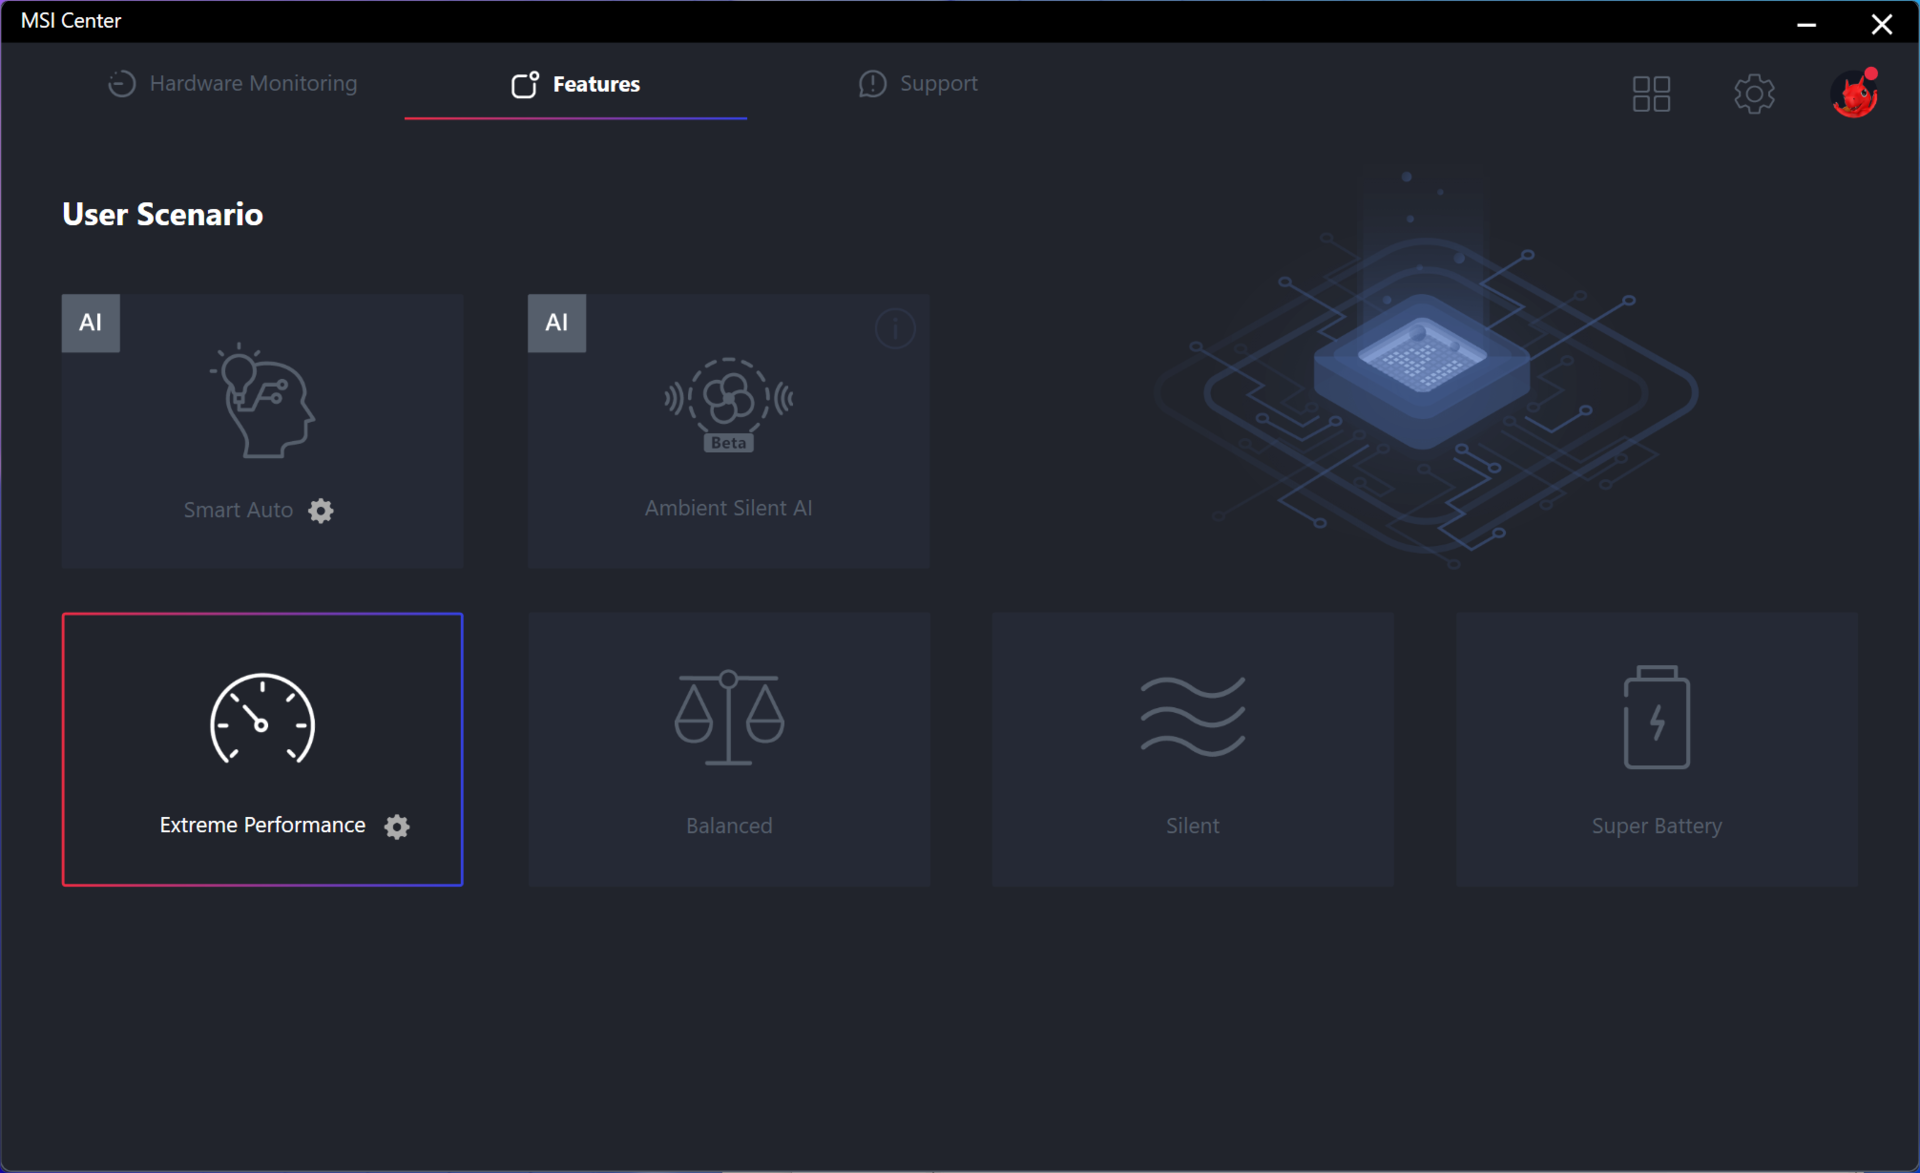
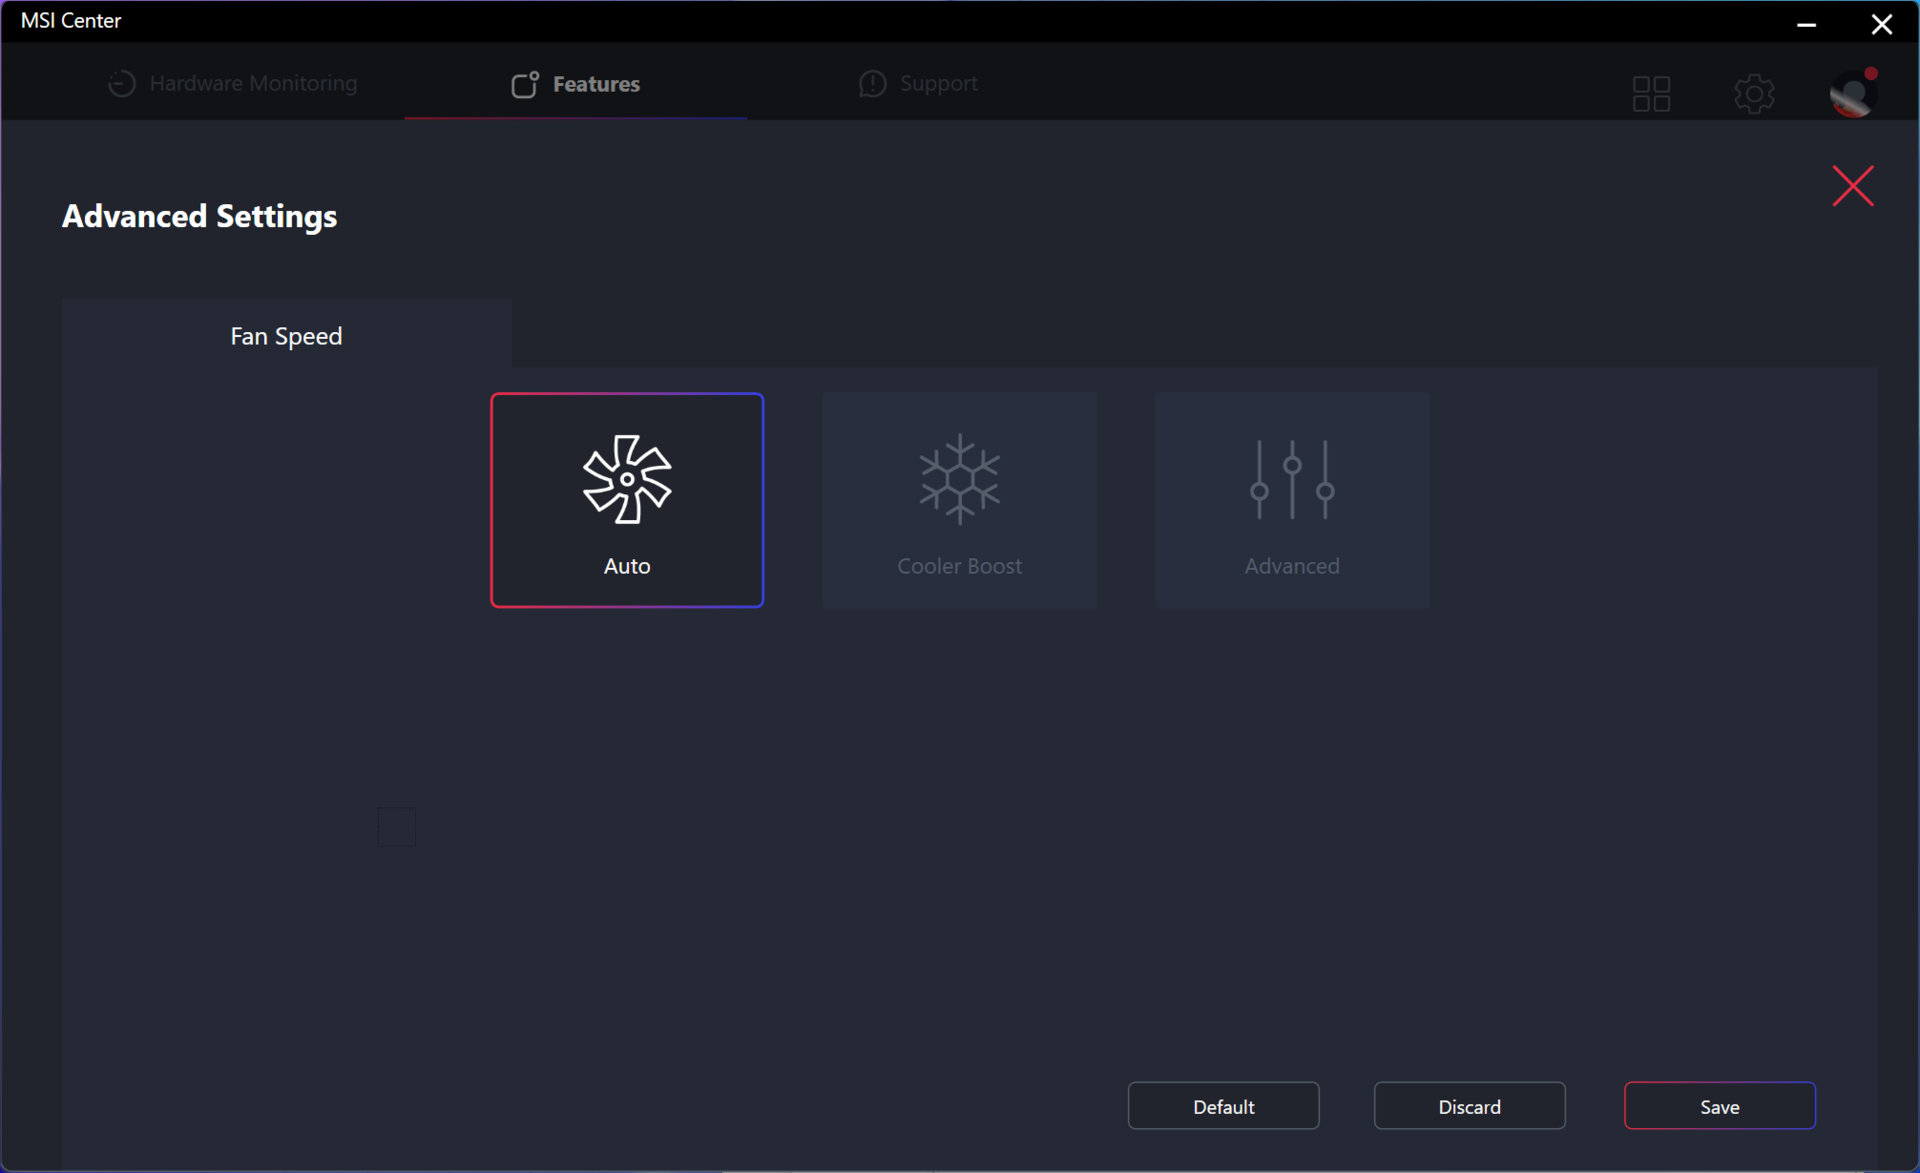
Wir haben Windows im Performance-Modus und das MSI Center im Extreme Performance-Modus konfiguriert, bevor wir die folgenden Benchmarks durchgeführt haben. Es wird empfohlen, dass Besitzer sich mit dem MSI Center vertraut machen, da es die zentrale Anlaufstelle für MSI-spezifische Updates und Funktionen ist.
Prozessor
Die CPU-Leistung zeigt einen deutlichen Sprung im Vergleich zu den Core U- und Core P-Optionen der letzten Generation. Unser Core Ultra 7 155H weist einen komfortablen Vorsprung von 20 bis 25 Prozent gegenüber dem Core i7-1360P und AMDs schnellster Option der Zen-4-U-Reihe, dem Ryzen 7 7840U.
Nutzer, die spürbare Verbesserungen gegenüber den Core H-Optionen der 13. Generation erwarten, könnten dennoch leicht enttäuscht werden. Beispielsweise bleibt die rohe Single- und Multi-Thread-Leistung etwas hinter der des Core i7-13700H zurück. Die größten Unterschiede zwischen Core H der 13. und 14. Generation betreffen die verbesserte iGPU und KI-Beschleunigung der neueren Optionen.
Ein höherwertiges Core Ultra 9 185H SKU ist ebenfalls für das Prestige 16 verfügbar, aber wir erwarten nicht, dass es viel schneller ist als unsere Core Ultra 7 155H Konfiguration, da beide CPUs die exakt gleiche Anzahl von Kernen haben, mit nur geringen Unterschieden in den Taktraten.
Cinebench R15 Multi Dauertest
Cinebench R23: Multi Core | Single Core
Cinebench R20: CPU (Multi Core) | CPU (Single Core)
Cinebench R15: CPU Multi 64Bit | CPU Single 64Bit
Blender: v2.79 BMW27 CPU
7-Zip 18.03: 7z b 4 | 7z b 4 -mmt1
Geekbench 5.5: Multi-Core | Single-Core
HWBOT x265 Benchmark v2.2: 4k Preset
LibreOffice : 20 Documents To PDF
R Benchmark 2.5: Overall mean
* ... kleinere Werte sind besser
AIDA64: FP32 Ray-Trace | FPU Julia | CPU SHA3 | CPU Queen | FPU SinJulia | FPU Mandel | CPU AES | CPU ZLib | FP64 Ray-Trace | CPU PhotoWorxx
| Performance Rating | |
| MSI Prestige 16 B1MG-001US | |
| Asus VivoBook Pro 16 K6602VU | |
| Durchschnittliche Intel Core Ultra 7 155H | |
| Dell Inspiron 16 Plus 7630 | |
| MSI Prestige 15 A12UD-093 | |
| LG Gram 2in1 16 16T90R - G.AA78G | |
| Lenovo ThinkBook 16 G6 ABP | |
| AIDA64 / FP32 Ray-Trace | |
| MSI Prestige 16 B1MG-001US | |
| Dell Inspiron 16 Plus 7630 | |
| Asus VivoBook Pro 16 K6602VU | |
| Durchschnittliche Intel Core Ultra 7 155H (6670 - 18470, n=50) | |
| Lenovo ThinkBook 16 G6 ABP | |
| MSI Prestige 15 A12UD-093 | |
| LG Gram 2in1 16 16T90R - G.AA78G | |
| LG Gram 2in1 16 16T90R - G.AA78G | |
| AIDA64 / FPU Julia | |
| MSI Prestige 16 B1MG-001US | |
| Asus VivoBook Pro 16 K6602VU | |
| Durchschnittliche Intel Core Ultra 7 155H (40905 - 93181, n=50) | |
| Lenovo ThinkBook 16 G6 ABP | |
| Dell Inspiron 16 Plus 7630 | |
| MSI Prestige 15 A12UD-093 | |
| LG Gram 2in1 16 16T90R - G.AA78G | |
| AIDA64 / CPU SHA3 | |
| MSI Prestige 16 B1MG-001US | |
| Asus VivoBook Pro 16 K6602VU | |
| Durchschnittliche Intel Core Ultra 7 155H (1940 - 4436, n=50) | |
| Dell Inspiron 16 Plus 7630 | |
| MSI Prestige 15 A12UD-093 | |
| LG Gram 2in1 16 16T90R - G.AA78G | |
| Lenovo ThinkBook 16 G6 ABP | |
| AIDA64 / CPU Queen | |
| Dell Inspiron 16 Plus 7630 | |
| Asus VivoBook Pro 16 K6602VU | |
| MSI Prestige 16 B1MG-001US | |
| Durchschnittliche Intel Core Ultra 7 155H (64698 - 94181, n=50) | |
| LG Gram 2in1 16 16T90R - G.AA78G | |
| MSI Prestige 15 A12UD-093 | |
| Lenovo ThinkBook 16 G6 ABP | |
| AIDA64 / FPU SinJulia | |
| MSI Prestige 16 B1MG-001US | |
| Lenovo ThinkBook 16 G6 ABP | |
| Durchschnittliche Intel Core Ultra 7 155H (5639 - 10647, n=50) | |
| Dell Inspiron 16 Plus 7630 | |
| Asus VivoBook Pro 16 K6602VU | |
| MSI Prestige 15 A12UD-093 | |
| LG Gram 2in1 16 16T90R - G.AA78G | |
| AIDA64 / FPU Mandel | |
| MSI Prestige 16 B1MG-001US | |
| Lenovo ThinkBook 16 G6 ABP | |
| Durchschnittliche Intel Core Ultra 7 155H (18236 - 47685, n=50) | |
| Asus VivoBook Pro 16 K6602VU | |
| Dell Inspiron 16 Plus 7630 | |
| MSI Prestige 15 A12UD-093 | |
| LG Gram 2in1 16 16T90R - G.AA78G | |
| AIDA64 / CPU AES | |
| Asus VivoBook Pro 16 K6602VU | |
| MSI Prestige 15 A12UD-093 | |
| LG Gram 2in1 16 16T90R - G.AA78G | |
| Durchschnittliche Intel Core Ultra 7 155H (45713 - 152179, n=50) | |
| MSI Prestige 16 B1MG-001US | |
| Dell Inspiron 16 Plus 7630 | |
| Lenovo ThinkBook 16 G6 ABP | |
| AIDA64 / CPU ZLib | |
| MSI Prestige 16 B1MG-001US | |
| Asus VivoBook Pro 16 K6602VU | |
| Durchschnittliche Intel Core Ultra 7 155H (557 - 1250, n=50) | |
| Dell Inspiron 16 Plus 7630 | |
| LG Gram 2in1 16 16T90R - G.AA78G | |
| MSI Prestige 15 A12UD-093 | |
| Lenovo ThinkBook 16 G6 ABP | |
| AIDA64 / FP64 Ray-Trace | |
| MSI Prestige 16 B1MG-001US | |
| Asus VivoBook Pro 16 K6602VU | |
| Dell Inspiron 16 Plus 7630 | |
| Durchschnittliche Intel Core Ultra 7 155H (3569 - 9802, n=50) | |
| Lenovo ThinkBook 16 G6 ABP | |
| MSI Prestige 15 A12UD-093 | |
| LG Gram 2in1 16 16T90R - G.AA78G | |
| AIDA64 / CPU PhotoWorxx | |
| Durchschnittliche Intel Core Ultra 7 155H (32719 - 54223, n=50) | |
| MSI Prestige 16 B1MG-001US | |
| MSI Prestige 15 A12UD-093 | |
| LG Gram 2in1 16 16T90R - G.AA78G | |
| Asus VivoBook Pro 16 K6602VU | |
| Dell Inspiron 16 Plus 7630 | |
| Lenovo ThinkBook 16 G6 ABP | |
System Performance
Die PCMark-Ergebnisse sind mit denen von Multimedia-Laptops mit einer separaten Mittelklasse-Grafikkarte wie dem Asus VivoBook Pro 16 vergleichbar. Es ist umstritten, die Ergebnisse zu interpretieren, da es schwierig ist, die Zahlen direkt zwischen Laptops mit integrierten Grafikeinheiten (iGPUs) und dedizierten Grafikkarten (dGPUs) zu vergleichen.
Die hohe Leistung des schnellen 6400 MHz System-RAM ist erwähnenswert, da die Performance der integrierten Grafikeinheit eng mit der RAM-Leistung verbunden ist.
CrossMark: Overall | Productivity | Creativity | Responsiveness
WebXPRT 3: Overall
WebXPRT 4: Overall
Mozilla Kraken 1.1: Total
| PCMark 10 / Score | |
| Dell Inspiron 16 Plus 7630 | |
| Asus VivoBook Pro 16 K6602VU | |
| MSI Prestige 16 B1MG-001US | |
| Durchschnittliche Intel Core Ultra 7 155H, Intel Arc 8-Core iGPU (4809 - 7529, n=34) | |
| MSI Prestige 15 A12UD-093 | |
| Lenovo ThinkBook 16 G6 ABP | |
| LG Gram 2in1 16 16T90R - G.AA78G | |
| PCMark 10 / Essentials | |
| LG Gram 2in1 16 16T90R - G.AA78G | |
| Dell Inspiron 16 Plus 7630 | |
| MSI Prestige 16 B1MG-001US | |
| Lenovo ThinkBook 16 G6 ABP | |
| Durchschnittliche Intel Core Ultra 7 155H, Intel Arc 8-Core iGPU (7605 - 11289, n=34) | |
| Asus VivoBook Pro 16 K6602VU | |
| MSI Prestige 15 A12UD-093 | |
| PCMark 10 / Productivity | |
| Dell Inspiron 16 Plus 7630 | |
| Lenovo ThinkBook 16 G6 ABP | |
| MSI Prestige 15 A12UD-093 | |
| MSI Prestige 16 B1MG-001US | |
| Asus VivoBook Pro 16 K6602VU | |
| Durchschnittliche Intel Core Ultra 7 155H, Intel Arc 8-Core iGPU (6042 - 10591, n=34) | |
| LG Gram 2in1 16 16T90R - G.AA78G | |
| PCMark 10 / Digital Content Creation | |
| Dell Inspiron 16 Plus 7630 | |
| Asus VivoBook Pro 16 K6602VU | |
| MSI Prestige 16 B1MG-001US | |
| Durchschnittliche Intel Core Ultra 7 155H, Intel Arc 8-Core iGPU (4985 - 10709, n=34) | |
| MSI Prestige 15 A12UD-093 | |
| LG Gram 2in1 16 16T90R - G.AA78G | |
| Lenovo ThinkBook 16 G6 ABP | |
| CrossMark / Overall | |
| Dell Inspiron 16 Plus 7630 | |
| MSI Prestige 16 B1MG-001US | |
| Asus VivoBook Pro 16 K6602VU | |
| MSI Prestige 15 A12UD-093 | |
| Durchschnittliche Intel Core Ultra 7 155H, Intel Arc 8-Core iGPU (1366 - 1903, n=34) | |
| LG Gram 2in1 16 16T90R - G.AA78G | |
| Lenovo ThinkBook 16 G6 ABP | |
| CrossMark / Productivity | |
| Dell Inspiron 16 Plus 7630 | |
| MSI Prestige 16 B1MG-001US | |
| Asus VivoBook Pro 16 K6602VU | |
| MSI Prestige 15 A12UD-093 | |
| Durchschnittliche Intel Core Ultra 7 155H, Intel Arc 8-Core iGPU (1291 - 1798, n=33) | |
| LG Gram 2in1 16 16T90R - G.AA78G | |
| Lenovo ThinkBook 16 G6 ABP | |
| CrossMark / Creativity | |
| Dell Inspiron 16 Plus 7630 | |
| MSI Prestige 16 B1MG-001US | |
| Asus VivoBook Pro 16 K6602VU | |
| Durchschnittliche Intel Core Ultra 7 155H, Intel Arc 8-Core iGPU (1519 - 1929, n=33) | |
| MSI Prestige 15 A12UD-093 | |
| LG Gram 2in1 16 16T90R - G.AA78G | |
| Lenovo ThinkBook 16 G6 ABP | |
| CrossMark / Responsiveness | |
| MSI Prestige 15 A12UD-093 | |
| Dell Inspiron 16 Plus 7630 | |
| MSI Prestige 16 B1MG-001US | |
| Asus VivoBook Pro 16 K6602VU | |
| LG Gram 2in1 16 16T90R - G.AA78G | |
| Durchschnittliche Intel Core Ultra 7 155H, Intel Arc 8-Core iGPU (939 - 1802, n=33) | |
| Lenovo ThinkBook 16 G6 ABP | |
| WebXPRT 3 / Overall | |
| Dell Inspiron 16 Plus 7630 | |
| MSI Prestige 16 B1MG-001US | |
| Durchschnittliche Intel Core Ultra 7 155H, Intel Arc 8-Core iGPU (252 - 299, n=34) | |
| Lenovo ThinkBook 16 G6 ABP | |
| LG Gram 2in1 16 16T90R - G.AA78G | |
| MSI Prestige 15 A12UD-093 | |
| WebXPRT 4 / Overall | |
| Dell Inspiron 16 Plus 7630 | |
| MSI Prestige 16 B1MG-001US | |
| Durchschnittliche Intel Core Ultra 7 155H, Intel Arc 8-Core iGPU (166.4 - 309, n=29) | |
| Asus VivoBook Pro 16 K6602VU | |
| Lenovo ThinkBook 16 G6 ABP | |
| Mozilla Kraken 1.1 / Total | |
| MSI Prestige 15 A12UD-093 | |
| LG Gram 2in1 16 16T90R - G.AA78G | |
| Lenovo ThinkBook 16 G6 ABP | |
| Asus VivoBook Pro 16 K6602VU | |
| Durchschnittliche Intel Core Ultra 7 155H, Intel Arc 8-Core iGPU (517 - 614, n=35) | |
| MSI Prestige 16 B1MG-001US | |
| Dell Inspiron 16 Plus 7630 | |
* ... kleinere Werte sind besser
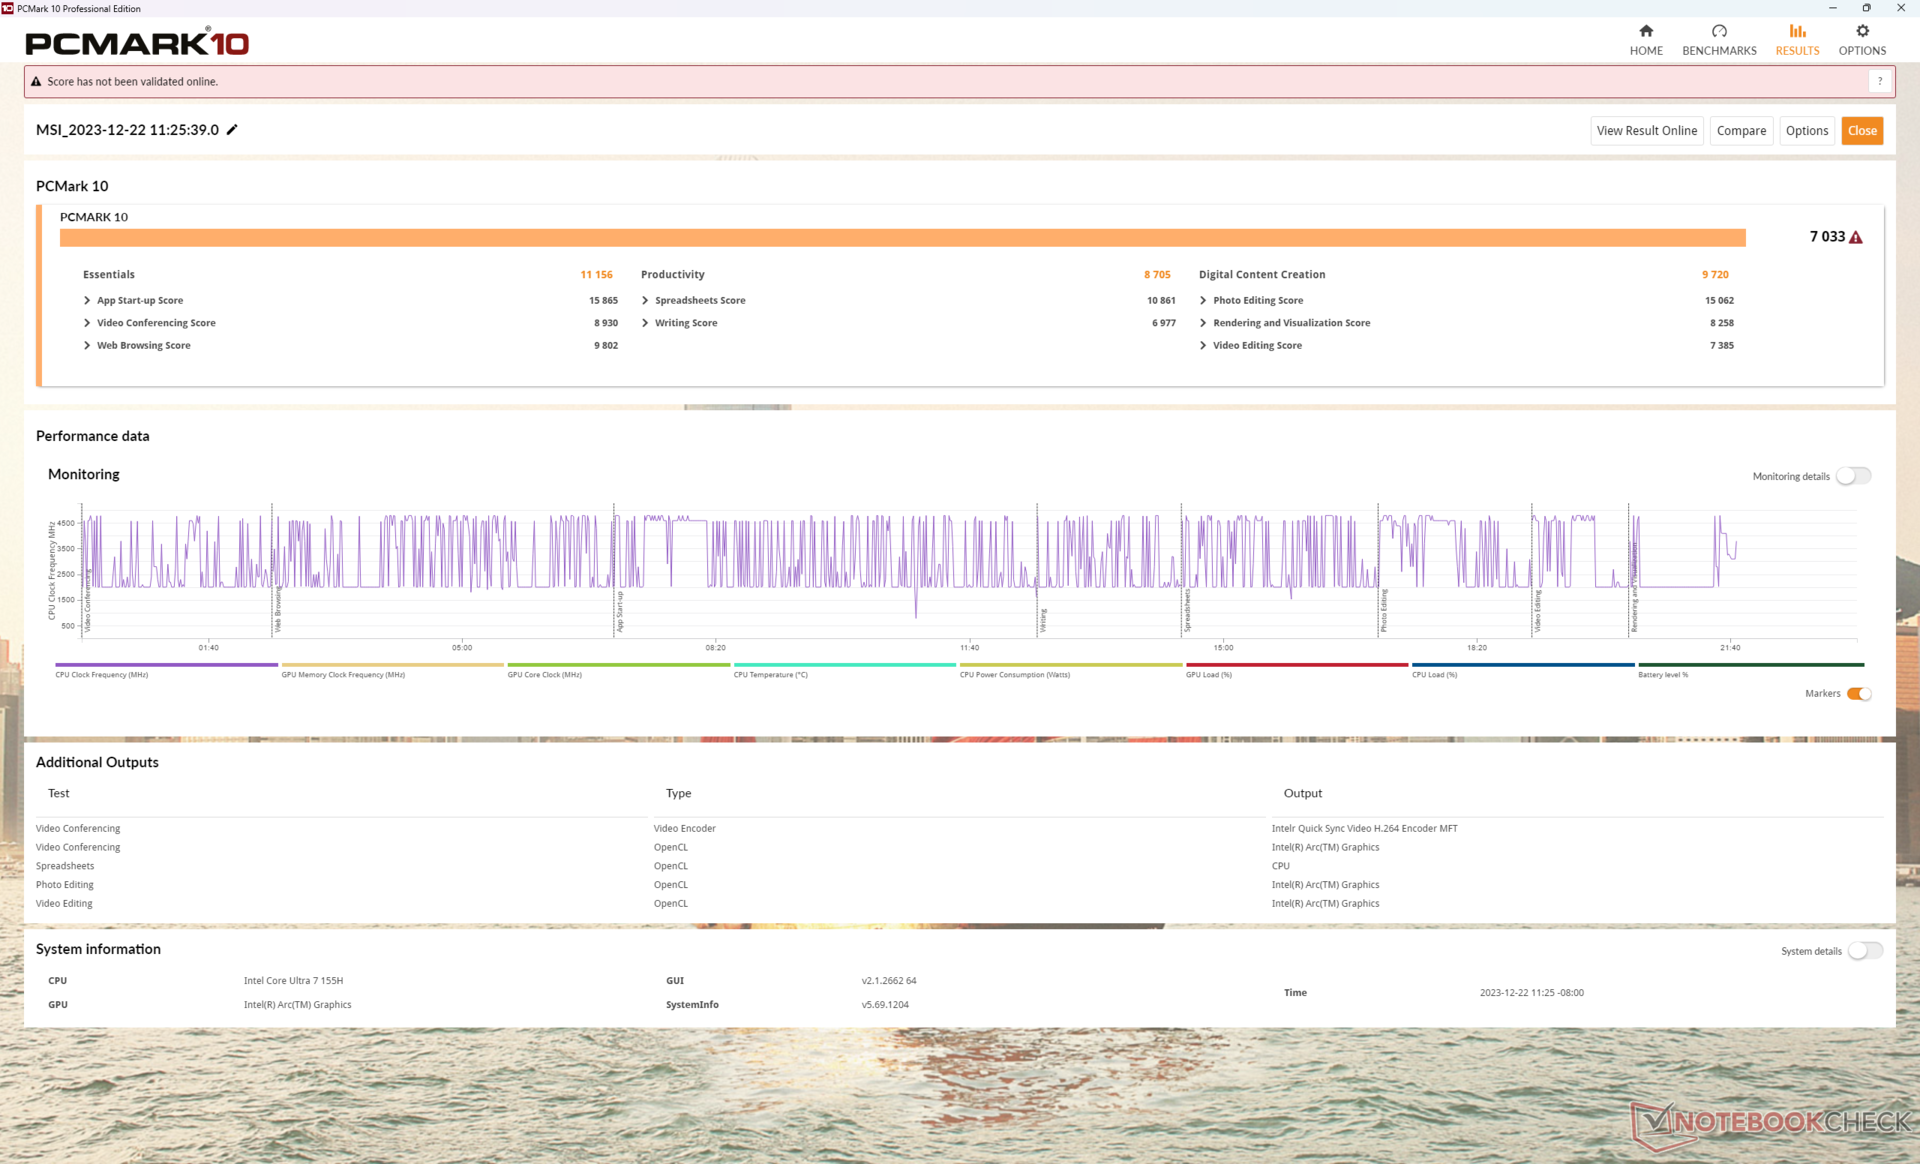
| PCMark 10 Score | 7033 Punkte | |
Hilfe | ||
| AIDA64 / Memory Copy | |
| Durchschnittliche Intel Core Ultra 7 155H (62397 - 96791, n=50) | |
| MSI Prestige 16 B1MG-001US | |
| MSI Prestige 15 A12UD-093 | |
| LG Gram 2in1 16 16T90R - G.AA78G | |
| Dell Inspiron 16 Plus 7630 | |
| Asus VivoBook Pro 16 K6602VU | |
| Lenovo ThinkBook 16 G6 ABP | |
| AIDA64 / Memory Read | |
| Durchschnittliche Intel Core Ultra 7 155H (60544 - 90647, n=50) | |
| MSI Prestige 16 B1MG-001US | |
| Dell Inspiron 16 Plus 7630 | |
| Asus VivoBook Pro 16 K6602VU | |
| MSI Prestige 15 A12UD-093 | |
| LG Gram 2in1 16 16T90R - G.AA78G | |
| Lenovo ThinkBook 16 G6 ABP | |
| AIDA64 / Memory Write | |
| LG Gram 2in1 16 16T90R - G.AA78G | |
| MSI Prestige 16 B1MG-001US | |
| Durchschnittliche Intel Core Ultra 7 155H (58692 - 93451, n=50) | |
| MSI Prestige 15 A12UD-093 | |
| Asus VivoBook Pro 16 K6602VU | |
| Dell Inspiron 16 Plus 7630 | |
| Lenovo ThinkBook 16 G6 ABP | |
| AIDA64 / Memory Latency | |
| Durchschnittliche Intel Core Ultra 7 155H (116.2 - 233, n=50) | |
| MSI Prestige 16 B1MG-001US | |
| LG Gram 2in1 16 16T90R - G.AA78G | |
| MSI Prestige 15 A12UD-093 | |
| Lenovo ThinkBook 16 G6 ABP | |
| Dell Inspiron 16 Plus 7630 | |
| Asus VivoBook Pro 16 K6602VU | |
* ... kleinere Werte sind besser
DPC-Latenzen
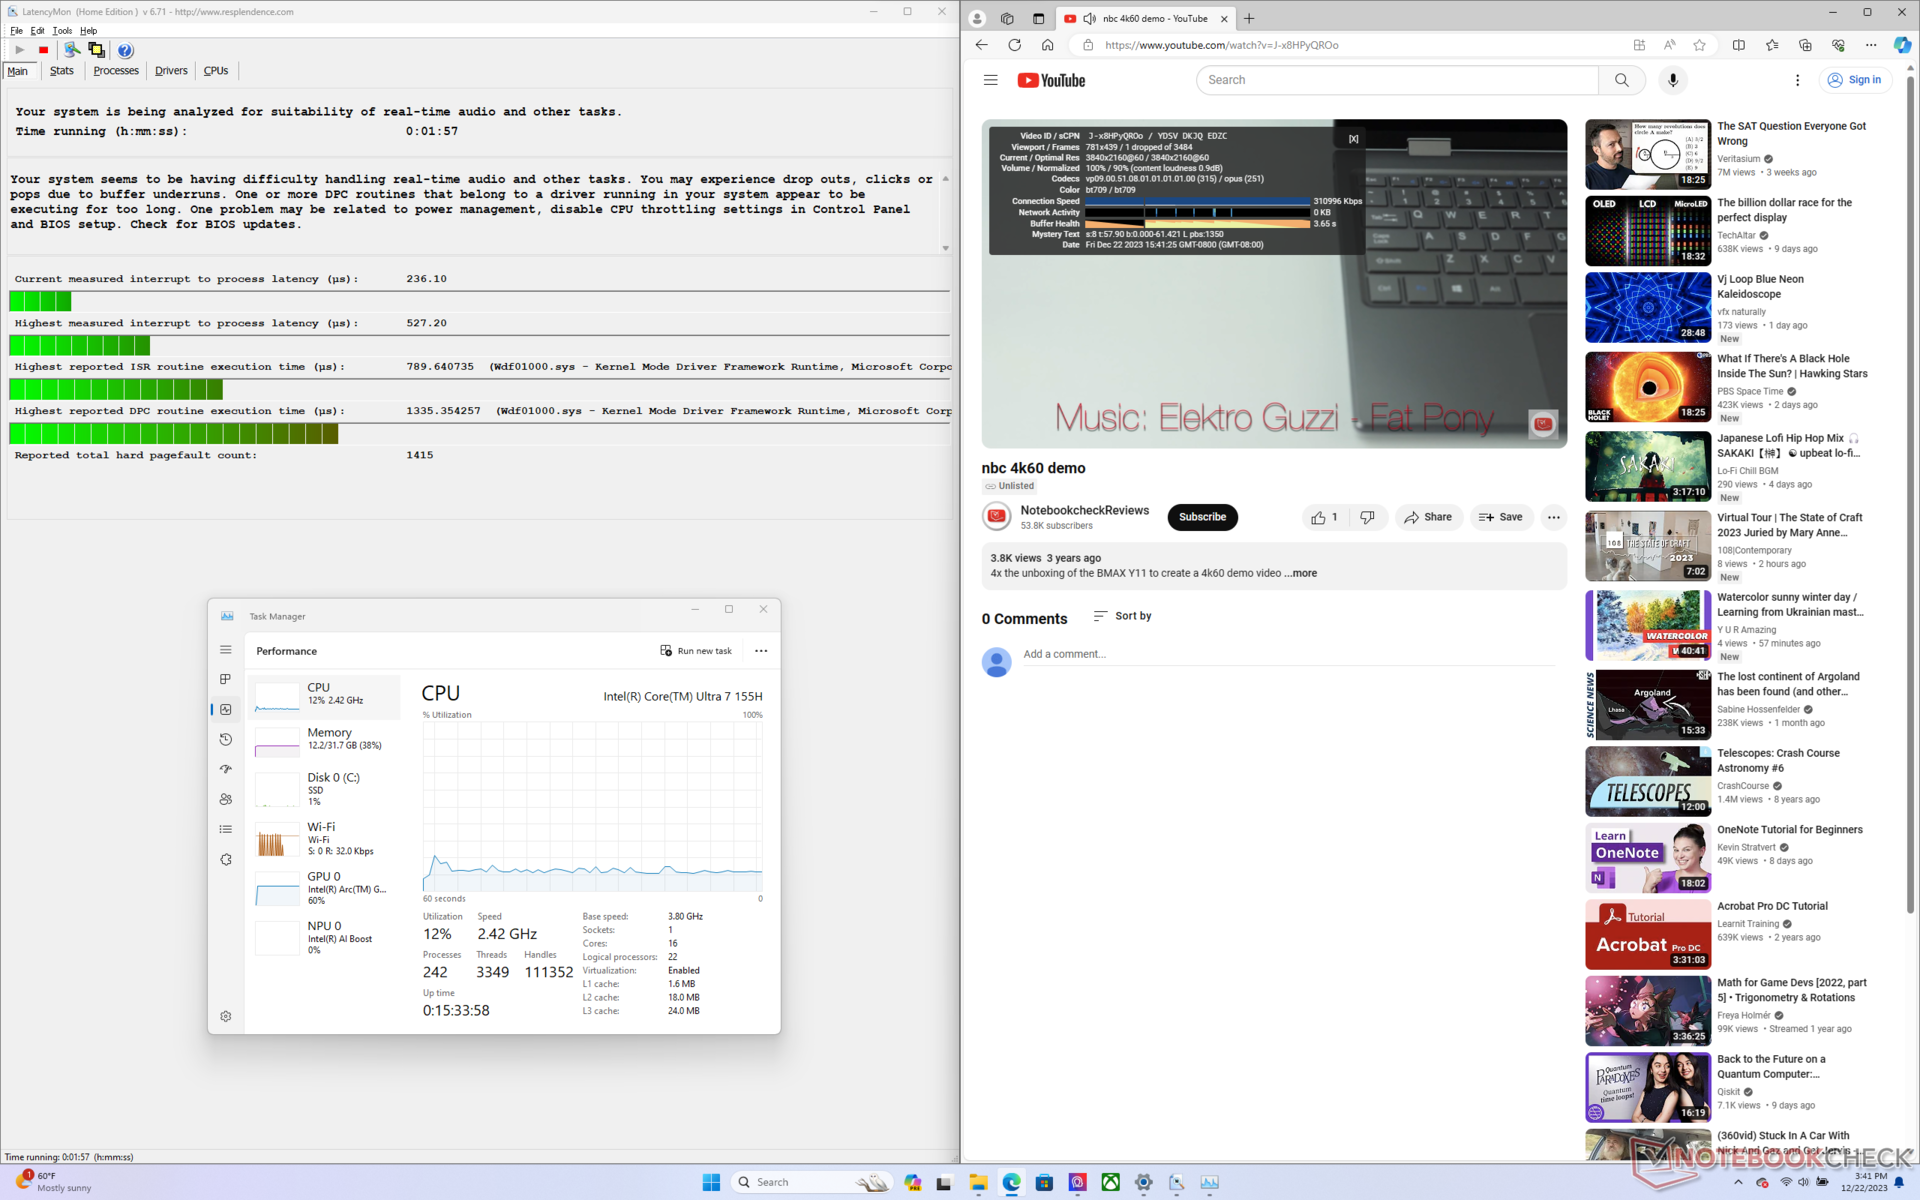
LatencyMon zeigt lediglich geringfügige DPC-Probleme beim Öffnen mehrerer Browser-Tabs unserer Homepage. Die 4K-Videowiedergabe bei 60 FPS ist nahezu perfekt. Während eines 60-sekündigen Testvideos wurde lediglich ein einziger Bildausfall verzeichnet.
| DPC Latencies / LatencyMon - interrupt to process latency (max), Web, Youtube, Prime95 | |
| LG Gram 2in1 16 16T90R - G.AA78G | |
| Asus VivoBook Pro 16 K6602VU | |
| MSI Prestige 15 A12UD-093 | |
| Lenovo ThinkBook 16 G6 ABP | |
| Dell Inspiron 16 Plus 7630 | |
| MSI Prestige 16 B1MG-001US | |
* ... kleinere Werte sind besser
Massenspeicher
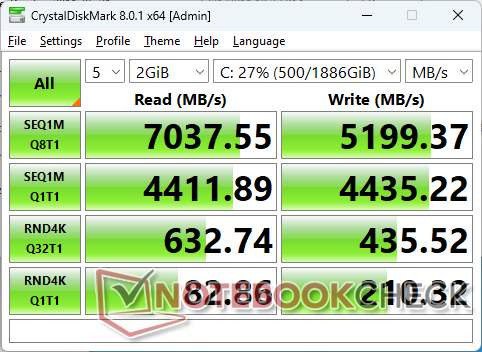
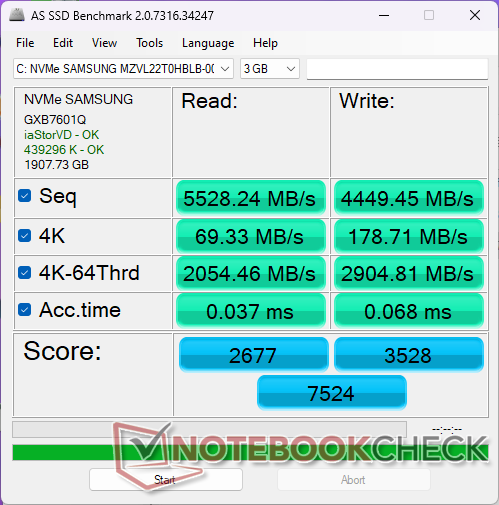
Unser Gerät ist mit einer 2 TB Samsung PM9A1 ausgestattet, die zu den schnellsten PCIe 4.0 x4 NVMe-SSDs der Consumer-Klasse gehört. Dieses Upgrade ersetzt die Micron 3400 in unserem älteren Prestige 15. Die SSD kann beeindruckende Geschwindigkeiten von etwa 7100 MB/s auch unter Last aufrechterhalten. Diese Leistung ist besonders beeindruckend, wenn man die geringe Dicke des Gehäuses berücksichtigt.

| Drive Performance Rating - Percent | |
| MSI Prestige 16 B1MG-001US | |
| LG Gram 2in1 16 16T90R - G.AA78G | |
| MSI Prestige 15 A12UD-093 | |
| Dell Inspiron 16 Plus 7630 | |
| Lenovo ThinkBook 16 G6 ABP | |
| Asus VivoBook Pro 16 K6602VU | |
* ... kleinere Werte sind besser
Disk-Throttling: DiskSpd Read Loop, 8 Runden
GPU Performance — Die Rückeroberung der Krone durch integrierte Grafik
Intel hat endlich seine integrierte GPU verbessert, um im Wettbewerb mit den Radeon 680M- und 780M-Serien. erfolgreicher zu werden. Gemäß den 3DMark-Ergebnissen ist die Arc 8 bei Titeln, die DX12 unterstützen, um etwa 20 Prozent oder sogar bis zu 50 Prozent schneller als die Radeon 780M. Benutzer, die ihre Iris Xe 96 EUs aufrüsten, können eine Leistungssteigerung von 1,5 bis 2 erwarten. Obwohl sie nicht vollständig dem Niveau einer GeForce RTX 3050 Ti entspricht, sind die Ergebnisse dennoch vergleichbar mit denen einer GeForce RTX 2050.
| Energieprofile | CPU-Leistung | Grafikleistung | Gesamtwert |
| Extreme Performance-Modus (Cooler Boost an) | 26439 | 8796 | 3242 |
| Extreme Performance-Modus (Cooler Boost aus) | 26460 (-0%) | 8614 (-2%) | 3187 (-2%) |
| Balanced-Modus | 25110 (-5%) | 8814 (-0%) | 3306 (-0%) |
| Battery-Modus | 21717 (-18%) | 7425 (-16%) | 2761 (-15%) |
Die Aktivierung von Cooler Boost scheint gemäß unserer oben stehenden Fire-Strike-Ergebnistabelle keine signifikanten Auswirkungen auf die Leistung zu haben. Im Balanced-Modus wird die CPU-Leistung nur minimal beeinträchtigt, während der Battery-Modus zu einer Reduzierung der Leistung um etwa 15 Prozent führt.
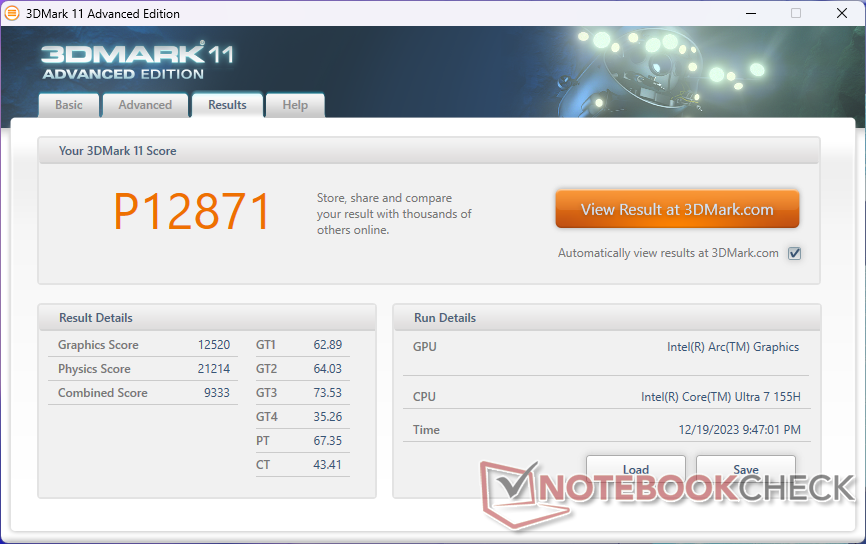

| 3DMark 11 Performance | 12871 Punkte | |
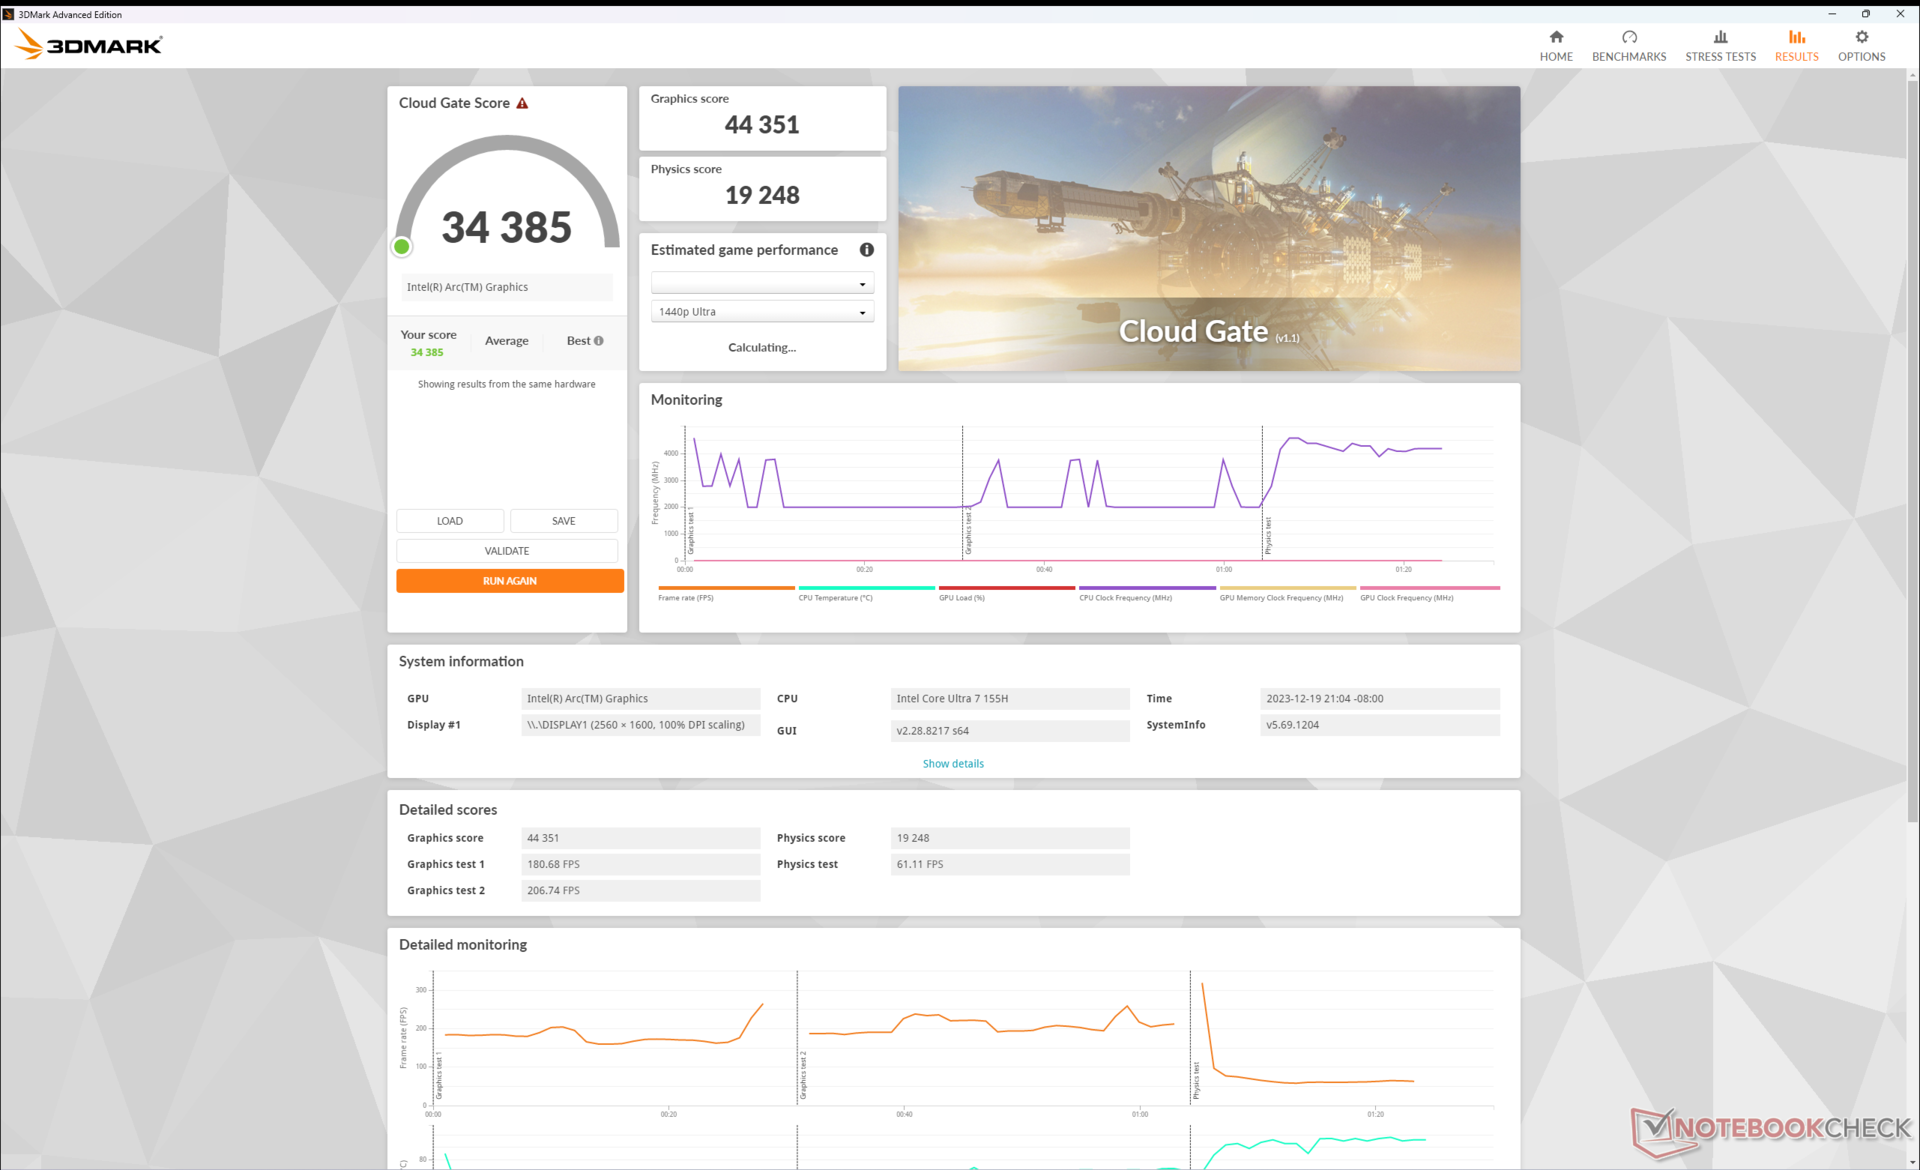
| 3DMark Cloud Gate Standard Score | 34385 Punkte | |
| 3DMark Fire Strike Score | 8211 Punkte | |
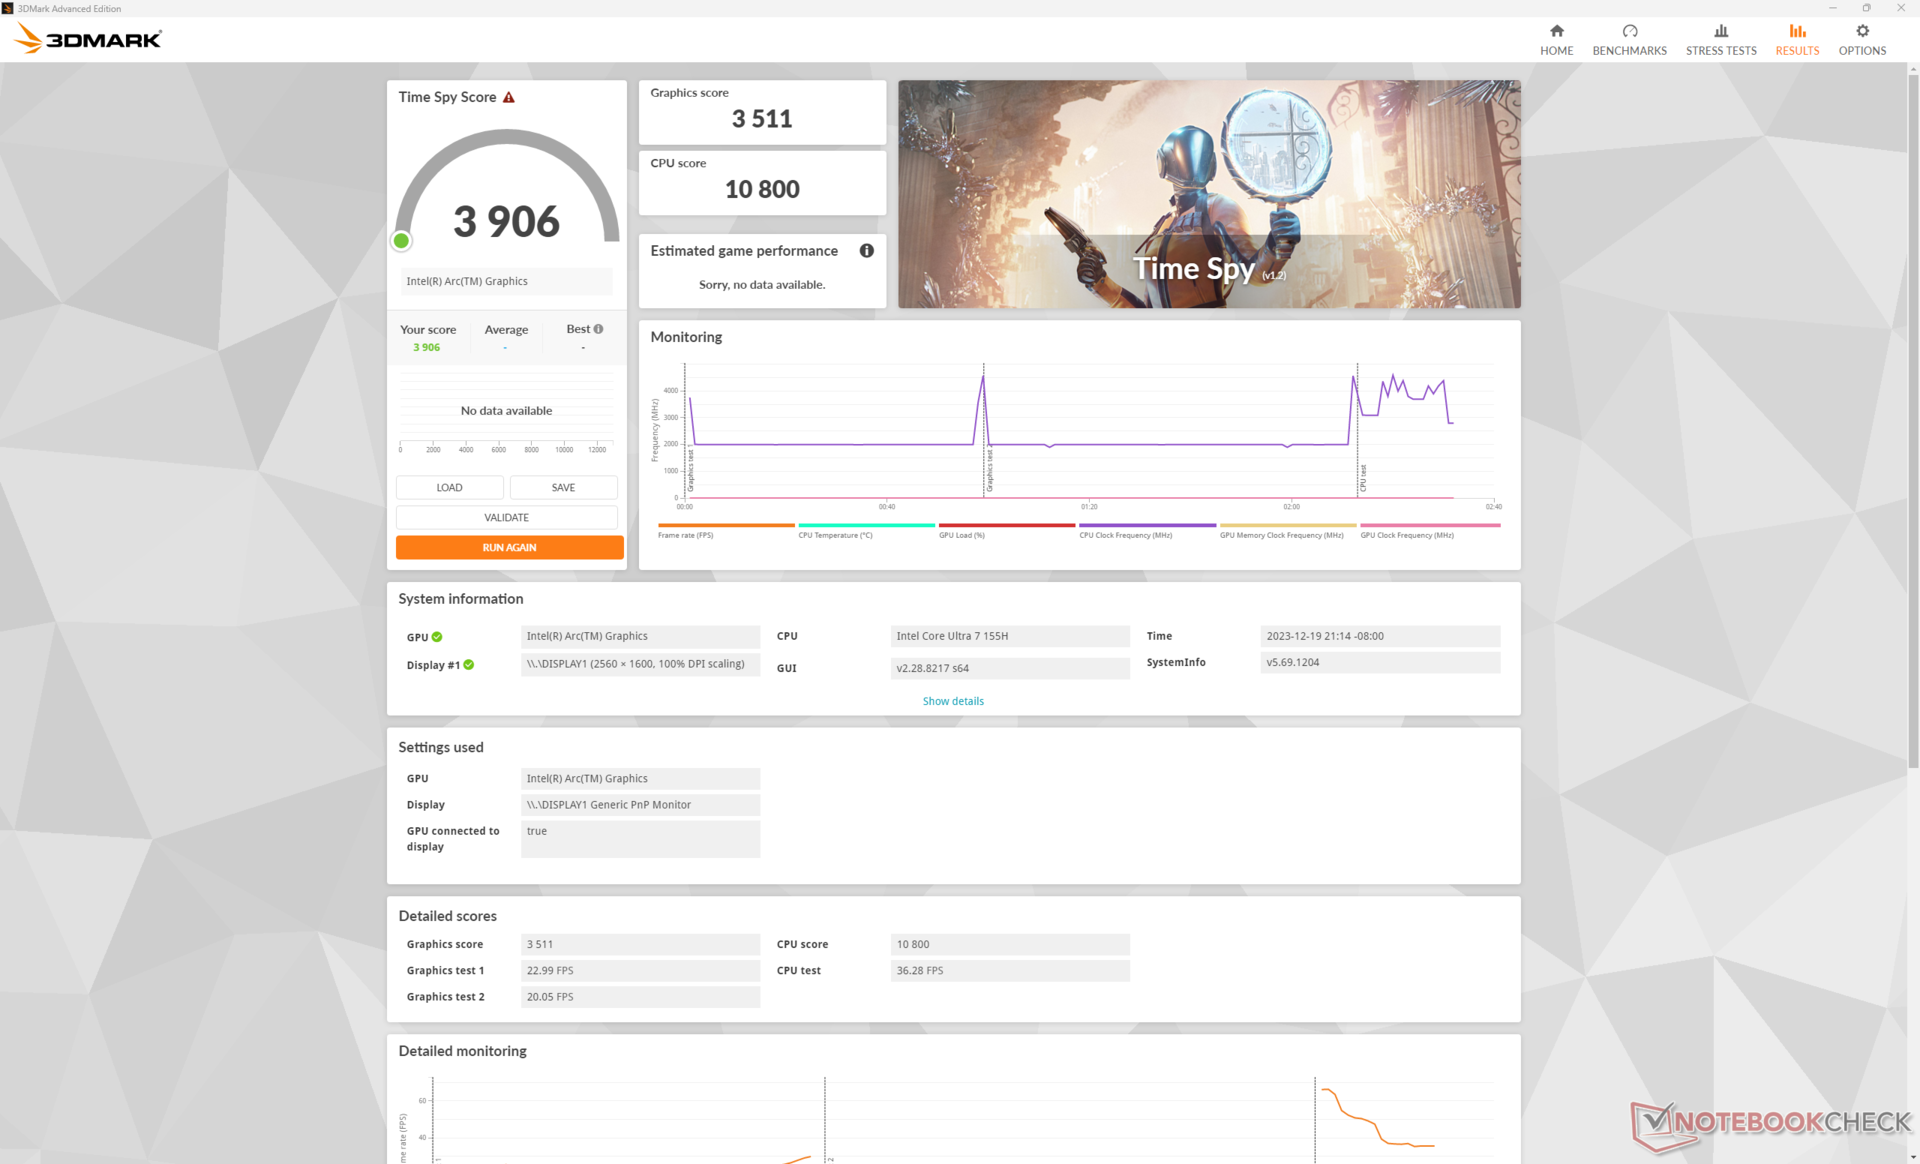
| 3DMark Time Spy Score | 3906 Punkte | |
Hilfe | ||
* ... kleinere Werte sind besser
Gaming Performance
Die Leistung in realen Spielsituationen ist hervorragend und deutet darauf hin, dass unser System mit den synthetischen Benchmark-Ergebnissen des GeForce 3050 Ti im Prestige 15 des letzten Jahres konkurrieren kann. Spiele wie. Far Cry 5 und F1 22 zeigen nur eine geringfügige Abweichung von 5 bis 15 Prozent im Vergleich zum Prestige 15. Es ist wichtig zu beachten, dass die GeForce-GPU im Prestige 15 signifikante Throttling-Probleme aufweist, die sich stark auf die Leistung auswirken. Im Gegensatz dazu führt unser integriertes Arc 8 Spiele immer noch schneller aus als die überwiegende Mehrheit anderer GeForce RTX 3050 Ti Laptops, darunter das Asus Vivobook Pro 16X.
Die Gesamtleistung liegt durchweg etwa 5 bis 20 Prozent über der Radeon 780M in allen getesteten Spielen. Einige DX12-Spiele wie Tiny Tina's Wonderlands und F1 22 könnten sogar um beeindruckende 50 bis 60 Prozent besser auf der neuen Intel-GPU laufen.
| The Witcher 3 - 1920x1080 Ultra Graphics & Postprocessing (HBAO+) | |
| Dell Inspiron 16 Plus 7630 | |
| Asus VivoBook Pro 16 K6602VU | |
| MSI Prestige 16 B1MG-001US | |
| MSI Prestige 15 A12UD-093 | |
| LG Gram 2in1 16 16T90R - G.AA78G | |
| Lenovo ThinkBook 16 G6 ABP | |
| GTA V - 1920x1080 Highest AA:4xMSAA + FX AF:16x | |
| Asus VivoBook Pro 16 K6602VU | |
| MSI Prestige 15 A12UD-093 | |
| Lenovo ThinkBook 16 G6 ABP | |
| LG Gram 2in1 16 16T90R - G.AA78G | |
| Final Fantasy XV Benchmark - 1920x1080 High Quality | |
| Dell Inspiron 16 Plus 7630 | |
| Asus VivoBook Pro 16 K6602VU | |
| MSI Prestige 16 B1MG-001US | |
| MSI Prestige 15 A12UD-093 | |
| LG Gram 2in1 16 16T90R - G.AA78G | |
| Lenovo ThinkBook 16 G6 ABP | |
| Strange Brigade - 1920x1080 ultra AA:ultra AF:16 | |
| Dell Inspiron 16 Plus 7630 | |
| Asus VivoBook Pro 16 K6602VU | |
| MSI Prestige 16 B1MG-001US | |
| MSI Prestige 15 A12UD-093 | |
| LG Gram 2in1 16 16T90R - G.AA78G | |
| Lenovo ThinkBook 16 G6 ABP | |
| Dota 2 Reborn - 1920x1080 ultra (3/3) best looking | |
| Dell Inspiron 16 Plus 7630 | |
| Asus VivoBook Pro 16 K6602VU | |
| MSI Prestige 16 B1MG-001US | |
| MSI Prestige 15 A12UD-093 | |
| LG Gram 2in1 16 16T90R - G.AA78G | |
| Lenovo ThinkBook 16 G6 ABP | |
| X-Plane 11.11 - 1920x1080 high (fps_test=3) | |
| Dell Inspiron 16 Plus 7630 | |
| Asus VivoBook Pro 16 K6602VU | |
| MSI Prestige 15 A12UD-093 | |
| LG Gram 2in1 16 16T90R - G.AA78G | |
| MSI Prestige 16 B1MG-001US | |
| Lenovo ThinkBook 16 G6 ABP | |
| Baldur's Gate 3 | |
| 1280x720 Low Preset AA:SM | |
| MSI Prestige 16 B1MG-001US | |
| Durchschnittliche Intel Arc 8-Core iGPU (31.8 - 57.6, n=14) | |
| 1920x1080 Low Preset AA:SM | |
| MSI Prestige 16 B1MG-001US | |
| Durchschnittliche Intel Arc 8-Core iGPU (21 - 40.3, n=26) | |
| 1920x1080 Medium Preset AA:T | |
| MSI Prestige 16 B1MG-001US | |
| Durchschnittliche Intel Arc 8-Core iGPU (16.3 - 31.1, n=27) | |
| 1920x1080 High Preset AA:T | |
| MSI Prestige 16 B1MG-001US | |
| Durchschnittliche Intel Arc 8-Core iGPU (15.4 - 27.7, n=26) | |
| 1920x1080 Ultra Preset AA:T | |
| MSI Prestige 16 B1MG-001US | |
| Durchschnittliche Intel Arc 8-Core iGPU (14.2 - 26.2, n=25) | |
| Cyberpunk 2077 | |
| 1280x720 Low Preset (FSR off) | |
| MSI Prestige 16 B1MG-001US | |
| Durchschnittliche Intel Arc 8-Core iGPU (34.5 - 58, n=19) | |
| LG Gram 2in1 16 16T90R - G.AA78G | |
| 1920x1080 Low Preset (FSR off) | |
| MSI Prestige 16 B1MG-001US | |
| Durchschnittliche Intel Arc 8-Core iGPU (11.3 - 38, n=37) | |
| LG Gram 2in1 16 16T90R - G.AA78G | |
| 1920x1080 Medium Preset (FSR off) | |
| MSI Prestige 16 B1MG-001US | |
| Durchschnittliche Intel Arc 8-Core iGPU (9.42 - 31.4, n=35) | |
| LG Gram 2in1 16 16T90R - G.AA78G | |
| 1920x1080 High Preset (FSR off) | |
| MSI Prestige 16 B1MG-001US | |
| Durchschnittliche Intel Arc 8-Core iGPU (7.3 - 27.6, n=35) | |
| LG Gram 2in1 16 16T90R - G.AA78G | |
| 1920x1080 Ultra Preset (FSR off) | |
| MSI Prestige 16 B1MG-001US | |
| Durchschnittliche Intel Arc 8-Core iGPU (13 - 24.7, n=27) | |
| LG Gram 2in1 16 16T90R - G.AA78G | |
Witcher 3 FPS-Diagramm
| min. | mittel | hoch | max. | |
|---|---|---|---|---|
| The Witcher 3 (2015) | 135.6 | 88.2 | 54.1 | 25.2 |
| Dota 2 Reborn (2015) | 101.7 | 92.8 | 79.1 | 75.6 |
| Final Fantasy XV Benchmark (2018) | 61 | 37.3 | 24.6 | |
| X-Plane 11.11 (2018) | 52.2 | 46.7 | 37.8 | |
| Far Cry 5 (2018) | 63 | 39 | 36 | 34 |
| Strange Brigade (2018) | 179.5 | 71 | 57.8 | 46.1 |
| Tiny Tina's Wonderlands (2022) | 53.3 | 41.2 | 30.1 | 25.1 |
| F1 22 (2022) | 77.7 | 71.6 | 53.3 | 15.3 |
| Baldur's Gate 3 (2023) | 31.9 | 28.2 | 24.1 | 23.4 |
| Cyberpunk 2077 (2023) | 35.7 | 29.5 | 25.2 | 22.1 |
Emissionen - Laut für einen Laptop mit integrierter Grafik
Geräuschemissionen
Das Lüftergeräusch ist bei niedriger Last leiser als beim Prestige 15, jedoch kehrt sich dieses Verhältnis unter hoher Last um. Beim Surfen oder Videostreaming liegt das Lüftergeräusch beispielsweise im Bereich von 26 bis 37 dB(A), verglichen mit 31 bis 42 dB(A) beim älteren Modell. Unter anspruchsvoller Last, wie etwa beim Spielen von Witcher 3, steigt das Lüftergeräusch auf 46 dB(A) an und erreicht sogar bis zu 53 dB(A), wenn Cooler Boost aktiviert ist. Der mittlere Bereich von 40 dB(A) ist ziemlich laut für ein Notebook, das ausschließlich mit integrierter Grafik arbeitet.
Wir gehen davon aus, dass sich die Lüftergeräusche bei SKUs mit diskreter Grafik anders verhalten werden, im Vergleich zu dem, was wir bei unserem iGPU-Testgerät festgestellt haben.
Lautstärkediagramm
| Idle |
| 24.5 / 26.3 / 26.3 dB(A) |
| Last |
| 36.5 / 52.9 dB(A) |
 | ||
30 dB leise 40 dB(A) deutlich hörbar 50 dB(A) störend |
||
min: | ||
| MSI Prestige 16 B1MG-001US Arc 8-Core, Ultra 7 155H, Samsung PM9A1 MZVL22T0HBLB | MSI Prestige 15 A12UD-093 GeForce RTX 3050 Ti Laptop GPU, i7-1280P, Micron 3400 1TB MTFDKBA1T0TFH | LG Gram 2in1 16 16T90R - G.AA78G Iris Xe G7 96EUs, i7-1360P, Samsung PM9A1 MZVL21T0HCLR | Lenovo ThinkBook 16 G6 ABP Vega 7, R5 7530U, SK hynix HFS512GEJ9X125N | Asus VivoBook Pro 16 K6602VU GeForce RTX 4050 Laptop GPU, i9-13900H, Micron 2400 MTFDKBA1T0QFM | Dell Inspiron 16 Plus 7630 GeForce RTX 4060 Laptop GPU, i7-13700H, WD PC SN740 SDDPTQD-1T00 | |
|---|---|---|---|---|---|---|
| Geräuschentwicklung | -6% | 8% | 13% | -4% | 4% | |
| aus / Umgebung * (dB) | 24.5 | 26 -6% | 25.1 -2% | 24.3 1% | 20.96 14% | 23.2 5% |
| Idle min * (dB) | 24.5 | 26 -6% | 25.1 -2% | 24.3 1% | 25.28 -3% | 23.2 5% |
| Idle avg * (dB) | 26.3 | 30.7 -17% | 25.1 5% | 24.3 8% | 25.28 4% | 23.2 12% |
| Idle max * (dB) | 26.3 | 30.7 -17% | 26.1 1% | 24.3 8% | 25.28 4% | 23.2 12% |
| Last avg * (dB) | 36.5 | 41.9 -15% | 31.4 14% | 29.7 19% | 51.88 -42% | 35.1 4% |
| Witcher 3 ultra * (dB) | 46.3 | 41.1 11% | 32.1 31% | 49 -6% | 52.5 -13% | |
| Last max * (dB) | 52.9 | 40.7 23% | 36.6 31% | 41.4 22% | 51.8 2% | 52.5 1% |
* ... kleinere Werte sind besser
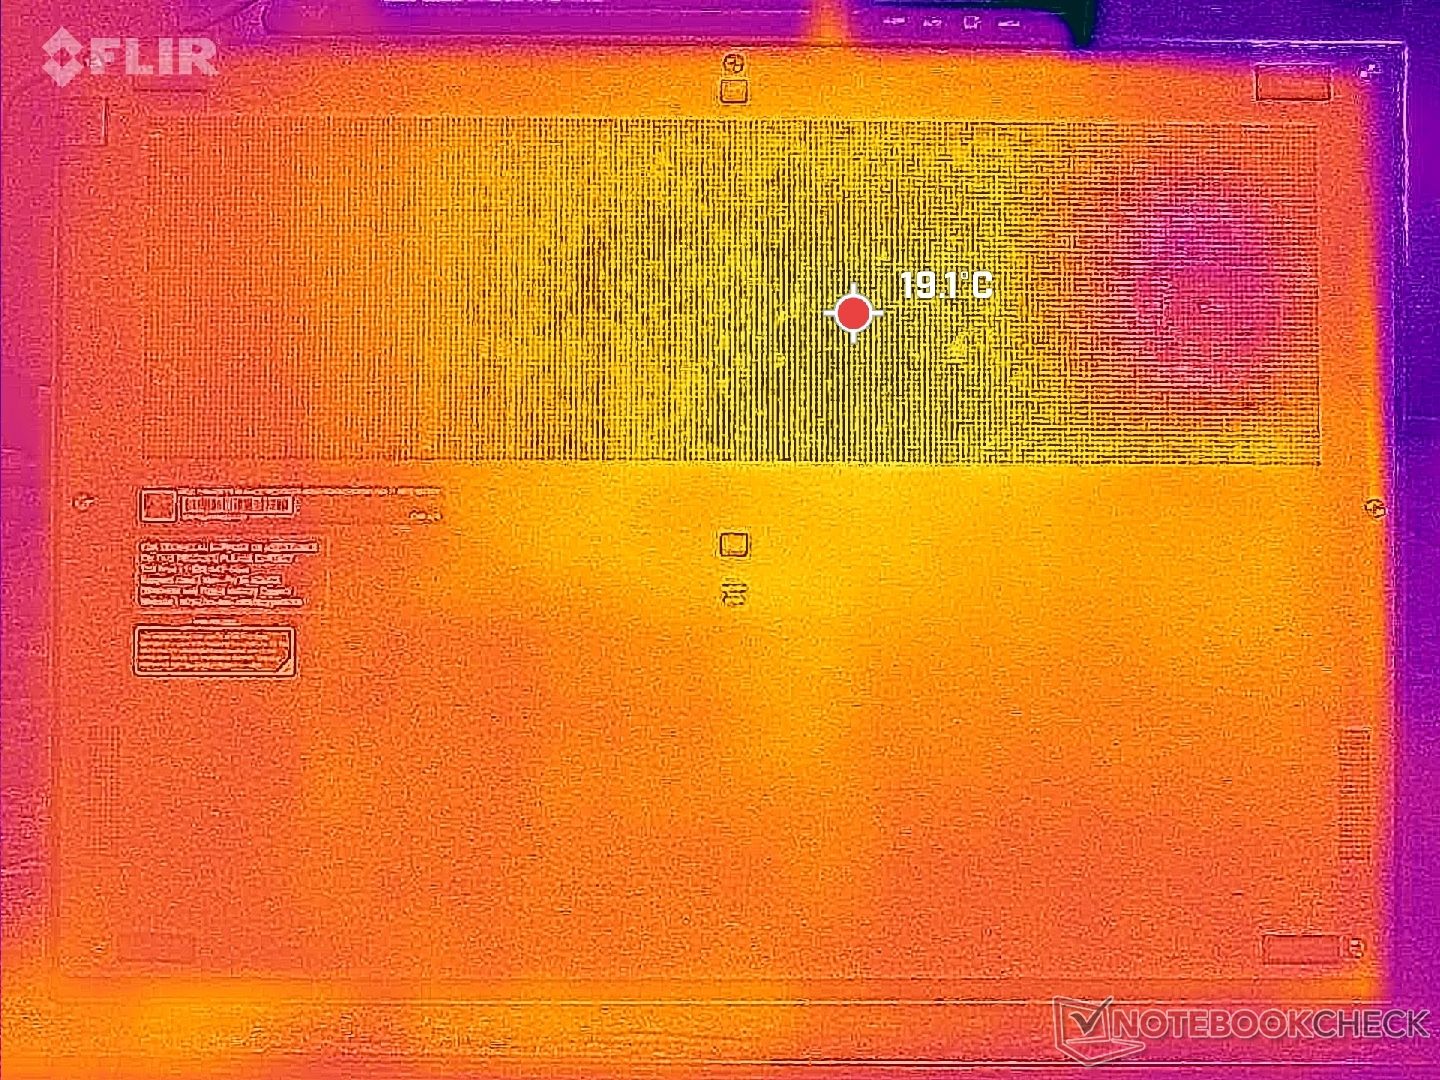
Temperatur
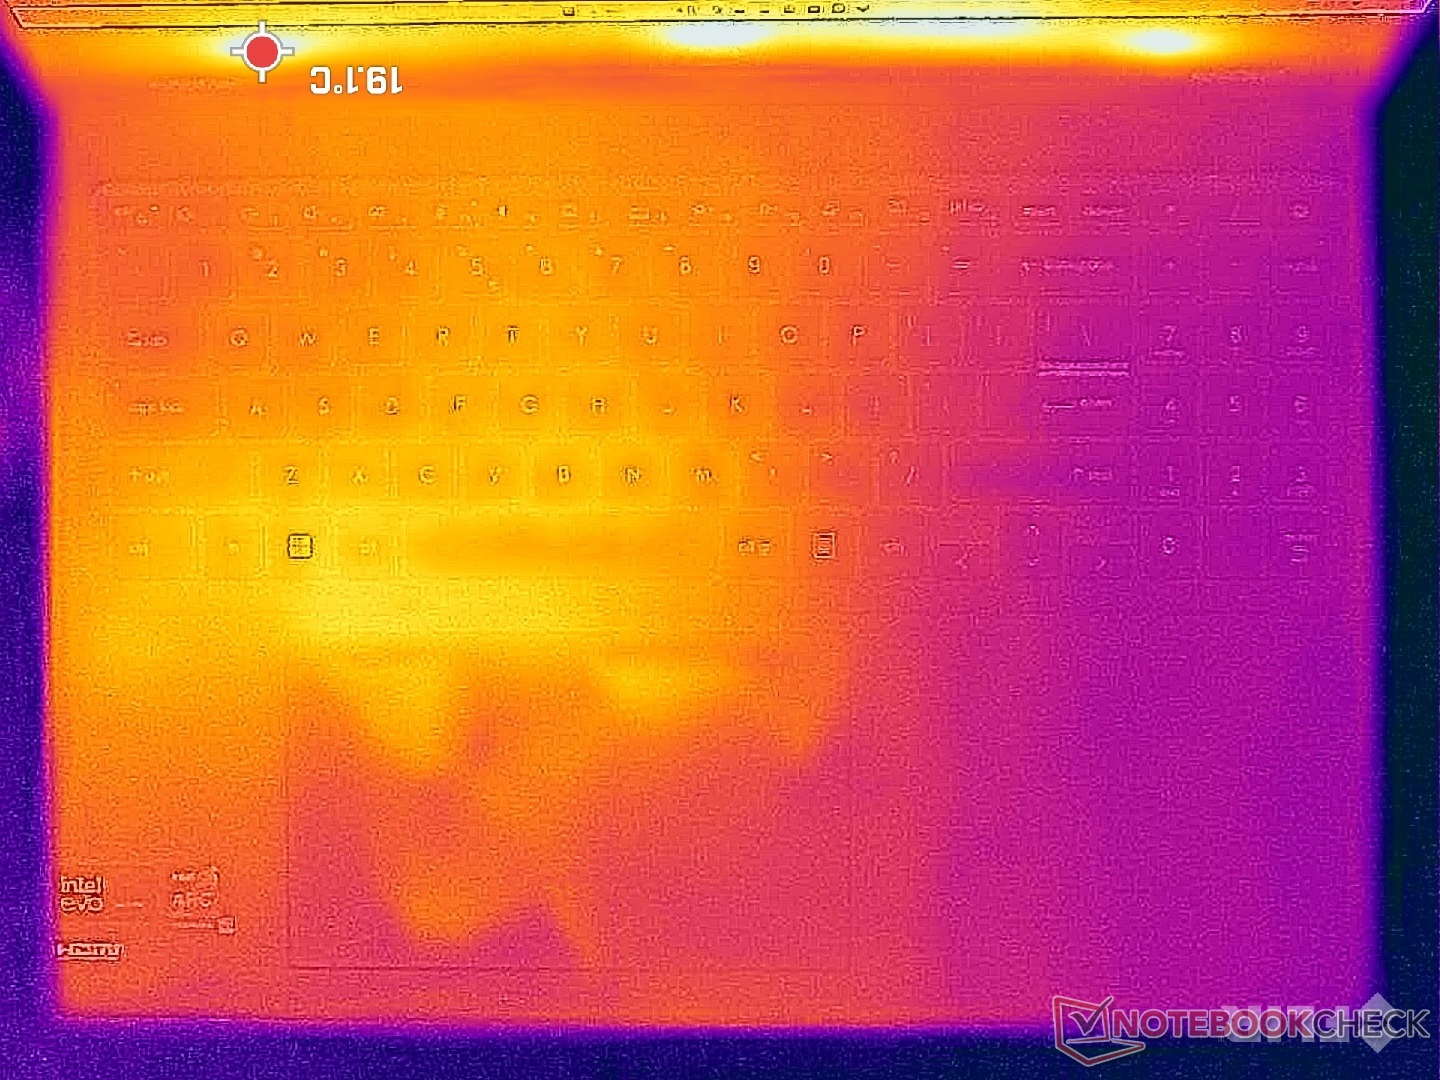
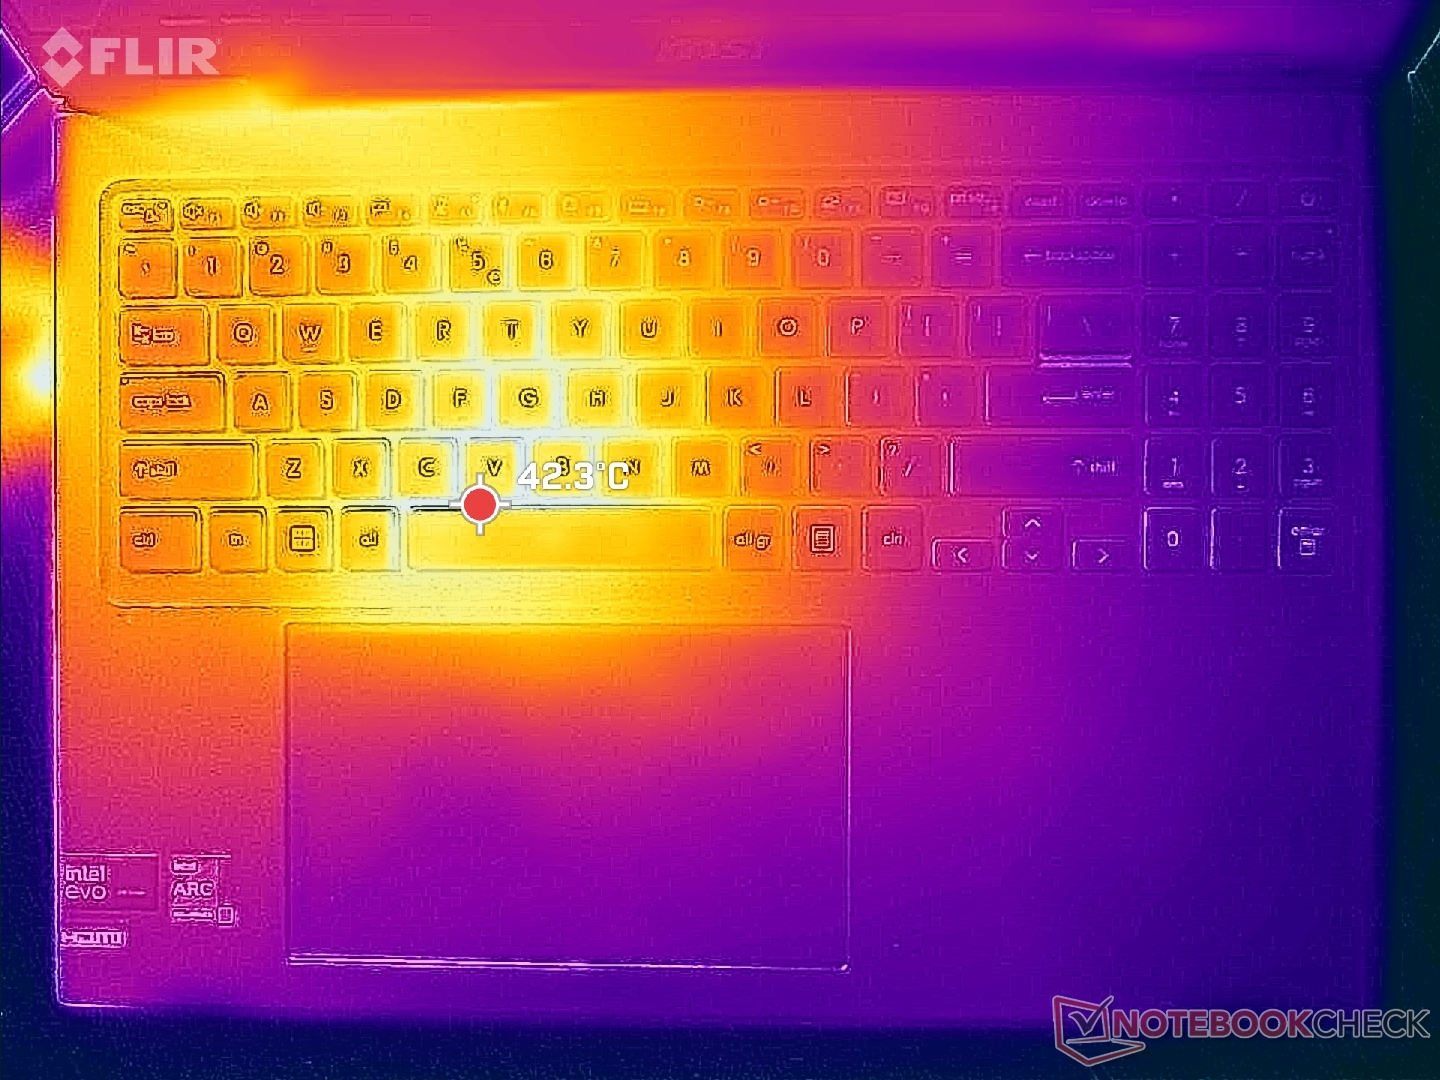
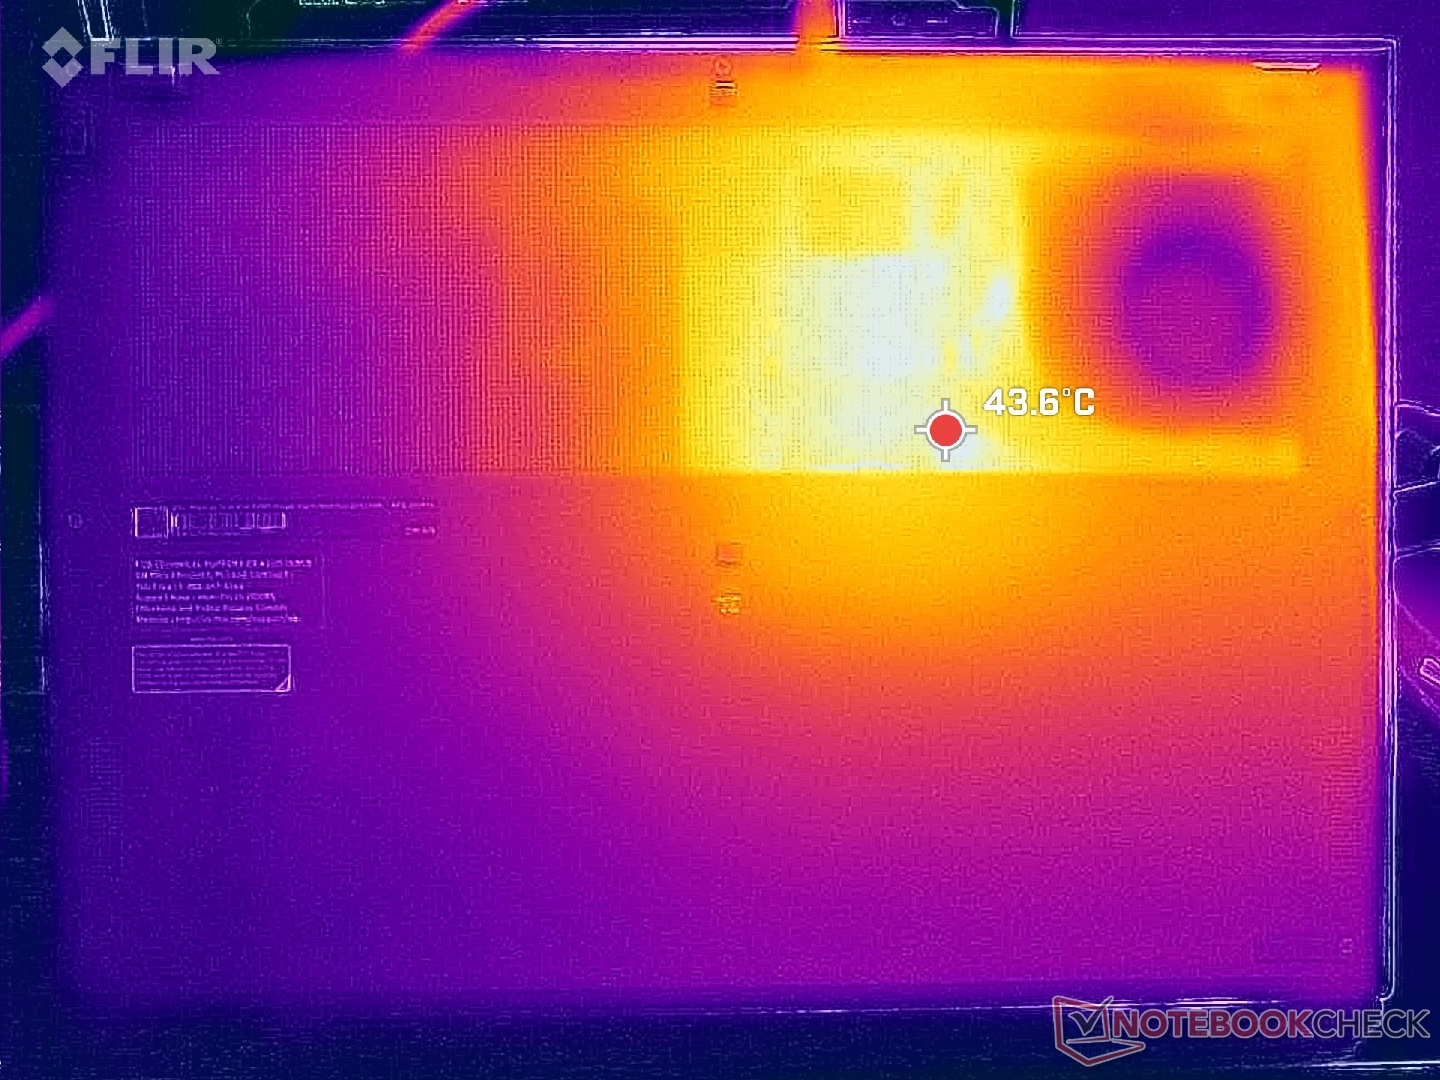
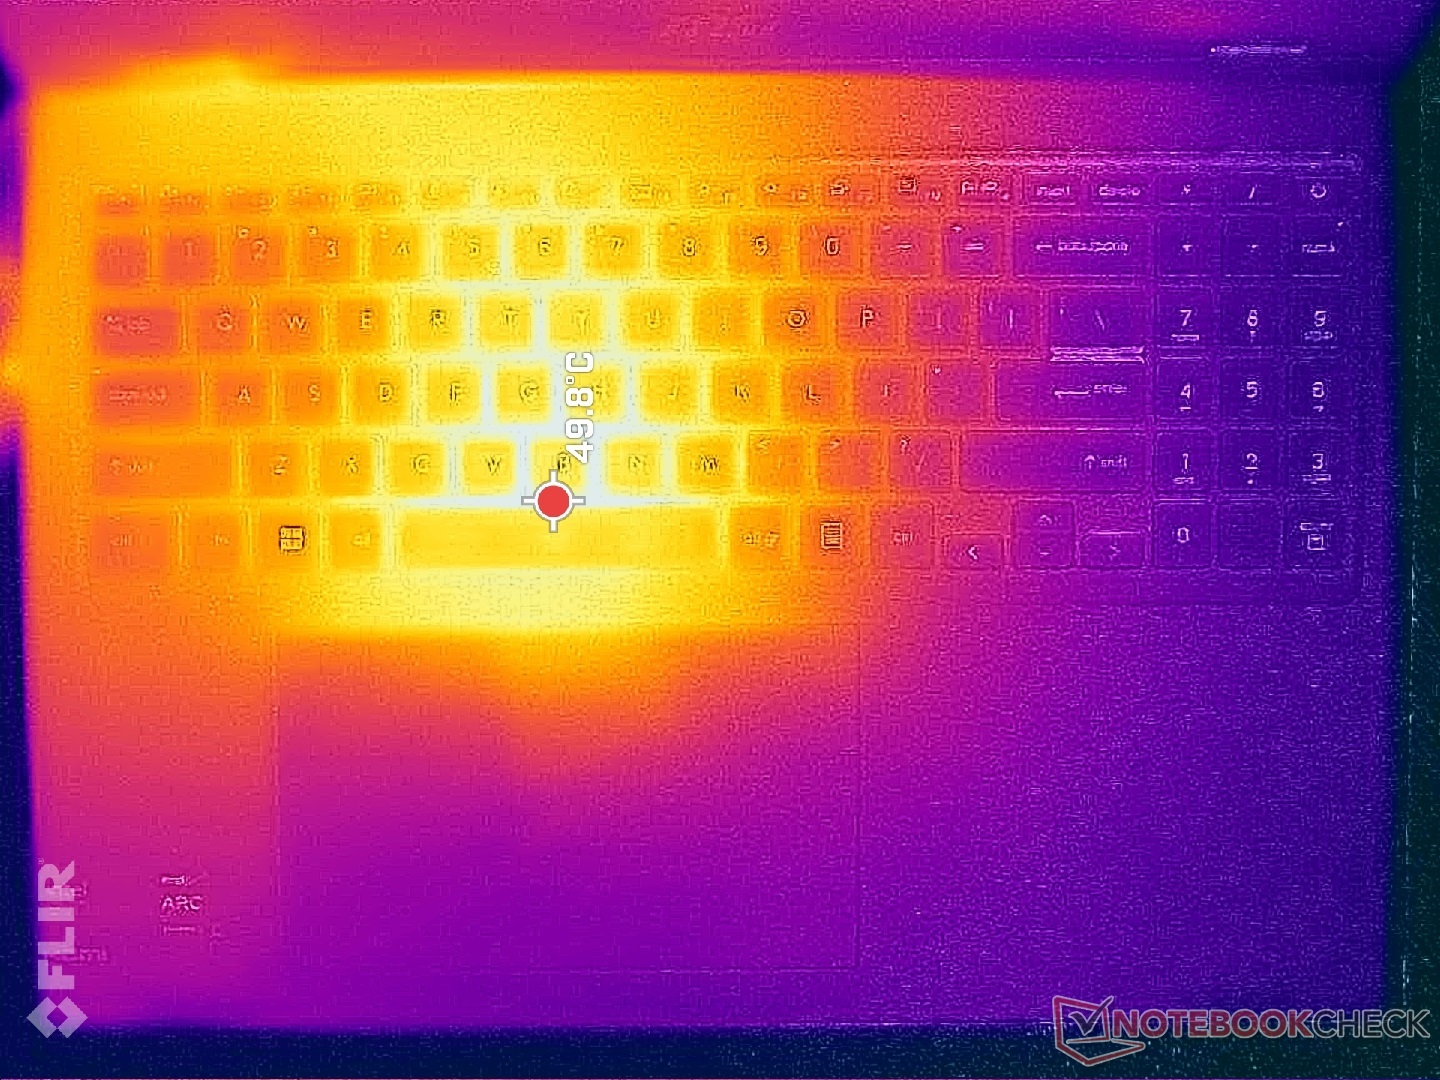
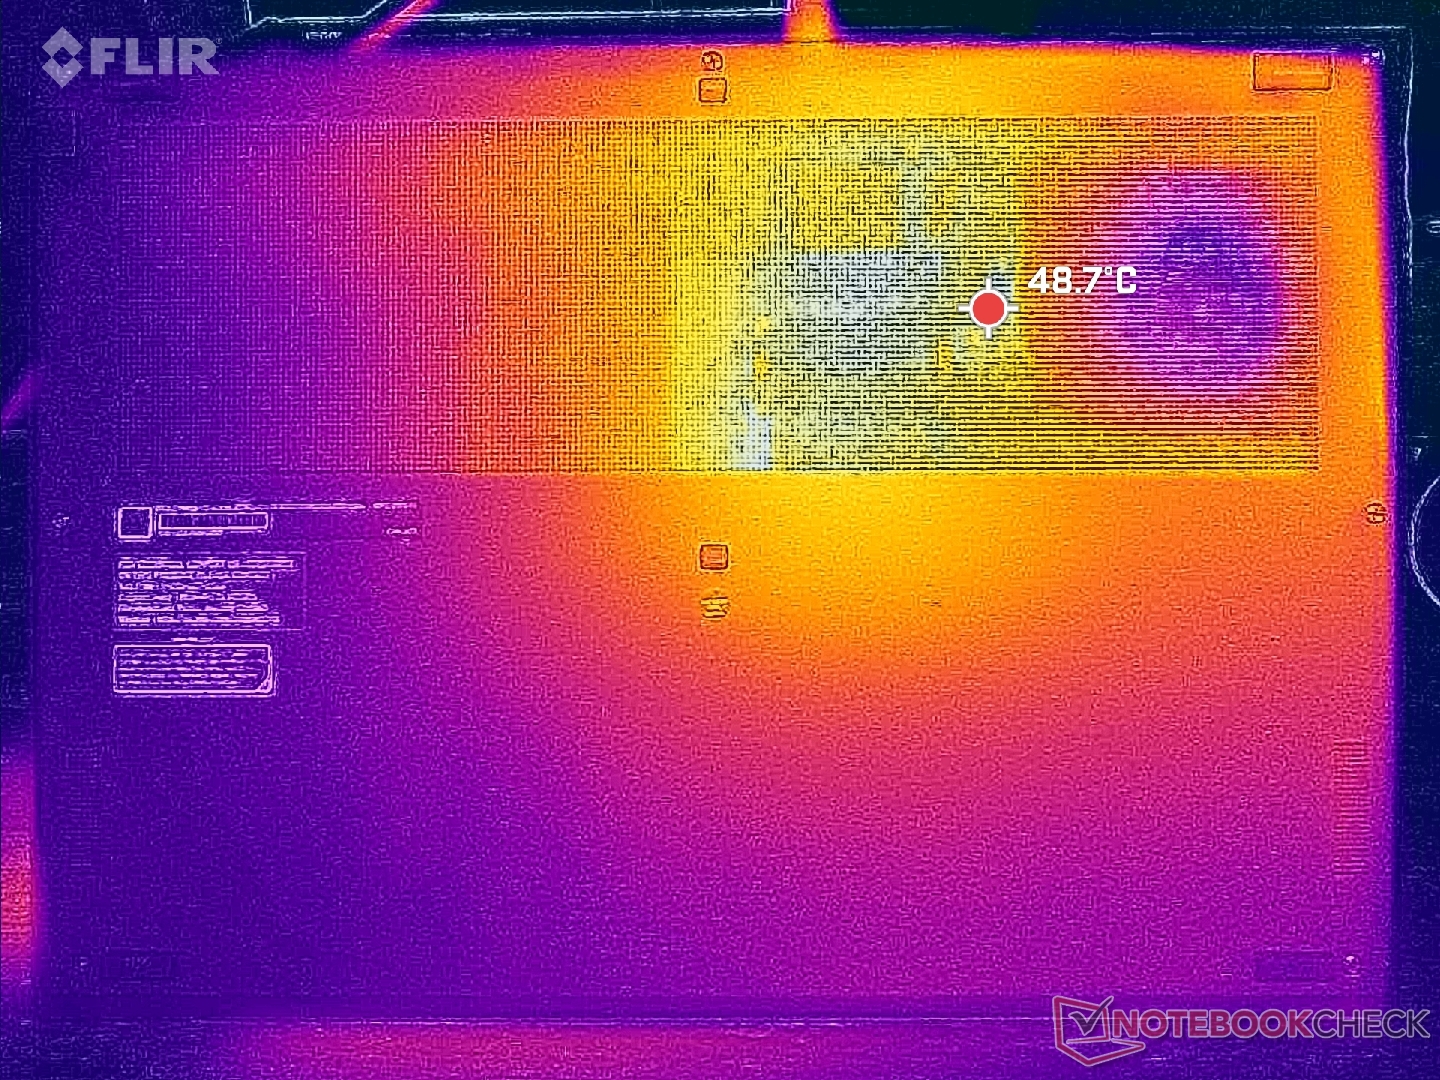
Die Oberflächentemperaturen sind auf der linken Hälfte des Laptops wärmer als auf der rechten, was auf die Positionierung der CPU und der internen Kühllösung zurückzuführen ist. Der Hotspot in der Nähe der Leertaste kann bei anspruchsvoller Last bis zu 50 °C erreichen, ähnlich dem Hotspot des letztjährigen Prestige 15 mit der dedizierten GeForce RTX GPU. Während des Spielens können daher die WASD-Tasten recht warm werden, jedoch bleiben die Handballenablagen und Pfeiltasten deutlich kühler. Aufgrund ihrer kompakten Bauweise neigen Prestige-Notebooks dazu, unter Last generell wärmer zu werden als durchschnittliche Ultrabooks, und das Prestige 16 bildet hier keine Ausnahme.
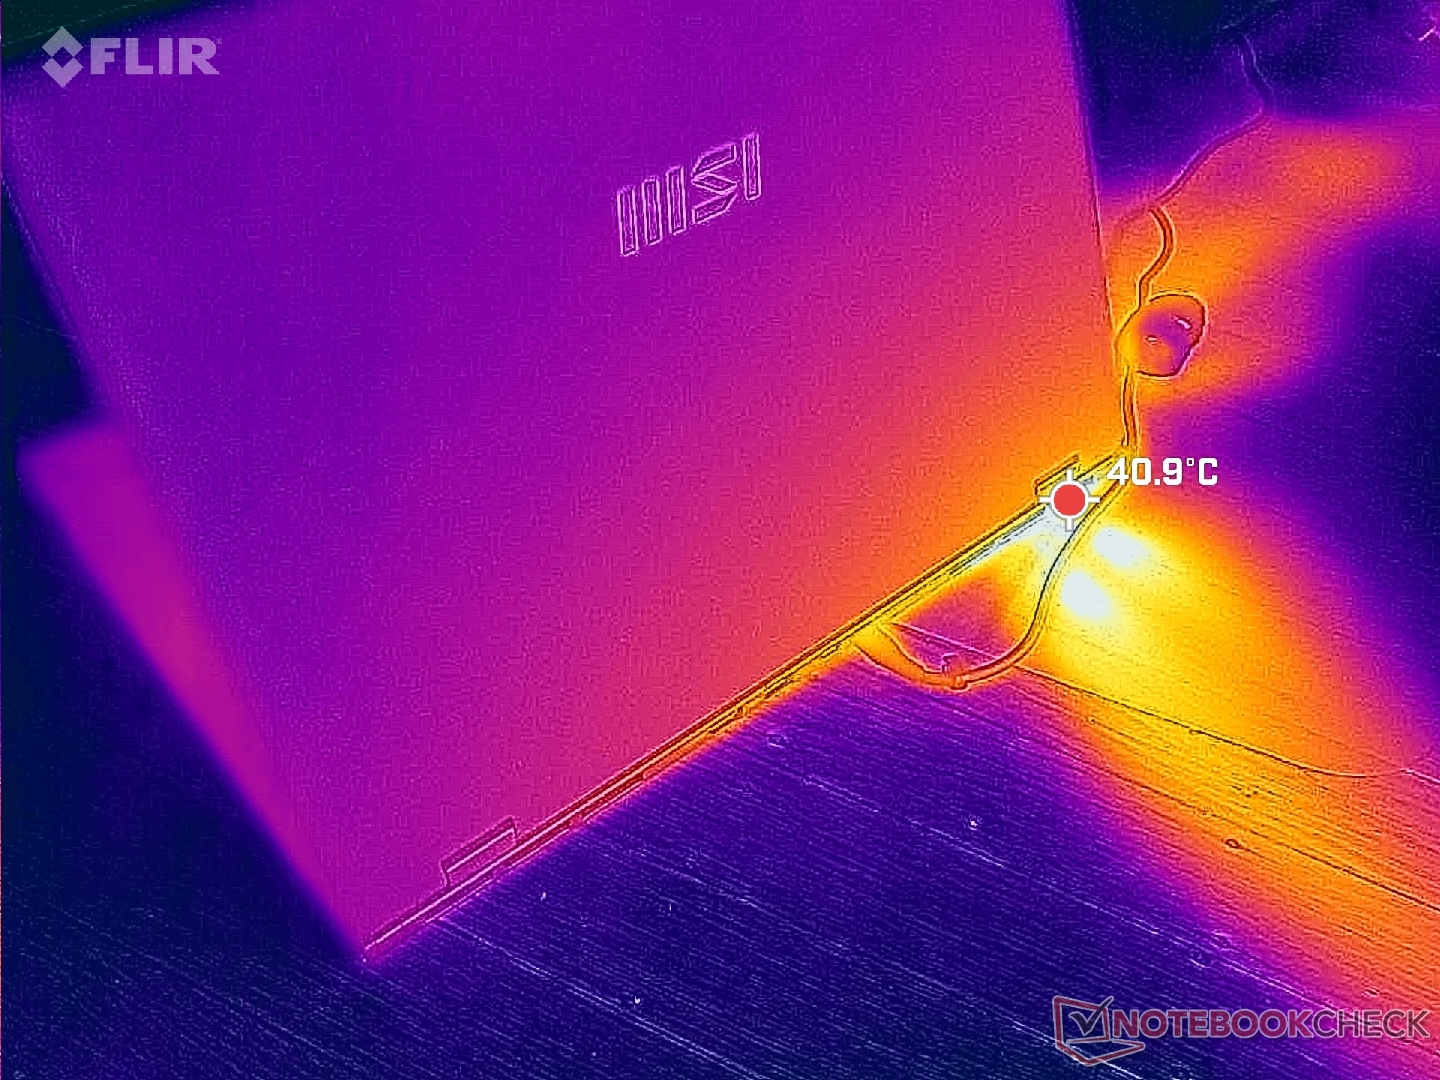
(-) Die maximale Temperatur auf der Oberseite ist 48.8 °C. Im Vergleich liegt der Klassendurchschnitt bei 36.8 °C (von 21 bis 71 °C für die Klasse Multimedia).
(-) Auf der Unterseite messen wir eine maximalen Wert von 47.6 °C (im Vergleich zum Durchschnitt von 39.1 °C).
(+) Ohne Last messen wir eine durchschnittliche Temperatur von 23 °C auf der Oberseite. Der Klassendurchschnitt erreicht 31.3 °C.
(±) Beim längeren Spielen von The Witcher 3 erhitzt sich das Gerät durchschnittlich auf 33.3 °C. Der Durchschnitt der Klasse ist derzeit 31.3 °C.
(+) Die Handballen und der Touchpad-Bereich sind mit gemessenen 30 °C kühler als die typische Hauttemperatur und fühlen sich dadurch kühl an.
(±) Die durchschnittliche Handballen-Temperatur anderer getesteter Geräte war 28.7 °C (-1.3 °C).
| MSI Prestige 16 B1MG-001US Intel Core Ultra 7 155H, Intel Arc 8-Core iGPU | MSI Prestige 15 A12UD-093 Intel Core i7-1280P, NVIDIA GeForce RTX 3050 Ti Laptop GPU | LG Gram 2in1 16 16T90R - G.AA78G Intel Core i7-1360P, Intel Iris Xe Graphics G7 96EUs | Lenovo ThinkBook 16 G6 ABP AMD Ryzen 5 7530U, AMD Radeon RX Vega 7 | Asus VivoBook Pro 16 K6602VU Intel Core i9-13900H, NVIDIA GeForce RTX 4050 Laptop GPU | Dell Inspiron 16 Plus 7630 Intel Core i7-13700H, NVIDIA GeForce RTX 4060 Laptop GPU | |
|---|---|---|---|---|---|---|
| Hitze | -16% | -25% | -15% | -30% | -20% | |
| Last oben max * (°C) | 48.8 | 49 -0% | 55 -13% | 40.8 16% | 42.6 13% | 47.8 2% |
| Last unten max * (°C) | 47.6 | 52.6 -11% | 55.4 -16% | 50.5 -6% | 48.4 -2% | 42.2 11% |
| Idle oben max * (°C) | 24.2 | 29.7 -23% | 34.9 -44% | 29.3 -21% | 39.4 -63% | 35.2 -45% |
| Idle unten max * (°C) | 23.6 | 30.7 -30% | 30 -27% | 35.2 -49% | 39.8 -69% | 35 -48% |
* ... kleinere Werte sind besser
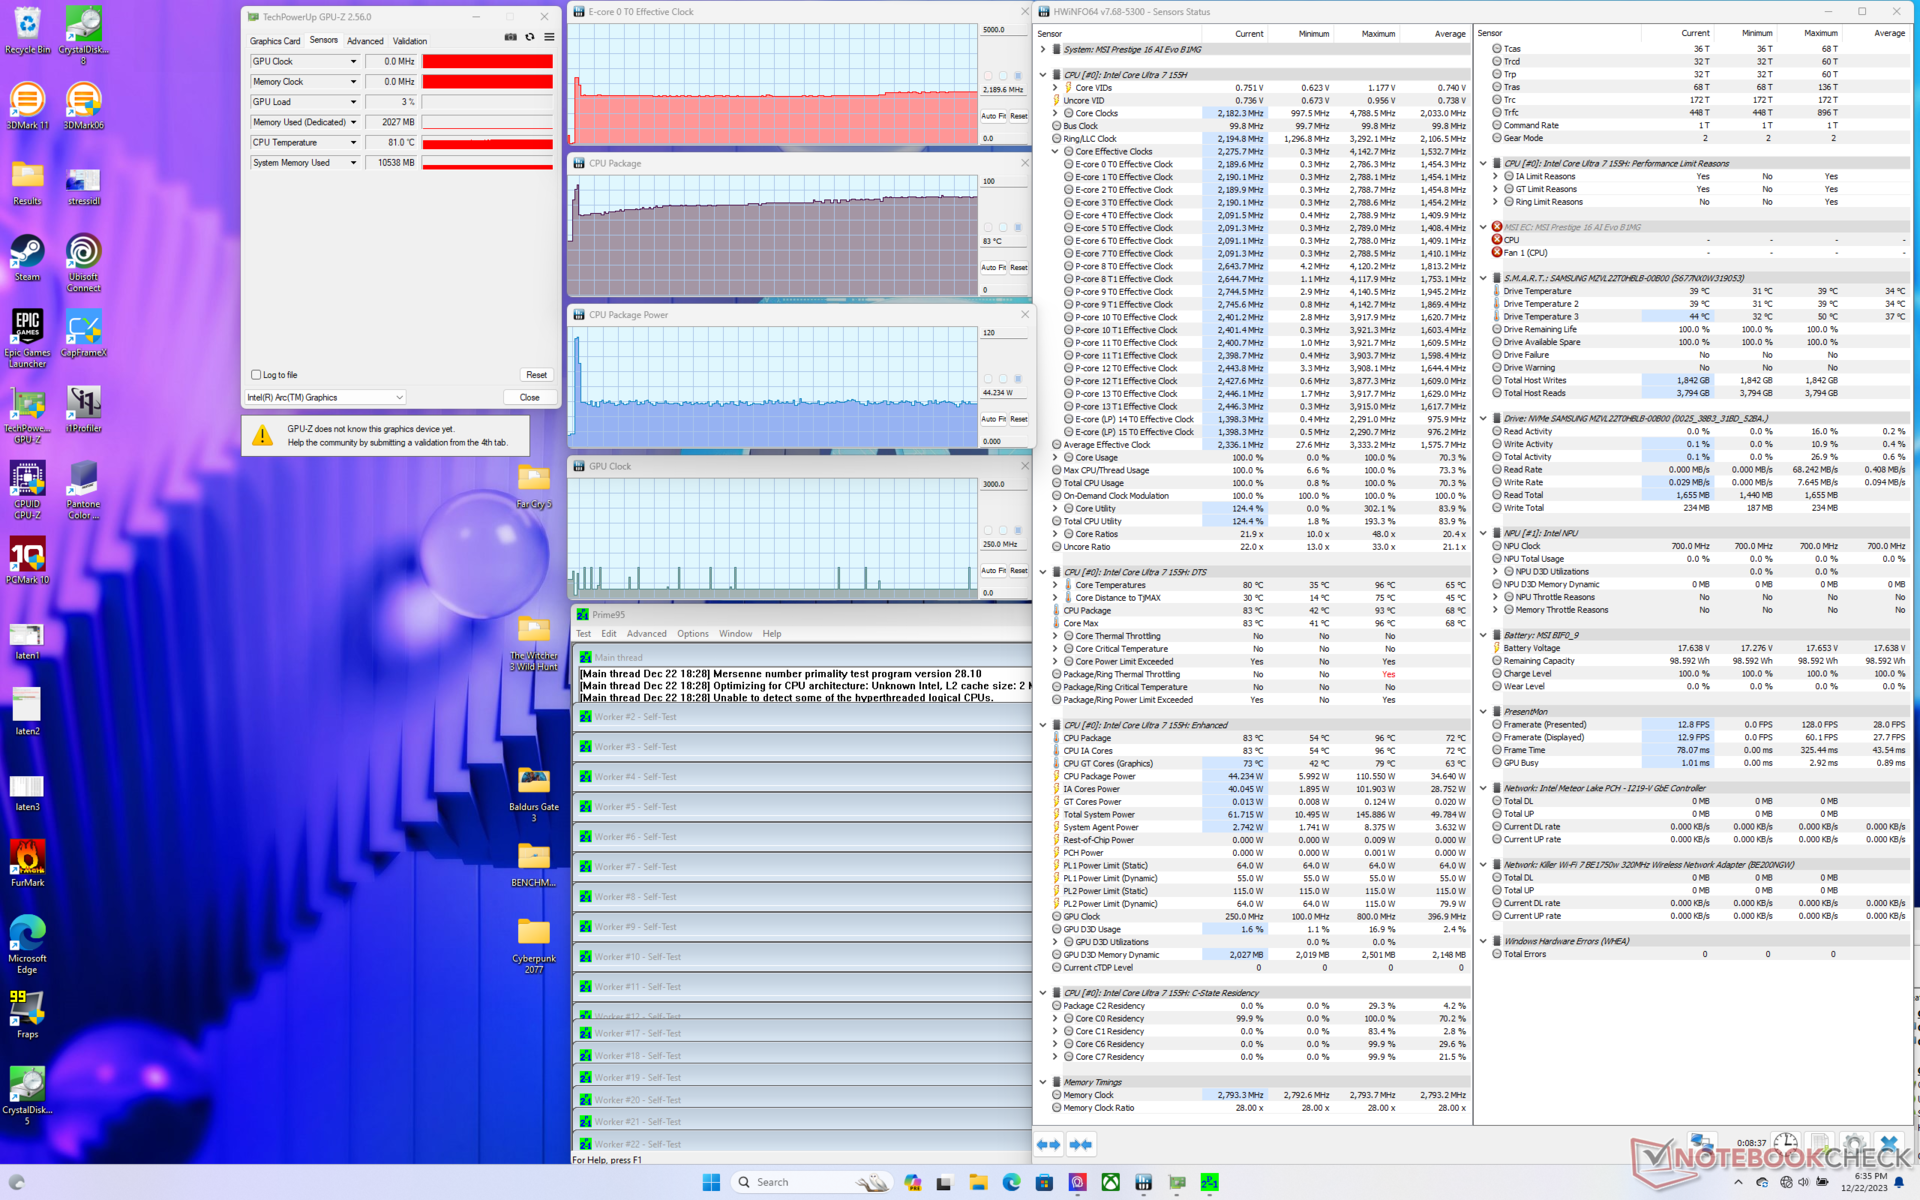
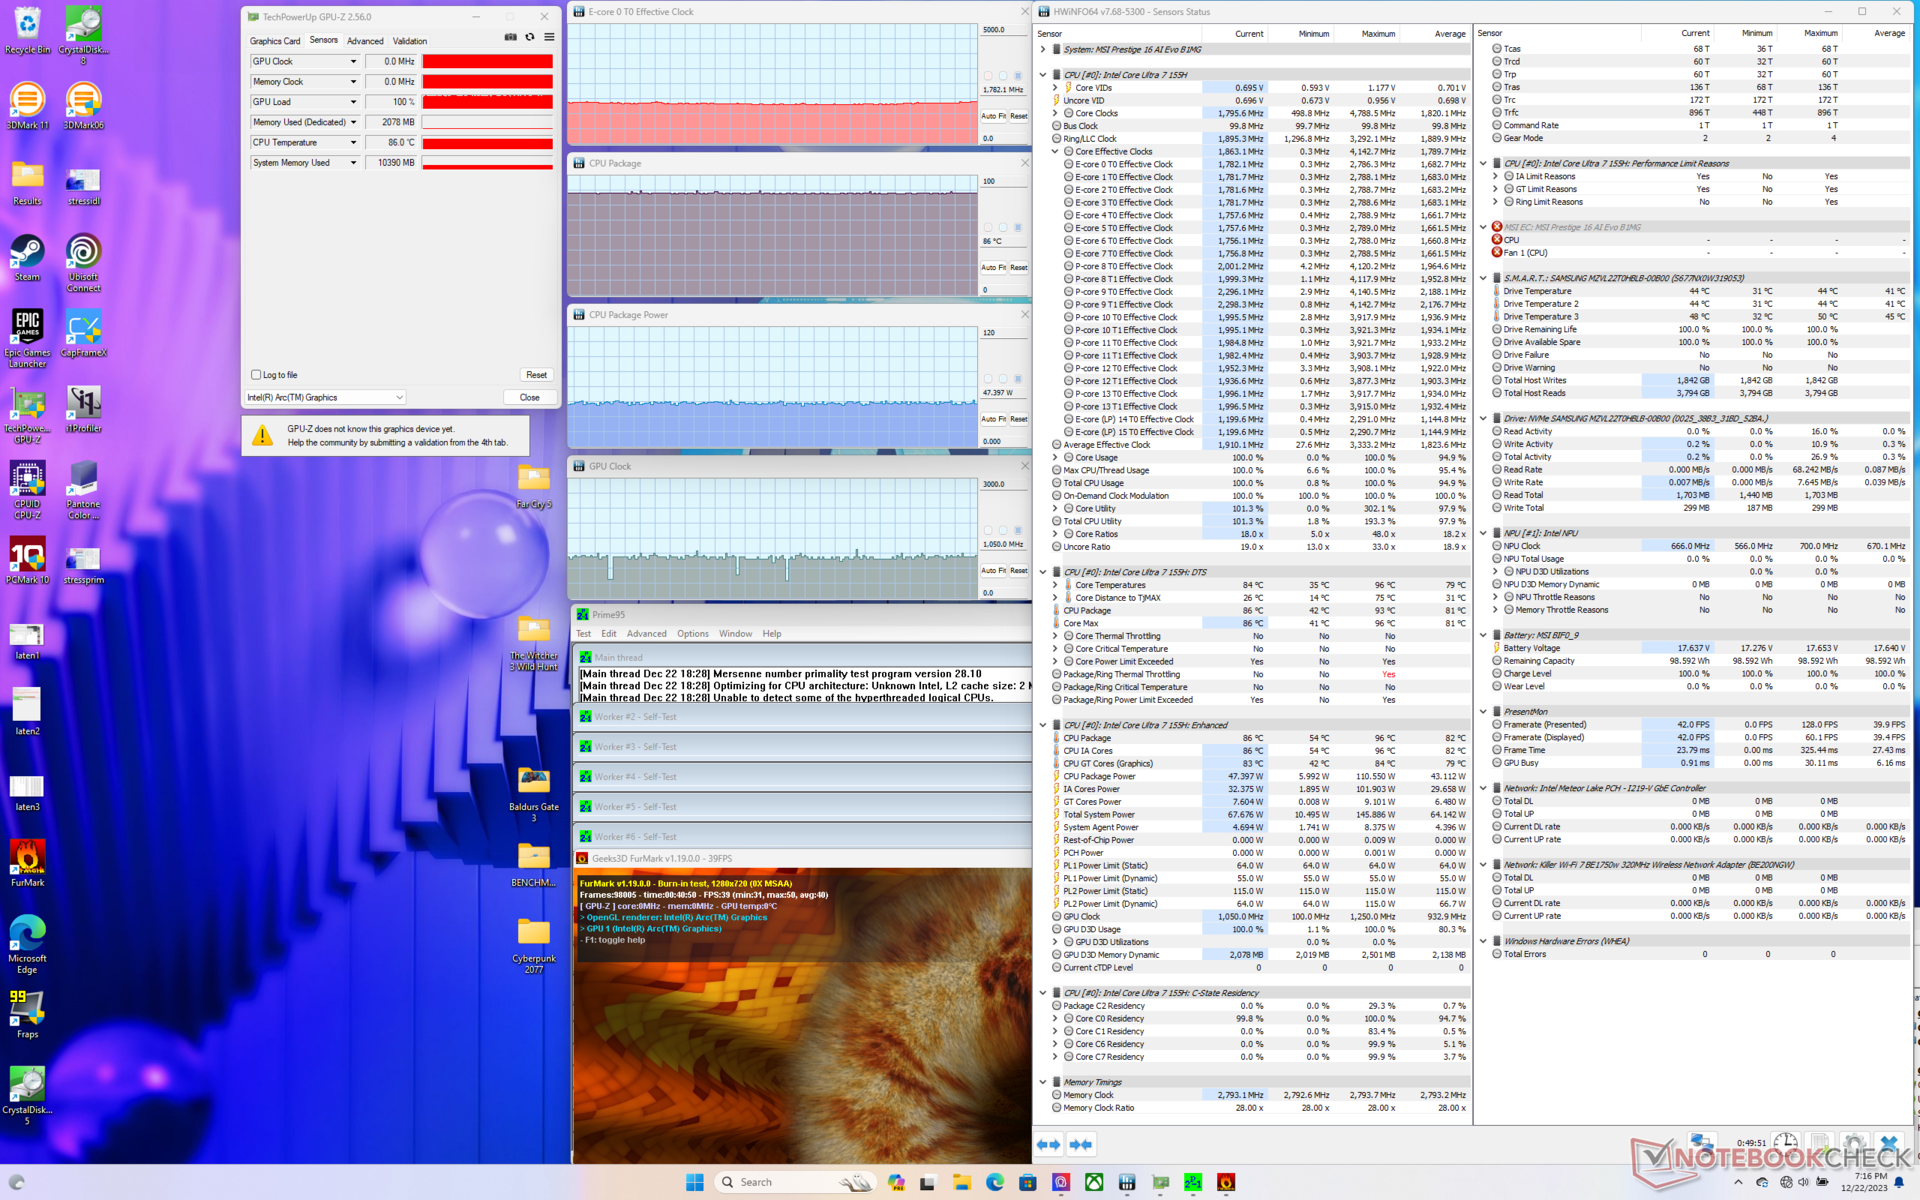
Stresstest
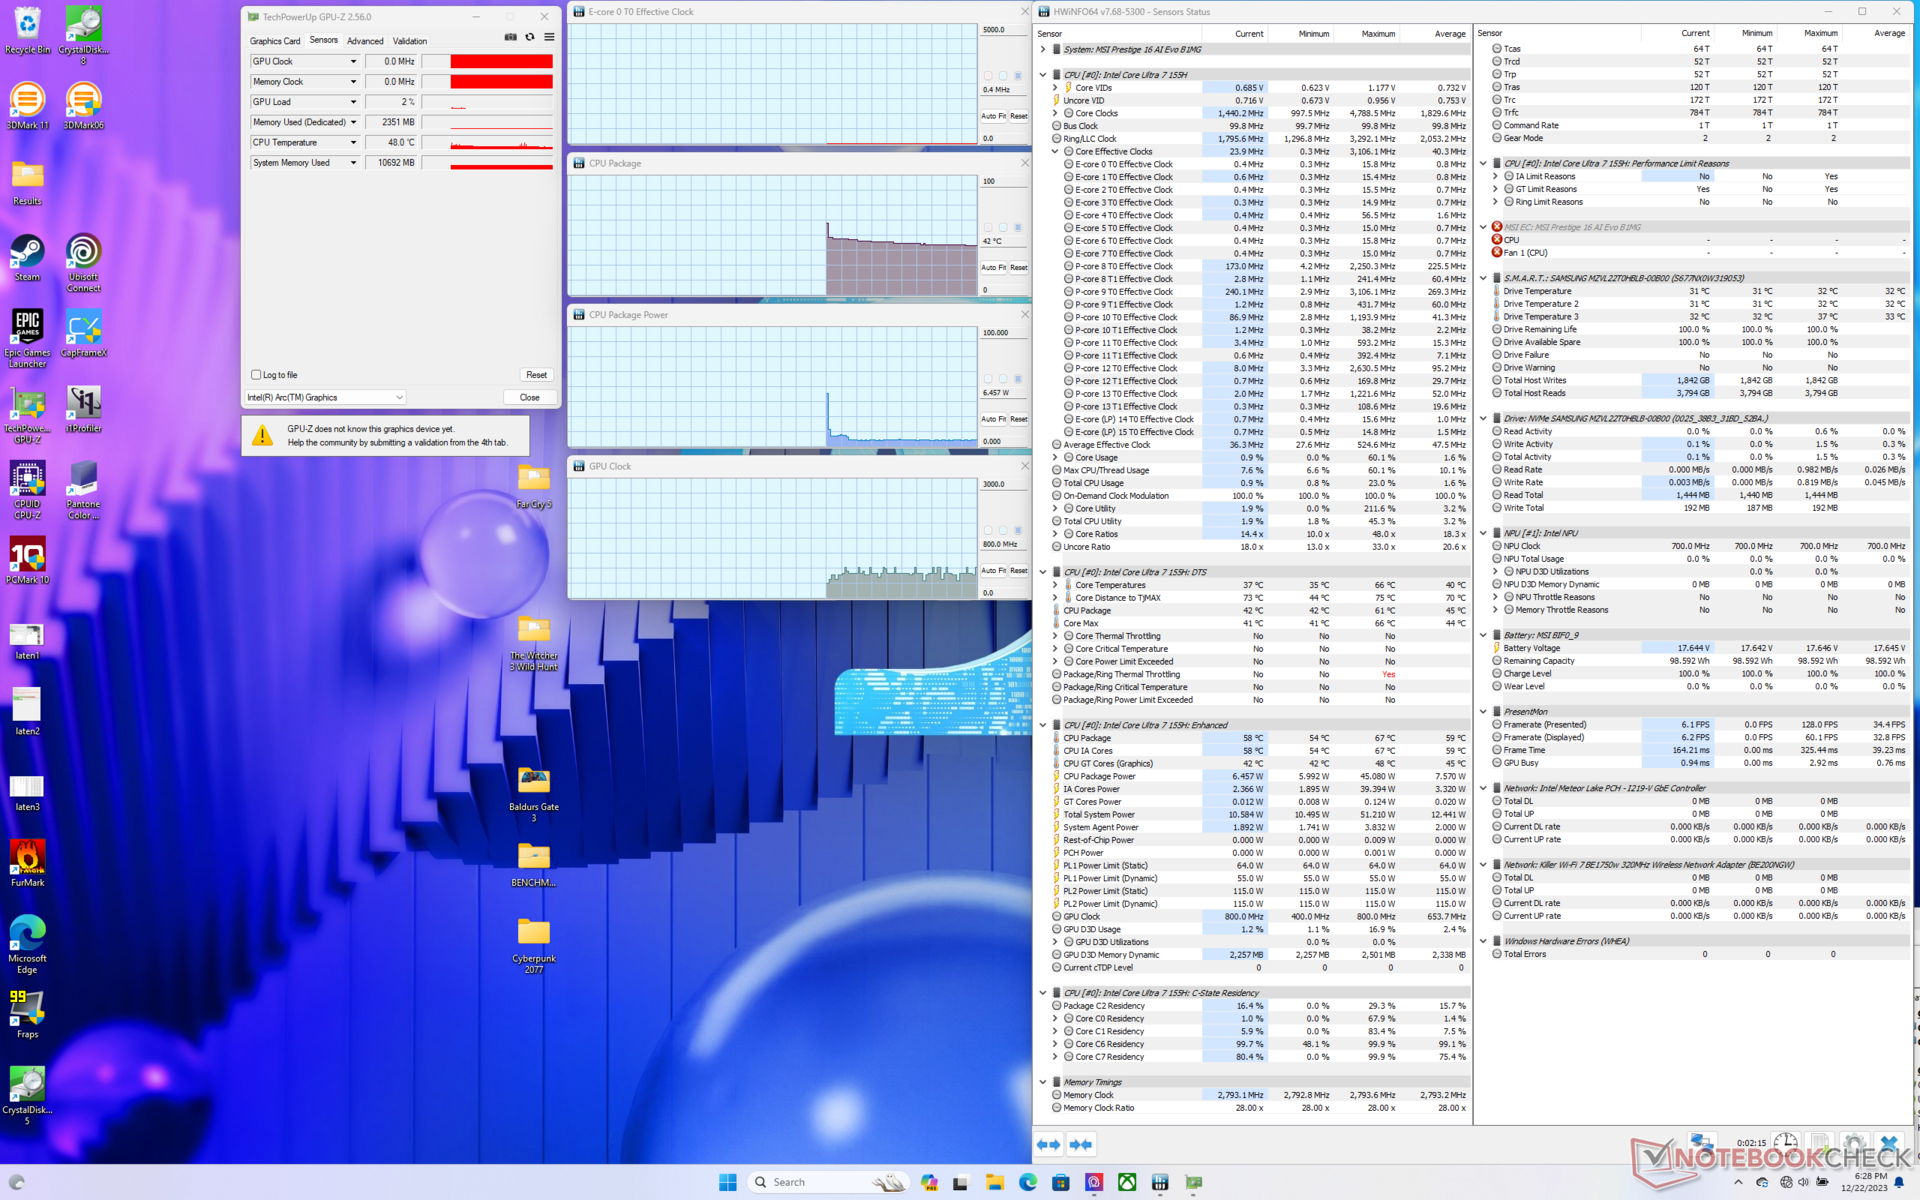
Die Leistung des CPU-Pakets erreichte kurzzeitig bis zu 110 W, 2,8 GHz und 96 °C, wenn der Prime95-Stresstest aktiviert wurde, bevor sie schnell abfiel und sich bei 2,2 GHz, 44 W und 83 °C stabilisierte. Obwohl dieser Temperaturbereich wärmer ist als der Durchschnitt für ein Ultrabook, ist er ansonsten typisch für ein Prestige-Modell. Zum Vergleich würde sich beispielsweise das Acer Swift Edge SFE16 mit dem Ryzen 7 7840U bei kühleren 64 °C stabilisieren, während das Core H-betriebene Lenovo Slim Pro 9i 16IRP8 unter ähnlichen Bedingungen jeweils bei 77 °C läge.
Die Verwendung des aktiven Cooler Boost scheint die Leistung nicht negativ zu beeinflussen. Zum Beispiel würde sich die CPU bei 85 °C stabilisieren, wenn Witcher 3 mit deaktiviertem Cooler Boost ausgeführt wird, während die GPU-Taktraten unverändert bleiben. Es sei denn, die Kerntemperaturen stellen ein Problem dar, ist der Cooler-Boost-Modus für eine maximale Leistung im Allgemeinen nicht erforderlich. Diese Beobachtung entspricht unseren Erfahrungen bei vielen anderen MSI-Notebooks, die Cooler Boost anbieten.
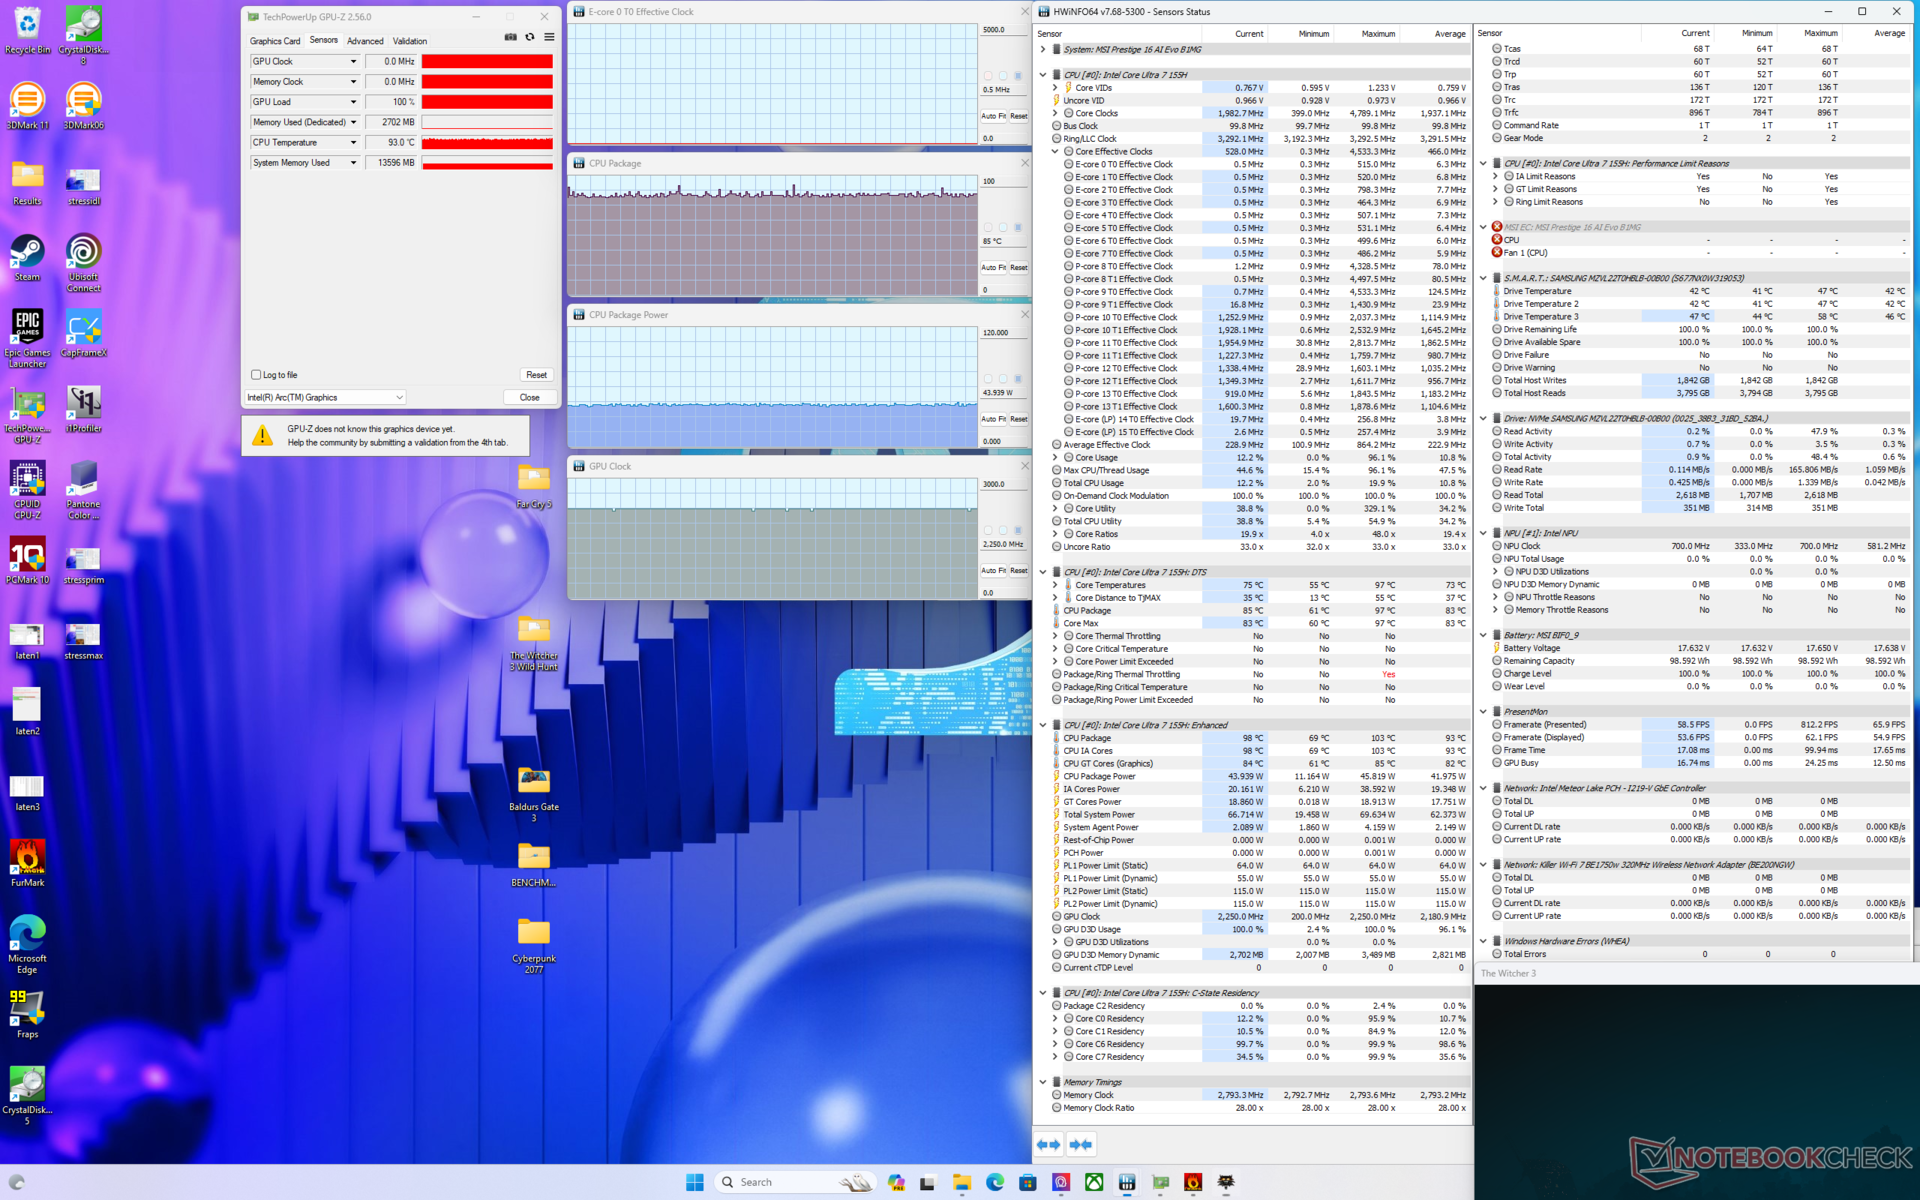

| CPU-Takt (GHz) | GPU Takt (MHz) | Durchschnittliche CPU-Temperatur (°C) | |
| System im Leerlauf | -- | -- | 42 |
| Prime95 Stresstest | 2.2 | -- | 83 |
| Prime95 + FurMark Stresstest | 1.8 | 1050 | 86 |
| Witcher 3 Stresstest (Extreme Performance mit ausgeschaltetem Cooler Boost) | 0.5 | 2250 | 85 |
| Witcher 3 Stresstest (Extreme Performance mit eingeschaltetem Cooler Boost) | 0.5 | 2250 | 77 |
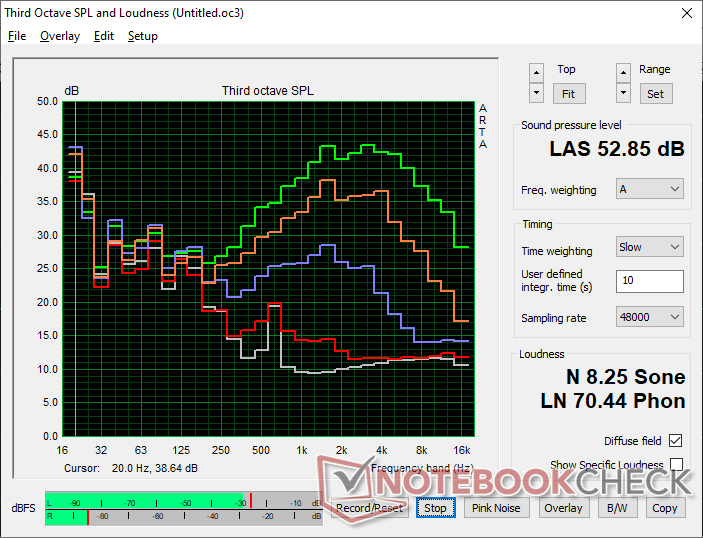
Lautsprecher
MSI Prestige 16 B1MG-001US Audio Analyse
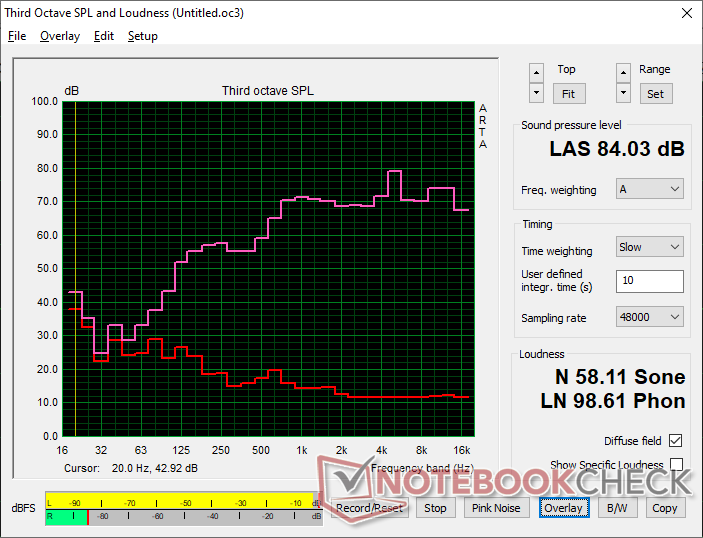
(+) | Die Lautsprecher können relativ laut spielen (84 dB)
Bass 100 - 315 Hz
(-) | kaum Bass - 15.3% niedriger als der Median
(±) | durchschnittlich lineare Bass-Wiedergabe (7% Delta zum Vorgänger)
Mitteltöne 400 - 2000 Hz
(+) | ausgeglichene Mitten, vom Median nur 4.3% abweichend
(+) | lineare Mitten (4.3% Delta zum Vorgänger)
Hochtöne 2 - 16 kHz
(+) | ausgeglichene Hochtöne, vom Median nur 3.2% abweichend
(+) | sehr lineare Hochtöne (6.5% Delta zum Vorgänger)
Gesamt im hörbaren Bereich 100 - 16.000 Hz
(+) | hörbarer Bereich ist sehr linear (13.3% Abstand zum Median
Im Vergleich zu allen Geräten derselben Klasse
» 28% aller getesteten Geräte dieser Klasse waren besser, 4% vergleichbar, 68% schlechter
» Das beste Gerät hat einen Delta-Wert von 5%, durchschnittlich ist 17%, das schlechteste Gerät hat 45%
Im Vergleich zu allen Geräten im Test
» 14% aller getesteten Geräte waren besser, 3% vergleichbar, 83% schlechter
» Das beste Gerät hat einen Delta-Wert von 4%, durchschnittlich ist 24%, das schlechteste Gerät hat 134%
Apple MacBook Pro 16 2021 M1 Pro Audio Analyse
(+) | Die Lautsprecher können relativ laut spielen (84.7 dB)
Bass 100 - 315 Hz
(+) | guter Bass - nur 3.8% Abweichung vom Median
(+) | lineare Bass-Wiedergabe (5.2% Delta zum Vorgänger)
Mitteltöne 400 - 2000 Hz
(+) | ausgeglichene Mitten, vom Median nur 1.3% abweichend
(+) | lineare Mitten (2.1% Delta zum Vorgänger)
Hochtöne 2 - 16 kHz
(+) | ausgeglichene Hochtöne, vom Median nur 1.9% abweichend
(+) | sehr lineare Hochtöne (2.7% Delta zum Vorgänger)
Gesamt im hörbaren Bereich 100 - 16.000 Hz
(+) | hörbarer Bereich ist sehr linear (4.6% Abstand zum Median
Im Vergleich zu allen Geräten derselben Klasse
» 0% aller getesteten Geräte dieser Klasse waren besser, 0% vergleichbar, 100% schlechter
» Das beste Gerät hat einen Delta-Wert von 5%, durchschnittlich ist 17%, das schlechteste Gerät hat 45%
Im Vergleich zu allen Geräten im Test
» 0% aller getesteten Geräte waren besser, 0% vergleichbar, 100% schlechter
» Das beste Gerät hat einen Delta-Wert von 4%, durchschnittlich ist 24%, das schlechteste Gerät hat 134%
Energieverwaltung — Niedrigere Tiefstwerte bei höheren Höchstwerten
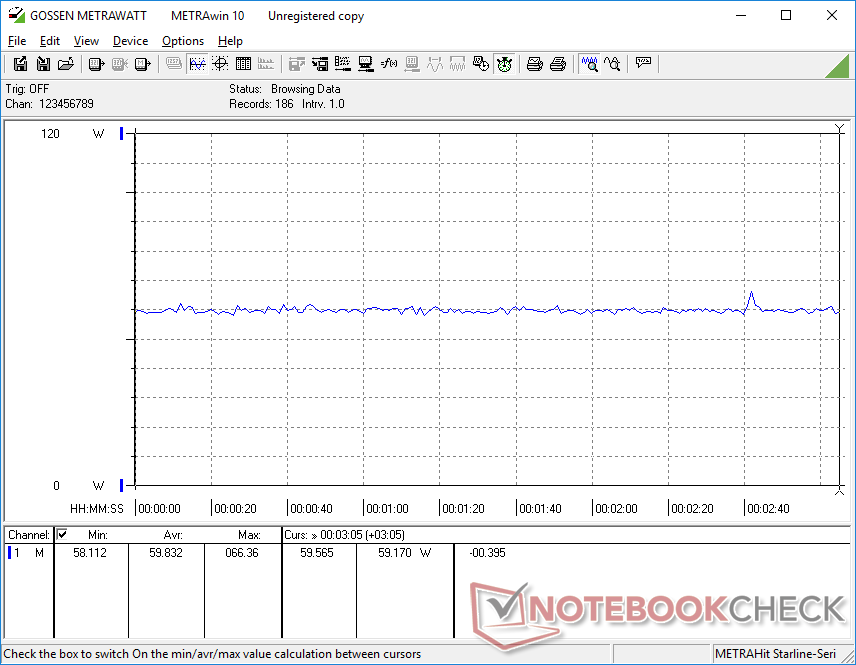
Energieaufnahme
Die Energieaufnahme im Leerlauf kann bis zu 3 W betragen, was einen der niedrigsten Werte aller 16-Zoll-Intel-Notebooks darstellt, die wir getestet haben. Dieser sehr niedrige Wert dürfte wahrscheinlich für die außergewöhnlich lange Akkulaufzeit im nächsten Abschnitt verantwortlich sein.
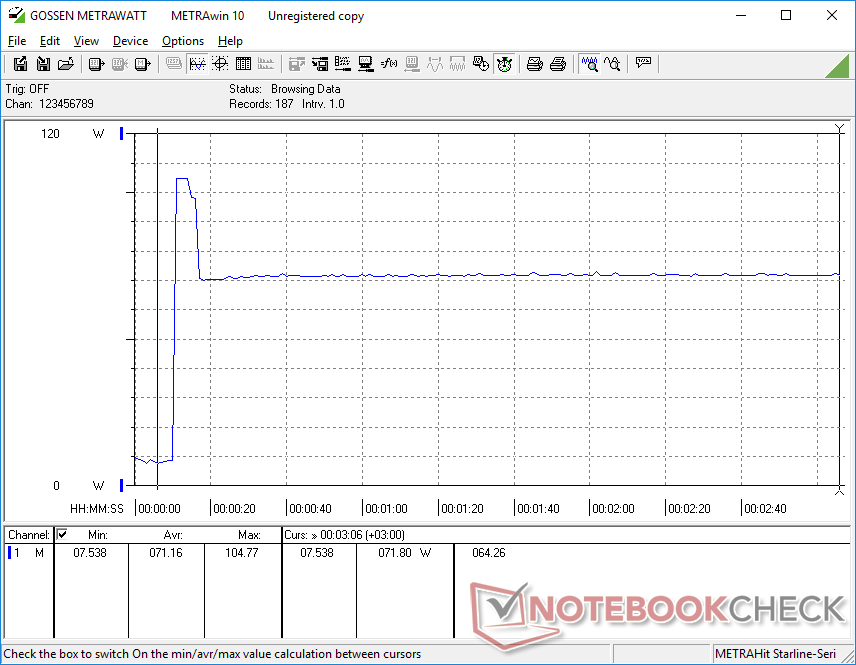
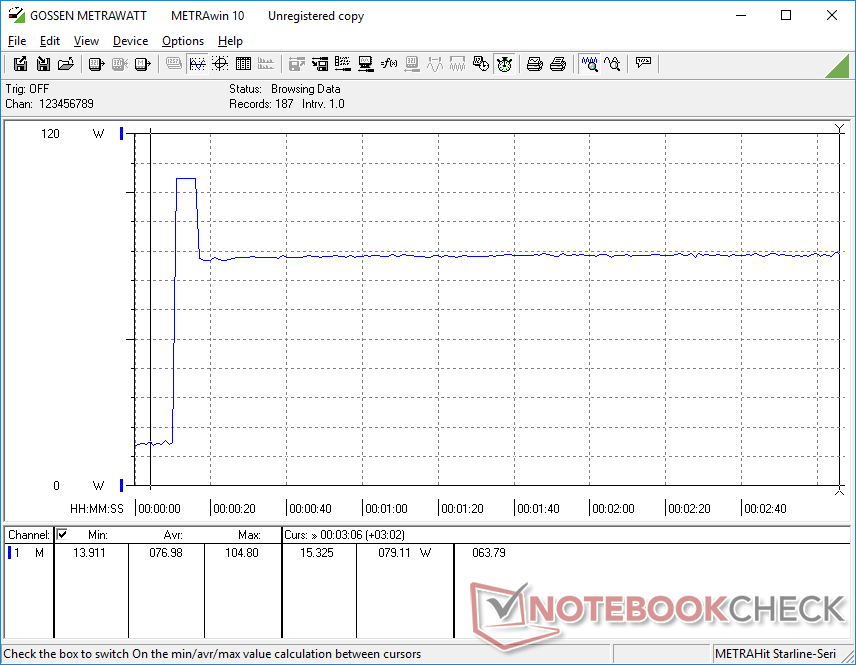
Auf der anderen Seite scheint der Energieverbrauch bei anspruchsvolleren Aufgaben höher zu sein als bei den meisten anderen U-Serien-Laptops. Zum Beispiel würde die Ausführung von 3DMark 06 oder von Spielen zwischen 60 und 70 Watt verbrauchen, verglichen mit 40 bis 55 Watt beim MSI Prestige 15, LG Gram 16 2-in-1, Acer Swift Edge SFE16 oder dem Core H-betriebenen Schenker Vision 14 unter ähnlichen Bedingungen. Dies gilt auch, wenn die CPU mit Prime95 voll ausgelastet wird. Dennoch liegt die Leistung pro Watt immer noch zugunsten der neueren 14er-CPU, sodass der höhere Stromverbrauch nicht unbedingt ein Nachteil ist.
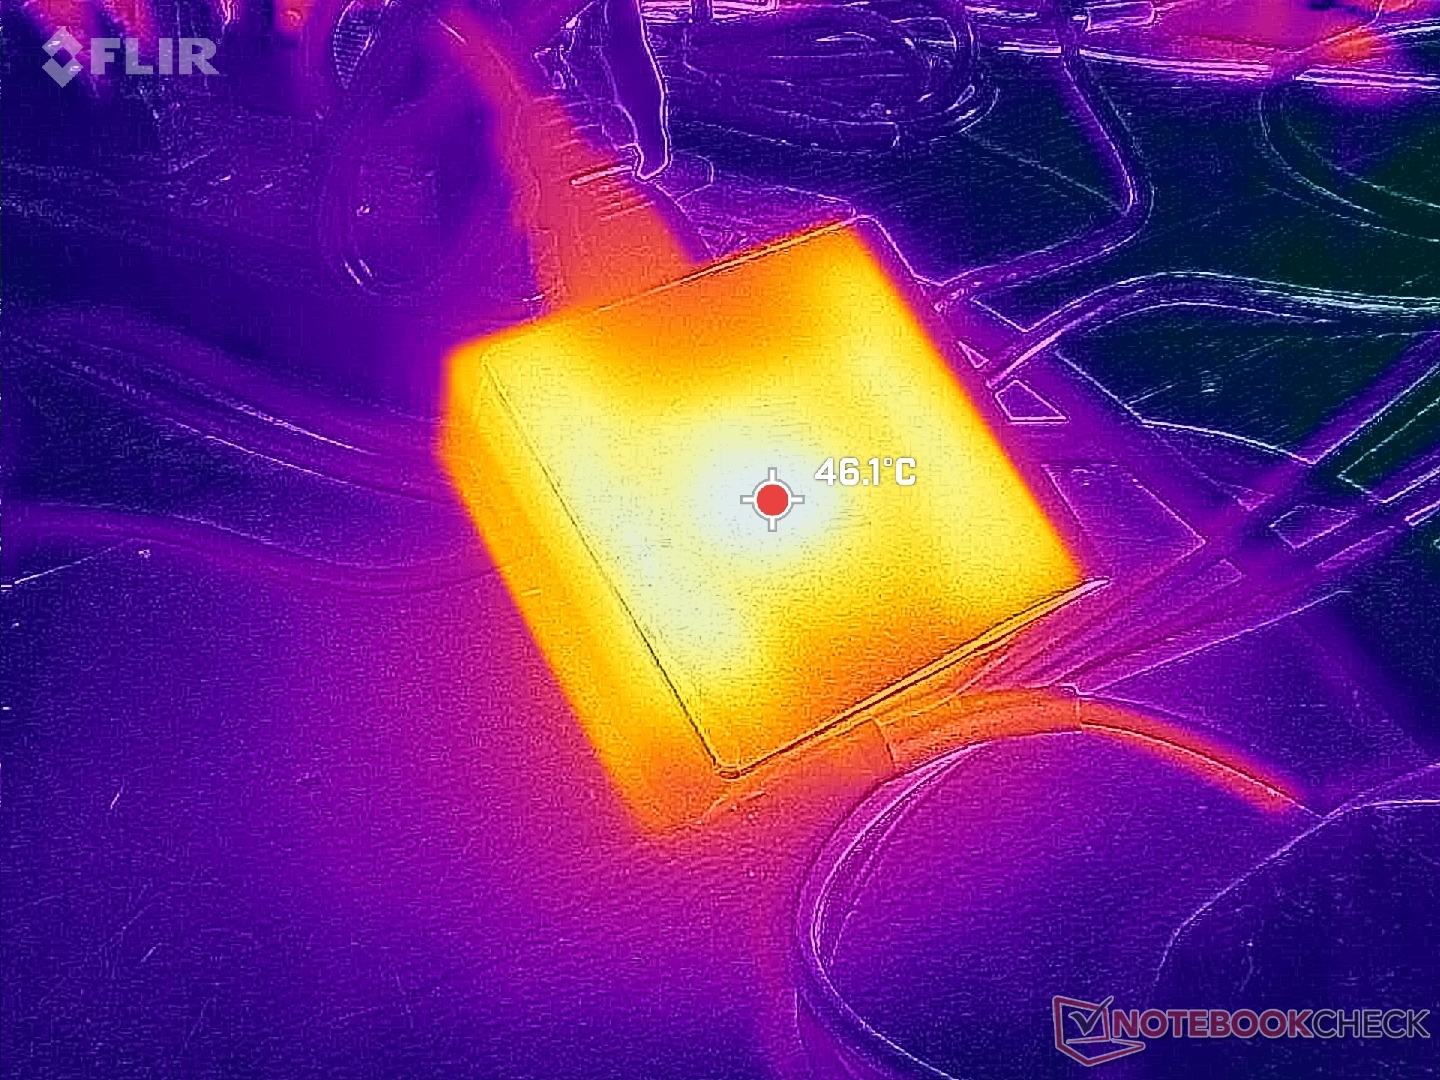
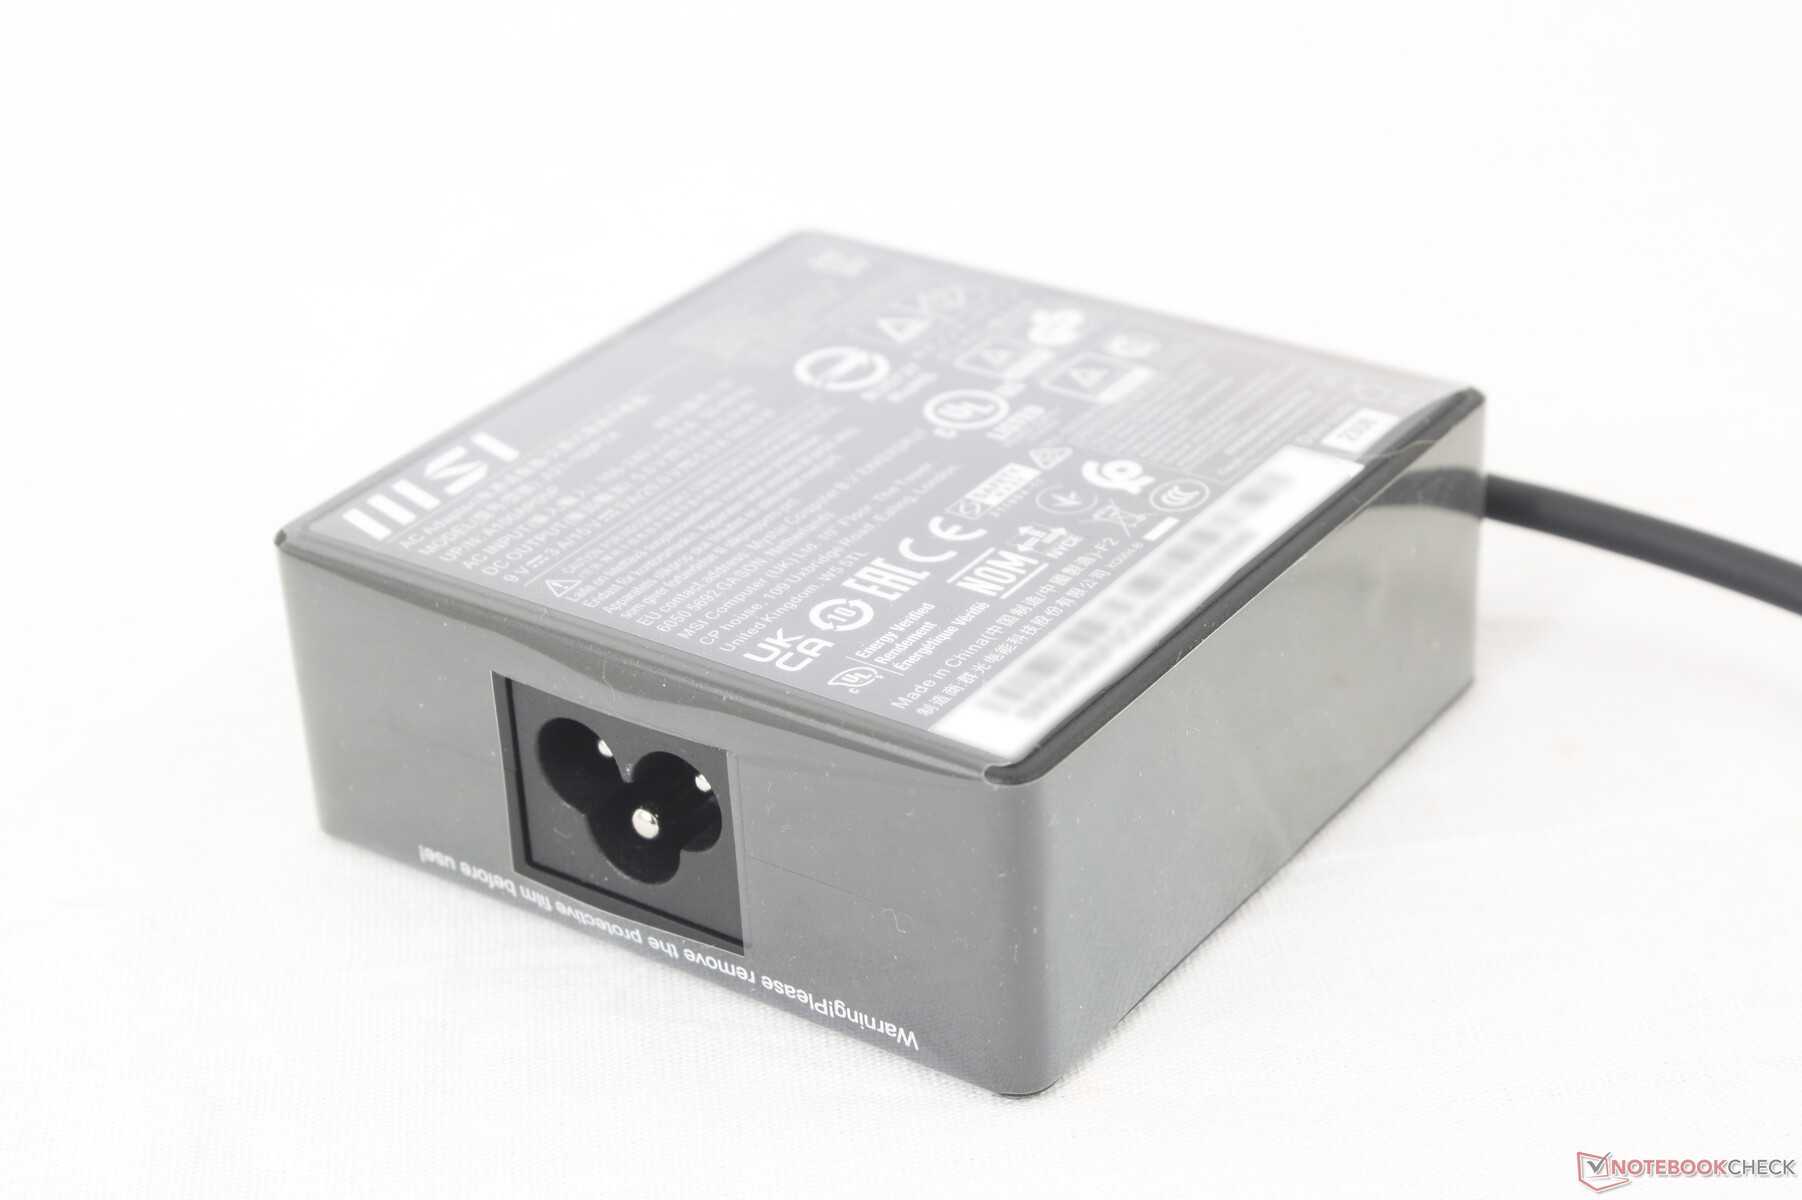
Mit dem kleinen (~7,5 x 7,5 x 3 cm) 100-W-USB-C-Netzteil können wir eine maximale Leistungsaufnahme von 105 W aufzeichnen, wenn die CPU zu 100 Prozent ausgelastet ist. Dieser Wert ist aufgrund des begrenzten Turbo-Boost-Potenzials nur vorübergehend und stabilisiert sich bei hoher Last bei etwa 70 W. Es ist zu beachten, dass SKUs mit diskreter RTX 4060- oder 4070-Grafik stattdessen mit einem größeren 140-W-USB-C-Netzteil geliefert werden.

| Aus / Standby | |
| Idle | |
| Last |
|
Legende:
min: | |
| MSI Prestige 16 B1MG-001US Ultra 7 155H, Arc 8-Core, Samsung PM9A1 MZVL22T0HBLB, IPS, 2560x1600, 16" | MSI Prestige 15 A12UD-093 i7-1280P, GeForce RTX 3050 Ti Laptop GPU, Micron 3400 1TB MTFDKBA1T0TFH, IPS, 3840x2160, 15.6" | LG Gram 2in1 16 16T90R - G.AA78G i7-1360P, Iris Xe G7 96EUs, Samsung PM9A1 MZVL21T0HCLR, IPS, 2560x1600, 16" | Lenovo ThinkBook 16 G6 ABP R5 7530U, Vega 7, SK hynix HFS512GEJ9X125N, IPS, 1920x1200, 16" | Asus VivoBook Pro 16 K6602VU i9-13900H, GeForce RTX 4050 Laptop GPU, Micron 2400 MTFDKBA1T0QFM, OLED, 3200x2000, 16" | Dell Inspiron 16 Plus 7630 i7-13700H, GeForce RTX 4060 Laptop GPU, WD PC SN740 SDDPTQD-1T00, IPS, 2560x1600, 16" | |
|---|---|---|---|---|---|---|
| Stromverbrauch | -2% | 2% | 24% | -161% | -124% | |
| Idle min * (Watt) | 3 | 5.4 -80% | 5.5 -83% | 3.7 -23% | 21.06 -602% | 15.6 -420% |
| Idle avg * (Watt) | 9.5 | 11.8 -24% | 7.2 24% | 7.1 25% | 24.27 -155% | 17.7 -86% |
| Idle max * (Watt) | 12 | 12.7 -6% | 12.9 -8% | 7.7 36% | 25.12 -109% | 20.6 -72% |
| Last avg * (Watt) | 68.3 | 45.9 33% | 55 19% | 43.9 36% | 52.4 23% | 87.4 -28% |
| Witcher 3 ultra * (Watt) | 59.8 | 45.7 24% | 47 21% | 40.8 32% | 110.2 -84% | 121.7 -104% |
| Last max * (Watt) | 104.8 | 63 40% | 63.6 39% | 66.6 36% | 146 -39% | 138 -32% |
* ... kleinere Werte sind besser
Energieverbrauch Witcher 3 / Stresstest
Energieverbrauch externer Monitor
Akkulaufzeit
Die Akkukapazität wurde von 80 Wh beim Prestige 15 auf 99 Wh beim Prestige 16 erhöht. Zusammen mit der Leistungsfähigkeit der neuen 14. Generation der Intel-CPU erzielt das Notebook extrem lange Laufzeiten von fast 18,5 Stunden bei realem Surfen im Internet. Dies platziert es unter den ausdauerndsten Windows-Notebooks, die wir getestet haben, und die Ergebnisse können mit denen der MacBook-Serie konkurrieren.
Das Aufladen von leer bis zur vollen Kapazität dauert etwa 90 Minuten.
| MSI Prestige 16 B1MG-001US Ultra 7 155H, Arc 8-Core, 99.9 Wh | MSI Prestige 15 A12UD-093 i7-1280P, GeForce RTX 3050 Ti Laptop GPU, 80 Wh | LG Gram 2in1 16 16T90R - G.AA78G i7-1360P, Iris Xe G7 96EUs, 80 Wh | Lenovo ThinkBook 16 G6 ABP R5 7530U, Vega 7, 45 Wh | Asus VivoBook Pro 16 K6602VU i9-13900H, GeForce RTX 4050 Laptop GPU, 96 Wh | Dell Inspiron 16 Plus 7630 i7-13700H, GeForce RTX 4060 Laptop GPU, 86 Wh | |
|---|---|---|---|---|---|---|
| Akkulaufzeit | -51% | -32% | -45% | -45% | -43% | |
| Idle (h) | 25.1 | 17.6 -30% | ||||
| WLAN (h) | 18.3 | 8.9 -51% | 11.9 -35% | 10.1 -45% | 10.1 -45% | 9.4 -49% |
| Last (h) | 2.8 | 1.4 -50% | 2 -29% | 1.4 -50% | ||
| H.264 (h) | 7.1 | 11.6 | 9.8 |
Pro
Contra
Fazit — Die Prestige-Serie in Bestform
Die 14. Generation von Intel verspricht eine bedeutende Verbesserung für Ultrabooks wie das MSI Prestige 16 zu sein. Obwohl die reine CPU-Leistung im Vergleich zur vorherigen Generation nicht signifikant gesteigert wurde, sind die Fortschritte in der integrierten Grafikleistung und der Akkulaufzeit ebenso wichtig für die Ultrabook-Kategorie. Der Intel Arc 8 hat die AMD Radeon 780M mit deutlichem Vorsprung überholt, was bedeutet, dass die meisten Gelegenheitsspieler und Fotobearbeiter mit seiner Leistung zufrieden sein sollten.
Allerdings könnten einige Aspekte des Modells verbessert werden. Zunächst einmal gibt es keine hohe Bildwiederholrate und keine Touchscreen-Optionen, was Alternativen wie das HP Spectre oder Asus Vivobook einige Vorteile bietet. Zweitens ist das Geisterbild bei der IPS-Konfiguration so auffällig, dass selbst Gelegenheitsspieler davon gestört werden könnten. Trotz der zu erwartenden Akkulaufzeit könnte sich das OLED-SKU als lohnenswert erweisen. Im Vergleich zu den meisten anderen Ultrabooks der U-Serie führt die höhere iGPU-Leistung und die Ausführung von GPU-intensiven Aufgaben zu einem höheren Stromverbrauch und einem lauteren Lüftergeräusch.
Insbesondere Studenten werden die lange Akkulaufzeit, das scharfe DCI-P3-Display und die vielfältigen Grafikoptionen des Prestige 16 als attraktive Alternative zum MacBook Pro betrachten.
Die tragbare Bauweise, der farbenfrohe Bildschirm, die lange Akkulaufzeit, die schnelle integrierte Grafik und der zügige SD-Kartenleser sind die herausragenden Merkmale des Prestige 16. Nutzer dürften bestrebt sein, diese Stärken optimal zu nutzen und das Beste aus dem MSI-Modell herauszuholen.
Preis und Verfügbarkeit
Das MSI Prestige 16 mit der 14. Generation der CPU ist nun auf Amazon für 2.799 Euro erhältlich.
MSI Prestige 16 B1MG-001US
- 28.12.2023 v7 (old)
Allen Ngo
Transparenz
Die Auswahl der zu testenden Geräte erfolgt innerhalb der Redaktion. Das vorliegende Testmuster wurde vom Autor auf eigene Kosten im freien Handel erworben. Der Hersteller erhielt keine Version des Reviews vor der Veröffentlichung, es bestand keine Verpflichtung zur Publikation. Als eigenständiges, unabhängiges Unternehmen unterliegt Notebookcheck keiner Diktion von Herstellern, Shops und Verlagen.
So testet Notebookcheck
Pro Jahr werden von Notebookcheck hunderte Laptops und Smartphones unabhängig in von uns standardisierten technischen Verfahren getestet, um eine Vergleichbarkeit aller Testergebnisse zu gewährleisten. Seit rund 20 Jahren entwickeln wir diese Testmethoden kontinuierlich weiter und setzen damit Branchenstandards. In unseren Testlaboren kommt ausschließlich hochwertiges Messequipment in die Hände erfahrener Techniker und Redakteure. Die Tests unterliegen einer mehrstufigen Kontrolle. Unsere komplexe Gesamtbewertung basiert auf hunderten fundierten Messergebnissen und Benchmarks, womit Ihnen Objektivität garantiert ist. Weitere Informationen zu unseren Testmethoden gibt es hier.
Preisvergleich

